Embed Size (px)
Citation preview

Global Research
Issuer of Report Standard Chartered Bank, Singapore Branch
Important disclosures can be found in the Disclosures Appendix
All rights reserved. Standard Chartered Bank 2018 https://research.sc.com
Global Focus – Q4-2018
Beneath the surface
research.sc.com
Standard Chartered Global Research is available across all iOS and Android devices.
Our intuitive, accessible and customisable apps* allow you to receive our reports, forecasts, audio-visual presentations and
interactive data visualisation tools on-the-go.
* Click the icons to download or search ‘Standard Chartered Global Research’ in the app store.
If you are in scope for MiFID II and want to opt out of our Research services, please contact us.
Global Focus – Q4-2018
Standard Chartered Global Research | 2 October 2018 2
Table of contents
Global overview 3
Executive summary 4 Distribution of world GDP growth 6 Global overview – Beneath the surface 10 Global charts 20
Geopolitical economics 22
US midterms – A looming risk for Trump 23
Economies – Asia 29
Asia – Top charts 30 Asia – Macro trackers 31 Australia – Boiling frog? 33 Bangladesh – A strong year likely; risks remain 35 China – Risks contained, despite downtrend 37 Hong Kong – A bumpier ride 39 India – Battling external headwinds 41 Indonesia – Playing defence 43 Japan – On a positive growth path 45 Malaysia – Will a single engine be enough? 47 Myanmar – Infrastructure projects needed 49 Nepal – Stable politics = better growth outlook 50 New Zealand – Dovishness is overdone 51 Philippines – More hikes to come 53 Singapore – Wait and see 55 South Korea – Between reality and ideals 57 Sri Lanka – Walking a tightrope 59 Taiwan – Growth momentum to slow 61 Thailand – About to move into election mode 63 Vietnam – Fast, not furious 65
Economies – Middle East, North Africa and
Pakistan 67
MENAP – Back to the future? 68 MENAP – Top charts 70 Bahrain – Funding for reform 71 Egypt – Steady progress 72 Iraq – Catching a break 73 Jordan – Just getting by 74 Kuwait – Getting back to growth 75 Lebanon – On hold until cabinet is formed 76 Oman – Some relief, but challenges remain 77 Pakistan – Fund, friends and financing 78 Qatar – Future tailwinds 80 Saudi Arabia – Adjusting reforms 81 Turkey – Of crises and policy responses 82 UAE – Policy support on the way 84
Economies – Africa 85
Africa – Navigating troubled waters 86 Africa – Top charts 88 Angola – Not just a summer fling 89 Botswana – A mining recovery 91
Cameroon – Coping with costly unrest 93 Côte d’Ivoire – Tomorrow is now 95 Ethiopia – New opportunities, old challenges 96 Gabon – Not there yet 97 Ghana – 25% bigger with recent rebasing 99 Kenya – Not such taxing times 101 Mozambique – Untying the Gordian knot 103 Nigeria – Politics, politics 105 Senegal – Losing its shine? 107 South Africa – Fears are overdone 108 Tanzania – Subdued outlook 110 Uganda – Rates steady for longer 111
Economies – Europe 112
Europe – Top charts 113 Euro area – Ending QE 114 Switzerland – Slowdown expected in H2 116 UK – Brexit to weigh on growth 117 Czech Republic – Risks of overheating 119 Hungary – Growth has likely peaked 120 Poland – Private consumption is key 121 Russia – Recovery remains intact 122
Economies – Americas 123
US and Canada – Top charts 124 Latin America – Top charts 125 US – Outlook remains positive 126 Canada – Internally solid, externally vulnerable 129 Brazil – Post-election hangover 130 Chile – Causes for concern 132 Colombia – Smells like animal spirits 134 Mexico – The shape of AMLO 136 Peru – Solid growth, fluid political backdrop 138
Strategy outlook 140
The return of the VaR shock 141
Forecasts and reference tables 148
Forecasts – Economies 149 Forecasts – FX 150 Forecasts – GDP 151 Forecasts – Rates 152 Forecasts – Commodities 153 Forecasts – Long-term 154 Forecasts – Selected interbank rates by tenor 156 Reference tables – Asia 157 Reference tables – MENAP 158 Reference tables – Africa 159 Reference tables – Europe 160 Reference tables – Americas 161
Authors 162

Global overview
Global Focus – Q4-2018
Standard Chartered Global Research | 2 October 2018 4
G
lob
al
o
verv
iew
Geopolit
ical
econom
ics
A
sia
M
EN
AP
A
fric
a
E
uro
pe
A
me
ricas
S
trate
gy
o
utlo
ok
Fo
recasts
and
re
fere
nces
Executive summary
Beneath the surface
Global growth has been strong so far this year, and we maintain our 2018 global
growth forecast of 3.9%. We expect the same robust pace to be maintained in 2019.
The improved global outlook is largely premised on our upgraded US forecasts,
driven by the ‘sugar rush’ from fiscal stimulus.
But while global growth has been resilient so far, risks bubbling beneath the surface
have increased since the start of 2018. These include the escalating US-China trade
war; a break higher in oil prices; and tightening global liquidity conditions due to the
end of the QE era, trends in the USD, and US monetary tightening. These factors
have led to mounting external pressure on emerging markets with twin deficits,
resulting in more aggressive monetary tightening in these economies.
Emerging markets with twin deficits
are having to tighten monetary
policy more aggressively
China: China’s economy is likely to lose further momentum in the coming months
amid rising trade tensions with the US and slowing housing-market growth. The
government is committed, however, to achieving its 6.5% growth target for 2018,
using more proactive fiscal policy via tax cuts and infrastructure spending to boost
domestic demand. We see limited room to loosen monetary policy further. On the
Chinese yuan (CNY), we expect more efforts by the authorities to slow depreciation
and prevent USD-CNY breaking above 7.0 this year.
ASEAN: Slowing growth in China and worries about escalating US-China trade
tensions are already beginning to affect export growth sentiment in ASEAN countries.
However, the growth outlook remains benign and ASEAN economies have been more
resilient to EM risk aversion than those in EMEA or Latin America. Domestic demand –
especially government infrastructure spending – should support growth in Indonesia, the
Philippines and Thailand. The inflation picture is mixed in ASEAN. The Philippines
central bank has hiked rates aggressively to counter strong inflationary pressure.
Indonesia’s inflation is comparatively manageable; while Bank Indonesia has also
tightened policy aggressively, Indonesian rupiah (IDR) stability has been the main driver.
India: India is one of the fastest-growing EM economies. However, higher oil prices
are a key global risk to India’s economic outlook. Policy makers are likely to stay
focused on managing external headwinds through monetary policy tightening, direct
measures to narrow the deficit, and fiscal prudence.
US monetary policy is likely to
remain relatively benign despite
four more rate hikes in 2019
US: The near-term economic outlook has strengthened further on fiscal stimulus,
and we recently raised our 2018 GDP growth forecast to 2.9%. Given the strength of
real growth and the tight labour market, we have raised our expectation of the
terminal federal funds target rate to 3.50%. Despite pencilling in a higher terminal
rate, we expect the policy stance to remain relatively benign. The US midterm
elections in November are increasingly becoming the focus for investors, who view it
as a ‘practice run’ for the 2020 presidential race. The House appears more
vulnerable than the Senate to a Democratic takeover.
Europe: The euro-area economy continues to grow at an above-trend pace,
supported by household consumption and investment spending. Growth is likely to
moderate over the next couple of years, however, in the face of high energy prices,
reduced QE support and an uncertain trade outlook. Concerns about Italy’s fiscal
position are likely to persist, especially as QE ends. While the European Central
Bank is on track to end QE, it is likely to be slow to raise rates. Brexit negotiations will
continue to dominate sentiment in the UK, with rising concerns about a ‘hard’ Brexit.
Global Focus – Q4-2018
Standard Chartered Global Research | 2 October 2018 5
Glo
ba
l
ov
erv
iew
Geopolitic
al
econom
ics
Asia
ME
NA
P
Afric
a
Euro
pe
Am
eric
as
Stra
tegy
outlo
ok
Fo
recasts
and
refe
rences
Africa: Commodity prices are key to the outlook. Higher oil prices have benefited
Nigeria and have been crucial in avoiding deeper economic crises in Angola and
Gabon. Among oil importers, Senegal’s fundamentals may deteriorate the most.
Further Fed tightening, trade-war concerns and EM vulnerabilities will shape the
external environment for Sub-Saharan Africa. Commitment to IMF programmes in
several countries will be crucial to maintaining investor confidence.
IMF programmes are important for
continued investor confidence for
several countries in SSA and
MENAP
MENAP: Higher oil prices improve the outlook for the GCC but raise risks for oil
importers. We forecast that growth in the Middle East, North Africa and Pakistan
(MENAP) region will accelerate to 3.5% in 2018 from our 3.2% estimate for 2017. For
GCC countries, higher oil prices will allow lower budget deficits despite an increase in
fiscal spending. We expect monetary policy to tighten across MENAP. Due to external
vulnerabilities, Egypt, Jordan and Iraq are in IMF programmes; Pakistan is likely to follow.
Latin America: Growth is diverging across economies. Peru, Colombia and Chile
are benefiting from increasing business confidence as incoming administrations try to
move to a pro-business reform agenda. Growth in Brazil and Argentina, on the other
hand, has underperformed Latam peers due to election-related risks (in Brazil) and a
currency crisis driven by a collapse in confidence over macro adjustment (Argentina).
Intensifying trade tensions and a stronger USD have affected local currencies.
Consequently, monetary policy is taking on a more explicit tightening bias, although
underlying inflation pressures are under control.
Where we differ from consensus
US: We see one more FOMC hike in 2018 (in December) and four in 2019, versus
the consensus call of three more hikes between now and end-2019. Our view is
premised on a strong US labour market and a positive output gap.
China: We forecast a faster deterioration in China’s current account (C/A) balance
than consensus. We expect the C/A surplus to turn to a deficit of 0.2% of GDP in
2019 from a surplus of 0.5% in 2018 as trade tariffs start to hurt exports.
Korea: We expect the BoK to hike rates in 2019, unlike the market consensus. Concerns
about rising wealth inequality and financial stability are likely to drive this decision.
Indonesia: We expect a wider current account deficit than market consensus, driven
by unfavourable commodity price movements.
MENAP: Egypt’s central bank is unlikely to cut rates, despite falling inflation, as it
seeks to protect against capital outflows. In Pakistan, we still think markets are
under-pricing monetary tightening. Pakistani rupee (PKR) adjustment amid higher oil
prices is likely to pressure CPI inflation higher. We expect the central bank to
respond with another 150bps of hikes.
Latin America: We think economic activity has already peaked in Chile, as it is
vulnerable to the current global combination of high oil prices and low metal prices. In
Mexico, we expect more aggressive rate cuts than consensus, as we see inflation
sharply undershooting consensus from Q2-2019. In Colombia, we expect growth to
be stronger than consensus, supported by domestic demand and higher oil prices.
Global Focus – Q4-2018
Standard Chartered Global Research | 2 October 2018 6
G
lob
al
o
verv
iew
Geopolit
ical
econom
ics
A
sia
M
EN
AP
A
fric
a
E
uro
pe
A
me
ricas
S
trate
gy
o
utlo
ok
Fo
recasts
and
re
fere
nces
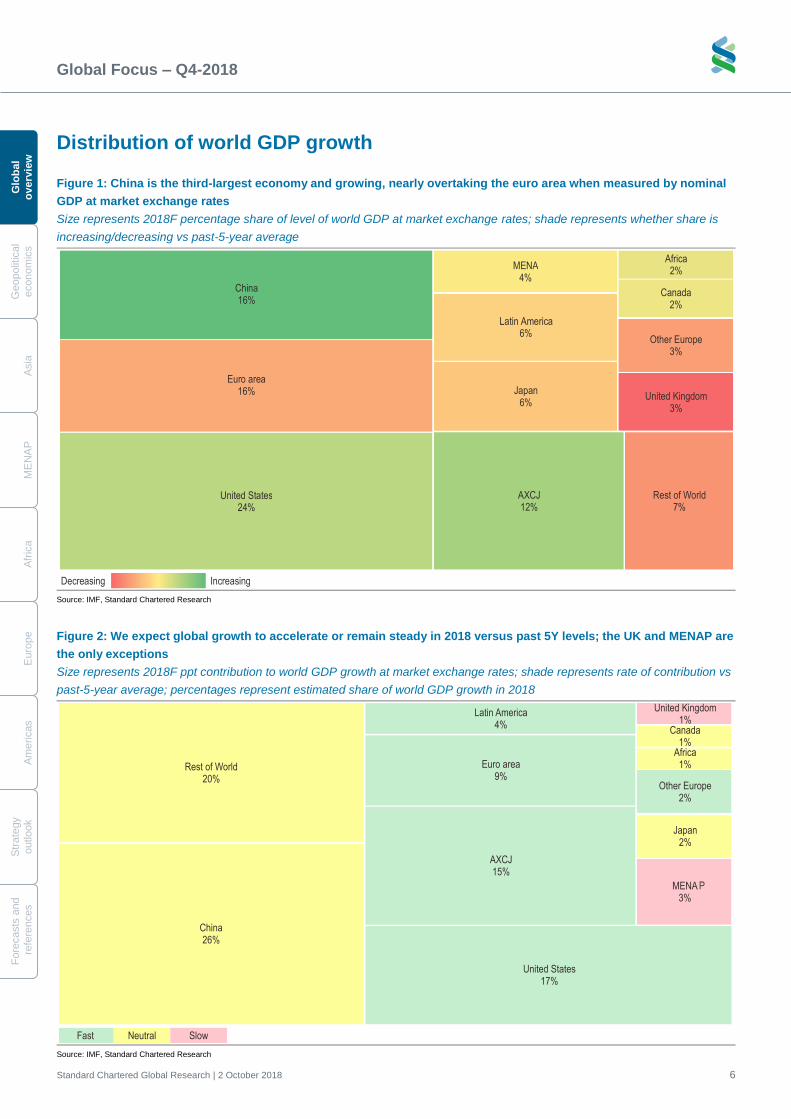
Distribution of world GDP growth
Figure 1: China is the third-largest economy and growing, nearly overtaking the euro area when measured by nominal
GDP at market exchange rates
Size represents 2018F percentage share of level of world GDP at market exchange rates; shade represents whether share is
increasing/decreasing vs past-5-year average
Source: IMF, Standard Chartered Research
Figure 2: We expect global growth to accelerate or remain steady in 2018 versus past 5Y levels; the UK and MENAP are
the only exceptions
Size represents 2018F ppt contribution to world GDP growth at market exchange rates; shade represents rate of contribution vs
past-5-year average; percentages represent estimated share of world GDP growth in 2018
Source: IMF, Standard Chartered Research
China26%
Euro area9%
United States17%
AXCJ15%
Japan2%
Latin America4%
MENA3%
Africa1%Rest of World
20%
United Kingdom1%
Canada1%
Other Europe2%
Fast Neutral Slow
P
China 16%
Euro area 16%
United States 24%
AXCJ 12%
Japan 6%
Latin America 6%
MENA 4%
Africa 2%
Rest of World 7%
United Kingdom 3%
Canada 2%
Other Europe 3%
Decreasing Increasing
Global Focus – Q4-2018
Standard Chartered Global Research | 2 October 2018 7
Glo
ba
l
ov
erv
iew
Geopolitic
al
econom
ics
Asia
ME
NA
P
Afric
a
Euro
pe
Am
eric
as
Stra
tegy
outlo
ok
Fo
recasts
and
refe
rences
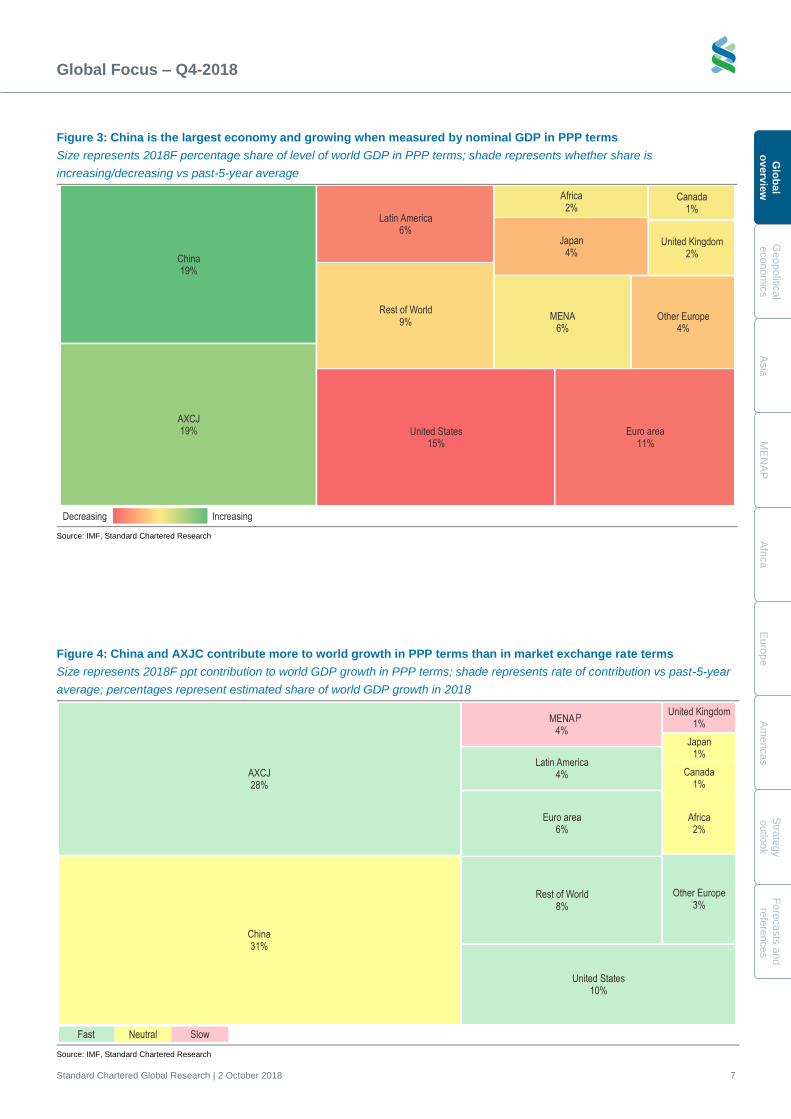
Figure 3: China is the largest economy and growing when measured by nominal GDP in PPP terms
Size represents 2018F percentage share of level of world GDP in PPP terms; shade represents whether share is
increasing/decreasing vs past-5-year average
Source: IMF, Standard Chartered Research
Figure 4: China and AXJC contribute more to world growth in PPP terms than in market exchange rate terms
Size represents 2018F ppt contribution to world GDP growth in PPP terms; shade represents rate of contribution vs past-5-year
average; percentages represent estimated share of world GDP growth in 2018
Source: IMF, Standard Chartered Research
China31%
Euro area6%
United States10%
AXCJ28%
Japan1%
Latin America4%
MENA4%
Africa2%
Rest of World8%
United Kingdom1%
Canada1%
Other Europe3%
Fast Neutral Slow
P
China 19%
Euro area 11%
United States 15%
AXCJ 19%
Japan 4%
Latin America 6%
MENA 6%
Africa 2%
Rest of World 9%
United Kingdom 2%
Canada 1%
Other Europe 4%
Decreasing Increasing
Glo
bal F
oc
us
– Q
4-2
01
8
Sta
nd
ard
Charte
red
Glo
bal R
esea
rch | 2
Octo
ber 2
018
8
Global overview
Geopolitical economics
Asia
MENAP
Africa
Europe
Americas
Strategy outlook
Forecasts and references
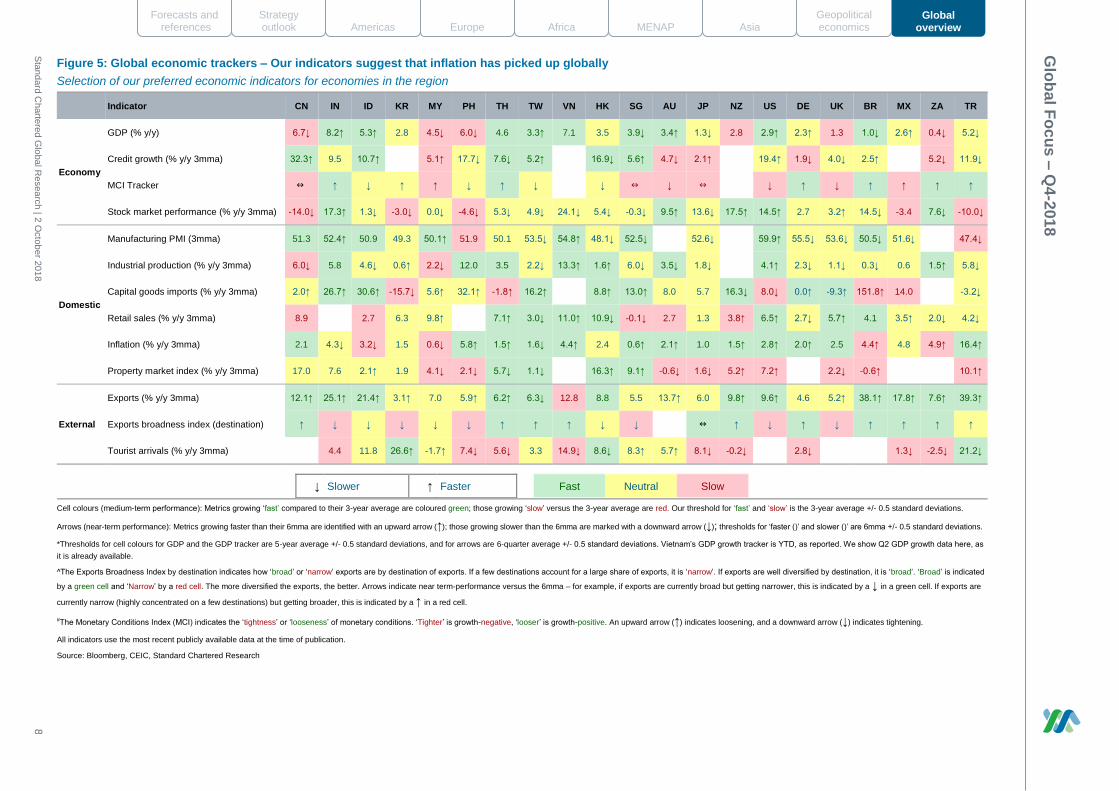
Figure 5: Global economic trackers – Our indicators suggest that inflation has picked up globally
Selection of our preferred economic indicators for economies in the region
Indicator CN IN ID KR MY PH TH TW VN HK SG AU JP NZ US DE UK BR MX ZA TR
Economy
GDP (% y/y) 6.7↓ 8.2↑ 5.3↑ 2.8 4.5↓ 6.0↓ 4.6 3.3↑ 7.1 3.5 3.9↓ 3.4↑ 1.3↓ 2.8 2.9↑ 2.3↑ 1.3 1.0↓ 2.6↑ 0.4↓ 5.2↓
Credit growth (% y/y 3mma) 32.3↑ 9.5 10.7↑ 5.1↑ 17.7↓ 7.6↓ 5.2↑ 16.9↓ 5.6↑ 4.7↓ 2.1↑ 19.4↑ 1.9↓ 4.0↓ 2.5↑ 5.2↓ 11.9↓
MCI Tracker ↑ ↓ ↑ ↑ ↓ ↑ ↓ ↓ ↓ ↓ ↑ ↓ ↑ ↑ ↑ ↑
Stock market performance (% y/y 3mma) -14.0↓ 17.3↑ 1.3↓ -3.0↓ 0.0↓ -4.6↓ 5.3↓ 4.9↓ 24.1↓ 5.4↓ -0.3↓ 9.5↑ 13.6↓ 17.5↑ 14.5↑ 2.7 3.2↑ 14.5↓ -3.4 7.6↓ -10.0↓
Domestic
Manufacturing PMI (3mma) 51.3 52.4↑ 50.9 49.3 50.1↑ 51.9 50.1 53.5↓ 54.8↑ 48.1↓ 52.5↓ 52.6↓ 59.9↑ 55.5↓ 53.6↓ 50.5↓ 51.6↓ 47.4↓
Industrial production (% y/y 3mma) 6.0↓ 5.8 4.6↓ 0.6↑ 2.2↓ 12.0 3.5 2.2↓ 13.3↑ 1.6↑ 6.0↓ 3.5↓ 1.8↓ 4.1↑ 2.3↓ 1.1↓ 0.3↓ 0.6 1.5↑ 5.8↓
Capital goods imports (% y/y 3mma) 2.0↑ 26.7↑ 30.6↑ -15.7↓ 5.6↑ 32.1↑ -1.8↑ 16.2↑ 8.8↑ 13.0↑ 8.0 5.7 16.3↓ 8.0↓ 0.0↑ -9.3↑ 151.8↑ 14.0 -3.2↓
Retail sales (% y/y 3mma) 8.9 2.7 6.3 9.8↑ 7.1↑ 3.0↓ 11.0↑ 10.9↓ -0.1↓ 2.7 1.3 3.8↑ 6.5↑ 2.7↓ 5.7↑ 4.1 3.5↑ 2.0↓ 4.2↓
Inflation (% y/y 3mma) 2.1 4.3↓ 3.2↓ 1.5 0.6↓ 5.8↑ 1.5↑ 1.6↓ 4.4↑ 2.4 0.6↑ 2.1↑ 1.0 1.5↑ 2.8↑ 2.0↑ 2.5 4.4↑ 4.8 4.9↑ 16.4↑
Property market index (% y/y 3mma) 17.0 7.6 2.1↑ 1.9 4.1↓ 2.1↓ 5.7↓ 1.1↓ 16.3↑ 9.1↑ -0.6↓ 1.6↓ 5.2↑ 7.2↑ 2.2↓ -0.6↑ 10.1↑
External
Exports (% y/y 3mma) 12.1↑ 25.1↑ 21.4↑ 3.1↑ 7.0 5.9↑ 6.2↑ 6.3↓ 12.8 8.8 5.5 13.7↑ 6.0 9.8↑ 9.6↑ 4.6 5.2↑ 38.1↑ 17.8↑ 7.6↑ 39.3↑
Exports broadness index (destination) ↑ ↓ ↓ ↓ ↓ ↓ ↑ ↑ ↑ ↓ ↓ ↑ ↓ ↑ ↓ ↑ ↑ ↑ ↑
Tourist arrivals (% y/y 3mma) 4.4 11.8 26.6↑ -1.7↑ 7.4↓ 5.6↓ 3.3 14.9↓ 8.6↓ 8.3↑ 5.7↑ 8.1↓ -0.2↓ 2.8↓ 1.3↓ -2.5↓ 21.2↓
↓ Slower ↑ Faster
Fast Neutral Slow
Cell colours (medium-term performance): Metrics growing ‘fast’ compared to their 3-year average are coloured green; those growing ‘slow’ versus the 3-year average are red. Our threshold for ‘fast’ and ‘slow’ is the 3-year average +/- 0.5 standard deviations.
Arrows (near-term performance): Metrics growing faster than their 6mma are identified with an upward arrow (↑); those growing slower than the 6mma are marked with a downward arrow (↓); thresholds for ‘faster ()’ and slower ()’ are 6mma +/- 0.5 standard deviations.
*Thresholds for cell colours for GDP and the GDP tracker are 5-year average +/- 0.5 standard deviations, and for arrows are 6-quarter average +/- 0.5 standard deviations. Vietnam’s GDP growth tracker is YTD, as reported. We show Q2 GDP growth data here, as
it is already available.
^The Exports Broadness Index by destination indicates how ‘broad’ or ‘narrow’ exports are by destination of exports. If a few destinations account for a large share of exports, it is ‘narrow’. If exports are well diversified by destination, it is ‘broad’. ‘Broad’ is indicated
by a green cell and ‘Narrow’ by a red cell. The more diversified the exports, the better. Arrows indicate near term-performance versus the 6mma – for example, if exports are currently broad but getting narrower, this is indicated by a ↓ in a green cell. If exports are
currently narrow (highly concentrated on a few destinations) but getting broader, this is indicated by a ↑ in a red cell.
#The Monetary Conditions Index (MCI) indicates the ‘tightness’ or ‘looseness’ of monetary conditions. ‘Tighter’ is growth-negative, ‘looser’ is growth-positive. An upward arrow (↑) indicates loosening, and a downward arrow (↓) indicates tightening.
All indicators use the most recent publicly available data at the time of publication.
Source: Bloomberg, CEIC, Standard Chartered Research
Global Focus – Q4-2018
Standard Chartered Global Research | 2 October 2018 9
Glo
ba
l
ov
erv
iew
Geopolitic
al
econom
ics
Asia
ME
NA
P
Afric
a
Euro
pe
Am
eric
as
Stra
tegy
outlo
ok
Fo
recasts
and
refe
rences
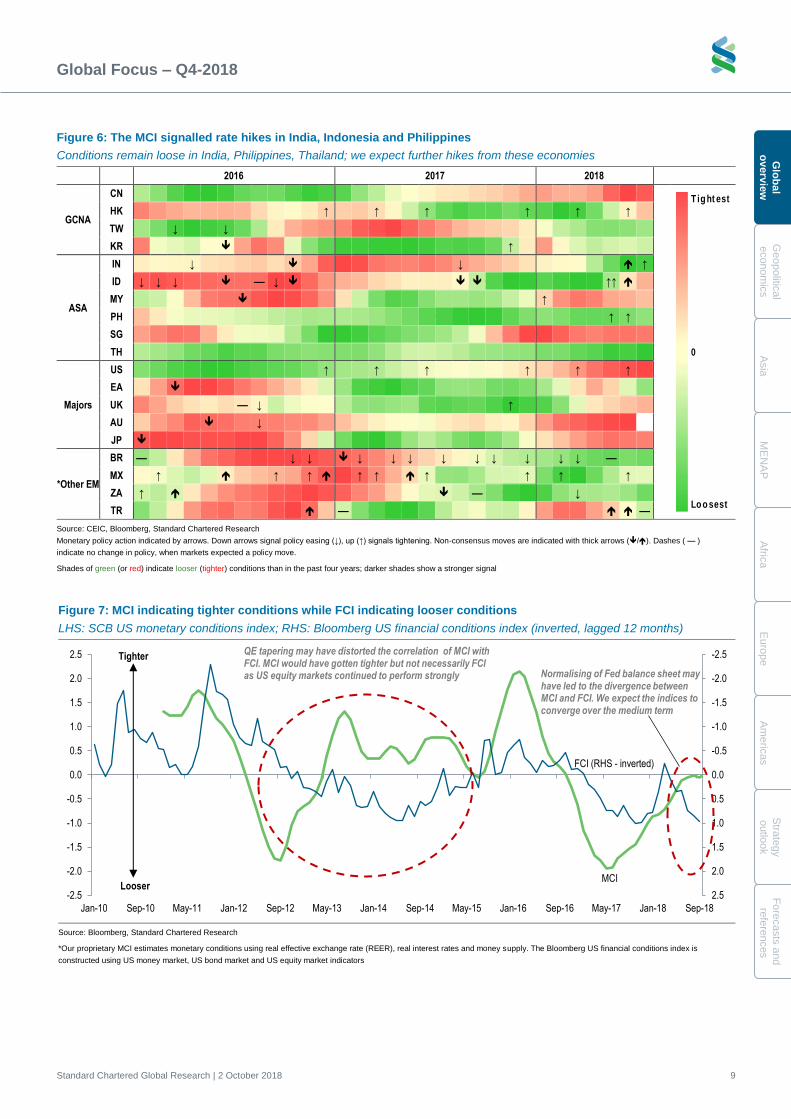
Figure 6: The MCI signalled rate hikes in India, Indonesia and Philippines
Conditions remain loose in India, Philippines, Thailand; we expect further hikes from these economies
2016 2017 2018
GCNA
CN
HK ↑
↑
↑
↑
↑
↑
TW ↓
↓
KR
↑
ASA
IN ↓
↓
↑
ID ↓ ↓ ↓
— ↓
↑↑
MY
↑
PH ↑ ↑
SG
TH
Majors
US ↑
↑
↑
↑
↑
↑
EA
UK — ↓
↑
AU
↓
JP
*Other EM
BR —
↓ ↓
↓
↓ ↓
↓
↓ ↓
↓
↓ ↓
—
MX ↑
↑
↑
↑ ↑
↑
↑
↑
↑
ZA ↑
—
↓
TR
—
—
Source: CEIC, Bloomberg, Standard Chartered Research
Monetary policy action indicated by arrows. Down arrows signal policy easing (↓), up (↑) signals tightening. Non-consensus moves are indicated with thick arrows (/). Dashes ( — )
indicate no change in policy, when markets expected a policy move.
Shades of green (or red) indicate looser (tighter) conditions than in the past four years; darker shades show a stronger signal
Figure 7: MCI indicating tighter conditions while FCI indicating looser conditions
LHS: SCB US monetary conditions index; RHS: Bloomberg US financial conditions index (inverted, lagged 12 months)
Source: Bloomberg, Standard Chartered Research
*Our proprietary MCI estimates monetary conditions using real effective exchange rate (REER), real interest rates and money supply. The Bloomberg US financial conditions index is
constructed using US money market, US bond market and US equity market indicators
T ig ht est
0
Lo o sest
MCI
FCI (RHS - inverted)
-2.5
-2.0
-1.5
-1.0
-0.5
0.0
0.5
1.0
1.5
2.0
2.5-2.5
-2.0
-1.5
-1.0
-0.5
0.0
0.5
1.0
1.5
2.0
2.5
Jan-10 Sep-10 May-11 Jan-12 Sep-12 May-13 Jan-14 Sep-14 May-15 Jan-16 Sep-16 May-17 Jan-18 Sep-18
QE tapering may have distorted the correlation of MCI with FCI. MCI would have gotten tighter but not necessarily FCI as US equity markets continued to perform strongly Normalising of Fed balance sheet may
have led to the divergence between MCI and FCI. We expect the indices to converge over the medium term
Tighter
Looser
Global Focus – Q4-2018
Standard Chartered Global Research | 2 October 2018 10
G
lob
al
o
verv
iew
Geopolit
ical
econom
ics
A
sia
M
EN
AP
A
fric
a
E
uro
pe
A
me
ricas
S
trate
gy
o
utlo
ok
Fo
recasts
and
re
fere
nces
Global overview – Beneath the surface
Global growth remains robust... for now
Our 2018 global growth forecast of 3.9% is unchanged since the start of the year,
despite mostly negative news flow. We expect the same robust pace to be
maintained in 2019. Downgrades to our growth forecasts in Africa and Latin America
have been countered by our upgraded US forecasts, which are premised on the
‘sugar rush’ from fiscal stimulus. The euro-area economy is on track to keep growing
above trend (2.0% in 2018). We expect China’s policy response to help its economy
weather the US-China trade war, growing 6.6% in 2018 and 6.4% in 2019. But while
global growth and trade have been resilient so far, negative tail risks to our forecasts
have increased since the start of 2018 – when we were already cautioning to
‘Beware of the Dog’. A number of risks are bubbling beneath the surface.
Global growth resilience so far contrasts with a steady flow of negative news for
longer-term growth: the escalating US-China trade war; a break higher in oil prices;
and mounting external pressure on emerging markets with twin deficits, which has
forced more aggressive monetary tightening in these economies. The end of the QE
era is also part of the story this year, but trends in the USD and US monetary policy
are just as important for emerging markets with twin (fiscal and current
account) deficits.
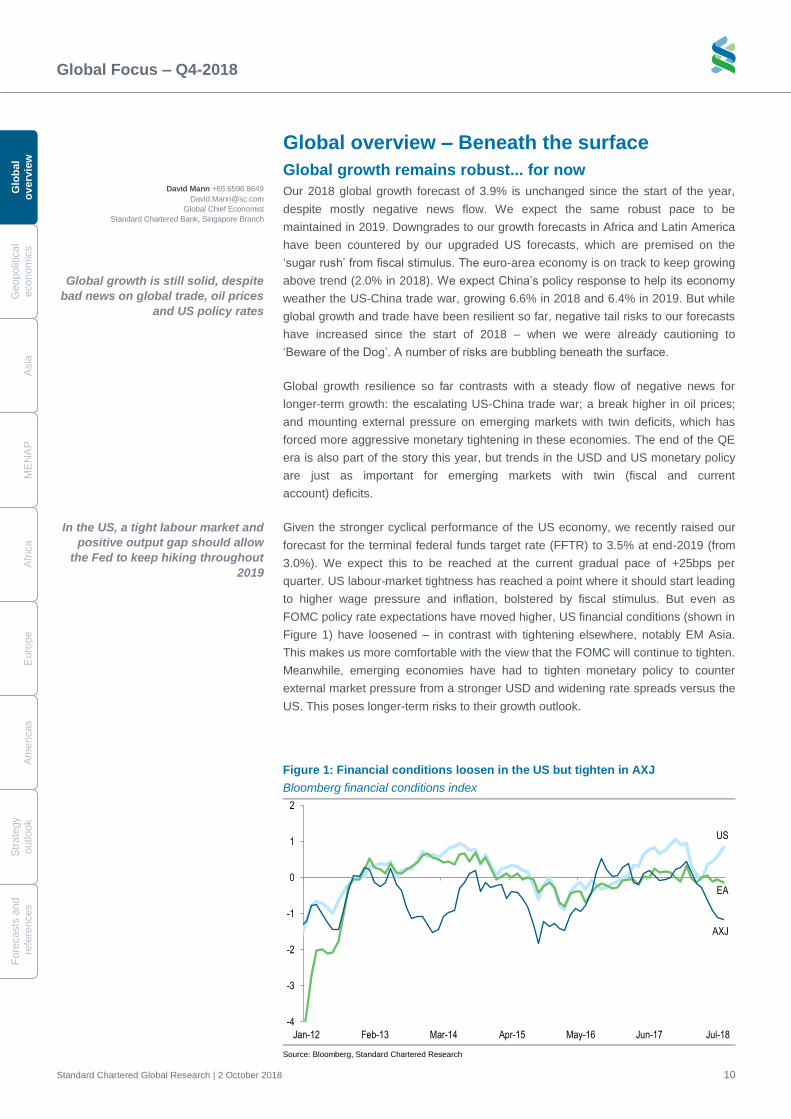
Given the stronger cyclical performance of the US economy, we recently raised our
forecast for the terminal federal funds target rate (FFTR) to 3.5% at end-2019 (from
3.0%). We expect this to be reached at the current gradual pace of +25bps per
quarter. US labour-market tightness has reached a point where it should start leading
to higher wage pressure and inflation, bolstered by fiscal stimulus. But even as
FOMC policy rate expectations have moved higher, US financial conditions (shown in
Figure 1) have loosened – in contrast with tightening elsewhere, notably EM Asia.
This makes us more comfortable with the view that the FOMC will continue to tighten.
Meanwhile, emerging economies have had to tighten monetary policy to counter
external market pressure from a stronger USD and widening rate spreads versus the
US. This poses longer-term risks to their growth outlook.
Figure 1: Financial conditions loosen in the US but tighten in AXJ
Bloomberg financial conditions index
Source: Bloomberg, Standard Chartered Research
US
EA
AXJ
-4
-3
-2
-1
0
1
2
Jan-12 Feb-13 Mar-14 Apr-15 May-16 Jun-17 Jul-18
In the US, a tight labour market and
positive output gap should allow
the Fed to keep hiking throughout
2019
Global growth is still solid, despite
bad news on global trade, oil prices
and US policy rates
David Mann +65 6596 8649
Global Chief Economist
Standard Chartered Bank, Singapore Branch
Global Focus – Q4-2018
Standard Chartered Global Research | 2 October 2018 11
Glo
ba
l
ov
erv
iew
Geopolitic
al
econom
ics
Asia
ME
NA
P
Afric
a
Euro
pe
Am
eric
as
Stra
tegy
outlo
ok
Fo
recasts
and
refe
rences
China – A pause in the deleveraging push
At the start of 2018, we saw China’s deleveraging agenda as the main driver of
weaker sentiment among domestic investors. We are now less concerned about a
slowdown in China’s growth as the authorities scale back the pace of deleveraging
and the policy mix shifts towards fiscal policy as a growth stabiliser.
The recent Politburo meeting pledged more proactive fiscal policy via tax cuts and
infrastructure spending to boost domestic demand, along with a measured pace of
deleveraging. We now see room for fiscal policy to play a much bigger role without a
revision of the 2018 budget. According to our calculation, if the budget is fully
implemented, the fiscal deficit will be 0.9% of GDP (or CNY 1.1tn) higher than last
year (see China – Growth likely to beat target with fiscal expansion).
While the People’s Bank of China (PBoC) has removed its tightening bias, we see
limited room to loosen monetary policy further. The PBoC has already provided
ample liquidity to the interbank market via reserve requirement ratio (RRR) cuts and
the medium-term lending facility. Recent remarks by PBoC officials suggest a
preference for total social financing to grow at a similar pace to nominal GDP. The
challenge, however, is to unclog the transmission mechanism in order to channel
financing to the real economy. We maintain our call that the PBoC will lower the RRR
by another 2.5ppt in total before end-2019 to prevent a tightening of the
monetary stance.
Our confidence that China’s growth will remain robust throughout 2018-19 reflects
how important the growth target currently is for policy makers. Once the 2020 target
of doubling real GDP versus 2010 levels has been achieved, there may be less
emphasis on this target and more on broader social goals such as environmental
protection and tackling systemic risks from prior leverage excesses. Given that China
is the top trading partner for most EM economies in Asia and accounts for more than
30% of global growth (using PPP exchange rates), this makes us less optimistic on
longer-term growth.
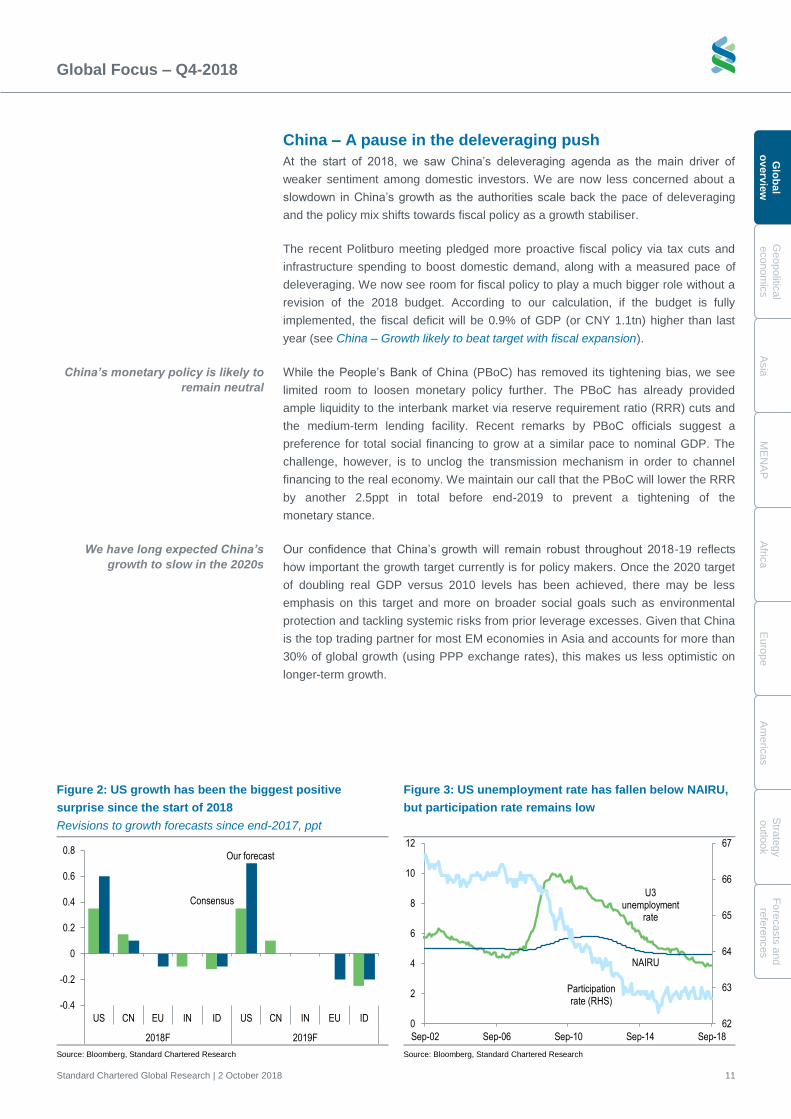
Figure 2: US growth has been the biggest positive
surprise since the start of 2018
Revisions to growth forecasts since end-2017, ppt
Figure 3: US unemployment rate has fallen below NAIRU,
but participation rate remains low
Source: Bloomberg, Standard Chartered Research Source: Bloomberg, Standard Chartered Research
Consensus
-0.4
-0.2
0
0.2
0.4
0.6
0.8
US CN EU IN ID US CN IN EU ID
2018F 2019F
Our forecast
U3 unemployment
rate
NAIRU
Participation rate (RHS)
62
63
64
65
66
67
0
2
4
6
8
10
12
Sep-02 Sep-06 Sep-10 Sep-14 Sep-18
China’s monetary policy is likely to
remain neutral
We have long expected China’s
growth to slow in the 2020s
Global Focus – Q4-2018
Standard Chartered Global Research | 2 October 2018 12
G
lob
al
o
verv
iew
Geopolit
ical
econom
ics
A
sia
M
EN
AP
A
fric
a
E
uro
pe
A
me
ricas
S
trate
gy
o
utlo
ok
Fo
recasts
and
re
fere
nces
US-China trade war – Bad news for all
The US-China trade war is a lose-lose situation given the two economies’ heavy
interdependence, in our view. US demand now accounts for 3% of China’s GDP, less
than half the 6.3% contribution in 2006. China’s contribution to US GDP has tripled
over the same period to about 1.0%, by our estimates. The US itself is the fourth-
largest contributor to the supply chain for China’s exports to the US. We estimate that
already-announced US tariffs on China, including those due to take effect in early
2019, will reduce China’s GDP growth by a cumulative 0.6ppt in 2018 and 2019.
Modest policy support should be able to counter this impact. However, if the trade
dispute escalates further in 2019, it may make a more worrying dent in
China’s growth.
There are also potential winners from the US-China trade war as other economies
step in to meet US demand diverted from China due to tariffs. The top five winners in
terms of direct exports would be Vietnam, Malaysia, Mexico, Taiwan and South
Korea. However, most of these economies are also among the five biggest losers
due their role in the supply chain for China’s exports to the US: Taiwan, Malaysia,
Singapore, Vietnam and Korea. Only Mexico stands out as an outright winner. For
the others, the key question is whether they will receive more inward investment as
manufacturers seek to diversify their production locations. Anecdotally, this already
appears to be happening on the perception that the US-China trade war is unlikely to
end soon.
We do not rule out the possibility of a ‘grand bargain’ between US President Trump
and China’s President Xi that would end tariffs and pledge further opening up,
investment and trade. The November G20 meeting, after the US midterm elections,
could provide an opportunity for the leaders to strike such a deal. A similar sudden
positive reversal was seen in Trump’s approach to North Korea earlier this year.
Barring such a deal, however, the trade situation is not looking good.
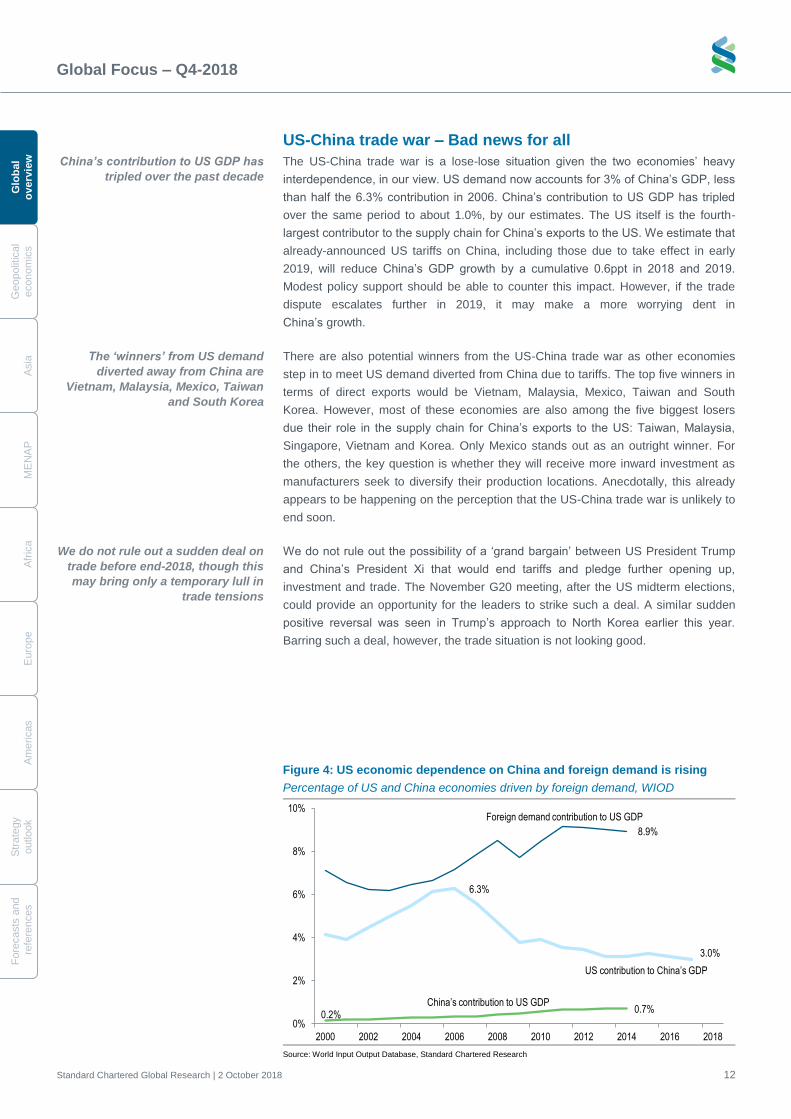
Figure 4: US economic dependence on China and foreign demand is rising
Percentage of US and China economies driven by foreign demand, WIOD
Source: World Input Output Database, Standard Chartered Research
6.3%
3.0%
0.2%0.7%
8.9%
0%
2%
4%
6%
8%
10%
2000 2002 2004 2006 2008 2010 2012 2014 2016 2018
US contribution to China’s GDP
Foreign demand contribution to US GDP
China’s contribution to US GDP
China’s contribution to US GDP has
tripled over the past decade
The ‘winners’ from US demand
diverted away from China are
Vietnam, Malaysia, Mexico, Taiwan
and South Korea
We do not rule out a sudden deal on
trade before end-2018, though this
may bring only a temporary lull in
trade tensions
Global Focus – Q4-2018
Standard Chartered Global Research | 2 October 2018 13
Glo
ba
l
ov
erv
iew
Geopolitic
al
econom
ics
Asia
ME
NA
P
Afric
a
Euro
pe
Am
eric
as
Stra
tegy
outlo
ok
Fo
recasts
and
refe
rences
Risk of an oil price shock
Sustainable spare capacity declines
Our Commodities Research team recently revised up its oil price forecasts to reflect
expectations of a decline in sustainable spare capacity by end-2018 (see Oil Notes –
This house is haunted; raising forecasts). This is partly due to the decline in supply
from Iran and Venezuela. We still see a risk that prices may overshoot the new
forecasts. We see upside risks to our average Brent price forecasts – USD 82/barrel
(bbl) for Q4-2018 and USD 78/bbl for 2019 – from the likely reduction in Iran’s
exports, other geopolitical issues, and our forecast slowdown in US supply growth.
Risks to growth beyond 2019
We see several risks that could emerge by 2019, slowing global growth.
1. Oil prices could rally beyond our expectations if supply tightens and demand
holds up better than expected. The negative growth impact would take about a
year to affect growth, according to our estimates (see Quantifying the impact of
an oil shock, 12 June 2018).
2. By 2020, China’s policy makers may feel less pressure to keep GDP growth at
today’s levels. The authorities have often repeated their commitment to double
GDP by 2020 versus the 2010 level. If this is achieved ahead of schedule, other
priorities – including tackling systemic debt-related risks or other qualitative
objectives – may be prioritised over growth, leading to a sharper slowdown than
we currently expect. Our current long-term assumption is that China’s growth will
slow to an average 5.5% in the 2020s.
3. We expect the growth boost from US fiscal stimulus to fade by 2020. This is
already reflected in our forecasts, which see US growth slowing to 1.9% in 2020.
The US-China trade war, which could potentially raise the cost of all imports
from China, poses a downside risk to growth in 2020 and beyond.
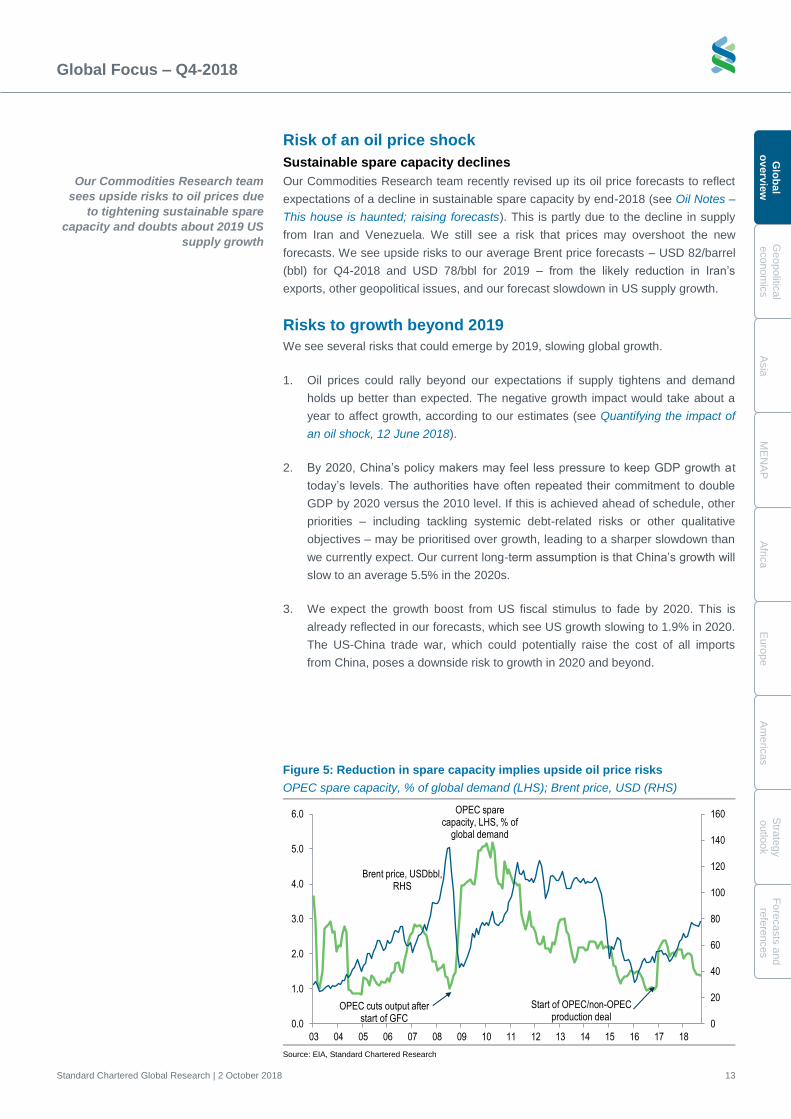
Figure 5: Reduction in spare capacity implies upside oil price risks
OPEC spare capacity, % of global demand (LHS); Brent price, USD (RHS)
Source: EIA, Standard Chartered Research
OPEC spare capacity, LHS, % of
global demand
Brent price, USDbbl, RHS
0
20
40
60
80
100
120
140
160
0.0
1.0
2.0
3.0
4.0
5.0
6.0
03 04 05 06 07 08 09 10 11 12 13 14 15 16 17 18
OPEC cuts output after start of GFC
Start of OPEC/non-OPEC production deal
Our Commodities Research team
sees upside risks to oil prices due
to tightening sustainable spare
capacity and doubts about 2019 US
supply growth
Global Focus – Q4-2018
Standard Chartered Global Research | 2 October 2018 14
G
lob
al
o
verv
iew
Geopolit
ical
econom
ics
A
sia
M
EN
AP
A
fric
a
E
uro
pe
A
me
ricas
S
trate
gy
o
utlo
ok
Fo
recasts
and
re
fere
nces
Where we differ from consensus and why
US – We expect 25bps FOMC hikes every quarter through end-2019
We see one more FOMC hike in 2018 (in December) and four in 2019, versus the
consensus call of three more hikes between now and end-2019. The strong US
labour market and the positive output gap support this call. We believe the Phillips
curve framework (the reverse relationship between unemployment and inflation/wage
growth) still features prominently in the FOMC’s assessment of the economy, and the
consensus view on the committee is that the Phillips curve has flattened compared to
previous cycles. But a ‘kink’ – an acceleration in wage growth below a certain
unemployment level – is possible. The FOMC is likely to want to avoid this for
financial stability reasons, as it would necessitate a more forceful policy response to
contain inflation expectations. A gradual but steady pace of tightening in 2019 should
help to accomplish that aim.
China – We expect the current account to turn to a deficit in 2019
We forecast a faster deterioration in China’s current account (C/A) balance than
consensus. China reported a C/A deficit of USD 28.3bn in H1-2018, the first half-year
deficit in 18 years. The US-China trade dispute is putting the export sector under
pressure. We estimate that additional US tariffs announced so far on China-made
goods will cause China’s exports to the US (currently c.USD 520bn per year) to fall
by 10% over the next 12 months. In contrast, China’s import growth is supported by
high oil prices, reduced import tariffs on consumer goods, and policies aimed at
boosting domestic demand. As a result, we expect the C/A surplus to turn to a deficit
of 0.2% of GDP in 2019 from a surplus of 0.5% in 2018.
We see substantial room for expansionary fiscal policy this year, without requiring a
revision of the budget. We calculate a broad budget deficit of 4.6% of GDP in 2018,
higher than the actual deficit of 3.7% in 2017. (Our deficit calculations, which are based
on international standards, combine the general public budget and the government
funds budget; we think this more accurately reflects the fiscal stance than the official
budget numbers.) In other words, if the 2018 budget is fully implemented, we think the
actual deficit will be 0.9% of GDP higher than in 2017. This is equivalent to fiscal
stimulus of CNY 1.1tn. We believe the authorities are under pressure to utilise this fiscal
headroom via tax cuts and accelerated infrastructure spending. As a result, we think
the 2018 GDP growth target of 6.5% is likely to be exceeded. (Based on China’s fiscal
track record, we assume that the budget will be mostly implemented and forecast an
actual deficit of 4.2% of GDP for 2018.)
Korea – Consensus underestimates Bank of Korea’s hawkish stance
We expect the Bank of Korea (BoK) to tighten policy in November and again in 2019.
For now, the market is only focused on this year’s expected hike, with not much
expected for next year. Some market participants believe that the BoK may not be
able hike at all, since key economic indicators peaked in Q2-2018. We think this view
underestimates the BoK’s hawkish stance and is based too narrowly on weak job-
market data and low inflation. Inequality and financial stability also need to be taken
into account when assessing the BoK’s policy stance, in our view. Apartment prices
in the Seoul area have risen rapidly this year, increasing wealth inequality. The ruling
party has attributed this to low interest rates and abundant liquidity. It appears to
believe that macro-prudential policies in the mortgage market would merely divert
flows into other assets, and that liquidity therefore needs to be controlled. This is
likely to put pressure on the BoK to tighten policy. The central bank will also want to
reduce the risk of sudden capital outflows triggered by US rate hikes in order to
preserve financial stability. We expect these considerations to override concerns
about the slowing economy.
We expect two more 25bps FOMC
hikes than consensus by end-2019
China’s current account is likely to
turn to a mild deficit in 2019
Fiscal policy may provide important
support to China’s growth
We do not think the peak in Korea’s
economic indicators in mid-2018
means the end of the BoK hiking
cycle
Global Focus – Q4-2018
Standard Chartered Global Research | 2 October 2018 15
Glo
ba
l
ov
erv
iew
Geopolitic
al
econom
ics
Asia
ME
NA
P
Afric
a
Euro
pe
Am
eric
as
Stra
tegy
outlo
ok
Fo
recasts
and
refe
rences
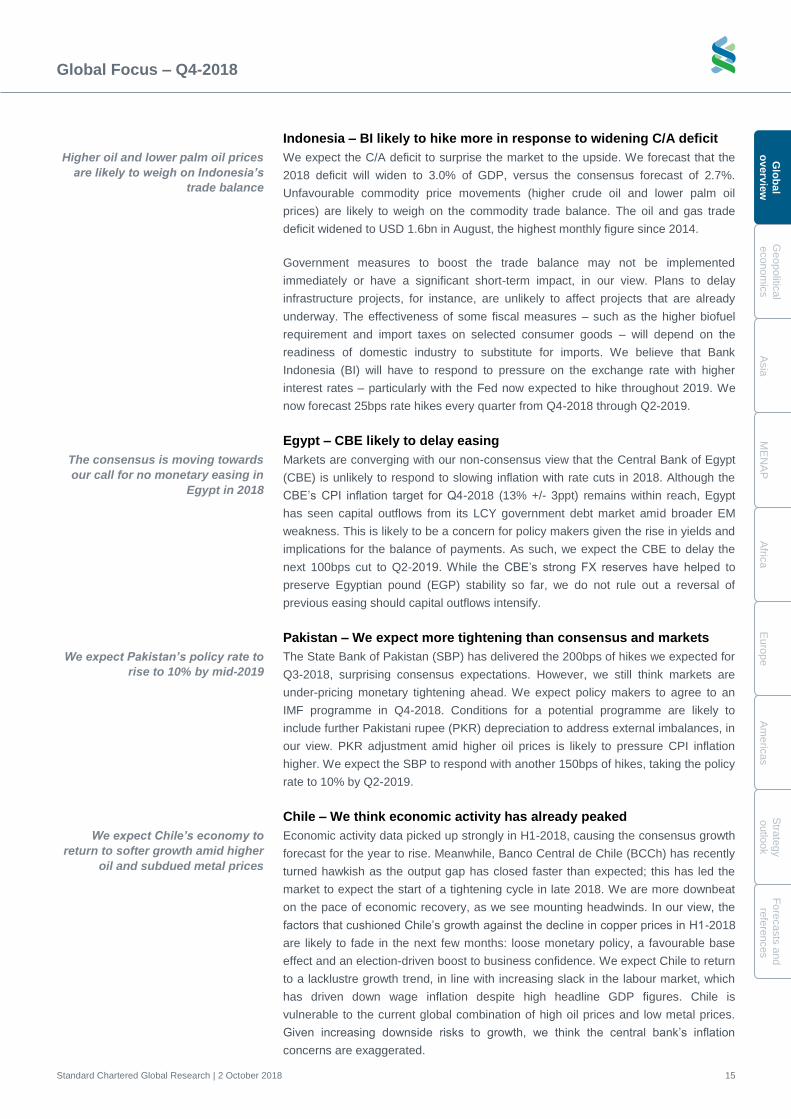
Indonesia – BI likely to hike more in response to widening C/A deficit
We expect the C/A deficit to surprise the market to the upside. We forecast that the
2018 deficit will widen to 3.0% of GDP, versus the consensus forecast of 2.7%.
Unfavourable commodity price movements (higher crude oil and lower palm oil
prices) are likely to weigh on the commodity trade balance. The oil and gas trade
deficit widened to USD 1.6bn in August, the highest monthly figure since 2014.
Government measures to boost the trade balance may not be implemented
immediately or have a significant short-term impact, in our view. Plans to delay
infrastructure projects, for instance, are unlikely to affect projects that are already
underway. The effectiveness of some fiscal measures – such as the higher biofuel
requirement and import taxes on selected consumer goods – will depend on the
readiness of domestic industry to substitute for imports. We believe that Bank
Indonesia (BI) will have to respond to pressure on the exchange rate with higher
interest rates – particularly with the Fed now expected to hike throughout 2019. We
now forecast 25bps rate hikes every quarter from Q4-2018 through Q2-2019.
Egypt – CBE likely to delay easing
Markets are converging with our non-consensus view that the Central Bank of Egypt
(CBE) is unlikely to respond to slowing inflation with rate cuts in 2018. Although the
CBE’s CPI inflation target for Q4-2018 (13% +/- 3ppt) remains within reach, Egypt
has seen capital outflows from its LCY government debt market amid broader EM
weakness. This is likely to be a concern for policy makers given the rise in yields and
implications for the balance of payments. As such, we expect the CBE to delay the
next 100bps cut to Q2-2019. While the CBE’s strong FX reserves have helped to
preserve Egyptian pound (EGP) stability so far, we do not rule out a reversal of
previous easing should capital outflows intensify.
Pakistan – We expect more tightening than consensus and markets
The State Bank of Pakistan (SBP) has delivered the 200bps of hikes we expected for
Q3-2018, surprising consensus expectations. However, we still think markets are
under-pricing monetary tightening ahead. We expect policy makers to agree to an
IMF programme in Q4-2018. Conditions for a potential programme are likely to
include further Pakistani rupee (PKR) depreciation to address external imbalances, in
our view. PKR adjustment amid higher oil prices is likely to pressure CPI inflation
higher. We expect the SBP to respond with another 150bps of hikes, taking the policy
rate to 10% by Q2-2019.
Chile – We think economic activity has already peaked
Economic activity data picked up strongly in H1-2018, causing the consensus growth
forecast for the year to rise. Meanwhile, Banco Central de Chile (BCCh) has recently
turned hawkish as the output gap has closed faster than expected; this has led the
market to expect the start of a tightening cycle in late 2018. We are more downbeat
on the pace of economic recovery, as we see mounting headwinds. In our view, the
factors that cushioned Chile’s growth against the decline in copper prices in H1-2018
are likely to fade in the next few months: loose monetary policy, a favourable base
effect and an election-driven boost to business confidence. We expect Chile to return
to a lacklustre growth trend, in line with increasing slack in the labour market, which
has driven down wage inflation despite high headline GDP figures. Chile is
vulnerable to the current global combination of high oil prices and low metal prices.
Given increasing downside risks to growth, we think the central bank’s inflation
concerns are exaggerated.
Higher oil and lower palm oil prices
are likely to weigh on Indonesia’s
trade balance
The consensus is moving towards
our call for no monetary easing in
Egypt in 2018
We expect Pakistan’s policy rate to
rise to 10% by mid-2019
We expect Chile’s economy to
return to softer growth amid higher
oil and subdued metal prices
Global Focus – Q4-2018
Standard Chartered Global Research | 2 October 2018 16
G
lob
al
o
verv
iew
Geopolit
ical
econom
ics
A
sia
M
EN
AP
A
fric
a
E
uro
pe
A
me
ricas
S
trate
gy
o
utlo
ok
Fo
recasts
and
re
fere
nces
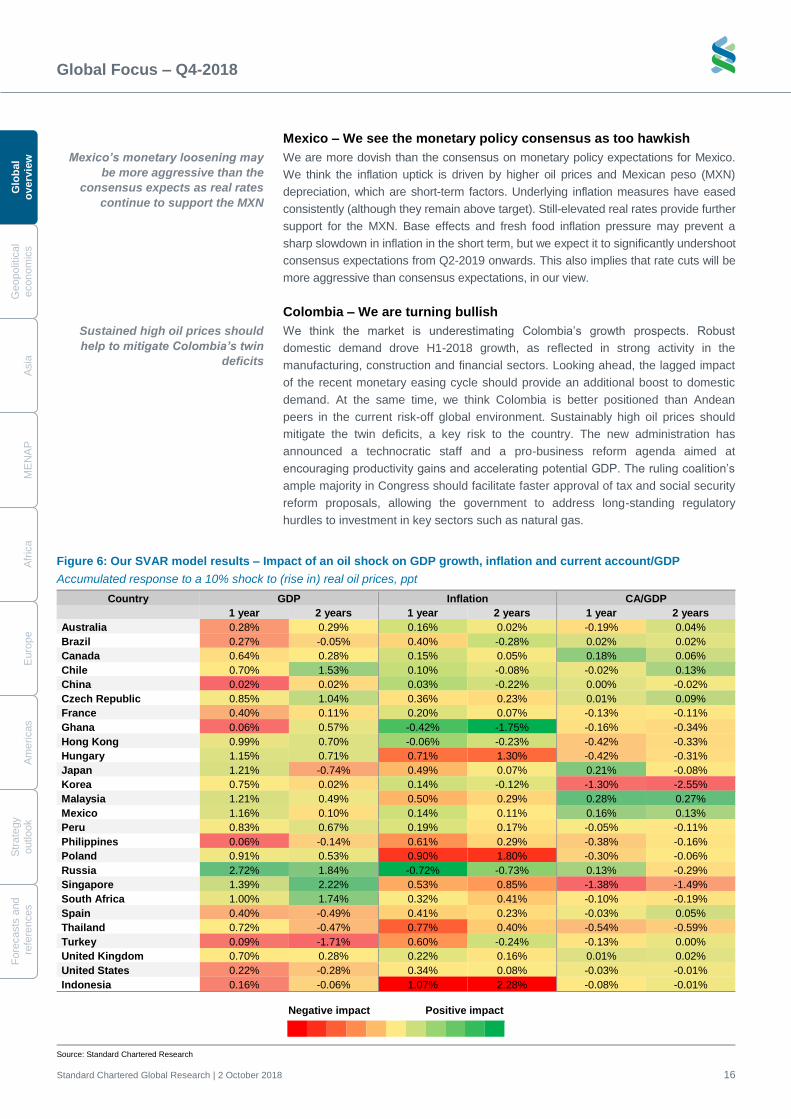
Mexico – We see the monetary policy consensus as too hawkish
We are more dovish than the consensus on monetary policy expectations for Mexico.
We think the inflation uptick is driven by higher oil prices and Mexican peso (MXN)
depreciation, which are short-term factors. Underlying inflation measures have eased
consistently (although they remain above target). Still-elevated real rates provide further
support for the MXN. Base effects and fresh food inflation pressure may prevent a
sharp slowdown in inflation in the short term, but we expect it to significantly undershoot
consensus expectations from Q2-2019 onwards. This also implies that rate cuts will be
more aggressive than consensus expectations, in our view.
Colombia – We are turning bullish
We think the market is underestimating Colombia’s growth prospects. Robust
domestic demand drove H1-2018 growth, as reflected in strong activity in the
manufacturing, construction and financial sectors. Looking ahead, the lagged impact
of the recent monetary easing cycle should provide an additional boost to domestic
demand. At the same time, we think Colombia is better positioned than Andean
peers in the current risk-off global environment. Sustainably high oil prices should
mitigate the twin deficits, a key risk to the country. The new administration has
announced a technocratic staff and a pro-business reform agenda aimed at
encouraging productivity gains and accelerating potential GDP. The ruling coalition’s
ample majority in Congress should facilitate faster approval of tax and social security
reform proposals, allowing the government to address long-standing regulatory
hurdles to investment in key sectors such as natural gas.
Figure 6: Our SVAR model results – Impact of an oil shock on GDP growth, inflation and current account/GDP
Accumulated response to a 10% shock to (rise in) real oil prices, ppt
Country GDP Inflation CA/GDP
1 year 2 years 1 year 2 years 1 year 2 years
Australia 0.28% 0.29% 0.16% 0.02% -0.19% 0.04%
Brazil 0.27% -0.05% 0.40% -0.28% 0.02% 0.02%
Canada 0.64% 0.28% 0.15% 0.05% 0.18% 0.06%
Chile 0.70% 1.53% 0.10% -0.08% -0.02% 0.13%
China 0.02% 0.02% 0.03% -0.22% 0.00% -0.02%
Czech Republic 0.85% 1.04% 0.36% 0.23% 0.01% 0.09%
France 0.40% 0.11% 0.20% 0.07% -0.13% -0.11%
Ghana 0.06% 0.57% -0.42% -1.75% -0.16% -0.34%
Hong Kong 0.99% 0.70% -0.06% -0.23% -0.42% -0.33%
Hungary 1.15% 0.71% 0.71% 1.30% -0.42% -0.31%
Japan 1.21% -0.74% 0.49% 0.07% 0.21% -0.08%
Korea 0.75% 0.02% 0.14% -0.12% -1.30% -2.55%
Malaysia 1.21% 0.49% 0.50% 0.29% 0.28% 0.27%
Mexico 1.16% 0.10% 0.14% 0.11% 0.16% 0.13%
Peru 0.83% 0.67% 0.19% 0.17% -0.05% -0.11%
Philippines 0.06% -0.14% 0.61% 0.29% -0.38% -0.16%
Poland 0.91% 0.53% 0.90% 1.80% -0.30% -0.06%
Russia 2.72% 1.84% -0.72% -0.73% 0.13% -0.29%
Singapore 1.39% 2.22% 0.53% 0.85% -1.38% -1.49%
South Africa 1.00% 1.74% 0.32% 0.41% -0.10% -0.19%
Spain 0.40% -0.49% 0.41% 0.23% -0.03% 0.05%
Thailand 0.72% -0.47% 0.77% 0.40% -0.54% -0.59%
Turkey 0.09% -1.71% 0.60% -0.24% -0.13% 0.00%
United Kingdom 0.70% 0.28% 0.22% 0.16% 0.01% 0.02%
United States 0.22% -0.28% 0.34% 0.08% -0.03% -0.01%
Indonesia 0.16% -0.06% 1.07% 2.28% -0.08% -0.01%
Negative impact
Positive impact
Source: Standard Chartered Research
Mexico’s monetary loosening may
be more aggressive than the
consensus expects as real rates
continue to support the MXN
Sustained high oil prices should
help to mitigate Colombia’s twin
deficits
Glo
bal F
oc
us
– Q
4-2
01
8
Sta
nd
ard
Charte
red
Glo
bal R
esea
rch | 2
Octo
ber 2
018
17
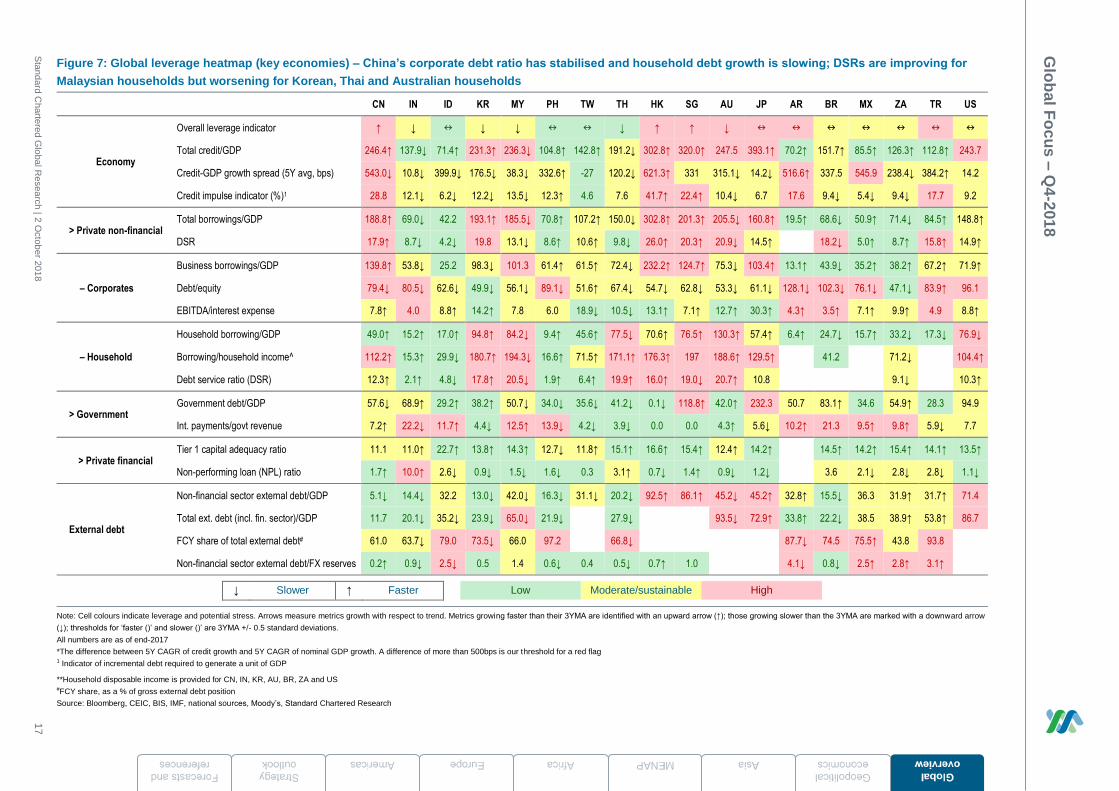
Figure 7: Global leverage heatmap (key economies) – China’s corporate debt ratio has stabilised and household debt growth is slowing; DSRs are improving for
Malaysian households but worsening for Korean, Thai and Australian households
CN IN ID KR MY PH TW TH HK SG AU JP AR BR MX ZA TR US
Economy
Overall leverage indicator ↑ ↓ ↓ ↓ ↓ ↑ ↑ ↓
Total credit/GDP 246.4↑ 137.9↓ 71.4↑ 231.3↑ 236.3↓ 104.8↑ 142.8↑ 191.2↓ 302.8↑ 320.0↑ 247.5 393.1↑ 70.2↑ 151.7↑ 85.5↑ 126.3↑ 112.8↑ 243.7
Credit-GDP growth spread (5Y avg, bps) 543.0↓ 10.8↓ 399.9↓ 176.5↓ 38.3↓ 332.6↑ -27 120.2↓ 621.3↑ 331 315.1↓ 14.2↓ 516.6↑ 337.5 545.9 238.4↓ 384.2↑ 14.2
Credit impulse indicator (%)1 28.8 12.1↓ 6.2↓ 12.2↓ 13.5↓ 12.3↑ 4.6 7.6 41.7↑ 22.4↑ 10.4↓ 6.7 17.6 9.4↓ 5.4↓ 9.4↓ 17.7 9.2
> Private non-financial Total borrowings/GDP 188.8↑ 69.0↓ 42.2 193.1↑ 185.5↓ 70.8↑ 107.2↑ 150.0↓ 302.8↑ 201.3↑ 205.5↓ 160.8↑ 19.5↑ 68.6↓ 50.9↑ 71.4↓ 84.5↑ 148.8↑
DSR 17.9↑ 8.7↓ 4.2↓ 19.8 13.1↓ 8.6↑ 10.6↑ 9.8↓ 26.0↑ 20.3↑ 20.9↓ 14.5↑ 18.2↓ 5.0↑ 8.7↑ 15.8↑ 14.9↑
– Corporates
Business borrowings/GDP 139.8↑ 53.8↓ 25.2 98.3↓ 101.3 61.4↑ 61.5↑ 72.4↓ 232.2↑ 124.7↑ 75.3↓ 103.4↑ 13.1↑ 43.9↓ 35.2↑ 38.2↑ 67.2↑ 71.9↑
Debt/equity 79.4↓ 80.5↓ 62.6↓ 49.9↓ 56.1↓ 89.1↓ 51.6↑ 67.4↓ 54.7↓ 62.8↓ 53.3↓ 61.1↓ 128.1↓ 102.3↓ 76.1↓ 47.1↓ 83.9↑ 96.1
EBITDA/interest expense 7.8↑ 4.0 8.8↑ 14.2↑ 7.8 6.0 18.9↓ 10.5↓ 13.1↑ 7.1↑ 12.7↑ 30.3↑ 4.3↑ 3.5↑ 7.1↑ 9.9↑ 4.9 8.8↑
– Household
Household borrowing/GDP 49.0↑ 15.2↑ 17.0↑ 94.8↑ 84.2↓ 9.4↑ 45.6↑ 77.5↓ 70.6↑ 76.5↑ 130.3↑ 57.4↑ 6.4↑ 24.7↓ 15.7↑ 33.2↓ 17.3↓ 76.9↓
Borrowing/household income^ 112.2↑ 15.3↑ 29.9↓ 180.7↑ 194.3↓ 16.6↑ 71.5↑ 171.1↑ 176.3↑ 197 188.6↑ 129.5↑ 41.2 71.2↓
104.4↑
Debt service ratio (DSR) 12.3↑ 2.1↑ 4.8↓ 17.8↑ 20.5↓ 1.9↑ 6.4↑ 19.9↑ 16.0↑ 19.0↓ 20.7↑ 10.8
9.1↓
10.3↑
> Government Government debt/GDP 57.6↓ 68.9↑ 29.2↑ 38.2↑ 50.7↓ 34.0↓ 35.6↓ 41.2↓ 0.1↓ 118.8↑ 42.0↑ 232.3 50.7 83.1↑ 34.6 54.9↑ 28.3 94.9
Int. payments/govt revenue 7.2↑ 22.2↓ 11.7↑ 4.4↓ 12.5↑ 13.9↓ 4.2↓ 3.9↓ 0.0 0.0 4.3↑ 5.6↓ 10.2↑ 21.3 9.5↑ 9.8↑ 5.9↓ 7.7
> Private financial Tier 1 capital adequacy ratio 11.1 11.0↑ 22.7↑ 13.8↑ 14.3↑ 12.7↓ 11.8↑ 15.1↑ 16.6↑ 15.4↑ 12.4↑ 14.2↑ 14.5↑ 14.2↑ 15.4↑ 14.1↑ 13.5↑
Non-performing loan (NPL) ratio 1.7↑ 10.0↑ 2.6↓ 0.9↓ 1.5↓ 1.6↓ 0.3 3.1↑ 0.7↓ 1.4↑ 0.9↓ 1.2↓ 3.6 2.1↓ 2.8↓ 2.8↓ 1.1↓
External debt
Non-financial sector external debt/GDP 5.1↓ 14.4↓ 32.2 13.0↓ 42.0↓ 16.3↓ 31.1↓ 20.2↓ 92.5↑ 86.1↑ 45.2↓ 45.2↑ 32.8↑ 15.5↓ 36.3 31.9↑ 31.7↑ 71.4
Total ext. debt (incl. fin. sector)/GDP 11.7 20.1↓ 35.2↓ 23.9↓ 65.0↓ 21.9↓
27.9↓
93.5↓ 72.9↑ 33.8↑ 22.2↓ 38.5 38.9↑ 53.8↑ 86.7
FCY share of total external debt# 61.0 63.7↓ 79.0 73.5↓ 66.0 97.2
66.8↓
87.7↓ 74.5 75.5↑ 43.8 93.8
Non-financial sector external debt/FX reserves 0.2↑ 0.9↓ 2.5↓ 0.5 1.4 0.6↓ 0.4 0.5↓ 0.7↑ 1.0
4.1↓ 0.8↓ 2.5↑ 2.8↑ 3.1↑
↓ Slower ↑ Faster
Low Moderate/sustainable High
Note: Cell colours indicate leverage and potential stress. Arrows measure metrics growth with respect to trend. Metrics growing faster than their 3YMA are identified with an upward arrow (↑); those growing slower than the 3YMA are marked with a downward arrow
(↓); thresholds for ‘faster ()’ and slower ()’ are 3YMA +/- 0.5 standard deviations.
All numbers are as of end-2017
*The difference between 5Y CAGR of credit growth and 5Y CAGR of nominal GDP growth. A difference of more than 500bps is our threshold for a red flag 1 Indicator of incremental debt required to generate a unit of GDP
**Household disposable income is provided for CN, IN, KR, AU, BR, ZA and US #FCY share, as a % of gross external debt position
Source: Bloomberg, CEIC, BIS, IMF, national sources, Moody’s, Standard Chartered Research
Global Focus – Q4-2018
Standard Chartered Global Research | 2 October 2018 18
G
lob
al
o
verv
iew
Geopolit
ical
econom
ics
A
sia
M
EN
AP
A
fric
a
E
uro
pe
A
me
ricas
S
trate
gy
o
utlo
ok
Fo
recasts
and
re
fere
nces
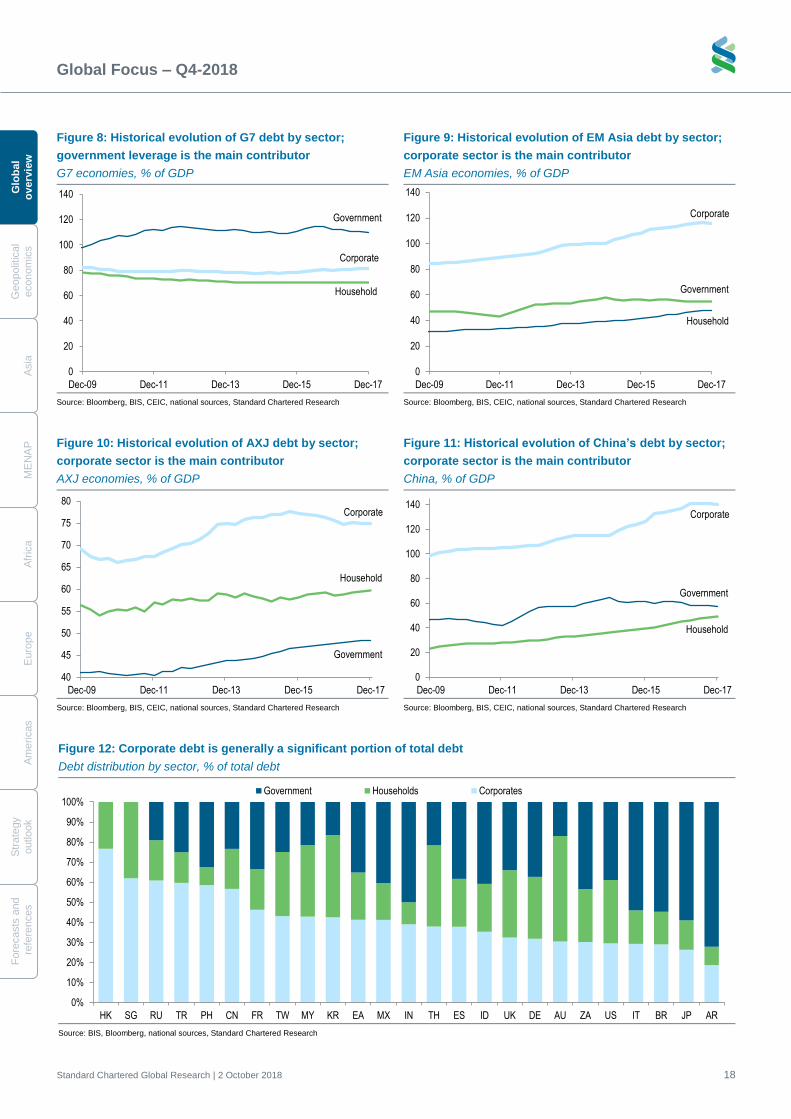
Figure 8: Historical evolution of G7 debt by sector;
government leverage is the main contributor
G7 economies, % of GDP
Figure 9: Historical evolution of EM Asia debt by sector;
corporate sector is the main contributor
EM Asia economies, % of GDP
Source: Bloomberg, BIS, CEIC, national sources, Standard Chartered Research Source: Bloomberg, BIS, CEIC, national sources, Standard Chartered Research
Figure 10: Historical evolution of AXJ debt by sector;
corporate sector is the main contributor
AXJ economies, % of GDP
Figure 11: Historical evolution of China’s debt by sector;
corporate sector is the main contributor
China, % of GDP
Source: Bloomberg, BIS, CEIC, national sources, Standard Chartered Research Source: Bloomberg, BIS, CEIC, national sources, Standard Chartered Research
Figure 12: Corporate debt is generally a significant portion of total debt
Debt distribution by sector, % of total debt
Source: BIS, Bloomberg, national sources, Standard Chartered Research
Corporate
Household
Government
0
20
40
60
80
100
120
140
Dec-09 Dec-11 Dec-13 Dec-15 Dec-17
Corporate
Government
Household
0
20
40
60
80
100
120
140
Dec-09 Dec-11 Dec-13 Dec-15 Dec-17
Corporate
Household
Government
40
45
50
55
60
65
70
75
80
Dec-09 Dec-11 Dec-13 Dec-15 Dec-17
Corporate
Household
Government
0
20
40
60
80
100
120
140
Dec-09 Dec-11 Dec-13 Dec-15 Dec-17
0%
10%
20%
30%
40%
50%
60%
70%
80%
90%
100%
HK SG RU TR PH CN FR TW MY KR EA MX IN TH ES ID UK DE AU ZA US IT BR JP AR
Government Households Corporates
Global Focus – Q4-2018
Standard Chartered Global Research | 2 October 2018 19
Glo
ba
l
ov
erv
iew
Geopolitic
al
econom
ics
Asia
ME
NA
P
Afric
a
Euro
pe
Am
eric
as
Stra
tegy
outlo
ok
Fo
recasts
and
refe
rences
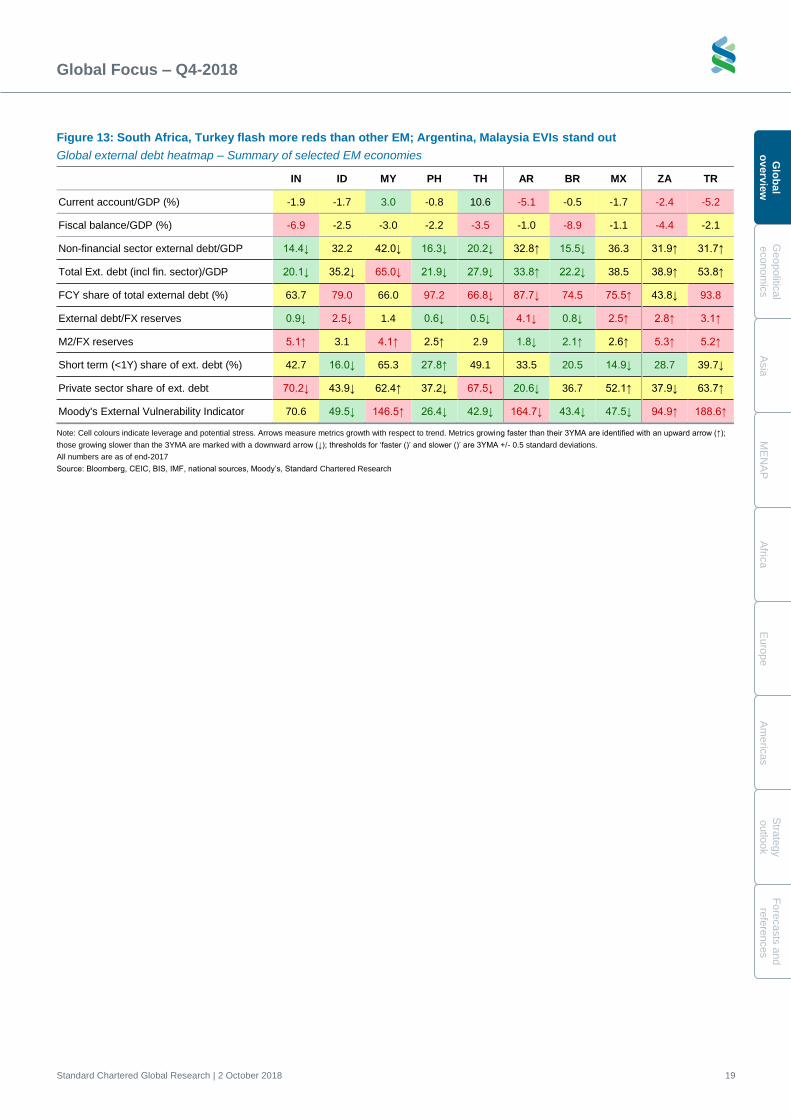
Figure 13: South Africa, Turkey flash more reds than other EM; Argentina, Malaysia EVIs stand out
Global external debt heatmap – Summary of selected EM economies
IN ID MY PH TH AR BR MX ZA TR
Current account/GDP (%) -1.9 -1.7 3.0 -0.8 10.6 -5.1 -0.5 -1.7 -2.4 -5.2
Fiscal balance/GDP (%) -6.9 -2.5 -3.0 -2.2 -3.5 -1.0 -8.9 -1.1 -4.4 -2.1
Non-financial sector external debt/GDP 14.4↓ 32.2 42.0↓ 16.3↓ 20.2↓ 32.8↑ 15.5↓ 36.3 31.9↑ 31.7↑
Total Ext. debt (incl fin. sector)/GDP 20.1↓ 35.2↓ 65.0↓ 21.9↓ 27.9↓ 33.8↑ 22.2↓ 38.5 38.9↑ 53.8↑
FCY share of total external debt (%) 63.7 79.0 66.0 97.2 66.8↓ 87.7↓ 74.5 75.5↑ 43.8↓ 93.8
External debt/FX reserves 0.9↓ 2.5↓ 1.4 0.6↓ 0.5↓ 4.1↓ 0.8↓ 2.5↑ 2.8↑ 3.1↑
M2/FX reserves 5.1↑ 3.1 4.1↑ 2.5↑ 2.9 1.8↓ 2.1↑ 2.6↑ 5.3↑ 5.2↑
Short term (<1Y) share of ext. debt (%) 42.7 16.0↓ 65.3 27.8↑ 49.1 33.5 20.5 14.9↓ 28.7 39.7↓
Private sector share of ext. debt 70.2↓ 43.9↓ 62.4↑ 37.2↓ 67.5↓ 20.6↓ 36.7 52.1↑ 37.9↓ 63.7↑
Moody's External Vulnerability Indicator 70.6 49.5↓ 146.5↑ 26.4↓ 42.9↓ 164.7↓ 43.4↓ 47.5↓ 94.9↑ 188.6↑
Note: Cell colours indicate leverage and potential stress. Arrows measure metrics growth with respect to trend. Metrics growing faster than their 3YMA are identified with an upward arrow (↑);
those growing slower than the 3YMA are marked with a downward arrow (↓); thresholds for ‘faster ()’ and slower ()’ are 3YMA +/- 0.5 standard deviations.
All numbers are as of end-2017
Source: Bloomberg, CEIC, BIS, IMF, national sources, Moody’s, Standard Chartered Research
Global Focus – Q4-2018
Standard Chartered Global Research | 2 October 2018 20
G
lob
al
o
verv
iew
Geopolit
ical
econom
ics
A
sia
M
EN
AP
A
fric
a
E
uro
pe
A
me
ricas
S
trate
gy
o
utlo
ok
Fo
recasts
and
re
fere
nces
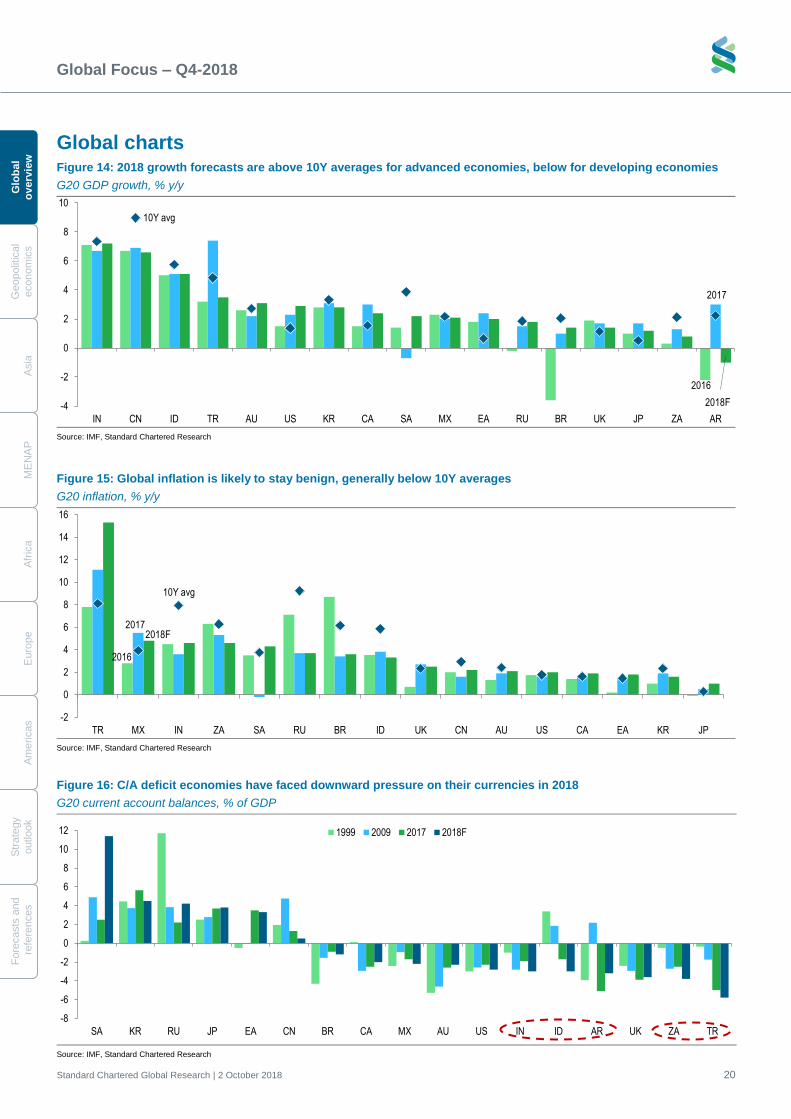
Global charts Figure 14: 2018 growth forecasts are above 10Y averages for advanced economies, below for developing economies
G20 GDP growth, % y/y
Source: IMF, Standard Chartered Research
Figure 15: Global inflation is likely to stay benign, generally below 10Y averages
G20 inflation, % y/y
Source: IMF, Standard Chartered Research
2016
2017
2018F
10Y avg
-4
-2
0
2
4
6
8
10
IN CN ID TR AU US KR CA SA MX EA RU BR UK JP ZA AR
2016
20172018F
10Y avg
-2
0
2
4
6
8
10
12
14
16
TR MX IN ZA SA RU BR ID UK CN AU US CA EA KR JP
Figure 16: C/A deficit economies have faced downward pressure on their currencies in 2018
G20 current account balances, % of GDP
Source: IMF, Standard Chartered Research
-8
-6
-4
-2
0
2
4
6
8
10
12
SA KR RU JP EA CN BR CA MX AU US IN ID AR UK ZA TR
1999 2009 2017 2018F
Global Focus – Q4-2018
Standard Chartered Global Research | 2 October 2018 21
Glo
ba
l
ov
erv
iew
Geopolitic
al
econom
ics
Asia
ME
NA
P
Afric
a
Euro
pe
Am
eric
as
Stra
tegy
outlo
ok
Fo
recasts
and
refe
rences
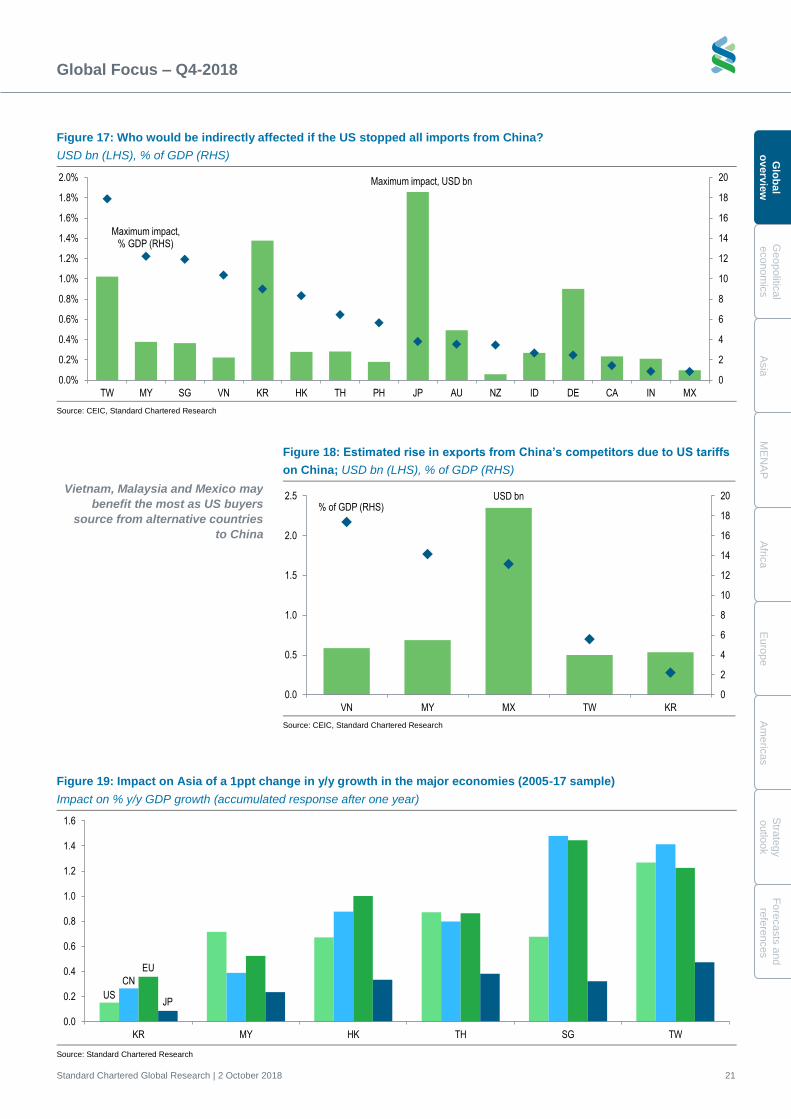
Figure 18: Estimated rise in exports from China’s competitors due to US tariffs
on China; USD bn (LHS), % of GDP (RHS)
Vietnam, Malaysia and Mexico may
benefit the most as US buyers
source from alternative countries
to China
Source: CEIC, Standard Chartered Research
USD bn% of GDP (RHS)
0
2
4
6
8
10
12
14
16
18
20
0.0
0.5
1.0
1.5
2.0
2.5
VN MY MX TW KR
Figure 17: Who would be indirectly affected if the US stopped all imports from China?
USD bn (LHS), % of GDP (RHS)
Source: CEIC, Standard Chartered Research
Figure 19: Impact on Asia of a 1ppt change in y/y growth in the major economies (2005-17 sample)
Impact on % y/y GDP growth (accumulated response after one year)
Source: Standard Chartered Research
Maximum impact, USD bn
Maximum impact, % GDP (RHS)
0
2
4
6
8
10
12
14
16
18
20
0.0%
0.2%
0.4%
0.6%
0.8%
1.0%
1.2%
1.4%
1.6%
1.8%
2.0%
TW MY SG VN KR HK TH PH JP AU NZ ID DE CA IN MX
US
CN
EU
JP
0.0
0.2
0.4
0.6
0.8
1.0
1.2
1.4
1.6
KR MY HK TH SG TW

Geopolitical economics
Global Focus – Q4-2018
Standard Chartered Global Research | 2 October 2018 23
Glo
bal
overv
iew
G
eo
po
litical
eco
no
mic
s
Asia
ME
NA
P
Afric
a
Euro
pe
Am
eric
as
Stra
tegy
outlo
ok
Fo
recasts
and
refe
rences
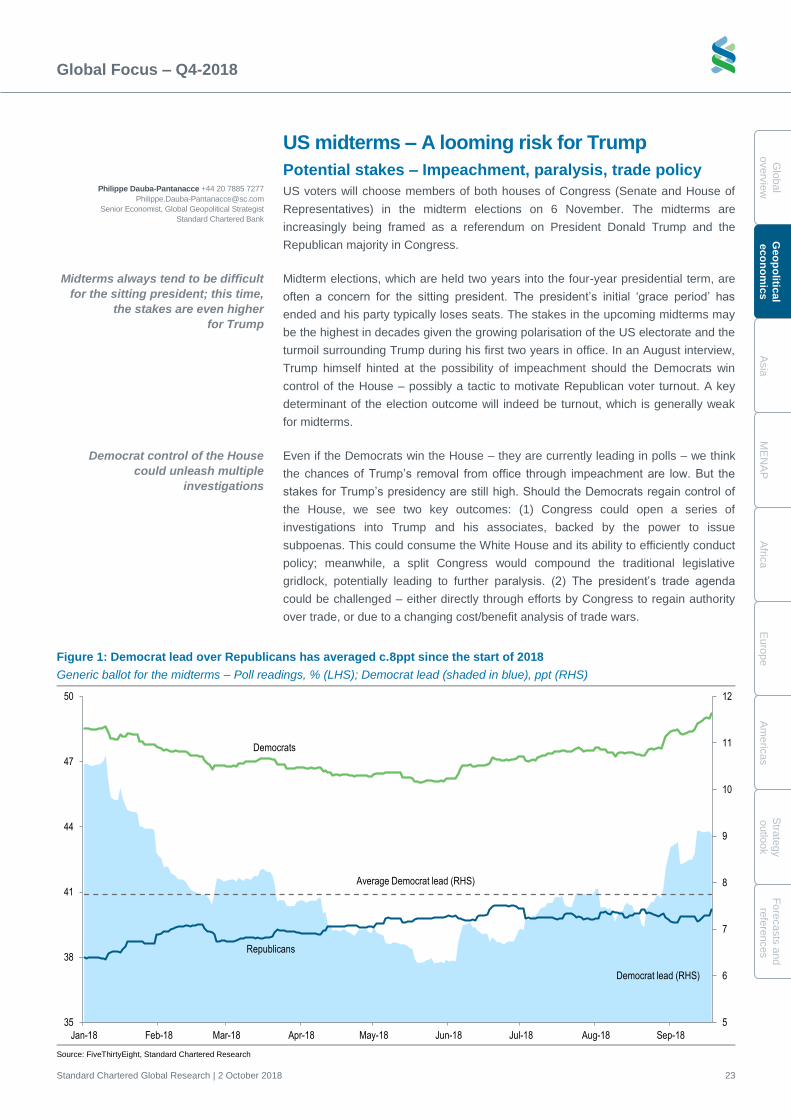
US midterms – A looming risk for Trump
Potential stakes – Impeachment, paralysis, trade policy
US voters will choose members of both houses of Congress (Senate and House of
Representatives) in the midterm elections on 6 November. The midterms are
increasingly being framed as a referendum on President Donald Trump and the
Republican majority in Congress.
Midterm elections, which are held two years into the four-year presidential term, are
often a concern for the sitting president. The president’s initial ‘grace period’ has
ended and his party typically loses seats. The stakes in the upcoming midterms may
be the highest in decades given the growing polarisation of the US electorate and the
turmoil surrounding Trump during his first two years in office. In an August interview,
Trump himself hinted at the possibility of impeachment should the Democrats win
control of the House – possibly a tactic to motivate Republican voter turnout. A key
determinant of the election outcome will indeed be turnout, which is generally weak
for midterms.
Even if the Democrats win the House – they are currently leading in polls – we think
the chances of Trump’s removal from office through impeachment are low. But the
stakes for Trump’s presidency are still high. Should the Democrats regain control of
the House, we see two key outcomes: (1) Congress could open a series of
investigations into Trump and his associates, backed by the power to issue
subpoenas. This could consume the White House and its ability to efficiently conduct
policy; meanwhile, a split Congress would compound the traditional legislative
gridlock, potentially leading to further paralysis. (2) The president’s trade agenda
could be challenged – either directly through efforts by Congress to regain authority
over trade, or due to a changing cost/benefit analysis of trade wars.
Figure 1: Democrat lead over Republicans has averaged c.8ppt since the start of 2018
Generic ballot for the midterms – Poll readings, % (LHS); Democrat lead (shaded in blue), ppt (RHS)
Source: FiveThirtyEight, Standard Chartered Research
Democrat lead (RHS)
Democrats
Republicans
Average Democrat lead (RHS)
5
6
7
8
9
10
11
12
35
38
41
44
47
50
Jan-18 Feb-18 Mar-18 Apr-18 May-18 Jun-18 Jul-18 Aug-18 Sep-18
Philippe Dauba-Pantanacce +44 20 7885 7277
Senior Economist, Global Geopolitical Strategist
Standard Chartered Bank
Midterms always tend to be difficult
for the sitting president; this time,
the stakes are even higher
for Trump
Democrat control of the House
could unleash multiple
investigations
Global Focus – Q4-2018
Standard Chartered Global Research | 2 October 2018 24
G
lobal
overv
iew
Geo
po
liti
cal
eco
no
mic
s
A
sia
M
EN
AP
A
fric
a
E
uro
pe
A
me
ricas
S
trate
gy
o
utlo
ok
Fo
recasts
and
re
fere
nces
Midterms are never good for sitting presidents
The US midterms on 6 November will elect the full House of Representatives
(435 seats) and 34 of the Senate’s 100 seats.
The midterms are widely seen as a referendum on Trump and the Republican Party’s
majority in Congress. Republican voters’ support for Trump is consolidating. His approval
rating within the party has been hovering around 90%, and averaged 87% in September
(Gallup poll tracking). However, Republicans’ share of total voting intentions has eroded,
according to polls. Current polls suggest that the Democrats are likely to regain control
of the House, while the statistical odds favour the Republicans retaining control of
the Senate.
We think that turnout will be the decisive factor in these elections. The president’s party
typically loses seats in midterms, and this is likely to be the case in November; the
question is whether these losses will be enough for the Democrats to win control of either
chamber. The Democrats need to gain 24 seats to take the House (435 seats in total). In
the Senate (100 seats), of the 34 seats at stake, the Democrats are defending 26, while
the Republicans are defending eight; so the statistical risks are unfavourable for the
Democrats. Furthermore, of these 26 Democratic seats, 10 are in states that Trump won
in 2016, half of them by a wide margin.
The ‘generic ballot’ average of polls – which ask voters if they will vote for Democrats or
Republicans for Congress and is historically a good indicator of the House result – shows
an average Democrat lead of c.8ppt since the start of 2018 (Figure 1). As of 24
September, FiveThirtyEight, which specialises in analysing opinion polls, indicated 49.4%
for Democrats against 40.9% for Republicans.
In the current highly polarised political environment, turnout is likely to be a function of
how strongly Democrats seek to express their disapproval for Trump’s agenda, and
how strongly Republicans seek to express their approval. Which side can get more
supporters to polling stations on election day will be the key determinant of
the outcome.
US elections tend to have low turnout compared with other OECD countries. Just over
half (55%) of eligible voters cast ballots in the 2016 presidential election; on average,
turnout for midterms is about one-third lower than for presidential elections. The 2014
midterms had the lowest participation rate in 72 years, at 36%. A recent study by
FiveThirtyEight (‘Do Republicans Really Have a Big Turnout Advantage in Midterms?’)
showed that Republicans tend to have slightly higher turnout than Democrats in
midterms on average, although this advantage is less clear if the GOP already holds
the White House.
Could the midterms alter trade policy?
We think the midterms could weaken Trump’s trade agenda, regardless of who
controls Congress. There have already been some initiatives from within Congress –
including by Republican lawmakers – to restrain the president’s power on trade. We
think these efforts are likely to gain strength after the midterms. If Democrats take
control of the House, they might be able to push through legislation to curb Trump’s
trade powers. Meanwhile, Republican lawmakers who oppose Trump’s trade stance
are likely to be more emboldened to challenge it once the political exigencies of the
midterms are out of the way. This would increase the chances of a bipartisan effort to
rein in the Trump administration’s trade policies. We also think that as the economic
cost of trade wars increases, so will the political cost – incentivising lawmakers to
push for a change.
Polls have shown a consistent lead
for Democrats in the House since
the start of the year
Global Focus – Q4-2018
Standard Chartered Global Research | 2 October 2018 25
Glo
bal
overv
iew
G
eo
po
litical
eco
no
mic
s
Asia
ME
NA
P
Afric
a
Euro
pe
Am
eric
as
Stra
tegy
outlo
ok
Fo
recasts
and
refe
rences
As part of his ‘America first’ approach, Trump has undermined the US’ most
important trade relationships and rejected the free-trade principles that have
traditionally been a cornerstone of Republican policy. Examples include imposing
tariffs on China and other trading partners; and withdrawing the US from the Trans-
Pacific Partnership (TPP), which was seen as a crucial element of US geopolitical
and commercial engagement with Asia.
While the president has the authority to negotiate international trade agreements,
Congress has sole constitutional authority over “the regulation of foreign commerce
and the imposition of tariffs”. In past decades, lawmakers have given presidents
special authority to negotiate trade deals within established parameters – notably in
the 1974 Trade Act. But the way this power is exercised by the president could be
challenged in courts, according to Jennifer Hillman, a Georgetown University law
professor and former WTO appellate judge.
Congressional pressure
Republicans have been at the forefront of initiatives to constrain Trump’s authority on
trade. The failure of these initiatives to gain traction may be partly explained by politics
– confronting Trump ahead of the midterms could anger his support base. This may
change after the midterms, given the conviction among many Republican lawmakers
that the party should continue to stand for free trade and that the president’s powers in
this sphere should be checked. In a recent media interview with Foreign Policy
magazine, Gary Hufbauer of the Peterson Institute for International Economics said, “I
think we’re getting closer to where Congress reasserts its authority on trade”.
In June, Bob Corker – a prominent Republican senator from Tennessee who has
been a vocal Trump critic and is not running for re-election – authored a bill that
would reform the 1974 Trade Act to remove the president’s unilateral authority on
trade and require congressional approval of all tariffs on national security grounds.
The Republican leadership did not bring the bill to a binding vote. In July, the Senate
backed another non-binding provision to give Congress more say on trade policy. It
was adopted with overwhelming bipartisan support of 88 votes to 11 (the Senate’s
current composition is 51 Republicans and 49 Democrats). Even if such a bill were to
pass, Trump could veto it; but it could precipitate a stand-off between the legislative
and executive branches.
Since the start of Trump’s presidency, there have been numerous calls – including
from Republicans – to roll back the delegation of trade powers to the president. Utah
Republican Senator Mike Lee, along with other senators from both parties, began
promoting The Global Trade Accountability Act in January 2017 to curb executive
authority on trade. The bill is supported by prominent Republican donors David and
Charles Koch; in March 2018, six Republican House representatives referred a
‘companion bill’ (which mirrored the Senate bill) to the House Committee on Ways
and Means and the House Committee on Rules for further review.
Economic cost, lobbying efforts could also bring change to the trade agenda
Against the backdrop of a booming US economy, corporate tax cuts and a strong
equity market, there has been little economic pressure on Trump to change his
confrontational trade policy, particularly with regards to China. This is likely to change
as corporate lobbying pressure and economic costs gradually rise. In response to
these pressures, we believe that the US will eventually reach a deal with China on
tariffs, defusing the trade war. However, we make a distinction between the issue of
Constitutionally, Congress has sole
authority over trade; but over the
years, it has delegated some of this
authority to the president
Senators have already taken
initiatives to restore Congress’
authority on trade
A deal with China could see a
‘rebalancing’ of the trade deficit;
resolving the IP issue would be
more difficult
Global Focus – Q4-2018
Standard Chartered Global Research | 2 October 2018 26
G
lobal
overv
iew
Geo
po
liti
cal
eco
no
mic
s
A
sia
M
EN
AP
A
fric
a
E
uro
pe
A
me
ricas
S
trate
gy
o
utlo
ok
Fo
recasts
and
re
fere
nces
tariffs and trade deficit ‘rebalancing’ on one side, and broader US-China differences
on intellectual property (IP) and technological transfers on the other. This second set
of issues is unlikely to be resolved imminently, and there is broad consensus – in US
political circles and beyond – that the US needs to be tough on China in these areas.
Concerns among US business groups are a source of mounting pressure on
Congress members to act against tariffs. Multiple organisations have criticised
Trump’s trade policy, including the National Retail Federation, the Consumer
Technology Association, the US Chamber of Commerce, the Business Roundtable,
the US-China Business Council and the National Association of Manufacturers. US
farmers have been negatively affected by China’s retaliatory tariffs on US exports of
soybeans, corn and other crops, prompting the Trump administration to announce a
USD 12bn bailout programme.
Farmers’ reaction was of particular concern to Republican lawmakers. Bloomberg
reported that “"the package has offended the sensibilities of many farmers who
supported both Trump and a party that historically champions small government and
free trade". Quoting Dave Struthers, a soy farmer affected by the tariffs, “we would
prefer trade, not aid.” In September, a coalition of the National Retail Federation and
150 organisations told the Trump administration in an open letter that “tit-for-tat tariffs
are counterproductive and so far have only produced increased costs for American
business, farmers, importers, exporters and consumers.”
Economic costs – in terms of both corporate profits and jobs – are likely to surface
gradually as tariffs remain in place. Companies may increase their lobbying efforts
before that happens; this was a theme of our recent conversations with US corporate
clients. Analysis of previous US tariff episodes shows that they have destroyed jobs
and incurred costs for the economy as a whole. A widely cited 2003 study by
consulting firm Trade Partnership Worldwide found that steel tariffs imposed by the
G.W. Bush administration in 2002 cost 200,000 US jobs (more than total US steel
industry employment at the time). One in four job losses was in the steel-making
industry itself, while there were many more in steel-consuming industries. The report
also mentioned USD 4bn in lost wages in only nine months. A 2012 study by the
Peterson Institute for International Economics showed that President Obama’s tariffs
on China-made tyres in 2009 saved 1,200 jobs at the distorted cost of USD 900,000
each, and caused 2,500 job losses in retail due to higher prices.
Trump’s tariffs may come at a higher economic cost than previous episodes. The Tax
Foundation – a public non-partisan US tax policy analysis institute – estimates that
tariffs announced and enacted as of 18 September would eventually result in half a
million job losses, a 0.38% drop in US wages, and a total loss of USD 148bn of GDP,
corresponding to a 0,59% decline in long-run GDP. Eventually, the political benefit of
‘standing up to China’ to appeal to parts of the Republican base might be outweighed
by the economic cost of such policies and pressure from corporate America.
Studies have consistently shown
that tariffs end up costing
many jobs
Trump’s trade policies face growing
opposition from corporates and
other interest groups
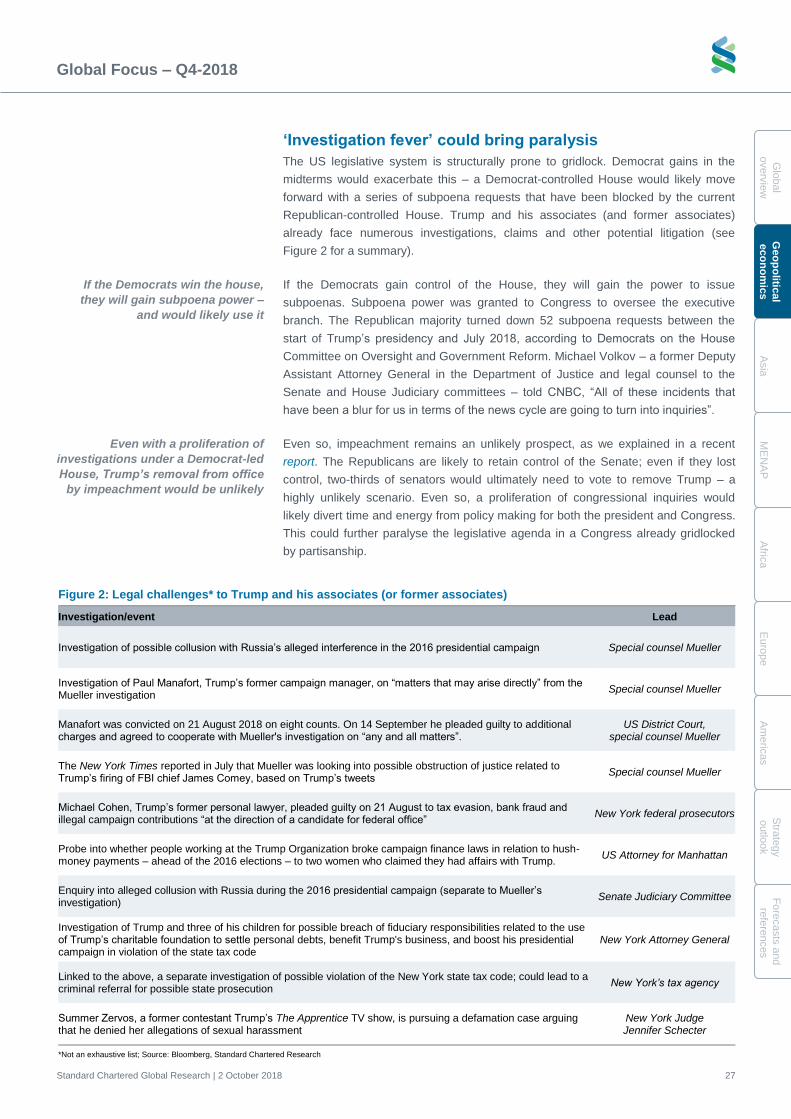
Global Focus – Q4-2018
Standard Chartered Global Research | 2 October 2018 27
Glo
bal
overv
iew
G
eo
po
litical
eco
no
mic
s
Asia
ME
NA
P
Afric
a
Euro
pe
Am
eric
as
Stra
tegy
outlo
ok
Fo
recasts
and
refe
rences
‘Investigation fever’ could bring paralysis
The US legislative system is structurally prone to gridlock. Democrat gains in the
midterms would exacerbate this – a Democrat-controlled House would likely move
forward with a series of subpoena requests that have been blocked by the current
Republican-controlled House. Trump and his associates (and former associates)
already face numerous investigations, claims and other potential litigation (see
Figure 2 for a summary).
If the Democrats gain control of the House, they will gain the power to issue
subpoenas. Subpoena power was granted to Congress to oversee the executive
branch. The Republican majority turned down 52 subpoena requests between the
start of Trump’s presidency and July 2018, according to Democrats on the House
Committee on Oversight and Government Reform. Michael Volkov – a former Deputy
Assistant Attorney General in the Department of Justice and legal counsel to the
Senate and House Judiciary committees – told CNBC, “All of these incidents that
have been a blur for us in terms of the news cycle are going to turn into inquiries”.
Even so, impeachment remains an unlikely prospect, as we explained in a recent
report. The Republicans are likely to retain control of the Senate; even if they lost
control, two-thirds of senators would ultimately need to vote to remove Trump – a
highly unlikely scenario. Even so, a proliferation of congressional inquiries would
likely divert time and energy from policy making for both the president and Congress.
This could further paralyse the legislative agenda in a Congress already gridlocked
by partisanship.
Figure 2: Legal challenges* to Trump and his associates (or former associates)
Investigation/event Lead
Investigation of possible collusion with Russia’s alleged interference in the 2016 presidential campaign Special counsel Mueller
Investigation of Paul Manafort, Trump’s former campaign manager, on “matters that may arise directly” from the Mueller investigation
Special counsel Mueller
Manafort was convicted on 21 August 2018 on eight counts. On 14 September he pleaded guilty to additional charges and agreed to cooperate with Mueller's investigation on “any and all matters”.
US District Court, special counsel Mueller
The New York Times reported in July that Mueller was looking into possible obstruction of justice related to Trump’s firing of FBI chief James Comey, based on Trump’s tweets
Special counsel Mueller
Michael Cohen, Trump’s former personal lawyer, pleaded guilty on 21 August to tax evasion, bank fraud and illegal campaign contributions “at the direction of a candidate for federal office”
New York federal prosecutors
Probe into whether people working at the Trump Organization broke campaign finance laws in relation to hush-money payments – ahead of the 2016 elections – to two women who claimed they had affairs with Trump.
US Attorney for Manhattan
Enquiry into alleged collusion with Russia during the 2016 presidential campaign (separate to Mueller’s investigation)
Senate Judiciary Committee
Investigation of Trump and three of his children for possible breach of fiduciary responsibilities related to the use of Trump’s charitable foundation to settle personal debts, benefit Trump's business, and boost his presidential campaign in violation of the state tax code
New York Attorney General
Linked to the above, a separate investigation of possible violation of the New York state tax code; could lead to a criminal referral for possible state prosecution
New York’s tax agency
Summer Zervos, a former contestant Trump’s The Apprentice TV show, is pursuing a defamation case arguing that he denied her allegations of sexual harassment
New York Judge Jennifer Schecter
*Not an exhaustive list; Source: Bloomberg, Standard Chartered Research
If the Democrats win the house,
they will gain subpoena power –
and would likely use it
Even with a proliferation of
investigations under a Democrat-led
House, Trump’s removal from office
by impeachment would be unlikely
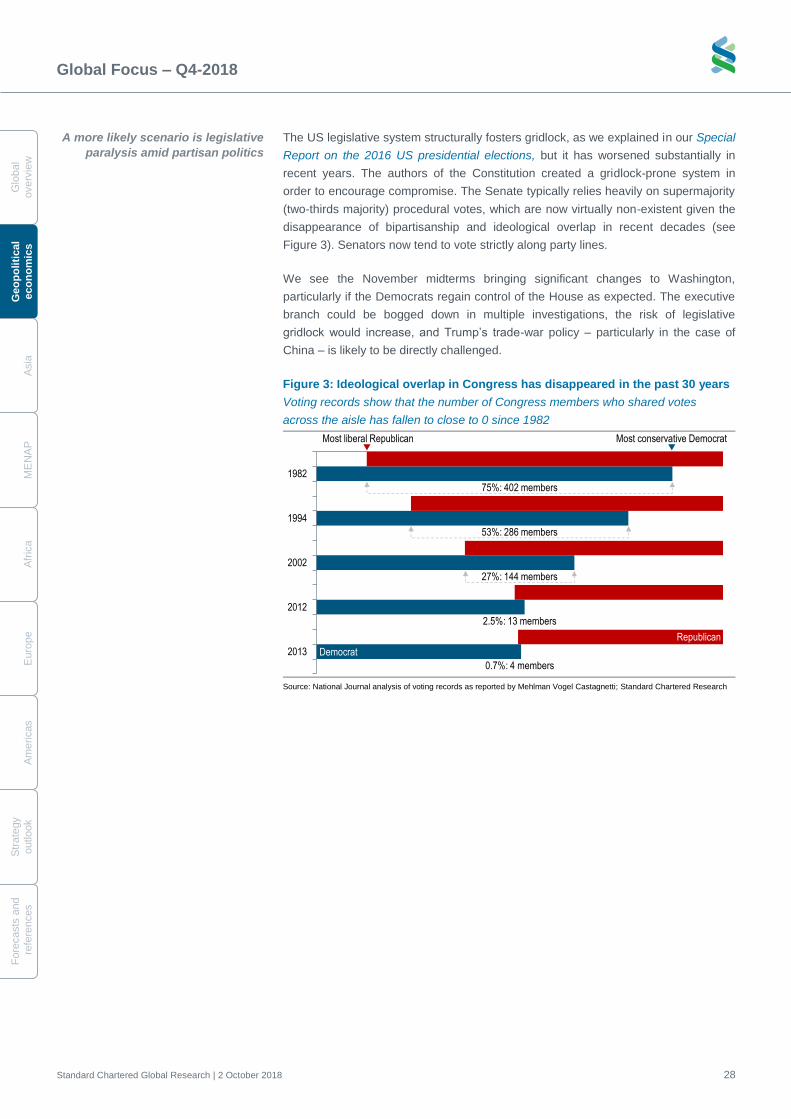
Global Focus – Q4-2018
Standard Chartered Global Research | 2 October 2018 28
G
lobal
overv
iew
Geo
po
liti
cal
eco
no
mic
s
A
sia
M
EN
AP
A
fric
a
E
uro
pe
A
me
ricas
S
trate
gy
o
utlo
ok
Fo
recasts
and
re
fere
nces
The US legislative system structurally fosters gridlock, as we explained in our Special
Report on the 2016 US presidential elections, but it has worsened substantially in
recent years. The authors of the Constitution created a gridlock-prone system in
order to encourage compromise. The Senate typically relies heavily on supermajority
(two-thirds majority) procedural votes, which are now virtually non-existent given the
disappearance of bipartisanship and ideological overlap in recent decades (see
Figure 3). Senators now tend to vote strictly along party lines.
We see the November midterms bringing significant changes to Washington,
particularly if the Democrats regain control of the House as expected. The executive
branch could be bogged down in multiple investigations, the risk of legislative
gridlock would increase, and Trump’s trade-war policy – particularly in the case of
China – is likely to be directly challenged.
Figure 3: Ideological overlap in Congress has disappeared in the past 30 years
Voting records show that the number of Congress members who shared votes
across the aisle has fallen to close to 0 since 1982
Source: National Journal analysis of voting records as reported by Mehlman Vogel Castagnetti; Standard Chartered Research
75%: 402 members
53%: 286 members
27%: 144 members
2.5%: 13 members
0.7%: 4 members
1982
1994
2002
2012
2013
Most liberal Republican Most conservative Democrat
Republican
Democrat
A more likely scenario is legislative
paralysis amid partisan politics

Economies – Asia
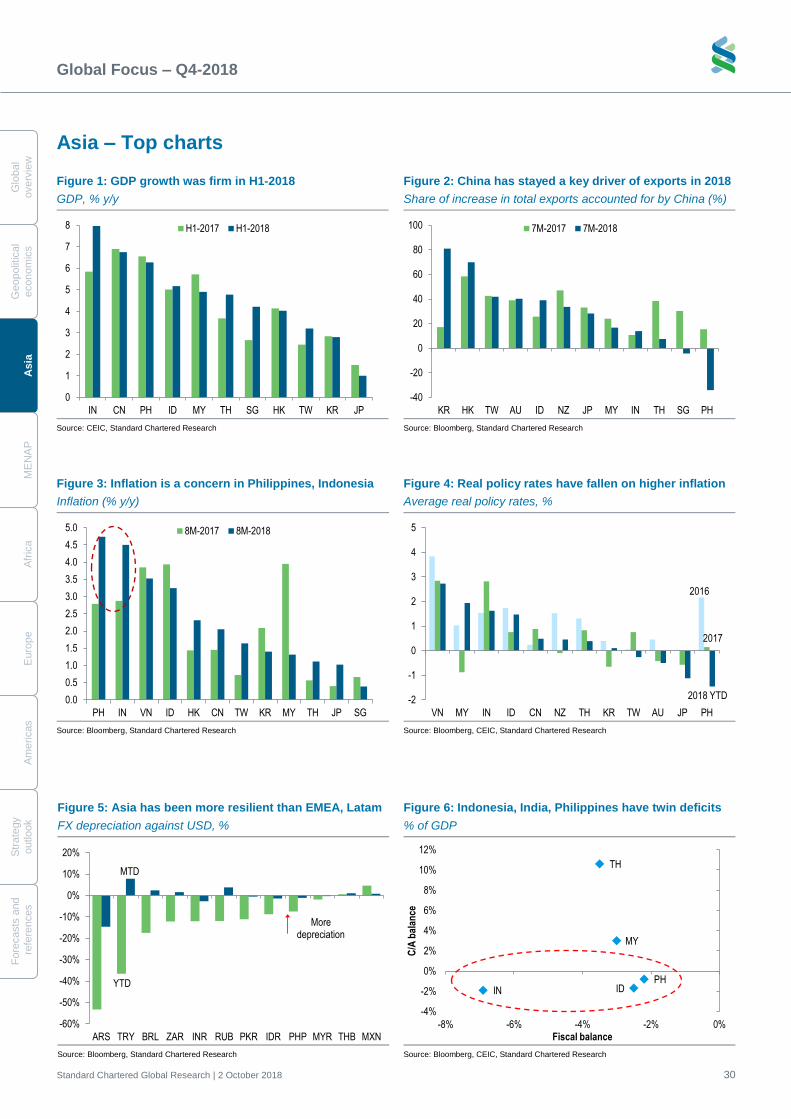
Global Focus – Q4-2018
Standard Chartered Global Research | 2 October 2018 30
G
lobal
overv
iew
Geopolit
ical
econom
ics
A
sia
M
EN
AP
A
fric
a
E
uro
pe
A
me
ricas
S
trate
gy
o
utlo
ok
Fo
recasts
and
re
fere
nces
Asia – Top charts Figure 1: GDP growth was firm in H1-2018
GDP, % y/y
Figure 2: China has stayed a key driver of exports in 2018
Share of increase in total exports accounted for by China (%)
Source: CEIC, Standard Chartered Research Source: Bloomberg, Standard Chartered Research
Figure 3: Inflation is a concern in Philippines, Indonesia
Inflation (% y/y)
Figure 4: Real policy rates have fallen on higher inflation
Average real policy rates, %
Source: Bloomberg, Standard Chartered Research Source: Bloomberg, CEIC, Standard Chartered Research
0
1
2
3
4
5
6
7
8
IN CN PH ID MY TH SG HK TW KR JP
H1-2017 H1-2018
-40
-20
0
20
40
60
80
100
KR HK TW AU ID NZ JP MY IN TH SG PH
7M-2017 7M-2018
0.0
0.5
1.0
1.5
2.0
2.5
3.0
3.5
4.0
4.5
5.0
PH IN VN ID HK CN TW KR MY TH JP SG
8M-2017 8M-2018
2016
2017
2018 YTD-2
-1
0
1
2
3
4
5
VN MY IN ID CN NZ TH KR TW AU JP PH
Figure 5: Asia has been more resilient than EMEA, Latam
FX depreciation against USD, %
Figure 6: Indonesia, India, Philippines have twin deficits
% of GDP
Source: Bloomberg, Standard Chartered Research Source: Bloomberg, CEIC, Standard Chartered Research
YTD
MTD
-60%
-50%
-40%
-30%
-20%
-10%
0%
10%
20%
ARS TRY BRL ZAR INR RUB PKR IDR PHP MYR THB MXN
More depreciation
IN ID
MY
PH
TH
-4%
-2%
0%
2%
4%
6%
8%
10%
12%
-8% -6% -4% -2% 0%
C/A
bal
ance
Fiscal balance
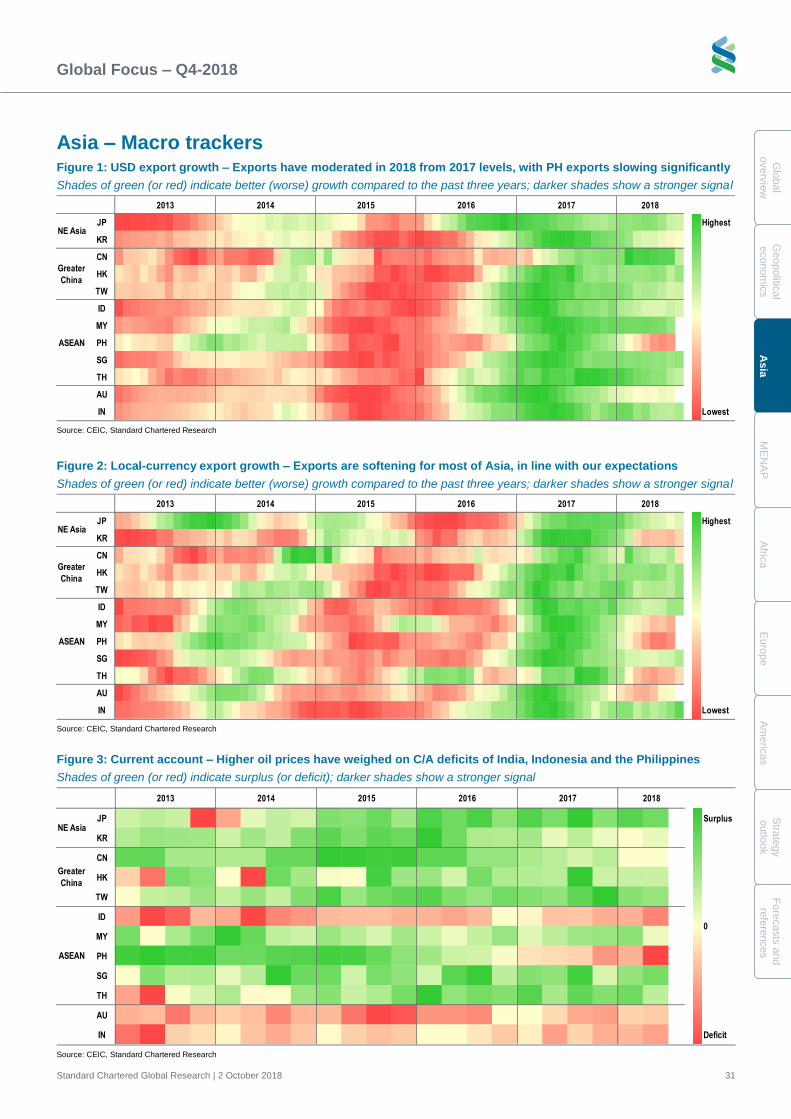
Global Focus – Q4-2018
Standard Chartered Global Research | 2 October 2018 31
Glo
bal
overv
iew
Geopolitic
al
econom
ics
Asia
ME
NA
P
Afric
a
Euro
pe
Am
eric
as
Stra
tegy
outlo
ok
Fo
recasts
and
refe
rences
Asia – Macro trackers Figure 1: USD export growth – Exports have moderated in 2018 from 2017 levels, with PH exports slowing significantly
Shades of green (or red) indicate better (worse) growth compared to the past three years; darker shades show a stronger signal
Source: CEIC, Standard Chartered Research
Figure 2: Local-currency export growth – Exports are softening for most of Asia, in line with our expectations
Shades of green (or red) indicate better (worse) growth compared to the past three years; darker shades show a stronger signal
Source: CEIC, Standard Chartered Research
JP Highest
KR
CN
HK
TW
ID
MY
PH
SG
TH
AU
IN Lowest
NE Asia
Greater
China
ASEAN
2017 20182013 2014 2015 2016
JP Highest
KR
CN
HK
TW
ID
MY
PH
SG
TH
AU
IN Lowest
NE Asia
Greater
China
ASEAN
2017 20182013 2014 2015 2016
Figure 3: Current account – Higher oil prices have weighed on C/A deficits of India, Indonesia and the Philippines
Shades of green (or red) indicate surplus (or deficit); darker shades show a stronger signal
Source: CEIC, Standard Chartered Research
JP Surplus
KR
CN
HK
TW
ID
MY
PH
SG
TH
AU
IN Deficit
NE Asia
Greater
China
ASEAN
2016 2017 20182013 2014 2015
0
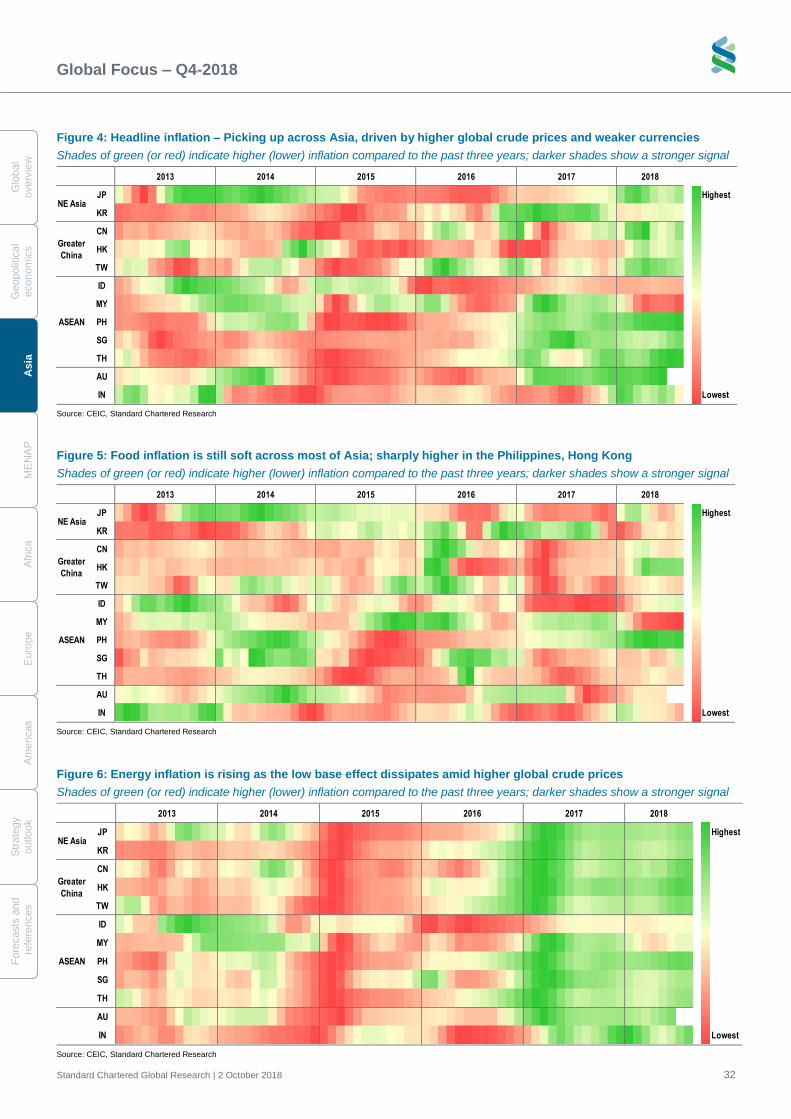
Global Focus – Q4-2018
Standard Chartered Global Research | 2 October 2018 32
G
lobal
overv
iew
Geopolit
ical
econom
ics
A
sia
M
EN
AP
A
fric
a
E
uro
pe
A
me
ricas
S
trate
gy
o
utlo
ok
Fo
recasts
and
re
fere
nces
Figure 4: Headline inflation – Picking up across Asia, driven by higher global crude prices and weaker currencies
Shades of green (or red) indicate higher (lower) inflation compared to the past three years; darker shades show a stronger signal
Source: CEIC, Standard Chartered Research
Figure 5: Food inflation is still soft across most of Asia; sharply higher in the Philippines, Hong Kong
Shades of green (or red) indicate higher (lower) inflation compared to the past three years; darker shades show a stronger signal
Source: CEIC, Standard Chartered Research
JP Highest
KR
CN
HK
TW
ID
MY
PH
SG
TH
AU
IN Lowest
20182013 2014 2015 2016
NE Asia
Greater
China
ASEAN
2017
JP Highest
KR
CN
HK
TW
ID
MY
PH
SG
TH
AU
IN Lowest
NE Asia
Greater
China
ASEAN
2017 20182013 2014 2015 2016
Figure 6: Energy inflation is rising as the low base effect dissipates amid higher global crude prices
Shades of green (or red) indicate higher (lower) inflation compared to the past three years; darker shades show a stronger signal
Source: CEIC, Standard Chartered Research
JP Highest
KR
CN
HK
TW
ID
MY
PH
SG
TH
AU
IN Lowest
NE Asia
Greater
China
ASEAN
2017 20182013 2014 2015 2016
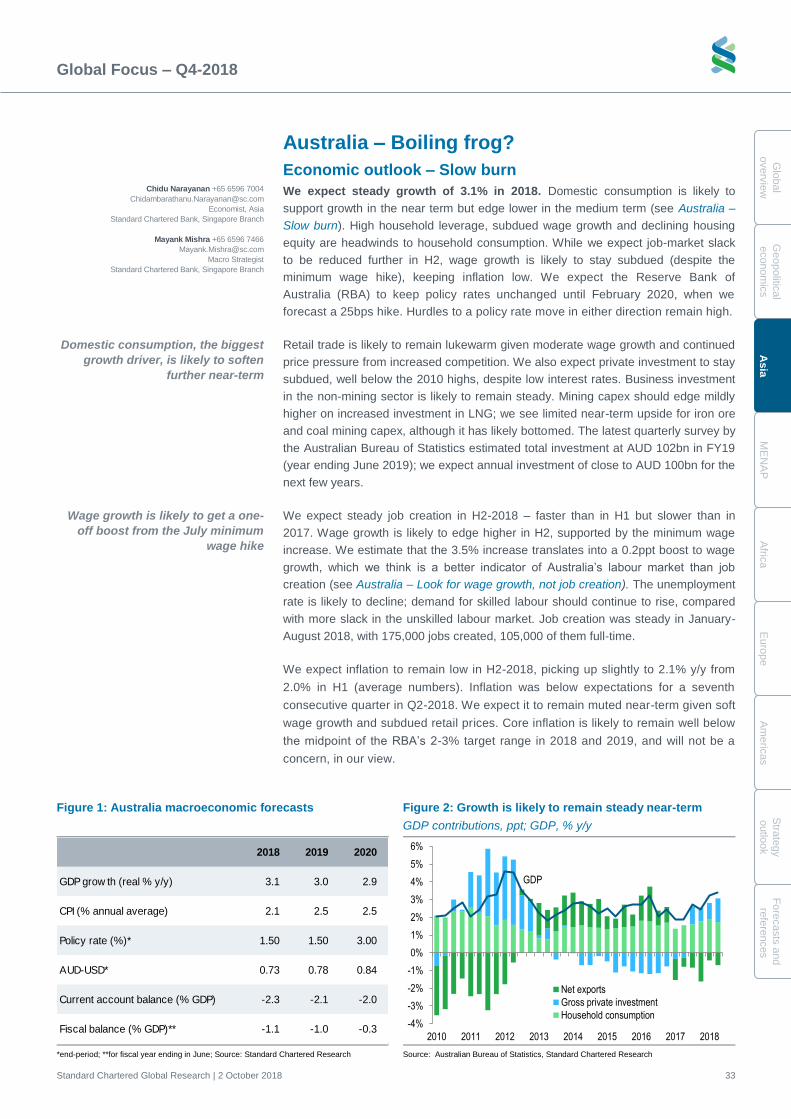
Global Focus – Q4-2018
Standard Chartered Global Research | 2 October 2018 33
Glo
bal
overv
iew
Geopolitic
al
econom
ics
Asia
ME
NA
P
Afric
a
Euro
pe
Am
eric
as
Stra
tegy
outlo
ok
Fo
recasts
and
refe
rences
Australia – Boiling frog?
Economic outlook – Slow burn
We expect steady growth of 3.1% in 2018. Domestic consumption is likely to
support growth in the near term but edge lower in the medium term (see Australia –
Slow burn). High household leverage, subdued wage growth and declining housing
equity are headwinds to household consumption. While we expect job-market slack
to be reduced further in H2, wage growth is likely to stay subdued (despite the
minimum wage hike), keeping inflation low. We expect the Reserve Bank of
Australia (RBA) to keep policy rates unchanged until February 2020, when we
forecast a 25bps hike. Hurdles to a policy rate move in either direction remain high.
Retail trade is likely to remain lukewarm given moderate wage growth and continued
price pressure from increased competition. We also expect private investment to stay
subdued, well below the 2010 highs, despite low interest rates. Business investment
in the non-mining sector is likely to remain steady. Mining capex should edge mildly
higher on increased investment in LNG; we see limited near-term upside for iron ore
and coal mining capex, although it has likely bottomed. The latest quarterly survey by
the Australian Bureau of Statistics estimated total investment at AUD 102bn in FY19
(year ending June 2019); we expect annual investment of close to AUD 100bn for the
next few years.
We expect steady job creation in H2-2018 – faster than in H1 but slower than in
2017. Wage growth is likely to edge higher in H2, supported by the minimum wage
increase. We estimate that the 3.5% increase translates into a 0.2ppt boost to wage
growth, which we think is a better indicator of Australia’s labour market than job
creation (see Australia – Look for wage growth, not job creation). The unemployment
rate is likely to decline; demand for skilled labour should continue to rise, compared
with more slack in the unskilled labour market. Job creation was steady in January-
August 2018, with 175,000 jobs created, 105,000 of them full-time.
We expect inflation to remain low in H2-2018, picking up slightly to 2.1% y/y from
2.0% in H1 (average numbers). Inflation was below expectations for a seventh
consecutive quarter in Q2-2018. We expect it to remain muted near-term given soft
wage growth and subdued retail prices. Core inflation is likely to remain well below
the midpoint of the RBA’s 2-3% target range in 2018 and 2019, and will not be a
concern, in our view.
Figure 1: Australia macroeconomic forecasts Figure 2: Growth is likely to remain steady near-term
GDP contributions, ppt; GDP, % y/y
*end-period; **for fiscal year ending in June; Source: Standard Chartered Research Source: Australian Bureau of Statistics, Standard Chartered Research
2018 2019 2020
GDP grow th (real % y/y) 3.1 3.0 2.9
CPI (% annual average) 2.1 2.5 2.5
Policy rate (%)* 1.50 1.50 3.00
AUD-USD* 0.73 0.78 0.84
Current account balance (% GDP) -2.3 -2.1 -2.0
Fiscal balance (% GDP)** -1.1 -1.0 -0.3
GDP
-4%
-3%
-2%
-1%
0%
1%
2%
3%
4%
5%
6%
2010 2011 2012 2013 2014 2015 2016 2017 2018
Net exports
Gross private investment
Household consumption
Wage growth is likely to get a one-
off boost from the July minimum
wage hike
Chidu Narayanan +65 6596 7004
Economist, Asia
Standard Chartered Bank, Singapore Branch
Mayank Mishra +65 6596 7466
Macro Strategist
Standard Chartered Bank, Singapore Branch
Domestic consumption, the biggest
growth driver, is likely to soften
further near-term
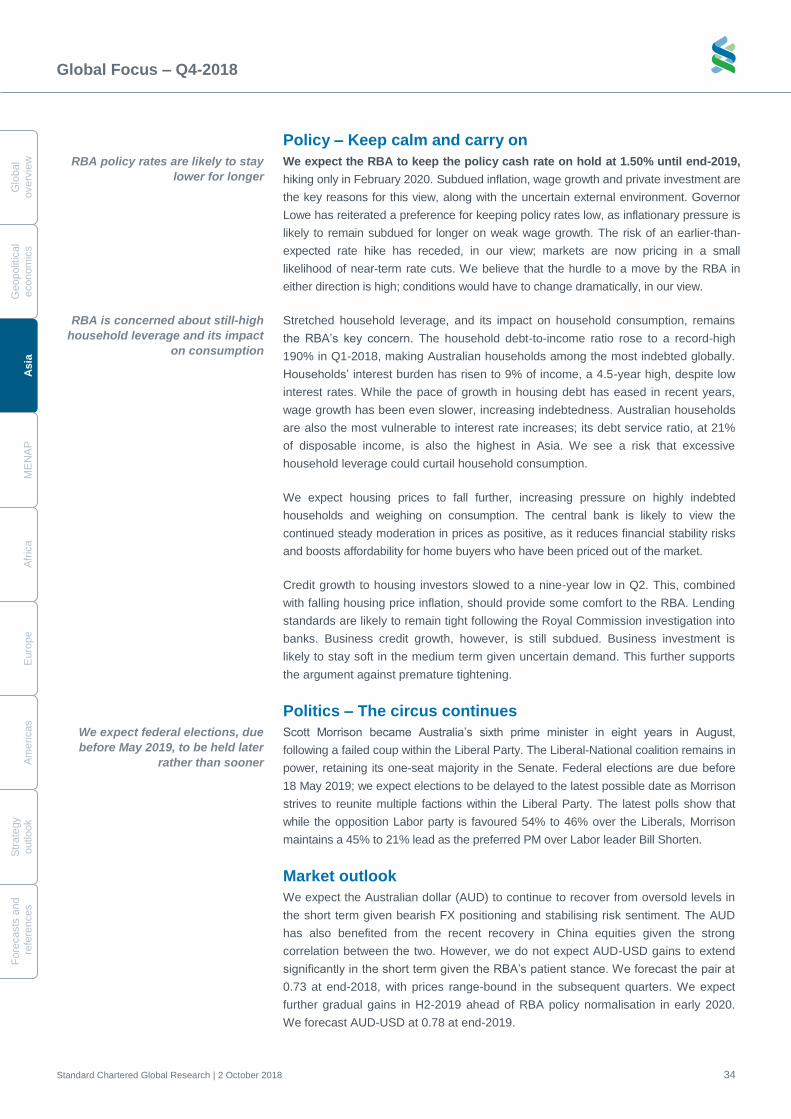
Global Focus – Q4-2018
Standard Chartered Global Research | 2 October 2018 34
G
lobal
overv
iew
Geopolit
ical
econom
ics
A
sia
M
EN
AP
A
fric
a
E
uro
pe
A
me
ricas
S
trate
gy
o
utlo
ok
Fo
recasts
and
re
fere
nces
Policy – Keep calm and carry on
We expect the RBA to keep the policy cash rate on hold at 1.50% until end-2019,
hiking only in February 2020. Subdued inflation, wage growth and private investment are
the key reasons for this view, along with the uncertain external environment. Governor
Lowe has reiterated a preference for keeping policy rates low, as inflationary pressure is
likely to remain subdued for longer on weak wage growth. The risk of an earlier-than-
expected rate hike has receded, in our view; markets are now pricing in a small
likelihood of near-term rate cuts. We believe that the hurdle to a move by the RBA in
either direction is high; conditions would have to change dramatically, in our view.
Stretched household leverage, and its impact on household consumption, remains
the RBA’s key concern. The household debt-to-income ratio rose to a record-high
190% in Q1-2018, making Australian households among the most indebted globally.
Households’ interest burden has risen to 9% of income, a 4.5-year high, despite low
interest rates. While the pace of growth in housing debt has eased in recent years,
wage growth has been even slower, increasing indebtedness. Australian households
are also the most vulnerable to interest rate increases; its debt service ratio, at 21%
of disposable income, is also the highest in Asia. We see a risk that excessive
household leverage could curtail household consumption.
We expect housing prices to fall further, increasing pressure on highly indebted
households and weighing on consumption. The central bank is likely to view the
continued steady moderation in prices as positive, as it reduces financial stability risks
and boosts affordability for home buyers who have been priced out of the market.
Credit growth to housing investors slowed to a nine-year low in Q2. This, combined
with falling housing price inflation, should provide some comfort to the RBA. Lending
standards are likely to remain tight following the Royal Commission investigation into
banks. Business credit growth, however, is still subdued. Business investment is
likely to stay soft in the medium term given uncertain demand. This further supports
the argument against premature tightening.
Politics – The circus continues
Scott Morrison became Australia’s sixth prime minister in eight years in August,
following a failed coup within the Liberal Party. The Liberal-National coalition remains in
power, retaining its one-seat majority in the Senate. Federal elections are due before
18 May 2019; we expect elections to be delayed to the latest possible date as Morrison
strives to reunite multiple factions within the Liberal Party. The latest polls show that
while the opposition Labor party is favoured 54% to 46% over the Liberals, Morrison
maintains a 45% to 21% lead as the preferred PM over Labor leader Bill Shorten.
Market outlook
We expect the Australian dollar (AUD) to continue to recover from oversold levels in
the short term given bearish FX positioning and stabilising risk sentiment. The AUD
has also benefited from the recent recovery in China equities given the strong
correlation between the two. However, we do not expect AUD-USD gains to extend
significantly in the short term given the RBA’s patient stance. We forecast the pair at
0.73 at end-2018, with prices range-bound in the subsequent quarters. We expect
further gradual gains in H2-2019 ahead of RBA policy normalisation in early 2020.
We forecast AUD-USD at 0.78 at end-2019.
We expect federal elections, due
before May 2019, to be held later
rather than sooner
RBA policy rates are likely to stay
lower for longer
RBA is concerned about still-high
household leverage and its impact
on consumption
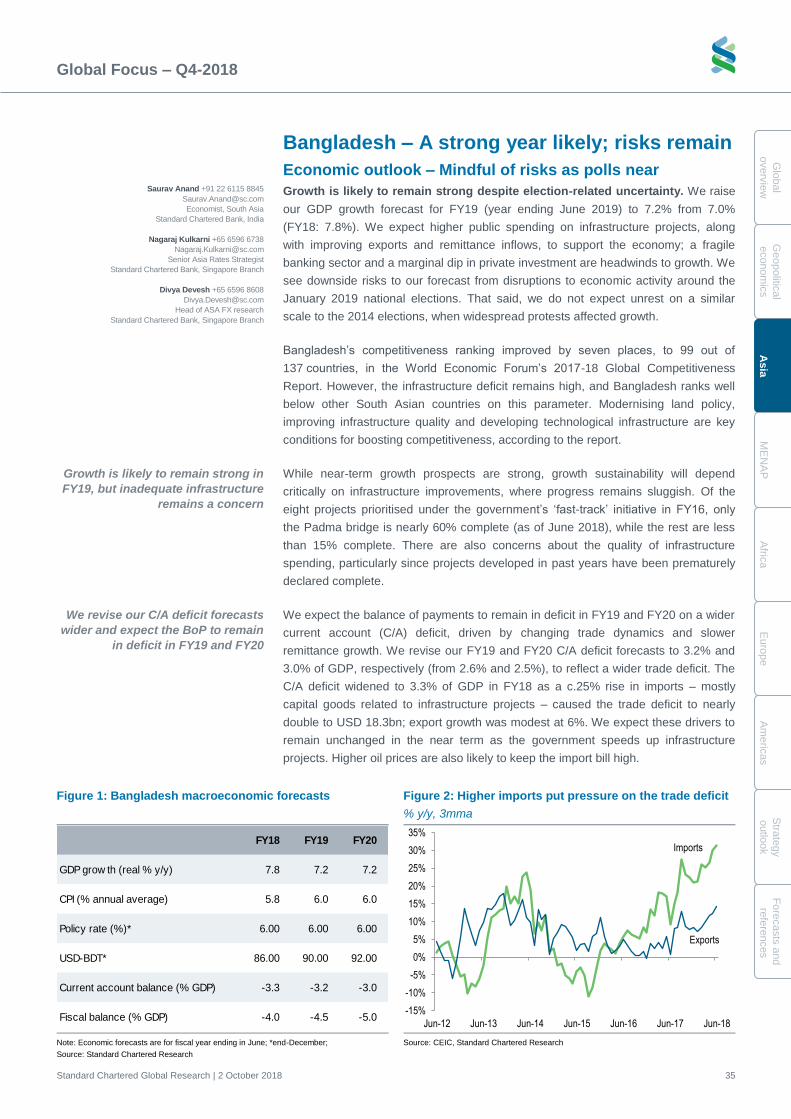
Global Focus – Q4-2018
Standard Chartered Global Research | 2 October 2018 35
Glo
bal
overv
iew
Geopolitic
al
econom
ics
Asia
ME
NA
P
Afric
a
Euro
pe
Am
eric
as
Stra
tegy
outlo
ok
Fo
recasts
and
refe
rences
Bangladesh – A strong year likely; risks remain
Economic outlook – Mindful of risks as polls near
Growth is likely to remain strong despite election-related uncertainty. We raise
our GDP growth forecast for FY19 (year ending June 2019) to 7.2% from 7.0%
(FY18: 7.8%). We expect higher public spending on infrastructure projects, along
with improving exports and remittance inflows, to support the economy; a fragile
banking sector and a marginal dip in private investment are headwinds to growth. We
see downside risks to our forecast from disruptions to economic activity around the
January 2019 national elections. That said, we do not expect unrest on a similar
scale to the 2014 elections, when widespread protests affected growth.
Bangladesh’s competitiveness ranking improved by seven places, to 99 out of
137 countries, in the World Economic Forum’s 2017-18 Global Competitiveness
Report. However, the infrastructure deficit remains high, and Bangladesh ranks well
below other South Asian countries on this parameter. Modernising land policy,
improving infrastructure quality and developing technological infrastructure are key
conditions for boosting competitiveness, according to the report.
While near-term growth prospects are strong, growth sustainability will depend
critically on infrastructure improvements, where progress remains sluggish. Of the
eight projects prioritised under the government’s ‘fast-track’ initiative in FY16, only
the Padma bridge is nearly 60% complete (as of June 2018), while the rest are less
than 15% complete. There are also concerns about the quality of infrastructure
spending, particularly since projects developed in past years have been prematurely
declared complete.
We expect the balance of payments to remain in deficit in FY19 and FY20 on a wider
current account (C/A) deficit, driven by changing trade dynamics and slower
remittance growth. We revise our FY19 and FY20 C/A deficit forecasts to 3.2% and
3.0% of GDP, respectively (from 2.6% and 2.5%), to reflect a wider trade deficit. The
C/A deficit widened to 3.3% of GDP in FY18 as a c.25% rise in imports – mostly
capital goods related to infrastructure projects – caused the trade deficit to nearly
double to USD 18.3bn; export growth was modest at 6%. We expect these drivers to
remain unchanged in the near term as the government speeds up infrastructure
projects. Higher oil prices are also likely to keep the import bill high.
Figure 1: Bangladesh macroeconomic forecasts Figure 2: Higher imports put pressure on the trade deficit
% y/y, 3mma
Note: Economic forecasts are for fiscal year ending in June; *end-December;
Source: Standard Chartered Research
Source: CEIC, Standard Chartered Research
FY18 FY19 FY20
GDP grow th (real % y/y) 7.8 7.2 7.2
CPI (% annual average) 5.8 6.0 6.0
Policy rate (%)* 6.00 6.00 6.00
USD-BDT* 86.00 90.00 92.00
Current account balance (% GDP) -3.3 -3.2 -3.0
Fiscal balance (% GDP) -4.0 -4.5 -5.0
Imports
Exports
-15%
-10%
-5%
0%
5%
10%
15%
20%
25%
30%
35%
Jun-12 Jun-13 Jun-14 Jun-15 Jun-16 Jun-17 Jun-18
Growth is likely to remain strong in
FY19, but inadequate infrastructure
remains a concern
Saurav Anand +91 22 6115 8845
Economist, South Asia
Standard Chartered Bank, India
Nagaraj Kulkarni +65 6596 6738
Senior Asia Rates Strategist
Standard Chartered Bank, Singapore Branch
Divya Devesh +65 6596 8608
Head of ASA FX research
Standard Chartered Bank, Singapore Branch
We revise our C/A deficit forecasts
wider and expect the BoP to remain
in deficit in FY19 and FY20
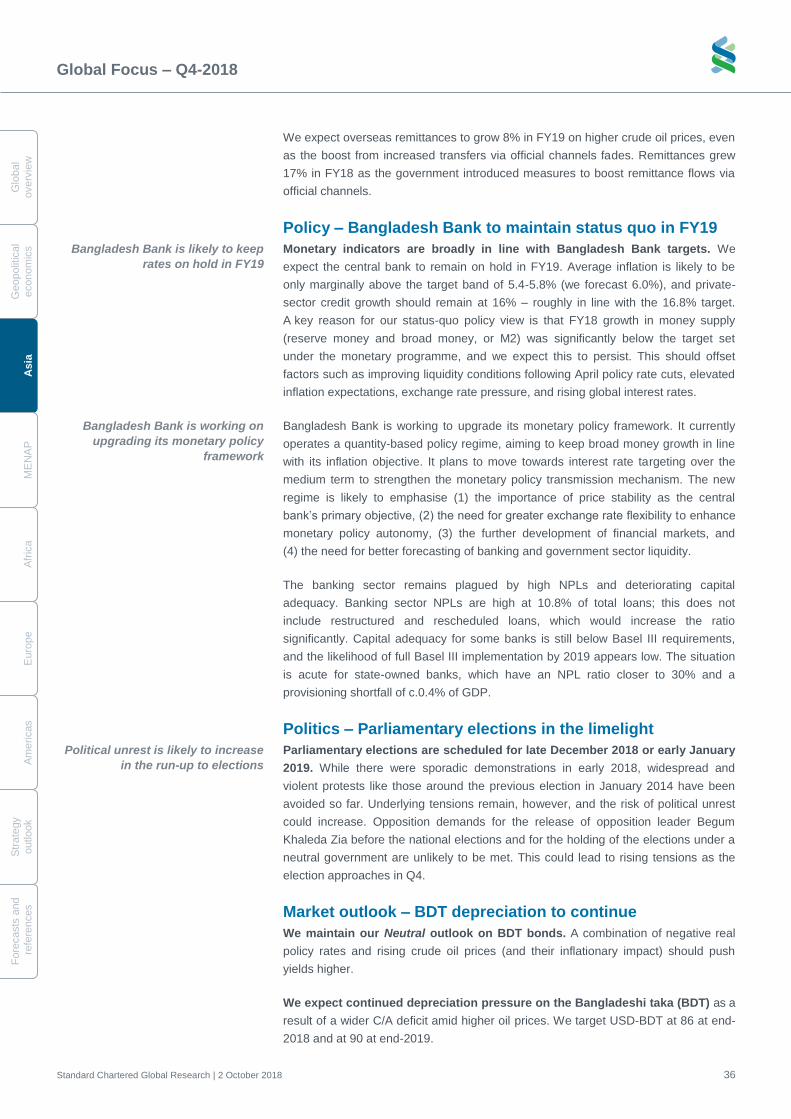
Global Focus – Q4-2018
Standard Chartered Global Research | 2 October 2018 36
G
lobal
overv
iew
Geopolit
ical
econom
ics
A
sia
M
EN
AP
A
fric
a
E
uro
pe
A
me
ricas
S
trate
gy
o
utlo
ok
Fo
recasts
and
re
fere
nces
We expect overseas remittances to grow 8% in FY19 on higher crude oil prices, even
as the boost from increased transfers via official channels fades. Remittances grew
17% in FY18 as the government introduced measures to boost remittance flows via
official channels.
Policy – Bangladesh Bank to maintain status quo in FY19
Monetary indicators are broadly in line with Bangladesh Bank targets. We
expect the central bank to remain on hold in FY19. Average inflation is likely to be
only marginally above the target band of 5.4-5.8% (we forecast 6.0%), and private-
sector credit growth should remain at 16% – roughly in line with the 16.8% target.
A key reason for our status-quo policy view is that FY18 growth in money supply
(reserve money and broad money, or M2) was significantly below the target set
under the monetary programme, and we expect this to persist. This should offset
factors such as improving liquidity conditions following April policy rate cuts, elevated
inflation expectations, exchange rate pressure, and rising global interest rates.
Bangladesh Bank is working to upgrade its monetary policy framework. It currently
operates a quantity-based policy regime, aiming to keep broad money growth in line
with its inflation objective. It plans to move towards interest rate targeting over the
medium term to strengthen the monetary policy transmission mechanism. The new
regime is likely to emphasise (1) the importance of price stability as the central
bank’s primary objective, (2) the need for greater exchange rate flexibility to enhance
monetary policy autonomy, (3) the further development of financial markets, and
(4) the need for better forecasting of banking and government sector liquidity.
The banking sector remains plagued by high NPLs and deteriorating capital
adequacy. Banking sector NPLs are high at 10.8% of total loans; this does not
include restructured and rescheduled loans, which would increase the ratio
significantly. Capital adequacy for some banks is still below Basel III requirements,
and the likelihood of full Basel III implementation by 2019 appears low. The situation
is acute for state-owned banks, which have an NPL ratio closer to 30% and a
provisioning shortfall of c.0.4% of GDP.
Politics – Parliamentary elections in the limelight
Parliamentary elections are scheduled for late December 2018 or early January
2019. While there were sporadic demonstrations in early 2018, widespread and
violent protests like those around the previous election in January 2014 have been
avoided so far. Underlying tensions remain, however, and the risk of political unrest
could increase. Opposition demands for the release of opposition leader Begum
Khaleda Zia before the national elections and for the holding of the elections under a
neutral government are unlikely to be met. This could lead to rising tensions as the
election approaches in Q4.
Market outlook – BDT depreciation to continue
We maintain our Neutral outlook on BDT bonds. A combination of negative real
policy rates and rising crude oil prices (and their inflationary impact) should push
yields higher.
We expect continued depreciation pressure on the Bangladeshi taka (BDT) as a
result of a wider C/A deficit amid higher oil prices. We target USD-BDT at 86 at end-
2018 and at 90 at end-2019.
Bangladesh Bank is working on
upgrading its monetary policy
framework
Political unrest is likely to increase
in the run-up to elections
Bangladesh Bank is likely to keep
rates on hold in FY19
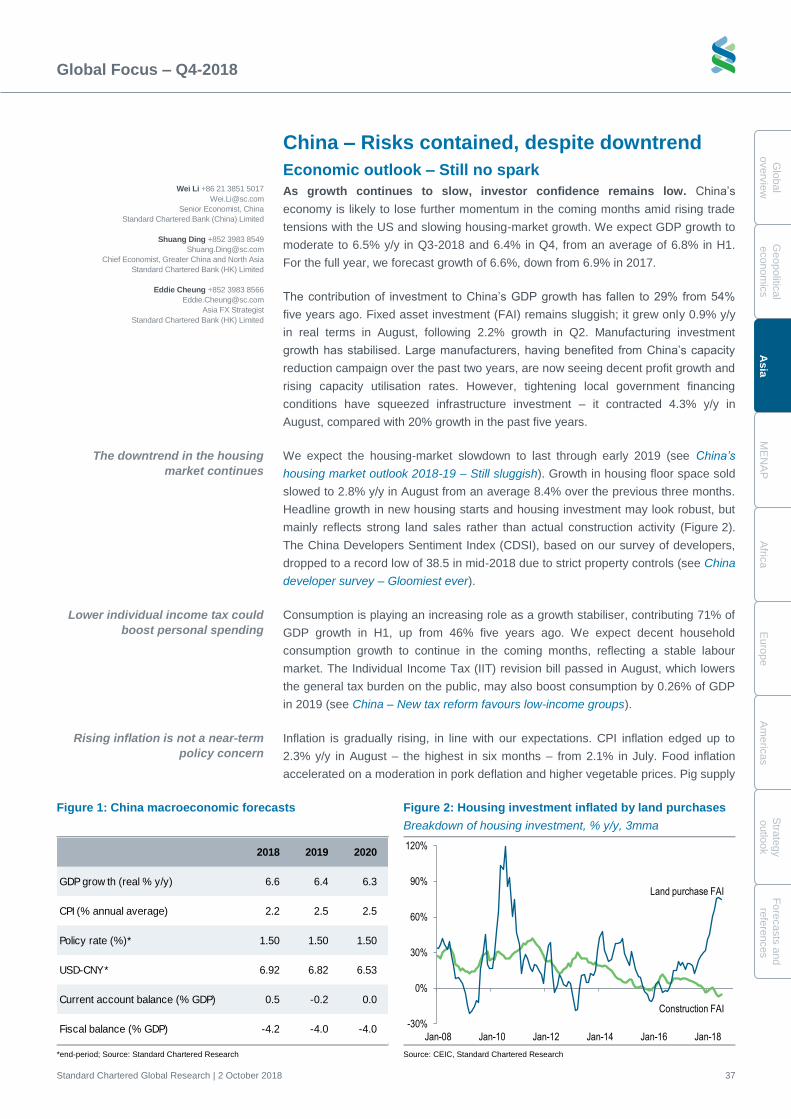
Global Focus – Q4-2018
Standard Chartered Global Research | 2 October 2018 37
Glo
bal
overv
iew
Geopolitic
al
econom
ics
Asia
ME
NA
P
Afric
a
Euro
pe
Am
eric
as
Stra
tegy
outlo
ok
Fo
recasts
and
refe
rences
China – Risks contained, despite downtrend
Economic outlook – Still no spark
As growth continues to slow, investor confidence remains low. China’s
economy is likely to lose further momentum in the coming months amid rising trade
tensions with the US and slowing housing-market growth. We expect GDP growth to
moderate to 6.5% y/y in Q3-2018 and 6.4% in Q4, from an average of 6.8% in H1.
For the full year, we forecast growth of 6.6%, down from 6.9% in 2017.
The contribution of investment to China’s GDP growth has fallen to 29% from 54%
five years ago. Fixed asset investment (FAI) remains sluggish; it grew only 0.9% y/y
in real terms in August, following 2.2% growth in Q2. Manufacturing investment
growth has stabilised. Large manufacturers, having benefited from China’s capacity
reduction campaign over the past two years, are now seeing decent profit growth and
rising capacity utilisation rates. However, tightening local government financing
conditions have squeezed infrastructure investment – it contracted 4.3% y/y in
August, compared with 20% growth in the past five years.
We expect the housing-market slowdown to last through early 2019 (see China’s
housing market outlook 2018-19 – Still sluggish). Growth in housing floor space sold
slowed to 2.8% y/y in August from an average 8.4% over the previous three months.
Headline growth in new housing starts and housing investment may look robust, but
mainly reflects strong land sales rather than actual construction activity (Figure 2).
The China Developers Sentiment Index (CDSI), based on our survey of developers,
dropped to a record low of 38.5 in mid-2018 due to strict property controls (see China
developer survey – Gloomiest ever).
Consumption is playing an increasing role as a growth stabiliser, contributing 71% of
GDP growth in H1, up from 46% five years ago. We expect decent household
consumption growth to continue in the coming months, reflecting a stable labour
market. The Individual Income Tax (IIT) revision bill passed in August, which lowers
the general tax burden on the public, may also boost consumption by 0.26% of GDP
in 2019 (see China – New tax reform favours low-income groups).
Inflation is gradually rising, in line with our expectations. CPI inflation edged up to
2.3% y/y in August – the highest in six months – from 2.1% in July. Food inflation
accelerated on a moderation in pork deflation and higher vegetable prices. Pig supply
Figure 1: China macroeconomic forecasts Figure 2: Housing investment inflated by land purchases
Breakdown of housing investment, % y/y, 3mma
*end-period; Source: Standard Chartered Research Source: CEIC, Standard Chartered Research
2018 2019 2020
GDP grow th (real % y/y) 6.6 6.4 6.3
CPI (% annual average) 2.2 2.5 2.5
Policy rate (%)* 1.50 1.50 1.50
USD-CNY* 6.92 6.82 6.53
Current account balance (% GDP) 0.5 -0.2 0.0
Fiscal balance (% GDP) -4.2 -4.0 -4.0-30%
0%
30%
60%
90%
120%
Jan-08 Jan-10 Jan-12 Jan-14 Jan-16 Jan-18
Land purchase FAI
Construction FAI
Wei Li +86 21 3851 5017
Senior Economist, China
Standard Chartered Bank (China) Limited
Shuang Ding +852 3983 8549
Chief Economist, Greater China and North Asia
Standard Chartered Bank (HK) Limited
Eddie Cheung +852 3983 8566
Asia FX Strategist
Standard Chartered Bank (HK) Limited
Rising inflation is not a near-term
policy concern
Lower individual income tax could
boost personal spending
The downtrend in the housing
market continues
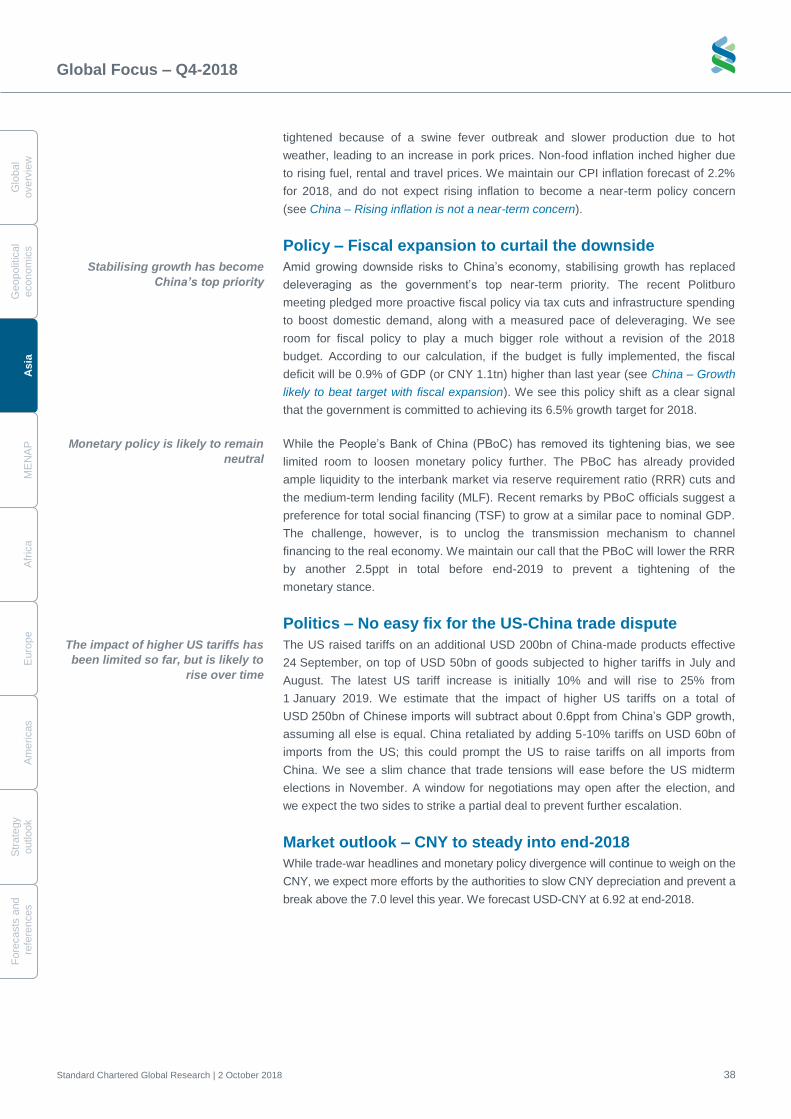
Global Focus – Q4-2018
Standard Chartered Global Research | 2 October 2018 38
G
lobal
overv
iew
Geopolit
ical
econom
ics
A
sia
M
EN
AP
A
fric
a
E
uro
pe
A
me
ricas
S
trate
gy
o
utlo
ok
Fo
recasts
and
re
fere
nces
tightened because of a swine fever outbreak and slower production due to hot
weather, leading to an increase in pork prices. Non-food inflation inched higher due
to rising fuel, rental and travel prices. We maintain our CPI inflation forecast of 2.2%
for 2018, and do not expect rising inflation to become a near-term policy concern
(see China – Rising inflation is not a near-term concern).
Policy – Fiscal expansion to curtail the downside
Amid growing downside risks to China’s economy, stabilising growth has replaced
deleveraging as the government’s top near-term priority. The recent Politburo
meeting pledged more proactive fiscal policy via tax cuts and infrastructure spending
to boost domestic demand, along with a measured pace of deleveraging. We see
room for fiscal policy to play a much bigger role without a revision of the 2018
budget. According to our calculation, if the budget is fully implemented, the fiscal
deficit will be 0.9% of GDP (or CNY 1.1tn) higher than last year (see China – Growth
likely to beat target with fiscal expansion). We see this policy shift as a clear signal
that the government is committed to achieving its 6.5% growth target for 2018.
While the People’s Bank of China (PBoC) has removed its tightening bias, we see
limited room to loosen monetary policy further. The PBoC has already provided
ample liquidity to the interbank market via reserve requirement ratio (RRR) cuts and
the medium-term lending facility (MLF). Recent remarks by PBoC officials suggest a
preference for total social financing (TSF) to grow at a similar pace to nominal GDP.
The challenge, however, is to unclog the transmission mechanism to channel
financing to the real economy. We maintain our call that the PBoC will lower the RRR
by another 2.5ppt in total before end-2019 to prevent a tightening of the
monetary stance.
Politics – No easy fix for the US-China trade dispute
The US raised tariffs on an additional USD 200bn of China-made products effective
24 September, on top of USD 50bn of goods subjected to higher tariffs in July and
August. The latest US tariff increase is initially 10% and will rise to 25% from
1 January 2019. We estimate that the impact of higher US tariffs on a total of
USD 250bn of Chinese imports will subtract about 0.6ppt from China’s GDP growth,
assuming all else is equal. China retaliated by adding 5-10% tariffs on USD 60bn of
imports from the US; this could prompt the US to raise tariffs on all imports from
China. We see a slim chance that trade tensions will ease before the US midterm
elections in November. A window for negotiations may open after the election, and
we expect the two sides to strike a partial deal to prevent further escalation.
Market outlook – CNY to steady into end-2018
While trade-war headlines and monetary policy divergence will continue to weigh on the
CNY, we expect more efforts by the authorities to slow CNY depreciation and prevent a
break above the 7.0 level this year. We forecast USD-CNY at 6.92 at end-2018.
Stabilising growth has become
China’s top priority
Monetary policy is likely to remain
neutral
The impact of higher US tariffs has
been limited so far, but is likely to
rise over time
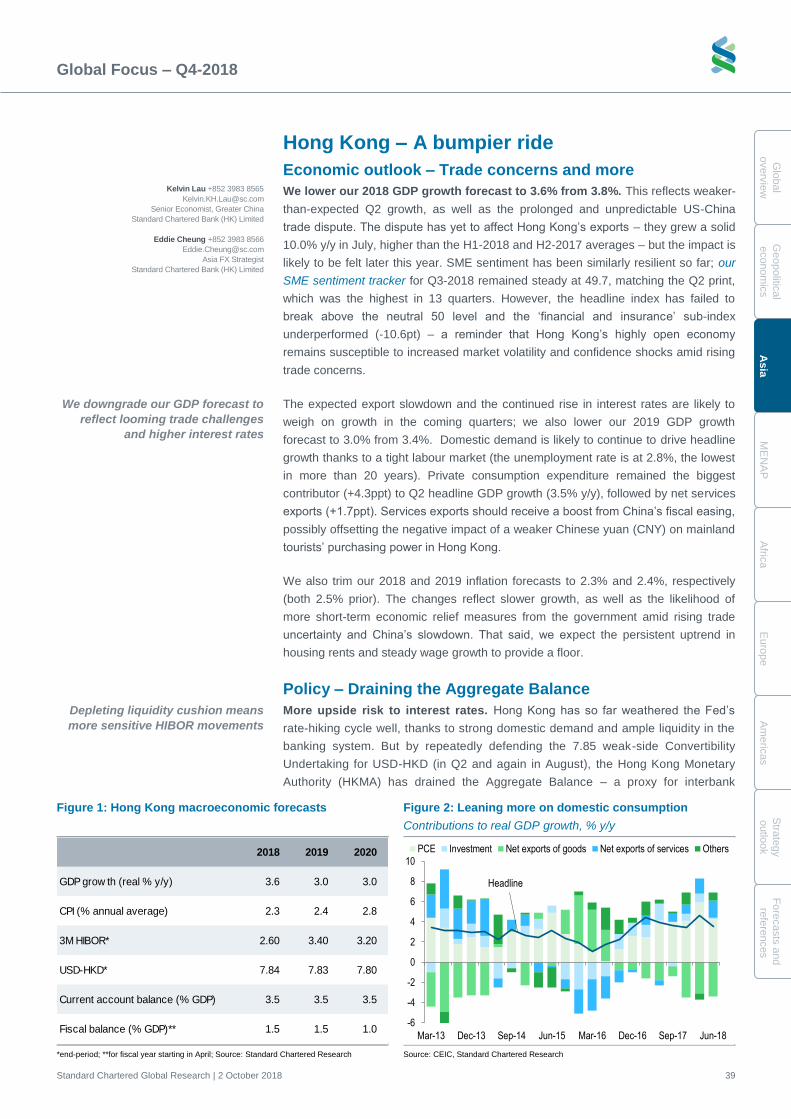
Global Focus – Q4-2018
Standard Chartered Global Research | 2 October 2018 39
Glo
bal
overv
iew
Geopolitic
al
econom
ics
Asia
ME
NA
P
Afric
a
Euro
pe
Am
eric
as
Stra
tegy
outlo
ok
Fo
recasts
and
refe
rences
Hong Kong – A bumpier ride
Economic outlook – Trade concerns and more
We lower our 2018 GDP growth forecast to 3.6% from 3.8%. This reflects weaker-
than-expected Q2 growth, as well as the prolonged and unpredictable US-China
trade dispute. The dispute has yet to affect Hong Kong’s exports – they grew a solid
10.0% y/y in July, higher than the H1-2018 and H2-2017 averages – but the impact is
likely to be felt later this year. SME sentiment has been similarly resilient so far; our
SME sentiment tracker for Q3-2018 remained steady at 49.7, matching the Q2 print,
which was the highest in 13 quarters. However, the headline index has failed to
break above the neutral 50 level and the ‘financial and insurance’ sub-index
underperformed (-10.6pt) – a reminder that Hong Kong’s highly open economy
remains susceptible to increased market volatility and confidence shocks amid rising
trade concerns.
The expected export slowdown and the continued rise in interest rates are likely to
weigh on growth in the coming quarters; we also lower our 2019 GDP growth
forecast to 3.0% from 3.4%. Domestic demand is likely to continue to drive headline
growth thanks to a tight labour market (the unemployment rate is at 2.8%, the lowest
in more than 20 years). Private consumption expenditure remained the biggest
contributor (+4.3ppt) to Q2 headline GDP growth (3.5% y/y), followed by net services
exports (+1.7ppt). Services exports should receive a boost from China’s fiscal easing,
possibly offsetting the negative impact of a weaker Chinese yuan (CNY) on mainland
tourists’ purchasing power in Hong Kong.
We also trim our 2018 and 2019 inflation forecasts to 2.3% and 2.4%, respectively
(both 2.5% prior). The changes reflect slower growth, as well as the likelihood of
more short-term economic relief measures from the government amid rising trade
uncertainty and China’s slowdown. That said, we expect the persistent uptrend in
housing rents and steady wage growth to provide a floor.
Policy – Draining the Aggregate Balance
More upside risk to interest rates. Hong Kong has so far weathered the Fed’s
rate-hiking cycle well, thanks to strong domestic demand and ample liquidity in the
banking system. But by repeatedly defending the 7.85 weak-side Convertibility
Undertaking for USD-HKD (in Q2 and again in August), the Hong Kong Monetary
Authority (HKMA) has drained the Aggregate Balance – a proxy for interbank
Figure 1: Hong Kong macroeconomic forecasts Figure 2: Leaning more on domestic consumption
Contributions to real GDP growth, % y/y
*end-period; **for fiscal year starting in April; Source: Standard Chartered Research Source: CEIC, Standard Chartered Research
2018 2019 2020
GDP grow th (real % y/y) 3.6 3.0 3.0
CPI (% annual average) 2.3 2.4 2.8
3M HIBOR* 2.60 3.40 3.20
USD-HKD* 7.84 7.83 7.80
Current account balance (% GDP) 3.5 3.5 3.5
Fiscal balance (% GDP)** 1.5 1.5 1.0
Headline
-6
-4
-2
0
2
4
6
8
10
Mar-13 Dec-13 Sep-14 Jun-15 Mar-16 Dec-16 Sep-17 Jun-18
PCE Investment Net exports of goods Net exports of services Others
Depleting liquidity cushion means
more sensitive HIBOR movements
Kelvin Lau +852 3983 8565
Senior Economist, Greater China
Standard Chartered Bank (HK) Limited
Eddie Cheung +852 3983 8566
Asia FX Strategist
Standard Chartered Bank (HK) Limited
We downgrade our GDP forecast to
reflect looming trade challenges
and higher interest rates
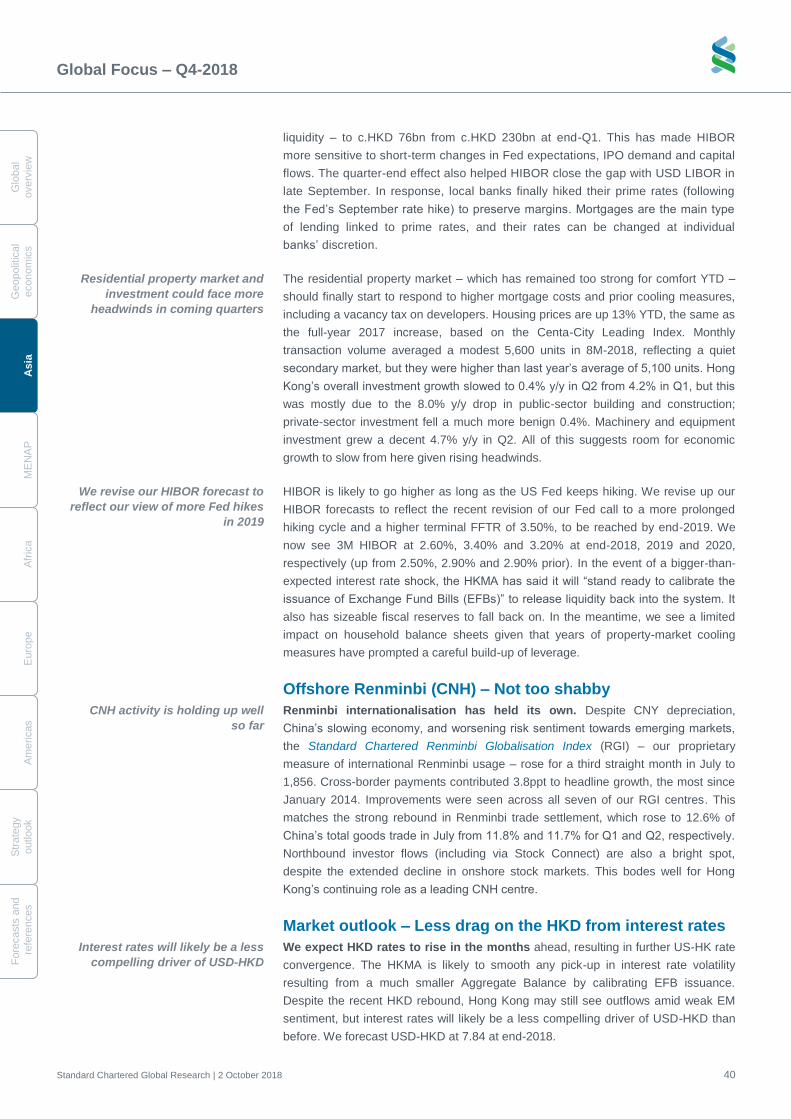
Global Focus – Q4-2018
Standard Chartered Global Research | 2 October 2018 40
G
lobal
overv
iew
Geopolit
ical
econom
ics
A
sia
M
EN
AP
A
fric
a
E
uro
pe
A
me
ricas
S
trate
gy
o
utlo
ok
Fo
recasts
and
re
fere
nces
liquidity – to c.HKD 76bn from c.HKD 230bn at end-Q1. This has made HIBOR
more sensitive to short-term changes in Fed expectations, IPO demand and capital
flows. The quarter-end effect also helped HIBOR close the gap with USD LIBOR in
late September. In response, local banks finally hiked their prime rates (following
the Fed’s September rate hike) to preserve margins. Mortgages are the main type
of lending linked to prime rates, and their rates can be changed at individual
banks’ discretion.
The residential property market – which has remained too strong for comfort YTD –
should finally start to respond to higher mortgage costs and prior cooling measures,
including a vacancy tax on developers. Housing prices are up 13% YTD, the same as
the full-year 2017 increase, based on the Centa-City Leading Index. Monthly
transaction volume averaged a modest 5,600 units in 8M-2018, reflecting a quiet
secondary market, but they were higher than last year’s average of 5,100 units. Hong
Kong’s overall investment growth slowed to 0.4% y/y in Q2 from 4.2% in Q1, but this
was mostly due to the 8.0% y/y drop in public-sector building and construction;
private-sector investment fell a much more benign 0.4%. Machinery and equipment
investment grew a decent 4.7% y/y in Q2. All of this suggests room for economic
growth to slow from here given rising headwinds.
HIBOR is likely to go higher as long as the US Fed keeps hiking. We revise up our
HIBOR forecasts to reflect the recent revision of our Fed call to a more prolonged
hiking cycle and a higher terminal FFTR of 3.50%, to be reached by end-2019. We
now see 3M HIBOR at 2.60%, 3.40% and 3.20% at end-2018, 2019 and 2020,
respectively (up from 2.50%, 2.90% and 2.90% prior). In the event of a bigger-than-
expected interest rate shock, the HKMA has said it will “stand ready to calibrate the
issuance of Exchange Fund Bills (EFBs)” to release liquidity back into the system. It
also has sizeable fiscal reserves to fall back on. In the meantime, we see a limited
impact on household balance sheets given that years of property-market cooling
measures have prompted a careful build-up of leverage.
Offshore Renminbi (CNH) – Not too shabby
Renminbi internationalisation has held its own. Despite CNY depreciation,
China’s slowing economy, and worsening risk sentiment towards emerging markets,
the Standard Chartered Renminbi Globalisation Index (RGI) – our proprietary
measure of international Renminbi usage – rose for a third straight month in July to
1,856. Cross-border payments contributed 3.8ppt to headline growth, the most since
January 2014. Improvements were seen across all seven of our RGI centres. This
matches the strong rebound in Renminbi trade settlement, which rose to 12.6% of
China’s total goods trade in July from 11.8% and 11.7% for Q1 and Q2, respectively.
Northbound investor flows (including via Stock Connect) are also a bright spot,
despite the extended decline in onshore stock markets. This bodes well for Hong
Kong’s continuing role as a leading CNH centre.
Market outlook – Less drag on the HKD from interest rates
We expect HKD rates to rise in the months ahead, resulting in further US-HK rate
convergence. The HKMA is likely to smooth any pick-up in interest rate volatility
resulting from a much smaller Aggregate Balance by calibrating EFB issuance.
Despite the recent HKD rebound, Hong Kong may still see outflows amid weak EM
sentiment, but interest rates will likely be a less compelling driver of USD-HKD than
before. We forecast USD-HKD at 7.84 at end-2018.
CNH activity is holding up well
so far
We revise our HIBOR forecast to
reflect our view of more Fed hikes
in 2019
Residential property market and
investment could face more
headwinds in coming quarters
Interest rates will likely be a less
compelling driver of USD-HKD
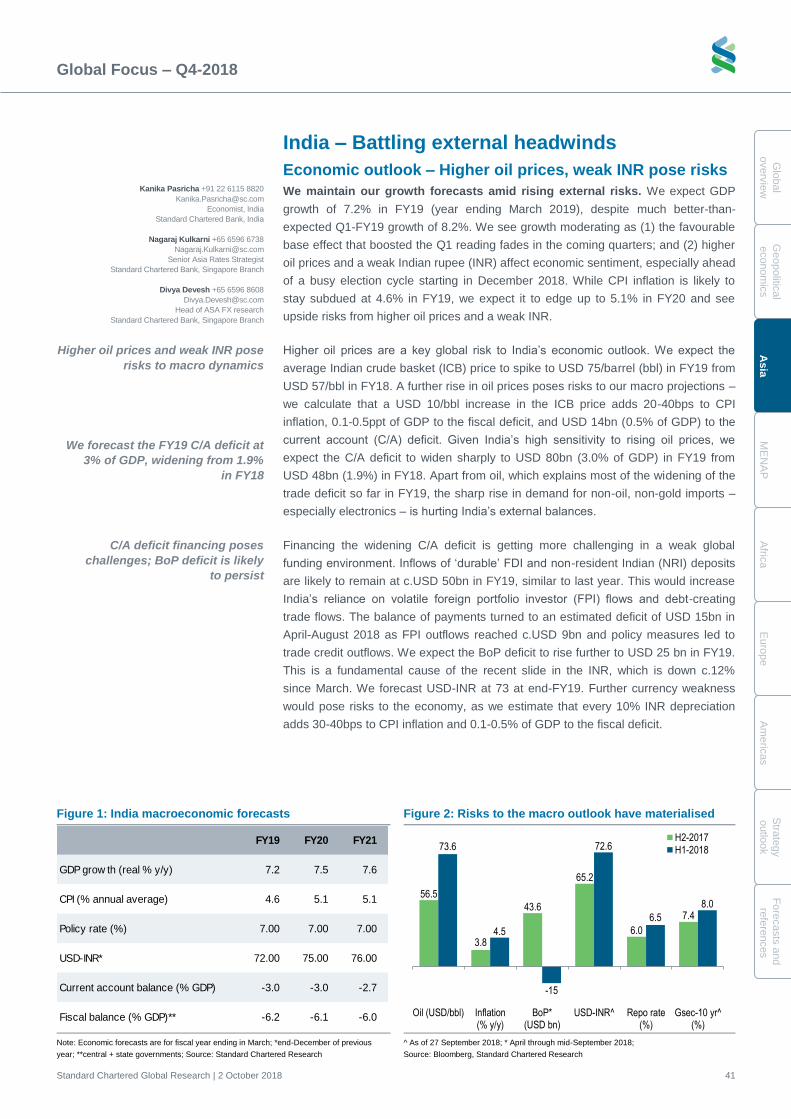
Global Focus – Q4-2018
Standard Chartered Global Research | 2 October 2018 41
Glo
bal
overv
iew
Geopolitic
al
econom
ics
Asia
ME
NA
P
Afric
a
Euro
pe
Am
eric
as
Stra
tegy
outlo
ok
Fo
recasts
and
refe
rences
India – Battling external headwinds
Economic outlook – Higher oil prices, weak INR pose risks
We maintain our growth forecasts amid rising external risks. We expect GDP
growth of 7.2% in FY19 (year ending March 2019), despite much better-than-
expected Q1-FY19 growth of 8.2%. We see growth moderating as (1) the favourable
base effect that boosted the Q1 reading fades in the coming quarters; and (2) higher
oil prices and a weak Indian rupee (INR) affect economic sentiment, especially ahead
of a busy election cycle starting in December 2018. While CPI inflation is likely to
stay subdued at 4.6% in FY19, we expect it to edge up to 5.1% in FY20 and see
upside risks from higher oil prices and a weak INR.
Higher oil prices are a key global risk to India’s economic outlook. We expect the
average Indian crude basket (ICB) price to spike to USD 75/barrel (bbl) in FY19 from
USD 57/bbl in FY18. A further rise in oil prices poses risks to our macro projections –
we calculate that a USD 10/bbl increase in the ICB price adds 20-40bps to CPI
inflation, 0.1-0.5ppt of GDP to the fiscal deficit, and USD 14bn (0.5% of GDP) to the
current account (C/A) deficit. Given India’s high sensitivity to rising oil prices, we
expect the C/A deficit to widen sharply to USD 80bn (3.0% of GDP) in FY19 from
USD 48bn (1.9%) in FY18. Apart from oil, which explains most of the widening of the
trade deficit so far in FY19, the sharp rise in demand for non-oil, non-gold imports –
especially electronics – is hurting India’s external balances.
Financing the widening C/A deficit is getting more challenging in a weak global
funding environment. Inflows of ‘durable’ FDI and non-resident Indian (NRI) deposits
are likely to remain at c.USD 50bn in FY19, similar to last year. This would increase
India’s reliance on volatile foreign portfolio investor (FPI) flows and debt-creating
trade flows. The balance of payments turned to an estimated deficit of USD 15bn in
April-August 2018 as FPI outflows reached c.USD 9bn and policy measures led to
trade credit outflows. We expect the BoP deficit to rise further to USD 25 bn in FY19.
This is a fundamental cause of the recent slide in the INR, which is down c.12%
since March. We forecast USD-INR at 73 at end-FY19. Further currency weakness
would pose risks to the economy, as we estimate that every 10% INR depreciation
adds 30-40bps to CPI inflation and 0.1-0.5% of GDP to the fiscal deficit.
Figure 1: India macroeconomic forecasts Figure 2: Risks to the macro outlook have materialised
Note: Economic forecasts are for fiscal year ending in March; *end-December of previous
year; **central + state governments; Source: Standard Chartered Research
^ As of 27 September 2018; * April through mid-September 2018;
Source: Bloomberg, Standard Chartered Research
FY19 FY20 FY21
GDP grow th (real % y/y) 7.2 7.5 7.6
CPI (% annual average) 4.6 5.1 5.1
Policy rate (%) 7.00 7.00 7.00
USD-INR* 72.00 75.00 76.00
Current account balance (% GDP) -3.0 -3.0 -2.7
Fiscal balance (% GDP)** -6.2 -6.1 -6.0
56.5
3.8
43.6
65.2
6.0
7.4
73.6
4.5
-15
72.6
6.5
8.0
Oil (USD/bbl) Inflation(% y/y)
BoP*(USD bn)
USD-INR^ Repo rate(%)
Gsec-10 yr^(%)
H2-2017H1-2018
Kanika Pasricha +91 22 6115 8820
Economist, India
Standard Chartered Bank, India
Nagaraj Kulkarni +65 6596 6738
Senior Asia Rates Strategist
Standard Chartered Bank, Singapore Branch
Divya Devesh +65 6596 8608
Head of ASA FX research
Standard Chartered Bank, Singapore Branch
Higher oil prices and weak INR pose
risks to macro dynamics
We forecast the FY19 C/A deficit at
3% of GDP, widening from 1.9%
in FY18
C/A deficit financing poses
challenges; BoP deficit is likely
to persist
Global Focus – Q4-2018
Standard Chartered Global Research | 2 October 2018 42
G
lobal
overv
iew
Geopolit
ical
econom
ics
A
sia
M
EN
AP
A
fric
a
E
uro
pe
A
me
ricas
S
trate
gy
o
utlo
ok
Fo
recasts
and
re
fere
nces
Policy – Focus on managing external risks Policy makers are likely to stay focused on managing external headwinds that are
affecting India via higher oil prices and INR weakness. A panic response is unlikely,
as evidenced by their reaction so far. While the INR is likely to remain the principal
shock absorber, we expect the following actions to anchor market expectations.
Rate hikes: The Monetary Policy Committee (MPC) faces a challenging task. While
recent sub-4% inflation readings – likely to be sustained in the coming months – do
not warrant rate hikes, higher oil prices and INR weakness pose upside risks to
inflation in the medium term. To cushion against these risks, we expect the MPC to
deliver a pre-emptive 25bps rate hike in October, followed by another 25bps hike in
December. We also expect a shift in the policy stance to tightening from neutral.
Steps to address the widening BoP deficit: The government has announced
measures to improve capital flows; it hiked customs duties on 19 non-essential items
with imports worth INR 860bn (c.USD 13bn) in FY18. However, with the FY19 import
bill projected at c.USD 540bn, we expect only a modest (at best) reduction in the import
bill as a result of higher duties. Given challenges in financing the C/A deficit, we believe
the option of tapping USD flows from NRIs is still on the table. This would shore up FX
reserves, which have declined by c.USD 25bn in FY19 to date, with c.40% of the loss
attributed to valuation effects. Further volatility in global markets could reduce reserves
further to USD 350bn (from c.USD 400bn currently), covering only eight months of
imports. As a result, we think the Reserve Bank of India (RBI) is unlikely to intervene
aggressively to support the INR. Meanwhile, given the widening BoP deficit, the RBI will
likely be required to provide banking-system liquidity via open-market operations
(OMOs) – we estimate c.INR 1.55tn worth of OMOs by end-FY19.
Fiscal prudence: Higher oil prices pose a risk to the budgeted FY19 fuel subsidy bill
of INR 250bn (0.13% of GDP). We also see rising risks to fiscal targets from lower-
than-expected GST revenues – which averaged c.INR 950bn monthly from April-
August 2018, versus the budget target of INR 1.05-1.10tn – as well as disinvestment
proceeds and pre-election spending. However, we think the government will strive to
meet its fiscal deficit target of 3.3% of GDP in FY19 in order to preserve macro
stability. The government’s push to merge three public-sector banks is a positive step
towards the medium-term goal of banking-sector consolidation.
Politics – Busy election cycle ahead Tight races are expected in the three state elections due in December 2018, with the
ruling party facing anti-incumbency. General elections due in H1-2019 are likely to
have a lasting effect on markets. The current consensus view is that the ruling BJP
party will return to power, albeit with a slimmer majority. While more extreme
scenarios are also being considered, the lack of a credible opposition and Prime
Minister Modi’s popularity are expected to keep the BJP in power.
Market outlook We maintain our 3M Neutral outlook on Indian Government Bonds (IGBs). While IGB
valuations are attractive and banks’ participation in the secondary market has picked
up, sentiment is weak, driven by FX market volatility. Broader EM sentiment is also
weak, especially towards twin-deficit economies. With rate-hike expectations back on
the table, IGBs are unlikely to gain significantly unless EM sentiment improves.
Elevated oil prices and further Fed rate hikes will continue to pose risks to the INR,
particularly amid heightened political uncertainty ahead of elections. Any relief rally
for the INR as a result of government measures is likely to be brief. We target
USD-INR at 72 at end-2018 and 74 in mid-2019.
Fed rate hikes and higher oil prices
are likely to pressure the INR ahead
of elections
BJP is widely expected to return to
power, albeit with a slimmer
majority
The option of tapping USD flows
from NRIs is not yet off the table
We expect the MPC to hike the repo
rate by another 50bps
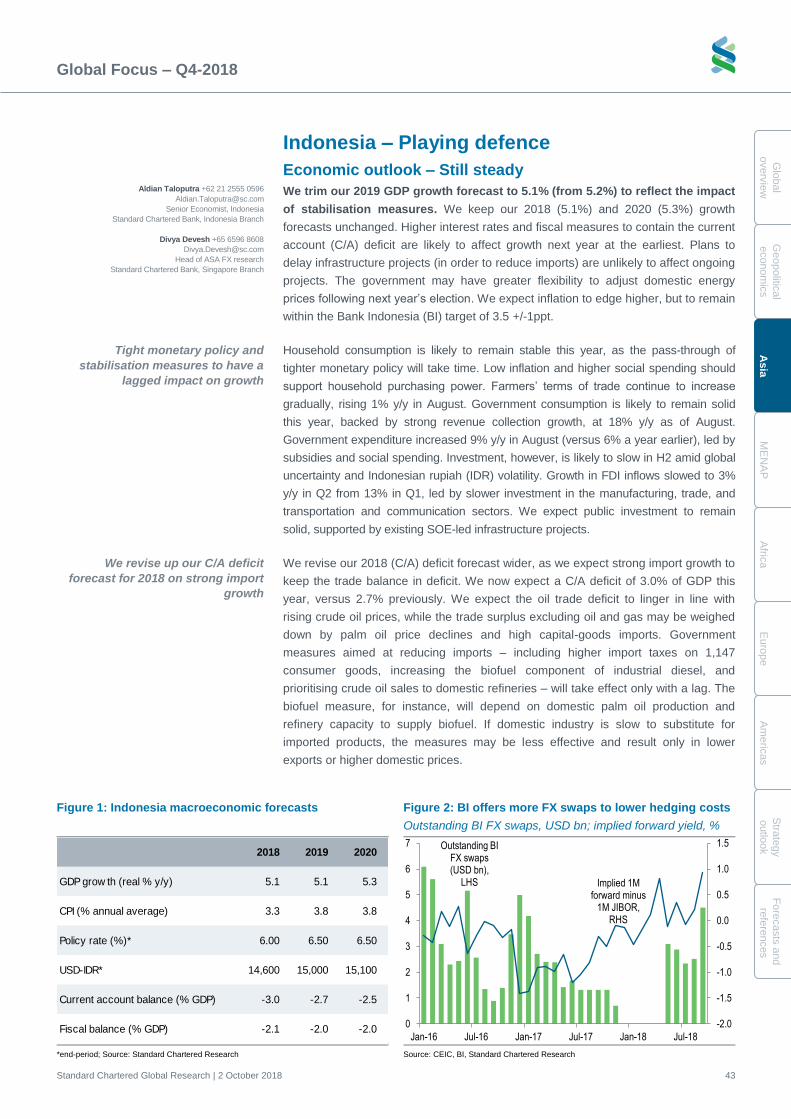
Global Focus – Q4-2018
Standard Chartered Global Research | 2 October 2018 43
Glo
bal
overv
iew
Geopolitic
al
econom
ics
Asia
ME
NA
P
Afric
a
Euro
pe
Am
eric
as
Stra
tegy
outlo
ok
Fo
recasts
and
refe
rences
Indonesia – Playing defence
Economic outlook – Still steady
We trim our 2019 GDP growth forecast to 5.1% (from 5.2%) to reflect the impact
of stabilisation measures. We keep our 2018 (5.1%) and 2020 (5.3%) growth
forecasts unchanged. Higher interest rates and fiscal measures to contain the current
account (C/A) deficit are likely to affect growth next year at the earliest. Plans to
delay infrastructure projects (in order to reduce imports) are unlikely to affect ongoing
projects. The government may have greater flexibility to adjust domestic energy
prices following next year’s election. We expect inflation to edge higher, but to remain
within the Bank Indonesia (BI) target of 3.5 +/-1ppt.
Household consumption is likely to remain stable this year, as the pass-through of
tighter monetary policy will take time. Low inflation and higher social spending should
support household purchasing power. Farmers’ terms of trade continue to increase
gradually, rising 1% y/y in August. Government consumption is likely to remain solid
this year, backed by strong revenue collection growth, at 18% y/y as of August.
Government expenditure increased 9% y/y in August (versus 6% a year earlier), led by
subsidies and social spending. Investment, however, is likely to slow in H2 amid global
uncertainty and Indonesian rupiah (IDR) volatility. Growth in FDI inflows slowed to 3%
y/y in Q2 from 13% in Q1, led by slower investment in the manufacturing, trade, and
transportation and communication sectors. We expect public investment to remain
solid, supported by existing SOE-led infrastructure projects.
We revise our 2018 (C/A) deficit forecast wider, as we expect strong import growth to
keep the trade balance in deficit. We now expect a C/A deficit of 3.0% of GDP this
year, versus 2.7% previously. We expect the oil trade deficit to linger in line with
rising crude oil prices, while the trade surplus excluding oil and gas may be weighed
down by palm oil price declines and high capital-goods imports. Government
measures aimed at reducing imports – including higher import taxes on 1,147
consumer goods, increasing the biofuel component of industrial diesel, and
prioritising crude oil sales to domestic refineries – will take effect only with a lag. The
biofuel measure, for instance, will depend on domestic palm oil production and
refinery capacity to supply biofuel. If domestic industry is slow to substitute for
imported products, the measures may be less effective and result only in lower
exports or higher domestic prices.
Figure 1: Indonesia macroeconomic forecasts Figure 2: BI offers more FX swaps to lower hedging costs
Outstanding BI FX swaps, USD bn; implied forward yield, %
*end-period; Source: Standard Chartered Research Source: CEIC, BI, Standard Chartered Research
2018 2019 2020
GDP grow th (real % y/y) 5.1 5.1 5.3
CPI (% annual average) 3.3 3.8 3.8
Policy rate (%)* 6.00 6.50 6.50
USD-IDR* 14,600 15,000 15,100
Current account balance (% GDP) -3.0 -2.7 -2.5
Fiscal balance (% GDP) -2.1 -2.0 -2.0
Outstanding BI FX swaps (USD bn),
LHS Implied 1M forward minus
1M JIBOR, RHS
-2.0
-1.5
-1.0
-0.5
0.0
0.5
1.0
1.5
0
1
2
3
4
5
6
7
Jan-16 Jul-16 Jan-17 Jul-17 Jan-18 Jul-18
Tight monetary policy and
stabilisation measures to have a
lagged impact on growth
Aldian Taloputra +62 21 2555 0596
Senior Economist, Indonesia
Standard Chartered Bank, Indonesia Branch
Divya Devesh +65 6596 8608
Head of ASA FX research
Standard Chartered Bank, Singapore Branch
We revise up our C/A deficit
forecast for 2018 on strong import
growth
Global Focus – Q4-2018
Standard Chartered Global Research | 2 October 2018 44
G
lobal
overv
iew
Geopolit
ical
econom
ics
A
sia
M
EN
AP
A
fric
a
E
uro
pe
A
me
ricas
S
trate
gy
o
utlo
ok
Fo
recasts
and
re
fere
nces
We maintain our average 2018 and 2019 inflation forecasts at 3.3% and 3.8%,
respectively. The government’s decision to keep regulated fuel and electricity tariffs
unchanged until end-2019 is likely to limit imported inflation, offsetting the inflationary
impact of c.8% IDR depreciation this year (BI estimates that 10% IDR depreciation
increases inflation by 0.7ppt). Adequate food supply and imports have helped to stabilise
food prices. The government’s rice stock recently reached 2.4mn tonnes (equivalent to
one month’s consumption), according to recent media reports – a level perceived as
adequate to keep rice prices stable. We expect inflation to edge higher in 2019 on larger
energy price increases than in 2018. We think the government will have more flexibility
to adjust energy prices following the general election in April. We estimate that a full
alignment of fuel prices with current market prices would add 110bps to inflation.
Policy – Staying hawkish
We now expect 25bps rate hikes every quarter from Q4-2018 through Q2-2019,
versus our previous call of no change. As a result, we now expect the BI rate to end
2018 at 6.0% (5.75% previously) and 2019 at 6.50% (5.75%). Our revised call
reflects our expectation of faster Fed rate hikes and higher inflationary pressure next
year. We recently revised our Fed call to four hikes in 2019 (from two previously).
A widening C/A deficit may also prompt BI to maintain a hawkish stance, as investors
are watching the deficit closely. That said, the pace of further monetary policy
tightening is likely be gradual; BI will want to avoid over-tightening as it responds to
investor sentiment and the impact of government measures to contain the C/A deficit.
To stabilise the IDR, BI introduced has alternative hedging instruments such as
domestic non-deliverable forwards (DNDFs) and improved its swap facilities. We
estimate that BI FX swaps reached USD 4.5bn in September. With fiscal
consolidation likely to remain on track (see Indonesia – Fiscal consolidation
continues), the government is likely to focus on improving the effectiveness of
spending by prioritising productive spending in areas such as infrastructure, health
care and education; optimising tax revenue to increase fiscal space; and improving
the investment climate by providing fiscal facilities for exports and investment.
Politics – Strong start for the incumbent
VP appointment strengthens Jokowi’s re-election prospects. The nomination of
Amin Maruf, the leader of Indonesia’s largest Islamic organisation, as vice
presidential candidate is likely to strengthen President Jokowi’s position ahead of
next year’s election. Jokowi has 52.2% support among voters, compared with 29.5%
for opposition candidate Prabowo, according to a recent LSI poll. He has formed a
solid team to coordinate his election campaign, consisting of senior politicians,
military officers and private-sector representatives. Some provincial governors and
regional heads have pledged to support Jokowi’s bid for a second term, including in
regions where Prabowo won in 2014, such as West Sumatra and West Java. The
campaign period will run from 23 September 2018 to 13 April 2019, with the election
to be held on 17 April.
Market outlook – Neutral
Hedging demand from foreign investors has weighed on the IDR in recent
months, even as domestic fundamentals remain stable. Given Indonesia’s persistent
C/A deficit, renewed portfolio inflows are likely to be needed before we see stability in
USD-IDR. We forecast USD-IDR at 14,600 at end-2018.
Fiscal policy is focused on
improving spending effectiveness
BI may have to hike more to stem
the C/A deficit amid heightened
IDR volatility
Inflation is likely to stay low as the
government keeps energy and food
prices steady
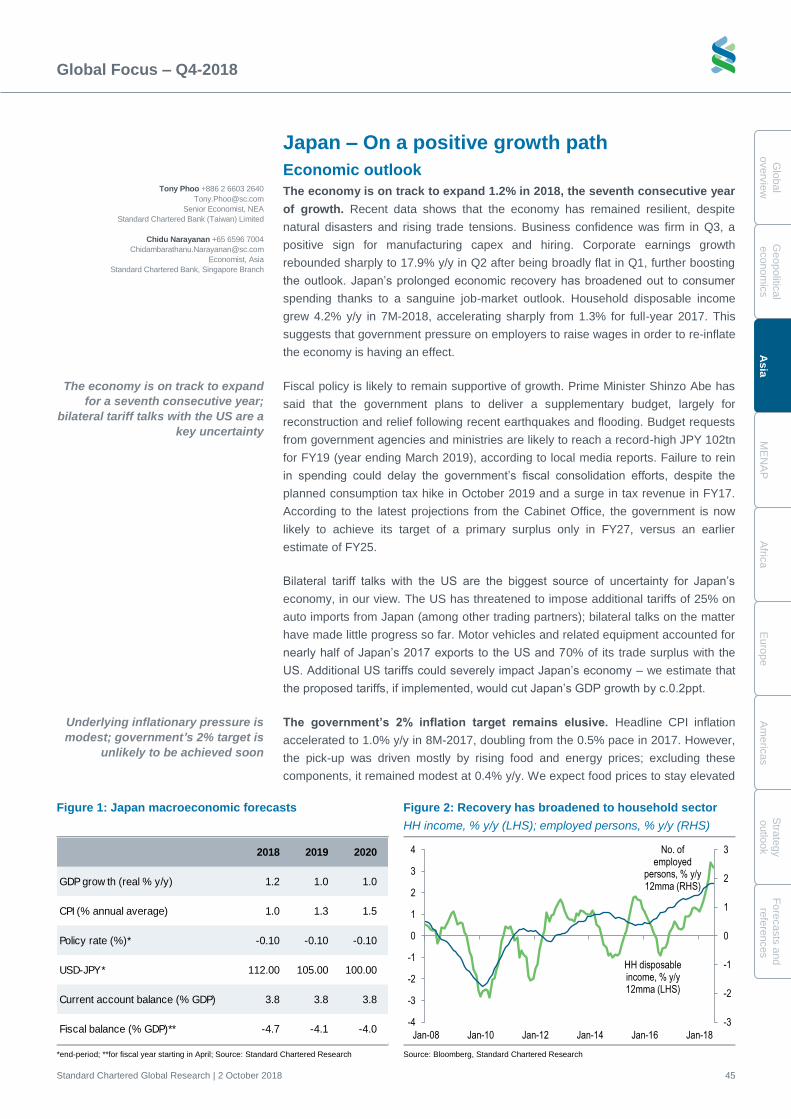
Global Focus – Q4-2018
Standard Chartered Global Research | 2 October 2018 45
Glo
bal
overv
iew
Geopolitic
al
econom
ics
Asia
ME
NA
P
Afric
a
Euro
pe
Am
eric
as
Stra
tegy
outlo
ok
Fo
recasts
and
refe
rences
Japan – On a positive growth path
Economic outlook
The economy is on track to expand 1.2% in 2018, the seventh consecutive year
of growth. Recent data shows that the economy has remained resilient, despite
natural disasters and rising trade tensions. Business confidence was firm in Q3, a
positive sign for manufacturing capex and hiring. Corporate earnings growth
rebounded sharply to 17.9% y/y in Q2 after being broadly flat in Q1, further boosting
the outlook. Japan’s prolonged economic recovery has broadened out to consumer
spending thanks to a sanguine job-market outlook. Household disposable income
grew 4.2% y/y in 7M-2018, accelerating sharply from 1.3% for full-year 2017. This
suggests that government pressure on employers to raise wages in order to re-inflate
the economy is having an effect.
Fiscal policy is likely to remain supportive of growth. Prime Minister Shinzo Abe has
said that the government plans to deliver a supplementary budget, largely for
reconstruction and relief following recent earthquakes and flooding. Budget requests
from government agencies and ministries are likely to reach a record-high JPY 102tn
for FY19 (year ending March 2019), according to local media reports. Failure to rein
in spending could delay the government’s fiscal consolidation efforts, despite the
planned consumption tax hike in October 2019 and a surge in tax revenue in FY17.
According to the latest projections from the Cabinet Office, the government is now
likely to achieve its target of a primary surplus only in FY27, versus an earlier
estimate of FY25.
Bilateral tariff talks with the US are the biggest source of uncertainty for Japan’s
economy, in our view. The US has threatened to impose additional tariffs of 25% on
auto imports from Japan (among other trading partners); bilateral talks on the matter
have made little progress so far. Motor vehicles and related equipment accounted for
nearly half of Japan’s 2017 exports to the US and 70% of its trade surplus with the
US. Additional US tariffs could severely impact Japan’s economy – we estimate that
the proposed tariffs, if implemented, would cut Japan’s GDP growth by c.0.2ppt.
The government’s 2% inflation target remains elusive. Headline CPI inflation
accelerated to 1.0% y/y in 8M-2017, doubling from the 0.5% pace in 2017. However,
the pick-up was driven mostly by rising food and energy prices; excluding these
components, it remained modest at 0.4% y/y. We expect food prices to stay elevated
Figure 1: Japan macroeconomic forecasts Figure 2: Recovery has broadened to household sector
HH income, % y/y (LHS); employed persons, % y/y (RHS)
*end-period; **for fiscal year starting in April; Source: Standard Chartered Research Source: Bloomberg, Standard Chartered Research
2018 2019 2020
GDP grow th (real % y/y) 1.2 1.0 1.0
CPI (% annual average) 1.0 1.3 1.5
Policy rate (%)* -0.10 -0.10 -0.10
USD-JPY* 112.00 105.00 100.00
Current account balance (% GDP) 3.8 3.8 3.8
Fiscal balance (% GDP)** -4.7 -4.1 -4.0
HH disposable income, % y/y 12mma (LHS)
No. of employed
persons, % y/y 12mma (RHS)
-3
-2
-1
0
1
2
3
-4
-3
-2
-1
0
1
2
3
4
Jan-08 Jan-10 Jan-12 Jan-14 Jan-16 Jan-18
The economy is on track to expand
for a seventh consecutive year;
bilateral tariff talks with the US are a
key uncertainty
Underlying inflationary pressure is
modest; government’s 2% target is
unlikely to be achieved soon
Tony Phoo +886 2 6603 2640
Senior Economist, NEA
Standard Chartered Bank (Taiwan) Limited
Chidu Narayanan +65 6596 7004
Economist, Asia
Standard Chartered Bank, Singapore Branch
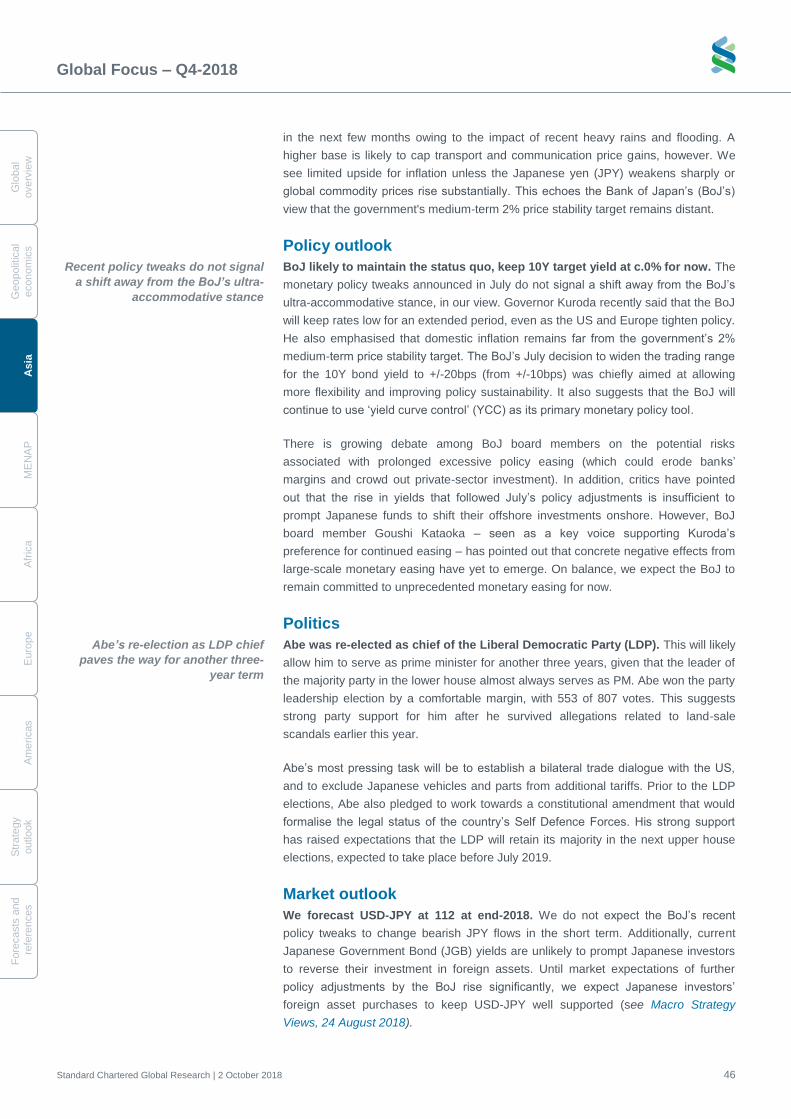
Global Focus – Q4-2018
Standard Chartered Global Research | 2 October 2018 46
G
lobal
overv
iew
Geopolit
ical
econom
ics
A
sia
M
EN
AP
A
fric
a
E
uro
pe
A
me
ricas
S
trate
gy
o
utlo
ok
Fo
recasts
and
re
fere
nces
in the next few months owing to the impact of recent heavy rains and flooding. A
higher base is likely to cap transport and communication price gains, however. We
see limited upside for inflation unless the Japanese yen (JPY) weakens sharply or
global commodity prices rise substantially. This echoes the Bank of Japan’s (BoJ’s)
view that the government's medium-term 2% price stability target remains distant.
Policy outlook
BoJ likely to maintain the status quo, keep 10Y target yield at c.0% for now. The
monetary policy tweaks announced in July do not signal a shift away from the BoJ’s
ultra-accommodative stance, in our view. Governor Kuroda recently said that the BoJ
will keep rates low for an extended period, even as the US and Europe tighten policy.
He also emphasised that domestic inflation remains far from the government’s 2%
medium-term price stability target. The BoJ’s July decision to widen the trading range
for the 10Y bond yield to +/-20bps (from +/-10bps) was chiefly aimed at allowing
more flexibility and improving policy sustainability. It also suggests that the BoJ will
continue to use ‘yield curve control’ (YCC) as its primary monetary policy tool.
There is growing debate among BoJ board members on the potential risks
associated with prolonged excessive policy easing (which could erode banks’
margins and crowd out private-sector investment). In addition, critics have pointed
out that the rise in yields that followed July’s policy adjustments is insufficient to
prompt Japanese funds to shift their offshore investments onshore. However, BoJ
board member Goushi Kataoka – seen as a key voice supporting Kuroda’s
preference for continued easing – has pointed out that concrete negative effects from
large-scale monetary easing have yet to emerge. On balance, we expect the BoJ to
remain committed to unprecedented monetary easing for now.
Politics
Abe was re-elected as chief of the Liberal Democratic Party (LDP). This will likely
allow him to serve as prime minister for another three years, given that the leader of
the majority party in the lower house almost always serves as PM. Abe won the party
leadership election by a comfortable margin, with 553 of 807 votes. This suggests
strong party support for him after he survived allegations related to land-sale
scandals earlier this year.
Abe’s most pressing task will be to establish a bilateral trade dialogue with the US,
and to exclude Japanese vehicles and parts from additional tariffs. Prior to the LDP
elections, Abe also pledged to work towards a constitutional amendment that would
formalise the legal status of the country’s Self Defence Forces. His strong support
has raised expectations that the LDP will retain its majority in the next upper house
elections, expected to take place before July 2019.
Market outlook
We forecast USD-JPY at 112 at end-2018. We do not expect the BoJ’s recent
policy tweaks to change bearish JPY flows in the short term. Additionally, current
Japanese Government Bond (JGB) yields are unlikely to prompt Japanese investors
to reverse their investment in foreign assets. Until market expectations of further
policy adjustments by the BoJ rise significantly, we expect Japanese investors’
foreign asset purchases to keep USD-JPY well supported (see Macro Strategy
Views, 24 August 2018).
Abe’s re-election as LDP chief
paves the way for another three-
year term
Recent policy tweaks do not signal
a shift away from the BoJ’s ultra-
accommodative stance
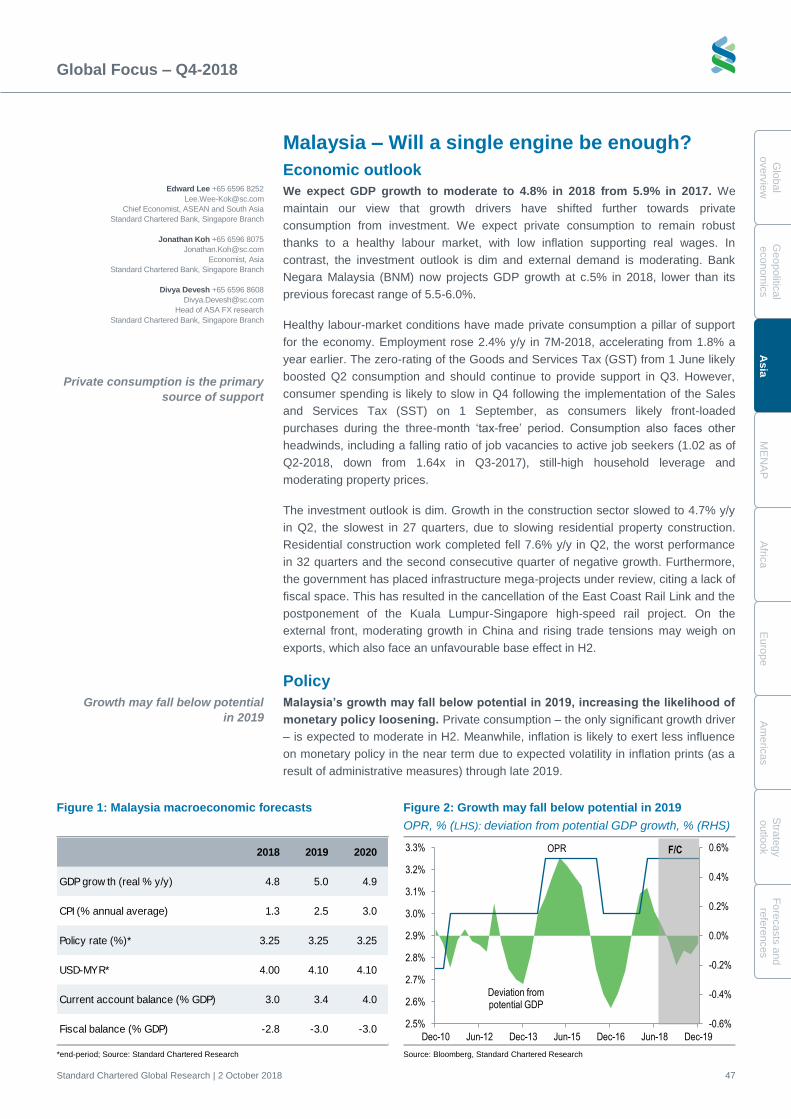
Global Focus – Q4-2018
Standard Chartered Global Research | 2 October 2018 47
Glo
bal
overv
iew
Geopolitic
al
econom
ics
Asia
ME
NA
P
Afric
a
Euro
pe
Am
eric
as
Stra
tegy
outlo
ok
Fo
recasts
and
refe
rences
Malaysia – Will a single engine be enough?
Economic outlook
We expect GDP growth to moderate to 4.8% in 2018 from 5.9% in 2017. We
maintain our view that growth drivers have shifted further towards private
consumption from investment. We expect private consumption to remain robust
thanks to a healthy labour market, with low inflation supporting real wages. In
contrast, the investment outlook is dim and external demand is moderating. Bank
Negara Malaysia (BNM) now projects GDP growth at c.5% in 2018, lower than its
previous forecast range of 5.5-6.0%.
Healthy labour-market conditions have made private consumption a pillar of support
for the economy. Employment rose 2.4% y/y in 7M-2018, accelerating from 1.8% a
year earlier. The zero-rating of the Goods and Services Tax (GST) from 1 June likely
boosted Q2 consumption and should continue to provide support in Q3. However,
consumer spending is likely to slow in Q4 following the implementation of the Sales
and Services Tax (SST) on 1 September, as consumers likely front-loaded
purchases during the three-month ‘tax-free’ period. Consumption also faces other
headwinds, including a falling ratio of job vacancies to active job seekers (1.02 as of
Q2-2018, down from 1.64x in Q3-2017), still-high household leverage and
moderating property prices.
The investment outlook is dim. Growth in the construction sector slowed to 4.7% y/y
in Q2, the slowest in 27 quarters, due to slowing residential property construction.
Residential construction work completed fell 7.6% y/y in Q2, the worst performance
in 32 quarters and the second consecutive quarter of negative growth. Furthermore,
the government has placed infrastructure mega-projects under review, citing a lack of
fiscal space. This has resulted in the cancellation of the East Coast Rail Link and the
postponement of the Kuala Lumpur-Singapore high-speed rail project. On the
external front, moderating growth in China and rising trade tensions may weigh on
exports, which also face an unfavourable base effect in H2.
Policy
Malaysia’s growth may fall below potential in 2019, increasing the likelihood of
monetary policy loosening. Private consumption – the only significant growth driver
– is expected to moderate in H2. Meanwhile, inflation is likely to exert less influence
on monetary policy in the near term due to expected volatility in inflation prints (as a
result of administrative measures) through late 2019.
Figure 1: Malaysia macroeconomic forecasts Figure 2: Growth may fall below potential in 2019
OPR, % (LHS): deviation from potential GDP growth, % (RHS)
*end-period; Source: Standard Chartered Research Source: Bloomberg, Standard Chartered Research
2018 2019 2020
GDP grow th (real % y/y) 4.8 5.0 4.9
CPI (% annual average) 1.3 2.5 3.0
Policy rate (%)* 3.25 3.25 3.25
USD-MYR* 4.00 4.10 4.10
Current account balance (% GDP) 3.0 3.4 4.0
Fiscal balance (% GDP) -2.8 -3.0 -3.0
Deviation from potential GDP
OPR
-0.6%
-0.4%
-0.2%
0.0%
0.2%
0.4%
0.6%
2.5%
2.6%
2.7%
2.8%
2.9%
3.0%
3.1%
3.2%
3.3%
Dec-10 Jun-12 Dec-13 Jun-15 Dec-16 Jun-18 Dec-19
F/C
Private consumption is the primary
source of support
Growth may fall below potential
in 2019
Edward Lee +65 6596 8252
Chief Economist, ASEAN and South Asia
Standard Chartered Bank, Singapore Branch
Jonathan Koh +65 6596 8075
Economist, Asia
Standard Chartered Bank, Singapore Branch
Divya Devesh +65 6596 8608
Head of ASA FX research
Standard Chartered Bank, Singapore Branch
Global Focus – Q4-2018
Standard Chartered Global Research | 2 October 2018 48
G
lobal
overv
iew
Geopolit
ical
econom
ics
A
sia
M
EN
AP
A
fric
a
E
uro
pe
A
me
ricas
S
trate
gy
o
utlo
ok
Fo
recasts
and
re
fere
nces
While BNM maintained a neutral stance at its September policy meeting, it adopted a
more cautious outlook on growth. The central bank dropped the phrase that
investment “will be supported by ongoing infrastructure projects” and cited downside
risks to growth, including heightened trade tensions, prolonged weakness in the
mining and agriculture sectors, domestic policy uncertainty and fiscal rationalisation.
Fiscal policy
We raise our budget deficit forecasts to 3% for both 2019 and 2020 (versus 2.4%
and 2.0% previously, respectively), as the loss of GST revenue is likely to make it
more difficult to keep fiscal consolidation on track.
The government budget announcement on 2 November 2018 will be in focus.
Markets will be looking for recurrent measures to replace the loss of GST revenue,
as the SST will still leave an annual revenue shortfall of c.MYR 2bn.
The government has cited concerns about the high level of public debt, and stated its
commitment to preserving fiscal discipline and rationalising expenditure. This has
resulted in the review, postponement and cancellation of some major infrastructure
projects. We estimate that spending rationalisation will cause government
expenditure growth (as calculated under GDP) to ease to 0.6% y/y in 2018 from 5.4%
in 2017.
Politics
Port Dickson by-election to pave the way for Anwar Ibrahim’s return to
parliament. Anwar is president-elect of the People’s Justice Party. According to local
media reports, he is slated to become the next prime minister. The by-election will be
held on 13 October 2018.
Market outlook
We are Neutral on the Malaysian ringgit (MYR) and expect range-bound trading in
USD-MYR. The MYR has depreciated in recent months amid external uncertainty
and risk-off sentiment. The currency remains undervalued and positioning is light
amid foreign portfolio outflows. Nevertheless, broad-based weakness in EM
sentiment may continue to weigh on the MYR.
We are constructive on long-end Malaysia Government Securities (MGS).
Onshore investor demand remains strong on high consumer and business
confidence, benefiting the bond market. Local long-term investors have high cash
levels and are likely to accelerate their allocation to long-end MGS.
Anwar Ibrahim to contest Port
Dickson by-election in October
2 November budget is in focus as
markets look for plans to replace
the GST revenue shortfall
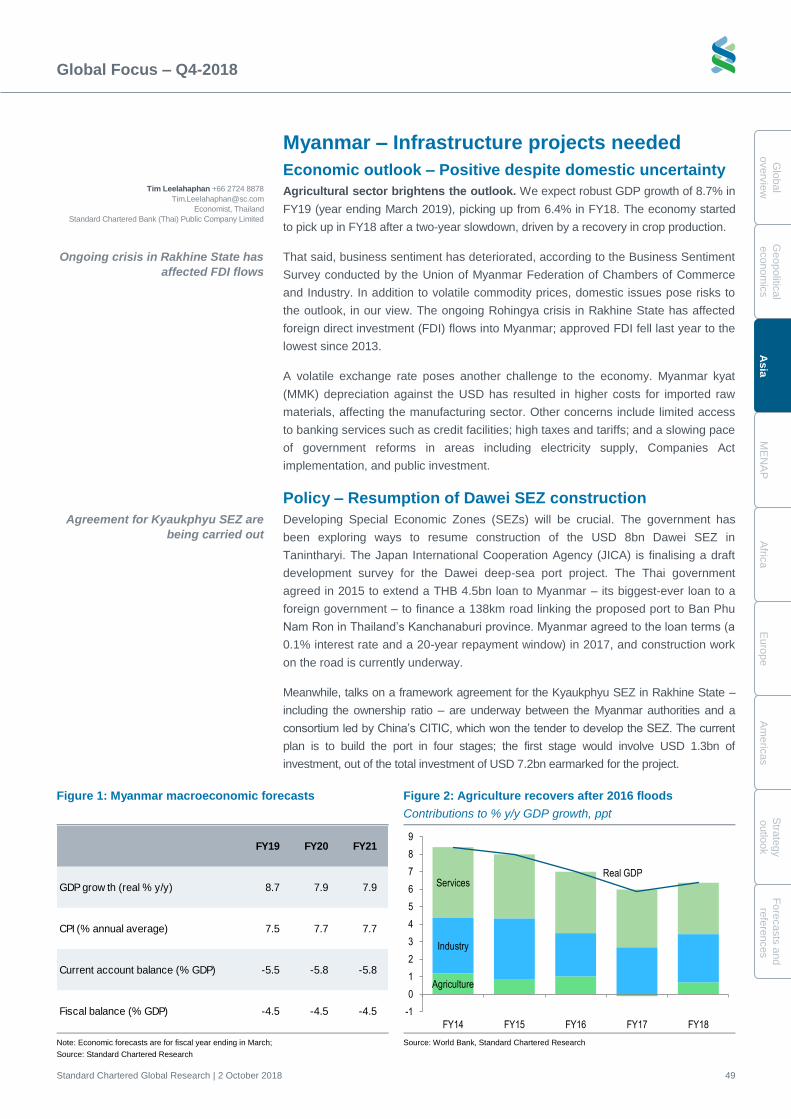
Global Focus – Q4-2018
Standard Chartered Global Research | 2 October 2018 49
Glo
bal
overv
iew
Geopolitic
al
econom
ics
Asia
ME
NA
P
Afric
a
Euro
pe
Am
eric
as
Stra
tegy
outlo
ok
Fo
recasts
and
refe
rences
Myanmar – Infrastructure projects needed
Economic outlook – Positive despite domestic uncertainty
Agricultural sector brightens the outlook. We expect robust GDP growth of 8.7% in
FY19 (year ending March 2019), picking up from 6.4% in FY18. The economy started
to pick up in FY18 after a two-year slowdown, driven by a recovery in crop production.
That said, business sentiment has deteriorated, according to the Business Sentiment
Survey conducted by the Union of Myanmar Federation of Chambers of Commerce
and Industry. In addition to volatile commodity prices, domestic issues pose risks to
the outlook, in our view. The ongoing Rohingya crisis in Rakhine State has affected
foreign direct investment (FDI) flows into Myanmar; approved FDI fell last year to the
lowest since 2013.
A volatile exchange rate poses another challenge to the economy. Myanmar kyat
(MMK) depreciation against the USD has resulted in higher costs for imported raw
materials, affecting the manufacturing sector. Other concerns include limited access
to banking services such as credit facilities; high taxes and tariffs; and a slowing pace
of government reforms in areas including electricity supply, Companies Act
implementation, and public investment.
Policy – Resumption of Dawei SEZ construction
Developing Special Economic Zones (SEZs) will be crucial. The government has
been exploring ways to resume construction of the USD 8bn Dawei SEZ in
Tanintharyi. The Japan International Cooperation Agency (JICA) is finalising a draft
development survey for the Dawei deep-sea port project. The Thai government
agreed in 2015 to extend a THB 4.5bn loan to Myanmar – its biggest-ever loan to a
foreign government – to finance a 138km road linking the proposed port to Ban Phu
Nam Ron in Thailand’s Kanchanaburi province. Myanmar agreed to the loan terms (a
0.1% interest rate and a 20-year repayment window) in 2017, and construction work
on the road is currently underway.
Meanwhile, talks on a framework agreement for the Kyaukphyu SEZ in Rakhine State –
including the ownership ratio – are underway between the Myanmar authorities and a
consortium led by China’s CITIC, which won the tender to develop the SEZ. The current
plan is to build the port in four stages; the first stage would involve USD 1.3bn of
investment, out of the total investment of USD 7.2bn earmarked for the project.
Figure 1: Myanmar macroeconomic forecasts Figure 2: Agriculture recovers after 2016 floods
Contributions to % y/y GDP growth, ppt
Note: Economic forecasts are for fiscal year ending in March;
Source: Standard Chartered Research
Source: World Bank, Standard Chartered Research
FY19 FY20 FY21
GDP grow th (real % y/y) 8.7 7.9 7.9
CPI (% annual average) 7.5 7.7 7.7
Current account balance (% GDP) -5.5 -5.8 -5.8
Fiscal balance (% GDP) -4.5 -4.5 -4.5
Agriculture
Industry
ServicesReal GDP
-1
0
1
2
3
4
5
6
7
8
9
FY14 FY15 FY16 FY17 FY18
Ongoing crisis in Rakhine State has
affected FDI flows
Agreement for Kyaukphyu SEZ are
being carried out
Tim Leelahaphan +66 2724 8878
Economist, Thailand
Standard Chartered Bank (Thai) Public Company Limited
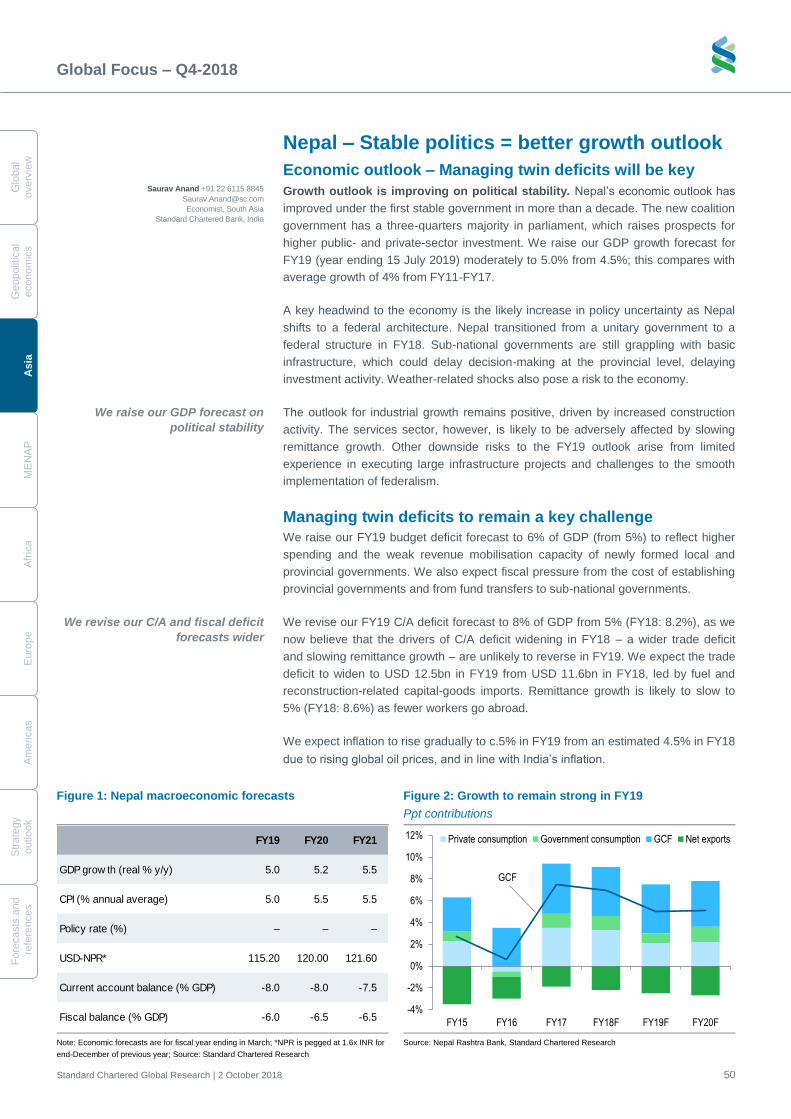
Global Focus – Q4-2018
Standard Chartered Global Research | 2 October 2018 50
G
lobal
overv
iew
Geopolit
ical
econom
ics
A
sia
M
EN
AP
A
fric
a
E
uro
pe
A
me
ricas
S
trate
gy
o
utlo
ok
Fo
recasts
and
re
fere
nces
Nepal – Stable politics = better growth outlook
Economic outlook – Managing twin deficits will be key
Growth outlook is improving on political stability. Nepal’s economic outlook has
improved under the first stable government in more than a decade. The new coalition
government has a three-quarters majority in parliament, which raises prospects for
higher public- and private-sector investment. We raise our GDP growth forecast for
FY19 (year ending 15 July 2019) moderately to 5.0% from 4.5%; this compares with
average growth of 4% from FY11-FY17.
A key headwind to the economy is the likely increase in policy uncertainty as Nepal
shifts to a federal architecture. Nepal transitioned from a unitary government to a
federal structure in FY18. Sub-national governments are still grappling with basic
infrastructure, which could delay decision-making at the provincial level, delaying
investment activity. Weather-related shocks also pose a risk to the economy.
The outlook for industrial growth remains positive, driven by increased construction
activity. The services sector, however, is likely to be adversely affected by slowing
remittance growth. Other downside risks to the FY19 outlook arise from limited
experience in executing large infrastructure projects and challenges to the smooth
implementation of federalism.
Managing twin deficits to remain a key challenge
We raise our FY19 budget deficit forecast to 6% of GDP (from 5%) to reflect higher
spending and the weak revenue mobilisation capacity of newly formed local and
provincial governments. We also expect fiscal pressure from the cost of establishing
provincial governments and from fund transfers to sub-national governments.
We revise our FY19 C/A deficit forecast to 8% of GDP from 5% (FY18: 8.2%), as we
now believe that the drivers of C/A deficit widening in FY18 – a wider trade deficit
and slowing remittance growth – are unlikely to reverse in FY19. We expect the trade
deficit to widen to USD 12.5bn in FY19 from USD 11.6bn in FY18, led by fuel and
reconstruction-related capital-goods imports. Remittance growth is likely to slow to
5% (FY18: 8.6%) as fewer workers go abroad.
We expect inflation to rise gradually to c.5% in FY19 from an estimated 4.5% in FY18
due to rising global oil prices, and in line with India’s inflation.
Figure 1: Nepal macroeconomic forecasts Figure 2: Growth to remain strong in FY19
Ppt contributions
Note: Economic forecasts are for fiscal year ending in March; *NPR is pegged at 1.6x INR for
end-December of previous year; Source: Standard Chartered Research
Source: Nepal Rashtra Bank, Standard Chartered Research
FY19 FY20 FY21
GDP grow th (real % y/y) 5.0 5.2 5.5
CPI (% annual average) 5.0 5.5 5.5
Policy rate (%) – – –
USD-NPR* 115.20 120.00 121.60
Current account balance (% GDP) -8.0 -8.0 -7.5
Fiscal balance (% GDP) -6.0 -6.5 -6.5
GCF
-4%
-2%
0%
2%
4%
6%
8%
10%
12%
FY15 FY16 FY17 FY18F FY19F FY20F
Private consumption Government consumption GCF Net exports
We revise our C/A and fiscal deficit
forecasts wider
Saurav Anand +91 22 6115 8845
Economist, South Asia
Standard Chartered Bank, India
We raise our GDP forecast on
political stability
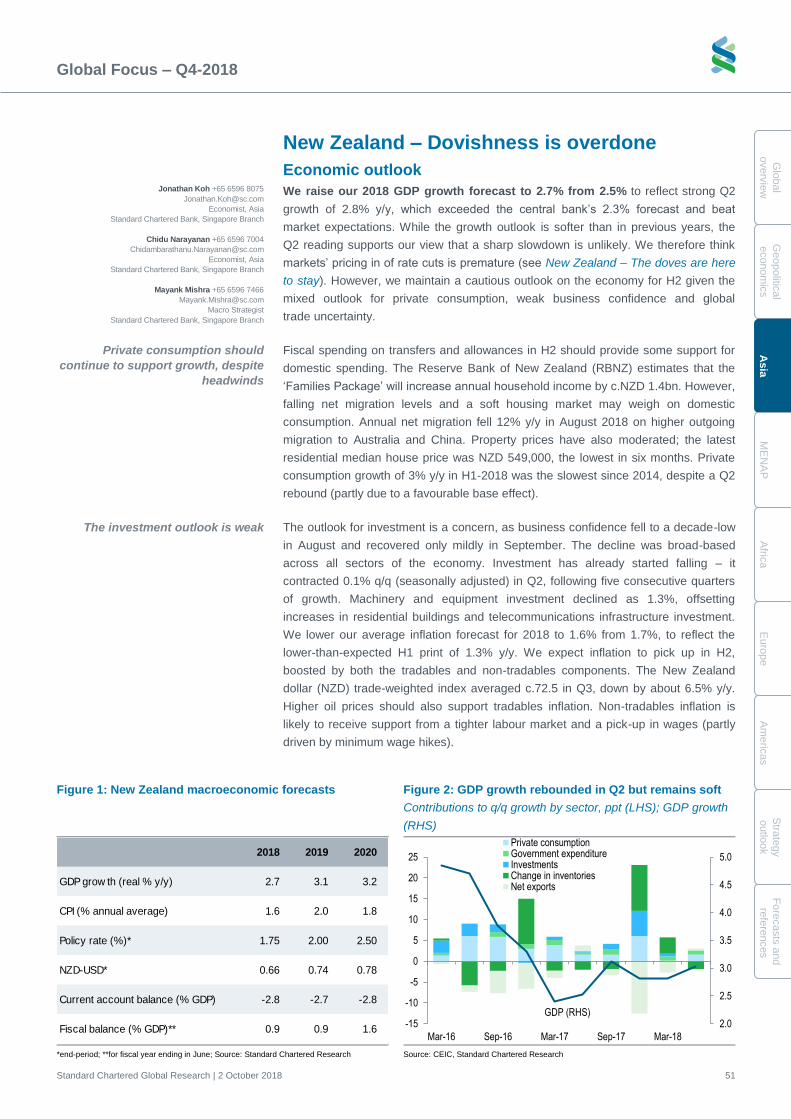
Global Focus – Q4-2018
Standard Chartered Global Research | 2 October 2018 51
Glo
bal
overv
iew
Geopolitic
al
econom
ics
Asia
ME
NA
P
Afric
a
Euro
pe
Am
eric
as
Stra
tegy
outlo
ok
Fo
recasts
and
refe
rences
New Zealand – Dovishness is overdone
Economic outlook
We raise our 2018 GDP growth forecast to 2.7% from 2.5% to reflect strong Q2
growth of 2.8% y/y, which exceeded the central bank’s 2.3% forecast and beat
market expectations. While the growth outlook is softer than in previous years, the
Q2 reading supports our view that a sharp slowdown is unlikely. We therefore think
markets’ pricing in of rate cuts is premature (see New Zealand – The doves are here
to stay). However, we maintain a cautious outlook on the economy for H2 given the
mixed outlook for private consumption, weak business confidence and global
trade uncertainty.
Fiscal spending on transfers and allowances in H2 should provide some support for
domestic spending. The Reserve Bank of New Zealand (RBNZ) estimates that the
‘Families Package’ will increase annual household income by c.NZD 1.4bn. However,
falling net migration levels and a soft housing market may weigh on domestic
consumption. Annual net migration fell 12% y/y in August 2018 on higher outgoing
migration to Australia and China. Property prices have also moderated; the latest
residential median house price was NZD 549,000, the lowest in six months. Private
consumption growth of 3% y/y in H1-2018 was the slowest since 2014, despite a Q2
rebound (partly due to a favourable base effect).
The outlook for investment is a concern, as business confidence fell to a decade-low
in August and recovered only mildly in September. The decline was broad-based
across all sectors of the economy. Investment has already started falling – it
contracted 0.1% q/q (seasonally adjusted) in Q2, following five consecutive quarters
of growth. Machinery and equipment investment declined as 1.3%, offsetting
increases in residential buildings and telecommunications infrastructure investment.
We lower our average inflation forecast for 2018 to 1.6% from 1.7%, to reflect the
lower-than-expected H1 print of 1.3% y/y. We expect inflation to pick up in H2,
boosted by both the tradables and non-tradables components. The New Zealand
dollar (NZD) trade-weighted index averaged c.72.5 in Q3, down by about 6.5% y/y.
Higher oil prices should also support tradables inflation. Non-tradables inflation is
likely to receive support from a tighter labour market and a pick-up in wages (partly
driven by minimum wage hikes).
Figure 1: New Zealand macroeconomic forecasts Figure 2: GDP growth rebounded in Q2 but remains soft
Contributions to q/q growth by sector, ppt (LHS); GDP growth
(RHS)
*end-period; **for fiscal year ending in June; Source: Standard Chartered Research Source: CEIC, Standard Chartered Research
2018 2019 2020
GDP grow th (real % y/y) 2.7 3.1 3.2
CPI (% annual average) 1.6 2.0 1.8
Policy rate (%)* 1.75 2.00 2.50
NZD-USD* 0.66 0.74 0.78
Current account balance (% GDP) -2.8 -2.7 -2.8
Fiscal balance (% GDP)** 0.9 0.9 1.6
GDP (RHS)2.0
2.5
3.0
3.5
4.0
4.5
5.0
-15
-10
-5
0
5
10
15
20
25
Mar-16 Sep-16 Mar-17 Sep-17 Mar-18
Private consumptionGovernment expenditureInvestmentsChange in inventoriesNet exports
The investment outlook is weak
Jonathan Koh +65 6596 8075
Economist, Asia
Standard Chartered Bank, Singapore Branch
Chidu Narayanan +65 6596 7004
Economist, Asia
Standard Chartered Bank, Singapore Branch
Mayank Mishra +65 6596 7466
Macro Strategist
Standard Chartered Bank, Singapore Branch
Private consumption should
continue to support growth, despite
headwinds
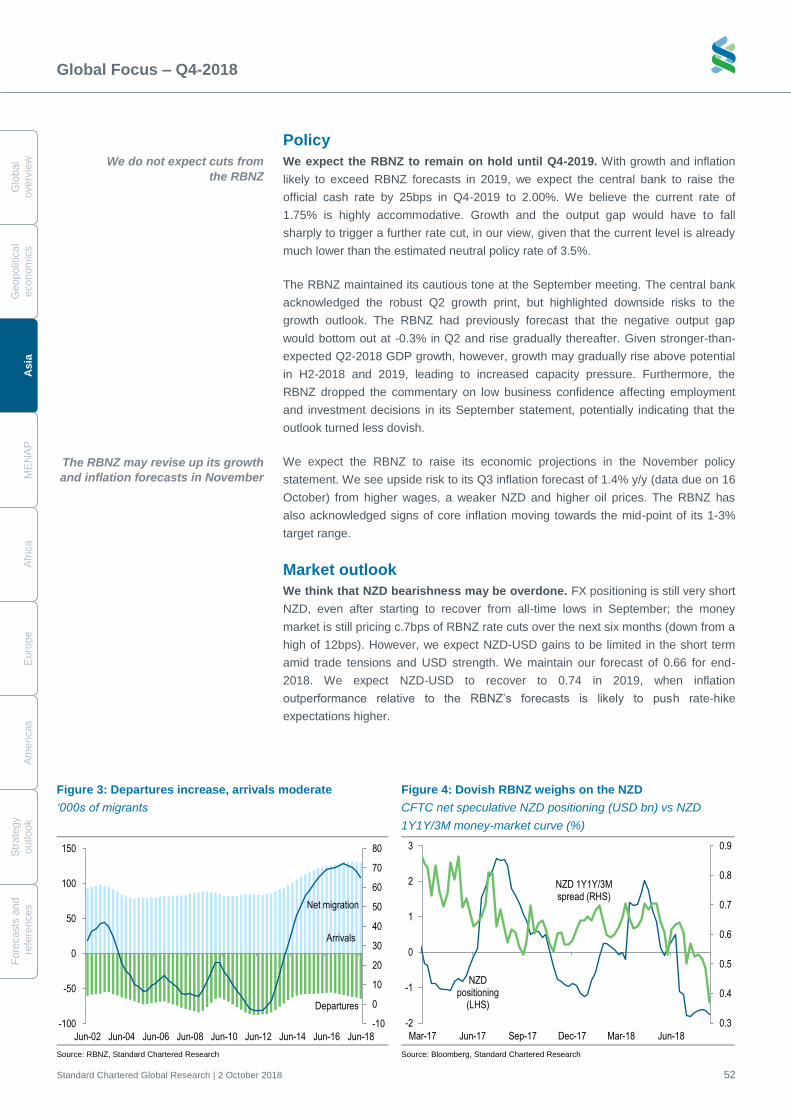
Global Focus – Q4-2018
Standard Chartered Global Research | 2 October 2018 52
G
lobal
overv
iew
Geopolit
ical
econom
ics
A
sia
M
EN
AP
A
fric
a
E
uro
pe
A
me
ricas
S
trate
gy
o
utlo
ok
Fo
recasts
and
re
fere
nces
Policy
We expect the RBNZ to remain on hold until Q4-2019. With growth and inflation
likely to exceed RBNZ forecasts in 2019, we expect the central bank to raise the
official cash rate by 25bps in Q4-2019 to 2.00%. We believe the current rate of
1.75% is highly accommodative. Growth and the output gap would have to fall
sharply to trigger a further rate cut, in our view, given that the current level is already
much lower than the estimated neutral policy rate of 3.5%.
The RBNZ maintained its cautious tone at the September meeting. The central bank
acknowledged the robust Q2 growth print, but highlighted downside risks to the
growth outlook. The RBNZ had previously forecast that the negative output gap
would bottom out at -0.3% in Q2 and rise gradually thereafter. Given stronger-than-
expected Q2-2018 GDP growth, however, growth may gradually rise above potential
in H2-2018 and 2019, leading to increased capacity pressure. Furthermore, the
RBNZ dropped the commentary on low business confidence affecting employment
and investment decisions in its September statement, potentially indicating that the
outlook turned less dovish.
We expect the RBNZ to raise its economic projections in the November policy
statement. We see upside risk to its Q3 inflation forecast of 1.4% y/y (data due on 16
October) from higher wages, a weaker NZD and higher oil prices. The RBNZ has
also acknowledged signs of core inflation moving towards the mid-point of its 1-3%
target range.
Market outlook
We think that NZD bearishness may be overdone. FX positioning is still very short
NZD, even after starting to recover from all-time lows in September; the money
market is still pricing c.7bps of RBNZ rate cuts over the next six months (down from a
high of 12bps). However, we expect NZD-USD gains to be limited in the short term
amid trade tensions and USD strength. We maintain our forecast of 0.66 for end-
2018. We expect NZD-USD to recover to 0.74 in 2019, when inflation
outperformance relative to the RBNZ’s forecasts is likely to push rate-hike
expectations higher.
Figure 3: Departures increase, arrivals moderate
‘000s of migrants
Figure 4: Dovish RBNZ weighs on the NZD
CFTC net speculative NZD positioning (USD bn) vs NZD
1Y1Y/3M money-market curve (%)
Source: RBNZ, Standard Chartered Research Source: Bloomberg, Standard Chartered Research
Arrivals
Departures
Net migration
-10
0
10
20
30
40
50
60
70
80
-100
-50
0
50
100
150
Jun-02 Jun-04 Jun-06 Jun-08 Jun-10 Jun-12 Jun-14 Jun-16 Jun-18
NZD positioning
(LHS)
NZD 1Y1Y/3M spread (RHS)
0.3
0.4
0.5
0.6
0.7
0.8
0.9
-2
-1
0
1
2
3
Mar-17 Jun-17 Sep-17 Dec-17 Mar-18 Jun-18
We do not expect cuts from
the RBNZ
The RBNZ may revise up its growth
and inflation forecasts in November
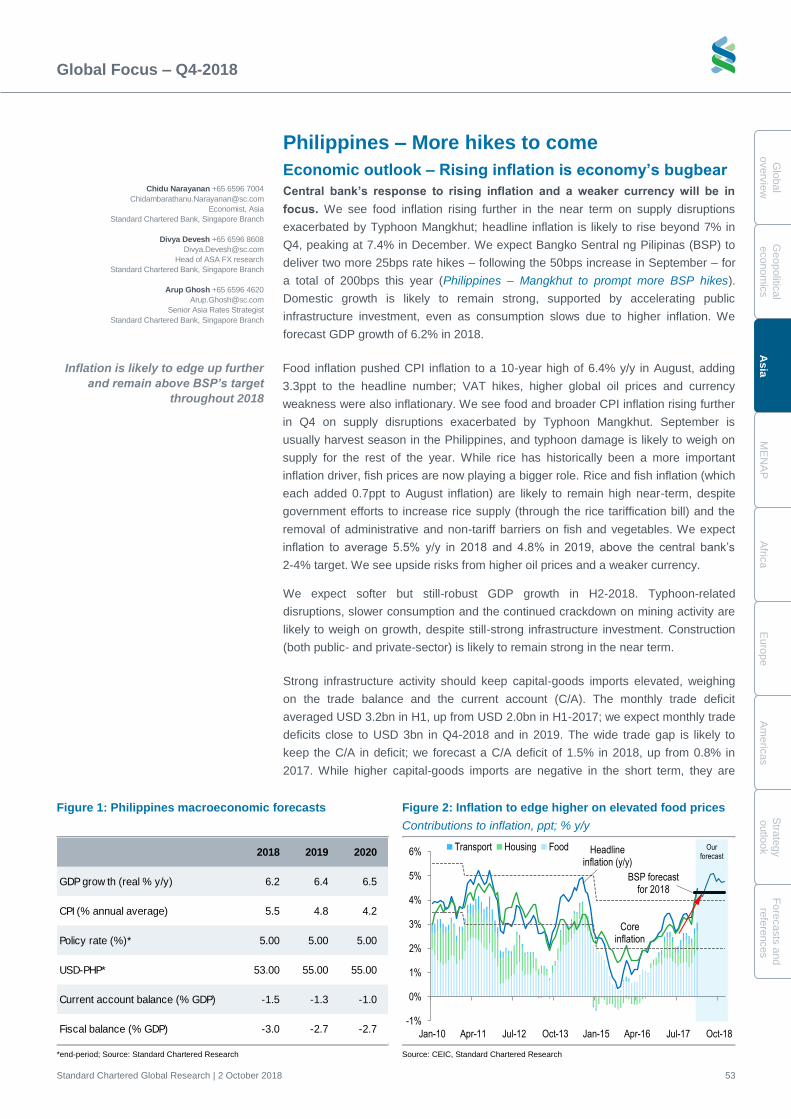
Global Focus – Q4-2018
Standard Chartered Global Research | 2 October 2018 53
Glo
bal
overv
iew
Geopolitic
al
econom
ics
Asia
ME
NA
P
Afric
a
Euro
pe
Am
eric
as
Stra
tegy
outlo
ok
Fo
recasts
and
refe
rences
Philippines – More hikes to come
Economic outlook – Rising inflation is economy’s bugbear
Central bank’s response to rising inflation and a weaker currency will be in
focus. We see food inflation rising further in the near term on supply disruptions
exacerbated by Typhoon Mangkhut; headline inflation is likely to rise beyond 7% in
Q4, peaking at 7.4% in December. We expect Bangko Sentral ng Pilipinas (BSP) to
deliver two more 25bps rate hikes – following the 50bps increase in September – for
a total of 200bps this year (Philippines – Mangkhut to prompt more BSP hikes).
Domestic growth is likely to remain strong, supported by accelerating public
infrastructure investment, even as consumption slows due to higher inflation. We
forecast GDP growth of 6.2% in 2018.
Food inflation pushed CPI inflation to a 10-year high of 6.4% y/y in August, adding
3.3ppt to the headline number; VAT hikes, higher global oil prices and currency
weakness were also inflationary. We see food and broader CPI inflation rising further
in Q4 on supply disruptions exacerbated by Typhoon Mangkhut. September is
usually harvest season in the Philippines, and typhoon damage is likely to weigh on
supply for the rest of the year. While rice has historically been a more important
inflation driver, fish prices are now playing a bigger role. Rice and fish inflation (which
each added 0.7ppt to August inflation) are likely to remain high near-term, despite
government efforts to increase rice supply (through the rice tariffication bill) and the
removal of administrative and non-tariff barriers on fish and vegetables. We expect
inflation to average 5.5% y/y in 2018 and 4.8% in 2019, above the central bank’s
2-4% target. We see upside risks from higher oil prices and a weaker currency.
We expect softer but still-robust GDP growth in H2-2018. Typhoon-related
disruptions, slower consumption and the continued crackdown on mining activity are
likely to weigh on growth, despite still-strong infrastructure investment. Construction
(both public- and private-sector) is likely to remain strong in the near term.
Strong infrastructure activity should keep capital-goods imports elevated, weighing
on the trade balance and the current account (C/A). The monthly trade deficit
averaged USD 3.2bn in H1, up from USD 2.0bn in H1-2017; we expect monthly trade
deficits close to USD 3bn in Q4-2018 and in 2019. The wide trade gap is likely to
keep the C/A in deficit; we forecast a C/A deficit of 1.5% in 2018, up from 0.8% in
2017. While higher capital-goods imports are negative in the short term, they are
Figure 1: Philippines macroeconomic forecasts Figure 2: Inflation to edge higher on elevated food prices
Contributions to inflation, ppt; % y/y
*end-period; Source: Standard Chartered Research Source: CEIC, Standard Chartered Research
2018 2019 2020
GDP grow th (real % y/y) 6.2 6.4 6.5
CPI (% annual average) 5.5 4.8 4.2
Policy rate (%)* 5.00 5.00 5.00
USD-PHP* 53.00 55.00 55.00
Current account balance (% GDP) -1.5 -1.3 -1.0
Fiscal balance (% GDP) -3.0 -2.7 -2.7
Headline inflation (y/y)
Core inflation
BSP forecast for 2018
-1%
0%
1%
2%
3%
4%
5%
6%
Jan-10 Apr-11 Jul-12 Oct-13 Jan-15 Apr-16 Jul-17 Oct-18
Transport Housing Food Our forecast
Chidu Narayanan +65 6596 7004
Economist, Asia
Standard Chartered Bank, Singapore Branch
Divya Devesh +65 6596 8608
Head of ASA FX research
Standard Chartered Bank, Singapore Branch
Arup Ghosh +65 6596 4620
Senior Asia Rates Strategist
Standard Chartered Bank, Singapore Branch
Inflation is likely to edge up further
and remain above BSP’s target
throughout 2018
Global Focus – Q4-2018
Standard Chartered Global Research | 2 October 2018 54
G
lobal
overv
iew
Geopolit
ical
econom
ics
A
sia
M
EN
AP
A
fric
a
E
uro
pe
A
me
ricas
S
trate
gy
o
utlo
ok
Fo
recasts
and
re
fere
nces
driven by domestic infrastructure activity and should support medium-term growth.
We would be more concerned about a trade deficit driven by higher consumer-goods
and fuel imports; the risk of the latter is increasing due to higher crude prices.
Overseas remittance growth is set to increase mildly in H2, supported by strong
inflows during the holiday season. Remittance growth moderated in the first seven
months of the year. Monthly remittances have been volatile and are likely to remain
so near-term, in line with volatility in the currency. We believe goods trade, services
exports and remittances are the most important drivers of the Philippines’ C/A; of the
three, the goods trade balance is the most volatile, making it the key swing factor
(see Philippines C/A – Peering into the crystal ball).
Policy – Pressure to deliver aggressive rate hikes
We expect BSP to respond to higher inflation with another 50bps of rate hikes
in Q4. The higher-than-expected August inflation print, combined with the inflationary
impact of Typhoon Mangkhut, has added to already-high inflation expectations. We
think BSP is keen to anchor inflation expectations, and will follow the 50bps rate hike
in September with two more 25bps hikes in November and December. This would
take real rates closer to 0% but they would still be negative. Our proprietary Monetary
Conditions Index for the Philippines suggests that conditions are among the loosest
in three years despite the hikes. Higher inflation, combined with a weak currency and
still-strong credit growth, is likely to loosen conditions further.
BSP has repeatedly raised its inflation forecasts since mid-2017. It now forecasts
average inflation of 5.2% in 2018 and 4.3% in 2019, edging closer to our own
forecasts. The 2019 forecast has moved above BSP’s target for the first time, and it
noted upside risks to its forecasts at its September meeting. The December policy
statement will be key to gauging future moves; a hawkish statement could indicate
future rate hikes, while a neutral one could point to the end of the hiking cycle.
Infrastructure proceeds further – ‘Build, build, build’
Infrastructure activity was much higher in H1-2018 than a year earlier; both public
and private investment picked up significantly. The Department of Budget and
Management forecasts that infrastructure spending will rise to 6.3% of GDP in 2018
from an average of 2.7% in 2011-15; it grew 5.0% in H1. Increased implementation of
planned projects poses upside risk to our 6.2% GDP growth forecast for 2018, but
could weigh on the current account due to higher import growth.
Market outlook
While a persistent trade deficit and low real yields are headwinds to the Philippine
peso (PHP), we see scope for a slight recovery ahead of year-end, driven by a
seasonal pick-up in remittances. We maintain our USD-PHP forecasts of 53 for end-
2018 and 55 for end-2019.
Republic of the Philippines Government Bonds (RPGBs) remain under pressure from
rising inflation, PHP weakness and a wider fiscal deficit. RPGBs are a consensus
underweight among foreign investors; PHP bonds have a low weight in the
benchmark index. We stay sidelined on RPGBs amid real yield erosion, likely further
BSP hikes, and local-currency (LCY) underperformance in countries with weak
external balances.
We expect another 50bps of hikes
from a hawkish BSP
Capital-goods imports may rebound
this year after growing 2.5% in 2017
We expect the strong pace of
infrastructure investment to
continue in H2
BSP is keen to anchor inflation
expectations
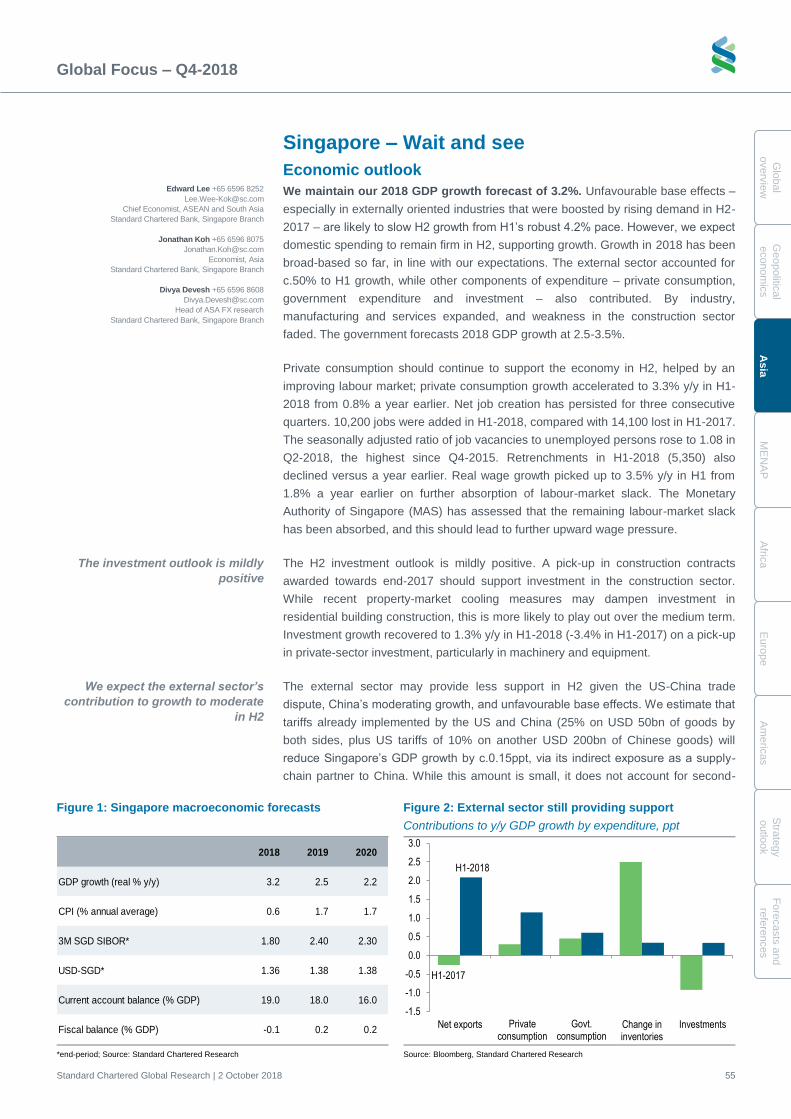
Global Focus – Q4-2018
Standard Chartered Global Research | 2 October 2018 55
Glo
bal
overv
iew
Geopolitic
al
econom
ics
Asia
ME
NA
P
Afric
a
Euro
pe
Am
eric
as
Stra
tegy
outlo
ok
Fo
recasts
and
refe
rences
Singapore – Wait and see
Economic outlook
We maintain our 2018 GDP growth forecast of 3.2%. Unfavourable base effects –
especially in externally oriented industries that were boosted by rising demand in H2-
2017 – are likely to slow H2 growth from H1’s robust 4.2% pace. However, we expect
domestic spending to remain firm in H2, supporting growth. Growth in 2018 has been
broad-based so far, in line with our expectations. The external sector accounted for
c.50% to H1 growth, while other components of expenditure – private consumption,
government expenditure and investment – also contributed. By industry,
manufacturing and services expanded, and weakness in the construction sector
faded. The government forecasts 2018 GDP growth at 2.5-3.5%.
Private consumption should continue to support the economy in H2, helped by an
improving labour market; private consumption growth accelerated to 3.3% y/y in H1-
2018 from 0.8% a year earlier. Net job creation has persisted for three consecutive
quarters. 10,200 jobs were added in H1-2018, compared with 14,100 lost in H1-2017.
The seasonally adjusted ratio of job vacancies to unemployed persons rose to 1.08 in
Q2-2018, the highest since Q4-2015. Retrenchments in H1-2018 (5,350) also
declined versus a year earlier. Real wage growth picked up to 3.5% y/y in H1 from
1.8% a year earlier on further absorption of labour-market slack. The Monetary
Authority of Singapore (MAS) has assessed that the remaining labour-market slack
has been absorbed, and this should lead to further upward wage pressure.
The H2 investment outlook is mildly positive. A pick-up in construction contracts
awarded towards end-2017 should support investment in the construction sector.
While recent property-market cooling measures may dampen investment in
residential building construction, this is more likely to play out over the medium term.
Investment growth recovered to 1.3% y/y in H1-2018 (-3.4% in H1-2017) on a pick-up
in private-sector investment, particularly in machinery and equipment.
The external sector may provide less support in H2 given the US-China trade
dispute, China’s moderating growth, and unfavourable base effects. We estimate that
tariffs already implemented by the US and China (25% on USD 50bn of goods by
both sides, plus US tariffs of 10% on another USD 200bn of Chinese goods) will
reduce Singapore’s GDP growth by c.0.15ppt, via its indirect exposure as a supply-
chain partner to China. While this amount is small, it does not account for second-
Figure 1: Singapore macroeconomic forecasts Figure 2: External sector still providing support
Contributions to y/y GDP growth by expenditure, ppt
*end-period; Source: Standard Chartered Research Source: Bloomberg, Standard Chartered Research
2018 2019 2020
GDP growth (real % y/y) 3.2 2.5 2.2
CPI (% annual average) 0.6 1.7 1.7
3M SGD SIBOR* 1.80 2.40 2.30
USD-SGD* 1.36 1.38 1.38
Current account balance (% GDP) 19.0 18.0 16.0
Fiscal balance (% GDP) -0.1 0.2 0.2
H1-2017
H1-2018
-1.5
-1.0
-0.5
0.0
0.5
1.0
1.5
2.0
2.5
3.0
Net exports Private cons. Govt. cons. Change ininventories
InvestmentsGovt. consumption
Private consumption
We expect the external sector’s
contribution to growth to moderate
in H2
Edward Lee +65 6596 8252
Chief Economist, ASEAN and South Asia
Standard Chartered Bank, Singapore Branch
Jonathan Koh +65 6596 8075
Economist, Asia
Standard Chartered Bank, Singapore Branch
Divya Devesh +65 6596 8608
Head of ASA FX research
Standard Chartered Bank, Singapore Branch
The investment outlook is mildly
positive
Global Focus – Q4-2018
Standard Chartered Global Research | 2 October 2018 56
G
lobal
overv
iew
Geopolit
ical
econom
ics
A
sia
M
EN
AP
A
fric
a
E
uro
pe
A
me
ricas
S
trate
gy
o
utlo
ok
Fo
recasts
and
re
fere
nces
round effects on sentiment, investment and global growth. Should tensions escalate
further, we think the downside risk is much greater. We expect China’s growth to
moderate to 6.45% in H2-2018 from 6.75% in H1-2018. Based on our impulse
response analysis, a 1ppt decline in China’s GDP growth leads to a 1.4ppt reduction
in Singapore’s GDP growth.
We lower our 2018 average headline inflation forecast to 0.6% from 0.8% to reflect
lower-than-expected readings to date. 8M-2018 headline inflation stood at 0.4% y/y
as the contribution from private road transport fell sharply (to 0.01ppt from 0.58ppt in
the year-earlier period). Purchases of motor cars account for c.50% of the private
transport inflation basket; the average premium for vehicle certificates of entitlement
(COE) fell 27% y/y in 8M-2018, on lower demand for new vehicles due to the sale of
second-hand hire-purchase vehicles.
We raise our 2018 average core inflation forecast to 1.8% from 1.6%. Core inflation
has picked up faster than expected due to administrative measures (water price
hikes) and higher fuel prices, which may lead to further rises in electricity tariffs. The
MAS expects average 2018 headline and core inflation to be in the upper half of its
forecast ranges (0-1% for headline and 1-2% for core).
Policy
We expect the MAS to maintain the status quo in October. On the one hand,
growth is healthy and core inflation has been within (potentially rising faster than)
MAS expectations. On the other, deteriorating US-China trade relations cloud the
growth outlook. These opposing dynamics complicate the MAS’ decision. On
balance, we expect no change in the slope, centre or width of the Singapore dollar
nominal effective exchange rate (SGD NEER) policy band (see Singapore – Growth
over inflation).
Property
The government introduced a ninth round of measures in July 2018 to cool the
‘euphoric’ property market and keep price increases in line with economic
fundamentals. Macro-prudential measures include raising the additional buyer stamp
duty and lowering the loan-to-value ratio to keep household leverage at a
manageable level, especially against a backdrop of rising interest rates. Property
prices rose by 9.1% from end-Q3-2017 through Q2-2018, almost reversing four
consecutive years of gradual declines totalling 11.6%.
Market outlook
The SGD NEER is currently trading around 1.5% above the middle of the band,
according to our model, the strongest since mid-2016. Even if the MAS delivers
further policy tightening (not our base case), SGD upside is likely to be capped. If the
MAS keeps policy unchanged, in line with our expectations, we expect the SGD
NEER to trade lower towards the middle of the band. Given attractive risk-reward, we
remain biased towards a weaker SGD in the coming months and expect the currency
to underperform Asian peers. A further escalation of trade tensions or renewed broad
USD strength could also push the SGD NEER lower.
Headline inflation weighed down by
falling prices for private vehicle
ownership certificates
Core inflation has surprised to the
upside in recent months
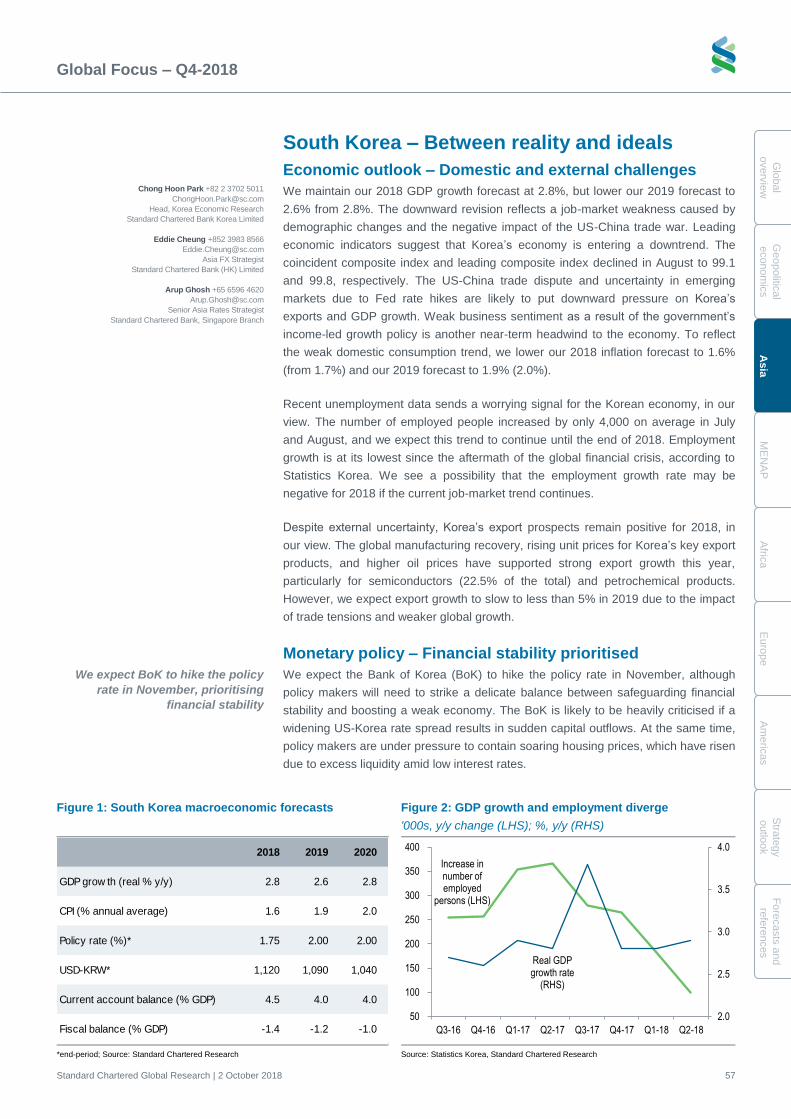
Global Focus – Q4-2018
Standard Chartered Global Research | 2 October 2018 57
Glo
bal
overv
iew
Geopolitic
al
econom
ics
Asia
ME
NA
P
Afric
a
Euro
pe
Am
eric
as
Stra
tegy
outlo
ok
Fo
recasts
and
refe
rences
South Korea – Between reality and ideals
Economic outlook – Domestic and external challenges
We maintain our 2018 GDP growth forecast at 2.8%, but lower our 2019 forecast to
2.6% from 2.8%. The downward revision reflects a job-market weakness caused by
demographic changes and the negative impact of the US-China trade war. Leading
economic indicators suggest that Korea’s economy is entering a downtrend. The
coincident composite index and leading composite index declined in August to 99.1
and 99.8, respectively. The US-China trade dispute and uncertainty in emerging
markets due to Fed rate hikes are likely to put downward pressure on Korea’s
exports and GDP growth. Weak business sentiment as a result of the government’s
income-led growth policy is another near-term headwind to the economy. To reflect
the weak domestic consumption trend, we lower our 2018 inflation forecast to 1.6%
(from 1.7%) and our 2019 forecast to 1.9% (2.0%).
Recent unemployment data sends a worrying signal for the Korean economy, in our
view. The number of employed people increased by only 4,000 on average in July
and August, and we expect this trend to continue until the end of 2018. Employment
growth is at its lowest since the aftermath of the global financial crisis, according to
Statistics Korea. We see a possibility that the employment growth rate may be
negative for 2018 if the current job-market trend continues.
Despite external uncertainty, Korea’s export prospects remain positive for 2018, in
our view. The global manufacturing recovery, rising unit prices for Korea’s key export
products, and higher oil prices have supported strong export growth this year,
particularly for semiconductors (22.5% of the total) and petrochemical products.
However, we expect export growth to slow to less than 5% in 2019 due to the impact
of trade tensions and weaker global growth.
Monetary policy – Financial stability prioritised
We expect the Bank of Korea (BoK) to hike the policy rate in November, although
policy makers will need to strike a delicate balance between safeguarding financial
stability and boosting a weak economy. The BoK is likely to be heavily criticised if a
widening US-Korea rate spread results in sudden capital outflows. At the same time,
policy makers are under pressure to contain soaring housing prices, which have risen
due to excess liquidity amid low interest rates.
Figure 1: South Korea macroeconomic forecasts Figure 2: GDP growth and employment diverge
'000s, y/y change (LHS); %, y/y (RHS)
*end-period; Source: Standard Chartered Research Source: Statistics Korea, Standard Chartered Research
2018 2019 2020
GDP grow th (real % y/y) 2.8 2.6 2.8
CPI (% annual average) 1.6 1.9 2.0
Policy rate (%)* 1.75 2.00 2.00
USD-KRW* 1,120 1,090 1,040
Current account balance (% GDP) 4.5 4.0 4.0
Fiscal balance (% GDP) -1.4 -1.2 -1.0
Increase in number of employed
persons (LHS)
Real GDP growth rate
(RHS)
2.0
2.5
3.0
3.5
4.0
50
100
150
200
250
300
350
400
3Q-
20…
4Q-
20…
1Q-
20…
2Q-
20…
3Q-
20…
4Q-
20…
1Q-
20…
2Q-
20…
Q3-16 Q4-16 Q1-17 Q2-17 Q3-17 Q4-17 Q1-18 Q2-18
Chong Hoon Park +82 2 3702 5011
Head, Korea Economic Research
Standard Chartered Bank Korea Limited
Eddie Cheung +852 3983 8566
Asia FX Strategist
Standard Chartered Bank (HK) Limited
Arup Ghosh +65 6596 4620
Senior Asia Rates Strategist
Standard Chartered Bank, Singapore Branch
We expect BoK to hike the policy
rate in November, prioritising
financial stability
Global Focus – Q4-2018
Standard Chartered Global Research | 2 October 2018 58
G
lobal
overv
iew
Geopolit
ical
econom
ics
A
sia
M
EN
AP
A
fric
a
E
uro
pe
A
me
ricas
S
trate
gy
o
utlo
ok
Fo
recasts
and
re
fere
nces
Prime Minister Lee Nak-yeon said recently that it is time to consider raising the base
rate; this sends a hawkish signal, as the prime minister rarely comments on monetary
policy. We think this signals that the government places a higher priority on
controlling the housing market and household debt than on addressing the weak job
market (which it may see as the result of longer-term structural issues and better
addressed via fiscal policy). However, we think the BoK will hike only if it sees signs
of a turnaround in the job market or an inflation pick-up, which we expect later this
year. For 2019, we forecast only one hike in Q3, the last one in this cycle. Declining
growth prospects and structural issues such as demographics are likely to lower
Korea’s neutral interest rate close to 0% in the near term.
Fiscal policy – Taxing and spending
The government has announced that it will increase its 2019 budget by 9.7%. This is
a much larger increase than this year’s 7.1% and the originally planned mid-7% rise,
and would take the 2019 budget to over KRW 470tn. The government has
announced that it will significantly increase social overhead capital (SOC) investment
and R&D spending to support its innovative growth strategy. Even with increased
government spending, we expect the fiscal deficit to narrow; we now forecast smaller
deficits of 1.4% of GDP in 2018 (versus 1.7% previously) and 1.2% in 2019 (1.8%
previously) because of increased tax revenue from middle- to high-income groups.
We are sceptical about whether the current fiscal policy will support the economy
given rising property and income tax collection. We think it will take several months
for the increased fiscal budget to be reflected in a rise in employment and the
broader economy.
Geopolitics – Denuclearisation in focus
At the third Inter-Korean summit of 2018, held from 18-20 September in Pyongyang,
North Korean leader Kim Jong-un expressed his willingness to denuclearise and
increase cross-border exchanges. The North pledged to permanently shut down the
Donchang-ri long-range missile test site and dismantle the Yongbyon nuclear
facilities in exchange for reciprocal measures by the US. We think the announcement
is a positive step, as the Yongbyon complex is viewed as a symbol of North Korea’s
nuclear development. The planned US-North Korea summit between Kim and
President Trump, still to be confirmed, could be a crucial turning point for North
Korea’s denuclearisation.
Market outlook
Supportive factors for Korea Treasury Bonds (KTBs) are largely priced in and yields
are likely to stay range-bound. We expect the swap curve to steepen in the belly as
markets price in some risk premium for an expected BoK hike amid financial-stability
concerns and an overheating housing market. Seasonal liquidity tightness in Q4 due
to higher debenture issuance is likely to put upward pressure on short-end rates.
That said, long-end KTBs remain anchored by local insurers’ asset-liability mismatch
and an inverted yield curve.
External and domestic factors have turned less positive for the Korean won (KRW).
The US-China trade war continues to weigh on risk sentiment and is unlikely to be
resolved soon. Soft domestic data is also a concern and may persist in the months
ahead. However, bond inflows remain strong and have offset equity outflows. We
have a Neutral FX weighting on the KRW.
The Pyongyang joint declaration
indicated that Kim Jong-un is
committed to denuclearisation
The government is increasing fiscal
spending in an effort to prop up the
economy
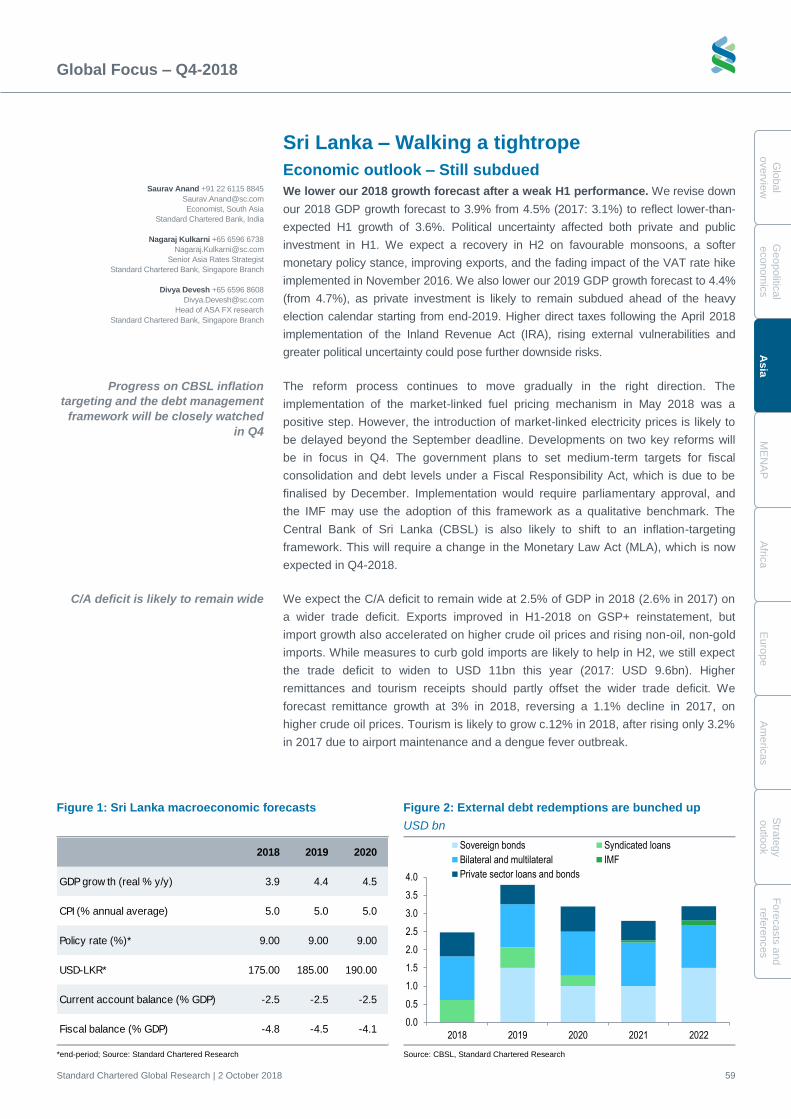
Global Focus – Q4-2018
Standard Chartered Global Research | 2 October 2018 59
Glo
bal
overv
iew
Geopolitic
al
econom
ics
Asia
ME
NA
P
Afric
a
Euro
pe
Am
eric
as
Stra
tegy
outlo
ok
Fo
recasts
and
refe
rences
Sri Lanka – Walking a tightrope
Economic outlook – Still subdued
We lower our 2018 growth forecast after a weak H1 performance. We revise down
our 2018 GDP growth forecast to 3.9% from 4.5% (2017: 3.1%) to reflect lower-than-
expected H1 growth of 3.6%. Political uncertainty affected both private and public
investment in H1. We expect a recovery in H2 on favourable monsoons, a softer
monetary policy stance, improving exports, and the fading impact of the VAT rate hike
implemented in November 2016. We also lower our 2019 GDP growth forecast to 4.4%
(from 4.7%), as private investment is likely to remain subdued ahead of the heavy
election calendar starting from end-2019. Higher direct taxes following the April 2018
implementation of the Inland Revenue Act (IRA), rising external vulnerabilities and
greater political uncertainty could pose further downside risks.
The reform process continues to move gradually in the right direction. The
implementation of the market-linked fuel pricing mechanism in May 2018 was a
positive step. However, the introduction of market-linked electricity prices is likely to
be delayed beyond the September deadline. Developments on two key reforms will
be in focus in Q4. The government plans to set medium-term targets for fiscal
consolidation and debt levels under a Fiscal Responsibility Act, which is due to be
finalised by December. Implementation would require parliamentary approval, and
the IMF may use the adoption of this framework as a qualitative benchmark. The
Central Bank of Sri Lanka (CBSL) is also likely to shift to an inflation-targeting
framework. This will require a change in the Monetary Law Act (MLA), which is now
expected in Q4-2018.
We expect the C/A deficit to remain wide at 2.5% of GDP in 2018 (2.6% in 2017) on
a wider trade deficit. Exports improved in H1-2018 on GSP+ reinstatement, but
import growth also accelerated on higher crude oil prices and rising non-oil, non-gold
imports. While measures to curb gold imports are likely to help in H2, we still expect
the trade deficit to widen to USD 11bn this year (2017: USD 9.6bn). Higher
remittances and tourism receipts should partly offset the wider trade deficit. We
forecast remittance growth at 3% in 2018, reversing a 1.1% decline in 2017, on
higher crude oil prices. Tourism is likely to grow c.12% in 2018, after rising only 3.2%
in 2017 due to airport maintenance and a dengue fever outbreak.
Figure 1: Sri Lanka macroeconomic forecasts Figure 2: External debt redemptions are bunched up
USD bn
*end-period; Source: Standard Chartered Research Source: CBSL, Standard Chartered Research
2018 2019 2020
GDP grow th (real % y/y) 3.9 4.4 4.5
CPI (% annual average) 5.0 5.0 5.0
Policy rate (%)* 9.00 9.00 9.00
USD-LKR* 175.00 185.00 190.00
Current account balance (% GDP) -2.5 -2.5 -2.5
Fiscal balance (% GDP) -4.8 -4.5 -4.10.0
0.5
1.0
1.5
2.0
2.5
3.0
3.5
4.0
2018 2019 2020 2021 2022
Sovereign bonds Syndicated loans
Bilateral and multilateral IMF
Private sector loans and bonds
Progress on CBSL inflation
targeting and the debt management
framework will be closely watched
in Q4
Saurav Anand +91 22 6115 8845
Economist, South Asia
Standard Chartered Bank, India
Nagaraj Kulkarni +65 6596 6738
Senior Asia Rates Strategist
Standard Chartered Bank, Singapore Branch
Divya Devesh +65 6596 8608
Head of ASA FX research
Standard Chartered Bank, Singapore Branch
C/A deficit is likely to remain wide
Global Focus – Q4-2018
Standard Chartered Global Research | 2 October 2018 60
G
lobal
overv
iew
Geopolit
ical
econom
ics
A
sia
M
EN
AP
A
fric
a
E
uro
pe
A
me
ricas
S
trate
gy
o
utlo
ok
Fo
recasts
and
re
fere
nces
Policy – External vulnerabilities likely to increase
We now expect a 50bps policy rate hike in Q4 (versus our earlier call of no
change). This reflects rising external-sector vulnerabilities amid higher global yields,
large external debt repayments starting in 2019, and likely policy rate hikes by other
Asian central banks. However, we see a risk that the CBSL may defer the rate hike to
Q1-2019 on benign domestic factors – inflation, private-sector credit growth and
subdued economic growth. Private-sector credit growth is likely to remain near the
CBSL’s target of c.15%. We forecast average 2018 inflation at 5.0% – well below the
CBSL target of 4-6%, and down from 6.3% in 2017 – on benign food prices, even as
higher crude oil prices and imported inflation exert upward pressure.
The CBSL’s reserves are low, at c.USD 8.5bn as of August; they are likely to reach
USD 9bn (still only 4.5 months of imports) by end-2018, factoring in a USD 1bn
syndicated loan in Q4. The central bank has used policy measures, such as
increasing margin requirements for imports, to manage Sri Lankan rupee (LKR)
depreciation since mid-August, to limited effect. If depreciation pressure on the LKR
moderates, we see a risk that the central bank may defer a rate hike until Q1 given
benign domestic growth dynamics. Sri Lanka remains highly indebted and has
significant external financing needs of c.USD 15bn in 2019-22, of which USD 4bn is
up for repayment in 2019. The government’s ability to keep fiscal consolidation on
track and smooth out the repayment of external liabilities will be crucial to retaining
market access during periods of volatility.
The government will present its 2019 budget in November. We expect fiscal
consolidation to continue but at a slower pace, deviating from the deficit target of
3.6% agreed with the IMF for 2019. We forecast the 2019 deficit at 4.5% of GDP
(2018F: 4.8%) as the government tries to offset higher spending in a pre-election
year with a modest increase in revenue. We do not expect significant revenue-
enhancing measures via the introduction of new taxes in the upcoming budget.
Nearly 50% of the fiscal deficit is financed with foreign flows. Slowing balance-sheet
expansion by major global central banks and rising global yields could add to
vulnerabilities in 2019. For 2018, we expect the government to meet its primary
deficit target of 1% of GDP and its fiscal deficit target of 4.8% by limiting development
expenditure in case of a revenue shortfall.
Politics to start dominating headlines by end-2018
Politics are likely to start dominating headlines and sentiment ahead of upcoming
elections. Provincial elections are likely in Q1-2019, and the performance of the
ruling parties will be closely watched. We will also monitor populist political pledges in
the run-up to elections. After the elections, the focus should quickly shift to the
presidential election due in January 2020.
Market outlook – Revising USD-LKR forecasts higher
We remain Neutral on LKR bonds, as global sentiment towards EM remains weak.
LKR bonds have been resilient despite rising local-currency yields in regional high-
beta markets due to relatively small foreign investor participation.
In the FX market, the pace of LKR depreciation has been faster than we had
expected. A persistent C/A deficit, low FX reserves and rising oil prices will likely
remain strong headwinds to the LKR in the coming years. We raise our USD-LKR
forecasts to 175 for end-2018 (from 165 previously) and to 185 for end-2019 (175).
We revise up our USD-LKR forecast
to 175 for end-2018
We expect fiscal consolidation
to continue in 2019, but at a
slower pace
We expect the CBSL to raise policy
rates by 50bps in Q4
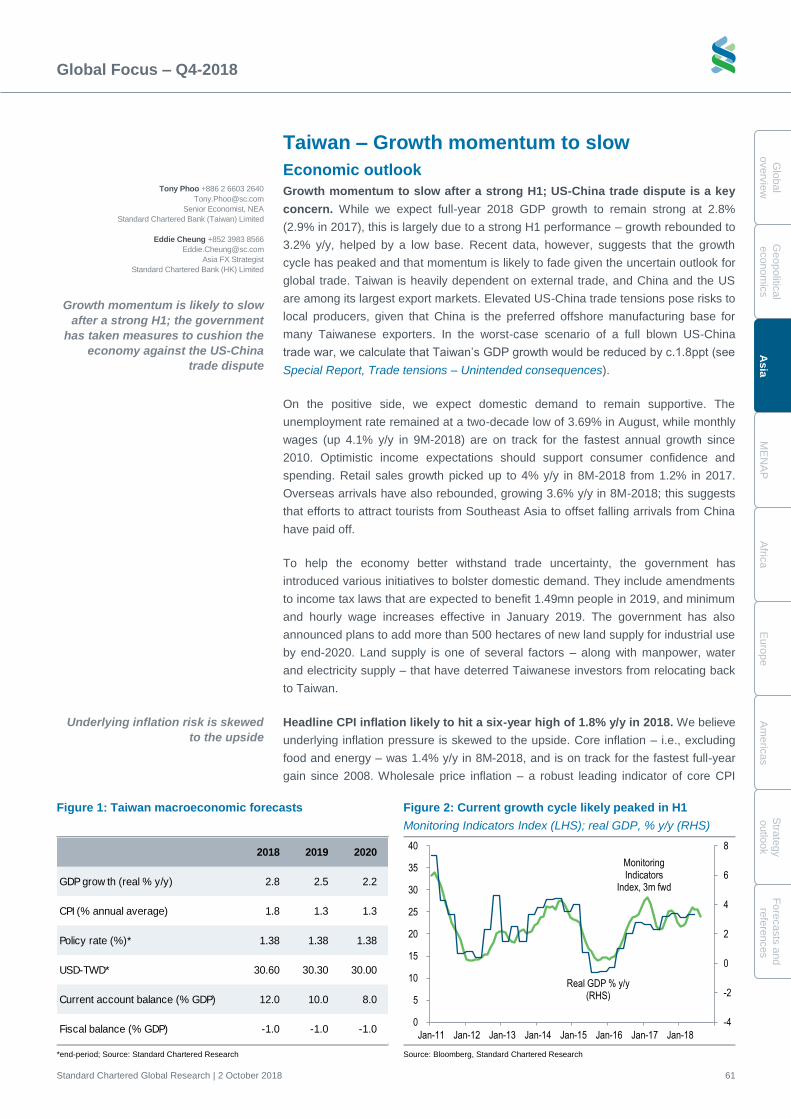
Global Focus – Q4-2018
Standard Chartered Global Research | 2 October 2018 61
Glo
bal
overv
iew
Geopolitic
al
econom
ics
Asia
ME
NA
P
Afric
a
Euro
pe
Am
eric
as
Stra
tegy
outlo
ok
Fo
recasts
and
refe
rences
Taiwan – Growth momentum to slow
Economic outlook
Growth momentum to slow after a strong H1; US-China trade dispute is a key
concern. While we expect full-year 2018 GDP growth to remain strong at 2.8%
(2.9% in 2017), this is largely due to a strong H1 performance – growth rebounded to
3.2% y/y, helped by a low base. Recent data, however, suggests that the growth
cycle has peaked and that momentum is likely to fade given the uncertain outlook for
global trade. Taiwan is heavily dependent on external trade, and China and the US
are among its largest export markets. Elevated US-China trade tensions pose risks to
local producers, given that China is the preferred offshore manufacturing base for
many Taiwanese exporters. In the worst-case scenario of a full blown US-China
trade war, we calculate that Taiwan’s GDP growth would be reduced by c.1.8ppt (see
Special Report, Trade tensions – Unintended consequences).
On the positive side, we expect domestic demand to remain supportive. The
unemployment rate remained at a two-decade low of 3.69% in August, while monthly
wages (up 4.1% y/y in 9M-2018) are on track for the fastest annual growth since
2010. Optimistic income expectations should support consumer confidence and
spending. Retail sales growth picked up to 4% y/y in 8M-2018 from 1.2% in 2017.
Overseas arrivals have also rebounded, growing 3.6% y/y in 8M-2018; this suggests
that efforts to attract tourists from Southeast Asia to offset falling arrivals from China
have paid off.
To help the economy better withstand trade uncertainty, the government has
introduced various initiatives to bolster domestic demand. They include amendments
to income tax laws that are expected to benefit 1.49mn people in 2019, and minimum
and hourly wage increases effective in January 2019. The government has also
announced plans to add more than 500 hectares of new land supply for industrial use
by end-2020. Land supply is one of several factors – along with manpower, water
and electricity supply – that have deterred Taiwanese investors from relocating back
to Taiwan.
Headline CPI inflation likely to hit a six-year high of 1.8% y/y in 2018. We believe
underlying inflation pressure is skewed to the upside. Core inflation – i.e., excluding
food and energy – was 1.4% y/y in 8M-2018, and is on track for the fastest full-year
gain since 2008. Wholesale price inflation – a robust leading indicator of core CPI
Figure 1: Taiwan macroeconomic forecasts Figure 2: Current growth cycle likely peaked in H1
Monitoring Indicators Index (LHS); real GDP, % y/y (RHS)
*end-period; Source: Standard Chartered Research Source: Bloomberg, Standard Chartered Research
2018 2019 2020
GDP grow th (real % y/y) 2.8 2.5 2.2
CPI (% annual average) 1.8 1.3 1.3
Policy rate (%)* 1.38 1.38 1.38
USD-TWD* 30.60 30.30 30.00
Current account balance (% GDP) 12.0 10.0 8.0
Fiscal balance (% GDP) -1.0 -1.0 -1.0
Monitoring Indicators
Index, 3m fwd
-4
-2
0
2
4
6
8
0
5
10
15
20
25
30
35
40
Jan-11 Jan-12 Jan-13 Jan-14 Jan-15 Jan-16 Jan-17 Jan-18
Real GDP % y/y (RHS)
Underlying inflation risk is skewed
to the upside
Growth momentum is likely to slow
after a strong H1; the government
has taken measures to cushion the
economy against the US-China
trade dispute
Tony Phoo +886 2 6603 2640
Senior Economist, NEA
Standard Chartered Bank (Taiwan) Limited
Eddie Cheung +852 3983 8566
Asia FX Strategist
Standard Chartered Bank (HK) Limited
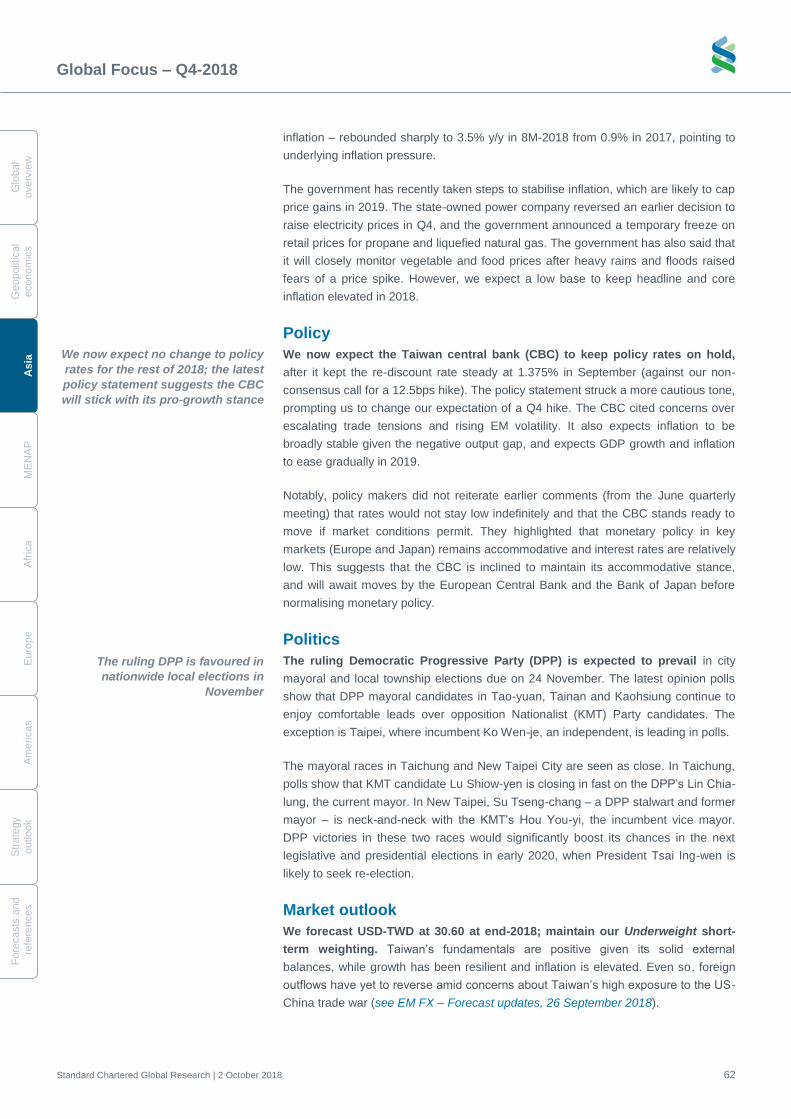
Global Focus – Q4-2018
Standard Chartered Global Research | 2 October 2018 62
G
lobal
overv
iew
Geopolit
ical
econom
ics
A
sia
M
EN
AP
A
fric
a
E
uro
pe
A
me
ricas
S
trate
gy
o
utlo
ok
Fo
recasts
and
re
fere
nces
inflation – rebounded sharply to 3.5% y/y in 8M-2018 from 0.9% in 2017, pointing to
underlying inflation pressure.
The government has recently taken steps to stabilise inflation, which are likely to cap
price gains in 2019. The state-owned power company reversed an earlier decision to
raise electricity prices in Q4, and the government announced a temporary freeze on
retail prices for propane and liquefied natural gas. The government has also said that
it will closely monitor vegetable and food prices after heavy rains and floods raised
fears of a price spike. However, we expect a low base to keep headline and core
inflation elevated in 2018.
Policy
We now expect the Taiwan central bank (CBC) to keep policy rates on hold,
after it kept the re-discount rate steady at 1.375% in September (against our non-
consensus call for a 12.5bps hike). The policy statement struck a more cautious tone,
prompting us to change our expectation of a Q4 hike. The CBC cited concerns over
escalating trade tensions and rising EM volatility. It also expects inflation to be
broadly stable given the negative output gap, and expects GDP growth and inflation
to ease gradually in 2019.
Notably, policy makers did not reiterate earlier comments (from the June quarterly
meeting) that rates would not stay low indefinitely and that the CBC stands ready to
move if market conditions permit. They highlighted that monetary policy in key
markets (Europe and Japan) remains accommodative and interest rates are relatively
low. This suggests that the CBC is inclined to maintain its accommodative stance,
and will await moves by the European Central Bank and the Bank of Japan before
normalising monetary policy.
Politics
The ruling Democratic Progressive Party (DPP) is expected to prevail in city
mayoral and local township elections due on 24 November. The latest opinion polls
show that DPP mayoral candidates in Tao-yuan, Tainan and Kaohsiung continue to
enjoy comfortable leads over opposition Nationalist (KMT) Party candidates. The
exception is Taipei, where incumbent Ko Wen-je, an independent, is leading in polls.
The mayoral races in Taichung and New Taipei City are seen as close. In Taichung,
polls show that KMT candidate Lu Shiow-yen is closing in fast on the DPP’s Lin Chia-
lung, the current mayor. In New Taipei, Su Tseng-chang – a DPP stalwart and former
mayor – is neck-and-neck with the KMT’s Hou You-yi, the incumbent vice mayor.
DPP victories in these two races would significantly boost its chances in the next
legislative and presidential elections in early 2020, when President Tsai Ing-wen is
likely to seek re-election.
Market outlook
We forecast USD-TWD at 30.60 at end-2018; maintain our Underweight short-
term weighting. Taiwan’s fundamentals are positive given its solid external
balances, while growth has been resilient and inflation is elevated. Even so, foreign
outflows have yet to reverse amid concerns about Taiwan’s high exposure to the US-
China trade war (see EM FX – Forecast updates, 26 September 2018).
We now expect no change to policy
rates for the rest of 2018; the latest
policy statement suggests the CBC
will stick with its pro-growth stance
The ruling DPP is favoured in
nationwide local elections in
November
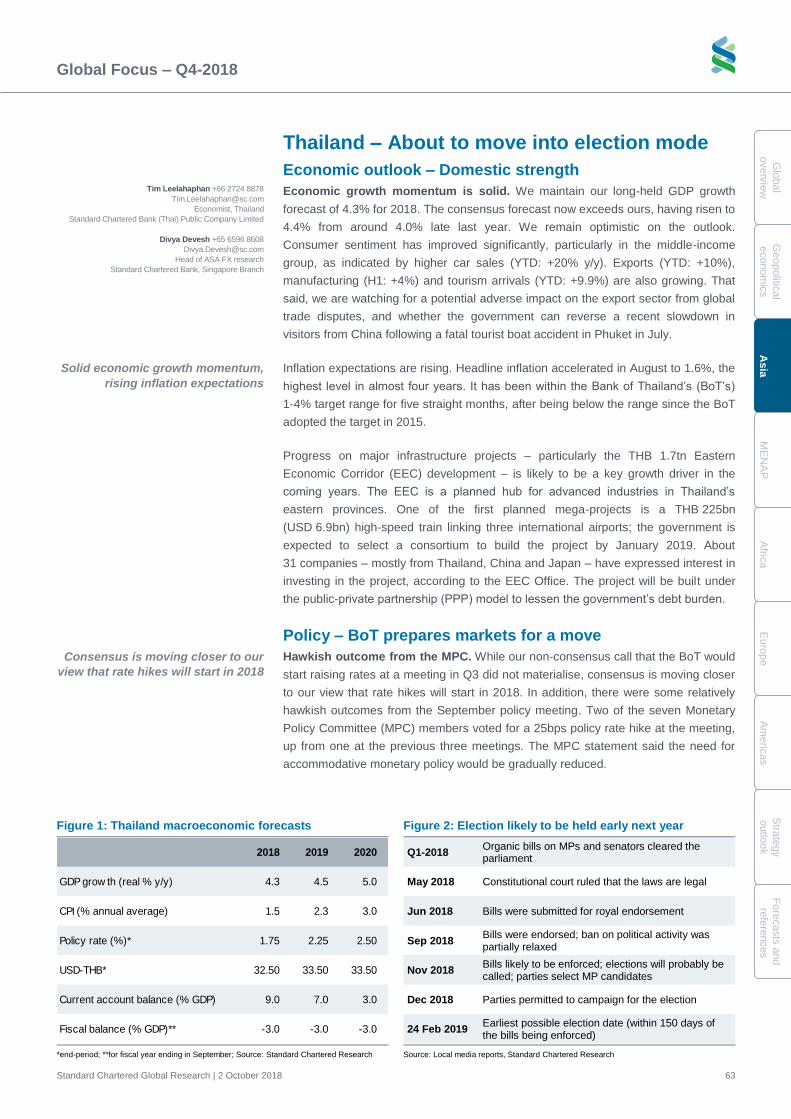
Global Focus – Q4-2018
Standard Chartered Global Research | 2 October 2018 63
Glo
bal
overv
iew
Geopolitic
al
econom
ics
Asia
ME
NA
P
Afric
a
Euro
pe
Am
eric
as
Stra
tegy
outlo
ok
Fo
recasts
and
refe
rences
Thailand – About to move into election mode
Economic outlook – Domestic strength
Economic growth momentum is solid. We maintain our long-held GDP growth
forecast of 4.3% for 2018. The consensus forecast now exceeds ours, having risen to
4.4% from around 4.0% late last year. We remain optimistic on the outlook.
Consumer sentiment has improved significantly, particularly in the middle-income
group, as indicated by higher car sales (YTD: +20% y/y). Exports (YTD: +10%),
manufacturing (H1: +4%) and tourism arrivals (YTD: +9.9%) are also growing. That
said, we are watching for a potential adverse impact on the export sector from global
trade disputes, and whether the government can reverse a recent slowdown in
visitors from China following a fatal tourist boat accident in Phuket in July.
Inflation expectations are rising. Headline inflation accelerated in August to 1.6%, the
highest level in almost four years. It has been within the Bank of Thailand’s (BoT’s)
1-4% target range for five straight months, after being below the range since the BoT
adopted the target in 2015.
Progress on major infrastructure projects – particularly the THB 1.7tn Eastern
Economic Corridor (EEC) development – is likely to be a key growth driver in the
coming years. The EEC is a planned hub for advanced industries in Thailand’s
eastern provinces. One of the first planned mega-projects is a THB 225bn
(USD 6.9bn) high-speed train linking three international airports; the government is
expected to select a consortium to build the project by January 2019. About
31 companies – mostly from Thailand, China and Japan – have expressed interest in
investing in the project, according to the EEC Office. The project will be built under
the public-private partnership (PPP) model to lessen the government’s debt burden.
Policy – BoT prepares markets for a move
Hawkish outcome from the MPC. While our non-consensus call that the BoT would
start raising rates at a meeting in Q3 did not materialise, consensus is moving closer
to our view that rate hikes will start in 2018. In addition, there were some relatively
hawkish outcomes from the September policy meeting. Two of the seven Monetary
Policy Committee (MPC) members voted for a 25bps policy rate hike at the meeting,
up from one at the previous three meetings. The MPC statement said the need for
accommodative monetary policy would be gradually reduced.
Figure 1: Thailand macroeconomic forecasts Figure 2: Election likely to be held early next year
Q1-2018
Organic bills on MPs and senators cleared the parliament
May 2018 Constitutional court ruled that the laws are legal
Jun 2018 Bills were submitted for royal endorsement
Sep 2018 Bills were endorsed; ban on political activity was partially relaxed
Nov 2018 Bills likely to be enforced; elections will probably be called; parties select MP candidates
Dec 2018 Parties permitted to campaign for the election
24 Feb 2019 Earliest possible election date (within 150 days of the bills being enforced)
*end-period; **for fiscal year ending in September; Source: Standard Chartered Research Source: Local media reports, Standard Chartered Research
2018 2019 2020
GDP grow th (real % y/y) 4.3 4.5 5.0
CPI (% annual average) 1.5 2.3 3.0
Policy rate (%)* 1.75 2.25 2.50
USD-THB* 32.50 33.50 33.50
Current account balance (% GDP) 9.0 7.0 3.0
Fiscal balance (% GDP)** -3.0 -3.0 -3.0
Solid economic growth momentum,
rising inflation expectations
Consensus is moving closer to our
view that rate hikes will start in 2018
Tim Leelahaphan +66 2724 8878
Economist, Thailand
Standard Chartered Bank (Thai) Public Company Limited
Divya Devesh +65 6596 8608
Head of ASA FX research
Standard Chartered Bank, Singapore Branch
Global Focus – Q4-2018
Standard Chartered Global Research | 2 October 2018 64
G
lobal
overv
iew
Geopolit
ical
econom
ics
A
sia
M
EN
AP
A
fric
a
E
uro
pe
A
me
ricas
S
trate
gy
o
utlo
ok
Fo
recasts
and
re
fere
nces
With a stronger shift towards a tightening stance at the September meeting, we think
the BoT will start policy normalisation with a 25bps rate hike (to 1.75%) at the next
MPC meeting on 14 November. We continue to expect the policy rate to rise to at
least 2% over the course of the normalisation cycle, creating 50bps of room to
manoeuvre in case of an unforeseen economic shock in the future.
However, given recent BoT concerns about the pace of Thai baht (THB)
appreciation, we think back-to-back rate hikes are unlikely; we therefore expect the
policy rate to end 2018 at 1.75%. That said, we think the outlook for Federal Reserve
tightening could cause the BoT to accelerate the pace of normalisation.
Politics – Election campaigning likely to start in December
Progress towards elections would lift political expectations. We expect further
political clarity to emerge in Q4. The King has endorsed two laws required to hold a
general election, one on the election of members of parliament and one on the
selection of senators. This removes a key hurdle to holding long-delayed elections.
The current military government has said that the election is likely to be held on
24 February 2019 at the earliest.
An election can be called after talks between the National Council for Peace and
Order (NCPO), including Prime Minister General Prayuth Chan-o-cha, and party
leaders are completed.
The long-standing ban on political activity has been partially relaxed. The two largest
political parties – Pheu Thai and Democrat – will elect new leaders and name their
prime minister candidates; each party can nominate no more than three such
candidates ahead of the election. Prayuth has yet to announce whether he will run in
the election, and for which party. Political parties are likely to start their election
campaigns in December. Selection of senators is expected to be completed by the
end of this year; the majority of senators will be hand-picked by the NCPO.
Given current low expectations, clear progress towards elections in H1-2019 would
support the macroeconomic outlook and boost sentiment and local assets,
supporting inflows. This pattern was seen in August 2016, when the constitutional
referendum was conducted smoothly, and in late 2017, when a verdict against the
previous administration in the rice-pledging scheme did not lead to political turmoil. In
both cases, sentiment and inflows received a boost.
Market outlook – Fundamentals justify a strong THB
We maintain our positive view on the THB. Recent comments by the BoT were
aimed at containing the pace of THB appreciation. However, we do not think
investors are buying the THB because they expect an imminent hike; domestic
fundamentals justify buying the currency, in our view.
We expect the normalisation cycle
to take the policy rate to at least 2%
Sentiment and inflows are likely to
receive a boost from election
progress
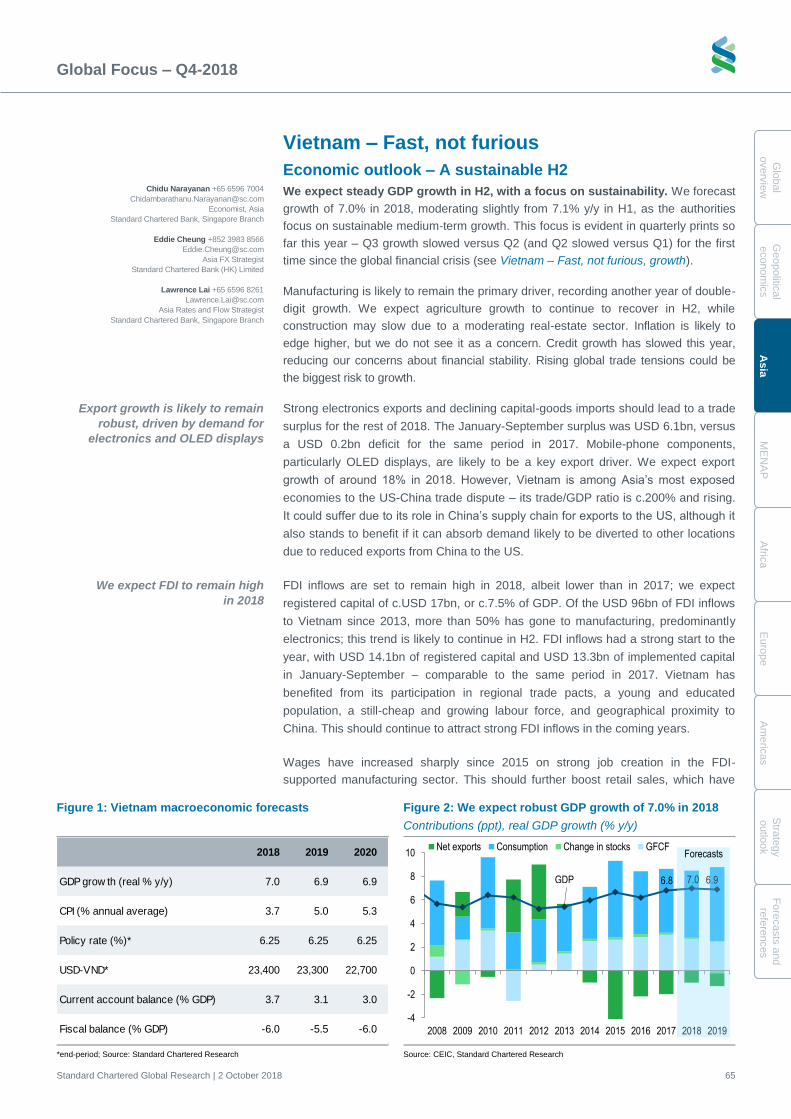
Global Focus – Q4-2018
Standard Chartered Global Research | 2 October 2018 65
Glo
bal
overv
iew
Geopolitic
al
econom
ics
Asia
ME
NA
P
Afric
a
Euro
pe
Am
eric
as
Stra
tegy
outlo
ok
Fo
recasts
and
refe
rences
Vietnam – Fast, not furious
Economic outlook – A sustainable H2
We expect steady GDP growth in H2, with a focus on sustainability. We forecast
growth of 7.0% in 2018, moderating slightly from 7.1% y/y in H1, as the authorities
focus on sustainable medium-term growth. This focus is evident in quarterly prints so
far this year – Q3 growth slowed versus Q2 (and Q2 slowed versus Q1) for the first
time since the global financial crisis (see Vietnam – Fast, not furious, growth).
Manufacturing is likely to remain the primary driver, recording another year of double-
digit growth. We expect agriculture growth to continue to recover in H2, while
construction may slow due to a moderating real-estate sector. Inflation is likely to
edge higher, but we do not see it as a concern. Credit growth has slowed this year,
reducing our concerns about financial stability. Rising global trade tensions could be
the biggest risk to growth.
Strong electronics exports and declining capital-goods imports should lead to a trade
surplus for the rest of 2018. The January-September surplus was USD 6.1bn, versus
a USD 0.2bn deficit for the same period in 2017. Mobile-phone components,
particularly OLED displays, are likely to be a key export driver. We expect export
growth of around 18% in 2018. However, Vietnam is among Asia’s most exposed
economies to the US-China trade dispute – its trade/GDP ratio is c.200% and rising.
It could suffer due to its role in China’s supply chain for exports to the US, although it
also stands to benefit if it can absorb demand likely to be diverted to other locations
due to reduced exports from China to the US.
FDI inflows are set to remain high in 2018, albeit lower than in 2017; we expect
registered capital of c.USD 17bn, or c.7.5% of GDP. Of the USD 96bn of FDI inflows
to Vietnam since 2013, more than 50% has gone to manufacturing, predominantly
electronics; this trend is likely to continue in H2. FDI inflows had a strong start to the
year, with USD 14.1bn of registered capital and USD 13.3bn of implemented capital
in January-September – comparable to the same period in 2017. Vietnam has
benefited from its participation in regional trade pacts, a young and educated
population, a still-cheap and growing labour force, and geographical proximity to
China. This should continue to attract strong FDI inflows in the coming years.
Wages have increased sharply since 2015 on strong job creation in the FDI-
supported manufacturing sector. This should further boost retail sales, which have
Figure 1: Vietnam macroeconomic forecasts Figure 2: We expect robust GDP growth of 7.0% in 2018
Contributions (ppt), real GDP growth (% y/y)
*end-period; Source: Standard Chartered Research Source: CEIC, Standard Chartered Research
2018 2019 2020
GDP grow th (real % y/y) 7.0 6.9 6.9
CPI (% annual average) 3.7 5.0 5.3
Policy rate (%)* 6.25 6.25 6.25
USD-VND* 23,400 23,300 22,700
Current account balance (% GDP) 3.7 3.1 3.0
Fiscal balance (% GDP) -6.0 -5.5 -6.0
6.8 7.0 6.9
-4
-2
0
2
4
6
8
10
2008 2009 2010 2011 2012 2013 2014 2015 2016 2017 2018 2019
Net exports Consumption Change in stocks GFCFForecasts
GDP
Chidu Narayanan +65 6596 7004
Economist, Asia
Standard Chartered Bank, Singapore Branch
Eddie Cheung +852 3983 8566
Asia FX Strategist
Standard Chartered Bank (HK) Limited
Lawrence Lai +65 6596 8261
Asia Rates and Flow Strategist
Standard Chartered Bank, Singapore Branch
Export growth is likely to remain
robust, driven by demand for
electronics and OLED displays
We expect FDI to remain high
in 2018
Global Focus – Q4-2018
Standard Chartered Global Research | 2 October 2018 66
G
lobal
overv
iew
Geopolit
ical
econom
ics
A
sia
M
EN
AP
A
fric
a
E
uro
pe
A
me
ricas
S
trate
gy
o
utlo
ok
Fo
recasts
and
re
fere
nces
been picking up since H2-2017. Tourism has rebounded strongly since end-2016 –
arrivals grew over 20% in both 2017 and 9M-2018 – and is likely to remain healthy
near-term. This should also boost retail sales, supporting consumption.
We forecast that inflation will remain soft in 2018, averaging 3.7% y/y versus 3.4% in
2017. Food and transport inflation edged higher in H1-2018 from a low base but are
unlikely to become a concern. Housing inflation is also likely to remain high, but lower
than in H2-2017. We expect inflation to pick up to 5% in 2019 due to a low base and
higher oil prices. We see core inflation (which excludes prices of food, energy, health
care and education services) staying below 2% in 2018, edging up slightly in 2019.
Policy
The State Bank of Vietnam (SBV) is likely to remain accommodative in the near term
to support growth, despite rate hikes by major central banks. We expect unchanged
policy rates in 2018 and a mild devaluation of the Vietnamese dong (VND).
Credit growth slowed to c.14% as of June 2018 from 18.2% in 2017; the SBV’s credit
growth target for 2018 is 17%, below the 2017 target. Growth in credit to the
construction sector rose more than 30% y/y in January-October 2017, the fastest in
at least four years. A sustained rapid rise in credit could lead to overleveraging,
raising financial stability risks and derailing the banking sector’s nascent recovery
from high NPLs. The SBV’s focus on reducing credit growth to the construction
sector provides comfort, however. Credit growth to the real-estate sector has been
capped at a lower rate, which should contain financial stability risks. The SBV has
also set limits on single-name exposure. These are prudent measures, in our view.
Other issues
Banking-sector NPLs have only just started to decline – to 2.18% of total loans as of
June 2018 from 3.6% in 2013, according to the Vietnam Asset Management
Company (VAMC). These exclude bad loans sold to the VAMC; the NPL ratio is
8.6% if these loans are included, according to the SBV. Still-strong credit growth has
increased the loan base, helping to reduce the NPL ratio. Lower NPLs and
implementation of the National Assembly’s resolution on bad debt settlement are
encouraging.
Market outlook
We expect steady growth momentum and strong trade performance to continue to
support the VND. Current account dynamics are positive, with the trade balance on
course to record a surplus in 2018. So far this year, the VND has weakened against
the USD and is flat against the EUR (Vietnam’s largest export market), while it has
strengthened against the CNY and KRW (Vietnam’s two largest import sources).
Market sentiment towards Vietnam Government Bonds (VGBs) has been broadly
stable despite deteriorating global risk sentiment. Onshore liquidity has turned less
flush given strong local credit growth. However, VGB yields have been largely range-
bound despite a tighter funding environment. We maintain our Neutral duration
outlook, as credit growth is unlikely to pick up significantly (positive for bond
demand). 5Y VGB yields increased 100bps in Q3 to 4.4% and we expect them to drift
higher, especially with global rates likely to keep rising amid the Fed hiking cycle.
While we see room for a further gradual rise in VGB yields, we do not expect
significant selling pressure, as a stable policy stance and low inflationary pressure
should continue to support the VGB market.
We expect the SBV to keep policy
unchanged in 2018
Slowing credit growth and prudent
regulatory measures provide
comfort
We expect mildly higher inflation in
H2, but do not see it as a concern
Economies – Middle East, North Africa and
Pakistan
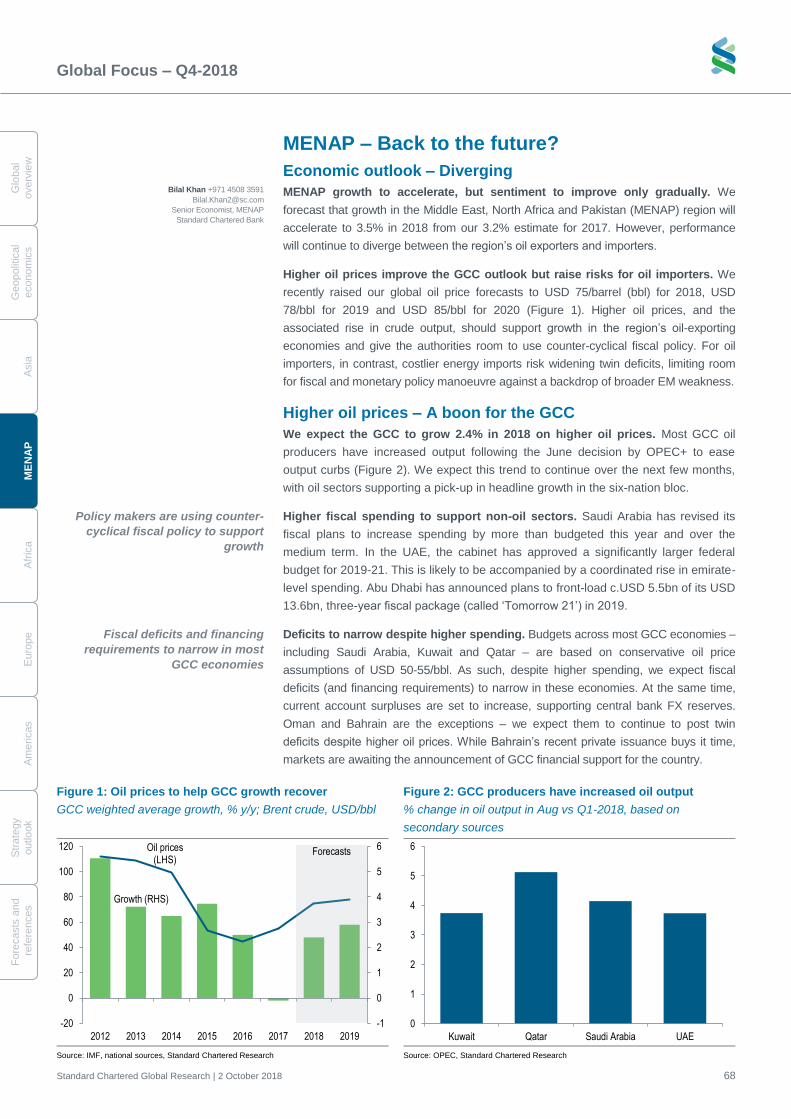
Global Focus – Q4-2018
Standard Chartered Global Research | 2 October 2018 68
G
lobal
overv
iew
Geopolit
ical
econom
ics
A
sia
M
EN
AP
A
fric
a
E
uro
pe
A
me
ricas
S
trate
gy
o
utlo
ok
Fo
recasts
and
re
fere
nces
MENAP – Back to the future?
Economic outlook – Diverging
MENAP growth to accelerate, but sentiment to improve only gradually. We
forecast that growth in the Middle East, North Africa and Pakistan (MENAP) region will
accelerate to 3.5% in 2018 from our 3.2% estimate for 2017. However, performance
will continue to diverge between the region’s oil exporters and importers.
Higher oil prices improve the GCC outlook but raise risks for oil importers. We
recently raised our global oil price forecasts to USD 75/barrel (bbl) for 2018, USD
78/bbl for 2019 and USD 85/bbl for 2020 (Figure 1). Higher oil prices, and the
associated rise in crude output, should support growth in the region’s oil-exporting
economies and give the authorities room to use counter-cyclical fiscal policy. For oil
importers, in contrast, costlier energy imports risk widening twin deficits, limiting room
for fiscal and monetary policy manoeuvre against a backdrop of broader EM weakness.
Higher oil prices – A boon for the GCC
We expect the GCC to grow 2.4% in 2018 on higher oil prices. Most GCC oil
producers have increased output following the June decision by OPEC+ to ease
output curbs (Figure 2). We expect this trend to continue over the next few months,
with oil sectors supporting a pick-up in headline growth in the six-nation bloc.
Higher fiscal spending to support non-oil sectors. Saudi Arabia has revised its
fiscal plans to increase spending by more than budgeted this year and over the
medium term. In the UAE, the cabinet has approved a significantly larger federal
budget for 2019-21. This is likely to be accompanied by a coordinated rise in emirate-
level spending. Abu Dhabi has announced plans to front-load c.USD 5.5bn of its USD
13.6bn, three-year fiscal package (called ‘Tomorrow 21’) in 2019.
Deficits to narrow despite higher spending. Budgets across most GCC economies –
including Saudi Arabia, Kuwait and Qatar – are based on conservative oil price
assumptions of USD 50-55/bbl. As such, despite higher spending, we expect fiscal
deficits (and financing requirements) to narrow in these economies. At the same time,
current account surpluses are set to increase, supporting central bank FX reserves.
Oman and Bahrain are the exceptions – we expect them to continue to post twin
deficits despite higher oil prices. While Bahrain’s recent private issuance buys it time,
markets are awaiting the announcement of GCC financial support for the country.
Figure 1: Oil prices to help GCC growth recover
GCC weighted average growth, % y/y; Brent crude, USD/bbl
Figure 2: GCC producers have increased oil output
% change in oil output in Aug vs Q1-2018, based on
secondary sources
Source: IMF, national sources, Standard Chartered Research Source: OPEC, Standard Chartered Research
Growth (RHS)
Oil prices (LHS)
-1
0
1
2
3
4
5
6
-20
0
20
40
60
80
100
120
2012 2013 2014 2015 2016 2017 2018 2019
Forecasts
0
1
2
3
4
5
6
Kuwait Qatar Saudi Arabia UAE
Bilal Khan +971 4508 3591
Senior Economist, MENAP
Standard Chartered Bank
Fiscal deficits and financing
requirements to narrow in most
GCC economies
Policy makers are using counter-
cyclical fiscal policy to support
growth
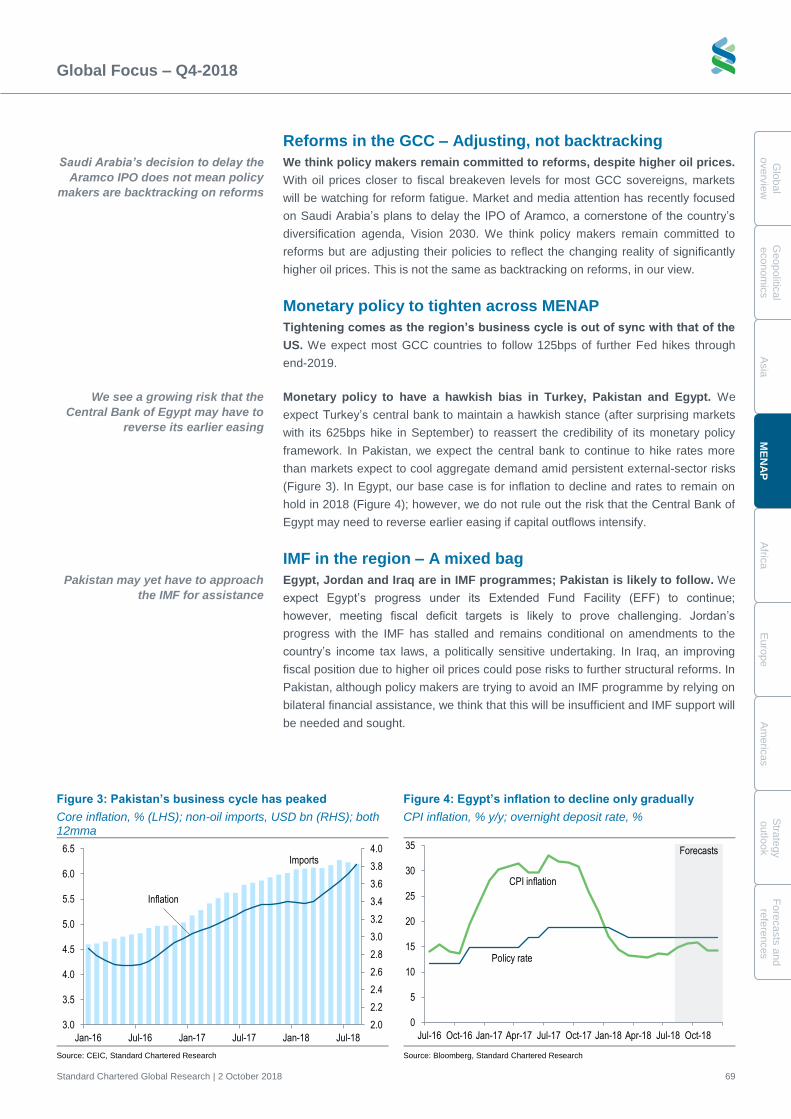
Global Focus – Q4-2018
Standard Chartered Global Research | 2 October 2018 69
Glo
bal
overv
iew
G
eopolitic
al
econom
ics
A
sia
ME
NA
P
A
frica
E
uro
pe
A
me
ricas
Stra
tegy
outlo
ok
Fo
recasts
and
refe
rences
Reforms in the GCC – Adjusting, not backtracking
We think policy makers remain committed to reforms, despite higher oil prices.
With oil prices closer to fiscal breakeven levels for most GCC sovereigns, markets
will be watching for reform fatigue. Market and media attention has recently focused
on Saudi Arabia’s plans to delay the IPO of Aramco, a cornerstone of the country’s
diversification agenda, Vision 2030. We think policy makers remain committed to
reforms but are adjusting their policies to reflect the changing reality of significantly
higher oil prices. This is not the same as backtracking on reforms, in our view.
Monetary policy to tighten across MENAP
Tightening comes as the region’s business cycle is out of sync with that of the
US. We expect most GCC countries to follow 125bps of further Fed hikes through
end-2019.
Monetary policy to have a hawkish bias in Turkey, Pakistan and Egypt. We
expect Turkey’s central bank to maintain a hawkish stance (after surprising markets
with its 625bps hike in September) to reassert the credibility of its monetary policy
framework. In Pakistan, we expect the central bank to continue to hike rates more
than markets expect to cool aggregate demand amid persistent external-sector risks
(Figure 3). In Egypt, our base case is for inflation to decline and rates to remain on
hold in 2018 (Figure 4); however, we do not rule out the risk that the Central Bank of
Egypt may need to reverse earlier easing if capital outflows intensify.
IMF in the region – A mixed bag
Egypt, Jordan and Iraq are in IMF programmes; Pakistan is likely to follow. We
expect Egypt’s progress under its Extended Fund Facility (EFF) to continue;
however, meeting fiscal deficit targets is likely to prove challenging. Jordan’s
progress with the IMF has stalled and remains conditional on amendments to the
country’s income tax laws, a politically sensitive undertaking. In Iraq, an improving
fiscal position due to higher oil prices could pose risks to further structural reforms. In
Pakistan, although policy makers are trying to avoid an IMF programme by relying on
bilateral financial assistance, we think that this will be insufficient and IMF support will
be needed and sought.
Figure 3: Pakistan’s business cycle has peaked
Core inflation, % (LHS); non-oil imports, USD bn (RHS); both 12mma
Figure 4: Egypt’s inflation to decline only gradually
CPI inflation, % y/y; overnight deposit rate, %
Source: CEIC, Standard Chartered Research Source: Bloomberg, Standard Chartered Research
Imports
Inflation
2.0
2.2
2.4
2.6
2.8
3.0
3.2
3.4
3.6
3.8
4.0
3.0
3.5
4.0
4.5
5.0
5.5
6.0
6.5
Jan-16 Jul-16 Jan-17 Jul-17 Jan-18 Jul-18
CPI inflation
Policy rate
0
5
10
15
20
25
30
35
Jul-16 Oct-16 Jan-17 Apr-17 Jul-17 Oct-17 Jan-18 Apr-18 Jul-18 Oct-18
Forecasts
Pakistan may yet have to approach
the IMF for assistance
Saudi Arabia’s decision to delay the
Aramco IPO does not mean policy
makers are backtracking on reforms
We see a growing risk that the
Central Bank of Egypt may have to
reverse its earlier easing
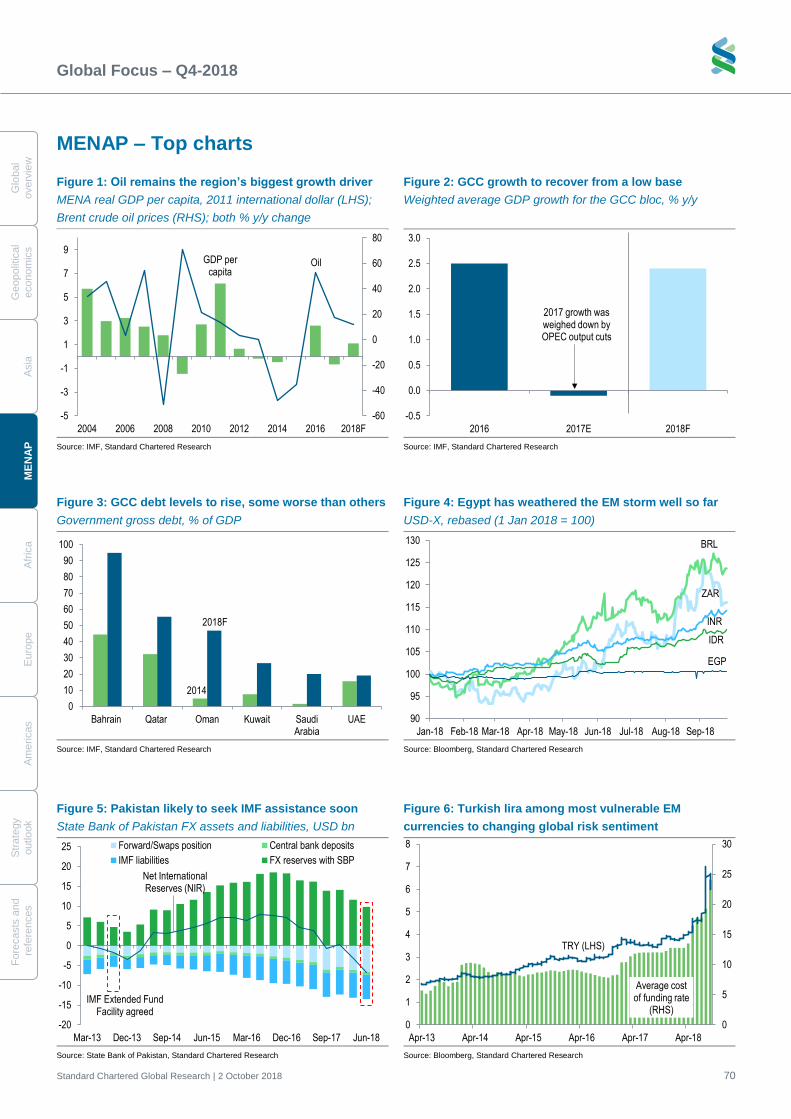
Global Focus – Q4-2018
Standard Chartered Global Research | 2 October 2018 70
G
lobal
overv
iew
Geopolit
ical
econom
ics
A
sia
M
EN
AP
A
fric
a
E
uro
pe
A
me
ricas
S
trate
gy
o
utlo
ok
Fo
recasts
and
re
fere
nces
MENAP – Top charts Figure 1: Oil remains the region’s biggest growth driver
MENA real GDP per capita, 2011 international dollar (LHS);
Brent crude oil prices (RHS); both % y/y change
Figure 2: GCC growth to recover from a low base
Weighted average GDP growth for the GCC bloc, % y/y
Source: IMF, Standard Chartered Research Source: IMF, Standard Chartered Research
Figure 3: GCC debt levels to rise, some worse than others
Government gross debt, % of GDP
Figure 4: Egypt has weathered the EM storm well so far
USD-X, rebased (1 Jan 2018 = 100)
Source: IMF, Standard Chartered Research Source: Bloomberg, Standard Chartered Research
GDP per capita
Oil
-60
-40
-20
0
20
40
60
80
-5
-3
-1
1
3
5
7
9
2004 2006 2008 2010 2012 2014 2016 2018F
-0.5
0.0
0.5
1.0
1.5
2.0
2.5
3.0
2016 2017E 2018F
2017 growth was weighed down by OPEC output cuts
2014
2018F
0
10
20
30
40
50
60
70
80
90
100
Bahrain Qatar Oman Kuwait SaudiArabia
UAE
ZAR
BRL
INR
IDR
EGP
90
95
100
105
110
115
120
125
130
Jan-18 Feb-18 Mar-18 Apr-18 May-18 Jun-18 Jul-18 Aug-18 Sep-18
Figure 5: Pakistan likely to seek IMF assistance soon
State Bank of Pakistan FX assets and liabilities, USD bn
Figure 6: Turkish lira among most vulnerable EM
currencies to changing global risk sentiment
Source: State Bank of Pakistan, Standard Chartered Research Source: Bloomberg, Standard Chartered Research
-20
-15
-10
-5
0
5
10
15
20
25
Mar-13 Dec-13 Sep-14 Jun-15 Mar-16 Dec-16 Sep-17 Jun-18
Forward/Swaps position Central bank deposits
IMF liabilities FX reserves with SBP
IMF Extended Fund Facility agreed
Net International Reserves (NIR)
Average cost of funding rate
(RHS)
TRY (LHS)
0
5
10
15
20
25
30
0
1
2
3
4
5
6
7
8
Apr-13 Apr-14 Apr-15 Apr-16 Apr-17 Apr-18
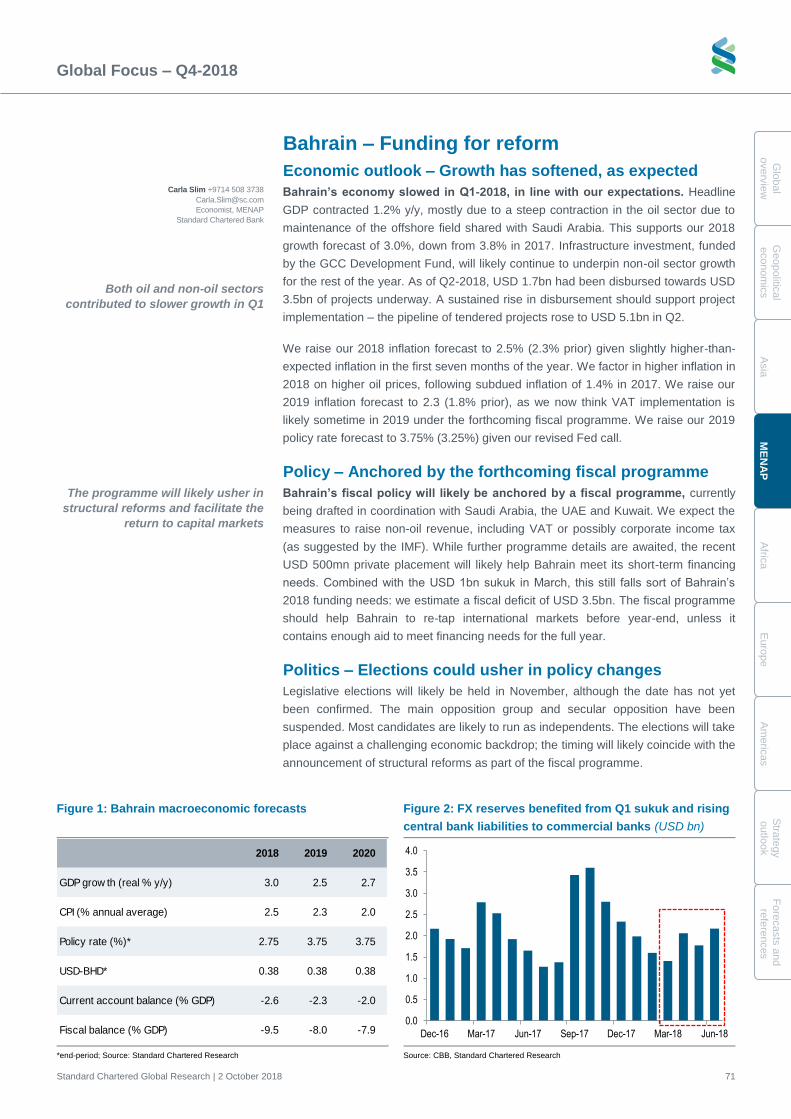
Global Focus – Q4-2018
Standard Chartered Global Research | 2 October 2018 71
Glo
bal
overv
iew
G
eopolitic
al
econom
ics
A
sia
ME
NA
P
A
frica
E
uro
pe
A
me
ricas
Stra
tegy
outlo
ok
Fo
recasts
and
refe
rences
Bahrain – Funding for reform
Economic outlook – Growth has softened, as expected
Bahrain’s economy slowed in Q1-2018, in line with our expectations. Headline
GDP contracted 1.2% y/y, mostly due to a steep contraction in the oil sector due to
maintenance of the offshore field shared with Saudi Arabia. This supports our 2018
growth forecast of 3.0%, down from 3.8% in 2017. Infrastructure investment, funded
by the GCC Development Fund, will likely continue to underpin non-oil sector growth
for the rest of the year. As of Q2-2018, USD 1.7bn had been disbursed towards USD
3.5bn of projects underway. A sustained rise in disbursement should support project
implementation – the pipeline of tendered projects rose to USD 5.1bn in Q2.
We raise our 2018 inflation forecast to 2.5% (2.3% prior) given slightly higher-than-
expected inflation in the first seven months of the year. We factor in higher inflation in
2018 on higher oil prices, following subdued inflation of 1.4% in 2017. We raise our
2019 inflation forecast to 2.3 (1.8% prior), as we now think VAT implementation is
likely sometime in 2019 under the forthcoming fiscal programme. We raise our 2019
policy rate forecast to 3.75% (3.25%) given our revised Fed call.
Policy – Anchored by the forthcoming fiscal programme
Bahrain’s fiscal policy will likely be anchored by a fiscal programme, currently
being drafted in coordination with Saudi Arabia, the UAE and Kuwait. We expect the
measures to raise non-oil revenue, including VAT or possibly corporate income tax
(as suggested by the IMF). While further programme details are awaited, the recent
USD 500mn private placement will likely help Bahrain meet its short-term financing
needs. Combined with the USD 1bn sukuk in March, this still falls sort of Bahrain’s
2018 funding needs: we estimate a fiscal deficit of USD 3.5bn. The fiscal programme
should help Bahrain to re-tap international markets before year-end, unless it
contains enough aid to meet financing needs for the full year.
Politics – Elections could usher in policy changes
Legislative elections will likely be held in November, although the date has not yet
been confirmed. The main opposition group and secular opposition have been
suspended. Most candidates are likely to run as independents. The elections will take
place against a challenging economic backdrop; the timing will likely coincide with the
announcement of structural reforms as part of the fiscal programme.
Figure 1: Bahrain macroeconomic forecasts Figure 2: FX reserves benefited from Q1 sukuk and rising
central bank liabilities to commercial banks (USD bn)
*end-period; Source: Standard Chartered Research Source: CBB, Standard Chartered Research
2018 2019 2020
GDP grow th (real % y/y) 3.0 2.5 2.7
CPI (% annual average) 2.5 2.3 2.0
Policy rate (%)* 2.75 3.75 3.75
USD-BHD* 0.38 0.38 0.38
Current account balance (% GDP) -2.6 -2.3 -2.0
Fiscal balance (% GDP) -9.5 -8.0 -7.90.0
0.5
1.0
1.5
2.0
2.5
3.0
3.5
4.0
Dec-16 Mar-17 Jun-17 Sep-17 Dec-17 Mar-18 Jun-18
Both oil and non-oil sectors
contributed to slower growth in Q1
The programme will likely usher in
structural reforms and facilitate the
return to capital markets
Carla Slim +9714 508 3738
Economist, MENAP
Standard Chartered Bank
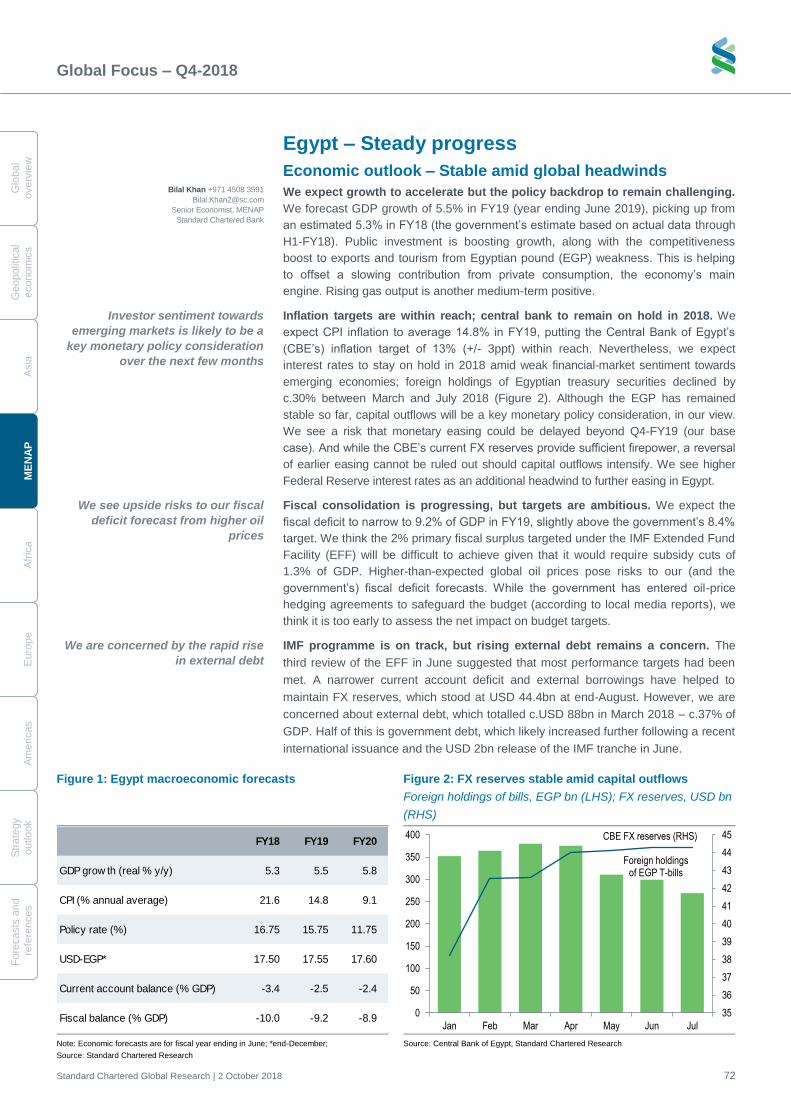
Global Focus – Q4-2018
Standard Chartered Global Research | 2 October 2018 72
G
lobal
overv
iew
Geopolit
ical
econom
ics
A
sia
M
EN
AP
A
fric
a
E
uro
pe
A
me
ricas
S
trate
gy
o
utlo
ok
Fo
recasts
and
re
fere
nces
Egypt – Steady progress
Economic outlook – Stable amid global headwinds
We expect growth to accelerate but the policy backdrop to remain challenging.
We forecast GDP growth of 5.5% in FY19 (year ending June 2019), picking up from
an estimated 5.3% in FY18 (the government’s estimate based on actual data through
H1-FY18). Public investment is boosting growth, along with the competitiveness
boost to exports and tourism from Egyptian pound (EGP) weakness. This is helping
to offset a slowing contribution from private consumption, the economy’s main
engine. Rising gas output is another medium-term positive.
Inflation targets are within reach; central bank to remain on hold in 2018. We
expect CPI inflation to average 14.8% in FY19, putting the Central Bank of Egypt’s
(CBE’s) inflation target of 13% (+/- 3ppt) within reach. Nevertheless, we expect
interest rates to stay on hold in 2018 amid weak financial-market sentiment towards
emerging economies; foreign holdings of Egyptian treasury securities declined by
c.30% between March and July 2018 (Figure 2). Although the EGP has remained
stable so far, capital outflows will be a key monetary policy consideration, in our view.
We see a risk that monetary easing could be delayed beyond Q4-FY19 (our base
case). And while the CBE’s current FX reserves provide sufficient firepower, a reversal
of earlier easing cannot be ruled out should capital outflows intensify. We see higher
Federal Reserve interest rates as an additional headwind to further easing in Egypt.
Fiscal consolidation is progressing, but targets are ambitious. We expect the
fiscal deficit to narrow to 9.2% of GDP in FY19, slightly above the government’s 8.4%
target. We think the 2% primary fiscal surplus targeted under the IMF Extended Fund
Facility (EFF) will be difficult to achieve given that it would require subsidy cuts of
1.3% of GDP. Higher-than-expected global oil prices pose risks to our (and the
government’s) fiscal deficit forecasts. While the government has entered oil-price
hedging agreements to safeguard the budget (according to local media reports), we
think it is too early to assess the net impact on budget targets.
IMF programme is on track, but rising external debt remains a concern. The
third review of the EFF in June suggested that most performance targets had been
met. A narrower current account deficit and external borrowings have helped to
maintain FX reserves, which stood at USD 44.4bn at end-August. However, we are
concerned about external debt, which totalled c.USD 88bn in March 2018 – c.37% of
GDP. Half of this is government debt, which likely increased further following a recent
international issuance and the USD 2bn release of the IMF tranche in June.
Figure 1: Egypt macroeconomic forecasts Figure 2: FX reserves stable amid capital outflows
Foreign holdings of bills, EGP bn (LHS); FX reserves, USD bn
(RHS)
Note: Economic forecasts are for fiscal year ending in June; *end-December;
Source: Standard Chartered Research
Source: Central Bank of Egypt, Standard Chartered Research
FY18 FY19 FY20
GDP grow th (real % y/y) 5.3 5.5 5.8
CPI (% annual average) 21.6 14.8 9.1
Policy rate (%) 16.75 15.75 11.75
USD-EGP* 17.50 17.55 17.60
Current account balance (% GDP) -3.4 -2.5 -2.4
Fiscal balance (% GDP) -10.0 -9.2 -8.9
Foreign holdings of EGP T-bills
CBE FX reserves (RHS)
35
36
37
38
39
40
41
42
43
44
45
0
50
100
150
200
250
300
350
400
Jan Feb Mar Apr May Jun Jul
Bilal Khan +971 4508 3591
Senior Economist, MENAP
Standard Chartered Bank
Investor sentiment towards
emerging markets is likely to be a
key monetary policy consideration
over the next few months
We are concerned by the rapid rise
in external debt
We see upside risks to our fiscal
deficit forecast from higher oil
prices
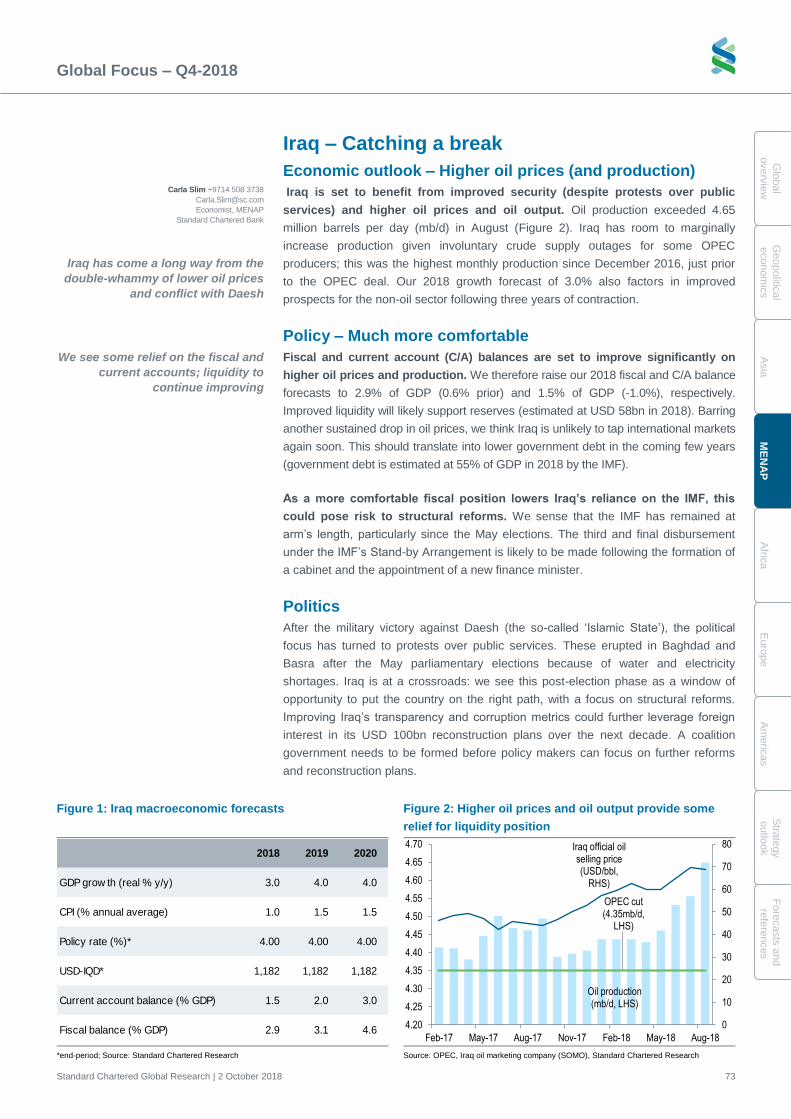
Global Focus – Q4-2018
Standard Chartered Global Research | 2 October 2018 73
Glo
bal
overv
iew
G
eopolitic
al
econom
ics
A
sia
ME
NA
P
A
frica
E
uro
pe
A
me
ricas
Stra
tegy
outlo
ok
Fo
recasts
and
refe
rences
Iraq – Catching a break
Economic outlook – Higher oil prices (and production)
Iraq is set to benefit from improved security (despite protests over public
services) and higher oil prices and oil output. Oil production exceeded 4.65
million barrels per day (mb/d) in August (Figure 2). Iraq has room to marginally
increase production given involuntary crude supply outages for some OPEC
producers; this was the highest monthly production since December 2016, just prior
to the OPEC deal. Our 2018 growth forecast of 3.0% also factors in improved
prospects for the non-oil sector following three years of contraction.
Policy – Much more comfortable
Fiscal and current account (C/A) balances are set to improve significantly on
higher oil prices and production. We therefore raise our 2018 fiscal and C/A balance
forecasts to 2.9% of GDP (0.6% prior) and 1.5% of GDP (-1.0%), respectively.
Improved liquidity will likely support reserves (estimated at USD 58bn in 2018). Barring
another sustained drop in oil prices, we think Iraq is unlikely to tap international markets
again soon. This should translate into lower government debt in the coming few years
(government debt is estimated at 55% of GDP in 2018 by the IMF).
As a more comfortable fiscal position lowers Iraq’s reliance on the IMF, this
could pose risk to structural reforms. We sense that the IMF has remained at
arm’s length, particularly since the May elections. The third and final disbursement
under the IMF’s Stand-by Arrangement is likely to be made following the formation of
a cabinet and the appointment of a new finance minister.
Politics
After the military victory against Daesh (the so-called ‘Islamic State’), the political
focus has turned to protests over public services. These erupted in Baghdad and
Basra after the May parliamentary elections because of water and electricity
shortages. Iraq is at a crossroads: we see this post-election phase as a window of
opportunity to put the country on the right path, with a focus on structural reforms.
Improving Iraq’s transparency and corruption metrics could further leverage foreign
interest in its USD 100bn reconstruction plans over the next decade. A coalition
government needs to be formed before policy makers can focus on further reforms
and reconstruction plans.
Figure 1: Iraq macroeconomic forecasts Figure 2: Higher oil prices and oil output provide some
relief for liquidity position
*end-period; Source: Standard Chartered Research Source: OPEC, Iraq oil marketing company (SOMO), Standard Chartered Research
2018 2019 2020
GDP grow th (real % y/y) 3.0 4.0 4.0
CPI (% annual average) 1.0 1.5 1.5
Policy rate (%)* 4.00 4.00 4.00
USD-IQD* 1,182 1,182 1,182
Current account balance (% GDP) 1.5 2.0 3.0
Fiscal balance (% GDP) 2.9 3.1 4.6
Oil production (mb/d, LHS)
OPEC cut (4.35mb/d,
LHS)
Iraq official oil selling price (USD/bbl,
RHS)
0
10
20
30
40
50
60
70
80
4.20
4.25
4.30
4.35
4.40
4.45
4.50
4.55
4.60
4.65
4.70
Feb-17 May-17 Aug-17 Nov-17 Feb-18 May-18 Aug-18
We see some relief on the fiscal and
current accounts; liquidity to
continue improving
Iraq has come a long way from the
double-whammy of lower oil prices
and conflict with Daesh
Carla Slim +9714 508 3738
Economist, MENAP
Standard Chartered Bank
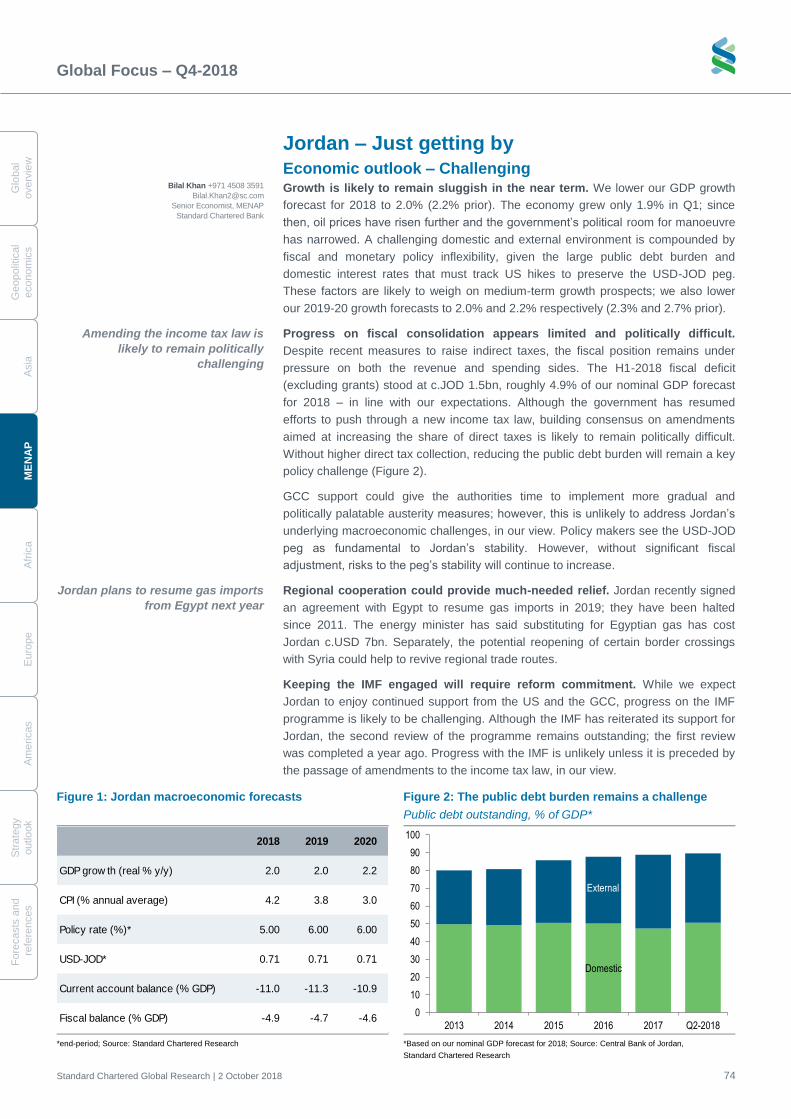
Global Focus – Q4-2018
Standard Chartered Global Research | 2 October 2018 74
G
lobal
overv
iew
Geopolit
ical
econom
ics
A
sia
M
EN
AP
A
fric
a
E
uro
pe
A
me
ricas
S
trate
gy
o
utlo
ok
Fo
recasts
and
re
fere
nces
Jordan – Just getting by
Economic outlook – Challenging Growth is likely to remain sluggish in the near term. We lower our GDP growth
forecast for 2018 to 2.0% (2.2% prior). The economy grew only 1.9% in Q1; since
then, oil prices have risen further and the government’s political room for manoeuvre
has narrowed. A challenging domestic and external environment is compounded by
fiscal and monetary policy inflexibility, given the large public debt burden and
domestic interest rates that must track US hikes to preserve the USD-JOD peg.
These factors are likely to weigh on medium-term growth prospects; we also lower
our 2019-20 growth forecasts to 2.0% and 2.2% respectively (2.3% and 2.7% prior).
Progress on fiscal consolidation appears limited and politically difficult.
Despite recent measures to raise indirect taxes, the fiscal position remains under
pressure on both the revenue and spending sides. The H1-2018 fiscal deficit
(excluding grants) stood at c.JOD 1.5bn, roughly 4.9% of our nominal GDP forecast
for 2018 – in line with our expectations. Although the government has resumed
efforts to push through a new income tax law, building consensus on amendments
aimed at increasing the share of direct taxes is likely to remain politically difficult.
Without higher direct tax collection, reducing the public debt burden will remain a key
policy challenge (Figure 2).
GCC support could give the authorities time to implement more gradual and
politically palatable austerity measures; however, this is unlikely to address Jordan’s
underlying macroeconomic challenges, in our view. Policy makers see the USD-JOD
peg as fundamental to Jordan’s stability. However, without significant fiscal
adjustment, risks to the peg’s stability will continue to increase.
Regional cooperation could provide much-needed relief. Jordan recently signed
an agreement with Egypt to resume gas imports in 2019; they have been halted
since 2011. The energy minister has said substituting for Egyptian gas has cost
Jordan c.USD 7bn. Separately, the potential reopening of certain border crossings
with Syria could help to revive regional trade routes.
Keeping the IMF engaged will require reform commitment. While we expect
Jordan to enjoy continued support from the US and the GCC, progress on the IMF
programme is likely to be challenging. Although the IMF has reiterated its support for
Jordan, the second review of the programme remains outstanding; the first review
was completed a year ago. Progress with the IMF is unlikely unless it is preceded by
the passage of amendments to the income tax law, in our view.
Figure 1: Jordan macroeconomic forecasts Figure 2: The public debt burden remains a challenge
Public debt outstanding, % of GDP*
*end-period; Source: Standard Chartered Research *Based on our nominal GDP forecast for 2018; Source: Central Bank of Jordan,
Standard Chartered Research
2018 2019 2020
GDP grow th (real % y/y) 2.0 2.0 2.2
CPI (% annual average) 4.2 3.8 3.0
Policy rate (%)* 5.00 6.00 6.00
USD-JOD* 0.71 0.71 0.71
Current account balance (% GDP) -11.0 -11.3 -10.9
Fiscal balance (% GDP) -4.9 -4.7 -4.6
Domestic
External
0
10
20
30
40
50
60
70
80
90
100
2013 2014 2015 2016 2017 Q2-2018
Bilal Khan +971 4508 3591
Senior Economist, MENAP
Standard Chartered Bank
Amending the income tax law is
likely to remain politically
challenging
Jordan plans to resume gas imports
from Egypt next year
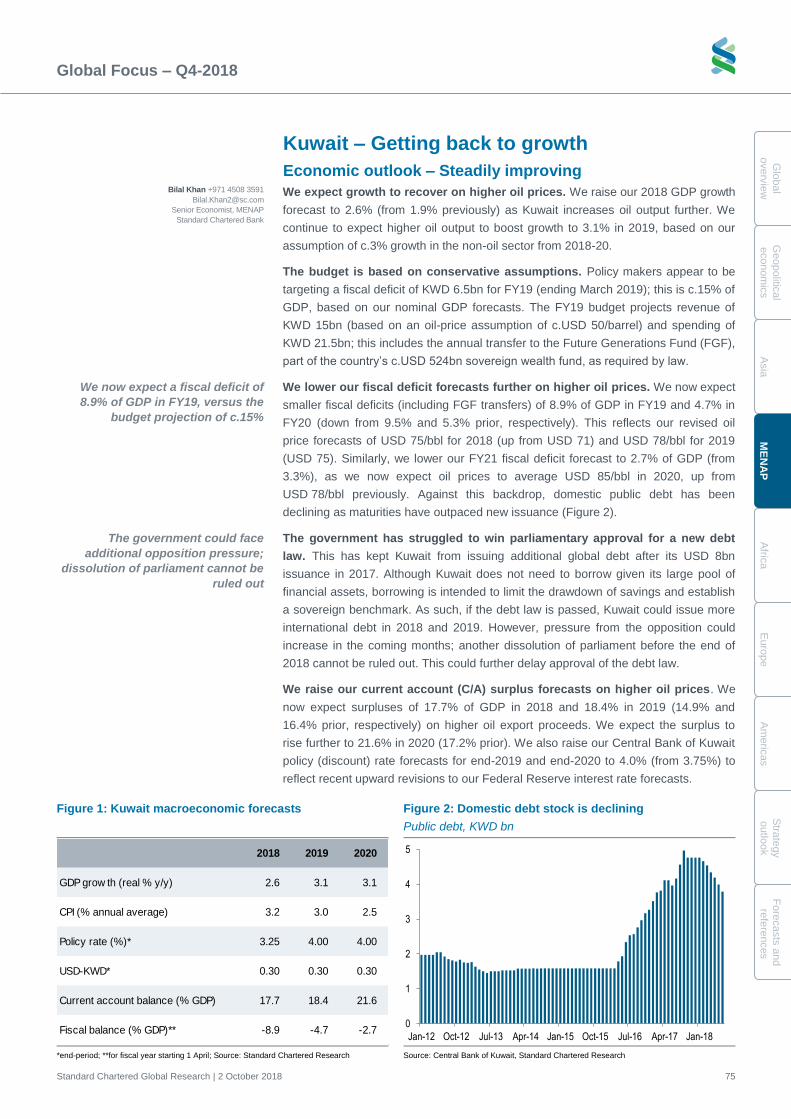
Global Focus – Q4-2018
Standard Chartered Global Research | 2 October 2018 75
Glo
bal
overv
iew
G
eopolitic
al
econom
ics
A
sia
ME
NA
P
A
frica
E
uro
pe
A
me
ricas
Stra
tegy
outlo
ok
Fo
recasts
and
refe
rences
Kuwait – Getting back to growth
Economic outlook – Steadily improving
We expect growth to recover on higher oil prices. We raise our 2018 GDP growth
forecast to 2.6% (from 1.9% previously) as Kuwait increases oil output further. We
continue to expect higher oil output to boost growth to 3.1% in 2019, based on our
assumption of c.3% growth in the non-oil sector from 2018-20.
The budget is based on conservative assumptions. Policy makers appear to be
targeting a fiscal deficit of KWD 6.5bn for FY19 (ending March 2019); this is c.15% of
GDP, based on our nominal GDP forecasts. The FY19 budget projects revenue of
KWD 15bn (based on an oil-price assumption of c.USD 50/barrel) and spending of
KWD 21.5bn; this includes the annual transfer to the Future Generations Fund (FGF),
part of the country’s c.USD 524bn sovereign wealth fund, as required by law.
We lower our fiscal deficit forecasts further on higher oil prices. We now expect
smaller fiscal deficits (including FGF transfers) of 8.9% of GDP in FY19 and 4.7% in
FY20 (down from 9.5% and 5.3% prior, respectively). This reflects our revised oil
price forecasts of USD 75/bbl for 2018 (up from USD 71) and USD 78/bbl for 2019
(USD 75). Similarly, we lower our FY21 fiscal deficit forecast to 2.7% of GDP (from
3.3%), as we now expect oil prices to average USD 85/bbl in 2020, up from
USD 78/bbl previously. Against this backdrop, domestic public debt has been
declining as maturities have outpaced new issuance (Figure 2).
The government has struggled to win parliamentary approval for a new debt
law. This has kept Kuwait from issuing additional global debt after its USD 8bn
issuance in 2017. Although Kuwait does not need to borrow given its large pool of
financial assets, borrowing is intended to limit the drawdown of savings and establish
a sovereign benchmark. As such, if the debt law is passed, Kuwait could issue more
international debt in 2018 and 2019. However, pressure from the opposition could
increase in the coming months; another dissolution of parliament before the end of
2018 cannot be ruled out. This could further delay approval of the debt law.
We raise our current account (C/A) surplus forecasts on higher oil prices. We
now expect surpluses of 17.7% of GDP in 2018 and 18.4% in 2019 (14.9% and
16.4% prior, respectively) on higher oil export proceeds. We expect the surplus to
rise further to 21.6% in 2020 (17.2% prior). We also raise our Central Bank of Kuwait
policy (discount) rate forecasts for end-2019 and end-2020 to 4.0% (from 3.75%) to
reflect recent upward revisions to our Federal Reserve interest rate forecasts.
Figure 1: Kuwait macroeconomic forecasts Figure 2: Domestic debt stock is declining
Public debt, KWD bn
*end-period; **for fiscal year starting 1 April; Source: Standard Chartered Research Source: Central Bank of Kuwait, Standard Chartered Research
2018 2019 2020
GDP grow th (real % y/y) 2.6 3.1 3.1
CPI (% annual average) 3.2 3.0 2.5
Policy rate (%)* 3.25 4.00 4.00
USD-KWD* 0.30 0.30 0.30
Current account balance (% GDP) 17.7 18.4 21.6
Fiscal balance (% GDP)** -8.9 -4.7 -2.70
1
2
3
4
5
Jan-12 Oct-12 Jul-13 Apr-14 Jan-15 Oct-15 Jul-16 Apr-17 Jan-18
We now expect a fiscal deficit of
8.9% of GDP in FY19, versus the
budget projection of c.15%
Bilal Khan +971 4508 3591
Senior Economist, MENAP
Standard Chartered Bank
The government could face
additional opposition pressure;
dissolution of parliament cannot be
ruled out
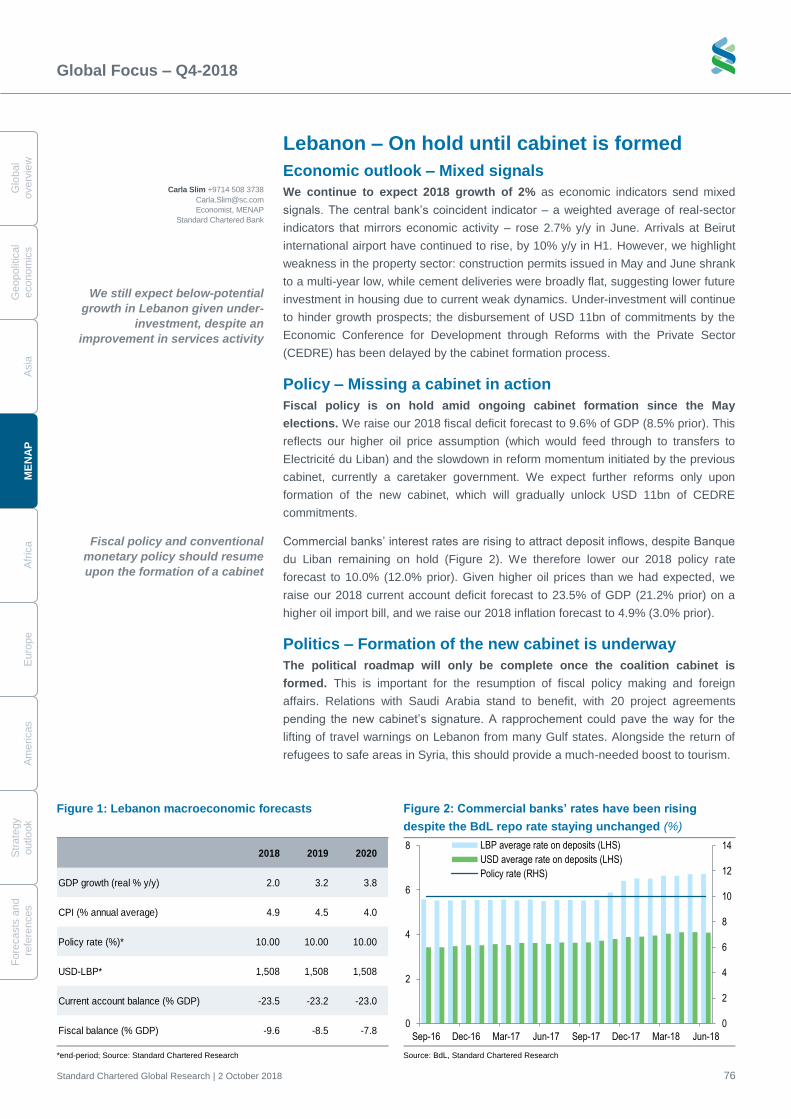
Global Focus – Q4-2018
Standard Chartered Global Research | 2 October 2018 76
G
lobal
overv
iew
Geopolit
ical
econom
ics
A
sia
M
EN
AP
A
fric
a
E
uro
pe
A
me
ricas
S
trate
gy
o
utlo
ok
Fo
recasts
and
re
fere
nces
Lebanon – On hold until cabinet is formed
Economic outlook – Mixed signals
We continue to expect 2018 growth of 2% as economic indicators send mixed
signals. The central bank’s coincident indicator – a weighted average of real-sector
indicators that mirrors economic activity – rose 2.7% y/y in June. Arrivals at Beirut
international airport have continued to rise, by 10% y/y in H1. However, we highlight
weakness in the property sector: construction permits issued in May and June shrank
to a multi-year low, while cement deliveries were broadly flat, suggesting lower future
investment in housing due to current weak dynamics. Under-investment will continue
to hinder growth prospects; the disbursement of USD 11bn of commitments by the
Economic Conference for Development through Reforms with the Private Sector
(CEDRE) has been delayed by the cabinet formation process.
Policy – Missing a cabinet in action
Fiscal policy is on hold amid ongoing cabinet formation since the May
elections. We raise our 2018 fiscal deficit forecast to 9.6% of GDP (8.5% prior). This
reflects our higher oil price assumption (which would feed through to transfers to
Electricité du Liban) and the slowdown in reform momentum initiated by the previous
cabinet, currently a caretaker government. We expect further reforms only upon
formation of the new cabinet, which will gradually unlock USD 11bn of CEDRE
commitments.
Commercial banks’ interest rates are rising to attract deposit inflows, despite Banque
du Liban remaining on hold (Figure 2). We therefore lower our 2018 policy rate
forecast to 10.0% (12.0% prior). Given higher oil prices than we had expected, we
raise our 2018 current account deficit forecast to 23.5% of GDP (21.2% prior) on a
higher oil import bill, and we raise our 2018 inflation forecast to 4.9% (3.0% prior).
Politics – Formation of the new cabinet is underway
The political roadmap will only be complete once the coalition cabinet is
formed. This is important for the resumption of fiscal policy making and foreign
affairs. Relations with Saudi Arabia stand to benefit, with 20 project agreements
pending the new cabinet’s signature. A rapprochement could pave the way for the
lifting of travel warnings on Lebanon from many Gulf states. Alongside the return of
refugees to safe areas in Syria, this should provide a much-needed boost to tourism.
Figure 1: Lebanon macroeconomic forecasts Figure 2: Commercial banks’ rates have been rising
despite the BdL repo rate staying unchanged (%)
*end-period; Source: Standard Chartered Research Source: BdL, Standard Chartered Research
2018 2019 2020
GDP growth (real % y/y) 2.0 3.2 3.8
CPI (% annual average) 4.9 4.5 4.0
Policy rate (%)* 10.00 10.00 10.00
USD-LBP* 1,508 1,508 1,508
Current account balance (% GDP) -23.5 -23.2 -23.0
Fiscal balance (% GDP) -9.6 -8.5 -7.80
2
4
6
8
10
12
14
0
2
4
6
8
Sep-16 Dec-16 Mar-17 Jun-17 Sep-17 Dec-17 Mar-18 Jun-18
LBP average rate on deposits (LHS)
USD average rate on deposits (LHS)
Policy rate (RHS)
We still expect below-potential
growth in Lebanon given under-
investment, despite an
improvement in services activity
Carla Slim +9714 508 3738
Economist, MENAP
Standard Chartered Bank
Fiscal policy and conventional
monetary policy should resume
upon the formation of a cabinet
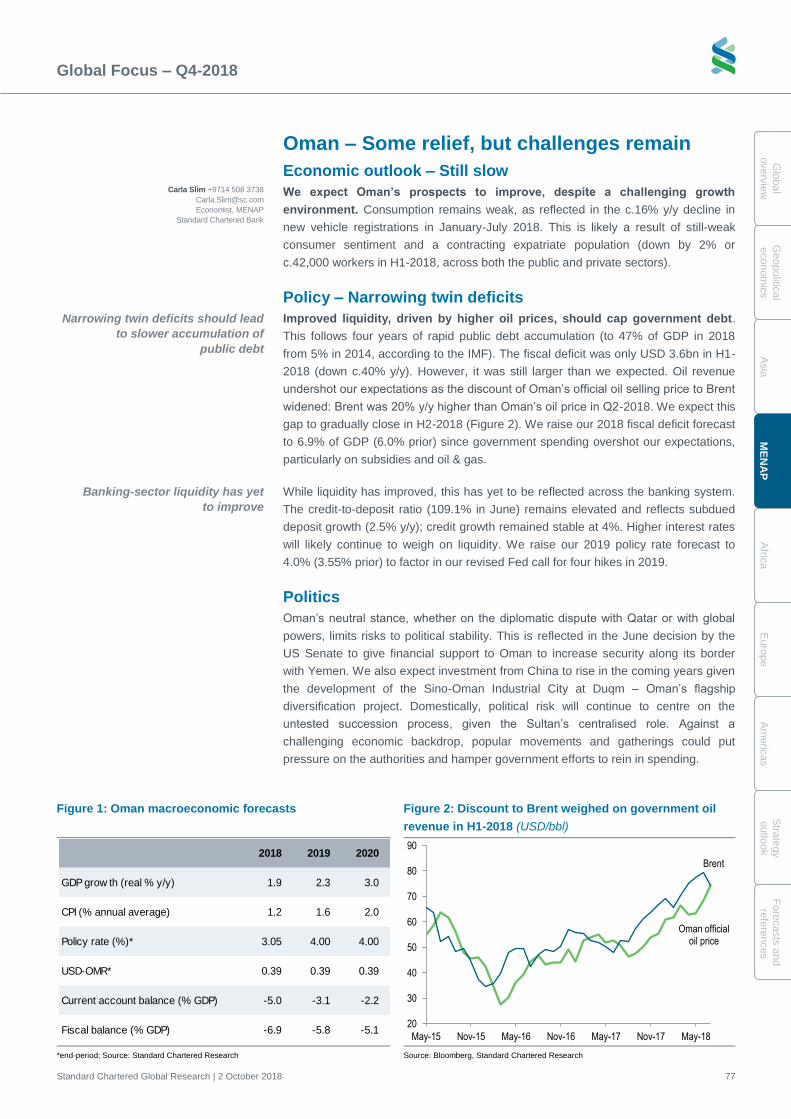
Global Focus – Q4-2018
Standard Chartered Global Research | 2 October 2018 77
Glo
bal
overv
iew
G
eopolitic
al
econom
ics
A
sia
ME
NA
P
A
frica
E
uro
pe
A
me
ricas
Stra
tegy
outlo
ok
Fo
recasts
and
refe
rences
Oman – Some relief, but challenges remain
Economic outlook – Still slow
We expect Oman’s prospects to improve, despite a challenging growth
environment. Consumption remains weak, as reflected in the c.16% y/y decline in
new vehicle registrations in January-July 2018. This is likely a result of still-weak
consumer sentiment and a contracting expatriate population (down by 2% or
c.42,000 workers in H1-2018, across both the public and private sectors).
Policy – Narrowing twin deficits
Improved liquidity, driven by higher oil prices, should cap government debt.
This follows four years of rapid public debt accumulation (to 47% of GDP in 2018
from 5% in 2014, according to the IMF). The fiscal deficit was only USD 3.6bn in H1-
2018 (down c.40% y/y). However, it was still larger than we expected. Oil revenue
undershot our expectations as the discount of Oman’s official oil selling price to Brent
widened: Brent was 20% y/y higher than Oman’s oil price in Q2-2018. We expect this
gap to gradually close in H2-2018 (Figure 2). We raise our 2018 fiscal deficit forecast
to 6.9% of GDP (6.0% prior) since government spending overshot our expectations,
particularly on subsidies and oil & gas.
While liquidity has improved, this has yet to be reflected across the banking system.
The credit-to-deposit ratio (109.1% in June) remains elevated and reflects subdued
deposit growth (2.5% y/y); credit growth remained stable at 4%. Higher interest rates
will likely continue to weigh on liquidity. We raise our 2019 policy rate forecast to
4.0% (3.55% prior) to factor in our revised Fed call for four hikes in 2019.
Politics
Oman’s neutral stance, whether on the diplomatic dispute with Qatar or with global
powers, limits risks to political stability. This is reflected in the June decision by the
US Senate to give financial support to Oman to increase security along its border
with Yemen. We also expect investment from China to rise in the coming years given
the development of the Sino-Oman Industrial City at Duqm – Oman’s flagship
diversification project. Domestically, political risk will continue to centre on the
untested succession process, given the Sultan’s centralised role. Against a
challenging economic backdrop, popular movements and gatherings could put
pressure on the authorities and hamper government efforts to rein in spending.
Figure 1: Oman macroeconomic forecasts Figure 2: Discount to Brent weighed on government oil
revenue in H1-2018 (USD/bbl)
*end-period; Source: Standard Chartered Research Source: Bloomberg, Standard Chartered Research
2018 2019 2020
GDP grow th (real % y/y) 1.9 2.3 3.0
CPI (% annual average) 1.2 1.6 2.0
Policy rate (%)* 3.05 4.00 4.00
USD-OMR* 0.39 0.39 0.39
Current account balance (% GDP) -5.0 -3.1 -2.2
Fiscal balance (% GDP) -6.9 -5.8 -5.1
Oman official oil price
Brent
20
30
40
50
60
70
80
90
May-15 Nov-15 May-16 Nov-16 May-17 Nov-17 May-18
Narrowing twin deficits should lead
to slower accumulation of
public debt
Carla Slim +9714 508 3738
Economist, MENAP
Standard Chartered Bank
Banking-sector liquidity has yet
to improve
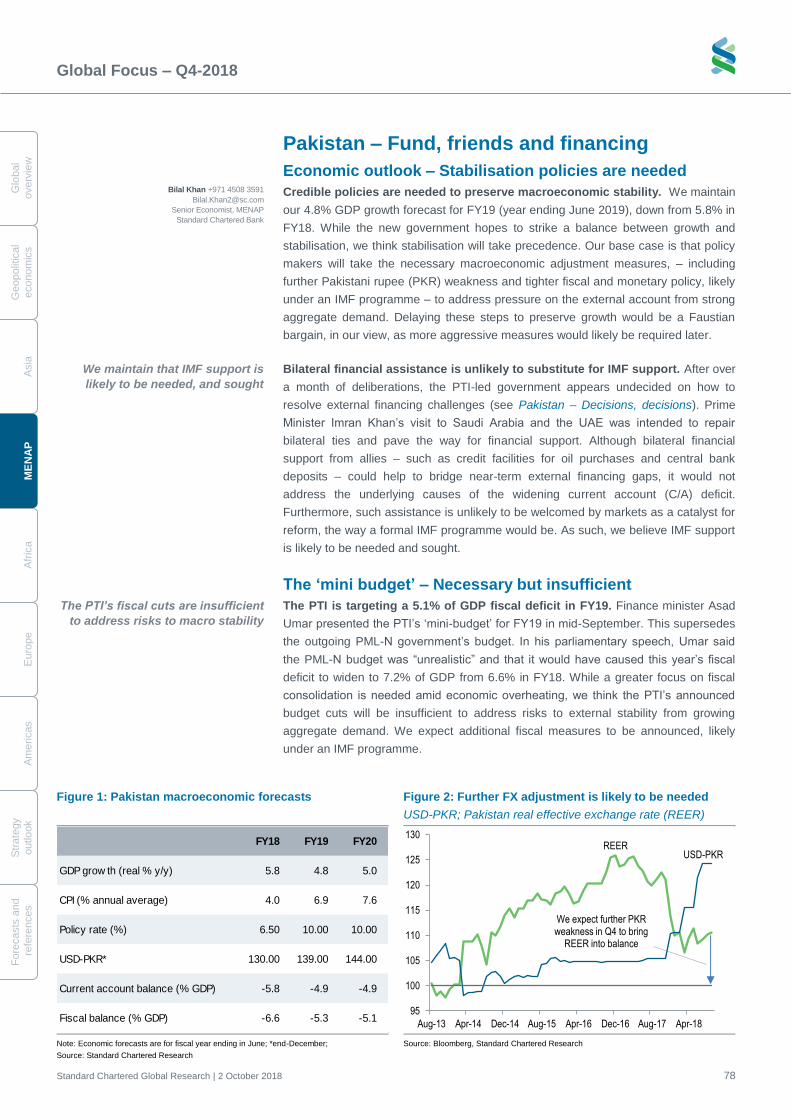
Global Focus – Q4-2018
Standard Chartered Global Research | 2 October 2018 78
G
lobal
overv
iew
Geopolit
ical
econom
ics
A
sia
M
EN
AP
A
fric
a
E
uro
pe
A
me
ricas
S
trate
gy
o
utlo
ok
Fo
recasts
and
re
fere
nces
Pakistan – Fund, friends and financing
Economic outlook – Stabilisation policies are needed
Credible policies are needed to preserve macroeconomic stability. We maintain
our 4.8% GDP growth forecast for FY19 (year ending June 2019), down from 5.8% in
FY18. While the new government hopes to strike a balance between growth and
stabilisation, we think stabilisation will take precedence. Our base case is that policy
makers will take the necessary macroeconomic adjustment measures, – including
further Pakistani rupee (PKR) weakness and tighter fiscal and monetary policy, likely
under an IMF programme – to address pressure on the external account from strong
aggregate demand. Delaying these steps to preserve growth would be a Faustian
bargain, in our view, as more aggressive measures would likely be required later.
Bilateral financial assistance is unlikely to substitute for IMF support. After over
a month of deliberations, the PTI-led government appears undecided on how to
resolve external financing challenges (see Pakistan – Decisions, decisions). Prime
Minister Imran Khan’s visit to Saudi Arabia and the UAE was intended to repair
bilateral ties and pave the way for financial support. Although bilateral financial
support from allies – such as credit facilities for oil purchases and central bank
deposits – could help to bridge near-term external financing gaps, it would not
address the underlying causes of the widening current account (C/A) deficit.
Furthermore, such assistance is unlikely to be welcomed by markets as a catalyst for
reform, the way a formal IMF programme would be. As such, we believe IMF support
is likely to be needed and sought.
The ‘mini budget’ – Necessary but insufficient
The PTI is targeting a 5.1% of GDP fiscal deficit in FY19. Finance minister Asad
Umar presented the PTI’s ‘mini-budget’ for FY19 in mid-September. This supersedes
the outgoing PML-N government’s budget. In his parliamentary speech, Umar said
the PML-N budget was “unrealistic” and that it would have caused this year’s fiscal
deficit to widen to 7.2% of GDP from 6.6% in FY18. While a greater focus on fiscal
consolidation is needed amid economic overheating, we think the PTI’s announced
budget cuts will be insufficient to address risks to external stability from growing
aggregate demand. We expect additional fiscal measures to be announced, likely
under an IMF programme.
Figure 1: Pakistan macroeconomic forecasts Figure 2: Further FX adjustment is likely to be needed
USD-PKR; Pakistan real effective exchange rate (REER)
Note: Economic forecasts are for fiscal year ending in June; *end-December;
Source: Standard Chartered Research
Source: Bloomberg, Standard Chartered Research
FY18 FY19 FY20
GDP grow th (real % y/y) 5.8 4.8 5.0
CPI (% annual average) 4.0 6.9 7.6
Policy rate (%) 6.50 10.00 10.00
USD-PKR* 130.00 139.00 144.00
Current account balance (% GDP) -5.8 -4.9 -4.9
Fiscal balance (% GDP) -6.6 -5.3 -5.1
REERUSD-PKR
95
100
105
110
115
120
125
130
Aug-13 Apr-14 Dec-14 Aug-15 Apr-16 Dec-16 Aug-17 Apr-18
We expect further PKR weakness in Q4 to bring
REER into balance
Bilal Khan +971 4508 3591
Senior Economist, MENAP
Standard Chartered Bank
The PTI’s fiscal cuts are insufficient
to address risks to macro stability
We maintain that IMF support is
likely to be needed, and sought
Global Focus – Q4-2018
Standard Chartered Global Research | 2 October 2018 79
Glo
bal
overv
iew
G
eopolitic
al
econom
ics
A
sia
ME
NA
P
A
frica
E
uro
pe
A
me
ricas
Stra
tegy
outlo
ok
Fo
recasts
and
refe
rences
External-sector challenges leave little room for manoeuvre Supporting FX reserves has caused central bank liabilities to rise sharply. We
focus on net international reserves (NIR) rather than gross FX reserves, as we think they
are a better indicator of the underlying FX reserve buffer given the central bank’s large
swap and forward positions with commercial banks. Accounting for FX liabilities, which
rose further after the State Bank of Pakistan (SBP) drew on the enhanced bilateral swap
line with the People’s Bank of China in Q2, we estimate that NIR declined to c.-USD
6.7bn in June. Gross FX reserves stood at USD 9.3bn as of 14 September.
C/A deficit to narrow on stabilisation focus. Umar has been quoted in the media
as saying that the FY19 C/A deficit would reach USD 21bn without the government’s
corrective measures through the mini-budget. This would translate into a deficit of
6.6% of GDP, based on our nominal GDP estimates. We expect further fiscal cuts,
along with tighter monetary policy and a weaker Pakistani rupee (PKR), to narrow the
C/A deficit. Although our C/A deficit forecasts for FY19 and FY20 remain unchanged
in USD terms, they now correspond to 4.9% of GDP for both years (versus 4.7% and
4.6% prior, respectively) due to revisions to our USD-PKR forecasts.
IMF support is likely to be agreed soon We expect Pakistan to seek an IMF programme, despite bilateral financial support
from the GCC and growing engagement with China. Based on Pakistan’s country
quota, a potential programme would be similar in size to the USD 6.6bn Extended
Fund Facility (EFF) concluded in September 2016. However, it could be significantly
larger should the IMF give Pakistan exceptional access to funding. This is likely to be
needed given the scale of Pakistan’s financing requirements. It is in the IMF’s interest
to play a role in Pakistan’s macroeconomic policy making, given its exposure to
Pakistan from the previous EFF.
We see further PKR weakness, higher inflation and tighter monetary policy. An
IMF agreement is likely to require further FX adjustment and greater exchange rate
flexibility. We see upside risks to our 130 forecast for end-2018 should a bigger
upfront FX adjustment be an IMF precondition. We raise our USD-PKR forecasts to
139 and 144 for end-2019 and 2020, respectively (135 and 140 prior). We also
recently raised our global oil price forecasts to USD 78/barrel (bbl) for 2019 and USD
85/bbl for 2020. A weaker PKR and higher oil import costs are likely to push domestic
inflation higher via first and second-round effects. Higher indirect taxes are likely to
put upward pressure on CPI inflation. To account for these factors, we raise our
average inflation forecasts for FY19 and FY20 to 6.9% and 7.6% (6.3% and 6.8%
prior). We expect rising inflation and the focus on stabilisation to lead to tighter
monetary policy. As such, we raise our SBP policy rate forecasts to 10% for end-
FY19 and FY20 (8.5% prior).
A geopolitical hotspot China and the US are vying for influence in Pakistan. The US has expressed
concerns about the implementation of the China-Pakistan Economic Corridor (CPEC)
in Pakistan. Secretary of State Mike Pompeo has warned that the US would not
support an IMF programme request by Pakistan if the funds were used to repay
Chinese lenders. While he subsequently said the US would not block an IMF bailout
request, we think greater transparency on CPEC agreements will be a key condition
for US support of an IMF programme request from Pakistan.
The scope, scale and conditions of potential Saudi financial support remain
unclear. Media reports suggest that Pakistan has invited Saudi Arabia to join CPEC. It
is unclear how this would fit with China’s plans in Pakistan. The conditions for Saudi
involvement in CPEC or other bilateral financial support to Pakistan are also unclear;
Khan pledged Pakistan’s commitment to Saudi security during his September visit.
We expect the C/A deficit to narrow
to 4.9% of GDP in FY19
The central bank’s net reserves
declined to -USD 6.7bn in June, by
our estimates
A potential IMF programme could
be larger than Pakistan’s country
quota suggests
Greater transparency on CPEC
projects is likely to be a key US
condition for supporting an IMF
programme
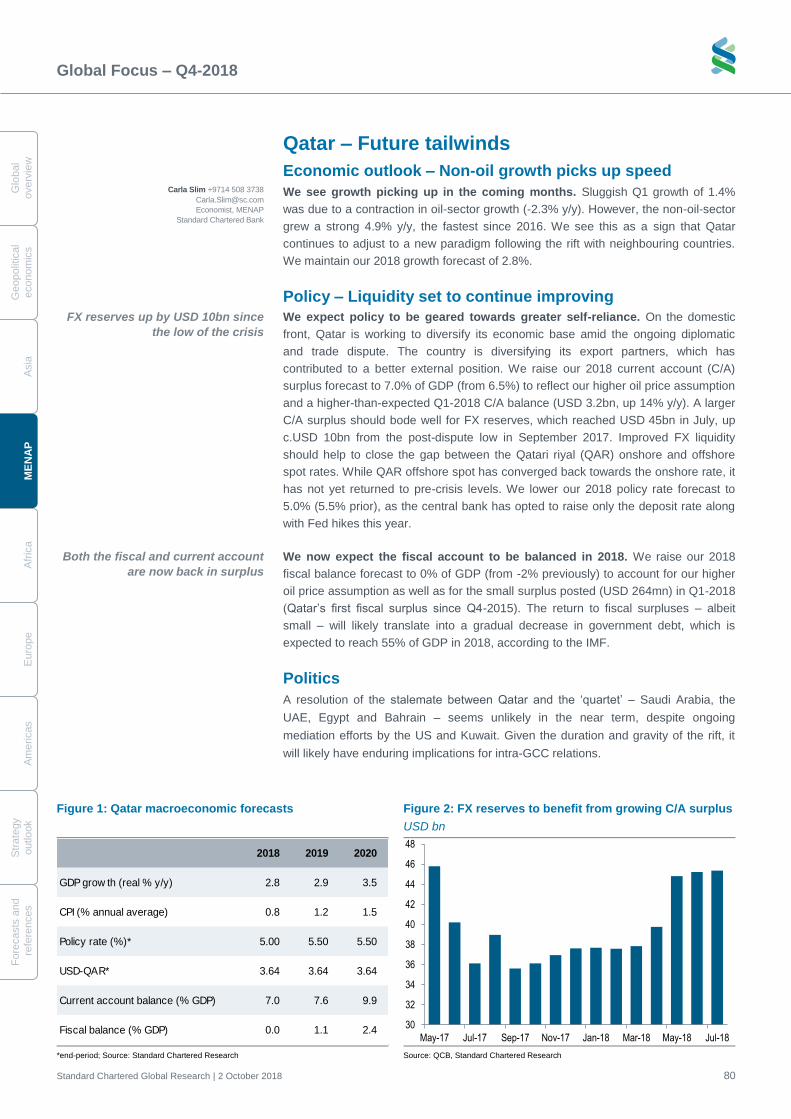
Global Focus – Q4-2018
Standard Chartered Global Research | 2 October 2018 80
G
lobal
overv
iew
Geopolit
ical
econom
ics
A
sia
M
EN
AP
A
fric
a
E
uro
pe
A
me
ricas
S
trate
gy
o
utlo
ok
Fo
recasts
and
re
fere
nces
Qatar – Future tailwinds
Economic outlook – Non-oil growth picks up speed
We see growth picking up in the coming months. Sluggish Q1 growth of 1.4%
was due to a contraction in oil-sector growth (-2.3% y/y). However, the non-oil-sector
grew a strong 4.9% y/y, the fastest since 2016. We see this as a sign that Qatar
continues to adjust to a new paradigm following the rift with neighbouring countries.
We maintain our 2018 growth forecast of 2.8%.
Policy – Liquidity set to continue improving
We expect policy to be geared towards greater self-reliance. On the domestic
front, Qatar is working to diversify its economic base amid the ongoing diplomatic
and trade dispute. The country is diversifying its export partners, which has
contributed to a better external position. We raise our 2018 current account (C/A)
surplus forecast to 7.0% of GDP (from 6.5%) to reflect our higher oil price assumption
and a higher-than-expected Q1-2018 C/A balance (USD 3.2bn, up 14% y/y). A larger
C/A surplus should bode well for FX reserves, which reached USD 45bn in July, up
c.USD 10bn from the post-dispute low in September 2017. Improved FX liquidity
should help to close the gap between the Qatari riyal (QAR) onshore and offshore
spot rates. While QAR offshore spot has converged back towards the onshore rate, it
has not yet returned to pre-crisis levels. We lower our 2018 policy rate forecast to
5.0% (5.5% prior), as the central bank has opted to raise only the deposit rate along
with Fed hikes this year.
We now expect the fiscal account to be balanced in 2018. We raise our 2018
fiscal balance forecast to 0% of GDP (from -2% previously) to account for our higher
oil price assumption as well as for the small surplus posted (USD 264mn) in Q1-2018
(Qatar’s first fiscal surplus since Q4-2015). The return to fiscal surpluses – albeit
small – will likely translate into a gradual decrease in government debt, which is
expected to reach 55% of GDP in 2018, according to the IMF.
Politics
A resolution of the stalemate between Qatar and the ‘quartet’ – Saudi Arabia, the
UAE, Egypt and Bahrain – seems unlikely in the near term, despite ongoing
mediation efforts by the US and Kuwait. Given the duration and gravity of the rift, it
will likely have enduring implications for intra-GCC relations.
Figure 1: Qatar macroeconomic forecasts Figure 2: FX reserves to benefit from growing C/A surplus
USD bn
*end-period; Source: Standard Chartered Research Source: QCB, Standard Chartered Research
2018 2019 2020
GDP grow th (real % y/y) 2.8 2.9 3.5
CPI (% annual average) 0.8 1.2 1.5
Policy rate (%)* 5.00 5.50 5.50
USD-QAR* 3.64 3.64 3.64
Current account balance (% GDP) 7.0 7.6 9.9
Fiscal balance (% GDP) 0.0 1.1 2.430
32
34
36
38
40
42
44
46
48
May-17 Jul-17 Sep-17 Nov-17 Jan-18 Mar-18 May-18 Jul-18
FX reserves up by USD 10bn since
the low of the crisis
Carla Slim +9714 508 3738
Economist, MENAP
Standard Chartered Bank
Both the fiscal and current account
are now back in surplus
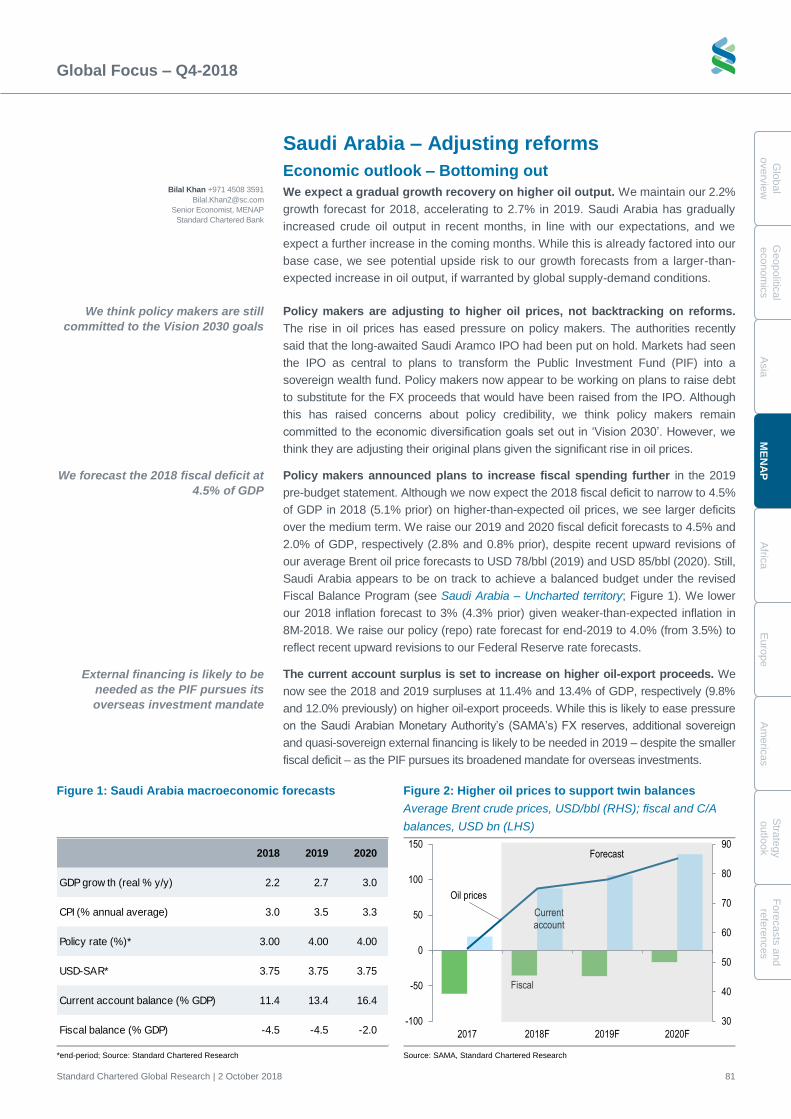
Global Focus – Q4-2018
Standard Chartered Global Research | 2 October 2018 81
Glo
bal
overv
iew
G
eopolitic
al
econom
ics
A
sia
ME
NA
P
A
frica
E
uro
pe
A
me
ricas
Stra
tegy
outlo
ok
Fo
recasts
and
refe
rences
Saudi Arabia – Adjusting reforms
Economic outlook – Bottoming out
We expect a gradual growth recovery on higher oil output. We maintain our 2.2%
growth forecast for 2018, accelerating to 2.7% in 2019. Saudi Arabia has gradually
increased crude oil output in recent months, in line with our expectations, and we
expect a further increase in the coming months. While this is already factored into our
base case, we see potential upside risk to our growth forecasts from a larger-than-
expected increase in oil output, if warranted by global supply-demand conditions.
Policy makers are adjusting to higher oil prices, not backtracking on reforms.
The rise in oil prices has eased pressure on policy makers. The authorities recently
said that the long-awaited Saudi Aramco IPO had been put on hold. Markets had seen
the IPO as central to plans to transform the Public Investment Fund (PIF) into a
sovereign wealth fund. Policy makers now appear to be working on plans to raise debt
to substitute for the FX proceeds that would have been raised from the IPO. Although
this has raised concerns about policy credibility, we think policy makers remain
committed to the economic diversification goals set out in ‘Vision 2030’. However, we
think they are adjusting their original plans given the significant rise in oil prices.
Policy makers announced plans to increase fiscal spending further in the 2019
pre-budget statement. Although we now expect the 2018 fiscal deficit to narrow to 4.5%
of GDP in 2018 (5.1% prior) on higher-than-expected oil prices, we see larger deficits
over the medium term. We raise our 2019 and 2020 fiscal deficit forecasts to 4.5% and
2.0% of GDP, respectively (2.8% and 0.8% prior), despite recent upward revisions of
our average Brent oil price forecasts to USD 78/bbl (2019) and USD 85/bbl (2020). Still,
Saudi Arabia appears to be on track to achieve a balanced budget under the revised
Fiscal Balance Program (see Saudi Arabia – Uncharted territory; Figure 1). We lower
our 2018 inflation forecast to 3% (4.3% prior) given weaker-than-expected inflation in
8M-2018. We raise our policy (repo) rate forecast for end-2019 to 4.0% (from 3.5%) to
reflect recent upward revisions to our Federal Reserve rate forecasts.
The current account surplus is set to increase on higher oil-export proceeds. We
now see the 2018 and 2019 surpluses at 11.4% and 13.4% of GDP, respectively (9.8%
and 12.0% previously) on higher oil-export proceeds. While this is likely to ease pressure
on the Saudi Arabian Monetary Authority’s (SAMA’s) FX reserves, additional sovereign
and quasi-sovereign external financing is likely to be needed in 2019 – despite the smaller
fiscal deficit – as the PIF pursues its broadened mandate for overseas investments.
Figure 1: Saudi Arabia macroeconomic forecasts Figure 2: Higher oil prices to support twin balances
Average Brent crude prices, USD/bbl (RHS); fiscal and C/A
balances, USD bn (LHS)
*end-period; Source: Standard Chartered Research Source: SAMA, Standard Chartered Research
2018 2019 2020
GDP grow th (real % y/y) 2.2 2.7 3.0
CPI (% annual average) 3.0 3.5 3.3
Policy rate (%)* 3.00 4.00 4.00
USD-SAR* 3.75 3.75 3.75
Current account balance (% GDP) 11.4 13.4 16.4
Fiscal balance (% GDP) -4.5 -4.5 -2.0
Fiscal
Current account
Oil prices
30
40
50
60
70
80
90
-100
-50
0
50
100
150
2017 2018F 2019F 2020F
Forecast
Bilal Khan +971 4508 3591
Senior Economist, MENAP
Standard Chartered Bank
We forecast the 2018 fiscal deficit at
4.5% of GDP
We think policy makers are still
committed to the Vision 2030 goals
External financing is likely to be
needed as the PIF pursues its
overseas investment mandate
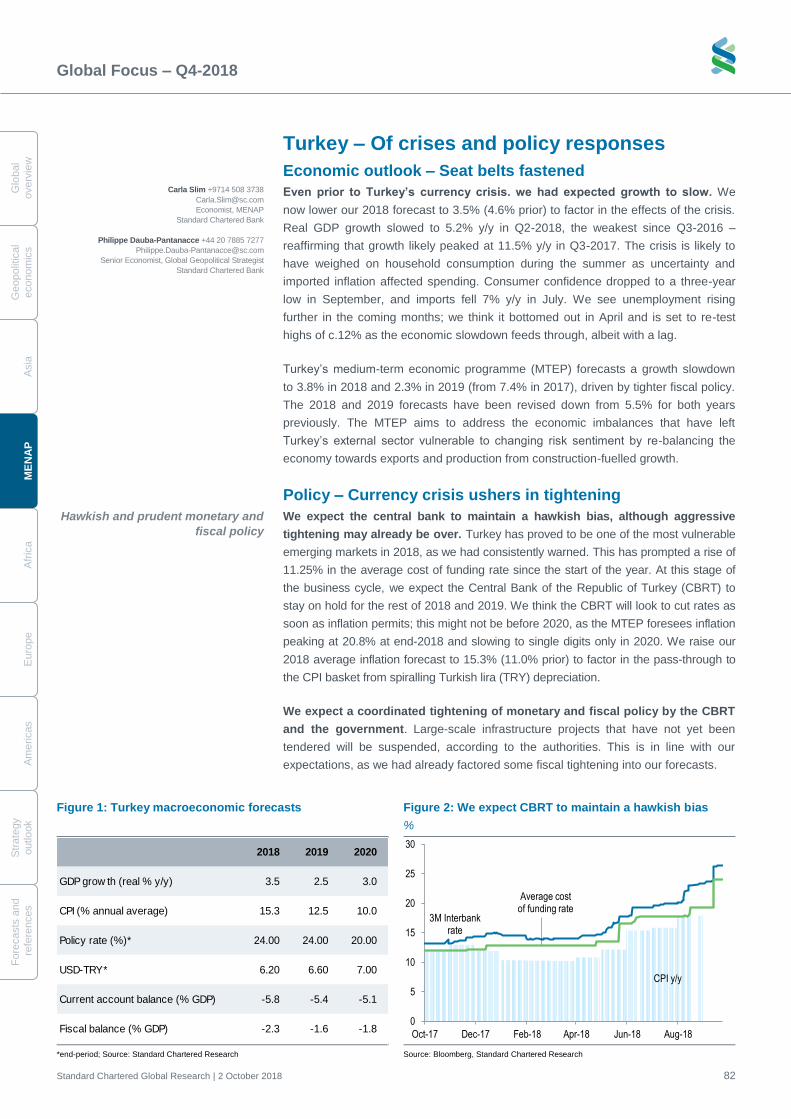
Global Focus – Q4-2018
Standard Chartered Global Research | 2 October 2018 82
G
lobal
overv
iew
Geopolit
ical
econom
ics
A
sia
M
EN
AP
A
fric
a
E
uro
pe
A
me
ricas
S
trate
gy
o
utlo
ok
Fo
recasts
and
re
fere
nces
Turkey – Of crises and policy responses
Economic outlook – Seat belts fastened
Even prior to Turkey’s currency crisis. we had expected growth to slow. We
now lower our 2018 forecast to 3.5% (4.6% prior) to factor in the effects of the crisis.
Real GDP growth slowed to 5.2% y/y in Q2-2018, the weakest since Q3-2016 –
reaffirming that growth likely peaked at 11.5% y/y in Q3-2017. The crisis is likely to
have weighed on household consumption during the summer as uncertainty and
imported inflation affected spending. Consumer confidence dropped to a three-year
low in September, and imports fell 7% y/y in July. We see unemployment rising
further in the coming months; we think it bottomed out in April and is set to re-test
highs of c.12% as the economic slowdown feeds through, albeit with a lag.
Turkey’s medium-term economic programme (MTEP) forecasts a growth slowdown
to 3.8% in 2018 and 2.3% in 2019 (from 7.4% in 2017), driven by tighter fiscal policy.
The 2018 and 2019 forecasts have been revised down from 5.5% for both years
previously. The MTEP aims to address the economic imbalances that have left
Turkey’s external sector vulnerable to changing risk sentiment by re-balancing the
economy towards exports and production from construction-fuelled growth.
Policy – Currency crisis ushers in tightening
We expect the central bank to maintain a hawkish bias, although aggressive
tightening may already be over. Turkey has proved to be one of the most vulnerable
emerging markets in 2018, as we had consistently warned. This has prompted a rise of
11.25% in the average cost of funding rate since the start of the year. At this stage of
the business cycle, we expect the Central Bank of the Republic of Turkey (CBRT) to
stay on hold for the rest of 2018 and 2019. We think the CBRT will look to cut rates as
soon as inflation permits; this might not be before 2020, as the MTEP foresees inflation
peaking at 20.8% at end-2018 and slowing to single digits only in 2020. We raise our
2018 average inflation forecast to 15.3% (11.0% prior) to factor in the pass-through to
the CPI basket from spiralling Turkish lira (TRY) depreciation.
We expect a coordinated tightening of monetary and fiscal policy by the CBRT
and the government. Large-scale infrastructure projects that have not yet been
tendered will be suspended, according to the authorities. This is in line with our
expectations, as we had already factored some fiscal tightening into our forecasts.
Figure 1: Turkey macroeconomic forecasts Figure 2: We expect CBRT to maintain a hawkish bias
%
*end-period; Source: Standard Chartered Research Source: Bloomberg, Standard Chartered Research
2018 2019 2020
GDP grow th (real % y/y) 3.5 2.5 3.0
CPI (% annual average) 15.3 12.5 10.0
Policy rate (%)* 24.00 24.00 20.00
USD-TRY* 6.20 6.60 7.00
Current account balance (% GDP) -5.8 -5.4 -5.1
Fiscal balance (% GDP) -2.3 -1.6 -1.8
CPI y/y
3M Interbank rate
Average cost of funding rate
0
5
10
15
20
25
30
Oct-17 Dec-17 Feb-18 Apr-18 Jun-18 Aug-18
Carla Slim +9714 508 3738
Economist, MENAP
Standard Chartered Bank
Philippe Dauba-Pantanacce +44 20 7885 7277
Senior Economist, Global Geopolitical Strategist
Standard Chartered Bank
Hawkish and prudent monetary and
fiscal policy
Global Focus – Q4-2018
Standard Chartered Global Research | 2 October 2018 83
Glo
bal
overv
iew
G
eopolitic
al
econom
ics
A
sia
ME
NA
P
A
frica
E
uro
pe
A
me
ricas
Stra
tegy
outlo
ok
Fo
recasts
and
refe
rences
We maintain our 2018 current account (C/A) deficit forecast of 5.8% of GDP,
above the new MTEP target of 4.7%. The C/A deficit for January-July 2018 widened
27% y/y to USD 33bn as import growth outpaced export growth. We welcome efforts
to boost exports under the MTEP, although we think they will take about 18 months
to kick in.
Other issues – Banking-sector pressure points
Leverage had increased across Turkey’s banks, households and corporates; the
corporate sector is the most highly leveraged, at c.70% of GDP in 2017 (see Special
Report, Global leverage – Finding the weak links). Of particular concern is the
corporate foreign-currency debt burden (c.USD 200bn), which has long been a
source of vulnerability, particularly in the context of TRY depreciation. Measures
introduced in Q1-2018 to regulate unhedged FX borrowing by corporates are a
positive step towards reducing vulnerability. A presidential decree published in mid-
September that requires contracts between two local entities to be TRY-denominated
is also positive, in our view.
Corporate debt could spill over to banks’ balance sheets. Even before the crisis,
we expected NPLs to rise from the current low of 3% on economic overheating
fuelled by the Credit Guarantee Fund (TRY 250bn). Following monetary tightening,
we expect credit growth to slow further in the coming months – which might
exacerbate asset-quality deterioration. Concerns also persist over the banking
sector’s reliance on external funding and short-term refinancing risks.
Politics – International tensions ratchet up
Strained relations with the US have become even more acute as Washington
demands that Ankara release US citizen Pastor Andrew Brunson. The US claims that
he is being detained for “hostage diplomacy” purposes, with Turkey continuing to
demand the extradition of US-based preacher Fethullah Gülen.
There are several other points of contention between the two countries. The US has
passed sanctions against two Turkish ministers and imposed tariffs on Turkish
aluminium and steel. It is also proposing a Defence Bill to block the delivery of F-35
fighter jets to Turkey, to retaliate against Turkey’s pledge to buy a Russian S-400
anti-missile system. Moreover, the US is investigating allegations that Turkey – via
individuals and/or banks – evaded US sanctions on Iran. An executive of a Turkish
state bank was convicted in May, and the investigation continues.
Syria further underscores Turkey’s complicated diplomatic position. Ankara has
increased its tactical cooperation with Russia and Iran, but has been at odds with
these countries in Syria, most recently on the Idlib situation. Turkey is fighting Syrian
Kurds, who want an autonomous territory on the Turkish border, while Western allies
have supported them.
On balance, we expect Erdogan to try to engineer a de-escalation with both Europe
and the US. The reality is that Turkey has no real alternatives to these alliances. It is
the second-largest military power in NATO. Europe is by far its largest trading partner
(via the customs union), and indispensable capital flows come mostly from the US
and Europe. Recent aggressive tightening by the central bank – despite Erdogan’s
repeated opposition to high interest rates – suggests that policy makers still have a
capacity for pragmatism in response to external pressure, albeit with a lag.
Corporate debt is the primary
leverage concern
Points of contention with the West –
notably the US – have multiplied
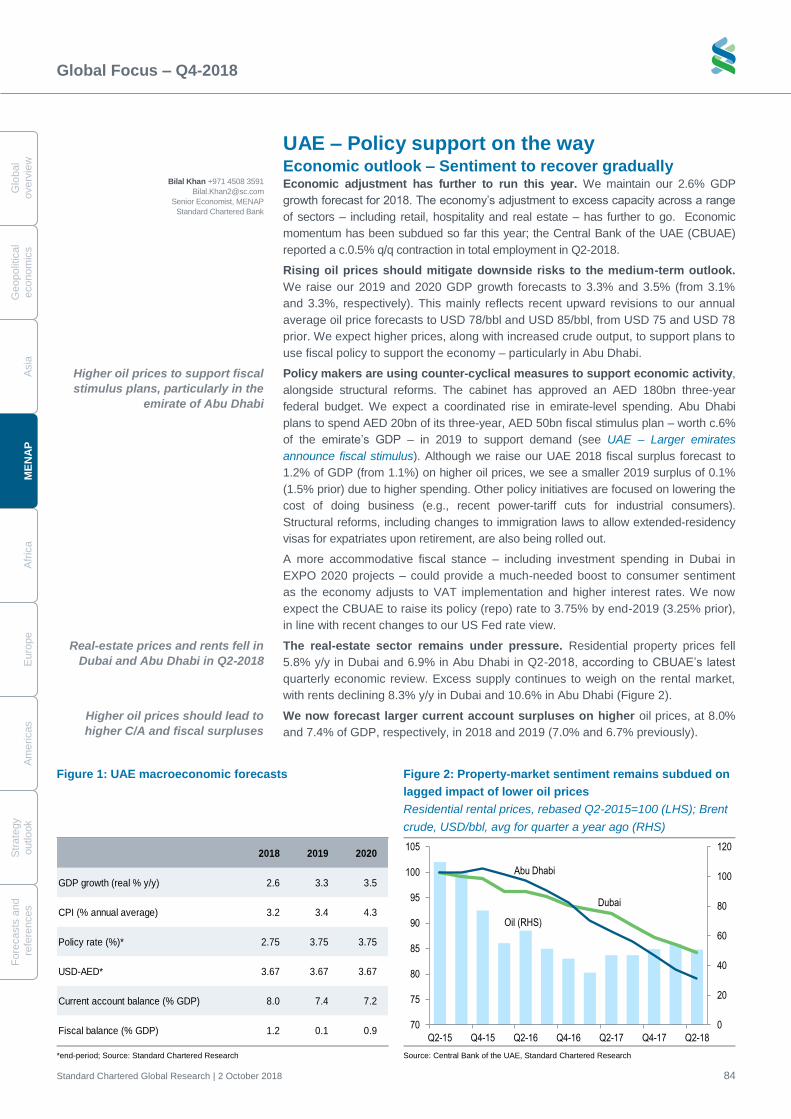
Global Focus – Q4-2018
Standard Chartered Global Research | 2 October 2018 84
G
lobal
overv
iew
Geopolit
ical
econom
ics
A
sia
M
EN
AP
A
fric
a
E
uro
pe
A
me
ricas
S
trate
gy
o
utlo
ok
Fo
recasts
and
re
fere
nces
UAE – Policy support on the way Economic outlook – Sentiment to recover gradually Economic adjustment has further to run this year. We maintain our 2.6% GDP
growth forecast for 2018. The economy’s adjustment to excess capacity across a range
of sectors – including retail, hospitality and real estate – has further to go. Economic
momentum has been subdued so far this year; the Central Bank of the UAE (CBUAE)
reported a c.0.5% q/q contraction in total employment in Q2-2018.
Rising oil prices should mitigate downside risks to the medium-term outlook.
We raise our 2019 and 2020 GDP growth forecasts to 3.3% and 3.5% (from 3.1%
and 3.3%, respectively). This mainly reflects recent upward revisions to our annual
average oil price forecasts to USD 78/bbl and USD 85/bbl, from USD 75 and USD 78
prior. We expect higher prices, along with increased crude output, to support plans to
use fiscal policy to support the economy – particularly in Abu Dhabi.
Policy makers are using counter-cyclical measures to support economic activity,
alongside structural reforms. The cabinet has approved an AED 180bn three-year
federal budget. We expect a coordinated rise in emirate-level spending. Abu Dhabi
plans to spend AED 20bn of its three-year, AED 50bn fiscal stimulus plan – worth c.6%
of the emirate’s GDP – in 2019 to support demand (see UAE – Larger emirates
announce fiscal stimulus). Although we raise our UAE 2018 fiscal surplus forecast to
1.2% of GDP (from 1.1%) on higher oil prices, we see a smaller 2019 surplus of 0.1%
(1.5% prior) due to higher spending. Other policy initiatives are focused on lowering the
cost of doing business (e.g., recent power-tariff cuts for industrial consumers).
Structural reforms, including changes to immigration laws to allow extended-residency
visas for expatriates upon retirement, are also being rolled out.
A more accommodative fiscal stance – including investment spending in Dubai in
EXPO 2020 projects – could provide a much-needed boost to consumer sentiment
as the economy adjusts to VAT implementation and higher interest rates. We now
expect the CBUAE to raise its policy (repo) rate to 3.75% by end-2019 (3.25% prior),
in line with recent changes to our US Fed rate view.
The real-estate sector remains under pressure. Residential property prices fell
5.8% y/y in Dubai and 6.9% in Abu Dhabi in Q2-2018, according to CBUAE’s latest
quarterly economic review. Excess supply continues to weigh on the rental market,
with rents declining 8.3% y/y in Dubai and 10.6% in Abu Dhabi (Figure 2).
We now forecast larger current account surpluses on higher oil prices, at 8.0%
and 7.4% of GDP, respectively, in 2018 and 2019 (7.0% and 6.7% previously).
Figure 1: UAE macroeconomic forecasts Figure 2: Property-market sentiment remains subdued on
lagged impact of lower oil prices
Residential rental prices, rebased Q2-2015=100 (LHS); Brent
crude, USD/bbl, avg for quarter a year ago (RHS)
*end-period; Source: Standard Chartered Research Source: Central Bank of the UAE, Standard Chartered Research
2018 2019 2020
GDP growth (real % y/y) 2.6 3.3 3.5
CPI (% annual average) 3.2 3.4 4.3
Policy rate (%)* 2.75 3.75 3.75
USD-AED* 3.67 3.67 3.67
Current account balance (% GDP) 8.0 7.4 7.2
Fiscal balance (% GDP) 1.2 0.1 0.9
Oil (RHS)
Dubai
Abu Dhabi
0
20
40
60
80
100
120
70
75
80
85
90
95
100
105
Q2-15 Q4-15 Q2-16 Q4-16 Q2-17 Q4-17 Q2-18
Bilal Khan +971 4508 3591
Senior Economist, MENAP
Standard Chartered Bank
Higher oil prices to support fiscal
stimulus plans, particularly in the
emirate of Abu Dhabi
Higher oil prices should lead to
higher C/A and fiscal surpluses
Real-estate prices and rents fell in
Dubai and Abu Dhabi in Q2-2018
Economies – Africa
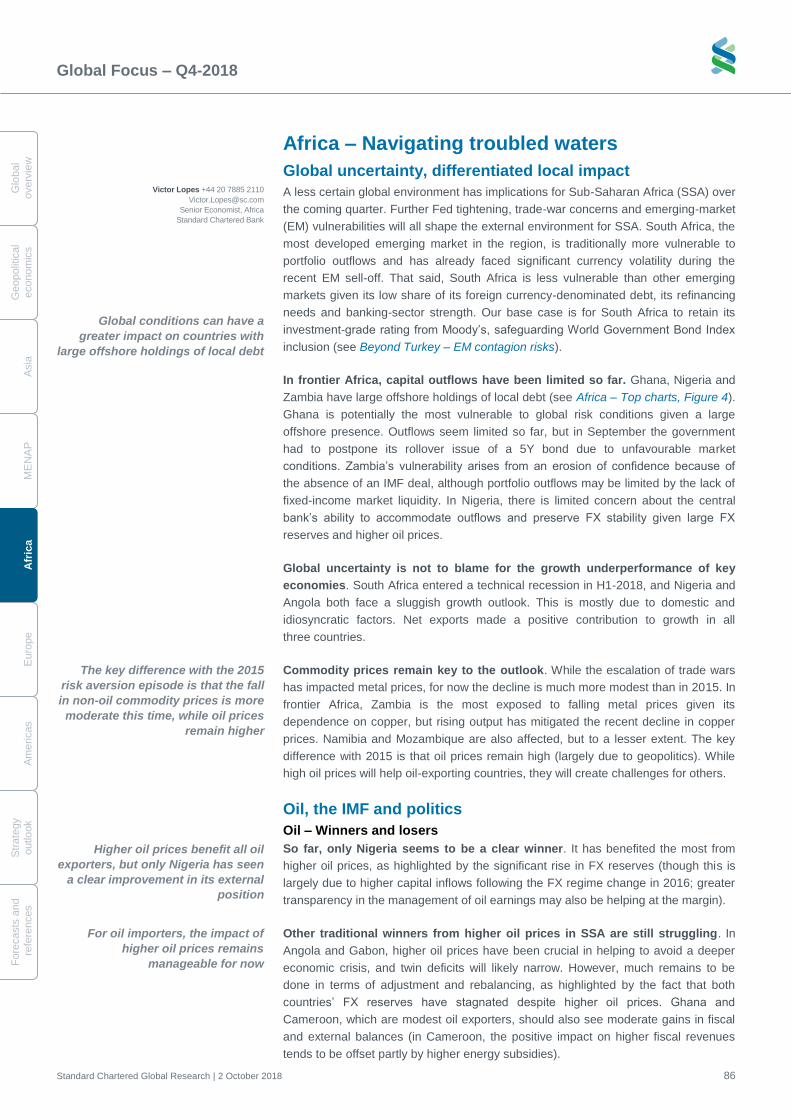
Global Focus – Q4-2018
Standard Chartered Global Research | 2 October 2018 86
G
lobal
overv
iew
Geopolit
ical
econom
ics
A
sia
M
EN
AP
A
fric
a
E
uro
pe
A
me
ricas
S
trate
gy
o
utlo
ok
Fo
recasts
and
re
fere
nces
Africa – Navigating troubled waters
Global uncertainty, differentiated local impact
A less certain global environment has implications for Sub-Saharan Africa (SSA) over
the coming quarter. Further Fed tightening, trade-war concerns and emerging-market
(EM) vulnerabilities will all shape the external environment for SSA. South Africa, the
most developed emerging market in the region, is traditionally more vulnerable to
portfolio outflows and has already faced significant currency volatility during the
recent EM sell-off. That said, South Africa is less vulnerable than other emerging
markets given its low share of its foreign currency-denominated debt, its refinancing
needs and banking-sector strength. Our base case is for South Africa to retain its
investment-grade rating from Moody’s, safeguarding World Government Bond Index
inclusion (see Beyond Turkey – EM contagion risks).
In frontier Africa, capital outflows have been limited so far. Ghana, Nigeria and
Zambia have large offshore holdings of local debt (see Africa – Top charts, Figure 4).
Ghana is potentially the most vulnerable to global risk conditions given a large
offshore presence. Outflows seem limited so far, but in September the government
had to postpone its rollover issue of a 5Y bond due to unfavourable market
conditions. Zambia’s vulnerability arises from an erosion of confidence because of
the absence of an IMF deal, although portfolio outflows may be limited by the lack of
fixed-income market liquidity. In Nigeria, there is limited concern about the central
bank’s ability to accommodate outflows and preserve FX stability given large FX
reserves and higher oil prices.
Global uncertainty is not to blame for the growth underperformance of key
economies. South Africa entered a technical recession in H1-2018, and Nigeria and
Angola both face a sluggish growth outlook. This is mostly due to domestic and
idiosyncratic factors. Net exports made a positive contribution to growth in all
three countries.
Commodity prices remain key to the outlook. While the escalation of trade wars
has impacted metal prices, for now the decline is much more modest than in 2015. In
frontier Africa, Zambia is the most exposed to falling metal prices given its
dependence on copper, but rising output has mitigated the recent decline in copper
prices. Namibia and Mozambique are also affected, but to a lesser extent. The key
difference with 2015 is that oil prices remain high (largely due to geopolitics). While
high oil prices will help oil-exporting countries, they will create challenges for others.
Oil, the IMF and politics
Oil – Winners and losers
So far, only Nigeria seems to be a clear winner. It has benefited the most from
higher oil prices, as highlighted by the significant rise in FX reserves (though this is
largely due to higher capital inflows following the FX regime change in 2016; greater
transparency in the management of oil earnings may also be helping at the margin).
Other traditional winners from higher oil prices in SSA are still struggling. In
Angola and Gabon, higher oil prices have been crucial in helping to avoid a deeper
economic crisis, and twin deficits will likely narrow. However, much remains to be
done in terms of adjustment and rebalancing, as highlighted by the fact that both
countries’ FX reserves have stagnated despite higher oil prices. Ghana and
Cameroon, which are modest oil exporters, should also see moderate gains in fiscal
and external balances (in Cameroon, the positive impact on higher fiscal revenues
tends to be offset partly by higher energy subsidies).
The key difference with the 2015
risk aversion episode is that the fall
in non-oil commodity prices is more
moderate this time, while oil prices
remain higher
Higher oil prices benefit all oil
exporters, but only Nigeria has seen
a clear improvement in its external
position
Global conditions can have a
greater impact on countries with
large offshore holdings of local debt
For oil importers, the impact of
higher oil prices remains
manageable for now
Victor Lopes +44 20 7885 2110
Senior Economist, Africa
Standard Chartered Bank
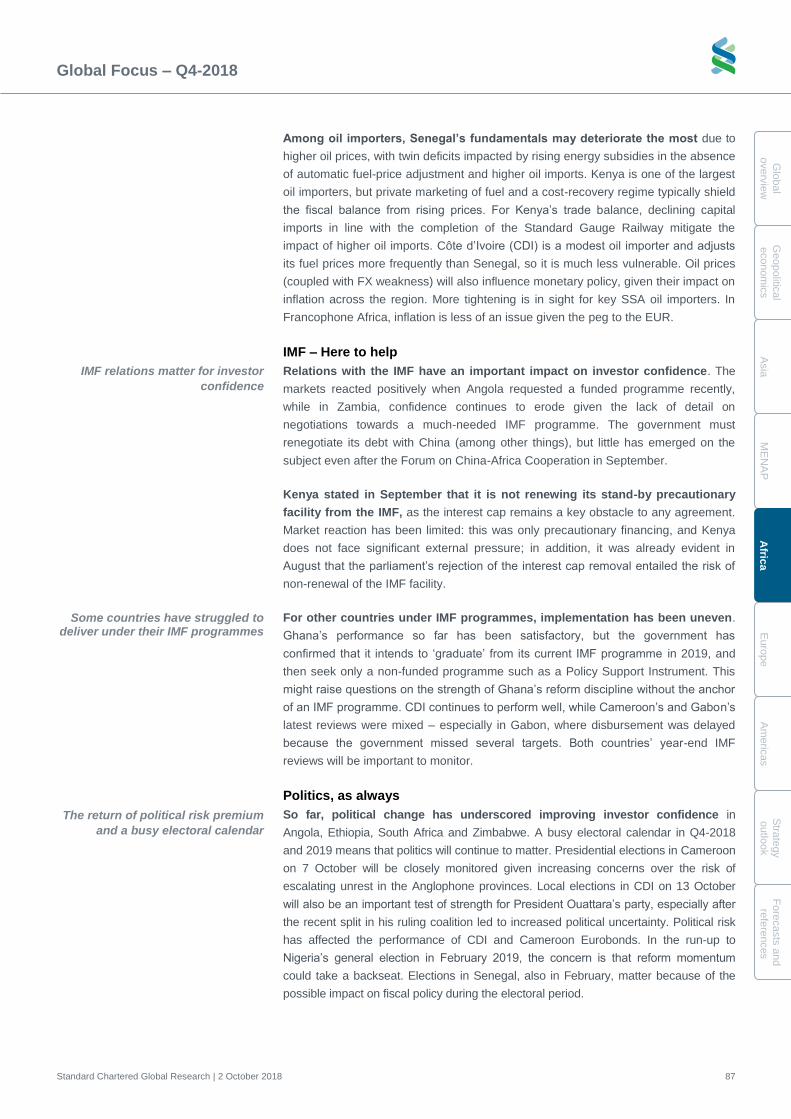
Global Focus – Q4-2018
Standard Chartered Global Research | 2 October 2018 87
Glo
bal
overv
iew
G
eopolitic
al
econom
ics
A
sia
M
EN
AP
A
frica
E
uro
pe
A
me
ricas
Stra
tegy
outlo
ok
Fo
recasts
and
refe
rences
Among oil importers, Senegal’s fundamentals may deteriorate the most due to
higher oil prices, with twin deficits impacted by rising energy subsidies in the absence
of automatic fuel-price adjustment and higher oil imports. Kenya is one of the largest
oil importers, but private marketing of fuel and a cost-recovery regime typically shield
the fiscal balance from rising prices. For Kenya’s trade balance, declining capital
imports in line with the completion of the Standard Gauge Railway mitigate the
impact of higher oil imports. Côte d’Ivoire (CDI) is a modest oil importer and adjusts
its fuel prices more frequently than Senegal, so it is much less vulnerable. Oil prices
(coupled with FX weakness) will also influence monetary policy, given their impact on
inflation across the region. More tightening is in sight for key SSA oil importers. In
Francophone Africa, inflation is less of an issue given the peg to the EUR.
IMF – Here to help
Relations with the IMF have an important impact on investor confidence. The
markets reacted positively when Angola requested a funded programme recently,
while in Zambia, confidence continues to erode given the lack of detail on
negotiations towards a much-needed IMF programme. The government must
renegotiate its debt with China (among other things), but little has emerged on the
subject even after the Forum on China-Africa Cooperation in September.
Kenya stated in September that it is not renewing its stand-by precautionary
facility from the IMF, as the interest cap remains a key obstacle to any agreement.
Market reaction has been limited: this was only precautionary financing, and Kenya
does not face significant external pressure; in addition, it was already evident in
August that the parliament’s rejection of the interest cap removal entailed the risk of
non-renewal of the IMF facility.
For other countries under IMF programmes, implementation has been uneven.
Ghana’s performance so far has been satisfactory, but the government has
confirmed that it intends to ‘graduate’ from its current IMF programme in 2019, and
then seek only a non-funded programme such as a Policy Support Instrument. This
might raise questions on the strength of Ghana’s reform discipline without the anchor
of an IMF programme. CDI continues to perform well, while Cameroon’s and Gabon’s
latest reviews were mixed – especially in Gabon, where disbursement was delayed
because the government missed several targets. Both countries’ year-end IMF
reviews will be important to monitor.
Politics, as always
So far, political change has underscored improving investor confidence in
Angola, Ethiopia, South Africa and Zimbabwe. A busy electoral calendar in Q4-2018
and 2019 means that politics will continue to matter. Presidential elections in Cameroon
on 7 October will be closely monitored given increasing concerns over the risk of
escalating unrest in the Anglophone provinces. Local elections in CDI on 13 October
will also be an important test of strength for President Ouattara’s party, especially after
the recent split in his ruling coalition led to increased political uncertainty. Political risk
has affected the performance of CDI and Cameroon Eurobonds. In the run-up to
Nigeria’s general election in February 2019, the concern is that reform momentum
could take a backseat. Elections in Senegal, also in February, matter because of the
possible impact on fiscal policy during the electoral period.
The return of political risk premium
and a busy electoral calendar
Some countries have struggled to deliver under their IMF programmes
IMF relations matter for investor
confidence
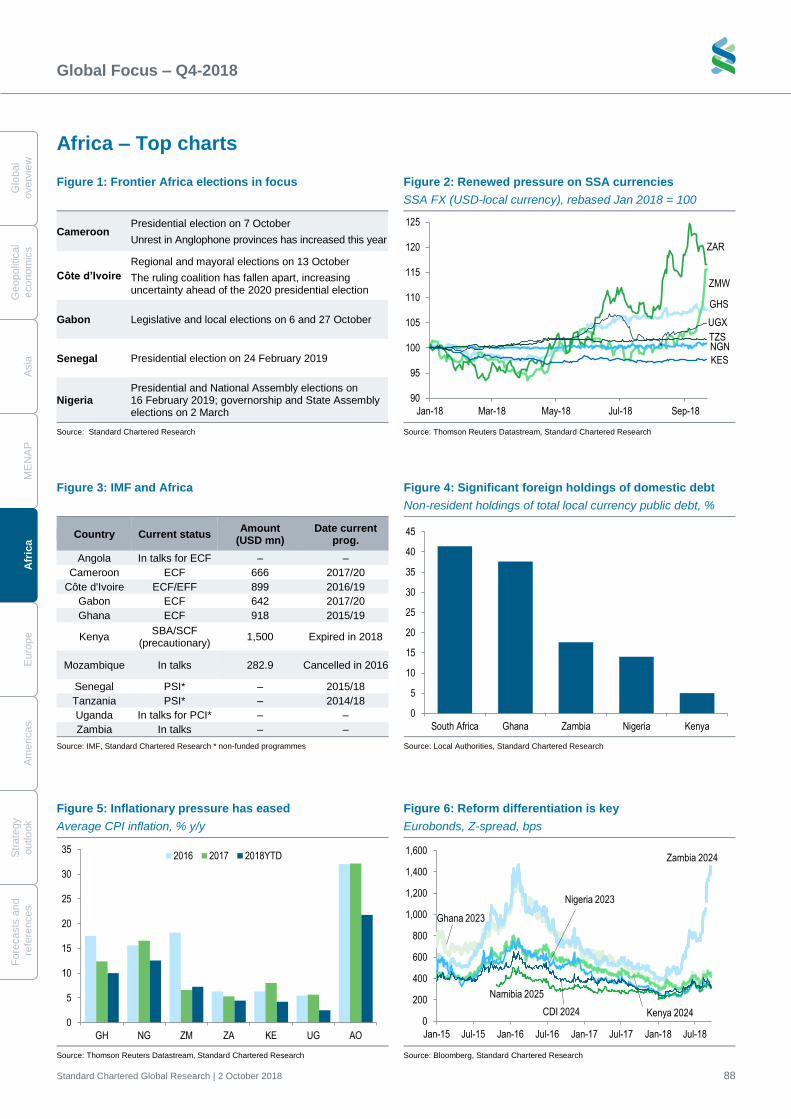
Global Focus – Q4-2018
Standard Chartered Global Research | 2 October 2018 88
G
lobal
overv
iew
Geopolit
ical
econom
ics
A
sia
M
EN
AP
A
fric
a
E
uro
pe
A
me
ricas
S
trate
gy
o
utlo
ok
Fo
recasts
and
re
fere
nces
Africa – Top charts Figure 1: Frontier Africa elections in focus
Figure 2: Renewed pressure on SSA currencies
SSA FX (USD-local currency), rebased Jan 2018 = 100
Cameroon Presidential election on 7 October
Unrest in Anglophone provinces has increased this year
Côte d’Ivoire
Regional and mayoral elections on 13 October
The ruling coalition has fallen apart, increasing uncertainty ahead of the 2020 presidential election
Gabon Legislative and local elections on 6 and 27 October
Senegal Presidential election on 24 February 2019
Nigeria Presidential and National Assembly elections on 16 February 2019; governorship and State Assembly elections on 2 March
Source: Standard Chartered Research Source: Thomson Reuters Datastream, Standard Chartered Research
Figure 3: IMF and Africa
Figure 4: Significant foreign holdings of domestic debt
Non-resident holdings of total local currency public debt, %
Country Current status Amount
(USD mn) Date current
prog.
Angola In talks for ECF – –
Cameroon ECF 666 2017/20
Côte d'Ivoire ECF/EFF 899 2016/19
Gabon ECF 642 2017/20
Ghana ECF 918 2015/19
Kenya SBA/SCF
(precautionary) 1,500 Expired in 2018
Mozambique In talks 282.9 Cancelled in 2016
Senegal PSI* – 2015/18
Tanzania PSI* – 2014/18
Uganda In talks for PCI* – –
Zambia In talks – –
Source: IMF, Standard Chartered Research * non-funded programmes Source: Local Authorities, Standard Chartered Research
GHS
ZMW
NGN
ZAR
KES
TZS
UGX
90
95
100
105
110
115
120
125
Jan-18 Mar-18 May-18 Jul-18 Sep-18
0
5
10
15
20
25
30
35
40
45
South Africa Ghana Zambia Nigeria Kenya
Figure 5: Inflationary pressure has eased
Average CPI inflation, % y/y
Figure 6: Reform differentiation is key
Eurobonds, Z-spread, bps
Source: Thomson Reuters Datastream, Standard Chartered Research Source: Bloomberg, Standard Chartered Research
0
5
10
15
20
25
30
35
GH NG ZM ZA KE UG AO
2016 2017 2018YTD
Ghana 2023
Zambia 2024
Nigeria 2023
Namibia 2025
CDI 2024 Kenya 20240
200
400
600
800
1,000
1,200
1,400
1,600
Jan-15 Jul-15 Jan-16 Jul-16 Jan-17 Jul-17 Jan-18 Jul-18
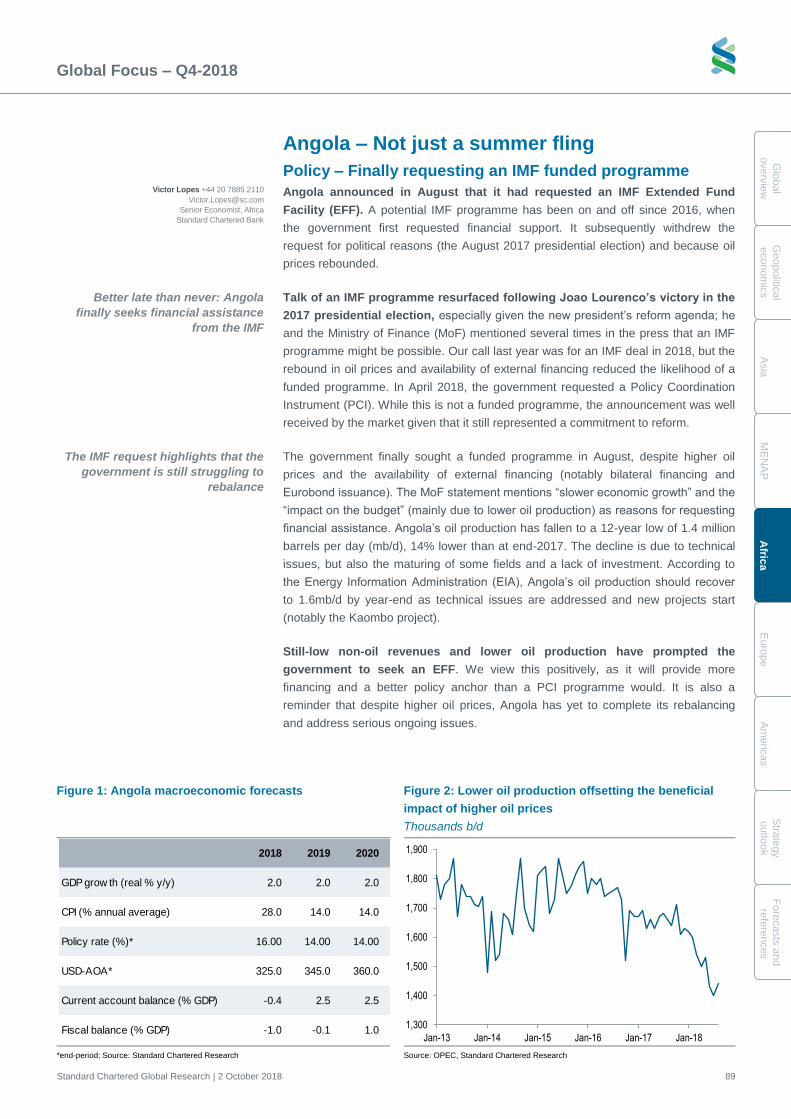
Global Focus – Q4-2018
Standard Chartered Global Research | 2 October 2018 89
Glo
bal
overv
iew
G
eopolitic
al
econom
ics
A
sia
M
EN
AP
A
frica
E
uro
pe
A
me
ricas
Stra
tegy
outlo
ok
Fo
recasts
and
refe
rences
Angola – Not just a summer fling
Policy – Finally requesting an IMF funded programme
Angola announced in August that it had requested an IMF Extended Fund
Facility (EFF). A potential IMF programme has been on and off since 2016, when
the government first requested financial support. It subsequently withdrew the
request for political reasons (the August 2017 presidential election) and because oil
prices rebounded.
Talk of an IMF programme resurfaced following Joao Lourenco’s victory in the
2017 presidential election, especially given the new president’s reform agenda; he
and the Ministry of Finance (MoF) mentioned several times in the press that an IMF
programme might be possible. Our call last year was for an IMF deal in 2018, but the
rebound in oil prices and availability of external financing reduced the likelihood of a
funded programme. In April 2018, the government requested a Policy Coordination
Instrument (PCI). While this is not a funded programme, the announcement was well
received by the market given that it still represented a commitment to reform.
The government finally sought a funded programme in August, despite higher oil
prices and the availability of external financing (notably bilateral financing and
Eurobond issuance). The MoF statement mentions “slower economic growth” and the
“impact on the budget” (mainly due to lower oil production) as reasons for requesting
financial assistance. Angola’s oil production has fallen to a 12-year low of 1.4 million
barrels per day (mb/d), 14% lower than at end-2017. The decline is due to technical
issues, but also the maturing of some fields and a lack of investment. According to
the Energy Information Administration (EIA), Angola’s oil production should recover
to 1.6mb/d by year-end as technical issues are addressed and new projects start
(notably the Kaombo project).
Still-low non-oil revenues and lower oil production have prompted the
government to seek an EFF. We view this positively, as it will provide more
financing and a better policy anchor than a PCI programme would. It is also a
reminder that despite higher oil prices, Angola has yet to complete its rebalancing
and address serious ongoing issues.
Figure 1: Angola macroeconomic forecasts Figure 2: Lower oil production offsetting the beneficial
impact of higher oil prices
Thousands b/d
*end-period; Source: Standard Chartered Research Source: OPEC, Standard Chartered Research
2018 2019 2020
GDP grow th (real % y/y) 2.0 2.0 2.0
CPI (% annual average) 28.0 14.0 14.0
Policy rate (%)* 16.00 14.00 14.00
USD-AOA* 325.0 345.0 360.0
Current account balance (% GDP) -0.4 2.5 2.5
Fiscal balance (% GDP) -1.0 -0.1 1.01,300
1,400
1,500
1,600
1,700
1,800
1,900
Jan-13 Jan-14 Jan-15 Jan-16 Jan-17 Jan-18
Better late than never: Angola
finally seeks financial assistance
from the IMF
Victor Lopes +44 20 7885 2110
Senior Economist, Africa
Standard Chartered Bank
The IMF request highlights that the
government is still struggling to
rebalance
Global Focus – Q4-2018
Standard Chartered Global Research | 2 October 2018 90
G
lobal
overv
iew
Geopolit
ical
econom
ics
A
sia
M
EN
AP
A
fric
a
E
uro
pe
A
me
ricas
S
trate
gy
o
utlo
ok
Fo
recasts
and
re
fere
nces
Angola’s FX reserves have not recovered as a result of the oil-price rebound, as
we noted in our previous publication (Global Focus – Fattening tail risks). FX reserves
improved to USD 18.9bn in May, mostly due to the USD 3bn Eurobond issuance, but
have since declined to USD 17.2bn (August 2018). Large external debt repayments
and, more recently, lower oil output have prevented a more significant improvement in
the balance-of-payments position.
The FX shortage seems to have improved, with increased Banco Nacional
de Angola (BNA) FX sales (BNA has sold EUR 3.6bn in the past three months). This
may also explain why FX reserves are not increasing. The economy has not fully
recovered from the imbalances accumulated in 2014-16. The Angolan kwanza (AOA)
depreciated more than anticipated in Q3-2018, losing 16.5% against the reference
currency, the EUR, since end-June; EUR-AOA is currently at 345. This compares
with only a 6.5% depreciation between end-January and end-May. It is unclear if the
prospect of an IMF programme was behind BNA’s decision to allow the currency to
depreciate more. Given the pace of depreciation, we revise our USD-AOA forecasts
to 325 in 2018 and 345 in 2019 (from 239 and 242 previously, respectively).
The IMF will return in October to discuss the EFF, so a programme is possible
by Q1-2019. Goodwill from the IMF and commitment on the government’s part have
led to expectations that negotiations will be more straightforward than with Zambia. If
an agreement is reached, this could lead to the second funded programme in
Angola’s history; the first was in 2009-11 in the aftermath of the global financial crisis.
In theory, an EFF can amount to 400% of a country’s IMF quota. In Angola’s case,
this would be c.USD 4.5bn over three years. In practice, however, programmes in
Africa generally average 170-180% of their quota, which would mean at least USD
1.8bn for Angola. The final amount will depend on the estimated external funding
gap, which is unclear at present.
The focus of any EFF programme is likely to be on fiscal adjustment, with
emphasis on the non-oil fiscal balance (something the government had already
highlighted in its 2018 budget). Angola’s wage bill is likely to feature prominently in
plans. Stabilising debt levels and dealing with banking-sector issues will be important
(high NPLs remain a key source of risk). Whether Angola has undergone a sufficient
FX adjustment will likely be part of the discussions. The IMF visit is in October, when
the government will start drafting the 2019 budget. IMF statements after previous
missions have sounded encouraging, with no particular sticking points. Unlike in
Zambia’s case, the debt owed to China has not been given prominence. Also in
contrast with Zambia, the IMF has noted the degree of fiscal adjustment that Angola
has already achieved. Angola may have already bilaterally negotiated some of its debt
service with China (possibly with Brazil too) but there is little information available.
The AOA exchange rate has
depreciated more than expected
More than the financing, an IMF deal
would help anchor fiscal policy and
confidence
In contrast with Zambia to date, we
expect Angola’s programme
discussions with the IMF to be
relatively smooth
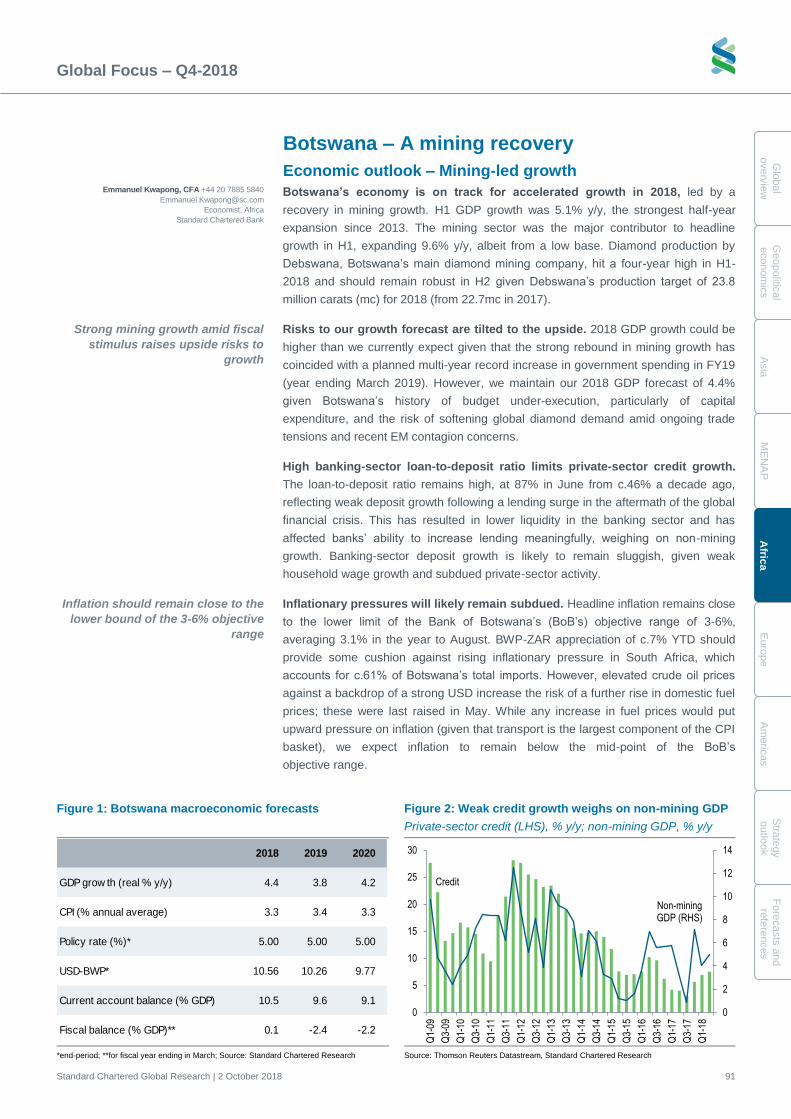
Global Focus – Q4-2018
Standard Chartered Global Research | 2 October 2018 91
Glo
bal
overv
iew
G
eopolitic
al
econom
ics
A
sia
M
EN
AP
A
frica
E
uro
pe
A
me
ricas
Stra
tegy
outlo
ok
Fo
recasts
and
refe
rences
Botswana – A mining recovery
Economic outlook – Mining-led growth
Botswana’s economy is on track for accelerated growth in 2018, led by a
recovery in mining growth. H1 GDP growth was 5.1% y/y, the strongest half-year
expansion since 2013. The mining sector was the major contributor to headline
growth in H1, expanding 9.6% y/y, albeit from a low base. Diamond production by
Debswana, Botswana’s main diamond mining company, hit a four-year high in H1-
2018 and should remain robust in H2 given Debswana’s production target of 23.8
million carats (mc) for 2018 (from 22.7mc in 2017).
Risks to our growth forecast are tilted to the upside. 2018 GDP growth could be
higher than we currently expect given that the strong rebound in mining growth has
coincided with a planned multi-year record increase in government spending in FY19
(year ending March 2019). However, we maintain our 2018 GDP forecast of 4.4%
given Botswana’s history of budget under-execution, particularly of capital
expenditure, and the risk of softening global diamond demand amid ongoing trade
tensions and recent EM contagion concerns.
High banking-sector loan-to-deposit ratio limits private-sector credit growth.
The loan-to-deposit ratio remains high, at 87% in June from c.46% a decade ago,
reflecting weak deposit growth following a lending surge in the aftermath of the global
financial crisis. This has resulted in lower liquidity in the banking sector and has
affected banks’ ability to increase lending meaningfully, weighing on non-mining
growth. Banking-sector deposit growth is likely to remain sluggish, given weak
household wage growth and subdued private-sector activity.
Inflationary pressures will likely remain subdued. Headline inflation remains close
to the lower limit of the Bank of Botswana’s (BoB’s) objective range of 3-6%,
averaging 3.1% in the year to August. BWP-ZAR appreciation of c.7% YTD should
provide some cushion against rising inflationary pressure in South Africa, which
accounts for c.61% of Botswana’s total imports. However, elevated crude oil prices
against a backdrop of a strong USD increase the risk of a further rise in domestic fuel
prices; these were last raised in May. While any increase in fuel prices would put
upward pressure on inflation (given that transport is the largest component of the CPI
basket), we expect inflation to remain below the mid-point of the BoB’s
objective range.
Figure 1: Botswana macroeconomic forecasts Figure 2: Weak credit growth weighs on non-mining GDP
Private-sector credit (LHS), % y/y; non-mining GDP, % y/y
*end-period; **for fiscal year ending in March; Source: Standard Chartered Research Source: Thomson Reuters Datastream, Standard Chartered Research
2018 2019 2020
GDP grow th (real % y/y) 4.4 3.8 4.2
CPI (% annual average) 3.3 3.4 3.3
Policy rate (%)* 5.00 5.00 5.00
USD-BWP* 10.56 10.26 9.77
Current account balance (% GDP) 10.5 9.6 9.1
Fiscal balance (% GDP)** 0.1 -2.4 -2.2
Credit
Non-mining GDP (RHS)
0
2
4
6
8
10
12
14
0
5
10
15
20
25
30
Q1-
09
Q3-
09
Q1-
10
Q3-
10
Q1-
11
Q3-
11
Q1-
12
Q3-
12
Q1-
13
Q3-
13
Q1-
14
Q3-
14
Q1-
15
Q3-
15
Q1-
16
Q3-
16
Q1-
17
Q3-
17
Q1-
18
Strong mining growth amid fiscal
stimulus raises upside risks to
growth
Emmanuel Kwapong, CFA +44 20 7885 5840
Economist, Africa
Standard Chartered Bank
Inflation should remain close to the
lower bound of the 3-6% objective
range
Global Focus – Q4-2018
Standard Chartered Global Research | 2 October 2018 92
G
lobal
overv
iew
Geopolit
ical
econom
ics
A
sia
M
EN
AP
A
fric
a
E
uro
pe
A
me
ricas
S
trate
gy
o
utlo
ok
Fo
recasts
and
re
fere
nces
Botswana’s external position remains robust. While the trade surplus swung into
a deficit in Q1 on weak diamond sales, sizeable Southern African Customs Union
transfers ensured that the current account (C/A) remained in surplus. In September,
the IMF stated that Botswana’s C/A surpluses of 13.7% and 12.3% for 2016 and
2017, respectively, “could be up to 4ppts of GDP lower than currently reported”
following a review of the balance of payment data. Our present C/A deficit forecasts
are therefore only provisional, pending the release of official data revisions.
Policy – Fiscal stimulus to push budget into deficit
We maintain our 2.4% fiscal deficit forecast for FY19 but raise our FY20 deficit
forecast to 2.2% (from 0.2%). Botswana revised its budget deficit for FY19 to 2.3%
from the 1.8% target in the budget due to a revision in anticipated mineral revenues,
according to Reuters. We had previously highlighted that the FY19 revenue
estimates were too optimistic, being dependent on an unrealistic c.50% y/y surge in
mineral revenue (see Botswana – FY19 budget: Going for growth). The government’s
revised FY19 target brings it closer to our own forecast. Our revised FY20 forecast
reflects our view of a more measured pace of fiscal consolidation. Botswana’s fiscal
outlook remains robust, however, given sizeable fiscal buffers from years of running
surpluses and its plan to return to a sustainable fiscal position in the medium term.
We expect monetary policy to remain accommodative and see the bank rate on
hold at least until end-2020. While growth is likely to rebound in 2018, the negative
non-mining output gap is likely to persist unless meaningful structural reforms to
boost economic diversification are implemented. Inflationary pressure should also
remain subdued against a backdrop of sluggish domestic demand. We view the
current bank rate of 5.0%, already a record low, as appropriate.
Politics – Tensions within the BDP
Rifts within the ruling Botswana Democratic Party (BDP) could impact the
party’s performance in the 2019 election. Relations between the current president
and his predecessor have deteriorated, resulting in factionalism within the party. With
the 2019 elections set to be the toughest yet for the BDP, increasing factionalism
could boost the opposition’s chances next year.
Market outlook – FX pressures to ease
We recently revised our USD-BWP forecasts higher to 10.56, 10.26 and 9.77 for
end-2018, 2019 and 2020, respectively (10.38, 9.78 and 9.73 previously; see SSA –
The more open and crowded, the less shielded). Our revised forecasts largely reflect
current market dynamics given recent South African rand (ZAR) depreciation (the
ZAR accounts for 45% of the pula basket), in line with broad-based EM currency
weakness on EM contagion risk.
We view the current monetary
policy stance as appropriate
Botswana now expects a larger
fiscal deficit
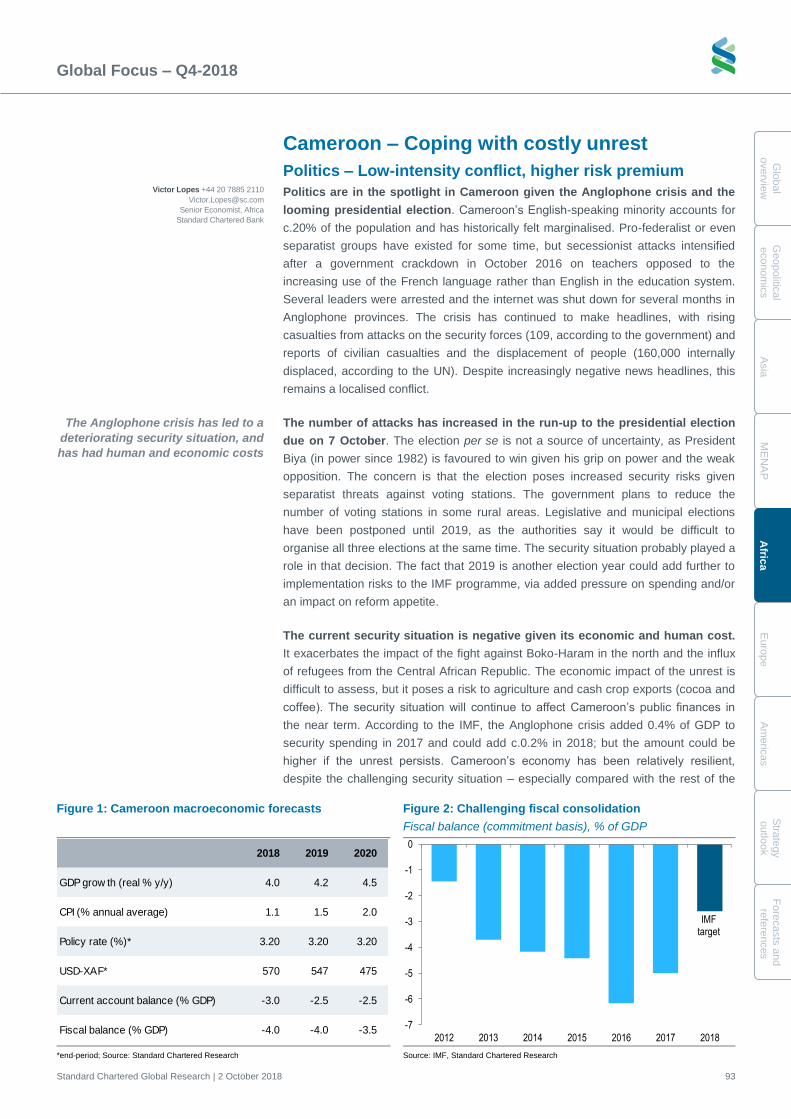
Global Focus – Q4-2018
Standard Chartered Global Research | 2 October 2018 93
Glo
bal
overv
iew
G
eopolitic
al
econom
ics
A
sia
M
EN
AP
A
frica
E
uro
pe
A
me
ricas
Stra
tegy
outlo
ok
Fo
recasts
and
refe
rences
Cameroon – Coping with costly unrest
Politics – Low-intensity conflict, higher risk premium
Politics are in the spotlight in Cameroon given the Anglophone crisis and the
looming presidential election. Cameroon’s English-speaking minority accounts for
c.20% of the population and has historically felt marginalised. Pro-federalist or even
separatist groups have existed for some time, but secessionist attacks intensified
after a government crackdown in October 2016 on teachers opposed to the
increasing use of the French language rather than English in the education system.
Several leaders were arrested and the internet was shut down for several months in
Anglophone provinces. The crisis has continued to make headlines, with rising
casualties from attacks on the security forces (109, according to the government) and
reports of civilian casualties and the displacement of people (160,000 internally
displaced, according to the UN). Despite increasingly negative news headlines, this
remains a localised conflict.
The number of attacks has increased in the run-up to the presidential election
due on 7 October. The election per se is not a source of uncertainty, as President
Biya (in power since 1982) is favoured to win given his grip on power and the weak
opposition. The concern is that the election poses increased security risks given
separatist threats against voting stations. The government plans to reduce the
number of voting stations in some rural areas. Legislative and municipal elections
have been postponed until 2019, as the authorities say it would be difficult to
organise all three elections at the same time. The security situation probably played a
role in that decision. The fact that 2019 is another election year could add further to
implementation risks to the IMF programme, via added pressure on spending and/or
an impact on reform appetite.
The current security situation is negative given its economic and human cost.
It exacerbates the impact of the fight against Boko-Haram in the north and the influx
of refugees from the Central African Republic. The economic impact of the unrest is
difficult to assess, but it poses a risk to agriculture and cash crop exports (cocoa and
coffee). The security situation will continue to affect Cameroon’s public finances in
the near term. According to the IMF, the Anglophone crisis added 0.4% of GDP to
security spending in 2017 and could add c.0.2% in 2018; but the amount could be
higher if the unrest persists. Cameroon’s economy has been relatively resilient,
despite the challenging security situation – especially compared with the rest of the
Figure 1: Cameroon macroeconomic forecasts Figure 2: Challenging fiscal consolidation
Fiscal balance (commitment basis), % of GDP
*end-period; Source: Standard Chartered Research Source: IMF, Standard Chartered Research
2018 2019 2020
GDP grow th (real % y/y) 4.0 4.2 4.5
CPI (% annual average) 1.1 1.5 2.0
Policy rate (%)* 3.20 3.20 3.20
USD-XAF* 570 547 475
Current account balance (% GDP) -3.0 -2.5 -2.5
Fiscal balance (% GDP) -4.0 -4.0 -3.5-7
-6
-5
-4
-3
-2
-1
0
2012 2013 2014 2015 2016 2017 2018
IMF target
Victor Lopes +44 20 7885 2110
Senior Economist, Africa
Standard Chartered Bank
The Anglophone crisis has led to a
deteriorating security situation, and
has had human and economic costs
Global Focus – Q4-2018
Standard Chartered Global Research | 2 October 2018 94
G
lobal
overv
iew
Geopolit
ical
econom
ics
A
sia
M
EN
AP
A
fric
a
E
uro
pe
A
me
ricas
S
trate
gy
o
utlo
ok
Fo
recasts
and
re
fere
nces
Central African Economic and Monetary Community (CEMAC) region, which is still
struggling to recover from the previous oil-price decline.
Investors have been concerned about Cameroon’s political backdrop, and how
this might impact its ability to repay its external debt. These concerns are reflected in
the widening risk premia on its traded debt. In our view, Cameroon’s capacity to
repay external debt remains strong despite security issues. The IMF has expressed
concern about rapid debt accumulation in recent years, to an estimated 38.7% of
GDP in 2018 from 33.3% in 2016. However, debt-service metrics appear moderate,
with an interest-to-revenue ratio of 3.9% and total external debt service at 10.6% of
government revenue. Debt-service and debt-to-GDP ratios compare favourably with
the rest of SSA.
Policy – Delivering consolidation amid spending pressure
The security situation could make it more challenging to achieve the fiscal
deficit target of 2.6% of GDP in 2018 (as per the current IMF programme). The
second review of the programme in July was relatively negative, as the 2017 deficit
reached 5% of GDP (against a target of 3.5%). Fiscal deficit targets were missed due
to additional spending linked to security, as well as the 2019 Africa Cup of Nations
and payment of electricity arrears. This is unsurprising: fiscal adjustment in an
election year and against the current security backdrop was never going to be
straightforward. Cameroon faces challenges to reining in spending; besides security,
fuel subsidies and the hosting of the Africa Cup of Nations in June 2019 could be
additional sources of spending.
The government quickly rectified the 2018 budget proposal and the
disbursement of the USD 78mn IMF tranche was not delayed, unlike in Gabon.
The government plans to increase revenue by 0.5% of GDP via new taxes and better
revenue administration. Budgeted spending now takes into account extra security
spending, fuel and electricity subsidies, as well as election-related spending, which
was not the case in the initial budget.
On a more positive note, government revenue performance has improved on
better-than-expected non-oil revenues, highlighting the economy’s resilience (oil
revenues should also perform well even if the fuel subsidy partly offsets the positive
impact). On the external side, FX reserves increased to USD 3.4bn in March 2018
versus just over USD 2bn a year ago, suggesting that rebalancing is underway. The
twin deficits are narrowing (while the fiscal deficit is higher than the initial target, it is
lower than it was in 2016) as public spending and imports decline.
Significant risks to the implementation of the IMF programme remain. However, a
degree of IMF leniency is likely given that Cameroon is the key economy in the
CEMAC. The Anglophone crisis is a key concern but does not threaten overall
stability. Political uncertainty is likely to remain high in the medium to long term
because of questions around the post-Biya era, especially given Francophone
countries’ poor track record in managing transitions from long-standing presidencies.
The conflict remains localised, and
Cameroon’s capacity to service its
external debt is not in question
Politics poses a risk to the
implementation of the IMF
programme
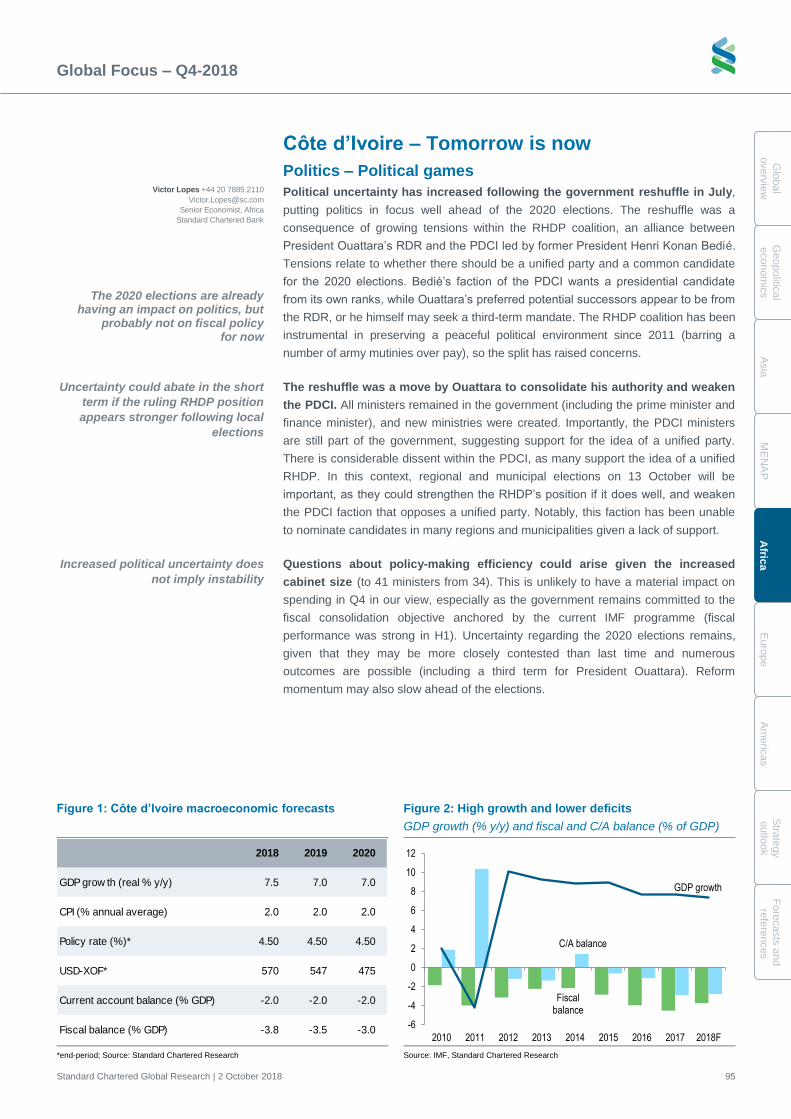
Global Focus – Q4-2018
Standard Chartered Global Research | 2 October 2018 95
Glo
bal
overv
iew
G
eopolitic
al
econom
ics
A
sia
M
EN
AP
A
frica
E
uro
pe
A
me
ricas
Stra
tegy
outlo
ok
Fo
recasts
and
refe
rences
Côte d’Ivoire – Tomorrow is now
Politics – Political games
Political uncertainty has increased following the government reshuffle in July,
putting politics in focus well ahead of the 2020 elections. The reshuffle was a
consequence of growing tensions within the RHDP coalition, an alliance between
President Ouattara’s RDR and the PDCI led by former President Henri Konan Bedié.
Tensions relate to whether there should be a unified party and a common candidate
for the 2020 elections. Bedié’s faction of the PDCI wants a presidential candidate
from its own ranks, while Ouattara’s preferred potential successors appear to be from
the RDR, or he himself may seek a third-term mandate. The RHDP coalition has been
instrumental in preserving a peaceful political environment since 2011 (barring a
number of army mutinies over pay), so the split has raised concerns.
The reshuffle was a move by Ouattara to consolidate his authority and weaken
the PDCI. All ministers remained in the government (including the prime minister and
finance minister), and new ministries were created. Importantly, the PDCI ministers
are still part of the government, suggesting support for the idea of a unified party.
There is considerable dissent within the PDCI, as many support the idea of a unified
RHDP. In this context, regional and municipal elections on 13 October will be
important, as they could strengthen the RHDP’s position if it does well, and weaken
the PDCI faction that opposes a unified party. Notably, this faction has been unable
to nominate candidates in many regions and municipalities given a lack of support.
Questions about policy-making efficiency could arise given the increased
cabinet size (to 41 ministers from 34). This is unlikely to have a material impact on
spending in Q4 in our view, especially as the government remains committed to the
fiscal consolidation objective anchored by the current IMF programme (fiscal
performance was strong in H1). Uncertainty regarding the 2020 elections remains,
given that they may be more closely contested than last time and numerous
outcomes are possible (including a third term for President Ouattara). Reform
momentum may also slow ahead of the elections.
Figure 1: Côte d’Ivoire macroeconomic forecasts Figure 2: High growth and lower deficits
GDP growth (% y/y) and fiscal and C/A balance (% of GDP)
*end-period; Source: Standard Chartered Research Source: IMF, Standard Chartered Research
2018 2019 2020
GDP grow th (real % y/y) 7.5 7.0 7.0
CPI (% annual average) 2.0 2.0 2.0
Policy rate (%)* 4.50 4.50 4.50
USD-XOF* 570 547 475
Current account balance (% GDP) -2.0 -2.0 -2.0
Fiscal balance (% GDP) -3.8 -3.5 -3.0
Fiscal balance
C/A balance
GDP growth
-6
-4
-2
0
2
4
6
8
10
12
2010 2011 2012 2013 2014 2015 2016 2017 2018F
Victor Lopes +44 20 7885 2110
Senior Economist, Africa
Standard Chartered Bank
Increased political uncertainty does
not imply instability
The 2020 elections are already having an impact on politics, but
probably not on fiscal policy for now
Uncertainty could abate in the short
term if the ruling RHDP position
appears stronger following local
elections
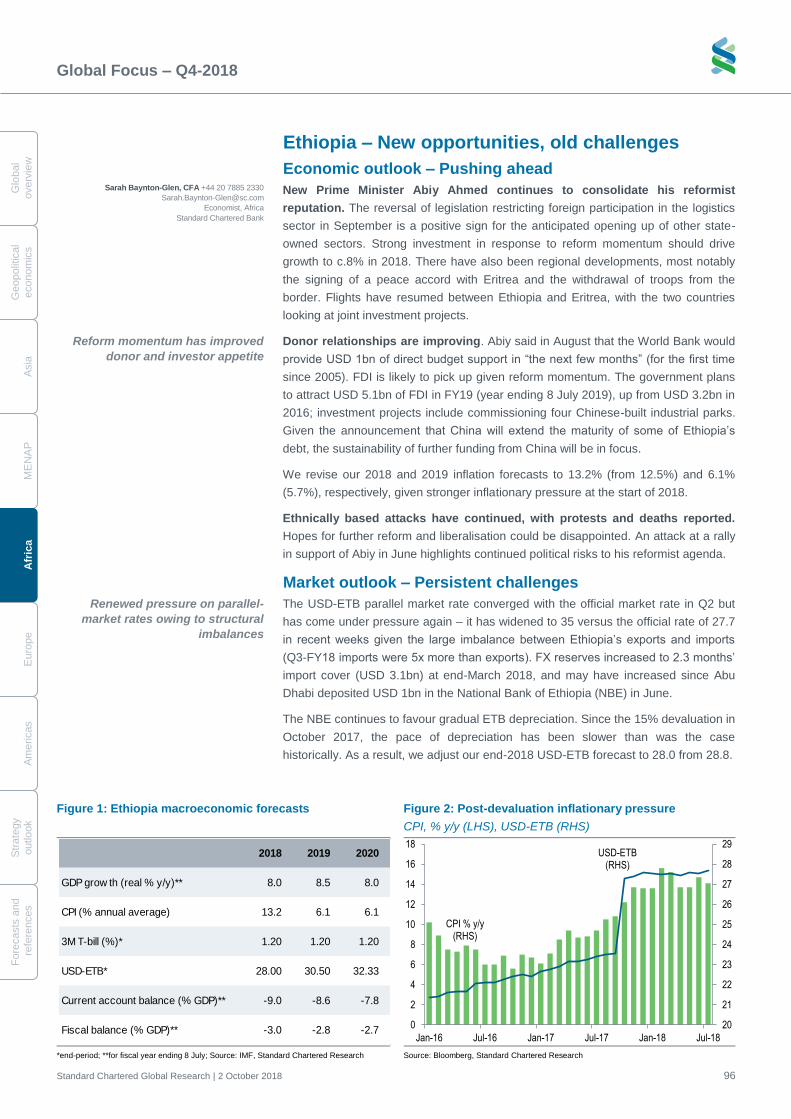
Global Focus – Q4-2018
Standard Chartered Global Research | 2 October 2018 96
G
lobal
overv
iew
Geopolit
ical
econom
ics
A
sia
M
EN
AP
A
fric
a
E
uro
pe
A
me
ricas
S
trate
gy
o
utlo
ok
Fo
recasts
and
re
fere
nces
Ethiopia – New opportunities, old challenges
Economic outlook – Pushing ahead
New Prime Minister Abiy Ahmed continues to consolidate his reformist
reputation. The reversal of legislation restricting foreign participation in the logistics
sector in September is a positive sign for the anticipated opening up of other state-
owned sectors. Strong investment in response to reform momentum should drive
growth to c.8% in 2018. There have also been regional developments, most notably
the signing of a peace accord with Eritrea and the withdrawal of troops from the
border. Flights have resumed between Ethiopia and Eritrea, with the two countries
looking at joint investment projects.
Donor relationships are improving. Abiy said in August that the World Bank would
provide USD 1bn of direct budget support in “the next few months” (for the first time
since 2005). FDI is likely to pick up given reform momentum. The government plans
to attract USD 5.1bn of FDI in FY19 (year ending 8 July 2019), up from USD 3.2bn in
2016; investment projects include commissioning four Chinese-built industrial parks.
Given the announcement that China will extend the maturity of some of Ethiopia’s
debt, the sustainability of further funding from China will be in focus.
We revise our 2018 and 2019 inflation forecasts to 13.2% (from 12.5%) and 6.1%
(5.7%), respectively, given stronger inflationary pressure at the start of 2018.
Ethnically based attacks have continued, with protests and deaths reported.
Hopes for further reform and liberalisation could be disappointed. An attack at a rally
in support of Abiy in June highlights continued political risks to his reformist agenda.
Market outlook – Persistent challenges
The USD-ETB parallel market rate converged with the official market rate in Q2 but
has come under pressure again – it has widened to 35 versus the official rate of 27.7
in recent weeks given the large imbalance between Ethiopia’s exports and imports
(Q3-FY18 imports were 5x more than exports). FX reserves increased to 2.3 months’
import cover (USD 3.1bn) at end-March 2018, and may have increased since Abu
Dhabi deposited USD 1bn in the National Bank of Ethiopia (NBE) in June.
The NBE continues to favour gradual ETB depreciation. Since the 15% devaluation in
October 2017, the pace of depreciation has been slower than was the case
historically. As a result, we adjust our end-2018 USD-ETB forecast to 28.0 from 28.8.
Figure 1: Ethiopia macroeconomic forecasts Figure 2: Post-devaluation inflationary pressure
CPI, % y/y (LHS), USD-ETB (RHS)
*end-period; **for fiscal year ending 8 July; Source: IMF, Standard Chartered Research Source: Bloomberg, Standard Chartered Research
2018 2019 2020
GDP grow th (real % y/y)** 8.0 8.5 8.0
CPI (% annual average) 13.2 6.1 6.1
3M T-bill (%)* 1.20 1.20 1.20
USD-ETB* 28.00 30.50 32.33
Current account balance (% GDP)** -9.0 -8.6 -7.8
Fiscal balance (% GDP)** -3.0 -2.8 -2.7
CPI % y/y (RHS)
USD-ETB (RHS)
20
21
22
23
24
25
26
27
28
29
0
2
4
6
8
10
12
14
16
18
Jan-16 Jul-16 Jan-17 Jul-17 Jan-18 Jul-18
Sarah Baynton-Glen, CFA +44 20 7885 2330
Economist, Africa
Standard Chartered Bank
Reform momentum has improved
donor and investor appetite
Renewed pressure on parallel-
market rates owing to structural
imbalances
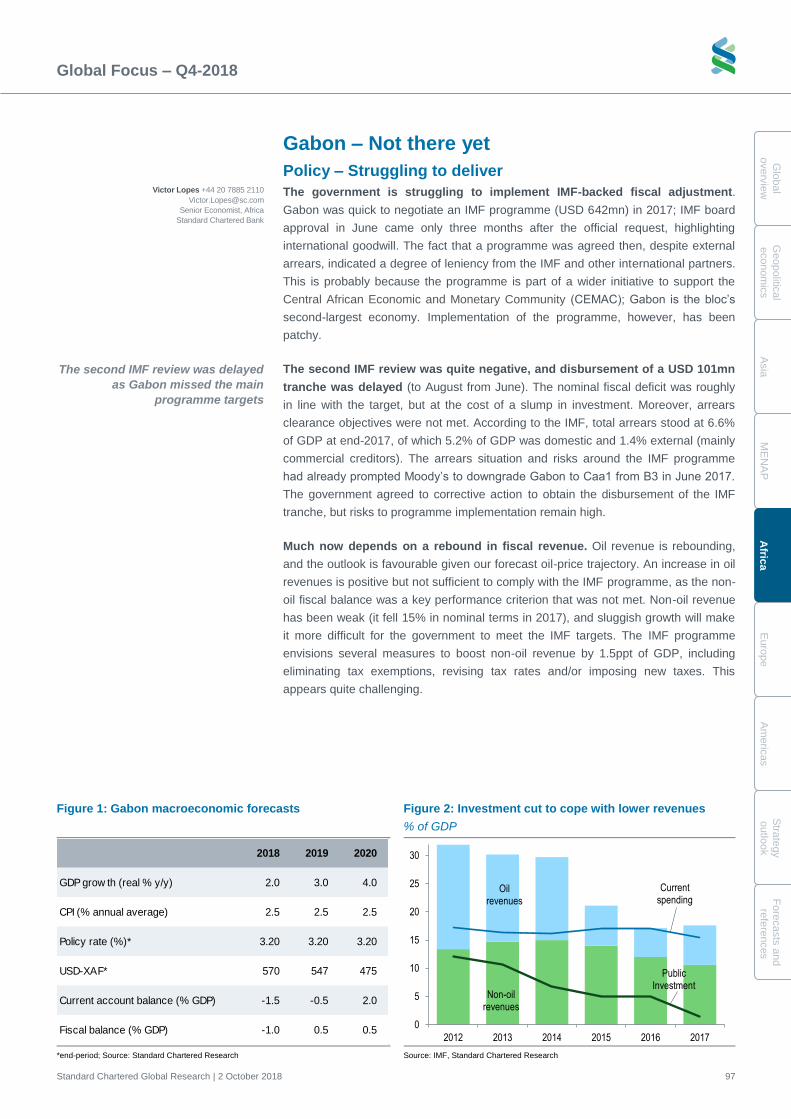
Global Focus – Q4-2018
Standard Chartered Global Research | 2 October 2018 97
Glo
bal
overv
iew
G
eopolitic
al
econom
ics
A
sia
M
EN
AP
A
frica
E
uro
pe
A
me
ricas
Stra
tegy
outlo
ok
Fo
recasts
and
refe
rences
Gabon – Not there yet
Policy – Struggling to deliver
The government is struggling to implement IMF-backed fiscal adjustment.
Gabon was quick to negotiate an IMF programme (USD 642mn) in 2017; IMF board
approval in June came only three months after the official request, highlighting
international goodwill. The fact that a programme was agreed then, despite external
arrears, indicated a degree of leniency from the IMF and other international partners.
This is probably because the programme is part of a wider initiative to support the
Central African Economic and Monetary Community (CEMAC); Gabon is the bloc’s
second-largest economy. Implementation of the programme, however, has been
patchy.
The second IMF review was quite negative, and disbursement of a USD 101mn
tranche was delayed (to August from June). The nominal fiscal deficit was roughly
in line with the target, but at the cost of a slump in investment. Moreover, arrears
clearance objectives were not met. According to the IMF, total arrears stood at 6.6%
of GDP at end-2017, of which 5.2% of GDP was domestic and 1.4% external (mainly
commercial creditors). The arrears situation and risks around the IMF programme
had already prompted Moody’s to downgrade Gabon to Caa1 from B3 in June 2017.
The government agreed to corrective action to obtain the disbursement of the IMF
tranche, but risks to programme implementation remain high.
Much now depends on a rebound in fiscal revenue. Oil revenue is rebounding,
and the outlook is favourable given our forecast oil-price trajectory. An increase in oil
revenues is positive but not sufficient to comply with the IMF programme, as the non-
oil fiscal balance was a key performance criterion that was not met. Non-oil revenue
has been weak (it fell 15% in nominal terms in 2017), and sluggish growth will make
it more difficult for the government to meet the IMF targets. The IMF programme
envisions several measures to boost non-oil revenue by 1.5ppt of GDP, including
eliminating tax exemptions, revising tax rates and/or imposing new taxes. This
appears quite challenging.
Figure 1: Gabon macroeconomic forecasts Figure 2: Investment cut to cope with lower revenues
% of GDP
*end-period; Source: Standard Chartered Research Source: IMF, Standard Chartered Research
2018 2019 2020
GDP grow th (real % y/y) 2.0 3.0 4.0
CPI (% annual average) 2.5 2.5 2.5
Policy rate (%)* 3.20 3.20 3.20
USD-XAF* 570 547 475
Current account balance (% GDP) -1.5 -0.5 2.0
Fiscal balance (% GDP) -1.0 0.5 0.5
Non-oil revenues
Oil revenues
Public Investment
Current spending
0
5
10
15
20
25
30
2012 2013 2014 2015 2016 2017
Victor Lopes +44 20 7885 2110
Senior Economist, Africa
Standard Chartered Bank
The second IMF review was delayed
as Gabon missed the main
programme targets
Global Focus – Q4-2018
Standard Chartered Global Research | 2 October 2018 98
G
lobal
overv
iew
Geopolit
ical
econom
ics
A
sia
M
EN
AP
A
fric
a
E
uro
pe
A
me
ricas
S
trate
gy
o
utlo
ok
Fo
recasts
and
re
fere
nces
On the spending side, further cuts are planned but may be difficult, especially
as the government must tackle the wage bill. There is virtually no public investment in
Gabon; at only 1.5% of GDP in 2017, the ratio is the lowest of any Sub-Saharan
Africa country. So far, the government has cut public capex (it has delayed some
projects, although the decline also reflects a lack of external financing). This allowed
the authorities to maintain low headline fiscal deficits, but as the IMF has noted, the
nature of this adjustment is “problematic”. The collapse in public investment and
large arrears remain key constraints to economic growth, which in turn complicates
the task of increasing non-oil revenue. As a result, we revise our 2018 GDP growth
forecast to 2% from 3%.
Recurrent spending will now bear the brunt of fiscal adjustment. Such an
adjustment is typically more difficult and politically sensitive, as it implies a reduction
in the public-sector wage bill. This stood at 8.4% of GDP in 2017 and the IMF
programme plans to reduce it to 6.9% this year. Legislative and local elections are
due in October; it remains to be seen whether they affect the willingness to reform.
We do not expect the same degree of controversy this time as was seen during the
2016 presidential election, as the opposition seems to have lost momentum and is
much less united now than in 2016.
There are still some oil subsidies (0.4% of GDP in 2017) to be reduced in 2018 and
eliminated in 2019. Also, the government plans to close some public agencies that
have had a material impact on spending (0.8% of GDP in 2017). Weak public
financial management appears to be one reason for Gabon’s poor performance
despite higher oil prices.
Gross financing needs for 2018, at 8% of GDP, are lower than in 2017 (10.7%).
More than half is to be covered by the IMF and other multilateral and bilateral donors.
Disbursement delays might have contributed to cash-flow pressures this year:
international donors are the key source of financing given Gabon’s limited
alternatives. In the past, the government relied on statutory advances from the
regional central bank (which still represent 29% of the domestic debt stock), but
Gabon has reached its borrowing limits. In any case, under IMF programmes in the
CEMAC region, the regional central bank (BEAC) is expected to eliminate such
advances. In 2018, Gabon has increased the amount of debt it issues in the regional
market, but the relatively shallow domestic market is not an alternative to external
support. As a result, the government had to use its deposits at the central bank for its
financing needs; this probably explains why the FX reserve trajectory has not
improved despite higher oil prices.
Pressure on public finances might ease following the IMF’s latest
disbursement. Further multilateral disbursements are also due in Q4: according to
the IMF, the World Bank and African Development Bank will disburse c.USD 430mn
in Q4-2018.
Implementation risks related to the IMF programme remain significant. Much
will depend on whether public financial management really improves, non-oil
revenues increase, the wage bill is addressed and arrears are repaid as agreed with
the IMF. Therefore, the third IMF review in December will be important for
the outlook.
Governance issues, delays in donor
disbursement and weak non-oil
revenues have led to cash-flow
pressure
Implementation risks related to the
IMF programme remain high
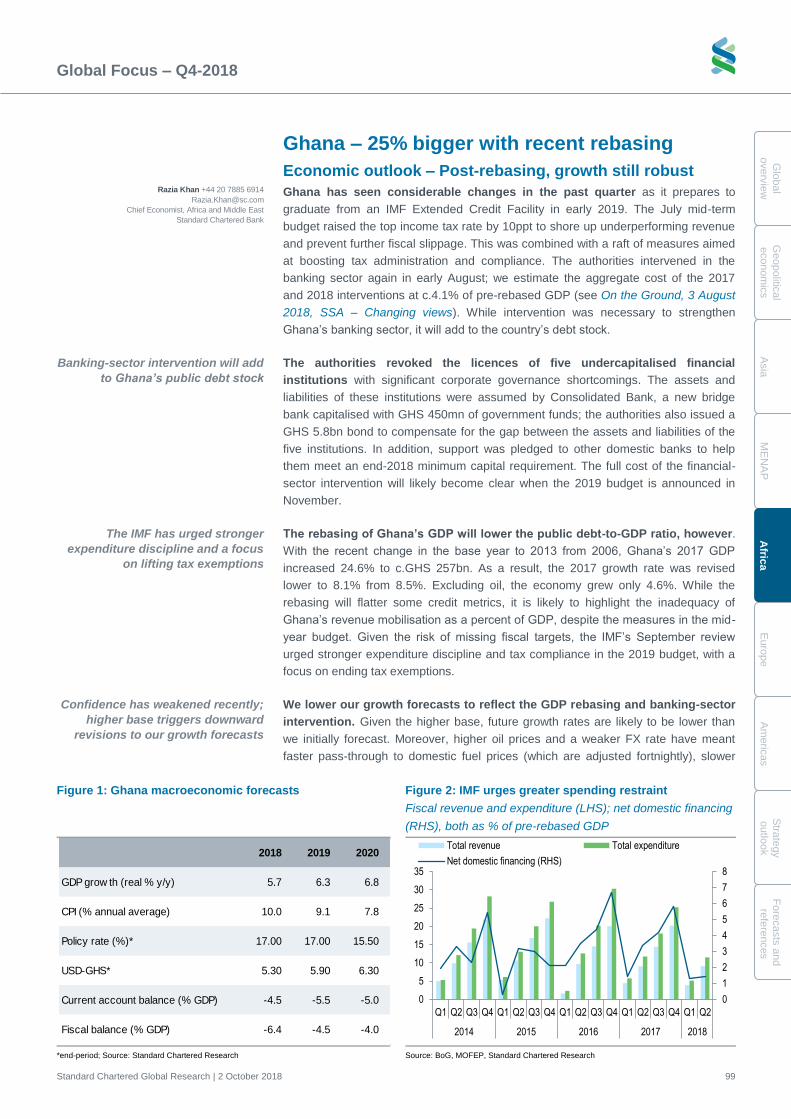
Global Focus – Q4-2018
Standard Chartered Global Research | 2 October 2018 99
Glo
bal
overv
iew
G
eopolitic
al
econom
ics
A
sia
M
EN
AP
A
frica
E
uro
pe
A
me
ricas
Stra
tegy
outlo
ok
Fo
recasts
and
refe
rences
Ghana – 25% bigger with recent rebasing
Economic outlook – Post-rebasing, growth still robust
Ghana has seen considerable changes in the past quarter as it prepares to
graduate from an IMF Extended Credit Facility in early 2019. The July mid-term
budget raised the top income tax rate by 10ppt to shore up underperforming revenue
and prevent further fiscal slippage. This was combined with a raft of measures aimed
at boosting tax administration and compliance. The authorities intervened in the
banking sector again in early August; we estimate the aggregate cost of the 2017
and 2018 interventions at c.4.1% of pre-rebased GDP (see On the Ground, 3 August
2018, SSA – Changing views). While intervention was necessary to strengthen
Ghana’s banking sector, it will add to the country’s debt stock.
The authorities revoked the licences of five undercapitalised financial
institutions with significant corporate governance shortcomings. The assets and
liabilities of these institutions were assumed by Consolidated Bank, a new bridge
bank capitalised with GHS 450mn of government funds; the authorities also issued a
GHS 5.8bn bond to compensate for the gap between the assets and liabilities of the
five institutions. In addition, support was pledged to other domestic banks to help
them meet an end-2018 minimum capital requirement. The full cost of the financial-
sector intervention will likely become clear when the 2019 budget is announced in
November.
The rebasing of Ghana’s GDP will lower the public debt-to-GDP ratio, however.
With the recent change in the base year to 2013 from 2006, Ghana’s 2017 GDP
increased 24.6% to c.GHS 257bn. As a result, the 2017 growth rate was revised
lower to 8.1% from 8.5%. Excluding oil, the economy grew only 4.6%. While the
rebasing will flatter some credit metrics, it is likely to highlight the inadequacy of
Ghana’s revenue mobilisation as a percent of GDP, despite the measures in the mid-
year budget. Given the risk of missing fiscal targets, the IMF’s September review
urged stronger expenditure discipline and tax compliance in the 2019 budget, with a
focus on ending tax exemptions.
We lower our growth forecasts to reflect the GDP rebasing and banking-sector
intervention. Given the higher base, future growth rates are likely to be lower than
we initially forecast. Moreover, higher oil prices and a weaker FX rate have meant
faster pass-through to domestic fuel prices (which are adjusted fortnightly), slower
Figure 1: Ghana macroeconomic forecasts Figure 2: IMF urges greater spending restraint
Fiscal revenue and expenditure (LHS); net domestic financing
(RHS), both as % of pre-rebased GDP
*end-period; Source: Standard Chartered Research Source: BoG, MOFEP, Standard Chartered Research
2018 2019 2020
GDP grow th (real % y/y) 5.7 6.3 6.8
CPI (% annual average) 10.0 9.1 7.8
Policy rate (%)* 17.00 17.00 15.50
USD-GHS* 5.30 5.90 6.30
Current account balance (% GDP) -4.5 -5.5 -5.0
Fiscal balance (% GDP) -6.4 -4.5 -4.0
0
1
2
3
4
5
6
7
8
0
5
10
15
20
25
30
35
Q1 Q2 Q3 Q4 Q1 Q2 Q3 Q4 Q1 Q2 Q3 Q4 Q1 Q2 Q3 Q4 Q1 Q2
2014 2015 2016 2017 2018
Total revenue Total expenditure
Net domestic financing (RHS)
Razia Khan +44 20 7885 6914
Chief Economist, Africa and Middle East
Standard Chartered Bank
Banking-sector intervention will add
to Ghana’s public debt stock
The IMF has urged stronger
expenditure discipline and a focus
on lifting tax exemptions
Confidence has weakened recently;
higher base triggers downward
revisions to our growth forecasts
Global Focus – Q4-2018
Standard Chartered Global Research | 2 October 2018 100
G
lobal
overv
iew
Geopolit
ical
econom
ics
A
sia
M
EN
AP
A
fric
a
E
uro
pe
A
me
ricas
S
trate
gy
o
utlo
ok
Fo
recasts
and
re
fere
nces
disinflation, and greater pressure on real disposable incomes. While the Bank of
Ghana’s (BoG’s) composite indicator for July still pointed to healthy real growth of
c.6.6%, consumer and business confidence measures have softened since then. We
still expect robust growth on rising oil production by end-2018, but lower our
forecasts for 2018 and 2019 to 5.7% and 6.3% (from 6.3% and 7.0% previously) to
account for the higher base, among other factors.
We now expect no further BoG policy easing in 2018 and 2019. Recent
pronounced Ghanaian cedi (GHS) weakness has implications for inflation. While
money supply growth is relatively well contained for now, supply-side shocks are
likely to drive inflation higher. We raise our average CPI inflation forecasts for 2019
and 2020 to 9.1% and 7.8% (8.3% and 7.5% prior) given our expectation of sharper
GHS depreciation, higher global oil prices, and an expected eventual pick-up in
private-sector credit growth following banking-sector consolidation.
Foreign investor participation in local markets appears to have declined
marginally; we think this has been driven by greater global risk aversion and
concern over the imminent end of Ghana’s IMF programme (see On the Ground,
SSA – The more open and crowded, the less shielded). Bond yields have risen to a
two-year high, and the authorities recently cancelled plans for a 5Y auction given
poor investor appetite. They may be forced to borrow in shorter tenors until risk
conditions improve.
The BoG’s September MPC statement said that recent developments would
“ordinarily... have warranted some adjustment in the policy rate”. While we do not
think the BoG will need to tighten monetary policy given ongoing fiscal adjustment,
we now expect the prime rate to be unchanged at 17% through end-2019 (versus our
previous call of 16.5% at end-2018 and 15.0% at end-2019). We expect the BoG to
resume its easing cycle in 2020, but now forecast only 150bps of further easing, with
the end-2020 policy rate at 15.5% (14.5% prior).
Greater dependence on short-term borrowing is likely to put renewed pressure on
3M T-bill yields. We forecast that the 91-day T-bill yield will rise gradually to 14.2% at
end-2018 and 13.9% at end-2019, before declining again in line with policy easing.
While Ghana has considered plans for a century bond to fund new infrastructure
investment (as well as refinancing existing external debt), we do not expect this to
reduce short-term borrowing significantly in the very near term.
We adjust our current account (C/A) and fiscal deficit forecasts to reflect the
GDP rebasing and higher oil prices. Ghana’s balance of payments is under pressure
from reduced cocoa output, softer gold prices and lower net capital inflows. However,
the GDP rebasing will result in smaller C/A deficits as a percentage of GDP. We now
expect C/A deficits of 4.5%, 5.5% and 5.0% in 2018, 2019 and 2020 (versus 5.4%,
5.8% and 5.5% previously).
Higher debt service costs are likely to pressure the fiscal balance. Moreover, the
positive impact of the tax measures introduced in July will only boost revenue
performance for part of the year. We now expect a 2018 larger fiscal deficit of 6.4%
of GDP (5.0% prior), reflecting weak revenue performance as well as banking-sector
intervention costs. This is partly offset by higher GDP. We see room for infrastructure
spending to increase in 2019 and 2020, even as the authorities adhere to a fiscal
deficit cap of 5% of GDP. We now expect smaller deficits of 4.5% of GDP in 2019
and 4.0% in 2020 (versus 4.9% and 4.8% previously), as the GDP rebasing offsets
increased public investment. Nonetheless, we expect public debt to be contained well
below the 70% of GDP threshold.
Rebased GDP should allow some
room to increase public investment,
while keeping public debt below the
70% threshold
Greater dependence on short-term
borrowing should see 3M T-bill
yields rise again
We now expect the policy rate to
stay on hold until 2020 on rising
risk aversion and FX weakness
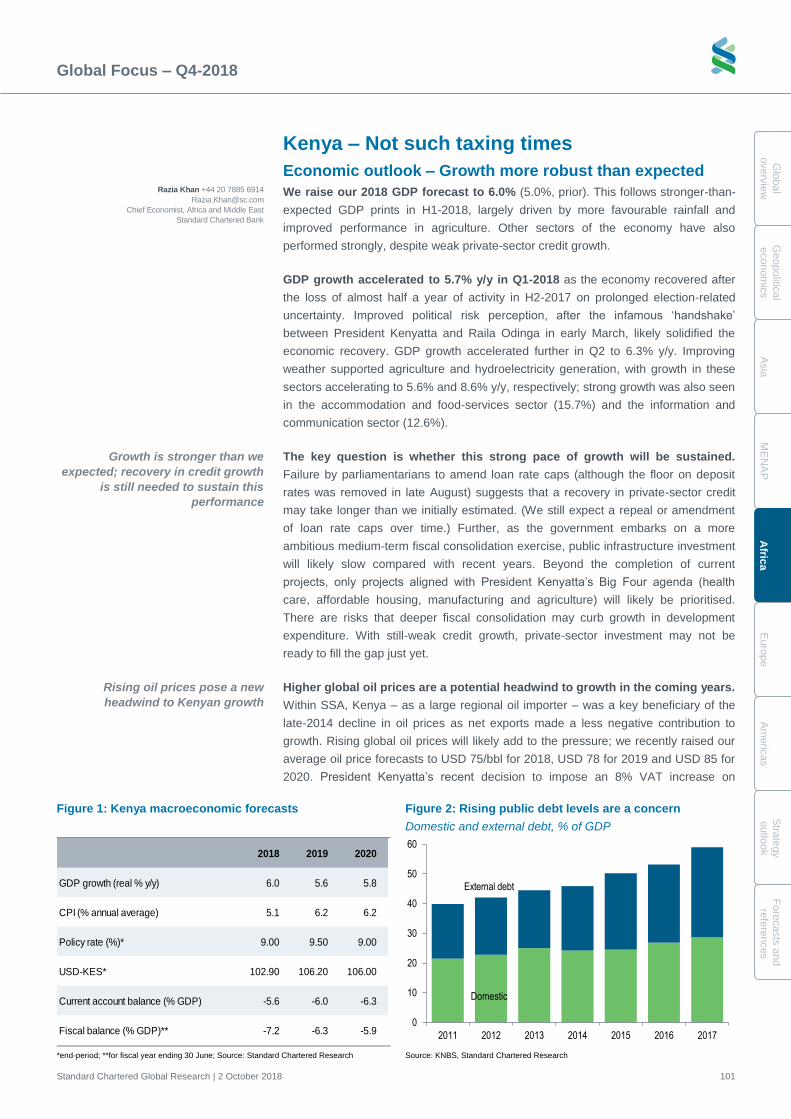
Global Focus – Q4-2018
Standard Chartered Global Research | 2 October 2018 101
Glo
bal
overv
iew
G
eopolitic
al
econom
ics
A
sia
M
EN
AP
A
frica
E
uro
pe
A
me
ricas
Stra
tegy
outlo
ok
Fo
recasts
and
refe
rences
Kenya – Not such taxing times
Economic outlook – Growth more robust than expected
We raise our 2018 GDP forecast to 6.0% (5.0%, prior). This follows stronger-than-
expected GDP prints in H1-2018, largely driven by more favourable rainfall and
improved performance in agriculture. Other sectors of the economy have also
performed strongly, despite weak private-sector credit growth.
GDP growth accelerated to 5.7% y/y in Q1-2018 as the economy recovered after
the loss of almost half a year of activity in H2-2017 on prolonged election-related
uncertainty. Improved political risk perception, after the infamous ‘handshake’
between President Kenyatta and Raila Odinga in early March, likely solidified the
economic recovery. GDP growth accelerated further in Q2 to 6.3% y/y. Improving
weather supported agriculture and hydroelectricity generation, with growth in these
sectors accelerating to 5.6% and 8.6% y/y, respectively; strong growth was also seen
in the accommodation and food-services sector (15.7%) and the information and
communication sector (12.6%).
The key question is whether this strong pace of growth will be sustained.
Failure by parliamentarians to amend loan rate caps (although the floor on deposit
rates was removed in late August) suggests that a recovery in private-sector credit
may take longer than we initially estimated. (We still expect a repeal or amendment
of loan rate caps over time.) Further, as the government embarks on a more
ambitious medium-term fiscal consolidation exercise, public infrastructure investment
will likely slow compared with recent years. Beyond the completion of current
projects, only projects aligned with President Kenyatta’s Big Four agenda (health
care, affordable housing, manufacturing and agriculture) will likely be prioritised.
There are risks that deeper fiscal consolidation may curb growth in development
expenditure. With still-weak credit growth, private-sector investment may not be
ready to fill the gap just yet.
Higher global oil prices are a potential headwind to growth in the coming years.
Within SSA, Kenya – as a large regional oil importer – was a key beneficiary of the
late-2014 decline in oil prices as net exports made a less negative contribution to
growth. Rising global oil prices will likely add to the pressure; we recently raised our
average oil price forecasts to USD 75/bbl for 2018, USD 78 for 2019 and USD 85 for
2020. President Kenyatta’s recent decision to impose an 8% VAT increase on
Figure 1: Kenya macroeconomic forecasts Figure 2: Rising public debt levels are a concern
Domestic and external debt, % of GDP
*end-period; **for fiscal year ending 30 June; Source: Standard Chartered Research Source: KNBS, Standard Chartered Research
2018 2019 2020
GDP growth (real % y/y) 6.0 5.6 5.8
CPI (% annual average) 5.1 6.2 6.2
Policy rate (%)* 9.00 9.50 9.00
USD-KES* 102.90 106.20 106.00
Current account balance (% GDP) -5.6 -6.0 -6.3
Fiscal balance (% GDP)** -7.2 -6.3 -5.9
Domestic
External debt
0
10
20
30
40
50
60
2011 2012 2013 2014 2015 2016 2017
Razia Khan +44 20 7885 6914
Chief Economist, Africa and Middle East
Standard Chartered Bank
Growth is stronger than we
expected; recovery in credit growth
is still needed to sustain this
performance
Rising oil prices pose a new
headwind to Kenyan growth
Global Focus – Q4-2018
Standard Chartered Global Research | 2 October 2018 102
G
lobal
overv
iew
Geopolit
ical
econom
ics
A
sia
M
EN
AP
A
fric
a
E
uro
pe
A
me
ricas
S
trate
gy
o
utlo
ok
Fo
recasts
and
re
fere
nces
petroleum products (less than the initially planned 16%), while still a much-needed
fiscal reform, nonetheless reinforces the impact of higher fuel prices on disposable
income growth.
We maintain our GDP forecasts for 2019 and 2020, at 5.6% and 5.8%,
respectively. The robust pace of 2018 growth, benefiting from a weak base, may not
be easy to sustain given greater global headwinds – higher oil prices and tighter
external financing conditions – in the coming years. However, trend growth is still
expected to remain within a 5.6-6.0% range.
We lower our 2018 current account (C/A) deficit forecast to 5.6% of GDP (5.9%
previously). Higher GDP is likely to be partly offset by a still-deteriorating trade
balance, reflecting the front-loading of infrastructure-related capital imports. The
establishment of direct Kenya-US flights is a longer-term positive for services,
supporting our expectation of a stable USD-KES FX rate. From this perspective, the
non-completion of a successful IMF review in September, and the subsequent
withdrawal of the IMF’s Stand-By Facility for Kenya, should not be a significant
influence on market developments. The IMF arrangement was useful in that it might
have anchored fiscal consolidation, boosting Kenya’s perceived creditworthiness. But
with FX reserves currently at a healthy level (USD 8.5bn, or 5.6 months of imports),
there is little need for recourse to emergency financing.
Monetary policy – CBR on hold until Q3-2019
While the retention of the loan rate cap has created renewed uncertainty over
monetary policy transmission, we do not expect this to be long-lasting. The
separation of the loan rate cap debate from the passage of the Finance Bill
(budgetary measures that were required) was politically astute, in our view, as it
allowed the approval of much-needed revenue generation measures without risking a
prolonged delay over the more contentious issue of banking-sector loan rates.
Given delayed full implementation of the 16% VAT on petroleum products,
previously incorporated into our inflation forecasts, we make the following changes.
We raise our average 2018 CPI inflation forecast to 5.1% (4.9% prior), partly
reflecting strong transport inflation prints recently. However, we lower our average
forecasts for 2019 and 2020 to 6.2% for both years (6.7% and 6.8% prior). With
inflation remaining largely within the Central Bank of Kenya’s (CBK’s) target band,
our central bank rate (CBR) trajectory is unchanged. We see a 50bps CBR hike in
late Q3-2019 to 9.5%, and a further hike to 10% in Q1-2020, as private-sector credit
recovers. However, a well-behaved inflation profile may allow easing later in 2020.
Fiscal policy – More consolidation
Our fiscal forecasts are little changed, except the deficit for FY19 (ends 30 June
2019), which we now expect to narrow to 6.3% of GDP (6.5% previously) on
improving growth. The authorities expect new fiscal measures – VAT on fuel, higher
taxation of money transfers, a new housing levy and spending cuts of KES 55bn – to
narrow the FY19 deficit to 5.9% of GDP, from the 5.6% initially estimated before the
reduction in fuel VAT. However, given traditional revenue undershooting, we maintain
our more conservative 6.3% forecast for now.
The end of the IMF stand-by
arrangement should have little
immediate implication for the KES
With backtracking on the 16% VAT
rate on fuel, we now see inflation
remaining within the CBK’s
target band
We lower our FY19 fiscal deficit
projection on higher growth
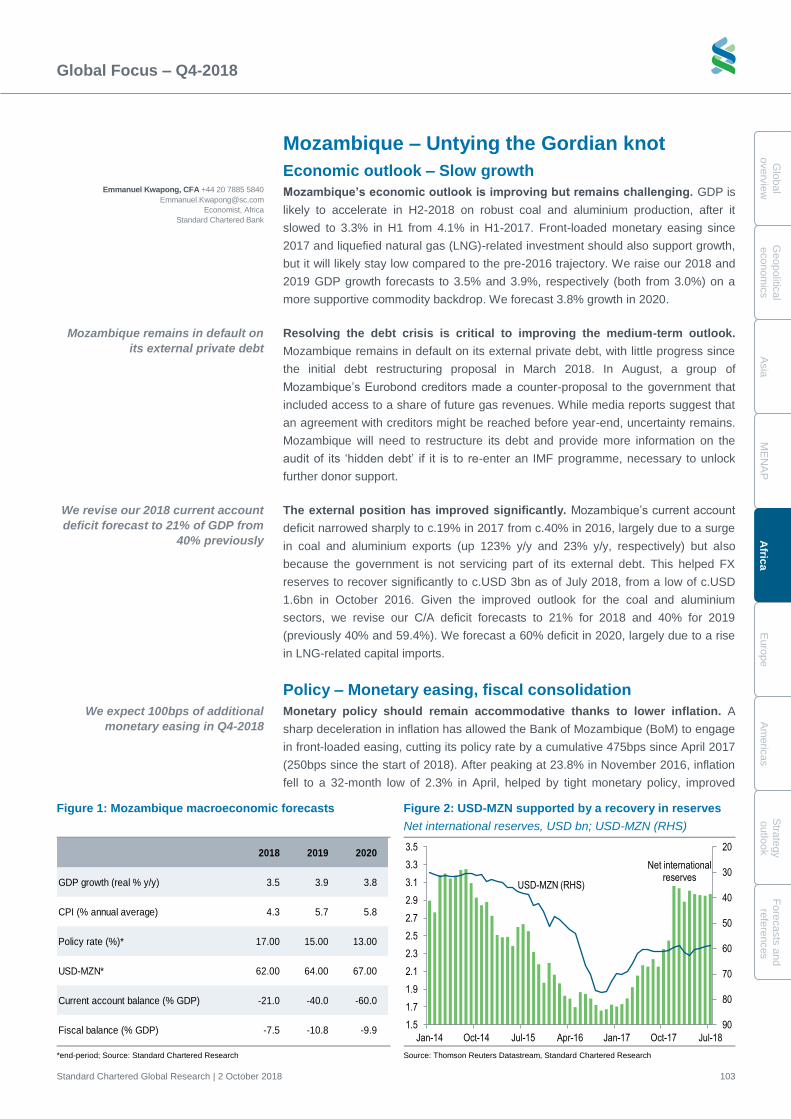
Global Focus – Q4-2018
Standard Chartered Global Research | 2 October 2018 103
Glo
bal
overv
iew
G
eopolitic
al
econom
ics
A
sia
M
EN
AP
A
frica
E
uro
pe
A
me
ricas
Stra
tegy
outlo
ok
Fo
recasts
and
refe
rences
Mozambique – Untying the Gordian knot
Economic outlook – Slow growth
Mozambique’s economic outlook is improving but remains challenging. GDP is
likely to accelerate in H2-2018 on robust coal and aluminium production, after it
slowed to 3.3% in H1 from 4.1% in H1-2017. Front-loaded monetary easing since
2017 and liquefied natural gas (LNG)-related investment should also support growth,
but it will likely stay low compared to the pre-2016 trajectory. We raise our 2018 and
2019 GDP growth forecasts to 3.5% and 3.9%, respectively (both from 3.0%) on a
more supportive commodity backdrop. We forecast 3.8% growth in 2020.
Resolving the debt crisis is critical to improving the medium-term outlook.
Mozambique remains in default on its external private debt, with little progress since
the initial debt restructuring proposal in March 2018. In August, a group of
Mozambique’s Eurobond creditors made a counter-proposal to the government that
included access to a share of future gas revenues. While media reports suggest that
an agreement with creditors might be reached before year-end, uncertainty remains.
Mozambique will need to restructure its debt and provide more information on the
audit of its ‘hidden debt’ if it is to re-enter an IMF programme, necessary to unlock
further donor support.
The external position has improved significantly. Mozambique’s current account
deficit narrowed sharply to c.19% in 2017 from c.40% in 2016, largely due to a surge
in coal and aluminium exports (up 123% y/y and 23% y/y, respectively) but also
because the government is not servicing part of its external debt. This helped FX
reserves to recover significantly to c.USD 3bn as of July 2018, from a low of c.USD
1.6bn in October 2016. Given the improved outlook for the coal and aluminium
sectors, we revise our C/A deficit forecasts to 21% for 2018 and 40% for 2019
(previously 40% and 59.4%). We forecast a 60% deficit in 2020, largely due to a rise
in LNG-related capital imports.
Policy – Monetary easing, fiscal consolidation
Monetary policy should remain accommodative thanks to lower inflation. A
sharp deceleration in inflation has allowed the Bank of Mozambique (BoM) to engage
in front-loaded easing, cutting its policy rate by a cumulative 475bps since April 2017
(250bps since the start of 2018). After peaking at 23.8% in November 2016, inflation
fell to a 32-month low of 2.3% in April, helped by tight monetary policy, improved
Figure 1: Mozambique macroeconomic forecasts Figure 2: USD-MZN supported by a recovery in reserves
Net international reserves, USD bn; USD-MZN (RHS)
*end-period; Source: Standard Chartered Research Source: Thomson Reuters Datastream, Standard Chartered Research
2018 2019 2020
GDP growth (real % y/y) 3.5 3.9 3.8
CPI (% annual average) 4.3 5.7 5.8
Policy rate (%)* 17.00 15.00 13.00
USD-MZN* 62.00 64.00 67.00
Current account balance (% GDP) -21.0 -40.0 -60.0
Fiscal balance (% GDP) -7.5 -10.8 -9.9
20
30
40
50
60
70
80
901.5
1.7
1.9
2.1
2.3
2.5
2.7
2.9
3.1
3.3
3.5
Jan-14 Oct-14 Jul-15 Apr-16 Jan-17 Oct-17 Jul-18
USD-MZN (RHS)
Net international reserves
We expect 100bps of additional
monetary easing in Q4-2018
Mozambique remains in default on
its external private debt
Emmanuel Kwapong, CFA +44 20 7885 5840
Economist, Africa
Standard Chartered Bank
We revise our 2018 current account
deficit forecast to 21% of GDP from
40% previously
Global Focus – Q4-2018
Standard Chartered Global Research | 2 October 2018 104
G
lobal
overv
iew
Geopolit
ical
econom
ics
A
sia
M
EN
AP
A
fric
a
E
uro
pe
A
me
ricas
S
trate
gy
o
utlo
ok
Fo
recasts
and
re
fere
nces
agricultural output and FX appreciation of c.29% since October 2016. Inflation has
since edged higher to 5% in August. Consequently, we lower our 2018 and 2019
forecasts to 4.3% and 5.7%, respectively (from 7.0% and 6.0%), largely reflecting the
faster-than-anticipated pace of disinflation in H1-2018; we forecast inflation at 5.8%
in 2020. With private-sector credit growth still negative and inflation within the BoM’s
target range of 5-6%, we see room for an additional 100bps of easing in Q4, most
likely at the October MPC meeting. We forecast further easing of 200bps each in
2019 and 2020.
Mozambique needs to intensify its fiscal consolidation efforts. The government
has implemented deficit-reducing measures, including removing fuel and wheat
subsidies and raising electricity and public transport prices. However, it needs to do
more if it is to attain a primary fiscal surplus, necessary to bring debt back to
sustainable levels. For now, FX appreciation has helped reduce the debt-to-GDP
ratio considerably, to c.112% at end-2017 from a peak of 128.3% at end-2016.
Politics – Election in focus
Municipal elections, scheduled for 10 October, will be in focus ahead of national
elections in October 2019. The outcome of the municipal elections will be seen as a
bellwether for the national elections, given that the ruling FRELIMO’s popularity has
been dented by difficult economic conditions and governance issues. We expect the
results to be close, with the main opposition, RENAMO, participating after boycotting
the 2013 municipal elections.
Significant progress has been made towards the peace process, despite the
death of long-serving opposition leader Afonso Dhlakama in May. The new RENAMO
leadership has agreed to implement the peace agreement reached in February. The
constitution was amended in May to enable greater decentralisation at the provincial
level, a key sticking point in the peace process. The two parties have also signed an
agreement on military affairs that will allow for the integration of RENAMO fighters
into the security forces. Terrorist-inspired violence has remained isolated in the north
and should not affect the country’s overall stability.
Market outlook – Moderate depreciation
We maintain our end-2018 USD-MZN forecast of 62.0 but raise our 2019 forecast
to 64 (60 previously). The Mozambique metical (MZN) has been one of the better-
performing SSA currencies this year, depreciating by c.3.6% YTD. Given the
improvement in FX reserves, we expect central bank intervention to continue to
support the currency against a backdrop of weak domestic demand.
The peace process remains on track
Municipal elections will be closely
contested
Fiscal consolidation is key to
returning debt to sustainable levels
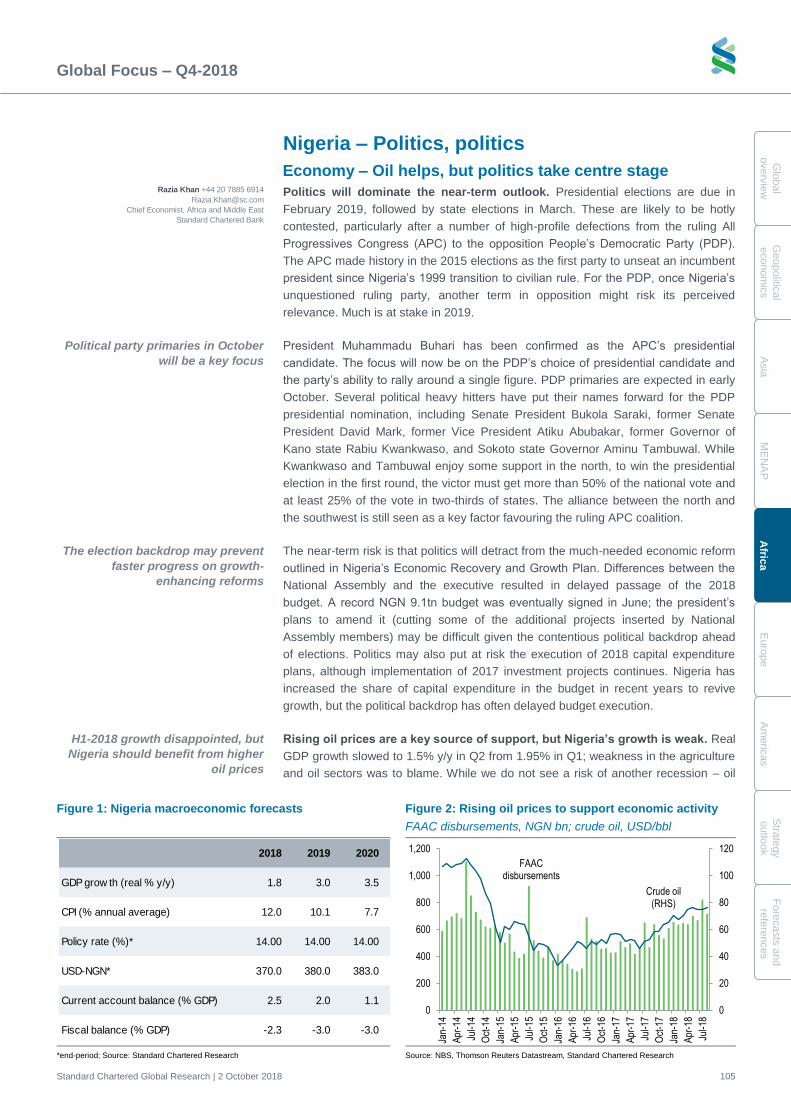
Global Focus – Q4-2018
Standard Chartered Global Research | 2 October 2018 105
Glo
bal
overv
iew
G
eopolitic
al
econom
ics
A
sia
M
EN
AP
A
frica
E
uro
pe
A
me
ricas
Stra
tegy
outlo
ok
Fo
recasts
and
refe
rences
Nigeria – Politics, politics
Economy – Oil helps, but politics take centre stage
Politics will dominate the near-term outlook. Presidential elections are due in
February 2019, followed by state elections in March. These are likely to be hotly
contested, particularly after a number of high-profile defections from the ruling All
Progressives Congress (APC) to the opposition People’s Democratic Party (PDP).
The APC made history in the 2015 elections as the first party to unseat an incumbent
president since Nigeria’s 1999 transition to civilian rule. For the PDP, once Nigeria’s
unquestioned ruling party, another term in opposition might risk its perceived
relevance. Much is at stake in 2019.
President Muhammadu Buhari has been confirmed as the APC’s presidential
candidate. The focus will now be on the PDP’s choice of presidential candidate and
the party’s ability to rally around a single figure. PDP primaries are expected in early
October. Several political heavy hitters have put their names forward for the PDP
presidential nomination, including Senate President Bukola Saraki, former Senate
President David Mark, former Vice President Atiku Abubakar, former Governor of
Kano state Rabiu Kwankwaso, and Sokoto state Governor Aminu Tambuwal. While
Kwankwaso and Tambuwal enjoy some support in the north, to win the presidential
election in the first round, the victor must get more than 50% of the national vote and
at least 25% of the vote in two-thirds of states. The alliance between the north and
the southwest is still seen as a key factor favouring the ruling APC coalition.
The near-term risk is that politics will detract from the much-needed economic reform
outlined in Nigeria’s Economic Recovery and Growth Plan. Differences between the
National Assembly and the executive resulted in delayed passage of the 2018
budget. A record NGN 9.1tn budget was eventually signed in June; the president’s
plans to amend it (cutting some of the additional projects inserted by National
Assembly members) may be difficult given the contentious political backdrop ahead
of elections. Politics may also put at risk the execution of 2018 capital expenditure
plans, although implementation of 2017 investment projects continues. Nigeria has
increased the share of capital expenditure in the budget in recent years to revive
growth, but the political backdrop has often delayed budget execution.
Rising oil prices are a key source of support, but Nigeria’s growth is weak. Real
GDP growth slowed to 1.5% y/y in Q2 from 1.95% in Q1; weakness in the agriculture
and oil sectors was to blame. While we do not see a risk of another recession – oil
Figure 1: Nigeria macroeconomic forecasts Figure 2: Rising oil prices to support economic activity
FAAC disbursements, NGN bn; crude oil, USD/bbl
*end-period; Source: Standard Chartered Research Source: NBS, Thomson Reuters Datastream, Standard Chartered Research
2018 2019 2020
GDP grow th (real % y/y) 1.8 3.0 3.5
CPI (% annual average) 12.0 10.1 7.7
Policy rate (%)* 14.00 14.00 14.00
USD-NGN* 370.0 380.0 383.0
Current account balance (% GDP) 2.5 2.0 1.1
Fiscal balance (% GDP) -2.3 -3.0 -3.0
FAAC disbursements
Crude oil (RHS)
0
20
40
60
80
100
120
0
200
400
600
800
1,000
1,200
Jan-
14
Apr
-14
Jul-1
4
Oct
-14
Jan-
15
Apr
-15
Jul-1
5
Oct
-15
Jan-
16
Apr
-16
Jul-1
6
Oct
-16
Jan-
17
Apr
-17
Jul-1
7
Oct
-17
Jan-
18
Apr
-18
Jul-1
8
Razia Khan +44 20 7885 6914
Chief Economist, Africa and Middle East
Standard Chartered Bank
Political party primaries in October
will be a key focus
The election backdrop may prevent
faster progress on growth-
enhancing reforms
H1-2018 growth disappointed, but
Nigeria should benefit from higher
oil prices
Global Focus – Q4-2018
Standard Chartered Global Research | 2 October 2018 106
G
lobal
overv
iew
Geopolit
ical
econom
ics
A
sia
M
EN
AP
A
fric
a
E
uro
pe
A
me
ricas
S
trate
gy
o
utlo
ok
Fo
recasts
and
re
fere
nces
prices and output have since improved – we lower our 2018 GDP growth forecast to
1.8% (from 2.4%) to reflect the weaker starting point. This brings our forecast in line
with the Central Bank of Nigeria’s (CBN’s) projection. We expect a gradual economic
recovery in 2019 and 2020, and leave our growth forecasts unchanged at 3.0% and
3.5%, respectively. We recently revised up our average oil price forecasts to USD
75/barrel (bbl) in 2018, USD 78/bbl in 2019, and USD 85/bbl in 2020. While this
should support Nigeria’s growth, significant potential headwinds remain.
The government has announced a plan to clear fiscal arrears at the state and
local government level by issuing local currency-denominated debt (arrears are
estimated at 2-3% of GDP). The plan awaits national assembly approval, however,
and progress ahead of the elections may be doubtful. Higher oil prices also highlight
the pace of under-recovery of imported fuel, and its fiscal implications. Fuel is now
primarily imported by the state-owned oil company. The regulated domestic fuel price
of NGN 145/litre remains lower than the landing cost of imported fuel. This precludes
more private-sector participation in fuel imports. There is no direct budget allocation
for the fuel subsidy. Instead, costs are extracted from state-owned oil company
remittances back to the Federation account (revenue belonging to the government),
so all three tiers of government share in the cost of the fuel subsidy. Continued oil
price gains will likely require revision of regulated fuel prices after the elections.
Higher oil prices should result in a healthier current account (C/A) surplus. We
adjust our C/A balance projections for 2018-20 to surpluses of 2.5%, 2.0% and 1.1%,
respectively (from 0.0%, -1.0% and -1.8% previously). The changes reflect our higher
oil price expectations, as well as weak growth in the near term. The C/A surplus is
likely to narrow in the years ahead, despite forecast higher oil prices, as domestic
demand recovers and capital budget execution improves.
We now see formal monetary policy tightening in 2019
A majority (six out of 10 MPC members) voted for some form of tightening at
the September Monetary Policy Committee (MPC) meeting. The benchmark
monetary policy rate (MPR) was kept on hold, as only three members favoured hiking
the MPR, while the other three advocated further tightening the cash reserve ratio
(CRR). Nonetheless, we see the outcome of the meeting as a signal of the MPC’s
future tightening intent amid renewed concerns about the reversal of capital inflows.
We raise our CPI inflation forecasts for 2018-20 to reflect recent NIFEX and
NAFEX exchange rate harmonisation, likely post-election fuel-price adjustment in
2019, and tighter policy in the interim to provide reassurance on FX stability. We now
forecast inflation at 12.0% in 2018 (11.4% prior), 10.1% in 2019 (8.0%) and 7.7% in
2020 (6.1%). We now expect a 25bps MPR hike to 14.25% in March 2019 (ahead of
likely fuel price deregulation), versus our previous forecast of an unchanged MPR
through 2019, with a reversal of this hike likely only in November 2019.
Near-term, the central bank is likely to rely on higher open-market operation (OMO)
rates to attract capital inflows to Nigeria. While higher Federal Accounts Allocation
Committee (FAAC) disbursements have recently driven interbank rates lower,
stepped-up tightening through OMOs and the asymmetric application of the CRR
should support T-bill yields. We raise our 3M T-bill yield forecasts to 13.3% at end-
March 2019, decelerating to c.12% by end-2019 and 10.5% by end-2020 (from
10.8%, 9.7% and 9.5%, previously).
Clearance of fiscal arrears and fuel
price deregulation may be on hold
until after the election
September MPC vote signals a
tightening intent; the MPC is
concerned about the risk of capital
outflows
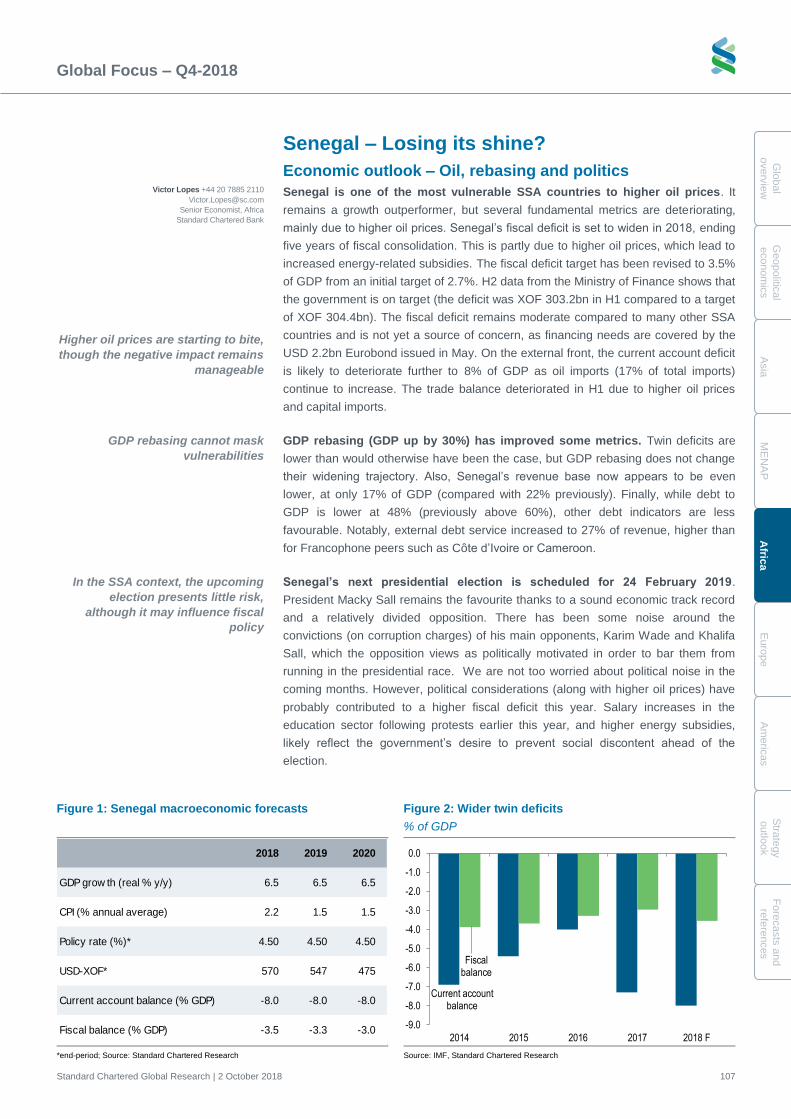
Global Focus – Q4-2018
Standard Chartered Global Research | 2 October 2018 107
Glo
bal
overv
iew
G
eopolitic
al
econom
ics
A
sia
M
EN
AP
A
frica
E
uro
pe
A
me
ricas
Stra
tegy
outlo
ok
Fo
recasts
and
refe
rences
Senegal – Losing its shine?
Economic outlook – Oil, rebasing and politics
Senegal is one of the most vulnerable SSA countries to higher oil prices. It
remains a growth outperformer, but several fundamental metrics are deteriorating,
mainly due to higher oil prices. Senegal’s fiscal deficit is set to widen in 2018, ending
five years of fiscal consolidation. This is partly due to higher oil prices, which lead to
increased energy-related subsidies. The fiscal deficit target has been revised to 3.5%
of GDP from an initial target of 2.7%. H2 data from the Ministry of Finance shows that
the government is on target (the deficit was XOF 303.2bn in H1 compared to a target
of XOF 304.4bn). The fiscal deficit remains moderate compared to many other SSA
countries and is not yet a source of concern, as financing needs are covered by the
USD 2.2bn Eurobond issued in May. On the external front, the current account deficit
is likely to deteriorate further to 8% of GDP as oil imports (17% of total imports)
continue to increase. The trade balance deteriorated in H1 due to higher oil prices
and capital imports.
GDP rebasing (GDP up by 30%) has improved some metrics. Twin deficits are
lower than would otherwise have been the case, but GDP rebasing does not change
their widening trajectory. Also, Senegal’s revenue base now appears to be even
lower, at only 17% of GDP (compared with 22% previously). Finally, while debt to
GDP is lower at 48% (previously above 60%), other debt indicators are less
favourable. Notably, external debt service increased to 27% of revenue, higher than
for Francophone peers such as Côte d’Ivoire or Cameroon.
Senegal’s next presidential election is scheduled for 24 February 2019.
President Macky Sall remains the favourite thanks to a sound economic track record
and a relatively divided opposition. There has been some noise around the
convictions (on corruption charges) of his main opponents, Karim Wade and Khalifa
Sall, which the opposition views as politically motivated in order to bar them from
running in the presidential race. We are not too worried about political noise in the
coming months. However, political considerations (along with higher oil prices) have
probably contributed to a higher fiscal deficit this year. Salary increases in the
education sector following protests earlier this year, and higher energy subsidies,
likely reflect the government’s desire to prevent social discontent ahead of the
election.
Figure 1: Senegal macroeconomic forecasts Figure 2: Wider twin deficits
% of GDP
*end-period; Source: Standard Chartered Research Source: IMF, Standard Chartered Research
2018 2019 2020
GDP grow th (real % y/y) 6.5 6.5 6.5
CPI (% annual average) 2.2 1.5 1.5
Policy rate (%)* 4.50 4.50 4.50
USD-XOF* 570 547 475
Current account balance (% GDP) -8.0 -8.0 -8.0
Fiscal balance (% GDP) -3.5 -3.3 -3.0-9.0
-8.0
-7.0
-6.0
-5.0
-4.0
-3.0
-2.0
-1.0
0.0
2014 2015 2016 2017 2018 F
Fiscal balance
Current account balance
Higher oil prices are starting to bite,
though the negative impact remains
manageable
Victor Lopes +44 20 7885 2110
Senior Economist, Africa
Standard Chartered Bank
GDP rebasing cannot mask
vulnerabilities
In the SSA context, the upcoming
election presents little risk,
although it may influence fiscal
policy
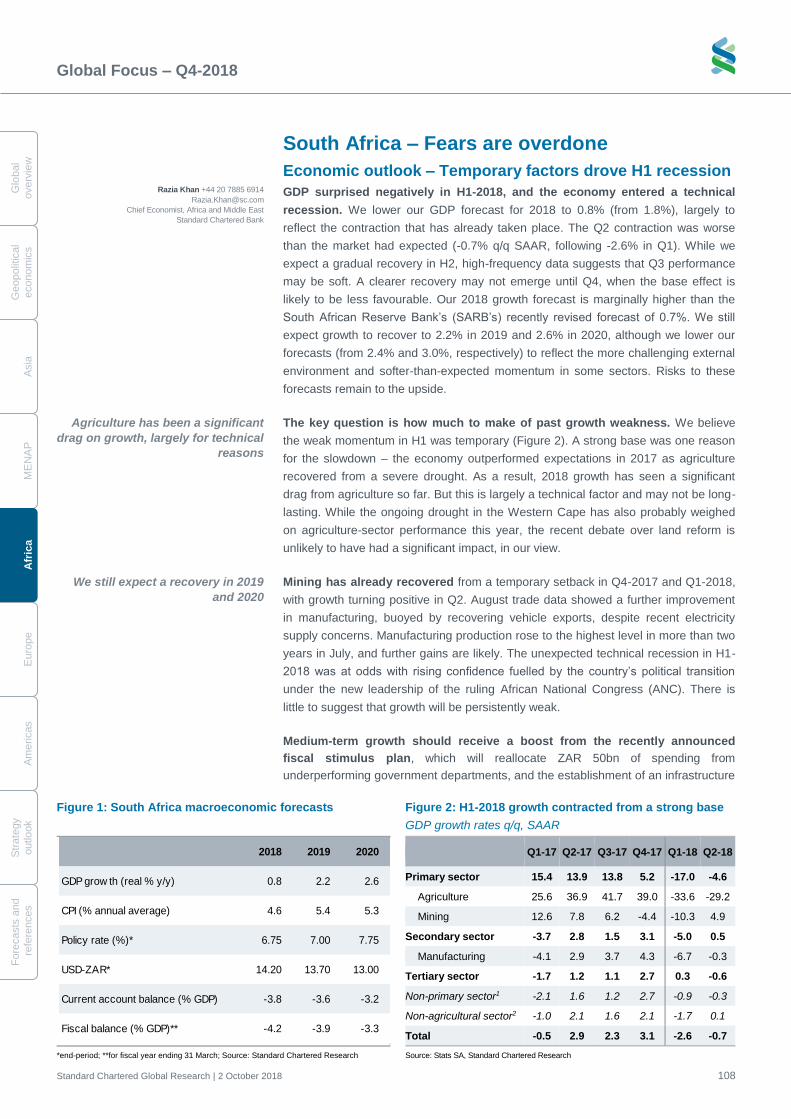
Global Focus – Q4-2018
Standard Chartered Global Research | 2 October 2018 108
G
lobal
overv
iew
Geopolit
ical
econom
ics
A
sia
M
EN
AP
A
fric
a
E
uro
pe
A
me
ricas
S
trate
gy
o
utlo
ok
Fo
recasts
and
re
fere
nces
South Africa – Fears are overdone
Economic outlook – Temporary factors drove H1 recession
GDP surprised negatively in H1-2018, and the economy entered a technical
recession. We lower our GDP forecast for 2018 to 0.8% (from 1.8%), largely to
reflect the contraction that has already taken place. The Q2 contraction was worse
than the market had expected (-0.7% q/q SAAR, following -2.6% in Q1). While we
expect a gradual recovery in H2, high-frequency data suggests that Q3 performance
may be soft. A clearer recovery may not emerge until Q4, when the base effect is
likely to be less favourable. Our 2018 growth forecast is marginally higher than the
South African Reserve Bank’s (SARB’s) recently revised forecast of 0.7%. We still
expect growth to recover to 2.2% in 2019 and 2.6% in 2020, although we lower our
forecasts (from 2.4% and 3.0%, respectively) to reflect the more challenging external
environment and softer-than-expected momentum in some sectors. Risks to these
forecasts remain to the upside.
The key question is how much to make of past growth weakness. We believe
the weak momentum in H1 was temporary (Figure 2). A strong base was one reason
for the slowdown – the economy outperformed expectations in 2017 as agriculture
recovered from a severe drought. As a result, 2018 growth has seen a significant
drag from agriculture so far. But this is largely a technical factor and may not be long-
lasting. While the ongoing drought in the Western Cape has also probably weighed
on agriculture-sector performance this year, the recent debate over land reform is
unlikely to have had a significant impact, in our view.
Mining has already recovered from a temporary setback in Q4-2017 and Q1-2018,
with growth turning positive in Q2. August trade data showed a further improvement
in manufacturing, buoyed by recovering vehicle exports, despite recent electricity
supply concerns. Manufacturing production rose to the highest level in more than two
years in July, and further gains are likely. The unexpected technical recession in H1-
2018 was at odds with rising confidence fuelled by the country’s political transition
under the new leadership of the ruling African National Congress (ANC). There is
little to suggest that growth will be persistently weak.
Medium-term growth should receive a boost from the recently announced
fiscal stimulus plan, which will reallocate ZAR 50bn of spending from
underperforming government departments, and the establishment of an infrastructure
Figure 1: South Africa macroeconomic forecasts Figure 2: H1-2018 growth contracted from a strong base
GDP growth rates q/q, SAAR
Q1-17 Q2-17 Q3-17 Q4-17 Q1-18 Q2-18
Primary sector 15.4 13.9 13.8 5.2 -17.0 -4.6
Agriculture 25.6 36.9 41.7 39.0 -33.6 -29.2
Mining 12.6 7.8 6.2 -4.4 -10.3 4.9
Secondary sector -3.7 2.8 1.5 3.1 -5.0 0.5
Manufacturing -4.1 2.9 3.7 4.3 -6.7 -0.3
Tertiary sector -1.7 1.2 1.1 2.7 0.3 -0.6
Non-primary sector1 -2.1 1.6 1.2 2.7 -0.9 -0.3
Non-agricultural sector2 -1.0 2.1 1.6 2.1 -1.7 0.1
Total -0.5 2.9 2.3 3.1 -2.6 -0.7
*end-period; **for fiscal year ending 31 March; Source: Standard Chartered Research Source: Stats SA, Standard Chartered Research
2018 2019 2020
GDP grow th (real % y/y) 0.8 2.2 2.6
CPI (% annual average) 4.6 5.4 5.3
Policy rate (%)* 6.75 7.00 7.75
USD-ZAR* 14.20 13.70 13.00
Current account balance (% GDP) -3.8 -3.6 -3.2
Fiscal balance (% GDP)** -4.2 -3.9 -3.3
Razia Khan +44 20 7885 6914
Chief Economist, Africa and Middle East
Standard Chartered Bank
Agriculture has been a significant
drag on growth, largely for technical
reasons
We still expect a recovery in 2019
and 2020
Global Focus – Q4-2018
Standard Chartered Global Research | 2 October 2018 109
Glo
bal
overv
iew
G
eopolitic
al
econom
ics
A
sia
M
EN
AP
A
frica
E
uro
pe
A
me
ricas
Stra
tegy
outlo
ok
Fo
recasts
and
refe
rences
fund. Further details will be revealed in the Medium Term Budget Policy Statement
(MTBPS) on 24 October. We expect South Africa’s negative output gap to narrow in
the coming years, with structural reforms raising potential output only gradually. This
has implications for monetary policy.
Policy – SARB to hike in November; fiscal fears overdone
We maintain our view that the SARB will hike rates in November, despite H1
growth weakness. At its September meeting, which followed a significant EM sell-off
and a rise in global oil prices, the Monetary Policy Committee (MPC) voted 4-3 to
keep the repo rate on hold at 6.50%. Brian Kahn, whom many consider a relatively
dovish MPC member, retires before the November meeting. It is not yet known if a
new member will join before then; this suggests the possibility of a split MPC, with
the SARB governor having the deciding vote. However, the reasons for our
November tightening view are more fundamental than technical; the expected closing
of the negative output gap is a key argument for policy normalisation. The SARB
considers the current level of interest rates to be accommodative.
The SARB kept its 2019 and 2020 growth forecasts broadly unchanged at its
September MPC meeting. It still expects the negative output gap to close by the end
of 2020. The SARB’s quarterly projection model (QPM), which is based on a point
inflation target of 4.5%, now implies five rate hikes of 25bps each by end-2020, in line
with our current forecasts (we see a hike at the November MPC meeting, a further
hike in March 2019, and three hikes of 25bps each in 2020).
SARB officials have been clear on the short-term trade-off between inflation and
growth, emphasising their price stability mandate even as they wait for the second-
round effects of currency weakness and fuel shocks to emerge. We now expect a
faster pick-up in CPI inflation in the coming years, to an average of 5.4% in 2019
(previous forecast: 5.1%) and 5.3% in 2020 (5.2%). This reflects our latest USD-ZAR
and oil price forecasts, both of which were recently revised higher. Our inflation
forecasts are still lower than the SARB’s projections of 5.6% and 5.4%, respectively.
We lower our 2018 average inflation forecast slightly to 4.6% from 4.7% to reflect the
benign impact of the VAT rate hike effective in April 2018.
Fears of fiscal slippage appear overdone. The Treasury is likely to lower its 2018
growth forecast to 0.7% from 1.5% in the upcoming MTBPS, to reflect the H1
contraction. We expect lower growth to have only a limited impact on fiscal receipts.
We revise our fiscal deficit projection for FY19 (year ending 31 March 2019) to 3.9%
of GDP from 3.6% (which was the Treasury’s FY19 forecast made in February 2018).
Our forecasts for fiscal consolidation in subsequent years are unchanged.
The deficit stood at ZAR 131.4bn in April-August 2018, narrowing from ZAR 141.4bn a
year earlier, when growth was much firmer. The government had initially forecast a
FY19 deficit of ZAR 180.5bn. This may not be far from the eventual outcome, if receipts
accelerate for the rest of the year on seasonal factors and growth picks up as we
expect (revenue rose 40% m/m in August and typically strengthens in the second half
of the fiscal year). The Treasury has a track record of adhering to its expenditure
ceiling, but in recent years, it achieved this by cutting capital expenditure. Given the
upcoming stimulus plan, sharp capex cuts may not be possible. Even so, we do not
expect a sizeable increase in the domestic borrowing requirement.
The November MPC meeting could
see a split decision; we expect
a hike
SARB projections now incorporate
five rate hikes through to end-2020
Growth forecasts may be halved,
but substantial fiscal slippage is
unlikely
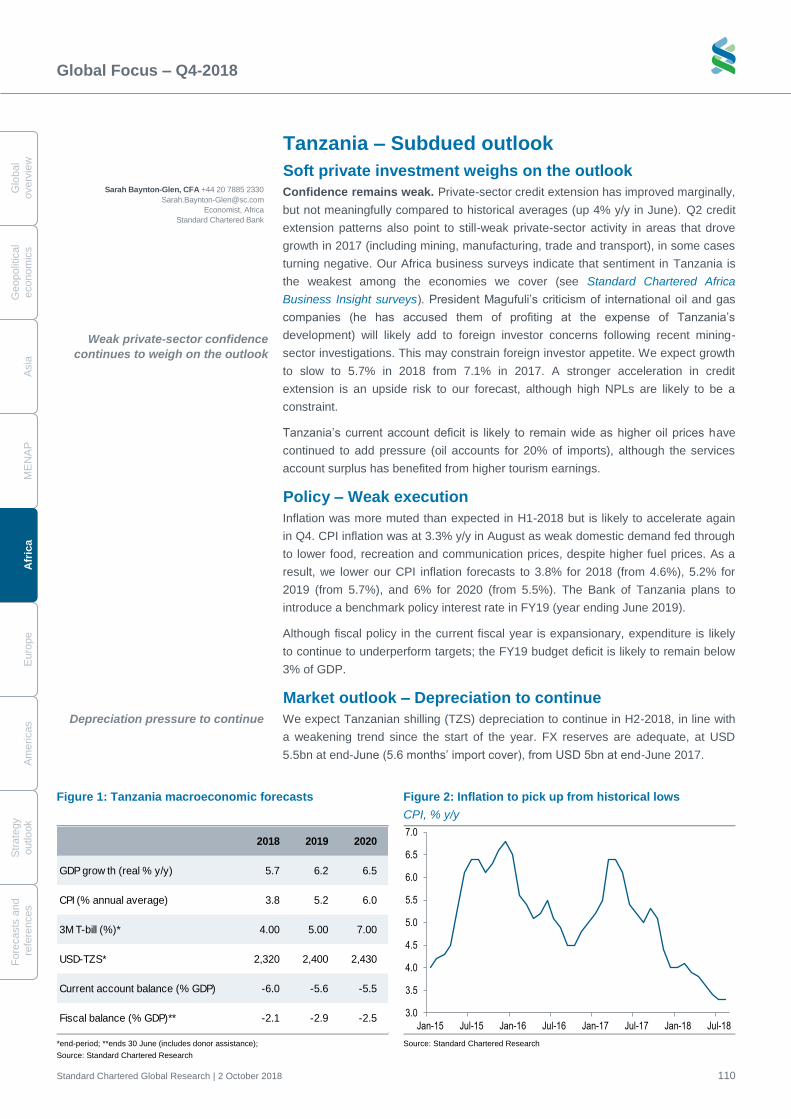
Global Focus – Q4-2018
Standard Chartered Global Research | 2 October 2018 110
G
lobal
overv
iew
Geopolit
ical
econom
ics
A
sia
M
EN
AP
A
fric
a
E
uro
pe
A
me
ricas
S
trate
gy
o
utlo
ok
Fo
recasts
and
re
fere
nces
Tanzania – Subdued outlook
Soft private investment weighs on the outlook
Confidence remains weak. Private-sector credit extension has improved marginally,
but not meaningfully compared to historical averages (up 4% y/y in June). Q2 credit
extension patterns also point to still-weak private-sector activity in areas that drove
growth in 2017 (including mining, manufacturing, trade and transport), in some cases
turning negative. Our Africa business surveys indicate that sentiment in Tanzania is
the weakest among the economies we cover (see Standard Chartered Africa
Business Insight surveys). President Magufuli’s criticism of international oil and gas
companies (he has accused them of profiting at the expense of Tanzania’s
development) will likely add to foreign investor concerns following recent mining-
sector investigations. This may constrain foreign investor appetite. We expect growth
to slow to 5.7% in 2018 from 7.1% in 2017. A stronger acceleration in credit
extension is an upside risk to our forecast, although high NPLs are likely to be a
constraint.
Tanzania’s current account deficit is likely to remain wide as higher oil prices have
continued to add pressure (oil accounts for 20% of imports), although the services
account surplus has benefited from higher tourism earnings.
Policy – Weak execution
Inflation was more muted than expected in H1-2018 but is likely to accelerate again
in Q4. CPI inflation was at 3.3% y/y in August as weak domestic demand fed through
to lower food, recreation and communication prices, despite higher fuel prices. As a
result, we lower our CPI inflation forecasts to 3.8% for 2018 (from 4.6%), 5.2% for
2019 (from 5.7%), and 6% for 2020 (from 5.5%). The Bank of Tanzania plans to
introduce a benchmark policy interest rate in FY19 (year ending June 2019).
Although fiscal policy in the current fiscal year is expansionary, expenditure is likely
to continue to underperform targets; the FY19 budget deficit is likely to remain below
3% of GDP.
Market outlook – Depreciation to continue
We expect Tanzanian shilling (TZS) depreciation to continue in H2-2018, in line with
a weakening trend since the start of the year. FX reserves are adequate, at USD
5.5bn at end-June (5.6 months’ import cover), from USD 5bn at end-June 2017.
Figure 1: Tanzania macroeconomic forecasts Figure 2: Inflation to pick up from historical lows
CPI, % y/y
*end-period; **ends 30 June (includes donor assistance);
Source: Standard Chartered Research
Source: Standard Chartered Research
2018 2019 2020
GDP grow th (real % y/y) 5.7 6.2 6.5
CPI (% annual average) 3.8 5.2 6.0
3M T-bill (%)* 4.00 5.00 7.00
USD-TZS* 2,320 2,400 2,430
Current account balance (% GDP) -6.0 -5.6 -5.5
Fiscal balance (% GDP)** -2.1 -2.9 -2.53.0
3.5
4.0
4.5
5.0
5.5
6.0
6.5
7.0
Jan-15 Jul-15 Jan-16 Jul-16 Jan-17 Jul-17 Jan-18 Jul-18
Weak private-sector confidence
continues to weigh on the outlook
Sarah Baynton-Glen, CFA +44 20 7885 2330
Economist, Africa
Standard Chartered Bank
Depreciation pressure to continue
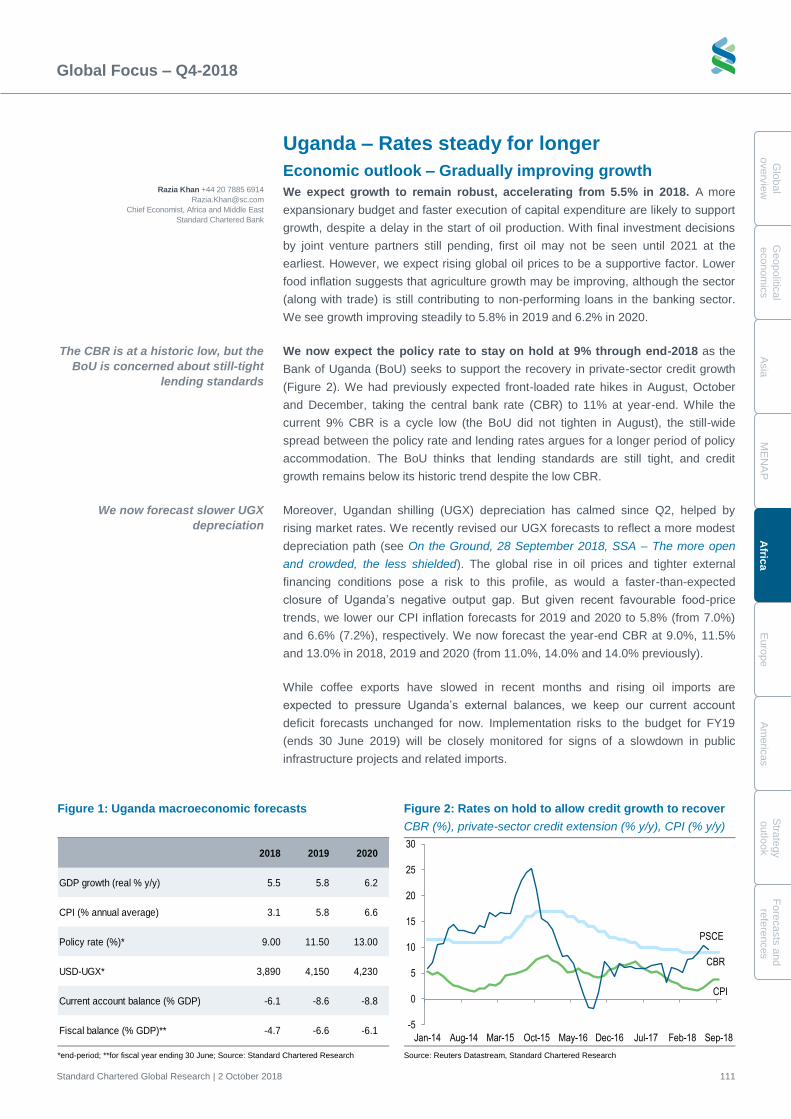
Global Focus – Q4-2018
Standard Chartered Global Research | 2 October 2018 111
Glo
bal
overv
iew
G
eopolitic
al
econom
ics
A
sia
M
EN
AP
A
frica
E
uro
pe
A
me
ricas
Stra
tegy
outlo
ok
Fo
recasts
and
refe
rences
Uganda – Rates steady for longer
Economic outlook – Gradually improving growth
We expect growth to remain robust, accelerating from 5.5% in 2018. A more
expansionary budget and faster execution of capital expenditure are likely to support
growth, despite a delay in the start of oil production. With final investment decisions
by joint venture partners still pending, first oil may not be seen until 2021 at the
earliest. However, we expect rising global oil prices to be a supportive factor. Lower
food inflation suggests that agriculture growth may be improving, although the sector
(along with trade) is still contributing to non-performing loans in the banking sector.
We see growth improving steadily to 5.8% in 2019 and 6.2% in 2020.
We now expect the policy rate to stay on hold at 9% through end-2018 as the
Bank of Uganda (BoU) seeks to support the recovery in private-sector credit growth
(Figure 2). We had previously expected front-loaded rate hikes in August, October
and December, taking the central bank rate (CBR) to 11% at year-end. While the
current 9% CBR is a cycle low (the BoU did not tighten in August), the still-wide
spread between the policy rate and lending rates argues for a longer period of policy
accommodation. The BoU thinks that lending standards are still tight, and credit
growth remains below its historic trend despite the low CBR.
Moreover, Ugandan shilling (UGX) depreciation has calmed since Q2, helped by
rising market rates. We recently revised our UGX forecasts to reflect a more modest
depreciation path (see On the Ground, 28 September 2018, SSA – The more open
and crowded, the less shielded). The global rise in oil prices and tighter external
financing conditions pose a risk to this profile, as would a faster-than-expected
closure of Uganda’s negative output gap. But given recent favourable food-price
trends, we lower our CPI inflation forecasts for 2019 and 2020 to 5.8% (from 7.0%)
and 6.6% (7.2%), respectively. We now forecast the year-end CBR at 9.0%, 11.5%
and 13.0% in 2018, 2019 and 2020 (from 11.0%, 14.0% and 14.0% previously).
While coffee exports have slowed in recent months and rising oil imports are
expected to pressure Uganda’s external balances, we keep our current account
deficit forecasts unchanged for now. Implementation risks to the budget for FY19
(ends 30 June 2019) will be closely monitored for signs of a slowdown in public
infrastructure projects and related imports.
Figure 1: Uganda macroeconomic forecasts Figure 2: Rates on hold to allow credit growth to recover
CBR (%), private-sector credit extension (% y/y), CPI (% y/y)
*end-period; **for fiscal year ending 30 June; Source: Standard Chartered Research Source: Reuters Datastream, Standard Chartered Research
2018 2019 2020
GDP growth (real % y/y) 5.5 5.8 6.2
CPI (% annual average) 3.1 5.8 6.6
Policy rate (%)* 9.00 11.50 13.00
USD-UGX* 3,890 4,150 4,230
Current account balance (% GDP) -6.1 -8.6 -8.8
Fiscal balance (% GDP)** -4.7 -6.6 -6.1
CBR
CPI
PSCE
-5
0
5
10
15
20
25
30
Jan-14 Aug-14 Mar-15 Oct-15 May-16 Dec-16 Jul-17 Feb-18 Sep-18
Razia Khan +44 20 7885 6914
Chief Economist, Africa and Middle East
Standard Chartered Bank
The CBR is at a historic low, but the
BoU is concerned about still-tight
lending standards
We now forecast slower UGX
depreciation

Economies – Europe
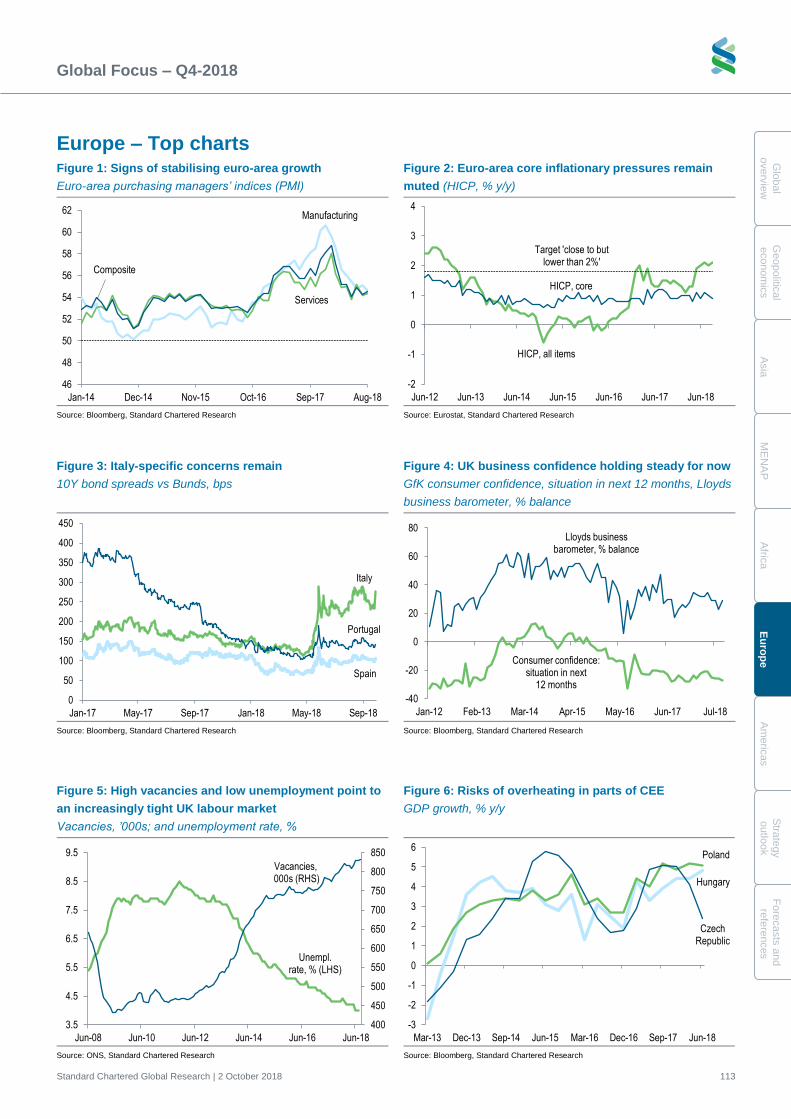
Global Focus – Q4-2018
Standard Chartered Global Research | 2 October 2018 113
Glo
bal
overv
iew
G
eopolitic
al
econom
ics
A
sia
M
EN
AP
A
frica
E
uro
pe
A
me
ricas
Stra
tegy
outlo
ok
Fo
recasts
and
refe
rences
Europe – Top charts Figure 1: Signs of stabilising euro-area growth
Euro-area purchasing managers’ indices (PMI)
Figure 2: Euro-area core inflationary pressures remain
muted (HICP, % y/y)
Source: Bloomberg, Standard Chartered Research Source: Eurostat, Standard Chartered Research
Figure 3: Italy-specific concerns remain
10Y bond spreads vs Bunds, bps
Figure 4: UK business confidence holding steady for now
GfK consumer confidence, situation in next 12 months, Lloyds
business barometer, % balance
Source: Bloomberg, Standard Chartered Research Source: Bloomberg, Standard Chartered Research
Manufacturing
Services
Composite
46
48
50
52
54
56
58
60
62
Jan-14 Dec-14 Nov-15 Oct-16 Sep-17 Aug-18
HICP, all items
HICP, core
Target 'close to but lower than 2%'
-2
-1
0
1
2
3
4
Jun-12 Jun-13 Jun-14 Jun-15 Jun-16 Jun-17 Jun-18
Spain
Italy
Portugal
0
50
100
150
200
250
300
350
400
450
Jan-17 May-17 Sep-17 Jan-18 May-18 Sep-18
-40
-20
0
20
40
60
80
Jan-12 Feb-13 Mar-14 Apr-15 May-16 Jun-17 Jul-18
Lloyds business barometer, % balance
Consumer confidence: situation in next
12 months
Figure 5: High vacancies and low unemployment point to
an increasingly tight UK labour market
Vacancies, ’000s; and unemployment rate, %
Figure 6: Risks of overheating in parts of CEE
GDP growth, % y/y
Source: ONS, Standard Chartered Research Source: Bloomberg, Standard Chartered Research
400
450
500
550
600
650
700
750
800
850
3.5
4.5
5.5
6.5
7.5
8.5
9.5
Jun-08 Jun-10 Jun-12 Jun-14 Jun-16 Jun-18
Vacancies, 000s (RHS)
Unempl.rate, % (LHS)
Hungary
Poland
Czech Republic
-3
-2
-1
0
1
2
3
4
5
6
Mar-13 Dec-13 Sep-14 Jun-15 Mar-16 Dec-16 Sep-17 Jun-18
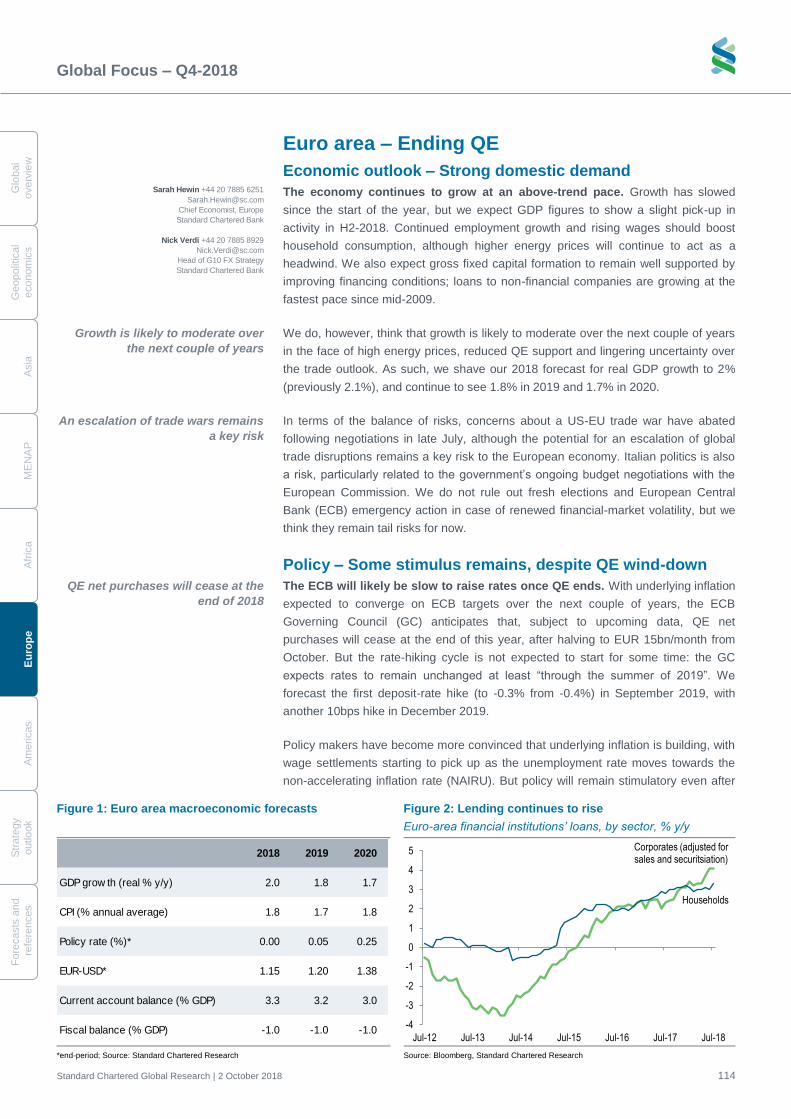
Global Focus – Q4-2018
Standard Chartered Global Research | 2 October 2018 114
G
lobal
overv
iew
Geopolit
ical
econom
ics
A
sia
M
EN
AP
A
fric
a
E
uro
pe
A
me
ricas
S
trate
gy
o
utlo
ok
Fo
recasts
and
re
fere
nces
Euro area – Ending QE
Economic outlook – Strong domestic demand
The economy continues to grow at an above-trend pace. Growth has slowed
since the start of the year, but we expect GDP figures to show a slight pick-up in
activity in H2-2018. Continued employment growth and rising wages should boost
household consumption, although higher energy prices will continue to act as a
headwind. We also expect gross fixed capital formation to remain well supported by
improving financing conditions; loans to non-financial companies are growing at the
fastest pace since mid-2009.
We do, however, think that growth is likely to moderate over the next couple of years
in the face of high energy prices, reduced QE support and lingering uncertainty over
the trade outlook. As such, we shave our 2018 forecast for real GDP growth to 2%
(previously 2.1%), and continue to see 1.8% in 2019 and 1.7% in 2020.
In terms of the balance of risks, concerns about a US-EU trade war have abated
following negotiations in late July, although the potential for an escalation of global
trade disruptions remains a key risk to the European economy. Italian politics is also
a risk, particularly related to the government’s ongoing budget negotiations with the
European Commission. We do not rule out fresh elections and European Central
Bank (ECB) emergency action in case of renewed financial-market volatility, but we
think they remain tail risks for now.
Policy – Some stimulus remains, despite QE wind-down
The ECB will likely be slow to raise rates once QE ends. With underlying inflation
expected to converge on ECB targets over the next couple of years, the ECB
Governing Council (GC) anticipates that, subject to upcoming data, QE net
purchases will cease at the end of this year, after halving to EUR 15bn/month from
October. But the rate-hiking cycle is not expected to start for some time: the GC
expects rates to remain unchanged at least “through the summer of 2019”. We
forecast the first deposit-rate hike (to -0.3% from -0.4%) in September 2019, with
another 10bps hike in December 2019.
Policy makers have become more convinced that underlying inflation is building, with
wage settlements starting to pick up as the unemployment rate moves towards the
non-accelerating inflation rate (NAIRU). But policy will remain stimulatory even after
Figure 1: Euro area macroeconomic forecasts Figure 2: Lending continues to rise
Euro-area financial institutions’ loans, by sector, % y/y
*end-period; Source: Standard Chartered Research Source: Bloomberg, Standard Chartered Research
2018 2019 2020
GDP grow th (real % y/y) 2.0 1.8 1.7
CPI (% annual average) 1.8 1.7 1.8
Policy rate (%)* 0.00 0.05 0.25
EUR-USD* 1.15 1.20 1.38
Current account balance (% GDP) 3.3 3.2 3.0
Fiscal balance (% GDP) -1.0 -1.0 -1.0
Households
-4
-3
-2
-1
0
1
2
3
4
5
Jul-12 Jul-13 Jul-14 Jul-15 Jul-16 Jul-17 Jul-18
Corporates (adjusted for sales and securitsiation)
Growth is likely to moderate over
the next couple of years
QE net purchases will cease at the
end of 2018
Sarah Hewin +44 20 7885 6251
Chief Economist, Europe
Standard Chartered Bank
Nick Verdi +44 20 7885 8929
Head of G10 FX Strategy
Standard Chartered Bank
An escalation of trade wars remains
a key risk
Global Focus – Q4-2018
Standard Chartered Global Research | 2 October 2018 115
Glo
bal
overv
iew
G
eopolitic
al
econom
ics
A
sia
M
EN
AP
A
frica
E
uro
pe
A
me
ricas
Stra
tegy
outlo
ok
Fo
recasts
and
refe
rences
the ending of QE. The reinvestment of some EUR 200bn of maturing securities will
ensure that the ECB remains active in euro-area government bond markets in 2019.
An ‘operation twist’-style of reinvesting could be deployed to support longer-term
securities in the euro-area periphery, but ECB President Draghi has said that
purchases would continue according to the capital key that has been used in the QE
programme so far.
Fiscal consolidation is being helped by buoyant growth rates and low borrowing
costs. We expect the euro area’s fiscal deficit to stay below 1% in 2018 and 2019,
with most countries expected to report deficits below 2% of GDP in 2018, except
Spain (2.6%) and France (2.3%). That said, Italy’s new government wants to ease
budgetary constraints, and will likely aim for a higher deficit in 2019. Overall fiscal
policy is likely to be mildly stimulatory this year and next. We expect the euro-area
debt/GDP ratio to fall to 87% in 2018, although debt in Greece, Italy, Belgium and
Portugal remains above 100%.
Politics – Italy, trade wars and Brexit in focus
Populism presents challenges for EU cohesion. Elections over the past two years
have tended to reflect increased support for populist parties. Consequently,
governments are alert to risks to EU cohesion. Within the euro area, Italy’s coalition
between the populist anti-establishment Five Star Movement and the nationalist Lega
presents the biggest challenge. The government has dialled back its anti-euro stance
but wants to expand spending and cut taxes, running up against EU rules on fiscal
deficits. We expect Brussels and Rome to come to agreement in the current budget
round. But rising support for Lega may encourage the party to break away from the
governing coalition and call new elections in 2019, with potentially damaging
consequences for market confidence.
In Germany, the focus is on Bavaria’s regional elections on 14 October, when the
nationalist Alternative für Deutschland (AfD) may prevent the ruling Christian Social
Union (CSU) from gaining a majority, forcing the CSU to enter into a coalition,
possibly with the Greens. Horst Seehofer, leader of the CSU, looks vulnerable. There
are also questions over Merkel’s place at the helm of the CDU, and she may
consider stepping down in the coming months (while staying on as Chancellor), with
a view to seeking the presidency of the European Council when Donald Tusk’s term
ends in November 2019.
The broader EU also faces testing geopolitical times, particularly the threat of
disruptions to trade with two important markets, the UK and the US. For now,
Washington and Brussels have dialled back from a trade confrontation, with both
parties working towards reducing tariffs and increasing trade flows. But the threat that
the US could impose tariffs on EU car exports remains. The Brexit transition should
allow EU-UK trade flows to continue, but cliff-edge risks – either in 2021 or in Q2-
2019 in case of a Brexit ‘no deal’ – may weigh on business sentiment.
Market outlook – US outperformance lingers
EUR drivers turn more positive beyond 2018. While euro-area economic activity is
solid, the ECB’s gradualist approach and ongoing US economic outperformance
could undermine EUR-USD in the near term. Beyond 2018, medium-term positive
drivers for the euro area point to a recovery in EUR-USD, particularly if trade war
concerns diminish.
Government deficits are low, but
debt remains high
Early elections cannot be ruled out
in Italy
For now, Washington and Brussels
have dialled back from a trade
confrontation
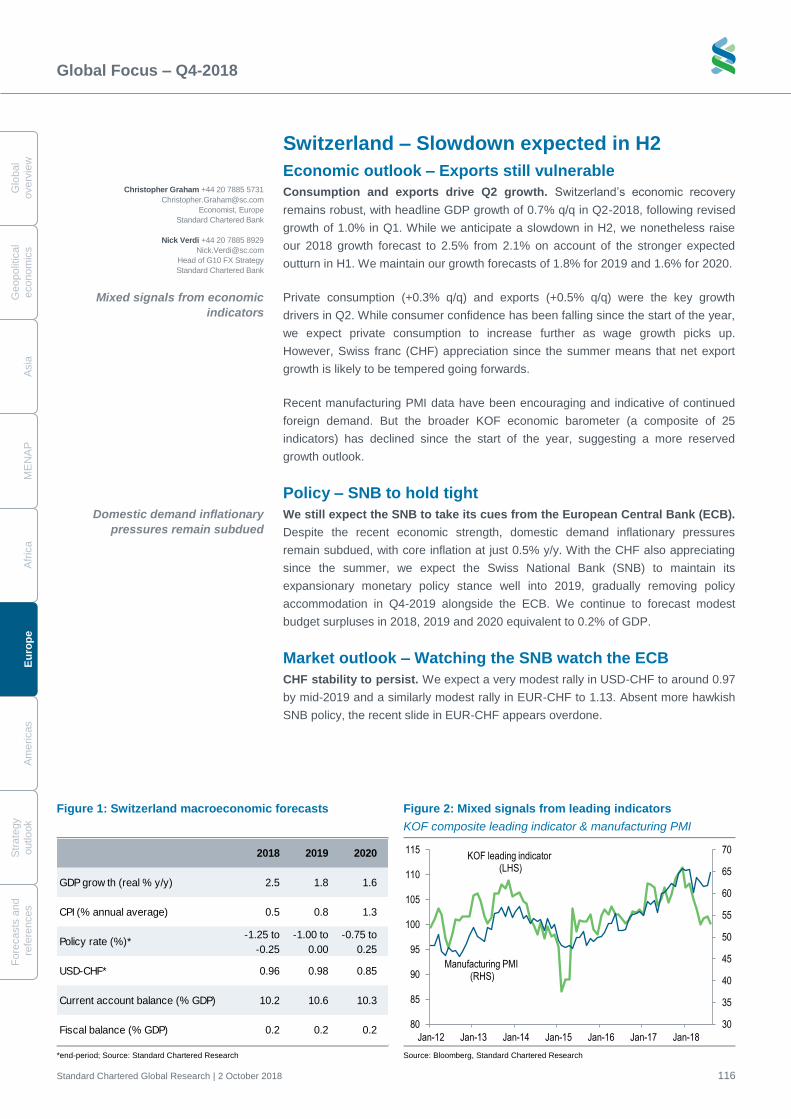
Global Focus – Q4-2018
Standard Chartered Global Research | 2 October 2018 116
G
lobal
overv
iew
Geopolit
ical
econom
ics
A
sia
M
EN
AP
A
fric
a
E
uro
pe
A
me
ricas
S
trate
gy
o
utlo
ok
Fo
recasts
and
re
fere
nces
Switzerland – Slowdown expected in H2
Economic outlook – Exports still vulnerable
Consumption and exports drive Q2 growth. Switzerland’s economic recovery
remains robust, with headline GDP growth of 0.7% q/q in Q2-2018, following revised
growth of 1.0% in Q1. While we anticipate a slowdown in H2, we nonetheless raise
our 2018 growth forecast to 2.5% from 2.1% on account of the stronger expected
outturn in H1. We maintain our growth forecasts of 1.8% for 2019 and 1.6% for 2020.
Private consumption (+0.3% q/q) and exports (+0.5% q/q) were the key growth
drivers in Q2. While consumer confidence has been falling since the start of the year,
we expect private consumption to increase further as wage growth picks up.
However, Swiss franc (CHF) appreciation since the summer means that net export
growth is likely to be tempered going forwards.
Recent manufacturing PMI data have been encouraging and indicative of continued
foreign demand. But the broader KOF economic barometer (a composite of 25
indicators) has declined since the start of the year, suggesting a more reserved
growth outlook.
Policy – SNB to hold tight
We still expect the SNB to take its cues from the European Central Bank (ECB).
Despite the recent economic strength, domestic demand inflationary pressures
remain subdued, with core inflation at just 0.5% y/y. With the CHF also appreciating
since the summer, we expect the Swiss National Bank (SNB) to maintain its
expansionary monetary policy stance well into 2019, gradually removing policy
accommodation in Q4-2019 alongside the ECB. We continue to forecast modest
budget surpluses in 2018, 2019 and 2020 equivalent to 0.2% of GDP.
Market outlook – Watching the SNB watch the ECB
CHF stability to persist. We expect a very modest rally in USD-CHF to around 0.97
by mid-2019 and a similarly modest rally in EUR-CHF to 1.13. Absent more hawkish
SNB policy, the recent slide in EUR-CHF appears overdone.
Figure 1: Switzerland macroeconomic forecasts Figure 2: Mixed signals from leading indicators
KOF composite leading indicator & manufacturing PMI
*end-period; Source: Standard Chartered Research Source: Bloomberg, Standard Chartered Research
2018 2019 2020
GDP grow th (real % y/y) 2.5 1.8 1.6
CPI (% annual average) 0.5 0.8 1.3
Policy rate (%)*-1.25 to
-0.25
-1.00 to
0.00
-0.75 to
0.25
USD-CHF* 0.96 0.98 0.85
Current account balance (% GDP) 10.2 10.6 10.3
Fiscal balance (% GDP) 0.2 0.2 0.230
35
40
45
50
55
60
65
70
80
85
90
95
100
105
110
115
Jan-12 Jan-13 Jan-14 Jan-15 Jan-16 Jan-17 Jan-18
KOF leading indicator (LHS)
Manufacturing PMI (RHS)
Mixed signals from economic
indicators
Christopher Graham +44 20 7885 5731
Economist, Europe
Standard Chartered Bank
Nick Verdi +44 20 7885 8929
Head of G10 FX Strategy
Standard Chartered Bank
Domestic demand inflationary
pressures remain subdued
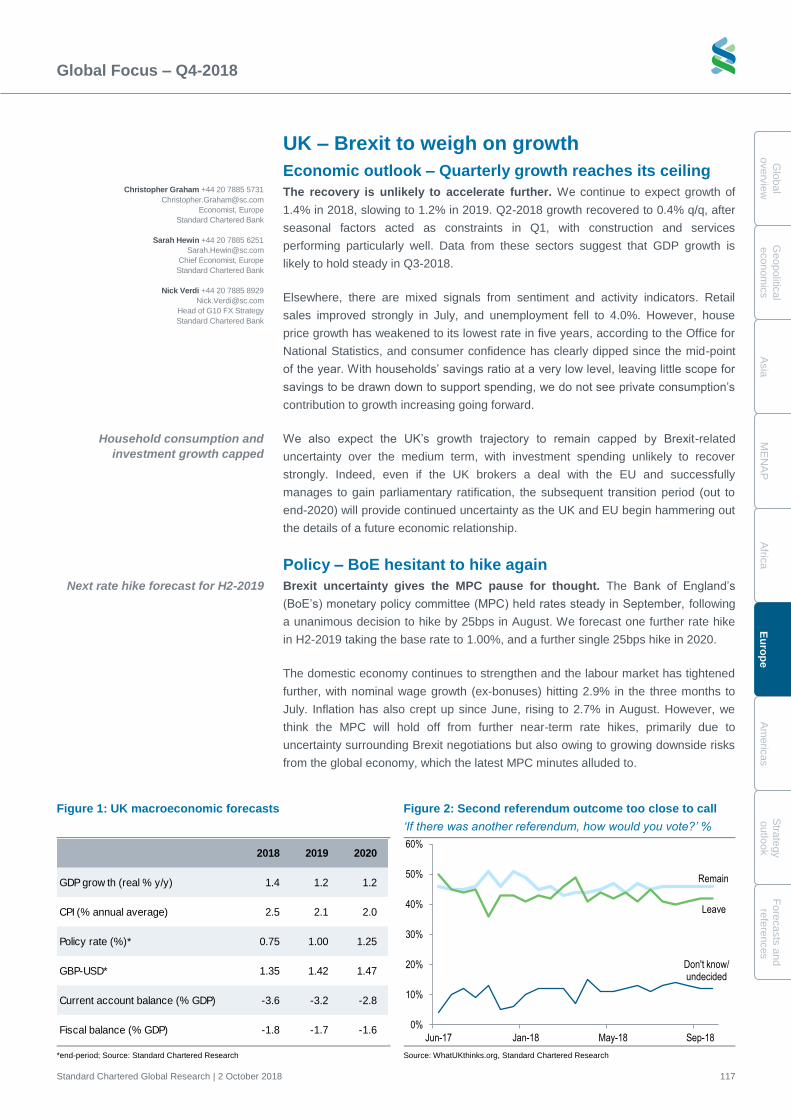
Global Focus – Q4-2018
Standard Chartered Global Research | 2 October 2018 117
Glo
bal
overv
iew
G
eopolitic
al
econom
ics
A
sia
M
EN
AP
A
frica
E
uro
pe
A
me
ricas
Stra
tegy
outlo
ok
Fo
recasts
and
refe
rences
UK – Brexit to weigh on growth
Economic outlook – Quarterly growth reaches its ceiling
The recovery is unlikely to accelerate further. We continue to expect growth of
1.4% in 2018, slowing to 1.2% in 2019. Q2-2018 growth recovered to 0.4% q/q, after
seasonal factors acted as constraints in Q1, with construction and services
performing particularly well. Data from these sectors suggest that GDP growth is
likely to hold steady in Q3-2018.
Elsewhere, there are mixed signals from sentiment and activity indicators. Retail
sales improved strongly in July, and unemployment fell to 4.0%. However, house
price growth has weakened to its lowest rate in five years, according to the Office for
National Statistics, and consumer confidence has clearly dipped since the mid-point
of the year. With households’ savings ratio at a very low level, leaving little scope for
savings to be drawn down to support spending, we do not see private consumption’s
contribution to growth increasing going forward.
We also expect the UK’s growth trajectory to remain capped by Brexit-related
uncertainty over the medium term, with investment spending unlikely to recover
strongly. Indeed, even if the UK brokers a deal with the EU and successfully
manages to gain parliamentary ratification, the subsequent transition period (out to
end-2020) will provide continued uncertainty as the UK and EU begin hammering out
the details of a future economic relationship.
Policy – BoE hesitant to hike again
Brexit uncertainty gives the MPC pause for thought. The Bank of England’s
(BoE’s) monetary policy committee (MPC) held rates steady in September, following
a unanimous decision to hike by 25bps in August. We forecast one further rate hike
in H2-2019 taking the base rate to 1.00%, and a further single 25bps hike in 2020.
The domestic economy continues to strengthen and the labour market has tightened
further, with nominal wage growth (ex-bonuses) hitting 2.9% in the three months to
July. Inflation has also crept up since June, rising to 2.7% in August. However, we
think the MPC will hold off from further near-term rate hikes, primarily due to
uncertainty surrounding Brexit negotiations but also owing to growing downside risks
from the global economy, which the latest MPC minutes alluded to.
Figure 1: UK macroeconomic forecasts Figure 2: Second referendum outcome too close to call
‘If there was another referendum, how would you vote?’ %
*end-period; Source: Standard Chartered Research Source: WhatUKthinks.org, Standard Chartered Research
2018 2019 2020
GDP grow th (real % y/y) 1.4 1.2 1.2
CPI (% annual average) 2.5 2.1 2.0
Policy rate (%)* 0.75 1.00 1.25
GBP-USD* 1.35 1.42 1.47
Current account balance (% GDP) -3.6 -3.2 -2.8
Fiscal balance (% GDP) -1.8 -1.7 -1.6
Remain
Leave
0%
10%
20%
30%
40%
50%
60%
Jun-17 Jan-18 May-18 Sep-18
Don't know/undecided
Household consumption and
investment growth capped
Next rate hike forecast for H2-2019
Christopher Graham +44 20 7885 5731
Economist, Europe
Standard Chartered Bank
Sarah Hewin +44 20 7885 6251
Chief Economist, Europe
Standard Chartered Bank
Nick Verdi +44 20 7885 8929
Head of G10 FX Strategy
Standard Chartered Bank
Global Focus – Q4-2018
Standard Chartered Global Research | 2 October 2018 118
G
lobal
overv
iew
Geopolit
ical
econom
ics
A
sia
M
EN
AP
A
fric
a
E
uro
pe
A
me
ricas
S
trate
gy
o
utlo
ok
Fo
recasts
and
re
fere
nces
The UK Treasury continues to make solid progress in reducing the fiscal deficit, and
we now expect it to shrink to 1.8% in 2018 (previously 2.1%), though future progress
may be slow if we are right about subdued GDP growth post-Brexit. The autumn
budget has been brought forward to 29 October in order to avoid it getting mixed up
with any Brexit legislation arriving in parliament in November.
Chancellor Philip Hammond had previously targeted eliminating the fiscal deficit by
the mid-2020s, but we think this will be difficult considering the government’s
commitment to inject GBP 20bn more per year into the National Health Service by
2023-24. In the case of a ‘no deal’ Brexit, the Treasury would likely be forced to relax
its fiscal stance considerably, which could see the deficit widen substantially from
current levels.
Politics – Brexit deadline approaches
There are fewer than 200 days until Brexit day (29 March 2019) and a mammoth
task still faces the UK government. Not only must Prime Minister (PM) Theresa
May reach an agreement with the European Commission – no simple task given how
intractable the Northern Ireland backstop issue is proving – but also, the much harder
job of getting the deal through the UK legislative branch will begin.
The key hurdle to finalising the Withdrawal Agreement remains the Northern Ireland
backstop. The EU has advocated a backstop that would allow Northern Ireland to
stay in the customs union, as well as parts of the Single Market but the UK has
rejected this given concerns over constitutional and geographic integrity. The UK has
instead advocated that the backstop should be ensured via a comprehensive
customs arrangement, whereby the UK remains aligned with the EU customs union
beyond the transition period; but the EU has noted that this prejudges the result of
negotiations on the future relationship.
Our core view remains that a deal will eventually be brokered between the UK and
EU, but this deal will likely depart from the government’s current Chequers plan.
More likely is that the UK government will make further concessions to the EU,
leading ultimately to a softer Brexit. Assuming a deal is reached between the UK and
EU, the harder task will arguably be to get the legislative branches to ratify the
agreement. In the UK, PM Theresa May cannot currently guarantee the required
support of a majority of Members of Parliament.
A ‘no deal’ Brexit would heighten the risk that the UK crashes out of the EU on WTO
terms, whereby trade tariffs and customs checks are applied from day one. A second
referendum looks a low probability, though cannot be completely ruled out, possibly
following an early general election. Polls show the two main parties, Conservatives
and Labour, neck-and-neck.
Market outlook – Brexit dominates the GBP outlook
Brexit risk premium remains but a positive outcome to negotiations would
drive the GBP higher. We remain bullish on GBP-USD. A withdrawal deal with the
EU passed by parliament after the UK presumably makes further concessions to the
EU would boost the GBP and front-end rate expectations in short order. Investors
expecting the outlines of a UK-EU trade deal later this year should prepare for more
hawkish monetary policy messaging from the BoE.
Even if a Brexit deal is agreed
between the UK government and
the EU, the UK parliament may
reject it
Northern Ireland backstop remains
the key hurdle to a deal
‘No deal’ Brexit could cause the
Treasury to relax the fiscal stance
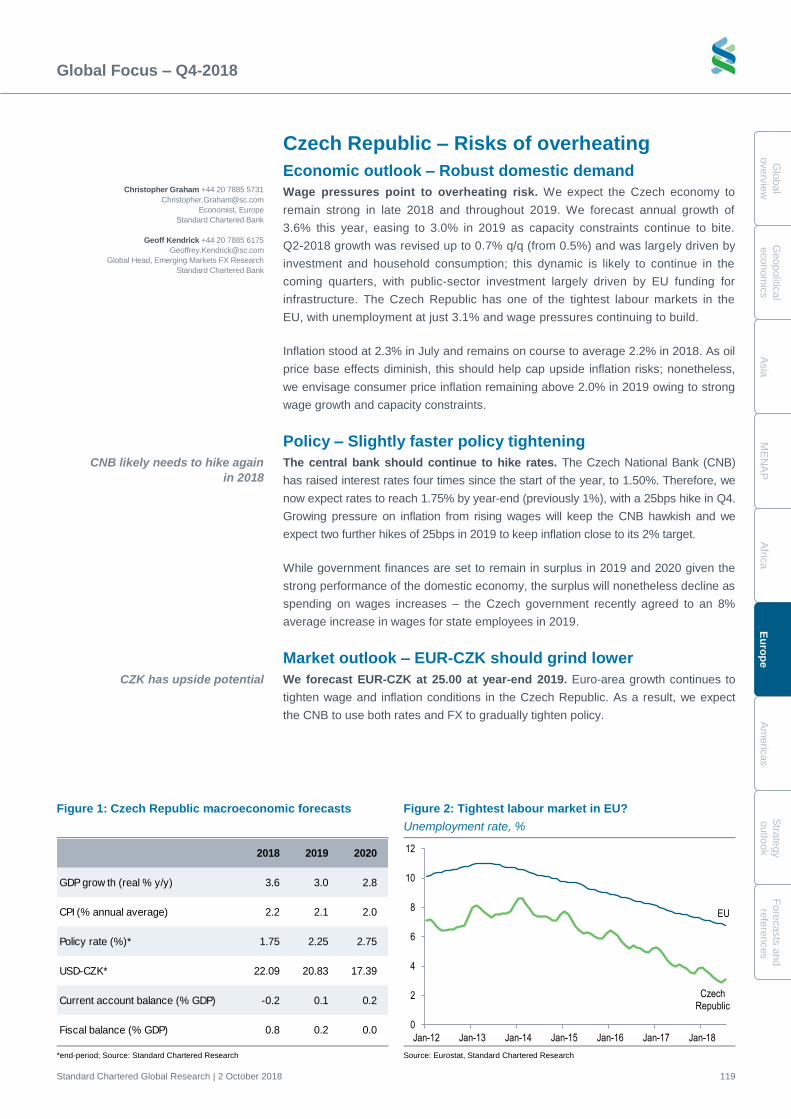
Global Focus – Q4-2018
Standard Chartered Global Research | 2 October 2018 119
Glo
bal
overv
iew
G
eopolitic
al
econom
ics
A
sia
M
EN
AP
A
frica
E
uro
pe
A
me
ricas
Stra
tegy
outlo
ok
Fo
recasts
and
refe
rences
Czech Republic – Risks of overheating
Economic outlook – Robust domestic demand
Wage pressures point to overheating risk. We expect the Czech economy to
remain strong in late 2018 and throughout 2019. We forecast annual growth of
3.6% this year, easing to 3.0% in 2019 as capacity constraints continue to bite.
Q2-2018 growth was revised up to 0.7% q/q (from 0.5%) and was largely driven by
investment and household consumption; this dynamic is likely to continue in the
coming quarters, with public-sector investment largely driven by EU funding for
infrastructure. The Czech Republic has one of the tightest labour markets in the
EU, with unemployment at just 3.1% and wage pressures continuing to build.
Inflation stood at 2.3% in July and remains on course to average 2.2% in 2018. As oil
price base effects diminish, this should help cap upside inflation risks; nonetheless,
we envisage consumer price inflation remaining above 2.0% in 2019 owing to strong
wage growth and capacity constraints.
Policy – Slightly faster policy tightening
The central bank should continue to hike rates. The Czech National Bank (CNB)
has raised interest rates four times since the start of the year, to 1.50%. Therefore, we
now expect rates to reach 1.75% by year-end (previously 1%), with a 25bps hike in Q4.
Growing pressure on inflation from rising wages will keep the CNB hawkish and we
expect two further hikes of 25bps in 2019 to keep inflation close to its 2% target.
While government finances are set to remain in surplus in 2019 and 2020 given the
strong performance of the domestic economy, the surplus will nonetheless decline as
spending on wages increases – the Czech government recently agreed to an 8%
average increase in wages for state employees in 2019.
Market outlook – EUR-CZK should grind lower
We forecast EUR-CZK at 25.00 at year-end 2019. Euro-area growth continues to
tighten wage and inflation conditions in the Czech Republic. As a result, we expect
the CNB to use both rates and FX to gradually tighten policy.
Figure 1: Czech Republic macroeconomic forecasts Figure 2: Tightest labour market in EU?
Unemployment rate, %
*end-period; Source: Standard Chartered Research Source: Eurostat, Standard Chartered Research
2018 2019 2020
GDP grow th (real % y/y) 3.6 3.0 2.8
CPI (% annual average) 2.2 2.1 2.0
Policy rate (%)* 1.75 2.25 2.75
USD-CZK* 22.09 20.83 17.39
Current account balance (% GDP) -0.2 0.1 0.2
Fiscal balance (% GDP) 0.8 0.2 0.0
Czech Republic
EU
0
2
4
6
8
10
12
Jan-12 Jan-13 Jan-14 Jan-15 Jan-16 Jan-17 Jan-18
CNB likely needs to hike again
in 2018
Christopher Graham +44 20 7885 5731
Economist, Europe
Standard Chartered Bank
Geoff Kendrick +44 20 7885 6175
Global Head, Emerging Markets FX Research
Standard Chartered Bank
CZK has upside potential
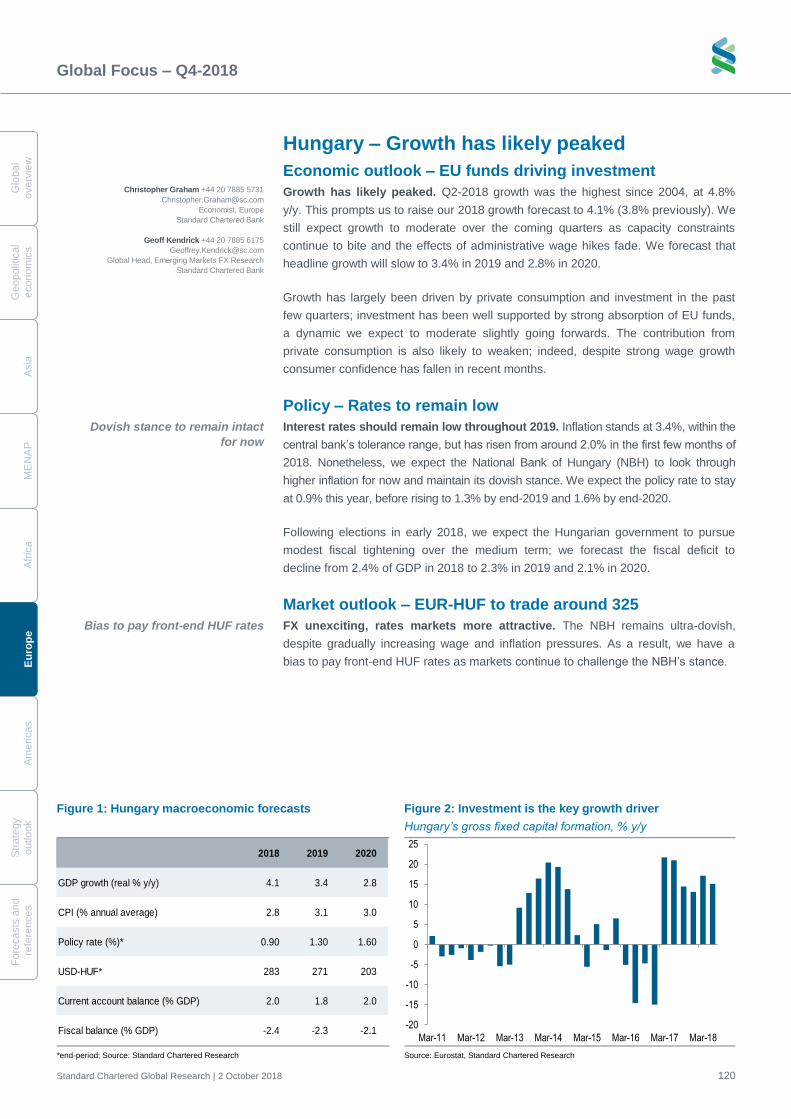
Global Focus – Q4-2018
Standard Chartered Global Research | 2 October 2018 120
G
lobal
overv
iew
Geopolit
ical
econom
ics
A
sia
M
EN
AP
A
fric
a
E
uro
pe
A
me
ricas
S
trate
gy
o
utlo
ok
Fo
recasts
and
re
fere
nces
Hungary – Growth has likely peaked
Economic outlook – EU funds driving investment
Growth has likely peaked. Q2-2018 growth was the highest since 2004, at 4.8%
y/y. This prompts us to raise our 2018 growth forecast to 4.1% (3.8% previously). We
still expect growth to moderate over the coming quarters as capacity constraints
continue to bite and the effects of administrative wage hikes fade. We forecast that
headline growth will slow to 3.4% in 2019 and 2.8% in 2020.
Growth has largely been driven by private consumption and investment in the past
few quarters; investment has been well supported by strong absorption of EU funds,
a dynamic we expect to moderate slightly going forwards. The contribution from
private consumption is also likely to weaken; indeed, despite strong wage growth
consumer confidence has fallen in recent months.
Policy – Rates to remain low
Interest rates should remain low throughout 2019. Inflation stands at 3.4%, within the
central bank’s tolerance range, but has risen from around 2.0% in the first few months of
2018. Nonetheless, we expect the National Bank of Hungary (NBH) to look through
higher inflation for now and maintain its dovish stance. We expect the policy rate to stay
at 0.9% this year, before rising to 1.3% by end-2019 and 1.6% by end-2020.
Following elections in early 2018, we expect the Hungarian government to pursue
modest fiscal tightening over the medium term; we forecast the fiscal deficit to
decline from 2.4% of GDP in 2018 to 2.3% in 2019 and 2.1% in 2020.
Market outlook – EUR-HUF to trade around 325
FX unexciting, rates markets more attractive. The NBH remains ultra-dovish,
despite gradually increasing wage and inflation pressures. As a result, we have a
bias to pay front-end HUF rates as markets continue to challenge the NBH’s stance.
Figure 1: Hungary macroeconomic forecasts Figure 2: Investment is the key growth driver
Hungary’s gross fixed capital formation, % y/y
*end-period; Source: Standard Chartered Research Source: Eurostat, Standard Chartered Research
2018 2019 2020
GDP growth (real % y/y) 4.1 3.4 2.8
CPI (% annual average) 2.8 3.1 3.0
Policy rate (%)* 0.90 1.30 1.60
USD-HUF* 283 271 203
Current account balance (% GDP) 2.0 1.8 2.0
Fiscal balance (% GDP) -2.4 -2.3 -2.1-20
-15
-10
-5
0
5
10
15
20
25
Mar-11 Mar-12 Mar-13 Mar-14 Mar-15 Mar-16 Mar-17 Mar-18
Bias to pay front-end HUF rates
Dovish stance to remain intact
for now
Christopher Graham +44 20 7885 5731
Economist, Europe
Standard Chartered Bank
Geoff Kendrick +44 20 7885 6175
Global Head, Emerging Markets FX Research
Standard Chartered Bank
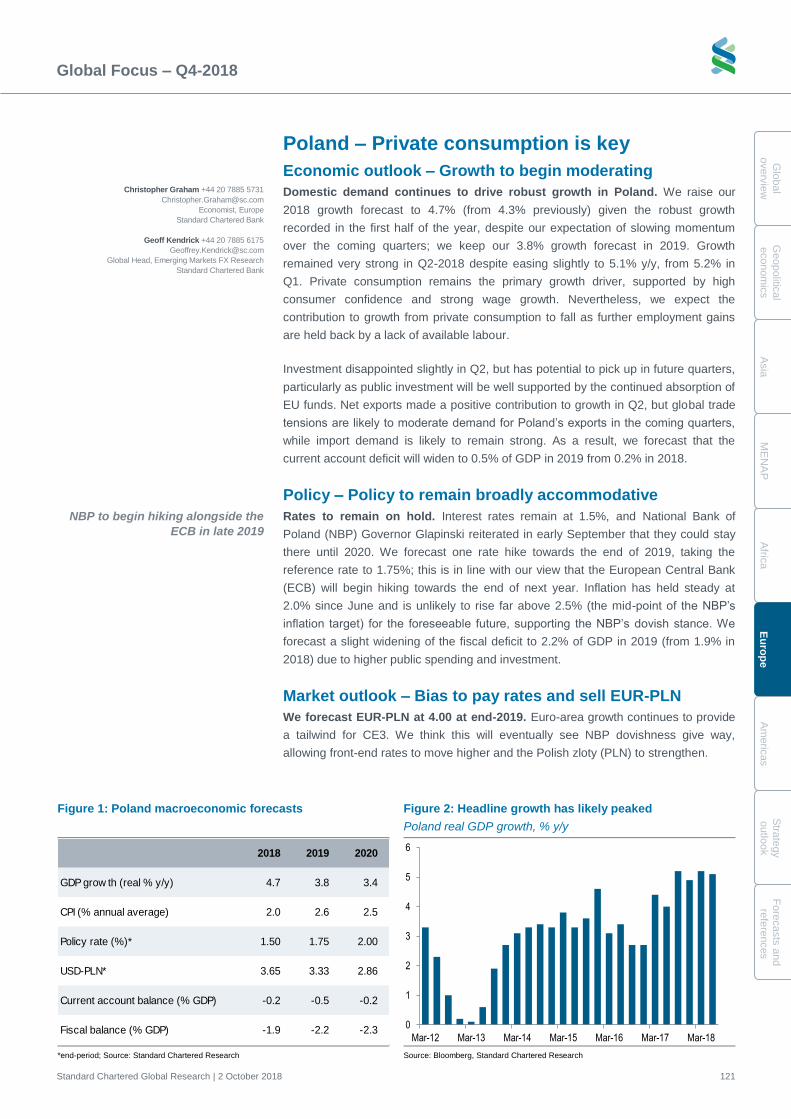
Global Focus – Q4-2018
Standard Chartered Global Research | 2 October 2018 121
Glo
bal
overv
iew
G
eopolitic
al
econom
ics
A
sia
M
EN
AP
A
frica
E
uro
pe
A
me
ricas
Stra
tegy
outlo
ok
Fo
recasts
and
refe
rences
Poland – Private consumption is key
Economic outlook – Growth to begin moderating
Domestic demand continues to drive robust growth in Poland. We raise our
2018 growth forecast to 4.7% (from 4.3% previously) given the robust growth
recorded in the first half of the year, despite our expectation of slowing momentum
over the coming quarters; we keep our 3.8% growth forecast in 2019. Growth
remained very strong in Q2-2018 despite easing slightly to 5.1% y/y, from 5.2% in
Q1. Private consumption remains the primary growth driver, supported by high
consumer confidence and strong wage growth. Nevertheless, we expect the
contribution to growth from private consumption to fall as further employment gains
are held back by a lack of available labour.
Investment disappointed slightly in Q2, but has potential to pick up in future quarters,
particularly as public investment will be well supported by the continued absorption of
EU funds. Net exports made a positive contribution to growth in Q2, but global trade
tensions are likely to moderate demand for Poland’s exports in the coming quarters,
while import demand is likely to remain strong. As a result, we forecast that the
current account deficit will widen to 0.5% of GDP in 2019 from 0.2% in 2018.
Policy – Policy to remain broadly accommodative
Rates to remain on hold. Interest rates remain at 1.5%, and National Bank of
Poland (NBP) Governor Glapinski reiterated in early September that they could stay
there until 2020. We forecast one rate hike towards the end of 2019, taking the
reference rate to 1.75%; this is in line with our view that the European Central Bank
(ECB) will begin hiking towards the end of next year. Inflation has held steady at
2.0% since June and is unlikely to rise far above 2.5% (the mid-point of the NBP’s
inflation target) for the foreseeable future, supporting the NBP’s dovish stance. We
forecast a slight widening of the fiscal deficit to 2.2% of GDP in 2019 (from 1.9% in
2018) due to higher public spending and investment.
Market outlook – Bias to pay rates and sell EUR-PLN
We forecast EUR-PLN at 4.00 at end-2019. Euro-area growth continues to provide
a tailwind for CE3. We think this will eventually see NBP dovishness give way,
allowing front-end rates to move higher and the Polish zloty (PLN) to strengthen.
Figure 1: Poland macroeconomic forecasts Figure 2: Headline growth has likely peaked
Poland real GDP growth, % y/y
*end-period; Source: Standard Chartered Research Source: Bloomberg, Standard Chartered Research
2018 2019 2020
GDP grow th (real % y/y) 4.7 3.8 3.4
CPI (% annual average) 2.0 2.6 2.5
Policy rate (%)* 1.50 1.75 2.00
USD-PLN* 3.65 3.33 2.86
Current account balance (% GDP) -0.2 -0.5 -0.2
Fiscal balance (% GDP) -1.9 -2.2 -2.30
1
2
3
4
5
6
Mar-12 Mar-13 Mar-14 Mar-15 Mar-16 Mar-17 Mar-18
NBP to begin hiking alongside the
ECB in late 2019
Christopher Graham +44 20 7885 5731
Economist, Europe
Standard Chartered Bank
Geoff Kendrick +44 20 7885 6175
Global Head, Emerging Markets FX Research
Standard Chartered Bank
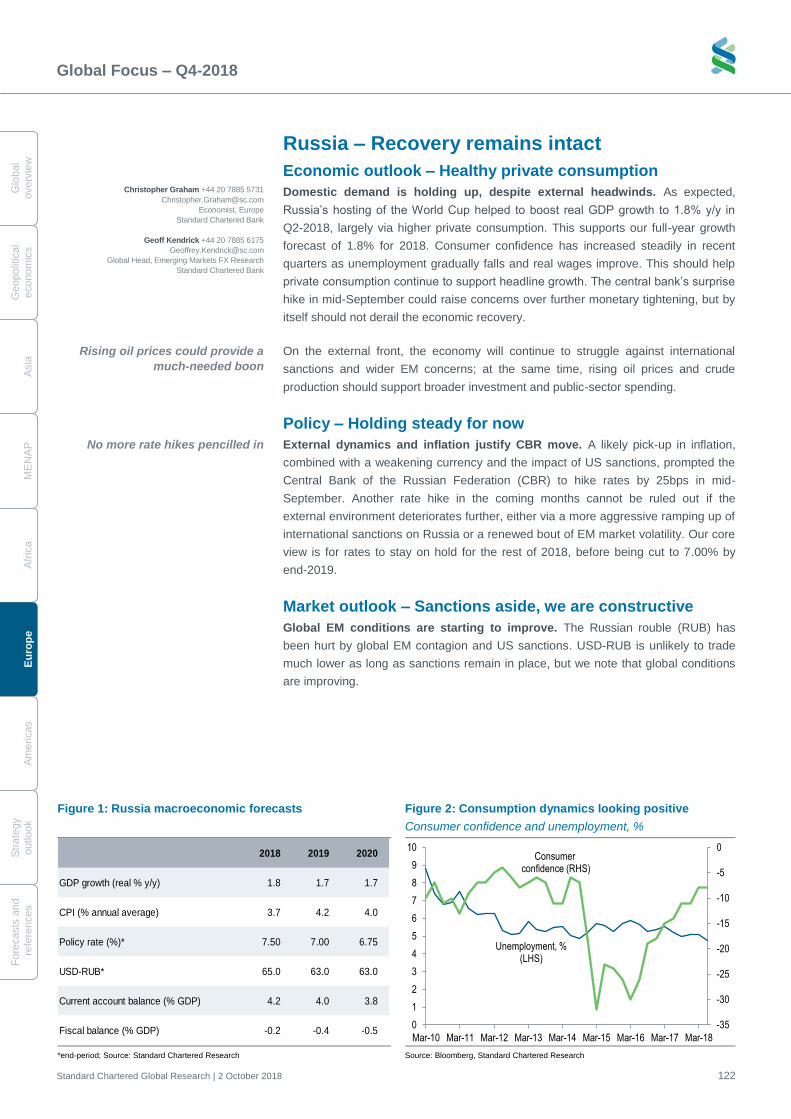
Global Focus – Q4-2018
Standard Chartered Global Research | 2 October 2018 122
G
lobal
overv
iew
Geopolit
ical
econom
ics
A
sia
M
EN
AP
A
fric
a
E
uro
pe
A
me
ricas
S
trate
gy
o
utlo
ok
Fo
recasts
and
re
fere
nces
Russia – Recovery remains intact
Economic outlook – Healthy private consumption
Domestic demand is holding up, despite external headwinds. As expected,
Russia’s hosting of the World Cup helped to boost real GDP growth to 1.8% y/y in
Q2-2018, largely via higher private consumption. This supports our full-year growth
forecast of 1.8% for 2018. Consumer confidence has increased steadily in recent
quarters as unemployment gradually falls and real wages improve. This should help
private consumption continue to support headline growth. The central bank’s surprise
hike in mid-September could raise concerns over further monetary tightening, but by
itself should not derail the economic recovery.
On the external front, the economy will continue to struggle against international
sanctions and wider EM concerns; at the same time, rising oil prices and crude
production should support broader investment and public-sector spending.
Policy – Holding steady for now
External dynamics and inflation justify CBR move. A likely pick-up in inflation,
combined with a weakening currency and the impact of US sanctions, prompted the
Central Bank of the Russian Federation (CBR) to hike rates by 25bps in mid-
September. Another rate hike in the coming months cannot be ruled out if the
external environment deteriorates further, either via a more aggressive ramping up of
international sanctions on Russia or a renewed bout of EM market volatility. Our core
view is for rates to stay on hold for the rest of 2018, before being cut to 7.00% by
end-2019.
Market outlook – Sanctions aside, we are constructive
Global EM conditions are starting to improve. The Russian rouble (RUB) has
been hurt by global EM contagion and US sanctions. USD-RUB is unlikely to trade
much lower as long as sanctions remain in place, but we note that global conditions
are improving.
Figure 1: Russia macroeconomic forecasts Figure 2: Consumption dynamics looking positive
Consumer confidence and unemployment, %
*end-period; Source: Standard Chartered Research Source: Bloomberg, Standard Chartered Research
2018 2019 2020
GDP growth (real % y/y) 1.8 1.7 1.7
CPI (% annual average) 3.7 4.2 4.0
Policy rate (%)* 7.50 7.00 6.75
USD-RUB* 65.0 63.0 63.0
Current account balance (% GDP) 4.2 4.0 3.8
Fiscal balance (% GDP) -0.2 -0.4 -0.5-35
-30
-25
-20
-15
-10
-5
0
0
1
2
3
4
5
6
7
8
9
10
Mar-10 Mar-11 Mar-12 Mar-13 Mar-14 Mar-15 Mar-16 Mar-17 Mar-18
Consumer confidence (RHS)
Unemployment, %(LHS)
Rising oil prices could provide a
much-needed boon
No more rate hikes pencilled in
Christopher Graham +44 20 7885 5731
Economist, Europe
Standard Chartered Bank
Geoff Kendrick +44 20 7885 6175
Global Head, Emerging Markets FX Research
Standard Chartered Bank
Economies – Americas
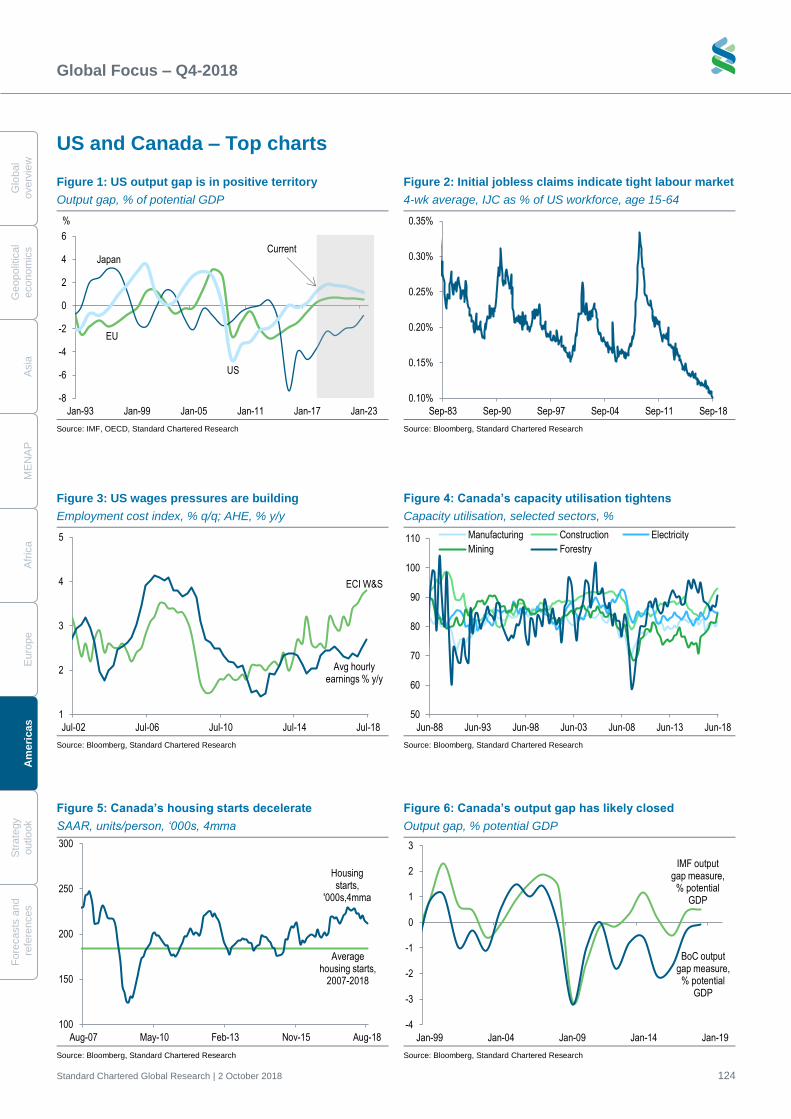
Global Focus – Q4-2018
Standard Chartered Global Research | 2 October 2018 124
G
lobal
overv
iew
Geopolit
ical
econom
ics
A
sia
M
EN
AP
A
fric
a
E
uro
pe
A
meri
cas
S
trate
gy
o
utlo
ok
Fo
recasts
and
re
fere
nces
US and Canada – Top charts Figure 1: US output gap is in positive territory
Output gap, % of potential GDP
Figure 2: Initial jobless claims indicate tight labour market
4-wk average, IJC as % of US workforce, age 15-64
Source: IMF, OECD, Standard Chartered Research Source: Bloomberg, Standard Chartered Research
Figure 3: US wages pressures are building
Employment cost index, % q/q; AHE, % y/y
Figure 4: Canada’s capacity utilisation tightens
Capacity utilisation, selected sectors, %
Source: Bloomberg, Standard Chartered Research Source: Bloomberg, Standard Chartered Research
EU
Japan
US
-8
-6
-4
-2
0
2
4
6
Jan-93 Jan-99 Jan-05 Jan-11 Jan-17 Jan-23
Current
%
0.10%
0.15%
0.20%
0.25%
0.30%
0.35%
Sep-83 Sep-90 Sep-97 Sep-04 Sep-11 Sep-18
ECI W&S
Avg hourly earnings % y/y
1
2
3
4
5
Jul-02 Jul-06 Jul-10 Jul-14 Jul-18
50
60
70
80
90
100
110
Jun-88 Jun-93 Jun-98 Jun-03 Jun-08 Jun-13 Jun-18
Manufacturing Construction Electricity
Mining Forestry
Figure 5: Canada’s housing starts decelerate
SAAR, units/person, ‘000s, 4mma
Figure 6: Canada’s output gap has likely closed
Output gap, % potential GDP
Source: Bloomberg, Standard Chartered Research Source: Bloomberg, Standard Chartered Research
Average housing starts,
2007-2018
Housing starts,
'000s,4mma
100
150
200
250
300
Aug-07 May-10 Feb-13 Nov-15 Aug-18
IMF output gap measure,
% potential GDP
BoC output gap measure,
% potential GDP
-4
-3
-2
-1
0
1
2
3
Jan-99 Jan-04 Jan-09 Jan-14 Jan-19
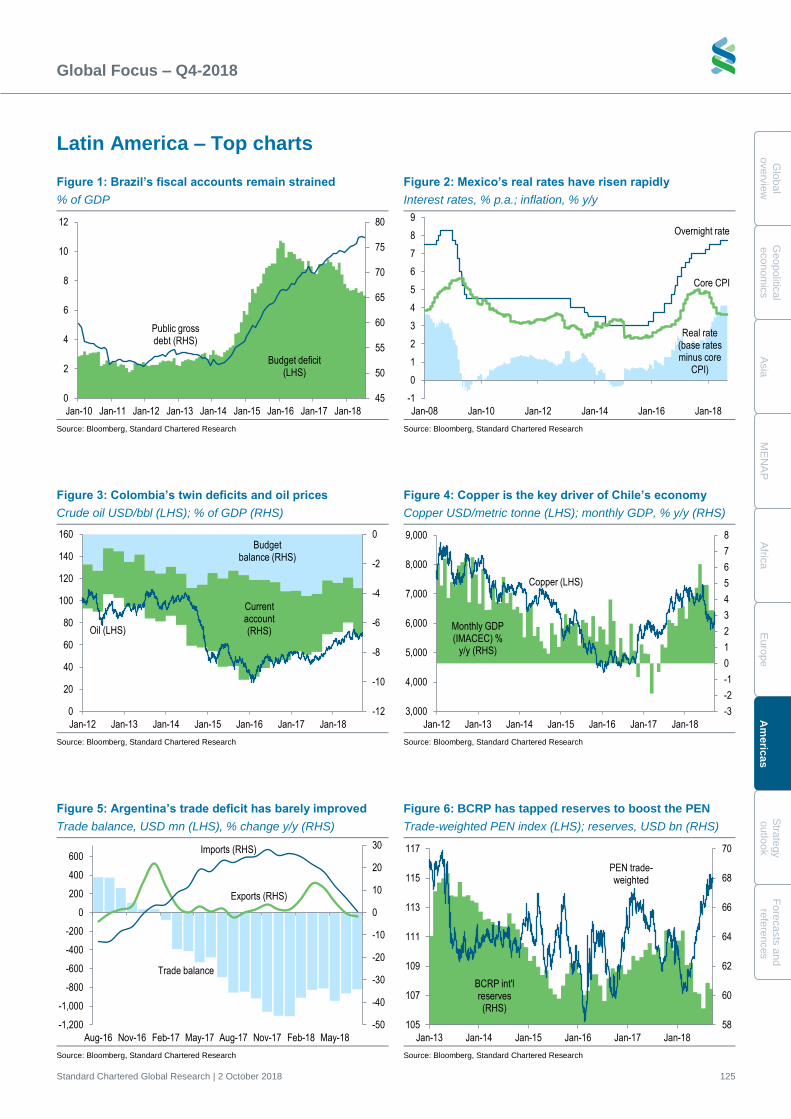
Global Focus – Q4-2018
Standard Chartered Global Research | 2 October 2018 125
Glo
bal
overv
iew
G
eopolitic
al
econom
ics
A
sia
M
EN
AP
A
frica
E
uro
pe
A
meric
as
Stra
tegy
outlo
ok
Fo
recasts
and
refe
rences
Latin America – Top charts Figure 1: Brazil’s fiscal accounts remain strained
% of GDP
Figure 2: Mexico’s real rates have risen rapidly
Interest rates, % p.a.; inflation, % y/y
Source: Bloomberg, Standard Chartered Research Source: Bloomberg, Standard Chartered Research
Figure 3: Colombia’s twin deficits and oil prices
Crude oil USD/bbl (LHS); % of GDP (RHS)
Figure 4: Copper is the key driver of Chile’s economy
Copper USD/metric tonne (LHS); monthly GDP, % y/y (RHS)
Source: Bloomberg, Standard Chartered Research Source: Bloomberg, Standard Chartered Research
Budget deficit (LHS)
Public gross debt (RHS)
45
50
55
60
65
70
75
80
0
2
4
6
8
10
12
Jan-10 Jan-11 Jan-12 Jan-13 Jan-14 Jan-15 Jan-16 Jan-17 Jan-18
Real rate (base rates minus core
CPI)
Overnight rate
Core CPI
-1
0
1
2
3
4
5
6
7
8
9
Jan-08 Jan-10 Jan-12 Jan-14 Jan-16 Jan-18
Budget balance (RHS)
Current account (RHS)Oil (LHS)
-12
-10
-8
-6
-4
-2
0
0
20
40
60
80
100
120
140
160
Jan-12 Jan-13 Jan-14 Jan-15 Jan-16 Jan-17 Jan-18
Monthly GDP (IMACEC) %
y/y (RHS)
Copper (LHS)
-3
-2
-1
0
1
2
3
4
5
6
7
8
3,000
4,000
5,000
6,000
7,000
8,000
9,000
Jan-12 Jan-13 Jan-14 Jan-15 Jan-16 Jan-17 Jan-18
Figure 5: Argentina’s trade deficit has barely improved
Trade balance, USD mn (LHS), % change y/y (RHS)
Figure 6: BCRP has tapped reserves to boost the PEN
Trade-weighted PEN index (LHS); reserves, USD bn (RHS)
Source: Bloomberg, Standard Chartered Research Source: Bloomberg, Standard Chartered Research
Trade balance
Exports (RHS)
Imports (RHS)
-50
-40
-30
-20
-10
0
10
20
30
-1,200
-1,000
-800
-600
-400
-200
0
200
400
600
Aug-16 Nov-16 Feb-17 May-17 Aug-17 Nov-17 Feb-18 May-18
BCRP int'l reserves (RHS)
PEN trade-weighted
58
60
62
64
66
68
70
105
107
109
111
113
115
117
Jan-13 Jan-14 Jan-15 Jan-16 Jan-17 Jan-18
Th
ou
san
ds
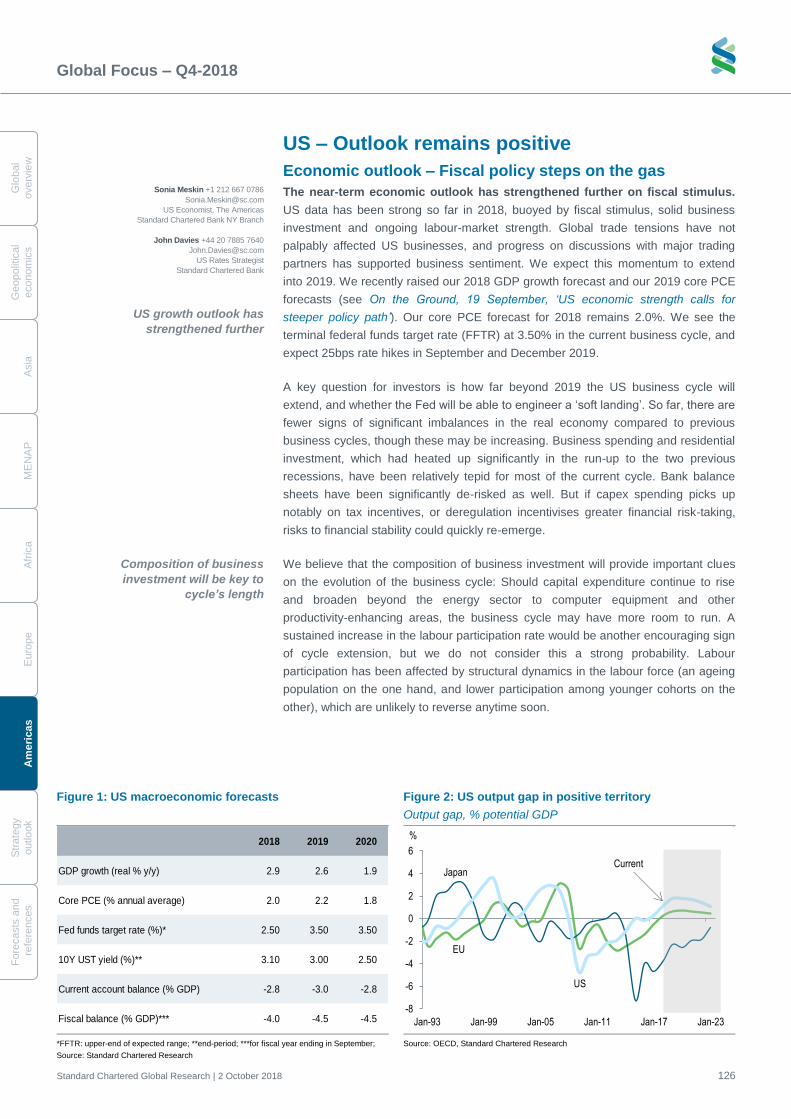
Global Focus – Q4-2018
Standard Chartered Global Research | 2 October 2018 126
G
lobal
overv
iew
Geopolit
ical
econom
ics
A
sia
M
EN
AP
A
fric
a
E
uro
pe
A
meri
cas
S
trate
gy
o
utlo
ok
Fo
recasts
and
re
fere
nces
US – Outlook remains positive
Economic outlook – Fiscal policy steps on the gas
The near-term economic outlook has strengthened further on fiscal stimulus.
US data has been strong so far in 2018, buoyed by fiscal stimulus, solid business
investment and ongoing labour-market strength. Global trade tensions have not
palpably affected US businesses, and progress on discussions with major trading
partners has supported business sentiment. We expect this momentum to extend
into 2019. We recently raised our 2018 GDP growth forecast and our 2019 core PCE
forecasts (see On the Ground, 19 September, ‘US economic strength calls for
steeper policy path’). Our core PCE forecast for 2018 remains 2.0%. We see the
terminal federal funds target rate (FFTR) at 3.50% in the current business cycle, and
expect 25bps rate hikes in September and December 2019.
A key question for investors is how far beyond 2019 the US business cycle will
extend, and whether the Fed will be able to engineer a ‘soft landing’. So far, there are
fewer signs of significant imbalances in the real economy compared to previous
business cycles, though these may be increasing. Business spending and residential
investment, which had heated up significantly in the run-up to the two previous
recessions, have been relatively tepid for most of the current cycle. Bank balance
sheets have been significantly de-risked as well. But if capex spending picks up
notably on tax incentives, or deregulation incentivises greater financial risk-taking,
risks to financial stability could quickly re-emerge.
We believe that the composition of business investment will provide important clues
on the evolution of the business cycle: Should capital expenditure continue to rise
and broaden beyond the energy sector to computer equipment and other
productivity-enhancing areas, the business cycle may have more room to run. A
sustained increase in the labour participation rate would be another encouraging sign
of cycle extension, but we do not consider this a strong probability. Labour
participation has been affected by structural dynamics in the labour force (an ageing
population on the one hand, and lower participation among younger cohorts on the
other), which are unlikely to reverse anytime soon.
Figure 1: US macroeconomic forecasts Figure 2: US output gap in positive territory
Output gap, % potential GDP
*FFTR: upper-end of expected range; **end-period; ***for fiscal year ending in September;
Source: Standard Chartered Research
Source: OECD, Standard Chartered Research
2018 2019 2020
GDP growth (real % y/y) 2.9 2.6 1.9
Core PCE (% annual average) 2.0 2.2 1.8
Fed funds target rate (%)* 2.50 3.50 3.50
10Y UST yield (%)** 3.10 3.00 2.50
Current account balance (% GDP) -2.8 -3.0 -2.8
Fiscal balance (% GDP)*** -4.0 -4.5 -4.5
EU
Japan
US
-8
-6
-4
-2
0
2
4
6
Jan-93 Jan-99 Jan-05 Jan-11 Jan-17 Jan-23
Current
%
Composition of business
investment will be key to
cycle’s length
Sonia Meskin +1 212 667 0786
US Economist, The Americas
Standard Chartered Bank NY Branch
John Davies +44 20 7885 7640
US Rates Strategist
Standard Chartered Bank
US growth outlook has
strengthened further
Global Focus – Q4-2018
Standard Chartered Global Research | 2 October 2018 127
Glo
bal
overv
iew
G
eopolitic
al
econom
ics
A
sia
M
EN
AP
A
frica
E
uro
pe
A
meric
as
Stra
tegy
outlo
ok
Fo
recasts
and
refe
rences
Policy – Onwards and upwards
So far, FOMC policy has been largely accommodative of fiscal stimulus. This
has been the case even though growth has surprised on the upside so far in 2018.
Based on the FOMC’s own upgraded GDP outlook for 2018-19, most policy rules,
including variants of the Taylor rule, would recommend c.100bps of additional
cumulative FFTR tightening beyond what was already planned. But the June
Summary of Economic Projections (SEP) indicated roughly half of this pace of
tightening. Given the strength of real growth and tight labour markets, we expect the
policy stance to remain relatively benign, even if the terminal rate moves to 3.50% as
we expect.
The FOMC’s main challenge now is to stabilise real growth and the labour market
without tipping the economy into a sharp recession. With unemployment significantly
below most estimates of the neutral level (3.9% versus 4.5%) and still on a declining
trajectory, a deceleration in real growth is required for the economy to achieve
equilibrium. For the Fed to manage a ‘soft landing’ – the stabilisation of
unemployment around 4.0-4.5% – real growth must decelerate to below 2%. Given
our expectation that fiscal stimulus will fade in 2020, we think only a mildly restrictive
policy may be sufficient to stabilise employment and mitigate financial-stability risks.
Core inflation has stayed near the FOMC’s 2% objective in 2018, but we see
moderate upside risks to 2019 on higher medical-services and core-goods prices,
among other factors. We believe, along with the Fed, that the Phillips curve is flatter
than in previous business cycles but is relevant. If the output gap moves further into
positive territory, wage growth should accelerate (barring a labour-participation
spike). The FOMC would likely tolerate a modest inflation overshoot (we believe up
to c.2.3%), partly because this would help the committee start the next easing cycle
with higher nominal rates. But a sustained acceleration in wage growth could unmoor
inflation expectations – a risk we believe the FOMC is unwilling to take.
The biggest downside risk to our outlook for Fed tightening would be less buoyant
business activity. H1-2018 brought the threat of a global trade war. However, trade
tensions have not sapped real activity or sentiment in the US so far, and with the US-
EU and NAFTA dialogue ongoing, this risk appears to be receding. Increased
political pressure on policy makers is a further risk to our view, but we believe Fed
officials will prioritise the credibility of the institution over political expedience.
Politics – All eyes on the midterms
US midterm elections are increasingly becoming the focus for investors.
Commentators have increasingly described the 8 November midterms as a ‘practice
run’ for the 2020 elections. It is not uncommon for the incumbent’s party to lose its
majority in Congress (in at least one chamber) in the first midterm election. However,
the combination of a strong labour market and the president’s increased popularity,
according to recent polls, may help the Republican party in November.
We believe that the House is more vulnerable than the Senate to a Democratic
takeover. In the Senate, more Democratic seats are up for re-election than
Republican, and many of these are not traditionally Democratic strongholds. In the
House, almost 50 seats are considered competitive, but the Democrats would need
to flip 24 Republican seats (and keep their current 194 seats) to gain a majority.
FOMC’s challenge is to stabilise
growth without tipping the economy
into recession
We believe the House is more
vulnerable than the Senate to
Democratic takeover
Global Focus – Q4-2018
Standard Chartered Global Research | 2 October 2018 128
G
lobal
overv
iew
Geopolit
ical
econom
ics
A
sia
M
EN
AP
A
fric
a
E
uro
pe
A
meri
cas
S
trate
gy
o
utlo
ok
Fo
recasts
and
re
fere
nces
A veto-proof Democratic Congress post-November 2018 looks highly implausible,
and a Democratic takeover of the Senate is unlikely, as far fewer Republican than
Democratic seats are up for re-election. But market participants may interpret a
decisive Democratic takeover of the House as increasing the likelihood of a 2020
Democratic takeover of all three chambers. If the Democrats won all three chambers
of government in 2020, they would likely seek to reverse the president’s domestic
agenda, specifically the Tax Cuts and Jobs Act (TCJA). No Democrat in the House or
Senate voted in favour of the Republican tax bill in 2017. If Democrats win a majority
in one chamber in 2018 and corporations see this as a precursor to the 2020 results,
they may begin to prepare for a TCJA reversal as early as late 2018 and 2019. This
could mean, among other things, accelerated capex investment limited to tax-
advantaged sectors and a shortened business cycle.
UST market outlook – Fed hikes remain a curve flattener
The short end of the US curve continues to under-price our view of the terminal Fed
policy rate and that implied by the ‘dot-plot’ (staff projections). However, as long as
the median longer-run policy rate projection – the Fed’s broad view of the neutral
policy rate – does not rise back above 3%, we see little upside for the 10Y US
Treasury benchmark yield beyond the 3.25% peak implied by our forecasts for the
next 6-12 months. Ongoing quarterly rates hikes, combined with well-behaved
inflation, are likely to underpin the curve-flattening trend, but there is a risk of outright
inversion in 2019.
Investors and corporates may
extrapolate 2018 midterm results
into 2020
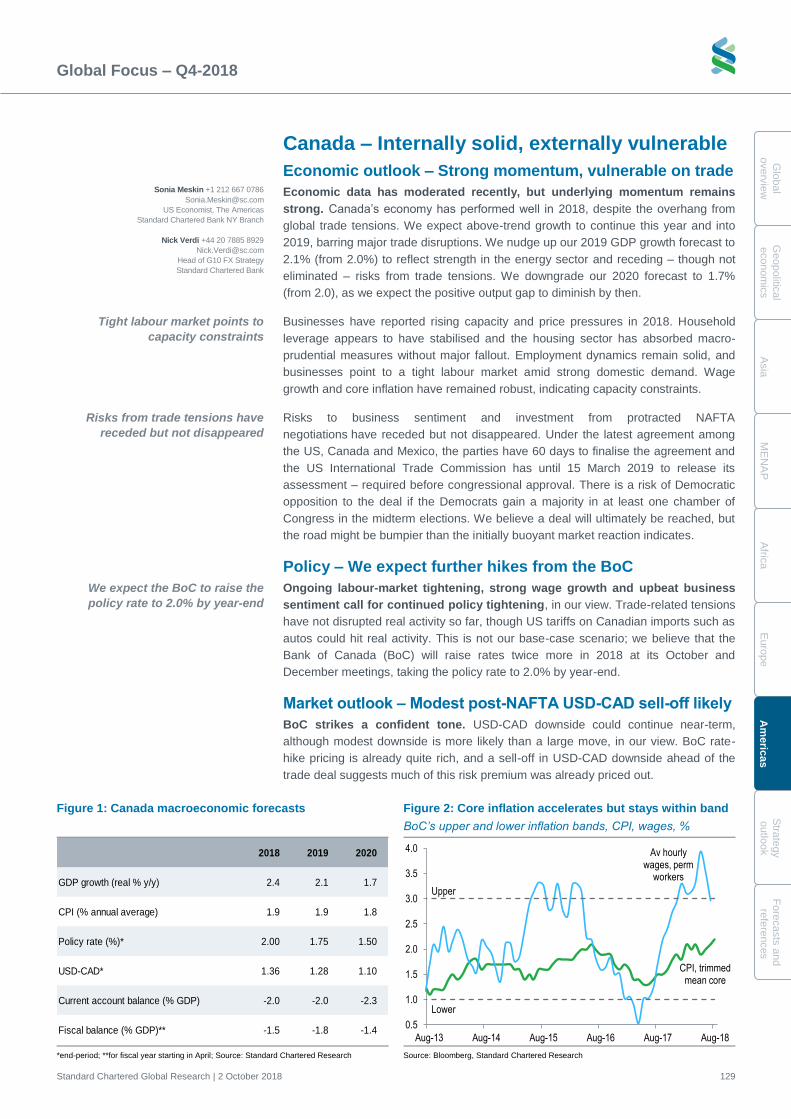
Global Focus – Q4-2018
Standard Chartered Global Research | 2 October 2018 129
Glo
bal
overv
iew
G
eopolitic
al
econom
ics
A
sia
M
EN
AP
A
frica
E
uro
pe
A
meric
as
Stra
tegy
outlo
ok
Fo
recasts
and
refe
rences
Canada – Internally solid, externally vulnerable
Economic outlook – Strong momentum, vulnerable on trade
Economic data has moderated recently, but underlying momentum remains
strong. Canada’s economy has performed well in 2018, despite the overhang from
global trade tensions. We expect above-trend growth to continue this year and into
2019, barring major trade disruptions. We nudge up our 2019 GDP growth forecast to
2.1% (from 2.0%) to reflect strength in the energy sector and receding – though not
eliminated – risks from trade tensions. We downgrade our 2020 forecast to 1.7%
(from 2.0), as we expect the positive output gap to diminish by then.
Businesses have reported rising capacity and price pressures in 2018. Household
leverage appears to have stabilised and the housing sector has absorbed macro-
prudential measures without major fallout. Employment dynamics remain solid, and
businesses point to a tight labour market amid strong domestic demand. Wage
growth and core inflation have remained robust, indicating capacity constraints.
Risks to business sentiment and investment from protracted NAFTA
negotiations have receded but not disappeared. Under the latest agreement among
the US, Canada and Mexico, the parties have 60 days to finalise the agreement and
the US International Trade Commission has until 15 March 2019 to release its
assessment – required before congressional approval. There is a risk of Democratic
opposition to the deal if the Democrats gain a majority in at least one chamber of
Congress in the midterm elections. We believe a deal will ultimately be reached, but
the road might be bumpier than the initially buoyant market reaction indicates.
Policy – We expect further hikes from the BoC
Ongoing labour-market tightening, strong wage growth and upbeat business
sentiment call for continued policy tightening, in our view. Trade-related tensions
have not disrupted real activity so far, though US tariffs on Canadian imports such as
autos could hit real activity. This is not our base-case scenario; we believe that the
Bank of Canada (BoC) will raise rates twice more in 2018 at its October and
December meetings, taking the policy rate to 2.0% by year-end.
Market outlook – Modest post-NAFTA USD-CAD sell-off likely
BoC strikes a confident tone. USD-CAD downside could continue near-term,
although modest downside is more likely than a large move, in our view. BoC rate-
hike pricing is already quite rich, and a sell-off in USD-CAD downside ahead of the
trade deal suggests much of this risk premium was already priced out.
Figure 1: Canada macroeconomic forecasts Figure 2: Core inflation accelerates but stays within band
BoC’s upper and lower inflation bands, CPI, wages, %
*end-period; **for fiscal year starting in April; Source: Standard Chartered Research Source: Bloomberg, Standard Chartered Research
2018 2019 2020
GDP growth (real % y/y) 2.4 2.1 1.7
CPI (% annual average) 1.9 1.9 1.8
Policy rate (%)* 2.00 1.75 1.50
USD-CAD* 1.36 1.28 1.10
Current account balance (% GDP) -2.0 -2.0 -2.3
Fiscal balance (% GDP)** -1.5 -1.8 -1.4
CPI, trimmed mean core
Av hourly wages, perm
workers
Upper
Lower
0.5
1.0
1.5
2.0
2.5
3.0
3.5
4.0
Aug-13 Aug-14 Aug-15 Aug-16 Aug-17 Aug-18
We expect the BoC to raise the
policy rate to 2.0% by year-end
Sonia Meskin +1 212 667 0786
US Economist, The Americas
Standard Chartered Bank NY Branch
Nick Verdi +44 20 7885 8929
Head of G10 FX Strategy
Standard Chartered Bank
Tight labour market points to
capacity constraints
Risks from trade tensions have
receded but not disappeared
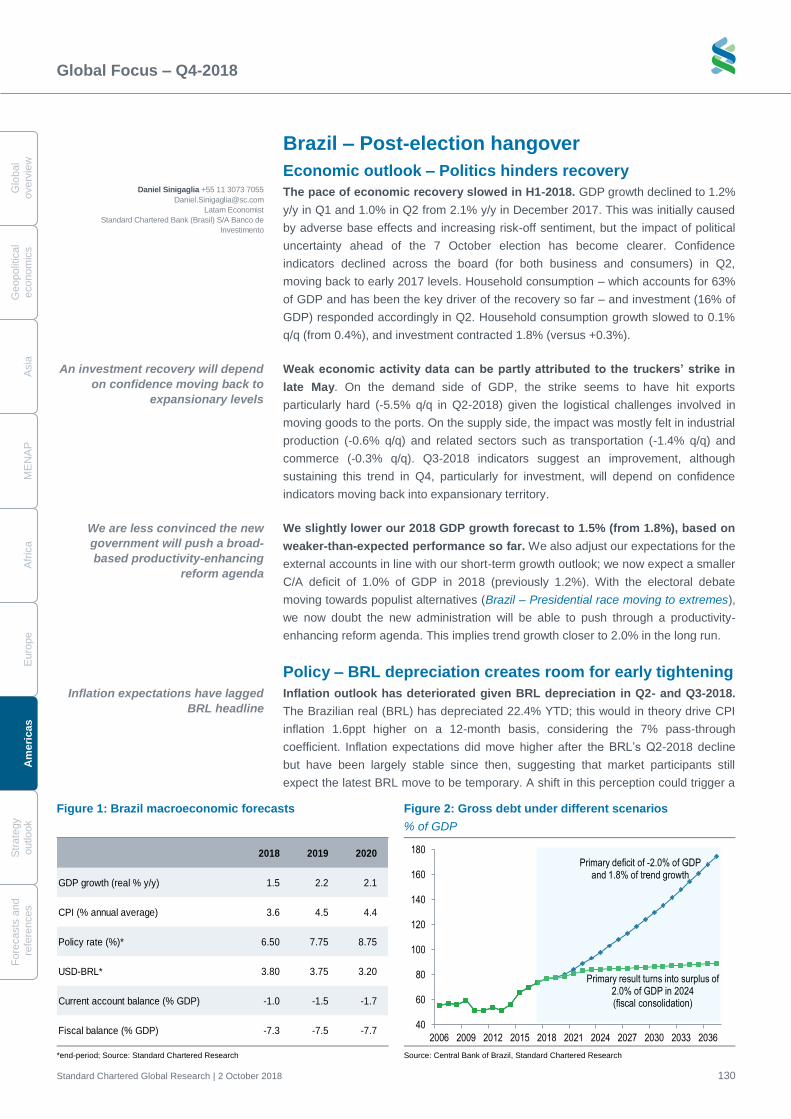
Global Focus – Q4-2018
Standard Chartered Global Research | 2 October 2018 130
G
lobal
overv
iew
Geopolit
ical
econom
ics
A
sia
M
EN
AP
A
fric
a
E
uro
pe
A
meri
cas
S
trate
gy
o
utlo
ok
Fo
recasts
and
re
fere
nces
Brazil – Post-election hangover
Economic outlook – Politics hinders recovery
The pace of economic recovery slowed in H1-2018. GDP growth declined to 1.2%
y/y in Q1 and 1.0% in Q2 from 2.1% y/y in December 2017. This was initially caused
by adverse base effects and increasing risk-off sentiment, but the impact of political
uncertainty ahead of the 7 October election has become clearer. Confidence
indicators declined across the board (for both business and consumers) in Q2,
moving back to early 2017 levels. Household consumption – which accounts for 63%
of GDP and has been the key driver of the recovery so far – and investment (16% of
GDP) responded accordingly in Q2. Household consumption growth slowed to 0.1%
q/q (from 0.4%), and investment contracted 1.8% (versus +0.3%).
Weak economic activity data can be partly attributed to the truckers’ strike in
late May. On the demand side of GDP, the strike seems to have hit exports
particularly hard (-5.5% q/q in Q2-2018) given the logistical challenges involved in
moving goods to the ports. On the supply side, the impact was mostly felt in industrial
production (-0.6% q/q) and related sectors such as transportation (-1.4% q/q) and
commerce (-0.3% q/q). Q3-2018 indicators suggest an improvement, although
sustaining this trend in Q4, particularly for investment, will depend on confidence
indicators moving back into expansionary territory.
We slightly lower our 2018 GDP growth forecast to 1.5% (from 1.8%), based on
weaker-than-expected performance so far. We also adjust our expectations for the
external accounts in line with our short-term growth outlook; we now expect a smaller
C/A deficit of 1.0% of GDP in 2018 (previously 1.2%). With the electoral debate
moving towards populist alternatives (Brazil – Presidential race moving to extremes),
we now doubt the new administration will be able to push through a productivity-
enhancing reform agenda. This implies trend growth closer to 2.0% in the long run.
Policy – BRL depreciation creates room for early tightening
Inflation outlook has deteriorated given BRL depreciation in Q2- and Q3-2018.
The Brazilian real (BRL) has depreciated 22.4% YTD; this would in theory drive CPI
inflation 1.6ppt higher on a 12-month basis, considering the 7% pass-through
coefficient. Inflation expectations did move higher after the BRL’s Q2-2018 decline
but have been largely stable since then, suggesting that market participants still
expect the latest BRL move to be temporary. A shift in this perception could trigger a
Figure 1: Brazil macroeconomic forecasts Figure 2: Gross debt under different scenarios
% of GDP
*end-period; Source: Standard Chartered Research Source: Central Bank of Brazil, Standard Chartered Research
2018 2019 2020
GDP growth (real % y/y) 1.5 2.2 2.1
CPI (% annual average) 3.6 4.5 4.4
Policy rate (%)* 6.50 7.75 8.75
USD-BRL* 3.80 3.75 3.20
Current account balance (% GDP) -1.0 -1.5 -1.7
Fiscal balance (% GDP) -7.3 -7.5 -7.740
60
80
100
120
140
160
180
2006 2009 2012 2015 2018 2021 2024 2027 2030 2033 2036
Primary result turns into surplus of 2.0% of GDP in 2024(fiscal consolidation)
Primary deficit of -2.0% of GDP and 1.8% of trend growth
Inflation expectations have lagged
BRL headline
An investment recovery will depend
on confidence moving back to
expansionary levels
Daniel Sinigaglia +55 11 3073 7055
Latam Economist
Standard Chartered Bank (Brasil) S/A Banco de
Investimento
We are less convinced the new
government will push a broad-
based productivity-enhancing
reform agenda
Global Focus – Q4-2018
Standard Chartered Global Research | 2 October 2018 131
Glo
bal
overv
iew
G
eopolitic
al
econom
ics
A
sia
M
EN
AP
A
frica
E
uro
pe
A
meric
as
Stra
tegy
outlo
ok
Fo
recasts
and
refe
rences
significant uptick in market consensus inflation forecasts for 2019. In fact, Banco
Central do Brasil (BCB) indicated an above-target inflation forecast for 2019 amid a
stable BRL in its Q3-2018 inflation report. In this scenario, we think BCB would likely
deliver some rate hikes starting in Q4-2018.
However, our base case is that the USD-BRL moves back to 3.80 at end-Q4-
2018, which would give BCB room to maintain rates until June next year, when we
expect it to start a gradual tightening cycle of 25bps hikes per meeting.
We see upside risks to our inflation forecasts if minimum freight-price
regulation is implemented in 2019. However, this could depend on the election
outcome. We revise our 2018 average CPI inflation forecast to 3.6% (from 3.5%); this
would mean 4.2% y/y at year-end, based on higher short-term CPI headline
readings. We now expect average 2019 CPI inflation of 4.5% (from 4.0% previously),
or 4.4% y/y at year-end. For 2020 we raise our average inflation forecast to 4.4%
(from 4.0%), or 4.1% y/y at year-end. Minimum freight prices could push these
figures up due to high food inflation, but the characteristics and implementation of
such a measure have yet to be decided.
Politics – Fiscal tightening of 4% of GDP is needed
Beyond elections lies the need for a 4%-of-GDP fiscal improvement. Our
simulations suggest that fiscal policy needs to be tightened by 4% of GDP to ensure
progress towards public debt solvency, which could be achieved via a combination of
higher revenue and lower expenditure. Regardless of the election outcome, market
participants’ assessment of the winning candidate’s proposals and the likelihood of
implementation will be the key driver of Brazil’s assets.
The starting point will be social security reform, which seems more likely under a
right-wing government. The polarising campaign and anti-establishment sentiment
have not only reduced the predictability of the election outcome, but are also likely to
create post-election social division and doubts about the legitimacy of the future
government. We expect low approval ratings for, and relentless political opposition
to, the incoming administration, creating a difficult environment for a structural reform
agenda to be passed in Congress.
Market outlook – Room for a post-election relief rally
Political uncertainty will likely continue to put downward pressure on Brazil’s
assets. In the short term, we would hesitate to own Brazil’s assets, as the run-up to
the elections will likely be marked by confusing news flow, volatile voter intentions
and high political uncertainty. However, we think the balance of risks is skewed
towards a post-election relief rally, as we highlighted in Latam strategy look ahead –
17-Sep-2018. Some constructive statements or political gestures are likely in Q4-
2018 as the winning candidate moves towards the centre to assuage market fears.
Consensus among politicians that some form of pension reform is needed has
hardened. We expect practical discussions to take place in the next few months.
Limitations on the approval of new proposals and the impact on prices are only likely
to become apparent in the medium term.
After elections, all eyes will likely
turn to social security reform
We expect BCB tightening to
resume in late H1-2019
Establishment of minimum freight
prices is the main upside risk to our
inflation forecast
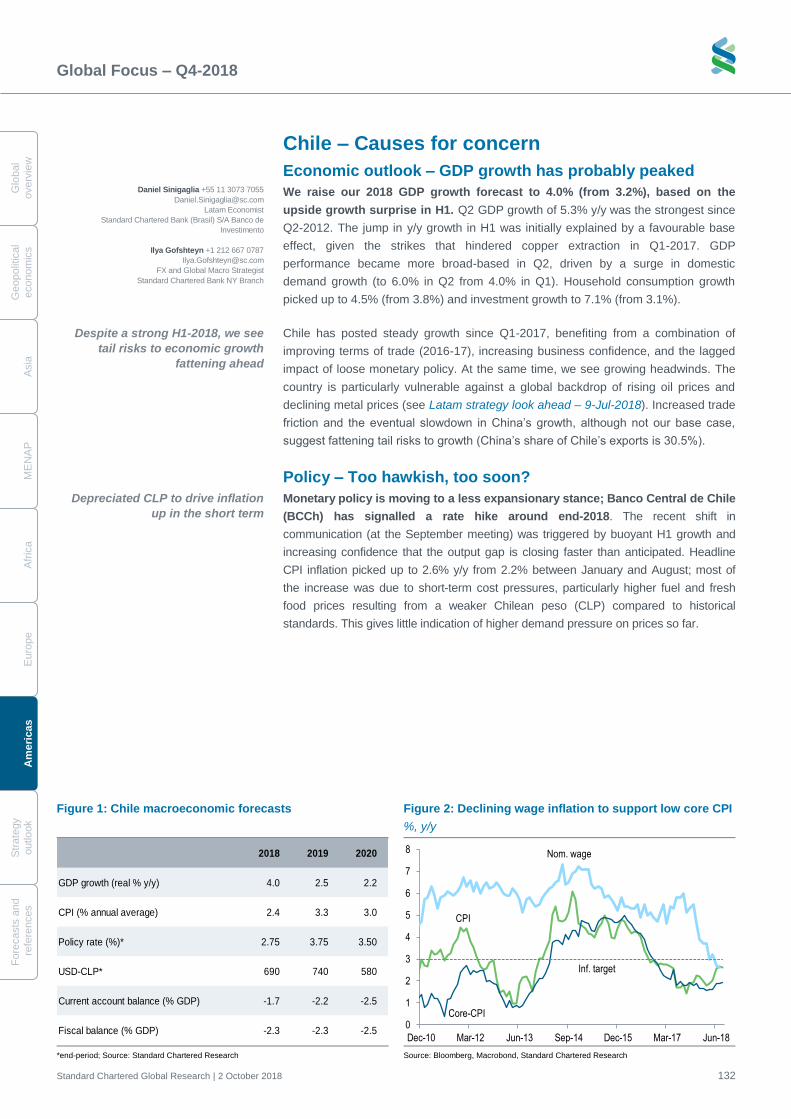
Global Focus – Q4-2018
Standard Chartered Global Research | 2 October 2018 132
G
lobal
overv
iew
Geopolit
ical
econom
ics
A
sia
M
EN
AP
A
fric
a
E
uro
pe
A
meri
cas
S
trate
gy
o
utlo
ok
Fo
recasts
and
re
fere
nces
Chile – Causes for concern
Economic outlook – GDP growth has probably peaked
We raise our 2018 GDP growth forecast to 4.0% (from 3.2%), based on the
upside growth surprise in H1. Q2 GDP growth of 5.3% y/y was the strongest since
Q2-2012. The jump in y/y growth in H1 was initially explained by a favourable base
effect, given the strikes that hindered copper extraction in Q1-2017. GDP
performance became more broad-based in Q2, driven by a surge in domestic
demand growth (to 6.0% in Q2 from 4.0% in Q1). Household consumption growth
picked up to 4.5% (from 3.8%) and investment growth to 7.1% (from 3.1%).
Chile has posted steady growth since Q1-2017, benefiting from a combination of
improving terms of trade (2016-17), increasing business confidence, and the lagged
impact of loose monetary policy. At the same time, we see growing headwinds. The
country is particularly vulnerable against a global backdrop of rising oil prices and
declining metal prices (see Latam strategy look ahead – 9-Jul-2018). Increased trade
friction and the eventual slowdown in China’s growth, although not our base case,
suggest fattening tail risks to growth (China’s share of Chile’s exports is 30.5%).
Policy – Too hawkish, too soon?
Monetary policy is moving to a less expansionary stance; Banco Central de Chile
(BCCh) has signalled a rate hike around end-2018. The recent shift in
communication (at the September meeting) was triggered by buoyant H1 growth and
increasing confidence that the output gap is closing faster than anticipated. Headline
CPI inflation picked up to 2.6% y/y from 2.2% between January and August; most of
the increase was due to short-term cost pressures, particularly higher fuel and fresh
food prices resulting from a weaker Chilean peso (CLP) compared to historical
standards. This gives little indication of higher demand pressure on prices so far.
Figure 1: Chile macroeconomic forecasts Figure 2: Declining wage inflation to support low core CPI
%, y/y
*end-period; Source: Standard Chartered Research Source: Bloomberg, Macrobond, Standard Chartered Research
2018 2019 2020
GDP growth (real % y/y) 4.0 2.5 2.2
CPI (% annual average) 2.4 3.3 3.0
Policy rate (%)* 2.75 3.75 3.50
USD-CLP* 690 740 580
Current account balance (% GDP) -1.7 -2.2 -2.5
Fiscal balance (% GDP) -2.3 -2.3 -2.5
CPI
Core-CPI
Nom. wage
Inf. target
0
1
2
3
4
5
6
7
8
Dec-10 Mar-12 Jun-13 Sep-14 Dec-15 Mar-17 Jun-18
Despite a strong H1-2018, we see
tail risks to economic growth
fattening ahead
Depreciated CLP to drive inflation
up in the short term
Daniel Sinigaglia +55 11 3073 7055
Latam Economist
Standard Chartered Bank (Brasil) S/A Banco de
Investimento
Ilya Gofshteyn +1 212 667 0787
FX and Global Macro Strategist
Standard Chartered Bank NY Branch
Global Focus – Q4-2018
Standard Chartered Global Research | 2 October 2018 133
Glo
bal
overv
iew
G
eopolitic
al
econom
ics
A
sia
M
EN
AP
A
frica
E
uro
pe
A
meric
as
Stra
tegy
outlo
ok
Fo
recasts
and
refe
rences
We think BCCh’s inflation concerns are overdone, as we expect demand
pressure to moderate ahead under more restrictive domestic and global conditions.
Core CPI is still anchored at the bottom of the inflation target range (3.0% +/-1ppt),
while wage growth has reached its lowest level since the data series began (2.6% y/y
in August). Wage inflation has reflected increasing slack in the labour market, as the
unemployment rate kept rising despite strong economic growth in H1. We do not
think the economy is cyclically well positioned for a tightening move yet, although
short-term inflation pressure may warrant a cautious BCCh stance.
Further headwinds may come from business confidence, which started to decline in
Q3 after reaching a five-year high in Q2. This was largely due to the fading impact of
the transition to President Piñera’s new administration, which now faces the
challenge of approving a pro-business agenda. Structurally, high household (60% of
GDP) and non-financial corporate (110%) leverage further limit growth in private
consumption and investment. To reflect this, we lower our 2019 GDP growth forecast
to 2.5% (from 2.9%), and our 2020 forecast to 2.2% (2.4%). Given the more
challenging outlook for copper prices, we now expect a current account deficit of
1.7% of GDP in 2018 (from 1.2%) and 2.2% of GDP in 2019 (from 1.7%).
Short-term inflation will likely be pressured by further CLP depreciation, but we see
less upside for inflation in the medium term. We raise our average CPI inflation
forecast for 2019 to 3.3% (from 3.0%) given the carryover from likely higher Q4-2018
inflation; but we lower our 2020 forecast to 3.0% (from 3.7%). We also now expect
BCCh to raise rates 25bps to 2.75% by end-2018 (versus our previous forecast of
2.5%), followed by an additional 100bps of hikes in 2019. This would take the base
rate to 3.75% at end-2019 (previous forecast: 3.50%). We no longer expect further
hikes into 2020. Instead, we now see a 25bps cut in Q4-2020 to 3.50%.
Market outlook – CLP to reflect economic slowdown
We have become more downbeat on Chilean assets on mounting risks to
growth. Lower copper prices and the resulting hit to terms of trade are likely to
dampen Chile’s market performance for the rest of 2018 and beyond. Meanwhile,
relatively high external debt magnifies Chile’s vulnerability to global rates volatility.
We think these factors will put downward pressure on the CLP relative to regional
peers. Similarly, the steep rate-hiking path currently priced into the CAMARA curve is
unlikely to materialise in an environment where core inflation remains at low levels.
Nevertheless, we prefer to remain on the sidelines for rates given BCCh’s
persistently hawkish rhetoric.
Declining wage inflation reflects
increasing slack in the labour
market
Based on the downbeat outlook for
growth, we have revised several
forecasts in our scenario for Chile
Piñera faces renewed challenges to
approving his pro-business agenda
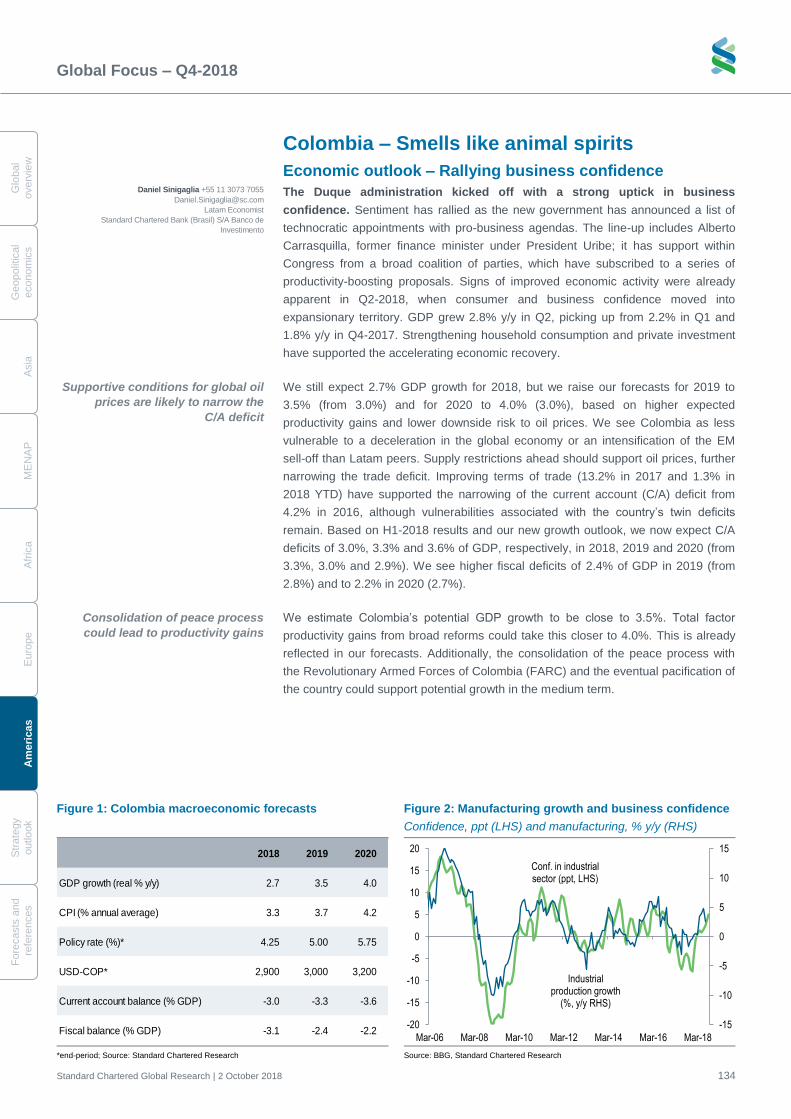
Global Focus – Q4-2018
Standard Chartered Global Research | 2 October 2018 134
G
lobal
overv
iew
Geopolit
ical
econom
ics
A
sia
M
EN
AP
A
fric
a
E
uro
pe
A
meri
cas
S
trate
gy
o
utlo
ok
Fo
recasts
and
re
fere
nces
Colombia – Smells like animal spirits
Economic outlook – Rallying business confidence
The Duque administration kicked off with a strong uptick in business
confidence. Sentiment has rallied as the new government has announced a list of
technocratic appointments with pro-business agendas. The line-up includes Alberto
Carrasquilla, former finance minister under President Uribe; it has support within
Congress from a broad coalition of parties, which have subscribed to a series of
productivity-boosting proposals. Signs of improved economic activity were already
apparent in Q2-2018, when consumer and business confidence moved into
expansionary territory. GDP grew 2.8% y/y in Q2, picking up from 2.2% in Q1 and
1.8% y/y in Q4-2017. Strengthening household consumption and private investment
have supported the accelerating economic recovery.
We still expect 2.7% GDP growth for 2018, but we raise our forecasts for 2019 to
3.5% (from 3.0%) and for 2020 to 4.0% (3.0%), based on higher expected
productivity gains and lower downside risk to oil prices. We see Colombia as less
vulnerable to a deceleration in the global economy or an intensification of the EM
sell-off than Latam peers. Supply restrictions ahead should support oil prices, further
narrowing the trade deficit. Improving terms of trade (13.2% in 2017 and 1.3% in
2018 YTD) have supported the narrowing of the current account (C/A) deficit from
4.2% in 2016, although vulnerabilities associated with the country’s twin deficits
remain. Based on H1-2018 results and our new growth outlook, we now expect C/A
deficits of 3.0%, 3.3% and 3.6% of GDP, respectively, in 2018, 2019 and 2020 (from
3.3%, 3.0% and 2.9%). We see higher fiscal deficits of 2.4% of GDP in 2019 (from
2.8%) and to 2.2% in 2020 (2.7%).
We estimate Colombia’s potential GDP growth to be close to 3.5%. Total factor
productivity gains from broad reforms could take this closer to 4.0%. This is already
reflected in our forecasts. Additionally, the consolidation of the peace process with
the Revolutionary Armed Forces of Colombia (FARC) and the eventual pacification of
the country could support potential growth in the medium term.
Figure 1: Colombia macroeconomic forecasts Figure 2: Manufacturing growth and business confidence
Confidence, ppt (LHS) and manufacturing, % y/y (RHS)
*end-period; Source: Standard Chartered Research Source: BBG, Standard Chartered Research
2018 2019 2020
GDP growth (real % y/y) 2.7 3.5 4.0
CPI (% annual average) 3.3 3.7 4.2
Policy rate (%)* 4.25 5.00 5.75
USD-COP* 2,900 3,000 3,200
Current account balance (% GDP) -3.0 -3.3 -3.6
Fiscal balance (% GDP) -3.1 -2.4 -2.2-15
-10
-5
0
5
10
15
-20
-15
-10
-5
0
5
10
15
20
Mar-06 Mar-08 Mar-10 Mar-12 Mar-14 Mar-16 Mar-18
Industrial production growth
(%, y/y RHS)
Conf. in industrial sector (ppt, LHS)
Supportive conditions for global oil
prices are likely to narrow the
C/A deficit
Daniel Sinigaglia +55 11 3073 7055
Latam Economist
Standard Chartered Bank (Brasil) S/A Banco de
Investimento
Consolidation of peace process
could lead to productivity gains
Global Focus – Q4-2018
Standard Chartered Global Research | 2 October 2018 135
Glo
bal
overv
iew
G
eopolitic
al
econom
ics
A
sia
M
EN
AP
A
frica
E
uro
pe
A
meric
as
Stra
tegy
outlo
ok
Fo
recasts
and
refe
rences
Policy – COP outperformance has reduced inflation risks
BanRep will likely keep the base rate stable at 4.25% until the final three meetings
of 2019, when we expect the start of a 150bps tightening cycle. The EM currency
sell-off in Q2 and Q3-2018 has raised inflation risks across the region. Currency
depreciation has halted food deflation in many countries and pushed energy prices
up. Local central banks previously in cutting mode have removed their easing biases
(Colombia and Brazil) or sent more hawkish signals (Chile).
Colombia’s inflation is also bottoming. Headline CPI inflation has been hovering
tightly around the 3.0% target since December 2017, as a result of low tradables
inflation and still-declining core inflation. Downside risks to inflation are associated
with core inflation, reflecting the still-wide output gap. However, signs of a bottoming
in the more volatile CPI components have become more evident. Lower-than-
expected Q2 inflation leads us to lower our 2018 forecast to 3.3% (from 3.5% prior).
In the medium term, we expect inflation pressure on core components to intensify
given the faster pace of recovery.
We think the combination of above-target core inflation measures and a bottoming of
more volatile inflation components (below target) suggest the need for a more
conservative monetary policy stance. With its dovish reputation, BanRep has
downplayed inflation risks based on the widening output gap, which we expect to
close sooner rather than later. The current y/y level of core components will likely
provide a high starting point for a 2019 CPI inflation upturn. We think a quick reversal
of the comfortable food inflation backdrop is most relevant short-term risk to CPI.
Politics – The Duque pull
The new administration has prioritised reducing fiscal imbalances via a two-
pronged plan: pension and tax reform. While only a few guidelines for pension
reform have been disclosed so far, the tax reform proposal is likely to be approved in
the next few months. This aims to increase government revenue by broadening
personal income tax, which currently only applies to high-income segments. If
approved, the tax would apply to all individuals earning 1.5 times the national
average wage.
Higher expected revenue would pave the way for corporate income tax cuts, in line
with a more general global trend. Changes in 2016 established a progressive decline
in tax rates. The new proposal aims to reduce the tax burden on companies by
allowing taxes levied by local entities to be subtracted from corporate income tax.
The main challenge is to ensure credible offsets for tax cuts, which markets would
otherwise perceive as negative.
Market outlook – Bullish on COP and fixed income assets
We are bullish on the COP and fixed income assets. Positive sentiment after
Duque’s victory has slowly turned to scepticism; we believe this scepticism is
overdone. The new administration has an effective plan to pursue fiscal reform and
reduce this key vulnerability. We therefore maintain our constructive bias on both the
COP and Colombia fixed income (see Colombia – Increasingly constructive.)
Colombia’s CPI has been hovering
tightly around the 3.0% inflation
target
The new administration has
targeted corporate income tax
so far
The main challenge is to ensure
offsets for proposed cuts
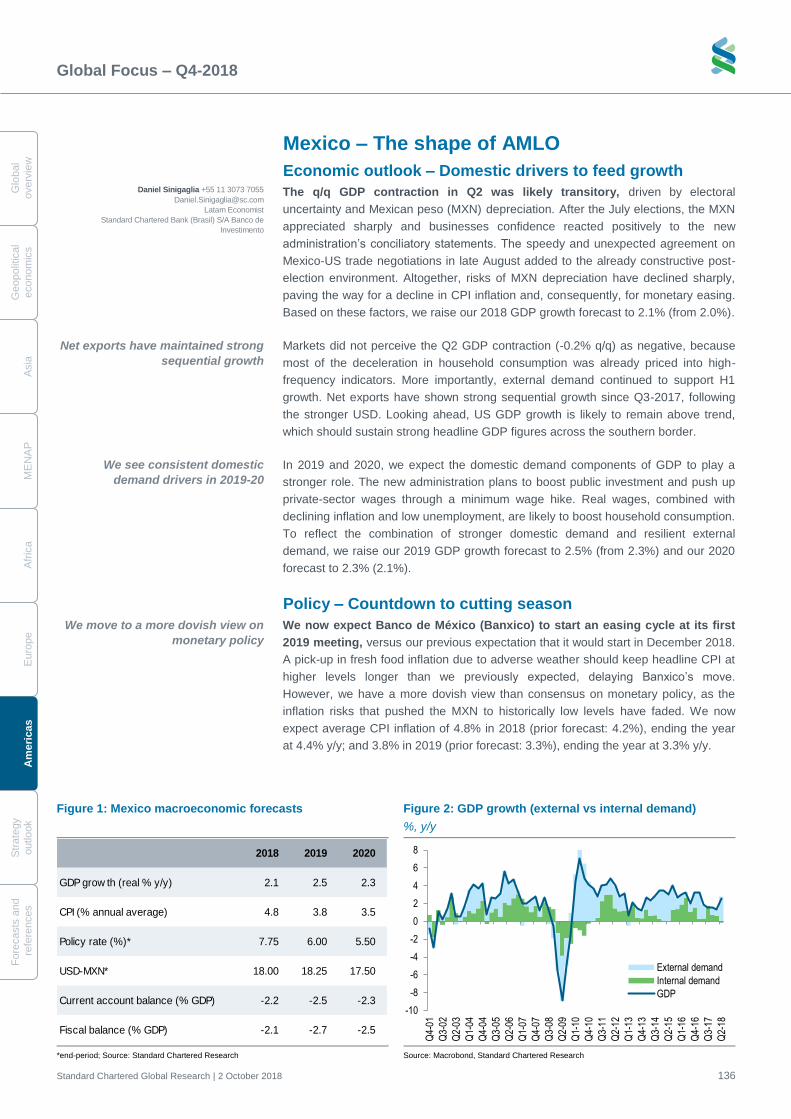
Global Focus – Q4-2018
Standard Chartered Global Research | 2 October 2018 136
G
lobal
overv
iew
Geopolit
ical
econom
ics
A
sia
M
EN
AP
A
fric
a
E
uro
pe
A
meri
cas
S
trate
gy
o
utlo
ok
Fo
recasts
and
re
fere
nces
Mexico – The shape of AMLO
Economic outlook – Domestic drivers to feed growth
The q/q GDP contraction in Q2 was likely transitory, driven by electoral
uncertainty and Mexican peso (MXN) depreciation. After the July elections, the MXN
appreciated sharply and businesses confidence reacted positively to the new
administration’s conciliatory statements. The speedy and unexpected agreement on
Mexico-US trade negotiations in late August added to the already constructive post-
election environment. Altogether, risks of MXN depreciation have declined sharply,
paving the way for a decline in CPI inflation and, consequently, for monetary easing.
Based on these factors, we raise our 2018 GDP growth forecast to 2.1% (from 2.0%).
Markets did not perceive the Q2 GDP contraction (-0.2% q/q) as negative, because
most of the deceleration in household consumption was already priced into high-
frequency indicators. More importantly, external demand continued to support H1
growth. Net exports have shown strong sequential growth since Q3-2017, following
the stronger USD. Looking ahead, US GDP growth is likely to remain above trend,
which should sustain strong headline GDP figures across the southern border.
In 2019 and 2020, we expect the domestic demand components of GDP to play a
stronger role. The new administration plans to boost public investment and push up
private-sector wages through a minimum wage hike. Real wages, combined with
declining inflation and low unemployment, are likely to boost household consumption.
To reflect the combination of stronger domestic demand and resilient external
demand, we raise our 2019 GDP growth forecast to 2.5% (from 2.3%) and our 2020
forecast to 2.3% (2.1%).
Policy – Countdown to cutting season
We now expect Banco de México (Banxico) to start an easing cycle at its first
2019 meeting, versus our previous expectation that it would start in December 2018.
A pick-up in fresh food inflation due to adverse weather should keep headline CPI at
higher levels longer than we previously expected, delaying Banxico’s move.
However, we have a more dovish view than consensus on monetary policy, as the
inflation risks that pushed the MXN to historically low levels have faded. We now
expect average CPI inflation of 4.8% in 2018 (prior forecast: 4.2%), ending the year
at 4.4% y/y; and 3.8% in 2019 (prior forecast: 3.3%), ending the year at 3.3% y/y.
Figure 1: Mexico macroeconomic forecasts Figure 2: GDP growth (external vs internal demand)
%, y/y
*end-period; Source: Standard Chartered Research Source: Macrobond, Standard Chartered Research
2018 2019 2020
GDP grow th (real % y/y) 2.1 2.5 2.3
CPI (% annual average) 4.8 3.8 3.5
Policy rate (%)* 7.75 6.00 5.50
USD-MXN* 18.00 18.25 17.50
Current account balance (% GDP) -2.2 -2.5 -2.3
Fiscal balance (% GDP) -2.1 -2.7 -2.5
-10
-8
-6
-4
-2
0
2
4
6
8
Q4-
01
Q3-
02
Q2-
03
Q1-
04
Q4-
04
Q3-
05
Q2-
06
Q1-
07
Q4-
07
Q3-
08
Q2-
09
Q1-
10
Q4-
10
Q3-
11
Q2-
12
Q1-
13
Q4-
13
Q3-
14
Q2-
15
Q1-
16
Q4-
16
Q3-
17
Q2-
18
External demand
Internal demand
GDP
We move to a more dovish view on
monetary policy
Net exports have maintained strong
sequential growth
Daniel Sinigaglia +55 11 3073 7055
Latam Economist
Standard Chartered Bank (Brasil) S/A Banco de
Investimento
We see consistent domestic
demand drivers in 2019-20
Global Focus – Q4-2018
Standard Chartered Global Research | 2 October 2018 137
Glo
bal
overv
iew
G
eopolitic
al
econom
ics
A
sia
M
EN
AP
A
frica
E
uro
pe
A
meric
as
Stra
tegy
outlo
ok
Fo
recasts
and
refe
rences
We think Mexico’s inflation upturn is driven by a combination of higher oil prices and
MXN depreciation. Underlying inflation measures, while above target, have
consistently declined. Base effects may prevent inflation from dropping too quickly,
but we see significant y/y declines from Q2-2019 onwards.
Politics – New government, old doubts
Andres Manuel Lopez Obrador (AMLO) will take office in December. Strong
popular support and a broad congressional base (62% in the lower house and 54% in
the senate) imply that constitutional changes are within his reach. So far, AMLO has
tried to signal economic policy continuity. He has also disclosed an extensive list of
proposals, ranging from a minimum wage hike and strict austerity for public
administration to increasing penalties for many felonies, including corruption charges.
We believe that the implications of such proposals boil down to two questions: (1) To
what extent could AMLO’s intent to increase income transfer programmes and public
investment jeopardise Mexico’s fiscal policy stance? (2) Could his approach, based
on new forms of direct-participation democracy (e.g., more frequent public
consultations, possibly recalling politicians in the middle of their mandates)
compromise Mexico’s institutions?
While (2) will remain an open question in the coming quarters, we already see
some hints regarding (1). AMLO’s team has unveiled 25 priorities to be included in
the 2019 budget. In his first year in office, he will seek to increase infrastructure
spending – including a new refinery, a railway line in southern Mexico, rural roads,
earthquake reconstruction, universities, and mining development programmes –
which could be positive for future potential growth. Social initiatives include adult
pension programmes, income support for youngsters, and discretionary transfers to
local entities. In all, this would be a 3.4%-of-GDP expenditure boost next year,
partially offset by 1.8% of GDP in savings from more efficient public administration
management and austerity measures.
Even if such these goals can be achieved, there is still a fiscal gap of 1.6% of GDP to
be filled, either through higher revenues or by sharing the burden of public
investment with the private sector via public-private partnerships. We therefore revise
our fiscal deficit forecasts to 2.7% of GDP for 2019 (from 2.0%) and to 2.5% for 2020
(from 2.0%).
Market outlook – We stay constructive on the MXN
Mexico’s assets are still on solid ground. Elevated real rates support MXN
performance, while strong external demand could allow Mexico to outperform Latam
peers. Even if G10 yields rise, MXN would likely be less exposed than peers. Higher
front-end yields as the Fed continues to tighten could curb Banxico easing. However,
thus far, markets have overestimated the Fed tightening cycle (see Latam strategy
look ahead 6-Aug-2018).
Deterioration in Mexico’s fiscal
policy stance is the main risk ahead
We expect moderately looser fiscal
policy in the first year of the new
administration
We see downside risks to the fiscal
target of 2.0% of GDP
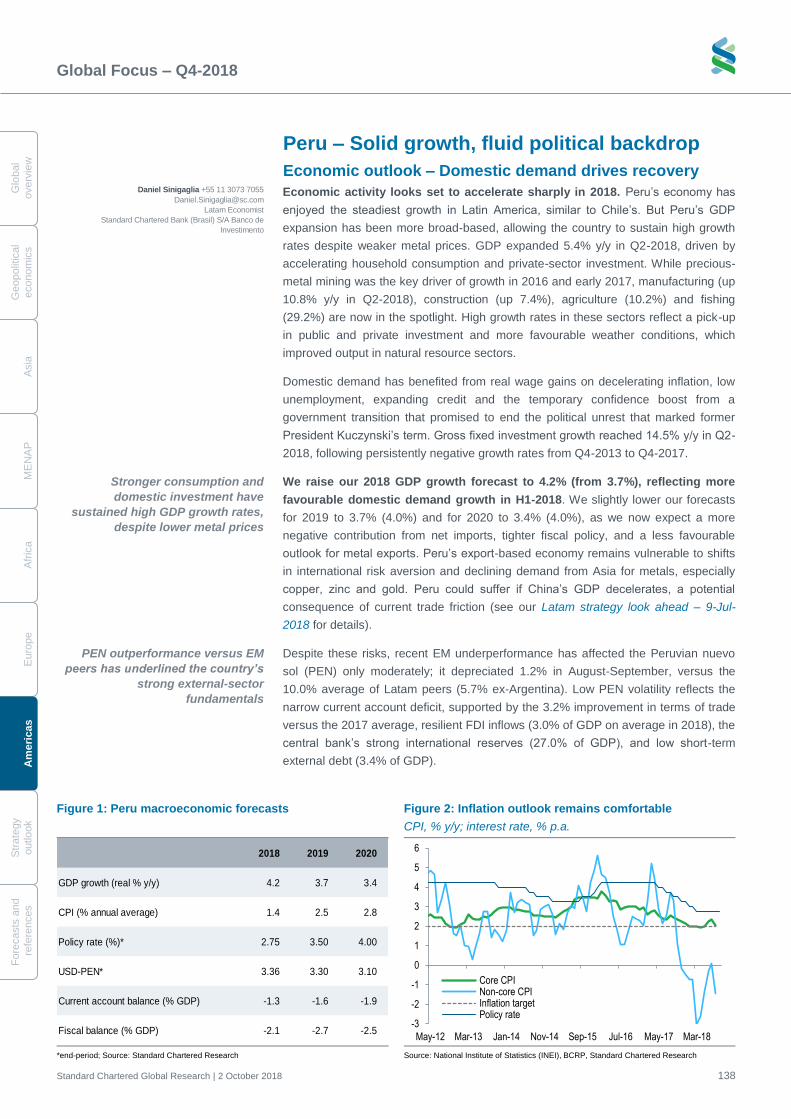
Global Focus – Q4-2018
Standard Chartered Global Research | 2 October 2018 138
G
lobal
overv
iew
Geopolit
ical
econom
ics
A
sia
M
EN
AP
A
fric
a
E
uro
pe
A
meri
cas
S
trate
gy
o
utlo
ok
Fo
recasts
and
re
fere
nces
Peru – Solid growth, fluid political backdrop
Economic outlook – Domestic demand drives recovery
Economic activity looks set to accelerate sharply in 2018. Peru’s economy has
enjoyed the steadiest growth in Latin America, similar to Chile’s. But Peru’s GDP
expansion has been more broad-based, allowing the country to sustain high growth
rates despite weaker metal prices. GDP expanded 5.4% y/y in Q2-2018, driven by
accelerating household consumption and private-sector investment. While precious-
metal mining was the key driver of growth in 2016 and early 2017, manufacturing (up
10.8% y/y in Q2-2018), construction (up 7.4%), agriculture (10.2%) and fishing
(29.2%) are now in the spotlight. High growth rates in these sectors reflect a pick-up
in public and private investment and more favourable weather conditions, which
improved output in natural resource sectors.
Domestic demand has benefited from real wage gains on decelerating inflation, low
unemployment, expanding credit and the temporary confidence boost from a
government transition that promised to end the political unrest that marked former
President Kuczynski’s term. Gross fixed investment growth reached 14.5% y/y in Q2-
2018, following persistently negative growth rates from Q4-2013 to Q4-2017.
We raise our 2018 GDP growth forecast to 4.2% (from 3.7%), reflecting more
favourable domestic demand growth in H1-2018. We slightly lower our forecasts
for 2019 to 3.7% (4.0%) and for 2020 to 3.4% (4.0%), as we now expect a more
negative contribution from net imports, tighter fiscal policy, and a less favourable
outlook for metal exports. Peru’s export-based economy remains vulnerable to shifts
in international risk aversion and declining demand from Asia for metals, especially
copper, zinc and gold. Peru could suffer if China’s GDP decelerates, a potential
consequence of current trade friction (see our Latam strategy look ahead – 9-Jul-
2018 for details).
Despite these risks, recent EM underperformance has affected the Peruvian nuevo
sol (PEN) only moderately; it depreciated 1.2% in August-September, versus the
10.0% average of Latam peers (5.7% ex-Argentina). Low PEN volatility reflects the
narrow current account deficit, supported by the 3.2% improvement in terms of trade
versus the 2017 average, resilient FDI inflows (3.0% of GDP on average in 2018), the
central bank’s strong international reserves (27.0% of GDP), and low short-term
external debt (3.4% of GDP).
Figure 1: Peru macroeconomic forecasts Figure 2: Inflation outlook remains comfortable
CPI, % y/y; interest rate, % p.a.
*end-period; Source: Standard Chartered Research Source: National Institute of Statistics (INEI), BCRP, Standard Chartered Research
2018 2019 2020
GDP growth (real % y/y) 4.2 3.7 3.4
CPI (% annual average) 1.4 2.5 2.8
Policy rate (%)* 2.75 3.50 4.00
USD-PEN* 3.36 3.30 3.10
Current account balance (% GDP) -1.3 -1.6 -1.9
Fiscal balance (% GDP) -2.1 -2.7 -2.5-3
-2
-1
0
1
2
3
4
5
6
May-12 Mar-13 Jan-14 Nov-14 Sep-15 Jul-16 May-17 Mar-18
Core CPINon-core CPIInflation targetPolicy rate
Stronger consumption and
domestic investment have
sustained high GDP growth rates,
despite lower metal prices
Daniel Sinigaglia +55 11 3073 7055
Latam Economist
Standard Chartered Bank (Brasil) S/A Banco de
Investimento
PEN outperformance versus EM
peers has underlined the country’s
strong external-sector
fundamentals
Global Focus – Q4-2018
Standard Chartered Global Research | 2 October 2018 139
Glo
bal
overv
iew
G
eopolitic
al
econom
ics
A
sia
M
EN
AP
A
frica
E
uro
pe
A
meric
as
Stra
tegy
outlo
ok
Fo
recasts
and
refe
rences
Policy – Inflation risks remain contained
CPI inflation has hovered at comfortable levels due to persistent food deflation
and still-moderating services inflation. Lima’s CPI inflation reached 1.1% y/y in
August (1.3% national CPI), slightly above the lower bound of the target range.
These figures are below our forecasts, so we lower our average CPI forecast to 1.4%
for 2018 (from 1.8%), equivalent to 2.2% y/y at year-end. We see moderate upside
risks to inflation, which will likely allow Banco Central de Reserva del Perú (BCRP) to
pursue expansionary monetary policy until later in 2019, when we expect the
tightening cycle to resume.
Given remaining slack in the labour market and the ongoing disinflation trend in core
components, we see food as the main inflation driver. However, risks are moderate:
grain inventories (2018/19) are expected to remain high for most crops, while
international supply conditions for wheat, sugar and rice will likely contain
international prices.
Tax reform bill expected in Q4-2018. Despite similarities with tax reform proposals
in other Andean economies, Peru’s version focuses more on increasing tax collection
and hence improving the government’s fiscal balance. The first leg of the proposal
will tackle exemptions, while the second aims to increase property and real-estate
taxes. The idea is to make taxes less dependent on VAT revenue, which accounts for
c.60% of total revenue. Official sources expect a 1ppt-of-GDP increase in the fiscal
balance due to tax reform over three years. A third stage, aimed at tax simplification,
is also expected; this will seek to reduce the informal economy and broaden the
current tax base.
Politics – Vizcarra to push for tax and political reforms
Controversy over political reform proposals has strained relations between
President Vizcarra and congress. The main proposal is to reinstate the two
chambers of congress – a senate with 30 members and a lower house with 100
representatives – reversing President Fujimori’s 1992 dissolution. Proposals also
include single-term limits for elected officials and several changes to the judiciary
system and public administration to include anti-corruption mechanisms. Vizcarra’s
independent stance and recovering approval ratings have not been enough to move
the bills from congress to popular consultation so far. Lack of support for the current
administration has led to congressional gridlock.
A legislative shift towards tax reform may eventually resonate with the right-wing-
dominated congress. Early elections remain possible, as Vizcarra may propose a
confidence vote to ensure congress supports his political bills. If the motion fails
twice, the cabinet is obliged to resign and Vizcarra can call new parliamentary
elections. Given popular opposition to corruption, new elections could reduce the
strength of Fujimori’s Fuerza Popular (FP) party, which currently has 47% of seats.
BCRP to maintain expansionary
monetary policy stance amid
decelerating core inflation
Tax reform to strengthen the
country’s fiscal stance
Controversy about political reform
has increased the chances of early
elections

Strategy outlook
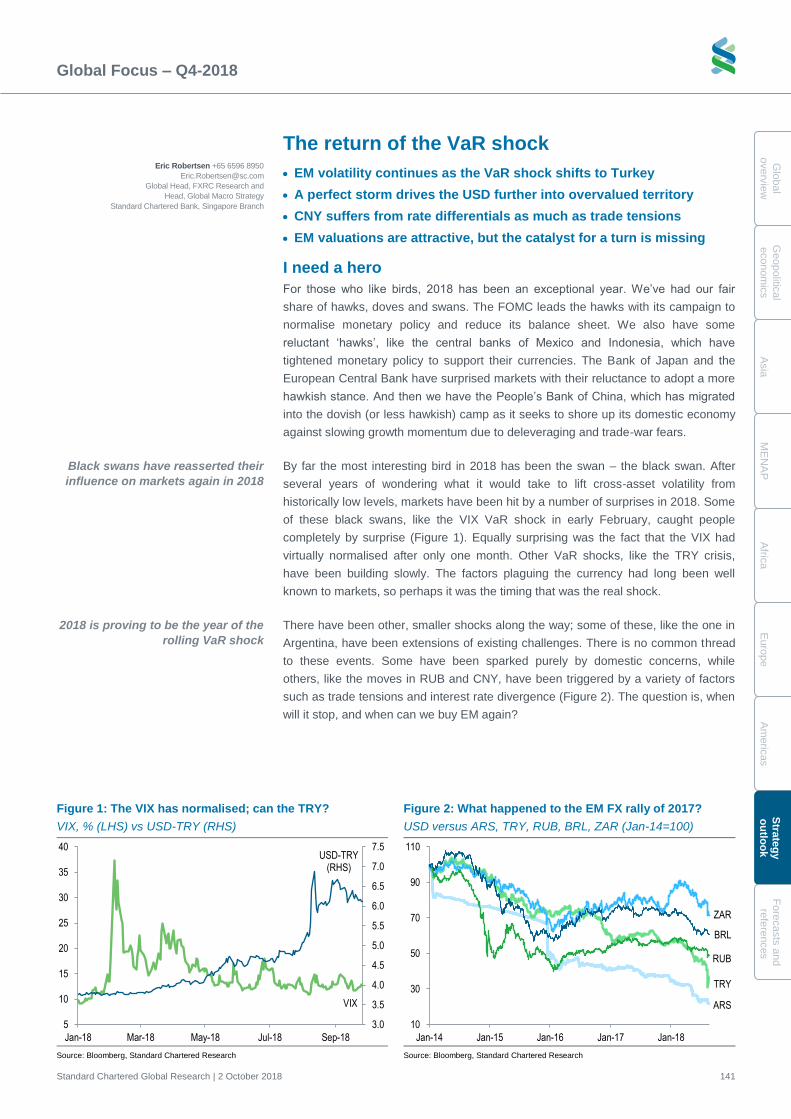
Global Focus – Q4-2018
Standard Chartered Global Research | 2 October 2018 141
Glo
bal
overv
iew
G
eopolitic
al
econom
ics
A
sia
M
EN
AP
A
frica
E
uro
pe
A
me
ricas
Stra
teg
y
ou
tloo
k
Fo
recasts
and
refe
rences
The return of the VaR shock
• EM volatility continues as the VaR shock shifts to Turkey
• A perfect storm drives the USD further into overvalued territory
• CNY suffers from rate differentials as much as trade tensions
• EM valuations are attractive, but the catalyst for a turn is missing
I need a hero
For those who like birds, 2018 has been an exceptional year. We’ve had our fair
share of hawks, doves and swans. The FOMC leads the hawks with its campaign to
normalise monetary policy and reduce its balance sheet. We also have some
reluctant ‘hawks’, like the central banks of Mexico and Indonesia, which have
tightened monetary policy to support their currencies. The Bank of Japan and the
European Central Bank have surprised markets with their reluctance to adopt a more
hawkish stance. And then we have the People’s Bank of China, which has migrated
into the dovish (or less hawkish) camp as it seeks to shore up its domestic economy
against slowing growth momentum due to deleveraging and trade-war fears.
By far the most interesting bird in 2018 has been the swan – the black swan. After
several years of wondering what it would take to lift cross-asset volatility from
historically low levels, markets have been hit by a number of surprises in 2018. Some
of these black swans, like the VIX VaR shock in early February, caught people
completely by surprise (Figure 1). Equally surprising was the fact that the VIX had
virtually normalised after only one month. Other VaR shocks, like the TRY crisis,
have been building slowly. The factors plaguing the currency had long been well
known to markets, so perhaps it was the timing that was the real shock.
There have been other, smaller shocks along the way; some of these, like the one in
Argentina, have been extensions of existing challenges. There is no common thread
to these events. Some have been sparked purely by domestic concerns, while
others, like the moves in RUB and CNY, have been triggered by a variety of factors
such as trade tensions and interest rate divergence (Figure 2). The question is, when
will it stop, and when can we buy EM again?
Figure 1: The VIX has normalised; can the TRY?
VIX, % (LHS) vs USD-TRY (RHS)
Figure 2: What happened to the EM FX rally of 2017?
USD versus ARS, TRY, RUB, BRL, ZAR (Jan-14=100)
Source: Bloomberg, Standard Chartered Research Source: Bloomberg, Standard Chartered Research
VIX
USD-TRY (RHS)
3.0
3.5
4.0
4.5
5.0
5.5
6.0
6.5
7.0
7.5
5
10
15
20
25
30
35
40
Jan-18 Mar-18 May-18 Jul-18 Sep-18
ARS
TRY
ZAR
RUB
BRL
10
30
50
70
90
110
Jan-14 Jan-15 Jan-16 Jan-17 Jan-18
Eric Robertsen +65 6596 8950
Global Head, FXRC Research and
Head, Global Macro Strategy
Standard Chartered Bank, Singapore Branch
Black swans have reasserted their
influence on markets again in 2018
2018 is proving to be the year of the
rolling VaR shock
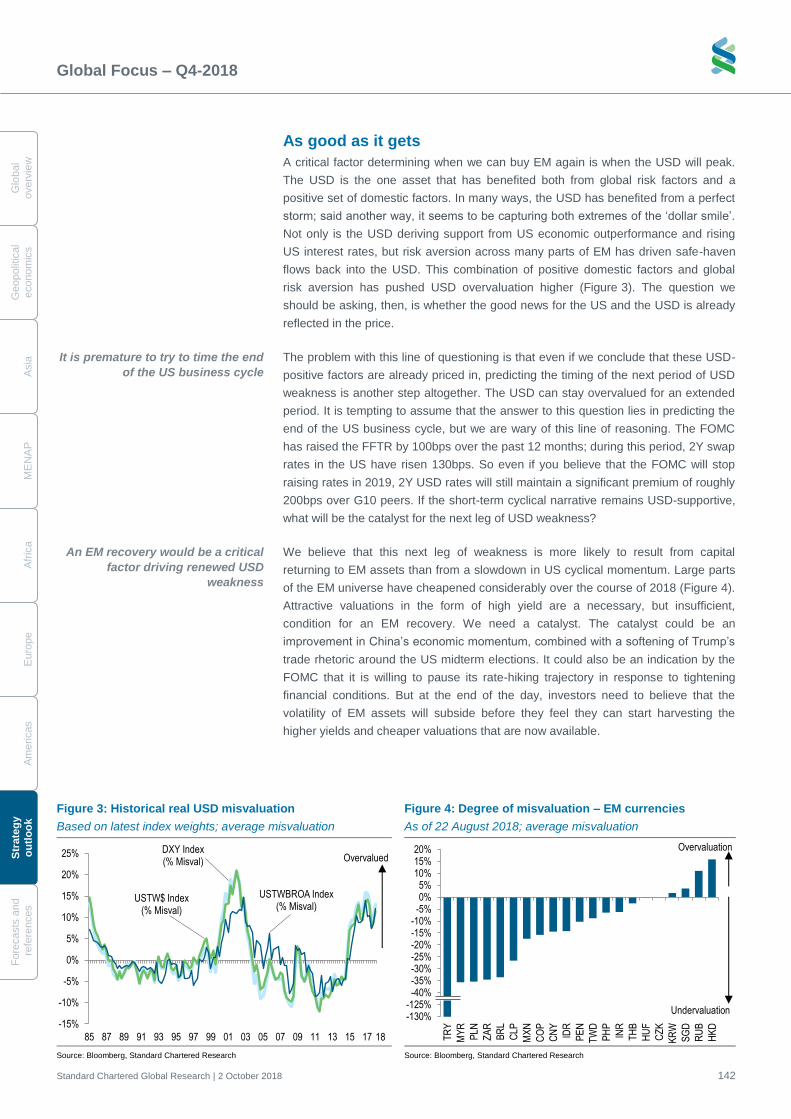
Global Focus – Q4-2018
Standard Chartered Global Research | 2 October 2018 142
G
lobal
overv
iew
Geopolit
ical
econom
ics
A
sia
M
EN
AP
A
fric
a
E
uro
pe
A
me
ricas
S
trate
gy
o
utl
oo
k
Fo
recasts
and
re
fere
nces
As good as it gets
A critical factor determining when we can buy EM again is when the USD will peak.
The USD is the one asset that has benefited both from global risk factors and a
positive set of domestic factors. In many ways, the USD has benefited from a perfect
storm; said another way, it seems to be capturing both extremes of the ‘dollar smile’.
Not only is the USD deriving support from US economic outperformance and rising
US interest rates, but risk aversion across many parts of EM has driven safe-haven
flows back into the USD. This combination of positive domestic factors and global
risk aversion has pushed USD overvaluation higher (Figure 3). The question we
should be asking, then, is whether the good news for the US and the USD is already
reflected in the price.
The problem with this line of questioning is that even if we conclude that these USD-
positive factors are already priced in, predicting the timing of the next period of USD
weakness is another step altogether. The USD can stay overvalued for an extended
period. It is tempting to assume that the answer to this question lies in predicting the
end of the US business cycle, but we are wary of this line of reasoning. The FOMC
has raised the FFTR by 100bps over the past 12 months; during this period, 2Y swap
rates in the US have risen 130bps. So even if you believe that the FOMC will stop
raising rates in 2019, 2Y USD rates will still maintain a significant premium of roughly
200bps over G10 peers. If the short-term cyclical narrative remains USD-supportive,
what will be the catalyst for the next leg of USD weakness?
We believe that this next leg of weakness is more likely to result from capital
returning to EM assets than from a slowdown in US cyclical momentum. Large parts
of the EM universe have cheapened considerably over the course of 2018 (Figure 4).
Attractive valuations in the form of high yield are a necessary, but insufficient,
condition for an EM recovery. We need a catalyst. The catalyst could be an
improvement in China’s economic momentum, combined with a softening of Trump’s
trade rhetoric around the US midterm elections. It could also be an indication by the
FOMC that it is willing to pause its rate-hiking trajectory in response to tightening
financial conditions. But at the end of the day, investors need to believe that the
volatility of EM assets will subside before they feel they can start harvesting the
higher yields and cheaper valuations that are now available.
Figure 3: Historical real USD misvaluation
Based on latest index weights; average misvaluation
Figure 4: Degree of misvaluation – EM currencies
As of 22 August 2018; average misvaluation
Source: Bloomberg, Standard Chartered Research Source: Bloomberg, Standard Chartered Research
-15%
-10%
-5%
0%
5%
10%
15%
20%
25%
85 87 89 91 93 95 97 99 01 03 05 07 09 11 13 15 17
USTW$ Index(% Misval)
USTWBROA Index(% Misval)
DXY Index(% Misval)
18
Overvalued
-130%-125%-40%-35%-30%-25%-20%-15%-10%
-5%0%5%
10%15%20%
TR
Y
MY
R
PLN
ZA
R
BR
L
CLP
MX
N
CO
P
CN
Y
IDR
PE
N
TW
D
PH
P
INR
TH
B
HU
F
CZ
K
KR
W
SG
D
RU
B
HK
D
Overvaluation
Undervaluation
It is premature to try to time the end
of the US business cycle
An EM recovery would be a critical
factor driving renewed USD
weakness
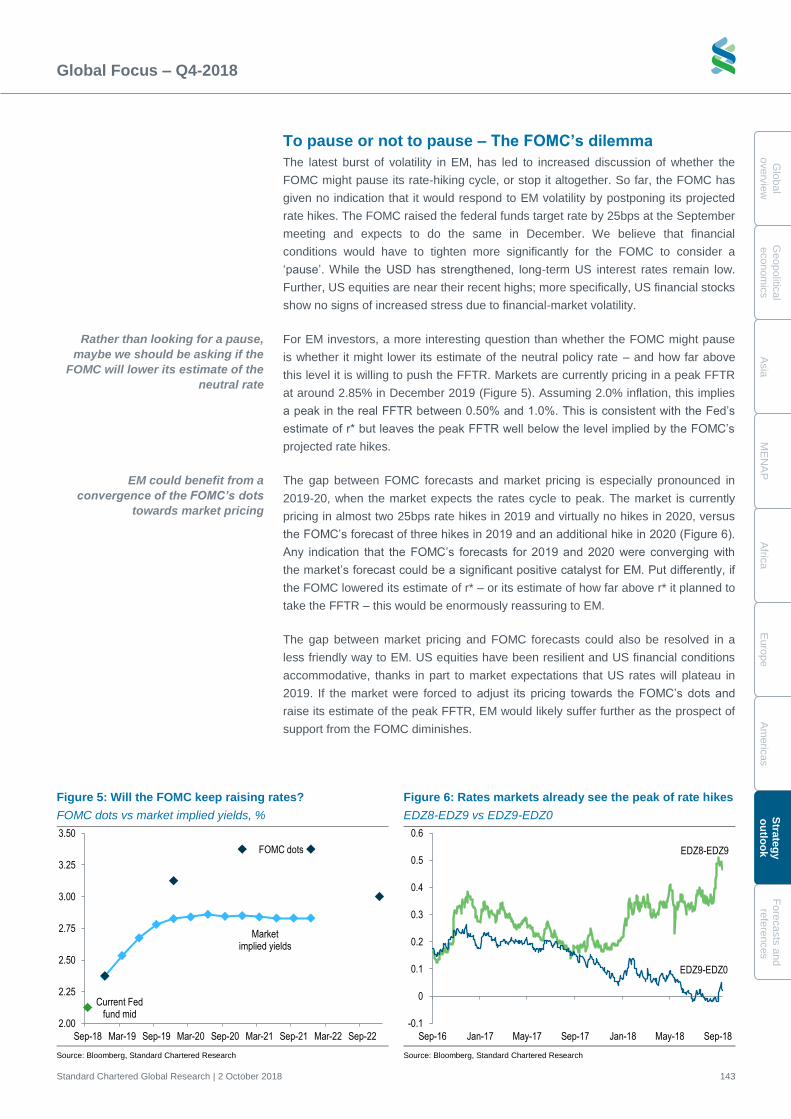
Global Focus – Q4-2018
Standard Chartered Global Research | 2 October 2018 143
Glo
bal
overv
iew
G
eopolitic
al
econom
ics
A
sia
M
EN
AP
A
frica
E
uro
pe
A
me
ricas
Stra
teg
y
ou
tloo
k
Fo
recasts
and
refe
rences
To pause or not to pause – The FOMC’s dilemma
The latest burst of volatility in EM, has led to increased discussion of whether the
FOMC might pause its rate-hiking cycle, or stop it altogether. So far, the FOMC has
given no indication that it would respond to EM volatility by postponing its projected
rate hikes. The FOMC raised the federal funds target rate by 25bps at the September
meeting and expects to do the same in December. We believe that financial
conditions would have to tighten more significantly for the FOMC to consider a
‘pause’. While the USD has strengthened, long-term US interest rates remain low.
Further, US equities are near their recent highs; more specifically, US financial stocks
show no signs of increased stress due to financial-market volatility.
For EM investors, a more interesting question than whether the FOMC might pause
is whether it might lower its estimate of the neutral policy rate – and how far above
this level it is willing to push the FFTR. Markets are currently pricing in a peak FFTR
at around 2.85% in December 2019 (Figure 5). Assuming 2.0% inflation, this implies
a peak in the real FFTR between 0.50% and 1.0%. This is consistent with the Fed’s
estimate of r* but leaves the peak FFTR well below the level implied by the FOMC’s
projected rate hikes.
The gap between FOMC forecasts and market pricing is especially pronounced in
2019-20, when the market expects the rates cycle to peak. The market is currently
pricing in almost two 25bps rate hikes in 2019 and virtually no hikes in 2020, versus
the FOMC’s forecast of three hikes in 2019 and an additional hike in 2020 (Figure 6).
Any indication that the FOMC’s forecasts for 2019 and 2020 were converging with
the market’s forecast could be a significant positive catalyst for EM. Put differently, if
the FOMC lowered its estimate of r* – or its estimate of how far above r* it planned to
take the FFTR – this would be enormously reassuring to EM.
The gap between market pricing and FOMC forecasts could also be resolved in a
less friendly way to EM. US equities have been resilient and US financial conditions
accommodative, thanks in part to market expectations that US rates will plateau in
2019. If the market were forced to adjust its pricing towards the FOMC’s dots and
raise its estimate of the peak FFTR, EM would likely suffer further as the prospect of
support from the FOMC diminishes.
Figure 5: Will the FOMC keep raising rates?
FOMC dots vs market implied yields, %
Figure 6: Rates markets already see the peak of rate hikes
EDZ8-EDZ9 vs EDZ9-EDZ0
Source: Bloomberg, Standard Chartered Research Source: Bloomberg, Standard Chartered Research
Current Fed fund mid
FOMC dots
Market implied yields
2.00
2.25
2.50
2.75
3.00
3.25
3.50
Sep-18 Mar-19 Sep-19 Mar-20 Sep-20 Mar-21 Sep-21 Mar-22 Sep-22
EDZ8-EDZ9
EDZ9-EDZ0
-0.1
0
0.1
0.2
0.3
0.4
0.5
0.6
Sep-16 Jan-17 May-17 Sep-17 Jan-18 May-18 Sep-18
Rather than looking for a pause,
maybe we should be asking if the
FOMC will lower its estimate of the
neutral rate
EM could benefit from a
convergence of the FOMC’s dots
towards market pricing
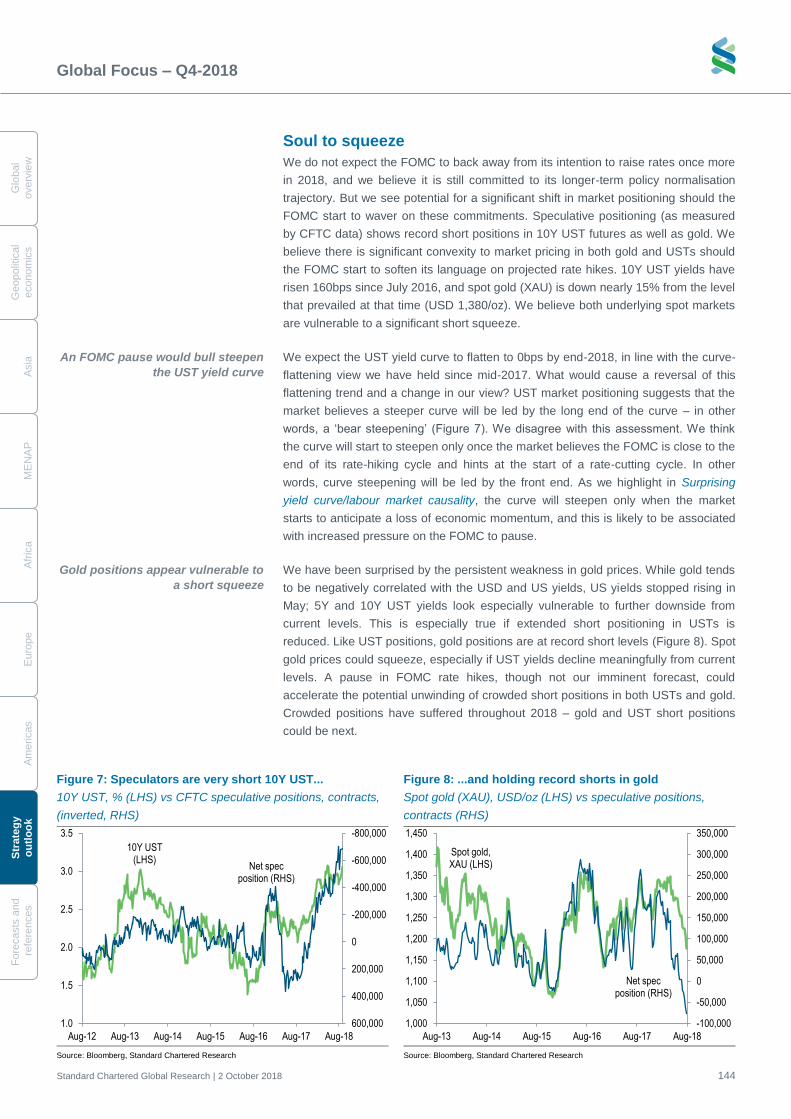
Global Focus – Q4-2018
Standard Chartered Global Research | 2 October 2018 144
G
lobal
overv
iew
Geopolit
ical
econom
ics
A
sia
M
EN
AP
A
fric
a
E
uro
pe
A
me
ricas
S
trate
gy
o
utl
oo
k
Fo
recasts
and
re
fere
nces
Soul to squeeze
We do not expect the FOMC to back away from its intention to raise rates once more
in 2018, and we believe it is still committed to its longer-term policy normalisation
trajectory. But we see potential for a significant shift in market positioning should the
FOMC start to waver on these commitments. Speculative positioning (as measured
by CFTC data) shows record short positions in 10Y UST futures as well as gold. We
believe there is significant convexity to market pricing in both gold and USTs should
the FOMC start to soften its language on projected rate hikes. 10Y UST yields have
risen 160bps since July 2016, and spot gold (XAU) is down nearly 15% from the level
that prevailed at that time (USD 1,380/oz). We believe both underlying spot markets
are vulnerable to a significant short squeeze.
We expect the UST yield curve to flatten to 0bps by end-2018, in line with the curve-
flattening view we have held since mid-2017. What would cause a reversal of this
flattening trend and a change in our view? UST market positioning suggests that the
market believes a steeper curve will be led by the long end of the curve – in other
words, a ‘bear steepening’ (Figure 7). We disagree with this assessment. We think
the curve will start to steepen only once the market believes the FOMC is close to the
end of its rate-hiking cycle and hints at the start of a rate-cutting cycle. In other
words, curve steepening will be led by the front end. As we highlight in Surprising
yield curve/labour market causality, the curve will steepen only when the market
starts to anticipate a loss of economic momentum, and this is likely to be associated
with increased pressure on the FOMC to pause.
We have been surprised by the persistent weakness in gold prices. While gold tends
to be negatively correlated with the USD and US yields, US yields stopped rising in
May; 5Y and 10Y UST yields look especially vulnerable to further downside from
current levels. This is especially true if extended short positioning in USTs is
reduced. Like UST positions, gold positions are at record short levels (Figure 8). Spot
gold prices could squeeze, especially if UST yields decline meaningfully from current
levels. A pause in FOMC rate hikes, though not our imminent forecast, could
accelerate the potential unwinding of crowded short positions in both USTs and gold.
Crowded positions have suffered throughout 2018 – gold and UST short positions
could be next.
Figure 7: Speculators are very short 10Y UST...
10Y UST, % (LHS) vs CFTC speculative positions, contracts,
(inverted, RHS)
Figure 8: ...and holding record shorts in gold
Spot gold (XAU), USD/oz (LHS) vs speculative positions,
contracts (RHS)
Source: Bloomberg, Standard Chartered Research Source: Bloomberg, Standard Chartered Research
10Y UST (LHS)
Net spec position (RHS)
-800,000
-600,000
-400,000
-200,000
0
200,000
400,000
600,0001.0
1.5
2.0
2.5
3.0
3.5
Aug-12 Aug-13 Aug-14 Aug-15 Aug-16 Aug-17 Aug-18
Spot gold, XAU (LHS)
Net spec position (RHS)
-100,000
-50,000
0
50,000
100,000
150,000
200,000
250,000
300,000
350,000
1,000
1,050
1,100
1,150
1,200
1,250
1,300
1,350
1,400
1,450
Aug-13 Aug-14 Aug-15 Aug-16 Aug-17 Aug-18
An FOMC pause would bull steepen
the UST yield curve
Gold positions appear vulnerable to
a short squeeze
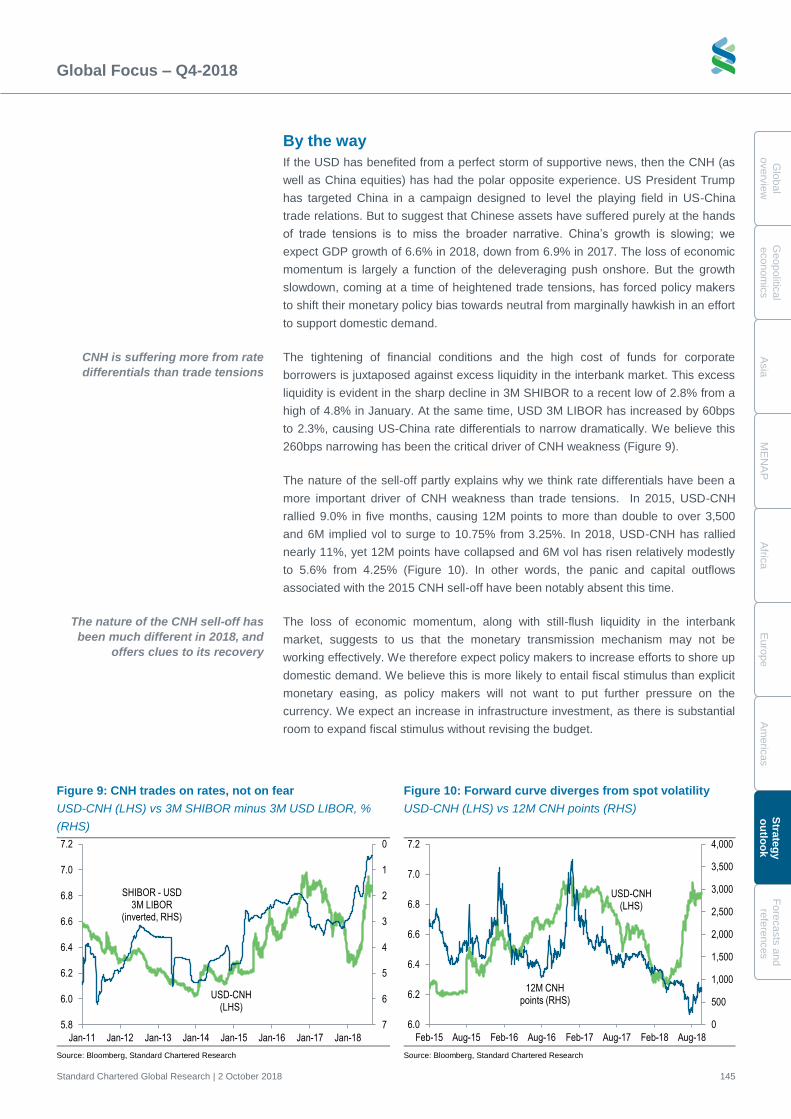
Global Focus – Q4-2018
Standard Chartered Global Research | 2 October 2018 145
Glo
bal
overv
iew
G
eopolitic
al
econom
ics
A
sia
M
EN
AP
A
frica
E
uro
pe
A
me
ricas
Stra
teg
y
ou
tloo
k
Fo
recasts
and
refe
rences
By the way
If the USD has benefited from a perfect storm of supportive news, then the CNH (as
well as China equities) has had the polar opposite experience. US President Trump
has targeted China in a campaign designed to level the playing field in US-China
trade relations. But to suggest that Chinese assets have suffered purely at the hands
of trade tensions is to miss the broader narrative. China’s growth is slowing; we
expect GDP growth of 6.6% in 2018, down from 6.9% in 2017. The loss of economic
momentum is largely a function of the deleveraging push onshore. But the growth
slowdown, coming at a time of heightened trade tensions, has forced policy makers
to shift their monetary policy bias towards neutral from marginally hawkish in an effort
to support domestic demand.
The tightening of financial conditions and the high cost of funds for corporate
borrowers is juxtaposed against excess liquidity in the interbank market. This excess
liquidity is evident in the sharp decline in 3M SHIBOR to a recent low of 2.8% from a
high of 4.8% in January. At the same time, USD 3M LIBOR has increased by 60bps
to 2.3%, causing US-China rate differentials to narrow dramatically. We believe this
260bps narrowing has been the critical driver of CNH weakness (Figure 9).
The nature of the sell-off partly explains why we think rate differentials have been a
more important driver of CNH weakness than trade tensions. In 2015, USD-CNH
rallied 9.0% in five months, causing 12M points to more than double to over 3,500
and 6M implied vol to surge to 10.75% from 3.25%. In 2018, USD-CNH has rallied
nearly 11%, yet 12M points have collapsed and 6M vol has risen relatively modestly
to 5.6% from 4.25% (Figure 10). In other words, the panic and capital outflows
associated with the 2015 CNH sell-off have been notably absent this time.
The loss of economic momentum, along with still-flush liquidity in the interbank
market, suggests to us that the monetary transmission mechanism may not be
working effectively. We therefore expect policy makers to increase efforts to shore up
domestic demand. We believe this is more likely to entail fiscal stimulus than explicit
monetary easing, as policy makers will not want to put further pressure on the
currency. We expect an increase in infrastructure investment, as there is substantial
room to expand fiscal stimulus without revising the budget.
Figure 9: CNH trades on rates, not on fear
USD-CNH (LHS) vs 3M SHIBOR minus 3M USD LIBOR, %
(RHS)
Figure 10: Forward curve diverges from spot volatility
USD-CNH (LHS) vs 12M CNH points (RHS)
Source: Bloomberg, Standard Chartered Research Source: Bloomberg, Standard Chartered Research
USD-CNH (LHS)
0
1
2
3
4
5
6
75.8
6.0
6.2
6.4
6.6
6.8
7.0
7.2
Jan-11 Jan-12 Jan-13 Jan-14 Jan-15 Jan-16 Jan-17 Jan-18
SHIBOR - USD 3M LIBOR
(inverted, RHS)
USD-CNH (LHS)
12M CNH points (RHS)
0
500
1,000
1,500
2,000
2,500
3,000
3,500
4,000
6.0
6.2
6.4
6.6
6.8
7.0
7.2
Feb-15 Aug-15 Feb-16 Aug-16 Feb-17 Aug-17 Feb-18 Aug-18
CNH is suffering more from rate
differentials than trade tensions
The nature of the CNH sell-off has
been much different in 2018, and
offers clues to its recovery
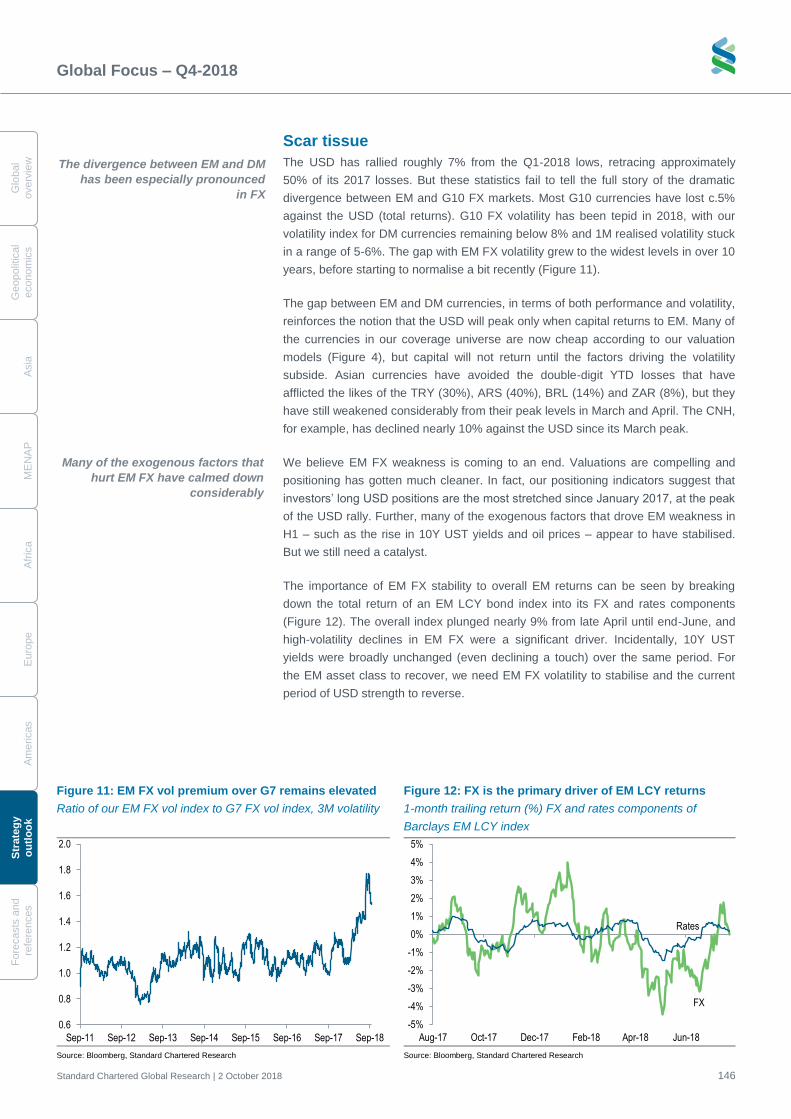
Global Focus – Q4-2018
Standard Chartered Global Research | 2 October 2018 146
G
lobal
overv
iew
Geopolit
ical
econom
ics
A
sia
M
EN
AP
A
fric
a
E
uro
pe
A
me
ricas
S
trate
gy
o
utl
oo
k
Fo
recasts
and
re
fere
nces
Scar tissue
The USD has rallied roughly 7% from the Q1-2018 lows, retracing approximately
50% of its 2017 losses. But these statistics fail to tell the full story of the dramatic
divergence between EM and G10 FX markets. Most G10 currencies have lost c.5%
against the USD (total returns). G10 FX volatility has been tepid in 2018, with our
volatility index for DM currencies remaining below 8% and 1M realised volatility stuck
in a range of 5-6%. The gap with EM FX volatility grew to the widest levels in over 10
years, before starting to normalise a bit recently (Figure 11).
The gap between EM and DM currencies, in terms of both performance and volatility,
reinforces the notion that the USD will peak only when capital returns to EM. Many of
the currencies in our coverage universe are now cheap according to our valuation
models (Figure 4), but capital will not return until the factors driving the volatility
subside. Asian currencies have avoided the double-digit YTD losses that have
afflicted the likes of the TRY (30%), ARS (40%), BRL (14%) and ZAR (8%), but they
have still weakened considerably from their peak levels in March and April. The CNH,
for example, has declined nearly 10% against the USD since its March peak.
We believe EM FX weakness is coming to an end. Valuations are compelling and
positioning has gotten much cleaner. In fact, our positioning indicators suggest that
investors’ long USD positions are the most stretched since January 2017, at the peak
of the USD rally. Further, many of the exogenous factors that drove EM weakness in
H1 – such as the rise in 10Y UST yields and oil prices – appear to have stabilised.
But we still need a catalyst.
The importance of EM FX stability to overall EM returns can be seen by breaking
down the total return of an EM LCY bond index into its FX and rates components
(Figure 12). The overall index plunged nearly 9% from late April until end-June, and
high-volatility declines in EM FX were a significant driver. Incidentally, 10Y UST
yields were broadly unchanged (even declining a touch) over the same period. For
the EM asset class to recover, we need EM FX volatility to stabilise and the current
period of USD strength to reverse.
Figure 11: EM FX vol premium over G7 remains elevated
Ratio of our EM FX vol index to G7 FX vol index, 3M volatility
Figure 12: FX is the primary driver of EM LCY returns
1-month trailing return (%) FX and rates components of
Barclays EM LCY index
Source: Bloomberg, Standard Chartered Research Source: Bloomberg, Standard Chartered Research
0.6
0.8
1.0
1.2
1.4
1.6
1.8
2.0
Sep-11 Sep-12 Sep-13 Sep-14 Sep-15 Sep-16 Sep-17 Sep-18
FX
Rates
-5%
-4%
-3%
-2%
-1%
0%
1%
2%
3%
4%
5%
Aug-17 Oct-17 Dec-17 Feb-18 Apr-18 Jun-18
The divergence between EM and DM
has been especially pronounced
in FX
Many of the exogenous factors that
hurt EM FX have calmed down
considerably
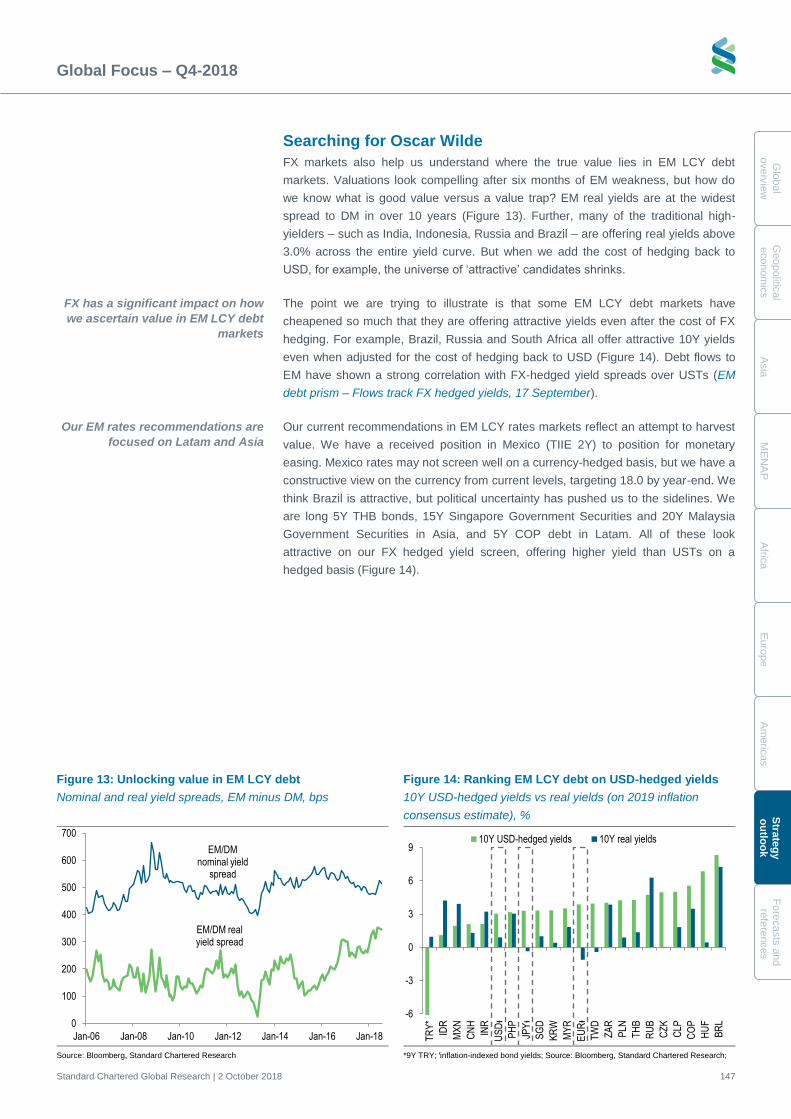
Global Focus – Q4-2018
Standard Chartered Global Research | 2 October 2018 147
Glo
bal
overv
iew
G
eopolitic
al
econom
ics
A
sia
M
EN
AP
A
frica
E
uro
pe
A
me
ricas
Stra
teg
y
ou
tloo
k
Fo
recasts
and
refe
rences
Searching for Oscar Wilde
FX markets also help us understand where the true value lies in EM LCY debt
markets. Valuations look compelling after six months of EM weakness, but how do
we know what is good value versus a value trap? EM real yields are at the widest
spread to DM in over 10 years (Figure 13). Further, many of the traditional high-
yielders – such as India, Indonesia, Russia and Brazil – are offering real yields above
3.0% across the entire yield curve. But when we add the cost of hedging back to
USD, for example, the universe of ‘attractive’ candidates shrinks.
The point we are trying to illustrate is that some EM LCY debt markets have
cheapened so much that they are offering attractive yields even after the cost of FX
hedging. For example, Brazil, Russia and South Africa all offer attractive 10Y yields
even when adjusted for the cost of hedging back to USD (Figure 14). Debt flows to
EM have shown a strong correlation with FX-hedged yield spreads over USTs (EM
debt prism – Flows track FX hedged yields, 17 September).
Our current recommendations in EM LCY rates markets reflect an attempt to harvest
value. We have a received position in Mexico (TIIE 2Y) to position for monetary
easing. Mexico rates may not screen well on a currency-hedged basis, but we have a
constructive view on the currency from current levels, targeting 18.0 by year-end. We
think Brazil is attractive, but political uncertainty has pushed us to the sidelines. We
are long 5Y THB bonds, 15Y Singapore Government Securities and 20Y Malaysia
Government Securities in Asia, and 5Y COP debt in Latam. All of these look
attractive on our FX hedged yield screen, offering higher yield than USTs on a
hedged basis (Figure 14).
Figure 13: Unlocking value in EM LCY debt
Nominal and real yield spreads, EM minus DM, bps
Figure 14: Ranking EM LCY debt on USD-hedged yields
10Y USD-hedged yields vs real yields (on 2019 inflation
consensus estimate), %
Source: Bloomberg, Standard Chartered Research *9Y TRY; ᵻinflation-indexed bond yields; Source: Bloomberg, Standard Chartered Research;
EM/DM real yield spread
EM/DM nominal yield
spread
0
100
200
300
400
500
600
700
Jan-06 Jan-08 Jan-10 Jan-12 Jan-14 Jan-16 Jan-18
-6
-3
0
3
6
9
TR
Y*
IDR
MX
N
CN
H
INR
US
Dᵻ
PH
P
JPYᵻ
SG
D
KR
W
MY
R
EU
Rᵻ
TW
D
ZA
R
PLN
TH
B
RU
B
CZ
K
CLP
CO
P
HU
F
BR
L
10Y USD-hedged yields 10Y real yields
FX has a significant impact on how
we ascertain value in EM LCY debt
markets
Our EM rates recommendations are
focused on Latam and Asia

Forecasts and reference tables
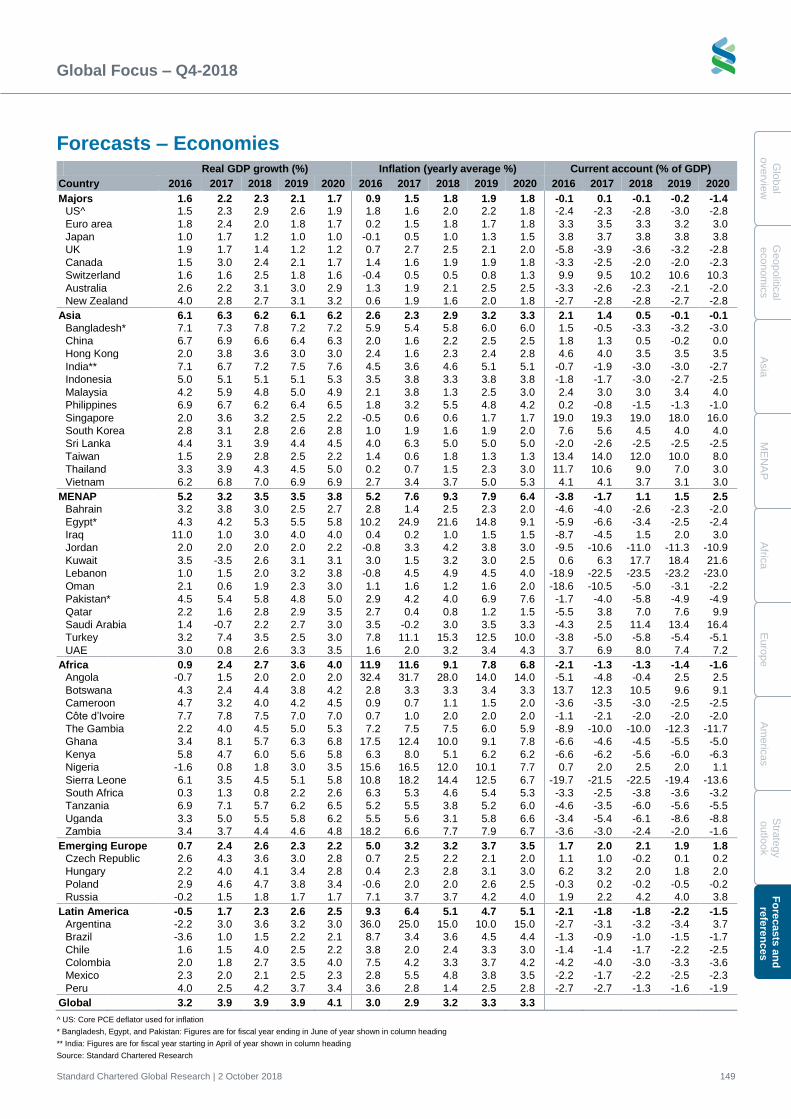
Global Focus – Q4-2018
Standard Chartered Global Research | 2 October 2018 149
Glo
bal
overv
iew
G
eopolitic
al
econom
ics
A
sia
M
EN
AP
A
frica
E
uro
pe
A
me
ricas
Stra
tegy
outlo
ok
Fo
recasts
an
d
refe
ren
ces
Forecasts – Economies Real GDP growth (%) Inflation (yearly average %) Current account (% of GDP)
Country 2016 2017 2018 2019 2020 2016 2017 2018 2019 2020 2016 2017 2018 2019 2020
Majors 1.6 2.2 2.3 2.1 1.7 0.9 1.5 1.8 1.9 1.8 -0.1 0.1 -0.1 -0.2 -1.4
US^ 1.5 2.3 2.9 2.6 1.9 1.8 1.6 2.0 2.2 1.8 -2.4 -2.3 -2.8 -3.0 -2.8
Euro area 1.8 2.4 2.0 1.8 1.7 0.2 1.5 1.8 1.7 1.8 3.3 3.5 3.3 3.2 3.0
Japan 1.0 1.7 1.2 1.0 1.0 -0.1 0.5 1.0 1.3 1.5 3.8 3.7 3.8 3.8 3.8
UK 1.9 1.7 1.4 1.2 1.2 0.7 2.7 2.5 2.1 2.0 -5.8 -3.9 -3.6 -3.2 -2.8
Canada 1.5 3.0 2.4 2.1 1.7 1.4 1.6 1.9 1.9 1.8 -3.3 -2.5 -2.0 -2.0 -2.3
Switzerland 1.6 1.6 2.5 1.8 1.6 -0.4 0.5 0.5 0.8 1.3 9.9 9.5 10.2 10.6 10.3
Australia 2.6 2.2 3.1 3.0 2.9 1.3 1.9 2.1 2.5 2.5 -3.3 -2.6 -2.3 -2.1 -2.0
New Zealand 4.0 2.8 2.7 3.1 3.2 0.6 1.9 1.6 2.0 1.8 -2.7 -2.8 -2.8 -2.7 -2.8
Asia 6.1 6.3 6.2 6.1 6.2 2.6 2.3 2.9 3.2 3.3 2.1 1.4 0.5 -0.1 -0.1
Bangladesh* 7.1 7.3 7.8 7.2 7.2 5.9 5.4 5.8 6.0 6.0 1.5 -0.5 -3.3 -3.2 -3.0
China 6.7 6.9 6.6 6.4 6.3 2.0 1.6 2.2 2.5 2.5 1.8 1.3 0.5 -0.2 0.0
Hong Kong 2.0 3.8 3.6 3.0 3.0 2.4 1.6 2.3 2.4 2.8 4.6 4.0 3.5 3.5 3.5
India** 7.1 6.7 7.2 7.5 7.6 4.5 3.6 4.6 5.1 5.1 -0.7 -1.9 -3.0 -3.0 -2.7
Indonesia 5.0 5.1 5.1 5.1 5.3 3.5 3.8 3.3 3.8 3.8 -1.8 -1.7 -3.0 -2.7 -2.5
Malaysia 4.2 5.9 4.8 5.0 4.9 2.1 3.8 1.3 2.5 3.0 2.4 3.0 3.0 3.4 4.0
Philippines 6.9 6.7 6.2 6.4 6.5 1.8 3.2 5.5 4.8 4.2 0.2 -0.8 -1.5 -1.3 -1.0
Singapore 2.0 3.6 3.2 2.5 2.2 -0.5 0.6 0.6 1.7 1.7 19.0 19.3 19.0 18.0 16.0
South Korea 2.8 3.1 2.8 2.6 2.8 1.0 1.9 1.6 1.9 2.0 7.6 5.6 4.5 4.0 4.0
Sri Lanka 4.4 3.1 3.9 4.4 4.5 4.0 6.3 5.0 5.0 5.0 -2.0 -2.6 -2.5 -2.5 -2.5
Taiwan 1.5 2.9 2.8 2.5 2.2 1.4 0.6 1.8 1.3 1.3 13.4 14.0 12.0 10.0 8.0
Thailand 3.3 3.9 4.3 4.5 5.0 0.2 0.7 1.5 2.3 3.0 11.7 10.6 9.0 7.0 3.0
Vietnam 6.2 6.8 7.0 6.9 6.9 2.7 3.4 3.7 5.0 5.3 4.1 4.1 3.7 3.1 3.0
MENAP 5.2 3.2 3.5 3.5 3.8 5.2 7.6 9.3 7.9 6.4 -3.8 -1.7 1.1 1.5 2.5
Bahrain 3.2 3.8 3.0 2.5 2.7 2.8 1.4 2.5 2.3 2.0 -4.6 -4.0 -2.6 -2.3 -2.0
Egypt* 4.3 4.2 5.3 5.5 5.8 10.2 24.9 21.6 14.8 9.1 -5.9 -6.6 -3.4 -2.5 -2.4
Iraq 11.0 1.0 3.0 4.0 4.0 0.4 0.2 1.0 1.5 1.5 -8.7 -4.5 1.5 2.0 3.0
Jordan 2.0 2.0 2.0 2.0 2.2 -0.8 3.3 4.2 3.8 3.0 -9.5 -10.6 -11.0 -11.3 -10.9
Kuwait 3.5 -3.5 2.6 3.1 3.1 3.0 1.5 3.2 3.0 2.5 0.6 6.3 17.7 18.4 21.6
Lebanon 1.0 1.5 2.0 3.2 3.8 -0.8 4.5 4.9 4.5 4.0 -18.9 -22.5 -23.5 -23.2 -23.0
Oman 2.1 0.6 1.9 2.3 3.0 1.1 1.6 1.2 1.6 2.0 -18.6 -10.5 -5.0 -3.1 -2.2
Pakistan* 4.5 5.4 5.8 4.8 5.0 2.9 4.2 4.0 6.9 7.6 -1.7 -4.0 -5.8 -4.9 -4.9
Qatar 2.2 1.6 2.8 2.9 3.5 2.7 0.4 0.8 1.2 1.5 -5.5 3.8 7.0 7.6 9.9
Saudi Arabia 1.4 -0.7 2.2 2.7 3.0 3.5 -0.2 3.0 3.5 3.3 -4.3 2.5 11.4 13.4 16.4
Turkey 3.2 7.4 3.5 2.5 3.0 7.8 11.1 15.3 12.5 10.0 -3.8 -5.0 -5.8 -5.4 -5.1
UAE 3.0 0.8 2.6 3.3 3.5 1.6 2.0 3.2 3.4 4.3 3.7 6.9 8.0 7.4 7.2
Africa 0.9 2.4 2.7 3.6 4.0 11.9 11.6 9.1 7.8 6.8 -2.1 -1.3 -1.3 -1.4 -1.6
Angola -0.7 1.5 2.0 2.0 2.0 32.4 31.7 28.0 14.0 14.0 -5.1 -4.8 -0.4 2.5 2.5
Botswana 4.3 2.4 4.4 3.8 4.2 2.8 3.3 3.3 3.4 3.3 13.7 12.3 10.5 9.6 9.1
Cameroon 4.7 3.2 4.0 4.2 4.5 0.9 0.7 1.1 1.5 2.0 -3.6 -3.5 -3.0 -2.5 -2.5
Côte d’lvoire 7.7 7.8 7.5 7.0 7.0 0.7 1.0 2.0 2.0 2.0 -1.1 -2.1 -2.0 -2.0 -2.0
The Gambia 2.2 4.0 4.5 5.0 5.3 7.2 7.5 7.5 6.0 5.9 -8.9 -10.0 -10.0 -12.3 -11.7
Ghana 3.4 8.1 5.7 6.3 6.8 17.5 12.4 10.0 9.1 7.8 -6.6 -4.6 -4.5 -5.5 -5.0
Kenya 5.8 4.7 6.0 5.6 5.8 6.3 8.0 5.1 6.2 6.2 -6.6 -6.2 -5.6 -6.0 -6.3
Nigeria -1.6 0.8 1.8 3.0 3.5 15.6 16.5 12.0 10.1 7.7 0.7 2.0 2.5 2.0 1.1
Sierra Leone 6.1 3.5 4.5 5.1 5.8 10.8 18.2 14.4 12.5 6.7 -19.7 -21.5 -22.5 -19.4 -13.6
South Africa 0.3 1.3 0.8 2.2 2.6 6.3 5.3 4.6 5.4 5.3 -3.3 -2.5 -3.8 -3.6 -3.2
Tanzania 6.9 7.1 5.7 6.2 6.5 5.2 5.5 3.8 5.2 6.0 -4.6 -3.5 -6.0 -5.6 -5.5
Uganda 3.3 5.0 5.5 5.8 6.2 5.5 5.6 3.1 5.8 6.6 -3.4 -5.4 -6.1 -8.6 -8.8
Zambia 3.4 3.7 4.4 4.6 4.8 18.2 6.6 7.7 7.9 6.7 -3.6 -3.0 -2.4 -2.0 -1.6
Emerging Europe 0.7 2.4 2.6 2.3 2.2 5.0 3.2 3.2 3.7 3.5 1.7 2.0 2.1 1.9 1.8
Czech Republic 2.6 4.3 3.6 3.0 2.8 0.7 2.5 2.2 2.1 2.0 1.1 1.0 -0.2 0.1 0.2
Hungary 2.2 4.0 4.1 3.4 2.8 0.4 2.3 2.8 3.1 3.0 6.2 3.2 2.0 1.8 2.0
Poland 2.9 4.6 4.7 3.8 3.4 -0.6 2.0 2.0 2.6 2.5 -0.3 0.2 -0.2 -0.5 -0.2
Russia -0.2 1.5 1.8 1.7 1.7 7.1 3.7 3.7 4.2 4.0 1.9 2.2 4.2 4.0 3.8
Latin America -0.5 1.7 2.3 2.6 2.5 9.3 6.4 5.1 4.7 5.1 -2.1 -1.8 -1.8 -2.2 -1.5
Argentina -2.2 3.0 3.6 3.2 3.0 36.0 25.0 15.0 10.0 15.0 -2.7 -3.1 -3.2 -3.4 3.7
Brazil -3.6 1.0 1.5 2.2 2.1 8.7 3.4 3.6 4.5 4.4 -1.3 -0.9 -1.0 -1.5 -1.7
Chile 1.6 1.5 4.0 2.5 2.2 3.8 2.0 2.4 3.3 3.0 -1.4 -1.4 -1.7 -2.2 -2.5
Colombia 2.0 1.8 2.7 3.5 4.0 7.5 4.2 3.3 3.7 4.2 -4.2 -4.0 -3.0 -3.3 -3.6
Mexico 2.3 2.0 2.1 2.5 2.3 2.8 5.5 4.8 3.8 3.5 -2.2 -1.7 -2.2 -2.5 -2.3
Peru 4.0 2.5 4.2 3.7 3.4 3.6 2.8 1.4 2.5 2.8 -2.7 -2.7 -1.3 -1.6 -1.9
Global 3.2 3.9 3.9 3.9 4.1 3.0 2.9 3.2 3.3 3.3
^ US: Core PCE deflator used for inflation
* Bangladesh, Egypt, and Pakistan: Figures are for fiscal year ending in June of year shown in column heading
** India: Figures are for fiscal year starting in April of year shown in column heading
Source: Standard Chartered Research
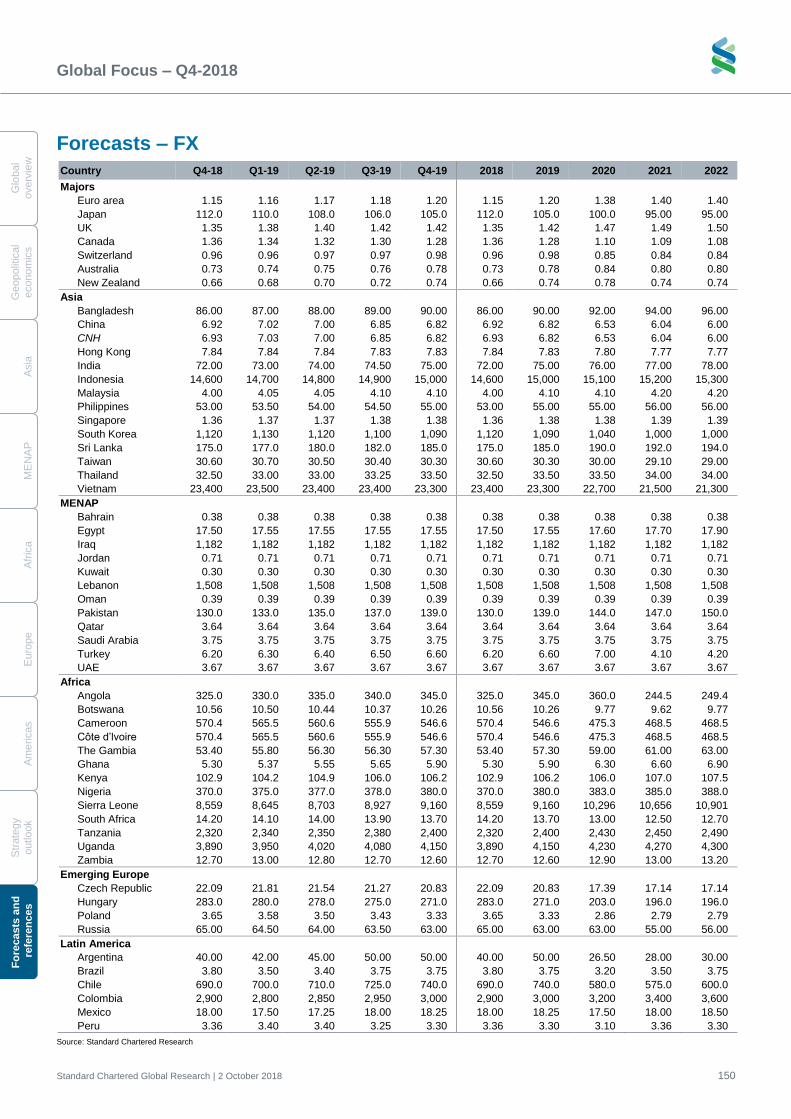
Global Focus – Q4-2018
Standard Chartered Global Research | 2 October 2018 150
G
lobal
overv
iew
Geopolit
ical
econom
ics
A
sia
M
EN
AP
A
fric
a
E
uro
pe
A
me
ricas
S
trate
gy
o
utlo
ok
Fo
recasts
an
d
re
fere
nc
es
Forecasts – FX
Country Q4-18 Q1-19 Q2-19 Q3-19 Q4-19 2018 2019 2020 2021 2022
Majors
Euro area 1.15 1.16 1.17 1.18 1.20 1.15 1.20 1.38 1.40 1.40
Japan 112.0 110.0 108.0 106.0 105.0 112.0 105.0 100.0 95.00 95.00
UK 1.35 1.38 1.40 1.42 1.42 1.35 1.42 1.47 1.49 1.50
Canada 1.36 1.34 1.32 1.30 1.28 1.36 1.28 1.10 1.09 1.08
Switzerland 0.96 0.96 0.97 0.97 0.98 0.96 0.98 0.85 0.84 0.84
Australia 0.73 0.74 0.75 0.76 0.78 0.73 0.78 0.84 0.80 0.80
New Zealand 0.66 0.68 0.70 0.72 0.74 0.66 0.74 0.78 0.74 0.74
Asia
Bangladesh 86.00 87.00 88.00 89.00 90.00 86.00 90.00 92.00 94.00 96.00
China 6.92 7.02 7.00 6.85 6.82 6.92 6.82 6.53 6.04 6.00
CNH 6.93 7.03 7.00 6.85 6.82 6.93 6.82 6.53 6.04 6.00
Hong Kong 7.84 7.84 7.84 7.83 7.83 7.84 7.83 7.80 7.77 7.77
India 72.00 73.00 74.00 74.50 75.00 72.00 75.00 76.00 77.00 78.00
Indonesia 14,600 14,700 14,800 14,900 15,000 14,600 15,000 15,100 15,200 15,300
Malaysia 4.00 4.05 4.05 4.10 4.10 4.00 4.10 4.10 4.20 4.20
Philippines 53.00 53.50 54.00 54.50 55.00 53.00 55.00 55.00 56.00 56.00
Singapore 1.36 1.37 1.37 1.38 1.38 1.36 1.38 1.38 1.39 1.39
South Korea 1,120 1,130 1,120 1,100 1,090 1,120 1,090 1,040 1,000 1,000
Sri Lanka 175.0 177.0 180.0 182.0 185.0 175.0 185.0 190.0 192.0 194.0
Taiwan 30.60 30.70 30.50 30.40 30.30 30.60 30.30 30.00 29.10 29.00
Thailand 32.50 33.00 33.00 33.25 33.50 32.50 33.50 33.50 34.00 34.00
Vietnam 23,400 23,500 23,400 23,400 23,300 23,400 23,300 22,700 21,500 21,300
MENAP
Bahrain 0.38 0.38 0.38 0.38 0.38 0.38 0.38 0.38 0.38 0.38
Egypt 17.50 17.55 17.55 17.55 17.55 17.50 17.55 17.60 17.70 17.90
Iraq 1,182 1,182 1,182 1,182 1,182 1,182 1,182 1,182 1,182 1,182
Jordan 0.71 0.71 0.71 0.71 0.71 0.71 0.71 0.71 0.71 0.71
Kuwait 0.30 0.30 0.30 0.30 0.30 0.30 0.30 0.30 0.30 0.30
Lebanon 1,508 1,508 1,508 1,508 1,508 1,508 1,508 1,508 1,508 1,508
Oman 0.39 0.39 0.39 0.39 0.39 0.39 0.39 0.39 0.39 0.39
Pakistan 130.0 133.0 135.0 137.0 139.0 130.0 139.0 144.0 147.0 150.0
Qatar 3.64 3.64 3.64 3.64 3.64 3.64 3.64 3.64 3.64 3.64
Saudi Arabia 3.75 3.75 3.75 3.75 3.75 3.75 3.75 3.75 3.75 3.75
Turkey 6.20 6.30 6.40 6.50 6.60 6.20 6.60 7.00 4.10 4.20
UAE 3.67 3.67 3.67 3.67 3.67 3.67 3.67 3.67 3.67 3.67
Africa
Angola 325.0 330.0 335.0 340.0 345.0 325.0 345.0 360.0 244.5 249.4
Botswana 10.56 10.50 10.44 10.37 10.26 10.56 10.26 9.77 9.62 9.77
Cameroon 570.4 565.5 560.6 555.9 546.6 570.4 546.6 475.3 468.5 468.5
Côte d’lvoire 570.4 565.5 560.6 555.9 546.6 570.4 546.6 475.3 468.5 468.5
The Gambia 53.40 55.80 56.30 56.30 57.30 53.40 57.30 59.00 61.00 63.00
Ghana 5.30 5.37 5.55 5.65 5.90 5.30 5.90 6.30 6.60 6.90
Kenya 102.9 104.2 104.9 106.0 106.2 102.9 106.2 106.0 107.0 107.5
Nigeria 370.0 375.0 377.0 378.0 380.0 370.0 380.0 383.0 385.0 388.0
Sierra Leone 8,559 8,645 8,703 8,927 9,160 8,559 9,160 10,296 10,656 10,901
South Africa 14.20 14.10 14.00 13.90 13.70 14.20 13.70 13.00 12.50 12.70
Tanzania 2,320 2,340 2,350 2,380 2,400 2,320 2,400 2,430 2,450 2,490
Uganda 3,890 3,950 4,020 4,080 4,150 3,890 4,150 4,230 4,270 4,300
Zambia 12.70 13.00 12.80 12.70 12.60 12.70 12.60 12.90 13.00 13.20
Emerging Europe
Czech Republic 22.09 21.81 21.54 21.27 20.83 22.09 20.83 17.39 17.14 17.14
Hungary 283.0 280.0 278.0 275.0 271.0 283.0 271.0 203.0 196.0 196.0
Poland 3.65 3.58 3.50 3.43 3.33 3.65 3.33 2.86 2.79 2.79
Russia 65.00 64.50 64.00 63.50 63.00 65.00 63.00 63.00 55.00 56.00
Latin America
Argentina 40.00 42.00 45.00 50.00 50.00 40.00 50.00 26.50 28.00 30.00
Brazil 3.80 3.50 3.40 3.75 3.75 3.80 3.75 3.20 3.50 3.75
Chile 690.0 700.0 710.0 725.0 740.0 690.0 740.0 580.0 575.0 600.0
Colombia 2,900 2,800 2,850 2,950 3,000 2,900 3,000 3,200 3,400 3,600
Mexico 18.00 17.50 17.25 18.00 18.25 18.00 18.25 17.50 18.00 18.50
Peru 3.36 3.40 3.40 3.25 3.30 3.36 3.30 3.10 3.36 3.30
Source: Standard Chartered Research
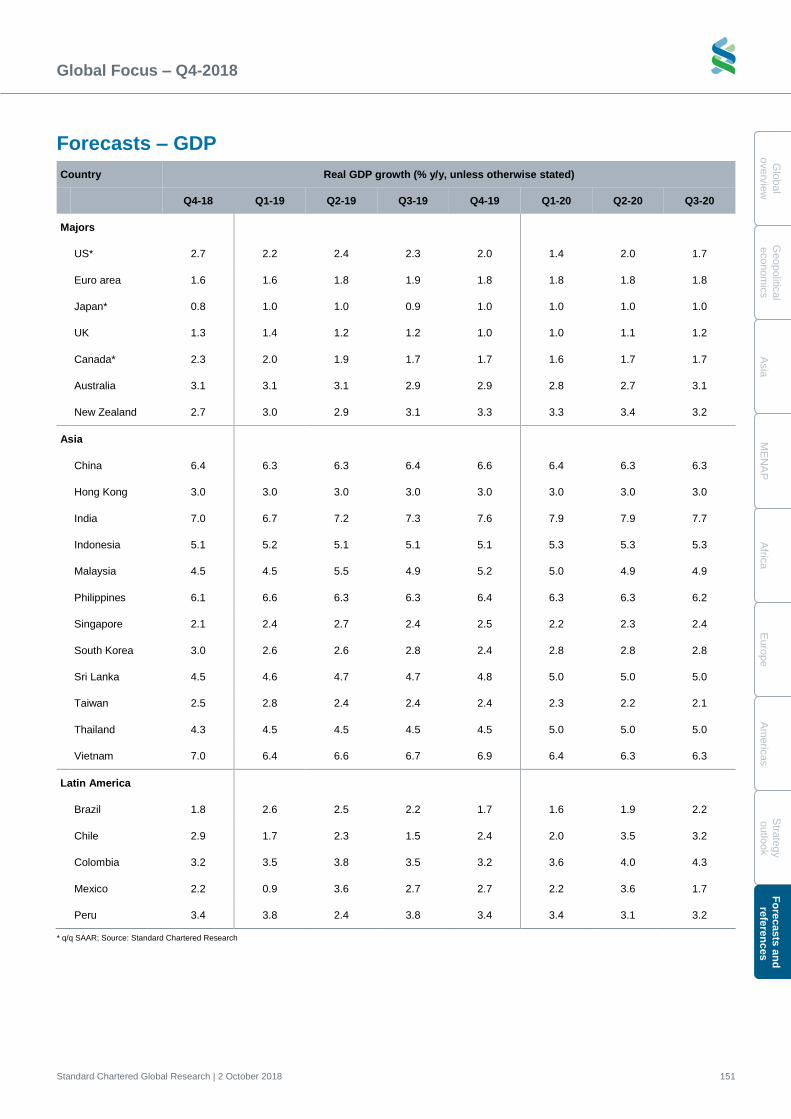
Global Focus – Q4-2018
Standard Chartered Global Research | 2 October 2018 151
Glo
bal
overv
iew
G
eopolitic
al
econom
ics
A
sia
M
EN
AP
A
frica
E
uro
pe
A
me
ricas
Stra
tegy
outlo
ok
Fo
recasts
an
d
refe
ren
ces
Forecasts – GDP
Country Real GDP growth (% y/y, unless otherwise stated)
Q4-18 Q1-19 Q2-19 Q3-19 Q4-19 Q1-20 Q2-20 Q3-20
Majors
US* 2.7 2.2 2.4 2.3 2.0 1.4 2.0 1.7
Euro area 1.6 1.6 1.8 1.9 1.8 1.8 1.8 1.8
Japan* 0.8 1.0 1.0 0.9 1.0 1.0 1.0 1.0
UK 1.3 1.4 1.2 1.2 1.0 1.0 1.1 1.2
Canada* 2.3 2.0 1.9 1.7 1.7 1.6 1.7 1.7
Australia 3.1 3.1 3.1 2.9 2.9 2.8 2.7 3.1
New Zealand 2.7 3.0 2.9 3.1 3.3 3.3 3.4 3.2
Asia
China 6.4 6.3 6.3 6.4 6.6 6.4 6.3 6.3
Hong Kong 3.0 3.0 3.0 3.0 3.0 3.0 3.0 3.0
India 7.0 6.7 7.2 7.3 7.6 7.9 7.9 7.7
Indonesia 5.1 5.2 5.1 5.1 5.1 5.3 5.3 5.3
Malaysia 4.5 4.5 5.5 4.9 5.2 5.0 4.9 4.9
Philippines 6.1 6.6 6.3 6.3 6.4 6.3 6.3 6.2
Singapore 2.1 2.4 2.7 2.4 2.5 2.2 2.3 2.4
South Korea 3.0 2.6 2.6 2.8 2.4 2.8 2.8 2.8
Sri Lanka 4.5 4.6 4.7 4.7 4.8 5.0 5.0 5.0
Taiwan 2.5 2.8 2.4 2.4 2.4 2.3 2.2 2.1
Thailand 4.3 4.5 4.5 4.5 4.5 5.0 5.0 5.0
Vietnam 7.0 6.4 6.6 6.7 6.9 6.4 6.3 6.3
Latin America
Brazil 1.8 2.6 2.5 2.2 1.7 1.6 1.9 2.2
Chile 2.9 1.7 2.3 1.5 2.4 2.0 3.5 3.2
Colombia 3.2 3.5 3.8 3.5 3.2 3.6 4.0 4.3
Mexico 2.2 0.9 3.6 2.7 2.7 2.2 3.6 1.7
Peru 3.4 3.8 2.4 3.8 3.4 3.4 3.1 3.2
* q/q SAAR; Source: Standard Chartered Research
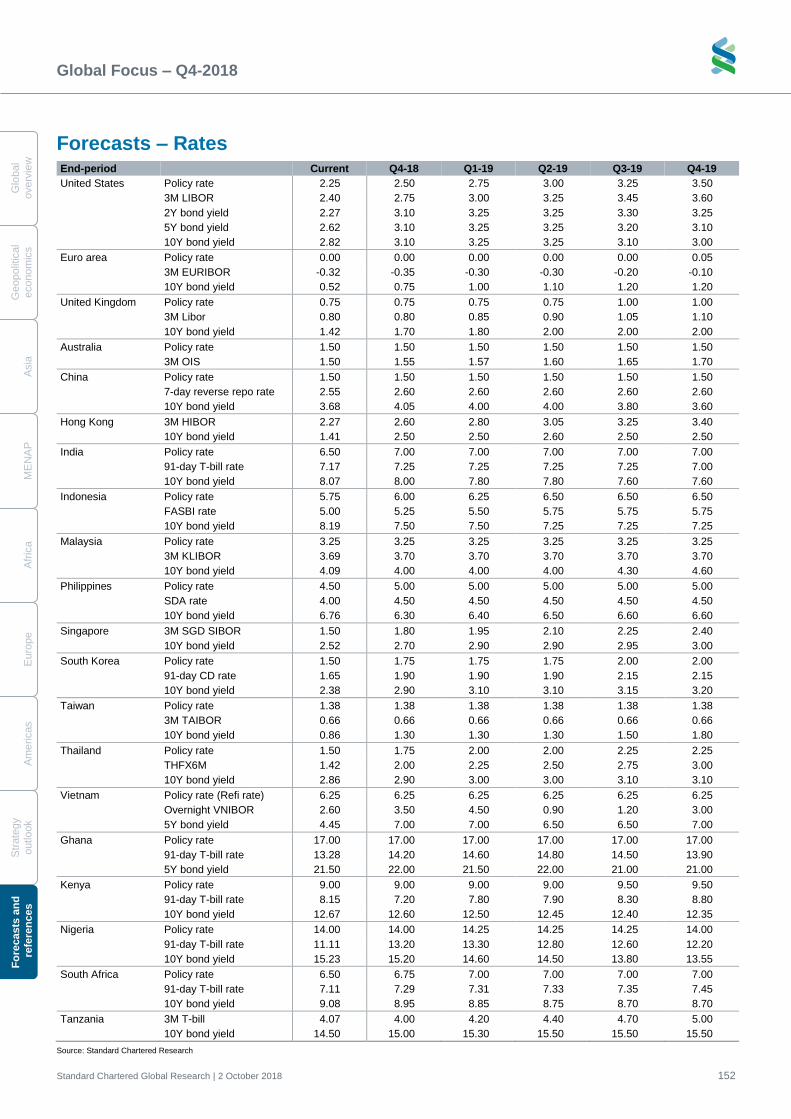
Global Focus – Q4-2018
Standard Chartered Global Research | 2 October 2018 152
G
lobal
overv
iew
Geopolit
ical
econom
ics
A
sia
M
EN
AP
A
fric
a
E
uro
pe
A
me
ricas
S
trate
gy
o
utlo
ok
Fo
recasts
an
d
re
fere
nc
es
Forecasts – Rates End-period Current Q4-18 Q1-19 Q2-19 Q3-19 Q4-19
United States Policy rate 2.25 2.50 2.75 3.00 3.25 3.50
3M LIBOR 2.40 2.75 3.00 3.25 3.45 3.60
2Y bond yield 2.27 3.10 3.25 3.25 3.30 3.25
5Y bond yield 2.62 3.10 3.25 3.25 3.20 3.10
10Y bond yield 2.82 3.10 3.25 3.25 3.10 3.00
Euro area Policy rate 0.00 0.00 0.00 0.00 0.00 0.05
3M EURIBOR -0.32 -0.35 -0.30 -0.30 -0.20 -0.10
10Y bond yield 0.52 0.75 1.00 1.10 1.20 1.20
United Kingdom Policy rate 0.75 0.75 0.75 0.75 1.00 1.00
3M Libor 0.80 0.80 0.85 0.90 1.05 1.10
10Y bond yield 1.42 1.70 1.80 2.00 2.00 2.00
Australia Policy rate 1.50 1.50 1.50 1.50 1.50 1.50
3M OIS 1.50 1.55 1.57 1.60 1.65 1.70
China Policy rate 1.50 1.50 1.50 1.50 1.50 1.50
7-day reverse repo rate 2.55 2.60 2.60 2.60 2.60 2.60
10Y bond yield 3.68 4.05 4.00 4.00 3.80 3.60
Hong Kong 3M HIBOR 2.27 2.60 2.80 3.05 3.25 3.40
10Y bond yield 1.41 2.50 2.50 2.60 2.50 2.50
India Policy rate 6.50 7.00 7.00 7.00 7.00 7.00
91-day T-bill rate 7.17 7.25 7.25 7.25 7.25 7.00
10Y bond yield 8.07 8.00 7.80 7.80 7.60 7.60
Indonesia Policy rate 5.75 6.00 6.25 6.50 6.50 6.50
FASBI rate 5.00 5.25 5.50 5.75 5.75 5.75
10Y bond yield 8.19 7.50 7.50 7.25 7.25 7.25
Malaysia Policy rate 3.25 3.25 3.25 3.25 3.25 3.25
3M KLIBOR 3.69 3.70 3.70 3.70 3.70 3.70
10Y bond yield 4.09 4.00 4.00 4.00 4.30 4.60
Philippines Policy rate 4.50 5.00 5.00 5.00 5.00 5.00
SDA rate 4.00 4.50 4.50 4.50 4.50 4.50
10Y bond yield 6.76 6.30 6.40 6.50 6.60 6.60
Singapore 3M SGD SIBOR 1.50 1.80 1.95 2.10 2.25 2.40
10Y bond yield 2.52 2.70 2.90 2.90 2.95 3.00
South Korea Policy rate 1.50 1.75 1.75 1.75 2.00 2.00
91-day CD rate 1.65 1.90 1.90 1.90 2.15 2.15
10Y bond yield 2.38 2.90 3.10 3.10 3.15 3.20
Taiwan Policy rate 1.38 1.38 1.38 1.38 1.38 1.38
3M TAIBOR 0.66 0.66 0.66 0.66 0.66 0.66
10Y bond yield 0.86 1.30 1.30 1.30 1.50 1.80
Thailand Policy rate 1.50 1.75 2.00 2.00 2.25 2.25
THFX6M 1.42 2.00 2.25 2.50 2.75 3.00
10Y bond yield 2.86 2.90 3.00 3.00 3.10 3.10
Vietnam Policy rate (Refi rate) 6.25 6.25 6.25 6.25 6.25 6.25
Overnight VNIBOR 2.60 3.50 4.50 0.90 1.20 3.00
5Y bond yield 4.45 7.00 7.00 6.50 6.50 7.00
Ghana Policy rate 17.00 17.00 17.00 17.00 17.00 17.00
91-day T-bill rate 13.28 14.20 14.60 14.80 14.50 13.90
5Y bond yield 21.50 22.00 21.50 22.00 21.00 21.00
Kenya Policy rate 9.00 9.00 9.00 9.00 9.50 9.50
91-day T-bill rate 8.15 7.20 7.80 7.90 8.30 8.80
10Y bond yield 12.67 12.60 12.50 12.45 12.40 12.35
Nigeria Policy rate 14.00 14.00 14.25 14.25 14.25 14.00
91-day T-bill rate 11.11 13.20 13.30 12.80 12.60 12.20
10Y bond yield 15.23 15.20 14.60 14.50 13.80 13.55
South Africa Policy rate 6.50 6.75 7.00 7.00 7.00 7.00
91-day T-bill rate 7.11 7.29 7.31 7.33 7.35 7.45
10Y bond yield 9.08 8.95 8.85 8.75 8.70 8.70
Tanzania 3M T-bill 4.07 4.00 4.20 4.40 4.70 5.00
10Y bond yield 14.50 15.00 15.30 15.50 15.50 15.50
Source: Standard Chartered Research
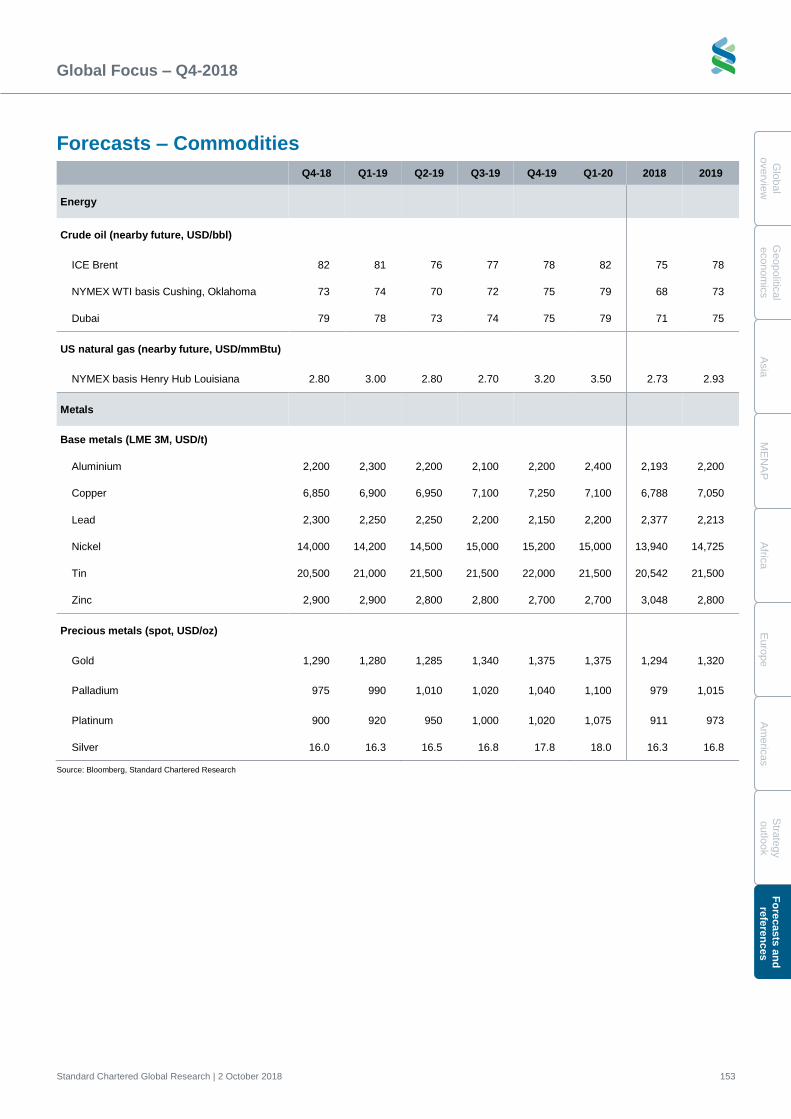
Global Focus – Q4-2018
Standard Chartered Global Research | 2 October 2018 153
Glo
bal
overv
iew
G
eopolitic
al
econom
ics
A
sia
M
EN
AP
A
frica
E
uro
pe
A
me
ricas
Stra
tegy
outlo
ok
Fo
recasts
an
d
refe
ren
ces
Forecasts – Commodities
Q4-18 Q1-19 Q2-19 Q3-19 Q4-19 Q1-20 2018 2019
Energy
Crude oil (nearby future, USD/bbl)
ICE Brent 82 81 76 77 78 82 75 78
NYMEX WTI basis Cushing, Oklahoma 73 74 70 72 75 79 68 73
Dubai 79 78 73 74 75 79 71 75
US natural gas (nearby future, USD/mmBtu)
NYMEX basis Henry Hub Louisiana 2.80 3.00 2.80 2.70 3.20 3.50 2.73 2.93
Metals
Base metals (LME 3M, USD/t)
Aluminium 2,200 2,300 2,200 2,100 2,200 2,400 2,193 2,200
Copper 6,850 6,900 6,950 7,100 7,250 7,100 6,788 7,050
Lead 2,300 2,250 2,250 2,200 2,150 2,200 2,377 2,213
Nickel 14,000 14,200 14,500 15,000 15,200 15,000 13,940 14,725
Tin 20,500 21,000 21,500 21,500 22,000 21,500 20,542 21,500
Zinc 2,900 2,900 2,800 2,800 2,700 2,700 3,048 2,800
Precious metals (spot, USD/oz)
Gold 1,290 1,280 1,285 1,340 1,375 1,375 1,294 1,320
Palladium 975 990 1,010 1,020 1,040 1,100 979 1,015
Platinum 900 920 950 1,000 1,020 1,075 911 973
Silver 16.0 16.3 16.5 16.8 17.8 18.0 16.3 16.8
Source: Bloomberg, Standard Chartered Research
Global Focus – Q4-2018
Standard Chartered Global Research | 2 October 2018 154
G
lobal
overv
iew
Geopolit
ical
econom
ics
A
sia
M
EN
AP
A
fric
a
E
uro
pe
A
me
ricas
S
trate
gy
o
utlo
ok
Fo
recasts
an
d
re
fere
nc
es
Forecasts – Long-term
Short-term strength; long-term growth unchanged
We expect strong global growth of 3.9% in 2018 and 2019, but we expect this
strength to be short-lived, as we see a number of risks bubbling beneath the surface.
Our long-term forecasts are broadly unchanged; emerging markets are still set to
capture an increasing share of the global GDP pie, led by Asia – particularly China.
Emerging markets’ growth is supported by more favourable demographics, rapid
urbanisation and the rise of the middle class. Asia and Africa should benefit from
their demographic dividend (young populations) relative to other regions in the
coming decade. India’s economy is set to expand by more than 8.0% p.a. on average
for the next 15 years. Even countries facing ageing populations – such as China and
countries in Southeast Asia and Eastern Europe – are likely to use digital
technologies to offset the drag from a shrinking workforce and boost growth.
Different kinds of reform needed in emerging and developed markets
Emerging markets’ ability to realise stronger growth momentum from these structural
factors will depend on the strength of reforms in these economies. Reforms in
emerging markets must focus on building infrastructure and institutions to support
growth. Improving reform momentum in India, Indonesia, Philippines, South Africa,
Ghana and Saudi Arabia should sustain long-term growth prospects in these
countries. Steady progress on the ASEAN Economic Community (AEC) and new
reforms could pose upside risk to our forecasts. Other countries, such as Nigeria and
Kenya, need to do more to realise their growth potential.
Ageing populations are more of a constraint on trend growth for developed markets
than for emerging markets. In addition, high levels of leverage, weak productivity
growth (despite technological progress), and the impact of rising inequality imply that
growth will remain subdued. In these economies, structural reforms to encourage
higher female participation in the workforce and raise the retirement age are needed
to bolster the labour force. Higher immigration would also be an effective policy to
raise labour-force participation rates, but growing anti-immigration sentiment in the
West poses a threat to labour-force growth.
Key challenges to the long-term growth outlook
The global economy currently faces several key challenges, which history suggests
may be bad for growth in the long term. These include a slide back into protectionism
and an unequal sharing of the potential benefits of globalisation. The anti-
globalisation trend and rising protectionism pose a threat to global growth potential –
particularly for emerging markets. Concerns about a full-blown global trade war have
come to the fore with the current US-China trade dispute and tit-for-tat retaliation. US
disengagement with the rest of the world may become even more disruptive in the
medium term, though we do not expect the current dispute to escalate into a full-
blown trade war. Over a longer-term horizon, the key concern is whether any other
economy, potentially China, can replace the US as the main engine of import
demand (see Global trade: Trade first! (Avoiding an own goal) and Trade tensions –
Unintended consequences).
Madhur Jha +91 124 617 6084
Head, Thematic Research
Standard Chartered Bank, India
Reforms aimed at improving
infrastructure and institutions are
needed to boost EM growth
A full-blown trade war would have a
lasting impact on EM and global
growth
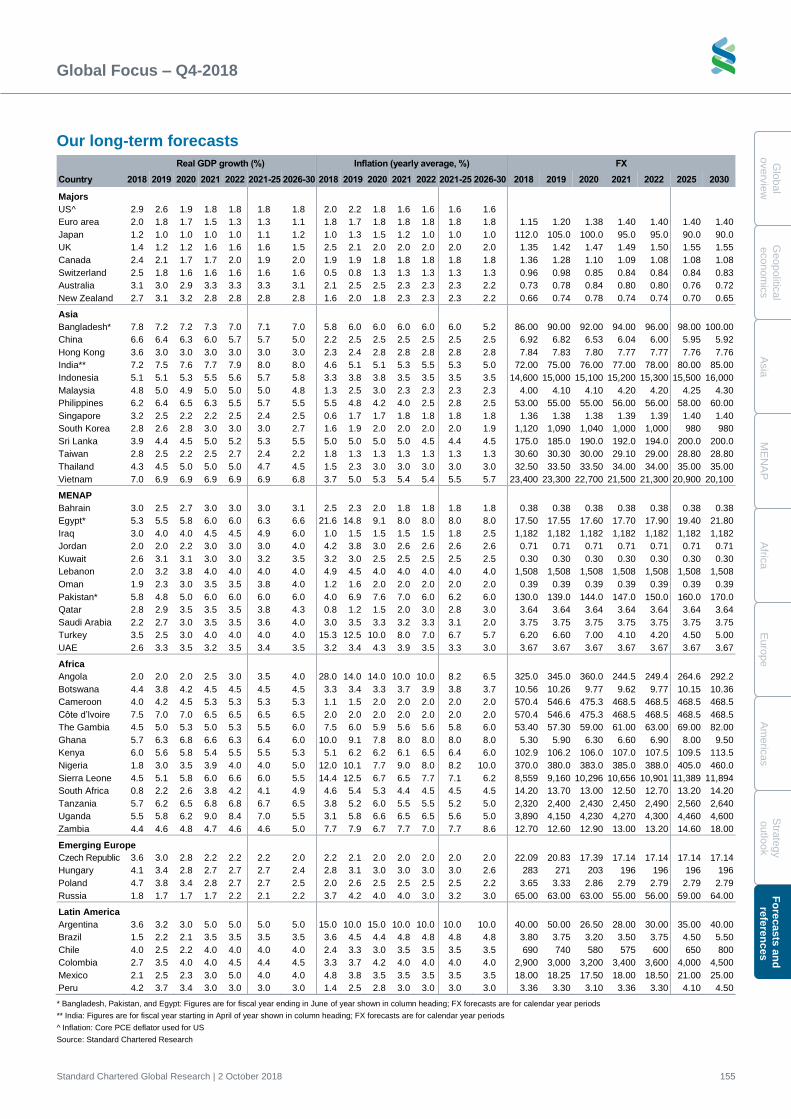
Global Focus – Q4-2018
Standard Chartered Global Research | 2 October 2018 155
Glo
bal
overv
iew
G
eopolitic
al
econom
ics
A
sia
M
EN
AP
A
frica
E
uro
pe
A
me
ricas
Stra
tegy
outlo
ok
Fo
recasts
an
d
refe
ren
ces
Our long-term forecasts
Real GDP growth (%) Inflation (yearly average, %) FX
Country 2018 2019 2020 2021 2022 2021-25 2026-30 2018 2019 2020 2021 2022 2021-25 2026-30 2018 2019 2020 2021 2022 2025 2030
Majors
US^ 2.9 2.6 1.9 1.8 1.8 1.8 1.8 2.0 2.2 1.8 1.6 1.6 1.6 1.6
Euro area 2.0 1.8 1.7 1.5 1.3 1.3 1.1 1.8 1.7 1.8 1.8 1.8 1.8 1.8 1.15 1.20 1.38 1.40 1.40 1.40 1.40
Japan 1.2 1.0 1.0 1.0 1.0 1.1 1.2 1.0 1.3 1.5 1.2 1.0 1.0 1.0 112.0 105.0 100.0 95.0 95.0 90.0 90.0
UK 1.4 1.2 1.2 1.6 1.6 1.6 1.5 2.5 2.1 2.0 2.0 2.0 2.0 2.0 1.35 1.42 1.47 1.49 1.50 1.55 1.55
Canada 2.4 2.1 1.7 1.7 2.0 1.9 2.0 1.9 1.9 1.8 1.8 1.8 1.8 1.8 1.36 1.28 1.10 1.09 1.08 1.08 1.08
Switzerland 2.5 1.8 1.6 1.6 1.6 1.6 1.6 0.5 0.8 1.3 1.3 1.3 1.3 1.3 0.96 0.98 0.85 0.84 0.84 0.84 0.83
Australia 3.1 3.0 2.9 3.3 3.3 3.3 3.1 2.1 2.5 2.5 2.3 2.3 2.3 2.2 0.73 0.78 0.84 0.80 0.80 0.76 0.72
New Zealand 2.7 3.1 3.2 2.8 2.8 2.8 2.8 1.6 2.0 1.8 2.3 2.3 2.3 2.2 0.66 0.74 0.78 0.74 0.74 0.70 0.65
Asia
Bangladesh* 7.8 7.2 7.2 7.3 7.0 7.1 7.0 5.8 6.0 6.0 6.0 6.0 6.0 5.2 86.00 90.00 92.00 94.00 96.00 98.00 100.00
China 6.6 6.4 6.3 6.0 5.7 5.7 5.0 2.2 2.5 2.5 2.5 2.5 2.5 2.5 6.92 6.82 6.53 6.04 6.00 5.95 5.92
Hong Kong 3.6 3.0 3.0 3.0 3.0 3.0 3.0 2.3 2.4 2.8 2.8 2.8 2.8 2.8 7.84 7.83 7.80 7.77 7.77 7.76 7.76
India** 7.2 7.5 7.6 7.7 7.9 8.0 8.0 4.6 5.1 5.1 5.3 5.5 5.3 5.0 72.00 75.00 76.00 77.00 78.00 80.00 85.00
Indonesia 5.1 5.1 5.3 5.5 5.6 5.7 5.8 3.3 3.8 3.8 3.5 3.5 3.5 3.5 14,600 15,000 15,100 15,200 15,300 15,500 16,000
Malaysia 4.8 5.0 4.9 5.0 5.0 5.0 4.8 1.3 2.5 3.0 2.3 2.3 2.3 2.3 4.00 4.10 4.10 4.20 4.20 4.25 4.30
Philippines 6.2 6.4 6.5 6.3 5.5 5.7 5.5 5.5 4.8 4.2 4.0 2.5 2.8 2.5 53.00 55.00 55.00 56.00 56.00 58.00 60.00
Singapore 3.2 2.5 2.2 2.2 2.5 2.4 2.5 0.6 1.7 1.7 1.8 1.8 1.8 1.8 1.36 1.38 1.38 1.39 1.39 1.40 1.40
South Korea 2.8 2.6 2.8 3.0 3.0 3.0 2.7 1.6 1.9 2.0 2.0 2.0 2.0 1.9 1,120 1,090 1,040 1,000 1,000 980 980
Sri Lanka 3.9 4.4 4.5 5.0 5.2 5.3 5.5 5.0 5.0 5.0 5.0 4.5 4.4 4.5 175.0 185.0 190.0 192.0 194.0 200.0 200.0
Taiwan 2.8 2.5 2.2 2.5 2.7 2.4 2.2 1.8 1.3 1.3 1.3 1.3 1.3 1.3 30.60 30.30 30.00 29.10 29.00 28.80 28.80
Thailand 4.3 4.5 5.0 5.0 5.0 4.7 4.5 1.5 2.3 3.0 3.0 3.0 3.0 3.0 32.50 33.50 33.50 34.00 34.00 35.00 35.00
Vietnam 7.0 6.9 6.9 6.9 6.9 6.9 6.8 3.7 5.0 5.3 5.4 5.4 5.5 5.7 23,400 23,300 22,700 21,500 21,300 20,900 20,100
MENAP
Bahrain 3.0 2.5 2.7 3.0 3.0 3.0 3.1 2.5 2.3 2.0 1.8 1.8 1.8 1.8 0.38 0.38 0.38 0.38 0.38 0.38 0.38
Egypt* 5.3 5.5 5.8 6.0 6.0 6.3 6.6 21.6 14.8 9.1 8.0 8.0 8.0 8.0 17.50 17.55 17.60 17.70 17.90 19.40 21.80
Iraq 3.0 4.0 4.0 4.5 4.5 4.9 6.0 1.0 1.5 1.5 1.5 1.5 1.8 2.5 1,182 1,182 1,182 1,182 1,182 1,182 1,182
Jordan 2.0 2.0 2.2 3.0 3.0 3.0 4.0 4.2 3.8 3.0 2.6 2.6 2.6 2.6 0.71 0.71 0.71 0.71 0.71 0.71 0.71
Kuwait 2.6 3.1 3.1 3.0 3.0 3.2 3.5 3.2 3.0 2.5 2.5 2.5 2.5 2.5 0.30 0.30 0.30 0.30 0.30 0.30 0.30
Lebanon 2.0 3.2 3.8 4.0 4.0 4.0 4.0 4.9 4.5 4.0 4.0 4.0 4.0 4.0 1,508 1,508 1,508 1,508 1,508 1,508 1,508
Oman 1.9 2.3 3.0 3.5 3.5 3.8 4.0 1.2 1.6 2.0 2.0 2.0 2.0 2.0 0.39 0.39 0.39 0.39 0.39 0.39 0.39
Pakistan* 5.8 4.8 5.0 6.0 6.0 6.0 6.0 4.0 6.9 7.6 7.0 6.0 6.2 6.0 130.0 139.0 144.0 147.0 150.0 160.0 170.0
Qatar 2.8 2.9 3.5 3.5 3.5 3.8 4.3 0.8 1.2 1.5 2.0 3.0 2.8 3.0 3.64 3.64 3.64 3.64 3.64 3.64 3.64
Saudi Arabia 2.2 2.7 3.0 3.5 3.5 3.6 4.0 3.0 3.5 3.3 3.2 3.3 3.1 2.0 3.75 3.75 3.75 3.75 3.75 3.75 3.75
Turkey 3.5 2.5 3.0 4.0 4.0 4.0 4.0 15.3 12.5 10.0 8.0 7.0 6.7 5.7 6.20 6.60 7.00 4.10 4.20 4.50 5.00
UAE 2.6 3.3 3.5 3.2 3.5 3.4 3.5 3.2 3.4 4.3 3.9 3.5 3.3 3.0 3.67 3.67 3.67 3.67 3.67 3.67 3.67
Africa
Angola 2.0 2.0 2.0 2.5 3.0 3.5 4.0 28.0 14.0 14.0 10.0 10.0 8.2 6.5 325.0 345.0 360.0 244.5 249.4 264.6 292.2
Botswana 4.4 3.8 4.2 4.5 4.5 4.5 4.5 3.3 3.4 3.3 3.7 3.9 3.8 3.7 10.56 10.26 9.77 9.62 9.77 10.15 10.36
Cameroon 4.0 4.2 4.5 5.3 5.3 5.3 5.3 1.1 1.5 2.0 2.0 2.0 2.0 2.0 570.4 546.6 475.3 468.5 468.5 468.5 468.5
Côte d’lvoire 7.5 7.0 7.0 6.5 6.5 6.5 6.5 2.0 2.0 2.0 2.0 2.0 2.0 2.0 570.4 546.6 475.3 468.5 468.5 468.5 468.5
The Gambia 4.5 5.0 5.3 5.0 5.3 5.5 6.0 7.5 6.0 5.9 5.6 5.6 5.8 6.0 53.40 57.30 59.00 61.00 63.00 69.00 82.00
Ghana 5.7 6.3 6.8 6.6 6.3 6.4 6.0 10.0 9.1 7.8 8.0 8.0 8.0 8.0 5.30 5.90 6.30 6.60 6.90 8.00 9.50
Kenya 6.0 5.6 5.8 5.4 5.5 5.5 5.3 5.1 6.2 6.2 6.1 6.5 6.4 6.0 102.9 106.2 106.0 107.0 107.5 109.5 113.5
Nigeria 1.8 3.0 3.5 3.9 4.0 4.0 5.0 12.0 10.1 7.7 9.0 8.0 8.2 10.0 370.0 380.0 383.0 385.0 388.0 405.0 460.0
Sierra Leone 4.5 5.1 5.8 6.0 6.6 6.0 5.5 14.4 12.5 6.7 6.5 7.7 7.1 6.2 8,559 9,160 10,296 10,656 10,901 11,389 11,894
South Africa 0.8 2.2 2.6 3.8 4.2 4.1 4.9 4.6 5.4 5.3 4.4 4.5 4.5 4.5 14.20 13.70 13.00 12.50 12.70 13.20 14.20
Tanzania 5.7 6.2 6.5 6.8 6.8 6.7 6.5 3.8 5.2 6.0 5.5 5.5 5.2 5.0 2,320 2,400 2,430 2,450 2,490 2,560 2,640
Uganda 5.5 5.8 6.2 9.0 8.4 7.0 5.5 3.1 5.8 6.6 6.5 6.5 5.6 5.0 3,890 4,150 4,230 4,270 4,300 4,460 4,600
Zambia 4.4 4.6 4.8 4.7 4.6 4.6 5.0 7.7 7.9 6.7 7.7 7.0 7.7 8.6 12.70 12.60 12.90 13.00 13.20 14.60 18.00
Emerging Europe
Czech Republic 3.6 3.0 2.8 2.2 2.2 2.2 2.0 2.2 2.1 2.0 2.0 2.0 2.0 2.0 22.09 20.83 17.39 17.14 17.14 17.14 17.14
Hungary 4.1 3.4 2.8 2.7 2.7 2.7 2.4 2.8 3.1 3.0 3.0 3.0 3.0 2.6 283 271 203 196 196 196 196
Poland 4.7 3.8 3.4 2.8 2.7 2.7 2.5 2.0 2.6 2.5 2.5 2.5 2.5 2.2 3.65 3.33 2.86 2.79 2.79 2.79 2.79
Russia 1.8 1.7 1.7 1.7 2.2 2.1 2.2 3.7 4.2 4.0 4.0 3.0 3.2 3.0 65.00 63.00 63.00 55.00 56.00 59.00 64.00
Latin America
Argentina 3.6 3.2 3.0 5.0 5.0 5.0 5.0 15.0 10.0 15.0 10.0 10.0 10.0 10.0 40.00 50.00 26.50 28.00 30.00 35.00 40.00
Brazil 1.5 2.2 2.1 3.5 3.5 3.5 3.5 3.6 4.5 4.4 4.8 4.8 4.8 4.8 3.80 3.75 3.20 3.50 3.75 4.50 5.50
Chile 4.0 2.5 2.2 4.0 4.0 4.0 4.0 2.4 3.3 3.0 3.5 3.5 3.5 3.5 690 740 580 575 600 650 800
Colombia 2.7 3.5 4.0 4.0 4.5 4.4 4.5 3.3 3.7 4.2 4.0 4.0 4.0 4.0 2,900 3,000 3,200 3,400 3,600 4,000 4,500
Mexico 2.1 2.5 2.3 3.0 5.0 4.0 4.0 4.8 3.8 3.5 3.5 3.5 3.5 3.5 18.00 18.25 17.50 18.00 18.50 21.00 25.00
Peru 4.2 3.7 3.4 3.0 3.0 3.0 3.0 1.4 2.5 2.8 3.0 3.0 3.0 3.0 3.36 3.30 3.10 3.36 3.30 4.10 4.50
* Bangladesh, Pakistan, and Egypt: Figures are for fiscal year ending in June of year shown in column heading; FX forecasts are for calendar year periods
** India: Figures are for fiscal year starting in April of year shown in column heading; FX forecasts are for calendar year periods
^ Inflation: Core PCE deflator used for US
Source: Standard Chartered Research
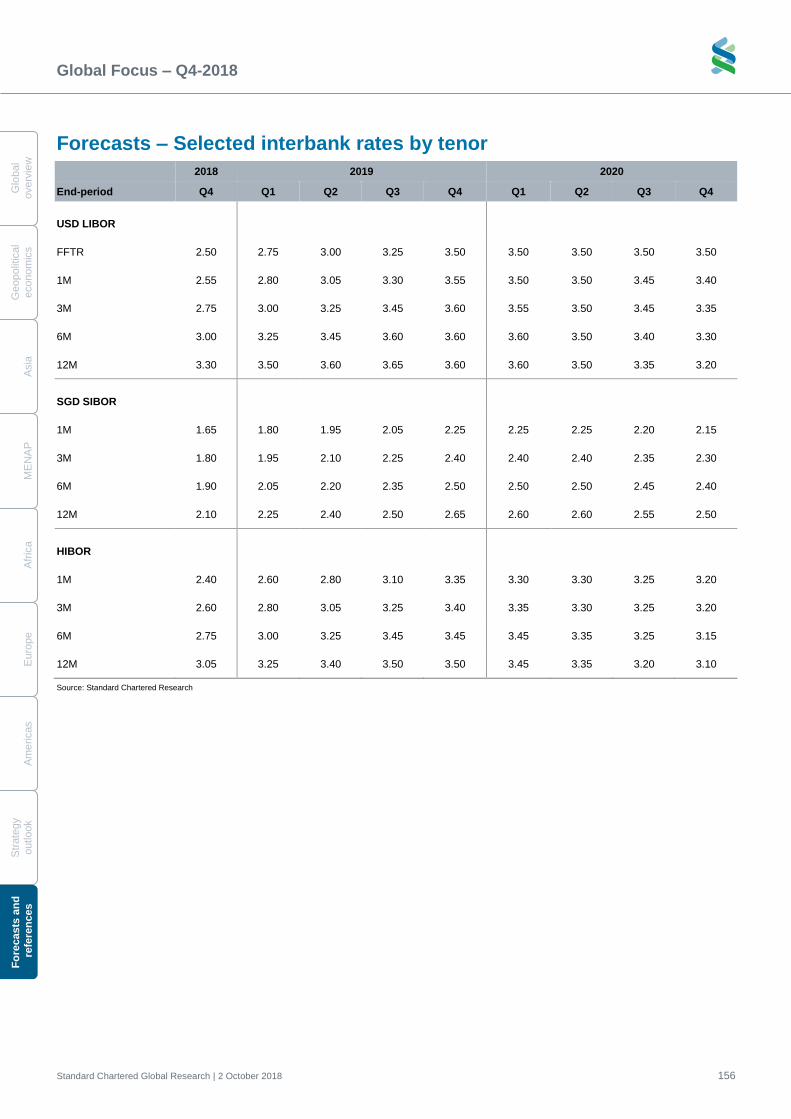
Global Focus – Q4-2018
Standard Chartered Global Research | 2 October 2018 156
G
lobal
overv
iew
Geopolit
ical
econom
ics
A
sia
M
EN
AP
A
fric
a
E
uro
pe
A
me
ricas
S
trate
gy
o
utlo
ok
Fo
recasts
an
d
re
fere
nc
es
Forecasts – Selected interbank rates by tenor
2018 2019 2020
End-period Q4 Q1 Q2 Q3 Q4 Q1 Q2 Q3 Q4
USD LIBOR
FFTR 2.50 2.75 3.00 3.25 3.50 3.50 3.50 3.50 3.50
1M 2.55 2.80 3.05 3.30 3.55 3.50 3.50 3.45 3.40
3M 2.75 3.00 3.25 3.45 3.60 3.55 3.50 3.45 3.35
6M 3.00 3.25 3.45 3.60 3.60 3.60 3.50 3.40 3.30
12M 3.30 3.50 3.60 3.65 3.60 3.60 3.50 3.35 3.20
SGD SIBOR
1M 1.65 1.80 1.95 2.05 2.25 2.25 2.25 2.20 2.15
3M 1.80 1.95 2.10 2.25 2.40 2.40 2.40 2.35 2.30
6M 1.90 2.05 2.20 2.35 2.50 2.50 2.50 2.45 2.40
12M 2.10 2.25 2.40 2.50 2.65 2.60 2.60 2.55 2.50
HIBOR
1M 2.40 2.60 2.80 3.10 3.35 3.30 3.30 3.25 3.20
3M 2.60 2.80 3.05 3.25 3.40 3.35 3.30 3.25 3.20
6M 2.75 3.00 3.25 3.45 3.45 3.45 3.35 3.25 3.15
12M 3.05 3.25 3.40 3.50 3.50 3.45 3.35 3.20 3.10
Source: Standard Chartered Research
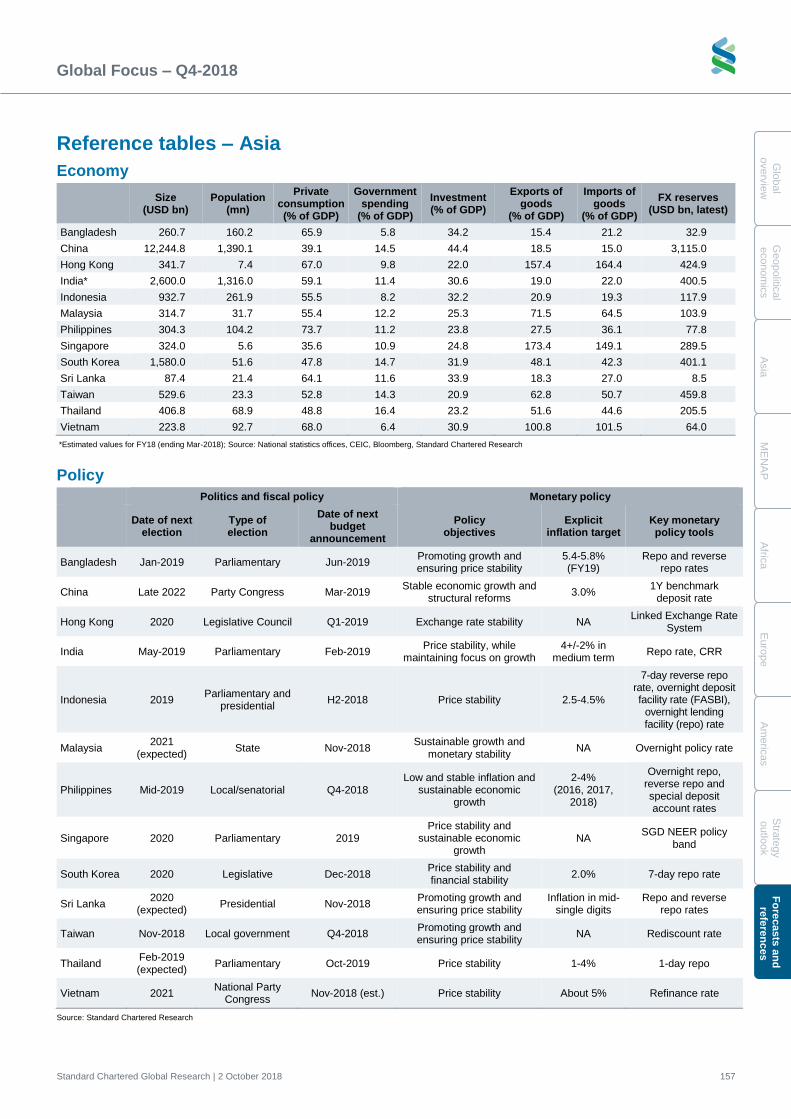
Global Focus – Q4-2018
Standard Chartered Global Research | 2 October 2018 157
Glo
bal
overv
iew
G
eopolitic
al
econom
ics
A
sia
M
EN
AP
A
frica
E
uro
pe
A
me
ricas
Stra
tegy
outlo
ok
Fo
recasts
an
d
refe
ren
ces
Reference tables – Asia
Economy
Size
(USD bn) Population
(mn)
Private consumption (% of GDP)
Government spending
(% of GDP)
Investment (% of GDP)
Exports of goods
(% of GDP)
Imports of goods
(% of GDP)
FX reserves (USD bn, latest)
Bangladesh 260.7 160.2 65.9 5.8 34.2 15.4 21.2 32.9
China 12,244.8 1,390.1 39.1 14.5 44.4 18.5 15.0 3,115.0
Hong Kong 341.7 7.4 67.0 9.8 22.0 157.4 164.4 424.9
India* 2,600.0 1,316.0 59.1 11.4 30.6 19.0 22.0 400.5
Indonesia 932.7 261.9 55.5 8.2 32.2 20.9 19.3 117.9
Malaysia 314.7 31.7 55.4 12.2 25.3 71.5 64.5 103.9
Philippines 304.3 104.2 73.7 11.2 23.8 27.5 36.1 77.8
Singapore 324.0 5.6 35.6 10.9 24.8 173.4 149.1 289.5
South Korea 1,580.0 51.6 47.8 14.7 31.9 48.1 42.3 401.1
Sri Lanka 87.4 21.4 64.1 11.6 33.9 18.3 27.0 8.5
Taiwan 529.6 23.3 52.8 14.3 20.9 62.8 50.7 459.8
Thailand 406.8 68.9 48.8 16.4 23.2 51.6 44.6 205.5
Vietnam 223.8 92.7 68.0 6.4 30.9 100.8 101.5 64.0
*Estimated values for FY18 (ending Mar-2018); Source: National statistics offices, CEIC, Bloomberg, Standard Chartered Research
Policy
Politics and fiscal policy Monetary policy
Date of next
election Type of election
Date of next budget
announcement
Policy objectives
Explicit inflation target
Key monetary policy tools
Bangladesh Jan-2019 Parliamentary Jun-2019 Promoting growth and ensuring price stability
5.4-5.8% (FY19)
Repo and reverse repo rates
China Late 2022 Party Congress Mar-2019 Stable economic growth and
structural reforms 3.0%
1Y benchmark deposit rate
Hong Kong 2020 Legislative Council Q1-2019 Exchange rate stability NA Linked Exchange Rate
System
India May-2019 Parliamentary Feb-2019 Price stability, while
maintaining focus on growth 4+/-2% in
medium term Repo rate, CRR
Indonesia 2019 Parliamentary and
presidential H2-2018 Price stability 2.5-4.5%
7-day reverse repo rate, overnight deposit facility rate (FASBI),
overnight lending facility (repo) rate
Malaysia 2021
(expected) State Nov-2018
Sustainable growth and monetary stability
NA Overnight policy rate
Philippines Mid-2019 Local/senatorial Q4-2018 Low and stable inflation and
sustainable economic growth
2-4% (2016, 2017,
2018)
Overnight repo, reverse repo and special deposit account rates
Singapore 2020 Parliamentary 2019 Price stability and
sustainable economic growth
NA SGD NEER policy
band
South Korea 2020 Legislative Dec-2018 Price stability and financial stability
2.0% 7-day repo rate
Sri Lanka 2020
(expected) Presidential Nov-2018
Promoting growth and ensuring price stability
Inflation in mid-single digits
Repo and reverse repo rates
Taiwan Nov-2018 Local government Q4-2018 Promoting growth and ensuring price stability
NA Rediscount rate
Thailand Feb-2019 (expected)
Parliamentary Oct-2019 Price stability 1-4% 1-day repo
Vietnam 2021 National Party
Congress Nov-2018 (est.) Price stability About 5% Refinance rate
Source: Standard Chartered Research
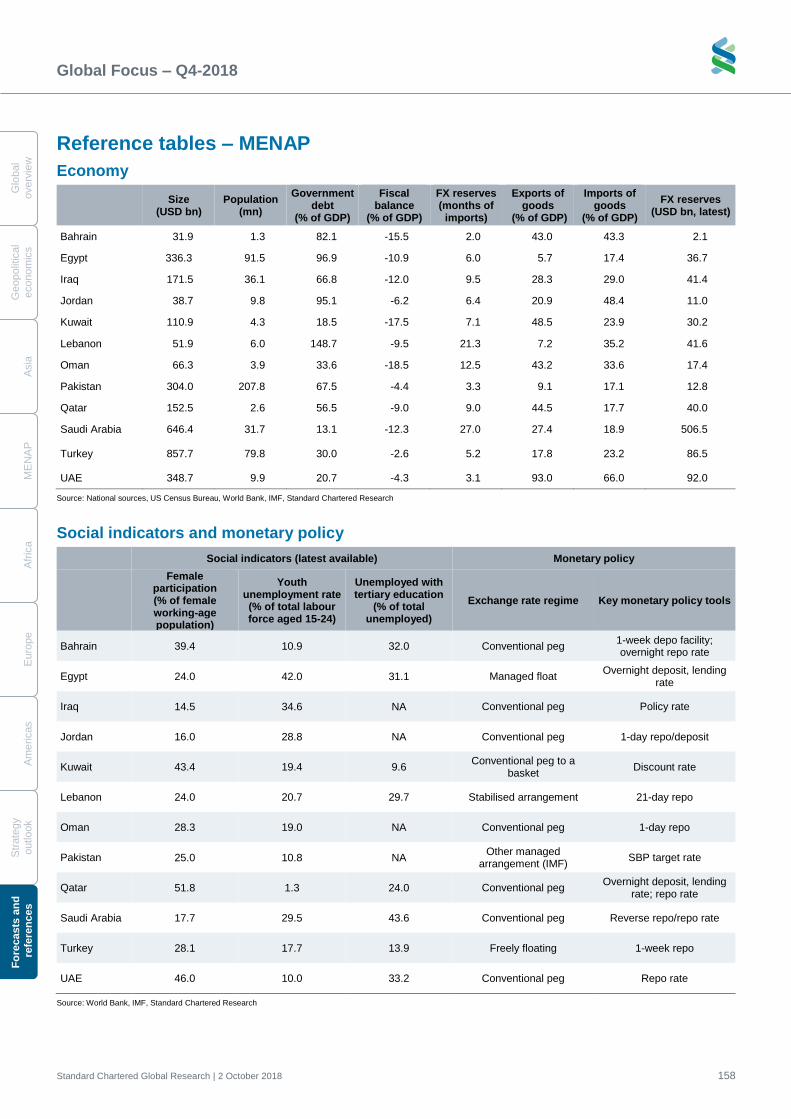
Global Focus – Q4-2018
Standard Chartered Global Research | 2 October 2018 158
G
lobal
overv
iew
Geopolit
ical
econom
ics
A
sia
M
EN
AP
A
fric
a
E
uro
pe
A
me
ricas
S
trate
gy
o
utlo
ok
Fo
recasts
an
d
re
fere
nc
es
Reference tables – MENAP
Economy
Size (USD bn)
Population (mn)
Government debt
(% of GDP)
Fiscal balance
(% of GDP)
FX reserves (months of
imports)
Exports of goods
(% of GDP)
Imports of goods
(% of GDP)
FX reserves (USD bn, latest)
Bahrain 31.9 1.3 82.1 -15.5 2.0 43.0 43.3 2.1
Egypt 336.3 91.5 96.9 -10.9 6.0 5.7 17.4 36.7
Iraq 171.5 36.1 66.8 -12.0 9.5 28.3 29.0 41.4
Jordan 38.7 9.8 95.1 -6.2 6.4 20.9 48.4 11.0
Kuwait 110.9 4.3 18.5 -17.5 7.1 48.5 23.9 30.2
Lebanon 51.9 6.0 148.7 -9.5 21.3 7.2 35.2 41.6
Oman 66.3 3.9 33.6 -18.5 12.5 43.2 33.6 17.4
Pakistan 304.0 207.8 67.5 -4.4 3.3 9.1 17.1 12.8
Qatar 152.5 2.6 56.5 -9.0 9.0 44.5 17.7 40.0
Saudi Arabia 646.4 31.7 13.1 -12.3 27.0 27.4 18.9 506.5
Turkey 857.7 79.8 30.0 -2.6 5.2 17.8 23.2 86.5
UAE 348.7 9.9 20.7 -4.3 3.1 93.0 66.0 92.0
Source: National sources, US Census Bureau, World Bank, IMF, Standard Chartered Research
Social indicators and monetary policy
Social indicators (latest available) Monetary policy
Female participation (% of female working-age population)
Youth unemployment rate (% of total labour force aged 15-24)
Unemployed with tertiary education
(% of total unemployed)
Exchange rate regime Key monetary policy tools
Bahrain 39.4 10.9 32.0 Conventional peg 1-week depo facility; overnight repo rate
Egypt 24.0 42.0 31.1 Managed float Overnight deposit, lending
rate
Iraq 14.5 34.6 NA Conventional peg Policy rate
Jordan 16.0 28.8 NA Conventional peg 1-day repo/deposit
Kuwait 43.4 19.4 9.6 Conventional peg to a
basket Discount rate
Lebanon 24.0 20.7 29.7 Stabilised arrangement 21-day repo
Oman 28.3 19.0 NA Conventional peg 1-day repo
Pakistan 25.0 10.8 NA Other managed
arrangement (IMF) SBP target rate
Qatar 51.8 1.3 24.0 Conventional peg Overnight deposit, lending
rate; repo rate
Saudi Arabia 17.7 29.5 43.6 Conventional peg Reverse repo/repo rate
Turkey 28.1 17.7 13.9 Freely floating 1-week repo
UAE 46.0 10.0 33.2 Conventional peg Repo rate
Source: World Bank, IMF, Standard Chartered Research
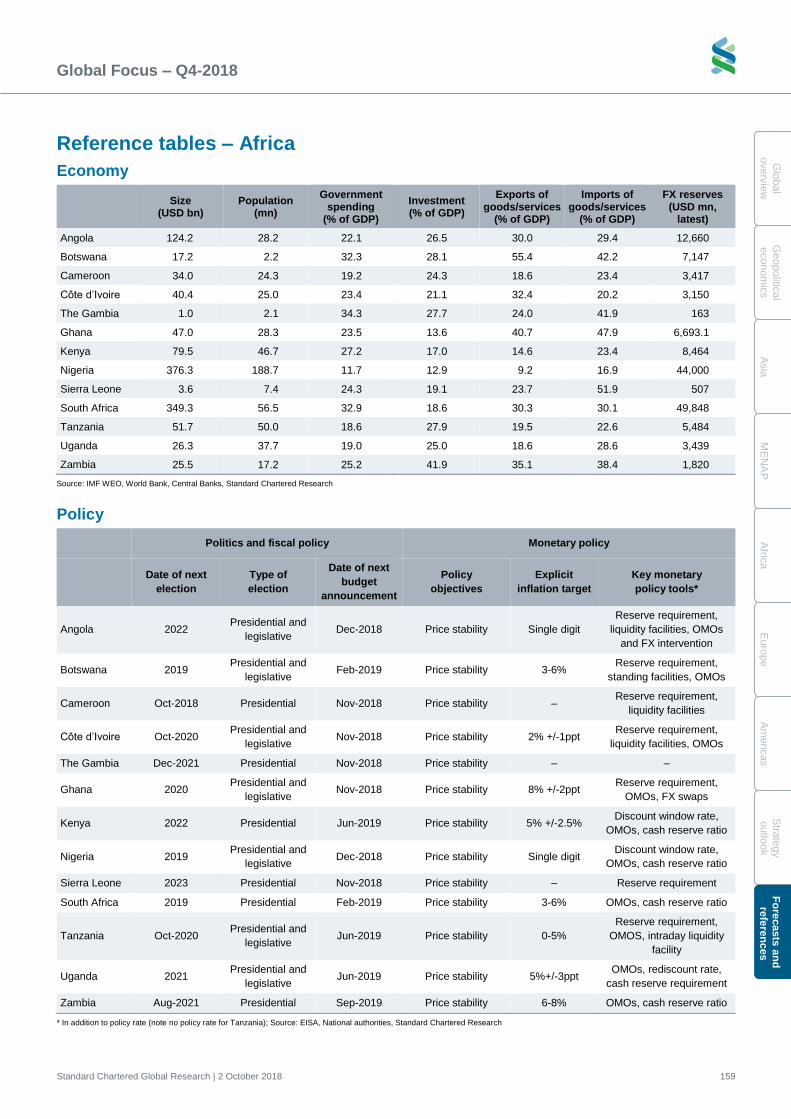
Global Focus – Q4-2018
Standard Chartered Global Research | 2 October 2018 159
Glo
bal
overv
iew
G
eopolitic
al
econom
ics
A
sia
M
EN
AP
A
frica
E
uro
pe
A
me
ricas
Stra
tegy
outlo
ok
Fo
recasts
an
d
refe
ren
ces
Reference tables – Africa
Economy
Size
(USD bn) Population
(mn)
Government spending
(% of GDP)
Investment (% of GDP)
Exports of goods/services
(% of GDP)
Imports of goods/services
(% of GDP)
FX reserves (USD mn,
latest)
Angola 124.2 28.2 22.1 26.5 30.0 29.4 12,660
Botswana 17.2 2.2 32.3 28.1 55.4 42.2 7,147
Cameroon 34.0 24.3 19.2 24.3 18.6 23.4 3,417
Côte d’Ivoire 40.4 25.0 23.4 21.1 32.4 20.2 3,150
The Gambia 1.0 2.1 34.3 27.7 24.0 41.9 163
Ghana 47.0 28.3 23.5 13.6 40.7 47.9 6,693.1
Kenya 79.5 46.7 27.2 17.0 14.6 23.4 8,464
Nigeria 376.3 188.7 11.7 12.9 9.2 16.9 44,000
Sierra Leone 3.6 7.4 24.3 19.1 23.7 51.9 507
South Africa 349.3 56.5 32.9 18.6 30.3 30.1 49,848
Tanzania 51.7 50.0 18.6 27.9 19.5 22.6 5,484
Uganda 26.3 37.7 19.0 25.0 18.6 28.6 3,439
Zambia 25.5 17.2 25.2 41.9 35.1 38.4 1,820
Source: IMF WEO, World Bank, Central Banks, Standard Chartered Research
Policy
Politics and fiscal policy Monetary policy
Date of next
election
Type of
election
Date of next
budget
announcement
Policy
objectives
Explicit
inflation target
Key monetary
policy tools*
Angola 2022 Presidential and
legislative Dec-2018 Price stability Single digit
Reserve requirement,
liquidity facilities, OMOs
and FX intervention
Botswana 2019 Presidential and
legislative Feb-2019 Price stability 3-6%
Reserve requirement,
standing facilities, OMOs
Cameroon Oct-2018 Presidential Nov-2018 Price stability – Reserve requirement,
liquidity facilities
Côte d’Ivoire Oct-2020 Presidential and
legislative Nov-2018 Price stability 2% +/-1ppt
Reserve requirement,
liquidity facilities, OMOs
The Gambia Dec-2021 Presidential Nov-2018 Price stability – –
Ghana 2020 Presidential and
legislative Nov-2018 Price stability 8% +/-2ppt
Reserve requirement,
OMOs, FX swaps
Kenya 2022 Presidential Jun-2019 Price stability 5% +/-2.5% Discount window rate,
OMOs, cash reserve ratio
Nigeria 2019 Presidential and
legislative Dec-2018 Price stability Single digit
Discount window rate,
OMOs, cash reserve ratio
Sierra Leone 2023 Presidential Nov-2018 Price stability – Reserve requirement
South Africa 2019 Presidential Feb-2019 Price stability 3-6% OMOs, cash reserve ratio
Tanzania Oct-2020 Presidential and
legislative Jun-2019 Price stability 0-5%
Reserve requirement,
OMOS, intraday liquidity
facility
Uganda 2021 Presidential and
legislative Jun-2019 Price stability 5%+/-3ppt
OMOs, rediscount rate,
cash reserve requirement
Zambia Aug-2021 Presidential Sep-2019 Price stability 6-8% OMOs, cash reserve ratio
* In addition to policy rate (note no policy rate for Tanzania); Source: EISA, National authorities, Standard Chartered Research
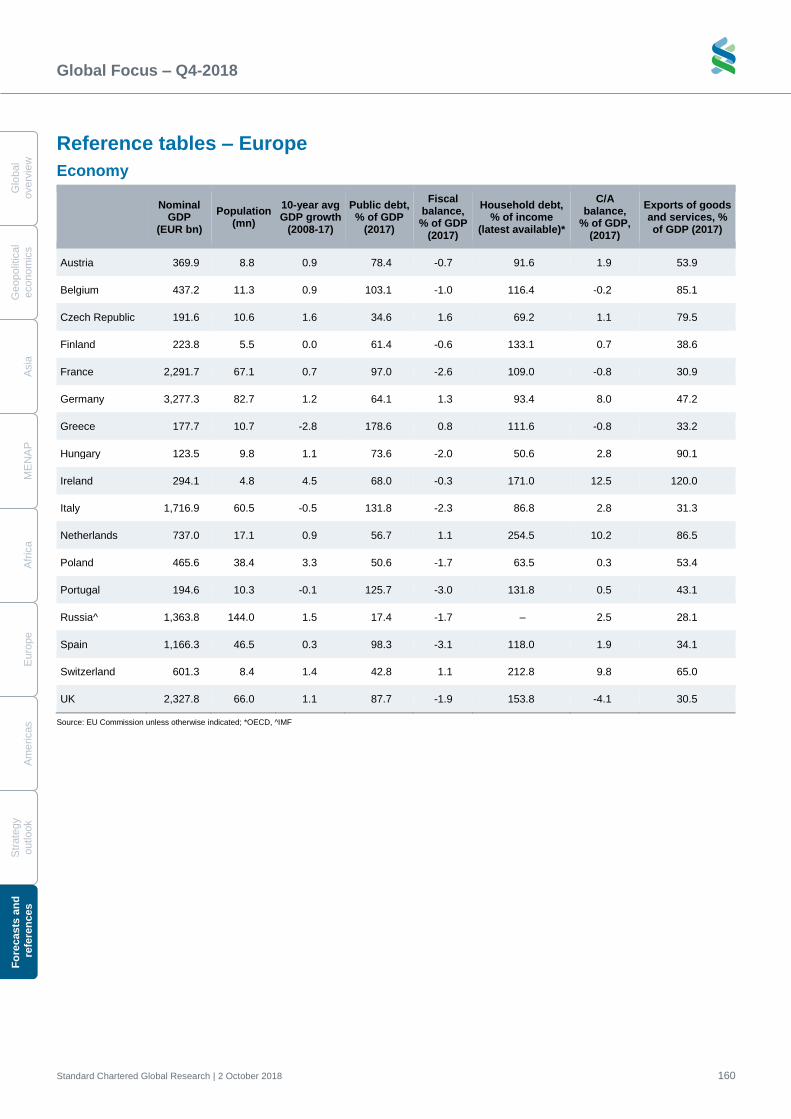
Global Focus – Q4-2018
Standard Chartered Global Research | 2 October 2018 160
G
lobal
overv
iew
Geopolit
ical
econom
ics
A
sia
M
EN
AP
A
fric
a
E
uro
pe
A
me
ricas
S
trate
gy
o
utlo
ok
Fo
recasts
an
d
re
fere
nc
es
Reference tables – Europe
Economy
Nominal
GDP (EUR bn)
Population (mn)
10-year avg GDP growth
(2008-17)
Public debt, % of GDP
(2017)
Fiscal balance, % of GDP
(2017)
Household debt, % of income
(latest available)*
C/A balance,
% of GDP, (2017)
Exports of goods and services, % of GDP (2017)
Austria 369.9 8.8 0.9 78.4 -0.7 91.6 1.9 53.9
Belgium 437.2 11.3 0.9 103.1 -1.0 116.4 -0.2 85.1
Czech Republic 191.6 10.6 1.6 34.6 1.6 69.2 1.1 79.5
Finland 223.8 5.5 0.0 61.4 -0.6 133.1 0.7 38.6
France 2,291.7 67.1 0.7 97.0 -2.6 109.0 -0.8 30.9
Germany 3,277.3 82.7 1.2 64.1 1.3 93.4 8.0 47.2
Greece 177.7 10.7 -2.8 178.6 0.8 111.6 -0.8 33.2
Hungary 123.5 9.8 1.1 73.6 -2.0 50.6 2.8 90.1
Ireland 294.1 4.8 4.5 68.0 -0.3 171.0 12.5 120.0
Italy 1,716.9 60.5 -0.5 131.8 -2.3 86.8 2.8 31.3
Netherlands 737.0 17.1 0.9 56.7 1.1 254.5 10.2 86.5
Poland 465.6 38.4 3.3 50.6 -1.7 63.5 0.3 53.4
Portugal 194.6 10.3 -0.1 125.7 -3.0 131.8 0.5 43.1
Russia^ 1,363.8 144.0 1.5 17.4 -1.7 – 2.5 28.1
Spain 1,166.3 46.5 0.3 98.3 -3.1 118.0 1.9 34.1
Switzerland 601.3 8.4 1.4 42.8 1.1 212.8 9.8 65.0
UK 2,327.8 66.0 1.1 87.7 -1.9 153.8 -4.1 30.5
Source: EU Commission unless otherwise indicated; *OECD, ^IMF
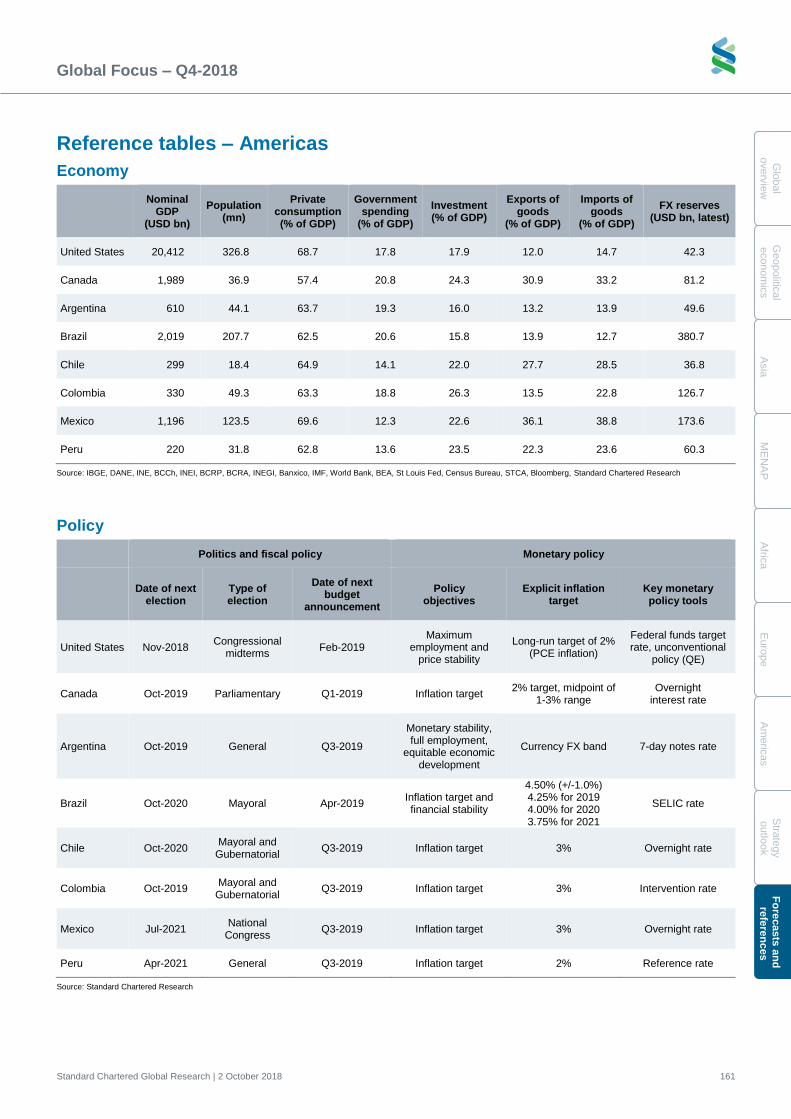
Global Focus – Q4-2018
Standard Chartered Global Research | 2 October 2018 161
Glo
bal
overv
iew
G
eopolitic
al
econom
ics
A
sia
M
EN
AP
A
frica
E
uro
pe
A
me
ricas
Stra
tegy
outlo
ok
Fo
recasts
an
d
refe
ren
ces
Reference tables – Americas
Economy
Nominal GDP
(USD bn)
Population (mn)
Private consumption (% of GDP)
Government spending
(% of GDP)
Investment (% of GDP)
Exports of goods
(% of GDP)
Imports of goods
(% of GDP)
FX reserves (USD bn, latest)
United States 20,412 326.8 68.7 17.8 17.9 12.0 14.7 42.3
Canada 1,989 36.9 57.4 20.8 24.3 30.9 33.2 81.2
Argentina 610 44.1 63.7 19.3 16.0 13.2 13.9 49.6
Brazil 2,019 207.7 62.5 20.6 15.8 13.9 12.7 380.7
Chile 299 18.4 64.9 14.1 22.0 27.7 28.5 36.8
Colombia 330 49.3 63.3 18.8 26.3 13.5 22.8 126.7
Mexico 1,196 123.5 69.6 12.3 22.6 36.1 38.8 173.6
Peru 220 31.8 62.8 13.6 23.5 22.3 23.6 60.3
Source: IBGE, DANE, INE, BCCh, INEI, BCRP, BCRA, INEGI, Banxico, IMF, World Bank, BEA, St Louis Fed, Census Bureau, STCA, Bloomberg, Standard Chartered Research
Policy
Politics and fiscal policy Monetary policy
Date of next
election Type of election
Date of next budget
announcement
Policy objectives
Explicit inflation target
Key monetary policy tools
United States Nov-2018 Congressional
midterms Feb-2019
Maximum employment and
price stability
Long-run target of 2% (PCE inflation)
Federal funds target rate, unconventional
policy (QE)
Canada Oct-2019 Parliamentary Q1-2019 Inflation target 2% target, midpoint of
1-3% range Overnight
interest rate
Argentina Oct-2019 General Q3-2019
Monetary stability, full employment,
equitable economic development
Currency FX band 7-day notes rate
Brazil Oct-2020 Mayoral Apr-2019 Inflation target and financial stability
4.50% (+/-1.0%) 4.25% for 2019 4.00% for 2020 3.75% for 2021
SELIC rate
Chile Oct-2020 Mayoral and
Gubernatorial Q3-2019 Inflation target 3% Overnight rate
Colombia Oct-2019 Mayoral and
Gubernatorial Q3-2019 Inflation target 3% Intervention rate
Mexico Jul-2021 National
Congress Q3-2019 Inflation target 3% Overnight rate
Peru Apr-2021 General Q3-2019 Inflation target 2% Reference rate
Source: Standard Chartered Research
Global Focus – Q4-2018
Standard Chartered Global Research | 2 October 2018 162
G
lobal
overv
iew
Geopolit
ical
econom
ics
A
sia
M
EN
AP
A
fric
a
E
uro
pe
A
me
ricas
S
trate
gy
o
utlo
ok
Fo
recasts
an
d
re
fere
nc
es
Authors David Mann
+65 6596 8649
Global Chief Economist
Standard Chartered Bank, Singapore Branch
Philippe Dauba-Pantanacce
+44 20 7885 7277
Senior Economist, Global Geopolitical Strategist
Standard Chartered Bank
Chidu Narayanan
+65 6596 7004
Economist, Asia
Standard Chartered Bank, Singapore Branch
Mayank Mishra
+65 6596 7466
Macro Strategist
Standard Chartered Bank, Singapore Branch
Saurav Anand
+91 22 6115 8845
Economist, South Asia
Standard Chartered Bank, India
Nagaraj Kulkarni
+65 6596 6738
Senior Asia Rates Strategist
Standard Chartered Bank, Singapore Branch
Divya Devesh
+65 6596 8608
Head of ASA FX research
Standard Chartered Bank, Singapore Branch
Wei Li
+86 21 3851 5017
Senior Economist, China
Standard Chartered Bank (China) Limited
Shuang Ding
+852 3983 8549
Chief Economist, Greater China and North Asia
Standard Chartered Bank (HK) Limited
Eddie Cheung
+852 3983 8566
Asia FX Strategist
Standard Chartered Bank (HK) Limited
Kelvin Lau
+852 3983 8565
Senior Economist, Greater China
Standard Chartered Bank (HK) Limited
Kanika Pasricha
+91 22 6115 8820
Economist, India
Standard Chartered Bank, India
Aldian Taloputra
+62 21 2555 0596
Senior Economist, Indonesia
Standard Chartered Bank, Indonesia Branch
Tony Phoo
+886 2 6603 2640
Senior Economist, NEA
Standard Chartered Bank (Taiwan) Limited
Edward Lee
+65 6596 8252
Chief Economist, ASEAN and South Asia
Standard Chartered Bank, Singapore Branch
Jonathan Koh
+65 6596 8075
Economist, Asia
Standard Chartered Bank, Singapore Branch
Tim Leelahaphan
+66 2724 8878
Economist, Thailand
Standard Chartered Bank (Thai) Public Company Limited
Arup Ghosh
+65 6596 4620
Senior Asia Rates Strategist
Standard Chartered Bank, Singapore Branch
Chong Hoon Park
+82 2 3702 5011
Head, Korea Economic Research
Standard Chartered Bank Korea Limited
Lawrence Lai
+65 6596 8261
Asia Rates and Flow Strategist
Standard Chartered Bank, Singapore Branch
Bilal Khan
+971 4508 3591
Senior Economist, MENAP
Standard Chartered Bank
Carla Slim
+9714 508 3738
Economist, MENAP
Standard Chartered Bank
Global Focus – Q4-2018
Standard Chartered Global Research | 2 October 2018 163
Glo
bal
overv
iew
G
eopolitic
al
econom
ics
A
sia
M
EN
AP
A
frica
E
uro
pe
A
me
ricas
Stra
tegy
outlo
ok
Fo
recasts
an
d
refe
ren
ces
Victor Lopes
+44 20 7885 2110
Senior Economist, Africa
Standard Chartered Bank
Emmanuel Kwapong, CFA
+44 20 7885 5840
Economist, Africa
Standard Chartered Bank
Sarah Baynton-Glen, CFA
+44 20 7885 2330
Economist, Africa
Standard Chartered Bank
Razia Khan
+44 20 7885 6914
Chief Economist, Africa and Middle East
Standard Chartered Bank
Sarah Hewin
+44 20 7885 6251
Chief Economist, Europe
Standard Chartered Bank
Nick Verdi
+44 20 7885 8929
Head of G10 FX Strategy
Standard Chartered Bank
Christopher Graham
+44 20 7885 5731
Economist, Europe
Standard Chartered Bank
Geoff Kendrick
+44 20 7885 6175
Global Head, Emerging Markets FX Research
Standard Chartered Bank
Sonia Meskin
+1 212 667 0786
US Economist, The Americas
Standard Chartered Bank NY Branch
John Davies
+44 20 7885 7640
US Rates Strategist
Standard Chartered Bank
Daniel Sinigaglia
+55 11 3073 7055
Latam Economist
Standard Chartered Bank (Brasil) S/A Banco de Investimento
Ilya Gofshteyn
+1 212 667 0787
FX and Global Macro Strategist
Standard Chartered Bank NY Branch
Eric Robertsen
+65 6596 8950
Global Head, FXRC Research and Head, Global Macro Strategy
Standard Chartered Bank, Singapore Branch
Lemon Zhang
+65 6596 9498
Macro & FX Strategist
Standard Chartered Bank, Singapore Branch
Madhur Jha
+91 124 617 6084
Head, Thematic Research
Standard Chartered Bank, India
Global Focus – Q4-2018
Standard Chartered Global Research | 2 October 2018 164
Disclosures appendix
Analyst Certification Disclosure: The research analyst or analysts responsible for the content of this research report certify that: (1) the views expressed and attributed to the research analyst or analysts in the research report accurately reflect their personal opinion(s) about the subject securities and issuers and/or other subject matter as appropriate; and, (2) no part of his or her compensation was, is or will be directly or indirectly related to the specific recommendations or views contained in this research report. On a general basis, the efficacy of recommendations is a factor in the performance appraisals of analysts. Chong Hoon Park is/are employed as an Economist(s) by Standard Chartered Bank Korea and authorised to provide views on Korean macroeconomic topics only.
Global Disclaimer: Standard Chartered Bank and/or its affiliates (“SCB”) makes no representation or warranty of any kind, express, implied or statutory regarding this document or any information contained or referred to in the document (including market data or statistical information). The information in this document, current at the date of publication, is provided for information and discussion purposes only. It does not constitute any offer, recommendation or solicitation to any person to enter into any transaction or adopt any hedging, trading or investment strategy, nor does it constitute any prediction of likely future movements in rates or prices, or represent that any such future movements will not exceed those shown in any illustration. The stated price of the securities mentioned herein, if any, is as of the date indicated and is not any representation that any transaction can be effected at this price. SCB does not represent or warrant that this information is accurate or complete. While reasonable care has been taken in preparing this document and data obtained from sources believed to be reliable, no responsibility or liability is accepted for errors of fact or for any opinion expressed herein. This document does not purport to contain all the information an investor may require and the contents of this document may not be suitable for all investors as it has not been prepared with regard to the specific investment objectives or financial situation of any particular person. Any investments discussed may not be suitable for all investors. Users of this document should seek professional advice regarding the appropriateness of investing in any securities, financial instruments or investment strategies referred to in this document and should understand that statements regarding future prospects may not be realised. Opinions, forecasts, assumptions, estimates, derived valuations, projections and price target(s), if any, contained in this document are as of the date indicated and are subject to change at any time without prior notice. Our recommendations are under constant review. The value and income of any of the securities or financial instruments mentioned in this document can fall as well as rise and an investor may get back less than invested. Future returns are not guaranteed, and a loss of original capital may be incurred. Foreign-currency denominated securities and financial instruments are subject to fluctuation in exchange rates that could have a positive or adverse effect on the value, price or income of such securities and financial instruments. Past performance is not indicative of comparable future results and no representation or warranty is made regarding future performance. While we endeavour to update on a reasonable basis the information and opinions contained herein, we are under no obligation to do so and there may be regulatory, compliance or other reasons that prevent us from doing so. Accordingly, information may be available to us which is not reflected in this document, and we may have acted upon or used the information prior to or immediately following its publication. SCB is acting on a principal-to-principal basis and not acting as your advisor, agent or in any fiduciary capacity to you. SCB is not a legal, regulatory, business, investment, financial and accounting and/or tax adviser, and is not purporting to provide any such advice. Independent legal, regulatory, business, investment, financial and accounting and/or tax advice should be sought for any such queries in respect of any investment. SCB and/or its affiliates may have a position in any of the securities, instruments or currencies mentioned in this document. SCB and/or its affiliates or its respective officers, directors, employee benefit programmes or employees, including persons involved in the preparation or issuance of this document may at any time, to the extent permitted by applicable law and/or regulation, be long or short any securities or financial instruments referred to in this document and on the SCB Research website or have a material interest in any such securities or related investments, or may be the only market maker in relation to such investments, or provide, or have provided advice, investment banking or other services, to issuers of such investments and may have received compensation for these services. SCB has in place policies and procedures and physical information walls between its Research Department and differing public and private business functions to help ensure confidential information, including ‘inside’ information is not disclosed unless in line with its policies and procedures and the rules of its regulators. Data, opinions and other information appearing herein may have been obtained from public sources. SCB expressly disclaims responsibility and makes no representation or warranty as to the accuracy or completeness of such information obtained from public sources. SCB also makes no representation or warranty as to the accuracy nor accepts any responsibility for any information or data contained in any third party’s website. You are advised to make your own independent judgment (with the advice of your professional advisers as necessary) with respect to any matter contained herein and not rely on this document as the basis for making any trading, hedging or investment decision. SCB accepts no liability and will not be liable for any loss or damage arising directly or indirectly (including special, incidental, consequential, punitive or exemplary damages) from the use of this document, howsoever arising, and including any loss, damage or expense arising from, but not limited to, any defect, error, imperfection, fault, mistake or inaccuracy with this document, its contents or associated services, or due to any unavailability of the document or any part thereof or any contents or associated services. This document is for the use of intended recipients only. In any jurisdiction in which distribution to private/retail customers would require registration or licensing of the distributor which the distributor does not currently have, this document is intended solely for distribution to professional and institutional investors. This communication is subject to the terms and conditions of the SCB Research Disclosure Website available at https://research.sc.com/Portal/Public/TermsConditions. The disclaimers set out at the above web link applies to this communication and you are advised to read such terms and conditions / disclaimers before continuing. Additional information, including analyst certification and full research disclosures with respect to any securities referred to herein, will be available upon request by directing such enquiries to [email protected] or clicking on the relevant SCB research report web link(s) referenced herein. MiFID II research and inducement rules apply. You are advised to determine the applicability and adherence to such rules as it relates to yourself.
Country-Specific Disclosures – This document is not for distribution to any person or to any jurisdiction in which its distribution would be prohibited. If you are receiving this document in any of the countries listed below, please note the following:
United Kingdom and European Economic Area: SCB is authorised in the United Kingdom by the Prudential Regulation Authority and regulated by the Financial Conduct Authority and the Prudential Regulation Authority. This communication is directed at persons Standard Chartered Bank can categorise as Eligible Counterparties or Professional Clients (such persons being the target market of this communication following Standard Chartered Bank’s target market assessment) under the Markets in Financial Instruments Directive II (Directive 2014/65/EU) (“MiFID II”). In particular, this communication is not directed at Retail Clients in the European Economic Area (as defined by MiFID II). Nothing in this document constitutes a personal recommendation or investment advice as defined by MiFID II. Germany: In Germany, this document is being distributed by Standard Chartered Bank Germany Branch, which is also regulated by the Bundesanstalt für Finanzdienstleistungsaufsicht (BaFin). Australia: The Australian Financial Services Licence for Standard Chartered Bank is Licence No: 246833 with the following Australian Registered Business Number (ARBN: 097571778). Australian investors should note that this communication was prepared for “wholesale clients” only and is not directed at persons who are “retail clients” as those terms are defined in sections 761G and 761GA of the Corporations Act 2001 (Cth). Bangladesh: This research has not been produced in Bangladesh. The report has been prepared by the research analyst(s) in an autonomous and independent way, including in relation to SCB. THE SECURITIES MENTIONED IN THIS REPORT HAVE NOT BEEN AND WILL NOT BE REGISTERED IN BANGLADESH AND MAY NOT BE OFFERED OR SOLD IN BANGLADESH WITHOUT PRIOR APPROVAL OF THE REGULATORY AUTHORITIES IN BANGLADESH. Any subsequent action(s) of the Recipient of these research reports in this area should be subject to compliance with all relevant law & regulations of Bangladesh; specially the prevailing foreign exchange control regulations. Botswana: This document is being distributed in Botswana by, and is attributable to, Standard Chartered Bank Botswana Limited, which is a financial institution licensed by Bank of Botswana under Section 6 of the Banking Act CAP 46.04 and is listed on the Botswana Stock Exchange. Brazil: SCB disclosures pursuant to the Securities Exchange Commission of Brazil (“CVM”) Instruction 598/18: This research has not been produced in Brazil. The report has been prepared by the research analyst(s) in an autonomous and independent way, including in relation to SCB. THE SECURITIES MENTIONED IN THIS REPORT HAVE NOT BEEN AND WILL NOT BE REGISTERED PURSUANT TO THE REQUIREMENTS OF THE SECURITIES AND EXCHANGE COMMISSION OF BRAZIL AND MAY NOT BE OFFERED OR SOLD IN BRAZIL EXCEPT PURSUANT TO AN APPLICABLE EXEMPTION FROM THE REGISTRATION REQUIREMENTS AND IN COMPLIANCE WITH THE SECURITIES LAWS OF BRAZIL. China: This document is being distributed in China by, and is attributable to, Standard Chartered Bank (China) Limited which is mainly regulated by China Banking and Insurance
Global Focus – Q4-2018
Standard Chartered Global Research | 2 October 2018 165
Regulatory Commission (CBIRC), State Administration of Foreign Exchange (SAFE), and People’s Bank of China (PBoC). Hong Kong: This document (except any part advising on or facilitating any decision on futures contracts trading) is being distributed in Hong Kong by, and any part hereof authored by an analyst licensed in Hong Kong is attributable to, Standard Chartered Bank (Hong Kong) Limited 渣打銀行(香港)有限公司 which is regulated by the Hong Kong Monetary Authority. Insofar as this document advises on or facilitates any decision on futures contracts trading, it is being distributed in Hong Kong by, and any part hereof authored by an analyst licensed in Hong Kong is attributable to, Standard Chartered Securities (Hong Kong) Limited 渣打證券(香港)有限公司 which is regulated by the Securities and Futures Commission. India: This document is being distributed in India by Standard Chartered Bank, India Branch (“SCB India”). SCB India is a branch of SCB, UK and is licensed by the Reserve Bank of India to carry on banking business in India. SCB India is also registered with Securities and Exchange Board of India in its capacity as Merchant Banker, Investment Advisor, Depository Participant, Bankers to an Issue, Custodian, etc. For details on group companies operating in India, please visit https://www.sc.com/in/india_result.html. Indonesia: Standard Chartered Bank, Jakarta Branch is a banking institution duly registered with and supervised by the Indonesian Financial Service Authority. The information in this document is provided for information purposes only. It does not constitute any offer, recommendation or solicitation to any person to enter into any transaction or adopt any hedging, trading or investment strategy, nor does it constitute any prediction of likely future movements in rates or prices or represent that any such future movements will not exceed those shown in any illustration. Future changes in such laws, rules, regulations, etc., could affect the information in this document, but SCB is under no obligation to keep this information current or to update it. Expressions of opinion are those of SCB only and are subject to change without notice. Japan: This document is being distributed to Specified Investors, as defined by the Financial Instruments and Exchange Law of Japan (FIEL), for information only and not for the purpose of soliciting any Financial Instruments Transactions as defined by the FIEL or any Specified Deposits, etc. as defined by the Banking Law of Japan. Kenya: Standard Chartered Bank Kenya Limited is regulated by the Central Bank of Kenya. The information in this document is provided for information purposes only. The document is intended for use only by Professional Clients and should not be relied upon by or be distributed to Retail Clients. Korea: This document is being distributed in Korea by, and is attributable to, Standard Chartered Bank Korea Limited which is regulated by the Financial Supervisory Service and Financial Services Commission. Macau: This document is being distributed in Macau Special Administrative Region of the Peoples' Republic of China, and is attributable to, Standard Chartered Bank (Macau Branch) which is regulated by Macau Monetary Authority. Malaysia: This document is being distributed in Malaysia by Standard Chartered Bank Malaysia Berhad only to institutional investors or corporate customers. Recipients in Malaysia should contact Standard Chartered Bank Malaysia Berhad in relation to any matters arising from, or in connection with, this document. Mauritius: Standard Chartered Bank (Mauritius) Limited is regulated by both the Bank of Mauritius and the Financial Services Commission in Mauritius. This document should not be construed as investment advice or solicitation to enter into securities transactions in Mauritius as per the Securities Act 2005. New Zealand: New Zealand Investors should note that this document was prepared for “wholesale clients” only within the meaning of section 5C of the Financial Advisers Act 2008. This document is not directed at persons who are “retail clients” as defined in the Financial Advisers Act 2008. NOTE THAT STANDARD CHARTERED BANK (incorporated in England) IS NOT A “REGISTERED BANK” IN NEW ZEALAND UNDER THE RESERVE BANK OF NEW ZEALAND ACT 1989, and it is not therefore regulated or supervised by the Reserve Bank of New Zealand. Pakistan: The securities mentioned in this report have not been, and will not be, registered in Pakistan, and may not be offered or sold in Pakistan, without prior approval of the regulatory authorities in Pakistan. Philippines: This document may be distributed in the Philippines by Standard Chartered Bank (Philippines) (“SCB PH”), which is regulated by Bangko Sentral ng Pilipinas (telephone no.: +63 708-7701, website: www.bsp.gov.ph). This document is directed to Qualified Buyers as defined under Section 10.1 (L) of Republic Act No. 8799, otherwise known as the Securities Regulation Code (“SRC”), other corporate and institutional clients only. This document is for information purposes only. SCB PH does not warrant the appropriateness and suitability of any security, investment or transaction that may have been discussed in this document with respect to any investor. Users of this document are required to undergo SCB’s appropriateness and suitability determination process prior to engaging with SCB on any transaction involving any of the securities that may have been mentioned in this document. Nothing in this document constitutes or should be construed as an offer to sell or distribute securities in the Philippines, which securities, if offered for sale or distribution in the Philippines, are required to be registered with the Securities and Exchange Commission unless such securities are exempt under Section 9 of the SRC or the transaction is exempt under Section 10 thereof. Singapore: This document is being distributed in Singapore by SCB Singapore branch (UEN No.:S16FC0027L) and/or Standard Chartered Bank (Singapore) Limited (UEN No.: 201224747C) only to Accredited Investors, Expert Investors or Institutional Investors, as defined in the Securities and Futures Act, Chapter 289 of Singapore. Recipients in Singapore should contact SCB Singapore branch or Standard Chartered Bank (Singapore) Limited (as the case may be) in relation to any matters arising from, or in connection with, this document. South Africa: Standard Chartered Bank, Johannesburg Branch (“SCB Johannesburg Branch”) is licensed as a Financial Services Provider in terms of Section 8 of the Financial Advisory and Intermediary Services Act 37 of 2002. SCB Johannesburg Branch is a Registered Credit Provider in terms of the National Credit Act 34 of 2005 under registration number NCRCP4. Thailand: This document is intended to circulate only general information and prepare exclusively for the benefit of Institutional Investors with the conditions and as defined in the Notifications of the Office of the Securities and Exchange Commission relating to the exemption of investment advisory service, as amended and supplemented from time to time. It is not intended to provide for the public. UAE: For residents of the UAE – Standard Chartered Bank UAE does not provide financial analysis or consultation services in or into the UAE within the meaning of UAE Securities and Commodities Authority Decision No. 48/r of 2008 concerning financial consultation and financial analysis. UAE (DIFC): Standard Chartered Bank, Dubai International Financial Centre (SCB DIFC) having its offices at Dubai International Financial Centre, Building 1, Gate Precinct, P.O. Box 999, Dubai, UAE is a branch of Standard Chartered Bank and is regulated by the Dubai Financial Services Authority (“DFSA”). This document is intended for use only by Professional Clients and is not directed at Retail Clients as defined by the DFSA Rulebook. In the DIFC we are authorized to provide financial services only to clients who qualify as Professional Clients and Market Counterparties and not to Retail Clients. As a Professional Client you will not be given the higher retail client protection and compensation rights and if you use your right to be classified as a Retail Client we will be unable to provide financial services and products to you as we do not hold the required license to undertake such activities. United States: Except for any documents relating to foreign exchange, FX or global FX, Rates or Commodities, distribution of this document in the United States or to US persons is intended to be solely to major institutional investors as defined in Rule 15a-6(a)(2) under the US Securities Exchange Act of 1934. All US persons that receive this document by their acceptance thereof represent and agree that they are a major institutional investor and understand the risks involved in executing transactions in securities. Any US recipient of this document wanting additional information or to effect any transaction in any security or financial instrument mentioned herein, must do so by contacting a registered representative of Standard Chartered Securities North America, LLC, 1095 Avenue of the Americas, New York, N.Y. 10036, US, tel + 1 212 667 0700. WE DO NOT OFFER OR SELL SECURITIES TO U.S. PERSONS UNLESS EITHER (A) THOSE SECURITIES ARE REGISTERED FOR SALE WITH THE U.S. SECURITIES AND EXCHANGE COMMISSION AND WITH ALL APPROPRIATE U.S. STATE AUTHORITIES; OR (B) THE SECURITIES OR THE SPECIFIC TRANSACTION QUALIFY FOR AN EXEMPTION UNDER THE U.S. FEDERAL AND STATE SECURITIES LAWS NOR DO WE OFFER OR SELL SECURITIES TO U.S. PERSONS UNLESS (i) WE, OUR AFFILIATED COMPANY AND THE APPROPRIATE PERSONNEL ARE PROPERLY REGISTERED OR LICENSED TO CONDUCT BUSINESS; OR (ii) WE, OUR AFFILIATED COMPANY AND THE APPROPRIATE PERSONNEL QUALIFY FOR EXEMPTIONS UNDER APPLICABLE U.S. FEDERAL AND STATE LAWS. Any documents relating to foreign exchange, FX or global FX, Rates or Commodities to US Persons, Guaranteed Affiliates, or Conduit Affiliates (as those terms are defined by any Commodity Futures Trading Commission rule, interpretation, guidance, or other such publication) are intended to be distributed only to Eligible Contract Participants are defined in Section 1a(18) of the Commodity Exchange Act. Zambia: Standard Chartered Bank Zambia Plc (SCB Zambia) is licensed and registered as a commercial bank under the Banking and Financial Services Act Cap 387 of the laws of Zambia and as a dealer under the Securities Act, No. 41 of 2016. SCB Zambia is regulated by the Bank of Zambia, the Lusaka Stock Exchange and the Securities and Exchange Commission.
© 2018 Standard Chartered Bank. All rights reserved. Copyright in third party materials is acknowledged and is used under licence. You may not reproduce or adapt any part of these materials for any purposes unless with express written approval from Standard Chartered Bank.
Document approved by
Sarah Hewin Chief Economist, Europe
Document is released at
20:24 GMT 02 October 2018