Embed Size (px)
Citation preview
BBA 104: Business Economics – II
Course Contents Unit I Lectures:-12
Concepts of Macro Economics and National Income Determination: Definitions, Importance, Limitations of macroeconomics, Macro-Economic Variables. Circular Flow of Income in Two, Three, Four Sector Economy, Relation between Leakages and Injections in Circular Flow. National Income: Concepts, Definition, Methods of Measurement, National Income in India, Problems in Measurement of National Income & Precautions in Estimation of National Income. Unit II Lectures:-16 Macro Economic Framework: Theory of Full Employment and Income: Classical, Modern (Keynesian) Approach, Consumption Function, Relationship between Saving and Consumption. Investment function, Concept of Marginal Efficiency of Capital and Marginal Efficiency of Investment; National Income Determination in Two, Three and Four Sector Models; Multiplier in Two, Three and Four Sector Model.
Unit III Lectures:-12
Analysis of Money Supply and Inflation: Functions and Forms of Money, Demand for Money- Classical, Keynesian and Friedmanian Approach, Measures of Money Supply, Quantity Theory of Money, Inflation- Types, Causes, Impact and Remedies. Unit IV Lectures:-12
Equilibrium of Product and Money Market: Introduction to IS-LM Model, Equilibrium- Product Market and Money Market, Monetary Policy, Fiscal Policy.
UNIT-1 Macro Economics Macro economics is a study of the economy as a whole, and the variables that control the macro-economy. The study of government policy meant to control and stabilize the economy over time, that is, to reduce fluctuations in the economy is known as macro economics. Macro economics also includes the study of monetary policy, fiscal policy, and supply-side economics. The term Macro is derived from the Greek word “MAKROS” which means large. It deals with the aggregates such as national income, output, employment and the general price level etc, therefore it is called the Aggregative Economics.
According to Shapiro, “Macroeconomics deals with the functioning of the economy as a whole”. According to Boulding, “Macroeconomics deals not with individual quantities as such, but with aggregates of these quantities, not with individual income but with national income, not with individual output but with national output”. Prof. Ackley defines Macro Economics as “Macro Economics deals with economic affairs ‘in the large, it concerns the overall dimensions of economic life. It looks at the total size and shape and functioning of the elephant of economic experience, rather than working of articulation or dimensions of the individual parts. It studies the character of the forest, independently of the tress which compose it.” Why macroeconomics and not only microeconomics? The whole is more complex than the sum of independent parts. It is not possible to describe an economy by forming models for all firms and persons and all their cross-effects. Macroeconomics investigates aggregate behavior by imposing simplifying assumptions (“assume there are many identical firms that produce the same good”) but without abstracting from the essential features. These assumptions are used in order to build macroeconomic models. Typically, such models have three aspects: the ‘story’, the mathematical model, and a graphical representation. Scope of Macroeconomics
The scope of macro economics has been explained as under:- 1. Theory of National Income:-Macro economics studies the concept of national income,
its different elements, methods of its measurement and social accounting. 2. Theory of Employment:-It studies the problems of employment and unemployment.
There are different factors which determine employment. They are like effective demand, aggregate demand, aggregate supply, total consumption, total savings and total investment etc.
3. Marco Theory of distribution:-There are macro economic theories of distribution. These theories try to explain how the national output is distributed among the factors of production.
4. Economic development:-.Economic development is a long run process. In it, we analyze the problems and theories of development.
5. Theory of International Trade:-It also studies principles determining trade among
different countries. Tariff's protection and free-trade polices fall under foreign trade. 6. Theory of Money: - Changes in demand and supply of money effect level of
employment. Therefore, under macro economics functions of money and theories relating to money are studied.
7. Theory of Business Fluctuations:-It also deals with the fluctuations in the level of employment, total expenditure, and general price level.
8. Theory of General Price Level:-A continuous rise in the price level is called inflation. It distorts production. It increases inequalities in the distribution of income and wealth. The common man is injured by inflation. Deflation is the opposite of inflation. The general price level falls continuously. Output and employment levels fall. Macro economics provides explanation provides explanation for the occurrence of inflation and deflation.
Importance of Macro economics
1. In Economic Policies
Macro Economics is extremely useful from the view point of the fiscal policy. Modern Governments, particularly, the underdeveloped economies are confronted with innumerable national problems. They are the problems of over population, inflation, balance of payments, general under production etc. The main conscientiousness of these governments rests in the regulation and control of over population, general prices, general volume of commerce, general productivity etc.
2. In General Unemployment
Redundancy is caused by deficiency of effectual demand. In order eradicate it, effective demand should be raised by increasing total investment, total productivity, total income and consumption. Thus, macro economics has special significance in studying the causes, effects and antidotes of general redundancy.
3. In National Income
The study of macro economics is very significant for evaluating the overall performance of the economy in terms of national income. This led to the construction of the data on national income. National income data help in anticipating the level of fiscal activity and to comprehend the distribution of income among different groups of people in the economy.
4. In Economic Growth
The economics of growth is also a study in macro economics. It is on the basis of macro economics that the resources and capabilities of an economy are evaluated. Plans for the overall increase in national income, productivity, employment are framed and executed so as to raise the level of fiscal development of the economy as a whole.
5. In Multi-dimensional Study
Macroeconomics has a very wide scope and covers multi-dimensional aspects like population, employment, income, production, distribution, consumption, inflation, etc.
6. In Monetary Problems
It is in terms of macro economics that monetary problems can be analysed and understood properly. Frequent changes in the value of money, inflation or deflation, affect the economy adversely. They can be counteracted by adopting monetary, fiscal and direct control measures for the economy as a whole.
7. In Business Cycle
Moreover, macro economics as an approach to fiscal problems started after the great Depression, thus its significance falls in analysing the grounds of fiscal variations and in providing remedies.
8. For Understanding the Behaviour of Individual Units
For understanding the performance of individual units, the study of macro economics is imperative. Demand for individual products depends upon aggregate demand in the economy. Unless the causes of deficiency in aggregate demand are analysed it is not feasible to understand fully the grounds for a fall in the demand of individual products. The reasons for increase in costs of a specific firm or industry cannot be analysed without knowing the average cost conditions of the whole economy. Thus, the study of individual units is not possible without macro economics.
9. Helpful in understanding the functioning of an Economy Modern economy has become a very complex affair. Several economic factors which are inter-dependent operate in it. To have an understanding of its organization and functioning one cannot depend on individual unit alone. Study of an economy as a whole, has therefore, become very essential.
10. Balance of Payment
It explains factors which determine balance of payment. At the same time, it identifies causes of deficit in balance of payment and suggests remedial measures. Limitations of Macro Economics
1. Danger of excessive thinking in terms of aggregates: There is danger of executive thinking in terms of aggregates which are not homogeneous. For example,2apples +3apples=5 apples is the meaning full aggregate, similarly 2 apples +3 oranges is meaningful to some extent.
2. Aggregate tendency may not affect all sectors equally: For example, the general increase in price affects different sections of the community or the different sectors of the economy differently. The increase in general level of price benefits the producers, but hurts the consumers.
3. Indicates no change has occurred: The study of aggregates make us believe that no change has occurred even if there is a change. It indicates that there is no need of new policy. For example, a 5 percent fall in agricultural price and 5 percent rise in industrial prices does not affect the price level.
4. Difficulty in the measurement of aggregates: There are at times, difficulties in the measurement of aggregates. It is difficult to measure the big aggregates. This problem has now been more or less erased by the use of calculators and the things which are not homogeneous.
5. The fallacy of composition: The aggregate economic behavior is the sum of individual behavior. This is called fallacies of composition. What is true in case of an individual may not be true in the case of economy as whole. For example, individual saving is a
virtue, whereas the public saving is vice. According to K.E. Boulding "These difficulties are aggregative paradoxes which are true when used to one person, but false when used to the economy as a whole.
6. It ignores the contribution of Individual Units: Macro economic analysis throws light only on the functioning of the aggregates. However, in real life, the economic activities and decision taken by individual units on private- level have their effects on the economy as a whole. Such effects are not known by the study of macro economics.
7. Limited Application: Another limitation of macro economics is that most of the models relating to it have only theoretical significance. They have very little use in practical life. Moreover it is very difficult to measure various aggregates of macro economics.
Macro economic variables:
Macroeconomic variable are generally classified as: 1. Endogenous Variables: These are those whose value is value is determined within the
model. Some typical endogenous variables used in macroeconomic models are national income, consumption, savings, investment, market interest rate, price level and employment.
2. Exogenous Variables: These are those that are determined outside the models, e.g. money supply, tax rates, government expenditures, exchange rates, etc. However depending on the objective of analysis, endogenous variables are converted into exogenous variables, and exogenous variables can be endogenised.
Difference between Micro and Macro Economics
Micro Economics
1. Evolution of micro economics took place earlier than macro economics. 2. It deals with an individual's economic behavior. 3. It is a branch of economics, which studies individual economic variables like demand,
supply, price etc. 4. It has a very narrow scope i.e. an individual, a market etc. 5. Demand, supply, market forms etc. relate to micro economics. 6. It is helpful in analysis of an individual economics unit like firm. 7. Theory of demand, theory of production, price determination theory etc., develop from
micro economics. 8. The concepts of micro-economics are independent concepts. 9. These concepts have more theoretical value. 10. The concepts were popularized by the famous Alfred Marshall. 11. Worm’s eye view/ Microscopic view 12. Method of Slicing 13. It is a mortal concept 14. Simple 15. Price Theory
Macro Economics
1. It evolved only after the publication of keynes' book. General theory of employment, interest and money.
2. It deals with aggregate economic behavior of the people in general.
3. It is a branch of economics which studies aggregate economic variables, like aggregate
demand, aggregate supply, price level etc. 4. It has a very wide scope i.e. a country. 5. Aggregate demand, aggregate supply, national income etc. relate to macro economics. 6. It is helpful for analyzing the level of employment, income, economic growth etc. 7. Theory of national income, theory of employment, theory of money, theory of general
price level etc. develop from macro economics. 8. The concepts of macro economics are interdependent on one another. 9. These concepts have more practical value. 10. The concepts were popularized by the famous Lord J.M. Keynes. 11. Bird’s eye view 12. Method of Lumping 13. It is an immortal concept 14. Complex 15. Income theory
Circular Flow of Income In economics, the terms circular flow of income or circular flow refer to a simple economic model which describes the reciprocal circulation of income between different sectors. A continuous flow of production, income and expenditure is known as circular flow of income. It is circular because it has neither any beginning nor an end. The circular flow of income involves two basic assumptions: - 1.In any exchange process, the seller or producer receives the same amount what buyer or consumer spends. 2. Goods and services flow in one direction and money payment to get these flow in return direction, causes a circular flow. Two Sector Model:
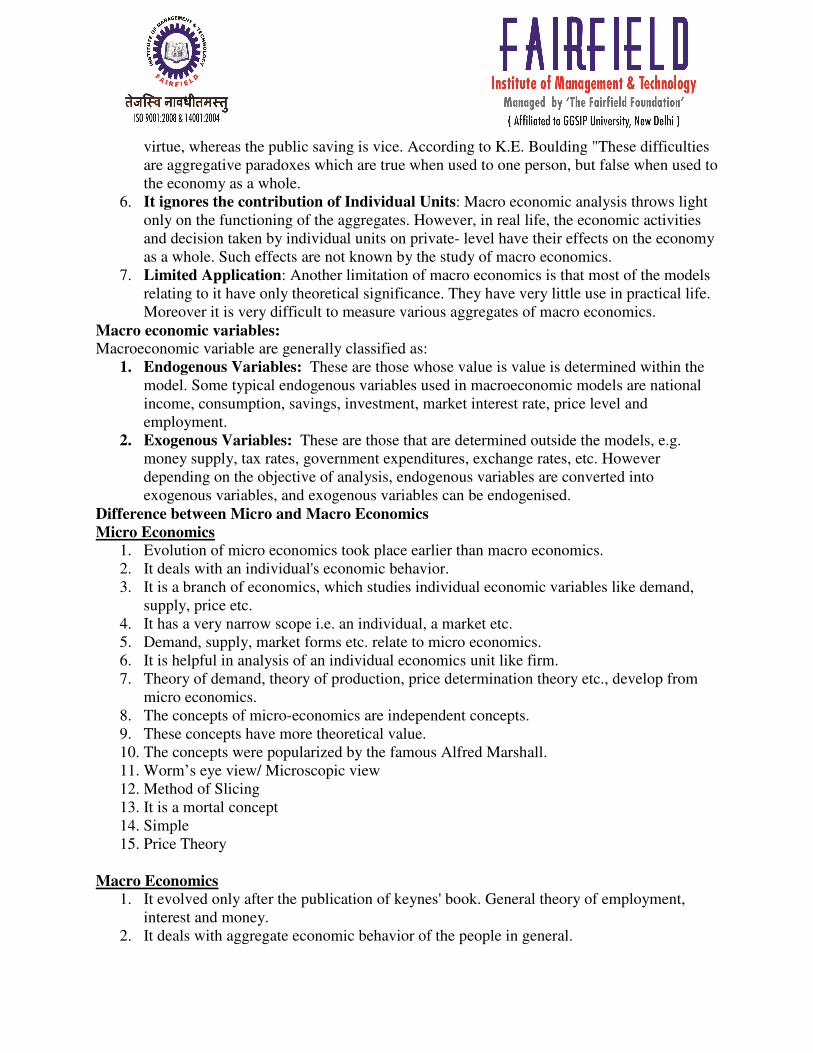
It signifies that the expenditure of buyers (households) becomes income for sellers (firms). The firms then spend this income on factors of production such as labour, capital and raw materials, "transferring" their income to the factor owners. The factor owners spend this income on goods which leads to a circular flow of income.
The circular flow diagram divides the economy into two sectors: one concerned with producing goods and services, and the other with consuming them. Resources are converted into goods and services by business, and in this transformed state travel back to consumers. Money flows in the opposite direction. These flows involve two markets in which exchange takes place: the resource or factor market in which business buys resources, and the goods and services market in which
business sells goods. (Some economists define a "factor of production" as the service of some resource. If resources are land, labor, and capital, the factors of production are the services of land, labor, and capital. We will ignore the distinction between resources and factors of production in the discussion that follows.) Three Sector Model
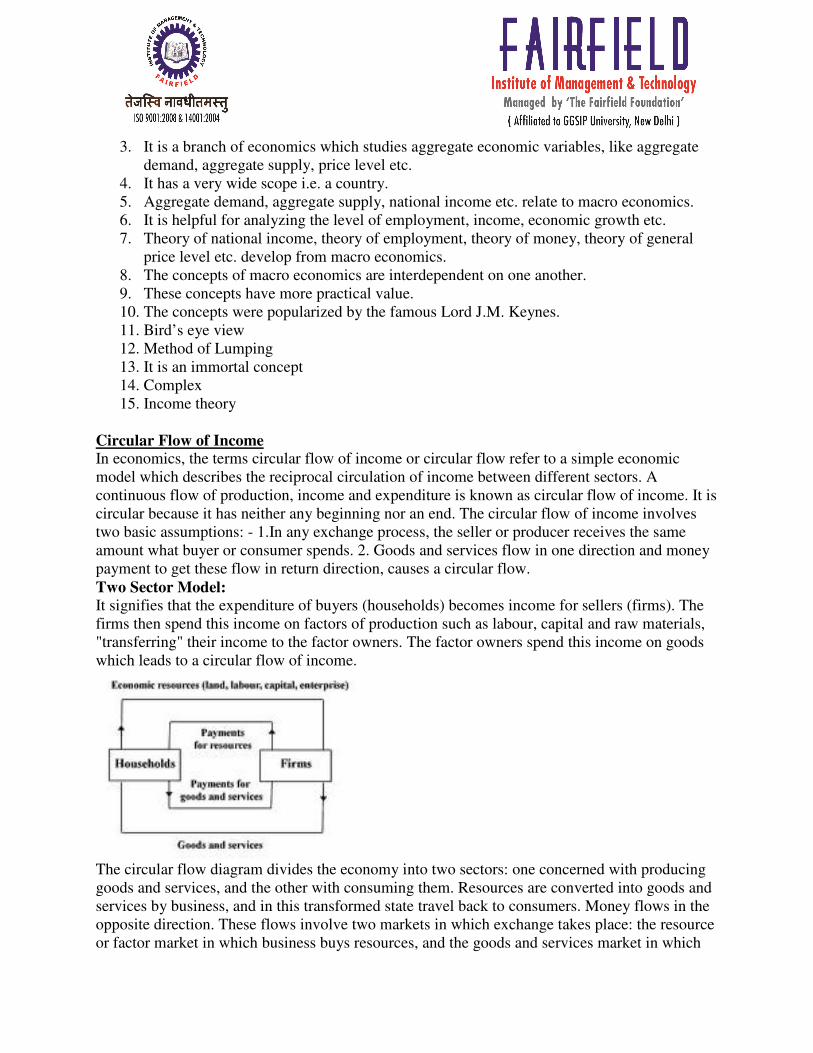
It includes household sector, producing sector and government sector. It will study a circular flow income in these sectors excluding rest of the world i.e. closed economy income. Here flows from household sector and producing sector to government sector are in the form of taxes. The income received from the government sector flows to producing and household sector in the form of payments for government purchases of goods and services as well as payment of subsides and transfer payments. Every payment has a receipt in response of it by which aggregate expenditure of an economy becomes identical to aggregate income and makes this circular flow and unending. Four Sector Model
A modern monetary economy comprises a network of four sector economy these are- 1.Household sector 2.Firms or Producing sector 3.Government sector 4.Rest of the world sector. Each of the above sectors receives some payments from the other in lieu of goods and services which makes a regular flow of goods and physical services. Money facilitates such an exchange smoothly. A residual of each market comes in capital market as saving which in turn is invested in firms and government sector. Technically speaking, so long as lending is equal to the borrowing i.e. leakage is equal to injections, the circular flow will continue indefinitely. However this job is done by financial institutions in the economy.
Leakages: These are those flow variables which have a negative impact on the process of production in the economy. These variables reduce the flow of income in the economy; hence called withdrawals or leakages. These are:
1. Savings
2. Imports 3. Taxes
Injections: These are those flow variables which cause an expansion in the process of production in the economy. These are:
1. Investment 2. Exports 3. Government expenditure
Basically all these are expenditure variables-expenditure on the goods and services produced in the economy. These variables affect the economy in two ways:
• Add to production capacity of the economy
• Generate demand for the produced goods and services. Relationship between Leakages and Injections in Circular Flow
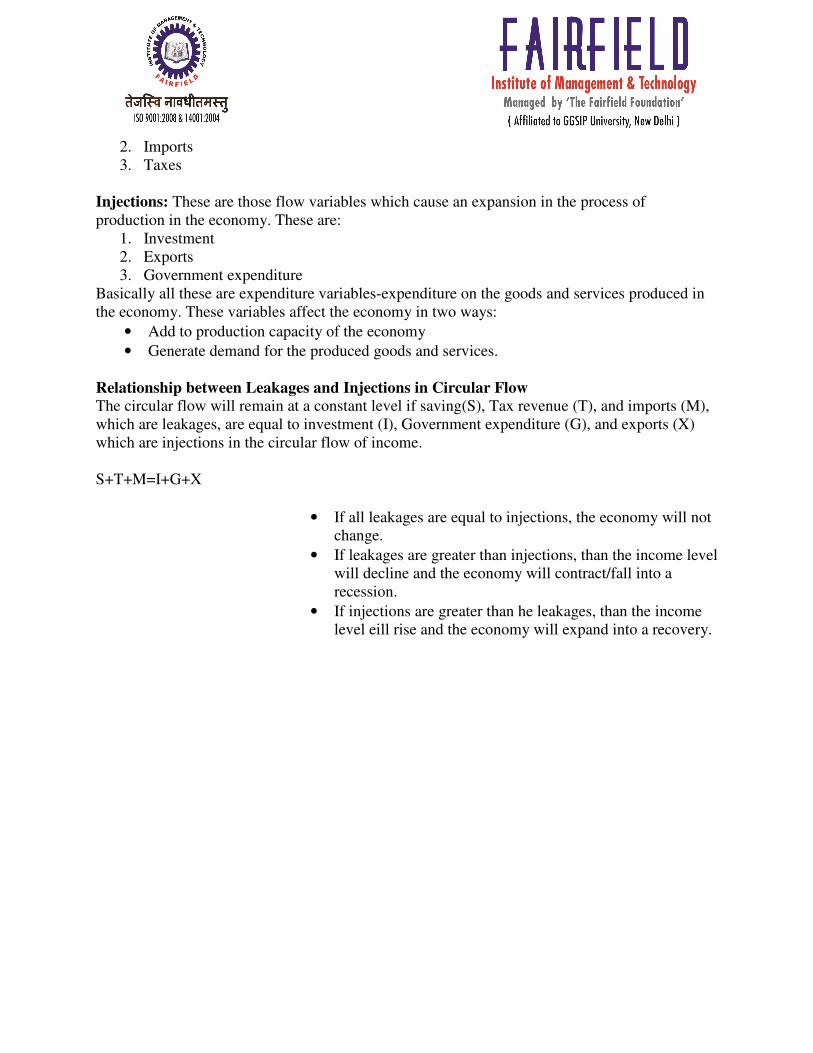
The circular flow will remain at a constant level if saving(S), Tax revenue (T), and imports (M), which are leakages, are equal to investment (I), Government expenditure (G), and exports (X) which are injections in the circular flow of income. S+T+M=I+G+X
• If all leakages are equal to injections, the economy will not change.
• If leakages are greater than injections, than the income level will decline and the economy will contract/fall into a recession.
• If injections are greater than he leakages, than the income level eill rise and the economy will expand into a recovery.
National Income
National income or national product is defined as the total market value of all the final goods and services produced in an economy in a given period of time. There are many concepts of national income which are used by different economists and all of which are inter-related. The total net value of all goods and services produced within a nation over a specified period of time, representing the sum of wages, profits, rents, interest, and pension payments to residents of the nation. It includes income from all the productive sectors such as Agricultural, Industrial and Service Industry. Final Goods: Final goods are those goods which have crossed the boundary line of production, and are ready for use by their final users. Final users may be consumers and any firm. Final goods as used by the producers are called capital goods. Intermediate Goods: These are those goods which are not out of the boundary line of production and are yet not ready for use by their final users. These used are largely used as raw material. Depreciation: A reduction in the value of an asset with the passage of time, due in particular to wear and tear. Depreciation is a non-cash expense that reduces the value of an asset over time. Assets depreciate for two reasons: Wear and tear. Net factor income from abroad (NFIA): Factor income earned by our residents from abroad-Factor income earned by non residents within our country. Transfer Payment: A payment made or income received in which no goods or services are being paid for, such as a benefit payment or subsidy. A noncompensatory government payment to individuals, as for welfare or social security benefits are transfer payment. People sometimes get income without any productive activity. Ex: Unemployment benefits, old age pensions etc. Change in Stock: It is measured as the difference between “Closing Stock” of the accounting year and “Opening stock” of the accounting year. Change in Stock = Closing Stock – Opening Stock GDPMP: GDPMP refers to the market value of final goods and services produced within the domestic territory of a country during an accounting year. GDPMP is the sum total of value added by all producing units within the domestic territory of a country during the period of an accounting year. GNPMP: Gross National Product is the total market value of all final goods and services produced annually in a country plus net factor income from abroad. GNP=GDP+NFIA (Net Factor Income from Abroad)
NNPMP: Net National Product is the market value of all final goods and services after allowing for depreciation. It is also called National Income at market price. When charges for depreciation are deducted from the gross national product, we get it. Thus, NNP=GNP-Depreciation
Personal Income (PI): Personal Income i s the total money income received by individuals and households of a country from all possible sources before direct taxes. Therefore, personal income can be expressed as follows:
PI = NI - Corporate Income Taxes - Undistributed Corporate Profits - Social Security
Contribution + Transfer Payments
Disposable Income (DI) : The income left after the payment of direct taxes from personal income is called Disposable Income. Disposable income means actual income which can be spent on consumption by individuals and families. Thus, it can be expressed as: DI=PI-Direct Taxes
Per Capita Income (PCI): Per Capita Income of a country is derived by dividing the national income of the country by the total population of a country. Thus, PCI=Total National Income/Total National Population
Measurement of National Income
1. Product Method or Value added Method 2. Income Method 3. Expenditure Method
Product Method/ Value added Method
Product method is that method, which measures domestic money by estimating the contribution of each enterprise to production in the domestic territory of the country in an accounting year. Product method or Value added method is also known as Industrial Origin Method or Net output
Method or Inventory Method or Commodity Service method.
Value added is the difference between value of output of an enterprise and the value of its intermediate consumption. Value added= Value of Output- Value of Intermediate consumption Value of Output= Sales (if entire output of the year is sold during the year) Value of output= Sales + Change in Stock
Value added=GDP mp To calculate the national income by this method, we need to identify and classify productive enterprises in three categories:
1. Primary Sector 2. Secondary Sector 3. Tertiary Sector
Primary Sector includes agriculture and allied activities such as animal husbandry fisheries, forestry, and mining etc. The Secondary Sector includes manufacturing sector which converts the raw materials into finished products. The Tertiary Sector is the service sector which includes services such as banking, insurance, transport, communication and trade etc. After classification, net value added in each sector is calculated in an accounting year. Gross value added is found by deducting the intermediate consumption from the value of production generated. Precautions used in production or value added method
1. The sale and purchase of old goods and included but the commission charges by agents in their transaction is a part of national income.
2. Imputed value of production for self-consumption is taken into account. Because, these goods are like those produced for the market.
3. Imputed rent on the owner occupied house is included. Because all houses have rental value, no matter these are self occupied or rented out.
4. Value of intermediate goods is not included into the estimation of national income. 5. Services for Self-consumption are not considered while estimating value added. Because
it is difficult to estimate their market value like services of housewives. 6. Income from illegal activities is not included in national income.
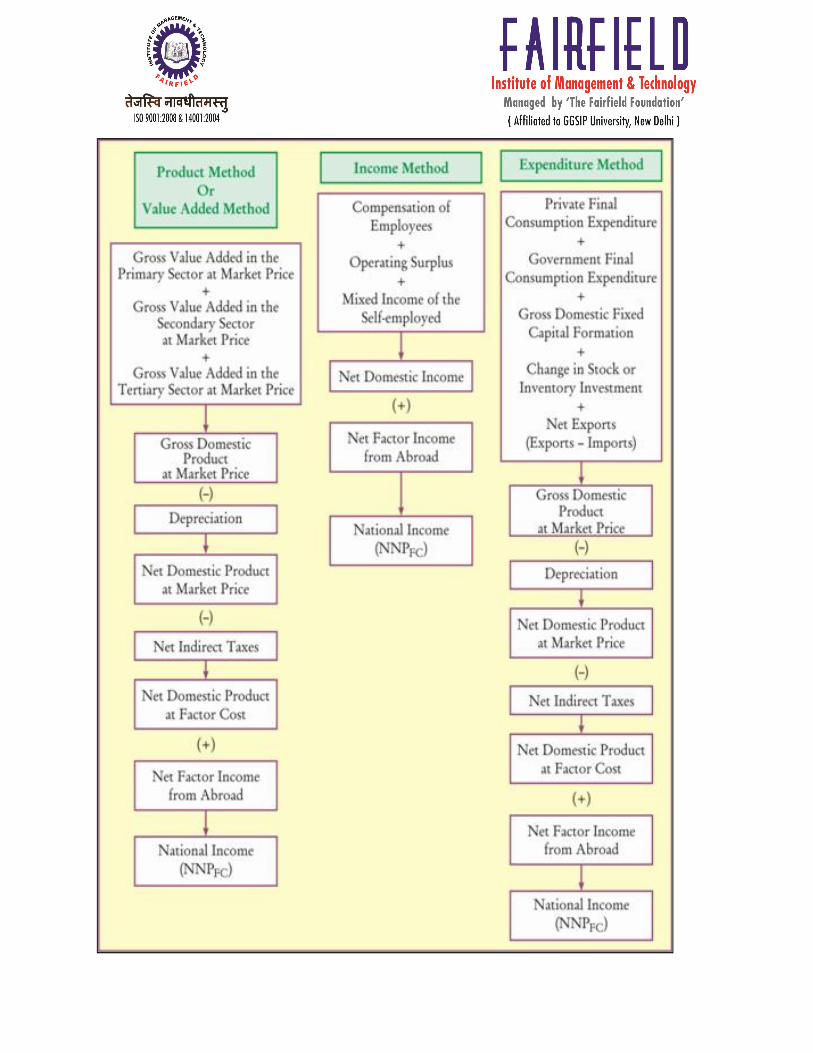
Income Method
This method is also known as factor cost method. Under this method, national income is obtained by adding the incomes such as rent, wages, interest and profit received by all persons in the country during a year. In practice, the income figures are obtainable mostly from income tax returns, books of accounts and published accounts. To this, net income from foreign trade and net investment from abroad should be added. According to income method, the net income payments received by all citizens of a country in a particular year are added up. The net incomes earned by the factors of production in the form of rent, wage, interest and profit aggregated but incomes in the form of transfer payments are not included in the national income. NDPFC= Compensation of Employees + Operating Surplus + Mixed Income Components of Income Method
Compensation of Employees: It includes Wages and salaries in cash, Employers contribution to social security scheme, Pension on retirement, Bonus, Allowances etc. Operating Surplus: It includes rent and royalty, interest, profit (dividend +corporation tax+ undistributed profits). Mixed Income: It is the income of the self employed persons such as farmers, shopkeepers, doctors etc. They generate goods and services with the help of their own land, capital and labour and thus earn mixed income in the form of interest, profit rent and wages. This income is included in national income. In India, this method is used for adding up the net income arising from trade, transport, public administration, professional and domestic services. Due to lack of popularity of personal accounting practices, this method cannot be fully used or practiced. This method is used only for some minor sectors. None of these methods alone will give a more correct figure. Precautions:
1. All transfer income which does not represent earnings from productive services such as pension, scholarship, unemployment doles, lottery prize, etc. are not to be included as they are not earned by participating in the current production.
2. All unpaid services like services of a housewife are to be excluded. 3. All capital gains or loss (buying an old house, or resale of property) should be excluded. 4. Direct tax, revenue to the government should be subtracted from the total income as it is
only transfer of income. 5. Undistributed profits of companies, income from government etc. should be added. 6. Subsidies given by the government should be deducted from profits of the subsidized
industry. 7. Income from sale of second hand goods is not included in national income. 8. Income from sales and purchase of old shares is not included in national income.
Expenditure Method
Expenditure method is the method which measures final expenditure on gross domestic product at market price during an accounting year. Final expenditure is equal to the gross domestic product at market price. This is also called “Income Disposal Method”, Consumption and
Investment Method”.
According to the expenditure method, the total expenditure incurred by the society in a particular year is added together. According to these methods total expenditure equals the national income. Following items are included in it: 1. Private Final Consumption expenditure 2. Govt. final consumption expenditure 4. Gross domestic capital formation 5. Change in stock 6. Net exports. 1. Private Final Consumption Expenditure
It consists of expenditure on durable goods (e.g., furniture, cars, etc), non-durable goods (e.g., food items and toiletries) and services (e.g., hotels, educational institutions, hospitals, public transport, etc.,) by the household consumers. The figures of private consumption expenditure may be collected from retail trade activities during an accounting period. But the purchases made by non-residents and foreign visitors should be deducted from the final consumption expenditure in the domestic market whereas direct purchases made by resident households abroad during foreign travel should be included in consumption expenditure. 2. Government Final Consumption Expenditure
The government final consumption expenditure refers to the final consumption expenditure by the general government and it can be arrived at by summing up (a) value of net purchases in the domestic market, (b) net purchases abroad. 3. Gross Fixed Capital Formation
If consists of (a) Business fixed Investment, (b) Govt. Fixed Investment, (c) Investment on residential construction. 4. Change in Stock as Inventory Investment
Change in stock is the difference between the opening stock and closing stock. All enterprises and trading companies incur expenditure on stock of raw materials; semi finished goods or finished goods. 5. Net Exports of Goods and Services
It is the difference between the value of exports and imports of a country during an accounting period. What the foreigners spend on a country’s exports is the part of expenditure on the Gross domestic product. Precautions used in Expenditure method
1. Only expenditure on current final goods should be included so expenditure on second hand goods must not be added in aggregate expenditure. 2. The intermediate expenditure also must not be included as it leads to double counting. 3. Expenditure on transfer payments should not be taken account of.
4. Gross domestic capital formation already has in it the replacement of machines therefore these two items should not be separately included in aggregate expenditure. 5. Expenditure on financial transactions, e.g., shares and bonds should not be included because these transactions do not add to the flow of goods and services but only change the ownership of financial assets. 6. Only expenditure on final goods and services should be included in aggregate expenditure. 7. The aggregate expenditure got by adding up various components includes in itself the cost of depreciation. Thus, we have the concept of so as to arrive at the Net Domestic Product at market price; depreciation should be deducted from it. Problems in measurement of National Income There are many difficulties in measuring national income of a country accurately. The difficulties involved in national income accounting are both conceptual and statistical in nature. Some of these difficulties involved in the measurement of national income are discussed below:
1. Non Monetary Transactions
The first problem in National Income accounting relates to the treatment of non-monetary transactions such as the services of housewives to the members of the families. For example, if a man employees a maid servant for household work, payment to her will appear as a positive item in the national income. But, if the man were to marry to the maid servant, she would perform the same job as before but without any extra payments. In this case, the national income will decrease as her services performed remains the same as before.
2. Problem of Double Counting
Only final goods and services should be included in the national income accounting. But, it is very difficult to distinguish between final goods and intermediate goods and services. An intermediate goods and service used for final consumption. The difference between final goods and services and intermediate goods and services depends on the use of those goods and services so there are possibilities of double counting.
3. The Underground Economy
The underground economy consists of illegal and unclear transactions where the goods and services are themselves illegal such as drugs, gambling, smuggling, and prostitution. Since, these incomes are not included in the national income; the national income seems to be less than the actual amount as they are not included in the accounting.
4. Petty Production
There are large numbers of petty producers and it is difficult to include their production in national income because they do not maintain any account.
5. Public Services
Another problem is whether the public services like general administration, police, army services, should be included in national income or not. It is very difficult to evaluate such services.
6. Transfer Payments
Individual get pension, unemployment allowance and interest on public loans, but these payments creates difficulty in the measurement of national income. These earnings are a part of individual income and they are also a part of government expenditures.
7. Capital Gains or Loss
When the market prices of capital assets change the owners make capital gains or loss such gains or losses are not included in national income.
8. Price Changes
National income is the money value of goods and services. Money value depends on market price, which often changes. The problem of changing prices is one of the major problems of national income accounting. Due to price rises the value of national income for particular year appends to increase even when the production is decreasing.
9. Wages and Salaries paid in Kind
Additional payments made in kind may not be included in national income. But, the facilities given in kind are calculated as the supplements of wages and salaries on the income side.
10. Illiteracy and Ignorance
The main problem is whether to include the income generated within the country or even generated abroad in national income and which method should be used in the measurement of national income.
11. Second hand transactions
12. Inadequate and unrealistic statistics
National Income in India In India, a systematic measurement of national income was first attempted in 1949. Earlier many attempts were made by some individual and institutions. In 1949, a National Income Committee (NIC) was appointed with P.C. Mahalanobis as its chairman, and D.R. Gadgil and V.K.R.V. Rao as members. The NIC not only highlighted the limitations of the statistical system of that time but also suggested the ways and means to improve data collection systems. In 1967, the task of estimating national income was assigned to the Central Statistical Organization (CSO). The CSO adopted a relatively improved methodology nad procedure which had become possible due to increased availability of data. The CSO publishes its estimates in its publication, Estimates of National Income. Currently, Output and income Methods are used by the CSO to estimate the national Income of the country. The output method is used for agriculture, and manufacturing sectors, i.e., the commodity producing sectors. Income method is used for the services sectors including trade, commerce, transport and government services. The national income is estimated at both constant and current price.
Unit -2 Macro Economic Framework Classical Model
Classical economics is widely regarded as the first modern school of economic thought. Its major developers include Adam Smith, Jean-Baptiste Say, David Ricardo, Thomas Malthus and John Stuart Mill. Classical economists claimed that free markets regulate themselves, when free of any intervention. Adam Smith referred to a so-called invisible hand, which will move markets towards their natural equilibrium, without requiring any outside intervention. Assumptions of Classical Approach
1. There is existence of full employment without inflation 2. There is a laissez faire capitalist economy without government interference 3. It is a closed economy without foreign trade 4. There is a perfect competition in labour and product markets 5. Total Output of the economy is divided between consumption and investment expenditure 6. The quantity of money is given and money is only the medium of exchange 7. Wages and Prices are perfectly flexible 8. Constant Technology 9. Equality between saving and investment
Say’s Law of Market: According to Say’s Law “Supply creates its own demand”, i.e., the very act of producing goods and services generates an amount of income equal to the value of the goods produced. Say’s Law can be easily understood under barter system where people produced (supply) goods to demand other equivalent goods. So, demand must be the same as supply. Say’s Law is equally applicable in a modern economy. The circular flow of income model suggests this sort of relationship. For instance, the income created from producing goods would be just sufficient to demand the goods produced. Saving-Investment Equality: There is a serious omission in Say’s Law. If the recipients of income in this simple model save a portion of their income, consumption expenditure will fall short of total output and supply would no longer create its own demand. Consequently there would be unsold goods, falling prices, reduction of production, unemployment and falling incomes. However, the classical economists ruled out this possibility because they believed that whatever is saved by households will be invested by firms. That is, investment would occur to fill any consumption gap caused by savings leakage. Thus, Say’s Law will hold and the level of national income and employment will remain unaffected.
Wage Flexibility: The classical economists also believed that a decline in product demand would lead to a fall in the demand for labour resulting in unemployment. However, the wage rate would also fall and competition among unemployed workers would force them to accept lower wages rather than remain unemployed. The process will continue until the wage rate falls enough to clear the labour market. So a new lower equilibrium wage rate will be established. Thus, involuntary unemployment was logical impossibility in the classical model. Keyne’s Criticism of Classical Theory:
J.M. Keynes criticized the classical theory on the following grounds: 1. According to Keynes saving is a function of national income and is not affected by changes
in the rate of interest. Thus, saving-investment equality through adjustment in interest rate is ruled out. So Say’s Law will no longer hold.
2. The labour market is far from perfect because of the existence of trade unions and government intervention in imposing minimum wages laws. Thus, wages are unlikely to be flexible. Wages are more inflexible downward than upward. So a fall in demand (when S exceeds I) will lead to a fall in production as well as a fall in employment.
3. Keynes also argued that even if wages and prices were flexible a free enterprise economy would not always be able to achieve automatic full employment.
Keynesian theory of Employment
Assumptions
1. The theory is applicable in advanced capitalistic Economy
2. Assumption of short period
3. Assumption of Perfect competition
4. Closed economy
5. It ignores the role of Government as a spender and Taxer 6. No time lag
7. Money also act as a store of value
8. Labour is the only variable factor of production
9. Under Employment Equilibrium
Saving depends upon income and Investment depends upon Rate of Interest Keynes has strongly criticised the classical theory in his book ‘General Theory of Employment, Interest and Money’. His theory of employment is widely accepted by modern economists. Keynesian economics is also known as ‘new economics’ and ‘economic revolution’. Keynes had invented new tools and techniques of economic analysis such as consumption function, multiplier, marginal efficiency of capital, liquidity preference, effective demand, etc. In the short run, it is assumed by Keynes that capital equipment, population, technical knowledge, and labour efficiency remain constant. That is why, according to Keynesian theory, volume of employment depends on the level of national income and output. Increase in national income would mean increase in employment. The larger the national income the larger the employment level and vice versa. That is why, the theory of Keynes is known as ‘theory of employment’ and ‘theory of income’. Theory of Effective Demand:
According to Keynes, the level of employment in the short run depends on aggregate effective demand for goods in the country. Greater the aggregate effective demand, the greater will be the
volume of employment and vice versa. According to Keynes, the unemployment is the result of deficiency of effective demand. Effective demand represents the total money spent on consumption and investment. The equation is: Effective demand = National Income (Y) = National Output (O) The deficiency of effective demand is due to the gap between income and consumption. The gap can be filled up by increasing investment and hence effective demand, in order to maintain employment at a high level. According to Keynes, the level of employment in effective demand depends on two factors: (a) Aggregate supply function, and (b) Aggregate demand function. (a) Aggregate supply function:
According to Dillard, the minimum price or proceeds which will induce employment on a given scale, is called the ‘aggregate supply price’ of that amount of employment. If the output does not fetch sufficient price so as to cover the cost, the entrepreneurs will employ less number of workers. Therefore, different numbers of workers will be employed at different supply prices. Thus, the aggregate supply price is a schedule of the minimum amount of proceeds required to induce varying quantities of employment. We can have a corresponding aggregate supply price curve or aggregate supply function, which slopes upward to right.
(b) Aggregate demand function:
The essence of aggregate demand function is that the greater the number of workers employed, the larger the output. That is, the aggregate demand price increases as the amount of employment increases, and vice versa. The aggregate demand is different from the demand for a product. The aggregate demand price represents the expected receipts when a given volume of employment is offered to workers. The aggregate demand curve or aggregate demand function represents a schedule of the proceeds of the output produced by different methods of employment.
Difference between Classical and Keynes Model Classical
1. Economy is in full employment 2. The wages and prices are very flexible 3. There is no need of fiscal or monetary policy 4. The Aggregate supply curve is Vertical according to classical so any rise in
aggregate demand will increase prices not production 5. There is a direct relationship between the money supply and the price level 6. Saving-investment equality is brought about by the rate of interest mechanism. 7. Supply creates its own demand 8. Laissez Faire or Capitalistic economy 9. Automatic adjustment works 10. Long run concept 11. Saving is good
Keynesian
1. Economy may not be in full employment in short run 2. Wage are rigid and prices are sticky (menu cost etc) 3. Fiscal as well as monitory policy may be needed to correct the disequilibrium or
improve the efficiency of economy 4. Aggregate supply is upward sloping in the short run so a rise in aggregate demand
may rise the production as well 5. No such direct relationship exists between the money supply and price level. The
relation is only indirect. 6. The equality between saving and investment is brought about by the income level. 7. Demand creates its own supply 8. No is no adjustments 9. No laissez Faire 10. Short run 11. Saving is bad
Consumption Function It is a functional relationship between two aggregates i.e., total consumption and National income. Consumption is an increasing function of income. It was developed by John Maynard Keynes Symbolically, C= f (Y) Consumption expenditure increases with increase in income. But increase in consumption is less than increase in income. It is known as Fundamental
Psychological Law”. Consumption Schedule It is the tabular representation of various amounts of consumption expenditure corresponding to different levels of income. Consumption is basically of two types:
Autonomous Consumption: This is the level of consumption which does not depend on income. The argument is that even with zero income you still need to buy enough food to eat, through borrowing or running down savings.
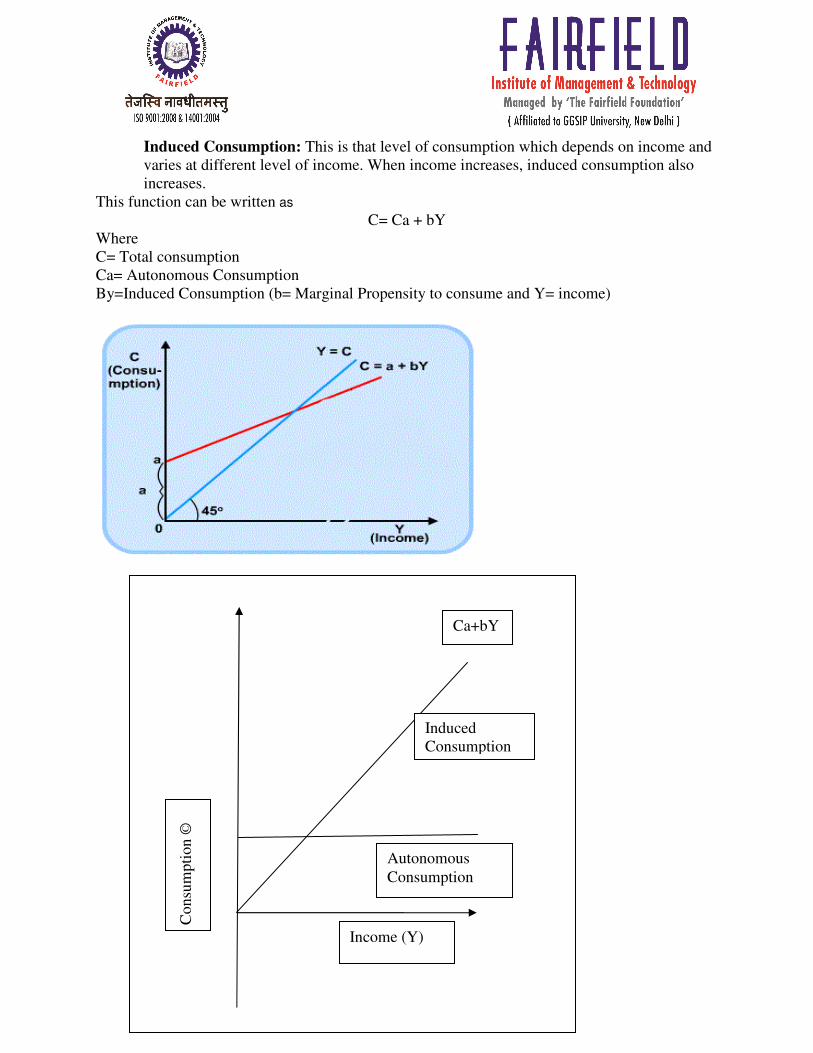
Induced Consumption: This is that level of consumption which depends on income and varies at different level of income. When income increases, induced consumption also increases.
This function can be written as
C= Ca + bY Where C= Total consumption Ca= Autonomous Consumption By=Induced Consumption (b= Marginal Propensity to consume and Y= income)
Co
nsu
mp
tio
n ©
Induced Consumption
Ca+bY
Autonomous Consumption
Income (Y)
Propensity to Consume
Propensity to consume is of two kinds:
• Average Propensity to Consume
• Marginal Propensity to Consume
Average Propensity to consume: APC is the ratio of total consumption to total income. It is found by dividing the total consumption with total income.
APC= C/Y
Marginal Propensity to consume: MPC is defined as the ratio of change in consumption to change in change in income. It is found by dividing the change in consumption expenditure with the change in income.
MPC =∆C/∆Y Characteristics of MPC
1. It is always positive 2. It is greater than zero and less than utility 3. MPC of the poor class is higher 4. Constant MPC in the long period 5. Falling MPC in the short period 6. MPC can be greater than 1 in abnormal conditions
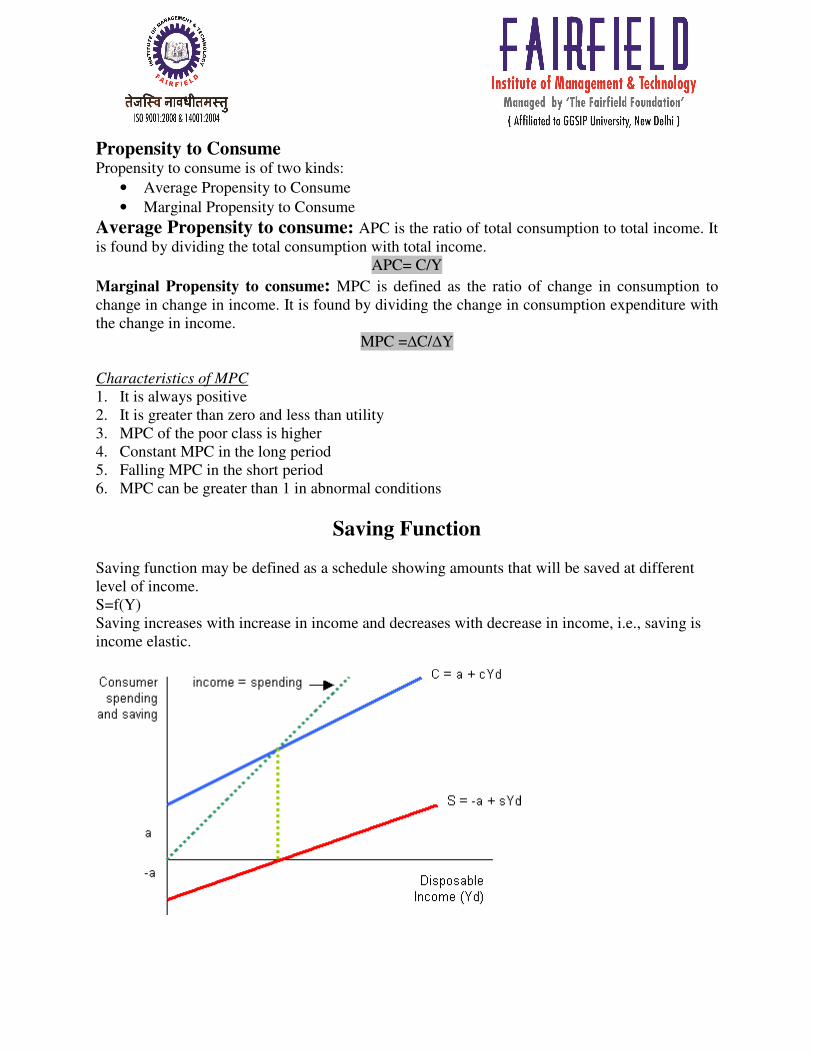
Saving Function Saving function may be defined as a schedule showing amounts that will be saved at different level of income. S=f(Y) Saving increases with increase in income and decreases with decrease in income, i.e., saving is income elastic.
Propensity to Save Average Propensity to Save: APS is the ratio between total saving (S) and total income (Y) at a given level of income and employment in the economy.
APS= S/Y Marginal Propensity to Save: MPS is defined as the ratio of change in consumption to change in income. It is found by dividing the change in consumption expenditure with the change in income.
MPS= ∆S/∆Y Relationship between Consumption and Saving Function
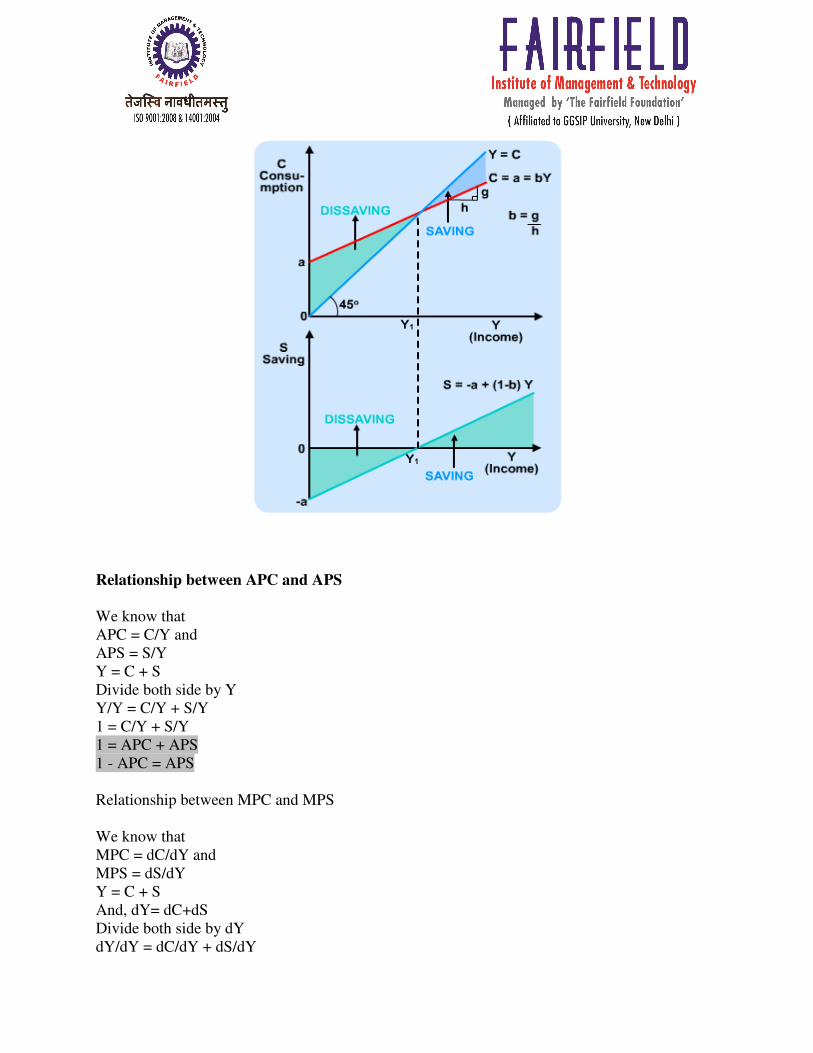
1. When consumption is more than income than saving is negative or when consumption graph is above to income graph than saving is negative. C>Y, than S becomes -S
2. When consumption becomes equals to income or consumption graph meet to income graph at that time saving is zero. C=Y, than S=0
3. When consumption is less than income or consumption graph is below to income than saving increases and becomes positive. C<Y, than S becomes +S
Relationship between APC and APS
We know that APC = C/Y and APS = S/Y Y = C + S Divide both side by Y Y/Y = C/Y + S/Y 1 = C/Y + S/Y 1 = APC + APS 1 - APC = APS Relationship between MPC and MPS We know that MPC = dC/dY and MPS = dS/dY Y = C + S And, dY= dC+dS Divide both side by dY dY/dY = dC/dY + dS/dY
1 = dC/dY + dS/dY 1 = MPC + MPS 1 - MPC = MPS
Investment Function An investment function is a concept or strategy within economics that helps to identify the connection between shifts in the national income and the investment patterns that take place within that particular national economy. In this type of situation, a function would be any variable within the framework of the economy that would motivate investors to change their typical buying and selling habits as a means of either taking advantage of the economic shift in a bid to increase their returns or to minimize the amount of loss incurred as a result of that shift. In weighing variables, the investor will consider the current level of gross domestic product (GDP) as well as the average interest rates that currently apply within the economy. The investment function is a summary of the variables that influence the levels of aggregate investments. It can be formalized as follows:
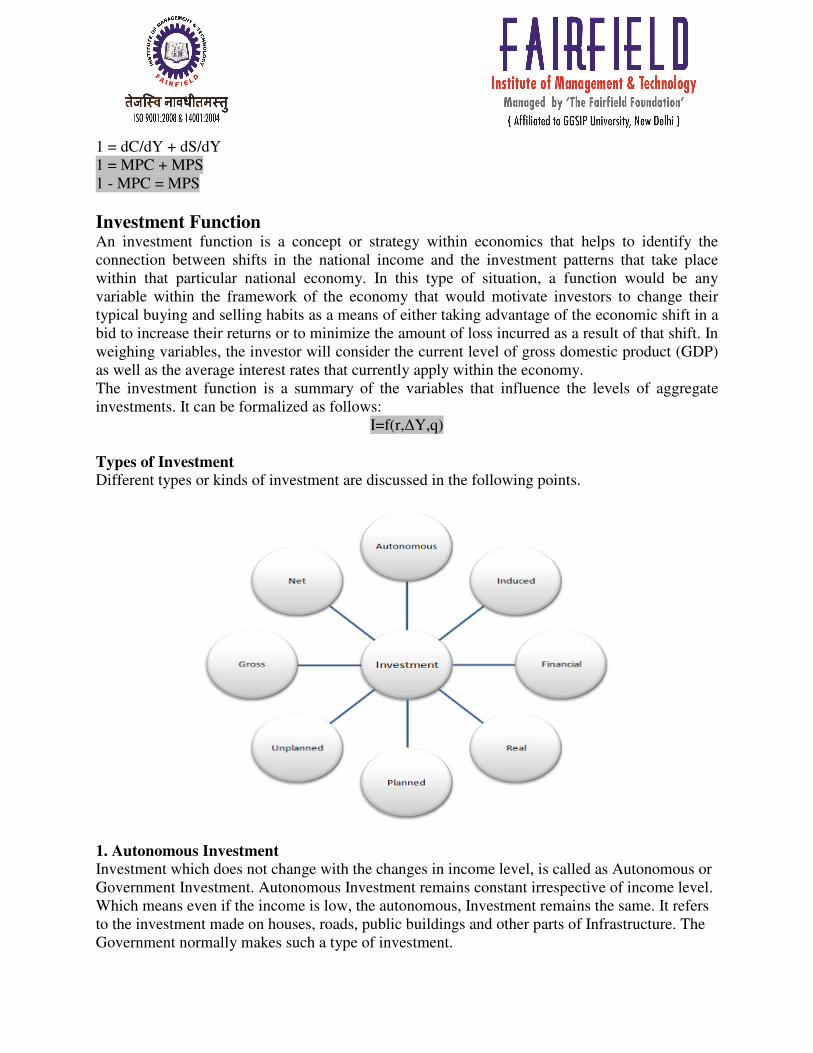
I=f(r,∆Y,q) Types of Investment Different types or kinds of investment are discussed in the following points.
1. Autonomous Investment
Investment which does not change with the changes in income level, is called as Autonomous or Government Investment. Autonomous Investment remains constant irrespective of income level. Which means even if the income is low, the autonomous, Investment remains the same. It refers to the investment made on houses, roads, public buildings and other parts of Infrastructure. The Government normally makes such a type of investment.
2. Induced Investment
Investment which changes with the changes in the income level, is called as Induced Investment. Induced Investment is positively related to the income level. That is, at high levels of income entrepreneurs are induced to invest more and vice-versa. At a high level of income, Consumption expenditure increases this leads to an increase in investment of capital goods, in order to produce more consumer goods. 3. Financial Investment
Investment made in buying financial instruments such as new shares, bonds, securities, etc. is considered as a Financial Investment. However, the money used for purchasing existing financial instruments such as old bonds, old shares, etc., cannot be considered as financial investment. It is a mere transfer of a financial asset from one individual to another. In financial investment, money invested for buying of new shares and bonds as well as debentures have a positive impact on employment level, production and economic growth. 4. Real Investment
Investment made in new plant and equipment, construction of public utilities like schools, roads and railways, etc., is considered as Real Investment. Real investment in new machine tools, plant and equipments purchased factory buildings, etc. increases employment, production and economic growth of the nation. Thus real investment has a direct impact on employment generation, economic growth, etc. 5. Planned Investment
Investment made with a plan in several sectors of the economy with specific objectives is called as Planned or Intended Investment. Planned Investment can also be called as Intended Investment because an investor while making investment, make a concrete plan of his investment. 6. Unplanned Investment
Investment done without any planning is called as an Unplanned or Unintended Investment. In unplanned type of investment, investors make investment randomly without making any concrete plans. Hence it can also be called as Unintended Investment. Under this type of investment, the investor may not consider the specific objectives while making an investment decision. 7. Gross Investment
Gross Investment means the total amount of money spent for creation of new capital assets like Plant and Machinery, Factory Building, etc.It is the total expenditure made on new capital assets in a period. 8. Net Investment
Net Investment is Gross Investment less (minus) Capital Consumption (Depreciation) during a period of time, usually a year. It must be noted that a part of the investment is meant for depreciation of the capital asset or for replacing a worn-out capital asset. Hence it must be deducted to arrive at net investment. Marginal Efficiency of Capital MEC The Marginal efficiency of capital displays the expected rate of return from investment, in a particular given time. The marginal efficiency of capital is compared to the rate of interest. Keynes described the marginal efficiency of capital as:
"The marginal efficiency of capital is equal to that rate of discount which would make the present value of the series of annuities given by the returns expected from the capital asset during its life just equal to its supply price." - J.M.Keynes, General Theory. This theory suggests investment will be influenced by: 1. The marginal efficiency of capital 2. The interest rates Generally, a lower interest rate makes investment relatively more attractive. If interest rates, were 3%, then firms would need an expected rate of return of at least 3% from their investment to justify investment. If the marginal efficiency of capital was lower than the interest rate, the firm would be better off not investing, but saving the money. Why are interest rates important for determining the Marginal efficiency of capital? To finance investment, firms will either borrow or reduce savings. If interest rates are lower, it's cheaper to borrow or their savings give a lower return making investment relatively more attractive.
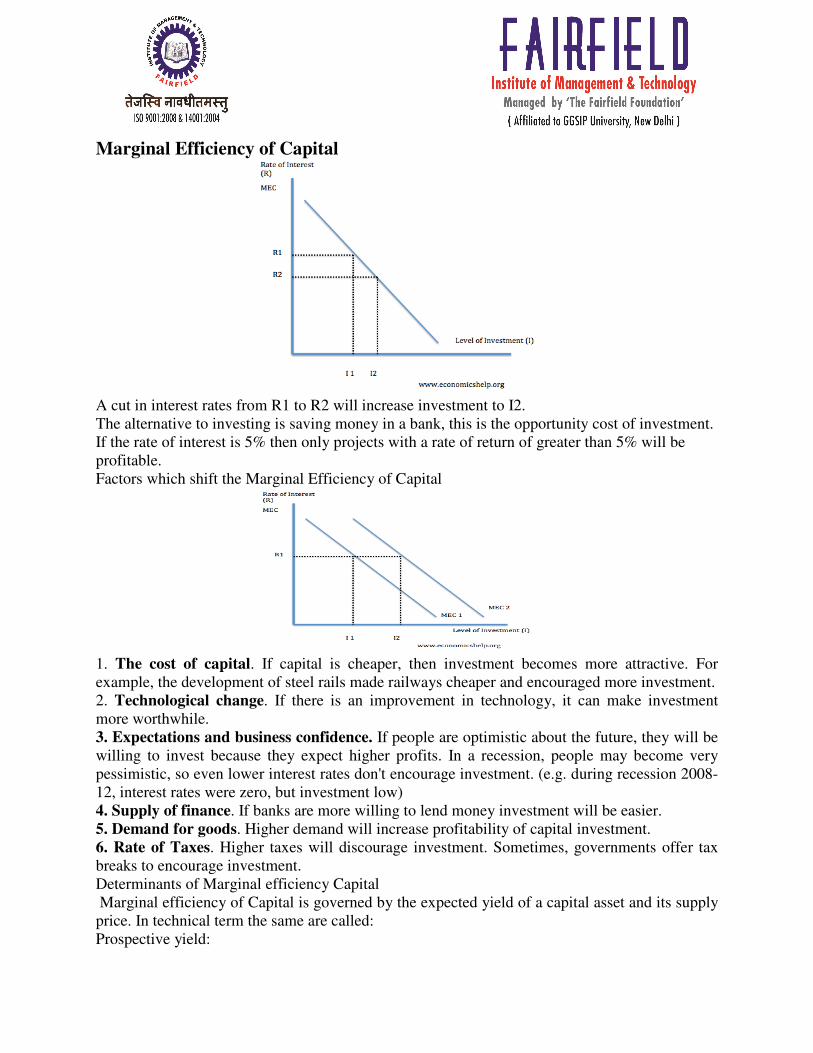
Marginal Efficiency of Capital
A cut in interest rates from R1 to R2 will increase investment to I2. The alternative to investing is saving money in a bank, this is the opportunity cost of investment. If the rate of interest is 5% then only projects with a rate of return of greater than 5% will be profitable. Factors which shift the Marginal Efficiency of Capital
1. The cost of capital. If capital is cheaper, then investment becomes more attractive. For example, the development of steel rails made railways cheaper and encouraged more investment. 2. Technological change. If there is an improvement in technology, it can make investment more worthwhile. 3. Expectations and business confidence. If people are optimistic about the future, they will be willing to invest because they expect higher profits. In a recession, people may become very pessimistic, so even lower interest rates don't encourage investment. (e.g. during recession 2008-12, interest rates were zero, but investment low) 4. Supply of finance. If banks are more willing to lend money investment will be easier. 5. Demand for goods. Higher demand will increase profitability of capital investment. 6. Rate of Taxes. Higher taxes will discourage investment. Sometimes, governments offer tax breaks to encourage investment. Determinants of Marginal efficiency Capital Marginal efficiency of Capital is governed by the expected yield of a capital asset and its supply price. In technical term the same are called: Prospective yield:
It is the aggregate net return expected from it during its whole life. In order to determine prospective yield, annual return of the capital is worked out. Aggregate of annual return expected from a capital asset over its life-time is called total prospective yield. The remainder, after deducting cost of production from total revenue earned by the sale of output produced with the help of capital asset, is called prospective yield. With rise in prices, prospective yield increases and with the fall in prices, it decreases. Prices are likely to change in the be expressed in terms of the following equations: Py = Q1 + Q2 + Q3 + Q4 +«««+ Qn (Here Py= Prospective Yield; Q1, Q2, Q3, Q4 and Qn = net revenue received in the first, second, third, fourth and nth year) Supply Price : The other factor influencing M.E.C. of a capital asset is its supply price. The supply price of a capital asset is the cost of producing a new asset of that kind, not the supply price of an existing asset. Hence, the supply price of a capital asset is also called Replacement Cost. It remains fixed in the short period.
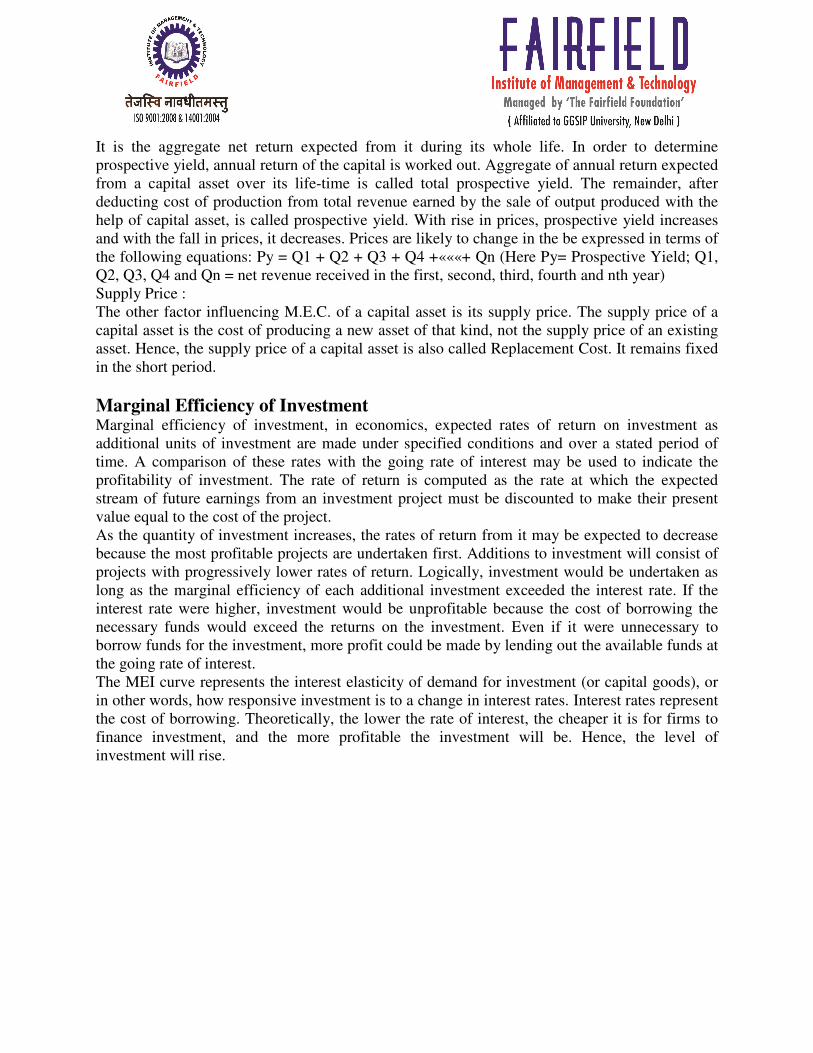
Marginal Efficiency of Investment Marginal efficiency of investment, in economics, expected rates of return on investment as additional units of investment are made under specified conditions and over a stated period of time. A comparison of these rates with the going rate of interest may be used to indicate the profitability of investment. The rate of return is computed as the rate at which the expected stream of future earnings from an investment project must be discounted to make their present value equal to the cost of the project. As the quantity of investment increases, the rates of return from it may be expected to decrease because the most profitable projects are undertaken first. Additions to investment will consist of projects with progressively lower rates of return. Logically, investment would be undertaken as long as the marginal efficiency of each additional investment exceeded the interest rate. If the interest rate were higher, investment would be unprofitable because the cost of borrowing the necessary funds would exceed the returns on the investment. Even if it were unnecessary to borrow funds for the investment, more profit could be made by lending out the available funds at the going rate of interest. The MEI curve represents the interest elasticity of demand for investment (or capital goods), or in other words, how responsive investment is to a change in interest rates. Interest rates represent the cost of borrowing. Theoretically, the lower the rate of interest, the cheaper it is for firms to finance investment, and the more profitable the investment will be. Hence, the level of investment will rise.
Keynes, however, suggested that investment is in fact relatively unresponsive to changes in interest rates, particularly at the extreme ends of the Trade Cycle. During a recession, businessmen are generally pessimistic about the future outlook and there is also likely to be excessive unused productive capacity, which prevents a fall in interest rates from stimulating I. On the other hand, during a boom, their optimism may cause them to disregard high interest rates. Hence, MEI is more likely to look like the relatively inelastic MEI1 than the relatively elastic MEI2.
NATIONAL INCOME DETERMINATION
Assumptions
1. It is a closed economy in which there are no exports and imports. 2. There are no business taxes and government expenditure and transfer payments 3. There is autonomous investment. 4. The economy is at less than full employment level of output. 5. The price level remains constant up to the level of full employment. 6. The rate of interest is fixed. 7. The money wage rate is constant. 8. There is a stable consumption function.
Given these assumptions, the equilibrium level of national income can be determined by the equality of aggregate demand and aggregate supply or by the equality of saving and investment. It is shown by the following two approaches:
Y=C+I AS=AD
S=I
MULTIPLIER The concept of multiplier occupies an important place in Keynesian theory of Income, Output and Employment. It is an important tool to analyze the effect of the changes in planned investment on the level of income. The concept of multiplier was first developed y R.F. Kahn a Cambridge economist in his article. There are three types of multiplier: 1. Investment Multiplier (Two sector) 2. Balanced Budget Multiplier (Three sector)
3. Foreign Trade Multiplier (Four Sector) Investment Multiplier (Multiplier in two sector model)
According to the keynes, “Investment multiplier tells us that when there is an increment of aggregate investment, income will increase by an amount which is K times the increment of investment.” In the words of Kurihara, “The multiplier is the ratio of change in income to the change in investment. Formula of Investment Multiplier:
K=∆Y/∆I (1) ∆Y= K.∆I
Here, K=Multiplier, ∆Y= Change in Income, ∆I= Change in Investment. Relation between Investment Multiplier and Marginal Propensity to consume
K=∆Y/∆I We also know that,
Y=C+I ∆Y= ∆C+∆I ∆I= ∆Y-∆C
Here, ∆I= change in Investment, ∆Y=change in Income, ∆C= Change in consumption Putting the value of ∆I in equation 1 K = ∆Y/∆Y-∆C ( ∆I =∆Y-∆C) K = ∆Y/∆Y ∆Y/∆Y- ∆C/∆Y OR K= 1/1-∆C/∆Y OR K= 1/1-MPC (∆C/∆Y=MPC) OR K= 1/MPS (1-MPC=MPS) Balanced Budget Multiplier (Multiplier in three sector model)
Balanced budget multiplier (BBM) is relevant only in a closed economy in which government expenditure and tax are the important tools in the working of BBM. Mr Wllich in his article, “Multiplier effect of Balanced Budget” published in Economertrica explains very clearly that public expenditure covered by taxes had an income generating effect, independent of numerical value of MPC and MPS. Working of BBM
He working of balanced budget or the process of income determination on under balanced budget can be discuss on the basis of income determination model of Keynes under C+I+G. In such a case we start first with some equilibrium level of income determined on the basis of consumption and increase in investment expenditure. After that we increase government
expenditure but government expenditure is not covered by tax and then examines the impact on income and employment when government expenditure is covered by direct taxes. Example: Let C= 25+0.75Y I=20 On the basis of AD and AS approach, equilibrium level of income is Y= 25 + 0.75Y + 20=180 i.e. 80 crores. If now government expenditure is increased by Rs. 25 and suppose government expenditure is not covered by tax, than the income will increase by simple multiplier times the government expenditure. It is proved as under:
Y= C+I+G Y= 25+0.75+20+25
Y-0.75Y=25+20+25 Y (1-0.75) = 70
Y=70/1-0.75 Y=280 crores in Rs.
Foreign Trade Multiplier (Multiplier in Four Sectors Models) The concept of foreign Trade multiplier, in an open economy, explains the estimated effect on country’s national income and employment due to excess of its exports over imports. A country carrying foreign trade with another country may come to have excess of exports and imports. Income earned as a result of excess of exports over imports is like an injection in the income stream, and has the same multiplier effect on domestic income and employment as created by the initial increase in domestic Investment. The ratio of the final increase in income due to an initial increase in exports over imports is called foreign trade multiplier. Symbolically,
Kf = ∆Y/∆X The foreign trade multiplier also known as export multiplier operates like the investment multiplier of Keynes. It may be defined as the amount by which national income of a nation will be raised by a unit increase in domestic investment on exports. As exports increase there is an increase in the income of all persons associated with the exports industries. These in turn create demand for goods. But this is dependent upon their marginal propensity to save (MPS) and marginal propensity to import (MPM). The smaller these two propensities are, the larger will be the value of multiplier and vice versa. In very simple terms we can say that foreign trade multiplier is a concept that states that net exports (exports minus imports) may magnify the impact on nation's income.
UNIT-3 MONEY: Anything is Money, which is generally acceptable as a medium of exchange, and at the same time it must act as a measure and a store of value. Anything implies a thing to be used as money need not be necessarily composed of any precious metal. The only necessary condition is that, it should be universally accepted by people as a medium of exchange. Functions of Money
Money performs five important functions:- 1. Medium of exchange: Money acts as a medium of exchange as it's generally accepted. On
the payment of money, purchase of goods and services can be made i.e. goods and services are exchanged for money. Money bifurcates buying and selling activities separately so it facilitates the exchange transactions.
2. Measure of value: Money is a common measure of value so it is possible to determine the rate of exchange between various goods and services purchased by the people. Exchange value of commodity can be expressed in terms of money. For e.g. we can say that 10 metres of Cotton Cloth cost $220 dollars or Rs.10,000 rupees only.
3. Store of value: Money acts as a store of value. Money being generally acceptable and its value being more or less stable, it is ideal for use as a store of value. Being non-perishable and also comparatively stable in value, the value of other assets can be stored in the form of money. Property can be sold and its value can be held in money and converted into other assets as and when necessary.
4. Standard or Deferred payment: Money is also inevitably used as the unit in terms of which all future or deferred payments are stated. Future transactions can be carried on in terms of money. The loans, which are taken at present, can be repaid in money in the future. The value of the future payments is regulated by money.
5. Transfer of value: Value of any asset can be transferred from one person to another or to any institution or to any place by transferring money. The transfer of money can take place irrespective of places, time and circumstances. Transfer of purchasing power, which is necessary in commerce and other transactions, has become available because of money.
Types of Money
There are four types of money.
1. Commodity money: Commodity money started as barter. The exchange of cattle and sheep advanced to one of gold and silver because metals are not perishable, their purity and weight can be measured easily and they can be traded for any good or service. Unlike diamonds, metals can be melted down and reformed into smaller quantities for smaller purchases without losing value.
2. Representative money: Representative money is money that consists of token coins, paper money or other physical tokens such as certificates, that can be reliably exchanged for a fixed quantity of a commodity such as gold or silver. The value of representative money stands in direct and fixed relation to the commodity that backs it, while not itself being composed of that commodity
3. Metallic money: Metallic money refers to coins made out of various metals like gold,
silver, bronze, nickel, etc. A coin is a piece of metal of a given size, shape, weight and fineness whose value is certified by the State.
4. Paper Money: Paper money consists of currency notes issued by the State Treasury or the Central Bank of the country. In India, one rupee notes are issued by the Minister of Finance of the Government of India, while all other currency notes of higher denominations are issued by the Reserve Bank of India.
5. Credit Money: In modern economic societies, with the development of banking activity, along with paper money, another form of convertible money has developed in the form of credit money or bank money. Bank demand deposits, withdrawal by issuing cheques, have started functioning as money, and cheques are now conventionally accepted as a mode of payment by the business community in general.
Demand For Money
Classical theory:
Classical economist emphasized the transaction demand for money because according to classical economist money acts as a medium for exchange of goods and services in Fisher’s equation of Exchange.
MV=PT where M= The total quantity or supply of money V= Velocity of money P= The price level T= Total amount of goods and services The right hand side of the equation PT represents the demand for money, which in turn depends upon the value of transactions to be undertaken in the economy. And MV represents the supply of money which is given and is in equilibrium equals the demand for money. Thus the equation becomes.
Md=PT, Ms=MV
In the end the classical theory of demand for money may be summarized as under: 1. Money acts as a medium of exchange 2. Velocity of money is constant 3. The people hold a constant fraction of their nominal income for transaction and
precaution motives. 4. Quantity of money demanded is directly related to the price levels.
Keynesian Theory:
John M. Keynes explained his liquidity preference theory through his famous book, ‘The General Theory of Employment, Interest Rates, and Money’ in 1936. He believed that there are three motives of holding money. They are as follows: Transactions motive: Money is a medium of exchange, and people hold money to buy stuff. So as income rises, people have more transactions and people will hold more money. Precautionary motive: People hold money for emergencies (cash for a tow truck, savings for unexpected job loss). Since this also depends on the amount of transactions people expect to make, money demand is again expected to rise with income. PDM depends upon income level, business activities, availability of cash opportunity for unexpected profitable deals, the cost of holding liquid assets in bank reserves etc. But the most important factor affecting PDM is income level. Speculative motive: Money is also a way for people to store wealth. Keynes assumed that people stored wealth with either money or bonds. Under the speculative motive, money demand is negatively related to the interest rate. The speculative motive for holding money relates to the taking advantage of future market movements or it is the motive of security profits from knowing better than market what the future will bring forth. In other words it is the motive of earning profits by sale & purchase of bonds & securities due to the variations in future rate of interest. Keynes modeled money demand as the REAL demand for money holding (Real balances) or M/P.
Milton Friedman’s Approach According to Friedman permanent real per capita demand for money is a function of permanent real income. He found the demand for money by using the following equation. He calculated two value of � and δ. γ = .00323 and the value of δ =1.8 where γ stands for interest elasticity of demand for money and δ stands for income elasticity of demand for money i.e.
���� = � � ����
�
γ = interest elasticity of demand for money =0.00323 δ = income elasticity of demand for money = 1.8 N= Population PP= Permanent price level YP= Total Permanent Income M/NPP = Permanent real per capita demand for money YP/NPP= Permanent per capita real income Interest elasticity of demand for money is negligence: It is only 0.00323. It means change in rate of interest does not affect much the demand for money.
Income elasticity of demand for money was proved to be very-very high. It is 1.8. It means change in income brings more than proportionate change in demand for money. Hence in his analysis money was proved to be a luxury good whose demand increases when income increases.
QUANTITY THEORY OF MONEY
The Quantity Theory of money was first developed by Irving Fisher in the inter-war years to explain the theoretical explanation for the link between money and the general price level. This is sometimes known as the Fisher identity or the equation of exchange. This is an identity which relates total aggregate demand to the total value of output (GDP). MV = PY Where M is the money supply
V is the velocity of circulation of money i.e. the no. of times a unit of currency changes hands
P is the general price level
Y is the real value of national output (i.e. real GDP) Assumptions: 1. Velocity of money is treated to be constant as it is predictable.
2. It is assumed that real value of GDP is not affected by monetary variables. Hence, assuming V and Y to be constant, changes in supply of money will be equated by changes in general price level. We can further modify this relationship by dividing both sides by V:
M = (1/V) x PY Since V is constant we can replace (1/V) with some constant, k, and when the money market is in equilibrium, Md = M. So our equation becomes
Md = k x PY So under the quantity theory of money, money demand is a function of income and does not depend on interest rates.
Money Supply Money supply means total amount of money available in an economy. In other words, money supply refers to the volume of money held by the people in the country for transactions or for settlement of debts. Money supply is actually money stock. Supply of money does not include:
i. Stock of the money held by the government ii. Stock of money held by banking system (Commercial ¢ral bank)
Government & banks are suppliers of money or producers of money. Hence money held by them is not a part of stock of money held by the people. Supply of money refers to the stock of money held by the public or those who demand money. Components of Money supply:
i. Currency component ii. Deposit component (Commercial and central bank)
Measures of Money supply:
In India, RBI has used four measures of money supply since 1977. These measures are M1, M2, M3 and M4. These measures are shown as under: M1=Currency with the public +Demand deposits of Banks + Other deposits with RBI M1= C+DD+OD M2=Currency with the public + Demand deposits of Banks + Other deposits with RBI+ Saving Deposits in Post Offices M2=C+DD+OD+SD or M2=M1+SD M3=Currency with the public + Demand deposits of Banks + Other Deposits with RBI +Time Deposits in Banks M3= C+DD+OD+TD or M3=M1+TD M4= Currency with the public + Demand deposits of Banks + Other Deposits with RBI +Time Deposits in Banks+ Saving Deposits in Post Offices M4=C+DD+OD+SD or M2=M1+SD
INFLATION It is a steady an upward movement in the level of prices, decreasing purchasing power over a period of time, usually one year. Inflation can be defined as a continuous increase in the general price level of goods & services in the economy. According to Prof. Crowther, Inflation is a state in which the value of money is falling and prices are rising. According to Prof. Kemmerer, Inflation means too much currency in comparison to the physical volume of business done. Keynes stated that the rise in the price level after the point of full employment is true Inflation. Measures of Inflation
In India, inflation is measured by using WPI (wholesale price Index). An index of several goods & services is prepared. India’s WPI is a weighted index of 435 commodities; it means price rise of all commodities will not be treated equally. Example: The price rise of rice will have more weight-age than a price rise of a car. That is because rice is consumed by a large number of people as compared to a car. In USA, UK, China CPI (Consumer price index) is used to measure inflation. In India, WPI is reported by Labour Bureau, Government of India.
Types of Inflation
1. On the basis of rate of inflation
a) Open Inflation: In a free market economy, prices go up freely due to supply-demand imbalances leading to open inflation. It is not checked by government. Since market is allowed to function without interference, it is called open inflation.
b) Suppressed inflation: On the other hand suppressed inflation occurs in a controlled economy where the upward pressure on prices is not allowed to influence the quoted or managed prices. According to Milton Friedman suppressed inflation is dangerous than open inflation.
2. On the basis of degree of control
a) Creeping inflation: There is moderate rise in prices of 2-3 percent per annum in creeping inflation. It is generally considered good for a growing economy. Mildly rising prices result in faster growth of output as they raise the profit margins of firms and encourage them to produce more.
b) Walking Inflation: When price increase over a decade between 30-40 percent or at the rate of 3.4 percent per annum that inflation is also known as walking inflation.
c) Running Inflation involves more accelerated movements in prices than in case of either creeping or walking. When price are rising at the rate of about 10 percent per annum or about 100 percent in a decade, it may be treated as a state of running inflation. It is a warning signal. Suitable measures are required to take place.
d) Hyper Inflation: In these types of inflation price rise at double or triple digit rates per annum. Hyper inflation is extreme form of inflation. It seriously cripples the economy. When there is no control over running inflation, then the situation comes under hyper inflation.
3. On the basis of Degree of causes
a) Cost-Push Inflation: Aggregate supply is the total volume of goods and services produced by an economy at a given price level. When there is a decrease in the aggregate supply of goods and services stemming from an increase in the cost of production, we have cost-push inflation. Cost-push inflation basically means that prices have been "pushed up" by increases in costs of any of the four factors of production (labor, capital, land or entrepreneurship) when companies are already running at full production capacity. With higher production costs and productivity maximized, companies cannot maintain profit margins by producing the same amounts of goods and services.
b) Demand-Pull Inflation: Demand-pull inflation occurs when there is an increase in aggregate demand, categorized by the four sections of the macro economy: households, businesses, governments and foreign buyers. When these four sectors concurrently want to purchase more output than the economy can produce, they compete to purchase limited amounts of goods and services. Buyers in essence "bid prices up", again cause inflation. This excessive demand, also referred to as "too much money chasing too few goods", usually occurs in an expanding economy.
Causes of Inflation: Inflation means there is a sustained increase in the price level. The main causes of inflation are either excess aggregate demand (economic growth too fast) or cost push factors (Supply side factors). The main cause of inflation is the increase in the demand of goods and services and at the same time decrease in the supply of goods and services. 1. Demand pull inflation
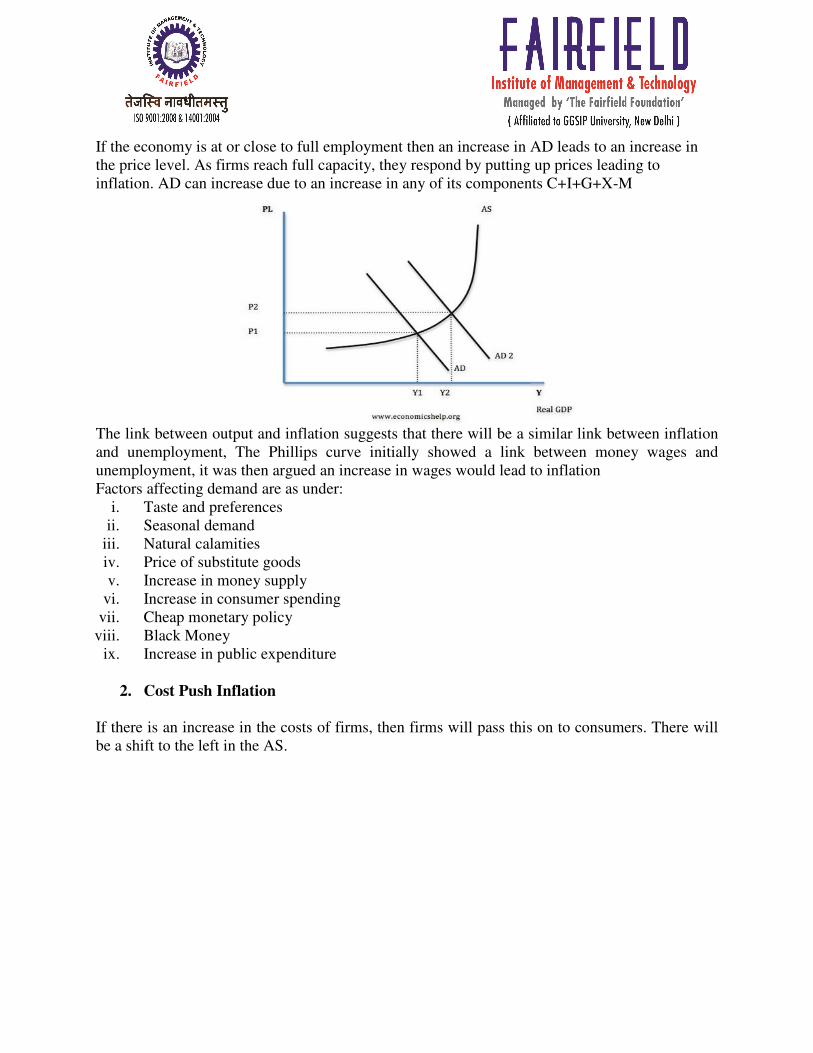
If the economy is at or close to full employment then an increase in AD leads to an increase in the price level. As firms reach full capacity, they respond by putting up prices leading to inflation. AD can increase due to an increase in any of its components C+I+G+X-M
The link between output and inflation suggests that there will be a similar link between inflation and unemployment, The Phillips curve initially showed a link between money wages and unemployment, it was then argued an increase in wages would lead to inflation Factors affecting demand are as under:
i. Taste and preferences ii. Seasonal demand
iii. Natural calamities iv. Price of substitute goods v. Increase in money supply
vi. Increase in consumer spending vii. Cheap monetary policy
viii. Black Money ix. Increase in public expenditure
2. Cost Push Inflation
If there is an increase in the costs of firms, then firms will pass this on to consumers. There will be a shift to the left in the AS.
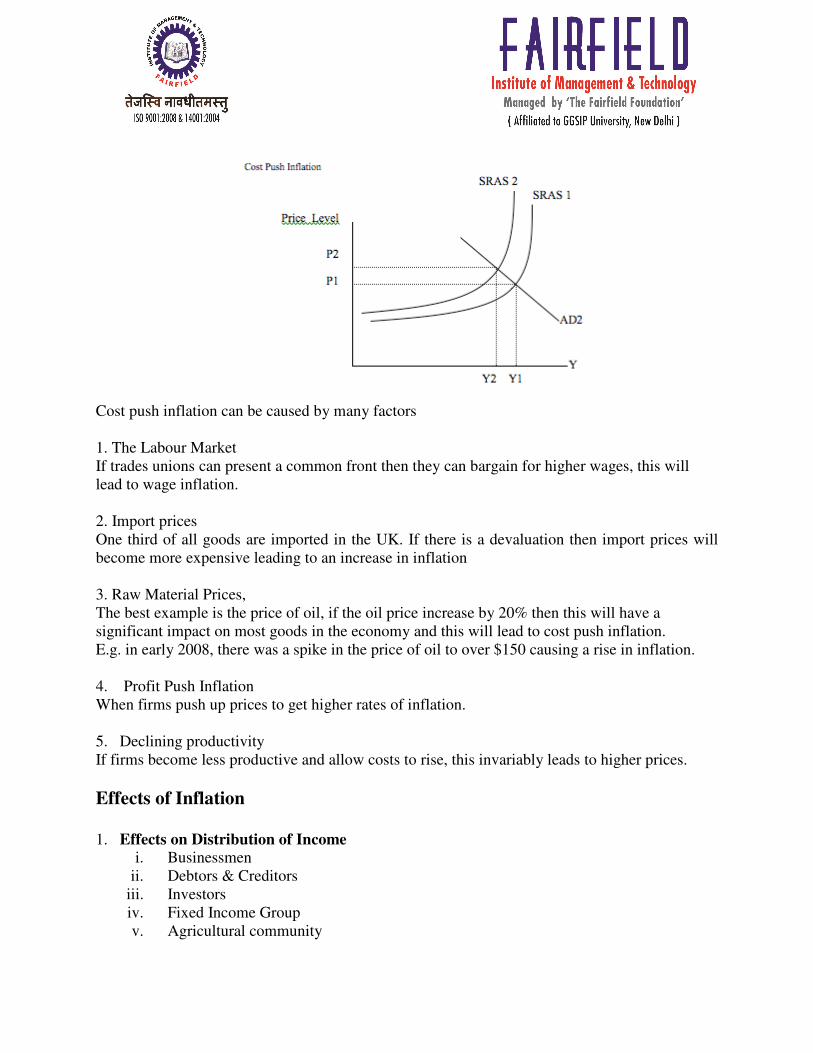
Cost push inflation can be caused by many factors 1. The Labour Market If trades unions can present a common front then they can bargain for higher wages, this will lead to wage inflation. 2. Import prices One third of all goods are imported in the UK. If there is a devaluation then import prices will become more expensive leading to an increase in inflation 3. Raw Material Prices, The best example is the price of oil, if the oil price increase by 20% then this will have a significant impact on most goods in the economy and this will lead to cost push inflation. E.g. in early 2008, there was a spike in the price of oil to over $150 causing a rise in inflation. 4. Profit Push Inflation When firms push up prices to get higher rates of inflation. 5. Declining productivity If firms become less productive and allow costs to rise, this invariably leads to higher prices.
Effects of Inflation
1. Effects on Distribution of Income
i. Businessmen ii. Debtors & Creditors
iii. Investors iv. Fixed Income Group v. Agricultural community
2. Effects on Economic Activities
i. Distortion of Price Mechanism ii. Hindrance in capital formation
iii. Uncertainty and confusion iv. Hoarding and Black Marketing v. Deterioration of quality of product
vi. Adverse effect on pattern of Investment vii. Loss of flexibility in economic system
3. Social, Political &Moral effects
Measures to control inflation 1. Monetary measures- Classical economists are of the view that inflation can be checked by controlling the supply of money. Some of the important monetary measures to check the inflation are as under:
a) Increasing Bank rate b) Sale of government securities/Open market operations c) High Reserve ratio d) Issue of new currency
2. Fiscal measures- Measures taken by the government to control inflation.
a) Decrease in public expenditure- One of the main reasons of inflation is excess public expenditure like building of roads, bridges etc. Government should drastically scale down its non essential expenditure.
b) Delay in payment of old debts: Payment of old debts that fall due should be postponed for sometime so that people may not acquire extra purchasing power.
c) Increase in taxes: Government should levy some new direct taxes and raise rates of old taxes.
d) Over valuation of money: To control the over valuation of money it is essential to encourage imports and discourage exports.
3. Other measures
a) Expansion of output b) Encouragement to saving
c) Overvaluation
d) Proper wage policy
e) Indexing
f) Population control g) Rationing

UNIT-4 Introduction to IS-LM Model Macro Economic General equilibrium is an integration of money, interest and income through the product and money markets. The integration is realized through the Hicks-Hansen diagrammatic framework known as IS-LM Model. Hicks & Hansen add the effects of interest rates on spending, and thus income and the dependence of the financial markets on income. Interest rates & income are determined jointly by equilibrium in the goods & financial markets. The IS–LM model is a macroeconomic tool that demonstrates the relationship between interest rates and real output, in the goods and services market and the money market. The intersection of the IS and LM curves is the "general equilibrium" where there is simultaneous equilibrium in both markets. IS curve represents the equality of investment & saving to show the product market equilibrium. LM curve on the other hand is the expression of the equality of money demand (L) & money supply (M) & represents the money market equilibrium. The product market equilibrium is also known as “real sector equilibrium” & the money market equilibrium is also known as “monetary sector equilibrium”.
Product Market Equilibrium Product market is in equilibrium when desired saving & investment are equal or aggregate supply (Y) is equal to aggregate demand (C+I). Assumption
a) Closed economy b) No government spending or taxes c) Consumption & saving are the function of income d) Investment is a function of rate of interest
I) Y=C+I
C= C(Y)…………(1) I= I (r)…………...(2) Y=C(Y) + I(r)……(3)
II) Y=C+S, so, I=S S=S(Y) I=I(r) S(Y) = I(r)
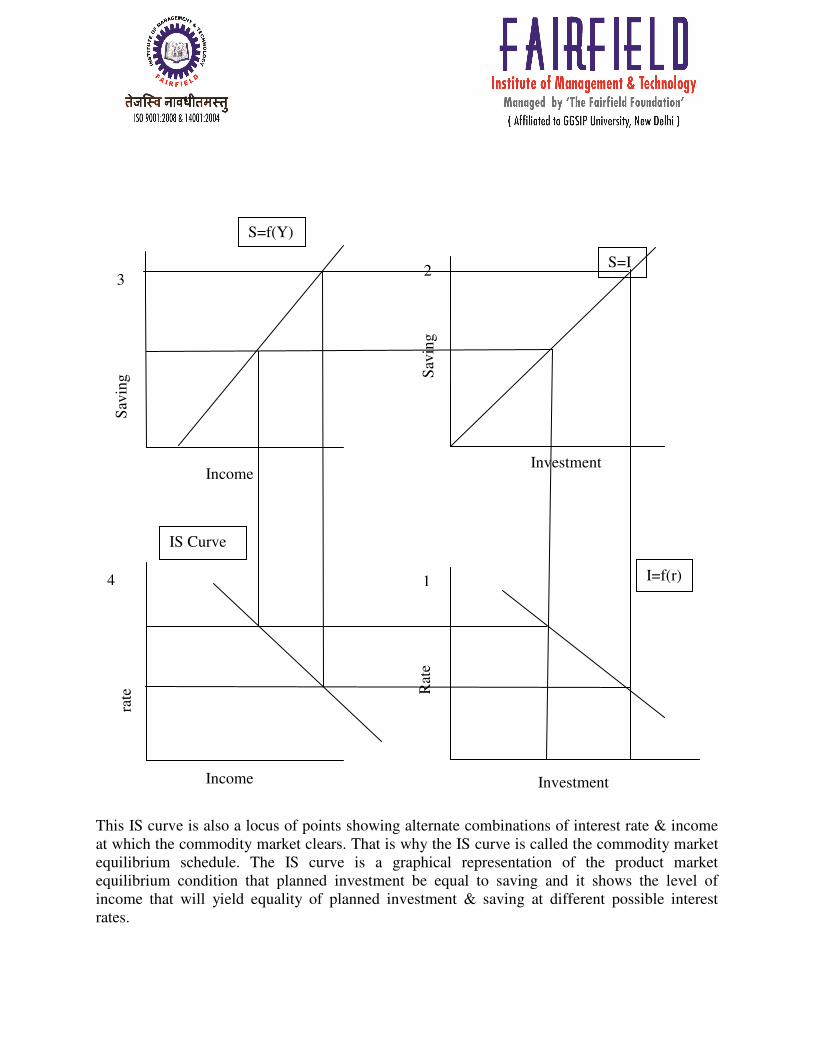
This IS curve is also a locus of points showing alternate combinations of interest rate & income at which the commodity market clears. That is why the IS curve is called the commodity market equilibrium schedule. The IS curve is a graphical representation of the product market equilibrium condition that planned investment be equal to saving and it shows the level of income that will yield equality of planned investment & saving at different possible interest rates.
3
Income
Sav
ing
Income
rate
4
Investment
Sav
ing
S=I 2
Investment
Rat
e
I=f(r) 1
S=f(Y)
IS Curve
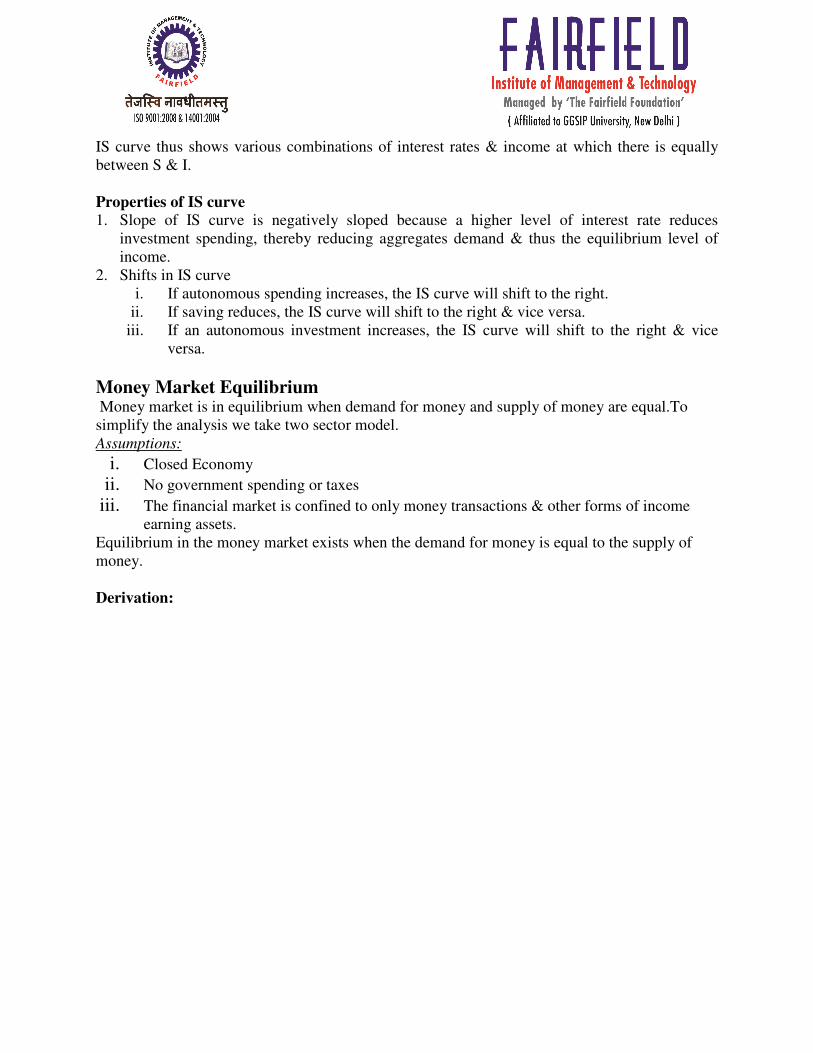
IS curve thus shows various combinations of interest rates & income at which there is equally between S & I. Properties of IS curve
1. Slope of IS curve is negatively sloped because a higher level of interest rate reduces investment spending, thereby reducing aggregates demand & thus the equilibrium level of income.
2. Shifts in IS curve i. If autonomous spending increases, the IS curve will shift to the right.
ii. If saving reduces, the IS curve will shift to the right & vice versa. iii. If an autonomous investment increases, the IS curve will shift to the right & vice
versa.
Money Market Equilibrium Money market is in equilibrium when demand for money and supply of money are equal.To simplify the analysis we take two sector model. Assumptions:
i. Closed Economy ii. No government spending or taxes
iii. The financial market is confined to only money transactions & other forms of income earning assets.
Equilibrium in the money market exists when the demand for money is equal to the supply of money. Derivation:
Properties of LM curve:
i. The slope of LM curve: The LM curve is positively sloped. This means that an increase in the interest rate reduces the demand for money.
ii. The Shift of the LM curve: The money supply is held constant along the LM curve. It follows that a change in the money supply shifts the LM curve.
MONETARY POLICY
Instruments
Monetary Policy means the policy by which the government of a country and the central bank try to control the supply of the money and the availability of credit in the system , with a view to achieve economic stability. There are two instruments of monetary policy:- 1. Quantitative instruments 2. Qualitative instruments. Qualitative
The qualitative measures do not regulate the total amount of credit created by the commercial banks. These measures make distinction between good credit and bad credit and regulate only such credit, which creates economic instability. Therefore, qualitative measures are known as the selective measures of credit control. Qualitative credit control measures include: (i) Change in margin requirements (ii) Consumer credit regulation (iii) Moral suasion (iv) Direct action (i) Change in margin requirements
Generally, commercial banks give loan against ‘stocks or ‘securities’. While giving loans against stocks or securities they keep margin. Margin is the difference between the market value of a security and its maximum loan valueIf central bank feels that prices of some goods are rising due to the speculative activities of businessmen and traders of such goods, it wants to discourage the flow of credit to such speculative activities. Therefore, it increases the margin requirement in case of borrowing for speculative business and thereby discourages borrowing. This leads to reduction is money supply for undertaking speculative activities and thus inflationary situation is arrested. On other contrary, central bank can encourage borrowing from the commercial banks by reducing the margin requirement. When there is a grater flow of credit to different business activities, investment is increased. Income of the people rises. Demand for goods expands and deflationary situation is controlled.
(ii) Consumer credit regulation:
Now-a-days, most of the consumer durables like T.V., Refrigerator, Motorcar, etc. are available on installment basis financed through bank credit. Such credit made available by commercial banks for the purchase of consumer durables is known as consumer credit. If there is excess demand for certain consumer durables leading to their high prices, central bank can reduce consumer credit by (a) increasing down payment, and (b) reducing the number of installments of repayment of such credit. On the other hand, if there is deficient demand for certain specific commodities causing deflationary situation, central bank can increase consumer credit by (a) reducing down payment and (b) increasing the number of installments of repayment of such credit. (iii) Moral suasion:
Moral suasion means persuasion and request. To arrest inflationary situation central bank pursuades and request the commercial banks to refrain from giving loans for speculative and non-essential purposes. On the other hand, to counteract deflation central bank pursuades the commercial banks to extend credit for different purposes. Central bank also appeals commercial banks to extend their wholehearted co-operation to achieve the objectives of monetary policy. Being the monetary authority directions of the central bank are usually followed by commercial banks. (iv) Direct Action:
This method is adopted when a commercial bank does not co-operate the central bank in achieving its desirable objectives. Direct action may take any of the following forms: Central banks may charge a penal rate of interest over and above the bank rate upon the defaulting banks; Central bank may refuse to rediscount the bills of those banks which are not following its directives; Central bank may refuse to grant further accommodation to those banks whose borrowings are in excess of their capital and reserves. Quantitative instruments
Quantitative instruments broadly include the following:- 1. Bank rate: it is the rate at which the central bank of a country is prepared to give credit to the commercial banks. Increase in bank rate increases the interest rates, and demand for credit gets reduced. On the other hand decrease in bank rate lowers the rate of interest and credit becomes cheap, and demand for credit expands.
2. Open market operations: It refers to purchase and sale of securities in the open market by the central bank. By selling the securities, central bank reduces the purchasing power of the system. 3. Change in minimum reserve ratio: Minimum reserve ratio refers to the minimum percentage of a bank total deposit which is required to be kept with the central bank. All the banks have to keep with the central bank a certain percentage of their deposits in the form of cash reserve ratio 4. Change in liquidity ratio: Every bank is required to maintain a fixed percentage of its assets in the form of cash or other liquid assets called liquidity ratio. With a view to reducing the flow of credit, in the market central bank enhances the liquidity ratio. However in case of expansion of credit liquidity ratio is reduce. Objectives of Monetary Policy
The objectives of a monetary policy in India are similar to the objectives of its five year plans. In a nutshell planning in India aims at growth, stability and social justice. After the Keynesian revolution in economics, many people accepted significance of monetary policy in attaining following objectives. Let us now see objectives of monetary policy in detail :- 1. Rapid Economic Growth : It is the most important objective of a monetary policy. The
monetary policy can influence economic growth by controlling real interest rate and its resultant impact on the investment. If the RBI opts for a cheap or easy credit policy by reducing interest rates, the investment level in the economy can be encouraged. This increased investment can speed up economic growth. Faster economic growth is possible if the monetary policy succeeds in maintaining income and price stability.
2. Price Stability: All the economics suffer from inflation and deflation. It can also be called as Price Instability. Inflation are harmful to the economy. Thus, the monetary policy having an objective of price stability tries to keep the value of money stable. It helps in reducing the income and wealth inequalities. When the economy suffers from recession the monetary policy should be an 'easy money policy' but when there is inflationary situation there should be a 'dear money policy'.
3. Exchange Rate Stability: Exchange rate is the price of a home currency expressed in terms of any foreign currency. If this exchange rate is very volatile leading to frequent ups and downs in the exchange rate, the international community might lose confidence in our economy. The monetary policy aims at maintaining the relative stability in the exchange rate. The RBI by altering the foreign exchange reserves tries to influence the demand for foreign exchange and tries to maintain the exchange rate stability.
4. Balance of Payments (BOP) Equilibrium: Many developing countries like India suffers from the Disequilibrium in the BOP. The Reserve Bank of India through its monetary policy tries to maintain equilibrium in the balance of payments. The BOP has two aspects i.e. the 'BOP Surplus' and the 'BOP Deficit'. The former reflects an excess money supply in the domestic economy, while the later stands for stringency of money. If the monetary policy succeeds in maintaining monetary equilibrium, then the BOP equilibrium can be achieved.
5. Full Employment: It refers to absence of involuntary unemployment. In simple words 'Full
Employment' stands for a situation in which everybody who wants jobs get jobs. However it does not mean that there is a Zero unemployment. In that senses the full employment is never full. Monetary policy can be used for achieving full employment. If the monetary policy is expansionary then credit supply can be encouraged. It could help in creating more jobs in different sector of the economy.
6. Neutrality of Money: Economist such as Wicksted, Robertson have always considered money as a passive factor. According to them, money should play only a role of medium of exchange and not more than that. Therefore, the monetary policy should regulate the supply of money. The change in money supply creates monetary disequilibrium. Thus monetary policy has to regulate the supply of money and neutralize the effect of money expansion. However this objective of a monetary policy is always criticized on the ground that if money supply is kept constant then it would be difficult to attain price stability.
7. Equal Income Distribution: Many economists used to justify the role of the fiscal policy is maintaining economic equality. However in resent years economists have given the opinion that the monetary policy can help and play a supplementary role in attainting an economic equality. monetary policy can make special provisions for the neglect supply such as agriculture, small-scale industries, village industries, etc. and provide them with cheaper credit for longer term. This can prove fruitful for these sectors to come up. Thus in recent period, monetary policy can help in reducing economic inequalities among different sections of society.
Limitations of Monetary policy
1. Lack of cooperation by commercial banks 2. Unorganized sector 3. Lack of banking habits of people 4. Problem in forecasting of Inflation and deflation 5. Time lag
FISCAL POLICY Fiscal Policy refers to the methods employed by the government to influence and monitor the economy by adjusting taxes and/or public spending. In doing so, the government aims to find a balance between lowering unemployment and reducing the inflation rate. The main tools of Fiscal Policy are changes in the composition of taxation and government spending. Definitions
“By fiscal policy we denote to government actions afflicting its receipts and outlays which are ordinarily taken as measured by the government’s receipts, its surplus or deficit.” “A policy under which the government uses its outlay and revenue programmes to produce desirable effects and avoid undesirable effects on the national earnings, manufacturing and employment.” Otto Eckstein defines fiscal policy as “changes in taxes and expenditures which aim at short run goals of full employment and price level stability.”
Objectives of Fiscal Policy
The following are the objectives – 1. To uphold and accomplish full employment. 2. To alleviate the price level. 3. To soothe the development rate of financial system. 4. To sustain symmetry in the balance of payment. 5. To endorse the monetary development of under developed nations.
Instruments of Fiscal Policy:
Following are the main instruments of fiscal policy: 1. Public Expenditure
Public Expenditure means expenditure incurred by the government of a country. It generates sufficient influence on aggregate demand and development activities of a country. The expenditure can be of two types:
I. Expenditure incurred by the government to get goods and services. It directly influences aggregate demand.
II. Public expenditure incurred on pensions, scholarships, educational and medical facilities to people etc. This expenditure is known as Transfer Payment. It also raises aggregate demand.
2. Taxation
Modern states are welfare oriented states and they have to use money to achieve this end. Tax is the main source to acquire money. Aggregate demand can also be influenced by taxes. Government collects money by imposing different taxes to finance public expenditure and to manage various development activities. Mainly, taxes can be classified into two groups-
I. Direct Tax: Direct tax reduces the income of the people and a part of their income goes into the government treasury.
II. Indirect Tax: Indirect taxes lead to a rise in prices of goods. Both direct and indirect taxes lead to the reduction in aggregate demand.
3. Public Debt
The third instrument of fiscal policy is public debt. Public debt means debt taken by the government from people or from the governments of other countries. The government has to take the help of public debt if public expenditure exceeds public revenue. Public debt can be of two types: Internal and External.
4. Deficit Financing
A public expenditure has to be incurred for economic development. This amount can be collected only through the public debt, taxation etc. So deficit financing has to be introduced. When there emerges a deficit due to excess of public expenditure over public revenue, this deficit is met with either by borrowing from the central bank or by issuing new notes. Deficit financing can be used to meet government expenditure. It increases aggregate demand.
References:
Books:
1. Dwivedi, D. N., (2005) Macro Economics, McGraw Hill Education. 2. Dr. Kumar Raj, Gupta Kuldip, (2009) Business Economics-II (Macro), UDH publishers 3. Jain T.R., Ohri V.K., (2009) Principal of Macro Economics, VK Publication 4. Agarwal, ((2010)) Macroeconomics Theory and Policy, 1st edition, Pearson Education.
Websites:
1. Www.google.com 2. Www.wikipedia.org 3. www.investopedia.com 4. www.economics.about.com 5. www.preservearticles.com 6. www.studymode.com


