Embed Size (px)
Citation preview
1
SUPPORTING INFORMATION
Batteries for lithium recovery from brines
Mauro Pasta†, Alberto Battistel
† and Fabio La Mantia
Analytische Chemie – Zentrum für Elektrochemie, Ruhr-Universität Bochum, Universitätsstr.
150, D-44780 Bochum, Germany.
† These two authors equally contributed to the manuscript
Corresponding author [email protected]
Electronic Supplementary Material (ESI) for Energy & Environmental ScienceThis journal is © The Royal Society of Chemistry 2012
2
1. Electrochemical Thermodynamics details
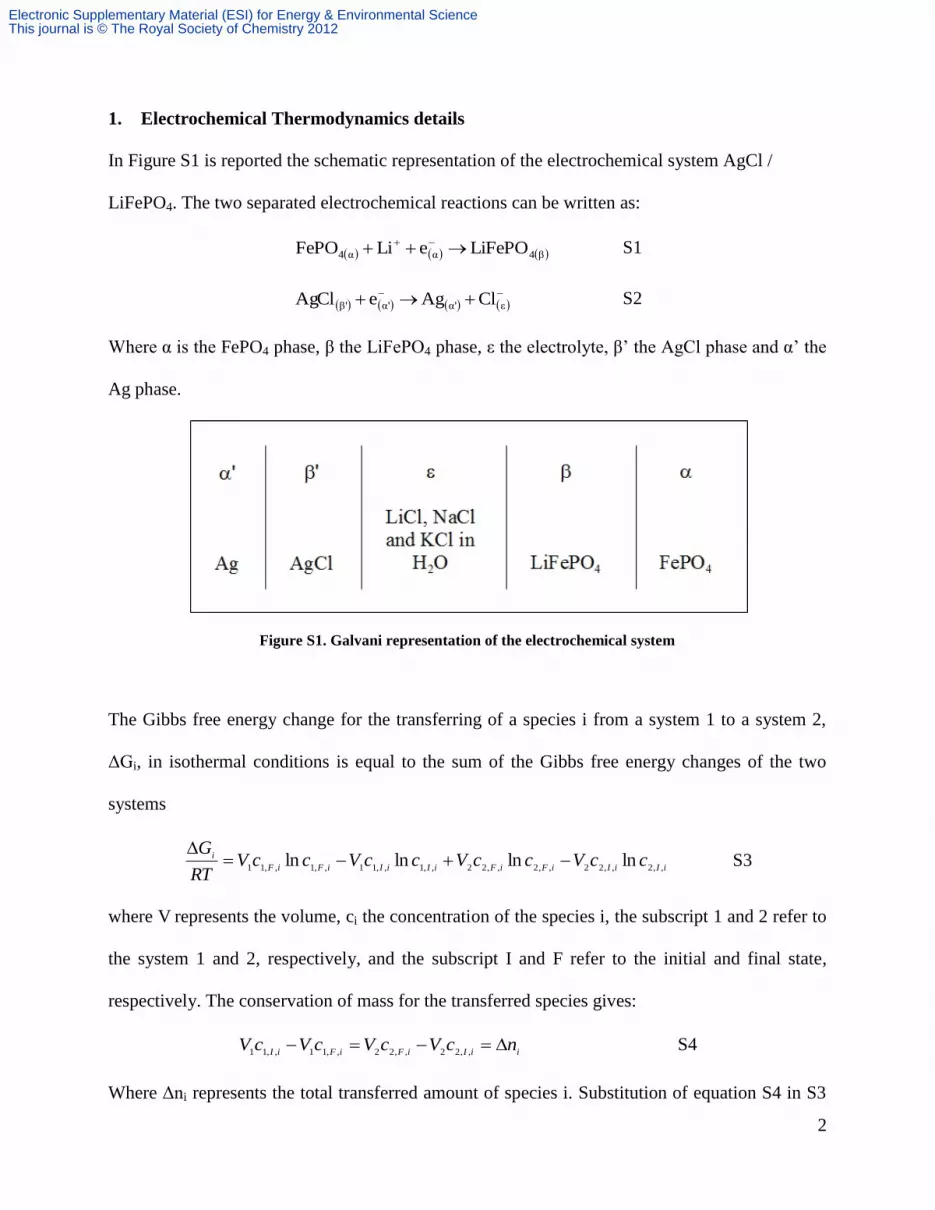
In Figure S1 is reported the schematic representation of the electrochemical system AgCl /
LiFePO4. The two separated electrochemical reactions can be written as:
β4αα4 LiFePOeLiFePO S1
εα'α'β' ClAgeAgCl S2
Where α is the FePO4 phase, β the LiFePO4 phase, ε the electrolyte, β’ the AgCl phase and α’ the
Ag phase.
Figure S1. Galvani representation of the electrochemical system
The Gibbs free energy change for the transferring of a species i from a system 1 to a system 2,
ΔGi, in isothermal conditions is equal to the sum of the Gibbs free energy changes of the two
systems
iIiIiFiFiIiIiFiF
i ccVccVccVccVRT
G,,2,,22,,2,,22,,1,,11,,1,,11
lnlnlnln
S3
where V represents the volume, ci the concentration of the species i, the subscript 1 and 2 refer to
the system 1 and 2, respectively, and the subscript I and F refer to the initial and final state,
respectively. The conservation of mass for the transferred species gives:
iiIiFiFiIncVcVcVcV
,,22,,22,,11,,11 S4
Where Δni represents the total transferred amount of species i. Substitution of equation S4 in S3
Electronic Supplementary Material (ESI) for Energy & Environmental ScienceThis journal is © The Royal Society of Chemistry 2012
3
and straightforward mathematical manipulation gives:
iF
iF
i
iI
iF
iI
iI
iF
iI
i
c
cn
c
ccV
c
ccV
RT
G
,,1
,,2
,,2
,,2
,,22
,,1
,,1
,,11lnlnln
S5
If the total transferred amount of species i is small with respect to its initial amount in system 1
and big with respect to its initial amount in the system 2, then equation S5 can be simplified with
the following formula:
ec
cn
RT
G
iF
iF
i
i
,,1
,,2ln S6
If more species are transferred, the total change in Gibbs free energy is the sum of the individual
ΔGi’s. It is important to mention that equation S6 shows in particular that the process of
transferring is thermodynamically favoured until the final concentration in the system 2 is lower
than “e” times the final concentration in the system 1. In plain words, no energy is required to
concentrate twofold a species, if only a small amount is transferred and V1 >> V2. These
conditions are fulfilled in our experiments. The theoretical required energy was calculated using
equation S6 for Li+, Na
+, and Cl
-, and the results was normalized by the amount of recovered
lithium.
2. Calculation of the energy from the integral area
The real energy spent during the experiments was calculated normalizing the integral area in the
E vs. q graph by the amount of recovered lithium. In this graph the length of the Li+ capture
and release steps have been matched, in fact the capture step lasted always for 2 hours, which
correspond to a charge of -2 mAh, but the third step (ion release) had a lower length. As
consequence, part of the charge transferred in the first step is lost. This lost is equivalent to circa
0.35 mAh, which corresponds to circa 17% of the total charge exchanged in the first step. The
Electronic Supplementary Material (ESI) for Energy & Environmental ScienceThis journal is © The Royal Society of Chemistry 2012
4
origin of the difference between in charge between the capturing and releasing step is not yet
clear and subject to further study.
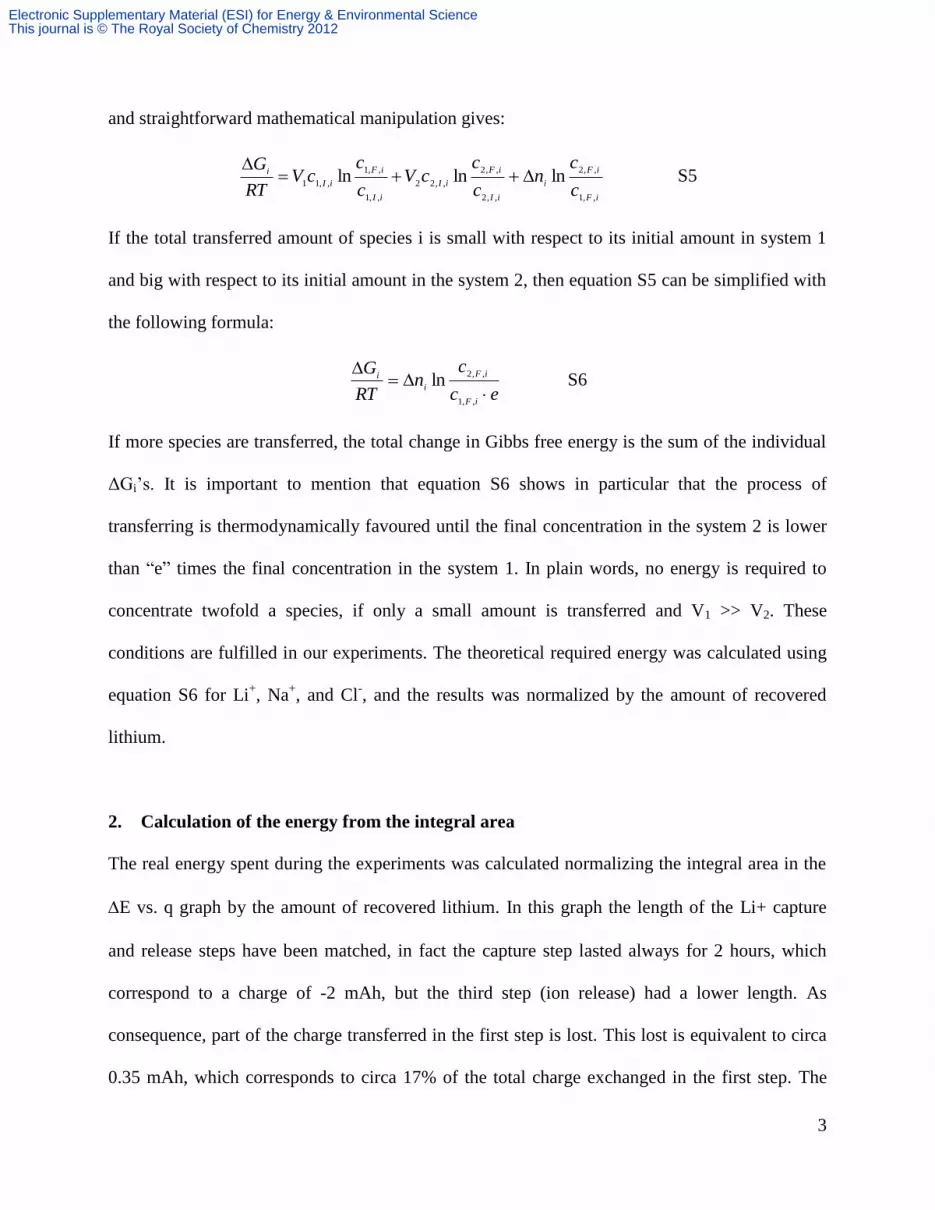
3. Water analysis
At the end of the second step a sample of solution of circa 200 µl was analysed. These samples
were analyzed by the Wessling Laboratorien GmbH by ICP (Inductively Coupled Plasma).
Abbreviations and methods ISO Certification Executive location
Metals / elements in water (ICP-
OES / ICP-MS)
ISO 11885 / ISO 17294-2A Environmental Analysis
Altenberge
Sulfate in water EN ISO 10304 D19/D20A Environmental Analysis
Bochum
Chloride in water EN ISO 10304-1A Environmental Analysis
Bochum
The solution of the recovery cell contained 50 mM KCl plus the ions, Li+, Na
+ and Cl
- released
during the experiment. For this reason the K+ was used as inner standard. The results were
normalized by the amount of K+ and presented as concentration in the recovery cell at the end of
the experiment.
4. Electrode preparation and electrochemical characterization
The electrodes were composed by a carbon cloth (CC AvCarb 1071 HCB, Fuel Cell Earth)
current collector of 5x1 cm2, covered by drop casting with a slurry on a geometrical surface of
2x1 cm2. CC was used to avoid any corrosion problems due to the very aggressive environment.
Two mixtures were prepared: the first based on LiFePO4 (80% w.t), Super-P (10% wt.) and PVdF
(10% wt.) for the LiFePO4 (LFP) electrodes; the second based on Ag particles (85% wt.), Super-P
Electronic Supplementary Material (ESI) for Energy & Environmental ScienceThis journal is © The Royal Society of Chemistry 2012

5
(7% wt.) and PVdF (8% wt.) for the Ag electrodes. N-methyl pirrolidone was added to the
mixtures and the resulting slurries were stirred overnight. The drop casted slurries were dried in
oven at 100 °C for 1 hour. The final mass loadings for LFP and Ag electrodes are around 20-25
mg/cm2 and 30-40 mg/cm
2 of active material, respectively.
The electrochemical characterization was carried out in a three electrode cell with Ag|AgCl|KCl
(3 M) electrode as reference electrode (RE) through galvanostatic cycling. In the case of LFP
electrode, the counter electrode was another LFP electrode with higher loading, which was acting
as a source/sink of lithium ions. The CE for the Ag electrode was a platinum wire. The LFP
electrode was cycled in a 0.5 M Li2SO4 solution between 0.05 and 0.5 V at a current intensity of
1 mA. The Ag electrode was cycled also with a current intensity of 1 mA in the potential range
from -0.150 to 0.150 V. Before starting the lithium recovery cycle the LFP electrode was
oxidized (lithium was removed) with 1 mA current up to 0.5 V. On the other hand the Ag
electrode needed to be reduced (chlorides removed) until -0.150 V and afterwards charged with 2
mA for 15 minutes. In this way the LFP electrode was completely delithiated and therefore ready
to start the lithium recovery with the first step (capturing of lithium ions); on the other side on the
Ag electrode the small amount of AgCl deposited was acting as a charge buffer.
Electronic Supplementary Material (ESI) for Energy & Environmental ScienceThis journal is © The Royal Society of Chemistry 2012
6
Figure S2. Electrochemical characterization of the LFP electrode in 0.25 M Li2SO4.
The Figure S2 presents the electrochemical characterization of the LFP electrode. It is possible to
observe the plateau at circa 0.2 V and its reversibility. As expected, there are no other plateaus
until 0.5 V.
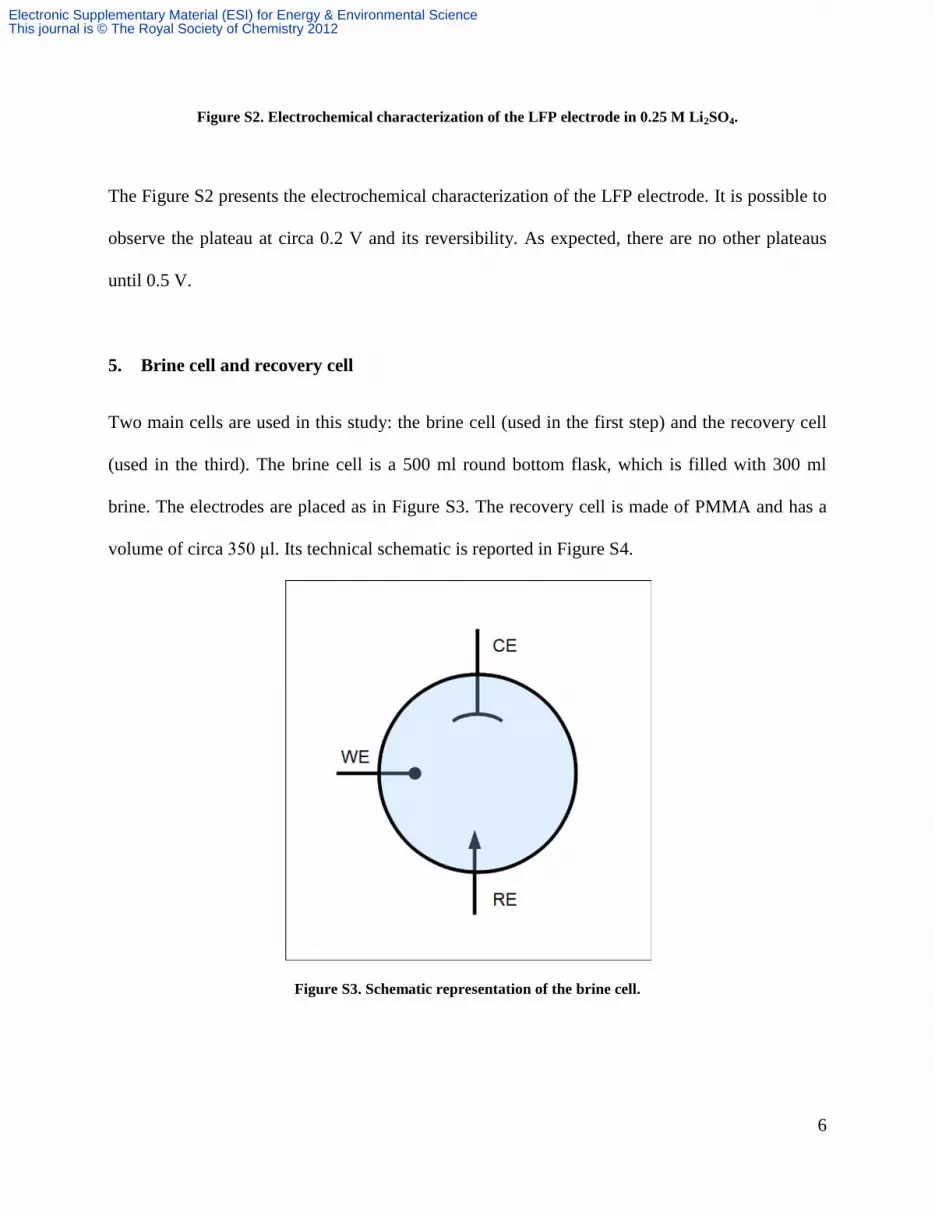
5. Brine cell and recovery cell
Two main cells are used in this study: the brine cell (used in the first step) and the recovery cell
(used in the third). The brine cell is a 500 ml round bottom flask, which is filled with 300 ml
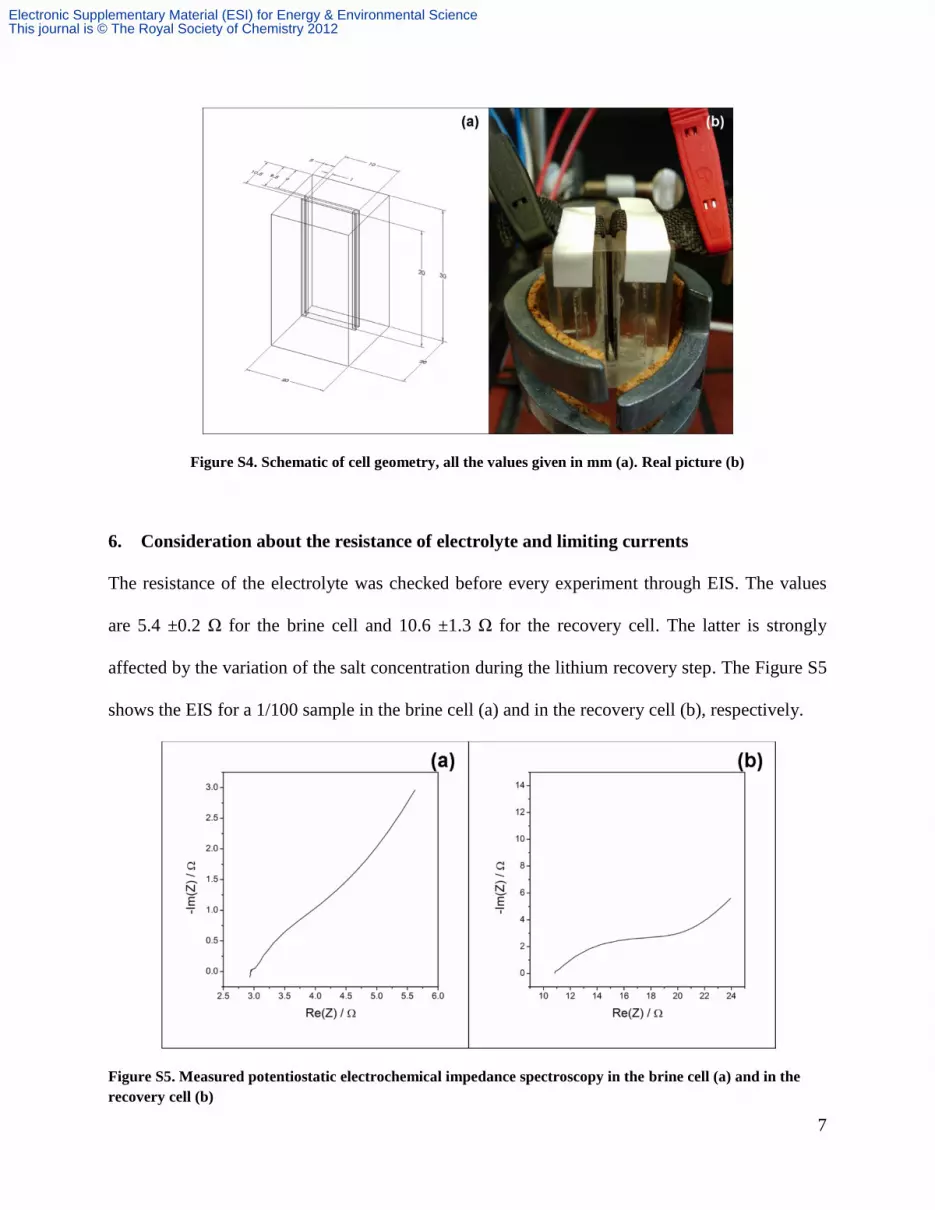
brine. The electrodes are placed as in Figure S3. The recovery cell is made of PMMA and has a
volume of circa 350 μl. Its technical schematic is reported in Figure S4.
Figure S3. Schematic representation of the brine cell.
Electronic Supplementary Material (ESI) for Energy & Environmental ScienceThis journal is © The Royal Society of Chemistry 2012
7
Figure S4. Schematic of cell geometry, all the values given in mm (a). Real picture (b)
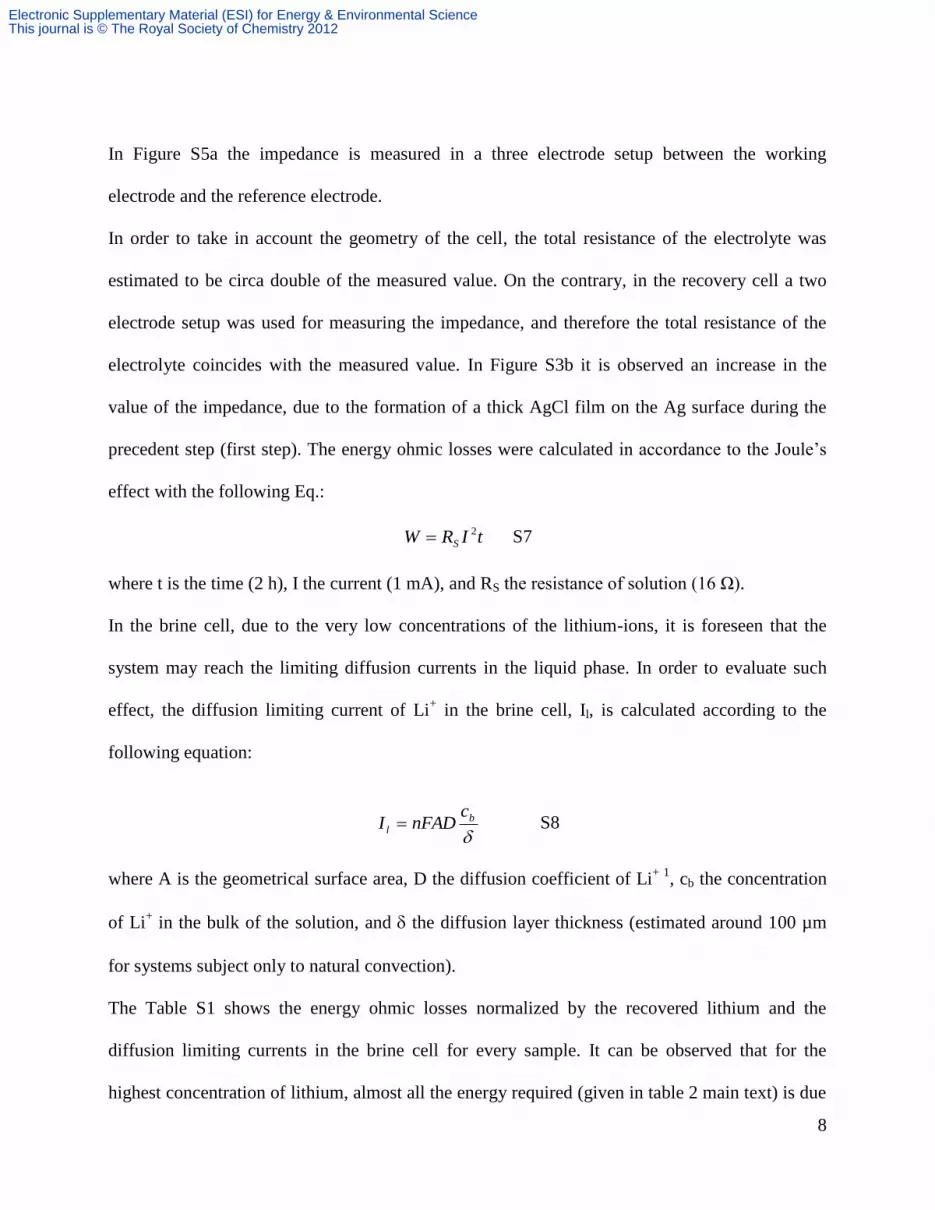
6. Consideration about the resistance of electrolyte and limiting currents
The resistance of the electrolyte was checked before every experiment through EIS. The values
are 5.4 ±0.2 Ω for the brine cell and 10.6 ±1.3 Ω for the recovery cell. The latter is strongly
affected by the variation of the salt concentration during the lithium recovery step. The Figure S5
shows the EIS for a 1/100 sample in the brine cell (a) and in the recovery cell (b), respectively.
Figure S5. Measured potentiostatic electrochemical impedance spectroscopy in the brine cell (a) and in the
recovery cell (b)
Electronic Supplementary Material (ESI) for Energy & Environmental ScienceThis journal is © The Royal Society of Chemistry 2012
8
In Figure S5a the impedance is measured in a three electrode setup between the working
electrode and the reference electrode.
In order to take in account the geometry of the cell, the total resistance of the electrolyte was
estimated to be circa double of the measured value. On the contrary, in the recovery cell a two
electrode setup was used for measuring the impedance, and therefore the total resistance of the
electrolyte coincides with the measured value. In Figure S3b it is observed an increase in the
value of the impedance, due to the formation of a thick AgCl film on the Ag surface during the
precedent step (first step). The energy ohmic losses were calculated in accordance to the Joule’s
effect with the following Eq.:
tIRW S
2
S7
where t is the time (2 h), I the current (1 mA), and RS the resistance of solution (16 Ω).
In the brine cell, due to the very low concentrations of the lithium-ions, it is foreseen that the
system may reach the limiting diffusion currents in the liquid phase. In order to evaluate such
effect, the diffusion limiting current of Li+ in the brine cell, Il, is calculated according to the
following equation:
b
l
cnFADI S8
where A is the geometrical surface area, D the diffusion coefficient of Li+ 1
, cb the concentration
of Li+ in the bulk of the solution, and the diffusion layer thickness (estimated around 100 µm
for systems subject only to natural convection).
The Table S1 shows the energy ohmic losses normalized by the recovered lithium and the
diffusion limiting currents in the brine cell for every sample. It can be observed that for the
highest concentration of lithium, almost all the energy required (given in table 2 main text) is due
Electronic Supplementary Material (ESI) for Energy & Environmental ScienceThis journal is © The Royal Society of Chemistry 2012

9
to the ohmic losses, while the limiting diffusion current becomes important already in the 1/1000
sample, and critical for lower concentrations.
Li/Na ratio W / Wh mol-1
Li+ Il / mA
1/100 0.8 10
1/1000 1.8 1
1/10000 3.4 0.15
0/1 3.8 0.05
Table S1. Ohmic loss calculated from the Eq. S7 and diffusion limiting current calculated from the Eq. S8.
7. Materials
NaCl: BioXtra, ≥99.5% (Sigma-Aldrich) 5 ppm Li
LiCl: Granular, BAKER ANALYZED ACS Reagent ≥99%
Polyvinylidene difluoride (PVdF): Solvay Solexis SolefS 6020 or SolefS 1013
Super-P C65: Timcal
LiFe(PO)4 (LFP): MTI Corporation EQ-Lib-LFPO
N-Methyl-2-pyrrolidone (NMP): ACS reagent, ≥99.0% (Sigma-Aldrich)
Artificial Brine solution: saturated NaCl, 50 mM PB, pH 8.0
Carbon cloth: AvCarb 1071 HCB, Fuel Cell Earth
Silver particle: Silver powder, spherical, APS 0.5-1 micron, 99.9% (metals basis), Alfa Aesar
References
1. K. Tanaka and M. Nomura, J. Chem. Soc., Faraday Trans. 1, 1987, 83, 1779–1782.
Electronic Supplementary Material (ESI) for Energy & Environmental ScienceThis journal is © The Royal Society of Chemistry 2012


![Electrochemical Performance of Sol-Gel Synthesized LiFePO[sub 4] in Lithium Batteries](https://img.dokumen.tips/doc/110x75/635402d5bc468263680e60ee/electrochemical-performance-of-sol-gel-synthesized-lifeposub-4-in-lithium-batteries.jpg)


