Embed Size (px)
Citation preview
Journal of Affective Disorders 146 (2013) 158–173
Contents lists available at SciVerse ScienceDirect
Journal of Affective Disorders
0165-03
http://d
n Corr
E-m
journal homepage: www.elsevier.com/locate/jad
Review
Baseline respiratory parameters in panic disorder: A meta-analysis
Massimiliano Grassi a,n, Daniela Caldirola a, Giovanna Vanni a, Giuseppe Guerriero a,Monica Piccinni a, Alessandro Valchera b, Giampaolo Perna a,c,d
a Department of Clinical Neurosciences, Villa San Benedetto Hospital, Hermanas Hospitalarias, FoRiPsi, Albese con Cassano (Co), Italyb Villa San Giuseppe Hospital, Hermanas Hospitalarias, Ascoli Piceno, Italyc Department of Psychiatry and Neuropsychology, Faculty of Health, Medicine and Life Sciences, University of Maastricht (NL), The Netherlandsd Leonard M. Miller School of Medicine, University of Miami, USA
a r t i c l e i n f o
Article history:
Received 10 July 2012
Received in revised form
21 August 2012
Accepted 21 August 2012Available online 27 October 2012
Keywords:
Panic disorder
Respiration
Meta-analysis
27/$ - see front matter & 2012 Elsevier B.V. A
x.doi.org/10.1016/j.jad.2012.08.034
esponding author. Tel.:þ39 031 4291511; fa
ail address: [email protected] (M. Grassi)
a b s t r a c t
Background: The presence of abnormalities in baseline respiratory function of subjects with panic
disorder (PD) is expected according to PD respiratory theories. We aimed to meta-analyze results from
studies comparing baseline respiratory and hematic parameters related to respiration between subjects
with PD and controls.
Methods: A literature research in bibliographic databases was performed. Fixed-effects models were
applied for all parameters while random-effects models only when suitable (at least 10 independent
studies). Several moderator analyses and publication bias diagnostics were performed.
Results: We found significantly higher mean minute ventilation and lower et-pCO2 in subjects with PD
than controls. Moreover we also found evidences of reduced HCO3� and PO4
� hematic concentrations,
higher indexes of respiratory variability/irregularity and higher rate of sighs and apneas. Evidence of
heterogeneity was partly explained by moderator analyses. No relevant publication bias was found.
Limitations: Several shortcomings affected the included studies, such as over-inclusive recruitment
criteria, samples unbalanced for socio-demographic characteristics, lack of statistical details and small
number of studies available for several parameters.
Discussion: Our results support the idea of abnormalities in respiratory function of subjects with PD.
Compared to controls, they showed baseline hyperventilation; the results from hematic parameters
suggest that hyperventilation may be chronic and not simply caused by their high anxiety levels during
respiratory assessment. Evidences of higher variability and irregularity in respiratory patterns of
subjects with PD were also found. It is unclear to what extent the higher rate of sighs and apneas may
explain the other baseline respiratory abnormalities found in PD.
& 2012 Elsevier B.V. All rights reserved.
Contents
1. Introduction . . . . . . . . . . . . . . . . . . . . . . . . . . . . . . . . . . . . . . . . . . . . . . . . . . . . . . . . . . . . . . . . . . . . . . . . . . . . . . . . . . . . . . . . . . . . . . . . . . . . . . 159
2. Methods . . . . . . . . . . . . . . . . . . . . . . . . . . . . . . . . . . . . . . . . . . . . . . . . . . . . . . . . . . . . . . . . . . . . . . . . . . . . . . . . . . . . . . . . . . . . . . . . . . . . . . . . . 159
2.1. Inclusion criteria . . . . . . . . . . . . . . . . . . . . . . . . . . . . . . . . . . . . . . . . . . . . . . . . . . . . . . . . . . . . . . . . . . . . . . . . . . . . . . . . . . . . . . . . . . . . 159
2.2. Search procedures . . . . . . . . . . . . . . . . . . . . . . . . . . . . . . . . . . . . . . . . . . . . . . . . . . . . . . . . . . . . . . . . . . . . . . . . . . . . . . . . . . . . . . . . . . . 160
2.3. Effect-sizes calculation and coding of studies. . . . . . . . . . . . . . . . . . . . . . . . . . . . . . . . . . . . . . . . . . . . . . . . . . . . . . . . . . . . . . . . . . . . . . 160
2.4. Meta-analytic statistics . . . . . . . . . . . . . . . . . . . . . . . . . . . . . . . . . . . . . . . . . . . . . . . . . . . . . . . . . . . . . . . . . . . . . . . . . . . . . . . . . . . . . . . 160
3. Results . . . . . . . . . . . . . . . . . . . . . . . . . . . . . . . . . . . . . . . . . . . . . . . . . . . . . . . . . . . . . . . . . . . . . . . . . . . . . . . . . . . . . . . . . . . . . . . . . . . . . . . . . . 161
3.1. Included studies . . . . . . . . . . . . . . . . . . . . . . . . . . . . . . . . . . . . . . . . . . . . . . . . . . . . . . . . . . . . . . . . . . . . . . . . . . . . . . . . . . . . . . . . . . . . . 161
3.2. Computation of effect size and coding of studies . . . . . . . . . . . . . . . . . . . . . . . . . . . . . . . . . . . . . . . . . . . . . . . . . . . . . . . . . . . . . . . . . . . 161
3.3. Meta-analysis of respiratory parameters comparing patients with PD and control groups . . . . . . . . . . . . . . . . . . . . . . . . . . . . . . . . . . 161
3.3.1. Mean respiratory parameters . . . . . . . . . . . . . . . . . . . . . . . . . . . . . . . . . . . . . . . . . . . . . . . . . . . . . . . . . . . . . . . . . . . . . . . . . . . 163
3.3.2. Within-subject standard deviations of the respiratory parameters . . . . . . . . . . . . . . . . . . . . . . . . . . . . . . . . . . . . . . . . . . . . . . 163
3.3.3. Indexes of irregularity of the respiratory parameters. . . . . . . . . . . . . . . . . . . . . . . . . . . . . . . . . . . . . . . . . . . . . . . . . . . . . . . . . 165
3.3.4. Rates of apneas and sighs . . . . . . . . . . . . . . . . . . . . . . . . . . . . . . . . . . . . . . . . . . . . . . . . . . . . . . . . . . . . . . . . . . . . . . . . . . . . . . 165
ll rights reserved.
x þ39 031 427246.
.
M. Grassi et al. / Journal of Affective Disorders 146 (2013) 158–173 159
3.3.5. Hematic parameters . . . . . . . . . . . . . . . . . . . . . . . . . . . . . . . . . . . . . . . . . . . . . . . . . . . . . . . . . . . . . . . . . . . . . . . . . . . . . . . . . . . 165
3.4. Heterogeneity and moderator analysis . . . . . . . . . . . . . . . . . . . . . . . . . . . . . . . . . . . . . . . . . . . . . . . . . . . . . . . . . . . . . . . . . . . . . . . . . . . 165
3.5. Publication bias . . . . . . . . . . . . . . . . . . . . . . . . . . . . . . . . . . . . . . . . . . . . . . . . . . . . . . . . . . . . . . . . . . . . . . . . . . . . . . . . . . . . . . . . . . . . . 168
4. Discussion . . . . . . . . . . . . . . . . . . . . . . . . . . . . . . . . . . . . . . . . . . . . . . . . . . . . . . . . . . . . . . . . . . . . . . . . . . . . . . . . . . . . . . . . . . . . . . . . . . . . . . . 169
4.1. Mean respiratory parameters . . . . . . . . . . . . . . . . . . . . . . . . . . . . . . . . . . . . . . . . . . . . . . . . . . . . . . . . . . . . . . . . . . . . . . . . . . . . . . . . . . 169
4.2. Hematic parameters. . . . . . . . . . . . . . . . . . . . . . . . . . . . . . . . . . . . . . . . . . . . . . . . . . . . . . . . . . . . . . . . . . . . . . . . . . . . . . . . . . . . . . . . . . 169
4.3. Variability and irregularity of baseline respiratory patterns . . . . . . . . . . . . . . . . . . . . . . . . . . . . . . . . . . . . . . . . . . . . . . . . . . . . . . . . . . 170
4.4. Limitations and conclusions . . . . . . . . . . . . . . . . . . . . . . . . . . . . . . . . . . . . . . . . . . . . . . . . . . . . . . . . . . . . . . . . . . . . . . . . . . . . . . . . . . . 171
Role of funding source . . . . . . . . . . . . . . . . . . . . . . . . . . . . . . . . . . . . . . . . . . . . . . . . . . . . . . . . . . . . . . . . . . . . . . . . . . . . . . . . . . . . . . . . . . . . . . . . . 171
Conflict of interest. . . . . . . . . . . . . . . . . . . . . . . . . . . . . . . . . . . . . . . . . . . . . . . . . . . . . . . . . . . . . . . . . . . . . . . . . . . . . . . . . . . . . . . . . . . . . . . . . . . . . 171
Acknowledgements . . . . . . . . . . . . . . . . . . . . . . . . . . . . . . . . . . . . . . . . . . . . . . . . . . . . . . . . . . . . . . . . . . . . . . . . . . . . . . . . . . . . . . . . . . . . . . . . . . . . 171
Appendix A. Supporting information . . . . . . . . . . . . . . . . . . . . . . . . . . . . . . . . . . . . . . . . . . . . . . . . . . . . . . . . . . . . . . . . . . . . . . . . . . . . . . . . . . . . . . 171
References . . . . . . . . . . . . . . . . . . . . . . . . . . . . . . . . . . . . . . . . . . . . . . . . . . . . . . . . . . . . . . . . . . . . . . . . . . . . . . . . . . . . . . . . . . . . . . . . . . . . . . . . . . . 171
1. Introduction
A well-established link between panic and respiration hasarisen from three decades of research on panic disorder (PD).This link is based on some main lines of empirical evidence:
1)
The presence of prominent respiratory symptoms (i.e., dys-pnea, feeling of choking, breathlessness) during both sponta-neous and laboratory-induced panic attacks, especially in theso-called respiratory subtype of PD (Briggs et al., 1993; Freireet al., 2010). A causal role of hyperventilation (breathing inexcess of metabolic need, thus resulting in lowering arterialpCO2 and increased pH) in pathogenesis of panic attacks waspreviously proposed (Ley, 1986); however, more recent stu-dies, including findings of abrupt CO2 partial pressureincreases before onset of panic attacks (Meuret et al., 2011),have suggested that hyperventilation is a respiratory symptomoccurring during panic attacks rather than a trigger of panic(Niccolai et al., 2009).2)
The behavioral and respiratory hypersensitivity to carbondioxide (CO2)�enriched air of many patients with PD com-pared to healthy subjects (Blechert et al., 2010; Griez andSchruers, 2003; Perna et al., 2004b; Perna et al., 1995b) and topatients with other psychiatric disorders, including SocialPhobia (Blechert et al., 2010), obsessive-compulsive disorder(Griez et al., 1990), major depressive disorder (Gorman et al.,2001) and eating disorders (Perna et al., 2004b). Hypercapnichypersensitivity appears to be both a familial marker of PD(Coryell, 1997; Coryell et al., 2001; Perna et al., 1995a; VanBeek and Griez, 2000) and a possible endophenotype of PDvulnerability (Battaglia et al., 2007).3)
The specific bidirectional association between PD and respira-tory diseases, mainly asthma and chronic obstructive pulmon-ary disease (COPD), in comparison to general population orpatients with other anxiety disorders (Zandbergen et al., 1991)(e.g., Hasler et al., 2005; Kunik et al., 2005; Perna et al., 1997;Pollack et al., 1996). In addition, adult patients with PD have asignificantly higher prevalence of childhood bronchitis andasthma than patients with other anxiety disorders (Verburget al., 1995) and asthma predicted subsequent PD in a 20-yearprospective community-based cohort study (Hasler et al., 2005).A common diathesis for PD and some respiratory disorders,such as asthma and COPD, has been proposed in both PDpatients and their first-degree relatives (Van Beek et al., 2005).Among the numerous theories of PD, the findings of a panic-respiration link have led to the formulation of respiratory theoriesthat, although not completely overlapping, share the idea of acausal relationship between aberrant respiratory regulation andpanic (Esquivel et al., 2010; Klein, 1993; Ley, 1986; Perna et al.,
2004a). According to this hypothesis, in addition to peculiarresponses to respiratory stimuli (Blechert et al., 2010; Lee et al.,1993; Papp et al., 1997), also abnormalities in baseline and restingrespiratory patterns may be expected in patients with PD.Although different abnormalities have been found, the methodo-logical heterogeneity of the studies makes difficult to drawunivocal conclusions and the exact nature of the panic-respiration connection has yet to be determined. Surprisingly,only a recent systematic review dealing with baseline/restingrespiratory patterns in PD is available (Niccolai et al., 2009). Itsuggests that lower pCO2 levels, increased tidal volume andminute ventilation and, mainly, higher respiratory variabilityand irregularity may be consistent findings in patients with PDas compared to controls; however this review underlines that thedifferent sample sizes, the heterogeneity of sampling methodsand applied techniques and other factors likely affecting respira-tory parameters, such as pharmacological treatments, make theresults of the different studies poorly comparable.
Thus, the aim of our study is to meta-analyze the results fromall the studies comparing baseline/resting respiratory variables ofpatients with PD and healthy subjects, published on peer-reviewjournals from 1980 to 2011. Meta-analysis is a widespread andpowerful approach that allows to perform quantitative andsystematic reviews combining results of previous studies on thesame topic. This method is extremely helpful especially whenresults from single studies appears to be inconsistent and need aquantitative reviewing approach to be explained. To our knowl-edge, no meta-analyses on this key topic have been publishedyet. To clarify the relationship between PD and respiratoryphysiology may be a potential clue to better understand mechan-isms underlying panic.
2. Methods
2.1. Inclusion criteria
To be included in our meta-analysis each study had to fulfillthe following criteria: (1) to perform a comparison of respiratoryparameters and/or hematic parameters related to the respiratoryfunction between subjects with PD, with or without agoraphobia,and controls; (2) parameters had to be measured only in restingcondition or in baseline condition preceding a subsequent stimu-lation. From now on we will refer with the term ‘‘baseline’’ toboth of the conditions altogether; (3) inclusion of the subjects inthe study had not to be not based on results of previouslyperformed challenges or stimulations; (4) age of subjectsZ18years; (5) criteria of psychiatric diagnoses according to DSM-III
M. Grassi et al. / Journal of Affective Disorders 146 (2013) 158–173160
(Association, 1980), DSM-III-R (Association, 1987) or DSM-IV/DSM-IV-TR (Association, 1992, 2000); (6) to be published in apeer-reviewed scientific journal; (7) enough statistical data had tobe available to allow the computation; (8) to be written inEnglish, French, Spanish or Italian.
2.2. Search procedures
We performed a literature research in PubMed, Embase andPsychinfo with the following combination of key words: ‘‘panicnAND (respiratn OR breathn OR hyperventilatn OR (tidal volume)OR (minute ventilation) OR pCO2 OR pO2 OR sigh OR sighs)’’.Papers from 1980, when the diagnosis of PD was first introducedin DSM-III (Association, 1980), to 22/07/2011 were screened by atwo-step procedure: (1) the titles and the abstracts of all theobtained references were read to select all the potential relevantpapers, (2) the full text of potential relevant papers were read toidentify those studies fulfilling inclusion criteria. Furthermore,references of all selected papers, relevant reviews and bookchapters were screened with the same procedure to find studiesmissed with the previous search. Each step of the search proce-dure was performed independently by two of the authors andinconsistency in the results were discussed and resolved beforeproceeding.
1 With summary effect-size we refer to the estimate of the population effect-
size resulting from the meta-analysis of all single-study effect-sizes of a certain
parameter.2 Two different types of meta-analytical models exist: fixed-effects and
random-effects models. When heterogeneity among characteristics of the studies
is a priori hypothesized, random-effects meta-analytic models are more accurate
than fixed-effects models because the latter assume that all studies share a
common true effect-size and differences among effect sizes of different studies are
due only to sampling error. However, part of the differences among effect-sizes
may be due also to study-level differences (i.e. methods of assessment, laboratory
settings, sample characteristics) and not only to sampling error. Random-effects
models take into account this further source of variance and are generally
preferred because, if this variance is not null, fixed-effects models may result in
overly narrow confidence intervals and in too optimistic statistical significance
(Schmidt et al., 2009). However, also random-effects models may be biased when
the sources of variance are imprecisely estimated, especially if the number of the
meta-analyzed studies is too little, as found in simulation studies for meta-
analysis of correlations (Field, 2001; Hafdahl and Williams, 2009). A commonly
applied strategy to decide whether a fixed- or random-effects model has to be
carried out is to choose random-effects models only if heterogeneity of statistics
(i.e., Q) results significant. However, the use of this strategy is objected (Petitti,
2001). On these bases, we decided to apply the strategy described above (section
Meta-analytic statistics).
2.3. Effect-sizes calculation and coding of studies
For each study, we calculated the effect-sizes of the compar-isons considering all of the different within-subject statistics foreach of the recorded parameter. Effect-sizes were calculated usingHedges’ g, a variation of Cohen’s d correcting for biases associatedwith small sample sizes (Hedges and Olkin, 1985). When groupmean, standard deviation, variance or standard error of mean andnumber of subjects of a within-subject statistic were availablefor both of the compared groups, these data were preferably usedto calculate the effect-sizes. When some data were missing,we sought for other data allowing the effect-sizes computation,such as unstandardized mean difference, t, p-value. When statis-tics of respiratory parameters were available only for sub-groupsof the sample (i.e., male and female), data of the whole groupwere obtained by pooling the different sub-groups statistics. Ifmultiple baseline measurements were available for a singleparameter (i.e., Lee et al. (1993)), data of the most distantmeasurement from the beginning of the measuring were usedto calculate the effect-size.
In order to check the characteristics of the studies that mightinfluence the heterogeneity of their effect-sizes, the followingvariables were coded and included in the analyses as moderators:(1) subjects were psychotropic medication-free for at least2 weeks before assessment, except for occasional use of benzo-diazepines; subjects completely refrained from occasional use ofbenzodiazepines for at least the whole day before the day of therespiratory assessment: yes/no; (2) subjects included in the studywere screened for medical illness and were not affected fromrespiratory diseases: yes/no; (3) type of study: resting/withstimulation; (4) subjects had a hematic catheter inserted duringrespiratory assessment: yes/no; (5) position of the subjects duringrespiratory assessment: supine, seated, not specified. We triedalso to code the percentage of Agoraphobia in the PD samples butmost of the included studies (67%) did not report any relevantdata on this characteristic. Furthermore only one study provided adirect and fully detailed comparison between the respiratoryparameters of PD subjects with and without Agoraphobia(Rapee et al., 1992). Thus, this variable was finally excluded from
the coding process because no reliable meta-analytic investiga-tion resulted performable.
Computation of effect-size and coding of studies were per-formed independently by two of the authors and any discrepancyresolved before analysis.
2.4. Meta-analytic statistics
To calculate the summary effect-size1 of each parameter, everysingle study effect-size was weighted by its inverse variance (thesum of the within-study variance and an estimate of the between-studies variance) in order to give larger weights to studies withlarge sample sizes than those with small sample-sizes. Beforeexcluding a study not meeting the inclusion criteria 7, we tried tocontact the corresponding author, only for studies published notmore that 10 years ago, asking for the missing details. Asignificance level of 0.05 was applied for summary effect-sizes.In order to improve the validity of our results, at first weperformed a fixed-effects model for all of the parameters and,only if the number of available studies was at least 10, weproceeded also with a random-effect model2. Concordance ofthe results obtained by the two meta-analytical models wasconsidered strongly suggestive of a consistence of results, whilesignificance of the fixed-effects model and non-significance of therandom-effects model was taken into account according to resultsof moderator analysis. Results obtained only by the fixed-effectsmodel were considered as preliminary.
We calculated the Q statistic and I2 index to study the hetero-geneity of effect-sizes among studies. Q statistic significance levelwas set at 0.1 instead of the conventional 0.05 as suggested byauthors (Petitti, 2001) due to the low-power and conservativeness ofthis test. I2 can be interpreted as the percentage of the totalvariability in a set of effect-sizes that cannot be due to only samplingerror within studies. If Q statistic resulted significant or I2 wassuggestive of heterogeneity, we performed moderator analyses withthe coded study-level variables in order to try to explain the possiblesource of heterogeneity. Thus, we performed separate fixed-effectsmodels within each level of the moderators and then we comparedthe different levels to find significant differences in the effect-sizesof the sub-groups by the between-groups Q statistic (statisticsignificance if po0.05).
Since we did not included any unpublished papers, we checkedfor the publication bias by the Egger’s regression test (Egger et al.,1997) (one-tailed po0.05 suggestive for the presence of the bias)and by the Duval and Tweedie’s trim and fill method (Duval and
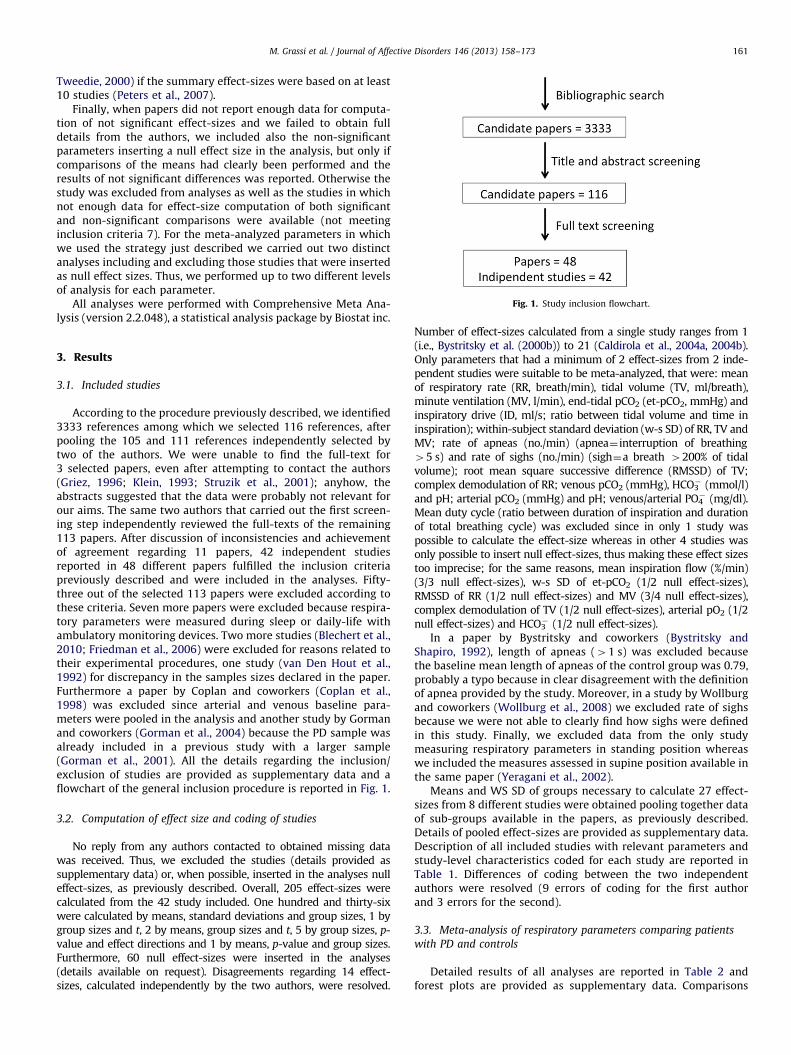
Fig. 1. Study inclusion flowchart.
M. Grassi et al. / Journal of Affective Disorders 146 (2013) 158–173 161
Tweedie, 2000) if the summary effect-sizes were based on at least10 studies (Peters et al., 2007).
Finally, when papers did not report enough data for computa-tion of not significant effect-sizes and we failed to obtain fulldetails from the authors, we included also the non-significantparameters inserting a null effect size in the analysis, but only ifcomparisons of the means had clearly been performed and theresults of not significant differences was reported. Otherwise thestudy was excluded from analyses as well as the studies in whichnot enough data for effect-size computation of both significantand non-significant comparisons were available (not meetinginclusion criteria 7). For the meta-analyzed parameters in whichwe used the strategy just described we carried out two distinctanalyses including and excluding those studies that were insertedas null effect sizes. Thus, we performed up to two different levelsof analysis for each parameter.
All analyses were performed with Comprehensive Meta Ana-lysis (version 2.2.048), a statistical analysis package by Biostat inc.
3. Results
3.1. Included studies
According to the procedure previously described, we identified3333 references among which we selected 116 references, afterpooling the 105 and 111 references independently selected bytwo of the authors. We were unable to find the full-text for3 selected papers, even after attempting to contact the authors(Griez, 1996; Klein, 1993; Struzik et al., 2001); anyhow, theabstracts suggested that the data were probably not relevant forour aims. The same two authors that carried out the first screen-ing step independently reviewed the full-texts of the remaining113 papers. After discussion of inconsistencies and achievementof agreement regarding 11 papers, 42 independent studiesreported in 48 different papers fulfilled the inclusion criteriapreviously described and were included in the analyses. Fifty-three out of the selected 113 papers were excluded according tothese criteria. Seven more papers were excluded because respira-tory parameters were measured during sleep or daily-life withambulatory monitoring devices. Two more studies (Blechert et al.,2010; Friedman et al., 2006) were excluded for reasons related totheir experimental procedures, one study (van Den Hout et al.,1992) for discrepancy in the samples sizes declared in the paper.Furthermore a paper by Coplan and coworkers (Coplan et al.,1998) was excluded since arterial and venous baseline para-meters were pooled in the analysis and another study by Gormanand coworkers (Gorman et al., 2004) because the PD sample wasalready included in a previous study with a larger sample(Gorman et al., 2001). All the details regarding the inclusion/exclusion of studies are provided as supplementary data and aflowchart of the general inclusion procedure is reported in Fig. 1.
3.2. Computation of effect size and coding of studies
No reply from any authors contacted to obtained missing datawas received. Thus, we excluded the studies (details provided assupplementary data) or, when possible, inserted in the analyses nulleffect-sizes, as previously described. Overall, 205 effect-sizes werecalculated from the 42 study included. One hundred and thirty-sixwere calculated by means, standard deviations and group sizes, 1 bygroup sizes and t, 2 by means, group sizes and t, 5 by group sizes, p-value and effect directions and 1 by means, p-value and group sizes.Furthermore, 60 null effect-sizes were inserted in the analyses(details available on request). Disagreements regarding 14 effect-sizes, calculated independently by the two authors, were resolved.
Number of effect-sizes calculated from a single study ranges from 1(i.e., Bystritsky et al. (2000b)) to 21 (Caldirola et al., 2004a, 2004b).Only parameters that had a minimum of 2 effect-sizes from 2 inde-pendent studies were suitable to be meta-analyzed, that were: meanof respiratory rate (RR, breath/min), tidal volume (TV, ml/breath),minute ventilation (MV, l/min), end-tidal pCO2 (et-pCO2, mmHg) andinspiratory drive (ID, ml/s; ratio between tidal volume and time ininspiration); within-subject standard deviation (w-s SD) of RR, TV andMV; rate of apneas (no./min) (apnea¼ interruption of breathing45 s) and rate of sighs (no./min) (sigh¼a breath 4200% of tidalvolume); root mean square successive difference (RMSSD) of TV;complex demodulation of RR; venous pCO2 (mmHg), HCO3
� (mmol/l)and pH; arterial pCO2 (mmHg) and pH; venous/arterial PO4
� (mg/dl).Mean duty cycle (ratio between duration of inspiration and durationof total breathing cycle) was excluded since in only 1 study waspossible to calculate the effect-size whereas in other 4 studies wasonly possible to insert null effect-sizes, thus making these effect sizestoo imprecise; for the same reasons, mean inspiration flow (%/min)(3/3 null effect-sizes), w-s SD of et-pCO2 (1/2 null effect-sizes),RMSSD of RR (1/2 null effect-sizes) and MV (3/4 null effect-sizes),complex demodulation of TV (1/2 null effect-sizes), arterial pO2 (1/2null effect-sizes) and HCO3
� (1/2 null effect-sizes).In a paper by Bystritsky and coworkers (Bystritsky and
Shapiro, 1992), length of apneas (41 s) was excluded becausethe baseline mean length of apneas of the control group was 0.79,probably a typo because in clear disagreement with the definitionof apnea provided by the study. Moreover, in a study by Wollburgand coworkers (Wollburg et al., 2008) we excluded rate of sighsbecause we were not able to clearly find how sighs were definedin this study. Finally, we excluded data from the only studymeasuring respiratory parameters in standing position whereaswe included the measures assessed in supine position available inthe same paper (Yeragani et al., 2002).
Means and WS SD of groups necessary to calculate 27 effect-sizes from 8 different studies were obtained pooling together dataof sub-groups available in the papers, as previously described.Details of pooled effect-sizes are provided as supplementary data.Description of all included studies with relevant parameters andstudy-level characteristics coded for each study are reported inTable 1. Differences of coding between the two independentauthors were resolved (9 errors of coding for the first authorand 3 errors for the second).
3.3. Meta-analysis of respiratory parameters comparing patients
with PD and controls
Detailed results of all analyses are reported in Table 2 andforest plots are provided as supplementary data. Comparisons
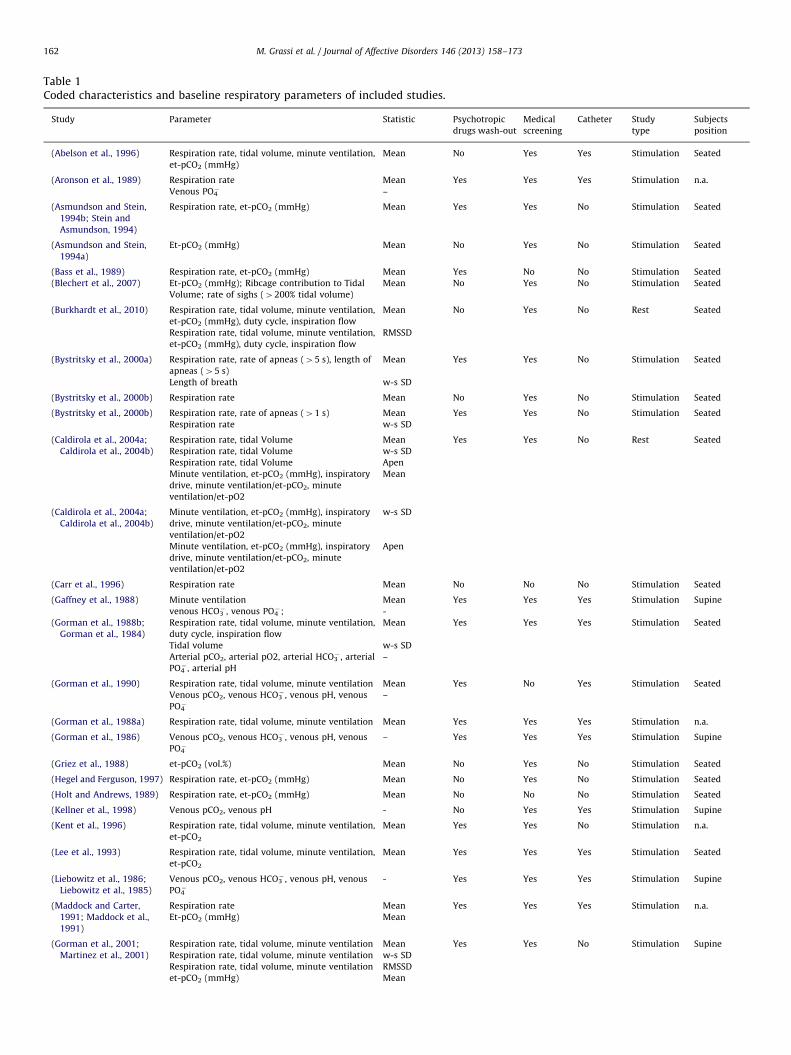
Table 1Coded characteristics and baseline respiratory parameters of included studies.
Study Parameter Statistic Psychotropic
drugs wash-out
Medical
screening
Catheter Study
type
Subjects
position
(Abelson et al., 1996) Respiration rate, tidal volume, minute ventilation,
et-pCO2 (mmHg)
Mean No Yes Yes Stimulation Seated
(Aronson et al., 1989) Respiration rate Mean Yes Yes Yes Stimulation n.a.
Venous PO4� –
(Asmundson and Stein,
1994b; Stein and
Asmundson, 1994)
Respiration rate, et-pCO2 (mmHg) Mean Yes Yes No Stimulation Seated
(Asmundson and Stein,
1994a)
Et-pCO2 (mmHg) Mean No Yes No Stimulation Seated
(Bass et al., 1989) Respiration rate, et-pCO2 (mmHg) Mean Yes No No Stimulation Seated
(Blechert et al., 2007) Et-pCO2 (mmHg); Ribcage contribution to Tidal
Volume; rate of sighs (4200% tidal volume)
Mean No Yes No Stimulation Seated
(Burkhardt et al., 2010) Respiration rate, tidal volume, minute ventilation,
et-pCO2 (mmHg), duty cycle, inspiration flow
Mean No Yes No Rest Seated
Respiration rate, tidal volume, minute ventilation,
et-pCO2 (mmHg), duty cycle, inspiration flow
RMSSD
(Bystritsky et al., 2000a) Respiration rate, rate of apneas (45 s), length of
apneas (45 s)
Mean Yes Yes No Stimulation Seated
Length of breath w-s SD
(Bystritsky et al., 2000b) Respiration rate Mean No Yes No Stimulation Seated
(Bystritsky et al., 2000b) Respiration rate, rate of apneas (41 s) Mean Yes Yes No Stimulation Seated
Respiration rate w-s SD
(Caldirola et al., 2004a;
Caldirola et al., 2004b)
Respiration rate, tidal Volume Mean Yes Yes No Rest Seated
Respiration rate, tidal Volume w-s SD
Respiration rate, tidal Volume Apen
Minute ventilation, et-pCO2 (mmHg), inspiratory
drive, minute ventilation/et-pCO2, minute
ventilation/et-pO2
Mean
(Caldirola et al., 2004a;
Caldirola et al., 2004b)
Minute ventilation, et-pCO2 (mmHg), inspiratory
drive, minute ventilation/et-pCO2, minute
ventilation/et-pO2
w-s SD
Minute ventilation, et-pCO2 (mmHg), inspiratory
drive, minute ventilation/et-pCO2, minute
ventilation/et-pO2
Apen
(Carr et al., 1996) Respiration rate Mean No No No Stimulation Seated
(Gaffney et al., 1988) Minute ventilation Mean Yes Yes Yes Stimulation Supine
venous HCO3� , venous PO4
�; -
(Gorman et al., 1988b;
Gorman et al., 1984)
Respiration rate, tidal volume, minute ventilation,
duty cycle, inspiration flow
Mean Yes Yes Yes Stimulation Seated
Tidal volume w-s SD
Arterial pCO2, arterial pO2, arterial HCO3� , arterial
PO4� , arterial pH
–
(Gorman et al., 1990) Respiration rate, tidal volume, minute ventilation Mean Yes No Yes Stimulation Seated
Venous pCO2, venous HCO3� , venous pH, venous
PO4�
–
(Gorman et al., 1988a) Respiration rate, tidal volume, minute ventilation Mean Yes Yes Yes Stimulation n.a.
(Gorman et al., 1986) Venous pCO2, venous HCO3� , venous pH, venous
PO4�
– Yes Yes Yes Stimulation Supine
(Griez et al., 1988) et-pCO2 (vol.%) Mean No Yes No Stimulation Seated
(Hegel and Ferguson, 1997) Respiration rate, et-pCO2 (mmHg) Mean No Yes No Stimulation Seated
(Holt and Andrews, 1989) Respiration rate, et-pCO2 (mmHg) Mean No No No Stimulation Seated
(Kellner et al., 1998) Venous pCO2, venous pH - No Yes Yes Stimulation Supine
(Kent et al., 1996) Respiration rate, tidal volume, minute ventilation,
et-pCO2
Mean Yes Yes No Stimulation n.a.
(Lee et al., 1993) Respiration rate, tidal volume, minute ventilation,
et-pCO2
Mean Yes Yes Yes Stimulation Seated
(Liebowitz et al., 1986;
Liebowitz et al., 1985)
Venous pCO2, venous HCO3� , venous pH, venous
PO4�
- Yes Yes Yes Stimulation Supine
(Maddock and Carter,
1991; Maddock et al.,
1991)
Respiration rate Mean Yes Yes Yes Stimulation n.a.
Et-pCO2 (mmHg) Mean
(Gorman et al., 2001;
Martinez et al., 2001)
Respiration rate, tidal volume, minute ventilation Mean Yes Yes No Stimulation Supine
Respiration rate, tidal volume, minute ventilation w-s SD
Respiration rate, tidal volume, minute ventilation RMSSD
et-pCO2 (mmHg) Mean
M. Grassi et al. / Journal of Affective Disorders 146 (2013) 158–173162
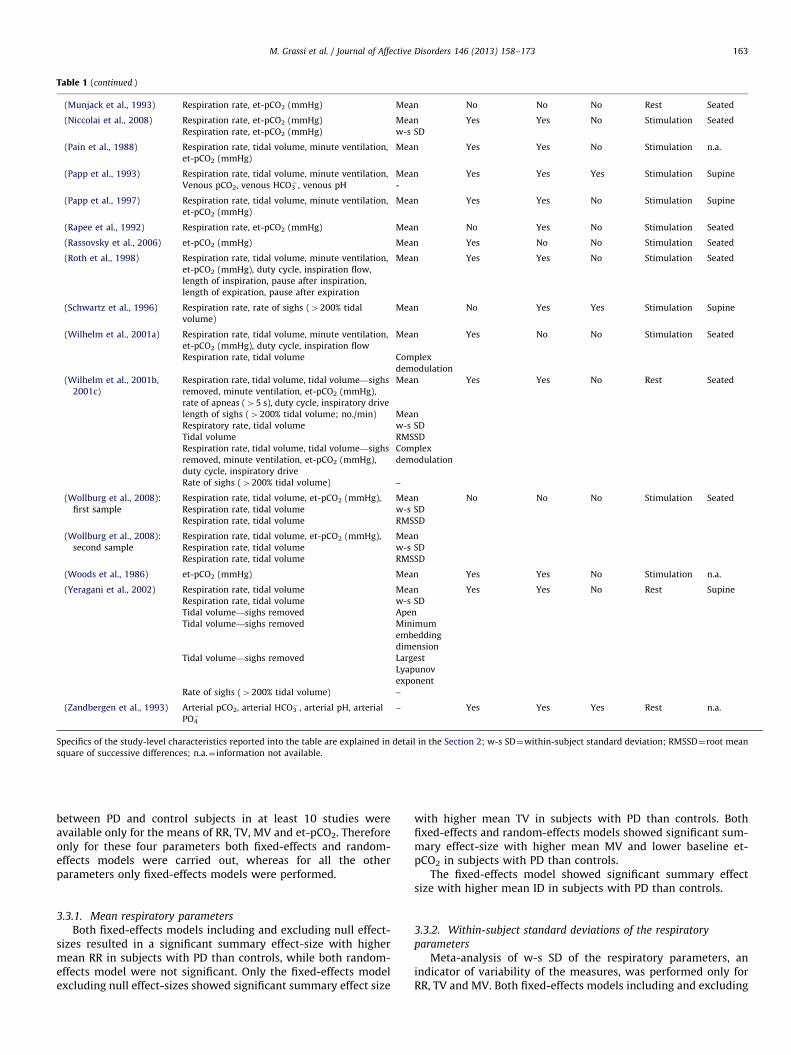
Table 1 (continued )
(Munjack et al., 1993) Respiration rate, et-pCO2 (mmHg) Mean No No No Rest Seated
(Niccolai et al., 2008) Respiration rate, et-pCO2 (mmHg) Mean Yes Yes No Stimulation Seated
Respiration rate, et-pCO2 (mmHg) w-s SD
(Pain et al., 1988) Respiration rate, tidal volume, minute ventilation,
et-pCO2 (mmHg)
Mean Yes Yes No Stimulation n.a.
(Papp et al., 1993) Respiration rate, tidal volume, minute ventilation, Mean Yes Yes Yes Stimulation Supine
Venous pCO2, venous HCO3� , venous pH -
(Papp et al., 1997) Respiration rate, tidal volume, minute ventilation,
et-pCO2 (mmHg)
Mean Yes Yes No Stimulation Supine
(Rapee et al., 1992) Respiration rate, et-pCO2 (mmHg) Mean No Yes No Stimulation Seated
(Rassovsky et al., 2006) et-pCO2 (mmHg) Mean Yes No No Stimulation Seated
(Roth et al., 1998) Respiration rate, tidal volume, minute ventilation,
et-pCO2 (mmHg), duty cycle, inspiration flow,
length of inspiration, pause after inspiration,
length of expiration, pause after expiration
Mean Yes Yes No Stimulation Seated
(Schwartz et al., 1996) Respiration rate, rate of sighs (4200% tidal
volume)
Mean No Yes Yes Stimulation Supine
(Wilhelm et al., 2001a) Respiration rate, tidal volume, minute ventilation,
et-pCO2 (mmHg), duty cycle, inspiration flow
Mean Yes No No Stimulation Seated
Respiration rate, tidal volume Complex
demodulation
(Wilhelm et al., 2001b,
2001c)
Respiration rate, tidal volume, tidal volume—sighs
removed, minute ventilation, et-pCO2 (mmHg),
rate of apneas (45 s), duty cycle, inspiratory drive
Mean Yes Yes No Rest Seated
length of sighs (4200% tidal volume; no./min) Mean
Respiratory rate, tidal volume w-s SD
Tidal volume RMSSD
Respiration rate, tidal volume, tidal volume—sighs
removed, minute ventilation, et-pCO2 (mmHg),
duty cycle, inspiratory drive
Complex
demodulation
Rate of sighs (4200% tidal volume) –
(Wollburg et al., 2008):
first sample
Respiration rate, tidal volume, et-pCO2 (mmHg), Mean No No No Stimulation Seated
Respiration rate, tidal volume w-s SD
Respiration rate, tidal volume RMSSD
(Wollburg et al., 2008):
second sample
Respiration rate, tidal volume, et-pCO2 (mmHg), Mean
Respiration rate, tidal volume w-s SD
Respiration rate, tidal volume RMSSD
(Woods et al., 1986) et-pCO2 (mmHg) Mean Yes Yes No Stimulation n.a.
(Yeragani et al., 2002) Respiration rate, tidal volume Mean Yes Yes No Rest Supine
Respiration rate, tidal volume w-s SD
Tidal volume—sighs removed Apen
Tidal volume—sighs removed Minimum
embedding
dimension
Tidal volume—sighs removed Largest
Lyapunov
exponent
Rate of sighs (4200% tidal volume) –
(Zandbergen et al., 1993) Arterial pCO2, arterial HCO3� , arterial pH, arterial
PO4�
– Yes Yes Yes Rest n.a.
Specifics of the study-level characteristics reported into the table are explained in detail in the Section 2; w-s SD¼within-subject standard deviation; RMSSD¼root mean
square of successive differences; n.a.¼ information not available.
M. Grassi et al. / Journal of Affective Disorders 146 (2013) 158–173 163
between PD and control subjects in at least 10 studies wereavailable only for the means of RR, TV, MV and et-pCO2. Thereforeonly for these four parameters both fixed-effects and random-effects models were carried out, whereas for all the otherparameters only fixed-effects models were performed.
3.3.1. Mean respiratory parameters
Both fixed-effects models including and excluding null effect-sizes resulted in a significant summary effect-size with highermean RR in subjects with PD than controls, while both random-effects model were not significant. Only the fixed-effects modelexcluding null effect-sizes showed significant summary effect size
with higher mean TV in subjects with PD than controls. Bothfixed-effects and random-effects models showed significant sum-mary effect-size with higher mean MV and lower baseline et-pCO2 in subjects with PD than controls.
The fixed-effects model showed significant summary effectsize with higher mean ID in subjects with PD than controls.
3.3.2. Within-subject standard deviations of the respiratory
parameters
Meta-analysis of w-s SD of the respiratory parameters, anindicator of variability of the measures, was performed only forRR, TV and MV. Both fixed-effects models including and excluding
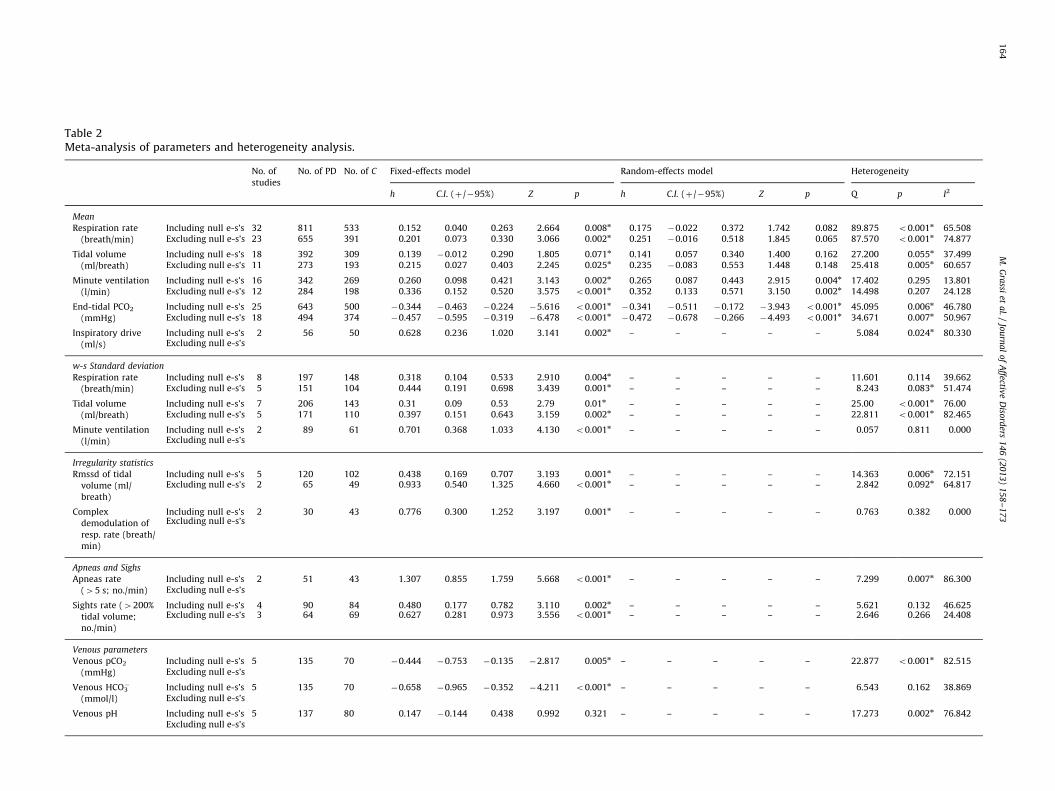
Table 2Meta-analysis of parameters and heterogeneity analysis.
No. of
studies
No. of PD No. of C Fixed-effects model Random-effects model Heterogeneity
h C.I. (þ/�95%) Z p h C.I. (þ/�95%) Z p Q p I2
Mean
Respiration rate
(breath/min)
Including null e-s’s 32 811 533 0.152 0.040 0.263 2.664 0.008n 0.175 �0.022 0.372 1.742 0.082 89.875 o0.001n 65.508Excluding null e-s’s 23 655 391 0.201 0.073 0.330 3.066 0.002n 0.251 �0.016 0.518 1.845 0.065 87.570 o0.001n 74.877
Tidal volume
(ml/breath)
Including null e-s’s 18 392 309 0.139 �0.012 0.290 1.805 0.071n 0.141 0.057 0.340 1.400 0.162 27.200 0.055n 37.499Excluding null e-s’s 11 273 193 0.215 0.027 0.403 2.245 0.025n 0.235 �0.083 0.553 1.448 0.148 25.418 0.005n 60.657
Minute ventilation
(l/min)
Including null e-s’s 16 342 269 0.260 0.098 0.421 3.143 0.002n 0.265 0.087 0.443 2.915 0.004n 17.402 0.295 13.801Excluding null e-s’s 12 284 198 0.336 0.152 0.520 3.575 o0.001n 0.352 0.133 0.571 3.150 0.002n 14.498 0.207 24.128
End-tidal PCO2
(mmHg)
Including null e-s’s 25 643 500 �0.344 �0.463 �0.224 �5.616 o0.001n�0.341 �0.511 �0.172 �3.943 o0.001n 45.095 0.006n 46.780
Excluding null e-s’s 18 494 374 �0.457 �0.595 �0.319 �6.478 o0.001n�0.472 �0.678 �0.266 �4.493 o0.001n 34.671 0.007n 50.967
Inspiratory drive
(ml/s)
Including null e-s’s 2 56 50 0.628 0.236 1.020 3.141 0.002n – – – – – 5.084 0.024n 80.330Excluding null e-s’s
w-s Standard deviation
Respiration rate
(breath/min)
Including null e-s’s 8 197 148 0.318 0.104 0.533 2.910 0.004n – – – – – 11.601 0.114 39.662Excluding null e-s’s 5 151 104 0.444 0.191 0.698 3.439 0.001n – – – – – 8.243 0.083n 51.474
Tidal volume
(ml/breath)
Including null e-s’s 7 206 143 0.31 0.09 0.53 2.79 0.01n – – – – – 25.00 o0.001n 76.00Excluding null e-s’s 5 171 110 0.397 0.151 0.643 3.159 0.002n – – – – – 22.811 o0.001n 82.465
Minute ventilation
(l/min)
Including null e-s’s 2 89 61 0.701 0.368 1.033 4.130 o0.001n – – – – – 0.057 0.811 0.000Excluding null e-s’s
Irregularity statistics
Rmssd of tidal
volume (ml/
breath)
Including null e-s’s 5 120 102 0.438 0.169 0.707 3.193 0.001n – – – – – 14.363 0.006n 72.151Excluding null e-s’s 2 65 49 0.933 0.540 1.325 4.660 o0.001n – – – – – 2.842 0.092n 64.817
Complex
demodulation of
resp. rate (breath/
min)
Including null e-s’s 2 30 43 0.776 0.300 1.252 3.197 0.001n – – – – – 0.763 0.382 0.000Excluding null e-s’s
Apneas and Sighs
Apneas rate
(45 s; no./min)
Including null e-s’s 2 51 43 1.307 0.855 1.759 5.668 o0.001n – – – – – 7.299 0.007n 86.300Excluding null e-s’s
Sights rate (4200%
tidal volume;
no./min)
Including null e-s’s 4 90 84 0.480 0.177 0.782 3.110 0.002n – – – – – 5.621 0.132 46.625Excluding null e-s’s 3 64 69 0.627 0.281 0.973 3.556 o0.001n – – – – – 2.646 0.266 24.408
Venous parameters
Venous pCO2
(mmHg)
Including null e-s’s 5 135 70 �0.444 �0.753 �0.135 �2.817 0.005n – – – – – 22.877 o0.001n 82.515Excluding null e-s’s
Venous HCO3�
(mmol/l)
Including null e-s’s 5 135 70 �0.658 �0.965 �0.352 �4.211 o0.001n – – – – – 6.543 0.162 38.869Excluding null e-s’s
Venous pH Including null e-s’s 5 137 80 0.147 �0.144 0.438 0.992 0.321 – – – – – 17.273 0.002n 76.842Excluding null e-s’s
M.
Gra
ssiet
al.
/Jo
urn
al
of
Affectiv
eD
isord
ers1
46
(20
13
)1
58
–1
73
16
4
Ven
ou
sp
ara
met
ers
(exc
lud
ing
Pa
pp
eta
l.,1
99
3)
Ve
no
us
pC
O2
(mm
Hg
)
Incl
ud
ing
nu
lle
-s’s
41
25
52
�0
.73
8�
1.0
71
�0
.40
5�
4.3
49
o0
.00
1n
––
––
–0
.90
60
.82
40
.00
0E
xcl
ud
ing
nu
lle
-s’s
Ve
no
us
HC
O3�
(mm
ol/
l)
Incl
ud
ing
nu
lle
-s’s
41
25
52
�0
.81
1�
1.1
46
�0
.47
5�
4.7
34
o0
.00
1n
––
––
–1
.79
10
.61
70
.00
0E
xcl
ud
ing
nu
lle
-s’s
Ve
no
us
pH
Incl
ud
ing
nu
lle
-s’s
41
27
62
0.3
44
0.0
32
0.6
55
2.1
63
0.0
31n
––
––
–5
.33
20
.14
94
3.7
32
Ex
clu
din
gn
ull
e-s
’s
Art
eria
lp
ara
met
ers
Art
eri
al
pC
O2
(mm
Hg
)
Incl
ud
ing
nu
lle
-s’s
23
52
9�
0.5
54
�1
.05
9�
0.0
50
�2
.15
50
.03
1n
––
––
–0
.22
80
.63
30
.00
0E
xcl
ud
ing
nu
lle
-s’s
Art
eri
al
pH
Incl
ud
ing
nu
lle
-s’s
22
62
2�
0.1
42
�0
.70
10
.41
7�
0.4
99
0.6
18
––
––
–1
.71
00
.19
14
1.
5
Ex
clu
din
gn
ull
e-s
’s
Ven
ou
s/a
rter
ial
pa
ram
eter
PO
4�(m
g/d
l)In
clu
din
gn
ull
e-s
’s6
14
86
8�
0.5
14
�0
.80
7�
0.2
21
�3
.43
40
.00
1n
––
––
–2
.71
90
.74
30
.00
0
Ex
clu
din
gn
ull
e-s
’s5
13
15
7�
0.6
11
�0
.93
0�
0.2
91
�3
.74
4o
0.0
01n
––
––
–0
.49
60
.97
40
.00
0
No
.of1
PD¼
tota
ln
um
be
ro
fsu
bje
cts
wit
hP
D;
No
.of
C¼
tota
ln
um
be
ro
fco
ntr
ol
sub
ject
s;h¼
He
dg
es’
h;
C.I
.¼co
nfi
de
nce
inte
rva
l;w
-s¼
wit
hin
-su
bje
ct;
RM
SS
D¼
roo
tm
ea
nsq
ua
red
succ
ess
ive
dif
fere
nce
s;n¼
for
fix
ed
-eff
ect
sa
nd
ran
do
m-e
ffe
cts
mo
de
ls:
po
0.0
5;
for
Qst
ati
stic
s:po
0.1
.P
osi
tiv
eh
ind
ica
tes
PD
gro
up4
con
tro
lg
rou
p,
wh
ile
ne
ga
tiv
eh
PD
gro
upo
con
tro
lg
rou
p.
M. Grassi et al. / Journal of Affective Disorders 146 (2013) 158–173 165
null effect-sizes resulted in a significant summary effect-size withhigher w-s SD of RR and TV in subjects with PD than controls. Thefixed-effects model showed significant summary effect-size withhigher w-s SD of MV in subjects with PD than controls.
3.3.3. Indexes of irregularity of the respiratory parameters
Among the several indexes of irregularity applied in thestudies, only RMSSD of TV and complex demodulation of RR(the higher the index the higher the irregularity) were suitable tobe meta-analyzed. Both fixed-effects models including andexcluding null effect-sizes resulted in a significant summaryeffect-size with higher RMSSD of TV and the fixed-effects modelshowed significant summary effect size with higher complexdemodulation of RR in subjects with PD than controls.
3.3.4. Rates of apneas and sighs
In subjects with PD as compared to controls the fixed-effectsmodel showed significant summary effect size with higher rate ofapneas and both fixed-effects models including and excludingnull effect-sizes showed significant summary effect-size withhigher rate of sighs.
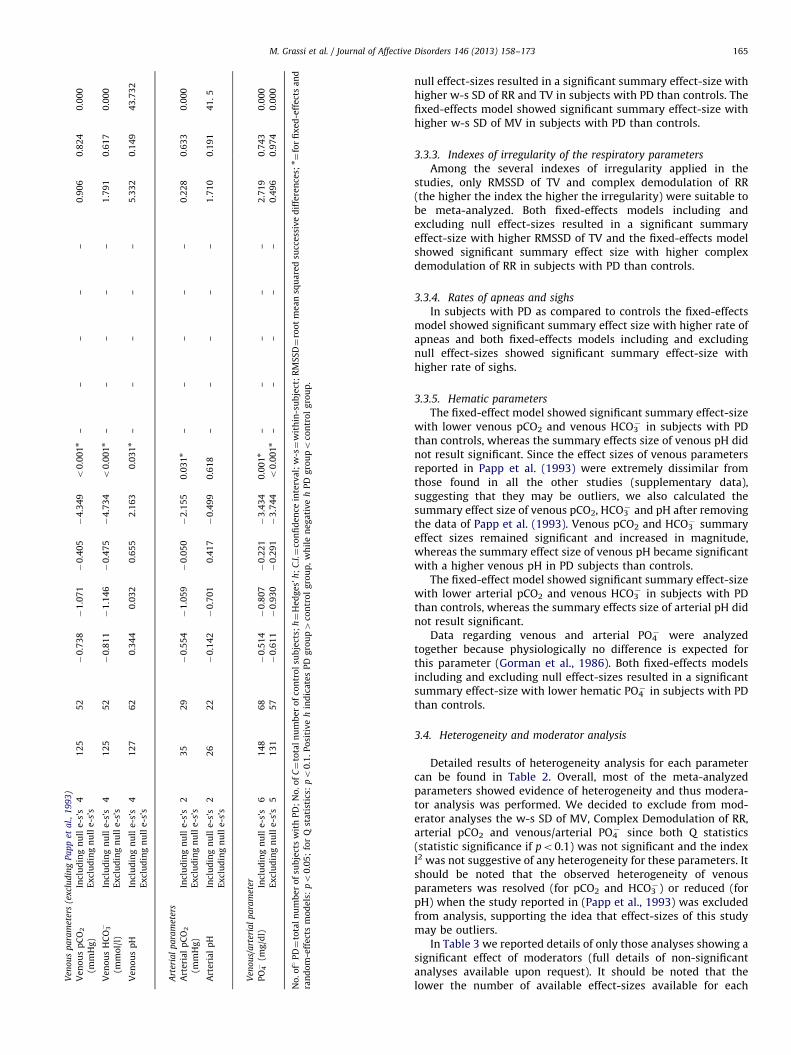
3.3.5. Hematic parameters
The fixed-effect model showed significant summary effect-sizewith lower venous pCO2 and venous HCO3
� in subjects with PDthan controls, whereas the summary effects size of venous pH didnot result significant. Since the effect sizes of venous parametersreported in Papp et al. (1993) were extremely dissimilar fromthose found in all the other studies (supplementary data),suggesting that they may be outliers, we also calculated thesummary effect size of venous pCO2, HCO3
� and pH after removingthe data of Papp et al. (1993). Venous pCO2 and HCO3
� summaryeffect sizes remained significant and increased in magnitude,whereas the summary effect size of venous pH became significantwith a higher venous pH in PD subjects than controls.
The fixed-effect model showed significant summary effect-sizewith lower arterial pCO2 and venous HCO3
� in subjects with PDthan controls, whereas the summary effects size of arterial pH didnot result significant.
Data regarding venous and arterial PO4� were analyzed
together because physiologically no difference is expected forthis parameter (Gorman et al., 1986). Both fixed-effects modelsincluding and excluding null effect-sizes resulted in a significantsummary effect-size with lower hematic PO4
� in subjects with PDthan controls.
3.4. Heterogeneity and moderator analysis
Detailed results of heterogeneity analysis for each parametercan be found in Table 2. Overall, most of the meta-analyzedparameters showed evidence of heterogeneity and thus modera-tor analysis was performed. We decided to exclude from mod-erator analyses the w-s SD of MV, Complex Demodulation of RR,arterial pCO2 and venous/arterial PO4
� since both Q statistics(statistic significance if po0.1) was not significant and the indexI2 was not suggestive of any heterogeneity for these parameters. Itshould be noted that the observed heterogeneity of venousparameters was resolved (for pCO2 and HCO3
�) or reduced (forpH) when the study reported in (Papp et al., 1993) was excludedfrom analysis, supporting the idea that effect-sizes of this studymay be outliers.
In Table 3 we reported details of only those analyses showing asignificant effect of moderators (full details of non-significantanalyses available upon request). It should be noted that thelower the number of available effect-sizes available for each
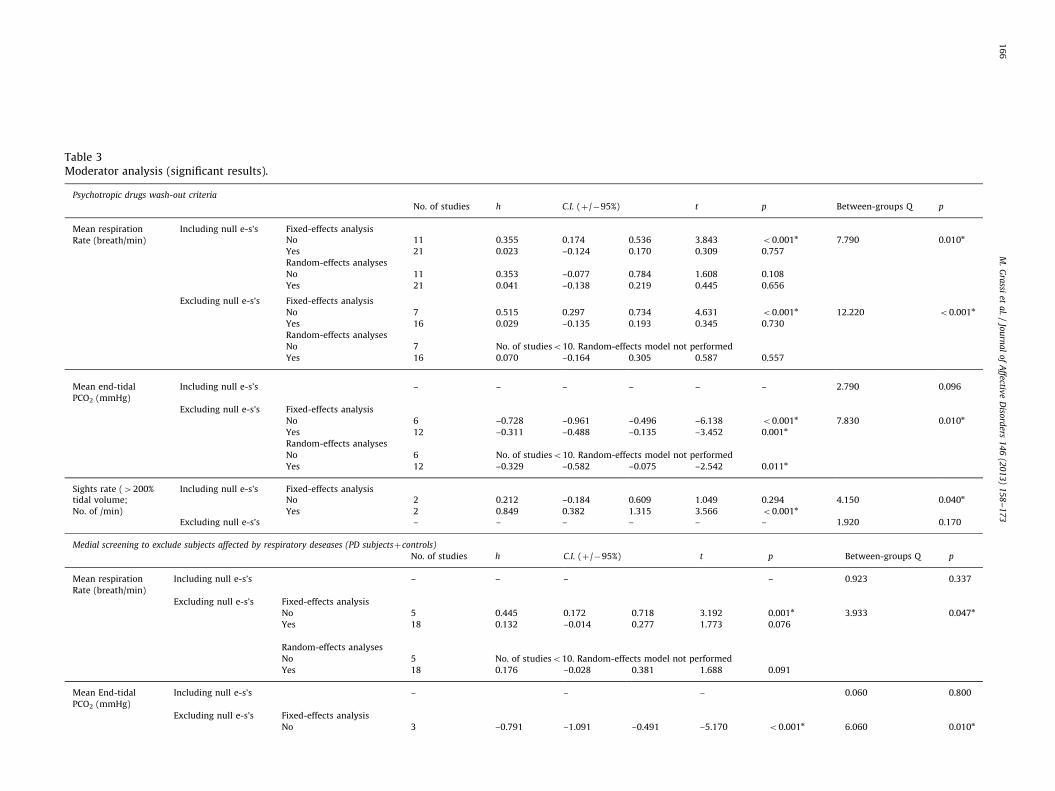
Table 3Moderator analysis (significant results).
Psychotropic drugs wash-out criteria
No. of studies h C.I. (þ/�95%) t p Between-groups Q p
Mean respiration Including null e-s’s Fixed-effects analysis
Rate (breath/min) No 11 0.355 0.174 0.536 3.843 o0.001n 7.790 0.010n
Yes 21 0.023 –0.124 0.170 0.309 0.757
Random-effects analyses
No 11 0.353 –0.077 0.784 1.608 0.108
Yes 21 0.041 –0.138 0.219 0.445 0.656
Excluding null e-s’s Fixed-effects analysis
No 7 0.515 0.297 0.734 4.631 o0.001n 12.220 o0.001n
Yes 16 0.029 –0.135 0.193 0.345 0.730
Random-effects analyses
No 7 No. of studieso10. Random-effects model not performed
Yes 16 0.070 –0.164 0.305 0.587 0.557
Mean end-tidal Including null e-s’s – – – – – – 2.790 0.096
PCO2 (mmHg)
Excluding null e-s’s Fixed-effects analysis
No 6 –0.728 –0.961 –0.496 –6.138 o0.001n 7.830 0.010n
Yes 12 –0.311 –0.488 –0.135 –3.452 0.001n
Random-effects analyses
No 6 No. of studieso10. Random-effects model not performed
Yes 12 –0.329 –0.582 –0.075 –2.542 0.011n
Sights rate (4200% Including null e-s’s Fixed-effects analysistidal volume; No 2 0.212 –0.184 0.609 1.049 0.294 4.150 0.040n
No. of /min) Yes 2 0.849 0.382 1.315 3.566 o0.001n
Excluding null e-s’s – – – – – – 1.920 0.170
Medial screening to exclude subjects affected by respiratory deseases (PD subjectsþcontrols)
No. of studies h C.I. (þ/�95%) t p Between-groups Q p
Mean respiration Including null e-s’s – – – – 0.923 0.337
Rate (breath/min)
Excluding null e-s’s Fixed-effects analysis
No 5 0.445 0.172 0.718 3.192 0.001n 3.933 0.047n
Yes 18 0.132 –0.014 0.277 1.773 0.076
Random-effects analyses
No 5 No. of studieso10. Random-effects model not performed
Yes 18 0.176 –0.028 0.381 1.688 0.091
Mean End-tidal Including null e-s’s – – – 0.060 0.800
PCO2 (mmHg)
Excluding null e-s’s Fixed-effects analysis
No 3 –0.791 –1.091 –0.491 –5.170 o0.001n 6.060 0.010n
M.
Gra
ssiet
al.
/Jo
urn
al
of
Affectiv
eD
isord
ers1
46
(20
13
)1
58
–1
73
16
6
Yes 15 –0.367 –0.523 –0.211 –4.615 o0.001n
Random-effects analyses
No 3 No. of studieso10. Random-effects model not performed
Yes 15 –0.377 –0.580 –0.174 –3.644 o0.001n
Study type
No. of Studies h C.I. (þ/�95%) t p Between-groups Q p
W-s SD Tidal Including null e-s’s – – – – – 1.420 0.233
Volume (ml/breath) Excluding null e-s’s Fixed-effects analysis
Rest 3 0.167 –0.153 0.487 1.022 0.307 4.841 0.028n
Stimulation 2 0.729 0.344 1.114 3.711 o0.001n
Apneas rate (45 s; No. of /min) – Fixed-effects analysis
Rest 1 0.632 –0.035 1.298 1.857 0.063 7.299 0.007n
Stimulation 1 1.881 1.267 2.496 5.998 o0.001n
Sights rate (4200% tidal Including null e-s’s Fixed-effects analysis
volume; No. of /min) Rest 2 0.849 0.382 1.315 3.566 o0.001n 4.146 0.042n
Stimulation 2 0.212 –0.184 0.609 1.049 0.294
Excluding null e-s’s – – – – – 1.922 0.166
Catheter
No. of Studies h C.I. (þ/�95%) t p Between-groups Q p
Mean respiration Including null e-s’s Fixed-effects analysisRate (breath/min) No 22 0.031 –0.094 0.157 0.491 0.624 17.254 o0.001n
Yes 10 0.617 0.371 0.863 4.910 o0.001n
Random-effects analyses
No 22 0.031 –0.112 0.174 0.428 0.669
Yes 10 0.573 –0.005 1.151 1.944 0.052
Excluding null e-s’s Fixed-effects analysis
No 16 0.040 –0.102 0.182 0.556 0.578 27.440 o0.001n
Yes 7 0.935 0.632 1.238 6.044 o0.001n
Random-effects analyses
No 16 0.042 –0.152 0.236 0.426 0.670
Yes 7 No. of studieso10. Random-effects model not performed
Mean End-tidal Including null e-s’s Fixed-effects analysisPCO2 (mmHg) No 21 –0.290 –0.417 –0.163 –4.476 o0.001n 6.470 0.011n
Yes 4 –0.793 –1.160 –0.427 –4.240 o0.001n
Random-effects analyses
No 21 –0.287 –0.442 –0.132 –3.618 o0.001n
Yes 4 No. of studieso10. Random-effects model not performed
Excluding null e-s’s Fixed-effects analysis
No 14 –0.401 –0.551 –0.252 –5.268 o0.001n 3.760 0.052
Yes 4 –0.793 –1.160 –0.427 –4.240 o0.001n
Random-effects analyses
No 14 –0.413 –0.609 –0.217 –4.135 o0.001n
Yes 4 No. of studieso10. Random-effects model not performed
h¼Hedges’ h; C.I.¼Confidence interval. n¼for fixed-effects models, random-effects models and between-groups Q: po0.05.
M.
Gra
ssiet
al.
/Jo
urn
al
of
Affectiv
eD
isord
ers1
46
(20
13
)1
58
–1
73
16
7
M. Grassi et al. / Journal of Affective Disorders 146 (2013) 158–173168
parameter, the lower was the statistical power for the moderatoranalyses, thus limiting our possibility to find significant modera-tor effects.
Differences between studies satisfying or not the psychophar-macological wash-out criterion emerged for mean RR, mean et-pCO2 and rate of sighs. For mean RR, the effect of this moderatorresulted significant both including and excluding null effect-sizes.In the fixed-effects models, mean RR remained significantlyhigher in PD only in the group of studies not satisfying thewash-out criterion, while the group of studies satisfying itshowed a non-significant effect-size. Instead, in the random-effects models no significant summary effect-size was found,similarly to what observed by performing random-effects modelsin the whole sample. For mean et-pCO2, the effect of thismoderator resulted significant only when null effect-sizes wereexcluded, with mean et-pCO2 significantly lower in subjects withPD than controls in both groups of studies satisfying and notsatisfying the criterion. Conversely, this moderator showed asignificant effect for rate of sighs only including null effect-sizes. The summary effect-size was significant in the group ofstudies satisfying the wash-out criterion only, showing a higherrate of sighs in subjects with PD than controls.
Differences between studies satisfying and not satisfying themedical screening criterion emerged for mean RR and mean et-pCO2 only when null effect-sizes were excluded. For mean RR,only the fixed-effects model for studies not satisfying the criterionwas significant, with mean RR significantly higher in subjectswith PD than controls. For et-pCO2, mean et-pCO2 resultedsignificantly lower in subjects with PD than controls in bothgroups of studies satisfying and not satisfying the criterion.
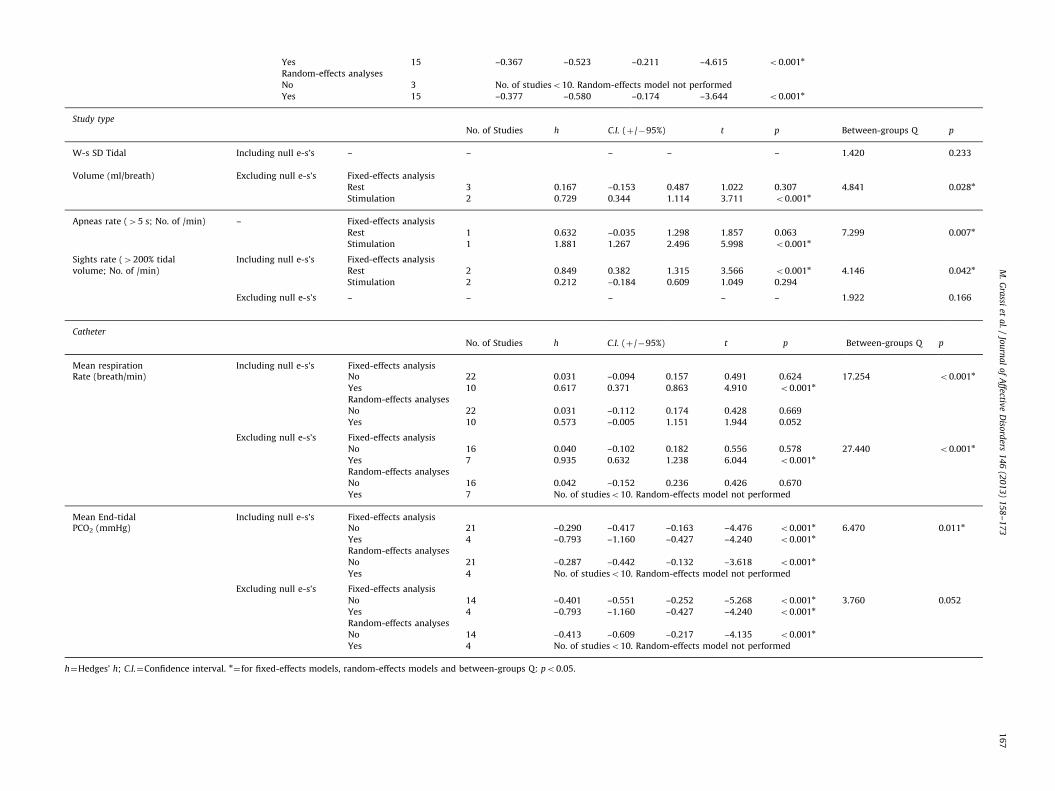
Differences between studies satisfying or not the type of studycriterion emerged for w-s SD of TV excluding null effect-sizes, rateof apneas and rate of sighs including null effect-sizes. Whenanalysis with fixed-effects models was performed separately foreach study group, the w-s SD of TV excluding null effect-sizesresulted significantly higher in subjects with PD than controls instimulation studies only. A similar result was found for the rate ofapneas, with the single available stimulation study showing asignificant higher rate of apneas in subjects with PD than controls.Conversely, the rate of sighs including null effect-sizes resultedsignificantly higher in PD than controls in rest studies only.
Differences between studies in which subjects had or not acatheter inserted during assessment were found for mean RR andmean et-pCO2. For studies coded as ‘‘yes’’, the fixed-effects modelincluding null effect-sizes showed significantly higher mean RR in
Table 4Publication bias. Adjusted effect-sizes estimates with trim and fill me
Parameters Duval and Tweedie’s trim
Side of
missing
studies
Fixed-effect
No. of
trimmed
studies
Mean respiration rate
(breath/min)
Including null e-s’s Left 0
Excluding null e-s’s Left 5
Mean tidal volume
(ml/breath)
Including null e-s’s Left 0
Excluding null e-s’s Left 0
Mean minute ventilation
(l/min)
Including null e-s’s Left 0
Excluding null e-s’s Left 0
Mean end-tidal PCO2
(mmHg)
Including null e-s’s Right 0
Excluding null e-s’s Right 2
PD than controls and the random-effects model including nulleffect-sizes showed a trend of significance. Instead, no significantdifferences between subject with PD and control were found forstudies coded as ‘‘no’’. The same pattern of results was foundwhen null effect-sizes were excluded. For mean et-pCO2, subjectswith PD resulted to have a significantly lower mean et-pCO2 thancontrols in both studies in which subjects had and not a catheter,both when fixed- and random-effects models were applied.However the difference between PD and control is significantlybigger in studies where subjects had a catheter inserted duringbaseline parameters assessment than in those studies where nocatheter was used during assessment.
Finally, no significant moderation effects resulted in any of theparameters when the position of subjects during assessment wastested as moderator.
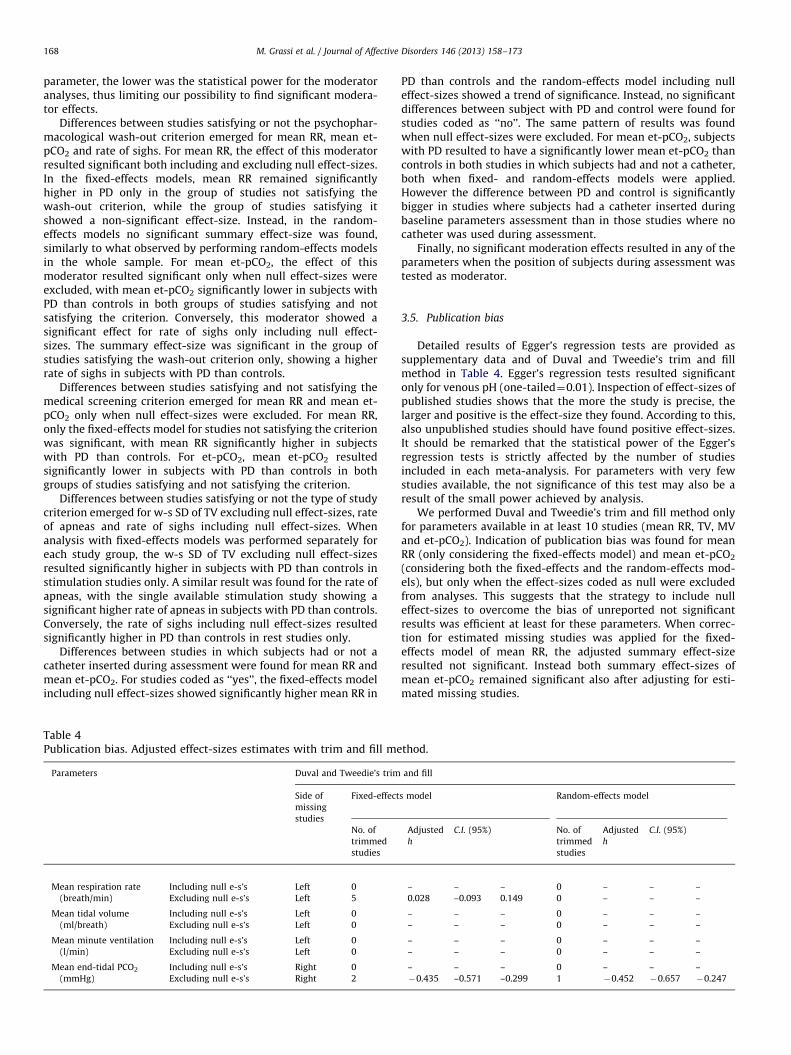
3.5. Publication bias
Detailed results of Egger’s regression tests are provided assupplementary data and of Duval and Tweedie’s trim and fillmethod in Table 4. Egger’s regression tests resulted significantonly for venous pH (one-tailed¼0.01). Inspection of effect-sizes ofpublished studies shows that the more the study is precise, thelarger and positive is the effect-size they found. According to this,also unpublished studies should have found positive effect-sizes.It should be remarked that the statistical power of the Egger’sregression tests is strictly affected by the number of studiesincluded in each meta-analysis. For parameters with very fewstudies available, the not significance of this test may also be aresult of the small power achieved by analysis.
We performed Duval and Tweedie’s trim and fill method onlyfor parameters available in at least 10 studies (mean RR, TV, MVand et-pCO2). Indication of publication bias was found for meanRR (only considering the fixed-effects model) and mean et-pCO2
(considering both the fixed-effects and the random-effects mod-els), but only when the effect-sizes coded as null were excludedfrom analyses. This suggests that the strategy to include nulleffect-sizes to overcome the bias of unreported not significantresults was efficient at least for these parameters. When correc-tion for estimated missing studies was applied for the fixed-effects model of mean RR, the adjusted summary effect-sizeresulted not significant. Instead both summary effect-sizes ofmean et-pCO2 remained significant also after adjusting for esti-mated missing studies.
thod.
and fill
s model Random-effects model
Adjusted
h
C.I. (95%) No. of
trimmed
studies
Adjusted
h
C.I. (95%)
– – – 0 – – –
0.028 –0.093 0.149 0 – – –
– – – 0 – – –
– – – 0 – – –
– – – 0 – – –
– – – 0 – – –
– – – 0 – – –
�0.435 –0.571 –0.299 1 �0.452 �0.657 �0.247
M. Grassi et al. / Journal of Affective Disorders 146 (2013) 158–173 169
4. Discussion
Overall, our meta-analysis indicates several differencesbetween baseline respiratory parameters of subjects with PDand controls. However, since only for mean RR, TV, MV and et-pCO2 the available studies allowed to apply random-effectsmodels, results regarding these parameters are more reliable,whereas, for all the other parameters, our meta-analytic resultsshould be considered preliminary and further independent stu-dies are needed before being able to draw more confidentconclusions from a meta-analytic reviewing approach.
Diagnostics of publication bias suggest that our meta-analysisis globally not affected by this problem. Egger’s regression test didnot find significant publication biases except for venous pH.However we also found contrasting meta-analytic results forvenous pH when a study with outlying results (Papp et al.,1993) was included or excluded from the analyses, suggesting ascarce consistency of this parameter in the available studies.Finally, even when trim and fill method estimated possiblemissing studies, no significant publication biases remained whennull effect-sizes were inserted in the analyses, suggesting thatincomplete statistical details reported in papers more than thenon-publication of studies with not significant results may be themain source of publication bias in our meta-analyses.
4.1. Mean respiratory parameters
Mean RR, TV, MV and et-pCO2 were the most investigatedrespiratory parameters in the selected studies, probably becausethey can be assessed by less invasive methods than bloodparameters and can be easily calculated through basic statistics.Both the fixed- and random-effects models indicated that subjectswith PD have significant higher mean MV and, as expectedconsequence of increased ventilation, lower mean et-pCO2 thancontrols. However, for both mean MV and et-pCO2, the values ofthe summary effect-sizes indicated that the differences betweenthe two groups can be considered small in magnitude (Cohen,1988).
Even if limited, the heterogeneity among effect-sizes of meanMV in the different studies was found not to be explained by theapplied moderator analyses. This indicates that other factors,different from those included in our analyses, may have influ-enced the heterogeneity of this parameter. Instead, a greaterheterogeneity for mean et-pCO2 was found and it was explainedby significant moderator effects of the psychopharmacologicalwash-out criterion, the medical screening criterion and the use ofa hematic catheter during assessment. However, significanteffects of the first two criteria resulted only when null effect-sizes were not inserted in the analyses, whereas, when they wereinserted, the significant effects of these moderators disappeared,suggesting that the incomplete reporting of statistical details fornon-significant results and not the psychopharmacological wash-out and medical screening criteria themselves may be the sourceof these significant results. Moreover, our strategy of insertingnull effect-sizes in the analyses seemed to have brought to morereliable meta-analytic results than simply excluding those other-wise not analyzable studies. Conversely, results obtained by using‘‘catheter’’ as moderator indicated a relevant influence of thisprocedure on the mean et-pCO2 since the significant differencebetween subjects with PD and controls was significantly higher inthose studies where a hematic catheter was employed, possiblyrelated to emotional states associated to the invasiveness of theprocedure, as discussed above for RR. Unfortunately, the availabledata did not allow to understand if the source of the increased MVof patients with PD was a higher RR and/or higher TV since themeta-analytic summary effect-sizes showed clearly significant
differences between patients and controls neither for mean RRnor for mean TV. The discrepancies of results between fixed- andrandom-effects models did not allow any reliable interpretationfor these parameters, with the source of these discrepanciesbetween models due to the particularly high heterogeneityamong the effect-sizes of the different studies that the fixed-effects models cannot take into account. For mean TV, moderatoranalysis was not able to explain the heterogeneity among studies,suggesting that it was influenced by other unclear factors,different from those included in our analyses. Conversely, thepsychopharmacological wash-out criterion, the medical screeningcriterion and the use of a hematic catheter during assessmentwere able to explain, at least partly, the heterogeneity of mean RR,similarly to what found for mean et-pCO2. In particular, the effectof the wash-out criterion remained significant also when nulleffect-sizes where included, whereas the effect of the medicalscreening criterion did not. When the wash-out criterion wasapplied as moderator in fixed-effects models, only the summaryeffect-sizes of studies not fulfilling this criterion resulted signifi-cant; overall, this suggests a relevant influence of psychopharma-cological wash-out criterion on the heterogeneity of mean RRamong studies. This is in accordance to experimental evidence ofincreased mean RR during chronic treatment with SSRI both inrats (Annerbrink et al., 2010; Olsson et al., 2004) and subjectswith PD (Yeragani et al., 2004). However, since the random-effects models did not result significant, these results should beconsidered with caution. Moderator analyses with ‘‘catheter’’ asmoderator indicated a relevant role of this procedure in explain-ing the heterogeneity of mean RR among studies. Indeed, only thestudies employing a blood-sampling catheter showed highermean RR in patients with PD than controls, resulting significantfor fixed-effects models and with a clear trend towards signifi-cance also for the random-effects model when null effect-sizewere included. The better concordance between the results offixed- and random-effects models for this moderator suggests abetter consistence of these results. A possible explanation of theinfluence of employing a catheter on respiratory parameters maybe related to emotional factors. Subjects with PD have higherHarm Avoidance (Wachleski et al., 2008) and Anxiety Sensitivity(Naragon-Gainey, 2010; Olatunji and Wolitzky-Taylor, 2009) thancontrols, thus showing a particularly high anxious reactivity inanticipation and experience of novel environments and physicalsensation. Thus, the physical pain and invasiveness associatedwith the procedure might have affected their anxiety levelsduring the assessment more strongly than in controls, influencingtheir respiratory parameters (Homma and Masaoka, 2008;Niccolai et al., 2009). This is in accordance to experimentalevidence of positive correlations between levels of trait anxietyand mean RR during mental stress paradigms (Masaoka andHomma, 1997, 1999) and increase of mean RR induced byanticipatory anxiety (Masaoka and Homma, 2001) in healthysubjects, indicating a role of anxiety in modulating respiration.Finally, we found very preliminary evidence of significantlyhigher mean Inspiratory Drive (TV/Inspiration Time) in PD thancontrols, arising from only two studies; however, we are not ableto disentangle if the increase of this parameter was related to themean TV and/or to the mean Inspiration Time since no clearmeta-analytic results were found for the former and no meta-analysis was performed for the latter because of lacking ofavailable data. Thus, this finding is hard to be interpreted andshould be considered with caution.
4.2. Hematic parameters
Beyond respiratory parameters, also certain hematic para-meters, such as hematic pCO2, HCO3
� and PO4� concentrations
M. Grassi et al. / Journal of Affective Disorders 146 (2013) 158–173170
and pH, may provide information about respiratory function. Anincrease in ventilation and the consequent decrease in hematic pCO2
produce a rise of blood pH (respiratory alkalosis), with variouscompensatory mechanisms acting to restore the acid-base balance.After first metabolic buffering mechanisms (cell buffering), inducingonly a very small drop in hematic HCO3
� , if hyperventilationbecomes chronic and respiratory alkalosis persists the renal buffer-ing system restores physiologic pH level, by inducing a significantdrop in hematic HCO3
� concentration, and also a drop in hematicPO4� concentration can be observed. Therefore, the comparison of
baseline hematic HCO3� , PO4
� and pH between subjects with PD andcontrols may help to clarify whether the increased mean ventilationand decreased pCO2 found in patients with PD may be consideredacute and setting-dependent or chronic and existent also before theexperimental period of assessment. Meta-analytic results showedpreliminary evidence of significantly lower venous and arterialpartial pressure of CO2 in subjects with PD than controls, accordingto what found for et-pCO2, and significantly lower venous HCO3
�
and PO4� with differences medium-to-large in magnitude between
the two groups. These findings are suggestive of chronic respiratoryalkalosis in subjects with PD. Both summary effect sizes for arterialand venous pH did not result significantly different between the twogroups, as expected because of the operating metabolic compensa-tory mechanisms in subjects with PD, even though these resultsmay also arise from the poor statistical power related to theextremely few number of studies available to be meta-analyzed.Furthermore, it should be noted that when the analysis was re-performed after removing the outlying effect-sizes reported in Pappet al., 1993 (Papp et al., 1993) a significantly higher venous pH insubjects with PD than in controls was found. Thus, confidentconclusions about the baseline pH level in PD are hard to be drawn.The discrepant results of higher venous pH and lower venous HCO3
�
and PO4� found at the same time in subjects with PD may be
interpreted as a mixed state of both chronic and acute respiratoryalkalosis during baseline assessment. Indeed, in addition to a chroniccondition of respiratory alkalosis, higher anxiety levels of subjectswith PD in experimental settings may induce a further increase intheir ventilation producing a transient acid-base unbalance, assuggested by Gorman and coworkers (Gorman et al., 1986).
Overall, these preliminary suggestions arising from the meta-analysis of hematic parameters are of particular relevance. The fewavailable studies employing ambulatory monitoring devices in real-life settings have failed to provide any evidence of hyperventilation inPD, finding non-significant differences in mean respiratory para-meters of subjects with PD and controls (Hoehn-Saric, 2004;Martinez et al., 1996; Pfaltz et al., 2010; Pfaltz et al., 2009). On thesebases, the authors of these studies have proposed that all thedifferences between respiratory function of subjects with PD andcontrols found in laboratory settings may be related to their exag-gerated emotional reactivity to experimental context. Conversely, ourresults suggests that, even if respiratory parameters of subjects withPD may be affected by their high anxiety levels during laboratoryassessment, these subjects may be also characterized by an under-lying chronic hyperventilation. Some reasons may explain thesediscrepancies, including that all of the ambulatory monitoring studiesconsidered only respiratory parameters such as mean MV, RR and TV,while not directly measuring end-tidal or transcutaneous pCO2, andthe sample sizes were quite small. Considering our meta-analyticresults of small significant differences s in mean MV between subjectswith PD and controls, these studies may have too little statisticalpower to catch such tiny differences between groups.
4.3. Variability and irregularity of baseline respiratory patterns
In order to analyze the overall variability of a respiratoryparameter in some studies the within-subject Standard Deviation
was calculated. It measures the magnitude of the deviation fromthe mean value for each parameter in each subject in a period oftime. Meta-analyses for w-s SD of MV, RR and TV showedsignificant summary effect-sizes, indicating a small-to-mediumhigher variability of these parameters in PD subjects than con-trols. However, since moderator analysis for w-s SD of TV with‘‘type of study’’ as moderator resulted significant only when nulleffect-sizes were excluded and the available studies were only afew, for this parameter no reliable conclusion can be drawn yet.Although preliminary, our results suggest that subjects with PDmay have not only higher ventilation than controls but alsohigher variability in their respiratory patterns, at least for someparameters.
Since the gold standard to study physiologic functions seemsto be the analysis of longitudinal time-series of physiologicsignals using indexes based on the dynamic complex systems,non-linear dynamics and chaos theory (Perna et al., 2004a), insome studies these statistics have been applied on respiratorypatterns of subjects with PD. Unfortunately, because of the highheterogeneity of the indexes used in different studies we wereable to perform meta-analytic analyses only for the rMSSD of TVand the Complex Demodulation statistics for RR. Our preliminaryresults showed significant summary effect-sizes of these para-meters, suggesting a greater irregularity in baseline TV and RRtime-series of subjects with PD than controls. Some of theambulatory monitoring studies also compared the irregularity(rMSSD) of respiratory patterns of subjects with PD and controls,failing to find any significant difference (Martinez et al., 1996;Pfaltz et al., 2010; Pfaltz et al., 2009), except for little evidence forinstability of TV regulation during low physical activity (Pfaltzet al., 2010) and higher irregularity of MV during sleep (Martinezet al., 1996). Once again the inconsistency between our prelimin-ary meta-analytic results and those found in the ambulatorymonitoring studies may arise from a too little statistical powerof the latter.
Finally, our meta-analytic results showed preliminary evi-dence of higher rate of both sighs and apneas in baselinerespiratory patterns of subjects with PD than controls. Moderatoranalyses found significantly higher rate of sighs in subjects withPD only in studies with a good methodological quality, that arethose where the psychopharmacological wash-out criterion wastaken into account and respiratory assessment were performedonly in resting condition. Instead, moderator analyses showed aclearly significant higher rate of apneas in subjects with PD onlyin studies with stimulation, suggesting a possible relevant influ-ence of anticipatory anxiety on this parameter. An open questionis whether the occurrence of sighs/apneas may explain, totally orpartially, the observed higher mean ventilation and/or the varia-bility and irregularity of respiratory patterns of subjects with PD.Even when variability/irregularity indexes resulted significant,they describe the overall pattern of a parameter within a period oftime since they are not able to disentangle whether variability/irregularity may be caused by the sporadic occurrence of sighs/apneas or may be intrinsic features of the respiratory patternbeyond occasional respiratory events. Only a few studies tried toanswer this question indicating an increased irregularity inrespiratory patterns of patients with PD also when the potentialrole of sighs and apneas had been excluded (Caldirola et al.,2004a; Yeragani et al., 2002). However, because of the differentstrategies employed in the studies, we were not able to performany meta-analytic investigation on this relevant topic. Similarly,the occurrence of sighs/apneas may affect the mean values ofrespiratory parameters since sighs may produce an increasing ofventilation and a reduction of pCO2 whereas opposite effects areproduced by apneas. Thus, findings of hyperventilation in subjectswith PD may be also related to occurrence of sighs (Wilhelm et al.,
M. Grassi et al. / Journal of Affective Disorders 146 (2013) 158–173 171
2001b) as well as their mean respiratory values apparentlysimilar to those of controls in some studies may be related tohidden apneas in their respiratory patterns. Considering thepreliminary meta-analytic evidence of a higher rate of both sighsand apneas in PD subjects than controls, an increased mean MVand decreased mean pCO2 in PD might also arise from a morefrequent occurrence of sighs than apneas during respiration.
Till now no reliable conclusions can be drawn on these issues,but these observations may be a stimulus for future studiesoperating more wide, complete and integrated investigations ofrespiratory patterns clarify the relationship among the severalrespiratory phenomena.
4.4. Limitations and conclusions
Most of the limitations affecting our meta-analysis arise fromgeneral limitations characterizing the state of art of the researchin respiratory physiology of PD. The quality of the studies shouldbe generally improved. For instance, only a few meta-analyzedstudies fully applied, as an exclusion criteria for sample recruit-ment, the concurrent co-morbidity with psychiatric disordersother than PD ((Griez et al., 1988; Kellner et al., 1998; Niccolaiet al., 2008). Caldirola et al. (2004a, 2004b) admitting onlycomorbidity with Simple Phobia); thus, we were not able toemploy this criteria as moderator in our analyses. Also this mightconstitutes a significant source of bias as it was found for othercriteria, such as psychopharmacological wash-out/medicalscreening, when they have been applied as moderators in ouranalyses. The samples of subjects with PD and controls were oftenunbalanced for socio-demographic characteristics, thus havingseveral potential sources of biases, including gender that is well-known to have relevant influence on respiration as indicated bysignificant differences in minute ventilation and several otherrespiratory parameters across the menstrual cycle (Behan andWenninger, 2008; Macnutt et al., 2012). Many studies werelacking of data allowing to calculate effect-sizes and often onlydata regarding significant effect-sizes were reported. Finally, thesmall number of relevant studies available for most of therespiratory parameters limited both our possibility to performcomplete meta-analytic procedures and the statistical powerachieved in the analyses. Overall, since a meta-analysis is basedon the results of all the studies performed to investigate a specifictopic, a global methodological weakness of the entire field ofresearch makes harder the meta-analysis to be performed and toprovide reliable answers to the questions of interest. On thesebases, some improvements may be suggested to allow futuresystematic and meta-analytic reviews providing more reliableresults: (1) to increase the studies investigating hematic para-meters, since they may be particularly relevant although moredifficult to be studied; (2) to investigate respiratory variabilityand irregularity by applying the same methods in the differentstudies, in order to provide comparable data avoiding the highheterogeneity of irregularity statistics and sighs’/apneas’ defini-tion criteria employed across the studies by now; (3) to use morestringent and methodologically correct criteria for sample recruit-ment or study planning and to improve the completeness of datareported in the papers including also the full details of notsignificant results.
Keeping in mind the limitations, the most reliable resultsemerging from our meta-analysis are the baseline higher meanMinute Ventilation and lower et-pCO2 of subjects with PD, whencompared to controls, suggesting that they may be characterizedby baseline hyperventilation. Besides, our preliminary results ofreduced HCO3
� and PO4� hematic concentrations in subjects with
PD suggest that hyperventilation may be chronic and not simplycaused by their high anxiety levels during respiratory assessment.
Preliminary indications of higher variability of MV, RR and TV andhigher irregularity of RR and TV in respiratory patterns of subjectswith PD were also found. Finally, our preliminary results of ahigher rate of sighs and apneas in subjects with PD leave open thepossibility that the occurrence of these occasional respiratoryevents may, in part or completely, explain all the other findings ofbaseline respiratory abnormalities in subjects with PD. Overall,our results support the idea of abnormalities in respiratoryfunction in PD, as proposed by the respiratory theories of PD.However, the well-known influence of anxiety on respirationleaves open the possibility that the observed respiratory abnorm-alities may be not intrinsic and specific characteristics of subjectswith PD but may be related to their high trait and state anxietylevels (Caldirola et al., 2004a). If so, similar respiratory abnorm-alities should be also found in other populations with high traitand state anxiety levels, such as in subjects suffering from otherAnxiety Disorders. Alternatively, it cannot be excluded the possi-bility that cognitive/behavioral factors, including fear of somaticsensations, panic-specific beliefs, phobic/protective behaviors,might influence respiration of subjects with PD in a peculiarway, leading to specific abnormalities in their respiratory patternseven when they do not differ in state/trait anxiety levels incomparison to subjects with other anxiety disorders. (Clark,1986; Gorman et al., 2000). Results from the studies comparingbaseline respiratory parameters between subjects with PD andsubjects with other Anxiety Disorders are mixed and no reliableconclusions can be drawn yet. In the attempt to clarify thisimportant issue, the authors of this paper are carrying on afurther meta-analysis comparing baseline respiratory parametersbetween these two populations.
Role of funding sourceNothing to declare.
Conflict of interestNothing to declare.
AcknowledgementsThis work was performed as a partial fulfillment towards the International
Master in Affective Neuroscience of Maastricht University and the University of
Florence.
Appendix A. Supporting information
Supplementary data associated with this article can be foundin the online version at http://dx.doi.org/10.1016/j.jad.2012.08.034.
References
Abelson, J.L., Nesse, R.M., Weg, J.G., Curtis, G.C., 1996. Respiratory psychophysiol-ogy and anxiety: cognitive intervention in the doxapram model of panic.Psychosomatic Medicine 58, 302–313.
Annerbrink, K., Olsson, M., Hedner, J., Eriksson, E., 2010. Acute and chronictreatment with serotonin reuptake inhibitors exert opposite effects onrespiration in rats: possible implications for panic disorder. Journal ofpsychopharmacology (Oxford, England) 24, 1793–1801.
Aronson, T., Carasiti, I., McBane, D., Whitaker-Azmitia, P., 1989. Biologicalcorrelates of lactate sensitivity in panic disorder. Biological Psychiatry 26,463–477.
Asmundson, G., Stein, M., 1994a. Triggering the false suffocation alarm in panicdisorder patients by using a voluntary breath-holding procedure. The Amer-ican Journal of Psychiatry 151, 264–266.
Asmundson, G., Stein, M., 1994b. Vagal attenuation in panic disorder: an assess-ment of parasympathetic nervous system function and subjective reactivity torespiratory manipulations. Psychosomatic Medicine 56, 187–193.
M. Grassi et al. / Journal of Affective Disorders 146 (2013) 158–173172
Association, A.P., 1980. Diagnostic and Statistical Manual of Mental Disorders, 3rded. American Psychiatric Association, Washington, DC.
Association, A.P., 1987. Diagnostic and Statistical Manual of Mental Disorders, 3rded., revised American Psychiatric Association, Washington, DC.
Association, A.P., 1992. Diagnostic and Statistical Manual of Mental Disorders, 4thed. American Psychiatric Association, Washington, DC.
Association, A.P., 2000. Diagnostic and Statistical Manual of Mental Disorders, 4thed., text revision American Psychiatric Association, Washington, DC.
Bass, C., Lelliott, P., Marks, I., 1989. Fear talk versus voluntary hyperventilation inagoraphobics and normals: a controlled study. Psychological Medicine 19,669–676.
Battaglia, M., Ogliari, A., Harris, J., Spatola, C.A.M., Pesenti-Gritti, P., Reichborn-Kjennerud, T., Torgersen, S., Kringlen, E., Tambs, K., 2007. A genetic study of theacute anxious response to carbon dioxide stimulation in man. Journal ofPsychiatric Research 41, 906–917.
Behan, M., Wenninger, J.M., 2008. Sex steroidal hormones and respiratory control.Respiratory Physiology & Neurobiology 164, 213–221.
Blechert, J., Michael, T., Grossman, P., Lajtman, M., Wilhelm, F.H., 2007. Autonomicand Respiratory Characteristics of Posttraumatic Stress Disorder and PanicDisorder.
Blechert, J., Wilhelm, F.H., Meuret, A.E., Wilhelm, E., Roth, W.T., 2010. Respiratory,autonomic, and experiential responses to repeated inhalations of 20%CO(2) enriched air in panic disorder, social phobia, and healthy controls.Biological Psychology 84, 104–111.
Briggs, A.C., Stretch, D.D., Brandon, S., 1993. Subtyping of panic disorder bysymptom profile. The British Journal of Psychiatry: The Journal of MentalScience 163, 201–209.
Burkhardt, S.C.A., Wilhelm, F.H., Meuret, A.E., Blechert, J., Roth, W.T., 2010.Temporal stability and coherence of anxiety, dyspnea, and physiologicalvariables in panic disorder. Biological Psychology 85, 226–232.
Bystritsky, A., Craske, M., Maidenberg, E., Vapnik, T., Shapiro, D., 2000a. Autonomicreactivity of panic patients during a CO2 inhalation procedure. Depression andAnxiety 11, 15–26.
Bystritsky, A., Maidenberg, E., Craske, M.G., Vapnik, T., Shapiro, D., 2000b.Laboratory psychophysiological assessment and imagery exposure in panicdisorder patients. Depression and Anxiety 12, 102–108.
Bystritsky, A., Shapiro, D., 1992. Continuous physiological changes and subjectivereports in panic patients: A preliminary methodological report. BiologicalPsychiatry 32, 766–777.
Caldirola, D., Bellodi, L., Caumo, A., Migliarese, G., Perna, G., 2004a. Approximateentropy of respiratory patterns in panic disorder. The American Journal ofPsychiatry 161, 79–87.
Caldirola, D., Bellodi, L., Perna, G., 2004b. Smoking and respiratory irregularity inpanic disorder. Biological Psychiatry 56, 393–398.
Carr, R., Lehrer, P., Hochron, S., Jackson, A., 1996. Effect of psychological stress onairway impedance in individuals with asthma and panic disorder. Journal ofAbnormal Psychology 105, 137–141.
Clark, D.M., 1986. A cognitive approach to panic. Behaviour Research and Therapy24, 461–470.
Cohen, J., 1988. Statistical Power Analysis for the Behavioural Sciences, 2nd ed.Erlbaum Associates, Hillsdale, NJ.
Coplan, J., Goetz, R., Klein, D., Papp, L., Fyer, A., Liebowitz, M., Davies, S., Gorman, J.,1998. Plasma cortisol concentrations preceding lactate-induced panic: psy-chological, biochemical, and physiological correlates. Archives of GeneralPsychiatry 55, 130–136.
Coryell, W., 1997. Hypersensitivity to carbon dioxide as a disease-specific traitmarker. Biological Psychiatry 41, 259–263.
Coryell, W., Fyer, A., Pine, D., Martinez, J., Arndt, S., 2001. Aberrant respiratorysensitivity to CO2 as a trait of familial panic disorder. Biological Psychiatry 49,582–587.
Duval, S., Tweedie, R., 2000. Trim and fill: a simple funnel-plot-based method oftesting and adjusting for publication bias in meta-analysis. Biometrics 56,455–463.
Egger, M., Davey Smith, G., Schneider, M., Minder, C., 1997. Bias in Meta-AnalysisDetected by a Simple, Graphical Test. BMJ (Clinical Research ed) 315,629–634.
Esquivel, G., Schruers, K.R., Maddock, R.J., Colasanti, A., Griez, E.J., 2010. Acids inthe brain: a factor in panic? Journal of Psychopharmacology (Oxford, England)24, 639–647.
Field, A.P., 2001. Meta-analysis of correlation coefficients: a Monte Carlocomparison of fixed- and random-effects methods. Psychol Methods 6,161–180.
Freire, R.C., Perna, G., Nardi, A.E., 2010. Panic disorder respiratory subtype:psychopathology, laboratory challenge tests, and response to treatment.Harvard Review of Psychiatry 18, 220–229.
Friedman, S.D., Mathis, C.M., Hayes, C., Renshaw, P., Dager, S.R., 2006. Brain pHresponse to hyperventilation in panic disorder: preliminary evidence foraltered acid-base regulation. The American Journal of Psychiatry 163,710–715.
Gaffney, F.A., Fenton, B.J., Lane, L.D., Lake, C.R., 1988. Hemodynamic, ventilatory,and biochemical responses of panic patients and normal controls with sodiumlactate infusion and spontaneous panic attacks. Archives of General Psychiatry45, 53–60.
Gorman, J., Cohen, B., Liebowitz, M., Fyer, A., 1986. Blood gas changes andhypophosphatemia in lactate-induced panic. Archives of General Psychiatry43, 1067–1071.
Gorman, J., Goetz, R., Uy, J., Ross, D., 1988a. Hyperventilation occurs during lactate-induced panic. Journal of Anxiety Disorders 2, 193–202.
Gorman, J.M., Fyer, M.R., Goetz, R., Liebowitz, M.R., Fyer, A.J., Kinney, J., Klein, D.F.,1988b. Ventilatory physiology of patients with panic disorder. Archives ofGeneral Psychiatry 45, 31–39.
Gorman, J.M., Kent, J., Martinez, J., Browne, S., Coplan, J., Papp, L.A., 2001.Physiological changes during carbon dioxide inhalation in patients with panicdisorder, major depression, and premenstrual dysphoric disorder: evidence fora central fear mechanism. Archives of General Psychiatry 58, 125–131.
Gorman, J.M., Kent, J.M., Sullivan, G.M., Coplan, J.D., 2000. Neuroanatomicalhypothesis of panic disorder, revised. The American Journal of Psychiatry157, 493–505.
Gorman, J.M., Liebowitz, M.R., Fyer, A.J., Klein, D.F., 1984. Response to hyperventi-lation in a group of patients with panic disorder. The American Journal ofPsychiatry 141, 857–861.
Gorman, J.M., Martinez, J., Coplan, J.D., Kent, J., Kleber, M., 2004. The effect ofsuccessful treatment on the emotional and physiological response to carbondioxide inhalation in patients with panic disorder. Biological Psychiatry 56,862–867.
Gorman, J.M., Papp, L.A., Martinez, J., Goetz, R.R., Hollander, E., Liebowitz, M.R.,Jordan, F., 1990. High-dose carbon dioxide challenge test in anxiety disorderpatients. Biological Psychiatry 28, 743–757.
Griez, E., 1996. Is CO2 inhalation a specific marker for panic disorder? Anexperimental panic model. Acta Neuropsychiatr 8, 105–107.
Griez, E., De Loof, C., Pols, H., Zandbergen, J., Lousberg, H., 1990. Specific sensitivityof patients with panic attacks to carbon dioxide inhalation. PsychiatryResearch 31, 193–199.
Griez, E., Schruers, K., 2003. Mechanisms of CO2 challenges. Journal of Psycho-pharmacology (Oxford, England) 17, 260–262.
Griez, E., Zandbergen, J., Lousberg, H., Van den Hout, M., 1988. Effects of lowpulmonary CO2 on panic anxiety. Comprehensive Psychiatry 29, 490–497.
Hafdahl, A.R., Williams, M.A., 2009. Meta-analysis of correlations revisited:attempted replication and extension of Field at al. (2001) simulation studies.Psychol Methods 14, 24–42.
Hasler, G., Gergen, P.J., Kleinbaum, D.G., Ajdacic, V., Gamma, A., Eich, D., Rossler,W., Angst, J., 2005. Asthma and panic in young adults: a 20-year prospectivecommunity study. American journal of respiratory and critical care medicine171, 1224–1230.
Hedges, L.V., Olkin, I., 1985. Statistical Methods for Meta-Analysis. Academic Press,London.
Hegel, M.T., Ferguson, R.J., 1997. Psychophysiological assessment of respiratoryfunction in panic disorder: evidence for a hyperventilation subtype. Psychoso-matic Medicine 59, 224–230.
Hoehn-Saric, R., 2004. Somatic symptoms and physiologic responses in general-ized anxiety disorder and panic disorder: an ambulatory monitor study.Archives of General Psychiatry 61, 913–921.
Holt, P., Andrews, G., 1989. Hyperventilation and anxiety in panic disorder, socialphobia, GAD and normal controls. Behaviour Research and Therapy 27,453–460.
Homma, I., Masaoka, Y., 2008. Breathing rhythms and emotions. ExperimentalPhysiology 93, 1011–1021.
Kellner, M., Knaudt, K., Jahn, H., Holsboer, F., Wiedemann, K., 1998. Atrialnatriuretic hormone in lactate-induced panic attacks: mode of release andendocrine and pathophysiological consequences. Journal of PsychiatricResearch 32, 37–48.
Kent, J.M., Coplan, J.D., Martinez, J., Karmally, W., Papp, L.A., Gorman, J.M., 1996.Ventilatory effects of tryptophan depletion in panic disorder: a preliminaryreport. Psychiatry Research 64, 83–90.
Klein, D.F., 1993. False suffocation alarms, spontaneous panics, and relatedconditions. An integrative hypothesis. Archives of General Psychiatry 50,306–317.
Kunik, M.E., Roundy, K., Veazey, C., Souchek, J., Richardson, P., Wray, N.P., Stanley,M.A., 2005. Surprisingly high prevalence of anxiety and depression in chronicbreathing disorders. Chest 127, 1205–1211.
Lee, Y.J., Curtis, G.C., Weg, J.G., Abelson, J.L., 1993. Panic attacks induced bydoxapram. Biological Psychiatry 33, 295–297.
Ley, R., 1986. Blood, breath and fears: a hyperventilation theory of panic attacksand agoraphobia. Clinical Psychology Review 5, 271–285.
Liebowitz, M.R., Gorman, J.M., Fyer, A., Dillon, D., Levitt, M., Klein, D.F., 1986.Possible mechanisms for lactate’s induction of panic. The American Journal ofPsychiatry 143, 495–502.
Liebowitz, M.R., Gorman, J.M., Fyer, A.J., Levitt, M., Dillon, D., Levy, G., Appleby, I.L.,Anderson, S., Palij, M., Davies, S.O., 1985. Lactate provocation of panic attacks.II. Biochemical and physiological findings. Archives of General Psychiatry 42,709–719.
Macnutt, M.J., De Souza, M.J., Tomczak, S.E., Homer, J.L., Sheel, A.W., 2012. Restingand exercise ventilatory chemosensitivity across the menstrual cycle. Journalof Applied Physiology (Bethesda, Md: 1985) 112, 737–747.
Maddock, R., Carter, C., 1991. Hyperventilation-induced panic attacks in panicdisorder with agoraphobia. Biological Psychiatry 29, 843–854.
Maddock, R., Carter, C., Gietzen, D., 1991. Elevated serum lactate associated withpanic attacks induced by hyperventilation. Psychiatry Research 38, 301–311.
Martinez, J.M., Kent, J.M., Coplan, J.D., Browne, S.T., Papp, L.A., Sullivan, G.M.,Kleber, M., Perepletchikova, F., Fyer, A.J., Klein, D.F., Gorman, J.M., 2001.Respiratory variability in panic disorder. Depression and Anxiety 14, 232–237.
M. Grassi et al. / Journal of Affective Disorders 146 (2013) 158–173 173
Martinez, J.M., Papp, L.A., Coplan, J.D., Anderson, D.E., Mueller, C.M., Klein, D.F.,Gorman, J.M., 1996. Ambulatory monitoring of respiration in anxiety. Anxiety2, 296–302.
Masaoka, Y., Homma, I., 1997. Anxiety and respiratory patterns: their relationshipduring mental stress and physical load. International Journal of Psychophy-siology 27, 153–159.
Masaoka, Y., Homma, I., 1999. Expiratory time determined by individual anxietylevels in humans. Journal of Applied Physiology (Bethesda, Md: 1985) 86,1329–1336.
Masaoka, Y., Homma, I., 2001. The effect of anticipatory anxiety on breathing andmetabolism in humans. Respiration Physiology 128, 171–177.
Meuret, A.E., Rosenfield, D., Zhou, E., Conrad, A., Ritz, T., Roth, W.T., 2011. Dounexpected panic attacks occur spontaneously? Biological Psychiatry 70,985–991.
Munjack, D.J., Brown, R.A., McDowell, D.E., 1993. Existence of hyperventilation inpanic disorder with and without agoraphobia, GAD, and normals: implicationsfor the cognitive theory of panic. Journal of Anxiety Disorders 7, 37–48.
Naragon-Gainey, K., 2010. Meta-analysis of the relations of anxiety sensitivity tothe depressive and anxiety disorders. Psychological Bulletin 136, 128–150.
Niccolai, V., van Duinen, M.A., Griez, E.J., 2008. Objective and subjective measuresin recovery from a 35% carbon dioxide challenge. Canadian Journal ofPsychiatry Revue Canadienne de Psychiatrie 53, 737–744.
Niccolai, V., van Duinen, M.A., Griez, E.J., 2009. Respiratory patterns in panicdisorder reviewed: a focus on biological challenge tests. Acta psychiatricaScandinavica 120, 167–177.
Olatunji, B.O., Wolitzky-Taylor, K.B., 2009. Anxiety sensitivity and the anxietydisorders: a meta-analytic review and synthesis. Psychological Bulletin 135,974–999.
Olsson, M., Annerbrink, K., Bengtsson, F., Hedner, J., Eriksson, E., 2004. Paroxetineinfluences respiration in rats: implications for the treatment of panic disorder.European Neuropsychopharmacology 14, 29–37.
Pain, M.C., Biddle, N., Tiller, J.W., 1988. Panic disorder, the ventilatory response tocarbon dioxide and respiratory variables. Psychosomatic Medicine 50,541–548.
Papp, L., Martinez, J., Klein, D., Coplan, J., Cole, R., Ross, D., Goetz, R., Gorman, J.,1997. Respiratory psychophysiology of panic disorder: three respiratorychallenges in 98 subjects. The American Journal of Psychiatry 154, 1557–1565.
Papp, L.A., Klein, D.F., Martinez, J., Schneier, F., Cole, R., Liebowitz, M.R., Hollander,E., Fyer, A.J., Jordan, F., Gorman, J.M., 1993. Diagnostic and substancespecificity of carbon-dioxide-induced panic. The American Journal of Psychia-try 150, 250–257.
Perna, G., Bertani, A., Politi, E., Colombo, G., Bellodi, L., 1997. Asthma and panicattacks. Biological Psychiatry 42, 625–630.
Perna, G., Caldirola, D., Bellodi, L., 2004a. Panic disorder: from respiration to thehomeostatic brain. Acta Neuropsychiatrica 16, 57–67.
Perna, G., Casolari, A., Bussi, R., Cucchi, M., Arancio, C., Bellodi, L., 2004b.Comparison of 35% carbon dioxide reactivity between panic disorder andeating disorder. Psychiatry Research 125, 277–283.
Perna, G., Cocchi, S., Bertani, A., Arancio, C., Bellodi, L., 1995a. Sensitivity to 35%CO2 in healthy first-degree relatives of patients with panic disorder. TheAmerican Journal of Psychiatry 152, 623–625.
Perna, G., Gabriele, A., Caldirola, D., Bellodi, L., 1995b. Hypersensitivity toinhalation of carbon dioxide and panic attacks. Psychiatry Research 57,267–273.
Peters, J.L., Sutton, A.J., Jones, D.R., Abrams, K.R., Rushton, L., 2007. Performance ofthe trim and fill method in the presence of publication bias and between-study heterogeneity. Statistics in Medicine 26, 4544–4562.
Petitti, D.B., 2001. Approaches to heterogeneity in meta-analysis. Statistics inMedicine 20, 3625–3633.
Pfaltz, M.C., Grossman, P., Michael, T., Margraf, J., Wilhelm, F.H., 2010. Physicalactivity and respiratory behavior in daily life of patients with panic disorderand healthy controls. International Journal of Psychophysiology: OfficialJournal of the International Organization of Psychophysiology 78, 42–49.
Pfaltz, M.C., Michael, T., Grossman, P., Blechert, J., Wilhelm, F.H., 2009. Respiratorypathophysiology of panic disorder: an ambulatory monitoring study. Psycho-somatic Medicine 71, 869–876.
Pollack, M.H., Kradin, R., Otto, M.W., Worthington, J., Gould, R., Sabatino, S.A.,Rosenbaum, J.F., 1996. Prevalence of panic in patients referred for pulmonaryfunction testing at a major medical center. The American Journal of Psychiatry153, 110–113.
Rapee, R., Brown, T., Antony, M., Barlow, D., 1992. Response to hyperventilationand inhalation of 5.5% carbon dioxide-enriched air across the DSM-III-Ranxiety disorders. Journal of Abnormal Psychology 101, 538–552.
Rassovsky, Y., Abrams, K., Kushner, M.G., 2006. Suffocation and respiratoryresponses to carbon dioxide and breath holding challenges in individuals withpanic disorder. Journal of Psychosomatic Research 60, 291–298.
Roth, W., Wilhelm, F., Trabert, W., 1998. Voluntary breath holding in panic andgeneralized anxiety disorders. Psychosomatic Medicine 60, 671–679.
Schmidt, F.L., Oh, I.S., Hayes, T.L., 2009. Fixed- versus random-effects models inmeta-analysis: model properties and an empirical comparison of differences inresults. British Journal of Mathematical and Statistical Psychology 62, 97–128.
Schwartz, G.E., Goetz, R.R., Klein, D.F., Endicott, J., Gorman, J.M., 1996. Tidal volumeof respiration and ‘‘sighing’’; as indicators of breathing irregularities in panicdisorder patients. Anxiety 2, 145–148.
Stein, M., Asmundson, G., 1994. Autonomic function in panic disorder: cardior-espiratory and plasma catecholamine responsivity to multiple challenges ofthe autonomic nervous system. Biological Psychiatry 36, 548–558.
Struzik, L., Katzman, M., Vijay, N., Coonerty-Femiano, A., Mahamed, S., Duffin, J.,2001. Central and peripheral chemoreflex characteristics: panic disorderpatients vs. healthy volunteers. Advances in Experimental Medicine andBiology 499, 435–437.
Van Beek, N., Griez, E., 2000. Reactivity to a 35% CO2 challenge in healthy first-degree relatives of patients with panic disorder. Biological Psychiatry 47,830–835.
Van Beek, N., Schruers, K.R., Griez, E.J., 2005. Prevalence of respiratory disorders infirst-degree relatives of panic disorder patients. Journal of Affective Disorders87, 337–340.
van Den Hout, M.A., Hoekstra, R., Arntz, A., Christiaanse, M., Ranschaert, W.,Schouten, E., 1992. Hyperventilation is not diagnostically specific to panicpatients. Psychosomatic Medicine 54, 182–191.
Verburg, K., Griez, E., Meijer, J., Pols, H., 1995. Respiratory disorders as a possiblepredisposing factor for panic disorder. Journal of Affective Disorders 33,129–134.
Wachleski, C., Salum, G.A., Blaya, C., Kipper, L., Paludo, A., Salgado, A.P., Manfro,G.G., 2008. Harm avoidance and self-directedness as essential features of panicdisorder patients. Comprehensive Psychiatry 49, 476–481.
Wilhelm, F.H., Gerlach, A.L., Roth, W.T., 2001a. Slow recovery from voluntaryhyperventilation in panic disorder. Psychosomatic Medicine 63, 638–649.
Wilhelm, F.H., Trabert, W., Roth, W.T., 2001b. Characteristics of sighing in panicdisorder. Biological Psychiatry 49, 606–614.
Wilhelm, F.H., Trabert, W., Roth, W.T., 2001c. Physiologic instability in panicdisorder and generalized anxiety disorder. Biological Psychiatry 49, 596–605.
Wollburg, E., Meuret, A.E., Conrad, A., Roth, W.T., Kim, S., 2008. Psychophysiolo-gical reactions to two levels of voluntary hyperventilation in panic disorder.Journal of Anxiety Disorders 22, 886–898.
Woods, S.W., Charney, D.S., Loke, J., Goodman, W.K., Redmond, D.E., Heninger, G.R.,1986. Carbon dioxide sensitivity in panic anxiety. Ventilatory and AnxiogenicResponse to Carbon Dioxide in Healthy Subjects and Patients With PanicAnxiety before and After Alprazolam Treatment. Archives of General Psychia-try 43, 900–909.
Yeragani, V., Rao, R., Uhde, T., 2004. Paroxetine decreases respiratory irregularityof linear and nonlinear measures of respiration in patients with panicdisorder: a preliminary report. Neuropsychobiology 49, 53–57.
Yeragani, V.K., Radhakrishna, R.K.A., Uhde, T., 2002. Nonlinear measures ofrespiration: respiratory irregularity and increased chaos of respiration inpatients with panic disorder. Neuropsychobiology 46, 111–120.
Zandbergen, J., Bright, M., Pols, H., Fernandez, I., De Loof, C., Griez, E.J., 1991. Higherlifetime prevalence of respiratory diseases in panic disorder? The AmericanJournal of Psychiatry 148, 1583–1585.
Zandbergen, J., de Loof, C., Pols, H., 1993. No chronic hyperventilation in panicdisorder patients. Psychiatry Research 47, 1–6.


