Embed Size (px)
Citation preview
135Information Management
!"#$%#&#%'$'
1.0 Introduction
Bank capital can be seen in two ways.
Narrowly, it can be seen as the amount con-
tributed by the owners of a bank (paid –up
share capital) that gives them the right to
enjoy all the future earnings of the bank.
More comprehensively, it can be seen as the
amount of owners’ funds available to support
a bank’s business (Athanasoglou, Brissimis
and Delis et al., 2005).While the growth in
the financial services sector is experiencing
geometric progression and a boom, the oth-
er sectors of the economy, such as the pro-
ductive sector are contracting and the whole
economy continued to plunge deeper into re-
cession. To gain a fair share of the market in
a highly competitive environment, the finan-
cial services sector especially the banks need
to be innovative. In the 1990’s, the financial
!"#$%!&'(!)'*!('+"$!",$-!.#/($01!./$'"$(1/$ Nigeria deposit banks (1986-2006)
Abstract(#)*+,# ,-./0# +123,-+45-3,# -*3# +6758-# !9# ,*5:3*!;/3:,<# 9.1/# !1#=51>#73:9!:65183# ?65:>3-#,*5:3@#+1#-*3# +43:+51#/37!,+-#=51>,#?$ABCD%''C@"#)*3#,-./0#857-.:3/##73:9!:65183#?65:>3-#,*5:3@##51/#
367;!03/#8:!,,#,38-+!15;#51/#-+63#,3:+3,#!9#=51>#/5-5#!=-5+13/#9:!6#E31-:5;#F51>#!9# +43:+5#?EF @")*3#
9!:6.;5-3/#6!/3;,#G3:3#3,-+65-3/#.,+14#!:/+15:0#;35,-#,H.5:3#:34:3,,+!1#63-*!/"#)*3#,-./0#9!.1/#5#,-:!14#
:3;5-+!1,*+7#=3-G331#=51>#857+-5;#9.1/,#51/#=51>#/37!,+-,I#;!51,#51/#5/25183,#?7:!J+3,#9!:#65:>3-#8!1831D
-:5-+!1@"#)*3#:3,.;-#,*!G,#-*5-#,*5:3*!;/3:,<#9.1/#51/#-!-5;#5,,3-,#!9#-*3#=51>,#*523#7!,+-+23#51/#,+41+9+D
851-#+6758-#+1#+19;.318+14#-*3#;323;#!9#-!-5;#/37!,+-,"#)*3#+67;+85-+!1#!9#-*+,#,-./0I#56!14#!-*3:,I#+,#-*5-#
5/3H.5-3#,*5:3*!;/3:,#9.1/#851#,3:23#5,#5#23:+-5=;3#,-+6.;51-#+1#,-:314-*31+14#-*3#73:9!:65183#!9# +43:+5#
8!663:8+5;#=51>,#51/#5;,!#*3+4*-31#-*3#8!19+/3183#!9#8.,-!63:,#3,738+5;;0#+1#-*+,#3:5#!9#4;!=5;#38!1!6+8#
63;-D/!G1#-*5-#*5,#-5>31#+-,#-!;;#+1#-*3# +43:+51#9+1518+5;#,0,-36"
Keywords: Concentration theory, Concentration Ratio, Market share.
&#K*"#L"#2#&/3!"$4%1/'$5')/-/"$$#?E!23151-#M1+23:,+-0I#N-5I#N4.1#O-5-3@
136 Information Management
!"#$%#&#%'$'
sector witnessed the development of some
innovative products and services, massive
investment in information technology and a
continuously re-engineering of financial in-
struments to meet the needs of discerning
customers by banks that wanted to maintain
their leading position and competitive edge
Consolidation and strengthening of the
banking system were taken to constitute the
first phase of the reforms designed to ensure
a diversified, strong and reliable banking
sector which will ensure the safety of deposi-
tors’ money, play active development role
on the Nigerian economy and as competitive
players in the African regional and global fi-
nancial systems. The goal of the reforms is to
help banks become stronger players, and in a
manner that will ensure longevity and hence
higher returns to their shareholders over
time and impact positively on the Nigerian
economy. The beneficiaries in the Nigerian
economy will include the ordinary men and
women who can put their deposits in the
banks and have a restful sleep; the entrepre-
neurs who can now have a stronger financial
system to finance their businesses; and the
Nigerian economy itself which will benefit
from internationally connected and competi-
tive banks that would also mobilize interna-
tional capital for Nigerian development. In
United States of America (USA) there were
over 7000 mergers between 1980 and 1998.
The nineties recorded the largest mergers in
the banking history of the US as the number
of banks in the US declined by more than one
third between 1980 and 1997.Consequently,
the proportion of the banking assets declined
sharply from 75 percent in 1980 to nearly 50
percent in 1997. The same trend occurred in
the United Kingdom and other European
countries (Boyd e tal, 1993).
In the period 1997 -1998, 2003 cases of
bank mergers and acquisitions took place in
the Euro area. In 1998, a merger in France re-
sulted in a new capital base of $688 billion,
while the merger in Germany resulted to a
capital base of $541 billion. In many emerg-
ing markets including Argentina, Brazil and
Korea, bank capitalization/consolidation be-
came prominent as banks try to reposition
their operations in order to cope with the
growing challenges in the globalized bank-
ing systems. Most mergers that took place in
countries were as a result of the government
efforts to restructure inefficient banking sys-
tems (as in many Latin American countries),
or from intervention following banking cri-
ses (as in Korea and Southeast Asia).
Just like Nigeria, in Asia the capitaliza-
tion/consolidation of the financial services
was more or less government-led rather than
market-driven. Bank mergers in this region
were motivated by the need to strengthen
capital adequacy and promote financial vi-
ability of many smaller, often family owned
banks that were affected by the 1997-1998 cri-
sis. Soludo (2004) posited that:
“In Malaysia, the first round of bank
consolidation was initiated by the govern-
ment in 2000, when it imposed a $526 million
capitalization requirement on banks. The
then 54 existing banks were ordered to merge
into 10 core groups, so called anchor banks.
The government has fully liberalized the sec-
tor in 2007. In Indonesia, four of the seven
state banks existing before the crisis were
consolidated into a new state bank (Bank
Mandiri), which now controls about a quar-
ter of the total commercial bank deposits. In
Singapore, a country with about three mil-
lion people, banks are being consolidated to
about six and further moving down to three,
137Information Management
!"#$%#&#%'$'
Two common measures of concen-
tration, the four-bank concentration ratio,
CR4, and the Herfindahl-Hirschman Index
(HERF), are used. CR4 is defined as the ratio
of the total deposits of the four largest banks
to the total deposits of all the banks in a given
year.CR4 should be closed to 0 for a perfectly
competitive market and 100 for a monopoly.
HERF is defined as the sum of squared mar-
ket shares of deposits of the sample of banks
in a given year. The index is slightly greater
than 0 for a perfectly competitive market and
100 for a monopoly. HERF takes into account
both the number of banks and the inequality
of market shares. Generally, the more banks
there are in a market, the lower is the value
with the second largest having a capital base
of about $67 billion’.
The concentration ratio gives us an idea
of the percentage of the total market and how
it is controlled by the biggest 3, 4 and 5 firms
in an industry. Hence, if for the Nigerian
banking industry CR3 = 80, then we can
say the three biggest banks in Nigeria con-
trol 80% of the market share in Nigeria. The
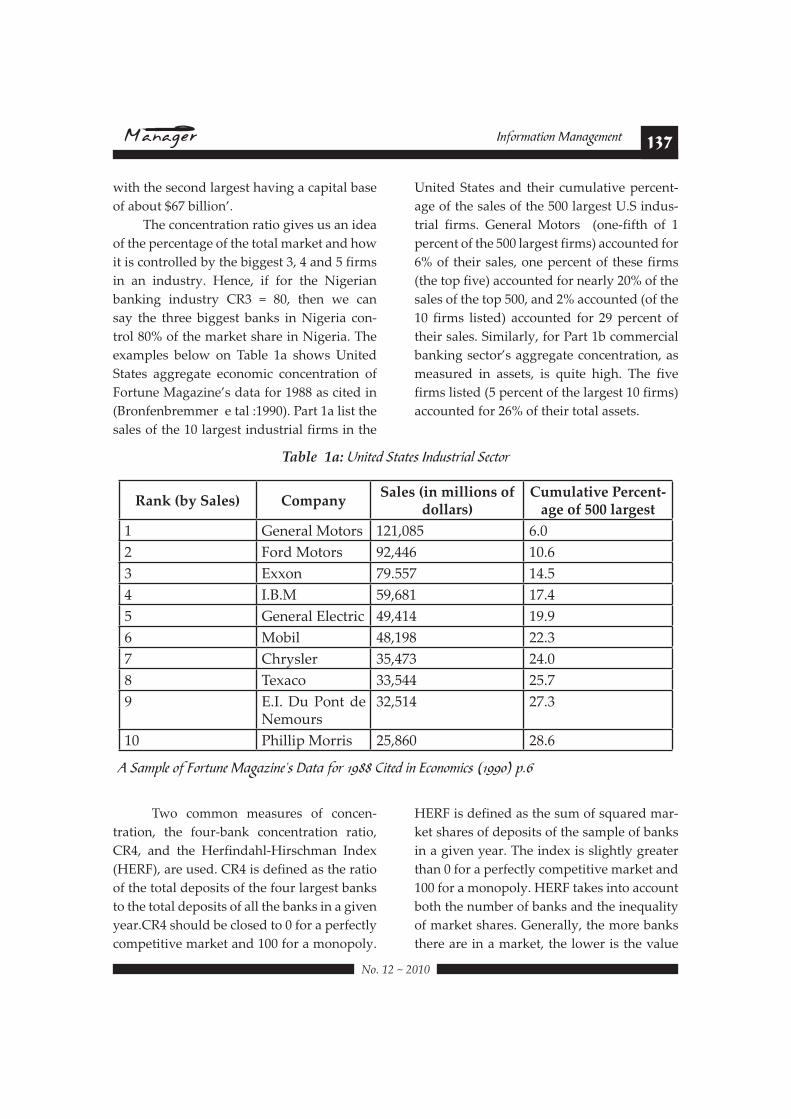
examples below on Table 1a shows United
States aggregate economic concentration of
Fortune Magazine’s data for 1988 as cited in
(Bronfenbremmer e tal :1990). Part 1a list the
sales of the 10 largest industrial firms in the
United States and their cumulative percent-
age of the sales of the 500 largest U.S indus-
trial firms. General Motors (one-fifth of 1
percent of the 500 largest firms) accounted for
6% of their sales, one percent of these firms
(the top five) accounted for nearly 20% of the
sales of the top 500, and 2% accounted (of the
10 firms listed) accounted for 29 percent of
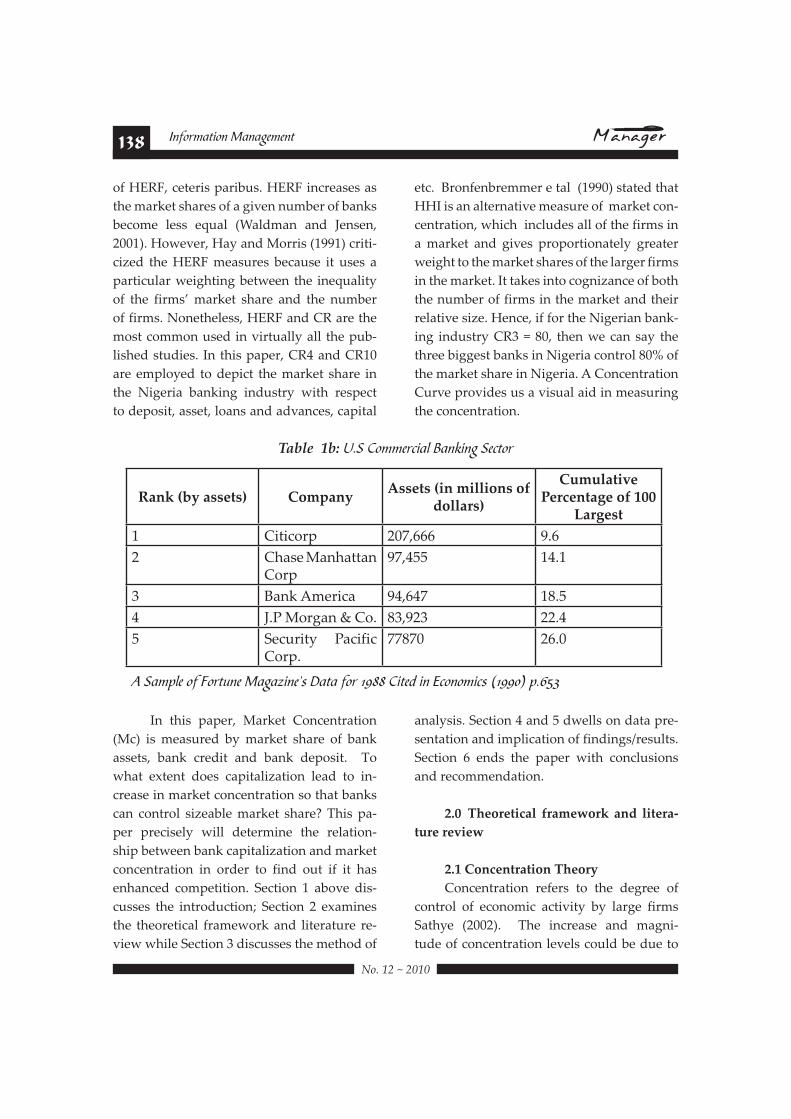
their sales. Similarly, for Part 1b commercial
banking sector’s aggregate concentration, as
measured in assets, is quite high. The five
firms listed (5 percent of the largest 10 firms)
accounted for 26% of their total assets.
Rank (by Sales) CompanySales (in millions of
dollars)Cumulative Percent-
age of 500 largest
1 General Motors 121,085 6.0
2 Ford Motors 92,446 10.6
3 Exxon 79.557 14.5
4 I.B.M 59,681 17.4
5 General Electric 49,414 19.9
6 Mobil 48,198 22.3
7 Chrysler 35,473 24.0
8 Texaco 33,544 25.7
9 E.I. Du Pont de Nemours
32,514 27.3
10 Phillip Morris 25,860 28.6
Table 1a: !"#$%& '$($%) *"&+)$,#(- '%.$/,
0 '(12-% /3 4/,$+"% 5(6(7#"%8) 9($( 3/, :;<< =#$%& #" >./"/1#.) ?:;;@A 2BC
138 Information Management
!"#$%#&#%'$'
In this paper, Market Concentration
(Mc) is measured by market share of bank
assets, bank credit and bank deposit. To
what extent does capitalization lead to in-
crease in market concentration so that banks
can control sizeable market share? This pa-
per precisely will determine the relation-
ship between bank capitalization and market
concentration in order to find out if it has
enhanced competition. Section 1 above dis-
cusses the introduction; Section 2 examines
the theoretical framework and literature re-
view while Section 3 discusses the method of
analysis. Section 4 and 5 dwells on data pre-
sentation and implication of findings/results.
Section 6 ends the paper with conclusions
and recommendation.
678$$91/+./('%!)$ 3.!-/:+.#$ !",$ )'(/.!-
ture review
67;$<+"%/"(.!('+"$91/+.=
Concentration refers to the degree of
control of economic activity by large firms
Sathye (2002). The increase and magni-
tude of concentration levels could be due to
of HERF, ceteris paribus. HERF increases as
the market shares of a given number of banks
become less equal (Waldman and Jensen,
2001). However, Hay and Morris (1991) criti-
cized the HERF measures because it uses a
particular weighting between the inequality
of the firms’ market share and the number
of firms. Nonetheless, HERF and CR are the
most common used in virtually all the pub-
lished studies. In this paper, CR4 and CR10
are employed to depict the market share in
the Nigeria banking industry with respect
to deposit, asset, loans and advances, capital
etc. Bronfenbremmer e tal (1990) stated that
HHI is an alternative measure of market con-
centration, which includes all of the firms in
a market and gives proportionately greater
weight to the market shares of the larger firms
in the market. It takes into cognizance of both
the number of firms in the market and their
relative size. Hence, if for the Nigerian bank-
ing industry CR3 = 80, then we can say the
three biggest banks in Nigeria control 80% of
the market share in Nigeria. A Concentration
Curve provides us a visual aid in measuring
the concentration.
Rank (by assets) CompanyAssets (in millions of
dollars)
Cumulative Percentage of 100
Largest
1 Citicorp 207,666 9.6
2 Chase Manhattan Corp
97,455 14.1
3 Bank America 94,647 18.5
4 J.P Morgan & Co. 83,923 22.4
5 Security Pacific Corp.
77870 26.0
Table 1b: !B' =/11%,.#(- D("E#"6 '%.$/,
0 '(12-% /3 4/,$+"% 5(6(7#"%8) 9($( 3/, :;<< =#$%& #" >./"/1#.) ?:;;@A 2BCFG
139Information Management
!"#$%#&#%'$'
considerable size enlargement of the domi-
nant firm(s) and/ or considerable size reduc-
tion of the non-dominant firm (s). Similarly,
curtailment of the concentration levels could
be attributed to considerable size reduction
of the dominant firm (s) and/ or considerable
size enlargement of non-dominant firm (s)
Athanasoglou e tal (2005). Bank concentration
theories and pro-deconcentration theories ex-
ist in the literature and Nigerian banks capi-
talization/consolidation exercise takes it roots
from these theories. Protagonists of banking
sector concentration posited that economies
of scale stimulate bank mergers and acqui-
sitions (increasing concentration), so that
increased concentration goes hand-in-hand
with efficiency improvements Demirguc-
Kunt and Levine (2001).In his study, Boyd
and Runkle (1993) examined 122 US bank
holding companies and found an inverse rela-
tionship between size and the volatility of as-
set returns. In the US situation consolidation
was voluntary while in the Nigerian case the
consolidation exercise was by compulsion. In
Allen and Gale (2000); Beck, Demirguc-Kunt
and Levine (2004) their theoretical arguments
suggests that concentrated banking sector
with many small banks is more prone to fi-
nancial crises than a concentrated banking
sector with a few large banks.
In the literature of finance, there are cas-
es that link bank capitalization and market
concentration especially where institution-
al behaviours by regulatory has pushed for
a policy of minimum capital requirements.
There are those by (Berger, Demsetz and
Strahan, 1999); Shih (2003); Studart (2001,
2003), Yacaman (2001). For instance, Studart
(2001, 2003) found that four Latin American
countries’ effort towards instituting an effi-
cient and competitive banking pushed for a
policy of concentration in the period (1997-
1998).This was facilitated by more effective
supervision by the apex banks. The tighten-
ing of the regulatory environment resulted in
“more international and more concentrated
!"#$"%& '()*+,-& .*/0!,*1& 233456& 78(,(9+,(1&
in this study, the relationship between
bank capitalization and market concentra-
tion (market share) in the Nigerian banking
industry will be investigated. The issue of
bank capitalization which often metamor-
phose into consolidation of banks around
the globe has fuelled an active policy debate
on the impact of consolidation on financial
stability, Beck, Demirguc-Kunt and Levine
(2003), Boyd and Graham (1991 and 1998). In
the literature, concentration levels have been
a major determinant of banking system per-
formance by way of efficiency. Berger, e tal
(1995) find evidence that the increase in the
proportion of banking industry assets con-
trolled by the largest banking organizations
in the 1990s, due to the liberalization of geo-
graphic restrictions on banking in the United
States, may have been responsible for part of
the credit crunch observed in 1989-1992. Peek
and Rosengren (1996), combining a single
cross-section data on lending businesses in
the New England states for 1994 with some
information on mergers and de novo entry,
find that after big banking organizations
merged with smaller organizations, the con-
solidated organization typically reduced the
amount of small business lending that was
conducted earlier by the acquired institution.
Reduced concentration in a bank-
ing market results in increased competition
among banks and vice-versa. Concentrated
banking systems contribute to enhanced per-
formance of the banks profit and also lower
bank fragility. Enhanced profits provide a
140 Information Management
!"#$%#&#%'$'
bulwark against adverse shocks and increase
the franchise value of the bank, reducing in-
centives for bankers to take excessive risk. In
addition, a few large banks are easier to moni-
tor than many small banks, so that regulatory
control of banks will be more effective and the
risks of contagion less pronounced in a con-
centrated banking system, Beck, Demirguc-
Kunt and Levine (2003). The protagonists of
this ‘concentration- stability’ view opined
that larger banks can diversify better so that
banking systems characterized by a few large
banks will tend to be less fragile than banking
systems with many small banks, Allen and
Gale (2003).The present structure of Nigerian
banking industry (commercial banks) is a
clear demonstration of their strength when
compared to the situation before 2005 bank
capitalization in Nigeria. Therefore, we can
say that there is a linkage between adequate
capital and market share. Capital has a big
role to play in helping bank to compete ef-
fectively. The Pro-Deconcentration theories
such as Chong (1991) in his finding indicate
that bank consolidation tends to increase the
risk of bank portfolios. The proponents of
banking sector deconcentration argue that
concentration will intensify market power
and political influence of financial conglom-
erates, stymie competition and access to
financial services, reduce efficiency, and de-
stabilize financial system as banks become
too big to discipline and use their influence
to shape banking regulations and policies
(Demirguc-Kunt and Levine: 2000); Beck,
Demirguc-Kunt and Levine (2004) and Bank
for International Settlements (2001). On the
one hand excessive competition may create
an unstable banking environment, insuffi-
cient competition and contestability in the
banking sector may breed inefficiencies. In
concentrated banking systems, bigger, politi-
cally connected banks may become more lev-
eraged and take on greater risk since they can
rely on policymakers to help when adverse
shocks hurt their solvency or profitability.
Similarly, large, politically influential
banks may help shape the policies and regu-
lations influencing banks activities in ways
that help banks, but not necessarily in ways
that help the overall economy. For instance,
powerful banks may argue against granting
generous deposit insurance since that levels
the playing field for smaller banks that do
not enjoy the too-big-to-fail policy of most
governments in economies where concentra-
tion levels are high. But it can also reduce the
number of banks. According to Demirguc-
Kunt and Levine (2000) if concentrated pow-
erful banks unduly influence the formation
of policies and regulations, this may hinder
political integrity and reduce tax compliance.
Advocates of concentrated banking structure
noted that larger banks frequently receive sub-
sidies through implicit ‘too big-to-fail’ policies
that small banks do not enjoy. According to
Boyd and Runkle (1993), this occurs when reg-
ulators fear potential macroeconomic conse-
quences of large bank failures. Capitalization
experiences in some of the countries reviewed
has taken the form of consolidation.
$$>78$?/(1+,$+3$!"!)=0'0$$$
This section tries to capture empiri-
cally the relationship between bank capital-
ization and market share. When we speak
of bank capitalization we are referring to
Shareholders. Therefore, our equation looks
at the extent to which shareholders funds
and total assets has facilitated/enhanced mar-
ket share of these Nigerian deposit banks.
141Information Management
!"#$%#&#%'$'
Further, the crux of this paper is to find how
bank capitalization and consolidation in
Nigeria make funds available for the realiza-
tion of adequacy of capital and performance
(market share). Obviously, we can only look
at a number of years given the fact that bank
consolidation took place only five years ago.
This is what makes it impossible to make use
of time series analysis because we have only
five years to seriously discuss issues. This is
why the use of panel data is preferred in this
exercise to time series analysis. Also, we have
not used cross sectional data analysis in this
paper because it is not possible to complete
set of data on any bank for any particular
year if only because merger has taken place
randomly and banks have also come into ex-
istence randomly. The panel data method-
ology provides a useful answer to all these.
Hence, the choice. This paper uses the econo-
metric approach in estimating the effect and
to be specific it uses the E-view software em-
ploying panel of data.
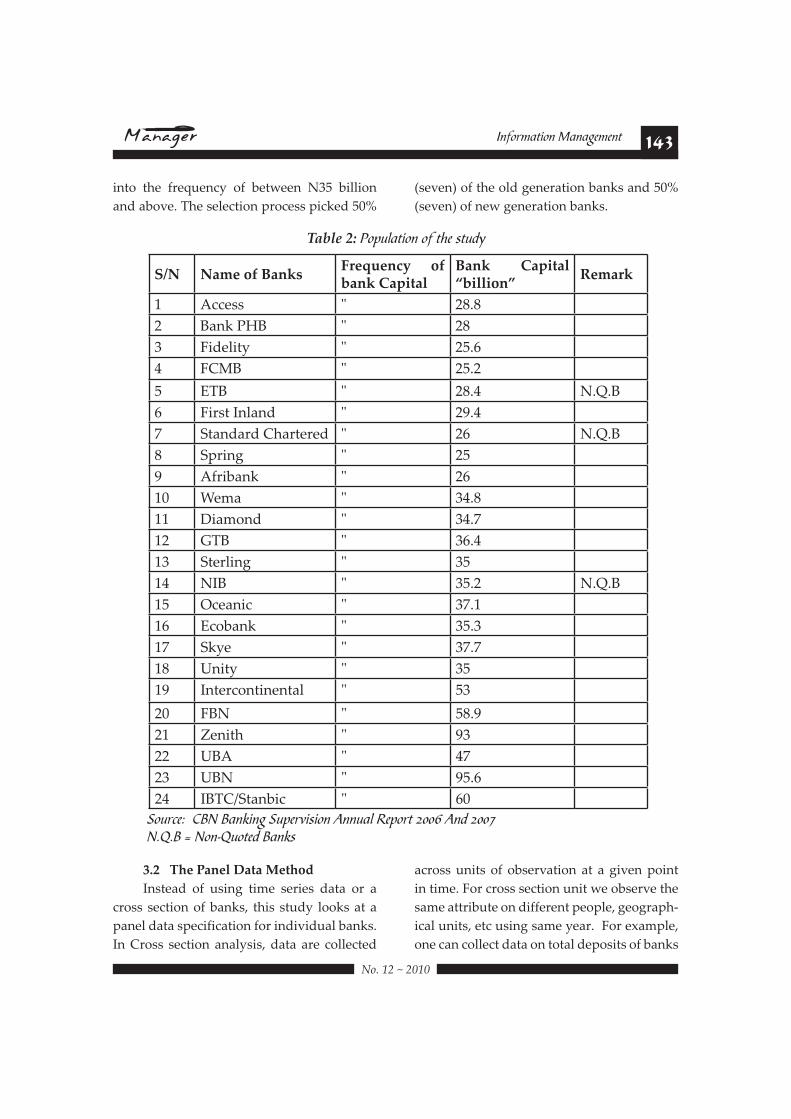
3.1 Population and Sample
The population of this research is
drawn from the Nigerian banking industry
(Nigerian deposit banks) referred to as the
conventional banks because they are depos-
it-taking institutions. This is because they
dominate the financial sector in terms of
number and coverage. Despite the involve-
ment of other financial institutions such as
non-bank financial institutions - insurance
companies, development banks, finance
houses, etc in the intermediation process,
commercial banks still control the major pro-
portion of the nation’s deposits and savings.
There were eighty-nine commercial banks in
Nigeria before the 2005 bank recapitalization
exercise and the number has been reduced
to twenty-five banks after consolidation and
to 24 (after merger of IBTC & Stanbic bank
to Stanbic-IBTC) in 2008. Of the twenty –
four banks, four of them that is: Unity bank,
Sterling bank, Spring and Skye banks are
new creation of mega banks. A sample size
of fourteen out of the twenty four commer-
cial banks was employed in the study. The
sample (of fourteen commercial banks) was
drawn from both the old and new generation
banks using the Stratified sampling tech-
nique based on simple random sampling
supported by Judgment Sampling (See table
2). The selection process is restricted to banks
quoted in the Nigerian Stock Exchange Daily
official List (SEDOL). The sample drawn
from the population was grouped into cat-
egories based on the size of their capital as at
the 2006. The sample size consists of both old
generation and new generation banks. Banks
that commenced operation before 1988 are
old generation banks while those that com-
menced operation from 1989 are new genera-
tion banks. Amongst others new generation
banks started aggressive marketing a depar-
ture from armchair banking which old gen-
eration banks were noted. New generation
banks also introduced new technology for
efficient service delivery change. There is a
modified sample size for banks in this study.
Since this study is between 1986-2006, banks
that are not quoted are eliminated because
their data are not readily available. During
the field work, it was observed that these
banks had no data bank for their Annual fi-
nancial statements. Hence, such banks are
not considered. Thus in our sample size
banks such as Nigerian International Bank,
Standard Chartered Bank, Equatorial Trust
bank that are not (listed) quoted were elim-
inated and this reduced our population of
study to twenty-one. This represents 14/21
142 Information Management
!"#$%#&#%'$'
v(67%) of the quoted banks in Nigeria. The
study analyses the data as contained in the fi-
nancial report of 14 commercial banks out of
the 24 banks operating in Nigeria as at the end
of 2006, representing about 60% of the com-
mercial banks and about 67% of the quoted
banks. The bank data were obtained from CBN
Banking Supervision and Annual Reports,
(2006-2007) and Annual financial Statements
from various years of the selected banks for
the years 1986 -2006 are used for the analysis.
The end of the cut-off date represent just one
year after the bank consolidation mandate of
2004 by the Central Bank of Nigeria which
took effect on 31st December, 2005. The study
of bank capitalization and performance thus
covers the period from the structural adjust-
ment program of 1986 to 2006. The period of
1986 was the beginning of bank deregulation
and liberalization (more banks were licensed)
while we projected from 2005 the commence-
ment year of the study to a cut-off date of 2006
(one year after bank consolidation) when fi-
nancial statements of banks are expected to be
available. Audited bank financial statements
most time fall in arrears.
As stated earlier, this study employed
the Stratified Sampling Technique. In strati-
fied sampling, the population is categorized
into groups that are distinctly different from
each other on relevant variables. Each group
is called stratum (plural strata). In applying
stratified sampling, we categorized the pop-
ulation and stratified using bank capital (See
table 2) below. As stated earlier, this study
employed the Stratified Sampling Technique.
In stratified sampling, the population is cat-
egorized into groups that are distinctly dif-
ferent from each other on relevant variables.
Each group is called stratum (plural strata).
In this study, the elements in a particu-
lar stratum are the same with respect to the
relevant parameter (bank capital). The banks
are grouped into stratum and were selected
using simple random sampling supported by
judgment sampling (non-probability) meth-
ods. Our table above shows that 11 banks (9
banks excluding non-quoted banks) fall into
the frequency of bank capital between N25 <
N34.9. This means that 2/3 multiplied 9 gives
approximately 6 which were selected from
the first stratum. The name of nine banks were
written on a piece of paper, wrapped and put
in a tray from where they were picked. The
six out of the nine banks picked are Access
bank, Fidelity bank, First Inland bank, Wema
bank, Spring bank and Diamond bank.
However, Spring bank was dropped because
the data is only for one year (that is 2006) and
would not be very useful. Using Judgment
sampling an additional bank that is Afribank
was selected to complete our simple random
sampling of 2/3 x 9 = 6 in the first stratum of
N25 < N34.9 billion frequency.
The remaining eight (8) out of the
twelve (12) banks were also selected by writ-
ing the names of the banks on a piece of pa-
per, wrapped and put in a tray from where
they were picked. Our table above shows
that of the 13 banks (12 banks excluding non-
quoted banks) fall into the frequency of bank
capital between N35 billion and above that
is 2/3 multiplied 12 gives 8. The following
banks were picked Oceanic bank, Guaranty
Trust bank, Intercontinental bank, First bank
of Nigeria, Union Bank of Nigeria, United
Bank, Zenith and IBTC/Stanbic bank
At the of end of the selection process,
60% that is six (6) out of the nine (9) banks
fall into the frequency of between N25 bil-
lon < N34.9 billion while 72% that is eight
(8) banks out of the twelve (12) banks fall
143Information Management
!"#$%#&#%'$'
>76$$$91/$@!"/)$A!(!$?/(1+,
Instead of using time series data or a
cross section of banks, this study looks at a
panel data specification for individual banks.
In Cross section analysis, data are collected
across units of observation at a given point
in time. For cross section unit we observe the
same attribute on different people, geograph-
ical units, etc using same year. For example,
one can collect data on total deposits of banks
into the frequency of between N35 billion
and above. The selection process picked 50%
(seven) of the old generation banks and 50%
(seven) of new generation banks.
S/N Name of BanksB./CD/"%=$ +3$bank Capital
Bank Capital “billion”
Remark
1 Access " 28.8
2 Bank PHB " 28
3 Fidelity " 25.6
4 FCMB " 25.2
5 ETB " 28.4 N.Q.B
6 First Inland " 29.4
7 Standard Chartered " 26 N.Q.B
8 Spring " 25
9 Afribank " 26
10 Wema " 34.8
11 Diamond " 34.7
12 GTB " 36.4
13 Sterling " 35
14 NIB " 35.2 N.Q.B
15 Oceanic " 37.1
16 Ecobank " 35.3
17 Skye " 37.7
18 Unity " 35
19 Intercontinental " 53
20 FBN " 58.9
21 Zenith " 93
22 UBA " 47
23 UBN " 95.6
24 IBTC/Stanbic " 60
Table 2: Population of the study
'/+,.%H =DI D("E#"6 '+2%,J#)#/" 0""+(- K%2/,$ L@@C 0"& L@@MN.Q.B = Non-Quoted Banks
144 Information Management
!"#$%#&#%'$'
in say 2006. Here the variation is across the
units, that is different banks and not for dif-
ferent years, say time. In Time series, data
span across time a horizon usually on quar-
terly or yearly basis. An example is the to-
tal deposits of First Bank from 1986-2006 as
could have been used in this study. In this
case the variation is over time.
Panel data or data set is a technique that
combines the features of both time series and
cross section methods. For example, total de-
posits of banks (one of our explanatory vari-
ables) in Nigeria from 1986-2006 as used in
this study. Thus, panel data has the features
of time series and cross section.
YEAR95$
(MSP)9<@$
(MSP)9A$
(MSP)
EF5
(MSP)
SAMPLED BANKS
Banks
1986 11.28 11.22 11.16 11.35 1 29
1987 33.58 65.75 50.4 32.8 5 34
1988 40 73.14 64.39 38 5 42
1989 45.18 69 82 41 8 47
1990 42 51 70 32 9 58
1991 38 52 67.38 24 10 65
1992 40 41 70 32 10 65
1993 40.4 66.33 63.54 37.8 10 66
1994 44 89 70.23 27.39 10 65
1995 43 95 81.68 30.4 10 64
1996 53.25 95 87 37.87 10 64
1997 65.87 81 86 36.67 10 54
1998 54.8 63.77 83.37 38.1 10 54
1999 49.68 67 77.27 37.28 10 54
2000 47.8 49.3 75.42 41 10 54
2001 43.59 39 71.97 27.88 10 90
2002 43 42.11 61 32 10 90
2003 47 43.3 71 31.5 10 89
2004 42.7 60.6 66 34.43 10 89
2005 53.11 51 77 39.6 10 89
2006 67 54 87 55.47 10 25
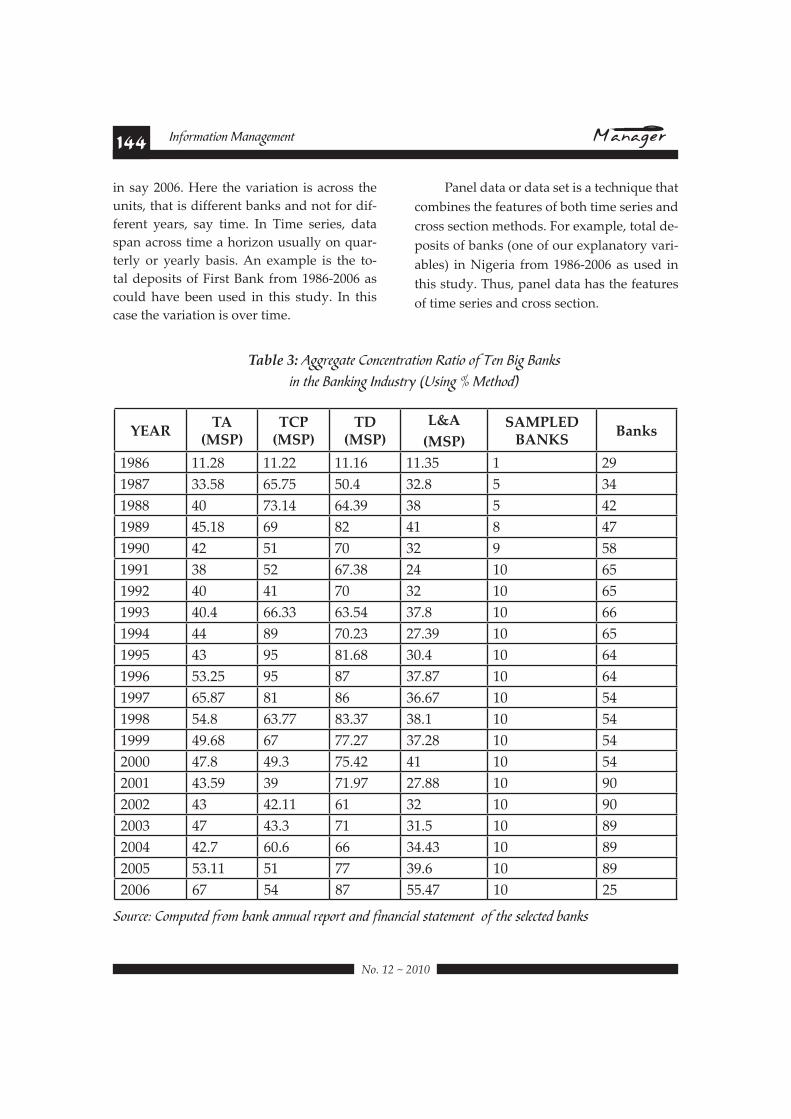
Table 3: Aggregate Concentration Ratio of Ten Big Banks #" $N% D("E#"6 *"&+)$,O ?!)#"6 P 5%$N/&A
Source: Computed from bank annual report and financial statement of the selected banks
145Information Management
!"#$%#&#%'$'
G78$$$$2-&)'%!('+"0$+3$(1/$0(D,=
Model 1 will test to the extent to which
shareholders fund of the (10) ten big banks
have significantly influenced market share
specifically bank deposit of Nigerian deposit
banks in Nigeria (See table 11). The model 1
has the proposition which state in null hy-
pothesis that shareholders fund and total
assets have not significantly influenced the
ten big banks to compete effectively by way
of control of market share (bank deposit)
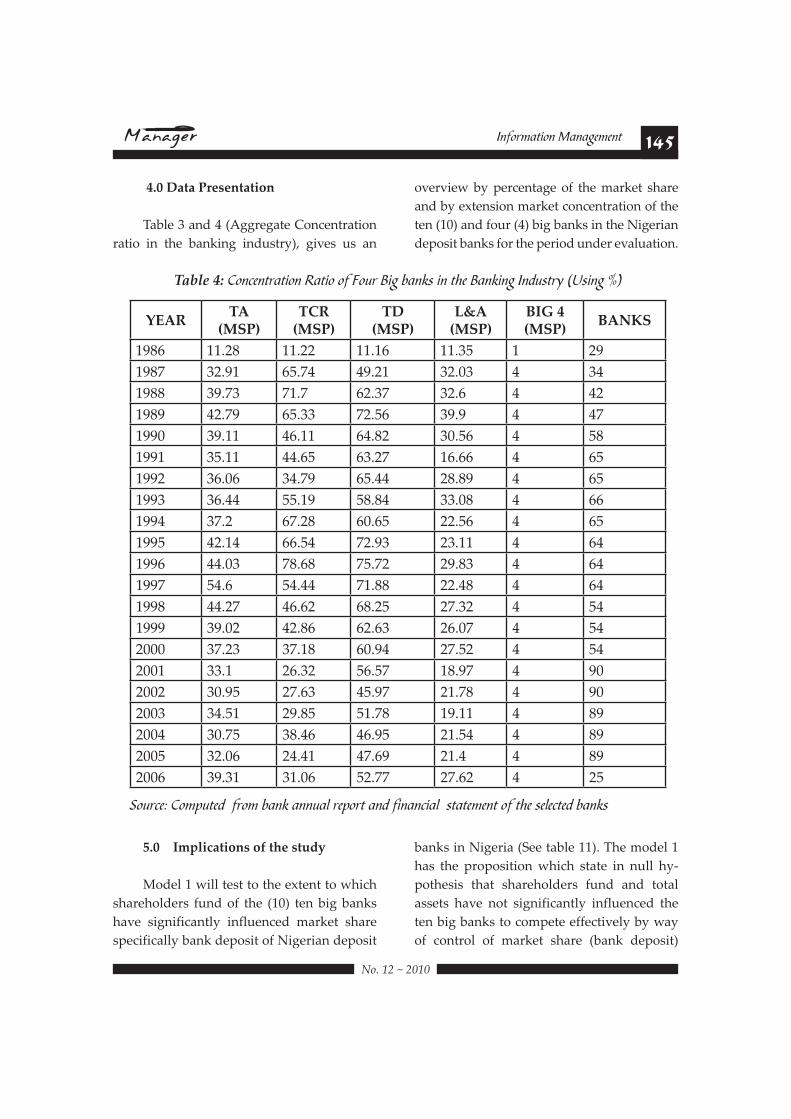
4.0 Data Presentation
Table 3 and 4 (Aggregate Concentration
ratio in the banking industry), gives us an
overview by percentage of the market share
and by extension market concentration of the
ten (10) and four (4) big banks in the Nigerian
deposit banks for the period under evaluation.
YEAR95$
(MSP)9<H$
(MSP)9A$
(MSP)EF5$
(MSP)BIG 4 (MSP)
BANKS
1986 11.28 11.22 11.16 11.35 1 29
1987 32.91 65.74 49.21 32.03 4 34
1988 39.73 71.7 62.37 32.6 4 42
1989 42.79 65.33 72.56 39.9 4 47
1990 39.11 46.11 64.82 30.56 4 58
1991 35.11 44.65 63.27 16.66 4 65
1992 36.06 34.79 65.44 28.89 4 65
1993 36.44 55.19 58.84 33.08 4 66
1994 37.2 67.28 60.65 22.56 4 65
1995 42.14 66.54 72.93 23.11 4 64
1996 44.03 78.68 75.72 29.83 4 64
1997 54.6 54.44 71.88 22.48 4 64
1998 44.27 46.62 68.25 27.32 4 54
1999 39.02 42.86 62.63 26.07 4 54
2000 37.23 37.18 60.94 27.52 4 54
2001 33.1 26.32 56.57 18.97 4 90
2002 30.95 27.63 45.97 21.78 4 90
2003 34.51 29.85 51.78 19.11 4 89
2004 30.75 38.46 46.95 21.54 4 89
2005 32.06 24.41 47.69 21.4 4 89
2006 39.31 31.06 52.77 27.62 4 25
Table 4: =/".%"$,($#/" K($#/ /3 4/+, D#6 Q("E) #" $N% D("E#"6 *"&+)$,O ?!)#"6 PA
Source: Computed from bank annual report and financial statement of the selected banks
146 Information Management
!"#$%#&#%'$'
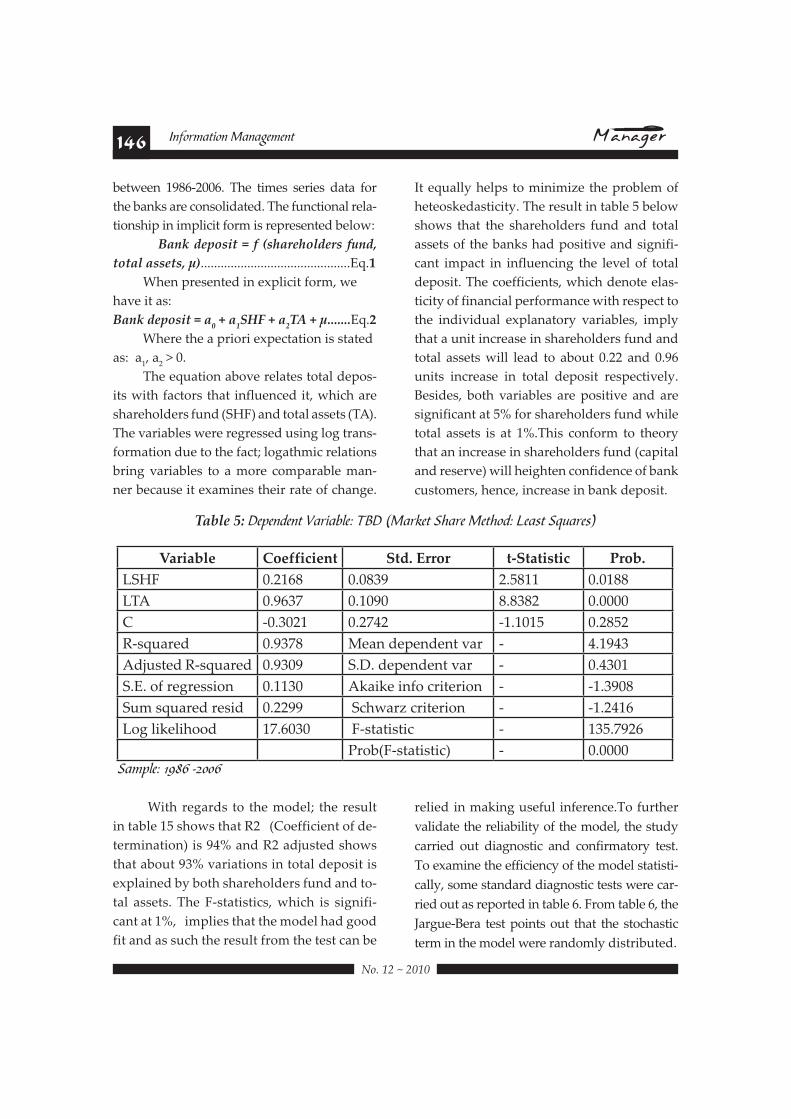
With regards to the model; the result
in table 15 shows that R2 (Coefficient of de-
termination) is 94% and R2 adjusted shows
that about 93% variations in total deposit is
explained by both shareholders fund and to-
tal assets. The F-statistics, which is signifi-
cant at 1%, implies that the model had good
fit and as such the result from the test can be
relied in making useful inference.To further
validate the reliability of the model, the study
carried out diagnostic and confirmatory test.
To examine the efficiency of the model statisti-
cally, some standard diagnostic tests were car-
ried out as reported in table 6. From table 6, the
Jargue-Bera test points out that the stochastic
term in the model were randomly distributed.
between 1986-2006. The times series data for
the banks are consolidated. The functional rela-
tionship in implicit form is represented below:
Bank deposit = f (shareholders fund,
total assets, µ).............................................Eq.1
When presented in explicit form, we
have it as:
Bank deposit = a0 + a
1SHF + a
2TA + µ.......Eq.2
Where the a priori expectation is stated
as: a1, a
2 > 0.
The equation above relates total depos-
its with factors that influenced it, which are
shareholders fund (SHF) and total assets (TA).
The variables were regressed using log trans-
formation due to the fact; logathmic relations
bring variables to a more comparable man-
ner because it examines their rate of change.
It equally helps to minimize the problem of
heteoskedasticity. The result in table 5 below
shows that the shareholders fund and total
assets of the banks had positive and signifi-
cant impact in influencing the level of total
deposit. The coefficients, which denote elas-
ticity of financial performance with respect to
the individual explanatory variables, imply
that a unit increase in shareholders fund and
total assets will lead to about 0.22 and 0.96
units increase in total deposit respectively.
Besides, both variables are positive and are
significant at 5% for shareholders fund while
total assets is at 1%.This conform to theory
that an increase in shareholders fund (capital
and reserve) will heighten confidence of bank
customers, hence, increase in bank deposit.
Table 5: Dependent Variable: TBD (Market Share Method: Least Squares)
Variable Coefficient Std. Error t-Statistic Prob.
LSHF 0.2168 0.0839 2.5811 0.0188
LTA 0.9637 0.1090 8.8382 0.0000
C -0.3021 0.2742 -1.1015 0.2852
R-squared 0.9378 Mean dependent var - 4.1943
Adjusted R-squared 0.9309 S.D. dependent var - 0.4301
S.E. of regression 0.1130 Akaike info criterion - -1.3908
Sum squared resid 0.2299 Schwarz criterion - -1.2416
Log likelihood 17.6030 F-statistic - 135.7926
Prob(F-statistic) - 0.0000'(12-%H :;<C RL@@C
147Information Management
!"#$%#&#%'$'
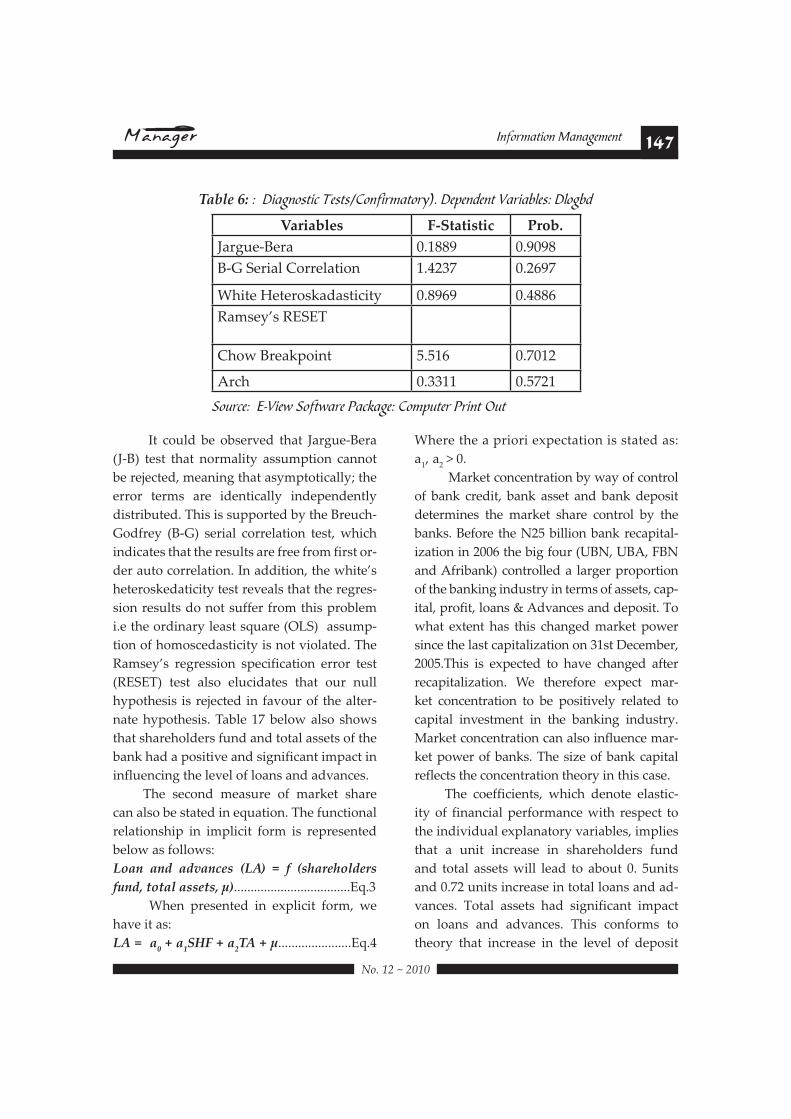
It could be observed that Jargue-Bera
(J-B) test that normality assumption cannot
be rejected, meaning that asymptotically; the
error terms are identically independently
distributed. This is supported by the Breuch-
Godfrey (B-G) serial correlation test, which
indicates that the results are free from first or-
der auto correlation. In addition, the white’s
heteroskedaticity test reveals that the regres-
sion results do not suffer from this problem
i.e the ordinary least square (OLS) assump-
tion of homoscedasticity is not violated. The
Ramsey’s regression specification error test
(RESET) test also elucidates that our null
hypothesis is rejected in favour of the alter-
nate hypothesis. Table 17 below also shows
that shareholders fund and total assets of the
bank had a positive and significant impact in
influencing the level of loans and advances.
The second measure of market share
can also be stated in equation. The functional
relationship in implicit form is represented
below as follows:
Loan and advances (LA) = f (shareholders
fund, total assets, µ)...................................Eq.3
When presented in explicit form, we
have it as:
LA = a0 + a
1SHF + a
2TA + µ......................Eq.4
Where the a priori expectation is stated as:
a1, a
2 > 0.
Market concentration by way of control
of bank credit, bank asset and bank deposit
determines the market share control by the
banks. Before the N25 billion bank recapital-
ization in 2006 the big four (UBN, UBA, FBN
and Afribank) controlled a larger proportion
of the banking industry in terms of assets, cap-
ital, profit, loans & Advances and deposit. To
what extent has this changed market power
since the last capitalization on 31st December,
2005.This is expected to have changed after
recapitalization. We therefore expect mar-
ket concentration to be positively related to
capital investment in the banking industry.
Market concentration can also influence mar-
ket power of banks. The size of bank capital
reflects the concentration theory in this case.
The coefficients, which denote elastic-
ity of financial performance with respect to
the individual explanatory variables, implies
that a unit increase in shareholders fund
and total assets will lead to about 0. 5units
and 0.72 units increase in total loans and ad-
vances. Total assets had significant impact
on loans and advances. This conforms to
theory that increase in the level of deposit
Table 6: : Diagnostic Tests/Confirmatory). Dependent Variables: Dlogbd
Source: E-View Software Package: Computer Print Out
Variables F-Statistic Prob.
Jargue-Bera 0.1889 0.9098
B-G Serial Correlation 1.4237 0.2697
White Heteroskadasticity 0.8969 0.4886
Ramsey’s RESET
Chow Breakpoint 5.516 0.7012
Arch 0.3311 0.5721
148 Information Management
!"#$%#&#%'$'
The functional relationship in implicit
form is represented below as follows:
Bank deposit = f (shareholders fund, total as-
sets, µ)...........................................................Eq.5
When presented in explicit form, we
have it as:
Bank deposit = a0 + a
1SHF + a
2TA + µ........Eq.6
Where the a priori expectation is
stated as: a1, a
2 > 0.
The above relates total deposits with
factors that influenced it, which are share-
holders fund (SHF) and total assets (TA). The
variables (See table 12) were regressed using
log transformation due to the fact, logathmic
relations bring variables to a more compa-
rable manner because it examines their rate
of change. It equally helps to minimize the
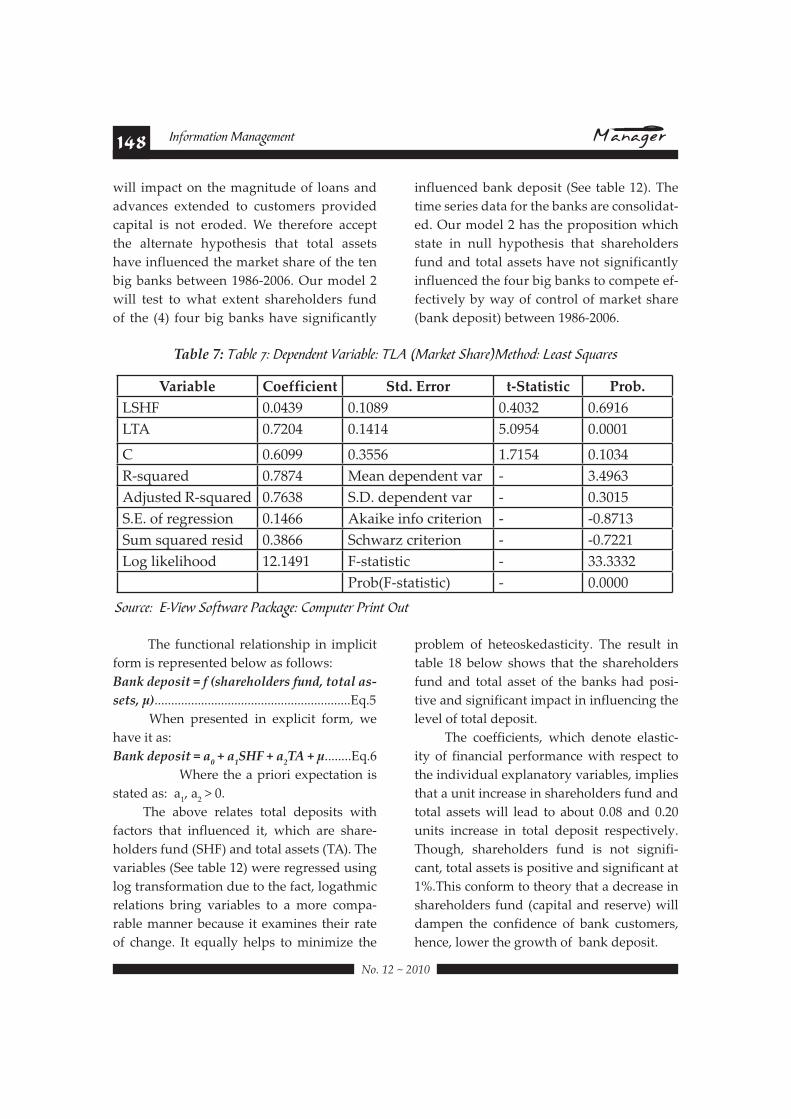
problem of heteoskedasticity. The result in
table 18 below shows that the shareholders
fund and total asset of the banks had posi-
tive and significant impact in influencing the
level of total deposit.
The coefficients, which denote elastic-
ity of financial performance with respect to
the individual explanatory variables, implies
that a unit increase in shareholders fund and
total assets will lead to about 0.08 and 0.20
units increase in total deposit respectively.
Though, shareholders fund is not signifi-
cant, total assets is positive and significant at
1%.This conform to theory that a decrease in
shareholders fund (capital and reserve) will
dampen the confidence of bank customers,
hence, lower the growth of bank deposit.
will impact on the magnitude of loans and
advances extended to customers provided
capital is not eroded. We therefore accept
the alternate hypothesis that total assets
have influenced the market share of the ten
big banks between 1986-2006. Our model 2
will test to what extent shareholders fund
of the (4) four big banks have significantly
influenced bank deposit (See table 12). The
time series data for the banks are consolidat-
ed. Our model 2 has the proposition which
state in null hypothesis that shareholders
fund and total assets have not significantly
influenced the four big banks to compete ef-
fectively by way of control of market share
(bank deposit) between 1986-2006.
Table 7: S(Q-% MH 9%2%"&%"$ T(,#(Q-%H SU0 ?5(,E%$ 'N(,%A5%$N/&H U%()$ 'V+(,%)
Variable Coefficient Std. Error t-Statistic Prob.
LSHF 0.0439 0.1089 0.4032 0.6916
LTA 0.7204 0.1414 5.0954 0.0001
C 0.6099 0.3556 1.7154 0.1034
R-squared 0.7874 Mean dependent var - 3.4963
Adjusted R-squared 0.7638 S.D. dependent var - 0.3015
S.E. of regression 0.1466 Akaike info criterion - -0.8713
Sum squared resid 0.3866 Schwarz criterion - -0.7221
Log likelihood 12.1491 F-statistic - 33.3332
Prob(F-statistic) - 0.0000
Source: E-View Software Package: Computer Print Out
149Information Management
!"#$%#&#%'$'
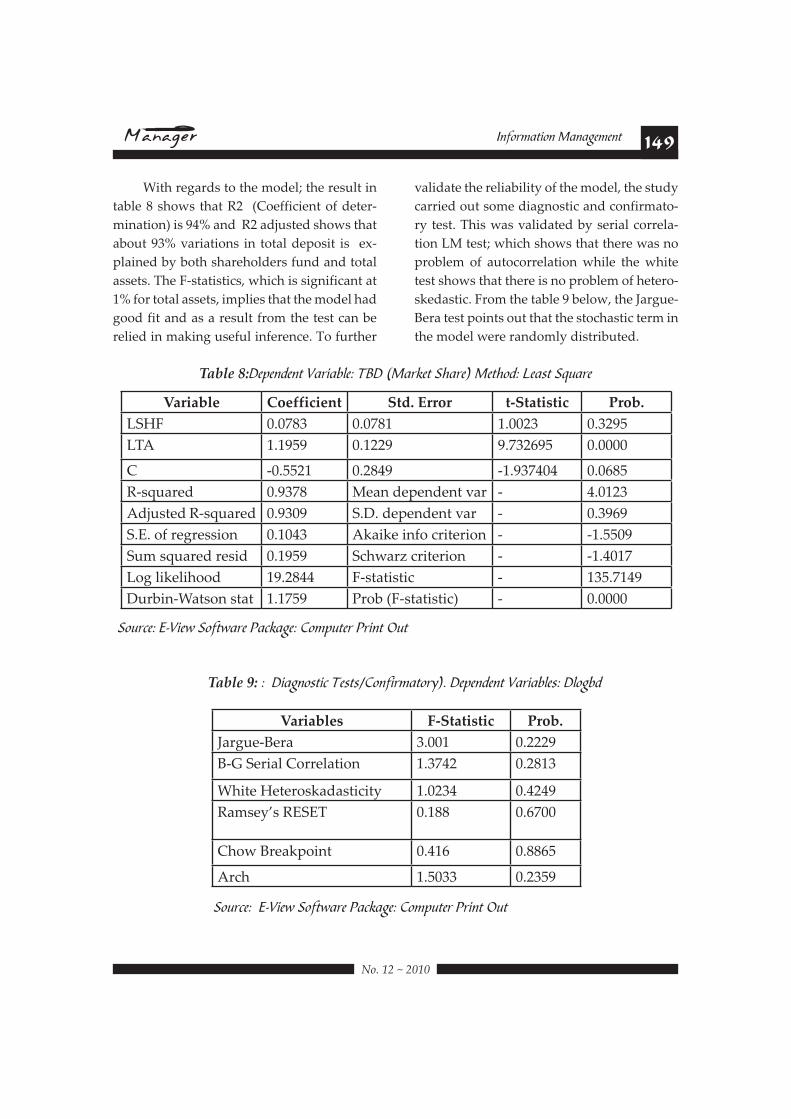
With regards to the model; the result in
table 8 shows that R2 (Coefficient of deter-
mination) is 94% and R2 adjusted shows that
about 93% variations in total deposit is ex-
plained by both shareholders fund and total
assets. The F-statistics, which is significant at
1% for total assets, implies that the model had
good fit and as a result from the test can be
relied in making useful inference. To further
validate the reliability of the model, the study
carried out some diagnostic and confirmato-
ry test. This was validated by serial correla-
tion LM test; which shows that there was no
problem of autocorrelation while the white
test shows that there is no problem of hetero-
skedastic. From the table 9 below, the Jargue-
Bera test points out that the stochastic term in
the model were randomly distributed.
Table 8:Dependent Variable: TBD (Market Share) Method: Least Square
Variable Coefficient Std. Error t-Statistic Prob.
LSHF 0.0783 0.0781 1.0023 0.3295
LTA 1.1959 0.1229 9.732695 0.0000
C -0.5521 0.2849 -1.937404 0.0685
R-squared 0.9378 Mean dependent var - 4.0123
Adjusted R-squared 0.9309 S.D. dependent var - 0.3969
S.E. of regression 0.1043 Akaike info criterion - -1.5509
Sum squared resid 0.1959 Schwarz criterion - -1.4017
Log likelihood 19.2844 F-statistic - 135.7149
Durbin-Watson stat 1.1759 Prob (F-statistic) - 0.0000
Source: E-View Software Package: Computer Print Out
Table 9: : Diagnostic Tests/Confirmatory). Dependent Variables: Dlogbd
Variables F-Statistic Prob.
Jargue-Bera 3.001 0.2229
B-G Serial Correlation 1.3742 0.2813
White Heteroskadasticity 1.0234 0.4249
Ramsey’s RESET 0.188 0.6700
Chow Breakpoint 0.416 0.8865
Arch 1.5033 0.2359
Source: E-View Software Package: Computer Print Out
150 Information Management
!"#$%#&#%'$'
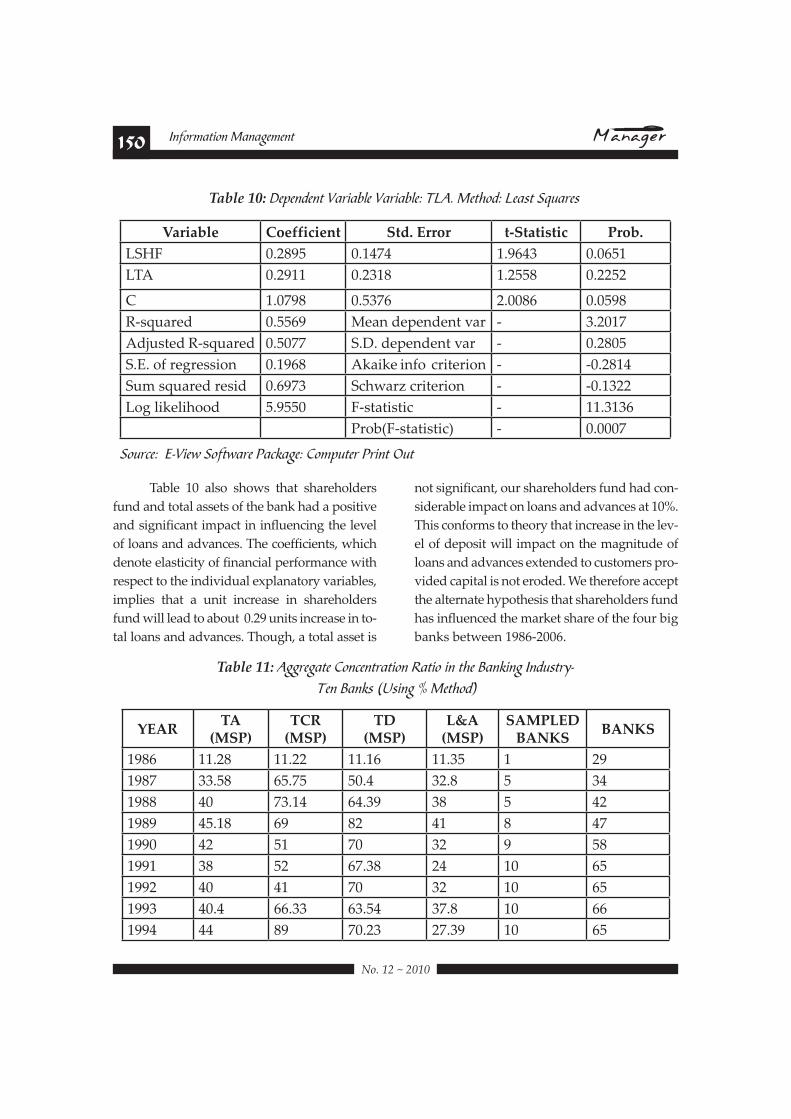
Table 10 also shows that shareholders
fund and total assets of the bank had a positive
and significant impact in influencing the level
of loans and advances. The coefficients, which
denote elasticity of financial performance with
respect to the individual explanatory variables,
implies that a unit increase in shareholders
fund will lead to about 0.29 units increase in to-
tal loans and advances. Though, a total asset is
not significant, our shareholders fund had con-
siderable impact on loans and advances at 10%.
This conforms to theory that increase in the lev-
el of deposit will impact on the magnitude of
loans and advances extended to customers pro-
vided capital is not eroded. We therefore accept
the alternate hypothesis that shareholders fund
has influenced the market share of the four big
banks between 1986-2006.
Table 10: Dependent Variable Variable: TLA. Method: Least Squares
Variable Coefficient Std. Error t-Statistic Prob.
LSHF 0.2895 0.1474 1.9643 0.0651
LTA 0.2911 0.2318 1.2558 0.2252
C 1.0798 0.5376 2.0086 0.0598
R-squared 0.5569 Mean dependent var - 3.2017
Adjusted R-squared 0.5077 S.D. dependent var - 0.2805
S.E. of regression 0.1968 Akaike info criterion - -0.2814
Sum squared resid 0.6973 Schwarz criterion - -0.1322
Log likelihood 5.9550 F-statistic - 11.3136
Prob(F-statistic) - 0.0007
Source: E-View Software Package: Computer Print Out
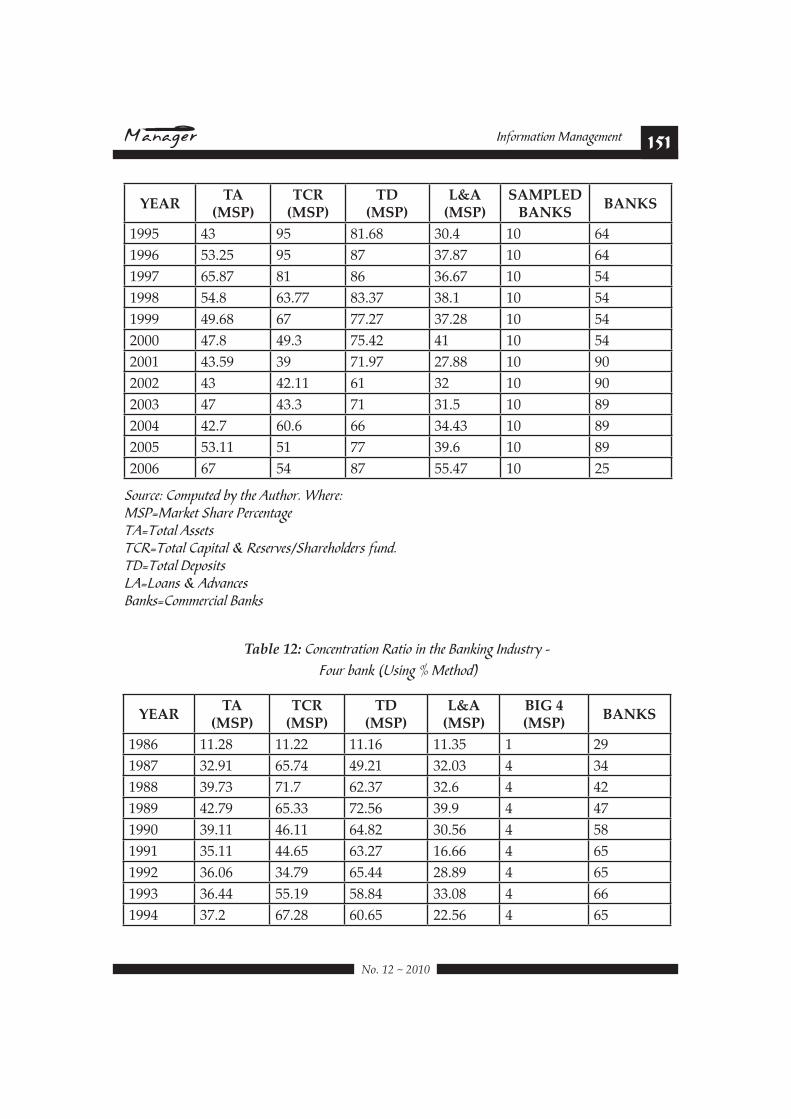
Table 11: Aggregate Concentration Ratio in the Banking Industry- S%" D("E) ?!)#"6 P 5%$N/&A
YEAR95$
(MSP)9<H$
(MSP)9A$
(MSP)EF5$
(MSP)SAMPLED
BANKSBANKS
1986 11.28 11.22 11.16 11.35 1 29
1987 33.58 65.75 50.4 32.8 5 34
1988 40 73.14 64.39 38 5 42
1989 45.18 69 82 41 8 47
1990 42 51 70 32 9 58
1991 38 52 67.38 24 10 65
1992 40 41 70 32 10 65
1993 40.4 66.33 63.54 37.8 10 66
1994 44 89 70.23 27.39 10 65
151Information Management
!"#$%#&#%'$'
YEAR95$
(MSP)9<H$
(MSP)9A$
(MSP)EF5$
(MSP)SAMPLED
BANKSBANKS
1995 43 95 81.68 30.4 10 64
1996 53.25 95 87 37.87 10 64
1997 65.87 81 86 36.67 10 54
1998 54.8 63.77 83.37 38.1 10 54
1999 49.68 67 77.27 37.28 10 54
2000 47.8 49.3 75.42 41 10 54
2001 43.59 39 71.97 27.88 10 90
2002 43 42.11 61 32 10 90
2003 47 43.3 71 31.5 10 89
2004 42.7 60.6 66 34.43 10 89
2005 53.11 51 77 39.6 10 89
2006 67 54 87 55.47 10 25
Source: Computed by the Author. Where: MSP=Market Share PercentageTA=Total Assets TCR=Total Capital & Reserves/Shareholders fund.TD=Total Deposits LA=Loans & Advances Banks=Commercial Banks
Table 12: =/".%"$,($#/" K($#/ #" $N% D("E#"6 *"&+)$,O W 4/+, Q("E ?!)#"6 P 5%$N/&A
YEAR95$
(MSP)9<H$
(MSP)9A$
(MSP)EF5$
(MSP)BIG 4 (MSP)
BANKS
1986 11.28 11.22 11.16 11.35 1 29
1987 32.91 65.74 49.21 32.03 4 34
1988 39.73 71.7 62.37 32.6 4 42
1989 42.79 65.33 72.56 39.9 4 47
1990 39.11 46.11 64.82 30.56 4 58
1991 35.11 44.65 63.27 16.66 4 65
1992 36.06 34.79 65.44 28.89 4 65
1993 36.44 55.19 58.84 33.08 4 66
1994 37.2 67.28 60.65 22.56 4 65
152 Information Management
!"#$%#&#%'$'
YEAR95$
(MSP)9<H$
(MSP)9A$
(MSP)EF5$
(MSP)BIG 4 (MSP)
BANKS
1995 42.14 66.54 72.93 23.11 4 64
1996 44.03 78.68 75.72 29.83 4 64
1997 54.6 54.44 71.88 22.48 4 64
1998 44.27 46.62 68.25 27.32 4 54
1999 39.02 42.86 62.63 26.07 4 54
2000 37.23 37.18 60.94 27.52 4 54
2001 33.1 26.32 56.57 18.97 4 90
2002 30.95 27.63 45.97 21.78 4 90
2003 34.51 29.85 51.78 19.11 4 89
2004 30.75 38.46 46.95 21.54 4 89
2005 32.06 24.41 47.69 21.4 4 89
2006 39.31 31.06 52.77 27.62 4 25
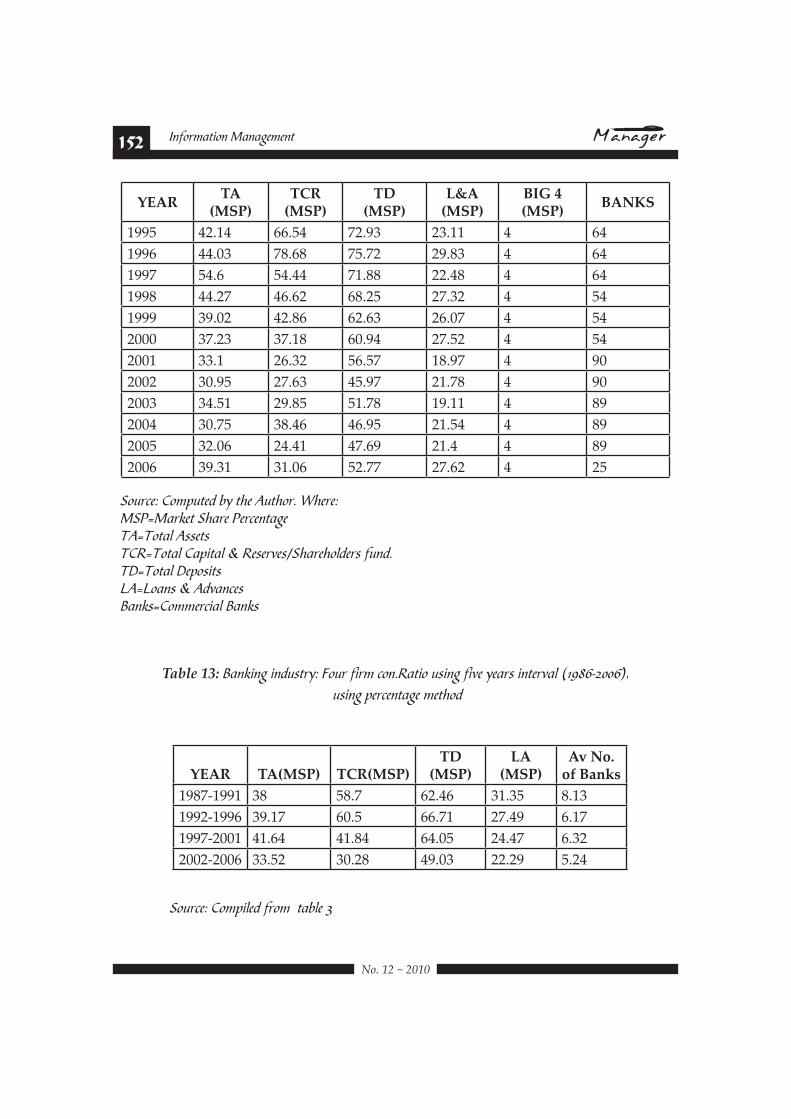
Source: Computed by the Author. Where: MSP=Market Share PercentageTA=Total Assets TCR=Total Capital & Reserves/Shareholders fund.TD=Total Deposits LA=Loans & Advances Banks=Commercial Banks
Table 13: D("E#"6 #"&+)$,OH 4/+, 3#,1 ./"BK($#/ +)#"6 3#J% O%(,) #"$%,J(- ?:;<CRL@@CAX using percentage method
YEAR
95I?J@K$$$$$$$$$$$$$$$$$$$$$$$ 9<HI?J@K9A$
(MSP)LA
(MSP)Av No.
of Banks
1987-1991 38 58.7 62.46 31.35 8.13
1992-1996 39.17 60.5 66.71 27.49 6.17
1997-2001 41.64 41.84 64.05 24.47 6.32
2002-2006 33.52 30.28 49.03 22.29 5.24
'/+,.%H =/12#-%& 3,/1 $(Q-% G
153Information Management
!"#$%#&#%'$'
6.0 Summary, conclusion and recom-
mendation
Summary of Finding
This study has attempted to find the re-
lationship between bank capitalization and
market share. The following are the findings:
:&We find evidence in support of a sig-
nificant impact of bank capital on market
concentration (market share). There is also
a strong relationship between bank capi-
tal funds and bank deposits, loans and ad-
vances (proxies for market concentration).
Prior to the recent bank capitalization, many
Nigerian banks were passive players in the
financial markets.
:&The result shows that shareholders’
fund and total assets of the banks have posi-
tive and significant impact in influencing the
level of total deposits. In the same vein, share-
holder fund and total assets of the bank had a
positive and significant impact in influencing
the level of loans and advances. The diagnos-
tic tests also lend credence to the results.
:&Tables 11, shows banking industry
(deposit money banks) as a highly concen-
trated industry from 1987 to 2006. Save for
1998, 2004, 2005 and 2006 where Zenith bank
broke into the big four, First Bank (FBN),
United Bank for Africa (UBA), Union Bank of
Nigeria (UBN) and Afribank bank had the
largest total assets, total capital and reserve
(shareholders fund), total deposits and loans
and advances from 1987-2006. Even when the
total number of banks increased from 29 in
1986 to 65 in 1991, decreased to 64 in 1996, in-
creased to 90 in 2001 and 25 in 2006, the four
giants banking firms more less maintained
their market power of 33.52 percent of to-
tal assets, 30.28 percent for total capital and
reserve, 49.03 percent for total deposits and
22.29 for loans and advances.
Conclusion
We strongly suggest that to reduce mar-
ket concentration in the Nigerian banking
industry, capital, technology, customer care,
aggressive marketing and efficient service
delivery are tools that can be used to attract
more customers to shore up bank deposit.
This will also help to reduce market concen-
tration and also break the monopoly power
of the big banks. With respect to bank capi-
tal and market power (market share), for
Nigerian banks to be major players in do-
mestic and international financial market,
its capital must be kept above the minimum
regulatory requirement at all times. To en-
hance market share (Concentration), Central
Bank of Nigeria should ensure that bank
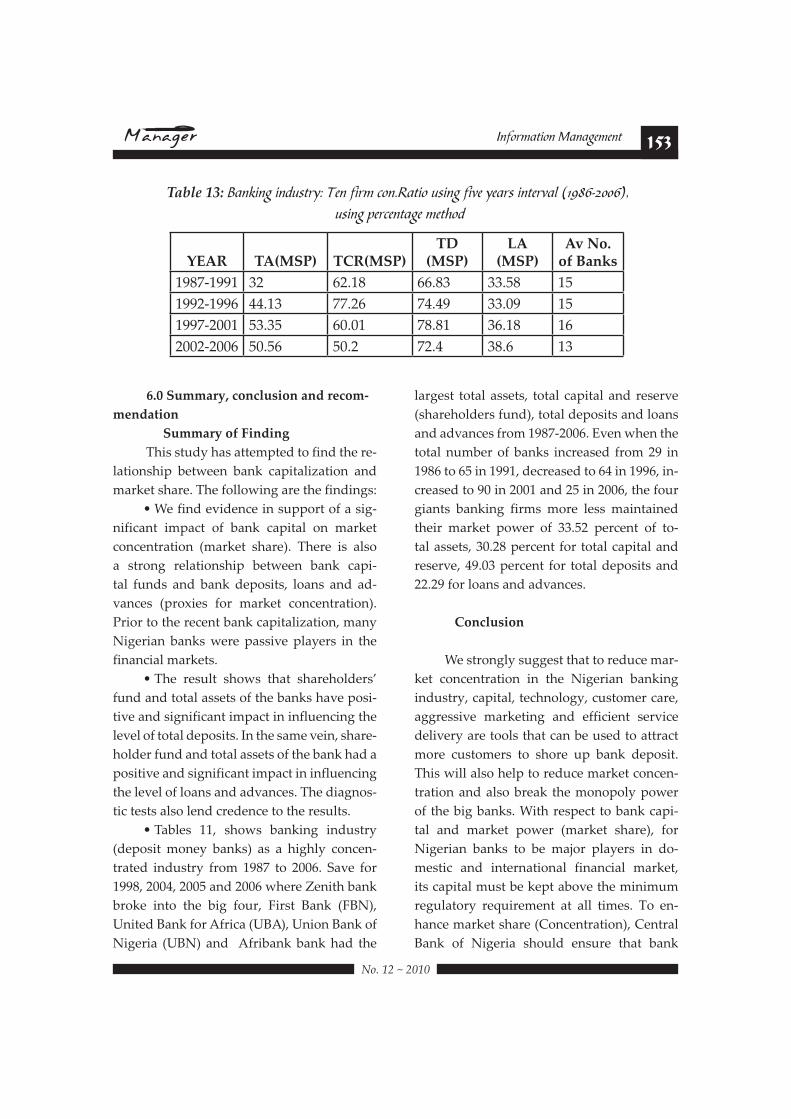
Table 13: D("E#"6 #"&+)$,OH S%" 3#,1 ./"BK($#/ +)#"6 3#J% O%(,) #"$%,J(- ?:;<CRL@@CAX using percentage method
YEAR
95I?J@K$$$$$$$$$$$$$$$$$$$$$$$ 9<HI?J@K9A$
(MSP)LA
(MSP)Av No.
of Banks
1987-1991 32 62.18 66.83 33.58 15
1992-1996 44.13 77.26 74.49 33.09 15
1997-2001 53.35 60.01 78.81 36.18 16
2002-2006 50.56 50.2 72.4 38.6 13
154 Information Management
!"#$%#&#%'$'
management/managers apply customers
deposit for worthwhile projects instead of
using such for prefer prestige, wrong loan
application, power and status, luxurious of-
fices and building, company cars and other
perquisites of office.
When bank loans are profitably em-
ployed it will definitely lead to increase in
profit and consequently shareholders fund.
When banks are able to influence the other
sectors in the economy through extension
of loans, it would lead to multiplier effect
in the long run, reduce inflation and appre-
ciate the naira. Bank management owes it a
duty to keep watch and constantly monitor
the quality of assets, especially the risk assets
must be improved upon. If the existing ratio
falls below the benchmark of 20%, excessive
and unnecessary growth of the loan portfo-
lio volume must be minimized. Bank capital
cannot on its own influence bank deposit as
depicted by our result. There is no doubt that
the days of armchair banking are over and
intense competition in the Nigerian bank-
ing industry has come to stay. Besides these
lapses of unfavorable enabling environment
(excessive operational expenses, sharehold-
ers fund/total assets that is risk of default),
mismanagement of assets, there is the issue
of bad governance on the part of bank man-
agement which has failed in all respect to
provide positive leadership.
Recommendations
A bank without good management (in-
put) may worsen the position it was before
the injection of new funds. Where managers
prefer prestige, power and status, it would be
reflected in the amount they receive in form
of expense account and luxury. Management
capability should be better supported, for the
best of assets can be overturned in short pe-
riod by poor management. It is a known fact
that CBN plays an important role in the se-
lection of bank executives at the directorate
level. The policy for the selection of this class
of bank workers should emphasize strict con-
sideration of good track records and sequen-
tial growth phase through the ranks as some
of the imperatives. On the basis of the theo-
retical and empirical findings of this study,
and considering the fact that the days of arm-
chair banking has been overtaken with the
intense competition in the Nigerian banking
industry, we recommend the following:
:&Shareholders’ fund and total assets of
the bank should be periodically evaluated.
The regulatory authorities will need to put in
place appropriate machinery or tool that will
address issues of bank liquidity and shore
assets quality in the industry. Bank manage-
ment in conjunction with the regulatory au-
thorities should at all times address causes
of illiquidity rather than the systems. In this
way, lost confidence can once again be re-
stored in the Nigerian banking industry. It is
important to carry routine checks, periodic
examinations on bank returns.
:& We strongly suggest that apart from
capital, technology, customer care, aggres-
sive marketing and efficient service deliv-
ery are tools that can be used to attract more
customers to shore up bank deposit. This
will also help to reduce market concentra-
tion and also break the monopoly power of
the big banks.
:& With respect to bank capital and mar-
ket power (market share), for Nigerian banks
to be major players in domestic and interna-
tional financial market, its capital must be
kept above the minimum regulatory require-
ment at all times.
155Information Management
!"#$%#&#%'$'
REFERENCES:
;6< !"#$%&'()*+," (1997): “ !"#$%&&#'())(*+#,-(./01#2-1(3-)#4*5#6-+7 !"""#$%"&'(%)'*+"",*+-%)!".*+/
June, pp. 16-19.
012 !"#$%&'()*+," (1992): 6-+7#'-+-8"9"+3:# !"#;"<1*+<(=()(3("<#*4#>(5"?3*5<, F & A Publishers Limited,
Lagos, pp 34-86
312Allen, F. and Gale, D. (2000): 2*91-5(+8#@(+-+?(-)#AB<3"9<, Cambridge and London, MIT Press, pp 440-475.
412 Allen, F. and Gale, D. (2003): “2*91"3(3(*+#-+.#@(+-+?(-)#A3-=()(3B !".56)+*7"58"95+%:!";)%<'="*+<",*+--
ing, 36, pp. 433-480.
>12Allen, L. and Rai, A. (1996): “C1"5-3(*+-)#D44(?("+?B#(+#6-+7(+8:#E+#F+3"5+-3(*+-)##2*91-5(<*+! ".56)+*7"58"
Banking and Finance 20, pp. 655-672.
?12Annual and Financial Reports of Banks (Various issues)
@12Anyanwaokoro, M. (1996): 6-+7(+8#'"3!*.<#-+.#,5*?"<<"<, Hosanna Publications, Enugu.
A12 -./%/0+1,+$()2324)56'00'&'0()738)and Delis, M.D (2005): 6-+7/A1"?(4(?G#F+.H<35B#A1"?(4(?#-+.#'-?5*"?*/
+*9(?#>"3"59(+-+3<#*4#6-+7#,5*4(3-=()(3B, Bank Greece Working Paper, No.25. Pp. 1-10.
B12 -./%/0+1,+$)23()9",'0):()and C. Staikouras (2006): “>"3"59(+-+3<#*4#6-+7(+8#,5*4(3-=()(3B#(+#3!"#A*H3!"5+#
D-<3"5+#DH5*1"-+#;"8(*+ !",*+-"58"C)%%D%E5)-'+("F*G%)"H?I4@1
JH12Bain, J.S (1956): “Relation of Profit Rate to Industry Concentration !"K6*)=%)7:".56)+*7"58""LD5+5M'DN!"?>!"0B3/3041""""""""""""""""""""""""""""
JJ12Bank for International Settlement (2001): “ !"#6-+7(+8#F+.H<35B#(+#3!"#D9"58(+8##'-57"3#D?*+*9("<:#2*9/
1"3(3(*+G#2*+<*)(.-3(*+#-+.#AB<3"9(?#A3-=()(3B !",OP"F*G%)"&514!"QR6(6N=S!"Q,*N%7T"95+%=*):"*+<"LD5+5M'DN"
Department), pp. 2-14.
J012Bank for International Settlements (2001): “ !"#6-+7(+8#F+.H<35B#(+#3!"#D9"58(+8#'-57"3#D?*+*9("<:#2*9/
1"3(3(*+G#2*+<*)(.-3(*+G#-+.#AB<3"9(?#A3-=()(3B 1",OP"F*G%)"4!"GG""">/0H1
J312Beck, Demirguc-Kunt, A and Levine, R. (2003): “Bank Concentration and Crises !"&,LU"E5)-'+("F*G%)"
No. 9921.Retrieved on February 19, 2005 From http://www.nber.org/papers/W9921, pp.3-7.
J4125";<()=3()9"&'61$;>?$%-() )and Levine, R. (2004): “6-+7#2*+?"+35-3(*+#-+.#@5-8()(3B:#F91-?3#-+.#'"?!-+/
ics 1"F*G%)"U%=)'%V%<"5+".6+%"J>!"0HH>"W)5M"$==G1IIXXX1+Y%)15)(IY55-NI)'N-IY%D-/%=/*7"J0/J>/H41G<8!"GG"3/A1
J>125";<()=3()@$,,()A3)and Jerome, A. (2005): “6-+7#,5(I-3(J-3(*+#-+.#,"54*59-+?"/#D91(5(?-)#DI(."+?"#45*9#$(/
8"5(-! "E5)7<",*+-"F57'D:"U%N%*)D$"E5)-'+("F*G%)"3>JJ1"""U%=)'%V%<"5+"RG)'7"@!"0HH>"8)5M"""$==GTIIX%Y1
worldbank.org/external/default/WDSContentServer/1W3P/1B/2005/03/02/000012009_20050302124337/
Rendered/PDF/wps3511.pdf.
J?12Berger, A. (1995): “ !"#,5*4(3/A35H?3H5"#;")-3(*+<!(1#(+#6-+7(+8K# "<3#*4#'-57"3/,*L"5#-+.#D44(?("+?B/A35H?/
ture Hypotheses’’, Journal of Money, Credit and Banking 27, pp. 404-431
J@12Berger, A.N., R.J . Herring and)7B"1+ (1995): “ !"#;*)"#*4#2-1(3-)# (+#@(+-+?(-)# F+<3(3H3(*+<! " .56)+*7"58"
Banking and Finance 19: pp 393-430.
JA12Berger, A. (1995a): “ !"#,5*4(3/A35H?3H5"#;")-3(*+<!(1#(+#6-+7(+8:# "<3<#*4#'-57"3/,*L"5#-+.###D44(?("+3/A35H?/
ture Hypotheses !".56)+*7"58"95+%:!";)%<'="*+<",*+-'+(!"0@!"GG1"""4H4/43J1
JB12Berger, A. (1995b): “ !"#;")-3(*+<!(1#="3L""+#2-1(3-)#-+.#D-5+(+8<#(+#6-+7(+8! ".56)+*7"58"95+%:!";)%<'="
and Banking, Vol. 27, pp. 404-431.
0H12Berger, A.N. and Hanweck, G.A. and)C$&D.6"E()935 (1987): “2*91"3(3(I"#M(-=()(3B#(+##6-+7(+8:#A?-)"G#
A?*1"#-+.#,5*.H?3#'(N#D?*+*9(?<#O&! "GG1">HJ/>0H1
156 Information Management
$*P#QO#R#O&Q&
0J125+E!()F+.%)C3()and David E. Runkle, (1993): “A(J"#-+.#,"54*59-+?"#*4#6-+7(+8#@(59< !".56)+*7"58"95+-
etary Economics, Vol. 31, pp. 47-67.
0012Boyd, J.H and D.E Runkle (1993): “A(J"#-+.#,"54*59-+?"#*4#6-+7(+8#@(59<G# "<3(+8#3!"#,5".(?3(*+<#*4# !"*/
ry !".56)+*7"58"95+%=*):"LD5+5M'DN"3J!"4@/?@1
031256+%G"%H6"&&"6():)7';.",()*)and)I/6!"%"6()* (1990): Economics, Houghton Mifflin Company,
Boston. pp. 599-653.
0412Central Bank of Nigeria (CBN):“Annual Report and Statement of Accounts "QJBBB/0HH3S1
0>12CBN Banking Supervision Annual Report 2006 and 2007
0?12@.+%1()537)(1991): “D44"?3<#*4# F+3"5<3-3"#6-+7(+8#*+#2*99"5?(-)#6-+7<S#;(<7#-+.#,5*4(3-=()(3B !"U%V'%X"58"
Economics and Statistics, 73, pp.78-82..
0@12Demigruc-Kunt A and)C3)C$'B'%1/3 (1999): “>"3"59(+-+3<#*4#2*99"5?(-)#6-+7#F+3"5"<3##'-58(+<#-+.#,5*4/
(3-=()(3B:#A*9"#F+3"5+-3(*+-)#DI(."+?" !"E5)7<",*+-"LD5+5M'D"U%V'%X!"Z571J3T"3@B/4HA!"GG1"3/A""""""""""""""""""""""
0A12Demigruc-Kunt A and Levine, R. (2000): “6-+7#2*+?"+35-3(*+:#25*<<#2*H+35B#DI(."+?" 1"U%=)'%V%<"5+"
February 19, 2005 from http:// www.globalpolicy.org/socecon/tncs/mergers/imfbankcons.htm.
0B12Demirguc-Kunt, A and)C$'B'%1/()C3 (2001): “@(+-+?(-)#A35H?3H5"#-+.#6-+7#,5*4(3-=()(3BG "'+""""W'+*+D'*7"P=)6D=6)%"
and Economic Growth: A Cross-Country Comparison of Banks, Markets, and Development, MIT Press, Cam-
bridge, MA, pp. 1-12 Retrieved on March 10, 2005 from http://www.econ.worldbank.org/doc/1185.pdf.
3H12Demirguc-Kunt, A, and)C$'B'%1/ (1998): “>"3"59(+-+3<#*4#2*99"5?(-)#6-+7#F+3"5"<3#'-58(+<#-+.#,5*4(3/
-=()(3B:#A*9"#F+3"5+-3(*+-)#DI(."+?" !"E5)7<",*+-"LD5+5M'D"U%V'%X"J3!"3@B/4HA1
3J12Diamond, D (1984): “@(+-+?(-)#F+3"59".(-5("<#-+.#>")"8-3".#'*+(3*5(+8! "U%V'%X"58"LD5+5M'D"P=6<-
ies 51, pp. 393-414
3012Dolan, G.E (1986): Economics, Dryden Press, Chicago p. 602
[email protected], Donsyah (2003): “ !"#F91-?3#*4#6-+7#2-1(3-)#;"TH(5"9"+3<#(+#F+.*+"<(- !"
Department of Economics, Loughborough. pp. 1-9.
3412JH.+!/1."()F+.%)K3 (1994): “6*-5.5**9U'-+-8"9"+3#,5-?3(?"<#-+.#>(<35"<<#(+#3!"#6-+7(+8#AB<3"9 !"&[O;"
Quarterly, Volume, 4 No. 2 (June), pp.15-25.
3>12L/1H+.$%1H"()M35 (2003): ;"<"-5?!#'"3!*.<#4*5#$(8"5(-+# "53(-5B#F+<3(3H3(*+<, Cole Consults, Lagos, p.48.
3?12I6""%"()*3C (2004): Econometric Analysis (Fifth Edition), Pearson Education (Singapore) Ltd, Delhi.
3@12Hay, D.A and D.J Morris (1991): F+.H<35(-)#D?*+*9(?<#-+.#C58-+(J-3(*+:# !"*5B#-+.#DI(."+?", 2 ed, Oxford
University Press, New York.
3A12Peek, J. and Rosengren, E. (1996): A9-))#6H<(+"<<#25".(3#EI-()-=()(3B:#V*L#F91*53-+3#(<#A(J"#*4#3!"#W"+."5XP#F+#
0+(I"5<-)#6-+7(+8:#@(+-+?(-)#AB<3"9, Design Reconsidered, Edited by Saunders and Walter, Irwin Publish-
ing, New York, pp. 12- 20.
3B127/-.E"():3)(2002): “ !"#F91-?3#*4#@*5"(8+#6-+7<#*+#'-57"3#2*+?"+35-3(*+:# !"###2-<"#*4#F+.(-P#E11)(".#D?*+*/
9"35(?<# -+.# F+3"5+-3(*+-)#>"I")*19"+3 " QRLLR[LS"Z5710/J!" GG" @/0H1U%=)'%V%<" 5+" .*+6*):" J!" 0HH>" 8)5M""""""""""""""""""""""
htt://www.ideas.respect.org/s/eaa/aeinde.html, pp 4-12.
4H127.'.()73C):';./", (2003): “E+#F+I"<3(8-3(*+#(+3*#3!"#0<"#*4#'"58"5<#-<#-#A*)H3(*+#@*5#3!"#E<(-+#6-+7(+8#A"?/
tor Crisis !"#$%"K6*)=%)7:"U%V'%X"58""LD5+5M'DN"*+<"W'+*+D%"\*(5N!"GG1"3J/4B1


