Embed Size (px)
Citation preview

Bank Competition and Collateral : Theory and Evidence
Christa HainzUniversity of Munich
Akademiestr. 1/III80799 Munich
e-mail : [email protected]
Laurent Weill+
Universite Robert Schuman47 avenue de la Foret Noire
67000 Strasbourge-mail: [email protected]
Christophe J. GodlewskiUniversite Louis Pasteur
61 avenue de la Foret Noire67000 Strasbourg
e-mail: [email protected]
+ Corresponding author.
11

Bank Competition and Collateral : Theory and Evidence
Abstract
We investigate the impact of bank competition on the use of collateral in loan contracts. We develop a theoretical model incorporating information asymmetries in a spatial competition framework where banks choose between screening the borrower and asking collateral. We show that presence of collateral is more likely when bank competition is lower. We then test empirically this prediction on a sample of bank loans from 70 countries. We perform logit regressions of the presence of collateral on bank competition, measured by the Lerner index. Our empirical tests corroborate the theoretical predictions of a negative role of bank competition on the presence of collateral. These findings survive several robustness checks.
JEL Codes: G21, D43, D82
Keywords: Collateral, Bank Competition, Asymmetric information.
22

1. Introduction
Following the significant structural changes of the banking industry witnessed
around the globe, much theoretical and empirical work has examined the economic
role of bank competition in recent years.1 The impact of bank competition on the
access to bank finance has notably been investigated, as benefits from bank
competition are intuitively expected from lower loan rates which should favor this
access (e.g. Beck, Demirgüc-Kunt and Maksimovic, 2004).
Nevertheless, the role of bank competition on the access to bank finance is also
dependent on its effects on collateral use, as collateral requirements are repeatedly
mentioned as a major financing obstacle. For instance, by relying on the WBES
survey for firms in 80 countries, Beck et al. (2006) notably report that collateral
requirements are rated as the third most important financing obstacle among 12
financing obstacles, just after high interest rates and access to long-term loans. One
can therefore wonder how bank competition influences the use of collateral.
However research on this topic is impressively poor. Three theoretical works
have investigated this issue. Manove, Padilla and Pagano (2001) display a model in
which banks choose between screening the borrower and asking the latter to pledge
collateral. In their model, the bank gets a very precise signal about the firm’s
creditworthiness through screening. Therefore, posting collateral by borrowers
induces banks to forego screening. Such behavior is exacerbated by bank competition,
as the paper predicts that borrowers are more likely to post collateral in competitive
markets than in monopolistic markets. Indeed enhanced competition would then favor
bank laziness, meaning its reluctance to screen borrowers. Berlin and Butler (2002)
develop a model based on the possibility of renegotiation between the bank and the
borrower. This renegotiation can take place after the completion of the initial loan
contract and depends on new information obtained by the bank. They support the
view that bank competition leads to lower collateral requirements, which results from
the incentives of the bank to proceed to renegotiation. Both former models consider
the role of collateral in solving adverse selection problems, and offer opposing
predictions. In contrast, Hainz (2003) proposes a model in which collateral helps
solve moral hazard problems. She observes that competition reduces the use of
collateral, as banks with monopoly power have incentives to use collateral to extract
rents.1 See the special issue of the Journal of Money, Credit and Banking in 2004 (vol. 36, n°3) on this topic.
33

On the empirical side, two recent papers can be related to the impact of bank
competition on the use of collateral, although they do not focus on this issue. Jimenez,
Salas and Saurina (2006) investigate a wide range of determinants of the presence of
collateral on a sample of 550 000 loans granted by Spanish banks. They notably
analyze the impact of bank concentration, measured by the Herfindahl index, and find
a negative impact of bank concentration on collateral use. Berger et al. (2007) test
whether the adoption of a lending technology reducing ex ante information
asymmetries, i.e. small business credit scoring, is associated with lower collateral use
in loan contracts. Bank concentration measured by the Herfindahl index is included as
a control variable. They find no significant sign for bank concentration to explain the
incidence of collateral in their estimations.
We can thus point out that theoretical literature provides conflicting predictions
which lack of empirical tests to their validation. The aim of this paper is to provide a
broad and consistent analysis of the role of bank competition on the use of collateral,
based on theoretical and empirical investigation.
We start by presenting an innovative theoretical explanation for the role of bank
competition on the use of collateral. The model incorporates information asymmetries
in an industrial organization framework. Our theoretical model is related to Manove,
Padilla and Pagano (2001). Our starting point is also the choice for a bank between
screening the borrower and asking collateral. However we differ from this model in
two major aspects. The first difference concerns the fact that banks are not lazy in our
model, in the sense that there is no additional information on the borrower that the
bank can obtain. Therefore, our results are not driven by bank laziness. The second
difference is the modeling of the market structure. Following recent theoretical works
on bank competition (e.g. Dell’Arricia, 2001; Hauswald and Marquez, 2006), we
consider a spatial competition framework based on a circular economy. Such
representation is closer to the reality of banking markets, marked by differentiation,
than monopoly or oligopoly. Furthermore, Degryse and Ongena (2005) have shown
the role of geographical distance in shaping lending rates of banks.
We then test empirically our theoretical predictions with a cross-country
analysis on a sample of 4931 bank loans from 70 countries. By performing a cross-
country analysis, we do not rely to on a single country for our study which may lead
to country-specific results. We perform logit regressions of the presence of collateral
on bank competition. Bank competition is measured by the Lerner index, in line with
44

the recent empirical works on bank competition (Martin, Salas and Saurina, 2006;
Maudos and Fernandez de Guevara, 2004, 2007). Unlike concentration indices,
Lerner index does not infer the degree of competition from indirect proxies such as
market shares. It infers bank’ conduct directly and then informs on the actual behavior
of the bank.
The rest of the paper is organized as follows. Section II presents the theoretical
model. In section III, we develop the empirical results. We finally provide some
concluding remarks in section IV.
II. Theoretical model
II.1 Set up of the model
Before analyzing the credit contracts offered, we describe the characteristics of
the firms possibly applying for a loan and the banking sector. The total mass of firms
is normalized to 1. Firms are distributed uniformly around a circle of length 1.2 The
share of good firms is µ and that of bad firms is (1-µ). The good firms have a project
that is successful with probability p. In the case of success the project’s payoff is X, in
the case of failure it is 0. The investment costs of the project are I. Thus, the expected
payoff of a good firm is pX-I>0, which we assume to be positive. Bad firms will fail
with probability 1. If they receive a loan, they take the money and run. Due to the lack
of own liquid funds, the firms need to finance their investment through credit. The
firm’s owners are endowed with an asset A that can potentially be offered as
collateral.
We consider a banking sector with N identical banks that are located
equidistantly around the circle. Banks cannot observe the firm’s type, i.e. whether a
particular firm is good or bad. However, they know the distribution of good and bad
firms. Moreover, banks can observe the firm’s location. They compete in repayments.
We assume that banks possess enough funds to finance all firms that apply for loans
and that the firms’ returns (and in the case of collateralization their assets) are high
enough such that the market is covered.
Banks have two means to discriminate between good and bad firms: they either
offer a collateralized credit contract which induces firms to signal their type, or they
screen all firms applying for credit by evaluating their credit proposals. In the case of
2 Thus, our model could be viewed as a Salop model where transportation costs are zero or without product differentiation and therefore have a model with perfect competition.
55

collateralization, the bank gets a payoff from the collateralized assets that are
liquidated if the project fails. There are costs associated with liquidation. Therefore,
the liquidation value of each unit of collateral, denoted by α, is lower than the
continuation value of the firm, i.e., α < 1.
If banks decide to screen, they receive a signal about a firm’s creditworthiness.
If the firm is good, the bank always gets the signal that the firm is good. However, if
the firm is bad, the bank’s signal is correct only with probability s(d) > 0.5.3 The
quality of this signal depends on the distance d between bank and firm, i.e. the closer
a firm is located to a bank the better is the quality of the signal, 0ds <
∂∂
.4 Thus, bad
firms will be financed because banks make mistakes when conducting the
creditworthiness test but these mistakes occur less frequently for firms that are located
more closely to the bank. The idea is that banks get better information if a firm is
located close-by because they can observe the firm’s business or personally know the
entrepreneur. Agarwal and Hauswald (2007) provide empirical evidence that distance
matters for the informativeness of a signal. Alternatively, distance could be
interpreted as a measure for the strength of the relationship between bank and firm.
Note that offering a contract without either screening or collateralization does not pay
off because we assume that µpX-I<0.
The timing of the game is as follows: In the first stage, banks decide
simultaneously which type of contract they offer. In the second stage, the banks
determine simultaneously the terms of the credit contract they offer. Firms apply at
the bank which offers the contract with the most favourable terms. If banks offer the
same rate, firms apply at the closest bank (due to the application costs).
To render the analysis as clear as possible we make three simplifying
assumptions. First, we assume that banks are not allowed to price-discriminate, i.e.
they cannot make the terms of the loan contract dependent on the firm’s location. This
assumption allows deriving the same contract terms for all firms and therefore avoids
that we have to give repayments for each individual firm.5 Second, the banks do not
3 Lehner and Schnitzer (2008) use the same setup in which the signal is imperfect for bad firms.4 In Hauswald and Marquez (2006), the quality of the screening signal depends on the distance between banks and borrowers as well. Empirical evidence also shows that different banks rate obtain different results from screening a particular borrower (Jacobson, Lindé and Roszbach, 2006; Mitchell and van Roy, 2007). This is consistent with our setup.5 It also implies that firms do not face a hold-up problem and therefore their payoffs are higher (except for the marginal firm). If the hold-up problem existed, firms would find the screening contract less
66

incur any costs per customer for performing the creditworthiness test. This cost would
only add an additional term in each repayment function but would not change the
insights obtained. The costs we want to emphasize are the losses the bank faces when
it erroneously provides a loan to a bad firm. Third, we assume that firms apply at the
closest bank if banks offer the same repayments. We would obtain the same
qualitative result if firm’s had to incur some cost of application.
We solve the game by backward induction. Thus, we first analyse the contract
terms for a situation in which both banks offer either a collateralized or a screening
contract. In a second step, we show that it is indeed optimal for the banks to offer the
same type of contract.
II.2 Collateralized credit contract
We first suppose that all banks offer a collateralized credit contract.
Collateralization implies that the firm repays an amount RL in the case of success and
that it loses collateral in the amount L in the case of failure. The credit contract has to
be designed in a way that the bad firms have no incentive to demand credit. This is
reached through collateralization. The incentive compatibility constraint for a bad
firm can be written as:
(IC.F_L) ILor A L) - (A I
≥≤+
If a bad firm receives a loan in the amount of I (and runs away with the money),
it will lose assets in the amount of L as the project fails with certainty. Therefore, it is
obvious that the amount of collateral that prevents bad firms from applying for credit
is I. As a result, bad firms do not apply for loans. Moreover, given that from (IC.F_L)
L=I, the participation constraint of the good firm must hold:
( ) (PC.F_L) 0I p) - (1 - R-Xp
or A I) - (A p) - (1 )R - X (A pL
L
≥
≥++
If the project is successful, a good firm repays RL from the payoff X it generates.
In the case of failure, collateralized assets in the amount of I are seized by the bank.
The expected payoff when the investment is credit-financed has to be at least as high
as the payoff from not investing.
attractive relative to the collateralized contract. The insights from our model would not change, only the parameter ranges in which a particular contract is optimal.
77
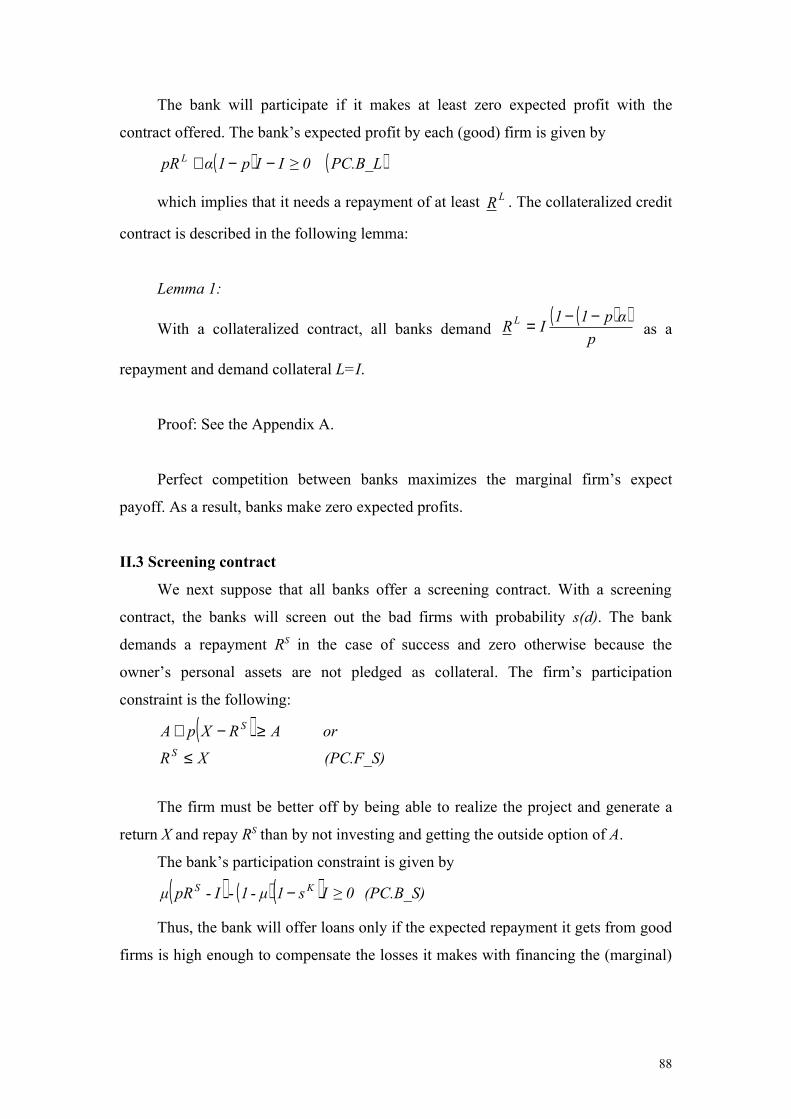
The bank will participate if it makes at least zero expected profit with the
contract offered. The bank’s expected profit by each (good) firm is given by
( ) ( ) PC.B_L 0IIp1αpR L ≥−−+
which implies that it needs a repayment of at least LR . The collateralized credit
contract is described in the following lemma:
Lemma 1:
With a collateralized contract, all banks demand ( )( )
pαp11IR L −−= as a
repayment and demand collateral L=I.
Proof: See the Appendix A.
Perfect competition between banks maximizes the marginal firm’s expect
payoff. As a result, banks make zero expected profits.
II.3 Screening contract
We next suppose that all banks offer a screening contract. With a screening
contract, the banks will screen out the bad firms with probability s(d). The bank
demands a repayment RS in the case of success and zero otherwise because the
owner’s personal assets are not pledged as collateral. The firm’s participation
constraint is the following:
( )(PC.F_S) XR
or ARXpAS
S
≤
≥−+
The firm must be better off by being able to realize the project and generate a
return X and repay RS than by not investing and getting the outside option of A.
The bank’s participation constraint is given by
( ) ( ) ( ) (PC.B_S) 0Is1μ1IpRμ KS ≥--- −
Thus, the bank will offer loans only if the expected repayment it gets from good
firms is high enough to compensate the losses it makes with financing the (marginal)
88

bad firm k. The marginal firm is the firm that the bank is financing and is furthest
away from the bank. The repayment the bank needs to break even is denoted by SR .
Lemma 2:
With a screening contract, all banks demand ( ) ( )
pμs1μ1μIR
KS −−+= as a
repayment from all firms with a positive signal. The marginal firm k is the firm that is
located half-way between two banks.
Proof: See the Appendix A.
Since all banks demand the same repayment in equilibrium, firms apply for
loans at the closest bank. We assume that if both banks ask the same repayment, firms
apply at the closest bank. Hence, all banks have the same market share and the
marginal firm k is located half-way between two banks. Due to competition banks
offer repayments that maximize the firm’s expected payoff.
II.4 Comparison of contracts
A firm is indifferent between the two contracts (derived in Lemma 1 and 2) if its
expected profits from both contracts are the same, i.e. if the firm obtains the same
profit with a collateralized and a screening contract
( ) ( ) ( ) ( )
( ) ( )( )p1
s1μ-1-1α
or pμ
s1μ1μIXpIp1p
p1α1IXp
K
K
−−=
−−++=−−
−−−
Having derived this threshold value, we can state the following proposition:
Proposition 1:
99

Both banks offer a collateralized contract if the liquidation value of collateral is
high enough, i.e. ( )( )
( )p1s1μ-1
-1αK
> . Otherwise, they both offer a screening
contract.
Proof: See the Appendix A.
Indeed, the banks have an incentive to offer the same types of contracts because
deviating could reduce their profit (see the Appendix). Therefore, we do not have an
equilibrium where both types of contracts are offered at the same time. Since there is
competition between banks, they offer the contract that minimizes costs, which allows
them to offer the most attractive contract terms. For high enough liquidation values,
this is a contract with collateralization.
The result formulated in Proposition 1 has interesting comparative statics. Here,
we have to take into account that the distance d between bank and firm depends on the
number of banks N. This means the higher the number of banks, the smaller is the
distance between firm and bank, i.e. 0Nd <
∂∂
and therefore the quality of the signal
increases, i.e. 0Nd
ds
Ns >
∂∂
∂∂=
∂∂
. We summarize the comparative statics results in the
next proposition.
Proposition 2:
It is more likely that a contract is collateralized if the less competition there is in
the banking sector, i.e. N is lower.
Proof: See the Appendix A.
Collaterization becomes more likely if it gets cheaper relative to screening.
Therefore, it is quite clear that collateralization is chosen more often if the liquidation
value increases. Screening becomes more efficient if the quality of the screening
101

signal increases. Then, the banks make fewer mistakes in the evaluation of credit
proposals and therefore have lower costs in form of non-repayments. The quality of
the screening signal depends on two factors: the screening technology as such and the
distance between bank and firm. The distance between bank and firm is determined
by the degree of bank competition. If there are more banks in the market (and by
assumption they are located equidistantly), the distance between banks is lower and so
is the distance between bank and firm. Distance influences the degree of asymmetric
information between firm and bank. The closer a firm is located to the bank, the more
informed is the bank, and more precise is the screening signal. Thus, with more banks
the distance between the marginal firm and the bank decreases. The quality of the
screening signal is higher and thus the repayment the bank needs to break-even is
lower.
III. Empirical evidence
The theoretical model shows that greater bank competition lowers collateral
requirements. We now bring empirical evidence to bear on this issue. We first
describe data and variables, before explaining how we measure bank competition. We
then develop the empirical results.
III.1. Data and variables
The sample of bank loans is obtained from the Dealscan database, which is
supplied by the Loan Pricing Corporation (LPC, Reuters). This database is commonly
used in empirical studies on bank loans (e.g. Dahiya et al., 2003; Qian and Strahan,
2007).
We use loan data for the period January 2000 to December 2005 as it is the
period with the best coverage for both loans and banks. Following Qian and Strahan
(2007), we drop loans to firms from the financial industry (SIC 6) and from the public
sector (SIC 9). Public ownership or the monopoly situation is likely to influence the
risk of loans granted to these firms, which may bias the use of collateral in
comparison to what would be observed in manufacturing and other services. These
criteria produced a sample of 4,931 bank loans made to borrowers located in 70
countries. List of countries is displayed in table 1.
The focus of our research is the investigation of the relationship between the
presence of collateral and the degree of bank competition. To this end, we proceed to
111
regressions of the presence of collateral on a set of variables including bank
competition and a wide range of control variables including loan-level and country-
level variables.
The explained variable is the presence of collateral, which is measured by a
dummy variable (Collateral) equal to one if the loan is secured and to zero if it is not.
The explanatory variable of primary concern is the Lerner index (Lerner Index),
measuring bank competition. We use the mean Lerner index for each country. Its
computation is described in the next subsection. Bank-level data are taken from the
“Bankscope” database of BVD-IBCA.
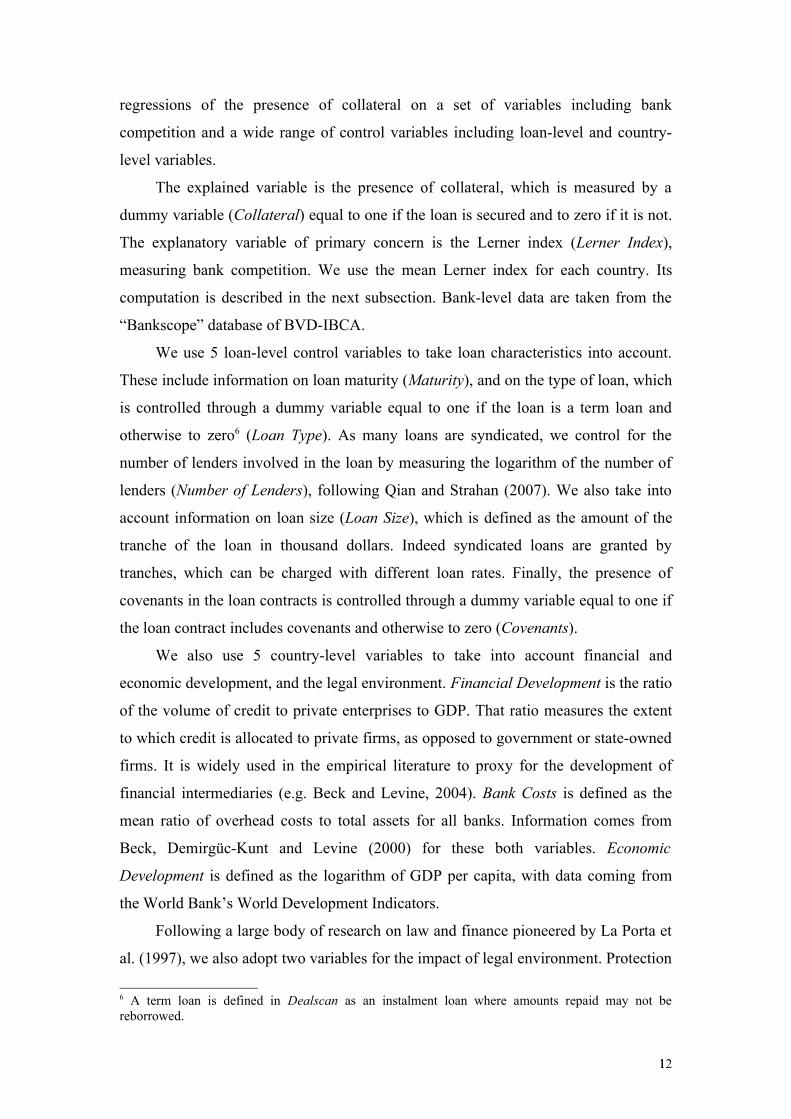
We use 5 loan-level control variables to take loan characteristics into account.
These include information on loan maturity (Maturity), and on the type of loan, which
is controlled through a dummy variable equal to one if the loan is a term loan and
otherwise to zero6 (Loan Type). As many loans are syndicated, we control for the
number of lenders involved in the loan by measuring the logarithm of the number of
lenders (Number of Lenders), following Qian and Strahan (2007). We also take into
account information on loan size (Loan Size), which is defined as the amount of the
tranche of the loan in thousand dollars. Indeed syndicated loans are granted by
tranches, which can be charged with different loan rates. Finally, the presence of
covenants in the loan contracts is controlled through a dummy variable equal to one if
the loan contract includes covenants and otherwise to zero (Covenants).
We also use 5 country-level variables to take into account financial and
economic development, and the legal environment. Financial Development is the ratio
of the volume of credit to private enterprises to GDP. That ratio measures the extent
to which credit is allocated to private firms, as opposed to government or state-owned
firms. It is widely used in the empirical literature to proxy for the development of
financial intermediaries (e.g. Beck and Levine, 2004). Bank Costs is defined as the
mean ratio of overhead costs to total assets for all banks. Information comes from
Beck, Demirgüc-Kunt and Levine (2000) for these both variables. Economic
Development is defined as the logarithm of GDP per capita, with data coming from
the World Bank’s World Development Indicators.
Following a large body of research on law and finance pioneered by La Porta et
al. (1997), we also adopt two variables for the impact of legal environment. Protection
6 A term loan is defined in Dealscan as an instalment loan where amounts repaid may not be reborrowed.
121
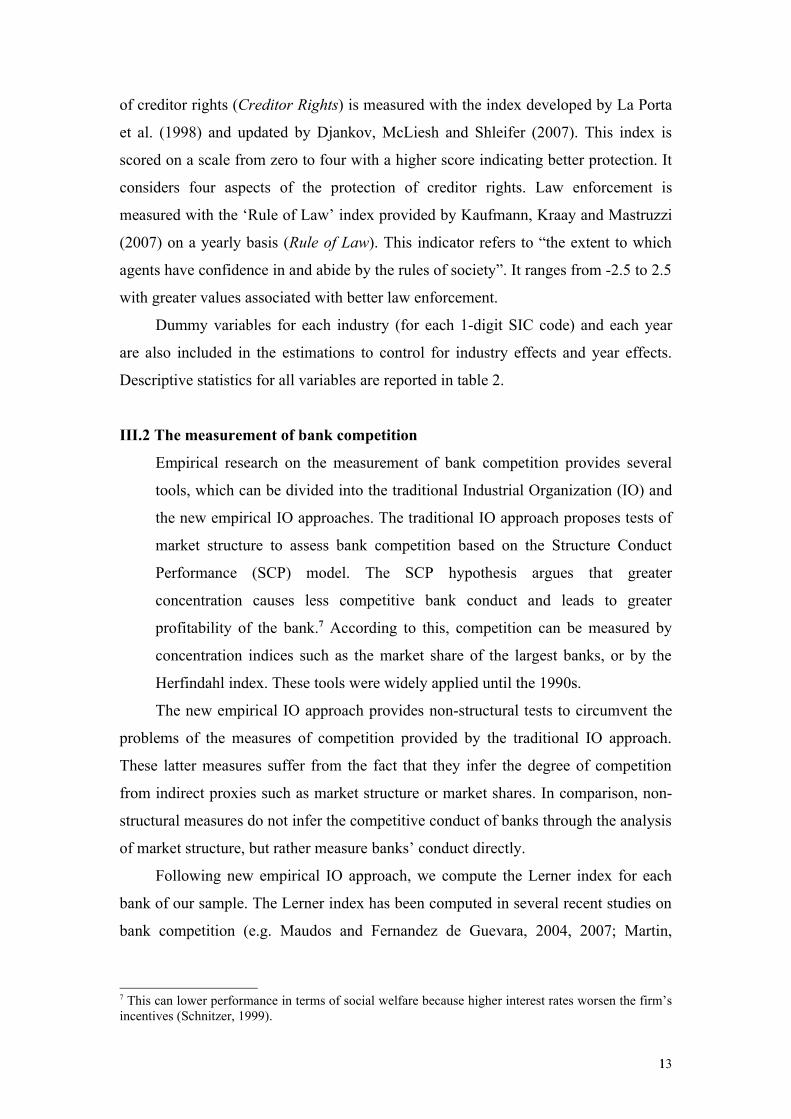
of creditor rights (Creditor Rights) is measured with the index developed by La Porta
et al. (1998) and updated by Djankov, McLiesh and Shleifer (2007). This index is
scored on a scale from zero to four with a higher score indicating better protection. It
considers four aspects of the protection of creditor rights. Law enforcement is
measured with the ‘Rule of Law’ index provided by Kaufmann, Kraay and Mastruzzi
(2007) on a yearly basis (Rule of Law). This indicator refers to “the extent to which
agents have confidence in and abide by the rules of society”. It ranges from -2.5 to 2.5
with greater values associated with better law enforcement.
Dummy variables for each industry (for each 1-digit SIC code) and each year
are also included in the estimations to control for industry effects and year effects.
Descriptive statistics for all variables are reported in table 2.
III.2 The measurement of bank competition
Empirical research on the measurement of bank competition provides several
tools, which can be divided into the traditional Industrial Organization (IO) and
the new empirical IO approaches. The traditional IO approach proposes tests of
market structure to assess bank competition based on the Structure Conduct
Performance (SCP) model. The SCP hypothesis argues that greater
concentration causes less competitive bank conduct and leads to greater
profitability of the bank.7 According to this, competition can be measured by
concentration indices such as the market share of the largest banks, or by the
Herfindahl index. These tools were widely applied until the 1990s.
The new empirical IO approach provides non-structural tests to circumvent the
problems of the measures of competition provided by the traditional IO approach.
These latter measures suffer from the fact that they infer the degree of competition
from indirect proxies such as market structure or market shares. In comparison, non-
structural measures do not infer the competitive conduct of banks through the analysis
of market structure, but rather measure banks’ conduct directly.
Following new empirical IO approach, we compute the Lerner index for each
bank of our sample. The Lerner index has been computed in several recent studies on
bank competition (e.g. Maudos and Fernandez de Guevara, 2004, 2007; Martin,
7 This can lower performance in terms of social welfare because higher interest rates worsen the firm’s incentives (Schnitzer, 1999).
131

Saurina and Salas, 2006). It is defined as the difference between the price and the
marginal cost, divided by the price.
The price is computed by estimating the average price of bank production
(proxied by total assets) as the ratio of total revenues to total assets, following Maudos
and Fernandez de Guevara (2004). The marginal cost is estimated on the basis of a
translog cost function with one output (total assets) and three input prices (price of
labor, price of physical capital, and price of borrowed funds). One cost function is
estimated for each year to allow technology to change over time. We impose the
restriction of linear homogeneity in input prices by normalizing total costs and input
prices by one input price. The cost function is specified as follows:
where TC denotes total costs, y total assets, w1 the price of labor (the ratio of
personnel expenses to total assets)8, w2 the price of physical capital (the ratio of other
non-interest expenses to fixed assets), w3 the price of borrowed funds (the ratio of
paid interests to all funding). Total costs are the sum of personnel expenses, other
non-interest expenses and paid interest. The indices for each bank have been dropped
from the presentation for the sake of simplicity. The estimated coefficients of the cost
function are then used to compute the marginal cost.
III.3 Results
We now display the empirical results. As the explained variable, the presence of
collateral, is a binary variable, we perform logit regressions following Jimenez, Salas 8 As Bankscope database does not provide information on the number of employees, we use this proxy variable for the price of labor following Maudos and Fernandez de Guevara (2004, 2007).
141
( )
εαα
ααα
ααααα
+
+
+
+
+
+
+
+++=
3
29
3
18
2
3
27
2
3
16
3
2
3
15
3
24
3
13
2210
3
lnlnlnln
ln21ln
21lnln
lnlnln21ln ln
wwy
wwy
ww
ww
ww
ww
ww
wwyy
wTC
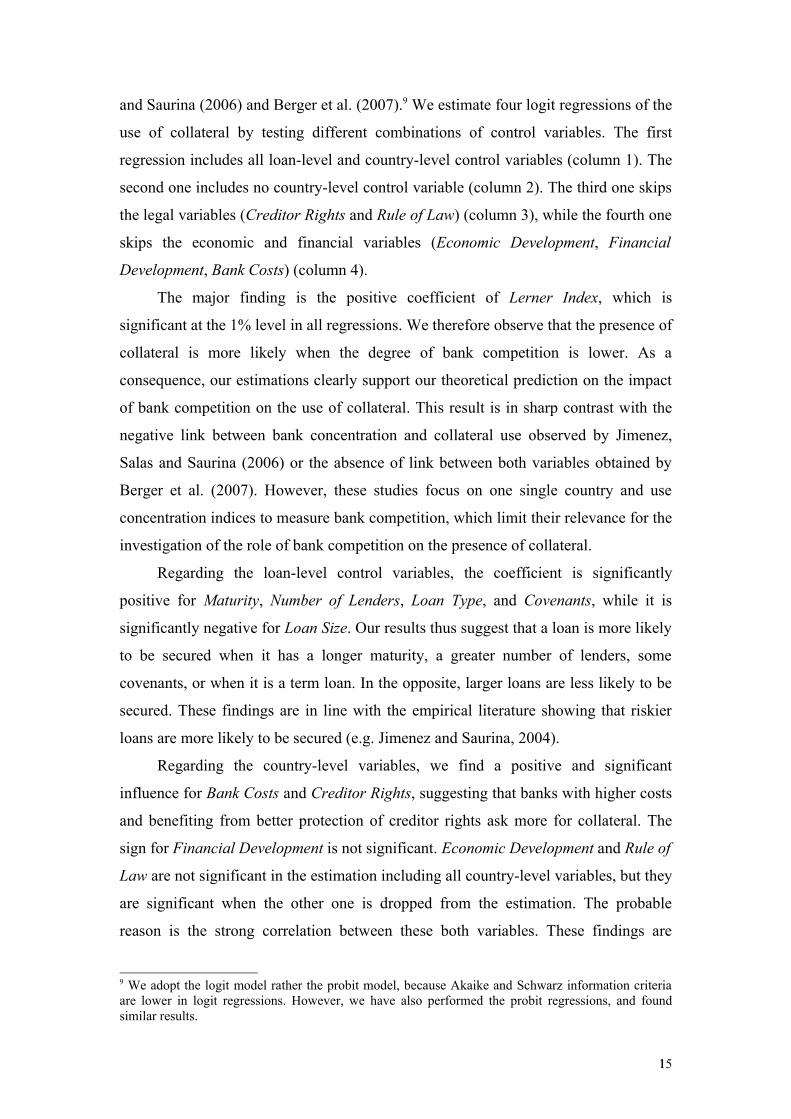
and Saurina (2006) and Berger et al. (2007).9 We estimate four logit regressions of the
use of collateral by testing different combinations of control variables. The first
regression includes all loan-level and country-level control variables (column 1). The
second one includes no country-level control variable (column 2). The third one skips
the legal variables (Creditor Rights and Rule of Law) (column 3), while the fourth one
skips the economic and financial variables (Economic Development, Financial
Development, Bank Costs) (column 4).
The major finding is the positive coefficient of Lerner Index, which is
significant at the 1% level in all regressions. We therefore observe that the presence of
collateral is more likely when the degree of bank competition is lower. As a
consequence, our estimations clearly support our theoretical prediction on the impact
of bank competition on the use of collateral. This result is in sharp contrast with the
negative link between bank concentration and collateral use observed by Jimenez,
Salas and Saurina (2006) or the absence of link between both variables obtained by
Berger et al. (2007). However, these studies focus on one single country and use
concentration indices to measure bank competition, which limit their relevance for the
investigation of the role of bank competition on the presence of collateral.
Regarding the loan-level control variables, the coefficient is significantly
positive for Maturity, Number of Lenders, Loan Type, and Covenants, while it is
significantly negative for Loan Size. Our results thus suggest that a loan is more likely
to be secured when it has a longer maturity, a greater number of lenders, some
covenants, or when it is a term loan. In the opposite, larger loans are less likely to be
secured. These findings are in line with the empirical literature showing that riskier
loans are more likely to be secured (e.g. Jimenez and Saurina, 2004).
Regarding the country-level variables, we find a positive and significant
influence for Bank Costs and Creditor Rights, suggesting that banks with higher costs
and benefiting from better protection of creditor rights ask more for collateral. The
sign for Financial Development is not significant. Economic Development and Rule of
Law are not significant in the estimation including all country-level variables, but they
are significant when the other one is dropped from the estimation. The probable
reason is the strong correlation between these both variables. These findings are
9 We adopt the logit model rather the probit model, because Akaike and Schwarz information criteria are lower in logit regressions. However, we have also performed the probit regressions, and found similar results.
151

consistent with Qian and Strahan (2007) who investigate how legal and institutional
variables influence loan characteristics including the presence of collateral.
To further address the validity of the results, we use an alternative measure for
bank competition in our estimations. Following the wide utilization of concentration
indices in the literature, we take an indicator of bank concentration as a natural
robustness check, even if we are fully aware of the limitations of such indices as
mentioned above. Bank concentration is measured by the assets of the three largest
banks as a share of all commercial banks (Concentration). Information comes again
from the Beck, Demirgüc-Kunt and Levine (2000)’s database. Table 4 displays the
estimations with bank concentration. We observe a positive and significant coefficient
for Concentration, meaning that bank concentration favors the presence of collateral.
Therefore, these results corroborate those obtained with the Lerner index.
Another source of skepticism might concern Dealscan database, which includes
many syndicated loans. Consequently, the loan can be granted by a syndicate of banks
from different countries, which might make hard to consider the degree of
competition of one country as relevant to explain the use of collateral. However the
investigation of the sample shows that a large number of banks involved in the
syndicated loans are domestic banks. Without meaning that all lenders are domestic, it
stresses the fact that bank competition at the domestic level clearly matters. From the
perspective of syndicated loans practitioners (Fight, 2004), the strong implication of
domestic banks in syndicated loans is in line with on the one hand the fact that the
arrangers are usually relationship banks, which are generally local banks with respect
to the borrower’s country (Esty, 2001), on the other hand the fact that the presence of
local lenders reduces problems related to information asymmetries (Sufi, 2007).
Nevertheless we perform additional estimations to check whether our findings are
dependent of the presence of syndicated loans. In this aim, we keep only single-lender
loans, resulting in a strong reduction of the sample size. The loan sample then
includes 1173 loans from 43 countries. The results of these estimations are reported in
table 5. Once again, we find that bank competition exerts a positive and significant
impact on the use of collateral. The only changes concern the significance of some
country-level control variables. Therefore, in spite of the limitations of Dealscan
database, these additional points support the relevance of our results.
161

Our findings have thus survived several robustness checks, leading to the strong
support of our theoretical prediction that a loan is more likely to be secured if
competition is lower in the banking industry.
IV. Concluding remarks
We investigate how bank competition influences the use of collateral. This
question is of major interest to assess the implications of the structural changes of the
banking industry on the access to bank finance, owing to the dependence of this
access to collateral requirements.
We construct a theoretical model incorporating information asymmetries in a
spatial competition framework. Banks can choose between screening the borrower or
asking collateral in the loan contract. Quality of the screening signal depends on bank
competition, as greater competition results in a better information for the bank on the
borrower and therefore a more efficient screening signal. Therefore, increased
competition in the banking industry makes less likely the use of collateral in loan
contracts, by making more attractive the choice for screening. The model thus predicts
that bank competition lowers the presence of collateral in loan contracts.
In order to check this theoretical prediction, we develop an empirical cross-
country analysis based on the regression of the presence of collateral on bank
competition measured by the Lerner index. As predicted by the model, our tests
provide evidence on a negative impact of bank competition on the presence of
collateral. Robustness checks confirm this finding with alternative specifications.
Thus our paper shows that presence of collateral is more likely when bank
competition is lower. As a consequence, the effects of bank competition on loan rates
and on collateral use are complementary for the access to bank finance, as the
reduction of loan rates is accompanied by lower collateral requirements. This
conclusion is in line with the finding of Beck, Demirgüc-Kunt and Maksimovic
(2004) that greater bank concentration fosters financing obstacles. The normative
implications of our findings are therefore the support of the efforts to favor bank
competition.
171

References:1. Agarwal, Sumit and Robert Hauswald, 2007. "Distance and Information
Asymmetries in Lending," Mimeo, American University, Washington, D.C.2. Beck, Thorsten, Asli Demirgüc-Kunt, Luc Laeven and Vojislav Maksimovic,
2006. "The Determinants of Financing Obstacles," Journal of International Money and Finance 25, 932-952.
3. Beck, Thorsten, Asli Demirgüc-Kunt and Ross Levine, 2000. "A New Database on Financial Development and Structure," World Bank Economic Review 14, 597-605.
4. Beck, Thorsten, Asli Demirgüc-Kunt and Vojislav Maksimovic, 2004. "Bank Competition and Access to Finance: International Evidence," Journal of Money, Credit and Banking 36, 3, 627-654.
5. Beck, Thorsten, and Ross Levine, 2004. "Stock Markets, Banks, and Growth: Panel Evidence," Journal of Banking and Finance 28, 423-442.
6. Berger, Allen, Marco Espinosa-Vega, W. Scott Frame and Nathan Miller, 2007. "Why Do Borrowers Pledge More Collateral? New Empirical Evidence on the Role of Asymmetric Information," Working Paper n°2006-29a, Federal Reserve Bank of Atlanta.
7. Berlin, Mitchell and Alexander Butler, (2002). "Collateral and Competition", Working Paper n°02-22, Federal Reserve of Philadelphia.
8. Dahiya Sandeep, John Kose, Manju Puri and Gabriel Ramirez, 2003. "Debtor-in-possession financing and bankruptcy resolution," Journal of Financial Economics 69, 1, 259-280.
9. Degryse, Hans and Steven Ongena, 2005. "Distance, Lending Relationships, and Competition," Journal of Finance 60, 1, 231-266.
10. Dell’Ariccia, Giovanni, 2001. "Asymmetric Information and the Structure of the Banking Industry," European Economic Review 45, 1957-1980.
11. Djankov, Simeon, Caralee McLiesh and Andrei Shleifer, 2007. "Private Credit in 129 Countries," Journal of Financial Economics 84, 2, 299-329.
12. Esty, Benjamin, 2001. "Structuring Loan Syndicates: A Case Study of the Hong Kong Disneyland Project Loan," Journal of Applied Corporate Finance 14, 3, 80-95.
13. Fight, Andrew, 2004. Syndicated Lending, Elsevier Butterworth-Heinemann, Oxford.
14. Hainz, Christa, 2003. "Bank Competition and Credit Markets in Transition Economies," Journal of Comparative Economics 31, 223-245.
15. Hauswald, Robert and Robert Marquez, 2006. "Competition and Strategic Information Acquisition in Credit Markets," Review of Financial Studies 19, 3, 967-1000.
16. Jacobson, Tor, Jesper Lindé and Kaspar Roszbach, 2006. "Internal Rating Systems, Implied Credit Risk and the Consistency of Banks' Risk Classification Policies," Journal of Banking and Finance 30, 1899-1926.
17. Jimenez, Gabriel, Vicente Salas and Jesus Saurina, 2006. "Determinants of Collateral," Journal of Financial Economics 81, 255-281.
18. Kaufmann, Daniel, Aart Kraay and Massimo Mastruzzi, 2007. "Governance Matters VI: Governance Indicators for 1996-2006," World Bank Policy Research Paper n°4280.
19. La Porta, Rafael, Florencio Lopez-de-Silanes, Andrei Shleifer and Robert W. Vishny, 1997. "Legal Determinants of External Finance," Journal of Finance 52, 1131-1150.
181

20. La Porta, Rafael, Florencio Lopez-de-Silanes, Andrei Shleifer and Robert W. Vishny, 1998. "Law and Finance," Journal of Political Economy 106, 1113-1155.
21. Lehner, Maria and Monika Schnitzer (2008). "Entry of Foreign Banks and their Impact on Host Countries," Journal of Comparative Economics, forthcoming.
22. Manove Michael, A. Jorge Padilla and Marco Pagano, 2001. "Collateral versus Project Screening: A Model of Lazy Banks, " Rand Journal of Economics 32, 4, 726-744.
23. Martin, Alfredo, Vicente Salas and Saurina, Jesus, 2006. "Risk Premium and Market Power in Credit Markets," Economics Letters 93, 3, 450-456.
24. Maudos, Joaquin and Juan Fernandez de Guevara, 2007. "The Cost of Market Power in Banking: Social Welfare Loss vs. Cost Inefficiency," Journal of Banking and Finance 31, 2103-2125.
25. Maudos Joaquin and Juan Fernandez de Guevara, 2004. "Factors Explaining the Interest Margin in the Banking Sectors of the European Union," Journal of Banking and Finance 28, 2259-2281.
26. Mitchell, Janet and Patrick van Roy, 2007. "Failure Prediction Models: Performance, Disagreements, and Internal Rating Systems," Working Paper n°123, National Bank of Belgium.
27. Qian, Jun, and Philip Strahan, 2007. "How Laws & Institutions Shape Financial Contracts: The Case of Bank Loans,” Journal of Finance LXII, 6, 2803-2834.
28. Schnitzer, Monika, 1999. "On the Role of Bank Competition for Corporate Finance and Corporate Control in Transition Economies," Journal of Institutional and Theoretical Economics 155, 1, 22-46.
29. Sufi, Amir, 2007. "Information Asymmetry and Financing Arrangements," Journal of Finance 62, 2, 629-668.
191
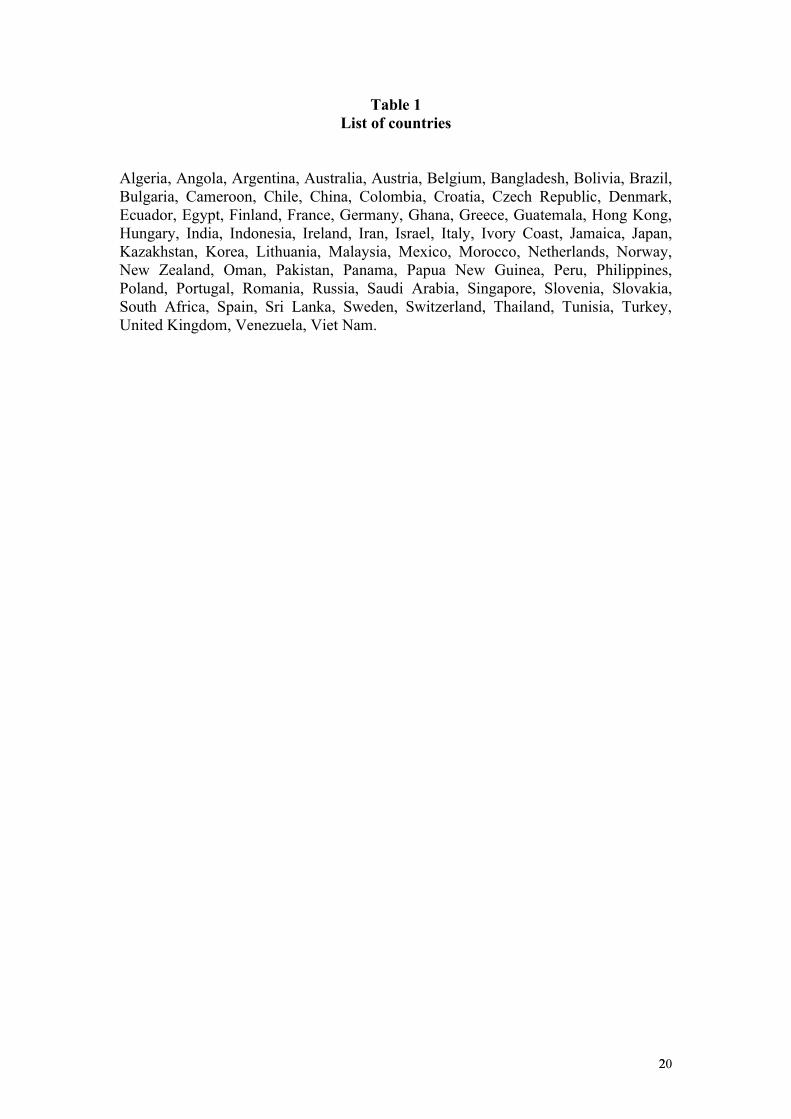
Table 1List of countries
Algeria, Angola, Argentina, Australia, Austria, Belgium, Bangladesh, Bolivia, Brazil, Bulgaria, Cameroon, Chile, China, Colombia, Croatia, Czech Republic, Denmark, Ecuador, Egypt, Finland, France, Germany, Ghana, Greece, Guatemala, Hong Kong, Hungary, India, Indonesia, Ireland, Iran, Israel, Italy, Ivory Coast, Jamaica, Japan, Kazakhstan, Korea, Lithuania, Malaysia, Mexico, Morocco, Netherlands, Norway, New Zealand, Oman, Pakistan, Panama, Papua New Guinea, Peru, Philippines, Poland, Portugal, Romania, Russia, Saudi Arabia, Singapore, Slovenia, Slovakia, South Africa, Spain, Sri Lanka, Sweden, Switzerland, Thailand, Tunisia, Turkey, United Kingdom, Venezuela, Viet Nam.
202
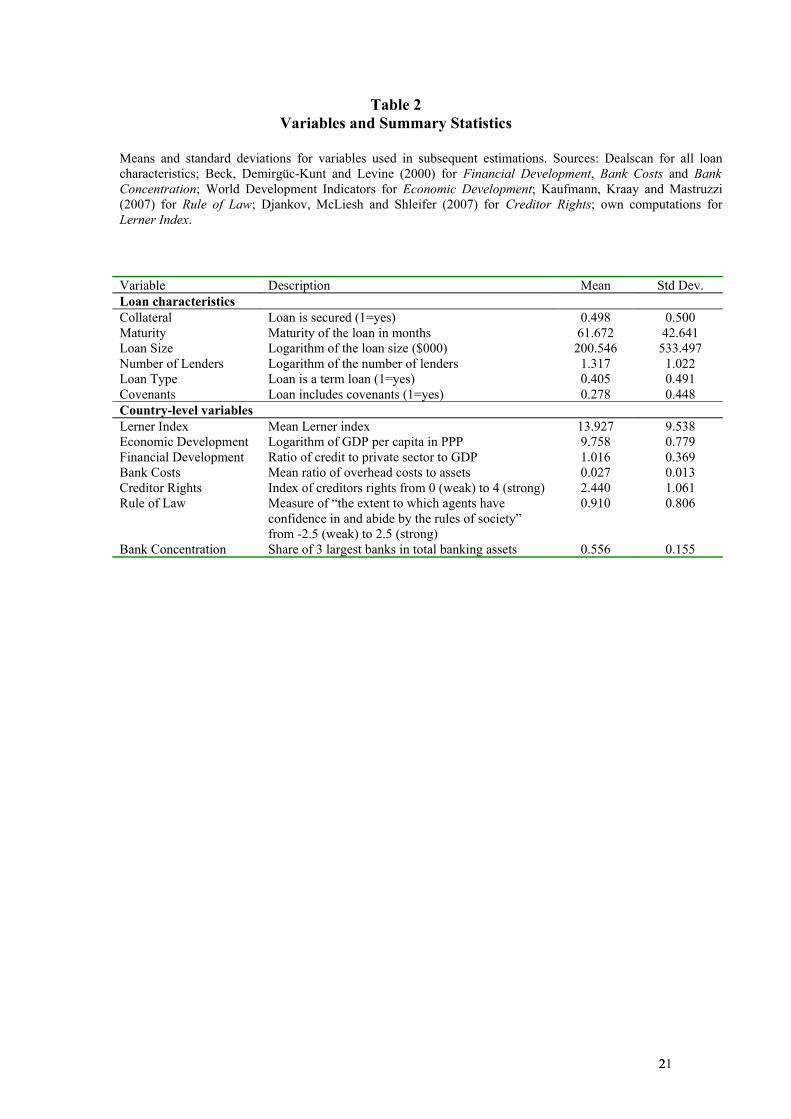
Table 2Variables and Summary Statistics
Means and standard deviations for variables used in subsequent estimations. Sources: Dealscan for all loan characteristics; Beck, Demirgüc-Kunt and Levine (2000) for Financial Development, Bank Costs and Bank Concentration; World Development Indicators for Economic Development; Kaufmann, Kraay and Mastruzzi (2007) for Rule of Law; Djankov, McLiesh and Shleifer (2007) for Creditor Rights; own computations for Lerner Index.
Variable Description Mean Std Dev.Loan characteristicsCollateral Loan is secured (1=yes) 0.498 0.500Maturity Maturity of the loan in months 61.672 42.641Loan Size Logarithm of the loan size ($000) 200.546 533.497Number of Lenders Logarithm of the number of lenders 1.317 1.022Loan Type Loan is a term loan (1=yes) 0.405 0.491Covenants Loan includes covenants (1=yes) 0.278 0.448Country-level variablesLerner Index Mean Lerner index 13.927 9.538Economic Development Logarithm of GDP per capita in PPP 9.758 0.779Financial Development Ratio of credit to private sector to GDP 1.016 0.369Bank Costs Mean ratio of overhead costs to assets 0.027 0.013Creditor Rights Index of creditors rights from 0 (weak) to 4 (strong) 2.440 1.061Rule of Law Measure of “the extent to which agents have
confidence in and abide by the rules of society” from -2.5 (weak) to 2.5 (strong)
0.910 0.806
Bank Concentration Share of 3 largest banks in total banking assets 0.556 0.155
212

Table 3Main regressions
Logit regressions for Collateral. Definitions of variables appear in table 1. Table reports coefficients with Wald Chi-Squares in parentheses. *, **, *** denote an estimate significantly different from 0 at the 10%, 5% or 1% level. Dummy variables for industries and years are included in the regressions but are not reported.
Explanatory variables Estimations(1) (2) (3) (4)
Intercept 4.441***(21.80)
4.337***(74.24)
4.436***(41.07)
4.268***(69.97)
Maturity 0.012***(166.92)
0.012***(172.55)
0.012***(165.19)
0.012***(167.80)
Loan Size -0.294***(104.08)
-0.278***(96.92)
-0.289***(100.99
-0.266***(87.85)
Number of Lenders 0.252***(36.54)
0.273***(46.35)
0.234***(32.17)
0.300***(54.02)
Loan Type 0.592***(61.83)
0.661***(82.05)
0.585***(61.39)
0.619***(70.28)
Covenants 0.608***(52.50)
0.648***(62.55)
0.627***(56.90)
0.684***(68.09)
Lerner Index 0.055***(124.96)
0.045***(130.24)
0.060***(179.60)
0.039***(78.10)
Economic Development -0.109(1.28)
- -0.100*(2.98)
-
Financial Development -0.147(1.04)
- 0.038(0.08)
-
Bank Costs 32.631***(79.84)
- 31.812***(83.67)
-
Creditor Rights 0.168***(16.09)
- - 0.101***(6.66)
Rule of Law -0.021(0.04)
- - -0.297***(34.84)
Likelihood ratio 1788.987*** 1648.856*** 1772.701*** 1684.402***Pseudo R² 0.3043 0.2842 0.3020 0.2894N 4931 4931 4931 4931
222
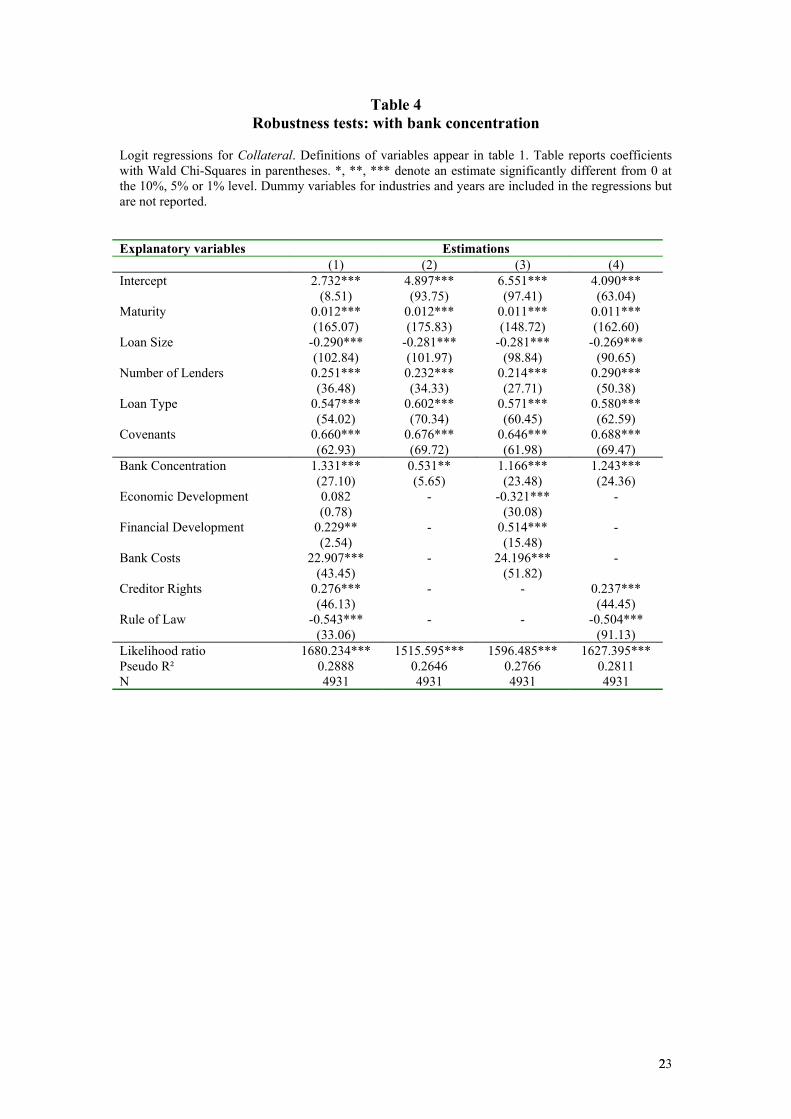
Table 4Robustness tests: with bank concentration
Logit regressions for Collateral. Definitions of variables appear in table 1. Table reports coefficients with Wald Chi-Squares in parentheses. *, **, *** denote an estimate significantly different from 0 at the 10%, 5% or 1% level. Dummy variables for industries and years are included in the regressions but are not reported.
Explanatory variables Estimations(1) (2) (3) (4)
Intercept 2.732***(8.51)
4.897***(93.75)
6.551***(97.41)
4.090***(63.04)
Maturity 0.012***(165.07)
0.012***(175.83)
0.011***(148.72)
0.011***(162.60)
Loan Size -0.290***(102.84)
-0.281***(101.97)
-0.281***(98.84)
-0.269***(90.65)
Number of Lenders 0.251***(36.48)
0.232***(34.33)
0.214***(27.71)
0.290***(50.38)
Loan Type 0.547***(54.02)
0.602***(70.34)
0.571***(60.45)
0.580***(62.59)
Covenants 0.660***(62.93)
0.676***(69.72)
0.646***(61.98)
0.688***(69.47)
Bank Concentration 1.331***(27.10)
0.531**(5.65)
1.166***(23.48)
1.243***(24.36)
Economic Development 0.082(0.78)
- -0.321***(30.08)
-
Financial Development 0.229**(2.54)
- 0.514***(15.48)
-
Bank Costs 22.907***(43.45)
- 24.196***(51.82)
-
Creditor Rights 0.276***(46.13)
- - 0.237***(44.45)
Rule of Law -0.543***(33.06)
- - -0.504***(91.13)
Likelihood ratio 1680.234*** 1515.595*** 1596.485*** 1627.395***Pseudo R² 0.2888 0.2646 0.2766 0.2811N 4931 4931 4931 4931
232
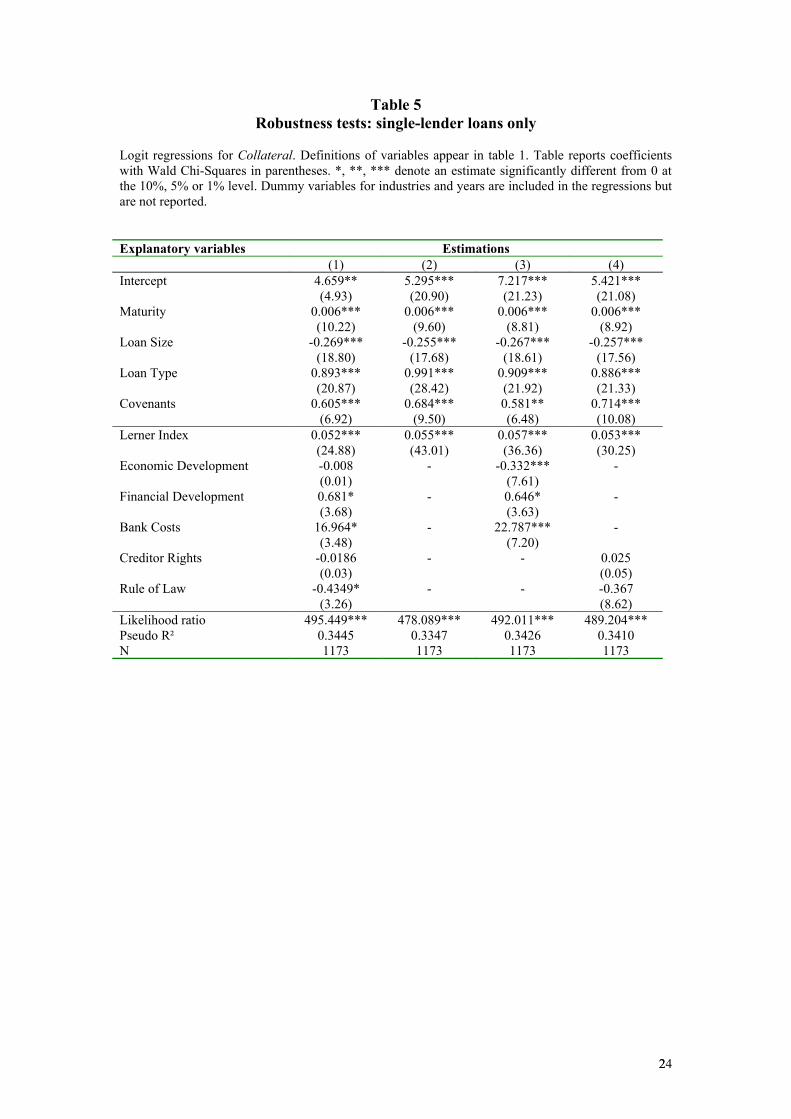
Table 5Robustness tests: single-lender loans only
Logit regressions for Collateral. Definitions of variables appear in table 1. Table reports coefficients with Wald Chi-Squares in parentheses. *, **, *** denote an estimate significantly different from 0 at the 10%, 5% or 1% level. Dummy variables for industries and years are included in the regressions but are not reported.
Explanatory variables Estimations(1) (2) (3) (4)
Intercept 4.659**(4.93)
5.295***(20.90)
7.217***(21.23)
5.421***(21.08)
Maturity 0.006***(10.22)
0.006***(9.60)
0.006***(8.81)
0.006***(8.92)
Loan Size -0.269***(18.80)
-0.255***(17.68)
-0.267***(18.61)
-0.257***(17.56)
Loan Type 0.893***(20.87)
0.991***(28.42)
0.909***(21.92)
0.886***(21.33)
Covenants 0.605***(6.92)
0.684***(9.50)
0.581**(6.48)
0.714***(10.08)
Lerner Index 0.052***(24.88)
0.055***(43.01)
0.057***(36.36)
0.053***(30.25)
Economic Development -0.008(0.01)
- -0.332***(7.61)
-
Financial Development 0.681*(3.68)
- 0.646*(3.63)
-
Bank Costs 16.964*(3.48)
- 22.787***(7.20)
-
Creditor Rights -0.0186(0.03)
- - 0.025(0.05)
Rule of Law -0.4349*(3.26)
- - -0.367(8.62)
Likelihood ratio 495.449*** 478.089*** 492.011*** 489.204***Pseudo R² 0.3445 0.3347 0.3426 0.3410N 1173 1173 1173 1173
242

Appendix
Proof of Lemma 1:We have to argue that banks have an incentive to offer the repayment LR .
Suppose that bank 1 deviates and demands εR L − . Then it attracts all (good) firms, but makes an expected loss.Suppose that bank 1 deviates and demands εR L + . Then it does not have any customers and makes zero expected profits.Since both banks demand the same repayment and the firms must incur some marginal application costs, firms apply for loans at the closest bank. As a result, both banks have the same market share. Q.E.D.
Proof of Lemma 2:We have to argue that banks have an incentive to offer the repayment SR .
Suppose that bank 1 deviates and demands εR S − . Then it would make an expected loss with the marginal firm k. On top of that, it would attract all firms even those located further away. But for those firms the quality of the screening signal is lower. As a result, the expected loss would be even higher.Suppose that bank 1 deviates and demands εR S + . Then all firms have an incentive to apply at the competing bank and bank 1 makes zero expected profits. (Problem: bank 2 would make a loss) Since both banks demand the same repayment and the firms must incur some marginal application costs, firms apply for loans at the closest bank. As a result, both banks have the same market share and the marginal firm k is located half-way between two banks. Q.E.D.
Proof of Proposition 1:We have already derived the terms of the credit contracts provided that both banks offer the same type of contract. We still have to argue that it is an equilibrium that both banks offer the same contract.
Suppose bank 1 and bank 2 are located next to each other and both offer a collateralized contract because α is above the threshold value. Both banks make zero expected profit with the marginal borrower. What happens if bank 1 deviates and offers a screening contract? Since the screening contract is less attractive than the collateralized contract, all good firms would apply at bank 2. Only bad firms would find it attractive to apply at bank 1. This could be bad firms from the area around bank 1 and bank 2. Thus, all applicants at bank 1 would be bad firms. As a result, bank 2 does not have an incentive to deviate and offer a screening contract.
Next, suppose that bank 1 and bank 2 offer a screening contract because α is below the threshold value. What happens if bank 1 deviates and offers a collateralized contract? Since the collateralized contract is less attractive than the screening contract, all good firms would apply at bank 2 for a screening contract and get the loan because
252

the signal is perfect. All bad firms would apply at bank 2 as well. Since bank 2 can observe the firm’s location it could deny loans to firms that are located further away than the marginal firm k. Thus, given the contract terms bank 2 offered, it will still make zero expected profits. Bank 1 would lose all its customers. As a result, bank 1 does not have an incentive to deviate and offer a collateralized contract. Q.E.D.
Proof of Proposition 2:
0Nd
ds
Ns and 0
sα since
0Nα
KK
K >∂∂
∂∂=
∂∂<
∂∂
<∂∂
262


