Embed Size (px)
Citation preview

Bangladesh Energy Saving, Environmental Protection and Improvement of On-stream Factor of Ghorasal Urea Fertilizer Factory
Field Survey: July 2003
1.Project Profile and Japan’s ODA Loan
Dacca
Bangladesh
Bhutan Nepal
India
Myanmar
Project Site
Location of the Ghorasal Urea Fertilizer Factory Ghrasal Urea Fertilizer Factory 1.1. Background
Agriculture is the largest industry in Bangladesh, accounting for approx. 60% of the working population (1996) and approx. 30% of GDP (1996). However, as almost one-third of this densely populated country is flooded to a depth of more than 1 meter in the rainy season every year, there is little room for developing arable land any further. Under these circumstances, it is considered extremely important to increase food production by ensuring high agricultural productivity through 1) irrigation, 2) fertilizer, and 3) high-yield crops. For this purpose, improvement of agricultural productivity through chemical fertilizers is considered essential in Bangladesh. Fertilizer containing urea, a nitrogen compound, has played a particularly important role by using the relatively abundant natural gas resources of this country effectively both as a raw material and as production fuel.
Since 1972, when it began operations, the Ghorasal Urea Fertilizer Factory has been
upgraded several times with the support of the International Development Association (IDA) and JBIC. However, with the passage of 25 years since the start of operations, the original equipment had become obsolete, adversely affecting not only production but also the environment. At the time of appraisal in 1999, the production volume of the factory had dropped to 75% (350,000 tons/year) of capacity (470,000 tons/year) because of the decline in energy efficiency and unstable power supply, and the obsolete facilities leaked ammonia, which is an intermediary in the production of urea (leakage concentration: 35-165ppm; leakage quantity: approx.19 tons/day1). Since this leakage concentration was 7 to 33 times higher than the legal limit2, it was feared that the health of the factory workers and the local residents would be harmed. Also, as two out of three existing private power generators were unworkable, the
1 As of FY1998 for the entire factory 2 The limit established by the Offensive Odor Control Law of Japan (5ppm or below)
1

factory could not receive a stable power supply under the difficult power supply situation in Bangladesh. As a result, the factory often had to suspend operations. 1.2. Objectives
The objectives of the project were to improve the Ghorasal Urea Fertilizer Factory’s energy efficiency and prevent ammonia leakage by upgrading obsolete equipment that had not been upgraded before, installing equipment to prevent ammonia leakage, and installing a new private power generator to secure stable power supply. 1.3. Output
The project covered the upgrading of obsolete factory equipment and installation of equipment to prevent ammonia leakage with the aim of improving the plant’s energy efficiency and reducing the concentration of leaked ammonia to the Japanese standard of 5ppm or below under the Offensive Order Control Law. Another goal was the introduction of up-to-date power generation equipment for the purpose of stabilizing operations and improving the energy efficiency of natural gas.
(1) Upgrade of the ammonia plant (2) Upgrade of the urea plant (3) Installation of a 16MW gas turbine power generator (4) Upgrade of ancillary facilities (piping repair of the cooling water system, construction of
a cooling tower, etc.) (5) Engineering service for the implementation of the above project items
The ODA loan covered the entire foreign currency portion (5,443 million yen) of the total project cost (6,461 million yen).
1.4. Borrower/Executing Agency The President of the People’s Republic of Bangladesh/Bangladesh Chemical Industries Corporation (BCIC) 1.5. Outline of Loan Agreement
Loan Amount/ Loan Disbursed Amount 5,443 million yen/ 5,443 million yen Exchange of Notes/ Loan Agreement June 1999/ July 1999 Terms and Conditions -Interest Rate -Repayment Period (Grace Period) -Procurement
0.75%、
40years (10 years) General untied
Final Disbursement Date November 2001 2.Results and Evaluation 2.1. Relevance
At the time of appraisal, domestic demand for urea fertilizer was expected to grow according to the Bangladesh Five-Year National Development Plan (1997-2002) (see Table 1). In order to
2
meet the growing demand, an increase in the country’s fertilizer production capacity was listed among the targets (see Table 1). Raising energy efficiency by upgrading the obsolete equipment under the project and the consequent stabilization of operations and increase in production capacity were in line with development policy at that time. Therefore, the project was relevant at appraisal.
The present relevance of the project is discussed below. The actual demand for urea fertilizer (“Sales Volume” in Table 2) has been far less than the
estimate in the five-year plan (“Domestic Demand” in Table 1). According to the executing agency, a steady annual increase of around 9.0% was predicted in the five-year plan based on urea fertilizer consumption of urea fertilizer in the preceding years, while but the consumption has not increased as expected due to the expanded use of phosphate fertilizer and decrease in cultivated land due to urbanization and river erosion.
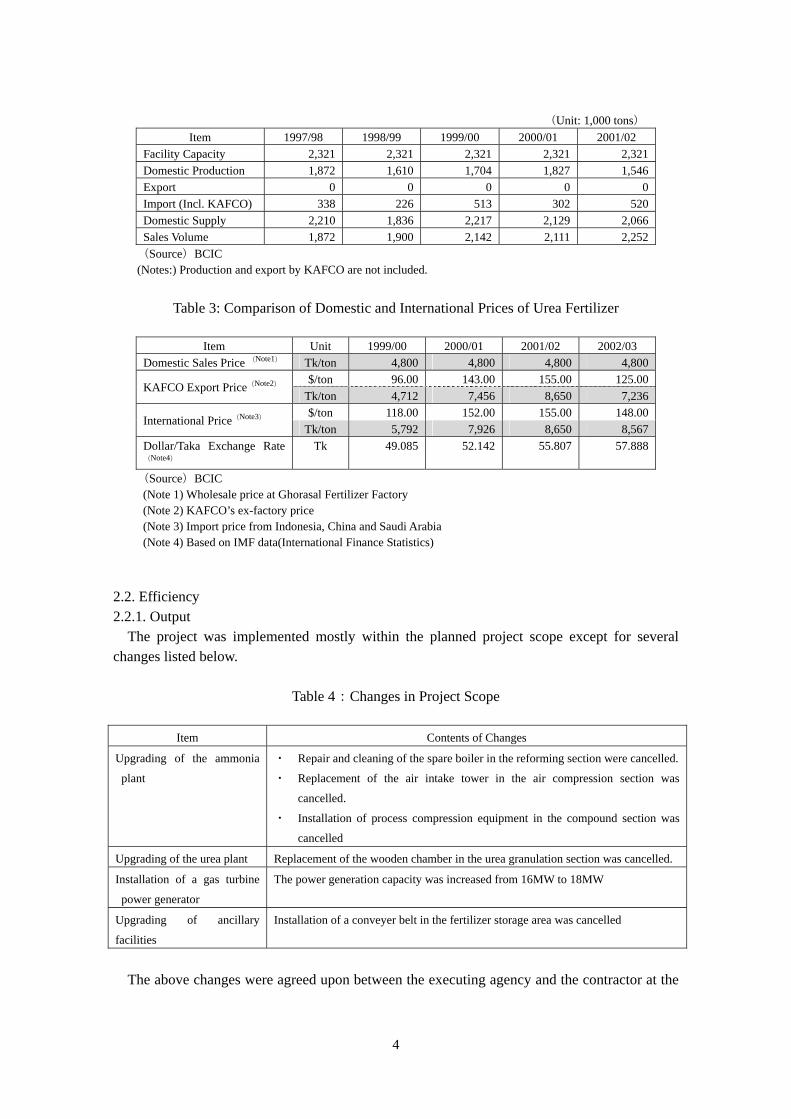
Domestic production (Table 2) has also been below the estimate in the five-year plan and has been on the decrease, though there are slight upward or downward changes each year. This is because sufficient domestic production has been prevented by unstable power supply, insufficient supply of natural gas as a raw material and obsolescence of equipment.
The five-year plan proposed making up the difference between domestic demand and domestic production (production shortage) with imports. The production shortage has been compensated for by the purchase of fertilizer from KAFCO3 at the export price4 (see Table 3).
The production cost of urea fertilizer at BCIC was 5,487Tk/ton for FY 2002/2003, which was 687Tk higher than the domestic selling price of 4,800Tk/ton. Considering that the international price is 8,567Tk/ton, it is more economical to produce urea fertilizer than import it (including purchasing from KAFCO) at present (domestic production cost 5,487Tk/ton<cost of import 8,567Tk/ton).
From the aim of “satisfying growing demand for urea fertilizer” set forth at appraisal, the necessity for the project has lessened under the present circumstances as demand has not increased as predicted. However, as the country still imports fertilizer (including purchases from KAFCO) and as the domestic production cost is lower than the international price, it would be desirable to continue producing fertilizer within the country. In this sense, the project is still relevant.
Table 1: Supply and Demand Estimates of Urea Fertilizer in the 5-Year Plan
(Unit: 1,000 tons) Item 1997/98 1998/99 1999/00 2000/01 2001/02
Domestic Demand 2,450 2,670 2,920 3,190 3,490 Domestic Production 2,100 2,100 2,100 2,490 2,550 Export 0 0 0 0 0 Import 350 570 820 700 940
(Source)Bangladesh 5-Year National Development Plan (1997-2002) (Notes:) Production and export by KAFCO are not included.
Table 2: Actual Domestic Supply of Urea Fertilizer
3 KAFCO (Karnaphuli Fertilizer Company) is an export-oriented joint venture corporation of foreign capital located in Chittagong. The firm is 43.51 % owned by BCIC and 31.29% owned by KAFCO Japan, established by JBIC, Marubeni Corporation and Chiyoda Corporation. 4 KAFCO is required to sell fertilizer at the export price even in Bangladesh because the loan agreement.madate to export all of the products..
3
(Unit: 1,000 tons) Item 1997/98 1998/99 1999/00 2000/01 2001/02
Facility Capacity 2,321 2,321 2,321 2,321 2,321 Domestic Production 1,872 1,610 1,704 1,827 1,546 Export 0 0 0 0 0 Import (Incl. KAFCO) 338 226 513 302 520 Domestic Supply 2,210 1,836 2,217 2,129 2,066 Sales Volume 1,872 1,900 2,142 2,111 2,252
(Source)BCIC (Notes:) Production and export by KAFCO are not included.
Table 3: Comparison of Domestic and International Prices of Urea Fertilizer
Item Unit 1999/00 2000/01 2001/02 2002/03
Domestic Sales Price (Note1) Tk/ton 4,800 4,800 4,800 4,800 $/ton 96.00 143.00 155.00 125.00
KAFCO Export Price(Note2)
Tk/ton 4,712 7,456 8,650 7,236 $/ton 118.00 152.00 155.00 148.00
International Price(Note3)
Tk/ton 5,792 7,926 8,650 8,567 Dollar/Taka Exchange Rate(Note4)
Tk 49.085 52.142 55.807 57.888
(Source)BCIC (Note 1) Wholesale price at Ghorasal Fertilizer Factory (Note 2) KAFCO’s ex-factory price (Note 3) Import price from Indonesia, China and Saudi Arabia (Note 4) Based on IMF data(International Finance Statistics)
2.2. Efficiency 2.2.1. Output
The project was implemented mostly within the planned project scope except for several changes listed below.
Table 4:Changes in Project Scope
Item Contents of Changes
Upgrading of the ammonia
plant
・ Repair and cleaning of the spare boiler in the reforming section were cancelled.
・ Replacement of the air intake tower in the air compression section was
cancelled.
・ Installation of process compression equipment in the compound section was
cancelled
Upgrading of the urea plant Replacement of the wooden chamber in the urea granulation section was cancelled.
Installation of a gas turbine
power generator
The power generation capacity was increased from 16MW to 18MW
Upgrading of ancillary
facilities
Installation of a conveyer belt in the fertilizer storage area was cancelled
The above changes were agreed upon between the executing agency and the contractor at the
4

detailed design stage in order to accommodate the conditions of the existing facilities. None of these changes substantially affected the project results. 2.2.2. Project Period
While the project was scheduled to be completed in 23 months from July 1999 to May 2001 (from the signing of the Loan Agreement to the completion of test operations), it was completed in 27 months from July 1999 to September 2001 (same as above). Although the completion was delayed by four months, the project was implemented almost as scheduled. 2.2.3. Project Cost
The project cost was 6,443 million yen (ODA portion: 5,443 million yen) against the initially planned 6,461million yen (ODA portion: 5,443 million yen). 2.3. Effectiveness 2.3.1. Improvement of Energy Efficiency
Power generation per 1N m3 of natural gas has increased by about 51% from 1.73 kWh in 2000/01 before the project to 2.62kWh in 2002/03, the second year after completion of the project, achieving the initially planned level (2.39kWh/1N m3 of natural gas). Thermal efficiency at the generating end has also improved from 17.0% in 2000/01 to 25.7% in 2002/03 (Table 5). These improvements are mostly due to the project’s installation of an 18MW gas turbine power generator, which provides stable power supply. In addition, the No.2 gas turbine power generator (made in 1968), which had been broken for a long time, was repaired and started to work in April 2003. The formerly unreliable power supply system of the Ghorasal Fertilizer Factory has improved substantially since completion of the project.
On the other hand, regarding the energy efficiency of the production process, both natural gas consumption (N m3) and cooling water consumption (ton) per 1 ton of urea produced have not changed much except for a slight improvement after the project completion. As of 2002/2003, they achieved only 83.4% and 74.6% of the respective target values (planned values) (Table 5). According to the executing agency (BCIC), one reason is that after completion, problems arose in other parts of the facility not covered by the project.
5

Table 5: Energy Efficiency
Item (1999/00) (2000/01) Completion
Year (2001/02)
Second Year (2002/03)
Planned - - 2.39 2.391. Power generation (kWh/1 Nm3of natural gas) Actual
1.73 1.73 2.67 (111.7%)
2.62(109.6%)
Planned - - (not specified) (not specified)2.Thermal efficiency at the generating end(%) Actual 17.0 17.0 26.1 25.7
Planned - - 868 8683. Natural gas consumption per 1 ton of urea produced (Nm3) Actual
1,083 1,108 1,116 (77.8%)
1,041(83.4%)
Planned - - 9.70 9.704. Cooling water consumption per 1 ton of urea produced (ton) Actual
13.40 13.94 14.40 (67.4%)
13.01(74.6%)
(Source)BCIC (Note 1) The parenthesized figures under the actual values indicate the achievement ratio of each planned value. (Note 2) Thermal efficiency at the generating end =(annual power generation at the generating end×860)/(annual
fuel consumption×fuel calorific value)×100 (Note 3) The planned values of the cooling water consumption per 1 ton of urea produced are set by BCIC.
2.3.2. Improvement of Urea Fertilizer Production Capacity
The Ghorasal Fertilizer Factory’s production capacity is 1,422 tons/day, while actual urea production in 2002/03 was 1,168 tons/day. Since the target production was the same as the facility capacity, both the capacity utilization ratio and the target achievement ratio are 82.1% (Table 6). As mentioned above, the capacity utilization ratio is less than 100% because, although some equipment of the unimproved ammonia plant and urea plant have been upgraded under the project, some failures in the production process not covered by the project led to a lower-than-expected utilization ratio. According to a survey conducted by JBIC in 2002-2003, these problems were caused by “some equipment that cannot provide as high performance as expected due to inadequate maintenance.”
On the other hand, operation days in 2002/03 were 322.82 days, almost achieving the target of 330 days thanks to the stable power supply realized by the project’s installation of the gas turbine power generator (18MW). Therefore, annual production rose 17% from 321,888 tons in 1999/2000 to 377,053 tons in 2002/03.
Since it began operations in 1972, the Ghorasal Fertilizer Factory has undergone improvements three times, including this project to repair and upgrade obsolete facilities. Now, after approx. 30 years since the start of operations, some machinery is defective because of inadequate maintenance, and the facilities are continuing to operate beyond the normal life cycle. It is necessary to take into consideration that this situation has contributed to failure to achieve certain targets. The executing agency plans to repair the known problems in October 2003, aiming to raise the capacity utilization ratio to 90%.
6

Table 6: Production and Sales Volume
Item (1999/00) (2000/01) Completion
Year (2001/02)
Second Year (2002/03)
Planned - - 1,422 1,4221. Urea Production
(ton/day) Actual 1,146 1,107 1,132
(79.6%) 1,168
(82.1%)Planned - - 100 100
2. Capacity Utilization Ratio* (%) Actual
80.59 77.85 79.61 (79.6%)
82.14(82.1%)
Planned - - 330 3303. Annual Operating Days
(operating days/year) Actual 280.88 276.70 286.91
(86.9%) 322.82
(97.8%)Planned - - 470 470
321 306 324 3774. Annual Production
(thousand tons) Actual (68.9%) (80.2%)
(Source)BCIC (Note)The parenthesized figures under the actual values indicate the achievement ratio of each planned value. *Production/Installed Capacity x 100 2.3.3. Operating Income and Operating Costs
Since domestic demand for urea fertilizer has not changed significantly, and as Ghorasal Fertilizer Factory’s urea production has remained at almost the same level, there has been little change in sales volume, which was 350,809 tons in 2002/03, or 78.7% of the planned level (Table 7). Also, sales income before and after project completion has not changed significantly because the sales price is kept at 4.800Tk under the government policy of protecting domestic agriculture and farmers and because the sales volume has increased very little, as mentioned above. The sales income in 2002/03 was 1,683,885Tk, only 78.7% of the planned level.
On the other hand, production costs have gone up due to increases in the prices of raw material natural gas, packing materials, and spare parts, as well as higher personnel expenses. As a result, operating costs (operating expenses) have risen from 1999/00 to 2001/02 in spite of the fall in sales income, thus lowering the return rate. Although the return rate improved slightly in 2002/03, the production cost per unit (5,487Tk/ton) and operating costs (5,897Tk/ton) keep exceeding the controlled price of 4,800Tk/ton, leading to a structural deficit.
7

Table 7: Operating Income and Operating Costs
Item (1999/00) (2000/01) Completion
Year (2001/02)
Second Year (2002/03)
Planned - - 445,500 445,5001. Sales Volume of Urea Fertilizer
(ton/year) Actual 324,634 328,678 303,334
(68.1%) 350,809(78.7%)
Planned - - 4,800 4,8002. Urea Price (Wholesale Price) (Tk/ton) Actual 4,815.96 4,803.54 4,800.84 4,800.00
Planned - - 2,138,400 2,138,4003. Sales Income
(1,000Tk/year) Actual 1,562,941 1,578,819 1,456,256
(68.1%) 1,683,885
(78.7%)Planned - - 1,905,559 1,913,979
4. Operation Cost (1,000Tk/year) Actual
1,943,940 2,023,062 2,087,363 (91.3%)
2,068,773(92.5%)
Planned - - 232,841 224,4215. Operating Profit (1,000Tk/year) Actual △380,999 △444,243 △631,107 △384,888
(Source)BCIC (Note)The parenthesized figures under the actual values indicate the achievement ratio of each planned value. 2.3.4. Environmental Improvement (Control of Ammonia Leakage)
At appraisal, the target values for environmental improvement were set according to the legal limits of Japan5: 5ppm or below for the ammonia concentration in water and 45ppm or below for the ammonia concentration in the air. Environmental monitoring carried out after project completion found that the ammonia concentration in the Sitalakhya River, into which the Ghorasal Fertilizer Factory’s wastewater is finally discharged, was 0.15~5.0ppm in 2002/03, achieving the target. The ammonia concentration in the air was 5.0~60.0ppm in 2002/03. This data shows the range of minimum and maximum values recorded during the year and, according to the executing agency, the ammonia concentration in air was below the target 45ppm most times. Therefore, the environmental improvement targets have mostly been achieved. The standards of the Department of Environment (DOE) of Bangladesh are 5ppm or below for the ammonia concentration in water and 50ppm for the ammonia concentration in the air. The monitoring data also mostly meet the DOE’s environmental standards.
5 The limits established by the Offensive Odor Control Law of Japan (5ppm or below)
8

Table 8: Environmental Monitoring Data (Unit: ppm)
Not Subject to DOE Standards
Subject to DOE Standards
Item
Ammonia Concentration in Water ( Monitoring point: drain outlet to the artificial lagoon)
Ammonia Concentration in Water ( Monitoring point: 50m downstream from the drain outlet from the artificial lagoon to the river)
Ammonia Concentration in Atmosphere ( Monitoring point: urea plant)
1999/00 100-400 n.a. n.a. 2000/01 80-300 n.a. n.a. 2001/02 50-275 0.25-5.0 10.0-80.0 2002/03 50-250 0.15-5.0 5.0-60.0
(Note 1)The wastewater from the Ghorasal Fertilizer Factory is temporarily stored in the artificial lagoon (reservoir) adjoining the factory and then discharged from the lagoon to the Sitalakhya River in the rainy season when the river rises. Environmental monitoring was conducted at the following four points. 1) The drain outlet from the factory to the artificial lagoon (reservoir) (two times a day) 2) Water surface 2-3 feet from the east and north shore of the artificial lagoon (every week) 3) The drain outlet from the artificial lagoon to the Sitalakhya River (rainy season only) 4) The point 50m downstream from the drain outlet to the Sitalakhya River (every day)
(Note 2)The data indicate the range between the minimum and maximum values recorded each year.
The factory’s wastewater is temporarily stored in the artificial lagoon (reservoir) adjoining the factory and then discharged from the lagoon to the Sitalakhya River in the rainy season when the river rises. With regard to the environmental control of the artificial lagoon, the DOE’s environmental standards do not apply and the executing agency regards the flow of wastewater into the lagoon as part of the wastewater treatment process. Therefore, no measures are taken to keep the ammonia concentration in the lagoon below 5ppm (Table 8). This practice of storing wastewater in a reservoir for a certain period of time in the treatment process is adopted in other countries as well and is not uncommon. However, in the case of this lagoon, in the dry season when the water level declines, the ammonia concentration in the water may increase and the evaporated ammonia may give off an odor. In the rainy season, on the other hand, the excess water in the lagoon may flood adjacent areas as has happened in the past. In order to prevent this, other countries take measures to keep the ammonia and pH concentrations in water below certain levels, including putting lids on storage tanks or adding an adjusting agent (neutralizer) or water as necessary. There is room for improving the management of the Ghorasal Fertilizer Factory’s artificial lagoon. Regarding this issue, some environmental measures are proposed in the abovementioned JBIC survey, such as establishing a greenbelt around the lagoon to separate it from residential areas and reduce the impact on local residents. The executing agency is actively responding to this proposal by drawing up a plan and preparing to make a budget. 2.3.5. Recalculation of Financial Internal Rate of Return (FIRR) and Economic Internal Rate of Return (EIRR)
The FIRR and EIRR of the project were estimated at 16.0% and 18.0%, respectively, at appraisal, while the IRR recalculation in this survey resulted in a negative figure for FIRR and 4% for EIRR. FIRR has declined because 1) the project cost (Taka basis) has increased from the estimate at appraisal, 2) operating expenses including production costs have risen, and 3) production and sales volume have not increased as expected. The lower EIRR is due to the
9

above three factors as well as the narrowing difference between the international price and the controlled price. At the time of appraisal, FIRR was calculated based on the following assumptions.
(Assumptions for Calculation) ・ Project Life: 17 years ・ Benefits: benefit from the sale of fertilizer ・ Costs: project cost, operating costs, and corporate taxes ・ Urea Sales Price: 4,800Tk/ton (controlled price)
(Note 1) In the calculation of EIRR, corporate taxes were excluded and the urea sales price was replaced by the
import substitution price.
(Note 2) In the above calculation, it was assumed that production would remain unchanged without the project.
Assuming that production would decline by 10% each year due to depreciation of equipment without the
project, FIRR and EIRR were calculated as 2% and 10% respectively.
2.4. Impact 2.4.1. Impact on Stable Supply of Urea Fertilizer
The Ghorasal Fertilizer Factory has a capacity of 470,000 tons/year and produced 324,772 tons of fertilizer in 2001/02, accounting for 21% of the total domestic production of urea fertilizer in Bangladesh in the same year, which was 1,546,000 tons, and 16% of the total domestic supply, which was 2,066,000 tons (Table 9). Thus, the factory is helping to stabilize the urea fertilizer supply in this country.
Table 9: Domestic Supply of Urea Fertilizer and Production at Ghorasal Fertilizer Factory
(Unit: 1,000 tons)
Item
(1998/99)
(1999/00)
(2000/01)
Completion Year
(2001/02)
Second Year(2002/03)
Domestic Production 1,610 1,704 1,827 1,546 n.a. Domestic Supply 1,836 2,217 2,129 2,066 n.a. Ghorasal Fertilizer Factory 287 321 306 324 377
(Source)BCIC (Note)Domestic supply is the sum of domestic production and imports.
2.4.2. Interview with Fertilizer Distributors
The executing agency BCIC has six affiliate fertilizer factories, each with its own designated command area (distribution and sales area). The command area of the Ghorasal Fertilizer Factory comprises 12 districts. The urea fertilizer produced in the factory is mainly sold in seven districts, and is sold in the remaining five districts only when there is a surplus (these five districts overlap the command areas of other factories). In the Ghorasal Fertilizer Factory’s command area, about 400 distributor companies (wholesalers) are registered. We selected five out of these 400 companies based on the advice of the Bangladesh Fertilizer Association, and interviewed them using a previously prepared questionnaire (Table 10). According to these companies, the urea fertilizer produced at the Ghorasal Fertilizer Factory is in great demand domestically and has a reputation for high quality.
10

Table 10: Results of the Interviews with 5 Fertilizer Distributors
Question Answer 1. Does UFFL urea fertilizer meet the demands of the market?
Yes, very much: 5
Yes, to some extent: 0
No: 0
2. Have sales of UFFL urea fertilizer increased since the completion of the project?
Yes, significantly: 0
Yes, to some extent: 5
No: 0
3. Has the number of employees increased since the completion of the project?
Yes, significantly: 0
Yes, to some extent: 0
No: 5
4. What is your view of the future trend in fertilizer use in Bangladesh?
Promising: 5 Skeptical: 0 Pessimistic: 0
5. What is your view of the future trend in fertilizer use overseas?
Promising: 1
Skeptical: 0
Pessimistic: 0
Unknown: 4
6. Has there been any change in the quality of UFFL urea fertilizer since the completion of the project?
Improved: 0 No change: 5 -
7. What do you think of the quality of UFFL urea fertilizer? Good: 5 Moderate: 0 Bad: 0 8. Has there been any change in the price of UFFL urea fertilizer since the completion of the project?
Increased: 0 No change: 5 Decreased: 0
9. What do you think of the price level of UFFL urea fertilizer?
High: 0 Reasonable: 5 Low: 0
10. Do you think that the application of fertilizer is effective in increasing agricultural production?
Yes, very much: 3
Yes, to some extent: 2
No: 0
(Note)UFFL: Ghorasal Fertilizer Factory 2.4.3. Interview Survey on Social and Living Environment
In order to examine the project’s impact on the social and living environment of local residents, we conducted an interview survey on 100 randomly selected people living within 2-3 km from the factory (estimated population: 22,500). We interviewed them using a previously prepared questionnaire. The interviewees included business persons, agricultural and service industry workers, housewives, students, etc. Table 11 below shows the target areas and the number of interviewees from each area.
Table 11: Targets of the Survey
Target Area Characteristics Number of
Interviewees
North of Ghorasal Fertilizer Factory
Estimated population: 3,000 This area is most likely to be affected directly by the ammonia discharge from the factory because of the south-north wind blowing throughout the year. It is closest to the artificial lagoon (reservoir).
35
North-East of Ghorasal Fertilizer Factory
Estimated population: 7,000 35
South of Ghorasal Fertilizer Factory
Estimated population: 10,000 Houses for employees of the Ghorasal Fertilizer Factory and the adjacent Ghorasal Power Station, Polash Fertilizer Factory and jute factories (2) are concentrated in this area.
20
West of Ghorasal Fertilizer Factory
Estimated population: 2,500 This area is on the opposite side of the Skitalakhya River from the Ghorasal Fertilizer Factory.
10
Total Estimated population: 22,500 100
11

Table 12: Result of Case Study
A. Impact on the Environment Question Before Completion % After Completion %
Serious/Considerable 62 Improved significantly 39Some/A little 34 Improved to some
extent 59
None 4 Deteriorated to some extent
0
1. Degree of environmental pollution ・What was the degree of environmental pollution before the project completion? ・What effects on the environment does this project have?
No change 2Cattle 20 Cattle 3Dogs 0 Dogs 0Horses 0 Horses 0Cats 0 Cats 0Fowl/ Wild Ducks/ Domestic Ducks
66 Fowl/ Wild Ducks/ Domestic Ducks
22
2. Damage to livestock (animals and fish) (multiple answers) ・Was there any damage to animals before the project completion?
If any, what kinds of animals were affected? ・Does any damage to animals remain after the project
completion? If so, what kinds of animals are affected?
(※The total is not 100% because the respondents gave multiple answers)
Fish (those inhabiting ponds and waterways including hatchery fish)
95 Fish (those inhabiting ponds and waterways including hatchery fish)
20
Serious/Considerable 65 Serious/Considerable 9Some/A little 19 Some/A little 39
3. Damage to fish in the Skitalakhya River and the surrounding areas
・Was there any damage to fish in the Skitalakhya River and the surrounding areas before the project completion?
・Does any damage to fish remain after the project completion?
None 16 None 52
Serious/Considerable 69 Serious/Considerable 45Some/A little 11 Some/A little 47
4. Water pollution in the Skitalakhya River and the surrounding areas
・Was the water polluted in the Skitalakhya River and the surrounding areas before the project completion?
・Is the water polluted after the project completion?
None 20 None 8
Serious/Considerable 70 Improved significantly 42Some/A little 17 Improved to some
extent 39
5. Damage to vegetation ・Was there any damage to the vegetation before the project
completion? ・Has the vegetation environment improved since the project completion?
None 13 No improvement 19
B. Impact on Human Health Question Before Completion % After Completion %
Serious/Considerable 57 Serious/Considerable 3Some/A little 41 Some/A little 67
1. Degree of the ammonia odor ・What was the degree of the ammonia odor before the project
completion? ・Do you still smell ammonia even after the project completion?
None 2 None 30
Seriously/Considerably 35 Seriously/Considerably 4To some extent/A little 65 To some extent/A little 43No 0 Little 51
2. Did the ammonia odor cause any damage to your health? ・Did the ammonia odor adversely affect your health before the
project completion? ・Is the ammonia odor adversely affecting your health after the
project completion? No 2
Summary of the Interview Survey (1)Impact on the Environment
Asked about the degree of environmental pollution by ammonia around the factory before the completion of the project, 62% of the respondents answered it was “serious/considerable” and 34% answered “some/a little,” while 98% said environmental pollution improved after the completion (39% said it had “improved significantly” and 59% said it had “improved to some extent”). Damage to livestock (animals and fish) has also been decreasing. The percentage of those who regard the damage to the fish in the Skitalakhya River and the surrounding areas to be “serious/considerable” dramatically decreased from 65% before completion to 9% after the completion. As for the impact on vegetation, 81% of the respondents said vegetation had improved after the completion of the project (42% said it had improved “significantly” and 39%
12

said “to some extent”). However, the results do not indicate a significant decrease in water pollution. (2)Impact on Human Health
Asked about the degree of the ammonia odor, 57% of the respondents answered it was “serious/considerable” and 41% said there had been “some/a little” odor before the completion of the project, while after the project completion, 3% said it is “serious/considerable” and 41% responded that there is “some/a little” odor, indicating that the ammonia odor has generally improved. With regard to the impact of ammonia on their health, 35% and 65% of the respondents, respectively, said they were affected “seriously/considerably” and “to some extent/a little” before project completion, while 4% said they are affected “seriously/considerably” and 65% “to some extent/a little” after completion. This result shows that the situation has improved. (3)General Summary of the Interview Survey
According to the results of the interview survey, the negative impact of ammonia on the environment and human health has generally been mitigated. It can be said that the serious effects have been reduced significantly. However, the negative effects felt by the local residents have not been removed completely. Many of them still smell ammonia more or less and they are concerned about its health impact even after the project completion. They seem to feel that animals and plants are also suffering some damage. This awareness is particularly high among the residents in the north and northeast areas adjacent to the factory and the artificial lagoon.
Although we cannot make definitive statements because the limited time and budget prevented us from conducting a more detailed additional survey and a verification survey utilizing scientific methods, possible factors behind above problems may include the abovementioned issue of environmental control of the artificial lagoon as well as other industrial facilities in the vicinity of the Ghorasal Fertilizer Factory (Polash Fertilizer Factory, Ghorasal Power Station and two jute factories). 2.5. Sustainability 2.5.1. Executing Agency (1) Technical Capacity
Facility maintenance includes daily maintenance, maintenance at the time of planned suspension and regular overhaul to be performed every 18 months, which are all conducted by Ghorasal Fertilizer Factory employees. In the event of a problem that they cannot handle alone or when performing an overhaul, instructions are provided by the professionals at BCIC headquarters, or engineers are sent from the manufacturer, or support is given by other BCIC-affiliated fertilizer factories, as necessary. Employee training is mainly provided at TICI (Training Institute of Chemical Industries). Overseas training programs such as those offered by the Asian Productivity Organization (APO) and the Japan International Cooperation Agency (JICA) are also utilized.
However, the following problems concerning factory maintenance are pointed out in the report on the abovementioned JBIC survey.
13

・ Maintenance Plan: Since achieving production targets has taken priority over enhancing the facility’s reliability and cutting costs, employees tend to solve problems not by consistent maintenance but by taking stopgap measures without identifying the root cause of the problem or taking permanent preventive measures. Other problems include inadequate testing devices, lack of technical knowledge, difficulty in arranging dispatch of professionals from the manufacturer in an emergency, lack of budget and complicated budget approval procedures. Moreover, a maintenance policy based on a long-term perspective and indicators of maintenance performance has not been established.
・ Preventive Maintenance: Although the necessity for preventive maintenance is recognized, a structure to support sufficient preventive maintenance has not been established because of personnel shortages, absence of a data management and analysis system, and lack of a standard procedure defining the kind of maintenance needed for each type of equipment.
・ Quality Control: The importance of quality management has not been fully recognized. As the achievement of annual production targets takes priority, employees’ cost-management awareness is low. There is no indicator concerning quality assurance.
・ Spare Parts: As for the procurement of spare parts, BCIC’s procedure takes time and often prevents timely procurement of necessary spare parts.
・ Information Management: Since documents and other materials are not managed systematically, there is no clear maintenance history of machinery and equipment. Consequently, it is difficult to make a long-term maintenance plan.
・ Training: There are only a few training programs for management staff. The preventive maintenance course is offered only in limited fields.
In response to the above problems, the JBIC survey report made the following eight
proposals to the executing agency: 1) revising the objectives of factory operation, 2) developing a documented maintenance policy, 3) developing a manual of maintenance activities, 4) developing a maintenance record management system, 5) conducting training on preventive maintenance and quality control, 6) introducing computers and a computer network, 7) participating in international meetings and exchanging information with factories at home and abroad, 8) streamlining and expediting the work flow(reviewing the budget approval process, in particular).
BCIC and the Ghorasal Fertilizer Factory are gradually putting these proposals into practice. The Ghorasal Fertilizer Factory sent its chief engineer to KAFCO with a view to using its advanced system as a model.
So far, a preventive maintenance subcommittee has been organized, computers have been introduced for the management of records of problems, and a LAN connecting each department has been established. With respect to spare parts procurement, the Ghorasal Fertilizer Factory is considering doing away with the practice of purchasing spare parts from manufacturers via a trading company and purchasing them directly from manufacturers as part of efforts to reduce transaction costs. We need to follow their efforts in the future. (2)Operation and Maintenance System
Operation and maintenance of the project facilities are carried out by the Ghorasal Fertilizer Factory (Urea Fertilizer Factory Ltd.: UFFL). UFFL is now promoting reorganization including
14

personnel restructuring. Within two years of the completion of the project, it had dismissed 491 employees (approx. 38%), most of whom were guards and kitchen staff, and is now outsourcing most of these services.
Also, as a measure to prevent ammonia leakage, which is one of the project objectives, UFFL, after project completion, reorganized the former Inspection and Quality Control Section into the Quality Control and Environmental Pollution Control Section (a lower branch of the Technical Department, see Table 13) under which the environmental monitoring scheme has been improved. The Quality Control and Environmental Pollution Control Section consists of employees with master’s degrees or equivalent academic background and 10-30 years of experience. They perform environmental monitoring and other activities under the direction and instruction of the Additional Chief Chemist who is in charge of the section.
Table 13: Changes in Number of Employees of Ghorasal Fertilizer Factory
Number of Employees
Department May 2001 July 2003
Operation Dept. 289 232 Maintenance Dept. 352 222 Sales Dept. 109 37 Finance and Accounting Dept. 75 34 Technical Dept. 84 83 Administration Dept. 319 167 Improvement Works Implementation Project Team
9 0 (merged into Technical Dept.)
Construction Dept. 29 0 (merged into Technical Dept.)
Total 1,266 775 (Source)BCIC (3) Financial Status
The executing agency, Bangladesh Chemical Industries Corporation (BCIC), is a public corporation established in 1976. It owns 21 companies, including seven fertilizer factories, including the Ghorasal Fertilizer Factory, and four paper mills. Among BCIC group companies’ various products such as fertilizer, paper and pulp, battery, matches, tile, rayon and plate grass, fertilizer is the main product accounting for nearly 70% of total sales.
BCIC has posted an operating loss on its income statements for the past two years (Table 14). While BCIC relies heavily on the fertilizer business, which constitutes 70% of its sales, the operating costs exceed the sales price, as already mentioned, as the sales price of fertilizer is fixed. This leads to permanent deficits. As for FY 2000/01, five out of 21 group companies made a profit of 503 million Tk in total, while the remaining 16 companies posted a deficit of 2,192 million Tk in total, indicating that the earning capacity of the group as a whole is quite low.
As with the case of BCIC, the Ghorasal Fertilizer Factory inevitably has a structural deficit because the price of fertilizer is fixed at the low government-controlled price without regard to production costs. In addition, it does not operate at full capacity due to unstable supply of natural gas and electricity as well as the defective production machinery, thus stopping short of
15

achieving the expected production volume. This situation, coupled with the increase in production costs caused by the increase in the fuel price, leads to constant deficits beginning with the gross profit.
As both BCIC and the Ghorasal Fertilizer Factory run deficits on a continuous basis, the balance sheet indicate that the capital strength has been reduced. In the case of the Ghorasal Fertilizer Factory, liabilities have exceeded assets since FY 2001/02 (Table 15).
Both BCIC and the Ghorasal Fertilizer Factory must improve organizational efficiency and production performance. Meanwhile, unless the price system of urea fertilizer is revised to reflect economic efficiency, it will be extremely difficult for them to get out of the red. Because of the nature of the public corporation, the future course of agricultural policy and support from the government will be of great importance. However, judging from the financial statements, we have to say that the financial sustainability of BCIC and the Ghorasal Fertilizer Factory is low.
Table 14:Profit and Loss Statement (Unit: million Tk)
Bangladesh Chemical Industries Corporation (BCIC)
Ghorasal Fertilizer Factory (UFFL) Item
1999/00 2000/01 2001/02 1999/00 2000/01 2001/02 1. Sales 13,799 13,898 - 1,590 1,647 1,5292. Cost of sales 13,420 13,731 - 1,692 1,874 1,7313. Gross profit 379 167 - △102 △227 △2024. Selling and administrative expenses
1,453 1,462 - 116 113 119
5. Operating profit △1,074 △1,295 - △218 △340 △3216. Non-operating income (miscellaneous income, etc.)
999 1,007 - 109 99 127
7. Non-operating expenses (interest expenses, etc.)
1,461 1,401 - 149 132 146
8. Ordinary profit before taxes △1,536 △1,689 - △258 △373 △3409. Corporate taxes, etc. 103 30 - - - -
10. Current net profit △1,639 △1,719 - △258 △373 △34011. Balance brought forward △7,382 △8,622 - 7 △251 △62412. Prior period adjustment 423 0 - - - -
13. Unappropriated income at end of period
△8,598 △10,341 - - △624 △964
14. Transferred from reserves 24 33 - - - -
15. Balance carried forward △8,622 △10,374 - △251 △624 △964(Note)Data of BCIC for 2001/02 was not available because BCIC was working on the Profit and Loss Statement.
16

Table 15: Balance Sheet (Unit: million Tk)
Bangladesh Chemical Industries Corporation (BCIC)
Ghorasal Fertilizer Factory (UFFL) Item
1999/00 2000/01 2001/02 1999/00 2000/01 2001/02 I. Assets 1.Current Assets 23,564 26,004 - 3,563 3,736 2,9862.Fixed Assets 41,997 40,280 - 7,673 6,988 6,7733.Other Long-term Assets 4,287 3,294 - 0 10 380Total Assets 69,848 69,578 - 11,236 10,734 10,139II. Liabilities 1.Current Liabilities 26,988 16,586 - 976 1,098 4552.Fixed Liabilities 31,039 42,923 - 9,716 9,465 9,853Total Liabilities 58,027 59,509 - 10,692 10,563 10,308III. Shareholders’ Equity 1.Capital Stock 17,314 17,314 - 669 669 6692.Surplus △5,493 △7,245 - △125 △498 △838Total Shareholders’ Equity 11,821 10,069 - 544 171 △169Total Liabilities and Shareholders’ Assets
69,848 69,578 - 11,236 10,734 10,139
(Note)Data of BCIC for 2001/02 was not available because BCIC was working on the Balance Sheet. 3.Feedback 3.1 Lessons Learned
None in particular
3.2 Recommendations (1)It is advisable that the executing agency put JBIC survey recommendations into practice in a concrete and continuous manner to enhance the maintenance and management of facilities
As pointed out in the JBIC survey report, there are problems in the maintenance and management system of the Ghorasal Fertilizer Factory (see “2.5.2 Technical Capacity”). In the case of an plant over 30 years old, the possibility of trouble is higher than a newer plant, even with rehabilitation. Therefore, a thorough maintenance and inspection system is necessary. At present, some JBIC survey recommendations, such as the introduction of computers, have been implemented. It is advisable that the executing agency BCIC and the Ghorasal Fertilizer Factory put the remaining recommendations into practice in a concrete and continuous manner to actively enhance the maintenance and management mechanism.
Also, as stated in “2.3.4 Environmental Improvement,” it is advisable that the environmental improvement of the artificial lagoon by taking concrete action using JBIC survey recommendations.
17

(2)The borrower and the executing agency should consider revising the urea fertilizer price system
The financial situation of the Ghorasal Fertilizer Factory is not sustainable with liabilities exceeding assets as of FY2001/02. The main cause is due to controlled price of fertilizer. In order to enhance the financial sustainability of the executing agency and maintain the effects of this project for the future, it is advisable that the borrower and executing agency consider conducting a cost analysis and review the fertilizer price. And when they review the fertilizer price system, the price be set up to a ceiling of international price considering profitability as well on the premise of product cost restructuring.
(3)It is advisable to study the trends of the fertilizer sector of Bangladesh
It is advisable to study what kind of discussions are taking place among the parties concerned (including IMF and World Bank) on the reform of the energy sector and the fertilizer sector of Bangladesh and how such discussions will influence government policy and the operation of the factory, and consider possible measures to be taken in response.
18

Comparison of Original and Actual Scope
Item Plan Actual
1) Project scope (1) Upgrading of the ammonia plant
Same as the left
(Changes only) Repair and cleaning of the spare boiler
in the reforming section were
cancelled.
Replacement of the air intake tower in
the air compression section was
cancelled. Installation of process compression equipment in the compound section was cancelled
(2) Upgrading of the urea plant
Same as the left Replacement of the wooden chamber in the urea granulation section was cancelled.
(3) Installation of a 16MW gas turbine power generator
Same as the left The power generation capacity was increased to 18MW
(4) Upgrading of ancillary facilities Same as the left Installation of a conveyer belt in the fertilizer storage area was cancelled
2) Implementation Schedule (1) Basic design (2) Detailed design (3) Installation of the gas turbine (4) Installation of the cooling equipment (5) Other works (6) Emergency works (7) Removal of the existing gas turbine (8) Installation of new equipment (9) Piping work, etc. (10)Operation suspension of the plant (11) Test operation
Jul. 1999 Aug.-Oct.1999 Sept. 1999-Apr.2001 Sept. 1999-Mar.2001 Sept. 1999-Feb.2001 Mar.- Jul.2000 Aug.-Oct. 2000 Oct.-Dec. 2000 Dec. 2000-Feb.2001 Feb.-Mar. 2001 Apr.-May 2001
Nov.-Dec. 1999 Dec.1999-Feb.2000 Jan.2000-Aug.2001 Jan. 2000-Jul. 2001 Jan.2000 –Jun. 2001 Jun.-Sep.2000
- Nov.2000-Feb.2001 Mar.-Jun.2001 May-Jul.2001 Jul.-Sept.2001
3) Production Cost Foreign Currency Local Currency Total ODA Loan Portion Exchange Rate
5,443million yen 1,018million yen
(393 million Tk) 6,461million yen 5,443million yen 1 Taka=2.59yen
(December 1998)
5,443million yen 1,000million yen
(497 million Tk) 6,443million yen 5,443million yen 1 Taka=2.01yen
(2000)
19

Third Party Evaluator’s Opinion on
Energy Saving and Improvement of Ghorasal Fertilizer Factory
Dr.A.N.M.Sayeedul Haque Khan Professor
University of Dhaka Relevance Improvement of agricultural productivity through chemical fertilizers, among others, is essential for Bangladesh. Ghorasal Fertilizer Factory (GFF) was established in 1972 and over the period of time—equipments and technology became obsolete having adverse effect on production and environment. Though present and forecasted demand vis a vis supply scenario of urea fertilizer in Bangladesh offer a mixed picture but by simplification, it can be stressed that 1)the present level of production need to be sustained and 2)more efficient way of production need to be adopted. Exactly those were the reasons, why “Energy saving, Environmental Protection and Improvement of on-steam factor of the Ghorasal Urea fertilizer Factory Project (ii)” was conceived and implemented. As the project resulted into 1) improved energy efficiency2) improved production capacity and 3) improved environment—all these evidenced from data and information from different sources—the project is relevant for the economy of Bangladesh. Sustainability Sustainability can be considered three pronged issue:1)Financial 2)Management and 3)Institutional. For variety of socio-political reasons—financial sustainability of the factory is a far-cry. But, financial sustainability will have to be there and to start with, people within the organisation need to be made aware about it. It is their factory and their country. In final analysis—it is their job to make the factory financially viable either by increasing return or by decreasing costs. It seems that neither BCIC nor GFF has been able to institutionalise a proper management system. It is not very difficult for me to understand as to why 32 years after inception (GFF) or 28 years of inception (BCIC)—failed to institutionalise a management system. Lack of commitment and ad-hocism are two reasons—to name a few. Institutional sustainability, in this case, is more a matter of stakeholders. As agriculture is the largest industry in Bangladesh and as fertilizer is one of the very important inputs—factories producing fertilizers are essential. Therefore, sustenance of these factories is not only the job of the factory-people but larger community also. Whether larger community take and retain sufficient interest or there are mechanism to arouse and channelise interest of the community—appear very vital. These are cultural issues warrant cultural interventions. It is my opinion that these factories are yet to be a part of the larger community as a result most of the people of larger community think it as ‘one of theirs’ as opposed to ‘one of ours’. Therefore, stakeholders of different categories need to be identified, apprised and encouraged. There is a special need for those who used to be known as “donors” and lately known as “development partners”. If one is to be a partner one must know the hopes, expectations, history, culture, capacity, world-view i.e.idiosyncracies of another partner. These things are very important for effective partnership.


