Embed Size (px)
Citation preview
Automated suppression of errors in LTP-II slope measurements with x-ray optics
Zulfiqar Alia,b, Nikolay A. Artemieva, Curtis L. Cummingsa, Edward E. Domninga, Nicholas Keleza,
Wayne R. McKinneya, Daniel J. Merthea, Gregory Y. Morrisona, Brian V. Smitha, and Valeriy V. Yashchuka,*
aLawrence Berkeley National Laboratory, Berkeley, California 94720, USA. bOptics Laboratory, P.O. Nilore, Islamabad, Pakistan.
ABSTRACT
Systematic error and instrumental drift are the major limiting factors of sub-microradian slope metrology with state-of-the-art x-ray optics. Significant suppression of the errors can be achieved by using an optimal measurement strategy suggested in [Rev. Sci. Instrum. 80, 115101 (2009)]. Here, we report on development of an automated, kinematic, rotational system that provides fully controlled flipping, tilting, and shifting of a surface under test. The system is to be integrated into the Advanced Light Source long trace profiler, LTP-II, allowing for complete realization of the advantages of the optimal measurement strategy method. We describe in detail the system’s specification, design operational control and data acquisition. The performance of the system is demonstrated via the results of high precision measurements with a number of super-polished mirrors.
Keywords: optical metrology, surface slope, long trace profiler, LTP, drift error, systematic error, optimal scanning, x-ray optics, deflectometry
1. INTRODUCTION Development, characterization, and application of state-of-the-art X-ray optics for 3rd and 4th generation X-ray light sources with a level of surface slope precision of 0.1-0.2 μrad requires the development of adequate, dedicated metrology instrumentation and methods.1-3 The best performing slope measuring profilers at synchrotron facilities, such as the Nanometer Optical Component Measuring Machines (NOM) at Helmholtz Zentrum Berlin (HZB)/BESSY-II (Germany)4-7 and at the Diamond Light Source (UK),8 as well as Long Trace Profilers (LTP) at SPring-8 (Japan),9 at ESRF,10,11 at SOLEIL (France),12,13 and at the Advanced Light Source (ALS, U.S.A.)14-16 come close to the required precision. The high performance of the instruments is based on thorough suppression of the measurement errors due to random noise, systematic effects, and instrumental drifts. A comprehensive analysis of errors of slope measurements and discussion of methods for decreasing the errors can be found, e.g., in Refs.16-21
Significant suppression of the errors (in particular, errors associated with instrumental and set-up drifts) can be achieved by using an optimal measurement strategy suggested and comprehensively analyzed in Ref.20 Here, we report on development of an automated, kinematic, rotational system that provides fully controlled flipping, tilting, and shifting of a surface under test. The system is to be integrated into the ALS long trace profiler, LTP-II, allowing for complete realization of the advantages of the optimal measurement strategy method.
In Sec. 2, we analyze the major contributors to the LTP error budget and a brief discussion of the methods developed to decrease the errors. The optimal measurement (scanning) strategy method, which we have successfully used to significantly suppress LTP drift error, is reviewed in Sec. 3. A brief discussion of experimental approaches to minimize systematic errors of slope measurements is also presented. In Secs. 4 and 5 we derive the requirements and crucial specifications for a system that would realize the advantages of the optimal scanning method, and allow also for effective suppression of random and systematic errors. The details of the system’s design, operational control, and data acquisition are provided in Sec. 6. In Sec. 7, we present the results of first use of the system for high precision measurements with a number of super-polished mirrors. Concluding, we point out to the problems of surface slope profilometers that still wait for solution, and project directions for further investigation.
*[email protected]; phone 1 510 495 2592; fax 1 510 486 7696
Advances in Computational Methods for X-Ray Optics II, edited by Manuel Sanchez del Rio, Oleg Chubar, Proc. of SPIE Vol. 8141, 81410O
© 2011 SPIE · CCC code: 0277-786X/11/$18
Proc. of SPIE Vol. 8141 81410O-1
Downloaded From: http://proceedings.spiedigitallibrary.org/ on 05/30/2013 Terms of Use: http://spiedl.org/terms
2. ANALYSIS OF LTP ERRORS In this section, we briefly review the major error sources and methods developed to minimize the contribution of the errors to surface slope measurements with emphasis on our experience measuring high quality x-ray optics with the ALS LTP-II.14-16
The main difference between an LTP II and an instrument of the first generation is the addition of a reference arm that records a reference slope signal from a stationary reference mirror.22-24 A similar approach has been used in a dual-beam laser deflection sensor described in Ref.25 In the LTP-II, the reference trace is subtracted from the sample trace, providing data basically free of errors (such as the ones due to wobbling of the LTP carriage and pointing instability of the laser beam) that are common to the sample and the reference channels. As a result, LTPs with the optical reference channel became capable of slope measurements with accuracy of about 1 µrad. Paradoxically, further improvement of LTP performance to the level of modern requirements of ~0.1 µrad must overcome a number of disadvantages inherent to the optical reference channel (see, e.g., Ref.14).
A slope measurement of a surface under test (SUT) provides the dependence of the surface slope ( )xα on a position x .
The measurement is performed with an LTP by scanning the position variable over the discrete points ix ,
0,1,..., ( 1)i I= − , uniformly distributed over the range of interest, e.g., the clear aperture of the surface under test (SUT). Generally a result of slope measurement can be expressed as
( ) ( ) ( ) ( )( ) ( ), ( )M i i i i i ix x R x S x x D x tα α α= + + + , (1)
where the measured slope ( )M ixα is affected by random error ( )iR x , systematic error ( )( ),i iS x xα , and drift
( )( )iD x t of the measurement instrument and experimental setup. Below we analyze errors specific to slope measurements with the ALS LTP-II.
2.1 Random errors
Random errors, shown in Eq. (1) as ( )iR x , are caused by unpredictable fluctuations in the readings due to the limited precision of the instrument, or may be due to the random character of spurious effects. Note that in spite of the fact that there is no correlation between the random error and the measured position, we still show in Eq. (1) a more general dependence of random error on ix that allows, e.g., a possible positional dependence of the variance of the random error.
The main source of random error of an LTP-II is air convection in the reference and sample channels caused by temperature gradients and air flow.26 Due to air convection (turbulence) the refractive index of the air along the optical paths changes, leading to pointing instability of the light beams. Because the optical paths of the sample and the reference beams are different, the corresponding errors do not correlate, and cannot be accounted by the optical reference channel.
The intensity of the air convection, as well as the overall stability of an optical profiler system, are strongly correlated with environmental conditions in the lab. Currently, the ALS optical metrology laboratory (OML) air-conditioner keeps the room temperature stable at approximately 20C with about a ±120 mK periodic (~12 min period) variation determined by the switch-on/-off cycle of the OML air-conditioner. Additional temperature insulation of the LTP with a surrounding hutch keeps temperature variation over the measuring set-up of ~20 mK.27 The resulting random error of the slope reading in the ALS LTP-II reference channel is still rather large of about 0.3 µrad/Hz1/2 (after averaging over 10 sequential measurements taken over an interval of about 1 second).
The air-convection error can be significantly suppressed by additional shielding of the LTP optical paths.26 However, it is difficult to apply adequate shielding to the reference channel that is subject to continuous change during a scan.
Due to the intrinsic low frequency character of the air convection noise (with characteristic frequencies of 0.1-1 Hz26), simple suppression of the noise by averaging the repeated measurements is inefficient. The frequency spectrum of the noise (and, therefore, the efficiency of averaging) can be significantly increased by using an air blowing technique described in Ref.26
Proc. of SPIE Vol. 8141 81410O-2
Downloaded From: http://proceedings.spiedigitallibrary.org/ on 05/30/2013 Terms of Use: http://spiedl.org/terms
Note that possible radical (but very expensive and impractical) solutions to the problems related to variation of optical paths due to the environmental factors (temperature gradients, air density and humidity changes) would be an LTP designed for operation under vacuum,17 or in a noble-gas atmosphere.
Below, we show that suppression of the errors due to systematic effects and instrumental drift can be achieved by averaging multiple measurements performed under controlled changes of the parameters of the experimental set-up and scanning (direction of scanning, orientation, and alignment of the SUT, etc.). In this case, the low frequency random noise is also effectively averaged out because of the significantly long time intervals between the sequential scans.
2.2 Systematic errors
Performance of the ALS LTP-II is still limited by systematic errors,14,15 which are systematically reproduced in identical scans and, therefore, cannot be suppressed by averaging over repeated measurements performed with an unchanged experimental arrangement. In general, the systematic error is specific for a particular measurement arrangement as it is accounted in the definition (1) with the term ( )( ),i iS x xα that depends not only on position but also on the measured value itself. Note that the only systematic error of the LTP-II that is accounted by the optical reference channel is due to profile imperfections of the ceramic beam, causing a systematic wobbling of the LTP carriage up to 10 µrad.
In order to totally account for other major sources of LTP systematic errors, non-ideality of the photo-detector,19 ‘ghost’ effects due to cross contamination of sample and reference signal into one another,28 imperfections of the LTP optical elements,14-19 and non-linearity of the LTP position-to-slope conversion, a sophisticated calibration of the instrument for a specific experimental arrangement is required.13,21,27,29 Nevertheless, a partial suppression of most of the systematic error is still possible without a precision calibration.
In our old LTP with a one-dimensional (1D) photo-diode array (PDA) as a detector, the PDA pixel-to-pixel (25 μm × 2.5 mm) photo-response non-uniformity, which was about ~2%, led to an LTP systematic error of ~0.3 μrad (rms).14,19 An equal systematic error was also due to PDA pixel pitch non-uniformity (~10%). Both these errors are effectively suppressed to a level of below 0.1 µrad with a 2D-CCD-based detector9,14,19,30 with a significantly small pixel size (7.4×7.4 μm2 in the upgraded ALS LTP-II,14 and a flat-field calibration of the photo-response non-uniformity.29
The ‘ghost’ effect arises when there is unavoidable cross-contamination of the LTP sample and reference signals into one another. Such a situation often happens in the measurements of a significantly curved optic with an LTP with a 1D PDA detector. The ‘ghost’ effect leads to a systematic perturbation in the recorded interference patterns and, therefore, a systematic variation of the measured slope trace. Perturbations of about 1-2 μrad and even larger have been observed with a cylindrically shaped X-ray mirror and with a mirror having a toroidal surface figure.28 A relatively simple method for effective suppression of the ‘ghost’ effect has been suggested in Ref.28 The method employs separate measurement of the ‘ghost’-effect-related interference patterns in the sample and the reference arms and then subtraction of the ‘ghost’ patterns from the sample and the reference interference patterns. Note that the procedure preserves the advantage of simultaneously measuring the sample and reference signals.
Optical inhomogeneity of materials and surface quality of the LTP optical elements (beam splitters, Dove prism, quarter wave plate, Fourier lens, folding mirrors) have been shown to produce a systematic error of 0.2-0.9 μrad, depending on the curvature of the SUT.14 In a slope trace measured with the LTP, these systematic errors appear as local (relatively high spatial frequency) perturbations.
Besides the significant improvement of quality of the optical elements (that can be rather expensive), there is an experimental way to decrease the systematic error due to imperfections of the LTP optics. For this, one should average multiple measurements with different alignments (tilt in the tangential and/or the sagittal directions), longitudinal positions, and orientations of the SUT with respect to the LTP. Because of differences in the optical paths of the LTP beams through the LTP sensor optics, systematic perturbations in these measurements will appear at different places of the slope trace and, therefore, will be effectively averaged out. Practically, in this way, the high special frequency systematic error of the LTP-II can be suppressed to the level of 0.1 to 0.4 µrad, depending on the curvature of the SUT.14,16
2.3 Drift errors
Drift error appears as a very slow temporal variation of the measured quantity with a characteristic time comparable to the duration of the measurements. It is, in some sense, in between random noise and systematic error. Drift error is
Proc. of SPIE Vol. 8141 81410O-3
Downloaded From: http://proceedings.spiedigitallibrary.org/ on 05/30/2013 Terms of Use: http://spiedl.org/terms
difficult to suppress by averaging over multiple identical scans carried out over a reasonable time. In contrast to systematic errors, drifts are not stable enough to be accounted by a precise calibration or by a simple change of the experimental arrangement.
Drift error is distinguished by its very low frequencies, requiring very long averaging times. These long times make suppression by multiple scans difficult for this error. However, it still appears to be possible.
Without loss of generality, a slow drift described with the term ( )( )iD x t in Eq. (1) can be expanded as a MacLaurin series in t ,
( ) ( )( )
0
(0)( )!
np
ip
DD x t D t tp
∞
=
= =∑ . (2)
During an LTP scan, only a few first terms in the sum (2) are practically important. In the next section, we will briefly overview an experimental method, described in detail in Ref.,20 for the effective suppression of spurious effects caused by a drift presented by a certain power polynomial in Eq. (2).
The main sources of drift error in LTP measurements are variations of the environmental conditions (temperature and, in some degree, humidity in the lab), and inherent temporal instabilities of the experimental setup (e.g., mechanical instability of the mirror mounting and alignment).1,5,20 In order to decrease the effect of ambient temperature variation on the measurements, the ALS LTP-II set-up is placed in a one layer hutch. Unfortunately, inside the hutch,14,17 there are a number of heat sources, such as the diode laser unit, carriage driving motor, CCD camera, and the heat sinks and fans of the temperature stabilized systems of the CCD camera and tiltmeters. These sources, as well as air flow of the air bearing system and stepper motors can potentially lead to temporal instabilities of various LTP components and therefore to drift error. Note that with a hutch, one also increases the effective time constant of the temperature stabilization of the set-up inside the hutch that can increase the delay time for system stabilization before starting measurement.
In an LTP-II with a classical optical schematic of a pencil-beam interferometer, two 90-degree-roof-prisms are used to produce two parallel beams with desired phase shift of π. Unfortunately, temperature instability of the prism mounts can cause the optical path difference between the two beams to change by several nanometers.14,16,20 The resultant shift in the fringe position for this error is on the order of several microradians. Different π-phase shifters that are basically insensitive to the temperature variation have been discussed in Refs.31,32 The most simple one is based on a stepped phase plate.15,31,32 Note that an LTP schematic with a single Gaussian beam is also possible.15
A change of temperature of the LTP diode laser leads to variations of wavelength and direction (pointing) of the emitted light beam.33 For the usual experimental arrangement of the ALS LTP-II, the resulting drift of the laser beam direction can be as large as 5 µrad/hour.14 Because of the difference of the optical paths of reference and sample beams and non-ideality of the LTP optics, the reference channel accounts for the laser pointing instability only to a certain extent, leaving a noticeable contribution to the drift error. Further improvement can be obtained by replacing the laser with a laser system less sensitive to the surrounding environmental conditions. Pointing instability of different lasers, a diode laser similar to one used with the existing ALS LTP-II, an intensity stabilized HeNe laser and a fiber coupled temperature stabilized diode laser, have been experimentally investigated.26,33 For the LTP laser, the low frequency (≤1 Hz) variations of laser pointing are characterized by a pointing instability of ~0.3 µrad rms. A fiber coupled laser has demonstrated the best stability of ~0.1 µrad (rms) that corresponds to the laser specification of ~0.1 µrad/K.34 The advantages of a fiber coupled diode laser have been realized, e.g., in the SPring-8 LTP.9
Temperature fluctuations of the LTP laser wavelength can also contribute to the LTP error budget via the dependence of the effective pixel optical center on the wavelength of light. Such dependence with a magnitude of ~0.01 µm/nm has been experimentally observed with a CCD camera with a pixel pitch of 24 µm.35 A reasonable temperature stabilization of the LTP laser system would make the effect negligible.
In the next sections we briefly discuss an experimental method to significantly suppress LTP errors.
3. OPTIMAL SCANNING STRATEGY METHOD AND DRIFT ERROR SUPPRESSION The experimental method for effective suppression of spurious effects in slope measurements caused by slow instrumental drifts was suggested and first demonstrated in Ref.20 The method is based on optimal scanning strategies for
Proc. of SPIE Vol. 8141 81410O-4
Downloaded From: http://proceedings.spiedigitallibrary.org/ on 05/30/2013 Terms of Use: http://spiedl.org/terms
multiple measurements analytically derived in Ref.20 A slope trace measurement run performed according to an optimal scanning strategy consists of a number, S , of repeatable scans arranged with a sequential reversal of the direction of scanning towards increasing or decreasing in ix and/or the orientation of the SUT with respect to the LTP. Such a run
provides repeatable measurements at a certain point ix at a sequence of time moments ( )it s , where s is the scan
number ( 1, 2,...,s S= ), specially arranged to anti-correlate with the temporal dependence of the drift.
Denoting the directionality of the s -th scan with sr ,
+1 if the s-th scan is performed in the forward direction,
-1 if the s-th scan is performed in the backward direction,sr⎧
= ⎨⎩
(3)
an optimal scanning strategy suitable to suppress the polynomial drift error up to the power p [see Eq. (2)] should satisfy equality:20
02
1
1 =∑=
=
−pS
s
pssr . (4)
It can be shown that for any natural number p , Eq. (4) has a solution.20 Practically interesting solutions for the few lower order polynomials are shown below.
Optimal scanning strategies, suitable for suppression of a linear drift, are straightforward:
{ }1,1)1( −±=sr . (5)
Then, suppression of drifts of the second order would require
{ }1 1,1,1, )2( −−±=sr , (6)
and for third order,
{ }11, 1, 1,1, 1,1,1, )3( −−−−±=sr , (7)
Solutions (5-7) suggest that the suppression of any order drift automatically suppresses lower orders.
There is no apparent preferred directionality of the scans, so it is natural that if the set { }sr is a solution then the set
{ }sr− is also a solution. Denoting the positive solution for the p th order drift suppression as { }( )sr p+ and the
negative solution as{ }( )sr p− , the general recursion relation20 between the sets { }( 1)sr p± + and { }( )sr p± is
{ } { }( 1) ( ), ( )s s sr p r p r p± + −+ = ± . (8)
For the case when only the scanning direction is reversed, the corresponding suppression factor can be estimated20 as a ratio of peak-to-valley variations of the major terms of the drift error of the optimized and non-optimized runs of the same total number of scans:
8 2 p pξ ≅ ⋅ . (9)
Estimation (9) shows that suppression factor, ξ , rapidly increases with increase of p for 2≥p .
Absolute zeroing of the drift-related errors is achieved with a strategy that includes simultaneous reversals of the direction of LTP scanning and orientation of the SUT with respect to the LTP.20 Therefore, the most efficient suppression of drift error (in fact, identical zeroing of polynomial drifts up to a desired order) is obtained with sequential scans with optimal reversing of the sign of the measuring quantity (surface slope) without changing the sign of the drift
Proc. of SPIE Vol. 8141 81410O-5
Downloaded From: http://proceedings.spiedigitallibrary.org/ on 05/30/2013 Terms of Use: http://spiedl.org/terms
error contribution. The optimal sequence of the sign reversals obeys the same identity as the one derived for reversing the direction of scanning, Eq. (4).
Note that the derived optimal sequences of reversals also describe the optimal square waveforms for drift-free multichannel phase-sensitive detection discussed in Ref.38 and first used in Refs.39,40 in an experiment searching for parity (P) and time-reversal invariance (T) violating electric dipole moment of xenon. Since then, this technique has been widely used in experiments searching for a P and T violating electric dipole moment in neutrons,41,42 atoms,43-45 molecules,46,47 and solids.48
In order to realize such a scanning strategy with a slope measuring instrument, the corresponding upgrade of the instrument should be made to allow automatic and simultaneous change of the orientation of a surface under test and the scanning direction of the profiler.
In Sec. 2, we pointed out that the major contributions to the random and systematic errors of LTP measurements are significantly reduced by averaging over repeatable measurements performed with the SUT differently positioned with respect to the LTP. Above, in this section, we have also shown that a significant reduction of the drift error is achieved by averaging over multiple scans performed according to optimal scanning strategies with changing of the scanning direction and flipping of the SUT. Therefore, with an appropriate combination of different SUT positions, orientations, and the LTP scanning directions, one can average out the major experimental errors of slope measurements with an LTP. The ALS LTP-II and DLTP14-16 translation systems already provide an automatic change of the scanning direction.
Below (Sec. 4), we outline a general specification for an automated rotating, flipping, and aligning (ARFA) system that will be integrated with the ALS LTP-II and, potentially, with a new state-of-the-art optical slope measuring system (OSMS), as one proposed in Ref.49 As a part of a slope measuring instrument, the ARFA system must support the required accuracy of surface slope metrology with absolute error below 0.1 µrad. A capability for rotation and shifting of a SUT would support 2D surface slope mapping measurements, analogous to an approach used with the HBZ/BESSY-II NOM instrument.50
4. REQUIRED ACCURACY OF SUT FLIPPING In this section, we estimate the accuracy of flipping an SUT required in two practical cases. First, we consider slope measurements with a sagittally cylindrical substrate that is designed for use as a bendable, toroidal x-ray mirror; second, we analyze a case of a tangentially curved cylindrical mirror. The geometrical parameters of the optics are chosen based on ALS-related applications. Because we suppose that the overall absolute error of the measurements must be less than 100 nrad, the absolute error related to the SUT mis-alignment due to flipping of its orientation should not surpass 10 nrad.
4.1 Flipping of a sagittal cylindrical substrate for a bendable toroidal mirror
Figure 1a illustrates the first case. A 1-meter long sagittal cylinder with radius of curvature of 50R = cm is measured along the cylinder’s generating line (shown in Fig. 1a with a dot-dashed line) in order to characterize the surface figure of the optic. A misalignment δα between the measured trace (a dashed line) and the generating line would lead to a spurious variation of the surface slope along the measured trace.
The spurious surface figure is described by a sector of an ellipse:
2 2( ) by x a xa
= ± − (10)
with semi-major axis a and semi-minor axis b given, respectively, by
,
.a R Sinb R
δα==
(11)
The maximum slope error δβ would be at the mirror edges, x L= ± :
2 2 2 2 1 2'( ) ( )y x Sin L R L Sinδβ δα δα −≅ = ⋅ ⋅ − . (12)
Proc. of SPIE Vol. 8141 81410O-6
Downloaded From: http://proceedings.spiedigitallibrary.org/ on 05/30/2013 Terms of Use: http://spiedl.org/terms
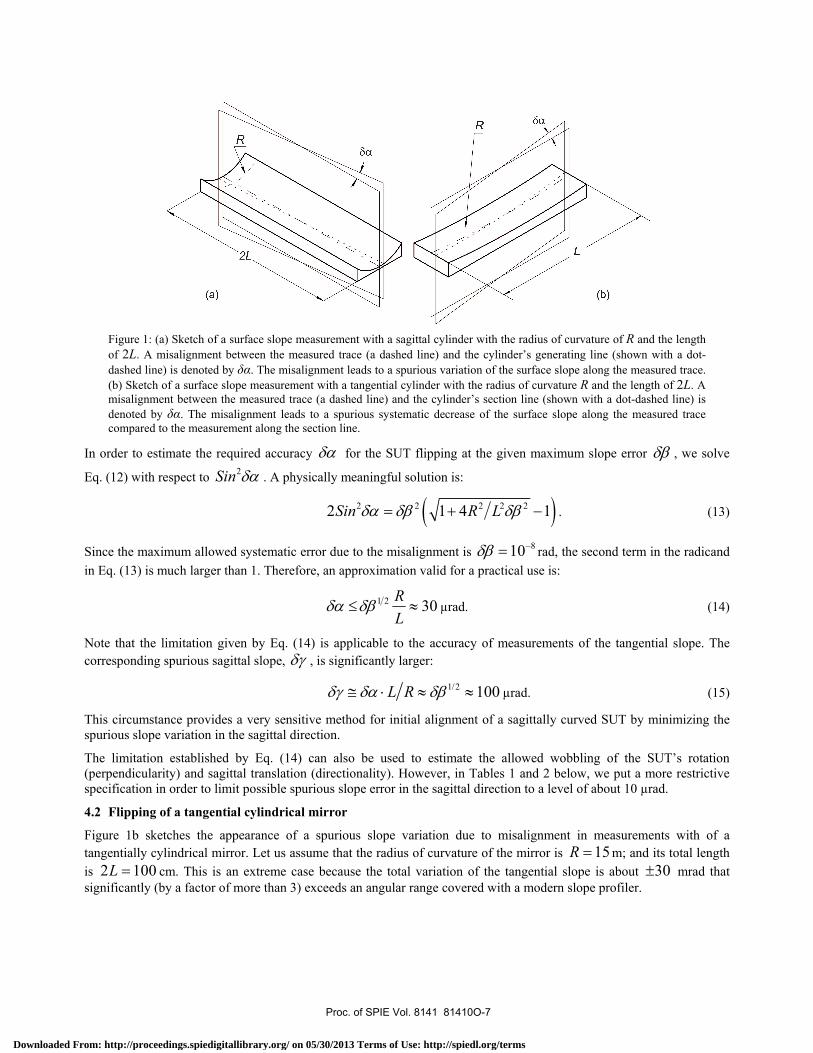
Figure 1: (a) Sketch of a surface slope measurement with a sagittal cylinder with the radius of curvature of R and the length of 2L. A misalignment between the measured trace (a dashed line) and the cylinder’s generating line (shown with a dot-dashed line) is denoted by δα. The misalignment leads to a spurious variation of the surface slope along the measured trace. (b) Sketch of a surface slope measurement with a tangential cylinder with the radius of curvature R and the length of 2L. A misalignment between the measured trace (a dashed line) and the cylinder’s section line (shown with a dot-dashed line) is denoted by δα. The misalignment leads to a spurious systematic decrease of the surface slope along the measured trace compared to the measurement along the section line.
In order to estimate the required accuracy δα for the SUT flipping at the given maximum slope error δβ , we solve
Eq. (12) with respect to 2Sin δα . A physically meaningful solution is:
( )2 2 2 2 22 1 4 1Sin R Lδα δβ δβ= + − . (13)
Since the maximum allowed systematic error due to the misalignment is 810δβ −= rad, the second term in the radicand in Eq. (13) is much larger than 1. Therefore, an approximation valid for a practical use is:
1 2 30RL
δα δβ≤ ≈ µrad. (14)
Note that the limitation given by Eq. (14) is applicable to the accuracy of measurements of the tangential slope. The corresponding spurious sagittal slope, δγ , is significantly larger:
1/2 100L Rδγ δα δβ≅ ⋅ ≈ ≈ µrad. (15)
This circumstance provides a very sensitive method for initial alignment of a sagittally curved SUT by minimizing the spurious slope variation in the sagittal direction.
The limitation established by Eq. (14) can also be used to estimate the allowed wobbling of the SUT’s rotation (perpendicularity) and sagittal translation (directionality). However, in Tables 1 and 2 below, we put a more restrictive specification in order to limit possible spurious slope error in the sagittal direction to a level of about 10 µrad.
4.2 Flipping of a tangential cylindrical mirror
Figure 1b sketches the appearance of a spurious slope variation due to misalignment in measurements with of a tangentially cylindrical mirror. Let us assume that the radius of curvature of the mirror is 15R = m; and its total length is 2 100L = cm. This is an extreme case because the total variation of the tangential slope is about 30± mrad that significantly (by a factor of more than 3) exceeds an angular range covered with a modern slope profiler.
Proc. of SPIE Vol. 8141 81410O-7
Downloaded From: http://proceedings.spiedigitallibrary.org/ on 05/30/2013 Terms of Use: http://spiedl.org/terms
In this case, the measured figure is also described with a sector of an ellipse. However now, the semi-major axis a and the semi-minor axis b are, respectively,
,.
a R Cosb R
δα==
(16)
The corresponding slope error δβ can be estimated as a difference between the correct slope trace of the cylinder and the measured slope:
2 2 1 2 2 2 2 2 1 2
'( , 0) '( , 0)( ) ( ) .y x y x
x R x x Cos R x Cosδβ δα δα
δα δα− −
≅ = − ≠
= ⋅ − − ⋅ ⋅ − (17)
Taking into account that the slope error δβ in Eq. (8) reached its maximum at the mirror edges, x L= ± and assuming
that 2 2R L>> (the typical case of x-ray optics), one can get the same expression for the misalignment error (with a requirement that rad810−=δβ ) as for the case considered in Sec. 3.1:
1 2 0.5RL
δα δβ≤ ≈ mrad. (18)
Note that in the case considered here, the requirement for accuracy of flipping is significantly weaker than that of the case of a sagittal cylinder (Sec. 3.1). For completeness, the details of the derivation of Eq. (18) are given in the Appendix.
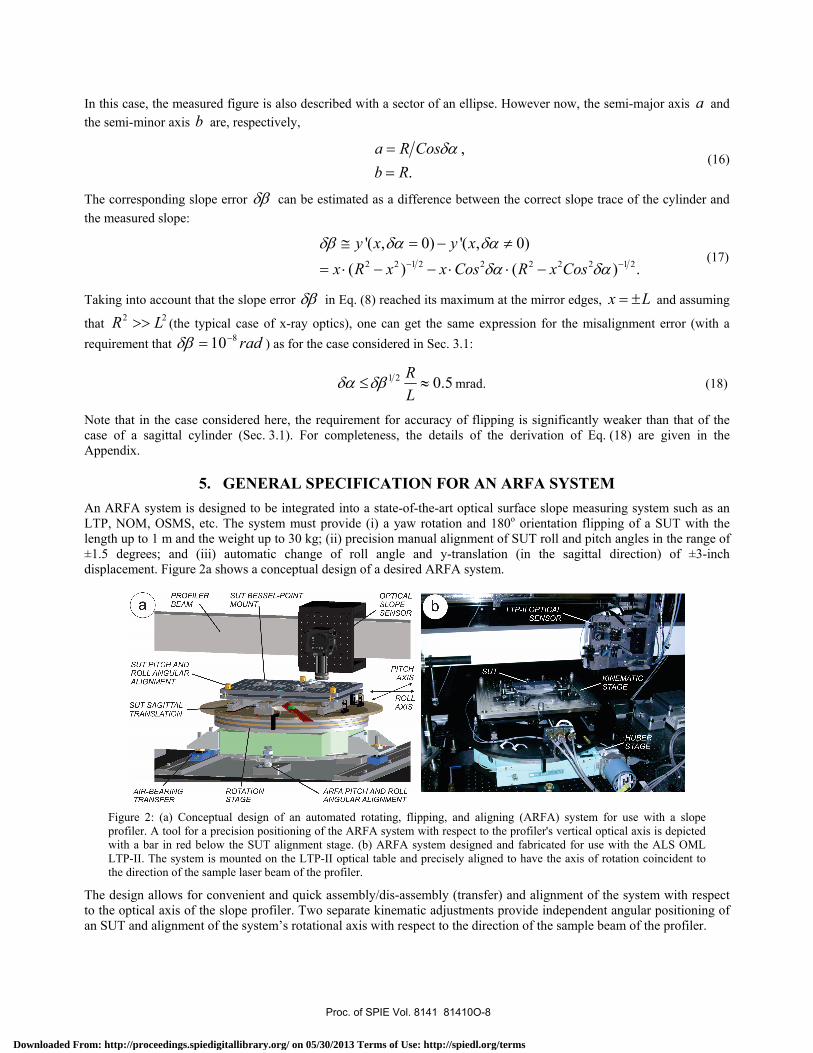
5. GENERAL SPECIFICATION FOR AN ARFA SYSTEM An ARFA system is designed to be integrated into a state-of-the-art optical surface slope measuring system such as an LTP, NOM, OSMS, etc. The system must provide (i) a yaw rotation and 180o orientation flipping of a SUT with the length up to 1 m and the weight up to 30 kg; (ii) precision manual alignment of SUT roll and pitch angles in the range of ±1.5 degrees; and (iii) automatic change of roll angle and y-translation (in the sagittal direction) of ±3-inch displacement. Figure 2a shows a conceptual design of a desired ARFA system.
Figure 2: (a) Conceptual design of an automated rotating, flipping, and aligning (ARFA) system for use with a slope profiler. A tool for a precision positioning of the ARFA system with respect to the profiler's vertical optical axis is depicted with a bar in red below the SUT alignment stage. (b) ARFA system designed and fabricated for use with the ALS OML LTP-II. The system is mounted on the LTP-II optical table and precisely aligned to have the axis of rotation coincident to the direction of the sample laser beam of the profiler.
The design allows for convenient and quick assembly/dis-assembly (transfer) and alignment of the system with respect to the optical axis of the slope profiler. Two separate kinematic adjustments provide independent angular positioning of an SUT and alignment of the system’s rotational axis with respect to the direction of the sample beam of the profiler.
Proc. of SPIE Vol. 8141 81410O-8
Downloaded From: http://proceedings.spiedigitallibrary.org/ on 05/30/2013 Terms of Use: http://spiedl.org/terms

Detailed specifications for the major parameters of an ARFA system are collected in Tables 1. Note that in comparison to the corresponding specifications in Ref.,49 the parameters in the tables are less restrictive. This becomes possible due to the additional analysis of the required system performance discussed above.
Table 1: Specification of the major parameters of the rotation and SUT alignment kinematic stages of an ARFA system. The specification assumes the move-stop-wait-measure (MSWM) mode of scanning. The requirements for rotation stage angular alignment mean the same spec for the roll, pitch, and yaw angles. Manual alignment of the stage rotation axis is to make it coincident to the direction of the LTP sample light beam.
Rotation stage SUT alignment kinematic stage Specified Parameter Values Units Specified Parameter Values Units Rotation range ±180 degree Roll and pitch tilting range ±1.5 degrees Rotation resolution ≤ 5 µrad Roll and pitch tilting resolution ≤ 5 µrad Minimum rotation speed ≤ 0.01 Degs./sec Roll and pitch angular stability ≤ 3 µrad/K Maximum rotation speed ≥ 1 Deg./sec Minimum tilting speed ≤ 3 µrad/sec Rotation repeatability (full range) ≤ 5 µrad@1σ Maximum tilting speed ≥ 20 µrad/sec Reversal error (360o) ≤ 5 µrad Tilting repeatability (full range) ≤ 10 µrad@1σ Rotation accuracy (full range) ≤ 10 µrad Tilting accuracy( full range) ≤ 10 µrad@1σ Integrated angular encoder - accuracy - repeatability
≤ 2 ≤ 2
µrad@1σ µrad@1σ
Integrated tilt (roll and pitch) sensors -accuracy -repeatability
≤ 2 ≤ 2
µrad@1σ µrad@1σ
Setting time for MSWM mode ≤ 0.3 sec Setting time for each angle ≤ 1 sec Rotation stage perpendicularity (wobble)
≤ 5 µrad Sagittal translation -range -resolution -accuracy -repeatability
±80 ≤ 2 ≤ 5 ≤ 5
mm µm µm µm
Eccentricity ≤ 5 µrad Angular alignment thermal stability ≤ 2 µrad/K Manual alignment of rotation axis (parallel to the sensor light beam) - range - resolution
±50 ≤ 10
mrad µrad
Integrated sagittal position sensor -accuracy -repeatability
≤ 1 ≤ 1
µm@1σ µm@1σ
Sagittal directionality (wobble) ≤ 10 µrad Lowest eigenfrequency (with load) ≥ 40 Hz Lowest eigenfrequency (with load) ≥ 40 Hz Load capacity ≥ 50 Kg Load capacity ≥ 30 Kg Heat loading (motors and sensors) ≤ 2 W Heat loading (motors and sensors) ≤ 1 W
6. THE ALS OML ARFA SYSTEM Figure 2b shows an ARFA system designed and fabricated for use with the ALS OML LTP-II. The system is based on a high precision Huber 1-Circle Goniometer-440XE rotation stage.51 The Huber stage is specified for 360 degree rotation range with accuracy of about 0.5 µrad. The specified performance of the stage is much better than that of that required in Table 2. The size of the stage with the diameter of the rotating flange of 500 mm is large enough to support the LTP measurements with large x-ray optics.
A specially designed kinematic stage is placed on the top of the Huber stage. It provides an automatic sagittal translation of an SUT in the range of ± 80 mm with a sub-micrometer resolution. The design of the stage top plate makes possible an optimal (on the Bessel points) support of differently sized SUTs. For fine alignment of an SUT, the top plate has three adjustment screws with a 0.5 mm pitch thread. An estimated resolution of the alignment is ≤5 µrad over the angular range of ±1.5 degrees.
In Fig. 2b, the ARFA system is shown as mounted on the LTP-II optical table. For precision pitch and roll angular alignment of the system’s rotation axis with respect to the direction of the sample laser beam of the profiler, there is an additional kinematic adjustment with three ball-headed mounting screws with a fine 5/8-80 thread. The screws sit on three V-grooved pads. After the first alignment, the position of the pads has been fixed. This allows to easy removing the ARFA system from the LTP-II and returning it back, practically, to the original alignment.
Behind the through hole in the center of the kinematic stage, a Gigabit Ethernet high resolution camera with a 5.6 mm × 5.6 mm field-of-view is mounted face up. The camera is used to align the ARFA axis of rotation. At the optimal position and angular orientation of the system, the center of gravity of the LTP sample beam stays unshifted upon rotation of the Huber stage.
Proc. of SPIE Vol. 8141 81410O-9
Downloaded From: http://proceedings.spiedigitallibrary.org/ on 05/30/2013 Terms of Use: http://spiedl.org/terms
Software specific for LTP applications has been integrated into the general National Instruments LabVIEWTM umbrella program used at the OML and various areas of the ALS for experimental control and data acquisition. This allows reasonably easy upgrade and modification of the instrumental data acquisition and control system needed for integration of the ARFA system. The motor control and position feedback of the ARFA system is done with a NI PCI-7350 motion control card and NI PCI-6221 DAQ card using both a rotation encoder on the Huber stage and a linear encoder on the sagittal translation stage. A NI PCIe-8231 controller acts as a frame grabber to interface between the camera and the LTP LabVIEWTM software. After the upgrade, the new LTP software allows the operator to use the camera in continuous acquisition mode (with monitoring of the beam spot position) that is useful, in particular, for mutual alignment of the ARFA rotation axis and the LTP sample beam.
The successful integration of the ARFA motor control and data acquisition into the NI LabVIEWTM environment has opened up the next development in LTP measurement with automatic sequential flipping, tilting, and shifting of the SUT.
7. FIRST USE OF ARFA SYSTEM The ARFA design concept and the experimental approaches for the system integrated into the ALS LTP-II were validated in the course of surface slope measurements with four super polished flat x-ray grating Si substrates. The substrate’s overall dimensions were 170 mm × 39 mm × 20 mm with a clear aperture of 150 mm × 29 mm. The polishing over the clear aperture was specified to have a residual slope variation < 0.2 µrad rms (the vendor was also asked to make a best effort to achieve 0.1 μrad) and a radius of curvature >10 km. Each substrate had to be measured along two longitudinal traces of 150 mm and five sagittal traces of 29 mm each. Figure 2b depicts the experimental arrangement of the measurements.
In order to provide the required accuracy of the slope metrology of ≤ 100 nrad, a single trace measurement consisted of 16 scans, which were averaged. The 16 scans were split to 2 runs with 2 different orientations (unflipped and flipped) of the SUT with respect to the LTP translation system. Each run consisted of 8 sequential scans performed in the forward (F) and backward (B) scanning directions according to the optimal strategy F-B-B-F-B-F-F-B (see Ref.20 and Sec. 3). For the substrate discussed below in this section, 2 additional runs with a different (shifted by 31 mm) longitudinal position of the SUT were carried out in order to make certain that the measured slope trace is really from the SUT, rather than due to LTP systematic error.
In the course of the measurements, the direction of the LTP scans was automatically controlled by the LTP software. Flipping of the SUT between the LTP runs were performed manually with the ARFA system, when the LTP was in rest. After each reset of the SUT with the ARFA system, we checked the preservation of the correct tangential and sagittal position of the next scanning trace.
The described measurement procedure allows us to effectively suppress errors due to drifts and systematic effects, as discussed in Secs. 2 and 3. Note that we did not make additional runs with different tilts of the SUT that would decrease the possible systematic error due to non-ideality of the LTP optical elements. As we have verified in a dedicated calibration experiment, in the case of ALS LTP-II measurements with flat optics, this systematic error is negligibly small. Nevertheless, after flipping and shifting, the SUT tilt with respect to the LTP was actually slightly (but significantly more than the total angular range of the measurements) changed; and averaging over the runs provided an additional suppression of the error, if any.
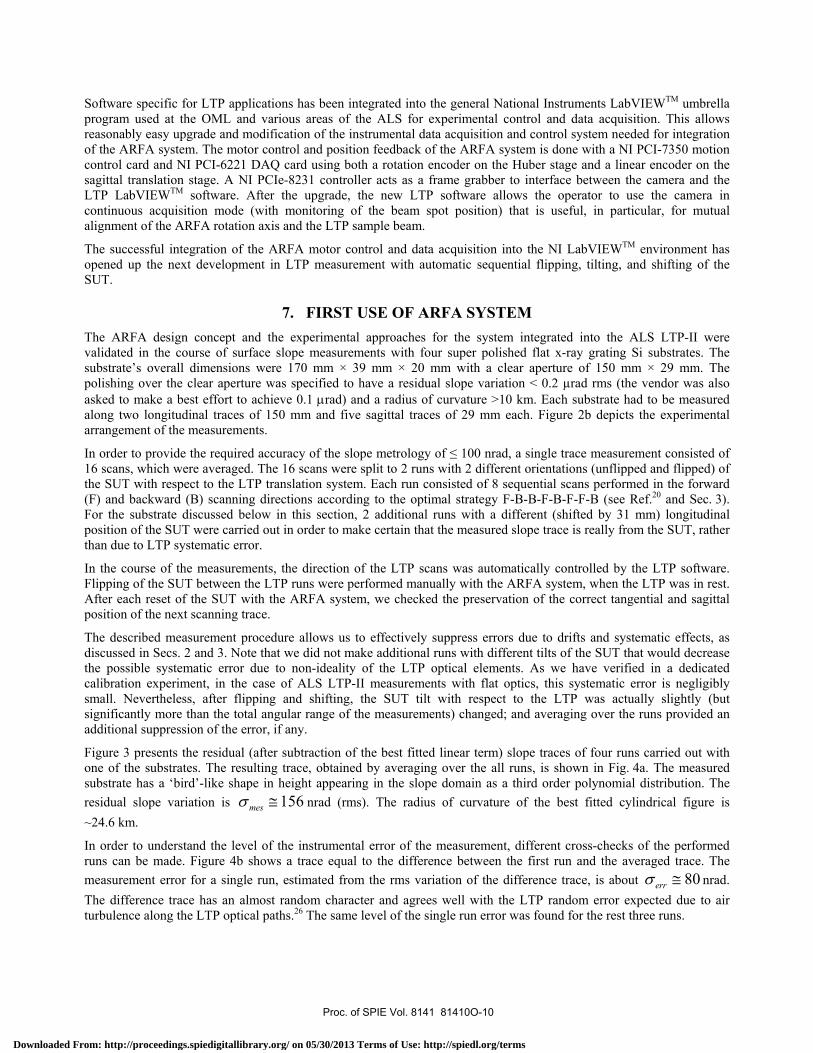
Figure 3 presents the residual (after subtraction of the best fitted linear term) slope traces of four runs carried out with one of the substrates. The resulting trace, obtained by averaging over the all runs, is shown in Fig. 4a. The measured substrate has a ‘bird’-like shape in height appearing in the slope domain as a third order polynomial distribution. The residual slope variation is 156mesσ ≅ nrad (rms). The radius of curvature of the best fitted cylindrical figure is ~24.6 km.
In order to understand the level of the instrumental error of the measurement, different cross-checks of the performed runs can be made. Figure 4b shows a trace equal to the difference between the first run and the averaged trace. The measurement error for a single run, estimated from the rms variation of the difference trace, is about 80errσ ≅ nrad. The difference trace has an almost random character and agrees well with the LTP random error expected due to air turbulence along the LTP optical paths.26 The same level of the single run error was found for the rest three runs.
Proc. of SPIE Vol. 8141 81410O-10
Downloaded From: http://proceedings.spiedigitallibrary.org/ on 05/30/2013 Terms of Use: http://spiedl.org/terms
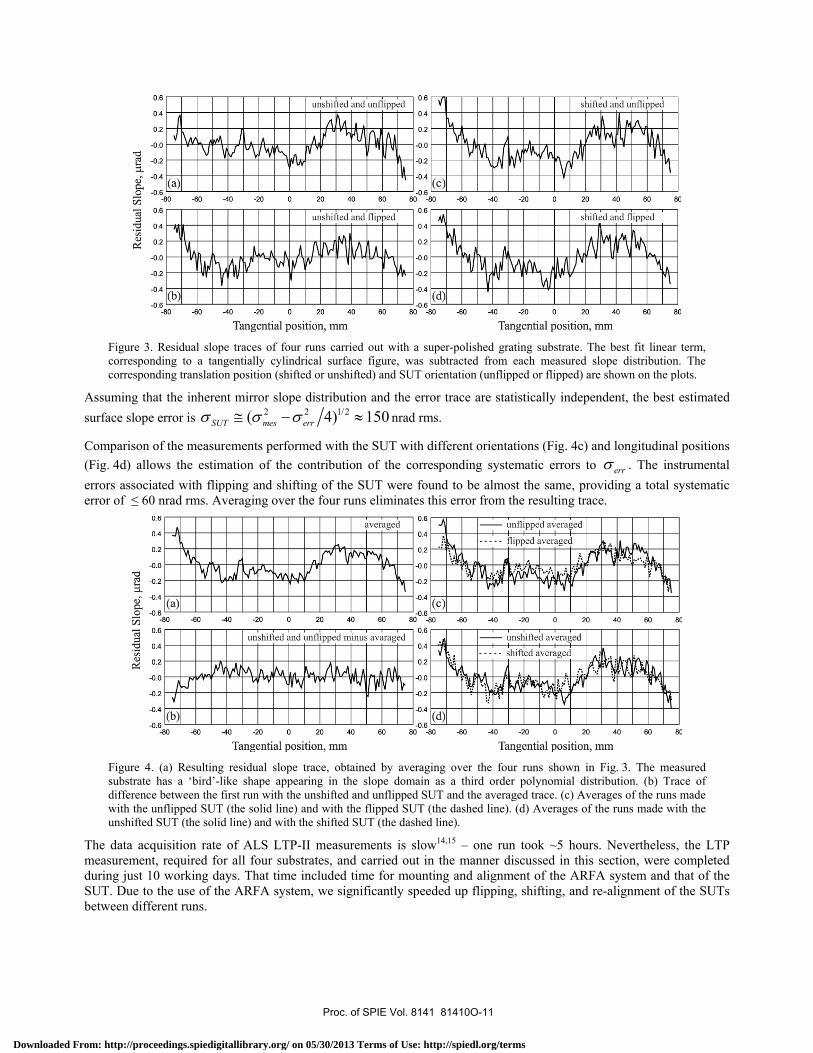
Figure 3. Residual slope traces of four runs carried out with a super-polished grating substrate. The best fit linear term, corresponding to a tangentially cylindrical surface figure, was subtracted from each measured slope distribution. The corresponding translation position (shifted or unshifted) and SUT orientation (unflipped or flipped) are shown on the plots.
Assuming that the inherent mirror slope distribution and the error trace are statistically independent, the best estimated surface slope error is 2 2 1/2( 4) 150SUT mes errσ σ σ≅ − ≈ nrad rms.
Comparison of the measurements performed with the SUT with different orientations (Fig. 4c) and longitudinal positions (Fig. 4d) allows the estimation of the contribution of the corresponding systematic errors to errσ . The instrumental errors associated with flipping and shifting of the SUT were found to be almost the same, providing a total systematic error of ≤ 60 nrad rms. Averaging over the four runs eliminates this error from the resulting trace.
Figure 4. (a) Resulting residual slope trace, obtained by averaging over the four runs shown in Fig. 3. The measured substrate has a ‘bird’-like shape appearing in the slope domain as a third order polynomial distribution. (b) Trace of difference between the first run with the unshifted and unflipped SUT and the averaged trace. (c) Averages of the runs made with the unflipped SUT (the solid line) and with the flipped SUT (the dashed line). (d) Averages of the runs made with the unshifted SUT (the solid line) and with the shifted SUT (the dashed line).
The data acquisition rate of ALS LTP-II measurements is slow14,15 – one run took ~5 hours. Nevertheless, the LTP measurement, required for all four substrates, and carried out in the manner discussed in this section, were completed during just 10 working days. That time included time for mounting and alignment of the ARFA system and that of the SUT. Due to the use of the ARFA system, we significantly speeded up flipping, shifting, and re-alignment of the SUTs between different runs.
Proc. of SPIE Vol. 8141 81410O-11
Downloaded From: http://proceedings.spiedigitallibrary.org/ on 05/30/2013 Terms of Use: http://spiedl.org/terms
7. CONCLUSIONS We have analyzed the major sources of the LTP measurement error and shown that a significant reduction of the error is achieved by averaging over multiple scans performed with an appropriate optimal combination of different SUT positions, orientations, and LTP scanning directions. We have derived the requirements and crucial specifications for an automatic SUT rotating, flipping, and aligning system that will realize the advantages of such an optimal (low noise) measurement procedure.
The ARFA system designed and fabricated for use with the ALS OML LTP-II has been described in detail. The system is based on a high precision, large diameter rotation stage and includes a specially designed kinematic translation stage mounted on the top of the rotation stage. It allows automatic rotation, flipping, and sagittal shifting of an SUT. The ARFA control system developed under the National Instruments LabVIEWTM umbrella has been integrated into the ALS LTP-II motion control and data acquisition system.
The high effectiveness of the design concept and the experimental approaches, used to develop the ARFA system integrated to the LTP-II, have been demonstrated via surface slope measurements with a super polished flat x-ray grating substrate. Using the ARFA system with the LTP-II provides high accuracy of the measurements due to a significant suppression of random, systematic, and drift errors. At the same time, the ARFA system allows us to more efficiently use the time assigned for the measurements without unnecessary time for multiple re-alignments of the SUT.
For complete integration of the ARFA system into the LTP-II, we will next develop an LTP measurement mode with automatic sequential flipping, tilting, and shifting of an SUT in a single run. This will require a special automatic procedure to compensate the spurious shift of the SUT sagittal position after flipping. The goal of the future upgrade of the LTP-II is to get a system that will provide totally automatic super-high precision measurements of one- and two-dimensional surface slope distributions, allowing unintended operation overnight when conditions are quieter.
APPENDIX
We start from Eq. (8) that describes the slope error δβ as a difference between the slope trace inherent for a tangential cylinder and the slope distribution measured along a scanning line misaligned by an angle δα :
1 2 2 2 1 2
'( , 0) '( , 0)
(1 ) (1 ) ,
y x y x
Cos Cos
δβ δα δα
ξ ξ ξ δα ξ δα− −
≅ = − ≠
= ⋅ − − ⋅ ⋅ − (A1)
where 2 2 1x Rξ = << . Considering only the liner terms of the Taylor series of 1 2(1 )ξ −− and 2 1 2(1 )Cosξ δα −− :
1 2
2 1 2 2
(1 ) 1 2 and(1 ) 1 2,Cos Cos
ξ ξ
ξ δα δα ξ
−
−
− ≈ +
− ⋅ ≈ + ⋅ (A2)
we obtain from (A1)
2 2
2 4
(1 2) (1 2)
1 2 2) .
Cos Cos
Cos Cos
δβ ξ ξ ξ δα δα ξ
ξ ξ δα δα ξ
≅ ⋅ + − ⋅ ⋅ + ⋅
⎡ ⎤= ⋅ + − − ⋅⎣ ⎦ (A3)
Assuming δα <<1,
2 2
4 2 2 2
1 and(1 ) 1 2 .
CosCos
δα δα
δα δα δα
≈ −
≈ − ≈ − (A4)
Inserting (A4) into (A3), we find
Proc. of SPIE Vol. 8141 81410O-12
Downloaded From: http://proceedings.spiedigitallibrary.org/ on 05/30/2013 Terms of Use: http://spiedl.org/terms
2 2 2 2
2 2 2 2
1 11 1 (1 2 )2 2
( ) .
δβ ξ ξ δα ξ δα
ξ δα ξ δα ξ δα
⎡ ⎤≈ + − + − −⎢ ⎥⎣ ⎦= ⋅ + ⋅ ≈ ⋅
(A5)
Finally from (A5), we get [compare with Eq. (18)]:
1 2 Rx
δα δβ≈ . (A6)
ACKNOWLEDGEMENT The Advanced Light Source is supported by the Director, Office of Science, Office of Basic Energy Sciences, Material Science Division, of the U.S. Department of Energy under Contract No. DE-AC02-05CH11231 at Lawrence Berkeley National Laboratory. One author, Zulfiqar Ali, wishes to thank the HEC, Pakistan for providing Post-doctoral scholarship.
This document was prepared as an account of work sponsored by the United States Government. While this document is believed to contain correct information, neither the United States Government nor any agency thereof, nor The Regents of the University of California, nor any of their employees, makes any warranty, express or implied, or assumes any legal responsibility for the accuracy, completeness, or usefulness of any information, apparatus, product, or process disclosed, or represents that its use would not infringe privately owned rights. Reference herein to any specific commercial product, process, or service by its trade name, trademark, manufacturer, or otherwise, does not necessarily constitute or imply its endorsement, recommendation, or favoring by the United States Government or any agency thereof, or The Regents of the University of California. The views and opinions of authors expressed herein do not necessarily state or reflect those of the United States Government or any agency thereof or The Regents of the University of California.
REFERENCES [1] L. Assoufid, O. Hignette, M. Howells, S. Irick, H. Lammert, and P. Takacs, “Future metrology needs for
synchrotron radiation grazing-incidence optics,” Nucl. Instrum. and Methods A 467-468, 267-70 (2001). [2] P. Z. Takacs, “X-ray optics metrology,” in [Handbook of Optics], 3rd ed., Vol. V, M. Bass, Ed., Chapter 46,
McGraw-Hill, New York (2009). [3] L. Samoylova, H. Sinn, F. Siewert, H. Mimura, K. Yamauchi, T. Tschentscher, “Requirements on Hard X-ray
Grazing Incidence Optics for European XFEL: Analysis and Simulation of Wavefront Transformations,” Proc. SPIE 7360, 73600E-1-9 (2009).
[4] E. Debler, K. Zander, PTB Mitteilungen Forschen + Prüfen, Amts und Mitteilungsblatt der Physikalisch Technischen Bundesanstalt, Braunschweig und Berlin (1979), pp. 339-349.
[5] F. Siewert, T. Noll, T. Schlegel, T. Zeschke, and H. Lammert, in: AIP Conference Proceedings 705, American Institute of Physics, Mellville, NY (2004), pp. 847-850.
[6] H. Lammert, T. Noll, T. Schlegel, F. Siewert, T. Zeschke, Patent No.: DE 103 03 659 (28 July 2005). [7] F. Siewert, H. Lammert, T. Zeschke, “The Nanometer Optical Component Measuring Machine;” in: [Modern
Developments in X-ray and Neutron Optics], Springer (2008). [8] S. G. Alcock, K. J. S. Sawhney, S. Scott, U. Pedersen, R. Walton, F. Siewert, T. Zeschke, et al., “The Diamond-
NOM: A non-contact profiler capable of characterizing optical figure error with sub-nanometre repeatability,” Nucl. Instrum. and Methods A 616(2-3), 224-228 (2010).
[9] Y. Senba, H. Kishimoto, H. Ohashi, H. Yumoto, T. Zeschke, F. Siewert, S. Goto, T. Ishikawa, “Upgrade of long trace profiler for characterization of high-precision X-ray mirrors at SPring-8,” Nucl. Instrum. and Methods A 616(2-3), 237-240 (2010).
[10] A. Rommeveaux, O. Hignette, C. Morawe, “Mirror metrology and bender characterization at ESRF,” Proc. SPIE 5921, 59210N/1-8 (2005).
[11] A. Rommeveaux, M. Thomasset, D. Cocco, “The Long Trace Profilers,” in Modern Developments in X-ray and Neutron Optics, A. Erko, M. Idir, T. Krist, A. G. Michette, Eds., Chapter 10, Springer-Verlag, Berlin/Heidelberg (2008).
[12] M. Thomasset, S. Brochet, F. Polack, “Latest metrology results with the SOLEIL synchrotron LTP,”Proc. SPIE 5921, 592102-1-9 (2005).
Proc. of SPIE Vol. 8141 81410O-13
Downloaded From: http://proceedings.spiedigitallibrary.org/ on 05/30/2013 Terms of Use: http://spiedl.org/terms

[13] F. Polack, M. Thomasset, S. Brochet, A. Rommeveaux, “An LTP stitching procedure with compensation of instrument errors: Comparison of SOLEIL and ESRF results on strongly curved mirrors,” Nucl. Instrum. and Methods A 616(2-3), 207-211 (2010).
[14] J. L. Kirschman, E. E. Domning, W. R. McKinney, G. Y. Morrison, B. V. Smith, and V. V. Yashchuk, "Performance of the upgraded LTP-II at the ALS Optical Metrology Laboratory," Proc. SPIE 7077, 70770A-1-12 (2008).
[15] W. R. McKinney, M. Anders, S. K. Barber, E. E. Domning, Y. Lou, G. Y. Morrison, F. Salmassi, B. V. Smith, and V. V. Yashchuk, ”Studies in Optimal Configuration of the LTP”, Proc. SPIE 7801, 780106-1-12 ( 2010).
[16] V. V. Yashchuk, S. Barber, E. E. Domning, J. L. Kirschman, G. Y. Morrison, B. V. Smith, F. Siewert, T. Zeschke, R. Geckeler, A. Just, “Sub-microradian surface slope metrology with the ALS Developmental Long Trace Profiler,” Nucl. Instrum. and Methods A, 616(2-3), 212-223 (2010).
[17] H. Lammert, F. Senf, and M. Berger “Improvement of synchrotron radiation mirrors below the 0.1-arcsec rms slope error limit with the help of a long trace profiler,” Proc. SPIE 3152, 168 (1997).
[18] P. Z. Takacs, and S. Qian, "Accuracy Limitations in Long-Trace Profilometry," AIP Conf. Proc. 705, 831-834 (2004).
[19] V. V. Yashchuk, "Positioning errors of pencil-beam interferometers for long trace profilers," Proc. SPIE 6317, 63170A/1-12 (2006).
[20] V. V. Yashchuk, “Optimal measurement strategies for effective suppression of drift errors,” Rev. Sci. Instrum. 80, 115101-10 (2009).
[21] F. Siewert, J. Buchheim, and T. Zeschke, “Characterization and calibration of 2nd generation slope measuring profiler,” Nucl. Instrum. and Methods A 616(2-3), 119-127 (2010).
[22] S. C. Irick, W. R. McKinney, D. L. J. Lunt, and P. Z. Takacs, “Using a straightness reference in obtaining more accurate surface profiles from a long trace profiler,” Rev. Sci. Instrum. 63(1), 1436-8 (1992).
[23] S. C. Irick, “Improved measurement accuracy in a long trace profiler: compensation for laser pointing instability,” Nucl. Instrum. and Methods A 347(1-3), 226-30 (1994).
[24] P. Z. Takacs, C. J. Bresloff, “Significant improvements in long trace profiler measurement performance,” Proc. SPIE 2856, 236-245 (1996).
[25] J. Pawliszyn, M. F. Weber, M. J. Dignam, “Dual-beam laser deflection sensor,” Rev. Sci. Instrum. 56(9), 1740-1743 (1985).
[26] V. V. Yashchuk, S. C. Irick, A. A. MacDowell, W. R. McKinney, P. Z. Takacs, “Air convection noise of pencil-beam interferometer for long-trace profiler,” Proc. SPIE 6317, 63170D-1-12 (2006).
[27] V. V. Yashchuk, W. R. McKinney, T. Warwick, T. Noll, F. Siewert, T. Zeschke, and R. D. Geckeler, “Proposal for a Universal Test Mirror for Characterization of Slope Measuring Instruments”, Proc. SPIE 6704, 67040A-1-12 (2007).
[28] V. V. Yashchuk, S. C. Irick, A. A. MacDowell, “Elimination of ‘ghost’-effect-related systematic errors in metrology of X-ray optics with a long trace profiler,” Proc. SPIE 5858, 58580X1-1-12 (2005).
[29] J. L. Kirschman, B. V. Smith, E. E. Domning, S. C. Irick, A. A. MacDowell, W. R. McKinney, G. Y. Morrison, B. V. Smith, T. Warwick, and V. V. Yashchuk, “Flat-Field Calibration of CCD Detector for Long Trace Profilers,” Proc. SPIE 6704, 67040J-1-12 (2007).
[30] M. Thomasset and F. Polack, “Characterization of optical surfaces for the present generations of synchrotron sources,” Proc. SPIE 7155, 715506-1-12 (2008).
[31] S. Qian and P. Takacs, “Equal optical path beam splitters by use of amplitude-splitting and wavefront-splitting methods for pencil beam interferometer,” Proc. SPIE 5193, 79-88 (2004).
[32] S. Qian and P. Takas, “Wave front-splitting phase shift beam splitter for pencil beam interferometer,” Rev. Sci. Instr. 74(11), 4881-4 (2003).
[33] S. C. Irick, W. R. McKinney, D. Peterman, and V. V. Yashchuk, "Performance Test of the Long Trace Profiler. Part 5.1: Systematic Noise due to Laser Pointing Instability," LSBL Note LSBL-762, 1-13 (2005).
[34] Melles Griot Inc., "57 ICS-Series Fiber-Coupled Diode Lasers Module," http://lasers.mellesgriot.com. [35] D. Kavaldjiev and Z. Ninkov, “Subpixel sensitivity map for a charge-coupled device sensor,” Opt. Eng. 37(3), 948-
54 (1998). [36] D. K. C. MacDonald, [Noise and Fluctuations: An Introduction], Dover, New York (2006). [37] P. Refregier, [Noise theory and Application to Physics, Springer], New York (2003). [38] G. E. Harrison, M. A. Player, and P. G. H. Sandars, “A multichannel phase-sensitive detection method using
orthogonal square waveforms,” J. Phys. E: Sci. Instrum. 4, 750–754 (1971).
Proc. of SPIE Vol. 8141 81410O-14
Downloaded From: http://proceedings.spiedigitallibrary.org/ on 05/30/2013 Terms of Use: http://spiedl.org/terms

[39] G. E. Harrison, P. G. H. Sandars, and S. J. Wright, “Experimental limit on the proton electric dipole moment,” Phys. Rev. Lett. 22, 1263–1265 (1969).
[40] M. A. Player and P. G. H. Sandars, “An experiment to search for an electric dipole moment in the 3P2 metastable state of xenon,” J. Phys. B: Atom. Molec. Phys. 3, 1620–1265 (1970).
[41] S. Altarev, Yu. V. Borisov, N. V. Borovikova, A. I. Egorov, S. N. Ivanov, E. A. Kolomensky, M. S. Lasakov, V. M. Lobashev, V. A. Nazarenko, A. N. Pirozhkov, AP A. P. Serebrov, Yu. V. Sobolev, E. V. Shulgina, “Search for the neutron electric dipole moment,” Phys. Atom. Nucl. 59(12), 1152–70 (1996).
[42] C. A. Baker, D. D. Doyle, P. Geltenbort, K. Green, M. G. D. van der Grinten, P. G. Harris, P. Iaydjiev, S. N. Ivanov, D. J. R. May, J. M. Pendlebury, J. D. Richardson, D. Shiers, K. F. Smith, “Improved experimental limit on the electric dipole moment of the neutron,” Phys. Rev. Lett. 97(14), 131801/1–4 (2006).
[43] B. C. Regan, E. D. Commins, C. J. Schmidt, and D. DeMille, “New Limit on the Electron Electric Dipole Moment,” Phys. Rev. Lett. 88(12), 071805/1–4 (2002).
[44] W. C. Griffith, M. D. Swallows, T. H. Loftus, M. V. Romalis, B. R. Heckel, and E. N. Fortson, “Improved Limit on the Permanent Electric Dipole Moment of 199Hg,” Phys. Rev. Lett. 102(4), 101601/1–4 (2009).
[45] S. A. Murthy, D. Krause, Z. L. Li, and L. R. Hunter, “New limits on the electron electric dipole moment from cesium,” Phys. Rev. Lett. 63, 965–968 (1989).
[46] Edward A. Hinds and P. G. Sandars, “Experiment to search for P- and T-violating interactions in the hyperfine structure of thallium fluoride,” Phys. Rev. A 21, 480–483 (1980).
[47] J. J. Hudson, B. E. Sauer, M. R. Tarbutt, and E. A. Hinds, “Measurement of the Electron Electric Dipole Moment Using YbF Molecules,” Phys. Rev. Lett. 89, 023003/1–4 (2002).
[48] B. J. Heidenreich, O. T. Elliott, N. D. Charney, K. A. Virgien, A. W. Bridges, M. A. McKeon, S. K. Peck, D. Krause, J. E. Gordon, L. R. Hunter, and S. K. Lamoreaux, “Limit on the Electron Electric Dipole Moment in Gadolinium-Iron Garnet,” Phys. Rev. Lett. 95, 253004/1–4 (2005).
[49] V. V. Yashchuk, P. Z. Takacs, W.R. McKinney, L. Assoufid, F. Siewert, T. Zeschke, “Development of a new generation of optical slope measuring profiler,” Nucl. Instrum. and Methods A 649(1), 153-155 (2011).
[50] F. Siewert, J. Buchheim, T. Zeschke, G. Brenner, S. Kapitzki, K. Tiedtke, “Sub-nm accuracy metrology for ultra-precise reflective X-ray optics,” Nucl. Instrum. and Methods A 635(1- S1), S52-S57 (2010).
[51] Huber 1-Circle Goniometer-440XE rotation stage. (http://www.xhuber.de/en/Products/ Positioning_Devices/Circle_Positioning/1_Circle_Goniometer/440/440.rsys).
Proc. of SPIE Vol. 8141 81410O-15
Downloaded From: http://proceedings.spiedigitallibrary.org/ on 05/30/2013 Terms of Use: http://spiedl.org/terms


