Embed Size (px)
Citation preview
Journal of Colloid and Interface Science 385 (2012) 225–234
Contents lists available at SciVerse ScienceDirect
Journal of Colloid and Interface Science
www.elsevier .com/locate / jc is
Attractive double-layer forces and charge regulation upon interaction betweenelectrografted amine layers and silica
Gunnar Dunér a,⇑, Joseph Iruthayaraj b, Kim Daasbjerg b, Steen Uttrup Pedersen b, Esben Thormann a,Andra Dedinaite a,c
a KTH Royal Institute of Technology, School of Chemical Sciences and Engineering, Department of Chemistry, Surface and Corrosion Science, Drottning Kristinas väg 51,SE-100 44 Stockholm, Swedenb Department of Chemistry, Aarhus University, Langelandsgade 140, DK-8000 Aarhus, Denmarkc YKI, Institute for Surface Chemistry, Box 5607, SE-114 86 Stockholm, Sweden
a r t i c l e i n f o a b s t r a c t
Article history:Received 14 May 2012Accepted 25 June 2012Available online 7 July 2012
Keywords:Double-layer forceSurface chargeSurface potentialAFMPhenylethylamineElectrografting
0021-9797/$ - see front matter � 2012 Elsevier Inc. Ahttp://dx.doi.org/10.1016/j.jcis.2012.06.071
⇑ Corresponding author. Fax: +46 (0) 8 20 82 84.E-mail address: [email protected] (G. Dunér).
Amine functionalities have been introduced on glassy carbon surfaces through electrografting of 4-(2-aminoethyl)benzenediazonium tetrafluoroborate. The grafted layers were characterized by ellipsometryand by nanomechanical mapping in air and aqueous solutions using the atomic force microscopy Peak-Force QNM mode. The layer was found to be 2.5 nm thick with low roughness, comparable to that of theglassy carbon substrate. However, small semi-spherical features were observed in the topographicalimage, indicating a clustering of the grafted amine compound. The nanomechanical mapping also dem-onstrated some swelling of the layer in water and pointed toward an important contribution of electro-static interactions for the tip-surface adhesion. The forces between an aminated glassy carbon surfaceand a lm-sized silica particle in aqueous solutions were measured at different ionic strength and pH-val-ues. The results demonstrate that an attractive double-layer force predominates at large separations, andthat the surface charge densities increase as the separation between the surfaces decreases. The degree ofcharge regulation on the aminated glassy carbon is significant. The relatively low surface charge densityof the aminated glassy carbon is attributed to significant incorporation of counterions in the water-richgrafted layer.
� 2012 Elsevier Inc. All rights reserved.
1. Introduction
The classical theoretical work on double layer forces by Derja-guin and Landau [1] and Verwey and Overbeek [2,3] treated thecase of two identically charged surfaces, where the ion distributionwas calculated by solving the Poisson Boltzmann equation. Also inpractice, the majority of experimental studies have been devotedto investigation of interactions between charged surfaces carryingthe same charge. Subsequently, the theoretical treatment of doublelayer forces between oppositely charged surfaces under constantpotential and constant charge [4] as well as under constant chem-ical potential [5] boundary conditions was developed within theframework of the non-linear Poisson–Boltzmann approximation.Experimental studies of the interaction between oppositelycharged surfaces remain relatively few, despite being of greatimportance. However, during the recent years, the attention toelectrostatic interactions between oppositely charged surfaces im-mersed in aqueous electrolyte solutions has increased consider-ably, as can be seen from the growing body of literature
ll rights reserved.
discussing experimental [6–13] and theoretical [4,14–22] aspectsof the problem.
From the experimental point of view, it is easy to obtain well-characterized negatively charged surface, such as mica or silica,in aqueous solution, whereas to find equally well-characterizedpositively charged surfaces is more difficult and this often hampersinvestigations of interactions between oppositely charged surfaces.Of course, such surfaces also exist and Larson et al. [12] have em-ployed silica and a-alumina that have different isoelectric pointsand at certain pH values are oppositely charged. This property en-abled the authors to study both repulsive and attractive double-layer interactions between these surfaces. Another way to createa positively charged surface was used by Dahlgren [23] and Kampfet al. [7] who adsorbed cationic polyelectrolytes on mica plates,thus obtaining a positively overcharged surface that could beprobed against a negatively charged bare mica. Normally, theinteraction between surfaces coated with polyelectrolytes of oppo-site charge is dominated by a bridging attraction, when some poly-electrolyte segments cross the mid-plane [24,25]. The bridgingattraction is stronger and longer range when only one surface iscoated with polyelectrolyte [23]. However, this was not the casein the work of Kampf et al. [7] where no bridging or material trans-
226 G. Dunér et al. / Journal of Colloid and Interface Science 385 (2012) 225–234
fer was detected and sub-Debye-length attraction between a chito-san coated surface and a bare mica plate was measured in water.Despite the above experimental successes, it is desirable to developstable surfaces carrying positively charged groups that are chemi-cally attached to the substrates.
Self-assembly techniques utilizing silane and thiol chemistrieshave been extensively used to attach monolayers with differentfunctional groups on various surfaces. Although simple to prepare,the layers formed are not completely stable at high temperatures[26,27] or in aqueous environment. For instance, silane modifiedsurfaces can lose functionality in aqueous environment [11,28]and alkanethiol self-assembled monolayers (SAMs) may degradeif exposed to air [29] or oxidize and desorb [30]. In many techno-logical applications, robust surface coatings that are resistant toharsh environments are a prerequisite, and an alternative way toprepare robust surface layers is to covalently bind functionalgroups on conducting surfaces by electrografting via electrochem-ical reduction of aryl diazonium salts [31] and aryl iodonium salts[32–34]. This technique has been applied to immobilize variousfunctional groups such as alkylamine, thiophenolates, hydroxyand aldehydes [35,36] on surfaces such as glassy carbon (GC)[33,34] and metal oxides [37]. It has been shown that under certainconditions, aryl films formed from reduction of diazonium salts areeven more strongly bound to gold surfaces than the thiol analogues[38].
Glassy carbon is widely used as an electrode material. It hassome excellent properties such as low roughness, electrical con-ductivity, low surface energy, low density, high strength, abilityto withstand high temperature and acids, and it is regarded asbeing biocompatible [39]. Considerable research efforts are focusedon modification of GC electrodes in order to use them as sensors forspecific biochemical processes [40–43]. Modification of GC sur-faces with relevant functional groups is also important for promot-ing adhesion and controlling friction and wear [44]. Further, GCsurfaces modified with hydroxyl and amine groups have founduse as substrates for anchoring ATRP (atom transfer radical poly-merization) initiators [45].
The surface modification of GC through the electrochemicalroute is successful in terms of simplicity, robustness, and flexibilityto incorporate diverse functional groups. However, the layersformed by this method are often multilayered and porous [46]and thus not as well ordered as, for example, thiols on gold sur-faces. Some recent approaches though have addressed controllabil-ity on the layer structure [47,48]. It is thus important to gain betterunderstanding of the structure of electrochemically grafted layersin order to control surface properties. In the present work, weinvestigate the morphology of electrochemically grafted layers ofphenylethylamine (PEA) on glassy carbon substrates using AFMimaging with the PeakForce QNM1 method that allows us to mapnot only the surface roughness but also the nanomechanical proper-ties across the surface with a nanometer resolution. We also describethe interactions between one positively charged GC-PEA surface anda negatively charged colloidal silica particle in aqueous solution atdifferent ionic strengths and pH-values.
N NNH2
BF4NH2
NH2
NH2A B
2. Experimental2.1. Materials
Acetonitrile (MeCN), acetone, hexane, and ethanol were of ana-lytical grade and used as received. The supporting electrolyte, tet-rabutylammonium tetrafluoroborate (Bu4NBF4), was synthesizedfollowing standard procedure. Deconex (2% v/v) from Borer Chemie
1 QNM stands for Quantitative Nanomechanical Property Mapping.
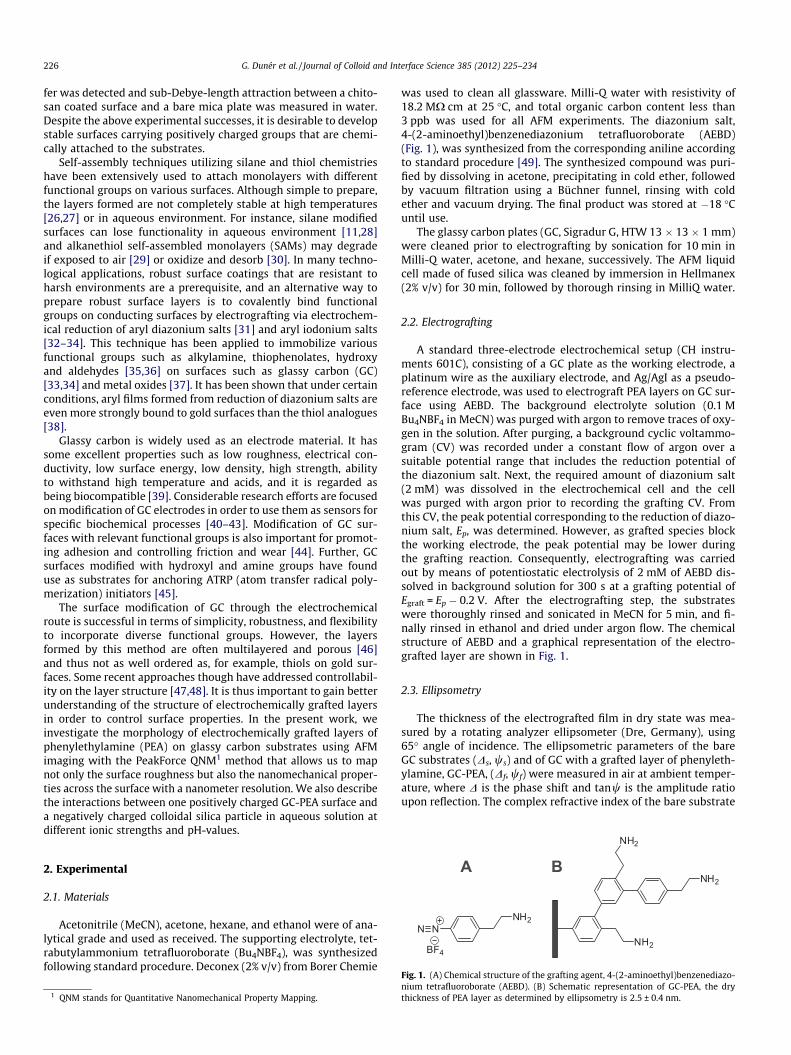
was used to clean all glassware. Milli-Q water with resistivity of18.2 MX cm at 25 �C, and total organic carbon content less than3 ppb was used for all AFM experiments. The diazonium salt,4-(2-aminoethyl)benzenediazonium tetrafluoroborate (AEBD)(Fig. 1), was synthesized from the corresponding aniline accordingto standard procedure [49]. The synthesized compound was puri-fied by dissolving in acetone, precipitating in cold ether, followedby vacuum filtration using a Büchner funnel, rinsing with coldether and vacuum drying. The final product was stored at �18 �Cuntil use.
The glassy carbon plates (GC, Sigradur G, HTW 13 � 13 � 1 mm)were cleaned prior to electrografting by sonication for 10 min inMilli-Q water, acetone, and hexane, successively. The AFM liquidcell made of fused silica was cleaned by immersion in Hellmanex(2% v/v) for 30 min, followed by thorough rinsing in MilliQ water.
2.2. Electrografting
A standard three-electrode electrochemical setup (CH instru-ments 601C), consisting of a GC plate as the working electrode, aplatinum wire as the auxiliary electrode, and Ag/AgI as a pseudo-reference electrode, was used to electrograft PEA layers on GC sur-face using AEBD. The background electrolyte solution (0.1 MBu4NBF4 in MeCN) was purged with argon to remove traces of oxy-gen in the solution. After purging, a background cyclic voltammo-gram (CV) was recorded under a constant flow of argon over asuitable potential range that includes the reduction potential ofthe diazonium salt. Next, the required amount of diazonium salt(2 mM) was dissolved in the electrochemical cell and the cellwas purged with argon prior to recording the grafting CV. Fromthis CV, the peak potential corresponding to the reduction of diazo-nium salt, Ep, was determined. However, as grafted species blockthe working electrode, the peak potential may be lower duringthe grafting reaction. Consequently, electrografting was carriedout by means of potentiostatic electrolysis of 2 mM of AEBD dis-solved in background solution for 300 s at a grafting potential ofEgraft = Ep � 0.2 V. After the electrografting step, the substrateswere thoroughly rinsed and sonicated in MeCN for 5 min, and fi-nally rinsed in ethanol and dried under argon flow. The chemicalstructure of AEBD and a graphical representation of the electro-grafted layer are shown in Fig. 1.
2.3. Ellipsometry
The thickness of the electrografted film in dry state was mea-sured by a rotating analyzer ellipsometer (Dre, Germany), using65� angle of incidence. The ellipsometric parameters of the bareGC substrates (Ds, ws) and of GC with a grafted layer of phenyleth-ylamine, GC-PEA, (Df, wf) were measured in air at ambient temper-ature, where D is the phase shift and tanw is the amplitude ratioupon reflection. The complex refractive index of the bare substrate
Fig. 1. (A) Chemical structure of the grafting agent, 4-(2-aminoethyl)benzenediazo-nium tetrafluoroborate (AEBD). (B) Schematic representation of GC-PEA, the drythickness of PEA layer as determined by ellipsometry is 2.5 ± 0.4 nm.
G. Dunér et al. / Journal of Colloid and Interface Science 385 (2012) 225–234 227
was calculated from the measured (Ds,ws) values. A three-layeroptical model consisting of the substrate with a complex refractiveindex, the grafted layer with a refractive index nf and thickness df,and the refractive index of the surrounding medium (nair) was usedto calculate the overall reflection coefficients for in-plane (Rp) andout-of-plane (Rs) polarized lights using the method described else-where [50,51]. A constant value of nf = 1.55 was assumed for theelectrografted film in order to calculate the thickness.
3. Atomic force microscopy
3.1. PeakForce QNM topographical and nanomechanical mapping
Imaging and force measurements (for Peak Force calibration)were carried out using a multimode atomic force microscope, aNanoScope V controller (Bruker AXS), equipped with a fused silicaliquid cell (Bruker AXS) for imaging in fluid. Imaging was carriedout using peak force tapping, which enables high-resolution imag-ing at low feedback forces and enable mapping of nanomechanicalproperties with the PeakForce QNM™ software package (Bruker).These measurements are done by oscillating the sample in the nor-mal direction, with a frequency of 2 kHz, while scanning the sam-ple in the lateral direction. The amplitude of the normal oscillationis set to bring the sample and AFM-tip in contact during each per-iod of oscillation and a complete approach and retraction forcecurve is hereby obtained at each lateral surface coordinate. Theseforce curves are then used to extract parameters as adhesion,deformation, and energy dissipation (see Fig. 2).
V-shaped silicon nitride cantilevers (ScanAsyst Fluid+, BrukerAXS) with silicon tips of nominal 2 nm radius were used for Peak-Force QNM imaging. The spring constant was determined to0.74 N m�1 by the Hutter and Bechhoefer method [52]. For imagingin air, the ScanAsyst algorithm was enabled, whereas in liquid, thepeak force was set to 4 nN. The images were obtained at a scan rateof 0.97 Hz, consisting of 512 � 512 pixels.
The deflection sensitivity was determined from the constantcompliance region for bare glassy carbon in air and GC-PEA inaqueous solution. Topography, adhesion, deformation, and dissipa-tion data were obtained on the fly from the force vs. separationdata, and the NanoScope Analysis (v. 1.20) software was used forobtaining topography, adhesion, deformation, and dissipationimages. Tilt in the recorded height data was removed by fittingand subtracting polynomials of the first order in the horizontaldirection for every scan line (1st order flattening). Image data wereexported in ASCII format and imported and visualized in MATLAB�.
Forc
e
Separation
A
B
C
D
E
Fig. 2. A schematic illustration of force versus separation curve on approach (solidline) and retraction (dashed line). It illustrates that the Peak Force (interval A) is themaximum applied force, adhesion (B) is the difference between the zero force andthe minimum value of the force on retraction, the deformation fit region (C)encompasses the force curve 85% from the peak force. The deformation (D) is thedistance between the surfaces at 15% of the peak force value and at the peak forcevalue. The shaded area (E) represents the energy dissipated during execution of oneforce curve.
3.2. Force measurements
The forces acting between a silica particle and GC-PEA weredetermined in aqueous solution of different pH and ionic strengthsutilizing a MultiMode Atomic Force Microscope with NanoscopeMultimode IIIa and Pico Force controllers (Bruker AXS) equippedwith a fused silica liquid cell. The spring-constants of the gold-coated tipless cantilevers (NCSC12/Cr–Au F-lever, MikroMasch,Tallin, Estonia) were determined by the Sader method [53,54],using the AFM Tune IT v 2.5 software (Force IT, Sweden). The silicaparticle was attached to the cantilever using high-temperaturemelting epoxy glue (Epikote 1004, Shell Chemicals) with the aidof an Eppendorf Micromanipulator 5171 and a Nikon Optiphot100S reflection microscope. The exact diameter of the particleswas also determined using the Nicon Optiphot 100S reflectionmicroscope, employing image analysis with National InstrumentVision Assistant 8.0. Raw data of cantilever deflection versus piezodisplacement was converted to force versus distance by definingthe deflection sensitivity for each individual force curve from theregion of constant compliance [55].
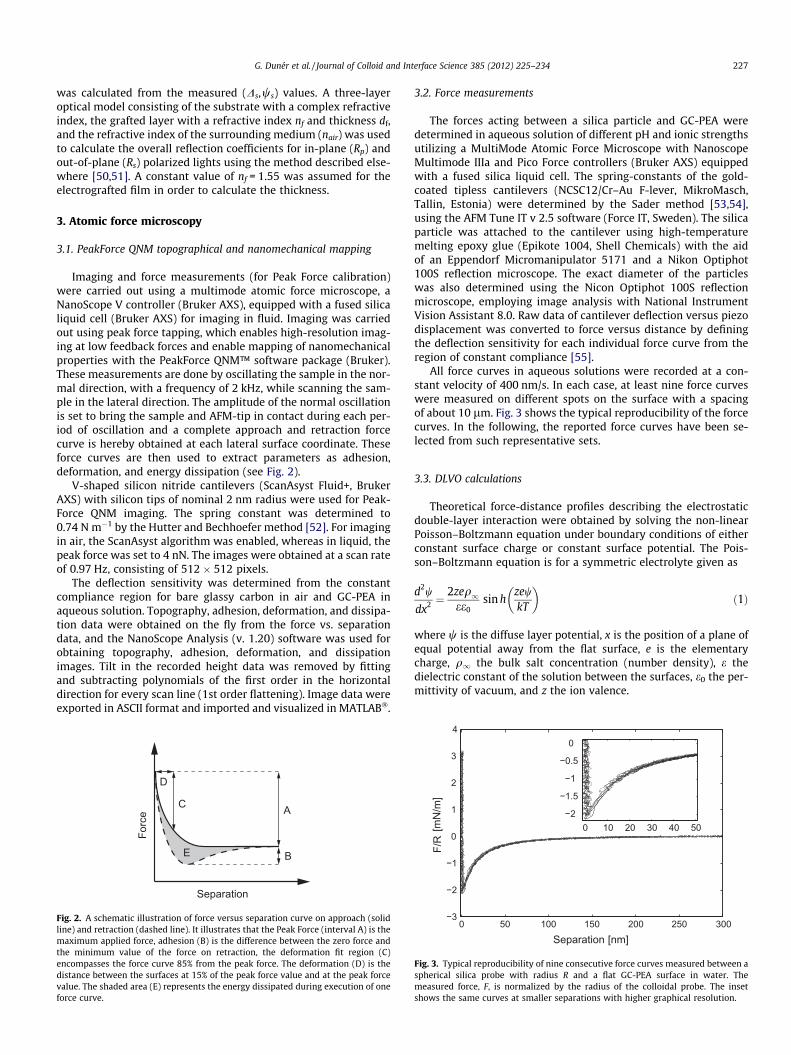
All force curves in aqueous solutions were recorded at a con-stant velocity of 400 nm/s. In each case, at least nine force curveswere measured on different spots on the surface with a spacingof about 10 lm. Fig. 3 shows the typical reproducibility of the forcecurves. In the following, the reported force curves have been se-lected from such representative sets.
3.3. DLVO calculations
Theoretical force-distance profiles describing the electrostaticdouble-layer interaction were obtained by solving the non-linearPoisson–Boltzmann equation under boundary conditions of eitherconstant surface charge or constant surface potential. The Pois-son–Boltzmann equation is for a symmetric electrolyte given as
d2w
dx2 ¼2zeq1ee0
sin hzewkT
� �ð1Þ
where w is the diffuse layer potential, x is the position of a plane ofequal potential away from the flat surface, e is the elementarycharge, q1 the bulk salt concentration (number density), e thedielectric constant of the solution between the surfaces, e0 the per-mittivity of vacuum, and z the ion valence.
0 50 100 150 200 250 300−3
−2
−1
0
1
2
3
4
F/R
0 10 20 30 40 50−2
−1.5
−1
−0.5
0
Separation [nm]
[mN
/m]
Fig. 3. Typical reproducibility of nine consecutive force curves measured between aspherical silica probe with radius R and a flat GC-PEA surface in water. Themeasured force, F, is normalized by the radius of the colloidal probe. The insetshows the same curves at smaller separations with higher graphical resolution.
E [V vs Ag/Al]
i [x1
03 A]
0.0
-0.1
-0.2
-0.3
-0.4
-1.0 -0.5 0.0 0.5 1.0 1.5
1
2
3
Electrolysis at -0.4 V for 300 s
i [x1
03 A]
Time [s]0 100 200 300
0.0
-0.1
-0.2
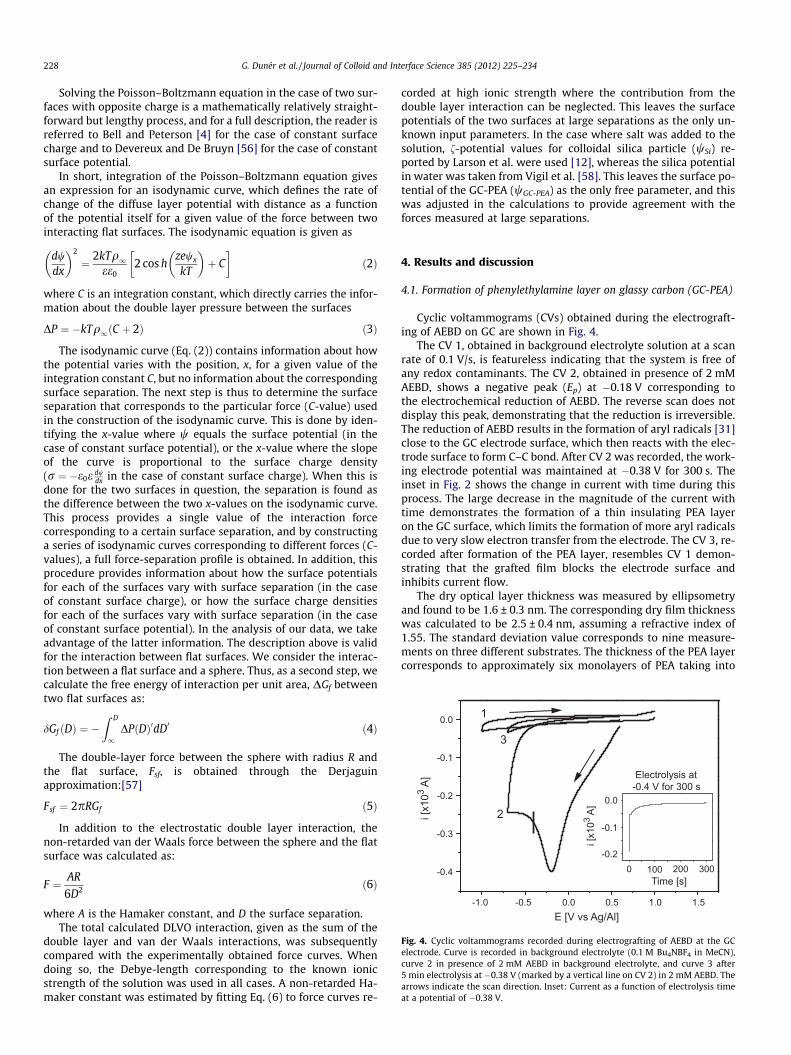
Fig. 4. Cyclic voltammograms recorded during electrografting of AEBD at the GCelectrode. Curve is recorded in background electrolyte (0.1 M Bu4NBF4 in MeCN),curve 2 in presence of 2 mM AEBD in background electrolyte, and curve 3 after5 min electrolysis at �0.38 V (marked by a vertical line on CV 2) in 2 mM AEBD. Thearrows indicate the scan direction. Inset: Current as a function of electrolysis timeat a potential of �0.38 V.
228 G. Dunér et al. / Journal of Colloid and Interface Science 385 (2012) 225–234
Solving the Poisson–Boltzmann equation in the case of two sur-faces with opposite charge is a mathematically relatively straight-forward but lengthy process, and for a full description, the reader isreferred to Bell and Peterson [4] for the case of constant surfacecharge and to Devereux and De Bruyn [56] for the case of constantsurface potential.
In short, integration of the Poisson–Boltzmann equation givesan expression for an isodynamic curve, which defines the rate ofchange of the diffuse layer potential with distance as a functionof the potential itself for a given value of the force between twointeracting flat surfaces. The isodynamic equation is given as
dwdx
� �2
¼ 2kTq1ee0
2 cos hzewx
kT
� �þ C
� �ð2Þ
where C is an integration constant, which directly carries the infor-mation about the double layer pressure between the surfaces
DP ¼ �kTq1ðC þ 2Þ ð3Þ
The isodynamic curve (Eq. (2)) contains information about howthe potential varies with the position, x, for a given value of theintegration constant C, but no information about the correspondingsurface separation. The next step is thus to determine the surfaceseparation that corresponds to the particular force (C-value) usedin the construction of the isodynamic curve. This is done by iden-tifying the x-value where w equals the surface potential (in thecase of constant surface potential), or the x-value where the slopeof the curve is proportional to the surface charge density(r ¼ �e0e dw
dx in the case of constant surface charge). When this isdone for the two surfaces in question, the separation is found asthe difference between the two x-values on the isodynamic curve.This process provides a single value of the interaction forcecorresponding to a certain surface separation, and by constructinga series of isodynamic curves corresponding to different forces (C-values), a full force-separation profile is obtained. In addition, thisprocedure provides information about how the surface potentialsfor each of the surfaces vary with surface separation (in the caseof constant surface charge), or how the surface charge densitiesfor each of the surfaces vary with surface separation (in the caseof constant surface potential). In the analysis of our data, we takeadvantage of the latter information. The description above is validfor the interaction between flat surfaces. We consider the interac-tion between a flat surface and a sphere. Thus, as a second step, wecalculate the free energy of interaction per unit area, DGf betweentwo flat surfaces as:
dGf ðDÞ ¼ �Z D
1DPðDÞ0dD0 ð4Þ
The double-layer force between the sphere with radius R andthe flat surface, Fsf, is obtained through the Derjaguinapproximation:[57]
Fsf ¼ 2pRGf ð5Þ
In addition to the electrostatic double layer interaction, thenon-retarded van der Waals force between the sphere and the flatsurface was calculated as:
F ¼ AR
6D2 ð6Þ
where A is the Hamaker constant, and D the surface separation.The total calculated DLVO interaction, given as the sum of the
double layer and van der Waals interactions, was subsequentlycompared with the experimentally obtained force curves. Whendoing so, the Debye-length corresponding to the known ionicstrength of the solution was used in all cases. A non-retarded Ha-maker constant was estimated by fitting Eq. (6) to force curves re-
corded at high ionic strength where the contribution from thedouble layer interaction can be neglected. This leaves the surfacepotentials of the two surfaces at large separations as the only un-known input parameters. In the case where salt was added to thesolution, f-potential values for colloidal silica particle (wSi) re-ported by Larson et al. were used [12], whereas the silica potentialin water was taken from Vigil et al. [58]. This leaves the surface po-tential of the GC-PEA (wGC-PEA) as the only free parameter, and thiswas adjusted in the calculations to provide agreement with theforces measured at large separations.
4. Results and discussion
4.1. Formation of phenylethylamine layer on glassy carbon (GC-PEA)
Cyclic voltammograms (CVs) obtained during the electrograft-ing of AEBD on GC are shown in Fig. 4.
The CV 1, obtained in background electrolyte solution at a scanrate of 0.1 V/s, is featureless indicating that the system is free ofany redox contaminants. The CV 2, obtained in presence of 2 mMAEBD, shows a negative peak (Ep) at �0.18 V corresponding tothe electrochemical reduction of AEBD. The reverse scan does notdisplay this peak, demonstrating that the reduction is irreversible.The reduction of AEBD results in the formation of aryl radicals [31]close to the GC electrode surface, which then reacts with the elec-trode surface to form C–C bond. After CV 2 was recorded, the work-ing electrode potential was maintained at �0.38 V for 300 s. Theinset in Fig. 2 shows the change in current with time during thisprocess. The large decrease in the magnitude of the current withtime demonstrates the formation of a thin insulating PEA layeron the GC surface, which limits the formation of more aryl radicalsdue to very slow electron transfer from the electrode. The CV 3, re-corded after formation of the PEA layer, resembles CV 1 demon-strating that the grafted film blocks the electrode surface andinhibits current flow.
The dry optical layer thickness was measured by ellipsometryand found to be 1.6 ± 0.3 nm. The corresponding dry film thicknesswas calculated to be 2.5 ± 0.4 nm, assuming a refractive index of1.55. The standard deviation value corresponds to nine measure-ments on three different substrates. The thickness of the PEA layercorresponds to approximately six monolayers of PEA taking into
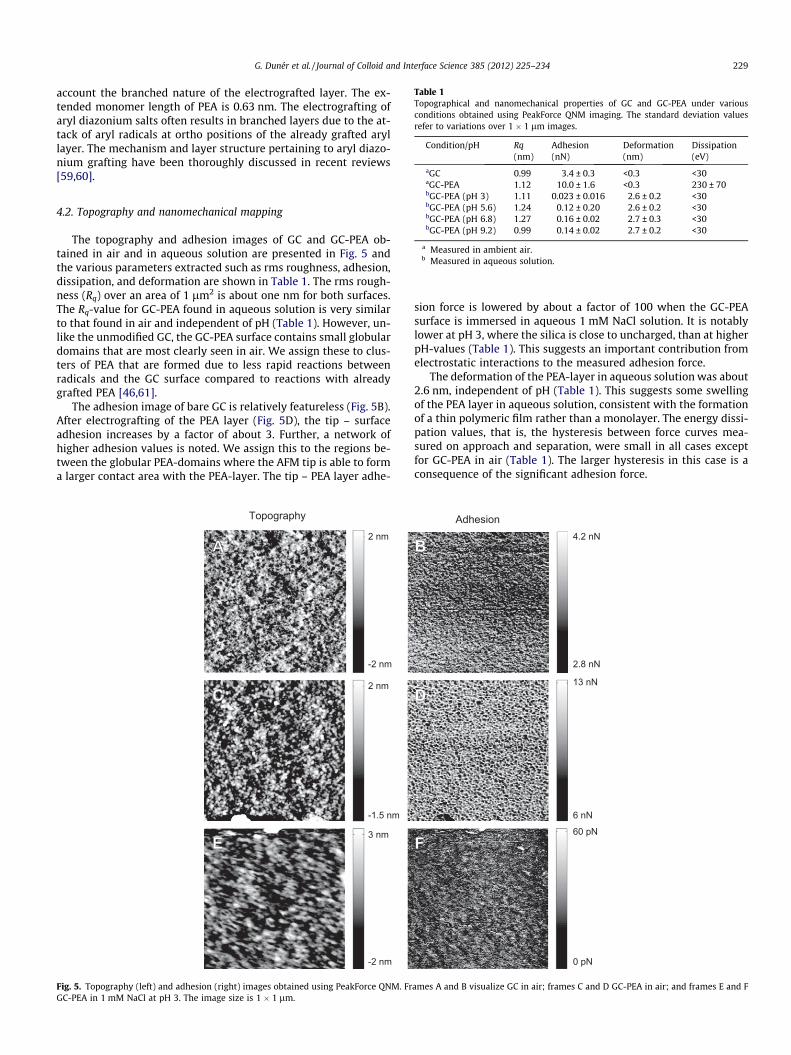
Table 1Topographical and nanomechanical properties of GC and GC-PEA under variousconditions obtained using PeakForce QNM imaging. The standard deviation valuesrefer to variations over 1 � 1 lm images.
Condition/pH Rq(nm)
Adhesion(nN)
Deformation(nm)
Dissipation(eV)
aGC 0.99 3.4 ± 0.3 <0.3 <30a
G. Dunér et al. / Journal of Colloid and Interface Science 385 (2012) 225–234 229
account the branched nature of the electrografted layer. The ex-tended monomer length of PEA is 0.63 nm. The electrografting ofaryl diazonium salts often results in branched layers due to the at-tack of aryl radicals at ortho positions of the already grafted aryllayer. The mechanism and layer structure pertaining to aryl diazo-nium grafting have been thoroughly discussed in recent reviews[59,60].
GC-PEA 1.12 10.0 ± 1.6 <0.3 230 ± 70bGC-PEA (pH 3) 1.11 0.023 ± 0.016 2.6 ± 0.2 <30bGC-PEA (pH 5.6) 1.24 0.12 ± 0.20 2.6 ± 0.2 <30bGC-PEA (pH 6.8) 1.27 0.16 ± 0.02 2.7 ± 0.3 <30bGC-PEA (pH 9.2) 0.99 0.14 ± 0.02 2.7 ± 0.2 <30
a Measured in ambient air.b Measured in aqueous solution.
4.2. Topography and nanomechanical mapping
The topography and adhesion images of GC and GC-PEA ob-tained in air and in aqueous solution are presented in Fig. 5 andthe various parameters extracted such as rms roughness, adhesion,dissipation, and deformation are shown in Table 1. The rms rough-ness (Rq) over an area of 1 lm2 is about one nm for both surfaces.The Rq-value for GC-PEA found in aqueous solution is very similarto that found in air and independent of pH (Table 1). However, un-like the unmodified GC, the GC-PEA surface contains small globulardomains that are most clearly seen in air. We assign these to clus-ters of PEA that are formed due to less rapid reactions betweenradicals and the GC surface compared to reactions with alreadygrafted PEA [46,61].
The adhesion image of bare GC is relatively featureless (Fig. 5B).After electrografting of the PEA layer (Fig. 5D), the tip – surfaceadhesion increases by a factor of about 3. Further, a network ofhigher adhesion values is noted. We assign this to the regions be-tween the globular PEA-domains where the AFM tip is able to forma larger contact area with the PEA-layer. The tip – PEA layer adhe-
2 nm
-2 nm
2 nm
-1.5 nm
3 nm
-2 nm
Topography
AA
C
E
Fig. 5. Topography (left) and adhesion (right) images obtained using PeakForce QNM. FrGC-PEA in 1 mM NaCl at pH 3. The image size is 1 � 1 lm.
sion force is lowered by about a factor of 100 when the GC-PEAsurface is immersed in aqueous 1 mM NaCl solution. It is notablylower at pH 3, where the silica is close to uncharged, than at higherpH-values (Table 1). This suggests an important contribution fromelectrostatic interactions to the measured adhesion force.
The deformation of the PEA-layer in aqueous solution was about2.6 nm, independent of pH (Table 1). This suggests some swellingof the PEA layer in aqueous solution, consistent with the formationof a thin polymeric film rather than a monolayer. The energy dissi-pation values, that is, the hysteresis between force curves mea-sured on approach and separation, were small in all cases exceptfor GC-PEA in air (Table 1). The larger hysteresis in this case is aconsequence of the significant adhesion force.
4.2 nN
2.8 nN
13 nN
6 nN
0 pN
60 pN
Adhesion
B
D
F
ames A and B visualize GC in air; frames C and D GC-PEA in air; and frames E and F
230 G. Dunér et al. / Journal of Colloid and Interface Science 385 (2012) 225–234
5. Surface interactions between silica sphere and GC-PEAsurface
5.1. Forces in different ionic strength solutions
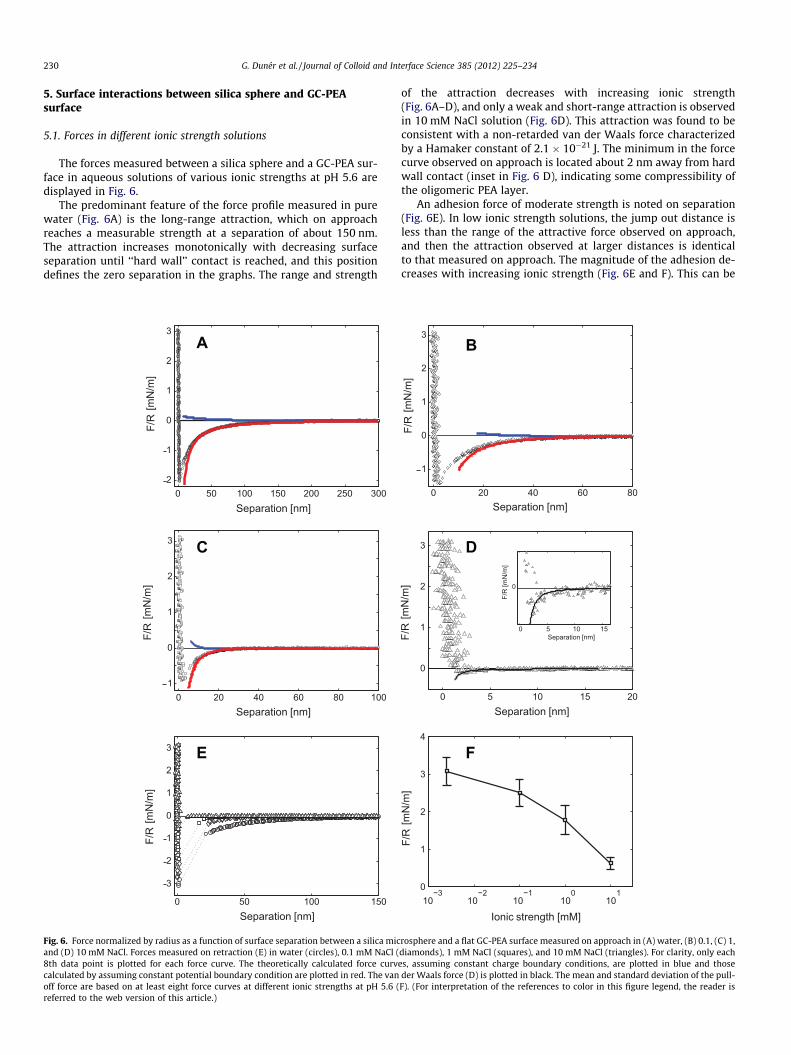
The forces measured between a silica sphere and a GC-PEA sur-face in aqueous solutions of various ionic strengths at pH 5.6 aredisplayed in Fig. 6.
The predominant feature of the force profile measured in purewater (Fig. 6A) is the long-range attraction, which on approachreaches a measurable strength at a separation of about 150 nm.The attraction increases monotonically with decreasing surfaceseparation until ‘‘hard wall’’ contact is reached, and this positiondefines the zero separation in the graphs. The range and strength
0 50 100 150 200 250 300
0
1
2
3
F/R
Separation
0 20 40 60 80 100
0
1
2
3
0 50 100 150
0
1
2
3
A
C
E
[nm]
[mN
/m]
F/R
[mN
/m]
F/R
[mN
/m]
Separation [nm]
Separation [nm]
1
2
1
1
2
3
Fig. 6. Force normalized by radius as a function of surface separation between a silica micand (D) 10 mM NaCl. Forces measured on retraction (E) in water (circles), 0.1 mM NaCl (8th data point is plotted for each force curve. The theoretically calculated force curvcalculated by assuming constant potential boundary condition are plotted in red. The vanoff force are based on at least eight force curves at different ionic strengths at pH 5.6 (referred to the web version of this article.)
of the attraction decreases with increasing ionic strength(Fig. 6A–D), and only a weak and short-range attraction is observedin 10 mM NaCl solution (Fig. 6D). This attraction was found to beconsistent with a non-retarded van der Waals force characterizedby a Hamaker constant of 2.1 � 10�21 J. The minimum in the forcecurve observed on approach is located about 2 nm away from hardwall contact (inset in Fig. 6 D), indicating some compressibility ofthe oligomeric PEA layer.
An adhesion force of moderate strength is noted on separation(Fig. 6E). In low ionic strength solutions, the jump out distance isless than the range of the attractive force observed on approach,and then the attraction observed at larger distances is identicalto that measured on approach. The magnitude of the adhesion de-creases with increasing ionic strength (Fig. 6E and F). This can be
0 20 40 60 80
0
1
2
3
0 5 10 15 20
0
1
2
3
10−3
10−2
10−1
100
101
0
1
2
3
4
0 5 10 15
0
F/R
[mN
/m]
B
D
F
F/R
[mN
/m]
Separation [nm]
Separation [nm]
F/R
[mN
/m]
F/R
[mN
/m]
Ionic strength [mM]
Separation [nm]
1
rosphere and a flat GC-PEA surface measured on approach in (A) water, (B) 0.1, (C) 1,diamonds), 1 mM NaCl (squares), and 10 mM NaCl (triangles). For clarity, only eaches, assuming constant charge boundary conditions, are plotted in blue and thoseder Waals force (D) is plotted in black. The mean and standard deviation of the pull-F). (For interpretation of the references to color in this figure legend, the reader is
G. Dunér et al. / Journal of Colloid and Interface Science 385 (2012) 225–234 231
rationalized by considering that at higher ionic strength the sur-face charges are screened, reducing the electrostatic attraction be-tween the two oppositely charged surfaces.
Theoretical force curves were calculated within the DLVOframework (the parameters used in the calculations can be foundin Table 2) and compared with the experimental data. We note thatthe charge density of the surfaces increases with increasing ionicstrength, which is a consequence of the screening effect of theadded electrolyte [62].
The forces calculated with the constant charge boundary condi-tion did not agree with measured data. In contrast, the constantpotential boundary condition provided good agreement betweencalculated and experimental force curves at large separations.However, at short separations, the calculated force curves are moreattractive than the measured ones (Fig. 6A–C).
We conclude that the measured attraction is due to an attrac-tive double-layer interaction that has the expected ionic strengthdependence. It is also clear that significant charge regulation oc-curs as the surfaces approach each other, with the positivelycharged PEA surface becoming more positively charged and thenegatively charged silica surface becoming more negativelycharged. However, the number of ionizable groups on the surfacesis limited, and this is the reason why the constant potential bound-ary condition fails to predict the interaction at short separations. Abetter agreement between theory and experiments can beachieved by using a charge regulation model, but this would re-quire the use of several unknown parameters (number of ionizablesites and their pKa values on the two surfaces). Thus, we did notproceed along these lines, but rather consider charge regulationwithin the constant potential model.
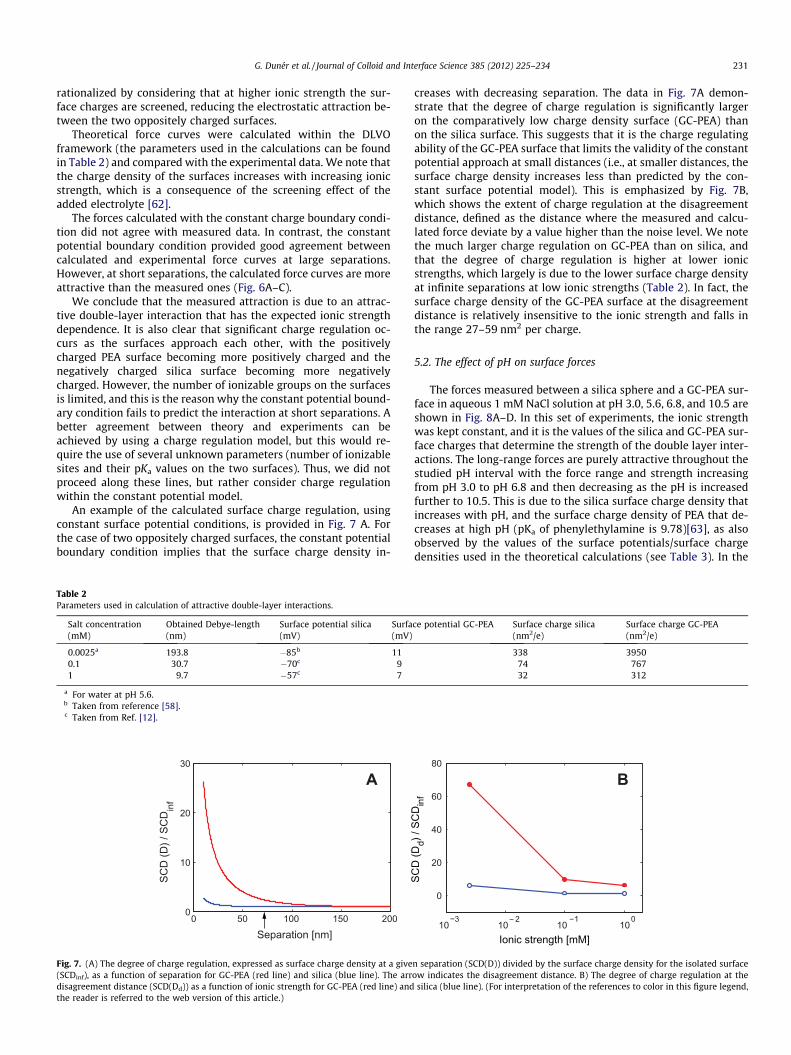
An example of the calculated surface charge regulation, usingconstant surface potential conditions, is provided in Fig. 7 A. Forthe case of two oppositely charged surfaces, the constant potentialboundary condition implies that the surface charge density in-
Table 2Parameters used in calculation of attractive double-layer interactions.
Salt concentration(mM)
Obtained Debye-length(nm)
Surface potential silica(mV)
Surfa(mV)
0.0025a 193.8 �85b 110.1 30.7 �70c 91 9.7 �57c 7
a For water at pH 5.6.b Taken from reference [58].c Taken from Ref. [12].
0 50 100 150 2000
10
20
30
Separation [nm]
SCD
(D) /
SC
Din
f
A
Fig. 7. (A) The degree of charge regulation, expressed as surface charge density at a give(SCDinf), as a function of separation for GC-PEA (red line) and silica (blue line). The arrdisagreement distance (SCD(Dd)) as a function of ionic strength for GC-PEA (red line) andthe reader is referred to the web version of this article.)
creases with decreasing separation. The data in Fig. 7A demon-strate that the degree of charge regulation is significantly largeron the comparatively low charge density surface (GC-PEA) thanon the silica surface. This suggests that it is the charge regulatingability of the GC-PEA surface that limits the validity of the constantpotential approach at small distances (i.e., at smaller distances, thesurface charge density increases less than predicted by the con-stant surface potential model). This is emphasized by Fig. 7B,which shows the extent of charge regulation at the disagreementdistance, defined as the distance where the measured and calcu-lated force deviate by a value higher than the noise level. We notethe much larger charge regulation on GC-PEA than on silica, andthat the degree of charge regulation is higher at lower ionicstrengths, which largely is due to the lower surface charge densityat infinite separations at low ionic strengths (Table 2). In fact, thesurface charge density of the GC-PEA surface at the disagreementdistance is relatively insensitive to the ionic strength and falls inthe range 27–59 nm2 per charge.
5.2. The effect of pH on surface forces
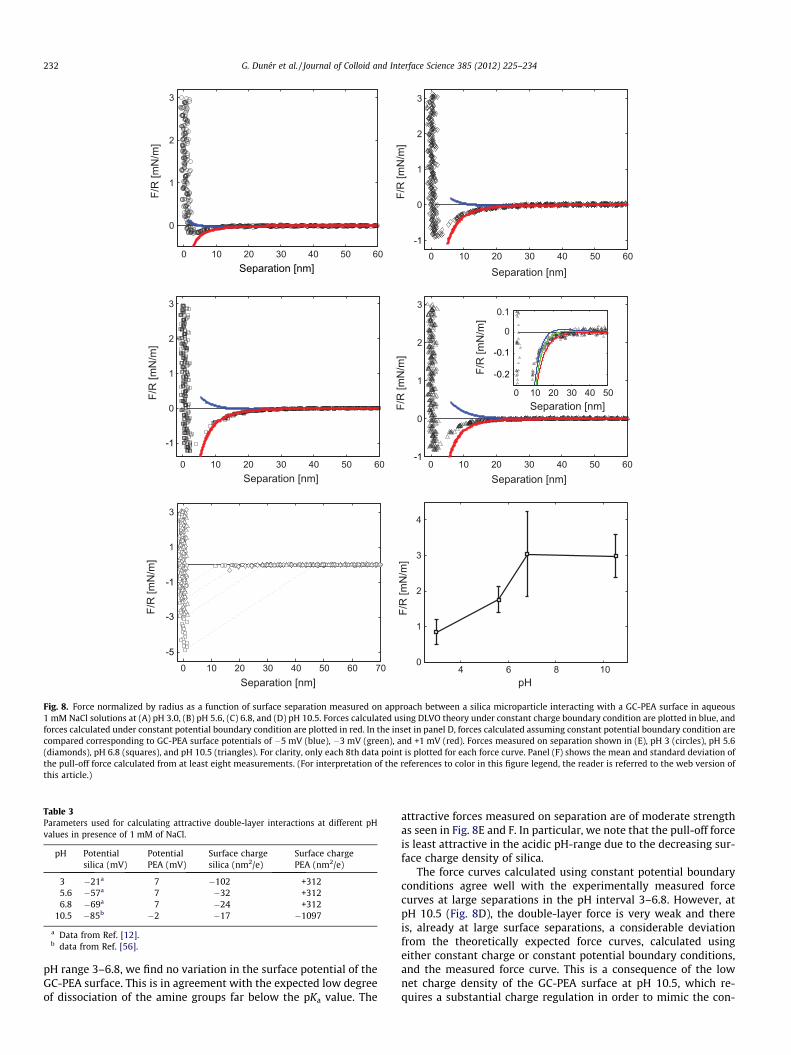
The forces measured between a silica sphere and a GC-PEA sur-face in aqueous 1 mM NaCl solution at pH 3.0, 5.6, 6.8, and 10.5 areshown in Fig. 8A–D. In this set of experiments, the ionic strengthwas kept constant, and it is the values of the silica and GC-PEA sur-face charges that determine the strength of the double layer inter-actions. The long-range forces are purely attractive throughout thestudied pH interval with the force range and strength increasingfrom pH 3.0 to pH 6.8 and then decreasing as the pH is increasedfurther to 10.5. This is due to the silica surface charge density thatincreases with pH, and the surface charge density of PEA that de-creases at high pH (pKa of phenylethylamine is 9.78)[63], as alsoobserved by the values of the surface potentials/surface chargedensities used in the theoretical calculations (see Table 3). In the
ce potential GC-PEA Surface charge silica(nm2/e)
Surface charge GC-PEA(nm2/e)
338 395074 76732 312
10− − −3
102
101
100
0
20
40
60
80
B
SCD
(Dd) /
SC
Din
f
Ionic strength [mM]
n separation (SCD(D)) divided by the surface charge density for the isolated surfaceow indicates the disagreement distance. B) The degree of charge regulation at the
silica (blue line). (For interpretation of the references to color in this figure legend,
0 10 20 30 40 50 60
0
1
2
3
F/R
[mN
/m]
0 10 20 30 40 50 60
0
1
2
3
Separation [nm]
F/R
[mN
/m]
0 10 20 30 40 50 60 70
1
3
Separation [nm]
F/R
[mN
/m]
4 6 8 100
1
2
3
4
pH
F/R
[mN
/m]
Separation [nm]
0 10 20 30 40 50 60
0
1
2
3
Separation [nm]
F/R
[mN
/m]
0 10 20 30 40 50 60
0
1
2
3
Separation [nm]
F/R
[mN
/m]
0 10 20 30 40 50
0
0.1
Separation [nm]
F/R
[mN
/m]
-1
-1-1
-0.2
-0.1
-1
-3
-5
Fig. 8. Force normalized by radius as a function of surface separation measured on approach between a silica microparticle interacting with a GC-PEA surface in aqueous1 mM NaCl solutions at (A) pH 3.0, (B) pH 5.6, (C) 6.8, and (D) pH 10.5. Forces calculated using DLVO theory under constant charge boundary condition are plotted in blue, andforces calculated under constant potential boundary condition are plotted in red. In the inset in panel D, forces calculated assuming constant potential boundary condition arecompared corresponding to GC-PEA surface potentials of �5 mV (blue), �3 mV (green), and +1 mV (red). Forces measured on separation shown in (E), pH 3 (circles), pH 5.6(diamonds), pH 6.8 (squares), and pH 10.5 (triangles). For clarity, only each 8th data point is plotted for each force curve. Panel (F) shows the mean and standard deviation ofthe pull-off force calculated from at least eight measurements. (For interpretation of the references to color in this figure legend, the reader is referred to the web version ofthis article.)
Table 3Parameters used for calculating attractive double-layer interactions at different pHvalues in presence of 1 mM of NaCl.
pH Potentialsilica (mV)
PotentialPEA (mV)
Surface chargesilica (nm2/e)
Surface chargePEA (nm2/e)
3 �21a 7 �102 +3125.6 �57a 7 �32 +3126.8 �69a 7 �24 +312
10.5 �85b �2 �17 �1097
a Data from Ref. [12].b data from Ref. [56].
232 G. Dunér et al. / Journal of Colloid and Interface Science 385 (2012) 225–234
pH range 3–6.8, we find no variation in the surface potential of theGC-PEA surface. This is in agreement with the expected low degreeof dissociation of the amine groups far below the pKa value. The
attractive forces measured on separation are of moderate strengthas seen in Fig. 8E and F. In particular, we note that the pull-off forceis least attractive in the acidic pH-range due to the decreasing sur-face charge density of silica.
The force curves calculated using constant potential boundaryconditions agree well with the experimentally measured forcecurves at large separations in the pH interval 3–6.8. However, atpH 10.5 (Fig. 8D), the double-layer force is very weak and thereis, already at large surface separations, a considerable deviationfrom the theoretically expected force curves, calculated usingeither constant charge or constant potential boundary conditions,and the measured force curve. This is a consequence of the lownet charge density of the GC-PEA surface at pH 10.5, which re-quires a substantial charge regulation in order to mimic the con-
4 6 8 100
5
10
15
20
25
30SC
D(D
d) / S
CD
inf
pH
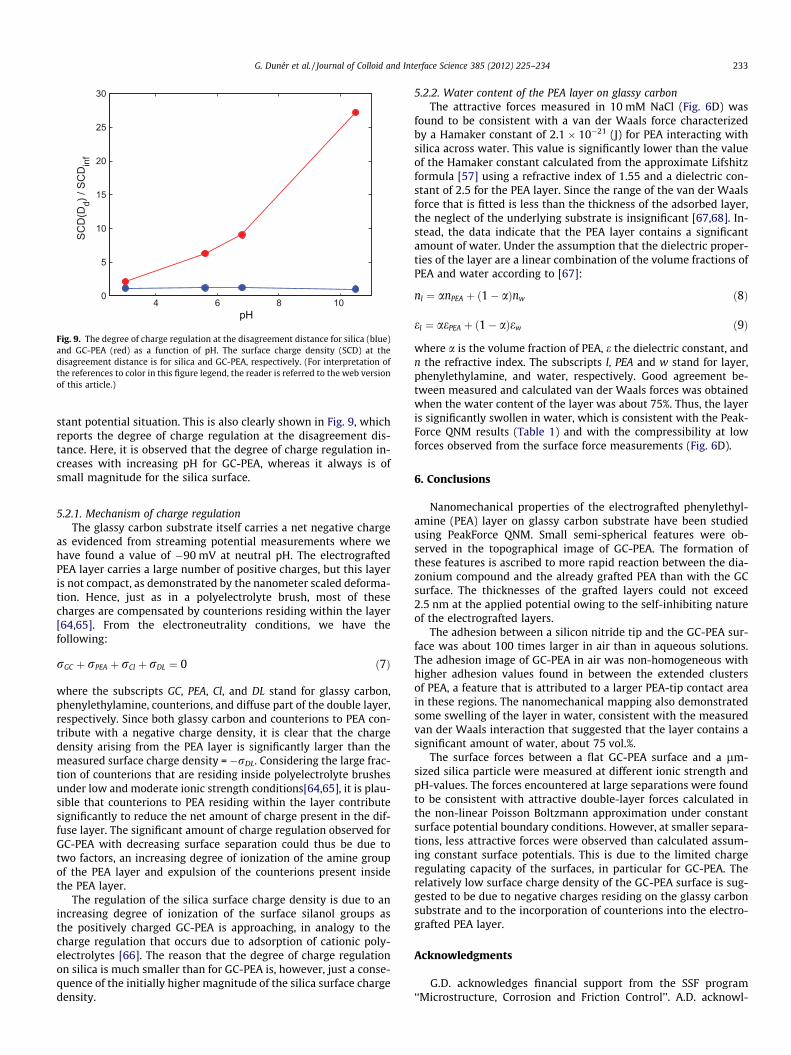
Fig. 9. The degree of charge regulation at the disagreement distance for silica (blue)and GC-PEA (red) as a function of pH. The surface charge density (SCD) at thedisagreement distance is for silica and GC-PEA, respectively. (For interpretation ofthe references to color in this figure legend, the reader is referred to the web versionof this article.)
G. Dunér et al. / Journal of Colloid and Interface Science 385 (2012) 225–234 233
stant potential situation. This is also clearly shown in Fig. 9, whichreports the degree of charge regulation at the disagreement dis-tance. Here, it is observed that the degree of charge regulation in-creases with increasing pH for GC-PEA, whereas it always is ofsmall magnitude for the silica surface.
5.2.1. Mechanism of charge regulationThe glassy carbon substrate itself carries a net negative charge
as evidenced from streaming potential measurements where wehave found a value of �90 mV at neutral pH. The electrograftedPEA layer carries a large number of positive charges, but this layeris not compact, as demonstrated by the nanometer scaled deforma-tion. Hence, just as in a polyelectrolyte brush, most of thesecharges are compensated by counterions residing within the layer[64,65]. From the electroneutrality conditions, we have thefollowing:
rGC þ rPEA þ rCl þ rDL ¼ 0 ð7Þ
where the subscripts GC, PEA, Cl, and DL stand for glassy carbon,phenylethylamine, counterions, and diffuse part of the double layer,respectively. Since both glassy carbon and counterions to PEA con-tribute with a negative charge density, it is clear that the chargedensity arising from the PEA layer is significantly larger than themeasured surface charge density = �rDL. Considering the large frac-tion of counterions that are residing inside polyelectrolyte brushesunder low and moderate ionic strength conditions[64,65], it is plau-sible that counterions to PEA residing within the layer contributesignificantly to reduce the net amount of charge present in the dif-fuse layer. The significant amount of charge regulation observed forGC-PEA with decreasing surface separation could thus be due totwo factors, an increasing degree of ionization of the amine groupof the PEA layer and expulsion of the counterions present insidethe PEA layer.
The regulation of the silica surface charge density is due to anincreasing degree of ionization of the surface silanol groups asthe positively charged GC-PEA is approaching, in analogy to thecharge regulation that occurs due to adsorption of cationic poly-electrolytes [66]. The reason that the degree of charge regulationon silica is much smaller than for GC-PEA is, however, just a conse-quence of the initially higher magnitude of the silica surface chargedensity.
5.2.2. Water content of the PEA layer on glassy carbonThe attractive forces measured in 10 mM NaCl (Fig. 6D) was
found to be consistent with a van der Waals force characterizedby a Hamaker constant of 2.1 � 10�21 (J) for PEA interacting withsilica across water. This value is significantly lower than the valueof the Hamaker constant calculated from the approximate Lifshitzformula [57] using a refractive index of 1.55 and a dielectric con-stant of 2.5 for the PEA layer. Since the range of the van der Waalsforce that is fitted is less than the thickness of the adsorbed layer,the neglect of the underlying substrate is insignificant [67,68]. In-stead, the data indicate that the PEA layer contains a significantamount of water. Under the assumption that the dielectric proper-ties of the layer are a linear combination of the volume fractions ofPEA and water according to [67]:
nl ¼ anPEA þ ð1� aÞnw ð8Þ
el ¼ aePEA þ ð1� aÞew ð9Þ
where a is the volume fraction of PEA, e the dielectric constant, andn the refractive index. The subscripts l, PEA and w stand for layer,phenylethylamine, and water, respectively. Good agreement be-tween measured and calculated van der Waals forces was obtainedwhen the water content of the layer was about 75%. Thus, the layeris significantly swollen in water, which is consistent with the Peak-Force QNM results (Table 1) and with the compressibility at lowforces observed from the surface force measurements (Fig. 6D).
6. Conclusions
Nanomechanical properties of the electrografted phenylethyl-amine (PEA) layer on glassy carbon substrate have been studiedusing PeakForce QNM. Small semi-spherical features were ob-served in the topographical image of GC-PEA. The formation ofthese features is ascribed to more rapid reaction between the dia-zonium compound and the already grafted PEA than with the GCsurface. The thicknesses of the grafted layers could not exceed2.5 nm at the applied potential owing to the self-inhibiting natureof the electrografted layers.
The adhesion between a silicon nitride tip and the GC-PEA sur-face was about 100 times larger in air than in aqueous solutions.The adhesion image of GC-PEA in air was non-homogeneous withhigher adhesion values found in between the extended clustersof PEA, a feature that is attributed to a larger PEA-tip contact areain these regions. The nanomechanical mapping also demonstratedsome swelling of the layer in water, consistent with the measuredvan der Waals interaction that suggested that the layer contains asignificant amount of water, about 75 vol.%.
The surface forces between a flat GC-PEA surface and a lm-sized silica particle were measured at different ionic strength andpH-values. The forces encountered at large separations were foundto be consistent with attractive double-layer forces calculated inthe non-linear Poisson Boltzmann approximation under constantsurface potential boundary conditions. However, at smaller separa-tions, less attractive forces were observed than calculated assum-ing constant surface potentials. This is due to the limited chargeregulating capacity of the surfaces, in particular for GC-PEA. Therelatively low surface charge density of the GC-PEA surface is sug-gested to be due to negative charges residing on the glassy carbonsubstrate and to the incorporation of counterions into the electro-grafted PEA layer.
Acknowledgments
G.D. acknowledges financial support from the SSF program‘‘Microstructure, Corrosion and Friction Control’’. A.D. acknowl-
234 G. Dunér et al. / Journal of Colloid and Interface Science 385 (2012) 225–234
edges support through VINNOVA in the form of a VINNMER grant(P38574-1). J.I., K.D., E.T., and A.D. acknowledge the Nordic Innova-tion Centre and the TopNano program for financial support.
References
[1] B.V. Derjaguin, L.D. Landau, Acta Physicochim. 14 (1941) 633.[2] E.J.W. Verwey, J. Phys. Colloid Chem. 51 (1947) 631.[3] E.J.W. Verwey, J.T.M.G. Overbeek, Theory of the Stability of Lyo-phobic
Colloids, Elsevier, Amsterdam, 1948.[4] G.M. Bell, G.C. Peterson, J. Colloid Interface Sci. 41 (1972) 542.[5] D. Chan, T.W. Healy, L.R. White, J. Chem. Soc. Faraday Trans. 1: Phys. Chem.
Condens. Phases 72 (1976) 2844.[6] I. Popa, P. Sinha, M. Finessi, P. Maroni, G. Papastavrou, M. Borkovec, Phys. Rev.
Lett. 104 (2010).[7] N. Kampf, D. Ben-Yaakov, D. Andelman, S.A. Safran, J. Klein, Phys. Rev. Lett. 103
(2009) 118304.[8] K. Besteman, M.A.G. Zevenbergen, H.A. Heering, S.G. Lemay, Phys. Rev. Lett. 93
(2004) 170802.[9] K. Besteman, M.A.G. Zevenbergen, S.G. Lemay, Phys. Rev. E 72 (2005) 061501.
[10] M. Giesbers, J.M. Kleijn, M.A. Cohen Stuart, J. Colloid Interface Sci. 248 (2002)88.
[11] M. Giesbers, J.M. Kleijn, M.A. Cohen Stuart, J. Colloid Interface Sci. 252 (2002)138.
[12] I. Larson, C.J. Drummond, D.Y.C. Chan, F. Grieser, Langmuir 13 (1997) 2109.[13] S. Veeramasuneni, M.R. Yalamanchili, J.D. Miller, Colloids Surf., A 131 (1998)
77.[14] A.A. Meier-Koll, C.C. Fleck, H.H. von Grunberg, J. Phys.-Condens. Matter 16
(2004) 6041.[15] D. Ben-Yaakov, Y. Burak, D. Andelman, S.A. Safran, Epl 79 (2007).[16] M. Borkovec, S.H. Behrens, J. Phys. Chem. B 112 (2008) 10795.[17] A. Flores-Amado, M. Hernandez-Contreras, Rev. Mex. Fis. 57 (2011) 356.[18] A. Flores-Amado, M. Hernández-Contreras, Phys. Rev. E 75 (2007) 031404.[19] S. Usui, J. Colloid Interface Sci. 320 (2008) 353.[20] S.M. Zhang, Colloid J. 67 (2005) 554.[21] M. Trulsson, B. Jönsson, T. Åkesson, J. Forsman, C. Labbez, Phys. Rev. Lett. 97
(2006) 068302.[22] V.A. Parsegian, D. Gingell, Biophys. J. 12 (1972) 1192.[23] M.A.G. Dahlgren, J. Colloid Interface Sci. 181 (1996) 654.[24] M.A.G. Dahlgren, Å. Waltermo, E. Blomberg, P.M. Claesson, L. Sjöström, T.
Åkesson, B. Jönsson, J. Phys. Chem. 97 (1993) 11769.[25] M.A.G. Dahlgren, P.M. Claesson, R. Audebert, J. Colloid Interface Sci. 166 (1994)
343.[26] A. Chandekar, S.K. Sengupta, J.E. Whitten, Appl. Surf. Sci. 256 (2010) 2742.[27] L. Civit, A. Fragoso, C.K. O’Sullivan, Electrochem. Commun. 12 (2010) 1045.[28] S.R. Wasserman, Y.T. Tao, G.M. Whitesides, Langmuir 5 (1989) 1074.[29] T.M. Willey, A.L. Vance, T. van Buuren, C. Bostedt, L.J. Terminello, C.S. Fadley,
Surf. Sci. 576 (2005) 188.[30] G.H. Yang, N.A. Amro, Z.B. Starkewolfe, G.Y. Liu, Langmuir 20 (2004) 3995.[31] J. Pinson, F. Podvorica, Chem. Soc. Rev. 34 (2005) 429.[32] K.H. Vase, A.H. Holm, K. Norrman, S.U. Pedersen, K. Daasbjerg, Langmuir 23
(2007) 3786.
[33] K.H. Vase, A.H. Holm, K. Norrman, S.U. Pedersen, K. Daasbjerg, Langmuir 24(2008) 182.
[34] K.H. Vase, A.H. Holm, S.U. Pedersen, K. Daasbjerg, Langmuir 21 (2005) 8085.[35] K. Malmos, M.D. Dong, S. Pillai, P. Kingshott, F. Besenbacher, S.U. Pedersen, K.
Daasbjerg, J. Am. Chem. Soc. 131 (2009) 4928.[36] L.T. Nielsen, M. Ceccato, A.H. Holm, M.V. Kristensen, S.U. Pedersen, K.
Daasbjerg, Langmuir 25 (2009) 12160.[37] M. Hinge, M. Ceccato, P. Kingshott, F. Besenbacher, S.U. Pedersen, K. Daasbjerg,
New J. Chem. 33 (2009) 2405.[38] D.M. Shewchuk, M.T. McDermott, Langmuir 25 (2009) 4556.[39] P.J.F. Harris, Phil. Mag. 84 (2004) 3159.[40] H. Zhang, J.S. Zhao, H.T. Liu, H.S. Wang, R.M. Liu, J.F. Liu, Int. J. Electrochem. Sci.
5 (2010) 295.[41] G.J. Yang, C.X. Wang, R. Zhang, C.Y. Wang, Q.S. Qu, X.Y. Hu, Bioelectrochemistry
73 (2008) 37.[42] F.Y. Liu, X. Yang, S.G. Sun, Analyst 136 (2011) 374..[43] A. Erdogmus, I.N. Booysen, T. Nyokong, Synth. Met. 161 (2011) 241.[44] M. Hokao, S. Hironaka, Y. Suda, Y. Yamamoto, Wear 237 (2000) 54.[45] J. Iruthayaraj, S. Chernyy, M. Lillethorup, M. Ceccato, T. Ron, M. Hinge, P.
Kingshott, F. Besenbacher, S.U. Pedersen, K. Daasbjerg, Langmuir 27 (2011)1070.
[46] J.K. Kariuki, M.T. McDermott, Langmuir 17 (2001) 5947.[47] C. Combellas, F. Kanoufi, J. Pinson, F.I. Podvorica, J. Am. Chem. Soc. 130 (2008)
8576.[48] L.T. Nielsen, K.H. Vase, M. Dong, F. Besenbacher, S.U. Pedersen, K. Daasbjerg, J.
Am. Chem. Soc. 129 (2007) 1888.[49] E.B. Starkey, in: Organic Syntheses, Wiley & Sons, New York, Collect. vol. 2,
1943, p. 225.[50] M. Landgren, B. Jonsson, J. Phys. Chem. 97 (1993) 1656.[51] F. Tiberg, M. Landgren, Langmuir 9 (1993) 927.[52] J.L. Hutter, J. Bechhoefer, Rev. Sci. Instrum. 64 (1993) 3342.[53] C.P. Green, H. Lioe, J.P. Cleveland, R. Proksch, P. Mulvaney, J.E. Sader, Rev. Sci.
Instrum. 75 (2004) 1988.[54] J.E. Sader, J.W.M. Chon, P. Mulvaney, Rev. Sci. Instrum. 70 (1999) 3967.[55] E. Thormann, T. Pettersson, P.M. Claesson, Rev. Sci. Instrum. 80 (2009).[56] O.F. Devereux, P.L. De Bruyn, Interaction of Plane-Parallel Double Layers, 1963.[57] J.N. Israelachvili, Intermolecular and Surface Forces, second ed., Academic
Press, London, 1992.[58] G. Vigil, Z. Xu, S. Steinberg, J. Israelachvili, J. Colloid Interface Sci. 165 (1994)
367.[59] P. Doppelt, G. Hallais, J. Pinson, F. Podvorica, S. Verneyre, Chem. Mater. 19
(2007) 4570.[60] D. Belanger, J. Pinson, Chem. Soc. Rev. 40 (2011) 3995.[61] C. Combellas, F.D.R. Kanoufi, J. Pinson, F.I. Podvorica, Langmuir 21 (2004) 280.[62] J. Iruthayaraj, G. Olanya, P.M. Claesson, J. Phys. Chem. C 112 (2008) 15028.[63] M.M. Tuckerman, J.R. Mayer, F.C. Nachod, J. Am. Chem. Soc. 81 (1959) 92.[64] M. Ballauff, O. Borisov, Curr. Opin. Colloid Interface Sci. 11 (2006) 316.[65] P. Pincus, Macromolecules 24 (1991) 2912.[66] P. Linse, Macromolecules 29 (1996) 326.[67] P.M. Claesson, M. Kjellin, O.J. Rojas, C. Stubenrauch, Phys. Chem. Chem. Phys. 8
(2006) 5501.[68] V.A. Parsegian, Van der Waals Forces, Cambridge University Press, Cambridge,
2006.


