Embed Size (px)
Citation preview

Attachment F
Feasibility Analysis - AEC Group October 2021
127

600-660 ELIZABETH STREET, REDFERN – FEASIBILITY STUDY OCTOBER 2021
128

600-660 ELIZABETH STREET, REDFERN – FEASIBILITY STUDY
DOCUMENT CONTROL
Job ID: J002200
Job Name: 600-660 Elizabeth Street, Redfern – Feasibility Study
Client: City of Sydney
Client Contact: Tim Wise
Project Manager: James Popovic
Email: [email protected]
Telephone: 0431 695 111
Document Name: 600-660 Elizabeth Street, Redfern – Feasibility Study_Final
Last Saved: 21/10/2021 2:36 PM
Version Date Reviewed Approved
Draft V.1 15/10/21 JP FI
Draft V.2 20/10/21 JP FI
Final 21/10/21 JP FI
Disclaimer:
Whilst all care and diligence have been exercised in the preparation of this report, AEC Group Pty Ltd does not warrant the
accuracy of the information contained within and accepts no liability for any loss or damage that may be suffered as a result of
reliance on this information, whether or not there has been any error, omission or negligence on the part of AEC Group Pty Ltd
or their employees. Any forecasts or projections used in the analysis can be affected by a number of unforeseen variables, and
as such no warranty is given that a particular set of results will in fact be achieved.
Liability limited by a scheme approved under Professional Standards Legislation
129
600-660 ELIZABETH STREET, REDFERN – FEASIBILITY STUDY
i
EXECUTIVE SUMMARY
BACKGROUND
AEC Group (AEC) has been engaged by the City of Sydney Council (the City) to assist the City’s understanding of
600-660 Elizabeth Street, Redfern’s (the Site) ability to be redeveloped and provide affordable rental housing over
and above a predefined threshold of 30% for dedication of social housing dwellings. Essentially, the City is seeking
to understand what the ‘tipping point’ is i.e., the amount of GFA that can be ascribed to affordable rental housing
in addition to social and market dwellings whilst the development project achieving desired hurdle rates and
maintaining project profitability and viability.
The Site itself forms part of the Redfern Housing Estate and is a rectangular shaped site of 10,850m² bound by
Elizabeth Street, Phillip Street, Walker Street and Kettle Street within the inner Sydney suburb of Redfern. The Site
is currently owned by the Land and Housing Corporation (LAHC).
In March 2020, LAHC lodged a planning proposal with the City of Sydney (the City) to rezone the Site in order to
develop a mixed use development providing 351 residential apartments across 3 buildings with building heights
ranging between 4-16 storeys. A Gateway Determination was subsequently issued in February 2021 with the
condition that at least 30% of the total residential floor space must be used for social and affordable rental housing.
However, this is lower than the City’s current benchmark of 40%, and it was also noted that the proposal does not
specify the apportionment between social and affordable dwellings. The City is currently working with LAHC to
ensure an appropriate mix of housing is provided on the Site.
Whilst the City were largely supportive of the proposal, the allocation towards social and affordable rental housing
was deemed to be 10% lower than that determined by the City and that the composition of social and affordable
rental housing was not properly defined. In response, the City prepared a revised reference scheme which was
informed by the City’s Design Advisory Panel (DAP) to introduce a maximum FSR of 2.75:1 with an allocation of
social/affordable rental housing of 40% of residential floor space.
Furthermore, we have been provided with an Urban Design Analysis (UDA) which was prepared in April 2021 by
LAHC, Silvester Fuller, Tyrell Studio and Architectus. The UDA proposes two concept designs over the Site whilst
also, in both instances, achieving an FSR of 2.75:1. Of the two concept designs, AEC have been directed by the
City to undertake feasibility modelling based on the “Alternate Mapping” scenario within the UDA which allows for
a flexible grid configuration of three buildings with 301 apartments in total.
As instructed by the City, AEC have undertaken our modelling on the basis 30% of the apartments being allocated
as social housing with the incremental addition of in-kind affordable rental housing to be iteratively modelled to
determine where the feasibility ‘tipping point’ lies to ascertain the maximum number of affordable rental housing
dwellings that could be incorporated whilst maintaining 30% social housing and the balance being market housing.
AEC consider the most appropriate variations of affordable rental housing to be tested are 5%, 7.5% and 10%
(resulting in 65%, 62.5% and 60% private dwellings respectively). As an additional method of comparison, we have
also undertaken modelling on the basis of an equivalent affordable rental housing ‘monetary’ contribution being
provided in lieu of ‘In-Kind’ affordable rental housing.
PURPOSE
The objective of the feasibility study is to inform the City of the potential for social and affordable rental housing to
be provided by LAHC under the Communities Plus model, while still ensuring the development results in an
appropriate financial return to LAHC. It is noted the project was originally proposed to fall under a Build-to-Rent
(BtR) scenario, but the City of Sydney have since confirmed the development is unlikely to be progressing in this
format.
130
600-660 ELIZABETH STREET, REDFERN – FEASIBILITY STUDY
ii
Tipping Point
Scenario
KEY FINDINGS
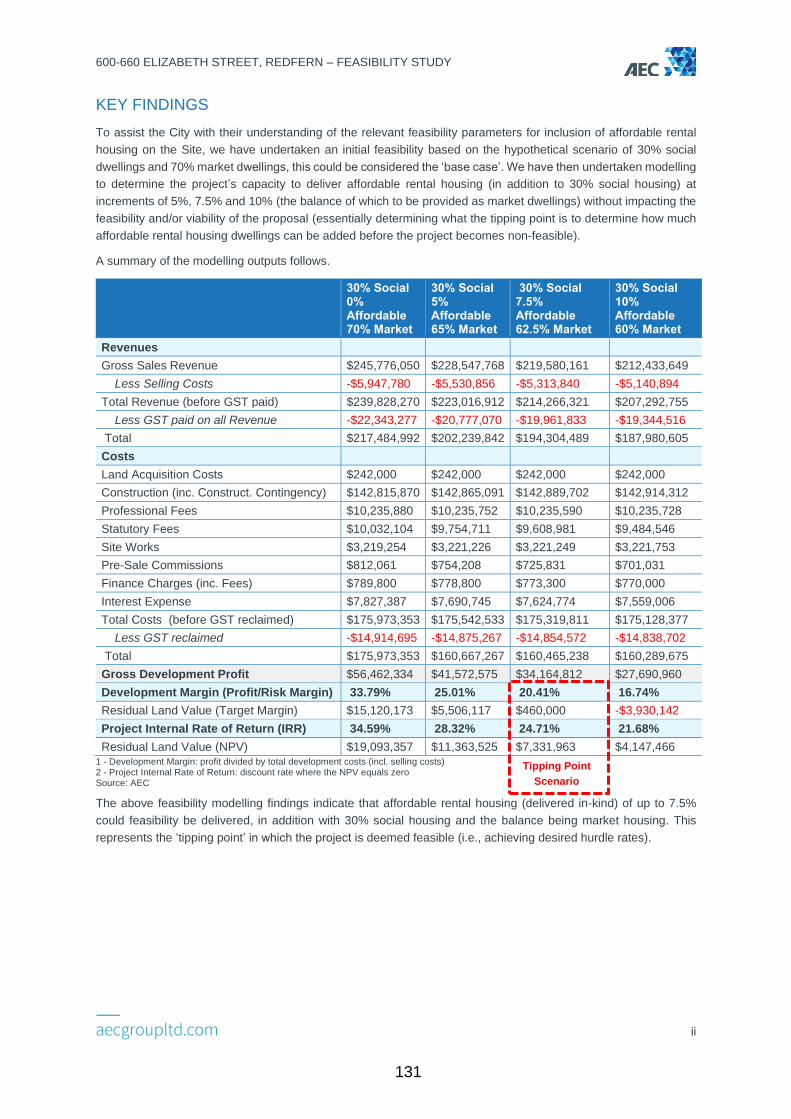
To assist the City with their understanding of the relevant feasibility parameters for inclusion of affordable rental
housing on the Site, we have undertaken an initial feasibility based on the hypothetical scenario of 30% social
dwellings and 70% market dwellings, this could be considered the ‘base case’. We have then undertaken modelling
to determine the project’s capacity to deliver affordable rental housing (in addition to 30% social housing) at
increments of 5%, 7.5% and 10% (the balance of which to be provided as market dwellings) without impacting the
feasibility and/or viability of the proposal (essentially determining what the tipping point is to determine how much
affordable rental housing dwellings can be added before the project becomes non-feasible).
A summary of the modelling outputs follows.
30% Social 0% Affordable 70% Market
30% Social 5% Affordable 65% Market
30% Social 7.5% Affordable 62.5% Market
30% Social 10% Affordable 60% Market
Revenues
Gross Sales Revenue $245,776,050 $228,547,768 $219,580,161 $212,433,649
Less Selling Costs -$5,947,780 -$5,530,856 -$5,313,840 -$5,140,894
Total Revenue (before GST paid) $239,828,270 $223,016,912 $214,266,321 $207,292,755
Less GST paid on all Revenue -$22,343,277 -$20,777,070 -$19,961,833 -$19,344,516
Total $217,484,992 $202,239,842 $194,304,489 $187,980,605
Costs
Land Acquisition Costs $242,000 $242,000 $242,000 $242,000
Construction (inc. Construct. Contingency) $142,815,870 $142,865,091 $142,889,702 $142,914,312
Professional Fees $10,235,880 $10,235,752 $10,235,590 $10,235,728
Statutory Fees $10,032,104 $9,754,711 $9,608,981 $9,484,546
Site Works $3,219,254 $3,221,226 $3,221,249 $3,221,753
Pre-Sale Commissions $812,061 $754,208 $725,831 $701,031
Finance Charges (inc. Fees) $789,800 $778,800 $773,300 $770,000
Interest Expense $7,827,387 $7,690,745 $7,624,774 $7,559,006
Total Costs (before GST reclaimed) $175,973,353 $175,542,533 $175,319,811 $175,128,377
Less GST reclaimed -$14,914,695 -$14,875,267 -$14,854,572 -$14,838,702
Total $175,973,353 $160,667,267 $160,465,238 $160,289,675
Gross Development Profit $56,462,334 $41,572,575 $34,164,812 $27,690,960
Development Margin (Profit/Risk Margin) 33.79% 25.01% 20.41% 16.74%
Residual Land Value (Target Margin) $15,120,173 $5,506,117 $460,000 -$3,930,142
Project Internal Rate of Return (IRR) 34.59% 28.32% 24.71% 21.68%
Residual Land Value (NPV) $19,093,357 $11,363,525 $7,331,963 $4,147,466 1 - Development Margin: profit divided by total development costs (incl. selling costs) 2 - Project Internal Rate of Return: discount rate where the NPV equals zero Source: AEC
The above feasibility modelling findings indicate that affordable rental housing (delivered in-kind) of up to 7.5%
could feasibility be delivered, in addition with 30% social housing and the balance being market housing. This
represents the ‘tipping point’ in which the project is deemed feasible (i.e., achieving desired hurdle rates).
131
600-660 ELIZABETH STREET, REDFERN – FEASIBILITY STUDY
iii
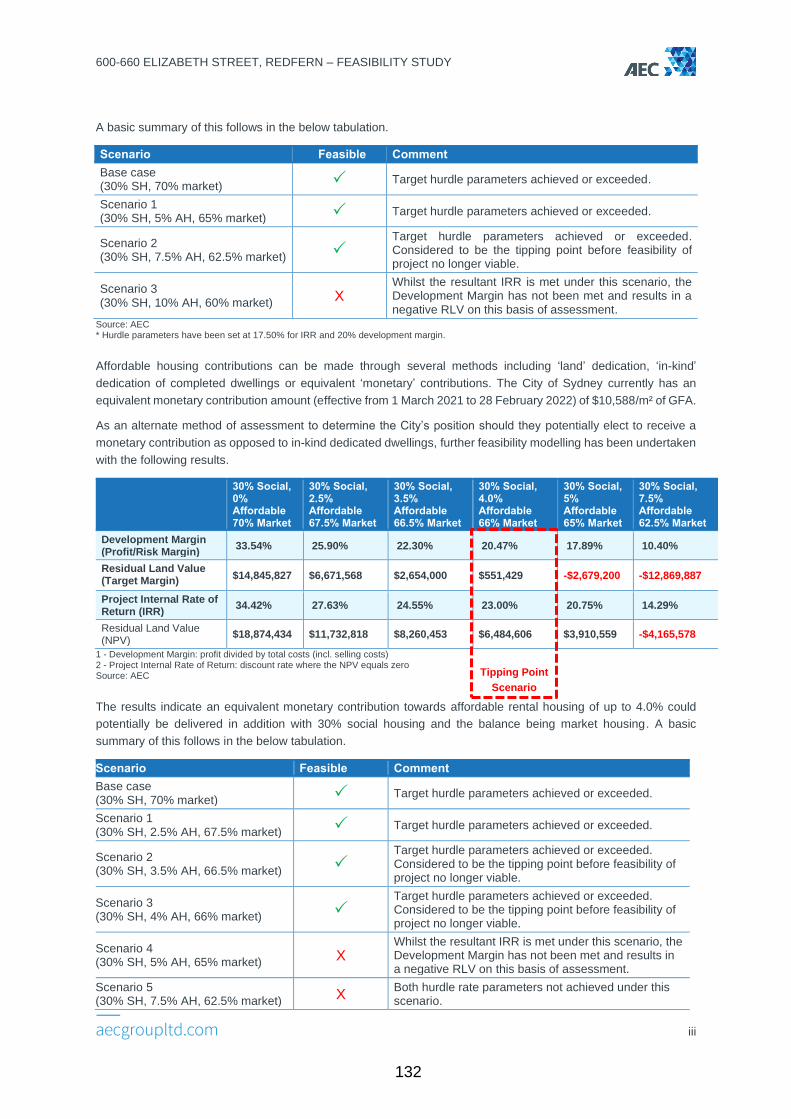
A basic summary of this follows in the below tabulation.
Scenario Feasible Comment
Base case (30% SH, 70% market) Target hurdle parameters achieved or exceeded.
Scenario 1 (30% SH, 5% AH, 65% market) Target hurdle parameters achieved or exceeded.
Scenario 2 (30% SH, 7.5% AH, 62.5% market)
Target hurdle parameters achieved or exceeded. Considered to be the tipping point before feasibility of project no longer viable.
Scenario 3 (30% SH, 10% AH, 60% market)
X
Whilst the resultant IRR is met under this scenario, the Development Margin has not been met and results in a negative RLV on this basis of assessment.
Source: AEC * Hurdle parameters have been set at 17.50% for IRR and 20% development margin.
Affordable housing contributions can be made through several methods including ‘land’ dedication, ‘in-kind’
dedication of completed dwellings or equivalent ‘monetary’ contributions. The City of Sydney currently has an
equivalent monetary contribution amount (effective from 1 March 2021 to 28 February 2022) of $10,588/m² of GFA.
As an alternate method of assessment to determine the City’s position should they potentially elect to receive a
monetary contribution as opposed to in-kind dedicated dwellings, further feasibility modelling has been undertaken
with the following results.
30% Social, 0% Affordable 70% Market
30% Social, 2.5% Affordable 67.5% Market
30% Social, 3.5% Affordable 66.5% Market
30% Social, 4.0% Affordable 66% Market
30% Social, 5% Affordable 65% Market
30% Social, 7.5% Affordable 62.5% Market
Development Margin (Profit/Risk Margin)
33.54% 25.90% 22.30% 20.47% 17.89% 10.40%
Residual Land Value (Target Margin)
$14,845,827 $6,671,568 $2,654,000 $551,429 -$2,679,200 -$12,869,887
Project Internal Rate of Return (IRR)
34.42% 27.63% 24.55% 23.00% 20.75% 14.29%
Residual Land Value (NPV)
$18,874,434 $11,732,818 $8,260,453 $6,484,606 $3,910,559 -$4,165,578
1 - Development Margin: profit divided by total costs (incl. selling costs) 2 - Project Internal Rate of Return: discount rate where the NPV equals zero Source: AEC
The results indicate an equivalent monetary contribution towards affordable rental housing of up to 4.0% could
potentially be delivered in addition with 30% social housing and the balance being market housing. A basic
summary of this follows in the below tabulation.
Scenario Feasible Comment
Base case (30% SH, 70% market) Target hurdle parameters achieved or exceeded.
Scenario 1 (30% SH, 2.5% AH, 67.5% market) Target hurdle parameters achieved or exceeded.
Scenario 2 (30% SH, 3.5% AH, 66.5% market)
Target hurdle parameters achieved or exceeded. Considered to be the tipping point before feasibility of project no longer viable.
Scenario 3 (30% SH, 4% AH, 66% market)
Target hurdle parameters achieved or exceeded. Considered to be the tipping point before feasibility of project no longer viable.
Scenario 4 (30% SH, 5% AH, 65% market)
X Whilst the resultant IRR is met under this scenario, the Development Margin has not been met and results in a negative RLV on this basis of assessment.
Scenario 5 (30% SH, 7.5% AH, 62.5% market)
X Both hurdle rate parameters not achieved under this scenario.
Tipping Point
Scenario
132

600-660 ELIZABETH STREET, REDFERN – FEASIBILITY STUDY
iv
Source: AEC * Hurdle parameters have been set at 17.50% for IRR and 20% development margin.
There are many potential scenarios including construction delays, cost increases, archaeological findings whilst
excavating etc that can impact project profitability. An added element of complexity occurs with the application of
affordable rental housing and the many potential funding arrangements/structures that exist which may depend on
whether the CHP is providing a cost offset to the project, is dedicated a portion of the land themselves to construct
affordable rental housing or whether a monetary contribution is provided as opposed to dedication of completed
dwellings etc.
Based on the Critical Assumptions adopted within Section 7.1, we have concluded the following feasibility results.
In-Kind Dedication of Affordable Rental Housing
Based on AEC’s analysis of the Alternate Mapping Scheme as identified within the UDA, the project can potentially
accommodate 30% social housing, up to 7.5% affordable rental housing and 62.5% market housing before
development margins fall below market expectations.
Equivalent Monetary Contribution
As an alternate measure, should the City elect to receive an equivalent monetary contribution for affordable rental
housing, the project could potentially accommodate 30% social housing, 4% equivalent monetary contribution and
65% market housing before development margins start being negatively impacted.
The above approximate potential allocations towards affordable rental housing in-kind (and monetary contribution)
are based on feasibility modelling which makes multiple assumptions in the absence of known feasibility inputs.
These feasibility inputs are ‘not exact’ but are intended to represent a researched estimate based on the available
market and in-house knowledge at the time. Whilst every endeavour has been undertaken by AEC to ensure these
feasibility inputs and outputs have been checked for accuracy, the feasibility modelling exercise remains a
‘hypothetical’ exercise. Key factors which may influence a different feasibility outcome include construction costs
(including latent ground conditions and unquantifiable remediation costs), market shifts influencing revenues,
(potential value discounting to the private market revenues associated with being in close proximity to large
concentrations of social housing) and multiple other factors.
Therefore, in recognition of the unverifiable feasibility inputs impacting feasibility sensitivity, we recommend the
City acknowledge that a feasibility tipping point tolerance attributable to the ARH contribution of between
1.50% - 2.00% could be considered reasonable which resulting in a Tipping Point sensitivity range of 5.5%/6.0%
as the lower bound to 9.0%/9.5% as the upper bound attributable towards Affordable Rental Housing floor
space in the project.
Furthermore, our modelling has been undertaken on the basis of no financial input from a prospective CHP and
that in accordance with the City of Sydney Affordable Housing Program, the affordable rental housing dwellings
are delivered in-kind free of cost. Should a CHP potentially contribute to the financing of construction, equity or
other means, this would likely improve upon the currently assessed return parameters.
133
600-660 ELIZABETH STREET, REDFERN – FEASIBILITY STUDY
TABLE OF CONTENTS EXECUTIVE SUMMARY ......................................................................................................................................... I
LIMITATIONS OF THIS STUDY ............................................................................................................................. 1
TERMINOLOGY ..................................................................................................................................................... 2
1. INTRODUCTION ............................................................................................................................................ 3
1.1 BACKGROUND .............................................................................................................................................. 3
1.2 PURPOSE & SCOPE ...................................................................................................................................... 4
2. SITE PARTICULARS .................................................................................................................................... 6
2.1 LOCATION .................................................................................................................................................... 6
2.2 SITE DESCRIPTION ....................................................................................................................................... 7
3. PLANNING CONSIDERATIONS ................................................................................................................... 8
3.1 SYDNEY LOCAL ENVIRONMENTAL PLAN 2012 .................................................................................................. 8
3.2 THE CITY OF SYDNEY AFFORDABLE HOUSING PROGRAM .................................................................................. 9
3.3 PLANNING PROPOSALS ................................................................................................................................. 9
4. URBAN DESIGN ANALYSIS ...................................................................................................................... 11
5. PROPERTY MARKET ANALYSIS .............................................................................................................. 12
5.1 GENERAL MARKET COMMENTARY ................................................................................................................ 12
5.2 AFFORDABLE HOUSING ................................................................................................................................ 13
5.3 DEVELOPMENT ACTIVITY ............................................................................................................................. 14
5.4 BUYER PROFILE ......................................................................................................................................... 14
6. SALES EVIDENCE ...................................................................................................................................... 15
6.1 NEW AND OFF THE PLAN APARTMENTS SALES .............................................................................................. 15
6.2 POTENTIAL PRICE POINTS FOR THE SITE ....................................................................................................... 17
6.3 DEVELOPMENT SITE SALES ......................................................................................................................... 17
7. FEASIBILITY ASSESSMENT...................................................................................................................... 20
7.1 FEASIBILITY ASSUMPTIONS .......................................................................................................................... 20
7.2 RESIDUAL LAND VALUE APPROACH .............................................................................................................. 20
7.3 AFFORDABLE RENTAL HOUSING SCENARIOS TESTED ..................................................................................... 21
7.4 PARKING ALLOCATIONS ADOPTED ................................................................................................................ 22
7.5 TAKE UP RATES ......................................................................................................................................... 23
7.6 PROXIMITY TO SOCIAL HOUSING CONCENTRATIONS ....................................................................................... 23
7.7 DEVELOPMENT COSTS ................................................................................................................................ 23
7.8 PERFORMANCE HURDLES ............................................................................................................................ 25
7.9 FEASIBILITY MODELLING RESULTS................................................................................................................ 25
7.10 FACTORS THAT CAN IMPACT DEVELOPMENT FEASIBILITY ................................................................................ 27
7.11 SUMMARY .................................................................................................................................................. 28
REFERENCES...................................................................................................................................................... 30
134
600-660 ELIZABETH STREET, REDFERN – FEASIBILITY STUDY
1
LIMITATIONS OF THIS STUDY
AEC acknowledges a number of limitations associated with this Study:
• All concept scheme designs and/or options remain conceptual and indicative only at the time of preparing this
report having not been through the development planning approval process.
• We have not been provided with a quantity surveyor’s construction costs for any of the proposed
concept/design schemes and have relied upon our interpretation of the costs based on industry publications,
perusal of costing reports prepared for other projects and discussions with developers.
• This is not a valuation report and should not be treated or relied upon for such purposes.
• The purpose of this report is to assist the City with their internal decision making only and should not be relied
upon for any other purposes.
• We have not undertaken any Title searches in this instance and our assessment has been conducted on the
basis the Title is free of any encumbrances (including easements, rights of carriageway, unregistered dealings
etc.) that could potentially hinder redevelopment or materially deviate from anticipated development yield as
identified within the Urban Design Analysis supplied.
• The feasibility modelling results are ‘sensitive’ to changes in construction costs and development yield.
Obtaining a QS costing will provide further certainty in the development feasibility modelling.
• We have not confirmed if the proposed project configuration as modelled under the Urban Design Analysis
complies with the Apartment Design Guideline. Should this not be the case, we reserve the right to review and
amend this report if there is likely to be a material impact on the feasibility.
• In light of recent volatility in economic conditions resulting from the COVID-19 pandemic it is difficult to provide
certainty in terms of market direction. Market dynamics can shift quickly and can adjust in a negative manner
particularly for development sites. AEC therefore recommend that this assessment is kept under regular
review.
• Details of transactions and settlement terms of the sales evidence considered within our assessment is
information that is generally ‘commercial in confidence’ and can be difficult to obtain. The only settlement terms
AEC can confirm is the exchange and settlement date and amounts as per land title information obtained
through Pricefinder and only after the sale has settled.
The Feasibility Study is desktop in nature and a number of generic assumptions are necessitated by the conceptual
nature of the options as well as the absence of detailed information available. These assumptions pertain to the
revenue and sources of revenue, cost of infrastructure and public realm works, staging of redevelopment, ‘hard’
and ‘soft’ development costs.
Given the foregoing and limited information available, the outcomes of the Feasibility Study should only be relied
on as preliminary or indicative.
135

600-660 ELIZABETH STREET, REDFERN – FEASIBILITY STUDY
2
TERMINOLOGY
A summary of the terminology used within this report follows.
Acronyms Definition
ADG
Australian Design Guideline The Apartment Design Guide provides consistent planning and design standards for apartments across the State. It provides design criteria and general guidance about how development proposals can achieve the nine design quality principles identified in SEPP 65 (State Environmental Planning Policy No 65 - Design Quality of Residential Apartment Development).
DA
Development Approval A legal document that allows you to undertake a development. Development Approvals specify the design and other documents that the development must follow – i.e., plans for the location and design of the buildings and the structural details for the building such as the depth of footings.
GBA Gross Building Area The total enclosed and unenclosed area of the building at all building floor levels measured between the normal outside face of any enclosing walls, balustrades and supports.
GFA
Gross Floor Area The sum of the floor area of each floor of a building measured from the internal face of external walls, or from the internal face of walls separating the building from any other building, measured at a height of 1.4 metres above the floor
FSR Floor Space Ratio The ratio of a building's total floor area to the size of the parcel of land upon which it is built.
LAHC
Land and Housing Corporation The NSW Land and Housing Corporation (LAHC) is a self-funded Public Trading Enterprise (PTE), governed by the Housing Act 2001, and is part of the NSW Government’s Department of Planning, Industry and Environment (DPIE).
LEP Local Environmental Plan A type of Environmental Planning Instrument (EPI) which is a legal document that controls development and set out how land is to be used.
SQM (m²) Square Metres The area equal to a square that is 1 meter on each side.
QS Quantity Surveyor A tertiary qualified professional who specialises in building measurement and estimates the value of construction costs
UDA
Urban Design Analysis We have been provided with an Urban Design Analysis (UDA) which was prepared in April 2021 for LAHC, Silvester Fuller, Tyrell Studio and Architectus. The UDA proposes two concept designs over the Site whilst in both instances achieving 2.75:1 FSR.
136
600-660 ELIZABETH STREET, REDFERN – FEASIBILITY STUDY
3
1. INTRODUCTION
1.1 BACKGROUND
600-660 Elizabeth Street, Redfern (the Site) forms part of the Redfern Housing Estate and is a rectangular shaped
redevelopment site with a total land area of 10,850m². The Site is bound by Elizabeth Street, Phillip Street, Walker
Street and Kettle Street within the inner Sydney suburb of Redfern and is currently owned by the Land and Housing
Corporation (LAHC). It formerly accommodated 18 social housing dwellings that were subsequently demolished in
2013 with remaining improvements comprising a Police and Community Youth Club (PCYC) facility, basketball
court and a series of planted exotic and native trees throughout the Site grounds.
In March 2020, LAHC lodged a planning proposal with the City of Sydney (the City) to rezone the Site in order to
develop the following concept scheme:
• A mixed-use development to provide 351 residential apartments across 3 buildings with building heights
ranging between 4-16 storeys and providing basement car parking over two levels. Non-residential floor space
of approximately 1,600m² was also to be included.
• A mix of social, affordable and private housing.
• 30% of dwellings to be social and affordable rental housing (apportionment undetermined).
• A range of apartment sizes and types with accommodation ranging from studios to 3 bedrooms.
• 3,500m² of community facilities inclusive of ground level non-residential floor space (retail and/or commercial
uses).
A Gateway determination was issued in February 2021 by DPIE with the condition that at least 30% of the total
residential floor space must be used for social and affordable rental housing. However, this 30% apportionment is
lower than the City’s current benchmark of 40%, and it was also noted the proposal does not specify the mix of
social and affordable dwellings as part of the 30% allocation.
The project is part of the Communities Plus program, under Future Directions for Social Housing in NSW which
represents the NSW Government’s 10-year plan for social housing. Under the program, LAHC seeks partnership
opportunities with the private sector to fast-track redevelopment of its social housing portfolio. Over the next 10
years, the program provides for the NSW Government to, inter alia, seek to ensure large redevelopments target a
70:30 ratio of private to social housing to enable more integrated communities (generally with an increased number
of social housing where practicable).
We also note the project was originally proposed to fall under a Build to Rent (BtR) scenario, but the City of Council
have since confirmed this scenario is no longer progressing.
Whilst the City were largely supportive of LAHC’s planning proposal, however the Gateway determination
confirmed allocation towards social and affordable rental housing was deemed to be 10% lower than that being
sought by the City and that the proportions of social and affordable rental housing were not properly defined within
the Gateway determination. In response, the City prepared a revised reference scheme which was informed by the
City’s Design Advisory Panel (DAP), summarised as follows:
• Rezone the Site R1 - General Residential.
• Introduce a maximum FSR of 2.75:1.
• The revised scheme to provide an equivalent amount of GFA and achieve a similar number of apartments to
the landowner's reference scheme.
• Allocation of social/affordable rental housing of 40% of residential floor space.
• Introduce a maximum height of buildings of RL 50.3 metres and RL 87.5 metres.
• Introduce Category B maximum car parking rates.
137
600-660 ELIZABETH STREET, REDFERN – FEASIBILITY STUDY
4
• 3,500m² of contiguous on-site land being used for community facilities.
We have been provided with an Urban Design Analysis (UDA) which was prepared in April 2021 by LAHC, Silvester
Fuller, Tyrell Studio and Architectus. The UDA proposes two concept designs over the Site whilst also, in both
instances, achieving:
• 2.75:1 FSR.
• Exceedance of ADG Solar.
• Exceedance of ADG Cross-Vent.
• No shadowing over Redfern Park.
• 70% solar access to the east.
• 15% deep soil.
Of the two concept designs, AEC have been advised by the City to undertake our modelling based on the “Alternate
Mapping” scenario within the UDA which allows for a flexible grid configuration of buildings across the Site that can
be modified further to allow for redesign and/or design excellence increases to FSR. The indicative Gross Floor
Area under the Alternate Mapping scenario equates to 27,612m² (with a Net Saleable Area of 23,517m² exclusive
of communal floor area). The apartment composition under this scenario follows:
• 942m² of retail floor space.
• Studios – 58.
• 1-bedroom apartments – 49.
• 2-bedroom apartments – 163.
• 3-bedroom apartments – 31.
Total number of apartments under this scenario equates to 301.
As instructed by the City, AEC have undertaken our modelling on the basis 30% of the apartments are to be
allocated towards social housing (same typology/apportionment as the private and affordable dwellings) with the
incremental addition of affordable rental housing to be iteratively modelled to reflect where the ‘tipping point’ lies to
ascertain the maximum number of affordable rental housing dwellings that could be incorporated whilst maintaining
social housing at 30% before the project is no longer deemed feasible.
AEC consider the most appropriate variations of affordable rental housing to be tested are 5%, 7.5% and 10%
(resulting in 65%, 62.5% and 60% private dwellings respectively).
1.2 PURPOSE & SCOPE
The objective of the feasibility study is to inform the City of the potential for social and affordable rental housing to
be provided by LAHC under the Communities Plus model, while still ensuring the development results in an
appropriate financial return.
The scope of the Study is to:
• Undertake feasibility of the ‘base case’ proposal, based on a given yield, height profile, contribution
requirement, public infrastructure requirement and tenure mix (30% of all residential floorspace to be provided
as social housing).
• Test variations of the built form in the ‘base case’; for each ‘base case’ outcome, test the impact of an additional
affordable rental housing requirement (in addition to the 30% social housing requirement in the ‘base case’).
• Identify an optimal affordable rental housing requirement on the site, where:
o the redevelopment results in an appropriate return to LAHC; and
138

600-660 ELIZABETH STREET, REDFERN – FEASIBILITY STUDY
5
o the forgone revenue to LAHC resulting from providing affordable rental housing, does not outweigh the
costs of providing social housing elsewhere (where they would need to buy land to provide it). It is noted
affordable rental housing and social housing may differ in ‘value’.
1.2.1 Approach
In order to fulfil the requirements of the brief, AEC have carried out the following tasks:
• Review of LAHC options and the City’s alternate development options.
• Development of parameters and assumptions for feasibility analysis of the:
o Urban Design Analysis (as instructed by the City).
• Market appraisal and research to develop underpinning revenue assumptions.
• Review of generic cost assumptions from various quantity surveyors reports (provided by the City) for other
inner Sydney projects and review of construction cost publications.
• Feasibility modelling of options to test ability of each option to fund delivery of affordable rental housing
dwellings.
139
600-660 ELIZABETH STREET, REDFERN – FEASIBILITY STUDY
6
2. SITE PARTICULARS
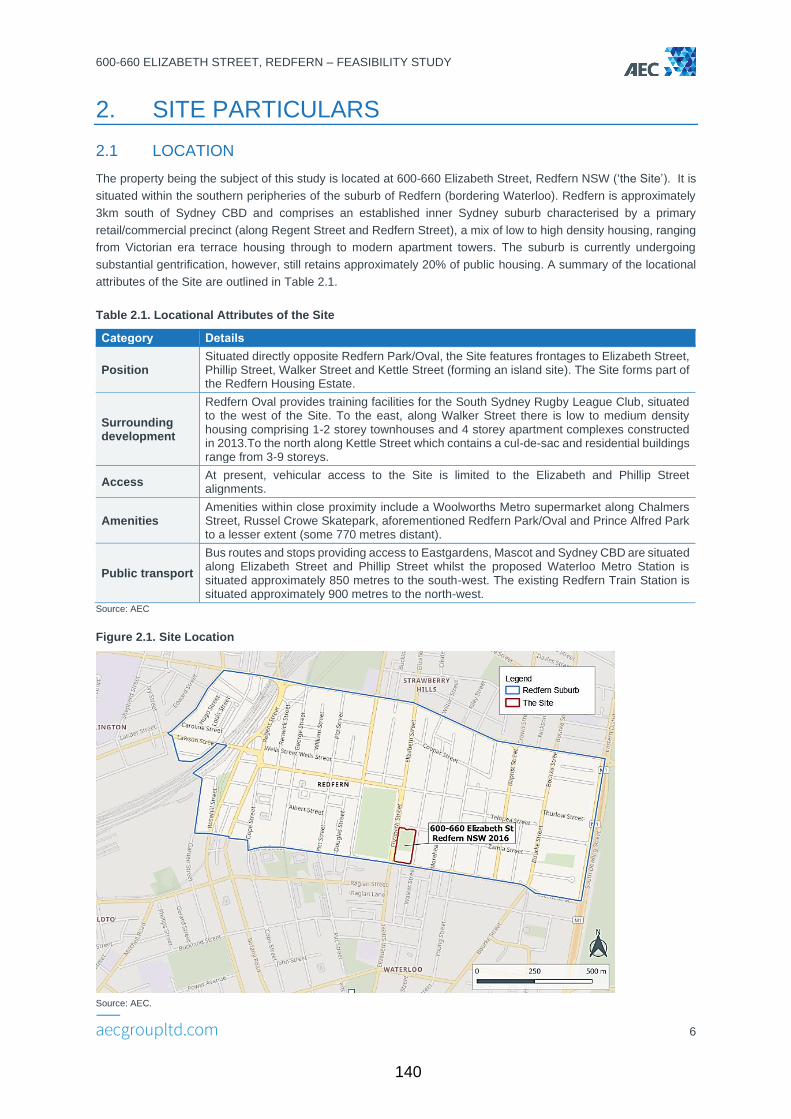
2.1 LOCATION
The property being the subject of this study is located at 600-660 Elizabeth Street, Redfern NSW (‘the Site’). It is
situated within the southern peripheries of the suburb of Redfern (bordering Waterloo). Redfern is approximately
3km south of Sydney CBD and comprises an established inner Sydney suburb characterised by a primary
retail/commercial precinct (along Regent Street and Redfern Street), a mix of low to high density housing, ranging
from Victorian era terrace housing through to modern apartment towers. The suburb is currently undergoing
substantial gentrification, however, still retains approximately 20% of public housing. A summary of the locational
attributes of the Site are outlined in Table 2.1.
Table 2.1. Locational Attributes of the Site
Category Details
Position Situated directly opposite Redfern Park/Oval, the Site features frontages to Elizabeth Street, Phillip Street, Walker Street and Kettle Street (forming an island site). The Site forms part of the Redfern Housing Estate.
Surrounding development
Redfern Oval provides training facilities for the South Sydney Rugby League Club, situated to the west of the Site. To the east, along Walker Street there is low to medium density housing comprising 1-2 storey townhouses and 4 storey apartment complexes constructed in 2013.To the north along Kettle Street which contains a cul-de-sac and residential buildings range from 3-9 storeys.
Access At present, vehicular access to the Site is limited to the Elizabeth and Phillip Street alignments.
Amenities Amenities within close proximity include a Woolworths Metro supermarket along Chalmers Street, Russel Crowe Skatepark, aforementioned Redfern Park/Oval and Prince Alfred Park to a lesser extent (some 770 metres distant).
Public transport
Bus routes and stops providing access to Eastgardens, Mascot and Sydney CBD are situated along Elizabeth Street and Phillip Street whilst the proposed Waterloo Metro Station is situated approximately 850 metres to the south-west. The existing Redfern Train Station is situated approximately 900 metres to the north-west.
Source: AEC
Figure 2.1. Site Location
Source: AEC.
140
600-660 ELIZABETH STREET, REDFERN – FEASIBILITY STUDY
7
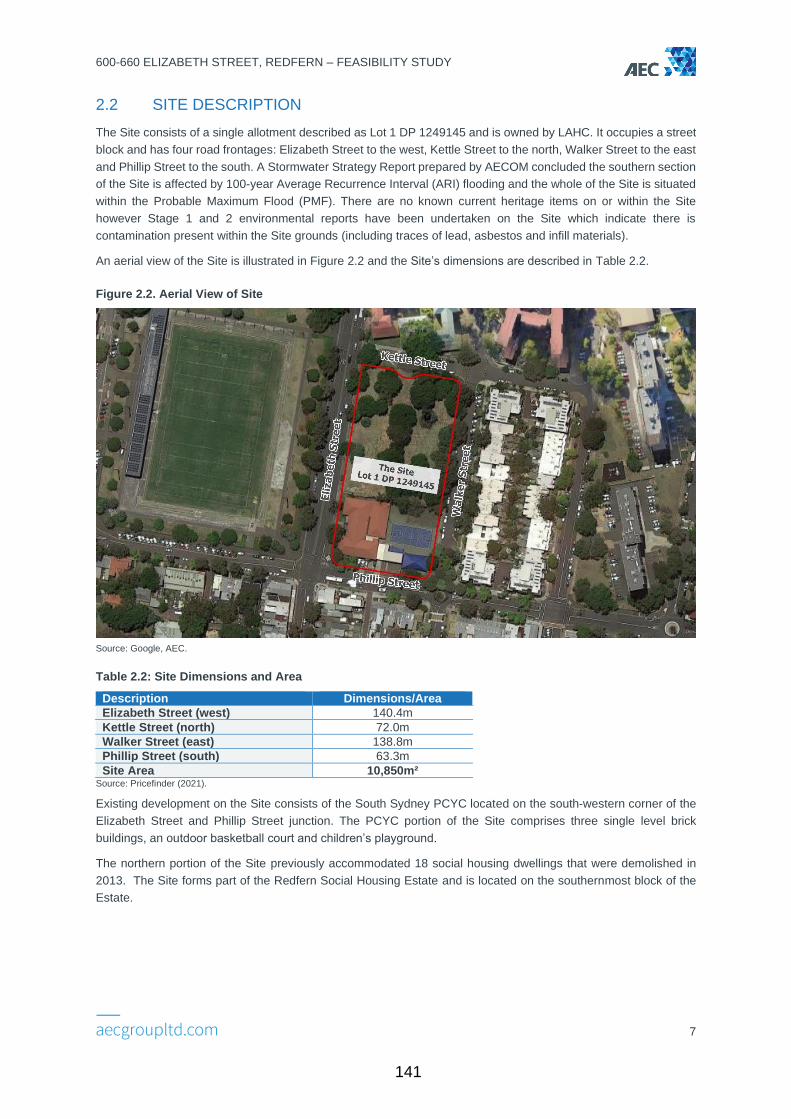
2.2 SITE DESCRIPTION
The Site consists of a single allotment described as Lot 1 DP 1249145 and is owned by LAHC. It occupies a street
block and has four road frontages: Elizabeth Street to the west, Kettle Street to the north, Walker Street to the east
and Phillip Street to the south. A Stormwater Strategy Report prepared by AECOM concluded the southern section
of the Site is affected by 100-year Average Recurrence Interval (ARI) flooding and the whole of the Site is situated
within the Probable Maximum Flood (PMF). There are no known current heritage items on or within the Site
however Stage 1 and 2 environmental reports have been undertaken on the Site which indicate there is
contamination present within the Site grounds (including traces of lead, asbestos and infill materials).
An aerial view of the Site is illustrated in Figure 2.2 and the Site’s dimensions are described in Table 2.2.
Figure 2.2. Aerial View of Site
Source: Google, AEC.
Table 2.2: Site Dimensions and Area
Description Dimensions/Area
Elizabeth Street (west) 140.4m
Kettle Street (north) 72.0m
Walker Street (east) 138.8m
Phillip Street (south) 63.3m
Site Area 10,850m² Source: Pricefinder (2021).
Existing development on the Site consists of the South Sydney PCYC located on the south-western corner of the
Elizabeth Street and Phillip Street junction. The PCYC portion of the Site comprises three single level brick
buildings, an outdoor basketball court and children’s playground.
The northern portion of the Site previously accommodated 18 social housing dwellings that were demolished in
2013. The Site forms part of the Redfern Social Housing Estate and is located on the southernmost block of the
Estate.
141
600-660 ELIZABETH STREET, REDFERN – FEASIBILITY STUDY
8
3. PLANNING CONSIDERATIONS
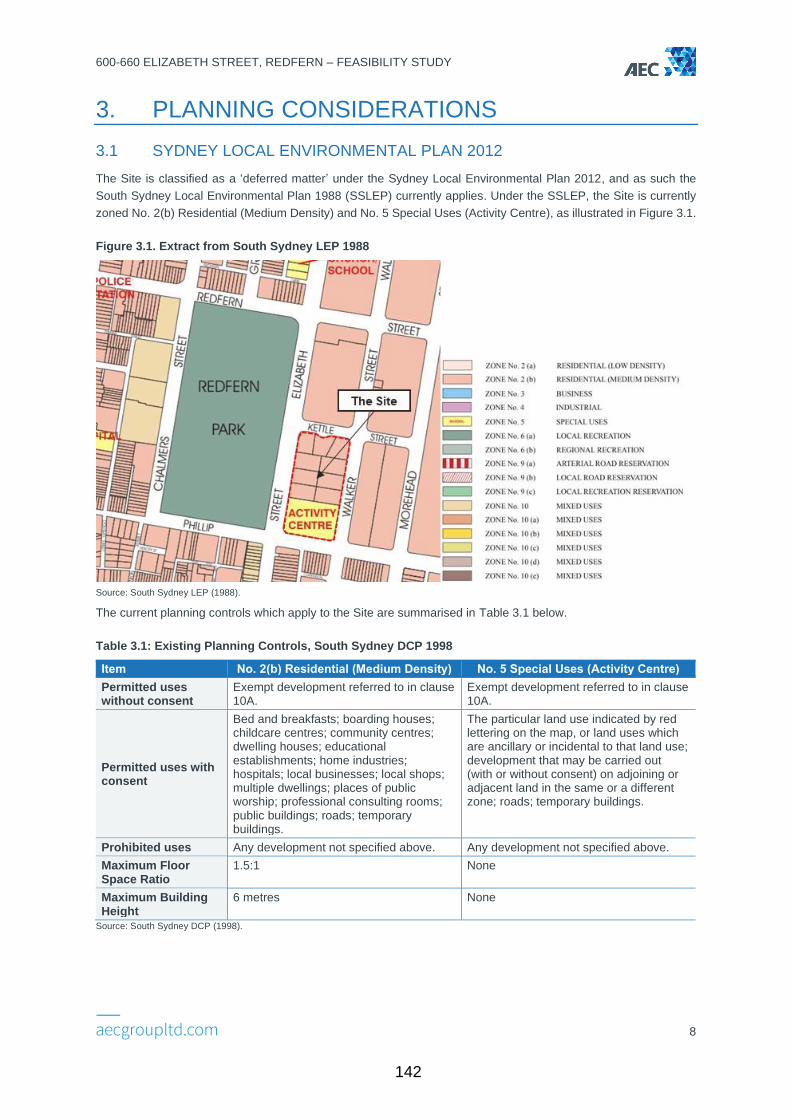
3.1 SYDNEY LOCAL ENVIRONMENTAL PLAN 2012
The Site is classified as a ‘deferred matter’ under the Sydney Local Environmental Plan 2012, and as such the
South Sydney Local Environmental Plan 1988 (SSLEP) currently applies. Under the SSLEP, the Site is currently
zoned No. 2(b) Residential (Medium Density) and No. 5 Special Uses (Activity Centre), as illustrated in Figure 3.1.
Figure 3.1. Extract from South Sydney LEP 1988
Source: South Sydney LEP (1988).
The current planning controls which apply to the Site are summarised in Table 3.1 below.
Table 3.1: Existing Planning Controls, South Sydney DCP 1998
Item No. 2(b) Residential (Medium Density) No. 5 Special Uses (Activity Centre)
Permitted uses without consent
Exempt development referred to in clause 10A.
Exempt development referred to in clause 10A.
Permitted uses with consent
Bed and breakfasts; boarding houses; childcare centres; community centres; dwelling houses; educational establishments; home industries; hospitals; local businesses; local shops; multiple dwellings; places of public worship; professional consulting rooms; public buildings; roads; temporary buildings.
The particular land use indicated by red lettering on the map, or land uses which are ancillary or incidental to that land use; development that may be carried out (with or without consent) on adjoining or adjacent land in the same or a different zone; roads; temporary buildings.
Prohibited uses Any development not specified above. Any development not specified above.
Maximum Floor Space Ratio
1.5:1 None
Maximum Building Height
6 metres None
Source: South Sydney DCP (1998).
142

600-660 ELIZABETH STREET, REDFERN – FEASIBILITY STUDY
9
3.2 THE CITY OF SYDNEY AFFORDABLE HOUSING PROGRAM
The City of Sydney Affordable Housing Program (the Program) was formally adopted by the City on 24 August
2020 and aims to provide the background, requirements and operational detail for various affordable contribution
provisions in local environmental plans (LEPs) that operate within the City of Sydney. The Program includes land
within central Sydney, Green Square, Southern Employment Lands, Residual Land and Planning Proposal Land.
The Program includes the following variations of the definition of affordable housing:
Affordable Housing
Affordable housing is defined by the Environmental Planning and Assessment Act 1979 as:
“Housing for very low-income households, low-income households or moderate-income households, being such
households as are prescribed by the regulations or as are provided for in an environmental planning instrument”.
Affordable Rental Housing
Under this Program, Affordable rental housing or Affordable rental dwelling is affordable housing that is owned and
managed by government, a recommended community housing provider, or an eligible community housing provider
and rented to very low to moderate income households.
It is understood that any proposed affordable housing within the project forming the basis of this report, shall be
dedicated as such for use as affordable rental housing.
For Central Sydney and Residual Lands, the following contribution rates apply:
Table 3.2: Contribution Rates
Date of lodgement of development application
Non- residential rate Residential rate
1 July 2021 to 30 June 2022 0.5% 1.5%
1 July 2022 onwards 1.0% 3.0% Source: Affordable Housing Program (2020).
Should a Proponent wish to provide an Equivalent Monetary Contribution as opposed to other forms i.e., in-kind
dedication or dedication of land, an amount of $10,588/m² (current rate) of equivalent affordable housing GFA is to
apply.
Further, the Program states that where multiple affordable rental dwellings are provided in the development, the
apartment design benchmarks as established by the Apartment Design Guideline (or any subsequent Guideline
that may apply from time to time) are to be generally achieved.
3.3 PLANNING PROPOSALS
3.3.1 LAHC’s Planning Proposal
LAHC submitted a planning proposal to the City in March 2020 for the Site, which seeks to amend the Sydney LEP
2012 to:
• Rezone the Site to “R1 - General Residential”.
• Introduce a maximum FSR of 2.75:1.
• Introduce a maximum height of buildings of RL 50.3 metres and RL 87.5 metres.
• Allocation of social/affordable rental housing of 30% of residential floor space.
• Introduce Category B maximum car parking rates.
• Insert a site-specific clause within Division 5 ‘Site specific provisions’ relating to the amount of affordable rental
housing to be provided on the site and the provision of 1,500 square metres of space for a community facility
either onsite or in the locality.
143

600-660 ELIZABETH STREET, REDFERN – FEASIBILITY STUDY
10
An illustrative reference scheme was also prepared as part of LAHC’s proposal, illustrated in Figure 3.2, which
outlines the following key features:
• An indicative yield of 351 apartments that demonstrate compliance with the requirements of the Apartment
Design Guide (ADG).
• Buildings ranging from 6 to 14 storeys, with a single tower located on the corner on Kettle and Walker Street
marking an important east-west connection.
• Up to 1,500 sqm of non-residential floor space to provide opportunities for street activation, with cafés, retail
spaces, childcare and community uses, on key corners.
• Three large communal spaces and landscaped setbacks that demonstrate the site can achieve 25% tree
canopy cover.
Figure 3.2. Illustrative Reference Scheme
Source: Architectus (2020).
3.3.2 City of Sydney’s Revised Version of the Planning Proposal
Whilst the City were largely supportive of the proposal, the allocation towards social and affordable rental housing
was deemed to be 10% lower than that determined by the City and that the proportions were not properly defined.
In response, the City prepared a revised reference scheme which was informed by the City’s Design Advisory
Panel (DAP), summarised as follows:
• Rezone the Site R1 - General Residential.
• Introduce a maximum FSR of 2.75:1.
• The revised scheme to provide an equivalent amount of GFA and achieve a similar number of apartments to
the landowner's reference scheme.
• Allocation of social/affordable rental housing of 40% of residential floor space.
• Introduce a maximum height of buildings of RL 50.3 metres and RL 87.5 metres.
• Introduce Category B maximum car parking rates.
• 3,500m² of contiguous on-site land being used for community facilities.
144

600-660 ELIZABETH STREET, REDFERN – FEASIBILITY STUDY
11
4. URBAN DESIGN ANALYSIS
We have been provided with an Urban Design Analysis (UDA) which was prepared in April 2021 for LAHC, Silvester
Fuller, Tyrell Studio and Architectus. The UDA proposes two concept designs over the Site whilst in both instances
achieving:
• 2.75:1 FSR.
• Exceedance of ADG Solar.
• Exceedance of ADG Cross-Vent.
• No shadowing over Redfern Park.
• 70% solar access to the east.
• 15% deep soil.
Of the two concept designs, AEC have been advised by the City to undertake our modelling based on the “Alternate
Mapping” scenario which allows for a flexible grid configuration of buildings across the Site that can be modified
further to allow for redesign and/or design excellence process. The indicative building layout follows in Figure 4.1
Figure 4.1: Indicative Building Configuration (Alternate Mapping Scenario)
Source: Urban Design Analysis (2021).
The indicative Gross Floor Area under the Alternate Mapping Scenario equates to 27,612m² (with a Net Saleable
Area of 23,517m² exclusive of communal floor area). The apartment (and retail) composition under this scenario
follows:
• 942m² of retail floor space.
• Studios – 58.
• 1-bedroom apartments – 49.
• 2-bedroom apartments – 163.
• 3-bedroom apartments – 31.
The total number of apartments under this scenario equates to 301. The three buildings (excluding the proposed
community facility) range in height between 4-14 storeys. Other provisions are to include 239 basement car spaces
over two levels (including 23 accessible car spaces) and 345 bikes stores.
145
600-660 ELIZABETH STREET, REDFERN – FEASIBILITY STUDY
12
5. PROPERTY MARKET ANALYSIS
5.1 GENERAL MARKET COMMENTARY
Housing markets rebounded far more rapidly out of the COVID-19 led economic contraction than was initially
expected (noting major banks were anticipating a fall in falls of 20-40%). Buyer demand led the property market
surge fuelled by historically low interest rates and government assistance for certain buyer groups. Conversely,
over the same period, the apartment market (and more particularly, high density projects across pockets of Sydney)
has lagged the housing recovery, attributable to the following factors:
• Subdued foreign/local investor appetite.
• Withdrawal of international students (due to pandemic).
• The desire for larger forms of accommodation (due to pandemic).
• The work from home movement (exacerbated by the pandemic) which has led to increased demand for coastal/
lifestyle dwellings (which has lessened demand for inner city apartments).
• Stigma revolving around new and off the plan apartments given notable building defects in recent years.
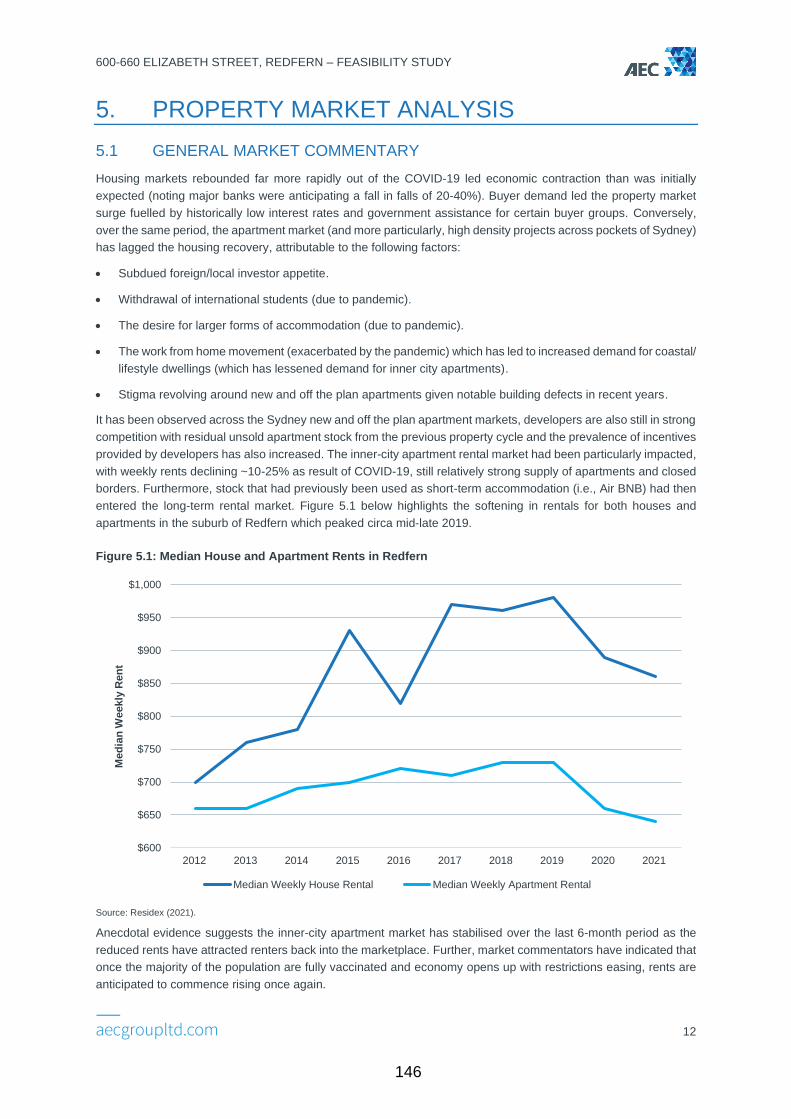
It has been observed across the Sydney new and off the plan apartment markets, developers are also still in strong
competition with residual unsold apartment stock from the previous property cycle and the prevalence of incentives
provided by developers has also increased. The inner-city apartment rental market had been particularly impacted,
with weekly rents declining ~10-25% as result of COVID-19, still relatively strong supply of apartments and closed
borders. Furthermore, stock that had previously been used as short-term accommodation (i.e., Air BNB) had then
entered the long-term rental market. Figure 5.1 below highlights the softening in rentals for both houses and
apartments in the suburb of Redfern which peaked circa mid-late 2019.
Figure 5.1: Median House and Apartment Rents in Redfern
Source: Residex (2021).
Anecdotal evidence suggests the inner-city apartment market has stabilised over the last 6-month period as the
reduced rents have attracted renters back into the marketplace. Further, market commentators have indicated that
once the majority of the population are fully vaccinated and economy opens up with restrictions easing, rents are
anticipated to commence rising once again.
$600
$650
$700
$750
$800
$850
$900
$950
$1,000
2012 2013 2014 2015 2016 2017 2018 2019 2020 2021
Med
ian
Weekly
Ren
t
Median Weekly House Rental Median Weekly Apartment Rental
146

600-660 ELIZABETH STREET, REDFERN – FEASIBILITY STUDY
13
2020 saw median values across the Redfern apartment decline in the order of ~15% however prices have
recovered over 2021 to pre-covid levels as shown in Figure 5.2.
Figure 5.2: Median Apartment Prices and Annual Growth Rates in Redfern
Source: Pricefinder(2021).
5.2 AFFORDABLE HOUSING
In Sydney as of August 2021, the median house price was $1,293,450 whilst the median apartment price was
$825,514 according to Corelogic. This level of pricing further solidifies Sydney’s position as Australia’s least
affordable city. This high cost of housing is a well-recognised economic and social issue for Sydney, particularly
within and around Sydney CBD where housing prices are amongst the highest in metropolitan Sydney.
The Eastern City District Plan (District Plan) which was implemented in March 2018 includes a target when planning
proposals are being prepared for urban infill or land release areas, that 5-10% of new floor area be provided as
affordable rental housing, subject to development feasibility being established at the precinct scale. In addition, the
City’s Sustainable Sydney 2030 Vision establishes an affordable housing target that by 2030, 7.5% of housing will
consist of social housing and a further 7.5% will consist of affordable housing.
As a general rule, housing is generally considered affordable if it costs less than 30% of gross household income.
The implementation of affordable rental housing is to assist those households on very low, low and moderate-
income households to be able to reside in areas close to amenities, transport, education and employment options
within regions that are characterised by higher housing costs.
In order to create better housing outcomes for people on lower wages and to assist CHPs with more favourable
funding arrangements for providing social and affordable housing, the National Housing Finance and Investment
Corporation (NHFIC) was formed in 2018. NHFIC act as a housing bond aggregator for the sector raising funds
from Australian debt capital markets through the issuance of bonds and then lending that money to CHPs. This
includes the Affordable Housing Bond Aggregator (AHBA) which was implemented to provide low cost, long-term
loans to registered CHPs to support the provision of more social and affordable housing.
-20.00%
-15.00%
-10.00%
-5.00%
0.00%
5.00%
10.00%
15.00%
20.00%
25.00%
$300,000
$400,000
$500,000
$600,000
$700,000
$800,000
$900,000
$1,000,000
$1,100,000
2009 2010 2011 2012 2013 2014 2015 2016 2017 2018 2019 2020 2021
An
nu
al G
row
th R
ate
(%)
Med
ian
An
nu
al
Ap
art
men
t P
rice
Median Apartment Price Annual Growth Rate (%)
147
600-660 ELIZABETH STREET, REDFERN – FEASIBILITY STUDY
14
CHPs can either partner with a developer or another government body in order to provide affordable and/or social
housing. In considering the appropriate housing typologies for the intended users, socio-demographic analysis is
compiled for the respective region in which the CHP is seeking to provide said housing in order to better serve the
needs and requirements for very low, low and moderate-income households.
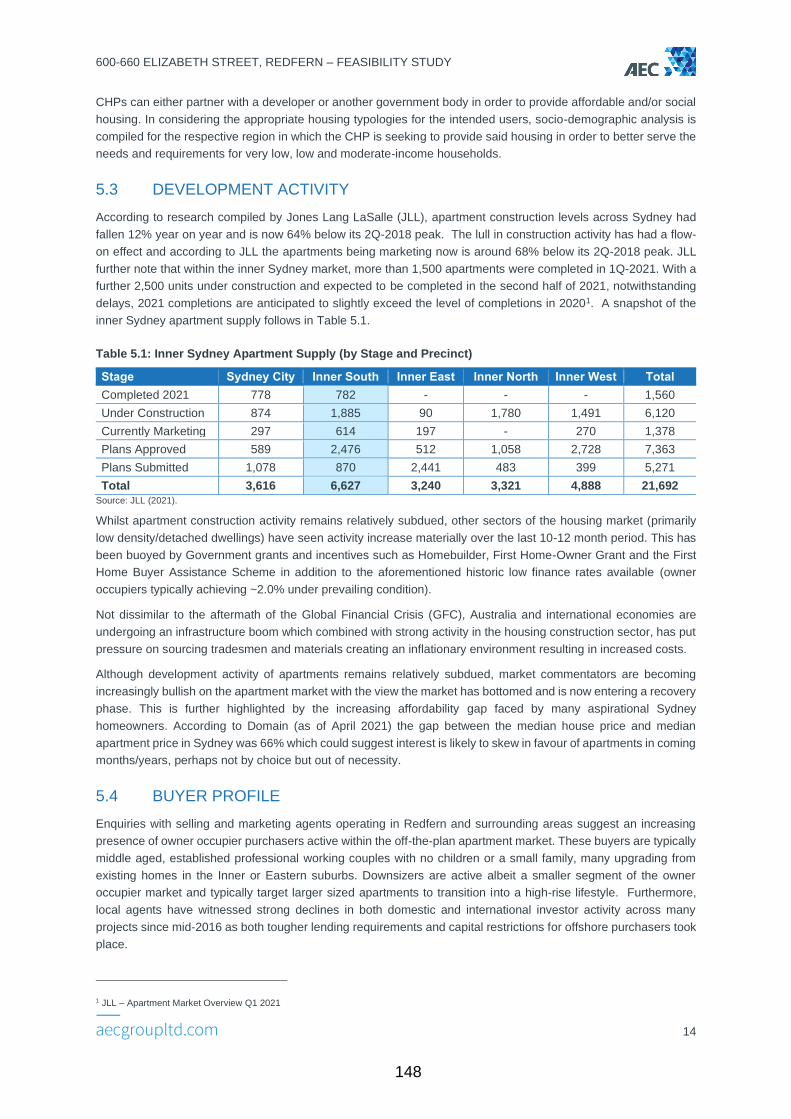
5.3 DEVELOPMENT ACTIVITY
According to research compiled by Jones Lang LaSalle (JLL), apartment construction levels across Sydney had
fallen 12% year on year and is now 64% below its 2Q-2018 peak. The lull in construction activity has had a flow-
on effect and according to JLL the apartments being marketing now is around 68% below its 2Q-2018 peak. JLL
further note that within the inner Sydney market, more than 1,500 apartments were completed in 1Q-2021. With a
further 2,500 units under construction and expected to be completed in the second half of 2021, notwithstanding
delays, 2021 completions are anticipated to slightly exceed the level of completions in 20201. A snapshot of the
inner Sydney apartment supply follows in Table 5.1.
Table 5.1: Inner Sydney Apartment Supply (by Stage and Precinct)
Stage Sydney City Inner South Inner East Inner North Inner West Total
Completed 2021 778 782 - - - 1,560
Under Construction 874 1,885 90 1,780 1,491 6,120
Currently Marketing 297 614 197 - 270 1,378
Plans Approved 589 2,476 512 1,058 2,728 7,363
Plans Submitted 1,078 870 2,441 483 399 5,271
Total 3,616 6,627 3,240 3,321 4,888 21,692 Source: JLL (2021).
Whilst apartment construction activity remains relatively subdued, other sectors of the housing market (primarily
low density/detached dwellings) have seen activity increase materially over the last 10-12 month period. This has
been buoyed by Government grants and incentives such as Homebuilder, First Home-Owner Grant and the First
Home Buyer Assistance Scheme in addition to the aforementioned historic low finance rates available (owner
occupiers typically achieving ~2.0% under prevailing condition).
Not dissimilar to the aftermath of the Global Financial Crisis (GFC), Australia and international economies are
undergoing an infrastructure boom which combined with strong activity in the housing construction sector, has put
pressure on sourcing tradesmen and materials creating an inflationary environment resulting in increased costs.
Although development activity of apartments remains relatively subdued, market commentators are becoming
increasingly bullish on the apartment market with the view the market has bottomed and is now entering a recovery
phase. This is further highlighted by the increasing affordability gap faced by many aspirational Sydney
homeowners. According to Domain (as of April 2021) the gap between the median house price and median
apartment price in Sydney was 66% which could suggest interest is likely to skew in favour of apartments in coming
months/years, perhaps not by choice but out of necessity.
5.4 BUYER PROFILE
Enquiries with selling and marketing agents operating in Redfern and surrounding areas suggest an increasing
presence of owner occupier purchasers active within the off-the-plan apartment market. These buyers are typically
middle aged, established professional working couples with no children or a small family, many upgrading from
existing homes in the Inner or Eastern suburbs. Downsizers are active albeit a smaller segment of the owner
occupier market and typically target larger sized apartments to transition into a high-rise lifestyle. Furthermore,
local agents have witnessed strong declines in both domestic and international investor activity across many
projects since mid-2016 as both tougher lending requirements and capital restrictions for offshore purchasers took
place.
1 JLL – Apartment Market Overview Q1 2021
148
600-660 ELIZABETH STREET, REDFERN – FEASIBILITY STUDY
15
6. SALES EVIDENCE
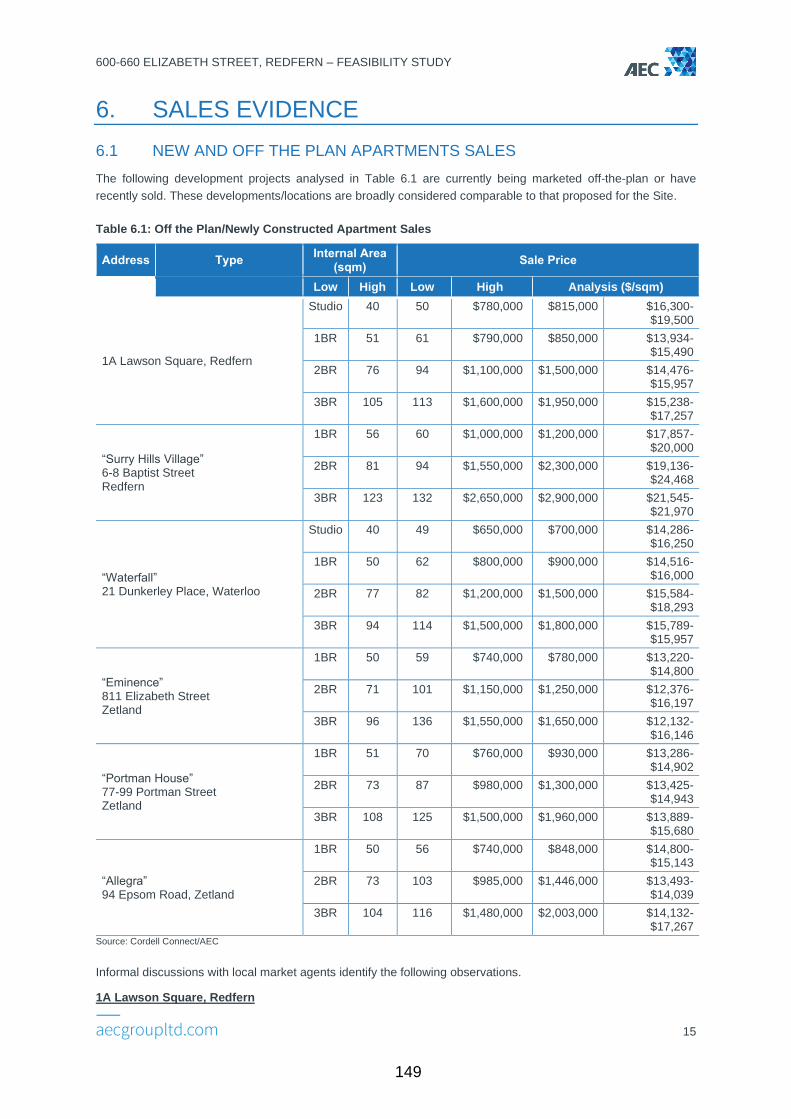
6.1 NEW AND OFF THE PLAN APARTMENTS SALES
The following development projects analysed in Table 6.1 are currently being marketed off-the-plan or have
recently sold. These developments/locations are broadly considered comparable to that proposed for the Site.
Table 6.1: Off the Plan/Newly Constructed Apartment Sales
Address Type Internal Area
(sqm) Sale Price
Low High Low High Analysis ($/sqm)
1A Lawson Square, Redfern
Studio 40 50 $780,000 $815,000 $16,300-$19,500
1BR 51 61 $790,000 $850,000 $13,934-$15,490
2BR 76 94 $1,100,000 $1,500,000 $14,476-$15,957
3BR 105 113 $1,600,000 $1,950,000 $15,238-$17,257
“Surry Hills Village” 6-8 Baptist Street Redfern
1BR 56 60 $1,000,000 $1,200,000 $17,857-$20,000
2BR 81 94 $1,550,000 $2,300,000 $19,136-$24,468
3BR 123 132 $2,650,000 $2,900,000 $21,545-$21,970
“Waterfall” 21 Dunkerley Place, Waterloo
Studio 40 49 $650,000 $700,000 $14,286-$16,250
1BR 50 62 $800,000 $900,000 $14,516-$16,000
2BR 77 82 $1,200,000 $1,500,000 $15,584-$18,293
3BR 94 114 $1,500,000 $1,800,000 $15,789-$15,957
“Eminence” 811 Elizabeth Street Zetland
1BR 50 59 $740,000 $780,000 $13,220-$14,800
2BR 71 101 $1,150,000 $1,250,000 $12,376-$16,197
3BR 96 136 $1,550,000 $1,650,000 $12,132-$16,146
“Portman House” 77-99 Portman Street Zetland
1BR 51 70 $760,000 $930,000 $13,286-$14,902
2BR 73 87 $980,000 $1,300,000 $13,425-$14,943
3BR 108 125 $1,500,000 $1,960,000 $13,889-$15,680
“Allegra” 94 Epsom Road, Zetland
1BR 50 56 $740,000 $848,000 $14,800-$15,143
2BR 73 103 $985,000 $1,446,000 $13,493-$14,039
3BR 104 116 $1,480,000 $2,003,000 $14,132-$17,267
Source: Cordell Connect/AEC
Informal discussions with local market agents identify the following observations.
1A Lawson Square, Redfern
149

600-660 ELIZABETH STREET, REDFERN – FEASIBILITY STUDY
16
This project comprises the partial demolition of the existing commercial building and shall comprise an 18-storey
tower providing a GFA of approximately 7,346m² comprising 6 storeys of commercial floorspace and ground floor
retail, 12 storeys of residential apartments, totalling approximately 70 units. We advised by the selling agent, there
are approximately 12 remaining apartments within the complex. studio apartments typically sell for between
$780,000 to $810,000, 1-bedroom apartments typically sell on average at $850,000 (without parking) and the 2-
bedroom apartments typically sell for around $1,200,000. The addition of parking we are advised is around
$100,000 per space.
“Surry Hills Village”, 397-399A Cleveland Street & 2-38 Baptist Street, Redfern
This project has commenced construction in July 2021 and is anticipated to be completed mid-2023. Upon
completion, it shall comprise 8 buildings in total which will include lower ground and first floor commercial (retail
and supermarket) uses (7 commercial premises) to Marriott, Baptist and Cleveland Streets, commercial office uses
in levels 2-6 of Building G (Cleveland Street) & 154 residential apartments across Buildings A to F. Basement car
parking shall be provided over 3 levels for 345 vehicles. Surry Hills Village is marketed as a luxurious development
with more premium quality finishes and given its proximity to Crown Street, Surry Hills restaurants, cafes and bars,
appeals more to the Surry Hills marketplace. To date, we are advised approximately 50% of stock within the project
has sold.
“Waterfall”, 21 Dunkerley Place, Waterloo
A multi-stage project that consists of the construction of a mixed-use development of 4 buildings, ranging in height
from 7 to 21 storeys, 331 residential apartments, 16 x studio, 135 x 1, 139 x 2 and 40 x 3-bedroom, 2 x ground
floor retail/commercial suites fronting O’Dea Ave and The Rope Walk, communal facilities (including gym, pool and
rooftop garden). Building A shall be built to height of 7/8 storeys, Building B 7/8 storeys, Building C 21 storey and
Building D 7/8 storeys. Basement carparking shall be provided over 3 levels for 307 vehicles, 18 motorbikes & 337
bicycles. We are advised by the selling agent approximately 280 of the apartments have sold to date.
“Eminence”, 811 Elizabeth Street, Zetland
Construction of this project was completed in June 2021. Project comprises three towers ranging in height between
3-15 levels accommodating 250 apartments in total. Parking is provided over two basement levels with car parking
for 206 vehicles and 5 motorcycle spaces. The marketing agent advises 137 apartments have sold to date.
“Portman House”, 77-99 Portman Street, Zetland
Portman House joins Portman on the Park in being Australia's first residential buildings to seek WELL v2
Certification, a globally recognised organisation leading the movement to improve the relationship between people
and the built environment. Portman House, as part of The Portman Collection is forecasted to be complete by mid-
2023. The site shall comprise four buildings (Buildings A, B, C and D) and incorporate 323 residential apartments
and 2,389m² of retail tenancies at ground level, plus car parking for residents, commercial/retail, service vehicles,
car share, car wash and motorbike spaces.
“Allegra”, 94 Epsom Road, Zetland
A four-building complex to be delivered by Meriton and designed by SJB Architects. The buildings shall range in
height between 6-13 levels with a total of 260 single and dual level apartments, a collection of three and four storey
terrace homes and rooftop penthouses. The project backs onto the proposed Gunyama Park Aquatic and
Recreational Precinct. Located within 500m to Woolworths Rosebery, a 10-minute walk to East Village shopping
centre and 900m to Green Square train station. The anticipated timing of delivery follows:
• Building A & B – June 2022.
• Building C & D – December 2022.
• Building E – October 2022.
150

600-660 ELIZABETH STREET, REDFERN – FEASIBILITY STUDY
17
6.2 POTENTIAL PRICE POINTS FOR THE SITE
At present, there are limited new apartments projects being marketed in Redfern (some of which include 1A Lawson
Street – 12 remaining apartments and “Surry Hills Village”, Cleveland Street – 50% of the 154 apartments having
sold to date). The majority of surrounding development activity remains in areas such as Zetland, Waterloo and
the Green Square precinct. This lack of potential competition in the immediately surrounding location should assist
with marketability and pricing levels achievable. Further, parking is observed to add $60,000-$100,000 per
apartment (where provided) and has been reflected in our adopted potential price points. Accordingly, we consider
potential price points expected to be achieved for new residential apartments in accordance with the Alternate
Mapping Scenario in the UDA as follows:
• Studio units (avg 44sqm): $640,000 - $695,000 ($14,545/sqm - $15,795/sqm of internal area).
• 1-bedroom units (avg 54sqm): $740,000 - $795,000 ($13,704/sqm - $14,722/sqm of internal area).
• 2-bedroom units (avg 83sqm): $1,100,000 - $1,200,000 ($13,253/sqm - $14,458sqm of internal area).
• 3-bedroom units (avg 123sqm): $1,700,000 - $1,900,000 ($13,821/sqm - $15,447/sqm of internal area).
The above revenue ranges are considered appropriate for the market dwellings under the Alternate Mapping
Scenario. No revenue has been attributed to the social and affordable rental housing within the proposed project.
6.3 DEVELOPMENT SITE SALES
Development site sales greater than 10,000m² within Redfern and surrounding regions have been scarce
throughout the 2019-21 period. Whilst increased transactional activity has been observed within the Green Square
precinct, particularly along Botany Road and Bourke Street as developers target redevelopment of ageing
commercial and industrial buildings. This is a trend being observed throughout much of the broader South Sydney
and Inner West regions, particularly in markets with existing train stations.
A divergent range of prices has been paid for development sites, reflective of:
• Varying Scale of Development - as a general rule of thumb, smaller sites sell for a higher rate per unit, all
things being equal.
• Proportion of Residential v Non-residential Floorspace - development sites are more valuable the greater
the proportion of residential floorspace that can be achieved.
• Unit Mix and Size - all things being equal, development sites which propose a greater number of smaller units
(for example studio and 1-bedroom units) sell for a lower rate per unit/site than development sites which contain
a greater proportion of larger units (for example 2 and 3-bedroom units).
• Planning Status - sites with the benefit of development consent typically sell for a premium as compared with
sites without consent even though appropriately zoned as planning risk is arguably at a minimum with the
developer only having to manage market and financial risk. Sites that require a rezoning or planning proposal
to vary planning controls are even more risky, the market accordingly prices the risk into price paid for the site.
• Date of Sale - prices paid for development sites over the 2018-2020 period weakened commensurate with
decreases in end sale values for completed apartments.
• Settlement Terms – where delayed settlement terms are agreed upon, slightly higher prices have been
observed to be paid for development sites, as they result in obvious cash flow benefit and opportunity for
existing supply pipeline to be absorbed. Details of transactions and settlement terms is information that is
generally ‘commercial in confidence’ and can be difficult to obtain. The only settlement terms AEC can confirm
is the exchange and settlement date and amounts as per land title information obtained through Pricefinder
and only after the sale has settled.
Recent development site sales in the inner eastern and southern Sydney suburbs analysed indicate a broad range
of $3,435/m² to $5,303/m² of GFA for sites greater than 1,000m² in site area whilst the most recent site sale (greater
than 10,000m² in land area) at 2-5 Halifax Street, Macquarie Park sold for ~$2,489/m² of GFA.
151

600-660 ELIZABETH STREET, REDFERN – FEASIBILITY STUDY
18
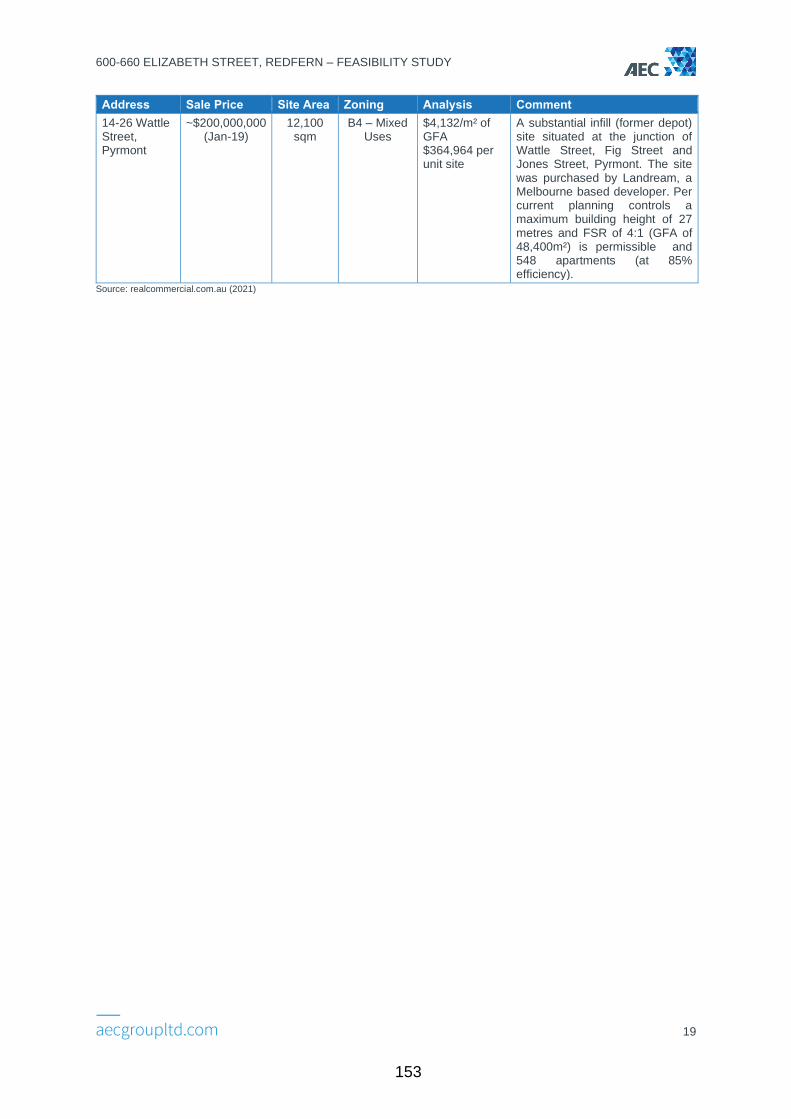
A summary of the development site transactions considered within our assessment are detailed in Table 6.2.
Table 6.2: Development Site Sales Evidence
Address Sale Price Site Area Zoning Analysis Comment
2-5 Halifax Street, Macquarie Park
$135,000,000 (Aug-21)
~18,509 sqm
R4 – High Density
Residential
$2,489/m² of GFA $142,105 per unit site
A large site of approximately 1.8 hectares within the Lachlan’s Line precinct at Macquarie Park. Acquired by Landmark Group from Landcom, the site is anticipated to deliver up to 950 apartments across 9 buildings. Current zoning controls allow an FSR range of 1.39 - 3.5:1 and building height range 33-99 metres across the site. Overall, the approximate permissible GFA equates to 54,248m².
177-197 Anzac Parade, Kensington
$80,367,664 (Aug-20)
~4,000 sqm
B2 – Local Centres
$3,588/m² of GFA $316,408 per unit site
An infill redevelopment site extending to approximately 4,000m² situated on the western side of Anzac Parade some 200 metres north of UNSW. The site comprised the sale (in one line basis) of 24 adjoining properties (a mix of freestanding commercial buildings and older style apartment buildings). The site was purchased by Cedar Pacific who are currently in the process of lodging a DA for student accommodation for the site. Permissible building heigh is 25 metres (circa 8 floors) however there are no FSR controls. Assuming a site cover of 70% we have calculated an approximate GFA of 22,400m² and 254 apartments (at 85% efficiency).
12-24 Rothschild Avenue, Rosebery
$65,000,000 (Dec-19)
8,411 sqm
B4 – Mixed Uses
$3,435/m² of GFA $303,738 per unit site
A rectangular shaped redevelopment site situated within Sydney’s inner southern suburbs. Permissible FSR is 1.75:1 with additional 0.5:1 available as bonus FSR in accordance with Clause 6.14 of the Sydney Local Environmental Plan 2012. Total permissible GFA equates to approximately 18,925m² and 214 apartments (at 85% efficiency).
104-116 Regent Street, Redfern
$50,710,000 (Nov-20)
1,366 sqm
E-Business Zone
(Commercial Core)
$5,303/m² of GFA $469,537 per unit site
A former service station site extending to 1,366m² situated on the corner of Regent Street, Margaret Street and William Lane within Redfern (approx. 150 metres from Redfern Train Station). Per current planning controls a maximum building height of 18 metres and FSR of 7:1 (GFA of 9,562m²) is permissible and 108 apartments (at 85% efficiency).
152
600-660 ELIZABETH STREET, REDFERN – FEASIBILITY STUDY
19
Address Sale Price Site Area Zoning Analysis Comment
14-26 Wattle Street, Pyrmont
~$200,000,000 (Jan-19)
12,100 sqm
B4 – Mixed Uses
$4,132/m² of GFA $364,964 per unit site
A substantial infill (former depot) site situated at the junction of Wattle Street, Fig Street and Jones Street, Pyrmont. The site was purchased by Landream, a Melbourne based developer. Per current planning controls a maximum building height of 27 metres and FSR of 4:1 (GFA of 48,400m²) is permissible and 548 apartments (at 85% efficiency).
Source: realcommercial.com.au (2021)
153

600-660 ELIZABETH STREET, REDFERN – FEASIBILITY STUDY
20
7. FEASIBILITY ASSESSMENT
7.1 FEASIBILITY ASSUMPTIONS
Key assumptions adopted in our feasibility modelling methodology include:
I. LAHC enters into a form of joint venture arrangement with a developer and contributes land (no transfer
of land occurs attracting no transfer duty). In return, a developer builds market housing for sale and builds
social housing to be dedicated to LAHC upon completion.
II. The developer also constructs affordable rental housing which is then dedicated to Council or directly to
a Council approved CHP to manage whilst noting that should a CHP potentially partner/form a joint venture
with a developer, the CHP would contribute equity into the project (for the affordable and/or social housing
component) potentially improving the feasibility return parameters.
III. Standard GST rule has been adopted for the modelling (i.e., no GST Margin Scheme).
IV. Take up rates for our sales revenue varies between 7-15 apartments per month depending on the time of
transaction (i.e., pre-construction, during construction or post construction).
V. Project financing based on standard development finance rates (5.25% adopted) with 100% debt funding.
VI. No CHP financial input into the project including use of the Affordable Housing Bond Aggregator (AHBA).
VII. The standard and quality of apartments across the project has been assumed to be consistent between
the market, social and affordable rental dwellings.
VIII. The construction of the community facility has not been incorporated into our modelling (assumed payable
or provided by PCYC).
IX. The Site has known contamination present and given it is very difficult to provide a cost estimate to
remediate the Site without formal costs prepared by an appropriate professional, for the purpose of our
modelling, we have increased the construction contingency from 5.0% to 7.5%.
X. S7.11 contributions for the market dwellings payable at issuance of Occupation Certificate (in accordance
with Planning Circular PS20-003 issued 3 July 2020).
XI. No land holding costs comprising Land Tax, Council Rates and Water Rates applicable (Site owned by a
not-for-profit organisation).
XII. As instructed, we have not included any potential value discounting to the private market revenues
associated with being in close proximity to large concentrations of social housing.
XIII. Project to be undertaken on the basis, the market housing is predominantly situated at the north-eastern
corner building on the Site with remaining affordable rental housing and social housing to be primarily
positioned at the southern periphery of the Site.
XIV. Construction has been staged for the market dwellings to commence first followed by the demolition of
the existing PCYC and erection of new community facility and the social and affordable rental housing.
XV. The modelling has been undertaken on the basis of no financial input from a prospective CHP and that in
accordance with the City of Sydney Affordable Housing Program, the affordable rental housing dwellings
are delivered in-kind free of cost. Should a CHP potentially contribute to the financing of construction etc.
this would likely increase the tipping point for affordable rental housing beyond the assessed parameters
herein.
7.2 RESIDUAL LAND VALUE APPROACH
The Residual Land Value (RLV) approach is a method of valuation that involves assessment of the value of the
end product of the development, allowing for development costs and making a further deduction for the profit and
risk that a developer would require to take on the project. For the purpose of this assessment, we have adopted
finance assumptions of 100% senior debt funding at 5.25%.
The Residual Land Value is the remainder that is available to pay for the land. In the absence of detailed design
schemes, engineering and cost inputs, the RLV method necessitates the adoption of a range of assumptions
(development mix and staging, cost and revenue, etc.) to approximate a hypothetical development and the likely
price a prospective purchaser could afford to pay for the land and pursue such a development.
154

600-660 ELIZABETH STREET, REDFERN – FEASIBILITY STUDY
21
7.3 AFFORDABLE RENTAL HOUSING SCENARIOS TESTED
As instructed by the City, AEC have undertaken our modelling on the basis 30% of the apartments are to be
allocated towards social housing (same typology/apportionment as the private and affordable dwellings) with the
incremental addition of affordable rental housing to be iteratively modelled to reflect where the ‘tipping point’ lies to
ascertain the maximum number of affordable rental housing dwellings that could be incorporated whilst maintaining
social housing at 30% before the project is no longer deemed feasible.
AEC consider the most appropriate variations of affordable rental housing to be tested are 5%, 7.5% and 10%
(resulting in 65%, 62.5% and 60% private dwellings respectively).
Summaries of the assessed approximate apportionments follow. We note the percentages have been applied to
the floor space. The unit numbers displayed in the table are representative of the equivalent number of units
(rounded) for each floor space percentage scenario allocated towards ARH.
Table 7.1: Apportionment of Dwellings (5% Affordable In-Kind Dedication)
Apartments 30% Social Housing 5% Affordable Rental Housing 65% Private Dwellings
Studio 17 3 38
1 Bed 15 2 32
2 Bed 49 8 106
3 Bed 9 2 20
Total 90 15 196 Source: Urban Design Analysis (2021), AEC.
Table 7.2: Apportionment of Dwellings (7.5% Affordable In-Kind Dedication)
Apartments 30% Social Housing 7.5% Affordable Rental Housing 62.5% Private Dwellings
Studio 17 4 37
1 Bed 15 4 31
2 Bed 49 12 102
3 Bed 9 2 19
Total 90 23 189 Source: Urban Design Analysis (2021), AEC.
Table 7.3: Apportionment of Dwellings (10% Affordable In-Kind Dedication)
Apartments 30% Social Housing 10% Affordable Rental Housing 60% Private Dwellings
Studio 17 6 35
1 Bed 15 5 29
2 Bed 49 16 98
3 Bed 9 3 19
Total 90 30 181
Source: Urban Design Analysis (2021), AEC.
Furthermore, as an alternate method of comparison, we have also undertaken modelling on the basis, an equivalent
monetary contribution is provided as opposed to dedication of in-kind affordable rental housing. City of Sydney
currently has an equivalent monetary contribution amount (effective from 1 March 2021 to 28 February 2022) of
$10,588/m² of GFA which has been utilised in our assessment.
155

600-660 ELIZABETH STREET, REDFERN – FEASIBILITY STUDY
22
7.4 PARKING ALLOCATIONS ADOPTED
In accordance with the UDA provided, the car parking totals 239 car spaces (broadly aligning with the City's Category B parking rates for residential flat buildings under 7.5.B of
the Sydney Local Environmental Plan 2012). As instructed and for the purpose of this assessment, we have ascribed parking to the market, affordable and social dwellings in
accordance with the parking ratios as delineated under Category B whilst also conforming with the Alternate Scheme in the UDA as follows.
Table 7.4: Adopted Parking Allocations within the Project
Unit Typology Number of
Units
Car
Spaces
Number of Units Car
Spaces
Number of Units Car
Spaces
Number of
Units
Car
Spaces
30% SH, 70% MKT
30% SH, 5% AH, 65% MKT
30% SH, 7.5% AH, 62.5% MKT
30% SH, 10% AH, 60% MKT
Market
Studio 41 8 38 8 37 7 35 7
1 Bed 34 14 32 13 31 12 29 12
2 Bed 114 91 106 84 102 83 98 78
3 Bed 22 24 20 22 19 21 19 21
Total 211 137 196 127 189 123 181 118
Affordable Rental Housing
Studio - - 3 1 4 1 6 1
1 Bed - - 2 1 4 2 5 2
2 Bed - - 8 6 12 9 16 13
3 Bed - - 2 2 2 2 3 3
Total 0 0 15 10 22 14 30 19
Social Housing
Studio 17 3 17 3 17 3 17 3
1 Bed 15 6 15 6 15 6 15 6
2 Bed 49 39 49 39 49 39 49 39
3 Bed 9 10 9 10 9 10 9 10
Total 90 58 90 58 90 58 90 58
Other
Visitor - 16 - 16 - 16 - 16
Accessible - 23 - 23 - 23 - 23
Wash Bays - 2 - 2 - 2 - 2
Service Vehicles
- 3 - 3 - 3 - 3
Grand Total 301 239 301 239 301 239 301 239 Source: AEC, Urban Design Analysis, City of Sydney Category B Parking Rates (2021).
156
600-660 ELIZABETH STREET, REDFERN – FEASIBILITY STUDY
23
7.5 TAKE UP RATES
Take up rates were materially impacted during the initial onset of COVID-19 in early 2020 and throughout the lock-
down period experienced in the latter half of the same year. Demand for apartments within the inner-city regions
including Redfern appears to have bottomed circa late 2020 and has been gradually improving since early 2021
with stabilisation in market rents and vacancy rates tightening. Discussions with local agents reveals take-up rates
have been mixed across various projects albeit with slower sales generated in the Green Square and Zetland
precincts due to higher levels of competition. Informal discussions with marketing agents reveal take up rates vary
from 4-9 apartments a month under prevailing market conditions.
It is worth highlighting the general market consensus is that pricing/rents for the apartment market have now passed
a cyclical bottoming and demand is likely to improve over the medium term. Historically, it has been observed
during stronger market conditions, inner city regions have experienced off the plan take up rates of 14-16 sales per
month.
For the purpose of this assessment, we consider an appropriate range of take up rates to apply is between 7-15
sales per month (dependant on whether pre, during or post construction) given the uncertain economic and market
conditions that still may result from the ongoing pandemic.
7.6 PROXIMITY TO SOCIAL HOUSING CONCENTRATIONS
Market acceptance/resistance of residential product in close proximity to social housing is an important
consideration for development in any market. The overall presentation of a social housing estate can have adverse
implications for the marketability and desirability of an area. While certain social housing estates can be relatively
well presented, there are estates that suffer from poor visual amenity which detract from overall desirability of an
area despite proximity to rail connections and retail facilities.
Given the subject proposal incorporates an amount of social housing which has been assessed at 30% of the
residential floorspace (also noting there is an existing high concentration of social housing to the north and east of
the Site), we consider there is potential for some reduction in pricing as a result. However, for the purpose of this
assessment, we have not applied any discounting in terms of the gross revenues adopted.
7.7 DEVELOPMENT COSTS
AEC have not been provided with any specific development cost estimates for the project. The adopted
development costs are ‘generic’ in nature, based on inhouse construction data, construction cost industry
publications, QS reports provided to us by the City for other projects and past industry experience. Stage 1 and 2
environmental reports have been undertaken on the Site which indicate there is contamination present (including
traces of lead, asbestos and infill materials).
Without the benefit of any formal costs to remediate the Site, we have increased our construction contingency from
5.0% to 7.5% to provision for the potential remediation works required and associated remediation action plan.
In addition, a Stormwater Strategy Report prepared by AECOM concluded the southern section of the Site is
affected by 100-year Average Recurrence Interval (ARI) flooding and the whole of the Site is situated within the
Probable Maximum Flood (PMF). In accordance with UDA, the proposed plans indicate a basement level flood
storage component of 1,142m². For the purpose of our modelling, we have included a cost to incorporate this
element within the construction costs.
No costs have been attributed for the construction of the replacement PCYC/community facility as it is understood
this is to be funded by the PCYC. We have however incorporated the demolition costs of the existing facility within
our modelling.
To assist with the application of appropriate construction costs for the Site, we have reviewed a number of DAs
and QS reports obtained from the City of Sydney and provide a summary of the costs in Table 7.5.
157
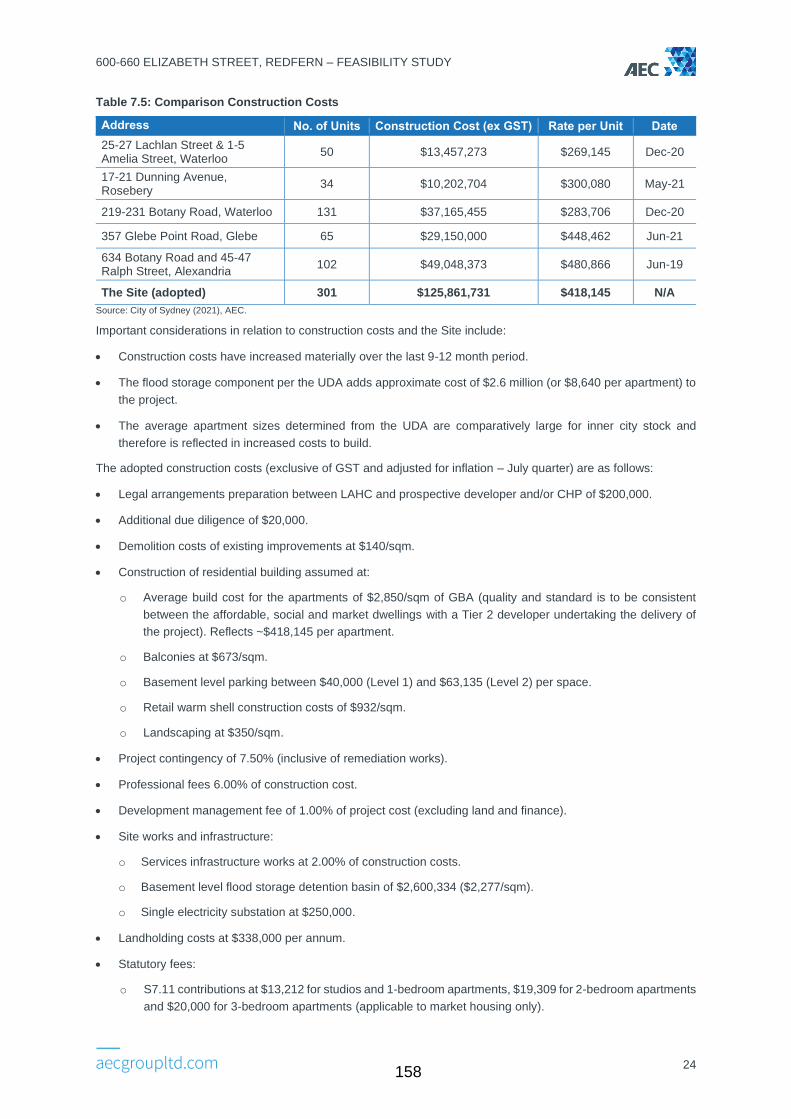
600-660 ELIZABETH STREET, REDFERN – FEASIBILITY STUDY
24
Table 7.5: Comparison Construction Costs
Address No. of Units Construction Cost (ex GST) Rate per Unit Date
25-27 Lachlan Street & 1-5 Amelia Street, Waterloo
50 $13,457,273 $269,145 Dec-20
17-21 Dunning Avenue, Rosebery
34 $10,202,704 $300,080 May-21
219-231 Botany Road, Waterloo 131 $37,165,455 $283,706 Dec-20
357 Glebe Point Road, Glebe 65 $29,150,000 $448,462 Jun-21
634 Botany Road and 45-47 Ralph Street, Alexandria
102 $49,048,373 $480,866 Jun-19
The Site (adopted) 301 $125,861,731 $418,145 N/A
Source: City of Sydney (2021), AEC.
Important considerations in relation to construction costs and the Site include:
• Construction costs have increased materially over the last 9-12 month period.
• The flood storage component per the UDA adds approximate cost of $2.6 million (or $8,640 per apartment) to
the project.
• The average apartment sizes determined from the UDA are comparatively large for inner city stock and
therefore is reflected in increased costs to build.
The adopted construction costs (exclusive of GST and adjusted for inflation – July quarter) are as follows:
• Legal arrangements preparation between LAHC and prospective developer and/or CHP of $200,000.
• Additional due diligence of $20,000.
• Demolition costs of existing improvements at $140/sqm.
• Construction of residential building assumed at:
o Average build cost for the apartments of $2,850/sqm of GBA (quality and standard is to be consistent
between the affordable, social and market dwellings with a Tier 2 developer undertaking the delivery of
the project). Reflects ~$418,145 per apartment.
o Balconies at $673/sqm.
o Basement level parking between $40,000 (Level 1) and $63,135 (Level 2) per space.
o Retail warm shell construction costs of $932/sqm.
o Landscaping at $350/sqm.
• Project contingency of 7.50% (inclusive of remediation works).
• Professional fees 6.00% of construction cost.
• Development management fee of 1.00% of project cost (excluding land and finance).
• Site works and infrastructure:
o Services infrastructure works at 2.00% of construction costs.
o Basement level flood storage detention basin of $2,600,334 ($2,277/sqm).
o Single electricity substation at $250,000.
• Landholding costs at $338,000 per annum.
• Statutory fees:
o S7.11 contributions at $13,212 for studios and 1-bedroom apartments, $19,309 for 2-bedroom apartments
and $20,000 for 3-bedroom apartments (applicable to market housing only).
158
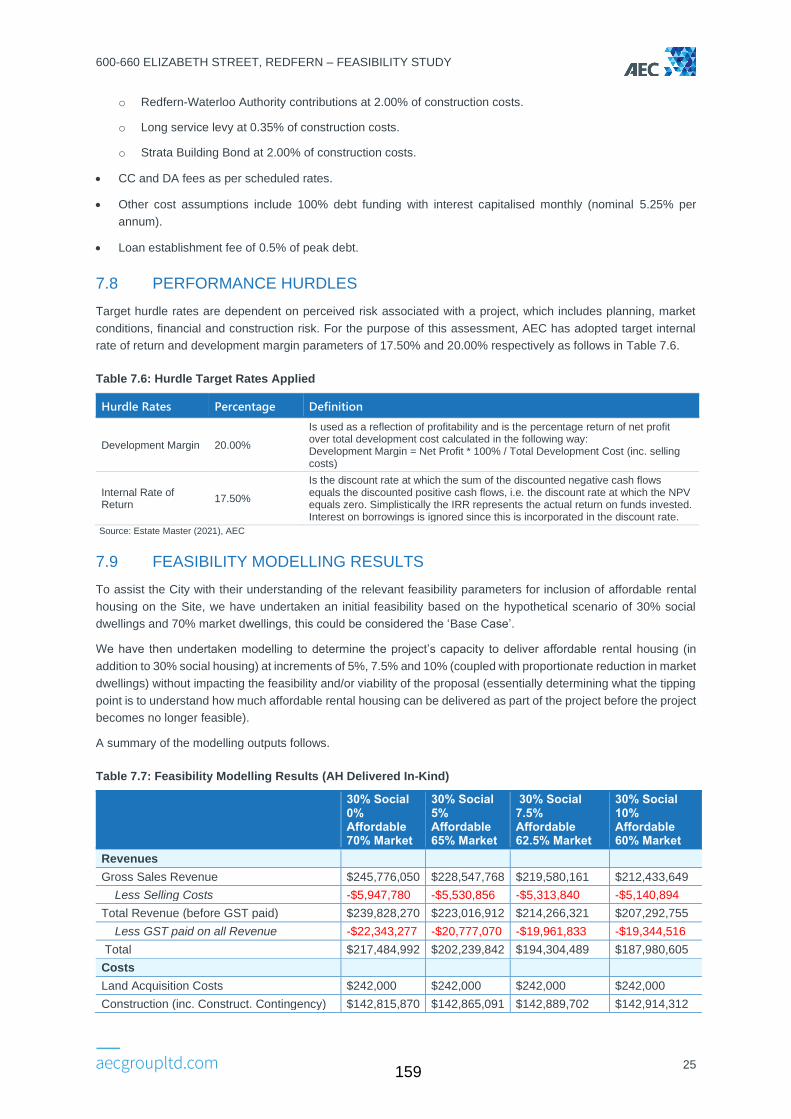
600-660 ELIZABETH STREET, REDFERN – FEASIBILITY STUDY
25
o Redfern-Waterloo Authority contributions at 2.00% of construction costs.
o Long service levy at 0.35% of construction costs.
o Strata Building Bond at 2.00% of construction costs.
• CC and DA fees as per scheduled rates.
• Other cost assumptions include 100% debt funding with interest capitalised monthly (nominal 5.25% per
annum).
• Loan establishment fee of 0.5% of peak debt.
7.8 PERFORMANCE HURDLES
Target hurdle rates are dependent on perceived risk associated with a project, which includes planning, market
conditions, financial and construction risk. For the purpose of this assessment, AEC has adopted target internal
rate of return and development margin parameters of 17.50% and 20.00% respectively as follows in Table 7.6.
Table 7.6: Hurdle Target Rates Applied
Hurdle Rates Percentage Definition
Development Margin 20.00%
Is used as a reflection of profitability and is the percentage return of net profit over total development cost calculated in the following way: Development Margin = Net Profit * 100% / Total Development Cost (inc. selling costs)
Internal Rate of Return
17.50%
Is the discount rate at which the sum of the discounted negative cash flows equals the discounted positive cash flows, i.e. the discount rate at which the NPV equals zero. Simplistically the IRR represents the actual return on funds invested. Interest on borrowings is ignored since this is incorporated in the discount rate.
Source: Estate Master (2021), AEC
7.9 FEASIBILITY MODELLING RESULTS
To assist the City with their understanding of the relevant feasibility parameters for inclusion of affordable rental
housing on the Site, we have undertaken an initial feasibility based on the hypothetical scenario of 30% social
dwellings and 70% market dwellings, this could be considered the ‘Base Case’.
We have then undertaken modelling to determine the project’s capacity to deliver affordable rental housing (in
addition to 30% social housing) at increments of 5%, 7.5% and 10% (coupled with proportionate reduction in market
dwellings) without impacting the feasibility and/or viability of the proposal (essentially determining what the tipping
point is to understand how much affordable rental housing can be delivered as part of the project before the project
becomes no longer feasible).
A summary of the modelling outputs follows.
Table 7.7: Feasibility Modelling Results (AH Delivered In-Kind)
30% Social 0% Affordable 70% Market
30% Social 5% Affordable 65% Market
30% Social 7.5% Affordable 62.5% Market
30% Social 10% Affordable 60% Market
Revenues
Gross Sales Revenue $245,776,050 $228,547,768 $219,580,161 $212,433,649
Less Selling Costs -$5,947,780 -$5,530,856 -$5,313,840 -$5,140,894
Total Revenue (before GST paid) $239,828,270 $223,016,912 $214,266,321 $207,292,755
Less GST paid on all Revenue -$22,343,277 -$20,777,070 -$19,961,833 -$19,344,516
Total $217,484,992 $202,239,842 $194,304,489 $187,980,605
Costs
Land Acquisition Costs $242,000 $242,000 $242,000 $242,000
Construction (inc. Construct. Contingency) $142,815,870 $142,865,091 $142,889,702 $142,914,312
159
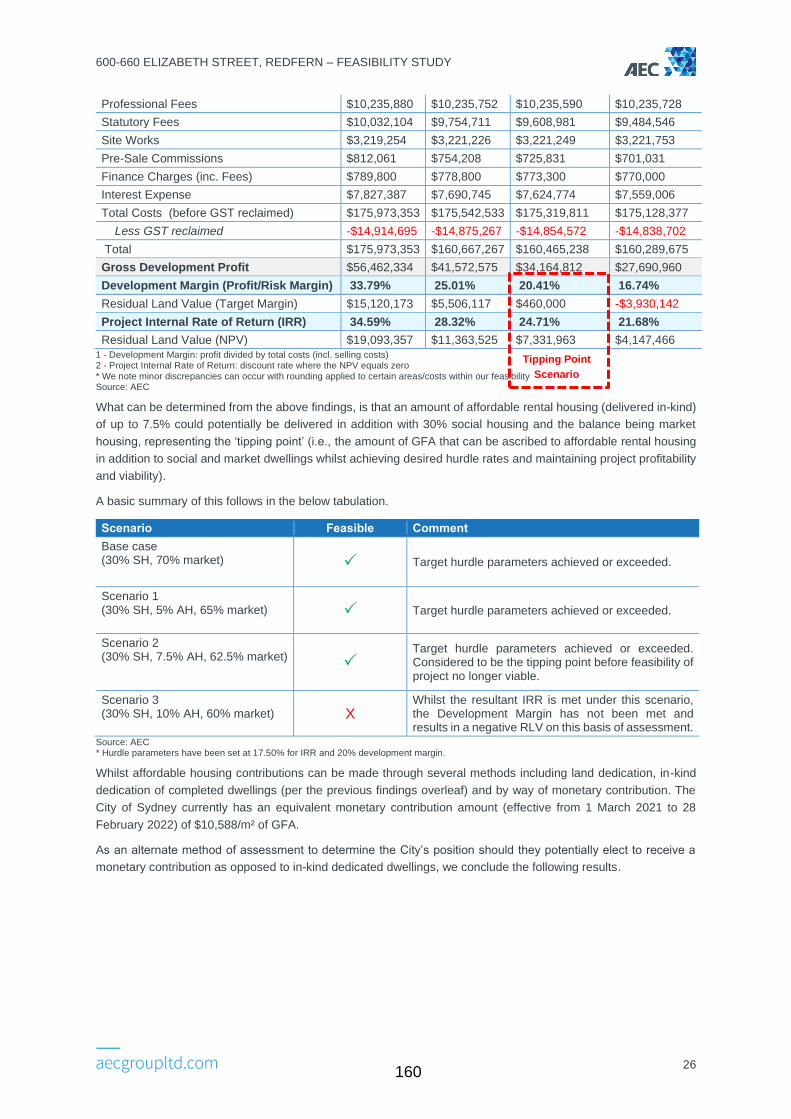
600-660 ELIZABETH STREET, REDFERN – FEASIBILITY STUDY
26
Tipping Point
Scenario
Professional Fees $10,235,880 $10,235,752 $10,235,590 $10,235,728
Statutory Fees $10,032,104 $9,754,711 $9,608,981 $9,484,546
Site Works $3,219,254 $3,221,226 $3,221,249 $3,221,753
Pre-Sale Commissions $812,061 $754,208 $725,831 $701,031
Finance Charges (inc. Fees) $789,800 $778,800 $773,300 $770,000
Interest Expense $7,827,387 $7,690,745 $7,624,774 $7,559,006
Total Costs (before GST reclaimed) $175,973,353 $175,542,533 $175,319,811 $175,128,377
Less GST reclaimed -$14,914,695 -$14,875,267 -$14,854,572 -$14,838,702
Total $175,973,353 $160,667,267 $160,465,238 $160,289,675
Gross Development Profit $56,462,334 $41,572,575 $34,164,812 $27,690,960
Development Margin (Profit/Risk Margin) 33.79% 25.01% 20.41% 16.74%
Residual Land Value (Target Margin) $15,120,173 $5,506,117 $460,000 -$3,930,142
Project Internal Rate of Return (IRR) 34.59% 28.32% 24.71% 21.68%
Residual Land Value (NPV) $19,093,357 $11,363,525 $7,331,963 $4,147,466 1 - Development Margin: profit divided by total costs (incl. selling costs) 2 - Project Internal Rate of Return: discount rate where the NPV equals zero * We note minor discrepancies can occur with rounding applied to certain areas/costs within our feasibility Source: AEC
What can be determined from the above findings, is that an amount of affordable rental housing (delivered in-kind)
of up to 7.5% could potentially be delivered in addition with 30% social housing and the balance being market
housing, representing the ‘tipping point’ (i.e., the amount of GFA that can be ascribed to affordable rental housing
in addition to social and market dwellings whilst achieving desired hurdle rates and maintaining project profitability
and viability).
A basic summary of this follows in the below tabulation.
Scenario Feasible Comment
Base case (30% SH, 70% market) Target hurdle parameters achieved or exceeded.
Scenario 1 (30% SH, 5% AH, 65% market) Target hurdle parameters achieved or exceeded.
Scenario 2 (30% SH, 7.5% AH, 62.5% market)
Target hurdle parameters achieved or exceeded. Considered to be the tipping point before feasibility of project no longer viable.
Scenario 3 (30% SH, 10% AH, 60% market) X
Whilst the resultant IRR is met under this scenario, the Development Margin has not been met and results in a negative RLV on this basis of assessment.
Source: AEC * Hurdle parameters have been set at 17.50% for IRR and 20% development margin.
Whilst affordable housing contributions can be made through several methods including land dedication, in-kind
dedication of completed dwellings (per the previous findings overleaf) and by way of monetary contribution. The
City of Sydney currently has an equivalent monetary contribution amount (effective from 1 March 2021 to 28
February 2022) of $10,588/m² of GFA.
As an alternate method of assessment to determine the City’s position should they potentially elect to receive a
monetary contribution as opposed to in-kind dedicated dwellings, we conclude the following results.
160

600-660 ELIZABETH STREET, REDFERN – FEASIBILITY STUDY
27
Table 7.8: Feasibility Modelling Results (Equivalent Monetary Contribution for AH)
30% Social, 0% Affordable 70% Market
30% Social, 2.5% Affordable 67.5% Market
30% Social, 3.5% Affordable 66.5% Market
30% Social, 4.0% Affordable 66% Market
30% Social, 5% Affordable 65% Market
30% Social, 7.5% Affordable 62.5% Market
Project Profit $56,015,590 $44,409,950 $38,618,676 $35,648,114 $31,535,932 $18,809,545
Development Margin (Profit/Risk Margin)
33.54% 25.90% 22.30% 20.47% 17.89% 10.40%
Residual Land Value (Target Margin)
$14,845,827 $6,671,568 $2,654,000 $551,429 -$2,679,200 -$12,869,887
Project Internal Rate of Return (IRR)
34.42% 27.63% 24.55% 23.00% 20.75% 14.29%
Residual Land Value (NPV)
$18,874,434 $11,732,818 $8,260,453 $6,484,606 $3,910,559 -$4,165,578
1 - Development Margin: profit divided by total costs (incl. selling costs) 2 - Project Internal Rate of Return: discount rate where the NPV equals zero Source: AEC
What can be determined from the above findings, is that an equivalent monetary contribution towards affordable
rental housing of up to 4.0% could potentially be delivered in addition with 30% social housing and the balance
being market housing, representing the ‘tipping point’ in which the project is deemed feasible (i.e., achieving desired
hurdle rates).
A basic summary of this follows in the below tabulation.
Scenario Feasible Comment
Base case (30% SH, 70% market) Target hurdle parameters achieved or exceeded.
Scenario 1 (30% SH, 2.5% AH, 67.5% market) Target hurdle parameters achieved or exceeded.
Scenario 2 (30% SH, 3.5% AH, 66.5% market)
Target hurdle parameters achieved or exceeded. Considered to be the tipping point before feasibility of project no longer viable.
Scenario 3 (30% SH, 4% AH, 66% market)
Target hurdle parameters achieved or exceeded. Considered to be the tipping point before feasibility of project no longer viable.
Scenario 4 (30% SH, 5% AH, 65% market)
X Whilst the resultant IRR is met under this scenario, the Development Margin has not been met and results in a negative RLV on this basis of assessment.
Scenario 5 (30% SH, 7.5% AH, 62.5% market)
X Both hurdle rate parameters not achieved under this scenario.
Source: AEC * Hurdle parameters have been set at 17.50% for IRR and 20% development margin.
7.10 FACTORS THAT CAN IMPACT DEVELOPMENT FEASIBILITY
The results/outputs derived from development feasibility modelling is very sensitive to the inputs and assumptions
that are used. What can further impact a project includes multiple factors working in unison which can compound
the unprofitability or profitability of a project i.e., should construction costs rise during the construction period,
coupled with delays and slowing sales, will then lead to more interest payable and adversely impact the project
profitability and vice versa should the opposite happen for each of the aforementioned items.
A summary outlining the components of development that present varying degrees of risk of impacting project
profitability and therefore the tipping point results have been noted as follows.
Tipping Point
Scenario
161
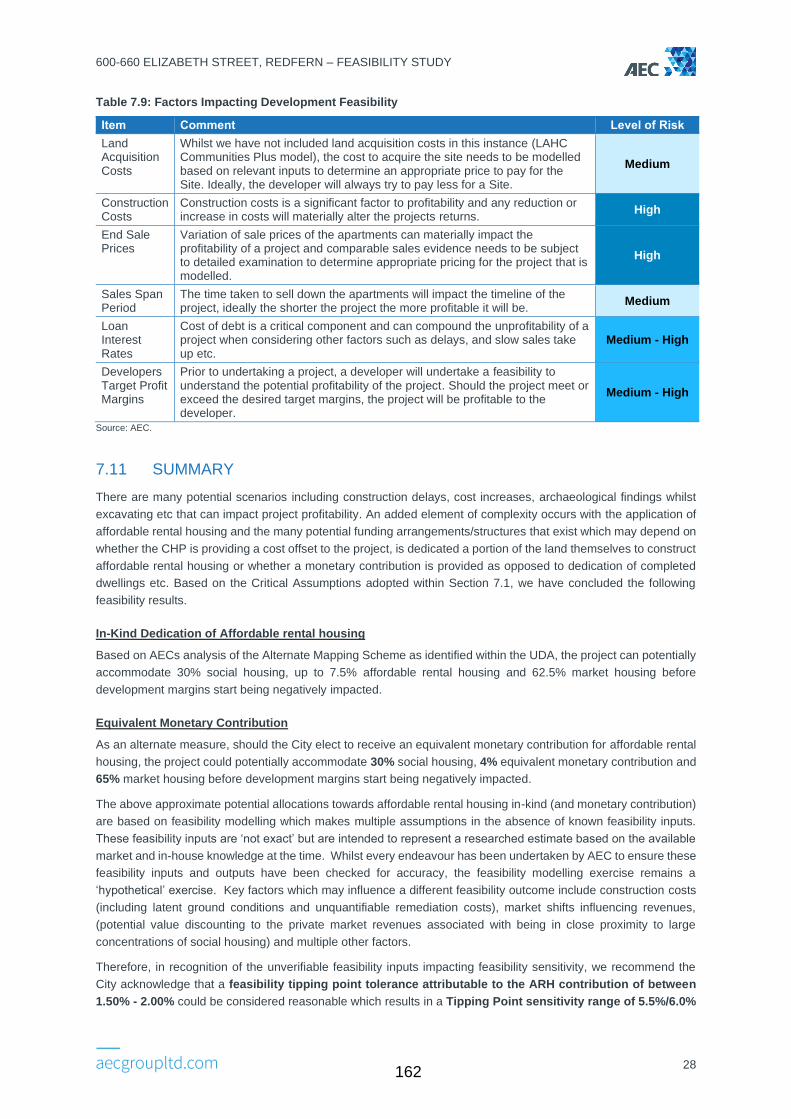
600-660 ELIZABETH STREET, REDFERN – FEASIBILITY STUDY
28
Table 7.9: Factors Impacting Development Feasibility
Item Comment Level of Risk
Land Acquisition Costs
Whilst we have not included land acquisition costs in this instance (LAHC Communities Plus model), the cost to acquire the site needs to be modelled based on relevant inputs to determine an appropriate price to pay for the Site. Ideally, the developer will always try to pay less for a Site.
Medium
Construction Costs
Construction costs is a significant factor to profitability and any reduction or increase in costs will materially alter the projects returns.
High
End Sale Prices
Variation of sale prices of the apartments can materially impact the profitability of a project and comparable sales evidence needs to be subject to detailed examination to determine appropriate pricing for the project that is modelled.
High
Sales Span Period
The time taken to sell down the apartments will impact the timeline of the project, ideally the shorter the project the more profitable it will be.
Medium
Loan Interest Rates
Cost of debt is a critical component and can compound the unprofitability of a project when considering other factors such as delays, and slow sales take up etc.
Medium - High
Developers Target Profit Margins
Prior to undertaking a project, a developer will undertake a feasibility to understand the potential profitability of the project. Should the project meet or exceed the desired target margins, the project will be profitable to the developer.
Medium - High
Source: AEC.
7.11 SUMMARY
There are many potential scenarios including construction delays, cost increases, archaeological findings whilst
excavating etc that can impact project profitability. An added element of complexity occurs with the application of
affordable rental housing and the many potential funding arrangements/structures that exist which may depend on
whether the CHP is providing a cost offset to the project, is dedicated a portion of the land themselves to construct
affordable rental housing or whether a monetary contribution is provided as opposed to dedication of completed
dwellings etc. Based on the Critical Assumptions adopted within Section 7.1, we have concluded the following
feasibility results.
In-Kind Dedication of Affordable rental housing
Based on AECs analysis of the Alternate Mapping Scheme as identified within the UDA, the project can potentially
accommodate 30% social housing, up to 7.5% affordable rental housing and 62.5% market housing before
development margins start being negatively impacted.
Equivalent Monetary Contribution
As an alternate measure, should the City elect to receive an equivalent monetary contribution for affordable rental
housing, the project could potentially accommodate 30% social housing, 4% equivalent monetary contribution and
65% market housing before development margins start being negatively impacted.
The above approximate potential allocations towards affordable rental housing in-kind (and monetary contribution)
are based on feasibility modelling which makes multiple assumptions in the absence of known feasibility inputs.
These feasibility inputs are ‘not exact’ but are intended to represent a researched estimate based on the available
market and in-house knowledge at the time. Whilst every endeavour has been undertaken by AEC to ensure these
feasibility inputs and outputs have been checked for accuracy, the feasibility modelling exercise remains a
‘hypothetical’ exercise. Key factors which may influence a different feasibility outcome include construction costs
(including latent ground conditions and unquantifiable remediation costs), market shifts influencing revenues,
(potential value discounting to the private market revenues associated with being in close proximity to large
concentrations of social housing) and multiple other factors.
Therefore, in recognition of the unverifiable feasibility inputs impacting feasibility sensitivity, we recommend the
City acknowledge that a feasibility tipping point tolerance attributable to the ARH contribution of between
1.50% - 2.00% could be considered reasonable which results in a Tipping Point sensitivity range of 5.5%/6.0%
162

600-660 ELIZABETH STREET, REDFERN – FEASIBILITY STUDY
29
as the lower bound to 9.0%/9.5% as the upper bound attributable towards Affordable Rental Housing floor
space in the project.
Furthermore, our modelling has been undertaken on the basis of no financial contribution to the development costs
from a prospective CHP. It is assumed the affordable rental housing dwellings are delivered in-kind ‘free of cost’
to the City in accordance with the City of Sydney Affordable Housing Program,. Should a CHP potentially contribute
to the financing of development costs (in the form of equity or other type of financial contribution), this may
potentially improve feasibility performance, subject to any terms and conditions associated with such a contribution.
163

600-660 ELIZABETH STREET, REDFERN – FEASIBILITY STUDY
30
REFERENCES
Jones Lang LaSalle (2021). Apartment Market Overview, Q1 2021. JLL
Silvester Fuller, Tyrell Studio and Architectus (2021). Urban design analysis Land and Housing Corporation April
2021
Rawlinsons (2021). Australian Construction Cost Guide 2021.
City of Sydney (2020). City of Sydney Affordable Housing Program).
NSW Government (2021). Gateway Determination (Department Ref: PP_2020_SYDNE_004_00).
City of Sydney (2021). Draft Design Guide).
Transport, Heritage and Planning Committee (2021). Transport, Heritage and Planning Committee Report – Public
Exhibition – Planning Proposal – 600-660 Elizabeth Street, Redfern (2020).
Douglas Partners (2020). Report on Geotechnical Investigation.
EMM (2020). Stage 2 Contamination Assessment.
AECOM (2019). Phase 1 Environmental Site Assessment and Geotechnical Desktop Study.
NSW Government (2018). Study Requirements for Elizabeth St, Redfern.
City of Sydney (2020). Planning Proposal - 600-660 Elizabeth Street, Redfern.
164
600-660 ELIZABETH STREET, REDFERN – FEASIBILITY STUDY
31
THIS PAGE IS INTENTIONALLY LEFT BLANK
165
166


![SEMESTER-II [e-Content] Course/Paper Code – AEC-1 Life](https://img.dokumen.tips/doc/110x75/6332793af3036b785c0bbe7d/semester-ii-e-content-coursepaper-code-aec-1-life-.jpg)


