Embed Size (px)
Citation preview
Atlantic States Marine Fisheries Commission
Draft Amendment 2 to the Interstate Fishery Management Plan for Atlantic Menhaden for
Public Comment
ASMFC Vision Statement: Healthy, self-sustaining populations for all Atlantic coast fish species or
successful restoration well in progress by the year 2015.
September, 2012
DRAFT AMENDMENT 2 FOR PUBLIC COMMENT
ii
Amendment 2 to the Interstate Fishery Management Plan for Atlantic Menhaden
Prepared by
Atlantic States Marine Fisheries Commission Atlantic Menhaden Plan Development Team
Plan Development Team Members: Jason McNamee, RI Department of Environmental Management Marine Fisheries Section
Harry Rickabaugh, Maryland Department of Natural Resources Joe Grist, Virginia Marine Resources Commission
Derek Orner, National Marine Fisheries Service Mike Waine (Chair), Atlantic States Marine Fisheries Commission
This is a report of the Atlantic States Marine Fisheries Commission pursuant to U.S. Department of Commerce, National Oceanic and Atmospheric Administration Award Nos. XXXXXXXXX.

DRAFT AMENDMENT 2 FOR PUBLIC COMMENT
iii
The Atlantic States Marine Fisheries Commission seeks your input on Draft Amendment 2 to the Atlantic Menhaden Fishery Management Plan
The public is encouraged to submit comments regarding this document during the public comment period. Comments must be received by 5:00 PM (EST) on November 16, 2012. Regardless of when they were sent, comments received after that time will not be included in the official record. The Atlantic Menhaden Management Board will consider public comment on this document before finalizing Amendment 2 at their October meeting. You may submit public comment in one or more of the following ways: 1. Attend public hearings held in your state or jurisdiction, if applicable. 2. Refer comments to your state’s members on the Atlantic Menhaden Board or Atlantic
Menhaden Advisory Panel, if applicable. 3. Mail, fax, or email written comments to the following address: Mail: Mike Waine Email: [email protected] Atlantic States Marine Fisheries Commission (Subject: Amend 2) 1050 N. Highland Street, Suite 200 A-N Phone: (703) 842-0740 Arlington VA. 22201 Fax: (703) 842-0741 If you have any questions please call Mike Waine at (703) 842-0740.
DRAFT AMENDMENT 2 FOR PUBLIC COMMENT
iv
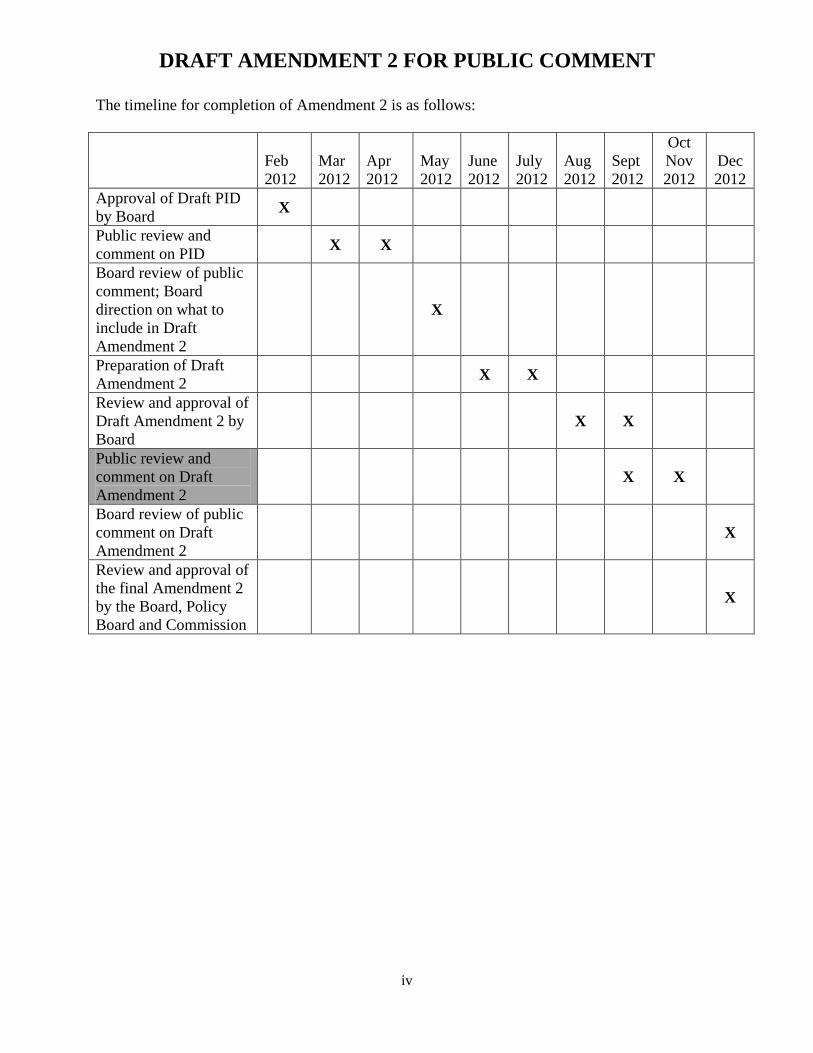
The timeline for completion of Amendment 2 is as follows:
Feb 2012
Mar 2012
Apr 2012
May 2012
June 2012
July2012
Aug 2012
Sept 2012
Oct Nov 2012
Dec 2012
Approval of Draft PID by Board X
Public review and comment on PID X X
Board review of public comment; Board direction on what to include in Draft Amendment 2
X
Preparation of Draft Amendment 2 X X
Review and approval of Draft Amendment 2 by Board
X X
Public review and comment on Draft Amendment 2
X X
Board review of public comment on Draft Amendment 2
X
Review and approval of the final Amendment 2 by the Board, Policy Board and Commission
X
DRAFT AMENDMENT 2 FOR PUBLIC COMMENT
v
EXECUTIVE SUMMARY The executive summary highlights all the sections of Draft Amendment 2 that contain a management decision. The summary is intended to be a shortened version of the document distributed at public hearings.
1.0 INTRODUCTION
The Atlantic States Marine Fisheries Commission (ASMFC) is developing an amendment to its Interstate Fishery Management Plan (FMP) for Atlantic Menhaden (Brevoortia tyrannus) under the authority of the Atlantic Coastal Fisheries Cooperative Management Act (ACFCMA). The Commission, through the coastal states of Maine through Florida, is responsible for managing Atlantic menhaden. ASMFC has coordinated interstate management of Atlantic menhaden in state waters (0-3 miles) since 1981. Atlantic menhaden is currently managed under Amendment 1 and Addenda I-V to the Fishery Management Plan (FMP). Amendment 2 to the Interstate Fishery Management Plan for Atlantic menhaden would replace Amendment 1 if adopted. This document contains all applicable management options still in implementation from Amendment 1 and all five addenda. Management authority in the exclusive economic zone (EEZ, 3-200 miles from shore) lies with NOAA Fisheries.
1.1 BACKGROUND INFORMATION 1.1.1 Statement of the Problem
The 2010 Atlantic menhaden benchmark stock assessment Peer Review Panel noted that menhaden population abundance had declined steadily and recruitment had been low since the last peak observed in the early 1980s. Fishing at the fishing mortality (F) threshold reference point in the terminal year (2008) has resulted in approximately 8% of the maximum spawning potential (MSP)1. Therefore, the Panel recommended alternative reference points be considered that provide greater protection for spawning stock biomass (SSB) or population fecundity relative to the unfished level. In November 2011, the Atlantic Menhaden Management Board responded to that recommendation and adopted new F reference points via Addendum V. The new reference points are more conservative than the previous to account for the following: (1) while menhaden are not overfished the number of fish in the population has been declining, (2) while menhaden are important for many fisheries they also provide important ecological services, (3) strong recruitment classes may be dependent on favorable environmental conditions, and (4) recent science suggests conserving a larger percentage of the spawning stock is an important consideration for forage species such as menhaden. The new F threshold is F15%MSP , and the new F target is F30%MSP. A stock assessment update was completed in July 2012, full F/F15%MSP for the terminal year (2011) was greater than 1, and therefore, overfishing is occurring. Addendum V states that when overfishing is occurring the Board will take steps to reduce F to the target level. In order to end overfishing and reduce F to the target, the Board needs to consider changes in the management tools used to regulate the fishery. 1 Natural mortality is a contributing factor to current estimates of %MSP (e.g., environmental conditions affecting recruitment success, predation).
DRAFT AMENDMENT 2 FOR PUBLIC COMMENT
vi
The new F reference points adopted by the Board through Addendum V are intended to be interim reference points while the Commission’s Multispecies Technical Committee develops ecological-based reference points (ERP). The ERPs will take some time to develop because of the complexity of modeling predator-prey relationship in marine species that rely on menhaden for forage (e.g., striped bass, bluefish, weakfish). In either case (biological or ecological reference points) the intent is to manage Atlantic menhaden at sustainable levels to support fisheries and meet predator demands through sufficient SSB to prevent stock depletion and protect against recruitment failure.
2.5 BIOLOGICAL REFERENCE POINTS Threshold reference points are the basis for determining stock status (i.e., whether overfishing is occurring or a stock is overfished). When the fishing mortality rate (F) exceeds the F-threshold, then overfishing is occurring; the rate of removal of fish by the fishery exceeds the ability of the stock to replenish itself. When the reproductive output (measured as spawning stock biomass or population fecundity) falls below the biomass-threshold, then the stock is overfished, meaning there is insufficient mature female biomass (SSB) or egg production (population fecundity) to replenish the stock. Current Overfishing, Overfished/Depleted Definitions The current overfishing definition is a fecundity-per-recruit threshold of F15%MSP and a target of F30%MSP. The current fecundity-based overfished definition is a target of SSBMED and a threshold of SSBMED.T (half of SSBMED). Benchmarks are calculated using all years, 1955-2011. Reference points are recalculated during an update and benchmark stock assessment, see the latest stock assessment for point estimates of reference points and stock status determination (ASMFC, 2012). Uncertainty in 2012 Stock Assessment Update As noted, an Atlantic menhaden stock assessment update was completed in July 2012. However, the results of the assessment are uncertain because the model fit the data poorly for the following reasons,
• Overweighting of the age composition data. • Lack of spatial modeling to address changes in the fishery over time. • Lack of a coastwide adult abundance index. • Poor fit to the PRFC index. • Strong retrospective pattern.
Although the Technical Committee could not come to consensus on the utility of the terminal year (2011) point estimates of F and SSB for management advice, there was consensus that the status determinations, overfishing is occurring and the stock is not overfished, were likely correct. However, the extent of overfishing could not be determined. This statement is supported both quantitatively and qualitatively. Quantitatively, results of the sensitivity analyses did not appreciably alter stock status. Qualitatively, the 2009 benchmark stock assessment also concluded that overfishing was occurring, and Addendum V reference points significantly reduced the overfishing threshold (from approximately F8%MSP to F15%MSP). As harvest levels
DRAFT AMENDMENT 2 FOR PUBLIC COMMENT
vii
have increased since 2008 and there has been no significant increase in stock size, overfishing is still likely occurring. Given the stated uncertainty in the most recent stock assessment update (ASMFC 2012), the projection analysis that explored constant landing scenarios with a probability and timeframe to achieve the target F, is not usable. Without a usable projection analysis, the only way to assess the progress towards achieving the target F is through future stock assessments. SSB Reference Points In 2011, the Atlantic Menhaden Management Board adopted F15%MSP as an overfishing threshold with the goal of increasing spawning potential of the stock through reduced fishing mortality. The current overfished threshold definition, 50% of SSBMED, was not changed at that time. This means that the current set of overfishing and overfished stock status definitions are derived from two different types of calculations (maximum spawning potential vs. medians) and are based on two different sets of goals and assumptions about the stock. The current difference between these stock status declarations for menhaden is largely a function of how the fishing mortality and biomass reference points are calculated, not an inherent characteristic of the stock and how it is being fished. The Technical Committee has warned of a mismatch between these overfishing and overfished definitions because their methods of calculation and underlying assumptions differ, making the link between them atypical. Traditionally, when overfishing reference points are calculated, an assumption is made that the overfishing threshold (in this case F15%MSP) is a reasonable proxy for FMSY, the fishing mortality rate that would achieve maximum sustainable yield. Likewise, an assumption is made that the spawning stock biomass target (in this case SSBMED) is a reasonable proxy for Bmsy, the stock biomass level at which maximum sustainable yield is achieved. In theory, fishing at Fmsy should result in a stock biomass of Bmsy. However, in the current case of Atlantic menhaden, the overfishing and overfished reference points are calculated using two different methodologies and there is no theoretical justification for assuming that fishing at F15%MSP will achieve SSBMED. The TC has suggested that consistent methodologies be used for both F-based and SSB-based calculations so that managers can more reasonably make the assumption that fishing at the threshold F should result in target biomass. Given F15%MSP is the interim reference point that has been adopted by the Board, the TC suggests that an SSB reference point of SSB15%MSP also be adopted. The Board may consider a change to the SSB biological reference points through Amendment 2. If the Board Selects Option B, the stock would be in an overfished condition based on the most recent estimate of SSB2011. If the SSB reference points remain unchanged (Option A), the stock is not overfished. Option A: Status Quo. The current fecundity-based overfished definition is a target of SSBMED and a threshold of SSBMED.T (half of SSBMED). Option B: The fecundity-based overfished definition is a target of SSB30%MSP and a threshold of SSB15%MSP.
DRAFT AMENDMENT 2 FOR PUBLIC COMMENT
viii
2.6.2 Stock Rebuilding and F Reduction Schedules
SSB Rebuilding Schedule The Board shall take action to rebuild the Atlantic menhaden stock to at least the target SSB level in a time frame that shall be no longer than 10 years. F Reduction Schedule Ending Overfishing (Reducing F to the threshold) Through implementation of Amendment 2, the Board will take immediate action to end overfishing. Timeframe to Achieve the F Target Because achieving the target F requires more substantial harvest reductions than achieving the threshold F, the board is considering a range of timeframes for reducing F to the target level. Depending on the schedule for reducing F, a time stepped approach may be used in which F would be reduced in increments until the target is reached. If the target F is to be achieved on a shorter time frame, annual reductions in landings will be more substantial than if the target F was achieved over a longer time period. Given the uncertainty in the most recent stock assessment update (ASMFC 2012), the projection analysis that explored constant landing scenarios with a probability and timeframe to achieve the target F, is not usable. This means that the level at which the Board needs to reduce landings to achieve the target F over a set time frame is unknown. Therefore, the only way to assess the progress towards achieving the target F is through future stock assessments. The Board is considering the following timeframes as a goal to achieve the target F. Until the next stock assessment is completed, the Board will not have an updated estimate of fishing mortality to assess progress toward achieving the target F. Note that the next benchmark stock assessment (peer review) for Atlantic menhaden is currently scheduled for 2015. Option A: The Board is not required to specify a time frame to reduce the current F to at least the target F30%MSP. Option B: The Board shall take action to reduce the current F to at least the target F30%MSP in a time frame that shall be no longer than 3 years. Option C: The Board shall take action to reduce the current F to at least the target F30%MSP in a time frame that shall be no longer than 5 years. Option D: The Board shall take action to reduce the current F to at least the target F30%MSP in a time frame that shall be no longer than 10 years. Option E: Upon receipt of results from a new benchmark peer-reviewed assessment, the Board shall specify a timeframe and take action to reduce F to at least the target F30%MSP.
DRAFT AMENDMENT 2 FOR PUBLIC COMMENT
ix
3.6 SUMMARY OF MONITORING PROGRAMS In order to achieve the goals and objectives of Amendment 2, the collection and maintenance of quality data is necessary.
3.6.1 Catch and Landings Information
The reporting requirements for the Atlantic menhaden fishery are based in part on Captains Daily Fishing Reports (CDFRs). The ASMFC, NMFS, US Fish & Wildlife Service, the New England, Mid-Atlantic, and South Atlantic Fishery Management Councils, and all the Atlantic coastal states have developed a coastwide fisheries statistics program (Atlantic Coastal Cooperative Statistics Program). A minimum set of reporting requirements based on a trip-level for fishermen and dealers has been developed as the minimum standard for data collection on the Atlantic coast. Nothing in the proposed program would prohibit a state/agency from requiring more detailed information on a trip basis if so desired.
3.6.1.1 Commercial Catch and Effort Data Collection Program(s) Reporting requirements for Bait and Reduction Fishery All menhaden purse seine and bait seine vessels (or snapper rigs) shall be required to submit the Captain’s Daily Fishing Reports (CDFRs) through the Standard Atlantic Fisheries Information System (eTrips), an ACCSP standards compliant electronic reporting system. The PDT notes that outside of the snapper rig and purse seine vessels that harvest bait, there are no standardized reporting requirements for the bait fishery in the ASMFC FMP for Atlantic menhaden. The following is a description of current reduction fishery reporting process. Daily vessel unloads (in thousands of standard fish) are emailed daily to the NMFS. Captains Daily Fishing Reports (CDFRs) from the Reedville menhaden fleet are used to estimate in-season removals from Chesapeake Bay (Chesapeake Bay Cap). CDRFs are deck logbooks maintained by the Virginia reduction purse-seine vessels. Total removals by area are calculated at the end of the fishing season. At-sea catches from the CDFRs are summed by vessel, and compared to total vessel unloads from company catch records. Individual at-sea sets are then multiplied by an adjustment factor (company records/ at-sea estimates). Adjusted catches by set are converted to metric tons, and accumulated by fishing area. Catch totals are reported by ocean fishing areas (New Jersey, Delaware, and Maryland in the EEZ, Virginia and North Carolina), while catches inside and outside Chesapeake Bay are delineated by the Chesapeake Bay Bridge Tunnel. NMFS port agent samples purse-seine catches at dockside in Reedville, VA, throughout the fishing season (May through December), providing data for age composition determination. The following is a description of current bait fishery reporting process. The summary of the current reporting requirements, by state, are provided in Table 12.
3.6.1.2 Quota Monitoring Quota monitoring, whether coastal, or state-by-state, is dependent upon the strength of state specific monitoring programs, as described in Section 3.6.1. The current catch reporting requirements for the Atlantic menhaden bait fishery does not provide timely or complete data for
DRAFT AMENDMENT 2 FOR PUBLIC COMMENT
x
use by managers and scientists. The ACCSP commercial data collection program is a mandatory, trip-based system with all fishermen and dealers required to report a minimum set of standard data elements. Required data elements for Atlantic menhaden (see Table 13 and Table 14 for details) (1) trip start date (2) vessel identifier (3) individual fisherman identifier (4) dealer identification (5) trip number (6) species (7) quantity (8) units of measurement (9) disposition (10) county or port landed (11) gear (12) quantity of gear (13) number of sets (14) fishing time (15) days/hours at sea (16) number of crew (17) area fished The quota monitoring options below are based on the ACCSP commercial data collection program with the required data elements listed above. Option A. Status Quo
• All menhaden purse seine and bait seine vessels (or snapper rigs) shall be required to submit the Captain’s Daily Fishing Reports (CDFRs) through the Standard Atlantic Fisheries Information System (eTrips), an ACCSP standards compliant electronic reporting system.
• PDT notes this does not improve timeliness or completeness of data collection. Option B. Approved State Methodology for Monitoring
• Must be approved by the Board as a valid method for monitoring (high probability of success)
• Program must have the ability to monitor fishery landings within 7 days of actual landing date.
• Required ACCSP data elements listed above Option C. Require SAFIS dealer weekly reporting system
• Due Tuesday by midnight, available by 6am Wednesday consolidated (lag 1-10 days) • Required ACCSP data elements listed above
PDT Notes • Consistent with NE dealers reporting requirements • Difficult to implement in states with established harvester-dependent reporting, not
dealer-dependent reporting. • Not difficult to implement in states that use ACCSP eTrips.
Option D. Require SAFIS eTrips fisherman daily reporting system
• Due by 10pm, available by 6am next day for consolidation • Required ACCSP data elements listed above
PDT Notes • Limiting factor, computer access and familiarity of fisherman
Option E. SAFIS weekly with trigger to SAFIS eTrips when approaching quota maximum (85%
trigger) • Utilize weekly system until it is projected that 85% of the quota will be attained, then
DRAFT AMENDMENT 2 FOR PUBLIC COMMENT
xi
require daily reporting system until close of fishery (or end of season), whichever comes first.
• Required ACCSP data elements listed above
3.6.2 Fishery-Dependent Data
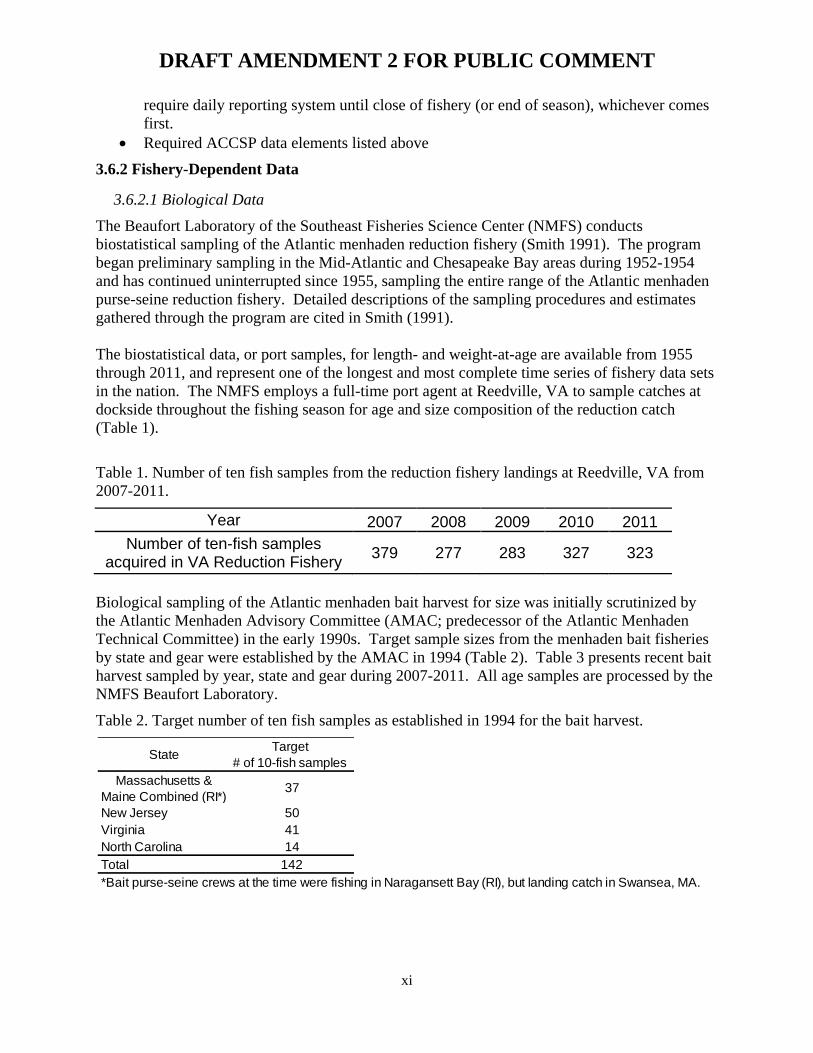
3.6.2.1 Biological Data The Beaufort Laboratory of the Southeast Fisheries Science Center (NMFS) conducts biostatistical sampling of the Atlantic menhaden reduction fishery (Smith 1991). The program began preliminary sampling in the Mid-Atlantic and Chesapeake Bay areas during 1952-1954 and has continued uninterrupted since 1955, sampling the entire range of the Atlantic menhaden purse-seine reduction fishery. Detailed descriptions of the sampling procedures and estimates gathered through the program are cited in Smith (1991). The biostatistical data, or port samples, for length- and weight-at-age are available from 1955 through 2011, and represent one of the longest and most complete time series of fishery data sets in the nation. The NMFS employs a full-time port agent at Reedville, VA to sample catches at dockside throughout the fishing season for age and size composition of the reduction catch (Table 1).
Table 1. Number of ten fish samples from the reduction fishery landings at Reedville, VA from 2007-2011.
Year 2007 2008 2009 2010 2011 Number of ten-fish samples
acquired in VA Reduction Fishery 379 277 283 327 323
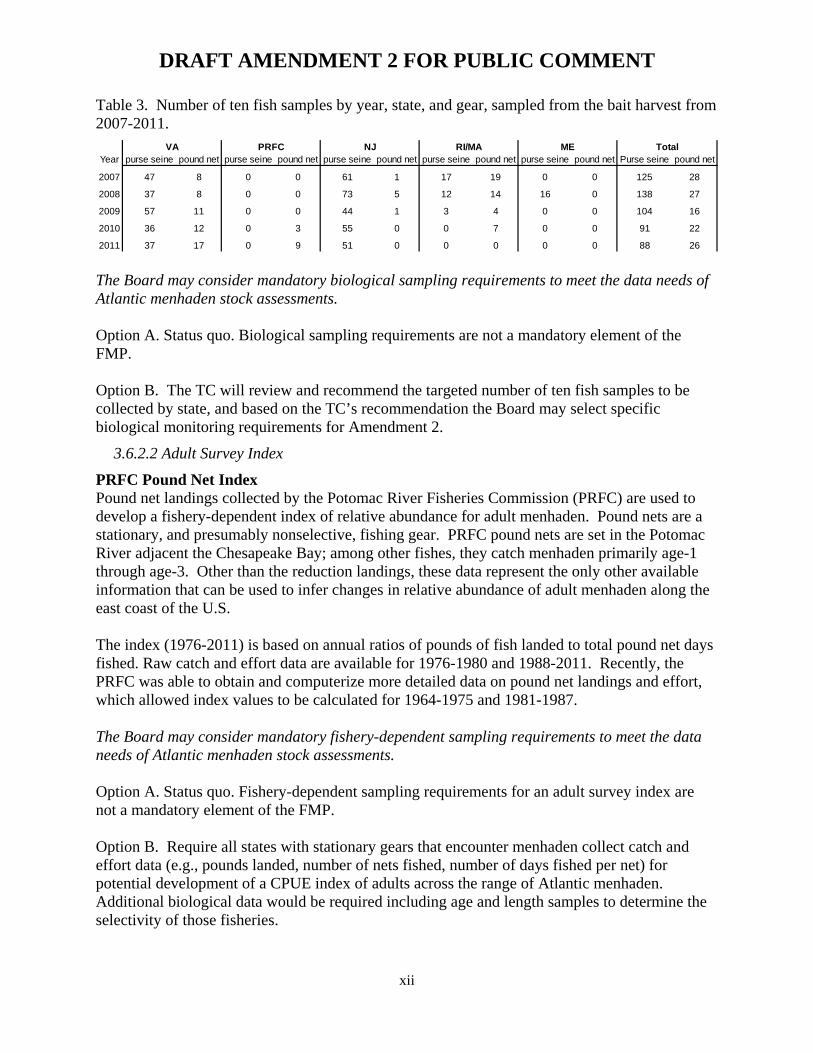
Biological sampling of the Atlantic menhaden bait harvest for size was initially scrutinized by the Atlantic Menhaden Advisory Committee (AMAC; predecessor of the Atlantic Menhaden Technical Committee) in the early 1990s. Target sample sizes from the menhaden bait fisheries by state and gear were established by the AMAC in 1994 (Table 2). Table 3 presents recent bait harvest sampled by year, state and gear during 2007-2011. All age samples are processed by the NMFS Beaufort Laboratory.
Table 2. Target number of ten fish samples as established in 1994 for the bait harvest.
Target # of 10-fish samples
New Jersey 50Virginia 41North Carolina 14Total 142*Bait purse-seine crews at the time were fishing in Naragansett Bay (RI), but landing catch in Swansea, MA.
37Massachusetts & Maine Combined (RI*)
State
DRAFT AMENDMENT 2 FOR PUBLIC COMMENT
xii
Table 3. Number of ten fish samples by year, state, and gear, sampled from the bait harvest from 2007-2011.
The Board may consider mandatory biological sampling requirements to meet the data needs of Atlantic menhaden stock assessments. Option A. Status quo. Biological sampling requirements are not a mandatory element of the FMP. Option B. The TC will review and recommend the targeted number of ten fish samples to be collected by state, and based on the TC’s recommendation the Board may select specific biological monitoring requirements for Amendment 2.
3.6.2.2 Adult Survey Index PRFC Pound Net Index Pound net landings collected by the Potomac River Fisheries Commission (PRFC) are used to develop a fishery-dependent index of relative abundance for adult menhaden. Pound nets are a stationary, and presumably nonselective, fishing gear. PRFC pound nets are set in the Potomac River adjacent the Chesapeake Bay; among other fishes, they catch menhaden primarily age-1 through age-3. Other than the reduction landings, these data represent the only other available information that can be used to infer changes in relative abundance of adult menhaden along the east coast of the U.S. The index (1976-2011) is based on annual ratios of pounds of fish landed to total pound net days fished. Raw catch and effort data are available for 1976-1980 and 1988-2011. Recently, the PRFC was able to obtain and computerize more detailed data on pound net landings and effort, which allowed index values to be calculated for 1964-1975 and 1981-1987. The Board may consider mandatory fishery-dependent sampling requirements to meet the data needs of Atlantic menhaden stock assessments. Option A. Status quo. Fishery-dependent sampling requirements for an adult survey index are not a mandatory element of the FMP. Option B. Require all states with stationary gears that encounter menhaden collect catch and effort data (e.g., pounds landed, number of nets fished, number of days fished per net) for potential development of a CPUE index of adults across the range of Atlantic menhaden. Additional biological data would be required including age and length samples to determine the selectivity of those fisheries.
Year purse seine pound net purse seine pound net purse seine pound net purse seine pound net purse seine pound net Purse seine pound net
2007 47 8 0 0 61 1 17 19 0 0 125 28
2008 37 8 0 0 73 5 12 14 16 0 138 27
2009 57 11 0 0 44 1 3 4 0 0 104 16
2010 36 12 0 3 55 0 0 7 0 0 91 22
2011 37 17 0 9 51 0 0 0 0 0 88 26
TotalPRFC NJ RI/MA MEVA
DRAFT AMENDMENT 2 FOR PUBLIC COMMENT
xiii
4.2 COMMERCIAL FISHERY MANAGEMENT MEASURES 4.2.1 Total Allowable Catch (TAC)
Option A. Status quo. Harvest will not be restricted through the use of a TAC. Option B. Harvest will be restricted through the use of a TAC. (If selected see Sections 4.2.1.1 through 4.2.1.7).
4.2.1.1 TAC Specification The Atlantic Menhaden Management Board will set an annual or multi-year TAC based on the following procedure. The Atlantic Menhaden TC will annually review the best available data including, but not limited to, commercial and recreational catch/landing statistics, current estimates of fishing mortality, stock status, survey indices, assessment modeling results, and target mortality levels. The TC will calculate TAC options based on the Board selected method of setting a TAC (see Section 4.2.1.2). The Board will set an annual TAC through Board action with the option of setting a multi-year TAC, reviewed annually. The directed fishery for Atlantic menhaden will be closed when the Plan Development Team Chair projects the catch will exceed a percentage of the TAC (see options below). States have the responsibility to close the Atlantic menhaden commercial fishery in their state once the TAC (or a percentage thereof) has been reached. Acknowledging that any changes selected in reporting requirements (Section 3.6.1.2) may take time to implement completely, the Board may select a lower closing percentage to account for incomplete and late reports at the time of season closure. Option A. 85% Option B. 90% Option C. 95% Option D. The Board will specify annually or for multiple years, a percentage of the TAC to base closures on.
4.2.1.2 TAC Setting Method Ending overfishing and reducing F to the target will require the implementation of management measures that lower landing levels compared to recent years. Given the uncertainty in the most recent stock assessment update (ASMFC 2012), the projection analysis that explored constant landing scenarios with a probability and timeframe to achieve the target F, are not usable for setting a TAC. This means that the level at which the Board needs to reduce landings to achieve the target F over a set time frame is unknown. However, because overfishing is occurring, the Board will take steps to reduce F to the target level. The first step in that process is to end overfishing immediately. Option A. Ad-hoc approach to setting TACs.
DRAFT AMENDMENT 2 FOR PUBLIC COMMENT
xiv
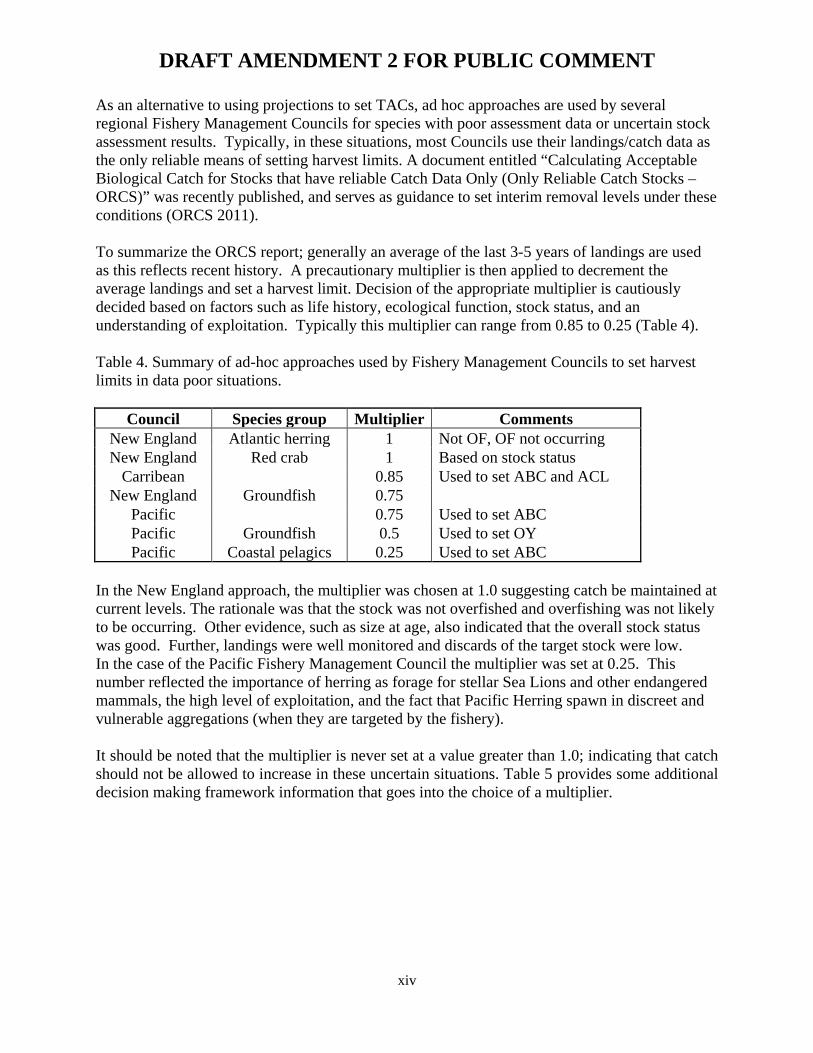
As an alternative to using projections to set TACs, ad hoc approaches are used by several regional Fishery Management Councils for species with poor assessment data or uncertain stock assessment results. Typically, in these situations, most Councils use their landings/catch data as the only reliable means of setting harvest limits. A document entitled “Calculating Acceptable Biological Catch for Stocks that have reliable Catch Data Only (Only Reliable Catch Stocks – ORCS)” was recently published, and serves as guidance to set interim removal levels under these conditions (ORCS 2011). To summarize the ORCS report; generally an average of the last 3-5 years of landings are used as this reflects recent history. A precautionary multiplier is then applied to decrement the average landings and set a harvest limit. Decision of the appropriate multiplier is cautiously decided based on factors such as life history, ecological function, stock status, and an understanding of exploitation. Typically this multiplier can range from 0.85 to 0.25 (Table 4). Table 4. Summary of ad-hoc approaches used by Fishery Management Councils to set harvest limits in data poor situations.
Council Species group Multiplier Comments New England Atlantic herring 1 Not OF, OF not occurring New England Red crab 1 Based on stock status
Carribean 0.85 Used to set ABC and ACL New England Groundfish 0.75
Pacific 0.75 Used to set ABC Pacific Groundfish 0.5 Used to set OY Pacific Coastal pelagics 0.25 Used to set ABC
In the New England approach, the multiplier was chosen at 1.0 suggesting catch be maintained at current levels. The rationale was that the stock was not overfished and overfishing was not likely to be occurring. Other evidence, such as size at age, also indicated that the overall stock status was good. Further, landings were well monitored and discards of the target stock were low. In the case of the Pacific Fishery Management Council the multiplier was set at 0.25. This number reflected the importance of herring as forage for stellar Sea Lions and other endangered mammals, the high level of exploitation, and the fact that Pacific Herring spawn in discreet and vulnerable aggregations (when they are targeted by the fishery). It should be noted that the multiplier is never set at a value greater than 1.0; indicating that catch should not be allowed to increase in these uncertain situations. Table 5 provides some additional decision making framework information that goes into the choice of a multiplier.
DRAFT AMENDMENT 2 FOR PUBLIC COMMENT
xv
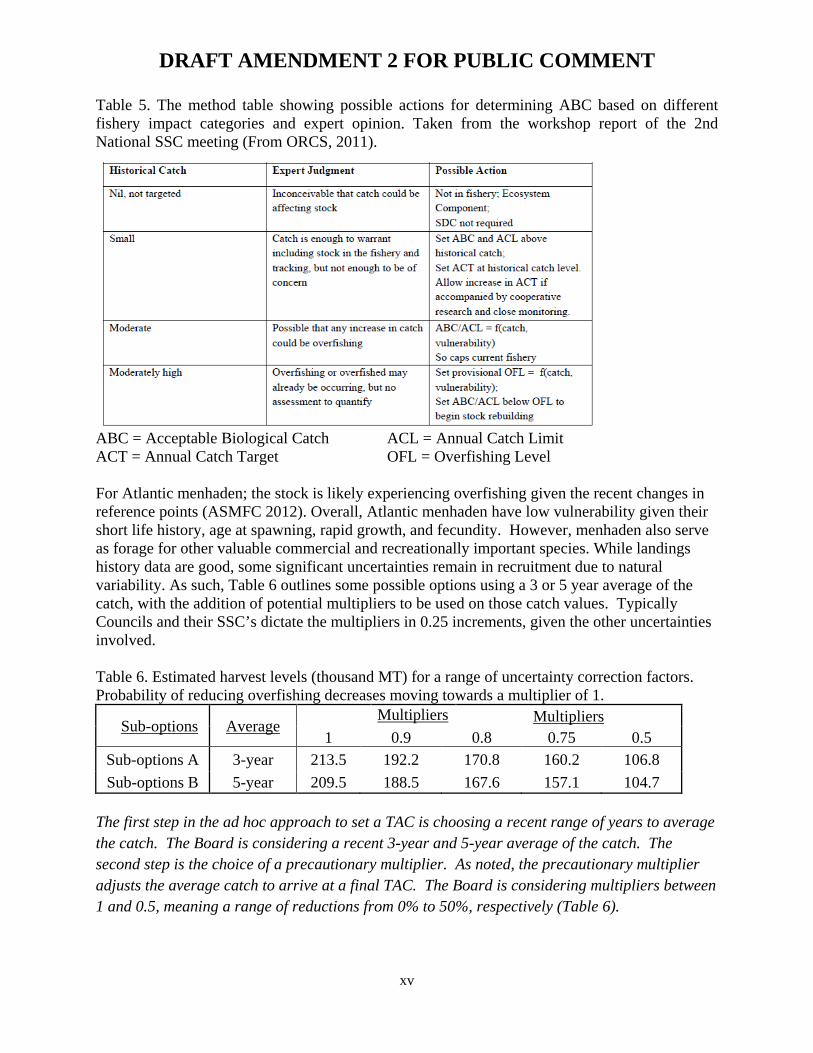
Table 5. The method table showing possible actions for determining ABC based on different fishery impact categories and expert opinion. Taken from the workshop report of the 2nd National SSC meeting (From ORCS, 2011).
ABC = Acceptable Biological Catch ACL = Annual Catch Limit ACT = Annual Catch Target OFL = Overfishing Level For Atlantic menhaden; the stock is likely experiencing overfishing given the recent changes in reference points (ASMFC 2012). Overall, Atlantic menhaden have low vulnerability given their short life history, age at spawning, rapid growth, and fecundity. However, menhaden also serve as forage for other valuable commercial and recreationally important species. While landings history data are good, some significant uncertainties remain in recruitment due to natural variability. As such, Table 6 outlines some possible options using a 3 or 5 year average of the catch, with the addition of potential multipliers to be used on those catch values. Typically Councils and their SSC’s dictate the multipliers in 0.25 increments, given the other uncertainties involved. Table 6. Estimated harvest levels (thousand MT) for a range of uncertainty correction factors. Probability of reducing overfishing decreases moving towards a multiplier of 1.
Sub-options Average Multipliers Multipliers
1 0.9 0.8 0.75 0.5 Sub-options A 3-year 213.5 192.2 170.8 160.2 106.8 Sub-options B 5-year 209.5 188.5 167.6 157.1 104.7
The first step in the ad hoc approach to set a TAC is choosing a recent range of years to average the catch. The Board is considering a recent 3-year and 5-year average of the catch. The second step is the choice of a precautionary multiplier. As noted, the precautionary multiplier adjusts the average catch to arrive at a final TAC. The Board is considering multipliers between 1 and 0.5, meaning a range of reductions from 0% to 50%, respectively (Table 6).
DRAFT AMENDMENT 2 FOR PUBLIC COMMENT
xvi
Sub-options A. Use a 3 year average of the catch to set an ad hoc TAC. Selecting this option also includes the choice of a multiplier (Sub-options A.1-A.5, below) that adjusts the average catch for a final TAC.
Sub-option A.1. Multiplier = 1, means a 0% reduction from the recent 3 year average
Sub-option A.2. Multiplier = 0.90, means a 10% reduction from the recent 3 year average
Sub-option A.3. Multiplier = 0.80, means a 20% reduction from the recent 3 year average
Sub-option A.4. Multiplier = 0.75, means a 25% reduction from the recent 3 year average
Sub-option A.5. Multiplier = 0.50, means a 50% reduction from the recent 3 year average
Sub-option B. Use a 5 year average of the catch to set an ad hoc TAC. Selecting this option also includes the choice of a multiplier (Sub-options B.1-B.5, below) that adjusts the average catch for a final TAC.Sub-option B.1. Multiplier = 1, means a 0% reduction from the recent 5 year average
Sub-option B.2. Multiplier = 0.90, means a 10% reduction from the recent 5 year average
Sub-option B.3. Multiplier = 0.80, means a 20% reduction from the recent 5 year average
Sub-option B.4. Multiplier = 0.75, means a 25% reduction from the recent 5 year average
Sub-option B.5. Multiplier = 0.50, means a 50% reduction from the recent 5 year average
Option B. Projections or Ad-hoc approach The Board will set the TAC based on the best available science (e.g., projection analysis), but if the projections are not recommended for use by the TC, the Board will set a quota based on the ad-hoc approaches used by the Regional Councils and detailed in Option A. If the Board selects Option B, they must use the ad hoc approach to set a TAC for 2013 because the projection analysis is currently not usable.
4.2.1.3 TAC Allocation If a TAC management approach is selected, it may be allocated to the bait and reduction fisheries separately, or it may be allocated based on total landings (bait and reduction fisheries combined). The following allocation options A, B, and C have additional options that consider sub-allocations. OPTION A. Menhaden commercial TAC to be managed on a coastwide basis.
(if chosen, go to sub-options A) OPTION B. Menhaden commercial TAC to be managed on a regional basis. (if chosen, go to sub-options B) Regions
DRAFT AMENDMENT 2 FOR PUBLIC COMMENT
xvii
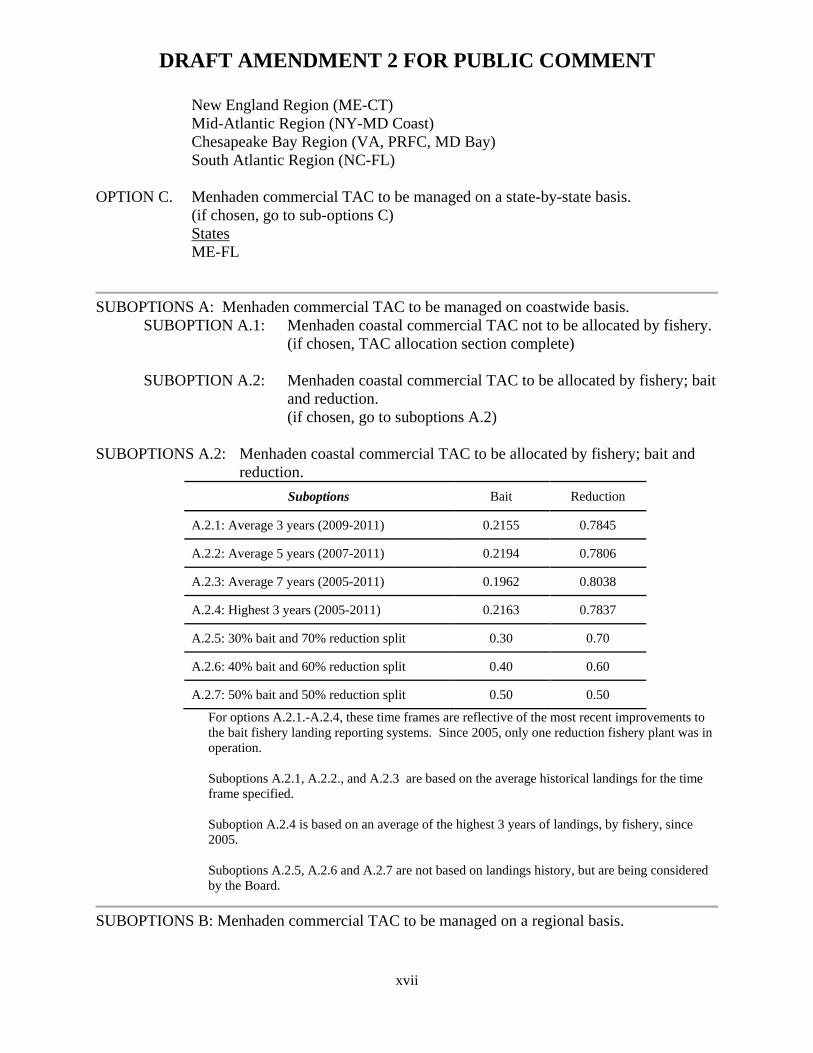
New England Region (ME-CT) Mid-Atlantic Region (NY-MD Coast) Chesapeake Bay Region (VA, PRFC, MD Bay) South Atlantic Region (NC-FL) OPTION C. Menhaden commercial TAC to be managed on a state-by-state basis. (if chosen, go to sub-options C) States ME-FL
SUBOPTIONS A: Menhaden commercial TAC to be managed on coastwide basis. SUBOPTION A.1: Menhaden coastal commercial TAC not to be allocated by fishery. (if chosen, TAC allocation section complete)
SUBOPTION A.2: Menhaden coastal commercial TAC to be allocated by fishery; bait and reduction.
(if chosen, go to suboptions A.2) SUBOPTIONS A.2: Menhaden coastal commercial TAC to be allocated by fishery; bait and
reduction. Suboptions Bait Reduction
A.2.1: Average 3 years (2009-2011) 0.2155 0.7845
A.2.2: Average 5 years (2007-2011) 0.2194 0.7806
A.2.3: Average 7 years (2005-2011) 0.1962 0.8038
A.2.4: Highest 3 years (2005-2011) 0.2163 0.7837
A.2.5: 30% bait and 70% reduction split 0.30 0.70
A.2.6: 40% bait and 60% reduction split 0.40 0.60
A.2.7: 50% bait and 50% reduction split 0.50 0.50
For options A.2.1.-A.2.4, these time frames are reflective of the most recent improvements to the bait fishery landing reporting systems. Since 2005, only one reduction fishery plant was in operation. Suboptions A.2.1, A.2.2., and A.2.3 are based on the average historical landings for the time frame specified. Suboption A.2.4 is based on an average of the highest 3 years of landings, by fishery, since 2005. Suboptions A.2.5, A.2.6 and A.2.7 are not based on landings history, but are being considered by the Board.
SUBOPTIONS B: Menhaden commercial TAC to be managed on a regional basis.
DRAFT AMENDMENT 2 FOR PUBLIC COMMENT
xviii
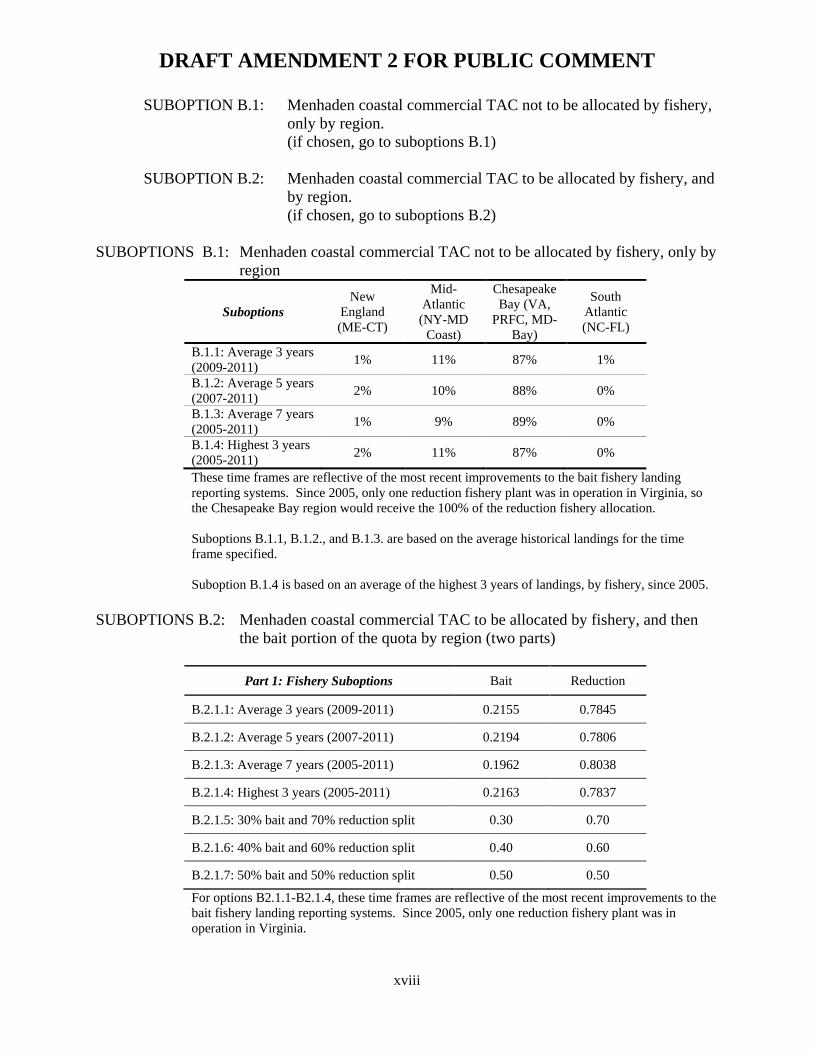
SUBOPTION B.1: Menhaden coastal commercial TAC not to be allocated by fishery, only by region.
(if chosen, go to suboptions B.1)
SUBOPTION B.2: Menhaden coastal commercial TAC to be allocated by fishery, and by region.
(if chosen, go to suboptions B.2) SUBOPTIONS B.1: Menhaden coastal commercial TAC not to be allocated by fishery, only by
region
Suboptions New
England (ME-CT)
Mid-Atlantic
(NY-MD Coast)
Chesapeake Bay (VA,
PRFC, MD-Bay)
South Atlantic (NC-FL)
B.1.1: Average 3 years (2009-2011) 1% 11% 87% 1%
B.1.2: Average 5 years (2007-2011) 2% 10% 88% 0%
B.1.3: Average 7 years (2005-2011) 1% 9% 89% 0%
B.1.4: Highest 3 years (2005-2011) 2% 11% 87% 0%
These time frames are reflective of the most recent improvements to the bait fishery landing reporting systems. Since 2005, only one reduction fishery plant was in operation in Virginia, so the Chesapeake Bay region would receive the 100% of the reduction fishery allocation. Suboptions B.1.1, B.1.2., and B.1.3. are based on the average historical landings for the time frame specified. Suboption B.1.4 is based on an average of the highest 3 years of landings, by fishery, since 2005.
SUBOPTIONS B.2: Menhaden coastal commercial TAC to be allocated by fishery, and then the bait portion of the quota by region (two parts)
Part 1: Fishery Suboptions Bait Reduction
B.2.1.1: Average 3 years (2009-2011) 0.2155 0.7845
B.2.1.2: Average 5 years (2007-2011) 0.2194 0.7806
B.2.1.3: Average 7 years (2005-2011) 0.1962 0.8038
B.2.1.4: Highest 3 years (2005-2011) 0.2163 0.7837
B.2.1.5: 30% bait and 70% reduction split 0.30 0.70
B.2.1.6: 40% bait and 60% reduction split 0.40 0.60
B.2.1.7: 50% bait and 50% reduction split 0.50 0.50
For options B2.1.1-B2.1.4, these time frames are reflective of the most recent improvements to the bait fishery landing reporting systems. Since 2005, only one reduction fishery plant was in operation in Virginia.
DRAFT AMENDMENT 2 FOR PUBLIC COMMENT
xix
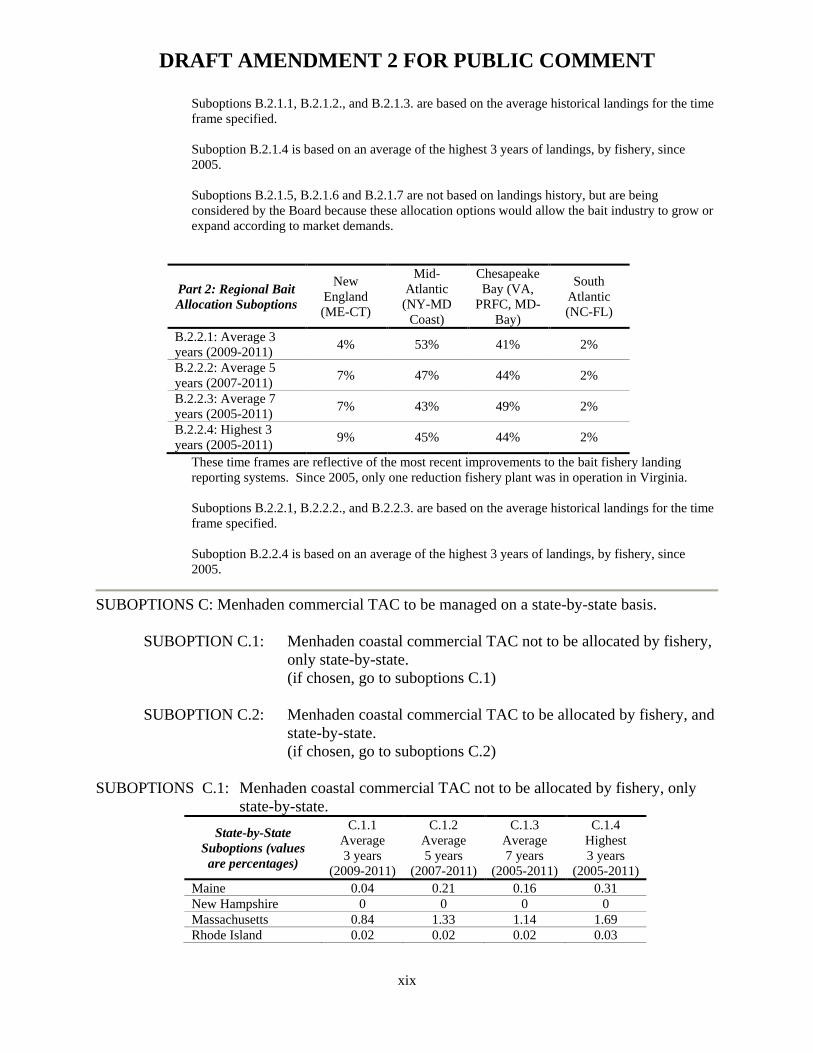
Suboptions B.2.1.1, B.2.1.2., and B.2.1.3. are based on the average historical landings for the time frame specified. Suboption B.2.1.4 is based on an average of the highest 3 years of landings, by fishery, since 2005. Suboptions B.2.1.5, B.2.1.6 and B.2.1.7 are not based on landings history, but are being considered by the Board because these allocation options would allow the bait industry to grow or expand according to market demands.
Part 2: Regional Bait Allocation Suboptions
New England (ME-CT)
Mid-Atlantic
(NY-MD Coast)
Chesapeake Bay (VA,
PRFC, MD-Bay)
South Atlantic (NC-FL)
B.2.2.1: Average 3 years (2009-2011) 4% 53% 41% 2%
B.2.2.2: Average 5 years (2007-2011) 7% 47% 44% 2%
B.2.2.3: Average 7 years (2005-2011) 7% 43% 49% 2%
B.2.2.4: Highest 3 years (2005-2011) 9% 45% 44% 2%
These time frames are reflective of the most recent improvements to the bait fishery landing reporting systems. Since 2005, only one reduction fishery plant was in operation in Virginia. Suboptions B.2.2.1, B.2.2.2., and B.2.2.3. are based on the average historical landings for the time frame specified. Suboption B.2.2.4 is based on an average of the highest 3 years of landings, by fishery, since 2005.
SUBOPTIONS C: Menhaden commercial TAC to be managed on a state-by-state basis.
SUBOPTION C.1: Menhaden coastal commercial TAC not to be allocated by fishery, only state-by-state.
(if chosen, go to suboptions C.1)
SUBOPTION C.2: Menhaden coastal commercial TAC to be allocated by fishery, and state-by-state.
(if chosen, go to suboptions C.2) SUBOPTIONS C.1: Menhaden coastal commercial TAC not to be allocated by fishery, only
state-by-state. State-by-State
Suboptions (values are percentages)
C.1.1 Average 3 years
(2009-2011)
C.1.2 Average 5 years
(2007-2011)
C.1.3 Average 7 years
(2005-2011)
C.1.4 Highest 3 years
(2005-2011) Maine 0.04 0.21 0.16 0.31 New Hampshire 0 0 0 0 Massachusetts 0.84 1.33 1.14 1.69 Rhode Island 0.02 0.02 0.02 0.03
DRAFT AMENDMENT 2 FOR PUBLIC COMMENT
xx
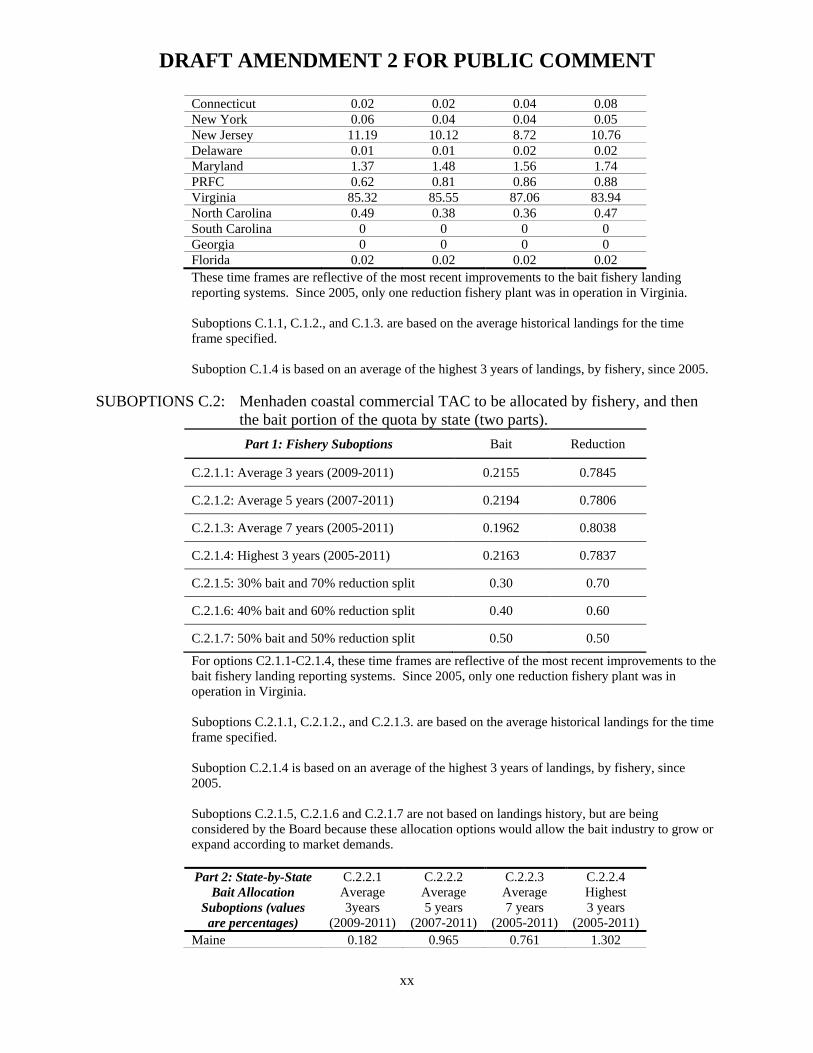
Connecticut 0.02 0.02 0.04 0.08 New York 0.06 0.04 0.04 0.05 New Jersey 11.19 10.12 8.72 10.76 Delaware 0.01 0.01 0.02 0.02 Maryland 1.37 1.48 1.56 1.74 PRFC 0.62 0.81 0.86 0.88 Virginia 85.32 85.55 87.06 83.94 North Carolina 0.49 0.38 0.36 0.47 South Carolina 0 0 0 0 Georgia 0 0 0 0 Florida 0.02 0.02 0.02 0.02 These time frames are reflective of the most recent improvements to the bait fishery landing reporting systems. Since 2005, only one reduction fishery plant was in operation in Virginia. Suboptions C.1.1, C.1.2., and C.1.3. are based on the average historical landings for the time frame specified. Suboption C.1.4 is based on an average of the highest 3 years of landings, by fishery, since 2005.
SUBOPTIONS C.2: Menhaden coastal commercial TAC to be allocated by fishery, and then the bait portion of the quota by state (two parts). Part 1: Fishery Suboptions Bait Reduction
C.2.1.1: Average 3 years (2009-2011) 0.2155 0.7845
C.2.1.2: Average 5 years (2007-2011) 0.2194 0.7806
C.2.1.3: Average 7 years (2005-2011) 0.1962 0.8038
C.2.1.4: Highest 3 years (2005-2011) 0.2163 0.7837
C.2.1.5: 30% bait and 70% reduction split 0.30 0.70
C.2.1.6: 40% bait and 60% reduction split 0.40 0.60
C.2.1.7: 50% bait and 50% reduction split 0.50 0.50
For options C2.1.1-C2.1.4, these time frames are reflective of the most recent improvements to the bait fishery landing reporting systems. Since 2005, only one reduction fishery plant was in operation in Virginia. Suboptions C.2.1.1, C.2.1.2., and C.2.1.3. are based on the average historical landings for the time frame specified. Suboption C.2.1.4 is based on an average of the highest 3 years of landings, by fishery, since 2005. Suboptions C.2.1.5, C.2.1.6 and C.2.1.7 are not based on landings history, but are being considered by the Board because these allocation options would allow the bait industry to grow or expand according to market demands. Part 2: State-by-State
Bait Allocation Suboptions (values are percentages)
C.2.2.1 Average 3years
(2009-2011)
C.2.2.2 Average 5 years
(2007-2011)
C.2.2.3 Average 7 years
(2005-2011)
C.2.2.4 Highest 3 years
(2005-2011) Maine 0.182 0.965 0.761 1.302
DRAFT AMENDMENT 2 FOR PUBLIC COMMENT
xxi
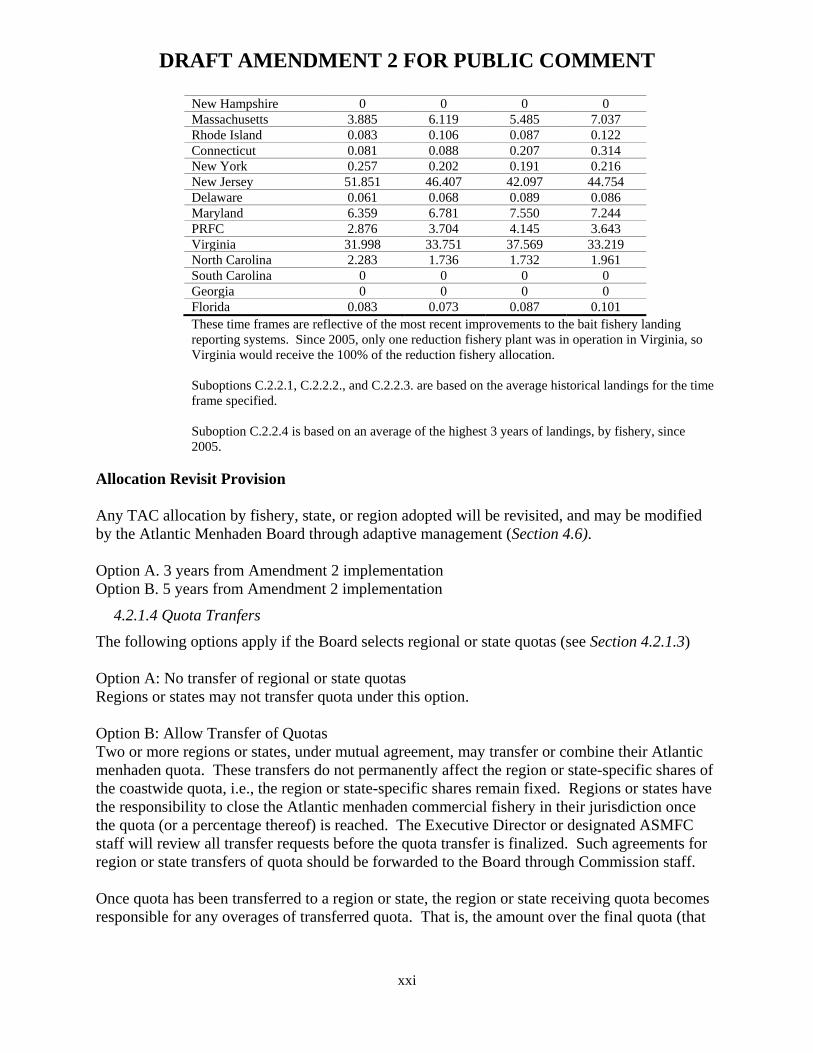
New Hampshire 0 0 0 0 Massachusetts 3.885 6.119 5.485 7.037 Rhode Island 0.083 0.106 0.087 0.122 Connecticut 0.081 0.088 0.207 0.314 New York 0.257 0.202 0.191 0.216 New Jersey 51.851 46.407 42.097 44.754 Delaware 0.061 0.068 0.089 0.086 Maryland 6.359 6.781 7.550 7.244 PRFC 2.876 3.704 4.145 3.643 Virginia 31.998 33.751 37.569 33.219 North Carolina 2.283 1.736 1.732 1.961 South Carolina 0 0 0 0 Georgia 0 0 0 0 Florida 0.083 0.073 0.087 0.101 These time frames are reflective of the most recent improvements to the bait fishery landing reporting systems. Since 2005, only one reduction fishery plant was in operation in Virginia, so Virginia would receive the 100% of the reduction fishery allocation. Suboptions C.2.2.1, C.2.2.2., and C.2.2.3. are based on the average historical landings for the time frame specified. Suboption C.2.2.4 is based on an average of the highest 3 years of landings, by fishery, since 2005.
Allocation Revisit Provision Any TAC allocation by fishery, state, or region adopted will be revisited, and may be modified by the Atlantic Menhaden Board through adaptive management (Section 4.6). Option A. 3 years from Amendment 2 implementation Option B. 5 years from Amendment 2 implementation
4.2.1.4 Quota Tranfers The following options apply if the Board selects regional or state quotas (see Section 4.2.1.3) Option A: No transfer of regional or state quotas Regions or states may not transfer quota under this option. Option B: Allow Transfer of Quotas Two or more regions or states, under mutual agreement, may transfer or combine their Atlantic menhaden quota. These transfers do not permanently affect the region or state-specific shares of the coastwide quota, i.e., the region or state-specific shares remain fixed. Regions or states have the responsibility to close the Atlantic menhaden commercial fishery in their jurisdiction once the quota (or a percentage thereof) is reached. The Executive Director or designated ASMFC staff will review all transfer requests before the quota transfer is finalized. Such agreements for region or state transfers of quota should be forwarded to the Board through Commission staff. Once quota has been transferred to a region or state, the region or state receiving quota becomes responsible for any overages of transferred quota. That is, the amount over the final quota (that
DRAFT AMENDMENT 2 FOR PUBLIC COMMENT
xxii
region or state’s quota plus any quota transferred to that region or state) for a region or state will be deducted from the corresponding state’s quota the following fishing season.
4.2.1.5 Quota Rollover The quota rollover option only applies if the stock status is not overfished and overfishing is not occurring. Any quota that is rolled over must be used in the subsequent fishing year, if it is not used the quota cannot carry into a second fishing year. Option A: Quotas May Not Be Rolled Over Unused quota may not be rolled over from one fishing year to the next. Option B. 100% Quota Rollover Any unused portion of a TAC may be rolled over to the subsequent fishing year only. This would apply to a coastwide TAC or any allocated portion of that TAC by fishery (bait and reduction), region, or state. This rollover option would apply to all final allocations (including transferred quota if applicable). Option C: Maximum Percent Quota Rollover as Specified by Board A specified maximum percentage of an unused portion of a TAC may be rolled over to the subsequent fishing year only. The maximum total rollover percentage may be specified by the Board during the annual specification process. This would apply to a coastwide TAC or any allocated portion of that TAC by fishery (bait and reduction), region, or state. This rollover option would apply to all final allocations (including transferred quota if applicable).
4.2.1.6 Quota Payback Option A: No Payback of Overharvest of Quota Option B: 100% Payback of Quota Overages Any overage of a TAC is subtracted from that specific TAC the subsequent fishing year. This would apply to a coastwide TAC or any allocated portion of that TAC by fishery (bait and reduction), region, or state. Overage determination is based on final allocations (including overages after transferred quota if applicable).
4.2.1.7 Bycatch Allowance An incidental bycatch allowance is strictly for non-directed fisheries. States are not eligible to submit alternative state management regimes (Section 4.5) in lieu of any selected bycatch allowance option. The Board may select a single option, or the two options in combination (e.g., pound and percent bycatch allowance). A hypothetical example of a combination option would be a 10 percent bycatch allowance (meaning 90% of landed pounds must be from species other than Atlantic menhaden) and the bycatch amount of Atlantic menhaden may not exceed 2,000 pounds. Option A. No bycatch allowance when the fishing season is closed. Option B. Pound based bycatch allowance
DRAFT AMENDMENT 2 FOR PUBLIC COMMENT
xxiii
No directed fisheries for Atlantic menhaden shall be allowed when the fishing season is closed. An incidental bycatch allowance of up to OPTION pounds of Atlantic menhaden per trip for non-directed fisheries shall be in place during a season closure. The amount of Atlantic menhaden landed by one vessel in a day, as a bycatch allowance, shall not exceed OPTION pounds (this prohibits a vessel from making multiple trips in one day to land more than the bycatch allowance). A trip shall be based on a calendar day basis. Option 1. 1,000 pound bycatch allowance Option 2. 2,000 pound bycatch allowance Option 3. 5,000 pound bycatch allowance Option 4. 10,000 pound bycatch allowance Option C. Percent based bycatch allowance No directed fisheries for Atlantic menhaden shall be allowed when the fishing season is closed. An incidental bycatch allowance of up to OPTION% of Atlantic menhaden relative to the total catch per trip for non-directed fisheries shall be in place during a season closure. The amount of Atlantic menhaden landed by one vessel in a day, as a bycatch allowance, shall not exceed OPTION% of the total landings for one trip (this prohibits a vessel from making multiple trips in one day to land more than the bycatch allowance). A trip shall be based on a calendar day basis. Option 1. 2 percent bycatch allowance Option 2. 5 percent bycatch allowance Option 3. 10 percent bycatch allowance Option 4. 20 percent bycatch allowance
4.2.1.8 TAC Set Aside for Small Scale Fisheries This option only applies if the Board selects a Coastwide TAC Allocation for Section 4.2.1.3. If the Board selects to include a set aside (Option B) a traditional small scale fishery will need to be defined. Option A. No allowance of a quota set aside
Option B. A specific percentage or poundage of the TAC may be set aside for small scale traditional fisheries. The set aside amount will be determined by the Board during annual specifications, and is subject to a technical analysis of the fishery receiving a set aside. This option would only be available if adequate monitoring exists in the fishery receiving the set aside.
4.2.1.9 TAC Set Aside for Episodic Events
This option only applies if the Board selects a State TAC Allocation for Section 4.2.1.3. Option A. No quota set aside option for episodic events Option B. One percent (1%) of the overall TAC as determined in Section 4.2.1.2 may be set aside for episodic events. Episodic events are times and areas where Atlantic menhaden are available in more abundance than they normally occur. Given the historical allocation options being considered in Section 4.2.1.3 do not account for the potential harvest that can occur during
DRAFT AMENDMENT 2 FOR PUBLIC COMMENT
xxiv
these episodic events, a set aside is designed to provide flexibility to states that experience episodic events to harvest menhaden in lieu of their original state by state bait allocation percentages (Option C2 in Section 4.2.1.3). However, the 30/70%, 40/60% and 50/50% bait/reduction allocation options may preclude the need for a TAC set aside because the allocation to states that have episodic events would increase. To qualify for the episodic event set aside, a state’s allocation must be less than 2% for the state by state bait allocation scenario (Option C2 in Section 4.2.1.3). A qualified state has the choice to opt into the episodic event set aside, giving that state the ability to harvest from the set aside amount as opposed to their allocated quota. Note the set aside amount will not be allocated to states opting in. Furthermore, if a state opts in, they forfeit their originally allocated quota to the remaining states that do not qualify or opted out of the set aside. The forfeited quota amount would be distributed to states that do not qualify or opted out of the set aside using an allocation table that is recalculated without the states that opted into the set aside. Additionally the set aside has the following provisions for states that opt in,
• Specify that any unused set aside will be rolled over into the overall quota after July 1, unless another date is selected by the Board after public comment.
• Specify that the Board will require states and or regions to implement effort controls to scale the fishery appropriate to the set-aside quota level. For example the State of Maine currently restricts harvester vessels >50’, restricts all vessels/carriers to land no more than 250,000 pounds per day and restricts carriers greater than 90’. Gear, time, season,trip limits and triggers etc are other options for different jurisdictions to consider.
• Require that reporting meet or exceeds requirements as specified in Section 3.6.1.2. • Require that if the set aside is exceeded, any overages are reduced from the next season’s
episodic event set-aside
4.2.2 Atlantic Menhaden Chesapeake Bay Reduction Fishery Harvest Cap
The Board may consider changes to the Atlantic menhaden harvest cap, a current management measure that will expire in 2013. The current management language is below the list of options. Option A: Status quo. 2013 is the final year for the Chesapeake Bay (CB) cap. Option B: Extend the CB cap to any specified time frame Option C: Adjust the CB cap as it relates to any quota management approach selected. The annual total allowable harvest from the Chesapeake Bay by the reduction fishery is limited to no more than 109,020 metric tons (the average landings from 2001-2005). Harvest for reduction purposes shall be prohibited within the Chesapeake Bay when 100% of the cap is harvested from Chesapeake Bay. This cap is in place for the fishing seasons starting in 2011 and going through 2013. Over-harvest in any given year will be deducted from the next year’s allowable harvest. Annual Credit for Harvest Underages
DRAFT AMENDMENT 2 FOR PUBLIC COMMENT
xxv
The annual Chesapeake Bay harvest cap under Addendum IV is not based on a scientifically quantified harvest threshold, fishery health index, or fishery population level study. Due to data limitations, it is unknown if exceeding the 109,020 metric-ton limit will negatively affect the health of the menhaden population. The cap is designed to prevent the Chesapeake Bay reduction fishery harvest of Atlantic menhaden from expanding while the necessary scientific studies are being conducted to explore the potential for localized depletion in the Chesapeake Bay. Assuming a cap of 109,020 metric tons had been in place over the 2001-2005 reference period, the maximum underage that would have occurred during that time period is 13,720 metric tons. The maximum rollover of unlanded fish is 13,720 metric tons. Adding that underage to the 109,020 metric ton cap results in a cap of 122,740 metric tons. In years when annual menhaden harvest in the Chesapeake Bay for reduction purposes is below the 109,020 metric-ton cap, the underage amount shall be credited to the following year’s allowable harvest. Under no circumstances can allowable harvest in any given year from 2011 through 2013 exceed 122,740 metric tons. Such credit can only be applied to the following calendar year’s harvest cap and cannot be reserved for future years or spread over multiple years. Further, if no more than the underage amount in one year is credited to the next year’s allowable harvest, the annual average harvest for 2011 through 2013 cannot exceed 109,020 metric tons.
4.5.3 De minimis Fishery Guidelines
Option A. Status Quo, de minimis criteria is not established through Amendment 2. Option B. Define de minimis for States without a Reduction Fishery. If Option B is selected, the Board must select both the Criteria for De Minimis Consideration (Section 4.5.3.1) and the plan requirements if de minimis is granted (Section 4.5.3.2).
4.5.3.1 Criteria for De Minimis Consideration A state can apply annually for de minimis status if a state does not have a reduction fishery. Option 1. To be eligible for de minimis consideration in the bait fishery, a state must prove that its commercial bait landings in the most recent two years for which data are available did not exceed 1% of the coastwide bait landings. Option 2. To be eligible for de minimis consideration in the bait fishery, a state must prove that its commercial bait landings in the most recent two years for which data are available did not exceed 2% of the coastwide bait landings.
4.5.3.2 Plan Requirements if De Minimis Status is Granted If de minimis status is granted, the de minimis state is required to implement, at a minimum, the coastwide requirements contained in Section 3.6 of Amendment 2. Any additional components of the FMP, which the Board determines necessary for a de minimis state to implement, can be defined at the time de minimis status is granted. For all other required components of the plan, the Board will specify by motion which measures a de minimis state must adopt.
DRAFT AMENDMENT 2 FOR PUBLIC COMMENT
xxvi
Option 3: De minimis criteria exempts a state from biological monitoring (e.g., age data), but the state must adhere to timely quota monitoring requirements (as specified in Section 3.1) and may not exceed their allocated quota. If the fishery is closed for any reason, de minimis states must close their fisheries as well. Option 4: De minimis criteria exempts a state from both biological monitoring (e.g., age data), and timely quota monitoring requirements (as specified in Section 3.1), but states must still submit annual landings, and may not exceed their allocated quota. If the fishery is closed for any reason, de minimis states must close their fisheries as well.
4.6.2 Measures Subject to Change
The following measures are subject to change under adaptive management upon approval by the Atlantic Menhaden Management Board:
(1) Fishing seasons including season closures (2) Trip limits (3) Limited entry (4) Area closures (5) Annual specifications, including maximum sustainable yield (MSY), allowable biological
catch (ABC), optimum yield (OY), internal waters processing (IWP) allocations, etc.; (6) Overfishing definition (7) Rebuilding targets and schedules (8) Catch controls (9) Effort controls (10) Reporting requirements (11) Gear restrictions including mesh sizes (12) Measures to reduce or monitor bycatch (13) Observer requirements (14) Management areas (15) Recommendations to the Secretaries for complementary actions in federal jurisdictions; (16) Research or monitoring requirements (17) TAC allocation (18) Harvest caps on other inland bodies of water (19) Any other management measures currently included in Amendment 2.
4.9 RECOMMENDATIONS TO THE SECRETARY FOR COMPLEMENTARY ACTIONS IN FEDERAL WATERS
The Atlantic States Marine Fisheries Commission believes that the measures contained in Amendment 2 are necessary to prevent the overfishing of the Atlantic menhaden resource. If any of the above options are adopted through the Amendment process, the Board should consider recommending the adopted measures to the National Marine Fisheries Service for implementation in the EEZ.
ACKNOWLEDGEMENTS Completed in final version
DRAFT AMENDMENT 2 FOR PUBLIC COMMENT
xxvii
TABLE OF CONTENTS
1.0 INTRODUCTION ............................................................................................................................. 1
1.1 BACKGROUND INFORMATION ............................................................................................... 1 1.1.1 Statement of the Problem ........................................................................................................ 1 1.1.2 Benefits of Implementation ..................................................................................................... 2 1.1.3 Ecological Benefits ................................................................................................................. 2
1.2 DESCRIPTION OF THE RESOURCE .................................................................................................... 2 1.2.1 Species Life History ................................................................................................................ 2 1.2.2 Stock Assessment Summary ................................................................................................... 6 1.2.3 Present condition of the stock ................................................................................................. 8 1.2.4 Peer Review Panel Results ...................................................................................................... 9
1.3 DESCRIPTION OF THE FISHERY ..................................................................................................... 10 1.3.1 Commercial Fishery .............................................................................................................. 10 1.3.2 Recreational Fishery .............................................................................................................. 14 1.3.3 Subsistence Fishing ............................................................................................................... 14 1.3.4 Non-Consumptive Factors..................................................................................................... 14 1.3.5 Interactions with Other Fisheries, Species, or Users ............................................................. 14
1.4 HABITAT CONSIDERATIONS .......................................................................................................... 15 1.4.1 Physical Description of Habitat ............................................................................................. 15 1.4.2 Habitat Quality ...................................................................................................................... 17 1.4.3 Environmental Requirements of Atlantic Menhaden ............................................................ 17 1.4.4 Identification and Distribution of Essential Habitat .............................................................. 20 1.4.5 Anthropogenic Impacts on Atlantic Menhaden and their Habitat ......................................... 21 1.4.6 Description of Programs to Protect, Restore, Preserve and Enhance Atlantic Menhaden Habitat ................................................................................................................................... 22
1.5 IMPACTS OF THE FISHERY MANAGEMENT PROGRAM .................................................................. 22 1.5.1 Biological and Environmental Impacts ................................................................................. 22 1.5.2 Social Impacts ....................................................................................................................... 24 1.5.3 Economic Impacts ................................................................................................................. 30 1.5.4 Other Resource Management Efforts .................................................................................... 33
1.6 LOCATION OF TECHNICAL DOCUMENTATION FOR FMP .............................................................. 33 1.6.1 Review of Resource Life History and Biological Relationships ........................................... 33 1.6.2 Stock Assessment Documentation ........................................................................................ 33 1.6.3 Social Assessment Documentation ....................................................................................... 34 1.6.4 Economic Assessment Documentation ................................................................................. 34 1.6.5 Law Enforcement Assessment Documentation ..................................................................... 34
2.0 GOALS AND OBJECTIVES ......................................................................................................... 34
2.1 HISTORY AND PURPOSE OF THE PLAN .......................................................................................... 34 2.1.1 History of Prior Management Actions .................................................................................. 34 2.1.2 Regulatory Trend .................................................................................................................. 35 2.1.3 Purpose and Need for Action ................................................................................................ 35
2.2 GOAL ............................................................................................................................................ 36 2.3 OBJECTIVES .................................................................................................................................. 36 2.4 SPECIFICATION OF MANAGEMENT UNIT ...................................................................................... 37
2.4.1 Management Area ................................................................................................................. 37 2.5 BIOLOGICAL REFERENCE POINTS ................................................................................................. 37 2.6 MAINTENANCE OF STOCK STRUCTURE ........................................................................................ 40
2.6.1 StockTargets .......................................................................................................................... 40
DRAFT AMENDMENT 2 FOR PUBLIC COMMENT
xxviii
2.6.2 Stock Rebuilding and F Reduction Schedules ...................................................................... 40 2.7 RESOURCE COMMUNITY ASPECTS ............................................................................................... 41 2.8 IMPLEMENTATION SCHEDULE ...................................................................................................... 41
3.0 MONITORING PROGRAM SPECIFICATIONS/ELEMENTS ............................................... 41
3.1 ASSESSMENT OF ANNUAL AGE/SIZE STRUCTURE .......................................................... 42 3.2 ASSESSMENT OF ANNUAL RECRUITMENT ........................................................................ 42 3.3 ASSESSMENT OF SPAWNING STOCK BIOMASS ................................................................ 42 3.4 ASSESSMENT OF FISHING MORTALITY .............................................................................. 43 3.5 PROJECTION METHODOLOGY .............................................................................................. 43 3.6 SUMMARY OF MONITORING PROGRAMS ...................................................................................... 43
3.6.1 Catch and Landings Information ........................................................................................... 43 3.6.2 Fishery-Dependent Data ........................................................................................................ 45 3.6.3 Fishery-Independent Survey Data ......................................................................................... 47 3.6.4 Social Information ................................................................................................................. 48 3.6.5 Economic Information .......................................................................................................... 48 3.6.6 Observer Programs ................................................................................................................ 48
3.7 STOCKING PROGRAM ............................................................................................................. 49 3.8 BYCATCH MONITORING PROGRAM .................................................................................... 49
3.8.1 Measures to Reduce/Monitor Bycatch .................................................................................. 49 3.9 HABITAT MONITORING PROGRAM ..................................................................................... 49
4.0 MANAGEMENT PROGRAM IMPLEMENTATION ............................................................... 49
4.1 RECREATIONAL FISHERY MANAGEMENT MEASURES .................................................................. 49 4.2 COMMERCIAL FISHERY MANAGEMENT MEASURES ..................................................................... 49
4.2.1 Total Allowable Catch (TAC) ............................................................................................... 49 4.2.2 Atlantic Menhaden Chesapeake Bay Reduction Fishery Harvest Cap ................................. 61
4.3 FOR-HIRE FISHERIES MANAGEMENT MEASURES ........................................................... 62 4.4 HABITAT CONSERVATION AND RESTORATION RECOMMENDATIONS ..................... 62
4.4.1 Preservation of Existing Habitat ........................................................................................... 62 4.4.2 Habitat Restoration, Improvement and Enhancement ........................................................... 62 4.4.3 Avoidance of Incompatible Activities ................................................................................... 62 4.4.4 Fishery Practices ................................................................................................................... 63
4.5 ALTERNATIVE STATE MANAGEMENT REGIMES ............................................................. 63 4.5.1 General Procedures ............................................................................................................... 63 4.5.2 Management Program Equivalency ...................................................................................... 64 4.5.3 De minimis Fishery Guidelines ............................................................................................. 64
4.6 ADAPTIVE MANAGEMENT .................................................................................................... 65 4.6.1 General Procedures ............................................................................................................... 65 4.6.2 Measures Subject to Change ................................................................................................. 66
4.7 EMERGENCY PROCEDURES ........................................................................................................... 67 4.8 MANAGEMENT INSTITUTIONS ...................................................................................................... 67
4.8.1 Atlantic States Marine Fisheries Commission and ISFMP Policy Board ............................. 67 4.8.2 Atlantic Menhaden Management Board ............................................................................... 67 4.8.3 Atlantic Menhaden Plan Development/Review Team .......................................................... 67 4.8.4 Atlantic Menhaden Technical Committee ............................................................................. 68 4.8.5 Atlantic Menhaden Stock Assessment Subcommittee .......................................................... 68 4.8.6 Atlantic Menhaden Advisory Panel ...................................................................................... 68 4.8.7 Federal Agencies ................................................................................................................... 68
4.9 RECOMMENDATIONS TO THE SECRETARY FOR COMPLEMENTARY ACTIONS IN FEDERAL JURISDICTIONS ........................................................................................................................................ 69
DRAFT AMENDMENT 2 FOR PUBLIC COMMENT
xxix
4.10 COOPERATION WITH OTHER MANAGEMENT INSTITUTIONS ..................................................... 69
5.0 COMPLIANCE ............................................................................................................................... 69
5.1 MANDATORY COMPLIANCE ELEMENTS FOR STATES ................................................................... 69 5.1.1 Mandatory Elements of State Programs ................................................................................ 70 5.1.2 Compliance Schedule ............................................................................................................ 70 5.1.3 Compliance/Technical Report Content ................................................................................. 71
5.2 PROCEDURES FOR DETERMINING COMPLIANCE ........................................................................... 71 5.3 RECOMMENDED (NON-MANDATORY) MANAGMENET MEASURES .............................................. 72 5.4 ANALYSIS OF THE ENFORCEABILITY OF PROPOSED MEASURES .................................................. 72
6.0 MANAGEMENT AND RESEARCH NEEDS ............................................................................. 72
6.1 STOCK ASSESSMENT AND POPULATION DYNAMICS .................................................................... 72 6.2 RESEARCH NEEDS ......................................................................................................................... 74
6.2.1 Social and Economic ............................................................................................................. 74 6.2.2 Habitat ................................................................................................................................... 74
7.0 PROTECTED SPECIES ................................................................................................................ 74
8.0 REFERENCES ................................................................................................................................ 85
9.0 TABLES ........................................................................................................................................... 96
10.0 FIGURES ....................................................................................................................................... 107
DRAFT AMENDMENT 2 FOR PUBLIC COMMENT
xxx
LIST OF TABLES Table 1. Number of ten fish samples from the reduction fishery landings at Reedville, VA from 2007-
2011. ................................................................................................................................................... 46 Table 2. Target number of ten fish samples as established in 1994 for the bait harvest. ............................ 46 Table 3. Number of ten fish samples by year, state, and gear, sampled from the bait harvest from 2007-
2011. ................................................................................................................................................... 46 Table 4. Summary of ad-hoc approaches used by Fishery Management Councils to set harvest limits in
data poor situations. ............................................................................................................................ 51 Table 5. The method table showing possible actions for determining ABC based on different fishery
impact categories and expert opinion. Taken from the workshop report of the 2nd National SSC meeting (from ORCS, 2011). .............................................................................................................. 52
Table 6. Estimated harvest levels (thousand MT) for a range of uncertainty correction factors. ............... 52 Table 7. Atlantic menhaden reduction landings (1940-2011), bait landings (1985-2011) and total landings
(1940-2011) in 1000s of metric tons. .................................................................................................. 96 Table 8. Menhaden total bait landings and bait landings by region in 1000s of metric tons, 1985-2011. .. 97 Table 9. Atlantic menhaden bait landings by state in pounds, 2005-2011. ................................................. 98 Table 10. Summary of State Regulations for 2011 ..................................................................................... 98 Table 11. Comparison of Atlantic menhaden biological reference points and model produced output
values. ............................................................................................................................................... 100 Table 12. Summary of Reporting Requirements, compiled in 2011. ........................................................ 101 Table 13. Data elements for Atlantic menhaden (required data elements are noted with an asterisk*) ... 104 Table 14. Standard measurements of gear quantity, fishing time and sets applicable to Atlantic menhaden.
.......................................................................................................................................................... 106
DRAFT AMENDMENT 2 FOR PUBLIC COMMENT
xxxi
LIST OF FIGURES Figure 1. Atlantic menhaden reduction (1940-2011) and bait (1985-2011) landings in 1000s of metric
tons. Note scale for bait landings is on right axis. ........................................................................... 107 Figure 2. Atlantic menhaden bait landings by region in 100s of metric tons, 1985-2011. ....................... 107 Figure 3. Atlantic Menhaden Recreational Harvest (A1+B1) from 1981-2011. Source: "Personal
communication from the National Marine Fisheries Service, Fisheries Statistics Division. [July 05, 2011] ................................................................................................................................................. 108
Figure 4. Estimated numbers at age of Atlantic menhaden (billions) at the start of the .......................... 109 Figure 5. Estimated annual full fishing mortality rate from the base BAM model. Included are the F15%MSP
threshold and F30%MSP target lines. .................................................................................................... 110 Figure 6. Estimated annual recruitment to age-0 (billions) from the base BAM model. .......................... 111 Figure 7. Estimated annual SSB (fecundity or number of mature ova) from the base BAM model.
Included are the SSBmed threshold and SSBmed target lines. .............................................................. 112
DRAFT AMENDMENT 2 FOR PUBLIC COMMENT
1
1.0 INTRODUCTION
The Atlantic States Marine Fisheries Commission (ASMFC) is developing an amendment to its Interstate Fishery Management Plan (FMP) for Atlantic Menhaden (Brevoortia tyrannus) under the authority of the Atlantic Coastal Fisheries Cooperative Management Act (ACFCMA). The Commission, through the coastal states of Maine through Florida, is responsible for managing Atlantic menhaden. ASMFC has coordinated interstate management of Atlantic menhaden in state waters (0-3 miles) since 1981. Atlantic menhaden is currently managed under Amendment 1 and Addenda I-V to the Fishery Management Plan (FMP). Amendment 2 to the Interstate Fishery Management Plan for Atlantic menhaden would replace Amendment 1 if adopted. This document contains all applicable management options still in implementation from Amendment 1 and all five addenda. Management authority in the exclusive economic zone (EEZ, 3-200 miles from shore) lies with NOAA Fisheries.
1.1 BACKGROUND INFORMATION
1.1.1 Statement of the Problem
The 2010 Atlantic menhaden benchmark stock assessment Peer Review Panel noted that menhaden population abundance had declined steadily and recruitment had been low since the last peak observed in the early 1980s. Fishing at the fishing mortality (F) threshold reference point in the terminal year (2008) has resulted in approximately 8% of the maximum spawning potential (MSP)1. Therefore, the Panel recommended alternative reference points be considered that provide greater protection for spawning stock biomass (SSB) or population fecundity relative to the unfished level. In November 2011, the Atlantic Menhaden Management Board responded to that recommendation and adopted new F reference points via Addendum V. The new reference points are more conservative than the previous to account for the following: (1) while menhaden are not overfished the number of fish in the population has been declining, (2) while menhaden are important for many fisheries they also provide important ecological services, (3) strong recruitment classes may be dependent on favorable environmental conditions, and (4) recent science suggests conserving a larger percentage of the spawning stock is an important consideration for forage species such as menhaden. The new F threshold is F15%MSP , and the new F target is F30%MSP.
A stock assessment update was completed in July 2012, full F/F15%MSP for the terminal year (2011) was greater than 1, and therefore, overfishing is occurring. Addendum V states that when overfishing is occurring the Board will take steps to reduce F to the target level. In order to end overfishing and reduce F to the target, the Board needs to consider changes in the management tools used to regulate the fishery. The new F reference points adopted by the Board through Addendum V are intended to be interim reference points while the Commission’s Multispecies Technical Committee develops ecological-based reference points (ERP). The ERPs will take some time to develop because of the complexity of modeling predator-prey relationship in marine species that rely on menhaden
1 Natural mortality is a contributing factor to current estimates of %MSP (e.g., environmental conditions affecting recruitment success, predation).
DRAFT AMENDMENT 2 FOR PUBLIC COMMENT
2
for forage (e.g., striped bass, bluefish, weakfish). In either case (biological or ecological reference points) the intent is to manage Atlantic menhaden at sustainable levels to support fisheries and meet predator demands through sufficient SSB to prevent stock depletion and protect against recruitment failure.
1.1.2 Benefits of Implementation
Amendment 2 when fully implemented, is designed to minimize the chance of a population decline due to overfishing, reduce the risk of recruitment failure, reduce impacts to species which are ecologically dependent on Atlantic menhaden, and minimize adverse effects on participants in the fishery. Amendment 2 contains a progressive management program designed to provide more flexibility in managing Atlantic menhaden. Issues Addressed in Amendment 2 1. Timeline to achieve the target fishing mortality rate
A timeline to reduce F to the target will end overfishing, and provide a program to maintain a healthy Atlantic Menhaden stock
2. A mechanism for effective and timely monitoring of the menhaden population. Timely and complete reporting enables managers and fishermen to monitor the landings throughout the season, and evaluate the effectiveness of any selected fishery management measures.
3. Commercial Fishery Management Tools A quota management program has been used in several fisheries to maintain a healthy stock size, while maximizing benefits of the fisheries.
1.1.3 Ecological Benefits
Ecologically, Atlantic Menhaden occupy a very important link in the coastal marine food chain, transferring planktonic material into animal biomass. Atlantic menhaden are ubiquitous in nearshore coastal waters because of their ability to directly utilize phytoplankton and zooplankton, which is the basic food resource in aquatic systems. Other species of marine fish are not equipped to filter such small organisms from the water. Consequently, large populations of other species cannot be supported without this contribution from menhaden, therefore maintaining a healthy Atlantic menhaden population will contribute to a balanced marine ecosystem. Because menhaden are so abundant in nearshore coastal and estuarine waters, they are an important forage fish for a variety of larger piscivorous fishes, birds, and marine mammals. As a result of this, menhaden influence the conversion and exchange of energy and organic matter within the coastal ecosystem throughout their range (Peters and Schaaf 1981; Lewis and Peters 1984; Peters and Lewis 1984).
1.2 DESCRIPTION OF THE RESOURCE
1.2.1 Species Life History
1.2.1.1 Stock Structure and Migration Atlantic menhaden are euryhaline species that inhabit nearshore and inland tidal waters from Florida to Nova Scotia, Canada. Size-frequency information and tagging studies indicate that the
DRAFT AMENDMENT 2 FOR PUBLIC COMMENT
3
Atlantic menhaden resource is a single unit stock (Dryfoos et al. 1973; Nicholson 1972 and 1978). Recent genetic studies also support the treatment of Atlantic menhaden as a single stock (Anderson 2007; Lynch 2008). Spawning occurs principally at sea with some activity in bays and sounds in the northern portion of its range (Judy and Lewis 1983). Eggs hatch at sea and the larvae are transported by ocean currents (Checkley et al. 1988; Nelson et al. 1977; Quinlan et al. 1999) to estuaries where they metamorphose and grow rapidly as juveniles (Edwards 2009). Adults stratify by size during the summer, with older, larger individuals migrating north to southern New England by May and the Gulf of Maine by June. During November and December, most of the adult population that migrated north of Chesapeake Bay moves south of the Virginia and North Carolina capes. Adults that remain in the south Atlantic region during spring and summer migrate south later in the year, reaching northern Florida by fall. Schools of adult menhaden reassemble in late March or early April and migrate northward. By June the population is redistributed from Florida to Maine.
1.2.1.2 Age and Growth Atlantic menhaden as old as age-8 were present in the spawning population during the 1950s and early 1960s, but fish older than age-6 have been uncommon since 1965. A few rare specimens of age 10 were landed in the 1950s and early 60s. In recent years, the majority of the landings are comprised of fish ages 1-3 (citation, maybe latest stock assessment report). Growth of Atlantic menhaden varies from year-to-year and occurs primarily during the warmer months (AMTC 2006). Growth of juveniles is density dependent (Ahrenholz et al. 1987); in other words, growth rates are accelerated during the first year when juvenile abundance is low and are reduced when juvenile abundance is high. Young-of-the-year menhaden range widely in size with lengths varying as a function of density, timing of larval ingress, temperature and chl-a availability (Ahrenholtz 1991; Houde 2011). Older (age-6) fish reach an average length of 330 mm FL and a weight of 630 g, although growth varies from year to year and is inversely density-dependent. Due to their greater migratory range (see Section 1.2.1.7), larger fish of a given age are captured farther north than smaller fish of the same age (Nicholson 1978; Reish et al. 1985). This fact complicates any attempt to estimate overall growth for the entire stock from size-at-age data compiled from any individual area along the coast.
1.2.1.3 Spawning and Reproduction Although some Atlantic menhaden become sexually mature during their second year (late age-1), most do not mature until their third year (late age-2; Higham and Nicholson 1964; Lewis et al. 1987). First-spawning age-3 fish have accounted for most of the stock's egg production since 1965 (Vaughan and Smith 1988). Atlantic menhaden mature at smaller sizes at the southern end of their range (180 mm FL in the south Atlantic versus 210 mm FL in the Chesapeake Bay and 230 mm farther north) because of latitudinal differences in size-at-age and the fact that larger fish of a given age are distributed farther north than smaller fish of the same cohort (Lewis et al. 1987). A majority of eggs are spawned over the continental shelf in winter in the coastal ocean off the Carolinas, inshore of the Gulf Stream (Ahrenholz 1991; Judy and Lewis 1983; Kendall and Reintjes 1975). However, evidence is accumulating that indicates a substantial fraction of
DRAFT AMENDMENT 2 FOR PUBLIC COMMENT
4
spawning occurs in fall months in the Mid-Atlantic Bight from New Jersey to Virginia (Warlen et al. 2002). Additionally, spring and summer spawning occurs within estuaries, in coastal embayments, and in near-shore coastal areas (i.e. Chesapeake Bay; Houde, UMCES, pers. comm.). There is evidence that spawning events may also occur in the South Atlantic Bight after strong winds and storms create conditions that promote upwelling and potentially high food production for larval menhaden (Checkley et al. 1999). Recently, there has been progress in relating measures of primary productivity to recruitment and growth of YOY menhaden. During the past two decades, there has been a positive correlation between recruitment and euphotic-zone chl-a and integrated annual primary production in the Chesapeake Bay (Houde and Harding 2009), suggesting that menhaden populations are controlled in part by bottom-up processes (i.e., quantity of food available). Furthermore, bioenergetics modeling indicates that much of the variability in YOY growth observed in the field can be explained by variability in chl-a levels and temperature (Annis et al. 2011). Spatially-explicit bioenergetics models have been used to estimate carrying capacity of menhaden in the Bay as well as the reduction of habitat volume and productivity from eutrophication and hypoxia (Brandt and Mason 2003; Luo et al. 2001). The recent validation of bioenergetics model estimates of growth potential using field data (Annis et al. 2011) indicates that these models have excellent potential to evaluate trophic interactions by menhaden with respect to water quality and plankton productivity on an ecosystem scale. Despite these findings, however, additional work has found no significant correlation between YOY menhaden abundance and chl-a for the entire four-decade period that included periods of both low and high menhaden recruitment events in Chesapeake Bay. The strong correlation between YOY menhaden abundance and chl-a in recent years (1989-2004) as noted above did not persist throughout the longer time series (1966-2006). On average, years with low freshwater flow and low turbidity supported higher abundances and recruitment of YOY menhaden (Love et al 2006; Lynch et al 2010). Other simple correlations between YOY menhaden abundance and environmental or hydrographic variables were not significant or were only marginally significant (e.g., negative correlations with total dissolved phosphorus and with abundances of zooplankton taxa favored by low salinities). These conflicting bodies of work further highlight the complexity that exists between nutrient cycling, climatic drivers, and understanding the life history traits of Atlantic menhaden.
1.2.1.4 Mortality The Atlantic menhaden population is subject to a high natural mortality rate. Natural mortality is also higher during the first two years of life than during subsequent years. Ahrenholz et al. (1987a) reported an annual instantaneous natural mortality rate (M) of 0.45 in the absence of fishing; this rate is equivalent to an annual reduction in population numbers of 36%. This rate is quite high compared to other pelagic marine species. Atlantic herring, for example, is characterized by an 18% annual natural mortality rate (Fogarty et al. 1989). Menhaden natural mortality is probably due primarily to predation given the fish are so abundant in coastal waters during the warmer months of the year. All large piscivorous sea mammals, birds, and fish are potential predators on Atlantic menhaden. Menhaden are preyed upon by species such as bluefish, striped bass, king mackerel, Spanish mackerel, pollock, cod, weakfish, silver hake, tunas, swordfish, bonito, tarpon, and a variety of sharks. See additional details in Ecolgoical Roles section below.
DRAFT AMENDMENT 2 FOR PUBLIC COMMENT
5
Coastal pollution, habitat degradation, and disease also threaten marine fish species like Atlantic menhaden which spend their first year of life in estuarine waters and the rest of their life in both ocean and estuarine waters. Fish kills, due principally to low dissolved oxygen conditions, disease, and parasites are additional and poorly understood sources of natural mortality (Burkholder et al. 1992; Blazer et al. 1999; Noga 2000; Law 2001; Glasgow et al. 2001; Vogelbein et al. 2001; Kiryu et al. 2002; Reimschussel et al. 2003; Burkholder et al. 2005). A variety of diseases are thought to affect menhaden survival (Stephens et al. 1980; Noga and Dykstra 1986; Noga et al. 1988; Levine et al. 1990a; Levine et al. 1990b; Dykstra and Kane 2000; Goshorn et al. 2004; Stine et al. 2005; Blazer et al. 2007). Atlantic menhaden found in estuaries may also be affected by large fluctuations in dissolved oxygen (Burnett 1997; Paerl et al. 1998). Menhaden are also known to induce fatal hypoxic events and reports of such school-induced hypoxia and resulting fish kills go back to the 1800’s (Oviatt et al. 1972; Smith 1999).
1.2.1.5 Ecological Roles In ecological terms, menhaden occupy a very important link in the coastal marine food chain, transferring planktonic material into animal biomass. As a result, menhaden influence the conversion and exchange of energy and organic matter within the coastal ecosystem throughout their range (Peters and Schaaf 1981; Lewis and Peters 1984; Peters and Lewis 1984).
1.2.1.6 As Forage Because menhaden are abundant in nearshore coastal and estuarine waters, they are an important forage fish for a variety of larger piscivorous fishes, birds, and marine mammals. Menhaden provides a critical link between primary production and larger piscivorous predators such as striped bass (Morone saxatilis), bluefish (Pomatomus saltatrix), weakfish (Cynoscion regalis), and piscivorous birds (Viverette et al. 2007). The important trophic role of menhaden is highlighted in the development of multispecies models (ASMFC’s coastwide MSVPA-X and the Chesapeake Bay EwE model).
1.2.1.7 Nutrient Dynamics Atlantic menhaden occupy two distinct types of feeding niches during their lifetime. Phytoplankton is the major food of juvenile and young adult menhaden. The role of zooplankton in the diet becomes more important in older menhaden as gill raker spacings on their filtering apparatus increase in size (Friedland et al. 1984, 2006). The relative importance of each food type varies with ontogeny, region, and in relation to local availability. The role of Atlantic menhaden in systems function and community dynamics has received much attention in recent years. Simulation models also indicated that Atlantic menhaden in Narragansett Bay and Chesapeake Bay potentially has substantial effects on zooplankton and phytoplankton populations, and on nutrient dynamics (Durbin and Durbin 1975, 1998; Gottlieb 1998), although more research is needed to confirm these possibilities. Spatially-explicit bioenergetics models have also been used to estimate carrying capacity of menhaden in the Bay as well as the reduction of habitat volume and productivity from eutrophication and hypoxia (Brandt and Mason 2003; Luo et al. 2001). The recent validation of bioenergetics model estimates of growth potential using field data (Annis et al. 2011) indicates that these models have excellent potential to evaluate trophic interactions by menhaden with respect to water quality and plankton productivity on an ecosystem scale. However, a recent study by Lynch et al. (2010) for
DRAFT AMENDMENT 2 FOR PUBLIC COMMENT
6
Chesapeake Bay suggests that the menhaden population probably plays little role in removing nitrogen from Chesapeake Bay waters, and may actually provide additional nitrogen to Bay phytoplankton. The study evaluated the influence of YOY and age-1+ menhaden in Chesapeake Bay on rates of phytoplankton (chl a) ingestion and total dissolved nitrogen (TDN) excretion, as measured experimentally across varying phytoplankton concentrations. Results suggest that YOY menhaden focus their grazing on patches of elevated phytoplankton abundance and/or supplement their diet with other sources (e.g. zooplankton and detritus) to maintain a positive nitrogen balance. Population-level estimates of net nitrogen removal imply that menhaden play a minimal role regarding water quality in Chesapeake Bay.
1.2.2 Stock Assessment Summary
Based on tagging studies (Dryfoos et al. 1973; Nicholson 1978), and genetic studies (Anderson 2007; Lynch 2008), the Atlantic menhaden fishery is believed to be a single stock or population of fish. Therefore it is assessed as a single coastwide stock. The Atlantic Menhaden Stock Assessment Subcommittee used commercial and recreational landings at age from Florida to Maine, a fishery dependent adult index developed from Potomac River Fisheries Commission (PRFC) pound net survey, and a juvenile index (JAI) developed from coastwide beach seine information. In addition, growth, weight, and maturity at age were developed using fishery dependent and independent information, while age and time variant natural mortality was estimated using a multi-species virtual population analysis (MSVPA-X) (NEFSC 2006a, 2006b). The Beaufort Assessment Model (BAM) was the model used to produce final assessment results. This is a statistical forward-projection model with separable selectivities using the Baranov catch equation (ASMFC, 2011).
1.2.2.1 Abundance and Structure Annual Atlantic menhaden population size (age 0 and older at the start of the fishing season) has ranged from approximately 8 to 85 billion fish since 1955 (Figure 4). Population size averaged 40.8 billion menhaden during 1955-1961 when landings were high (averaging 604,400 mt), while the average was 14.5 billion menhaden between 1962 and 1974 when landings were low (288,600 mt). From 1975 to 1992 population size averaged 36.6 billion menhaden, comparing favorably to population sizes between 1955 and 1961, but landings improved by only 15% to an average of 355,800 mt. The inability of the modern fishery to regain former high levels of landings (in weight) is due primarily to reduced mean weight-at-age which occurred during the 1970s, and was caused in part by changes in fishing patterns, both geographically and seasonally. As has been noted, the migratory behavior of Atlantic menhaden results in older and larger menhaden moving farther north during spring and summer. Part of the decline in landings is due to the shift of the center of the fishing activity southward and subsequent fishing on smaller fish at age. Part can also be explained by the inverse relationship noted between first year growth of Atlantic menhaden and year class strength (Reish et al. 1985; Ahrenholz et al. 1987a). These factors, however, do not account for the entire decline in mean weight-at-age. The remainder is attributable to unknown biological or environmental factors.
1.2.2.2 Fishing Mortality Total full fishing mortality rates (full F) were estimated within BAM (Figure 5). Highly variable fishing mortalities were noted throughout the entire time series, with a slight decline in fishing mortality from the mid-1960s to the early 1980s. Since the mid-1980s the fishing mortality rate
DRAFT AMENDMENT 2 FOR PUBLIC COMMENT
7
has been quite variable, ranging between some of the highest and lowest values in the entire time series. The estimates suggest a high degree of variability, but in general the reduction fishery has experienced declining fishing mortality rates since the mid-1960s, while the bait fishery has experienced increasing fishing mortality rates since the 1980s. However, reduction fishery fishing mortality rate has risen in the last two years of the assessment (2010-2011). Finally, F rates can vary substantially among age groups. Selectivity on age-1 is small, greater on age-2, almost fully selected at age-3, and generally fully selected at older ages.
1.2.2.3 Recruitment Age-0 recruits of Atlantic menhaden (Figure 6) were high during the late 1950s, especially the 1958 year-class. Recruitment was generally poor during the 1960s and high during the late 1970s and early 1980s. The late 1970 and early 1980s values are comparable to the late 1950s (with the exception of the extraordinary 1958 year-class). Generally low recruitment has occurred since the early 1990s. There is a hint of a potential long-term cycle from this historical pattern of recruitment, but not enough data are present to draw any conclusions regarding the underlying cause at this point. The most recent estimate for 2011 is quite low and likely to be modified in the future as more data from the cohort (age-1 in 2012, age-2 in 2013, etc.) are added to the analysis. The current estimate of recruits to age-0 in 2011 (4.03 billion) is the second lowest recruitment value for the entire time series.
1.2.2.4 Spawning Stock Biomass (Fecundity) Section 1.2.2.1 describes the current understanding of the stock abundance and age structure of Atlantic menhaden. Often reproductive capacity of a stock is modeled using female weight-at-age, primarily because of a lack of fecundity data. To the extent that egg production is not linearly related to female weight, indices of egg production (fecundity) are better measures of reproductive output of a stock of a given size and age structure. Additionally, fecundity better emphasizes the important contribution of older and larger individuals to population egg production. Thus in the most recent stock assessment update (ASMFC 2012), modeling increases in egg production with size is preferable to female biomass as a measure of reproductive ability of the stock. Population fecundity (SSB, number of maturing ova) is variable, but in general declined from high levels in the late 1960s, increased through the 1990s, then declined through 2011 (Figure 7). The largest values of population fecundity were present in 1955 and 1961, resulting from two very strong recruitment events in 1951 and 1958 as noted in earlier stock assessments (Ahrenholz et al. 1987b; Vaughan and Smith 1988; Vaughan et al. 2002b; ASMFC 2004). Throughout the time series, the age-3 fish produced most of the total estimated number of eggs spawned annually.
1.2.2.5 Maximum Spawning Potential During the 2010 Atlantic menhaden benchmark stock assessment, the Peer Review Panel noted that menhaden population abundance had declined steadily and recruitment had been low since the last peak observed in the early 1980s (ASMFC 2010). Therefore, the Panel recommended alternative reference points be considered that provide greater protection for spawning stock biomass (SSB) or population fecundity relative to the unfished level.
DRAFT AMENDMENT 2 FOR PUBLIC COMMENT
8
In November of 2011, the Atlantic menhaden management board approved Addendum V to Amendment 1 of the Atlantic menhaden fishery management plan (ASMFC 2011). This addendum set forth new biological reference points to be used in the menhaden fishery. In part based on the recommendation from the peer review panel, the board approved using maximum spawning potential (MSP) as an interim reference point for menhaden. The MSP approach identifies the fishing mortality rate necessary to maintain a given level of stock fecundity (number of mature eggs) relative to the potential maximum stock fecundity under unfished conditions. The management board chose two MSP values to use as the two interim biological reference points; an MSP of 15% as the threshold and an MSP of 30% for the target. As an example, a 15% MSP would equate to a fishing mortality rate threshold required to maintain approximately 15% of the spawning potential of an unfished stock. An unfished stock is equal to 100% MSP.
1.2.3 Present condition of the stock
Current stock status determination is based on the 2012 Atlantic Menhaden Stock Assessment Update report (ASMFC 2012). See http://www.asmfc.org/atlanticMenhaden.htm for the most recent stock assessment reports and stock status determination.
1.2.3.1 2012 Assessment Update Report Summary (ASMFC, 2012) The purpose of the 2012 assessment was to update the 2010 Atlantic menhaden benchmark with recent data from 2009-2011. No changes in structure or parameterization were made to the base model run. Additional sensitivity analyses and landings projections were conducted. Updated data included reduction, bait, and recreational landings, samples of annual size and age compositions from the landings, the coastwide juvenile abundance index (JAI), and the Potomac River Fisheries Commission (PRFC) pound net index. Also, a new matrix of age- and time-varying natural mortality estimates was obtained from the 2012 update of the MSVPA-X model. Abundance of menhaden has remained at similar levels as reported in the 2010 benchmark assessment. Total abundance in 2011 was estimated to be 7.84 billion fish. Generally low recruitment has occurred since the early 1990s. The most recent estimate for 2011 (4.03 billion) is the second lowest recruitment value for the entire time series, but is likely to be modified in the future as more data from the cohort are added to the analysis. Population fecundity (SSB, number of maturing ova) was variable across the time series, but has declined since the 1990s to a 2011 terminal year estimate of 13 trillion eggs. Fishing mortality estimates suggest a high degree of variability, but in general the reduction fishery has experienced declining fishing mortality rates since the mid-1960s, while the bait fishery has experienced increasing fishing mortality rates since the 1980s. Reduction fishing mortality rates have risen, though, in the last two years of the assessment (2010-2011). The estimate of full fishing mortality in 2011 was 4.5. The current overfishing definition is a fecundity-per-recruit threshold of F15%MSP. The current fecundity-based overfished definition is a threshold of SSBMED.T (half of SSBMED). Benchmarks were calculated using all years, 1955-2011. The ratio of Full F in the terminal year to the overfishing benchmark (F2011/F15%MSP) was greater than 1. The ratio of SSB in the terminal year
DRAFT AMENDMENT 2 FOR PUBLIC COMMENT
9
to the SSB benchmark (SSB2011/SSBthreshold was greater than 1. Therefore overfishing is occurring, but the stock is not overfished. However, the TC warns that there is a technical mismatch between the current overfishing and overfished reference points. The TC recommends that, given the Board has adopted a F15%MSP overfishing definition, a matching overfished definition of SSB15%MSP should be adopted as well. Retrospective pattern analysis suggested that this model is not robust to addition of new data. An underestimation of F and overestimation of SSB was evident during the 2010 benchmark stock assessment; however, these patterns became more worrisome during this update when a switch in direction of the pattern was observed such that F was overestimated and SSB was underestimated in recent years. It is unclear exactly what is causing this retrospective pattern, but it appears that some data sources have developed discordance since 2003. Overall, the retrospective pattern and a number of other issues cast considerable doubt on the accuracy of the estimates from this stock assessment update. The TC warns that additional data analysis and modeling work are necessary to resolve these model structure and performance issues. An expedited benchmark assessment during which the TC can more fully examine many of the issues raised above is warranted. Although the Technical Committee could not come to consensus on the utility of the terminal year point estimates of F and SSB for management advice, there was consensus that the status determinations were likely robust. In other words, the ratio of F2011/F15%MSP is likely greater than 1.0 (overfishing is occurring), and SSB2011/ SSBMED.T is likely greater than 1.0 (the stock is not overfished), but the exact magnitude of these ratios could not be determined.
1.2.4 Peer Review Panel Results
A Review Workshop of the 2010 Atlantic Menhaden Benchmark Assessment Report was held March 8 – 12, 2010 in Charleston, South Carolina. The Review Workshop provided a comprehensive and in-depth evaluation of this assessment. The following are the Panel’s summary findings: The Panel was comfortable with the results from the menhaden base run. They stated that the model results and the status determination were robust. The Panel was concerned that the 2008 F estimate was very close to the threshold. Following the Peer review, a coding error was found in the model, which was subsequently corrected, and the determination upon that correction was that overfishing was occurring. The Panel also voiced concern about the use of Fmed and the fecundity associated with it as reference points. As stated previously in this document, their concern was that there was no information on the relationship of the target and threshold fecundity in relation to virgin fecundity levels. Projections were run to examine this, and they found that estimated annual fecundity since 1998 was only 5 to 10% of the virgin fecundity. The Panel recommended that model specifications similar to the Panel’s reference run be considered for future assessments, including capped effective sample size at 200, allowing the gaps in the pound net index and bait fishery age composition where data were not available,
DRAFT AMENDMENT 2 FOR PUBLIC COMMENT
10
modification of the reduction and bait fleets to northern and southern fleets, and time-varying domed selectivity for the southern region. Many of these recommendations were considered during the development of both Addendum V to the Atlantic Menhaden Fishery Management Plan as well as during the development of the 2012 update stock assessment. 1.3 DESCRIPTION OF THE FISHERY 1.3.1 Commercial Fishery
Atlantic menhaden have supported one of the United States' largest fisheries since colonial times. Menhaden have repeatedly been listed as one the nation's most important commercial fisheries species in terms of quantity. Preliminary Atlantic menhaden landings in 2011 totaled 228,800 mt (504 million lb). Landings records indicate that 24 million mt (52.9 billion lb.) of Atlantic menhaden have been caught by fishing fleets operating from Maine to Florida since 1940. Native Americans were the first to use menhaden, primarily for fertilizer. Colonists soon recognized the value of whole menhaden for fertilizer, and local seine fisheries gradually developed from New York to Maine. The menhaden oil industry began in Rhode Island in 1811 (Frye 1999). Numerous small factories were located along the coasts of the northeastern states. However, their supply was limited to fish that could be captured by the traditional shore-based seines. In 1845, the purse seine was introduced, and an adequate supply of raw material was no longer a problem. By 1870, the industry had expanded southward, with several plants in the Chesapeake Bay and North Carolina areas (Whitehurst 1973). The industry gradually developed during the late 1800s and early 1900s and was described in considerable detail prior to World War I by Greer (1915). The primary use of menhaden changed from fertilizer to animal feed during the period following World War I, through a process known as fish reduction. Menhaden meal was mixed into poultry, swine, and cattle feeds as the amount used for fertilizer was decreasing (Harrison 1931). The current commercial fishery is divided into the reduction fishery and the bait fishery (menhaden harvested to supply bait to other commercial and recreational fisheries).
1.3.1.1 Reduction Fishery Vessels and Domestic Harvesting Capacity The early menhaden purse seine reduction fishery utilized sailing vessels, while coal-fired steamers were introduced after the Civil War. In the 1930s, diesel-powered vessels began to replace the steamers, although a few sailing vessels were still in use. The refrigeration of vessel holds in the 1960s and 1970s was crucial for the industry to maintain its viability. Despite restricted access to a number of traditional grounds, a reduced fleet size and fewer processing plants to land fish, refrigerated holds enabled the fleet to maximize the harvest during peak resource availability. Refrigeration also allowed the fleet to range over a larger area and stay out longer, greatly improving the ability to catch fish when and where they are available. All ten vessels in the menhaden fleet in 2011 utilized refrigerated fish holds, compared to only 60% of the fleet in 1980. A more detailed description of historical fishing vessels and methods is available in Amendment 1 (ASMFC 2001). Currently, commercial reduction menhaden purse seine fishing operations use spotter aircraft to
DRAFT AMENDMENT 2 FOR PUBLIC COMMENT
11
locate schools of menhaden and direct vessels to the fish. When a school is located, two purse boats approximately 39 ft (13 m) in length with a net stretched between them are deployed. The purse boats encircle the school and close the net to form a purse or bag. The typical purse-seine net used for reduction has a bar mesh of 7/8 in (2.2 cm) and net lengths up to 1,800 ft and the depth from about 65 ft (20 m) to 90 ft (27 m). Catch from individual sets can vary from 10 to more than 100 mt, and large vessels can carry 400-600 mt of refrigerated fish. Historically, the total number of vessels fishing for menhaden was generally related to the availability of the resource. Greer (1915) reported 147 vessels in 1912. During 1955-1959, about 115-130 vessels fished during the summer season, while 30-60 participated in the North Carolina fall fishery. As the resource declined during the 1960s, fleet size decreased more than 50%. Through the 1970s, approximately 40 vessels fished during the summer season, while nearly 20 were active in the fall fishery. During 1980-1990, 16-33 vessels fished the summer season, and the level of effort in the fall fishery ranged from 3 to 25 vessels. The reduction fleet during the 1990 season was composed of 22 vessels each using two purse boats. An additional 3-4 large vessels from Virginia and/or the Gulf of Mexico fished in the south Atlantic during the fall fishery. A major change in the reduction industry took place following the 1997 fishing season, when the two reduction plants operating in Reedville, VA, consolidated into a single company and a single factory; this significantly reduced effort and overall production capacity. Seven of the 20 vessels operating out of Reedville, VA, were removed from the fleet prior to the 1998 fishing year and 3 more vessels were removed prior to the 2000 fishing year, reducing the Virginia fleet to generally 10 vessels from 2000 through 2011. Another major event within the industry occurred in spring of 2005 when the fish factory at Beaufort, NC, closed and the owners sold the property to coastal developers. Over the years, vessels participating in the Atlantic menhaden purse seine reduction fishery have varied considerably in size, fishing methods, gear type, and intensity of effort. During peak landing years (1953-1962), mean vessel capacity was about 678,000 standard fish, representing a total fleet capacity of approximately 76,000,000 standard fish (Nicholson 1971). The fleet landed daily catches at 20 menhaden reduction plants from New York to Florida. In comparison, the 1990 fleet of 33 vessels, which operated within a more restrictive and regulated environment, landed their catch at five plants, including a foreign processing vessel. In 2011, 10 reduction purse seine vessels ranging from about 166 ft (51 m) to 200 ft (61 m) in length (the majority were less than 170 ft long) landed at a single plant in Reedville,Virginia. Reduction landings averaged 322,700 mt from 1940-2011, but only averaged 164,400 mt from 2002 – 2011 (Table 7; Figure 1). Reduction landings since 1940 peaked in 1956 at 712,100 mt, with the lowest value since 1940 (141,100 mt) occurring in 2008. Reduction landings in recent years have been the lowest of the time series. This decline is most likely influenced by several factors including population size, reduced fleet size and reduced reduction plant capacity. Since preparation of the 1981 Atlantic Menhaden FMP, there have been numerous regulatory changes affecting the menhaden fishery, such as season limits, area closures, a Chesapeake Bay annual landings cap and changes in license fees. In some state waters, a prohibition on commercial menhaden fishing operations using purse seines has been implemented.
DRAFT AMENDMENT 2 FOR PUBLIC COMMENT
12
Processing Activities and Products Menhaden reduction plants, through a process of heating, separating, and drying, produce fish meal, fish oil, and fish solubles from fresh menhaden. Meal is a valuable ingredient in poultry and livestock feeds because of its high protein content (at least 60%). Menhaden oil is (or has been) used in cooking oils, margarine, dietary supplements, soap, linoleum, waterproof fabrics, and certain types of paint. Solubles are the aqueous liquid component remaining after oil removal. In general, most meal producers add the soluble component to the meal to create a product termed "full meal." The use of solubles as an export product is limited because most companies in the feed industry are not equipped with the necessary storage tanks, pumps, and meters to handle a liquid product. Section 306 of the Magnuson-Stevens Fishery Conservation and Management Act (PL 94-265) allows foreign fish processing vessels to operate within the internal waters of a state with the permission of the Governor of that state. Up to three IWP ventures operated within Maine's coastal waters during 1988-93. Under state jurisdiction, a foreign vessel was permitted to process menhaden caught by US vessels into fish meal and oil during the 1988-93 fishing seasons. In 1987, two New England-based menhaden vessels began to fish the Gulf of Maine area, landing the catch at a Canadian processing plant. Another Canadian factory in Nova Scotia processed menhaden in 1992 and 1993. No menhaden have been processed in the North Atlantic since the summer of 1993.
1.3.1.2 Bait Fishery Harvest comes from directed fisheries, primarily purse seines, pound nets, cast nets and gill nets, and bycatch in various food-fish fisheries, such as pound nets, haul seines, and trawls. Menhaden are taken for bait in almost all Atlantic coast states and are used for bait in crab pots, lobster pots, and hook and line fisheries (both sport and commercial). Information on the harvest and use of menhaden for bait is difficult to obtain because of the nature of the bait fisheries and data collection systems. (Table 8; Figure 1). The New England region accounted for a high proportion of bait landings in the late 1980s and early 1990s (Figure 2). The Chesapeake Bay region has generally been the largest harvester of menhaden bait since the 1993, with the Mid-Atlantic only exceeding the Chesapeake Bay harvest in 1994, 1997, 2010 and 2011. Reported bait landings averaged 11% of the total Atlantic menhaden landings from 1985-99 and 19% of total landings from 2000 to 2011. The increase in percent of coastal landings are attributed to better data collection in the bait fishery and a decline in coastal reduction landings due to reductions in the number of processing plants and fleet size. Closure of reduction plants in New England and the mid-Atlantic may have influenced growth in the bait fishery, making more product available for the lobster and crab pot fisheries, as well as bait and chum for sport fishermen. Additionally, the passage of a net ban in Florida in November 1994 reduced the availability of bait and chum in that state, which opened up new markets for menhaden bait caught in Virginia and the mid-Atlantic states. The appearance of growth in the Atlantic coast bait fishery (Figure 1) must be tempered by the knowledge that reporting systems for bait landings, particularly for Atlantic menhaden, have historically been incomplete at best. Despite problems associated with estimating menhaden bait landings, data collection has improved in many areas. Some states license directed bait fisheries and require detailed landings records. In most cases, recent landings estimates are more accurate, but for some states, bait landings may continue to be underestimated (Table 9). There are some well-documented, large-scale, directed bait fisheries for menhaden using gears such as purse seines, pound nets, and gill nets. There are
DRAFT AMENDMENT 2 FOR PUBLIC COMMENT
13
also many smaller-scale directed bait fisheries and bycatch fisheries supplying large quantities of bait which historically had few, if any reporting requirements. Most states implemented reporting requirements for the smaller scale fisheries by the late 2000’s. Menhaden taken as bycatch in other commercial fisheries is often reported as "bait" together with other fish species. The "over-the-side" sale of menhaden for bait among commercial fishermen is likely under-reported (and may go unreported (Table 12).
The principal use for menhaden as bait in North Carolina is in the blue crab pot fishery. Very small operators use cast nets in the late afternoon or early morning during the summer months. In addition to harvesting bait for crab fishing, one type of operation keeps the fish alive in holding tanks for “slow trolling” for king mackerel, or bottom fishing for cobia. Nearshore head and charter boats also purchase menhaden. South Carolina and Georgia have no directed menhaden fisheries, shrimp trawl bycatch and cast netting supply menhaden to crab potters and sport fishermen in those states. Florida's east coast had substantial menhaden landings for bait from gill nets and purse seines prior to the implementation of a net ban in 1994. Bait landings of menhaden in Virginia are dominated by purse seine vessels referred to as ‘snapper rigs’; most have only one purse boat. From 2009 to 2011 four ‘snapper rig’ vessels have operated from Northern Neck, VA, near Reedville. These vessels range from about 80 to 135 ft long. On average vessels in the reduction fleet make about 5 sets per fishing day (Smith 1999), whereas snapper rig vessels make three to four purse-seine sets per day (Smith and O’Bier 2011). ‘Snapper rig’ nets traditionally were somewhat smaller than the nets employed by reduction vessels, but have been approaching the size of reduction nets in recent years. The catches of the snapper rigs are mostly sold for bait (sport fishery, crab pots, etc.) with minor quantities being used for reduction. Bait landings of menhaden in Maryland and the Potomac River are dominated by pound net catches. Pound nets are a large fixed gear, with most fishermen having one to five nets set at any given time. The pound net fishery in the Chesapeake Bay region is prosecuted by numerous small non-refrigerated vessels. Maximum hold capacity of pound net vessels is 9 mt or less, but daily catches are usually well below vessel capacity and are limited by the number of fish encountering the fixed gear. The majority of these fish supply the local blue crab pot fishery. In recent years there has been an expansion of the purse seine bait fishery in New Jersey. The New Jersey fishery utilizes about 20 carry vessels and about 15 catch vessels per year. Most operations have a catch vessel paired with a specific carry vessel, but some vessels are both catch and carry. Carry vessel length ranges from 59 to 90 feet, though most are in the 70-85 foot range, and catch vessel length ranges from 40 to 88 feet, but most are 40-50 feet. Net length is restricted to 150 fathoms (900 feet) by regulation. Pound nets and gill nets contribute to bait landings in New York and New Jersey. Delaware closely regulates its directed gill net fishery, obtaining detailed catch/effort data each year. In the New England region, purse seine landings in Maine, Massachusetts and Rhode Island account for the majority of the recorded bait landings. The New England operators are fairly small, typically with one harvest vessel, with the size ranging from the mid-30s to 90 feet in length. Smaller operators also have a “carry” boat to take the catch to shore. In past years, an
DRAFT AMENDMENT 2 FOR PUBLIC COMMENT
14
ocean trap net fishery operated in Rhode Island and Massachusetts. In New Hampshire and Connecticut, smaller directed gill net fisheries are well-regulated and monitored. The bulk of menhaden landings for bait in New England are used in the lobster fishery. Schools of large menhaden have been scarce in the New England region since the early 1990s.
1.3.2 Recreational Fishery
Menhaden are important bait in many recreational fisheries; some recreational fishermen employ cast nets to capture menhaden or snag them with hook and line for use as bait, both dead and live. Recreational harvest is not well captured by the Marine Recreational Information Program (MRIP) because there is not a known identified direct harvest for menhaden, other than for bait. MRIP intercepts typically capture the landed fish from recreational trips as fishermen come to the dock or on the beach. Since menhaden caught by recreational fishermen are used as bait during their trip, they will not be a part of the catch that is typically seen by the surveyor completing the intercept. The recreational catch has varied over time with a high of 672.3 mt in 1992 and a low of 12.2 metric tons in 2000. The average harvest since 1981 is 176.5 mt. Landings have averaged 300 mt over the last 5 years (Figure 3).
1.3.3 Subsistence Fishing
No subsistence fisheries for Atlantic menhaden have been identified at this time.
1.3.4 Non-Consumptive Factors
Outside of providing a forage base for various predators and the ecological role which menhaden serve (see Sections 1.2.1.10; 1.2.1.11; 2.7), other non-consumptive factors have not been identified at this time.
1.3.5 Interactions with Other Fisheries, Species, or Users
Incidental bycatch of other finfish species in menhaden purse seines has been a topic of interest and concern for many years to the commercial and recreational fishing industry, as well as the scientific community (Smith 1896; Christmas et al. 1960; Oviatt 1977). Numerous past studies have shown that there is little or no bycatch in the menhaden purse seine fishery. Some states restrict bycatch to 1% or less of the total catch on a vessel by regulation. The Virginia Institute of Marine Science studied bycatch levels of finfish, turtles, and marine mammals in the Atlantic menhaden fishery. Results from that study indicated that bycatch in the 1992 Atlantic menhaden reduction fishery was minimal, comprising about 0.04% by number (Austin et al. 1994). The maximum percentage bycatch occurred in August (0.14%) and was lowest in September (0.002%). Among important recreational species, bluefish accounted for the largest bycatch, 1,206 fish (0.0075% of the total menhaden catch). No marine mammals, sea turtles, or other protected species were killed, captured, entangled or observed during sampling. Additional data are available from the Gulf of Maine IWP fishery in 1991. Every catch unloaded onto the processing vessel was inspected by a state observer. A total of 93 fish were taken as bycatch along with about 60,000,000 individual menhaden (D. Stevenson, Maine DMR, pers. comm.; as cited in ASMFC 1992).
DRAFT AMENDMENT 2 FOR PUBLIC COMMENT
15
1.4 HABITAT CONSIDERATIONS
1.4.1 Physical Description of Habitat
Atlantic menhaden occupy a wide variety of habitats during their life history. Adult Atlantic menhaden spawn primarily offshore in continental shelf waters. Larvae enter estuaries and transform into juveniles, utilizing coastal estuaries as nursery areas before migrating to ocean waters in the fall. They make extensive north-south migrations in the near-shore ocean.
1.4.1.1 Gulf of Maine The Gulf of Maine is a semi-enclosed sea of 36,300 mi2 (90,700 km2) bordered on the east, north and west by the coasts of Nova Scotia, New Brunswick, and the New England states. To the south, the Gulf is open to the North Atlantic Ocean. Below about 165 ft (50 m) depth, however, Georges Bank forms a southern boundary for the Gulf. The interior of the Gulf of Maine is characterized by five major deep basins (>600 ft, 200 m) which are separated by irregular topography that includes shallow ridges, banks, and ledges. Water flows in and out of the Bay of Fundy around Grand Manan Island. Major tributary rivers are the St. John in New Brunswick; St. Croix, Penobscot, Kennebec, Androscoggin, and Saco in Maine; and Merrimack in Massachusetts. The predominantly rocky coast north of Portland, Maine is characterized by steep terrain and bathymetry, with numerous islands, embayments, pocket beaches, and relatively small estuaries. Tidal marshes and mud flats occur along the margins of these estuaries. Farther south, the coastline is more uniform with few sizable bays, inlets, or islands, but with many small coves. Extensive tidal marshes, mud flats, and sandy beaches along this portion of the coast are gently sloped. Marshes exist along the open coast and within the coves and estuaries. The surface circulation of the Gulf of Maine is generally counterclockwise, with an offshore flow at Cape Cod which joins the clockwise gyre on the northern edge of Georges Bank. The counterclockwise gyre in the Gulf is more pronounced in the spring when river runoff adds to the southwesterly flowing coastal current. Surface currents reach velocities of 1.5 knots (80 cm sec) in eastern Maine and the Bay of Fundy region under the influence of extreme tides, up to 30 ft (9 m) and gradually diminish to 0.2 knots (10-20 cm/sec) in Massachusetts Bay where tidal amplitude is about 10 ft (3 m). There is great seasonal variation in sea surface temperature in the Gulf, ranging from 4°C in March throughout the Gulf to 18°C in the western Gulf and 14°C in the eastern Gulf in August. The salinity of the surface layer also varies seasonally, with minimum values in the west occurring during summer, from the accumulated spring river runoff, and during winter in the east under the influence of runoff from the St. Lawrence River (from the previous spring). With the seasonal temperature and salinity changes, the density stratification in the upper water column also exhibits a seasonal cycle. From well mixed, vertically uniform conditions in winter, stratification develops through the spring and reaches a maximum in the summer. Stratification is more pronounced in the southwestern portion of the Gulf where tidal mixing is diminished.
1.4.1.2 Middle Atlantic Region (Cape Cod, MA to Cape Hatteras, NC) The coastal zone of the middle Atlantic states varies from a glaciated coastline in southern New England to the flat and swampy coastal plain of North Carolina. Along the coastal plain, the
DRAFT AMENDMENT 2 FOR PUBLIC COMMENT
16
beaches of the barrier islands are wide, gently sloped, and sandy, with gradually deepening offshore waters. The area is characterized by a series of sounds, broad estuaries, large river basins (e.g., Connecticut, Hudson, Delaware, and Susquehanna), and barrier islands. Conspicuous estuarine features are Narragansett Bay (Rhode Island), Long Island Sound and Hudson River (New York), Delaware Bay (New Jersey and Delaware), Chesapeake Bay (Maryland and Virginia), and the nearly continuous band of estuaries behind barrier islands along southern Long Island, New Jersey, Delaware, Maryland, Virginia, and North Carolina. The complex estuary of Currituck, Albemarle, and Pamlico Sounds behind the Outer Banks of North Carolina (covering an area of 2,500 square miles) is an important feature of the region. Coastal marshes border small estuaries in Narragansett Bay and much of the glaciated coast from Cape Cod to Long Island Sound. Nearly continuous marshes occur along the shores of the estuaries behind the barrier islands and around Delaware Bay. At Cape Hatteras, the Continental Shelf extends seaward approximately 20 mi (33 km), and widens gradually northward to about 68 mi (113 km) off New Jersey and Rhode Island where it is intersected by numerous underwater canyons. Surface circulation north of Cape Hatteras is generally southwesterly during all seasons, although this may be interrupted by coastal indrafting and some reversal of flow at the northern and southern extremities of the area. Speeds of the drift north of Cape Hatteras are on the order of six miles (9.7 km) per day. There may be a shoreward component to this drift during the warm half of the year and an offshore component during the cold half. The western edge of the Gulf Stream meanders in and out off Cape Hatteras, sometimes coming within 12 mi (20 km) of the shore, but it becomes less discrete and veers to the northeast north of the Cape. Surface currents as high as 4 knots (200 cm/sec) have been measured in the Gulf Stream off Cape Hatteras. Hydrographic conditions in the mid-Atlantic region vary seasonally due to river runoff and warming in spring and cooling in winter. The water column becomes increasingly stratified in the summer and homogeneous in the winter due to fall-winter cooling of surface waters. In winter, the mean range of sea surface temperatures is 0-7°C off Cape Cod and 1-14°C off Cape Charles (at the southern end of the Delmarva Peninsula); in summer, the mean range is 15-21°C off Cape Cod and 20-27°C off Cape Charles. The tidal range averages slightly over 3 ft (1 m) on Cape Cod, decreasing to the west. Within Long Island Sound and along the south shore of Long Island, tide ranges gradually increase, reaching 6 ft (2 m) at the head of the Sound and in the New York Bight. South of the Bight, tide ranges decrease gradually to slightly over 3 ft (1 m) at Cape Hatteras. Prevailing southwest winds during the summer along the Outer Banks often lead to nearshore upwelling of colder bottom water from offshore, so that surface water temperatures can vary widely during that period (15-27°C over a period of a few days). The waters of the coastal middle Atlantic region have a complex and seasonally dependent circulation pattern. Seasonally varying winds and irregularities in the coastline result in the formation of a complex system of local eddies and gyres. Surface currents tend to be strongest during the peak river discharge period in late spring and during periods of highest winds in the winter. In late summer, when winds are light and estuarine discharge is minimal, currents tend to be sluggish, and the water column is generally stratified.
DRAFT AMENDMENT 2 FOR PUBLIC COMMENT
17
1.4.1.3 South Atlantic Region The south Atlantic coastal zone extends in a large oceanic bight from Cape Hatteras south to Biscayne Bay and the Florida Keys. North of Florida it is bordered by a coastal plain that stretches inland for a hundred miles and a broad continental shelf that reaches into the ocean for nearly an equal distance. This broad shelf tapers down to a very narrow and precipitous shelf off the southeastern coast of Florida. The irregular coastline of North Carolina, South Carolina, Georgia, and eastern Florida is generally endowed with extensive bays and estuarine waters, bordered by nutrient-rich marshlands. Barrier beaches and dunes protect much of the shoreline. Along much of the southern coast from central South Carolina to northern Florida estuarine salt-marsh is prominent. Most of the east coast of Florida varies little in general form. Sand beaches with dunes are sporadically interrupted by mangrove swamps and low banks of earth and rock. The movements of oceanic waters along the South Atlantic coast have not been well defined. The surface currents, countercurrents, and eddies are all affected by environmental factors, particularly by winds. The Gulf Stream flows along the coast at 6-7 miles per hour (10-11 km/hr). It is nearest the coast off southern Florida and gradually moves away from the coast as it flows northward. A gyral current that flows southward inshore of the Gulf Stream exists for most of the year north of Cape Canaveral. Sea surface temperatures during the winter increase southward from Cape Hatteras to Fort Lauderdale, Florida, with mean minimums ranging from 2-20ΕC and maximums ranging from 17-26°C. In the summer, the increases are more gradual, ranging north to south from minimums of 21-27°C to maximums of 28-30°C. Mean sea-surface salinity is generally in the range of 34 to 36 ppt year round. Mean tidal range is just over 3 ft (1 m) at Cape Hatteras and increases gradually to about 6-7 ft (2 m) along the Georgia coast. Tides decrease south of Cape Canaveral to 3 ft (1 m) at Fort Lauderdale.
1.4.2 Habitat Quality
Of primary importance is the fact that Atlantic menhaden are estuarine-dependent. Following oceanic spawning, menhaden larvae are transported into the coastal estuaries where they transform into juveniles. They utilize the estuary from low salinity headwaters to high salinity areas near inlets as nursery areas for most of their first year.
1.4.3 Environmental Requirements of Atlantic Menhaden
1.4.3.1 Temperature, Salinity and Dissolved Oxygen (see Amendment 1) 1.4.3.2 Primary Production
Abundance of YOY juvenile menhaden is strongly and positively correlated with chl-a and primary production in Chesapeake Bay, at least during the most recent two decades (Houde and Harding 2009). Furthermore, the relationship between chl-a and abundance of YOY recruits is principally generated in spring months during the period larvae are transitioning to the filter-feeding juvenile stage when menhaden become dependent on phytoplankton for food. Although recent research indicates that age-1 and older menhaden may derive most energy from zooplankton food (Lynch et al. 2010; Friedland et al. 2011), it is apparent that YOY menhaden can efficiently filter small phytoplankton (Friedland et al. 2006) and that it is their primary food. The timing, intensity, quality, and spatial variability of the spring phytoplankton bloom in
DRAFT AMENDMENT 2 FOR PUBLIC COMMENT
18
Chesapeake Bay show high interannual variability and are strongly affected by climate (Adolf et al. 2006; Miller and Harding 2007). This variability in primary production is probably a key factor controlling production potential of young menhaden in Chesapeake Bay.
1.4.3.3 Environmental Factors and Recruitment Success Relationships between recruitment success of YOY menhaden and factors other than variables associated with primary productivity were less clear. Numerous fish and avian predators are major consumers of young menhaden in Chesapeake Bay but there are no estimates of predation rates or of variability in natural mortality rates of YOY menhaden. Bioenergetics and predation models indicate potential for predators to control abundances of YOY menhaden in Chesapeake Bay (Annis et al. 2011). There is evidence that temperature experienced by YOY menhaden positively affects seasonal and inter-annual variability in growth within the Bay (Houde and Harding 2009) and is an important parameter in bioenergetics models that predict growth potential (Annis et al. 2011). Recent observations suggested that flow-related variables were important, but acted indirectly and in complex ways to exercise control over recruitment levels. Regional analyses of synoptic climatology supported the observation that menhaden recruitment, in general, is elevated in years of low late-winter precipitation and freshwater flow, when relatively warm and dry weather conditions, often described as “Bermuda High” patterns, prevail (Wood et al. 2004; Kimmel et al. 2009; Wood and Austin 2009).
1.4.3.4 Sediments and Turbidity Historically, forest clearing has led to changes in sediment loading (Brush 1986). Regionally in Chesapeake Bay, before 1700, the mean rate of deposition was 0.05cm/yr, but increased to 0.60 cm/yr after 1750 (Hilgartner and Brush, 2006). Without the buffer provided by trees, shrubs, plants, and wetlands that previously bordered tributaries and the Bay, storm water was unchecked. This resulted in erosion that brought increased sediment into the estuary. Moreover, the dramatic increase in impermeable surfaces has also increased runoff. Impervious surfaces amplify storm water discharges into streams that feed the Bay (Goetz and Jantz 2006). One consequence of these changes is that sediment grain size has changed over time so that very fine sediment predominates now that reduces light penetration. Secchi disk readings have steadily declined since 1985 from just over 2 meters to about 1 meter in 2008 (Greer 2008). Because juvenile menhaden while filter feeding can retain particles as small as 5-7 μm, and to a minor extent particles <5 μm, there is a possibility that menhaden feeding could be compromised (Friedland et al. 1984). Increased turbidity acts to shade submerged aquatic vegetation (SAV), thus decreasing the extent and composition of SAV beds. Loss of SAV may indirectly affect menhaden by increasing turbidity as a result of increased sediment resuspension (Orth et al., 2006) which in turn can lower phytoplankton productivity. SAV has also been shown to exercise control over ecosystem function through nutrient recycling and linkage to fish productivity (Orth et al., 2006; Hughes et al., 2009), which may impact menhaden abundance, although specific impacts in Chesapeake Bay are not known at present.
DRAFT AMENDMENT 2 FOR PUBLIC COMMENT
19
1.4.3.5 Water Movement Currents and circulation features play an important role in cueing reproduction and in controlling dispersal of larval stages, assuring that some larvae are transported to the coastal estuaries and embayments that serve as juvenile nurseries. Most larval menhaden are found shoreward of the Gulf Stream Front (GSF); those sampled in the GSF or seaward of it presumably are rapidly advected northeast and lost to the population, although it is possible that warm-core rings and onshore streamers could return some larvae to the shelf (Hare and Govoni 2005). There is ample evidence, based on observations and models, that coastward transport of larvae is supported by favorable winds and currents on the shelf (e.g., Checkley et al. 1988; Werner et al., 1999). Models and observations of advective mechanisms at estuary mouths present a less-clear picture of how menhaden larvae move into estuaries, although it is apparent that winds, tides, and larval behavior control the ingress. Interannual variability in recruitments is believed to be at least partly controlled by variability in oceanographic conditions that affect hydrography, circulation, and possibly biological productivity. Weather and climate patterns are probable drivers of such variability. Wood et al. (2004) demonstrated that prevalence of a late-winter climate pattern designated a “Bermuda-Azores High” that brings dry and warm late-winter weather to the Mid-Atlantic region is associated with high recruitment of Atlantic menhaden. This weather pattern may promote favorable shoreward transport or feeding conditions for early-stage menhaden larvae while on the continental shelf. The remarkable temperature tolerance of larval menhaden is notable in distribution statistics. Larvae have been collected at temperatures from 0 to 25 °C. The low-temperature observations are for late-stage menhaden larvae (usually >20 mm length), in winter that have been advected to the mouths of mid-Atlantic estuaries (e.g., Kendall and Reintjes 1975). The mechanics and details of larval ingress to estuaries are poorly known, despite numerous studies to describe and explain it. Larval ingress may occur in pulses, supported by windgenerated high-inflow events (Forward et al. 1999b). Wind forcing may play an important role, in combination with entrainment in up-estuary residual flow (Hare et al 2005).
1.4.3.6 Environmental Contaminants In a study of chlorinated hydrocarbon residues in menhaden fishery products from the Atlantic and Gulf of Mexico, Stout et al. (1981) showed that overall levels have decreased since the late 1960s, although significant differences between years for levels of polychlorinated biphenyls (PCB’s) in the South Atlantic region and for dieldrin in the Mid-Atlantic region could not be demonstrated. There was also a general lack of significant differences between areas within years, although this may have been due to the sampling regime. They speculated that PCB levels have remained somewhat high because of leakage from sources established prior to regulation and continued allowance of limited specialty uses. Menhaden oil products carry the highest concentrations of such non-polar compounds and some samples contained levels in excess of USFDA temporary tolerances as of 1977. Warlen et al. (1977) demonstrated that C14 - DDT uptake by Atlantic menhaden is dose-dependent, with an assimilation value between 17 and 27%. Application of their model to field data suggested that uptake was by way of plankton and

DRAFT AMENDMENT 2 FOR PUBLIC COMMENT
20
detritus. Little information exists about the toxicity of contaminants to Atlantic menhaden (Rogers and Van Den Avyle 1989).
1.4.3.7 Substrate and System Features The association of Atlantic menhaden with estuarine and nearshore systems during all phases of its life cycle is well documented. It is evident that young menhaden require these food rich waters to survive and grow, and the fishery is concentrated near major estuarine systems. Filling of estuarine wetlands, in addition to exacerbating extremes in environmental conditions, has physically limited the nursery habitat available to Atlantic menhaden and other estuarine-dependent species. The relative importance, however, of different habitat types (i.e. sounds, channels, marshes) and salinity regimes has received little detailed attention (Rogers and Van Den Avyle 1989).
1.4.4 Identification and Distribution of Essential Habitat
Almost all of the estuarine and nearshore waters along the Atlantic coast from Florida to Nova Scotia, serve as important habitat for juvenile and/or adult Atlantic menhaden. Spawning occurs in oceanic waters along the Continental Shelf, as well as in sounds and bays in the northern extent of their range (Judy and Lewis 1983). Larvae are carried by inshore currents into estuaries from May to October in the New England area, from October to June in the mid-Atlantic area, and from December to May in the south Atlantic area (Reintjes and Pacheco 1966). After entering the estuary, larvae congregate in large concentrations near the upstream limits of the tidal zone, where they undergo metamorphosis into juveniles (June and Chamberlin 1959, Houde 2011). The relative densities of juvenile menhaden have been shown to be positively correlated with higher chlorophyll a levels in the lower salinity zones of estuaries (Friedland et al. 1996, Houde and Harding 2009). As juvenile menhaden grow and develop, they form dense schools and range throughout the lower salinity portions of the estuary, most eventually migrating to the ocean in late fall-winter. Many factors in the estuarine environment affect the behavior and well-being of menhaden. The combined influence of weather, tides, and river flow can expose estuarine fish to rapid changes in temperature and salinity. It has been reported that salinity affects menhaden temperature tolerance, activity and metabolic levels, and growth (Lewis 1966; Hettler 1976). Factors such as waves, currents, turbidity, and dissolved oxygen levels can impact the suitability of the habitat, as well as the distribution of fish and their feeding behavior (Reintjes and Pacheco 1966). However, the most important factors affecting natural mortality in Atlantic menhaden are considered to be predators, parasites and fluctuating environmental conditions (Reish et al. 1985). It is clearly evident that estuarine and coastal areas along the Atlantic coast provide essential habitat for most life stages of Atlantic menhaden. However, an increasing number of people live near the coast, which precipitates associated industrial and municipal expansion, thus, accelerating competition for use of the same habitats. Consequently, estuarine and coastal habitats have been significantly reduced and continue to be stressed adversely by dredging, filling, coastal construction, energy plant development, pollution, waste disposal, and other human-related activities.
DRAFT AMENDMENT 2 FOR PUBLIC COMMENT
21
Estuaries of the mid-Atlantic and south Atlantic states provide almost all of the nursery areas utilized by Atlantic menhaden. Areas such as Chesapeake Bay and the Albemarle-Pamlico system are especially susceptible to pollution because they are generally shallow, have a high total volume relative to freshwater inflow, low tidal exchange, and a long retention time. Most tributaries of these systems originate in the Coastal Plain and have relatively little freshwater flow to remove pollutants. Shorelines of most estuarine areas are becoming increasingly developed, even with existing habitat protection programs. Thus, the specific habitats of greatest long-term importance to the menhaden stock and fishery are increasingly at risk.
1.4.5 Anthropogenic Impacts on Atlantic Menhaden and their Habitat
Pollution and habitat degradation threaten the Atlantic menhaden population, particularly during the estuarine residency of larvae and juveniles. Concern has been expressed (Ahrenholz et al. 1987b) that the outbreaks of ulcerative mycosis in the 1980s may have been symptomatic of deteriorating water quality in estuarine waters along the east coast. The growth of the human population and increasing development in the coastal zone are expected to further reduce water quality unless steps are taken to ameliorate their effect on the environment (Cross et al. 1985). Changing habitats and water quality potentially can affect habitat use and productivity of menhaden in the coastal ocean, estuaries, and particularly the estuarine systems. Menhaden’s various life stages occur in waters ranging from the coastal estuaries and inlets along the continental shelf to the western margin of the Gulf Stream from southern Florida to Nova Scotia (Manooch 1991) Estuarine habitats have been altered dramatically over the past decade. Perhaps the most significant physical alteration of the Chesapeake Bay watershed in recent decades has been the increase in impervious surfaces, with at least 400,000 hectares projected by 2010 (Brush 2009). These surfaces increase the rate of flow of nutrients, sediment, and contaminants to the Chesapeake Bay (Clagett 2007) and exacerbate eutrophication and expansion of anoxic zones. Although not studied at present, reduced water quality associated with increases in impervious surfaces could diminish habitat for menhaden or their predators. Effects on menhaden habitat use and productivity are possible as well due to climate change. Menhaden ingress is sensitive to changes in wind patterns and temperatures which are known to be variable and may be influenced by climate change (Quinlan et al. 1999; Austin 2002). Moreover, nursery habitats within bays and estuaries are likely to be transformed by the effects of climate change, in some cases potentially enhancing menhaden productivity and other cases resulting in lower production and recruitment. The effects of climate change are projected to include: increased water temperatures; sea-level rise; change in precipitation patterns, changes in climate variability that include increased storm and drought events, among other related phenomena (Sherman et al. 2009). These changes can influence salinity, temperature, and nutrients throughout nursery grounds. In addition to long-term climate change, the Atlantic coast has also experienced shorter-term, decadal fluctuations in weather, shifting between cold-wet and warm-dry periods. Austin (2002) showed that the 1960s were warmer and wetter than the 1970s and 1990s in the mid-Atlantic. Menhaden recruitment success tends to be relatively high in years when late winter-spring conditions are warm and dry (Wood 2000). The generally low recruitments of YOY menhaden in recent years appear to be constrained by frequent cool and wet, winter-spring conditions that

DRAFT AMENDMENT 2 FOR PUBLIC COMMENT
22
favor recruitment of anadromous spawners, but not offshore-spawning fishes such as menhaden (Kimmel et al. 2009). It is not certain how climate change will affect longterm abundance and productivity of menhaden, as noted in the next section.
1.4.6 Description of Programs to Protect, Restore, Preserve and Enhance Atlantic Menhaden Habitat
The federal Coastal Zone Management Act provides a framework under which individual coastal states have developed their own coastal habitat protection programs. In general, wholesale dredging and filling are not allowed. Individual development projects are subject to state and federal review and permit limitations. Every Atlantic coast state has a coastal habitat protection program in place (Table 11.27 in ASMFC 1992). These protection programs have greatly reduced the loss of vital coastal habitat to dredging and filling since the mid-1970s. Virtually all proposals affecting coastal habitat are now reviewed by a variety of local, state, and federal agencies, and wholesale destruction of coastal wetlands is rare. Many important estuarine habitats are now protected as part of various wildlife refuges, national and state parks, and public and private nature preserves. In addition, a federal permit program is conducted by the U.S. Army Corps of Engineers, generally in cooperation with the state programs. Every state also conducts water quality protection programs under the federal Clean Water Act. National Pollution Discharge Elimination System permits are required for point-source discharges. Unfortunately, these programs provide much less control over non-point pollution, especially that originating from agricultural and silvicultural activities.
1.5 IMPACTS OF THE FISHERY MANAGEMENT PROGRAM
1.5.1 Biological and Environmental Impacts
1.5.1.1 Timeline to Achieve Target F The new F reference points adopted by the Board are intended to be interim reference points while the Commission’s Multispecies Technical Committee develops ecological-based reference points (ERP). The ERPs will take some time to develop because of the complexity of modeling predator-prey relationship in marine species that rely on menhaden for forage (e.g., striped bass, bluefish, weakfish). A multi-species model will take into account the effect of changes in the menhaden population on species that utilize them as prey, as well as how changes in predator populations affect menhaden abundance. In either case (biological or ecological reference points) the intent is to manage Atlantic menhaden at sustainable levels to support fisheries and meet predator demands through sufficient SSB to prevent stock depletion and recruitment failure. The current status of the Atlantic menhaden stock is not overfished, but overfishing is occurring. Through Amendment 2, the Board will take immediately actions to end overfishing. However, because the reductions in F are more substantial to achieve the F target, the Board is considering a longer time schedule to reduce F to the target level. If the target F is to be achieved on a shorter time frame, annual reductions in landings may be more substantial than if the F was achieved over a longer time period.
1.5.1.2 Data Collection and Reporting Requirements Implementing improved reporting criteria for menhaden bait fishermen and continuation of the current reduction fishery reporting will increase the precision of estimates of stock status and
DRAFT AMENDMENT 2 FOR PUBLIC COMMENT
23
calculation of reference points. If one or more quotas are used to manage the fishery accurate and timely landings reporting would be vital to their success. Reporting systems for most bait fisheries currently include delays up to three months, or more, from the time of landing until becoming available to fisheries managers. These lengthy delays could lead to quota overages or fisheries being closed prematurely because of uncertainty in levels of harvest. Updating current reporting systems will require increased staff time and resources for agencies gathering the information and/or the individual fishermen. This cost may reduce fishermen profits, increase financial demands on states/jurisdictions or both. Utilizing electronic reporting systems (e.g., SAFIS) on existing systems could minimize costs of implementation and the associate impacts on fishermen and states/jurisdictions.
1.5.1.3 Quotas (Total Allowable Catch – TAC) Limiting the catch by imposing quotas by fishery, region or state is an efficient reliable way to reduce harvest. The fishing season would close after the annual total allowable catch has been harvested. In theory this would protect a larger proportion of the spawning stock, rather than allowing fishing to continue under current regulations. If properly set and enforced a quota would likely end overfishing and allow the stock to increase. In the long term this would lead to increased quotas that potentially would equal or exceed current harvest levels. An increase in stock size would also increase the forage base of commercially and recreationally important predator species. A quota would reduce income, and likely employment levels, of one or more of the following groups in the short term: menhaden bait fishermen, commercial fisheries reliant on menhaden for bait, the reduction industry, businesses reliant on menhaden products (from reduction) or business that use species caught using menhaden for bait. Harvest of other bait species may increase if the number of menhaden landed for bait is not adequate to meet the demand of the blue crab and American lobster fisheries, which both currently rely heavily on menhaden. Another potential consequence of a quota system is dead discards of menhaden in multi-species fisheries, particular in fixed gear such as pound nets, after the quota has been met but the gear is still being fished for other species.
1.5.1.4 De minimis De minimis status could exempt qualifying states from mandatory monitoring measures, such as updated commercial monitoring systems or biological monitoring. In jurisdictions with relatively small Atlantic menhaden commercial landings, the cost of implementing monitoring measures may be greater than the value of the jurisdictions fishery. Jurisdiction granted de minimis status would still have to abide by any management measures that are in place to safeguard against developing nontraditional fisheries or a market for out of jurisdiction fish.
1.5.1.5 No Action The menhaden fishery would be managed under the existing rules and regulations enforced throughout the Atlantic coast fishery by the individual states/jurisdictions (Table 10). Management would be piecemeal and subject to regional perceptions and influences. This option would allow existing fisheries to operate so that the participants can maximize their benefits, with minimal additional costs to administer and enforce management or monitoring measures. However, taking no action will allow overfishing to continue and would likely lead to over-exploitation of the resource in the long term. If the stock became overfished or depleted there would be a significant economic impact in the menhaden fisheries, fisheries for species that feed on menhaden and fisheries that use menhaden for bait. Impacts to non-game species of fish,

DRAFT AMENDMENT 2 FOR PUBLIC COMMENT
24
birds and marine mammals that feed on menhaden, or feed on species that feed on menhaden, would also be negatively impacted. No action may lead to increased social and political conflicts and could also result in additional area closures based on socio-economic concerns rather than a biological basis.
1.5.2 Social Impacts
Menhaden, also known as pogies, bugmouth, fat-back, mossbunker and bunker, were highly prized for human consumption due to their “superior flavor” from the mid-18th to late 19th century. With the exception of roe (Smith 2000), menhaden are no longer commonly sought for the fresh fish market in the United States (Frye 1978). Rather, menhaden are processed to obtain omega-3 fish oil that is used as a dietary health supplement for humans (Lands 1986). In addition to human consumption, menhaden is used in fertilizer, fishmeal, and livestock feed (Smith 1991). Menhaden oil has long been used for marine lubricants and additives, as well as formulated for use in paints, plastics, resins and cosmetics. Menhaden are used as bait in several valuable commercial fisheries, particularly the blue crab fishery of the Chesapeake Bay and the Atlantic lobster fishery, as well as in several recreational fisheries. In addition, menhaden are thought to provide important ecosystem services, not only serving as forage for a variety of fish, birds and marine mammals, but also as filter feeders, and their widespread abundance is considered beneficial to water quality. Consequently, analysis of the potential social impacts of changes in the regulation of menhaden should consider effects on businesses directly dependent on menhaden; the commercial fisheries that land menhaden and the processors that transform the menhaden into products such as fish oil, fishmeal, fertilizer and livestock feed. Other stakeholders, indirectly dependent on menhaden, include both the commercial and recreational fisheries that rely on menhaden for bait (e.g., lobster and crab fisheries; striped bass, tuna, and bluefish fisheries); those that rely on the presence of menhaden as forage for their business activity (e.g., charter boats, bird-watching companies, and whale watch boats); as well as those who rely on or value clear water. Others who may also be affected by regulatory change include the businesses that support the commercial and recreational fisheries (e.g., gear manufacturers, fuel providers, other infrastructure providers), companies and individuals who rely on or need the products of menhaden processing, and individuals who value the way of life associated with fishing. A lack of data detailing the full range of stakeholders and their dependency on menhaden, either directly or indirectly, prohibits full analysis of the social impacts of menhaden regulation. We know little about the demographics of the various stakeholders and even less about the social variables (e.g., families, behavioral norms, cultural values) associated with the menhaden industry. What follows is a description of the major characteristics of the businesses or others that use menhaden (e.g., gear and vessels used, processing plant) and the most prominent businesses likely to be impacted by regulatory change.
1.5.2.1 Fisheries Gear As has been described previously in Section 1.3.1 focused on the commercial fishery, there are multiple gears used to fish for menhaden along the Atlantic coast. The gear associated with the greatest landings, however, is the purse seine that is used by the reduction fishery and by some in

DRAFT AMENDMENT 2 FOR PUBLIC COMMENT
25
the bait fishery. Other gear used includes gill nets, cast nets and pound nets. Pound nets and smaller purse seines tend to be more commonly used in the Chesapeake Bay to obtain menhaden for sale as bait for the blue crab fishery.
1.5.2.2 Recreational Fishery There is a recreational fishery for menhaden, but it is currently neither monitored external to MRIP nor thought to be extensive enough to have significant effects upon populations of the fish. Typically the fish are caught by cast net and used soon after as bait in recreational fishing targeting such species such as striped bass, bluefish, tuna, cobia, and crab. In addition, some menhaden caught commercially are purchased and used as chum, cut fish for bait, and as processed oils and attractants for various fish from crustaceans to game fish.2Stanley O’Bier (2012) noted that the menhaden from the Chesapeake supplies approximately half the bait for Florida recreational fishing in the form of whole fish and chum.
1.5.2.3 The Reduction Fishery3 Menhaden was used as fertilizer by Native Americans long before the Europeans arrived. By the 19th century, farmers in New England had formed small companies to catch and transport menhaden to their fields. In the 1850’s the scarcity of whale oil led to the production of menhaden oil for use as lubricants and liquid fuel in the burgeoning industrial economy. Twenty years later, with the invention of the purse seine and increasing demand, almost 100 factories reduced the menhaden to extract oil and sell the scrap as fertilizer. Following World War II, spotter planes were used to locate huge menhaden schools along the Atlantic coast and the catch soared to 1.6 billion pounds in 1956. The product became a key ingredient in agricultural feed. By 1969, however, the annual catch had plummeted. Eventually, most of the factories went out of business. The reduction fishery for Atlantic menhaden is now associated with a single processing plant, Omega Protein, located in Reedville, Northumberland County, Virginia. The plant corporate office is located in Houston, Texas. It is incorporated in the state of Nevada. The company maintains operations in both the northwest Atlantic and the Gulf of Mexico with processing facilities in Louisiana, Mississippi, and Reedville, Virginia. The Louisiana and Mississippi plants process Gulf menhaden. In 2008, the company employed 159 individuals, of which 157 were full time seasonal workers, to harvest menhaden. The company also employed 140 individuals of which 126 were full time year round employees, to process and distribute menhaden-based products. Omega provides health care, paid holidays, and retirement programs for all employees. Plant employees also receive paid life insurance and vacation days. In 2008, the Reedville facility had total sales of meal, oil, and soluble of approximately $60.0 million. The total payroll for vessel and plant employees was nearly $11.4 million, which was fairly evenly divided between plant and vessel employees. In addition, Omega Protein paid approximately $1.2 million in union dues on behalf of its employees. The plant’s total
2 (http://www.catchnbait.com/fishing-chum.htm, http://www.tarbayseafood.com/Menhaden-Bait-Fish-6-Pack-p/bfm-m01.htm). 3Information for this section comes from Kirkley et al.2011

DRAFT AMENDMENT 2 FOR PUBLIC COMMENT
26
operational expenditures, excluding payroll, equaled $18.9 million. In 2008, Omega Protein of Reedville donated approximately $70,000 to charity. Kirkley et al (2011) found that reductions in the bay fishery could largely be replaced by the ocean fishery for Atlantic menhaden with little effect on the reduction fishery in terms of overall product output. Costs would increase for the plant and there would be loss of approximately 20 jobs (roughly 7 percent). However, when a survey was undertaken as to the preferences of the people of Virginia for the employment of fishermen and/or plant employees as opposed to retaining menhaden in the Chesapeake, it was determined that the people of Virginia preferred the higher employment level as opposed to increased numbers of menhaden in the Chesapeake. The people who worked in the plant at the time of the study thought that if they became unemployed they could find other employment, but they did not think they could find employment in the same type of work or at the same level of income. This part of the study was conducted in 2008, and since then, the unemployment rate in the region and nation has increased, making alternative employment more difficult to find.
1.5.2.4 The Bait Fishery Menhaden are caught for bait in all regions of the Atlantic. In recent years there has been increasing demand for menhaden as bait for lobster in response to the limitations on herring availability due to regulatory changes. Since menhaden are more plentiful in the Mid-Atlantic and Chesapeake areas and due to a preference for larger menhaden as noted by Smith and O’Bier (2011), it is assumed that much of the lobster bait originates from the Mid-Atlantic area. New England As described in Draft Addendum V to the menhaden management plan, New England operators tend to be small, generally with one harvest vessel, of a size range from the mid-30s to 90 feet in length.4 Smaller operators also have a “carry” boat to take the catch to shore. Each vessel carries from seven to ten crewmembers, and has associated support employees onshore to accommodate the business end of the operation, including unloading, packing, salting, and any other shipping preparations. The geographic range of a portion of the New England fleet is substantial, from Maine to New Jersey, while the seasonal basis is from late spring to fall. As the boats travel from location to location, they purchase dock space, food, and fuel from the local communities. In Maine there are also two to three herring seiners who switch to harvesting menhaden for bait on an opportunistic basis including outside of the Gulf of Maine.5 Other vessels that land herring also land menhaden as ancillary catch, though whether targeted or incidental is not specified. By herring vessel category, Category A and Category C had a 2% dependency on menhaden for years 2007-2010. Smaller inshore bait vessels are at a disadvantage compared to vessels prepared to go beyond the EEZ limit to fish for menhaden or that move to the Mid-Atlantic to access additional bait sources. 4 Based on information from Kaelin, personal communication, 2011 5From Draft Amendment 5to the Fishery Management Plan for Atlantic Herring(http://www.nefmc.org/herring/planamen/draft_a5/FORMAL%20DEIS%20RESUBMISSION%20MARCH%2014%202012/FINAL.VERSION.Draft.AM.5.DEIS.Resubmission.WITH.INDEX.March.14.2012.pdf)
DRAFT AMENDMENT 2 FOR PUBLIC COMMENT
27
For New England, the main use of menhaden is for lobster bait. Although herring is the preferred bait for lobster, herring supply has been reduced due to changes in regulations designed to limit potential bycatch of river herring and move the larger herring vessels offshore. These limits have encouraged the lobstermen to look for additional sources of bait. The lobster fishery is important to New England and the United States because lobster is a high value fishery that from 2007 to 2010 provided 380,133,575 pounds of landings valued at $1,378,276,659 in New England.6 Herring is the preferred bait for lobster in Maine, but due in part to the herring restrictions, the percentage use of menhaden has increased from roughly 6% in 2006 to as high as 32% in 2012 according to the Maine Lobstermen’s Association.7 A provider of menhaden for bait in New England notes that she is now providing double the amount of menhaden for the lobster fishery as she did four years ago. Mid-Atlantic Mid-Atlantic operators for menhaden use pound nets, haul seines, fyke nets, gill nets, handlines, eel pots, turtle traps and purse seines (McCay and Cieri 2000). The highest landings come from purse seines and with the possible exception of pound nets, the other landings may be considered incidental because the landings for all species were equal to or less than 0.1% of all landings. The landings from fyke nets, gill nets, handlines, eel pots and turtle traps are unlikely to have contributed greatly to the significantly increased landings in the Mid-Atlantic area. McCay and Cieri note that pound nets are used in limited areas, so without expansion of these specific areas, it is also unlikely that they have contributed to the increase in landings. According to Smith and O’Bier (2011), older and larger menhaden are caught in New Jersey compared to the Chesapeake and these menhaden are preferred for the lobster fishery. This probably explains the recent increase in catches and landings of menhaden in the Mid-Atlantic because Atlantic herring are the preferred lobster bait for Maine and much of New England is currently under restriction under ASMFC Addendum II to Amendment 2 to the Atlantic Herring Plan and New England Fishery Management Council’s Amendment 4 to the Fishery Management Plan. Further restrictions are anticipated when Amendment 5 is completed and implemented. Chesapeake Bay8
Chesapeake Bay menhaden are predominantly caught by two methods, purse seines – locally known as snapper rigs—and pound nets. Chesapeake Bay menhaden are primarily used for the crab pot fishery of the Chesapeake, North Carolina, and other pot crab fisheries. If there is a bait glut, menhaden may be sold to the reduction fishery. Five vessels are currently being used for menhaden bait landings in the Chesapeake Bay. Snapper rigs tend to be smaller vessels than the reduction fishery purse seine vessels although three of the five vessels active in the last five years were originally purse seine vessels from Beaufort, NC. Typically, vessels employ six crew members (Stanley O’Bier, personal communication). Spotter planes were used to assist in 90% of the purse seine sets. The season generally runs from mid-May through mid-November. Data is collected via log books known as Captain’s Daily Fishing Reports. Most sets occur in the central 6http://www.st.nmfs.noaa.gov/pls/webpls/MF_MONTHLY_LANDINGS.RESULTS. 7http://www.ncfish.org/A_Great_Bait_-_2-29-12.pdf. 8Much of the Chesapeake Bay data comes from Smith and O’Bier (2011)

DRAFT AMENDMENT 2 FOR PUBLIC COMMENT
28
bay, between the Rappahannock River and the Maryland state line, with some sets occurring between the York River and the Rappahannock River. No sets of the purse seines appeared to have occurred south of the York River area near the mouth of the Chesapeake for the time period under study. Pound nets are found in Virginia, although there is a cap on pound nets set at a total of 161 nets.9 More pound nets are concentrated in Maryland waters as purse seines are prohibited in Maryland state waters. Currently, Virginia pound nets are placed in locations to select for higher value species than menhaden, such as striped bass and other food fishes, so they tend to contribute less to the menhaden fishery (Stanley O’Bier, personal communication). In Maryland the geographic distribution of pound nets are concentrated in the area along the Eastern Shore between Cambridge and Crisfield, and on the western side of the Chesapeake between Deale and Annapolis and around the southernmost peninsulas and rivers.10 This is not to say that pound nets are not found above the Bay Bridge or on the Atlantic, but that they are less common. Menhaden are the predominant bait for the blue crab pot fishery in the central area of the Chesapeake Bay. Blue crab is the highest value fishery from the Chesapeake Bay, with a dockside value in Maryland alone of $52,020,000 in 2009.11 In Maryland the crabbers prefer to use fresh menhaden collected from pound nets in 65 pound bushels each morning due to their higher oil content, lower price and to support local business. Watermen of the area consider it “the mainstay of the bait business.” When not able to access their local pound nets, crabbers purchase frozen menhaden in 50 pound flats from a Virginia distributer for $10-$12. A bushel of fresh menhaden, costing about $8 in 2012, is used to bait approximately 100 pots. Cuts in the menhaden fishery could result in more severe reductions for the pound net fishery than for the more mobile purse seine fishery of the Chesapeake which could, if pushed, physically move to offshore waters to take bait. Economically however, this response may not be feasible. According to Stanley O’Bier (2012), the fuel costs would double, product quality would diminish due to the longer distance to offloading facilities, and more importantly, safety concerns would inhibit the use of snapper rigs in the EEZ. Resulting increases in the cost of bait to the blue crab fishery could be quite difficult for both Maryland and Virginia. Both states saw an early spring return of crabs in 2012 but this did not lead to economic benefits in the summer. The blue crab fishery has already faced difficult decisions and is struggling to maintain a way of life in isolated communities.12 Stanley O’Bier (2012) noted that the menhaden supplied from the Chesapeake provides approximately half the bait for Florida recreational fishing in the form of menhaden fish and chum. Further, nearly 55% of the company’s production is distributed to states in the southern region for bait used in both commercial and recreational fishing. Therefore one could expect 9http://www.mrc.virginia.gov/regulations/fr600.shtm. 10http://dnr.maryland.gov/fisheries/commercial/poundnets/index.asp, http://www.arcgis.com/home/webmap/viewer.html?webmap=eae2515e27f84c2dbcc4d3864f35501d&extent=-77.2886,37.7866,-74.8551,39.6444) 11http://www.msa.md.gov/msa/mdmanual/01glance/html/seafoodp.html 12http://www.smithsonianmag.com/people-places/Tangier-Island-and-the-Way-of-the-Watermen.htmlandhttp://www.nytimes.com/2008/03/31/us/31cake.html
DRAFT AMENDMENT 2 FOR PUBLIC COMMENT
29
increasing pressures on more distant users of menhaden bait from the Chesapeake. Specifically, the increases in the price of bait plus delivery costs will probably lead to a search for substitute baits or other changes, possibly including a reduction in fishing. Finally, Mr. O’Bier (2012) discussed what he considered the important linkage between the bait fishery and the reduction fishery. When the market for menhaden bait is oversupplied, the market for menhaden reduction generally takes the excess, thus maintaining a better price for harvesters, and making the bait fishery a viable fishery year round. Considering the need for the bait fishery for the larger area from Maryland to Texas, this linkage may be worth additional consideration. South Atlantic In the South Atlantic area menhaden fishing occurred most frequently around Beaufort, NC where a reduction plant was located until 2004. Its demise has eased fishing pressure in the area, but ancillary fishing for bait still occurs in the state. Gears used included gill net, fly net, pound net and other, with gill net, and fly net providing 37.8% of landings, and 32.2% of landings respectively between 2006 and 2010 yet making up only 0.3% of Atlantic coast-wide landings.13 North Carolina also noted that in 2010, 258 commercial fishermen reported landing 1.3 million pounds of menhaden in 1,629 trips. Thus menhaden supported the crab fishery that used 11.2 million pounds of menhaden as bait, costing about $3 million.14 Note that an additional 9.9 million pounds of menhaden for bait necessarily came from elsewhere. Large scale fishing for menhaden, referred to as industrial fishing, has recently been prohibited in North Carolina waters, though smaller purse seines are allowed.15 Other states within the region have had some landings, but they are not the dominant locations for landings when compared to the northern portion of this region. As noted in the Chesapeake region discussion, menhaden bait from the Chesapeake is distributed into the southern region and there are links between the two regions. One processor noted that nearly 55% of their distribution is to the southern region, and another substantial percentage is sent to the Gulf Coast.
1.5.2.5 Non Consumptive Uses Kirkley et al (2011) and Chesapeake Bay Foundation describe menhaden as being of interest to conservation since they are filter feeders, interpreted to mean that they “clean the bay.” In addition, they are prey for several species of fish, for various bird species (particularly osprey), and for marine mammals.16 Further north, in the Mid-Atlantic and New England, conservation efforts are mostly concerned with menhaden as forage species for recreationally fished species. 13NC Marine Fisheries, (http://mobile.ncleg.net/DocumentSites/Committees/MFC-LRC/Meetings/2-02-2012/Handouts%20and%20Presentations/2012-0202%20L.Daniel-DMF_Menhaden%20Presentation.pdf, slide 5 14http://mobile.ncleg.net/DocumentSites/Committees/MFC-LRC/Meetings/2-02-2012/Handouts%20and%20Presentations/2012-0202%20L.Daniel-DMF_Menhaden%20Presentation.pdf, slide 11 15http://portal.ncdenr.org/web/mf/nr-18-12-menhaden-purse-seine. 16http://www.cbf.org/Page.aspx?pid=1624
DRAFT AMENDMENT 2 FOR PUBLIC COMMENT
30
The greatest interest is found among fishing organizations focused on striped bass and similar species. These groups maintain that the more menhaden available, the larger and healthier individual striped bass will be and the larger and healthier the striped bass population will be. As noted earlier, whale-watching and bird-watching (both commercial businesses and individual recreational activities) may also benefit from menhaden left in the water as forage. Because of their schooling behavior, menhaden are a favorite target for the common loon, herons, egrets, gulls, gannets, ospreys, and eagles. Some mammals, such as whales and dolphins, also feed on menhaden.17
1.5.3 Economic Impacts
1.5.3.1 Economic impacts of status quo and harvest restrictions on the reduction fishery The menhaden reduction fishery creates direct, indirect and induced economic impacts which are concentrated in Virginia, particularly in Northumberland County, the location of OMEGA Protein. Because OMEGA is the only firm engaged in the harvesting and processing of menhaden for reduction, economic impacts from reduction quota that take place outside the Northumberland County area can be assumed to be negligible. Kirkley et al (2011) developed an input/output (IO) model for economic activities of the reduction fishery to estimate economic impacts from sales, income, and employment generated by operations of OMEGA Protein. The authors estimate baseline (status quo) economic impacts of OMEGA Protein Operations in 2008 that include 519 full and part-time jobs (299 direct, 114 indirect and 106 induced), approximately $22.75 million in incomes ($12.56 million direct, $6.2 million indirect and $4 million induced), and output valued at $88.15 million ($59.92 million direct, $15.75 million indirect and $12.49 million induced). Closure of the reduction industry would result in the loss of these economic impacts, which is equivalent to a 14.3% decline in total outputin Northumberland County, a 14.1% decline in county income and a 8.1% decline in county employment. Closure of the Chesapeake Bay reduction fishery would result in profit losses between $7.3 million and $10 million, depending on assumptions about changes in costs. Reducing Bay quota from 109,020 metric tons to 25,000 metric tons (a 77% decrease) would reduce employment by 221 jobs (60%), output by $37.54 million (42.6%) and income by $9.69 million (42.6%). Reducing Bay quota from 109,020 metric tons to 50,000 metric tons(a 54% decrease) would reduce employment by 128 jobs (25%), output by $21.8 million (25%) and income by $5.63 million (25%). Reducing the commercial Bay quota from 109,020 metric tons to 75,000 metric tons (a 31% decrease) would reduce Virginia employment by 37 jobs (7.1%), output by $6.2 million (7.1%), and income by $1.6 million (7.1%). The relatively small impacts from this latter reduction stem from the fact that contemporary Bay harvests have been below quota, not exceeding 85,000 metric tons in recent years. Assuming that coastal ocean harvests remain unchanged, restricting Bay quota to 50,000 metric tons and 25,000 metric tons reduces OMEGA gross profits to $11.3 million and $0.6 million respectively. Restricting coastal ocean quotas from 141,100 metric tons to 50,000 metric tons is expected to reduce the value of
17 Atlantic Menhaden, Chesapeake Bay Ecological Foundation. Available online at http://www.chesbay.org/forageFish/menhaden.asp
DRAFT AMENDMENT 2 FOR PUBLIC COMMENT
31
OMEGA sales proportionately from $59.5 to $21.2 million, and decrease profits from $14.2 to $2.3 million. The disproportionate impact on profits is due to an assumed increase in operating costs that would result if harvest operations were limited to offshore. While the Kirkley analysis does not explicitly examine reductions in quota outside of the Bay, and does not permit estimation of the effects of quota changes outside of Virginia, decreases in harvest quota in other states can be assumed to have economic impacts that are proportionately higher due to fuel, maintenance and repair expenses that are expected to increase with distance from OMEGA and additional time required for harvest. In short, harvest quota restrictions in states further from Virginia are expected to have proportionately higher economic impacts. In addition to the input/output analysis, Kirkley et al (2011) used contingent valuation analysis to estimate the economic value to regional stakeholders of retaining or reducing the current commercial quota in the Bay. This analysis produced estimates of the annual dollar amounts that individuals would be willing to pay for different levels of commercial harvest of menhaden for reduction purposes, and suggests that a decrease in the menhaden industrial catch is valued at $28 in net benefits per household, while its maintenance is valued at $50 per household. Aggregation of this result suggests that there is a gain in net benefits of $110.0 million for maintaining the status quo relative to reducing the Bay quota. In other words, regional stakeholders prefer maintenance of the status quo over reducing allowable Bay quota, suggesting that economic value is associated with the existence of the reduction fishery.
1.5.3.2 Economic impacts of status quo and harvest restrictions on the bait fishery Landings of menhaden for bait have averaged approximately 40,000 metric tons per year since 2002, the majority of which is harvested in the Mid-Atlantic and Chesapeake Bay. Comprising roughly 20% of total menhaden landings in recent years, the bait fishery plays an important economic role in commercial and recreational fisheries throughout the range of the species. The use of menhaden as bait appears to be especially critical for the commercial crab and lobster fisheries, which are among the most economically significant fisheries on the east coast. Menhaden harvested for bait in the Mid-Atlantic region appear to be primarily directed toward lobster fisheries, while those harvested in the Chesapeake Bay appear to largely support blue crab fisheries (Smith and O’Bier 2011). According to the National Marine Fisheries Service (2010) in New England (Connecticut, Maine, Massachusetts, New Hampshire, and Rhode Island) American lobster had higher landings revenues than any other species or species group, averaging $323 million in landings revenue from 2000 to 2009. In the Mid-Atlantic Region (Delaware, Maryland, New Jersey, New York, and Virginia), blue crab generated landing revenues of $70 million, while American lobster generated landings revenues of roughly $8 million. In the South Atlantic Region (East Florida, Georgia, North Carolina, and South Carolina) blue crab averaged approximately $38.3 million in landings revenues from 2000-2009, and was responsible for the highest landings revenue across all species in the South Atlantic Region in 2009, with $35 million. Menhaden appear to comprise an increasingly large percentage of bait used by lobster and crab fishers. For example, in New Jersey, where menhaden are the preferred bait for lobster, between 70 and 100 percent of bait used by lobstermen is menhaden (ASMFC Lobster Advisory Panel). In Connecticut, menhaden comprise between 40 and 70 percent of bait used by lobster fishers depending on the season (ASMFC Lobster Advisory Panel). In Maine, the preferred lobster bait
DRAFT AMENDMENT 2 FOR PUBLIC COMMENT
32
is herring, but menhaden may comprise up to 30 percent of bait. It is unknown what percentage of crab bait is comprised of menhaden. While it is clear that menhaden play an important supporting role in these fisheries, it is beyond the scope of this report to attempt to assign a specific portion of lobster and crab fishery value to the maintenance of menhaden harvests, or to attempt to determine the economic impact on these fisheries from menhaden quota reductions. Such valuations would require a more detailed understanding of the prices and availability of substitute baits and how lobster and crab catch rates vary with bait type. We can however put forth a back-of-the-envelope estimate of the gross value of menhaden bait landings. Assuming an ex-vessel price of roughly $0.0738 per pound for menhaden (ASMFC Lobster Advisory Panel) and sales prices ranging from $0.1125 (direct wholesale to fishers) to $0.22 per pound (retail), the average annual bait harvest of 88.2 million pounds generates approximately $6.5 million in gross revenues to fishers, with an additional $3.41 – $12.87 million in gross value added realized by wholesalers and retailers. These sales also create indirect and induced economic impacts, which we do not attempt to estimate here.
1.5.3.3 Benefits of commercial harvest restrictions to recreational fishing Reductions in menhaden quota may have positive economic impacts on the recreational fishing sector. The economic value and economic impact of recreational angling are unquestionably significant. For example, in a review of 26 empirical studies estimating the economic values of recreational fishing, Sturtevant et al (1995) find that river fishing experiences in the eastern region of the United States generate net economic gains of up to $59.00 per person per trip, with an average of approximately $20.00 per trip. Schuhmann and Schwabe (2004) find that the value of a 25% increase in the expected catch of striped bass is between $2.67 and $36.98 per trip, depending on the characterization of congestion and whether or not anglers practice catch-and-release. Freeman (1995) finds that most per trip values for recreational fishing access to singlespecies are between $10 and $100 and that most annual values are between $100 and $1,000 per person. Importantly, the literature provides a clear link between the behavior of recreational anglers and the quality of catch (Freeman, 1995). However, despite the obvious and measurable benefits from recreational fishing, and the obvious connection between fishing success and economic value, the empirical link between the quality of fishing and menhaden harvest remains tenuous. An examination of the relationships between numbers of striped bass, bluefish, weakfish, and spotted sea trout caught, abundance of those species and the abundance of menhaden, Kirkley et al (2011) find no empirical evidence that a restriction or elimination of menhaden harvest for reduction in the Bay or in coastal waters would result in an increase in the economic impacts derived from the recreational fishing for game fish species that prey on menhaden. The authors find no statistically significant causality between game fish abundance and menhaden abundance and game fish catch (numbers) and menhaden abundance. No causality is found between menhaden abundance and recreational angler trips. It is important to note that based on data from 2000-2008, Kirkley et al (2011) do find a relationship between menhaden abundance and the weight of striped bass. Specifically, a 1.0 billion fish increase in menhaden abundance is expected to increase the mean weight of recreationally harvested striped bass by 0.05 pounds per fish. Hence, to the extent that recreational anglers derive value from marginal increases in the weight of striped bass, increased
DRAFT AMENDMENT 2 FOR PUBLIC COMMENT
33
abundance of menhaden due to harvest restrictions may produce additional economic value. To conclude, while it seems intuitive that reductions in menhaden harvest will improve the quality of economically valuable recreational fishing experiences, more evidence is needed to ascertain the nature and extent of the associated economic gains.
1.5.4 Other Resource Management Efforts
Single species management of various predators of Atlantic menhaden will have a direct effect on the status of the menhaden population and should be considered in a multispecies management approach. Such an approach is not available at this time but the Commission has sponsored a workshop to investigate the feasibility of various modeling approaches in relation to Atlantic menhaden and has awarded a grant to develop a multispecies model incorporating menhaden, striped bass, bluefish and weakfish abundance and interactions. This grant led to the production of a multi-species virtual population analysis (MSVPA-X) (NEFSC 2006a, 2006b). The MSVPAX has been used in the menhaden model to produce the predation component of the natural mortality information being used in the model. As well, the ASMFC has awarded an additional grant to the University of Rhode Island to produce a second multi-species model using the same species complex, but will be developed in a statistical catch-at-age framework. Along with the modeling exercises, a formal ecological reference point (ERP) evaluation process implemented through a series of facilitated workshops is being proposed through a Multiple Management Objective Decision Analysis (MODA). MODA would involve representative Board members, key stakeholders, and technical committee members as well as use a facilitated “Structured Decision-Making” process to come to consensus on an explicit set of ecosystem management goals and objectives and ERP performance measures. The MODA process would allow for the collaborative development of models to evaluate ERP performance under a suite of uncertain environmental conditions. The MODA would also transparently evaluate and review potential consequences of ERPs and produce a recommended set of ERPs for Atlantic menhaden that are most likely to adequately meet the consensus ecosystem goals and objectives. MODA would help the Board to evaluate the unanticipated consequences of managing a forage fish like menhaden through collaborative model development and performance evaluation. The results of these efforts should ultimately lead to a better understanding of the dynamics involving these species and could lead to alternative management approaches in the future. In addition to the fishery analysis and management efforts noted above, habitat and water quality management efforts can also impact the status of the menhaden population.
1.6 LOCATION OF TECHNICAL DOCUMENTATION FOR FMP
1.6.1 Review of Resource Life History and Biological Relationships
Atlantic menhaden life history information was summarized by Ahrenholz (1991) and Rogers and Van Den Avyle (1989).
1.6.2 Stock Assessment Documentation
Detailed information pertaining to the menhaden stock assessment and methodology can be found in the report of the Menhaden Peer Review Panel (ASMFC 2010), and in the following research publications: Vaughan (1993); Cadrin and Vaughan (1997); and Vaughan et al. (2002).
DRAFT AMENDMENT 2 FOR PUBLIC COMMENT
34
Assessment updates occur every three years and the results are found in the most recent report of the Stock Assessment Subcommittee (ASMFC 2012).
1.6.3 Social Assessment Documentation
Kirkley et al. (2011) evaluated the social components of the reduction fishery as it relates to OMEGA Protein, and the Chesapeake Bay region. The results of the Kirkley et al. (2011) study are summarized in Section 1.5.
1.6.4 Economic Assessment Documentation
Kirkley et al. (2011) developed an input/output (IO) model for economic activities of the reduction fishery to estimate economic impacts from sales, income, and employment generated by operations of OMEGA Protein. The results of the Kirkley et al. (2011) study are summarized in Section 1.5.
1.6.5 Law Enforcement Assessment Documentation
The Commission’s Law Enforcement Committee has prepared a document entitled Guidelines for Resource Managers on the Enforceability of Fishery Management Measures (November 2002) which can be used to evaluate the effectiveness of future measures.
2.0 GOALS AND OBJECTIVES
2.1 HISTORY AND PURPOSE OF THE PLAN
2.1.1 History of Prior Management Actions
The first coastwide management plan (FMP) for Atlantic menhaden was passed in 1981 (ASMFC 1981). The 1981 FMP did not recommend or require specific management actions, but provided a suite of options should they be needed. After the FMP was approved, a combination of additional state restrictions, imposition of local land use rules, and changing economic conditions resulted in the closure of most reduction plants north of Virginia by the late 1980s (ASMFC 1992). In 1988, the ASMFC concluded that the 1981 FMP had become obsolete and initiated a revision to the plan. The 1992 Plan Revision included a suite of objectives to improve data collection and promote awareness of the fishery and its research needs (ASMFC 1992). Under this revision, the menhaden program was directed by the ASMFC Atlantic Menhaden Management Board, which at the time was composed of up to five state directors, up to five industry representatives, and one representative each from the National Marine Fisheries Service and the National Fish Meal and Oil Association. Representation on the Management Board was revised in 2001 to include three representatives from each state Maine through Florida, including the state fisheries director, a legislator, and a governor’s appointee. The reformatted board has passed one amendment and five addenda to the 1992 FMP revision. Amendment 1, passed in 2001, provides specific biological, social/economic, ecological, and management objectives. Addendum I (2004) addressed biological reference points for menhaden,
DRAFT AMENDMENT 2 FOR PUBLIC COMMENT
35
the frequency of stock assessments (every three years), and updated the habitat section of the FMP. Addendum II (2005) instituted a harvest cap on Atlantic menhaden by the reduction fishery in Chesapeake Bay. This cap was established for the fishing seasons in 2006 through 2010. The Atlantic Menhaden Technical Committee determined the following research priorities to examine the possibility of localized depletion of Atlantic menhaden in the Chesapeake Bay: determine menhaden abundance in Chesapeake Bay; determine estimates of removal of menhaden by predators; exchange of menhaden between bay and coastal systems; and larval Studies (determining recruitment to the Bay). Addendum III (2006) was initiated in response to a proposal submitted by the Commonwealth of Virginia that essentially mirrors the intent and provisions of Addendum II. It placed a five-year annual cap on reduction fishery landings in Chesapeake Bay. The cap, based on the mean landings from 2001 – 2005, was in place from 2006 through 2010. Addendum III also allowed a harvest underage in one year to be added to the next year’s quota. The maximum cap in a given year is 122,740 metric tons. Though not required by the plan, other states have implemented more conservation management measures in their waters. Addendum IV (2009) extends the Chesapeake Bay harvest cap three additional years (2011-2013) at the same cap levels as established in Addendum III. Addendum V (2011) establishes a new F threshold and target rate (based on MSP) with the goal of increasing abundance, spawning stock biomass, and menhaden availability as a forage species. Amendment 2 to the Interstate Fishery Management Plan for Atlantic menhaden replaces Amendment 1. This document contains all applicable management options still in implementation from Amendment 1 and all five addenda.
2.1.2 Regulatory Trend
Throughout much of its history, the Atlantic menhaden fishery has been managed by unilateral regulatory actions imposed by individual states. Current state specific regulations are detailed in (Table 10).
2.1.3 Purpose and Need for Action
The 2010 Atlantic menhaden benchmark stock assessment Peer Review Panel noted that menhaden population abundance had declined steadily and recruitment had been low since the last peak observed in the early 1980s. Fishing at the fishing mortality (F) threshold reference point in the terminal year (2008) has resulted in approximately 8% of the maximum spawning potential (MSP). Therefore, the Panel recommended alternative reference points be considered that provide greater protection for spawning stock biomass (SSB) or population fecundity relative to the unfished level. In November 2011, the Atlantic Menhaden Management Board responded to that recommendation and adopted new F reference points. The new reference points are more conservative than the previous to account for the following: (1) while menhaden are not overfished the number of fish in the population has been declining, (2) while menhaden are important for many fisheries they also provide important ecological services, (3) strong recruitment classes may be dependent on favorable environmental conditions, and (4) recent

DRAFT AMENDMENT 2 FOR PUBLIC COMMENT
36
science suggest conserving a larger percentage of the spawning stock. The new F threshold is F15%MSP and the new F target is F30%MSP. Full F/F15%MSP for the terminal year (2011) was greater than 1, therefore, overfishing is occurring. Addendum V states that when overfishing is occurring the Board will take steps to reduce F to the target level. In order to reduce overfishing to the target, the Board needs to consider changes in the management tools used to regulate the fishery.
2.2 GOAL
Amendment 2 to the Interstate Fishery Management Plan for Atlantic Menhaden replaces Amendment 1 to the 1981 FMP for Atlantic Menhaden. The goal of Amendment 2 is to manage the Atlantic menhaden fishery in a manner that is biologically, economically, socially and ecologically sound, while protecting the resource and those who benefit from it.
2.3 OBJECTIVES
The following objectives are selected to support the goal of Amendment 2: Biological Objectives
• Protect and maintain the Atlantic menhaden stock at levels to maintain viable fisheries and the forage base with sufficient spawning stock biomass to prevent stock depletion and guard against recruitment failure.
• Maintain a uniform data collection system for the reduction fishery and develop new
protocols for other harvesting sectors, including biological, economic, and sociological data (ACCSP protocols as a minimum; NMFS reduction fishery monitoring system should be continued).
• Evaluate, develop, and improve approaches or methodologies for stock assessment
including fishery-independent surveys and variable natural mortality at age or by area.
• Optimize utilization of the resource within the constraints imposed by distribution of
the resource, available fishing areas, and harvest capacity. Social/Economic Objectives
• Maintain existing social and cultural features of the fishery to the extent possible.
• Develop a public information program for Atlantic menhaden, including the fishery, biology, estuarine ecology and role of menhaden in the ecosystem.
Ecological Objectives
• Protect fishery habitats and water quality in the nursery grounds to insure recruitment levels are adequate to support and maintain a healthy menhaden population.
• Improve understanding of menhaden biology, food web ecology and multispecies
DRAFT AMENDMENT 2 FOR PUBLIC COMMENT
37
interactions that may bear upon predator-prey and recruitment dynamics.
• Protect and maintain the important ecological role Atlantic menhaden play along the coast.
• Improve understanding of climatic drivers of recruitment.
Management Objectives
• Insure adequate accessibility to fishing grounds.
• Develop options or programs to control or limit effort, and regulate fishing mortality by time or area.
• Base regulatory measures upon the best available scientific information and
coordinate management efforts among the various political entities having jurisdiction over the fisheries.
2.4 SPECIFICATION OF MANAGEMENT UNIT
The management unit for Amendment 2 is defined as the Atlantic menhaden resource throughout the range of the species within U.S. waters of the northwest Atlantic Ocean from the estuaries eastward to the offshore boundary of the EEZ. This definition is consistent with recent stock assessments which treat the entire resource in U.S. waters of the northwest Atlantic as a single stock. It is also recognized that the menhaden resource, as defined here, is interstate and state-federal in nature, and that effective assessment and management can be enhanced through cooperative efforts with all Atlantic coast state and federal scientists and fisheries managers.
2.4.1 Management Area
The management area for Amendment 2 shall be the entire coastwide distribution of the resource.
2.5 BIOLOGICAL REFERENCE POINTS
Threshold reference points are the basis for determining stock status (i.e., whether overfishing is occurring or a stock is overfished). When the fishing mortality rate (F) exceeds the F-threshold, then overfishing is occurring; the rate of removal of fish by the fishery exceeds the ability of the stock to replenish itself. When the reproductive output (measured as spawning stock biomass or population fecundity) falls below the biomass-threshold, then the stock is overfished, meaning there is insufficient mature female biomass (SSB) or egg production (population fecundity) to replenish the stock. Current Overfishing, Overfished/Depleted Definitions The current overfishing definition is a fecundity-per-recruit threshold of F15%MSP and a target of F30%MSP. The current fecundity-based overfished definition is a target of SSBMED and a threshold of SSBMED.T (half of SSBMED). Benchmarks are calculated using all years, 1955-2011.
DRAFT AMENDMENT 2 FOR PUBLIC COMMENT
38
Reference points are recalculated during an update and benchmark stock assessment, see the latest stock assessment for point estimates of reference points and stock status determination (ASMFC, 2012). Uncertainty in 2012 Stock Assessment Update As noted, an Atlantic menhaden stock assessment update was completed in July 2012. However, the results of the assessment are uncertain because the model fit the data poorly for the following reasons,
• Overweighting of the age composition data. • Lack of spatial modeling to address changes in the fishery over time. • Lack of a coastwide adult abundance index. • Poor fit to the PRFC index. • Strong retrospective pattern.
Although the Technical Committee could not come to consensus on the utility of the terminal year (2011) point estimates of F and SSB for management advice, there was consensus that the status determinations, overfishing is occurring and the stock is not overfished, were likely correct. However, the extent of overfishing could not be determined. This statement is supported both quantitatively and qualitatively. Quantitatively, results of the sensitivity analyses did not appreciably alter stock status. Qualitatively, the 2009 benchmark stock assessment also concluded that overfishing was occurring, and Addendum V reference points significantly reduced the overfishing threshold (from approximately F8%MSP to F15%MSP). As harvest levels have increased since 2008 and there has been no significant increase in stock size, overfishing is still likely occurring. Given the stated uncertainty in the most recent stock assessment update (ASMFC 2012), the projection analysis that explored constant landing scenarios with a probability and timeframe to achieve the target F, is not usable. Without a usable projection analysis, the only way to assess the progress towards achieving the target F is through future stock assessments. SSB Reference Points In 2011, the Atlantic Menhaden Management Board adopted F15%MSP as an overfishing threshold with the goal of increasing spawning potential of the stock through reduced fishing mortality. The current overfished threshold definition, 50% of SSBMED, was not changed at that time. This means that the current set of overfishing and overfished stock status definitions are derived from two different types of calculations (maximum spawning potential vs. medians) and are based on two different sets of goals and assumptions about the stock. The current difference between these stock status declarations for menhaden is largely a function of how the fishing mortality and biomass reference points are calculated, not an inherent characteristic of the stock and how it is being fished. The Technical Committee has warned of a mismatch between these overfishing and overfished definitions because their methods of calculation and underlying assumptions differ, making the link between them atypical. Traditionally, when overfishing reference points are calculated, an assumption is made that the overfishing threshold (in this case F15%MSP) is a reasonable proxy for FMSY, the fishing mortality rate that would achieve maximum sustainable yield. Likewise, an
DRAFT AMENDMENT 2 FOR PUBLIC COMMENT
39
assumption is made that the spawning stock biomass target (in this case SSBMED) is a reasonable proxy for Bmsy, the stock biomass level at which maximum sustainable yield is achieved. In theory, fishing at Fmsy should result in a stock biomass of Bmsy. However, in the current case of Atlantic menhaden, the overfishing and overfished reference points are calculated using two different methodologies and there is no theoretical justification for assuming that fishing at F15%MSP will achieve SSBMED. The TC has suggested that consistent methodologies be used for both F-based and SSB-based calculations so that managers can more reasonably make the assumption that fishing at the threshold F should result in target biomass. Given F15%MSP is the interim reference point that has been adopted by the Board, the TC suggests that an SSB reference point of SSB15%MSP also be adopted. The Board may consider a change to the SSB biological reference points through Amendment 2. If the Board Selects Option B, the stock would be in an overfished condition based on the most recent estimate of SSB2011. If the SSB reference points remain unchanged (Option A), the stock is not overfished. Option A: Status Quo. The current fecundity-based overfished definition is a target of SSBMED and a threshold of SSBMED.T (half of SSBMED). Option B: The fecundity-based overfished definition is a target of SSB30%MSP and a threshold of SSB15%MSP. History of Atlantic Menhaden Biological Reference Points Amendment 1 Benchmarks The reference points in Amendment 1, adopted in 2001, were developed from the historic spawning stock per recruit (SSB/R) relationship. As such, FMED was selected as Fthreshold (representing replacement level of stock, also known as FREP) and was calculated by inverting the median value of R/SSB and comparing to the SSB/R curve following the method of Sissenwine and Shepherd (1987). The spawning stock biomass corresponding to Fthreshold , was calculated as a product of median recruitment and SSB/R at FMED, from equilibrium YPR analysis, which became the SSBtarget. The threshold for SSB (SSBthreshold) was calculated to account for natural mortality [(1-M)*SSB-target, where M=0.45]. In Amendment 1, the Ftarget was based on FMAX (maximum fishing mortality before the process of recruitment overfishing begins). Addendum 1 Benchmarks Based on the 2003 benchmark stock assessment for Atlantic menhaden, the benchmarks were modified by the ASMFC in Addendum 1 as recommended by the Technical Committee (ASMFC 2004). The TC recommended using population fecundity (number of maturing or ripe eggs; SSB) as a more direct measure of reproductive output of the population compared to spawning stock biomass (the weight of mature females; SSB). For Atlantic menhaden, older menhaden release more eggs than younger menhaden per unit of female biomass. By using the number of eggs released, more reproductive importance is given to older fish in the population than accounted for simply by female biomass. They also recommended modifications to the fishing mortality (F) target and threshold. The TC recommended continued use of FMED to represent FREP as the Fthreshold, but estimated it using fecundity per recruit rather the SSB per recruit. Because the analysis calculated an FMAX (target) that was greater than FMED (and may
DRAFT AMENDMENT 2 FOR PUBLIC COMMENT
40
be infinite), they recommended instead that Ftarget be based on the 75th percentile. This approach was consistent with the approach used for the Fthreshold. For biomass (or egg) benchmarks, the TC recommended following the approach of Amendment 1. Addendum V Benchmarks In November 2011, Addendum V was approved, which established an interim fishing mortality threshold and target. The interim Fthreshold and Ftarget are based on maximum spawning potential (MSP). The new threshold and target equate to MSP of 15% and 30%, respectively. Addendum V did not establish any new interim SSB based reference points.
2.6 MAINTENANCE OF STOCK STRUCTURE
2.6.1 StockTargets
The Management Board will evaluate the current estimates of F with respect to its reference points (Section 2.5) before proposing any additional management measures. If the current F exceeds the threshold level, the Board will take steps to reduce F to the target level; if current F exceeds the target, but is below the threshold, the Board should consider steps to reduce F to the target level. If current F is below the target F, then no action would be necessary to reduce F. The Management Board will evaluate the current estimates of SSB with respect to its reference points (Section 2.5) before proposing any additional management measures. If the current SSB is below the threshold level, the Board will take steps to increase SSB to the target level; if current SSB is below the target, but above the threshold, the Board should consider steps to increase SSB to the target level. If current SSB is above the target SSB, then no action would be necessary to increase SSB.
2.6.2 Stock Rebuilding and F Reduction Schedules
SSB Rebuilding Schedule The Board shall take action to rebuild the Atlantic menhaden stock to at least the target SSB level in a time frame that shall be no longer than 10 years. F Reduction Schedule Ending Overfishing (Reducing F to the threshold) Through implementation of Amendment 2, the Board will take immediate action to end overfishing. Timeframe to Achieve the F Target Because achieving the target F requires more substantial harvest reductions than achieving the threshold F, the board is considering a range of timeframes for reducing F to the target level. Depending on the schedule for reducing F, a time stepped approach may be used in which F would be reduced in increments until the target is reached. If the target F is to be achieved on a shorter time frame, annual reductions in landings will be more substantial than if the target F was achieved over a longer time period.
DRAFT AMENDMENT 2 FOR PUBLIC COMMENT
41
Given the uncertainty in the most recent stock assessment update (ASMFC 2012), the projection analysis that explored constant landing scenarios with a probability and timeframe to achieve the target F, is not usable. This means that the level at which the Board needs to reduce landings to achieve the target F over a set time frame is unknown. Therefore, the only way to assess the progress towards achieving the target F is through future stock assessments. The Board is considering the following timeframes as a goal to achieve the target F. Until the next stock assessment is completed, the Board will not have an updated estimate of fishing mortality to assess progress toward achieving the target F. Note that the next benchmark stock assessment (peer review) for Atlantic menhaden is currently scheduled for 2015. Option A: The Board is not required to specify a time frame to reduce the current F to at least the target F30%MSP. Option B: The Board shall take action to reduce the current F to at least the target F30%MSP in a time frame that shall be no longer than 3 years. Option C: The Board shall take action to reduce the current F to at least the target F30%MSP in a time frame that shall be no longer than 5 years. Option D: The Board shall take action to reduce the current F to at least the target F30%MSP in a time frame that shall be no longer than 10 years. Option E: Upon receipt of results from a new benchmark peer-reviewed assessment, the Board shall specify a timeframe and take action to reduce F to at least the target F30%MSP.
2.7 RESOURCE COMMUNITY ASPECTS
See Section 1.4 for the role Atlantic Menhaden play in ecosystem dynamics.
2.8 IMPLEMENTATION SCHEDULE
As part of the final approval of Amendment 2, the Management Board will establish an implementation schedule.
3.0 MONITORING PROGRAM SPECIFICATIONS/ELEMENTS An Atlantic menhaden stock assessment will be performed on a schedule of every three years by the stock assessment subcommittee. The technical committee and advisory panel will meet to review the stock assessment and all other relevant data sources. In interim years, a series of population metrics, or “triggers” will be monitored. An annual report will be presented to the Management Board in a timely fashion (usually May or June depending on Commission meeting week scheduling) in order to make annual adjustments to the management program as necessary. The stock assessment report shall follow the general outline as approved by the ISFMP Policy Board for all Commission-managed species. In addition to the general content of the report as specified in the outline, the stock assessment report will also address the specific topics detailed in the following sections.
DRAFT AMENDMENT 2 FOR PUBLIC COMMENT
42
3.1 ASSESSMENT OF ANNUAL AGE/SIZE STRUCTURE
Annual estimates of Atlantic menhaden age and size structure will be monitored based on results of the stock assessment. These estimates are available from the BAM model and are mainly based on the reduction fishery, though efforts are being made to acquire age and size samples from the bait fisheries, particularly in the northern range of the stock. Efforts to include data from the bait fishery and other sources as available should be continued in order to provide an overall picture of the status of the menhaden population. The Technical Committee will monitor the age structure through the current BAM model methodology and report to the Board the results. The old trigger estimates, from the 1992 FMP, will be retained as part of a long-term monitoring program and renamed as Biological and Fishery Status Reference Points. These data will be used only for the evaluation of current stock status with the caveats identified by the Menhaden Peer Review Panel (i.e. landings based reference points reflect conditions of the fishery and not the actual population, subject to sampling coverage; ASMFC 1999b). In particular, the percent age-0 and percent age-3+ fish in the reduction landings may serve to indicate the status of the population age structure and incoming year-class strength. Another indicator could be the number and relative size of age-classes in the population as estimated through the BAM model.
3.2 ASSESSMENT OF ANNUAL RECRUITMENT
Annual recruitment of Atlantic menhaden will be estimated by examination of a variety of data sources. The first is the estimate of recruitment to age-1 from the BAM model as currently conducted. Secondly will be the examination of various fishery-independent data sources, including the juvenile abundance indices that are integrated in to the statistical modeling process. Although many of these surveys are not designed to specifically target menhaden, continued examination of these surveys in the future may prove worthwhile. In addition, surveys designed to specifically monitor menhaden abundance along the coast are needed. Efforts to examine power plant impingement data for their utility in estimating young-of-year menhaden abundance should be continued.
3.3 ASSESSMENT OF SPAWNING STOCK BIOMASS
Spawning stock biomass (SSB, measured as mature ova) will be estimated from the BAM model every three years. The terminal year estimates will be used for evaluating stock status versus the chosen reference points. Because of the retrospective problems observed in the latest menhaden stock assessment update, a three-year running average of SSB will also be developed (Table 11). Terminal year estimates generated by the BAM model tend to be subject to some fluctuation as additional data are added each year. Therefore, terminal year estimates may not accurately depict current conditions. A three-year running average may be more reflective of overall trends in the population and might reduce the risk of implementing management measures based on a false reading of the population status. However, three-year running averages may lessen the chance of detecting a decline in SSB or an increase in F over the short term. The running average approach may be fine so long as the menhaden population does not undergo wide variations or fluctuations from year to year.
DRAFT AMENDMENT 2 FOR PUBLIC COMMENT
43
3.4 ASSESSMENT OF FISHING MORTALITY
Fishing mortality (F) rates will be estimated by the BAM model every three years. Fishing mortality will be estimated for each age-class for examination, but the metric used for comparison to the reference point values will be full F, or the comprehensive fishing mortality rate for all ages of the entire coastwide stock. Currently, fishing mortality rates are estimated for the reduction fishery, the bait fishery, and the recreational fishery.
3.5 PROJECTION METHODOLOGY
Given the stated uncertainty in the most recent stock assessment update (ASMFC 2012), the projection analysis that explored constant landing scenarios with a probability and timeframe to achieve the target F, is not usable. Decisions regarding the structure and inputs for the projection analysis were discussed by the TC during a meeting on January 9, 2012; for documentation see the projection analysis white paper (ASMFC 2012).
3.6 SUMMARY OF MONITORING PROGRAMS
In order to achieve the goals and objectives of Amendment 2, the collection and maintenance of quality data is necessary.
3.6.1 Catch and Landings Information
The reporting requirements for the Atlantic menhaden fishery are based in part on Captains Daily Fishing Reports (CDFRs). The ASMFC, NMFS, US Fish & Wildlife Service, the New England, Mid-Atlantic, and South Atlantic Fishery Management Councils, and all the Atlantic coastal states have developed a coastwide fisheries statistics program (Atlantic Coastal Cooperative Statistics Program). A minimum set of reporting requirements based on a trip-level for fishermen and dealers has been developed as the minimum standard for data collection on the Atlantic coast. Nothing in the proposed program would prohibit a state/agency from requiring more detailed information on a trip basis if so desired.
3.6.1.1 Commercial Catch and Effort Data Collection Program(s) Reporting requirements for Bait and Reduction Fishery All menhaden purse seine and bait seine vessels (or snapper rigs) shall be required to submit the Captain’s Daily Fishing Reports (CDFRs) through the Standard Atlantic Fisheries Information System (eTrips), an ACCSP standards compliant electronic reporting system. The PDT notes that outside of the snapper rig and purse seine vessels that harvest bait, there are no standardized reporting requirements for the bait fishery in the ASMFC FMP for Atlantic menhaden. The following is a description of current reduction fishery reporting process. Daily vessel unloads (in thousands of standard fish) are emailed daily to the NMFS. Captains Daily Fishing Reports (CDFRs) from the Reedville menhaden fleet are used to estimate in-season removals from Chesapeake Bay (Chesapeake Bay Cap). CDRFs are deck logbooks maintained by the Virginia reduction purse-seine vessels. Total removals by area are calculated at the end of the fishing season. At-sea catches from the CDFRs are summed by vessel, and
DRAFT AMENDMENT 2 FOR PUBLIC COMMENT
44
compared to total vessel unloads from company catch records. Individual at-sea sets are then multiplied by an adjustment factor (company records/ at-sea estimates). Adjusted catches by set are converted to metric tons, and accumulated by fishing area. Catch totals are reported by ocean fishing areas (New Jersey, Delaware, and Maryland in the EEZ, Virginia and North Carolina), while catches inside and outside Chesapeake Bay are delineated by the Chesapeake Bay Bridge Tunnel. NMFS port agent samples purse-seine catches at dockside in Reedville, VA, throughout the fishing season (May through December), providing data for age composition determination. The following is a description of current bait fishery reporting process. The summary of the current reporting requirements, by state, are provided in Table 12.
3.6.1.2 Quota Monitoring Quota monitoring, whether coastal, or state-by-state, is dependent upon the strength of state specific monitoring programs, as described in Section 3.6.1. The current catch reporting requirements for the Atlantic menhaden bait fishery does not provide timely or complete data for use by managers and scientists. The ACCSP commercial data collection program is a mandatory, trip-based system with all fishermen and dealers required to report a minimum set of standard data elements. Required data elements for Atlantic menhaden (see Table 13 and Table 14 for details) (1) trip start date (2) vessel identifier (3) individual fisherman identifier (4) dealer identification (5) trip number (6) species (7) quantity (8) units of measurement (9) disposition (10) county or port landed (11) gear (12) quantity of gear (13) number of sets (14) fishing time (15) days/hours at sea (16) number of crew (17) area fished The quota monitoring options below are based on the ACCSP commercial data collection program with the required data elements listed above. Option A. Status Quo
• All menhaden purse seine and bait seine vessels (or snapper rigs) shall be required to submit the Captain’s Daily Fishing Reports (CDFRs) through the Standard Atlantic Fisheries Information System (eTrips), an ACCSP standards compliant electronic reporting system.
• PDT notes this does not improve timeliness or completeness of data collection. Option B. Approved State Methodology for Monitoring
• Must be approved by the Board as a valid method for monitoring (high probability of success)
• Program must have the ability to monitor fishery landings within 7 days of actual landing date.
• Required ACCSP data elements listed above Option C. Require SAFIS dealer weekly reporting system
• Due Tuesday by midnight, available by 6am Wednesday consolidated (lag 1-10 days)
DRAFT AMENDMENT 2 FOR PUBLIC COMMENT
45
• Required ACCSP data elements listed above PDT Notes
• Consistent with NE dealers reporting requirements • Difficult to implement in states with established harvester-dependent reporting, not
dealer-dependent reporting. • Not difficult to implement in states that use ACCSP eTrips.
Option D. Require SAFIS eTrips fisherman daily reporting system
• Due by 10pm, available by 6am next day for consolidation • Required ACCSP data elements listed above
PDT Notes • Limiting factor, computer access and familiarity of fisherman
Option E. SAFIS weekly with trigger to SAFIS eTrips when approaching quota maximum (85%
trigger) • Utilize weekly system until it is projected that 85% of the quota will be attained, then
require daily reporting system until close of fishery (or end of season), whichever comes first.
• Required ACCSP data elements listed above
3.6.1.3 Recreational Catch and Effort Data Collection Program(s) The Marine Recreational Fisheries Statistics Survey (MRFSS) contains estimated Atlantic menhaden catches from 1981-2003 and the Marine Recreational Information Program (MRIP) contains estimated Atlantic menhaden catches from 2004-2011. These catches were downloaded from http://www.st.nmfs.noaa.gov/st1/recreational/queries/index.html using the query option. See MRFSS/MRIP online for discussion of survey methods: http://www.st.nmfs.noaa.gov/st1/recreational/overview/overview.html#meth
3.6.1.4 For-Hire Catch/Effort Data Collection Programs ACCSP standards allow for the use of MRIP for-hire sampling or a census system such as ACCSP’s eTrips. For-hire sampling provide data by period, but eTrips can provide data within a 24-hour period.
3.6.2 Fishery-Dependent Data
3.6.2.1 Biological Data The Beaufort Laboratory of the Southeast Fisheries Science Center (NMFS) conducts biostatistical sampling of the Atlantic menhaden reduction fishery (Smith 1991). The program began preliminary sampling in the Mid-Atlantic and Chesapeake Bay areas during 1952-1954 and has continued uninterrupted since 1955, sampling the entire range of the Atlantic menhaden purse-seine reduction fishery. Detailed descriptions of the sampling procedures and estimates gathered through the program are cited in Smith (1991). The biostatistical data, or port samples, for length- and weight-at-age are available from 1955 through 2011, and represent one of the longest and most complete time series of fishery data sets in the nation. The NMFS employs a full-time port agent at Reedville, VA to sample catches at
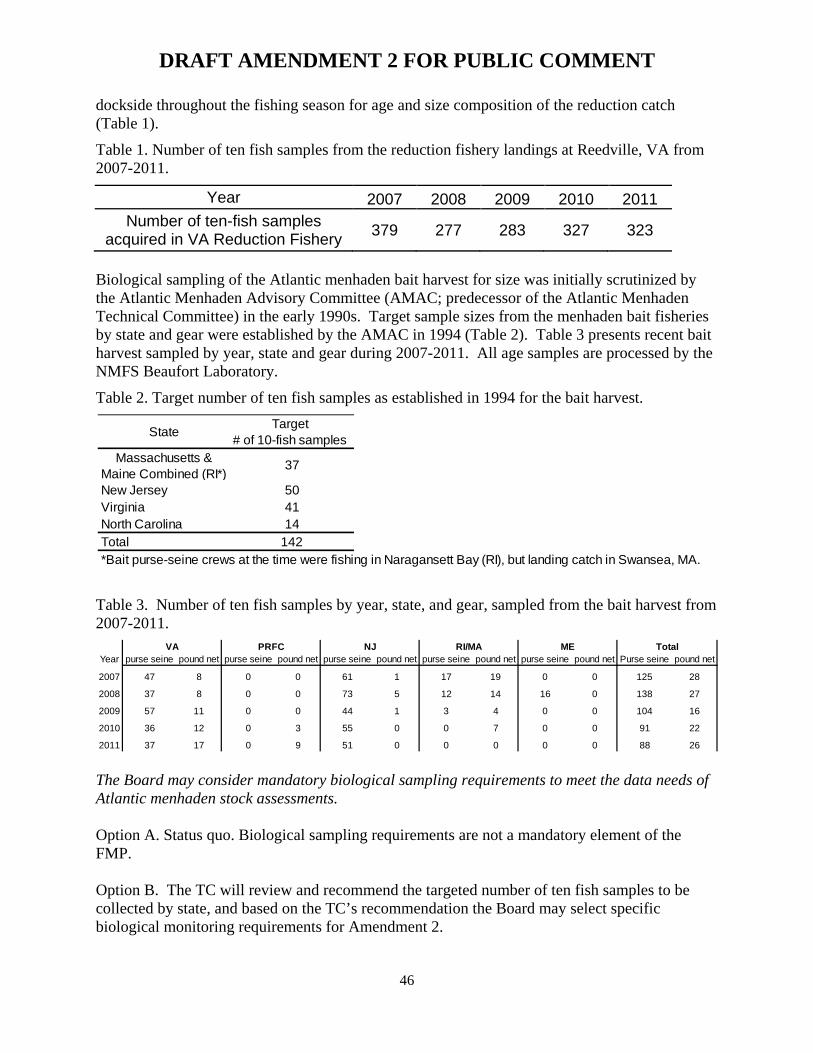
DRAFT AMENDMENT 2 FOR PUBLIC COMMENT
46
dockside throughout the fishing season for age and size composition of the reduction catch (Table 1).
Table 1. Number of ten fish samples from the reduction fishery landings at Reedville, VA from 2007-2011.
Year 2007 2008 2009 2010 2011 Number of ten-fish samples
acquired in VA Reduction Fishery 379 277 283 327 323
Biological sampling of the Atlantic menhaden bait harvest for size was initially scrutinized by the Atlantic Menhaden Advisory Committee (AMAC; predecessor of the Atlantic Menhaden Technical Committee) in the early 1990s. Target sample sizes from the menhaden bait fisheries by state and gear were established by the AMAC in 1994 (Table 2). Table 3 presents recent bait harvest sampled by year, state and gear during 2007-2011. All age samples are processed by the NMFS Beaufort Laboratory.
Table 2. Target number of ten fish samples as established in 1994 for the bait harvest.
Table 3. Number of ten fish samples by year, state, and gear, sampled from the bait harvest from 2007-2011.
The Board may consider mandatory biological sampling requirements to meet the data needs of Atlantic menhaden stock assessments. Option A. Status quo. Biological sampling requirements are not a mandatory element of the FMP. Option B. The TC will review and recommend the targeted number of ten fish samples to be collected by state, and based on the TC’s recommendation the Board may select specific biological monitoring requirements for Amendment 2.
Target # of 10-fish samples
New Jersey 50Virginia 41North Carolina 14Total 142*Bait purse-seine crews at the time were fishing in Naragansett Bay (RI), but landing catch in Swansea, MA.
37Massachusetts & Maine Combined (RI*)
State
Year purse seine pound net purse seine pound net purse seine pound net purse seine pound net purse seine pound net Purse seine pound net
2007 47 8 0 0 61 1 17 19 0 0 125 28
2008 37 8 0 0 73 5 12 14 16 0 138 27
2009 57 11 0 0 44 1 3 4 0 0 104 16
2010 36 12 0 3 55 0 0 7 0 0 91 22
2011 37 17 0 9 51 0 0 0 0 0 88 26
TotalPRFC NJ RI/MA MEVA
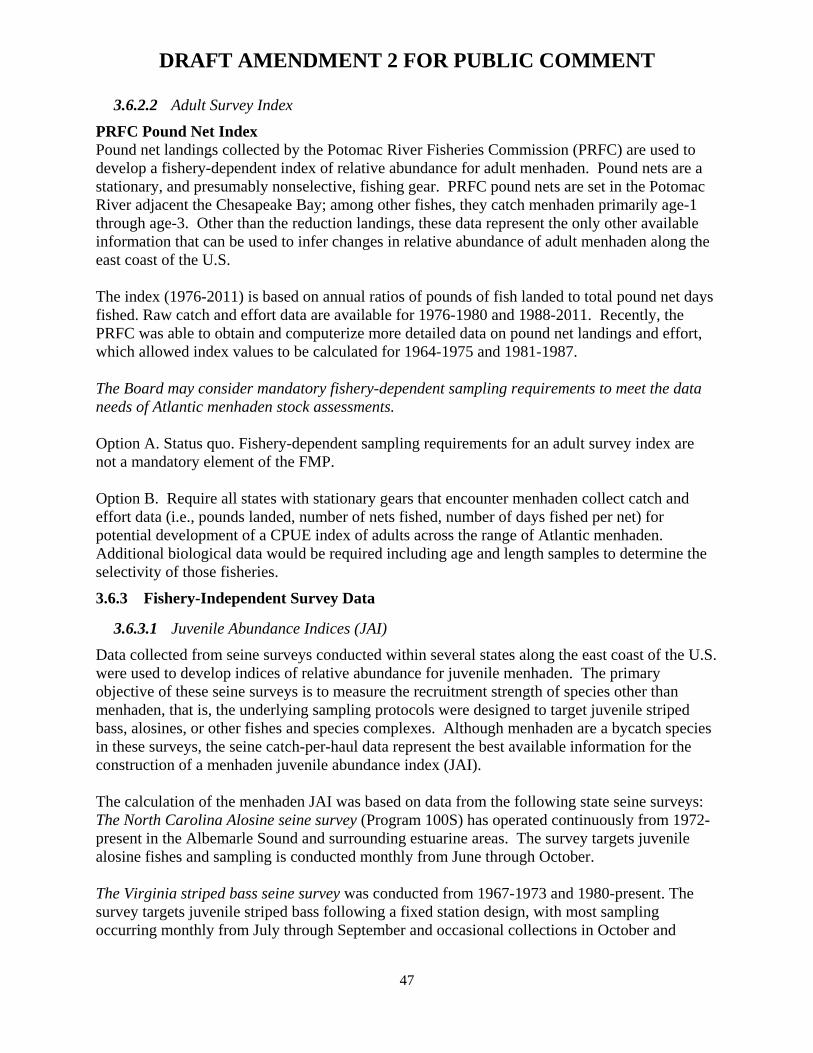
DRAFT AMENDMENT 2 FOR PUBLIC COMMENT
47
3.6.2.2 Adult Survey Index PRFC Pound Net Index Pound net landings collected by the Potomac River Fisheries Commission (PRFC) are used to develop a fishery-dependent index of relative abundance for adult menhaden. Pound nets are a stationary, and presumably nonselective, fishing gear. PRFC pound nets are set in the Potomac River adjacent the Chesapeake Bay; among other fishes, they catch menhaden primarily age-1 through age-3. Other than the reduction landings, these data represent the only other available information that can be used to infer changes in relative abundance of adult menhaden along the east coast of the U.S. The index (1976-2011) is based on annual ratios of pounds of fish landed to total pound net days fished. Raw catch and effort data are available for 1976-1980 and 1988-2011. Recently, the PRFC was able to obtain and computerize more detailed data on pound net landings and effort, which allowed index values to be calculated for 1964-1975 and 1981-1987. The Board may consider mandatory fishery-dependent sampling requirements to meet the data needs of Atlantic menhaden stock assessments. Option A. Status quo. Fishery-dependent sampling requirements for an adult survey index are not a mandatory element of the FMP. Option B. Require all states with stationary gears that encounter menhaden collect catch and effort data (i.e., pounds landed, number of nets fished, number of days fished per net) for potential development of a CPUE index of adults across the range of Atlantic menhaden. Additional biological data would be required including age and length samples to determine the selectivity of those fisheries.
3.6.3 Fishery-Independent Survey Data
3.6.3.1 Juvenile Abundance Indices (JAI) Data collected from seine surveys conducted within several states along the east coast of the U.S. were used to develop indices of relative abundance for juvenile menhaden. The primary objective of these seine surveys is to measure the recruitment strength of species other than menhaden, that is, the underlying sampling protocols were designed to target juvenile striped bass, alosines, or other fishes and species complexes. Although menhaden are a bycatch species in these surveys, the seine catch-per-haul data represent the best available information for the construction of a menhaden juvenile abundance index (JAI). The calculation of the menhaden JAI was based on data from the following state seine surveys: The North Carolina Alosine seine survey (Program 100S) has operated continuously from 1972-present in the Albemarle Sound and surrounding estuarine areas. The survey targets juvenile alosine fishes and sampling is conducted monthly from June through October. The Virginia striped bass seine survey was conducted from 1967-1973 and 1980-present. The survey targets juvenile striped bass following a fixed station design, with most sampling occurring monthly from July through September and occasional collections in October and
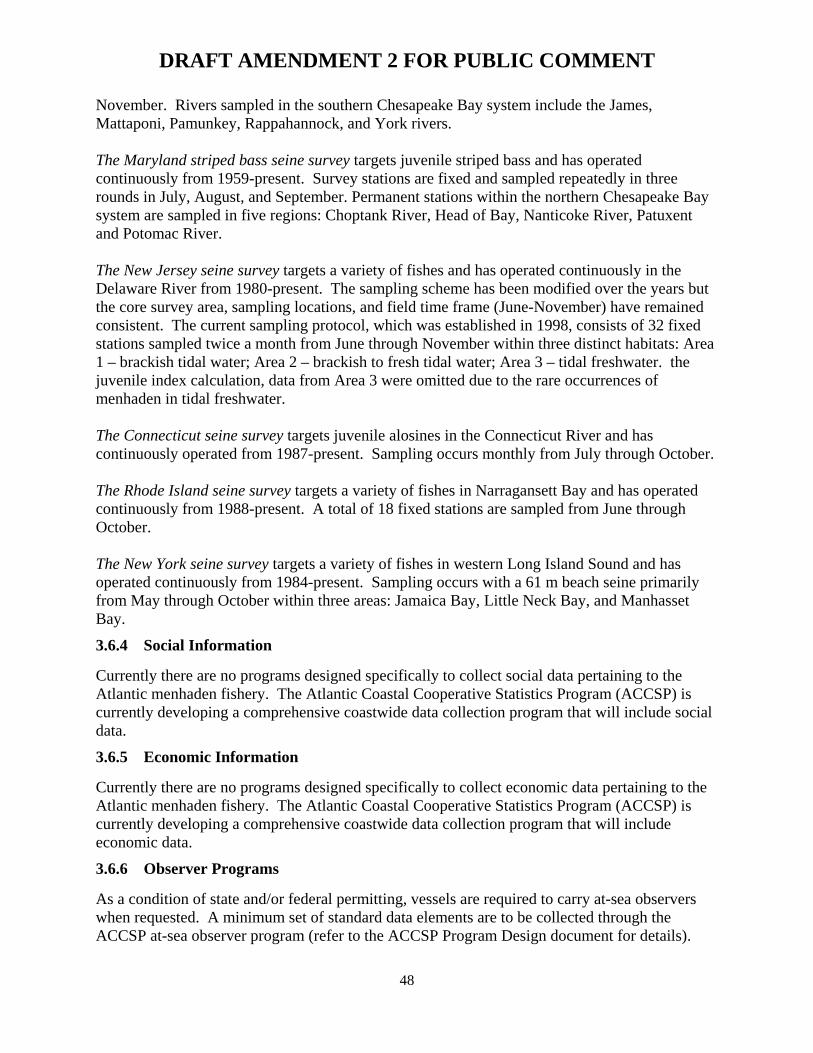
DRAFT AMENDMENT 2 FOR PUBLIC COMMENT
48
November. Rivers sampled in the southern Chesapeake Bay system include the James, Mattaponi, Pamunkey, Rappahannock, and York rivers. The Maryland striped bass seine survey targets juvenile striped bass and has operated continuously from 1959-present. Survey stations are fixed and sampled repeatedly in three rounds in July, August, and September. Permanent stations within the northern Chesapeake Bay system are sampled in five regions: Choptank River, Head of Bay, Nanticoke River, Patuxent and Potomac River. The New Jersey seine survey targets a variety of fishes and has operated continuously in the Delaware River from 1980-present. The sampling scheme has been modified over the years but the core survey area, sampling locations, and field time frame (June-November) have remained consistent. The current sampling protocol, which was established in 1998, consists of 32 fixed stations sampled twice a month from June through November within three distinct habitats: Area 1 – brackish tidal water; Area 2 – brackish to fresh tidal water; Area 3 – tidal freshwater. the juvenile index calculation, data from Area 3 were omitted due to the rare occurrences of menhaden in tidal freshwater. The Connecticut seine survey targets juvenile alosines in the Connecticut River and has continuously operated from 1987-present. Sampling occurs monthly from July through October. The Rhode Island seine survey targets a variety of fishes in Narragansett Bay and has operated continuously from 1988-present. A total of 18 fixed stations are sampled from June through October. The New York seine survey targets a variety of fishes in western Long Island Sound and has operated continuously from 1984-present. Sampling occurs with a 61 m beach seine primarily from May through October within three areas: Jamaica Bay, Little Neck Bay, and Manhasset Bay.
3.6.4 Social Information
Currently there are no programs designed specifically to collect social data pertaining to the Atlantic menhaden fishery. The Atlantic Coastal Cooperative Statistics Program (ACCSP) is currently developing a comprehensive coastwide data collection program that will include social data.
3.6.5 Economic Information
Currently there are no programs designed specifically to collect economic data pertaining to the Atlantic menhaden fishery. The Atlantic Coastal Cooperative Statistics Program (ACCSP) is currently developing a comprehensive coastwide data collection program that will include economic data.
3.6.6 Observer Programs
As a condition of state and/or federal permitting, vessels are required to carry at-sea observers when requested. A minimum set of standard data elements are to be collected through the ACCSP at-sea observer program (refer to the ACCSP Program Design document for details).
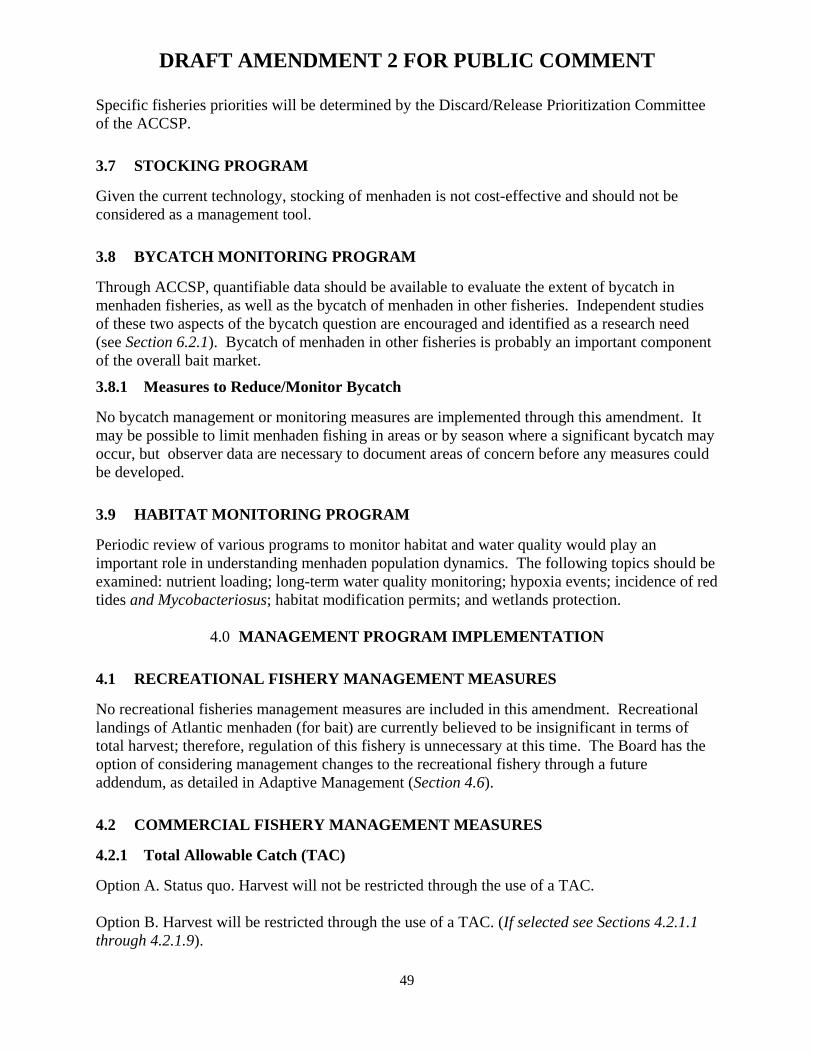
DRAFT AMENDMENT 2 FOR PUBLIC COMMENT
49
Specific fisheries priorities will be determined by the Discard/Release Prioritization Committee of the ACCSP.
3.7 STOCKING PROGRAM
Given the current technology, stocking of menhaden is not cost-effective and should not be considered as a management tool.
3.8 BYCATCH MONITORING PROGRAM
Through ACCSP, quantifiable data should be available to evaluate the extent of bycatch in menhaden fisheries, as well as the bycatch of menhaden in other fisheries. Independent studies of these two aspects of the bycatch question are encouraged and identified as a research need (see Section 6.2.1). Bycatch of menhaden in other fisheries is probably an important component of the overall bait market.
3.8.1 Measures to Reduce/Monitor Bycatch
No bycatch management or monitoring measures are implemented through this amendment. It may be possible to limit menhaden fishing in areas or by season where a significant bycatch may occur, but observer data are necessary to document areas of concern before any measures could be developed.
3.9 HABITAT MONITORING PROGRAM
Periodic review of various programs to monitor habitat and water quality would play an important role in understanding menhaden population dynamics. The following topics should be examined: nutrient loading; long-term water quality monitoring; hypoxia events; incidence of red tides and Mycobacteriosus; habitat modification permits; and wetlands protection.
4.0 MANAGEMENT PROGRAM IMPLEMENTATION
4.1 RECREATIONAL FISHERY MANAGEMENT MEASURES
No recreational fisheries management measures are included in this amendment. Recreational landings of Atlantic menhaden (for bait) are currently believed to be insignificant in terms of total harvest; therefore, regulation of this fishery is unnecessary at this time. The Board has the option of considering management changes to the recreational fishery through a future addendum, as detailed in Adaptive Management (Section 4.6).
4.2 COMMERCIAL FISHERY MANAGEMENT MEASURES
4.2.1 Total Allowable Catch (TAC)
Option A. Status quo. Harvest will not be restricted through the use of a TAC. Option B. Harvest will be restricted through the use of a TAC. (If selected see Sections 4.2.1.1 through 4.2.1.9).
DRAFT AMENDMENT 2 FOR PUBLIC COMMENT
50
4.2.1.1 TAC Specification The Atlantic Menhaden Management Board will set an annual or multi-year TAC based on the following procedure. The Atlantic Menhaden TC will annually review the best available data including, but not limited to, commercial and recreational catch/landing statistics, current estimates of fishing mortality, stock status, survey indices, assessment modeling results, and target mortality levels. The TC will calculate TAC options based on the Board selected method of setting a TAC (see Section 4.2.1.2). The Board will set an annual TAC through Board action with the option of setting a multi-year TAC, reviewed annually. The directed fishery for Atlantic menhaden will be closed when the Plan Development Team Chair projects the catch will exceed a percentage of the TAC (see options below). States have the responsibility to close the Atlantic menhaden commercial fishery in their state once the TAC (or a percentage thereof) has been reached. Acknowledging that any changes selected in reporting requirements (Section 3.6.1.2) may take time to implement completely, the Board may select a lower closing percentage to account for incomplete and late reports at the time of season closure. Option A. 85% Option B. 90% Option C. 95% Option D. The Board will specify annually or for multiple years, a percentage of the TAC to base closures on.
4.2.1.2 TAC Setting Method Ending overfishing and reducing F to the target will require the implementation of management measures that lower landing levels compared to recent years. Given the uncertainty in the most recent stock assessment update (ASMFC 2012), the projection analysis that explored constant landing scenarios with a probability and timeframe to achieve the target F, are not usable for setting a TAC. This means that the level at which the Board needs to reduce landings to achieve the target F over a set time frame is unknown. However, because overfishing is occurring, the Board will take steps to reduce F to the target level. The first step in that process is to end overfishing immediately. Option A. Ad-hoc approach to setting TACs. As an alternative to using projections to set TACs, ad hoc approaches are used by several regional Fishery Management Councils for species with poor assessment data or uncertain stock assessment results. Typically, in these situations, most Councils use their landings/catch data as the only reliable means of setting harvest limits. A document entitled “Calculating Acceptable Biological Catch for Stocks that have reliable Catch Data Only (Only Reliable Catch Stocks – ORCS)” was recently published, and serves as guidance to set interim removal levels under these conditions (ORCS 2011).
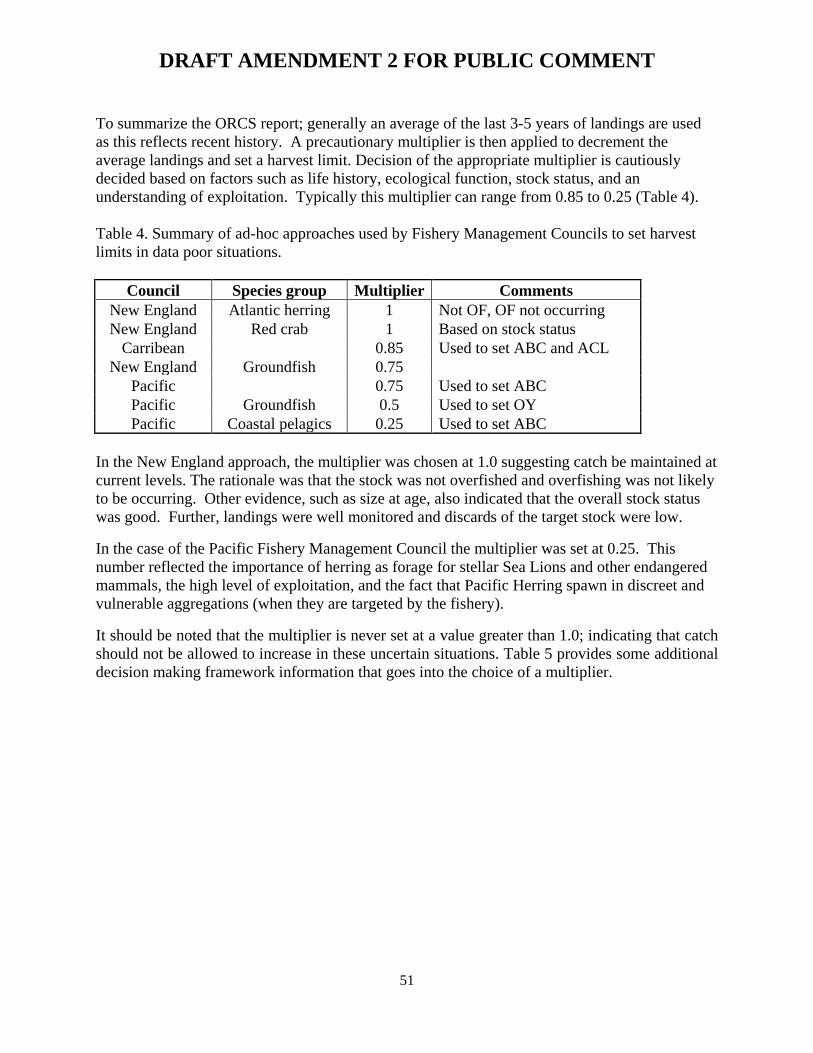
DRAFT AMENDMENT 2 FOR PUBLIC COMMENT
51
To summarize the ORCS report; generally an average of the last 3-5 years of landings are used as this reflects recent history. A precautionary multiplier is then applied to decrement the average landings and set a harvest limit. Decision of the appropriate multiplier is cautiously decided based on factors such as life history, ecological function, stock status, and an understanding of exploitation. Typically this multiplier can range from 0.85 to 0.25 (Table 4). Table 4. Summary of ad-hoc approaches used by Fishery Management Councils to set harvest limits in data poor situations.
Council Species group Multiplier Comments New England Atlantic herring 1 Not OF, OF not occurring New England Red crab 1 Based on stock status
Carribean 0.85 Used to set ABC and ACL New England Groundfish 0.75
Pacific 0.75 Used to set ABC Pacific Groundfish 0.5 Used to set OY Pacific Coastal pelagics 0.25 Used to set ABC
In the New England approach, the multiplier was chosen at 1.0 suggesting catch be maintained at current levels. The rationale was that the stock was not overfished and overfishing was not likely to be occurring. Other evidence, such as size at age, also indicated that the overall stock status was good. Further, landings were well monitored and discards of the target stock were low.
In the case of the Pacific Fishery Management Council the multiplier was set at 0.25. This number reflected the importance of herring as forage for stellar Sea Lions and other endangered mammals, the high level of exploitation, and the fact that Pacific Herring spawn in discreet and vulnerable aggregations (when they are targeted by the fishery).
It should be noted that the multiplier is never set at a value greater than 1.0; indicating that catch should not be allowed to increase in these uncertain situations. Table 5 provides some additional decision making framework information that goes into the choice of a multiplier.

DRAFT AMENDMENT 2 FOR PUBLIC COMMENT
52
Table 5. The method table showing possible actions for determining ABC based on different fishery impact categories and expert opinion. Taken from the workshop report of the 2nd National SSC meeting (from ORCS, 2011).
ABC = Acceptable Biological Catch ACL = Annual Catch Limit ACT = Annual Catch Target OFL = Overfishing Level For Atlantic menhaden; the stock is likely experiencing overfishing given the recent changes in reference points (ASMFC 2012). Overall, Atlantic menhaden have low vulnerability given their short life history, age at spawning, rapid growth, and fecundity. However, menhaden also serve as forage for other valuable commercial and recreationally important species. While landings history data are good, some significant uncertainties remain in recruitment due to natural variability. As such Table 6 outlines some possible options using a 3 or 5 year average of the catch, with the addition of potential multipliers to be used on those catch values. Typically Councils and their SSC’s dictate the multipliers in 0.25 increments, given the other uncertainties involved.
Table 6. Estimated harvest levels (thousand MT) for a range of uncertainty correction factors. Probability of reducing overfishing decreases moving towards a multiplier of 1.
Sub-options Average Multipliers Multipliers
1 0.9 0.8 0.75 0.5 Sub-options A 3-year 213.5 192.2 170.8 160.2 106.8 Sub-options B 5-year 209.5 188.5 167.6 157.1 104.7
The first step in the ad hoc approach to set a TAC is choosing a recent range of years to average the catch. The Board is considering a recent 3-year and 5-year average of the catch. The second step is the choice of a precautionary multiplier. As noted, the precautionary multiplier adjusts the average catch to arrive at a final TAC. The Board is considering multipliers between 1 and 0.5, meaning a range of reductions from 0% to 50%, respectively (Table 6).
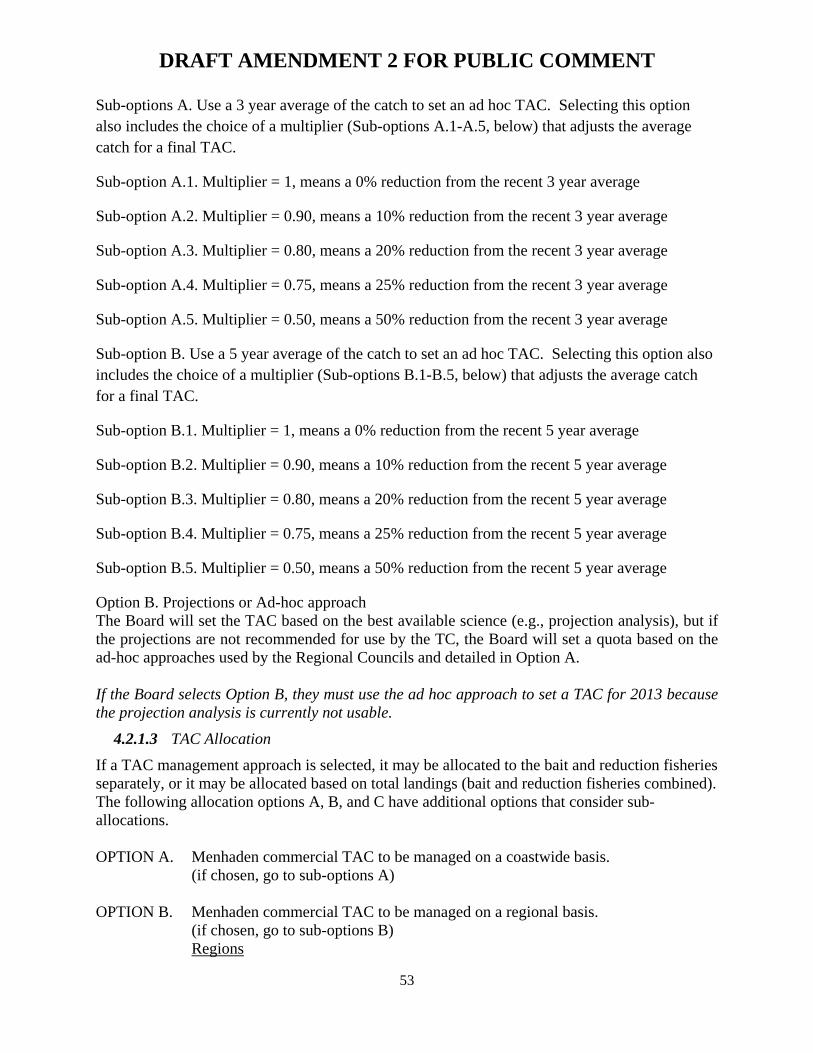
DRAFT AMENDMENT 2 FOR PUBLIC COMMENT
53
Sub-options A. Use a 3 year average of the catch to set an ad hoc TAC. Selecting this option also includes the choice of a multiplier (Sub-options A.1-A.5, below) that adjusts the average catch for a final TAC.
Sub-option A.1. Multiplier = 1, means a 0% reduction from the recent 3 year average
Sub-option A.2. Multiplier = 0.90, means a 10% reduction from the recent 3 year average
Sub-option A.3. Multiplier = 0.80, means a 20% reduction from the recent 3 year average
Sub-option A.4. Multiplier = 0.75, means a 25% reduction from the recent 3 year average
Sub-option A.5. Multiplier = 0.50, means a 50% reduction from the recent 3 year average
Sub-option B. Use a 5 year average of the catch to set an ad hoc TAC. Selecting this option also includes the choice of a multiplier (Sub-options B.1-B.5, below) that adjusts the average catch for a final TAC.
Sub-option B.1. Multiplier = 1, means a 0% reduction from the recent 5 year average
Sub-option B.2. Multiplier = 0.90, means a 10% reduction from the recent 5 year average
Sub-option B.3. Multiplier = 0.80, means a 20% reduction from the recent 5 year average
Sub-option B.4. Multiplier = 0.75, means a 25% reduction from the recent 5 year average
Sub-option B.5. Multiplier = 0.50, means a 50% reduction from the recent 5 year average
Option B. Projections or Ad-hoc approach The Board will set the TAC based on the best available science (e.g., projection analysis), but if the projections are not recommended for use by the TC, the Board will set a quota based on the ad-hoc approaches used by the Regional Councils and detailed in Option A. If the Board selects Option B, they must use the ad hoc approach to set a TAC for 2013 because the projection analysis is currently not usable.
4.2.1.3 TAC Allocation If a TAC management approach is selected, it may be allocated to the bait and reduction fisheries separately, or it may be allocated based on total landings (bait and reduction fisheries combined). The following allocation options A, B, and C have additional options that consider sub-allocations. OPTION A. Menhaden commercial TAC to be managed on a coastwide basis.
(if chosen, go to sub-options A) OPTION B. Menhaden commercial TAC to be managed on a regional basis. (if chosen, go to sub-options B) Regions

DRAFT AMENDMENT 2 FOR PUBLIC COMMENT
54
New England Region (ME-CT) Mid-Atlantic Region (NY-MD Coast) Chesapeake Bay Region (VA, PRFC, MD Bay) South Atlantic Region (NC-FL) OPTION C. Menhaden commercial TAC to be managed on a state-by-state basis. (if chosen, go to sub-options C) States ME-FL
SUBOPTIONS A: Menhaden commercial TAC to be managed on coastwide basis. SUBOPTION A.1: Menhaden coastal commercial TAC not to be allocated by fishery. (if chosen, TAC allocation section complete)
SUBOPTION A.2: Menhaden coastal commercial TAC to be allocated by fishery; bait and reduction.
(if chosen, go to suboptions A.2) SUBOPTIONS A.2: Menhaden coastal commercial TAC to be allocated by fishery; bait and
reduction. Suboptions Bait Reduction
A.2.1: Average 3 years (2009-2011) 0.2155 0.7845
A.2.2: Average 5 years (2007-2011) 0.2194 0.7806
A.2.3: Average 7 years (2005-2011) 0.1962 0.8038
A.2.4: Highest 3 years (2005-2011) 0.2163 0.7837
A.2.5: 30% bait and 70% reduction split 0.30 0.70
A.2.6: 40% bait and 60% reduction split 0.40 0.60
A.2.7: 50% bait and 50% reduction split 0.50 0.50
For options A.2.1.-A.2.4, these time frames are reflective of the most recent improvements to the bait fishery landing reporting systems. Since 2005, only one reduction fishery plant was in operation. Suboptions A.2.1, A.2.2., and A.2.3 are based on the average historical landings for the time frame specified. Suboption A.2.4 is based on an average of the highest 3 years of landings, by fishery, since 2005. Suboptions A.2.5, A.2.6 and A.2.7 are not based on landings history, but are being considered by the Board.
SUBOPTIONS B: Menhaden commercial TAC to be managed on a regional basis.

DRAFT AMENDMENT 2 FOR PUBLIC COMMENT
55
SUBOPTION B.1: Menhaden coastal commercial TAC not to be allocated by fishery, only by region.
(if chosen, go to suboptions B.1)
SUBOPTION B.2: Menhaden coastal commercial TAC to be allocated by fishery, and by region.
(if chosen, go to suboptions B.2) SUBOPTIONS B.1: Menhaden coastal commercial TAC not to be allocated by fishery, only by
region
Suboptions New
England (ME-CT)
Mid-Atlantic
(NY-MD Coast)
Chesapeake Bay (VA,
PRFC, MD-Bay)
South Atlantic (NC-FL)
B.1.1: Average 3 years (2009-2011) 1% 11% 87% 1%
B.1.2: Average 5 years (2007-2011) 2% 10% 88% 0%
B.1.3: Average 7 years (2005-2011) 1% 9% 89% 0%
B.1.4: Highest 3 years (2005-2011) 2% 11% 87% 0%
These time frames are reflective of the most recent improvements to the bait fishery landing reporting systems. Since 2005, only one reduction fishery plant was in operation in Virginia, so the Chesapeake Bay region would receive the 100% of the reduction fishery allocation. Suboptions B.1.1, B.1.2., and B.1.3. are based on the average historical landings for the time frame specified. Suboption B.1.4 is based on an average of the highest 3 years of landings, by fishery, since 2005.
SUBOPTIONS B.2: Menhaden coastal commercial TAC to be allocated by fishery, and then the bait portion of the quota by region (two parts)
Part 1: Fishery Suboptions Bait Reduction
B.2.1.1: Average 3 years (2009-2011) 0.2155 0.7845
B.2.1.2: Average 5 years (2007-2011) 0.2194 0.7806
B.2.1.3: Average 7 years (2005-2011) 0.1962 0.8038
B.2.1.4: Highest 3 years (2005-2011) 0.2163 0.7837
B.2.1.5: 30% bait and 70% reduction split 0.30 0.70
B.2.1.6: 40% bait and 60% reduction split 0.40 0.60
B.2.1.7: 50% bait and 50% reduction split 0.50 0.50
For options B2.1.1-B2.1.4, these time frames are reflective of the most recent improvements to the bait fishery landing reporting systems. Since 2005, only one reduction fishery plant was in operation in Virginia.
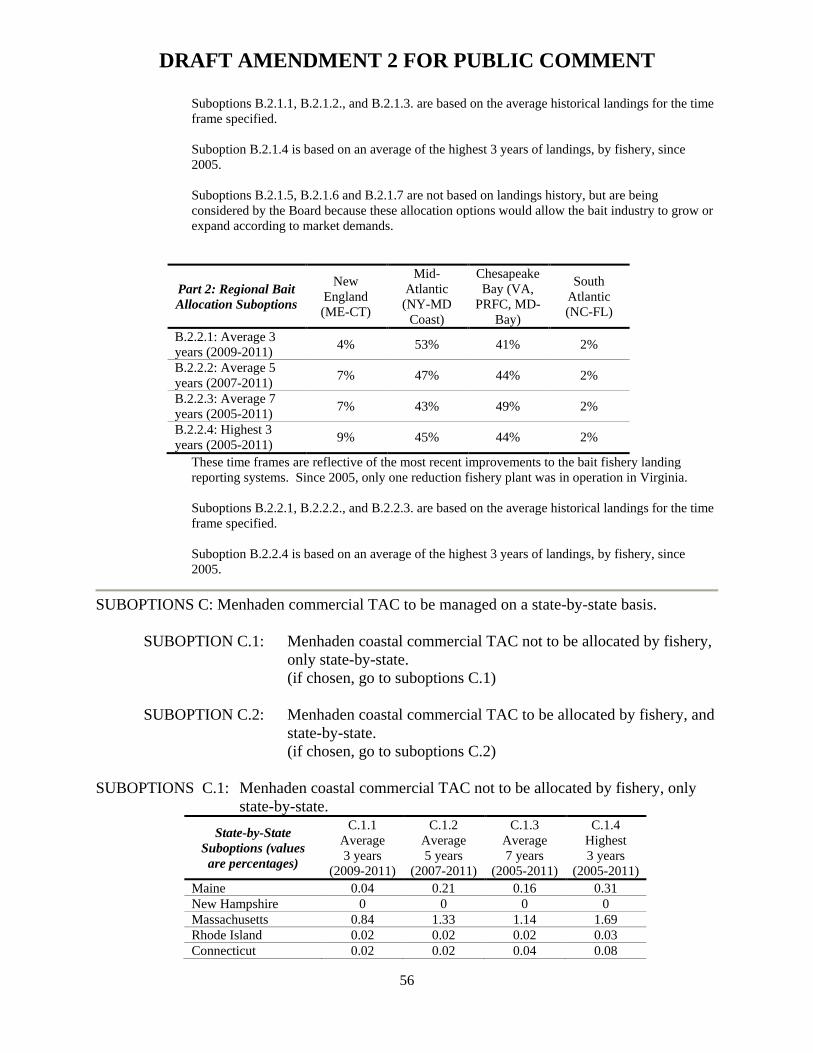
DRAFT AMENDMENT 2 FOR PUBLIC COMMENT
56
Suboptions B.2.1.1, B.2.1.2., and B.2.1.3. are based on the average historical landings for the time frame specified. Suboption B.2.1.4 is based on an average of the highest 3 years of landings, by fishery, since 2005. Suboptions B.2.1.5, B.2.1.6 and B.2.1.7 are not based on landings history, but are being considered by the Board because these allocation options would allow the bait industry to grow or expand according to market demands.
Part 2: Regional Bait Allocation Suboptions
New England (ME-CT)
Mid-Atlantic
(NY-MD Coast)
Chesapeake Bay (VA,
PRFC, MD-Bay)
South Atlantic (NC-FL)
B.2.2.1: Average 3 years (2009-2011) 4% 53% 41% 2%
B.2.2.2: Average 5 years (2007-2011) 7% 47% 44% 2%
B.2.2.3: Average 7 years (2005-2011) 7% 43% 49% 2%
B.2.2.4: Highest 3 years (2005-2011) 9% 45% 44% 2%
These time frames are reflective of the most recent improvements to the bait fishery landing reporting systems. Since 2005, only one reduction fishery plant was in operation in Virginia. Suboptions B.2.2.1, B.2.2.2., and B.2.2.3. are based on the average historical landings for the time frame specified. Suboption B.2.2.4 is based on an average of the highest 3 years of landings, by fishery, since 2005.
SUBOPTIONS C: Menhaden commercial TAC to be managed on a state-by-state basis.
SUBOPTION C.1: Menhaden coastal commercial TAC not to be allocated by fishery, only state-by-state.
(if chosen, go to suboptions C.1)
SUBOPTION C.2: Menhaden coastal commercial TAC to be allocated by fishery, and state-by-state.
(if chosen, go to suboptions C.2) SUBOPTIONS C.1: Menhaden coastal commercial TAC not to be allocated by fishery, only
state-by-state. State-by-State
Suboptions (values are percentages)
C.1.1 Average 3 years
(2009-2011)
C.1.2 Average 5 years
(2007-2011)
C.1.3 Average 7 years
(2005-2011)
C.1.4 Highest 3 years
(2005-2011) Maine 0.04 0.21 0.16 0.31 New Hampshire 0 0 0 0 Massachusetts 0.84 1.33 1.14 1.69 Rhode Island 0.02 0.02 0.02 0.03 Connecticut 0.02 0.02 0.04 0.08
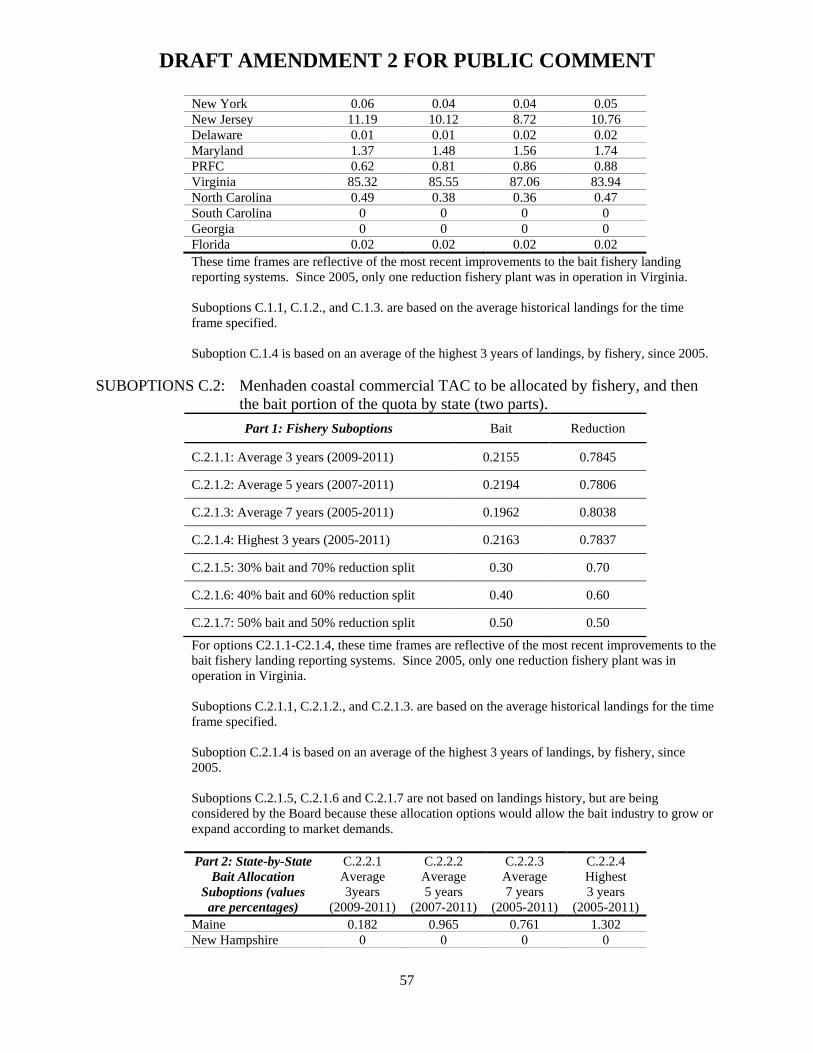
DRAFT AMENDMENT 2 FOR PUBLIC COMMENT
57
New York 0.06 0.04 0.04 0.05 New Jersey 11.19 10.12 8.72 10.76 Delaware 0.01 0.01 0.02 0.02 Maryland 1.37 1.48 1.56 1.74 PRFC 0.62 0.81 0.86 0.88 Virginia 85.32 85.55 87.06 83.94 North Carolina 0.49 0.38 0.36 0.47 South Carolina 0 0 0 0 Georgia 0 0 0 0 Florida 0.02 0.02 0.02 0.02 These time frames are reflective of the most recent improvements to the bait fishery landing reporting systems. Since 2005, only one reduction fishery plant was in operation in Virginia. Suboptions C.1.1, C.1.2., and C.1.3. are based on the average historical landings for the time frame specified. Suboption C.1.4 is based on an average of the highest 3 years of landings, by fishery, since 2005.
SUBOPTIONS C.2: Menhaden coastal commercial TAC to be allocated by fishery, and then the bait portion of the quota by state (two parts). Part 1: Fishery Suboptions Bait Reduction
C.2.1.1: Average 3 years (2009-2011) 0.2155 0.7845
C.2.1.2: Average 5 years (2007-2011) 0.2194 0.7806
C.2.1.3: Average 7 years (2005-2011) 0.1962 0.8038
C.2.1.4: Highest 3 years (2005-2011) 0.2163 0.7837
C.2.1.5: 30% bait and 70% reduction split 0.30 0.70
C.2.1.6: 40% bait and 60% reduction split 0.40 0.60
C.2.1.7: 50% bait and 50% reduction split 0.50 0.50
For options C2.1.1-C2.1.4, these time frames are reflective of the most recent improvements to the bait fishery landing reporting systems. Since 2005, only one reduction fishery plant was in operation in Virginia. Suboptions C.2.1.1, C.2.1.2., and C.2.1.3. are based on the average historical landings for the time frame specified. Suboption C.2.1.4 is based on an average of the highest 3 years of landings, by fishery, since 2005. Suboptions C.2.1.5, C.2.1.6 and C.2.1.7 are not based on landings history, but are being considered by the Board because these allocation options would allow the bait industry to grow or expand according to market demands. Part 2: State-by-State
Bait Allocation Suboptions (values are percentages)
C.2.2.1 Average 3years
(2009-2011)
C.2.2.2 Average 5 years
(2007-2011)
C.2.2.3 Average 7 years
(2005-2011)
C.2.2.4 Highest 3 years
(2005-2011) Maine 0.182 0.965 0.761 1.302 New Hampshire 0 0 0 0
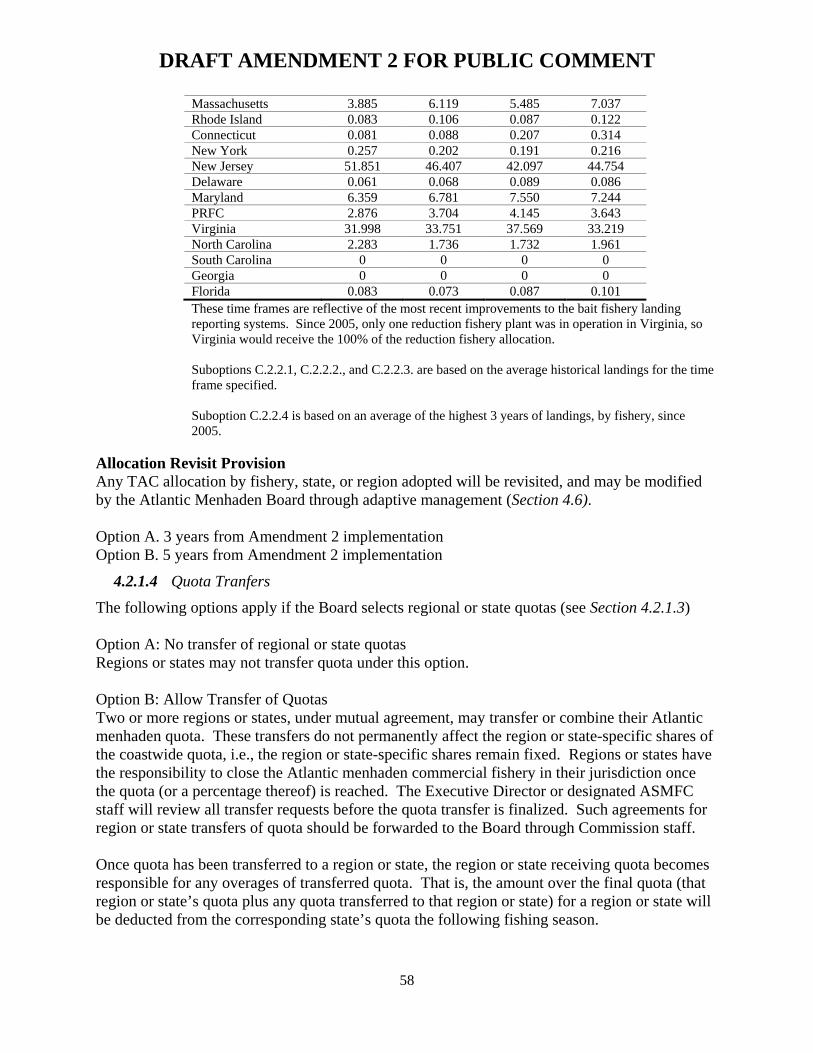
DRAFT AMENDMENT 2 FOR PUBLIC COMMENT
58
Massachusetts 3.885 6.119 5.485 7.037 Rhode Island 0.083 0.106 0.087 0.122 Connecticut 0.081 0.088 0.207 0.314 New York 0.257 0.202 0.191 0.216 New Jersey 51.851 46.407 42.097 44.754 Delaware 0.061 0.068 0.089 0.086 Maryland 6.359 6.781 7.550 7.244 PRFC 2.876 3.704 4.145 3.643 Virginia 31.998 33.751 37.569 33.219 North Carolina 2.283 1.736 1.732 1.961 South Carolina 0 0 0 0 Georgia 0 0 0 0 Florida 0.083 0.073 0.087 0.101 These time frames are reflective of the most recent improvements to the bait fishery landing reporting systems. Since 2005, only one reduction fishery plant was in operation in Virginia, so Virginia would receive the 100% of the reduction fishery allocation. Suboptions C.2.2.1, C.2.2.2., and C.2.2.3. are based on the average historical landings for the time frame specified. Suboption C.2.2.4 is based on an average of the highest 3 years of landings, by fishery, since 2005.
Allocation Revisit Provision Any TAC allocation by fishery, state, or region adopted will be revisited, and may be modified by the Atlantic Menhaden Board through adaptive management (Section 4.6). Option A. 3 years from Amendment 2 implementation Option B. 5 years from Amendment 2 implementation
4.2.1.4 Quota Tranfers The following options apply if the Board selects regional or state quotas (see Section 4.2.1.3) Option A: No transfer of regional or state quotas Regions or states may not transfer quota under this option. Option B: Allow Transfer of Quotas Two or more regions or states, under mutual agreement, may transfer or combine their Atlantic menhaden quota. These transfers do not permanently affect the region or state-specific shares of the coastwide quota, i.e., the region or state-specific shares remain fixed. Regions or states have the responsibility to close the Atlantic menhaden commercial fishery in their jurisdiction once the quota (or a percentage thereof) is reached. The Executive Director or designated ASMFC staff will review all transfer requests before the quota transfer is finalized. Such agreements for region or state transfers of quota should be forwarded to the Board through Commission staff. Once quota has been transferred to a region or state, the region or state receiving quota becomes responsible for any overages of transferred quota. That is, the amount over the final quota (that region or state’s quota plus any quota transferred to that region or state) for a region or state will be deducted from the corresponding state’s quota the following fishing season.
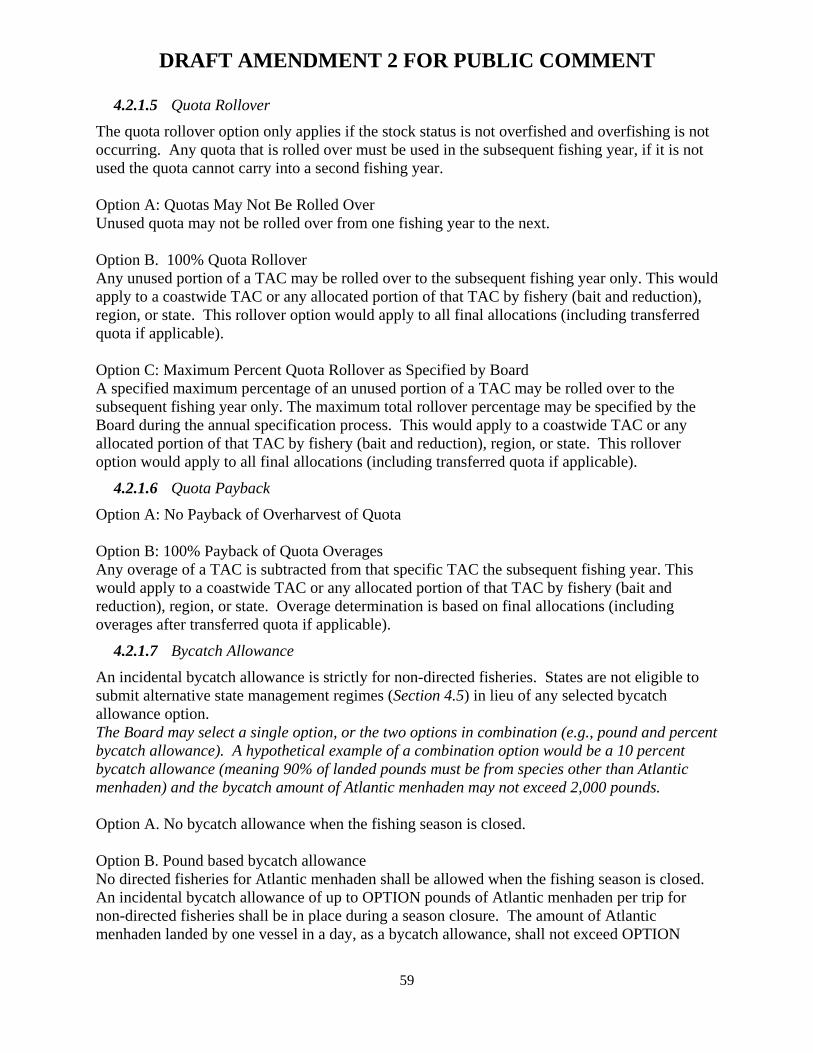
DRAFT AMENDMENT 2 FOR PUBLIC COMMENT
59
4.2.1.5 Quota Rollover The quota rollover option only applies if the stock status is not overfished and overfishing is not occurring. Any quota that is rolled over must be used in the subsequent fishing year, if it is not used the quota cannot carry into a second fishing year. Option A: Quotas May Not Be Rolled Over Unused quota may not be rolled over from one fishing year to the next. Option B. 100% Quota Rollover Any unused portion of a TAC may be rolled over to the subsequent fishing year only. This would apply to a coastwide TAC or any allocated portion of that TAC by fishery (bait and reduction), region, or state. This rollover option would apply to all final allocations (including transferred quota if applicable). Option C: Maximum Percent Quota Rollover as Specified by Board A specified maximum percentage of an unused portion of a TAC may be rolled over to the subsequent fishing year only. The maximum total rollover percentage may be specified by the Board during the annual specification process. This would apply to a coastwide TAC or any allocated portion of that TAC by fishery (bait and reduction), region, or state. This rollover option would apply to all final allocations (including transferred quota if applicable).
4.2.1.6 Quota Payback Option A: No Payback of Overharvest of Quota Option B: 100% Payback of Quota Overages Any overage of a TAC is subtracted from that specific TAC the subsequent fishing year. This would apply to a coastwide TAC or any allocated portion of that TAC by fishery (bait and reduction), region, or state. Overage determination is based on final allocations (including overages after transferred quota if applicable).
4.2.1.7 Bycatch Allowance An incidental bycatch allowance is strictly for non-directed fisheries. States are not eligible to submit alternative state management regimes (Section 4.5) in lieu of any selected bycatch allowance option. The Board may select a single option, or the two options in combination (e.g., pound and percent bycatch allowance). A hypothetical example of a combination option would be a 10 percent bycatch allowance (meaning 90% of landed pounds must be from species other than Atlantic menhaden) and the bycatch amount of Atlantic menhaden may not exceed 2,000 pounds. Option A. No bycatch allowance when the fishing season is closed. Option B. Pound based bycatch allowance No directed fisheries for Atlantic menhaden shall be allowed when the fishing season is closed. An incidental bycatch allowance of up to OPTION pounds of Atlantic menhaden per trip for non-directed fisheries shall be in place during a season closure. The amount of Atlantic menhaden landed by one vessel in a day, as a bycatch allowance, shall not exceed OPTION
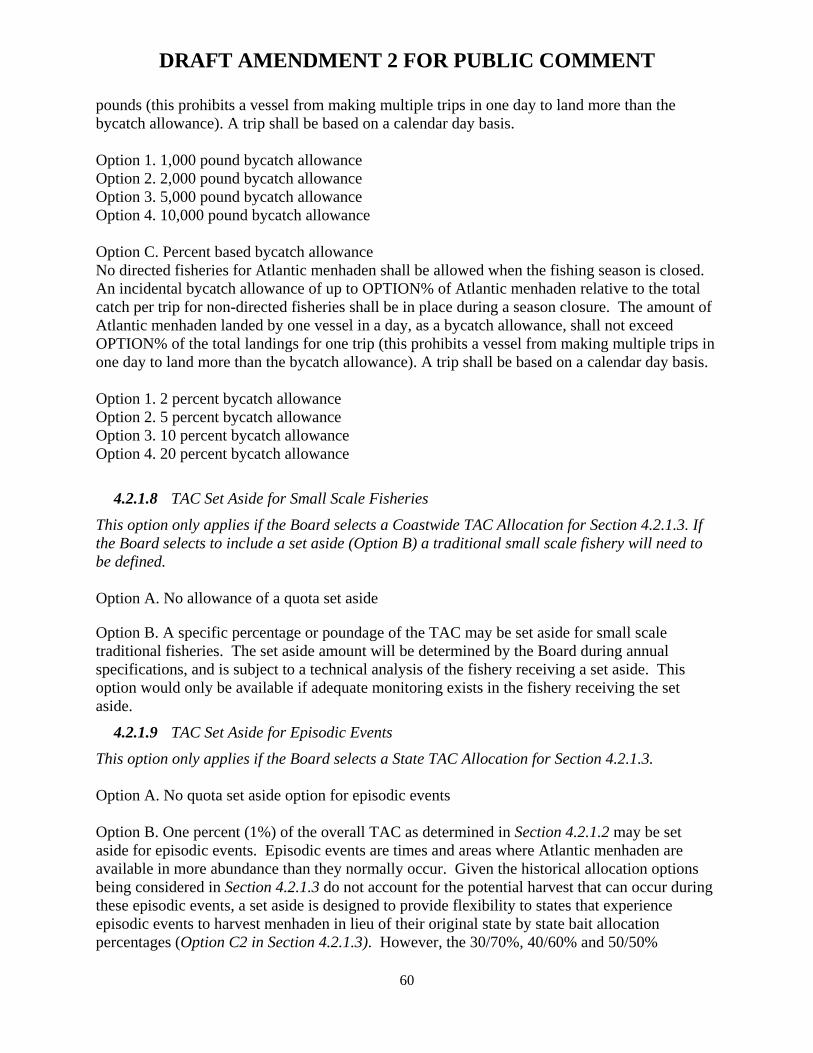
DRAFT AMENDMENT 2 FOR PUBLIC COMMENT
60
pounds (this prohibits a vessel from making multiple trips in one day to land more than the bycatch allowance). A trip shall be based on a calendar day basis. Option 1. 1,000 pound bycatch allowance Option 2. 2,000 pound bycatch allowance Option 3. 5,000 pound bycatch allowance Option 4. 10,000 pound bycatch allowance Option C. Percent based bycatch allowance No directed fisheries for Atlantic menhaden shall be allowed when the fishing season is closed. An incidental bycatch allowance of up to OPTION% of Atlantic menhaden relative to the total catch per trip for non-directed fisheries shall be in place during a season closure. The amount of Atlantic menhaden landed by one vessel in a day, as a bycatch allowance, shall not exceed OPTION% of the total landings for one trip (this prohibits a vessel from making multiple trips in one day to land more than the bycatch allowance). A trip shall be based on a calendar day basis. Option 1. 2 percent bycatch allowance Option 2. 5 percent bycatch allowance Option 3. 10 percent bycatch allowance Option 4. 20 percent bycatch allowance
4.2.1.8 TAC Set Aside for Small Scale Fisheries This option only applies if the Board selects a Coastwide TAC Allocation for Section 4.2.1.3. If the Board selects to include a set aside (Option B) a traditional small scale fishery will need to be defined. Option A. No allowance of a quota set aside
Option B. A specific percentage or poundage of the TAC may be set aside for small scale traditional fisheries. The set aside amount will be determined by the Board during annual specifications, and is subject to a technical analysis of the fishery receiving a set aside. This option would only be available if adequate monitoring exists in the fishery receiving the set aside.
4.2.1.9 TAC Set Aside for Episodic Events This option only applies if the Board selects a State TAC Allocation for Section 4.2.1.3. Option A. No quota set aside option for episodic events Option B. One percent (1%) of the overall TAC as determined in Section 4.2.1.2 may be set aside for episodic events. Episodic events are times and areas where Atlantic menhaden are available in more abundance than they normally occur. Given the historical allocation options being considered in Section 4.2.1.3 do not account for the potential harvest that can occur during these episodic events, a set aside is designed to provide flexibility to states that experience episodic events to harvest menhaden in lieu of their original state by state bait allocation percentages (Option C2 in Section 4.2.1.3). However, the 30/70%, 40/60% and 50/50%
DRAFT AMENDMENT 2 FOR PUBLIC COMMENT
61
bait/reduction allocation options may preclude the need for a TAC set aside because the allocation to states that have episodic events would increase. To qualify for the episodic event set aside, a state’s allocation must be less than 2% for the state by state bait allocation scenario (Option C2 in Section 4.2.1.3). A qualified state has the choice to opt into the episodic event set aside, giving that state the ability to harvest from the set aside amount as opposed to their allocated quota. Note the set aside amount will not be allocated to states opting in. Furthermore, if a state opts in, they forfeit their originally allocated quota to the remaining states that do not qualify or opted out of the set aside. The forfeited quota amount would be distributed to states that do not qualify or opted out of the set aside using an allocation table that is recalculated without the states that opted into the set aside. Additionally the set aside has the following provisions for states that opt in,
• Specify that any unused set aside will be rolled over into the overall quota after July 1, unless another date is selected by the Board after public comment.
• Specify that the Board will require states and or regions to implement effort controls to scale the fishery appropriate to the set-aside quota level. For example the State of Maine currently restricts harvester vessels >50’, restricts all vessels/carriers to land no more than 250,000 pounds per day and restricts carriers greater than 90’. Gear, time, season,trip limits and triggers etc are other options for different jurisdictions to consider.
• Require that reporting meet or exceeds requirements as specified in Section 3.6.1.2. • Require that if the set aside is exceeded, any overages are reduced from the next season’s
episodic event set-aside.
4.2.2 Atlantic Menhaden Chesapeake Bay Reduction Fishery Harvest Cap
The Board may consider changes to the Atlantic menhaden harvest cap, a current management measure that will expire in 2013. The current management language is below the list of options. Option A: Status quo. 2013 is the final year for the Chesapeake Bay (CB) cap. Option B: Extend the CB cap to any specified time frame. Option C: Adjust the CB cap as it relates to any quota management approach selected. The annual total allowable harvest from the Chesapeake Bay by the reduction fishery is limited to no more than 109,020 metric tons (the average landings from 2001-2005). Harvest for reduction purposes shall be prohibited within the Chesapeake Bay when 100% of the cap is harvested from Chesapeake Bay. This cap is in place for the fishing seasons starting in 2011 and going through 2013. Over-harvest in any given year will be deducted from the next year’s allowable harvest. Annual Credit for Harvest Underages The annual Chesapeake Bay harvest cap under Addendum IV is not based on a scientifically quantified harvest threshold, fishery health index, or fishery population level study. Due to data limitations, it is unknown if exceeding the 109,020 metric-ton limit will negatively affect the health of the menhaden population. The cap is designed to prevent the Chesapeake Bay reduction fishery harvest of Atlantic menhaden from expanding while the necessary scientific
DRAFT AMENDMENT 2 FOR PUBLIC COMMENT
62
studies are being conducted to explore the potential for localized depletion in the Chesapeake Bay. Assuming a cap of 109,020 metric tons had been in place over the 2001-2005 reference period, the maximum underage that would have occurred during that time period is 13,720 metric tons. The maximum rollover of unlanded fish is 13,720 metric tons. Adding that underage to the 109,020 metric ton cap results in a cap of 122,740 metric tons. In years when annual menhaden harvest in the Chesapeake Bay for reduction purposes is below the 109,020 metric-ton cap, the underage amount shall be credited to the following year’s allowable harvest. Under no circumstances can allowable harvest in any given year from 2011 through 2013 exceed 122,740 metric tons. Such credit can only be applied to the following calendar year’s harvest cap and cannot be reserved for future years or spread over multiple years. Further, if no more than the underage amount in one year is credited to the next year’s allowable harvest, the annual average harvest for 2011 through 2013 cannot exceed 109,020 metric tons.
4.3 FOR-HIRE FISHERIES MANAGEMENT MEASURES
No management measures for for-hire fisheries are proposed in this amendment.
4.4 HABITAT CONSERVATION AND RESTORATION RECOMMENDATIONS
In order to ensure the productivity of populations, each state should implement identification and protection of critical nursery areas within its boundaries for estuarine dependent, marine migratory species in general and Atlantic menhaden in particular. Such efforts should inventory historical habitats, identify habitats presently used and specify those that are targeted for recovery, and impose or encourage measures to retain or increase the quantity and quality of Atlantic menhaden essential habitats.
4.4.1 Preservation of Existing Habitat
States should provide inventories and locations of critical Atlantic menhaden habitat to other state and federal regulatory agencies. Regulatory agencies should be advised of the types of threats to Atlantic menhaden populations and recommended measures that should be employed to avoid, minimize or eliminate any threat to current habitat extent or quality.
4.4.2 Habitat Restoration, Improvement and Enhancement
While Atlantic menhaden appear to be utilizing the bulk of their historic nursery areas, water quality in these areas should be maintained or improved (if impaired), to prevent hypoxic fish kills and minimize the threat of increased mortality due to disease and parasitism. Modern trends toward the protection of wetlands will protect and improve menhaden habitat.
4.4.3 Avoidance of Incompatible Activities
Federal and state fishery management agencies should take steps to limit the introduction of compounds which are known or suspected to accumulate in any animal species’ tissue and which pose a threat to human health or any animals’ health.
DRAFT AMENDMENT 2 FOR PUBLIC COMMENT
63
Each state should establish windows of compatibility for activities known or suspected to adversely affect Atlantic menhaden life stages and their habitats, such as navigational dredging, inlet modifications, and dredged material disposal, and notify the appropriate construction or regulatory agencies in writing. Projects involving water withdrawal from nursery habitats (e.g. power plants, irrigation, water supply projects) should be scrutinized to ensure that adverse impacts resulting from larval/juvenile impingement, entrainment, and/or modification of flow, temperature and salinity regimes due to water removal, will not adversely impact estuarine dependent species, including Atlantic menhaden, especially early life stages. Each state which contains Atlantic menhaden nursery areas within its jurisdiction should develop water use and flow regime guidelines which are protective of these nursery areas and which will ensure to the extent possible, the long-term health and sustainability of the stock.
4.4.4 Fishery Practices
The use of any fishing gear or practice which is documented by management agencies to have an unacceptable impact on Atlantic menhaden (e.g. habitat damage, bycatch mortality) should be prohibited within the effected essential habitats (e.g. trawling in primary nursery areas should be prohibited).
4.5 ALTERNATIVE STATE MANAGEMENT REGIMES
Once approved by the Atlantic Menhaden Management Board, states are required to obtain prior approval from the Board of any changes to their management program for which a compliance requirement is in effect. Other measures must be reported to the Board but may be implemented without prior Board approval A state can request permission to implement an alternative to any mandatory compliance measure only if that state can show to the Board’s satisfaction that its alternative proposal will have the same conservation value as the measure contained in this amendment or any addenda prepared under Adaptive Management (Section 4.6). States submitting alternative proposals must demonstrate that the proposed action will not contribute to overfishing of the resource. All changes in state plans must be submitted in writing to the Board and to the Commission either as part of the annual FMP Review process or the Annual Compliance Reports.
4.5.1 General Procedures
A state may submit a proposal for a change to its regulatory program or any mandatory compliance measure under this amendment to the Commission, including a proposal for de minimis status. Such changes shall be submitted to the Chair of the Plan Review Team, who shall distribute the proposal to the Management Board, the Plan Review Team, the Technical Committee, the Stock Assessment Committee and the Advisory Panel. The Plan Review Team is responsible for gathering the comments of the Technical Committee, the Stock Assessment Committee and the Advisory Panel, and presenting these comments as soon as possible to the Management Board for decision.

DRAFT AMENDMENT 2 FOR PUBLIC COMMENT
64
The Atlantic Menhaden Management Board will decide whether to approve the state proposal for an alternative management program if it determines that it is consistent with the target fishing mortality rate applicable, and the goals and objectives of this amendment. In order to maintain fishing seasons similar to those currently in place, new rules should be implemented prior to the start of the fishing season and be effective on March 1 each year. Given the time for the annual assessment to be prepared and presented to the Technical Committee, Advisory Panel and the Management Board, and the time for individual states to promulgate new regulations, it may not be possible to implement new regulations for the current fishing season. Therefore new regulations should be effective at the start of the following season after a determination to do so has been made.
4.5.2 Management Program Equivalency
The Atlantic Menhaden Technical Committee (and/or Plan Review Team) will review any alternative state proposals under this section and provide to the Atlantic Menhaden Management Board its evaluation of the adequacy of such proposals.
4.5.3 De minimis Fishery Guidelines
Option A. Status Quo, de minimis criteria is not established through Amendment 2. Option B. Define de minimis for States without a Reduction Fishery. If Option B is selected, the Board must select both the Criteria for De Minimis Consideration (Section 4.5.3.1) and the plan requirements if de minimis is granted (Section 4.5.3.2).
4.5.3.1 Criteria for De Minimis Consideration A state can apply annually for de minimis status if a state does not have a reduction fishery. Option 1. To be eligible for de minimis consideration in the bait fishery, a state must prove that its commercial bait landings in the most recent two years for which data are available did not exceed 1% of the coastwide bait landings. Option 2. To be eligible for de minimis consideration in the bait fishery, a state must prove that its commercial bait landings in the most recent two years for which data are available did not exceed 2% of the coastwide bait landings.
4.5.3.2 Plan Requirements if De Minimis Status is Granted If de minimis status is granted, the de minimis state is required to implement, at a minimum, the coastwide requirements contained in Section 3.6 of Amendment 2. Any additional components of the FMP, which the Board determines necessary for a de minimis state to implement, can be defined at the time de minimis status is granted. For all other required components of the plan, the Board will specify by motion which measures a de minimis state must adopt.
Option 3: De minimis criteria exempts a state from biological monitoring (e.g., age data), but the state must adhere to timely quota monitoring requirements (as specified in Section 3.1) and may not exceed their allocated quota. If the fishery is closed for any reason, de minimis states must close their fisheries as well.
DRAFT AMENDMENT 2 FOR PUBLIC COMMENT
65
Option 4: De minimis criteria exempts a state from both biological monitoring (e.g., age data), and timely quota monitoring requirements (as specified in Section 3.1), but states must still submit annual landings, and may not exceed their allocated quota. If the fishery is closed for any reason, de minimis states must close their fisheries as well.
4.5.3.3 Procedure to apply for De Minimis Status States must specifically request de minimis status each year. Requests for de minimis status will be reviewed by the Atlantic Menhaden Plan Review Team (PRT) as part of the annual FMP review process. Requests for de minimis must be submitted to the ASMFC Atlantic Menhaden FMP Coordinator as a part of the state’s yearly compliance report. The request must contain the following information: all available commercial landings data for the current and 2 previous full years of data, commercial regulations for the current year, and the proposed management measures the state plans to implement for the year de minimis status is requested. The FMP Coordinator will then forward the information to the PRT and, if necessary, the Atlantic Menhaden Technical Committee and Stock Assessment Subcommittee.
In determining whether or not a state meets the de minimis criteria, the PRT will consider the information provided with the request, the most recent available coastwide landings data, any information provided by the Technical Committee and Stock Assessment Subcommittee, and projections of future landings. The PRT will make a recommendation to the Board to either accept or deny the de minimis request. The Board will then review the PRT recommendation and either grant or deny the de minimis classification.
The Board must make a specific motion to grant a state de minimis status. By deeming a given state de minimis, the Board is recognizing that: the state has a minimal Atlantic menhaden fishery; there is little risk to the health of the menhaden stock if the state does not implement the full suite of management measures; and the overall burden of implementing the complete management and monitoring requirements of the FMP outweigh the conservation benefits of implementing those measures in the particular state.
If commercial landings in a de minimis state exceed the de minimis threshold, the state will lose its de minimis classification, will be ineligible for de minimis in the following year, and will be required to implement all the commercial fishery requirements of the FMP. If the Board denies a state’s de minimis request, the state will be required to implement all the commercial fishery requirements of the FMP. When a state rescinds or loses its de minimis status the Board will set a compliance date by which the state must implement the required regulations.
4.6 ADAPTIVE MANAGEMENT
4.6.1 General Procedures
The Atlantic Menhaden Management Board may vary the requirements specified in this Amendment as a part of adaptive management in order to conserve the Atlantic menhaden resource. The elements that can be modified by adaptive management are listed in Section 4.6.2. The process under which adaptive management can occur is provided below. The Plan Review Team (PRT) will monitor the status of the fishery and the resource and report on that status to the Atlantic Menhaden Management Board annually or when directed to do so

DRAFT AMENDMENT 2 FOR PUBLIC COMMENT
66
by the Management Board. The PRT will consult with the Technical Committee, the Stock Assessment Committee and the Advisory Panel, if any, in making such review and report. The report will contain recommendations concerning proposed adaptive management revisions to the management program if necessary. The Atlantic Menhaden Management Board will review the report of the PRT, and may consult further with Technical Committee, the Stock Assessment Committee or the Advisory Panel. The Management Board may direct the PRT to prepare an addendum to make any changes it deems necessary. The addendum shall contain a schedule for the states to implement its provisions. Should the Management Board deem that an addendum to the fishery management plan is necessary, the Plan Development Team (PDT) will prepare a draft addendum as directed by the Management Board, and shall distribute it to all states for review and comment. A public hearing will be held in any state that requests one. The PDT will also request comment from federal agencies and the public at large. After a 30-day review period, the PDT will summarize the comments and prepare a final version of the addendum for the Management Board. The Management Board shall review the final version of the addendum prepared by the PDT, and shall also consider the public comments received and the recommendations of the Technical Committee, the Stock Assessment Committee and the Advisory Panel; and shall then decide whether to adopt or revise and adopt the addendum. Upon adoption of an addendum implementing adaptive management by the Management Board, states shall prepare proposals in which their plans to carry out the addendum are outlined and submit them to the Management Board for approval, according to a schedule to be contained in the addendum.
4.6.2 Measures Subject to Change
The following measures are subject to change under adaptive management upon approval by the Atlantic Menhaden Management Board: (1) Fishing seasons including season closures (2) Trip limits (3) Limited entry (4) Area closures (5) Annual specifications, including maximum sustainable yield (MSY), allowable biological catch (ABC), optimum yield (OY), internal waters processing (IWP) allocations, etc.; (6) Overfishing definition (7) Rebuilding targets and schedules (8) Catch controls (9) Effort controls (10) Reporting requirements (11) Gear restrictions including mesh sizes (12) Measures to reduce or monitor bycatch (13) Observer requirements (14) Management areas (15) Recommendations to the Secretaries for complementary actions in federal jurisdictions;
DRAFT AMENDMENT 2 FOR PUBLIC COMMENT
67
(16) Research or monitoring requirements (17) TAC allocation (18) Harvest caps on other inland bodies of water (19) Any other management measures currently included in Amendment 2.
4.7 EMERGENCY PROCEDURES
Emergency procedures may be used by the Atlantic Menhaden Management Board to require any emergency action that is not covered by or is an exception or change to any provision in Amendment 2. Procedures for implementation are addressed in the ASMFC Interstate Fisheries Management Program Charter, Section Six (c)(10) (ASMFC 2009).
4.8 MANAGEMENT INSTITUTIONS
The management institutions for Atlantic menhaden shall be subject to the provisions of the ISFMP Charter (ASMFC 2009). The following is not intended to replace any or all of the provisions of the ISFMP Charter. All committee roles and responsibilities are included in detail in the ISFMP Charter and are only summarized here.
4.8.1 Atlantic States Marine Fisheries Commission and ISFMP Policy Board
The ASMFC (Commission) and the ISFMP Policy Board are generally responsible for the oversight and management of the Commission’s fisheries management activities. The Commission must approve all fishery management plans, and amendments, including this Amendment 2; and must also make all final determinations concerning state compliance or noncompliance. The ISFMP Policy Board reviews recommendations of the various Management Boards and Sections and, if it concurs, forwards them on to the Commission for action.
4.8.2 Atlantic Menhaden Management Board
The Atlantic Menhaden Management Board is hereby established under the provisions of the Commission’s ISFMP Charter (Section Four [b]) and is generally responsible for carrying out all activities under this Amendment (ASMFC 2009).
4.8.3 Atlantic Menhaden Plan Development/Review Team
The Plan Development Team (PDT) and the Plan Review Team (PRT) will be composed of a small group of scientists and/or managers whose responsibility is to provide all of the technical support necessary to carry out and document the decisions of the Atlantic Menhaden Management Board. Both are chaired by an ASMFC FMP Coordinator. The Atlantic Menhaden PDT/PRT is directly responsible to the Board for providing information and documentation concerning the implementation, review, monitoring and enforcement of Amendment 2. The Atlantic Menhaden PDT/PRT shall be comprised of personnel from state and federal agencies who have scientific and management ability and knowledge of Atlantic menhaden. The PDT will be responsible for preparing all documentation necessary for the development of Amendment 2, using the best scientific information available and the most current stock assessment information. The PDT will either disband or assume inactive status upon completion of Amendment 2. Alternatively, the Board may elect to retain PDT members as members of the PRT or appoint new members. The PRT will provide annual advice concerning the
DRAFT AMENDMENT 2 FOR PUBLIC COMMENT
68
implementation, review, monitoring, and enforcement of Amendment 2 once it has been adopted by the Commission.
4.8.4 Atlantic Menhaden Technical Committee
The Atlantic Menhaden Technical Committee will consist of representatives from state or federal agencies, Regional Fishery Management Councils, Commission, university or other specialized personnel with scientific and technical expertise and knowledge of the Atlantic menhaden fishery. The Board will appoint the members of the Technical Committee and may authorize additional seats as it sees fit. Its role is to act as a liaison to the individual state and federal agencies, provide information to the management process, and review and develop options concerning the management program. The Technical Committee will provide scientific and technical advice to the Management Board, PDT, and PRT in the development and monitoring of a fishery management plan or amendment.
4.8.5 Atlantic Menhaden Stock Assessment Subcommittee
The Atlantic Menhaden Stock Assessment Subcommittee shall be appointed by the Technical Committee at the request of the Management Board, and will consist of scientists with expertise in the assessment of the Atlantic menhaden population. Its role is to assess the Atlantic menhaden population and provide scientific advice concerning the implications of proposed or potential management alternatives, or to respond to other scientific questions from the Board, Technical Committee, PDT or PRT. The Stock Assessment Subcommittee will report to the Technical Committee.
4.8.6 Atlantic Menhaden Advisory Panel
The Atlantic Menhaden Advisory Panel will be established according to the Commission’s Advisory Committee Charter. Members of the Advisory Panel will be citizens who represent a cross-section of commercial and recreational fishing interests and others who are concerned about Atlantic menhaden conservation and management. The Advisory Panel provides the Board with advice directly concerning the Commission’s Atlantic menhaden management program.
4.8.7 Federal Agencies
4.8.7.1 Management in the Exclusive Economic Zone (EEZ) Management of Atlantic menhaden in the EEZ is within the jurisdiction of the three Regional Fishery Management Councils under the Magnuson-Stevens Act (16 U.S.C. 1801 et seq.). In the absence of a Council Fishery Management Plan, management is the responsibility of the NMFS as mandated by the Atlantic Coastal Fishery Conservation and Management Act (16 U.S.C. 5105 et seq.)
4.8.7.2 Federal Agency Participation in the Management Process The Commission has accorded the United States Fish and Wildlife Service (USFWS) and the NMFS voting status on the ISFMP Policy Board and the Atlantic Menhaden Management Board in accordance with the Commission’s ISFMP Charter. The NMFS also participates on the Atlantic Menhaden Plan Development Team, Plan Review Team, Technical Committee and Stock Assessment Subcommittee.
DRAFT AMENDMENT 2 FOR PUBLIC COMMENT
69
4.8.7.3 Consultation with Fishery Management Councils At the time of adoption of Amendment 2, none of the Regional Fishery Management Councils had implemented a management plan for Atlantic menhaden nor had they indicated an intent to develop a plan.
4.9 RECOMMENDATIONS TO THE SECRETARY FOR COMPLEMENTARY ACTIONS IN FEDERAL JURISDICTIONS
The Atlantic States Marine Fisheries Commission believes that the measures contained in Amendment 2 are necessary to prevent the overfishing of the Atlantic menhaden resource. If any of the above options are adopted through the Amendment process, the Board should consider recommending the adopted measures to the National Marine Fisheries Service for implementation in the EEZ.
4.10 COOPERATION WITH OTHER MANAGEMENT INSTITUTIONS
The Section will cooperate, when necessary, with other management institutions during the implementation of this amendment, including the National Marine Fisheries Service and the New England, Mid-Atlantic, and South Atlantic Fishery Management Council.
5.0 COMPLIANCE
Full implementation of the provisions of this amendment is necessary for the management program to be equitable, efficient and effective. States are expected to implement these measures faithfully under state laws. Although ASMFC does not have authority to directly compel states implementation of these measures, it will continually monitor the effectiveness of state implementation and determine whether states are in compliance with the provisions of this fishery management plan. The Section sets forth specific elements that the Commission will consider in determining state compliance with this fishery management plan, and the procedures that will govern the evaluation of compliance. Additional details of the procedures are found in the ASMFC Interstate Fishery Management Program Charter (ASMFC 2009).
5.1 MANDATORY COMPLIANCE ELEMENTS FOR STATES
A state will be determined to be out of compliance with the provision of this fishery management plan according to the terms of Section 7 of the ISFMP Charter if:
• It fails to meet any schedule required by Section 5.1.2, or any addendum prepared under
adaptive management (Section 4.6); or • It has failed to implement a change to its program when determined necessary by the
Atlantic Menhaden Management Board; or • it makes a change to its regulations required under Section 4 or any addendum prepared
under adaptive management (Section 4.6), without prior approval of the Atlantic Menhaden Management Board.
DRAFT AMENDMENT 2 FOR PUBLIC COMMENT
70
5.1.1 Mandatory Elements of State Programs
To be considered in compliance with this fishery management plan, all state programs must include a regime of restrictions on Atlantic menhaden fisheries consistent with the requirements of Sections 4.2; except that a state may propose an alternative management program under Section 4.5, which, if approved by the Management Board, may be implemented as an alternative regulatory requirement for compliance. In addition, the Atlantic Menhaden Management Board (through its Technical Committee and Advisory Panel), will monitor bycatch of Atlantic menhaden in other fisheries and report excessive bycatch problems to the management authority for the fishery causing the bycatch.
5.1.1.1 Regulatory Requirements States may begin to implement Amendment 2 after final approval by the Commission. Each state must submit its required Atlantic menhaden regulatory program to the Commission through the ASMFC staff for approval by the Atlantic Menhaden Management Board. During the period from submission, until the Management Board makes a decision on a state’s program, a state may not adopt a less protective management program than contained in this Amendment or contained in current state law. The following lists the specific compliance criteria that a state/jurisdiction must implement in order to be in compliance with Amendment 2: Regulatory requirements will be specified during final action by the Management Board
5.1.1.2 Monitoring Requirements Monitoring requirements will be specified during final action by the Management Board
5.1.1.3 Research Requirements No mandatory research requirements have been identified at this time. However, mandatory research requirements may be added in the future under Adaptive Management, Section 4.6.
5.1.1.4 Law Enforcement Requirements All state programs must include law enforcement capabilities adequate for successfully implementing the state’s Atlantic menhaden regulations. The adequacy of a state’s enforcement activity will be measured by annual report to the ASMFC Law Enforcement Committee and the PRT.
5.1.1.5 Habitat Requirements There are no mandatory habitat requirements in Amendment 2. See Section 4.4 for Habitat Recommendations.
5.1.2 Compliance Schedule
States must implement this Amendment according to the following schedule:
XXXXXXXXXX: Submission of state programs to implement Amendment 2 for approval by the Atlantic Menhaden Management Board. Programs must be implemented upon approval by the Management Board.
XXXXXXXXXX: States with approved management programs must implement Amendment 2. States may begin implementing management
DRAFT AMENDMENT 2 FOR PUBLIC COMMENT
71
programs prior to this deadline if approved by the Management Board.
Reports on compliance should be submitted to the Commission by each jurisdiction annually, no later than April 1st, each year.
5.1.3 Compliance/Technical Report Content
Each state must submit to the Commission an annual report concerning its Atlantic menhaden fisheries and management program for the previous year. A standard compliance report format has been prepared and adopted by the ISFMP Policy Board. States should follow this format in completing the annual compliance report. The report shall cover: • the previous calendar year's fishery and management program including activity and results
of monitoring, regulations that were in effect, and harvest, including estimates of non-harvest losses; and
• the planned management program for the current calendar year summarizing regulations that will be in effect and monitoring programs that will be performed, highlighting any changes from the previous year.
5.2 PROCEDURES FOR DETERMINING COMPLIANCE
Detailed procedures regarding compliance determinations are contained in the ISFMP Charter, Section Seven (ASMFC 2009).
In brief, all states are responsible for the full and effective implementation and enforcement of fishery management plans in areas subject to their jurisdiction. Written compliance reports as specified in the Plan or Amendment must be submitted annually by each state with a declared interest. Compliance with Amendment 2 will be reviewed at least annually. The Atlantic Menhaden Management Board, ISFMP Policy Board or the Commission, may request the Plan Review Team to conduct a review of plan implementation and compliance at any time. The Atlantic Menhaden Management Board will review the written findings of the PRT within 60 days of receipt of a State's compliance report. Should the Management Board recommend to the Policy Board that a state be determined to be out of compliance, a rationale for the recommended noncompliance finding will be addressed in a report. The report will include the required measures of Amendment 2 that the state has not implemented or enforced, a statement of how failure to implement or enforce required measures jeopardizes Atlantic menhaden conservation, and the actions a state must take in order to comply with Amendment 2 requirements.
The ISFMP Policy Board will review any recommendation of noncompliance from the Atlantic Menhaden Management Board within 30 days. If it concurs in the recommendation, it shall recommend at that time to the Commission that a state be found out of compliance.
The Commission shall consider any noncompliance recommendation from the ISFMP Policy Board within 30 days. Any state that is the subject of a recommendation for a noncompliance finding is given an opportunity to present written and/or oral testimony concerning whether it
DRAFT AMENDMENT 2 FOR PUBLIC COMMENT
72
should be found out of compliance. If the Commission agrees with the recommendation of the ISFMP Policy Board, it may determine that a state is not in compliance with Amendment 2, and specify the actions the state must take to come into compliance.
Any state that has been determined to be out of compliance may request that the Commission rescind its noncompliance findings, provided the state has revised its Atlantic menhaden conservation measures.
5.3 RECOMMENDED (NON-MANDATORY) MANAGMENET MEASURES
The NMFS is encouraged to at least maintain its current Atlantic menhaden sampling program. This includes the monitoring of catch and effort data, Captains Daily Fishing Reports (CDFRs), and the biostatistical sampling program.
5.4 ANALYSIS OF THE ENFORCEABILITY OF PROPOSED MEASURES
The Law Enforcement Committee will, during the implementation of this amendment, analyze the enforceability of conservation and management measures as they are proposed.
6.0 MANAGEMENT AND RESEARCH NEEDS
6.1 STOCK ASSESSMENT AND POPULATION DYNAMICS
Many of the research and modeling recommendations from the last benchmark stock assessment remain relevant for this update stock assessment. Research recommendations are broken down into two categories: data and modeling. While all recommendations are high priority, the first recommendation is the highest priority. Each category is further broken down into recommendations that can be completed in the short term and recommendations that will require long term commitment. Annual Data Collection Long term:
1. [Highest Priority] Develop a coastwide fishery independent index of adult abundance at age to replace or augment the existing Potomac River pound net index in the model. Possible methodologies include an air spotter survey, or an industry-based survey with scientific observers on board collecting the data. In all cases, a sound statistical design is essential (involve statisticians in the development and review of the design; some trial surveys may be necessary). NOTE: An industry funded feasibility study conducted in 2011 further supported the need for this work (Sulikowski et al. 2012). A subcommittee of the Menhaden Technical Committee began discussions for development of a coastwide aerial survey in 2008. At the time of this update assessment, a contract has been awarded to develop the survey design, with results expected by the end of 2012. The Technical Committee is in consensus that an index of adult abundance is the highest priority research recommendation but recognizes that implementation of the survey will require significant levels of funding.
2. Work with industry to collect age structure data outside the range of the fishery.
DRAFT AMENDMENT 2 FOR PUBLIC COMMENT
73
3. Validate MSVPA model parameters through the development and implementation of stomach sampling program that will cover major menhaden predators along the Atlantic coast. Validation of prey preferences, size selectivity and spatial overlap is critically important to the appropriate use of MSVPA model results.
Short term:
1. Continue current level of sampling from bait fisheries, particularly in the mid-Atlantic and New England.
2. Investigate interannual maturity variability via collection of annual samples of mature fish along the Atlantic coast.
3. Recover historical tagging data from paper data sheets. 4. Continue annual sampling of menhaden from the PRFC pound net fishery to better
characterize age and size structure of catch. 5. Compare age composition of PRFC catch with the age composition of the reduction bait
fishery catch in Chesapeake Bay. Upon completion of comparative analysis develop most efficient and representative method of sampling for age structure.
6. Consider developing an adult index, similar to PRFC CPUE index, using MD, VA, NJ and RI pound net information.
7. Explore additional sources of information that could be used as additional indices of abundance for juvenile and adult menhaden (ichthyoplankton surveys, NEAMAP, etc.).
Assessment Methodology Long term:
1. Develop a spatially-explicit model, once sufficient age-specific data on movement rates of menhaden are available.
2. Develop multispecies statistical catch-at-age model to estimate menhaden natural mortality at age.
Short term:
1. Thoroughly explore causes of retrospective pattern in model results. 2. Explore alternative treatments of the reduction and bait fleets (e.g., spatial split,
alternative selectivity configurations) in the BAM to reflect latitudinal variability in menhaden biology (larger and older fish migrating farther north during summer).
3. Review underlying data and evaluate generation of JAI and PRFC indices. 4. Perform likelihood profiling analysis to guide model selection decision-making. 5. Examine the variance assumptions and weighting factors of all the likelihood components
in the model. 6. Re-evaluate menhaden natural mortality-at-age and population response to changing
predator populations by updating and augmenting the MSVPA (e.g., add additional predator, prey, and diet data when available).
7. Incorporate maturity-at-age variability in the assessment model. Future Research
1. Evaluate productivity of different estuaries (e.g., replicate similar methodology to Ahrenholz et al. 1987).
2. Collect age-specific data on movement rates of menhaden to develop regional abundance trends.
DRAFT AMENDMENT 2 FOR PUBLIC COMMENT
74
3. Determine selectivity of PRFC pound nets. 4. Update information on maturity, fecundity, spatial and temporal patterns of spawning and
larval survivorship. 5. Investigate the effects of global climate change on distribution, movement, and behavior
of menhaden.
6.2 RESEARCH NEEDS
6.2.1 Social and Economic
• A more complete examination of the industry is needed to properly analyze the potential impacts of the plan and the current amendment. Additional research needs include:
• Broad-based and detailed socioeconomic description and analysis of the structure, operations, markets, revenues and expenditures of the Atlantic menhaden fishery itself and in relation to other commercial fisheries along the Atlantic coast.
• Ground-truthing for all of the data gathered via Federal and State databases. Contradictions and inaccuracies abound, so face-to-face interviews with a randomized sample of participants in all sectors of the fishery are needed.
• Develop a bioeconomic model to study the interactions between four variables: movements of Atlantic menhaden, catchability of menhaden, days fished, and market price.
• Develop an economic-management model to determine (1) the most profitable times to fish, (2) how harvest timing effects markets, and (3) how the market effects the timing of harvesting.
• Identify significant variables driving market prices and how their dynamic interactions result in the observed intra-annual and inter-annual fluctuations in market price for Atlantic menhaden.
• Explore networks between the various fisheries that rely on menhaden as bait.
6.2.2 Habitat
• Study specific habitat requirements for all life history stages.
• Develop habitat maps for all life history stages.
• Identify migration routes of adults.
• Study the effects of large-scale climatic events and the impacts on Atlantic menhaden.
• Evaluate effects of habitat loss/degradation on Atlantic menhaden.
7.0 PROTECTED SPECIES
The PDT will update the protected species section before the completion of Amendment 2. In the fall of 1995, Commission member states, the National Marine Fisheries Service (NMFS) and the U.S. Fish and Wildlife Service (USFWS) began discussing ways to improve implementation of the
DRAFT AMENDMENT 2 FOR PUBLIC COMMENT
75
Marine Mammal Protection Act (MMPA) and the Endangered Species Act (ESA) in state waters. Historically, these policies have been only minimally implemented and enforced in state waters (0-3 miles). In November 1995, the Commission, through its Interstate Fisheries Management Program (ISFMP) Policy Board, approved amendment of its ISFMP Charter (Section Six (b)(2)) so that protected species/fishery interactions are addressed in the Commission's fisheries management planning process. Specifically, the Commission's fishery management plans will describe impacts of state fisheries on certain marine mammals and endangered species (collectively termed "protected species"), and recommend ways to minimize these impacts. The following section outlines: (1) the federal legislation which guides protection of marine mammals and sea turtles, (2) the protected species with potential fishery interactions; (3) the specific type(s) of fishery interaction; (4) population status of the affected protected species; and (5) potential impacts to Atlantic coastal state and interstate fisheries. 7.1 MARINE MAMMAL PROTECTION ACT (MMPA) REQUIREMENTS Since its passage in 1972, one of the underlying goals of the Marine Mammal Protection Act (MMPA) has been to reduce the incidental serious injury and mortality of marine mammals permitted in the course of commercial fishing operations to insignificant levels approaching a zero mortality and serious injury rate. Under 1994 Amendments, the Act requires the National Marine Fisheries Service (NMFS) to develop and implement a take reduction plan to assist in the recovery or prevent the depletion of each strategic stock that interacts with a Category I or II fishery. Specifically, a strategic stock is defined as a stock: (1) for which the level of direct human-caused mortality exceeds the potential biological removal (PBR)18 level; (2) which is declining and is likely to be listed under the Endangered Species Act (ESA) in the foreseeable future; or (2) which is listed as a threatened or endangered species under the ESA or as a depleted species under the MMPA. Category I and II fisheries are those that have frequent or occasional incidental mortality and serious injury of marine mammals, respectively, whereas Category III fisheries have a remote likelihood of incidental mortality and serious injury of marine mammals. Under 1994 mandates, the MMPA also requires fishermen in Category I and II to register under the Marine Mammal Authorization Program (MMAP), the purpose of which is to provide an exception for commercial fishers from the general taking prohibitions of the MMPA. All fishermen, regardless of the category of fishery they participate in, must report all incidental injuries and mortalities caused by commercial fishing operations. Section 101(a)(5)(E) of the MMPA requires the authorization of the incidental taking of individuals from marine mammal stocks listed as threatened or endangered under the ESA in the course of commercial fishing operations if it is determined that (1) incidental mortality and serious injury will have a negligible impact on the affected species or stock; (2) a recovery plan has been developed or is being developed for such species or stock under the ESA; and (3) where required under Section 118 of the MMPA, a monitoring program has been established, vessels engaged in such fisheries are registered in accordance with Section 118 of the MMPA, and a take reduction plan has been developed or is being developed for such species or stock. Currently, there are no permits that authorize takes of threatened or endangered species by any commercial fishery in the Atlantic. Permits are not required for Category III fisheries, however, any serious injury or mortality of a marine mammal must be reported. 7.2 ENDANGERED SPECIES ACT (ESA) REQUIREMENTS
18 PBR is the number of human-caused deaths per year each stock can withstand and still reach an optimum population level. This is calculated by multiplying the minimum population estimate by stock’s net productivity rate by a recovery factor ranging from 0.1 for endangered species to 1.0 for healthy stocks.
DRAFT AMENDMENT 2 FOR PUBLIC COMMENT
76
The taking of endangered sea turtles and marine mammals is prohibited under Section 9 of the ESA. In addition, NMFS may issue Section 4(d) protective regulations necessary and advisable to provide for the conservation of threatened species. There are several mechanisms established in the ESA to avoid the takings prohibition in Section 9. First, a 4(d) regulation may include less stringent requirements intended to reduce incidental take and thus allow for the exemption from the taking prohibition. Section 10(a)(1)(B) of the ESA authorizes NMFS to permit, under prescribed terms and conditions, any taking otherwise prohibited by Section 9 of the ESA, if the taking is incidental to, and not the purpose of, carrying out an otherwise lawful activity. Finally, Section 7(a) requires NMFS to consult with each federal agency to ensure that any action that is authorized, funded, or carried out by such agency is not likely to jeopardize the continued existence of any listed species. Section 7(b) authorizes incidental take of listed species after full consultation and identification of reasonable and prudent alternatives or measure to monitor and minimize such take. 7.3 PROTECTED SPECIES WITH POTENTIAL FISHERY INTERACTIONS A number of protected species inhabit the management unit, which includes inshore and nearshore waters, as addressed in Amendment 1 to the Fishery Management Plan for Atlantic Menhaden. Nine are classified as endangered or threatened under the ESA; the remainder are protected under provisions of the MMPA. The species found in coastal Northwest Atlantic waters are listed below. Endangered Right whale (Eubalaena glacialis) Humpback whale (Megaptera novaeangliae) Fin whale (Balaenoptera physalus) Leatherback turtle (Dermochelys coriacea) Kemp=s ridley (Lepidochelys kempii) Green sea turtle (Chelonia mydas) Shortnose sturgeon (Acipenser brevirostrum) Threatened Loggerhead turtle (Caretta caretta) Species Proposed for ESA Listing Harbor porpoise (Phocoena phocoena) MMPA Includes all marine mammals above in addition to: Minke whale (Balaenoptera acutorostrata) Bottlenose dolphin (Tursiops truncatus) Harbor seal (Phoca vitulina) Grey seal (Halichoerus grypus) Harp seal (Phoca groenlandica) In the Northwest Atlantic waters, protected species utilize marine habitats for purposes of feeding, reproduction, as nursery areas and as migratory corridors. For several stocks of marine mammals, including humpback whales, menhaden are an important prey species. Some species occupy the area year round while others use the region only seasonally or move intermittently nearshore, inshore and offshore. Interactions may occur whenever fishing gear and marine mammals overlap spatially and temporally. For sea turtles, the Atlantic seaboard is considered to provide important developmental habitat for post-pelagic juveniles, as well as foraging and nesting habitat for adults. The distribution and abundance of sea turtles along the Atlantic coast is related to geographic location and seasonal variations in water
DRAFT AMENDMENT 2 FOR PUBLIC COMMENT
77
temperatures. Water temperatures dictate how early northward migration begins each year and is a useful factor for assessing when turtles will be found in certain areas. Moderate to high abundances of sea turtles have been observed both offshore and nearshore when water temperatures are greater than or equal to 21o C. As water temperatures decline below 11o C, abundance declines markedly and turtles typically move from cold inshore waters in the late fall to move offshore to the warmer waters in the Gulf Stream, generally south of Cape Hatteras, North Carolina. Conversely, in the late spring and early summer, they migrate from the Gulf Stream waters into the sounds and embayments. 7.4 PROTECTED SPECIES INTERACTIONS WITH EXISTING FISHERIES 7.4.1 Marine Mammals There have been marine mammal interactions in the primary fisheries that target menhaden- including the purse seine, pound net and gill net- in addition to those gear types for which menhaden is a bycatch, including trawl, haul seine, cast net, as well as the pound net and gill net already mentioned. The bycatch reports included below do not represent a complete list but rather available records. It should be noted that without an observer program for many of these fisheries, actual numbers of interactions are difficult to obtain.
7.4.1.1 Purse seine The Gulf of Maine and U.S. mid-Atlantic menhaden purse seine fisheries are currently classified as Category III fisheries (under the MMPA). In the 2000 MMPA List of Fisheries (65 FR 24448, April 26, 2000), the Gulf of Maine menhaden purse seine fishery is listed as having no incidental bycatch of marine mammals, and the U.S. mid-Atlantic menhaden purse seine fishery is listed with reported incidental bycatch of the coastal stock of bottlenose dolphin. However, in 1999, a mid-Atlantic menhaden purse seine fisherman reported through the MMAP that a humpback whale became entangled after bumping into the net; upon release from the gear, the animal was reported as showing an inability to swim or dive and equilibrium imbalance. NMFS will be updating the List of Fisheries to include the humpback whale as a marine mammal species/stocks incidentally injured/killed in the mid-Atlantic menhaden purse seine listing. The Atlantic purse seine fishery reported the lethal incidental take of one minke whale in 1990 (NMFS 1993); however, the target species of the purse seine (i.e. tuna or menhaden) is unknown. Historically, Atlantic menhaden purse seine fishermen have reported an annual incidental take of one to five coastal bottlenose dolphins (NMFS 1991). This information comes from reports required under a small take exemption issued under the then Section 101(a)(4) of the MMPA. Atlantic purse seine fishermen (target species unknown) also reported the lethal take of four coastal bottlenose dolphins in 1990 (NMFS 1993). Other than the humpback whale above, however, no other marine mammal interactions have been reported by the Atlantic purse seine fishery since 1990. Yet, the proposed 1999 MMPA List of Fisheries (63 FR 42803, August 11, 1998) summarizes the results of the analysis which re-categorized the Gulf of Mexico menhaden purse seine fishery based on interactions with coastal bottlenose dolphin. In brief, an observer program conducted by Louisiana State University in 1992, 1994, and 1995 recorded nine captures of coastal bottlenose dolphin, three of which were reported as mortalities. The Gulf of Mexico menhaden purse seine was subsequently re-categorized from Category III to Category II in the final 1999 MMPA List of Fisheries (64 FR 9067, February 24, 1999) as estimated mortality, based on observer data, exceeded the combined PBR level for the three Gulf coastal stocks of bottlenose dolphins. Similar observer programs of the menhaden purse seine fisheries have been conducted in the Atlantic. From September 1978 through early 1980, approximately 40 sea days were observed for fish sampling aboard menhaden purse seine vessels fishing from Maine south to North Carolina. No marine mammals were recorded as bycatch (S. Epperly, NMFS SEFSC, pers. comm.). Additionally, observations of the Atlantic menhaden fishery between June and November 1992 observed
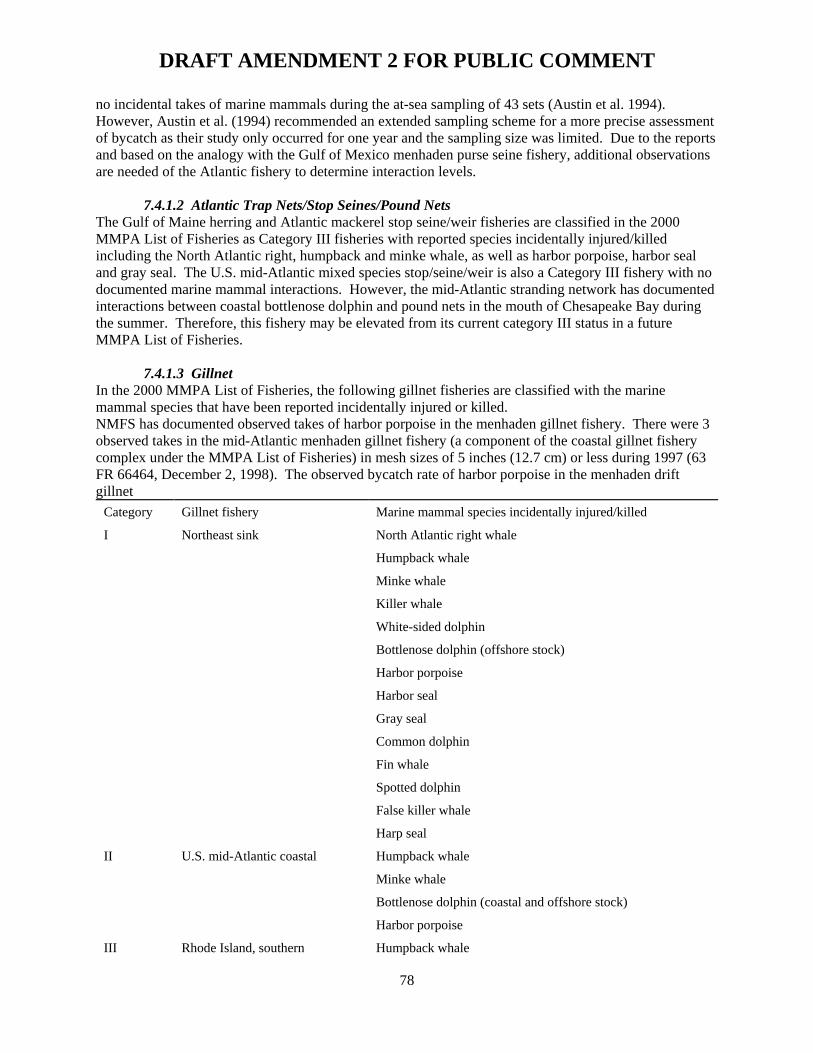
DRAFT AMENDMENT 2 FOR PUBLIC COMMENT
78
no incidental takes of marine mammals during the at-sea sampling of 43 sets (Austin et al. 1994). However, Austin et al. (1994) recommended an extended sampling scheme for a more precise assessment of bycatch as their study only occurred for one year and the sampling size was limited. Due to the reports and based on the analogy with the Gulf of Mexico menhaden purse seine fishery, additional observations are needed of the Atlantic fishery to determine interaction levels.
7.4.1.2 Atlantic Trap Nets/Stop Seines/Pound Nets The Gulf of Maine herring and Atlantic mackerel stop seine/weir fisheries are classified in the 2000 MMPA List of Fisheries as Category III fisheries with reported species incidentally injured/killed including the North Atlantic right, humpback and minke whale, as well as harbor porpoise, harbor seal and gray seal. The U.S. mid-Atlantic mixed species stop/seine/weir is also a Category III fishery with no documented marine mammal interactions. However, the mid-Atlantic stranding network has documented interactions between coastal bottlenose dolphin and pound nets in the mouth of Chesapeake Bay during the summer. Therefore, this fishery may be elevated from its current category III status in a future MMPA List of Fisheries.
7.4.1.3 Gillnet In the 2000 MMPA List of Fisheries, the following gillnet fisheries are classified with the marine mammal species that have been reported incidentally injured or killed. NMFS has documented observed takes of harbor porpoise in the menhaden gillnet fishery. There were 3 observed takes in the mid-Atlantic menhaden gillnet fishery (a component of the coastal gillnet fishery complex under the MMPA List of Fisheries) in mesh sizes of 5 inches (12.7 cm) or less during 1997 (63 FR 66464, December 2, 1998). The observed bycatch rate of harbor porpoise in the menhaden drift gillnet
Category Gillnet fishery
Marine mammal species incidentally injured/killed
I
Northeast sink
North Atlantic right whale
Humpback whale
Minke whale
Killer whale
White-sided dolphin
Bottlenose dolphin (offshore stock)
Harbor porpoise
Harbor seal
Gray seal
Common dolphin
Fin whale
Spotted dolphin
False killer whale
Harp seal
II
U.S. mid-Atlantic coastal
Humpback whale
Minke whale
Bottlenose dolphin (coastal and offshore stock)
Harbor porpoise
III
Rhode Island, southern
Humpback whale
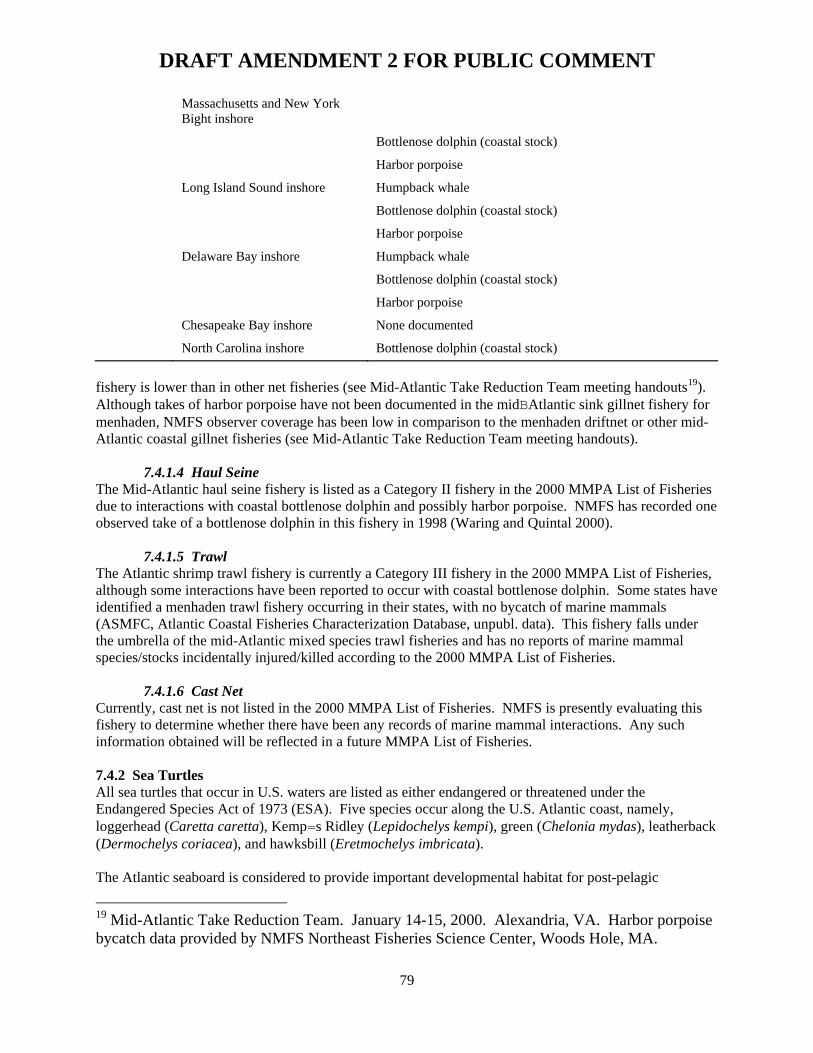
DRAFT AMENDMENT 2 FOR PUBLIC COMMENT
79
Massachusetts and New York Bight inshore
Bottlenose dolphin (coastal stock)
Harbor porpoise
Long Island Sound inshore
Humpback whale
Bottlenose dolphin (coastal stock)
Harbor porpoise
Delaware Bay inshore
Humpback whale
Bottlenose dolphin (coastal stock)
Harbor porpoise
Chesapeake Bay inshore
None documented
North Carolina inshore
Bottlenose dolphin (coastal stock)
fishery is lower than in other net fisheries (see Mid-Atlantic Take Reduction Team meeting handouts19). Although takes of harbor porpoise have not been documented in the midBAtlantic sink gillnet fishery for menhaden, NMFS observer coverage has been low in comparison to the menhaden driftnet or other mid-Atlantic coastal gillnet fisheries (see Mid-Atlantic Take Reduction Team meeting handouts).
7.4.1.4 Haul Seine The Mid-Atlantic haul seine fishery is listed as a Category II fishery in the 2000 MMPA List of Fisheries due to interactions with coastal bottlenose dolphin and possibly harbor porpoise. NMFS has recorded one observed take of a bottlenose dolphin in this fishery in 1998 (Waring and Quintal 2000).
7.4.1.5 Trawl The Atlantic shrimp trawl fishery is currently a Category III fishery in the 2000 MMPA List of Fisheries, although some interactions have been reported to occur with coastal bottlenose dolphin. Some states have identified a menhaden trawl fishery occurring in their states, with no bycatch of marine mammals (ASMFC, Atlantic Coastal Fisheries Characterization Database, unpubl. data). This fishery falls under the umbrella of the mid-Atlantic mixed species trawl fisheries and has no reports of marine mammal species/stocks incidentally injured/killed according to the 2000 MMPA List of Fisheries.
7.4.1.6 Cast Net Currently, cast net is not listed in the 2000 MMPA List of Fisheries. NMFS is presently evaluating this fishery to determine whether there have been any records of marine mammal interactions. Any such information obtained will be reflected in a future MMPA List of Fisheries. 7.4.2 Sea Turtles All sea turtles that occur in U.S. waters are listed as either endangered or threatened under the Endangered Species Act of 1973 (ESA). Five species occur along the U.S. Atlantic coast, namely, loggerhead (Caretta caretta), Kemp=s Ridley (Lepidochelys kempi), green (Chelonia mydas), leatherback (Dermochelys coriacea), and hawksbill (Eretmochelys imbricata). The Atlantic seaboard is considered to provide important developmental habitat for post-pelagic
19 Mid-Atlantic Take Reduction Team. January 14-15, 2000. Alexandria, VA. Harbor porpoise bycatch data provided by NMFS Northeast Fisheries Science Center, Woods Hole, MA.
DRAFT AMENDMENT 2 FOR PUBLIC COMMENT
80
juveniles, as well as foraging and nesting habitat for adult sea turtles. The distribution and abundance of sea turtles along the Atlantic coast is related to geographic location and seasonal variations in water temperatures. Water temperatures dictate how early northward migration begins each year and is a useful factor for assessing when turtles will be found in certain areas. Turtle abundance in estuarine and nearshore waters is generally seasonal north of Canaveral, Florida. Sea turtles do not usually appear on the summer foraging grounds in the Gulf of Maine until June, but are found in Virginia as early as April. As water temperatures decline, turtles typically move from cold inshore waters in the late fall to move offshore to the warmer waters in the Gulf stream. The effect water temperature has on sea turtle presence is important in assessing possible interactions with the menhaden fishery. Menhaden are also affected by water temperatures and similarily migrate north in the spring and south in the fall. Thus, the menhaden purse seine fishery exhibits a >summer= season beginning in April off North Carolina and appearing off New England in June, and a >fall= season beginning in early November between Cape Hatteras and Cape Fear, North Carolina. The main gear used in the directed menhaden fishery is a small mesh purse seine, however other gear is deployed, including trawls, fixed net, gillnet, haul beach seine, pound net, and cast net. From September 1978 through early 1980, approximately 40 sea days were observed for fish sampling aboard menhaden purse seiners fishing from Maine south to North Carolina. No sea turtles were recorded as bycatch (S. Epperly, NMFS SEFSC, pers. comm.). Several states have indicated that sea turtles have been incidentally captured in menhaden fixed nets and trawls, but not for seine nets (ASMFC, Atlantic Coastal Fisheries Characterization Database, unpubl. data). An observer program for protected species has not been established for this fishery. 7.4.3 Seabirds Like marine mammals, seabirds are vulnerable to entanglement in commercial fishing gear. The interaction has not been quantified in the Atlantic menhaden fishery, but impacts are not considered to be significant. Human activities such as coastal development, habitat degradation and destruction, and the presence of organochlorine contaminants are considered to be the major threats to some seabird populations. Endangered and threatened bird species, which include the roseate tern and piping plover, are unlikely to be impacted by the gear types employed in the menhaden fishery. 7.5 POPULATION STATUS REVIEW OF RELEVANT PROTECTED SPECIES 7.5.1 Marine Mammals Five marine mammal species known to co-occur with or become entangled in gear used by the Atlantic menhaden fishery - namely, Atlantic right whale, humpback whale, fin whale, coastal bottlenose dolphin and harbor porpoise - are classified as strategic stocks under the MMPA. Additionally, the right, humpback and fin whales are listed as endangered, and the harbor porpoise is classified as a candidate species under the ESA. Above all, the species of greatest concern is the right whale, which is one of the most endangered species in the world, numbering only around 300 animals (Waring et al. 1999). The status of these and other marine mammal populations inhabiting the Northwest Atlantic has been discussed in great detail in the U.S. Atlantic and Gulf of Mexico Marine Mammal Stock Assessments. Initial assessments were presented in Blaylock et al. (1995) and were updated in Waring et al. (1999). The report presents information on stock definition, geographic range, population size, productivity rates, PBR, fishery specific mortality estimates, and compares the PBR to estimated human-caused mortality for each stock. 7.5.2 Sea Turtles All sea turtles that occur in U.S. waters are listed as either endangered or threatened under the ESA. Five
DRAFT AMENDMENT 2 FOR PUBLIC COMMENT
81
species occur along the U.S. Atlantic coast, namely, loggerhead (Caretta caretta), Kemp=s Ridley (Lepidochelys kempii), green (Chelonia mydas), leatherback (Dermochelys coriacea), and hawksbill (Eretmochelys imbricata).
7.5.2.1 Biological Synopsis: Loggerhead Sea Turtle The threatened loggerhead turtle is the most abundant species of sea turtle in U.S. waters, commonly occurring throughout the inner continental shelf from Florida through Cape Cod, Massachusetts. This species is found in a wide range of habitats throughout the temperate and tropical regions of the globe. These include open ocean, continental shelves, bays, lagoons, and estuaries (NMFS and USFWS 1995). The activity of the loggerhead is limited by temperature. Keinath et al. (1987) observed sea turtle emigration from the Chesapeake Bay when water temperatures cooled to below 181 C, generally in November. Sea turtles emigrate from the estuarine rivers, coastal bays and sounds when water temperatures cool to below 181 C (Keinath et al. 1987) and conversely immigrate when temperatures warm to 201 C (Burke et al. 1989; Musick et al. 1984). Work in North Carolina showed a significant movement of sea turtles into more northern waters at 111 C (Chester et al. 1994). Scientists studying movements of turtles in New York waters have seen loggerheads remain in that area for extended periods at temperatures as low as 81 C. Surveys conducted offshore and sea turtle strandings during November and December off North Carolina suggest that sea turtles emigrating from northern waters in fall and winter months may concentrate in nearshore and southerly areas influenced by warmer Gulf stream waters (Epperly et al. 1995). This is supported by the collected work of Morreale and Standora (1998) who tracked 12 loggerheads and 3 Kemp's ridleys by satellite. All of the turtles tracked similar spatial and temporal corridors, migrating south from Long Island Sound, NY, in a time period of October through December. The turtles traveled within a narrow band along the continental shelf and became sedentary for one to two months south of Cape Hatteras. Some of the turtles lingered between Cape Lookout Shoals and Frying Pan Shoals offshore of Wilmington, NC prior to moving south or into the Gulf Stream. Since they are limited by water temperatures, sea turtles do not usually appear on the summer foraging grounds in the Gulf of Maine until June, but are found in Virginia as early as April. They remain in these areas until as late as November and December in some cases, but the large majority are leaving the Gulf of Maine by mid-September. Aerial surveys of loggerhead turtles at sea north of Cape Hatteras indicate that they are most common in waters from 22 to 49 m deep, although they range from the beach to waters beyond the continental shelf (Shoop and Kenney 1992). There is no information regarding the activity of these offshore turtles. Loggerhead sea turtles are primarily benthic feeders, opportunistically foraging on crustaceans and mollusks. Under certain conditions they also feed on finfish, particularly if they are easy to catch (e.g., caught in gillnets or inside pound nets where the fish are accessible to turtles). During 1996, a Turtle Expert Working Group (TEWG) met on several occasions and produced a report assessing the status of the loggerhead sea turtle population in the Western North Atlantic (WNA). Of significance is the conclusion that in the WNA, there are at least 4 loggerhead subpopulations separated at the nesting beach (TEWG 1998). This finding was based on analysis of mitochondrial DNA, which the turtle inherits from its mother. It is theorized that nesting assemblages represent distinct genetic entities, but further research is necessary to address the stock definition question. These nesting subpopulations include the following areas: northern North Carolina to northeast Florida, south Florida, the Florida Panhandle, and the Yucatan Peninsula. Genetic evidence has shown that loggerheads from Chesapeake Bay southward to Georgia are nearly equally divided in origin between South Florida and northern subpopulations. Work is currently ongoing in the Northwestern North Atlantic to collect samples which will provide information relative to turtles north of the Chesapeake, which is most of the action area for this consultation.
DRAFT AMENDMENT 2 FOR PUBLIC COMMENT
82
The loggerhead turtle was listed as threatened under the ESA on July 28, 1978, but is considered endangered by the World Conservation Union (IUCN) and under the Convention on International Trade in Endangered Species of Flora and Fauna (CITES). The significance of the results of the TEWG analysis is that the northern subpopulation may be experiencing a significant decline (2.5 percent - 3.2 percent for various beaches). A recovery goal of 12,800 nests has been assumed for the Northern Subpopulation, but current nests number around 6,200 (TEWG 1998). Since the number of nests declined in the 1980's, the TEWG concluded that it is unlikely that this subpopulation will reach this goal given current stresses on population performance. Considering this apparent decline and the current lack of information on the stock definition of the northern subpopulation, a conservative approach must be implemented and adverse effects from fisheries minimized as a priority for recovery. The most recent 5-year ESA sea turtle status review (NMFS and USFWS 1995) reiterates the difficulty of obtaining detailed information on sea turtle population sizes and trends. Most long-term data is from the nesting beaches, and this is often complicated by the fact that they occupy extensive areas outside U.S. waters. The TEWG was unable to determine acceptable levels of mortality. This status review supports the conclusion of the TEWG that the northern subpopulation may be experiencing a decline and that inadequate information is available to assess whether its status has changed since the initial listing as threatened in 1978. The current recommendation from the 5-year review is to retain the threatened designation but note that further study is needed before the next status review is conducted.
7.5.2.2 Biological Synopsis: Leatherback Sea Turtle The leatherback is the largest living turtle and ranges farther than any other sea turtle species, exhibiting broad thermal tolerances (NMFS and USFWS 1995). Leatherback turtles are often found in association with jellyfish. The turtles feed primarily on the Cnidarians (medusae, siphonophores) and tunicates (salps, pyrosomas). These turtles are found throughout the action area of this consultation and, while predominantly pelagic, they occur annually in places such as Cape Cod Bay and Narragansett Bay during certain times of the year, particularly the Fall. Of the turtle species common to the action area, leatherback turtles seem to be the most susceptible to entanglement in pot gear and pelagic trawl gear. The susceptibility to entanglement in pot gear may be the result of attraction to gelatinous organisms and algae that collect on buoys and buoy lines at or near the surface. Nest counts are the only reliable population information available for leatherback turtles. Recent declines have been seen in the number of leatherbacks nesting worldwide (NMFS and USFWS 1995). The status review notes that it is unclear whether this observation is due to natural fluctuations or whether the population is at serious risk. With regard to repercussions of these observations for the U.S. leatherback populations in general, it is unknown whether they are stable, increasing, or declining, but it is certain that some nesting populations (e.g., St. John and St. Thomas, U.S. Virgin Islands) have been extirpated.
7.5.2.3 Biological Synopsis: Kemp=s Ridley Sea Turtle The Kemp's ridley is the most endangered of the world=s sea turtle species. The only major nesting site for ridleys is a single stretch of beach near Rancho Nuevo, Tamaulipas, Mexico (Carr 1963). Estimates on the adult population reached a low of 1,050 in 1985, and increased to 3,000 individuals in 1997. First-time nesting adults increased from 6 percent to 28 percent from 1981 to 1989, and from 23 percent to 41 percent from 1990 to 1994, indicating that the ridley population may be in the early stages of exponential growth (TEWG 1998). Juvenile Kemp's ridleys use northeastern and mid-Atlantic coastal waters of the U.S. Atlantic coastline as primary developmental habitat during summer months, with shallow coastal embayments serving as important foraging grounds. Post-pelagic ridleys feed primarily on crabs, consuming a variety of species, including Callinectes sp., Ovalipes sp., Libinia sp., and Cancer sp. Mollusks, shrimp, and fish are

DRAFT AMENDMENT 2 FOR PUBLIC COMMENT
83
consumed less frequently (Bjorndal 1997). Juvenile ridleys migrate south as water temperatures cool in fall, and are predominantly found in shallow coastal embayments along the Gulf Coast during fall and winter months. Although the natural tendency of sea turtles is to migrate south to warmer waters, they may be susceptible to rapid drops in water temperatures in the enclosed, shallow bays of the mid-Atlatntic. In November and early December, 1999, 184 sea turtles, including 178 Kemp=s ridleys, stranded along the Massachusetts coast as a result of cold-stunning. Ridleys found in mid-Atlantic waters are primarily post-pelagic juveniles averaging 40 centimeters in carapace length, and weighing less than 20 kilograms (Terwilliger and Musick 1995). Next to loggerheads, they are the second most abundant sea turtle in Virginia and Maryland waters, arriving in these areas during May and June, and migrating to more southerly waters from September to November (Keinath et al. 1987; Musick and Limpus 1997). In the Chesapeake Bay, ridleys frequently forage in shallow embayments, particularly in areas supporting submerged aquatic vegetation (Lutcavage and Musick 1985; Bellmund et al. 1987; Keinath et al. 1987; Musick and Limpus 1997). The juvenile population in Chesapeake Bay is estimated to be 211 to 1,083 turtles (Musick and Limpus 1997). Juvenile ridleys follow regular coastal routes during spring and fall migrations to and from developmental foraging grounds along the mid-Atlantic and northeastern coastlines. Consequently, many ridleys occurring in coastal waters off Virginia and Maryland are transients involved in seasonal migrations. However, Maryland's and Virginia=s coastal embayments - which contain an abundance of crabs, shrimp, and other prey as well as preferred foraging habitat such as shallow subtidal flats and submerged aquatic vegetation beds - are likely used as a foraging ground by Kemp=s ridley sea turtles (J. Musick, VIMS, 1998; pers. comm.; S. Epperly, NMFS SEFSC, 1998; pers. comm.; M. Lutcavage, New England Aquarium, 1998; pers. comm.). No known nesting occurs on Virginia or Maryland beaches.
7.5.2.4 Biological Synopsis: Green Sea Turtle: Green turtles are distributed circumglobally, mainly in waters between the northern and southern 20EC isotherms (Hirth 1971). In the western Atlantic, several major nesting assemblages have been identified and studied. However, most green turtle nesting in the continental United States occurs on the Atlantic Coast of Florida. Nesting has been documented along the Gulf coast of Florida, at Southwest Florida beaches, as well as the beaches on the Florida Panhandle. On the west coast of Florida the Florida Department of Environmental Protection (FDEP) documented 35 nests in 1996, only 6 in 1997, and 45 in 1998. However, most documented green turtle nesting activity occurs on Florida index beaches, which are on the east coast and were established to standardize data collection methods and effort on key nesting beaches. The pattern of green turtle nesting shows biennial peaks in abundance, with a generally positive trend during the six years of regular monitoring since establishment of the index beaches in 1989, perhaps due to increased protective legislation throughout the Caribbean. The FDEP documented 3,061 nest in 1996, 731 in 1997, and 5,512 in 1998 on the east coast of Florida. There is evidence that green turtle nesting has been on the increase during the past decade. While nesting activity is obviously important in determining population distributions, the remaining portion of the green turtle's life is spent on the foraging grounds. Juvenile green sea turtles occupy pelagic habitats after leaving the nesting beach. Pelagic juveniles are assumed to be omnivorous, but with a strong tendency toward carnivory during early life stages. At approximately 20 to 25 cm carapace length, juveniles leave pelagic habitats, and enter benthic foraging areas, shifting to a chiefly herbivorous diet (Bjorndal 1997). Post-pelagic green turtles feed primarily on sea grasses and benthic algae, but also consume jellyfish, salps, and sponges. Known feeding habitats along U.S. coasts of the western Atlantic include shallow lagoons and embayments in Florida, and similar shallow inshore areas elsewhere. Some of the principal feeding pastures in the western Atlantic Ocean include the upper west coast of Florida, the northwestern coast of the Yucatan Peninsula, the south coast of Cuba, the Mosquito Coast of Nicaragua, the Caribbean Coast of Panama, and scattered areas along Colombia and Brazil (Hirth 1971).
DRAFT AMENDMENT 2 FOR PUBLIC COMMENT
84
The preferred food sources in these areas are Cymodocea, Thalassia, Zostera, Sagittaria, and Vallisneria. Juvenile green turtles occur north to Long Island Sound, presumably foraging in coastal embayments. In North Carolina, green turtles are known from estuarine and oceanic waters. Recently, green turtle nesting occurred on Bald Head Island, just east of the mouth of the Cape Fear River, on Onslow Island, and on Cape Hatteras National Seashore. No information is available regarding the occurrence of green turtles in the Chesapeake Bay, although they are presumably present in very low numbers. In the western Atlantic region, the summer developmental habitat encompasses estuarine and coastal waters as far north as Long Island Sound, Chesapeake Bay, and the North Carolina sounds, and south throughout the tropics (Musick and Limpus 1997). Most of the individuals reported in U.S. waters are immature (Thompson 1988). Individuals that use waters north of Florida during the summer must return to southern waters in autumn, or face the risk of cold stunning. 7.5.3 Sea Birds No information is available at this time. 7.6 EXISTING AND PROPOSED FEDERAL REGULATIONS/ACTIONS PERTAINING TO THE RELEVANT PROTECTED SPECIES 7.7 POTENTIAL IMPACTS TO ATLANTIC COASTAL STATE AND INTERSTATE FISHERIES The Northeast sink and Mid-Atlantic coastal gillnet fisheries are the two fisheries regulated by the Harbor Porpoise Take Reduction Plan (63 FR 66464, December 2, 1998; also refer to for defined fishery boundaries). Amongst other measures, the plan uses time area closures in combination with pingers in Northeast waters, and time area closures along with gear modifications for both small (mesh size greater than 5 inches (12.7 cm) to less than 7 inches (17.78 cm)), and large (mesh size greater than or equal to 7 inches (17.78 cm ) to 18 inches (45.72 cm)) mesh gillnet in mid-Atlantic waters. Although the plan predominately impacts the dogfish and monkfish fisheries due to their higher porpoise bycatch rates, other gillnet fisheries are also affected. NMFS has documented observed takes of harbor porpoise in the mesh sizes of 5 inches or less and will be reevaluating observed data for these fisheries and stranding data to reconsider whether management measures are needed to reduce bycatch in these smaller mesh fisheries (63 FR 66464, December 2, 1998). The Atlantic Large Whale Take Reduction Plan (64 FR 7529; February 16, 1999) addresses the incidental bycatch of large baleen whales, primarily the northern right whale and the humpback whale, in several fisheries including the Northeast sink gillnet and Mid-Atlantic coastal gillnet. Amongst other measures, the plan closes right whale critical habitat areas to specific types of fishing gear during certain seasons and modifies fishing practices. The Atlantic Large Whale Take Reduction Team continues to identify ways to reduce possible interactions between large whales and commercial gear. Upcoming rules will address additional gear marking and modification provisions to further reduce the risk of entanglement. The Bottlenose Dolphin Take Reduction Team is scheduled to convene in January 2001 and will include representatives from Category I and II fisheries impacting the coastal bottlenose dolphin stock. Currently, the fisheries to be represented that also participate in the Atlantic menhaden fishery include the Mid-Atlantic coastal gillnet and haul seine fisheries. These participating fisheries may change depending on any fishery re-categorizations in future MMPA Lists of Fisheries. 7.8 IDENTIFICATION OF CURRENT DATA GAPS AND RESEARCH NEEDS A lack of sea sampling data in regards to protected species interactions in the domestic Atlantic menhaden fisheries has been identified during the course of drafting this amendment. Additional observer coverage
DRAFT AMENDMENT 2 FOR PUBLIC COMMENT
85
for these fisheries is needed to understand the level of interaction in the fisheries where there is no or limited data.
8.0 REFERENCES
Adolf, J. E., C. L. Yeager, W. D. Miller, M. E. Mallonee, and L. W. Harding. 2006.
Environmental forcing of phytoplankton floral composition, biomass, and primary productivity in Chesapeake Bay, USA. Estuarine, Coastal and Shelf Science 67(1-2):108-122.
Ahrenholz, D.W. 1991. Population biology and life history of the North American menhadens,
Brevoortia spp. Mar. Fish. Rev. 53: 3-19. Ahrenholz, D.W., W.R. Nelson, and S.P. Epperly. 1987a. Population and fishery characteristics
of Atlantic menhaden, Brevoortia tyrannus. Fish. Bull. 85: 569-600. Ahrenholz, D.W., J.F. Guthrie, and R.M. Clayton. 1987b. Observations of ulcerative mycosis
infections on Atlantic menhaden (Brevoortia tyrannus). U.S. NMFS. Tech. Mem. NMFS-SEFC 196, 28 p.
Anderson, J. D. 2007. Systematics of the North American menhadens: molecular evolutionary
reconstructions in the genus Brevoortia (Clupeiformes: Clupeidae). Fish. Bull. 205:368-378.
Annis, E. A., E. D. Houde, L. W. Harding, Jr., M.E. Mallonee, and M. J. Wilberg. 2011.
Calibration of a bioenergetics model linking primary production to Atlantic Menhaden,Brevoortia tyrannus, growth in Chesapeake Bay. Mar. Ecol. Prog. Ser. Vol. 437: 253-267.
AMAC. 2000. Atlantic Menhaden Management Review, 2000. Report to ASMFC Atlantic
Menhaden Board. 18 p.
Atlantic Menhaden Technical Committee (AMTC). 2006 Stock Assessment Report for Atlantic Menhaden. A report prepared for the Atlantic Menhaden Management Board, Atlantic States Marine Fisheries Commission, Washington, DC, 139 p.
Atlantic States Marine Fisheries Commission (ASMFC). 1981. Fishery Management Plan for
Atlantic Menhaden. ASMFC, Washington, D.C. 146 p. _____. 1992. Fishery Management Plan for Atlantic Menhaden: 1992 revision. FMR No. 22.
ASMFC, Washington, D.C. 159 p. _____. 1999a. Atlantic Menhaden Stock Assessment Report for Peer Review. Stock Assessment
Report No. 99-01 (supplement) of the ASMFC. 146 p.
DRAFT AMENDMENT 2 FOR PUBLIC COMMENT
86
_____. 1999b. Terms of Reference & Advisory Report for the Atlantic Menhaden Stock Assessment Peer Review. Stock Assessment Report No. 99-01 of the ASMFC.16 p.
_____. 2001. Amendment 1 to The Interstate Fishery Management Plan for Atlantic Menhaden.
ASMFC, Washington, D.C. 146 p. _____. 2002. Law Enforcement Committee, Guidelines for Resource Managers on the
Enforceability of Fishery Management Measures. ASMFC, Washington, DC. _____. 2004. Atlantic Menhaden Stock Assessment Report for Peer Review. Atlantic States
Marine Fisheries Commission, Stock Assessment Report No. 04-01 (supplement), 145 p. _____. 2009. Interstate Fisheries Management Program Charter. ASMFC, Washington, D.C. 23
p.
_____. 2010. Atlantic menhaden stock assessment and review panel reports. ASMFC stock assessment report no. 10-02, 325 p.
_____. 2011. Addendum V to Amendment 1 to the Atlantic Menhaden Fishery Management
Plan. ASMFC, Arlington, VA 17 p. _____. 2012. Atlantic menhaden stock assessment update report. ASMFC, Arlington, VA, 228
p. Ahrenholz, D.W., W.R. Nelson, and S.P. Epperly. 1987a. Population and fishery characteristics
of Atlantic menhaden, Brevoortia tyrannus. Fish. Bull. 85: 569-600. Ahrenholz, D.W., J.F. Guthrie, and R.M. Clayton. 1987b. Observations of ulcerative mycosis
infections on Atlantic menhaden (Brevoortia tyrannus). U.S. NMFS. Tech. Mem. NMFS-SEFC 196, 28 p.
Ahrenholz, D.W. 1991. Population biology and life history of the North American menhadens,
Brevoortia spp. Mar. Fish. Rev. 53: 3-19. Austin, H. 2002. Decadal oscillations and regime shifts, a characterization of the Chesapeake
Bay Marine Climate. In Fisheries in a Changing Climate. Amer. Fish. Soc. Symp. 32: 155-170.
Austin, H. M., J. Kirkley, and J. Jucy. 1994. By-catch and the fishery for Atlantic menhaden
(Brevoortia tyrannus) in the mid-Atlantic bight: AN assessment of the nature and extent of by-catch. VIMS, Va. Mar. Resour. Advisory No. 53, Va. Sea Grant College Prog. Publ. No. VSG-94-06, 39 p.
Austin, H.M. and J.F. Walter. 1998. Food habits of large striped bass in the lower Chesapeake
Bay and its tributaries, March 1997 - May 1998. Final Rept. submitted to VMRC, Mar. Rec. Fish. Adv. Bd. and Comm. Fish. Adv. Bd. Contract Nos. RF-97-08 & CF-97-08. 56 p.
DRAFT AMENDMENT 2 FOR PUBLIC COMMENT
87
Blazer, V. S., W.K. Vogelbein, C. L. Densmore, E. B. May, J. H. Lilley, and D. E. Zwerner.
1999.Aphanomyces as a cause of ulcerative skin lesions of menhaden from Chesapeake Bay tributaries. J. of Aquatic Animal Health 11: 340-349.
Blazer, V. S., C. A. Ottinger and C. L. Densmore. 2007. Chapter 13. Factors affecting fish
health. pp.54-59. In: Phillips, S. W. (ed.). Synthesis of U.S. Geological Survey science for the ChesapeakeBay ecosystem and implications for environmental management. U.S. Geological Survey Circular 1316.
Brandt, S. B., and D. M. Mason. 2003. Effect of nutrient loading on Atlantic menhaden
(Brevoortia tyrannus) growth rate potential in the Patuxent River. Estuaries 26(2A):298-309.
Brush, G. S. 1986. Geology and paleoecology of Chesapeake Bay: A long-term monitoring tool
for management. J. Wash. Acad. Sciences 76: 146-160. _____. 2009. Historical land use, nitrogen, and coastal eutrophication: A paleoecological perspective. Estuaries and Coasts 32: 18-28. Burkholder, J. M., A. S. Gordon, P. D. Moeller, J. M. Law, K. J. Coyne, A. J. Lewitus, J. S.
Ramsdell, H. G. Marshall, N. J. Deamer, S. C. Cary, J. W. Kempton, S. L. Morton, and P. A. Rublee. 2005. Demonstration of toxicity to fish and to mammalian cells by Pfiesteria species: Comparison of assay methods
Burkholder, J. M., E. J. Noga, C. W. Hobbs, H. B. Glasgow, and S. A. Smith. 1992. New
“phantom” dinoflagellate is the causative agent of major estuarine fish kills. Nature 358:407-410 (see correction in Nature 360:768).
Burnett, L. E. (1997). The challenge of living in hypoxic and hypercapnic aquatic environments. American Zoology 37: 633-640. Cadrin, S.X., and D.S. Vaughan. 1997. Retrospective analysis of virtual population estimates for
Atlantic menhaden stock assessment. U.S. Fish. Bull. 95: 445-455.
Checkley, D.M., Jr., S. Raman, G.L. Maillet and K.M. Mason. 1988. Winter storm effects on the spawning and larval drift of a pelagic fish. Nature 335(6188): 346-348.
Checkley, D.M., Jr., P.B. Ortner, F.E. Werner, L.R. Settle, and S.R. Cummings. 1999. Spawning
habitat of the Atlantic menhaden in Onslow Bay, North Carolina. Fish. Oceanogr. 8 (Suppl. 2): 22-36.
Christmas, J.Y., G. Gunter, and E.C. Whatley. 1960. Fishes taken in the menhaden fishery of
Alabama, Mississippi and eastern Louisiana. U.S. FWS., Spec. Sci. Rep. Fish. No. 339, 10 p.
DRAFT AMENDMENT 2 FOR PUBLIC COMMENT
88
Clagett, P. R. 2007. Human Population Growth and Land-Use Change. In: Phillips, S.W., ed., Synthesis of U.S. Geological Survey science for the Chesapeake Bay ecosystem and implications for environmental management: U.S. Geological Survey Circular 1316, 63p.
Cross, F.A., D.S. Peters, and W.E. Schaaf. 1985. Implications of waste disposal in coastal waters
on fish populations, p. 383-399 In: Cardwell, R.D., R. Purdy, and R.C. Bahner (eds). Aquatic Toxicology and Hazard Assessment: Seventh Symposium. ASTM STP854. Amer. Soc. for Testing and Materials, Philadelphia.
De Silva, J. and R. Condrey. 1997. Bycatch in the U.S. Gulf of Mexico menhaden fishery. Results of onboard sampling conducted in the 1994 and 1995 fishing seasons. Coastal Fish. Inst., CCEER, LSU, Baton Rouge, LA. Final Rept. MARFIN Proj. NA47FF0020-02, 119 p.
Dryfoos, R.L., R.P. Cheek, and R.L. Kroger. 1973. Preliminary analyses of Atlantic menhaden,
Brevoortia tyrannus, migrations, population structure, survival and exploitation rates, and availability as indicated from tag returns. Fish. Bull. 71: 719-734.
Durbin, A.G., and E.G. Durbin. 1975. Grazing rates of the Atlantic menhaden, Brevoortia
tyrannus, as a function of particle size and concentration. Mar. Biol. (Berl.) 33: 265-277. Durbin, A.G. and E.G. Durbin. 1998. Effects of menhaden predation on plankton populations in
Narragansett Bay, Rhode Island. Estuaries 21(3): 449-465. Dykstra, M., and A. S. Kane. 2000. Pfiesteria piscicida and ulcerative mycosis of Atlantic
Menhaden — Current status of understanding. J. of Aquatic Animal Health 12: 18-25. Edward, J.L. 2009. An RNA:DNA-based index of growth in juvenile Atlantic menhaden
(Brevoortia tyrannus): laboratory calibration and field assessment. University of Maryland, Marine-Estuarine Environmental Sciencies, Masters Sci. thesis.
Fogarty, M.J., F.P. Almeida, J. Chenoweth, and J.S. Idoine. 1989. Population dynamics of
Atlantic herring in the Gulf of Maine. NMFS, NEFC SAW-9 Working Paper 7, 12 p. Forward, Jr., R.B., M.C. De Vries, R.A. Tankersley, D. Rittschof, W.F. Hettler, J.S. Burke, J.M.
Welch and D.E. Hoss. 1999. Behaviour and sensory physiology of Atlantic menhaden larvae, Brevoortia tyrannus, during horizontal transport. In: Crowder, L.B. and F.E. Werner (eds.) Fisheries Oceanography of the Estuarine-Dependent Fishes of the South Atlantic Bight. Fish. Oceanogr. 8(suppl. 2): 37-56.
Freeman, A. M., III. 1995. “The Benefits of Water Quality Improvements for Marine Recreation:
A Review of the Empirical Evidence”, Marine Resource Economics, 10, 385–406. Friedland, K.D., L.W. Haas, and J.V. Merriner. 1984. Filtering rates of the juvenile Atlantic
menhaden Brevoortia tyrannus (Pisces: Clupeidae), with consideration of the effects of detritus and swimming speed. Mar. Biol. (Berl.) 84: 109-117.
DRAFT AMENDMENT 2 FOR PUBLIC COMMENT
89
Friedland, K.D., D.W. Ahrenholz and J.F. Guthrie. 1996. Formation and seasonal evolution of
Atlantic menhaden juvenile nurseries in coastal estuaries. Estuaries 19(1): 105-114. Friedland, K. D., D. W. Ahrenholz, J. W. Smith, M. Manning, and J. Ryan. 2006. Sieving
functional morphology of the gill raker feeding apparatus of Atlantic menhaden. J. Exp. Zool. 305A:974-985.
Friedland, K. D., Patrick D. Lynch, and Christopher J. Gobler. 2011. Time Series Mesoscale
Response of Atlantic Menhaden Brevoortia tyrannus to Variation in Plankton Abundances. Journal of Coastal Research: Volume 27, Issue 6: pp. 1148 – 1158.
Frye, John 1978. The men all singing: The story of menhaden fishing. Donning, Norfolk, Va.
_____. 1999. The men all singing. The story of menhaden fishing (expanded second edition). The Donning Co., Virginia Beach, Va., 242 p.
Glasgow, H. B., Burkholder, J. M., Mallin, M. A., Deamer-Melia, and N. J., Reed, R. E., 2001.
Field ecology of toxic Pfiesteria complex species and a conservative analysis of their role in estuarine fish kills. Environ. Health Perspect. 109: 715–730.
Goetz, S. J., and P. Jantz. 2006. Sattelite maps show Chesapeake Bay urban development. EOS
87(15): 149, 152 Goshorn, D., J. Deeds, P. Tango, C. Poukish, A. Place, M. McGinty, W. Butler, C. Luckett, and
R. Magnien. 2004. Occurrence of Karlodinium micrum and its association with fish kills in Maryland Estuaries. In Proceedings of the Tenth International Conference on Harmful Algae, St. Petersburg, FL.
Gottlieb, S.J. 1998. Ecological role of Atlantic menhaden (Brevoortia tyrannus) in Chesapeake
Bay and implications for management of the fishery. MS Thesis, U. of MD, MEES Program. 112 p.
Greer, R.L. 1915. The menhaden fishing industry of the Atlantic coast. Rep. U.S. Comm. Fish.,
1914, Append. 3, 27 p. _____. 2008. Shadow on the Chesapeake. Chesapeake Quarterly 7(3): 4-13. Hare, J. A. and J. J. Govoni. 2005. Comparison of average larval fish vertical distributions
among species exhibiting different transport pathways on the southeast United States continental shelf. Fish. Bull., U.S. 103:728-736.
Hare, J. A., S. Thorrold, H. Walsh, C. Reiss, A. Valle-Levinson and C. Jones. 2005. Biophysical
mechanisms of larval fish ingress into Chesapeake Bay. Marine Ecology Progress Series 303:295-310.
Harrison, R.W. 1931. The menhaden industry. U.S. Bur. Fish., Invest. Rep. 1, 113 p.
DRAFT AMENDMENT 2 FOR PUBLIC COMMENT
90
Hettler, W.F. 1976. Influence of temperature and salinity on routine metabolic rate and growth of
young Atlantic menhaden. J. Fish. Biol. 8: 55-65. Higham, J.R., and W.R. Nicholson. 1964. Sexual maturation and spawning of Atlantic
menhaden. Fish. Bull. 63: 255-271. Hilgartner, W. B. and G.S. Brush. 2006. Prehistoric habitat stability and post-settlement habitat
change in a Chesapeake Bay freshwater tidal wetland, USA. Holocene 16:479-494. Houde, E. D. and L. W. Harding, Jr. 2009. Menhaden abundance and productivity in Chesapeake
Bay: linking the environment and primary production to variability in fish recruitment. Final Report to NOAA Chesapeake Bay Office, Annapolis, MD. Grant No. NA04NMF4570359. Ref. No.
Houde unpublished. 2011. Unpublished data. Larval ingress research supported by NOAA
Chesapeake Bay Office, Maryland DNR, and Atlantic States Marine Fisheries Commission. University of Maryland Center for Environmental Science, Chesapeake Biological Laboratory, Solomons, MD.
Hughes, A. R., S. L. Williams, C. M. Duarte, K. L. Heck, Jr., and M. Waycott. 2009.
Associations of concern: declining seagrasses and threatened dependent species. Front. Ecol. Environ. 7(5): 242-246.
Judy, M.H., and R.M. Lewis. 1983. Distribution of eggs and larvae of Atlantic menhaden,
Brevoortia tyrannus, along the Atlantic coast of the United States. U.S. NMFS. Spec. Sci. Rep. Fish. 774, 23 p.
June, F.C., and J.L. Chamberlin. 1959. The role of the estuary in the life history and biology of
Atlantic menhaden. Proc. Gulf Carib. Fish. Inst. 11: 41-45. Kendall, A.W. and J.W. Reintjes. 1975. Geographic and hydrographic distribution of Atlantic
menhaden eggs and larvae along the middle Atlantic coast from R/V Dolphin cruises, 1965-1966. NMFS Fish. Bull. 73: 317-355.
Kimmel, D. G., W. D. Miller, L. W. Harding Jr., E. D. Houde, and M. R. Roman. 2009.
Estuarine ecosystem response captured using a synoptic climatology. Estuaries and Coasts. 32:3: 403-409.
Kirkley, J.E., Hartman, T. McDaniel, T., McConnell, K., and Whitehead, J. 2011. “An
Assessment of the Social and Economic Importance of Menhaden in Chesapeake Bay Region”, Virginia Institute of Marine Science, VIMS Marine Resource Report No. 2011-14.
Kiryu, Y., J. D. Shields, W. K. Vogelbein, D. E. Zwerner, and H. Kator. 2002. Induction of skin
ulcers in Atlantic menhaden by injection and aqueous exposure to the zoospores of Aphanomyces invadans. J. of Aquatic Animal Health 14(1): 11-24.
DRAFT AMENDMENT 2 FOR PUBLIC COMMENT
91
Lands, William E. M. 1986. Fish and Human Health. Academic Press: Orlando, FL.
Law, M. 2001. Differential diagnosis of ulcerative lesions in fish. Env. Health Persp. 109(S5):681-686.
Lellis-Dibble, K.A., K. E. McGlynn, and T. E. Bigford2008. Estuarine Fish and Shellfish Species in U.S. Commercial and Recreational Fisheries: Economic Value as an Incentive to Protect and Restore Estuarine Habitat. National Oceanic and Atmospheric Administration, National Marine Fisheries Service, NOAA Technical Memorandum NMFS-F/SPO-90.
Levine, J. F., J. H. Hawkins, M. J. Dykstra, E. J. Noga, D. W. Moye, and R. S. Cone 1990a. Epidemiology of Ulcerative Mycosis in Atlantic Menhaden in the Tar-Palmico River Estuary, North Carolina. J. of Aquatic Animal Health 2:162-171.
_____. 1990b. Species distribution of ulcerative lesions on finfish in the Tar-Pamlico River
Estuary, North Carolina. Dis, of Aquatic Org. 8:1-5. Lewis, R.M. 1966. Effects of salinity and temperature on survival and development of larval
Atlantic menhaden, Brevoortia tyrannus. Trans. Am. Fish. Soc. 95: 423-426.
Lewis, V.P., and D.S. Peters. 1984. Menhaden - a single step from vascular plant to fishery harvest. J. Exp. Mar. Biol. Ecol. 84: 95-100.
Lewis, R.M., D.W. Ahrenholz, and S.P. Epperly. 1987. Fecundity of Atlantic menhaden, Brevoortia tyrannus. Estuaries 10(4): 347-350.
Love, J. W., A. K. Johnson and E. B. May. 2006. Spatial and temporal differences of Atlantic menhaden (Brevoortia tyrannus) recruitment across major drainages (1966-2004) of the Chesapeake Bay watershed. Estuaries and Coasts 29:794-801.
Luo, J., K. J. Hartman, S. B. Brandt, C. F. Cerco, and T. H. Rippetoe. 2001. A spatially-explicit
approach for estimating carrying capacity: an application for the Atlantic menhaden (Brevoortia tyrannus) in Chesapeake Bay. Estuaries 24(4):545-556.
Lynch, A. J. 2008. A molecular analysis of Atlantic menhaden (Brevoortia tyrannus) stock
structure. Coll. of William and Mary, Masters Sci. thesis, 240 p. Lynch, P.D., M.J. Brush, E.D. Condon, and R.J. Latour. 2010. Net removal of nitrogen through
ingestion of phytoplankton by Atlantic menhaden (Brevoortia tyrannus) in Chesapeake Bay. Marine Ecological Progress Series 401: 195-209.
Manooch, III, C.S. 1991. Fisherman’s Guide: Fishes of the southeastern United States. North Carolina State Museum of Natural History, Raleigh, N.C. 362p.
DRAFT AMENDMENT 2 FOR PUBLIC COMMENT
92
McCay, Bonnie and Cieri, Marie 2000. Fishing Ports of the Mid-Atlantic. Report to the Mid-Atlantic Fishery Management Council Department of Human Ecology, Cook College, Rutgers the State University, New Brunswick, NJ.(available online at: http://www.st.nmfs.noaa.gov/st1/econ/cia/McCay_Port_Study-Apr2000_Revised.pdf)
Miller, W. D., and L. W. Harding, Jr. 2007. Climate forcing of the spring bloom in Chesapeake Bay. Marine Ecology Progress Series 331:11-22.
National Marine Fisheries Service. 2010. Fisheries Economics of the United States, 2009. U.S.
Dept. Commerce, NOAA. Tech. Memo. NMFS-F/SPO-118, 172p. Available at: https://www.st.nmfs.noaa.gov/st5/publication/index.html.
Northeast Fisheries Science Center (NEFSC). 2006a. 42nd Northeast Regional Stock Assessment
Workshop (42nd SAW): 42nd SAW assessment summary report. U.S. Dep. Commer., Northeast Fish. Sci. Cent. Ref. Doc. 06-01; 61 p.
_____. 2006b. 42nd Northeast Regional Stock Assessment Workshop (42nd SAW) stock
assessment report, part B: Expanded Multispecies Virtual Population Analysis(MSVPAX)stock assessment model. U.S. Dep. Commer., Northeast Fish. Sci. Cent. Ref. Doc. 06-09b; 308 p.
Nelson, W.R., M.C. Ingham, and W.E. Schaaf. 1977. Larval transport and year-class strength of
Atlantic menhaden, Brevoortia tyrannus. Fish. Bull. 75: 23-41. Nicholson, W.R. 1971. Coastal movements of Atlantic menhaden as inferred from changes in
age and length distributions. Trans. Am. Fish. Soc. 100: 708-716. Nicholson, W.R. 1972. Population structure and movements of Atlantic menhaden, Brevoortia
tyrannus, as inferred from back-calculated length frequencies. Ches. Sci. 13: 161-174. _____.1978. Movements and population structure of Atlantic menhaden indicated by tag returns.
Estuaries 1: 141-150. Noga, E. J. 2000. Skin ulcers in fish: Pfiesteria and other etiologies. Tox. Path. 28(6):807-823. Noga, E. J. and M. J. Dykstra. 1986. Oomycete fungi associated with Ulcerative Mycosis in
Menhaden, Brevoortia-tyrannus (Latrobe). Journal of Fish Diseases 9(1):47-53. Noga, E. J., J. F. Levine, M. J. Dykstra, and J. H. Hawkins. 1988. Pathology of ulcerative
mycosis in Atlantic menhaden Brevoortia tyrannus. Dis. of Aquatic Org. 4: 189-197. O’Bier, Stanley. Personal Communication. Orth, R, J., T. J. B. Carruthers, W. G. Dennison, C. M. Duarte, J. W. Fourqurean, K. L. Heck, Jr.,
A. R.Hughes, G. A. Kendrick, W. J. Kenworthy, S. Olyarnik, F. T. Short, M. Waycott,
DRAFT AMENDMENT 2 FOR PUBLIC COMMENT
93
and S. L.Williams. 2006. A global crisis for seagrass ecosystems. BioScience 56(12): 987-996.
Oviatt, A. 1977. Menhaden, sport fish and fishermen, p. 53-66 In: Clepper, H. [Ed.] Marine
recreational fisheries 2. Sport Fish. Inst., 220 p. Oviatt, C.A., A.L. Gall, and S.W. Nixon. 1972. Environmental effects of Atlantic menhaden on
surrounding waters. Chesapeake Sci. 13: 321-323. ORCS-Berkson, J., L. Barbieri, S. Cadrin, S. L. Cass-Calay, P. Crone, M. Dorn, C. Friess, D.
Kobayashi, T. J. Miller, W. S. Patrick, S. Pautzke, S. Ralston, M. Trianni. 2011. Calculating Acceptable Biological Catch for Stocks That Have Reliable Catch Data Only (Only Reliable Catch Stocks – ORCS). NOAA Technical Memorandum NMFS-SEFSC-616, 56 P.
Paerl, H. W., J. L. Pickney, J. M. Fear, and B. L. Peierls. 1998. Ecosystem responses to internal and watershed organic matter loading: consequences for hypoxia in the eutrophying Neuse River Estuary, North Carolina, USA. Marine Ecol. Progress Ser. 166: 17-25.
Peters, D.S., and V.P. Lewis. 1984. Estuarine productivity: Relating trophic ecology to fisheries,
p. 255-264 In: B.J. Copeland, K. Hart, N. Davis and S. Friday, (eds.) Research Managing the Nation's Estuaries. UNC Sea Grant College, Pub. UNC-SG-84-08, 420 p.
Peters, D.S., and W.E. Schaaf. 1981. Food requirements and sources for juvenile Atlantic menhaden. Trans. Am. Fish. Soc. 110: 317-324.
Quinlan, J. A., B. O. Blanton, T. J. Miller, and F. E. Werner. 1999. From spawning grounds to the estuary: using linked individual-based and hydrodynamic models to interpret patterns and processes in the oceanic phase of Atlantic menhaden Brevoortia tyrannus life history. Fisheries Oceanography 8 (Supplement 2):224-246.
Reimschussel, R., C. M. Gieseker, C. Driscoll, A. Baya, A. S. Kane, V. S. Blazer, J. J. Evans, M.
L. Kent, J. D. W. Moran and S. L. Poynton. 2003. Myxosporean plasmodial infection associated with ulcerative lesions in young-of-the-year Atlantic menhaden in a tributary of the Chesapeake Bay, and possible links to Kudoa clupeidae. Diseases Aquatic Organisms 53:143-166.
Reintjes, J.W., and A. Pacheco. 1966. The relation of menhaden to estuaries. Am. Fish. Soc.
Spec. Publ. 3: 50-58. Reish, R.L., R.B. Deriso, D. Ruppert, and R.J. Carroll. 1985. An investigation of the population
dynamics of Atlantic menhaden (Brevoortia tyrannus). Can. J. Fish. Aquat. Sci. 42 (Suppl. 1): 147-157.
Rogers, S.G. and M.J. Van Den Avyle. 1989. Species Profiles: Life histories and environmental
requirements of coastal fishes and invertebrates (Mid-Atlantic). Atlantic Menhaden. Biol. Rept. 82(11.108) TR EL-82-4. 23 p.
DRAFT AMENDMENT 2 FOR PUBLIC COMMENT
94
Schuhmann, P.W. and K.A. Schwabe, 2004. “An Analysis of Congestion Measures and Heterogeneous Angler Preferences In A Random Utility Model of Recreational Fishing”, Journal of Environmental and Resource Economics, 27(4):429-450.
Sherman, K., Belkin, I., Friedland, K.D., O’Reilly, J. & Hyde, K. (2009). Accelerated warming and emergent trends in fisheries biomass yields of the world’s Large Marine Ecosystems. In: [25], pp. 41-79.
Smith, H.M. 1896. Notes on an investigation of the menhaden fishery in 1894 with special reference to the 93 food fishes taken. Bull. U.S. Fish Comm. 15: 285-302.
Smith, J. W. 1991. The Atlantic and gulf menhaden purse seine fisheries: origins, harvesting
technologies, biostatistical monitoring, recent trends in fisheries statistics, and forecasting. Mar. Fish. Rev. 53(4):28–41.
_____.1999. Distribution of Atlantic menhaden, Brevoortia tyrannus, purse-seine seta and catches from southern New England to North Carolina, 1985-1996, NOAA Tech. Rep. NMFS 144, 22p.
Smith, JW and Ahrenholz DW 2000.The ancillary harvest of Atlantic menhaden, Brevoortia
tyrannus, roe on the North Carolina coast. Marine Fisheries Review (available as .pdf at: http://spo.nwr.noaa.gov/mfr621/mfr6211.pdf)
Smith, JW and WB O’Bier. 2011. The bait purse-seine fishery for Atlantic menhaden, Brevoortia tyrannus, in the Virginia portion of Chesapeake Bay. Mar Fish Rev 73(1): 1-12.
Stephens, E. B., M. W. Newman, A. L. Zachary and F. M. Hetrick. (1980). A viral aetiology for
the annual spring epizootics of Atlantic menhaden, Brevoortia tyrannus (Latrobe) in Chesapeake Bay. Journal of Fish Diseases 3:387-398.
Stine et al. 2005. Mycobacterial infection in laboratory-maintained Atlantic menhaden. J.
Aquatic Animal Health 17:380-385. Stout, V.F., C.R. Houle, and F.L. Beezhold. 1981. A survey of chlorinated hydrocarbon residues
in menhaden fishery products. Mar. Fish. Rev. 43(3): 1-13. Sturtevant, L.A., Johnson, F.R. and Desvousges, W.H. 1995.A Meta-analysis of Recreational
Fishing, Triangle Economic Research, Durham. Vaughan, D.S. 1993. A comparison of event-tree risk analysis to Ricker spawner-recruit
simulation: An example with Atlantic menhaden. Can. Spec. Publ. Fish. Aquat. Sci. 120: 231-241.
Vaughan, D.S., and J.W. Smith. 1988. A stock assessment of the Atlantic menhaden, Brevoortia
tyrannus, fishery. NOAA Tech. Rep. NMFS 63, 18 p.
DRAFT AMENDMENT 2 FOR PUBLIC COMMENT
95
Vaughan, D.S., M.H. Prager, and J.W. Smith. 2002. Consideration of uncertainty in stock assessment of Atlantic menhaden. Amer. Fish. Soc. Symp. 27:83-112.
Viverette, C. B., Garman, G. ., McIninch, S. P., Markham, A. C., Watts, B. D., and S. A. Macko.
2007. Finfish-waterbird trophic interactions in tidal freshwater tributaries of the Chesapeake Bay. Waterbirds. 32:1: 50-62.
Vogelbein, W. K., J. D. Shields, L. W. Haas, K. S. Reece and D. E. Zwerner. 2001. Skin ulcers
in Estuarine fishes: A comparative pathological evaluation of wild and laboratory exposed fish. Env. Health Persp. 109(S5): 687-693.
Warlen, S.M., D.A. Wolfe, C.W. Lewis, and D.R. Colby. 1977. Accumulation and retention of
dietary 14C-DDT by Atlantic menhaden. Trans. Am. Fish. Soc. 106: 95-104. Warlen, S. M., K. W. Able and E. H. Laban. 2002. Recruitment of larval Atlantic menhaden
(Brevoortia tyrannus) to North Carolina and New Jersey estuaries: evidence for larval transport northward along the east coast of the United States. Fish. Bull., U. S. 100:609-623.
Werner, F.E., B.O. Blanton, J.A. Quinlan and R.A. Luettich, Jr. 1999. Physical oceanography of
the North Carolina continental shelf during the fall and winter seasons: implications for the transport of larval menhaden. In: Crowder, L.B. and F.E. Werner (eds.) Fisheries Oceanography of the Estuarine-dependent Fishes of the South Atlantic Bight. Fish. Oceanogr. 8(suppl. 2): 7-21.
Whitehurst, J.W. 1973. The menhaden fishing industry in North Carolina. UNC-Sea Grant Publ.
No. UNC-SG-72-12, 51 p. Wood, R. J. 2000. Synoptic scale climatic foraging of multispecies fish recruitment patterns in Chesapeake Bay. Coll. of William and Mary, Ph.D. Dissertation, 163 p. Wood, R. J., and H. M. Austin. 2009. Synchronous multidecadal fish recruitment patterns in
Chesapeake Bay, USA. Can. J. Fish. Aquat. Sci. Wood, R. J., E. D. Houde and S. Jung. 2004. Variability in the dynamics of forage fish
abundances in Chesapeake Bay: retrospective analysis models and synthesis. Pages 97-107. In; Orner, D. M. (ed.). Chesapeake Bay Fisheries Research Program, Symposium Report- -2003. NOAA Chesapeake Bay Office, Annapolis, MD.
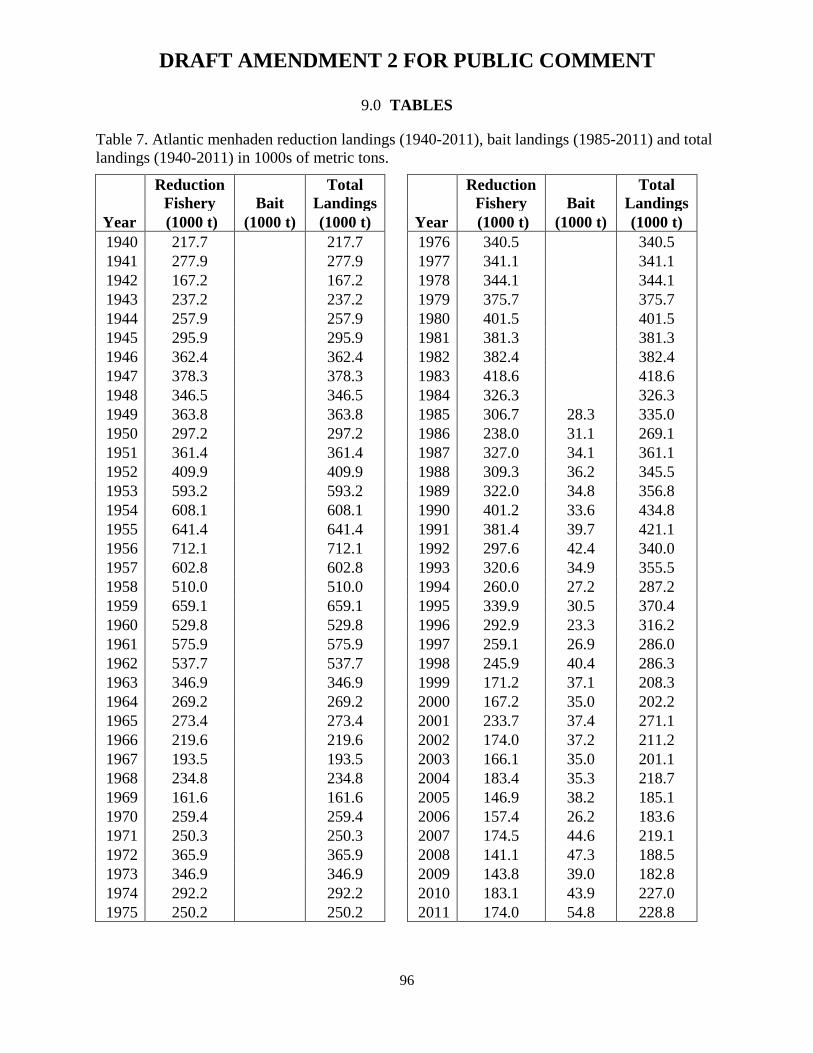
DRAFT AMENDMENT 2 FOR PUBLIC COMMENT
96
9.0 TABLES
Table 7. Atlantic menhaden reduction landings (1940-2011), bait landings (1985-2011) and total landings (1940-2011) in 1000s of metric tons.
Reduction
Fishery Bait Total
Landings Reduction
Fishery Bait Total
Landings Year (1000 t) (1000 t) (1000 t) Year (1000 t) (1000 t) (1000 t) 1940 217.7 217.7 1976 340.5 340.5 1941 277.9 277.9 1977 341.1 341.1 1942 167.2 167.2 1978 344.1 344.1 1943 237.2 237.2 1979 375.7 375.7 1944 257.9 257.9 1980 401.5 401.5 1945 295.9 295.9 1981 381.3 381.3 1946 362.4 362.4 1982 382.4 382.4 1947 378.3 378.3 1983 418.6 418.6 1948 346.5 346.5 1984 326.3 326.3 1949 363.8 363.8 1985 306.7 28.3 335.0 1950 297.2 297.2 1986 238.0 31.1 269.1 1951 361.4 361.4 1987 327.0 34.1 361.1 1952 409.9 409.9 1988 309.3 36.2 345.5 1953 593.2 593.2 1989 322.0 34.8 356.8 1954 608.1 608.1 1990 401.2 33.6 434.8 1955 641.4 641.4 1991 381.4 39.7 421.1 1956 712.1 712.1 1992 297.6 42.4 340.0 1957 602.8 602.8 1993 320.6 34.9 355.5 1958 510.0 510.0 1994 260.0 27.2 287.2 1959 659.1 659.1 1995 339.9 30.5 370.4 1960 529.8 529.8 1996 292.9 23.3 316.2 1961 575.9 575.9 1997 259.1 26.9 286.0 1962 537.7 537.7 1998 245.9 40.4 286.3 1963 346.9 346.9 1999 171.2 37.1 208.3 1964 269.2 269.2 2000 167.2 35.0 202.2 1965 273.4 273.4 2001 233.7 37.4 271.1 1966 219.6 219.6 2002 174.0 37.2 211.2 1967 193.5 193.5 2003 166.1 35.0 201.1 1968 234.8 234.8 2004 183.4 35.3 218.7 1969 161.6 161.6 2005 146.9 38.2 185.1 1970 259.4 259.4 2006 157.4 26.2 183.6 1971 250.3 250.3 2007 174.5 44.6 219.1 1972 365.9 365.9 2008 141.1 47.3 188.5 1973 346.9 346.9 2009 143.8 39.0 182.8 1974 292.2 292.2 2010 183.1 43.9 227.0 1975 250.2 250.2 2011 174.0 54.8 228.8
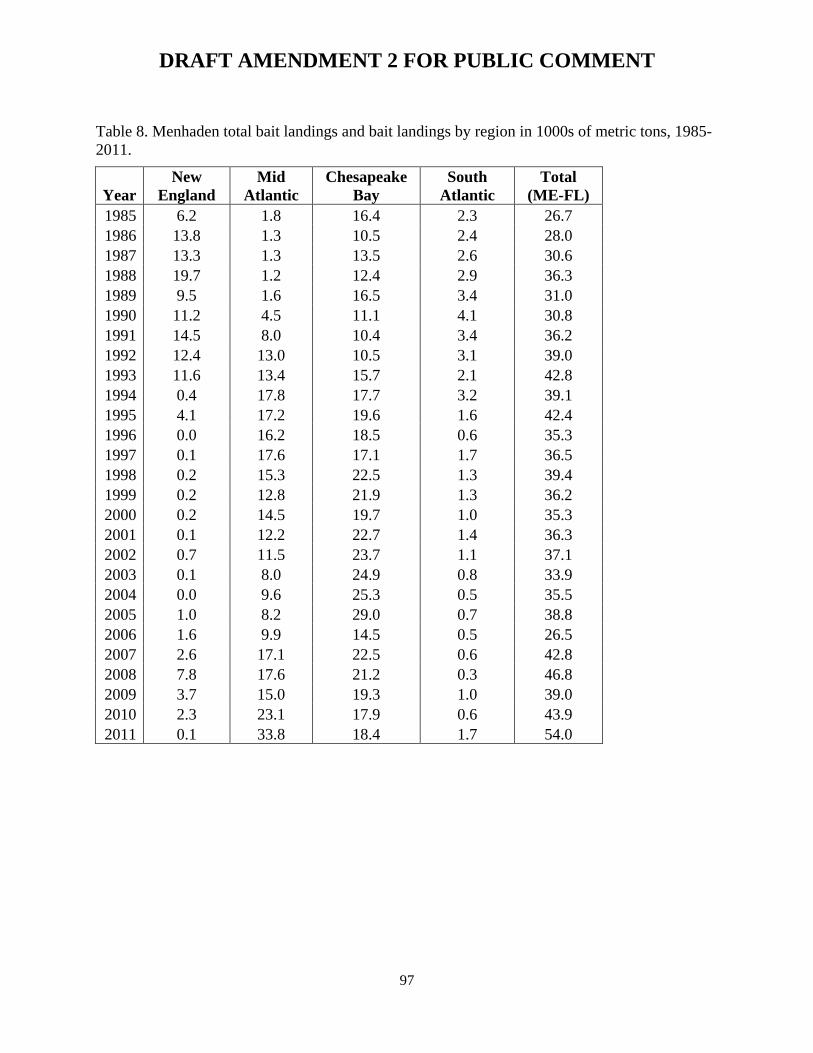
DRAFT AMENDMENT 2 FOR PUBLIC COMMENT
97
Table 8. Menhaden total bait landings and bait landings by region in 1000s of metric tons, 1985-2011.
Year New
England Mid
Atlantic Chesapeake
Bay South
Atlantic Total
(ME-FL) 1985 6.2 1.8 16.4 2.3 26.7 1986 13.8 1.3 10.5 2.4 28.0 1987 13.3 1.3 13.5 2.6 30.6 1988 19.7 1.2 12.4 2.9 36.3 1989 9.5 1.6 16.5 3.4 31.0 1990 11.2 4.5 11.1 4.1 30.8 1991 14.5 8.0 10.4 3.4 36.2 1992 12.4 13.0 10.5 3.1 39.0 1993 11.6 13.4 15.7 2.1 42.8 1994 0.4 17.8 17.7 3.2 39.1 1995 4.1 17.2 19.6 1.6 42.4 1996 0.0 16.2 18.5 0.6 35.3 1997 0.1 17.6 17.1 1.7 36.5 1998 0.2 15.3 22.5 1.3 39.4 1999 0.2 12.8 21.9 1.3 36.2 2000 0.2 14.5 19.7 1.0 35.3 2001 0.1 12.2 22.7 1.4 36.3 2002 0.7 11.5 23.7 1.1 37.1 2003 0.1 8.0 24.9 0.8 33.9 2004 0.0 9.6 25.3 0.5 35.5 2005 1.0 8.2 29.0 0.7 38.8 2006 1.6 9.9 14.5 0.5 26.5 2007 2.6 17.1 22.5 0.6 42.8 2008 7.8 17.6 21.2 0.3 46.8 2009 3.7 15.0 19.3 1.0 39.0 2010 2.3 23.1 17.9 0.6 43.9 2011 0.1 33.8 18.4 1.7 54.0
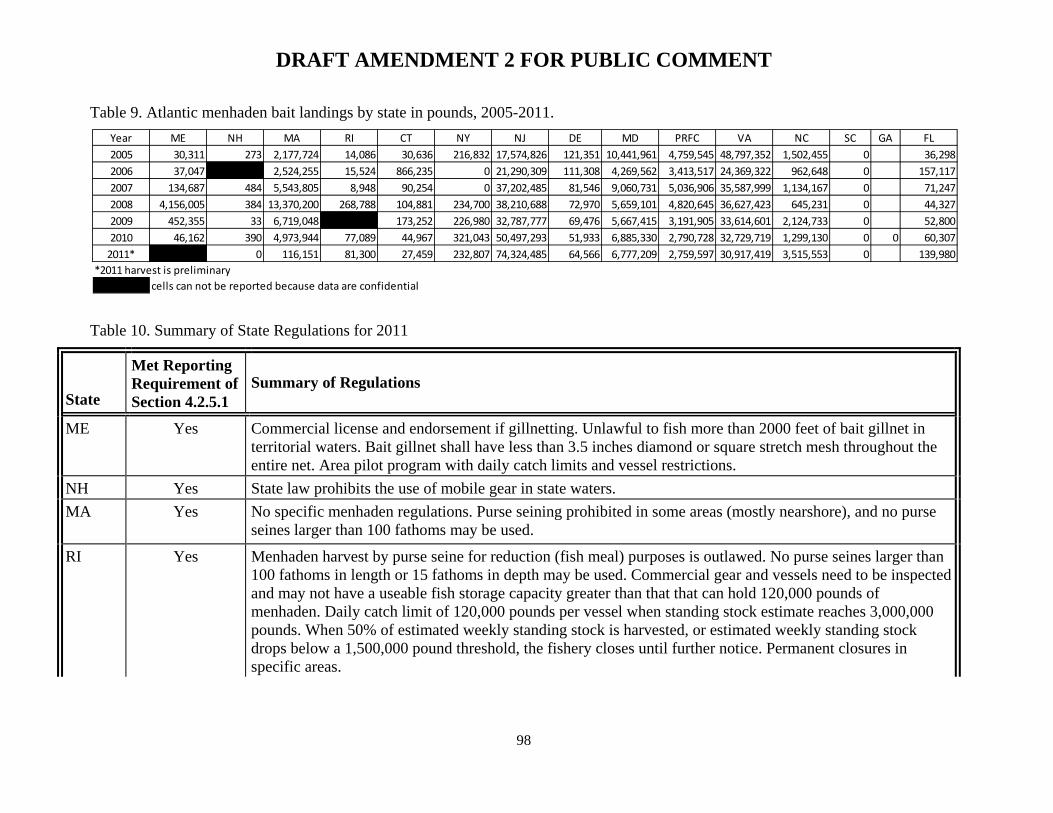
DRAFT AMENDMENT 2 FOR PUBLIC COMMENT
98
Table 9. Atlantic menhaden bait landings by state in pounds, 2005-2011.
Table 10. Summary of State Regulations for 2011
State
Met Reporting Requirement of Section 4.2.5.1
Summary of Regulations
ME Yes Commercial license and endorsement if gillnetting. Unlawful to fish more than 2000 feet of bait gillnet in territorial waters. Bait gillnet shall have less than 3.5 inches diamond or square stretch mesh throughout the entire net. Area pilot program with daily catch limits and vessel restrictions.
NH Yes State law prohibits the use of mobile gear in state waters. MA Yes No specific menhaden regulations. Purse seining prohibited in some areas (mostly nearshore), and no purse
seines larger than 100 fathoms may be used.
RI Yes Menhaden harvest by purse seine for reduction (fish meal) purposes is outlawed. No purse seines larger than 100 fathoms in length or 15 fathoms in depth may be used. Commercial gear and vessels need to be inspected and may not have a useable fish storage capacity greater than that that can hold 120,000 pounds of menhaden. Daily catch limit of 120,000 pounds per vessel when standing stock estimate reaches 3,000,000 pounds. When 50% of estimated weekly standing stock is harvested, or estimated weekly standing stock drops below a 1,500,000 pound threshold, the fishery closes until further notice. Permanent closures in specific areas.
Year ME NH MA RI CT NY NJ DE MD PRFC VA NC SC GA FL2005 30,311 273 2,177,724 14,086 30,636 216,832 17,574,826 121,351 10,441,961 4,759,545 48,797,352 1,502,455 0 36,2982006 37,047 797 2,524,255 15,524 866,235 0 21,290,309 111,308 4,269,562 3,413,517 24,369,322 962,648 0 157,1172007 134,687 484 5,543,805 8,948 90,254 0 37,202,485 81,546 9,060,731 5,036,906 35,587,999 1,134,167 0 71,2472008 4,156,005 384 13,370,200 268,788 104,881 234,700 38,210,688 72,970 5,659,101 4,820,645 36,627,423 645,231 0 44,3272009 452,355 33 6,719,048 93,880 173,252 226,980 32,787,777 69,476 5,667,415 3,191,905 33,614,601 2,124,733 0 52,8002010 46,162 390 4,973,944 77,089 44,967 321,043 50,497,293 51,933 6,885,330 2,790,728 32,729,719 1,299,130 0 0 60,307
2011* 56,000 0 116,151 81,300 27,459 232,807 74,324,485 64,566 6,777,209 2,759,597 30,917,419 3,515,553 0 139,980*2011 harvest is preliminary
cells can not be reported because data are confidential
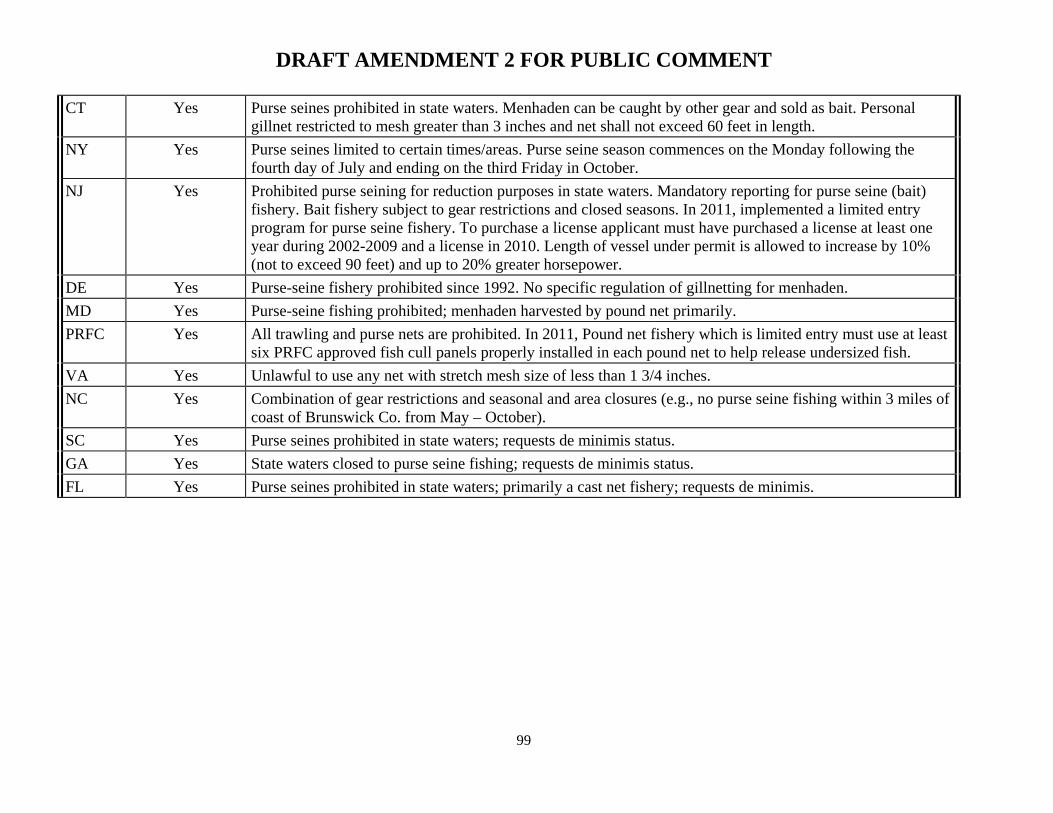
DRAFT AMENDMENT 2 FOR PUBLIC COMMENT
99
CT Yes Purse seines prohibited in state waters. Menhaden can be caught by other gear and sold as bait. Personal gillnet restricted to mesh greater than 3 inches and net shall not exceed 60 feet in length.
NY Yes Purse seines limited to certain times/areas. Purse seine season commences on the Monday following the fourth day of July and ending on the third Friday in October.
NJ Yes Prohibited purse seining for reduction purposes in state waters. Mandatory reporting for purse seine (bait) fishery. Bait fishery subject to gear restrictions and closed seasons. In 2011, implemented a limited entry program for purse seine fishery. To purchase a license applicant must have purchased a license at least one year during 2002-2009 and a license in 2010. Length of vessel under permit is allowed to increase by 10% (not to exceed 90 feet) and up to 20% greater horsepower.
DE Yes Purse-seine fishery prohibited since 1992. No specific regulation of gillnetting for menhaden. MD Yes Purse-seine fishing prohibited; menhaden harvested by pound net primarily. PRFC Yes All trawling and purse nets are prohibited. In 2011, Pound net fishery which is limited entry must use at least
six PRFC approved fish cull panels properly installed in each pound net to help release undersized fish. VA Yes Unlawful to use any net with stretch mesh size of less than 1 3/4 inches. NC Yes Combination of gear restrictions and seasonal and area closures (e.g., no purse seine fishing within 3 miles of
coast of Brunswick Co. from May – October). SC Yes Purse seines prohibited in state waters; requests de minimis status. GA Yes State waters closed to purse seine fishing; requests de minimis status. FL Yes Purse seines prohibited in state waters; primarily a cast net fishery; requests de minimis.

DRAFT AMENDMENT 2 FOR PUBLIC COMMENT
100
Table 11. Comparison of Atlantic menhaden biological reference points and model produced output values. 10.0
11.0
12.0
Reference Points
Model Produced Output
Values
Target Threshold
2011 Estimate
2009-2011
Fishing Mortality
0.62
1.34
4.50
3.07
SSB (in billions of mature ova)
19,092
9,546
13,333
16,879
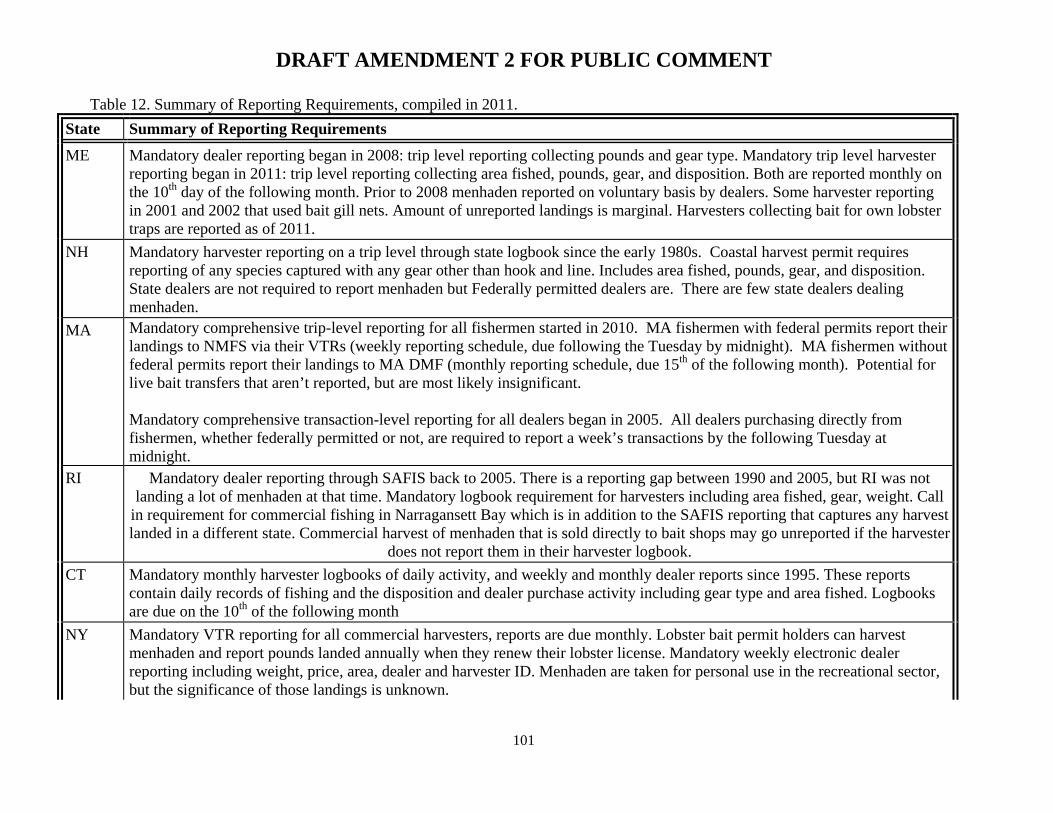
DRAFT AMENDMENT 2 FOR PUBLIC COMMENT
101
Table 12. Summary of Reporting Requirements, compiled in 2011. State Summary of Reporting Requirements
ME Mandatory dealer reporting began in 2008: trip level reporting collecting pounds and gear type. Mandatory trip level harvester reporting began in 2011: trip level reporting collecting area fished, pounds, gear, and disposition. Both are reported monthly on the 10th day of the following month. Prior to 2008 menhaden reported on voluntary basis by dealers. Some harvester reporting in 2001 and 2002 that used bait gill nets. Amount of unreported landings is marginal. Harvesters collecting bait for own lobster traps are reported as of 2011.
NH Mandatory harvester reporting on a trip level through state logbook since the early 1980s. Coastal harvest permit requires reporting of any species captured with any gear other than hook and line. Includes area fished, pounds, gear, and disposition. State dealers are not required to report menhaden but Federally permitted dealers are. There are few state dealers dealing menhaden.
MA Mandatory comprehensive trip-level reporting for all fishermen started in 2010. MA fishermen with federal permits report their landings to NMFS via their VTRs (weekly reporting schedule, due following the Tuesday by midnight). MA fishermen without federal permits report their landings to MA DMF (monthly reporting schedule, due 15th of the following month). Potential for live bait transfers that aren’t reported, but are most likely insignificant. Mandatory comprehensive transaction-level reporting for all dealers began in 2005. All dealers purchasing directly from fishermen, whether federally permitted or not, are required to report a week’s transactions by the following Tuesday at midnight.
RI Mandatory dealer reporting through SAFIS back to 2005. There is a reporting gap between 1990 and 2005, but RI was not landing a lot of menhaden at that time. Mandatory logbook requirement for harvesters including area fished, gear, weight. Call
in requirement for commercial fishing in Narragansett Bay which is in addition to the SAFIS reporting that captures any harvest landed in a different state. Commercial harvest of menhaden that is sold directly to bait shops may go unreported if the harvester
does not report them in their harvester logbook. CT Mandatory monthly harvester logbooks of daily activity, and weekly and monthly dealer reports since 1995. These reports
contain daily records of fishing and the disposition and dealer purchase activity including gear type and area fished. Logbooks are due on the 10th of the following month
NY Mandatory VTR reporting for all commercial harvesters, reports are due monthly. Lobster bait permit holders can harvest menhaden and report pounds landed annually when they renew their lobster license. Mandatory weekly electronic dealer reporting including weight, price, area, dealer and harvester ID. Menhaden are taken for personal use in the recreational sector, but the significance of those landings is unknown.
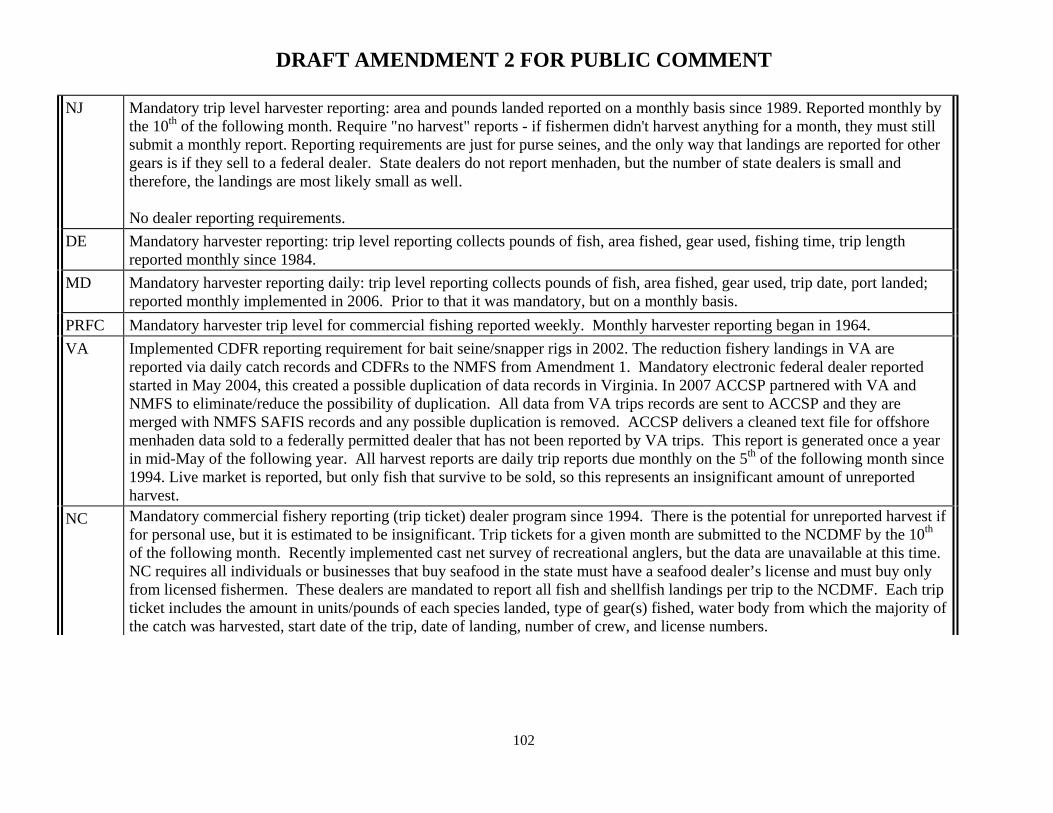
DRAFT AMENDMENT 2 FOR PUBLIC COMMENT
102
NJ Mandatory trip level harvester reporting: area and pounds landed reported on a monthly basis since 1989. Reported monthly by the 10th of the following month. Require "no harvest" reports - if fishermen didn't harvest anything for a month, they must still submit a monthly report. Reporting requirements are just for purse seines, and the only way that landings are reported for other gears is if they sell to a federal dealer. State dealers do not report menhaden, but the number of state dealers is small and therefore, the landings are most likely small as well. No dealer reporting requirements.
DE Mandatory harvester reporting: trip level reporting collects pounds of fish, area fished, gear used, fishing time, trip length reported monthly since 1984.
MD Mandatory harvester reporting daily: trip level reporting collects pounds of fish, area fished, gear used, trip date, port landed; reported monthly implemented in 2006. Prior to that it was mandatory, but on a monthly basis.
PRFC Mandatory harvester trip level for commercial fishing reported weekly. Monthly harvester reporting began in 1964. VA Implemented CDFR reporting requirement for bait seine/snapper rigs in 2002. The reduction fishery landings in VA are
reported via daily catch records and CDFRs to the NMFS from Amendment 1. Mandatory electronic federal dealer reported started in May 2004, this created a possible duplication of data records in Virginia. In 2007 ACCSP partnered with VA and NMFS to eliminate/reduce the possibility of duplication. All data from VA trips records are sent to ACCSP and they are merged with NMFS SAFIS records and any possible duplication is removed. ACCSP delivers a cleaned text file for offshore menhaden data sold to a federally permitted dealer that has not been reported by VA trips. This report is generated once a year in mid-May of the following year. All harvest reports are daily trip reports due monthly on the 5th of the following month since 1994. Live market is reported, but only fish that survive to be sold, so this represents an insignificant amount of unreported harvest.
NC Mandatory commercial fishery reporting (trip ticket) dealer program since 1994. There is the potential for unreported harvest if for personal use, but it is estimated to be insignificant. Trip tickets for a given month are submitted to the NCDMF by the 10th of the following month. Recently implemented cast net survey of recreational anglers, but the data are unavailable at this time. NC requires all individuals or businesses that buy seafood in the state must have a seafood dealer’s license and must buy only from licensed fishermen. These dealers are mandated to report all fish and shellfish landings per trip to the NCDMF. Each trip ticket includes the amount in units/pounds of each species landed, type of gear(s) fished, water body from which the majority of the catch was harvested, start date of the trip, date of landing, number of crew, and license numbers.
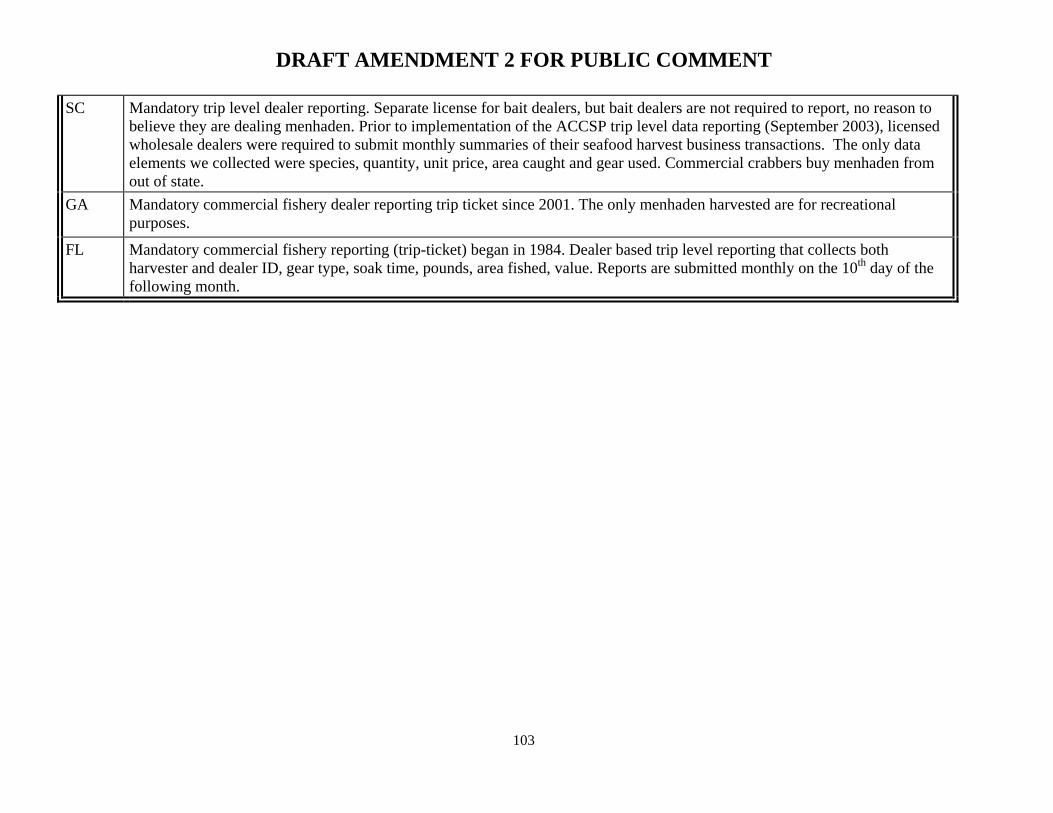
DRAFT AMENDMENT 2 FOR PUBLIC COMMENT
103
SC Mandatory trip level dealer reporting. Separate license for bait dealers, but bait dealers are not required to report, no reason to believe they are dealing menhaden. Prior to implementation of the ACCSP trip level data reporting (September 2003), licensed wholesale dealers were required to submit monthly summaries of their seafood harvest business transactions. The only data elements we collected were species, quantity, unit price, area caught and gear used. Commercial crabbers buy menhaden from out of state.
GA Mandatory commercial fishery dealer reporting trip ticket since 2001. The only menhaden harvested are for recreational purposes.
FL Mandatory commercial fishery reporting (trip-ticket) began in 1984. Dealer based trip level reporting that collects both harvester and dealer ID, gear type, soak time, pounds, area fished, value. Reports are submitted monthly on the 10th day of the following month.
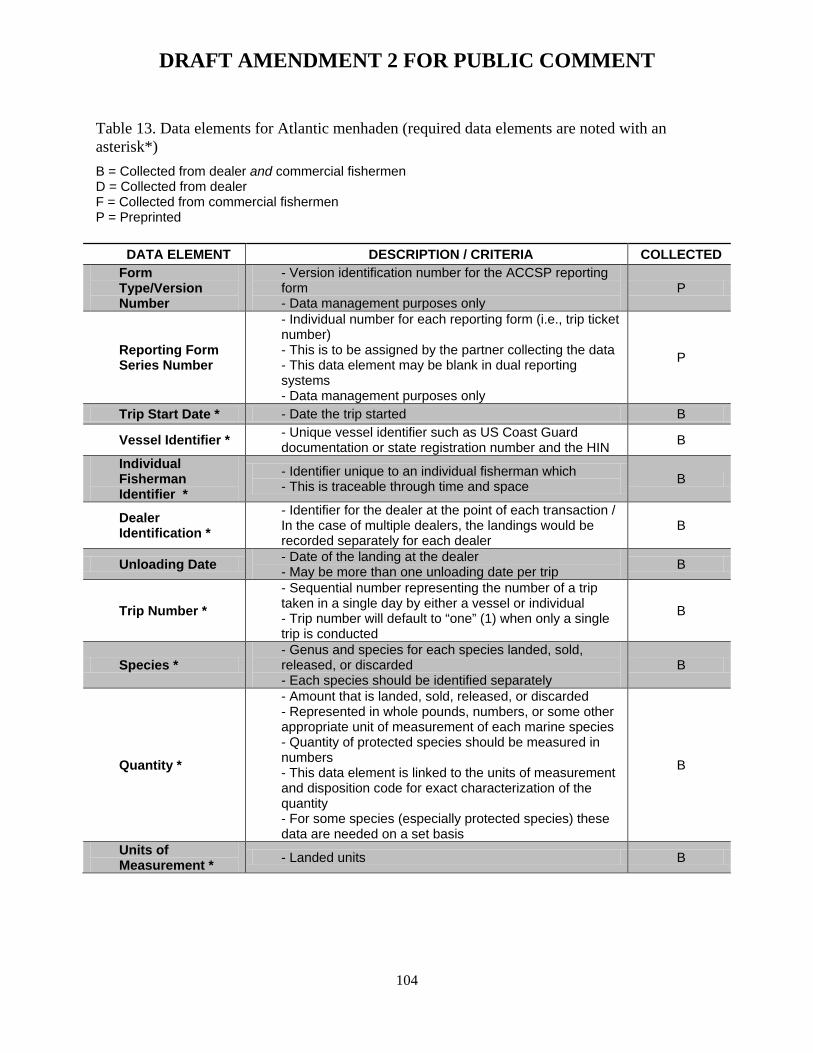
DRAFT AMENDMENT 2 FOR PUBLIC COMMENT
104
Table 13. Data elements for Atlantic menhaden (required data elements are noted with an asterisk*) B = Collected from dealer and commercial fishermen D = Collected from dealer F = Collected from commercial fishermen P = Preprinted
DATA ELEMENT DESCRIPTION / CRITERIA COLLECTED Form Type/Version Number
- Version identification number for the ACCSP reporting form - Data management purposes only
P
Reporting Form Series Number
- Individual number for each reporting form (i.e., trip ticket number) - This is to be assigned by the partner collecting the data - This data element may be blank in dual reporting systems - Data management purposes only
P
Trip Start Date * - Date the trip started B
Vessel Identifier * - Unique vessel identifier such as US Coast Guard documentation or state registration number and the HIN B
Individual Fisherman Identifier *
- Identifier unique to an individual fisherman which - This is traceable through time and space B
Dealer Identification *
- Identifier for the dealer at the point of each transaction / In the case of multiple dealers, the landings would be recorded separately for each dealer
B
Unloading Date - Date of the landing at the dealer - May be more than one unloading date per trip B
Trip Number * - Sequential number representing the number of a trip taken in a single day by either a vessel or individual - Trip number will default to “one” (1) when only a single trip is conducted
B
Species * - Genus and species for each species landed, sold, released, or discarded - Each species should be identified separately
B
Quantity *
- Amount that is landed, sold, released, or discarded - Represented in whole pounds, numbers, or some other appropriate unit of measurement of each marine species - Quantity of protected species should be measured in numbers - This data element is linked to the units of measurement and disposition code for exact characterization of the quantity - For some species (especially protected species) these data are needed on a set basis
B
Units of Measurement * - Landed units B
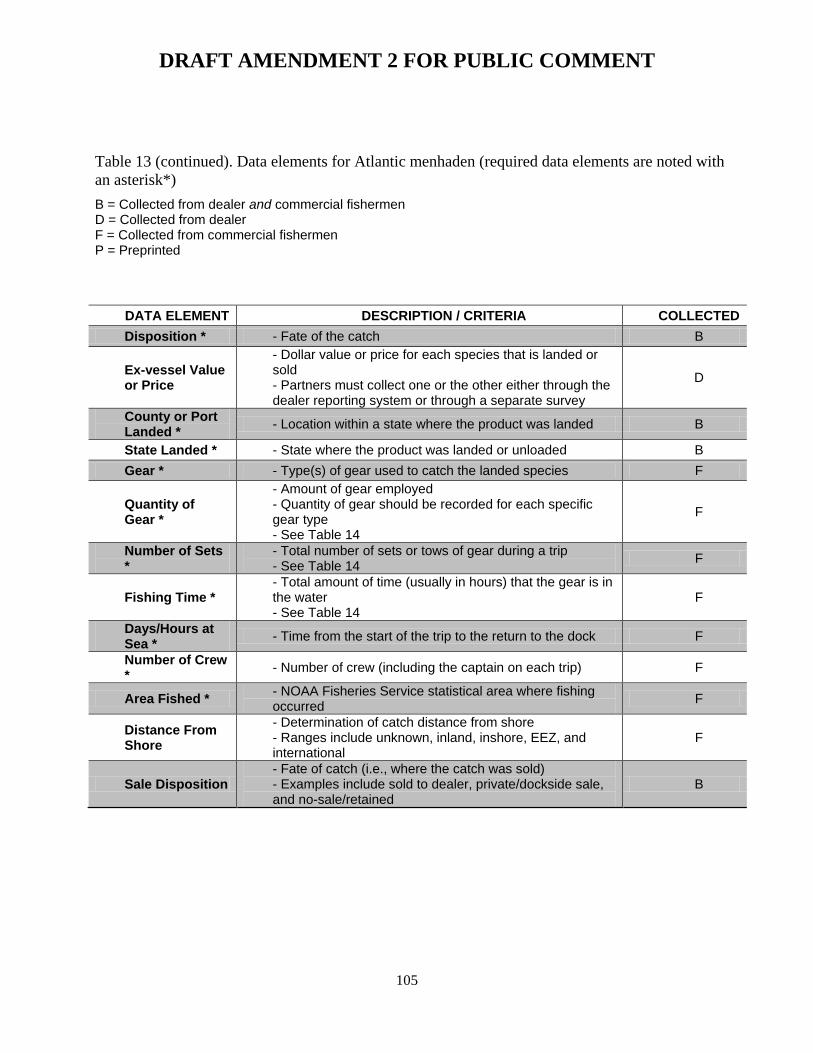
DRAFT AMENDMENT 2 FOR PUBLIC COMMENT
105
DATA ELEMENT DESCRIPTION / CRITERIA COLLECTED Disposition * - Fate of the catch B
Ex-vessel Value or Price
- Dollar value or price for each species that is landed or sold - Partners must collect one or the other either through the dealer reporting system or through a separate survey
D
County or Port Landed * - Location within a state where the product was landed B
State Landed * - State where the product was landed or unloaded B Gear * - Type(s) of gear used to catch the landed species F
Quantity of Gear *
- Amount of gear employed - Quantity of gear should be recorded for each specific gear type - See Table 14
F
Number of Sets *
- Total number of sets or tows of gear during a trip - See Table 14 F
Fishing Time * - Total amount of time (usually in hours) that the gear is in the water - See Table 14
F
Days/Hours at Sea * - Time from the start of the trip to the return to the dock F
Number of Crew * - Number of crew (including the captain on each trip) F
Area Fished * - NOAA Fisheries Service statistical area where fishing occurred F
Distance From Shore
- Determination of catch distance from shore - Ranges include unknown, inland, inshore, EEZ, and international
F
Sale Disposition - Fate of catch (i.e., where the catch was sold) - Examples include sold to dealer, private/dockside sale, and no-sale/retained
B
Table 13 (continued). Data elements for Atlantic menhaden (required data elements are noted with an asterisk*) B = Collected from dealer and commercial fishermen D = Collected from dealer F = Collected from commercial fishermen P = Preprinted
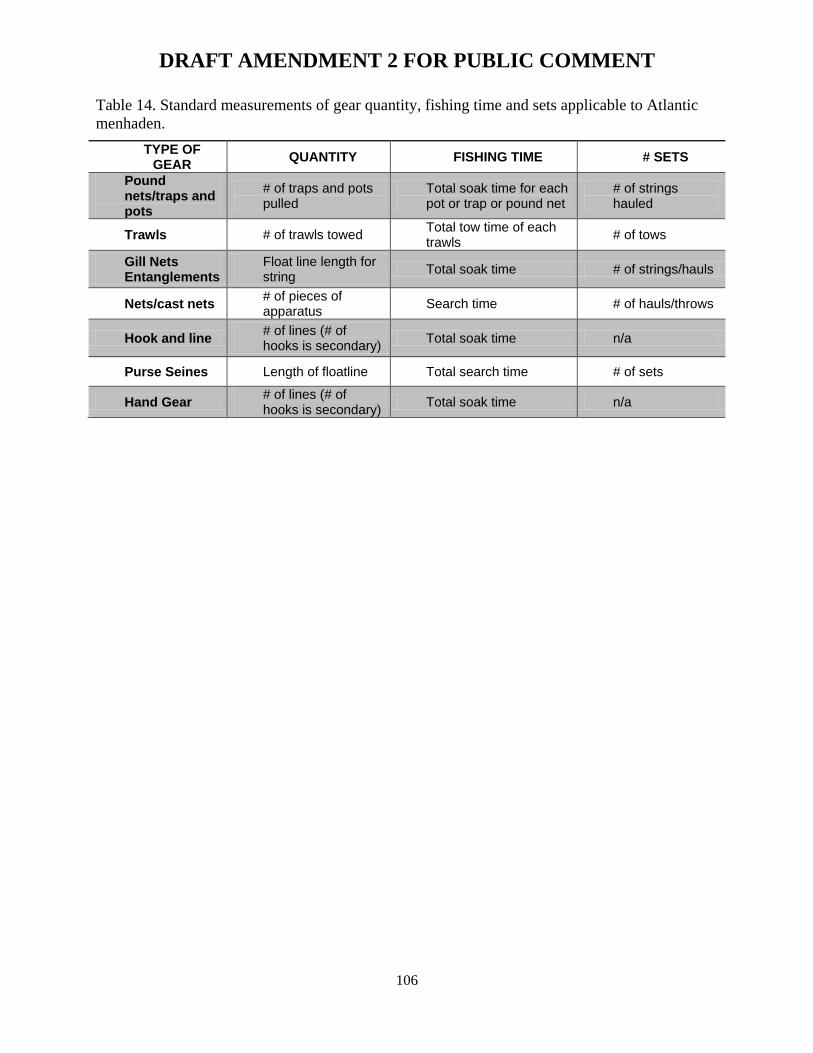
DRAFT AMENDMENT 2 FOR PUBLIC COMMENT
106
Table 14. Standard measurements of gear quantity, fishing time and sets applicable to Atlantic menhaden.
TYPE OF GEAR QUANTITY FISHING TIME # SETS
Pound nets/traps and pots
# of traps and pots pulled
Total soak time for each pot or trap or pound net
# of strings hauled
Trawls # of trawls towed Total tow time of each trawls # of tows
Gill Nets Entanglements
Float line length for string Total soak time # of strings/hauls
Nets/cast nets # of pieces of apparatus Search time # of hauls/throws
Hook and line # of lines (# of hooks is secondary) Total soak time n/a
Purse Seines Length of floatline Total search time # of sets
Hand Gear # of lines (# of hooks is secondary) Total soak time n/a
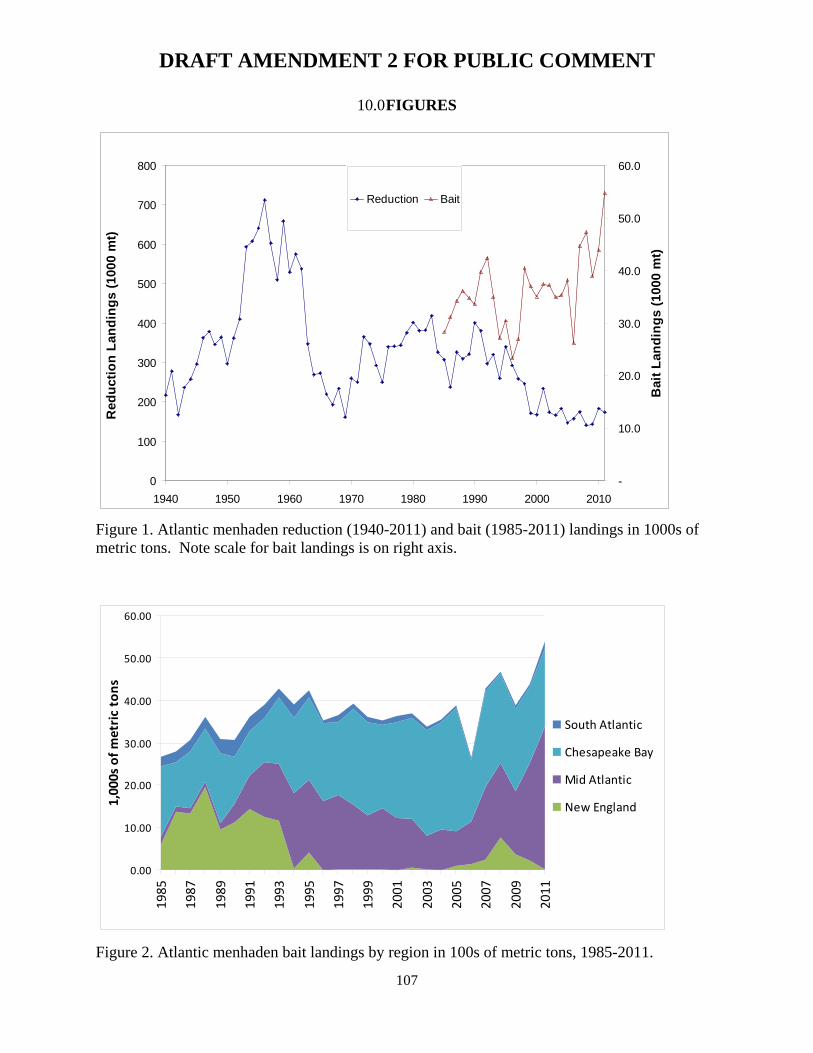
DRAFT AMENDMENT 2 FOR PUBLIC COMMENT
107
10.0 FIGURES
Figure 1. Atlantic menhaden reduction (1940-2011) and bait (1985-2011) landings in 1000s of metric tons. Note scale for bait landings is on right axis.
Figure 2. Atlantic menhaden bait landings by region in 100s of metric tons, 1985-2011.
0
100
200
300
400
500
600
700
800
1940 1950 1960 1970 1980 1990 2000 2010
Red
uctio
n La
ndin
gs (1
000
mt)
-
10.0
20.0
30.0
40.0
50.0
60.0
Bai
t Lan
ding
s (1
000
mt)
Reduction Bait
0.00
10.00
20.00
30.00
40.00
50.00
60.00
1985
1987
1989
1991
1993
1995
1997
1999
2001
2003
2005
2007
2009
2011
1,00
0s o
f met
ric
tons
South Atlantic
Chesapeake Bay
Mid Atlantic
New England
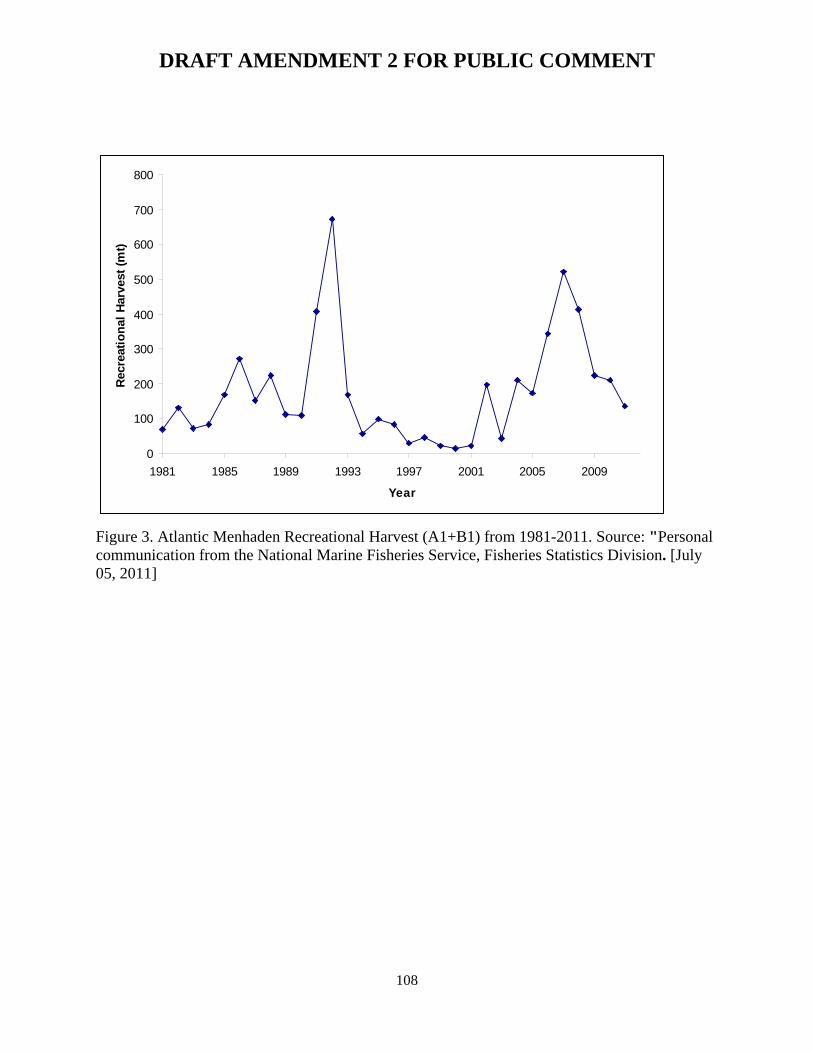
DRAFT AMENDMENT 2 FOR PUBLIC COMMENT
108
Figure 3. Atlantic Menhaden Recreational Harvest (A1+B1) from 1981-2011. Source: "Personal communication from the National Marine Fisheries Service, Fisheries Statistics Division. [July 05, 2011]
0
100
200
300
400
500
600
700
800
1981 1985 1989 1993 1997 2001 2005 2009
Year
Recr
eatio
nal H
arve
st (m
t)
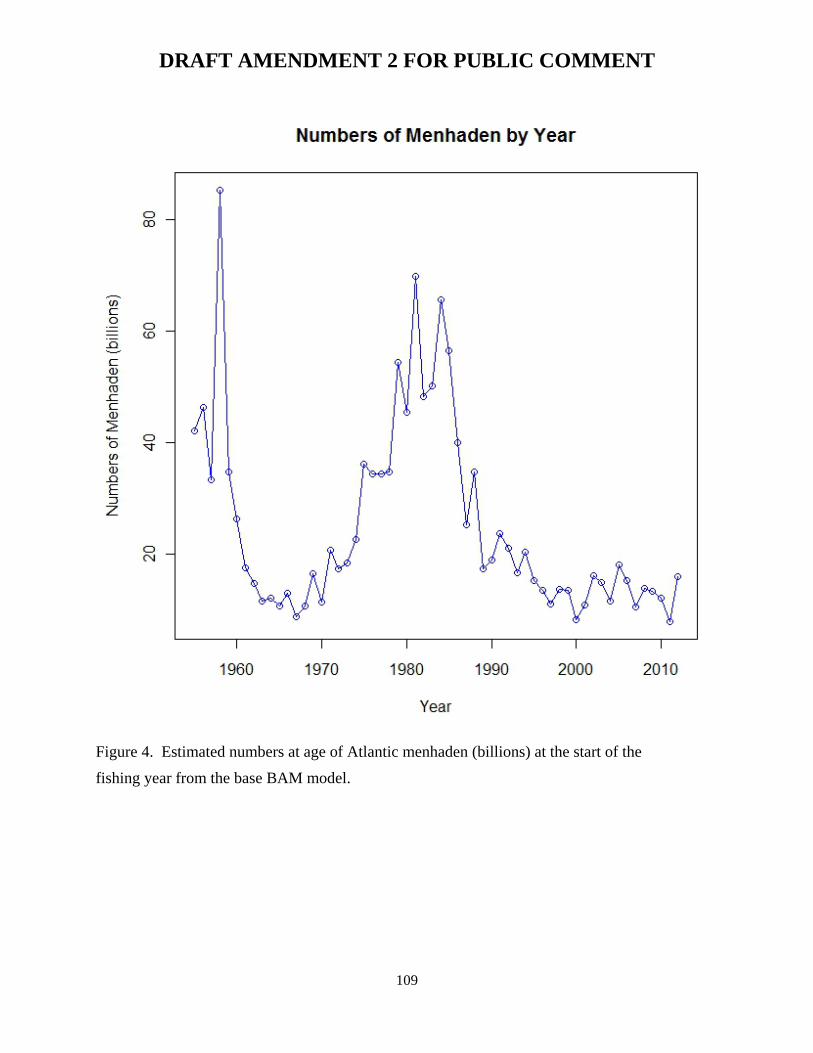
DRAFT AMENDMENT 2 FOR PUBLIC COMMENT
109
Figure 4. Estimated numbers at age of Atlantic menhaden (billions) at the start of the
fishing year from the base BAM model.
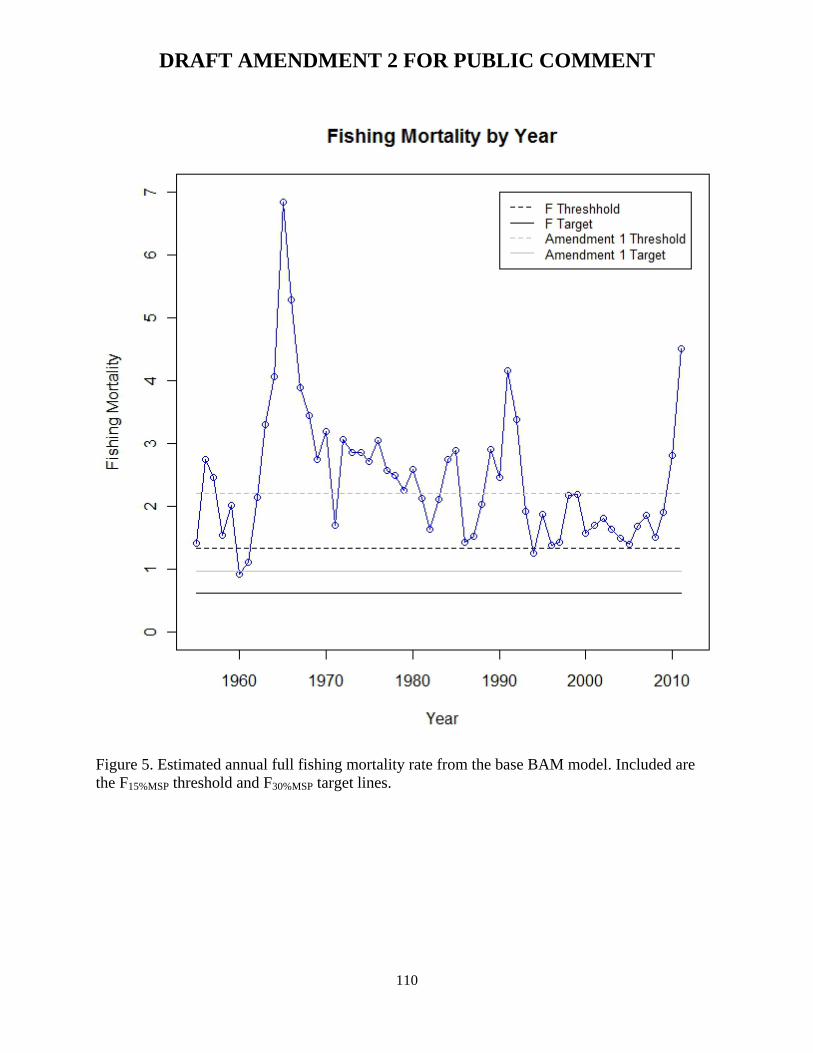
DRAFT AMENDMENT 2 FOR PUBLIC COMMENT
110
Figure 5. Estimated annual full fishing mortality rate from the base BAM model. Included are the F15%MSP threshold and F30%MSP target lines.
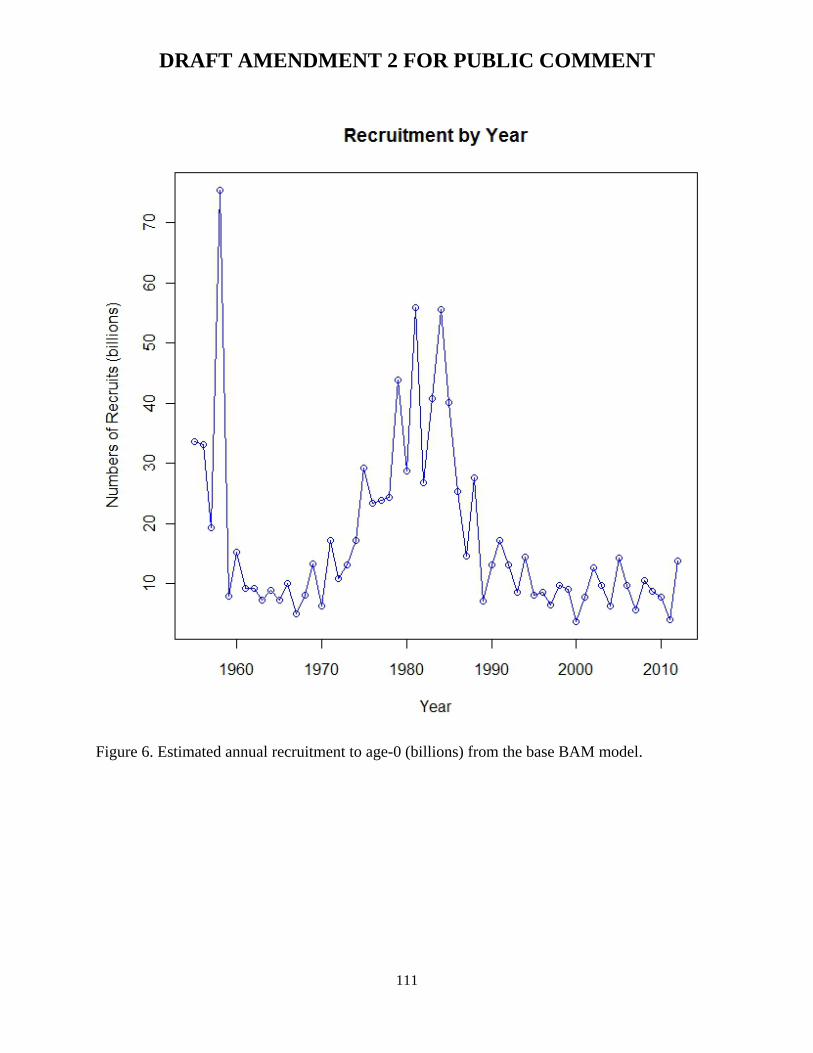
DRAFT AMENDMENT 2 FOR PUBLIC COMMENT
111
Figure 6. Estimated annual recruitment to age-0 (billions) from the base BAM model.
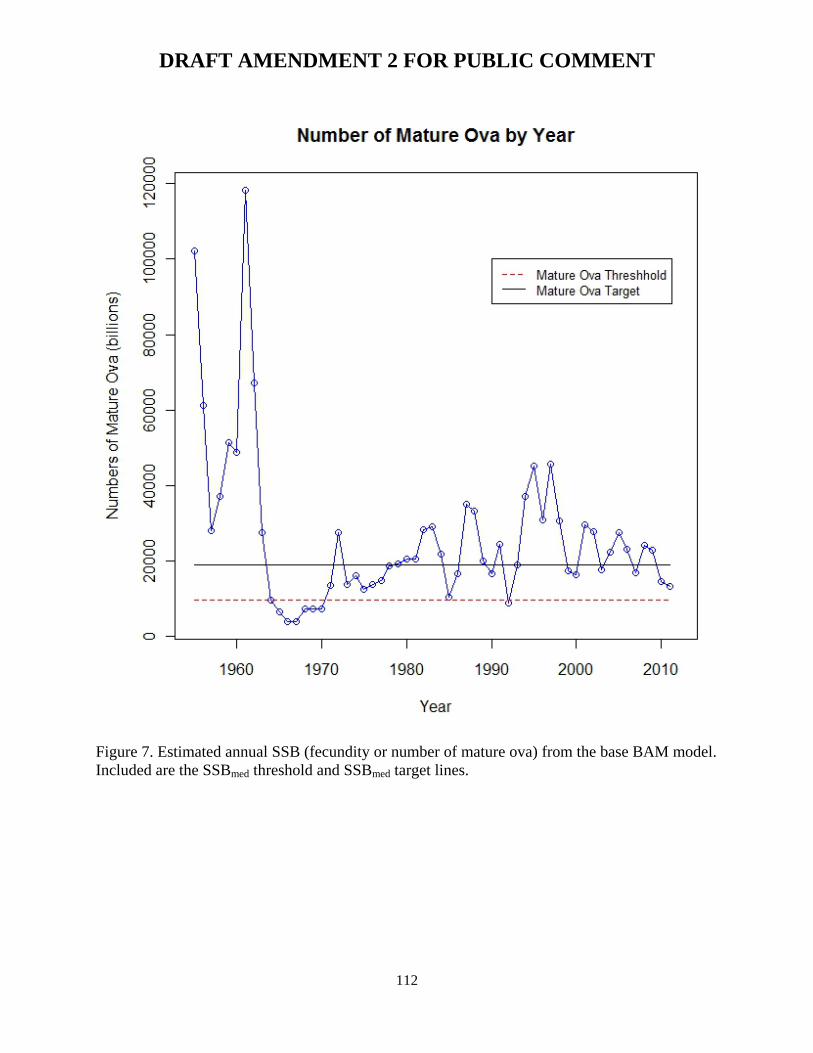
DRAFT AMENDMENT 2 FOR PUBLIC COMMENT
112
Figure 7. Estimated annual SSB (fecundity or number of mature ova) from the base BAM model. Included are the SSBmed threshold and SSBmed target lines.


