Embed Size (px)
Citation preview

Abh
MKa
Cb
c
d
ARRA
KDFSL
0h
Preventive Veterinary Medicine 111 (2013) 245– 255
Contents lists available at SciVerse ScienceDirect
Preventive Veterinary Medicine
j ourna l h om epa ge: www.elsev ier .com/ locate /prevetmed
ssociations of herd- and cow-level factors, cow lyingehavior, and risk of elevated somatic cell count in free-stalloused lactating dairy cows
.E. Alexandrea Wattersa, Karin M.A. Meijera, Herman W. Barkemab,enneth E. Lesliec, Marina A.G. von Keyserlingkd, Trevor J. DeVriesa,∗
Department of Animal and Poultry Science, University of Guelph, Kemptville Campus, 830 Prescott Street, Kemptville, ON K0G 1J0,anadaDepartment of Production Animal Health, University of Calgary, 2500 University Drive NW., Calgary, AB T2N 1N4, CanadaDepartment of Population Medicine, University of Guelph, 50 Stone Road E., Guelph, ON N1G 2W1, CanadaAnimal Welfare Program, University of British Columbia, 2329 West Mall, Vancouver, BC V6T 1Z4, Canada
a r t i c l e i n f o
rticle history:eceived 12 December 2012eceived in revised form 16 April 2013ccepted 23 May 2013
eywords:airy cowree stallomatic cell countying behavior
a b s t r a c t
Recent evidence suggests that the risk of intramammary infection in dairy cows is related tolying patterns. The objectives of this study were to quantify the standing and lying behaviorof dairy cows milked 3×/d, determine the cow- and herd-level factors associated with thesebehaviors, and relate these findings to the risk of an elevated somatic cell count (SCC).Five commercial free-stall dairy herds in Eastern Ontario, milking 3×/d, were enrolled ina longitudinal study. Forty Holstein-Friesian cows/herd were randomly selected as focalanimals based on days in milk (<200 d) and SCC (<100,000 cells/mL). Farms were followedfor 4, 5-week periods. Individual-cow SCC was recorded at the beginning of each periodand end of the final period. Elevated SCC (eSCC) was used as an indicator of subclinicalmastitis. A new incident eSCC was defined as an individual cow that started the period witha SCC <100,000 cells/mL but whose next SCC exceeded 200,000 cells/mL. Lying behavior wasrecorded 5 d after each milk sampling using data loggers. For these 5 d, individual milkingtimes and feeding times were also recorded. On d 1 of each recording period 2 trainedobservers scored focal cows for hygiene and lameness. Throughout the course of the study,cows averaged 11.2 h/d of lying time, split into 8.6 lying bouts/d that were on average84.6 min in length. Later lactation cows had longer daily lying times that were split intofewer lying bouts of longer duration than cows earlier in lactation. Lame cows had longerdaily lying times and lying bout durations than non-lame cows. Cows with greater milkyield had lower lying times than lower producing cows. Average post-milking standingtime across the study herds was 103 min. Manipulation of feed (feed delivery or push-up) by the stockperson, in the hour before milking or shortly thereafter, resulted in thelongest post-milking standing times. Over the study period, 48 new eSCC were detected,resulting in a mean herd incidence rate of 0.91 eSCC/cow-year at risk for all study herds.A non-linear relationship between post-milking standing time and eSCC incidence wasfound; compared to those cows that lie down <90 min after milking, cows that lie down
for the first time >90 min after milking had a lower risk of acquiring a new eSCC. The riskof experiencing an eSCC whigher SCC at the beginninthat promote post-milkinmilking times, should be e∗ Corresponding author. Tel.: +1 613 258 8336x61458; fax: +1 613 258 8285.E-mail address: [email protected] (T.J. DeVries).
167-5877/$ – see front matter © 2013 Elsevier B.V. All rights reserved.ttp://dx.doi.org/10.1016/j.prevetmed.2013.05.015
as also increased in multiparous cows, and in those cows with a
g of the study. These results indicate that management practicesg standing time, such as the manipulation of feed delivery aroundncouraged to reduce the risk of cows experiencing new eSCC.
© 2013 Elsevier B.V. All rights reserved.

Veterina
246 M.E.A. Watters et al. / Preventive1. Introduction
Mastitis is the most economically significant diseaseimpacting the global dairy industry (Seegers et al., 2003).Given the complexity of the disease, complete elimina-tion of intramammary infection is not feasible at thistime (Smith, 1983). Thus, understanding farm managementpractices that reduce the incidence of mastitis is essen-tial, from both an economic and animal welfare standpoint(Barkema et al., 1999).
A long-accepted management practice assumed toreduce the risk of mastitis is to promote longer stand-ing times after milking. The presence of feed, particularlyfresh feed, has been shown to encourage longer post-milking standing times (Tyler et al., 1997; DeVries and vonKeyserlingk, 2005; DeVries et al., 2010). Keeping cows ontheir feet for a certain period of time after milking willincrease the likelihood that the teat canals have closed priorto the udder contacting the stall surface when the cow liesdown, thus decreasing the odds of bacterial penetration ofthe teat (Tyler et al., 1997; Johansson et al., 1999). A study oftie-stall housed cows observed that cows that laid down,on average between 40 and 60 min after milking, tendedto have a decreased risk of acquiring a new environmen-tal intramammary infection (IMI) compared to those cowsthat laid down within 40 min after milking (DeVries et al.,2010).
In the study by DeVries et al. (2010), the mean post-milking standing duration of the studied tie-stall housedcows was 79 min. This is much longer than that previ-ously reported for free-stall housed cows (milked 2×/d),ranging from 33 to 62 min (Tyler et al., 1997; DeVriesand von Keyserlingk, 2005; DeVries et al., 2005; Fregonesiet al., 2007). These results provide some evidence that infree-stall housing systems, a large percentage of cows liedown relatively quickly (within 40 min) after returningfrom milking. One possible explanation for this may bethe additional time required for these cows to access feedin addition to the time spent standing before and duringmilking. In a study of 16 free-stall farms, it was foundthat increased time spent milking was associated with adecrease in time spent feeding and lying (Gomez and Cook,2010). Further, lying behavior has been shown to increaseduring the night and early morning hours, unless dis-rupted by management practices (Mattachini et al., 2011).Decreased post-milking standing durations observed infree-stall housed, parlor milked, cows may thus be a con-sequence of these animals attempting to regain lost lyingtimes. One management practice that could further exac-erbate this behavior is milking frequency. In herds with3×/d milking, cows are being milked on average every8 h; a practice that arguably disrupts their diurnal behav-ior patterns. Therefore, it is expected that the tendencyfor free-stall housed cows to lie down soon after milkingmay be further exacerbated when cows are milked morefrequently.
There were three objectives for this study: (1) to
quantify the standing and lying behavior, with particularemphasis on post-milking standing time, of dairy cowsmilked 3×/d, (2) to determine the cow- and herd-levelfactors associated with lying behavior, and (3) to relatery Medicine 111 (2013) 245– 255
these findings to the risk of experiencing an elevation insomatic cell count (SCC). It was hypothesized that post-milking standing times would be shorter when fresh feedwas not offered near the time of milking, and that thosecows which lie soonest after milking would have a higherrisk of acquiring a new elevated SCC (eSCC).
2. Materials and methods
2.1. Farm selection
Five commercial dairy farms in Eastern Ontario, Canadawere recruited for participation in this study. Herds wereselected as a convenience sample. Selection was basedon the criteria that they had free-stall housing, milkedcows in a parlor, milked 3×/d, participated in a dairyherd improvement (DHI) program, were predominantlyHolstein-Friesian (>90%), and had >120 lactating cows inthe herd. Overall, these farms had a mean herd size of337 (range: 144–566) lactating cows and a mean adjusted305 d milk yield of 10,097 kg (range: 9541–10,699 kg). Themean annual bulk milk SCC was 247,000 cells/mL (range:141,000–316,000 cells/mL). The study was conducted onthese herds between September 2011 and February 2012.The farms were on a rolling start date corresponding totheir DHI test dates.
2.2. Animal selection
Forty focal cows per herd were randomly selected fromall herds. Eligible cows were <200 d days in milk (DIM),ensuring that they would be available for 2 further DHItests prior to dry-off, and had a SCC <100,000 cells/mL atthe most recent DHI test. Lactation number and DIM wererecorded from farm records for each focal cow and vali-dated using DHI data.
2.3. Milk sampling and analysis
Cow-level SCC testing was conducted using compositemilk samples taken approximately every 35 days, as part ofthe DHI program, and on-line reports of results were madeavailable a few days after testing. Farms were enrolledin the study immediately following a regularly scheduledDHI test date, with each subsequent period beginning afterthe next DHI test date (which occurred on average at 5-wk intervals; average interval was 37 ± 13 d (mean ± SD)).A total of 4 observation periods were targeted on eachfarm. Milk sampling was conducted by the DHI customerservice representative assigned to the farm and milk sam-ples shipped overnight to the CanWest DHI Laboratory(Guelph, ON, Canada), and were analyzed for SCC using theFossomatic method (Fossomatic 5000 series, Foss Electric,Hillerød, Denmark).
Somatic cell counts (eSCC) were used as a proxyfor subclinical mastitis (Dufour et al., 2011 when>200,000 cells/mL). A new case was identified as one where
the previous test was <100,000 cells/mL and the mostrecent test was >200,000 cells/mL (Dohoo and Leslie, 1991;Schepers et al., 1997; Schukken et al., 2003). Thus, overthe 4, 5-week periods, the maximum number of new eSCC
Veterina
aermp(tfif
2
(r1wnOtbliiiriGnatrbt
(ardlmbv
2
oc4sf2uspaad(
M.E.A. Watters et al. / Preventive
ny individual cow could develop was 2. Incidence rate ofSCC was calculated as: number of new eSCC/# of cows atisk/d at risk × 365 d/year (Dohoo et al., 2009). To deter-ine required number of cows and observation periods, a
ower analysis was conducted a priori using PASS softwarePASS, Kaysville, UT, USA). For the calculation, beta was seto 0.20 (80% power), and alpha was set to 0.10. Estimatesor incidence rates of infection, as well as for variabilityn observation of standing and lying behavior, were takenrom previous findings (DeVries et al., 2010, 2011a).
.4. Standing and lying behavior
Lying behaviors were recorded using data loggersHOBO Pendant G Data Logger, Onset Computer Corpo-ation, Pocasset, MA, USA) that record leg orientation in-min intervals (Ledgerwood et al., 2010). Data loggersere placed on the hind limb of focal cows with veteri-ary bandaging tape (Vetrap Bandaging Tape, 3 M, London,N, Canada) for the first 5 d of each period following DHI
esting. Ito et al. (2009) demonstrated that recording lyingehavior for 3 d produced an accurate estimate of herd-
evel lying behavior using the same technology as utilizedn this study. Thus, a 5 d recording period was chosen tomprove the accuracy of the observations. Recordings maden the first 5 d following the DHI test were assumed toeflect a cow’s normal (typical) behavior and cows weredentified as infection free when SCC <100,000 (Medrano-alarza et al., 2012). A cow’s typical lying behavior (whenot infected) was assumed to be related to her risk ofcquiring a new infection based on the SCC obtained athe next DHI test. Feed delivery and feed push-up wereecorded by the herd manager on the same days as lyingehavior. The interval between feed delivery and milkingime was calculated for each cow.
Standing and lying times (min/d), lying bout durationmin/bout), and lying bout frequency (#/d) were calculated,s per description by Ledgerwood et al. (2010), using theecorded data. Pre-milking standing duration (min) wasefined as the interval between the last observation of
ying prior to milking and the termination of milking. Post-ilking standing duration (min) was defined as the interval
etween the termination of milking and the initial obser-ation of lying following milking.
.5. Cow-based measures
Individual milking times and milk production werebtained from parlor records obtained at each farm. Focalows were scored for cleanliness in the milk parlor using a-point scale (1 = very clean to 4 = very dirty) hygienecoring system (www.vetmed.wisc.edu/dms/fapm/apmtools/4hygiene/hygiene.pdf; Cook and Reinemann,007) on the first day of each 5 d recording period. Thedder, lower legs, and upper legs-flank were evaluatedeparately. Locomotion was scored as cows exited thearlor on the first day of the 5 d recording period using
5-point scale (1 = normal to 5 = severely lame; Flowernd Weary, 2006). For statistical analysis, lameness wasichotomized into lame (gait score = ≥3) and not lamegait score = <3). Both scoring procedures were completed
ry Medicine 111 (2013) 245– 255 247
by the same two trained observers on all farms for allperiods and their scores were averaged for each cow. Forboth hygiene and locomotion scoring, training occurred byproviding the two observers the scoring scales, along withvisual examples (photographs for hygiene and video forlameness) for each score to study and practice with. Theobservers practiced scoring individual cows (n = 40) beforethe start of the study; inter-observer reliability of thispractice scoring was tested and correlated to acceptablestandards (r > 0.75).
2.6. Herd, housing, and management data
A questionnaire, adapted from Dufour et al. (2010,2011), was administered on each farm before the com-mencement of the study. Farm owners or herd managerswere questioned regarding housing and management prac-tices, including milking practices, stall dimensions, andbedding (type, quantity, frequency of cleaning). Althoughall farms fed a TMR, bedding type and frequency of deliv-ery, feeding regimen (both frequency of feed delivery andfeed push-ups), and cleaning systems varied by farm. Feed-ing frequency was either 1×/d (n = 3) or 2×/d (n = 2). Feedpush-ups ranged in frequency from 0 to 5×/d. Mean free-stall stocking density (# cows/stall) for all 5 farms was 104%(range: 95–114%). Linear bunk space per cow averaged0.66 m/cow (range: 0.36–1.22 m). The median parlor capac-ity was 24 (range: 12–36) cows. While daily milking timeswere variable by farms, each farm did maintain an 8 h inter-val between milking start times. Only one farm used sandbedding while the other 4 used mattresses or waterbedspartially covered with either straw or composted manuresolids. The sand bedded farm used deep bedding (>2 cm)while two of the mattress based farms provided bedding(<2 cm), and the other farms used >2 cm of bedding. Fourof the farms docked tails and 3 clipped or flamed udders.Two farms had scheduled gait scoring; one farm recordedgait scores 1×/year while the second recorded 2×/year,a third farm just observed cows for lameness at milkingtime, and the other two farms had no specific gait scoringpractices. All farms cleaned stalls 3×/day, correspondingto milking times, while alleyways were cleaned either byautomatic scrapers (3 farms) or tractors (2 farms), withcleaning schedules ranging from 2×/week to 24×/d. Cowsentered a holding pen prior to milking and farms milked bygroup according to production and/or parity. Focal animalswere randomly selected to ensure representation across allof the farms’ milking groups. All farms engaged in pre- andpost-milking cleaning procedures employing teat dips orfoams pre- and post-milking; 2 farms utilized foam in theirpre-milking cleaning procedure while all farms used a teatdip post-milking. Milking practices on all farms ensuredthat all teats were cleaned and dried before applying themilking machines that had automatic take offs. Two ofthe farms encouraged post-milking standing by pushing-up feed at the time cows returned from milking while
the other 3 farms had no specific practices to encouragepost-milking standing. Any variables that were unique to aspecific herd were not retained as an explanatory variablein the statistical analyses since its measure of association
248 M.E.A. Watters et al. / Preventive Veterinary Medicine 111 (2013) 245– 255
Table 1Descriptive summary of the cows sampled within each study herd at the beginning of the study period.
Herd Cows sampled/herd # of periods Mean parity Mean DIM Mean beginning SCC(×1000 cells/mL)
Mean 305 d milkproduction (kg)
1 40 3a 2.2 115 51 98452 39b 3c 2.1 73 41 98203 40 4 2.2 68 36 10,7774 40 1d 2.0 79 34 10,2505 40 4 2.5 66 33 11,845
Total 199 – 2.2 74 39 10,521
a This herd was switched to 2×/d milking before the completion of period 4.
f period
b One of the focal animals was sold before the completion of period 1.c The final DHI test for this herd failed to include SCC data for the end od Herd switched to robotic milking before the completion of periods 2.
would be perfectly confounded by other characteristicsspecific to that herd.
2.7. Statistical analysis
Prior to analyses, all data were screened for normal-ity using the UNIVARIATE procedure of SAS (SAS InstituteInc, 2009). Cow SCCs at the study beginning were slightlyright skewed and, thus, transformed by the natural loga-rithm. All cow-level data were summarized across each ofthe 5-d observation periods for each cow. The associationsbetween dependent behavioral variables (lying time, lyingbout frequency and duration, post-milking and pre-milkingstanding time) and possible cow-level and herd-levelexplanatory (independent) fixed-effect variables were ana-lyzed with multivariable linear mixed models using theMIXED procedure of SAS (SAS Institute Inc, 2009), treat-ing period as a repeated measure. The models includedthe random effects of herd and cow within herd. Cowwithin herd was included in the models as the subjectof the repeated statement. Initially, unconditional asso-ciations between independent variables and dependentvariables were examined. Only independent variables withP ≤ 0.10 in this initial screening were included in mul-tivariable linear regression models. The CORR procedureof SAS was used to check for correlations between theretained explanatory variables. If two variables were highlycorrelated (r > 0.8), the one with the lower P value inthe unconditional associations was retained. For the mul-tivariable models, effects were considered significant atP ≤ 0.1. Manual backward elimination of non-significanteffects was used to construct the final multivariable mod-els. Period was not retained in any of the final models, thusno estimates for this effect are further presented. From theresultant models, plausible 2-way interactions were exam-ined and retained if P ≤ 0.10. Only those results retainedin the final multivariable models are further presented.The covariance structure was first-order autoregressive orcompound symmetry depending upon best fit according toSchwarz’s Bayesian information criterion.
The association of the various cow-level and farm-levelexplanatory variables on the occurrence or non-occurrence
of an eSCC was assessed using a random intercept mixedlogistic model using the GLIMMIX procedure (distribu-tion = binomial and link = logit) of SAS (SAS Institute Inc,2009). As new eSCC were assessed at the cow level,4.
both herd and cow within herd were considered ran-dom. Unconditional associations were estimated in thedescribed model to screen all potential explanatory vari-ables. For variables measured on a continuous scale,linearity of the relationship between the variable and theoccurrence of an eSCC was assessed by categorizing thecontinuous variable and visual inspection of plots of theodds ratio against mean values of the categories. Vari-ables with P ≤ 0.20 were retained for model building. TheCORR procedure of SAS was used to check for correlationsbetween the kept explanatory variables. If two variableswere highly correlated (r > 0.8), the one with the lowerP value in the unconditional associations was retained.These kept variables were then included in a multivariableanalysis using the above mentioned model. Effects in themultivariable logistic model were considered significantat P ≤ 0.1. Manual backward elimination of non-significanteffects was used to construct the final multivariable model.From the resultant model, plausible 2-way interactionswere examined and retained if P ≤ 0.10. Only those resultsretained in the final multivariable logistic model are furtherpresented.
One of the farms was removed from the study afterperiod 1 due to switching from parlor milking to an auto-mated milking system; when this farm was enrolled in thestudy they had indicated they would not be making theswitch between the 2 milking systems until a later datehowever unforeseen circumstances pushed this date for-ward. Two farms completed only 3 periods due to one farmswitching from 3×/d to 2×/d milking due to a staff shortageand the final DHI test for the second farm failed to includeSCC data. One cow on one farm was sold before the end ofthe first period, thus 199 cows completed the first period.Throughout the remainder of the study various cows wereremoved from the study as they were either culled or driedoff. A complete data set (for 4 periods) was obtained for 67cows from 2 of the 5 farms, however, all cow data were usedin the analysis regardless of whether a cow had a completedata set.
3. Results
Parity, DIM, initial SCC, and milk production of the studycows were similar across study herds (Table 1). Due to lowselection availability on one farm (i.e. the farm lacked 40cows with baseline SCC <100,000 cells/mL), one of the
M.E.A. Watters et al. / Preventive Veterinary Medicine 111 (2013) 245– 255 249
Table 2Descriptive summary of data from focal cows (n = 199) across all 5 study herdsa.
Variable Mean SD Minimum Maximum
Lying time (h/d) 11.2 2.1 1.2 17.2Lying bouts (#/d) 8.6 2.9 1.2 26.4Lying bout duration (min/bout) 84.6 27.2 11.7 221.1Post-milking standing time (min) 103 96 1 798Pre-milking standing time (min) 88 87 1 867Lameness scoreb 1.5 0.8 1 4Hygiene scorec
Udder 2.4 0.7 1 4Upper leg/flank 2.6 0.6 1 4Lower legs 4 0.2 3 4
a Data are averaged across the recording periods for each of the 40 focal cows from each of the 5 herds (with the exception of 39 cows at one herd) thatwere observed for 5 d observation periods (4 periods for 2 herds, 3 periods for 2 herds, and 1 period for 1 herd) with 35 d intervals between periods.
b Lameness: no = gait score <3; yes = gait score ≥3. Gait score was assessed on a 5-point scale (1 = normal to 5 = severely lame) (Flower and Weary, 2006;I
very dirty) (www.vetmed.wisc.edu/dms/fapm/fapmtools/4hygiene/hygiene.pdf;C
4LtoTwf
3
bhnwialbcdltwl
3s
ombvnfsitaps
0
20
40
60
80
100
120
140
-240 -180 -120 -60 0 60 120 180
Po
st-
milk
ing
sta
nd
ing
tim
e (
min
)
Interval between milking time and feed manipulation time (min)
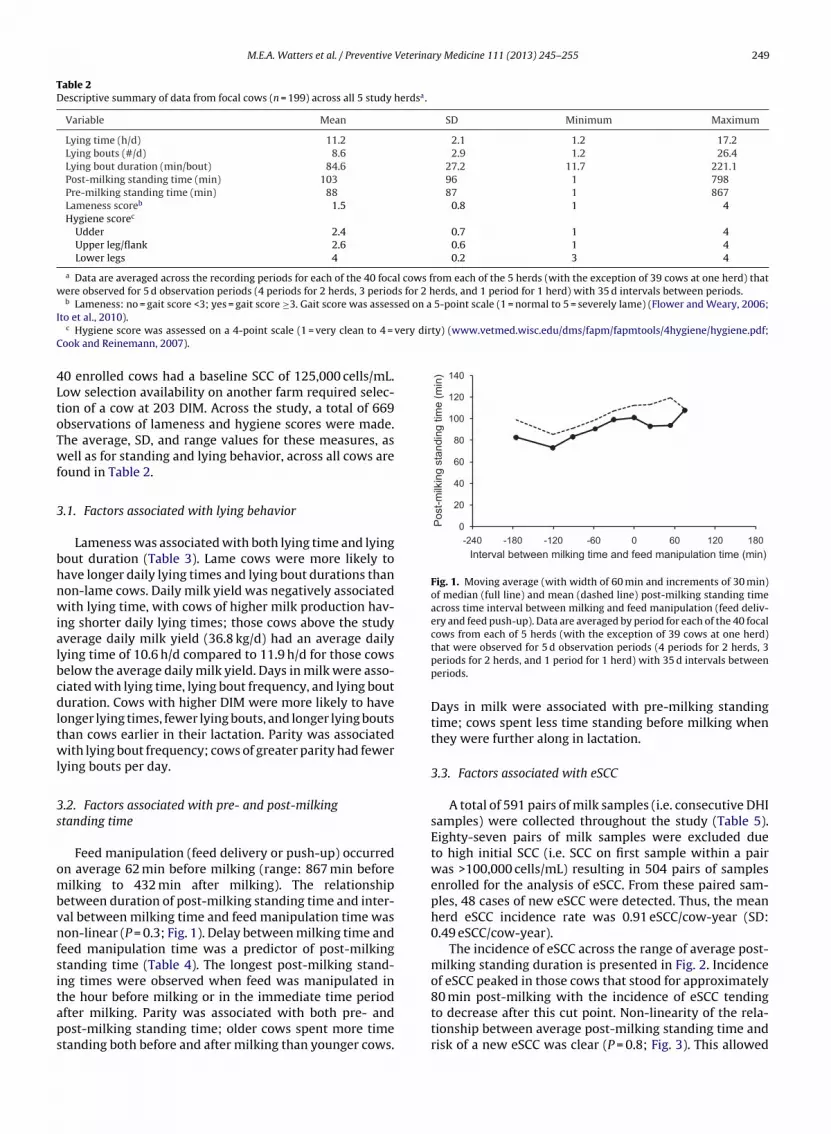
Fig. 1. Moving average (with width of 60 min and increments of 30 min)of median (full line) and mean (dashed line) post-milking standing timeacross time interval between milking and feed manipulation (feed deliv-ery and feed push-up). Data are averaged by period for each of the 40 focalcows from each of 5 herds (with the exception of 39 cows at one herd)
to et al., 2010).c Hygiene score was assessed on a 4-point scale (1 = very clean to 4 =
ook and Reinemann, 2007).
0 enrolled cows had a baseline SCC of 125,000 cells/mL.ow selection availability on another farm required selec-ion of a cow at 203 DIM. Across the study, a total of 669bservations of lameness and hygiene scores were made.he average, SD, and range values for these measures, asell as for standing and lying behavior, across all cows are
ound in Table 2.
.1. Factors associated with lying behavior
Lameness was associated with both lying time and lyingout duration (Table 3). Lame cows were more likely toave longer daily lying times and lying bout durations thanon-lame cows. Daily milk yield was negatively associatedith lying time, with cows of higher milk production hav-
ng shorter daily lying times; those cows above the studyverage daily milk yield (36.8 kg/d) had an average dailyying time of 10.6 h/d compared to 11.9 h/d for those cowselow the average daily milk yield. Days in milk were asso-iated with lying time, lying bout frequency, and lying bouturation. Cows with higher DIM were more likely to have
onger lying times, fewer lying bouts, and longer lying boutshan cows earlier in their lactation. Parity was associatedith lying bout frequency; cows of greater parity had fewer
ying bouts per day.
.2. Factors associated with pre- and post-milkingtanding time
Feed manipulation (feed delivery or push-up) occurredn average 62 min before milking (range: 867 min beforeilking to 432 min after milking). The relationship
etween duration of post-milking standing time and inter-al between milking time and feed manipulation time wason-linear (P = 0.3; Fig. 1). Delay between milking time and
eed manipulation time was a predictor of post-milkingtanding time (Table 4). The longest post-milking stand-ng times were observed when feed was manipulated in
he hour before milking or in the immediate time periodfter milking. Parity was associated with both pre- andost-milking standing time; older cows spent more timetanding both before and after milking than younger cows.that were observed for 5 d observation periods (4 periods for 2 herds, 3periods for 2 herds, and 1 period for 1 herd) with 35 d intervals betweenperiods.
Days in milk were associated with pre-milking standingtime; cows spent less time standing before milking whenthey were further along in lactation.
3.3. Factors associated with eSCC
A total of 591 pairs of milk samples (i.e. consecutive DHIsamples) were collected throughout the study (Table 5).Eighty-seven pairs of milk samples were excluded dueto high initial SCC (i.e. SCC on first sample within a pairwas >100,000 cells/mL) resulting in 504 pairs of samplesenrolled for the analysis of eSCC. From these paired sam-ples, 48 cases of new eSCC were detected. Thus, the meanherd eSCC incidence rate was 0.91 eSCC/cow-year (SD:0.49 eSCC/cow-year).
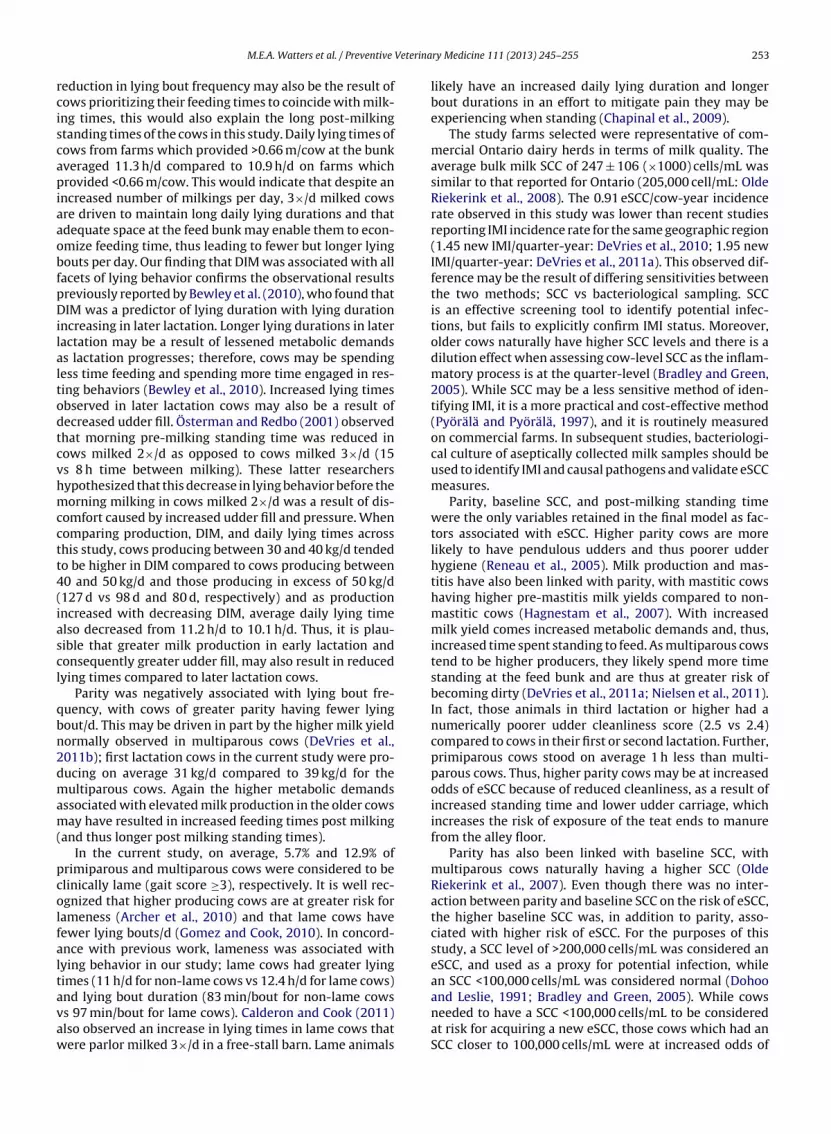
The incidence of eSCC across the range of average post-milking standing duration is presented in Fig. 2. Incidenceof eSCC peaked in those cows that stood for approximately
80 min post-milking with the incidence of eSCC tendingto decrease after this cut point. Non-linearity of the rela-tionship between average post-milking standing time andrisk of a new eSCC was clear (P = 0.8; Fig. 3). This allowed
250 M.E.A. Watters et al. / Preventive Veterinary Medicine 111 (2013) 245– 255
Table 3Final general linear model for factors associated with lying behaviora of free-stall housed cows.
Variable Lying time (h/d) Lying bout frequency (bouts/d) Lying bout duration (min/bout)
ˇb SE P value ̌ SE P value ̌ SE P value
Intercept 11.7 0.62 <0.001 10.26 0.74 <0.001 64.43 6.95 <0.001DIMc 0.009 0.002 <0.001 −0.008 0.002 <0.001 0.15 0.017 <0.001Parity – 0.09 –
1 – – Refd – – –2 – – −0.52 0.38 – –≥3 – – −0.82 0.38 – –
Milk yield, kg/d −0.046 0.013 <0.001 – – – – – –Lamenesse 0.001 – 0.005
No Ref – – – Ref –Yes 0.75 0.023 – – 7.51 2.63
a Data are averaged across the recording periods for each of the 40 focal cows from each of the 5 herds (with the exception of 39 cows at one herd) thatwere observed for 5 d observation periods (4 periods for 2 herds, 3 periods for 2 herds, and 1 period for 1 herd) with 35 d intervals between periods.
b � = estimated regression coefficient.c DIM = days in milk at the beginning of each observation period.d Ref = Reference category.e Lameness: no = gait score <3; yes = gait score ≥3. Gait score was assessed on a 5-point scale (1 = normal to 5 = severely lame) (Flower and Weary, 2006;
Ito et al., 2010).
Table 4Final general linear model for factors associated with pre- and post-milking standing time of free-stall housed cowsa.
Variable Pre-milking standing time (min) Post-milking standing time (min)
ˇb SE P value ̌ SE P value
Intercept 101.6 6.4 <0.001 96.1 15.5 0.001Milking-feeding intervalc 0.10
<−60 min – – – −11.1 5.4−60 to 0 min – – −0.5 5.5>0 min – – Refd –
DIMe −0.18 0.04 <0.001 – – –Parity 0.07 0.06
1 Ref – Ref –2 9.3 5.7 11.6 6.4≥3 12.3 5.7 14.7 6.3
a Data are averaged across the recording periods for each of the 40 focal cows from each of the 5 herds (with the exception of 39 cows at one herd) thatwere observed for 5 d observation periods (4 periods for 2 herds, 3 periods for 2 herds, and 1 period for 1 herd) with 35 d intervals between periods.
b ̌ = estimated regression coefficient.
c Minimum difference in time between when cows were milked and when fresh feed was provided.d Ref = Reference category.e DIM = days in milk at the beginning of each observation period.
Table 5Number of pairs of milk samples taken per farm and number of newly elevated somatic cell count (eSCC) across the study perioda.
Herd Total pairs of samples Total pairs at riskb Number of new eSCCc eSCC incidence rate (eSCC/cow-year)
1 118 108 12 1.132 117 91 15 1.583 160 133 7 0.514 40 39 2 0.375 156 133 12 0.96
Total 591 504 48 0.91
a Data are averaged across the recording periods for each of the 40 focal cows from each of the 5 herds (with the exception of 39 cows at one herd) thatwere observed for 5 d observation periods (4 periods for 2 herds, 3 periods for 2 herds, and 1 period for 1 herd) with 35 d intervals between periods.
nning ofriod wh
b Pairs were considered at risk when SCC <100,000 cells/mL at the begic New eSCC was defined as SCC >200,000 cells/mL at the end of each pe
for more meaningful categories to be chosen for averagepost-milking standing times based on variable distributionand on existing knowledge concerning teat canal closure
following milking (McDonald, 1975; Schultze and Bright,1983). Two categories of average post-milking standingtime were defined: 0–90 min and >90 min based on thedistribution of post-milking standing durations (whereeach observation period.en SCC <100,000 cells/mL at the beginning of each period.
the median post-milking standing time was 92 min) andthe observed relationship between post-milking standingtime and incidence of eSCC (Figs. 2 and 3).
Unconditional estimates of association between inde-pendent explanatory factors and odds of having an incidenteSCC are described in Table 6. Post-milking standing time>90 min, encouraging post-milking standing time through

M.E.A. Watters et al. / Preventive Veterinary Medicine 111 (2013) 245– 255 251
Table 6Unconditional estimates of association between explanatory factors and odds of having an incident elevated somatic cell counta.
Variable Percentage or mean (±SD)b Odds ratio (95% CI)c P value
Parity 0.0071 26.0 Refd
2 40.7 5.31 (1.86, 15.19)≥3 33.3 2.99 (1.02, 8.75)
DIMe 113.5 (50.9) 1.31 (0.95, 1.81) 0.09LnSCCf 3.44 (0.63) 2.13 (1.51, 3.02) <0.001Post-milking standing time 0.035
0–90 min 49.2 Ref>90 min 50.8 0.47 (0.23, 0.95)
Encourage post-milking standingg 0.03No 64.1 RefYes 35.9 0.40 (0.18, 0.92)
Lamenessh 0.09No 88.9 RefYes 11.1 1.27 (0.97, 1.67)
Udder hygiene 2.49 (0.69) 1.24 (0.90, 1.71) 0.19Teat dip method 0.20
Dip cup 53.5 RefFoam 46.5 1.81 (0.72, 4.60)
Stall width (cm) 121.7 (6.0) 0.70 (0.46, 1.07) 0.10
a Data are averaged across the recording periods for each of the 40 focal cows from each of the 5 herds (with the exception of 39 cows at one herd) thatwere observed for 5 d observation periods (4 periods for 2 herds, 3 periods for 2 herds, and 1 period for 1 herd) with 35 d intervals between periods.
b Proportion of observations for categorical variables or mean and standard deviation for continuous variables.c Odds ratio and 95% confidence interval for 1 SD increase for continuous variables presented.d Ref = Reference category.e DIM = days in milk at the beginning of each observation period.f LnSCC = natural log of individual cow SCC (×1000 cells/mL) at the beginning of the study period.
ed up inu
sed on a
fafltaitbi>S
TF
w
g Encourage post-milking standing: no = feed was not intentionally pushp in the bunk at the return from milking.h Lameness: no = gait score <3; yes = gait score ≥3. Gait score was asses
eed push up, and greater stall width were all associ-ted with decreased odds of experiencing eSCC. Otheractors, including greater parity, DIM, SCC at the study start,ameness, having poorer udder hygiene and use of foameat disinfection, were associated with increased odds ofcquiring a new eSCC. The final logistic regression models presented in Table 7. Three variables were retained inhe final model: post-milking standing time, parity, and
aseline SCC. The model showed decreased odds for acquir-ng a new eSCC when post-milking standing time averaged90 min. In addition, increased parity and a greater baselineCC were associated with increased odds of a new eSCC.
able 7inal logistic regression model for factors associated with the incidence of elevate
Variables Coefficient S
Intercept −7.73 1Random effects
Herd-level variance 0.18 0Cow-level variance 0.09 0
Post-milking standing time
0–90 min Refb –>90 min −1.04 0
Parity
1 Ref –2 1.76 0≥3 0.95 0
LnSCCc 1.30 0
a Data are averaged across the recording periods for each of the 40 focal cows fere observed for 5 d observation periods (4 periods for 2 herds, 3 periods for 2 hb Ref = Reference category.c LnSCC = natural log of individual cow SCC (×1,000 cells/mL) at the beginning
d Odds ratio and 95% confidence interval for one standard deviation increase in
the bunk at the return from milking; yes = feed was intentionally pushed
5-point scale (1 = normal to 5 = severely lame).
4. Discussion
The existence of an association between post-milkingstanding time and udder health, in terms of SCC and infec-tion rates, has long been hypothesized. A study of tie-stallhoused cows by DeVries et al. (2010) provided the firstdirect empirical evidence of an association between post-milking standing time and incidence of IMI. Evidence for
this relationship in free-stall housed cows milked with anAMS was also recently reported (DeVries et al., 2011a). Toour knowledge, this is the first study to report the associ-ation between post-milking standing duration and udderd somatic cell counta.
E Odds ratio (95% CI) P value
.19 – ––
.22 –
.49 –0.008
–.39 0.35 (0.16, 0.76)
0.002 –.54 5.83 (2.03, 16.73).55 2.59 (0.88, 7.60).29 2.26 (1.58, 3.24)d <0.001
rom each of the 5 herds (with the exception of 39 cows at one herd) thaterds, and 1 period for 1 herd) with 35 d intervals between periods.
of the study period. initial LnSCC.

252 M.E.A. Watters et al. / Preventive Veterina
0.0
0.5
1.0
1.5
2.0
2.5
3.0
0 20 40 60 80 100 120 140 160
Incid
en
ce
ra
te o
f e
leva
ted
SC
C
(nu
mb
er
of e
Ieva
ted
SC
C/c
ow
-ye
ar)
Post-milking standing time (min)
Fig. 2. Moving average (with width of 30 min and increments of 15 min) ofincidence rate of elevated somatic cell count across average post-milkingstanding time. The elevated SCC incidence rate (full line) with 90% (dashedlines), and 95% (dotted line) confidence limits. Data are averaged by periodfor each of the 40 focal cows from each of 5 herds (with the exception of39 cows at one herd) that were observed for 5 d observation periods (4periods for 2 herds, 3 periods for 2 herds, and 1 period for 1 herd) with35 d intervals between periods.
0
1
2
3
4
5
6
0 50 100 150 200 250
Odds r
atio
Post -milking standing time (min)
Fig. 3. Adjusted estimates of the odds of acquiring a newly elevatedsomatic cell count across deciles of average post-milking standing time(solid line) with 90% (dashed lines), and 95% (dotted lines) confidencelimits. Data are averaged by period for each of the 40 focal cows from
show this effect. Rather it appears that cows with long post-
each of 5 herds (with the exception of 39 cows at one herd) that wereobserved for 5 d observation periods (4 periods for 2 herds, 3 periods for2 herds, and 1 period for 1 herd) with 35 d intervals between periods.
health, of free-stall housed cows that are parlor milked3×/d. Mean post-milking standing time across all 5 herdswas 103 min (range: 1–798 min), which is much longerthan previously reported for free-stall housing systemsmilking 2×/d in a parlor, range 33–62 min, (Tyler et al.,1997; DeVries and von Keyserlingk, 2005; DeVries et al.,2005) or milking 2.3×/d in an AMS (78 min: DeVries et al.,2011a). In addition, the present duration of post-milkingstanding time was also much longer than the 79 minreported in the tie-stall study by DeVries et al. (2010). Theaverage duration of pre-milking standing of 87 min wascomparable to results from free-stall housed cows milkedby an AMS (94 min: DeVries et al., 2011a). Given the dura-tion of average pre-milking standing time, the duration ofthe post-milking standing times observed in the presentstudy were unexpected, as one could hypothesize that cowswould lie down sooner post-milking given their increased
pre-milking standing time demands when milked 3×/d.While we did not collect data on time spent in the hold-ing pen prior to being milked, one possible explanationry Medicine 111 (2013) 245– 255
for the long pre-milking standing times observed in thesecows could be that parlor milked, free-stall housed cowsoften have a forced standing period in the holding pen of30 min to >1 h prior to being milked (Cook and Nordlund,2009). A more recent study of North American free-stallfarms which were milking either 2 or 3×/d found that theaverage amount of time cows were spending away fromtheir pens for milking was 249 min, indicating that thesecows are likely spending long periods of time in the hold-ing pen waiting to be milked (von Keyserlingk et al., 2012).Despite the pre-milking standing time of the study cows,indicating that they are likely spending long periods oftime in the holding pen waiting to be milked, their post-milking standing times did not appear to be reduced. Also,across the study farms, higher producing animals (milkproduction >36.8 kg/d) stood on average for 12 min longerpost-milking than the lower producing focal cows. There-fore, a possible explanation for the duration of post-milkingstanding time would be that these cows may have greatermetabolic demands as a consequence of the higher milkproduction normally observed with increased frequency ofmilking and thus increased feeding motivation (O’Driscollet al., 2010).
It is well established that the presence of fresh feed pro-motes longer post-milking standing time in cows (Tyleret al., 1997; DeVries and von Keyserlingk, 2005; DeVrieset al., 2010). Given the variation in both the frequency offeed delivery (1 to 2×/d) of fresh feed and feed push-up (0 to5×/d) across farms it was not surprising that feed manip-ulation (both feed delivery and push-up) was associatedwith post-milking standing time. On average feed manip-ulation occurred 62 min before milking with post-milkingstanding times reduced when feed manipulation occurred>60 min before milking. The longest post-milking stand-ing times were observed when cows were fed in the hourbefore milking or in the short period of time after the returnfrom milking (DeVries and von Keyserlingk, 2005; DeVrieset al., 2010, 2011a).
The average daily lying time of 11.2 h/d was comparableto the average lying time reported for 16 free-stall herdsmilked either 2×/d or 3×/d (11.9 h/d; Gomez and Cook,2010) and was comparable to the lying time reported in astudy on high-producing Holsteins from North Americanfree-stall herds (von Keyserlingk et al., 2012). However,the average lying times for the 5 herds observed in thepresent study were slightly higher than that reported byCalderon and Cook (2011: 3×/d milked herd; 9.8–10.8 h/d)and lower than the 13 h/d reported by Krawczel et al.(2012). The average number of lying bouts (8.6 bouts/d) andaverage bout duration (84.6 min/bout) were also similarto other studies observing 2×/d milking herds (Krohn andMunksgaard, 1993; Ito et al., 2009). However, the reducedlying bouts observed in our study compared to previouswork (12.9 bouts/d; Gomez and Cook, 2010; 12.5 bouts/d;Krawczel et al., 2012) is difficult to explain. Previous workhas speculated that cows increase their bout frequency inrelation to increased milking frequency but we failed to
milking standing times compensate by increasing the boutduration of their lying and standing events, thus decreasingthe total number of daily lying and standing bouts. The
Veterina
rciscapiaaobfpDilaltodtcvhmcctt4(iascl
qbn2dmam(
pcolfaltavaw
M.E.A. Watters et al. / Preventive
eduction in lying bout frequency may also be the result ofows prioritizing their feeding times to coincide with milk-ng times, this would also explain the long post-milkingtanding times of the cows in this study. Daily lying times ofows from farms which provided >0.66 m/cow at the bunkveraged 11.3 h/d compared to 10.9 h/d on farms whichrovided <0.66 m/cow. This would indicate that despite an
ncreased number of milkings per day, 3×/d milked cowsre driven to maintain long daily lying durations and thatdequate space at the feed bunk may enable them to econ-mize feeding time, thus leading to fewer but longer lyingouts per day. Our finding that DIM was associated with allacets of lying behavior confirms the observational resultsreviously reported by Bewley et al. (2010), who found thatIM was a predictor of lying duration with lying duration
ncreasing in later lactation. Longer lying durations in lateractation may be a result of lessened metabolic demandss lactation progresses; therefore, cows may be spendingess time feeding and spending more time engaged in res-ing behaviors (Bewley et al., 2010). Increased lying timesbserved in later lactation cows may also be a result ofecreased udder fill. Österman and Redbo (2001) observedhat morning pre-milking standing time was reduced inows milked 2×/d as opposed to cows milked 3×/d (15s 8 h time between milking). These latter researchersypothesized that this decrease in lying behavior before theorning milking in cows milked 2×/d was a result of dis-
omfort caused by increased udder fill and pressure. Whenomparing production, DIM, and daily lying times acrosshis study, cows producing between 30 and 40 kg/d tendedo be higher in DIM compared to cows producing between0 and 50 kg/d and those producing in excess of 50 kg/d127 d vs 98 d and 80 d, respectively) and as productionncreased with decreasing DIM, average daily lying timelso decreased from 11.2 h/d to 10.1 h/d. Thus, it is plau-ible that greater milk production in early lactation andonsequently greater udder fill, may also result in reducedying times compared to later lactation cows.
Parity was negatively associated with lying bout fre-uency, with cows of greater parity having fewer lyingout/d. This may be driven in part by the higher milk yieldormally observed in multiparous cows (DeVries et al.,011b); first lactation cows in the current study were pro-ucing on average 31 kg/d compared to 39 kg/d for theultiparous cows. Again the higher metabolic demands
ssociated with elevated milk production in the older cowsay have resulted in increased feeding times post milking
and thus longer post milking standing times).In the current study, on average, 5.7% and 12.9% of
rimiparous and multiparous cows were considered to belinically lame (gait score ≥3), respectively. It is well rec-gnized that higher producing cows are at greater risk forameness (Archer et al., 2010) and that lame cows haveewer lying bouts/d (Gomez and Cook, 2010). In concord-nce with previous work, lameness was associated withying behavior in our study; lame cows had greater lyingimes (11 h/d for non-lame cows vs 12.4 h/d for lame cows)
nd lying bout duration (83 min/bout for non-lame cowss 97 min/bout for lame cows). Calderon and Cook (2011)lso observed an increase in lying times in lame cows thatere parlor milked 3×/d in a free-stall barn. Lame animalsry Medicine 111 (2013) 245– 255 253
likely have an increased daily lying duration and longerbout durations in an effort to mitigate pain they may beexperiencing when standing (Chapinal et al., 2009).
The study farms selected were representative of com-mercial Ontario dairy herds in terms of milk quality. Theaverage bulk milk SCC of 247 ± 106 (×1000) cells/mL wassimilar to that reported for Ontario (205,000 cell/mL: OldeRiekerink et al., 2008). The 0.91 eSCC/cow-year incidencerate observed in this study was lower than recent studiesreporting IMI incidence rate for the same geographic region(1.45 new IMI/quarter-year: DeVries et al., 2010; 1.95 newIMI/quarter-year: DeVries et al., 2011a). This observed dif-ference may be the result of differing sensitivities betweenthe two methods; SCC vs bacteriological sampling. SCCis an effective screening tool to identify potential infec-tions, but fails to explicitly confirm IMI status. Moreover,older cows naturally have higher SCC levels and there is adilution effect when assessing cow-level SCC as the inflam-matory process is at the quarter-level (Bradley and Green,2005). While SCC may be a less sensitive method of iden-tifying IMI, it is a more practical and cost-effective method(Pyörälä and Pyörälä, 1997), and it is routinely measuredon commercial farms. In subsequent studies, bacteriologi-cal culture of aseptically collected milk samples should beused to identify IMI and causal pathogens and validate eSCCmeasures.
Parity, baseline SCC, and post-milking standing timewere the only variables retained in the final model as fac-tors associated with eSCC. Higher parity cows are morelikely to have pendulous udders and thus poorer udderhygiene (Reneau et al., 2005). Milk production and mas-titis have also been linked with parity, with mastitic cowshaving higher pre-mastitis milk yields compared to non-mastitic cows (Hagnestam et al., 2007). With increasedmilk yield comes increased metabolic demands and, thus,increased time spent standing to feed. As multiparous cowstend to be higher producers, they likely spend more timestanding at the feed bunk and are thus at greater risk ofbecoming dirty (DeVries et al., 2011a; Nielsen et al., 2011).In fact, those animals in third lactation or higher had anumerically poorer udder cleanliness score (2.5 vs 2.4)compared to cows in their first or second lactation. Further,primiparous cows stood on average 1 h less than multi-parous cows. Thus, higher parity cows may be at increasedodds of eSCC because of reduced cleanliness, as a result ofincreased standing time and lower udder carriage, whichincreases the risk of exposure of the teat ends to manurefrom the alley floor.
Parity has also been linked with baseline SCC, withmultiparous cows naturally having a higher SCC (OldeRiekerink et al., 2007). Even though there was no inter-action between parity and baseline SCC on the risk of eSCC,the higher baseline SCC was, in addition to parity, asso-ciated with higher risk of eSCC. For the purposes of thisstudy, a SCC level of >200,000 cells/mL was considered aneSCC, and used as a proxy for potential infection, whilean SCC <100,000 cells/mL was considered normal (Dohoo
and Leslie, 1991; Bradley and Green, 2005). While cowsneeded to have a SCC <100,000 cells/mL to be consideredat risk for acquiring a new eSCC, those cows which had anSCC closer to 100,000 cells/mL were at increased odds of
Veterina
254 M.E.A. Watters et al. / Preventiveacquiring a new eSCC. A potential limitation of our studyis the presence of false negatives; cows that were catego-rized as not infected according to our eSCC definition butin fact did have an IMI. Bradley and Green (2005) notedthat while major pathogens cause SCC to increase above200,000 cells/mL, minor pathogens have a lesser impact onSCC. In fact, SCC may be as low as 50,000 cells/mL eventhough a cow is infected. In future studies, bacteriologicalculture is recommended to help ensure that those animalsselected as uninfected based on SCC were actually trueculture-negative.
Cows with post-milking standing times averaging>90 min were at decreased odds for acquiring a new eSCC.Previous research (McDonald, 1975; Schultze and Bright,1983) would suggest that there are 2 periods of timewhereby teat canal diameter may be expanded and, thus,more susceptible to bacterial penetration following milk-ing: immediately after removal of the milking machineand 2 to 4 h after milking. Given that in the current studyfew cows chose to lie down quickly after milking (only6% of cows studied laid down within 40 min after milk-ing), it is not that surprising that we did not detect anychange in odds of incidence of eSCC in those cows. Thedecreased odds of eSCC with post-milking standing times>90 min in the current study contrasts to that found byDeVries et al. (2010, 2011a), who noted increased odds ofIMI when cows spent >1.5 and 2.5 h, respectively, stand-ing after milking. These latter authors speculated that thethreshold for the second period of susceptibility might beat the lower end of the 2–4 h period after milking. In thecurrent study, just over 23% of cows spent between 90 and120 min standing after milking, 25% of cows spent between2 and 4 h standing after milking, while only 3% stoodfor over 4 h after milking. These findings would suggestthat the start of the second period of susceptibility mightunder certain conditions be closer to the 4 h mark aftermilking. Further research is required to fully understandthese factors that may affect teat canal diameter at varioustime points post-milking, and the resultant influence thishas on the risk of acquiring infections during those timeperiods.
5. Conclusions
Free-stall housed that are milked 3×/d that were in laterlactation, produced less milk, or were lame had the longestdaily lying times. Lying bout frequency was greater in oldercows or cows in earlier lactation, while lying bout dura-tion increased with DIM and in those cows identified asbeing lame. The results of the current study suggest thatfree-stall housed cows milked 3×/d that remain stand-ing for greater than 90 min after milking are at decreasedodds for acquiring a new eSCC compared to those cowsthat lay down within 90 min after milking. Provision offeed in the hour before milking, or in the time period
immediately after milking, led to the longest duration ofpost-milking standing. Management practices that pro-mote post-milking standing duration, such as providingnew feed or pushing-up feed around milking time may helpto improve udder health.ry Medicine 111 (2013) 245– 255
Acknowledgments
We thank the participating producers for allowing usto collect data on their herds. We thank Megan Bruce ofthe University of Guelph, Kemptville Campus for her tech-nical help through the data collection and summarizingperiods. Financial support for this research was receivedfrom the Dairy Farmers of Canada (Ottawa, ON, Canada),the Canadian Dairy Commission (Ottawa, ON, Canada), andAgriculture and Agri-Food Canada (Ottawa, ON, Canada)through the Canadian Bovine Mastitis Research Network(Saint-Hyacinthe, QC, Canada). This research was alsosupported through contributions from the Canadian Foun-dation for Innovation (Ottawa, ON, Canada) and the OntarioResearch Fund (Ministry of Research and Innovation,Toronto, ON, Canada).
References
Archer, S.C., Green, M.J., Huxley, J.N., 2010. Association between milk yieldand serial locomotion score assessments in UK dairy cows. J. Dairy Sci.93, 4045–4053.
Barkema, H.W., Schukken, Y.H., Lam, T.J.G.M., Beiboer, M.L., Benedictus, G.,Brand, A., 1999. Management practices associated with the incidencerate of clinical mastitis. J. Dairy Sci. 82, 1643–1654.
Bewley, J.M., Boyce, R.E., Hockin, J., Munksgaard, L., Eicher, S.D., Einstein,M.E., Schutz, M.M., 2010. Influence of milk yield, stage of lactation andbody condition on dairy cattle lying behavior using and automatedactivity monitoring sensor. J. Dairy Sci. 77, 1–6.
Bradley, A., Green, M., 2005. Use and interpretation of somatic cell countdata in dairy cows. In Pract. 27, 310–315.
Calderon, D.F., Cook, N.B., 2011. The effects of lameness on the restingbehavior and metabolic status of dairy cattle during the tran-sition period in a freestall-housed dairy herd. J. Dairy Sci. 94,2883–2894.
Chapinal, N., de Passillé, A.M., Weary, D.M., von Keyserlingk, M.A.G.,Rushen, J., 2009. Using gait score, walking speed, and lyingbehavior to detect hoof lesions in dairy cows. J. Dairy Sci. 93,4365–4374.
Cook, N.B., Nordlund, K.V., 2009. The influence of the environment on dairycow behavior, claw health and herd lameness dynamics. Vet. J. 179,360–369.
Cook, N.B., Reinemann, D., 2007. A toolbox for assessing cow, udder andteat hygiene. In: Proc. NMC. Annu. Mtg, NMC. Inc., Verona, WI, USA,pp. 31–43.
DeVries, M.A.G., von Keyserlingk, T.J., 2005. Time of feed delivery affectsthe feeding and lying patterns of dairy cows. J. Dairy Sci. 88,625–631.
DeVries, T.J., von Keyserlingk, M.A.G., Beauchemin, K.A., 2005. Frequencyof feed delivery affects the behavior of lactating dairy cows. J. DairySci. 88, 3553–3562.
DeVries, T.J., Dufour, S., Scholl, D.T., 2010. Relationship between feed-ing strategy, lying behavior patterns, and incidence of intramammaryinfection in dairy cows. J. Dairy Sci. 93, 1987–1997.
DeVries, T.J., Deming, J.A., Rodenburg, J., Seguin, G., Leslie, K.E., Barkema,H.W., 2011a. Association of standing and lying behavior patterns andincidence of intramammary infection in dairy cows milked with anautomatic milking system. J. Dairy Sci. 94, 3845–3855.
DeVries, T.J., Holtshausen, L., Oba, M., Beauchemin, K.A., 2011b. Effect ofparity and stage of lactation on feed sorting behavior of lactating dairycows. J. Dairy Sci. 94, 4039–4045.
Dohoo, I.R., Leslie, K.E., 1991. Evaluation of changes in somatic cell countsas indicators of new intramammary infections. Prev. Vet. Med. 10,225–237.
Dohoo, I., Martin, W., Stryhn, H., 2009. Veterinary Epidemiologic Research,2nd ed. VER Inc., Charlottetown, PEI, Canada.
Dufour, S., Barkema, H.W., DesCoteaux, L., DeVries, T.J., Dohoo, I.R., Reyher,K., Roy, J.P., Scholl, D.T., 2010. Development and validation of a bilin-
gual questionnaire for measuring udder health related managementpractices on dairy farms. Prev. Vet. Med. 95, 74–85.Dufour, S., Fréchette, A., Barkema, H.W., Mussell, A., Scholl, D.T., 2011.Effect of udder health management practices on herd somatic cellcount. J. Dairy Sci. 94, 563–579.

Veterina
F
F
G
H
I
I
J
K
K
L
M
M
M
N
M.E.A. Watters et al. / Preventive
lower, F.C., Weary, D.M., 2006. Effect of hoof pathologies on subjectiveassessments of dairy cow gait. J. Dairy Sci. 89, 139–146.
regonesi, J.A., Tucker, C.B., Weary, D.M., 2007. Overstocking reduces lyingtime in dairy cows. J. Dairy Sci. 90, 3349–3354.
omez, A., Cook, N.B., 2010. Time budgets of lactating dairy cattle in com-mercial freestall herds. J. Diary Sci. 93, 5772–5781.
agnestam, C., Emanuelson, U., Berglund, B., 2007. Yield losses associatedwith clinical mastitis occurring in different weeks of lactation. J. DairySci. 90, 2260–2270.
to, K., Weary, D.M., von Keyserlingk, M.A.G., 2009. Lying behavior:assessing within- and between-herd variation in free-stall-houseddairy cows. J. Dairy Sci. 92, 4412–4420.
to, K., von Keyserlingk, M.A.G., LeBlanc, S.J., Weary, D.M., 2010. Lyingbehavior as an indicator of lameness in dairy cows. J. Dairy Sci. 93,3553–3560.
ohansson, B., Redbo, I., Svennersten-Sjaunja, K., 1999. Effect of feedingbefore, during and after milking on dairy cow behaviour and the hor-mone coritsol. Anim. Sci. 68, 597–604.
rawczel, P.D., Mooney, C.S., Dann, H.M., Carter, M.P., Butzler, R.E., Bal-lard, C.S., Grant, R.J., 2012. Effect of alternative models for increasingstocking density on the short-term behavior and hygiene of Holsteindairy cows. J. Dairy Sci. 95, 2467–2475.
rohn, R.R., Munksgaard, L., 1993. Behaviour of dairy cows kept in exten-sive (loose housing/pasture) or intensive (tie stall) environments: II.Lying and lying-down behaviour. Appl. Anim. Behav. Sci. 37, 1–16.
edgerwood, D.N., Winckler, C., Tucker, C.B., 2010. Evaluation of data log-gers, sampling intervals, and editing techniques for measuring thelying behavior of dairy cattle. J. Dairy Sci. 93, 5129–5139.
attachini, G., Riva, E., Provolo, G., 2011. The lying and standing activityindices of dairy cows in free-stall housing. Appl. Anim. Behav. Sci 129,18–27.
edrano-Galarza, C., Gibbons, J., Wagner, S., de Passillé, A.M., Rushen, J.,2012. Behavioral changes in dairy cows with mastitis. J. Dairy Sci. 95,6994–7002.
cDonald, J.S., 1975. Radiographic method for anatomic study of the
teat canal: changes between milking periods. Am. J. Vet. Res. 36,1241–1242.ielsen, B.H., Thomsen, P.T., Sørensen, J.T., 2011. Identifying risk factors forpoor hind limb cleanliness in Danish loose-housed dairy cows. Animal5, 1613–1619.
ry Medicine 111 (2013) 245– 255 255
O’Driscoll, K., Gleeson, D., O’Brien, B., Boyle, L., 2010. Effect of milkingfrequency and nutritional level on hoof health, locomotion score andlying behaviour of dairy cows. Livest. Sci. 127, 248–256.
Olde Riekerink, R.G.M., Barkema, H.W., Stryhn, H., 2007. The effect of sea-son on somatic cell count and incidence of clinical mastitis. J. DairySci. 90, 1704–1715.
Olde Riekerink, R.G.M., Barkema, H.W., Kelton, D.F., Scholl, D.T., 2008. Inci-dence rate of clinical mastitis on Canadian dairy farms. J. Dairy Sci. 91,1366–1377.
Österman, S., Redbo, I., 2001. Effects of milking frequency on lying downand getting up behaviour in dairy cows. Appl. Anim. Behav. Sci. 70,167–176.
Pyörälä, S., Pyörälä, E., 1997. Accuracy of methods using somatic cell countand N-acetyl-�-d-glucosaminidase activity in milk to assess the bac-teriological cure of bovine clinical mastitis. J. Dairy Sci. 80, 2820–2825.
Reneau, J.K., Seykora, A.J., Heins, B.H., Endres, M.I., Farnsworth, R.J., Bey,R.F., 2005. Association between hygiene scores and subclinical masti-tis. J. Am. Vet. Med. Assoc. 227, 1297–1301.
SAS Institute, 2009. SAS User’s Guide: Statistics. Version 9. 2. SAS InstituteInc., Cary, NC.
Schepers, A.J., Lam, T.J.G.M., Schukken, Y.H., Wilmink, J.B.M., Hanekamp,W.J.A., 1997. Estimation of variance components for somatic cellcounts to determine thresholds for uninfected quarters. J. Dairy Sci.80, 1833–1840.
Schukken, Y.H., Wilson, D.J., Welcome, F., Garrison-Tikofsky, L., Gonzalez,R.N., 2003. Monitoring udder health and milk quality using somaticcell counts. Vet. Res. 34, 579–596.
Schultze, W.D., Bright, S.C., 1983. Changes in penetrability of bovine pap-illary duct to endotoxin after milking. Am. J. Vet. Res. 44, 2373–2375.
Seegers, H., Fourichon, C., Beaudeau, F., 2003. Production effects relatedto mastitis and mastitis economics in dairy cattle herds. Vet. Res. 34,475–491.
Smith, K.L., 1983. Mastitis control: a discussion. J. Dairy Sci. 66, 1790–1794.Tyler, J.W., Fox, L.K., Parish, S.M., Swain, J., Johnson, D.L., Grasseschi, H.A.,
Gant, R., 1997. Effect of feed availability on post-milking standing time
in dairy cows. J. Dairy Res. 64, 617–620.von Keyserlingk, M.A.G., Barrientos, A., Ito, K., Galo, E., Weary, D.M., 2012.Benchmarking cow comfort on North American freestall dairies: lame-ness, leg injuries, lying time, facility design, and management forhigh-producing Holstein dairy cows. J. Dairy Sci. 95, 7399–7408.


