Embed Size (px)
Citation preview
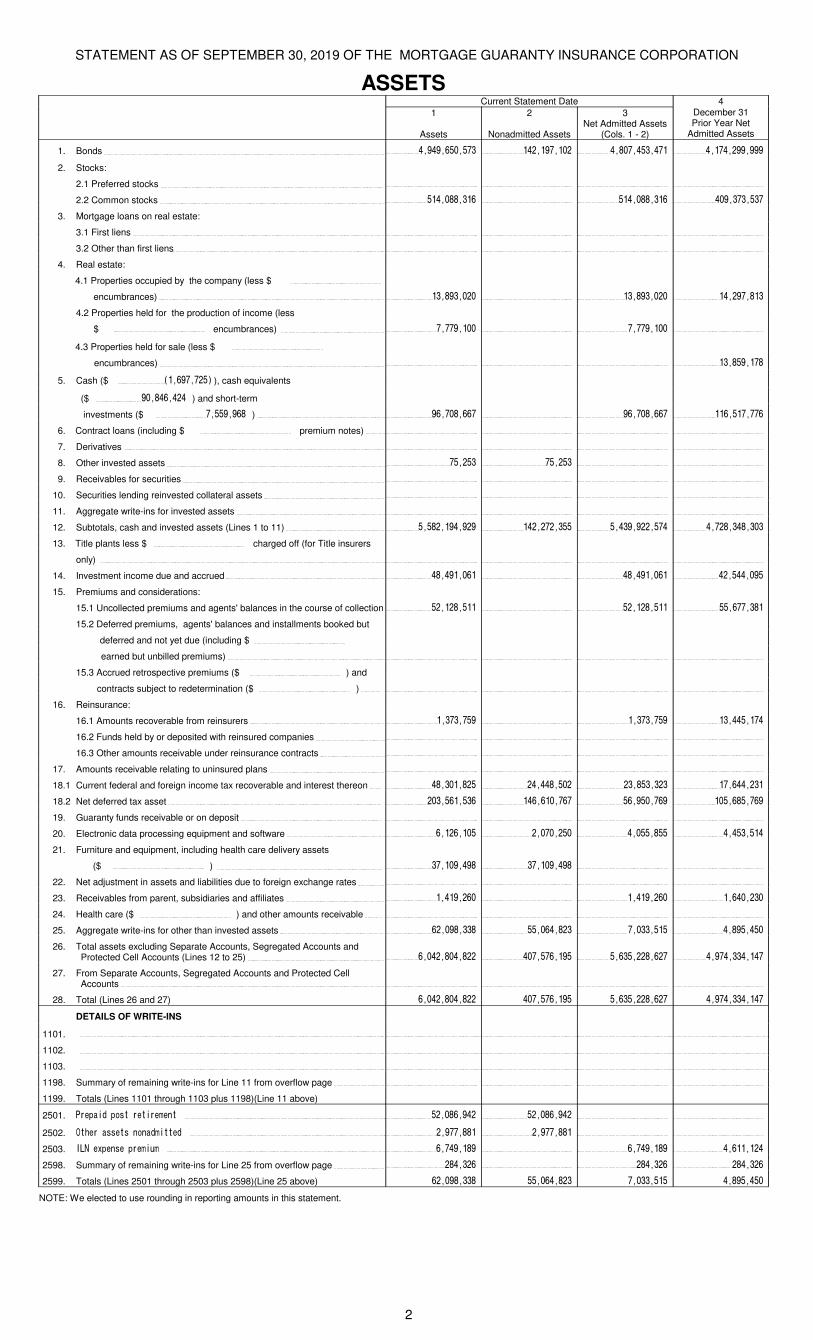
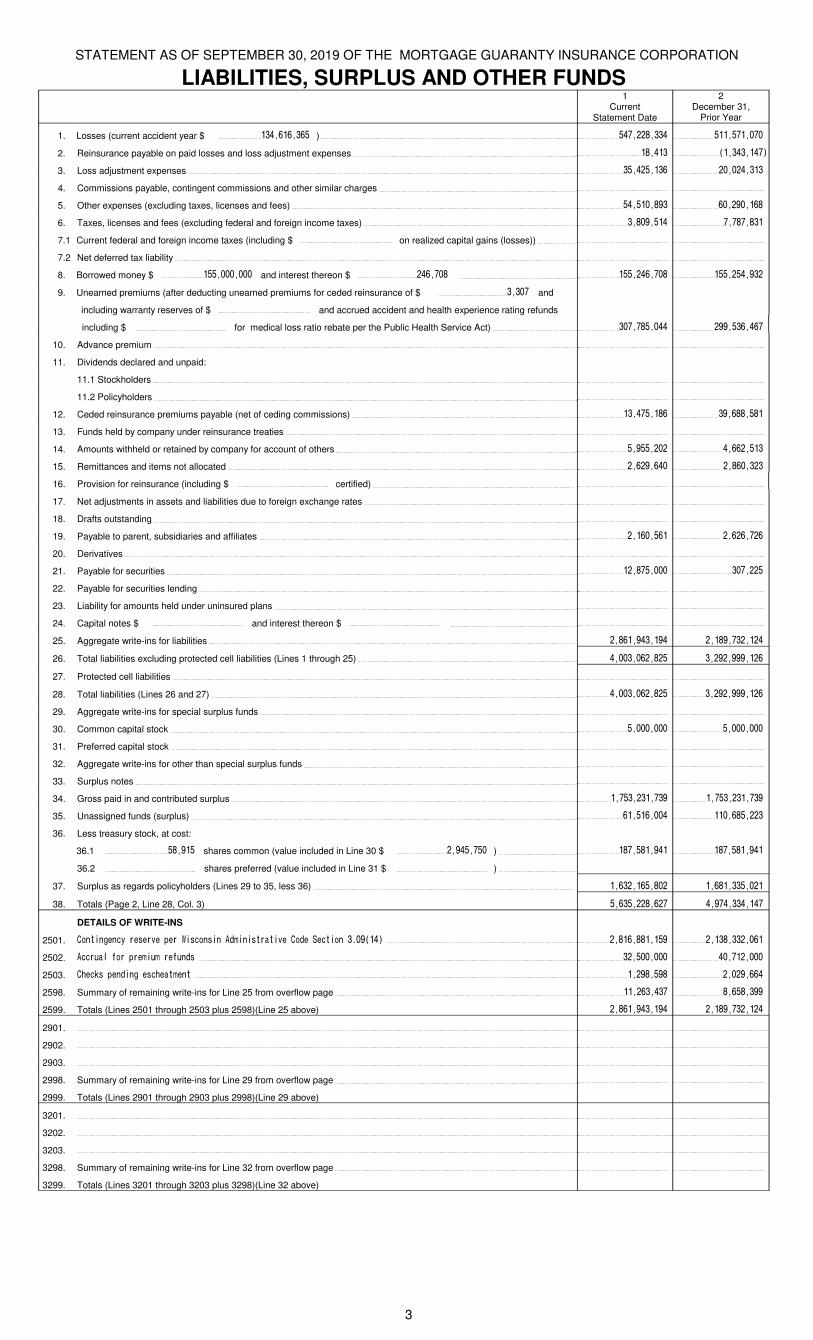
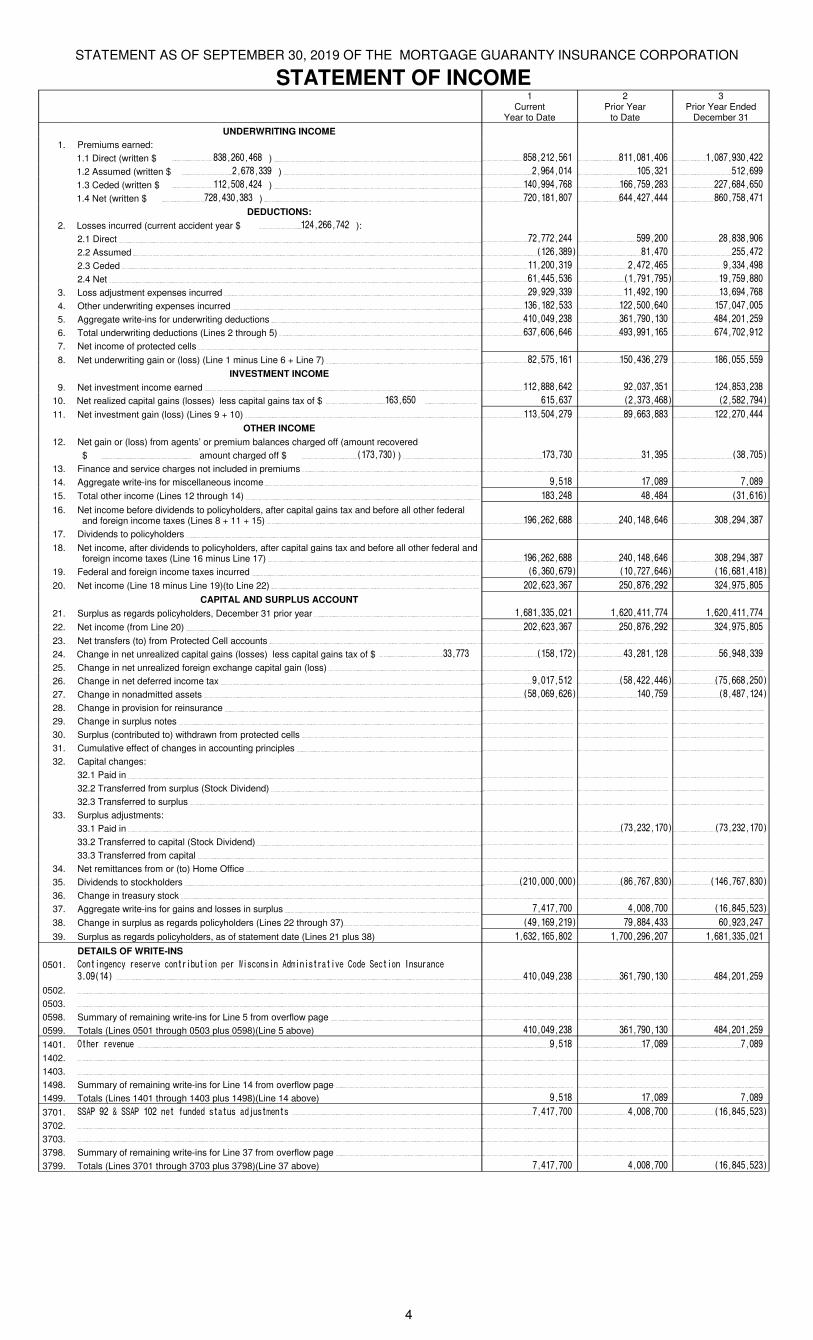
STATEMENT AS OF SEPTEMBER 30, 2019 OF THE MORTGAGE GUARANTY INSURANCE CORPORATION
ASSETSCurrent Statement Date 4
1
Assets
2
Nonadmitted Assets
3Net Admitted Assets
(Cols. 1 - 2)
December 31Prior Year Net
Admitted Assets
1. Bonds 4,949,650,573 142,197,102 4,807,453,471 4,174,299,999
2. Stocks:
2.1 Preferred stocks
2.2 Common stocks 514,088,316 514,088,316 409,373,537
3. Mortgage loans on real estate:
3.1 First liens
3.2 Other than first liens
4. Real estate:
4.1 Properties occupied by the company (less $
encumbrances) 13,893,020 13,893,020 14,297,813
4.2 Properties held for the production of income (less
$ encumbrances) 7,779,100 7,779,100
4.3 Properties held for sale (less $
encumbrances) 13,859,178
5. Cash ($ (1,697,725) ), cash equivalents
($ 90,846,424 ) and short-term
investments ($ 7,559,968 ) 96,708,667 96,708,667 116,517,776
6. Contract loans (including $ premium notes)
7. Derivatives
8. Other invested assets 75,253 75,253
9. Receivables for securities
10. Securities lending reinvested collateral assets
11. Aggregate write-ins for invested assets
12. Subtotals, cash and invested assets (Lines 1 to 11) 5,582,194,929 142,272,355 5,439,922,574 4,728,348,303
13. Title plants less $ charged off (for Title insurers
only)
14. Investment income due and accrued 48,491,061 48,491,061 42,544,095
15. Premiums and considerations:
15.1 Uncollected premiums and agents' balances in the course of collection 52,128,511 52,128,511 55,677,381
15.2 Deferred premiums, agents' balances and installments booked but
deferred and not yet due (including $
earned but unbilled premiums)
15.3 Accrued retrospective premiums ($ ) and
contracts subject to redetermination ($ )
16. Reinsurance:
16.1 Amounts recoverable from reinsurers 1,373,759 1,373,759 13,445,174
16.2 Funds held by or deposited with reinsured companies
16.3 Other amounts receivable under reinsurance contracts
17. Amounts receivable relating to uninsured plans
18.1 Current federal and foreign income tax recoverable and interest thereon 48,301,825 24,448,502 23,853,323 17,644,231
18.2 Net deferred tax asset 203,561,536 146,610,767 56,950,769 105,685,769
19. Guaranty funds receivable or on deposit
20. Electronic data processing equipment and software 6,126,105 2,070,250 4,055,855 4,453,514
21. Furniture and equipment, including health care delivery assets
($ ) 37,109,498 37,109,498
22. Net adjustment in assets and liabilities due to foreign exchange rates
23. Receivables from parent, subsidiaries and affiliates 1,419,260 1,419,260 1,640,230
24. Health care ($ ) and other amounts receivable
25. Aggregate write-ins for other than invested assets 62,098,338 55,064,823 7,033,515 4,895,450
26. Total assets excluding Separate Accounts, Segregated Accounts and Protected Cell Accounts (Lines 12 to 25) 6,042,804,822 407,576,195 5,635,228,627 4,974,334,147
27. From Separate Accounts, Segregated Accounts and Protected Cell Accounts
28. Total (Lines 26 and 27) 6,042,804,822 407,576,195 5,635,228,627 4,974,334,147
DETAILS OF WRITE-INS
1101.
1102.
1103.
1198. Summary of remaining write-ins for Line 11 from overflow page
1199. Totals (Lines 1101 through 1103 plus 1198)(Line 11 above)
2501. Prepaid post retirement 52,086,942 52,086,942
2502. Other assets nonadmitted 2,977,881 2,977,881
2503. ILN expense premium 6,749,189 6,749,189 4,611,124
2598. Summary of remaining write-ins for Line 25 from overflow page 284,326 284,326 284,326
2599. Totals (Lines 2501 through 2503 plus 2598)(Line 25 above) 62,098,338 55,064,823 7,033,515 4,895,450
NOTE: We elected to use rounding in reporting amounts in this statement.
2
STATEMENT AS OF SEPTEMBER 30, 2019 OF THE MORTGAGE GUARANTY INSURANCE CORPORATION
LIABILITIES, SURPLUS AND OTHER FUNDS1
CurrentStatement Date
2December 31,
Prior Year
1. Losses (current accident year $ 134,616,365 ) 547,228,334 511,571,070
2. Reinsurance payable on paid losses and loss adjustment expenses 18,413 (1,343,147)
3. Loss adjustment expenses 35,425,136 20,024,313
4. Commissions payable, contingent commissions and other similar charges
5. Other expenses (excluding taxes, licenses and fees) 54,510,893 60,290,168
6. Taxes, licenses and fees (excluding federal and foreign income taxes) 3,809,514 7,787,831
7.1 Current federal and foreign income taxes (including $ on realized capital gains (losses))
7.2 Net deferred tax liability
8. Borrowed money $ 155,000,000 and interest thereon $ 246,708 155,246,708 155,254,932
9. Unearned premiums (after deducting unearned premiums for ceded reinsurance of $ 3,307 and
including warranty reserves of $ and accrued accident and health experience rating refunds
including $ for medical loss ratio rebate per the Public Health Service Act) 307,785,044 299,536,467
10. Advance premium
11. Dividends declared and unpaid:
11.1 Stockholders
11.2 Policyholders
12. Ceded reinsurance premiums payable (net of ceding commissions) 13,475,186 39,688,581
13. Funds held by company under reinsurance treaties
14. Amounts withheld or retained by company for account of others 5,955,202 4,662,513
15. Remittances and items not allocated 2,629,640 2,860,323
16. Provision for reinsurance (including $ certified)
17. Net adjustments in assets and liabilities due to foreign exchange rates
18. Drafts outstanding
19. Payable to parent, subsidiaries and affiliates 2,160,561 2,626,726
20. Derivatives
21. Payable for securities 12,875,000 307,225
22. Payable for securities lending
23. Liability for amounts held under uninsured plans
24. Capital notes $ and interest thereon $
25. Aggregate write-ins for liabilities 2,861,943,194 2,189,732,124
26. Total liabilities excluding protected cell liabilities (Lines 1 through 25) 4,003,062,825 3,292,999,126
27. Protected cell liabilities
28. Total liabilities (Lines 26 and 27) 4,003,062,825 3,292,999,126
29. Aggregate write-ins for special surplus funds
30. Common capital stock 5,000,000 5,000,000
31. Preferred capital stock
32. Aggregate write-ins for other than special surplus funds
33. Surplus notes
34. Gross paid in and contributed surplus 1,753,231,739 1,753,231,739
35. Unassigned funds (surplus) 61,516,004 110,685,223
36. Less treasury stock, at cost:
36.1 58,915 shares common (value included in Line 30 $ 2,945,750 ) 187,581,941 187,581,941
36.2 shares preferred (value included in Line 31 $ )
37. Surplus as regards policyholders (Lines 29 to 35, less 36) 1,632,165,802 1,681,335,021
38. Totals (Page 2, Line 28, Col. 3) 5,635,228,627 4,974,334,147
DETAILS OF WRITE-INS
2501. Contingency reserve per Wisconsin Administrative Code Section 3.09(14) 2,816,881,159 2,138,332,061
2502. Accrual for premium refunds 32,500,000 40,712,000
2503. Checks pending escheatment 1,298,598 2,029,664
2598. Summary of remaining write-ins for Line 25 from overflow page 11,263,437 8,658,399
2599. Totals (Lines 2501 through 2503 plus 2598)(Line 25 above) 2,861,943,194 2,189,732,124
2901.
2902.
2903.
2998. Summary of remaining write-ins for Line 29 from overflow page
2999. Totals (Lines 2901 through 2903 plus 2998)(Line 29 above)
3201.
3202.
3203.
3298. Summary of remaining write-ins for Line 32 from overflow page
3299. Totals (Lines 3201 through 3203 plus 3298)(Line 32 above)
3
STATEMENT AS OF SEPTEMBER 30, 2019 OF THE MORTGAGE GUARANTY INSURANCE CORPORATION
STATEMENT OF INCOME1
CurrentYear to Date
2Prior Year
to Date
3Prior Year Ended
December 31
UNDERWRITING INCOME
1. Premiums earned:
1.1 Direct (written $ 838,260,468 ) 858,212,561 811,081,406 1,087,930,422
1.2 Assumed (written $ 2,678,339 ) 2,964,014 105,321 512,699
1.3 Ceded (written $ 112,508,424 ) 140,994,768 166,759,283 227,684,650
1.4 Net (written $ 728,430,383 ) 720,181,807 644,427,444 860,758,471
DEDUCTIONS:
2. Losses incurred (current accident year $ 124,266,742 ):
2.1 Direct 72,772,244 599,200 28,838,906
2.2 Assumed (126,389) 81,470 255,472
2.3 Ceded 11,200,319 2,472,465 9,334,498
2.4 Net 61,445,536 (1,791,795) 19,759,880
3. Loss adjustment expenses incurred 29,929,339 11,492,190 13,694,768
4. Other underwriting expenses incurred 136,182,533 122,500,640 157,047,005
5. Aggregate write-ins for underwriting deductions 410,049,238 361,790,130 484,201,259
6. Total underwriting deductions (Lines 2 through 5) 637,606,646 493,991,165 674,702,912
7. Net income of protected cells
8. Net underwriting gain or (loss) (Line 1 minus Line 6 + Line 7) 82,575,161 150,436,279 186,055,559
INVESTMENT INCOME
9. Net investment income earned 112,888,642 92,037,351 124,853,238
10. Net realized capital gains (losses) less capital gains tax of $ 163,650 615,637 (2,373,468) (2,582,794)
11. Net investment gain (loss) (Lines 9 + 10) 113,504,279 89,663,883 122,270,444
OTHER INCOME
12. Net gain or (loss) from agents’ or premium balances charged off (amount recovered
$ amount charged off $ (173,730) ) 173,730 31,395 (38,705)
13. Finance and service charges not included in premiums
14. Aggregate write-ins for miscellaneous income 9,518 17,089 7,089
15. Total other income (Lines 12 through 14) 183,248 48,484 (31,616)
16. Net income before dividends to policyholders, after capital gains tax and before all other federal and foreign income taxes (Lines 8 + 11 + 15) 196,262,688 240,148,646 308,294,387
17. Dividends to policyholders
18. Net income, after dividends to policyholders, after capital gains tax and before all other federal and foreign income taxes (Line 16 minus Line 17) 196,262,688 240,148,646 308,294,387
19. Federal and foreign income taxes incurred (6,360,679) (10,727,646) (16,681,418)
20. Net income (Line 18 minus Line 19)(to Line 22) 202,623,367 250,876,292 324,975,805
CAPITAL AND SURPLUS ACCOUNT
21. Surplus as regards policyholders, December 31 prior year 1,681,335,021 1,620,411,774 1,620,411,774
22. Net income (from Line 20) 202,623,367 250,876,292 324,975,805
23. Net transfers (to) from Protected Cell accounts
24. Change in net unrealized capital gains (losses) less capital gains tax of $ 33,773 (158,172) 43,281,128 56,948,339
25. Change in net unrealized foreign exchange capital gain (loss)
26. Change in net deferred income tax 9,017,512 (58,422,446) (75,668,250)
27. Change in nonadmitted assets (58,069,626) 140,759 (8,487,124)
28. Change in provision for reinsurance
29. Change in surplus notes
30. Surplus (contributed to) withdrawn from protected cells
31. Cumulative effect of changes in accounting principles
32. Capital changes:
32.1 Paid in
32.2 Transferred from surplus (Stock Dividend)
32.3 Transferred to surplus
33. Surplus adjustments:
33.1 Paid in (73,232,170) (73,232,170)
33.2 Transferred to capital (Stock Dividend)
33.3 Transferred from capital
34. Net remittances from or (to) Home Office
35. Dividends to stockholders (210,000,000) (86,767,830) (146,767,830)
36. Change in treasury stock
37. Aggregate write-ins for gains and losses in surplus 7,417,700 4,008,700 (16,845,523)
38. Change in surplus as regards policyholders (Lines 22 through 37) (49,169,219) 79,884,433 60,923,247
39. Surplus as regards policyholders, as of statement date (Lines 21 plus 38) 1,632,165,802 1,700,296,207 1,681,335,021
DETAILS OF WRITE-INS
0501. Contingency reserve contribution per Wisconsin Administrative Code Section Insurance
3.09(14) 410,049,238 361,790,130 484,201,259
0502.
0503.
0598. Summary of remaining write-ins for Line 5 from overflow page
0599. Totals (Lines 0501 through 0503 plus 0598)(Line 5 above) 410,049,238 361,790,130 484,201,259
1401. Other revenue 9,518 17,089 7,089
1402.
1403.
1498. Summary of remaining write-ins for Line 14 from overflow page
1499. Totals (Lines 1401 through 1403 plus 1498)(Line 14 above) 9,518 17,089 7,089
3701. SSAP 92 & SSAP 102 net funded status adjustments 7,417,700 4,008,700 (16,845,523)
3702.
3703.
3798. Summary of remaining write-ins for Line 37 from overflow page
3799. Totals (Lines 3701 through 3703 plus 3798)(Line 37 above) 7,417,700 4,008,700 (16,845,523)
4
STATEMENT AS OF SEPTEMBER 30, 2019 OF THE MORTGAGE GUARANTY INSURANCE CORPORATION
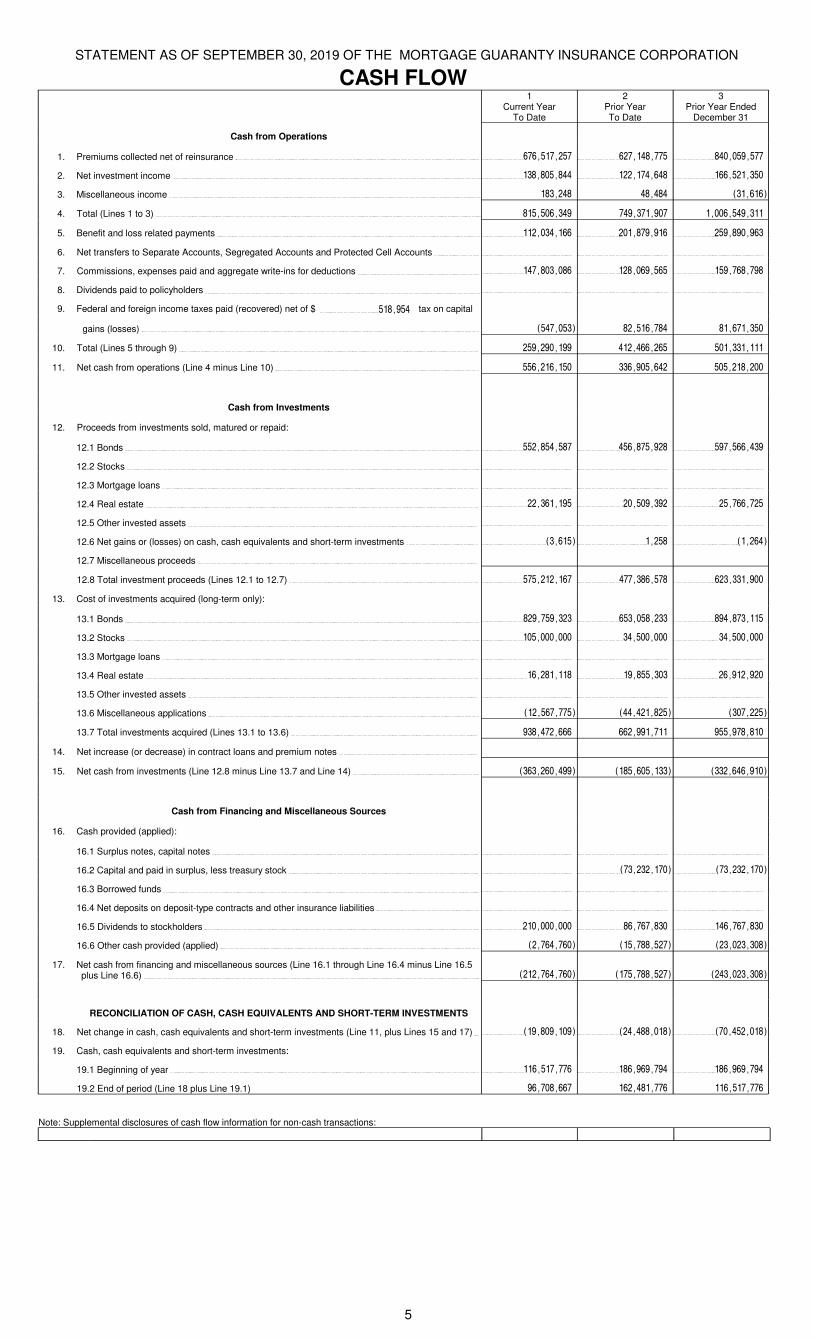
CASH FLOW1
Current YearTo Date
2Prior YearTo Date
3Prior Year Ended
December 31
Cash from Operations
1. Premiums collected net of reinsurance 676,517,257 627,148,775 840,059,577
2. Net investment income 138,805,844 122,174,648 166,521,350
3. Miscellaneous income 183,248 48,484 (31,616)
4. Total (Lines 1 to 3) 815,506,349 749,371,907 1,006,549,311
5. Benefit and loss related payments 112,034,166 201,879,916 259,890,963
6. Net transfers to Separate Accounts, Segregated Accounts and Protected Cell Accounts
7. Commissions, expenses paid and aggregate write-ins for deductions 147,803,086 128,069,565 159,768,798
8. Dividends paid to policyholders
9. Federal and foreign income taxes paid (recovered) net of $ 518,954 tax on capital
gains (losses) (547,053) 82,516,784 81,671,350
10. Total (Lines 5 through 9) 259,290,199 412,466,265 501,331,111
11. Net cash from operations (Line 4 minus Line 10) 556,216,150 336,905,642 505,218,200
Cash from Investments
12. Proceeds from investments sold, matured or repaid:
12.1 Bonds 552,854,587 456,875,928 597,566,439
12.2 Stocks
12.3 Mortgage loans
12.4 Real estate 22,361,195 20,509,392 25,766,725
12.5 Other invested assets
12.6 Net gains or (losses) on cash, cash equivalents and short-term investments (3,615) 1,258 (1,264)
12.7 Miscellaneous proceeds
12.8 Total investment proceeds (Lines 12.1 to 12.7) 575,212,167 477,386,578 623,331,900
13. Cost of investments acquired (long-term only):
13.1 Bonds 829,759,323 653,058,233 894,873,115
13.2 Stocks 105,000,000 34,500,000 34,500,000
13.3 Mortgage loans
13.4 Real estate 16,281,118 19,855,303 26,912,920
13.5 Other invested assets
13.6 Miscellaneous applications (12,567,775) (44,421,825) (307,225)
13.7 Total investments acquired (Lines 13.1 to 13.6) 938,472,666 662,991,711 955,978,810
14. Net increase (or decrease) in contract loans and premium notes
15. Net cash from investments (Line 12.8 minus Line 13.7 and Line 14) (363,260,499) (185,605,133) (332,646,910)
Cash from Financing and Miscellaneous Sources
16. Cash provided (applied):
16.1 Surplus notes, capital notes
16.2 Capital and paid in surplus, less treasury stock (73,232,170) (73,232,170)
16.3 Borrowed funds
16.4 Net deposits on deposit-type contracts and other insurance liabilities
16.5 Dividends to stockholders 210,000,000 86,767,830 146,767,830
16.6 Other cash provided (applied) (2,764,760) (15,788,527) (23,023,308)
17. Net cash from financing and miscellaneous sources (Line 16.1 through Line 16.4 minus Line 16.5 plus Line 16.6) (212,764,760) (175,788,527) (243,023,308)
RECONCILIATION OF CASH, CASH EQUIVALENTS AND SHORT-TERM INVESTMENTS
18. Net change in cash, cash equivalents and short-term investments (Line 11, plus Lines 15 and 17) (19,809,109) (24,488,018) (70,452,018)
19. Cash, cash equivalents and short-term investments:
19.1 Beginning of year 116,517,776 186,969,794 186,969,794
19.2 End of period (Line 18 plus Line 19.1) 96,708,667 162,481,776 116,517,776
Note: Supplemental disclosures of cash flow information for non-cash transactions:
5
STATEMENT AS OF SEPTEMBER 30, 2019 OF THE MORTGAGE GUARANTY INSURANCE CORPORATION
6
NOTES TO FINANCIAL STATEMENTS
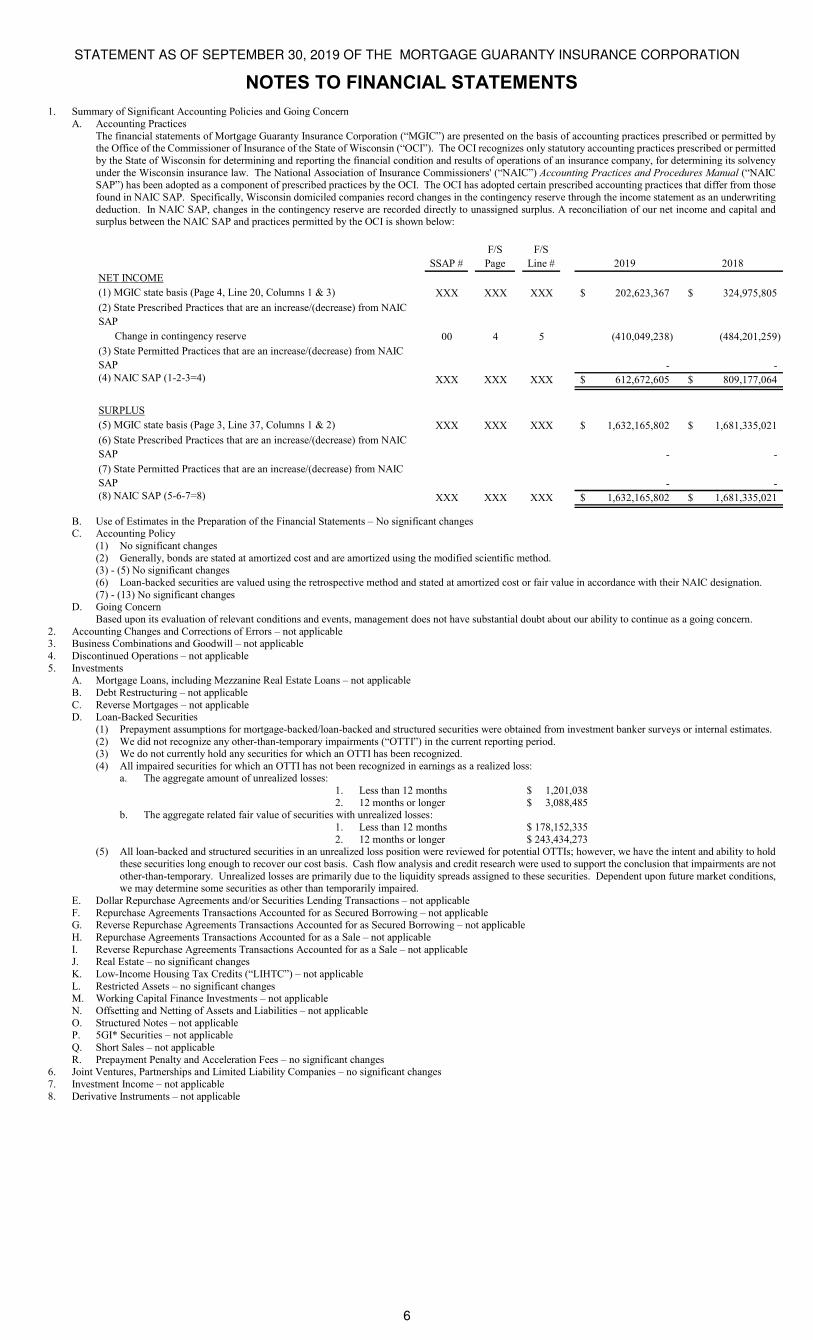
1. Summary of Significant Accounting Policies and Going Concern A. Accounting Practices
The financial statements of Mortgage Guaranty Insurance Corporation (“MGIC”) are presented on the basis of accounting practices prescribed or permitted by the Office of the Commissioner of Insurance of the State of Wisconsin (“OCI”). The OCI recognizes only statutory accounting practices prescribed or permitted by the State of Wisconsin for determining and reporting the financial condition and results of operations of an insurance company, for determining its solvency under the Wisconsin insurance law. The National Association of Insurance Commissioners' (“NAIC”) Accounting Practices and Procedures Manual (“NAIC SAP”) has been adopted as a component of prescribed practices by the OCI. The OCI has adopted certain prescribed accounting practices that differ from those found in NAIC SAP. Specifically, Wisconsin domiciled companies record changes in the contingency reserve through the income statement as an underwriting deduction. In NAIC SAP, changes in the contingency reserve are recorded directly to unassigned surplus. A reconciliation of our net income and capital and surplus between the NAIC SAP and practices permitted by the OCI is shown below:
SSAP #
F/S
Page
F/S
Line # 2019 2018
NET INCOME
(1) MGIC state basis (Page 4, Line 20, Columns 1 & 3) XXX XXX XXX 202,623,367$ 324,975,805$
(2) State Prescribed Practices that are an increase/(decrease) from NAIC
SAP
Change in contingency reserve 00 4 5 (410,049,238) (484,201,259)
(3) State Permitted Practices that are an increase/(decrease) from NAIC
SAP - - (4) NAIC SAP (1-2-3=4) XXX XXX XXX 612,672,605$ 809,177,064$
SURPLUS
(5) MGIC state basis (Page 3, Line 37, Columns 1 & 2) XXX XXX XXX 1,632,165,802$ 1,681,335,021$
(6) State Prescribed Practices that are an increase/(decrease) from NAIC
SAP - -
(7) State Permitted Practices that are an increase/(decrease) from NAIC
SAP - - (8) NAIC SAP (5-6-7=8) XXX XXX XXX 1,632,165,802$ 1,681,335,021$
B. Use of Estimates in the Preparation of the Financial Statements – No significant changes C. Accounting Policy
(1) No significant changes (2) Generally, bonds are stated at amortized cost and are amortized using the modified scientific method. (3) - (5) No significant changes (6) Loan-backed securities are valued using the retrospective method and stated at amortized cost or fair value in accordance with their NAIC designation. (7) - (13) No significant changes
D. Going Concern Based upon its evaluation of relevant conditions and events, management does not have substantial doubt about our ability to continue as a going concern.
2. Accounting Changes and Corrections of Errors – not applicable 3. Business Combinations and Goodwill – not applicable 4. Discontinued Operations – not applicable 5. Investments
A. Mortgage Loans, including Mezzanine Real Estate Loans – not applicable B. Debt Restructuring – not applicable C. Reverse Mortgages – not applicable D. Loan-Backed Securities
(1) Prepayment assumptions for mortgage-backed/loan-backed and structured securities were obtained from investment banker surveys or internal estimates. (2) We did not recognize any other-than-temporary impairments (“OTTI”) in the current reporting period. (3) We do not currently hold any securities for which an OTTI has been recognized. (4) All impaired securities for which an OTTI has not been recognized in earnings as a realized loss:
a. The aggregate amount of unrealized losses: 1. Less than 12 months $ 1,201,038 2. 12 months or longer $ 3,088,485
b. The aggregate related fair value of securities with unrealized losses: 1. Less than 12 months $ 178,152,335 2. 12 months or longer $ 243,434,273
(5) All loan-backed and structured securities in an unrealized loss position were reviewed for potential OTTIs; however, we have the intent and ability to hold these securities long enough to recover our cost basis. Cash flow analysis and credit research were used to support the conclusion that impairments are not other-than-temporary. Unrealized losses are primarily due to the liquidity spreads assigned to these securities. Dependent upon future market conditions, we may determine some securities as other than temporarily impaired.
E. Dollar Repurchase Agreements and/or Securities Lending Transactions – not applicable F. Repurchase Agreements Transactions Accounted for as Secured Borrowing – not applicable G. Reverse Repurchase Agreements Transactions Accounted for as Secured Borrowing – not applicable H. Repurchase Agreements Transactions Accounted for as a Sale – not applicable I. Reverse Repurchase Agreements Transactions Accounted for as a Sale – not applicable J. Real Estate – no significant changes K. Low-Income Housing Tax Credits (“LIHTC”) – not applicable L. Restricted Assets – no significant changes M. Working Capital Finance Investments – not applicable N. Offsetting and Netting of Assets and Liabilities – not applicable O. Structured Notes – not applicable P. 5GI* Securities – not applicable Q. Short Sales – not applicable R. Prepayment Penalty and Acceleration Fees – no significant changes
6. Joint Ventures, Partnerships and Limited Liability Companies – no significant changes 7. Investment Income – not applicable 8. Derivative Instruments – not applicable
STATEMENT AS OF SEPTEMBER 30, 2019 OF THE MORTGAGE GUARANTY INSURANCE CORPORATION
6.1
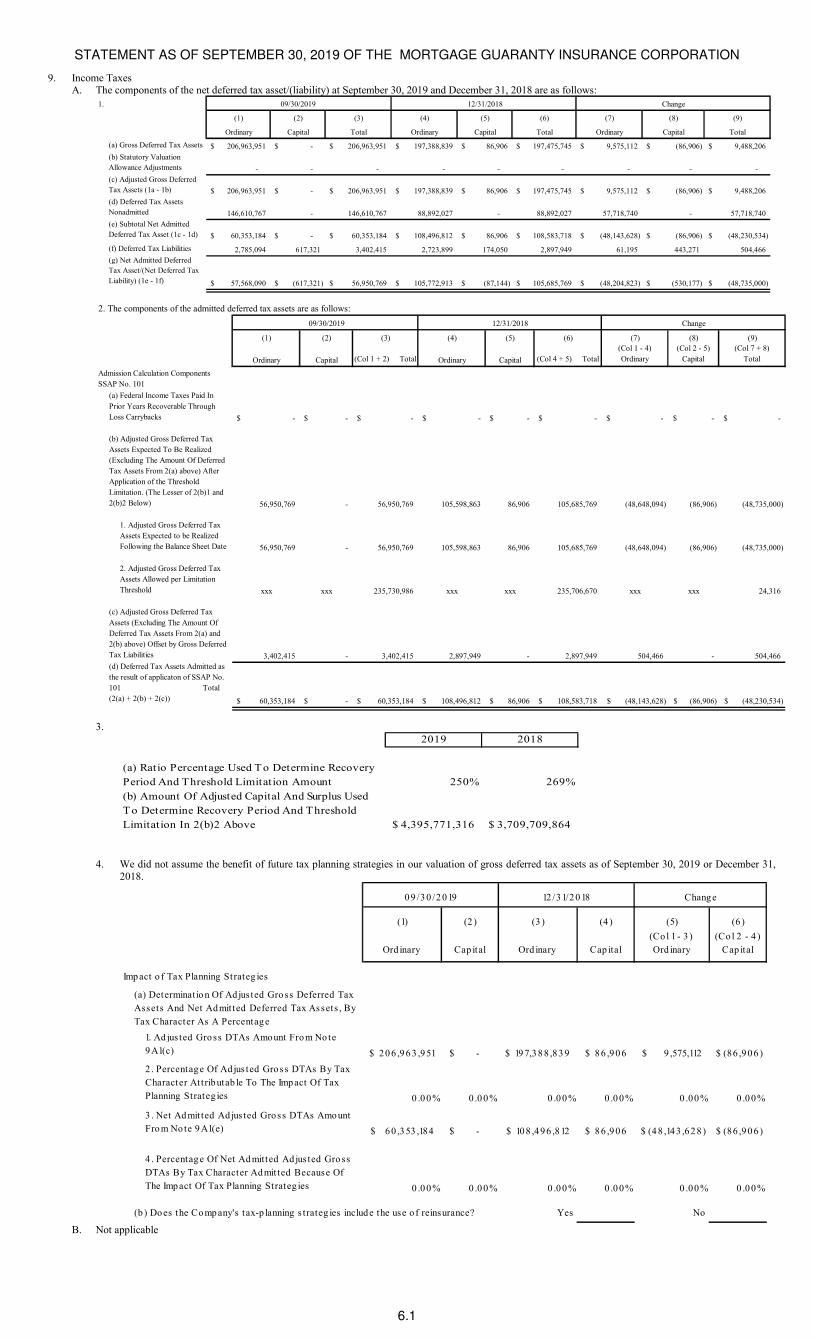
9. Income Taxes A. The components of the net deferred tax asset/(liability) at September 30, 2019 and December 31, 2018 are as follows:
1. 09/30/2019 12/31/2018 Change
(1) (2) (3) (4) (5) (6) (7) (8) (9)
Ordinary Capital Total Ordinary Capital Total Ordinary Capital Total
(a) Gross Deferred Tax Assets 206,963,951$ -$ 206,963,951$ 197,388,839$ 86,906$ 197,475,745$ 9,575,112$ (86,906)$ 9,488,206$
(b) Statutory Valuation
Allowance Adjustments - - - - - - - - -
(c) Adjusted Gross Deferred
Tax Assets (1a - 1b) 206,963,951$ -$ 206,963,951$ 197,388,839$ 86,906$ 197,475,745$ 9,575,112$ (86,906)$ 9,488,206$
(d) Deferred Tax Assets
Nonadmitted 146,610,767 - 146,610,767 88,892,027 - 88,892,027 57,718,740 - 57,718,740
(e) Subtotal Net Admitted
Deferred Tax Asset (1c - 1d) 60,353,184$ -$ 60,353,184$ 108,496,812$ 86,906$ 108,583,718$ (48,143,628)$ (86,906)$ (48,230,534)$
(f) Deferred Tax Liabilities 2,785,094 617,321 3,402,415 2,723,899 174,050 2,897,949 61,195 443,271 504,466
(g) Net Admitted Deferred
Tax Asset/(Net Deferred Tax
Liability) (1e - 1f) 57,568,090$ (617,321)$ 56,950,769$ 105,772,913$ (87,144)$ 105,685,769$ (48,204,823)$ (530,177)$ (48,735,000)$
2. The components of the admitted deferred tax assets are as follows:
09/30/2019 12/31/2018 Change
(1) (2) (3) (4) (5) (6) (7) (8) (9)
Ordinary Capital (Col 1 + 2) Total Ordinary Capital (Col 4 + 5) Total
(Col 1 - 4)
Ordinary
(Col 2 - 5)
Capital
(Col 7 + 8)
Total
Admission Calculation Components
SSAP No. 101
(a) Federal Income Taxes Paid In
Prior Years Recoverable Through
Loss Carrybacks -$ -$ -$ -$ -$ -$ -$ -$ -$
(b) Adjusted Gross Deferred Tax
Assets Expected To Be Realized
(Excluding The Amount Of Deferred
Tax Assets From 2(a) above) After
Application of the Threshold
Limitation. (The Lesser of 2(b)1 and
2(b)2 Below) 56,950,769 - 56,950,769 105,598,863 86,906 105,685,769 (48,648,094) (86,906) (48,735,000)
1. Adjusted Gross Deferred Tax
Assets Expected to be Realized
Following the Balance Sheet Date 56,950,769 - 56,950,769 105,598,863 86,906 105,685,769 (48,648,094) (86,906) (48,735,000)
2. Adjusted Gross Deferred Tax
Assets Allowed per Limitation
Threshold xxx xxx 235,730,986 xxx xxx 235,706,670 xxx xxx 24,316
(c) Adjusted Gross Deferred Tax
Assets (Excluding The Amount Of
Deferred Tax Assets From 2(a) and
2(b) above) Offset by Gross Deferred
Tax Liabilities 3,402,415 - 3,402,415 2,897,949 - 2,897,949 504,466 - 504,466
(d) Deferred Tax Assets Admitted as
the result of applicaton of SSAP No.
101 Total
(2(a) + 2(b) + 2(c)) 60,353,184$ -$ 60,353,184$ 108,496,812$ 86,906$ 108,583,718$ (48,143,628)$ (86,906)$ (48,230,534)$
3. 2019 2018
(a) Ratio Percentage Used To Determine Recovery
Period And Threshold Limitation Amount 250% 269%
(b) Amount Of Adjusted Capital And Surplus Used
To Determine Recovery Period And Threshold
Limitation In 2(b)2 Above 4,395,771,316$ 3,709,709,864$
4. We did not assume the benefit of future tax planning strategies in our valuation of gross deferred tax assets as of September 30, 2019 or December 31, 2018.
(1) (2 ) (3 ) (4 ) (5) (6 )
Ord inary Cap ital Ord inary Cap ital
(Co l 1 - 3 )
Ord inary
(Co l 2 - 4 )
Cap ital
Imp act o f Tax Planning Strateg ies
(a) Determinatio n Of Ad jus ted Gro ss Deferred Tax
Assets And Net Ad mit ted Deferred Tax Assets , By
Tax Character As A Percentag e
1. Ad jus ted Gro ss DTAs Amount Fro m No te
9 A1(c) 2 0 6 ,9 6 3 ,9 51$ -$ 19 7,3 8 8 ,8 3 9$ 8 6 ,9 0 6$ 9 ,575,112$ (86 ,9 0 6 )$
2 . Percentag e Of Ad jus ted Gro ss DTAs By Tax
Character Att rib utab le To The Imp act Of Tax
Planning Strateg ies 0 .0 0 % 0 .0 0 % 0 .0 0 % 0 .0 0 % 0 .00 % 0 .0 0 %
3 . Net Ad mit ted Ad jus ted Gro ss DTAs Amo unt
Fro m No te 9 A1(e) 6 0 ,3 53 ,184$ -$ 10 8 ,4 9 6 ,8 12$ 8 6 ,9 0 6$ (4 8 ,14 3 ,6 2 8 )$ (86 ,9 0 6 )$
4 . Percentag e Of Net Ad mitted Ad jus ted Gro ss
DTAs By Tax Character Ad mit ted Because Of
The Imp act Of Tax Planning Strateg ies 0 .0 0 % 0 .0 0 % 0 .0 0 % 0 .0 0 % 0 .00 % 0 .0 0 %
(b ) Do es the Co mp any's tax-p lanning s trateg ies includ e the use o f reinsurance? Yes No
0 9 /3 0 /2 0 19 12 /3 1/2 0 18 Chang e
B. Not applicable
STATEMENT AS OF SEPTEMBER 30, 2019 OF THE MORTGAGE GUARANTY INSURANCE CORPORATION
6.2
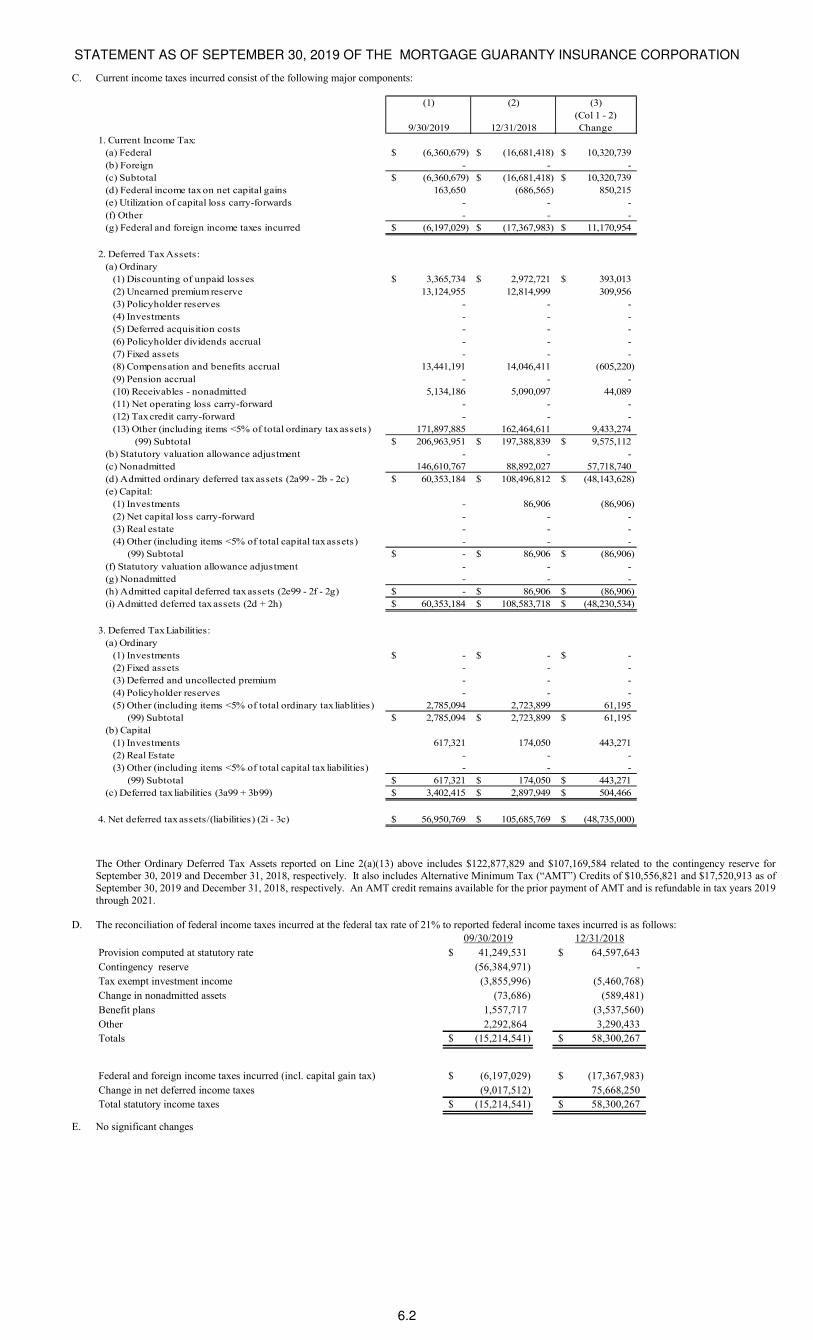
C. Current income taxes incurred consist of the following major components:
(1) (2) (3)
9/30/2019 12/31/2018
(Col 1 - 2)
Change
1. Current Income Tax:
(a) Federal (6,360,679)$ (16,681,418)$ 10,320,739$
(b) Foreign - - -
(c) Subtotal (6,360,679)$ (16,681,418)$ 10,320,739$
(d) Federal income tax on net capital gains 163,650 (686,565) 850,215
(e) Utilization of capital loss carry-forwards - - -
(f) Other - - -
(g) Federal and foreign income taxes incurred (6,197,029)$ (17,367,983)$ 11,170,954$
2. Deferred Tax Assets:
(a) Ordinary
(1) Discounting of unpaid losses 3,365,734$ 2,972,721$ 393,013$
(2) Unearned premium reserve 13,124,955 12,814,999 309,956
(3) Policyholder reserves - - -
(4) Investments - - -
(5) Deferred acquisition costs - - -
(6) Policyholder dividends accrual - - -
(7) Fixed assets - - -
(8) Compensation and benefits accrual 13,441,191 14,046,411 (605,220)
(9) Pension accrual - - -
(10) Receivables - nonadmitted 5,134,186 5,090,097 44,089
(11) Net operating loss carry-forward - - -
(12) Tax credit carry-forward - - -
(13) Other (including items <5% of total ordinary tax assets) 171,897,885 162,464,611 9,433,274
(99) Subtotal 206,963,951$ 197,388,839$ 9,575,112$
(b) Statutory valuation allowance adjustment - - -
(c) Nonadmitted 146,610,767 88,892,027 57,718,740
(d) Admitted ordinary deferred tax assets (2a99 - 2b - 2c) 60,353,184$ 108,496,812$ (48,143,628)$
(e) Capital:
(1) Investments - 86,906 (86,906)
(2) Net capital loss carry-forward - - -
(3) Real estate - - -
(4) Other (including items <5% of total capital tax assets) - - -
(99) Subtotal -$ 86,906$ (86,906)$
(f) Statutory valuation allowance adjustment - - -
(g) Nonadmitted - - -
(h) Admitted capital deferred tax assets (2e99 - 2f - 2g) -$ 86,906$ (86,906)$
(i) Admitted deferred tax assets (2d + 2h) 60,353,184$ 108,583,718$ (48,230,534)$
3. Deferred Tax Liabilities:
(a) Ordinary
(1) Investments -$ -$ -$
(2) Fixed assets - - -
(3) Deferred and uncollected premium - - -
(4) Policyholder reserves - - -
(5) Other (including items <5% of total ordinary tax liablities) 2,785,094 2,723,899 61,195
(99) Subtotal 2,785,094$ 2,723,899$ 61,195$
(b) Capital
(1) Investments 617,321 174,050 443,271
(2) Real Estate - - -
(3) Other (including items <5% of total capital tax liabilities) - - -
(99) Subtotal 617,321$ 174,050$ 443,271$
(c) Deferred tax liabilities (3a99 + 3b99) 3,402,415$ 2,897,949$ 504,466$
4. Net deferred tax assets/(liabilities) (2i - 3c) 56,950,769$ 105,685,769$ (48,735,000)$
The Other Ordinary Deferred Tax Assets reported on Line 2(a)(13) above includes $122,877,829 and $107,169,584 related to the contingency reserve for September 30, 2019 and December 31, 2018, respectively. It also includes Alternative Minimum Tax (“AMT”) Credits of $10,556,821 and $17,520,913 as of September 30, 2019 and December 31, 2018, respectively. An AMT credit remains available for the prior payment of AMT and is refundable in tax years 2019 through 2021.
D. The reconciliation of federal income taxes incurred at the federal tax rate of 21% to reported federal income taxes incurred is as follows:
09/30/2019 12/31/2018
Provision computed at statutory rate 41,249,531$ 64,597,643$
Contingency reserve (56,384,971) -
Tax exempt investment income (3,855,996) (5,460,768)
Change in nonadmitted assets (73,686) (589,481)
Benefit plans 1,557,717 (3,537,560)
Other 2,292,864 3,290,433
Totals (15,214,541)$ 58,300,267$
Federal and foreign income taxes incurred (incl. capital gain tax) (6,197,029)$ (17,367,983)$
Change in net deferred income taxes (9,017,512) 75,668,250
Total statutory income taxes (15,214,541)$ 58,300,267$
E. No significant changes
STATEMENT AS OF SEPTEMBER 30, 2019 OF THE MORTGAGE GUARANTY INSURANCE CORPORATION
6.3
F. Our Federal Income Tax return is consolidated with the following entities (“MGIC Group”): MGIC Investment Corporation MGIC Investor Services Corporation
MGIC Reinsurance Corporation of Wisconsin MGIC Insurance Services Corporation
MGIC Credit Assurance Corporation CMI Investors 2, L.P.
MGIC Assurance Corporation CMI Investors 5, L.P.
MGIC Indemnity Corporation CMI Investors 8, L.P.
MGIC Reinsurance Corporation of Vermont CMI Investors 9, L.P.
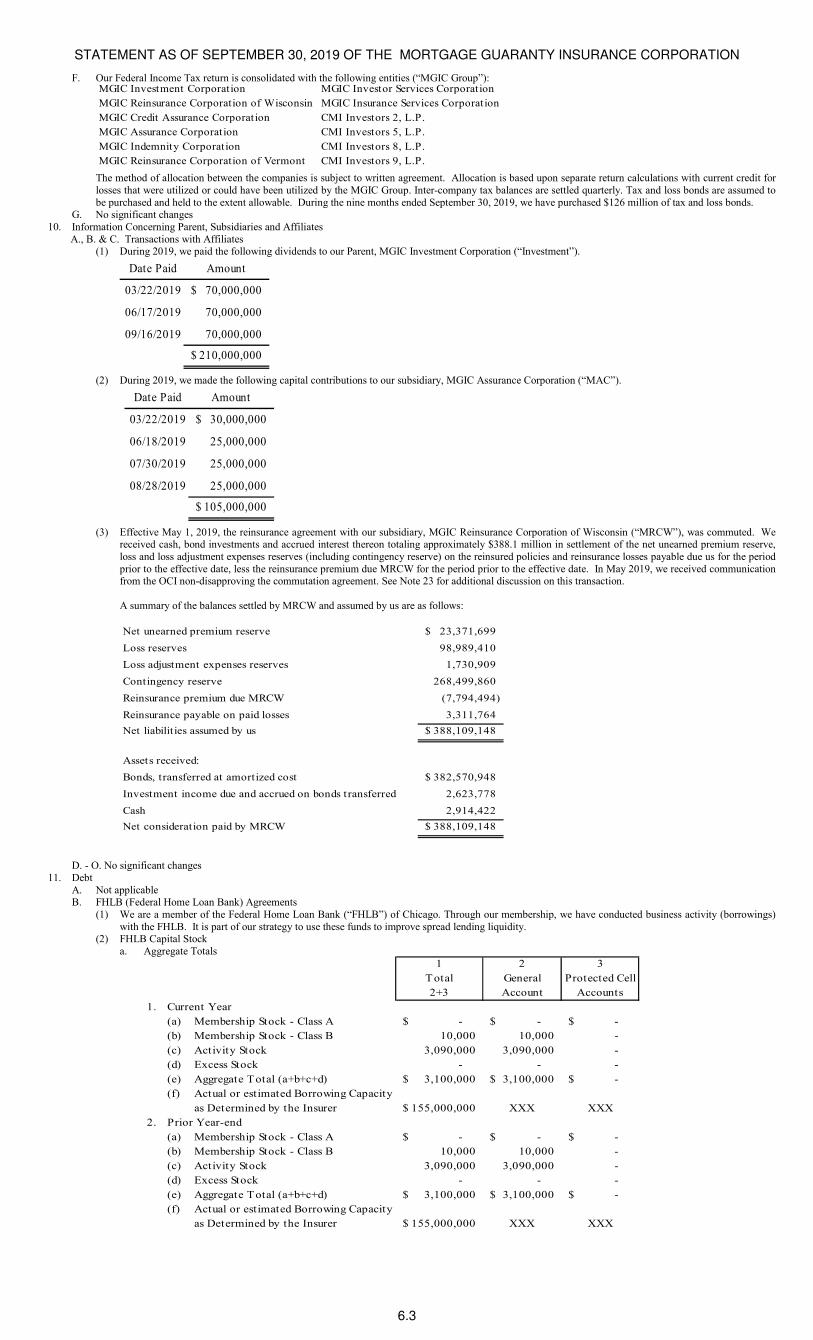
The method of allocation between the companies is subject to written agreement. Allocation is based upon separate return calculations with current credit for losses that were utilized or could have been utilized by the MGIC Group. Inter-company tax balances are settled quarterly. Tax and loss bonds are assumed to be purchased and held to the extent allowable. During the nine months ended September 30, 2019, we have purchased $126 million of tax and loss bonds.
G. No significant changes 10. Information Concerning Parent, Subsidiaries and Affiliates
A., B. & C. Transactions with Affiliates (1) During 2019, we paid the following dividends to our Parent, MGIC Investment Corporation (“Investment”).
Date Paid Amount
03/22/2019 70,000,000$
06/17/2019 70,000,000
09/16/2019 70,000,000
210,000,000$
(2) During 2019, we made the following capital contributions to our subsidiary, MGIC Assurance Corporation (“MAC”).
Date Paid Amount
03/22/2019 30,000,000$
06/18/2019 25,000,000
07/30/2019 25,000,000
08/28/2019 25,000,000
105,000,000$
(3) Effective May 1, 2019, the reinsurance agreement with our subsidiary, MGIC Reinsurance Corporation of Wisconsin (“MRCW”), was commuted. We
received cash, bond investments and accrued interest thereon totaling approximately $388.1 million in settlement of the net unearned premium reserve, loss and loss adjustment expenses reserves (including contingency reserve) on the reinsured policies and reinsurance losses payable due us for the period prior to the effective date, less the reinsurance premium due MRCW for the period prior to the effective date. In May 2019, we received communication from the OCI non-disapproving the commutation agreement. See Note 23 for additional discussion on this transaction. A summary of the balances settled by MRCW and assumed by us are as follows:
Net unearned premium reserve 23,371,699$
Loss reserves 98,989,410
Loss adjustment expenses reserves 1,730,909
Contingency reserve 268,499,860
Reinsurance premium due MRCW (7,794,494)
Reinsurance payable on paid losses 3,311,764
Net liabilities assumed by us 388,109,148$
Assets received:
Bonds, transferred at amortized cost 382,570,948$
Investment income due and accrued on bonds transferred 2,623,778
Cash 2,914,422
Net consideration paid by MRCW 388,109,148$
D. - O. No significant changes
11. Debt A. Not applicable B. FHLB (Federal Home Loan Bank) Agreements
(1) We are a member of the Federal Home Loan Bank (“FHLB”) of Chicago. Through our membership, we have conducted business activity (borrowings) with the FHLB. It is part of our strategy to use these funds to improve spread lending liquidity.
(2) FHLB Capital Stock a. Aggregate Totals
1 2 3
Total General Protected Cell
2+3 Account Accounts
1. Current Year
(a) Membership Stock - Class A -$ -$ -$
(b) Membership Stock - Class B 10,000 10,000 -
(c) Activity Stock 3,090,000 3,090,000 -
(d) Excess Stock - - -
(e) Aggregate Total (a+b+c+d) 3,100,000$ 3,100,000$ -$
(f) Actual or estimated Borrowing Capacity
as Determined by the Insurer 155,000,000$ XXX XXX
2. Prior Year-end
(a) Membership Stock - Class A -$ -$ -$
(b) Membership Stock - Class B 10,000 10,000 -
(c) Activity Stock 3,090,000 3,090,000 -
(d) Excess Stock - - -
(e) Aggregate Total (a+b+c+d) 3,100,000$ 3,100,000$ -$
(f) Actual or estimated Borrowing Capacity
as Determined by the Insurer 155,000,000$ XXX XXX
STATEMENT AS OF SEPTEMBER 30, 2019 OF THE MORTGAGE GUARANTY INSURANCE CORPORATION
6.4
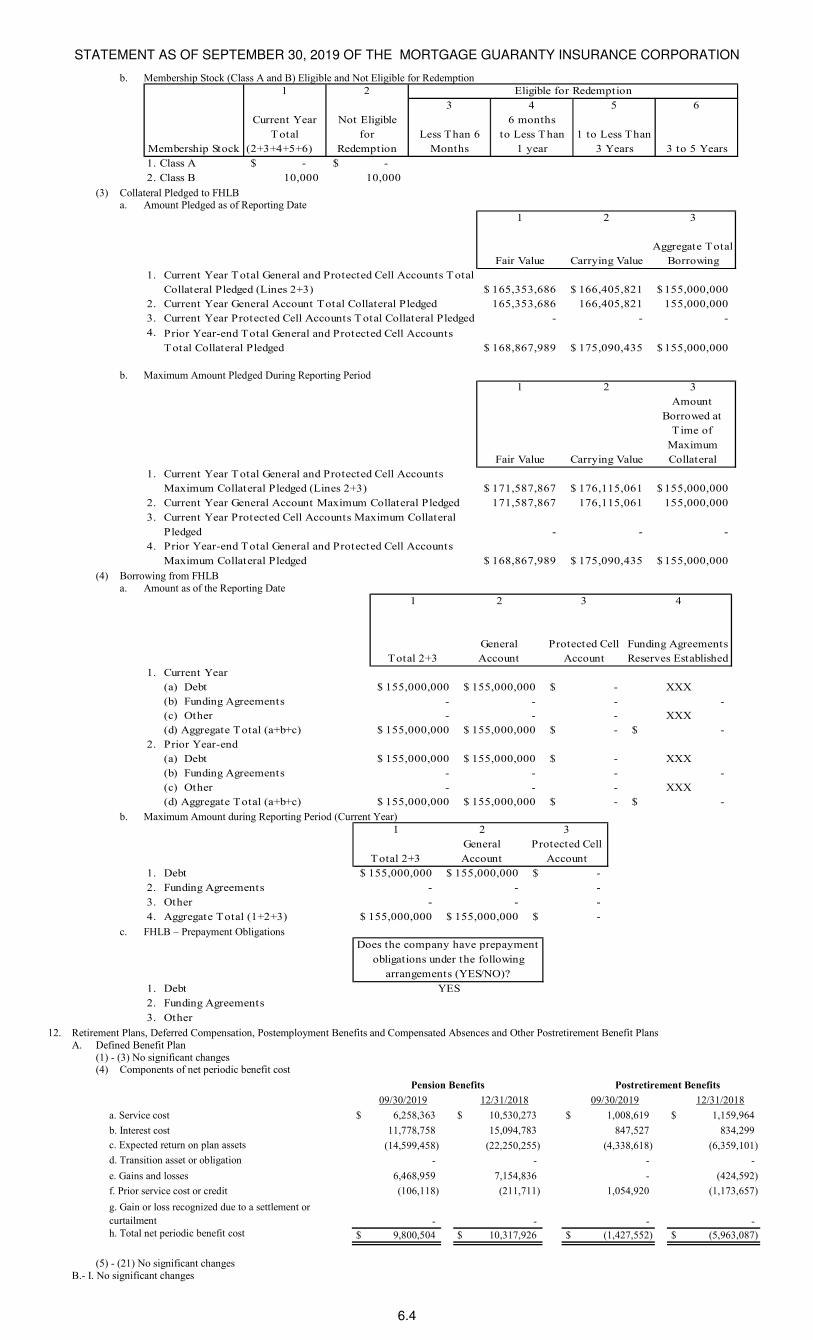
b. Membership Stock (Class A and B) Eligible and Not Eligible for Redemption
1 2
3 4 5 6
Current Year Not Eligible 6 months
Total for Less Than 6 to Less Than 1 to Less Than
Membership Stock (2+3+4+5+6) Redemption Months 1 year 3 Years 3 to 5 Years
1. Class A -$ -$
2. Class B 10,000 10,000
Eligible for Redemption
(3) Collateral Pledged to FHLB
a. Amount Pledged as of Reporting Date
1 2 3
Fair Value Carrying Value
Aggregate Total
Borrowing
1. Current Year Total General and Protected Cell Accounts Total
Collateral Pledged (Lines 2+3) 165,353,686$ 166,405,821$ 155,000,000$
2. Current Year General Account Total Collateral Pledged 165,353,686 166,405,821 155,000,000
3. Current Year Protected Cell Accounts Total Collateral Pledged - - -
4. Prior Year-end Total General and Protected Cell Accounts
Total Collateral Pledged 168,867,989$ 175,090,435$ 155,000,000$
b. Maximum Amount Pledged During Reporting Period 1 2 3
Fair Value Carrying Value
Amount
Borrowed at
T ime of
Maximum
Collateral
1. Current Year Total General and Protected Cell Accounts
Maximum Collateral Pledged (Lines 2+3) 171,587,867$ 176,115,061$ 155,000,000$
2. Current Year General Account Maximum Collateral Pledged 171,587,867 176,115,061 155,000,000
3. Current Year Protected Cell Accounts Maximum Collateral
Pledged - - -
4. Prior Year-end Total General and Protected Cell Accounts
Maximum Collateral Pledged 168,867,989$ 175,090,435$ 155,000,000$
(4) Borrowing from FHLB a. Amount as of the Reporting Date
1 2 3 4
Total 2+3
General
Account
Protected Cell
Account
Funding Agreements
Reserves Established
1. Current Year
(a) Debt 155,000,000$ 155,000,000$ -$ XXX
(b) Funding Agreements - - - -
(c) Other - - - XXX
(d) Aggregate Total (a+b+c) 155,000,000$ 155,000,000$ -$ -$
2. Prior Year-end
(a) Debt 155,000,000$ 155,000,000$ -$ XXX
(b) Funding Agreements - - - -
(c) Other - - - XXX
(d) Aggregate Total (a+b+c) 155,000,000$ 155,000,000$ -$ -$
b. Maximum Amount during Reporting Period (Current Year)
1 2 3
Total 2+3
General
Account
Protected Cell
Account
1. Debt 155,000,000$ 155,000,000$ -$
2. Funding Agreements - - -
3. Other - - -
4. Aggregate Total (1+2+3) 155,000,000$ 155,000,000$ -$
c. FHLB – Prepayment Obligations
Does the company have prepayment
obligations under the following
arrangements (YES/NO)?
1. Debt YES
2. Funding Agreements
3. Other
12. Retirement Plans, Deferred Compensation, Postemployment Benefits and Compensated Absences and Other Postretirement Benefit Plans A. Defined Benefit Plan
(1) - (3) No significant changes (4) Components of net periodic benefit cost
09/30/2019 12/31/2018 09/30/2019 12/31/2018
a. Service cost $ 6,258,363 $ 10,530,273 $ 1,008,619 $ 1,159,964
b. Interest cost 11,778,758 15,094,783 847,527 834,299
c. Expected return on plan assets (14,599,458) (22,250,255) (4,338,618) (6,359,101)
d. Transition asset or obligation - - - -
e. Gains and losses 6,468,959 7,154,836 - (424,592)
f. Prior service cost or credit (106,118) (211,711) 1,054,920 (1,173,657)
g. Gain or loss recognized due to a settlement or
curtailment - - - - h. Total net periodic benefit cost $ 9,800,504 $ 10,317,926 $ (1,427,552) $ (5,963,087)
Postretirement BenefitsPension Benefits
(5) - (21) No significant changes
B.- I. No significant changes
STATEMENT AS OF SEPTEMBER 30, 2019 OF THE MORTGAGE GUARANTY INSURANCE CORPORATION
6.5
13. Capital and Surplus, Dividend Restrictions and Quasi-Reorganizations (1) - (3) No significant changes (4) On each of March 22, June 17 and September 16, 2019 we paid a dividend of $70 million to Investment. (5) No significant changes (6) Substantially all of our insurance written since 2008 has been for loans purchased by Fannie Mae and Freddie Mac (“the GSEs”). The current private
mortgage insurer eligibility requirements ("PMIERs") of the GSEs include financial requirements, as well as business, quality control and certain transactional approval requirements. The financial requirements of the PMIERs require a mortgage insurer’s "Available Assets" (generally only the most liquid assets of an insurer) to equal or exceed its "Minimum Required Assets" (which are based on an insurer's book of insurance in force, calculated from tables of factors with several risk dimensions and subject to a floor amount). Based on our application of the more restrictive PMIERs, as of September 30, 2019, our Available Assets are in excess of our Minimum Required Assets; and we are in compliance with the financial requirements of the PMIERs and eligible to insure loans purchased by the GSEs. The insurance laws of 16 jurisdictions, including Wisconsin, our domiciliary state, require a mortgage insurer to maintain a minimum amount of statutory capital relative to the risk in force (or a similar measure) in order for the mortgage insurer to continue to write new business. We refer to these requirements as the “State Capital Requirements.” While they vary among jurisdictions, the most common State Capital Requirements allow for a maximum risk-to-capital ratio of 25 to 1. A risk-to-capital ratio will increase if (i) the percentage decrease in capital exceeds the percentage decrease in insured risk, or (ii) the percentage increase in capital is less than the percentage increase in insured risk. Wisconsin does not regulate capital by using a risk-to-capital measure but instead requires a minimum policyholder position (“MPP”). The “policyholder position” of a mortgage insurer is its net worth or surplus, contingency reserve and a portion of the reserves for unearned premiums. At September 30, 2019, our risk-to-capital ratio was 9.9 to 1, below the maximum allowed by the jurisdictions with State Capital Requirements, and our policyholder position was $2.9 billion above the required MPP of $1.6 billion. The calculation of our risk-to-capital ratio and MPP reflect credit for the risk ceded under our quota share reinsurance transactions (“QSR Transactions”) and excess-of-loss reinsurance transactions with a group of unaffiliated reinsurers. It is possible that under the revised State Capital Requirements discussed below, we will not be allowed full credit for the risk ceded to the reinsurers. If we are not allowed an agreed level of credit under either the State Capital Requirements or the financial requirements of the PMIERs, we may terminate the reinsurance transactions, without penalty. At this time, we expect to continue to comply with the current State Capital Requirements. The NAIC has previously announced plans to revise the minimum capital and surplus requirements for mortgage insurers that are provided for in its Mortgage Guaranty Insurance Model Act. In May 2016, a working group of state regulators released an exposure draft of a risk-based capital framework to establish capital requirements for mortgage insurers, although no date has been established by which the NAIC must propose revisions to the capital requirements and certain items have not yet been completely addressed by the framework, including the treatment of ceded risk, minimum capital floors, and action level triggers. Currently, we believe that the PMIERs contain more restrictive capital requirements than the draft Mortgage Guaranty Insurance Model Act in most circumstances.
While we currently meet the State Capital Requirements of Wisconsin and all other jurisdictions, we could be prevented from writing new business in the future in all jurisdictions if we fail to meet the State Capital Requirements of Wisconsin, or we could be prevented from writing new business in a particular jurisdiction if we fail to meet the State Capital Requirements of that jurisdiction, and in each case we do not obtain a waiver of such requirements. It is possible that regulatory action by one or more jurisdictions, including those that do not have specific State Capital Requirements, may prevent us from continuing to write new insurance in such jurisdictions. If we are unable to write business in a particular jurisdiction, lenders may be unwilling to procure insurance from us anywhere. In addition, a lender’s assessment of the future ability of our insurance operations to meet the State Capital Requirements or the PMIERs may affect its willingness to procure insurance from us. A possible future failure by us to meet the State Capital Requirements or the PMIERs will not necessarily mean that we lack sufficient resources to pay claims on our insurance liabilities. We believe we have sufficient claims paying resources to meet our claim obligations on our insurance in force on a timely basis.
(7) - (13) No significant changes 14. Liabilities, Contingencies and Assessments
A. - F. No significant changes G. All Other Contingencies
Before paying an insurance claim, we review the loan and servicing files to determine the appropriateness of the claim amount. When reviewing the files, we may determine that we have the right to rescind coverage on the loan. We refer to insurance rescissions and denials of claims collectively as “rescissions” and variations of that term. In addition, our insurance policies generally provide that we can reduce or deny a claim if the servicer did not comply with its obligations under our insurance policy. We call such reduction of claims “curtailments.” In recent quarters, an immaterial percentage of claims received in a quarter have been resolved by rescissions. In 2018 and the first nine months of 2019, curtailments reduced our average claim paid by approximately 5.8% and 4.7%, respectively. Our loss reserving methodology incorporates our estimates of future rescissions, curtailments, and reversals of rescissions and curtailments. A variance between ultimate actual rescission, curtailment and reversal rates and our estimates, as a result of the outcome of litigation, settlements or other factors, could materially affect our losses. When the insured disputes our right to rescind coverage or curtail claims, we generally engage in discussions in an attempt to settle the dispute. If we are unable to reach a settlement, the outcome of a dispute ultimately may be determined by legal proceedings. Under SSAP 5R, until a loss associated with settlement discussions or legal proceedings becomes probable and can be reasonably estimated, we consider our claim payment or rescission resolved for financial reporting purposes and do not accrue an estimated loss. Where we have determined that a loss is probable and can be reasonably estimated, we have recorded our best estimate of our probable loss, including recording a probable loss of $23.5 million in the first quarter of 2019. Until settlement negotiations or legal proceedings for which we have recorded a probable loss are concluded (including the receipt of any necessary GSE approvals), it is reasonably possible that we will record an additional loss. In addition to matters for which we have recorded a probable loss, we are involved in other discussions and/or proceedings with insureds with respect to our claims paying practices. Although it is reasonably possible that when all of these matters are resolved we will not prevail in all cases, we are unable to make a reasonable estimate or range of estimates of the potential liability. We estimate the maximum exposure associated with matters where a loss is reasonably possible to be approximately $264.0 million more than the amount of probable loss we have recorded. This estimate of maximum exposure is based upon currently available information; is subject to significant judgment, numerous assumptions and known and unknown uncertainties; will include an amount for matters for which we have recorded a probable loss until such matters are concluded; will include different matters from time to time; and does not include interest or consequential or exemplary damages. In the third quarter of 2019, we entered into an agreement to settle a claims paying practices dispute for which we previously had recognized a probable loss. There was no additional loss recognized as a result of entering into the agreement, as the settlement amount was consistent with our original estimate of the probable loss. The agreement remains subject to GSE approval. Mortgage insurers, us included, have in the past been involved in litigation and regulatory actions related to alleged violations of the anti-referral fee provisions of the Real Estate Settlement Procedures Act (“RESPA”), and the notice provisions of the Fair Credit Reporting Act (“FCRA”). While these proceedings in the aggregate did not result in material liability for us, there can be no assurance that the outcome of future proceedings, if any, under these laws would not have a material adverse effect on us. In addition to the matters described above, we are involved in other legal proceedings in the ordinary course of business. In our opinion, based on the facts known at this time, the ultimate resolution of these ordinary course legal proceedings will not have a material adverse effect on our financial position or results of operations.
15. Leases – no significant changes 16. Information About Financial Instruments with Off-Balance Sheet Risk and Financial Instruments with Concentrations of Credit Risk – not applicable 17. Sale, Transfer and Servicing of Financial Assets and Extinguishments of Liabilities – not applicable 18. Gain or Loss to the Reporting Entity from Uninsured Plans and the Uninsured Portion of Partially Insured Plans – not applicable 19. Direct Premium Written/Produced by Managing General Agents/Third Party Administrators – not applicable
STATEMENT AS OF SEPTEMBER 30, 2019 OF THE MORTGAGE GUARANTY INSURANCE CORPORATION
6.6
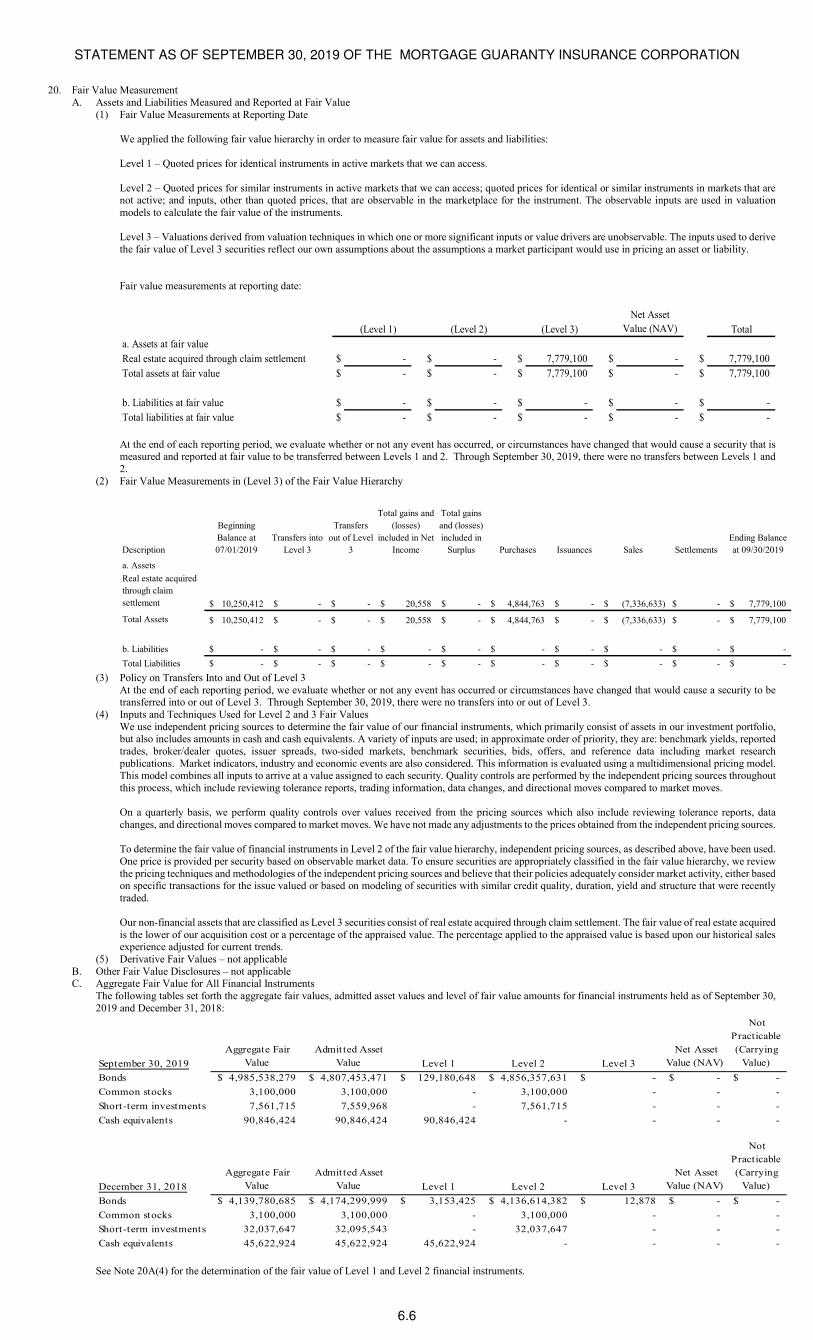
20. Fair Value Measurement
A. Assets and Liabilities Measured and Reported at Fair Value (1) Fair Value Measurements at Reporting Date
We applied the following fair value hierarchy in order to measure fair value for assets and liabilities:
Level 1 – Quoted prices for identical instruments in active markets that we can access.
Level 2 – Quoted prices for similar instruments in active markets that we can access; quoted prices for identical or similar instruments in markets that are not active; and inputs, other than quoted prices, that are observable in the marketplace for the instrument. The observable inputs are used in valuation models to calculate the fair value of the instruments.
Level 3 – Valuations derived from valuation techniques in which one or more significant inputs or value drivers are unobservable. The inputs used to derive the fair value of Level 3 securities reflect our own assumptions about the assumptions a market participant would use in pricing an asset or liability.
Fair value measurements at reporting date:
(Level 1) (Level 2) (Level 3)
Net Asset
Value (NAV) Total
a. Assets at fair value
Real estate acquired through claim settlement $ - $ - $ 7,779,100 $ - $ 7,779,100
Total assets at fair value $ - $ - $ 7,779,100 $ - $ 7,779,100
b. Liabilities at fair value $ - $ - $ - $ - $ -
Total liabilities at fair value $ - $ - $ - $ - $ -
At the end of each reporting period, we evaluate whether or not any event has occurred, or circumstances have changed that would cause a security that is measured and reported at fair value to be transferred between Levels 1 and 2. Through September 30, 2019, there were no transfers between Levels 1 and 2.
(2) Fair Value Measurements in (Level 3) of the Fair Value Hierarchy
Description
Beginning
Balance at
07/01/2019
Transfers into
Level 3
Transfers
out of Level
3
Total gains and
(losses)
included in Net
Income
Total gains
and (losses)
included in
Surplus Purchases Issuances Sales Settlements
Ending Balance
at 09/30/2019
a. Assets
Real estate acquired
through claim
settlement 10,250,412$ -$ -$ 20,558$ -$ 4,844,763$ -$ (7,336,633)$ -$ 7,779,100$
Total Assets 10,250,412$ -$ -$ 20,558$ -$ 4,844,763$ -$ (7,336,633)$ -$ 7,779,100$
b. Liabilities -$ -$ -$ -$ -$ -$ -$ -$ -$ -$
Total Liabilities -$ -$ -$ -$ -$ -$ -$ -$ -$ -$ (3) Policy on Transfers Into and Out of Level 3
At the end of each reporting period, we evaluate whether or not any event has occurred or circumstances have changed that would cause a security to be transferred into or out of Level 3. Through September 30, 2019, there were no transfers into or out of Level 3.
(4) Inputs and Techniques Used for Level 2 and 3 Fair Values We use independent pricing sources to determine the fair value of our financial instruments, which primarily consist of assets in our investment portfolio, but also includes amounts in cash and cash equivalents. A variety of inputs are used; in approximate order of priority, they are: benchmark yields, reported trades, broker/dealer quotes, issuer spreads, two-sided markets, benchmark securities, bids, offers, and reference data including market research publications. Market indicators, industry and economic events are also considered. This information is evaluated using a multidimensional pricing model. This model combines all inputs to arrive at a value assigned to each security. Quality controls are performed by the independent pricing sources throughout this process, which include reviewing tolerance reports, trading information, data changes, and directional moves compared to market moves. On a quarterly basis, we perform quality controls over values received from the pricing sources which also include reviewing tolerance reports, data changes, and directional moves compared to market moves. We have not made any adjustments to the prices obtained from the independent pricing sources. To determine the fair value of financial instruments in Level 2 of the fair value hierarchy, independent pricing sources, as described above, have been used. One price is provided per security based on observable market data. To ensure securities are appropriately classified in the fair value hierarchy, we review the pricing techniques and methodologies of the independent pricing sources and believe that their policies adequately consider market activity, either based on specific transactions for the issue valued or based on modeling of securities with similar credit quality, duration, yield and structure that were recently traded. Our non-financial assets that are classified as Level 3 securities consist of real estate acquired through claim settlement. The fair value of real estate acquired is the lower of our acquisition cost or a percentage of the appraised value. The percentage applied to the appraised value is based upon our historical sales experience adjusted for current trends.
(5) Derivative Fair Values – not applicable B. Other Fair Value Disclosures – not applicable C. Aggregate Fair Value for All Financial Instruments
The following tables set forth the aggregate fair values, admitted asset values and level of fair value amounts for financial instruments held as of September 30, 2019 and December 31, 2018:
September 30, 2019
Aggregate Fair
Value
Admitted Asset
Value Level 1 Level 2 Level 3
Net Asset
Value (NAV)
Not
Practicable
(Carrying
Value)
Bonds 4,985,538,279$ 4,807,453,471$ 129,180,648$ 4,856,357,631$ -$ -$ -$
Common stocks 3,100,000 3,100,000 - 3,100,000 - - -
Short-term investments 7,561,715 7,559,968 - 7,561,715 - - -
Cash equivalents 90,846,424 90,846,424 90,846,424 - - - -
December 31, 2018
Aggregate Fair
Value
Admitted Asset
Value Level 1 Level 2 Level 3
Net Asset
Value (NAV)
Not
Practicable
(Carrying
Value)
Bonds 4,139,780,685$ 4,174,299,999$ 3,153,425$ 4,136,614,382$ 12,878$ -$ -$
Common stocks 3,100,000 3,100,000 - 3,100,000 - - -
Short-term investments 32,037,647 32,095,543 - 32,037,647 - - -
Cash equivalents 45,622,924 45,622,924 45,622,924 - - - -
See Note 20A(4) for the determination of the fair value of Level 1 and Level 2 financial instruments.
STATEMENT AS OF SEPTEMBER 30, 2019 OF THE MORTGAGE GUARANTY INSURANCE CORPORATION
6.7
D. Not Practicable to Estimate Fair Value – not applicable E. Not applicable
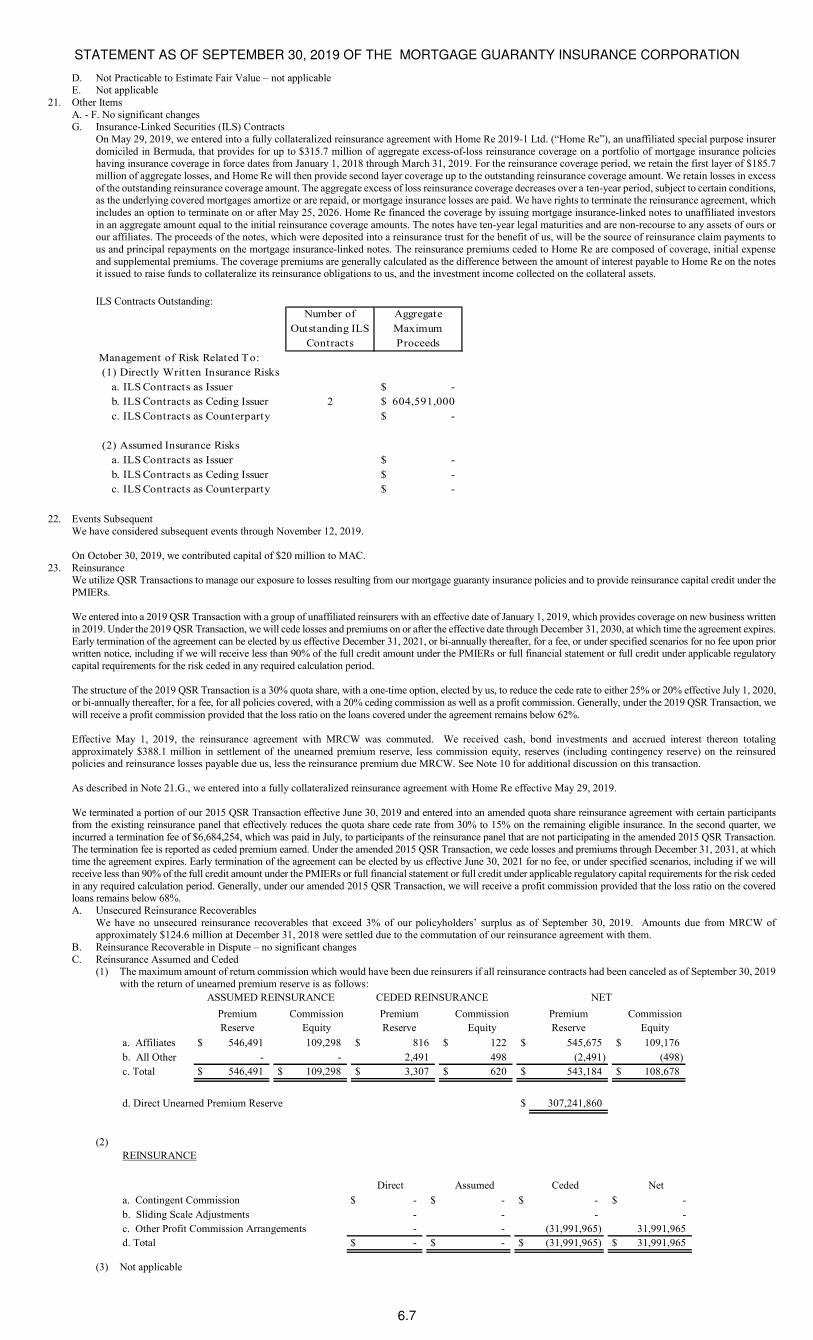
21. Other Items A. - F. No significant changes G. Insurance-Linked Securities (ILS) Contracts
On May 29, 2019, we entered into a fully collateralized reinsurance agreement with Home Re 2019-1 Ltd. (“Home Re”), an unaffiliated special purpose insurer domiciled in Bermuda, that provides for up to $315.7 million of aggregate excess-of-loss reinsurance coverage on a portfolio of mortgage insurance policies having insurance coverage in force dates from January 1, 2018 through March 31, 2019. For the reinsurance coverage period, we retain the first layer of $185.7 million of aggregate losses, and Home Re will then provide second layer coverage up to the outstanding reinsurance coverage amount. We retain losses in excess of the outstanding reinsurance coverage amount. The aggregate excess of loss reinsurance coverage decreases over a ten-year period, subject to certain conditions, as the underlying covered mortgages amortize or are repaid, or mortgage insurance losses are paid. We have rights to terminate the reinsurance agreement, which includes an option to terminate on or after May 25, 2026. Home Re financed the coverage by issuing mortgage insurance-linked notes to unaffiliated investors in an aggregate amount equal to the initial reinsurance coverage amounts. The notes have ten-year legal maturities and are non-recourse to any assets of ours or our affiliates. The proceeds of the notes, which were deposited into a reinsurance trust for the benefit of us, will be the source of reinsurance claim payments to us and principal repayments on the mortgage insurance-linked notes. The reinsurance premiums ceded to Home Re are composed of coverage, initial expense and supplemental premiums. The coverage premiums are generally calculated as the difference between the amount of interest payable to Home Re on the notes it issued to raise funds to collateralize its reinsurance obligations to us, and the investment income collected on the collateral assets.
ILS Contracts Outstanding:
Number of
Outstanding ILS
Contracts
Aggregate
Maximum
Proceeds
Management of Risk Related To:
(1) Directly Writ ten Insurance Risks
a. ILS Contracts as Issuer -$
b. ILS Contracts as Ceding Issuer 2 604,591,000$
c. ILS Contracts as Counterparty -$
(2) Assumed Insurance Risks
a. ILS Contracts as Issuer -$
b. ILS Contracts as Ceding Issuer -$
c. ILS Contracts as Counterparty -$
22. Events Subsequent
We have considered subsequent events through November 12, 2019. On October 30, 2019, we contributed capital of $20 million to MAC.
23. Reinsurance We utilize QSR Transactions to manage our exposure to losses resulting from our mortgage guaranty insurance policies and to provide reinsurance capital credit under the PMIERs. We entered into a 2019 QSR Transaction with a group of unaffiliated reinsurers with an effective date of January 1, 2019, which provides coverage on new business written in 2019. Under the 2019 QSR Transaction, we will cede losses and premiums on or after the effective date through December 31, 2030, at which time the agreement expires. Early termination of the agreement can be elected by us effective December 31, 2021, or bi-annually thereafter, for a fee, or under specified scenarios for no fee upon prior written notice, including if we will receive less than 90% of the full credit amount under the PMIERs or full financial statement or full credit under applicable regulatory capital requirements for the risk ceded in any required calculation period. The structure of the 2019 QSR Transaction is a 30% quota share, with a one-time option, elected by us, to reduce the cede rate to either 25% or 20% effective July 1, 2020, or bi-annually thereafter, for a fee, for all policies covered, with a 20% ceding commission as well as a profit commission. Generally, under the 2019 QSR Transaction, we will receive a profit commission provided that the loss ratio on the loans covered under the agreement remains below 62%. Effective May 1, 2019, the reinsurance agreement with MRCW was commuted. We received cash, bond investments and accrued interest thereon totaling approximately $388.1 million in settlement of the unearned premium reserve, less commission equity, reserves (including contingency reserve) on the reinsured policies and reinsurance losses payable due us, less the reinsurance premium due MRCW. See Note 10 for additional discussion on this transaction. As described in Note 21.G., we entered into a fully collateralized reinsurance agreement with Home Re effective May 29, 2019. We terminated a portion of our 2015 QSR Transaction effective June 30, 2019 and entered into an amended quota share reinsurance agreement with certain participants from the existing reinsurance panel that effectively reduces the quota share cede rate from 30% to 15% on the remaining eligible insurance. In the second quarter, we incurred a termination fee of $6,684,254, which was paid in July, to participants of the reinsurance panel that are not participating in the amended 2015 QSR Transaction. The termination fee is reported as ceded premium earned. Under the amended 2015 QSR Transaction, we cede losses and premiums through December 31, 2031, at which time the agreement expires. Early termination of the agreement can be elected by us effective June 30, 2021 for no fee, or under specified scenarios, including if we will receive less than 90% of the full credit amount under the PMIERs or full financial statement or full credit under applicable regulatory capital requirements for the risk ceded in any required calculation period. Generally, under our amended 2015 QSR Transaction, we will receive a profit commission provided that the loss ratio on the covered loans remains below 68%. A. Unsecured Reinsurance Recoverables
We have no unsecured reinsurance recoverables that exceed 3% of our policyholders’ surplus as of September 30, 2019. Amounts due from MRCW of approximately $124.6 million at December 31, 2018 were settled due to the commutation of our reinsurance agreement with them.
B. Reinsurance Recoverable in Dispute – no significant changes C. Reinsurance Assumed and Ceded
(1) The maximum amount of return commission which would have been due reinsurers if all reinsurance contracts had been canceled as of September 30, 2019 with the return of unearned premium reserve is as follows:
Premium
Reserve
Commission
Equity
Premium
Reserve
Commission
Equity
Premium
Reserve
Commission
Equity
a. Affiliates $ 546,491 109,298 $ 816 $ 122 $ 545,675 $ 109,176
b. All Other - - 2,491 498 (2,491) (498)
c. Total $ 546,491 $ 109,298 $ 3,307 $ 620 $ 543,184 $ 108,678
d. Direct Unearned Premium Reserve $ 307,241,860
ASSUMED REINSURANCE CEDED REINSURANCE NET
(2)
REINSURANCE
Direct Assumed Ceded Net
a. Contingent Commission $ - $ - $ - $ -
b. Sliding Scale Adjustments - - - -
c. Other Profit Commission Arrangements - - (31,991,965) 31,991,965
d. Total $ - $ - $ (31,991,965) $ 31,991,965
(3) Not applicable
STATEMENT AS OF SEPTEMBER 30, 2019 OF THE MORTGAGE GUARANTY INSURANCE CORPORATION
6.8
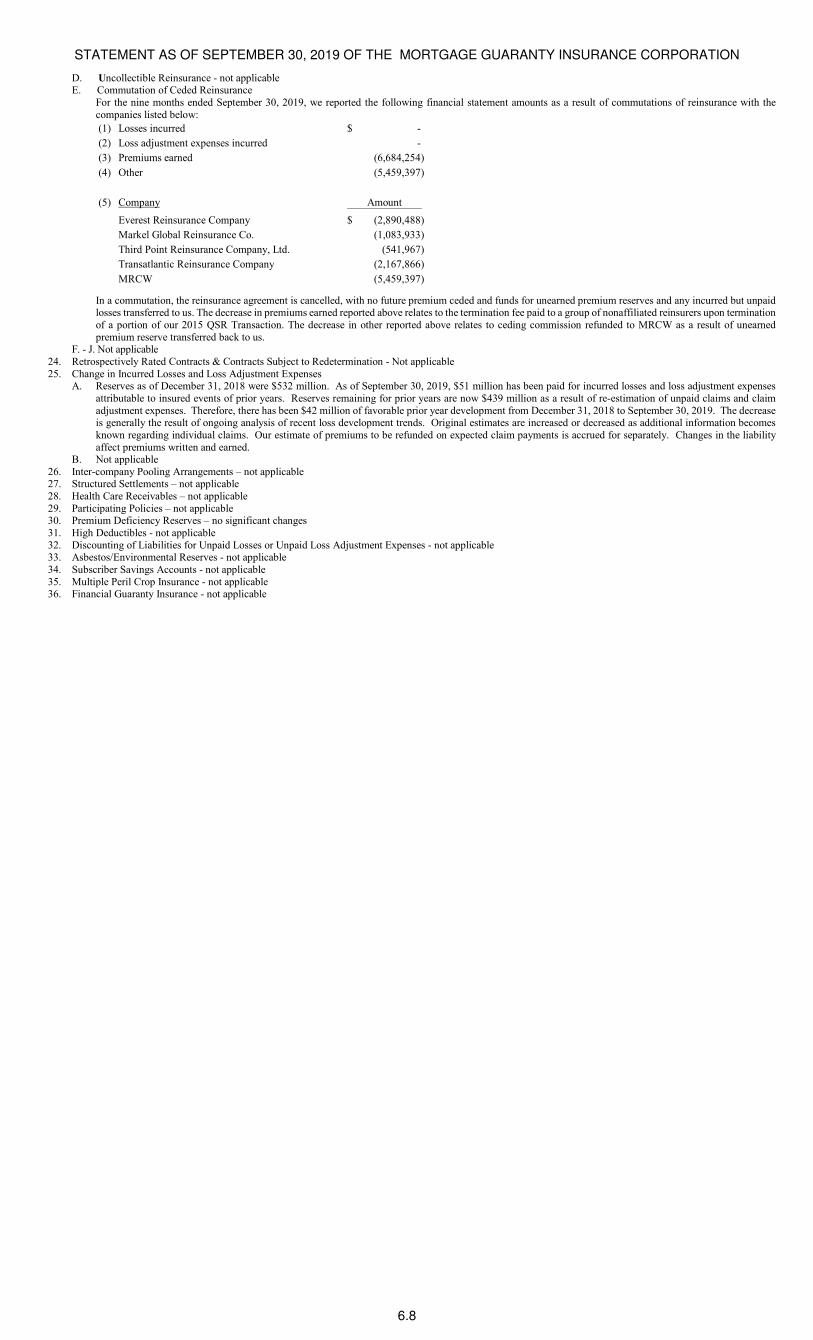
D. Uncollectible Reinsurance - not applicable E. Commutation of Ceded Reinsurance
For the nine months ended September 30, 2019, we reported the following financial statement amounts as a result of commutations of reinsurance with the companies listed below:
(1) Losses incurred -$
(2) Loss adjustment expenses incurred -
(3) Premiums earned (6,684,254)
(4) Other (5,459,397)
(5) Company Amount
Everest Reinsurance Company (2,890,488)$
Markel Global Reinsurance Co. (1,083,933)
Third Point Reinsurance Company, Ltd. (541,967)
Transatlantic Reinsurance Company (2,167,866)
MRCW (5,459,397)
In a commutation, the reinsurance agreement is cancelled, with no future premium ceded and funds for unearned premium reserves and any incurred but unpaid losses transferred to us. The decrease in premiums earned reported above relates to the termination fee paid to a group of nonaffiliated reinsurers upon termination of a portion of our 2015 QSR Transaction. The decrease in other reported above relates to ceding commission refunded to MRCW as a result of unearned premium reserve transferred back to us.
F. - J. Not applicable 24. Retrospectively Rated Contracts & Contracts Subject to Redetermination - Not applicable 25. Change in Incurred Losses and Loss Adjustment Expenses
A. Reserves as of December 31, 2018 were $532 million. As of September 30, 2019, $51 million has been paid for incurred losses and loss adjustment expenses attributable to insured events of prior years. Reserves remaining for prior years are now $439 million as a result of re-estimation of unpaid claims and claim adjustment expenses. Therefore, there has been $42 million of favorable prior year development from December 31, 2018 to September 30, 2019. The decrease is generally the result of ongoing analysis of recent loss development trends. Original estimates are increased or decreased as additional information becomes known regarding individual claims. Our estimate of premiums to be refunded on expected claim payments is accrued for separately. Changes in the liability affect premiums written and earned.
B. Not applicable 26. Inter-company Pooling Arrangements – not applicable 27. Structured Settlements – not applicable 28. Health Care Receivables – not applicable 29. Participating Policies – not applicable 30. Premium Deficiency Reserves – no significant changes 31. High Deductibles - not applicable 32. Discounting of Liabilities for Unpaid Losses or Unpaid Loss Adjustment Expenses - not applicable 33. Asbestos/Environmental Reserves - not applicable 34. Subscriber Savings Accounts - not applicable 35. Multiple Peril Crop Insurance - not applicable 36. Financial Guaranty Insurance - not applicable
STATEMENT AS OF SEPTEMBER 30, 2019 OF THE MORTGAGE GUARANTY INSURANCE CORPORATION
GENERAL INTERROGATORIES
PART 1 - COMMON INTERROGATORIES
GENERAL
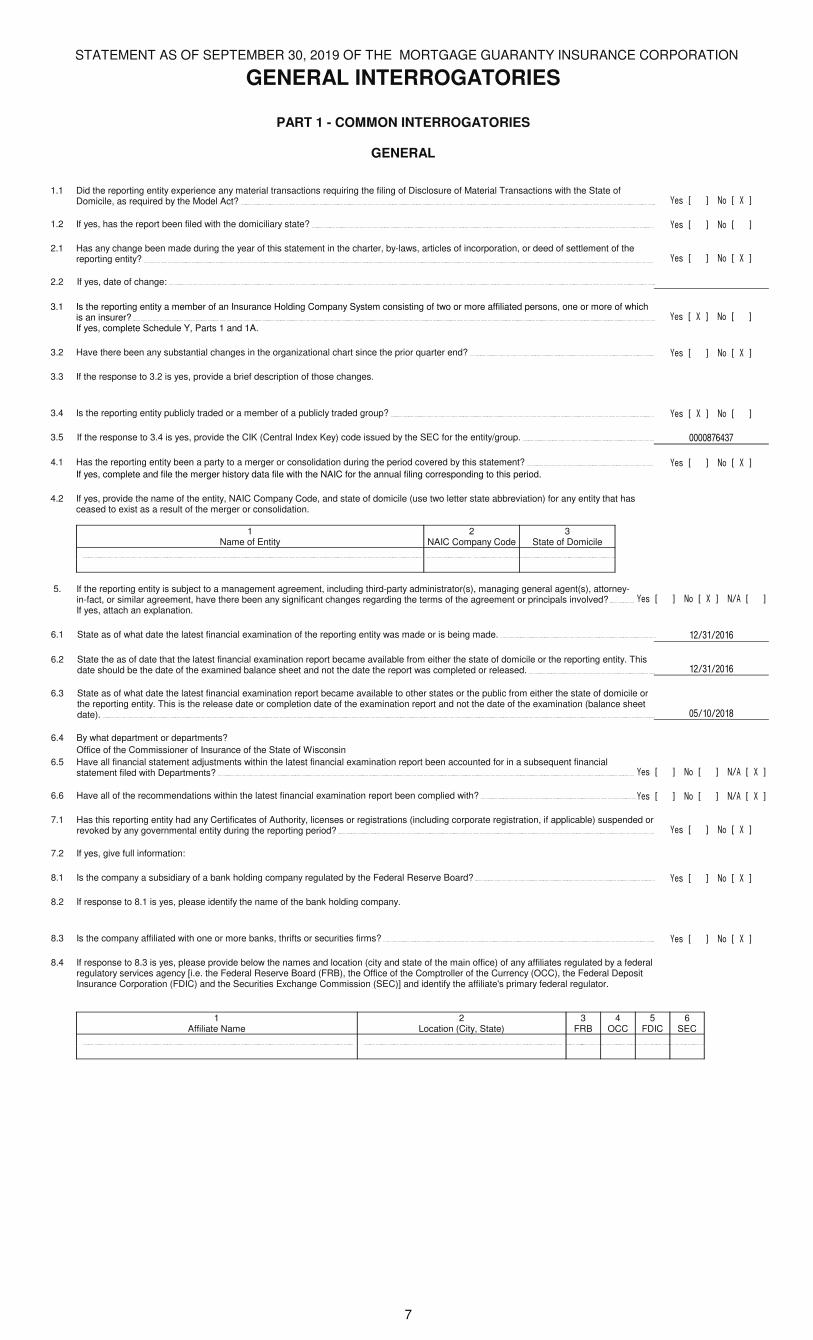
1.1 Did the reporting entity experience any material transactions requiring the filing of Disclosure of Material Transactions with the State of Domicile, as required by the Model Act? Yes [ ] No [ X ]
1.2 If yes, has the report been filed with the domiciliary state? Yes [ ] No [ ]
2.1 Has any change been made during the year of this statement in the charter, by-laws, articles of incorporation, or deed of settlement of the reporting entity? Yes [ ] No [ X ]
2.2 If yes, date of change:
3.1 Is the reporting entity a member of an Insurance Holding Company System consisting of two or more affiliated persons, one or more of which is an insurer? Yes [ X ] No [ ]
If yes, complete Schedule Y, Parts 1 and 1A.
3.2 Have there been any substantial changes in the organizational chart since the prior quarter end? Yes [ ] No [ X ]
3.3 If the response to 3.2 is yes, provide a brief description of those changes.
3.4 Is the reporting entity publicly traded or a member of a publicly traded group? Yes [ X ] No [ ]
3.5 If the response to 3.4 is yes, provide the CIK (Central Index Key) code issued by the SEC for the entity/group. 0000876437
4.1 Has the reporting entity been a party to a merger or consolidation during the period covered by this statement? Yes [ ] No [ X ]
If yes, complete and file the merger history data file with the NAIC for the annual filing corresponding to this period.
4.2 If yes, provide the name of the entity, NAIC Company Code, and state of domicile (use two letter state abbreviation) for any entity that has ceased to exist as a result of the merger or consolidation.
1Name of Entity
2NAIC Company Code
3State of Domicile
5. If the reporting entity is subject to a management agreement, including third-party administrator(s), managing general agent(s), attorney-in-fact, or similar agreement, have there been any significant changes regarding the terms of the agreement or principals involved? Yes [ ] No [ X ] N/A [ ]
If yes, attach an explanation.
6.1 State as of what date the latest financial examination of the reporting entity was made or is being made. 12/31/2016
6.2 State the as of date that the latest financial examination report became available from either the state of domicile or the reporting entity. This date should be the date of the examined balance sheet and not the date the report was completed or released. 12/31/2016
6.3 State as of what date the latest financial examination report became available to other states or the public from either the state of domicile or the reporting entity. This is the release date or completion date of the examination report and not the date of the examination (balance sheet date). 05/10/2018
6.4 By what department or departments?
Office of the Commissioner of Insurance of the State of Wisconsin
6.5 Have all financial statement adjustments within the latest financial examination report been accounted for in a subsequent financial statement filed with Departments? Yes [ ] No [ ] N/A [ X ]
6.6 Have all of the recommendations within the latest financial examination report been complied with? Yes [ ] No [ ] N/A [ X ]
7.1 Has this reporting entity had any Certificates of Authority, licenses or registrations (including corporate registration, if applicable) suspended or revoked by any governmental entity during the reporting period? Yes [ ] No [ X ]
7.2 If yes, give full information:
8.1 Is the company a subsidiary of a bank holding company regulated by the Federal Reserve Board? Yes [ ] No [ X ]
8.2 If response to 8.1 is yes, please identify the name of the bank holding company.
8.3 Is the company affiliated with one or more banks, thrifts or securities firms? Yes [ ] No [ X ]
8.4 If response to 8.3 is yes, please provide below the names and location (city and state of the main office) of any affiliates regulated by a federal regulatory services agency [i.e. the Federal Reserve Board (FRB), the Office of the Comptroller of the Currency (OCC), the Federal Deposit Insurance Corporation (FDIC) and the Securities Exchange Commission (SEC)] and identify the affiliate's primary federal regulator.
1Affiliate Name
2Location (City, State)
3FRB
4OCC
5FDIC
6SEC
7
STATEMENT AS OF SEPTEMBER 30, 2019 OF THE MORTGAGE GUARANTY INSURANCE CORPORATION
GENERAL INTERROGATORIES
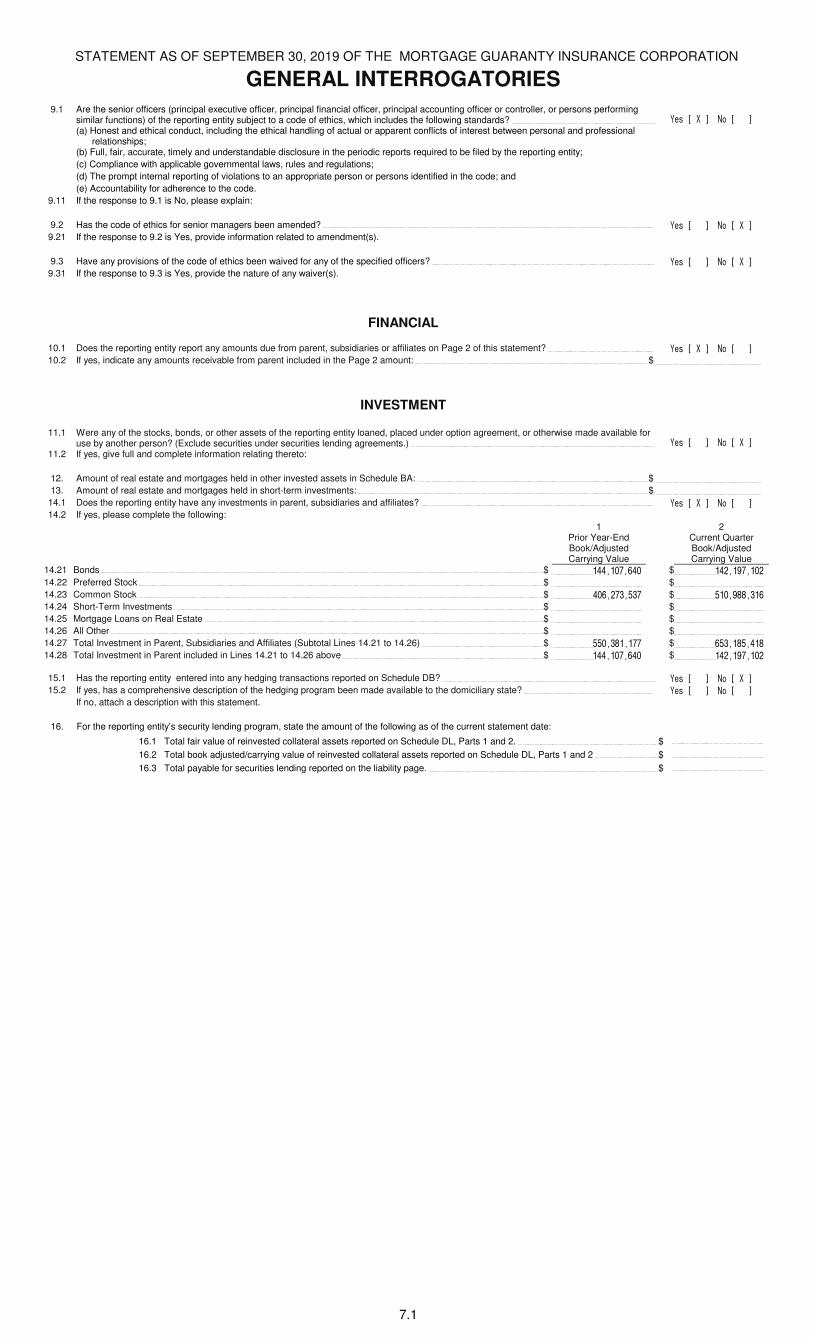
9.1 Are the senior officers (principal executive officer, principal financial officer, principal accounting officer or controller, or persons performing similar functions) of the reporting entity subject to a code of ethics, which includes the following standards? Yes [ X ] No [ ](a) Honest and ethical conduct, including the ethical handling of actual or apparent conflicts of interest between personal and professional
relationships;(b) Full, fair, accurate, timely and understandable disclosure in the periodic reports required to be filed by the reporting entity;
(c) Compliance with applicable governmental laws, rules and regulations;
(d) The prompt internal reporting of violations to an appropriate person or persons identified in the code; and
(e) Accountability for adherence to the code.
9.11 If the response to 9.1 is No, please explain:
9.2 Has the code of ethics for senior managers been amended? Yes [ ] No [ X ]9.21 If the response to 9.2 is Yes, provide information related to amendment(s).
9.3 Have any provisions of the code of ethics been waived for any of the specified officers? Yes [ ] No [ X ]9.31 If the response to 9.3 is Yes, provide the nature of any waiver(s).
FINANCIAL
10.1 Does the reporting entity report any amounts due from parent, subsidiaries or affiliates on Page 2 of this statement? Yes [ X ] No [ ]10.2 If yes, indicate any amounts receivable from parent included in the Page 2 amount: $
INVESTMENT
11.1 Were any of the stocks, bonds, or other assets of the reporting entity loaned, placed under option agreement, or otherwise made available for use by another person? (Exclude securities under securities lending agreements.) Yes [ ] No [ X ]
11.2 If yes, give full and complete information relating thereto:
12. Amount of real estate and mortgages held in other invested assets in Schedule BA: $ 13. Amount of real estate and mortgages held in short-term investments: $ 14.1 Does the reporting entity have any investments in parent, subsidiaries and affiliates? Yes [ X ] No [ ]14.2 If yes, please complete the following:
1Prior Year-End Book/Adjusted Carrying Value
2Current Quarter Book/Adjusted Carrying Value
14.21 Bonds $ 144,107,640 $ 142,197,102 14.22 Preferred Stock $ $ 14.23 Common Stock $ 406,273,537 $ 510,988,316 14.24 Short-Term Investments $ $ 14.25 Mortgage Loans on Real Estate $ $ 14.26 All Other $ $ 14.27 Total Investment in Parent, Subsidiaries and Affiliates (Subtotal Lines 14.21 to 14.26) $ 550,381,177 $ 653,185,418 14.28 Total Investment in Parent included in Lines 14.21 to 14.26 above $ 144,107,640 $ 142,197,102
15.1 Has the reporting entity entered into any hedging transactions reported on Schedule DB? Yes [ ] No [ X ]15.2 If yes, has a comprehensive description of the hedging program been made available to the domiciliary state? Yes [ ] No [ ]
If no, attach a description with this statement.
16. For the reporting entity’s security lending program, state the amount of the following as of the current statement date:
16.1 Total fair value of reinvested collateral assets reported on Schedule DL, Parts 1 and 2. $
16.2 Total book adjusted/carrying value of reinvested collateral assets reported on Schedule DL, Parts 1 and 2 $
16.3 Total payable for securities lending reported on the liability page. $
7.1
STATEMENT AS OF SEPTEMBER 30, 2019 OF THE MORTGAGE GUARANTY INSURANCE CORPORATION
GENERAL INTERROGATORIES
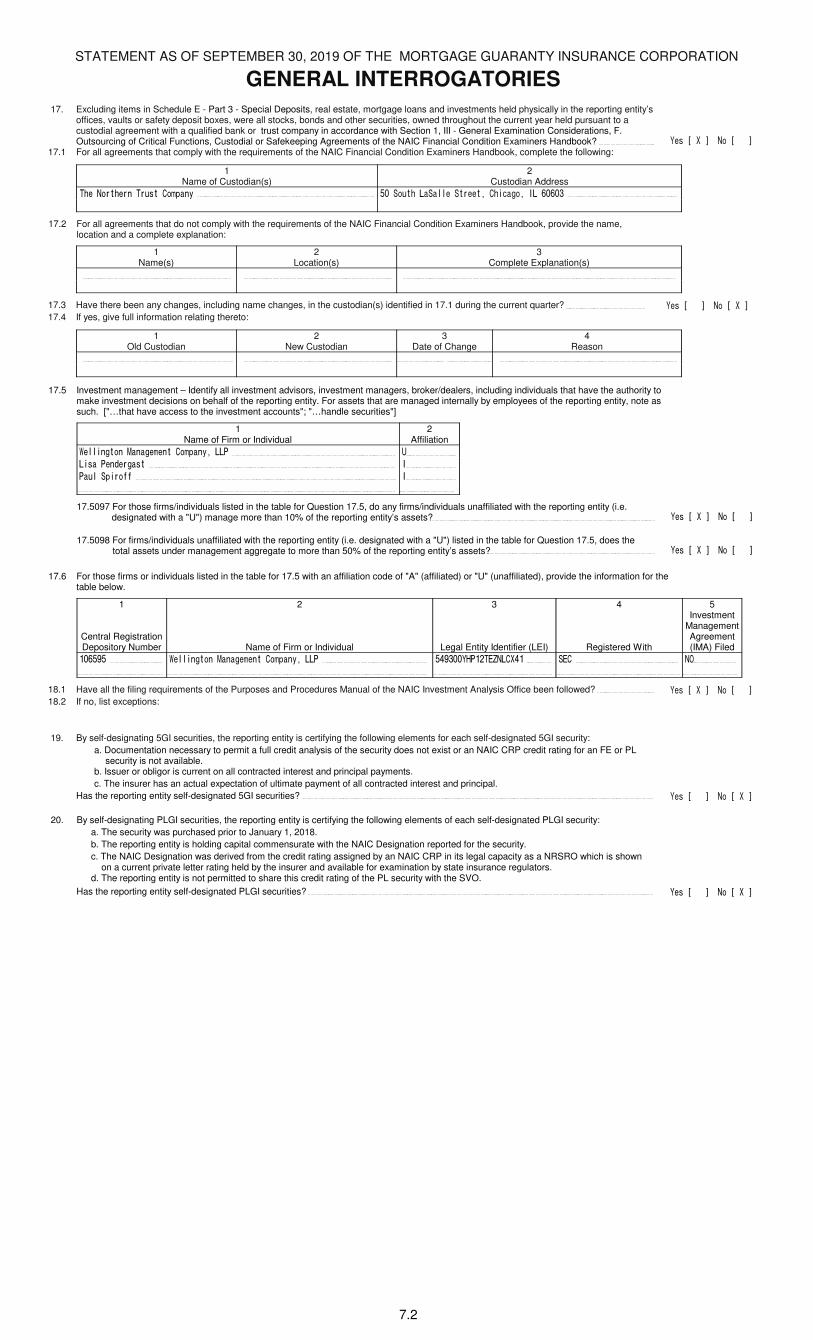
17. Excluding items in Schedule E - Part 3 - Special Deposits, real estate, mortgage loans and investments held physically in the reporting entity’s offices, vaults or safety deposit boxes, were all stocks, bonds and other securities, owned throughout the current year held pursuant to a custodial agreement with a qualified bank or trust company in accordance with Section 1, III - General Examination Considerations, F. Outsourcing of Critical Functions, Custodial or Safekeeping Agreements of the NAIC Financial Condition Examiners Handbook? Yes [ X ] No [ ]
17.1 For all agreements that comply with the requirements of the NAIC Financial Condition Examiners Handbook, complete the following:
1Name of Custodian(s)
2Custodian Address
The Northern Trust Company 50 South LaSalle Street, Chicago, IL 60603
17.2 For all agreements that do not comply with the requirements of the NAIC Financial Condition Examiners Handbook, provide the name, location and a complete explanation:
1Name(s)
2Location(s)
3Complete Explanation(s)
17.3 Have there been any changes, including name changes, in the custodian(s) identified in 17.1 during the current quarter? Yes [ ] No [ X ]17.4 If yes, give full information relating thereto:
1Old Custodian
2New Custodian
3Date of Change
4Reason
17.5 Investment management – Identify all investment advisors, investment managers, broker/dealers, including individuals that have the authority to make investment decisions on behalf of the reporting entity. For assets that are managed internally by employees of the reporting entity, note as such. ["…that have access to the investment accounts"; "…handle securities"]
1Name of Firm or Individual
2Affiliation
Wellington Management Company, LLP U
Lisa Pendergast I
Paul Spiroff I
17.5097 For those firms/individuals listed in the table for Question 17.5, do any firms/individuals unaffiliated with the reporting entity (i.e. designated with a "U") manage more than 10% of the reporting entity’s assets? Yes [ X ] No [ ]
17.5098 For firms/individuals unaffiliated with the reporting entity (i.e. designated with a "U") listed in the table for Question 17.5, does the total assets under management aggregate to more than 50% of the reporting entity’s assets? Yes [ X ] No [ ]
17.6 For those firms or individuals listed in the table for 17.5 with an affiliation code of "A" (affiliated) or "U" (unaffiliated), provide the information for the table below.
1
Central Registration Depository Number
2
Name of Firm or Individual
3
Legal Entity Identifier (LEI)
4
Registered With
5Investment
Management Agreement (IMA) Filed
106595 Wellington Management Company, LLP 549300YHP12TEZNLCX41 SEC NO
18.1 Have all the filing requirements of the Purposes and Procedures Manual of the NAIC Investment Analysis Office been followed? Yes [ X ] No [ ]18.2 If no, list exceptions:
19. By self-designating 5GI securities, the reporting entity is certifying the following elements for each self-designated 5GI security:
a. Documentation necessary to permit a full credit analysis of the security does not exist or an NAIC CRP credit rating for an FE or PL security is not available.
b. Issuer or obligor is current on all contracted interest and principal payments.
c. The insurer has an actual expectation of ultimate payment of all contracted interest and principal.
Has the reporting entity self-designated 5GI securities? Yes [ ] No [ X ]
20. By self-designating PLGI securities, the reporting entity is certifying the following elements of each self-designated PLGI security:
a. The security was purchased prior to January 1, 2018.
b. The reporting entity is holding capital commensurate with the NAIC Designation reported for the security.
c. The NAIC Designation was derived from the credit rating assigned by an NAIC CRP in its legal capacity as a NRSRO which is shown on a current private letter rating held by the insurer and available for examination by state insurance regulators.
d. The reporting entity is not permitted to share this credit rating of the PL security with the SVO.
Has the reporting entity self-designated PLGI securities? Yes [ ] No [ X ]
7.2
STATEMENT AS OF SEPTEMBER 30, 2019 OF THE MORTGAGE GUARANTY INSURANCE CORPORATION
GENERAL INTERROGATORIES
PART 2 - PROPERTY & CASUALTY INTERROGATORIES
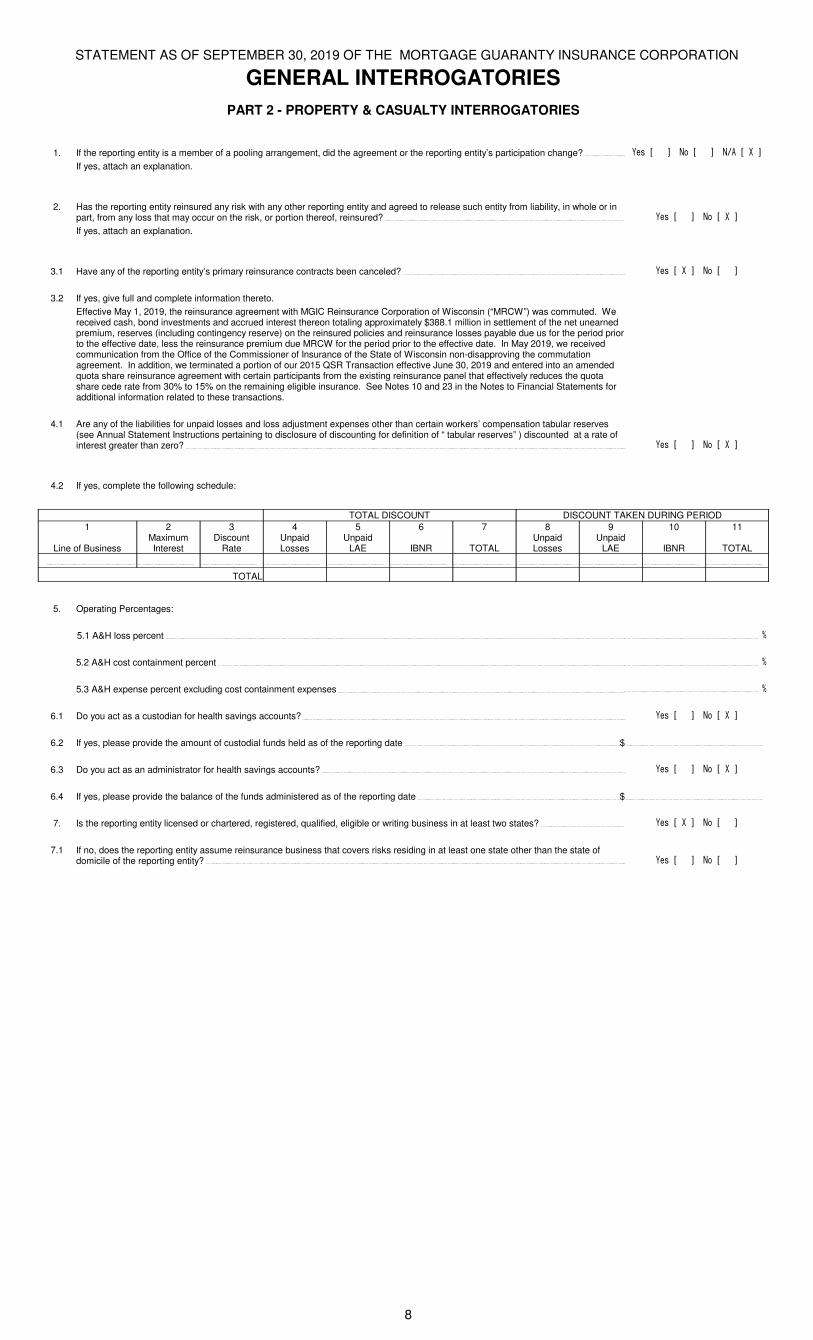
1. If the reporting entity is a member of a pooling arrangement, did the agreement or the reporting entity’s participation change? Yes [ ] No [ ] N/A [ X ]
If yes, attach an explanation.
2. Has the reporting entity reinsured any risk with any other reporting entity and agreed to release such entity from liability, in whole or in part, from any loss that may occur on the risk, or portion thereof, reinsured? Yes [ ] No [ X ]
If yes, attach an explanation.
3.1 Have any of the reporting entity’s primary reinsurance contracts been canceled? Yes [ X ] No [ ]
3.2 If yes, give full and complete information thereto.
Effective May 1, 2019, the reinsurance agreement with MGIC Reinsurance Corporation of Wisconsin (“MRCW”) was commuted. We received cash, bond investments and accrued interest thereon totaling approximately $388.1 million in settlement of the net unearned premium, reserves (including contingency reserve) on the reinsured policies and reinsurance losses payable due us for the period prior to the effective date, less the reinsurance premium due MRCW for the period prior to the effective date. In May 2019, we received communication from the Office of the Commissioner of Insurance of the State of Wisconsin non-disapproving the commutation agreement. In addition, we terminated a portion of our 2015 QSR Transaction effective June 30, 2019 and entered into an amended quota share reinsurance agreement with certain participants from the existing reinsurance panel that effectively reduces the quota share cede rate from 30% to 15% on the remaining eligible insurance. See Notes 10 and 23 in the Notes to Financial Statements for additional information related to these transactions.
4.1 Are any of the liabilities for unpaid losses and loss adjustment expenses other than certain workers’ compensation tabular reserves (see Annual Statement Instructions pertaining to disclosure of discounting for definition of “ tabular reserves” ) discounted at a rate of interest greater than zero? Yes [ ] No [ X ]
4.2 If yes, complete the following schedule:
TOTAL DISCOUNT DISCOUNT TAKEN DURING PERIOD
1
Line of Business
2Maximum Interest
3Discount
Rate
4UnpaidLosses
5Unpaid
LAE
6
IBNR
7
TOTAL
8UnpaidLosses
9Unpaid
LAE
10
IBNR
11
TOTAL
TOTAL
5. Operating Percentages:
5.1 A&H loss percent %
5.2 A&H cost containment percent %
5.3 A&H expense percent excluding cost containment expenses %
6.1 Do you act as a custodian for health savings accounts? Yes [ ] No [ X ]
6.2 If yes, please provide the amount of custodial funds held as of the reporting date $
6.3 Do you act as an administrator for health savings accounts? Yes [ ] No [ X ]
6.4 If yes, please provide the balance of the funds administered as of the reporting date $
7. Is the reporting entity licensed or chartered, registered, qualified, eligible or writing business in at least two states? Yes [ X ] No [ ]
7.1 If no, does the reporting entity assume reinsurance business that covers risks residing in at least one state other than the state of domicile of the reporting entity? Yes [ ] No [ ]
8
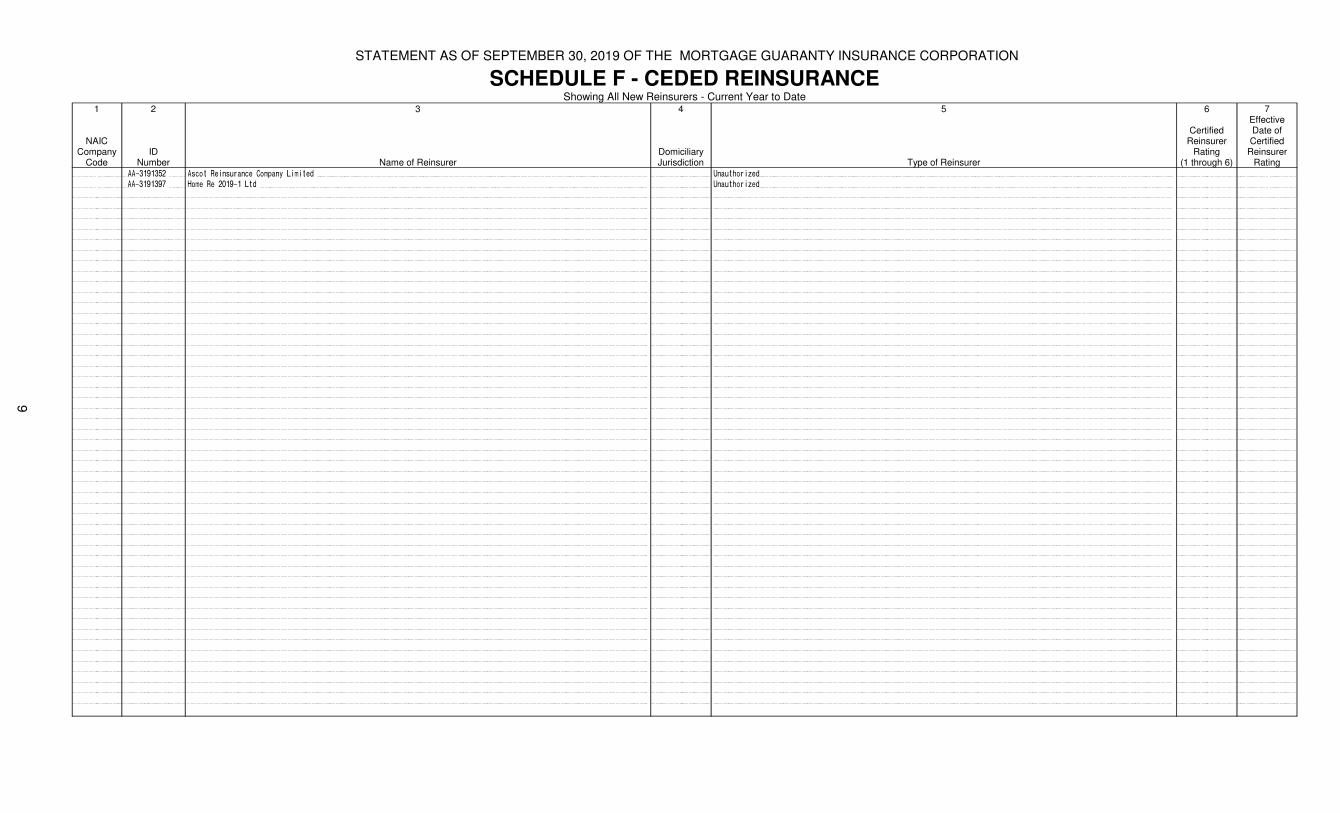
STATEMENT AS OF SEPTEMBER 30, 2019 OF THE MORTGAGE GUARANTY INSURANCE CORPORATION
SCHEDULE F - CEDED REINSURANCEShowing All New Reinsurers - Current Year to Date
1
NAICCompany
Code
2
IDNumber
3
Name of Reinsurer
4
Domiciliary Jurisdiction
5
Type of Reinsurer
6
Certified Reinsurer
Rating(1 through 6)
7EffectiveDate ofCertified
Reinsurer Rating
AA-3191352 Ascot Reinsurance Company Limited Unauthorized
AA-3191397 Home Re 2019-1 Ltd Unauthorized
9
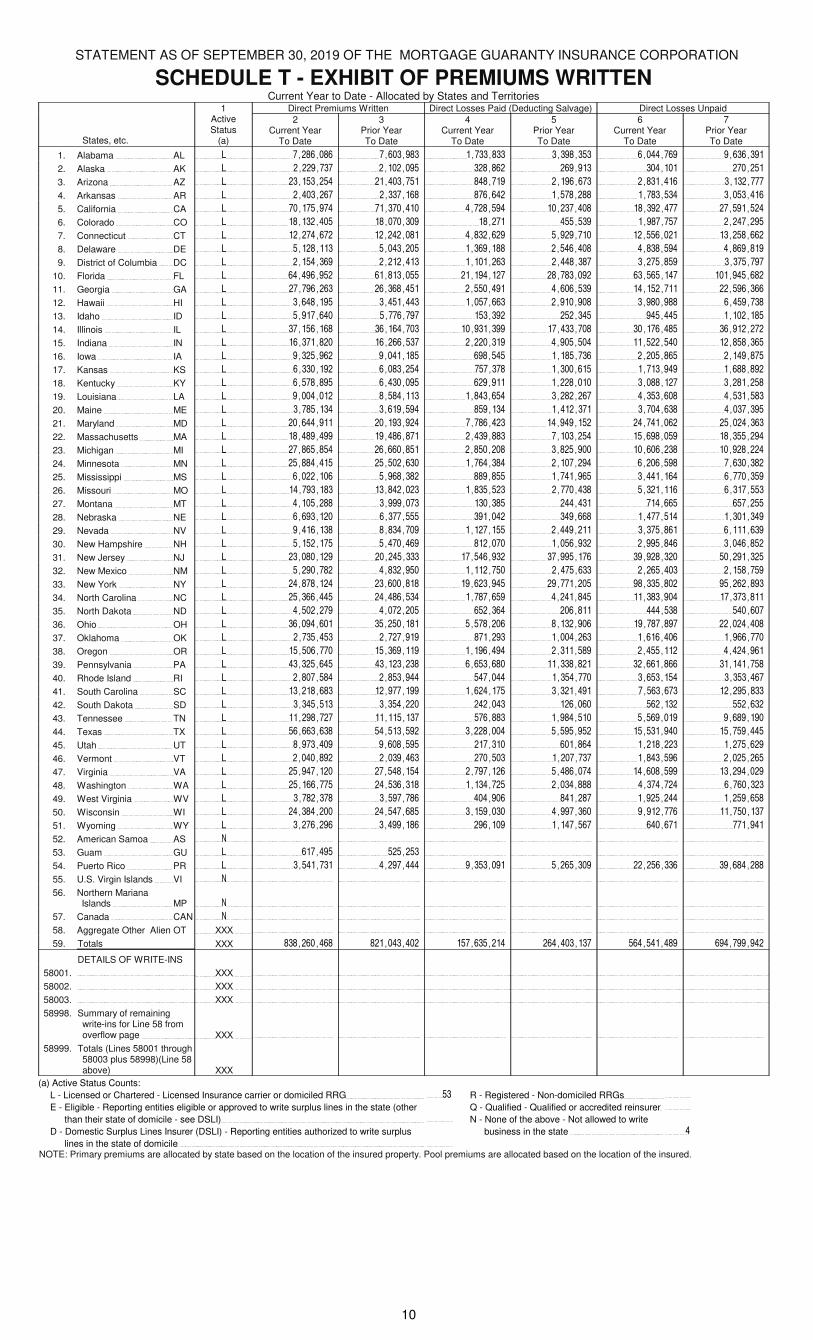
STATEMENT AS OF SEPTEMBER 30, 2019 OF THE MORTGAGE GUARANTY INSURANCE CORPORATION
SCHEDULE T - EXHIBIT OF PREMIUMS WRITTENCurrent Year to Date - Allocated by States and Territories
1 Direct Premiums Written Direct Losses Paid (Deducting Salvage) Direct Losses Unpaid
States, etc.
ActiveStatus
(a)
2Current Year
To Date
3Prior YearTo Date
4Current Year
To Date
5Prior YearTo Date
6Current Year
To Date
7Prior YearTo Date
1. Alabama AL L 7,286,086 7,603,983 1,733,833 3,398,353 6,044,769 9,636,391
2. Alaska AK L 2,229,737 2,102,095 328,862 269,913 304,101 270,251
3. Arizona AZ L 23,153,254 21,403,751 848,719 2,196,673 2,831,416 3,132,777
4. Arkansas AR L 2,403,267 2,337,168 876,642 1,578,288 1,783,534 3,053,416
5. California CA L 70,175,974 71,370,410 4,728,594 10,237,408 18,392,477 27,591,524
6. Colorado CO L 18,132,405 18,070,309 18,271 455,539 1,987,757 2,247,295
7. Connecticut CT L 12,274,672 12,242,081 4,832,629 5,929,710 12,556,021 13,258,662
8. Delaware DE L 5,128,113 5,043,205 1,369,188 2,546,408 4,838,594 4,869,819
9. District of Columbia DC L 2,154,369 2,212,413 1,101,263 2,448,387 3,275,859 3,375,797
10. Florida FL L 64,496,952 61,813,055 21,194,127 28,783,092 63,565,147 101,945,682
11. Georgia GA L 27,796,263 26,368,451 2,550,491 4,606,539 14,152,711 22,596,366
12. Hawaii HI L 3,648,195 3,451,443 1,057,663 2,910,908 3,980,988 6,459,738
13. Idaho ID L 5,917,640 5,776,797 153,392 252,345 945,445 1,102,185
14. Illinois IL L 37,156,168 36,164,703 10,931,399 17,433,708 30,176,485 36,912,272
15. Indiana IN L 16,371,820 16,266,537 2,220,319 4,905,504 11,522,540 12,858,365
16. Iowa IA L 9,325,962 9,041,185 698,545 1,185,736 2,205,865 2,149,875
17. Kansas KS L 6,330,192 6,083,254 757,378 1,300,615 1,713,949 1,688,892
18. Kentucky KY L 6,578,895 6,430,095 629,911 1,228,010 3,088,127 3,281,258
19. Louisiana LA L 9,004,012 8,584,113 1,843,654 3,282,267 4,353,608 4,531,583
20. Maine ME L 3,785,134 3,619,594 859,134 1,412,371 3,704,638 4,037,395
21. Maryland MD L 20,644,911 20,193,924 7,786,423 14,949,152 24,741,062 25,024,363
22. Massachusetts MA L 18,489,499 19,486,871 2,439,883 7,103,254 15,698,059 18,355,294
23. Michigan MI L 27,865,854 26,660,851 2,850,208 3,825,900 10,606,238 10,928,224
24. Minnesota MN L 25,884,415 25,502,630 1,764,384 2,107,294 6,206,598 7,630,382
25. Mississippi MS L 6,022,106 5,968,382 889,855 1,741,965 3,441,164 6,770,359
26. Missouri MO L 14,793,183 13,842,023 1,835,523 2,770,438 5,321,116 6,317,553
27. Montana MT L 4,105,288 3,999,073 130,385 244,431 714,665 657,255
28. Nebraska NE L 6,693,120 6,377,555 391,042 349,668 1,477,514 1,301,349
29. Nevada NV L 9,416,138 8,834,709 1,127,155 2,449,211 3,375,861 6,111,639
30. New Hampshire NH L 5,152,175 5,470,469 812,070 1,056,932 2,995,846 3,046,852
31. New Jersey NJ L 23,080,129 20,245,333 17,546,932 37,995,176 39,928,320 50,291,325
32. New Mexico NM L 5,290,782 4,832,950 1,112,750 2,475,633 2,265,403 2,158,759
33. New York NY L 24,878,124 23,600,818 19,623,945 29,771,205 98,335,802 95,262,893
34. North Carolina NC L 25,366,445 24,486,534 1,787,659 4,241,845 11,383,904 17,373,811
35. North Dakota ND L 4,502,279 4,072,205 652,364 206,811 444,538 540,607
36. Ohio OH L 36,094,601 35,250,181 5,578,206 8,132,906 19,787,897 22,024,408
37. Oklahoma OK L 2,735,453 2,727,919 871,293 1,004,263 1,616,406 1,966,770
38. Oregon OR L 15,506,770 15,369,119 1,196,494 2,311,589 2,455,112 4,424,961
39. Pennsylvania PA L 43,325,645 43,123,238 6,653,680 11,338,821 32,661,866 31,141,758
40. Rhode Island RI L 2,807,584 2,853,944 547,044 1,354,770 3,653,154 3,353,467
41. South Carolina SC L 13,218,683 12,977,199 1,624,175 3,321,491 7,563,673 12,295,833
42. South Dakota SD L 3,345,513 3,354,220 242,043 126,060 562,132 552,632
43. Tennessee TN L 11,298,727 11,115,137 576,883 1,984,510 5,569,019 9,689,190
44. Texas TX L 56,663,638 54,513,592 3,228,004 5,595,952 15,531,940 15,759,445
45. Utah UT L 8,973,409 9,608,595 217,310 601,864 1,218,223 1,275,629
46. Vermont VT L 2,040,892 2,039,463 270,503 1,207,737 1,843,596 2,025,265
47. Virginia VA L 25,947,120 27,548,154 2,797,126 5,486,074 14,608,599 13,294,029
48. Washington WA L 25,166,775 24,536,318 1,134,725 2,034,888 4,374,724 6,760,323
49. West Virginia WV L 3,782,378 3,597,786 404,906 841,287 1,925,244 1,259,658
50. Wisconsin WI L 24,384,200 24,547,685 3,159,030 4,997,360 9,912,776 11,750,137
51. Wyoming WY L 3,276,296 3,499,186 296,109 1,147,567 640,671 771,941
52. American Samoa AS N
53. Guam GU L 617,495 525,253
54. Puerto Rico PR L 3,541,731 4,297,444 9,353,091 5,265,309 22,256,336 39,684,288
55. U.S. Virgin Islands VI N
56. Northern Mariana Islands MP N
57. Canada CAN N
58. Aggregate Other Alien OT XXX
59. Totals XXX 838,260,468 821,043,402 157,635,214 264,403,137 564,541,489 694,799,942
DETAILS OF WRITE-INS
58001. XXX
58002. XXX
58003. XXX
58998. Summary of remaining write-ins for Line 58 from overflow page XXX
58999. Totals (Lines 58001 through 58003 plus 58998)(Line 58 above) XXX
(a) Active Status Counts:
L - Licensed or Chartered - Licensed Insurance carrier or domiciled RRG 53 R - Registered - Non-domiciled RRGs
E - Eligible - Reporting entities eligible or approved to write surplus lines in the state (other Q - Qualified - Qualified or accredited reinsurer
than their state of domicile - see DSLI) N - None of the above - Not allowed to write
D - Domestic Surplus Lines Insurer (DSLI) - Reporting entities authorized to write surplus business in the state 4
lines in the state of domicile NOTE: Primary premiums are allocated by state based on the location of the insured property. Pool premiums are allocated based on the location of the insured.
10
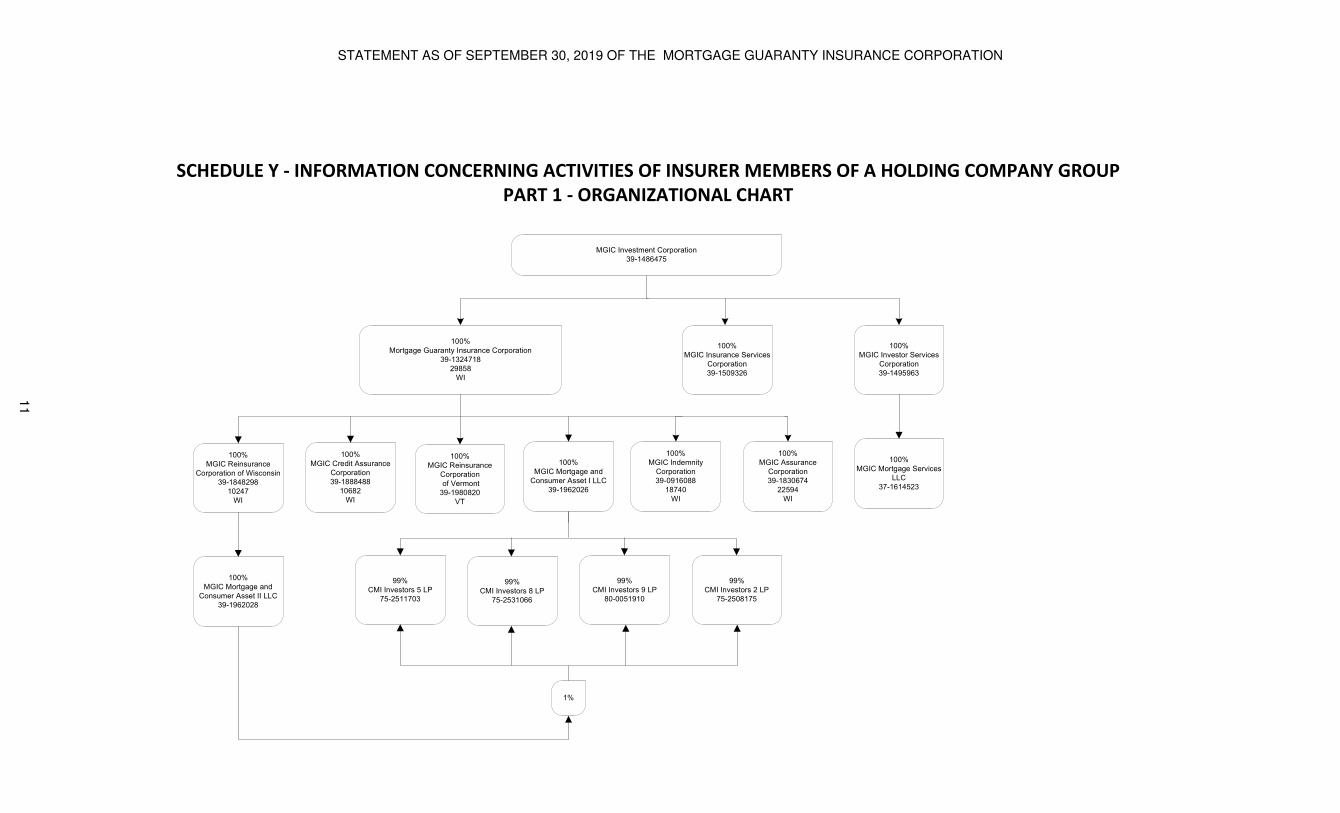
STATEMENT AS OF SEPTEMBER 30, 2019 OF THE MORTGAGE GUARANTY INSURANCE CORPORATION
11
MGIC Investment Corporation
39-1486475
100%
MGIC Insurance Services
Corporation
39-1509326
100%
Mortgage Guaranty Insurance Corporation
39-1324718
29858
WI
100%
MGIC Assurance
Corporation
39-1830674
22594
WI
100%
MGIC Indemnity
Corporation
39-0916088
18740
WI
100%
MGIC Credit Assurance
Corporation
39-1888488
10682
WI
100%
MGIC Reinsurance
Corporation of Wisconsin
39-1848298
10247
WI
100%
MGIC Mortgage and
Consumer Asset II LLC
39-1962028
100%
MGIC Mortgage and
Consumer Asset I LLC
39-1962026
99%
CMI Investors 2 LP
75-2508175
1%
100%
MGIC Reinsurance
Corporation
of Vermont
39-1980820
VT
100%
MGIC Investor Services
Corporation
39-1495963
99%
CMI Investors 5 LP
75-2511703
99%
CMI Investors 8 LP
75-2531066
99%
CMI Investors 9 LP
80-0051910
SCHEDULE Y - INFORMATION CONCERNING ACTIVITIES OF INSURER MEMBERS OF A HOLDING COMPANY GROUP
PART 1 - ORGANIZATIONAL CHART
100%
MGIC Mortgage Services
LLC
37-1614523
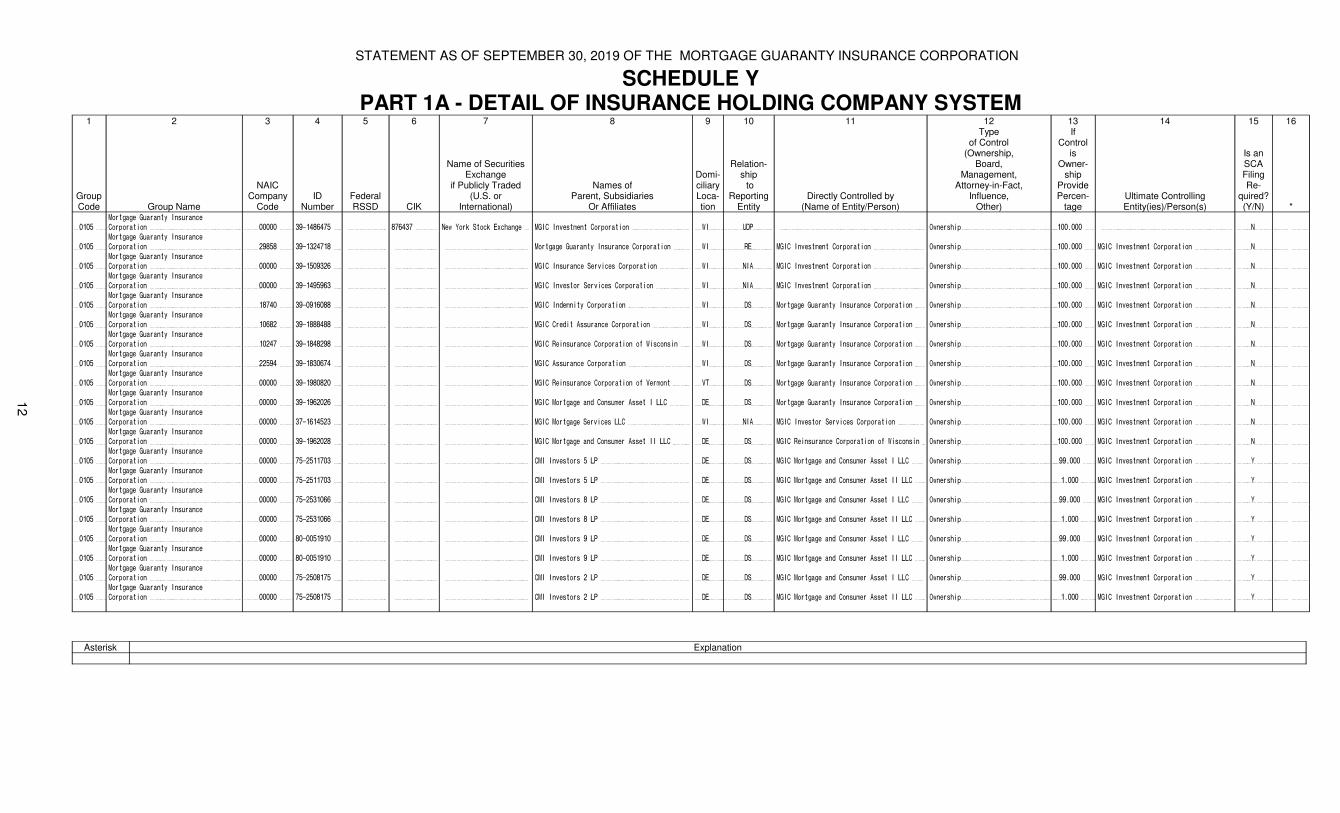
STATEMENT AS OF SEPTEMBER 30, 2019 OF THE MORTGAGE GUARANTY INSURANCE CORPORATION
SCHEDULE YPART 1A - DETAIL OF INSURANCE HOLDING COMPANY SYSTEM
1
GroupCode
2
Group Name
3
NAICCompany
Code
4
IDNumber
5
Federal RSSD
6
CIK
7
Name of SecuritiesExchange
if Publicly Traded(U.S. or
International)
8
Names ofParent, Subsidiaries
Or Affiliates
9
Domi-ciliaryLoca-tion
10
Relation-ship to
ReportingEntity
11
Directly Controlled by(Name of Entity/Person)
12Type
of Control(Ownership,
Board,Management,
Attorney-in-Fact,Influence,
Other)
13If
Controlis
Owner-ship
ProvidePercen-
tage
14
Ultimate ControllingEntity(ies)/Person(s)
15
Is anSCA FilingRe-
quired? (Y/N)
16
*
0105
Mortgage Guaranty Insurance
Corporation 00000 39-1486475 876437 New York Stock Exchange MGIC Investment Corporation WI UDP Ownership 100.000 N
0105
Mortgage Guaranty Insurance
Corporation 29858 39-1324718 Mortgage Guaranty Insurance Corporation WI RE MGIC Investment Corporation Ownership 100.000 MGIC Investment Corporation N
0105
Mortgage Guaranty Insurance
Corporation 00000 39-1509326 MGIC Insurance Services Corporation WI NIA MGIC Investment Corporation Ownership 100.000 MGIC Investment Corporation N
0105
Mortgage Guaranty Insurance
Corporation 00000 39-1495963 MGIC Investor Services Corporation WI NIA MGIC Investment Corporation Ownership 100.000 MGIC Investment Corporation N
0105
Mortgage Guaranty Insurance
Corporation 18740 39-0916088 MGIC Indemnity Corporation WI DS Mortgage Guaranty Insurance Corporation Ownership 100.000 MGIC Investment Corporation N
0105
Mortgage Guaranty Insurance
Corporation 10682 39-1888488 MGIC Credit Assurance Corporation WI DS Mortgage Guaranty Insurance Corporation Ownership 100.000 MGIC Investment Corporation N
0105
Mortgage Guaranty Insurance
Corporation 10247 39-1848298 MGIC Reinsurance Corporation of Wisconsin WI DS Mortgage Guaranty Insurance Corporation Ownership 100.000 MGIC Investment Corporation N
0105
Mortgage Guaranty Insurance
Corporation 22594 39-1830674 MGIC Assurance Corporation WI DS Mortgage Guaranty Insurance Corporation Ownership 100.000 MGIC Investment Corporation N
0105
Mortgage Guaranty Insurance
Corporation 00000 39-1980820 MGIC Reinsurance Corporation of Vermont VT DS Mortgage Guaranty Insurance Corporation Ownership 100.000 MGIC Investment Corporation N
0105
Mortgage Guaranty Insurance
Corporation 00000 39-1962026 MGIC Mortgage and Consumer Asset I LLC DE DS Mortgage Guaranty Insurance Corporation Ownership 100.000 MGIC Investment Corporation N
0105
Mortgage Guaranty Insurance
Corporation 00000 37-1614523 MGIC Mortgage Services LLC WI NIA MGIC Investor Services Corporation Ownership 100.000 MGIC Investment Corporation N
0105
Mortgage Guaranty Insurance
Corporation 00000 39-1962028 MGIC Mortgage and Consumer Asset II LLC DE DS MGIC Reinsurance Corporation of Wisconsin Ownership 100.000 MGIC Investment Corporation N
0105
Mortgage Guaranty Insurance
Corporation 00000 75-2511703 CMI Investors 5 LP DE DS MGIC Mortgage and Consumer Asset I LLC Ownership 99.000 MGIC Investment Corporation Y
0105
Mortgage Guaranty Insurance
Corporation 00000 75-2511703 CMI Investors 5 LP DE DS MGIC Mortgage and Consumer Asset II LLC Ownership 1.000 MGIC Investment Corporation Y
0105
Mortgage Guaranty Insurance
Corporation 00000 75-2531066 CMI Investors 8 LP DE DS MGIC Mortgage and Consumer Asset I LLC Ownership 99.000 MGIC Investment Corporation Y
0105
Mortgage Guaranty Insurance
Corporation 00000 75-2531066 CMI Investors 8 LP DE DS MGIC Mortgage and Consumer Asset II LLC Ownership 1.000 MGIC Investment Corporation Y
0105
Mortgage Guaranty Insurance
Corporation 00000 80-0051910 CMI Investors 9 LP DE DS MGIC Mortgage and Consumer Asset I LLC Ownership 99.000 MGIC Investment Corporation Y
0105
Mortgage Guaranty Insurance
Corporation 00000 80-0051910 CMI Investors 9 LP DE DS MGIC Mortgage and Consumer Asset II LLC Ownership 1.000 MGIC Investment Corporation Y
0105
Mortgage Guaranty Insurance
Corporation 00000 75-2508175 CMI Investors 2 LP DE DS MGIC Mortgage and Consumer Asset I LLC Ownership 99.000 MGIC Investment Corporation Y
0105
Mortgage Guaranty Insurance
Corporation 00000 75-2508175 CMI Investors 2 LP DE DS MGIC Mortgage and Consumer Asset II LLC Ownership 1.000 MGIC Investment Corporation Y
Asterisk Explanation
12
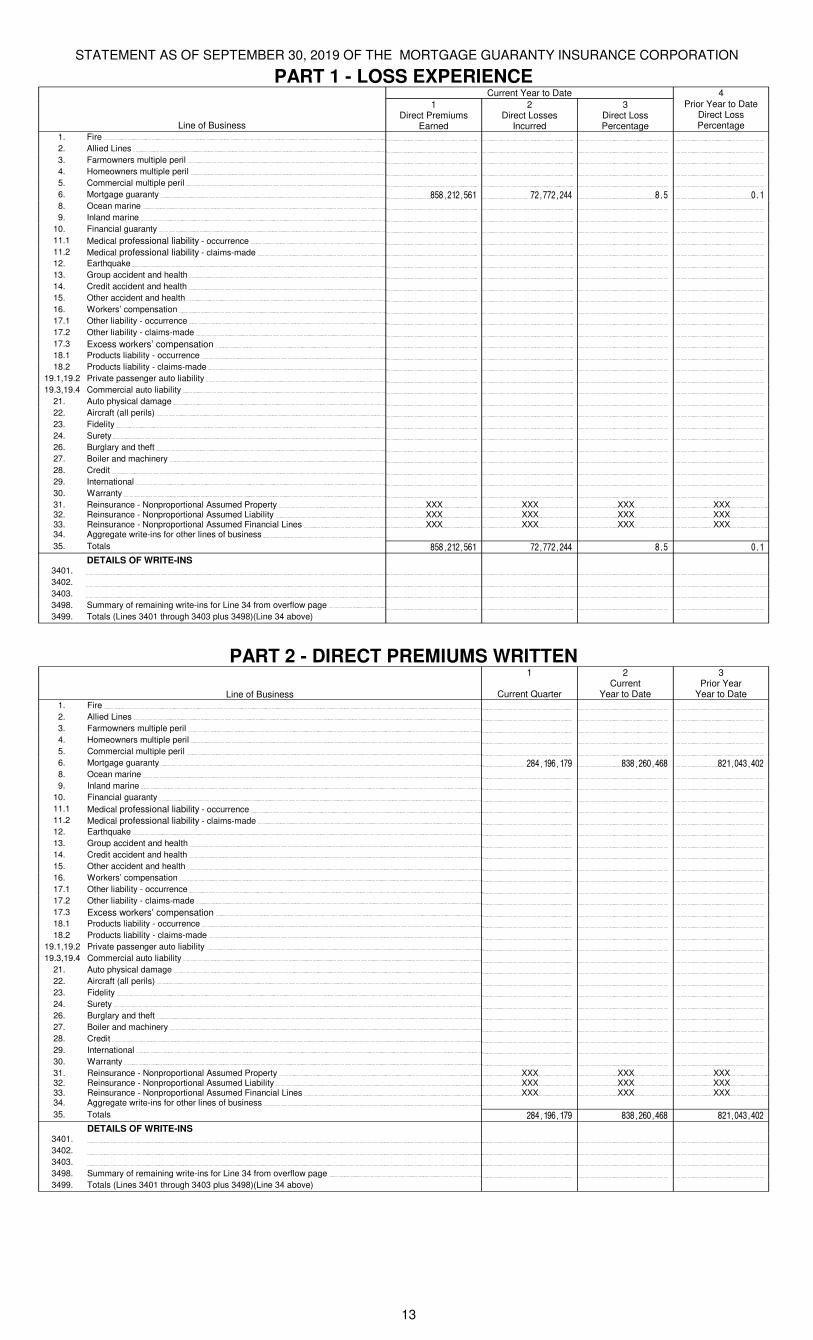
STATEMENT AS OF SEPTEMBER 30, 2019 OF THE MORTGAGE GUARANTY INSURANCE CORPORATION
PART 1 - LOSS EXPERIENCECurrent Year to Date 4
Line of Business
1Direct Premiums
Earned
2Direct Losses
Incurred
3Direct LossPercentage
Prior Year to DateDirect Loss Percentage
1. Fire 2. Allied Lines 3. Farmowners multiple peril 4. Homeowners multiple peril 5. Commercial multiple peril 6. Mortgage guaranty 858,212,561 72,772,244 8.5 0.1 8. Ocean marine 9. Inland marine
10. Financial guaranty 11.1 Medical professional liability - occurrence 11.2 Medical professional liability - claims-made 12. Earthquake 13. Group accident and health 14. Credit accident and health 15. Other accident and health 16. Workers’ compensation 17.1 Other liability - occurrence 17.2 Other liability - claims-made 17.3 Excess workers’ compensation 18.1 Products liability - occurrence 18.2 Products liability - claims-made
19.1,19.2 Private passenger auto liability 19.3,19.4 Commercial auto liability
21. Auto physical damage 22. Aircraft (all perils) 23. Fidelity 24. Surety 26. Burglary and theft 27. Boiler and machinery 28. Credit 29. International 30. Warranty 31. Reinsurance - Nonproportional Assumed Property XXX XXX XXX XXX32. Reinsurance - Nonproportional Assumed Liability XXX XXX XXX XXX33. Reinsurance - Nonproportional Assumed Financial Lines XXX XXX XXX XXX34. Aggregate write-ins for other lines of business
35. Totals 858,212,561 72,772,244 8.5 0.1
DETAILS OF WRITE-INS3401.
3402.
3403.
3498. Summary of remaining write-ins for Line 34 from overflow page 3499. Totals (Lines 3401 through 3403 plus 3498)(Line 34 above)
PART 2 - DIRECT PREMIUMS WRITTEN
Line of Business
1
Current Quarter
2Current
Year to Date
3Prior Year
Year to Date1. Fire 2. Allied Lines 3. Farmowners multiple peril 4. Homeowners multiple peril 5. Commercial multiple peril 6. Mortgage guaranty 284,196,179 838,260,468 821,043,402 8. Ocean marine 9. Inland marine
10. Financial guaranty 11.1 Medical professional liability - occurrence 11.2 Medical professional liability - claims-made 12. Earthquake 13. Group accident and health 14. Credit accident and health 15. Other accident and health 16. Workers’ compensation 17.1 Other liability - occurrence 17.2 Other liability - claims-made 17.3 Excess workers’ compensation 18.1 Products liability - occurrence 18.2 Products liability - claims-made
19.1,19.2 Private passenger auto liability 19.3,19.4 Commercial auto liability
21. Auto physical damage 22. Aircraft (all perils) 23. Fidelity 24. Surety 26. Burglary and theft 27. Boiler and machinery 28. Credit 29. International 30. Warranty 31. Reinsurance - Nonproportional Assumed Property XXX XXX XXX32. Reinsurance - Nonproportional Assumed Liability XXX XXX XXX33. Reinsurance - Nonproportional Assumed Financial Lines XXX XXX XXX34. Aggregate write-ins for other lines of business
35. Totals 284,196,179 838,260,468 821,043,402
DETAILS OF WRITE-INS3401.
3402.
3403.
3498. Summary of remaining write-ins for Line 34 from overflow page 3499. Totals (Lines 3401 through 3403 plus 3498)(Line 34 above)
13
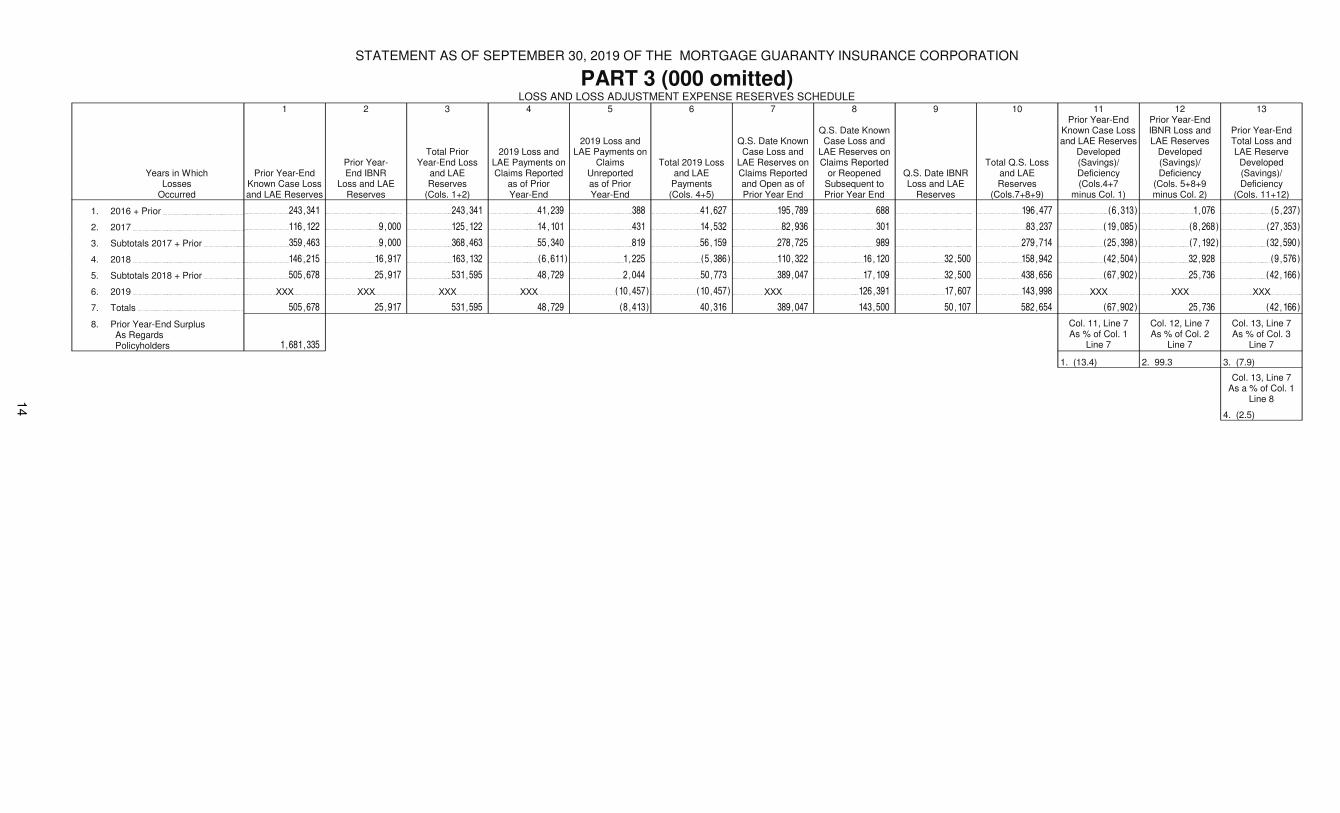
STATEMENT AS OF SEPTEMBER 30, 2019 OF THE MORTGAGE GUARANTY INSURANCE CORPORATION
PART 3 (000 omitted)LOSS AND LOSS ADJUSTMENT EXPENSE RESERVES SCHEDULE
Years in WhichLosses
Occurred
1
Prior Year-EndKnown Case Lossand LAE Reserves
2
Prior Year-End IBNR
Loss and LAEReserves
3
Total PriorYear-End Loss
and LAEReserves
(Cols. 1+2)
4
2019 Loss andLAE Payments onClaims Reported
as of PriorYear-End
5
2019 Loss andLAE Payments on
ClaimsUnreportedas of PriorYear-End
6
Total 2019 Lossand LAE
Payments(Cols. 4+5)
7
Q.S. Date KnownCase Loss and
LAE Reserves onClaims Reportedand Open as ofPrior Year End
8
Q.S. Date KnownCase Loss and
LAE Reserves onClaims Reported
or ReopenedSubsequent toPrior Year End
9
Q.S. Date IBNRLoss and LAE
Reserves
10
Total Q.S. Lossand LAEReserves
(Cols.7+8+9)
11Prior Year-End
Known Case Lossand LAE Reserves
Developed(Savings)/Deficiency(Cols.4+7
minus Col. 1)
12Prior Year-EndIBNR Loss andLAE Reserves
Developed(Savings)/Deficiency
(Cols. 5+8+9minus Col. 2)
13
Prior Year-EndTotal Loss andLAE Reserve
Developed(Savings)/Deficiency
(Cols. 11+12)
1. 2016 + Prior 243,341 243,341 41,239 388 41,627 195,789 688 196,477 (6,313) 1,076 (5,237)
2. 2017 116,122 9,000 125,122 14,101 431 14,532 82,936 301 83,237 (19,085) (8,268) (27,353)
3. Subtotals 2017 + Prior 359,463 9,000 368,463 55,340 819 56,159 278,725 989 279,714 (25,398) (7,192) (32,590)
4. 2018 146,215 16,917 163,132 (6,611) 1,225 (5,386) 110,322 16,120 32,500 158,942 (42,504) 32,928 (9,576)
5. Subtotals 2018 + Prior 505,678 25,917 531,595 48,729 2,044 50,773 389,047 17,109 32,500 438,656 (67,902) 25,736 (42,166)
6. 2019 XXX XXX XXX XXX (10,457) (10,457) XXX 126,391 17,607 143,998 XXX XXX XXX
7. Totals 505,678 25,917 531,595 48,729 (8,413) 40,316 389,047 143,500 50,107 582,654 (67,902) 25,736 (42,166)
8. Prior Year-End SurplusAs RegardsPolicyholders 1,681,335
Col. 11, Line 7As % of Col. 1
Line 7
Col. 12, Line 7As % of Col. 2
Line 7
Col. 13, Line 7As % of Col. 3
Line 7
1. (13.4) 2. 99.3 3. (7.9)
Col. 13, Line 7As a % of Col. 1
Line 8
4. (2.5)
14
STATEMENT AS OF SEPTEMBER 30, 2019 OF THE MORTGAGE GUARANTY INSURANCE CORPORATION
SUPPLEMENTAL EXHIBITS AND SCHEDULES INTERROGATORIESThe following supplemental reports are required to be filed as part of your statement filing. However, in the event that your company does not transact the type of business for which the special report must be filed, your response of NO to the specific interrogatory will be accepted in lieu of filing a “NONE” report and a bar code will be printed below. If the supplement is required of your company but is not being filed for whatever reason enter SEE EXPLANATION and provide an explanation following the interrogatory questions.
Response
1. Will the Trusteed Surplus Statement be filed with the state of domicile and the NAIC with this statement? NO
2. Will Supplement A to Schedule T (Medical Professional Liability Supplement) be filed with this statement? NO
3. Will the Medicare Part D Coverage Supplement be filed with the state of domicile and the NAIC with this statement? NO
4. Will the Director and Officer Insurance Coverage Supplement be filed with the state of domicile and the NAIC with this statement? NO
Explanations:
1.
2.
3.
4.
Bar Codes:
1. Trusteed Surplus Statement [Document Identifier 490]
*29858201949000003*2. Supplement A to Schedule T [Document Identifier 455]
*29858201945500003*3. Medicare Part D Coverage Supplement [Document Identifier 365]
*29858201936500003*4. Director and Officer Supplement [Document Identifier 505]
*29858201950500003*
15
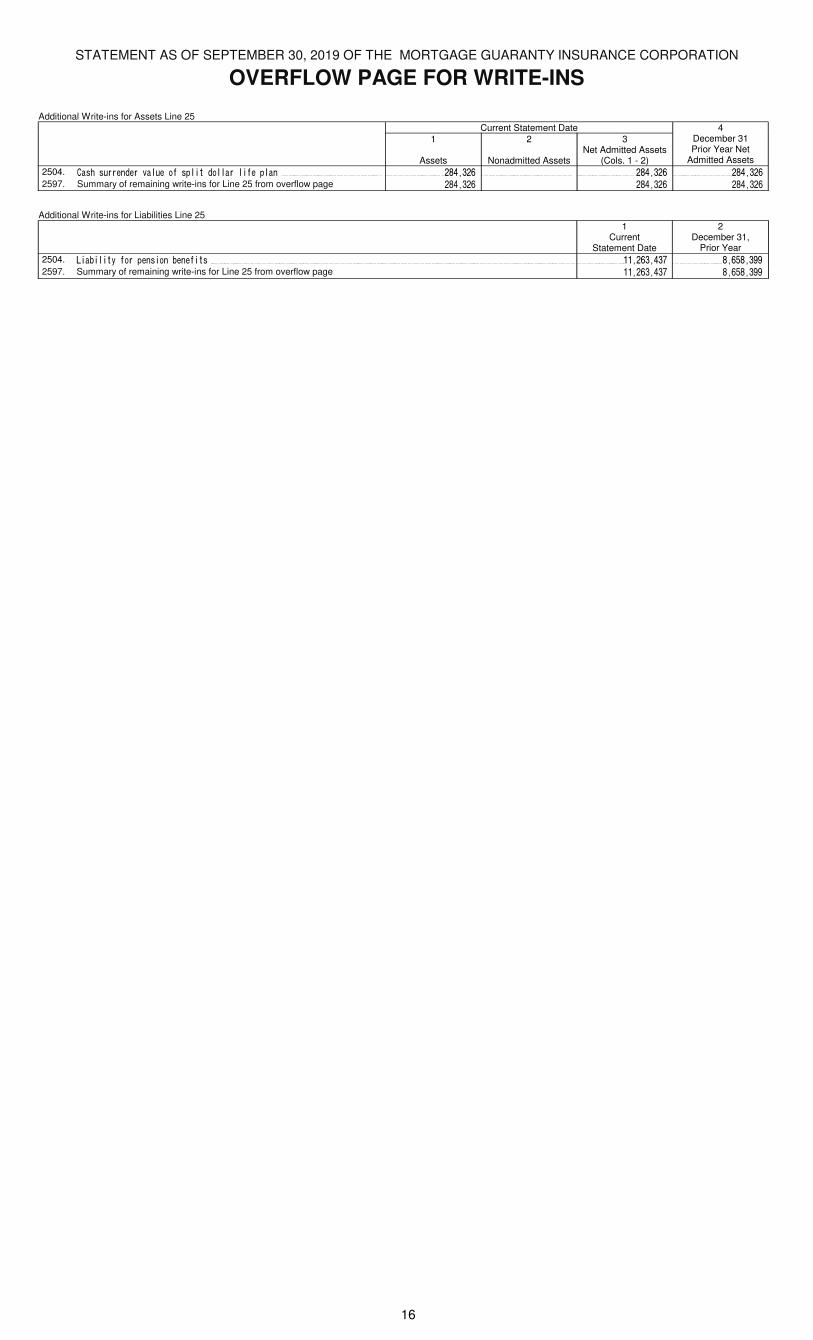
STATEMENT AS OF SEPTEMBER 30, 2019 OF THE MORTGAGE GUARANTY INSURANCE CORPORATION
OVERFLOW PAGE FOR WRITE-INS
Additional Write-ins for Assets Line 25Current Statement Date 4
1
Assets
2
Nonadmitted Assets
3Net Admitted Assets
(Cols. 1 - 2)
December 31Prior Year Net
Admitted Assets
2504. Cash surrender value of split dollar life plan 284,326 284,326 284,326 2597. Summary of remaining write-ins for Line 25 from overflow page 284,326 284,326 284,326
Additional Write-ins for Liabilities Line 251
CurrentStatement Date
2December 31,
Prior Year
2504. Liability for pension benefits 11,263,437 8,658,399 2597. Summary of remaining write-ins for Line 25 from overflow page 11,263,437 8,658,399
16
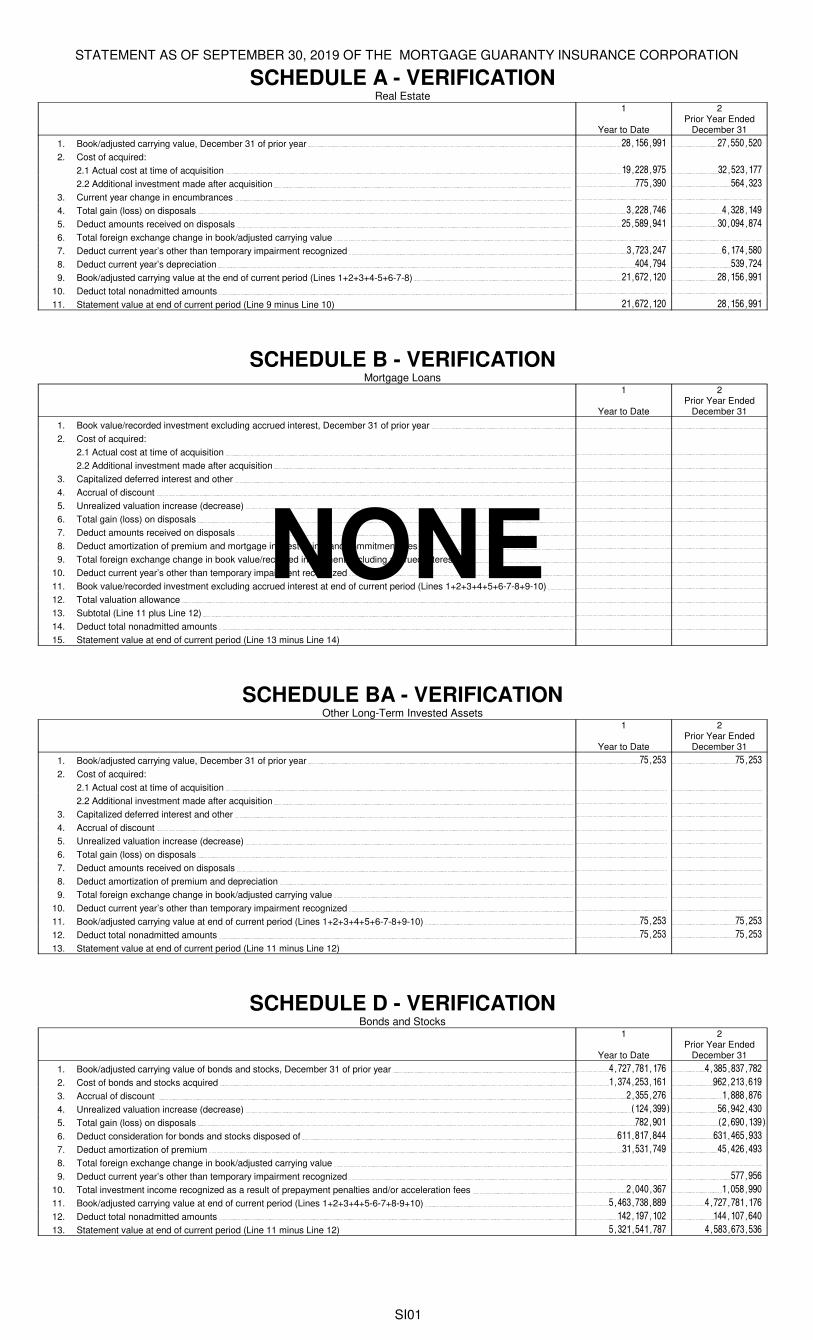
STATEMENT AS OF SEPTEMBER 30, 2019 OF THE MORTGAGE GUARANTY INSURANCE CORPORATION
SCHEDULE A - VERIFICATIONReal Estate
1
Year to Date
2Prior Year Ended
December 31
1. Book/adjusted carrying value, December 31 of prior year 28,156,991 27,550,520
2. Cost of acquired:
2.1 Actual cost at time of acquisition 19,228,975 32,523,177
2.2 Additional investment made after acquisition 775,390 564,323
3. Current year change in encumbrances
4. Total gain (loss) on disposals 3,228,746 4,328,149
5. Deduct amounts received on disposals 25,589,941 30,094,874
6. Total foreign exchange change in book/adjusted carrying value
7. Deduct current year’s other than temporary impairment recognized 3,723,247 6,174,580
8. Deduct current year’s depreciation 404,794 539,724
9. Book/adjusted carrying value at the end of current period (Lines 1+2+3+4-5+6-7-8) 21,672,120 28,156,991
10. Deduct total nonadmitted amounts
11. Statement value at end of current period (Line 9 minus Line 10) 21,672,120 28,156,991
SCHEDULE B - VERIFICATIONMortgage Loans
1
Year to Date
2Prior Year Ended
December 31
1. Book value/recorded investment excluding accrued interest, December 31 of prior year
2. Cost of acquired:
2.1 Actual cost at time of acquisition
2.2 Additional investment made after acquisition
3. Capitalized deferred interest and other
4. Accrual of discount
5. Unrealized valuation increase (decrease)
6. Total gain (loss) on disposals
7. Deduct amounts received on disposals
8. Deduct amortization of premium and mortgage interest points and commitment fees
9. Total foreign exchange change in book value/recorded investment excluding accrued interest
10. Deduct current year’s other than temporary impairment recognized
11. Book value/recorded investment excluding accrued interest at end of current period (Lines 1+2+3+4+5+6-7-8+9-10)
12. Total valuation allowance
13. Subtotal (Line 11 plus Line 12)
14. Deduct total nonadmitted amounts
15. Statement value at end of current period (Line 13 minus Line 14)
SCHEDULE BA - VERIFICATIONOther Long-Term Invested Assets
1
Year to Date
2Prior Year Ended
December 31
1. Book/adjusted carrying value, December 31 of prior year 75,253 75,253
2. Cost of acquired:
2.1 Actual cost at time of acquisition
2.2 Additional investment made after acquisition
3. Capitalized deferred interest and other
4. Accrual of discount
5. Unrealized valuation increase (decrease)
6. Total gain (loss) on disposals
7. Deduct amounts received on disposals
8. Deduct amortization of premium and depreciation
9. Total foreign exchange change in book/adjusted carrying value
10. Deduct current year’s other than temporary impairment recognized
11. Book/adjusted carrying value at end of current period (Lines 1+2+3+4+5+6-7-8+9-10) 75,253 75,253
12. Deduct total nonadmitted amounts 75,253 75,253
13. Statement value at end of current period (Line 11 minus Line 12)
SCHEDULE D - VERIFICATIONBonds and Stocks
1
Year to Date
2Prior Year Ended
December 31
1. Book/adjusted carrying value of bonds and stocks, December 31 of prior year 4,727,781,176 4,385,837,782
2. Cost of bonds and stocks acquired 1,374,253,161 962,213,619
3. Accrual of discount 2,355,276 1,888,876
4. Unrealized valuation increase (decrease) (124,399) 56,942,430
5. Total gain (loss) on disposals 782,901 (2,690,139)
6. Deduct consideration for bonds and stocks disposed of 611,817,844 631,465,933
7. Deduct amortization of premium 31,531,749 45,426,493
8. Total foreign exchange change in book/adjusted carrying value
9. Deduct current year’s other than temporary impairment recognized 577,956
10. Total investment income recognized as a result of prepayment penalties and/or acceleration fees 2,040,367 1,058,990
11. Book/adjusted carrying value at end of current period (Lines 1+2+3+4+5-6-7+8-9+10) 5,463,738,889 4,727,781,176
12. Deduct total nonadmitted amounts 142,197,102 144,107,640
13. Statement value at end of current period (Line 11 minus Line 12) 5,321,541,787 4,583,673,536
NONE
SI01
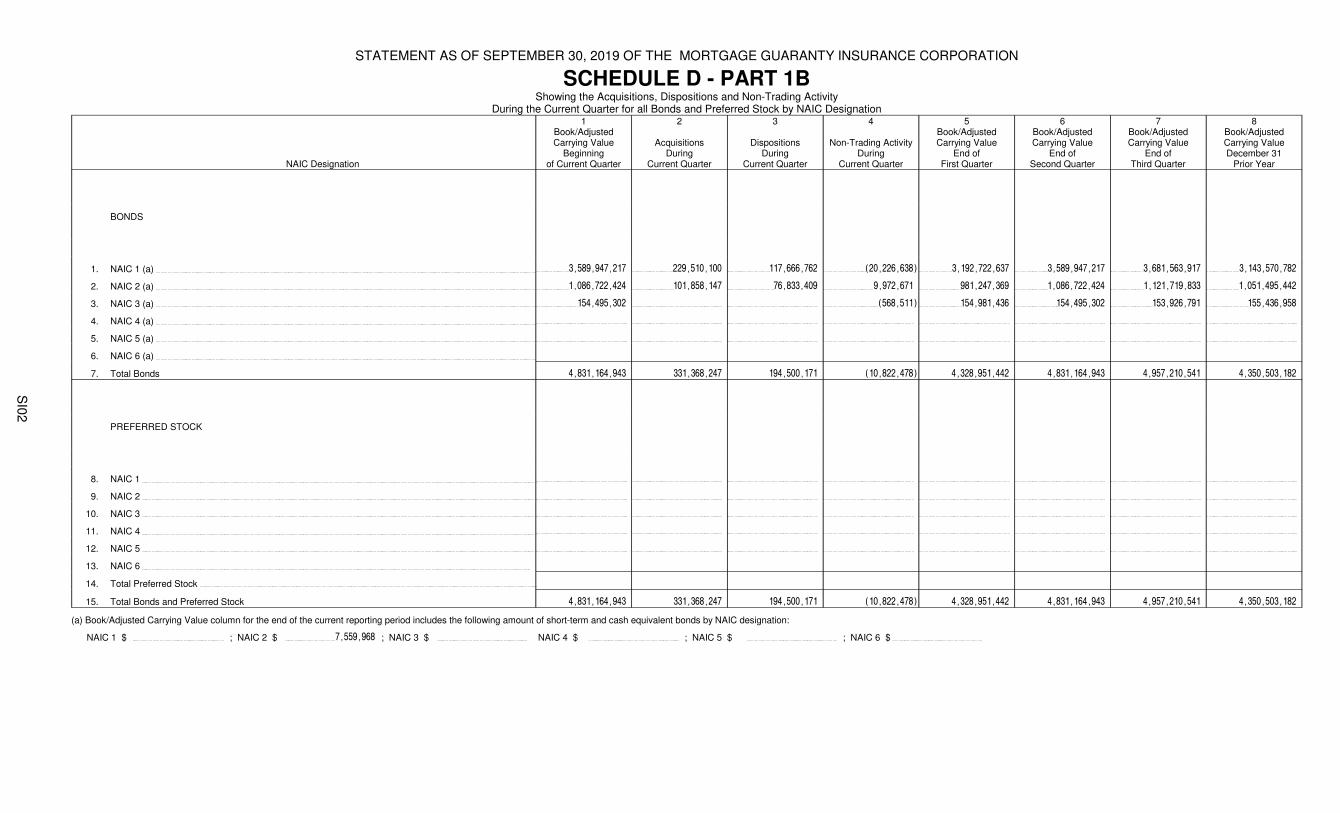
STATEMENT AS OF SEPTEMBER 30, 2019 OF THE MORTGAGE GUARANTY INSURANCE CORPORATION
SCHEDULE D - PART 1BShowing the Acquisitions, Dispositions and Non-Trading Activity
During the Current Quarter for all Bonds and Preferred Stock by NAIC Designation
NAIC Designation
1Book/AdjustedCarrying Value
Beginningof Current Quarter
2
AcquisitionsDuring
Current Quarter
3
DispositionsDuring
Current Quarter
4
Non-Trading ActivityDuring
Current Quarter
5Book/AdjustedCarrying Value
End ofFirst Quarter
6Book/AdjustedCarrying Value
End ofSecond Quarter
7Book/AdjustedCarrying Value
End ofThird Quarter
8Book/AdjustedCarrying ValueDecember 31
Prior Year
BONDS
1. NAIC 1 (a) 3,589,947,217 229,510,100 117,666,762 (20,226,638) 3,192,722,637 3,589,947,217 3,681,563,917 3,143,570,782
2. NAIC 2 (a) 1,086,722,424 101,858,147 76,833,409 9,972,671 981,247,369 1,086,722,424 1,121,719,833 1,051,495,442
3. NAIC 3 (a) 154,495,302 (568,511) 154,981,436 154,495,302 153,926,791 155,436,958
4. NAIC 4 (a)
5. NAIC 5 (a)
6. NAIC 6 (a)
7. Total Bonds 4,831,164,943 331,368,247 194,500,171 (10,822,478) 4,328,951,442 4,831,164,943 4,957,210,541 4,350,503,182
PREFERRED STOCK
8. NAIC 1
9. NAIC 2
10. NAIC 3
11. NAIC 4
12. NAIC 5
13. NAIC 6
14. Total Preferred Stock
15. Total Bonds and Preferred Stock 4,831,164,943 331,368,247 194,500,171 (10,822,478) 4,328,951,442 4,831,164,943 4,957,210,541 4,350,503,182
(a) Book/Adjusted Carrying Value column for the end of the current reporting period includes the following amount of short-term and cash equivalent bonds by NAIC designation:
NAIC 1 $ ; NAIC 2 $ 7,559,968 ; NAIC 3 $ NAIC 4 $ ; NAIC 5 $ ; NAIC 6 $
SI0
2
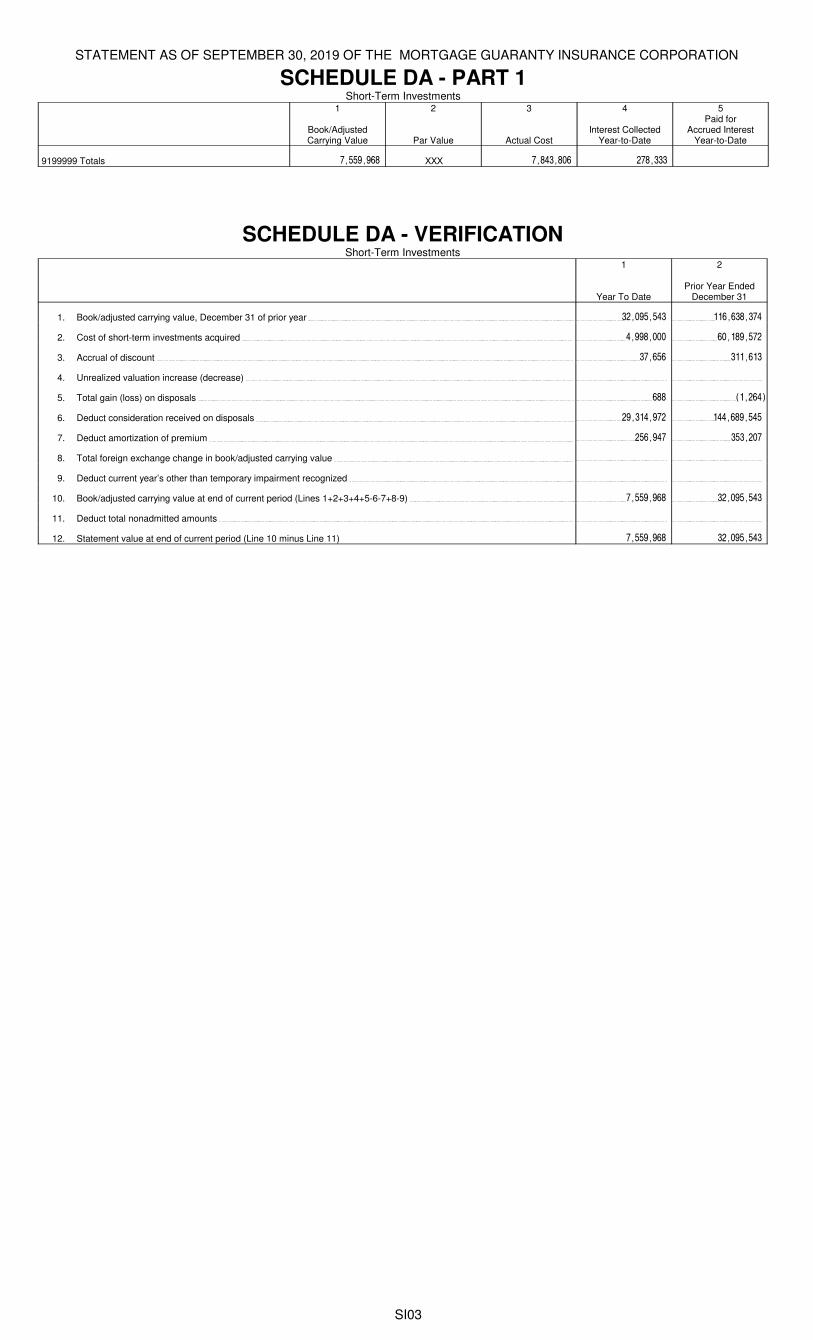
STATEMENT AS OF SEPTEMBER 30, 2019 OF THE MORTGAGE GUARANTY INSURANCE CORPORATION
SCHEDULE DA - PART 1Short-Term Investments
1
Book/AdjustedCarrying Value
2
Par Value
3
Actual Cost
4
Interest CollectedYear-to-Date
5Paid for
Accrued InterestYear-to-Date
9199999 Totals 7,559,968 XXX 7,843,806 278,333
SCHEDULE DA - VERIFICATIONShort-Term Investments
1
Year To Date
2
Prior Year Ended December 31
1. Book/adjusted carrying value, December 31 of prior year 32,095,543 116,638,374
2. Cost of short-term investments acquired 4,998,000 60,189,572
3. Accrual of discount 37,656 311,613
4. Unrealized valuation increase (decrease)
5. Total gain (loss) on disposals 688 (1,264)
6. Deduct consideration received on disposals 29,314,972 144,689,545
7. Deduct amortization of premium 256,947 353,207
8. Total foreign exchange change in book/adjusted carrying value
9. Deduct current year’s other than temporary impairment recognized
10. Book/adjusted carrying value at end of current period (Lines 1+2+3+4+5-6-7+8-9) 7,559,968 32,095,543
11. Deduct total nonadmitted amounts
12. Statement value at end of current period (Line 10 minus Line 11) 7,559,968 32,095,543
SI03

STATEMENT AS OF SEPTEMBER 30, 2019 OF THE MORTGAGE GUARANTY INSURANCE CORPORATION
Schedule DB - Part A - Verification - Options, Caps, Floors, Collars, Swaps and Forwards
N O N E
Schedule DB - Part B - Verification - Futures Contracts
N O N E
Schedule DB - Part C - Section 1 - Replication (Synthetic Asset) Transactions (RSATs) Open
N O N E
Schedule DB-Part C-Section 2-Reconciliation of Replication (Synthetic Asset) Transactions Open
N O N E
Schedule DB - Verification - Book/Adjusted Carrying Value, Fair Value and Potential Exposure of Derivatives
N O N E
SI04, SI05, SI06, SI07
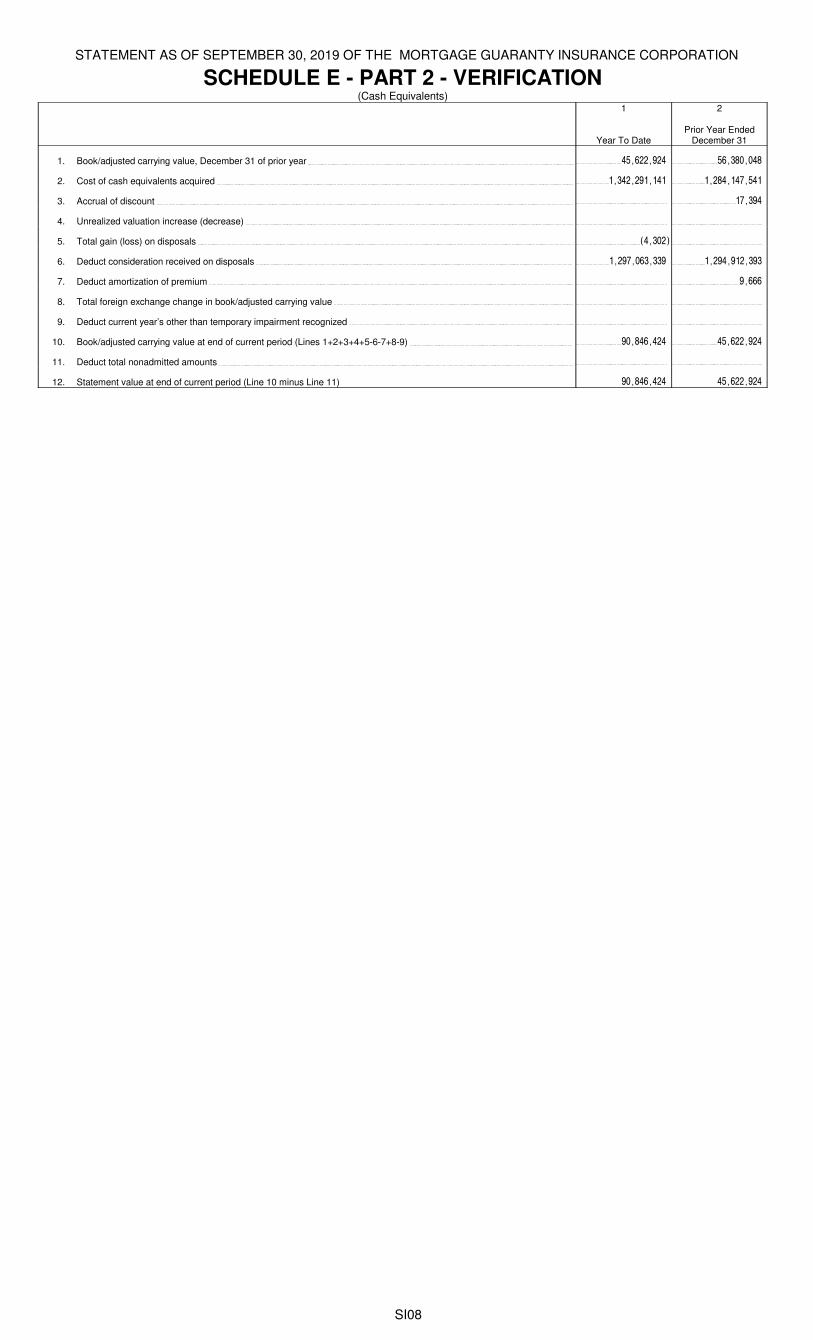
STATEMENT AS OF SEPTEMBER 30, 2019 OF THE MORTGAGE GUARANTY INSURANCE CORPORATION
SCHEDULE E - PART 2 - VERIFICATION(Cash Equivalents)
1
Year To Date
2
Prior Year Ended December 31
1. Book/adjusted carrying value, December 31 of prior year 45,622,924 56,380,048
2. Cost of cash equivalents acquired 1,342,291,141 1,284,147,541
3. Accrual of discount 17,394
4. Unrealized valuation increase (decrease)
5. Total gain (loss) on disposals (4,302)
6. Deduct consideration received on disposals 1,297,063,339 1,294,912,393
7. Deduct amortization of premium 9,666
8. Total foreign exchange change in book/adjusted carrying value
9. Deduct current year’s other than temporary impairment recognized
10. Book/adjusted carrying value at end of current period (Lines 1+2+3+4+5-6-7+8-9) 90,846,424 45,622,924
11. Deduct total nonadmitted amounts
12. Statement value at end of current period (Line 10 minus Line 11) 90,846,424 45,622,924
SI08
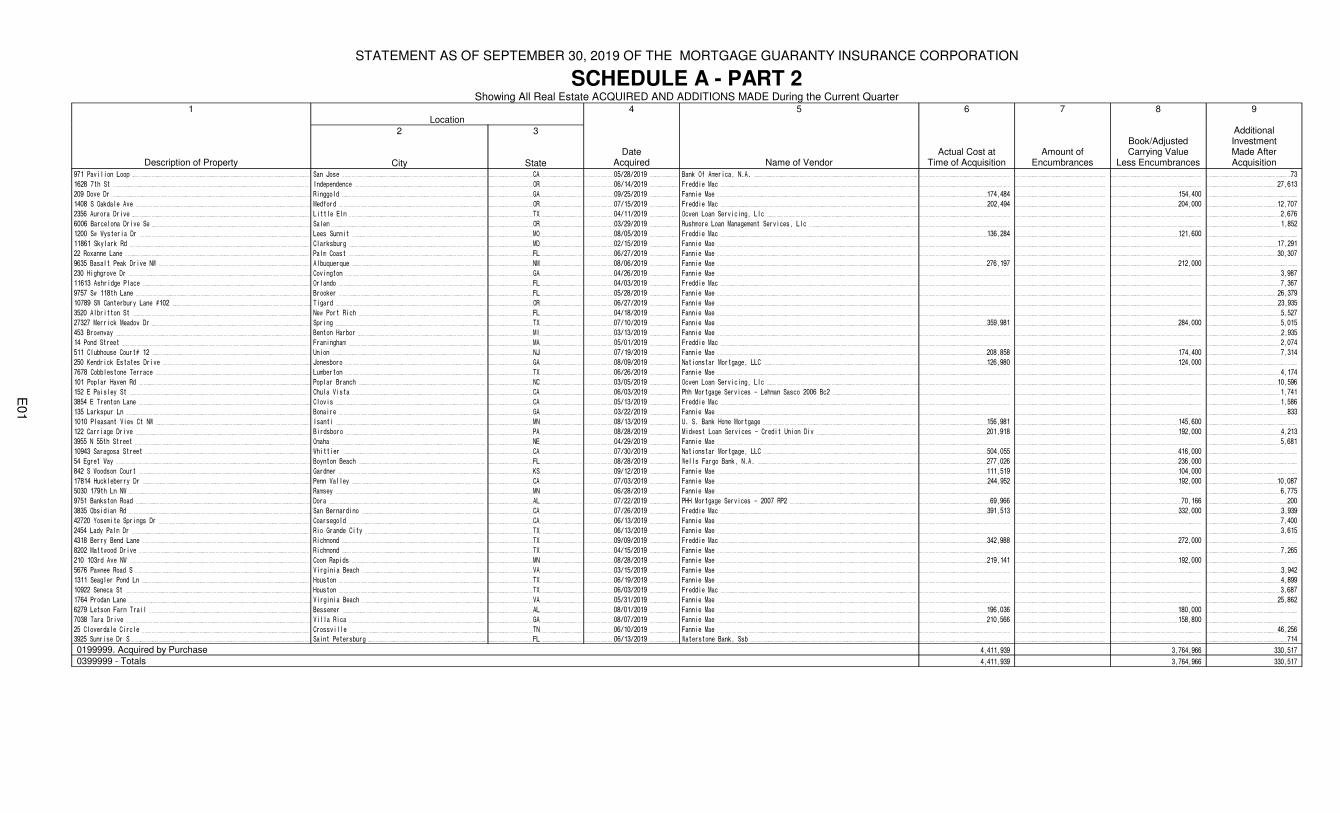
STATEMENT AS OF SEPTEMBER 30, 2019 OF THE MORTGAGE GUARANTY INSURANCE CORPORATION
SCHEDULE A - PART 2Showing All Real Estate ACQUIRED AND ADDITIONS MADE During the Current Quarter
1Location
4 5 6 7 8 9
Description of Property
2
City
3
StateDate
Acquired Name of VendorActual Cost at
Time of AcquisitionAmount of
Encumbrances
Book/Adjusted Carrying Value
Less Encumbrances
AdditionalInvestmentMade AfterAcquisition
971 Pavilion Loop San Jose CA 05/28/2019 Bank Of America, N.A. 73
1628 7th St Independence OR 06/14/2019 Freddie Mac 27,613
209 Dove Dr Ringgold GA 09/25/2019 Fannie Mae 174,484 154,400
1408 S Oakdale Ave Medford OR 07/15/2019 Freddie Mac 202,494 204,000 12,707
2356 Aurora Drive Little Elm TX 04/11/2019 Ocwen Loan Servicing, Llc 2,676
6006 Barcelona Drive Se Salem OR 03/29/2019 Rushmore Loan Management Services, Llc 1,852
1200 Sw Wysteria Dr Lees Summit MO 08/05/2019 Freddie Mac 136,284 121,600
11861 Skylark Rd Clarksburg MD 02/15/2019 Fannie Mae 17,291
22 Roxanne Lane Palm Coast FL 06/27/2019 Fannie Mae 30,307
9635 Basalt Peak Drive NW Albuquerque NM 08/06/2019 Fannie Mae 276,197 212,000
230 Highgrove Dr Covington GA 04/26/2019 Fannie Mae 3,987
11613 Ashridge Place Orlando FL 04/03/2019 Freddie Mac 7,367
9757 Sw 118th Lane Brooker FL 05/28/2019 Fannie Mae 26,379
10789 SW Canterbury Lane #102 Tigard OR 06/27/2019 Fannie Mae 23,935
3520 Albritton St New Port Rich FL 04/18/2019 Fannie Mae 5,527
27327 Merrick Meadow Dr Spring TX 07/10/2019 Fannie Mae 359,981 284,000 5,015
453 Brownway Benton Harbor MI 03/13/2019 Fannie Mae 2,935
14 Pond Street Framingham MA 05/01/2019 Freddie Mac 2,074
511 Clubhouse Court# 12 Union NJ 07/19/2019 Fannie Mae 208,858 174,400 7,314
250 Kendrick Estates Drive Jonesboro GA 08/09/2019 Nationstar Mortgage, LLC 126,980 124,000
7678 Cobblestone Terrace Lumberton TX 06/26/2019 Fannie Mae 4,174
101 Poplar Haven Rd Poplar Branch NC 03/05/2019 Ocwen Loan Servicing, Llc 10,596
152 E Paisley St Chula Vista CA 06/03/2019 Phh Mortgage Services - Lehman Sasco 2006 Bc2 1,741
3854 E Trenton Lane Clovis CA 05/13/2019 Freddie Mac 1,586
135 Larkspur Ln Bonaire GA 03/22/2019 Fannie Mae 833
1010 Pleasant View Ct NW Isanti MN 08/13/2019 U. S. Bank Home Mortgage 156,981 145,600
122 Carriage Drive Birdsboro PA 08/28/2019 Midwest Loan Services - Credit Union Div 201,918 192,000 4,213
3955 N 55th Street Omaha NE 04/29/2019 Fannie Mae 5,681
10943 Saragosa Street Whittier CA 07/30/2019 Nationstar Mortgage, LLC 504,055 416,000
54 Egret Way Boynton Beach FL 08/28/2019 Wells Fargo Bank, N.A. 277,026 236,000
842 S Woodson Court Gardner KS 09/12/2019 Fannie Mae 111,519 104,000
17814 Huckleberry Dr Penn Valley CA 07/03/2019 Fannie Mae 244,952 192,000 10,087
5030 179th Ln NW Ramsey MN 06/28/2019 Fannie Mae 6,775
9751 Bankston Road Dora AL 07/22/2019 PHH Mortgage Services - 2007 RP2 69,966 70,166 200
3835 Obsidian Rd San Bernardino CA 07/26/2019 Freddie Mac 391,513 332,000 3,939
42720 Yosemite Springs Dr Coarsegold CA 06/13/2019 Fannie Mae 7,400
2454 Lady Palm Dr Rio Grande City TX 06/13/2019 Fannie Mae 3,615
4318 Berry Bend Lane Richmond TX 09/09/2019 Freddie Mac 342,988 272,000
8202 Mattwood Drive Richmond TX 04/15/2019 Fannie Mae 7,265
210 103rd Ave NW Coon Rapids MN 08/28/2019 Fannie Mae 219,141 192,000
5676 Pawnee Road S Virginia Beach VA 03/15/2019 Fannie Mae 3,942
1311 Seagler Pond Ln Houston TX 06/19/2019 Fannie Mae 4,899
10922 Seneca St Houston TX 06/03/2019 Freddie Mac 3,687
1764 Prodan Lane Virginia Beach VA 05/31/2019 Fannie Mae 25,862
6279 Letson Farm Trail Bessemer AL 08/01/2019 Fannie Mae 196,036 180,000
7038 Tara Drive Villa Rica GA 08/07/2019 Fannie Mae 210,566 158,800
25 Cloverdale Circle Crossville TN 06/10/2019 Fannie Mae 46,256
3925 Sunrise Dr S Saint Petersburg FL 06/13/2019 Waterstone Bank, Ssb 714
0199999. Acquired by Purchase 4,411,939 3,764,966 330,517
0399999 - Totals 4,411,939 3,764,966 330,517
E01
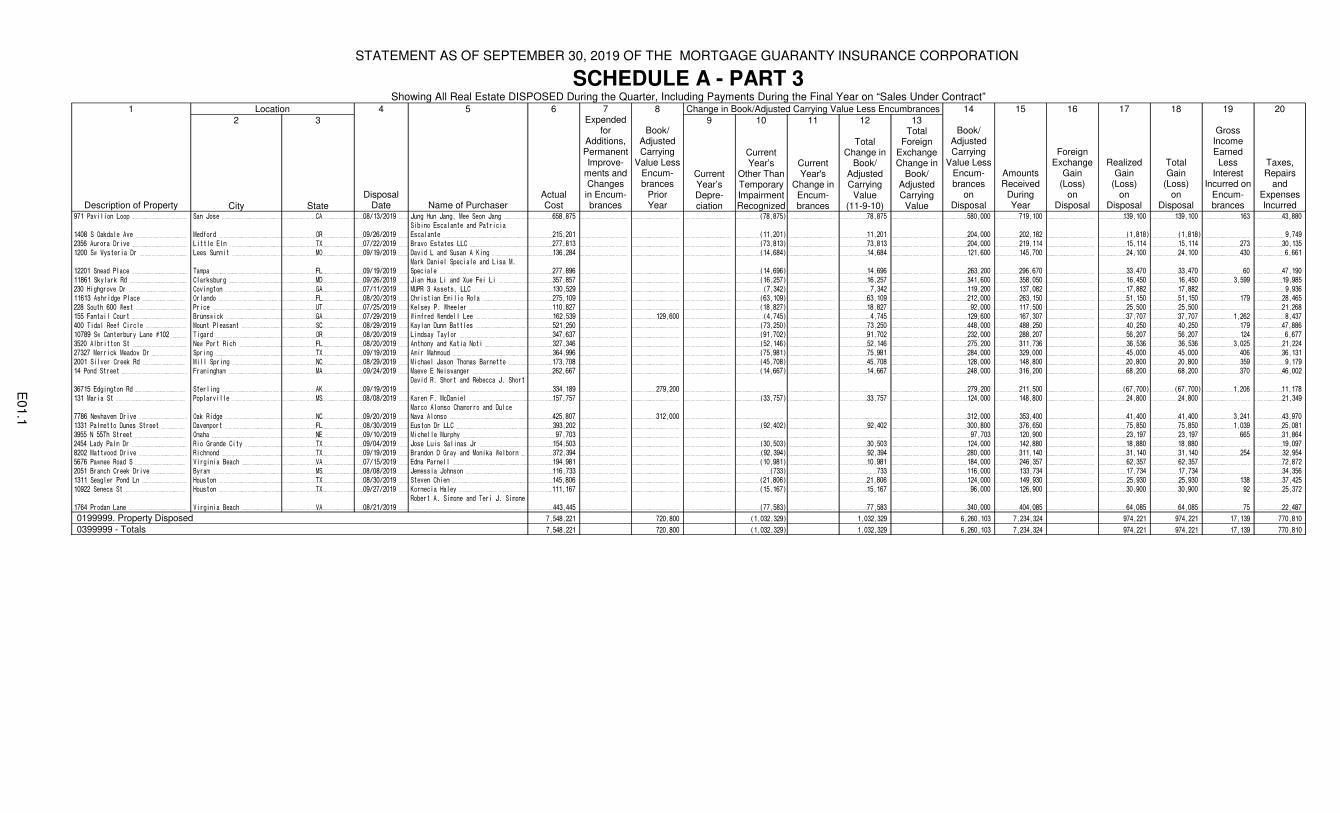
STATEMENT AS OF SEPTEMBER 30, 2019 OF THE MORTGAGE GUARANTY INSURANCE CORPORATION
SCHEDULE A - PART 3Showing All Real Estate DISPOSED During the Quarter, Including Payments During the Final Year on “Sales Under Contract”
1 Location 4 5 6 7 8 Change in Book/Adjusted Carrying Value Less Encumbrances 14 15 16 17 18 19 20
Description of Property
2
City
3
StateDisposal
Date Name of PurchaserActualCost
Expended for
Additions, Permanent Improve-
ments and Changesin Encum-brances
Book/Adjusted Carrying
Value Less Encum-brances
PriorYear
9
Current Year’sDepre-ciation
10
Current Year’s
Other Than Temporary Impairment Recognized
11
Current Year's
Change in Encum-brances
12
Total Change in
Book/Adjusted Carrying
Value(11-9-10)
13Total
Foreign Exchange Change in
Book/Adjusted Carrying
Value
Book/Adjusted Carrying
Value Less Encum-brances
onDisposal
Amounts Received
DuringYear
Foreign Exchange
Gain(Loss)
onDisposal
RealizedGain
(Loss)on
Disposal
TotalGain
(Loss)on
Disposal
Gross Income Earned Less
Interest Incurred on
Encum-brances
Taxes, Repairs
and Expenses Incurred
971 Pavilion Loop San Jose CA 08/13/2019 Jung Hun Jang, Mee Seon Jang 658,875 (78,875) 78,875 580,000 719,100 139,100 139,100 163 43,880
1408 S Oakdale Ave Medford OR 09/26/2019
Sibino Escalante and Patricia
Escalante 215,201 (11,201) 11,201 204,000 202,182 (1,818) (1,818) 9,749
2356 Aurora Drive Little Elm TX 07/22/2019 Bravo Estates LLC 277,813 (73,813) 73,813 204,000 219,114 15,114 15,114 273 30,135
1200 Sw Wysteria Dr Lees Summit MO 09/19/2019 David L and Susan A King 136,284 (14,684) 14,684 121,600 145,700 24,100 24,100 430 6,661
12201 Snead Place Tampa FL 09/19/2019
Mark Daniel Speciale and Lisa M.
Speciale 277,896 (14,696) 14,696 263,200 296,670 33,470 33,470 60 47,190
11861 Skylark Rd Clarksburg MD 09/26/2019 Jian Hua Li and Xue Fei Li 357,857 (16,257) 16,257 341,600 358,050 16,450 16,450 3,599 19,985
230 Highgrove Dr Covington GA 07/11/2019 MUPR 3 Assets, LLC 130,529 (7,342) 7,342 119,200 137,082 17,882 17,882 9,936
11613 Ashridge Place Orlando FL 08/20/2019 Christian Emilio Rola 275,109 (63,109) 63,109 212,000 263,150 51,150 51,150 179 28,465
228 South 600 West Price UT 07/25/2019 Kelsey P. Wheeler 110,827 (18,827) 18,827 92,000 117,500 25,500 25,500 21,268
155 Fantail Court Brunswick GA 07/29/2019 Winfred Wendell Lee 162,539 129,600 (4,745) 4,745 129,600 167,307 37,707 37,707 1,262 8,437
400 Tidal Reef Circle Mount Pleasant SC 08/29/2019 Kaylan Dunn Battles 521,250 (73,250) 73,250 448,000 488,250 40,250 40,250 179 47,886
10789 Sw Canterbury Lane #102 Tigard OR 08/20/2019 Lindsay Taylor 347,637 (91,702) 91,702 232,000 288,207 56,207 56,207 124 6,677
3520 Albritton St New Port Rich FL 08/20/2019 Anthony and Katia Noti 327,346 (52,146) 52,146 275,200 311,736 36,536 36,536 3,025 21,224
27327 Merrick Meadow Dr Spring TX 09/19/2019 Amir Mahmoud 364,996 (75,981) 75,981 284,000 329,000 45,000 45,000 406 36,131
2001 Silver Creek Rd Mill Spring NC 08/29/2019 Michael Jason Thomas Barnette 173,708 (45,708) 45,708 128,000 148,800 20,800 20,800 359 9,179
14 Pond Street Framingham MA 09/24/2019 Maeve E Neiswanger 262,667 (14,667) 14,667 248,000 316,200 68,200 68,200 370 46,002
36715 Edgington Rd Sterling AK 09/19/2019
David R. Short and Rebecca J. Short
334,189 279,200 279,200 211,500 (67,700) (67,700) 1,206 11,178
131 Maria St Poplarville MS 08/08/2019 Karen F. McDaniel 157,757 (33,757) 33,757 124,000 148,800 24,800 24,800 21,349
7786 Newhaven Drive Oak Ridge NC 09/20/2019
Marco Alonso Chamorro and Dulce
Nava Alonso 425,807 312,000 312,000 353,400 41,400 41,400 3,241 43,970
1331 Palmetto Dunes Street Davenport FL 08/30/2019 Euston Dr LLC 393,202 (92,402) 92,402 300,800 376,650 75,850 75,850 1,039 25,081
3955 N 55Th Street Omaha NE 09/10/2019 Michelle Murphy 97,703 97,703 120,900 23,197 23,197 665 31,864
2454 Lady Palm Dr Rio Grande City TX 09/04/2019 Jose Luis Salinas Jr 154,503 (30,503) 30,503 124,000 142,880 18,880 18,880 19,097
8202 Mattwood Drive Richmond TX 09/19/2019 Brandon D Gray and Monika Welborn 372,394 (92,394) 92,394 280,000 311,140 31,140 31,140 254 32,954
5676 Pawnee Road S Virginia Beach VA 07/15/2019 Edna Parnell 194,981 (10,981) 10,981 184,000 246,357 62,357 62,357 72,872
2051 Branch Creek Drive Byram MS 08/08/2019 Jemessia Johnson 116,733 (733) 733 116,000 133,734 17,734 17,734 34,356
1311 Seagler Pond Ln Houston TX 08/30/2019 Steven Chiem 145,806 (21,806) 21,806 124,000 149,930 25,930 25,930 138 37,425
10922 Seneca St Houston TX 09/27/2019 Kormecia Haley 111,167 (15,167) 15,167 96,000 126,900 30,900 30,900 92 25,372
1764 Prodan Lane Virginia Beach VA 08/21/2019
Robert A. Simone and Teri J. Simone
443,445 (77,583) 77,583 340,000 404,085 64,085 64,085 75 22,487
0199999. Property Disposed 7,548,221 720,800 (1,032,329) 1,032,329 6,260,103 7,234,324 974,221 974,221 17,139 770,810
0399999 - Totals 7,548,221 720,800 (1,032,329) 1,032,329 6,260,103 7,234,324 974,221 974,221 17,139 770,810
E01.1

STATEMENT AS OF SEPTEMBER 30, 2019 OF THE MORTGAGE GUARANTY INSURANCE CORPORATION
Schedule B - Part 2 - Mortgage Loans Acquired and Additions Made
N O N E
Schedule B - Part 3 - Mortgage Loans Disposed, Transferred or Repaid
N O N E
Schedule BA - Part 2 - Other Long-Term Invested Assets Acquired and Additions Made
N O N E
Schedule BA - Part 3 - Other Long-Term Invested Assets Disposed, Transferred or Repaid
N O N E
E02, E03
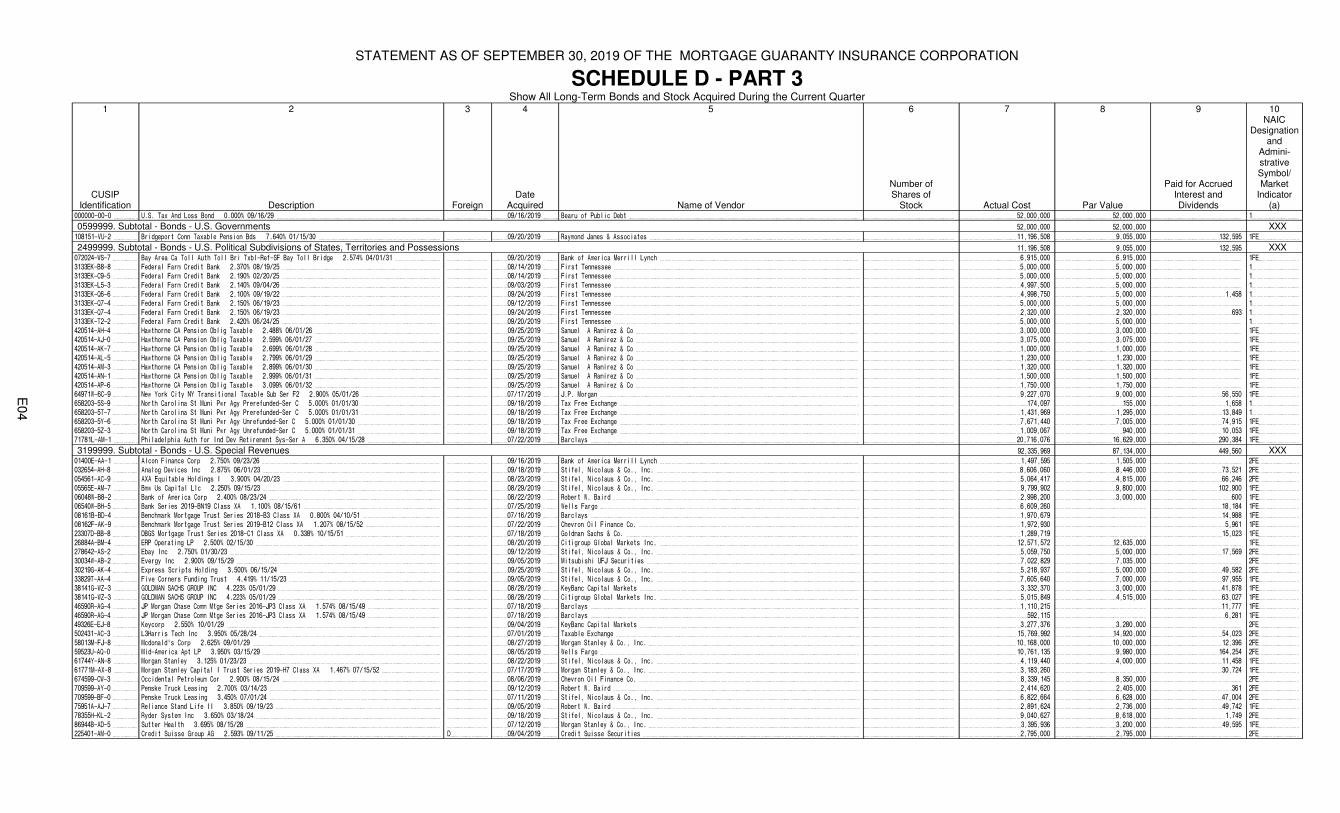
STATEMENT AS OF SEPTEMBER 30, 2019 OF THE MORTGAGE GUARANTY INSURANCE CORPORATION
SCHEDULE D - PART 3Show All Long-Term Bonds and Stock Acquired During the Current Quarter
1
CUSIP Identification
2
Description
3
Foreign
4
DateAcquired
5
Name of Vendor
6
Number ofShares of
Stock
7
Actual Cost
8
Par Value
9
Paid for Accrued Interest andDividends
10NAIC
Designation and
Admini-strative Symbol/Market
Indicator(a)
000000-00-0 U.S. Tax And Loss Bond 0.000% 09/16/29 09/16/2019 Bearu of Public Debt 52,000,000 52,000,000 1
0599999. Subtotal - Bonds - U.S. Governments 52,000,000 52,000,000 XXX108151-VU-2 Bridgeport Conn Taxable Pension Bds 7.640% 01/15/30 09/20/2019 Raymond James & Associates 11,196,508 9,055,000 132,595 1FE
2499999. Subtotal - Bonds - U.S. Political Subdivisions of States, Territories and Possessions 11,196,508 9,055,000 132,595 XXX072024-WS-7 Bay Area Ca Toll Auth Toll Bri Txbl-Ref-SF Bay Toll Bridge 2.574% 04/01/31 09/20/2019 Bank of America Merrill Lynch 6,915,000 6,915,000 1FE
3133EK-B8-8 Federal Farm Credit Bank 2.370% 08/19/25 08/14/2019 First Tennessee 5,000,000 5,000,000 1
3133EK-C9-5 Federal Farm Credit Bank 2.190% 02/20/25 08/14/2019 First Tennessee 5,000,000 5,000,000 1
3133EK-L5-3 Federal Farm Credit Bank 2.140% 09/04/26 09/03/2019 First Tennessee 4,997,500 5,000,000 1
3133EK-Q6-6 Federal Farm Credit Bank 2.100% 09/19/22 09/24/2019 First Tennessee 4,998,750 5,000,000 1,458 1
3133EK-Q7-4 Federal Farm Credit Bank 2.150% 06/19/23 09/12/2019 First Tennessee 5,000,000 5,000,000 1
3133EK-Q7-4 Federal Farm Credit Bank 2.150% 06/19/23 09/24/2019 First Tennessee 2,320,000 2,320,000 693 1
3133EK-T2-2 Federal Farm Credit Bank 2.420% 06/24/25 09/20/2019 First Tennessee 5,000,000 5,000,000 1
420514-AH-4 Hawthorne CA Pension Oblig Taxable 2.488% 06/01/26 09/25/2019 Samuel A Ramirez & Co 3,000,000 3,000,000 1FE
420514-AJ-0 Hawthorne CA Pension Oblig Taxable 2.599% 06/01/27 09/25/2019 Samuel A Ramirez & Co 3,075,000 3,075,000 1FE
420514-AK-7 Hawthorne CA Pension Oblig Taxable 2.699% 06/01/28 09/25/2019 Samuel A Ramirez & Co 1,000,000 1,000,000 1FE
420514-AL-5 Hawthorne CA Pension Oblig Taxable 2.799% 06/01/29 09/25/2019 Samuel A Ramirez & Co 1,230,000 1,230,000 1FE
420514-AM-3 Hawthorne CA Pension Oblig Taxable 2.899% 06/01/30 09/25/2019 Samuel A Ramirez & Co 1,320,000 1,320,000 1FE
420514-AN-1 Hawthorne CA Pension Oblig Taxable 2.999% 06/01/31 09/25/2019 Samuel A Ramirez & Co 1,500,000 1,500,000 1FE
420514-AP-6 Hawthorne CA Pension Oblig Taxable 3.099% 06/01/32 09/25/2019 Samuel A Ramirez & Co 1,750,000 1,750,000 1FE
64971W-6C-9 New York City NY Transitional Taxable Sub Ser F2 2.900% 05/01/26 07/17/2019 J.P. Morgan 9,227,070 9,000,000 56,550 1FE
658203-5S-9 North Carolina St Muni Pwr Agy Prerefunded-Ser C 5.000% 01/01/30 09/18/2019 Tax Free Exchange 174,097 155,000 1,658 1
658203-5T-7 North Carolina St Muni Pwr Agy Prerefunded-Ser C 5.000% 01/01/31 09/18/2019 Tax Free Exchange 1,431,969 1,295,000 13,849 1
658203-5Y-6 North Carolina St Muni Pwr Agy Unrefunded-Ser C 5.000% 01/01/30 09/18/2019 Tax Free Exchange 7,671,440 7,005,000 74,915 1FE
658203-5Z-3 North Carolina St Muni Pwr Agy Unrefunded-Ser C 5.000% 01/01/31 09/18/2019 Tax Free Exchange 1,009,067 940,000 10,053 1FE
71781L-AM-1 Philadelphia Auth for Ind Dev Retirement Sys-Ser A 6.350% 04/15/28 07/22/2019 Barclays 20,716,076 16,629,000 290,384 1FE
3199999. Subtotal - Bonds - U.S. Special Revenues 92,335,969 87,134,000 449,560 XXX01400E-AA-1 Alcon Finance Corp 2.750% 09/23/26 09/16/2019 Bank of America Merrill Lynch 1,497,595 1,505,000 2FE
032654-AH-8 Analog Devices Inc 2.875% 06/01/23 09/18/2019 Stifel, Nicolaus & Co., Inc. 8,606,060 8,446,000 73,521 2FE
054561-AC-9 AXA Equitable Holdings I 3.900% 04/20/23 08/23/2019 Stifel, Nicolaus & Co., Inc. 5,064,417 4,815,000 66,246 2FE
05565E-AM-7 Bmw Us Capital Llc 2.250% 09/15/23 08/29/2019 Stifel, Nicolaus & Co., Inc. 9,799,902 9,800,000 102,900 1FE
06048W-B8-2 Bank of America Corp 2.400% 08/23/24 08/22/2019 Robert W. Baird 2,998,200 3,000,000 600 1FE
06540W-BH-5 Bank Series 2019-BN19 Class XA 1.100% 08/15/61 07/25/2019 Wells Fargo 6,609,260 18,184 1FE
08161B-BD-4 Benchmark Mortgage Trust Series 2018-B3 Class XA 0.800% 04/10/51 07/16/2019 Barclays 1,970,679 14,988 1FE
08162F-AK-9 Benchmark Mortgage Trust Series 2019-B12 Class XA 1.207% 08/15/52 07/22/2019 Chevron Oil Finance Co. 1,972,930 5,961 1FE
23307D-BB-8 DBGS Mortgage Trust Series 2018-C1 Class XA 0.338% 10/15/51 07/18/2019 Goldman Sachs & Co. 1,289,719 15,023 1FE
26884A-BM-4 ERP Operating LP 2.500% 02/15/30 08/20/2019 Citigroup Global Markets Inc. 12,571,572 12,635,000 1FE
278642-AS-2 Ebay Inc 2.750% 01/30/23 09/12/2019 Stifel, Nicolaus & Co., Inc. 5,059,750 5,000,000 17,569 2FE
30034W-AB-2 Evergy Inc 2.900% 09/15/29 09/05/2019 Mitsubishi UFJ Securities 7,022,829 7,035,000 2FE
30219G-AK-4 Express Scripts Holding 3.500% 06/15/24 09/25/2019 Stifel, Nicolaus & Co., Inc. 5,218,937 5,000,000 49,582 2FE
33829T-AA-4 Five Corners Funding Trust 4.419% 11/15/23 09/05/2019 Stifel, Nicolaus & Co., Inc. 7,605,640 7,000,000 97,955 1FE
38141G-WZ-3 GOLDMAN SACHS GROUP INC 4.223% 05/01/29 08/28/2019 KeyBanc Capital Markets 3,332,370 3,000,000 41,878 1FE
38141G-WZ-3 GOLDMAN SACHS GROUP INC 4.223% 05/01/29 08/28/2019 Citigroup Global Markets Inc. 5,015,849 4,515,000 63,027 1FE
46590R-AG-4 JP Morgan Chase Comm Mtge Series 2016-JP3 Class XA 1.574% 08/15/49 07/18/2019 Barclays 1,110,215 11,777 1FE
46590R-AG-4 JP Morgan Chase Comm Mtge Series 2016-JP3 Class XA 1.574% 08/15/49 07/18/2019 Barclays 592,115 6,281 1FE
49326E-EJ-8 Keycorp 2.550% 10/01/29 09/04/2019 KeyBanc Capital Markets 3,277,376 3,280,000 2FE
502431-AC-3 L3Harris Tech Inc 3.950% 05/28/24 07/01/2019 Taxable Exchange 15,769,992 14,920,000 54,023 2FE
58013M-FJ-8 Mcdonald's Corp 2.625% 09/01/29 08/27/2019 Morgan Stanley & Co., Inc. 10,168,000 10,000,000 12,396 2FE
59523U-AQ-0 Mid-America Apt LP 3.950% 03/15/29 08/05/2019 Wells Fargo 10,761,135 9,980,000 164,254 2FE
61744Y-AN-8 Morgan Stanley 3.125% 01/23/23 08/22/2019 Stifel, Nicolaus & Co., Inc. 4,119,440 4,000,000 11,458 1FE
61771M-AX-8 Morgan Stanley Capital I Trust Series 2019-H7 Class XA 1.467% 07/15/52 07/17/2019 Morgan Stanley & Co., Inc. 3,183,260 30,724 1FE
674599-CW-3 Occidental Petroleum Cor 2.900% 08/15/24 08/06/2019 Chevron Oil Finance Co. 8,339,145 8,350,000 2FE
709599-AY-0 Penske Truck Leasing 2.700% 03/14/23 09/12/2019 Robert W. Baird 2,414,620 2,405,000 361 2FE
709599-BF-0 Penske Truck Leasing 3.450% 07/01/24 07/11/2019 Stifel, Nicolaus & Co., Inc. 6,822,664 6,628,000 47,004 2FE
75951A-AJ-7 Reliance Stand Life II 3.850% 09/19/23 09/05/2019 Robert W. Baird 2,891,624 2,736,000 49,742 1FE
78355H-KL-2 Ryder System Inc 3.650% 03/18/24 09/18/2019 Stifel, Nicolaus & Co., Inc. 9,040,627 8,618,000 1,749 2FE
86944B-AD-5 Sutter Health 3.695% 08/15/28 07/12/2019 Morgan Stanley & Co., Inc. 3,395,936 3,200,000 49,595 1FE
225401-AM-0 Credit Suisse Group AG 2.593% 09/11/25 D 09/04/2019 Credit Suisse Securities 2,795,000 2,795,000 2FE
E04
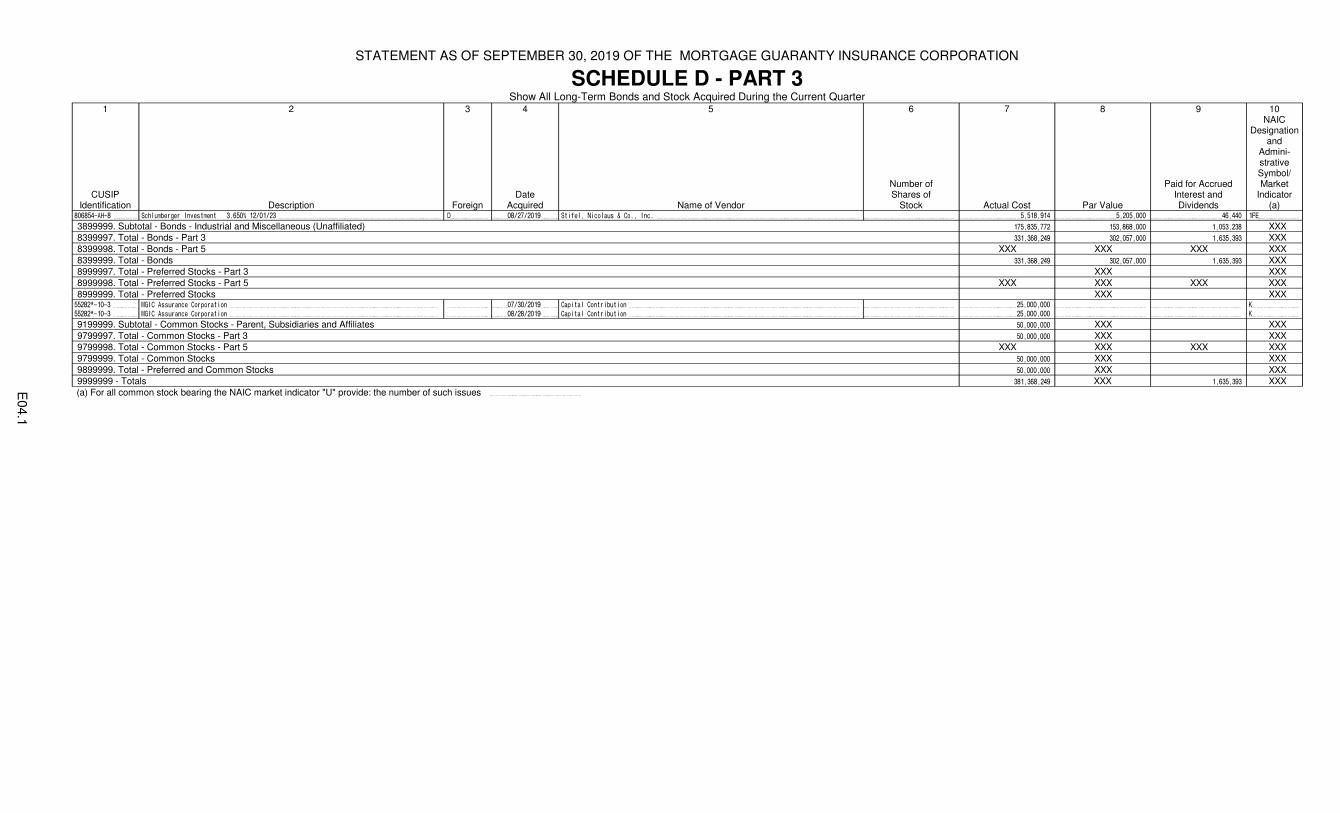
STATEMENT AS OF SEPTEMBER 30, 2019 OF THE MORTGAGE GUARANTY INSURANCE CORPORATION
SCHEDULE D - PART 3Show All Long-Term Bonds and Stock Acquired During the Current Quarter
1
CUSIP Identification
2
Description
3
Foreign
4
DateAcquired
5
Name of Vendor
6
Number ofShares of
Stock
7
Actual Cost
8
Par Value
9
Paid for Accrued Interest andDividends
10NAIC
Designation and
Admini-strative Symbol/Market
Indicator(a)
806854-AH-8 Schlumberger Investment 3.650% 12/01/23 D 08/27/2019 Stifel, Nicolaus & Co., Inc. 5,518,914 5,205,000 46,440 1FE
3899999. Subtotal - Bonds - Industrial and Miscellaneous (Unaffiliated) 175,835,772 153,868,000 1,053,238 XXX8399997. Total - Bonds - Part 3 331,368,249 302,057,000 1,635,393 XXX8399998. Total - Bonds - Part 5 XXX XXX XXX XXX8399999. Total - Bonds 331,368,249 302,057,000 1,635,393 XXX8999997. Total - Preferred Stocks - Part 3 XXX XXX8999998. Total - Preferred Stocks - Part 5 XXX XXX XXX XXX8999999. Total - Preferred Stocks XXX XXX55282*-10-3 MGIC Assurance Corporation 07/30/2019 Capital Contribution 25,000,000 K
55282*-10-3 MGIC Assurance Corporation 08/28/2019 Capital Contribution 25,000,000 K
9199999. Subtotal - Common Stocks - Parent, Subsidiaries and Affiliates 50,000,000 XXX XXX9799997. Total - Common Stocks - Part 3 50,000,000 XXX XXX9799998. Total - Common Stocks - Part 5 XXX XXX XXX XXX9799999. Total - Common Stocks 50,000,000 XXX XXX9899999. Total - Preferred and Common Stocks 50,000,000 XXX XXX9999999 - Totals 381,368,249 XXX 1,635,393 XXX(a) For all common stock bearing the NAIC market indicator "U" provide: the number of such issues
E04.1
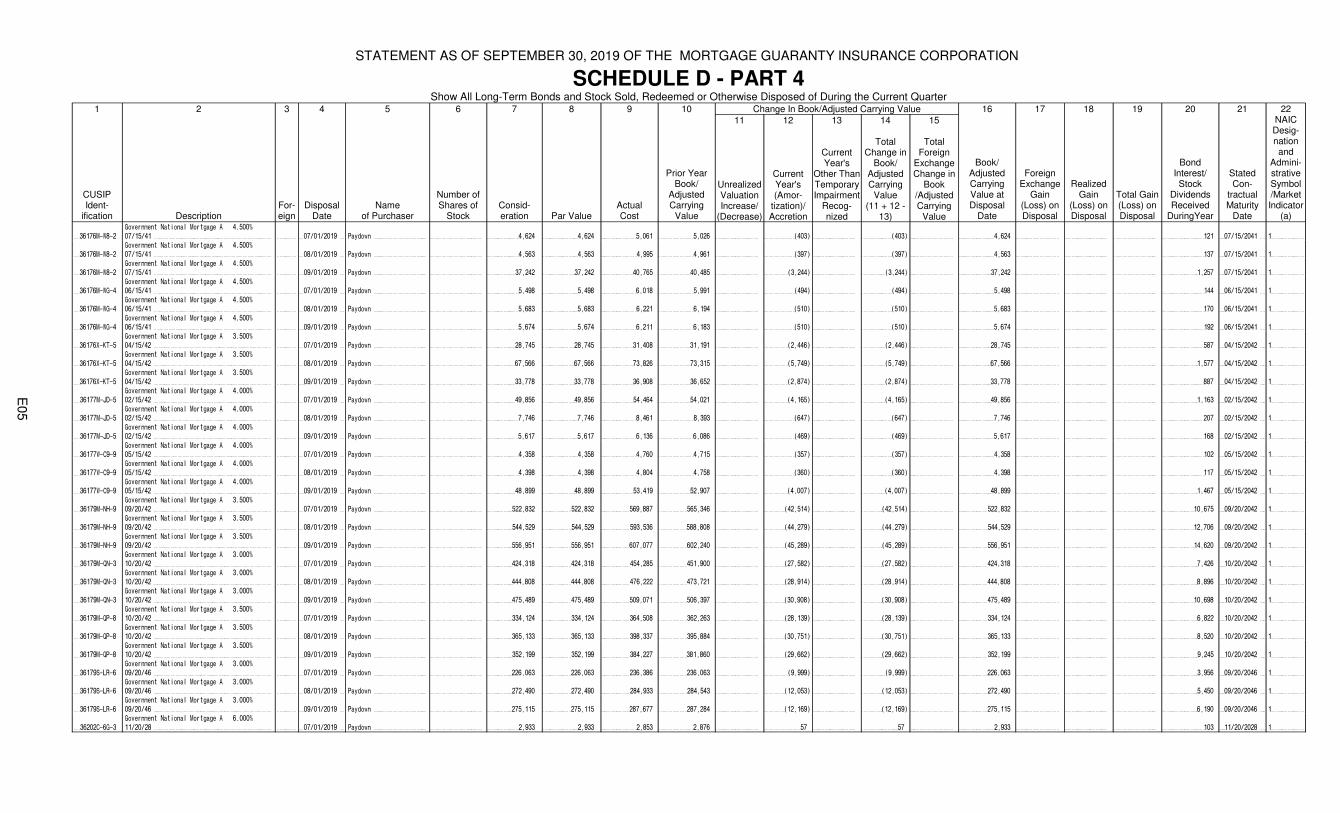
STATEMENT AS OF SEPTEMBER 30, 2019 OF THE MORTGAGE GUARANTY INSURANCE CORPORATION
SCHEDULE D - PART 4Show All Long-Term Bonds and Stock Sold, Redeemed or Otherwise Disposed of During the Current Quarter
1 2 3 4 5 6 7 8 9 10 Change In Book/Adjusted Carrying Value 16 17 18 19 20 21 22
CUSIPIdent-
ification DescriptionFor-eign
DisposalDate
Nameof Purchaser
Number of Shares of
StockConsid-eration Par Value
ActualCost
Prior YearBook/
Adjusted Carrying
Value
11
Unrealized Valuation Increase/
(Decrease)
12
Current Year's (Amor-
tization)/Accretion
13
Current Year's
Other Than Temporary Impairment
Recog-nized
14
TotalChange in
Book/Adjusted Carrying
Value(11 + 12 -
13)
15
TotalForeign
Exchange Change in
Book /Adjusted Carrying
Value
Book/Adjusted Carrying Value at Disposal
Date
Foreign Exchange
Gain (Loss) on Disposal
Realized Gain
(Loss) on Disposal
Total Gain (Loss) on Disposal
Bond Interest/ Stock
Dividends Received
DuringYear
StatedCon-
tractualMaturity
Date
NAICDesig-nation and
Admini-strative Symbol/Market Indicator
(a)
36176M-W8-2
Government National Mortgage A 4.500%
07/15/41 07/01/2019 Paydown 4,624 4,624 5,061 5,026 (403) (403) 4,624 121 07/15/2041 1
36176M-W8-2
Government National Mortgage A 4.500%
07/15/41 08/01/2019 Paydown 4,563 4,563 4,995 4,961 (397) (397) 4,563 137 07/15/2041 1
36176M-W8-2
Government National Mortgage A 4.500%
07/15/41 09/01/2019 Paydown 37,242 37,242 40,765 40,485 (3,244) (3,244) 37,242 1,257 07/15/2041 1
36176M-WG-4
Government National Mortgage A 4.500%
06/15/41 07/01/2019 Paydown 5,498 5,498 6,018 5,991 (494) (494) 5,498 144 06/15/2041 1
36176M-WG-4
Government National Mortgage A 4.500%
06/15/41 08/01/2019 Paydown 5,683 5,683 6,221 6,194 (510) (510) 5,683 170 06/15/2041 1
36176M-WG-4
Government National Mortgage A 4.500%
06/15/41 09/01/2019 Paydown 5,674 5,674 6,211 6,183 (510) (510) 5,674 192 06/15/2041 1
36176X-KT-5
Government National Mortgage A 3.500%
04/15/42 07/01/2019 Paydown 28,745 28,745 31,408 31,191 (2,446) (2,446) 28,745 587 04/15/2042 1
36176X-KT-5
Government National Mortgage A 3.500%
04/15/42 08/01/2019 Paydown 67,566 67,566 73,826 73,315 (5,749) (5,749) 67,566 1,577 04/15/2042 1
36176X-KT-5
Government National Mortgage A 3.500%
04/15/42 09/01/2019 Paydown 33,778 33,778 36,908 36,652 (2,874) (2,874) 33,778 887 04/15/2042 1
36177M-JD-5
Government National Mortgage A 4.000%
02/15/42 07/01/2019 Paydown 49,856 49,856 54,464 54,021 (4,165) (4,165) 49,856 1,163 02/15/2042 1
36177M-JD-5
Government National Mortgage A 4.000%
02/15/42 08/01/2019 Paydown 7,746 7,746 8,461 8,393 (647) (647) 7,746 207 02/15/2042 1
36177M-JD-5
Government National Mortgage A 4.000%
02/15/42 09/01/2019 Paydown 5,617 5,617 6,136 6,086 (469) (469) 5,617 168 02/15/2042 1
36177W-C9-9
Government National Mortgage A 4.000%
05/15/42 07/01/2019 Paydown 4,358 4,358 4,760 4,715 (357) (357) 4,358 102 05/15/2042 1
36177W-C9-9
Government National Mortgage A 4.000%
05/15/42 08/01/2019 Paydown 4,398 4,398 4,804 4,758 (360) (360) 4,398 117 05/15/2042 1
36177W-C9-9
Government National Mortgage A 4.000%
05/15/42 09/01/2019 Paydown 48,899 48,899 53,419 52,907 (4,007) (4,007) 48,899 1,467 05/15/2042 1
36179M-NH-9
Government National Mortgage A 3.500%
09/20/42 07/01/2019 Paydown 522,832 522,832 569,887 565,346 (42,514) (42,514) 522,832 10,675 09/20/2042 1
36179M-NH-9
Government National Mortgage A 3.500%
09/20/42 08/01/2019 Paydown 544,529 544,529 593,536 588,808 (44,279) (44,279) 544,529 12,706 09/20/2042 1
36179M-NH-9
Government National Mortgage A 3.500%
09/20/42 09/01/2019 Paydown 556,951 556,951 607,077 602,240 (45,289) (45,289) 556,951 14,620 09/20/2042 1
36179M-QN-3
Government National Mortgage A 3.000%
10/20/42 07/01/2019 Paydown 424,318 424,318 454,285 451,900 (27,582) (27,582) 424,318 7,426 10/20/2042 1
36179M-QN-3
Government National Mortgage A 3.000%
10/20/42 08/01/2019 Paydown 444,808 444,808 476,222 473,721 (28,914) (28,914) 444,808 8,896 10/20/2042 1
36179M-QN-3
Government National Mortgage A 3.000%
10/20/42 09/01/2019 Paydown 475,489 475,489 509,071 506,397 (30,908) (30,908) 475,489 10,698 10/20/2042 1
36179M-QP-8
Government National Mortgage A 3.500%
10/20/42 07/01/2019 Paydown 334,124 334,124 364,508 362,263 (28,139) (28,139) 334,124 6,822 10/20/2042 1
36179M-QP-8
Government National Mortgage A 3.500%
10/20/42 08/01/2019 Paydown 365,133 365,133 398,337 395,884 (30,751) (30,751) 365,133 8,520 10/20/2042 1
36179M-QP-8
Government National Mortgage A 3.500%
10/20/42 09/01/2019 Paydown 352,199 352,199 384,227 381,860 (29,662) (29,662) 352,199 9,245 10/20/2042 1
36179S-LR-6
Government National Mortgage A 3.000%
09/20/46 07/01/2019 Paydown 226,063 226,063 236,386 236,063 (9,999) (9,999) 226,063 3,956 09/20/2046 1
36179S-LR-6
Government National Mortgage A 3.000%
09/20/46 08/01/2019 Paydown 272,490 272,490 284,933 284,543 (12,053) (12,053) 272,490 5,450 09/20/2046 1
36179S-LR-6
Government National Mortgage A 3.000%
09/20/46 09/01/2019 Paydown 275,115 275,115 287,677 287,284 (12,169) (12,169) 275,115 6,190 09/20/2046 1
36202C-6G-3
Government National Mortgage A 6.000%
11/20/28 07/01/2019 Paydown 2,933 2,933 2,853 2,876 57 57 2,933 103 11/20/2028 1
E05
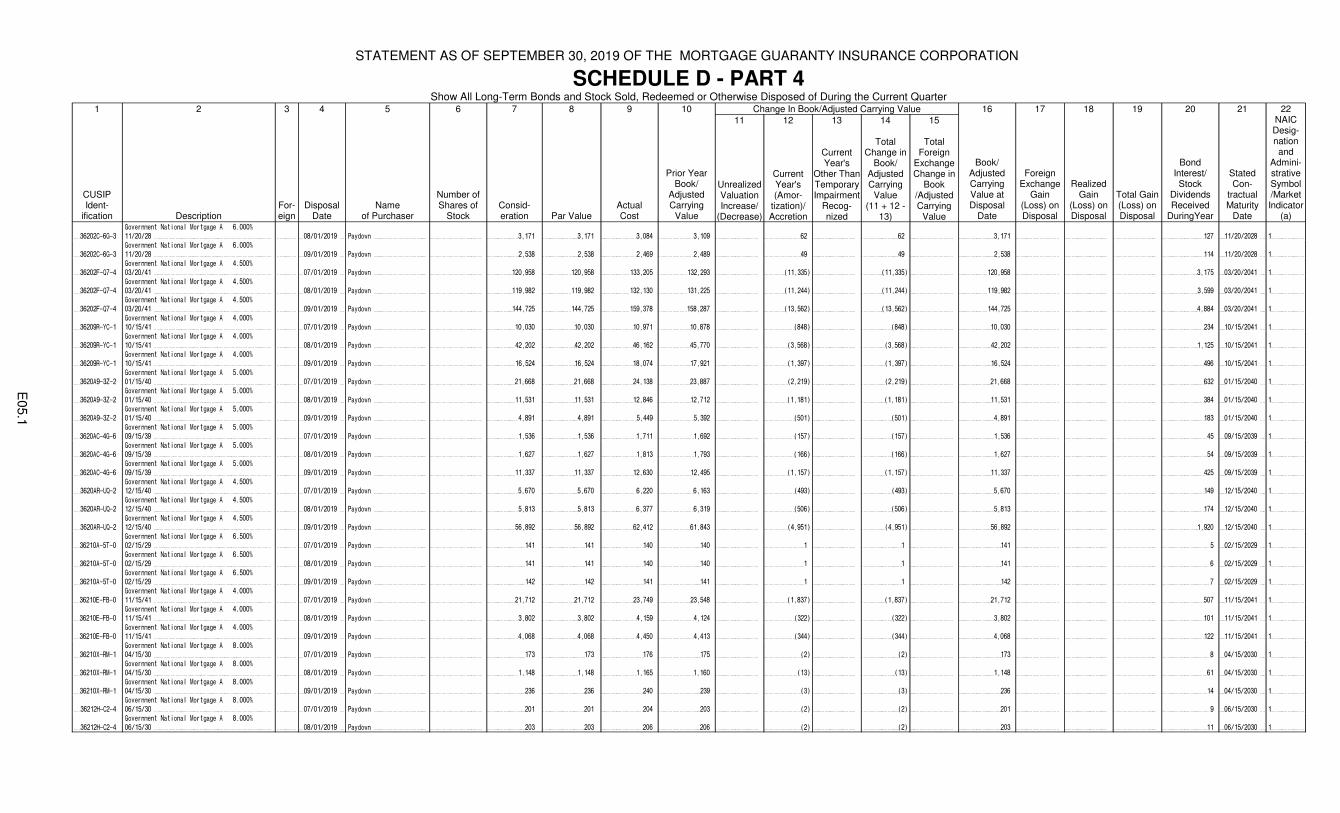
STATEMENT AS OF SEPTEMBER 30, 2019 OF THE MORTGAGE GUARANTY INSURANCE CORPORATION
SCHEDULE D - PART 4Show All Long-Term Bonds and Stock Sold, Redeemed or Otherwise Disposed of During the Current Quarter
1 2 3 4 5 6 7 8 9 10 Change In Book/Adjusted Carrying Value 16 17 18 19 20 21 22
CUSIPIdent-
ification DescriptionFor-eign
DisposalDate
Nameof Purchaser
Number of Shares of
StockConsid-eration Par Value
ActualCost
Prior YearBook/
Adjusted Carrying
Value
11
Unrealized Valuation Increase/
(Decrease)
12
Current Year's (Amor-
tization)/Accretion
13
Current Year's
Other Than Temporary Impairment
Recog-nized
14
TotalChange in
Book/Adjusted Carrying
Value(11 + 12 -
13)
15
TotalForeign
Exchange Change in
Book /Adjusted Carrying
Value
Book/Adjusted Carrying Value at Disposal
Date
Foreign Exchange
Gain (Loss) on Disposal
Realized Gain
(Loss) on Disposal
Total Gain (Loss) on Disposal
Bond Interest/ Stock
Dividends Received
DuringYear
StatedCon-
tractualMaturity
Date
NAICDesig-nation and
Admini-strative Symbol/Market Indicator
(a)
36202C-6G-3
Government National Mortgage A 6.000%
11/20/28 08/01/2019 Paydown 3,171 3,171 3,084 3,109 62 62 3,171 127 11/20/2028 1
36202C-6G-3
Government National Mortgage A 6.000%
11/20/28 09/01/2019 Paydown 2,538 2,538 2,469 2,489 49 49 2,538 114 11/20/2028 1
36202F-Q7-4
Government National Mortgage A 4.500%
03/20/41 07/01/2019 Paydown 120,958 120,958 133,205 132,293 (11,335) (11,335) 120,958 3,175 03/20/2041 1
36202F-Q7-4
Government National Mortgage A 4.500%
03/20/41 08/01/2019 Paydown 119,982 119,982 132,130 131,225 (11,244) (11,244) 119,982 3,599 03/20/2041 1
36202F-Q7-4
Government National Mortgage A 4.500%
03/20/41 09/01/2019 Paydown 144,725 144,725 159,378 158,287 (13,562) (13,562) 144,725 4,884 03/20/2041 1
36209R-YC-1
Government National Mortgage A 4.000%
10/15/41 07/01/2019 Paydown 10,030 10,030 10,971 10,878 (848) (848) 10,030 234 10/15/2041 1
36209R-YC-1
Government National Mortgage A 4.000%
10/15/41 08/01/2019 Paydown 42,202 42,202 46,162 45,770 (3,568) (3,568) 42,202 1,125 10/15/2041 1
36209R-YC-1
Government National Mortgage A 4.000%
10/15/41 09/01/2019 Paydown 16,524 16,524 18,074 17,921 (1,397) (1,397) 16,524 496 10/15/2041 1
3620A9-3Z-2
Government National Mortgage A 5.000%
01/15/40 07/01/2019 Paydown 21,668 21,668 24,138 23,887 (2,219) (2,219) 21,668 632 01/15/2040 1
3620A9-3Z-2
Government National Mortgage A 5.000%
01/15/40 08/01/2019 Paydown 11,531 11,531 12,846 12,712 (1,181) (1,181) 11,531 384 01/15/2040 1
3620A9-3Z-2
Government National Mortgage A 5.000%
01/15/40 09/01/2019 Paydown 4,891 4,891 5,449 5,392 (501) (501) 4,891 183 01/15/2040 1
3620AC-4G-6
Government National Mortgage A 5.000%
09/15/39 07/01/2019 Paydown 1,536 1,536 1,711 1,692 (157) (157) 1,536 45 09/15/2039 1
3620AC-4G-6
Government National Mortgage A 5.000%
09/15/39 08/01/2019 Paydown 1,627 1,627 1,813 1,793 (166) (166) 1,627 54 09/15/2039 1
3620AC-4G-6
Government National Mortgage A 5.000%
09/15/39 09/01/2019 Paydown 11,337 11,337 12,630 12,495 (1,157) (1,157) 11,337 425 09/15/2039 1
3620AR-UQ-2
Government National Mortgage A 4.500%
12/15/40 07/01/2019 Paydown 5,670 5,670 6,220 6,163 (493) (493) 5,670 149 12/15/2040 1
3620AR-UQ-2
Government National Mortgage A 4.500%
12/15/40 08/01/2019 Paydown 5,813 5,813 6,377 6,319 (506) (506) 5,813 174 12/15/2040 1
3620AR-UQ-2
Government National Mortgage A 4.500%
12/15/40 09/01/2019 Paydown 56,892 56,892 62,412 61,843 (4,951) (4,951) 56,892 1,920 12/15/2040 1
36210A-5T-0
Government National Mortgage A 6.500%
02/15/29 07/01/2019 Paydown 141 141 140 140 1 1 141 5 02/15/2029 1
36210A-5T-0
Government National Mortgage A 6.500%
02/15/29 08/01/2019 Paydown 141 141 140 140 1 1 141 6 02/15/2029 1
36210A-5T-0
Government National Mortgage A 6.500%
02/15/29 09/01/2019 Paydown 142 142 141 141 1 1 142 7 02/15/2029 1
36210E-FB-0
Government National Mortgage A 4.000%
11/15/41 07/01/2019 Paydown 21,712 21,712 23,749 23,548 (1,837) (1,837) 21,712 507 11/15/2041 1
36210E-FB-0
Government National Mortgage A 4.000%
11/15/41 08/01/2019 Paydown 3,802 3,802 4,159 4,124 (322) (322) 3,802 101 11/15/2041 1
36210E-FB-0
Government National Mortgage A 4.000%
11/15/41 09/01/2019 Paydown 4,068 4,068 4,450 4,413 (344) (344) 4,068 122 11/15/2041 1
36210X-RM-1
Government National Mortgage A 8.000%
04/15/30 07/01/2019 Paydown 173 173 176 175 (2) (2) 173 8 04/15/2030 1
36210X-RM-1
Government National Mortgage A 8.000%
04/15/30 08/01/2019 Paydown 1,148 1,148 1,165 1,160 (13) (13) 1,148 61 04/15/2030 1
36210X-RM-1
Government National Mortgage A 8.000%
04/15/30 09/01/2019 Paydown 236 236 240 239 (3) (3) 236 14 04/15/2030 1
36212H-C2-4
Government National Mortgage A 8.000%
06/15/30 07/01/2019 Paydown 201 201 204 203 (2) (2) 201 9 06/15/2030 1
36212H-C2-4
Government National Mortgage A 8.000%
06/15/30 08/01/2019 Paydown 203 203 206 206 (2) (2) 203 11 06/15/2030 1
E05.1
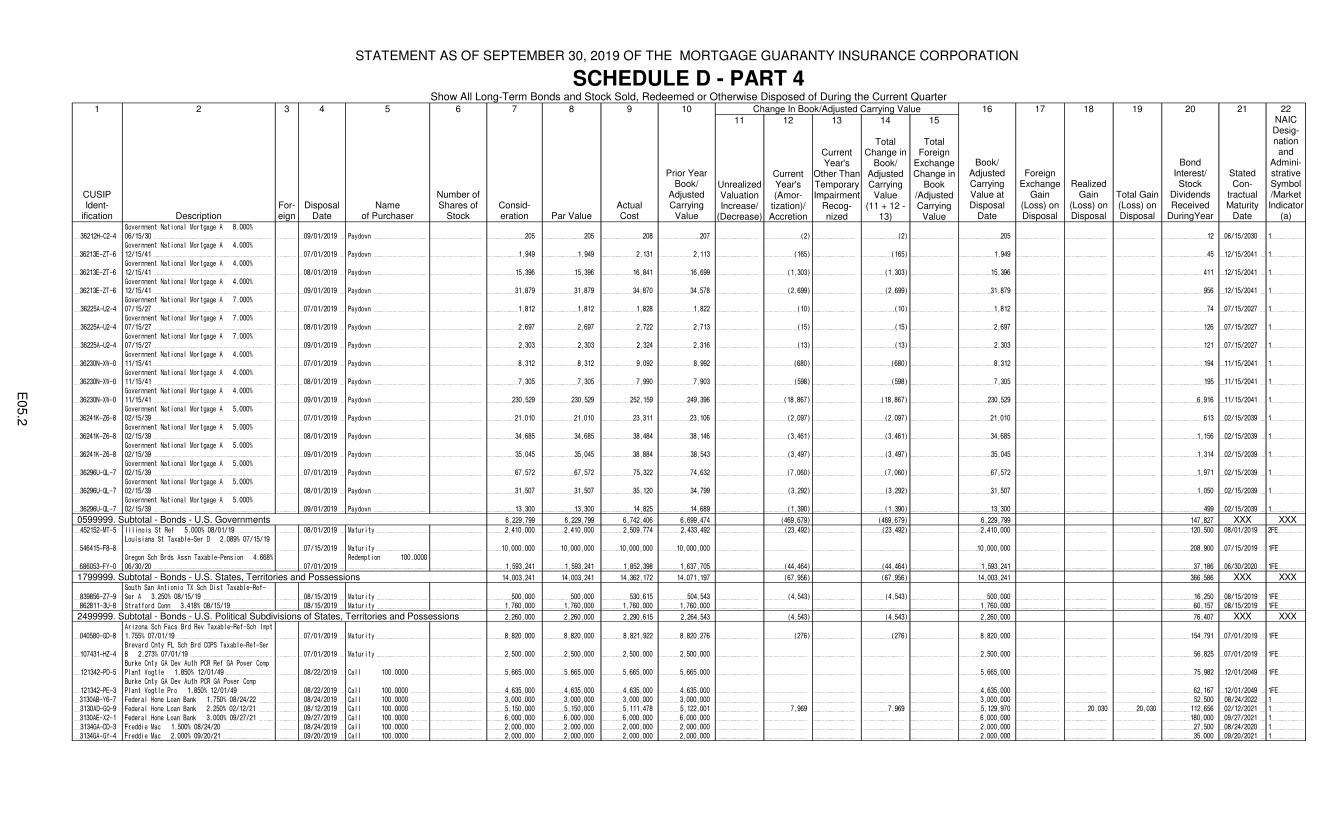
STATEMENT AS OF SEPTEMBER 30, 2019 OF THE MORTGAGE GUARANTY INSURANCE CORPORATION
SCHEDULE D - PART 4Show All Long-Term Bonds and Stock Sold, Redeemed or Otherwise Disposed of During the Current Quarter
1 2 3 4 5 6 7 8 9 10 Change In Book/Adjusted Carrying Value 16 17 18 19 20 21 22
CUSIPIdent-
ification DescriptionFor-eign
DisposalDate
Nameof Purchaser
Number of Shares of
StockConsid-eration Par Value
ActualCost
Prior YearBook/
Adjusted Carrying
Value
11
Unrealized Valuation Increase/
(Decrease)
12
Current Year's (Amor-
tization)/Accretion
13
Current Year's
Other Than Temporary Impairment
Recog-nized
14
TotalChange in
Book/Adjusted Carrying
Value(11 + 12 -
13)
15
TotalForeign
Exchange Change in
Book /Adjusted Carrying
Value
Book/Adjusted Carrying Value at Disposal
Date
Foreign Exchange
Gain (Loss) on Disposal
Realized Gain
(Loss) on Disposal
Total Gain (Loss) on Disposal
Bond Interest/ Stock
Dividends Received
DuringYear
StatedCon-
tractualMaturity
Date
NAICDesig-nation and
Admini-strative Symbol/Market Indicator
(a)
36212H-C2-4
Government National Mortgage A 8.000%
06/15/30 09/01/2019 Paydown 205 205 208 207 (2) (2) 205 12 06/15/2030 1
36213E-ZT-6
Government National Mortgage A 4.000%
12/15/41 07/01/2019 Paydown 1,949 1,949 2,131 2,113 (165) (165) 1,949 45 12/15/2041 1
36213E-ZT-6
Government National Mortgage A 4.000%
12/15/41 08/01/2019 Paydown 15,396 15,396 16,841 16,699 (1,303) (1,303) 15,396 411 12/15/2041 1
36213E-ZT-6
Government National Mortgage A 4.000%
12/15/41 09/01/2019 Paydown 31,879 31,879 34,870 34,578 (2,699) (2,699) 31,879 956 12/15/2041 1
36225A-U2-4
Government National Mortgage A 7.000%
07/15/27 07/01/2019 Paydown 1,812 1,812 1,828 1,822 (10) (10) 1,812 74 07/15/2027 1
36225A-U2-4
Government National Mortgage A 7.000%
07/15/27 08/01/2019 Paydown 2,697 2,697 2,722 2,713 (15) (15) 2,697 126 07/15/2027 1
36225A-U2-4
Government National Mortgage A 7.000%
07/15/27 09/01/2019 Paydown 2,303 2,303 2,324 2,316 (13) (13) 2,303 121 07/15/2027 1
36230N-XW-0
Government National Mortgage A 4.000%
11/15/41 07/01/2019 Paydown 8,312 8,312 9,092 8,992 (680) (680) 8,312 194 11/15/2041 1
36230N-XW-0
Government National Mortgage A 4.000%
11/15/41 08/01/2019 Paydown 7,305 7,305 7,990 7,903 (598) (598) 7,305 195 11/15/2041 1
36230N-XW-0
Government National Mortgage A 4.000%
11/15/41 09/01/2019 Paydown 230,529 230,529 252,159 249,396 (18,867) (18,867) 230,529 6,916 11/15/2041 1
36241K-Z6-8
Government National Mortgage A 5.000%
02/15/39 07/01/2019 Paydown 21,010 21,010 23,311 23,106 (2,097) (2,097) 21,010 613 02/15/2039 1
36241K-Z6-8
Government National Mortgage A 5.000%
02/15/39 08/01/2019 Paydown 34,685 34,685 38,484 38,146 (3,461) (3,461) 34,685 1,156 02/15/2039 1
36241K-Z6-8
Government National Mortgage A 5.000%
02/15/39 09/01/2019 Paydown 35,045 35,045 38,884 38,543 (3,497) (3,497) 35,045 1,314 02/15/2039 1
36296U-QL-7
Government National Mortgage A 5.000%
02/15/39 07/01/2019 Paydown 67,572 67,572 75,322 74,632 (7,060) (7,060) 67,572 1,971 02/15/2039 1
36296U-QL-7
Government National Mortgage A 5.000%
02/15/39 08/01/2019 Paydown 31,507 31,507 35,120 34,799 (3,292) (3,292) 31,507 1,050 02/15/2039 1
36296U-QL-7
Government National Mortgage A 5.000%
02/15/39 09/01/2019 Paydown 13,300 13,300 14,825 14,689 (1,390) (1,390) 13,300 499 02/15/2039 1
0599999. Subtotal - Bonds - U.S. Governments 6,229,799 6,229,799 6,742,406 6,699,474 (469,679) (469,679) 6,229,799 147,827 XXX XXX452152-MT-5 Illinois St Ref 5.000% 08/01/19 08/01/2019 Maturity 2,410,000 2,410,000 2,509,774 2,433,492 (23,492) (23,492) 2,410,000 120,500 08/01/2019 2FE
546415-F8-8
Louisiana St Taxable-Ser D 2.089% 07/15/19
07/15/2019 Maturity 10,000,000 10,000,000 10,000,000 10,000,000 10,000,000 208,900 07/15/2019 1FE
686053-FY-0
Oregon Sch Brds Assn Taxable-Pension 4.668%
06/30/20 07/01/2019
Redemption 100.0000
1,593,241 1,593,241 1,852,398 1,637,705 (44,464) (44,464) 1,593,241 37,186 06/30/2020 1FE
1799999. Subtotal - Bonds - U.S. States, Territories and Possessions 14,003,241 14,003,241 14,362,172 14,071,197 (67,956) (67,956) 14,003,241 366,586 XXX XXX
839856-Z7-9
South San Antionio TX Sch Dist Taxable-Ref-
Ser A 3.250% 08/15/19 08/15/2019 Maturity 500,000 500,000 530,615 504,543 (4,543) (4,543) 500,000 16,250 08/15/2019 1FE
862811-3U-8 Stratford Conn 3.418% 08/15/19 08/15/2019 Maturity 1,760,000 1,760,000 1,760,000 1,760,000 1,760,000 60,157 08/15/2019 1FE
2499999. Subtotal - Bonds - U.S. Political Subdivisions of States, Territories and Possessions 2,260,000 2,260,000 2,290,615 2,264,543 (4,543) (4,543) 2,260,000 76,407 XXX XXX
040580-GD-8
Arizona Sch Facs Brd Rev Taxable-Ref-Sch Impt
1.755% 07/01/19 07/01/2019 Maturity 8,820,000 8,820,000 8,821,922 8,820,276 (276) (276) 8,820,000 154,791 07/01/2019 1FE
107431-HZ-4
Brevard Cnty FL Sch Brd COPS Taxable-Ref-Ser
B 2.273% 07/01/19 07/01/2019 Maturity 2,500,000 2,500,000 2,500,000 2,500,000 2,500,000 56,825 07/01/2019 1FE
121342-PD-5
Burke Cnty GA Dev Auth PCR Ref GA Power Comp
Plant Vogtle 1.850% 12/01/49 08/22/2019 Call 100.0000 5,665,000 5,665,000 5,665,000 5,665,000 5,665,000 75,982 12/01/2049 1FE
121342-PE-3
Burke Cnty GA Dev Auth PCR GA Power Comp
Plant Vogtle Pro 1.850% 12/01/49 08/22/2019 Call 100.0000 4,635,000 4,635,000 4,635,000 4,635,000 4,635,000 62,167 12/01/2049 1FE
3130AB-Y6-7 Federal Home Loan Bank 1.750% 08/24/22 08/24/2019 Call 100.0000 3,000,000 3,000,000 3,000,000 3,000,000 3,000,000 52,500 08/24/2022 1
3130AD-GQ-9 Federal Home Loan Bank 2.250% 02/12/21 08/12/2019 Call 100.0000 5,150,000 5,150,000 5,111,478 5,122,001 7,969 7,969 5,129,970 20,030 20,030 112,656 02/12/2021 1
3130AE-X2-1 Federal Home Loan Bank 3.000% 09/27/21 09/27/2019 Call 100.0000 6,000,000 6,000,000 6,000,000 6,000,000 6,000,000 180,000 09/27/2021 1
3134GA-DD-3 Freddie Mac 1.500% 08/24/20 08/24/2019 Call 100.0000 2,000,000 2,000,000 2,000,000 2,000,000 2,000,000 27,500 08/24/2020 1
3134GA-GY-4 Freddie Mac 2.000% 09/20/21 09/20/2019 Call 100.0000 2,000,000 2,000,000 2,000,000 2,000,000 2,000,000 35,000 09/20/2021 1
E05.2
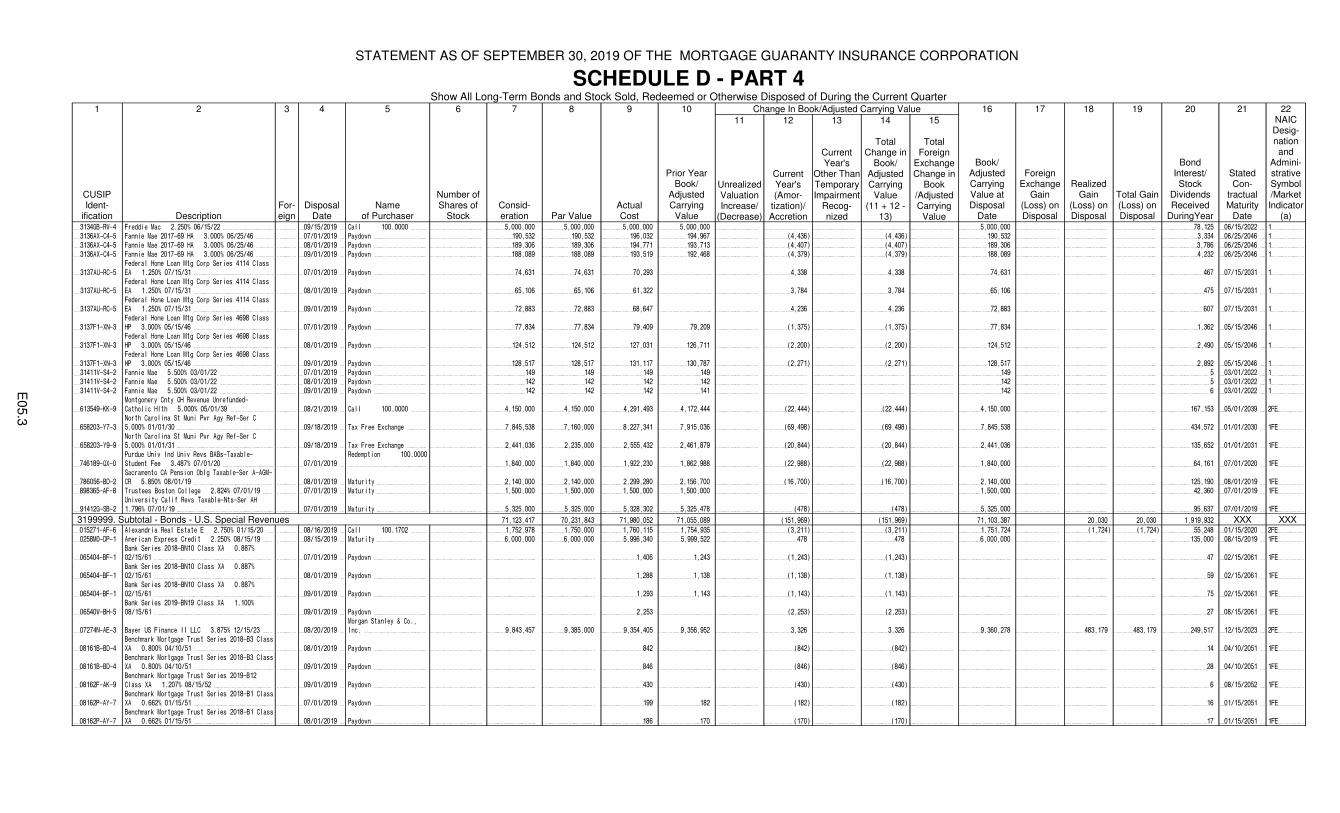
STATEMENT AS OF SEPTEMBER 30, 2019 OF THE MORTGAGE GUARANTY INSURANCE CORPORATION
SCHEDULE D - PART 4Show All Long-Term Bonds and Stock Sold, Redeemed or Otherwise Disposed of During the Current Quarter
1 2 3 4 5 6 7 8 9 10 Change In Book/Adjusted Carrying Value 16 17 18 19 20 21 22
CUSIPIdent-
ification DescriptionFor-eign
DisposalDate
Nameof Purchaser
Number of Shares of
StockConsid-eration Par Value
ActualCost
Prior YearBook/
Adjusted Carrying
Value
11
Unrealized Valuation Increase/
(Decrease)
12
Current Year's (Amor-
tization)/Accretion
13
Current Year's
Other Than Temporary Impairment
Recog-nized
14
TotalChange in
Book/Adjusted Carrying
Value(11 + 12 -
13)
15
TotalForeign
Exchange Change in
Book /Adjusted Carrying
Value
Book/Adjusted Carrying Value at Disposal
Date
Foreign Exchange
Gain (Loss) on Disposal
Realized Gain
(Loss) on Disposal
Total Gain (Loss) on Disposal
Bond Interest/ Stock
Dividends Received
DuringYear
StatedCon-
tractualMaturity
Date
NAICDesig-nation and
Admini-strative Symbol/Market Indicator
(a)3134GB-RW-4 Freddie Mac 2.250% 06/15/22 09/15/2019 Call 100.0000 5,000,000 5,000,000 5,000,000 5,000,000 5,000,000 78,125 06/15/2022 1
3136AX-C4-5 Fannie Mae 2017-69 HA 3.000% 06/25/46 07/01/2019 Paydown 190,532 190,532 196,032 194,967 (4,436) (4,436) 190,532 3,334 06/25/2046 1
3136AX-C4-5 Fannie Mae 2017-69 HA 3.000% 06/25/46 08/01/2019 Paydown 189,306 189,306 194,771 193,713 (4,407) (4,407) 189,306 3,786 06/25/2046 1
3136AX-C4-5 Fannie Mae 2017-69 HA 3.000% 06/25/46 09/01/2019 Paydown 188,089 188,089 193,519 192,468 (4,379) (4,379) 188,089 4,232 06/25/2046 1
3137AU-RC-5
Federal Home Loan Mtg Corp Series 4114 Class
EA 1.250% 07/15/31 07/01/2019 Paydown 74,631 74,631 70,293 4,338 4,338 74,631 467 07/15/2031 1
3137AU-RC-5
Federal Home Loan Mtg Corp Series 4114 Class
EA 1.250% 07/15/31 08/01/2019 Paydown 65,106 65,106 61,322 3,784 3,784 65,106 475 07/15/2031 1
3137AU-RC-5
Federal Home Loan Mtg Corp Series 4114 Class
EA 1.250% 07/15/31 09/01/2019 Paydown 72,883 72,883 68,647 4,236 4,236 72,883 607 07/15/2031 1
3137F1-XN-3
Federal Home Loan Mtg Corp Series 4698 Class
HP 3.000% 05/15/46 07/01/2019 Paydown 77,834 77,834 79,409 79,209 (1,375) (1,375) 77,834 1,362 05/15/2046 1
3137F1-XN-3
Federal Home Loan Mtg Corp Series 4698 Class
HP 3.000% 05/15/46 08/01/2019 Paydown 124,512 124,512 127,031 126,711 (2,200) (2,200) 124,512 2,490 05/15/2046 1
3137F1-XN-3
Federal Home Loan Mtg Corp Series 4698 Class
HP 3.000% 05/15/46 09/01/2019 Paydown 128,517 128,517 131,117 130,787 (2,271) (2,271) 128,517 2,892 05/15/2046 1
31411V-S4-2 Fannie Mae 5.500% 03/01/22 07/01/2019 Paydown 149 149 149 149 149 5 03/01/2022 1
31411V-S4-2 Fannie Mae 5.500% 03/01/22 08/01/2019 Paydown 142 142 142 142 142 5 03/01/2022 1
31411V-S4-2 Fannie Mae 5.500% 03/01/22 09/01/2019 Paydown 142 142 142 141 142 6 03/01/2022 1
613549-KK-9
Montgomery Cnty OH Revenue Unrefunded-
Catholic Hlth 5.000% 05/01/39 08/21/2019 Call 100.0000 4,150,000 4,150,000 4,291,493 4,172,444 (22,444) (22,444) 4,150,000 167,153 05/01/2039 2FE
658203-Y7-3
North Carolina St Muni Pwr Agy Ref-Ser C
5.000% 01/01/30 09/18/2019 Tax Free Exchange 7,845,538 7,160,000 8,227,341 7,915,036 (69,498) (69,498) 7,845,538 434,572 01/01/2030 1FE
658203-Y9-9
North Carolina St Muni Pwr Agy Ref-Ser C
5.000% 01/01/31 09/18/2019 Tax Free Exchange 2,441,036 2,235,000 2,555,432 2,461,879 (20,844) (20,844) 2,441,036 135,652 01/01/2031 1FE
746189-QX-0
Purdue Univ Ind Univ Revs BABs-Taxable-
Student Fee 3.487% 07/01/20 07/01/2019
Redemption 100.0000
1,840,000 1,840,000 1,922,230 1,862,988 (22,988) (22,988) 1,840,000 64,161 07/01/2020 1FE
786056-BD-2
Sacramento CA Pension Oblg Taxable-Ser A-AGM-
CR 5.850% 08/01/19 08/01/2019 Maturity 2,140,000 2,140,000 2,299,280 2,156,700 (16,700) (16,700) 2,140,000 125,190 08/01/2019 1FE
898365-AF-8 Trustees Boston College 2.824% 07/01/19 07/01/2019 Maturity 1,500,000 1,500,000 1,500,000 1,500,000 1,500,000 42,360 07/01/2019 1FE
91412G-SB-2
University Calif Revs Taxable-Nts-Ser AH
1.796% 07/01/19 07/01/2019 Maturity 5,325,000 5,325,000 5,328,302 5,325,478 (478) (478) 5,325,000 95,637 07/01/2019 1FE
3199999. Subtotal - Bonds - U.S. Special Revenues 71,123,417 70,231,843 71,980,052 71,055,089 (151,969) (151,969) 71,103,387 20,030 20,030 1,919,932 XXX XXX015271-AF-6 Alexandria Real Estate E 2.750% 01/15/20 08/16/2019 Call 100.1702 1,752,978 1,750,000 1,760,115 1,754,935 (3,211) (3,211) 1,751,724 (1,724) (1,724) 55,248 01/15/2020 2FE
0258M0-DP-1 American Express Credit 2.250% 08/15/19 08/15/2019 Maturity 6,000,000 6,000,000 5,996,340 5,999,522 478 478 6,000,000 135,000 08/15/2019 1FE
065404-BF-1
Bank Series 2018-BN10 Class XA 0.887%
02/15/61 07/01/2019 Paydown 1,406 1,243 (1,243) (1,243) 47 02/15/2061 1FE
065404-BF-1
Bank Series 2018-BN10 Class XA 0.887%
02/15/61 08/01/2019 Paydown 1,288 1,138 (1,138) (1,138) 59 02/15/2061 1FE
065404-BF-1
Bank Series 2018-BN10 Class XA 0.887%
02/15/61 09/01/2019 Paydown 1,293 1,143 (1,143) (1,143) 75 02/15/2061 1FE
06540W-BH-5
Bank Series 2019-BN19 Class XA 1.100%
08/15/61 09/01/2019 Paydown 2,253 (2,253) (2,253) 27 08/15/2061 1FE
07274N-AE-3 Bayer US Finance II LLC 3.875% 12/15/23 08/20/2019
Morgan Stanley & Co.,
Inc. 9,843,457 9,385,000 9,354,405 9,356,952 3,326 3,326 9,360,278 483,179 483,179 249,517 12/15/2023 2FE
08161B-BD-4
Benchmark Mortgage Trust Series 2018-B3 Class
XA 0.800% 04/10/51 08/01/2019 Paydown 842 (842) (842) 14 04/10/2051 1FE
08161B-BD-4
Benchmark Mortgage Trust Series 2018-B3 Class
XA 0.800% 04/10/51 09/01/2019 Paydown 846 (846) (846) 28 04/10/2051 1FE
08162F-AK-9
Benchmark Mortgage Trust Series 2019-B12
Class XA 1.207% 08/15/52 09/01/2019 Paydown 430 (430) (430) 6 08/15/2052 1FE
08162P-AY-7
Benchmark Mortgage Trust Series 2018-B1 Class
XA 0.662% 01/15/51 07/01/2019 Paydown 199 182 (182) (182) 16 01/15/2051 1FE
08162P-AY-7
Benchmark Mortgage Trust Series 2018-B1 Class
XA 0.662% 01/15/51 08/01/2019 Paydown 186 170 (170) (170) 17 01/15/2051 1FE
E05.3
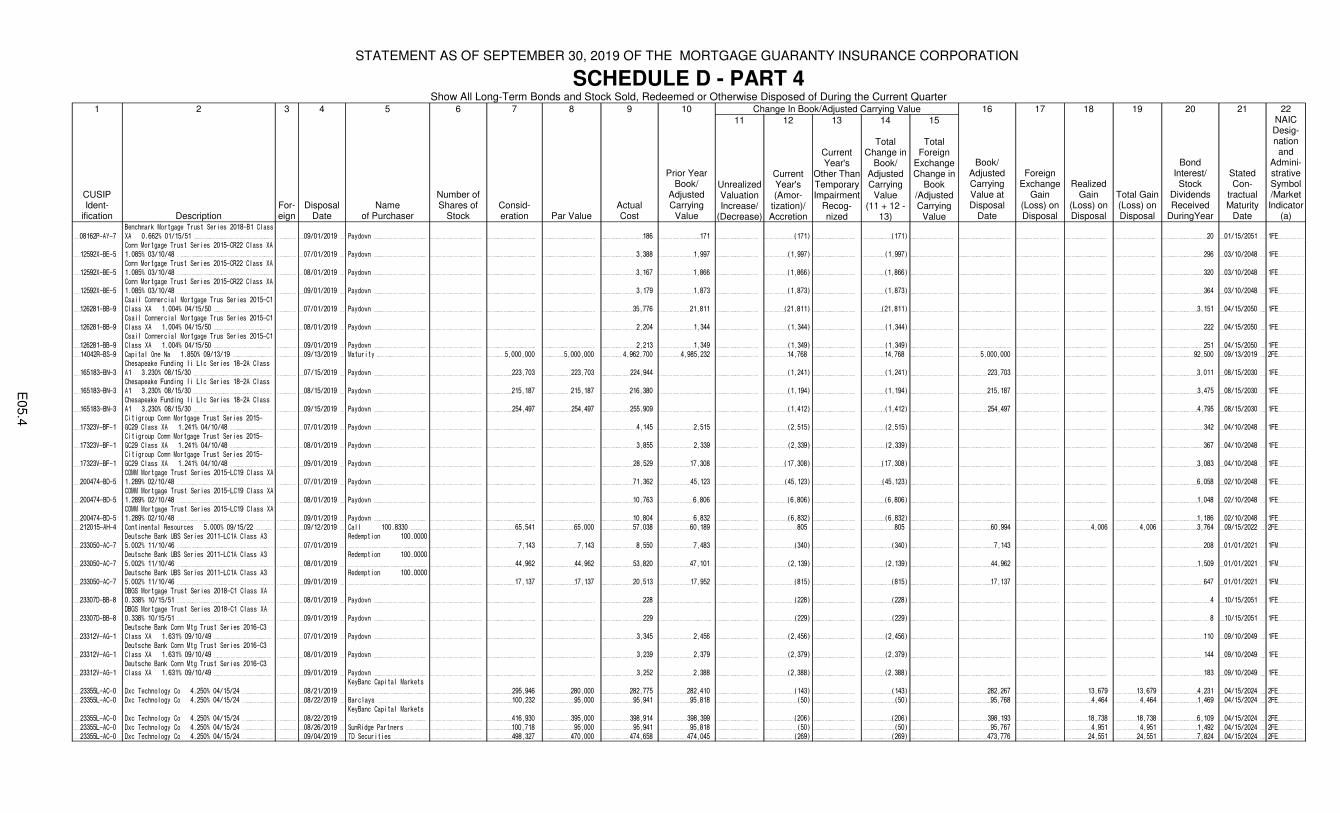
STATEMENT AS OF SEPTEMBER 30, 2019 OF THE MORTGAGE GUARANTY INSURANCE CORPORATION
SCHEDULE D - PART 4Show All Long-Term Bonds and Stock Sold, Redeemed or Otherwise Disposed of During the Current Quarter
1 2 3 4 5 6 7 8 9 10 Change In Book/Adjusted Carrying Value 16 17 18 19 20 21 22
CUSIPIdent-
ification DescriptionFor-eign
DisposalDate
Nameof Purchaser
Number of Shares of
StockConsid-eration Par Value
ActualCost
Prior YearBook/
Adjusted Carrying
Value
11
Unrealized Valuation Increase/
(Decrease)
12
Current Year's (Amor-
tization)/Accretion
13
Current Year's
Other Than Temporary Impairment
Recog-nized
14
TotalChange in
Book/Adjusted Carrying
Value(11 + 12 -
13)
15
TotalForeign
Exchange Change in
Book /Adjusted Carrying
Value
Book/Adjusted Carrying Value at Disposal
Date
Foreign Exchange
Gain (Loss) on Disposal
Realized Gain
(Loss) on Disposal
Total Gain (Loss) on Disposal
Bond Interest/ Stock
Dividends Received
DuringYear
StatedCon-
tractualMaturity
Date
NAICDesig-nation and
Admini-strative Symbol/Market Indicator
(a)
08162P-AY-7
Benchmark Mortgage Trust Series 2018-B1 Class
XA 0.662% 01/15/51 09/01/2019 Paydown 186 171 (171) (171) 20 01/15/2051 1FE
12592X-BE-5
Comm Mortgage Trust Series 2015-CR22 Class XA
1.085% 03/10/48 07/01/2019 Paydown 3,388 1,997 (1,997) (1,997) 296 03/10/2048 1FE
12592X-BE-5
Comm Mortgage Trust Series 2015-CR22 Class XA
1.085% 03/10/48 08/01/2019 Paydown 3,167 1,866 (1,866) (1,866) 320 03/10/2048 1FE
12592X-BE-5
Comm Mortgage Trust Series 2015-CR22 Class XA
1.085% 03/10/48 09/01/2019 Paydown 3,179 1,873 (1,873) (1,873) 364 03/10/2048 1FE
126281-BB-9
Csail Commercial Mortgage Trus Series 2015-C1
Class XA 1.004% 04/15/50 07/01/2019 Paydown 35,776 21,811 (21,811) (21,811) 3,151 04/15/2050 1FE
126281-BB-9
Csail Commercial Mortgage Trus Series 2015-C1
Class XA 1.004% 04/15/50 08/01/2019 Paydown 2,204 1,344 (1,344) (1,344) 222 04/15/2050 1FE
126281-BB-9
Csail Commercial Mortgage Trus Series 2015-C1
Class XA 1.004% 04/15/50 09/01/2019 Paydown 2,213 1,349 (1,349) (1,349) 251 04/15/2050 1FE
14042R-BS-9 Capital One Na 1.850% 09/13/19 09/13/2019 Maturity 5,000,000 5,000,000 4,962,700 4,985,232 14,768 14,768 5,000,000 92,500 09/13/2019 2FE
165183-BN-3
Chesapeake Funding Ii Llc Series 18-2A Class
A1 3.230% 08/15/30 07/15/2019 Paydown 223,703 223,703 224,944 (1,241) (1,241) 223,703 3,011 08/15/2030 1FE
165183-BN-3
Chesapeake Funding Ii Llc Series 18-2A Class
A1 3.230% 08/15/30 08/15/2019 Paydown 215,187 215,187 216,380 (1,194) (1,194) 215,187 3,475 08/15/2030 1FE
165183-BN-3
Chesapeake Funding Ii Llc Series 18-2A Class
A1 3.230% 08/15/30 09/15/2019 Paydown 254,497 254,497 255,909 (1,412) (1,412) 254,497 4,795 08/15/2030 1FE
17323V-BF-1
Citigroup Comm Mortgage Trust Series 2015-
GC29 Class XA 1.241% 04/10/48 07/01/2019 Paydown 4,145 2,515 (2,515) (2,515) 342 04/10/2048 1FE
17323V-BF-1
Citigroup Comm Mortgage Trust Series 2015-
GC29 Class XA 1.241% 04/10/48 08/01/2019 Paydown 3,855 2,339 (2,339) (2,339) 367 04/10/2048 1FE
17323V-BF-1
Citigroup Comm Mortgage Trust Series 2015-
GC29 Class XA 1.241% 04/10/48 09/01/2019 Paydown 28,529 17,308 (17,308) (17,308) 3,083 04/10/2048 1FE
200474-BD-5
COMM Mortgage Trust Series 2015-LC19 Class XA
1.289% 02/10/48 07/01/2019 Paydown 71,362 45,123 (45,123) (45,123) 6,058 02/10/2048 1FE
200474-BD-5
COMM Mortgage Trust Series 2015-LC19 Class XA
1.289% 02/10/48 08/01/2019 Paydown 10,763 6,806 (6,806) (6,806) 1,048 02/10/2048 1FE
200474-BD-5
COMM Mortgage Trust Series 2015-LC19 Class XA
1.289% 02/10/48 09/01/2019 Paydown 10,804 6,832 (6,832) (6,832) 1,186 02/10/2048 1FE
212015-AH-4 Continental Resources 5.000% 09/15/22 09/12/2019 Call 100.8330 65,541 65,000 57,038 60,189 805 805 60,994 4,006 4,006 3,764 09/15/2022 2FE
233050-AC-7
Deutsche Bank UBS Series 2011-LC1A Class A3
5.002% 11/10/46 07/01/2019
Redemption 100.0000
7,143 7,143 8,550 7,483 (340) (340) 7,143 208 01/01/2021 1FM
233050-AC-7
Deutsche Bank UBS Series 2011-LC1A Class A3
5.002% 11/10/46 08/01/2019
Redemption 100.0000
44,962 44,962 53,820 47,101 (2,139) (2,139) 44,962 1,509 01/01/2021 1FM
233050-AC-7
Deutsche Bank UBS Series 2011-LC1A Class A3
5.002% 11/10/46 09/01/2019
Redemption 100.0000
17,137 17,137 20,513 17,952 (815) (815) 17,137 647 01/01/2021 1FM
23307D-BB-8
DBGS Mortgage Trust Series 2018-C1 Class XA
0.338% 10/15/51 08/01/2019 Paydown 228 (228) (228) 4 10/15/2051 1FE
23307D-BB-8
DBGS Mortgage Trust Series 2018-C1 Class XA
0.338% 10/15/51 09/01/2019 Paydown 229 (229) (229) 8 10/15/2051 1FE
23312V-AG-1
Deutsche Bank Comm Mtg Trust Series 2016-C3
Class XA 1.631% 09/10/49 07/01/2019 Paydown 3,345 2,456 (2,456) (2,456) 110 09/10/2049 1FE
23312V-AG-1
Deutsche Bank Comm Mtg Trust Series 2016-C3
Class XA 1.631% 09/10/49 08/01/2019 Paydown 3,239 2,379 (2,379) (2,379) 144 09/10/2049 1FE
23312V-AG-1
Deutsche Bank Comm Mtg Trust Series 2016-C3
Class XA 1.631% 09/10/49 09/01/2019 Paydown 3,252 2,388 (2,388) (2,388) 183 09/10/2049 1FE
23355L-AC-0 Dxc Technology Co 4.250% 04/15/24 08/21/2019
KeyBanc Capital Markets
295,946 280,000 282,775 282,410 (143) (143) 282,267 13,679 13,679 4,231 04/15/2024 2FE
23355L-AC-0 Dxc Technology Co 4.250% 04/15/24 08/22/2019 Barclays 100,232 95,000 95,941 95,818 (50) (50) 95,768 4,464 4,464 1,469 04/15/2024 2FE
23355L-AC-0 Dxc Technology Co 4.250% 04/15/24 08/22/2019
KeyBanc Capital Markets
416,930 395,000 398,914 398,399 (206) (206) 398,193 18,738 18,738 6,109 04/15/2024 2FE
23355L-AC-0 Dxc Technology Co 4.250% 04/15/24 08/26/2019 SumRidge Partners 100,718 95,000 95,941 95,818 (50) (50) 95,767 4,951 4,951 1,492 04/15/2024 2FE
23355L-AC-0 Dxc Technology Co 4.250% 04/15/24 09/04/2019 TD Securities 498,327 470,000 474,658 474,045 (269) (269) 473,776 24,551 24,551 7,824 04/15/2024 2FE
E05.4
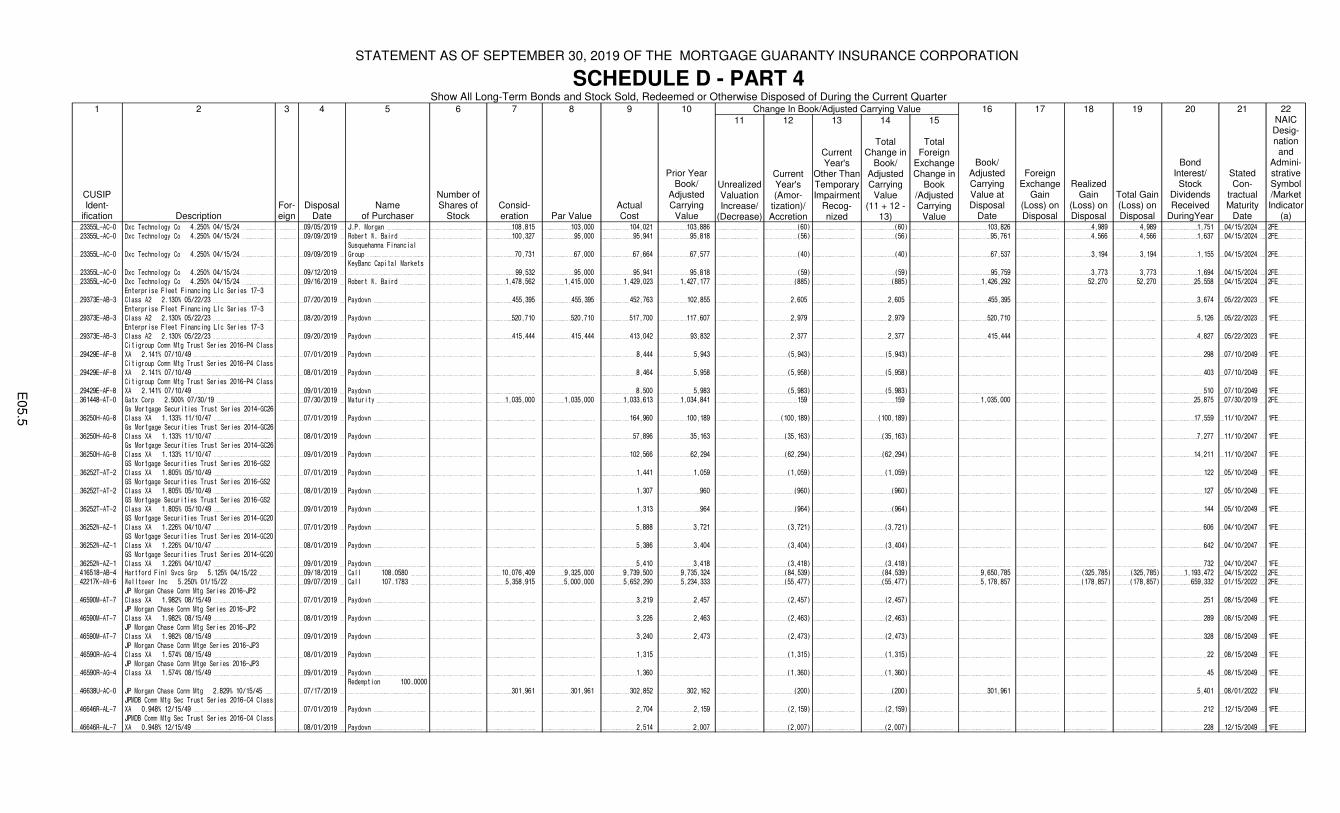
STATEMENT AS OF SEPTEMBER 30, 2019 OF THE MORTGAGE GUARANTY INSURANCE CORPORATION
SCHEDULE D - PART 4Show All Long-Term Bonds and Stock Sold, Redeemed or Otherwise Disposed of During the Current Quarter
1 2 3 4 5 6 7 8 9 10 Change In Book/Adjusted Carrying Value 16 17 18 19 20 21 22
CUSIPIdent-
ification DescriptionFor-eign
DisposalDate
Nameof Purchaser
Number of Shares of
StockConsid-eration Par Value
ActualCost
Prior YearBook/
Adjusted Carrying
Value
11
Unrealized Valuation Increase/
(Decrease)
12
Current Year's (Amor-
tization)/Accretion
13
Current Year's
Other Than Temporary Impairment
Recog-nized
14
TotalChange in
Book/Adjusted Carrying
Value(11 + 12 -
13)
15
TotalForeign
Exchange Change in
Book /Adjusted Carrying
Value
Book/Adjusted Carrying Value at Disposal
Date
Foreign Exchange
Gain (Loss) on Disposal
Realized Gain
(Loss) on Disposal
Total Gain (Loss) on Disposal
Bond Interest/ Stock
Dividends Received
DuringYear
StatedCon-
tractualMaturity
Date
NAICDesig-nation and
Admini-strative Symbol/Market Indicator
(a)23355L-AC-0 Dxc Technology Co 4.250% 04/15/24 09/05/2019 J.P. Morgan 108,815 103,000 104,021 103,886 (60) (60) 103,826 4,989 4,989 1,751 04/15/2024 2FE
23355L-AC-0 Dxc Technology Co 4.250% 04/15/24 09/09/2019 Robert W. Baird 100,327 95,000 95,941 95,818 (56) (56) 95,761 4,566 4,566 1,637 04/15/2024 2FE
23355L-AC-0 Dxc Technology Co 4.250% 04/15/24 09/09/2019
Susquehanna Financial
Group 70,731 67,000 67,664 67,577 (40) (40) 67,537 3,194 3,194 1,155 04/15/2024 2FE
23355L-AC-0 Dxc Technology Co 4.250% 04/15/24 09/12/2019
KeyBanc Capital Markets
99,532 95,000 95,941 95,818 (59) (59) 95,759 3,773 3,773 1,694 04/15/2024 2FE
23355L-AC-0 Dxc Technology Co 4.250% 04/15/24 09/16/2019 Robert W. Baird 1,478,562 1,415,000 1,429,023 1,427,177 (885) (885) 1,426,292 52,270 52,270 25,558 04/15/2024 2FE
29373E-AB-3
Enterprise Fleet Financing Llc Series 17-3
Class A2 2.130% 05/22/23 07/20/2019 Paydown 455,395 455,395 452,763 102,855 2,605 2,605 455,395 3,674 05/22/2023 1FE
29373E-AB-3
Enterprise Fleet Financing Llc Series 17-3
Class A2 2.130% 05/22/23 08/20/2019 Paydown 520,710 520,710 517,700 117,607 2,979 2,979 520,710 5,126 05/22/2023 1FE
29373E-AB-3
Enterprise Fleet Financing Llc Series 17-3
Class A2 2.130% 05/22/23 09/20/2019 Paydown 415,444 415,444 413,042 93,832 2,377 2,377 415,444 4,827 05/22/2023 1FE
29429E-AF-8
Citigroup Comm Mtg Trust Series 2016-P4 Class
XA 2.141% 07/10/49 07/01/2019 Paydown 8,444 5,943 (5,943) (5,943) 298 07/10/2049 1FE
29429E-AF-8
Citigroup Comm Mtg Trust Series 2016-P4 Class
XA 2.141% 07/10/49 08/01/2019 Paydown 8,464 5,958 (5,958) (5,958) 403 07/10/2049 1FE
29429E-AF-8
Citigroup Comm Mtg Trust Series 2016-P4 Class
XA 2.141% 07/10/49 09/01/2019 Paydown 8,500 5,983 (5,983) (5,983) 510 07/10/2049 1FE
361448-AT-0 Gatx Corp 2.500% 07/30/19 07/30/2019 Maturity 1,035,000 1,035,000 1,033,613 1,034,841 159 159 1,035,000 25,875 07/30/2019 2FE
36250H-AG-8
Gs Mortgage Securities Trust Series 2014-GC26
Class XA 1.133% 11/10/47 07/01/2019 Paydown 164,960 100,189 (100,189) (100,189) 17,559 11/10/2047 1FE
36250H-AG-8
Gs Mortgage Securities Trust Series 2014-GC26
Class XA 1.133% 11/10/47 08/01/2019 Paydown 57,896 35,163 (35,163) (35,163) 7,277 11/10/2047 1FE
36250H-AG-8
Gs Mortgage Securities Trust Series 2014-GC26
Class XA 1.133% 11/10/47 09/01/2019 Paydown 102,566 62,294 (62,294) (62,294) 14,211 11/10/2047 1FE
36252T-AT-2
GS Mortgage Securities Trust Series 2016-GS2
Class XA 1.805% 05/10/49 07/01/2019 Paydown 1,441 1,059 (1,059) (1,059) 122 05/10/2049 1FE
36252T-AT-2
GS Mortgage Securities Trust Series 2016-GS2
Class XA 1.805% 05/10/49 08/01/2019 Paydown 1,307 960 (960) (960) 127 05/10/2049 1FE
36252T-AT-2
GS Mortgage Securities Trust Series 2016-GS2
Class XA 1.805% 05/10/49 09/01/2019 Paydown 1,313 964 (964) (964) 144 05/10/2049 1FE
36252W-AZ-1
GS Mortgage Securities Trust Series 2014-GC20
Class XA 1.226% 04/10/47 07/01/2019 Paydown 5,888 3,721 (3,721) (3,721) 606 04/10/2047 1FE
36252W-AZ-1
GS Mortgage Securities Trust Series 2014-GC20
Class XA 1.226% 04/10/47 08/01/2019 Paydown 5,386 3,404 (3,404) (3,404) 642 04/10/2047 1FE
36252W-AZ-1
GS Mortgage Securities Trust Series 2014-GC20
Class XA 1.226% 04/10/47 09/01/2019 Paydown 5,410 3,418 (3,418) (3,418) 732 04/10/2047 1FE
416518-AB-4 Hartford Finl Svcs Grp 5.125% 04/15/22 09/18/2019 Call 108.0580 10,076,409 9,325,000 9,739,500 9,735,324 (84,539) (84,539) 9,650,785 (325,785) (325,785) 1,193,472 04/15/2022 2FE
42217K-AW-6 Welltower Inc 5.250% 01/15/22 09/07/2019 Call 107.1783 5,358,915 5,000,000 5,652,290 5,234,333 (55,477) (55,477) 5,178,857 (178,857) (178,857) 659,332 01/15/2022 2FE
46590M-AT-7
JP Morgan Chase Comm Mtg Series 2016-JP2
Class XA 1.982% 08/15/49 07/01/2019 Paydown 3,219 2,457 (2,457) (2,457) 251 08/15/2049 1FE
46590M-AT-7
JP Morgan Chase Comm Mtg Series 2016-JP2
Class XA 1.982% 08/15/49 08/01/2019 Paydown 3,226 2,463 (2,463) (2,463) 289 08/15/2049 1FE
46590M-AT-7
JP Morgan Chase Comm Mtg Series 2016-JP2
Class XA 1.982% 08/15/49 09/01/2019 Paydown 3,240 2,473 (2,473) (2,473) 328 08/15/2049 1FE
46590R-AG-4
JP Morgan Chase Comm Mtge Series 2016-JP3
Class XA 1.574% 08/15/49 08/01/2019 Paydown 1,315 (1,315) (1,315) 22 08/15/2049 1FE
46590R-AG-4
JP Morgan Chase Comm Mtge Series 2016-JP3
Class XA 1.574% 08/15/49 09/01/2019 Paydown 1,360 (1,360) (1,360) 45 08/15/2049 1FE
46638U-AC-0 JP Morgan Chase Comm Mtg 2.829% 10/15/45 07/17/2019
Redemption 100.0000
301,961 301,961 302,852 302,162 (200) (200) 301,961 5,401 08/01/2022 1FM
46646R-AL-7
JPMDB Comm Mtg Sec Trust Series 2016-C4 Class
XA 0.948% 12/15/49 07/01/2019 Paydown 2,704 2,159 (2,159) (2,159) 212 12/15/2049 1FE
46646R-AL-7
JPMDB Comm Mtg Sec Trust Series 2016-C4 Class
XA 0.948% 12/15/49 08/01/2019 Paydown 2,514 2,007 (2,007) (2,007) 228 12/15/2049 1FE
E05.5
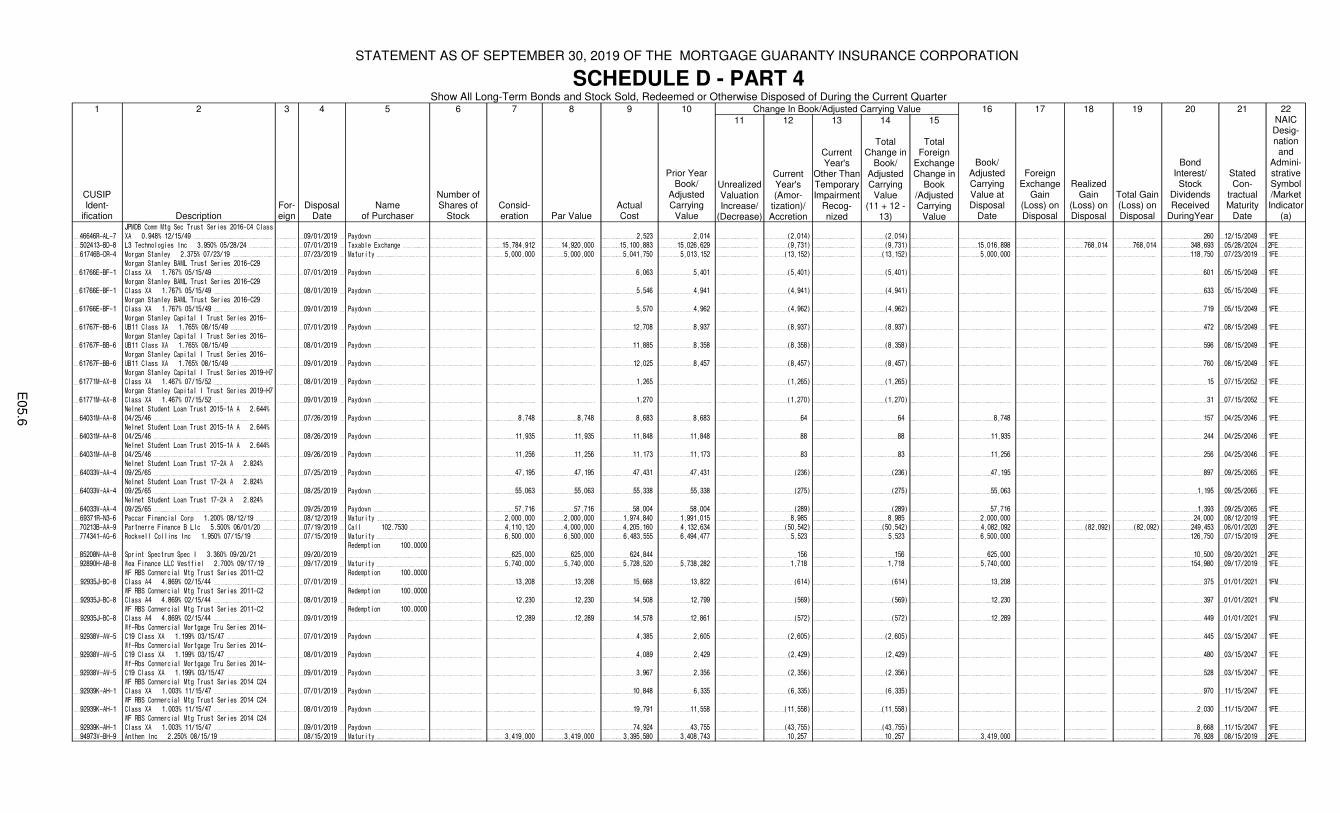
STATEMENT AS OF SEPTEMBER 30, 2019 OF THE MORTGAGE GUARANTY INSURANCE CORPORATION
SCHEDULE D - PART 4Show All Long-Term Bonds and Stock Sold, Redeemed or Otherwise Disposed of During the Current Quarter
1 2 3 4 5 6 7 8 9 10 Change In Book/Adjusted Carrying Value 16 17 18 19 20 21 22
CUSIPIdent-
ification DescriptionFor-eign
DisposalDate
Nameof Purchaser
Number of Shares of
StockConsid-eration Par Value
ActualCost
Prior YearBook/
Adjusted Carrying
Value
11
Unrealized Valuation Increase/
(Decrease)
12
Current Year's (Amor-
tization)/Accretion
13
Current Year's
Other Than Temporary Impairment
Recog-nized
14
TotalChange in
Book/Adjusted Carrying
Value(11 + 12 -
13)
15
TotalForeign
Exchange Change in
Book /Adjusted Carrying
Value
Book/Adjusted Carrying Value at Disposal
Date
Foreign Exchange
Gain (Loss) on Disposal
Realized Gain
(Loss) on Disposal
Total Gain (Loss) on Disposal
Bond Interest/ Stock
Dividends Received
DuringYear
StatedCon-
tractualMaturity
Date
NAICDesig-nation and
Admini-strative Symbol/Market Indicator
(a)
46646R-AL-7
JPMDB Comm Mtg Sec Trust Series 2016-C4 Class
XA 0.948% 12/15/49 09/01/2019 Paydown 2,523 2,014 (2,014) (2,014) 260 12/15/2049 1FE
502413-BD-8 L3 Technologies Inc 3.950% 05/28/24 07/01/2019 Taxable Exchange 15,784,912 14,920,000 15,100,883 15,026,629 (9,731) (9,731) 15,016,898 768,014 768,014 348,693 05/28/2024 2FE
61746B-DR-4 Morgan Stanley 2.375% 07/23/19 07/23/2019 Maturity 5,000,000 5,000,000 5,041,750 5,013,152 (13,152) (13,152) 5,000,000 118,750 07/23/2019 1FE
61766E-BF-1
Morgan Stanley BAML Trust Series 2016-C29
Class XA 1.767% 05/15/49 07/01/2019 Paydown 6,063 5,401 (5,401) (5,401) 601 05/15/2049 1FE
61766E-BF-1
Morgan Stanley BAML Trust Series 2016-C29
Class XA 1.767% 05/15/49 08/01/2019 Paydown 5,546 4,941 (4,941) (4,941) 633 05/15/2049 1FE
61766E-BF-1
Morgan Stanley BAML Trust Series 2016-C29
Class XA 1.767% 05/15/49 09/01/2019 Paydown 5,570 4,962 (4,962) (4,962) 719 05/15/2049 1FE
61767F-BB-6
Morgan Stanley Capital I Trust Series 2016-
UB11 Class XA 1.765% 08/15/49 07/01/2019 Paydown 12,708 8,937 (8,937) (8,937) 472 08/15/2049 1FE
61767F-BB-6
Morgan Stanley Capital I Trust Series 2016-
UB11 Class XA 1.765% 08/15/49 08/01/2019 Paydown 11,885 8,358 (8,358) (8,358) 596 08/15/2049 1FE
61767F-BB-6
Morgan Stanley Capital I Trust Series 2016-
UB11 Class XA 1.765% 08/15/49 09/01/2019 Paydown 12,025 8,457 (8,457) (8,457) 760 08/15/2049 1FE
61771M-AX-8
Morgan Stanley Capital I Trust Series 2019-H7
Class XA 1.467% 07/15/52 08/01/2019 Paydown 1,265 (1,265) (1,265) 15 07/15/2052 1FE
61771M-AX-8
Morgan Stanley Capital I Trust Series 2019-H7
Class XA 1.467% 07/15/52 09/01/2019 Paydown 1,270 (1,270) (1,270) 31 07/15/2052 1FE
64031M-AA-8
Nelnet Student Loan Trust 2015-1A A 2.644%
04/25/46 07/26/2019 Paydown 8,748 8,748 8,683 8,683 64 64 8,748 157 04/25/2046 1FE
64031M-AA-8
Nelnet Student Loan Trust 2015-1A A 2.644%
04/25/46 08/26/2019 Paydown 11,935 11,935 11,848 11,848 88 88 11,935 244 04/25/2046 1FE
64031M-AA-8
Nelnet Student Loan Trust 2015-1A A 2.644%
04/25/46 09/26/2019 Paydown 11,256 11,256 11,173 11,173 83 83 11,256 256 04/25/2046 1FE
64033W-AA-4
Nelnet Student Loan Trust 17-2A A 2.824%
09/25/65 07/25/2019 Paydown 47,195 47,195 47,431 47,431 (236) (236) 47,195 897 09/25/2065 1FE
64033W-AA-4
Nelnet Student Loan Trust 17-2A A 2.824%
09/25/65 08/25/2019 Paydown 55,063 55,063 55,338 55,338 (275) (275) 55,063 1,195 09/25/2065 1FE
64033W-AA-4
Nelnet Student Loan Trust 17-2A A 2.824%
09/25/65 09/25/2019 Paydown 57,716 57,716 58,004 58,004 (289) (289) 57,716 1,393 09/25/2065 1FE
69371R-N3-6 Paccar Financial Corp 1.200% 08/12/19 08/12/2019 Maturity 2,000,000 2,000,000 1,974,840 1,991,015 8,985 8,985 2,000,000 24,000 08/12/2019 1FE
70213B-AA-9 Partnerre Finance B Llc 5.500% 06/01/20 07/19/2019 Call 102.7530 4,110,120 4,000,000 4,205,160 4,132,634 (50,542) (50,542) 4,082,092 (82,092) (82,092) 249,453 06/01/2020 2FE
774341-AG-6 Rockwell Collins Inc 1.950% 07/15/19 07/15/2019 Maturity 6,500,000 6,500,000 6,483,555 6,494,477 5,523 5,523 6,500,000 126,750 07/15/2019 2FE
85208N-AA-8 Sprint Spectrum Spec I 3.360% 09/20/21 09/20/2019
Redemption 100.0000
625,000 625,000 624,844 156 156 625,000 10,500 09/20/2021 2FE
92890H-AB-8 Wea Finance LLC Westfiel 2.700% 09/17/19 09/17/2019 Maturity 5,740,000 5,740,000 5,728,520 5,738,282 1,718 1,718 5,740,000 154,980 09/17/2019 1FE
92935J-BC-8
WF RBS Commercial Mtg Trust Series 2011-C2
Class A4 4.869% 02/15/44 07/01/2019
Redemption 100.0000
13,208 13,208 15,668 13,822 (614) (614) 13,208 375 01/01/2021 1FM
92935J-BC-8
WF RBS Commercial Mtg Trust Series 2011-C2
Class A4 4.869% 02/15/44 08/01/2019
Redemption 100.0000
12,230 12,230 14,508 12,799 (569) (569) 12,230 397 01/01/2021 1FM
92935J-BC-8
WF RBS Commercial Mtg Trust Series 2011-C2
Class A4 4.869% 02/15/44 09/01/2019
Redemption 100.0000
12,289 12,289 14,578 12,861 (572) (572) 12,289 449 01/01/2021 1FM
92938V-AW-5
Wf-Rbs Commercial Mortgage Tru Series 2014-
C19 Class XA 1.199% 03/15/47 07/01/2019 Paydown 4,385 2,605 (2,605) (2,605) 445 03/15/2047 1FE
92938V-AW-5
Wf-Rbs Commercial Mortgage Tru Series 2014-
C19 Class XA 1.199% 03/15/47 08/01/2019 Paydown 4,089 2,429 (2,429) (2,429) 480 03/15/2047 1FE
92938V-AW-5
Wf-Rbs Commercial Mortgage Tru Series 2014-
C19 Class XA 1.199% 03/15/47 09/01/2019 Paydown 3,967 2,356 (2,356) (2,356) 528 03/15/2047 1FE
92939K-AH-1
WF RBS Commercial Mtg Trust Series 2014 C24
Class XA 1.003% 11/15/47 07/01/2019 Paydown 10,848 6,335 (6,335) (6,335) 970 11/15/2047 1FE
92939K-AH-1
WF RBS Commercial Mtg Trust Series 2014 C24
Class XA 1.003% 11/15/47 08/01/2019 Paydown 19,791 11,558 (11,558) (11,558) 2,030 11/15/2047 1FE
92939K-AH-1
WF RBS Commercial Mtg Trust Series 2014 C24
Class XA 1.003% 11/15/47 09/01/2019 Paydown 74,924 43,755 (43,755) (43,755) 8,668 11/15/2047 1FE
94973V-BH-9 Anthem Inc 2.250% 08/15/19 08/15/2019 Maturity 3,419,000 3,419,000 3,395,580 3,408,743 10,257 10,257 3,419,000 76,928 08/15/2019 2FE
E05.6
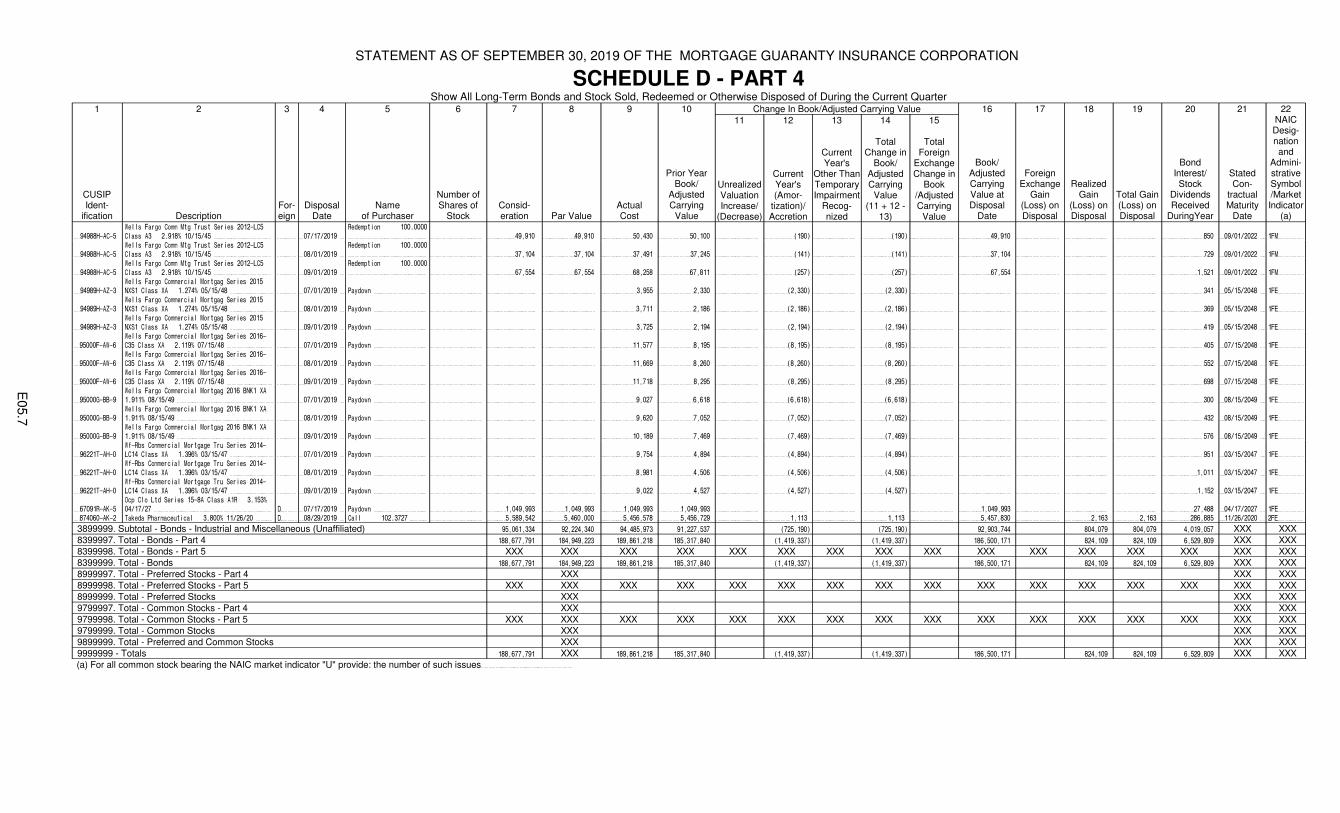
STATEMENT AS OF SEPTEMBER 30, 2019 OF THE MORTGAGE GUARANTY INSURANCE CORPORATION
SCHEDULE D - PART 4Show All Long-Term Bonds and Stock Sold, Redeemed or Otherwise Disposed of During the Current Quarter
1 2 3 4 5 6 7 8 9 10 Change In Book/Adjusted Carrying Value 16 17 18 19 20 21 22
CUSIPIdent-
ification DescriptionFor-eign
DisposalDate
Nameof Purchaser
Number of Shares of
StockConsid-eration Par Value
ActualCost
Prior YearBook/
Adjusted Carrying
Value
11
Unrealized Valuation Increase/
(Decrease)
12
Current Year's (Amor-
tization)/Accretion
13
Current Year's
Other Than Temporary Impairment
Recog-nized
14
TotalChange in
Book/Adjusted Carrying
Value(11 + 12 -
13)
15
TotalForeign
Exchange Change in
Book /Adjusted Carrying
Value
Book/Adjusted Carrying Value at Disposal
Date
Foreign Exchange
Gain (Loss) on Disposal
Realized Gain
(Loss) on Disposal
Total Gain (Loss) on Disposal
Bond Interest/ Stock
Dividends Received
DuringYear
StatedCon-
tractualMaturity
Date
NAICDesig-nation and
Admini-strative Symbol/Market Indicator
(a)
94988H-AC-5
Wells Fargo Comm Mtg Trust Series 2012-LC5
Class A3 2.918% 10/15/45 07/17/2019
Redemption 100.0000
49,910 49,910 50,430 50,100 (190) (190) 49,910 850 09/01/2022 1FM
94988H-AC-5
Wells Fargo Comm Mtg Trust Series 2012-LC5
Class A3 2.918% 10/15/45 08/01/2019
Redemption 100.0000
37,104 37,104 37,491 37,245 (141) (141) 37,104 729 09/01/2022 1FM
94988H-AC-5
Wells Fargo Comm Mtg Trust Series 2012-LC5
Class A3 2.918% 10/15/45 09/01/2019
Redemption 100.0000
67,554 67,554 68,258 67,811 (257) (257) 67,554 1,521 09/01/2022 1FM
94989H-AZ-3
Wells Fargo Commercial Mortgag Series 2015
NXS1 Class XA 1.274% 05/15/48 07/01/2019 Paydown 3,955 2,330 (2,330) (2,330) 341 05/15/2048 1FE
94989H-AZ-3
Wells Fargo Commercial Mortgag Series 2015
NXS1 Class XA 1.274% 05/15/48 08/01/2019 Paydown 3,711 2,186 (2,186) (2,186) 369 05/15/2048 1FE
94989H-AZ-3
Wells Fargo Commercial Mortgag Series 2015
NXS1 Class XA 1.274% 05/15/48 09/01/2019 Paydown 3,725 2,194 (2,194) (2,194) 419 05/15/2048 1FE
95000F-AW-6
Wells Fargo Commercial Mortgag Series 2016-
C35 Class XA 2.119% 07/15/48 07/01/2019 Paydown 11,577 8,195 (8,195) (8,195) 405 07/15/2048 1FE
95000F-AW-6
Wells Fargo Commercial Mortgag Series 2016-
C35 Class XA 2.119% 07/15/48 08/01/2019 Paydown 11,669 8,260 (8,260) (8,260) 552 07/15/2048 1FE
95000F-AW-6
Wells Fargo Commercial Mortgag Series 2016-
C35 Class XA 2.119% 07/15/48 09/01/2019 Paydown 11,718 8,295 (8,295) (8,295) 698 07/15/2048 1FE
95000G-BB-9
Wells Fargo Commercial Mortgag 2016 BNK1 XA
1.911% 08/15/49 07/01/2019 Paydown 9,027 6,618 (6,618) (6,618) 300 08/15/2049 1FE
95000G-BB-9
Wells Fargo Commercial Mortgag 2016 BNK1 XA
1.911% 08/15/49 08/01/2019 Paydown 9,620 7,052 (7,052) (7,052) 432 08/15/2049 1FE
95000G-BB-9
Wells Fargo Commercial Mortgag 2016 BNK1 XA
1.911% 08/15/49 09/01/2019 Paydown 10,189 7,469 (7,469) (7,469) 576 08/15/2049 1FE
96221T-AH-0
Wf-Rbs Commercial Mortgage Tru Series 2014-
LC14 Class XA 1.396% 03/15/47 07/01/2019 Paydown 9,754 4,894 (4,894) (4,894) 951 03/15/2047 1FE
96221T-AH-0
Wf-Rbs Commercial Mortgage Tru Series 2014-
LC14 Class XA 1.396% 03/15/47 08/01/2019 Paydown 8,981 4,506 (4,506) (4,506) 1,011 03/15/2047 1FE
96221T-AH-0
Wf-Rbs Commercial Mortgage Tru Series 2014-
LC14 Class XA 1.396% 03/15/47 09/01/2019 Paydown 9,022 4,527 (4,527) (4,527) 1,152 03/15/2047 1FE
67091R-AK-5
Ocp Clo Ltd Series 15-8A Class A1R 3.153%
04/17/27 D 07/17/2019 Paydown 1,049,993 1,049,993 1,049,993 1,049,993 1,049,993 27,488 04/17/2027 1FE
874060-AK-2 Takeda Pharmaceutical 3.800% 11/26/20 D 08/29/2019 Call 102.3727 5,589,542 5,460,000 5,456,578 5,456,729 1,113 1,113 5,457,830 2,163 2,163 286,885 11/26/2020 2FE
3899999. Subtotal - Bonds - Industrial and Miscellaneous (Unaffiliated) 95,061,334 92,224,340 94,485,973 91,227,537 (725,190) (725,190) 92,903,744 804,079 804,079 4,019,057 XXX XXX8399997. Total - Bonds - Part 4 188,677,791 184,949,223 189,861,218 185,317,840 (1,419,337) (1,419,337) 186,500,171 824,109 824,109 6,529,809 XXX XXX8399998. Total - Bonds - Part 5 XXX XXX XXX XXX XXX XXX XXX XXX XXX XXX XXX XXX XXX XXX XXX XXX8399999. Total - Bonds 188,677,791 184,949,223 189,861,218 185,317,840 (1,419,337) (1,419,337) 186,500,171 824,109 824,109 6,529,809 XXX XXX8999997. Total - Preferred Stocks - Part 4 XXX XXX XXX8999998. Total - Preferred Stocks - Part 5 XXX XXX XXX XXX XXX XXX XXX XXX XXX XXX XXX XXX XXX XXX XXX XXX8999999. Total - Preferred Stocks XXX XXX XXX9799997. Total - Common Stocks - Part 4 XXX XXX XXX9799998. Total - Common Stocks - Part 5 XXX XXX XXX XXX XXX XXX XXX XXX XXX XXX XXX XXX XXX XXX XXX XXX9799999. Total - Common Stocks XXX XXX XXX9899999. Total - Preferred and Common Stocks XXX XXX XXX9999999 - Totals 188,677,791 XXX 189,861,218 185,317,840 (1,419,337) (1,419,337) 186,500,171 824,109 824,109 6,529,809 XXX XXX(a) For all common stock bearing the NAIC market indicator "U" provide: the number of such issues
E05.7

STATEMENT AS OF SEPTEMBER 30, 2019 OF THE MORTGAGE GUARANTY INSURANCE CORPORATION
Schedule DB - Part A - Section 1 - Options, Caps, Floors, Collars, Swaps and Forwards Open
N O N E
Schedule DB - Part B - Section 1 - Futures Contracts Open
N O N E
Schedule DB - Part B - Section 1B - Brokers with whom cash deposits have been made
N O N E
Schedule DB - Part D - Section 1 - Counterparty Exposure for Derivative Instruments Open
N O N E
Schedule DB - Part D-Section 2 - Collateral for Derivative Instruments Open - Pledged By
N O N E
Schedule DB - Part D-Section 2 - Collateral for Derivative Instruments Open - Pledged To
N O N E
Schedule DL - Part 1 - Reinvested Collateral Assets Owned
N O N E
Schedule DL - Part 2 - Reinvested Collateral Assets Owned
N O N E
E06, E07, E08, E09, E10, E11
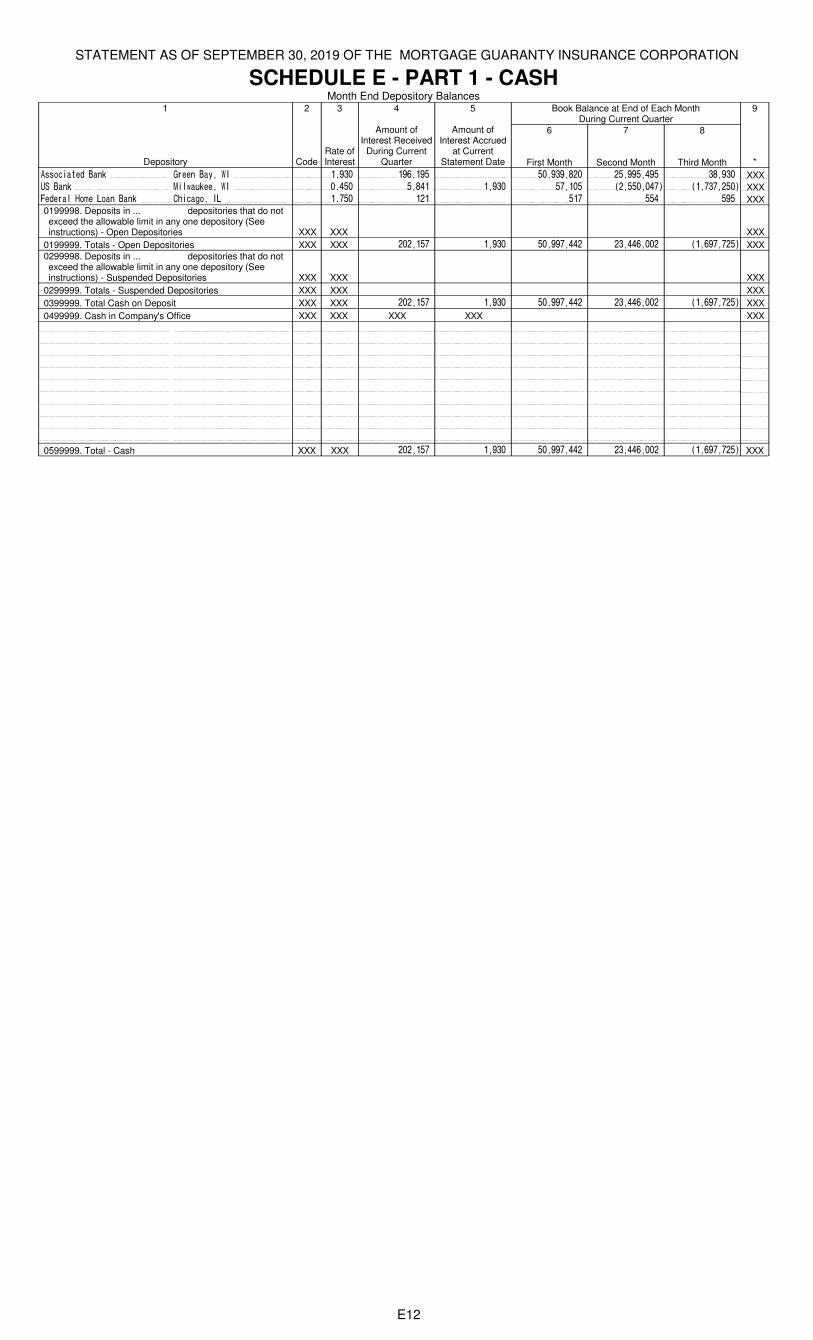
STATEMENT AS OF SEPTEMBER 30, 2019 OF THE MORTGAGE GUARANTY INSURANCE CORPORATION
SCHEDULE E - PART 1 - CASHMonth End Depository Balances
1 2 3 4 5 Book Balance at End of Each MonthDuring Current Quarter
9
Depository CodeRate of Interest
Amount of Interest Received
During Current Quarter
Amount of Interest Accrued
at Current Statement Date
6
First Month
7
Second Month
8
Third Month *
Associated Bank Green Bay, WI 1.930 196,195 50,939,820 25,995,495 38,930 XXX
US Bank Milwaukee, WI 0.450 5,841 1,930 57,105 (2,550,047) (1,737,250) XXX
Federal Home Loan Bank Chicago, IL 1.750 121 517 554 595 XXX0199998. Deposits in ... depositories that do not exceed the allowable limit in any one depository (See instructions) - Open Depositories XXX XXX XXX
0199999. Totals - Open Depositories XXX XXX 202,157 1,930 50,997,442 23,446,002 (1,697,725) XXX0299998. Deposits in ... depositories that do not exceed the allowable limit in any one depository (See instructions) - Suspended Depositories XXX XXX XXX
0299999. Totals - Suspended Depositories XXX XXX XXX
0399999. Total Cash on Deposit XXX XXX 202,157 1,930 50,997,442 23,446,002 (1,697,725) XXX
0499999. Cash in Company's Office XXX XXX XXX XXX XXX
0599999. Total - Cash XXX XXX 202,157 1,930 50,997,442 23,446,002 (1,697,725) XXX
E12
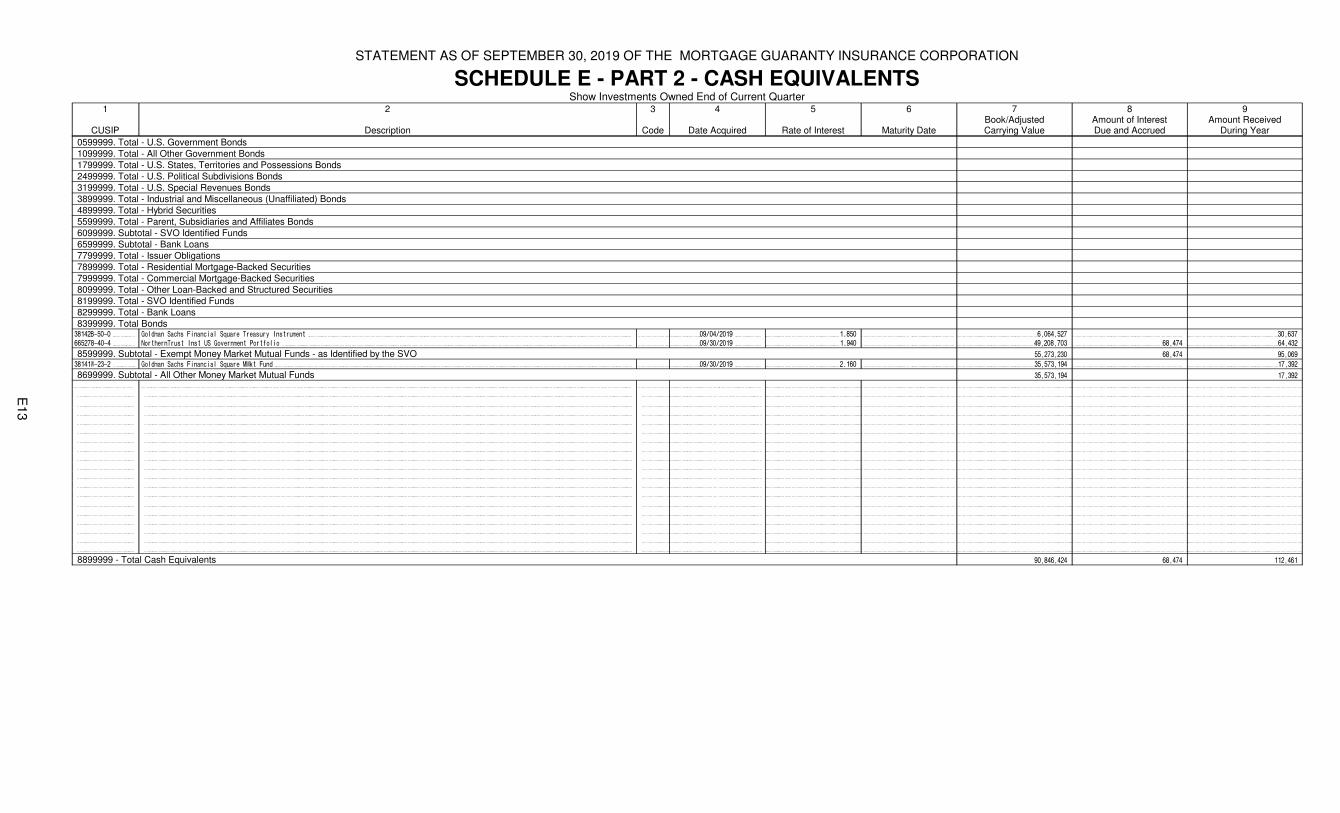
STATEMENT AS OF SEPTEMBER 30, 2019 OF THE MORTGAGE GUARANTY INSURANCE CORPORATION
SCHEDULE E - PART 2 - CASH EQUIVALENTSShow Investments Owned End of Current Quarter
1
CUSIP
2
Description
3
Code
4
Date Acquired
5
Rate of Interest
6
Maturity Date
7Book/AdjustedCarrying Value
8Amount of InterestDue and Accrued
9Amount Received
During Year
0599999. Total - U.S. Government Bonds
1099999. Total - All Other Government Bonds
1799999. Total - U.S. States, Territories and Possessions Bonds
2499999. Total - U.S. Political Subdivisions Bonds
3199999. Total - U.S. Special Revenues Bonds
3899999. Total - Industrial and Miscellaneous (Unaffiliated) Bonds
4899999. Total - Hybrid Securities
5599999. Total - Parent, Subsidiaries and Affiliates Bonds
6099999. Subtotal - SVO Identified Funds
6599999. Subtotal - Bank Loans
7799999. Total - Issuer Obligations
7899999. Total - Residential Mortgage-Backed Securities
7999999. Total - Commercial Mortgage-Backed Securities
8099999. Total - Other Loan-Backed and Structured Securities
8199999. Total - SVO Identified Funds
8299999. Total - Bank Loans
8399999. Total Bonds
38142B-50-0 Goldman Sachs Financial Square Treasury Instrument 09/04/2019 1.850 6,064,527 30,637
665278-40-4 NorthernTrust Inst US Government Portfolio 09/30/2019 1.940 49,208,703 68,474 64,432
8599999. Subtotal - Exempt Money Market Mutual Funds - as Identified by the SVO 55,273,230 68,474 95,069
38141W-23-2 Goldman Sachs Financial Square MMkt Fund 09/30/2019 2.160 35,573,194 17,392
8699999. Subtotal - All Other Money Market Mutual Funds 35,573,194 17,392
8899999 - Total Cash Equivalents 90,846,424 68,474 112,461
E13


