Embed Size (px)
Citation preview
بسم اهللا الرحمن الرحيم
Assessment of Some Productive and Reproductive Traits of Sudan Desert Goats
under Conventional and Supplemented Feeding Systems
By
Bushara Hassan El.Tahir Ali
B.Sc. Agric (Honors) University of Zalingei (1998) M.Sc. (Tropical Animal Production), Faculty of Animal
production, University of Khartoum (2002)
A Thesis Submitted to the University of Khartoum, in Fulfillment of the Requirements for the Degree of Doctor
of Philosophy (PhD) in Animal Production. Supervisor:
Prof. A/Moneim Mukhter Abu Nikhaila
Department of Dairy Production Faculty of Animal Production
University of Khartoum January 2010

To my lovely sons Hani and Mustafa (Abdia)
To my parents and my wife Hussna with love
To war affected people of Darfur
for their patience and sacrifices I dedicate
this humble work.
Bushara
I
ACKNOWLEDGEMENT
Without genuine suggestions, valuable advice, prolonged
guidance and keen supervision from prof. A/Moneim Mukhtar
Abonikhila, who backward never motivating and initiating
confidence of my personal capabilities, this work could not have
been accomplished.
I do offer my sincer gratitude to my colleague Fathi
erhaman Abdlgelel for his endless support and enthusiasm
during critical period of experiment and typing of manuscript.
Further, my appreciations and indebtedness obligations
are extended to my brothers Izedeen Hassan El.tahir, Abdallah
Abdia and Uncle Yagoub El.Tahir for their especial care of
managing the experimental flock in the study area.
Utmost thanks to all small ruminants scientists for their
literature contribution I benefited.
II
TABLE OF CONTENTS
ACKNOWLEDGEMENTS……………………………….………….………….…I
TABLE OF CONTENTS……………………………………….……...……..……II
LIST OF TABLES…………………………………………..….……………..…..IX
LIST OF FIGURES…………………………………………….….……………. .XI
ABSTRACT…………………………………………………..……….…………..XII
ARABIC ABSTRICAT……………………………………….….……………….XV
CHAPTER ONE: INTRODUCTION………………………...…….……….. …...1
CHAPTER TWO: LITERATURE OF REVIEW………………….…………… 4
2.1. Origin and background of goats…………..….………….4
2.1.1. Classification ………………………………..…………..4
2.1.2. Goat distribution………………………….……………...5
2.1.3. Sudanese goat types……………………………………..5
2.1.3.1. Desert goat………………………………….…….……...5
2.1.3.2. Nubian goat………………………………….……..........7
2.1.3.3. Nilotic goat………………………………….....................9
2.1.3.4. Taggari goats…………………………………………..11
2.1.3.5. Exotic goat's breeds……………………..........................11
2.1.4. Role of goat in socio-economic contribution……..........12
2.2. Management and production systems of goat…………13
2.2.1. Tethering system…………………...……………..........14
2.2.2. Extensive system……………………….……………...15
III
2.2.3. Semi-extensive system……………………..……..........15
2.2.4. Very intensive system…………………….….................16
2.2.5. Integration with cropping system…………….…….......16
2.2.1. Sudanese Livestock management system……………………………..……17
2.2.1.1. Sudanese traditional livestock system………………………….…............17
2.2.1.1.1. Pastoralist nomadic…………………………………………..……...17
2.2.1.1.2. Transhumance system…………………………………..……..……18
2.2.1.1.3. The sedentary and semi-sedentary system………………..………...18
2.2.1.1.4. The Intra-urban backyard system………………………..…….........20
2.2.1.2. Improved modernized systems…………...……………..…………….20
2.2.1.2.1. Integrated intensive livestock/crop production system…………..…20
2.2.1.2.2. Commercial production system……………..………………………20
2.2.1.2.3. Transitional system……………………………..……………..……21
2.3. Goats nutrition……………………………………...22
2.3.1. Goat feeding behavior……………….…………......23
2.3.2. Nutrients requirements……………………………..25
2.3.2.1. Energy requirements……………………………….25
2.3.2.2. Protein requirements……………………………….25
2.3.3. Nutritional supplementation………………………………..….……….26
2.3.4. Water requirements……………………………………..….…………...27
2.4. Productive performance…………………………...28
2.4.1. Growth……………………………………………..28
2.4.1.1. Birth weight………………………………………...29
IV
2.4.1.2. Pre-weaning growth rate…………………………...30
2.4.1.3. Weaning weight……………………………………32
2.4.1.4. Post-weaning weight……………..............................32
2.4.2. Kidding mortality…………………….……………33
2.4.3. Milk yield………………………………………….34
2.4.3.1. Factors affecting on milk yield…………….………35
2.4.3.1.1. Nutrition…………………………………………....35
2.4.3.1.2. Body weight of doe………………………………..36
2.4.3.1.3. Litter size……………...…………………………...36
Lactation length………………………….....................................36
2.4.3.1.4. Dry period……………………...…...........................37
2.4.3.1.5. Persistency…..……………………………………..37
2.4.3.1.6. Season of kidding…………………...………….......37
2.4.4. Lactation length……………..…………..………...38
2.4.4.1. Factors affecting on lactation length………..…......38
2.4.4.1.1. Breeds…………………………………………..………………......38
2.4.4.1.2. Year and season of kidding……………………..……………….....39
2.4.4.1.3. Parity order………………………………………….…………........39
2.4.4.1.4. Level of nutrition……………………………………..………….....39
2.4.5. Persistency………………………………………………..…………….40
2.4.6. Indices of doe productivity…………………………….…...………......40
V
2.5.7. Milk composition……………………………………..……..……….…41
2.5.7.1. Milk fat…………………………………………………………….…42
2.5.7.1.1. Factors affecting on milk fat……………………….…...………......42
2.5.7.1.1.1. Breeds……………………………………………….…………....42
2.5.7.1.1.2. Age………………………….………………………….………....42
2.5.7.1.1.3. Nutrition………………………………………..………………....42
2.5.7.1.1.4. Stage of lactation…………………………..……………………..43
2.5.7.2. Milk protein…………………………………..…………………….....43
2.5.7.3. Milk total solids……………………………..……………………..….44
2.5. Reproductive performance………….……..…..……..…...44
2.5.1. Gestation period………………………..……...........44
2.5.1.1. Factors affecting gestation period….………...…….45
2.5.1.1.1. Breeds………………………………...………..…...45
2.5.1.1.2. Sex of kids……………………….........….................45
2.5.1.1.3. Litter size (type of birth)………….......….................46
Season of kidding……………….…....…..……………………......46
2.5.2. Kidding interval ………………………………….….46
2.5.2.1. Factors affecting kidding interval……….…………...46
2.5.2.1.1. Breed……
…………………………..……..…………47
2.5.2.1.2. Level of nutrition……………….………..……...........47
2.5.2.1.3. Season of kidding…………….…………...…….........48
VI
2.5.3. Post-partum Anestrus period………………………………..…..……......48
2.5.4. Litter size…………………………………………………....…….............50
2.5.5. Puberty……………………………………………………....……............50
2.5.5.1. Factors affecting puberty………………………………..…..………....52
2.5.5.1.1. Breeds…………………………………………………....……….…..52
2.5.5.1.2. Level of nutrition………………………………………....……….......52
2.5.5.1.3. Season of the year………………………………………..….……......52
2.5.5.1.4. Presence of the male……………………………………..…………...53
CHAPTER THREE MATERIALS & METHODS……………………….....54
3.1 Area of study……………………………………………….…..………........54
3.1.1. Location …………………………………………….………..……….….54
3.1.2. Climate……………………………………..…………………….…….....54
3.1.3. Vegetation ……………………………………………..………….……...54
3.2. Experimental animals…………………………................….........................55
3.3. Housing…………………………………………………..…….……….….57
3.4. Feed and feeding………………………………………..…………….…....57
3.5. Productive Performance………………………………..………….……....59
3.5.1. Kids and does growth…………………………..…………….…………..59
3.5.2. Milk Yield……………………………………………..…..……...............59
3.5.4. Milk composition…………………………..………………….…………64
3.5.4.1. Determination of milk fat content…………..………………….…..…..64
3.5.4.2. Determination of milk protein content…………..………..……....…….....65
3.5.4.3. Determination of milk ash content…………………..…….…….…...........65
3.5.4.4. Total solids content………………………..………..…….………..……...66
3.6. Reproductive performance……………………..…..………..……………..….67
3.7. Data collection…………………………………..…………………………….68
3.8. Statistical analysis………………………………...….………...…….………..68
VII
CHAPTER FOUR: RESULTS……………………….………………………..…70
4.1 Kid’s performance………………………………..……………………..…….70
4.1.1. Birth weight………………………………..………………………………...70
4.1.2. Weaning weight ………………………..………………………….…..…….70
4.1.3. Post Weaning weight ……………………..…………………………………73
4.1.4. Kids mortality………………………………..……………………………...74
4.2. Reproductive performance……………………..………………………….….75
4.2.1. Gestation period ……………………………..………………………….…..75
4.2.2. Kidding interval…………………………..…….……………………………75
4.2.3. Litter size…………………………………………..….……………..………78
4.2.4. Puberty……………………………………………..………………..………79
4.2.5. Post-partum anestrus…………………………………...…...………………79
4.3. Productive performance………………………………..……………..…........80
4.3.1. Milk production………………………………………..……………………80
4.3.2. Lactation period……………………………………..………………………83
4.3.3. Indices of doe productivity…………………………..….……………….…..83
4.3.4. Milk composition……………………………………………...…………….85
4.3.4.1. Milk fat……………………………………………...……………….…….85
4.3.4.2. Milk protein……………………………………………..………………....85
4.3.4.3. Milk total solid………………………………………..…...……………….86
CHPTER FIVE: DISCUSSION……………………………..…….………………87
5.1. Kids performance………………………………………..………………..……87
5.1.1. Birth weight …………………………………………..……………….…......87
5.1.2. Weaning weight……………………………………..……………………….88
5.1.3. Post – weaning weight……………………………..………………….….......89
5.1.4. Kids mortality ………………………………………..……………….…......90
VIII
5.2. Reproductive performance…………………………..…………………..……91
5.2.1. Gestation period……………………………………..………………….…...91
5.2.2. Kidding interval……………………………………..………………………92
5.2.3. Litter size…………………………………………..……………………......94
5.2.4. Puberty……………………………………………..…………………..……95
5.2.5. Post- partum anestrus………………………………...………..………..…..96
5.3. Productive performance…………………………………..………………......97
5.3.1. Milk production………………………………………..……………….…..97
5.3.2. Lactation period………………………………………..………….......……98
5.3.3. Indices of doe productivity……………………………………..……........100
5.3.4. Milk composition……………………..……………………………….......102
5.3.4.1. Milk fat……………………………..……………….……...………........102
5.3.4.2. Milk protein ………………………………………...…...………………103
5.3.4.3. Milk total solid…………………………………..…....…………………103
Recommendations……………………………………..…….….…………..…...105
REFERENCES…………………………………………..…………………….....107
IX
LIST OF TABLES
Table Title Page
1 Some range description lands in the study area... 56
2 Formation of supplemented rations………………………… 58
3 Effect of feed supplementation on experimental kids
performance……………………………………………….
71
4 Effect of season on experimental kid’s performance…….... 72
5 Effect of feed supplementation on reproductive performance
of experimental goats…………………………..…………..
76
6 Effect of season on reproductive performance of
experimental goats………………………………………...…
77
7 Effect of feed supplementation on productive performance of
experimental goats…………………………………………..
81
8 Effect of season on productive performance of experimental
goats………………………………………………..………
82
X
LIST OF PLATES
Plate Title Page
1 Sudanese desert goat’s phenotypic characteristic…. 8
2 Sudanese Nubian goat.……………………………. 10
3-a Natural grazing during rainy season………………. 19
3-b Natural grazing during dry season………………… 60
4 Grazing range plants (Ipomoea Spp)……………. 61
5 Grazing range plants (Echinochloa colonum)……... 62
6 Grazing range plants (Cenchurs biflorus)…………. 63
XI
ABSTRACT
This study was undertaken to evaluate the productive and
reproductive performance of Sudanese Desert goats under the traditional
management systems with supplemented feed containing different energy
levels with iso-nitrogenous protein. Also to investigate the effects of
rainy and dry seasons on the productive and reproductive performance of
desert goats. Hence, the experiment was undertaken to evaluate the
effects of supplemented feed with three different levels of energy and iso-
nitrogenous protein(A,B,C ) compared to unsupplemented feed group (D)
on kids performance (birth weight, weaning weight, post-weaning weight
and mortality), productive performance (milk yield, lactation period, milk
composition and indices of doe productivity) and reproductive
performance (kidding interval, gestation length, litter size, post-partum
anestrus and puberty). Experiment was also undertaken to determine the
effect of season mainly rainy and dry periods on kids performance,
productive performance and reproductive performance.
Kid's performance analysis demonstrated that the birth weight,
weaning weight, post-weaning weight and kid's mortality percentage was
positively affected by feeding supplemented groups; high energy (A),
medium energy (B) and low energy (C) compared with unsupplemented
group (D). Exception with kid's mortality, kid's performance differed
significantly (P<0.05). Supplemented feed group containing higher
energy (A) secured the highest values compared with unsupplemented
group (D). Also, the effect of season (rainy and dry) analysis on the kid's
performance was demonstrated. Rainy season compared with dry season
differed significantly (P<0.05). Kid's performance of those kidded on
rainy season had secured the highest values compared with kid's borned
on dry season.
XII
Reproductive performance of the experimental goats analysis
demonstrated that the gestation yield, kidding interval, litter size, post
partum anestrus and puberty was affected by feed supplemented groups;
high energy (A), medium energy (B) and low energy (C) compared with
unsupplemented group (D). Exception with litter size, reproductive
performance of experimental goats differed significantly (P<0.05).
Supplemented feed group containing higher energy (A) secured the
superior values compared with unsupplemented group (D). The effect of
season on reproductive performance was also analyzed. Reproductive
performance of experimental goats differed significantly (P<0.05).
Reproductive performance of experimental goats on rainy season secured
the superior values compared with dry season.
Productive performance of the experimental goat's analysis
demonstrated that the milk yield, lactation period, indices of doe
productivity and milk composition was affected by supplemented feed
groups compared with unsupplemented group. Productive performance of
experimental goats significantly differed (P<0.05). Supplemented feed
groups (A, B and C) had the higher values compared with
unsupplemented group (D). Also, the effect of season on productive
performance of experimental goats differed significantly (P<0.05).
Productive performance of experimental goats on rainy season secured
higher values compared with dry season.
Therefore, it is concluded that feeding supplemented groups; high
energy (A), medium energy (B) and low energy (C) compared with
unsupplemented group increased birth weight, weaning weight, post-
weaning weight, milk yield, indices of doe productivity, lactation period
and milk composition. Gestation period, kidding interval, post-partum
anestrus and puberty were decreased. However, supplementing feed with
XIII
different energy levels had no affect on kid's mortality and litter size. This
study concluded that, the rainy season compared with dry season
increased birth weight, weaning weight, post-weaning, litter size, milk
yield, indices of productivity, lactation period and milk composition .On
the other hand, kid's mortality, gestation period, kidding interval, pos-
partum anestrus and puberty were positively decreased.
XIV
ملخص األطروحة
لتحديد الصفات التناسلية واالنتاجية وخصائص املواليد هذه الدراسةواجريت صممت
عز الصحراوي يف نظام الرعي التقليدي ونظام العليقة االضافية بتغذية املاعز الناجتة من قطيع املا
واليت ) د(ومقارنتها مبجموعة التحكم ) أ، ب، ج(الصحراوي علي مستويات خمتلفة من الطاقة
االمطار، (كذلك صممت التحربة ملعرفة اثر فترتني من املوسم . مل يقدم هلا اي عليقة اضافية
لتقييم اثر .صائص التناسلية واالنتاجية وخصائص املواليد لنفس قطيع التجربةعلي اخل) اجلفاف
علي ثالث مستويات خمتلفة من الطاقة ) أ، ب، ج(العليقة االضافية مت تغذية جمموعات التجربة
اليت غذيت علي املرعي الطبيعي دون ) د(ومتساوية مستوي الربوتني ومقارنتها مبجموعة التحكم
وزن املواليد، وزن الفطام، وزن ما بعد (ضافية واثرها علي خصائص املواليد الناجتة تقدمي عليقة ا
انتاج احلليب، فترة احلليب، التركيب (واخلصائص االنتاجية ) الفطام، نسبة نفوق املواليد
الفترة ما بني والدتني، فترة (واخلصائص التناسلية ) الكيميائي للحليب، دالئل انتاج احلليب
لتقييم ). د املواليد الناجتة من ولدة واحدة، اول دورة شبق بعد الوالدة، البلوغ اجلنسياحلمل، عد
.علي نفس اخلصائص السابقة) االمطار واجلفاف(اثر فترتني من املوسم
أظهرت نتائج خصائص املواليد الناجتة من قطيع التجربة ان وزن املواليد، وزن الفطام،
املواليد قد تاثرت بنظام التغذية التقليدية علي املرعي ونظام تقدمي وزن ما بعد الفطام، نسبة نفوق
النفوق قد تاثرت تاثرياً نسبةحيث وجد ان مجيع خصائص املواليد ما عدا . عالئق خمتلفة الطاقة
ذات احملتوي العايل من الطاقة اعطت اعلي القيم ) أ(جمموعة عليقة التجربة ). 0.05<أ(كبرياً
اما يف تاثري . اليت مل تعطي عليقة اضافية) د(الناجتة مقارنة مبجموعة التحكم خلصائص املواليد
بني فترة ) 0.05<أ(وجود تاثري معنوي فقد اظهرت النتائج ) االمطار، اجلفاف(فترتني من املوسم
XV
حيث ان خصائص املواليد الناجتة يف فترة االمطار . االمطار واجلفاف علي خصائص املواليد الناجتة
.ت افضل مقارنة باملواليد الناجتة يف فترة اجلفافكان
الفترة ما بني والدتني، فترة احلمل، (أثبتت النتائج املتحصل عليها من اخلصائص التناسلية
الناث قطيع ) عدد املواليد الناجتة من ولدة واحدة، اول دورة شبق بعد الوالدة، البلوغ اجلنسي
ة بالعليقة االضافية ذات الثالث مستويات من الطاقة ونظام التجربة، اا قد تاثرت بنظام التغذي
ما عدا عدد املواليد الناجتة من ولدة واحدة فان مجيع . املرعي التقليدي دون تقدمي عليقة اضافية
) أ(جمموعة عليقة التجربة ). 0.05<أ(ينها فروقات معنوية اخلصائص التناسلية االخري يوجد ب
ذات احملتوي العايل من الطاقة اعطت اعلي القيم يف اخلصائص التناسلية مقارنة مبجموعة التحكم
اما يف تاثري فترتني من املوسم .واليت غذيت علي املرعي الطبيعي دون تقدمي عليقة اضافية) د(
ائص التناسلية الناث قطيع التجربة، فقد اظهرت النتائج وجود علي اخلص) االمطار، اجلفاف(
حيث ان اخلصائص التناسلية الناث قطيع . بني فترة االمطار واجلفاف) 0.05<أ(تاثري معنوي
التجربة يف فترة االمطار كانت افضل مقارنة باخلصائص التناسلية الناث قطيع التجربة يف فترة
.اجلفاف
انتاج (يها من دراسة اخلصائص االنتاجية الناث قطيع التجربة اثبت نتائج املتحصل عل
، اا قد )، فترة احلليب، التركيب الكيميائي للحليب، دالئل انتاج احلليباحلليب
تاثرت بنظام التغذية بالعليقة االضافية ذات الثالث مستويات من الطاقة ونظام املرعي
اخلصائص االنتاجية الناث قطيع اذ وجد ان . التقليدي دون تقدمي عليقة اضافية
أ، (حيث وجد ان عالئق التجربة االضافية ). 0.05<أ(التجربة ا اختالفات معنوية
ذات مستوي خمتلف من الطاقة قد حصلت علي اعلي القيم بينما جمموعة ) ب، ج
واليت غذيت علي املرعي الطبيعي فقط دون عليقة اضافية حصلت علي ) د(التحكم
كذلك اظهرت النتائج املتحصل عليها من اثر . سبة للخصائص االنتاجيةقيم اقل بالن
XVI
علي اخلصائص االنتاجية ) 0.05<أ(تاثرياً معنوياً ) االمطار، اجلفاف(فترة املوسم
حيث انه يف فترة االمطار فان اناث قطيع التجربة اعطي قيم اعلي يف . الناث قطيع التجربة
. اجلفافاخلصائص االنتاجية مبقارنة بفترة
ختلص هذه الدراسة إيل أن تقدمي العليقة االضافية لقطيع التجربة مبستويات الطاقة
واليت غذيت بنظام الرعي التقليدي علي املرعي ) د(مقارنة مبجموعة التحكم ) أ، ب، ج(املختلفة
ام، الطبيعي ومل يقدم هلا عليقة اضافية، تزيد من خصائص الوزن عند امليالد، الوزن عند الفط
كما اا . الوزن بعد الفطام، انتاج احلليب الكلي، دالئل انتاج احلليب، القيمة الغذائية للحليب
بينما مل . تقلل ممن طول فترة احلمل، الفترة بني والدتني، اول شبق بعد الوالدة، البلوغ اجلنسي
ملواليد وعدد تؤثر علي بعض اخلصائص االنتاجية والتناسلية لقطيع التجربة مثل نسبة نفوق ا
.املواليد الناجتة من ولدة واحدة
خلصت الدراسة ايضا ايل تاثري فترة املوسم علي اخلصائص االنتاجية والتناسلية لقطيع
التجربة، حيث ان فترة االمطار مقارنة بفترة اجلفاف تعطي زيادة يف الوزن عند امليالد، الوزن
ن ولدة واحدة، انتاج احلليب الكلي، دالئل انتاج عند الفطام، الوزن بعد الفطام، عدد املواليد م
كما اا تقلل من نسبة نفوق املواليد، فترة . احلليب، طول فترة احلليب، القيمة الغذائية للحليب
.احلمل، الفترة ما بني والدتني، اول دورة شبق بعد الوالدة و البلوغ اجلنسي
1
Chapter One
Introduction
The chronic mischaracterization of natural resources conflicts
coupled with lack of development in infra-structures and continua’s
environmental degradation have positively led to devastating impacts on
livestock situation in the study area of North Darfur State, Sudan.
Goats are neglected animals in the Sudan despite the fact that they
play a very important role in the rural economy. They live mostly on
grazing poor natural pastures in arid and semi arid areas with no
supplementary feeding. They live as scavengers in the streets of towns and
cities requiring minimum care and attention despite the fact that they
provide many poor urban and rural families with milk and meat. Although
their origins in Asia, they are found under all environmental; conditions.
thus, their ability to withstand dehydration and their browsing habit enable
them to survive where cattle and sheep cannot (Steele, 1996).
There are about 744 million head of goat world wide of which
about 30% of world goat population is found in Africa and up to 89% of
the 21% of goat population is located in 14 countries of Central and Eastern
African regions (Wilson, 1991). F.A.O., (2003) estimated that the arid zone
of the world contains about 39% of the goat population, in spite of low
grazing potential; the semi-arid zone has the greatest concentration of
goats.
Sudan possesses a vast mass of agricultural land and diversified
climatic zones ranging from desert in the extreme North to semi equatorial
in the South. The diverse climate creates a variety of animal resources, and
recognizes Sudan as one of the countries with promising agricultural
2
potentials with largest population of livestock in Arab world and is second
to Ethiopia in Africa. According to recent estimates of livestock population
reached 140.003 million heads that divided into 41.426 million heads of
cattle, 51.067 million heads of sheep, 43.104 million heads of goats and
4.406 million heads of camels. Meanwhile, the livestock population in
North Darfur State is estimated to be 7.779.184 heads that are distributed
into 679.386 heads of cattle, 2.866.416 heads of goats, 3.687.037 heads of
sheep and 546.344 heads of camel (M. A. R., 2008).
Goats are important species of livestock in most traditional
agricultural production systems. Rural families own small ruminants for
provision of milk, meat and other needs. The recognition of the importance
of goats is developed as results of the capacity that goats can service under
marginal conditions unfavorable for cattle and sheep. Its preferred diet is
largely ignored by other animals, and goats can therefore contribute
substantially to the solution of food problems in many arid and semi arid
areas, where hunger and malnutrition are prevalent.
About 90% of livestock are raised under traditional pastoral system,
mainly in the Western States of Kordofan, Darfur and Southern states,
rangeland that occupy an area of 110 million hectares and produces about
18.6 million tones of crop resides (AOAD, 1994). Range land provides
about 86% of feed for livestock, crop residues and agriculture 10% while
irrigated forage and concentrates contributes 4%. The rangeland suffer
from un-even distribution of stocking capacity, bush fires, deforestation,
un-even distribution of water sources and encouragement of both
traditional and mechanized agricultural (Fadlalah and Ahmed, 2005) Information on performance of the main Sudanese dairy goat breeds is very
limited. Also, research on goat’s husbandry, feeding and management
3
Is comparatively limited compared to other livestock class. One may attribute to the believe that goats are environmentally hostile elements. Meager research is present regarding their particular husbandry needs (Johnson, 2005). The Sudanese desert goat received very little concern in research investigating their productive and reproductive traits, despite their large distribution in the Sudanese rural community where they play important economic roles.
This research is intended to achieve the following objectives:
1. To evaluate the performance of desert goats under the traditional
management systems with an immediate objective of securing a
valid data base on various productive and reproductive traits of
this species.
2. To assess the impact of feeding different energy levels with iso-
nitrogenous protein on performance of desert goats.
3. To monitor the effect of feed supplementation on pre and post
pubertal performance of kids of both sexes.
4
Chapter Two
Literature Review
2.1. Origin and background of goat:
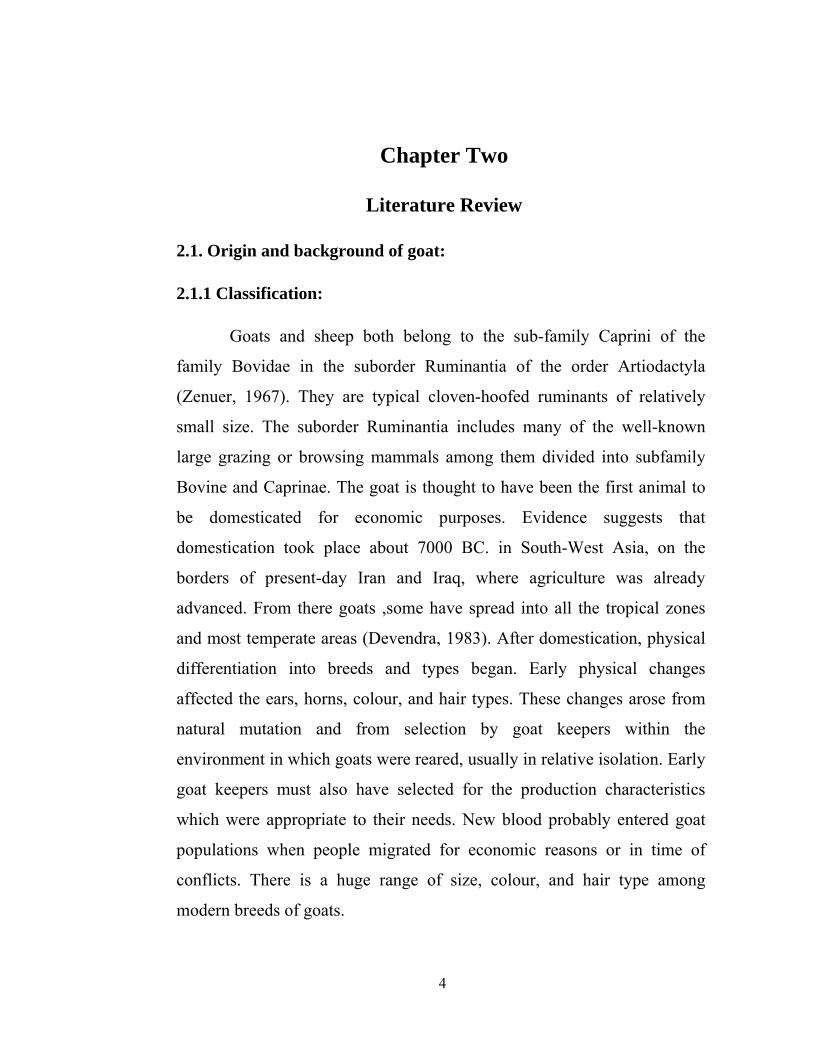
2.1.1 Classification:
Goats and sheep both belong to the sub-family Caprini of the
family Bovidae in the suborder Ruminantia of the order Artiodactyla
(Zenuer, 1967). They are typical cloven-hoofed ruminants of relatively
small size. The suborder Ruminantia includes many of the well-known
large grazing or browsing mammals among them divided into subfamily
Bovine and Caprinae. The goat is thought to have been the first animal to
be domesticated for economic purposes. Evidence suggests that
domestication took place about 7000 BC. in South-West Asia, on the
borders of present-day Iran and Iraq, where agriculture was already
advanced. From there goats ,some have spread into all the tropical zones
and most temperate areas (Devendra, 1983). After domestication, physical
differentiation into breeds and types began. Early physical changes
affected the ears, horns, colour, and hair types. These changes arose from
natural mutation and from selection by goat keepers within the
environment in which goats were reared, usually in relative isolation. Early
goat keepers must also have selected for the production characteristics
which were appropriate to their needs. New blood probably entered goat
populations when people migrated for economic reasons or in time of
conflicts. There is a huge range of size, colour, and hair type among
modern breeds of goats.
5
2.1.2. Goat distribution:
Goats have shown themselves to be extremely adaptable animals
and found as far north as Scandinavia and as far south as South America.
They can be found at very high altitudes. Some types of goats live in desert
area and upper hills, while other goats are able to thrive in the humid
forests. The highest proportions of the total world goat 30.7% are found in
Africa, while Central America has the lowest population of goats. Within
region of the Near East and South America, both sheep and goats are
widely distributed (Devendra, 1980). However, goats are probably more
widely distributed than sheep from the semi arid and arid areas to the super
humid environments. Goats flourish, however, and prefer areas of low
rainfalls and sheep are more important than goats in the highland eco -
zones and in the semi arid areas of North Africa, the Near East and
Northwest Africa.
2.1.3. Sudanese goat types:
The main types of goat in the Sudan are Nubian, Sudan desert,
Nilotic dwarf and Taggari. In addition, some of their mixed crossed with
Sannen, Toggenburg and Anglo-Nubian were also found since the
importation of exotic breeds in 1976.
2.1.3.1. Desert goat
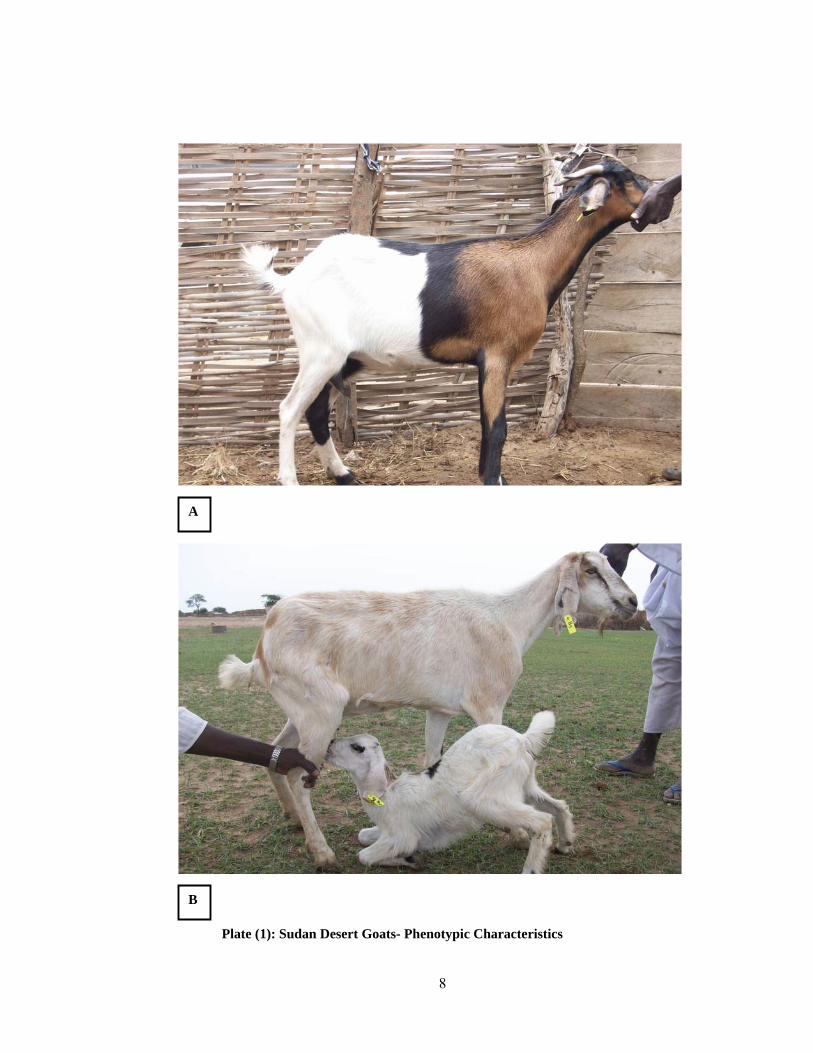
Desert goats arecommonly found in the arid regions of northern Sudan and of various countries where goats resemble each other in being medium or large size, with long legs and in most cases a short fine coat. The desert goats are located in the Northern Sudan and is possibly allied to the Shukria goat of western Eritrea, although the latter is probably a much better milk producer, more closely related to the Nubian. The Desert goat estimated to represent about 17% of the Sudanese goat
6
population. It is probable that the so-called Zaghawa goat that are found in Darfur and western Kordofan with a black colour variant of the Sudan Desert type. The main area of desert goat is dry areas of the Sudan, generally to the north of 12°N but north of 10°. The breed is well-adapted to heat and spares grazing of desert conditions that can thrive well in the desert environmental conditions. They are better meat producers even to desert sheep with tender and juicy meat (Gaili et.al., 1972). At its southern limit in Sudan, intermediate types with small forest goats are seen. Numbers are estimated at 1.0 million in early 1950s but certainly much more numerous than this in 1970s and 1980s. Population figures based on tax returns were 571 000 in Southern Darfur area alone in 1972.
Wilson (1976) describes sedentary herds in Western Sudan. Also,
Wilson and Clarke (1975) state that in that area, its large size 65-85 cm
with weight 40-60 kg for male and 32.7 ± 5.22 kg for female. Puberty was
at 5.87 months in males and 5.54 months in females. Mean age at first
kidding was 10.44 ± 0.19 months and kidding interval was 265.25 ± 3.99
days (Mohammed and El-imam, 2007). Head fine, forehead flat, profile
straight or slightly dished. Horns in 95 per cent of both sexes large and
flattened in cross-section in males, homonymously twisted, up to 35 cm
long projecting outwards or backwards; while females finer and curving
upwards and backwards, up to 30 cm in length. Ears in medium to very
long (12 - 20 cm), lopped. Toggles in 15 percent of both sexes. Beards in
both sexes, very bushy in males. Males may have a mane to the
shoulders or extending the whole length of the back. Mane in
occasionally present in females. Neck rather short. Chest shallow
and often pinched. Withers prominent (male 69-83 cm; female
65.5 ± 3.73 cm). Back short and straight. Croup very weak
and sharply sloping with tail set low. Legs are long
7
and poorly boned. Colour is variable from white to black, greys common but many mixed colours black back stripe in dark colours and grey in light colours (Plate, 1). Coat is usually short and fine except for mane, some animals particularly Zaghawa have longer hair which may be general over the whole body or confined to hindquarters and legs. 2.1.3.2. Nubian goats:
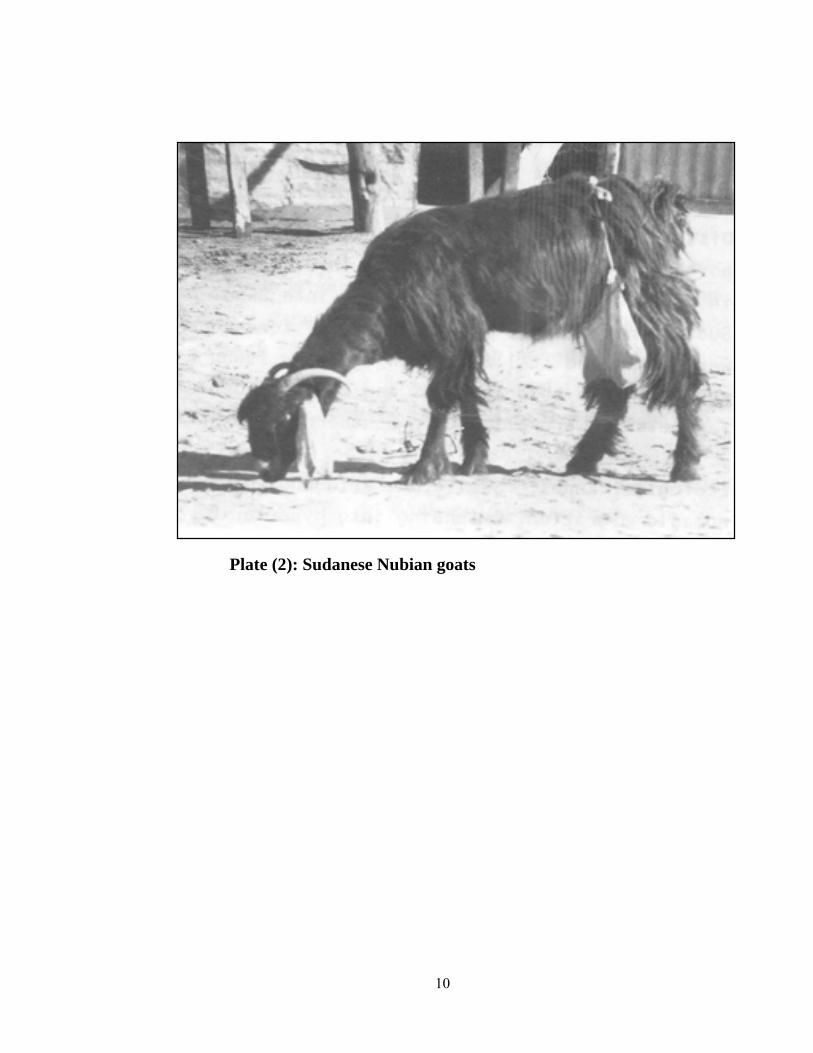
Nubian goats are referred as “local breed” and it is widespread in
North Eastern Africa and Mediterranean coastal belt. It is the only African
breed specialized for milk production. In the Sudan, the Nubian goat,
among other indigenous goats is the only acknowledged dairy goat
(Hassan and El-Derani, 1990). It's represents about 50% of the goats’
population. The Nubian goats are predominately found in the Northern
region and Khartoum. It is widely distributed north of 12º N mainly in the
riverain environments (FAO., 1991). Phenotypically it is allied to Egyptian
Zariabi, Eriterian Shokri and Syrian Damascus (Devendra and McLeroy,
1982). It is considered an improved dairy goat under local conditions and
well adapted to harsh environments. It originated in the Sudan, and is
widely distributed in Africa (French, 1970).
Its physical characteristics were described by El-Naim (1979) as a
large size goat of 70 -75 cm height males weighing 50 – 70 Kg and
females 40 – 60 Kg. the head is small medium, the forehead prominent
with markedly convex profile in males and females and depressed just
behind nostrils. Horns when present are rather light and medium length.
Ears are long (25 cm), broad and pendulous, especially lop with black
colour (Plate, 2). Beard usually absent. Legs are long but well
proportioned. Colour is generally black, other colours from dark chocolate
8
Plate (1): Sudan Desert Goats- Phenotypic Characteristics
A
B
9
brown, light fawn also occur. Longer hairs on front legs and especially on
hindquarters and hind legs give appearance of breeches. Liveweight range
is reported as 27 to 60 kg (Devendra and Burns, 1970). Milk yields
arranges in the order of 1 to 2 Kg daily and 120 to 140nkg daily annually
in two lactations (Devendra and Burns, 1970). Surplus kids would be
valuable for meat production (Mason and Maule, 1960). It could be a very
valuable breed for up-grading other non-seasonal breeders in Africa for
milk production (Devendra and Burns, 1983).
2.1.3.3. Nilotic goat:
Nilotic goats are riverian known as dwarf, Equatorial or Southern
Sudan goat. They are found in the humid tropics of the Sudan throughout
Southern Sudan. They are meat type producer and are characterized by
variable features of compact body and smaller in size. Nilotic goats often
weigh as little as 11 Kg with a height at withers of 40 t0 50 cm. Males
have short horns, females with either very short horns or none. The
forehead is convex and facial profile is straight. The ears are of medium
size. Light in colour, black or white or both colors is found predominantly
south of 12 latitude and represents 30% of the goat population of goats
population in Sudan (Mason and Maule, 1960). They have some
similarities with small East African goat. (Devendra and Burns, 1970).
There were three varieties of Nilotic goat that can be distinguished: (a)
Toposa (Mongola) goat which are mainly found in Eastern Equatorial State
and characterized by comparatively large size; (b) Yei (Dinka) goats which
are located in Western Equatorial ; and (c) Latuka Bari goat in Jongelli
State (AODA, 1990 and Muffarrah, 1995).
10
Plate (2): Sudanese Nubian goats
11
2.1.3.4. Taggari goats
Taggari goats also known as mountain goats because their presence
is associated with mountain and hills. They are distributed in Nuba
Mountain (Southern Kordofan State), Ingessana Mountain (Blue Nile state)
and Red Sea mountains (Red Sea State) at Toker and Halaib area (AODA,
1990). Both sexes have straight horned. The male is beard and maned. The
coat is short with black lines extended a long the face from the base of the
horns to the nostrils. The most common colour is dark-brown or grey-
brown (El-naim, 1979 and Muffarah, 1995). Due to their small size and
short legs they are very active and well adapted to the topographical and
climatic conditions prevailing in the area as well as to vegetation which
dominates the predominately mountains rangelands (Muffarah, 1995). It is
characterized by very short ears carried horizontally, short neck and legs
with live body weight range ranges 20 – 30 Kg. Age of puberty was 7.43
months in males and 8.04 month in females. Age at first service was 6.87
months in male and 7.87 month in female. Age at first kidding was 13.1
month with kidding interval of 245.4 days (El-imam et. al., 2007).
2.1.3.5. Exotic goats’ breeds
There are a number of exotic breeds of goat’s t6 that have been
imparted into the country (Abulazayim, 1996). The temperate zones goat
breeds are Saaneen, Toggenburg, Anglo-Nubian and Alpine which are
frequently owned by individuals and/or in hands of few goat keepers in the
country. They are mainly European breeds introduced into the tropics to
improve the local breed productivity particularly milk yield. However,
some of them such as Anglo-Nubian are recognized as dual purpose (milk
and meat) breeds which are not as good milkers as the breeds of the Swiss
origin. Damascus breed originated Middle East is also introduced to
12
improve milk yield production by some owned goat keepers in the Sudan.
Its ancestry has been acclimatized well in the tropical climates and
successfully been used in up-grading indigenous stock for meat and milk in
various countries such as the West Indies, Mauritius, Malaya and
Philippines. In the Sudan, the up-graded cross with local goats is known as
the Swiss-Nubian cross. The Anglo-Nubian is a British crossbreed from
our indigenous Nubian goats. Sannen proved to be an adequate breed.
Crosses with selected indigenous Nubian goats produced milk yield as
high as 4.5 kg/day.
2.1.4. Role of goat socio-economic contribution:
Goats are socio–economically important in developing countries,
ensuring food and fiber supply and providing income to small households
(Lebbie, 2004; Sahlu et al., 2004; Sahlu & Goetsch, 2005). Often the only
animal protein source, goat meat and milk help ensure infant development
and sustain human health. Owing to increased demand for goat products,
more livestock producers are raising goats in developing countries,
including Ethiopia (Sahlu & Goetsch, 2005). Human population growth,
increased urban income in several African countries, and new
opportunities for export, has encouraged the marketing of goats from rural
households and pastoral communities. Goat production thus helps meet
local meat demands, keeps hard currency from being spent on importing
meat, and increases hard currency reserves through exports of goat meat
and skins. Goat production provides employment for poor rural families,
especially for women and children (Lebbie, 2004). Goats can also serve as
a store of value and a security system. They can be sold to attain
immediate cash assets for poor goat holders, helping them to improve
livestock and crop farming and financing social events (Morand-Fehr et
13
al., 2004). Especially during droughts when crops fail, goats, due to their
adaptation capabilities, can survive on woody browses and infrequent
watering; coupled with their high reproductive rate and short generation
interval. Goats enable their owners to recover quickly and economically
(Lebbie, 2004; Peacock, 2005). The value of goats for the use of the vast
areas of natural grasslands, regions where crop production is yet
impracticable, should not be overlooked (Lebbie, 2004). Goats are also
important in various cultural activities, especially in pastoral and agro-
pastoral production systems.
2.2. Management and production system of goat:
Livestock production systems in African can possibly distinguish
two major systems depends on essentially differ in their use of the main
factors of production; traditional and modernized system. With traditional
system using mainly land and labor while modernized system have large
capital requirements and generally a lesser requirement for one or other of
the remaining factors. Principle criteria serve to define traditional systems
is the degree of dependence of household or the production unit on
livestock or livestock products either for household income or for food
supply. In Addition, the type of agriculture practiced in association with
livestock production. The distance and duration of movement
(transhumance and migration) might also be used to define system and it is
recognized that this is an important aspect of management within a system.
The feed cost in each of production systems is different and in
itself represents an important determinant of the ultimate economic benefit.
The proportion of total costs attributable to feed for goats grazing
uncultivated grass for meat in Malaysia was 2.2%; for goats stall fed with
cultivated grass for meat, feed represented 23% of the total cost, and for
14
goats stall fed on cultivated grass and concentrates for milk, the figure was
48.2% (Devendra, 1975).
Water is an important but often overlooked nutrient for livestock.
Water makes up over 98 percent of all molecules in the body and is
necessary for regulation of body temperature, growth reproduction,
lactation, digestion, lubricant of joints, eyesight and as a cleaning agent.
Limiting water intake can depress animal performance more quickly and
drastically than any other nutrient deficiency. Domesticated animals can
live about 60 days without food, but only seven days without water.
Hearing and sight are impaired without water (Charles and Greg, 1999).
Devendra (1990) stated that production system of goat and sheep in
the tropics and subtropics are divided to five systems:
2.2.1. Tethering system:
Tethering system is the most common systems that a very low level
of mostly unpaid family labor represents the main work input. Tethering
system or village system of feeding is divided to two categories; tethering
and alternative. Tethering where one to five heads are involved in situation
that there is intensive crops cultivation. The second alternative is feed in
situ the various crop residues available. Tethering system embrace the
traditional village system typical in Africa, parts of Central America and
Southeast Asia. Here, the animals browse and scavenge on what feeds are
immediately available near the farm and the households. A tendency to
treat sheep and goats with special care and also to feed them with kitchen
remnants in Africa encourages the animals to remain closer to the villages
than elsewhere.
15
2.2.2. Extensive system:
Extensive grazing is common where there is access to common
grazing involving mainly women and children. The flock size is large (one
to fifteen head) and goats are often mixed with sheep belonging to several
owners are run and herded together. Stocking density is usually in the
range of one to four head per hectare. In the extensive system, sheep and
goats graze over large areas, usually on marginal lands with low rainfall
which are unsuited for alternative forms of agriculture. Devendra (1976)
reported that, extensive system includes nomadic transhumance and
sedentrized patterns of production. It is characterized by fact that more
animals tend to be carried than in the intensive system. Extensive systems
include nomadic, transhumant and sedentarlized patterns of production and
are characterized by the fact that more animals tend to be carried than in
the intensive system. Also, few or no concentrates, salt or mineral licks are
provided. Those migratory systems suffer from the seasonal fluctuation in
forage and water availability, host social and political problems including
those concerning grazing rights.
2.2.3. Semi-intensive system:
Semi-intensive systems are a compromise between the extensive
and intensive systems, limited grazing or stall feeding is practiced
depending on the availability of time, labour and also feeds. It is
essentially a part-time operation, like the village system. The duration of
grazing is variable but is about 4 – 6 hours daily, usually in the late
morning or evening. The goats are then housed and given cut forage,
mainly tree leaves or crop residue, very seldom they concentrates offered.
16
2.2.4. Very intensive systems:
Very intensive systems are of two categories, intensive use of
cultivated forges or stall-feeding. Although goats prefer to browse in
comparison to grazing, they can sufficiently use cultivated pastures for
meat or milk production. Stocking density of the order of 37 – 126 head of
goats/ hectare have been reported depending on the type of grass used,
level if fertilizer application and the presence or absence of legumes.
The most intensive form of production called zero-grazing is one in
which the animals are fed in confinement with limited access to land. It is
by definition a system with a high labor and cash input. In this system,
cultivated grasses and/or by-products are fed such as straw with molasses-
urea supplementation. With goats, this system of feeding also has the
advantage of allowing control over the animals. Dairy goats are usually
stall-fed which is varied than intensive production based on a stall feeding
approach is feedlot fattening. This method appears to have had little
application with goats, but it has been used successfully with sheep in
Egypt (Salash et. al., 1970). He suggests that much more use can be made
of such systems, especially in environments where agro-industrial by-
products are plentiful.
2.2.5. Integration with cropping system:
Integration system is especially common in the humid and sub-
humid regions of the tropics where intensive crop production practice. The
integration of sheep and goats with crop agriculture has been practiced to
some degree in countries, but the nature and extent of integration depend
on the type of crops being grown and the relative importance of sheep and
goats. The system is closely associated with the different patterns of crop
production, notably tree crops such as coconut, rubber and oil palm.
17
Devendra (1975) recognized that 70 % of the goat population in Fiji is
found in the sugar cane growing areas. Similarly, in Sir Lanka, Malaysia,
Indonesia and the Philippines, sheep and goats under-graze coconut, oil
palm or rubber plantations. The advantages of the integration system are;
increased fertility of the land via the return of dung and urine, control of
waste herbage growth, reduced fertilizer wastage and use of weedicides,
easier management of the crop and possibilities of increases in crop yields
and greater economic returns including sale of animals and their products
(Devendra, 1990).
2.2.1. Sudanese livestock management systems:
The livestock production systems in Sudan is generally fall under
five major systems:
(a) Pastoralist system: (i) nomadic and (ii) transhumant.
(b) Sedentary and semi-sedentary.
(c). Intensified livestock/crop production system.
(d) Commercial production system.
(e) Intra-urban backyard production system
2.2.1.1. Sudanese traditional livestock system
2.2.1.1.1. Pastoralist nomadic
Livestock, mainly camels and sheep, with some goats, are raised
entirely on natural rangelands. Households move with their animals and
have no permanent base on which to grow crops. They spend the rainy
season in the northern, semi-desert zone and during the dry season, move
further south into the savannah. Income is derived from the sale of
animals, meat and milk in the form of white cheese.
Pastoralists depend on rangelands and move animals where feed
and water are available, in specific geographical zones (camel and cattle
18
owners in Kordofan and Darfur). These groups own 80 - 90% of the total
number of cattle, 100% of camels, 80% of sheep and 60% of the goats of
the country. The herd sizes in the system vary, averaging 200, 70, 90 and
200 for cattle, sheep, camels and goats, respectively. The system is the
main source of meat for the local demand and for export. (Plate, 3).
2.2.1.1.2. Transhumance system
In the transhumant agro-pastoral system, households depend
mainly on livestock, mostly cattle, with some sheep and goats, although
there is some cropping. In western Sudan, households migrate north during
the rainy season and return to the savannah during the dry season. In the
central and eastern states, migration is towards the Nile during the rainy
season and back during the dry season.
This is practiced in the southern part of the country where
herdsmen move away during the flood time and to it when it recedes. The
herds are kept in enclosures (luaks). The seasonal movement is short for
distances as compared to the nomadic system. Herd sizes are small and are
mainly cattle, which represent the pivot for the economic and social life of
the people.
2.2.1.1.3. The sedentary and semi-sedentary system
The sedentary system exists where there is rain-fed, arable farming
in settled villages. Some livestock, mainly small ruminants, are kept, but
the animals are less important than the crops. Sorghum, sesame and cotton
are grown on clay soils, and millet and groundnuts on sandy soils.
This includes livestock owners who practice rain-fed agriculture
and also send their animals with the nomads to feed on agricultural by-
products in the area. The system also includes farmers in the irrigated
schemes who raise small ruminants for supplementary financial support.
19
Owners keep milking animals and send dry ones with the pastoralist
nomads. The system supplies milk to towns and urban areas, and is
characterized by low technology.
The sedentary and semi-sedentary system is located in the irrigated
areas of central Sudan where cotton, sorghum, groundnuts and wheat are
grown. They also raise livestock, especially small ruminants. Livestock,
although its less important than crops, are a supplementary source of
income, which is used to hire labour for agricultural work before the
harvest. Productivity is low and animals depend heavily on crop residues,
industrial by-products and the grazing of limited areas of fallow and the
sides of canals. Intensive cow’s milk production is becoming more
common within the large irrigation schemes, and these areas are seen as
promising for future expansion of livestock production.
2.2.1.1.4. The Intra-urban backyard system
In this system, mainly goats and poultry are kept for domestic
supply. This system is widespread in rural and around urban areas for
"productive families". Animals and birds live on household waste and as
scavengers.
2.2.1.2. Improved modernized systems
2.2.1.2.1. Integrated intensive livestock/crop production system
In this system, intensive dairy production is practiced using
irrigated fodder and concentrates with exotic breeds or indigenous local
breeds. This system is seen as the promising system for the future supply
of milk and meat for the increasing demand of the communities in the
country.
Plate (3) a: Natural grazing during rainy season
Plate (3) b: Natural grazing during cool dry season
20
A migratory agro-pastoral system as a part from integrated
intensive livestock/crop production system is found in southern Sudan,
where livestock are raised in traditional rain-fed agricultural systems in
settled villages. Livestock are moved away from the torches to highlands
in the period of flooding and back when the floods recede.
2.2.1.2.2. Commercial production system:
Commercial production system includes (a): Milk cooperatives,
specialized. Large dairy enterprises and individuals that own high
producing milking cows. The system is particularly seen around big towns;
(b): Feedlots for fattening cattle and sheep trekked for long distances from
the western regions of the country to urban areas and markets. Fattening is
also practiced in big privately owned rain-fed mechanized agricultural
schemes on crop residues; and (c): Poultry commercial production business
around big towns.
2.2.1.2.3. Transitional system
Improvement of the traditional systems is a progressive activity
recently practiced where animals are raised on natural range (especially
sheep), and water and feed supplements are transformed to those areas.
Another recent activity is raising animals on mechanized rain-fed
agricultural schemes.
Ranching is a recent trend in Sudan. Animals are raised for meat on
natural rangelands in western Sudan in Kordofan and Darfur, and in
Butana in Kassala State. Poor range management within the ranch is,
however, a major constraint. Feedlots have existed for over 30 years.
Animals, mainly beef cattle, are brought on the hoof from western Sudan
and fattened in Khartoum State on sorghum grain, oilseed cakes and
roughage, with gains of up to 1 kg/day in cattle and 0.35 kg in sheep. Near
21
and within urban areas, goats and poultry fed on household waste are kept
for domestic supply.
2.3. Goat nutrition
Goats have the unique ability to utilize forage resources that cannot
be utilized effectively by other ungulates (Meuret, 1994) such as sheep or
cattle (thorny plants and species containing high proportions of phenolic
compounds). They exhibit a versatile feeding behaviour, advantage which
comes mainly from their physical body structure (bipedal stance, mobility
of upper lip and vigorous grazing), as well as their variable rumen
microflora allows them to cope in harsh environments. In the tropics they
exploit even the meager shrubby resources, selecting the more nutritive
parts and converting them is a useful product. In the arctic they perform
better than other domestic ungulates having considerable versatility in
feeding behaviour, but well in all animals, goats have no advantage also
coping with cold weather. In temperate climates, where forages are
relatively more nutritiously uniform and no special selection skills are
needed to select high quality diet, goats may not be different in
performance from other domestic ungulates. Goats have a more hospitable
microflora environment for noxious phenolic compounds degradation, than
other domestic animals. Furthermore it is believed that goats tolerate better
phenolic compounds than other ungulates, due to their enlarged salivary
gland ensuring extensive proline excretion, neutralizing the negative effect.
Goats’ diet almost always contains high proportions of lignified
components whenever woody species exist within the pasture. Lopez-
Trujillo and Carcia-Elizondo (1995) have reported at even in shrub land
reseeded with grasses goats selected very low proportions of grasses.
Similarly Papachristou and Nastis (1994) have demonstrated that even
22
during spring when herbaceous species are very palatable, goats ingest
high proportions of shrubs. However, when herbaceous species are more
palatable, certain goat breeds (Fedele et al. 1993) may consume more
herbage (63% vs. 28%). Goats naive to Leucaena leucocephalu (leucaena)
are incapable of utilizing it while those that have developed the proper
microbial populations thrive effectively on it. A similar phenomenon has
been observed for goats naive to Quercus coccifera (kermes oak), which,
within a week are fully adapted. Sheep require longer period.
2.3.1. Goat feeding behavior
Animals decisions where to feed, distance between foraging sites,
for how long to graze, how long to search between bites; all greatly affects
the rate and level of food intake as well as the nutritional content of their
diet.
The factors governing habitat selection seems to be primarily
vegetation type and composition parameters. In complex rangeland
ecosystems animals congregate in areas of higher forage quality and
quantity. Quality seems to be the main driving force (Bailey et al. 1995)
being non-linearly related to site selection (overmatching) while quantity
within some limits is linearly related. In homogenous areas, though,
animals alternate between foraging sites insisting on those with higher
yield. Arnold (1987) and Bazely (1990) have reported that sheep preferred
higher biomass grass patches quantitatively optimizing intake. Due to
different grazing habits goats prefer areas dominated by shrubs (Gordon
and Illius 1989) while other ungulates concentrate more on mesotrophic
graminoid sites where they can obtain the highest quality diet. The
decision making process is influenced, to a lesser extent by other factors
such as 'topographic features, slope, aspect, environmental conditions as
23
well as internal animal-related factors. When qualitative or quantitative
differences are small easily accessible sites are always preferred to sites
requiring higher expenditure for walking energy. Goats compared to other
ungulates are less affected by topographical barriers. They search for food
more vigorously even in rough terrain consuming forage up to 1, 5 m
height by practicing bipedal grazing. Consecutive visits to a site reinforce
memory for spatial distribution while herding modifies their free habitat
choice. Despite the existing experimental information, the hierarchy of the
factors that govern habitat selection is not yet fully understood. If we are to
make the most efficient use of the renewable natural resources available in
marginal areas it is essential to improve the understanding of the foraging
strategy of goat, which is the animal making the best use of these
ecosystems.
Compared to other domestic ungulates goats are more flexible in
their feeding habits, expressing rapid seasonal shifts. The goat is
characterized as a generalized feeder since it adapts its choice according to
what is available, having a very large selection choice (Van Soest 1982).
Grazing goats are obliged to shift foods since natural pastures are
continuously changing composition and therefore quality. It has been
demonstrated experimentally (Papachristou and Nastis 1993) that goats
exhibited very rapid seasonal shifts between shrubs, grasses and forbs,
depending on their availability and their seasonal nutritive value. Selection
rations (Nastis et al. 1993) of most species vary greatly from season to
season. Under conditions of extreme nutritional stress Malechek and
Narjisse (1987) have reported sheep forage lazily and do not cover wide
areas, while goats search more vigorously, even for litter and for less
palatable shrubs.
24
2.3.2. Nutrients requirements
The daily feed intake of goat ranges from 3-4% of body weight as
expressed in pounds (dry matter/head/day). The daily feed intake is
influenced by body weight, % of dry matter in the feeds eaten (12-35% in
forages, 86-92% in hays and concentrates), palatability, and physiological
stage of the goats (growth, pregnancy, and lactation).
2.3.2.1. Energy requirements
Fresh pastures and young plants may have highly digestible fiber
and provide high energy compared to older plants. Higher energy levels
come from lower fiber feeds. Energy is represented as Total Digestible
energy (%TDN) in feed analysis reports. It is important to supply half of
the goat ration in the form of hay or pasture to avoid high energy related
problems. Maintain at least 12% crude fiber in the diet. Energy
requirements for different physiological stages; maintenance, pregnancy,
lactation and growth vary. The maintenance requirement for energy
remains the same for most goats except dairy kids; they require 21%
energy higher than the average. It is important to feed high-energy rations
at the time of breeding, late gestation and lactation. Lactating does have
the highest energy demand.
2.3.2.2. Protein requirements
Feeds like forages, hays, pellets (alfalfa), barley, peas (screenings,
whole, split), corn, oats, distilled grains and meals (soybean, canola,
cottonseed meals) are common sources of protein for goat rationing. The
protein requirements are higher during growth (kids), milk synthesis
(lactation), and mohair growth. Producers may need to supplement protein
sometimes during the year, especially in late fall or winter. It is very
important for a commercial goat operation to do cost-effective rationing as
25
proteins can be an expensive feed ingredient. Good quality hay does not
need much protein supplement for goats. If the hay has about 12-13%
protein content then provide ½ lb of protein source in the form of corn,
barley, peas or oats (with 20% protein in total). In case the hay is of
average quality, add one pound of protein as supplement.
2.3.3. Nutritional supplementation:
During the gestation period and the overall location period under
any feeding program, goat can give optimum annual diary performance
because goats have great ability for adapting themselves to different
feeding conditions (Fehr and Sauvant, 1977). Nevertheless, the milk
production has been shown to exhibit great variation with the quantitative
and qualitiative character of the diet offered. Owen et. al. (1967) studied
the effect of molasses in normal and high grain rations and concluded that,
the highest persistency was produced by the two ration combinations
containing no molasses and fed with the normal level of grain that
averaged 97% persistency. Jubartalla (1998) studied Sudanese Nubian
goats and claimed that, sorghum fed group maintained a record of 33%
increase in fat corrected milk. While, Tewfik (1997) for Sudanese Nubian
goats showed that, the milk produced by goats fed on 1.5 Kg/ day sorghum
stalk plus molasses ration containing (50% molasses, 36% wheat bran,
10% cotton seed cake, 3% urea and 1% salt) at rate of 1Kg/ day was found
to be significantly higher (P< 0.01) than that produced by goats fed on
sorghum stalk only at rate of 2 Kg/ animal/ day.
Tag Eldin (2000) studied the effect of different energy levels (A =
Maintenance, B = Maintenance × 1.125 and C = Maintenance ×1.250) on
milk yield of Sudanese Nubian goats and reported that, the effect of energy
intake was significant (P< 0.05). Shetaewi et. al. (2001) studied milk
26
production of Damascus goats in North Sinai, Egypt, the goats were fed
0.6 Kg/ day concentrate and ad libitum amount of any of the following:
rice straw (R = control ration), green acacia (A = treat ration) and berseem
clover hay (B = treat ration). They found that the total milk yield over 10
weeks was significantly different among the three groups. Group (B) had
the highest means while group (R) had the lowest value.
2.3.4. Water requirement:
Water is obviously important for goats, and the amount required
depends on that needed for the maintenance of normal water balance and
to provide satisfactory levels of production. Goats consumed water at the
rate of 8% of their body weight per day under the scarcity conditions
(Wani, 2002). Also, he added that goats have the ability to maintain itself
at 4 % body weight per day. Maloiy and Taylor (1971); and Macfarlane
and Howard (1972) compared the importance of water to goats and other
animals. They reported that goats are among the most efficient users of
water, after the camel in the low rate of water turnover per unit of body
weight. This may be due to ability of goats to be fewer subjects to high
temperatures stress than other species.
Wani (2002) demonstrated that, there were many factors affecting
water consumption of goats such as: lactation level, environmental
temperature, water content of forage consumed, amount of exercise, and
salt and mineral content of the diet. Brown and Lynch (1972) and Lynch
et. al. (1972) reported that, when feeding on dry forages lacking of water,
the efficiency of reproduction will be suffer. Wani (2002) reported that
suboptimum water intake will result initially in reduced feed intake, then
reduced performance and gradual starvation. Also, he added that a cute
27
problems occur when goats are unable to maintain water balance or control
body temperature.
2.4. Productive performance:
2.4.1. Growth:
Growth is defined as change per unit time and/or change relative to
time. Lawes and Gilbert (1859) established scientifically that a high
growth rate leads to an enhanced rate of fat deposition; and conversely Le
Maho et. al. (1988)has shown that starvation or slow growth leads to fat
utilization and consequent depletion of fat in the body. Wallace (1948)
however, questioned whether increases in fat content of an animal could be
considered as an essential part of true growth. Wilson (1954) with poultry
concluded by conducting further trials on the basis of comparing fat-free
carcasses. Growth is measured in terms of liveweight per unit time. This is
not sufficient, as the animal grows, its body size or conformation changes
and hence body measurements are considered as measurement of growth
(Pemeroy et. al., 1952). The growth curve is sigmoid in shape and is much
the same in shape in all species except in man where juvenile period is
very long.
However, growth has been studied and results interpreted in the
terms of theories of algometric and heterogenic growth and centripetal
development first postulated by Brody (1927) and Huxley (1932). It is
measured in terms of liveweight per unit time due to the different genetic
factors in different breeds (Hammond, 1932; Palsson, 1940) and changes
due to different patterns of growth (McMeekan, 1940, 1940; Palsson and
Verges,, 1952, 1954). Hammond (1932) demonstrated in the sheep that as
the animal develops, a wave of increasing growth rate passes from the head
and extremities of the limbs towards the central region of the body.
28
2.4.1.1. Birth Weight:
Birth weight represents the weight of the animal which was
reached by its tissues and organs at the final stages of development in the
uterus. Darokhan and Tomar (1983) reported that, birth weight is one of
the traits that have no direct economic values but permit early selection by
its high association with growth and production in later ages. The average
birth weight of crossbred Sannen and Nubian kids was 3.56 Kg for the
range of 4.8 – 2.0 kg (El Zubeir and Abd El Gadir, 2005). Studying
production traits of Southern Darfur goats, Wilson (1976) reported that the
average birth weights were 2.10 ± 0.61 and 2.16 ± 0.61 Kg for males and
females respectively, and 2.09 ± 0.5 and 2.01 ± 0.4 kg for males and
females born for the first kidder goats. Ageeb (1992) showed that the birth
weight of Baggara goat of South Kordofan were 2.0 ± 0.5 and 1.8 ± 0.40
kg for males and females, respectively. Litter size increase was found to
decrease the birth weight of individual goat kids. Elabeid (2002) reported
that the average birth weight of Sudanese Nubian kids was 2.489, 1.963
and 1.500 Kg for single, twins and triplets. Similar observation was
reported for Sudan Desert sheep. Alama (1987) noted that the birth weight
of single and twin Gezira sub-ecotype were 4.2 and 3.2 Kg respectively.
Sex of kid also influences weight at birth and males were heavier than
females (Khan, 1979; Darkokhan and Tomar, 1983; Lebbie and Manzini,
1989; Karua, 1989 and Nefzaoui et. al., 1995). The birth weight of
Jamnapari goats was studied by Khan (1979) and showed that, birth weight
of Jamnapari ranged between 2.20 and 4.80 kg for males and between 1.40
and 4.00 Kg for females. Darokhan and Tomar (1983) reported an average
birth weight of 2.03 ± 0.83 Kg for Changthang Pashmina goat. On the
other hand, Lebbie and Manzini (1989) showed that the average birth
29
weight of Swaziland indigenous goat was 1.9 ± 0.14 Kg under traditional
management system, with male kids weighing more than females. These
findings were differ with both studies of Wilson (1976) and Ageeb (1992),
who reported that, the sex of kids had no significant effect on birth weight.
2.4.1.2. Pre-weaning growth rate:
The pre-weaning growth period is characterized by high growth
rate compared to the post-weaning growth rate. Wilson (1976) studying the
production traits of the Southern Darfur indigenous goats; reported that the
average growth rate was 86.9 g/d from birth up to 3 month of age. Ageeb
(1992) showed that, the growth rate of Southern Kordofan Baggara goats
was 60.0 g/d from birth up to 3 months of age. Pre-weaning daily weight
gain of Indian Jamnapari goat was 92.0 g and 85.0 g for males and females
respectively from birth up to 90 days of age (Khan, 1979). However, for
the different type of birth the same author found that the daily pre-weaning
weight gain were 65.0 g/d and 58.0 g/d for male and female single born
kids respectively from birth up to 4 – 5 months of age. Joshi (1979)
showed that Barabari Indian goat breed had an average growth rate of 61.5,
57.5 and 64.0 g/d for single, twin and triplets born kids up to 3 months of
age, respectively. Lebbie and Manzini (1986) stated a growth rate of 68.2
g/d for Swaziland indigenous goats from birth up to 3 months of age, and
the growth rate was influenced by the kid birth weight, sex of kids and
environment. Moreover, Kiwuwa (1986) reviewing the growth characters
of East African goats showed that pre-weaning daily weight gain were
56.0, 53.0, 57.0, 62.0, 106.0 and 102.0 g for East African, Mudende,
Sudanese Nubian, Galla, Boer and Galla× Boer goat breeds respectively.
Rossanigo et. al. (1995) studying Argentina Criollo goats reported a pre-
weaning daily weight gain of 76.8 g and 91.3 g under extensive and semi-
30
intensive management systems. Mahgoub (1997) reported that, Omani
Dhofari Wethers have a pre-weaning growth rate of 96.0 and 88.0 g/d for
males and females respectively. Mahgoub and Lodge (1998) showed that
the pre-weaning daily weight gain was 120.0 and 105.0 g/d for Oman
Batina male and female kids respectively. An average pre-weaning daily
weight gain of Spanish Criollo goats was studied by (Dayenoff et. al.,
1999) and reported 90.1± 20.6 g/d from birth up to 42 days of age. El-
Moula et. al. (1999) reported that, males of Sudan Desert goat kids had a
significantly (P<0.05) greater liveweight gain and consumed more dry
matter with slightly higher feed conversion efficiency than females.
Devendra and Burns (1970) reported an average liveweight gain of
0.5 Kg weekly for tropical goats. Babiker et. al. (1985) reported a weekly
rate of liveweight of 0.5 Kg with Sudan desert goats for entire and 0.38 Kg
for castrated goat kids fed intensively from weaning to 7.5 month of age.
Mukudan et. al. (1982) compared variation in body weight gain between
Malabari goats and their Sannen half bred goats under intensive feeding.
He reported Sannen half bred goats to grow faster by 0.091 Kg per week in
all periods than the purebred Malabari goats. Mukudan and Bhat (1978)
compared Malabari goats and their crosses with Sannen and Alpine. They
found their weekly growth rates to be 0.24 kg, 0.29 Kg and 0.36 Kg
respectively. Bello (1985) reported growth rate of 0.57 kg per week in
crossbred kids. Wilson (1988) carried out study of the factors affecting
weight in traditional managed goats and sheep in central Mali. He reported
that the growth rates observed during the study were within the range
reported for African goats and sheep of similar mature size.
31
2.4.1.3. Weaning weight:
The weaning age and weight are dependent on the individual
growth performance before weaning and factors affecting it, beside the
type of production. However, many workers studied factors affecting
weaning weight. Nicoll (1985) working with Angora goats in New Zealand
stated that, the single reared kids were significantly heavier at weaning. A
similar result was reported by Mavrogenis et. al. (1984) for Damascus
goats in Cyprus. Laes and Peters (1995) in a comparative study of
performance of Egyptian goat breeds (Baladi, Zaraibi and Damascu) stated
that birth litter size significantly (P<0.05) affected the weaning weight. Al
kass et. al. (1999) working on native Iraqi goats reported a significant
(P<0.01) effect of the type of birth on weaning weight. On the other hand,
the sex of the kids was reported to affect the weaning weight. Nicoll
(1985) studying the weaning weight of Angora goat in New Zealand and
reported that, male kids were significantly heavier at weaning than female.
Leaes and Peters (1995) stated that the kids weaning weight of Egyptian
goats were significantly affected by the sex of the kids. Also, Al kass et. al.
(1995) reported a highly significant (P<0.01) difference in weaning weight
between males and females; males were heavier than females for native
Iraqi goat and their crosses with Sannen and Damascus goats. On other
hand, Morand (1997) and Lu and Potchoiba (1988) reported that weaning
as a procedure of stopping suckling is to result in a shock to kids growth
rate.
2.4.1.4. Post-weaning weight:
The post-weaning growth period is characterized by a decrease in
growth rate, and the kids start to depend on their self to meet their nutrients
requirements. Therefore, weight gain is much lower compared to the pre-
32
weaning growth period. Wilson (1976) reported an average daily weight
gain of Southern Darfur indigenous goats was 67.0 g/d up to six month s of
age. Moreover, Ageeb (1992) showed that the growth rate of the Southern
Kordofan Baggara goats was 40.8 ± 18.1 g/d and 38.6 ± 22.7 g/d for ages
up to 6 months and 9 months, respectively. For Indian Jamnapari goat,
Khan (1979) reported a post-weaning growth rate of 42.0 g/ d and 32.0 g/d
for male and female kids, respectively. In the same study the growth rate
from 3 to 12 months of the single born males and females were 31.0 and
24.0 g/d respectively, and for twin born males and females were 41.0 and
32.0 g/d respectively. Mahagoub and Lodge (1998) studying the
production performance of Batina goats of Oman, showed that the post-
weaning growth rate of this breed was 102.0 g/d.
2.4.2. Kidding Mortality:
Kid mortality is one of the main factors that reduce the profitability
of goat enterprises. There are many factors affecting kids mortality such as
diseases, inadequate nutrition and other individual characters of the kid.
Usually kids have higher mortality rates than adult goat. Khan (1979) for
Jamnapari goats of India showed that, the pre-weaning mortality was
higher in the kids having low birth weight and the mortalities were 8.49%,
14.92% and 10% for pre-weaning, post-weaning and adult respectively.
Ageeb (1999) using South Kordofan Baggara goats, reported a mortality of
40.2% for kids than 6 months of age. Vihan (1979) investigated the
common causes of mortality in kids and their control, showed that 50 % of
the deaths were infected in the first month and about 25% in the first week
of the birth, with other peak death from 3rd to 5th month where milk is
completely from kid diets. Nair (1979) found a mortality rate of 5.06%,
6.05% for Malabari adult males and females respectively, under normal
33
conditions then the mortality rates increased to 32.73%, 11.16% for males
and females due to outbreak of viral pneumonia.
2.4.3. Milk Yield:
Milk yield is the most important factor in dairy economy. The
profitability of dairy enterprise depends on obtaining as high a level of
milk production as possible. Goat milk is more widely produced than
sheep milk, and globally goat production yields 60% of its value as milk,
35% as meat and 5% as skin (Devendra and Mcleroy, 1988; Malau-Aduli
et. al., 2001). Sulieman and El-Tahir (1989) investigated the milking
capacity of Dubasi and Shugur ewes at El-Huda Sheep Research Station in
Gezira Irrigated Agricultural Scheme. They recorded 140.2 liters of milk in
186.3 days for Shugur and 134.1 liters in 189.5 days for Dubasi. They
mentioned that the ewes were sustained only sorghum straw for some days
during the rainy season. It's likely that such poor quality feeds could have
caused a substantial decline in milk yield. Milk biosynthesis depends on
the mamary gland receiving a continuous supply of various metabolites
and hormones from the blood. The milk yield of the mammalian species
undergoes seasonal variation (Harding, 1999). Webster (1989) reported
that, countries like Iraq and Libya obtain half of their total milk
requirements from goats. Although, there is similarity between cattle,
goats, sheep and buffaloes in the genetics of milk production, there is
evidence that on livewight basis the goat is a much more efficient milk
producer than the other species (Malau-Aduli et. al., 2001). Also, the goat
has higher feed conversion efficiency to meat and milk than cattle, sheep
and buffaloes (Okello and Obwolo, 1985).
34
Milk yield of goats is affected by many factors such as: plane of
nutrition, doe body weight, litter size, lactation length, dry period,
persistency and season of kidding.
2.4.3.1. Factors affecting on milk yield:
2.4.3.1.1. Nutrition:
Milk production will rapidly rise in early lactation and reach peak
between 50 and 70 days, and dry matter intake does not peak until 75 to
100 days. Thus, doe not able to consume enough nutrients to meet her
needs for producing greater levels of milk, to compensate for this lack of
energy intake, fat reserves are metabolized to provide the energy necessary
to accommodate higher milk production (Hadjipanayiotou et. a., 1988;
Susmel and Cuzzit, 1988). Leclerc (2000) reported that, energy seemed to
be the limited factor for milk yield. The pre-natal and post-natal nutrition
of the doe influences milk yield, milk composition and persistency, and is
known to have major affects on the growth of kids (Ali et. al., 1991).
Supplementation of diets affects the daily milk yield over the 90
day period of the cool dry season(Malau-Aduli et.al., 2004; Min et. al.,
2005). Abdel Wahab (1998) found that, milk yield of Sudanese Nubian
goats was 208.72 ± 95.5 and 254.07 ± 9.3 Kg for goats given two level of
energy. Alexander et. al. (2002) showed that, milk production is higher in
supplemented goats than grazing goats were 1023 ± 162 and 520 ± 174
days over the 12 weeks of lactation, respectively. Jubartalla et. al. (2002)
reported that, the average daily milk yield was 1.14 ± 0.4 and 1.7 ± 0.3 Kg
for doe fed molasses and sorghum respectively. Mirgani and Nasir (1993)
reported that, a 30% increased in milk yield of Sudanese Nubian goats fed
on 30% molasses and sesame cake. However, El Gallad et. al. (1988)
found that, increasing dietary did not improve total lactation milk yield.
35
2.4.3.1.2. Body weight of doe:
Lactation of goats has been shown to have affected significantly by
size of the animal. Moreover, milk yield in dairy goats is positively
correlated with the weight of the lactating doe. Havrevoll et. al. (1995)
showed that, the milk yield in Norwegian goats increase with increasing
age and weight of doe up to five years. Also, Gamal and Elkhidir (1993)
found that milk yield of Sudanese goats is influenced by the weight of the
doe up to 40 Kg of liveweight.
2.4.3.1.3. Litter size:
Litter size or multiple births influence subsequent milk yields so,
the effect of litter size was significantly with highest value of daily milk
yield found in goats with three and more kids (Ciappesoni et. al., 2004).
Also, he added that the number of kids born and the number of kids
suckled affected the milk yield after weaning. Lyatuu et. al. (1994)
reported that, the does with single kids had higher lactation yields and
longer lactation lengths.
Generally, mothers of twins gave proportionately 0.27 more milk
yield than mothers of singles and mother of triplets who gave 0.47more.
Moreover, it was suggested that multiple fetuses led to a higher lactogenic
activity, thus causing higher yields post-partum (Williams, 1993).
2.4.3.1.4. Lactation length:
Lactation length had a significant influence on the total milk yield.
Papachristoforou and Mavrogenis (2000) revealed that, the lactation length
was longer for lactation third, fourth and fifth compared with lactation
second, sixth and first. Moreover, Concalves and Wechsler (2000) reported
that milk yield was 635.3 ± 39.75 Kg for mean lactation length of 246
days. Tambajong et. al. (2000) showed that, the average daily milk yield
36
increased from 1.19 ± 0.14 Kg at the end of the first week to 2.32 ± 0.14
Kg at the fifth week.
2.4.3.1.5. Dry period:
Dry period is period which extended from the end of lactation to
the following parturition. This period should be at least 6 – 8 weeks to
allow the doe to build up enough reserves for coming lactation and to
provide nutrients for the fetus (Kudouda, 1985). Salama et. al. (2005)
reported that pregnancy reduced milk yield from week to after conceiving
onwards, extended lactation did not significantly decrease milk yield, but
increase milk components.
2.4.5.1.6. Persistency:
Persistency or ability of the lactation goat to maintain a high milk
secretion throughout the period affects on milk yield. Gonales and Marting
(1988) reported that, the peak of daily milk yield was obtained between 5th
and 11th week of lactation. Napoleone and Gillet (1990) revealed that,
maximum daily milk yield in a flock of goats was observed in the first to
second month of lactation. Also, Gamal and Elkhidir (1993) studied
Sudanese Nubian goats reported that the peak of daily milk yield was in
the second month of lactation.
2.4.5.1.7. Season of kidding:
Ciappesoni et. al. (2004) reported that, season of kidding have
affect on milk yield and lactation length, probably due to climatic variation
between the months and years. El-naim (1979) reported that, in Sudanese
Nubian goats, there was no effect of season on milk yield. Banda et. al.
(1992) reported that, the mean total milk for 12 weeks of lactation in the
dry and wet season was 84.6 ± 3.1 and 66.8 ±2.6 Kg respectively, for
Malawi goats. Lyatuu et. al. (1994), and Concalves and Wechsler (2000)
37
they reported that, does kidding in wet season had higher lactation milk
yields and longer lactation length compared with does kidded in cool dry
season. This variation is due to availability of flush, green pastures during
the wet season compared to low quality forages in the cool dry season.
The reduction in milk production during exposure to heat, or during the
summer, cannot be attributed solely to a fall in feed intake or forage
quality. The effect of heat on physiological mechanisms related to lactation
is also of importance, mainly, the low level of thyroxin during the summer
(Haffez, 1968).
2.4.4. Lactation Length:
Lactation length is defined as the period from parturition till drying
off. This is the period during which ewes are capable of producing milk or
lactating.
2.4.4.1. Factors affecting lactation length:
The lactation length has been an extremely large variability
exceeding that in cattle and sheep. Variability may be contributed greatly
to the variation in milk yield.
2.4.4.1.1. Breeds:
Many workers investigate the lactation length of Sudanese Nubian
goats and their significant influence on the total milk yield (Elnaim, 1979;
Kudouda, 1985 and Khalaffalla and Sulieman, 1990). Elnaim (1979)
reported that lactation length of Sudanese Nubian goats was 147 days with
73.5 Kg milk yield. Kudouda (1985) reported that in Sudanese Nubain
goats the lactation length was 24 weeks (168 days) and the goat dried up 2
– 3 months after conception. Also, Khalaffalla and Sulieman (1990)
reported that lactation length of Sudanese Nubian, Sannen, Toggenburg
and Anglo-Nubian goats were 121.47, 253, 206 and 60 days with milk
38
yield 71.8, 249.3, 244.3 and 162.4 Kg respectively. Garcia et. al. (1976)
working on Nubian, Alpine, Toggenburg and Sannen goats imported to
Venezuela reported that, there was a phenotypic correlation of 0.54
between milk yield and lactation length. The maximum daily production in
goats was reached between the 8th and 12th week of lactation (Mackenize,
1967).
2.4.4.1.2. Year and season of kidding:
Year and season of kidding had a significant effect on lactation
length. Garacia et.al. (1976) reported that the lactation length was
significantly affected by month and year of kidding for Anglo-Nubian,
Alpine, Toggenburg and Sannen goats imported into Venezuela. Khan and
Sahni (1983) pointed to Jamnapari goats verified that lactation length was
significantly affected by year and season of kidding and their interaction.
2.4.4.1.3. Parity order:
Parity order affect on lactation length. Singh and Acharya (1980)
reported that the lactation length of Beetal goats ranged from 172 ± 2.71
days in the third lactation to 188.24 ± 2.52 in the second lactation.
Montaldo et. al. (1981) reported that parity had a significant effect on
lactation length of Mexico goats. Bhatnagar et. al. (1976) stated claimed
that in Alpine × Beetal, Alpine and Beetal, the first lactation length
averaged 238.206 and 161 day respectively.
2.4.4.1.4. Level of nutrition:
Tewfik (1997) working on Sudanese Nubian goat reported that the
lactation length of goats fed on 1.5 Kg/day sorghum stalk plus concentrate
ration compose of (50% molasses, 36% wheat bran, 10% cotton seed cake,
3% urea and 1% salt) at a rate of 1 Kg/ day was found to be not
significantly higher than the lactation length fed on sorghum stalk only.
39
2.4.5. Persistancy:
Persistancy demonstrates the ability of the female’s animal to
maintain a leveled milk yield during the lactation period.
Persistency estimates were measured to predict the approximate
milk yield of the goat to be below in the next lactation. Elnaim (1979)
reported for Sudanese Nubian goats that total milk yield was highly
correlated with the first month yield (r = 0.74). While, Ehoche and
Buvanedran (1983) referred to Red Sokoto goats showed that the
correlation of 12 week milk yield with 2 week and 4 week yield were 0.88
and 0.94 respectively for female rearing singles, and 0.82 and 0.91 for
females rearing twins (P<0.01) for all correlations.
2.4.6. Indices of doe productivity:
Productivity indices were used to examine the overall annual
output of doe-kid unit. The productivity indices combining characters of
doe productive performance, kid viability, kid weaning weight and doe
weight to build three productivity indices. Index 1, the total weight of
weaned kid per doe per year, it equals the number of kids/doe/parturition ×
kids weaning weight × 365 ÷ kidding interval period. Index 2, the total
weight of weaned kid per Kg of doe per year, it equals index 1÷ doe
average kidding weight. Index 3, the total weight of weaned kid per Kg of
metabolic weight of doe per year, it equals index 1 ÷ doe average weight
0.75.
According to Wilson (1986) reported that productivity indices of
goat and sheep were constructed in the same manner as for cattle, except
that weight of the litter at presumed weaning at 150 days was used as the
measure of production. Wilson (1986) studied the productivity indices of
Mali goats and reported that the total weight of weaned kid per doe per
40
year (index, 1) was found to be 14.6 Kg/ doe, the total weight of weaned
kid per Kg of doe per year (index, 2) was found to be 0.494 Kg., and the
total weight of weaned kid per Kg of metabolic weight of doe per year
(index, 3) was found to be 1.23 Kg.
Productivity indices were affected by many factors such as:
production system, season, year, parity type of birth and nutrition Wilson
(1986). Season affect on productivity indices such that goats given birth in
the hot dry or rainy seasons were more productive than those kidding in the
post-rains season, while births in the cold dry resulted in lowest
productivity. First-parity does were clearly inferior to the indices of index,
(1) only and when the resources-based indices, (2) and (3) were calculated,
the productivity of primiparous does did not differ significantly from that
of second-parity females and most of those from the sixth parity upwards.
There were no differences in goat productivity arising from sex of young,
this being most probably due to the relative lack of precocious sexual
dimorphism in goats at weaning. Although, twin-bearing does had indices
superior to those giving birth to singles, the productivity of dams giving
birth to triplets was inferior to those having twins and equal only to those
giving birth to singles. This was due to largely to the high death rate in
triplets.
2.5.7. Milk composition:
Milk composition and quality are most important attributes that
determine the nutritive value and consumer acceptability. Goat milk
contains more fat and ash than cow milk. However, as infant food it is
nearly as high in vitamin B6 and twice in vitamin B12 as human milk.
They also reported that vitamin A in goat milk exists exclusively in its true
form and not as carotenoid pigments. Goat's milk exhibits wide variation
41
which is encountered within and among breeds, feeding standards,
technique of yield estimation, number of kids suckling and parity (Banda
et. al., 1992).
2.5.7.1. Milk fat:
Fat content of goats is comparable to that of cow's milk, which is
range from 2.7 to 5.9 %( Parakash and Jennes, 1968). Milk fat content
varied due to different factors.
2.5.7.1.1 Factors affecting on milk fat:
2.5.7.1.1.1. Breeds:
Breeds contribute to influence in fact content of the goat milk. El-
naim (1979) reported that, Sudanese Nubian goats milk fat content was
3.6% fat. While, Baruah et. al. (2000) revealed that, the percentage of fat
of Assam local goats range from 6.58 ± 0.09 to 5.87 ± 0.08 and overall
mean levels of fat was 6.8% for local Malawi goats.
2.5.7.1.1.2. Age:
Milk fat content increase due to increasing age of does, 23.4% of
total variation. Statistically, significant differences in the fat contents
depending on lactation number levels were observed. Ciappesoni et. al.
(2004) reported that, first lactation goats had a significantly lower fat
content than goats in second and fourth further lactations. Moreover,
Papachristoforou and Mavrogenis (2000) reported that, milk fat percentage
in third to sixth lactation was higher than that in second and first lactation.
2.5.7.1.1.3. Nutrition
Nutritional status of the lactating doe and the composition of the
diet affect significantly the fat content of goat's milk. Morand-Fehr et. al.
(2000) observed that, milk fat percentage in goats even fed on
Mediterranean rangeland can be lower than protein percentage because of
42
low availability of vegetation especially in summer and reduced ingestion
of fiber. Min et. al. (2005) reported that, the average percentage of milk fat
was lower in goats giving zero concentrate (2.9%) compared with other
groups giving concentrate (3.1%). Schmidely et. al. (1999) confirmed that,
increasing the level of energy intake in dairy goats improved their milk
yield and decreased the milk fat percentage. While, Hussein et. al. (1996)
reported that, with less yielding goats an increase in energy increased
sometime milk yields and fat percentage. Spruzz and Selegoska (2006)
worked on goats given supplemented diets and found that, supplemented
diets increased milk yield by 12.64% and fat content to 3.2%.
2.5.7.1.1.4. Stage of lactation:
Stage of lactation had a marked influence on milk fat content.
Knowles and Watkins (1983) reported that, the milk fat percent reaches the
maximum values about second months from kidding and decrease to
minimum values in fourth month and rises again. Arkinosoynu et. al.
(1975) worked on West African Dwarf goats and reported that, there was a
significant fall in milk fat content with advancement of lactation.
2.5.7.2. Milk protein:
Protein content of goat's milk show a small variation range between
2.3 to 3.7%, this variation may be due to the interaction of the factors
which affect of milk production and chemical composition. Spruzz and
Selegoska (2006) reported that, goat supplemented with wheat bran and
grazing pasture and hay increased protein, fat and sugar contents of goat's
milk on 13.3%, 22.8% and 1.1% respectively. Tambajong et. al. (2000)
demonstrated that, milk protein content dropped slightly until the end of
the fourth week of lactation. Min et. al. (2005) reported that, average milk
concentration of protein, fat and lactose decreased as lactation progressed,
43
except for fat in the second year and tended to increase toward the end of
lactation. Highest protein contents were observed in goats with single litter
size and lowest fat contents in does with three and more kids (Ciappesoni
et. al., 2004).
2.5.7.3. Milk total solids:
Total Solids (TS), Solid-Not-Fat (SNF) and ash contents of goat's
milk show a little variation within and in between breeds of goats. El
Gallad et. al. (1998) reported that, all milk constitutes were negatively
correlated to the amount of milk secreted by the dairy goats, and increase
with increased energy content of the diet. Baruah et. al. (2000) reported
that, the milk total solids ranged between 15.77 ± 0.18 to 14.92 ± 0.23 and
the overall mean for total solids, solids-not-fat, lactose and ash were
17.4%, 10.6%, 4.7% and 0.88% respectively.
2.5. Reproductive Performance:
The reproductive performance and hence the production
capabilities of the animal are governed by a diversity of factors. The
following parameters constitute important criteria for improved
reproductive traits.
2.5.1. Gestation Period:
It is the period extending from the date of conception and
fertilization of one or more ova after successful mating to that of delivery.
Its duration ranged between 145 and 155 days for both sheep and goats
(Mukasa-Mugerwa et al., 1988). For tropical goats it is reported to be less
by 3 – 5 days which may be attributed to either genetic or environmental
factors. Devendra and Mcleroy (1987) studied the gestation periods in
44
several breeds of goats in the tropics and reported that gestation periods
ranged between 144 to 153 days with average 146 days.
2.5.1.1. Factors affecting gestation period:
There several factors affecting the gestation periods of goats
include genetical and or/ or environmental factors, such as breed, size of
goat, sex of kids, litter size, order of birth, ambient temperature and time of
year.
2.5.1.1.1. Breed:
Many workers (Elnaim 1979, Jubartalla, 1998 and Elabeid, 2002)
studied the gestation periods of Sudanese Nubian goats. Elnaim, (1979)
reported that the gestation period was 146.5 ± 1 days, while Jubartalla
(1998) reported that gestation periods ranged between 143 – 149 days.
Also, Elabeid (2002) was agree with other workers and reported that,
gestation periods averaged 148.57 ± 3.6 days. Badawy et. al. (1971)
studied the gestation periods in Egyptian Baladi goats and reported that the
gestation period was 148.81 days.
2.5.1.1.2. Sex of kids:
Ageeb (1992) studied the effect of sex of kids on gestation periods
of Baggara goats and observed that, the sex of kids had significantly effect
on gestation. Obviously, when does bearing female kids had longer
gestation period (147 ± 2.9 days) than does bearing male kids (146 ± 1.3
days). On the other hand, El-naim (1979) and Kudouda (1985) studied
Sudanese Nubian goats and Mishra et. al. (1979) studied Indian Sirohi
goats and reported that sex of kid had no significant effect on gestation
period.
45
2.5.1.1.3. Litter size (type of birth):
Forbes and Robinson (1967) stated that duration of gestation within
a particular breed is extremely stable and there was no obvious influence
observed in gestation length with the increase in litter size. These results
were confirmed by Prasad et. al. (1972) and Kudouda (1985), who reported
that gestation period was not affected by type of birth for Barbari and
Sudanese Nubian goats respectively. While Khan et.al. (1982) used 107
gestation records of Jamunapari breed in India. They reported that the
mean value of the gestation length was 147.9 ± 0.327 days and observed
one day difference in gestation period length between single and twin.
These results were confirmed by Ageeb (1992), who reported that the
goats that carried twins had longer gestations compared to those carried for
Baggara goats.
2.5.1.1.4. Season of kidding:
Mishra et. al. (1979) and Esquivel and Camara (1991) for Sirrohi
and Criollo × Anglo-Nubian goats reported that season of kidding had no
significant effect on gestation period.
2.5.2. Kidding Interval:
It is the period between two consecutive kidding. The interval
comprises the service period and the gestation period. This is a useful
comparison of fertility and productivity between breeds. A regular kidding
is known to be economical in terms of production and breeding efficiency.
Wilson (1979) reported that, the kidding interval of Southern Darfur goats
averaged 238 ± 41 days.
46
2.5.2.1. Factors affecting kidding interval:
The length of the kidding interval is mostly affected by the service
period and varies with breed, level of nutrition, age of the dam and season.
2.5.2.1.1. Breed:
Khalaffala and Sulieman (1990) noted that the average kidding
interval period of Sannen breed in Sudan was 346 ± 68 days and this was
longer than 326 ± 76 for Toggenburg breed in Sudan. Ageeb (1992)
reported that, the kidding interval of Baggara breed was 234.1 ± 28.9 days.
2.5.2.1.2. Level of nutrition:
The kidding interval has been studied by many workers and they reported to be affected by the level of nutrition. Singh and Sengar (1970) reported that, the kidding interval of Jamnapari does was shorter when fed on high and medium energy feeds compared to does on lower energy diet. Sachdeva et. al. (1973) studied the effect of plane of nutrition on reproductive performance of Barbari and Jamnapari goats. They found that the kidding intervals were 245, 231, 242, 243 and 244 of Barbari goats Vs. 298, 283, 307, 333 and 385 of Jamnapari for high energy-high protein, high energy-medium protein, medium energy-medium protein, medium energy-low protein and low energy-low energy respectively. Kudouda (1985) working on Sudanese Nubian goats and reported that, the kidding interval of roughage fed group was 343.5 ± 57.3 days, while it was 251.2 ± 19.3 days for concentrate supplemented goats. Also, Jubartalla (1998) studied the effect of feeding Molasses based ration and sorghum based ration to Sudanese Nubian goats and reported that, the kidding interval was 271 ± 27 for sorghum fed group and longer compared to the molasses fed group 251 ± 41 days.
47
2.5.2.1.3. Season of kidding:
Season of kidding influences on kidding interval was studied by
many workers (Haumesser, 1975; Gracia et. al., 1976; Gangwar and
Yadav, 1987 and Cabello et. al., 1991) for different goat breeds.
Haumesser (1975) worked on Red Sokoto goats reported that, following
parturition during September – April, May – June or July – August, the
kidding intervals average 343.2, 302.3 and 266.1 days respectively. Garcia
et. al. (1976) working on Nubian, Alpine, Toggenburg and Sannen goats
reported that, the length of kidding interval average 388.5 days and the
month of the previous kidding had a significant effect on kidding interval.
Ganwar and Yadav (1987) studied the influence of various factors on
service period and kidding interval in Indian goats and reported that, year
and season of kidding had a significant effect on drinking interval 235.71
days in the monsoon season Vs. 271.39 and 278.22 days in summer and
winter respectively. Cabello et. al. (1991) claimed that in Anglo-Nubian
goats, season of kidding significantly affected kidding interval 214.9 days
for female kidding in the rainy season Vs. 246.3 in the dry season.
2.5.3. Post-partum Anestrous Period:
The period from parturition of ovarian activity is called the post-
partum an estrous period.
The post-partum (PP) period is comprised of a series of integrated
anatomic and physiologic re-adjustments of both the uterus and endocrine
system, and is a crucial factor for the resumption of reproductive capacity
and regular cycling of a breeding goat. Morphological changes or their
delay in the PP uterus and ovaries of farm animals exert a limitation on
reproductive performance following parturition (Greyling, 2000).
48
Completion of uterine involution and resumption of sexual activity
following parturition in ruminants normally depend on several factors,
such as nutrition, nursing of offspring and season of parturition (Van et.
al., 1972; and Delgadillo et al., 1998;). Different research reports have
shown different intervals to complete uterine involution in goats. While
Baru et al. (1983) demonstrated complete macroscopic uterine involution
by day 19 P.P., Greyling and Van Niekerk (1991) reported day 28 P.P. as
the day of complete uterine involution. Moreover, histochemical study of
caprine endometrium indicated complete regression of endometrium and
re-epithelialization by day 16 PP (Sanchez et. al., 2002).
The post-partum period in ewes characterized by a gradual
recovery of ovarian activity and high prolactin hormone level that
gradually decreased after the first week of parturition (Lamming et al.,
1974) and also low tonic LH level which increased slowly (Restall and
Starr, 1977). Akinbami et al. (1992) found the uterine involution to be in
ewes between day 30 and day 50 after lambing. They concluded that the
low fertility and conception rate observed in ewes mated before day 50
after lambing was probably a consequence of incomplete uterine
involution. Boly et al. (1993) found that the average period before the
resumption of ovarian cyclicity after parturition for the West African dwarf
ewes was 56 ± 0.95 days and it was delayed by lamb suckling, however,
good feeding was found to modify this response. Effect of nutrition on the
length of post-partum an estrous period was observed by Kamwanja et al.
(1985) on the Droper of Kenya and local Malwi sheep and their crossed.
They found that the post-partum an estrous period of natural grazing ewes
was 105 days and it was reduced by high feeding level to the mean of 52.4
49
days. Kushwaha et al. (1997) reported a shorter period range between 16 –
30 days and an average 26 days, for the Indian Chokla ewes.
2.5.4. Litter Size:
Litter size is defined as the number of kids born per nanny at one
kidding (Steele, 1996). It is one of the most important factors influencing
the birth weight in goats. Breed, age and body condition of the animal as
well as the environmental factors may contribute towards the incidence of
multiple births in goats as reported by many workers (Karua, 1989;
Devendra, 1990; Alexander et. al., 1999; Shalaby et. al., 2000; Sodiq et.
al., 2003; and Webb and Mamabolo, 2004). Devendra (1990) demonstrated
that, the litter size is affected by body weight, birth type, size, season and
level of nutrition. Webb and Mamabolo (2004) found that, the litter size of
South African indigenous goats was 1.7 kids per doe. Also, Alexander et.
al. (1999) showed that, the litter size at birth, during suckling and weaning
were 2.25, 2.05 and 1.95 kids respectively. Karua (1989) who studied the
litter size of Malawi indigenous goats revealed that, the litter size was 1.35
± 0.5 and 1.33 ± 0.5 in village and ranch systems conditions. Shalaby et.
al. (2000) reported that, the litter size at birth was 1.47.
2.5.5. Puberty:
Puberty is defined as the stage or time at which generative organs
become functioning and female or male is sexually mature and able to
reproduce (Robberts, 1971, Arthur and Ahunu, 1989). Walkden (2001)
stated that the attainment of puberty in does occur when there is
spontaneous ovulation and occurrence of oestrus signs and for bucks when
there are able to induce pregnancy. Chakraporty et. al (1989) defined
puberty in males as the stage at which and ejaculation containing motile
50
spermatozoa was first collected by electro-ejaculation. While Hafez and
Hafez (2000) stated that puberty in a male or female is governed by their
ability to release gametes and exhibit sexual behaviours. Moreover,
Bearden and Fuquay (1997) reported that puberty is the stage at which
expressed oestrus with ovulation occur, and goandotrophins (FSH and LH)
are produce at enough levels to initiate follicular growth and oocyte
maturation and ovulation.
Generally, in goats the age of puberty ranges between 5 – 7 months
in does and 4 – 6 in bucks (Arthur et .al., 1998; Hafez and Hafez, 2000).
Moreover, Bearden and Fuquay (1997) added that males at body weight
range between 10 – 30 Kg reach puberty between 3 – 5 months of age.
Walkden (2001) reported that age at puberty ranged between 5 – 7 months
when body weight approximately reaches 50 % of the mature weight, but
bucks born after the season of breeding and did not reach puberty in the
first breeding season will be delayed up to 18 moths of age. Chakraporty
et. al. (1989) reported that sexual maturity was reached at age and body
weight of 34.4 ± 0.9 weeks and 27.7 ± 3.3 Kg in Anglo-Nubian goats.
Wolde-Michael et.al. (1989) found that the age and weight of puberty was
172 days and 15 Kg in Feral Cashmere respectively, while male were
sexually active at weight of 22 Kg. Camboav et. al. (1992). reported that
age of puberty was 209.8 days in Sinaloa goats. Wang et. al. (1991) found
that age and body weight was 154.7 days and 10.2 Kg in Sannen goats in
China. Lawar et.al. (1991) reported that age and weight at puberty were
677.5 ± 22 days and 20.3 ± 0.3 Kg in Angora goats. Myenuddin and
Wahab (1989) reported that age of puberty was 180.74 ± 1.68 days in
Black Bengal goats. However, Miltal (1991) reported that age and weight

51
were 560 and 326 days and 25.5 and 15.8 Kg in Kutachi and Morwari
goats respectively.
2.5.5.1.Factors affecting puberty:
Arthur et. al. (1998) stated that the time of onset of puberty is
determined by individuals’ genotypes, and this inherent time is influencing
by a number of external factors such as:
2.5.5.1.1. Breeds:
The smaller breeds of animals tend to reach puberty earlier (Arthur
and Ahunu, 1998). However, variations in age of puberty exist within the
same species (Bearden and Fuquay, 1997; Arthur and Ahunu, 1998 and
Hafez and Hafez, 2000).
2.5.5.1.2. Level of nutrition:
Weight of puberty is affected by genetic factors (Bearden and
Fuquay, 1997). The onset of puberty is more closely related to weight and
nutritional levels modulate age at puberty (Bearden and Fuquay, 1997 and
Hafez and Hafez, 2000). Thus, Arthur et. al. (1998) and Walkden (2001)
stated that animals are well fed with good growth rate reach puberty before
those which are poorly fed with slow growth rate.
2.5.5.1.2. Season of the year:
Arthur et. al. (1998) reported that age of puberty in seasonal
breeders will be influenced by of the year. Moreover, if the seasonal breeds
fail to reach puberty weight in the first breeding season after birth, puberty
will be delayed until the next breeding season (Arthur and Ahunu, 1998
and Walkden, 2001).
52
2.5.5.1.3. Presence of the male:
Many workers studied the effect of presence of the male on puberty
of females (Bearden and Fuquay, 1997; Arthur and Ahunu, 1998; Hafez
and Hafez, 2000 and Walkden, 2001). They reported that exposure of
females to the male of the same species will advance the timing of onset of
puberty and this is called male affects while, Hafez and Hafez (2000)
added that puberty occurs earlier in animals bred in groups than those bred
alone. Arthur et. al. (1998) reported that the male effect is probably
mediated by pheromones and some other sensory cues influencing the
hypothalamic-GnRH secretion.
53
Chapter Three
Materials and Methods
The experiment was conducted during the period extending from
July 2006 to June 2008, to assess the effect of conventional and
supplemented feeding system on productive and reproductive traits of
Sudanese Desert goats.
3.1. Area of study:
3.1.1 Location:
The experiment was carried out in North Darfur State at (Shangli
Tobya) located south of Al-fashir town about 65 Km) the region is a flat
land sloping from West to the East where the rain collects in a few water
reservoir. The soil is clay vertisole with sandy (Goze).
3.1.2. Climate:
The North Darfur State lies within the low rainfall woodland
savanna with an annual rainfall ranging 250 – 500m.m. Rainfall has a
maximum of 300 mm but it's very erratic in distribution occurring in June
to September and along cool dry season of about eight to nine months. The
climate can generally be considered to be semi-arid with rain. Average
annual temperatures of the diurnal variate from 27 – 43 ºC (UNDP, 2006).
3.1.3. Vegetation:
Vegetation in North Darfur is largely of a low-rainfall woodland
savanna type with thorny, predominantly Acacia species, dwarf shrubs and
ephemeral grasses. Semi-arid zone vegetation is an important features of
pasture and grazing for nomadic herds of camels, sheep and goats (Ministry
of Environment and Tourism, 1990).
54
In the study area, the native vegetation is a complex of grasses,
herbs, woody species (mainly shrubs). Dominant annual grasses are
Cenchrus biflours, Aristida spp., Eragrotis tremula and Echinochloa. The
dominant forbs are Tribulus terrestris and Ipomoea spp. The dominant
trees and shrubs are Boslia senegalensis, Acacia nubica, Acacia Senegal,
Acacia tortilis Leptadenia pyrotechnica and Capparis deciduas. (Table, 1).
Water scarcity represents a meager problem compared to pasture
mainly in dry season, where livestock herders depend on hand digged well,
engine pumps and few water reservoirs for both animals and human
drinking water. Meanwhile, in the rainy season the rainfallis consider of a
key source of water needs for naturally grazing animals in the area.
3.2. Experimental animals
Sixty adult lactating desert goats and two bucks, indigenous to arid
and semi-arid northern and savannah regions of western Sudan, were
employed in this experiment together with their kids. The goats and bucks
were purchased and collected from small-scale farmers who live mainly in
Shangli Tobaya and local market around the study area. The goats had
medium body size (20 Kg) with different colors ranging from black to gray
and white. Horns are present in both sexes, large and flatter in the male
(30±35 cm in length), the long lop ears are 12±20 cm. The does were ear
tagged. General examination was carried out for each doe of the flock and
treated against ecto-parasites (ticks) sprayed with Gamatox. Dewarming
was done against endo-parasite using Pamizole ambolus of 2 mg for every
10 kg liveweight plus Ivermactin. Treatments were done at the beginning
and middle of the experiment. The data were collected for the two
generation and whole lactation period of the goats whereas the kids were
followed up to weaning age.
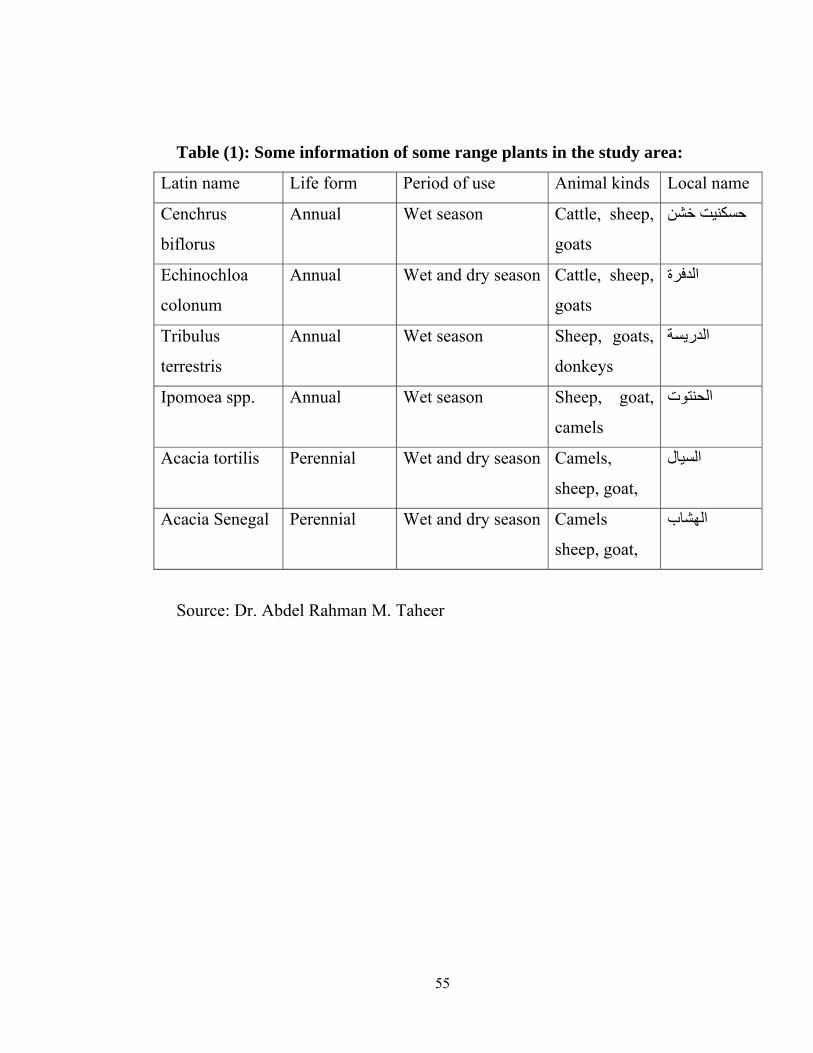
55
Table (1): Some information of some range plants in the study area:
Latin name Life form Period of use Animal kinds Local name
Cenchrus
biflorus
Annual Wet season Cattle, sheep,
goats
حسكنيت خشن
Echinochloa
colonum
Annual Wet and dry season Cattle, sheep,
goats
الدفرة
Tribulus
terrestris
Annual Wet season Sheep, goats,
donkeys
دريسةال
Ipomoea spp. Annual Wet season Sheep, goat,
camels
الحنتوت
Acacia tortilis Perennial Wet and dry season Camels,
sheep, goat,
السيال
Acacia Senegal Perennial Wet and dry season Camels
sheep, goat,
الهشاب
Source: Dr. Abdel Rahman M. Taheer
56
3.3. Housing
The goats were divided into four equal groups of fifteen each (A, B,
C and D) that were as far as possible matching in liveweight. The mean
liveweight of each group was 20 Kg. The four groups were kept in a
separate enclosures constructed from local materials with a sandy floor
mixed with clay soils. Each pen was equipped with feeders and water
troughs with clean water. Inside each enclosure the animals were kept
together at sufficient distance space and offered feed and water in gathered
troughs for supplemented groups only. Kids were kept in a separate
enclosure during the night and left with their does during the day with
special means to ensure no suckling.
3.4. Feed and Feeding:
Based on live body weight, animals were blocked randomly into
two feeding regimes, conventional and supplementary. Supplemented
animals group was also blocked into three feeding groups (A, B and C)
differ (low, medium and high) dietary energy levels (9.5, 10.5 and 11.5 MJ
ME/kg DM) respectively. The supplemental diets were fed daily at early
morning where the animals were kept in isolated enclosures and the refusal
was collected and weighed to determine the daily feed intake. The ration of
supplemented groups are composed of concentrate mixtures offered once
daily consisting of millet, millet bran, groundnut hulls and ground nut cake
(Table, 2). The proximate analysis of supplemented diets samples were
proceeded to determine metabolic energy (ME) and chemical composition
content of experimental diets. The chemical composition of pasture plants
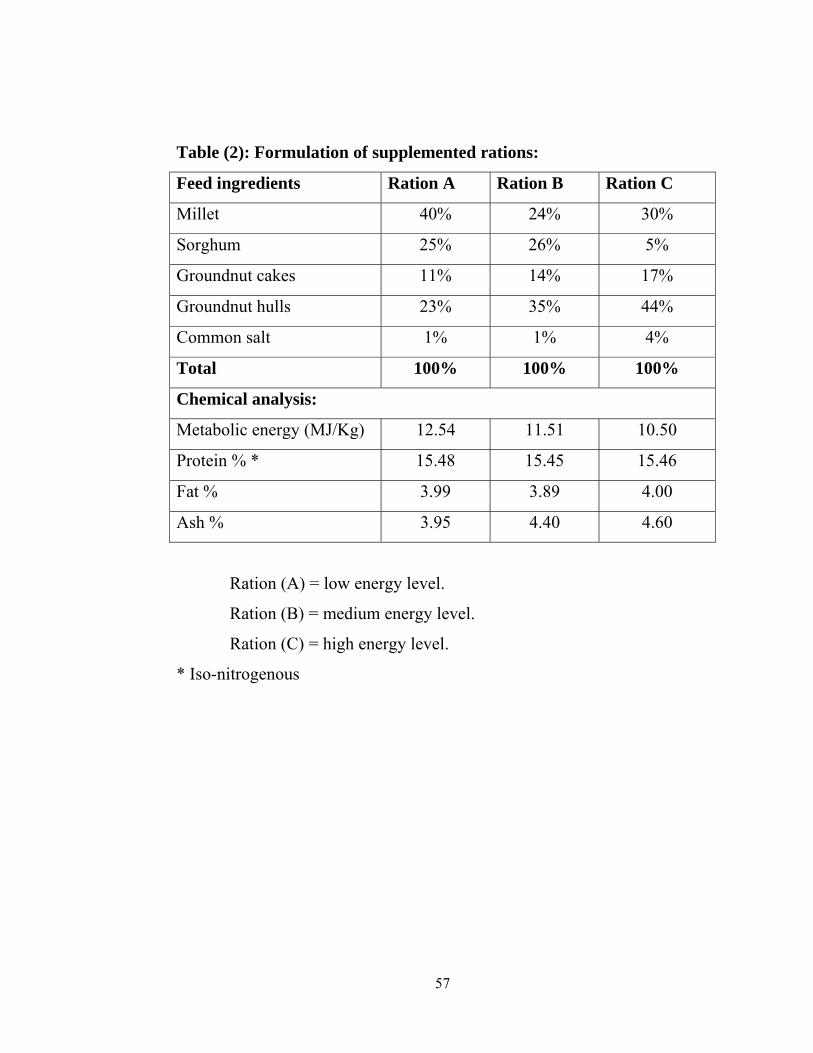
57
Table (2): Formulation of supplemented rations:
Feed ingredients Ration A Ration B Ration C
Millet 40% 24% 30%
Sorghum 25% 26% 5%
Groundnut cakes 11% 14% 17%
Groundnut hulls 23% 35% 44%
Common salt 1% 1% 4%
Total 100% 100% 100%
Chemical analysis:
Metabolic energy (MJ/Kg) 12.54 11.51 10.50
Protein % * 15.48 15.45 15.46
Fat % 3.99 3.89 4.00
Ash % 3.95 4.40 4.60
Ration (A) = low energy level.
Ration (B) = medium energy level.
Ration (C) = high energy level.
* Iso-nitrogenous
58
was considered also (Appendix, 1 and plate, 3, 4, 5 and 6). Each goat fed
together and offered concentrates at the rate of 0.75 Kg/head of
supplemental diet.
In conventional grazing system experimental animals’ flock were
moved to the natural range pastures starting early in the morning at sunrise
and they return at sun set during the experiment period. Animals offered
drinking water once per day after returning from the range on cool dry
season. Meanwhile, during autumn season while range plants are succulent,
usually there was no water offer to animals on daily basis.
Bucks are used for mating for the first time at an age of one year
and were kept for about 2 years.
3.5. Productive performance:
3.5.1. Kids and does growth:
The kids were weighed immediately following delivery at their
birth weight and recorded and then weighed at definite intervals up to
weaning at the third month of age (pre-weaning, weaning and post-
weaning). Kid's mortality for each group also was recorded. On the other
hand, goat’s milk yield, lactation length, persistency indices of productivity
and milk composition were recorded.
3.5.2. Milk yield:
The kids were kept with their mothers during the first week after
birth; during this week milk is considered as closterom. The second week
the kids were kept away from their dams from 8:00 p.m. till 8:00 a.m.
However, the does were hand milked once a in the morning. The yield was
considered half-day production and it was multiplied by two to estimate the
daily yield using a graduated milk cup.
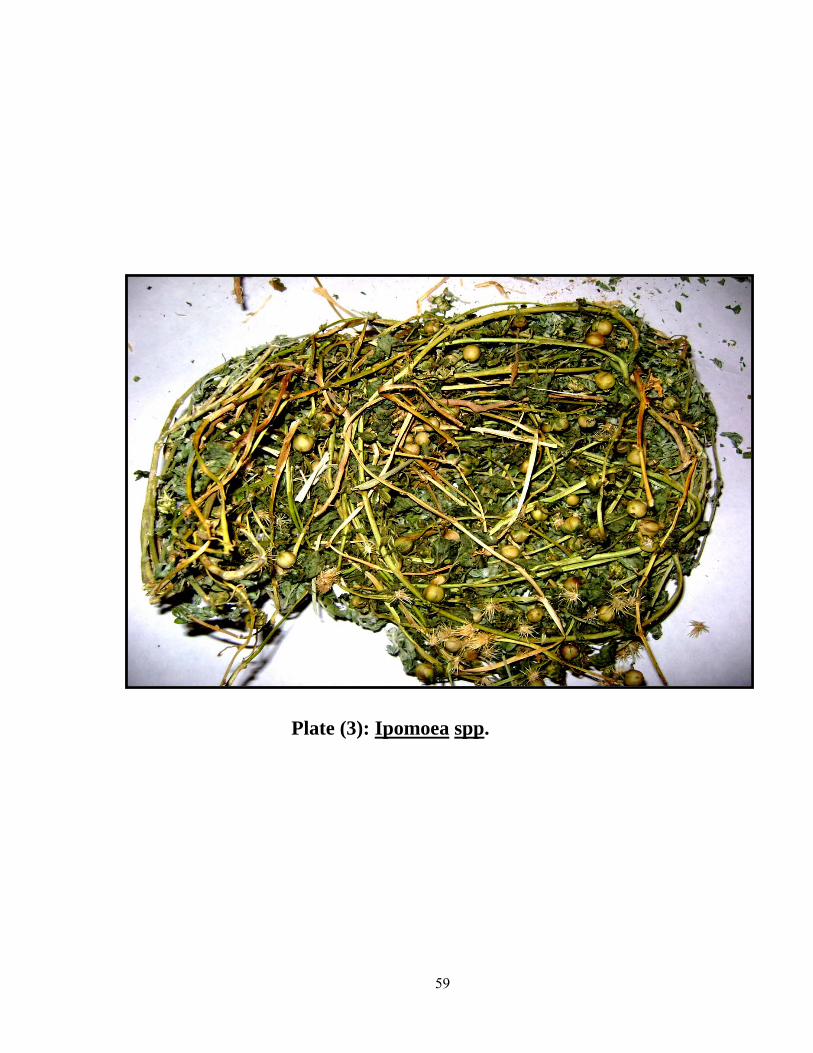
59
Plate (3): Ipomoea spp.
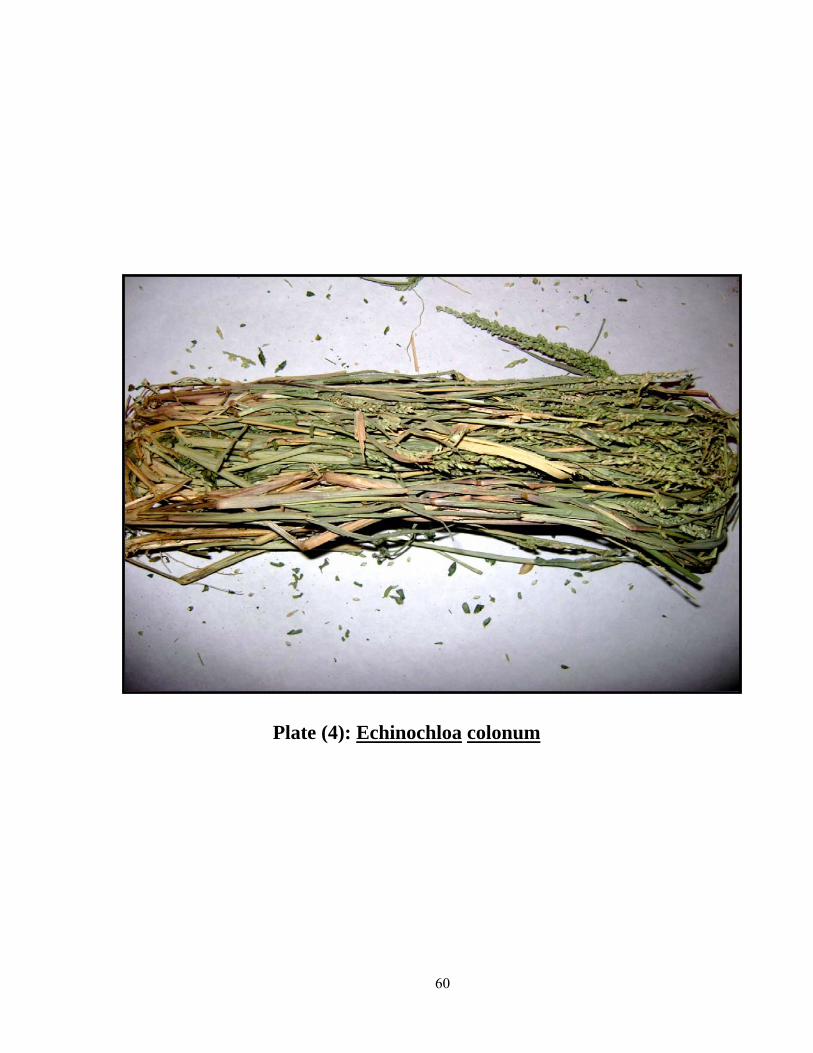
60
Plate (4): Echinochloa colonum
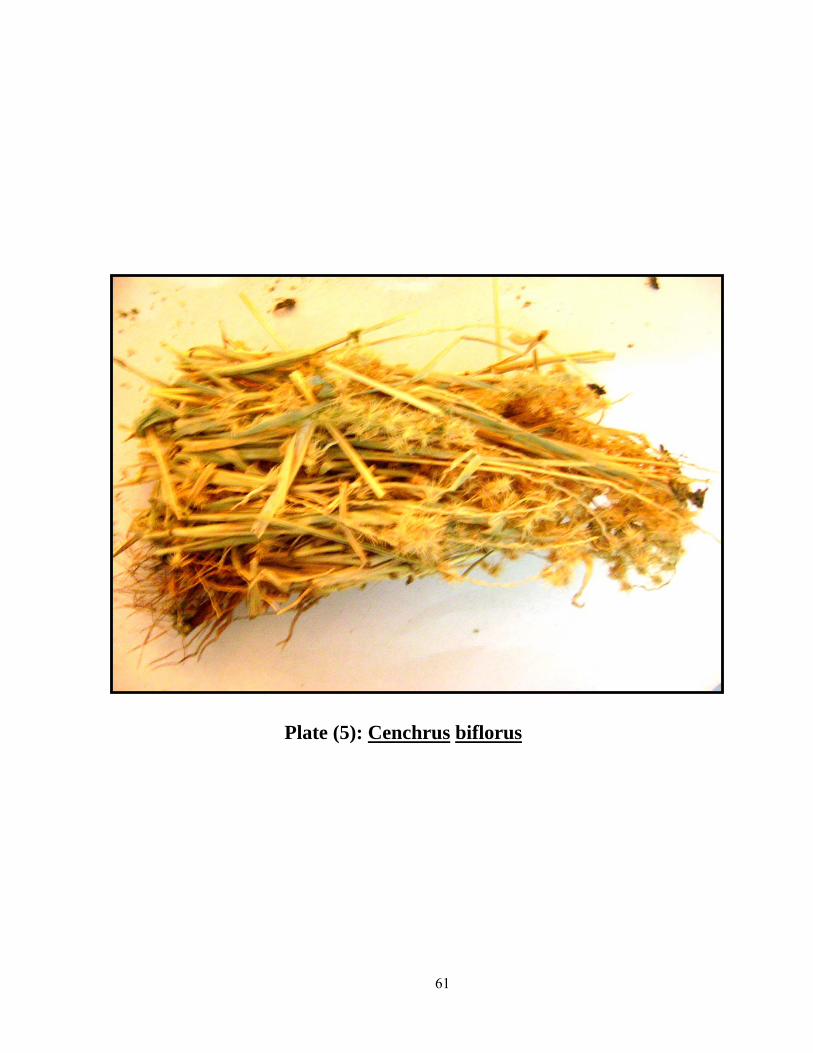
61
Plate (5): Cenchrus biflorus
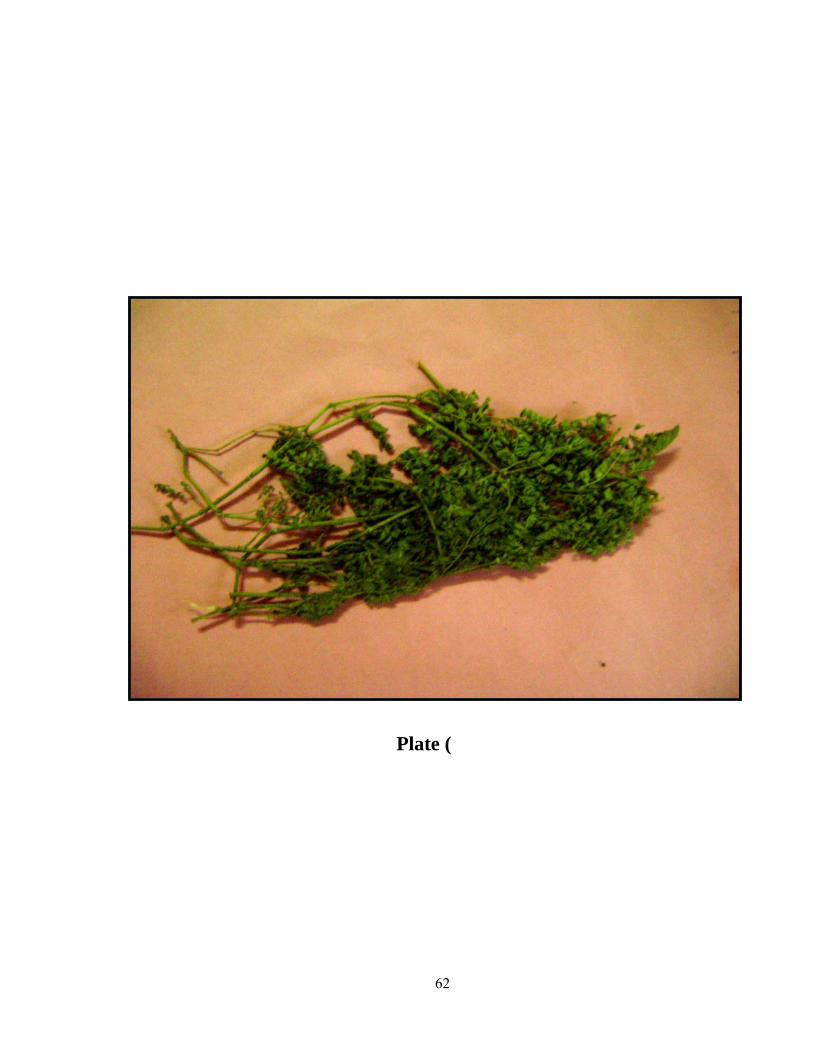
62
Plate (
63
3.5.3. Milk composition:
Five liters of milk samples were collected from each group and
frozen for analysis to determine chemical composition. Immediately after
samples of milk were collected, frozen for sometime till it was receiveds
milk laboratory of Animal Production Research Centre (Kuku) in
Khartoum North for analysis.
3.5.3.1. Determination of milk Fat content:
Fat content was determined using Gerber method (marshal 1993)
Ten ml of sulfuric acid (specific gravity 1.82 at 15.5C) was measured into a
Gerber butyrometer. From a well mixed sample at 24C, a sample of milk
was with drawn using 10.94 ml pipette. Milk was allowed to drain into the
butyrometer slowly at first to prevent a violent reaction with the acid then
the pipette was permitted to drain normally. One ml of amyl alcohol (sp.g.
0.814 at 15.5c) was added and the lock stopper was inserted securely. With
the stopper end up, the butyreometer was grasped at the graduated column
and shaken until the crude was completely digested. Holding the
butyrometor at the stopper and neck was inverted five times to mix the acid
remaining in the bulb with the contents. The butyrometers were then placed
in a rack and centrifuged at 1100rpm for four minutes.
The butyrometer was placed in the water- bath 65c, leaving only the
bulb exposed, for five minutes. the straight line at the bottom of the fat
column was pushed gently upwards so that it coincided with nearest whole
percent graduation mark .the scale at the bottom of the meniscus at the top
of the fat column was read promptly to the nearest 0.05% graduation the
lower reading was subtracted from the upper reading and the differences
was recorded as fat content.
64
3.5.3.2. Determination of milk protein content
Total Nitrogen was determined using Kjeldahal method (Marshal,1993)
Ten ml of milk sample was weight into Kjeldahal digestion flask.25 ml of
sulfuric acid (Sp.g.1.84,nitrogen-free) was added to the flask. Two tablets
of Kjeldahal catalyst (each tablet contain 1 gram of Na2So4 and equivalent
of 1 gram Hg) .The flask was placed on a heater for three hours or until the
solution become clear. The flask was then cooled to room temperature and
the solution diluted to 100 ml by graduate pipette using distilled water. Five
ml of the sample was transferred to distillator and then 10 ml of 40%
sodium hydroxide (Na OH) were added. The distillate was received in a
conical flask containing 25 ml of boric acid and bromocresol green plus
methylene blue as indicator, until the volume reached 75 ml, the sample
was then titrated with N/10 HCL. The acid consumed was then measured.
The protein content was calculated as follows:
Crude protein (%) = T x N x 0.014x20x6.38 × 100
Weight of Sample
Where:
T = titrate volume
N = normality of the HCL
3.5.3.3. Determination of milk ash content:
Ash was determined by gravimetric method (Marshal, 1993). The
principle of the method is to burn all organic matter at a temperature of
540-550 C .Ten grams of milk were weighted accurately into a dry clean
pre-weighted crucible. The sample was burned in a muffle furnace
65
regulated at 550C for 1.5 hr. Then cooled .the crucibles were removed and
placed in a descanter to cool and weighed. Then the ash content was
calculated accordingly to the following formula:
Ash (%) = Weight of residue × 100
Weight of the sample
3.5.3.4. Total solid content:
The total solid content was determined by gravimeteric method as
follows: the required number of trays of aluminum drying dishes were
placed into a desiccators from the oven (100 C) using fresh phosphorus
pentoxide as desiccant. When cooled the numbered dishes were removed
singly from the desiccators and weighed. One gram of milk sample was
added into the dish and reweighed accurately. The dishes were tilted to give
an even covering of milk on the base and transferred to the hot plate
surface (137 C). When the milk has dried and just started to brown the dish
was removed from the hot plate, placed on its appropriate position on the
tray and placed in the oven (100 C) for 1½ to 2 hours. The tray was then
removed to a desiccator with fresh phosphorus pentoxide, cooled and the
dishes reweighed.
Calculation:
Wt. of (dish +sample) – Wt. of dish = Wt. of milk sample.
Wt. of (dish + dried sample) – Wt. of dish = Wt. of solid material
Total solids % = Wt. of solid material × 100
Wt. of milk sample
66
3.5.4. The productivity indices of doe:
The productivity indices of doe combining characters of doe
productive performance, kid viability, kid weaning weight and doe weight
to build three productivity indices calculated by equation.
3.5.4.1. Index 1:
Index 1 is the total weight of weaned kid per doe per year and
calculated as follows:
The number of kids/doe/parturition × kids weaning weight × 365
Kidding interval period
3.5.4.2. Index 2:
Index 2 is the total weight of weaned kid per Kg of doe per year
and calculated as follows:
Index 1
Doe average kidding weight.
3.5.4.3. Index 3:
Index 3 is the total weight of weaned kid per Kg of metabolic
weight of doe per year and calculated as follows:
Index 1
Doe average weight 0.75.
3.6. Reproductive Performance:
During experiment of period the bucks were allowed to stay with females,
where close observations changes in behavior and appearance of estrus
cycle signs were recorded. So the post-partum anestrus for female was
67
recorded, and gestation period, kidding interval, litter size and puberty were
also recorded.
3.7. Data Collection:
Data of 60 parent female goats in their first and second season were
arranged according to feeding system, beening used in the present study.
For each female in the first and second season, the data of daily feed intake,
kidding interval, gestation length, litter size, post-partum anestrus, milk
yield, lactation period, milk composition, persistency, indices of doe
productivity and puberty were recorded. On the other hand, birth weight,
pre-weaning weight, weaning weight post-weaning weight kidding
mortality for kids were all collected.
3.8. Statistical Analysis:
The experiment was designed as a completely randomized design
(CRD) arranged 4 × 2× 2 factorial to compare four feeding groups (A, B, C
and D) for low, medium and high energy supplemented and conventional
grazing groups respectively, two types of season (Cool dry and Rainy) for
two off-springs. The conventional grazing system was used as a compare
group. Data were analyzed statistically according to Steal and Torrie (1980)
by the analysis of variance (ANOVA). For each response, the average
values for the main effects of different feeding group, types of season and
generation number treatments were subjected to pair wise comparison
procedures by Duncan Multiple Range test (Duncan, 1955) to determine
which pairs were different.

68
Means, standard deviations, standard errors and co-efficient of
variations of the reproductive and productive traits were computed by using
the SPSS program (version, 12).
69
CHAPTER FOUR
RESULTS
4.1. Kid's performance:
4.1.1. Birth weight:
The data pertaining to the effect of feeding supplement A (high
energy), B (medium energy) and C (low energy) compared with D (natural
grazing without supplementation) on birth weight is presented in table (3).
The results show that birth weight of kids differ significantly (P< 0.05) for
supplemented groups and unsupplemented group. The mean values of birth
weight of kids were 2.20Kg ± 0.40, 1.95 ± 0.36, 1.63 ± 0.14 and 1.55 ±
0.23 for supplemented groups (A, B, C and D). The results indicated that
group of does supplemented with A (higher energy) secured the highest
birth weight (2.20) compared the unsupplemented that secured the lowest
birth weight (1.55).
The data highlighting the effect of season on birth weight of kids
presented in table (4). The results shows that birth weight of kids during
rainy season was significantly (P< 0.05) higher than that kids born in cool
dry season. The mean values of birth weight of kids were 1.982 ± 0.44 and
1.695 ± 0.29 for rainy season and cool dry season respectively. The results
indicated that does born during the rainy season gave a higher birth weight
of kids as compared to birth weight of kids born in cool dry season.
4.1.2. Weaning weight:
Weaning weight of kids was measured at 3 month of age. The
effect of feed supplementation on the body weight of kids at weaning was
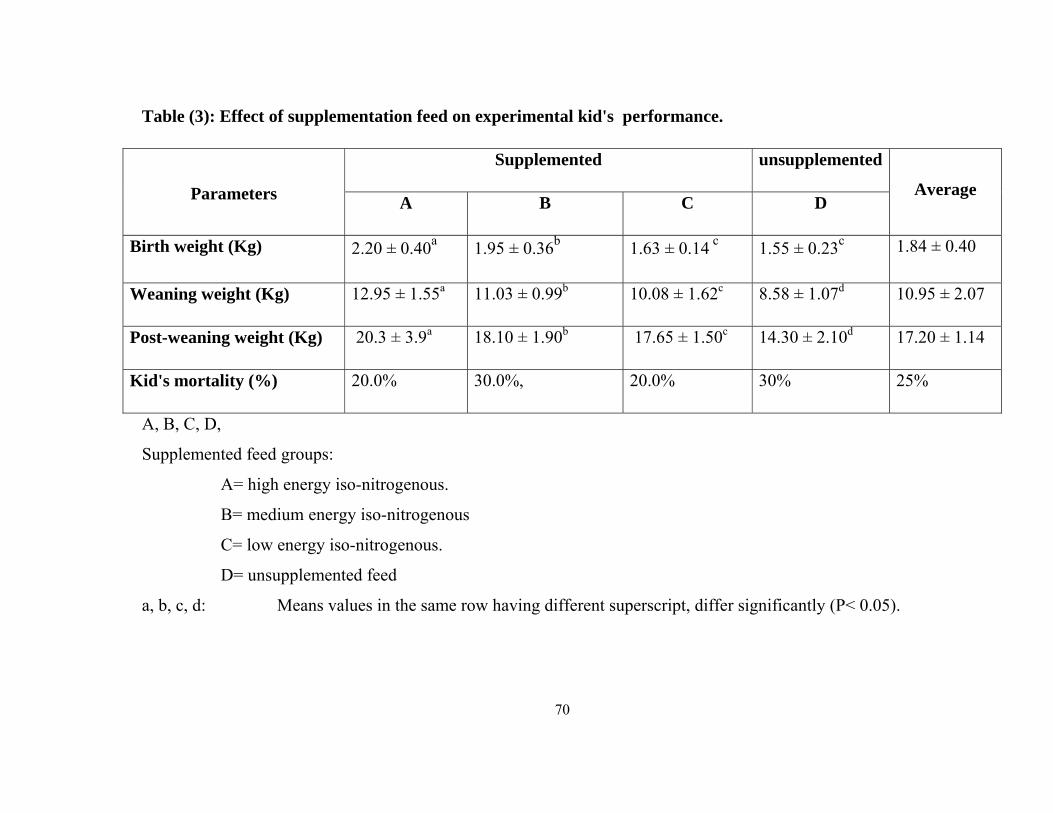
70
Table (3): Effect of supplementation feed on experimental kid's performance.
Parameters
Supplemented unsupplemented
Average A B C D
Birth weight (Kg) 2.20 ± 0.40a 1.95 ± 0.36b 1.63 ± 0.14 c 1.55 ± 0.23c 1.84 ± 0.40
Weaning weight (Kg) 12.95 ± 1.55a 11.03 ± 0.99b 10.08 ± 1.62c 8.58 ± 1.07d 10.95 ± 2.07
Post-weaning weight (Kg) 20.3 ± 3.9a 18.10 ± 1.90b 17.65 ± 1.50c 14.30 ± 2.10d 17.20 ± 1.14
Kid's mortality (%) 20.0% 30.0%, 20.0% 30% 25%
A, B, C, D,
Supplemented feed groups:
A= high energy iso-nitrogenous.
B= medium energy iso-nitrogenous
C= low energy iso-nitrogenous.
D= unsupplemented feed
a, b, c, d: Means values in the same row having different superscript, differ significantly (P< 0.05).
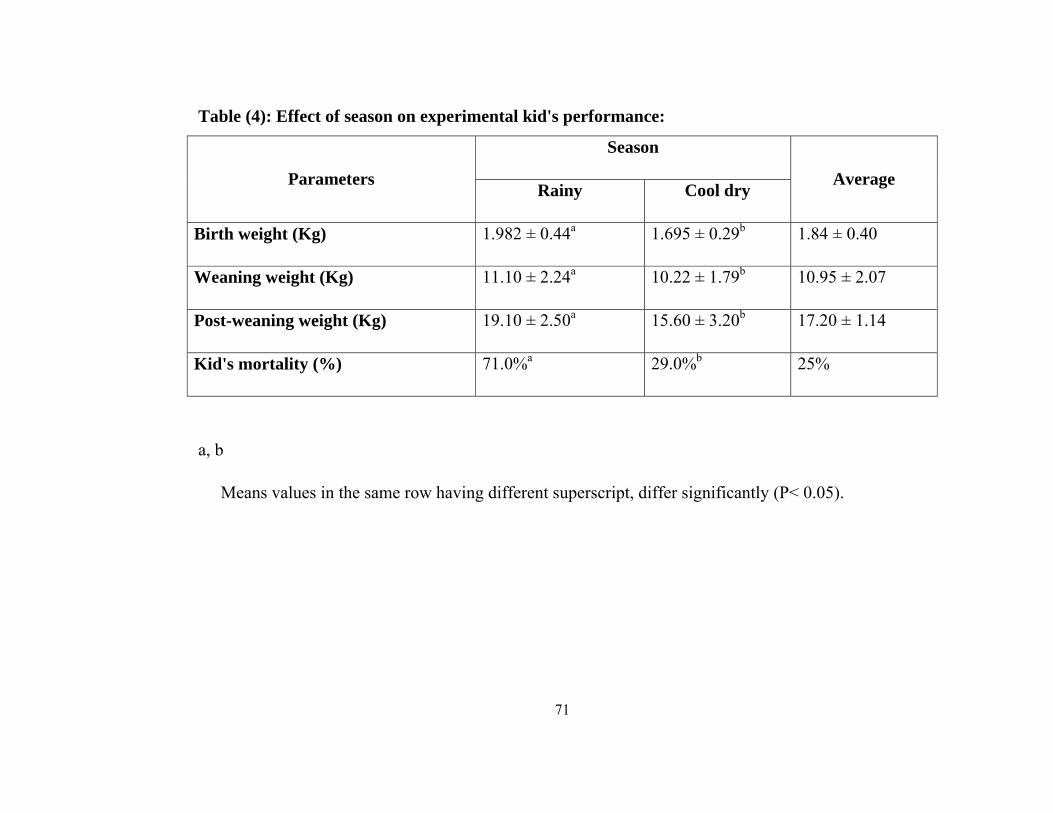
71
Table (4): Effect of season on experimental kid's performance:
Parameters
Season
Average Rainy Cool dry
Birth weight (Kg) 1.982 ± 0.44a 1.695 ± 0.29b 1.84 ± 0.40
Weaning weight (Kg) 11.10 ± 2.24a 10.22 ± 1.79b 10.95 ± 2.07
Post-weaning weight (Kg) 19.10 ± 2.50a 15.60 ± 3.20b 17.20 ± 1.14
Kid's mortality (%) 71.0%a 29.0%b 25%
a, b
Means values in the same row having different superscript, differ significantly (P< 0.05).
72
Monitored and tabulated in table (3). The results shows the weaning weight
of the supplemented groups (A, B and C) was significantly (P<0.05) higher
than unsupplemented group. The mean values of weaning weight of kid
were 12.95 ± 1.55, 11.03 ± 0.99, 10.08 ± 1.62 and 8.58 ± 1.07 for
supplemented groups (A, B, C) and unsupplemented group (D)
respectively. The results indicated that kid’s born to group (A), maintained
on higher energy secured the heaviest birth weight compared to the other
groups.
The data in table (4) shows the effect of season on birth weights.
The results verified significant effects on the birth weight (P<0.05). The
heaviest weaning weight was attained by kids kidded in rainy season (11.10
± 2.24), while the lowest weaning weight was attained by kid's kidded in
cool dry season (10.22 ± 1.79). The overall results indicated the poorest
performance of kid's born in cool dry seasons compared to wet season.
4.1.3. Post-weaning weight:
The post-weaning weight of kid's was measured at 9 month of age.
The effect of feed supplementation on the body weight of kid's post-
weaning was monitored and tabulated in table (3). The results shows the
post-weaning weight of the supplemented groups (A, B and C) was
significantly (P<0.05) higher than unsupplemented group. The mean values
of post weaning weight of kids were 20.3 ± 3.9, 18.10 ± 1.90, 17.65 ± 1.50
and 14.30 ± 2.10 for supplemented groups (A, B, C and D) respectively.
These results indicated that kids grow faster when fed supplemented feed
with higher energy diets compared to feed on grazing pastures without
supplemented feed.
73
The effect of season on post-weaning weight of kid's was revealed
in table (4). The results revealed significant differences (P<0.05) on the
post-weaning weight of kid's. The heaviest post-weaning weight was
attained by kids grown the in the rainy season (19.10 ± 2.50), while the
lowest post-weaning weight was attained by kid's grow in cool dry
season(15.60 ± 3.20). The results indicated that when kids grow in wet
season the post-weaning growth rate was faster compared to grow in cool
dry season.
4.1.4. Kids mortality:
Kid mortality refers to all kids' deaths that occurred during the first
three months post kidding to the total pregnancies. The effect of feed
supplementation on the Kid mortality percentage was monitored and
tabulated in table (3). The results shows the kid's mortality percentage of
the supplemented groups (A, B, C and D) was not significantly different
(P<0.05). The percentage values of kid's mortality were 20.0%, 30.0%,
20.0% and 30% for supplemented groups (A, B, C and D) respectively.
Although, the results indicated that kid's mortality was not affected by feed
supplementation but kid's may be dead due to scare of nutrient
requirements combined with other factors such as diseases, weight losses
and pre-weaning rearing.
The effect of season on kid's mortality percentages was monitored
and tabulated in table (4). The results shows that kid's mortality was
significantly differ (P<0.05). The results indicated that the percentage of
kid's mortality was higher in rainy season (71.0%) compared to kid's
mortality percentage in cool dry season (29.0%).
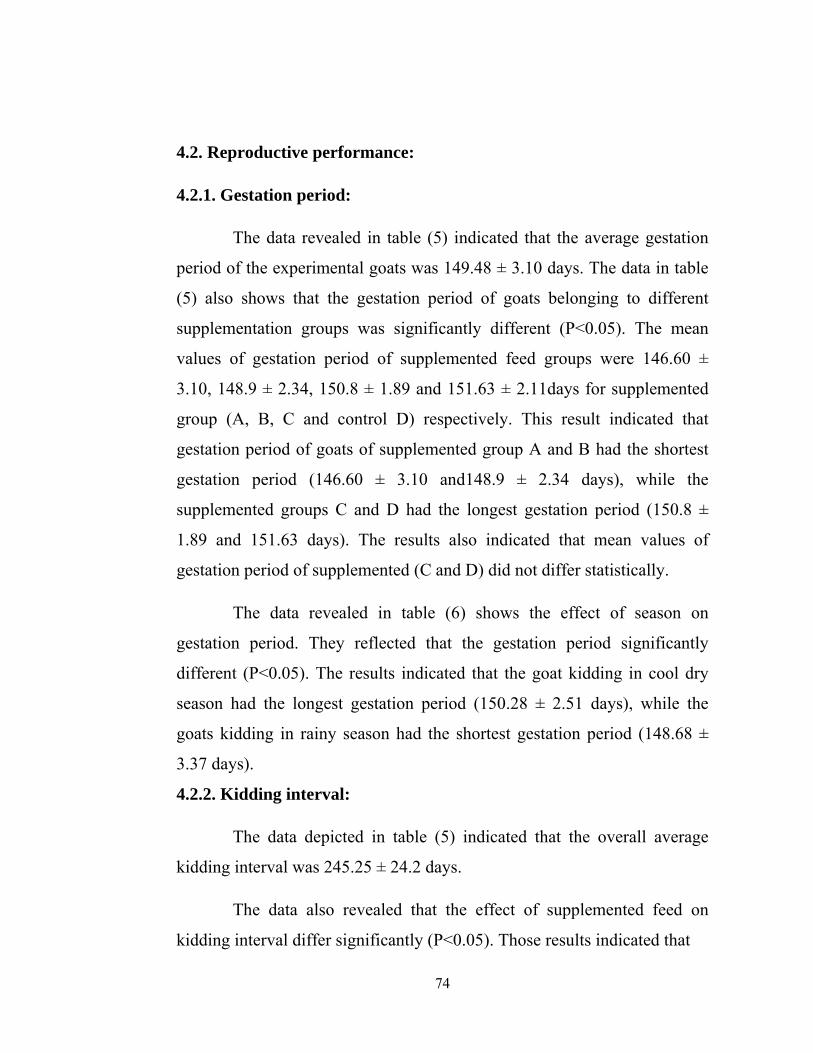
74
4.2. Reproductive performance:
4.2.1. Gestation period:
The data revealed in table (5) indicated that the average gestation
period of the experimental goats was 149.48 ± 3.10 days. The data in table
(5) also shows that the gestation period of goats belonging to different
supplementation groups was significantly different (P<0.05). The mean
values of gestation period of supplemented feed groups were 146.60 ±
3.10, 148.9 ± 2.34, 150.8 ± 1.89 and 151.63 ± 2.11days for supplemented
group (A, B, C and control D) respectively. This result indicated that
gestation period of goats of supplemented group A and B had the shortest
gestation period (146.60 ± 3.10 and148.9 ± 2.34 days), while the
supplemented groups C and D had the longest gestation period (150.8 ±
1.89 and 151.63 days). The results also indicated that mean values of
gestation period of supplemented (C and D) did not differ statistically.
The data revealed in table (6) shows the effect of season on
gestation period. They reflected that the gestation period significantly
different (P<0.05). The results indicated that the goat kidding in cool dry
season had the longest gestation period (150.28 ± 2.51 days), while the
goats kidding in rainy season had the shortest gestation period (148.68 ±
3.37 days).
4.2.2. Kidding interval:
The data depicted in table (5) indicated that the overall average
kidding interval was 245.25 ± 24.2 days.
The data also revealed that the effect of supplemented feed on
kidding interval differ significantly (P<0.05). Those results indicated that
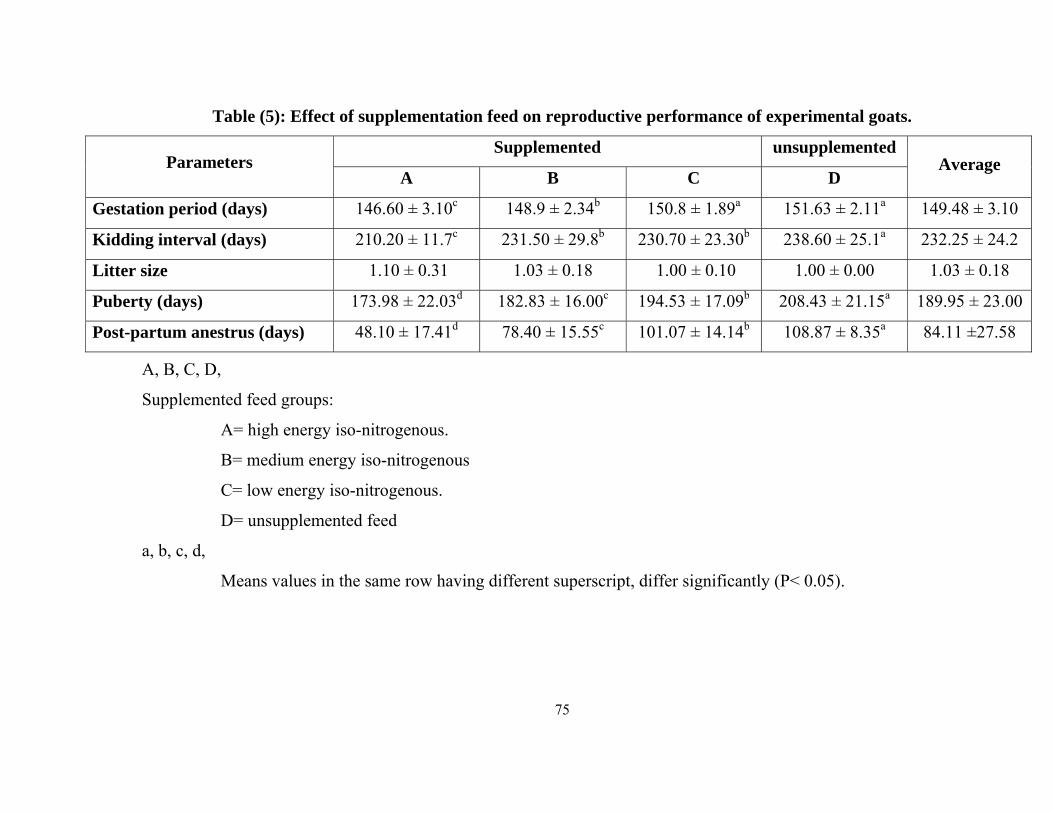
75
Table (5): Effect of supplementation feed on reproductive performance of experimental goats.
Parameters Supplemented unsupplemented
Average A B C D
Gestation period (days) 146.60 ± 3.10c 148.9 ± 2.34b 150.8 ± 1.89a 151.63 ± 2.11a 149.48 ± 3.10
Kidding interval (days) 210.20 ± 11.7c 231.50 ± 29.8b 230.70 ± 23.30b 238.60 ± 25.1a 232.25 ± 24.2
Litter size 1.10 ± 0.31 1.03 ± 0.18 1.00 ± 0.10 1.00 ± 0.00 1.03 ± 0.18
Puberty (days) 173.98 ± 22.03d 182.83 ± 16.00c 194.53 ± 17.09b 208.43 ± 21.15a 189.95 ± 23.00
Post-partum anestrus (days) 48.10 ± 17.41d 78.40 ± 15.55c 101.07 ± 14.14b 108.87 ± 8.35a 84.11 ±27.58
A, B, C, D,
Supplemented feed groups:
A= high energy iso-nitrogenous.
B= medium energy iso-nitrogenous
C= low energy iso-nitrogenous.
D= unsupplemented feed
a, b, c, d,
Means values in the same row having different superscript, differ significantly (P< 0.05).
76
Table (6): Effect of season on reproductive performance of experimental goats:
Parameters
Season
Average Rainy Cool dry
Gestation period (days) 148.68 ± 3.37b 150.28 ± 2.51a 149.48 ± 3.10
Kidding interval (days) 216 ± 12.80b 228 ± 23.60a 245.25 ± 24.2
Litter size 1.07 ± 0.25 1.00 ± 0.00 1.03 ± 0.18
Puberty (days) 174 ± 17.06b 205.53 ± 16.78a 189.95 ± 23.00
Post-partum anestrus (days) 75.95 ± 30.15b 92.27 ± 22.13a 84.11 ±27.58
a, b
Means values in the same row having different superscript, differ significantly (P< 0.05).
77
The kidding interval of goats of the supplemented groups were 210.20 ±
11.7, 231.50 ± 29.8, 230.70 ± 23.30 and 238.60 ± 25.1 days for
supplemented groups (A, B, C and D) respectively. The results showed that
the goats of supplemented group (A) had the shortest kidding interval
(210.20 ± 11.7days), while goats of unsupplemented group (D) had the
longest kidding interval (238.60 ± 25.1). The results also indicated that the
mean values of kidding interval of supplemented groups (B and C) were
not statistically different.
The data depicted in table (6) shows the effect of season on kidding
interval .The results show that the kidding interval differ significantly
(P<0.05). The results also revealed that the goat kidded in cool dry season
had the longest kidding interval (228 ± 23.60 days), while the goats kidded
in rainy season had the shortest kidding interval (216 ± 12.8 days).
4.2.3. Litter size:
The results revealed in table (5) shows the effect of supplemented
feed on litter size. The data demonstrated a non significance (p 0.05)
between all supplemented groups. The mean values of litter size of
supplemented group were 1.10 ± 0.31, 1.03 ± 0.18, 1.00 ± 0.10 and 1.00 for
supplemented groups (A, B, C and D) respectively. The overall litter size of
experimental goats was 1.03 ± 0.18.
The data presented in table (6) shows the effect of season on the
litter size. The results shows that the Litter size differed significantly
(P<0.05). This result indicated that the litter size of goats which kidded in
rainy season (1.07 ± 0.25) higher than litter size of goats which kidded in
cool dry season(1.00 ± 0.00).
78
4.2.4. Puberty:
The data in table (5) monitored the effects of supplemented feed on
kid puberty and shows that the average age at puberty of female kids was
189.95 ± 23.00 day (6.33 ± 0.23 months).
The data indicated that the age at puberty was significantly
(P<0.05) affected by feed supplementation. Also the results show the age of
experimental female kids at puberty were 173.98 ± 22.03 day, 182.83 ±
16.00 day, 194.53 ± 17.09 day and 208.43 ± 21.15 day. Table (5) shows
female kids belonged to supplemented feed group (A) were sexually
mature at an earlier age (173.98 ± 22.03 day) compared to female kids
belonged to group (D) unsupplemented feed (208.43 ± 21.15 day). This
results indicated that supplementation feed accelerate sexual maturity age.
The data revealed in table (6) shows the effect of season on the age
of female puberty. The results show that the sexual maturity of female in
rainy season was significantly (P<0.05) earlier than female kids mature
sexually at cool dry season. This result shows that the puberty of females'
goats which matured in cool dry season (205.53 ± 16.78 day) delay than
puberty of females' goats which matured in rainy season (174 ± 17.06 day).
4.2.5. Post-partum anestrus:
Post-partum anestrus of experimental goats was revealed in table
(5). It reflect a high significant (P<0.05) effect of feed supplementation
.The results also show that mean values of female post-partum anestrus
were 48.10 ± 17.41 day, 78.40 ± 15.55 day, 101.07 ± 14.14 day and 108.87
± 8.35 day.
79
The effect of season on post-partum an estrus is revealed in table
(6). The result shows that the post-partum anestrus was affected
significantly (P<0.05) by season of year. The results indicated that post-
partum anestrus of female in cool dry season was longer (92.27 ± 22.13
day) than post-partum anestrus of female in rainy season (75.95 ± 30.15).
4.3. Productive performance:
4.3.1. Milk production:
The data in table (7) shows that the overall average total milk yield
of the experimental goats was 52.31 ± 20.07 Kg. The data also highlighted
the effects of feed supplementation on milk yield and demonstrated that
there were highly significant differences (P < 0.05). They also show that
total milk yield of goats were 78.97± 7.54 Kg, 56.57± 14.22 Kg, 40.50±
9.81Kg and 33.20 ± 4.46 Kg for the un- supplemented groups (A, B, C and
D) respectively. This results indicated that goats of supplemented group
(A) having the highest milk yield (78.97± 7.54 Kg), while goats of
unsupplemented group D having the lowest milk yield (33.20 ± 4.46 Kg).
Generally, the goats of supplemented groups having the higher total milk
yield compared with goats of unsupplemented group.
The data in table (8) revealed the effect of season on total milk
yield. Those results show that there was highly significantly (P<0.05) affect
on average milk yield of goats. The results indicated that goats kidded in
rainy season having the highest milk yield 59.12± 19.86 Kg compared with
the milk yield of the goats kidded in cool dry season45.50 ± 17.99Kg.
80
Table (7): Effect of season on productive performance of experimental goats:
Parameters
Supplemented unsupplemented
Average A B C D
Milk yield (Kg) 78.97± 7.54a 56.57± 14.22b 40.50± 9.81c 33.20± 4.46d 52.31± 20.07
Lactation period (days) 121.47 ± 17.71a 113.63 ± 14.44b 99.03 ± 8.66c 84.63 ± 16.95d 104. 69 ± 20.40
Index 1 (Kg) 23.89 ± 3.64a 19.07 ± 2.12b 17.23 ± 3.01c 14.19 ± 1.92d 18.60 ± 4.47
Index 2 (Kg) 0.79 ± 0.20a 0.78 ± 0.16a 0.63 ± 0.14b 0.48 ± 0.10c 0.67 ± 0.20
Index 3(Kg) 1.85 ± 0.39a 1.74 ± 0.27a 1.44 ± 0.30b 1.11 ± 0.19c 1.53 ± 0.41
Milk fat % 3.36 ± 0.35a 2.95 ± 0.34b 2.19 ± 0.38c 1.68 ± 0.14d 2.54 ± 0.73
Milk protein 3.94 ± 0.68a 2.77 ± 0.86b 1.75 ± 0.12c 1.59 ± 0.22c 2.54 ± 0.11
Milk total solid 15.54 ± 2.03a 14.23 ± 1.74b 12.92 ± 0.85c 11.83 ± 1.41d 13.63 ± 2.08
A, B, C, D: Supplemented feed groups: A= high energy iso-nitrogenous, B= medium energy iso-nitrogenous, C= low energy
iso-nitrogenous and D= unsupplemented feed
a, b, c, d,
Means values in the same row having different superscript, differ significantly (P< 0.05).
81
Table (8): Effect of season on productive performance of experimental goats:
a, b
Means values in the same row having different superscript, differ significantly (P< 0.05).
Parameters Season
Average Rainy Cool dry
Total milk yield (Kg)) 59.12 ± 19.86a 45.50± 17.99b 52.31± 20.07
Lactation period (days) 116.87 ± 16.73a 92.52 ± 16.07b 104. 69 ± 20.40
Index 1 (Kg) 19.82 ± 4.84a 17.27 ± 3.70b 18.60 ± 4.47
Index 2 (Kg) 0.65 ± 0.21 0.69 ± 0.20 0.67 ± 0.20
Index 3 (Kg) 1.47 ± 0.41 1.59 ± 0.41a 1.53 ± 0.41b
Milk fat % 2.74 ± 0.74a 2.34 ± 0.66b 2.54 ± 0.73
Milk protein % 2.83 ± 1.22a 2.19 ± 0.85b 2.54 ± 0.11
Milk total solid 14.84 ± 2.05a 12.42 ± 1.27b 13.63 ± 2.08
82
4.3.2. Lactation period:
The data depicted in table (7) revealed the effect of feed
supplementation on lactation period. The results show that the overall mean
of lactation period of the experimental goats was 104.69 ± 20.40 day. The
data also shows the effect feed supplementation on lactation period and
demonstrated there were highly significant differences (P<0.05). The mean
values of lactation period of goats were 121.47 ± 17.71 day, 113.63 ± 14.44
day, 99.03 ± 8.66 day and 84.63 ± 16.95day for supplemented feed groups
(A, B, C and D) respectively. Goats of supplemented group (A) have the
longest period of lactation (121.47 ± 17.71 day), while goats of
unsupplemented group (D) have the shortest period of lactation (84.63 ±
16.95day). Generally, goats of the supplemented feeds groups have the
longest lactation period compared with goats of unsupplemented feed
group.
Effect of season on lactation period of kidding of the experimental
goats was monitored and tabulated in table (8). The results indicated that
rainy season born does had significantly (P<0.05) the longest lactation
period (116.87 ± 16.73 day) compared with goats kidded in cool dry season
that had the shortest lactation period (92.52 ± 16.07 day).
4.3.3. Indices of doe productivity:
The data of indices of doe productivity (index 1, index 2 and index
3) were monitored and tabulated in table (7). The results shows that the
indices of doe productivity were highly significantly different (P<0.05).
The mean values of index 1 (the total weight of weaned kid per doe per
year) were 23.89 ± 3.64, 19.07 ± 2.12, 17.23 ± 3.01 and 14.19 ± 1.92 Kg/doe for
supplemented feed groups (A, B, C and D) respectively. The mean values
83
of index 2 (the total weight of weaned kid per Kg of doe per year) were
0.79 ± 0.20, 0.78 ± 0.16, 0.63 ± 0.14 and 0.48 ± 0.1 Kg for supplemented
feed groups (A, B, C and D) respectively. The results also indicated that
index 2 of supplemented groups A and B were highest (0.79 ± 0.20 and
0.78 ± 0.16 Kg) than that of supplemented groups C (0.63 ± 0.14 Kg) and
D (0.48 ± 0.10 Kg) respectively. The mean values of index 3 (the total
weight of weaned kid per Kg of metabolic weight of doe per year) were
1.85 ± 0.39, 1.74 ± 0.27, 1.44 ± 0.30 and 1.11 ± 0.19 Kg for supplemented
groups (A, B, C and D) respectively. The results also indicated that index 3
of supplemented groups A and B were highest (1.85 ± 0.39 and 1.74 ± 0.27
Kg) than that of supplemented groups C (1.44 ± 0.30 Kg) and D (1.11 ±
0.19 Kg) respectively.
The effect of season on indices of doe productivity was revealed
in table (8). Except with, index 2 the indices of doe productivity were
significantly differ (P<0.05). The mean values of index 1 (the total weight
of weaned kid per doe per year) were 17.27 ± 3.70 and 19.82 ± 4.84
Kg/doe for cool dry and rainy respectively. The mean values of index 2
(the total weight of weaned kid per Kg of doe per year) were 0.65 ± 0.21
and 0.69 ± 0.20 Kg for cool dry and rainy season respectively. The results
also indicated that index 2 of cool dry season (0.65 ± 0.21 Kg) was not
significantly differences with rainy season (0.69 ± 0.20 Kg). The mean
values of index 3 (the total weight of weaned kid per Kg of metabolic
weight of doe per year) were 1.47 ± 0.41 and 1.59 ± 0.41 Kg for cool dry
and rainy season respectively. The results also indicated that index 3 of
rainy season was highest (1.59 ± 0.41 Kg) than that of cool dry season
(1.47 ± 0.41 Kg) respectively.
84
4.3.4. Milk composition:
4.3.4.1. Milk fat:
The effect of supplementation feed groups data of milk fat content
depicted in table (7). The results shows that the milk fat content was
affected significantly (P<0.05) by feed supplementation. The results show
the overall average milk fat content was 2.54 ± 0.73 %. Those results also
show that the mean values of milk fat content were 3.36 ± 0.35 %, 2.95 ±
0.34 %, 2.19 ± 0.38 % and 1.68 ± 0.14 % for feed supplemented groups
(A, B, C and D).respectively. The results indicated that the milk fat content
increased when goats were fed on feed supplementations which have
higher energy content.
Table (8) shows the effect of season on milk fat content and the
milk fat content in rainy season (2.74 ± 0.74) was significantly (P<0.05)
higher than milk fat content in cool dry season(2.34 ± 0.66).
4.3.4.2. Milk protein:
The data on milk protein content revealed in table (7) shows the
effect of feed supplementation. The results show that the milk protein
content was affected significantly (P<0.05) by supplementation of feed.
The results show the overall average milk protein content was 2.54 ± 0.11
%. The results also show that the mean values of milk protein content were
3.94 ± 0.68 %, 2.77 ± 0.86 %, 1.75 ± 0.12 % and 1.59 ± 0.22 % for
supplemented feed groups (A, B, C and D).respectively. Milk protein
content of supplemented groups (C and D) was not statistically different for
milk protein of supplemented groups (A and B). The data indicated that the
milk protein content was affected by feed supplementation.
85
Table (8) shows the effect of season on milk protein content.
The milk protein content in rainy season (2.83 ± 1.22) was significantly
(P<0.05) higher than milk protein content in cool dry season (2.19 ± 0.85).
4.3.4.3. Milk total solid:
The data in table (7) revealed milk total solid and shows the effect
of feed supplementation. The results show that the feed supplementation
was significantly (P<0.05) affecting on milk total solid content. The results
show that the overall average of milk total solid was 13.63 ± 2.08 %. The
results also show that the mean values of milk total solid content were
15.54 ± 2.03 %, 14.23 ± 1.74 %, 12.92 ± 0.85 % and 11.83 ± 1.41 % for
supplemented and un-supplemented feed groups (A, B, C and
D).respectively. The data indicated that the milk total solid content
increased when goats were fed by higher energy feeds.
Table (8) shows the effect of season on milk total solid content.
The milk total solid content in rainy season (14.84 ± 2.05) was significantly
(P<0.05) higher than that of cool dry season (12.42 ± 1.27).
86
CHAPTER FIVE DISCUSSION
5.1. Kid's performance:
5.1.1. Birth weight:
The overall average birth weight of experimental kids of this study
was 1.84 ± 0.40 Kg. This result was in agreement with data authenticated
by both Wilson (1976) who studied production traits of Southern Darfur
goats and reported that the average birth weights were 2.10 ± 0.61 and 2.16
± 0.61 Kg for males and females respectively, and 2.09 ± 0.5 and 2.01 ±
0.4 kg for males and females born for the first kidder goats. And , Ageeb
(1992) who reported that, the birth weight of Baggara goat of South
Kordofan were 2.0 ± 0.5 and 1.8 ± 0.40 kg for males and females
respectively, the average birth weights were 2.10 ± 0.61 and 2.16 ± 0.61 Kg
for males and females respectively, and 2.09 ± 0.5 and 2.01 ± 0.4 kg for
males and females born for the first kidder goats.
The effect of feed supplementation on birth weight of experimental kid's was investigated. The Findings of this study showed that birth weight of kids differ significantly (P< 0.05) for supplemented and unsupplemented groups. The results indicated that group of does supplemented with A (higher energy) secured the highest birth weight (2.20) compared to the unsupplemented group (D) that secured the lowest birth weight (1.55). These differences in kid's birth weight could be attributed to differences in nutritional energy levels. As the energy requirements is variate for different physiological stages of doe such as; maintenance, pregnancy, lactation and growth.
The impact of season on birth weight of kids was also investigated
and showed that the birth weight of kids during rainy season was, 1.982 ±
87
0.44, significantly (P< 0.05) higher than that kids born in cool dry season,
1.695 ± 0.29. The results indicated that does born during the rainy season
maintained a higher birth weight of kids as compared to birth weight of
kids born in cool dry season. Higher values of birth weight of kid's on rainy
season could be referred to availability of green grasses and forages, and
young succulent plants that containing edible portion that provide high
energy in rainy season resulting in a well body condition score compared to
older browsing plants with undigested fiber which are found greatly in
cool dry season.
5.1.2. Weaning weight:
The overall average weaning weight of experimental kid's that was
weighted at 3 months of age was 10.95 ± 2.07. These results were
compatible with claims obtained by Elabid (2002), who reported that the
average weaning weight of Nubian kids were 8.641 Kg and 8.150 Kg for
male and female respectively.
The effects of feed supplementation on the weaning weight was studied and showed that the weaning weight of the supplemented groups (A, B and C) was significantly (P<0.05) heavier than unsupplemented group. Those differences in weaning weight might be referred to differences in feed energy levels. The mean values of weaning weight of kids were 12.95 ± 1.55, 11.03 ± 0.99, 10.08 ± 1.62 and 8.58 ± 1.07 for supplemented groups (A, B, C) and unsupplemented group (D) respectively. The results indicated that kid's borned and maintained on higher energy (A) secured the heaviest weaning weight compared to the other groups.
88
The present result verified significant effects of season on the
weaning weight (P<0.05). The heaviest weaning weight was attained by
kids kidded in rainy season (11.10 ± 2.24), while the lowest weaning
weight was attained by kid's kidded in cool dry season (10.22 ± 1.79). This
result could be attributed to availability of good young pasture during rainy
season as compared with cool dry season. Moreover, the poorest
performance of kid's born in cool dry season may be due to the lower milk
yield of their dams when compared to rainy season kidders.
5.1.3. Post-weaning weight:
The effect of feed supplementation on the body weight of kid's
post-weaning measured at 9 month of age, the supplemented groups (A, B
and C) was significantly (P<0.05) higher than unsupplemented group (D).
These results indicated that kids grow faster when fed on supplemented
feed with higher energy diets compared to fed on grazing pastures without
supplementation.
The effect of season on post-weaning weight of kid's verified
significant differences (P<0.05). Results show that the heaviest post-
weaning weight was attained by kid's grown in rainy season (19.10 ± 2.50)
compared with the lowest post-weaning weight attained by kid's grown in
cool dry season (15.60 ± 3.20). These differences could be referred to the
presence of pastures and browsing plants in rainy season.
89
5.1.4. Kids mortality:
Kid mortality encountered in this study (25%) refers to all kids'
deaths that occurred during the first five months post kidding to the total
pregnancies and represent about quarter of the whole kids to be produced
by the experimental flock. The mortality rate in this study was due to many
factors such as diseases, inadequate nutrition and other individual. These
results were complying with many authors (Khan 1979; Ageeb 1999;
Vihan 1979 and Nair 1979). Khan (1979) studied the kid's mortality for
Jamnapari goats of India and reported that, the pre-weaning mortality was
higher in the kids having low birth weight and the mortalities were 8.49%,
14.92% and 10% for pre-weaning, post-weaning and adult respectively.
Ageeb (1999) using South Kordofan Baggara goats, reported a mortality of
40.2% for kids less than 6 months of age. Vihan (1979) investigated the
common causes of mortality in kids and their control, showed that 50 % of
the deaths were infected in the first month and about 25% in the first week
of the birth, with other peak death from 3rd to 5th month where milk is
completely forms kid diets. Nair (1979) found a mortality rate of 5.06%,
6.05% for Malabari adult males and females respectively, under normal
conditions then the mortality rates increased to 32.73%, 11.16% for males
and females due to outbreak of viral pneumonia.
The present study indicated that results of the kid's mortality
percentages of the supplemented and un-supplemented groups (A, B, C and
D) exerted no significant effect (P<0.05).
On the other hand, the effect of season on kid's mortality revealed
significant differences (P<0.05). The results indicated that the
overall (25 %) percentage of kid's mortality occurred higher in cool
90
dry season compared to one-third in rainy season. However, these rates of
kid's mortalities are due to deficiencies of nutrients requirements combined
with other factors such as bacterial disease (diaherria), viral pneumonia and
other individual causes.
5.2. Reproductive performance:
Importance of reproductive performance of an animal referred to
the efficiency of the animal production, whatever on production function
of animal keeping. Dairy goats are kept primarily for milk production, the
economic utilization does not begin until after kidding, since with each kid
the lactation period is limited. Meanwhile, in case of goats kept primarily
for meat the kidding rate and the frequency of kidding determine the
attainable economic benefit.
In this study, the reproductive performances of experimental goats
investigated, were gestation period, kidding interval, litter size, puberty and
post-partum anestrus period.
5.2.1. Gestation period:
Data revealed in table (5) indicated that the average gestation period of the experimental goats was 149.48 ± 3.10 days. These results were in conformity with Mukasa-Mugerwa et al. (1988), and Devendra and Mcleroy (1987). Mukasa-Mugerwa et al. (1988) reported that duration of gestation ranged between 145 and 155 days for both sheep and goats. Devendra and Mcleroy (1987) studied the gestation periods in several breeds of goats in the tropics and reported that gestation periods ranged between 144 to 153 days with average 146 days. However, those researchers
91
concluded that the gestation period for most of tropical goat's variate by
less 3 – 5 days could be to either genetic or environmental factors.
Data in table (5) also shows that the gestation period of
experimental goats belonging to different supplementation groups was
significantly different (P<0.05). The differences in gestation period might
be referred to differences in energy supplementation levels used in this
study. Results also showed that gestation period of experimental goats of
supplemented group A and B had shorter gestation period (146.60 ± 3.10
and148.9 ± 2.34 days), while the supplemented groups C and D had longer
gestation period (150.8 ± 1.89 and 151.63 days). Hence, provision of
amount of energy level in pregnant doe feed would accelerate in growth
rate of fetus that ultimately result in shortening gestation period.
Data presented in table (6) shows the effect of season on gestation
period. Goats pregnant in the cool dry season had significantly (P<0.05)
longer gestation period (150.28 ± 2.51 days) compared to goats pregnant in
the rainy season. These differences might be referred to the seasonal impact
on grazing pastures quality which negatively influence the pregnant doe
requirement.
5.2.2. Kidding interval:
The overall average of the kidding interval in experimental goat
was 245.25 ± 24.2 days. These results were in agreement with Wilson
(1979), who reported that the kidding interval of Southern Darfur goats
averaged was 238 ± 41 days. Also, these results were similar to Ageeb
(1992) who reported that, the kidding interval of Baggara breed was 234.1
± 28.9 days.
92
The effect of supplemented feed on kidding interval significantly
different (P<0.05). These results were comparable with results that had
been advocated by many authors who studied effects the of nutritional
level on kidding interval. Singh and Sengar (1970) reported that, the
kidding interval of Jamnapari does was shorter when fed on high and
medium energy feeds compared to does fed on lower energy diet.
Sachdeva et. al. (1973) studied the effect of plane of nutrition on
reproductive performance of Barbari and Jamnapari goats. They found that
the kidding intervals were 245, 231, 242, 243 and 244 of Barbari goats Vs.
298, 283, 307, 333 and 385 of Jamnapari for high energy-high protein,
high energy-medium protein, medium energy-medium protein, medium
energy-low protein and low energy-low protein respectively. Kudouda
(1985) worked on Sudanese Nubian goats and reported that, the kidding
interval of roughage fed group was 343.5 ± 57.3 days, while it was 251.2 ±
19.3 days for concentrate supplemented goats. Also, Jubartalla (1998)
studied the effect of feeding Molasses based ration and sorghum based
ration to Sudanese Nubian goats and reported that, the kidding interval was
271 ± 27 for sorghum fed group and longer compared to the molasses fed
group 251 ± 41 days.
The findings of this study concerning with most of these workers
indicated that goats of supplemented group (A) had secured shortest
kidding interval (210.20 ± 11.7days), while goats of unsupplemented group
(D) had longest kidding interval (238.60 ± 25.1). However, the mean
values of kidding interval of supplemented groups (B and C) were not
statistically different.
93
Data demonstrated in table (6) revealed significant (P<0.05)
difference in responses to season influenced on kidding interval. These
results were in match with data obtained by many workers (Haumesser,
1975; Gracia et. al., 1976; Gangwar and Yadav, 1987 and Cabello et. al.,
1991) for different goat breeds. Haumesser (1975) worked on Red Sokoto
goats reported that, following parturition during September – April, May –
June or July – August, the kidding intervals average 343.2, 302.3 and 266.1
days respectively. Ganwar and Yadav (1987) studied the influence of
various factors on service period and kidding interval in Indian goats and
reported that, year and season of kidding had a significant effect on
drinking interval 235.71 days in the monsoon season Vs. 271.39 and
278.22 days in summer and winter respectively. Cabello et. al. (1991)
claimed that in Anglo-Nubian goats, season of kidding significantly
affected kidding interval 214.9 days for female kidding in the rainy season
Vs. 246.3 in the dry season where factors such as temperature, humidity
and availability are the main influential.
5.2.3. Litter size:
In the present study, the overall average of litter size obtained (1.03
± 0.18) had shown significant differences (P<0.05) and remained in
harmony with other workers (Karua 1989, Shalaby et. al. 2000 and Webb
and Mamabolo 2004). Karua (1989) studied the litter size of Malawi
indigenous goats and revealed that, the litter size was 1.35 ± 0.5 and 1.33 ±
0.5 in village and ranch systems conditions. Shalaby et. al. (2000) reported,
the litter size at birth was 1.47,while, Webb and Mamabolo (2004)
reported that, the litter size of South African indigenous goats was 1.7 kids
per doe.
94
On the other hand, the overall average of litter size tackled in this study
was contradictable with claims of Alexander et. al. (1999) who showed
that, the litter size at birth, during suckling and weaning were 2.25, 2.05
and 1.95 respectively. This contradiction might be attributed to the
different breed's sizes, environmental and managerial factors involved in
the different experiment conducted. Furthermore, the effect of season on
the litter size was calculated and the results showed that the litter size of
experimental goats which kidded in rainy season (1.07 ± 0.25) was
significantly (P<0.05) higher than goats kidded in cool dry season (1.00 ±
0.00). These findings were corresponding with Devendra (1990), who
stated that, the litter size is affected by level of nutrition, body weight and
birth type.
5.2.4. Puberty:
The data in table (5) monitored the effects of supplemented feed on
puberty and shows that the average age at puberty of female kids was
189.95 ± 23.00 day (6.33 ± 0.23 months). Results were favourably in
confairmty with data indicated by many workers (Myenuddin and Wahab,
1989; Wolde-Michael et.al. 1989; Camboav et. al., 1992 and Walkden,
2001). Myenuddin and Wahab (1989) who , reported that the age at
puberty of Black Bengal goats was 180.74 ± 1.68 days. Wolde-Michael
et.al. (1989) found that the age and weight of puberty was 172 days and 15
Kg in Feral Cashmere respectively. Camboav et. al. (1992). reported that
age of puberty was 209.8 days in Sinaloa goats. Moreover, Walkden (2001)
reported that age at puberty ranged between 5 – 7 months when body
weight approximately reaches 50 % of the mature weight, but bucks born
after the season of breeding and did not reach puberty in the first breeding
season would be delayed up to 18 moths of age
95
Data of this study indicated that the age at puberty was
significantly (P<0.05) affected by feed supplementation. Results and
observations were in agreement with the results obtained by many
researchers (Arthur et. al., 1998 and Walkden, 2001), who reported that
animals well fed with good growth rate reach puberty before those which
were poorly fed with slow growth rate.
Data revealed in table (6) shows the effect of season on the age of
female puberty. Results shows that the sexual maturity of female in rainy
season (174 ± 17.06 day) was significantly (P<0.05) earlier than female
kids matured sexually at cool dry season (205.53 ± 16.78 day). These
results were in line with (Arthur and Ahunu, 1998 and Walkden, 2001)
who reported that age of puberty in seasonal breeders will be influenced by
the year. However, it came clear in the review if the seasonal breeds fail to
reach puberty weight in the first breeding season after birth, puberty will
be delayed until the next breeding season.
5.2.5. Post-partum anestrus:
In this study, the overall average of experimental female post-
partum anestrus was 84.11 ±27.58 day.
Post-partum an estrus of experimental goats was revealed in table
(5) and affected significantly (P<0.05) by the feed supplementation. These
results were in conformity with what had been observed by (Kamwanja et
al., 1985) on the Droper of Kenya and local Malwi sheep and their crosses.
They found that the post-partum an estrous period of natural grazing ewes
was 105 days and it was reduced by high feeding level to the mean of 52.4
days
96
The effect of season on post-partum an estrus is revealed
in table (6). The results shows that the post-partum anestrus was
affected significantly (P<0.05) by season of year. The results
indicated that post-partum anestrus
of female in cool dry season was longer (92.27 ± 22.13 day) than post-
partum anestrus of female in rainy season (75.95 ± 30.15). The differences
might be attributed to availability of good feeding in rainy season
compared to cool dry season coupled with breed’s intervention.
5.3. Productive performance:
5.3.1. Milk production:
Data in table (7) shows that the overall average total milk yield of
the experimental goats was 52.31 ± 20.07 Kg. This result is lower than the
findings obtained by other workers (Abdel Wahab, 1989, Jubartall et. al.,
2002) who worked on Sudanese Nubian goats.
Further, the data also highlighted the effects of feed
supplementation on milk yield and demonstrated that there were highly
significant differences (P < 0.05) among the supplemented groups. Group
(A) revealed the highest milk yield (78.97 ± 7.54 Kg), while group D
secured the lowest milk yield (33.20 ± 4.46 Kg). These findings supporting
the concept concluded by Ali et. al., (1991) and Leclerc (2000) who
reported that energy seemed to be the limiting factor for milk yield. Pre-
natal and post-natal nutrition of the doe influence milk yield, milk
composition and persistency, and is known to have major effects on the
growth of kids. Abdel Wahab (1998) found that, milk yield of Sudanese
Nubian goats was 208.72 ± 95.5 and 254.07 ± 9.3 Kg for goats given two
97
levels of energy. Alexander et. al. (2002) showed that, milk production is
higher in supplemented goats than grazing goats were 1023 ± 162 and 520
± 174 days over the 12 weeks of lactation, respectively. Jubartalla et. al.
(2002) reported that, the average daily milk yield was 1.14 ± 0.4 and 1.7 ±
0.3 Kg for doe fed molasses and sorghum respectively. Mirgani and Nasir (1993)
reported that, a 30% increase in milk yield of Sudanese Nubian goats fed
on 30% molasses and sesame cake.
Data in table (8) revealed the effects of season on total milk yield.
The results depicted that there were highly significant effect (P<0.05) on
average milk yield of goats. Goats kidded in rainy season produced higher
milk yield (59.12 ± 19.86) compared with the milk yield of the goats
kidded in cool dry season (45.5 ± 17.99). The seasonal effect is in
agreement with results obtained of Concalves and Wechsler, (2000) and
(Haffez, 1968) whom reported that, does kidding in wet season had higher
lactation milk yields and longer lactation length compared with does
kidded in cool dry season. This variation is due to availability of fresh,
green pastures during the wet season compared to low quality forages in
the dry season. The reduction in milk production during exposure to heat,
or during the summer, cannot be attributed solely to a fall in feed intake or
forage quality. The effect of heat on physiological mechanisms related to
lactation is also of importance, mainly, the low level of thyroxin during the
summer.
5.3.2. Lactation period:
The overall mean of lactation period of the experimental goats was
104.69 ± 20.40 days. Results showed that the lactation period of
experimental goats was lower than other breeds investigated by other
workers. The lactation length of Sudanese Nubian goats was investigated
98
by (Elnaim, 1979; Kudouda, 1985 and Khalaffalla and Sulieman, 1990).
Elnaim (1979) reported that lactation length of Sudanese Nubian goats was
147 days with 73.5 Kg milk yield. Kudouda (1985) reported that in
Sudanese Nubain goats the lactation length was 24 weeks (168 days) and
the goat dried up 2 – 3 months after conception. Also, Khalaffalla and
Sulieman (1990) noted that lactation length of Sudanese Nubian, Sannen,
Toggenburg and Anglo-Nubian goats were 121.47, 253, 206 and 60 days
with milk yield 71.8, 249.3, 244.3 and 162.4 Kg respectively.
The data demonstrated in table (7) revealed the effect of feed
supplementation on lactation period. Results showed that there were highly
significant differences (P<0.05) between supplemented groups.group (A)
showed the longest period of lactation (121.47 ± 17.71 days), while goats
of unsupplemented group (D) showed the shortest period of lactation
(84.63 ± 16.95days). The variations of lactation period encountered among
the supplemented groups could be solely attributed to offer supplemented
feed containing required ingredients for milk synthesis. was, hence
ultimately enhance prolonging the lactation period.
Impact of season on lactation period for the experimental goats was
monitored, and the results indicated that rainy born dams had significantly
(P<0.05) the longest lactation period (116.87 ± 16.73 days) compared with
goats kidded in cool dry season that had the shortest lactation period (92.52
± 16.07 days).Those results emphasizing the results obtained by many
workers (Garacia et.al., 1976; and Khan and Sahni, 1983). Garacia et.al.
(1976) who, reported that the lactation length was significantly affected by
month and year of kidding for Anglo-Nubian, Alpine, Toggenburg and
Sannen goats imported into Venezuela. Khan and Sahni (1983) pointed out

99
that the Jamnapari goats verified that lactation length was significantly
affected by year and season of kidding and their interaction.
100
5.3.3. Indices of doe productivity:
There is a little information about indices of goat’s productivity. It
is used to examine the overall annual output of doe-kid unit which combine
characters of doe productive performance, kid viability, kid weaning
weight and doe weight to build three productivity indices.
The effect of feed supplementation on indices of doe productivity
(index 1, index 2 and index 3) was monitored and tabulated in table (7).
These results show that the indices of doe productivity were highly
significantly different (P<0.05). The mean values of index 1 (the total
weight of weaned kid per doe per year) were 23.89 ± 3.64, 19.07 ± 2.12,
17.23 ± 3.01 and 14.19 ± 1.92 Kg/doe for supplemented feed groups (A, B,
C and D) respectively. The mean values of index 2 (the total weight of
weaned kid per Kg of doe per year) were 0.79 ± 0.20, 0.78 ± 0.16, 0.63 ±
0.14 and 0.48 ± 0.1 Kg for supplemented feed groups (A, B, C and D)
respectively. The results also indicated that index 2 of supplemented
groups A and B were highest (0.79 ± 0.20 and 0.78 ± 0.16 Kg) than that of
supplemented groups C (0.63 ± 0.14 Kg) and D (0.48 ± 0.10 Kg)
respectively. The mean values of index 3 (the total weight of weaned kid
per Kg of metabolic weight of doe per year) were 1.85 ± 0.39, 1.74 ± 0.27,
1.44 ± 0.30 and 1.11 ± 0.19 Kg for supplemented groups (A, B, C and D)
respectively). The results also indicated that index 3 of supplemented
groups A and B were highest (1.85 ± 0.39 and 1.74 ± 0.27 Kg) than that of
supplemented groups C (1.44 ± 0.30 Kg) and D (1.11 ± 0.19 Kg)
respectively. these results were in line with (Wilson, 1986) who, studied
the productivity indices of Mali goats and reported that the total weight of
weaned kid per doe per year (index, 1) was found to be 14.6 Kg/ doe, the
total weight of weaned kid per Kg of doe per year (index, 2) was found to
101
be 0.494 Kg., and the total weight of weaned kid per Kg of metabolic
weight of doe per year (index, 3) was found to be 1.23 Kg.
The effect of season on indices of doe productivity revealed in
table (8). Exception with, index 2 the indices of doe productivity were
significantly different (P<0.05). The mean values of index 1 (the total
weight of weaned kid per doe per year) were 17.27 ± 3.70 and 19.82 ± 4.84
Kg/doe for cool dry and rainy respectively. The mean values of index 2
(the total weight of weaned kid per Kg of doe per year) were 0.65 ± 0.21
and 0.69 ± 0.20 Kg for cool dry and rainy season respectively. The results
also indicated that index 2 of cool dry season (0.65 ± 0.21 Kg) was not
significantly difference with rainy season (0.69 ± 0.20 Kg). The mean
values of index 3 (the total weight of weaned kid per Kg of metabolic
weight of doe per year) were 1.47 ± 0.41 and 1.59 ± 0.41 Kg for cool dry
and rainy season respectively. The results also indicated that index 3 of
rainy season was highest (1.59 ± 0.41 Kg) than that of cool dry season
(1.47 ± 0.41 Kg) respectively. Results were in line with (Wilson, 1986)
who, stated that Productivity indices were affected by many factors such
as: production system, season, year, parity type of birth and nutrition
moreover, season effect on productivity indices such that goats given birth
in the hot dry or rainy seasons were more productive than those kidding in
the post-rains season, while births in the cold dry resulted in lowest
productivity.
102
5.3.4. Milk composition:
5.3.4.1. Milk fat:
In the present study, the overall average milk fat content was 2.54 ±
0.73 %. Results were in line (Parakash and Jennes, 1968) who, reported
that the milk fat content ranged from 2.7 to 5.9 %. Also, El-naim (1979)
reported that, Sudanese Nubian goat’s milk fat content was 3.6%.
Feed supplementation feed of the experimental lactating does was
significantly (P<0.05) affecting on milk fat. Results indicated that the milk
fat content increased when goats were fed on feed supplementations which
had higher energy content. These results were in conformity with results
obtained by (Hussein et. al., 1996; Schmidely et. al., 1999; Morand-Fehr et.
al., 2000;. Min et. al., 2005; and Spruzz and Selegoska,2006). Morand-Fehr
et. al. (2000) observed that, milk fat percentage in goats even fed on
Mediterranean rangeland can be lower than protein percentage because of
low availability of vegetation especially in summer and reduced ingestion
of fiber. Min et. al. (2005) reported that, the average percentage of milk fat
was lower in goats giving zero concentrate (2.9%) compared with other
groups giving concentrate (3.1%). Schmidely et. al. (1999) confirmed that,
increasing the level of energy intake in dairy goats improved their milk
yield and decreased the milk fat percentage. While, Hussein et. al. (1996)
reported that, with less yielding goats an increase in energy increased
sometime milk yields and fat percentage. Spruzz and Selegoska (2006)
worked on goats given supplemented diets and found that, supplemented
diets increased milk yield by 12.64% and fat content to 3.2%.
Table (8) shows the effect of season on milk fat content and the
milk fat content in rainy season (2.74 ± 0.74) was significantly (P<0.05)
103
higher than milk fat content in cool dry season(2.34 ± 0.66). Theose
differences might be due to availability of green pastures in rainy season as
compared with scarcity of green fodders and pastures in cool dry season.
5.3.4.2. Milk protein:
The overall average milk protein content was 2.54 ± 0.11 %. The
data of milk protein content revealed in table (7) showed that the milk
protein content was affected significantly (P<0.05) by feed supplemented.
The results indicated that the milk protein content was affected by feed
supplemented energy. Results were agreement with (Spruzz and Selegoska,
(2006) who, reported that goats supplemented with wheat bran and grazing
pasture and hay increased protein, fat and sugar contents of goat's milk on
13.3%, 22.8% and 1.1% respectively
Table (8) shows the effect of season on goats milk protein content
where the milk protein content in rainy season (2.83 ± 1.22) was
significantly (P<0.05) higher than milk protein content in cool dry season
(2.19 ± 0.85). The differences might be due to presence of young pastures
and other factors affecting milk protein during rainy season as compared
with cool dry season.
5.3.4.3. Milk total solids:
In the present study, the overall average milk total solids were
13.63 ± 2.08 %. Result of this study was in harmony with results obtained
by Baruah et. al. (2000) who, reported that the milk total solids ranged
between 15.77 ± 0.18 to 14.92 ± 0.23 and the overall mean for total solids,
solids-not-fat, lactose and ash were 17.4%, 10.6%, 4.7% and 0.88%
respectively.
104
The effect of the feed supplementation had influenced significantly
(P<0.05) on milk total solid content. The data indicated that the milk total
solids content was increased when goats were fed by supplemented with
feed containing higher energy. Results were in reliance with findings of
Gallad et. al. (1998) who, reported that all milk constitutes were negatively
correlated to the amount of milk secreted by the dairy goats, and increase
with increased energy content of the diet.
Table (8) shows the effect of season on milk total solids content
and the milk total solids content in rainy season (14.84 ± 2.05) was
significantly (P<0.05) higher than milk total solid content in cool dry
season (12.42 ± 1.27). Those differences could be attributed to availability
of wide varieties of grazing pastures in the rainfall season compared to
scarce feeding sources in cool dry season.
105
CONCLUSIONS AND RECOMMANDATIONS
Productive and reproductive performances of Sudan Desert Goats
under conventional system with supplemented feedings composed of
different energy levels with Iso- nitrogenous protein were studied .In
addition to, the influences of rainy and cool dry seasons on both goat and
kid productive and reproductive performances were monitored.
Milk yield, Lactation period, milk composition, and indices of doe
productivity were measured as productive traits. Meanwhile, Kidding
interval, gestation length, Litter size, Post-partum anoestrus and Puberty
were calculated as reproductive traits.
The concluded results of the study were:-
1. The positive impacts of feed supplementation on most of
the studied parameters suggest that the plan of nutrition
on Desert goat’s production systems is a crucial issue.
2. Sudan Desert goats had revealed better productive and
reproductive potentialities that ensured its contribution in
increasing social economical benefits for local societies
as well as its tolerance to harsh conditions.
As there are meager conducted studies regarding Sudan Desert
goats potentials, this study was undertaken to contribute in securing
data base on various productive and reproductive performances.
106
With Recommendations of further studies in the following areas:-
1. Improvement of range pastures quality, quantity and improvement of
grazing land to.
2. Utilization of watering interval systems that practiced in the study
area as the constrain factor of goats productive performance.
3. Rising up the awareness of local communities to adopt feed
supplementation as strategic goal to enhance goat’s productive and
reproductive performances.
107
References
A.O.D.A., (1990). Goat Resources in Arab state. II. Sudan (in Arabic).
Arab Organization for Agricultural Development (A.O.A.D).
Printing Press, Khartoum, Sudan.
Abdel Wahab, K. (1998). Effect of energy and protein source on some
productive and reproductive potentials of Sudan Nubian goat.
Ph. D. Thesis, University of Khartoum, Sudan.
Abulazayim, M (1996). Goats. Animal Resources and Animal Production in
the Sudan. Khartoum University Press, University of Khartoum
Casting house: 36- 90. (Arabic Publication).
Ageeb, A. A. (1992). Production and reproduction characteristics of a
flock of Baggara goats of South Kordofan, Sudan. Sudan J.
Animal Production,(5): 11– 24.
Akinbami, M. A. Meridith, Warren, J E. Jr. Day, B N. and Ganjam, V. K.
(1992). Leukocyte concentration and vascular permeability of
uterine post-partum ewes. Journal of Anim. Sci.,70(Suppl. 1); p:26.
Al kass, J. E.; Al-Zzawi, W. A. R. and Elia, J. V. (1999). Factors affecting performance of native Iraq goats and their crosses with saanen and Damascus goat. IPA J. Agri. Res. 9 (2): 369 – 377.
Alama, A. H. (1987). A study of reproduction and production traits in Sudan Desert Sheep. M. V. Sc. Thesis, University of Khartoum.
Alexander, G Fleury, J., Coppy, O., Archimede, H. and Xande, A. (2002). Effects of mode of supplementation upon milk and growth performances of suckling Creole goats and their kids reared at pasture in Guadeloupe. Livestock Research for Rural Development, 14 (1).
108
Alexander, G., Aumont, G. Maingud, G. C., Fleury, J. and Naves.
(1999). Productive performance of Guadeloupean Creole goats
during the suckling period: Small Ruminant Research, 34 (2):
157 – 162.
Ali, M., Khanum, S. A. and Noqvi, S. H. M. (1991). Effect of feeding
salt tolerant plants on growth and reproduction of goats. In:
isotope aided studies on goat and sheep production in the
tropical, proceeding of the final research meeting, FAO/IAEA,
Perth, Australia, 20 – 24 Feb., 1989, Vienna, 1991. pp.75 – 88.
Arkinosoynu, A. O. Mba, A. U. and Dlubaj. (1975). Studies on milk
yield and composition of West Africa goats in Nigeria. J.
Dairy Res. 44 (1): 57 – 62.
Arnold, G.W. (1987). Influence of the biomass, botanical composition
and sward height of annual pastures on foraging behavior of
sheep. J. Appl. Ecol. 24:759-772.
Arthur, P. F. and Ahunu, B. K. (1998). Changes in size and shape with
time of cross bred West African hair sheep raised under tree-
crop plantations. Livestock Prod. Sci. 21 (3): 235 – 249.
Babiker, A., Maglad, M. and Koudoda, M. E. (1985). Effect of
castration on performance and carcass characteristics of male
Sudanese Desert goats. World Review of Animal Production.
21 (1): 22.
Badawy, A. M. and Elbashary, A. S. and Moshen, M. K. M. (1971).
Post-puberty oestrus cycle and gestation period of female
Angora goats. Alex.. J. Agric. Res., 20 (1): 27 – 30.
109
Bailey, D.W., Rittenhouse, L.R. and. Swift, D.M. (1995). A conceptual
model for studying grazing distribution patterns of large
herbivores. 5th Int. Rangeland Congr. Salt Lake, USA.
Banda, J. W., Steinbach, J. and Zerpas, H. P. (1992). Milk yield, milk
composition and kid growth in Boer and East African goat in
Malawi. Recent Advances in Goat Production: 5th
International Conference; on goats: New Delhi, India.
Baru, P., Khar, S. K., Gupta, R. C. and Luthra, R. A. (1983): Uterine
involution in goats. Agricultural practice. Vet. Med. Small
Anim. Clinician 11, 1773-1776.
Baruah, K. K., Saikia, B. N., Chakravorty, P. and Choudhurysaikia, A.
(2000). Yield and composition of milk in Assan local and
Beetal × Assan local crossbred goats. In: Proceedings of the
7th International Conference Goats. 15 – 21 May, France. P:
603.
Bazely, D.R. (1990). Rules and cues used by sheep foraging in
monocultures. In: Behavioral Mechanisms of Food Selection.
R.N. Hughes (ed.). pp. 343-368. Springer-Verlag, New York,
USA.
Bearden, G. H. and Fuquay, J. W. (1997). Applied animal reproduction.
4th ed. Jersey Prentice hall, Upper saddle, New Jersey, USA.
Bello,A. M. (1985). Performance and carcass characteristics of Sudan
Desert goat kids compared with their temperate crosses.
M.V.Sc. Thesis. University of Khartoum, Sudan.
110
Bhatnagar, D. S.; Sharma, R. C. and Mishra, R. R. (1976).
Crossbreeding of Indian goats with exotics breed. A
vikanagar, India, central Sheep and Wool Research Institute.
(1976). 3pp. A.B.A. 46.(1): 285.
Boly, H.; Koubaye, A.; Vigguier, Martinez, M. C. and Yenikoye, A.
(1993). Pregnancy and resumption of sexual activity after
parturition in West African dwarf ewes of the Moshi variety
Reiue d' Elevage et de Medicine Veterinaire des Pays
Tropicauer; 46, 4: 631 – 636.
Brody, S. (1927). Growth and development with special referenc to
domestic animals. VII. Equivalence of age during the self-
inhibiting face of growth.. Mo. Agri. Exp. Sta. Res. Bull. No.
102.
Brown, G.D. and Lynch, J.J. (1972). Some aspects of the water balance
of sheep at pasture when deprived of drinking water. Aust. J.
Agric. Res. 23: 669-684.
Cabello, F. E., Andrade, M. H. and Olmas, V. J. (1991). Production and
reproduction in Anglo-Nubian goats under extensive
management in a semi-arid climate. Universitdad Autonoma
Metropolitana Iztapalapa. 13 – 17. A.B.A. 60 (3): 1588.
Camboav, J., Portillo, J., Vadez, L. M., Estrada, B. E., and Borquez, G.
J. (1992). Goat breeding in Sinaloa. Anim. Breed. Abstr., 9:
221 – 223.
Chakraporty, P. K., Stauart, L. D. and Brown, J. L. (1989). Puberty in
the male Nubian goats: Serum concentration of LH, FSH and
111
testosterone from birth through puberty and semen
characteristics at sexual maturity. J. Anim. Repro. Sci., 20:
(2): 91 – 101.
Charles, S. and Greg, S. (1999). Livestock and water. NDSN.
Extension Services. North Dakota State. University of
Agriculture and Applied Science. USA.
Ciappesoni, G., Pribyle, J., Milerski, M. and Mares, V. (2004). Factors
affecting goat milk yield and its composition. Zech. J. Anim.
Sci., 49 (11): 465 – 473.
Concalves, H. C. and Wechsler, F. S. (2000). Genetic and
environmental factors affecting milk production of dairy goat
in Brazil. In: Proc. of 7th International Conference on goat. 15
– 21 May. France.
Darokhan, M. D. and Tomar, N. S. (1983). Studies on body weight and
measurement at birth in Changthang Pashmina goats of
Ladakh. Indian Vet. Journal, 60(7): 564 – 569.
Dayenoff, P. Boano, M., Caceres, R. and maercado. L. (1999). Growth
and carcass characteristics of Criollo Type kids, under
restricted milking. Vet. Argentina. 16, 153: 191 – 200.
Delgadillo, J. A.,. Flores, J. A., Villareal, M. J., Hoyos, G., Chemineau,
P. Malpaux, B. (1998): Length of postpartum anestrous in
goats in subtropical Mexico: Effect of season of parturition
and duration of nursing. Theriogenology. 49, 1209-1218.
112
Devendra, C. (1975). Effective utilizations of feeding stuffs in
Malaysia: Perspectives and potential prospects. Bull. No. 141.
Ministry of Agriculture and Rural Development, Kuala
Lumpur, p. 11 – 31.
Devendra, C. (1976). Small ruminant production in various regions of
the world. Proc. Workshop on the Role of Sheep an Goats in
Agricultural Development, WINROCK Rep., Morrilton, AK.
Devendra, C. (1980). Milk production in goats compared to buffalo and
cattle in humid tropics. J. Dairy Sci. 63:1755.
Devendra, C. (1990). Goats. In: Paye, W. J. A. (Ed.). An Introduction
to animal husbandry in the tropics. 4th Ed. Longman. Ltd. UK.
Devendra, C. and Burns, M. (1970). Goat production in the tropics.
Commonwealth Bureaux of animal breeding and genetics,
Tech. Comm. No. 19.
Devendra, C. and Burns, M. (1983). Goat production in the tropics. 2nd
Ed.,(Tech. Comm. No. 19. Commonwealth Agricultural
Bureaux of Animal Breeding and Genetics). Commonwealth
Agricultural Bureaux of Animal Breeding Genetics. No. 19.
Devendra, C. and Burns, M. (1983). Goats production in the tropics. G.
Carton House Terrace. London, UK.
Devendra, C. and G.B. McLeroy, 1982. Goat and Sheep Production in
the Tropics. Intermediate tropical agriculture series, Longman
group limited, Essex, UK.
113
Devendra, C. and Mcleroy, (1987). Goat and Sheep production in the
tropics. Longman Scientific and Technical, UK.
Devendra, C. and Mcleroy, G. B. (1988). Sheep and goat production in
the tropics. ELBS. Longman Ltd., Singapore, pp. 271.
Ehoche, O. W. and Buvanedran, (1983). The yield and composition of
milk and pre-weaning growth rate of Red Sokoto goats in
Nigeria. World Review of Animal Production. 19 (2): 19 – 24.
El Gallad, T. T., Gihad, E. A., Allam, S. M., and Badway. A. (1988).
Effect of energy intake and roughage ratio on the lactation of
Egyptian Nubian goats. Small Ruminant Research, 1 (4): 327
– 341.
El Zubeir, Ibtisam. E.M. and Abd El Gadir, M. E. (2005). Production
performance of crossbred (Saanen and Nubian) goats in the
second kidding under Sudan conditions. Pakistan Journal of
Biological Sciences, 8 (5): 734 – 739.
Elabid, K. E. (2002). Studies on some productive and reproductive
traits of Sudan Nubian goats under village and small holder
system. Ph. D. Thesis, University of Khartoum. Sudan.
Elabid, K. E. (2008). Various factors affecting birth weight of Sudanese
Nubian goat kids. Research Journal of Agriculture and
Biological Sciences, 4 (6): 700 – 703.
El-imam, M. E. Tilal, M. A. M. and Mohamed, K. A. (2007).
Characterization of the Tagger goat in Eldelang area in the
Nuba Mountain in South Kordofan, Sudan. Conference on
114
genetic resources of the Sudanese livestock wealth. Khartoum.
5 – 6 March.
El-Moula, I. H. A., Babiker, S. A., El-Khidir, O. and Ibrahim, S. E.
(1999). Meat production from female goat kids compared with
males. J. Agric. Sic., 133 (2): 223 – 226.
El-naim, Y. V. (1979). Some reproductive and productive traits of
Sudan Nubian goats. M.V.Sc. Thesis, University of Khartoum.
Esquivel, M. H. and Camara, S. R. (1991). Observation on some
production traits in Criollo × Anglo-Nubian goats in Yucatan
State. Memorias del VIII Congreso Nacional AZTECA, 1 al 4
de Octubre, 1991. Mexico, D. F. 1991, 67 – 74.
Fedele, V., M. Pizzillo, S . Claps, P. Morand-Fehr and R. Rubino.
(1993). Grazing behavior and diet selection of goats on native
pasture in Southern Italy. Small Ruminant Research. 11:305-
322.
Fehr and Sauvant, (1977). Nutrition and optimum performance of dairy
goats. Livestock Production Science. 5 : 203 – 213.
Food and Agriculture Organization, 1991. Small ruminants genetic
resources in tropical Africa, FAO Animal production and
health paper No. 88-3118, Rome, Italy.
Forbes, T. J. and Robinson, J.J. (1967). The effect of source and level
of dietary protein on the performance of in-lamb ewes. Anim.
Prod. (9): 521 – 529.
115
French, M.H., 1970. Observations on goats. FAO., Agricultural Studies
N0. 80, Rome, Italy.
Gaili, E. S. E., Ghanem, Y. S. and Mukhtar, A. M. S. (1972). A
comparative study of some characteristics of Sudan Desert
sheep and goats. Anim. Prod. 14: 352 – 357.
Gamal, A. and Elkhidir, O. A. (1993). Some productive traits of
Sudanese Nubian goat. Sudan J. Anim. Prod., 6
Gangwar, S. D. and Yadav, M. C. (1987). Influence of various factors
on service period and kidding interval in Indian goats. Indian
J. Anim. Sci, 57 (4) : 338 – 346.
Ganwar, S. D. and Yadav, M. C. (1987). Influence of various factors on
service period and kidding interval in Indian goats. Indian . J.
Anim. Sci., 57 (4): 338 – 346.
Garcia, O., Castillo, J., Verde, S. O. and Osal, N. (1976). Kid mortality
in four imported goat breeds. Memoria, Association Latio-
americana de Production Animal. (1976) 11, 27. A.B.A. 46
(3):1360.
Gonales, H. S. and Marting, R. A. (1988). Dairy goats milk production
response to feeding levels. Indian J. Dairy Sci., 41 (2): 167 –
170.
Gordon, I.J. and Illius, A.W. (1989). Resource partitioning by ungulates
on the isle of Rhum. Oecologia. 79: 383-389.
Greyling, J. P. C. (2000): Reproduction traits in the Boar goat doe.
Small Rumin. Res. 36, 171-177.
116
Greyling, J. P. C. and Van Niekerk, C. H (1991): Macroscopic uterine
involution in the postpartum Boar goat. Small Rumin. Res. 4,
277-283.
Hadjipanayiotou, H., Georghiades, E. and Kouma, A. (1988). The
effect of protein source on the performance of suckling Chios
ewes and Damascus goats. Anim. Prod., 46: 249 – 255.
Hafez, B. and Hafez, E. S. E. (2000). Reproduction in farm animals. 7th
ed. Awolters Kuwe Company. Philadelphia, USA
Haffez, E.S.E. (1968). Adaptation of Domestic Animals. Washington
State University, Pullma, Washington.
Hammond, J. (1932). Growth development of mutton qualities in the
sheep. Edinburg: Oliver and Boyd.
Harding, F. (1999). Milk quality. An Aspen publication. Gaitherburg,
Maryland. USA.
Hassan, N. I. and El-Derani, O. H. (1990). Goat resources in the Arab
World. 2. republic of Sudan. ACSAD.
Haumesser, J. B. (1975). Some aspects of reproduction in the Red
Sokoto goat. Comparison with other tropical and subtropical
breeds. Revue d'Elevage et de Medecine Veterinaire des Pays
Tropicaux. 28 (2): 225 – 233. A.B.A. 44 (1): 203.
Havrevoll, O., Rajbhandari, S. P., Eik, L. O. and Nedkvitne, J. J.
(1995). Effects of different energy levels during indoor rearing
on performance of Norwegian dairy goats. Small Ruminant
Res., 15: 231-237.
117
Hussein, S. S., Horst, P. and Islam, A. B. M. M. (1996). Study on the
growth performance of Black Bengal goat in different periods.
Small Ruminant Research, 21: 165 – 171.
Huxley, J. S. (1932). Problems of relative growth. Dial Press. New
York, USA.
Joshi, J. D. (1979). The Barbari breed of goat: Proceedings of the
summer Institute on goat production. Central Institute for
Research on Goats. India. 28 – 41.
Jubartalla, K. A. (1998). Effect of energy and protein sources on some
productive and reproductive potential of Sudan Nubian goats.
Ph. D. Thesis, University of Khartoum, Sudan.
Jubartalla, K. A., Abu Nikhaila, A. M. and El Khidir, O. A. (2002).
Production and reproduction performance of flock of
Sudanese Nubian goats fed molasses or sorghum based diets.
(1) Production. Sudan J. Anim. Prod., 15: 43 – 54.
Kamwanja, L. A., Ayoade, J. A. and Mahambera, T. P. E. (1985).
Characterization of small ruminants in the Mitunduarea
Liolongwe, Malawi. In: Small Ruminant in Africa Agriculture.
Proceeding of conference held at ILCA, Addis Ababa,
Ethiopia.
Karua, S. K. (1989). Some performance indicators of Malawi
indigenous goats under village and ranch condition. In:
African Small Ruminant Research and development, Proc.
Conf. held in 18 – 25. Jan., 1989, Bamend, Cameroon.
118
Khalaffalla, A. M. and Sulieman, Y. R. (1990). Some notes on the
performance of Sudan Nubian and exotic goats in Sudan.
Sudan J. Animal Production, 3 (2): 115 – 119.
Khan, B. U and Sahni, K. L. (1983). Non-genetic sources of variation
on milk-production traits in Jamnapari goats under semi-arid
farm condition. Indian J. Anim. Sci., 5 (7): 776 778.
Khan, B. U. (1979). Jamnapari goats production performance.
Proceeding of the summer Institute research on goats. India, 9
– 27.
Khan, B. U., Sinha, N. K. and Shani, K. L. (1982). Note in gestation
length in Jamnapari goats. Indian J. Anim. Sci., 52 (2): 1258 –
1259.
Kiwuwa, G. H. (1986). Breeding strategies for small ruminant
production in Eastern and South Africa.1. Breeding character
and general performance. Proceedings of workshop on
improvement of small ruminants in Eastern and South Africa,
Nairobi, Kenya, 16 – 22, Oct., 986
Knowles, F. and Watkins, J. E. (1983). The milk of the goats under
English conditions. J. Dairy Res., 9: 153 – 165.
Kudouda, M. E.M. (1985). Growth, reproductive and productive
performance of Sudanese Nubian goats. M. Sc. (Agric.),
Thesis, University of Khartoum, Sudan
119
Kushwaha, B. P.; Kumar, S.; Kumar, R. and Mehta, B. S. (1997). The
Chokla Sheep in India. Animal Genetic Resources Information
22:19 – 27.
Laes, F. C. and Peters, K. J. (1995). A comparative study of
performance of Egyptian Goat Breeds. II: Growth
performance and productivity . Archiv. Fur. Tierzucht. 38, 5:
563 – 575.
Lamming, G. E.; Moseley, S. R. and Mc Neilly, J. R. (1974). Production
release in the sheep. Journal of Reproduction and Fertility, 40: 151
– 168.
Lawar, V. S., Wani, V. S. Srivastava, A. K. and Patil, S. G. (1991). A
note on reproductive performance of Angora goats. Livestock
Advisor, 16 (11): 22.
Lawes, J. B. and Gilbert, J. H. (1859). Proc. Roy. Soc. 2, 493.
Le Maho, Y. Robin, J. P. and Cherel, Y. ( 1988)Starvation as a
treatment of Obesity: The Need to Conserve Body Protein.
News Physiol. Sci., 3: 21-24,;
Lebbie, S. H. and Manzini, A. T. (1989). The productivity of
indigenous goats under traditional management in Swaziland.
Proc. Conf. Small Ruminant Research and Development, held
in 18 – 25, Jan, 1989, Bamenda, Cameroon.
Lebbie, S.H.B. (2004). Goats under household conditions. Small
Ruminant Research 51, 131-136.
120
Leclerc, M. C. (2000). Goat feeding systems in Centre-Quest (France):
effect on milk yield and composition. In: proc. 7th Inter. Conf.
15 – 21, May, 2000 on goat. France. P. 157.
Lopez-Trujillo, R. and Carcia-Elizondo, R. (1995). Botanical
composition and diet quality of goats grazing natural and gross
reseeded shrub lands. Small Ruminant Research. 16: 37-47
Lu, C. D and Potchoiba, M. J. (1988). Milk feeding and weaning of
goat kids. Small Ruminant Research. 1,2: 105 – 112.
Lyatuu, E. T. R., Das, S. M. and Mkonyi, J. (1994). Some production
parameters of Beleded goats in semi-arid regions of Tanzania.
In: Small Ruminant Research and Development in African,
Proceedings of the 2nd biennial conference of the African small
ruminant research network, AICC, 7 – 11 Dec., 1992, Arush,
Tanzania.
Lynch, J. J., Brown, G. D., May, P. F., and Donnely, J. B. (1972). The
effect of withholding drinking water on wool growth and lamb
production of grazing Merino sheep in a temperate climate.
Aust. J. Agri. Res., 23: 659 – 668.
M. A. R. (2008). Ministry of Animal Resources, Department of
Statistics and Information. The republic of Sudan.
Macfarlane, W. V. and Howard, B. (1972). Comparative water and
energy economy of wild and domestic animals. Symp. Zool.
Soc., London. UK., 31: 261 – 296.
121
Mackenize, D. (1967). Goat Husbandry. Faber and Faber Ltd. London,
UK.
Mahagoub, O. and Lodge, G. H. (1998). A comparative study on
growth, body composition and carcass tissue distribution on
Omani sheep and goats. J. Agri. Sci., 131: 329 – 339.
Mahgoub, O. (1997). Meat production from the Omani Dhofari Goat.
1-Liveweight, growth and body composition. Inter. J. Anim.
Sci., 121: 1, 25 – 30.
Malau-Aduli, B. S., Eduvie, I. O., Lakpini, C. A. M and Malau-Aduli,
A. E. O. (2001). Effect of supplementation on the milk yield
of Red Sokoto does. Proceedings of the 26th Annual
Conference of Nigerian Society for Animal Production.
March, 2001, ABU, Zaria, Nigeria, pp. 353 – 355.
Malau-Aduli, B. S., Eduvie, L., Lakpini, C. and Malau-Aduli, E. (2004)
Crop-residue supplementation of pregnant does influences
birth and weight gain of kids, daily milk yield but not the
progesterone profile of Red Sokoto goats. Reproduction,
Nutrition and Development. 44: 111 – 121.
Malechek, J. and Narjisse, H. (1987). Behavioral ecology of sheep and
goats: Production on pastures and rangelands. 36th meeting of
the European Assoc. of Animal Prod. Toulouse, France
Maloiy, G. M. O., and Taylor, C. R. (1971). Water requirements of
African goats and haired-sheep. J. Agri. Sci., 77: 203 – 208.

122
Marshal, R. T. (1993). Standard methods for the examination of dairy
products. American Public Health Association, Washington
DC.
Mason, I. L. and Maule, I. P. (1960). The indigenous livestock of
eastern and Southern Africa. Agricultural Bureaux Famham
Royal Buck. UK.
Mavrogenis, A. P., Constantinou, A. and Louca, A. (1984).
Environmental and genetic causes of variation in production
traits of Damascus goats. 1 – Pre-weaning and post-weaning
growth. J. Anim. Production, 38 (1): 91 – 97.
McMeekan, C.P (1940). Growth and development of the big with
special reference to carcass quality characteristics. J. Agri.
Sci., 30: 276 – 344.
Meuret , M. (1994). A grazing route in province. EC/EAAP/SCANS
meeting on the welfare of extensively farmed animals.
Edinburgh, U.K.
Miltal, J. P. (1991). Performance of Kutchi goat in arid Western
Raasthun. Ind. J. Anim. Sci., 61: 904 – 905.
Min, B. R., Hart, S. P., Sahlu, T. and Satter, L. D. (2005). The effect of
diets on milk production and composition on lactation curves
in pastured dairy goats. J. Dairy Sci., 88 (7): 2604 – 2615.
Mirgani, T. and Nasir, N. M. (1993). Effect of feeding crop residues on
milk yield, milk composition and blood biochemistry of
lactation goats. World Rev. Anim. Prod., 28 (1): 25 – 28.
123
Mishra, R. K., Nivsarkar, A. E and Arora, C. L. (1979). A note on the
analysis of gestation length in Sirohi goats. Indian J. Anim.
Sci., 49 (11): 967 – 968.
Mohammed, Y. A. 0 and El-imam, M. (2007). Characteristics of the
desert goat as a meat producer in El-Obied area, Sudan. In:
Conference on the genetic resources of the Sudanese livestock
wealth. Held at Khartoum, 5 – 6 March, 2007.
Montaldo, H., Tapia, G. and Juarez, A. (1981). Some genetic and
environmental factors affecting milk yield and kidding interval
in goats. Tecnia Pecuaria en Mexico. No. 41, 32 – 44. A.B.A.
Morand, F. P. (1997). Effective feeding strategies for kids from
weaning to insemination. Animal Nutrition Production Res.
Chever,
Morand-Fehr, P. Sanz Sampelay, M. R., Fedele, Y. V., LeFrilux, Y.,
Eknaes, M., Schmidely, P. H., Ciger Reverdin, S., Bas, P.,
Rubino, R., Havrevoll, Q. and Sauvant, D. (2000). Effect of
feeding on the quality of goat milk and cheese. In: Pro. 7th
Inter. Conf. on goat, 15 – 21 May, 2000. France, P. 53 – 58.
Morand-Fehr, P., Boutonnet, J.P., Devendra, C., Dubeuf, J.P.,
Haenlein, G.F.W., Holst, P., Mowlem, L. & Capote, J. 2004.
Strategy for goat farming in the 21st century. Small Ruminant
Research 51, 175-183.
Muffarrah, M. B. (1995). Goat’s breeds and variation in Sudan. In:
Proc. of Training course on sheep and goat production, held by
124
Arab Centre for Studies of Arid-zone and Dry-land (ASCAD).
Sudan, Khartoum. 17 – 27 Jan., 1995.
Mukassa-Mugerwa, E. and Tekelye, B. (1988). The reproductive
performance of Ethiopian highland sheep. J. Anim. Rep. Sci.,
(17): 95 – 102.
Mukudan, G., Khan, B. W. and Bhat, P. N. (1982). A note on the
growth curve in Malabari goats and their Saanen half breeds.
Indian J. Anim. Sci., 52 (11). 1112 – 1114.
Mukudans, G. and Bhat, P. N. (1978). Genetic parameters of
production traits in Malabari goats and their crosses with
Saanen and Alpine. Anim. Brit. Abstr., 47 (6).
Myenuddin, M. and Wahab, (1989). Reproductive performance of
Black Bengal goat in Munikgni. Banngladish Veterinarian, 6:
49 – 59.
Nair, B. R. (1979). The Malabari goat. Proceedings of the Summer
Institute for Research on Goats. India. 42 – 51.
Napoleone, M. and Gillet, T. (1990). Goat lactation curve and
production system in Province Coted Azur regions. Production
Animal, 3 (5): 347 – 351.
Nastis, A., Papanastasis, V. and Tsiouvaras, C. (1993). Goat
preferences of herbaceous and woody species and their effect
on pine reforestation. FAO CZHEA meeting on Management
of Mediterranean shrublands and related forage resources.
Rome.
125
Nefzaoui, A. Abdouli, H. El Aich. A. (1995). Goat production systems
in Tunisia. Goat production system in the Mediterranean,
EAAP Publication No. 71: 166 – 183.
Nicoll, G. B. (1985). Estimates of environmental effects and some
genetics parameters for weaning weight and fleece weight of
young Angora goats. Proceedings of the New Zealand Society
of Animal Production, 45: 217 – 219.
Okello, K. L. and Obwolo, M. J. (1985). Review of the potentialities of
goat production. World Animal production. 53: 27 – 31.
Owen, F. G., Kellogg, D. W. and Howard, W.T. (1967). Effect of
molasses in normal and high grain rations on utilization of
nutrients for lactation. J. Dairy Sci., 50 (7): 1120 – 1125.
Palsson, H. (1940). Meat Qualities in the Sheep with Special Reference
to Scottish II, Part III. Comparative Development of Selected
Individuals of Different Breeds and Crosses as Lambs and
Hoggets. J. Agri. Sci. 30, 1-82.
Palsson, H. and Verges, G. B. (1952). Effect of the plane of nutrition
and growth and development of carcass quality in lambs. 1.
the effect of high and low planes of nutrition at different ages.
J. Agri. Sci., 42.
Papachristoforou, C. and Mavrogenis, A. B. (2000). Factors affecting
reproduction traits and milk yield. In: Proc. Of 7th Inter. Conf.
on goat, 15 – 21 May, 2000. France. P. 247 – 248.
126
Papachristou T.G. and Nastis, A.S. (1994). Diets of goats grazing
kermes oak shrub land as influenced by stocking rate. In:
International Symposium on Animal Production Systems.
Thessaloniki, Greece.
Papachristou, T.G., Nastis, A.S. (1993). Diets of goats grazing oak
shrub lands of varying cover in Northern Greece J. Range
Manage. 46: 420-426.
Parakash, S. and Jennes, R. (1968). Composition and characters of
goats' milk. Dairy Sci. Abstr., 30: 67 – 87.
Peacock, C. 2005. Goats- A pathway out of poverty. Small Ruminant
Research 60, 179-186.
Pomeroy, S.L., LaMantia, A.S and Purves, D. (1952) Post-natal
construction of neural circuitry in the mouse olfactory bulb.
Journal of Neuroscience. 10 (6), 1952
Prasad, S. P., Roy, A. and Pandey, M. D. (1972). Influence of age,
body weight, parity and season on the reproductive
performance of Barbari goats. Angra University. J. Res., 20
(1): 31 – 39
Restall, B J. and Starr, B G. (1977). The influence of Season of lambing and
lactation on reproductive activity and plasma LH concentration in
Merino ewes. Journal of Reproduction and Fertility, 49: 297 – 303.
Robberts, Z. J. (1971). Veterinary obstetrics and genital disease. 2nd ed.
Wook Stock Vermont. USA.
127
Rossanigo, C. E., Frigerio, K. L., Silva, C. J. (1995). Production of the
Sanlvisena (Argenina) Criollo goat. Revista, Argentina de
Prod. Anim. 15: 1161 – 1164.
Sachdeva, K. K. Sengar, O. P. S., Singh, S. N. and Lindahl, I. L.
(1973). Studies on goats. 1. effect of plane of nutrition on the
reproductive performance of does. J. Agri. Sci. Camb., 80: 375
– 379.
Sahlu, T. & Goetsch, A. 2005. A foresight on goat research. Small
Ruminant Research, 60: 7-12.
Sahlu, T., Goetsch, A.L., Luo, J., Nsahlai, I.V., Moore, J.E., Galyean,
M.L., Owens, F.N., Ferrell, C.L. & Johnson, Z.B. 2004.
Nutrient requirements of goats: developed equations, other
considerations and future research to improve them. Small
Ruminant Research,53: 191-219.
Salash, M. Musa, A. A. Nawito, M. Farroc, H. . Oaf, F. Selim, M. and
Tawfik, M. A. (1970). Economic evaluation of some goats
breeds in Egypt. Vet. Med. J., U. A. R., 18: 295 – 312.
Sanchez, M. A., Garcia, P., Menendez, S. Sanchez, B. Gonzalez, M.
and Flores J. M. (2002): Fibroblastic growth factor receptor
(FGF-R) expression during uterine involution in goat. Anim.
Reprod. Sci. 69, 25-35.
Schmidely, P. L., Lloretpujol, M. Bas, P., Rouzeau, A. and Sauvant, D.
(1999). Influence of feed intake and source of dietary
carbohydrates on milk yield and composition, nitrogen balance
128
and plasma constituents of lactating goats. J. Dairy Sci., 82:
747 – 755.
Shalaby, A. S., Sharawy, S. M. Saleh, N. H. and Medan, M. S. (2000).
Reproductive performance of Damascus goats in semi-arid
areas in Egypt. In: Proc. 7th Inter. Conf. on goats. 15 – 21,
May. France. P., 424 – 425.
Shetaewi, M. M., Abdel-Samee, A.M. and Baker, E. A.
(2001).reproductive performance and milk production of
Damascus goats fed acacia shrubs or berseem clover hay in
North Sinai, Egypt. Tropical Animal Health and Production.
33 (1): 67 – 79.
Singh, R. N. and Acharya, R. M. (1980). Beetal goat: genetic selection
for maximizing life time milk production. International Goat
and Sheep Research, 1 (3): 226 – 233.
Singh, S. N. and Sengar, O. p. S. (1970). Investigations on the milk and
meat potentialities of Indian goats. RBS. College, Bickpuri,
Agra, India. Department of Husbandry and Dairying Tech.
report.
Sodiq, A. A. S. and Tewfik, E. (2003). Reproduction rate of Kacang
and Peranakan Etawah goats under village production system
in Indonesia. Deutcher Tropentage-Gottingen, 8 – 10, Oct.,
2003. Inter. Person Food Security, National Resource
Management and Rural Development.
129
Spruzz, J. and Selegovska, E. (2006). Effect of additional feedstuff on
milk quality and health status in organic goats. Vet. J. IR.
Zootechnika. T. 35 (57).
Steele, M. (1996). Goats. In: Tropical Agriculturalist Series. Macmillan
Education Ltd, UK.
Sulieman, A. H. and El-Tahir, A. K. (1984). Preliminary study on milk
on milk production and quantity in some tribal breeds of
Sudan Desert Sheep. Sudan J. Vet. Sci. and Anim. Husb., 24
(2): 94 – 100.
Susmel, P. and Cuzzit, R. (1988). An approach to defining the energy
requirements of dairy sheep. In: Isotope aided studies on
livestock productivity in Mediterranean and North African
countries. Proceedings of the final research coordination
meeting on optimizing grazing animal productivity in the
Mediterranean and North Africa, 23 – 27 March, 1987.
FAO/IAEA, Vienna, p. 301 – 317.
Tag Eldin, M. I. (2000). Studies on productive and reproductive
parameters of Nubian goats and their Saanen crossbreds under
local environmental conditions. Ph. D (Animal Production)
Thesis, University of Khartoum, Sudan.
Tambajong, D., Wallenhorts, S. and Holtz, W. (2000). Quality and
composition of milk produced by suckled Boer goat does. In:
Proc. Of the 7th Inter. Conf., 15 – 21 May. France. on goat,
p.599.
130
Tewfik, E. M. (1997). The effect of traditional and intensive system of
feeding on milk production and some productive parameters of
Sudanese Nubian goats. M. Sc. Thesis, university of
Khartoum. Sudan.
U. N. D. P. (2006). Annual report of humanitarian aid assessment.
United Nations Development Program, Al-fashir Office,
Sudan.
Van Soest, P.J. (1982). Nutritional ecology of ruminant. O and B
Books, Corvallis, Oreg.
Van WYK, L. C., Van Niekerk, C. H. and Belonje, P. C. (1972):
Further observations on the involution of the postpartum
uterus of the ewe. J. South African Vet. Ass. 43, 29-33.
Vihan, B. R. (1979). Common cause of mortality in kids and their
control. Proceedings of the Summer Institute for Research on
Goats. India. 287 – 297.
Walkden-Brown, S. W. (2001). Reproduction in goats. P. and C.
Murray consulting
Wallace, L. R. (1948). The growth of lambs before and after birth in
relation to the level of nutrition. J. Agri. Sci., 38 : 367 – 401.
Wang , J., Duan, E., Huang, O., Hao, Z. and Wlu, H. (1991).
Reproductive performance in the Saanen goat in China.
International Atomic Energy Agency, 165 – 176. Vienna,
Australia.
131
Wani, 2002. M. G. water requirements of desert goats. WWW.
Articlebase.com/Science-articles-water-requirements-of-
desert-goat-by-Ghulam-mohyuddin-wani-1133057.html.
Webb, E. C. and Mamabolo, M. J. (2004). Production and reproduction
characteristics of South Africa indigenous goats in communal
farming system. J. Anim. Sci., 34 (1): 236 – 239.
Webster, C. C. (1989). Agricultural production in the tropics. Longman
Inc., New York, USA. Pp. 357 – 370.
Williams, J. C. (1993). An empirical model for the lactation curve of
White British dairy goats. Anim. Prod., 57: 91 – 97.
Wilson , R. T. (1976). Studies on the livestock of Southern Darfur,
Sudan: VI. Production traits in goats. Tropical Animal Health
and Production, 8 (4): 221 – 232.
Wilson, P. N. (1954). The effect of plane of nutrition on the growth and
development of the East African Dwarf goat. J. Agri. Sci., 50
(2): 198 – 210.
Wilson, R. T. (1986). Livestock production in Central Mali: Long-term
studies on cattle and small ruminants in the agro-pastoral
system. ILCA Research Report No. 14, 67 - 103.
Wilson, R. T. (1988). The productivity of Sahel goats and sheep under
transhumant management in Northern Burkina Faso. Bulletin
of Anim. Health and production in Africa, 36: 348 – 355.
132
Wilson, T.R. (1991). Small ruminant production and the small ruminant
genetic resource in tropical Africa. FAO Animal Production
and Health Paper., 88.
Wolde-Michael, T. Miller, H. M. Holmes, J. G. H., McGregor, B. A.
and Galloway, D. B. (1989). Effect of supplementary feeding
and zero land on puberty in feral Cashmere goats. Aust. Vet.
J., 66: 124 – 126.
Zenuer, F. E. (1967). History of domesticated animals. Significance of
goat production for covering protein requirements. Anim. Res.
And Dev., 9: 41.