Embed Size (px)
Citation preview

Assessment of mercury exposure among small-scale gold miners usingmercury stable isotopes
Laura S. Sherman a,n, Joel D. Blum a, Niladri Basu b, Mozhgon Rajaee c, David C. Evers d,David G. Buck d, Jindrich Petrlik e, Joseph DiGangi fa University of Michigan, Department of Earth and Environmental Sciences, 1100 North University Avenue, Ann Arbor, MI 48109, United Statesb McGill University, Faculty of Agricultural and Environmental Sciences, 21,111 Lakeshore Road, Ste. Anne de Bellevue, Quebec, Canada H9X3V9c University of Michigan, Department of Environmental Health Sciences, 1415 Washington Heights, Ann Arbor, MI 48109, United Statesd Biodiversity Research Institute, 19 Flaggy Meadow Road, Gorham, ME 04038, United Statese Arnika Association, Chlumova 17, Prague 3, Czech Republicf IPEN, Box 7256, SE-402 35 Gothenburg, Sweden
a r t i c l e i n f o
Article history:Received 11 October 2014Received in revised form29 November 2014Accepted 25 December 2014
Keywords:Small-scale gold miningMethylmercuryMercury isotopesBiomarkers
a b s t r a c t
Total mercury (Hg) concentrations in hair and urine are often used as biomarkers of exposure to fish-derived methylmercury (MeHg) and gaseous elemental Hg, respectively. We used Hg stable isotopes toassess the validity of these biomarkers among small-scale gold mining populations in Ghana and In-donesia. Urine from Ghanaian miners displayed similar Δ199Hg values to Hg derived from ore deposits(mean urine Δ199Hg¼0.01‰, n¼6). This suggests that urine total Hg concentrations accurately reflectexposure to inorganic Hg among this population. Hair samples from Ghanaian miners displayed lowpositive Δ199Hg values (0.23–0.55‰, n¼6) and low percentages of total Hg as MeHg (7.6–29%, n¼7).These data suggest that the majority of the Hg in these miners' hair samples is exogenously adsorbedinorganic Hg and not fish-derived MeHg. Hair samples from Indonesian gold miners who eat fish dailydisplayed a wider range of positive Δ199Hg values (0.21–1.32‰, n¼5) and percentages of total Hg asMeHg (32–72%, n¼4). This suggests that total Hg in the hair samples from Indonesian gold miners islikely a mixture of ingested fish MeHg and exogenously adsorbed inorganic Hg. Based on data from bothpopulations, we suggest that total Hg concentrations in hair samples from small-scale gold miners likelyoverestimate exposure to MeHg from fish consumption.
& 2014 Elsevier Inc. All rights reserved.
1. Introduction
Humans today are primarily exposed to methylmercury (MeHg)through fish consumption and gaseous elemental mercury (GEM)through inhalation of GEM released from dental fillings and duringsmall-scale gold mining activities. Methylmercury can cause se-vere central nervous system damage and developmental delays(Clarkson, 2002; Clarkson and Magos, 2006; Grandjean et al.,1999), while exposure to high levels of GEM can cause tremors,neurological disorders, and kidney damage (Böse-O’Reilly et al.,2000; Veiga et al., 2005). To assess the health effects and risks of
exposure to these two forms of mercury (Hg), epidemiologicalstudies often use conveniently measured biomarkers as a proxy forHg concentrations in vital internal organs. Hair total Hg con-centrations are often used as a proxy for MeHg exposure from fishconsumption (Goodrich et al., 2012; Paruchuri et al., 2010). Me-thylmercury is concentrated in human hair and, among popula-tions that consume fish, the majority of the Hg in hair is MeHg(480%; Berglund et al., 2005; McDowell et al., 2004). Similarly,because the majority of inhaled GEM is rapidly oxidized in thebloodstream and excreted in urine (Clarkson et al., 2007; Suzukiet al., 1992), total Hg concentrations in urine are commonly usedas a measure of GEM exposure (Berglund et al., 2005; McDowellet al., 2004; Paruchuri et al., 2010). However, in populations thateat large quantities of fish or are occupationally exposed to highlevels of GEM, total Hg concentrations in human hair and urinemay not accurately reflect exposure to MeHg and/or GEM (Abeet al., 1995; Laffont et al., 2011; Li et al., 2008a, 2008b; Ohno et al.,2007; Sherman et al., 2013; Suzuki et al., 1992; Wilhelm et al.,
Contents lists available at ScienceDirect
journal homepage: www.elsevier.com/locate/envres
Environmental Research
http://dx.doi.org/10.1016/j.envres.2014.12.0210013-9351/& 2014 Elsevier Inc. All rights reserved.
Abbreviations: ; MeHg, Methylmercury; GEM, gaseous elemental mercury; Hg,mercury; ASGM, artisanal and small-scale gold mining; Au, gold; MDF, mass-de-pendent fractionation; MIF, mass-independent fractionation; IPEN, InternationalPersistent Organic Pollutants Elimination Network; MC-ICP-MS, multi-collectorinductively-coupled plasma mass spectrometry
n Corresponding author. Fax: þ1 734 763 4690.E-mail address: [email protected] (L.S. Sherman).
Environmental Research 137 (2015) 226–234

1996).Globally, one of the largest sources of anthropogenic Hg
emissions (410–1040 metric tons annually; United Nations En-vironment Programme, 2013) is artisanal and small-scale goldmining (ASGM). Although at least 10–15 million people in over 70countries are engaged in ASGM (Jennings, 1999; Swain et al., 2007;Veiga et al., 2005), these operations are very difficult to regulatebecause they are often located in impoverished rural areas (Hilsonand Pardie, 2006; Jennings, 1999). Most small-scale gold minerslack awareness of Hg toxicity and use Hg to amalgamate gold (Au)because it has been effective and affordable and appropriate al-ternatives have not been widely established (Styles et al., 2010;Telmer and Veiga, 2009). Because Hg–Au amalgams are burned toseparate the Au, miners and surrounding communities are ex-posed to high concentrations of GEM (Veiga et al., 2005). ASGMalso releases Hg to local waterways (United Nations EnvironmentProgramme, 2013), which can be biologically methylated andbioaccumulated in aquatic ecosystems (Donkor et al., 2006). Thiscan result in elevated MeHg exposure due to consumption of localfish (Barbosa et al., 2001; Lebel et al., 1998).
Recent studies have used Hg stable isotope ratios both to dis-tinguish between human exposure to MeHg and GEM and to re-evaluate the use of total Hg concentrations in hair and urine asexposure biomarkers (Laffont et al., 2009, 2011; Sherman et al.,2013). The seven stable isotopes of Hg (196–204 amu) can undergomass-dependent fractionation (MDF, Eq. (1)) during biogeochem-ical reactions including methylation (Rodríguez-González et al.,2009) and demethylation (Bergquist and Blum, 2007; Kritee et al.,2009).
⎛⎝⎜
⎡⎣⎢
⎤⎦⎥
⎞⎠⎟( ) ( )Hg(‰) Hg/ Hg / Hg/ Hg 1
1000 (1)
samplexxx xxx 198 xxx 198
SRM 3133δ = –
×In Eq. (1), xxxHg is an isotope of Hg and SRM 3133 is a National
Institute of Standards and Technology Standard Reference Material(Blum and Bergquist, 2007). Mercury isotopes can also undergomass-independent fractionation (MIF, Eq. (2)), which is reported asthe deviation of a measured isotope ratio from the ratio theore-tically predicted to result from MDF.
Hg Hg ( Hg ) (2)xxx xxx 202δ δ βΔ = – ×
In Eq. (2), β is equal to 0.252 for 199Hg and 0.752 for 201Hg forkinetic reactions (Blum and Bergquist, 2007). The greatest mag-nitude of MIF of Hg isotopes occurs during photochemical reac-tions (Bergquist and Blum, 2007; Buchachenko, 2001). Becauseonly the odd-mass-number isotopes have unpaired nuclear spinand nuclear magnetic moments, the odd- and even-mass-numberisotopes recombine at different rates, resulting in an over-abun-dance of the odd- or even-mass-number isotopes in the reactionproducts.
Large positive MIF of Hg isotopes has been widely observed infish muscle tissue (Bergquist and Blum, 2007; Perrot et al., 2012;Senn et al., 2010; Sherman and Blum, 2013). However, bioticprocesses have not been shown to produce MIF of Hg isotopes(Kritee et al., 2007, 2009; Kwon et al., 2012; Rodríguez-Gonzálezet al., 2009) and abiotic reactions in the absence of light produceonly limited MIF (o#0.3‰; Estrade et al., 2009; Ghosh et al.,2013; Zheng and Hintelmann, 2010). It is hypothesized, therefore,that photochemical demethylation of MeHg in aquatic systemscauses the preferential loss of the even-mass-number isotopes ofHg, resulting in an excess of the odd-mass-number isotopes of Hgin the remaining aqueous MeHg (Bergquist and Blum, 2007). As aresult, the MeHg that subsequently enters the food web and isbioaccumulated displays positive Δ199Hg values (Bergquist andBlum, 2007; Perrot et al., 2012; Senn et al., 2010; Sherman and
Blum, 2013). These positive Δ199Hg values are preserved throughthe food web to higher trophic level consumers including humans(Laffont et al., 2011; Li et al., 2014; Sherman et al., 2013). In con-trast, the Hg in geologic ore deposits that is mined for use in in-dustrial processes and ASGM does not display significant MIF of Hgisotopes because it has not undergone photochemical cycling(Cooke et al., 2013; Foucher et al., 2009; Hintelmann and Lu, 2003;Laffont et al., 2011; Smith et al., 2008; Stetson et al., 2009; Yinet al., 2013).
These differences in MIF can be used to distinguish betweenhuman exposure to fish-derived MeHg and ore-derived inorganicHg (Laffont et al., 2009, 2011; Li et al., 2014; Sherman et al., 2013).Sherman et al. (2013) measured Hg isotope ratios in hair samplesfrom a cohort of U.S. dentists who ate primarily open-ocean fish(e.g., tuna). Mercury in hair samples from these individuals dis-played similar positive Δ199Hg values as those measured in open-ocean fish (Sherman et al., 2013). This suggests that in this po-pulation, hair total Hg concentrations are a good measure of ex-posure to fish-derived MeHg. In contrast, among Bolivian ASGMcommunities, Laffont et al. (2011) found that a significant amountof inorganic Hg was exogenously adsorbed to the hair and notderived from fish MeHg.
Sherman et al. (2013) also measured Hg isotope ratios in urinesamples from the same U.S. dentists from whom hair was ana-lyzed, and concluded that Hg in the urine was a mixture of inhaledGEM derived from their dental fillings (Δ199Hg¼0‰) and de-methylated MeHg derived from consumed fish (Δ199Hgc0‰).This suggests that among people who eat large amounts of fish,total Hg concentrations in urine may overestimate exposure toGEM. However, urine total Hg concentrations may be an accuratereflection of exposure to inhaled GEM among small-scale goldminers who experience elevated GEM exposure. We conducted thestudy reported here to further assess the accuracy of urine andhair total Hg concentrations as biomarkers for inorganic and MeHgexposure among individuals in ASGM communities.
2. Methods
2.1. Sample collection: Ghana
Gold mining using Hg amalgamation has been conducted inGhana since the 1800s (Bawa, 2010). Amalgams are usually burnedin the open-air of household yards using small kerosene torches,releasing large amounts of GEM to the local environment (Par-uchuri et al., 2010; Styles et al., 2010; Veiga et al., 2005). As part ofa larger study to investigate the health impacts of ASGM, hair,urine and soil samples were collected from the mining communityof Kejetia in the Upper East region of Ghana during two samplingcampaigns (May–June 2010 and May–July 2011). Households(n¼54) were selected for study participation using convenient(Paruchuri et al., 2010) and random sampling methods in 2010 and2011, respectively. Adults in each selected household (n¼118)were verbally surveyed regarding demographic characteristics,occupational histories, health, and diets. Members of this com-munity typically eat only small amounts of dried fish or fish pasteas a condiment or as seasoning in soup. It was not possible,therefore, to accurately determine the types or quantities of fishthat each individual consumed. Spot urine samples (#20–50 mL)were collected into Hg-free containers and stored at room tem-perature until they could be frozen. Hair samples were collectedclose to the scalp from the occipital region and wrapped in paper(Goodrich et al., 2012). Soil samples were collected from an out-door common area (“yard”) identified by the head of each selectedhousehold. In each yard, surface soils were collected using acid-cleaned plastic spoons and mixed together from the four corners
L.S. Sherman et al. / Environmental Research 137 (2015) 226–234 227

and center of a 30 cm2$30 cm2 area.
2.2. Sample collection: Indonesia
The Global Fish and Community Mercury Monitoring projectwas a collaborative effort between the Biodiversity Research In-stitute and the International Persistent Organic Pollutants Elim-ination Network (IPEN) to identify locations of elevated fish Hgconcentrations and human Hg exposure (Biodiversity ResearchInstitute and IPEN, 2013). Human hair and locally consumed fishwere sampled from 13 countries following standardized proce-dures. Hair samples were collected from the occipital region of thehead as close to the scalp as possible, wrapped with a self-ad-hesive label, and placed in a sampling bag. All participants werealso asked to complete a confidential, standardized questionnairedetailing their occupations and fish consumption habits includingtypes of fish and number of fish-meals consumed each week.Commonly consumed local fish were collected, weighed, mea-sured, and filleted on site. Muscle fillets were stored in samplingbags and immediately frozen.
For this study, we analyzed hair and fish samples collected in agold mining community in Indonesia. Gold mining has occurred inthe North Sulawesi Province of Indonesia for more than 100 yearsand ASGM currently represents the country’s largest source of Hgemissions to the atmosphere (Dewi, 2012). In a similar manner tothe ASGM operations in Ghana, Hg–Au amalgams are burned inthe open or in homemade metal barrel chimneys. In collaborationwith the BaliFokus Foundation, hair samples and dietary ques-tionnaires were collected from individuals in Sekotong village andin the Poboya area of Palu (n¼20; Biodiversity Research Instituteand IPEN, 2013). Commonly consumed fish including kerapu(humpback grouper, Cromileptes altivelis), tongkol (mackerel tuna,Euthynnus affinis), and kekap (barramundi, Lates calcarifer) werecollected from local waterways and stored frozen until analysis.
2.3. Sample processing
Based on sample availability and approximate Hg content, weanalyzed Hg isotope ratios in hair and urine samples from sixGhanaian gold miners, in nine soil samples from Ghana, in fivehair samples from Indonesia, and in three fish samples from In-donesia. Prior to analysis, the Ghanaian hair samples were washedwith acetone and deionized water. However, it has been demon-strated that washing hair with deionized water, soap, acetone, HCl,or reagents with sulfhydryl groups like L-cysteine does not removea significant percentage of exogenously adsorbed Hg (Li et al.,2008b; Morton et al., 2002).
Depending on the amount of hair available, #3–40 mg of hairper sample was weighed into a ceramic boat. Urine samples werehomogenized by vigorous shaking and then pipetted into ceramicboats in #4 mL aliquots (total¼4–12 mL). Each aliquot was eva-porated to dryness in an oven at 60 °C for 4–6 h. The soil samplesfrom Ghana were not additionally crushed or sieved; sub-splits ofeach sample (#200 mg) were weighed into a ceramic boat. Thefish samples from Indonesia were freeze-dried for 48 h and thenground to a fine powder using an alumina ball mill mixer. Betweensamples the ball mill was cleaned by repeatedly grinding Hg-freesilica sand that had been baked at 750 °C for 8 h to remove all Hg.Approximately 1.2–1.8 g of ground fish powder per sample wasloaded into two ceramic boats.
After boat preparation, all of the samples were covered withHg-free activated alumina and sodium carbonate powders thathad been combusted at 800 °C for 8 h. The Hg was then thermallyreleased using previously published methods (Sherman and Blum,2013; Sherman et al., 2012). Briefly, the boats were placed in atwo-stage furnace where the temperature of the first furnace was
slowly increased to 750 °C over a period of 6 hours and the secondfurnace was maintained at 1000 °C. The released GEM was trans-ferred by a stream of O2 and bubbled into an oxidizing 1% KMnO4
solution. The Hg in these solutions was subsequently transferredto secondary KMnO4 solutions to concentrate and separate it fromother combustion products (Sherman and Blum, 2013). Mercuryconcentrations were measured in these final solutions usingatomic absorption spectroscopy.
Human hair procedural standards (BCR CRM 397, n¼10), hu-man urine procedural standards (QMEQAS08U-07, Institut Na-tional de Santé Publique Québec, n¼6), fish protein standards(NIST DORM-3, n¼15), and procedural blanks (n¼7) were pro-cessed according to the same methods. Hair (n¼1) and fish samplereplicates (n¼2) from Indonesia as well as soil sample replicates(n¼3) from Ghana were processed as separate samples. Mercuryrecoveries for the human hair and urine standards were con-sistently between 80% and 90% (mean hair recovery¼83.7%,1 SD¼3.1%, n¼10; mean urine recovery¼86.0%, 1 SD¼2.7%, n¼6).It is possible that the slightly lower but consistent recoveries forthese human tissue standards were due to inhomogeneity in thestandard material or differences in sample digestion procedurebetween the analytical laboratory and this study. Mercury re-coveries for the fish protein standard were all 490%(mean¼97.2%, 1 SD¼3.5%, n¼15). Previous studies have observedsimilarly high Hg recoveries for sediment standards (mean¼95%,1 SD¼15%, n¼6; Sherman and Blum, 2013). The procedural blankscontained only small quantities of Hg that was all attributable tothe 1% KMnO4 solutions (mean¼0.00770.004 ng Hg per g solu-tion, 1 SD, n¼7).
2.4. Methylmercury concentrations
Due to limited sample sizes, we were only able to measure theMeHg concentration of one of the hair samples that was analyzedfor Hg isotope ratios (ID-05-Hair). However, we were able toanalyze MeHg concentrations in other hair samples collected inGhana (n¼7) and Indonesia (n¼3) from the same mining popu-lations. Methylmercury in representative hair samples was ex-tracted and analyzed following previously published methods(Nam and Basu, 2011). Briefly, hair samples were digested usingTris–HCl, protease, NaOH, cysteine, CuSO4, and acidic NaBr. TheMeHg was then extracted using toluene and Na2S2O3. MeHg con-centrations were measured using a Direct Mercury Analyzer 80(Milestone Inc., CT) according to U.S. EPA Method 7473.
2.5. Mercury stable isotope analyses
Mercury isotope ratios were measured in samples and stan-dards using multi-collector inductively-coupled plasma massspectrometry (MC-ICP-MS) according to previously publishedmethods (Blum and Bergquist, 2007). During each analytical ses-sion, the UM-Almadén secondary standard was analyzed fivetimes. We estimate sample analytical uncertainty for each isotoperatio as the larger of two times the standard deviation of the sameratio measured either in the relevant procedural standards or theUM-Almadén secondary standard. Hair and fish sample replicateswere the same within this analytical uncertainty. Soil sample re-plicates were slightly more variable, likely due to soil hetero-geneity (Appendix B, Table S1).
3. Results and discussion
3.1. Total Hg and MeHg concentrations
It is important to note that total Hg concentrations in the
L.S. Sherman et al. / Environmental Research 137 (2015) 226–234228

samples selected for this study of Hg isotope ratios are not ne-cessarily representative of the full range or average Hg con-centrations in each population. The measured total Hg con-centrations are presented in Table 1 and MeHg concentrations arepresented in Table 2. Total Hg concentrations in analyzed urinesamples from the Ghanaian gold miners were elevated(mean¼15.0 μg/L, 1 SD¼16.2 μg/L, n¼6) compared to those innon-occupationally exposed populations (Goodrich et al., 2012;McDowell et al., 2004) but were similar to those observed in other
ASGM populations (Böse-O’Reilly et al., 2000; Paruchuri et al.,2010). Hair samples from the Ghanaian gold miners displayed si-milar total Hg concentrations to those of other African small-scalegold miners (Voegborlo et al., 2010; mean¼1.43 μg/g,1 SD¼0.71 μg/g, n¼6). Soil samples from Ghana had very hightotal Hg concentrations (mean¼6.18 μg/g, 1 SD¼11.0 μg/g,range¼0.458–34.7 μg/g, n¼9). The highest soil concentrationswere observed in yards where Hg–Au amalgams were activelyburned and the occupants operated a gold mine (mean¼16.0 μg/g,1 SD¼16.3 μg/g, range¼4.67–34.7 μg/g, n¼3). These data suggestthat Hg is sometimes spilled during amalgam processing and/orthat some of the GEM emitted during amalgam burning is locallyoxidized and deposited to the soils (Veiga et al., 2005).
Due to small sample sizes, we were unable to analyze theGhanaian hair samples for both Hg isotope ratios and MeHg con-centrations. We were able to analyze MeHg concentrations in hairsamples from seven other Ghanaian miners living in Kejetia thatwere collected during the same sampling campaigns. These hairsamples displayed similar total Hg concentrations to those thatwere analyzed for Hg isotopes (mean¼0.89 μg/g, 1 SD¼0.41 μg/g,n¼7; Table 2) and we expect that these miners were similarlyexposed to GEM and MeHg. These hair samples displayed rela-tively low MeHg concentrations (mean¼0.13 μg/g, 1 SD¼0.05 μg/g, n¼7) and MeHg represented only 7.6–29% of the total Hg in thehair samples (mean¼16.5%, 1 SD¼8.0%, n¼7; Table 2).
Table 1Summary concentration and Hg isotope ratio data. Samples from Ghanaian miners are identified as GH-#-Hair/Urine, soil samples collected in Ghana are identified as GH-00#-Soil, and samples from Indonesian individuals are identified as ID-#-Hair/Urine. Replicates are separate splits of a given sample that were combusted and analyzedindependently for Hg concentration and isotopic composition. Total Hg concentration data are based on sample combustions, analysis of Hg concentrations in the oxidizingtrapping solutions, and calculation of the total Hg concentration in the original material. Soil samples collected in Ghana are not spatially related to similarly labeled hair andurine samples (e.g., GH-001-Soil was not collected from the yard of individual GH-01).
Sample ID Sample type [Hg] (μg/g) n δ202Hg (‰) 2r (‰) Δ199Hg (‰) 2r (‰)
GH-01-Hair Hair 1.01 1 %0.16 0.23GH-01-Urine Urine 0.004 1 0.55 -0.03GH-02-Hair Hair 0.570 1 0.77 0.27GH-02-Urine Urine 0.020 1 %0.93 0.03GH-03-Hair Hair 2.61 1 %1.51 0.38GH-03-Urine Urine 0.045 2 %1.55 0.12 0.07 0.10GH-04-Hair Hair 1.56 1 %0.47 0.55GH-04-Urine Urine 0.004 1 %0.62 0.01GH-05-Hair Hair 1.08 1 0.28 0.50GH-05-Urine Urine 0.011 2 %1.47 0.14 0.00 0.08GH-06-Hair Hair 1.77 1 %1.67 0.54GH-06-Urine Urine 0.006 2 %2.13 0.01 0.00 0.05GH-001-Soil Soil 1.33 2 %0.59 0.03 0.06 0.07GH-001-Soil Rep 1.04 2 %0.79 0.17 0.04 0.03GH-002-Soil Soil 0.458 2 %0.23 0.04 -0.01 0.00GH-003-Soil Soil 0.724 2 %1.22 0.22 -0.01 0.05GH-004-Soil Soil 3.98 2 %3.08 0.24 0.12 0.09GH-004-Soil Rep 5.36 2 %2.76 0.08 0.10 0.09GH-005-Soil Soil 8.72 2 0.35 0.03 %0.02 0.02GH-006-Soil Soil 34.7 2 0.87 0.12 0.01 0.06GH-007-Soil Soil 2.07 2 %1.40 0.03 0.05 0.15GH-007-Soil Rep 1.91 2 %1.70 0.07 0.06 0.02GH-008-Soil Soil 1.34 2 %0.92 0.05 -0.07 0.14GH-009-Soil Soil 1.79 2 %0.65 0.07 -0.08 0.02
Sample ID Sample type/fish species [Hg] (μg/g) n δ202Hg (‰) 2r (‰) Δ199Hg (‰) 2r (‰)ID-01-Hair Hair 9.05 1 0.94 0.21ID-02-Hair Hair 20.6 2 1.35 0.06 0.23 0.04ID-03-Hair Hair 6.41 2 0.64 0.12 0.81 0.06ID-04-Hair Hair 4.30 2 1.67 0.04 1.31 0.08ID-04-Hair Rep Hair 4.14 2 1.62 0.11 1.33 0.08ID-05-Hair Hair 2.98 2 1.39 0.01 1.04 0.09ID-01-Fish Kerapu 0.199 2 0.47 0.06 2.58 0.11ID-01-Fish Rep 0.210 2 0.50 0.07 2.63 0.10ID-02-Fish Tongkol 0.155 2 0.44 0.17 2.39 0.06ID-02-Fish Rep 0.154 2 0.45 0.10 2.40 0.01ID-03-Fish Kekap 0.188 2 %0.50 0.30 0.41 0.06
Table 2MeHg concentrations in hair samples. Hair samples from Ghanaian miners areidentified as GH-#-Hair and hair samples from Indonesian individuals are identi-fied as ID-#-Hair. Only sample ID-05-Hair was also analyzed for Hg isotope ratios.
Sample ID Sex Age Occupation [Hg](μg/g)
[MeHg](μg/g)
% MeHg
GH-10260301-Hair F 18 Miner 1.71 0.13 7.6GH-10360101-Hair M 27 Miner 1.14 0.15 13GH-10380201-Hair F 19 Miner 0.71 0.10 14GH-10130101-Hair F 25 Miner 0.64 0.06 9.3GH-10210101-Hair F 25 Miner 0.61 0.10 16GH-10240101-Hair F 38 Miner 0.62 0.18 29GH-10220201-Hair M 32 Miner 0.78 0.20 26ID-05-Hair F 35 Farmer 2.98 2.15 72ID-12-Hair F 45 Miner 3.21 1.60 50ID-13-Hair M 41 Miner 5.49 1.77 32ID-15-Hair M 37 Miner 2.75 1.52 55
L.S. Sherman et al. / Environmental Research 137 (2015) 226–234 229

Total Hg concentrations in the analyzed hair samples from theIndonesian individuals were higher than those of the Ghanaianminers (mean¼8.66 μg/g, 1 SD¼7.08 μg/g, n¼5; Table 1). Al-though some of the individuals from Indonesia were not miners,hair samples from the miners displayed similarly variable total Hgconcentrations (4.22 μg/g and 9.05 μg/g) to hair samples fromindividuals who were not miners (2.98–20.6 μg/g). As described,we were not able to analyze most of the Indonesian hair samplesfor MeHg concentrations. The Indonesian hair samples analyzedfor MeHg concentrations contained slightly lower total Hg con-centrations (mean total Hg¼3.61 μg/g, 1 SD¼1.27 μg/g, n¼4; Ta-ble 2) than those analyzed for Hg isotope ratios. MeHg con-centrations in these samples were higher than those measured inthe Ghanaian miners’ hair samples (mean¼1.76 μg/g,1 SD¼0.28 μg/g, n¼4) and represented 32–72% of the total Hg inthe hair samples (mean¼52%, 1 SD¼16%, n¼4; Table 2). Total Hgconcentrations in commonly consumed fish from Indonesia dis-played relatively moderate total Hg concentrations(mean¼0.159 μg/g, 1 SD¼0.043 μg/g, n¼3).
3.2. Hg exposure: Ghana
Abbreviated Hg isotope ratio data are presented in Table 1 andthe complete data are presented in Appendix B (Table S1). Urinesamples from the Ghanaian miners displayed a wide range ofδ202Hg values (%2.13–0.55‰) but no significant MIF (Δ199Hg:%0.03–0.07‰). As shown in Fig. 1, these values were very similarto those observed in the soils collected from the miners’ yards(δ202Hg: %2.92–0.87‰; Δ199Hg: %0.08–0.11‰). However, theminers' urine displayed significantly lower Δ199Hg values thanthose previously measured in urine from U.S. dentists (Fig. 1;Sherman et al., 2013) and those of previously analyzed freshwaterfish (mean Δ199Hg¼1.29‰, 1 SD¼1.41‰, n¼135; Bergquist andBlum, 2007; Laffont et al., 2009; Perrot et al., 2010,, 2012; Sennet al., 2010; Sherman and Blum, 2013; Tsui et al., 2012). In contrast,
the Hg used to amalgamate Au is mined from ore deposits whichdisplay no significant MIF and a wide range of δ202Hg values(Fig. 1; Cooke et al., 2013; Foucher et al., 2009; Stetson et al., 2009;Yin et al., 2013). As shown in Fig. 1, the Ghanaian miners' urinesamples displayed similar Hg isotope ratios to those measuredpreviously in ore deposits. It is likely, therefore, that the Hg in theGhanaian miners' urine and Ghanaian soils results from exposureto the ore-derived Hg that is used to amalgamate Au and burnedlocally. This result is not unexpected given that individuals in thiscommunity are exposed to elevated levels of GEM released duringamalgam burning on a daily basis. These data indicate that in casesof high occupational exposure to GEM and limited fish consump-tion, Hg in human urine is almost entirely derived from inhalationof GEM. Therefore, in contrast to non-occupationally exposed in-dividuals, in these populations of miners, total Hg concentrationsin urine are a good biomarker for exposure to inorganic Hg.
As shown in Fig. 2, hair samples from the Ghanaian gold minersdisplayed a similar range in δ202Hg values as the urine samples(%1.67–0.77‰) but higher, positive Δ199Hg values (0.23–0.55‰).In general, these Δ199Hg values were lower than those of U.S.dentists and Europeans who consumed primarily open-ocean fish(Laffont et al., 2011; Sherman et al., 2013), but similar to hairsamples from Bolivian gold miners who consumed limited quan-tities of local freshwater and coastal fish (Fig. 2; Laffont et al.,2011). As described above, because the Ghanaian miners typicallyeat dried fish or fish paste instead of fish fillets, we were unable toquantify their fish consumption. However, Δ199Hg values mea-sured in the hair samples from the Ghanaian individuals were si-milar to those previously measured in coastal marine fish species(meanΔ199Hg¼0.53‰, 1 SD¼0.11‰, n¼10; Senn et al., 2010) andfreshwater fish from lakes with low light penetration (Shermanand Blum, 2013). It is therefore possible that the MIF observed inthe miner's hair reflects the Δ199Hg values of the fish that theyconsume.
Previous studies have, however, found that δ202Hg values in
Fig. 1. δ202Hg (‰) versus Δ199Hg (‰) for Ghanaian miners' urine and soil samples. Urine samples are shown as filled red circles and soil samples are shown as open redtriangles. Previously reported analyses of Hg ores are shown as black x’s (Cooke et al., 2013; Foucher et al., 2009; Stetson et al., 2009; Yin et al., 2013) and previouslymeasured urine samples from U.S. dentists are shown as open black circles (Sherman et al., 2013). Representative 2 SD analytical uncertainty for urine samples fromGhanaian miners is shown; replicate sample variability for soil samples is slightly larger (see Table S1). (For interpretation of the references to color in this figure legend, thereader is referred to the web version of this article.)
L.S. Sherman et al. / Environmental Research 137 (2015) 226–234230

hair samples are typically approximately 2‰ higher than δ202Hgvalues in consumed fish species (Laffont et al., 2009, 2011; Li et al.,2014; Sherman et al., 2013). Based on paired analyses of hair andurine samples from U.S. dentists, Sherman et al. (2013) hypothe-sized that this offset is caused by MDF occurring during in vivodemethylation of fish MeHg. According to this hypothesis, thelighter isotopes of Hg are preferentially demethylated and ex-creted in urine and the heavier isotopes are preferentially retainedas MeHg in hair. This may result in the observation of lower urineδ202Hg values and higher hair δ202Hg values than those of con-sumed fish (Sherman et al., 2013). Regardless of the underlyingmechanisms, all published studies have reported a similar mag-nitude of offset in δ202Hg values between human hair and con-sumed seafood (1.75–2‰; Laffont et al., 2009,, 2011; Li et al., 2014;Sherman et al., 2013). Based on this offset, if the Hg in the Gha-naian miners' hair is largely MeHg derived from fish consumption,we estimate that these miners would have consumed fish withδ202Hg values between approximately %3.7 and %1.0‰. Theseδ202Hg values are substantially lower than those that have beenpreviously measured in marine coastal and freshwater fish(Bergquist and Blum, 2007; Gantner et al., 2009; Gehrke et al.,2011; Laffont et al., 2009; Perrot et al., 2010, 2012; Sherman andBlum, 2013). It is therefore not likely that exposure to MeHg fromlocal fish alone results in the observed Hg isotope ratios in theGhanaian miners’ hair.
Instead, it is more likely that the hair samples from the Gha-naian miners contain a mixture of MeHg from consumed fish andexogenously adsorbed inorganic Hg released during Au–Hgamalgam burning. Sulfur-containing functional groups and mela-nin in human hair are capable of strongly binding metals to thehair structure (Larsson, 1993; Li et al., 2008b). In ASGM commu-nities, high concentrations of GEM persist in the air both wherethe Hg–Au amalgams are burned and throughout the area (Linet al., 1997; Malm et al., 1995; Veiga et al., 2005). Previous studies
have found that 490% of the total Hg in and on the hair of small-scale gold miners can be inorganic Hg (Donkor et al., 2006; Laffontet al., 2011). As described above, hair samples from Ghanaianminers contained very low percentages of total Hg as MeHg(mean¼16.5%, 1 SD¼8.0%, n¼7; Table 2), suggesting that a largepercentage of the total Hg in these samples is inorganic Hg ad-sorbed to the hair. Based on the measured MeHg percentages, wecan use a simple two-end-member mixing equation to estimatethe average Δ199Hg value of MeHg in the Ghanaian hair samples(Eq. (3)).
f fHg Hg Hg (3)MeHg199
MeHg inorg Hg199
inorg Hg199
GH hairΔ× + × Δ = Δ
In Eq. 3, fMeHg is the average fraction of MeHg in the Ghanaianhair samples (i.e., 0.165), finorg Hg is the average fraction of in-organic Hg in the hair (i.e., 0.835), Δ199Hginorg Hg is the averageΔ199Hg value of inorganic Hg adsorbed onto the hair samples(estimated based on the isotopic composition of the urine sam-ples; mean Δ199Hg¼0.02‰), Δ199HgGH hair is the average Δ199Hgvalue measured in the Ghanaian hair samples (mean Δ199Hg¼0.41‰), and Δ199HgMeHg is the estimated average Δ199Hg valueof MeHg in the hair samples. Based on this calculation, we esti-mate that MeHg in the Ghanaian miners’ hair displays an averageΔ199Hg value of #2.5‰. This value is within the range of thosepreviously observed values in freshwater ecosystems (Bergquistand Blum, 2007; Sherman and Blum, 2013) and it is possible thatMeHg in fish consumed by the Ghanaian miners displays a similarmagnitude of MIF.
3.3. Hg exposure: Indonesia
Hair samples from the Indonesian individuals were character-ized by positive δ202Hg values (0.64–1.67‰) and a wide range ofΔ199Hg values (0.21–1.33‰) (Fig. 3, Table 1). Based on dietarysurveys, we were able to estimate each individual's weekly fish
Fig. 2. δ202Hg (‰) versus Δ199Hg (‰) for Ghanaian miners' urine and hair samples. Urine samples are shown as filled circles and hair samples are shown as filled squareswhere each color corresponds to a different individual. Previously reported analyses of hair samples from U.S. and European non-miners are shown as open black squares(Laffont et al., 2011; Sherman et al., 2013) and measurements of hair from Bolivian gold miners are shown as open brown squares (Laffont et al., 2011). Representative 2 SDanalytical uncertainty based on measurement of procedural standards is shown. (For interpretation of the references to color in this figure legend, the reader is referred tothe web version of this article.)
L.S. Sherman et al. / Environmental Research 137 (2015) 226–234 231
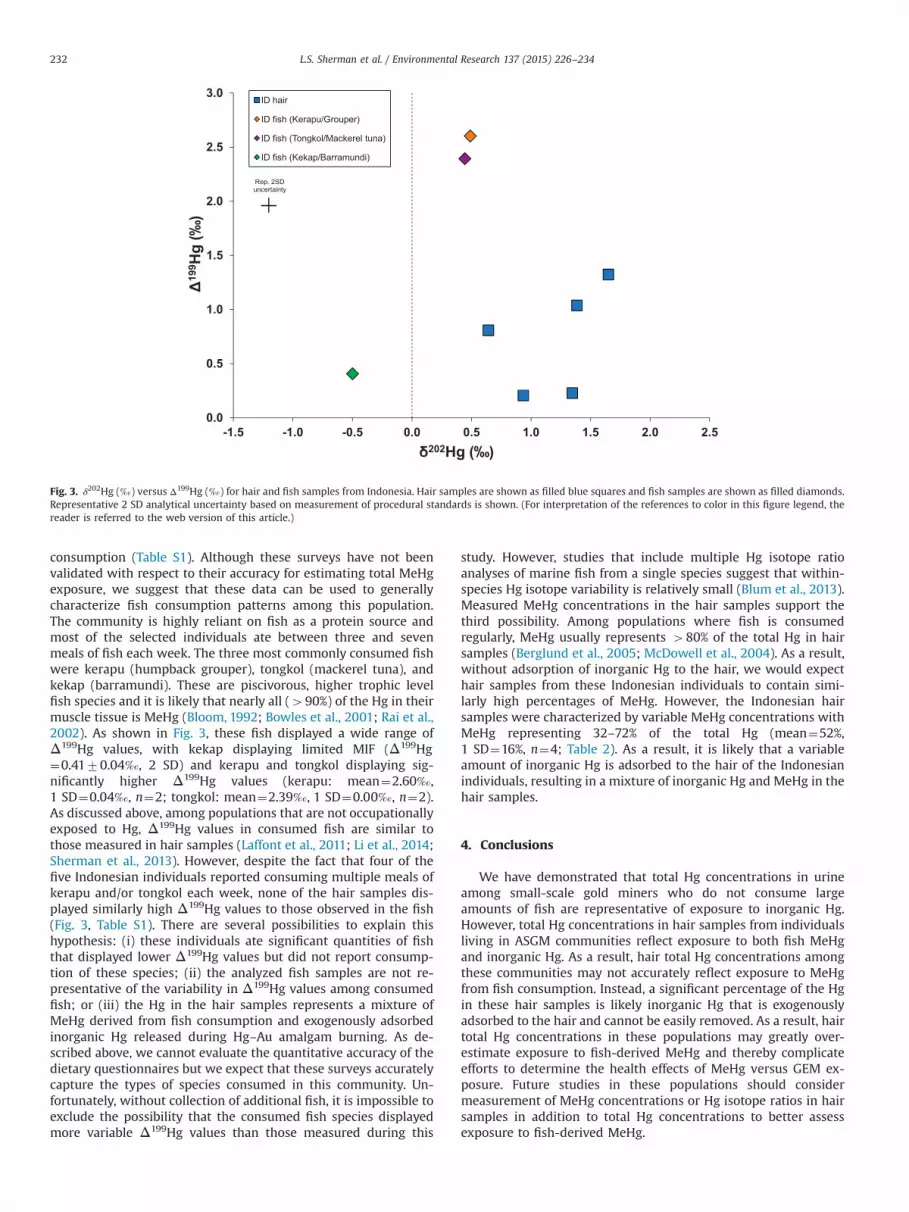
consumption (Table S1). Although these surveys have not beenvalidated with respect to their accuracy for estimating total MeHgexposure, we suggest that these data can be used to generallycharacterize fish consumption patterns among this population.The community is highly reliant on fish as a protein source andmost of the selected individuals ate between three and sevenmeals of fish each week. The three most commonly consumed fishwere kerapu (humpback grouper), tongkol (mackerel tuna), andkekap (barramundi). These are piscivorous, higher trophic levelfish species and it is likely that nearly all (490%) of the Hg in theirmuscle tissue is MeHg (Bloom, 1992; Bowles et al., 2001; Rai et al.,2002). As shown in Fig. 3, these fish displayed a wide range ofΔ199Hg values, with kekap displaying limited MIF (Δ199Hg¼0.4170.04‰, 2 SD) and kerapu and tongkol displaying sig-nificantly higher Δ199Hg values (kerapu: mean¼2.60‰,1 SD¼0.04‰, n¼2; tongkol: mean¼2.39‰, 1 SD¼0.00‰, n¼2).As discussed above, among populations that are not occupationallyexposed to Hg, Δ199Hg values in consumed fish are similar tothose measured in hair samples (Laffont et al., 2011; Li et al., 2014;Sherman et al., 2013). However, despite the fact that four of thefive Indonesian individuals reported consuming multiple meals ofkerapu and/or tongkol each week, none of the hair samples dis-played similarly high Δ199Hg values to those observed in the fish(Fig. 3, Table S1). There are several possibilities to explain thishypothesis: (i) these individuals ate significant quantities of fishthat displayed lower Δ199Hg values but did not report consump-tion of these species; (ii) the analyzed fish samples are not re-presentative of the variability in Δ199Hg values among consumedfish; or (iii) the Hg in the hair samples represents a mixture ofMeHg derived from fish consumption and exogenously adsorbedinorganic Hg released during Hg–Au amalgam burning. As de-scribed above, we cannot evaluate the quantitative accuracy of thedietary questionnaires but we expect that these surveys accuratelycapture the types of species consumed in this community. Un-fortunately, without collection of additional fish, it is impossible toexclude the possibility that the consumed fish species displayedmore variable Δ199Hg values than those measured during this
study. However, studies that include multiple Hg isotope ratioanalyses of marine fish from a single species suggest that within-species Hg isotope variability is relatively small (Blum et al., 2013).Measured MeHg concentrations in the hair samples support thethird possibility. Among populations where fish is consumedregularly, MeHg usually represents 480% of the total Hg in hairsamples (Berglund et al., 2005; McDowell et al., 2004). As a result,without adsorption of inorganic Hg to the hair, we would expecthair samples from these Indonesian individuals to contain simi-larly high percentages of MeHg. However, the Indonesian hairsamples were characterized by variable MeHg concentrations withMeHg representing 32–72% of the total Hg (mean¼52%,1 SD¼16%, n¼4; Table 2). As a result, it is likely that a variableamount of inorganic Hg is adsorbed to the hair of the Indonesianindividuals, resulting in a mixture of inorganic Hg and MeHg in thehair samples.
4. Conclusions
We have demonstrated that total Hg concentrations in urineamong small-scale gold miners who do not consume largeamounts of fish are representative of exposure to inorganic Hg.However, total Hg concentrations in hair samples from individualsliving in ASGM communities reflect exposure to both fish MeHgand inorganic Hg. As a result, hair total Hg concentrations amongthese communities may not accurately reflect exposure to MeHgfrom fish consumption. Instead, a significant percentage of the Hgin these hair samples is likely inorganic Hg that is exogenouslyadsorbed to the hair and cannot be easily removed. As a result, hairtotal Hg concentrations in these populations may greatly over-estimate exposure to fish-derived MeHg and thereby complicateefforts to determine the health effects of MeHg versus GEM ex-posure. Future studies in these populations should considermeasurement of MeHg concentrations or Hg isotope ratios in hairsamples in addition to total Hg concentrations to better assessexposure to fish-derived MeHg.
Fig. 3. δ202Hg (‰) versus Δ199Hg (‰) for hair and fish samples from Indonesia. Hair samples are shown as filled blue squares and fish samples are shown as filled diamonds.Representative 2 SD analytical uncertainty based on measurement of procedural standards is shown. (For interpretation of the references to color in this figure legend, thereader is referred to the web version of this article.)
L.S. Sherman et al. / Environmental Research 137 (2015) 226–234232

Funding sources
Funding for this research was provided by the John D. Ma-cArthur Professorship to J. D. Blum, by the Graham EnvironmentalSustainability Institute to N. Basu, and by the Gelfond Fund to D. C.Evers. IPEN also received financial support from the EnvironmentProtection Agency of Sweden and the Federal Office for the En-vironment of Switzerland.
Human subjects review
Institutional Review Board (IRB) approval for the studies con-ducted in Ghana was obtained from the University of Michigan(HUM00028444). The research conducted using samples fromIndonesia was deemed IRB exempt by the University of SouthernMaine because all of the hair samples were analyzed withoutpersonal identification information.
Acknowledgements
Funding was provided by the John D. MacArthur Professorshipto J. D. Blum, by the Graham Environmental Sustainability Instituteto N. Basu, and by the Gelfond Fund to D. C. Evers. IPEN gratefullyacknowledges the financial support from the Environment Pro-tection Agency of Sweden, the Federal Office for the Environmentof Switzerland, and others. The content and views expressed inthis report, however, are those of the authors and not necessarilythe views of the institutions providing financial support. In addi-tion, we are grateful to BaliFokus Foundation for assistance withsample collection in Indonesia.
Appendix A. Supplementary material
Supplementary data associated with this article can be found inthe online version at http://dx.doi.org/10.1016/j.envres.2014.12.021.
References
Abe, T., Akagi, H., Akimichi, T., Hongo, T., Nakano, A., Ohtsuka, R., 1995. High hairand urinary mercury levels of fish easters in the nonpolluted environment ofPapua New Guinea. Arch. Environ. Health 50, 367–373.
Barbosa, A.C., Jardim, W., Dórea, J.G., Fosberg, B., Souza, J., 2001. Hair mercuryspeciation as a function of gender, age, and body mass index in inhabitants ofthe Negro River Basin, Amazon, Brazil. Arch. Environ. Contam. Toxicol. 40,439–444.
Bawa, I., 2010. A viewpoint on small-scale gold mining in Ghana: a regulatoryperspective on current practices, mercury use and the UNIDO and EU projects.Int. J. Environ. Pollut. 41, 195–201.
Berglund, M., Lind, B., Björnberg, K.A., Palm, B., Einarsson, Ö, Vahter, M., 2005. Inter-individual variations of human mercury exposure biomarkers: across-sectionalassessment. Environ. Health: A Glob. Access Sci. Source 4 (20), http://dx.doi.org/10.1186/1476-069X-4-20.
Bergquist, B.A., Blum, J.D., 2007. Mass-dependent and mass-independent fractio-nation of Hg isotopes by photo-reduction in aquatic systems. Science 318,417–420.
Biodiversity Research Institute and IPEN, 2013. Global Mercury Hotspots: NewEvidence Reveals Mercury Contamination Regularly Exceeds Health AdvisoryLevels in Humans and Fish Worldwide.
Bloom, N.S., 1992. On the chemical form of mercury in edible fish and marine in-vertebrate tissue. Can. J. Fish. Aquat. Sci. 49, 1010–1017.
Blum, J.D., Bergquist, B.A., 2007. Reporting the variations in the natural isotopiccomposition of mercury. Anal. Bioanal. Chem. 388, 353–359.
Blum, J.D., Popp, B.N., Drazen, J.C., Choy, C.A., Johnson, M.W., 2013. Methylmercuryproduction below the mixed layer in the North Pacific Ocean. Nat. Geosci. ,http://dx.doi.org/10.1038/NGEO1918.
Böse-O’Reilly S., Maydl S., Drasch G., Roider G., 2000. UNIDO Project No. DP/PHI/98/005. Mercury as a health hazard due to gold mining and mineral processing
activities in Mindanao/Philippines.Bowles, K.C., Apte, S.C., Maher, W.A., Kawei, M., Smith, R., 2001. Bioaccumulation
and biomagnification of mercury in Lake Murray, Papua New Guinea. Can. J.Fish. Aquat. Sci. 58, 888–897.
Buchachenko, A.L., 2001. Magnetic isotope effect: nuclear spin control of chemicalreactions. J. Phys. Chem. 105, 9995–10011.
Clarkson, T.W., 2002. The three modern faces of mercury. Environ. Health Perspect.110 (Suppl. 1), S11–S23.
Clarkson, T.W., Magos, L., 2006. The toxicology of mercury and its chemical com-pounds. Crit. Rev. Toxicol. 36, 609–662.
Clarkson, T.W., Vyas, J.B., Ballatori, N., 2007. Mechanisms of mercury disposition inthe body. Am. J. Ind. Med. 50, 757–764.
Cooke, C.A., Hintelmann, H., Ague, J.J., Burger, R., Biester, H., Sachs, J.P., et al., 2013.Use and legacy of mercury in the Andes. Environ. Sci. Technol. 47, 4181–4188.
Dewi, K., 2012. BaliFokus Foundation. Inventory of mercury releases in Indonesia.Donkor, A.K., Bonzongo, J.C., Nartey, V.K., Adotey, D.K., 2006. Mercury in different
environmental compartments of the Pra River Basin, Ghana. Sci. Total Environ.368, 164–176.
Estrade, N., Carignan, J., Sonke, J.E., Donard, O.F.X., 2009. Mercury isotope fractio-nation during liquid–vapor evaporation experiments. Geochim. Cosmochim.Acta 73, 2693–2711. http://dx.doi.org/10.1016/j.gca.2009.01.024.
Foucher, D., Ogrinc, N., Hintelmann, H., 2009. Tracing mercury contamination fromthe Idrija mining region (Slovenia) to the Gulf of Trieste using Hg isotope ratiomeasurements. Environ. Sci. Technol. 43, 33–39. http://dx.doi.org/10.1021/es801772b.
Gantner, N., Hintelmann, H., Zheng, W., Muir, D.C., 2009. Variations in stable iso-tope fractionation of Hg in food webs of Arctic lakes. Environ. Sci. Technol. 43,9148–9154.
Gehrke, G.E., Blum, J.D., Slotton, D.G., Greenfield, B.K., 2011. Mercury isotopes linkmercury in San Francisco Bay forage fish to surface sediments. Environ. Sci.Technol. 45, 1264–1270. http://dx.doi.org/10.1021/es103053y.
Ghosh, S., Schauble, E.A., Couloume, G.L., Blum, J.D., Bergquist, B.A., 2013. Estima-tion of nuclear volume dependent fractionation of mercury isotopes in equili-brium liquid–vapor evaporation experiments. Chem. Geol. 336, 5–12. http://dx.doi.org/10.1016/j.chemgeo.2012.01.008.
Goodrich, J.M., Wang, Y., Gillespie, B., Werner, R., Franzblau, A., Basu, N., 2012.Methylmercury and elemental mercury differentially associate with bloodpressure among dental professionals. Int. J. Hyg. Environ. Health 216, 195–201.http://dx.doi.org/10.1016/j.ijheh.2012.03.001.
Grandjean, P., Budtz-Jørgensen, E., White, R.F., Jørgensen, P.J., Weihe, P., Debes, F.,et al., 1999. Methylmercury exposure biomarkers as indicators of neurotoxicityin children aged 7 years. Am. J. Epidemiol. 150, 301–305.
Hilson, G., Pardie, S., 2006. Mercury: an agent of poverty in Ghana’s small-scalegold-mining sector? Resourc. Policy 31, 106–116.
Hintelmann, H., Lu, S., 2003. High precision isotope ratio measurements of mercuryisotopes in cinnabar ores using multi-collector inductively coupled plasmamass spectrometry. Analyst 128, 635–639.
Jennings, N., 1999. International Labour Organization. Social and Labour Issues inSmall-scale Mines, Report for Discussion at the Tripartite Meeting on Social andLabour Issues in Small-scale Mines.
Kritee, K., Barkay, T., Blum, J.D., 2009. Mass dependent stable isotope fractionationof mercury during mer mediated microbial degradation of mono-methylmercury. Geochim. Cosmochim. Acta 73, 1285–1296.
Kritee, K., Blum, J.D., Johnson, M.W., Bergquist, B.A., Barkay, T., 2007. Mercury stableisotope fractionation during reduction of Hg(II) to Hg(0) by mercury resistantmicroorganisms. Environ. Sci. Technol. 41, 1889–1895.
Kwon, S.Y., Blum, J.D., Carvan, M.J., Basu, N., Head, J.A., Madenjian, C.P., et al., 2012.Absence of fractionation of mercury isotopes during trophic transfer of me-thylmercury to freshwater fish in captivity. Environ. Sci. Technol. 46,7527–7534.
Laffont, L., Sonke, J.E., Maurice, L., Hintelmann, H., Pouilly, M., Bacarreza, Y.S., et al.,2009. Anomalous mercury isotopic compositions of fish and human hair in theBolivian Amazon. Environ. Sci. Technol. 43, 8985–8990.
Laffont, L., Sonke, J.E., Maurice, L., Monrroy, S.L., Chincheros, J., Amouroux, D., et al.,2011. Hg speciation and stable isotope signatures in human hair as a tracer fordietary and occupational exposure to mercury. Environ. Sci. Technol. 45,9910–9916. http://dx.doi.org/10.1021/es202353m.
Larsson, B.S., 1993. Interaction between chemicals and melanin. Pigment Cell Res. 6,127–133.
Lebel, J., Mergler, D., Branches, F., Lucotte, M., Amorim, M., Larribe, F., et al., 1998.Neurotoxic effects of low-level methylmercury contamination in the Amazo-nian Basin. Environ. Res. 79, 20–32.
Li, M., Sherman, L.S., Blum, J.D., Grandjean, P., Mikkelsen, B., Weihe, P., et al., 2014.Assessing sources of human methylmercury exposure using stable mercuryisotopes. Environ. Sci. Technol. 48, 8800–8806. http://dx.doi.org/10.1021/es500340r.
Li, P., Feng, X., Qiu, G., Li, Z., Fu, X., Sakamoto, M., et al., 2008a. Mercury exposuresand symptoms in smelting workers of artisanal mercury mines in Wuchuan,Guizhou, China. Environ. Res. 107, 108–114.
Li, Y.-F., Chen, C., Li, B., Wang, J., Gao, Y., Zhao, Y., et al., 2008b. Scalp hair as abiomarker in environmental and occupational mercury exposed populations:suitable or not? Environ. Res. 107, 39–44.
Lin, Y., Guo, M., Gan, W., 1997. Mercury pollution from small gold mines in China.Water Air Soil Pollut. 97, 233–239.
Malm, O., Castro, M.B., Bastos, W.R., Branches, F.J.P., Guimarães, J.R.D., Zuffo, C.E.,et al., 1995. As assessment of Hg pollution in different goldmining areas,
L.S. Sherman et al. / Environmental Research 137 (2015) 226–234 233

Amazon Brazil. Sci. Total Environ. 175, 127–140.McDowell, M.A., Dillon, C.F., Osterloh, J., Bolger, P.M., Pellizzari, E., Fernando, R.,
et al., 2004. Hair mercury levels in U.S. children and women of childbearingage: reference range data from NHANES 1999–2000. Environ. Health Perspect.112, 1165–1171.
Morton, J., Carolan, V.A., Gariner, P.H.E., 2002. Removal of exogenously bound ele-ments from human hair by various washing procedures and determination byinductively coupled plasma mass spectrometry. Anal. Chim. Acta 455, 23–34.
Nam, D.-H., Basu, N., 2011. Rapid methods to detect organic mercury and totalselenium in biological samples. Chem. Central J. 5, 5.
Ohno, T., Sakamoto, M., Kurosawa, R., Dakeishi, M., Iwata, T., Murata, K., 2007. Totalmercury levels in hair, toenail, and urine among women free from occupationalexposure and their relations to renal tubular function. Environ. Res. 103,191–197.
Paruchuri, Y., Siuniak, A., Johnson, N., Levin, E., Mitchell, K., Goodrich, J.M., et al.,2010. Occupational and environmental mercury exposure among small-scalegold miners in the Talensi-Nabdam District of Ghana’s Upper East region. Sci.Total Environ. 408, 6079–6085.
Perrot, V., Epov, V.N., Pastukhov, M.V., Grebenshchikova, V.I., Zouiten, C., Sonke, J.E.,et al., 2010. Tracing sources and bioaccumulation of mercury in fish of LakeBaikal-Angara River using Hg isotopic composition. Environ. Sci. Technol. 44,8030–8037. http://dx.doi.org/10.1021/es101898e.
Perrot, V., Pastukhov, M.V., Epov, V.N., Husted, S., Donard, O.F.X., Amouroux, D.,2012. Higher mass-independent isotope fractionation of methylmercury in thepelagic food web of Lake Baikal (Russia). Environ. Sci. Technol. 46, 5902–5911.
Rai, R., Maher, W., Kirkowa, F., 2002. Measurement of inorganic and methylmercuryin fish tissues by enzymatic hydrolysis and HPLC-ICP-MS. J. Anal. At. Spectrom.12, 1560–1563.
Rodríguez-González, P., Epov, V.N., Bridou, R., Tessier, E., Guyoneaud, R., Monperrus,M., et al., 2009. Species-specfic stable isotope fractionation of mercury duringHg(II) methylation by an anaerobic bacteria (Desulfobulbus propionicus) underdark conditions. Environ. Sci. Technol. 43, 9183–9188.
Senn, D.B., Chesney, E.J., Blum, J.D., Bank, M.S., Maage, A., Shine, J.P., 2010. Stableisotope (N, C, Hg) study of methylmercury sources and trophic transfer in thenorthern Gulf of Mexico. Environ. Sci. Technol. 44, 1630–1637.
Sherman, L.S., Blum, J.D., 2013. Mercury stable isotopes in sediments and large-mouth bass from Florida lakes, USA. Sci. Total Environ. 448, 163–175. http://dx.doi.org/10.1016/j.scitotenv.2012.09.038.
Sherman, L.S., Blum, J.D., Franzblau, A., Basu, N., 2013. New insight into biomarkersof human mercury exposure using naturally occurring mercury stable isotopes.Environ. Sci. Technol. 47, 3403–3409. http://dx.doi.org/10.1021/es305250z.
Sherman, L.S., Blum, J.D., Keeler, G.J., Demers, J.D., Dvonch, J.T., 2012. Investigationof local mercury deposition from a coal-fired power plant using mercury iso-topes. Environ. Sci. Technol. 46, 382–390. http://dx.doi.org/10.1021/es202793c.
Smith, C.N., Kesler, S.E., Blum, J.D., Rytuba, J.J., 2008. Isotope geochemistry ofmercury in source rocks, mineral deposits and spring deposits of the CaliforniaCoast Ranges, USA. Earth Planet. Sci. Lett. 269, 399–407.
Stetson, S.J., Gray, J.E., Wanty, R.B., Macalady, D.L., 2009. Isotopic variability ofmercury in ore, mine-waste calcine, and leachates of mine-waste calcine fromareas mined for mercury. Environ. Sci. Technol. 43, 7331–7336.
Styles, M.T., Amankwah, R.K., Al-Hassan, S., Nartey, R.S., 2010. The identification andtesting of a method for mercury-free gold processing for artisanal and small-scale gold miners in Ghana. Int. J. Environ. Pollut. 41, 289–303.
Suzuki, T., Hongo, T., Matsuo, N., Imai, H., Nakazawa, M., Abe, T., et al., 1992. Anacute mercuric mercury poisoning: chemical speciation of hair mercury showsa peak of inorganic mercury value. Hum. Exp. Toxicol. 11, 53–57.
Swain, E.B., Jakus, P.M., Rice, G., Lupi, F., Maxson, P.A., Pacyna, J.M., et al., 2007.Socioeconomic consequences of mercury use and pollution. Ambio 36, 45–61.
Telmer, K.H., Veiga, M.M., 2009. Chapter 8: World emissions of mercury from ar-tisanal and small scale gold mining. In: Pirrone, N., Mason, R. (Eds.), MercuryFate and Transport in the Global Atmosphere: Emissions, Measurements, andModels. Springer, New York, pp. 131–172.
Tsui, M.T.K., Blum, J.D., Kwon, S.Y., Finlay, J.C., Balogh, S.J., Nollet, Y.H., 2012. Sourcesand transfers of methylmercury in adjacent river and forest food webs. Environ.Sci. Technol. 46, 10957–10964. http://dx.doi.org/10.1021/es3019836.
United Nations Environment Programme, 2013. Global Mercury Assessment:Sources, Emissions, Releases, and Environmental Transport.
Veiga, M.M., Shoko, D., Spiegel, S.J., Savornin, O., Raphael, P., Castigo, P., et al., 2005.UNIDO, Global Mercury Project. Pilot Project for the Reduction of MercuryContamination Resulting From Artisanal Gold Mining Fields in the ManicaDistrict of Mozambique.
Voegborlo, R.B., Matsuyama, A., Adimado, A.A., Akagi, H., 2010. Head hair totalmercury and methylmercury levels in some Ghanaian individuals for the esti-mation of their exposure to mercury: preliminary studies. Bull. Environ. Con-tam. Toxicol. 84, 34–38.
Wilhelm, M., Müller, F., Idel, H., 1996. Biological monitoring of mercury vapor ex-posure by scalp hair analysis in comparison to blood and urine. Toxicol. Lett. 88,221–226.
Yin, R., Feng, X., Wang, J., Li, P., Liu, J., Zhang, Y., et al., 2013. Mercury speciation andmercury isotope fractionation during ore roasting process and their implicationto source identification of downstream sediment in the Wanshan mercurymining area, SW China. Chem. Geol. 336, 72–79.
Zheng, W., Hintelmann, H., 2010. Isotope fractionation of mercury during its pho-tochemical reduction by low-molecular-weight organic compounds. J. Phys.Chem. A 114, 4246–4253. http://dx.doi.org/10.1021/jp9111348.
L.S. Sherman et al. / Environmental Research 137 (2015) 226–234234


