Embed Size (px)
Citation preview

www.newphytologist.org
485
Research
Blackwell Publishing, Ltd.
Assessing the generality of global leaf trait relationships
Ian J. Wright
1
, Peter B. Reich
2
, Johannes H. C. Cornelissen
3
, Daniel S. Falster
4
, Eric Garnier
5
, Kouki Hikosaka
6
, Byron B. Lamont
7
, William Lee
8
, Jacek Oleksyn
2,9
, Noriyuki Osada
6,10
, Hendrik Poorter
11
, Rafael Villar
12
, David I. Warton
13
and Mark Westoby
1
1
Department of Biological Sciences, Macquarie University, NSW 2109, Australia;
2
Department of Forest Resources, University of Minnesota, St Paul, MN
55108, USA;
3
Institute of Ecological Science, Department of Systems Ecology, Vrije Universiteit, Amsterdam, the Netherlands;
4
Faculty of Medicine, University
of Oslo, 0315 Oslo, Norway;
5
Centre d’Ecologie Fonctionnelle et Evolutive, CNRS, Montpellier, France;
6
Graduate School of Life Sciences, Tohoku University,
Aoba, Sendai 980-8578, Japan;
7
Department of Environmental Biology, Curtin University of Technology, Perth, WA 6845, Australia;
8
Landcare Research,
Private Bag 1930, Dunedin, New Zealand;
9
Polish Academy of Sciences, Institute of Dendrology, Parkowa 5, 62-035 Kornik, Poland;
10
Nikko Botanical
Garden, Graduate School of Science, University of Tokyo, Japan;
11
Plant Ecophysiology, Utrecht University, Utrecht, the Netherlands;
12
Area de Ecología,
Campus de Rabanales, Universidad de Córdoba, 14071 Córdoba, Spain;
13
Department of Statistics, School of Mathematics, University of New South Wales,
NSW 2052, Australia
Summary
•
Global-scale quantification of relationships between plant traits gives insight intothe evolution of the world’s vegetation, and is crucial for parameterizing vegetation–climate models.
•
A database was compiled, comprising data for hundreds to thousands of speciesfor the core ‘leaf economics’ traits leaf lifespan, leaf mass per area, photosyntheticcapacity, dark respiration, and leaf nitrogen and phosphorus concentrations, as wellas leaf potassium, photosynthetic N-use efficiency (PNUE), and leaf N : P ratio.
•
While mean trait values differed between plant functional types, the range foundwithin groups was often larger than differences among them. Future vegetation–climate models could incorporate this knowledge.
•
The core leaf traits were intercorrelated, both globally and within plant functionaltypes, forming a ‘leaf economics spectrum’. While these relationships are very general,they are not universal, as significant heterogeneity exists between relationshipsfitted to individual sites. Much, but not all, heterogeneity can be explained by variationin sample size alone. PNUE can also be considered as part of this trait spectrum,whereas leaf K and N : P ratios are only loosely related.
Key words:
leaf economics, nutrient stoichiometry, photosynthesis, plant functionaltypes, respiration.
New Phytologist
(2005)
166
: 485–496
©
New Phytologist
(2005)
doi
: 10.1111/j.1469-8137.2005.01349.x
Author for correspondence:
Ian J. Wright Tel: +61 29850 8194 Fax: +61 29850 8246 Email: [email protected]
Received:
12 October 2004
Accepted:
13 December 2004
Introduction
There are
≈
250 000 vascular plant species, yet all face the samebasic challenges: they must obtain sufficient water, nutrientsand light to drive carbon fixation, and make enough carbonprofit to ensure continuity to future generations. Over the pasttwo decades, plant ecologists and physiologists have becomeincreasingly concerned with quantifying correlations betweenkey leaf traits, and between leaf traits and climate (Field &
Mooney, 1986; Reich
et al
., 1992; Schulze
et al
., 1994; Körner,1995; Grime
et al
., 1997; Reich
et al
., 1997; Niinemets, 2001;Wright & Westoby, 2002). This can be seen as part of a broaderpush to identify and understand the major dimensions oftrait variation among the vegetation of the world (Weiher
et al
.,1999; Westoby
et al
., 2002; Diaz
et al
., 2004). Recent modelsconcerning shifts in vegetation with climate and land-usechange have begun to make use of information from studiessuch as that of Reich
et al
. (1997), in order to model fluxes

New Phytologist
(2005)
166
: 485–496
www.newphytologist.org
©
New Phytologist
(2005)
Research486
and pools of carbon and nitrogen (Moorcroft
et al
., 2001;Bonan
et al
., 2002; Kaplan
et al
., 2003). Reliable large-scalequantification of leaf trait relationships will help to improvethese models, as well as increasing our understanding ofplant evolution.
With these aims in mind, we have compiled leaf trait datafrom >2500 vascular plant species, from 175 sites aroundthe world. Recently we showed that nearly three-quarters of theglobal variation in six key leaf traits (leaf mass per area, LMA;leaf lifespan, LL; leaf N per unit mass,
N
mass
; photosyntheticcapacity per unit leaf mass,
A
mass
; leaf dark respiration rateper unit mass,
Rd
mass
; leaf P concentration per unit mass,
P
mass
) is captured by a single axis through multidimensionaltrait space. This ‘leaf economics spectrum’ (Wright
et al
.,2004) runs from species with the potential for quick returnson investments of nutrients and dry mass in leaves to thosewith a slower potential rate of return. At the quick-return endare species with high leaf nutrient concentrations, high ratesof photosynthesis and respiration, short leaf lifespan and lowdry-mass investment per leaf area. At the slow-return end arespecies with long LL, expensive high-LMA leaf construction,low nutrient concentrations, and low rates of photosynthesisand respiration. Importantly, the directionality of trait correla-tions along the primary axis of this spectrum was shown tooperate similarly across species pooled by growth form, func-tional group or major biome, indicating a very general andpredictable interdependence of these key leaf traits (Wright
et al
., 2004).Here we present a number of complementary analyses
concerning variation in leaf traits and trait relationships fromthe GLOPNET database. We extend our analyses of leaf traitrelationships to include the macronutrient potassium (datafor 251 species), as well as to photosynthetic N-use efficiency(PNUE, 710 species) and leaf N : P ratios (745 species). Firstwe describe the patterning of leaf traits according to growthform and common plant functional types (PFTs, e.g. decidu-ous vs evergreen species). Second, we quantify pairwise traitrelationships among these species groupings, providing a setof regression equations for use in modelling exercises. Third,we assess the extent to which leaf K, PNUE and N : P ratiosare associated with traits making up the leaf economicsspectrum. Finally, we examine the extent to which differencesin leaf trait relationships fitted to individual sites can beexplained by variation in sample size or the range of traitvariation at sites, as opposed to, say, indicating that fundamen-tally different trait relationships occur among different sets ofco-occurring species (Reich, 1993; Diemer, 1998).
This study represents the first attempt simultaneously toassess the relationship of leaf K to several leaf economic traitsfor a large data set of field-grown plants, at a broad geographicscale. Leaf K data were compiled from 16 sites, representinga variety of different vegetation types from eight countries(Canada, England, Germany, Malaysia, New Zealand, Sri Lanka,USA, Venezuela). The majority of the data were for trees and
shrubs (229 species), with the remaining species beingferns, grasses, herbs (five species each) or vines (seven species).Previous surveys have looked only at the relationship of leafK with other leaf nutrients (Garten, 1976; Garten, 1978;Thompson
et al
., 1997), or where correlations betweenleaf K and a wide range of other plant traits were assessed,the study was restricted to common species from the BritishIsles (Grime
et al
., 1997).PNUE is defined as the ratio of photosynthetic capacity
to leaf N. Understanding how different plant groups vary inPNUE, and how PNUE relates to other plant traits, gives usfurther insight into the role of leaf N in plant economics (Pons
et al
., 1994; Poorter & Evans, 1998). Again, our databaserepresents the largest compilation of PNUE data to date,allowing us to assess the extent to which PNUE varies alongthe leaf economics spectrum at a very broad scale. Previouswork has shown that species at the slow-return end of thespectrum (as evidenced by having a long LL) tend to havelower PNUE (Reich
et al
., 1992). Here we assess the generalityof that result.
There has been a recent resurgence of interest in nutrientstoichiometry in biology, particularly that between N, P andC. Leaf N : P ratios may influence plant–herbivore interactionsin food webs (Sterner & Elser, 2002), as well as indicating soilN or P limitation to plant growth (Koerselman & Meuleman,1996; Aerts & Chapin, 2000; Tessier & Raynal, 2003; Güsewell,2004). On average, leaf N : P ratios increase from the polestowards the equator, presumably related to latitudinal trendsin temperature and biogeographical gradients in soil substrateage (McGroddy
et al
., 2004; Reich & Oleksyn, 2004). Inorganisms lacking major mineral storage of P (as in vacuolesor bones), the potential for rapid growth tends to be corre-lated with low biomass C : P and N : P ratios. This is thoughtto reflect increased allocation to P-rich ribosomal RNA, asrapid protein synthesis by ribosomes is required to supportfast growth (Elser
et al
., 2000; Sterner & Elser, 2002). In abroad survey of (mostly) aquatic and terrestrial plant species(Nielsen
et al
., 1996), growth rate was correlated with boththe N and P concentration of the photosynthetic tissue,and N : P ratios tended to be lower in faster-growing species.But is this generally true for higher plants? Higher plantswith inherently fast growth tend to have low LMA and LL,and high
A
mass
(Lambers & Poorter, 1992; Reich
et al
., 1992;Grime
et al
., 1997). Consequently, we quantified how leafN : P ratios were correlated with these other leaf traits in orderto assess the extent to which recent concepts of ‘ecologicalstoichiometry’ (Elser
et al
., 2000; Sterner & Elser, 2002) applyto higher plants, particularly to shrubs and trees (717 of the745 species for which we could calculate leaf N : P ratios).
Materials and Methods
Leaf trait data were compiled from both published and unpub-lished sources. A data set was considered suitable provided it
©
New Phytologist
(2005)
www.newphytologist.org
New Phytologist
(2005)
166
: 485–496
Research 487
contained data for at least two of the leaf traits for a minimumof four co-occurring species. The total data set represented175 sites and contained 2548 species/site combinations, con-sisting of 2021 different species, with 341 occurring at morethan one site. This coverage of traits, species and sites issubstantially larger than previous data compilations, extends toall vegetated continents, and represents a wide range of vegeta-tion types, including arctic tundra, boreal, temperate andtropical forests, grasslands, shrublands, woodlands anddesert. The data set (available on request from the lead author)includes broad- and needle-leaved trees and shrubs, herbs,grasses, ferns, geophytes and epiphytes. Site elevation rangesfrom below sea level (Death Valley, USA) to
≈
4800 m. Meanannual temperature ranges from
−
16 to 27.5
°
C; mean annualrainfall ranges from 133 to 5300 mm yr
−
1
. This covers mostof the range of mean annual temperature–rainfall space inwhich higher plants are found (Whittaker, 1975). Still, somelarge geographic regions are poorly represented in the data set,in particular Russia, China, north and central Africa, and theMiddle East.
Mean trait values were calculated for each species at a site.Here, photosynthetic ‘capacity’ refers to photosynthetic ratesmeasured on young but fully expanded leaves, under highlight and low water stress, and at ambient CO
2
concentration.Where photosynthetic capacity or leaf N was reported on anarea basis, the traits were converted to a mass basis usingLMA, or
vice versa
when reported on a mass basis only. Wheretraits were reported separately for sun leaves and shade leaves,sun-leaf data were used. Where data were presented separatelyfor recently matured and for old leaves, data for recentlymatured leaves were used.
Data analysis
All leaf traits were log-transformed before analyses as theirdistributions were strongly right-skewed. Group means forthe various leaf traits and species groupings (growth forms,PFTs) were compared by
t
-test for two-group tests, or by
followed by multiple comparison tests where morethan two groups were compared (Games–Howell tests wherevariances were deemed heterogeneous with Levene’s test;Tukey’s tests where variances were deemed homogeneous).The strength of bivariate trait relationships was quantifiedwith standard correlation and ordinary least-squares regres-sion statistics in conjunction with standardized major axisslopes (SMAs, also known as reduced major axis slopes).An SMA fit is the line along the longest axis of a data cloud,fit by minimizing sums of squares in
X
and
Y
dimensionssimultaneously. It gives the slope of the first component froma principal components analysis calculated from a correlationmatrix; that is, the line is a summary in the sense that a singledimension is used to describe two-dimensional data. SMA slope-fitting is commonly required for allometric studies (Niklas,1994). However, for
predicting
one trait from another, ordinary
least-squares regression should be used (Sokal & Rohlf, 1995).The regression equations given in online Appendix 2 use thismethod. SMA slopes can be calculated from these equationssimply by dividing the ordinary least-squares slope by therelevant correlation
r
value. In the Results section, where variationin trait relationships between sites is examined, we look atheterogeneity in both correlation
r
values and SMA slopes.SMA routines were run using a DOS-based computer
package (
)
(Falster
et al
., 2003). In this program heter-ogeneity between SMA slopes is tested via a permutation test.Where deemed nonheterogeneous, a common SMA slope isestimated using a likelihood-ratio method (Warton & Weber,2002). Differences in SMA elevation (intercept) can thenbe tested with the SMA analogue of standard
, i.e. by
on
Y
′
, where
Y
′
is the set of
Y
values for each group ofdata transformed by the common slope (Wright
et al
., 2001).Heterogeneity among correlation coefficients calculated fortrait relationships fitted to individual sites was assessed by thestandard procedure for this test, whereby the weighted sumsof squares of the
z
values corresponding to the correlationcoefficients are subjected to a
χ
2
test (Sokal & Rohlf, 1995).
Results
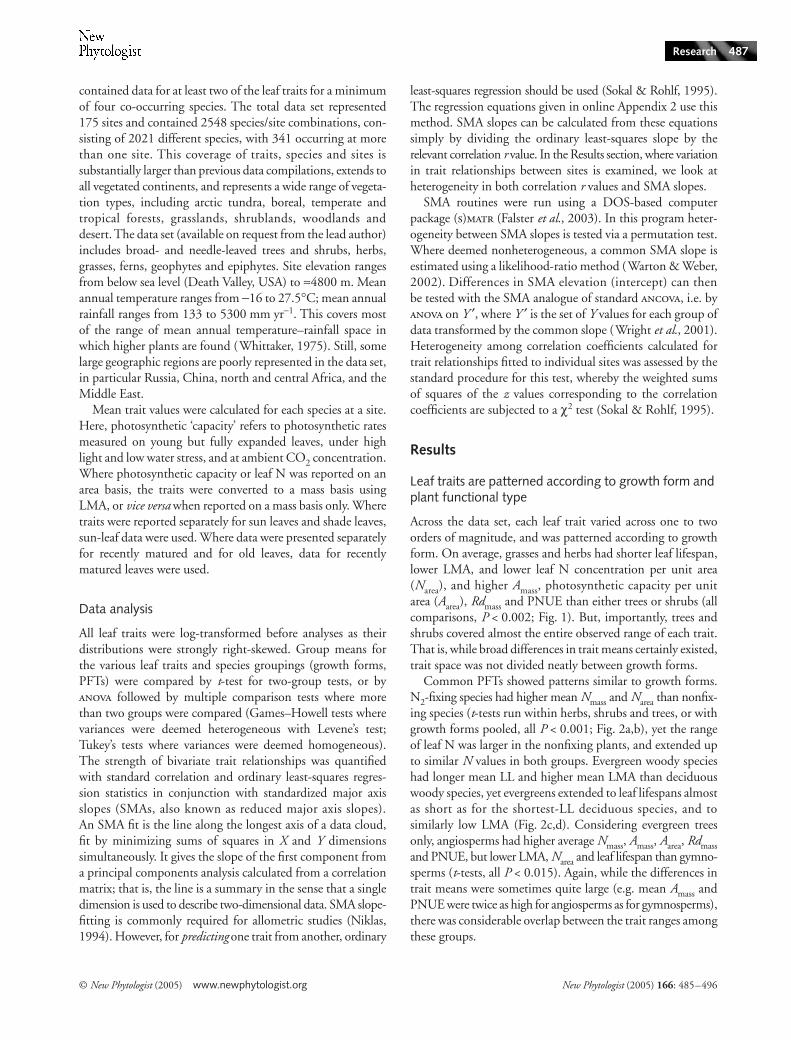
Leaf traits are patterned according to growth form and plant functional type
Across the data set, each leaf trait varied across one to twoorders of magnitude, and was patterned according to growthform. On average, grasses and herbs had shorter leaf lifespan,lower LMA, and lower leaf N concentration per unit area(
N
area
), and higher
A
mass
, photosynthetic capacity per unitarea (
A
area
),
Rd
mass
and PNUE than either trees or shrubs (allcomparisons,
P
< 0.002; Fig. 1). But, importantly, trees andshrubs covered almost the entire observed range of each trait.That is, while broad differences in trait means certainly existed,trait space was not divided neatly between growth forms.
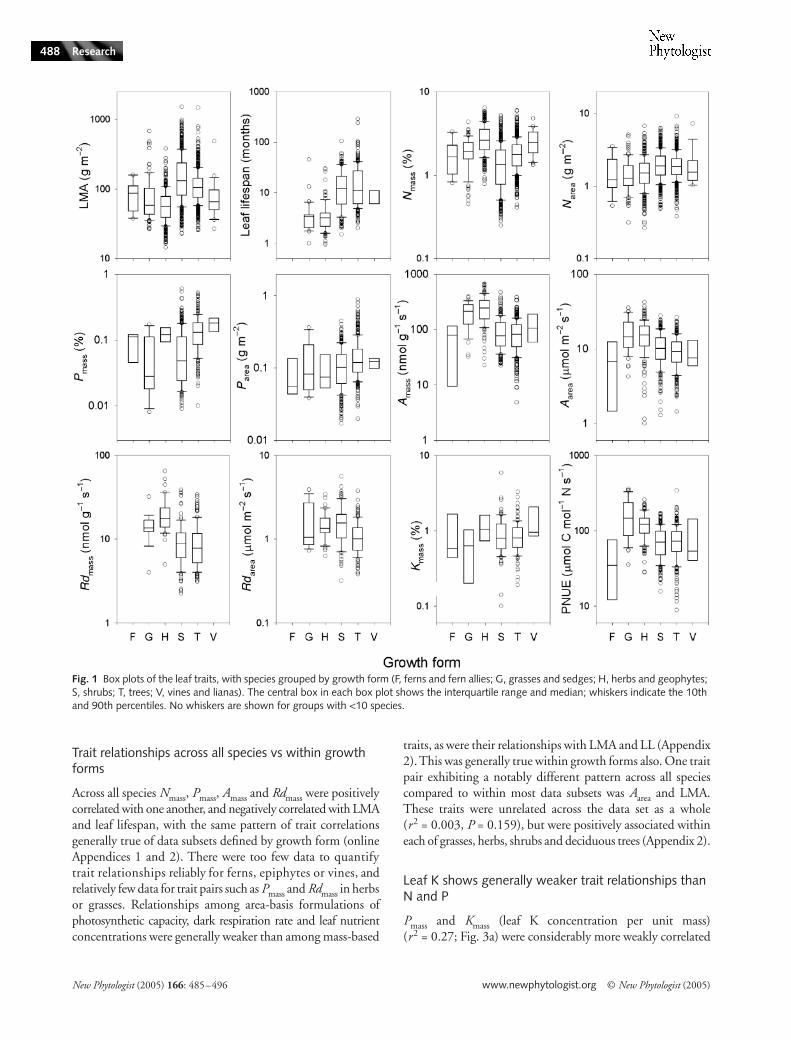
Common PFTs showed patterns similar to growth forms.N
2
-fixing species had higher mean
N
mass
and
N
area
than nonfix-ing species (
t
-tests run within herbs, shrubs and trees, or withgrowth forms pooled, all
P
< 0.001; Fig. 2a,b), yet the rangeof leaf N was larger in the nonfixing plants, and extended upto similar N values in both groups. Evergreen woody specieshad longer mean LL and higher mean LMA than deciduouswoody species, yet evergreens extended to leaf lifespans almostas short as for the shortest-LL deciduous species, and tosimilarly low LMA (Fig. 2c,d). Considering evergreen treesonly, angiosperms had higher average Nmass, Amass, Aarea, Rdmassand PNUE, but lower LMA, Narea and leaf lifespan than gymno-sperms (t-tests, all P < 0.015). Again, while the differences intrait means were sometimes quite large (e.g. mean Amass andPNUE were twice as high for angiosperms as for gymnosperms),there was considerable overlap between the trait ranges amongthese groups.
New Phytologist (2005) 166: 485–496 www.newphytologist.org © New Phytologist (2005)
Research488
Trait relationships across all species vs within growth forms
Across all species Nmass, Pmass, Amass and Rdmass were positivelycorrelated with one another, and negatively correlated with LMAand leaf lifespan, with the same pattern of trait correlationsgenerally true of data subsets defined by growth form (onlineAppendices 1 and 2). There were too few data to quantifytrait relationships reliably for ferns, epiphytes or vines, andrelatively few data for trait pairs such as Pmass and Rdmass in herbsor grasses. Relationships among area-basis formulations ofphotosynthetic capacity, dark respiration rate and leaf nutrientconcentrations were generally weaker than among mass-based
traits, as were their relationships with LMA and LL (Appendix2). This was generally true within growth forms also. One traitpair exhibiting a notably different pattern across all speciescompared to within most data subsets was Aarea and LMA.These traits were unrelated across the data set as a whole(r2 = 0.003, P = 0.159), but were positively associated withineach of grasses, herbs, shrubs and deciduous trees (Appendix 2).
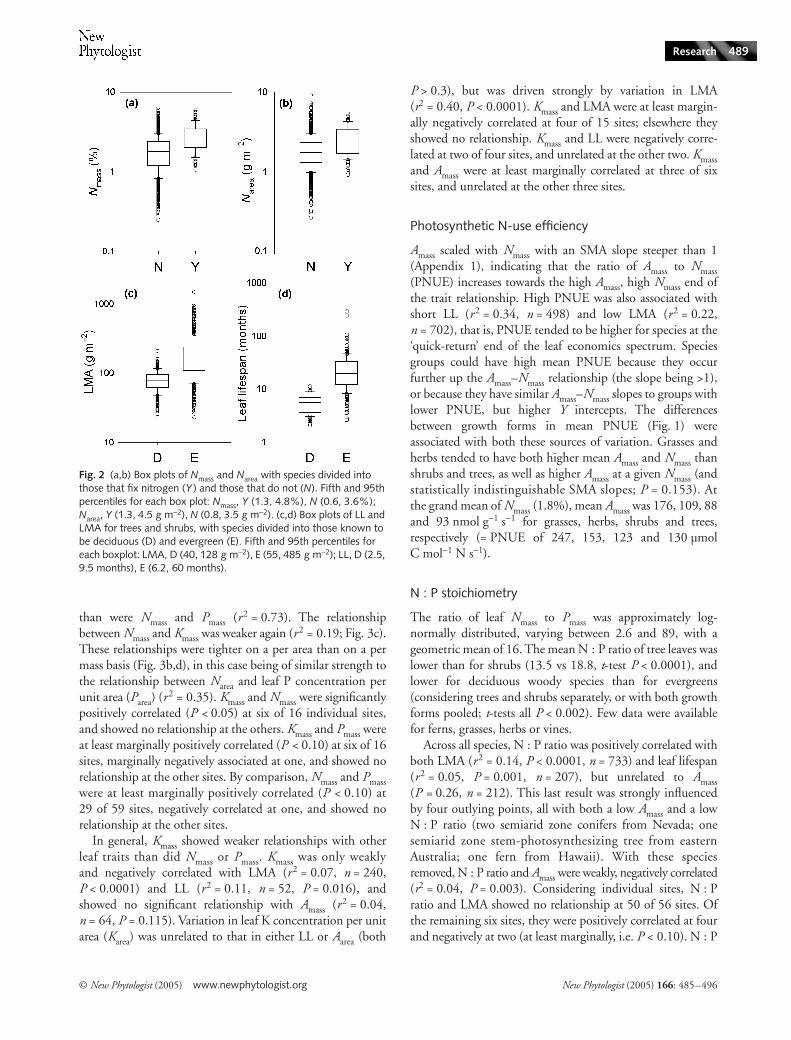
Leaf K shows generally weaker trait relationships than N and P
Pmass and Kmass (leaf K concentration per unit mass)(r2 = 0.27; Fig. 3a) were considerably more weakly correlated
Fig. 1 Box plots of the leaf traits, with species grouped by growth form (F, ferns and fern allies; G, grasses and sedges; H, herbs and geophytes; S, shrubs; T, trees; V, vines and lianas). The central box in each box plot shows the interquartile range and median; whiskers indicate the 10th and 90th percentiles. No whiskers are shown for groups with <10 species.
© New Phytologist (2005) www.newphytologist.org New Phytologist (2005) 166: 485–496
Research 489
than were Nmass and Pmass (r2 = 0.73). The relationshipbetween Nmass and Kmass was weaker again (r2 = 0.19; Fig. 3c).These relationships were tighter on a per area than on a permass basis (Fig. 3b,d), in this case being of similar strength tothe relationship between Narea and leaf P concentration perunit area (Parea) (r
2 = 0.35). Kmass and Nmass were significantlypositively correlated (P < 0.05) at six of 16 individual sites,and showed no relationship at the others. Kmass and Pmass wereat least marginally positively correlated (P < 0.10) at six of 16sites, marginally negatively associated at one, and showed norelationship at the other sites. By comparison, Nmass and Pmasswere at least marginally positively correlated (P < 0.10) at29 of 59 sites, negatively correlated at one, and showed norelationship at the other sites.
In general, Kmass showed weaker relationships with otherleaf traits than did Nmass or Pmass. Kmass was only weaklyand negatively correlated with LMA (r2 = 0.07, n = 240,P < 0.0001) and LL (r2 = 0.11, n = 52, P = 0.016), andshowed no significant relationship with Amass (r2 = 0.04,n = 64, P = 0.115). Variation in leaf K concentration per unitarea (Karea) was unrelated to that in either LL or Aarea (both
P > 0.3), but was driven strongly by variation in LMA(r2 = 0.40, P < 0.0001). Kmass and LMA were at least margin-ally negatively correlated at four of 15 sites; elsewhere theyshowed no relationship. Kmass and LL were negatively corre-lated at two of four sites, and unrelated at the other two. Kmassand Amass were at least marginally correlated at three of sixsites, and unrelated at the other three sites.
Photosynthetic N-use efficiency
Amass scaled with Nmass with an SMA slope steeper than 1(Appendix 1), indicating that the ratio of Amass to Nmass(PNUE) increases towards the high Amass, high Nmass end ofthe trait relationship. High PNUE was also associated withshort LL (r2 = 0.34, n = 498) and low LMA (r2 = 0.22,n = 702), that is, PNUE tended to be higher for species at the‘quick-return’ end of the leaf economics spectrum. Speciesgroups could have high mean PNUE because they occurfurther up the Amass–Nmass relationship (the slope being >1),or because they have similar Amass–Nmass slopes to groups withlower PNUE, but higher Y intercepts. The differencesbetween growth forms in mean PNUE (Fig. 1) wereassociated with both these sources of variation. Grasses andherbs tended to have both higher mean Amass and Nmass thanshrubs and trees, as well as higher Amass at a given Nmass (andstatistically indistinguishable SMA slopes; P = 0.153). Atthe grand mean of Nmass (1.8%), mean Amass was 176, 109, 88and 93 nmol g−1 s−1 for grasses, herbs, shrubs and trees,respectively (= PNUE of 247, 153, 123 and 130 µmolC mol−1 N s−1).
N : P stoichiometry
The ratio of leaf Nmass to Pmass was approximately log-normally distributed, varying between 2.6 and 89, with ageometric mean of 16. The mean N : P ratio of tree leaves waslower than for shrubs (13.5 vs 18.8, t-test P < 0.0001), andlower for deciduous woody species than for evergreens(considering trees and shrubs separately, or with both growthforms pooled; t-tests all P < 0.002). Few data were availablefor ferns, grasses, herbs or vines.
Across all species, N : P ratio was positively correlated withboth LMA (r2 = 0.14, P < 0.0001, n = 733) and leaf lifespan(r2 = 0.05, P = 0.001, n = 207), but unrelated to Amass(P = 0.26, n = 212). This last result was strongly influencedby four outlying points, all with both a low Amass and a lowN : P ratio (two semiarid zone conifers from Nevada; onesemiarid zone stem-photosynthesizing tree from easternAustralia; one fern from Hawaii). With these speciesremoved, N : P ratio and Amass were weakly, negatively correlated(r2 = 0.04, P = 0.003). Considering individual sites, N : Pratio and LMA showed no relationship at 50 of 56 sites. Ofthe remaining six sites, they were positively correlated at fourand negatively at two (at least marginally, i.e. P < 0.10). N : P
Fig. 2 (a,b) Box plots of Nmass and Narea with species divided into those that fix nitrogen (Y ) and those that do not (N). Fifth and 95th percentiles for each box plot: Nmass, Y (1.3, 4.8%), N (0.6, 3.6%); Narea, Y (1.3, 4.5 g m−2), N (0.8, 3.5 g m−2). (c,d) Box plots of LL and LMA for trees and shrubs, with species divided into those known to be deciduous (D) and evergreen (E). Fifth and 95th percentiles for each boxplot: LMA, D (40, 128 g m−2), E (55, 485 g m−2); LL, D (2.5, 9.5 months), E (6.2, 60 months).
New Phytologist (2005) 166: 485–496 www.newphytologist.org © New Phytologist (2005)
Research490
ratio and LL were unrelated at 12 of 16 sites, positively corre-lated at three, and negatively at one (at least marginally). Amassand N : P ratio were unrelated at 15 of 17 sites, and positivelyor negatively correlated at one site apiece.
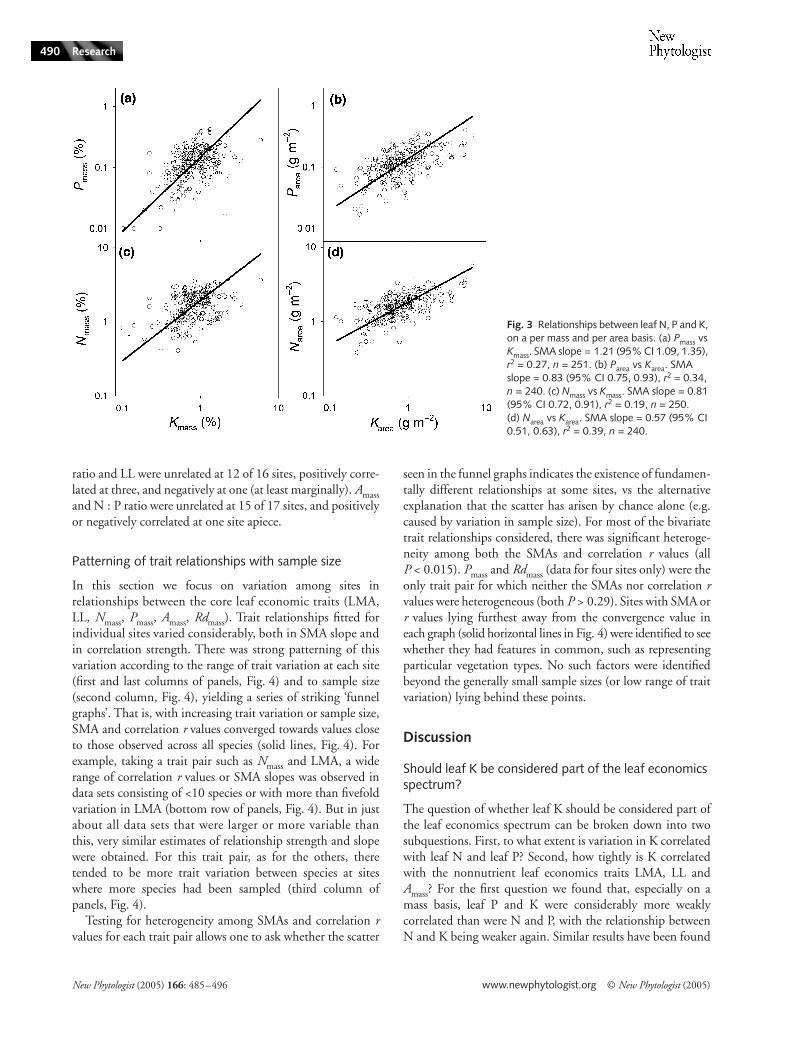
Patterning of trait relationships with sample size
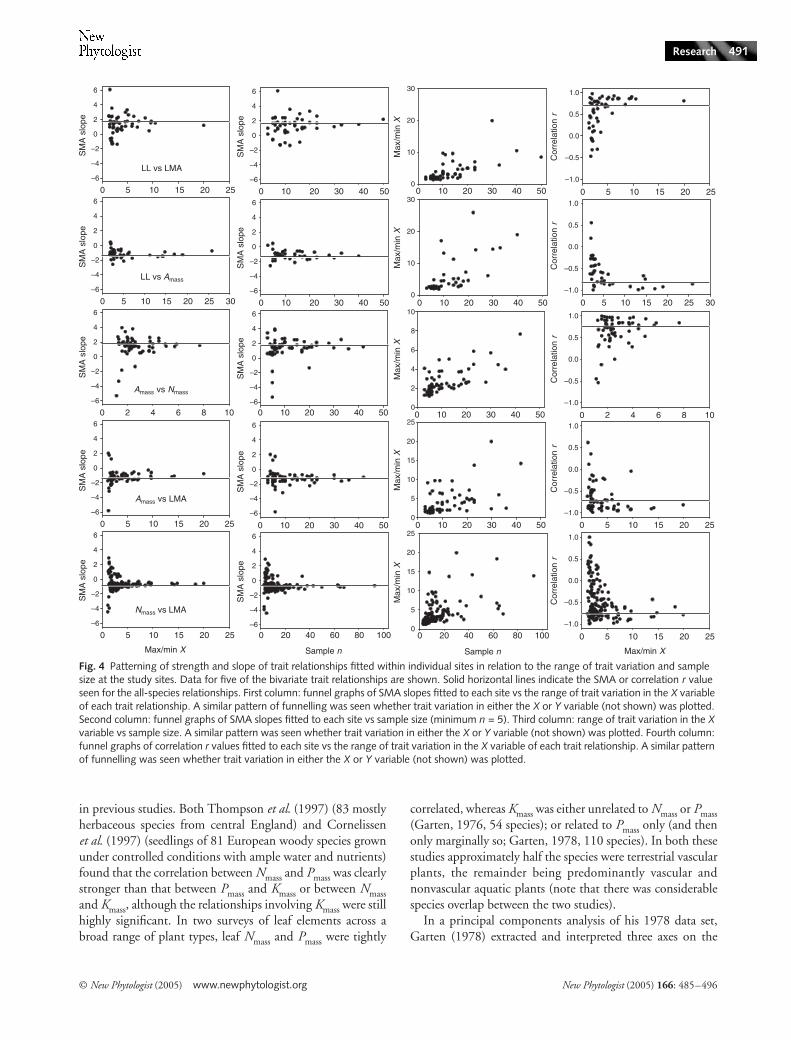
In this section we focus on variation among sites inrelationships between the core leaf economic traits (LMA,LL, Nmass, Pmass, Amass, Rdmass). Trait relationships fitted forindividual sites varied considerably, both in SMA slope andin correlation strength. There was strong patterning of thisvariation according to the range of trait variation at each site(first and last columns of panels, Fig. 4) and to sample size(second column, Fig. 4), yielding a series of striking ‘funnelgraphs’. That is, with increasing trait variation or sample size,SMA and correlation r values converged towards values closeto those observed across all species (solid lines, Fig. 4). Forexample, taking a trait pair such as Nmass and LMA, a widerange of correlation r values or SMA slopes was observed indata sets consisting of <10 species or with more than fivefoldvariation in LMA (bottom row of panels, Fig. 4). But in justabout all data sets that were larger or more variable thanthis, very similar estimates of relationship strength and slopewere obtained. For this trait pair, as for the others, theretended to be more trait variation between species at siteswhere more species had been sampled (third column ofpanels, Fig. 4).
Testing for heterogeneity among SMAs and correlation rvalues for each trait pair allows one to ask whether the scatter
seen in the funnel graphs indicates the existence of fundamen-tally different relationships at some sites, vs the alternativeexplanation that the scatter has arisen by chance alone (e.g.caused by variation in sample size). For most of the bivariatetrait relationships considered, there was significant heteroge-neity among both the SMAs and correlation r values (allP < 0.015). Pmass and Rdmass (data for four sites only) were theonly trait pair for which neither the SMAs nor correlation rvalues were heterogeneous (both P > 0.29). Sites with SMA orr values lying furthest away from the convergence value ineach graph (solid horizontal lines in Fig. 4) were identified to seewhether they had features in common, such as representingparticular vegetation types. No such factors were identifiedbeyond the generally small sample sizes (or low range of traitvariation) lying behind these points.
Discussion
Should leaf K be considered part of the leaf economics spectrum?
The question of whether leaf K should be considered part ofthe leaf economics spectrum can be broken down into twosubquestions. First, to what extent is variation in K correlatedwith leaf N and leaf P? Second, how tightly is K correlatedwith the nonnutrient leaf economics traits LMA, LL andAmass? For the first question we found that, especially on amass basis, leaf P and K were considerably more weaklycorrelated than were N and P, with the relationship betweenN and K being weaker again. Similar results have been found
Fig. 3 Relationships between leaf N, P and K, on a per mass and per area basis. (a) Pmass vs Kmass. SMA slope = 1.21 (95% CI 1.09, 1.35), r2 = 0.27, n = 251. (b) Parea vs Karea. SMA slope = 0.83 (95% CI 0.75, 0.93), r2 = 0.34, n = 240. (c) Nmass vs Kmass. SMA slope = 0.81 (95% CI 0.72, 0.91), r2 = 0.19, n = 250. (d) Narea vs Karea. SMA slope = 0.57 (95% CI 0.51, 0.63), r2 = 0.39, n = 240.
© New Phytologist (2005) www.newphytologist.org New Phytologist (2005) 166: 485–496
Research 491
in previous studies. Both Thompson et al. (1997) (83 mostlyherbaceous species from central England) and Cornelissenet al. (1997) (seedlings of 81 European woody species grownunder controlled conditions with ample water and nutrients)found that the correlation between Nmass and Pmass was clearlystronger than that between Pmass and Kmass or between Nmassand Kmass, although the relationships involving Kmass were stillhighly significant. In two surveys of leaf elements across abroad range of plant types, leaf Nmass and Pmass were tightly
correlated, whereas Kmass was either unrelated to Nmass or Pmass(Garten, 1976, 54 species); or related to Pmass only (and thenonly marginally so; Garten, 1978, 110 species). In both thesestudies approximately half the species were terrestrial vascularplants, the remainder being predominantly vascular andnonvascular aquatic plants (note that there was considerablespecies overlap between the two studies).
In a principal components analysis of his 1978 data set,Garten (1978) extracted and interpreted three axes on the
Fig. 4 Patterning of strength and slope of trait relationships fitted within individual sites in relation to the range of trait variation and sample size at the study sites. Data for five of the bivariate trait relationships are shown. Solid horizontal lines indicate the SMA or correlation r value seen for the all-species relationships. First column: funnel graphs of SMA slopes fitted to each site vs the range of trait variation in the X variable of each trait relationship. A similar pattern of funnelling was seen whether trait variation in either the X or Y variable (not shown) was plotted. Second column: funnel graphs of SMA slopes fitted to each site vs sample size (minimum n = 5). Third column: range of trait variation in the X variable vs sample size. A similar pattern was seen whether trait variation in either the X or Y variable (not shown) was plotted. Fourth column: funnel graphs of correlation r values fitted to each site vs the range of trait variation in the X variable of each trait relationship. A similar pattern of funnelling was seen whether trait variation in either the X or Y variable (not shown) was plotted.

New Phytologist (2005) 166: 485–496 www.newphytologist.org © New Phytologist (2005)
Research492
basis of biochemical functions of elements in cells. The firstaxis, PCA1, was a ‘nucleic acid-protein set’ correlated withconcentrations of P, N, Cu, S and Fe. PCA2 was a ‘structuraland photosynthetic set’ correlated with concentrations of Mg,Ca, K, Zn, Mn and N. PCA3 was an ‘enzymatic set’ correlatedwith concentrations of Mn, K and Mg. We ran a similar analysison the data of Thompson et al. (1997) (principal componentsextracted from the correlation matrix of log10-transformeddata), finding a pattern congruent with Garten’s, with the firstaxis largely representing variation in N and P; the second Ca,Mg and K; and the third Mn (details not shown).
Whereas the major pools of N and P in leaves are in cellularconstituents such as proteins, ribosomes and nucleic acids, Kis primarily found in cell sap as a dissolved ion (Larcher, 2003).Potassium is important as an activator of many enzymes thatare essential for photosynthesis and respiration, as an importantcontributor to the osmotic potential of cells, and in stomatalcontrol (Salisbury & Ross, 1991). Leaf calcium is found in cellwalls; Mg is central to chlorophyll and helps maintain ribos-ome structure; Mn plays a role in maintaining the structure ofchloroplast membranes; and both Mn and Mg also act asactivators of enzymes (Garten, 1978; Salisbury & Ross, 1991).Collectively, the studies cited above suggest that, while Kconcentration may be broadly correlated with the concentra-tion of N and P in leaves, it is at least as tightly associated withelements such as Ca and Mg, if not more so. To some extentthis appears to reflect the different roles these groups ofelements play in leaves.
Few studies have quantified the strength of associationbetween leaf K and plant traits other than tissue nutrient con-centrations. Here, we found that Kmass showed clearly weakerrelationships with LMA, LL and Amass than did either Nmass orPmass; indeed the Amass–Kmass relationship was nonsignificantacross all species (although the traits were positively correlatedat three of the six individual sites). Considering the individualsets of site-based data that constituted our data set, none ofthe relationships between Kmass and LMA and LL went the‘wrong’ way (i.e. opposite in sign to the all-species relation-ship), but compelling evidence for general relationshipsbetween K and these other leaf traits was lacking. Among theseedlings studied by Cornelissen et al. (1997), the strengthof association with both LMA and seedling maximum RGRdecreased in the order Nmass, Pmass then Kmass, but all theserelationships were highly significant (P < 0.001), and the trendtowards weaker relationships involving Kmass was much lessobvious than in our field-based data set.
In conclusion, leaf K cannot be considered as one of thecore traits making up the leaf economics spectrum, althoughit is still loosely associated with it. Here we have consideredjust leaf traits. In the landmark study of Grime et al. (1997),43 common species from the British Isles were screened for adiverse array of 67 traits. Pairwise correlations among thetraits were not reported; rather, a variety of data-reductionanalyses were run. These analyses indicated that the primary
axis of trait variation was made up of leaf nutrient concentra-tions (N, P, K, Ca, Mg), life history (ephemeral, annual,perennial), root and shoot foraging ability, specific leaf area(SLA), LL, leaf strength, leaf palatability and litter decompo-sition rate. In essence, this axis describes the capacity of speciesto take advantage of favourable growth opportunities (Grime,1977; Grime et al., 1997). The leaf economics spectrum isthus a major part of this axis.
Photosynthetic N-use efficiency
By contrast with leaf K, PNUE was quite tightly related to thecore leaf economic traits. This adds further generality to thefinding from a previous data compilation where PNUE wasshown to be negatively correlated with leaf lifespan (Reich et al.,1992). At least three factors could contribute to species withhigh LMA (thicker or denser leaf tissue, or both) having lowerphotosynthetic capacity at a given leaf N (Reich et al., 1998).First, the path of CO2 diffusion may be more tortuous, that is,they suffer a higher degree of diffusional limitation to photo-synthesis (Parkhurst, 1994; Enriquez et al., 1996). Second, alower fraction of light may be transmitted through the leaf, thatis, photosynthesis may be relatively more light-limited (Green& Kruger, 2001). Third, leaf N may be partitioned differentlyin high-LMA species, with a greater fraction occurring in non-photosynthetic components (Hikosaka et al., 1998; Poorter& Evans, 1998; Hikosaka & Hirose, 2000). These prospectiveexplanations are not mutually exclusive. But in our view thethird point, in particular, warrants further systematic investiga-tion across the vegetation of the world.
Leaf N : P ratios
Across all species, leaf N : P ratios were positively correlated withLL and LMA, and negatively correlated with Amass. These trendsare consistent with what would be expected if low N : P ratiosare characteristic of species with fast growth rates (Elser et al.,2000; Sterner & Elser, 2002). However, the relationships hadonly low explanatory power (all r2 < 0.14). Within individualsites, the relationships between N : P ratio and these other leaftraits were nonsignificant in the majority of cases (75% to89% of the time, depending on the trait pair). Thus, acrossthis broad sample of species, variation in leaf N : P ratio canbe considered as only very weakly associated with the leafeconomics spectrum. Yet in a variety of organisms, particularlythose with small body size, the potential for rapid growth tendsto be quite tightly correlated with tissue N : P ratios (Elser et al.,2000; Sterner & Elser, 2002). Possible factors contributing tothis apparent discrepancy include the following.(i) Terrestrial plants, particularly woody species, have a muchgreater proportion of biomass tied up in ‘nonproductive’ tissues,such as stems, with rather different N : P ratios to leaves. Ourdatabase of leaf N : P ratios was strongly dominated by woodyspecies.

© New Phytologist (2005) www.newphytologist.org New Phytologist (2005) 166: 485–496
Research 493
(ii) Differential partitioning of leaf N and P among speciesmay cloud any underlying link between growth rate and N : Pratio. Rather than measuring total P, perhaps we should bemeasuring just the inorganic P pool? Rather than studyingtotal N, perhaps we should be studying just organic N or pro-tein N? As pointed out above, the degree to which species andspecies groups vary in within-leaf partitioning of key elementswarrants further investigation.(iii) Traits such as LL, LMA and Amass are only approximateindices of growth rate. This appears to be the weakestargument of the three. In a number of vegetation types, LMAand LL are quite tightly correlated with the amount of above-ground net primary production per unit foliage biomass(Reich et al., 1992; Gower et al., 1993; Garnier et al., 2004) and,at least in seedlings, LMA is a strong predictor of potentialRGR (Lambers & Poorter, 1992). Furthermore, several leafeconomic traits contribute strongly to the primary axis ofstrategic variation identified by Grime (1977) and Grimeet al. (1997), this axis describing the capacity of species forrapid growth when growing under favourable conditions.
Relationships between leaf trait data and ecosystem properties
Leaf traits such as LMA (or its inverse, SLA), LL, Nmassand dark respiration rates are used as input parameters inmany global vegetation models (Friend et al., 1997; Moorcroftet al., 2001; Bonan et al., 2002; Bonan et al., 2003; Kaplanet al., 2003; Sitch et al., 2003). Models such as the LPJ model(Sitch et al., 2003) and the ecosystem demography model(Moorcroft et al., 2001) make use of published relationshipsbetween traits such as LL, SLA and Nmass (Reich et al., 1997) forparameterization. The degree of accuracy in parameterizingthese kinds of model can substantially affect the reliability ofmodel output. For example, output from the BIOME–BGCterrestrial ecosystem model is particularly sensitive to the choiceof SLA assigned to each PFT (White et al., 2000). Here, leaftraits were patterned by growth form and PFT, echoingprevious results from smaller studies (Diaz & Cabido, 1997;Aerts & Chapin, 2000; Reich et al., 2003). An important con-clusion from our study is that, despite mean trait differencesbetween species groups, the overlap in trait ranges are sufficientlylarge that considerable caution should be exercised whenassigning average trait values to growth forms or PFTs for usein global vegetation models.
One possible way forward would be to describe differentvegetation types in models with frequency distributions ofindividual traits (e.g. SLA) rather than with frequency distri-butions of PFTs, with each PFT assigned a given set of fixedtrait values (Moorcroft et al., 2001; Bonan et al., 2002; Kaplanet al., 2003). This does not mean that trait values would beneeded for every species at a site, but the trait frequencydistributions would need to be weighted by the relative abun-dance of the constituent species, and values would be needed
for the more common species. In a recent study concerninga successional sequence of post-agricultural sites in France(Garnier et al., 2004), above-ground production efficiency(above-ground net primary production/foliage biomass),litter decomposition rate, and soil N and C concentrationswere all tightly correlated with community-mean SLA, Nmassand leaf dry matter concentration (ratio of dry mass to freshmass). Community-mean trait values were weighted byspecies abundance. Remarkably, the correlations were almostas tight when trait means were calculated from just the twomost dominant species at each site, rather than from thewhole set. The biggest differences were seen in correlationsinvolving litter decomposition rate, being tighter using thecommunity-mean trait values. Across a variety of forest sites,canopy-mean leaf lifespan and LMA have also been shownto be negatively correlated with above-ground productionefficiency, as well as being positively correlated with the totalfoliage mass or area per unit ground area (Reich et al., 1992;Gower et al., 1993; Pierce et al., 1994). The high foliage massof species with long leaf lifespans appeared to compensatefor low production per unit foliage mass, as above-groundnet primary production of forest stands was not related toleaf lifespan (Reich et al., 1992; Gower et al., 1993). Similarly,above-ground net primary production was not correlatedwith SLA, Nmass or leaf dry matter concentration in the Frenchstudy (Garnier et al., 2004).
Sample size and funnel graphs
Funnel graphs are sometimes used for meta-analysis of experi-mental studies in order to identify whether, with increasingsample size, the effect size (e.g. correlation strength) convergestowards an average value (the ‘true’ effect size), and to detectbias caused by the selective nonreporting of nonsignificant orcounterintuitive results (Devlin et al., 1997; Egger et al., 1997;Palmer, 2002). Here, however, we were not searching for the‘true’ effect size, so much as asking whether the heterogeneitybetween results from different studies could be explained bysample size alone, as opposed to reflecting truly different traitrelationships among different sets of coexisting species. Thatis, we used this technique to assess the generality of thetrait relationships seen across the larger data set. The tests forheterogeneity among SMA slopes and correlation coefficientssuggested that there was indeed real heterogeneity among theresults. So what factors may contribute to heterogeneity, overand above that expected on the basis of variable sample size alone?
Different mixes of growth forms or functional types occurringat different sites could contribute to among-site heterogeneity:for all trait pairs there was variation in both relationship slopeand correlation strength with growth form of PFT (Appendix2). Still, even when our analyses were restricted to morehomogeneous groups, such as evergreen trees only, there wasstill heterogeneity among the SMAs fitted to individual sites(data not shown). What other factors might also be at play?

New Phytologist (2005) 166: 485–496 www.newphytologist.org © New Phytologist (2005)
Research494
Abiotic site factors may be important. For example, some keytrait relationships are modulated by climatic factors:considered across all species, both LL–LMA and Amass–Nmassrelationships become less steep with increasing site temperature,potential evapotranspiration or irradiance (Wright et al.,2004; I.J.W. and co-workers, unpublished data). Trait rela-tionships may also be modified by soil nutrients (Wright et al.,2001; Niinemets & Kull, 2003). Differences in the methodsused to measure leaf traits may be another factor. In recogni-tion of this fact, there has been increased effort in recent timesto encourage researchers to employ standard protocols(Garnier et al., 2001; Cornelissen et al., 2003). Otherpossibilities include variation associated with limiting speciessampling to within restricted clades (e.g. where the rangeof trait variation may be low), and differences in leaf traitrelationships associated with the degree of light exposureexperienced by plants.
Conclusions: looking forward
The main conclusions emerging from these analyses were asfollows.(i) Despite mean trait differences between species groupsfor core leaf economic traits (LMA, LL, Nmass, Pmass, Amass,Rdmass), the overlap in trait ranges was sufficiently large thatconsiderable caution should be exercised when assigningaverage trait values to growth forms or PFTs.(ii) These core traits were intercorrelated, both globally andwithin growth forms and PFTs; together the traits can beconsidered as forming a ‘leaf economics spectrum’ (Wrightet al., 2004). Whereas PNUE can also be considered as partof this trait spectrum, the same cannot be said for leaf K orfor leaf N : P ratios. At this stage it is not clear that recentideas on ecological stoichiometry (Sterner & Elser, 2002)can be applied to terrestrial, woody vegetation.(iii) Much of the scatter among trait relationships fitted toindividual sites reflects variation in sample size and differencesin the range of trait variation between studies. Still, there wasmore scatter than expected by chance alone, suggesting that,while these trait relationships can indeed be considered verygeneral, they are not necessarily universal.
In this project we have brought together unpublished leaftrait data with much of the data that is scattered through theliterature. For traits such as LMA, we now have data for almost1% of vascular plant species. For other traits and growth forms,the sampling is less comprehensive. For example, we know farless about how respiration varies among species than aboutphotosynthetic rates, and we know considerably less aboutleaf P than about leaf N concentrations, especially for herbs,grasses, ferns and vines, and we have few data for cryptograms,despite the fact that mosses and lichens are extremely impor-tant in cool and cold biomes. The addition of data such asthese to global trait compilations would increase their gener-ality considerably.
Our ability to model vegetation shifts with climate andland-use change has been, and will continue to be, enhancedby formulating solid generalizations about key structural andphysiological leaf traits at world scale. However, linking thissort of information to data from other scales remains a signif-icant challenge. In particular, linking leaf-level informationwith multi-species data sets concerning root, canopy andwhole-plant traits would be valuable, as would matching datawith information on the relative abundance of species, andwith ecosystem properties such as rates of nutrient cyclingthrough communities (Garnier et al., 2004). Incorporatingthis sort of knowledge into future vegetation–climate modelswould indeed represent an exciting challenge.
Acknowledgements
We thank the many researchers who generously providedadditional information about their study sites and publisheddata. This study was partially supported by grants from theAustralian Research Council and the US National ScienceFoundation (NSF/DEB 9411972, 0080382 and NSF 0128958).
References
Aerts R, Chapin FS. 2000. The mineral nutrition of wild plants revisited: a re-evaluation of processes and patterns. Advances in Ecological Research 30: 1–67.
Bonan GB, Levis S, Kergoat L, Oleson KW. 2002. Landscapes as patches of plant functional types: an integrating concept for climate and ecosystem models. Global Biogeochemical Cycles 16: 1021.
Bonan GB, Levis S, Sitch S, Vertenstein M, Oleson KW. 2003. A dynamic global vegetation model for use with climate models: concepts and description of simulated vegetation dynamics. Global Change Biology 9: 1543–1566.
Cornelissen JHC, Werger MJA, Castro-Diez P, van Rheenan JWA, Rowland AP. 1997. Foliar nutrients in relation to growth, allocation and leaf traits in seedlings of a wide range of woody plant species and types. Oecologia 111: 460–469.
Cornelissen JHC, Lavorel S, Garnier E, Diaz S, Buchmann N, Gurvich DE, Reich PB, ter Steege H, Morgan HD, van der Heijden MGA, Pausas JG, Poorter H. 2003. A handbook of protocols for standardised and easy measurement of plant functional traits worldwide. Australian Journal of Botany 51: 335–380.
Devlin B, Daniels M, Roeder K. 1997. The heritability of IQ. Nature 388: 468–471.
Diaz S, Cabido M. 1997. Plant functional types and ecosystem function in relation to global change. Journal of Vegetation Science 8: 463–474.
Diaz S, Hodgson JG, Thompson K, Cabido M, Cornelissen JHC, Jalili A, Montserrat-Marti G, Grime JP, Zarrinkamar F, Asri Y, Band SR, Basconcelo S, Castro-Diez P, Funes G, Hamzehee B, Khoshnevi M, Perez-Harguindeguy N, Perez-Rontome MC, Shirvany FA, Vendramini F, Yazdani S, Abbas-Azimi R, Bogaard A, Boustani S, Charles M, Dehghan M, de Torres-Espuny L, Falczuk V, Guerrero-Campo J, Hynd A, Jones G, Kowsary E, Kazemi-Saeed F, Maestro-Martinez M, Romo-Diez A, Shaw S, Siavash B, Villar-Salvador P, Zak MR. 2004. The plant traits that drive ecosystems: evidence from three continents. Journal of Vegetation Science 15: 295–304.
Diemer M. 1998. Life span and dynamics of leaves of herbaceous perennials in high-elevation environments – news from the elephant’s leg. Functional Ecology 12: 413–425.
© New Phytologist (2005) www.newphytologist.org New Phytologist (2005) 166: 485–496
Research 495
Egger M, Davey GD, Schneider M, Minder C. 1997. Bias in meta-analysis detected by a simple, graphical test. British Medical Journal 315: 629–634.
Elser JJ, Sterner RW, Gorokhova E, Fagan WF, Markow TA, Cotner JB, Harrison JF, Hobbie SE, Odell GM, Weider LJ. 2000. Biological stoichiometry from genes to ecosystems. Ecology Letters 3: 540–550.
Enriquez S, Duarte CM, Sandjensen K, Nielsen SL. 1996. Broad-scale comparison of photosynthetic rates across phototrophic organisms. Oecologia 108: 197–206.
Falster DS, Warton DI, Wright IJ. 2003. (S)MATR: Standardised Major Axis Tests and Routines. http://www.bio.mq.edu.au/ecology/SMATR/.
Field C, Mooney HA. 1986. The photosynthesis–nitrogen relationship in wild plants. In: Givnish TJ, ed. On the Economy of Plant Form and Function. Cambridge, UK: Cambridge University Press, 25–55.
Friend AD, Stevens AK, Knox RG, Cannell MGR. 1997. A process-based, terrestrial biosphere model of ecosystem dynamics ( v. 3.0). Ecological Modelling 95: 249–287.
Garnier E, Shipley B, Roumet C, Laurent G. 2001. A standardized protocol for the determination of specific leaf area and leaf dry matter content. Functional Ecology 15: 688–695.
Garnier E, Cortez J, Billès G, Navas M-L, Roumet C, Debussche M, Laurent G, Blanchard A, Aubry D, Bellmann A, Neill C, Toussaint J-P. 2004. Plant functional markers capture ecosystem properties during secondary succession. Ecology 85: 2630–2637.
Garten CT. 1976. Correlations between concentrations of elements in plants. Nature 261: 686–688.
Garten CTJ. 1978. Multivariate perspectives on the ecology of plant mineral element composition. American Naturalist 112: 533–544.
Gower ST, Reich PB, Son Y. 1993. Canopy dynamics and aboveground production of five tree species with different leaf longevities. Tree Physiology 12: 327–345.
Green DS, Kruger EL. 2001. Light-mediated constraints on leaf function correlate with leaf structure among deciduous and evergreen tree species. Tree Physiology 21: 1341–1346.
Grime JP. 1977. Evidence for the existence of three primary strategies in plants and its relevance to ecological and evolutionary theory. American Naturalist 111: 1169–1194.
Grime JP, Thompson K, Hunt R, Hodgson JG, Cornelissen JHC, Rorison IH, Hendry GAF, Ashenden TW, Askew AP, Band SR, Booth RE, Bossard CC, Campbell BD, Cooper JEL, Davison AW, Gupta PL, Hall W, Hand DW, Hannah MA, Hillier SH, Hodkinson DJ, Jalili A, Liu Z, Mackey JML, Matthews N, Mowforth MA, Meal AM, Reader RJ, Reiling K, Ross-Fraser W, Sutton F, Tasker DE, Thorpe PC, Whitehouse J. 1997. Integrated screening validates primary axes of specialisation in plants. Oikos 79: 259–281.
Güsewell S. 2004. N : P ratios in terrestrial plants: variation and functional significance. New Phytologist 164: 243–266.
Hikosaka K, Hirose T. 2000. Photosynthetic nitrogen-use efficiency in evergreen broad-leaved woody species coexisting in a warm-temperate forest. Tree Physiology 20: 1249–1254.
Hikosaka K, Hanba YT, Hirose T, Terashima I. 1998. Photosynthetic nitrogen-use efficiency in leaves of woody and herbaceous species. Functional Ecology 12: 896–905.
Kaplan JO, Bigelow NH, Prentice IC, Harrison SP, Bartlein PJ, Christensen TR, Cramer W, Matveyeva NV, McGuire AD, Murray DF, Razzhivin VY, Smith B, Walker DA, Anderson PM, Andreev AA, Brubaker LB, Edwards ME, Lozhkin AV. 2003. Climate change and arctic ecosystems II: Modeling, paleodata-model comparisons, and future projections. Journal of Geophysical Research – Atmospheres 108: 8171.
Koerselman W, Meuleman AFM. 1996. The vegetation N/P ratio – a new tool to detect the nature of nutrient limitation. Journal of Applied Ecology 33: 1441–1450.
Körner C. 1995. Leaf diffusive conductances in the major vegetation types of the globe. In: Schulze E-D, Caldwell MM, eds Ecophysiology of Photosynthesis. Berlin, Heidelberg: Springer-Verlag, 463–490.
Lambers H, Poorter H. 1992. Inherent variation in growth rate between higher plants: a search for ecological causes and consequences. Advances in Ecological Research 23: 187–261.
Larcher W. 2003. Physiological plant ecology. Ecophysiology and Stress Ecology of Functional Groups, 4th edn. Berlin, Heidelberg, New York: Springer-Verlag.
McGroddy ME, Daufresne T, Hedin LO. 2004. Scaling of C : N : P stoichiometry in forests worldwide: implications of terrestrial Redfield-type ratios. Ecology 85: 2390–2401.
Moorcroft PR, Hurtt GC, Pacala SW. 2001. A method for scaling vegetation dynamics: the ecosystem demography model (ED). Ecological Monographs 71: 557–585.
Nielsen SL, Enriquez S, Durate CM, Sand-Jensen K. 1996. Scaling maximum growth rates across photosynthetic organisms. Functional Ecology 10: 167–175.
Niinemets U. 2001. Global-scale climatic controls of leaf dry mass per area, density, and thickness in trees and shrubs. Ecology 82: 453–469.
Niinemets U, Kull K. 2003. Leaf structure vs. nutrient relationships vary with soil conditions in temperate shrubs and trees. Acta Oecologica 24: 209–219.
Niklas KJ. 1994. Plant Allometry: The Scaling of Form and Process. Chicago, IL, USA: University of Chicago Press.
Palmer AR. 2002. Chimpanzee right-handedness reconsidered: evaluating the evidence with funnel plots. American Journal of Physical Anthropology 118: 191–199.
Parkhurst DF. 1994. Diffusion of CO2 and other gases inside leaves. New Phytologist 126: 449–479.
Pierce LL, Running SW, Walker J. 1994. Regional-scale relationships of leaf area index to specific leaf area and leaf nitrogen content. Ecological Applications 4: 313–321.
Pons TL, van der Werf A, Lambers H. 1994. Photosynthetic nitrogen use efficiency of inherently slow- and fast-growing species: possible explanations for observed differences. In: Roy E, Garnier E, eds, A Whole Plant Perspective on Carbon–Nitrogen Interactions. The Hague: SPB Academic Publishing, 61–77.
Poorter H, Evans JR. 1998. Photosynthetic nitrogen-use efficiency of species that differ inherently in specific leaf area. Oecologia 116: 26–37.
Reich PB. 1993. Reconciling apparent discrepancies among studies relating life span, structure and function of leaves in contrasting plant life forms and climates: ‘the blind men and the elephant retold’. Functional Ecology 7: 721–725.
Reich PB, Oleksyn J. 2004. Global patterns of plant leaf N and P in relation to temperature and latitude. Proceedings of the National Academy of Sciences, USA 101: 11001–11006.
Reich PB, Walters MB, Ellsworth DS. 1992. Leaf life-span in relation to leaf, plant, and stand characteristics among diverse ecosystems. Ecological Monographs 62: 365–392.
Reich PB, Walters MB, Ellsworth DS. 1997. From tropics to tundra: global convergence in plant functioning. Proceedings of the National Academy of Sciences, USA 94: 13730–13734.
Reich PB, Ellsworth DS, Walters MB. 1998. Leaf structure (specific leaf area) modulates photosynthesis–nitrogen relations: evidence from within and across species and functional groups. Functional Ecology 12: 948–958.
Reich PB, Wright IJ, Cavender-Bares J, Craine JM, Oleksyn J, Westoby M, Walters MB. 2003. The evolution of plant functional variation: traits, spectra, and strategies. International Journal of Plant Sciences 164: S143–S164.
Salisbury FB, Ross CW. 1991. Plant Physiology, 4th edn. Belmont, CA, USA: Wadsworth Publishing.
Schulze E-D, Kelliher FM, Körner C, Lloyd J, Leuning R. 1994. Relationships among maximum stomatal conductance, ecosystem surface conductance, carbon assimilation rate, and plant nitrogen nutrition: a global scaling exercise. Annual Review of Ecology and Systematics 25: 629–660.
New Phytologist (2005) 166: 485–496 www.newphytologist.org © New Phytologist (2005)
Research496
Sitch S, Smith B, Prentice IC, Arneth A, Bondeau A, Cramer W, Kaplan JO, Levis S, Lucht W, Sykes MT, Thonicke K, Venevsky S. 2003. Evaluation of ecosystem dynamics, plant geography and terrestrial carbon cycling in the LPJ dynamic global vegetation model. Global Change Biology 9: 161–185.
Sokal RR, Rohlf FJ. 1995. Biometry: The Principles and Practice of Statistics in Biological Research, 3rd edn. New York: W.H. Freeman.
Sterner RW, Elser JJ. 2002. Ecological stoichiometry. The Biology of Elements from Molecules to the Biosphere. Princeton, NJ, USA/Oxford, UK: Princeton University Press.
Tessier JT, Raynal DJ. 2003. Use of nitrogen to phosphorus ratios in plant tissue as an indicator of nutrient limitation and nitrogen saturation. Journal of Applied Ecology 40: 523–534.
Thompson K, Parkinson JA, Band SR, Spencer RE. 1997. A comparative study of leaf nutrient concentrations in a regional herbaceous flora. New Phytologist 136: 679–689.
Warton DI, Weber NC. 2002. Common slope tests for bivariate errors-in-variables models. Biometrical Journal 44: 161–174.
Weiher E, van der Werf A, Thompson K, Roderick M, Garnier E, Eriksson O. 1999. Challenging Theophrastus: a common core list of plant traits for functional ecology. Journal of Vegetation Science 10: 609–620.
Westoby M, Falster DS, Moles AT, Vesk PA, Wright IJ. 2002. Plant ecological strategies: some leading dimensions of variation between species. Annual Review of Ecology and Systematics 33: 125–159.
White MA, Thornton PE, Running SW, Nemani RR. 2000. Parameterization and sensitivity analysis of the BIOME–BGC terrestrial ecosystem model: net primary production controls. Earth Interactions 4: 1–85.
Whittaker R. 1975. Communities and Ecosystems, 2nd edn. New York: Macmillan.
Wright IJ, Westoby M. 2002. Leaves at low versus high rainfall: coordination of structure, lifespan and physiology. New Phytologist 155: 403–416.
Wright IJ, Reich PB, Westoby M. 2001. Strategy-shifts in leaf physiology, structure and nutrient content between species of high and low rainfall, and high and low nutrient habitats. Functional Ecology 15: 423–434.
Wright IJ, Reich PB, Westoby M, Ackerly DD, Baruch Z, Bongers F, Cavender-Bares J, Chapin FS, Cornelissen JHC, Diemer M, Flexas J, Garnier E, Groom PK, Gulias J, Hikosaka K, Lamont BB, Lee T, Lee W, Lusk C, Midgley JJ, Navas M-L, Niinemets Ü, Oleksyn J, Osada N, Poorter H, Poot P, Prior L, Pyankov VI, Roumet C, Thomas SC, Tjoelker MG, Veneklaas EJ, Villar R. 2004. The world-wide leaf economics spectrum. Nature 428: 821–827.
Supplementary material
The following material is available as supplementary materialat http://www.blackwellpublishing.com/products/journals/suppmat/NPH/NPH1349/NPH1349sm.htm
Appendix 1
Matrix of scatterplots for six key leaf traits.
Appendix 2
Details of OLS regression relationships among the leaf traits.
About New Phytologist
• New Phytologist is owned by a non-profit-making charitable trust dedicated to the promotion of plant science, facilitating projectsfrom symposia to open access for our Tansley reviews. Complete information is available at www.newphytologist.org.
• Regular papers, Letters, Research reviews, Rapid reports and Methods papers are encouraged. We are committed to rapidprocessing, from online submission through to publication ‘as-ready’ via OnlineEarly – the 2003 average submission to decision timewas just 35 days. Online-only colour is free, and essential print colour costs will be met if necessary. We also provide 25 offprintsas well as a PDF for each article.
• For online summaries and ToC alerts, go to the website and click on ‘Journal online’. You can take out a personal subscription tothe journal for a fraction of the institutional price. Rates start at £109 in Europe/$202 in the USA & Canada for the online edition(click on ‘Subscribe’ at the website).
• If you have any questions, do get in touch with Central Office ([email protected]; tel +44 1524 592918) or, for a localcontact in North America, the USA Office ([email protected]; tel 865 576 5261).


