Embed Size (px)
Citation preview
AS BALTIKA
Consolidated interim report for the first quarter of 2015
Commercial name AS Baltika
Commercial registry number 10144415
Legal address Veerenni 24, Tallinn 10135, Estonia
Phone +372 630 2731
Fax +372 630 2814
E-mail [email protected]
Web page www.baltikagroup.com
Main activities Design, development, production and sales
arrangement of the fashion brands of clothing
Auditor AS PricewaterhouseCoopers
Financial year 1 January 2015 – 31 December 2015
Reporting period 1 January 2015 – 31 March 2015
Consolidated interim report for the I quarter of 2015 (in thousands euros, unaudited)
2
CONTENTS Brief description of Baltika Group ............................................................................................................ 3
Management report ................................................................................................................................. 4
Management board’s confirmation of the management report ............................................................. 12
Interim financial statements ................................................................................................................... 13
Consolidated statement of financial position ......................................................................................... 14
Consolidated statement of profit and loss ............................................................................................. 15
Consolidated statement of other comprehensive income ..................................................................... 16
Consolidated cash flow statement ......................................................................................................... 17
Consolidated statement of changes in equity........................................................................................ 18
Notes to consolidated interim report ...................................................................................................... 19
NOTE 1 Accounting policies and methods used in the preparation of the interim report .......... 19
NOTE 2 Financial risks .............................................................................................................. 19
NOTE 3 Cash and cash equivalents .......................................................................................... 23
NOTE 4 Trade and other receivables ........................................................................................ 23
NOTE 5 Inventories ................................................................................................................... 24
NOTE 6 Property, plant and equipment ..................................................................................... 24
NOTE 7 Intangible assets .......................................................................................................... 25
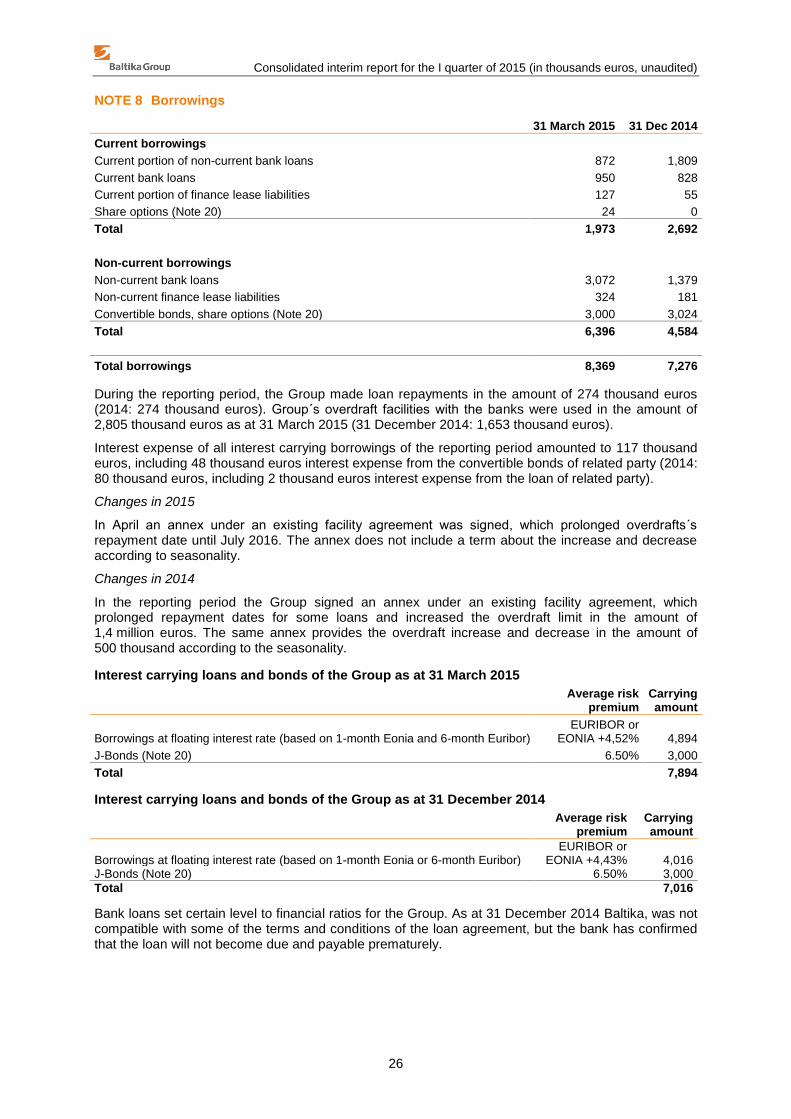
NOTE 8 Borrowings ................................................................................................................... 26
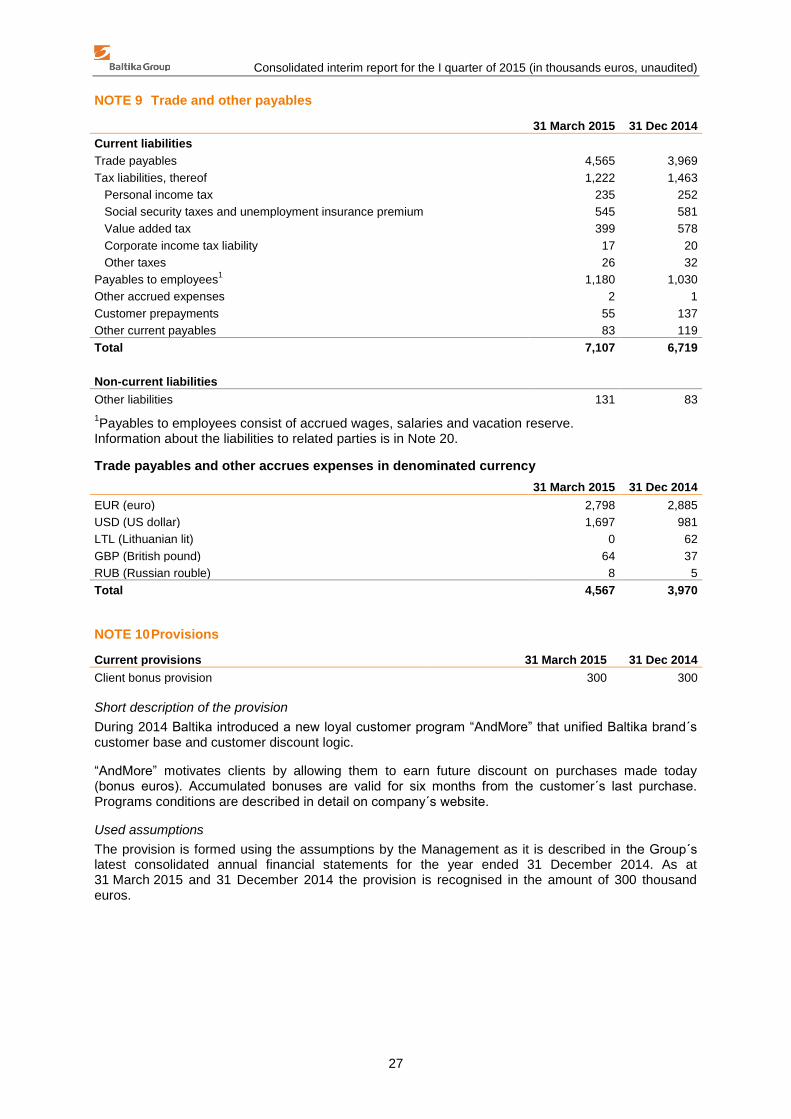
NOTE 9 Trade and other payables ............................................................................................ 27
NOTE 10 Provisions .................................................................................................................... 27
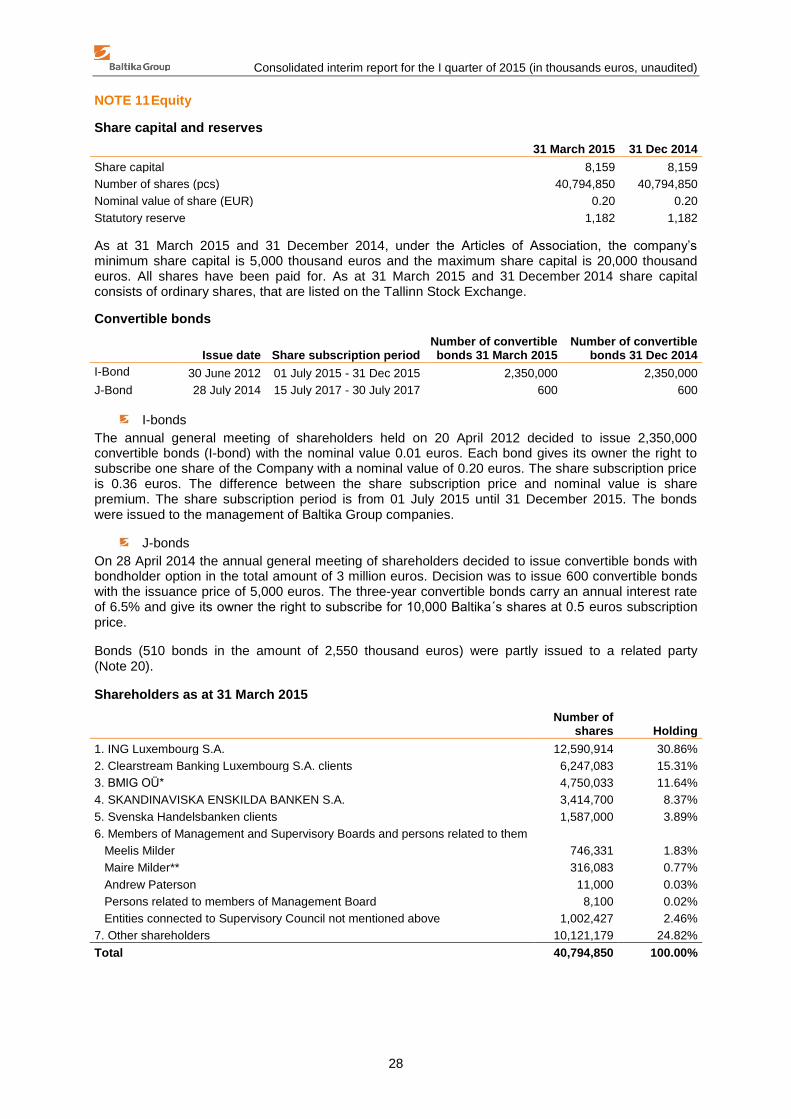
NOTE 11 Equity ........................................................................................................................... 28
NOTE 12 Segments ..................................................................................................................... 29
NOTE 13 Revenue ....................................................................................................................... 30
NOTE 14 Cost of goods sold ....................................................................................................... 31
NOTE 15 Distribution costs.......................................................................................................... 31
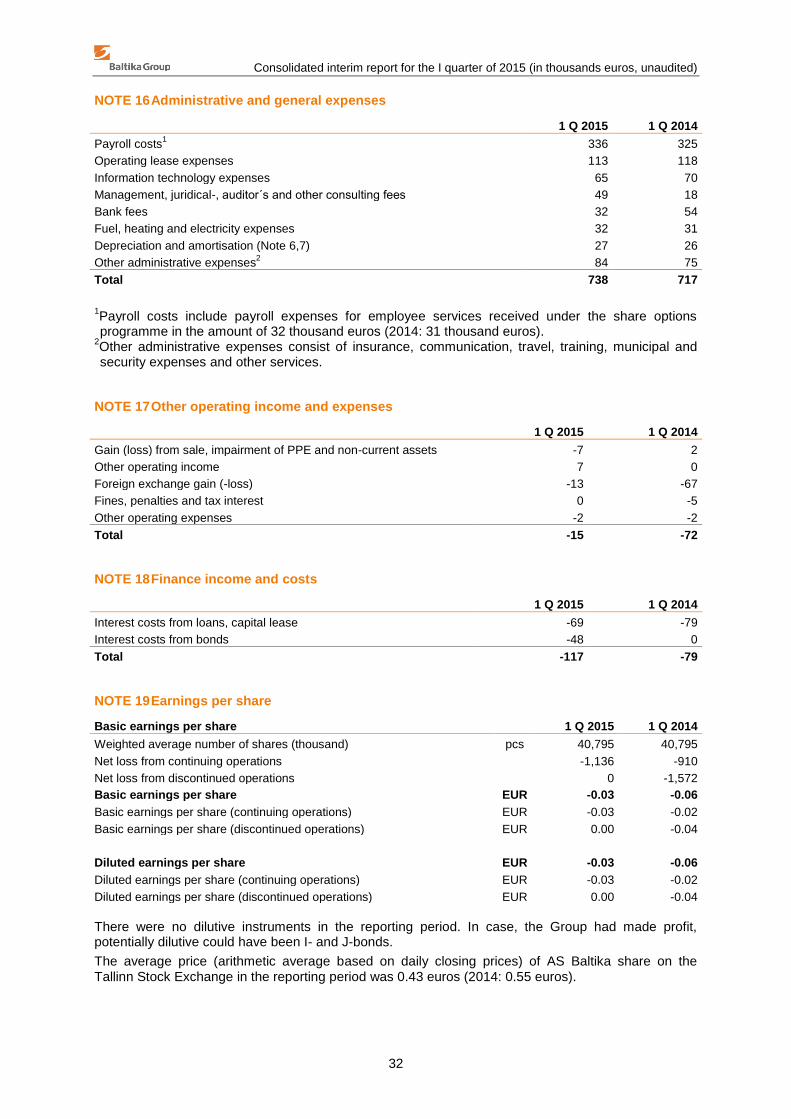
NOTE 16 Administrative and general expenses .......................................................................... 32
NOTE 17 Other operating income and expenses ........................................................................ 32
NOTE 18 Finance income and costs ........................................................................................... 32
NOTE 19 Earnings per share....................................................................................................... 32
NOTE 20 Related parties ............................................................................................................. 33
NOTE 21 Discontinued operations .............................................................................................. 34
AS Baltika Supervisory Council ............................................................................................................. 35
AS Baltika Management Board ............................................................................................................. 37

Consolidated interim report for the I quarter of 2015 (in thousands euros, unaudited)
3
BRIEF DESCRIPTION OF BALTIKA GROUP
The Baltika Group, with the parent company AS Baltika, is an international fashion retailer operating in the Baltic countries and Eastern Europe. Baltika Group operates six retail concepts: Monton, Mosaic, Baltman, Bastion, Ivo Nikkolo and also under franchise agreement Blue Inc. The Group employs a vertically integrated business model, which means that it controls all stages of the fashion process: design, manufacturing, supply chain management, distribution/logistics and retail sales. The Group also sells its collections through wholesale.
The shares of AS Baltika are listed on the Tallinn Stock Exchange which belongs to the NASDAQ OMX Group.
As at 31 March 2015 the Group employed 1,216 people (31 December 2014: 1,228).
The parent company is located and has been registered at 24 Veerenni in Tallinn, Estonia.
The Group consists of the following companies:
Subsidiary Location Activity Holding as at
31 March 2015 Holding as at
31 Dec 2014
OÜ Baltika Retail Estonia Holding 100% 100%
OÜ Baltman1 Estonia Retail 100% 100%
SIA Baltika Latvija1 Latvia Retail 100% 100%
UAB Baltika Lietuva1 Lithuania Retail 100% 100%
OOO „Olivija“1,2
Russia Retail 100% 100%
OY Baltinia AB Finland Distribution 100% 100%
Baltika Sweden AB Sweden Distribution 100% 100%
OÜ Baltika Tailor Estonia Production 100% 100%
OÜ Baltika TP Estonia Real estate management 100% 100%
1Interest through a subsidiary.
2OOO “Olivija” represents Russian consolidation group, which also includes OOO „Plazma“ and OOO
„Stelsing“.
Consolidated interim report for the I quarter of 2015 (in thousands euros, unaudited)
4
MANAGEMENT REPORT
BALTIKA’S UNAUDITED FINANCIAL RESULTS, FIRST QUARTER 2015
Baltika’s first quarter resulted in net loss in the amount of 1,136 thousand euros. The result of last year comparative period was loss of 2,482 thousand euros and comparative figure of continued operations was loss of 910 thousand euros.
In connection with Baltika’s exit from the Ukrainian retail business in 2014, which represented a major line of business of the Group, the results of the Ukrainian entity are presented as discontinued operation. Therefore the results of the discontinued operation are reported separately from continuing operations, to allow better assessment of the performance of continuing operations.
Baltika’s sales increased by 154 thousand euros that is 1% compared to the first quarter last year. Largest sales growth figures came from e-commerce with 245%, wholesale and franchise with 69% that is in line with strategic objective of preferential development of other channels and to grow sales both in wholesale and franchise and in e-store. Retail sales decrease was 6%.
First quarter was a challenge for Baltics as last year same period sales were the largest of prior five years. Retail sales grew in the Baltics by 1%, increase of 62 thousand euros. Meanwhile the results were different by countries – when Latvia showed the largest sales growth (+5%) then in Lithuania the quarter was better in terms of efficiency figures and gross profit growth. Economy in Baltics remained stable in the first quarter - economic situation is improving domestic demand. In the same time tourist flow from Eastern and Finnish neighbours to Baltics decreased. Baltic countries first quarter result was most impacted by weak January, where goods from previous season were realised with higher than planned discount and in smaller amount. Trend was upward in the quarter – March sales results were in line with expectations.
Russian unstable economy, weaker rouble and rising prices continue to decrease consumer confidence and hinder developments in fashion industry. Despite the complicated economic situation sales efficiency increased in first quarter by 8% in local currency. Sales revenue in local currency decreased in first quarter by 11%, while the average operating area of stores decreased by 18%. Due to reduced operating area and weaker currency the first quarter retail was down by 731 thousand euros (-40%). In total, result of Russia in first quarter improved with the optimisation of costs and closing of loss making stores.
Company gross profit margin in the first quarter was 44.5% that is 4.1 percentage points lower than in the same period last year. The decrease of gross profit margin has from one side been impacted by the lower margin in wholesale and franchise, which proportion from sales has increased from 8% to 13%. In addition Group’s margin is impacted from US dollar strengthening driven increase of purchase prices of goods and weakening of rouble. Russian retail gross profit margin decreased by 9.1 percentage points compared to same period in prior year.
Baltika has initiated a number of initiatives to catch up with the yearly financial targets shortage. Strong control is on head-office operating expense, general stock level is reduced and usage made more efficient, restructuring is taking place in product department to strengthen process based management.
Highlights of the period until the date of release of this quarterly report
Nasdaq Baltic Market exchanges awarded in January those with best investors’ relations and Baltika received the nomination in two categories – 5
th place in the Best Investors Relations in
the Baltic Market and 2-3rd
place in The Best Annual Report and Corporate Governance Report.
On January 30, 2015 the Supervisory Board of AS Baltika suspended Maigi Pärnik-Pernik Management Board contract for the duration of her maternity leave. The Management Board member responsible for the finance function during the leave of Maigi Pärnik-Pernik is Meelis Milder.
Additional problem to economic situation in Russia has proved to be the situation in banking sector. Baltika Group companies have used in Russia several banks services, including one
Consolidated interim report for the I quarter of 2015 (in thousands euros, unaudited)
5
among the top largest 100 banks in Russia, ООО Судостроительный банк. The bank has had liquidity issues since January and on 16th February 2015 the Central Bank of Russia withdrew their license. No disruption has thus far occurred with the other banks used. Baltika is working together with law firm partners on resolving the matter to know when and how much funds from what was held on the account would be returned. Baltika’s operations continue as usual and the possible maximum loss is not significant.
On 20 February 2015, OÜ Baltika TP and OÜ Baltika Retail executed a merger agreement according to which OÜ Baltika Retail is the acquiring company and OÜ Baltika TP the company being merged. Since July 2012 Baltika TP has been dormant and the goal of the merger is to minimise Baltika TP administrative management costs. Proposed merger is within the Group and therefore results in no changes to the Baltika Group assets, rights and obligations amount, content and nature. The merger will have no economic effect on the other subsidiaries of the Group.
Supervisory Council decided on 26 of March 2015 to propose to the Annual General Meeting of shareholders to increase conditionally the share capital of AS Baltika for the option scheme for Management Board members, by issuing additionally up to 1,000,000 (one million) registered shares with the nominal value of 0.20 euros and with the issuance price of 0.20 euros per each share. Each share option grants its owner the right to acquire 1 (one) share of the Company. The subscription of the shares takes place within two years after the lapse of a period of three years from the execution of the option agreement with the eligible persons of the share option program.
Supervisory Council of AS Baltika decided to recall from the Management Board starting from 14 April 2015 Management Board member Andrew James David Paterson.
The Annual General Meeting of AS Baltika, held on 27 April 2015, decided to approve the Annual report for 2014 and covering of net loss from retained earnings. Meeting elected to extend the powers of current Supervisory Council members for next three year term and agreed to the remuneration of Supervisory Council members in accordance with the proposal. The meeting decided to increase conditionally the share capital of AS Baltika, to issue ordinary shares in accordance with Terms and conditions of Share Option Program proposed by Supervisory Council
Baltika continued the optimisation of Russian retail market, four stores were closed: Monton and Mosaic stores in Novosibirsk, Monton store in Nizni Novgorod and outlet store in St. Petersburg. One new Ivo Nikkolo store was opened in March in Tasku shopping centre in Tartu, Estonia that is the only flagship store of this brand in Tartu. Baltika’s brands franchise stores portfolio saw addition of three new stores in January: franchise partner Gold Button opened outlet store in Moscow, Russia and franchise partner Mirworld opened Baltman and Bastion flagship stores in Tenerife, in Spain.
REVENUE
Baltika’s first quarter sales revenue increased by 1% and was 12,325 thousand euros. Growth was biggest in other channels - wholesale and franchise growth was 69% and e-channel growth was more than three times that is 245%. Planned development of other channels signified an increase of 842 thousand euros compared to same period in prior year. Retail sales were more modest mainly due to the impact of Russian market, decreasing 6% compared to same period in prior year. Retail sales in Baltics exceeded the result of the first quarter last year – that was the first quarter with biggest sales in five years.
Revenue by activity
Continued operations
EUR thousand Q1 2015 Q1 2014 +/-
Retail 10,440 11,109 -6%
Wholesale & Franchise 1,602 949 69%
E-com sales 266 77 245%
Other 17 36 -53%
Total 12,325 12,171 1%
Consolidated interim report for the I quarter of 2015 (in thousands euros, unaudited)
6
Revenue including discontinued operations
EUR thousand Q1 2015 Q1 2014 +/-
Retail 10,440 12,3851
-16%
Wholesale & Franchise 1,602 949 69%
E-com sales 266 77 245%
Other 17 36 -53%
Total 12,325 13,447 -8%
12014 retail revenue includes Ukrainian market sales
Stores and sales area
Group had 128 stores as at 31 March, among which 102 Baltika’s retail network stores and 26 franchise stores. During the first quarter one new Ivo Nikkolo store was opened in Tasku shopping center in Tartu, Estonia and four stores were closed in Russia: Monton and Mosaic stores in Novosibirsk, Monton store in Nizni Novgorod and outlet store in St. Petersburg. Baltika’s brands franchise stores portfolio saw addition of three new stores – in January franchise partner Gold Button opened outlet store in Moscow, Russia and franchise partner Mirworld opened Baltman and Bastion flagship stores in Tenerife, in Spain.
Stores by market
31 March
2015 31 March
2014 Average area
change*
Estonia 41 37 0%
Lithuania 28 28 -1%
Latvia 22 21 4%
Russia 11 20 -18%
Ukraine1 14 17 -21%
Belarus2 2 2 0%
Spain2 5 0 -
Russia2 5 0 -
Total stores 128 125
Total sales area, sqm 23,988 23,735 0%
*average area change also takes into account the time store is closed for renovation
1Three franchise shops in Donetsk are currently agreed to be closed for longer term. Operating Franchise shops are with total sales area of 2 646 m
2. In comparative figures is part of the
discontinued operations.
2Franchise stores in Belarus, Spain and Russia are with total sales area of 1,620 sqm.
Retail
Retail sales in the first quarter decreased by 6% compared to same period in previous year and were 10,440 thousand euros. Thereof sales in Baltic countries increased by 62 thousand euros (+1%) and decreased in Russia by 731 thousand euros (-40%).
Similar to last year retail sales growth was led by Latvia, who showed 5% improvement in 2015 first quarter. After Lithuanian accession of Euro zone January 1, 2015 consumers became conservative, while March showed signs of recovery. First quarter Lithuanian retail sales total decreased by 1%, but efficiency numbers improved. In Estonia revenue decreased by 1% compared to same period last year. A reason behind Estonian market decrease is the closing of Monton, Baltman and Bastion flagship stores in Viru Keskus in the first half-year of 2014.
Sales in Russia decreased by 11% in local currency, while the average operating area of stores decreased by 18%. Due to smaller operating area and weaker currency retail sales in Russia decreased in first quarter by 731 thousand euros (-40%).
Consolidated interim report for the I quarter of 2015 (in thousands euros, unaudited)
7
Retail sales by market
EUR thousands Q1 2015 Q1 2014 +/- Share
Estonia 4,169 4,202 -1% 40%
Lithuania 2,648 2,663 -1% 25%
Latvia 2,518 2,408 5% 24%
Russia 1,105 1,836 -40% 10%
Total 10,440 11,109 -6% 100%
Ukraine* 0 1,276 -100% -
The first quarter average operating area in the Baltics remained at the level of same period in previous year. The largest growth of average operating area was in Latvia with 4%. The best sales efficiency growth was achieved in Lithuania with 1%. Addition to that the best gross profit growth was in Lithuania. Baltika total sales efficiency growth in the first quarter was -3%.
Sales efficiency by market (sales per sqm in a month, EUR)
Q1 2015 Q1 2014 +/- 3m 2015
Estonia 202 204 -1% 202
Lithuania 161 160 1% 161
Latvia 212 211 0% 212
Russia 111 152 -27% 111
Total 177 183 -3% 177
Sales efficiency growth in local currency in the first quarter in Russia was 8%.
Brands
In the first quarter the largest brands by volume – Mosaic and Monton – were influenced by sales decrease in Russia. In the first quarter very good results were shown by Mosaic, being especially successful in Estonia. Mosaic sales increased in Baltics by 12% and sales efficiency was 9% higher compared to same period last year. Monton sales decreased in Baltics by 2% compared to the first quarter last year, at the same time brand’s sales per square metre and gross profit grew. The best result for Monton was achieved in Latvia, where sales increased by 9% and sales efficiency by 2%. Monton setback in Estonian market is related to closing Viru Centre shop in Tallinn at the end of the first quarter of 2014.
Retail revenue by brand
EUR thousands Q1 2015 Q1 2014 +/- Share
Monton 4,519 5,143 -12% 43%
Mosaic 3,366 3,200 5% 32%
Baltman 1,058 1,152 -8% 10%
Ivo Nikkolo 1,010 1,089 -7% 10%
Bastion 359 393 -9% 3%
Blue Inc 128 107 20% 1%
Other 0 25 -100% 0%
Total 10,440 11,109 -6% 100%
Sales numbers of Baltika’s premium brands Baltman (-8%) and Ivo Nikkolo (-7%) and also the newest brand Bastion (-9%) didn’t met the expectations in the first quarter. Despite of the very good sales growth (+7%) and efficiency growth (+13%) of Baltman achieved in Latvia, the brand’s total sales were smaller than in same period last year due to weak result in Estonia and Lithuania. In Estonia, sales of Baltman and Bastion were negatively impacted by closing of Viru Centre stores in Tallinn last year. Above all the premium brands are impacted by decreased number of tourists in Baltics – impact of Russian tourists in all Baltic States, addition to those Finnish tourists in Estonia and Belarusian tourists in Lithuania.
Sales through other channels
Sales result to wholesale and franchise clients was 1,602 thousand euros in the 2015 first quarter, an increase of 653 thousand euros i.e. 69% compared to previous year.
Consolidated interim report for the I quarter of 2015 (in thousands euros, unaudited)
8
The first quarter was successful to whole- and franchise sales due to extended franchise network. Sales to Belarusian and Ukrainian partners continued, new franchise stores were opened in Russia and in Spain. In January Baltika’s franchise partner in Russia Gold Button opened outlet store in Moscow and franchise partner in Spain Mirworld opened Baltman and Bastion stores in Tenerife. With this, number of operating franchise shops at the end of March was 26.
Sales of e-store increased in the first quarter by more than three times i.e 245% and amounted to 266 thousand euros. The orders were made from 29 countries. The biggest five countries were: Estonia (55% of sales), Latvia (15% of sales), Russia (7% of sales), Lithuania (6% of sales) and Finland (5% of sales). The best-selling brands in e-store were Monton, Mosaic and Ivo Nikkolo.
OPERATING EXPENSES AND NET PROFIT
Company gross profit margin in the first quarter was 44.5% that is by 4.1 percentage points lower than in the same period last year. One of the reasons of the decrease of gross profit margin in the first quarter is the lower margin in wholesale and franchise, which proportion from sales has increased from 8% to 13%. Addition to that the great impact to Group gross margin has been the risen purchase price of goods due to strengthening of US dollar and weaker Russian rouble. Gross margin in Russia decreased by 9.1 percentage points compared to same period last year. Distribution expenses in the first quarter were 5,751 thousand euros, decrease of 3% compared to same period in previous year. Main reason behind the decrease of distribution expense is savings in Russian market – in addition to smaller operating area due to closed shops, expenses in euros have decreased due to weaker rouble exchange rate.
In the first quarter, general and administrative expense was 738 thousand euros, increasing by 3% compared to same period in previous year. With this the first quarter ratio of operating expense to revenue was 53%, which is improvement by 2 percentage points compared to same period last year.
Other operating net expense was 15 thousand euros in the first quarter and the operating loss amounted to 1,022 thousand euros. Same period in previous year operating loss was 826 thousand euros.
Net financial expense in the first quarter was 117 thousand euros, which is 38 thousand euros more than in same period last year. Due to the bond issuance in July last year, the interest expense has increased.
Group activities are seasonal and the first quarter is the weakest for Baltika. Baltika’s first quarter resulted in net loss in the amount of 1,136 thousand euros. The result of last year comparative period was 2,482 thousand euros and comparative figure of continued operations was net loss of 910 thousand euros.
FINANCIAL POSITION
As at 31 March 2015, Group inventories totalled 13,581 thousand euros, increasing by 166 thousand euros compared to last year end. Due to closed shops the retail inventory has decreased in Russia. On the other hand the stock level of finished goods increased in parent company due to growth of wholesale and e-store sales.
As at 31 March 2015 trade and other payables were 7,407 thousand euros, increase of 388 thousand euros compared to year-end. At the same time the trade and other receivables have grown by 507 thousand euros compared to year end due to VAT reclaims that have increased in line with larger purchase volume, amounting as at 31 March 2015 to 2,397 thousand euros.
As at 31 March 2015 the total borrowings amounted to 8,369 thousand euros, which signifies together with the usage of overdraft facility change of 1,093 thousand euros compared to last year-end (31.12.2014 7,276 thousand euros).
Purchase of fixed assets was made in the amount of 497 and depreciation was 306 thousand euros. Property, plant and equipment at residual value increased by 256 thousand euros compared to last year-end. 463 thousand euros were invested into retail network.
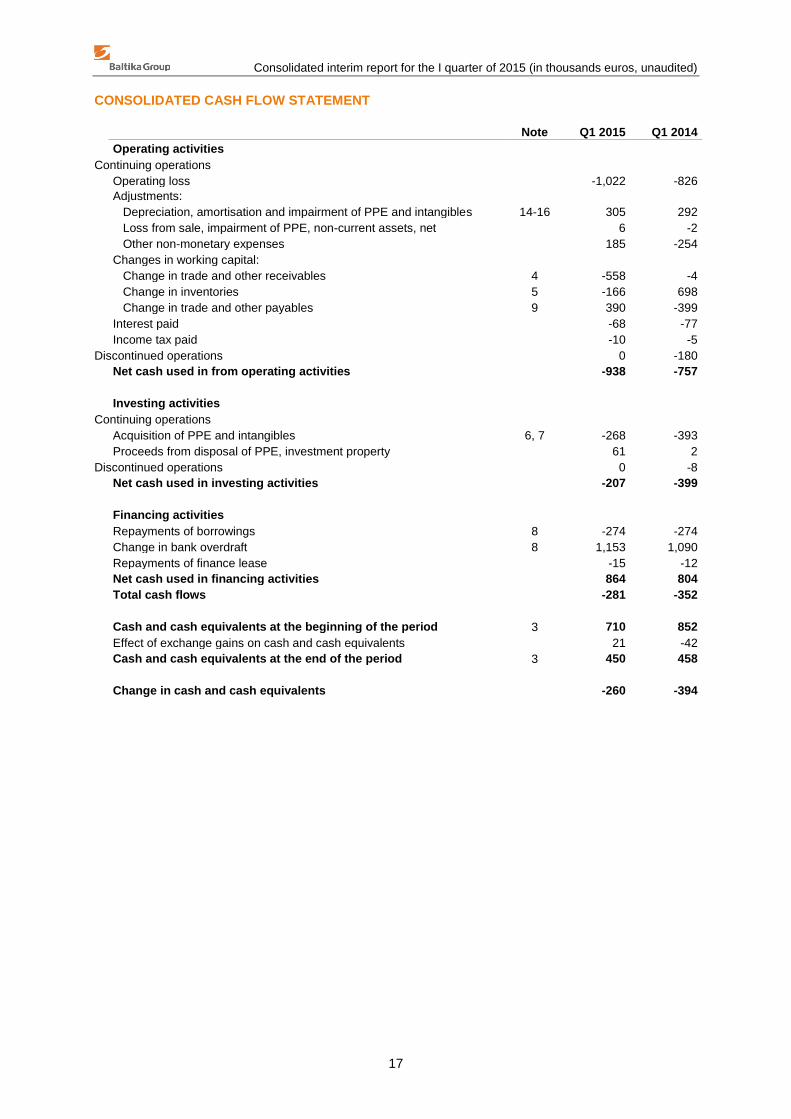
The first quarter cash-flow from operating activities was -938 thousand euros (I quarter 2014: -757 thousand euros). Input to the investment activity was 207 thousand euros. Bank loan repayments was

Consolidated interim report for the I quarter of 2015 (in thousands euros, unaudited)
9
made in amount of 274, at the same time overdraft used limit increased by 1,153 thousand euros. Total cash flow for the first quarter was -281 thousand euros (I quarter 2014: -352 thousand euros).
Due to higher needs of financing in the first quarter caused by production cycle and negative cash flow from operating activities, as at 31 March 2015 the Group’s net debt (interest-bearing liabilities less cash and cash equivalents) was 7,895 thousand euros, which has increased by 1,353 thousand euros compared to the end of last year. The net debt to equity ratio was 99% as at 31 March 2015 (31.12.2014: 75%). Ratio increased due to higher borrowings amount and quarter net loss reducing equity.
PEOPLE
As at 31 March 2015, Baltika Group employed a total of 1,216 people that is 12 people less than as at 31 December 2014 (1,228): 616 (31.12.2014: 629) in the retail system, 397 (31.12.2014: 391) in manufacturing and 203 (31.12.2014: 208) at the head office and logistics centre. The 2015 three months’ average number of staff was 1,216 (I quarter 2014 with Ukrainian retail market staff: 1,336).
Starting from January 27th, 2015 Lea Endrikson joined Baltika as Head of Wholesale and Franchise. Lea has previously launched the I.L.U chain of beauty stores in Kaubamaja Group, and led it for the past seven years, worked as Marketing Director for Stockmann in Estonia and Russia, and as an advertising manager at Sampo Bank.
On January 30, 2015 the Supervisory Board of AS Baltika suspended Maigi Pärnik-Pernik Management Board contract for the duration of her maternity leave. The Management Board member responsible for the finance function during the leave of Maigi Pärnik-Pernik is Meelis Milder.
Supervisory Council of AS Baltika decided to recall from the Management Board starting from 14 April 2015 Management Board member Andrew James David Paterson.
As the result of annual research conducted by Estonian recruitment service provider CV Keskus, Baltika was noted as one of 20 most desirable employers in Estonia.
Baltika Group employees remuneration expense of continued operations in the first quarter amounted to 2,818 thousand euros (I quarter 2014: 2,681 thousand euros). The accrued remuneration with taxes, of the members of the Supervisory Council and Management Board totalled 84 thousand euros (I quarter 2014: 92 thousand euros).
Consolidated interim report for the I quarter of 2015 (in thousands euros, unaudited)
10
KEY FIGURES OF THE GROUP (I QUARTER 2015)
Sales activity key figures 3M and 31
March 2015 3M and 31
March 20141
3M and 31 March 2013
3M and 31 March 2012
3M and 31 March 2011
Revenue (EUR thousand) 12,325 12,171 13,186 12,643 53,409
Retail sales (EUR thousand) 10,440 11,109 12,289 11,531 50,072
Share of retail sales in revenue 85% 91% 93% 91% 94%
Share of exports in revenue 63% 63% 69% 70% 70%
Number of stores in retail 102 106 112 108 115
Number of stores 128 108 112 108 115
Sales area at the end of period (sqm) 19,722 20,053 22,193 21,807 23,111
Number of employees (end of period) 1,216 1,208 1,299 1,316 1,363
Gross margin 44.5% 48.6% 51.3% 51.1% 53.1%
EBITDA (EUR thousand) -718 -513 -154 -215 -1,377
Net profit (EUR thousand) -1,136 -910 -603 -1,044 -5,860
EBITDA margin -5.8% -4.2% -1.2% -1.7% -2.6%
Operating margin -8.3% -6.8% -4.0% -6.2% -8.3%
EBT margin -9.2% -7.4% -4.6% -8.1% -10.8%
Net margin -9.2% -7.5% -4.6% -8.2% -11.0%
Inventory turnover 2.02 2.00 2.26 2.89 2.13
Other ratios2
Current ratio 1.8 1.5 1.8 1.2 1.3
Net gearing ratio 98.8% 64.0% 65.1% 209.8% 181.0%
Return on equity -12.8% -23.1% -6.5% -57.2% -54.8%
Return on assets -4.8% -10.2% -2.3% -15.4% -15.1%
1In connection with Baltika’s exit from the Ukrainian retail business last year, the sales activity key figures of the first-quarter of 2014 presents only results of continued operations.
2Other ratios include impact of continued and discontinued operations.
Definitions of key ratios
EBITDA = Operating profit-amortisation depreciation and loss from disposal of fixed assets EBITDA margin = EBITDA/Revenue Gross margin = (Revenue-Cost of goods sold)/Revenue Operating margin = Operating profit/Revenue EBT margin = Profit before income tax/Revenue Net margin = Net profit (attributable to parent)/Revenue Current ratio = Current assets/Current liabilities Inventory turnover = Cost of goods sold/Average inventories* Net gearing ratio = (Interest-bearing liabilities-cash and cash equivalents)/Equity Return on equity (ROE) = Net profit /Average equity* Return on assets (ROA) = Net profit /Average total assets*
*Based on 12-month average
Consolidated interim report for the I quarter of 2015 (in thousands euros, unaudited)
11
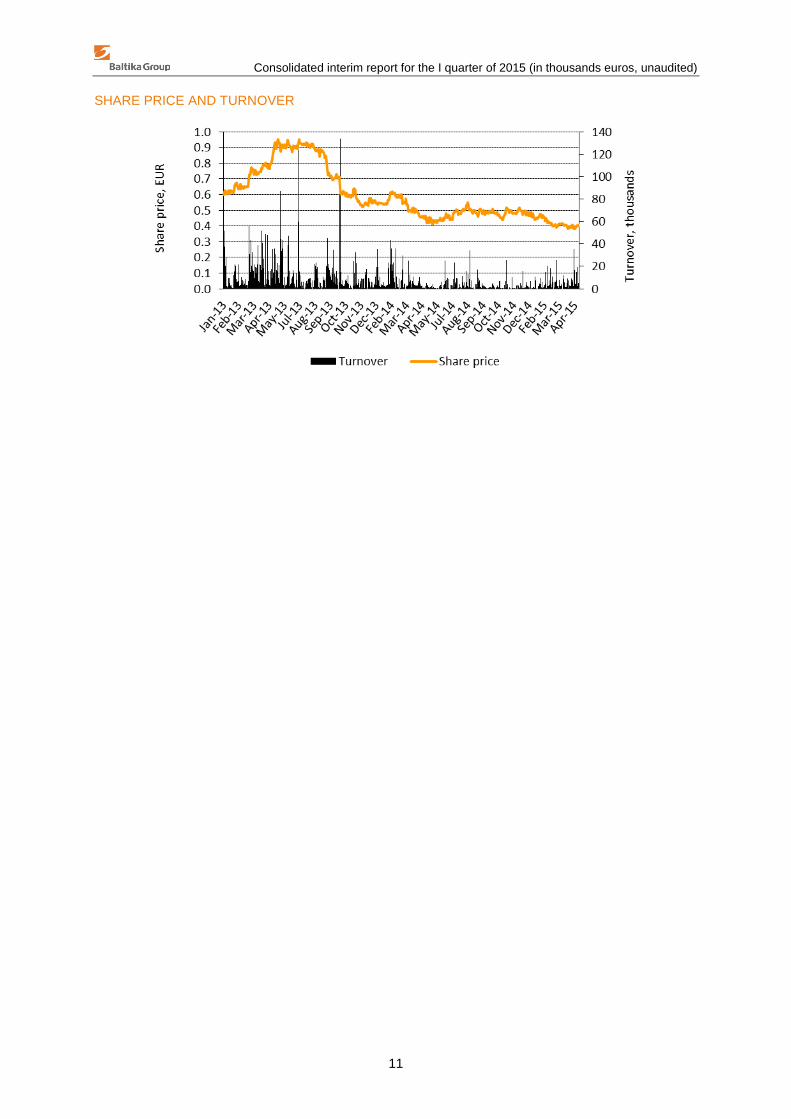
SHARE PRICE AND TURNOVER
Consolidated interim report for the I quarter of 2015 (in thousands euros, unaudited)
12
MANAGEMENT BOARD’S CONFIRMATION OF THE MANAGEMENT REPORT
The Management Board confirms that the management report presents a true and fair view of all significant events that occurred during the reporting period as well as their impact on the condensed consolidated interim financial statements; includes the description of major risks and doubts influencing the remainder of the financial year; and provides an overview of all significant transactions with related parties.
Meelis Milder Chairman of the Management Board 30 April 2015
Maire Milder Member of the Management Board 30 April 2015 _____________________________ Kati Kusmin Member of the Management Board 30 April 2015
Consolidated interim report for the I quarter of 2015 (in thousands euros, unaudited)
13
INTERIM FINANCIAL STATEMENTS
MANAGEMENT BOARD’S CONFIRMATION OF THE FINANCIAL STATEMENTS
The Management Board confirms the correctness and completeness of AS Baltika’s consolidated interim report for the first quarter of 2015 as presented on pages 13-34.
The Management Board confirms that: 1. the accounting policies and presentation of information is in compliance with International
Financial Reporting Standards as adopted by the European Union; 2. the financial statements give a true and fair view of the assets and liabilities of the Group
comprising of the parent company and other Group entities as well as its financial position, its results of the operations and the cash flows of the Group; and its cash flows;
3. the Group is going concern.
Meelis Milder Chairman of the Management Board 30 April 2015
Maire Milder Member of the Management Board 30 April 2015 _____________________________ Kati Kusmin Member of the Management Board 30 April 2015

Consolidated interim report for the I quarter of 2015 (in thousands euros, unaudited)
14
CONSOLIDATED STATEMENT OF FINANCIAL POSITION
Note 31 March 2015 31 Dec 2014
ASSETS Current assets Cash and cash equivalents 3 450 710
Trade and other receivables 4 2,397 1,890
Inventories 5 13,581 13,415
Total current assets
16,428 16,015
Non-current assets
Deferred income tax asset
420 420
Other non-current assets 4 606 605
Property, plant and equipment 6 3,151 2,895
Intangible assets 7 3,292 3,180
Total non-current assets
7,469 7,100
TOTAL ASSETS
23,897 23,115
EQUITY AND LIABILITIES
Current liabilities
Borrowings 8 1,973 2,692
Trade and other payables 9,10 7,407 7,019
Total current liabilities
9,380 9,711
Non-current liabilities
Borrowings 8 6,396 4,584
Other liabilities 9 131 83
Total non-current liabilities
6,527 4,667
TOTAL LIABILITIES
15,907 14,378
EQUITY
Share capital at par value 11 8,159 8,159
Share premium
841 809
Reserves 11 1,182 1,182
Retained earnings
1,310 2,573
Net profit (loss) for the period
-1,136 -1,263
Currency translation differences
-2,366 -2,723
TOTAL EQUITY
7,990 8,737
TOTAL LIABILITIES AND EQUITY
23,897 23,115
Consolidated interim report for the I quarter of 2015 (in thousands euros, unaudited)
15
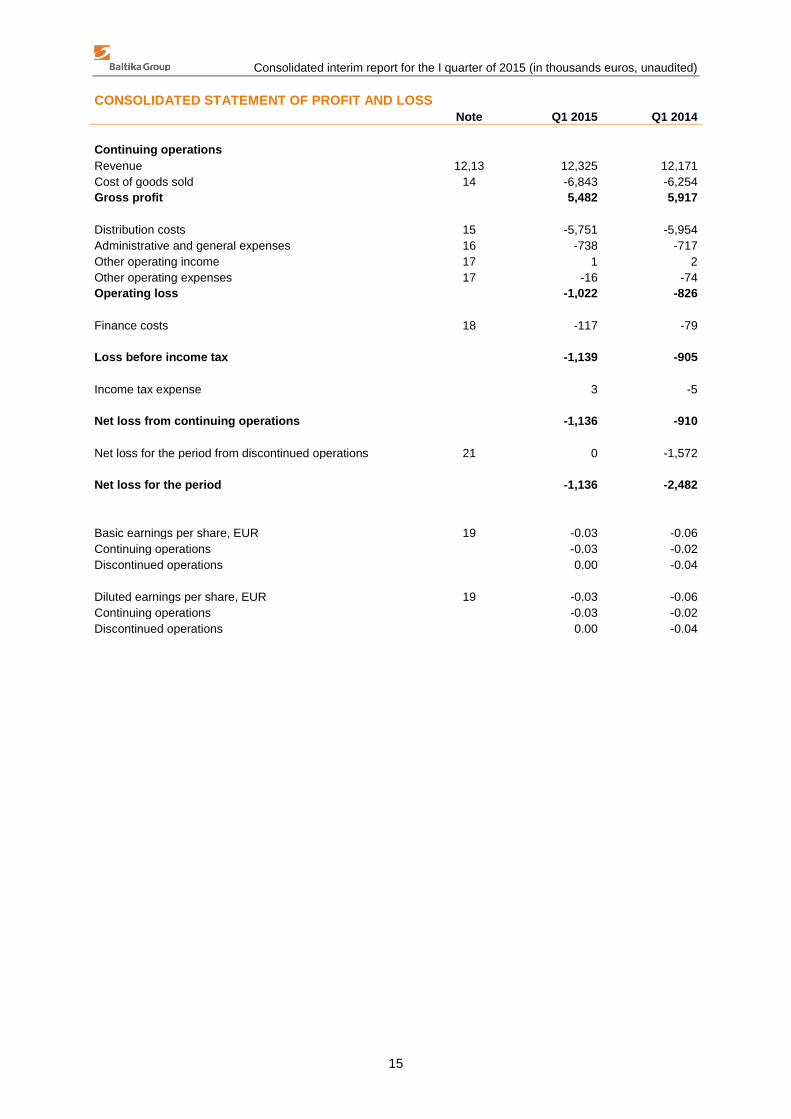
CONSOLIDATED STATEMENT OF PROFIT AND LOSS
Note Q1 2015 Q1 2014
Continuing operations
Revenue 12,13 12,325 12,171
Cost of goods sold 14 -6,843 -6,254
Gross profit
5,482 5,917
Distribution costs 15 -5,751 -5,954
Administrative and general expenses 16 -738 -717
Other operating income 17 1 2
Other operating expenses 17 -16 -74
Operating loss
-1,022 -826
Finance costs 18 -117 -79
Loss before income tax
-1,139 -905
Income tax expense
3 -5
Net loss from continuing operations
-1,136 -910
Net loss for the period from discontinued operations 21 0 -1,572
Net loss for the period
-1,136 -2,482
Basic earnings per share, EUR 19 -0.03 -0.06
Continuing operations
-0.03 -0.02
Discontinued operations
0.00 -0.04
Diluted earnings per share, EUR 19 -0.03 -0.06
Continuing operations
-0.03 -0.02
Discontinued operations
0.00 -0.04

Consolidated interim report for the I quarter of 2015 (in thousands euros, unaudited)
16
CONSOLIDATED STATEMENT OF OTHER COMPREHENSIVE INCOME
Q1 2015 Q1 2014
Net loss for the period -1,136 -2,482
Other comprehensive loss
Items that subsequently might be classified to profit or loss Currency translation differences 357 -226
Total comprehensive loss -779 -2,708
Total comprehensive loss attributable to equity shareholders arises from: Continuing operations -779 -1,136
Discontinued operations 0 -1,572
Consolidated interim report for the I quarter of 2015 (in thousands euros, unaudited)
17
CONSOLIDATED CASH FLOW STATEMENT
Note Q1 2015 Q1 2014
Operating activities Continuing operations
Operating loss
-1,022 -826
Adjustments:
Depreciation, amortisation and impairment of PPE and intangibles 14-16 305 292
Loss from sale, impairment of PPE, non-current assets, net
6 -2
Other non-monetary expenses
185 -254
Changes in working capital:
Change in trade and other receivables 4 -558 -4
Change in inventories 5 -166 698
Change in trade and other payables 9 390 -399
Interest paid
-68 -77
Income tax paid
-10 -5
Discontinued operations
0 -180
Net cash used in from operating activities
-938 -757
Investing activities
Continuing operations
Acquisition of PPE and intangibles 6, 7 -268 -393
Proceeds from disposal of PPE, investment property
61 2
Discontinued operations
0 -8
Net cash used in investing activities
-207 -399
Financing activities
Repayments of borrowings 8 -274 -274
Change in bank overdraft 8 1,153 1,090
Repayments of finance lease
-15 -12
Net cash used in financing activities
864 804
Total cash flows
-281 -352
Cash and cash equivalents at the beginning of the period 3 710 852
Effect of exchange gains on cash and cash equivalents
21 -42
Cash and cash equivalents at the end of the period 3 450 458
Change in cash and cash equivalents
-260 -394

Consolidated interim report for the I quarter of 2015 (in thousands euros, unaudited)
18
CONSOLIDATED STATEMENT OF CHANGES IN EQUITY
Sh
are
ca
pit
al
Sh
are
pre
miu
m
Re
se
rve
s
Re
tain
ed
ea
rnin
gs
Cu
rre
nc
y
tra
ns
lati
on
res
erv
e
To
tal
Balance as at 31 Dec 2013 8,159 684 1,182 2,573 -1,090 11,508
Loss for the period 0 0 0 -2,482 0 -2,482
Other comprehensive loss 0 0 0 0 -226 -226
Total comprehensive loss 0 0 0 -2,482 -226 -2,708
Equity-settled share-based transactions (Note 16) 0 31 0 0 0 31
Balance as at 31 March 2014 8,159 715 1,182 91 -1,316 8,831
Balance as at 31 Dec 2014 8,159 809 1,182 1,310 -2,723 8,737
Loss for the period 0 0 0 -1,136 0 -1,136
Other comprehensive income 0 0 0 0 357 357
Total comprehensive loss 0 0 0 -1,136 357 -779
Equity-settled share-based transactions (Note 16) 0 32 0 0 0 32
Balance as at 31 March 2015 8,159 841 1,182 174 -2,366 7,990

Consolidated interim report for the I quarter of 2015 (in thousands euros, unaudited)
19
NOTES TO CONSOLIDATED INTERIM REPORT
NOTE 1 Accounting policies and methods used in the preparation of the interim report
The Baltika Group, with in the parent company AS Baltika, is an international fashion retailer. Baltika Group develops and operates fashion brands: Monton, Mosaic, Baltman, Bastion, Ivo Nikkolo. In addition Baltika operates under franchise agreement British fashion brand Blue Inc stores in Baltic countries. The Group employes a vertically integrated business model which means that it controls all stages of the fashion process: design, manufacturing, supply chain management, logistics and whole-, franchise- and retail sales. AS Baltika’s shares are listed on the Tallinn Stock Exchange. The largest shareholder and the only company holding above 20% of shares (Note 11) of AS Baltika is KJK Fund Sicaf-SIF (on ING Luxembourg S.A. account).
The Group’s condensed consolidated interim report for the first quarter ended 31 March 2015 has been prepared in accordance with IAS 34 Interim Financial Reporting, as adopted by the European Union. The interim report should be read in conjunction with the Group’s consolidated annual financial statements for the year ended 31 December 2014, which has been prepared in accordance with International Financial Reporting Standards. The interim report has been prepared in accordance with the principal accounting policies applied in the preparation of the Group’s consolidated financial statements for the year ended 31 December 2014. New and revised standards and interpretations effective from 1 January 2015 do not have a significant impact on the Group’s financial statements as of preparing the interim financial report.
All information in the financial statements is presented in thousands euros, unless otherwise stated.
This interim report has not been audited or otherwise reviewed by auditors, and includes only Group’s consolidated reports and does not include all of the information required for full annual financial statements.
NOTE 2 Financial risks
In its daily activities, the Group is exposed to different types of risk, managing these risks is an important and integral part of the business activities of the Group. The Group’s ability to identify, measure and control different risks is a key input for the Group’s profitability. The Group’s management defines risk as a potential negative deviation from the expected financial results. The main risk factors are market (including currency risk, interest rate risk and price risk), credit, liquidity and operational risks. Group’s Parent company considers all the risks as significant risks for the Group.
The basis for risk management in the Group are the requirements set by the Tallinn Stock Exchange, the Financial Supervision Authority and other regulatory bodies, adherence to generally accepted accounting principles, as well as the company’s internal regulations and risk policies. Overall risk management includes identification, measurement and control of risks. The management of the Parent company plays a major role in managing risks and approving risk procedures. The Supervisory Council of the Group’s Parent company supervises the Management Board’s risk management activities.
Market risk
Foreign exchange risk
Sales in foreign currencies from continuing operations not pegged to euro constitute 11% (2014: 16%).
The sales in retail markets were conductes in following currencies:EUR (euro) and RUB (Russian rouble). The majority of raw materials used in production are acquired from European Union, goods purchased for resale outside European Union. The major foreign currencies for purchases are EUR (euro) and USD (US dollar).
Trading with the counterparties in countries belonging to the European Monetary Union is handled mainly in euros. Some of Groups revenue is influenced by fluctuation of Russian rouble, as the salesprices in the Russian market are fixed in local currency. In addition, a change in the economic environment and relative appreciation/depreciation of a local currency may greatly affect the purchasing power of customers in the market of the respective segment.

Consolidated interim report for the I quarter of 2015 (in thousands euros, unaudited)
20
Republic of Lithuania joined Euro area on 1st January 2015 and adopted the Euro as its national currency, replasing Lithuanian lit. On 1st January 2014 the Republic of Latvia joined the Euro area and adopted the Euro as its national currency, replacing Latvian lat.
The Group’s results are open to fluctuations in foreign currency rates. The changes in average foreign currency rates against euro in the reporting period were following:
Average currencies 1 Q 2015 1 Q 2014
RUB (Russian rouble) -47.70% -19.65%
USD (US dollar) 17.78% -3.71%
GBP (British pound) 10.21% 2.73%
The changes in foreign currency rates against euro between balance-sheet dates were following:
Balance-sheet date rates (31 March 2015; 31 Dec 2014)
RUB (Russian rouble) 13.68%
USD (US dollar) 11.38%
GBP (British pound) 6.62%
Foreign exchange risk arises from cash and bank (Note 3), trade receivables (Note 4) and trade payables (Note 9).
The Group’s non-current borrowings carrying floating interest rate were denominated in euros, therefore no currency risk is assumed.
No instruments were used to hedge foreign currency risks in 2015 and 2014. The Management monitors changes of foreign currency constantly and assesses if the changes exceed the risk tolerance determined by the Group. If feasible, foreign currencies collected are used for the settling of liabilities denominated in the same currency. Additionally the Group uses the possibilities to regulate retail prices, reduces expenses and if necessary restructures the Group’s internal transactions.
Interest rate risk
As the Group’s cash and cash equivalents carry fixed interest rate and the Group has no other significant interest-bearing assets, the Group’s income and operating cash flows are substantially independent of changes in market interest rates.
The Group’s interest rate risk arises mainly from current and non-current borrowings issued at floating interest rate and thus exposing the Group to cash flow interest rate risk. Interest rate risk is primarily caused by the potential fluctuations of Euribor or Eonia and the changing of the average interest rates of banks. The Group’s risk margins have not changed significantly and correspond to market conditions.
All non-current borrowings as at 31 March 2015 and 31 December 2014 were subject to a floating interest rate based on Euribor, which is fixed every six months (Note 8). The Group analyses its interest rate exposure on a regular basis. Various scenarios are simulated taking into consideration refinancing, renewal of existing positions and alternative financing.
The Group uses no hedging instruments to manage the risks arising from fluctuations in interest rates.
Price risk
The Group is not exposed to the price risk with respect to financial instruments as it does not hold any equity securities.
Credit risk
Credit risk arises from cash and cash equivalents, deposits with banks and financial institutions, also from deposits under other receivables and trade receivables.
Cash and cash equivalents
For banks and financial institutions, mostly independently rated parties with a minimum rating of “A” are accepted as long-term counterparties in Baltic states. In Eastern Europe region also lower rating is considered acceptable.
Consolidated interim report for the I quarter of 2015 (in thousands euros, unaudited)
21
Trade receivables
For the wholesale customers’ credit policy is based on next actions: monitoring credit amounts, past experience and other factors are taken into consideration. For some wholesale clients prepayments or payment guarantees through bank are required. For some contractual clients no collaterals to secure the trade receivables are required but instead, deliveries, outstanding credit amount and adherence to agreed dates are monitored continuously.
Sales to retail customers are settled in cash or using major credit cards, thus no credit risk is involved except the risk arising from financial institutions selected as approved counterparties.
At 31 March 2015 the maximum exposure to credit risk from trade receivables and other non-current assets (Note 4) amounted to 1,857 thousand euros (31 December 2014: 1,566 thousand euros) on a net basis after the allowances made previously.
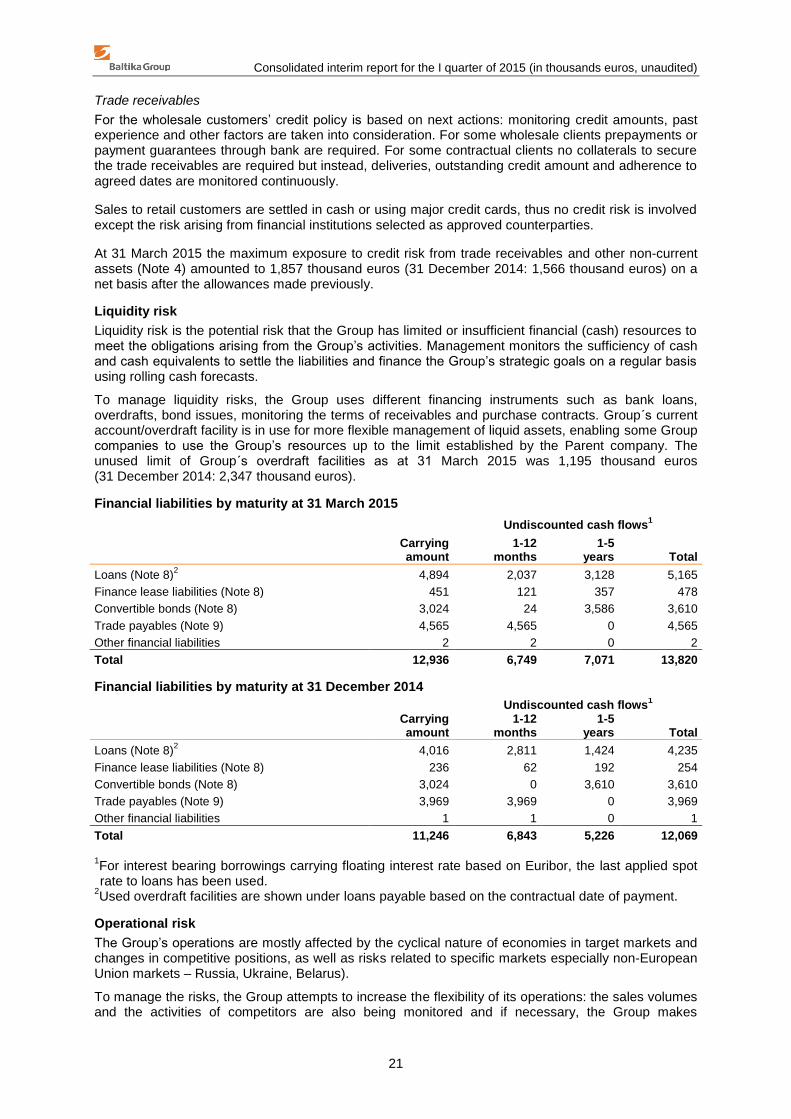
Liquidity risk
Liquidity risk is the potential risk that the Group has limited or insufficient financial (cash) resources to meet the obligations arising from the Group’s activities. Management monitors the sufficiency of cash and cash equivalents to settle the liabilities and finance the Group’s strategic goals on a regular basis using rolling cash forecasts.
To manage liquidity risks, the Group uses different financing instruments such as bank loans, overdrafts, bond issues, monitoring the terms of receivables and purchase contracts. Group´s current account/overdraft facility is in use for more flexible management of liquid assets, enabling some Group companies to use the Group’s resources up to the limit established by the Parent company. The unused limit of Group´s overdraft facilities as at 31 March 2015 was 1,195 thousand euros (31 December 2014: 2,347 thousand euros).
Financial liabilities by maturity at 31 March 2015
Undiscounted cash flows
1
Carrying amount
1-12 months
1-5 years Total
Loans (Note 8)2 4,894 2,037 3,128 5,165
Finance lease liabilities (Note 8) 451 121 357 478
Convertible bonds (Note 8) 3,024 24 3,586 3,610
Trade payables (Note 9) 4,565 4,565 0 4,565
Other financial liabilities 2 2 0 2
Total 12,936 6,749 7,071 13,820
Financial liabilities by maturity at 31 December 2014
Undiscounted cash flows
1
Carrying amount
1-12 months
1-5 years Total
Loans (Note 8)2 4,016 2,811 1,424 4,235
Finance lease liabilities (Note 8) 236 62 192 254
Convertible bonds (Note 8) 3,024 0 3,610 3,610
Trade payables (Note 9) 3,969 3,969 0 3,969
Other financial liabilities 1 1 0 1
Total 11,246 6,843 5,226 12,069
1For interest bearing borrowings carrying floating interest rate based on Euribor, the last applied spot rate to loans has been used.
2Used overdraft facilities are shown under loans payable based on the contractual date of payment.
Operational risk
The Group’s operations are mostly affected by the cyclical nature of economies in target markets and changes in competitive positions, as well as risks related to specific markets especially non-European Union markets – Russia, Ukraine, Belarus).
To manage the risks, the Group attempts to increase the flexibility of its operations: the sales volumes and the activities of competitors are also being monitored and if necessary, the Group makes
Consolidated interim report for the I quarter of 2015 (in thousands euros, unaudited)
22
adjustments in price levels, marketing activities and collections offered. In addition to central gathering and assessment of information, an important role in analysing and planning actions is played by a market organisation in each target market enabling the Group to obtain fast and direct feedback on market developments on one hand and adequately consider local conditions on the other.
As improvement of flexibility plays an important role in increasing the Group’s competitiveness, continuous efforts are being made to shorten the cycles of business processes and minimise potential deviations. This also helps to improve the relative level and structure of inventories and the fashion collections’ meeting consumer expectations.
The most important operating risk arises from the Group’s inability to produce collections which would meet customer expectations and the goods that cannot be sold when expected and as budgeted. Another important risk is that the Group’s information technology system is unable to ensure sufficiently fast and accurate transmission of information for decision-making purposes.
To ensure good collections, the Group employs a strong team of designers who monitor and are aware of fashion trends by using internationally acclaimed channels. Such a structure, procedures and information systems have been set up at the Group which help daily monitoring of sales and balance of inventories and using the information in subsequent activities. In order to avoid supply problems, cooperation with the world’s leading procurement intermediaries as well as material-manufacturers has been expanded.
The unavoidable risk factor in selling clothes is the weather. Collections are created and sales volumes as well as timing of sales is planned under the assumption that regular weather conditions prevail in the target markets – in case weather conditions differ significantly from normal conditions, the actual sales results may significantly differ from the budget.
Capital risk management
The Group’s objectives when managing capital are to safeguard the Group’s ability to continue as a going concern in order to provide returns for shareholders and benefits for interest groups and to maintain an optimal capital structure to reduce the cost of capital. In order to maintain or adjust the capital structure, the Group may adjust the amount of dividends paid to shareholders, return capital to shareholders, issue new shares or sell assets to reduce debt.
The Group monitors capital on the basis of net gearing ratio. This ratio is calculated as net debt divided by equity. Net debt is calculated as interest carrying borrowings less cash and cash equivalents.
The Group’s strategy is to maintain the capital to net gearing ratio under 50%. In the end of reporting period the ratio was 99%. In the end of 2014 the ratio was 75%. The worsening of the ratio is influenced by the seasonality of the first quarter, but also by slight increase in borrowings (usage of overdraft).
Net gearing ratio
31 March 2015 31 Dec 2014
Interest carrying borrowings (Note 8) 8,345 7,252
Cash and bank (Note 3) -450 -710
Net debt 7,895 6,542
Total equity 7,990 8,737
Net gearing ratio 99% 75%
Fair value
The Group estimates that the fair values of the assets and liabilities measured in the statement of financial position at amortised cost do not differ significantly from their carrying amounts presented in the Group’s consolidated statement of financial position at 31 March 2015 and 31 December 2014.
The carrying amount less an impairment provision of trade receivables and payables is estimated by management to approximate their fair values as trade receivables and payables are mostly short-term.
As the Group’s long-term borrowings have a floating interest rate that changes along with the changes in market interest rates, the discount rates used in the discounted cash flow model are applied to calculate the fair value of borrowings. The Group’s risk margins have not changed considerably and are reflecting the market conditions. Regarding to the Group´s long-term borrowings that have a fixed

Consolidated interim report for the I quarter of 2015 (in thousands euros, unaudited)
23
interest rate, the interest rate does not differ from the market rate. Based on that, the Management estimates that the fair value of long-term borrowings does not significantly differ from their carrying amounts. The fair value of financial liabilities for disclosure purposes is estimated by discounting the future contractual cash flows at the current market interest rate that is available to the Group for similar financial instruments.
NOTE 3 Cash and cash equivalents
31 March 2015 31 Dec 2014
Cash at hand 107 86
Cash at bank and overnight deposits 343 624
Total 450 710
Cash and cash equivalents by currency
31 March 2015 31 Dec 2014
EUR (euro) 298 429
RUB (Russian rouble) 152 84
LTL (Lithuanian lit) 0 197
Total 450 710
NOTE 4 Trade and other receivables
Short-term trade and other receivables 31 March 2015 31 Dec 2014
Trade receivables, net 1,697 1,456
Other prepaid expenses 460 401
Tax prepayments and tax reclaims, thereof 206 3
Value added tax 181 1
Prepaid income tax 10 0
Other taxes 15 2
Other current receivables 34 30
Total 2,397 1,890
Long-term assets
Non-current lease prepayments 344 343
Other long-term receivables 262 262
Total 606 605
Trade receivables by region (client location) and by due date
31 March 2015 Baltic region
Eastern European
region Other
regions Total
Not due 616 427 287 1,330
Up to 1 month past due 10 13 20 43
1-3 months past due 83 6 78 167
3-6 months past due 0 0 123 123
Over 6 months past due 0 0 34 34
Total 709 446 542 1,697

Consolidated interim report for the I quarter of 2015 (in thousands euros, unaudited)
24
31 Dec 2014 Baltic region
Eastern European
region Other
regions Total
Not due 620 276 161 1,057
Up to 1 month past due 42 0 48 90
1-3 months past due 39 20 203 262
3-6 months past due 0 0 46 46
Over 6 months past due 0 0 1 1
Total 701 296 459 1,456
Trade receivables (net) in denominated currency
31 March 2015 31 Dec 2014
EUR (euro) 1,646 1,352
RUB (Russian rouble) 51 53
LTL (Lithuanian lit) 0 51
Total 1,697 1,456
NOTE 5 Inventories
31 March 2015 31 Dec 2014
Fabrics and accessories 1,782 2,180
Work-in-progress 79 79
Finished goods and goods purchased for resale 11,071 10,911
Allowance for impairment of finished goods and goods purchased for resale 0 -330
Prepayments to suppliers 649 575
Total 13,581 13,415
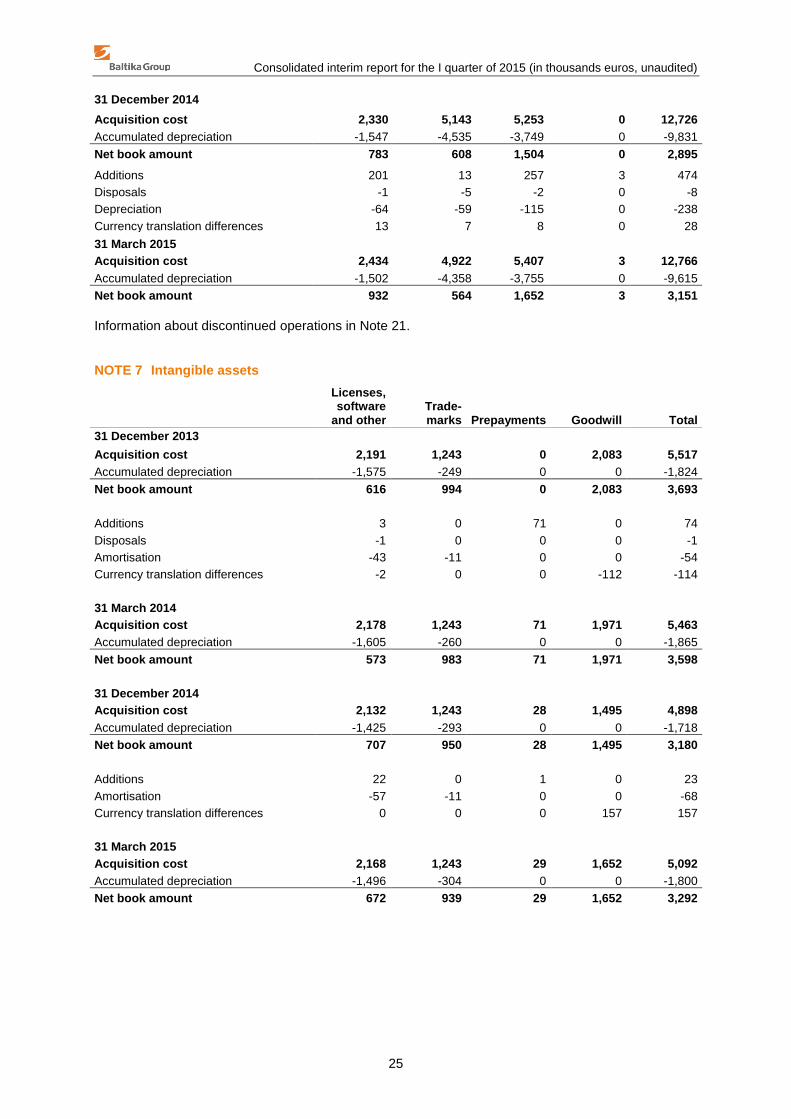
NOTE 6 Property, plant and equipment
Buildings and
structures
Machinery and
equipment Other
fixtures
Pre-payments, PPE not in yet in use Total
31 December 2013
Acquisition cost 4,318 5,410 7,041 0 16,769
Accumulated depreciation -3,392 -4,685 -5,669 0 -13,746
Net book amount 926 725 1,372 0 3,023
Additions 133 19 174 1 327 Reclassifications as non-current assets held for sale -91 -16 -57 0 -164
Depreciation -95 -76 -110 0 -281
Currency translation differences -49 -15 -32 0 -96
31 March 2014
Acquisition cost 3,863 5,298 6,488 1 15,650
Accumulated depreciation -3,039 -4,661 -5,141 0 -12,841
Net book amount 824 637 1,347 1 2,809
Consolidated interim report for the I quarter of 2015 (in thousands euros, unaudited)
25
31 December 2014
Acquisition cost 2,330 5,143 5,253 0 12,726
Accumulated depreciation -1,547 -4,535 -3,749 0 -9,831
Net book amount 783 608 1,504 0 2,895
Additions 201 13 257 3 474
Disposals -1 -5 -2 0 -8
Depreciation -64 -59 -115 0 -238
Currency translation differences 13 7 8 0 28
31 March 2015
Acquisition cost 2,434 4,922 5,407 3 12,766
Accumulated depreciation -1,502 -4,358 -3,755 0 -9,615
Net book amount 932 564 1,652 3 3,151
Information about discontinued operations in Note 21.
NOTE 7 Intangible assets
Licenses, software
and other Trade- marks Prepayments Goodwill Total
31 December 2013
Acquisition cost 2,191 1,243 0 2,083 5,517
Accumulated depreciation -1,575 -249 0 0 -1,824
Net book amount 616 994 0 2,083 3,693
Additions 3 0 71 0 74
Disposals -1 0 0 0 -1
Amortisation -43 -11 0 0 -54
Currency translation differences -2 0 0 -112 -114
31 March 2014 Acquisition cost 2,178 1,243 71 1,971 5,463
Accumulated depreciation -1,605 -260 0 0 -1,865
Net book amount 573 983 71 1,971 3,598
31 December 2014
Acquisition cost 2,132 1,243 28 1,495 4,898
Accumulated depreciation -1,425 -293 0 0 -1,718
Net book amount 707 950 28 1,495 3,180
Additions 22 0 1 0 23
Amortisation -57 -11 0 0 -68
Currency translation differences 0 0 0 157 157
31 March 2015
Acquisition cost 2,168 1,243 29 1,652 5,092
Accumulated depreciation -1,496 -304 0 0 -1,800
Net book amount 672 939 29 1,652 3,292
Consolidated interim report for the I quarter of 2015 (in thousands euros, unaudited)
26
NOTE 8 Borrowings
31 March 2015 31 Dec 2014
Current borrowings
Current portion of non-current bank loans 872 1,809
Current bank loans 950 828
Current portion of finance lease liabilities 127 55
Share options (Note 20) 24 0
Total 1,973 2,692
Non-current borrowings
Non-current bank loans 3,072 1,379
Non-current finance lease liabilities 324 181
Convertible bonds, share options (Note 20) 3,000 3,024
Total 6,396 4,584
Total borrowings 8,369 7,276
During the reporting period, the Group made loan repayments in the amount of 274 thousand euros (2014: 274 thousand euros). Group´s overdraft facilities with the banks were used in the amount of 2,805 thousand euros as at 31 March 2015 (31 December 2014: 1,653 thousand euros).
Interest expense of all interest carrying borrowings of the reporting period amounted to 117 thousand euros, including 48 thousand euros interest expense from the convertible bonds of related party (2014: 80 thousand euros, including 2 thousand euros interest expense from the loan of related party).
Changes in 2015
In April an annex under an existing facility agreement was signed, which prolonged overdrafts´s repayment date until July 2016. The annex does not include a term about the increase and decrease according to seasonality.
Changes in 2014
In the reporting period the Group signed an annex under an existing facility agreement, which prolonged repayment dates for some loans and increased the overdraft limit in the amount of 1,4 million euros. The same annex provides the overdraft increase and decrease in the amount of 500 thousand according to the seasonality.
Interest carrying loans and bonds of the Group as at 31 March 2015
Average risk
premium Carrying amount
Borrowings at floating interest rate (based on 1-month Eonia and 6-month Euribor) EURIBOR or
EONIA +4,52% 4,894
J-Bonds (Note 20) 6.50% 3,000
Total 7,894
Interest carrying loans and bonds of the Group as at 31 December 2014
Average risk
premium Carrying amount
Borrowings at floating interest rate (based on 1-month Eonia or 6-month Euribor) EURIBOR or
EONIA +4,43% 4,016 J-Bonds (Note 20) 6.50% 3,000
Total 7,016
Bank loans set certain level to financial ratios for the Group. As at 31 December 2014 Baltika, was not compatible with some of the terms and conditions of the loan agreement, but the bank has confirmed that the loan will not become due and payable prematurely.
Consolidated interim report for the I quarter of 2015 (in thousands euros, unaudited)
27
NOTE 9 Trade and other payables
31 March 2015 31 Dec 2014
Current liabilities Trade payables 4,565 3,969
Tax liabilities, thereof 1,222 1,463
Personal income tax 235 252
Social security taxes and unemployment insurance premium 545 581
Value added tax 399 578
Corporate income tax liability 17 20
Other taxes 26 32
Payables to employees1 1,180 1,030
Other accrued expenses 2 1
Customer prepayments 55 137
Other current payables 83 119
Total 7,107 6,719
Non-current liabilities
Other liabilities 131 83 1Payables to employees consist of accrued wages, salaries and vacation reserve.
Information about the liabilities to related parties is in Note 20.
Trade payables and other accrues expenses in denominated currency
31 March 2015 31 Dec 2014
EUR (euro) 2,798 2,885
USD (US dollar) 1,697 981
LTL (Lithuanian lit) 0 62
GBP (British pound) 64 37
RUB (Russian rouble) 8 5
Total 4,567 3,970
NOTE 10 Provisions
Current provisions 31 March 2015 31 Dec 2014
Client bonus provision 300 300
Short description of the provision
During 2014 Baltika introduced a new loyal customer program “AndMore” that unified Baltika brand´s customer base and customer discount logic.
“AndMore” motivates clients by allowing them to earn future discount on purchases made today (bonus euros). Accumulated bonuses are valid for six months from the customer´s last purchase. Programs conditions are described in detail on company´s website.
Used assumptions
The provision is formed using the assumptions by the Management as it is described in the Group´s latest consolidated annual financial statements for the year ended 31 December 2014. As at 31 March 2015 and 31 December 2014 the provision is recognised in the amount of 300 thousand euros.
Consolidated interim report for the I quarter of 2015 (in thousands euros, unaudited)
28
NOTE 11 Equity
Share capital and reserves
31 March 2015 31 Dec 2014
Share capital 8,159 8,159
Number of shares (pcs) 40,794,850 40,794,850
Nominal value of share (EUR) 0.20 0.20
Statutory reserve 1,182 1,182
As at 31 March 2015 and 31 December 2014, under the Articles of Association, the company’s minimum share capital is 5,000 thousand euros and the maximum share capital is 20,000 thousand euros. All shares have been paid for. As at 31 March 2015 and 31 December 2014 share capital consists of ordinary shares, that are listed on the Tallinn Stock Exchange.
Convertible bonds
Issue date Share subscription period Number of convertible bonds 31 March 2015
Number of convertible bonds 31 Dec 2014
I-Bond 30 June 2012 01 July 2015 - 31 Dec 2015 2,350,000 2,350,000
J-Bond 28 July 2014 15 July 2017 - 30 July 2017 600 600
I-bonds
The annual general meeting of shareholders held on 20 April 2012 decided to issue 2,350,000 convertible bonds (I-bond) with the nominal value 0.01 euros. Each bond gives its owner the right to subscribe one share of the Company with a nominal value of 0.20 euros. The share subscription price is 0.36 euros. The difference between the share subscription price and nominal value is share premium. The share subscription period is from 01 July 2015 until 31 December 2015. The bonds were issued to the management of Baltika Group companies.
J-bonds
On 28 April 2014 the annual general meeting of shareholders decided to issue convertible bonds with bondholder option in the total amount of 3 million euros. Decision was to issue 600 convertible bonds with the issuance price of 5,000 euros. The three-year convertible bonds carry an annual interest rate of 6.5% and give its owner the right to subscribe for 10,000 Baltika´s shares at 0.5 euros subscription price.
Bonds (510 bonds in the amount of 2,550 thousand euros) were partly issued to a related party (Note 20).
Shareholders as at 31 March 2015
Number of
shares Holding
1. ING Luxembourg S.A. 12,590,914 30.86%
2. Clearstream Banking Luxembourg S.A. clients 6,247,083 15.31%
3. BMIG OÜ* 4,750,033 11.64%
4. SKANDINAVISKA ENSKILDA BANKEN S.A. 3,414,700 8.37%
5. Svenska Handelsbanken clients 1,587,000 3.89%
6. Members of Management and Supervisory Boards and persons related to them Meelis Milder 746,331 1.83%
Maire Milder** 316,083 0.77%
Andrew Paterson 11,000 0.03%
Persons related to members of Management Board 8,100 0.02%
Entities connected to Supervisory Council not mentioned above 1,002,427 2.46%
7. Other shareholders 10,121,179 24.82%
Total 40,794,850 100.00%
Consolidated interim report for the I quarter of 2015 (in thousands euros, unaudited)
29
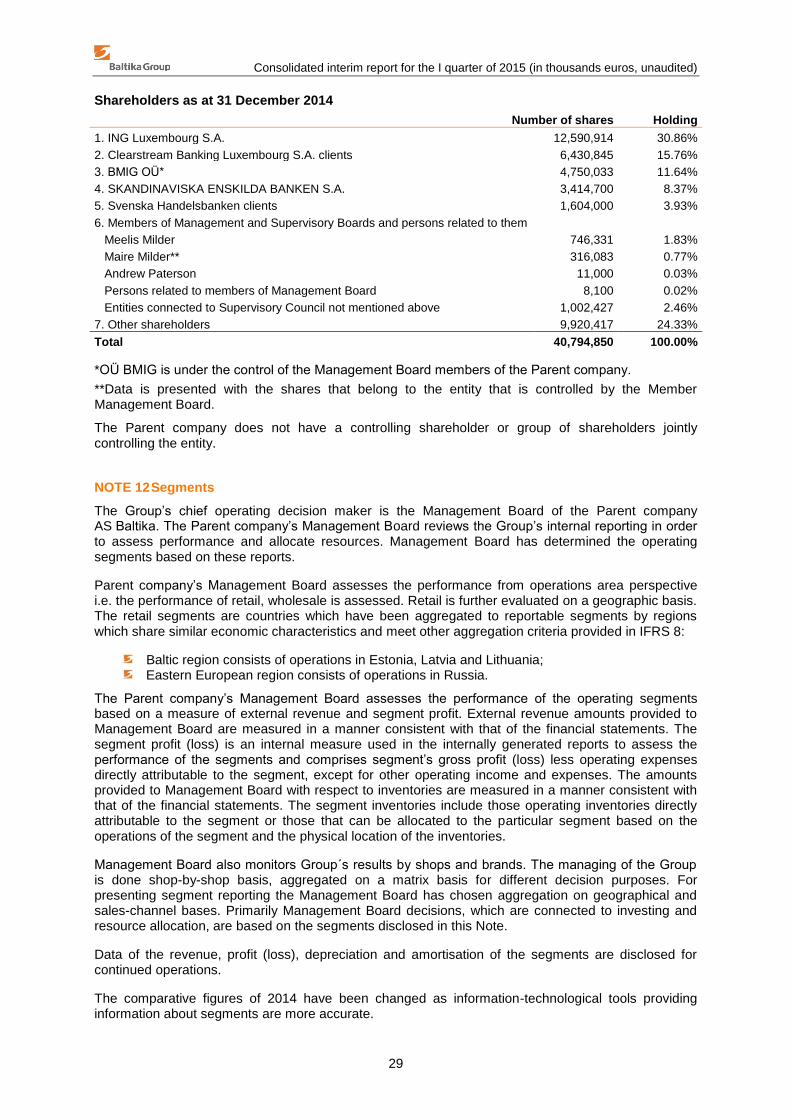
Shareholders as at 31 December 2014
Number of shares Holding
1. ING Luxembourg S.A. 12,590,914 30.86%
2. Clearstream Banking Luxembourg S.A. clients 6,430,845 15.76%
3. BMIG OÜ* 4,750,033 11.64%
4. SKANDINAVISKA ENSKILDA BANKEN S.A. 3,414,700 8.37%
5. Svenska Handelsbanken clients 1,604,000 3.93%
6. Members of Management and Supervisory Boards and persons related to them Meelis Milder 746,331 1.83%
Maire Milder** 316,083 0.77%
Andrew Paterson 11,000 0.03%
Persons related to members of Management Board 8,100 0.02%
Entities connected to Supervisory Council not mentioned above 1,002,427 2.46%
7. Other shareholders 9,920,417 24.33%
Total 40,794,850 100.00%
*OÜ BMIG is under the control of the Management Board members of the Parent company.
**Data is presented with the shares that belong to the entity that is controlled by the Member Management Board.
The Parent company does not have a controlling shareholder or group of shareholders jointly controlling the entity.
NOTE 12 Segments
The Group’s chief operating decision maker is the Management Board of the Parent company AS Baltika. The Parent company’s Management Board reviews the Group’s internal reporting in order to assess performance and allocate resources. Management Board has determined the operating segments based on these reports.
Parent company’s Management Board assesses the performance from operations area perspective i.e. the performance of retail, wholesale is assessed. Retail is further evaluated on a geographic basis. The retail segments are countries which have been aggregated to reportable segments by regions which share similar economic characteristics and meet other aggregation criteria provided in IFRS 8:
Baltic region consists of operations in Estonia, Latvia and Lithuania; Eastern European region consists of operations in Russia.
The Parent company’s Management Board assesses the performance of the operating segments based on a measure of external revenue and segment profit. External revenue amounts provided to Management Board are measured in a manner consistent with that of the financial statements. The segment profit (loss) is an internal measure used in the internally generated reports to assess the performance of the segments and comprises segment’s gross profit (loss) less operating expenses directly attributable to the segment, except for other operating income and expenses. The amounts provided to Management Board with respect to inventories are measured in a manner consistent with that of the financial statements. The segment inventories include those operating inventories directly attributable to the segment or those that can be allocated to the particular segment based on the operations of the segment and the physical location of the inventories.
Management Board also monitors Group´s results by shops and brands. The managing of the Group is done shop-by-shop basis, aggregated on a matrix basis for different decision purposes. For presenting segment reporting the Management Board has chosen aggregation on geographical and sales-channel bases. Primarily Management Board decisions, which are connected to investing and resource allocation, are based on the segments disclosed in this Note.
Data of the revenue, profit (loss), depreciation and amortisation of the segments are disclosed for continued operations.
The comparative figures of 2014 have been changed as information-technological tools providing information about segments are more accurate.

Consolidated interim report for the I quarter of 2015 (in thousands euros, unaudited)
30
The segment information provided to the Management Board for the reportable segments
Retail, Baltic
region
Retail, Eastern Europe
Whole- sale
1 Total
1 Quarter 2015 and as at 31 March 2015 Revenue (from external customers) 9,336 1,104 1,885 12,325
Segment profit (loss)2 882 -333 278 827
Incl. depreciation and amortisation -166 -20 -19 -205
Inventories of segments 5,036 808 0 5,844
1 Quarter 2014 and as at 31 March 2014 Revenue (from external customers) 9,273 1,837 1,061 12,171
Segment profit (loss)2 1,087 -379 254 962
Incl. depreciation and amortisation -154 -53 -1 -208
Inventories of segments 4,197 1,021 0 5,218 1The wholesale segment includes the sale of goods to wholesale and franchise clients, materials and sewing services and the sales from e-commerce.
2The segment profit (loss) is the segment operating profit (loss), excluding other operating expenses and income.
Reconciliation of segment profit to consolidated operating profit
1 Q 2015 1 Q 2014
Total segment profit 827 962
Unallocated expenses1:
Costs of goods sold and distribution costs -1,096 -999
Administrative and general expenses -738 -717
Other operating income (expenses), net -15 -72
Operating loss -1,022 -826
1Unallocated expenses include the expenses of the parent and production company which are not allocated to the reportable segments in internal reporting.
Reconciliation of segment inventories to consolidated inventories
31 March 2015 31 Dec 2014 31 Mar 2014
Total inventories of segments 5,844 5,917 5,218
Inventories in Parent company and production company 7,737 7,498 7,192
Inventories on statement of financial position 13,581 13,415 12,410
NOTE 13 Revenue
1 Q 2015 1 Q 2014
Sale of goods in retail channel 10,440 11,109
Sale of goods in wholesale and e-commerce channel 1,868 1,026
Other sales 17 36
Total 12,325 12,171

Consolidated interim report for the I quarter of 2015 (in thousands euros, unaudited)
31
Sales by geographical (client location) areas
1 Q 2015 1 Q 2014
Estonia 4,608 4,490
Lithuania 2,674 2,682
Latvia 2,647 2,533
Russia 1,380 2,015
Spain 312 0
Ukraine 309 2
Finland 247 246
Belarus 106 69
Germany 9 101
Other countries 33 33
Total 12,325 12,171
NOTE 14 Cost of goods sold
1 Q 2015 1 Q 2014
Materials and supplies 5,934 5,407
Payroll costs in production 933 866
Operating lease expenses 169 169
Other production costs 106 108
Depreciation of assets used in production (Note 6,7) 31 46
Change in allowance for inventories -330 -342
Total 6,843 6,254
NOTE 15 Distribution costs
1 Q 2015 1 Q 2014
Payroll costs 2,556 2,449
Operating lease expenses 1,927 2,145
Advertising expenses 298 323
Depreciation and amortisation (Note 6,7) 247 240
Fuel, heating and electricity costs 151 164
Fees for card payments 83 92
Travel expenses 69 69
Municipal services and security expenses 67 60
Consultation and management fees 52 52
Information technology expenses 38 43
Communication expenses 34 33
Other sales expenses1 229 284
Total 5,751 5,954
1Other sales expenses mostly consist of insurance and customs expenses, bank fees, expenses for uniforms, packaging, transportation and renovation expenses of stores, and service fees connected to administration of market organisations.
Consolidated interim report for the I quarter of 2015 (in thousands euros, unaudited)
32
NOTE 16 Administrative and general expenses
1 Q 2015 1 Q 2014
Payroll costs1 336 325
Operating lease expenses 113 118
Information technology expenses 65 70
Management, juridical-, auditor´s and other consulting fees 49 18
Bank fees 32 54
Fuel, heating and electricity expenses 32 31
Depreciation and amortisation (Note 6,7) 27 26
Other administrative expenses2 84 75
Total 738 717
1Payroll costs include payroll expenses for employee services received under the share options programme in the amount of 32 thousand euros (2014: 31 thousand euros).
2Other administrative expenses consist of insurance, communication, travel, training, municipal and security expenses and other services.
NOTE 17 Other operating income and expenses
1 Q 2015 1 Q 2014
Gain (loss) from sale, impairment of PPE and non-current assets -7 2
Other operating income 7 0
Foreign exchange gain (-loss) -13 -67
Fines, penalties and tax interest 0 -5
Other operating expenses -2 -2
Total -15 -72
NOTE 18 Finance income and costs
1 Q 2015 1 Q 2014
Interest costs from loans, capital lease -69 -79
Interest costs from bonds -48 0
Total -117 -79
NOTE 19 Earnings per share
Basic earnings per share
1 Q 2015 1 Q 2014
Weighted average number of shares (thousand) pcs 40,795 40,795
Net loss from continuing operations
-1,136 -910
Net loss from discontinued operations
0 -1,572
Basic earnings per share EUR -0.03 -0.06
Basic earnings per share (continuing operations) EUR -0.03 -0.02
Basic earnings per share (discontinued operations) EUR 0.00 -0.04
Diluted earnings per share EUR -0.03 -0.06
Diluted earnings per share (continuing operations) EUR -0.03 -0.02
Diluted earnings per share (discontinued operations) EUR 0.00 -0.04
There were no dilutive instruments in the reporting period. In case, the Group had made profit, potentially dilutive could have been I- and J-bonds.
The average price (arithmetic average based on daily closing prices) of AS Baltika share on the Tallinn Stock Exchange in the reporting period was 0.43 euros (2014: 0.55 euros).

Consolidated interim report for the I quarter of 2015 (in thousands euros, unaudited)
33
NOTE 20 Related parties
For the purpose of these financial statements, parties are considered to be related if one party has the ability to control the other party, is under common control, or can exercise significant influence over the financial and management decisions of the other one in accordance with IAS 24, Related Party Disclosures. Not only the legal form of the transactions and mutual relationships, but also their actual substance has been taken into consideration when defining related parties.
For the reporting purposes in consolidated interim statements of the Group, the following entities have been considered related parties:
owners, that have significant influence, generally implying an ownership interest of 20% or more; and entities under their control (Note 11);
members of the Management Board and the Supervisory Council1;
close family members of the persons stated above; entities under the control or significant influence of the members of the Management Board
and Supervisory Council.
1Only members of the Parent company Management Board and Supervisory Council are considered as key management personnel, as only they have responsibility for planning, directing and controlling Group activities.
Transactions with related parties
1 Q 2015 1 Q 2014
Purchases Sales Purchases Sales
Goods 0 3 0 0
Services 162 0 60 0
Total 162 3 60 0
In 2015 as well as 2014 AS Baltika bought mostly management, communication and other services from related parties.
Balances with related parties
31 March 2015 31 Dec 2014
Other current loans and interests (Note 8, 9) 2,680 2,639
Trade payables (Note 9) 25 31
Payables to related parties total 2,705 2,670
Information about interest from related party, see in Note 8.
All transactions in 2015 as well as in 2014 reporting periods and balances with related parties as at 31 March 2015 and 31 December 2014 were with entities under the control or significant influence of the members of the Management Board and Supervisory Council and close family members. As at 31 March 2015 and 31 December 2014 the balances from borrowings, interests are partly with counterparty, who is also an owner that has significant influence.
Compensation for the members of the Management Board and Supervisory Council
1 Q 2015 1 Q 2014
Salaries of the members of the Management Board 79 87
Remuneration of the members of the Supervisory Council 5 5
Total 84 92
As at 31 March 2015 and 31 December 2014 there were five Management Board and five Supervisory Council Members. In the reporting period no changes took place composition of Management Board or Supervisory Council.
On April 14, 2015 the Supervisory Council decided to recall from the Management Board Andrew James David Paterson.
On January 30 2015 the Supervisory Board of AS Baltika decided to suspend Maigi Pärnik-Pernik Management Board contract for the duration of her maternity leave.
Convertible bonds (I- and J-bonds) are partly issued to related parties (Note 8).
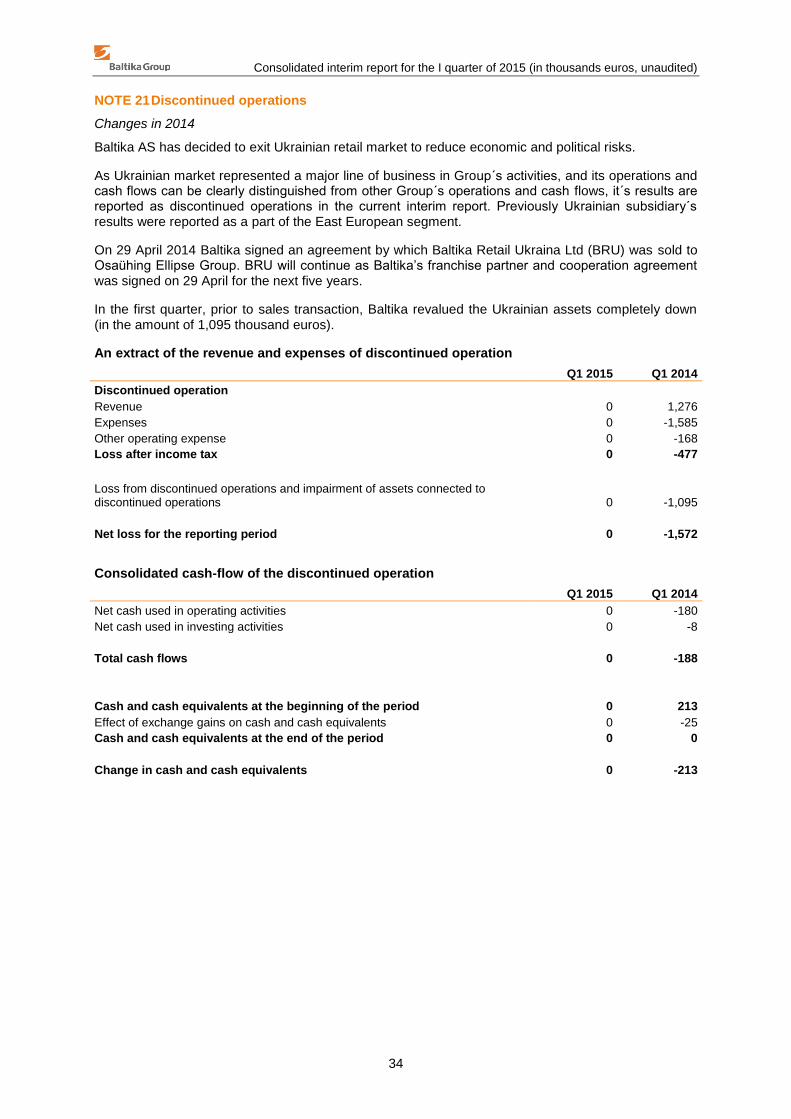
Consolidated interim report for the I quarter of 2015 (in thousands euros, unaudited)
34
NOTE 21 Discontinued operations
Changes in 2014
Baltika AS has decided to exit Ukrainian retail market to reduce economic and political risks.
As Ukrainian market represented a major line of business in Group´s activities, and its operations and cash flows can be clearly distinguished from other Group´s operations and cash flows, it´s results are reported as discontinued operations in the current interim report. Previously Ukrainian subsidiary´s results were reported as a part of the East European segment.
On 29 April 2014 Baltika signed an agreement by which Baltika Retail Ukraina Ltd (BRU) was sold to Osaühing Ellipse Group. BRU will continue as Baltika’s franchise partner and cooperation agreement was signed on 29 April for the next five years.
In the first quarter, prior to sales transaction, Baltika revalued the Ukrainian assets completely down (in the amount of 1,095 thousand euros).
An extract of the revenue and expenses of discontinued operation
Q1 2015 Q1 2014
Discontinued operation Revenue 0 1,276
Expenses 0 -1,585
Other operating expense 0 -168
Loss after income tax 0 -477
Loss from discontinued operations and impairment of assets connected to discontinued operations 0 -1,095
Net loss for the reporting period 0 -1,572
Consolidated cash-flow of the discontinued operation
Q1 2015 Q1 2014
Net cash used in operating activities 0 -180
Net cash used in investing activities 0 -8
Total cash flows 0 -188
Cash and cash equivalents at the beginning of the period 0 213
Effect of exchange gains on cash and cash equivalents 0 -25
Cash and cash equivalents at the end of the period 0 0
Change in cash and cash equivalents 0 -213
Consolidated interim report for the I quarter of 2015 (in thousands euros, unaudited)
35
AS BALTIKA SUPERVISORY COUNCIL
JAAKKO SAKARI MIKAEL SALMELIN Member of the Supervisory Council since 21.06.2010 Partner, KJK Capital Oy Master of Science in Finance, Helsinki School of Economics Other assignments:
Member of the Management Board of KJK Fund SICAV-SIF, Member of the Board of Directors, KJK Management SA, Member of the Board of Directors, KJK Capital Oy.
Baltika shares held on 31 March 2015: 0
TIINA MÕIS Member of the Supervisory Council since 03.05.2006 Chairman of the Management Board of AS Genteel Degree in Economical Engineering, Tallinn University of Technology Other assignments: Member of the Supervisory Council of AS Nordecon International, Member of the Supervisory Councils of AS LHV Pank and AS LHV Group, Member of the Board of Estonian Chamber of Commerce and Industry, Member of Estonian Accounting Standards Board. Baltika shares held on 31 March 2015: 977,837 shares (on AS Genteel account)
REET SAKS Member of the Supervisory Council since 25.03.1997 Attorney at Raidla Lejins & Norcous Law Office Degree in Law, University of Tartu Other assignments: Member of the Management Board of MTÜ International Association for the Protection of Intellectual Property (AIPPI) Estonian National Group. Baltika shares held on 31 March 2015: 0
Consolidated interim report for the I quarter of 2015 (in thousands euros, unaudited)
36
LAURI KUSTAA ÄIMÄ Member of the Supervisory Council since 18.06.2009 Managing Director of Kaima Capital Oy Master of Economics, University of Helsinki Other assignments: Member of the Supervisory Council of AS Tallink Grupp, Member of the Board of Oy Tallink Silja Ab, Member of the Board of KJK Invest Oy, Member of the Board of Aurejärvi Varainhoito Oy, Member of the Board of UAB Malsena Plius, Member of the Board of Bostads AB Blåklinten Oy, Member of the Supervisory Council of Salva Kindlustuse AS, Member of the Supervisory Council of AS Premia Foods, Member of the Supervisory Council of AS Premia Tallinna Külmhoone AS, Member of the Supervisory Council of Managetrade OÜ, Member of the Supervisory Council of Toode AS, Vice-chairman of the Board of AAS BAN, Vice-chairman of the Management Board of Amber Trust Management SA, Chairman of the Management Board of Amber Trust II Management SA, Chairman of the Management Board of KJK Fund SICAV-SIF, Chairman of the Management Board of KJK Fund II SICAV-SIF, Chairman of the Supervisory Council of JSC Rigas Dzirnavnieks, Chairman of the Board of Directors, KJK Management SA, Chairman of the Board of Directors, KJK Capital Oy. Baltika shares held on 31 March 2015: 24 590 shares (on Kaima Capital Eesti OÜ account)
VALDO KALM Member of the Supervisory Council since 20.04.2012 Chairman of the Board of AS EMT Automation and telemechanics, Tallinn University of Technology Other assignments: Chairman of the Board of AS Eesti Telekom Baltika shares held on 31 March 2015: 0
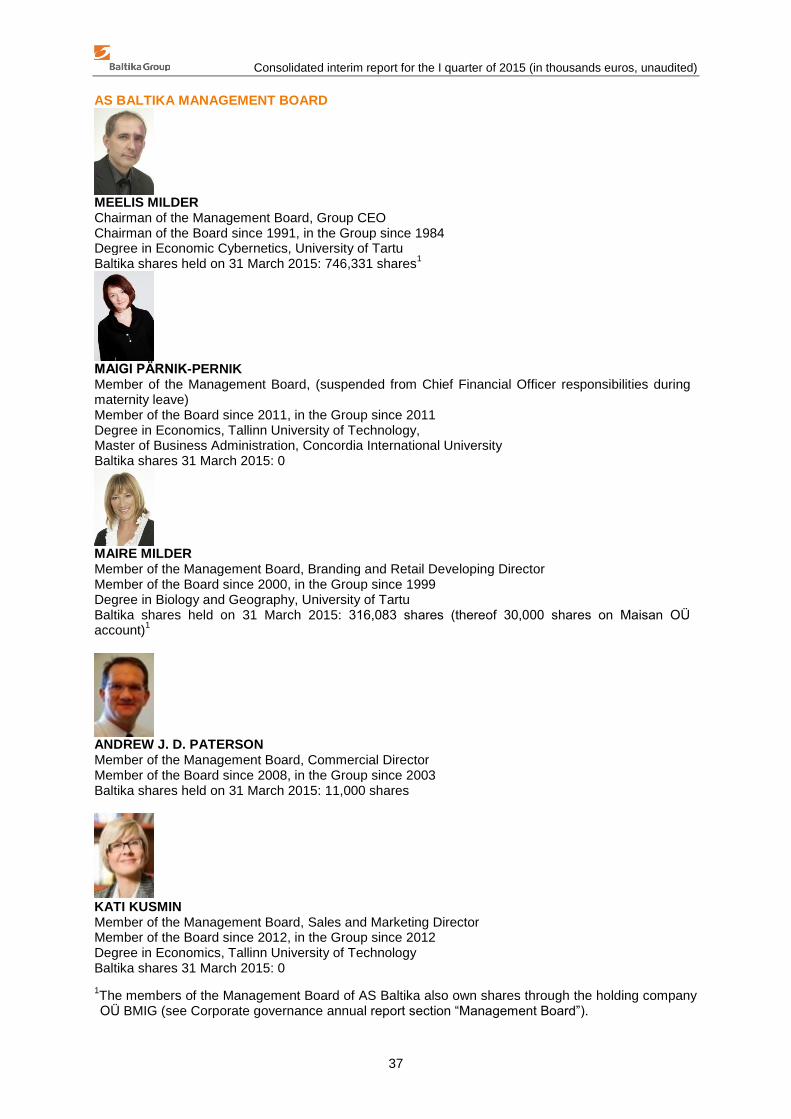
Consolidated interim report for the I quarter of 2015 (in thousands euros, unaudited)
37
AS BALTIKA MANAGEMENT BOARD
MEELIS MILDER Chairman of the Management Board, Group CEO Chairman of the Board since 1991, in the Group since 1984 Degree in Economic Cybernetics, University of Tartu Baltika shares held on 31 March 2015: 746,331 shares
1
MAIGI PÄRNIK-PERNIK Member of the Management Board, (suspended from Chief Financial Officer responsibilities during maternity leave) Member of the Board since 2011, in the Group since 2011 Degree in Economics, Tallinn University of Technology, Master of Business Administration, Concordia International University Baltika shares 31 March 2015: 0
MAIRE MILDER Member of the Management Board, Branding and Retail Developing Director Member of the Board since 2000, in the Group since 1999 Degree in Biology and Geography, University of Tartu Baltika shares held on 31 March 2015: 316,083 shares (thereof 30,000 shares on Maisan OÜ account)
1
ANDREW J. D. PATERSON Member of the Management Board, Commercial Director Member of the Board since 2008, in the Group since 2003 Baltika shares held on 31 March 2015: 11,000 shares
KATI KUSMIN Member of the Management Board, Sales and Marketing Director Member of the Board since 2012, in the Group since 2012 Degree in Economics, Tallinn University of Technology Baltika shares 31 March 2015: 0
1The members of the Management Board of AS Baltika also own shares through the holding company OÜ BMIG (see Corporate governance annual report section “Management Board”).


