Embed Size (px)
Citation preview
ARIZONA BOARD OF REGENTS
THIS IS A VIRTUAL MEETING
November 18 – 20, 2020 Members of the public may attend the public portion of the virtual meeting by viewing the livestream of the meeting. To view the livestream of the meeting please follow the instructions below.
ABOR Live is available at the following link: https://www.youtube.com/user/abornews • Click the top video for the live stream of the meeting.
If the above link does not work, open a browser, go to www.youtube.com or search YouTube
• Once in YouTube, use the search bar to search for ABOR News • Click the video that says Live
If livestream fails a call-in option will be available for public access and will be posted on the ABOR website at http://www.azregents.edu/about/abor-live.
For technical assistance, click the link here ABOR Tech Support or email [email protected] and [email protected]
Schedule of Events and Meetings
Wednesday, November 18, 2020 3:00 p.m. – 5:30 p.m. Executive Session (3:00 – 3:30 p.m. – Executive Session) (3:30 – 5:30 p.m. – Executive Director Review of Assignments)
Thursday, November 19, 2020 9:00 a.m. – 12:30 p.m. ABOR Meeting 12:30 p.m. – 1:30 p.m. Break for Lunch 1:30 p.m. – 4:15 p.m. Executive Session (1:30 p.m. – 2:30 p.m. – Enterprise Executive Committee Review of Assignments) (2:30 p.m. – 2:45 p.m. – Break) (2:45 p.m. – 4:15 p.m. – President Crow Review of Assignments)
Friday, November 20, 2020 9:00 a.m. – 2:15 p.m. Executive Session (9:00 a.m. – 10:30 a.m. – President Cheng Review of Assignments) (10:30 a.m. – 10:45 a.m. – Break) (10:45 a.m. – 2:15 p.m. – President Robbins Review of Assignments) (12:15 p.m. – 1:15 p.m. – Break for Lunch)

This page intentionally left blank

Wednesday, November 18, Thursday, November 19 and Friday, November 20
THIS IS A VIRTUAL MEETING
Members of the public may attend the public portion of the virtual meeting by viewing the livestream of the meeting. To view the livestream of the meeting please follow the instructions below.
ABOR Live is available at the following link: https://www.youtube.com/user/abornews
• Click the top video for the livestream of the meeting.
If the above link does not work, open a browser, go to www.youtube.com or search YouTube
• Once in YouTube, use the search bar to search for ABOR News • Click the video that says Live
If livestream fails a call-in option will be available for public access and will be posted on the ABOR website at http://www.azregents.edu/about/abor-live.
For technical assistance, click the link here ABOR Tech Support or email [email protected] and [email protected].
Wednesday, November 18, 2020
3:00 p.m. CALL TO ORDER 3:01 p.m. EXECUTIVE SESSION Pursuant to A.R.S. §38-431.03, the board will convene in executive session
to discuss items identified on the executive session agenda. 5:30 p.m. RECESS Thursday, November 19, 2020 9:00 a.m. RESUME PUBLIC MEETING, GREETINGS AND ANNOUNCEMENTS
FROM THE BOARD CHAIR
ARIZONA BOARD OF REGENTS MEETING November 18-20, 2020 2
9:05 a.m. CALL TO THE AUDIENCE During each regular board meeting, the board conducts a “Call to the
Audience” when members of the public may address the board regarding issues related to board governance. Due to the virtual nature of this board meeting and processes put in place to address Covid-19 and recommendations to limit the size of gatherings, the Call to the Audience will be conducted via written submissions. To provide a written submission, members of the public must submit a form by clicking on the following: https://www.azregents.edu/virtual-call-to-the-audience If you would like to submit additional materials for distribution to the board, please use the form to upload attachments. These materials along with the written submission provided will be distributed to the board. Because of the diversity of issues presented, Regents will not respond to the written submissions at the meeting. The written submission from members of the public will be recorded and referred to the appropriate university or board staff for follow-up, if necessary and if contact information is provided. The board is informed of the outcomes of the staff efforts to respond to the concerns submitted. Should you wish to mail your comments directly to the Board of Regents, please address them to: Larry Penley, Chair Arizona Board of Regents 2700 N. Central Avenue, Suite 400 Phoenix, AZ 85004 Submissions will be accepted until 8:30 a.m. on Thursday, November 19, 2020. After that time, please use the form at: http://azregents.edu/contact-us to submit any questions or comments to the board. Forms submitted will become part of the public record.
9:10 a.m. ADOPTION OF CONSENT AGENDA ACTION ITEMS AND ACCEPTANCE
OF CONSENT INFORMATION ITEMS All items on the Consent Agenda are listed at the end of this agenda,
underlined and marked with an asterisk (*). These items will be considered by a single motion with no discussion. All other items will be considered individually.
ARIZONA BOARD OF REGENTS MEETING November 18-20, 2020 3
9:15 a.m. ACADEMIC AFFAIRS AND EDUCATIONAL ATTAINMENT COMMITTEE 1. Postsecondary Attainment Report The board office asks the board to approve the Postsecondary
Attainment Report. 2. Comparator Institutions The board will engage in a discussion with the board office and university
staff regarding a proposed method for identifying comparator institutions for performance benchmarking purposes.
3. Appointment of Regents Professors for Arizona State University Arizona State University asks the board to approve the appointment of
four Regents’ Professors effective December 31, 2020: Ferran Garcia-Pichel (School of Life Sciences, College of Liberal Arts and Sciences), Steven Graham (Mary Lou Fulton Teachers College), Devoney Looser (Department of English, College of Liberal Arts and Sciences), and Ayanna Thompson (Department of English, College of Liberal Arts and Sciences).
10:10 a.m. LEGISLATIVE UPDATE 4. Discussion and Consideration of Legislation Affecting the
University Enterprise The board office asks the board to discuss and consider legislation
affecting the university system and may possibly approve positions regarding the legislation.
10:55 a.m. 20-MINUTE BREAK 11:15 a.m. ADMINISTRATIVE BUSINESS 5. Approval of the NAU Presidential Leadership Characteristics The board office asks the board to approve the NAU Presidential
Leadership Characteristics. 6. Arizona Innovation Alliance The presidents will discuss the establishment of the Arizona Innovation
Alliance.
ARIZONA BOARD OF REGENTS MEETING November 18-20, 2020 4
7. Proposed Allocation of TRIF Revenues that Exceed the FY 2020
TRIF Budget The board office asks the board to approve the proposed allocation of
TRIF revenues that exceeded the FY 2020 TRIF budget. 8. Ratification of Authorization to Initiate Litigation Against the
Department of Labor’s New Interim Rule on Prevailing Wage and Against the Department of Homeland Security’s new Rule Narrowing Eligibility for H1B Visas (ASU, NAU, UArizona)
Pursuant to ABOR Policy 1-109, ASU, NAU, and UArizona request that
the board ratify the prior authorization for ASU, NAU and UArizona to initiate litigation against the Department of Labor’s New Interim Rule on Prevailing Wage and Against the Department of Homeland Security’s New Rule Narrowing Eligibility for H1B Visas
9. Multiple-year Employment Contract for Vice President for
Intercollegiate Athletics at Northern Arizona University (NAU) Northern Arizona University asks the board to approve a one-year
contract extension for Michael Marlow as Vice President for Intercollegiate Athletics (Athletic Director).
10. Presidents’ Contracts The board will vote to recognize the achievement of 2017-2020 at-risk
compensation goals assigned to President Cheng and President Robbins.
12:10 p.m. STUDENT REGENT REPORT 12:20 p.m. REPORT FROM THE ARIZONA FACULTIES COUNCIL 12:25 p.m. INQUIRIES, REQUESTS, REPORTS, AND COMMENTS FROM REGENTS
AND MEMBERS OF THE ENTERPRISE EXECUTIVE COMMITTEE 12:30 p.m. RECESS 1:30 p.m. RECONVENE EXECUTIVE SESSION Pursuant to A.R.S. §38-431.03, the board will reconvene in executive session
to discuss items identified on the executive session agenda.
ARIZONA BOARD OF REGENTS MEETING November 18-20, 2020 5
Friday, November 20, 2020 9:00 a.m. RECONVENE EXECUTIVE SESSION Pursuant to A.R.S. §38-431.03, the board will reconvene in executive session
to discuss items identified on the executive session agenda. CONSENT AGENDA These items were considered by a single motion with no discussion and
approved earlier in the meeting. 11. *Minutes (a) June 4, 2020 Special Executive Session; (b) June 10-12, 2020
Executive Session; (c) June 22, 2020 Special Executive Session, (d) June 30, 2020 Special Executive Session, (e) July 21, 2020 Special Executive Session, (f) August 20, 2020 Special Executive Session, (g) September 9, 2020 Special Executive Session, (h) September 10, 2020 Special Board Meeting, (i) September 30-October 2, 2020 Regular Board Meeting, (j) October 13, 2020 Special Board Meeting, (k) October 26, 2020 Special Board Meeting, (l) November 9, 2020 Special Board Meeting.
FINANCE, CAPITAL AND RESOURCES COMMITTEE 12. *Report on the Finance, Capital and Resources Committee Meeting The board office asks the board to review the report of the November 5,
2020 Finance, Capital and Resources Committee meeting. 13. *Proposed Revision to ABOR Policy 6-803 “Vacation Leave”
(Second Reading) The universities ask the board to approve on second reading the
proposed revisions to ABOR Policy 6-803 “Vacation Leave.” 14. *FY 2021 Capital Development Plan (UArizona) The University of Arizona (UArizona) is submitting no new projects as
part of its Capital Development Plan and therefore requires no action to be taken.
15. *Revised Sunset Review Fee Schedule (UArizona) The University of Arizona asks the board to approve its revised
academic fees sunset review schedule.
ARIZONA BOARD OF REGENTS MEETING November 18-20, 2020 6
16. *Amended Capital Development Plan (ASU) Arizona State University asks the board to approve its Amended Capital
Development Plan, which includes one new project and totals $115.0 million.
17. *Premium Payment, Health and Dependent Care Cafeteria Plan The board office asks the board to approve the Fifth Amendment to the
Premium Payment, Health and Dependent Care Cafeteria Plan. 18. *Proposed Revision to ABOR Policy 1-117 (Naming of Facilities and
Programmatic Units for Individuals or Organizations) and Incorporation and Repeal of Guidelines for Assigning the Names of Individuals, Families or Organizations to Campus Facilities or Programmatic Units (First Reading)
The board office asks the board to review on first reading the proposed
revisions to ABOR Policy 1-117 “Naming of Facilities and Programmatic Units for Individuals or Organizations” and the proposed incorporation and repeal of the Guidelines for Assigning the Names of Individuals, Families or Organizations to Campus Facilities or Programmatic Units.
19. *Approve Use of Funds Bequeathed to the University of Arizona Approve use of funds bequeathed to the University of Arizona, where
the decedent’s trust requested a joint decision of the board. ACADEMIC AFFAIRS AND EDUCATIONAL ATTAINMENT COMMITTEE 20. *Report on the Academic Affairs and Educational Attainment
Committee Meeting The board office asks the board to review the report of the November 5,
2020 Academic Affairs and Educational Attainment Committee Meeting. 21. *Proposed Revision to ABOR Policy 2-210 “General Education”
(First Reading) The board office asks the board to review on first reading the proposed
revisions to ABOR Policy 2-210 “General Education.” 22. *Fall Enrollment Report The board office asks the board to approve the Fall Enrollment Report.
ARIZONA BOARD OF REGENTS MEETING November 18-20, 2020 7
23. *Proposed Revisions to ABOR Policy 2-223 “Academic Locations,
Programs and Organizational Units” [Formerly “Academic Strategic Plan”] (First Reading)
The board office asks the board to review on first reading the proposed
revision to ABOR Policy 2-223 “Academic Locations, Programs and Organizational Units.”
24. *Request for New Academic Programs for Arizona State University Arizona State University asks the board to approve the new program
requests effective in the 2021-2022 catalog year. 25. *Request for New Academic Programs for Northern Arizona
University Northern Arizona University asks the board to approve the new program
requests effective in the 2021-2022 catalog year. 26. *Request for Credit Exception for Northern Arizona University Northern Arizona University asks the board to approve an exception to
the community college transfer credit limit. 27. *Request for New Academic Programs for the University of Arizona The University of Arizona asks the board to approve the new program
requests effective in the Spring of 2021. 28. *Fiscal Year 2020 Financial Aid Report The board office asks the board to approve the Fiscal Year 2020
Financial Aid Report. 29. *Arizona Community College Transfer Students and Review of the
2020 Annual Report on Articulation and Transfer for Arizona Postsecondary Education
The board office asks the board to approve the annual report on
articulation and transfer, to be submitted to the Joint Legislative Budget Committee (JLBC) by December 15, 2020.
AUDIT COMMITTEE 30. *Report on the Audit Committee Meeting The board office asks the board to review the report of the November 5,
2020 Audit Committee Meeting.
ARIZONA BOARD OF REGENTS MEETING November 18-20, 2020 8
2:15 p.m. ADJOURN
PLEASE NOTE: This agenda may be amended at any time prior to 24 hours before the board meeting. Estimated starting times for the agenda items are indicated; however, discussions may commence, or action may be taken, before or after the suggested times. Any item on the agenda may be considered at any time out of order at the discretion of the board chair. The board may discuss, consider, or take action regarding any item on the agenda. During the meeting, the board may convene in executive session pursuant to A.R.S. § 38-431.03(A)(3) for legal advice regarding any item on the agenda. Board Meeting Schedule Meeting Schedule for 2020-2021 February 10-12, 2021 ASU April 14-16, 2021 UA June 9-11, 2021 NAU Meeting Schedule for 2021-2022 August 26, 2021 ASU Fulton September 29-October 1, 2021 NAU November 17-19, 2021 UA February 9-11, 2022 ASU April 6-8, 2022 UA June 8-10, 2022 NAU Meeting Schedule for 2022-2023 August 25, 2022 ASU Fulton September 28-30, 2022 NAU November 16-18, 2022 UA February 8-10, 2023 ASU April 26-28, 2023 UA June 14-16, 2023 NAU
Instruction re: Confidentiality Pursuant to A.R.S. §38-431.03(B) & (C) all are reminded that minutes of and discussions that occur in executive sessions are confidential by law and that violations of that confidentiality may subject the individuals involved to such penalties as are prescribed by law, including fines, costs, attorneys’ fees, and removal from office.
ARIZONA BOARD OF REGENTS EXECUTIVE SESSION AGENDA
THIS IS A VIRTUAL MEETING
November 18, 19 and 20, 2020
NOTE: This agenda may be amended at any time prior to 24 hours before the board meeting.
Executive session is scheduled for 3:00 p.m. on Wednesday, November 18, 1:30 p.m. on Thursday, November 19, and 9:00 a.m. on Friday, November 2020. Executive session may be recessed and continued as necessary.
Statutory Authorization
A.R.S. § 38-431.03
Items to be Discussed (A. 2) I. Review of minutes of previous executive session(s) II. From the board, board office staff or counsel to the board (A. 2 & 3) A. Legal advice and discussion regarding the Northern
Arizona University presidential search (A. 1, 3 & 4) B. Review of assignments – Presidents, Executive Director
and Enterprise Executive Committee (A. 3) C. Legal advice and discussion regarding November 2020
ballot initiatives and their effects on the University Enterprise
(A. 3 & 4) D. Legal advice, discussion and report on pending or
contemplated litigation and related filings and matters (A. 3 & 4) E. Legal advice and discussion concerning the State of
Arizona, ex rel. Mark Brnovich, Attorney General, v. Arizona Board of Regents; John P. Creer, Assistant Vice President for University Real Estate Development at ASU, Defendants, Paul D. Petersen, in his official capacity as Maricopa County Assessor, and Royce T. Flora, in his official capacity as Maricopa County Treasurer, Relief-Defendants. (Case Nos. TX 2019-000011, 1 CA-TX 20-0003 and related filings and matters)
2
Instruction re: Confidentiality
Pursuant to A.R.S. §38-431.03(B) & (C) all are reminded that minutes of and discussions that occur in executive sessions are confidential by law and that violations of that confidentiality may subject the individuals involved to such penalties as are prescribed by law, including fines, costs, attorneys’ fees, and removal from office.
(A. 3 & 4)
F. Legal advice and discussion concerning the State of Arizona, ex rel. Mark Brnovich, Attorney General, v. Arizona Board of Regents (Case Nos. CV 2017-012115; 1 CA-CV 18-0420; T-19-0002-CV; CV-19-0027-SA, CV-19-0247 and related filings and matters)
III From Northern Arizona University (A. 1, 3 & 4) G. Legal advice and discussion regarding the Multiple-year
Employment Contract for Michael Marlow, Vice President of Intercollegiate Athletics (Athletic Director), at Northern Arizona University
IV. From the University of Arizona (A. 1, 3 & 4) H. Legal advice and discussion regarding University of
Arizona athletics and the NCAA investigation (A. 3 & 4) I. Legal advice and discussion regarding the Banner
affiliation (A. 3 & 4) J. Legal advice and discussion regarding University of
Arizona Global Campus
PLEASE NOTE: This agenda may be amended at any time prior to 24 hours before the board meeting. Estimated starting times for the agenda items are indicated; however, discussions may commence before or after the suggested times. Any item on the agenda may be considered at any time out of order at the discretion of the board chair. Pursuant to A.R.S. §38-431.03 (A)(3) the board may convene in executive session at any time during the meeting to receive legal advice regarding any item on the agenda.
Board of Regents Meeting November 18-20, 2020
Item #1 EXECUTIVE SUMMARY Page 1 of 1
Contact Information: Chad Sampson, ABOR [email protected] 602-229-2512
Item Name: Postsecondary Attainment Report
Action Item
History and Discussion The Postsecondary Attainment report is designed to provide a snapshot of the proportion of Arizona high school students who continue to two and four-year colleges, as well as the percentage within a six-year cohort who complete a two or four-year degree. The emphasis, however, is on four-year institution enrollment and degree completion. The report examines the 2009 through 2018 high school graduating classes for college enrollment purposes and the 2005 through 2013 high school graduating classes for college completion purposes. The universe of students considered in this report is limited to those who attended public high schools and postsecondary institutions that accept federal financial aid. The report is compiled by matching student information from the Arizona Department of Education with enrollment and college completion data from the National Student Clearinghouse. The report included with these materials contains significant detail and information, including demographic and high school regarding college enrollment and completion in Arizona. Statutory/Policy Requirements A.R.S. §15-1626(A) “General administrative powers and duties of board”
Requested Action: The board office asks the board to approve the Postsecondary Attainment Report.

This page intentionally left blank
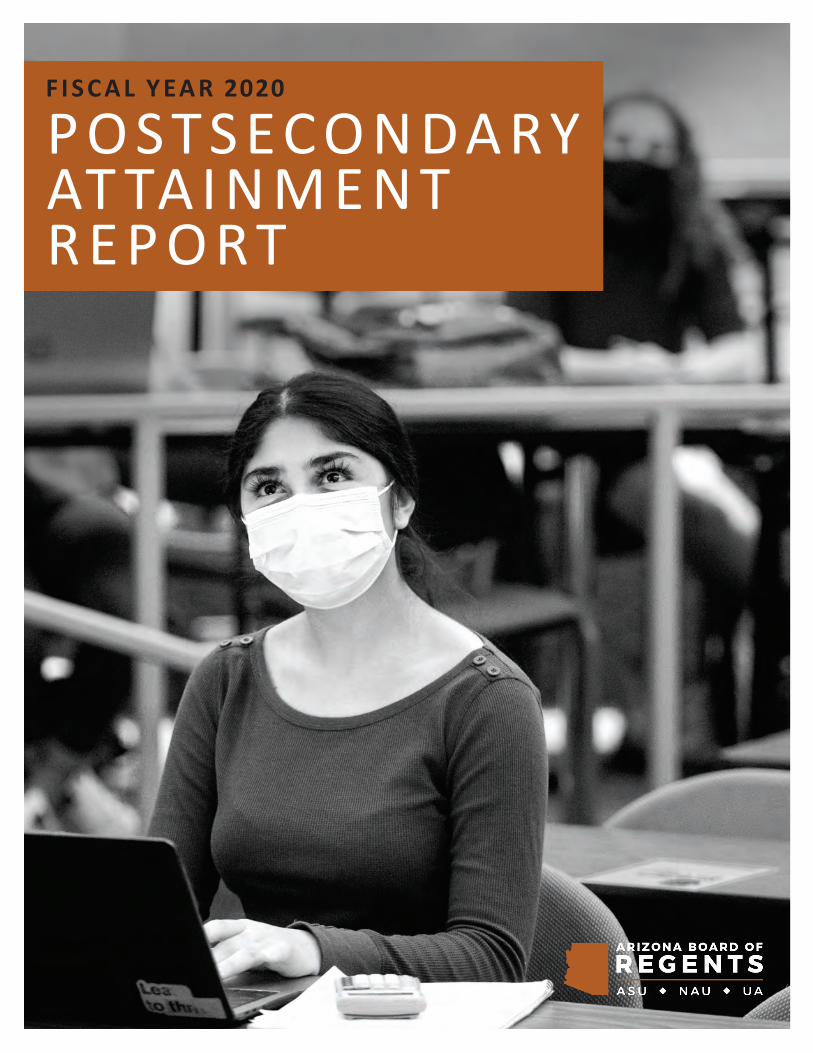
POSTSECONDARY ATTAINMENT REPORT | 1
F I S C A L Y EA R 2020
P O ST S ECO N DA RY AT TA I N M E N TR E P O RT
The Arizona Board of Regents Postsecondary Attainment Report examines the number and proportion of Arizona public high school graduates who enroll in postsecondary institutions within one year of graduation, as well as the number and proportion that complete a postsecondary credential within six years of graduation. Data in this report uses graduation records from Arizona public high schools provided by the Arizona Department of Education, and postsecondary enrollment and completion records for these graduates from the National Student Clearinghouse. This year’s report restates data from the report’s inception to correct irregularities that were identified in the records of Arizona public high school graduates provided by the Arizona Department of Education. To address these anomalies, the Arizona Department of Education recommended and applied an algorithm to uniquely assign high school graduates to a single graduation year, high school, gender and race. Students whose graduation records could not be disambiguated by this algorithm are reported as having graduated from an “unknown” high school. The Arizona Board of Regents provides this report to inform the state’s understanding of postsecondary enrollment and completion trends and the educational attainment challenges and opportunities in Arizona.
ABOUT THE AR IZONA BOARD OF REGENTSThe Arizona Board of Regents is committed to ensuring access for qualified residents of Arizona to undergraduate and graduate institutions; promoting the discovery, application and dissemination of new knowledge; extending the benefits of university activities to Arizona’s citizens outside the university; and maximizing the benefits derived from the state’s investment in education.
MEMBERSLarry Penley, ChairLyndel Manson, Chair ElectKarrin Taylor Robson, SecretaryRon Shoopman, TreasurerBill RidenourFred DuValKathryn Hackett KingCecilia MataAnthony Rusk, Student RegentNikhil Dave, Student RegentGov. Doug Ducey, Ex-OfficioSuperintendent Kathy Hoffman, Ex-Officio
ABOR EXECUTIVE D IRECTORJohn Arnold
A B O U T T H I S R E P O R T
TA B L E O F C O N T E N T STakeaways
Executive Summary
Postsecondary Enrollments within One Year After Graduation
Four-Year College Enrollments Within One Year After Graduation
Top Postsecondary Institutions by 2018 High School Graduate Enrollments
Top Ten Percent of Arizona High Schools Ranked by 2018 Enrollment Rate at Four-Year Colleges
2018 Graduates and Four-Year College Enrollment Rate Based on High School Tiers
2018 Graduates by Race Ethnicity and High School Tier
Number of Graduates Enrolled at Four-Year Colleges by Gender and Race Ethnicity
Percentage of Graduates Enrolled at Four-Year Colleges by Gender and Race Ethnicity
Postsecondary Completions Within Six Years After Graduation
Bachelor’s Degree Completion Within Six Years After Graduation
Top Postsecondary Institutions by 2013 High School Graduate Completions
Top Ten Percent of Arizona Public High Schools Ranked by 2013 Six Year Completion Rate of Bachelor’s Degrees
2013 Graduates and Bachelor’s Degree Completions Within Six Years by High School Tier
2013 Graduates by Race Ethnicity and High School Tier
Number of Graduates Completing Bachelor’s Degrees Within Six Years of Graduation by Gender and Race Ethnicity
Percentage of Graduates Completing Bachelor’s Degrees Within Six Years of Graduation by Gender and Race Ethnicity
1
4
7
8
9
10
11
12
13
14
15
16
17
18
19
20
21
22
1 | POSTSECONDARY ATTAINMENT REPORT
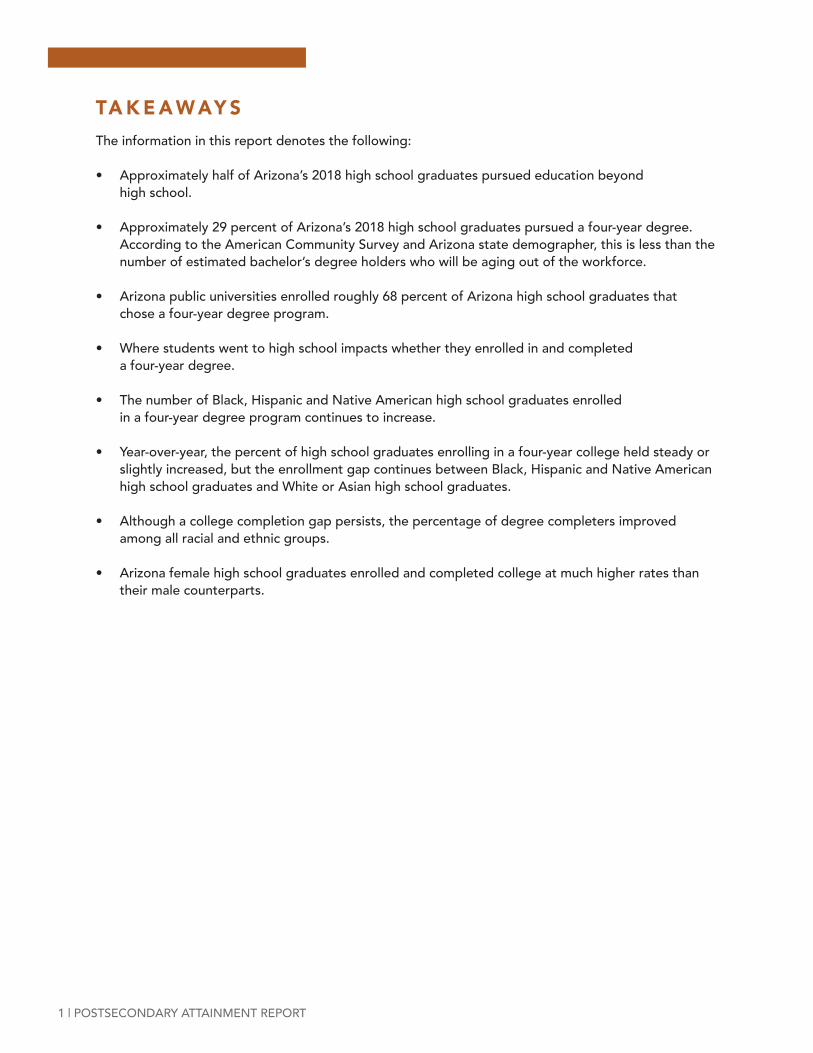
The information in this report denotes the following:
• Approximately half of Arizona’s 2018 high school graduates pursued education beyond high school.
• Approximately 29 percent of Arizona’s 2018 high school graduates pursued a four-year degree. According to the American Community Survey and Arizona state demographer, this is less than the number of estimated bachelor’s degree holders who will be aging out of the workforce.
• Arizona public universities enrolled roughly 68 percent of Arizona high school graduates that chose a four-year degree program.
• Where students went to high school impacts whether they enrolled in and completed a four-year degree.
• The number of Black, Hispanic and Native American high school graduates enrolled in a four-year degree program continues to increase.
• Year-over-year, the percent of high school graduates enrolling in a four-year college held steady or slightly increased, but the enrollment gap continues between Black, Hispanic and Native American high school graduates and White or Asian high school graduates.
• Although a college completion gap persists, the percentage of degree completers improved among all racial and ethnic groups.
• Arizona female high school graduates enrolled and completed college at much higher rates than their male counterparts.
TA K E A W AY S
POSTSECONDARY ATTAINMENT REPORT | 2
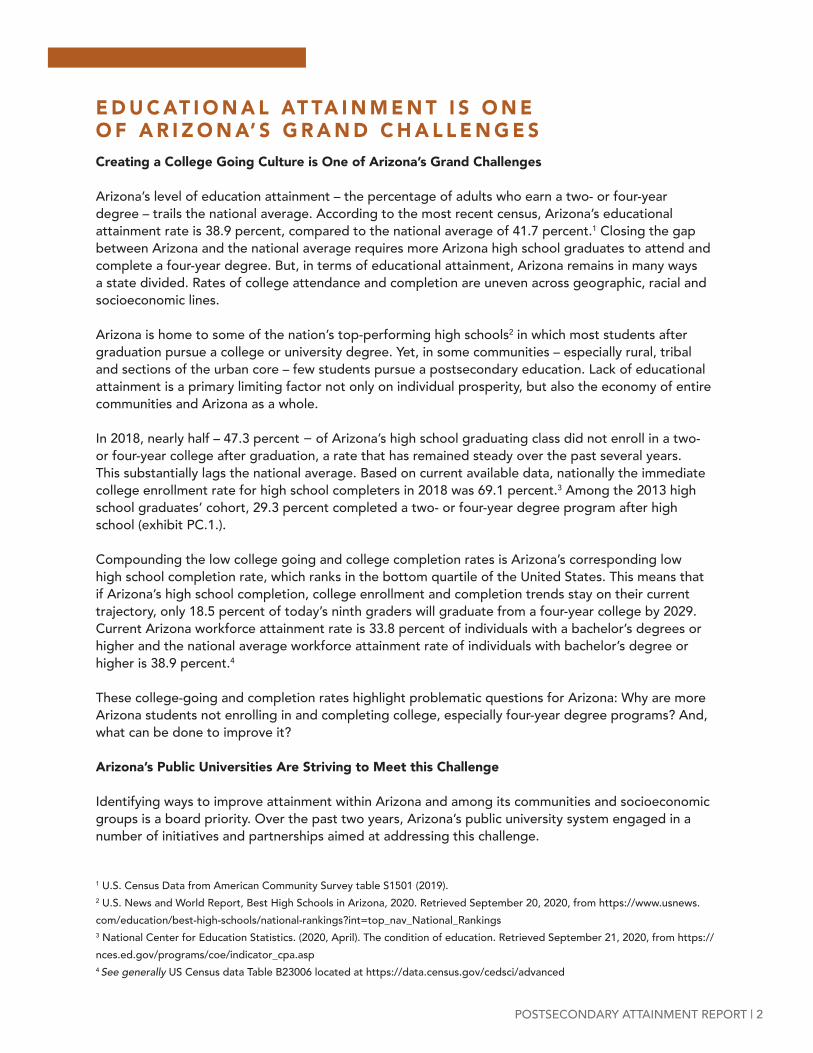
Creating a College Going Culture is One of Arizona’s Grand Challenges
Arizona’s level of education attainment – the percentage of adults who earn a two- or four-year degree – trails the national average. According to the most recent census, Arizona’s educational attainment rate is 38.9 percent, compared to the national average of 41.7 percent.1 Closing the gap between Arizona and the national average requires more Arizona high school graduates to attend and complete a four-year degree. But, in terms of educational attainment, Arizona remains in many ways a state divided. Rates of college attendance and completion are uneven across geographic, racial and socioeconomic lines.
Arizona is home to some of the nation’s top-performing high schools2 in which most students after graduation pursue a college or university degree. Yet, in some communities – especially rural, tribal and sections of the urban core – few students pursue a postsecondary education. Lack of educational attainment is a primary limiting factor not only on individual prosperity, but also the economy of entire communities and Arizona as a whole.
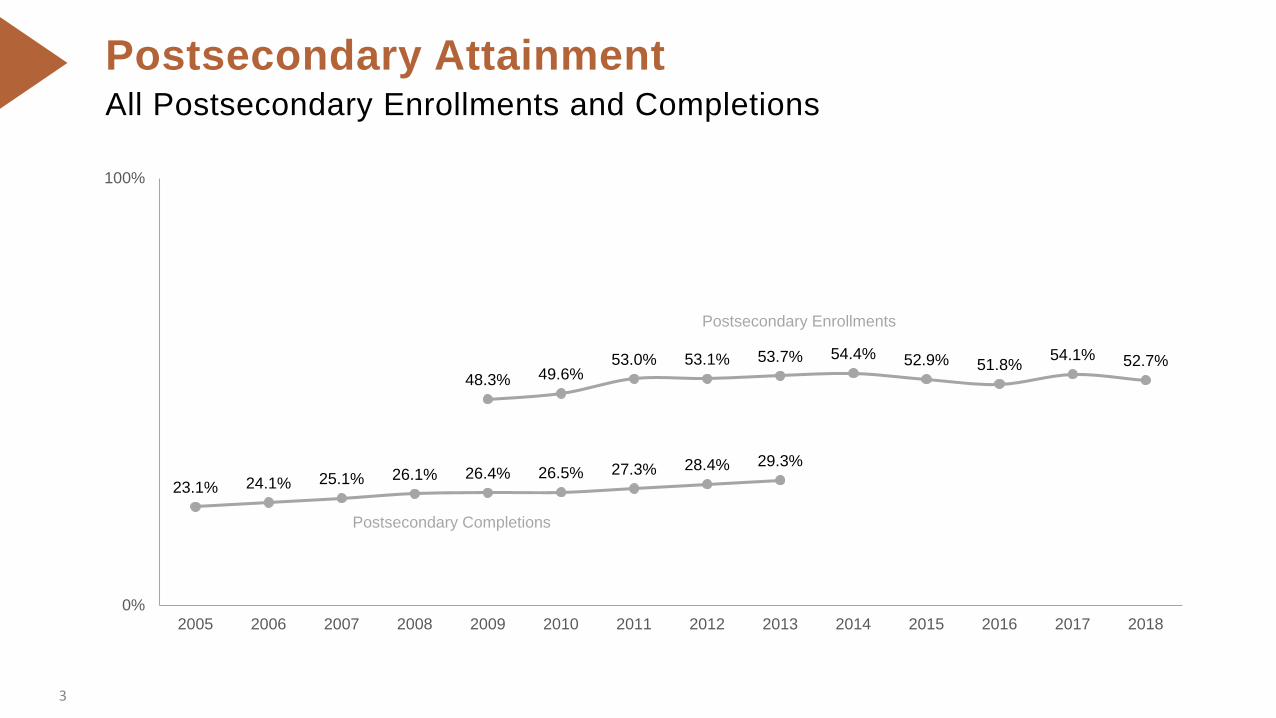
In 2018, nearly half – 47.3 percent − of Arizona’s high school graduating class did not enroll in a two- or four-year college after graduation, a rate that has remained steady over the past several years. This substantially lags the national average. Based on current available data, nationally the immediate college enrollment rate for high school completers in 2018 was 69.1 percent.3 Among the 2013 high school graduates’ cohort, 29.3 percent completed a two- or four-year degree program after high school (exhibit PC.1.).
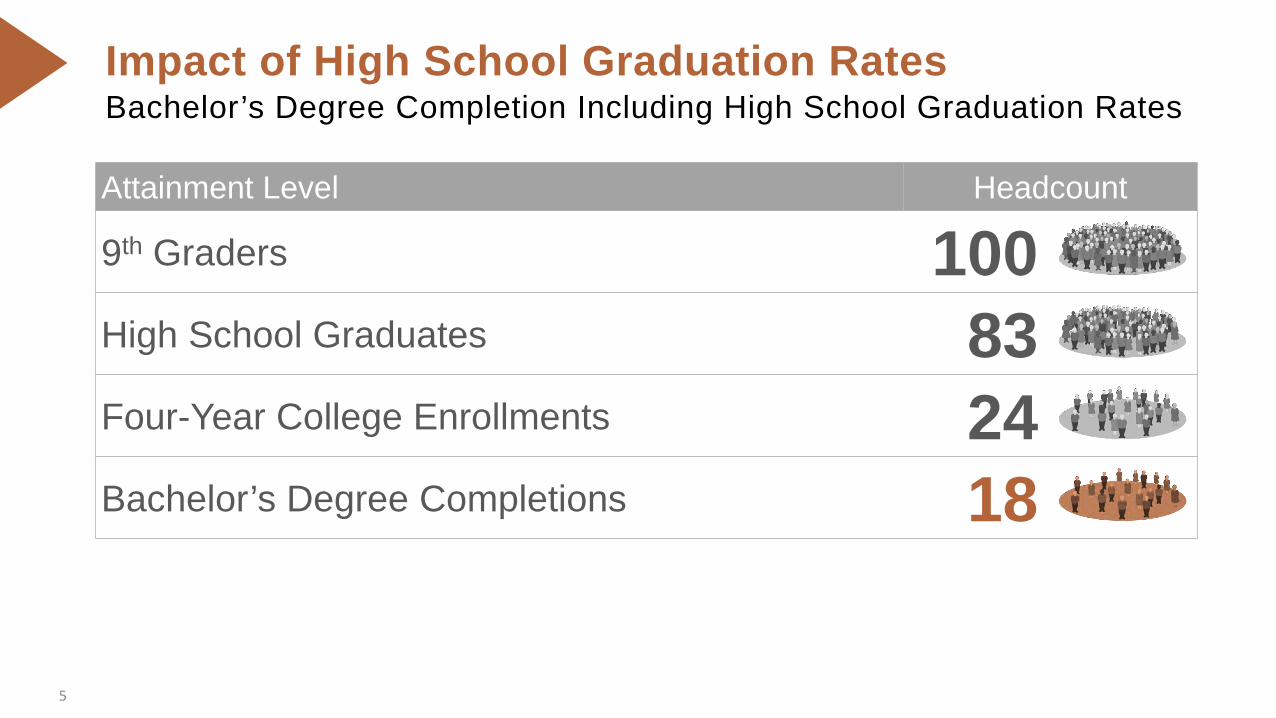
Compounding the low college going and college completion rates is Arizona’s corresponding low high school completion rate, which ranks in the bottom quartile of the United States. This means that if Arizona’s high school completion, college enrollment and completion trends stay on their current trajectory, only 18.5 percent of today’s ninth graders will graduate from a four-year college by 2029. Current Arizona workforce attainment rate is 33.8 percent of individuals with a bachelor’s degrees or higher and the national average workforce attainment rate of individuals with bachelor’s degree or higher is 38.9 percent.4
These college-going and completion rates highlight problematic questions for Arizona: Why are more Arizona students not enrolling in and completing college, especially four-year degree programs? And, what can be done to improve it?
Arizona’s Public Universities Are Striving to Meet this Challenge
Identifying ways to improve attainment within Arizona and among its communities and socioeconomic groups is a board priority. Over the past two years, Arizona’s public university system engaged in a number of initiatives and partnerships aimed at addressing this challenge.
E D U C AT I O N A L AT TA I N M E N T I S O N E O F A R I Z O N A’ S G R A N D C H A L L E N G E S
1 U.S. Census Data from American Community Survey table S1501 (2019).2 U.S. News and World Report, Best High Schools in Arizona, 2020. Retrieved September 20, 2020, from https://www.usnews.com/education/best-high-schools/national-rankings?int=top_nav_National_Rankings3 National Center for Education Statistics. (2020, April). The condition of education. Retrieved September 21, 2020, from https://nces.ed.gov/programs/coe/indicator_cpa.asp4 See generally US Census data Table B23006 located at https://data.census.gov/cedsci/advanced
3 | POSTSECONDARY ATTAINMENT REPORT
Those initiatives include:
• Partnering with the Governor to create and establish the Arizona Teachers Academy to address teacher shortages;
• Launching the New Economy Initiative to garner legislative support for four-year degree attainment;
• ASU Digital Preparatory Academy’s partnership with dozens of Arizona high schools to provide better access to curriculum and great instructors;
• Improvement of existing and development of new external relationships to promote the value of higher education;
• Entered into data sharing agreements with the Arizona Department of Education and the community colleges to better understand student persistence;
• Set-aside of funding for a plan to further study K-12 student preparedness for higher education;
• Development and dissemination of research reports on the worth of a college degree, including the Graduate Wages Report;
• In partnership with Achieve60AZ, the Arizona Commission for Postsecondary Education and College Success AZ, ASU developed Benji – an Artificial Intelligence technology with an open bot platform to help students and families get answers to their FAFSA questions instantly and complete the FAFSA as quickly and easily as possible;
• A new partnership with the U.S. Census to expand college graduate outcome reporting; and
• Pursuit of multiple public engagement initiatives, including launch of the Regents’ Cup.
Through these and other efforts, ABOR and Arizona’s public universities are making strides to develop a stronger college-going culture in our state.
POSTSECONDARY ATTAINMENT REPORT | 4
E X E C U T I V E S U M M A RYFifty-Two Percent of Arizona’s High School Graduates Go on to College
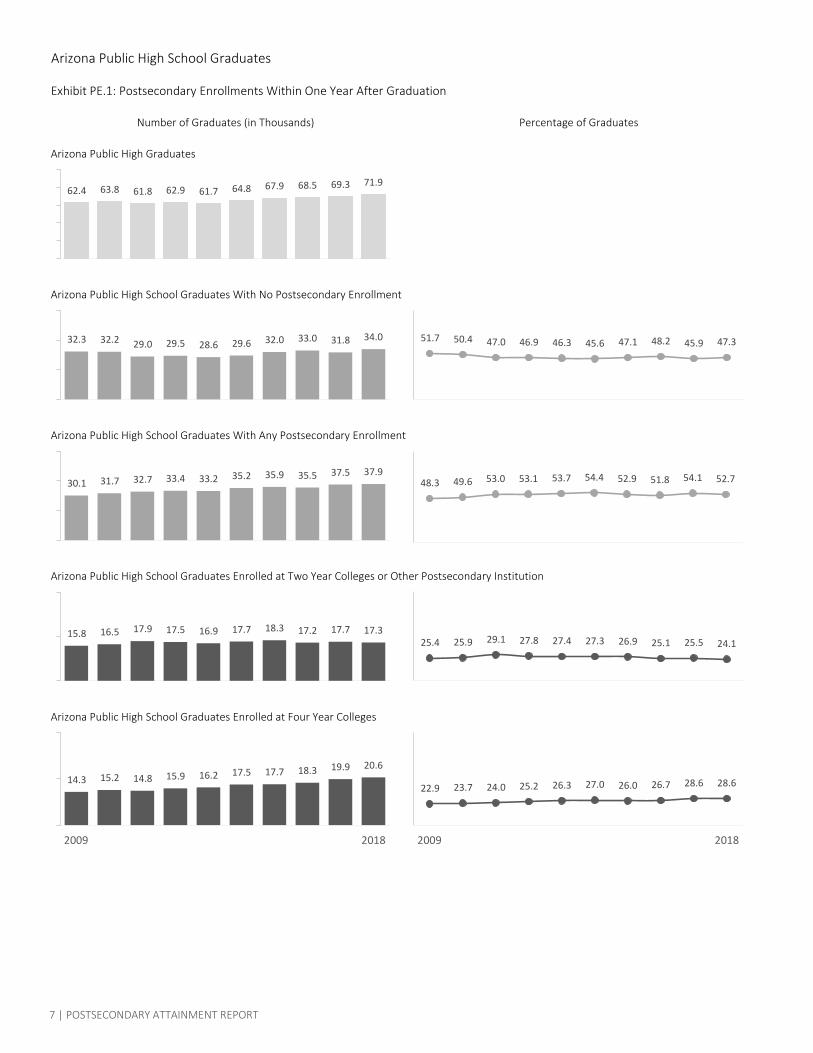
Arizona is not moving the needle fast enough on high school graduates going to college. Among the approximately 72,000 high school students who graduated in 2018, nearly half – 34,000 – did not enroll in a postsecondary education institution (exhibit PE.1.). A smaller percentage of high school graduates chose to enroll in college in 2018 than in 2009, indicating a troubling trend. Educational attainment is a primary factor that impacts the quality of Arizona’s labor market and our ability to compete regionally and nationally for high-paying employers and jobs.
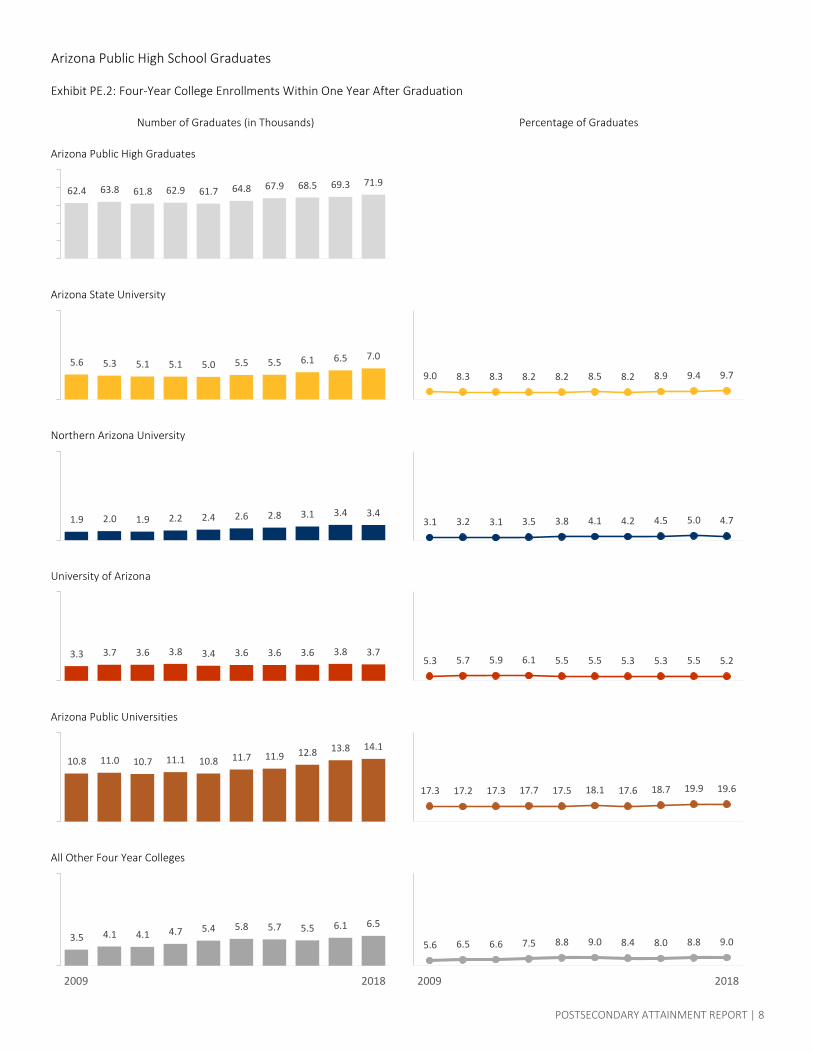
Arizona’s college-going rate is relatively static and will likely be impacted by the pandemic in the near future. In 2018, the enrollment rate was 52.7 percent, a decline from 2017, and the current pandemic may cause the enrollment rate to decline further next year (exhibit PE.1.).
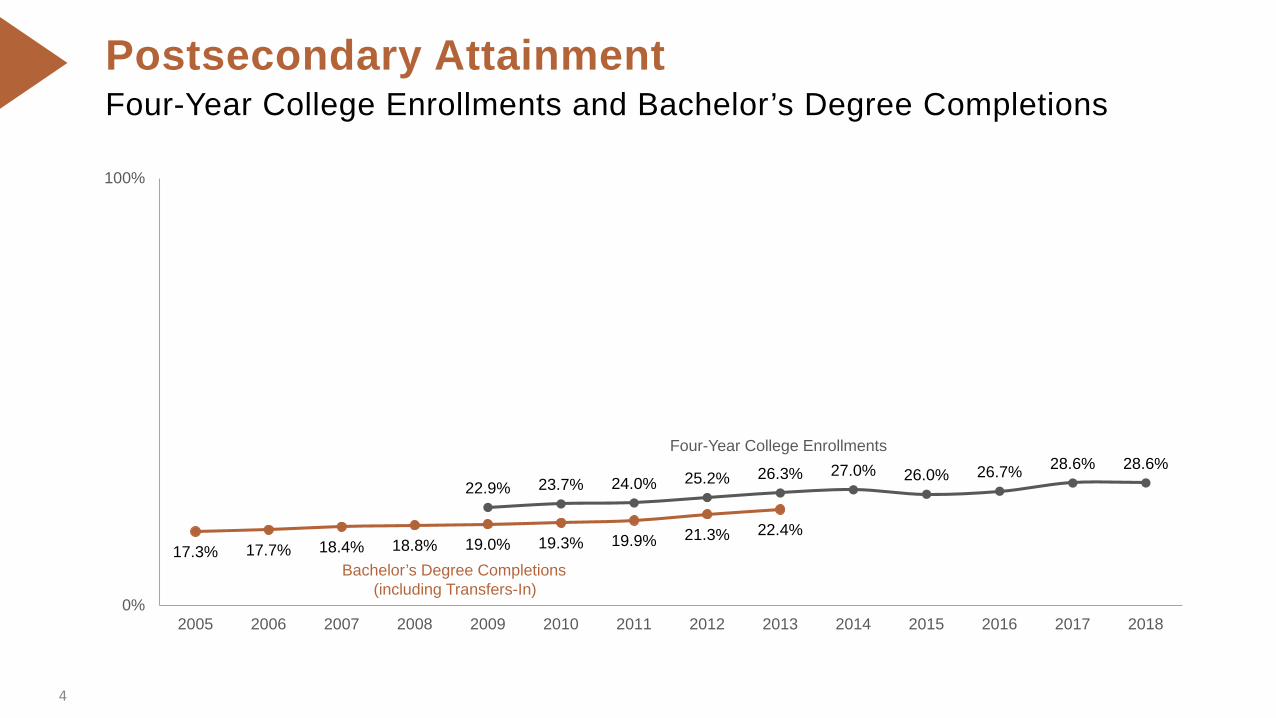
Although the overall rate of enrollment in higher education decreased, the rate of high school graduates enrolling in four-year institutions remained steady at 28.6 percent in 2018. That means, of those students choosing to go to college during the past couple of years, a greater percentage have elected to attend a four-year institution (exhibit PE.1.). There are several possible reasons for this enrollment shift, including the value proposition of a four-year degree compared to a two-year degree, and increased availability of financial aid that has brought a university education within reach of more Arizonans.
Where You Go to High School Matters
The college enrollment data sheds light on Arizona high schools’ inconsistent performance in preparing students for higher education. The top Arizona high schools educate 60.8 percent of high school graduates and produce 82 percent of those who subsequently enroll in a four-year college (exhibit PE.5).
The report divides Arizona public high schools into tiers based on their graduates’ college enrollment. The grouping is done by separating the Arizona high schools into 10 tiers, with each tier representing 10 percent of Arizona public high schools. The top 10 percent of high schools with the highest four-year college enrollment rates are placed in the first tier, and so on, until schools with the lowest four-year college enrollment rates are placed into tier 10.
Unsurprisingly, the charts show that graduates from high schools in the top-performing tiers have a much greater chance of enrolling in a four-year college relative to students who graduate from schools in the lower tiers. Graduates from the top tier of high schools have a 67.7 percent college enrollment rate, while graduates from schools in tier five have an 18.9 percent college enrollment rate. Graduates from schools in the lowest performing tier have a zero percent college enrollment rate (exhibit PE.5). Addressing the enrollment disparities among high schools is a strategic imperative for Arizona.
Arizona is not Producing Enough Four-Year Degrees Per High School Graduating Class
Among students who pursued a college or university education, enrollment trends are almost evenly split between two- and four-year schools (exhibit PE.1.). The 28.6 percent of Arizona high school

5 | POSTSECONDARY ATTAINMENT REPORT
graduates choosing to attend a four-year program is insufficient to replace the number of college degree-holders forecast to retire in the coming years. Unless Arizona rapidly improves its educational attainment, our state will be forced to continue relying upon in-migration from other states to fill positions that require a four-year degree.5 Most Arizona High School Graduates Who Pursue a Four-Year Degree Do So at an Arizona Public University
Arizona’s public universities educate most of Arizona high school graduates who seek a four-year degree. More than two-thirds – 68.4 percent of Arizona high school graduates who seek a four-year degree choose to enroll in an Arizona public university (exhibit PE.3).
Arizona Graduates from Historically Underrepresented Populations Enroll at Lower Rates Than Their Peers, but Progress is Being Made Across All Race and Ethnic Groups
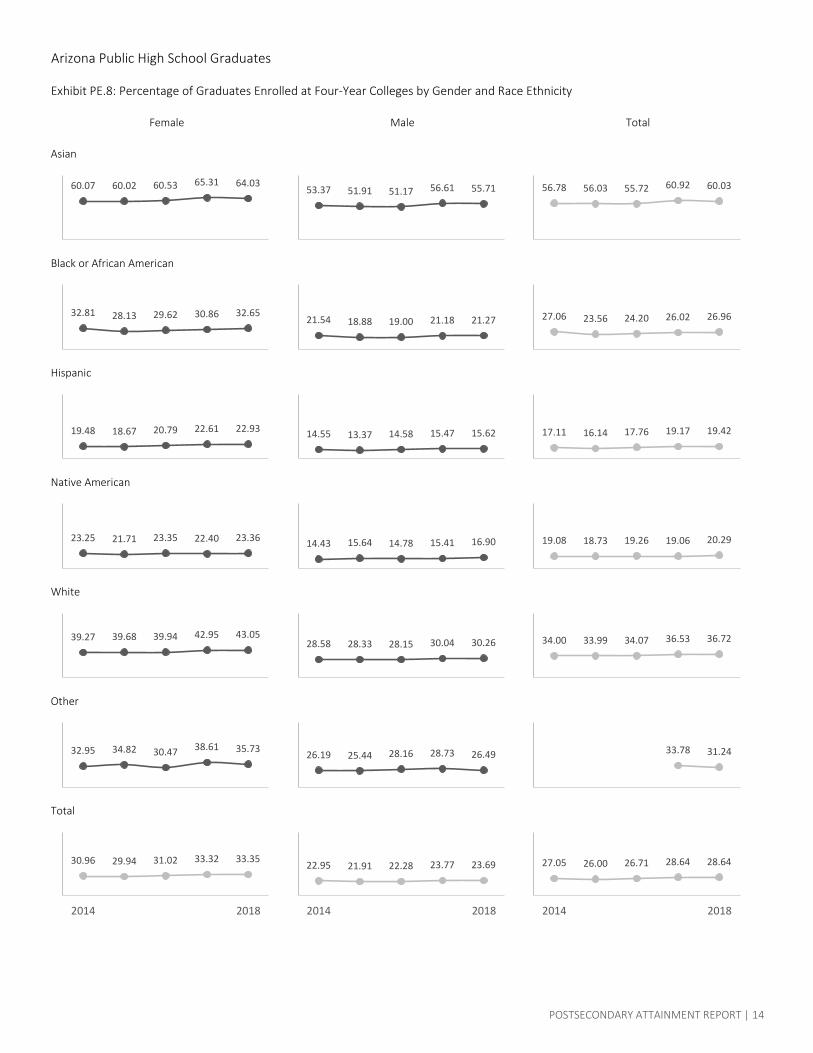
College enrollment rates among Hispanic and Native American high school graduates increased between 2014 and 2018, while the rate of Black high school graduates who went on to attend college fell slightly. These demographic groups that have been historically underrepresented in college continue to lag the enrollment rates of their white and Asian peers (exhibit PE.8).
In 2018, college enrollment rates among Hispanic graduates improved 2.3 percentage points relative to five years earlier (exhibit PE.8). Native American high school graduates’ enrollment increased 1.2 percent points in that same timeframe (exhibit PE.8). The percentage of Black high school graduates who enrolled in college has remained nearly flat over the last five years, while Asian and white high school graduates’ enrollment rates rose (exhibit PE.8). Given existing demographic trends, Arizona must find solutions to close this college enrollment gap if it hopes to improve its overall attainment.
Females Outpace Males in Enrollment
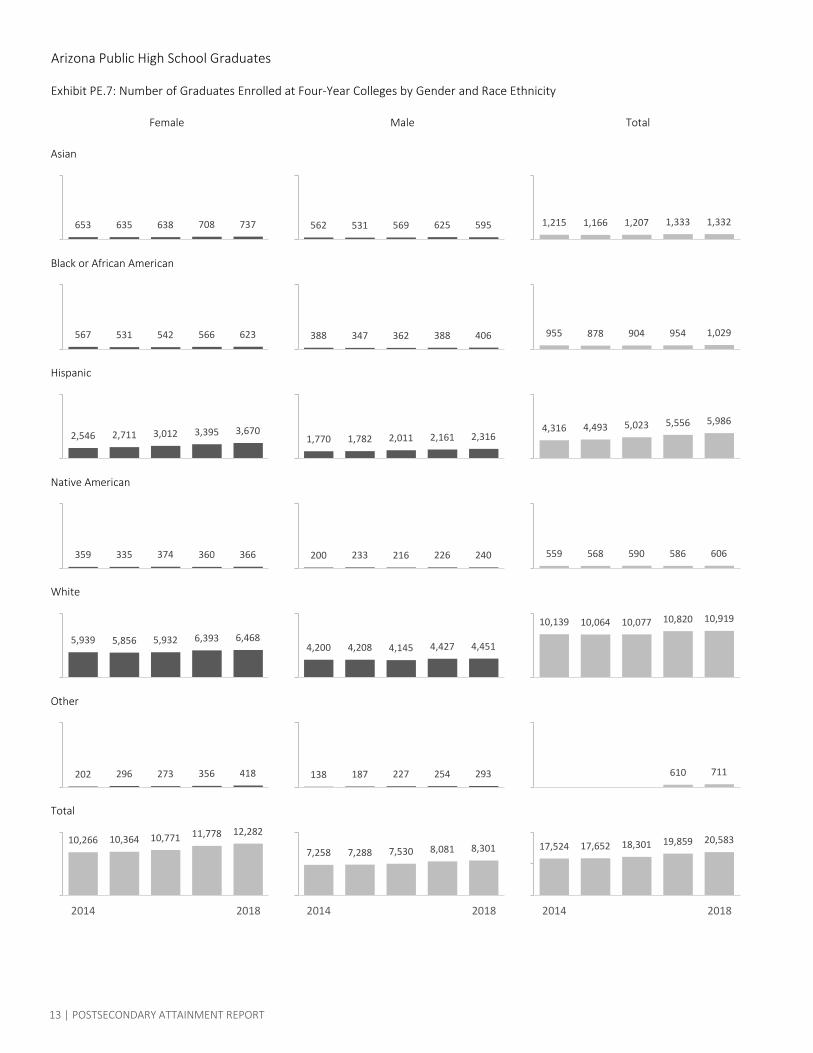
Female high school graduates continue to outpace males in enrollment in four-year institutions. In 2018, females comprised 59.7 percent of four-year college enrollments (exhibit PE.7).
Moreover, female enrollment trends continue to improve, while male enrollment rates have stagnated for the past five years (exhibit PE.7).
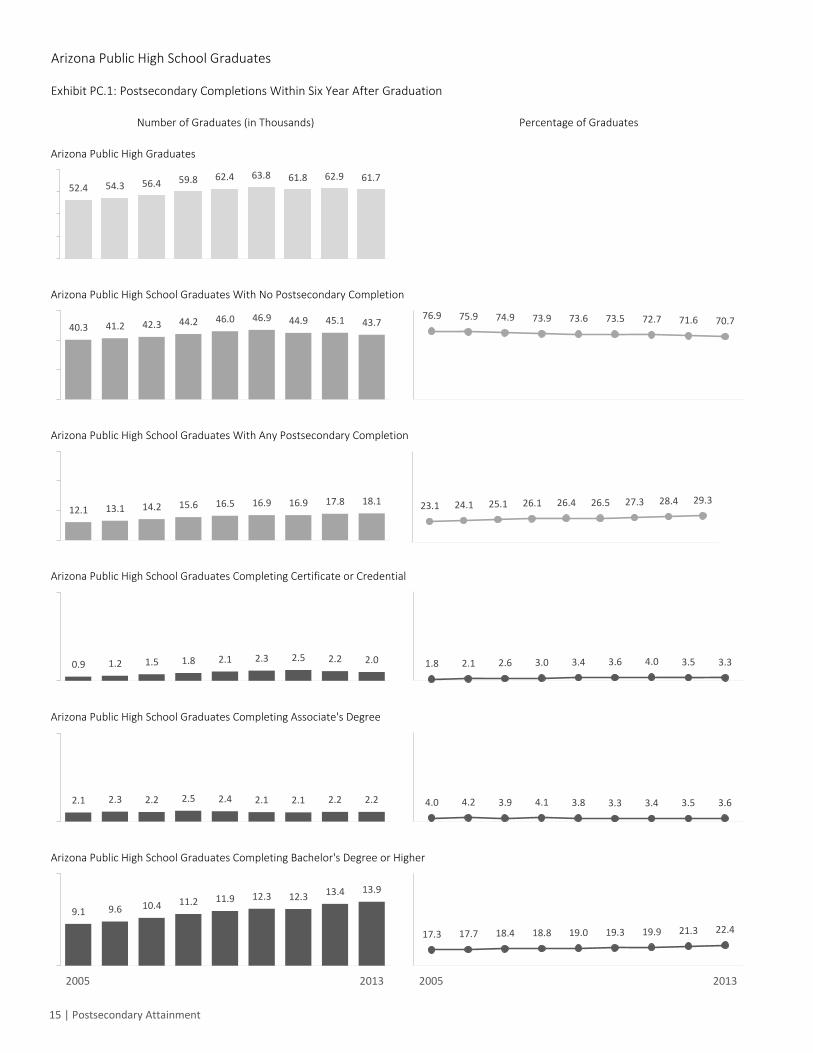
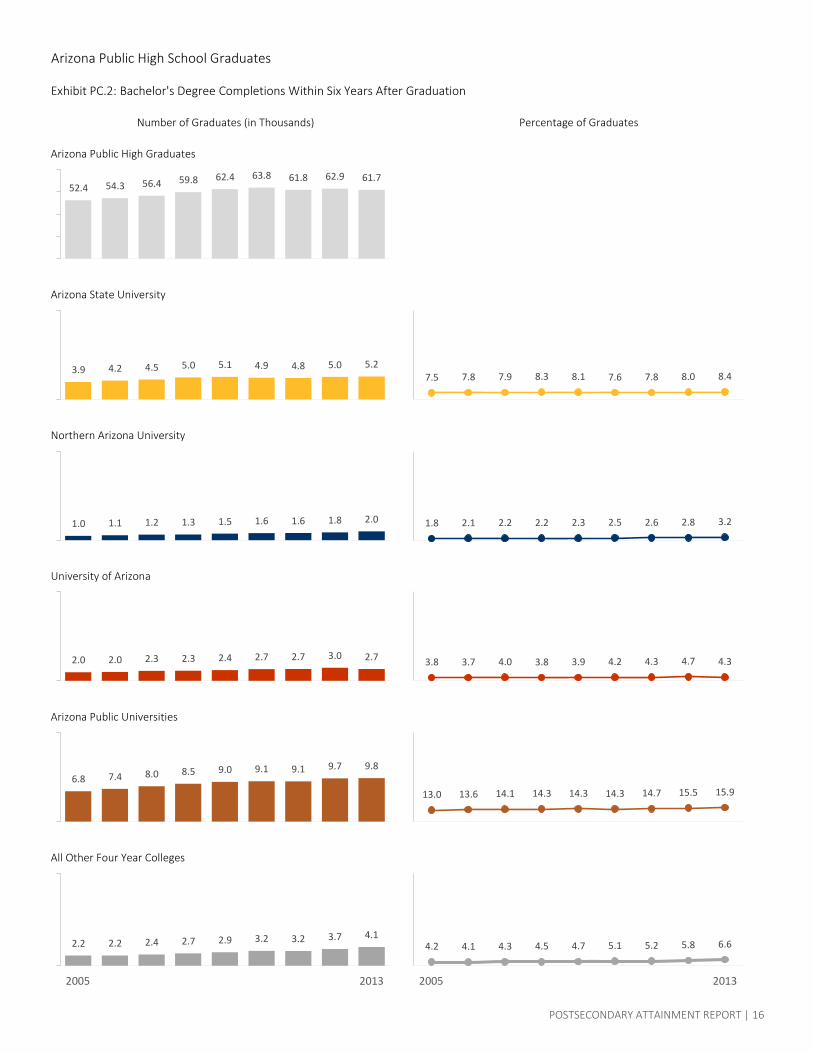
Arizona’s High Schools Graduates Four-year College Completions Trends Continue to Improve Just as the college enrollment rate has remained flat for the past two years, college completion rates for the most recent cohort also are essentially flat. Among the 2013 class of high school graduates, over 22.4 percent completed a four-year degree. That was a slight improvement over the 2012 class, which had a college completion rate of 21.3 percent and a significant improvement from the 2005 graduating class’s 17.3 percent completion rate (exhibit PC.1.).
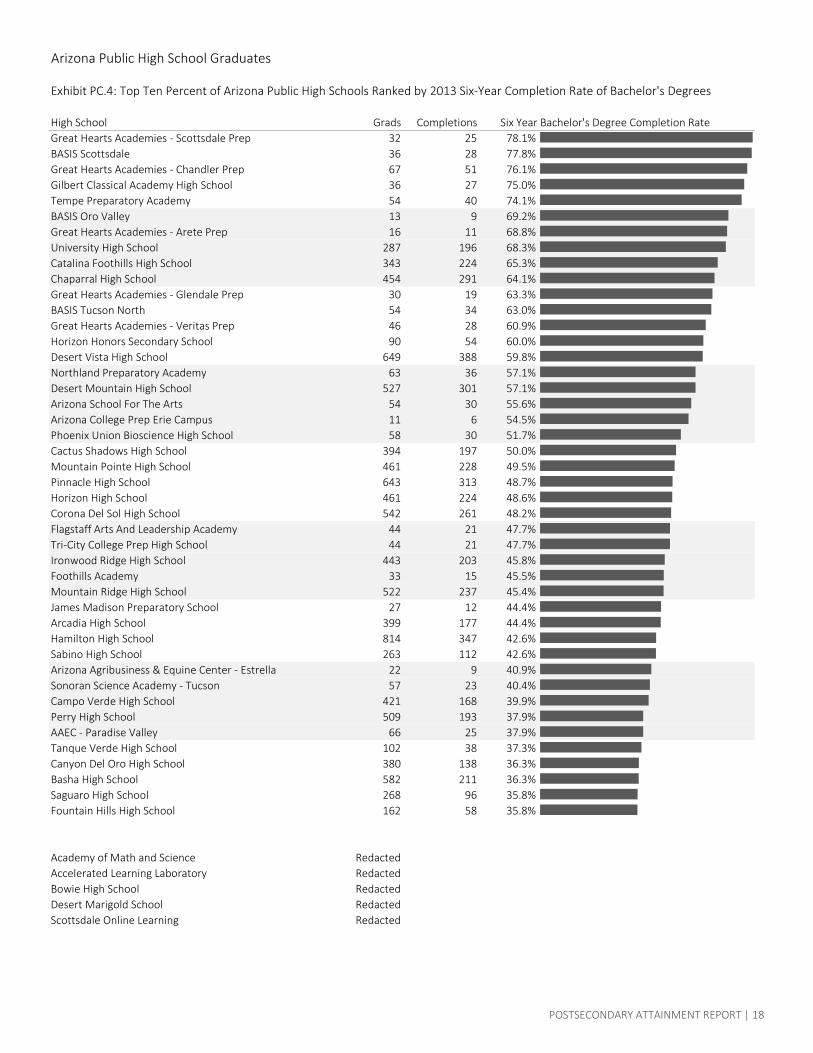
Where a Graduate Attends High School Impact Her Chances of Completing a Four-Year Degree
Four-year college completion trends further highlight the differentiated performance among Arizona high schools. For college completions, the top 30 percent of Arizona high schools educate 58.6 percent
5 See U.S. Census Data from American Community Survey table S1501, (2019), stating Arizona residents ages 65+ make up 27.2 percent of all Arizona degrees Bachelor for ages 25+.
POSTSECONDARY ATTAINMENT REPORT | 6
of Arizona high school graduates and produce 82.3 percent of the high school graduates who go on to complete a four-year degree (exhibit PC.5). Generally, Arizona’s college preparatory charter schools and a few public high schools in affluent areas produce higher rates of four-year degree earners.
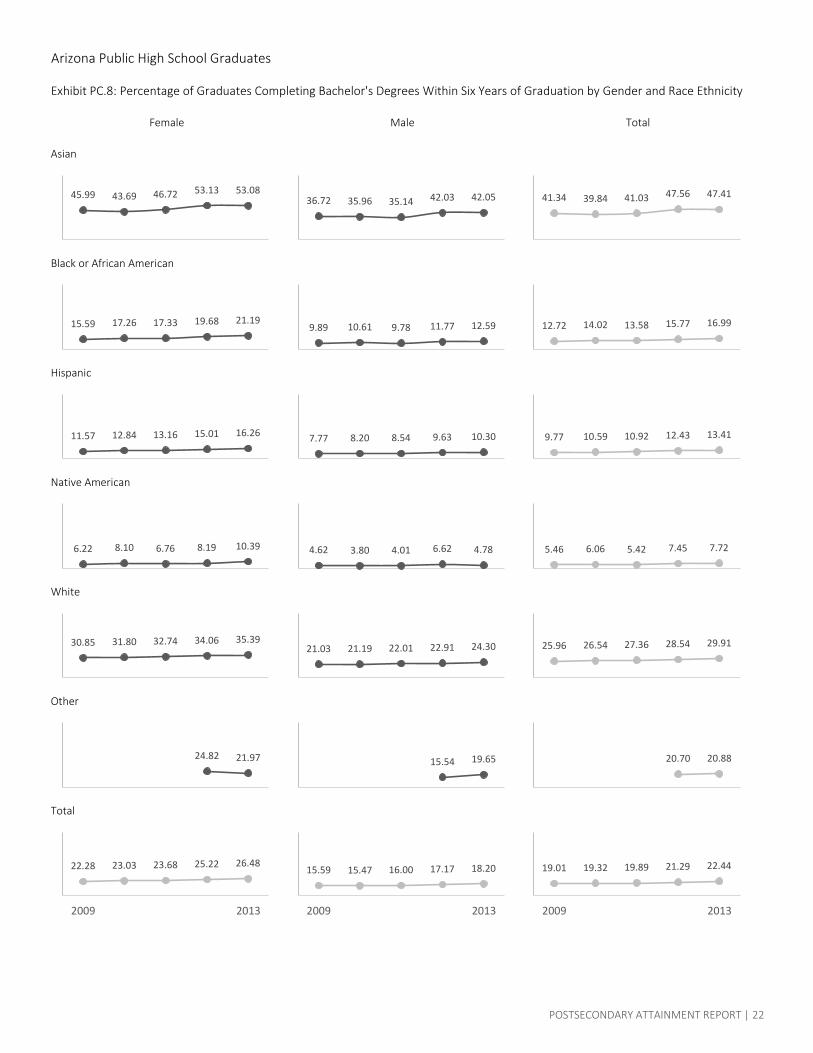
The Percentage of Degree Completers Improved Among All Racial and Ethnic Groups
Over the past five years, high school graduates of Asian descent experienced the most improvement in their rate of college completion. However, four-year degree completion rates for all racial and ethnic groups showed improvement (exhibit PC.8).
While college completion rates improved for most racial and ethnic groups, differentiated outcomes persist between the historically underrepresented population of Black, Hispanic and Native American graduates relative to their Asian and white peers (exhibit PC.8). The completion gap has shrunk since 2005, but a Native American high school graduate still only has a 7.7 percent chance of completing a four-year degree. A Hispanic graduate has a 13.4 percent chance, and a Black graduate has a 17.0 percent chance. By comparison, high school graduates of Asian descent who attend college have a 47.4 percent chance of completing their degree, and white students have a 29.9 percent chance (exhibit PC. 8). Improvement in the area of college completion is vital because students of color comprise a majority and fast-growing segment of Arizona’s K-12 system.6
Arizona Female High School Graduates are Completing College at a Much Higher Rate than Male High School Graduates
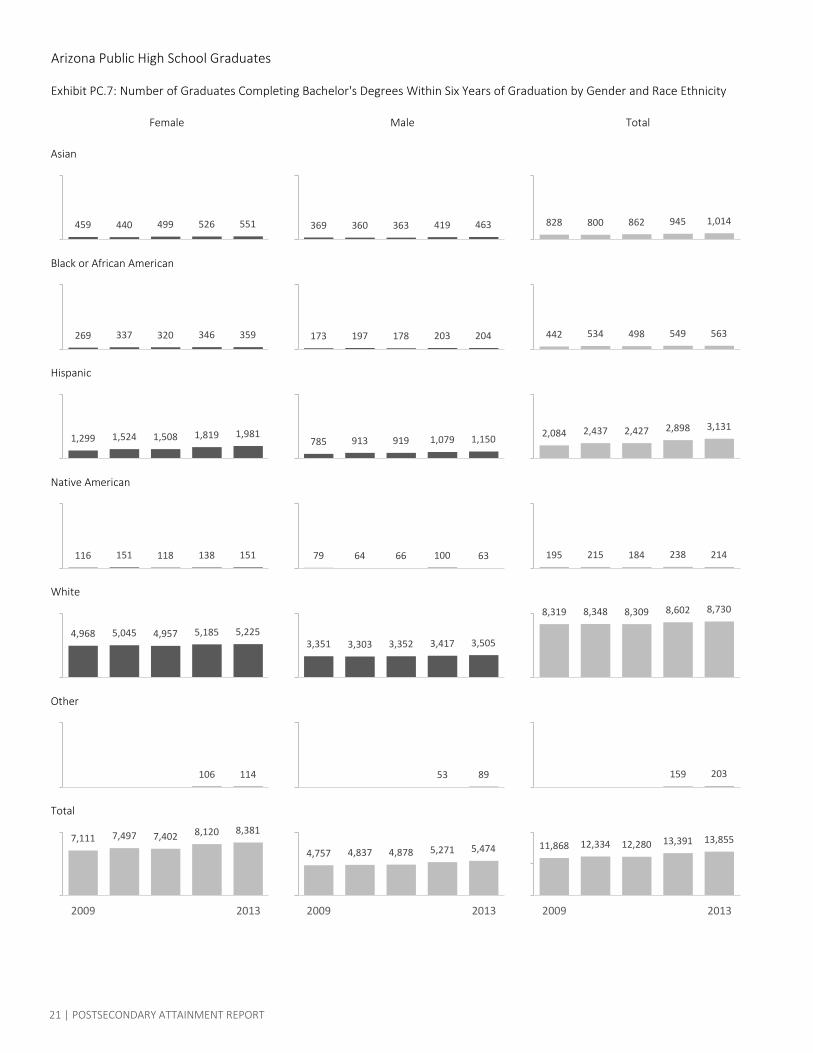
More women are completing college and at much higher rates than their male counterparts. Females represent 60.5 percent of four-year college completions (exhibit PC.7). Among the 2013 Arizona cohort, 26.5 percent of female high school graduates completed a four-year degree within six years, as compared to 18.2 percent of their male peers (exhibit PC.8).
Moreover, the number of Arizona females who attend a postsecondary institution after high school continues to increase. Between the high school graduating class of 2009 and 2013, the number of women earning a four-year degree increased 4.2 percentage points. During that same period, Arizona men saw a 2.6 percentage point growth in four-year degrees completed (exhibit PC.8).
6 See Arizona Minority Education Policy Analysis Center’s 2018 Arizona Minority Student Progress report, https://highered.az.gov/sites/default/files/AMEPAC%202018%20Report.pdf.
Arizona Public High School Graduates
Exhibit PE.1: Postsecondary Enrollments Within One Year After Graduation
Arizona Public High Graduates
Arizona Public High School Graduates With No Postsecondary Enrollment
Arizona Public High School Graduates With Any Postsecondary Enrollment
Arizona Public High School Graduates Enrolled at Two Year Colleges or Other Postsecondary Institution
Arizona Public High School Graduates Enrolled at Four Year Colleges
Number of Graduates (in Thousands) Percentage of Graduates
34.031.833.032.029.628.629.529.032.232.3
71.969.368.567.964.861.762.961.863.862.4
17.317.717.218.317.716.917.517.916.515.8
20.619.918.317.717.516.215.914.815.214.3
20182009
28.628.626.726.027.026.325.224.023.722.9
20182009
47.345.948.247.145.646.346.947.050.451.7
24.125.525.126.927.327.427.829.125.925.4
37.937.535.535.935.233.233.432.731.730.1 52.754.151.852.954.453.753.153.049.648.3
7 | POSTSECONDARY ATTAINMENT REPORT
Arizona Public High School Graduates
Exhibit PE.2: Four-Year College Enrollments Within One Year After Graduation
Arizona Public High Graduates
Arizona State University
Northern Arizona University
University of Arizona
Arizona Public Universities
All Other Four Year Colleges
Number of Graduates (in Thousands) Percentage of Graduates
3.43.43.12.82.62.42.21.92.01.9 4.75.04.54.24.13.83.53.13.23.1
7.06.56.15.55.55.05.15.15.35.69.79.48.98.28.58.28.28.38.39.0
14.113.812.811.911.710.811.110.711.010.8
19.619.918.717.618.117.517.717.317.217.3
71.969.368.567.964.861.762.961.863.862.4
3.73.83.63.63.63.43.83.63.73.35.25.55.35.35.55.56.15.95.75.3
6.56.15.55.75.85.44.74.14.13.5
20182009
9.08.88.08.49.08.87.56.66.55.6
20182009
POSTSECONDARY ATTAINMENT REPORT | 8
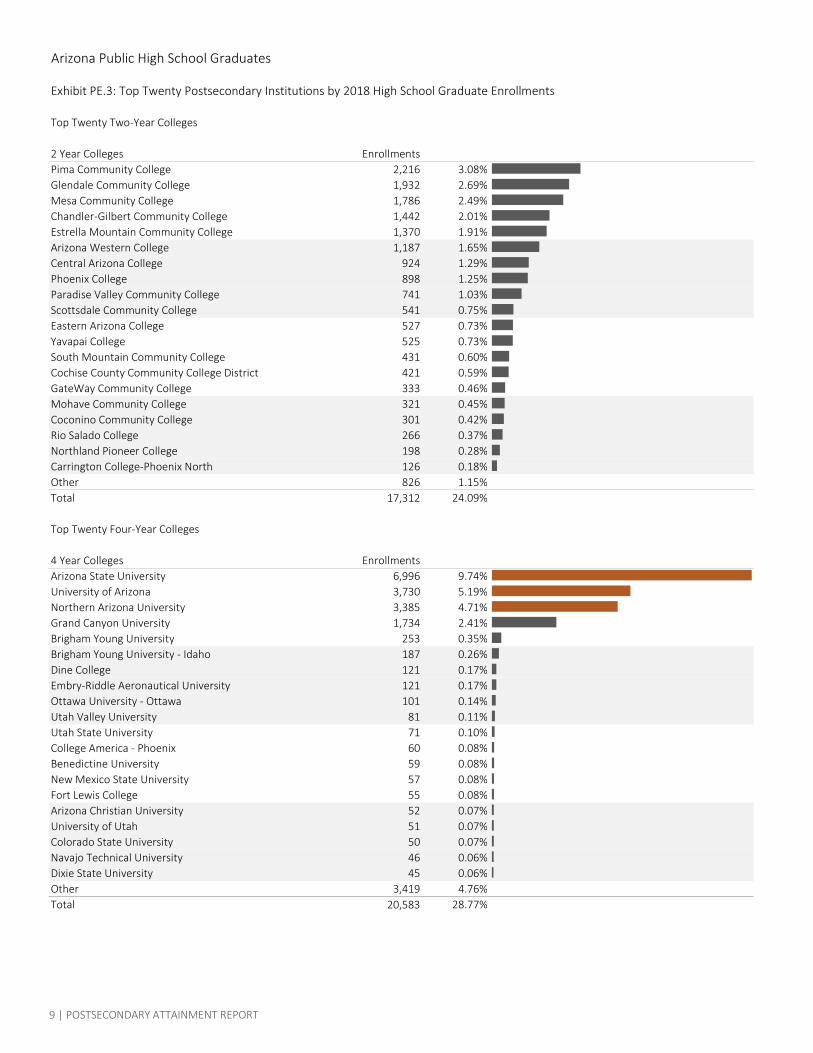
Arizona Public High School Graduates
Exhibit PE.3: Top Twenty Postsecondary Institutions by 2018 High School Graduate Enrollments
Top Twenty Two-Year Colleges
2 Year Colleges EnrollmentsPima Community College 2,216 3.08%Glendale Community College 1,932 2.69%Mesa Community College 1,786 2.49%Chandler-Gilbert Community College 1,442 2.01%Estrella Mountain Community College 1,370 1.91%Arizona Western College 1,187 1.65%Central Arizona College 924 1.29%Phoenix College 898 1.25%Paradise Valley Community College 741 1.03%Scottsdale Community College 541 0.75%Eastern Arizona College 527 0.73%Yavapai College 525 0.73%South Mountain Community College 431 0.60%Cochise County Community College District 421 0.59%GateWay Community College 333 0.46%Mohave Community College 321 0.45%Coconino Community College 301 0.42%Rio Salado College 266 0.37%Northland Pioneer College 198 0.28%Carrington College-Phoenix North 126 0.18%Other 826 1.15%Total 17,312 24.09%
Top Twenty Four-Year Colleges
4 Year Colleges EnrollmentsArizona State University 6,996 9.74%University of Arizona 3,730 5.19%Northern Arizona University 3,385 4.71%Grand Canyon University 1,734 2.41%Brigham Young University 253 0.35%Brigham Young University - Idaho 187 0.26%Dine College 121 0.17%Embry-Riddle Aeronautical University 121 0.17%Ottawa University - Ottawa 101 0.14%Utah Valley University 81 0.11%Utah State University 71 0.10%College America - Phoenix 60 0.08%Benedictine University 59 0.08%New Mexico State University 57 0.08%Fort Lewis College 55 0.08%Arizona Christian University 52 0.07%University of Utah 51 0.07%Colorado State University 50 0.07%Navajo Technical University 46 0.06%Dixie State University 45 0.06%Other 3,419 4.76%Total 20,583 28.77%
9 | POSTSECONDARY ATTAINMENT REPORT
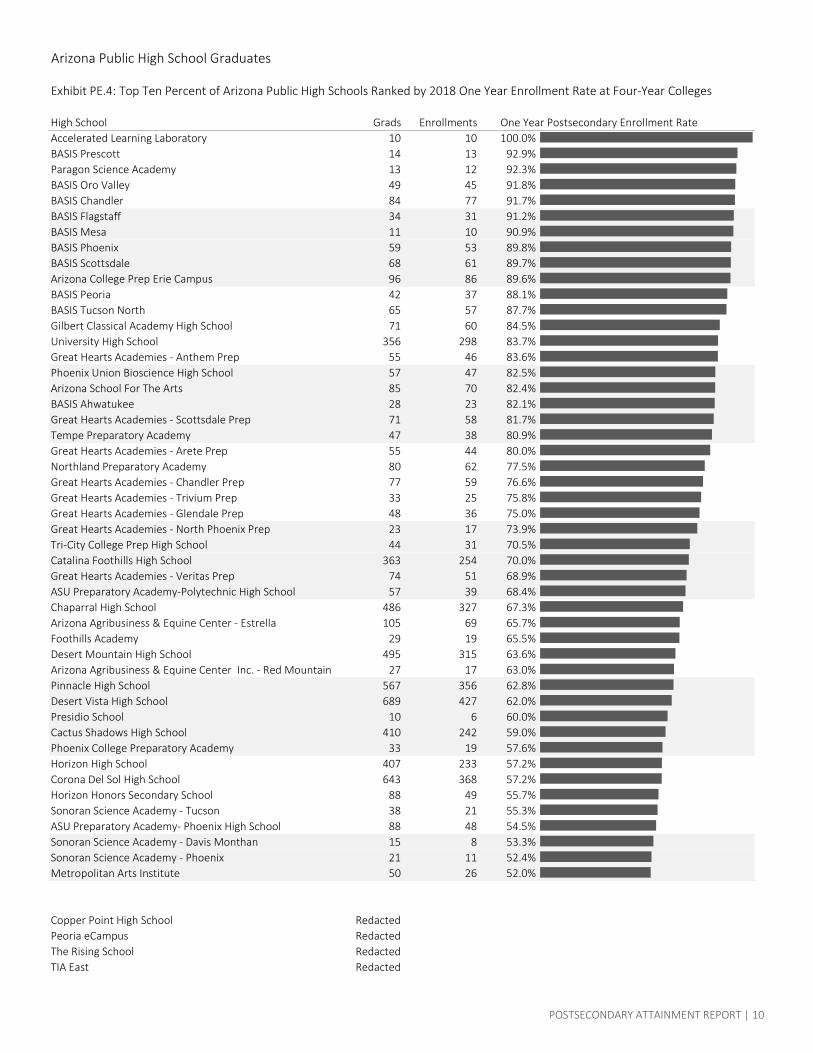
Arizona Public High School Graduates
Exhibit PE.4: Top Ten Percent of Arizona Public High Schools Ranked by 2018 One Year Enrollment Rate at Four-Year Colleges
High School Grads Enrollments One Year Postsecondary Enrollment RateAccelerated Learning Laboratory 10 10 100.0%BASIS Prescott 14 13 92.9%Paragon Science Academy 13 12 92.3%BASIS Oro Valley 49 45 91.8%BASIS Chandler 84 77 91.7%BASIS Flagstaff 34 31 91.2%BASIS Mesa 11 10 90.9%BASIS Phoenix 59 53 89.8%BASIS Scottsdale 68 61 89.7%Arizona College Prep Erie Campus 96 86 89.6%BASIS Peoria 42 37 88.1%BASIS Tucson North 65 57 87.7%Gilbert Classical Academy High School 71 60 84.5%University High School 356 298 83.7%Great Hearts Academies - Anthem Prep 55 46 83.6%Phoenix Union Bioscience High School 57 47 82.5%Arizona School For The Arts 85 70 82.4%BASIS Ahwatukee 28 23 82.1%Great Hearts Academies - Scottsdale Prep 71 58 81.7%Tempe Preparatory Academy 47 38 80.9%Great Hearts Academies - Arete Prep 55 44 80.0%Northland Preparatory Academy 80 62 77.5%Great Hearts Academies - Chandler Prep 77 59 76.6%Great Hearts Academies - Trivium Prep 33 25 75.8%Great Hearts Academies - Glendale Prep 48 36 75.0%Great Hearts Academies - North Phoenix Prep 23 17 73.9%Tri-City College Prep High School 44 31 70.5%Catalina Foothills High School 363 254 70.0%Great Hearts Academies - Veritas Prep 74 51 68.9%ASU Preparatory Academy-Polytechnic High School 57 39 68.4%Chaparral High School 486 327 67.3%Arizona Agribusiness & Equine Center - Estrella 105 69 65.7%Foothills Academy 29 19 65.5%Desert Mountain High School 495 315 63.6%Arizona Agribusiness & Equine Center Inc. - Red Mountain 27 17 63.0%Pinnacle High School 567 356 62.8%Desert Vista High School 689 427 62.0%Presidio School 10 6 60.0%Cactus Shadows High School 410 242 59.0%Phoenix College Preparatory Academy 33 19 57.6%Horizon High School 407 233 57.2%Corona Del Sol High School 643 368 57.2%Horizon Honors Secondary School 88 49 55.7%Sonoran Science Academy - Tucson 38 21 55.3%ASU Preparatory Academy- Phoenix High School 88 48 54.5%Sonoran Science Academy - Davis Monthan 15 8 53.3%Sonoran Science Academy - Phoenix 21 11 52.4%Metropolitan Arts Institute 50 26 52.0%
Copper Point High School RedactedPeoria eCampus RedactedThe Rising School RedactedTIA East Redacted
POSTSECONDARY ATTAINMENT REPORT | 10
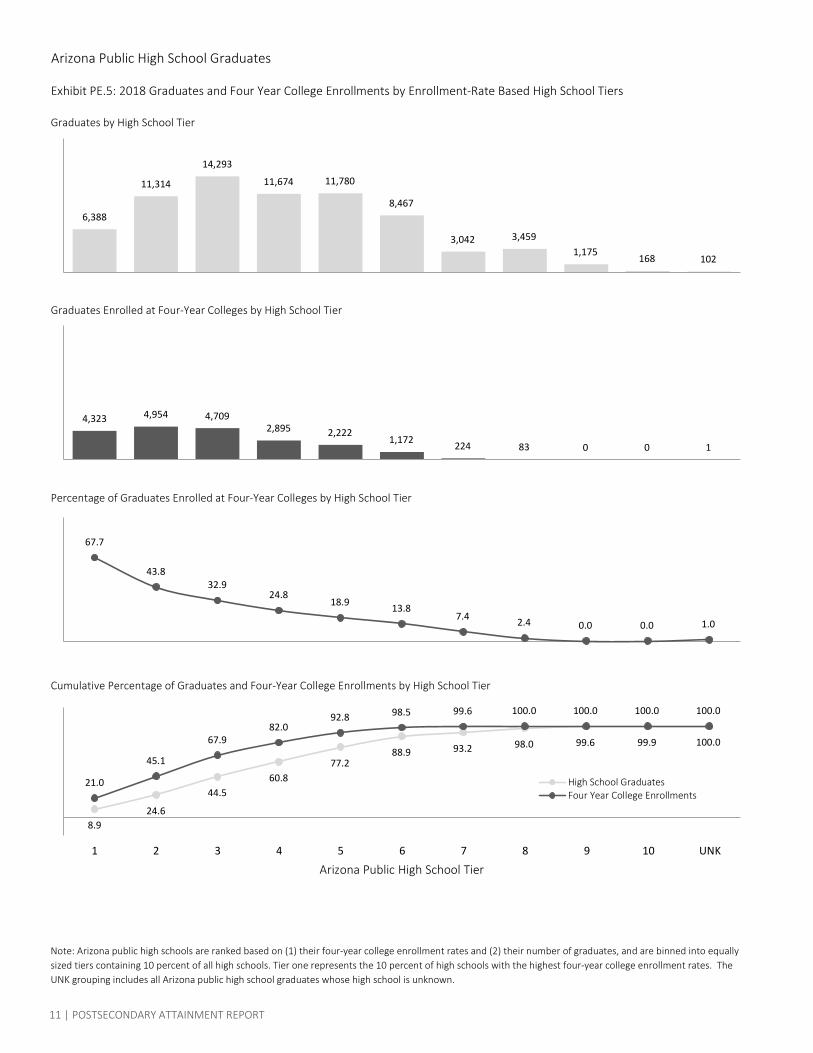
Arizona Public High School Graduates
Exhibit PE.5: 2018 Graduates and Four Year College Enrollments by Enrollment-Rate Based High School Tiers
Graduates by High School Tier
Graduates Enrolled at Four-Year Colleges by High School Tier
Percentage of Graduates Enrolled at Four-Year Colleges by High School Tier
Cumulative Percentage of Graduates and Four-Year College Enrollments by High School Tier
Note: Arizona public high schools are ranked based on (1) their four-year college enrollment rates and (2) their number of graduates, and are binned into equally sized tiers containing 10 percent of all high schools. Tier one represents the 10 percent of high schools with the highest four-year college enrollment rates. The UNK grouping includes all Arizona public high school graduates whose high school is unknown.
67.7
43.832.9
24.818.9 13.8
7.4 2.4 0.0 0.0 1.0
6,388
11,314
14,293
11,674 11,780
8,467
3,042 3,4591,175
168 102
4,323 4,954 4,7092,895 2,222
1,172 224 83 0 0 1
8.924.6
44.560.8
77.288.9 93.2 98.0 99.6 99.9 100.0
21.0
45.1
67.982.0
92.8 98.5 99.6 100.0 100.0 100.0 100.0
1 2 3 4 5 6 7 8 9 10 UNK
Arizona Public High School Tier
High School GraduatesFour Year College Enrollments
11 | POSTSECONDARY ATTAINMENT REPORT
Arizona Public High School Graduates
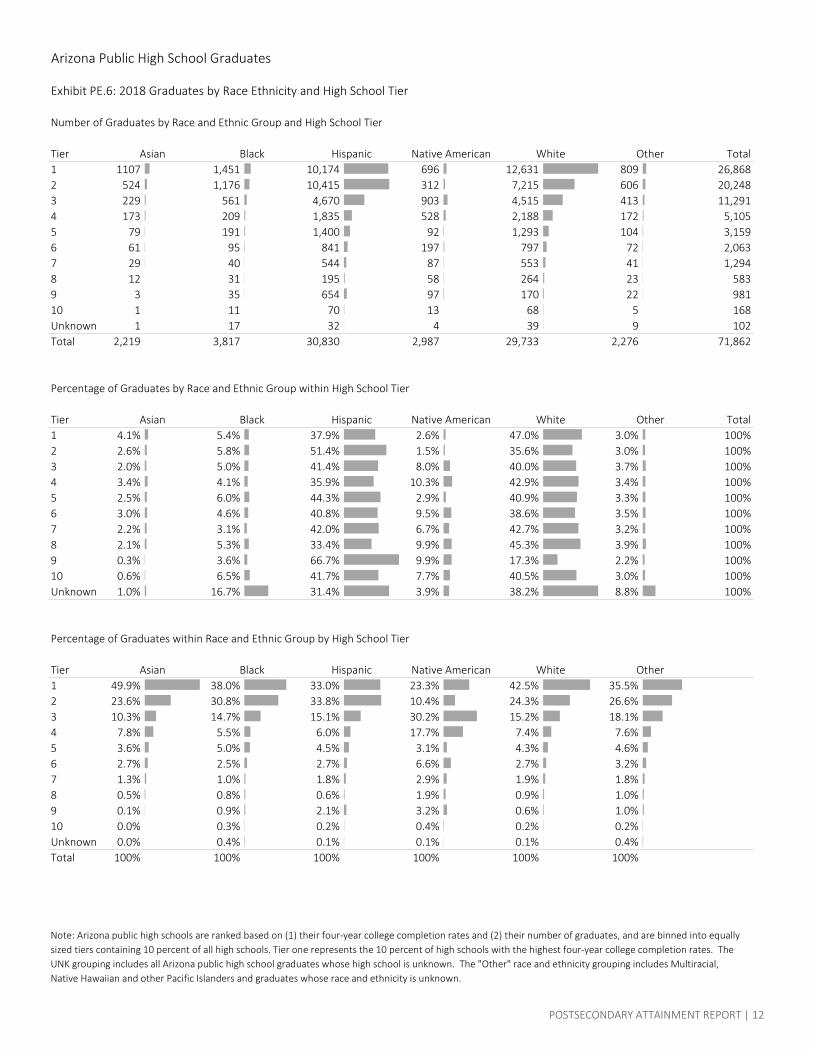
Exhibit PE.6: 2018 Graduates by Race Ethnicity and High School Tier
Number of Graduates by Race and Ethnic Group and High School Tier
Tier Total1 1107 1,451 10,174 696 12,631 809 26,8682 524 1,176 10,415 312 7,215 606 20,2483 229 561 4,670 903 4,515 413 11,2914 173 209 1,835 528 2,188 172 5,1055 79 191 1,400 92 1,293 104 3,1596 61 95 841 197 797 72 2,0637 29 40 544 87 553 41 1,2948 12 31 195 58 264 23 5839 3 35 654 97 170 22 98110 1 11 70 13 68 5 168Unknown 1 17 32 4 39 9 102Total 2,219 3,817 30,830 2,987 29,733 2,276 71,862
Percentage of Graduates by Race and Ethnic Group within High School Tier
Tier Total1 4.1% 5.4% 37.9% 2.6% 47.0% 3.0% 100%2 2.6% 5.8% 51.4% 1.5% 35.6% 3.0% 100%3 2.0% 5.0% 41.4% 8.0% 40.0% 3.7% 100%4 3.4% 4.1% 35.9% 10.3% 42.9% 3.4% 100%5 2.5% 6.0% 44.3% 2.9% 40.9% 3.3% 100%6 3.0% 4.6% 40.8% 9.5% 38.6% 3.5% 100%7 2.2% 3.1% 42.0% 6.7% 42.7% 3.2% 100%8 2.1% 5.3% 33.4% 9.9% 45.3% 3.9% 100%9 0.3% 3.6% 66.7% 9.9% 17.3% 2.2% 100%10 0.6% 6.5% 41.7% 7.7% 40.5% 3.0% 100%Unknown 1.0% 16.7% 31.4% 3.9% 38.2% 8.8% 100%
Percentage of Graduates within Race and Ethnic Group by High School Tier
Tier1 49.9% 38.0% 33.0% 23.3% 42.5% 35.5%2 23.6% 30.8% 33.8% 10.4% 24.3% 26.6%3 10.3% 14.7% 15.1% 30.2% 15.2% 18.1%4 7.8% 5.5% 6.0% 17.7% 7.4% 7.6%5 3.6% 5.0% 4.5% 3.1% 4.3% 4.6%6 2.7% 2.5% 2.7% 6.6% 2.7% 3.2%7 1.3% 1.0% 1.8% 2.9% 1.9% 1.8%8 0.5% 0.8% 0.6% 1.9% 0.9% 1.0%9 0.1% 0.9% 2.1% 3.2% 0.6% 1.0%10 0.0% 0.3% 0.2% 0.4% 0.2% 0.2%Unknown 0.0% 0.4% 0.1% 0.1% 0.1% 0.4%Total 100% 100% 100% 100% 100% 100%
Other
Asian Black Hispanic Native American White Other
Asian Black Hispanic Native American White
Note: Arizona public high schools are ranked based on (1) their four-year college completion rates and (2) their number of graduates, and are binned into equally sized tiers containing 10 percent of all high schools. Tier one represents the 10 percent of high schools with the highest four-year college completion rates. The UNK grouping includes all Arizona public high school graduates whose high school is unknown. The "Other" race and ethnicity grouping includes Multiracial, Native Hawaiian and other Pacific Islanders and graduates whose race and ethnicity is unknown.
Asian Black Hispanic Native American White Other
POSTSECONDARY ATTAINMENT REPORT | 12
Arizona Public High School Graduates
Exhibit PE.7: Number of Graduates Enrolled at Four-Year Colleges by Gender and Race Ethnicity
Asian
Black or African American
Hispanic
Native American
White
Other
Total
Female Male Total
10,266 10,364 10,771 11,778 12,282
2014 2018
7,258 7,288 7,530 8,081 8,301
2014 2018
202 296 273 356 418 138 187 227 254 293 610 711
5,939 5,856 5,932 6,393 6,4684,200 4,208 4,145 4,427 4,451
10,139 10,064 10,077 10,820 10,919
359 335 374 360 366 200 233 216 226 240 559 568 590 586 606
2,546 2,711 3,012 3,395 3,6701,770 1,782 2,011 2,161 2,316
4,316 4,493 5,023 5,556 5,986
567 531 542 566 623 388 347 362 388 406 955 878 904 954 1,029
653 635 638 708 737 562 531 569 625 595 1,215 1,166 1,207 1,333 1,332
17,524 17,652 18,301 19,859 20,583
2014 2018
13 | POSTSECONDARY ATTAINMENT REPORT
Arizona Public High School Graduates
Exhibit PE.8: Percentage of Graduates Enrolled at Four-Year Colleges by Gender and Race Ethnicity
Asian
Black or African American
Hispanic
Native American
White
Other
Total
TotalFemale Male
30.96 29.94 31.02 33.32 33.35
2014 2018
22.95 21.91 22.28 23.77 23.69
2014 2018
39.27 39.68 39.94 42.95 43.0528.58 28.33 28.15 30.04 30.26 34.00 33.99 34.07 36.53 36.72
23.25 21.71 23.35 22.40 23.36 14.43 15.64 14.78 15.41 16.90 19.08 18.73 19.26 19.06 20.29
32.95 34.82 30.47 38.61 35.73 26.19 25.44 28.16 28.73 26.49 33.78 31.24
19.48 18.67 20.79 22.61 22.93 14.55 13.37 14.58 15.47 15.62 17.11 16.14 17.76 19.17 19.42
32.81 28.13 29.62 30.86 32.6521.54 18.88 19.00 21.18 21.27 27.06 23.56 24.20 26.02 26.96
60.07 60.02 60.53 65.31 64.0353.37 51.91 51.17 56.61 55.71 56.78 56.03 55.72 60.92 60.03
27.05 26.00 26.71 28.64 28.64
2014 2018
POSTSECONDARY ATTAINMENT REPORT | 14
Arizona Public High School Graduates
Exhibit PC.1: Postsecondary Completions Within Six Year After Graduation
Arizona Public High Graduates
Arizona Public High School Graduates With No Postsecondary Completion
Arizona Public High School Graduates With Any Postsecondary Completion
Arizona Public High School Graduates Completing Certificate or Credential
Arizona Public High School Graduates Completing Associate's Degree
Arizona Public High School Graduates Completing Bachelor's Degree or Higher
Number of Graduates (in Thousands) Percentage of Graduates
43.745.144.946.946.044.242.341.240.3
61.762.961.863.862.459.856.454.352.4
2.02.22.52.32.11.81.51.20.9
13.913.412.312.311.911.210.49.69.1
20132005
22.421.319.919.319.018.818.417.717.3
20132005
70.771.672.773.573.673.974.975.976.9
3.33.54.03.63.43.02.62.11.8
18.117.816.916.916.515.614.213.112.129.328.427.326.526.426.125.124.123.1
2.22.22.12.12.42.52.22.32.1 3.63.53.43.33.84.13.94.24.0
15 | Postsecondary Attainment
Arizona Public High School Graduates
Exhibit PC.2: Bachelor's Degree Completions Within Six Years After Graduation
Arizona Public High Graduates
Arizona State University
Northern Arizona University
University of Arizona
Arizona Public Universities
All Other Four Year Colleges
Number of Graduates (in Thousands) Percentage of Graduates
2.01.81.61.61.51.31.21.11.0 3.22.82.62.52.32.22.22.11.8
5.25.04.84.95.15.04.54.23.98.48.07.87.68.18.37.97.87.5
9.89.79.19.19.08.58.07.46.8
4.13.73.23.22.92.72.42.22.2
20132005
6.65.85.25.14.74.54.34.14.2
20132005
15.915.514.714.314.314.314.113.613.0
61.762.961.863.862.459.856.454.352.4
2.73.02.72.72.42.32.32.02.0 4.34.74.34.23.93.84.03.73.8
POSTSECONDARY ATTAINMENT REPORT | 16
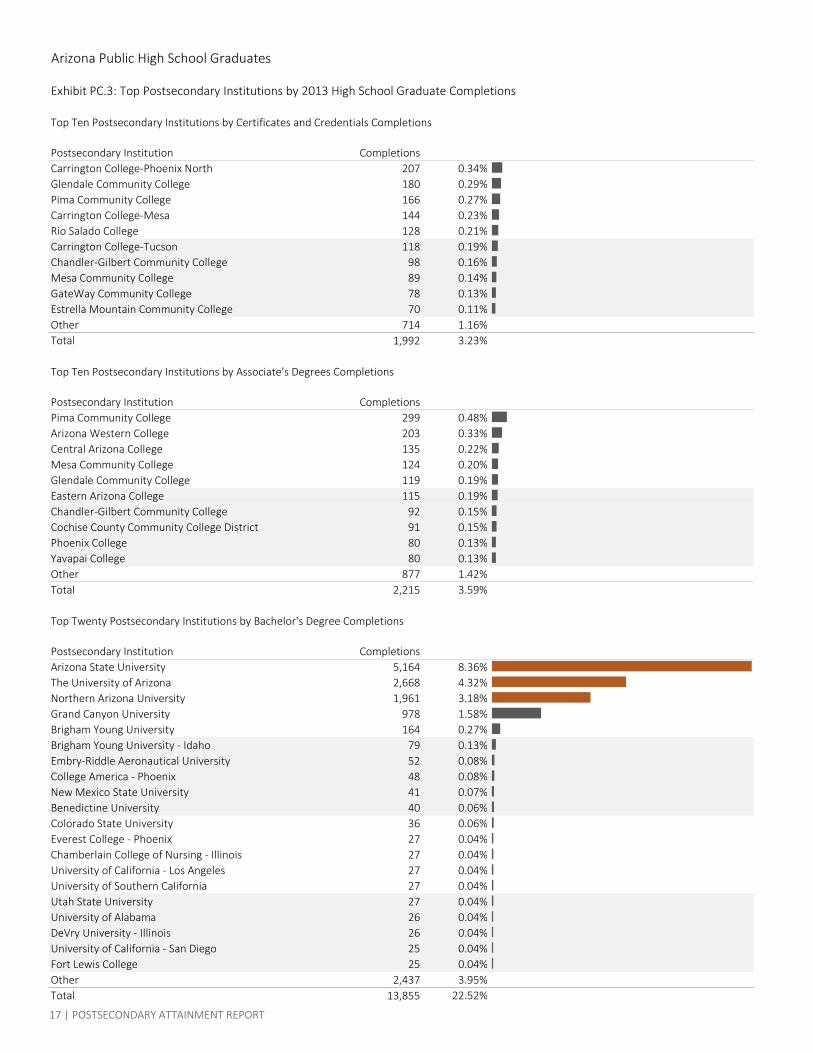
Arizona Public High School Graduates
Exhibit PC.3: Top Postsecondary Institutions by 2013 High School Graduate Completions
Top Ten Postsecondary Institutions by Certificates and Credentials Completions
Postsecondary Institution CompletionsCarrington College-Phoenix North 207 0.34%Glendale Community College 180 0.29%Pima Community College 166 0.27%Carrington College-Mesa 144 0.23%Rio Salado College 128 0.21%Carrington College-Tucson 118 0.19%Chandler-Gilbert Community College 98 0.16%Mesa Community College 89 0.14%GateWay Community College 78 0.13%Estrella Mountain Community College 70 0.11%Other 714 1.16%Total 1,992 3.23%
Top Ten Postsecondary Institutions by Associate's Degrees Completions
Postsecondary Institution CompletionsPima Community College 299 0.48%Arizona Western College 203 0.33%Central Arizona College 135 0.22%Mesa Community College 124 0.20%Glendale Community College 119 0.19%Eastern Arizona College 115 0.19%Chandler-Gilbert Community College 92 0.15%Cochise County Community College District 91 0.15%Phoenix College 80 0.13%Yavapai College 80 0.13%Other 877 1.42%Total 2,215 3.59%
Top Twenty Postsecondary Institutions by Bachelor's Degree Completions
Postsecondary Institution CompletionsArizona State University 5,164 8.36%The University of Arizona 2,668 4.32%Northern Arizona University 1,961 3.18%Grand Canyon University 978 1.58%Brigham Young University 164 0.27%Brigham Young University - Idaho 79 0.13%Embry-Riddle Aeronautical University 52 0.08%College America - Phoenix 48 0.08%New Mexico State University 41 0.07%Benedictine University 40 0.06%Colorado State University 36 0.06%Everest College - Phoenix 27 0.04%Chamberlain College of Nursing - Illinois 27 0.04%University of California - Los Angeles 27 0.04%University of Southern California 27 0.04%Utah State University 27 0.04%University of Alabama 26 0.04%DeVry University - Illinois 26 0.04%University of California - San Diego 25 0.04%Fort Lewis College 25 0.04%Other 2,437 3.95%Total 13,855 22.52%
17 | POSTSECONDARY ATTAINMENT REPORT
Arizona Public High School Graduates
Exhibit PC.4: Top Ten Percent of Arizona Public High Schools Ranked by 2013 Six-Year Completion Rate of Bachelor's Degrees
High School Grads Completions Six Year Bachelor's Degree Completion RateGreat Hearts Academies - Scottsdale Prep 32 25 78.1%BASIS Scottsdale 36 28 77.8%Great Hearts Academies - Chandler Prep 67 51 76.1%Gilbert Classical Academy High School 36 27 75.0%Tempe Preparatory Academy 54 40 74.1%BASIS Oro Valley 13 9 69.2%Great Hearts Academies - Arete Prep 16 11 68.8%University High School 287 196 68.3%Catalina Foothills High School 343 224 65.3%Chaparral High School 454 291 64.1%Great Hearts Academies - Glendale Prep 30 19 63.3%BASIS Tucson North 54 34 63.0%Great Hearts Academies - Veritas Prep 46 28 60.9%Horizon Honors Secondary School 90 54 60.0%Desert Vista High School 649 388 59.8%Northland Preparatory Academy 63 36 57.1%Desert Mountain High School 527 301 57.1%Arizona School For The Arts 54 30 55.6%Arizona College Prep Erie Campus 11 6 54.5%Phoenix Union Bioscience High School 58 30 51.7%Cactus Shadows High School 394 197 50.0%Mountain Pointe High School 461 228 49.5%Pinnacle High School 643 313 48.7%Horizon High School 461 224 48.6%Corona Del Sol High School 542 261 48.2%Flagstaff Arts And Leadership Academy 44 21 47.7%Tri-City College Prep High School 44 21 47.7%Ironwood Ridge High School 443 203 45.8%Foothills Academy 33 15 45.5%Mountain Ridge High School 522 237 45.4%James Madison Preparatory School 27 12 44.4%Arcadia High School 399 177 44.4%Hamilton High School 814 347 42.6%Sabino High School 263 112 42.6%Arizona Agribusiness & Equine Center - Estrella 22 9 40.9%Sonoran Science Academy - Tucson 57 23 40.4%Campo Verde High School 421 168 39.9%Perry High School 509 193 37.9%AAEC - Paradise Valley 66 25 37.9%Tanque Verde High School 102 38 37.3%Canyon Del Oro High School 380 138 36.3%Basha High School 582 211 36.3%Saguaro High School 268 96 35.8%Fountain Hills High School 162 58 35.8%
Academy of Math and Science RedactedAccelerated Learning Laboratory RedactedBowie High School RedactedDesert Marigold School RedactedScottsdale Online Learning Redacted
POSTSECONDARY ATTAINMENT REPORT | 18
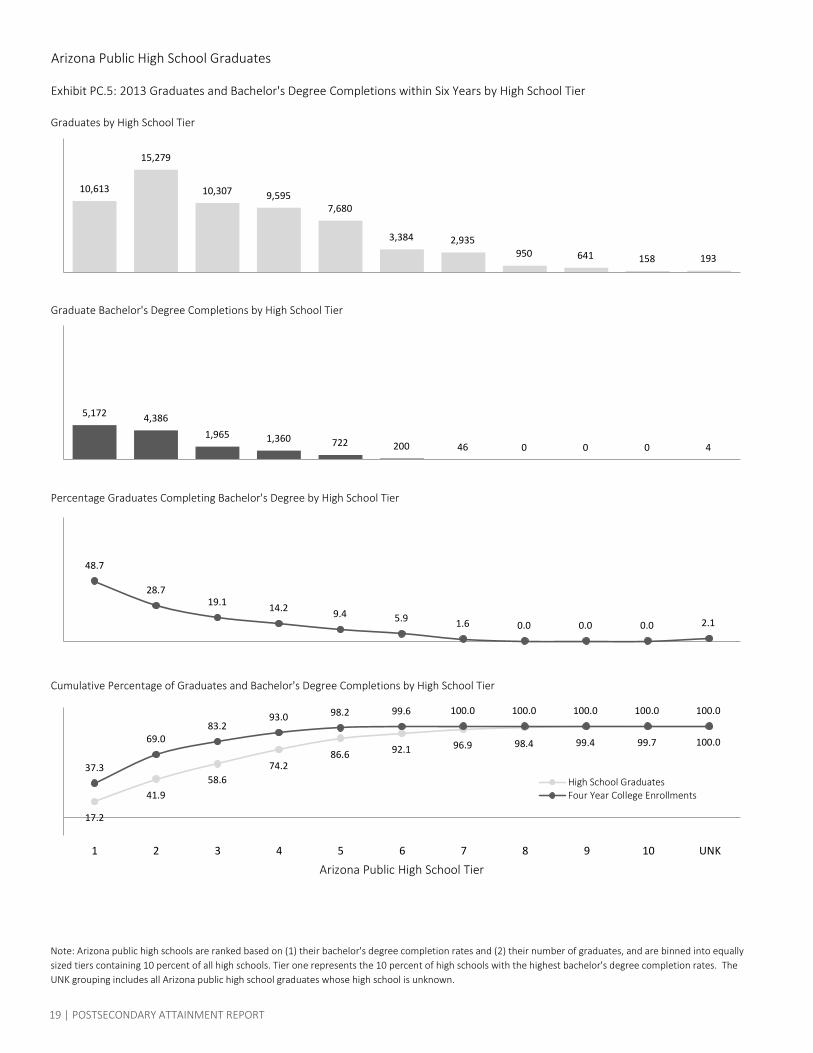
Arizona Public High School Graduates
Exhibit PC.5: 2013 Graduates and Bachelor's Degree Completions within Six Years by High School Tier
Graduates by High School Tier
Graduate Bachelor's Degree Completions by High School Tier
Percentage Graduates Completing Bachelor's Degree by High School Tier
Cumulative Percentage of Graduates and Bachelor's Degree Completions by High School Tier
Note: Arizona public high schools are ranked based on (1) their bachelor's degree completion rates and (2) their number of graduates, and are binned into equally sized tiers containing 10 percent of all high schools. Tier one represents the 10 percent of high schools with the highest bachelor's degree completion rates. The UNK grouping includes all Arizona public high school graduates whose high school is unknown.
48.7
28.719.1 14.2 9.4 5.9 1.6 0.0 0.0 0.0 2.1
10,613
15,279
10,307 9,5957,680
3,384 2,935950 641 158 193
5,172 4,3861,965 1,360 722 200 46 0 0 0 4
17.2
41.958.6
74.286.6 92.1 96.9 98.4 99.4 99.7 100.0
37.3
69.083.2
93.0 98.2 99.6 100.0 100.0 100.0 100.0 100.0
1 2 3 4 5 6 7 8 9 10 UNK
Arizona Public High School Tier
High School GraduatesFour Year College Enrollments
19 | POSTSECONDARY ATTAINMENT REPORT
Arizona Public High School Graduates
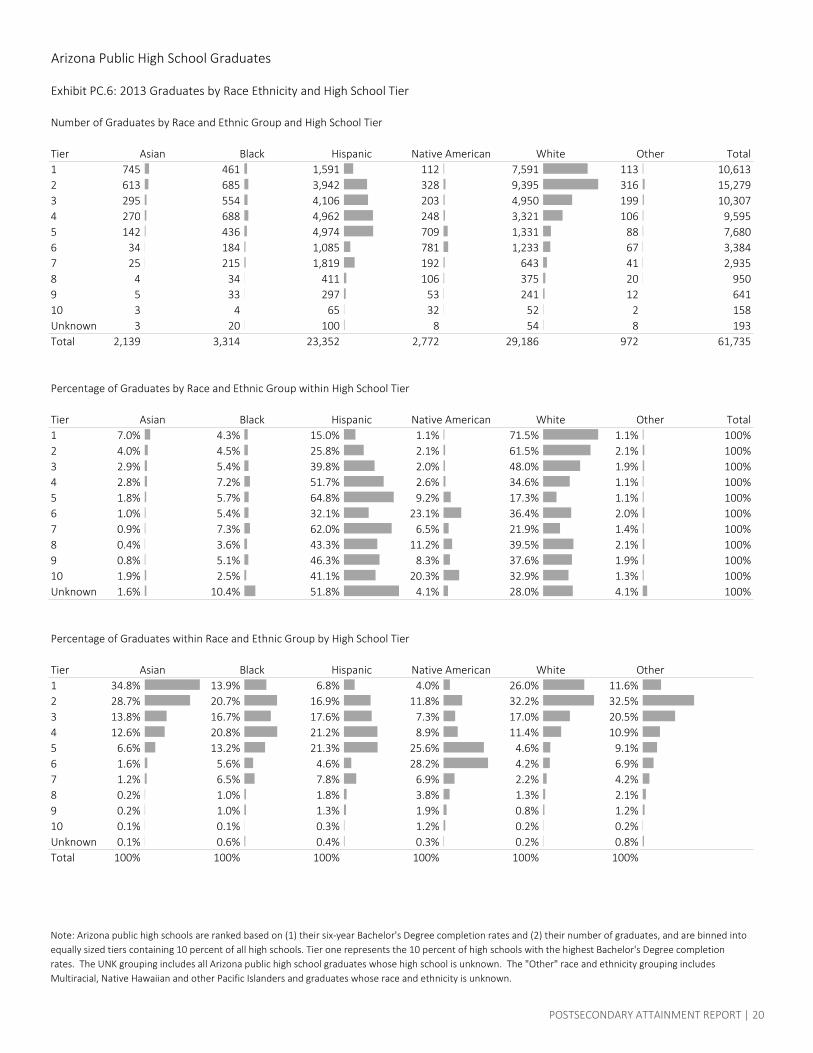
Exhibit PC.6: 2013 Graduates by Race Ethnicity and High School Tier
Number of Graduates by Race and Ethnic Group and High School Tier
Tier Total1 745 461 1,591 112 7,591 113 10,6132 613 685 3,942 328 9,395 316 15,2793 295 554 4,106 203 4,950 199 10,3074 270 688 4,962 248 3,321 106 9,5955 142 436 4,974 709 1,331 88 7,6806 34 184 1,085 781 1,233 67 3,3847 25 215 1,819 192 643 41 2,9358 4 34 411 106 375 20 9509 5 33 297 53 241 12 64110 3 4 65 32 52 2 158Unknown 3 20 100 8 54 8 193Total 2,139 3,314 23,352 2,772 29,186 972 61,735
Percentage of Graduates by Race and Ethnic Group within High School Tier
Tier Total1 7.0% 4.3% 15.0% 1.1% 71.5% 1.1% 100%2 4.0% 4.5% 25.8% 2.1% 61.5% 2.1% 100%3 2.9% 5.4% 39.8% 2.0% 48.0% 1.9% 100%4 2.8% 7.2% 51.7% 2.6% 34.6% 1.1% 100%5 1.8% 5.7% 64.8% 9.2% 17.3% 1.1% 100%6 1.0% 5.4% 32.1% 23.1% 36.4% 2.0% 100%7 0.9% 7.3% 62.0% 6.5% 21.9% 1.4% 100%8 0.4% 3.6% 43.3% 11.2% 39.5% 2.1% 100%9 0.8% 5.1% 46.3% 8.3% 37.6% 1.9% 100%10 1.9% 2.5% 41.1% 20.3% 32.9% 1.3% 100%Unknown 1.6% 10.4% 51.8% 4.1% 28.0% 4.1% 100%
Percentage of Graduates within Race and Ethnic Group by High School Tier
Tier1 34.8% 13.9% 6.8% 4.0% 26.0% 11.6%2 28.7% 20.7% 16.9% 11.8% 32.2% 32.5%3 13.8% 16.7% 17.6% 7.3% 17.0% 20.5%4 12.6% 20.8% 21.2% 8.9% 11.4% 10.9%5 6.6% 13.2% 21.3% 25.6% 4.6% 9.1%6 1.6% 5.6% 4.6% 28.2% 4.2% 6.9%7 1.2% 6.5% 7.8% 6.9% 2.2% 4.2%8 0.2% 1.0% 1.8% 3.8% 1.3% 2.1%9 0.2% 1.0% 1.3% 1.9% 0.8% 1.2%10 0.1% 0.1% 0.3% 1.2% 0.2% 0.2%Unknown 0.1% 0.6% 0.4% 0.3% 0.2% 0.8%Total 100% 100% 100% 100% 100% 100%
Asian Black Hispanic
Note: Arizona public high schools are ranked based on (1) their six-year Bachelor's Degree completion rates and (2) their number of graduates, and are binned into equally sized tiers containing 10 percent of all high schools. Tier one represents the 10 percent of high schools with the highest Bachelor's Degree completion rates. The UNK grouping includes all Arizona public high school graduates whose high school is unknown. The "Other" race and ethnicity grouping includes Multiracial, Native Hawaiian and other Pacific Islanders and graduates whose race and ethnicity is unknown.
Native American White Other
Other
Asian Black Hispanic Native American White Other
Asian Black Hispanic Native American White
POSTSECONDARY ATTAINMENT REPORT | 20
Arizona Public High School Graduates
Exhibit PC.7: Number of Graduates Completing Bachelor's Degrees Within Six Years of Graduation by Gender and Race Ethnicity
Asian
Black or African American
Hispanic
Native American
White
Other
Total
Female Male Total
7,111 7,497 7,402 8,120 8,381
2009 2013
4,757 4,837 4,878 5,271 5,474
2009 2013
106 114 53 89 159 203
4,968 5,045 4,957 5,185 5,2253,351 3,303 3,352 3,417 3,505
8,319 8,348 8,309 8,602 8,730
116 151 118 138 151 79 64 66 100 63 195 215 184 238 214
1,299 1,524 1,508 1,819 1,981785 913 919 1,079 1,150 2,084 2,437 2,427 2,898 3,131
269 337 320 346 359 173 197 178 203 204 442 534 498 549 563
459 440 499 526 551 369 360 363 419 463 828 800 862 945 1,014
11,868 12,334 12,280 13,391 13,855
2009 2013
21 | POSTSECONDARY ATTAINMENT REPORT
Arizona Public High School Graduates
Exhibit PC.8: Percentage of Graduates Completing Bachelor's Degrees Within Six Years of Graduation by Gender and Race Ethnicity
Asian
Black or African American
Hispanic
Native American
White
Other
Total
TotalFemale Male
22.28 23.03 23.68 25.22 26.48
2009 2013
15.59 15.47 16.00 17.17 18.20
2009 2013
30.85 31.80 32.74 34.06 35.3921.03 21.19 22.01 22.91 24.30 25.96 26.54 27.36 28.54 29.91
6.22 8.10 6.76 8.19 10.39 4.62 3.80 4.01 6.62 4.78 5.46 6.06 5.42 7.45 7.72
24.82 21.97 15.54 19.65 20.70 20.88
11.57 12.84 13.16 15.01 16.26 7.77 8.20 8.54 9.63 10.30 9.77 10.59 10.92 12.43 13.41
15.59 17.26 17.33 19.68 21.199.89 10.61 9.78 11.77 12.59 12.72 14.02 13.58 15.77 16.99
45.99 43.69 46.72 53.13 53.0836.72 35.96 35.14 42.03 42.05 41.34 39.84 41.03 47.56 47.41
19.01 19.32 19.89 21.29 22.44
2009 2013
POSTSECONDARY ATTAINMENT REPORT | 22


2700 N CENTRAL AVE., SUITE 400 | PHOENIX, AZ 85004 | AZREGENTS.EDU
Postsecondary AttainmentJohn ArnoldExecutive Director
November 19, 2020
2
Postsecondary Attainment Report
Report is compiled by matching records Arizona public high school graduation records provided by the Arizona Department of Education Data with postsecondary education records from the National Student Clearinghouse to examine:
• Postsecondary Enrollment of Arizona public high school graduates within one year of their graduation.
• Postsecondary Completions of Arizona public high school graduates within six years of their graduation.
3
Postsecondary Attainment
48.3% 49.6%53.0% 53.1% 53.7% 54.4% 52.9% 51.8% 54.1% 52.7%
23.1% 24.1% 25.1% 26.1% 26.4% 26.5% 27.3% 28.4% 29.3%
0%
100%
2005 2006 2007 2008 2009 2010 2011 2012 2013 2014 2015 2016 2017 2018
Postsecondary Enrollments
Postsecondary Completions
All Postsecondary Enrollments and Completions
4
Postsecondary Attainment
22.9% 23.7% 24.0% 25.2% 26.3% 27.0% 26.0% 26.7% 28.6% 28.6%
17.3% 17.7% 18.4% 18.8% 19.0% 19.3% 19.9% 21.3% 22.4%
0%
100%
2005 2006 2007 2008 2009 2010 2011 2012 2013 2014 2015 2016 2017 2018
Four-Year College Enrollments
Bachelor’s Degree Completions(including Transfers-In)
Four-Year College Enrollments and Bachelor’s Degree Completions
5
Bachelor’s Degree Completion Including High School Graduation Rates
Attainment Level Headcount
9th Graders 100High School Graduates 83Four-Year College Enrollments 24Bachelor’s Degree Completions 18
Impact of High School Graduation Rates
6
Bachelor’s Degree Completion Including High School Graduation Rates
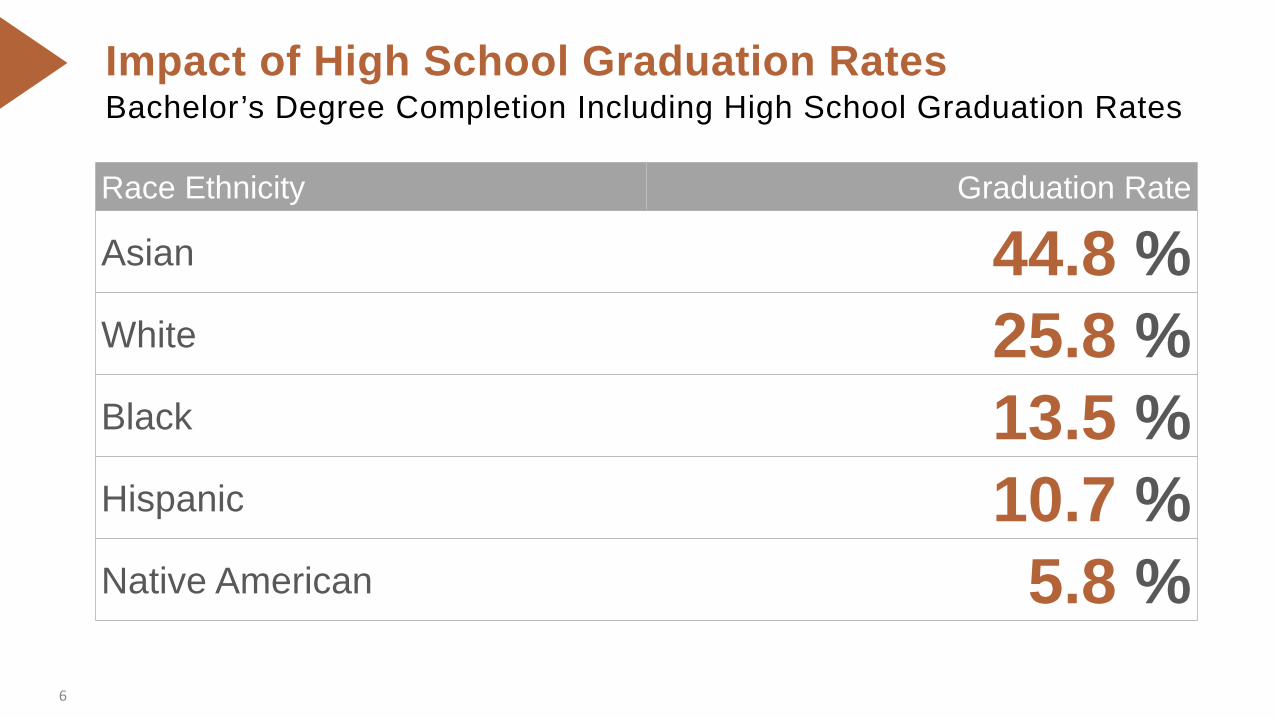
Race Ethnicity Graduation Rate
Asian 44.8 %White 25.8 %Black 13.5 %Hispanic 10.7 %Native American 5.8 %
Impact of High School Graduation Rates
7
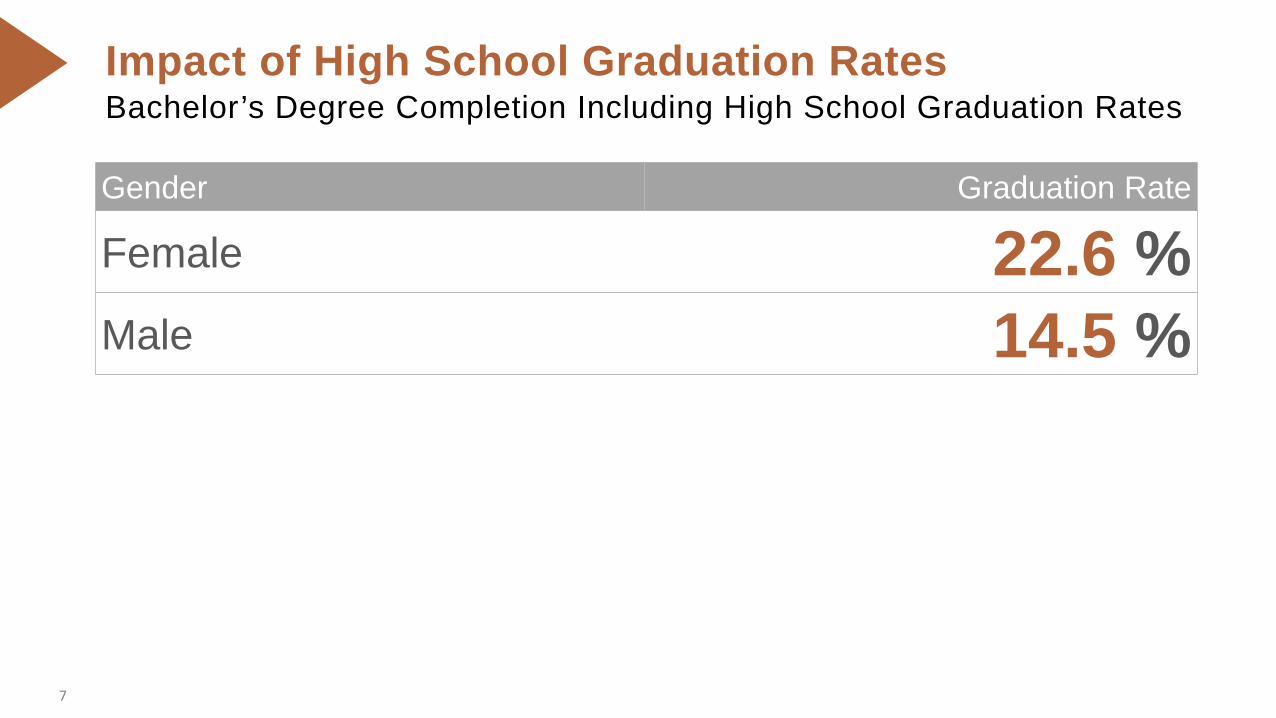
Bachelor’s Degree Completion Including High School Graduation Rates
Gender Graduation Rate
Female 22.6 %Male 14.5 %
Impact of High School Graduation Rates
8
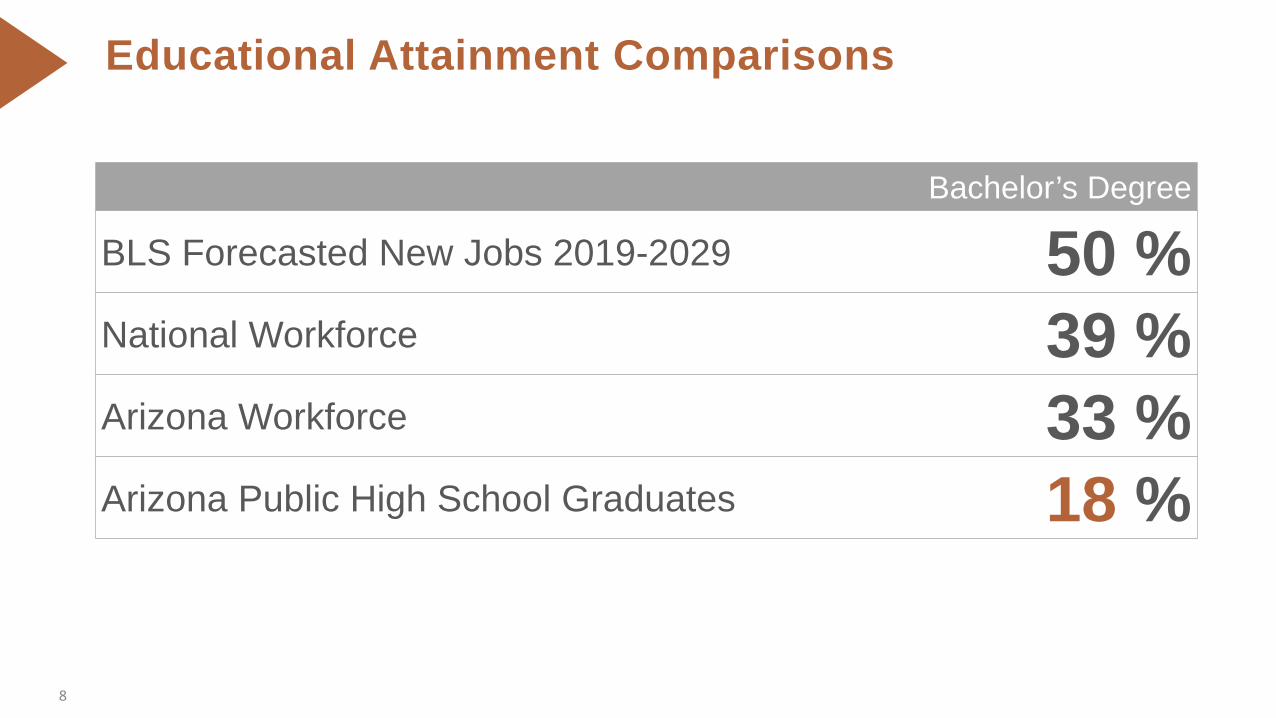
Educational Attainment Comparisons
Bachelor’s Degree
BLS Forecasted New Jobs 2019-2029 50 %National Workforce 39 %Arizona Workforce 33 %Arizona Public High School Graduates 18 %
9
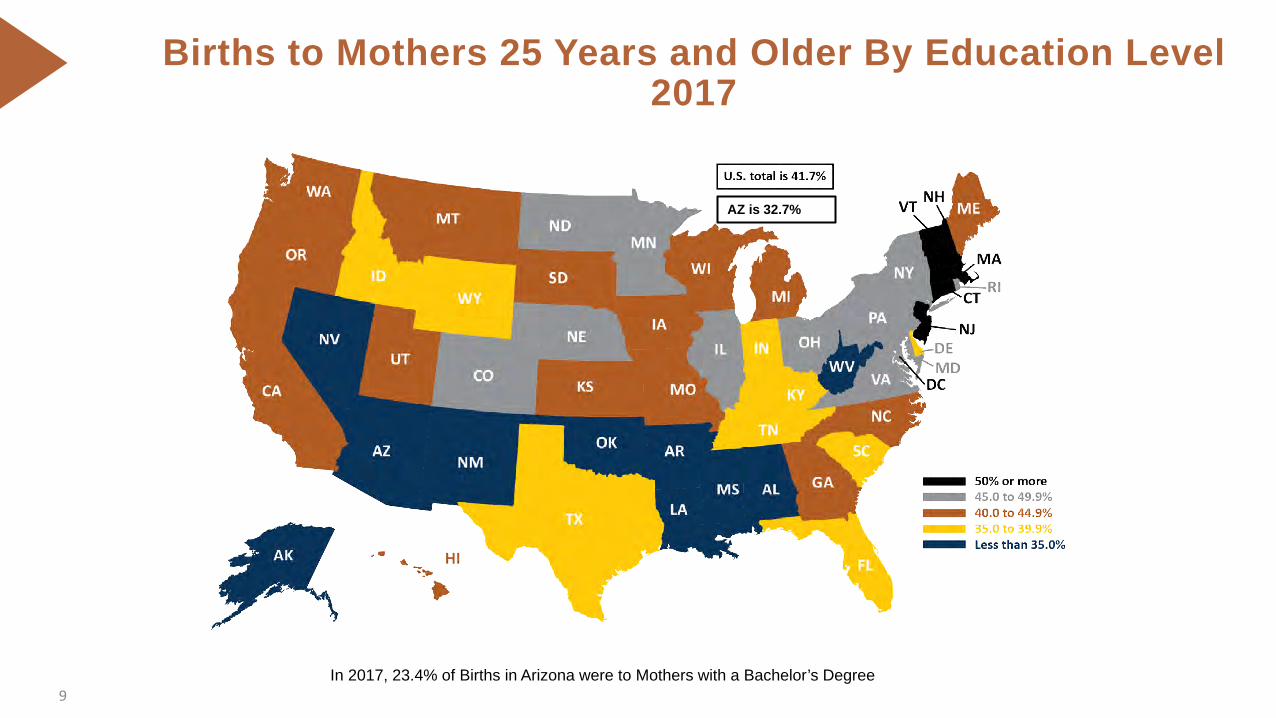
Births to Mothers 25 Years and Older By Education Level2017
In 2017, 23.4% of Births in Arizona were to Mothers with a Bachelor’s Degree
AZ is 32.7%
10
Educational Attainment Comparisons
0
200
400
600
800
1,000
1,200
0%10%20%30%40%50%60%70%80%90%100%
Gra
duat
es
Four-Year College Enrollment Rate
Outperforming National Four-year College Enrollment Rate
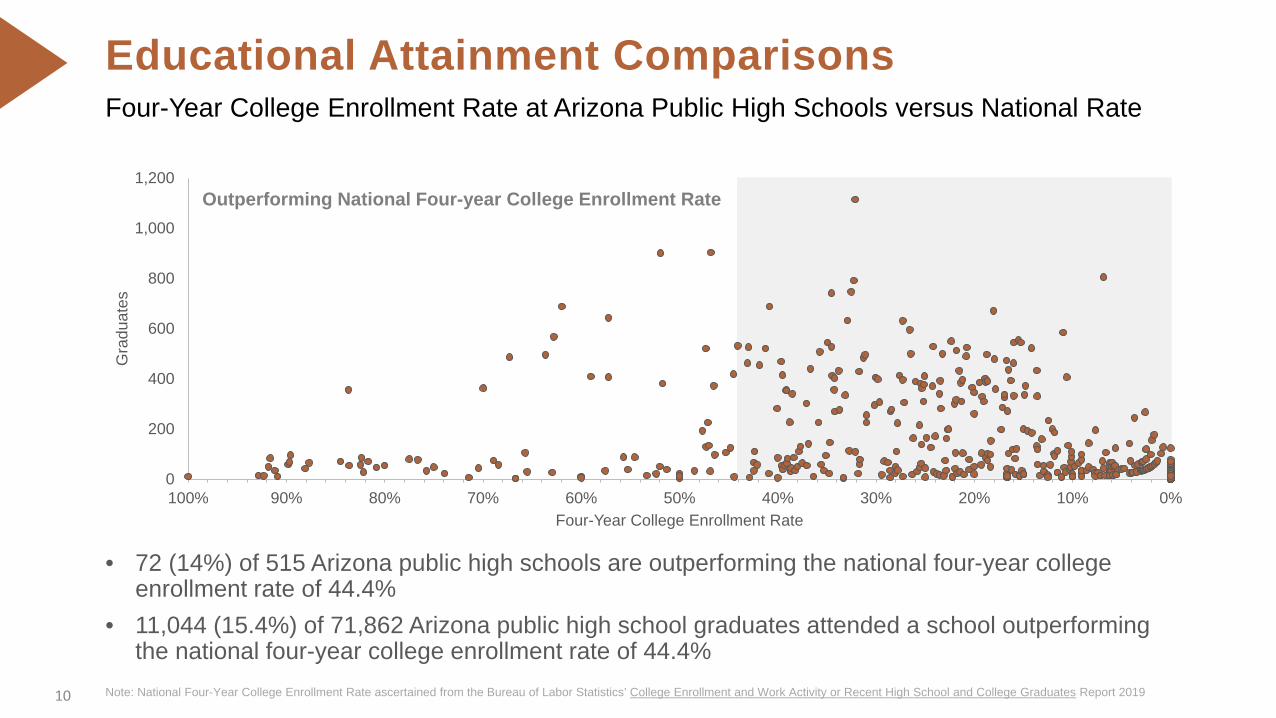
• 72 (14%) of 515 Arizona public high schools are outperforming the national four-year college enrollment rate of 44.4%
• 11,044 (15.4%) of 71,862 Arizona public high school graduates attended a school outperforming the national four-year college enrollment rate of 44.4%
Four-Year College Enrollment Rate at Arizona Public High Schools versus National Rate
Note: National Four-Year College Enrollment Rate ascertained from the Bureau of Labor Statistics’ College Enrollment and Work Activity or Recent High School and College Graduates Report 2019
11
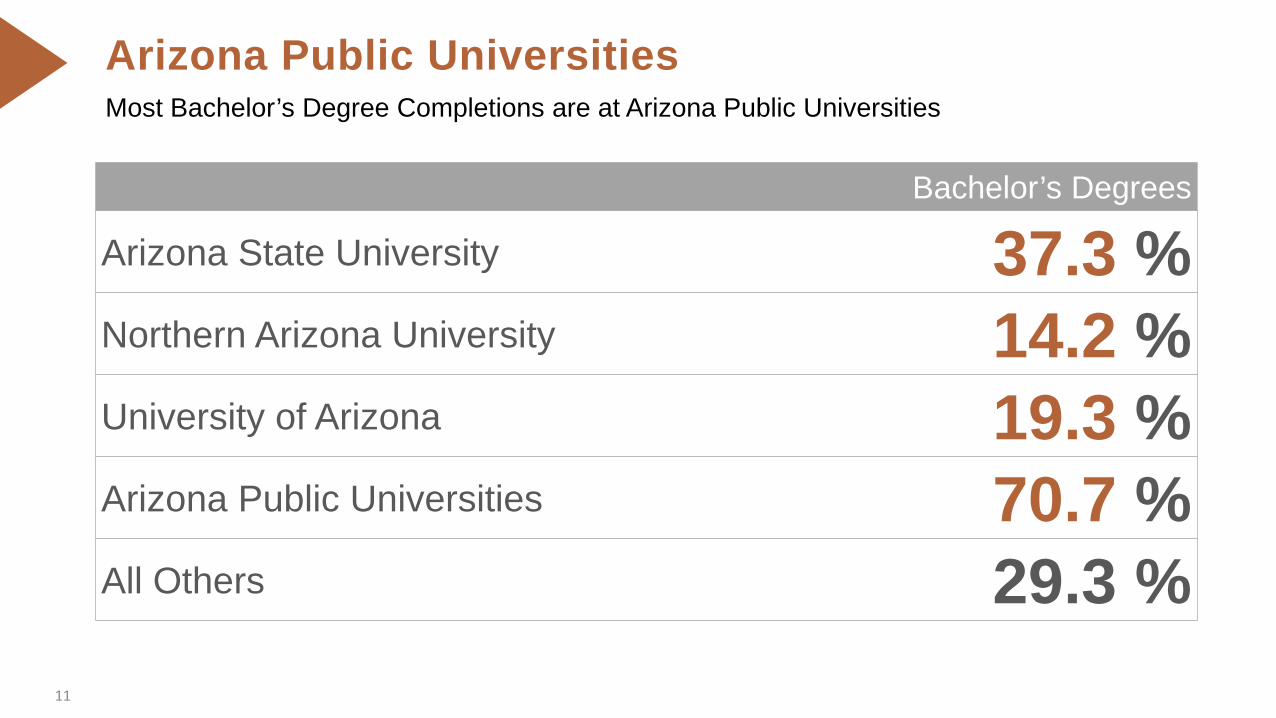
Arizona Public Universities
Bachelor’s Degrees
Arizona State University 37.3 %Northern Arizona University 14.2 %University of Arizona 19.3 %Arizona Public Universities 70.7 %All Others 29.3 %
Most Bachelor’s Degree Completions are at Arizona Public Universities
12
• Partnering with the Governor to create and establish the Arizona Teachers Academy to address teacher shortages
• Launching the New Economy Initiative to garner legislative support for four-year degree attainment
• ASU Digital Preparatory Academy’s partnership with dozens of Arizona high schools to provide better access to curriculum and great instructors
• Improvement of existing and development of new external relationships to promote the value of higher education
• Entered into data sharing agreements with the Arizona Department of Education and the community colleges to better understand student persistence
Arizona Public Universities are Actively Addressing Arizona’s Educational Attainment
Arizona Public Universities
13
• Set-aside of funding for a plan to further study K-12 student preparedness for higher education
• Development and dissemination of research reports on the worth of a college degree, including the Graduate Wages Report
• In partnership with Achieve60AZ, the Arizona Commission for Postsecondary Education and College Success AZ, ASU developed Benji – an Artificial Intelligence technology with an open bot platform to help students and families get answers to their FAFSA questions instantly and complete the FAFSA as quickly and easily as possible
• A new partnership with the U.S. Census to expand college graduate outcome reporting
• Pursuit of multiple public engagement initiatives, including launch of the Regents’ Cup
Arizona Public Universities are Actively Addressing Arizona’s Educational Attainment
Arizona Public Universities
Board of Regents Meeting November 18-20, 2020
Item #2 EXECUTIVE SUMMARY Page 1 of 6
Contact Information: Chad Sampson, ABOR [email protected] 602-229-2512
Item Name: Comparator Institutions
Action Item
Background/History of Previous Board Action The use of comparator groups in higher education is a common practice. Since 2009, ABOR has maintained three sets of 15 institutions referred to as the respective ‘ABOR peers’ of our three public universities. The development of ABOR peer lists in 2009 was intended to serve multiple ends, including: to inform the development of a new funding model and long-term financial projections; to assess progress against goals and performance targets set out in a new strategic plan; and to inform tuition policy decisions – e.g. to develop a notion of ‘adequacy’ in funding by comparing levels to like institutions. Several of the functions for which the initial peer lists were devised – for instance, informing funding models and contextualizing tuition policy decisions – have, in practice, been abandoned. Indeed, there is no longer a compelling reason to maintain a single universal list of ABOR peers. Moreover, relying on a single universal ‘peer’ list impeded meaningful performance benchmarking:
1. A single universal list was, by definition, static. Consequently, its utility as an instrument of comparison diminished over time. Institutions that might have been good comparators in 2009, were not necessarily good comparators a decade later. By abandoning this approach and instead adopting a framework for identifying, for a given metric, the most similarly performing institutions to ours year on year the board office can provide much more timely and informative data to regents, to institutions, and to other interested parties.
2. Devising a single universal list of peers requires the conflation of many
variables (some pertaining to research, some to education, others to institutional characteristics), and the inevitably subjective assignment of weightings to these many variables. Moreover, characteristics that influence research performance (such as the presence or absence of a medical school) have no bearing on educational outcomes and vice versa (for instance, the proportion of undergraduate Pell grant recipients has no bearing on research performance). The use of a single master list of
Requested Action: The board will engage in a discussion with the board office and university staff regarding a proposed method for identifying comparator institutions for performance benchmarking purposes.
Board of Regents Meeting November 18-20, 2020
Item #2 EXECUTIVE SUMMARY Page 2 of 6
peers precludes important distinctions between factors that influence education outcomes and factors that influence research outcomes.
3. Devising a single universal list of peers requires the deployment of more
complex statistical methods such as cluster analysis and the standardization of scores across many different units of measurement. We propose a much more intuitive and simple approach requiring nothing more technical than ranked lists of institutions selected using transparent scope conditions as detailed below.
Discussion ABOR has proposed and circulated a new framework for the construction and use of comparator lists for institutional analysis. Instead of devising a single, static set of peers for each of our institutions, ABOR will adopt a simple, objective methodology to develop new ‘nearest neighbor’ and ‘best in class’ comparator lists specific to identified research and educational outcomes. We believe this approach provides more timely and useful contextual information about the performance of our institutions, relative to other institutions operating under similar parameters. Further elaboration of this method is provided below. Step 1: Identify scope conditions As an initial step the universe of four-year institutions must be winnowed to a set of reference institutions that share some basic characteristics with the target institution. These scope conditions define the institution’s ‘class’ and are intended to ensure a baseline of legitimate comparability, but should not be so prescriptive as to overly limit the number of comparators. Moreover, only characteristics that materially affect institutional performance for a given outcome should be selected as scope conditions. For instance, the presence or absence of a medical school materially affects research expenditures, but does not substantially affect educational outcomes such as 6-year graduation rates. Therefore, the presence or absence of a medical school should only be a scope condition for defining research comparators, but not for defining educational comparators.
Board of Regents Meeting November 18-20, 2020
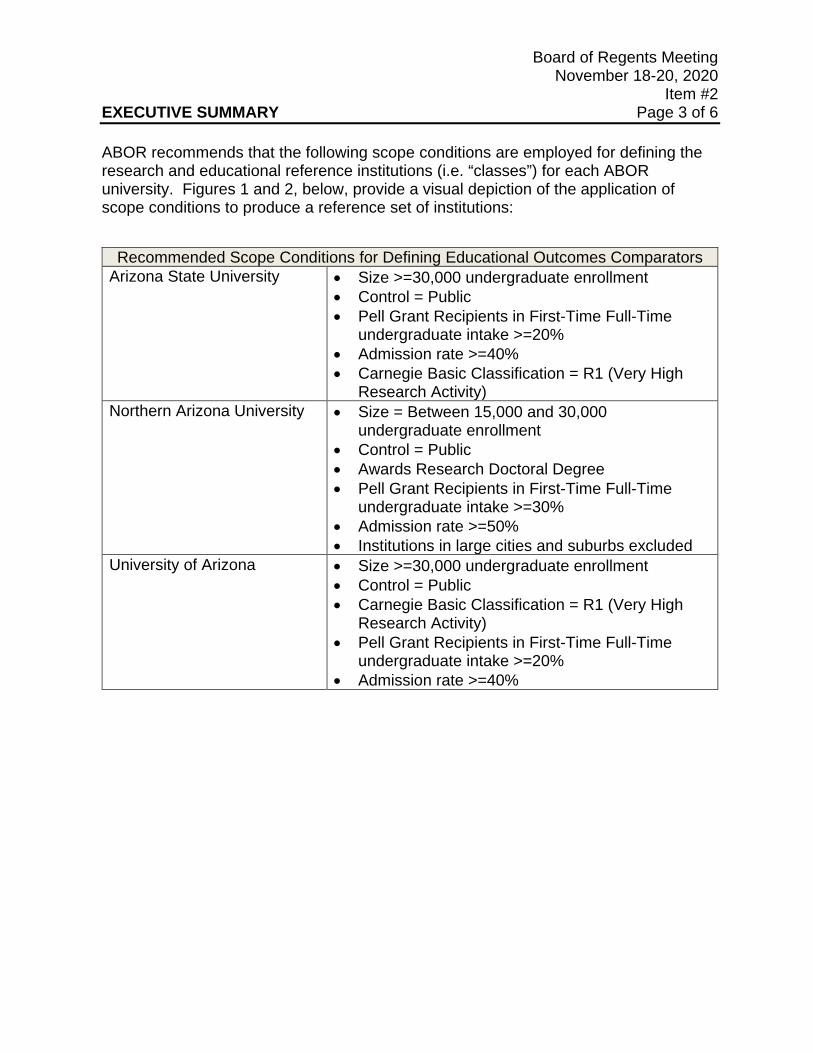
Item #2 EXECUTIVE SUMMARY Page 3 of 6 ABOR recommends that the following scope conditions are employed for defining the research and educational reference institutions (i.e. “classes”) for each ABOR university. Figures 1 and 2, below, provide a visual depiction of the application of scope conditions to produce a reference set of institutions:
Recommended Scope Conditions for Defining Educational Outcomes Comparators Arizona State University • Size >=30,000 undergraduate enrollment
• Control = Public • Pell Grant Recipients in First-Time Full-Time
undergraduate intake >=20% • Admission rate >=40% • Carnegie Basic Classification = R1 (Very High
Research Activity) Northern Arizona University • Size = Between 15,000 and 30,000
undergraduate enrollment • Control = Public • Awards Research Doctoral Degree • Pell Grant Recipients in First-Time Full-Time
undergraduate intake >=30% • Admission rate >=50% • Institutions in large cities and suburbs excluded
University of Arizona • Size >=30,000 undergraduate enrollment • Control = Public • Carnegie Basic Classification = R1 (Very High
Research Activity) • Pell Grant Recipients in First-Time Full-Time
undergraduate intake >=20% • Admission rate >=40%
Board of Regents Meeting November 18-20, 2020
Item #2 EXECUTIVE SUMMARY Page 4 of 6
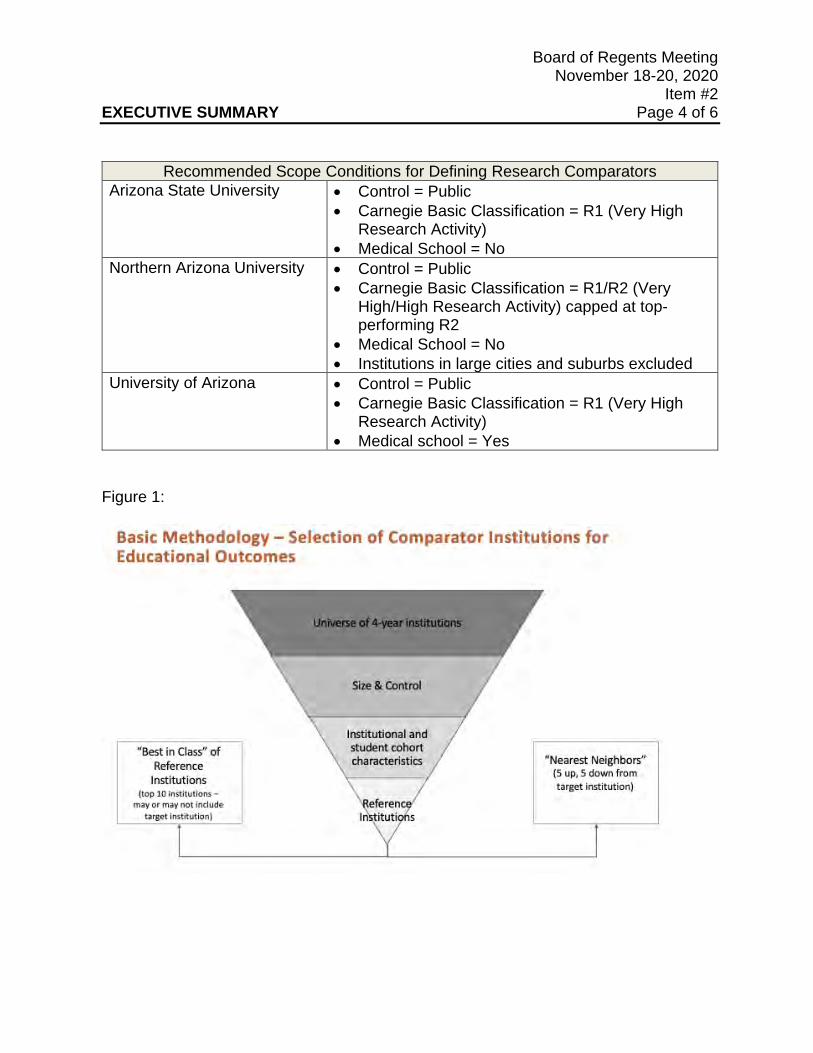
Recommended Scope Conditions for Defining Research Comparators Arizona State University • Control = Public
• Carnegie Basic Classification = R1 (Very High Research Activity)
• Medical School = No Northern Arizona University • Control = Public
• Carnegie Basic Classification = R1/R2 (Very High/High Research Activity) capped at top-performing R2
• Medical School = No • Institutions in large cities and suburbs excluded
University of Arizona • Control = Public • Carnegie Basic Classification = R1 (Very High
Research Activity) • Medical school = Yes
Figure 1:
Board of Regents Meeting November 18-20, 2020
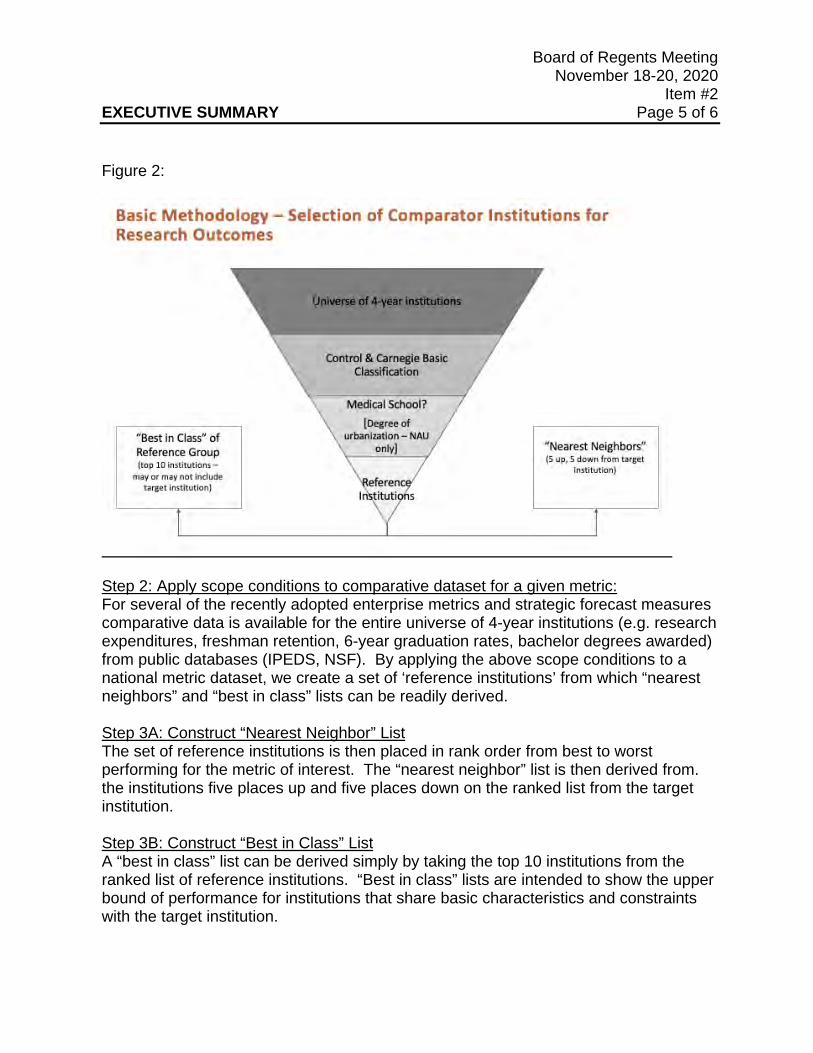
Item #2 EXECUTIVE SUMMARY Page 5 of 6 Figure 2:
Step 2: Apply scope conditions to comparative dataset for a given metric: For several of the recently adopted enterprise metrics and strategic forecast measures comparative data is available for the entire universe of 4-year institutions (e.g. research expenditures, freshman retention, 6-year graduation rates, bachelor degrees awarded) from public databases (IPEDS, NSF). By applying the above scope conditions to a national metric dataset, we create a set of ‘reference institutions’ from which “nearest neighbors” and “best in class” lists can be readily derived. Step 3A: Construct “Nearest Neighbor” List The set of reference institutions is then placed in rank order from best to worst performing for the metric of interest. The “nearest neighbor” list is then derived from. the institutions five places up and five places down on the ranked list from the target institution. Step 3B: Construct “Best in Class” List A “best in class” list can be derived simply by taking the top 10 institutions from the ranked list of reference institutions. “Best in class” lists are intended to show the upper bound of performance for institutions that share basic characteristics and constraints with the target institution.
Board of Regents Meeting November 18-20, 2020
Item #2 EXECUTIVE SUMMARY Page 6 of 6 The following pages provide applied examples of this proposed methodology as it would appear in ABOR reporting for one research outcome (research expenditures) and one educational outcome (6-year graduation rates) for each of Arizona State University, Northern Arizona University, and The University of Arizona.
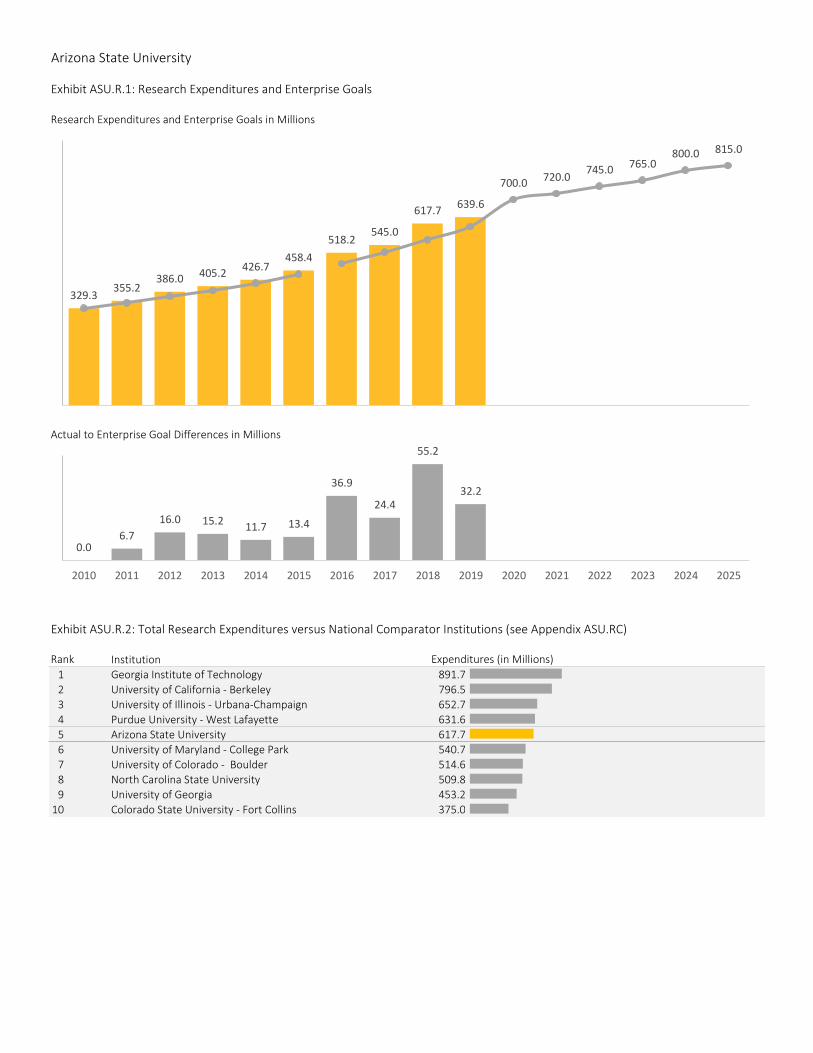
Arizona State University
Exhibit ASU.R.1: Research Expenditures and Enterprise Goals
Research Expenditures and Enterprise Goals in Millions
Actual to Enterprise Goal Differences in Millions
Exhibit ASU.R.2: Total Research Expenditures versus National Comparator Institutions (see Appendix ASU.RC)
Institution1 Georgia Institute of Technology 891.72 University of California - Berkeley 796.53 University of Illinois - Urbana-Champaign 652.74 Purdue University - West Lafayette 631.65 Arizona State University 617.76 University of Maryland - College Park 540.77 University of Colorado - Boulder 514.68 North Carolina State University 509.89 University of Georgia 453.2
10 Colorado State University - Fort Collins 375.0
Rank Expenditures (in Millions)
0.06.7
16.0 15.2 11.7 13.4
36.9
24.4
55.2
32.2
2010 2011 2012 2013 2014 2015 2016 2017 2018 2019 2020 2021 2022 2023 2024 2025
329.3355.2
386.0 405.2 426.7458.4
518.2545.0
617.7 639.6
700.0 720.0745.0 765.0
800.0 815.0
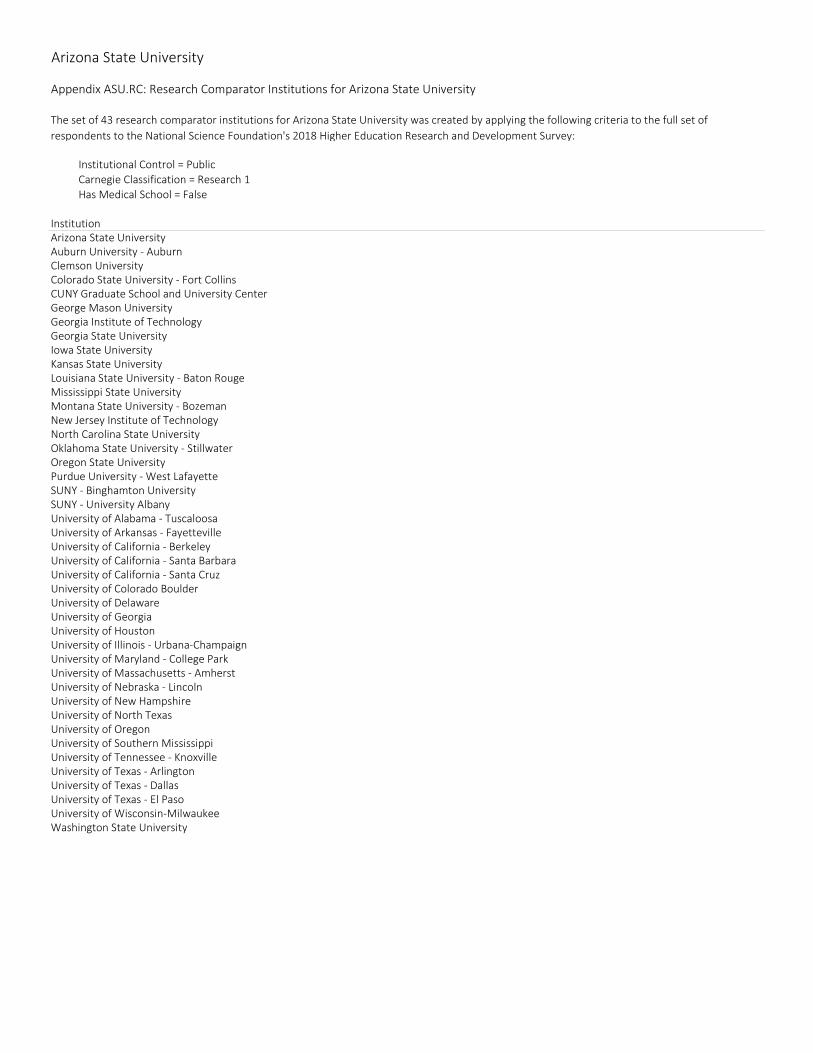
Arizona State University
Appendix ASU.RC: Research Comparator Institutions for Arizona State University
Institutional Control = PublicCarnegie Classification = Research 1Has Medical School = False
InstitutionArizona State UniversityAuburn University - AuburnClemson UniversityColorado State University - Fort CollinsCUNY Graduate School and University CenterGeorge Mason UniversityGeorgia Institute of TechnologyGeorgia State UniversityIowa State UniversityKansas State UniversityLouisiana State University - Baton RougeMississippi State UniversityMontana State University - BozemanNew Jersey Institute of TechnologyNorth Carolina State UniversityOklahoma State University - StillwaterOregon State UniversityPurdue University - West LafayetteSUNY - Binghamton UniversitySUNY - University AlbanyUniversity of Alabama - TuscaloosaUniversity of Arkansas - FayettevilleUniversity of California - BerkeleyUniversity of California - Santa BarbaraUniversity of California - Santa CruzUniversity of Colorado BoulderUniversity of DelawareUniversity of GeorgiaUniversity of HoustonUniversity of Illinois - Urbana-ChampaignUniversity of Maryland - College ParkUniversity of Massachusetts - AmherstUniversity of Nebraska - LincolnUniversity of New HampshireUniversity of North TexasUniversity of OregonUniversity of Southern MississippiUniversity of Tennessee - KnoxvilleUniversity of Texas - ArlingtonUniversity of Texas - DallasUniversity of Texas - El PasoUniversity of Wisconsin-MilwaukeeWashington State University
The set of 43 research comparator institutions for Arizona State University was created by applying the following criteria to the full set of respondents to the National Science Foundation's 2018 Higher Education Research and Development Survey:
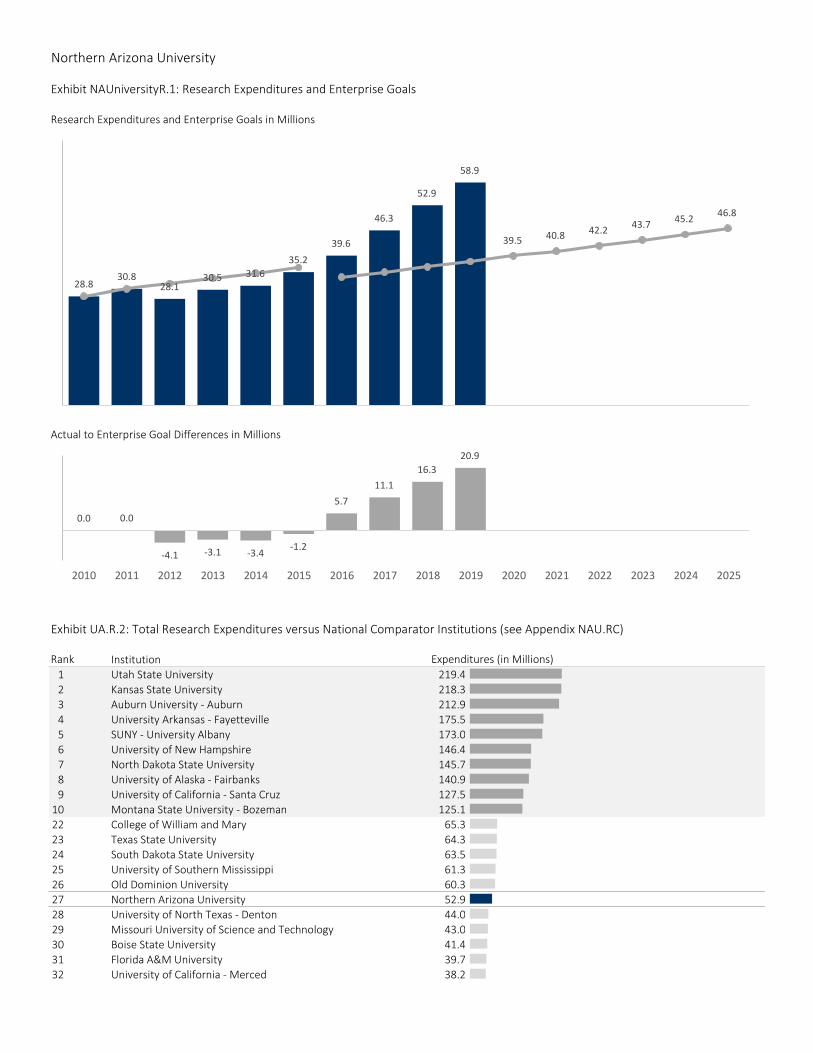
Northern Arizona University
Exhibit NAUniversityR.1: Research Expenditures and Enterprise Goals
Research Expenditures and Enterprise Goals in Millions
Actual to Enterprise Goal Differences in Millions
Exhibit UA.R.2: Total Research Expenditures versus National Comparator Institutions (see Appendix NAU.RC)
Institution1 Utah State University 219.42 Kansas State University 218.33 Auburn University - Auburn 212.94 University Arkansas - Fayetteville 175.55 SUNY - University Albany 173.06 University of New Hampshire 146.47 North Dakota State University 145.78 University of Alaska - Fairbanks 140.99 University of California - Santa Cruz 127.5
10 Montana State University - Bozeman 125.122 College of William and Mary 65.323 Texas State University 64.324 South Dakota State University 63.525 University of Southern Mississippi 61.326 Old Dominion University 60.327 Northern Arizona University 52.928 University of North Texas - Denton 44.029 Missouri University of Science and Technology 43.030 Boise State University 41.431 Florida A&M University 39.732 University of California - Merced 38.2
Rank Expenditures (in Millions)
28.830.8
28.130.5 31.6
35.2
39.6
46.3
52.9
58.9
39.5 40.8 42.2 43.7 45.2 46.8
0.0 0.0
-4.1 -3.1 -3.4-1.2
5.711.1
16.320.9
2010 2011 2012 2013 2014 2015 2016 2017 2018 2019 2020 2021 2022 2023 2024 2025
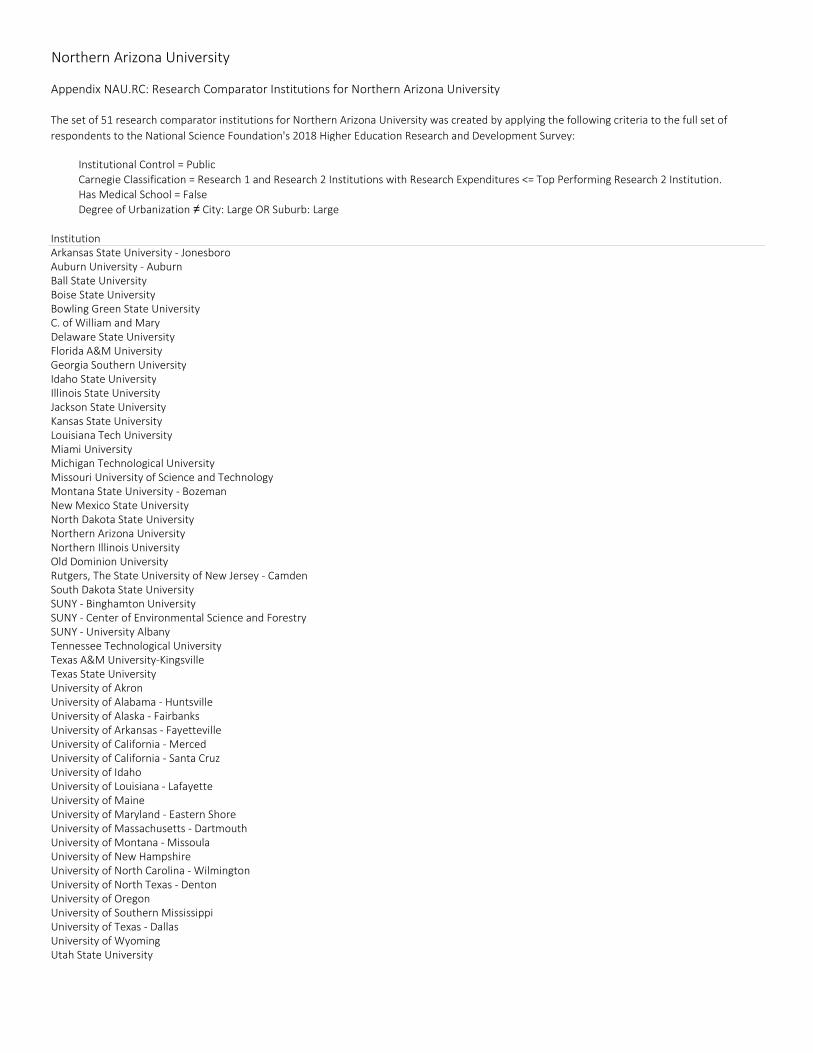
Northern Arizona University
Appendix NAU.RC: Research Comparator Institutions for Northern Arizona University
Institutional Control = PublicCarnegie Classification = Research 1 and Research 2 Institutions with Research Expenditures <= Top Performing Research 2 Institution.Has Medical School = FalseDegree of Urbanization ≠ City: Large OR Suburb: Large
InstitutionArkansas State University - JonesboroAuburn University - AuburnBall State UniversityBoise State UniversityBowling Green State UniversityC. of William and Mary Delaware State UniversityFlorida A&M UniversityGeorgia Southern UniversityIdaho State UniversityIllinois State UniversityJackson State UniversityKansas State UniversityLouisiana Tech UniversityMiami UniversityMichigan Technological UniversityMissouri University of Science and TechnologyMontana State University - BozemanNew Mexico State UniversityNorth Dakota State UniversityNorthern Arizona UniversityNorthern Illinois UniversityOld Dominion UniversityRutgers, The State University of New Jersey - CamdenSouth Dakota State UniversitySUNY - Binghamton UniversitySUNY - Center of Environmental Science and ForestrySUNY - University AlbanyTennessee Technological UniversityTexas A&M University-KingsvilleTexas State UniversityUniversity of AkronUniversity of Alabama - HuntsvilleUniversity of Alaska - FairbanksUniversity of Arkansas - FayettevilleUniversity of California - MercedUniversity of California - Santa CruzUniversity of IdahoUniversity of Louisiana - LafayetteUniversity of MaineUniversity of Maryland - Eastern ShoreUniversity of Massachusetts - DartmouthUniversity of Montana - MissoulaUniversity of New HampshireUniversity of North Carolina - WilmingtonUniversity of North Texas - DentonUniversity of OregonUniversity of Southern MississippiUniversity of Texas - DallasUniversity of WyomingUtah State University
The set of 51 research comparator institutions for Northern Arizona University was created by applying the following criteria to the full set of respondents to the National Science Foundation's 2018 Higher Education Research and Development Survey:
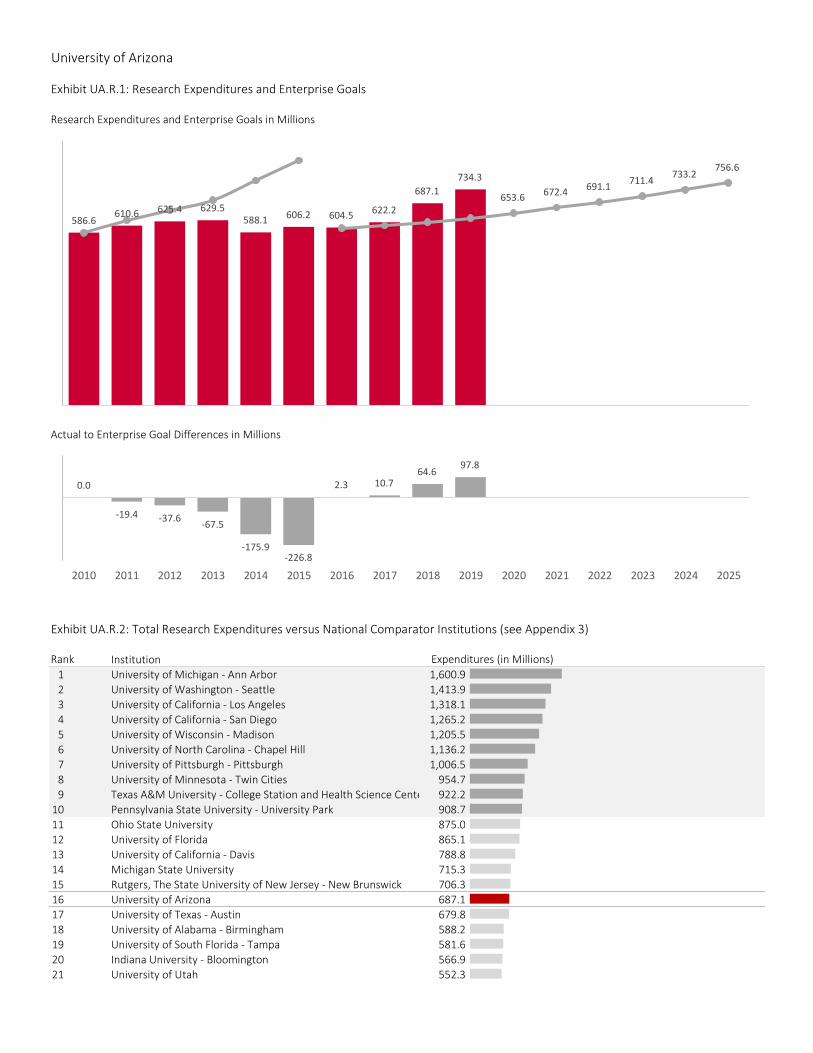
University of Arizona
Exhibit UA.R.1: Research Expenditures and Enterprise Goals
Research Expenditures and Enterprise Goals in Millions
Actual to Enterprise Goal Differences in Millions
Exhibit UA.R.2: Total Research Expenditures versus National Comparator Institutions (see Appendix 3)
Institution1 University of Michigan - Ann Arbor 1,600.92 University of Washington - Seattle 1,413.93 University of California - Los Angeles 1,318.14 University of California - San Diego 1,265.25 University of Wisconsin - Madison 1,205.56 University of North Carolina - Chapel Hill 1,136.27 University of Pittsburgh - Pittsburgh 1,006.58 University of Minnesota - Twin Cities 954.79 Texas A&M University - College Station and Health Science Center 922.2
10 Pennsylvania State University - University Park 908.711 Ohio State University 875.012 University of Florida 865.113 University of California - Davis 788.814 Michigan State University 715.315 Rutgers, The State University of New Jersey - New Brunswick 706.316 University of Arizona 687.117 University of Texas - Austin 679.818 University of Alabama - Birmingham 588.219 University of South Florida - Tampa 581.620 Indiana University - Bloomington 566.921 University of Utah 552.3
Rank Expenditures (in Millions)
586.6610.6 625.4 629.5
588.1 606.2 604.5 622.2
687.1734.3
653.6 672.4 691.1 711.4 733.2756.6
0.0
-19.4 -37.6 -67.5
-175.9-226.8
2.3 10.764.6
97.8
2010 2011 2012 2013 2014 2015 2016 2017 2018 2019 2020 2021 2022 2023 2024 2025
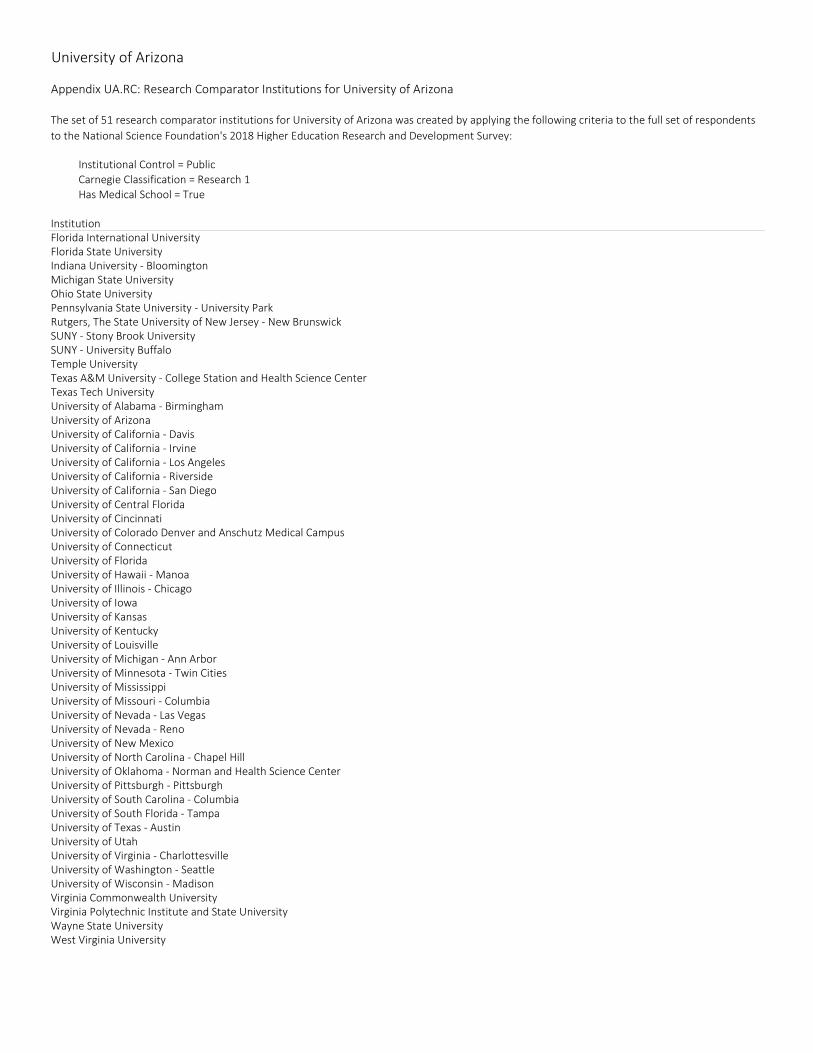
University of Arizona
Appendix UA.RC: Research Comparator Institutions for University of Arizona
Institutional Control = PublicCarnegie Classification = Research 1Has Medical School = True
InstitutionFlorida International UniversityFlorida State UniversityIndiana University - BloomingtonMichigan State UniversityOhio State UniversityPennsylvania State University - University ParkRutgers, The State University of New Jersey - New BrunswickSUNY - Stony Brook UniversitySUNY - University BuffaloTemple UniversityTexas A&M University - College Station and Health Science CenterTexas Tech UniversityUniversity of Alabama - BirminghamUniversity of ArizonaUniversity of California - DavisUniversity of California - IrvineUniversity of California - Los AngelesUniversity of California - Riverside University of California - San DiegoUniversity of Central FloridaUniversity of CincinnatiUniversity of Colorado Denver and Anschutz Medical CampusUniversity of ConnecticutUniversity of FloridaUniversity of Hawaii - ManoaUniversity of Illinois - ChicagoUniversity of IowaUniversity of KansasUniversity of KentuckyUniversity of LouisvilleUniversity of Michigan - Ann ArborUniversity of Minnesota - Twin CitiesUniversity of MississippiUniversity of Missouri - ColumbiaUniversity of Nevada - Las VegasUniversity of Nevada - RenoUniversity of New MexicoUniversity of North Carolina - Chapel HillUniversity of Oklahoma - Norman and Health Science CenterUniversity of Pittsburgh - PittsburghUniversity of South Carolina - ColumbiaUniversity of South Florida - TampaUniversity of Texas - AustinUniversity of UtahUniversity of Virginia - CharlottesvilleUniversity of Washington - SeattleUniversity of Wisconsin - MadisonVirginia Commonwealth UniversityVirginia Polytechnic Institute and State UniversityWayne State UniversityWest Virginia University
The set of 51 research comparator institutions for University of Arizona was created by applying the following criteria to the full set of respondents to the National Science Foundation's 2018 Higher Education Research and Development Survey:
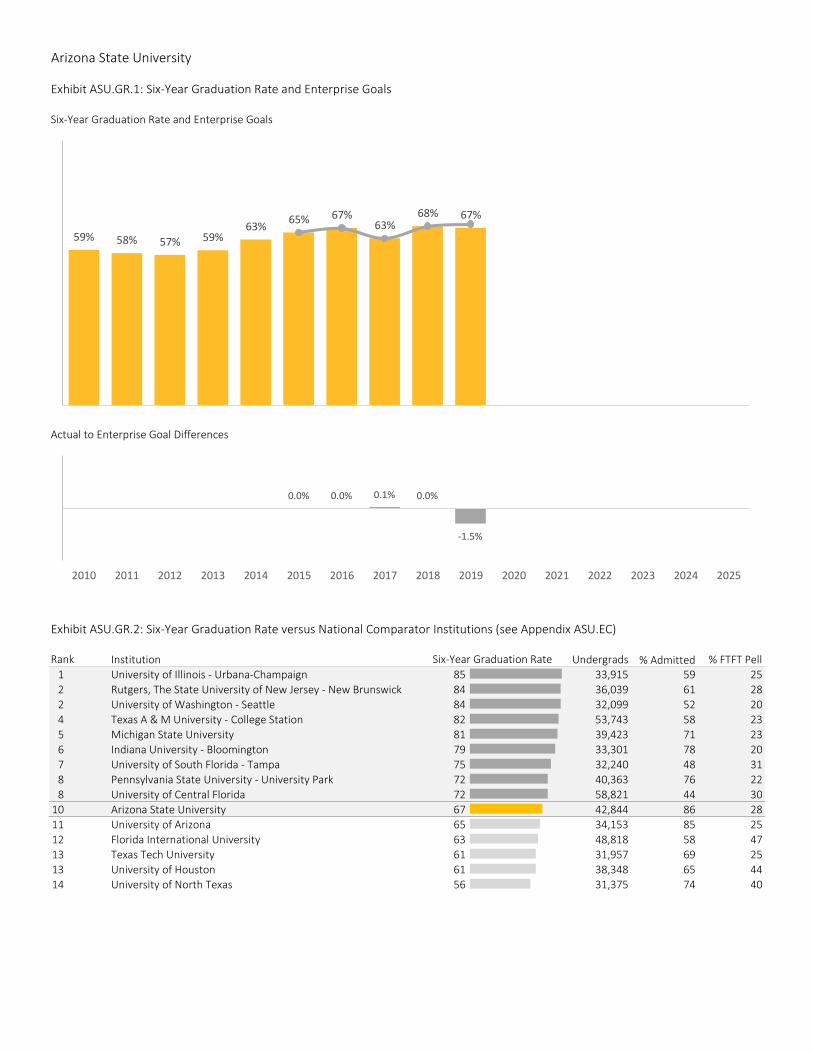
Arizona State University
Exhibit ASU.GR.1: Six-Year Graduation Rate and Enterprise Goals
Six-Year Graduation Rate and Enterprise Goals
Actual to Enterprise Goal Differences
Exhibit ASU.GR.2: Six-Year Graduation Rate versus National Comparator Institutions (see Appendix ASU.EC)
Institution Undergrads % Admitted % FTFT Pell1 University of Illinois - Urbana-Champaign 85 33,915 59 252 Rutgers, The State University of New Jersey - New Brunswick 84 36,039 61 282 University of Washington - Seattle 84 32,099 52 204 Texas A & M University - College Station 82 53,743 58 235 Michigan State University 81 39,423 71 236 Indiana University - Bloomington 79 33,301 78 207 University of South Florida - Tampa 75 32,240 48 318 Pennsylvania State University - University Park 72 40,363 76 228 University of Central Florida 72 58,821 44 30
10 Arizona State University 67 42,844 86 2811 University of Arizona 65 34,153 85 2512 Florida International University 63 48,818 58 4713 Texas Tech University 61 31,957 69 2513 University of Houston 61 38,348 65 4414 University of North Texas 56 31,375 74 40
Rank Six-Year Graduation Rate
59% 58% 57% 59%63% 65% 67%
63%68% 67%
0.0% 0.0% 0.1% 0.0%
-1.5%
2010 2011 2012 2013 2014 2015 2016 2017 2018 2019 2020 2021 2022 2023 2024 2025
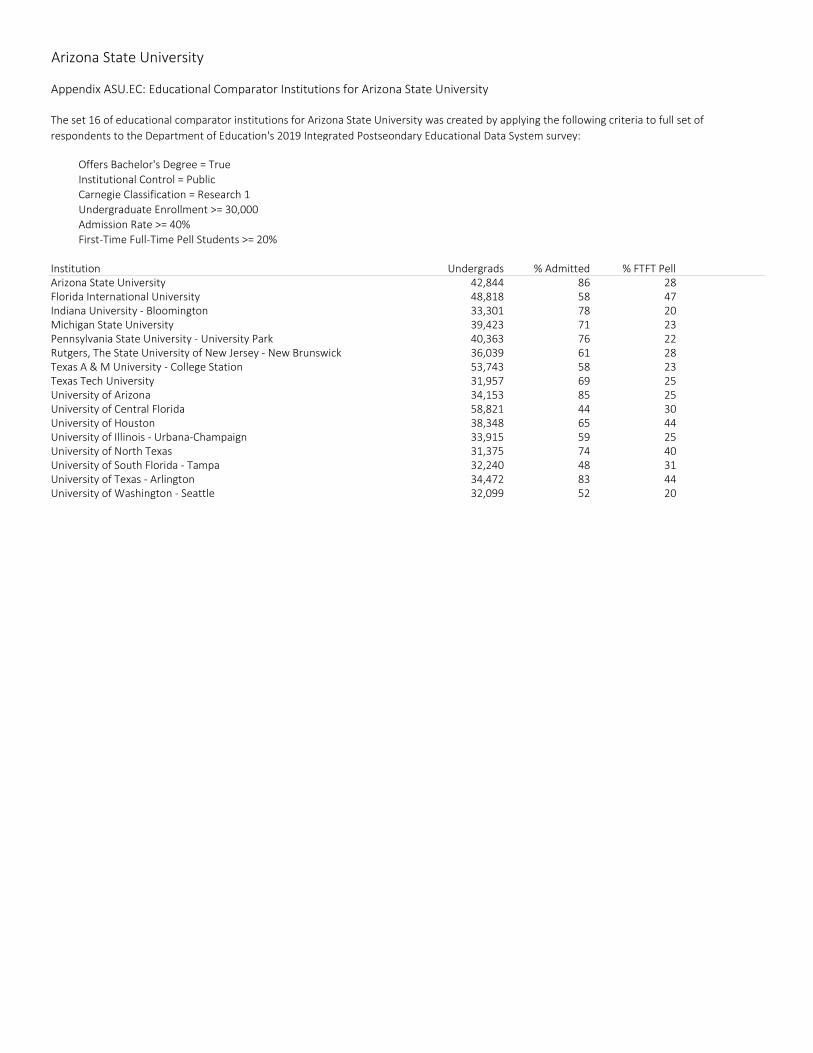
Arizona State University
Appendix ASU.EC: Educational Comparator Institutions for Arizona State University
Offers Bachelor's Degree = TrueInstitutional Control = PublicCarnegie Classification = Research 1Undergraduate Enrollment >= 30,000Admission Rate >= 40%First-Time Full-Time Pell Students >= 20%
Institution Undergrads % Admitted % FTFT PellArizona State University 42,844 86 28Florida International University 48,818 58 47Indiana University - Bloomington 33,301 78 20Michigan State University 39,423 71 23Pennsylvania State University - University Park 40,363 76 22Rutgers, The State University of New Jersey - New Brunswick 36,039 61 28Texas A & M University - College Station 53,743 58 23Texas Tech University 31,957 69 25University of Arizona 34,153 85 25University of Central Florida 58,821 44 30University of Houston 38,348 65 44University of Illinois - Urbana-Champaign 33,915 59 25University of North Texas 31,375 74 40University of South Florida - Tampa 32,240 48 31University of Texas - Arlington 34,472 83 44University of Washington - Seattle 32,099 52 20
The set 16 of educational comparator institutions for Arizona State University was created by applying the following criteria to full set of respondents to the Department of Education's 2019 Integrated Postseondary Educational Data System survey:
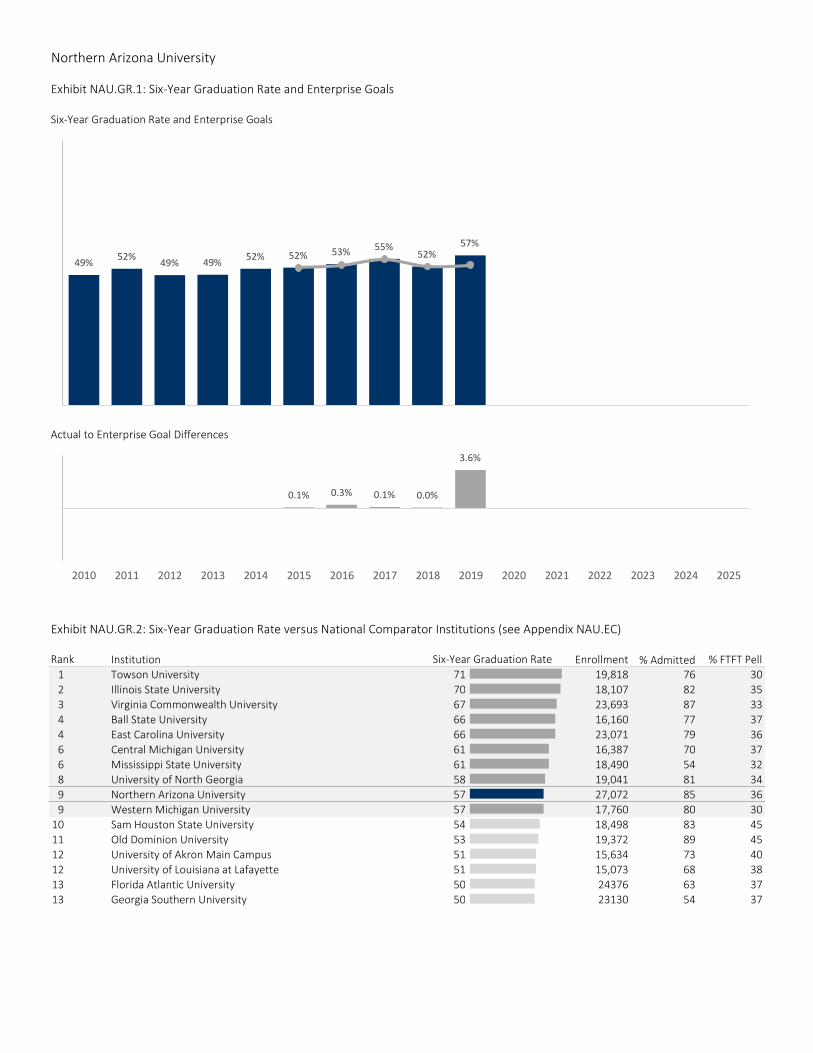
Northern Arizona University
Exhibit NAU.GR.1: Six-Year Graduation Rate and Enterprise Goals
Six-Year Graduation Rate and Enterprise Goals
Actual to Enterprise Goal Differences
Exhibit NAU.GR.2: Six-Year Graduation Rate versus National Comparator Institutions (see Appendix NAU.EC)
Institution Enrollment % Admitted % FTFT Pell1 Towson University 71 19,818 76 302 Illinois State University 70 18,107 82 353 Virginia Commonwealth University 67 23,693 87 334 Ball State University 66 16,160 77 374 East Carolina University 66 23,071 79 366 Central Michigan University 61 16,387 70 376 Mississippi State University 61 18,490 54 328 University of North Georgia 58 19,041 81 349 Northern Arizona University 57 27,072 85 369 Western Michigan University 57 17,760 80 30
10 Sam Houston State University 54 18,498 83 4511 Old Dominion University 53 19,372 89 4512 University of Akron Main Campus 51 15,634 73 4012 University of Louisiana at Lafayette 51 15,073 68 3813 Florida Atlantic University 50 24376 63 3713 Georgia Southern University 50 23130 54 37
Rank Six-Year Graduation Rate
49% 52% 49% 49% 52% 52% 53% 55%52%
57%
0.1% 0.3% 0.1% 0.0%
3.6%
2010 2011 2012 2013 2014 2015 2016 2017 2018 2019 2020 2021 2022 2023 2024 2025
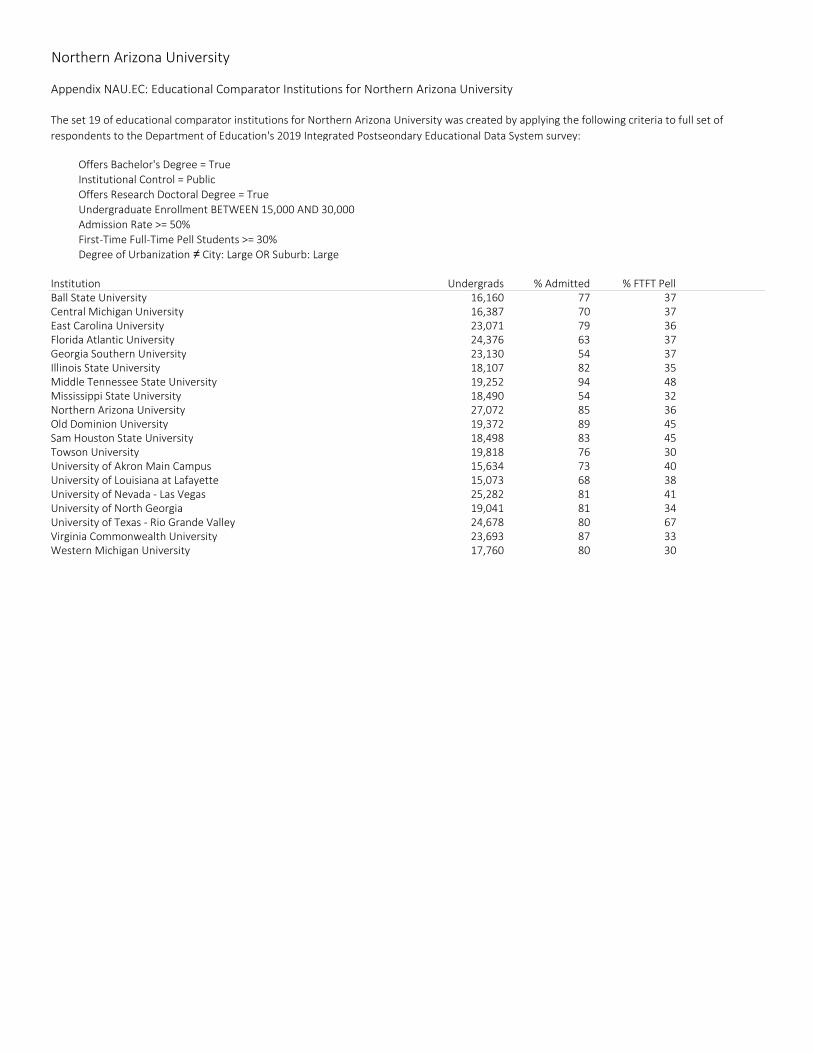
Northern Arizona University
Appendix NAU.EC: Educational Comparator Institutions for Northern Arizona University
Offers Bachelor's Degree = TrueInstitutional Control = PublicOffers Research Doctoral Degree = TrueUndergraduate Enrollment BETWEEN 15,000 AND 30,000Admission Rate >= 50%First-Time Full-Time Pell Students >= 30%Degree of Urbanization ≠ City: Large OR Suburb: Large
Institution Undergrads % Admitted % FTFT PellBall State University 16,160 77 37Central Michigan University 16,387 70 37East Carolina University 23,071 79 36Florida Atlantic University 24,376 63 37Georgia Southern University 23,130 54 37Illinois State University 18,107 82 35Middle Tennessee State University 19,252 94 48Mississippi State University 18,490 54 32Northern Arizona University 27,072 85 36Old Dominion University 19,372 89 45Sam Houston State University 18,498 83 45Towson University 19,818 76 30University of Akron Main Campus 15,634 73 40University of Louisiana at Lafayette 15,073 68 38University of Nevada - Las Vegas 25,282 81 41University of North Georgia 19,041 81 34University of Texas - Rio Grande Valley 24,678 80 67Virginia Commonwealth University 23,693 87 33Western Michigan University 17,760 80 30
The set 19 of educational comparator institutions for Northern Arizona University was created by applying the following criteria to full set of respondents to the Department of Education's 2019 Integrated Postseondary Educational Data System survey:
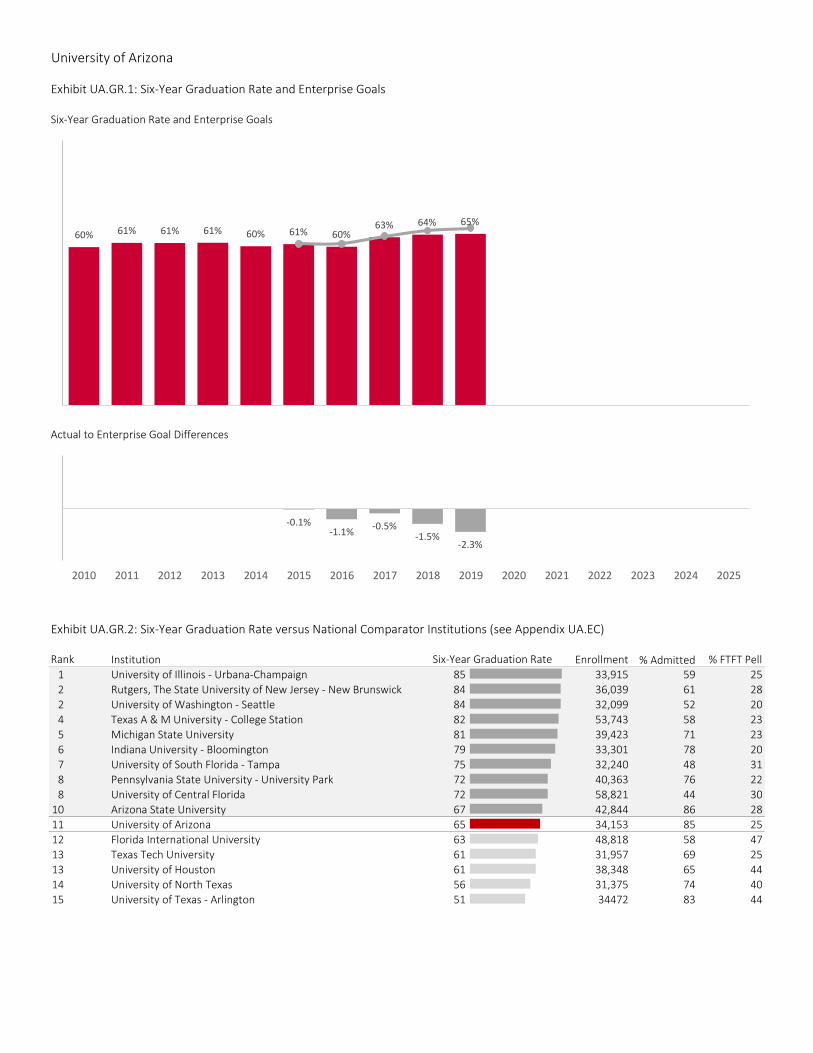
University of Arizona
Exhibit UA.GR.1: Six-Year Graduation Rate and Enterprise Goals
Six-Year Graduation Rate and Enterprise Goals
Actual to Enterprise Goal Differences
Exhibit UA.GR.2: Six-Year Graduation Rate versus National Comparator Institutions (see Appendix UA.EC)
Institution Enrollment % Admitted % FTFT Pell1 University of Illinois - Urbana-Champaign 85 33,915 59 252 Rutgers, The State University of New Jersey - New Brunswick 84 36,039 61 282 University of Washington - Seattle 84 32,099 52 204 Texas A & M University - College Station 82 53,743 58 235 Michigan State University 81 39,423 71 236 Indiana University - Bloomington 79 33,301 78 207 University of South Florida - Tampa 75 32,240 48 318 Pennsylvania State University - University Park 72 40,363 76 228 University of Central Florida 72 58,821 44 30
10 Arizona State University 67 42,844 86 2811 University of Arizona 65 34,153 85 2512 Florida International University 63 48,818 58 4713 Texas Tech University 61 31,957 69 2513 University of Houston 61 38,348 65 4414 University of North Texas 56 31,375 74 4015 University of Texas - Arlington 51 34472 83 44
Rank Six-Year Graduation Rate
60% 61% 61% 61% 60% 61% 60%63% 64% 65%
-0.1%-1.1% -0.5%
-1.5%-2.3%
2010 2011 2012 2013 2014 2015 2016 2017 2018 2019 2020 2021 2022 2023 2024 2025
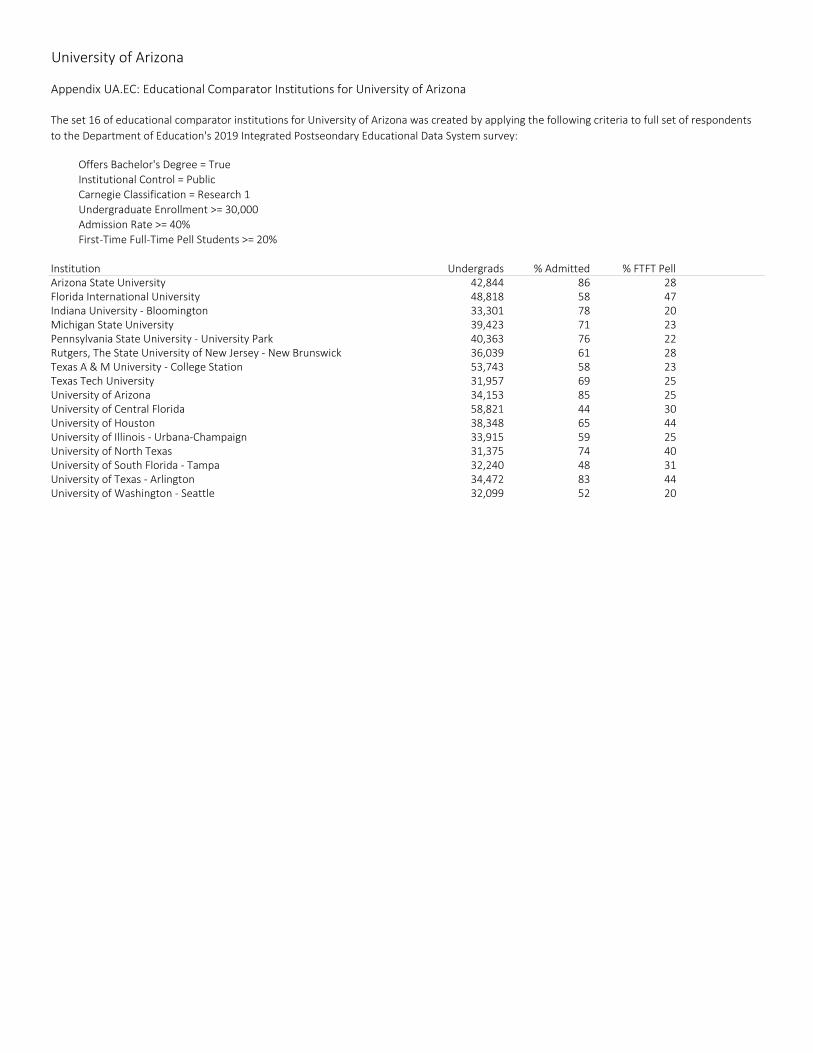
University of Arizona
Appendix UA.EC: Educational Comparator Institutions for University of Arizona
Offers Bachelor's Degree = TrueInstitutional Control = PublicCarnegie Classification = Research 1Undergraduate Enrollment >= 30,000Admission Rate >= 40%First-Time Full-Time Pell Students >= 20%
Institution Undergrads % Admitted % FTFT PellArizona State University 42,844 86 28Florida International University 48,818 58 47Indiana University - Bloomington 33,301 78 20Michigan State University 39,423 71 23Pennsylvania State University - University Park 40,363 76 22Rutgers, The State University of New Jersey - New Brunswick 36,039 61 28Texas A & M University - College Station 53,743 58 23Texas Tech University 31,957 69 25University of Arizona 34,153 85 25University of Central Florida 58,821 44 30University of Houston 38,348 65 44University of Illinois - Urbana-Champaign 33,915 59 25University of North Texas 31,375 74 40University of South Florida - Tampa 32,240 48 31University of Texas - Arlington 34,472 83 44University of Washington - Seattle 32,099 52 20
The set 16 of educational comparator institutions for University of Arizona was created by applying the following criteria to full set of respondents to the Department of Education's 2019 Integrated Postseondary Educational Data System survey:
ABOR Comparator InstitutionsA proposed new approach to benchmarking institutional performance
Helen BaxendaleDirector, Academic Affairs and Policy
November 2020
Background and General Principles
2
• Contextualize performance of ABOR universities on key metrics through comparison to other institutions operating under similar basic conditions
• Move away from a single static universal list towards an objective method for regular comparative analysis on key educational and research metrics
• Take better account of the different contextual factors that influence research and educational performance when identifying comparators
• Adopt a simple and transparent approach that is readily integrated into routine ABOR reporting and relies on publicly available datasets.
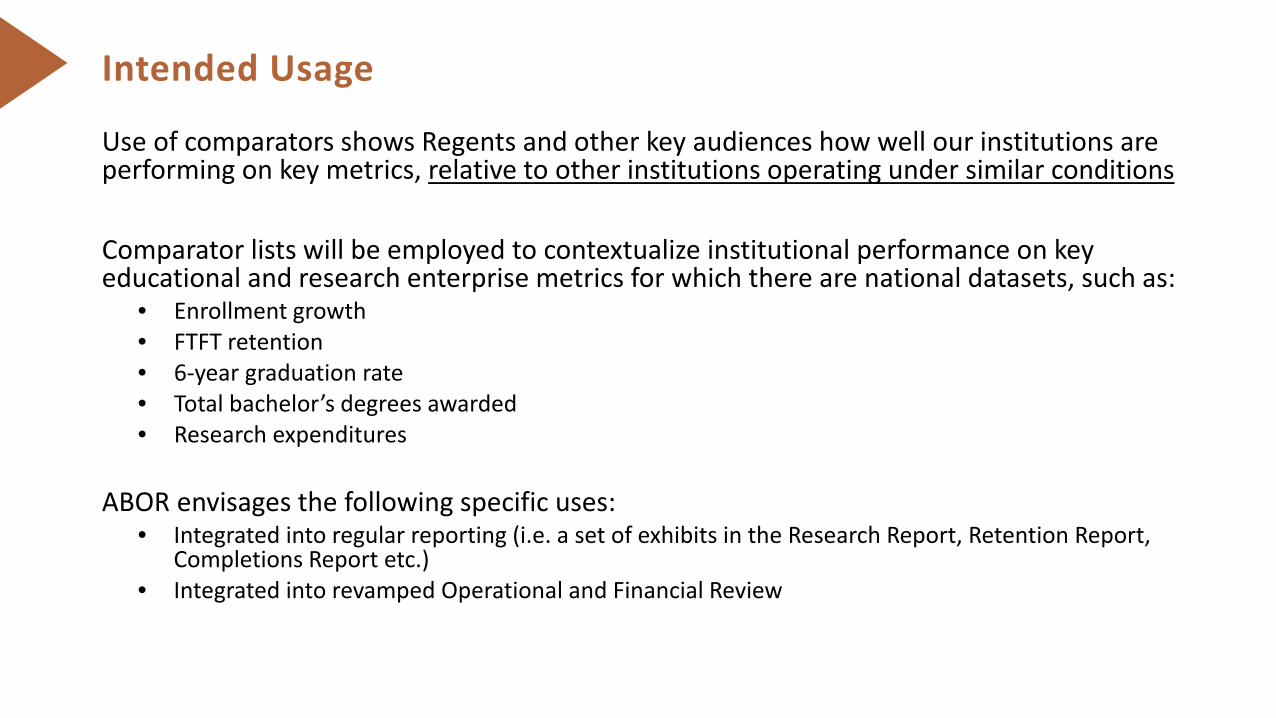
Intended Usage
Use of comparators shows Regents and other key audiences how well our institutions are performing on key metrics, relative to other institutions operating under similar conditions
Comparator lists will be employed to contextualize institutional performance on key educational and research enterprise metrics for which there are national datasets, such as:
• Enrollment growth• FTFT retention• 6-year graduation rate• Total bachelor’s degrees awarded• Research expenditures
ABOR envisages the following specific uses: • Integrated into regular reporting (i.e. a set of exhibits in the Research Report, Retention Report,
Completions Report etc.)• Integrated into revamped Operational and Financial Review
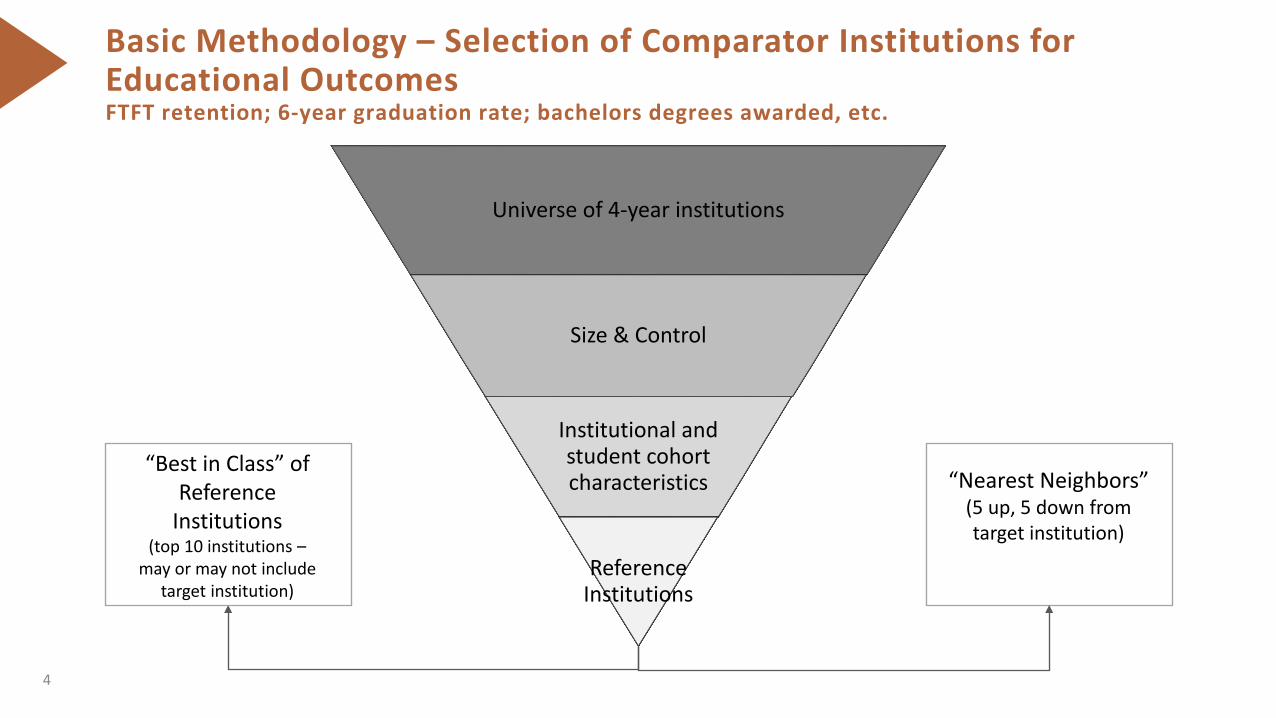
Basic Methodology – Selection of Comparator Institutions for Educational OutcomesFTFT retention; 6-year graduation rate; bachelors degrees awarded, etc.
4
Universe of 4-year institutions
Size & Control
Institutional and student cohort characteristics
Reference Institutions
“Nearest Neighbors”(5 up, 5 down from target institution)
“Best in Class” of Reference
Institutions(top 10 institutions –
may or may not include target institution)
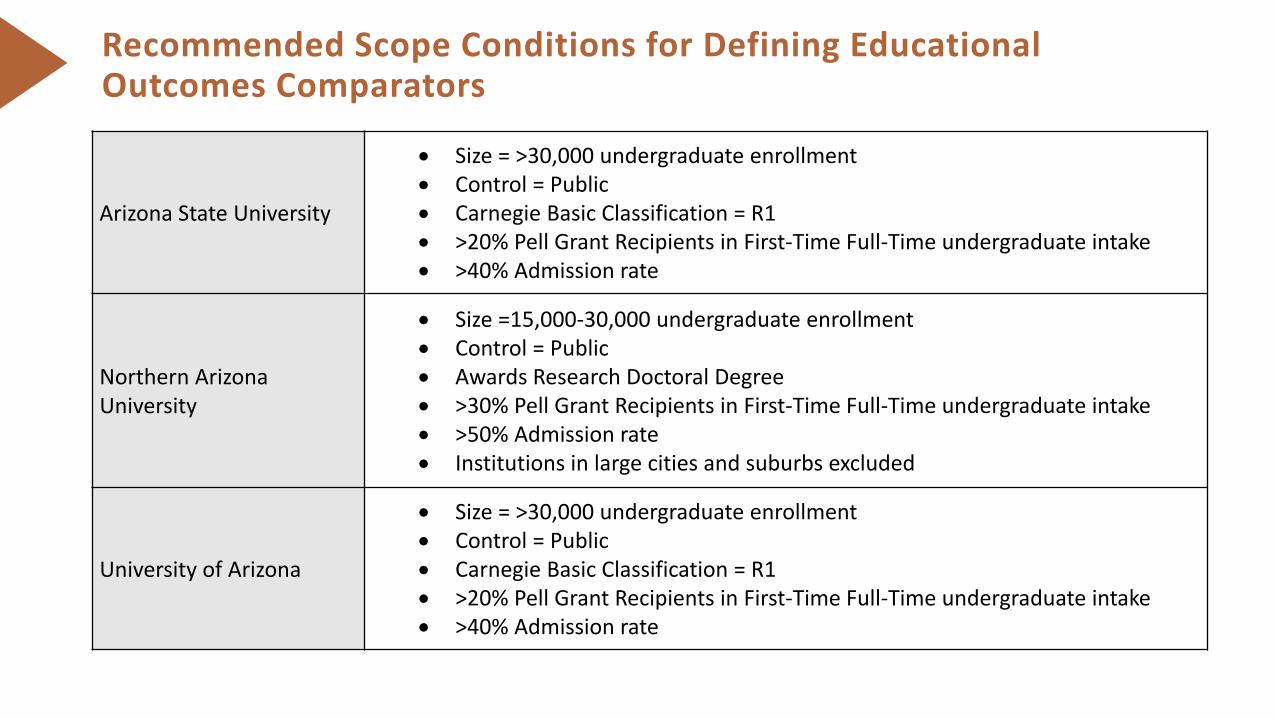
Recommended Scope Conditions for Defining Educational Outcomes Comparators
Arizona State University
• Size = >30,000 undergraduate enrollment• Control = Public • Carnegie Basic Classification = R1• >20% Pell Grant Recipients in First-Time Full-Time undergraduate intake• >40% Admission rate
Northern Arizona University
• Size =15,000-30,000 undergraduate enrollment• Control = Public• Awards Research Doctoral Degree• >30% Pell Grant Recipients in First-Time Full-Time undergraduate intake• >50% Admission rate• Institutions in large cities and suburbs excluded
University of Arizona
• Size = >30,000 undergraduate enrollment• Control = Public • Carnegie Basic Classification = R1 • >20% Pell Grant Recipients in First-Time Full-Time undergraduate intake• >40% Admission rate
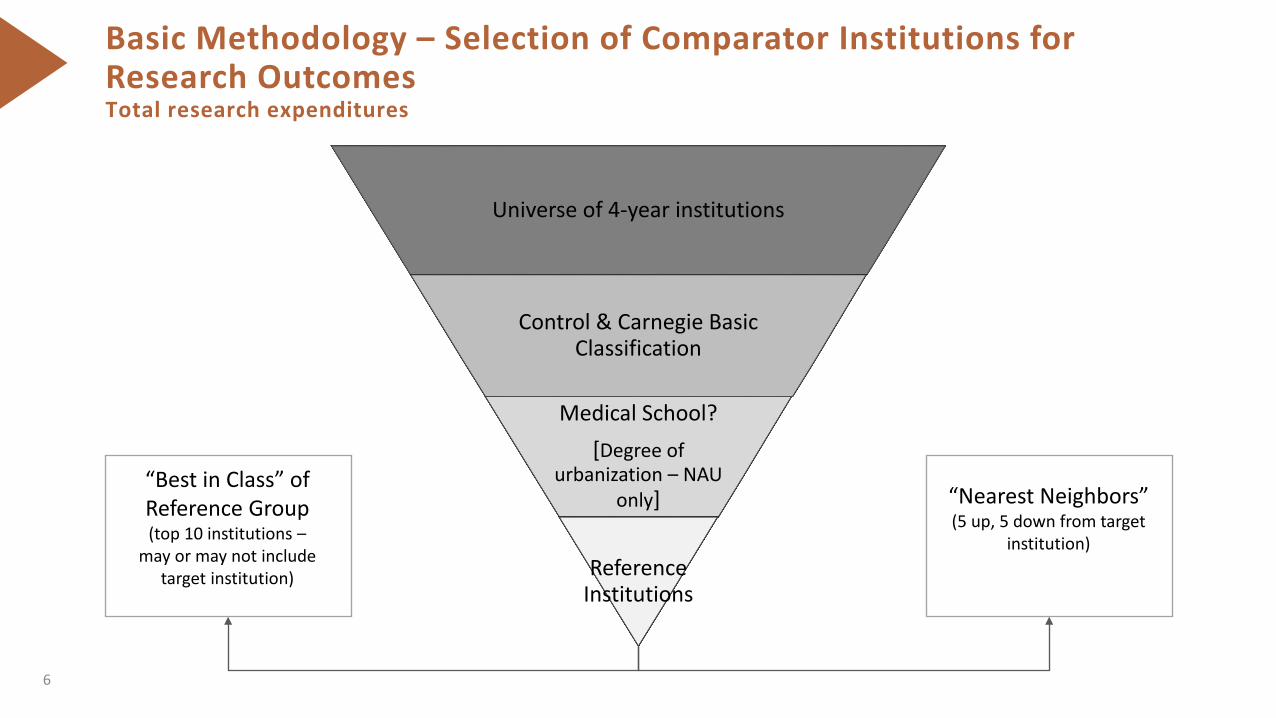
Basic Methodology – Selection of Comparator Institutions for Research OutcomesTotal research expenditures
6
Universe of 4-year institutions
Control & Carnegie Basic Classification
Medical School?[Degree of
urbanization – NAU only]
Reference Institutions
“Nearest Neighbors”(5 up, 5 down from target
institution)
“Best in Class” of Reference Group(top 10 institutions –
may or may not include target institution)
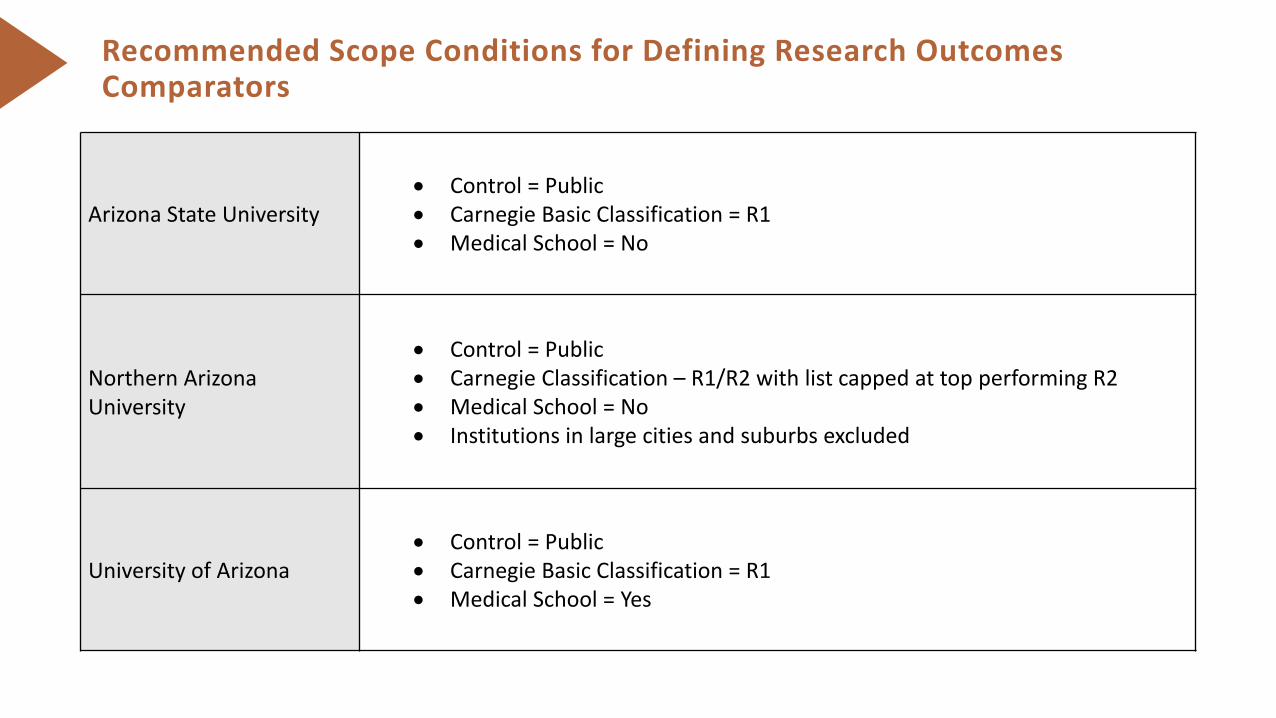
Recommended Scope Conditions for Defining Research Outcomes Comparators
Arizona State University• Control = Public • Carnegie Basic Classification = R1• Medical School = No
Northern Arizona University
• Control = Public• Carnegie Classification – R1/R2 with list capped at top performing R2• Medical School = No• Institutions in large cities and suburbs excluded
University of Arizona• Control = Public • Carnegie Basic Classification = R1 • Medical School = Yes
Outstanding concerns and questions
• Framework applies to traditional immersion student outcomes. Different scope conditions and data required for identifying online education comparators.
• Scope conditions may be over-specified for educational outcomes, resulting in too few reference institutions.
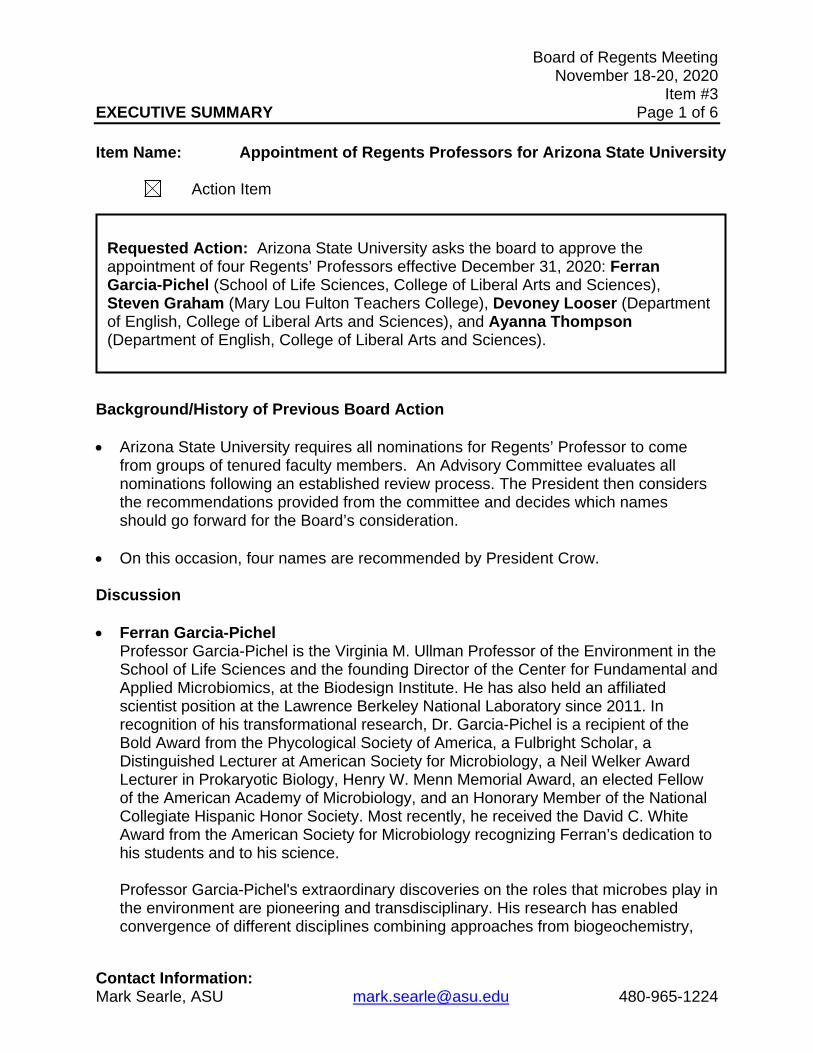
Board of Regents Meeting November 18-20, 2020 Item #3 EXECUTIVE SUMMARY Page 1 of 6
Contact Information: Mark Searle, ASU [email protected] 480-965-1224
Item Name: Appointment of Regents Professors for Arizona State University
Action Item
Background/History of Previous Board Action • Arizona State University requires all nominations for Regents’ Professor to come
from groups of tenured faculty members. An Advisory Committee evaluates all nominations following an established review process. The President then considers the recommendations provided from the committee and decides which names should go forward for the Board’s consideration.
• On this occasion, four names are recommended by President Crow. Discussion • Ferran Garcia-Pichel
Professor Garcia-Pichel is the Virginia M. Ullman Professor of the Environment in the School of Life Sciences and the founding Director of the Center for Fundamental and Applied Microbiomics, at the Biodesign Institute. He has also held an affiliated scientist position at the Lawrence Berkeley National Laboratory since 2011. In recognition of his transformational research, Dr. Garcia-Pichel is a recipient of the Bold Award from the Phycological Society of America, a Fulbright Scholar, a Distinguished Lecturer at American Society for Microbiology, a Neil Welker Award Lecturer in Prokaryotic Biology, Henry W. Menn Memorial Award, an elected Fellow of the American Academy of Microbiology, and an Honorary Member of the National Collegiate Hispanic Honor Society. Most recently, he received the David C. White Award from the American Society for Microbiology recognizing Ferran’s dedication to his students and to his science.
Professor Garcia-Pichel's extraordinary discoveries on the roles that microbes play in the environment are pioneering and transdisciplinary. His research has enabled convergence of different disciplines combining approaches from biogeochemistry,
Requested Action: Arizona State University asks the board to approve the appointment of four Regents’ Professors effective December 31, 2020: Ferran Garcia-Pichel (School of Life Sciences, College of Liberal Arts and Sciences), Steven Graham (Mary Lou Fulton Teachers College), Devoney Looser (Department of English, College of Liberal Arts and Sciences), and Ayanna Thompson (Department of English, College of Liberal Arts and Sciences).
Board of Regents Meeting November 18-20, 2020 Item #3 EXECUTIVE SUMMARY Page 2 of 6
geomicrobiology, and global change biology, thus opening up new frontiers of research. His research provided much of the most important knowledge of microbial ecology including the ecological and genetic diversity of the cyanobacteria, perhaps the most essential bacteria on the planet. His discoveries are shaping our understanding of the deep history of Earth from deserts to oceans. Ecological research is only beginning to come to grips with some of Ferran’s newest discoveries. The breadth of his research is expressed as well by the diversity of funding sources, which range from the NSF, USDA, NASA, and the Department of Defense. Ferran has published more than 170 articles with citations totaling over 14,000. Stunningly, he sustained all of this research, even during his exceptional service as Dean of Natural Sciences, a testament to his commitment to ASU. One reference explains the extraordinary impact of his discoveries thusly: “To him we owe the (1) discovery and identification of many cyanobacterial sunscreens that allow survival in environments of high insolation and stress ... (2) the newly developing field of biological soil crust science, introducing microbiological sciences to this field of study ... (3) the potential roles of microbes which cemented the central role played by photosynthetic microorganisms in the ecology of arid lands. … (4) a translation [of his findings] into conservation, daringly delving into geotechnics. These efforts, important locally in Arizona, recently earned him a recognition from the Arizona governor.” Another external reference provides testimony to his pioneering research. “Ferran’s work has documented the presence and functional importance of pigments which effectively protect cyanobacterial cells from damaging UV radiation. While these discoveries were critically important to understanding the survival and activity of cells at the soil surface, the American Skin Cancer Foundation recognized the importance of this body of work by presenting Ferran the Henry W. Menn Memorial Award.” A third further attests to the pioneering aspect of his research: “In summary, Ferran Garcia-Pichel is a brilliant and creative biogeoscientist with broad interests who, through his scientific discoveries and great talent for investigating interesting environments, has opened up 3 completely different fields of science.” Professor Garcia-Pichel’s pioneering research has explored issues from the origins of life to the functioning of ecosystems under future global change exemplified by his international awards in Microbiological Sciences, Phycology and microbial ecology. His devotion to research, teaching and academic leadership epitomize what the title of Regents’ Professor conveys.
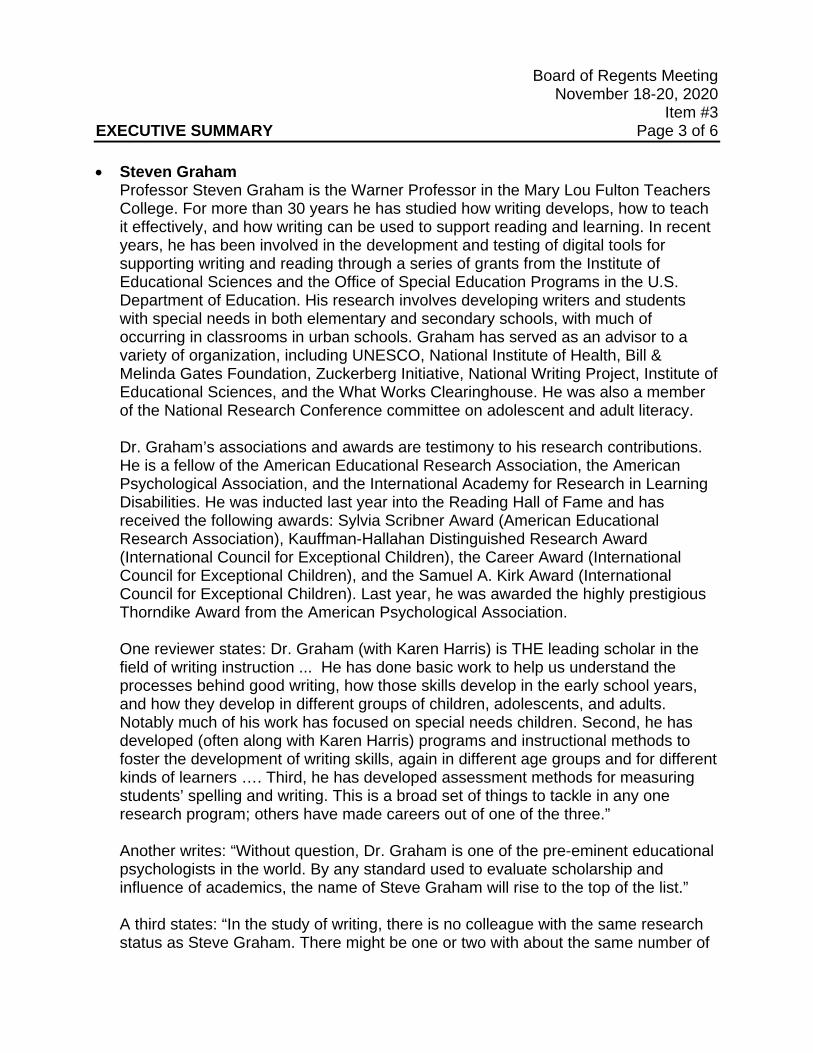
Board of Regents Meeting November 18-20, 2020 Item #3 EXECUTIVE SUMMARY Page 3 of 6
• Steven Graham
Professor Steven Graham is the Warner Professor in the Mary Lou Fulton Teachers College. For more than 30 years he has studied how writing develops, how to teach it effectively, and how writing can be used to support reading and learning. In recent years, he has been involved in the development and testing of digital tools for supporting writing and reading through a series of grants from the Institute of Educational Sciences and the Office of Special Education Programs in the U.S. Department of Education. His research involves developing writers and students with special needs in both elementary and secondary schools, with much of occurring in classrooms in urban schools. Graham has served as an advisor to a variety of organization, including UNESCO, National Institute of Health, Bill & Melinda Gates Foundation, Zuckerberg Initiative, National Writing Project, Institute of Educational Sciences, and the What Works Clearinghouse. He was also a member of the National Research Conference committee on adolescent and adult literacy. Dr. Graham’s associations and awards are testimony to his research contributions. He is a fellow of the American Educational Research Association, the American Psychological Association, and the International Academy for Research in Learning Disabilities. He was inducted last year into the Reading Hall of Fame and has received the following awards: Sylvia Scribner Award (American Educational Research Association), Kauffman-Hallahan Distinguished Research Award (International Council for Exceptional Children), the Career Award (International Council for Exceptional Children), and the Samuel A. Kirk Award (International Council for Exceptional Children). Last year, he was awarded the highly prestigious Thorndike Award from the American Psychological Association. One reviewer states: Dr. Graham (with Karen Harris) is THE leading scholar in the field of writing instruction ... He has done basic work to help us understand the processes behind good writing, how those skills develop in the early school years, and how they develop in different groups of children, adolescents, and adults. Notably much of his work has focused on special needs children. Second, he has developed (often along with Karen Harris) programs and instructional methods to foster the development of writing skills, again in different age groups and for different kinds of learners …. Third, he has developed assessment methods for measuring students’ spelling and writing. This is a broad set of things to tackle in any one research program; others have made careers out of one of the three.” Another writes: “Without question, Dr. Graham is one of the pre-eminent educational psychologists in the world. By any standard used to evaluate scholarship and influence of academics, the name of Steve Graham will rise to the top of the list.”
A third states: “In the study of writing, there is no colleague with the same research status as Steve Graham. There might be one or two with about the same number of
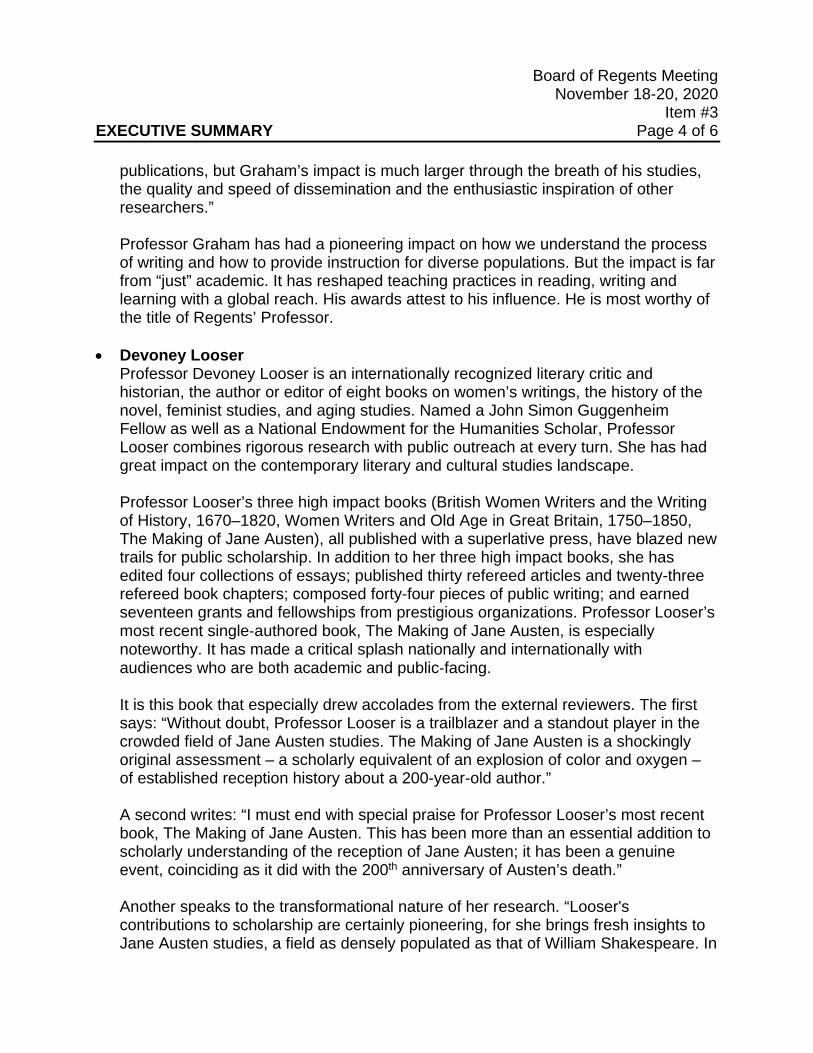
Board of Regents Meeting November 18-20, 2020 Item #3 EXECUTIVE SUMMARY Page 4 of 6
publications, but Graham’s impact is much larger through the breath of his studies, the quality and speed of dissemination and the enthusiastic inspiration of other researchers.” Professor Graham has had a pioneering impact on how we understand the process of writing and how to provide instruction for diverse populations. But the impact is far from “just” academic. It has reshaped teaching practices in reading, writing and learning with a global reach. His awards attest to his influence. He is most worthy of the title of Regents’ Professor.
• Devoney Looser Professor Devoney Looser is an internationally recognized literary critic and historian, the author or editor of eight books on women’s writings, the history of the novel, feminist studies, and aging studies. Named a John Simon Guggenheim Fellow as well as a National Endowment for the Humanities Scholar, Professor Looser combines rigorous research with public outreach at every turn. She has had great impact on the contemporary literary and cultural studies landscape. Professor Looser’s three high impact books (British Women Writers and the Writing of History, 1670–1820, Women Writers and Old Age in Great Britain, 1750–1850, The Making of Jane Austen), all published with a superlative press, have blazed new trails for public scholarship. In addition to her three high impact books, she has edited four collections of essays; published thirty refereed articles and twenty-three refereed book chapters; composed forty-four pieces of public writing; and earned seventeen grants and fellowships from prestigious organizations. Professor Looser’s most recent single‐authored book, The Making of Jane Austen, is especially noteworthy. It has made a critical splash nationally and internationally with audiences who are both academic and public‐facing.
It is this book that especially drew accolades from the external reviewers. The first says: “Without doubt, Professor Looser is a trailblazer and a standout player in the crowded field of Jane Austen studies. The Making of Jane Austen is a shockingly original assessment – a scholarly equivalent of an explosion of color and oxygen – of established reception history about a 200-year-old author.” A second writes: “I must end with special praise for Professor Looser’s most recent book, The Making of Jane Austen. This has been more than an essential addition to scholarly understanding of the reception of Jane Austen; it has been a genuine event, coinciding as it did with the 200th anniversary of Austen’s death.” Another speaks to the transformational nature of her research. “Looser's contributions to scholarship are certainly pioneering, for she brings fresh insights to Jane Austen studies, a field as densely populated as that of William Shakespeare. In
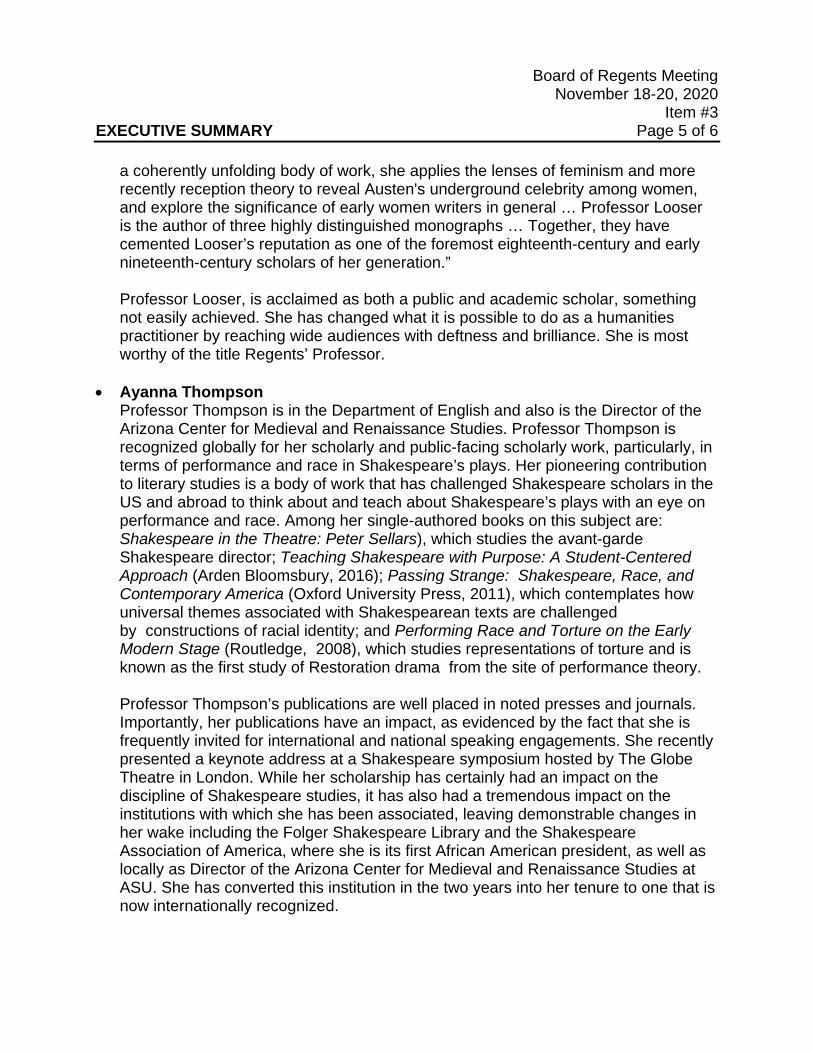
Board of Regents Meeting November 18-20, 2020 Item #3 EXECUTIVE SUMMARY Page 5 of 6
a coherently unfolding body of work, she applies the lenses of feminism and more recently reception theory to reveal Austen's underground celebrity among women, and explore the significance of early women writers in general … Professor Looser is the author of three highly distinguished monographs … Together, they have cemented Looser’s reputation as one of the foremost eighteenth-century and early nineteenth-century scholars of her generation.” Professor Looser, is acclaimed as both a public and academic scholar, something not easily achieved. She has changed what it is possible to do as a humanities practitioner by reaching wide audiences with deftness and brilliance. She is most worthy of the title Regents’ Professor.
• Ayanna Thompson Professor Thompson is in the Department of English and also is the Director of the Arizona Center for Medieval and Renaissance Studies. Professor Thompson is recognized globally for her scholarly and public-facing scholarly work, particularly, in terms of performance and race in Shakespeare’s plays. Her pioneering contribution to literary studies is a body of work that has challenged Shakespeare scholars in the US and abroad to think about and teach about Shakespeare’s plays with an eye on performance and race. Among her single-authored books on this subject are: Shakespeare in the Theatre: Peter Sellars), which studies the avant-garde Shakespeare director; Teaching Shakespeare with Purpose: A Student-Centered Approach (Arden Bloomsbury, 2016); Passing Strange: Shakespeare, Race, and Contemporary America (Oxford University Press, 2011), which contemplates how universal themes associated with Shakespearean texts are challenged by constructions of racial identity; and Performing Race and Torture on the Early Modern Stage (Routledge, 2008), which studies representations of torture and is known as the first study of Restoration drama from the site of performance theory. Professor Thompson’s publications are well placed in noted presses and journals. Importantly, her publications have an impact, as evidenced by the fact that she is frequently invited for international and national speaking engagements. She recently presented a keynote address at a Shakespeare symposium hosted by The Globe Theatre in London. While her scholarship has certainly had an impact on the discipline of Shakespeare studies, it has also had a tremendous impact on the institutions with which she has been associated, leaving demonstrable changes in her wake including the Folger Shakespeare Library and the Shakespeare Association of America, where she is its first African American president, as well as locally as Director of the Arizona Center for Medieval and Renaissance Studies at ASU. She has converted this institution in the two years into her tenure to one that is now internationally recognized.
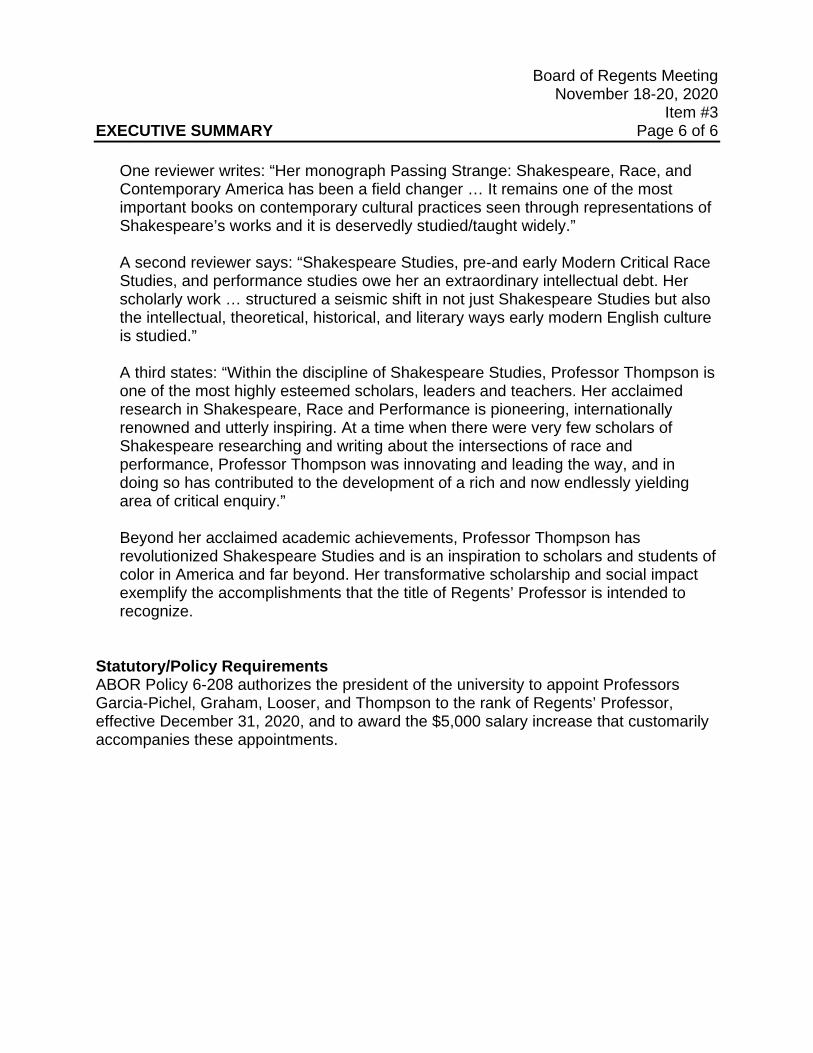
Board of Regents Meeting November 18-20, 2020 Item #3 EXECUTIVE SUMMARY Page 6 of 6
One reviewer writes: “Her monograph Passing Strange: Shakespeare, Race, and Contemporary America has been a field changer … It remains one of the most important books on contemporary cultural practices seen through representations of Shakespeare’s works and it is deservedly studied/taught widely.” A second reviewer says: “Shakespeare Studies, pre-and early Modern Critical Race Studies, and performance studies owe her an extraordinary intellectual debt. Her scholarly work … structured a seismic shift in not just Shakespeare Studies but also the intellectual, theoretical, historical, and literary ways early modern English culture is studied.” A third states: “Within the discipline of Shakespeare Studies, Professor Thompson is one of the most highly esteemed scholars, leaders and teachers. Her acclaimed research in Shakespeare, Race and Performance is pioneering, internationally renowned and utterly inspiring. At a time when there were very few scholars of Shakespeare researching and writing about the intersections of race and performance, Professor Thompson was innovating and leading the way, and in doing so has contributed to the development of a rich and now endlessly yielding area of critical enquiry.” Beyond her acclaimed academic achievements, Professor Thompson has revolutionized Shakespeare Studies and is an inspiration to scholars and students of color in America and far beyond. Her transformative scholarship and social impact exemplify the accomplishments that the title of Regents’ Professor is intended to recognize.
Statutory/Policy Requirements ABOR Policy 6-208 authorizes the president of the university to appoint Professors Garcia-Pichel, Graham, Looser, and Thompson to the rank of Regents’ Professor, effective December 31, 2020, and to award the $5,000 salary increase that customarily accompanies these appointments.
Board of Regents Meeting November 18-20, 2020
Item #4 EXECUTIVE SUMMARY Page 1 of 1
Contact Information: Brittney Kaufmann, ABOR [email protected] 602-229-2509
Item Name: Discussion and Consideration of Legislation Affecting the University Enterprise
Action Item
Discussion There are no written materials provided at this time for this item.
Requested Action: The board office asks the board to discuss and consider legislation affecting the university system and may possibly approve positions regarding the legislation.

This page intentionally left blank
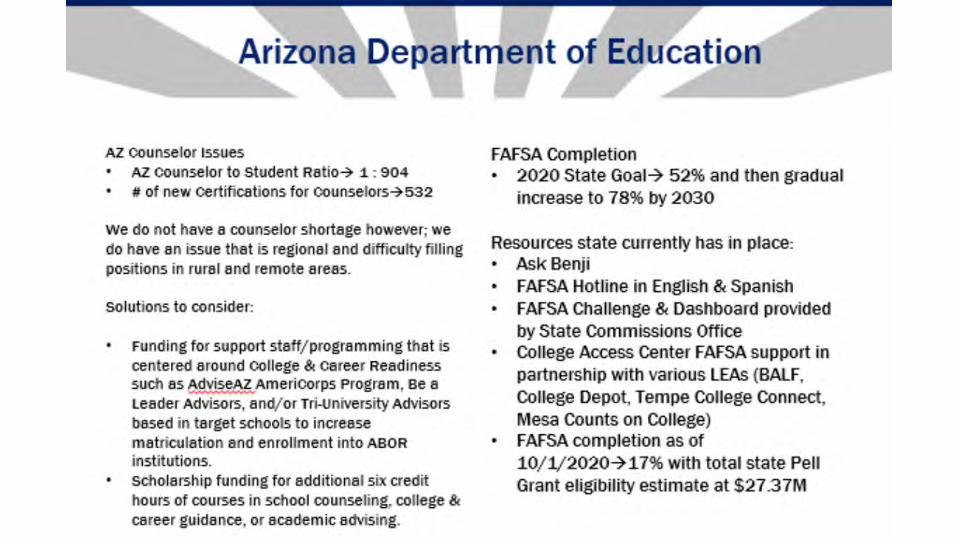
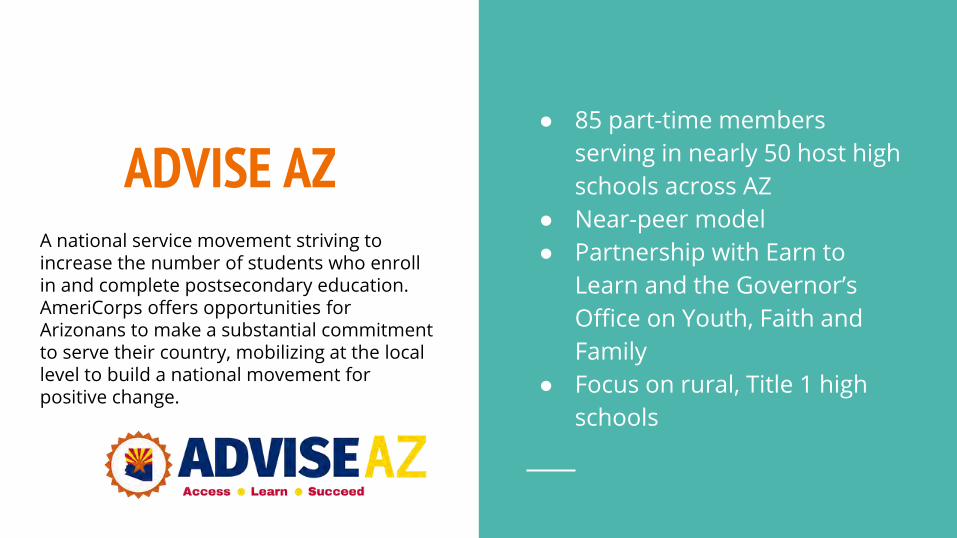
ADVISE AZ A national service movement striving to increase the number of students who enroll in and complete postsecondary education. AmeriCorps offers opportunities for Arizonans to make a substantial commitment to serve their country, mobilizing at the local level to build a national movement for positive change.
● 85 part-time members
serving in nearly 50 host high
schools across AZ
● Near-peer model
● Partnership with Earn to
Learn and the Governor’s
Office on Youth, Faith and
Family
● Focus on rural, Title 1 high
schools
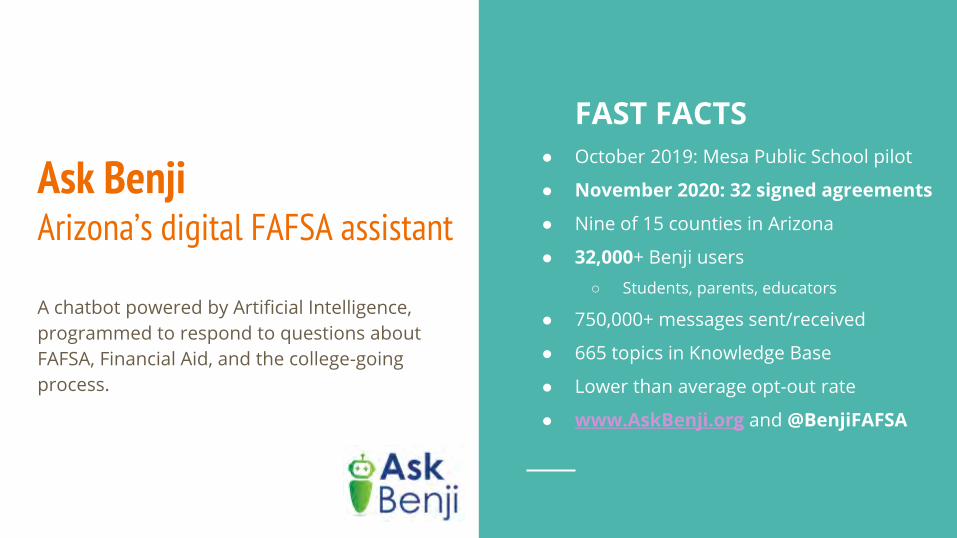
Ask BenjiArizona’s digital FAFSA assistant
FAST FACTS
● October 2019: Mesa Public School pilot
● November 2020: 32 signed agreements
● Nine of 15 counties in Arizona
● 32,000+ Benji users
○ Students, parents, educators
● 750,000+ messages sent/received
● 665 topics in Knowledge Base
● Lower than average opt-out rate
● www.AskBenji.org and @BenjiFAFSA
A chatbot powered by Artificial Intelligence,
programmed to respond to questions about
FAFSA, Financial Aid, and the college-going
process.
Questions?
Amanda [email protected]
Andrea [email protected]
Roxanne [email protected]
Heidi [email protected]
Board of Regents Meeting November 18-20, 2020
Item #5 EXECUTIVE SUMMARY Page 1 of 1
Contact Information: Chad Sampson, ABOR [email protected] 602-229-2512
Item Name: Approval of the Northern Arizona University Presidential Leadership Characteristics
Action Item
Background/History of Previous Board Action The board is conducting a search for the next president for Northern Arizona University. As part of the search the board adopts Leadership Characteristics to guide the presidential search process. The leadership characteristics attached below are categorized among five performance areas – leadership, strategy, people management, operating metrics, and relationships with external constituencies but their order does not imply priority. Committee Review and Recommendation The Northern Arizona University Presidential Search Advisory Committee reviewed the Leadership Characteristics at its meetings held on October 16, 2020 and November 3, 2020.
Requested Action: The board office asks the board to approve the Northern Arizona University President Leadership Characteristics.

This page intentionally left blank
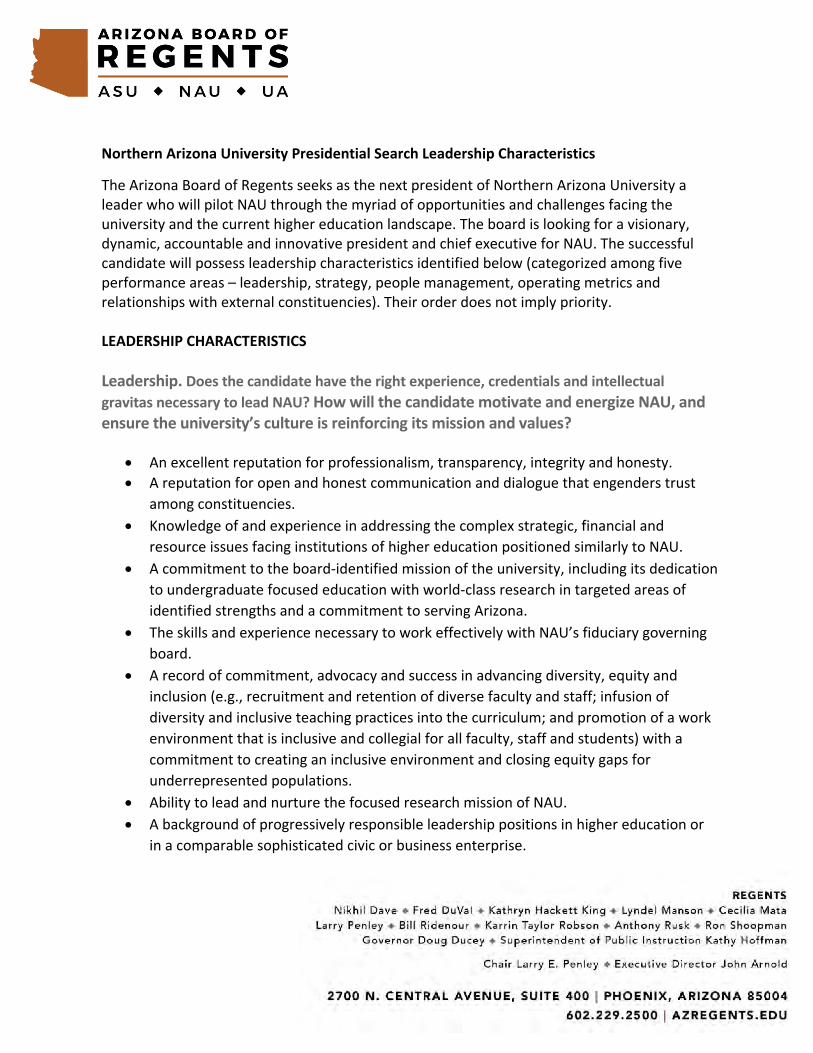
Northern Arizona University Presidential Search Leadership Characteristics
The Arizona Board of Regents seeks as the next president of Northern Arizona University a leader who will pilot NAU through the myriad of opportunities and challenges facing the university and the current higher education landscape. The board is looking for a visionary, dynamic, accountable and innovative president and chief executive for NAU. The successful candidate will possess leadership characteristics identified below (categorized among five performance areas – leadership, strategy, people management, operating metrics and relationships with external constituencies). Their order does not imply priority. LEADERSHIP CHARACTERISTICS Leadership. Does the candidate have the right experience, credentials and intellectual gravitas necessary to lead NAU? How will the candidate motivate and energize NAU, and ensure the university’s culture is reinforcing its mission and values?
• An excellent reputation for professionalism, transparency, integrity and honesty. • A reputation for open and honest communication and dialogue that engenders trust
among constituencies. • Knowledge of and experience in addressing the complex strategic, financial and
resource issues facing institutions of higher education positioned similarly to NAU. • A commitment to the board-identified mission of the university, including its dedication
to undergraduate focused education with world-class research in targeted areas of identified strengths and a commitment to serving Arizona.
• The skills and experience necessary to work effectively with NAU’s fiduciary governing board.
• A record of commitment, advocacy and success in advancing diversity, equity and inclusion (e.g., recruitment and retention of diverse faculty and staff; infusion of diversity and inclusive teaching practices into the curriculum; and promotion of a work environment that is inclusive and collegial for all faculty, staff and students) with a commitment to creating an inclusive environment and closing equity gaps for underrepresented populations.
• Ability to lead and nurture the focused research mission of NAU. • A background of progressively responsible leadership positions in higher education or
in a comparable sophisticated civic or business enterprise.
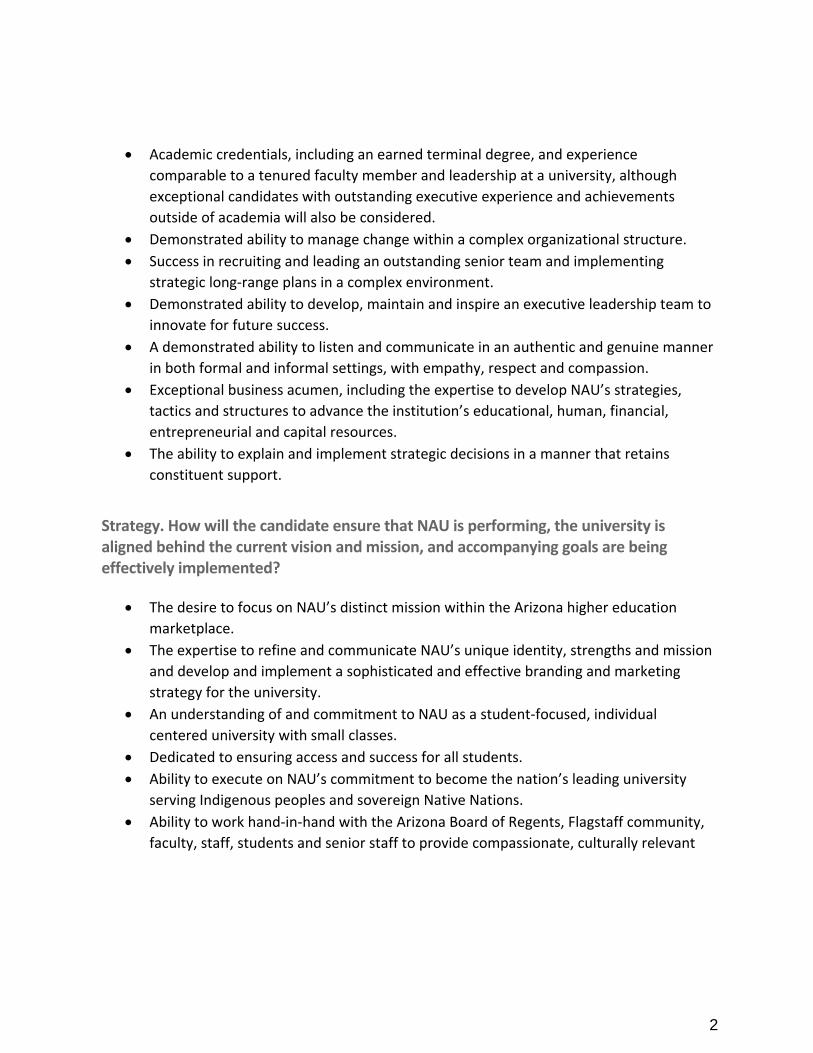
2
• Academic credentials, including an earned terminal degree, and experience comparable to a tenured faculty member and leadership at a university, although exceptional candidates with outstanding executive experience and achievements outside of academia will also be considered.
• Demonstrated ability to manage change within a complex organizational structure. • Success in recruiting and leading an outstanding senior team and implementing
strategic long-range plans in a complex environment. • Demonstrated ability to develop, maintain and inspire an executive leadership team to
innovate for future success. • A demonstrated ability to listen and communicate in an authentic and genuine manner
in both formal and informal settings, with empathy, respect and compassion. • Exceptional business acumen, including the expertise to develop NAU’s strategies,
tactics and structures to advance the institution’s educational, human, financial, entrepreneurial and capital resources.
• The ability to explain and implement strategic decisions in a manner that retains constituent support.
Strategy. How will the candidate ensure that NAU is performing, the university is aligned behind the current vision and mission, and accompanying goals are being effectively implemented?
• The desire to focus on NAU’s distinct mission within the Arizona higher education marketplace.
• The expertise to refine and communicate NAU’s unique identity, strengths and mission and develop and implement a sophisticated and effective branding and marketing strategy for the university.
• An understanding of and commitment to NAU as a student-focused, individual centered university with small classes.
• Dedicated to ensuring access and success for all students. • Ability to execute on NAU’s commitment to become the nation’s leading university
serving Indigenous peoples and sovereign Native Nations. • Ability to work hand-in-hand with the Arizona Board of Regents, Flagstaff community,
faculty, staff, students and senior staff to provide compassionate, culturally relevant

3
and competent leadership and guidance around diversity, equity and inclusion initiatives.
• A desire to act as a bridge builder within the broader NAU community and ability to nurture a vibrant and healthy community where all people feel welcomed and valued.
• A record of embracing a teacher-scholar model across all disciplines while supporting rigorous and groundbreaking research that drives economic, health, and environmental policy and practice.
• The ability to recognize, build upon and communicate NAU’s strengths and a demonstrated commitment to the teaching mission of NAU.
• The ability to develop and implement a strategy strengthening NAU’s statewide offerings and distributed learning centers.
• Ability to strengthen NAU’s commitment to Northern and rural Arizona. • Demonstrated ability to foster collaboration on campus toward interdisciplinary work. • Experience in supporting online learning at the undergraduate and graduate levels.
People management. Will the candidate put the right people in the right positions and providing them the support they need to achieve the mission and vision and metric goals?
• The ability to recognize and develop talent and appropriately delegate responsibility and authority.
• The interpersonal and collaboration skills necessary to cultivate and strengthen relationships with multiple stakeholders, including students, faculty, staff, the Flagstaff community, policymakers, alumni, affiliates and business partners to support the mission of the university and the Arizona public university enterprise.
• The demonstrated ability to instill enthusiasm and support from others for a shared vision for the university.
• The ability to retain, recruit and develop world-class teacher scholars, student-centered support staff and students that represent the diversity of our state and nation.
• A commitment to academic values and respect for the role of faculty and the principles of shared governance as provided in Arizona law.
• A deep understanding of and passion for the work of inclusion and diversity; a willingness to be a leader, ambassador and catalyst for change in a complex and dynamic environment, respecting all constituent groups using current and proven best practices for efficient and successful results; and knowledge of current diversity issues
4
with a clear understanding of the importance of an inclusive and diverse environment in a comprehensive university or similar setting.
• The skills necessary to be an effective and collaborative member of the system’s executive management team comprised of the board’s executive director and other university presidents in a collective enterprise executive committee providing leadership to achieve enterprise goals.
Operating metrics. How will the candidate ensure performance, productivity, asset utilization, quality and constituent satisfaction?
• The ability to successfully achieve system-wide and university specific performance metrics.
• The ability to drive the university’s success in multiple statewide, national and international markets.
• An ability to execute against the board’s vision for an outstanding student-centered, access-oriented comprehensive university in today’s changing higher education ecosystem.
• Promotes students’ individual growth, discovery and success so they can contribute to society and meet the needs of employers today and in the future.
• Eager to expand and diversify funding sources while remaining mission focused.
Relationships with external constituencies. How well will the candidate engage with NAU’s various outside constituencies, including alumni, donors, policymakers and other stakeholders?
• Recognition of NAU’s distinctive role in and importance to the state, Flagstaff and other Northern Arizona communities, and a commitment to continue and expand the university’s leadership mission in addressing community and statewide issues.
• Ability to develop and augment NAU’s strong relationship and partnerships with Arizona’s Indigenous peoples and sovereign Native Nations.
• Ability to develop and augment partnerships with community colleges, tribal colleges and K-12 schools to enhance student access and success.
• An exceptional ability to represent university and enterprise interests at the Arizona Legislature.
5
• Demonstrate a commitment to working with policymakers at local, state and national levels.
• A record of success in generating significant financial support from both the public and private sectors.
• Dynamic fundraiser, who understands the power of engaging donors and partners, and has a strong desire to participate in philanthropic efforts.
• Politically astute, strategic communicator with proven ability to rapidly inspire trust and build strong, collaborative relationships with key constituents including local, state and national leaders, citizens, faculty and administrators, students, parents, alumni, other university leaders and the media.

This page intentionally left blank

Board of Regents Meeting November 18-20, 2020
Item #6 EXECUTIVE SUMMARY Page 1 of 2
Contact Information: John Arnold, ABOR [email protected] 602-229-2505
Item Name: Arizona Innovation Alliance
Action Item
Background/History of Previous Board Action The Arizona Innovation Alliance (AIA) will be a partnership among the three Arizona public universities that will seek to enhance the performance of higher education in Arizona in the arenas of student success, technology solutions, general cost effectiveness, and best practices for resource allocation through sharing of innovative practices and cooperative development and deployment of support structures. The AIA will be modeled on the University Innovation Alliance, a coalition of 11 universities including ASU. President Crow will initially lead the effort and each university will commit resources including university liaisons and fellows to implement the work at the university level. Discussion Initial AIA work will focus on three areas. 1. Improving overall student success (retention, graduation, academic performance)
with particular attention on traditionally under-served populations
Specific goals for student success:
• Improve first year retention, four-year graduation, and six-year graduation rates in line with ABOR-established metrics.
• Increase the number of Pell-eligible students enrolled and graduating. • Enroll entering resident undergraduate cohorts (freshman and transfer)
which reflect the income and ethnic diversity of the overall population of high school graduates in Arizona.
Requested Action: The presidents will discuss the establishment of the Arizona Innovation Alliance.
Board of Regents Meeting November 18-20, 2020
Item #6 EXECUTIVE SUMMARY Page 2 of 2 2. Deploying educational practices and programs which combine high standards of
student outcomes with cost effective teaching and student support.
Specific goals for cost effectiveness:
• Develop a mix of program design and delivery methods (face-to-face, online, hybrid, technology-enhanced, etc.) that best meet the needs of each institution’s goals.
• Design and deploy technology-based solutions and innovative structures
in all aspects of the education, student support, and administrative services.
• Create innovative partnerships among the three universities, with other
universities, and with the private sector where greater effectiveness or cost advantages can be gained.
3. Optimizing resource allocation between the proportion of student tuition and state
appropriations available for the delivery of educational programs and the funding needed to assure accessibility and affordability.
Specific goals for resource allocation:
• Through innovations in program design and service delivery, limit the
resource requirement from resident undergraduate tuition rate while achieving the student success goals.
• Collaborate on innovative approaches to financial aid that support access,
educational goals, and optimal use of resources.
Board of Regents Meeting November 18-20, 2020
Item #7 EXECUTIVE SUMMARY Page 1 of 2
Contact Information: John Arnold, ABOR [email protected] 602-229-2505
Item Name: Proposed Allocation of TRIF Revenues that Exceed the FY 2020 TRIF Budget
Action Item
Background/History of Previous Board Action In FY 2020, TRIF revenues out performed the existing TRIF budget by $8.2 million. Traditionally, minor variations to the TRIF budget are allocated to the three universities using a 2/2/1 pattern. This year, the overage was significant enough, staff is asking the board to consider a specific budget. Below are proposals for a portion of the funds. The balance will be discussed at a later time. Discussion The proposed budget consists of the following: PBC $450,000
Board Initiatives General Education Assessment $400,000
Attainment Study $200,000 Workforce Study $100,000
Innovation Alliance $700,000
Total $1,850,000
• Phoenix Biomedical Campus: The amount would provide a start-up budget for
the new Executive Director position. ASU is currently serving as the fiduciary for this position, therefore the funds will be distributed to ASU, but will also provide financial relief to NAU and UA who contribute to the maintenance of PBC.
• General Education Assessment: The Regents have an expectation that
learning outcomes in each core general education competency/knowledge area must be assessed at least once every 4 years. A tri-institutional workgroup is
Requested Action: The board office asks the board to approve the proposed allocation of TRIF revenues that exceeded the FY 2020 TRIF budget.
Board of Regents Meeting Date
Item # EXECUTIVE SUMMARY Page 2 of 2
currently developing an assessment regime of the four core competencies/areas of:
• Written Communication; • Quantitative Reasoning; • Critical Thinking; and • Civic Knowledge.
TRIF revenues will support the tri-university workgroups efforts in developing these general education assessments to ensure that Arizona public university graduates have the skills and competency needed to lead in Arizona 21st century economy and the high-tech industries located in Arizona.
• Attainment Study: The board office will work with the universities to design and
complete a methodologically robust survey of Arizona’s educational pipeline to identify barriers to attainment and inform the development of strategies to improve academic attainment.
• Workforce Study: The board office has worked with local business organizations to develop a workforce study that will consider the impacts of educational attainment on Arizona’s economy and forecast workforce needs for the next 20 years.
• Arizona Innovation Alliance: Funds will support a partnership among the three public universities that will seek to enhance the performance of higher education in Arizona in the arenas of student success, technology solutions, general cost effectiveness, and best practices through the sharing of innovative practices and cooperative development and deployment of support structures. Consistent with TRIF requirements, the AIA will focus efforts on improving student success, financial aid programs, and educational delivery methods.
Statutory/Policy Requirements ARS §15-1648 (C)(1) allows the board to award TRIF dollars to individual universities for various purposes including academic or research activities, expanding access for students, improving student success, etc.
Board of Regents Meeting November 18-20, 2020
Item #8 EXECUTIVE SUMMARY Page 1 of 2
Contact Information: Jennifer Pollock, ABOR [email protected] 602-229-2546
Item Name: Ratification of Authorization to Initiate Litigation Against the Department of Labor’s New Interim Rule on Prevailing Wage and Against the Department of Homeland Security’s new Rule Narrowing Eligibility for H1B Visas (ASU, NAU, UArizona)
Action Item
Background/History of Previous Board Action On October 8, 2020, the DOL promulgated and implemented an interim rule, without comment, that set new levels for determining wages for H1B visas and PERM applications (permanent residency applications based on labor certification). The new salary levels would require significant salary increases when hiring new employees and when retaining current employees who need to renew their visas. For example, an entry level postdoc in the biomedical engineering field who is currently paid $54,589 will now be required to be paid $73,528—a 35% increase, at the time of visa application or renewal. For an entry level postdoc in biochemical engineering, it would increase from $52,229 to $83,554—a 60% increase. Lecturer positions within the liberal arts would see increases of $7,150 to $30,050. A number of salary categories have been eliminated. If a salary category is not available, the default salary is $208,000. These new salary levels will make it difficult to hire international employees and may lead to demands for salary equities among non H1B employees that are beyond competitive market wages. On October 6, 2020, DHS announced a new rule that changes the definition of a “specialty occupation”. The new rule would require that the H1B beneficiary have a degree that is directly related to the position into which they will be hired. Degrees that are in wide variety of fields would be unacceptable and general degrees “without further specialization” are also unacceptable. This new rule becomes effective December 7, 2020.
Requested Action: Pursuant to ABOR Policy 1-109, ASU, NAU, and UArizona request that the board ratify the prior authorization for ASU, NAU and UArizona to initiate litigation against the Department of Labor’s New Interim Rule on Prevailing Wage and Against the Department of Homeland Security’s New Rule Narrowing Eligibility for H1B Visas
Board of Regents Meeting November 18-20, 2020
Item #8 EXECUTIVE SUMMARY Page 2 of 2
Litigation was filed against the DOL in the United States District Court for the District of Columbia. ASU and NAU are named plaintiffs. A motion for preliminary injunction was also filed but one count of that motion will be heard as a motion for summary judgment on Nov. 13, 2020. A number of organizations filed litigation against DHS in the United States District Court for the Northern District of California to enjoin the new rule on “specialty occupation” and ASU and NAU are members of one of those organizations. The board is requested to ratify the authorization granted to the universities to litigate these actions to protect the rights and interests of the board and the universities.
Board of Regents Meeting November 18-20, 2020
Item #9 EXECUTIVE SUMMARY Page 1 of 5
Contact Information: Michelle Parker, NAU [email protected] 928-523-6517
Item Name: Multiple-year Employment Contract for Vice President for Intercollegiate Athletics at Northern Arizona University (NAU)
Action Item
Background/History of Previous Board Action • The board approved Athletic Director (AD) Marlow’s initial five-year contract, which
commenced on January 15, 2018, and ends on January 15, 2023.
• AD Marlow’s initial base salary was $200,000.00 per annum. • AD Marlow has the strong support of the university, community, donors, and the
staff in the Department of Athletics. He has proven himself to be an exceptional leader in student athlete development and engagement, with a particular focus on enhancing the student athlete experience, both academically and physically. AD Marlow has also demonstrated success in fundraising, marketing, and the recruitment and retention of quality coaches and staff. His accomplishments since coming to NAU include:
o AD Marlow celebrated the efforts of student athletes, coaches, and staff in
achieving the highest cumulative GPA in the history of NAU Athletics in 2018-2019.
o AD Marlow rebranded the department’s development unit and refocused the
general fundraising approach, resulting in a 60% growth in philanthropic contributions and a 66% increase in the number of donors from 2018 to 2019. With $1,275,000.00 raised in 2019, NAU Athletics eclipsed the million-dollar mark for the first time in university history.
o AD Marlow secured the renewal of the department’s Adidas apparel contract,
making it the largest such agreement in the Big Sky Conference, and one of the most lucrative at the Division I FCS level.
o AD Marlow worked collaboratively with a team of students and staff to
successfully implement the university’s first ever athletic student fee; this included creating a student advisory council to effectively engage with the
Requested Action: Northern Arizona University asks the board to approve a one-year contract extension for Michael Marlow as Vice President for Intercollegiate Athletics (Athletic Director).
Board of Regents Meeting November 18-20, 2020
Item #9 EXECUTIVE SUMMARY Page 2 of 5
student body and provide NAU Athletics with a better understanding of the student voice when considering how best to make use of the funds.
o AD Marlow has worked to improve NAU facilities, to benefit not only our
student athletes and students, but also our fans and community; this included commissioning the design and installation of a new state-of-the-art video board cluster in the Skydome and installing an artificial surface practice field, which is used not only for our field sports, but also by our general student body for recreational activities.
Discussion Major terms of the additional one-year contract would be as follows:
• Term: approximately 3 years. An additional year is proposed to be added to the original five-year contract, making the new contract ending date January 15, 2024.
• Base Salary: continues to be $200,000.00 per annum.
• Duties and responsibilities: AD Marlow is responsible for supervising, planning, and coordinating the interests and activities of the university’s Department of Intercollegiate Athletics (“Department”) with integrity and in a manner that is consistent and in compliance with: (i) the academic goals of the university; (ii) the constitution, bylaws, rules and regulations (collectively, and as amended from time to time, the “Legislation”) of the National Collegiate Athletic Association (“NCAA”) and the Big Sky Conference (“Conference”); and (iii) the rules, regulations, and policies as in effect from time to time (collectively, the “Rules”) of the board and the university.
• Miscellaneous Terms: o Benefits and employee-related benefits provided to university employees. o Use of a courtesy automobile provided by an athletics donor. o Tickets to university events for family and guests. o Travel funding for post-season sporting events. o Requirement to disclose outside compensation, as well as obtain advance
written approval for all athletically-related income, in accordance with any applicable requirements of the Big Sky Conference, NCAA, and university policies.
o Requirement to promptly disclose suspected violations of NCAA or Big Sky Conference rules to the university president and other authorities as appropriate.
o Requirement to cooperate fully in investigations initiated by the NCAA, Big Sky Conference, the university, or law enforcement.
Board of Regents Meeting November 18-20, 2020
Item #9 EXECUTIVE SUMMARY Page 3 of 5
o Requirement to comply with all board and university policies, including all reporting and other requirements under TIX and other laws related to sexual violence, sexual assault, and related conduct.
o A clawback provision requiring the return of incentives paid for performance if credit for games or championships are vacated, diminished, or otherwise “lost” due to NCAA infractions or violations of other binding rules or other penalties, whether self-imposed by the university, or imposed by the Big Sky Conference o the NCAA.
• Incentives (please note that the maximum amount which can be received for a single Academic Year combined for the incentives and designated compensation listed below is $50,000.00):
o Academic Performance incentives intended to promote student-athlete success: Grade Point Average (GPA) (please note that for 2018-2019, the
department cumulative GPA was 3.15): • Marlow will receive one week’s salary for department
cumulative GPA of 3.00 up to 3.2. • Marlow will receive two weeks’ salary for department
cumulative GPA of 3.2 up to 3.49. • Marlow will receive three weeks’ salary for department
cumulative GPA of 3.5 and above.
o Athletic Performance: Big Sky Conference President’s Cup Bonus: Marlow will receive
two weeks’ salary if tie for first place or first place win
Men’s or Women’s Basketball Team Success: Marlow will receive one week’s salary for each team’s participation in an NCAA or NIT/WNIT tournament and two weeks’ salary for each team that participates in an NCAA or NIT/WNIT post-season tournament round of sixteen games. Marlow will receive four weeks’ salary for each team that wins a national championship.
Football Team Success:
• Marlow will receive two weeks’ salary for a tie or a top three finish in the Big Sky Conference.
• Marlow will receive two weeks’ salary if the team appears in a Football Championship Subdivision playoff game.
• Marlow will receive four weeks’ salary if the team wins the Football Championship Subdivision playoff.
Board of Regents Meeting November 18-20, 2020
Item #9 EXECUTIVE SUMMARY Page 4 of 5
Other Sports (Men’s or Women’s Tennis, Volleyball, Soccer, Swimming and Diving, Men’s and Women’s Indoor and Outdoor Track and Field, Cross Country and Golf):
• Marlow will receive one week’s salary for a Big Sky Conference or Western Athletic Conference Championship in each of the sports listed above.
• Marlow will receive two week’s salary for each NCAA top 5 team finish in the sports listed above.
• Marlow will receive four weeks’ salary for each NCAA team championship in the sports listed above.
o Fundraising: Marlow will receive two weeks’ salary if the value of
total fundraising from Major Gifts (pledges exceeding $25,000, including endowments) exceeds $500,000 during a single academic year.
• Designated Compensation for achieving or maintaining a designated standard of
continuning academic performance:
o Academic Progress Rate (APR); please note that for the past five years, the overall annual APR was:
o 2014-15: 963 o 2015-16 967 o 2016-17: 966 o 2017-18: 976 o 2018-19: 980
• Marlow will receive one week’s salary for an annual APR of 965 up to 970.
• Marlow will receive two weeks’ salary for an annual APR of 971 up to 980.
• Marlow will receive three weeks’ salary for an annual APR of 981 and above.
• Separation terms:
o Termination without cause:
If terminated without cause by the university, NAU pays 50% of the amount of base salary remaining on the contract.
If president departs the university prior to the end of contract, the contract may be terminated by new university president.
Liquidated damages payment to Marlow is mitigated and offset dollar-for-dollar if Marlow obtains other employment as a Vice president, Athletic Director, Associate Athletic Director, or similar position.
Board of Regents Meeting November 18-20, 2020
Item #9 EXECUTIVE SUMMARY Page 5 of 5
o Termination with cause:
If terminated with cause, the university agrees to pay only the payment of salary and other compensation earned as of the termination date.
If the cause is a material violation of NCAA or Conference rules, Marlow will pay NAU its actual damages up to $100,000 and forfeits/repays any bonuses received for Academic and/or Athletic Performance affected by any sanctions
o Voluntary termination by VP for Intercollegiate Athletics:
Marlow may terminate contract prior to completion of contract, but will be subject to liquidated damages of 50% of the Base Salary amount remaining on contract.
If president vacates the position, Marlow will not be subjected to the liquidated damages clause.
o Covenant not to Compete:
Marlow is not to seek or accept any other positions absent prior notice to NAU’s president. If Marlow accepts a competing Big Sky position, NAU may seek all available remedies, including injunctive relief and monetary damages.
Statutory/Policy Requirements ABOR Policy 6-1001 requires board approval of multiple-year employment contracts for Intercollegiate Athletics Directors.

This page intentionally left blank

Board of Regents Meeting November 18-20, 2020
Item #10 EXECUTIVE SUMMARY Page 1 of 8
Contact Information: Nancy Tribbensee, ABOR [email protected] 602-229-2510
Item Name: Presidents’ Contracts
Action Item
Background and Discussion • President Cheng and President Robbins were each assigned multiple-year goals
for 2017-2020, to be measured as of June 30, 2020. (The multiple-year goals for President Crow are not due to be measured until June 30, 2021.)
• Compensation designated as “at-risk” will not be paid if the assigned goals are
not achieved. Payment for achievement of multiple-year at-risk goals will be made no later than December 31, 2020.
• Copies of the at-risk goals, noting the goals achieved, are attached:
o Attachment A: President Cheng o Attachment B: President Robbins
• This item will evaluate achievement of multiple-year goals. In recognition of the need to focus efforts on the universities’ successful response to the pandemic, the board suspended the annual 2019-2020 at-risk goals for the presidents and the executive director in June 2020.
Statutory/Policy Requirements • A.R.S. §15-1626 “General Administrative Powers and Duties of the Board” • ABOR Policy 6-1101 “Appointments of Presidents”
Requested Action: The board will vote to recognize the achievement of 2017-2020 at-risk compensation goals assigned to President Cheng and President Robbins.
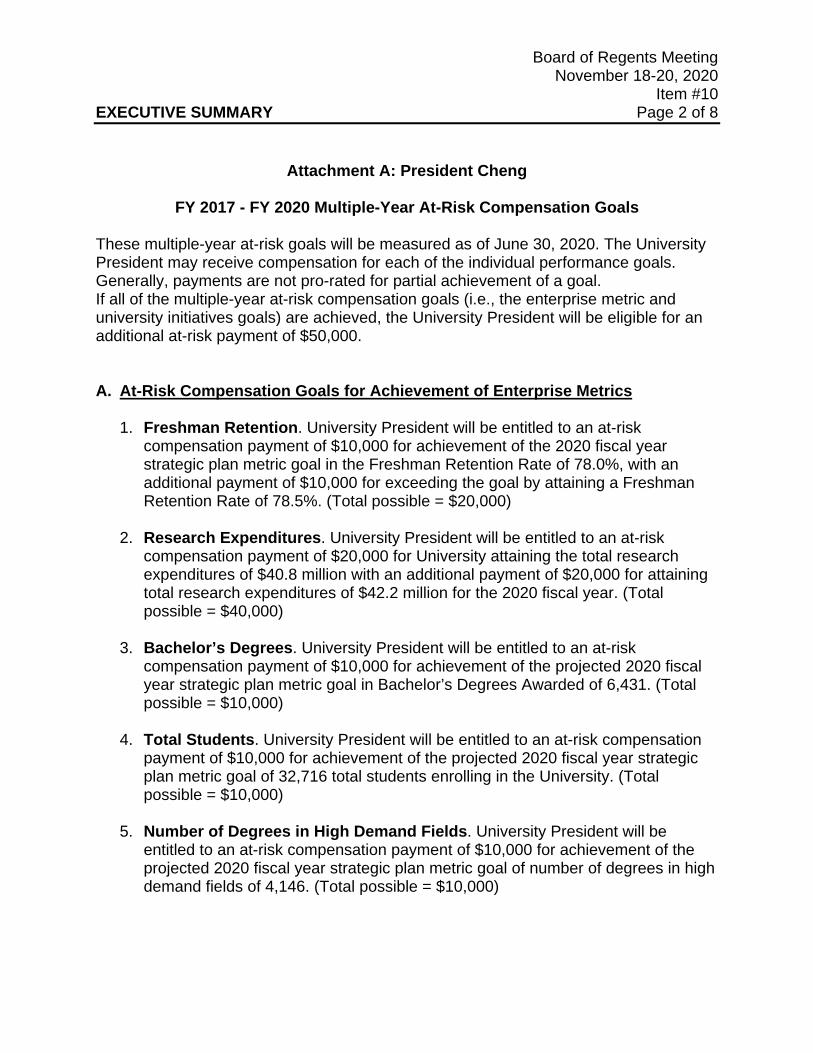
Board of Regents Meeting November 18-20, 2020
Item #10 EXECUTIVE SUMMARY Page 2 of 8
Attachment A: President Cheng
FY 2017 - FY 2020 Multiple-Year At-Risk Compensation Goals
These multiple-year at-risk goals will be measured as of June 30, 2020. The University President may receive compensation for each of the individual performance goals. Generally, payments are not pro-rated for partial achievement of a goal. If all of the multiple-year at-risk compensation goals (i.e., the enterprise metric and university initiatives goals) are achieved, the University President will be eligible for an additional at-risk payment of $50,000.
A. At-Risk Compensation Goals for Achievement of Enterprise Metrics
1. Freshman Retention. University President will be entitled to an at-risk compensation payment of $10,000 for achievement of the 2020 fiscal year strategic plan metric goal in the Freshman Retention Rate of 78.0%, with an additional payment of $10,000 for exceeding the goal by attaining a Freshman Retention Rate of 78.5%. (Total possible = $20,000)
2. Research Expenditures. University President will be entitled to an at-risk
compensation payment of $20,000 for University attaining the total research expenditures of $40.8 million with an additional payment of $20,000 for attaining total research expenditures of $42.2 million for the 2020 fiscal year. (Total possible = $40,000)
3. Bachelor’s Degrees. University President will be entitled to an at-risk
compensation payment of $10,000 for achievement of the projected 2020 fiscal year strategic plan metric goal in Bachelor’s Degrees Awarded of 6,431. (Total possible = $10,000)
4. Total Students. University President will be entitled to an at-risk compensation
payment of $10,000 for achievement of the projected 2020 fiscal year strategic plan metric goal of 32,716 total students enrolling in the University. (Total possible = $10,000)
5. Number of Degrees in High Demand Fields. University President will be
entitled to an at-risk compensation payment of $10,000 for achievement of the projected 2020 fiscal year strategic plan metric goal of number of degrees in high demand fields of 4,146. (Total possible = $10,000)
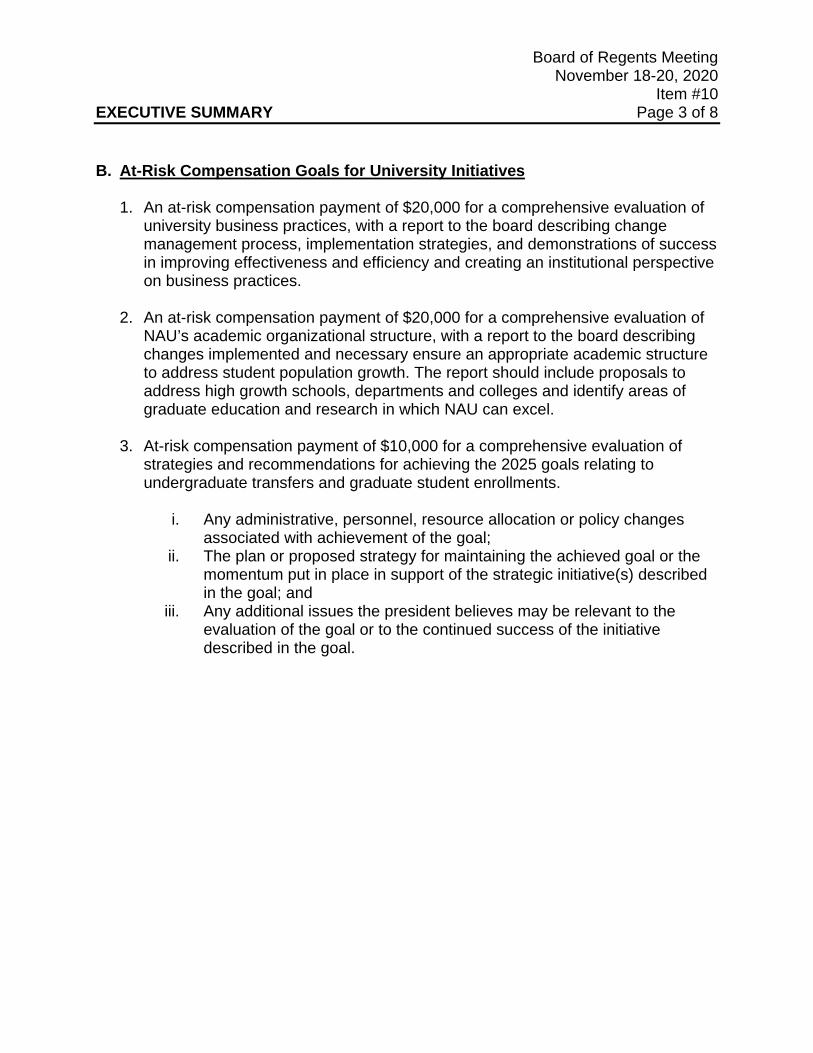
Board of Regents Meeting November 18-20, 2020
Item #10 EXECUTIVE SUMMARY Page 3 of 8
B. At-Risk Compensation Goals for University Initiatives
1. An at-risk compensation payment of $20,000 for a comprehensive evaluation of
university business practices, with a report to the board describing change management process, implementation strategies, and demonstrations of success in improving effectiveness and efficiency and creating an institutional perspective on business practices.
2. An at-risk compensation payment of $20,000 for a comprehensive evaluation of
NAU’s academic organizational structure, with a report to the board describing changes implemented and necessary ensure an appropriate academic structure to address student population growth. The report should include proposals to address high growth schools, departments and colleges and identify areas of graduate education and research in which NAU can excel.
3. At-risk compensation payment of $10,000 for a comprehensive evaluation of
strategies and recommendations for achieving the 2025 goals relating to undergraduate transfers and graduate student enrollments.
i. Any administrative, personnel, resource allocation or policy changes
associated with achievement of the goal; ii. The plan or proposed strategy for maintaining the achieved goal or the
momentum put in place in support of the strategic initiative(s) described in the goal; and
iii. Any additional issues the president believes may be relevant to the evaluation of the goal or to the continued success of the initiative described in the goal.
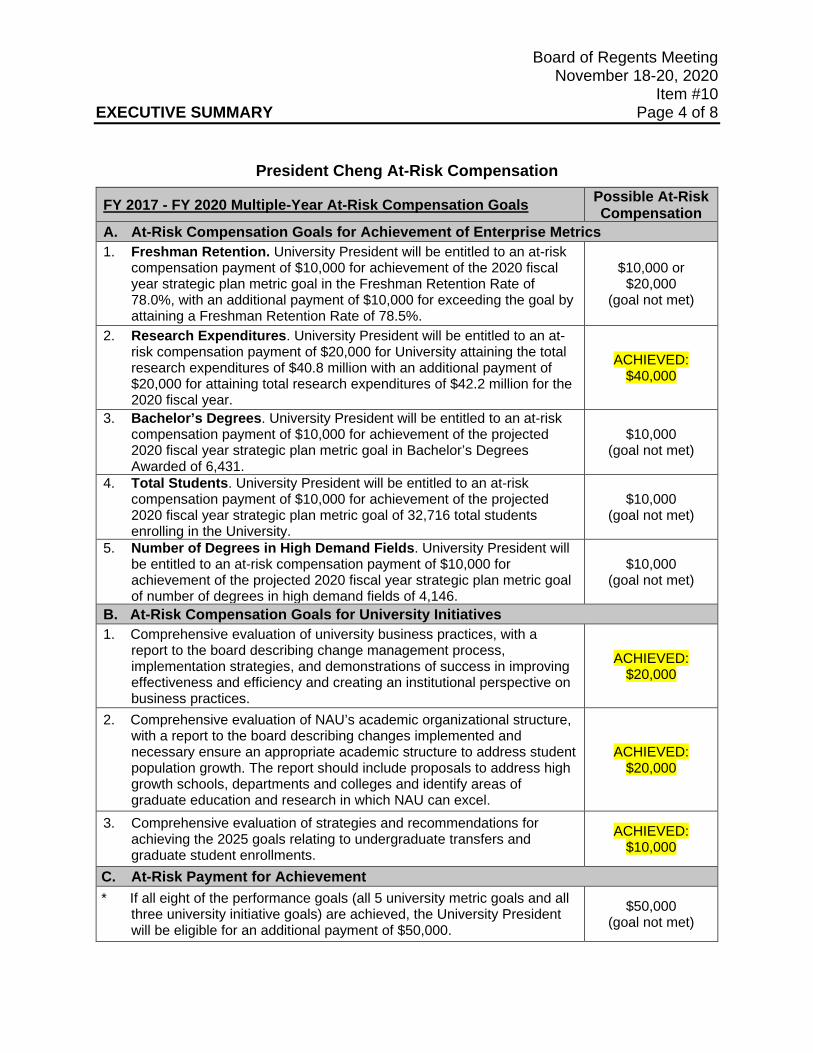
Board of Regents Meeting November 18-20, 2020
Item #10 EXECUTIVE SUMMARY Page 4 of 8
President Cheng At-Risk Compensation
FY 2017 - FY 2020 Multiple-Year At-Risk Compensation Goals Possible At-Risk Compensation
A. At-Risk Compensation Goals for Achievement of Enterprise Metrics 1. Freshman Retention. University President will be entitled to an at-risk
compensation payment of $10,000 for achievement of the 2020 fiscal year strategic plan metric goal in the Freshman Retention Rate of 78.0%, with an additional payment of $10,000 for exceeding the goal by attaining a Freshman Retention Rate of 78.5%.
$10,000 or $20,000
(goal not met)
2. Research Expenditures. University President will be entitled to an at-risk compensation payment of $20,000 for University attaining the total research expenditures of $40.8 million with an additional payment of $20,000 for attaining total research expenditures of $42.2 million for the 2020 fiscal year.
ACHIEVED: $40,000
3. Bachelor’s Degrees. University President will be entitled to an at-risk compensation payment of $10,000 for achievement of the projected 2020 fiscal year strategic plan metric goal in Bachelor’s Degrees Awarded of 6,431.
$10,000 (goal not met)
4. Total Students. University President will be entitled to an at-risk compensation payment of $10,000 for achievement of the projected 2020 fiscal year strategic plan metric goal of 32,716 total students enrolling in the University.
$10,000 (goal not met)
5. Number of Degrees in High Demand Fields. University President will be entitled to an at-risk compensation payment of $10,000 for achievement of the projected 2020 fiscal year strategic plan metric goal of number of degrees in high demand fields of 4,146.
$10,000 (goal not met)
B. At-Risk Compensation Goals for University Initiatives 1. Comprehensive evaluation of university business practices, with a
report to the board describing change management process, implementation strategies, and demonstrations of success in improving effectiveness and efficiency and creating an institutional perspective on business practices.
ACHIEVED: $20,000
2. Comprehensive evaluation of NAU’s academic organizational structure, with a report to the board describing changes implemented and necessary ensure an appropriate academic structure to address student population growth. The report should include proposals to address high growth schools, departments and colleges and identify areas of graduate education and research in which NAU can excel.
ACHIEVED: $20,000
3. Comprehensive evaluation of strategies and recommendations for achieving the 2025 goals relating to undergraduate transfers and graduate student enrollments.
ACHIEVED: $10,000
C. At-Risk Payment for Achievement * If all eight of the performance goals (all 5 university metric goals and all
three university initiative goals) are achieved, the University President will be eligible for an additional payment of $50,000.
$50,000 (goal not met)
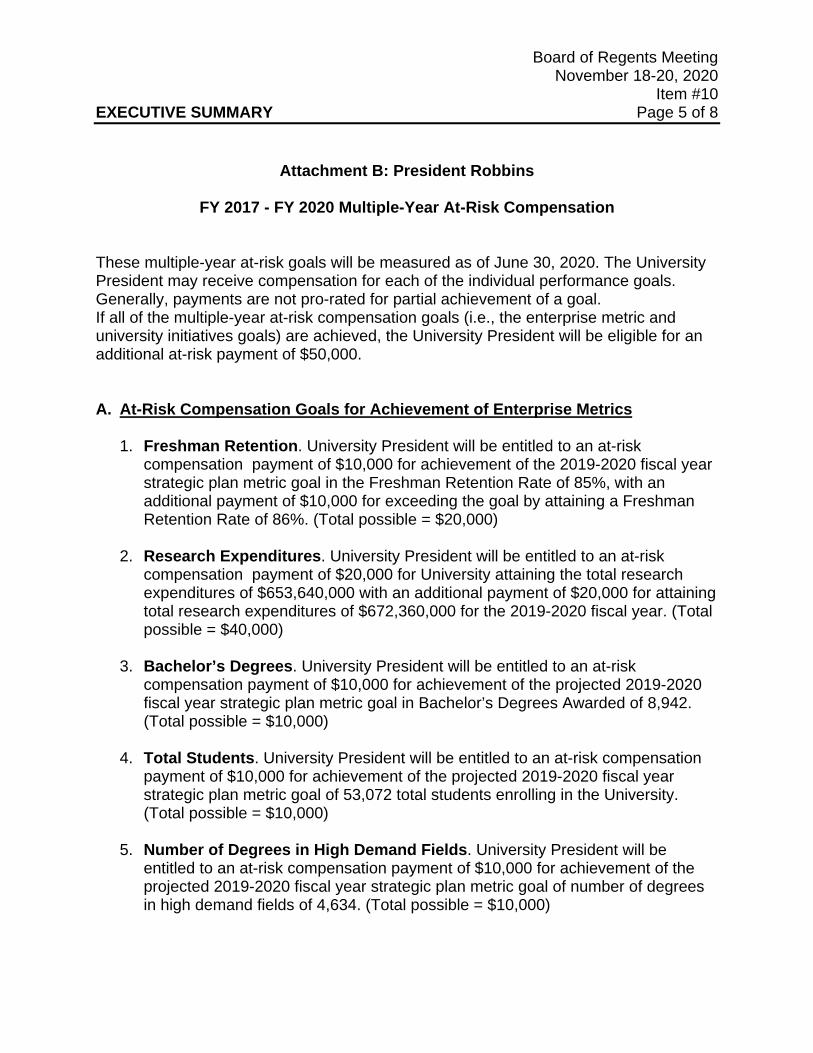
Board of Regents Meeting November 18-20, 2020
Item #10 EXECUTIVE SUMMARY Page 5 of 8
Attachment B: President Robbins
FY 2017 - FY 2020 Multiple-Year At-Risk Compensation
These multiple-year at-risk goals will be measured as of June 30, 2020. The University President may receive compensation for each of the individual performance goals. Generally, payments are not pro-rated for partial achievement of a goal. If all of the multiple-year at-risk compensation goals (i.e., the enterprise metric and university initiatives goals) are achieved, the University President will be eligible for an additional at-risk payment of $50,000.
A. At-Risk Compensation Goals for Achievement of Enterprise Metrics
1. Freshman Retention. University President will be entitled to an at-risk compensation payment of $10,000 for achievement of the 2019-2020 fiscal year strategic plan metric goal in the Freshman Retention Rate of 85%, with an additional payment of $10,000 for exceeding the goal by attaining a Freshman Retention Rate of 86%. (Total possible = $20,000)
2. Research Expenditures. University President will be entitled to an at-risk
compensation payment of $20,000 for University attaining the total research expenditures of $653,640,000 with an additional payment of $20,000 for attaining total research expenditures of $672,360,000 for the 2019-2020 fiscal year. (Total possible = $40,000)
3. Bachelor’s Degrees. University President will be entitled to an at-risk
compensation payment of $10,000 for achievement of the projected 2019-2020 fiscal year strategic plan metric goal in Bachelor’s Degrees Awarded of 8,942. (Total possible = $10,000)
4. Total Students. University President will be entitled to an at-risk compensation
payment of $10,000 for achievement of the projected 2019-2020 fiscal year strategic plan metric goal of 53,072 total students enrolling in the University. (Total possible = $10,000)
5. Number of Degrees in High Demand Fields. University President will be
entitled to an at-risk compensation payment of $10,000 for achievement of the projected 2019-2020 fiscal year strategic plan metric goal of number of degrees in high demand fields of 4,634. (Total possible = $10,000)
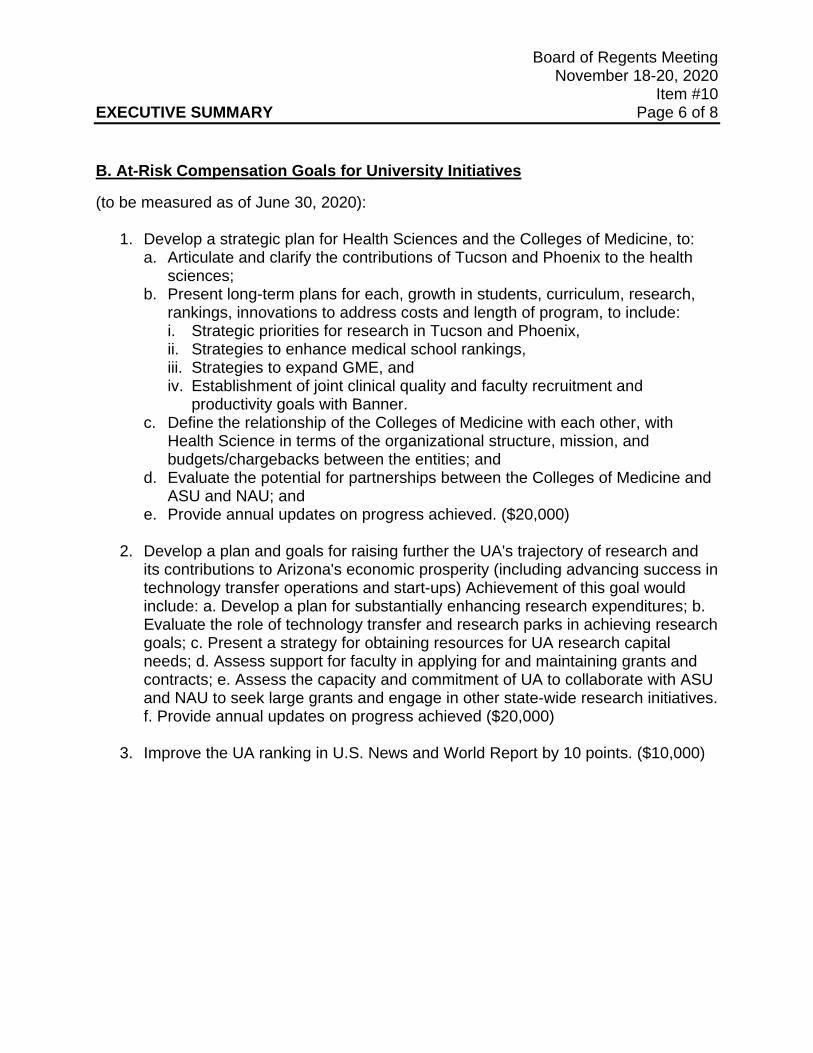
Board of Regents Meeting November 18-20, 2020
Item #10 EXECUTIVE SUMMARY Page 6 of 8
B. At-Risk Compensation Goals for University Initiatives
(to be measured as of June 30, 2020):
1. Develop a strategic plan for Health Sciences and the Colleges of Medicine, to: a. Articulate and clarify the contributions of Tucson and Phoenix to the health
sciences; b. Present long-term plans for each, growth in students, curriculum, research,
rankings, innovations to address costs and length of program, to include: i. Strategic priorities for research in Tucson and Phoenix, ii. Strategies to enhance medical school rankings, iii. Strategies to expand GME, and iv. Establishment of joint clinical quality and faculty recruitment and
productivity goals with Banner. c. Define the relationship of the Colleges of Medicine with each other, with
Health Science in terms of the organizational structure, mission, and budgets/chargebacks between the entities; and
d. Evaluate the potential for partnerships between the Colleges of Medicine and ASU and NAU; and
e. Provide annual updates on progress achieved. ($20,000)
2. Develop a plan and goals for raising further the UA's trajectory of research and its contributions to Arizona's economic prosperity (including advancing success in technology transfer operations and start-ups) Achievement of this goal would include: a. Develop a plan for substantially enhancing research expenditures; b. Evaluate the role of technology transfer and research parks in achieving research goals; c. Present a strategy for obtaining resources for UA research capital needs; d. Assess support for faculty in applying for and maintaining grants and contracts; e. Assess the capacity and commitment of UA to collaborate with ASU and NAU to seek large grants and engage in other state-wide research initiatives. f. Provide annual updates on progress achieved ($20,000)
3. Improve the UA ranking in U.S. News and World Report by 10 points. ($10,000)
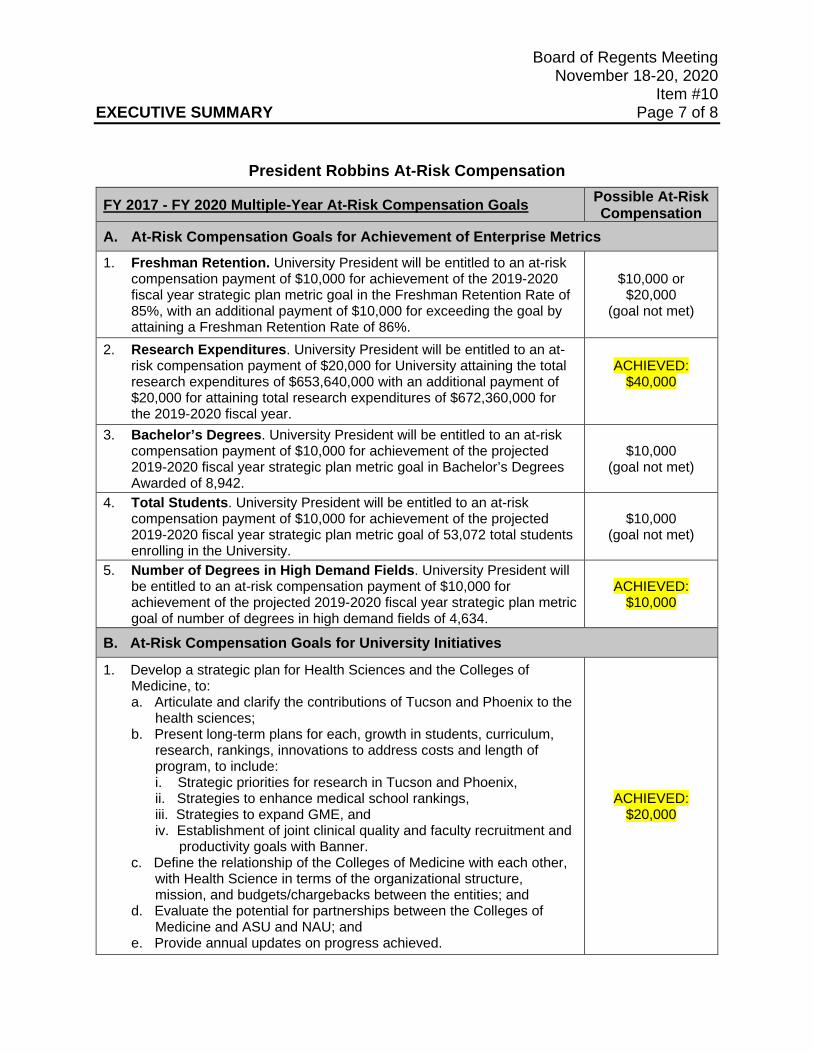
Board of Regents Meeting November 18-20, 2020
Item #10 EXECUTIVE SUMMARY Page 7 of 8
President Robbins At-Risk Compensation
FY 2017 - FY 2020 Multiple-Year At-Risk Compensation Goals Possible At-Risk Compensation
A. At-Risk Compensation Goals for Achievement of Enterprise Metrics
1. Freshman Retention. University President will be entitled to an at-risk compensation payment of $10,000 for achievement of the 2019-2020 fiscal year strategic plan metric goal in the Freshman Retention Rate of 85%, with an additional payment of $10,000 for exceeding the goal by attaining a Freshman Retention Rate of 86%.
$10,000 or $20,000
(goal not met)
2. Research Expenditures. University President will be entitled to an at-risk compensation payment of $20,000 for University attaining the total research expenditures of $653,640,000 with an additional payment of $20,000 for attaining total research expenditures of $672,360,000 for the 2019-2020 fiscal year.
ACHIEVED: $40,000
3. Bachelor’s Degrees. University President will be entitled to an at-risk compensation payment of $10,000 for achievement of the projected 2019-2020 fiscal year strategic plan metric goal in Bachelor’s Degrees Awarded of 8,942.
$10,000 (goal not met)
4. Total Students. University President will be entitled to an at-risk compensation payment of $10,000 for achievement of the projected 2019-2020 fiscal year strategic plan metric goal of 53,072 total students enrolling in the University.
$10,000 (goal not met)
5. Number of Degrees in High Demand Fields. University President will be entitled to an at-risk compensation payment of $10,000 for achievement of the projected 2019-2020 fiscal year strategic plan metric goal of number of degrees in high demand fields of 4,634.
ACHIEVED: $10,000
B. At-Risk Compensation Goals for University Initiatives
1. Develop a strategic plan for Health Sciences and the Colleges of Medicine, to: a. Articulate and clarify the contributions of Tucson and Phoenix to the
health sciences; b. Present long-term plans for each, growth in students, curriculum,
research, rankings, innovations to address costs and length of program, to include: i. Strategic priorities for research in Tucson and Phoenix, ii. Strategies to enhance medical school rankings, iii. Strategies to expand GME, and iv. Establishment of joint clinical quality and faculty recruitment and
productivity goals with Banner. c. Define the relationship of the Colleges of Medicine with each other,
with Health Science in terms of the organizational structure, mission, and budgets/chargebacks between the entities; and
d. Evaluate the potential for partnerships between the Colleges of Medicine and ASU and NAU; and
e. Provide annual updates on progress achieved.
ACHIEVED: $20,000
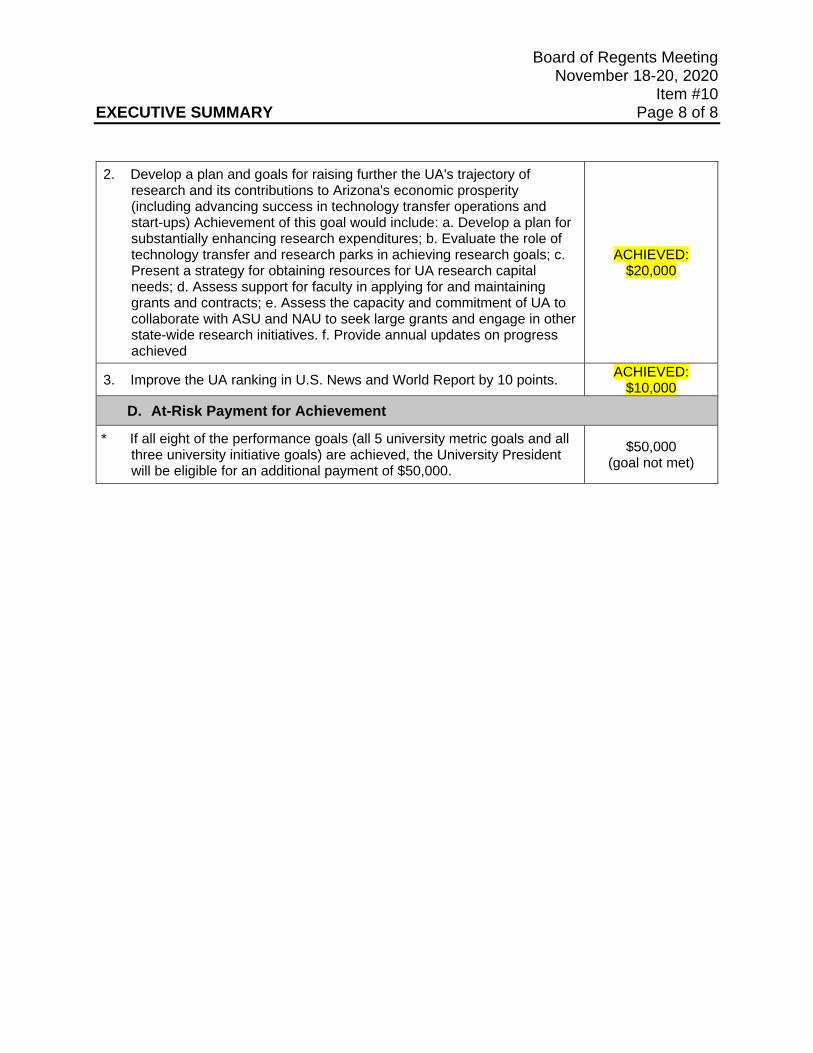
Board of Regents Meeting November 18-20, 2020
Item #10 EXECUTIVE SUMMARY Page 8 of 8
2. Develop a plan and goals for raising further the UA's trajectory of
research and its contributions to Arizona's economic prosperity (including advancing success in technology transfer operations and start-ups) Achievement of this goal would include: a. Develop a plan for substantially enhancing research expenditures; b. Evaluate the role of technology transfer and research parks in achieving research goals; c. Present a strategy for obtaining resources for UA research capital needs; d. Assess support for faculty in applying for and maintaining grants and contracts; e. Assess the capacity and commitment of UA to collaborate with ASU and NAU to seek large grants and engage in other state-wide research initiatives. f. Provide annual updates on progress achieved
ACHIEVED: $20,000
3. Improve the UA ranking in U.S. News and World Report by 10 points. ACHIEVED: $10,000
D. At-Risk Payment for Achievement
* If all eight of the performance goals (all 5 university metric goals and all three university initiative goals) are achieved, the University President will be eligible for an additional payment of $50,000.
$50,000 (goal not met)
Student Regent ReportAnthony Rusk and Nikhil Dave
November 19, 2020
Basic Need Coalition Updates

Working Group Updates

Updates on the next blog post
Conversations with Campus Leaders for Focus Issues

THANK YOU

Adoption of Minutes

This page intentionally left blank
DRAFT ARIZONA BOARD OF REGENTS
Minutes of a Special Board Meeting Thursday, September 10, 2020
A special board meeting of the Arizona Board of Regents was held virtually on Thursday, September 10, 2020 at 9:00 a.m. Members Present via video: Regent Penley, Regent Manson, Regent Shoopman, Regent DuVal, Regent Ridenour (entered at 9:26 a.m.), Regent Taylor Robson, Regent King (entered at 9:36 a.m.), Regent Mata (entered at 9:19 a.m.), Superintendent Hoffman (entered at 10:23 a.m.), Regent Rusk and Regent Dave Members Absent: Governor Ducey Also present via video were: from the board office Executive Director John Arnold, General Counsel Jennifer Pollock, Samantha Blevins, Nancy Tribbensee, Suzanne Templin, Chad Sampson, Lorenzo Martinez, Kris Okazaki, Rick Gfeller, Lia Foy and Tom Merriam; from Arizona State University President Crow, Christine Wilkinson, Morgan Olsen, Mark Searle, Jose Cardenas, Lisa Loo, Katie Paquet, Maria Anguiano, and Phil Regier; from the University of Arizona President Robbins, Jon Dudas, Lisa Rulney, Liesel Folks, Steve Voeller, Laura Todd Johnson, Michael Dake, Betsy Cantwell, Craig Wilson, and Jessica Summers; from Northern Arizona University President Cheng, Bjorn Flugstad, Diane Sterns, Christy Farley, Garth Perry, Andrea Glenn, Gayla Stoner Closed Captioners: Courtney Albright, Dave Wallenhaup and Nicole Flaherty. Regent Penley called the meeting to order at 9:08 a.m. Regent Penley welcomed Regent Mata who is replacing Regent Krishna. Regent Penley noted Regent Krishna’s accomplishments as a regent and a civic leader in the Yuma area. Regent Penley expressed his and the board’s gratitude to Regent Krishna. Regent Penley announced the organization of a presidential search committee co-chaired by Regent DuVal and Regent Manson. Regents DuVal and Manson will begin taking input from the public and various constituents regarding NAU’s future and characteristics of leadership for the next president at NAU.
Arizona Board of Regents September 10, 2020 Page 2 of 8
FY 2021 Annual Budgets for Arizona State University, Northern Arizona University, University of Arizona and the Board’s System Office (ASU, NAU, UA, ABOR) (Item 1) The board was asked to approve the FY 2021 Annual Budgets for Arizona State University, Northern Arizona University, University of Arizona and the board’s system office. Arizona State University’s FY 2021 Annual Budget Presentation President Crow began his budget prestation by explaining that ASU seeks a stable relationship with the State of Arizona as an investor in the institution. ASU has been systematically unfunded since 2009, with no return on the investment while ASU takes on more responsibility and educates more in-state students. The financial structure of ASU assumes a $250 million loss for in-state students, restated, $1 billion every four years. ASU finds ways to off-set that loss by using positive margins in other things but it is with great difficulty. Generating that revenue from other activities inhibits ASU from investing in other things that it needs. Arizona State University is withdrawing its supplemental budget requests and asks that the state provide financial support for students from Arizona and to invest in initiatives that the universities are asked to undertake. ASU’s budget request is built around its desire to be a greater net-positive contribution to the state and the emergence of the New Economy. The New Economy is essential for Arizona’s long-term success. At ASU, there is significant capacity to enhance and drive the New Economy forward and that is the core of ASU’s budget request. ASU will continue its plan to find a way to operate, to move forward and to support everyone. Morgan Olsen covered the details of ASU’s budget for FY2021 and the philosophy used to determine the budget request as described in the FY2021 Budget report in the executive summary. [A copy of the presentation can be found in the September 10, 2020 Document Files] President Crow reiterated that ASU is not participating in the supplemental funding request. ASU will find a way to fund the operations of the institution and is only asking that the state support Arizona students and help with the special initiatives i.e. the New Economy initiative. President Crow spoke on current high enrollment numbers and maintaining core faculty, with no general layoffs and no furloughs. ASU is managing 74,500 on-campus students, in two different modalities, in addition to record online enrollment, and ASU’s core faculty are teaching both. President Crow reported that ASU has successfully addressed many difficult obstacles while staying the course of its strategic plan and will move forward on capital investments and the university’s continued transitions.
Arizona Board of Regents September 10, 2020 Page 3 of 8
Regent Penley lauded ASU for its record summer enrollment and fall enrollment as well. Regent Penley acknowledged President Crow and his staff’s efforts towards successful outcomes despite uncertain and confusing circumstances. Mr. Olsen confirmed Regent Manson’s understanding regarding research spending. The increase in research rewards and increase in research spending equals net-zero. Mr. Olsen explained that the expenses under academic programs and support for new faculty was in the budget because of an anticipated increase in enrollment, which did happen. It also allows for other types of qualitative institutional improvement and unique programmatic opportunities to be identified and invested in. This has helped ASU to grow its responsive research volume. ASU is hiring some faculty who are early in their careers and others who are more established in their careers to allow ASU to build new programs and continue the quality of existing programs. President Crow commented that faculty is the single most important investment for ASU. This is a cherished core activity of the institution that has been in place for many years and has proven to produce a faculty that is able to do things never done before, namely to perform scholarly research, teach on campus, teach/train graduate students and take on new and innovative ways of teaching online all simultaneously. This caliber of faculty allows ASU to create new degree programs which generates more enrollment and research activities. Regent Shoopman pointed out that Arizona’s public universities are distinctly different with distinct assets and distinct challenges. The universities have become so highly differentiated it is important as a board to think of each in a differentiated way to ensure that each of them has the assets and the support they need to succeed. Regent Shoopman congratulated President Crow on ASU’s outcomes. Regent Taylor Robson clarified that because ASU is not requesting supplemental funding from the state the dollar amount assigned for ASU be removed and the request reduced by that amount. President Crow confirmed that ASU is not requesting a supplemental bail-out, it is only asking for support for instate students and special initiatives being assigned to the universities. Regent Penley clarified that the restoration funding and shortfall funding for ASU would be removed from the supplemental budget request. In response to Regent Ridenour’s request, President Crow discussed projections of online education for the future. Northern Arizona University’s FY 2021 Annual Budget Presentation President Cheng and Bjorn Flugstad presented Northern Arizona University’s FY 2021 budget request. President Cheng noted that the student-focused budget aligns with NAU’s mission. Alignment in expenditures to revenue reductions are seen mostly because of the
Arizona Board of Regents September 10, 2020 Page 4 of 8
change in the mix of students attending NAU. NAU experienced a minimal decline of 3.8% in enrollment overall and that was because the incredible work of the staff through the summer making personal contact with perspective students, current students and their families. There was a great amount of connection to the students and their determination to stay on their journey to graduate from NAU. The investments consist of increased technology, infrastructure and health and safety components dealing with COVID-19. There is a continued focus on effectiveness and efficiency ensuring that NAU has the appropriate staffing for the mix of students attending and keeping class-sizes and faculty-to-student and advisor-to-student ratios low. NAU welcomed new faculty members and retained faculty to address challenges brought about by the mix of students who attend NAU. Bjorn Flugstad presented details of Northern Arizona University’s FY 2021 budget request. [A PowerPoint presentation supplemented Mr. Flugstad’s presentation. A copy of the presentation can be found in the September 10, 2020 Document Files] Regent Ridenour requested a dollar amount that represented Northern Arizona University’s top budget priorities. President Cheng commented that the $80 million decrease in legislative investment was sobering. President Cheng listed faculty and staff salaries, wages and benefits as a top priority. This request equals about $25 million and would bring NAU back to pre-COVID-19 status in that aspect. Regent Manson requested clarification regarding the tuition and fee revenue deficit, down over $30 million yet there is an increase in financial aid of $2.6 million. She is concerned that this is eroding/increasing the discount rate. President Cheng reported that a large number of Lumberjack scholars returned for the fall semester and Pell students are reflected in those numbers. Mr. Flugstad confirmed a large retention for students with scholarships. Online enrollment is up and less scholarship recipients attend online. Online gross dollars flow into net dollar. This was a big factor in driving overall, potential net tuition fees for the year. Regent Shoopman congratulated NAU for their efforts to minimize enrollment loss from an anticipated 8% to 3.8%. University of Arizona’s FY 2021 Annual Budget Presentation President Robbins noted enrollment was flat for in-state students and as expected, there was a decrease in international student enrollment. Higher than expected domestic nonresident students chose to come back to UArizona. Faculty, staff and students participated in the efforts to retain students. In preparing for upcoming semesters, UArizona developed a public health care system within the University which included developing and administering vigorous testing in the community, contact tracing activities and isolating students once positive infection was determined. The institution is working closely with the county and the city in terms of trying to mitigate infection. Cases continue to go down in Pima County but a rise in off-campus housing is expected and the administration is working with the county and the city to minimize this
Arizona Board of Regents September 10, 2020 Page 5 of 8
serious risk. Betsy Cantwell and her research team led efforts to set up protocols keeping research labs running in the spring and the summer; approximately 90% of the research labs are operational. Research expenditures, specifically health sciences, have increased during 2020. President Robbins also noted the extraordinary efforts by UArizona staff to reach out to international students to help recruit the most accomplished and diverse class in the University of Arizona’s history. Lisa Rulney presented details of University of Arizona’s FY 2021 budget request. She noted the information provided in the board material regarding net tuition revenue, enrollment and auxiliary revenue had been updated since the original submission. [A PowerPoint presentation supplemented Ms. Rulney’s presentation. A copy of the presentation can be found in the September 10, 2020 Document Files.] Regent Ridenour requested a dollar amount that would reposition UArizona. President Robbins focused on continued testing and healthcare to combat the virus in order to initiate more face-to-face course deliveries. UArizona supplemental request is $29.2 million won’t begin to cover the expenses UArizona has regarding mitigation efforts; testing alone will cost around $20 million. Lisa Rulney noted a top priority would be to offset the unexpected expenses related to the Corona virus, projected to be $20-$25 million. Those expenses continue to increase on a daily basis as UArizona responds to the needs of the campus community. Regent Manson asked for rationale regarding the reduction of the $77 million in research and the reduction in student financial aid rewards/tuition waivers of $23 million. Lisa Rulney responded that the reduction in sponsored research was based on projections that UArizona was modeling in the spring and anticipated a $16 million decrease in F & A response recovery and the inability to continue at the normal rate. This has not been the case. Dr. Cantwell has done a tremendous job keeping operations moving despite the challenges. Sponsored research is tracking closely with FY 2020 actuals. Regarding the scholarship allowance decrease, it is directly related to enrollment. Regent Shoopman acknowledged the efforts of President Robbins and his team. He also supported the direction of Regent Ridenour’s inquiry to set priorities and suggested the board spend time thinking through what is appropriate and possible. ABOR System Office’s FY 2021 Annual Budget Presentation Lorenzo Martinez reviewed the board system office budget. Mr. Martinez noted that 20% of the $30.5 billion budget is for operating costs, the rest is pass-through funding from the general fund for Arizona Teachers Academy, WICHE, etc. Details of revenue and expenses were provided. [A copy of the presentation can be found in the September 10, 2020 Document Files]
Arizona Board of Regents September 10, 2020 Page 6 of 8
Upon motion by Regent Penley; seconded by Regent Ridenour, the board approved the FY 2021 Annual Budgets for Arizona State University, Northern Arizona University, the University of Arizona as modified and presented orally and the ABOR office as presented in the executive summary. Regents Penley, Manson, Taylor Robson, Shoopman, Ridenour, King, Mata, Rusk and Superintendent Hoffman voted in favor. None opposed and none abstained. Regent DuVal was not present for the vote. Regent Taylor Robson brought attention to the ABOR system office budget noting the efficiency of the system office. The FTE is lower than it was 30 years ago despite serving over 200,000 students compared to 80,000 students 30 years ago. FY 2022 State Budget Request Including FY 2021 Supplemental Budget Request (Item 2) The board was asked to approve the FY 2022 State Budget Request of the universities and board office, including a FY 2021supplemental budget request as described in this executive summary. The approved requests will be forwarded to the Governor by September 15. Lorenzo Martinez presented the FY 2022 State Budget Request. John Arnold explained the process for deriving the pandemic shortfall dollar amounts as listed in the supplemental budget request. [A PowerPoint presentation supplemented Mr. Martinez’s presentation. A copy of the presentation can be found in the September 10, 2020 Document Files] Regent Ridenour suggested the board’s priority be to stabilize NAU’s and UArizona’s losses and referred to previous statements by university staff regarding their basic needs. He suggested submitting to the legislature, a necessary and reasonable request with a specific dollar amount, itemizing each university’s needs. Also included should be the restoration of the $35 million. Regent Ridennour stated that it is critical that the board take a different approach to how it prioritizes its request to the legislature, requesting what is absolutely necessary to sustain Arizona students and universities. Discussion was led by Regent Taylor suggesting the initiative of in-state student funding be added to the motion.
Upon motion by Regent Penley; seconded by Regent Shoopman the board approved the FY 2022 State Budget Request of the universities and board office, including a FY 2021 supplemental budget request for both support of in-state students and addressing the shortfall caused by the pandemic; the specific amount of that request to be worked out by executive director Arnold with the three presidents and approval by the chairman of the board. Regents Penley, Manson, Taylor Robson, Shoopman, Ridenour, King, Mata, Rusk and Superintendent Hoffman voted in favor. None opposed and none abstained. Regent DuVal was not present for the vote.
Arizona Board of Regents September 10, 2020 Page 7 of 8
Ratification of Authorization to Initiate Litigation Against John Doe aka “asu_covid.parties” an Individual, and Facebook, Inc., a Delaware Corporation, for Direct and Contributory Federal Trademark Infringement and Related Issues and to Extend Such Authorization to the Board on Behalf of Itself and All Universities Under the Board’s Governance for Similar Actions (Item 3) Pursuant to ABOR Policy 1-109, (1) Arizona State University requested that the board ratify the prior authorization to initiate litigation against John Doe aka “asu_covid.parties” an individual, and Facebook, Inc., a Delaware corporation for direct and contributory federal trademark infringement, false designation of origin and false advertising under Lanham Act Section 43(a), State Trademark Dilution under Arizona Revised Statutes Section 44-1448.01, and unfair competition and (2) the board office requested that such authorization be extended to the board on behalf of itself and all universities under the governance of the board for similar actions. Jennifer Pollock presented the request for ratification of prior authorization to initiate litigation as described in the executive summary. Upon motion by Regent Penley; seconded by Regent King, the board ratified the prior authorization to initiate litigation against John Doe aka “asu_covid.parties” an individual, and Facebook, Inc., a Delaware corporation for direct and contributory federal trademark infringement, false designation of origin and false advertising under Lanham Act Section 43(a), State Trademark Dilution under Arizona Revised Statutes Section 44-1448.01, and unfair competition and (2) extended such authorization to the board on behalf of itself and all universities under the governance of the board for similar actions. Regents Penley, Manson, Taylor Robson, Shoopman, Ridenour, King, Mata, Rusk and Superintendent Hoffman voted in favor. None opposed and none abstained. Regent DuVal was not present for the vote. Arizona Teachers Academy GEER Grant Funding (Item 4) The board was asked to approve the allocation of scholarships funded by the $6 million in grant funds for the Arizona Teachers Academy contingent on finalization of the agreement with the Governor’s Office and directed executive director John Arnold to finalize the Interagency Services Agreement with the Governor’s Office. John Arnold presented the report on the allocation of scholarships for the Arizona Teachers Academy granted by the Governor’s Office. The grant will fund approximately 653 undergraduate scholarships, 105 postbaccalaureate scholarships and 242 graduate scholarships. Mr. Arnold detailed the allocation methodology between the institutions. Upon motion by Regent Penley; seconded by Regent Taylor Robson the board approved the allocation of scholarships funded by the $6 million in grant funds for the Arizona Teachers Academy contingent on finalization of the agreement with the Governor’s Office and directed executive director John Arnold to finalize the Interagency
Arizona Board of Regents September 10, 2020 Page 8 of 8
Services Agreement with the Governor’s Office. Regents Penley, Manson, Taylor Robson, Shoopman, Ridenour, King, Mata, Rusk and Superintendent Hoffman voted in favor. None opposed and none abstained. Regent DuVal was not present for the vote. ADJOURNMENT The meeting adjourned 11:16 a.m.
Submitted by:
Kim Edwards Administrative Associate
ARIZONA BOARD OF REGENTS Minutes of a Regular Meeting
Wednesday, September 30, Thursday, October 1 and Friday, October 2, 2020
A meeting of the Arizona Board of Regents was held virtually on Wednesday, September 30, Thursday, October 1 and Friday, October 2, 2020.
Members present via video: Regent Penley, Regent Manson, Regent Taylor Robson, Regent Shoopman, Regent Ridenour, Regent DuVal, Regent King and Regent Mata, Regent Rusk (entered at 3:03 p.m.) and Regent Dave (entered at 3:03 p.m.) Members absent: Superintendent Hoffman and Governor Ducey Also present via video were: from the board office Executive Director John Arnold, Nancy Tribbensee, Samantha Blevins, Chad Sampson, Tom Merriam and Suzanne Templin. All lists, reports, summaries, background material and other documents referred to in the minutes can be found in the September 30 – October 2, 2020 Document File and the board’s website at www.azregents.edu. CALL TO ORDER The meeting was called to order on Wednesday, September 30, 2020 at 3:02 p.m. Upon motion by Regent Manson, seconded by Regent Ridenour, the board approved convening in executive session. Regents Penley, Manson, Taylor Robson, Shoopman, Ridenour, DuVal, King and Mata voted in favor. None opposed and none abstained. Regent Rusk was not present for the vote. EXECUTIVE SESSION The board convened in executive session on Wednesday, September 30, 2020 at 3:04 p.m. Executive session recessed at 5:09 p.m. The board recessed at 5:09 p.m. Thursday, October 1, 2020 RECONVENE EXECUTIVE SESSION The board reconvened in executive session on Thursday, October 1, 2020 at 9:01 a.m. Executive session recessed at 5:09 p.m.
Arizona Board of Regents September 30 – October 2, 2020 Page 2 of 16
The board recessed at 5:09 p.m. Friday, October 2, 2020 RESUME PUBLIC MEETING, GREETINGS AND ANNOUNCEMENTS FROM THE BOARD CHAIR Members present via video: Regent Penley, Regent Manson, Regent Taylor Robson, Regent Shoopman, Regent Ridenour, Regent DuVal, Regent King, Regent Mata, Regent Rusk and Regent Dave Members absent: Superintendent Hoffman and Governor Ducey Also present via video were: from the board office Executive Director Arnold, Nancy Tribbensee, Samantha Blevins, Chad Sampson, Lorenzo Martinez, Mark Denke, Mary Adelman, Tom Merriam, John Murnane and Suzanne Templin; from Arizona State University President Michael Crow, Christine Wilkinson, Mark Searle, Jose Cardenas, Jim Rund and Morgan Olsen; from Northern Arizona University President Rita Cheng; Christy Farley, Michelle Parker, Bjorn Flugstad, Diane Stearns and Dan Okoli; and from the University of Arizona President Robert Robbins, Jon Dudas, Steve Voeller, Lisa Rulney, Liesl Folks, Barry Brummond, Jessica Summers, Bridgette Nobbe and Dani Carrillo. Closed Captioner: Kris Teshima Regent Penley reconvened public session at 9:01 a.m. Regent Penley welcomed everyone to the board meeting and recognized President Cheng’s commitment and contributions to NAU. President Cheng will be leaving a legacy that includes a better university in many ways, one that has substantially expanded NAU’s Allied Health Program, provided a permanent home for the Lumberjack honors students and has added Kitt Recital Hall to NAU’s music program. The board appreciates what President Cheng has done and she will continue to do great work at the university. Regent Penley acknowledged that this is a time of challenge with COVID-19 and a time of opportunity. The enterprise cannot deviate even as it addresses COVID-19, making the campuses healthy and safe places to be. The enterprise continues to focus on the future and on the opportunity to continue to raise attainment in the state of Arizona. Educational attainment remains a central focus for the universities and the Arizona Board of Regents. The enterprise has a responsibility for assuring that the value of higher education continues into the future. Regent Penley relayed that Governor Ducey commented that the universities have been important in this pandemic and have shown what they have done to reach out to the state and universe to assure a safe and healthy environment. The importance of the universities is why the board is asking Governor Ducey and our legislature to do some things that really represent the needs of investing in public higher education. The board is asking Governor Ducey and the legislature to restore the $35 million that was cut at the end of the last legislative session to reflect the expenses and other issues associated with the pandemic and further asking that Governor Ducey and the legislature provide $138.9 million to address the impact of the coronavirus on the universities. Regent Penley further relayed that the board is going to return to the agenda from last year that the legislature was
Arizona Board of Regents September 30 – October 2, 2020 Page 3 of 16
supporting and that Governor Ducey called out in his State of the State address last January to extend the capacity of the three universities to drive the new economy into Arizona. The board is asking for an additional $160 million investment to public higher education to build the workforce for the future and provide the opportunity for every qualified high school graduate to attend the universities with the kind of scholarships that many other states have provide. The board is committed to raising the quality of the universities and to always improve the quality of these institutions. The enterprise asks for a public investment for these universities and understands that they have a responsibility through tuition and other means to raise a great deal of the revenue, but is also a system that deserves to have the support of the state. Regent Penley thanked the students, faculty and staff for all that they are doing to maintain health and safety on the campuses. CALL TO THE AUDIENCE Per board policy 1-114, time has been set aside for Call to the Audience, an opportunity for people to express their views or concerns on matters of board governance to the entire board in a public setting. Regent Penley stated that during each regular board meeting, the board conducts a Call to the Audience, due to the virtual nature of the board meeting and the process put in place to address COVID-19 and health department recommendations to limit gatherings, the call to the audience has been conducted by written submission. The submission form has been available since Tuesday, September 22, 2020. The board has received all of the submission, if members of the public were unable to submit a form for Call to the Audience in time for this board meeting, they may continue to use the contact link on the board’s website. All forms submitted referred to in the minutes can be found in the September 30 – October 2, 2020 Document File.
• Gabriel Montaño, Ben Ruddell, Constantin Ciocanel, Paul Gremillion and Jennifer Martinez - College of Engineering, Informatics, and Applied Sciences (CEIAS) wrote to advocate for inclusion of a representative from the College of Engineering, Informatics, and Applied Sciences on the NAU President Search Advisory Committee.
CONSENT AGENDA All items on the Consent Agenda that are marked with an asterisk (*) are consent matters. Regent Penley asked the board members if they have any conflicts to declare. Regent Taylor Robson and Regent King recused themselves from item 10A on the Consent Agenda. Regent Penley separated the consent agenda into 3 motions. Upon motion by Regent Penley, seconded by Regent Shoopman, the board approved items 7-9, 10B and 11-27 as listed on the Consent Agenda. Regents Penley, Manson, Taylor Robson, Shoopman, Ridenour, DuVal, King, Mata and Rusk voted in favor. None opposed and none abstained.
Arizona Board of Regents September 30 – October 2, 2020 Page 4 of 16
Upon motion by Regent Penley, seconded by Regent Taylor Robson, the board approved item 10A – ASU’s FY 2020-2024 Capital Improvement Plan as described in the executive summary and excluding the Mesa City Center Project. Regents Penley, Manson, Taylor Robson, Shoopman, Ridenour, DuVal, King, Mata and Rusk voted in favor. None opposed and none abstained. Upon motion by Regent Penley, seconded by Regent Manson, the board approved the Mesa City Center project for inclusion in item 10A – ASU’s FY 2020 2024 Capital Improvement Plan as described in the executive summary. Regents Penley, Manson, Shoopman, Ridenour, DuVal, Mata and Rusk voted in favor. None opposed and none abstained. Regent Taylor Robson and Regent King were recused from this action. *Minutes (Item 7) The board approved the minutes for (a) March 19, 2019 Special Executive Session; (b) April 2-3, 2020 Executive Session; (c) April 7, 2020 Special Executive Session, (d) April 24, 2020 Special Executive Session, (e) May 7, 2020 Special Board Meeting, (f) May 21, 2020 Special Board Meeting, (g) May 21 Special Executive Session, (h) June 4, 2020 Special Board Meeting, (i) June 10-12 Regular Board Meeting, (j) June 22, 2020 Special Board Meeting, (k) June 30, 2020 Special Board Meeting, (l) July 21, 2020 Special Board Meeting, (m) August 20, 2020 Special Board Meeting, (n) September 9, 2020 Special Board Meeting. FINANCE, CAPITAL AND RESOURCES COMMITTEE *Report on the Finance, Capital and Resources Committee Meeting (Item 8) The board reviewed the report of the September 10, 2020 Finance, Capital and Resources Committee meeting. *Novus® Annual Report (ASU) (Item 9) The board received Arizona State University (ASU) Novus Innovation Corridor® annual report, in accordance with the reporting process approved by the board in September 2017. *FY 2022 – 2024 Capital Improvement Plans (ASU, UArizona) (Item 10) The board approved the Arizona State University and the University of Arizona FY 2022 – 2024 Capital Improvement Plans. *Capital Development Plan (NAU) (Item 11) The board approved Northern Arizona University Capital Development Plan (CDP), which does not include any projects. The CDP has no financial impact. *Veterans Administration Lease (UArizona) (Item 12) The board authorized a lease for the Veterans Administration (“VA”) to occupy 17,024 Rentable Square Feet on the 7th Floor of the Biosciences Partnership Building on the Phoenix Biomedical Campus.
Arizona Board of Regents September 30 – October 2, 2020 Page 5 of 16
*54-Acre West Campus Agricultural Center Sale Authorization, Including Waiver of ABOR Policy Requiring Public Auction (UArizona) (Item 13) The board authorized the sale of an approximately 54-acre parcel of property that is a portion of the West Campus Agricultural Center to Prince Interstate Commerce Campus, LLP, including waiver of ABOR Policy requiring public auction. *Sale of Property Adjacent to State Route 260, Including Waiver of ABOR Policy Requiring Public Auction (UArizona) (Item 14) The board approved the listing for sale with a licensed commercial real estate broker an approximate 4.1 acre parcel of real property located adjacent to SR-260 in Yavapai County, Arizona, including waiver of ABOR Policy requiring public auction. *Proposed Revision to Board Policy 6-803 “Vacation Leave” (Item 15) The board reviewed on first reading the proposed revisions to ABOR Policy 6-803 “Vacation Leave.” ACADEMIC AFFAIRS AND EDUCATIONAL ATTAINMENT COMMITTEE *Report on the Academic Affairs and Educational Attainment Committee Meeting (Item 16) The board reviewed the report of the September 10, 2020 Academic Affairs and Educational Attainment Committee Meeting. *Proposed Revision to ABOR Policy 1-201 “General Provisions Procedures for Rule Adoption” (Second Reading) (Item 17) The board approved on second reading the proposed revision to ABOR Policy 1-201 “General Provisions-Procedures for Rule Adoption.” *Proposed Revision to ABOR Policy 2-120 “Establishment of Admission Requirements” (Second Reading) (Item 18) The board approved on second reading the proposed revision to ABOR Policy 2-120 “Establishment of Admission Requirements”. *Proposed Revision to ABOR Policy 2-121 “Undergraduate Admission” (Second Reading) (Item 19) The board approved on second reading the proposed revision to ABOR Policy 2-121 “Undergraduate Admission.”
Arizona Board of Regents September 30 – October 2, 2020 Page 6 of 16
*Proposed Revision to ABOR Policy 2-224 “Academic Credit” (Second Reading) (Item 20) The board approved on second reading the proposed revision to ABOR Policy 2-224 “Academic Credit”. *Proposed Revision to ABOR Policy 2-323 “Course Materials” (Second Reading) (Item 21) The board approved on second reading the proposed revision to ABOR Policy 2-323 “Course Materials”. Postsecondary Performance Report (Item 22) The board approved the 2020 Postsecondary Performance Report. *Graduate Wages Report (Item 23) The board approved the Graduate Wages Report. *Request for Credit Exceptions for Northern Arizona University (Item 24) The board approved the new credit exceptions effective in the 2020-2021 academic year for Northern Arizona University. ADMINISTRATIVE BUSINESS *Proposed Revisions to ABOR Policy 3-501 “Issuance of Debt and Financing” (Second Reading) (Item 25) The board approved on second reading the proposed revisions to ABOR Policy 3-501 “Issuance of Debt and Financing.” *Proposed Revision to ABOR Policy 1-119 “Nondiscrimination and Anti-Harassment” (Second Reading) (Item 26) The board approved on second reading the proposed revisions to ABOR Policy 1-119 “Nondiscrimination and Anti-Harassment.” *Proposed New ABOR Policy 6-812 “Pay Reduction Programs” (Item 27) The board approved on second reading a new ABOR policy 6-812 “Pay Reduction Programs.”
Arizona Board of Regents September 30 – October 2, 2020 Page 7 of 16
ADMINISTRATIVE BUSINESS Arizona State University, Northern Arizona State University and the University of Arizona Fall 2020 Operations Update (Item 1) The board received an update and discussed Arizona State University, Northern Arizona University and the University of Arizona Fall 2020 Operations. Northern Arizona University [A PowerPoint presentation supplemented President Cheng’s presentation. A copy of the presentation can be found in the September 30-October 2, 2020 Document Files.] President Cheng updated the board on NAU COVID-19 planning, response and mitigation efforts and how NAU is working through the NAU and Flagstaff community to ensure that the students receive a quality education while keeping the community as healthy as possible. COVID-19 strategies include a number of measures put in place to mitigate risk and protect health and safety with education and prevention as key points. A robust system is in place for individuals who contract the virus. President Cheng reminded the board that NAU moved to an early start for the fall semester, implemented a test and isolate protocol for students arriving on campus, testing in close collaboration with the Coconino County and the Arizona Department of Health Services and phased move-ins for students returning to campus for in-person instruction. During the month of August, NAU was primarily using NAU flex remote. Towards the end of August and into September, instruction has changed to a hybrid in-person/remote modality. Extensive education and campus communications have been sent to students, faculty and staff around health and safety, as well as asking students to sign a pledge for their behavior. NAU engaged with Coconino County in September to perform mitigation testing in field houses, using the ASU saliva test. NAU is testing 2 percent of their campus each day. Two thousand students and employees are selected each week for mandatory random testing, to identify asymptomatic students or employees in particular those that maybe in a higher risk. NAU has the ability to conduct 500–1500 additional tests per week. The Flagstaff community, students, faculty and staff who wish to be tested can be tested on a walk-in basis. NAU has a formal IGA with Coconino County, to embed employees in the county contact tracing effort. NAU is using technology for both the health check app daily self-screening and a COVID watch app for exposure notification. Wastewater is being monitored as a key early warning system, as well as a confirmation of cases that are being seen across the campus. Campus housing is at 74.3 percent capacity which allowed NAU to set aside isolation and quarantine space on the campus community and also has an arrangement with the Drury hotel. COVID testing results have raised the raw number of positives in the community, however, the positivity rate on campus is lower than what the county is seeing. Testing in Coconino County has spiked up as a result of these efforts. The positivity rate overall in the county will also see a decline. Regular meetings are held with experts from Coconino County, City of Flagstaff, Northern Arizona Healthcare/Flagstaff Medical Center, and TGen North to ensure open communications and cohesive planning efforts for community-wide health. President Cheng and the Dean of Students have met with the Flagstaff manager and police department to ensure that NAU is getting data on a timely basis around conduct issues off
Arizona Board of Regents September 30 – October 2, 2020 Page 8 of 16
campus. There is a public form available on the website for community members to report any violations. NAU research is very directed at the COVID-19 issue. The Pathogen and Microbiome Institute is spearheading the Arizona COVID-19 genomics union with a partnership with UArizona and ASU. The Center for Health Equity Research received NIH funding to investigate various community engagement research opportunities. The Center for Materials Interfaces in Research Application is working on a rapid grant for interdisciplinary approaches for virus detection and the Economic Policy Institute is working with various communities within Coconino County to assess the economic impact and also advise on efforts to revitalize the economy in this new era of COVID-19. President Cheng provided an overview of the instructional and technology efforts to meet students’ needs. Eighty percent of classes have in-person interactions, 4 percent of classes were converted to fully online as a result of COVID-19. NAU has met students' needs and have roughly 20 percent of students taking advantage of the fully remote NAU flex options. Training is available across campus for faculty, staff and students on how to be successful in a remote learning NAU flex environment. Students share they are engaged and appreciate the use of Zoom. Academic support, advising and success centers have reported many engagements. Campus Health, Telecom Counseling and Tele Health appointments are up and running strong to support the students. Regent Taylor Robson thanked President Cheng for her report and commended President Cheng and her team for their work. Regent Penley thanked President Cheng for making NAU available and providing a technologically driven, safe, and healthy environment. University of Arizona [A PowerPoint presentation supplemented President Robbins’ presentation. A copy of the presentation can be found in the September 30-October 2, 2020 Document Files.] President Robbins presented key COVID-19 effort dates, highlighting when UArizona in partnership with Governor Ducey and Dr. Christ began a statewide antibody testing strategy on April 1; Rolling out Test Trace Treat strategy on May 19; on May 20 UArizona announced the Dr. Rich Carmona would lead the reentry task force and set up an incident command system to lead UArizona through a reentry process working closely with Provost Folks and the senior leadership team. In July, UArizona began a testing program using 3 tests and introduced the Wildcat WellCheck along with the COVID Watch application that uses Bluetooth technology that is secure and mitigates most of the privacy issues. Test Trace Track Strategy UArizona uses three tests: Antigen, PCR and Antibody tests. The Antigen test is a quick test that UArizona has the capability through a supply chain arrangement to do 8,000 tests per week through the end of the term. UArizona also uses the PCR nasal swab tests and found that to be the most accurate and are able to test in house. President Robbins shared that Dr. Yoon, a bio-engineer is working on a test similar to the microfluidic test President Crow has mentioned, and UArizona is hoping to deploy the test in January. Knowing the supply chain would be a challenge, UArizona produced testing kits and were able to provide them to local hospital partners in southern Arizona and the Native Nation partners across
Arizona Board of Regents September 30 – October 2, 2020 Page 9 of 16
Arizona. The Antibody test is one of the most accurate and is validated by third party evaluators around the world. The first two tests will tell you if you have COVID-19 at the moment, the antibody tests will tell you if you have had it in the past. President Robbins shared that a very high-profile peer reviewed journal article will be coming out on Arizona’s antibody testing group, that will detail the development of this test, which is not only the nuclear antibody, but the spike surface antibody that are antigen, that the antibody detects. It is an important neutralizing test that shows that an individual has the antibody, but that the antibody can kill the virus which helps to understand the true incidence in the community. It will also answer the question, “Is there any lasting immunity?” The COVID virus is a very simple, single strand virus and is very similar to MERS and SARS. In those cases, immunity to the virus was sustained for at least 6 to 12 and up to 18 months and believes this is going to be an important detail in this paper. For the Trace strategy, UArizona is using the COVID Watch app for contact tracing. Many of the large spreading events that are occurring are being seen mostly at off-campus gatherings. There has been a very low transmissibility in the classroom and in the public places on campus due to mitigation efforts. UArizona also has the Wildcat Wellcheck that helps to trace individuals that may be experiencing symptoms. The Treat strategy in place at UArizona is isolation. Isolation dorms have been identified and outfitted. Dedicated transportation to the dorms, onsite check-in and support have been coordinated. Campus Health check-in with telemedicine visits and establishing the UA cares check-in has been really important for students in isolation. President Robbins provided testing results and was concerned with the Labor Day spike on isolations rooms, UArizona had 400 beds and expanded to 600 and further made accommodations with local hotels. UArizona experienced 400-450 students in isolation after this spike. In collaboration with the county, Chuck Huckleberry, Dr. Cullen, Mayor Ramiro and the City Council, it was decided that UArizona would ask for a voluntary stay at home recommendation for two weeks. The main objective of the voluntary stay at home recommendation was to decrease the off-campus activities. In the peak of the pandemic, UArizona was near 20 percent positives, and the goal is to be down near 5 percent. On-campus students have mandatory testing, UArizona strongly encouraged and has had partnership with the county and the city to do testing of high-rise apartments near the university. During the voluntary stay at home request, the county worked with high-rises to close down their pools and gyms and to develop better practices for cleaning their units and creating dedicated isolation rooms. UArizona is working on increasing off-campus testing. UArizona serves about 15,000 employees and there have only been 20 cases that are known. The mitigation efforts are working on campus. President Robbins reported that Dr. Pepper is conducting wastewater-based epidemiology to identify hotspots. When the virus is identified, testing and contract tracing are done. This has been an effective way to find asymptomatic individuals and isolate them. Wastewater testing has expanded across campus into the Panhellenic houses and even into the high-rises off campus. Campus Health visits have increased due to symptomatic individual being directed to Campus Health. Telehealth visits have also increased as well as Campus Health Counseling and Psych Service. UArizona is very transparent and we post data on the UArizona COVID-19 website.
Arizona Board of Regents September 30 – October 2, 2020 Page 10 of 16
Regent Penley thanked President Robbins for everything that he has done to move the University of Arizona forward during the pandemic and also the generosity in his praise to President Cheng and President Crow for what they have done at their universities. Regent Shoopman commented that the board is very fortunate to have hired President Robbins, his medical training during this pandemic has been shown through. The combination of what President Cheng, President Crow and President Robbins have done have made Arizona universities leaders in this pandemic. Regent Penley commented that the board would like to share best practices at its next board meeting and try to look how to take innovations from each university and embed them into all three. Regent Penley thanked President Robbins, his senior team, students, faculty and staff at the University of Arizona. Arizona State University President Crow provided and update on the fall semester. ASU is in operations mode 2 which means that ASU is operating in a technologically intensive, hybrid when needed modality, where a person can come into and out of the university digitally. Mode 2 is built on the assumption of personal responsibility and choice. ASU has the largest enrollment in the history of the university for this fall semester with 128,500 students. There are 74,500 on campus in fully immersion hybrid mode. ASU is operating in 3 modes; ASU Immersion (ASUI) is on campus, students are attending classes on campus. ASU Sync (ASUS) is the ability of the university to be visited and interacted with in a digital format. ASU Online is a degree seeking pathway for qualified admitted students that are admitted to a university degree program and have the opportunity to pursue their programs in an asynchronous mode which allows students to join a class whenever their work schedule or life circumstances allow. Enrollment for ASU Online has increased substantially. There are 10,000 new students online this semester that ASU didn't have last semester. In addition, ASU is attempting to train over 45,000 teachers in Arizona on advanced digital education modalities. There are 75,000 students in ASU Prep, digitally pursuing a high school degree and early college courses. There are also students attending ASU Prep charter schools. ASU staff have been trained and are working in multiple digital modalities. Freshman retention is slightly lower than Fall of 2019. Faculty have been fantastic to keep the freshman retention up by keeping students on track during this pandemic. President Crow shared that Research has increased. There have been more proposals submitted and acquisition of new resources, projects, new activities, more collaboration with the UArizona and NAU. The research teams are able to work in modalities whether it's related to COVID or not. ASU has been in COVID management mode and have been slowly building ASU’s capabilities to manage this pandemic. A phone-based health check has been deployed that allows individuals to assess their symptoms and track whether or not they should come on campus, or be tested. Faculty and staff are developing digital learning technologies to teach students and faculty ways to connect through Zoom and different ways to teach and learn. In February 2021 ASU will be releasing content with Dreamscape Immersive, a Los Angeles based, full immersion avatar driven, virtual reality learning platform. ASU is further
Arizona Board of Regents September 30 – October 2, 2020 Page 11 of 16
developing and deploying soft technology, digital technology and biotechnologies for COVID management. ASU currently has fewer staff that are positive with COVID compared to the spring. They have not seen any transfer between students, staff or faculty. Which shows the management tools and ASU’s management techniques will keep the virus from spreading. ASU has purchased about 300,000 masks and are buying more. With the masking technology, social distancing, testing implemented, dorms management related to social distancing and behavior, ASU is now down to less than 175 positives in the student body. Updates are provided twice a week, at the beginning of the week and on Thursday nights. ASU’s international student campus enrollment is lower than last year. Provost Searle relayed how ASU is providing courses remotely for international students that were not able to return to ASU by rescheduling classes to allow students in different geographies to participate. President Crow praised his faculty and staff for their engagement in finding every way possible for the university to continue to work in fulfilling their mission with new ways to interact and engage students. President Crow commented that ASU continues to evolve and innovate, by the opening of spring semester 2021, ASU will be the most advanced teaching and learning platform built. Regent Penley thanked President Crow, his team, faculty, staff and student for the work they have done and further thanked all three presidents for their work and successfully managing COVID-19. Regent Penley commented on an article by the Atlantic featuring the University of Arizona is emblematic of what all three universities have done. Proposed Amendments to the Presidents’ Contracts (Item 2) The board was asked to approve the proposed amendments to the presidents’ contracts and authorize the board chair as described in the executive summary. Nancy Tribbensee presented and explained that the board is asked to authorize the chair to enter contract amendments with each president. President Cheng’s amendment to her contract will reflect the transition terms included in the executive summary and President Crow’s and President Robbins’ amendments will restore their contracts to their original terms by adding a one-year extension. Upon motion by Regent Manson, seconded by Regent Taylor Robson, the board approved the proposed amendments to the presidents’ contracts and authorized the board chair as described in the executive summary. Regents Penley, Manson, Taylor Robson, Shoopman, Ridenour, DuVal, King, Mata and Rusk voted in favor. None opposed and none abstained. Update on Northern Arizona Presidential Search and Approval of Search Guidelines (Item 3) The board received an update on the NAU presidential search, and the board office asked the board to approve the proposed Northern Arizona University Presidential Search Guidelines. Regent Manson and Regent DuVal provided an update on Northern Arizona Presidential Search and Nancy Tribbensee presented the Search Guidelines. Regent
Arizona Board of Regents September 30 – October 2, 2020 Page 12 of 16
Manson reported that a 14-member advisory committee has been appointed and it covers numerous constituencies both inside and outside of the university. They are hoping to plan their first committee meeting the week of October 12th to inform the committee of their obligations and responsibilities as members of the committee and to review and provide input on the leadership characteristics they believe are important for the advisory committee and board to consider. A Request for Proposal (RFP) has been issued for a search consultant and responses are due by October 13, 2020. They are hoping to schedule a search advisory committee meeting with the consultant by October 30, 2020. Regent DuVal reported on the outreach and listening phases. The first phase in the input and listening tour phase. Every submission received is reviewed and taken seriously. Conversations are being held with key stakeholders which include both a wide array of campus leaders, off campus leaders, elected officials and group meetings. On Monday, Regent Manson and Regent DuVal will be meeting with the faculty senate and are arranging meetings with the deans and foundation leadership. The goal is to complete this process in the month of October or shortly thereafter. Nancy Tribbensee said that the search guidelines outline the arc of the search process from beginning to end so members of the advisory committee can follow the process. The board website will provide progress updates on the search. The goal of a good search is to develop a broad and diverse pool of qualified prospects, one element of developing that pool is to maintain the confidentiality of individuals who inquire or express interest at the early stages of the search. The guidelines set forth that information about individuals who participate in the early parts of the process is confidential. When an individual accepts an invitation from the board to conduct an interview with the board, their information will become public. The point at which the information becomes public is set forth in the guidelines. The board ultimately makes the decision to select the next president, but the advisory committee, the search consultant and the input the regents described from the community are very important to help the board make that decision. Upon motion by Regent Penley, seconded by Regent Taylor Robson, the board approved the proposed Northern Arizona Presidential Search Guidelines as presented. Regents Penley, Manson, Taylor Robson, Shoopman, Ridenour, DuVal, King, Mata and Rusk voted in favor. None opposed and none abstained. Food Insecurity and Housing Work Group Update (Item 4) The board received an update regarding the establishment of a food insecurity and housing work group. Regent Rusk shared that basic needs insecurity is an epidemic across the entirety of the nation. College students, particularly in this time of COVID are struggling with basic needs more than ever. This working group is tasked to attack this epidemic. Regent Rusk provided a definition for food insecurity and housing insecurity and provided related statistics. Bridgette Nobbe commented that food insecurity is simply the lack of access to food and it is different to everybody due for reason such as financial access, transportation or lack of nutritious food. Colleges are located physically within a food desert – a mile away from the nearest grocery store, food on campus is sold at inflated rates and in addition to just the general cost of living that students are paying for in the cost of attending a university.
Arizona Board of Regents September 30 – October 2, 2020 Page 13 of 16
Nationwide it is estimated that between 30 to 40 percent of college students experience food insecurity at some point in their academic career. The most recent data from the University of Arizona is the 2016 campus climate survey, showed roughly 29 percent of students experienced food insecurity at some point, the students were mostly Latinx students, students with disabilities, Pell grant recipients and students from the LGBTQ community. Students may receive support from families for tuition, but many do not for food and housing. Middle class students who are not eligible for Pell are also food insecure. The University of Arizona campus pantry has experienced significant growth over the last eight years that they’ve been open and exponential growth over the last three years from 150 to over 1,050 visits per week pre-COVID. Over the past year and a half, the campus pantry served roughly 1900 unique individuals per semester and is subtly growing. Dani Carillo discussed housing insecurity and provided statistics from the 2016 Campus Climate Survey and from the College and University Basic Needs Insecurity April 2018 national report and explained how the statistic measures unstable housing and are national averages. Fostering success works with students that have experienced foster care or housing insecurity, the program officially launched in fall 2018 with 12 students and now has 75 students. It is important to note there is a large gap between the numbers from the campus climate survey to the number of eligible students and those who are actively participating. Fostering Success is an initiative at the University of Arizona within the division of Student Success and Retention Innovation, housed within the Thrive Center on campus and operate through a peer to peer model of support. The student peer mentors have also been participants in the program and qualified for the program based on their own lived experiences. They support students by connecting them to services. Regent Dave commented that for the project they are taking a data driven approach and currently understand the “as is” situation that exists on campuses by evaluating existing or emerging best practices across all three of the public universities and gathering additional student data. From there create a model to determine what to improve in the future. Regent Rusk commented that through this process they will look at what policy changes could be potentially made and presented a timeline. Regent Dave shared that in February/April they will create working documents and a report based on the data collected and an analysis of best practices and will present a final report with recommendations at the April Board of Regents meeting. Regent Rusk thanked the regents, board office and the three universities for their work and support. Regent Taylor Robson commented that the work is very commendable and focusing on data which will allow the regents to measure progress over time and asked for information on support from the businesses, local philanthropy or local community. Bridgette Nobbe responded that they work with the alumni association, different businesses within the community, and have received some outreach from some large corporations within Tucson. They are also partnering with the Southern Arizona community food bank and a church has assisted and setup bins all across the east side of Tucson for donations every week. Regent Taylor Robson commented that the grassroots approach they are taking and involving the broader community will help sustain and support what they are doing and continue to raise awareness. Regent DuVal complimented Regents Rusk and Dave for their work and appreciates the insight that the student regents bring to the board.
Arizona Board of Regents September 30 – October 2, 2020 Page 14 of 16
Cash Balance Pension Plan (Item 5) The board was asked to approve the Fifth Amendment to the Cash Balance Pension Plan. Mary Adelman presented that the amendment to the Cash Balance Pension Plan conforms the plan document to the changes made to the presidents’ contracts for plan year 2020. Upon motion by Regent Penley, seconded by Regent Manson, the board approved the Fifth Amendment to the Cash Balance Pension Plan as described in the executive summary. Regents Penley, Manson, Taylor Robson, Shoopman, Ridenour, DuVal, King, Mata and Rusk voted in favor. None opposed and none abstained. FINANCE, CAPITAL AND RESOURCE COMMITTEE FY2022 – 2024 Capital Improvement Plan (NAU) (Item 6) Northern Arizona University asked the board for approval of its FY 2022 - 2024 Capital Improvement Plan (CIP). Regent Taylor Robson commented that the Finance Capital and Resources committee directed NAU to revise their CIP and resubmit for board action. Dan Okoli presented the revised NAU Capital Improvement plan, indicating that there are no new capital projects for FY21 and FY22. For FY23 and FY24, projects include only those that were previously presented during the committee meeting. Upon motion by Regent Taylor Robson, seconded by Regent Manson, the board approved the NAU’s FY 2022 – 2024 Capital Improvement Plan (CIP) as presented in the executive summary. Regents Penley, Manson, Taylor Robson, Shoopman, Ridenour, DuVal, King, Mata and Rusk voted in favor. None opposed and none abstained. STUDENT REGENT REPORT Regents Rusk and Dave provided their student regent report to the board. [A copy of the presentation can be found in the September 30 – October 2, 2020 Document Files.] Regent Dave updated the board that fireside chats had been held on a monthly basis and are now biweekly due to the nature of COVID-19 and the need to increase communication. The fireside chats provide an opportunity for Regent Rusk and Regent Dave to engage with the student body leaders on issues from the three universities. A new student regent blog has been introduced and serves as a means to communicate with the student constituency across the three universities. Regent Rusk reported that the NAU Student Focus Groups allows students to meet with the student regents across NAU to gain their perspective on what they are looking for in a new president and what it means for the enterprise as a whole. Regents Rusk and Dave highlighted that their priorities for this year are to continue working on Basic Needs Insecurity, increase engagement and communication and revamp the student regent report to include the student body’s insight and perspective.
Arizona Board of Regents September 30 – October 2, 2020 Page 15 of 16
REPORT FROM THE ARIZONA FACULTIES COUNCIL Professor Jessica Summers provided her report on behalf of the Arizona Faculties Council (AFC). [A copy of the presentation can be found in the September 30 – October 2, 2020 Document Files.] Professor Summers commented the Arizona Faculty’s Council is encouraged by the onboarding of three faculty on the NAU presidential search committee and are hopeful that more faculty will be chosen by President Crow for the provost search committee at ASU. The AFC is excited about the establishment of a coalition designed to address students' basic needs. They are grateful the board continues to meet virtually, faculty are motivated to stay safe and keep students as safe as possible until a vaccine can be developed. Professor Summers shared the professional, personal and economic hardships and concerns faculty have associated with COVID-19 related to research, relearning how to be an effective instructor in different modalities and caring for loved ones at home. Professor Summers further shared AFC members’ concerns about students being able to access quality research experience and that ABOR and university metrics of student attainment may not be the best measure of success during this pandemic. They encourage the board to consider collecting other types of data during this time to demonstrate empirically that students may be thriving. The AFC urges the board to help universities to set reliable, consistent safety message measures to serve the whole community to better ensure economic recovery and to work collaboratively with state legislators to change policies to allow employees to access their vested state retirement money or to be able to use the childcare or elder care tax credits to pay for in home care. As far as COVID-19 and the lack of economic resources, the AFC believes the state of Arizona is sending mixed signals to the universities; they value the universities’ ability to produce high quality graduates in top-ranked programs, with many deciding to stay in the state of Arizona for work and on the other hand they are the lowest funded university system in the country. From the standpoint of state appropriations, the universities depend on net tuition revenue and out of state tuition dollars to pay the bills. No relief has been provided to date, and it's clear that while some institutions like ASU have figured out how 65,000 students and online programs can help sustain students, UArizona and NAU are suffering with no such revenue stream in their portfolio. NAU laid off hundreds of faculty and staff prior to the fall semester. Employees who kept their jobs are taking pay cuts of up to 4.6 percent. Faculty are struggling to pay their bills and are applying for private sector jobs, or finding jobs at state institutions that have the financial support necessary for growth and development. Professor Summers shared a survey that was conducted back in July before the furlough showing that many people were looking for alternate employment. They implore the university leaders and members of the board to seek short term financial mitigation strategies. In the interest of long-term sustainability, it is crucial that the best teachers and brightest researchers are retained so students can continue to expect a high-quality educational experience in the state of Arizona. The AFC implores the regents to identify consistent, sustainable, and long-term economic strategies forward. Ongoing planning of their symposium on civil discourse continues and are hoping it can be offered in partnership with the upcoming Regents Cups event in early spring in 2021. Education should continue to be accessible to all Arizona's and the institutions are committed to anti-racism anti-discrimination policies. Regent Penley commented that for members of the public who are interested, the board held an in-depth discussion of issues associated with lines of credit and other issues related to taking out loans during the August 20, 2020 meeting.
Arizona Board of Regents September 30 – October 2, 2020 Page 16 of 16
INQUIRIES, REQUESTS, REPORTS, AND COMMENTS FROM REGENTS AND MEMBERS OF THE ENTERPRISE EXECUTIVE COMMITTEE Regent Penley recognized Provost Mark Searle’s retirement announcement and offered on behalf of the board, sincere appreciation for the great work he has done and continues to do on behalf of the faculty, staff and students at Arizona State University. ADJOURNMENT The meeting adjourned at 11:42 a.m.
Submitted by: Suzanne Templin Secretary to the Board
DRAFT ARIZONA BOARD OF REGENTS
Minutes of a Special Board Meeting Tuesday, October 13, 2020
A special board meeting of the Arizona Board of Regents was held virtually on Tuesday, October 13, 2020 at 9:30 a.m. Members Present via video: Regent Penley, Regent Manson, Regent Taylor Robson (entered at 9:34 a.m. via phone and video), Regent Shoopman, Regent DuVal, Regent Ridenour, Regent Mata, and Regent Dave Members Absent: Regent King, Regent Rusk, Superintendent Hoffman and Governor Ducey Others present via video: from the board office Executive Director John Arnold, General Counsel Jennifer Pollock, Nancy Tribbensee, Samantha Blevins, and Suzanne Templin; from the University of Arizona President Robbins, Jon Dudas, Laura Todd Johnson, Lisa Rulney, and Michael Dake; from Mannat Keith Anderson Regent Penley called the meeting to order at 9:32 a.m. EXECUTIVE SESSION Upon motion by Regent Manson; seconded by Regent Mata, the board approved convening in executive session. Regents Penley, Manson, Shoopman, DuVal, Ridenour, and Mata voted in favor. None opposed and none abstained. Regent Taylor Robson was not present for the vote. The board recessed at 9:33 a.m. The board convened in executive session at 9:36 a.m. ADJOURNMENT The meeting adjourned 11:04 a.m.
Submitted by:
Kim Edwards Administrative Associate

This page intentionally left blank
DRAFT ARIZONA BOARD OF REGENTS
Minutes of a Special Board Meeting Monday, October 26, 2020
A special board meeting of the Arizona Board of Regents was held virtually on Monday, October 26, 2020 at 12:30 p.m. Members Present via video: Regent Penley, Regent Manson, Regent Shoopman, Regent Ridenour, Regent DuVal, Regent King, Regent Rusk and Regent Dave Members Absent: Regent Taylor Robson, Regent Mata, Superintendent Hoffman and Governor Ducey Others present via video: from the board office Executive Director John Arnold, General Counsel Jennifer Pollock, Nancy Tribbensee, Samantha Blevins, Suzanne Templin and Tom Merriam; from the University of Arizona President Robbins, Jon Dudas, Laura Todd Johnson, David Wagner, and Steve Moore Regent Penley called the meeting to order at 12:31 p.m. EXECUTIVE SESSION Upon motion by Regent Manson; seconded by Regent Ridenour, the board approved convening in executive session. Regents Penley, Manson, Shoopman, Ridenour, DuVal, King and Rusk voted in favor. None opposed and none abstained. The board recessed at 12:33 p.m. The board convened in executive session at 12:33 p.m. ADJOURNMENT The meeting adjourned 1:56 p.m.
Submitted by:
Kim Edwards Administrative Associate

This page intentionally left blank
DRAFT ARIZONA BOARD OF REGENTS
Minutes of a Special Board Meeting Monday, November 9, 2020
A special board meeting of the Arizona Board of Regents was held virtually on Monday, November 9, 2020 at 1:00 p.m. Members Present via video: Regent Penley, Regent Manson, Regent Taylor Robson (entered at 1:05 p.m.), Regent Shoopman, Regent Ridenour, Regent DuVal, Regent King, Regent Mata and Regent Rusk Members Absent: Regent Dave, Superintendent Hoffman and Governor Ducey Others present via video: from the board office Executive Director John Arnold, General Counsel Jennifer Pollock, Nancy Tribbensee, Samantha Blevins, Tom Merriam and Suzanne Templin; from University of Arizona President Robbins, Jon Dudas, Laura Todd Johnson and Heather Gaines; from Manatt Keith Anderson; and from Hogan Marren Babbot & Rose LTD Charlie Rose Regent Penley called the meeting to order at 1:02 p.m. EXECUTIVE SESSION Upon motion by Regent Shoopman; seconded by Regent Mata, the board approved convening in executive session. Regents Penley, Manson, Shoopman, Ridenour, DuVal, King, Mata and Rusk voted in favor. None opposed and none abstained. Regent Taylor Robson was not present for the vote. The board recessed at 1:03 p.m. The board convened in executive session at 1:04 p.m. ADJOURNMENT The meeting adjourned 3:08 p.m.
Submitted by:
Kim Edwards Administrative Associate

This page intentionally left blank
Board of Regents Meeting November 18-20, 2020
Item #12 EXECUTIVE SUMMARY Page 1 of 3
Contact Information: Lorenzo Martinez, ABOR [email protected] 602-229-2525
Item Name: Report on Finance, Capital and Resources Committee Meeting
Action Item
Agenda Highlights Finance, Capital and Resources Committee
November 5, 2020
1. Approval of Minutes Outcomes and Assignments: • Public session and executive session minutes from the September 10,
2020 Finance, Capital and Resources Committee meeting were approved.
2. FY 2021 Financial Status Report – Fall Update (ASU, NAU, UArizona)
Outcomes and Assignments: • The committee discussed the fall updates of the FY 2021 Financial
Status Report for all three universities.
3. Discussion of FY 2021 Capital Development Plan (UArizona) Outcomes and Assignments: • The committee discussed the UArizona Capital Development Plan
(CDP). No action was taken since the CDP does not include any new projects. The item will be on the board consent agenda.
4. Review of Revised Sunset Review Fee Schedule (UArizona)
Outcomes and Assignments: • The committee forwarded to the full board for approval the UArizona
revised academic fees sunset review schedule, as described in the executive summary. The item will be on the board consent agenda.
Requested Action: The board office asks the full board to review the report of the November 5, 2020 Finance, Capital and Resources Committee.
Board of Regents Meeting November 19-20, 2020
Item #12 EXECUTIVE SUMMARY Page 2 of 3
5. Review of Amended Capital Development Plan (ASU)
Outcomes and Assignments: • The committee forwarded to the full board for approval the ASU
Amended CDP, as described in the executive summary. The item will be on the board consent agenda.
6. Review of Premium Payment, Health and Dependent Care Cafeteria Plan
Outcomes and Assignments: • The committee forwarded to the full board for approval the Fifth
Amendment to the Premium Payment, Health and Development Care Cafeteria Plan, as described in the executive summary. The item will be on the board consent agenda.
7. Review of Proposed Revision to Board Policy 1-117 (Naming of Facilities
and Programmatic Units for Individuals or Organizations) and Incorporation and Repeal of the Guidelines For Assigning the Names of Individuals, Families or Organizations to Campus Facilities or Programmatic Units (First Reading)
Outcomes and Assignments: • The committee forwarded to the full board first reading of proposed
revisions to Board Policy 1-117, as described in the executive summary. In addition, language will be added to the policy revisions to reference sponsorship agreements. The item will be on the board consent agenda.
8. Debt Refunding Discussion (ASU, NAU, UArizona)
Outcomes and Assignments: • The committee discussed actions each university has taken or plan to
take to sell refunding bonds and Certificates of Participation to refinance all or a portion of the principal and interest payments accruing in fiscal years 2021 through 2022 to provide cash flow relief in light of the financial pressures placed on the universities by the COVID-19 pandemic.
Board of Regents Meeting November 19-20, 2020
Item #12 EXECUTIVE SUMMARY Page 3 of 3
9. Debt Reform Review
Outcomes and Assignments: • The committee discussed possible statutory changes to allow the
universities to issue long-term debt for university capitalization purposes.
• Staff was directed to work with the board on the next steps in this process.

This page intentionally left blank
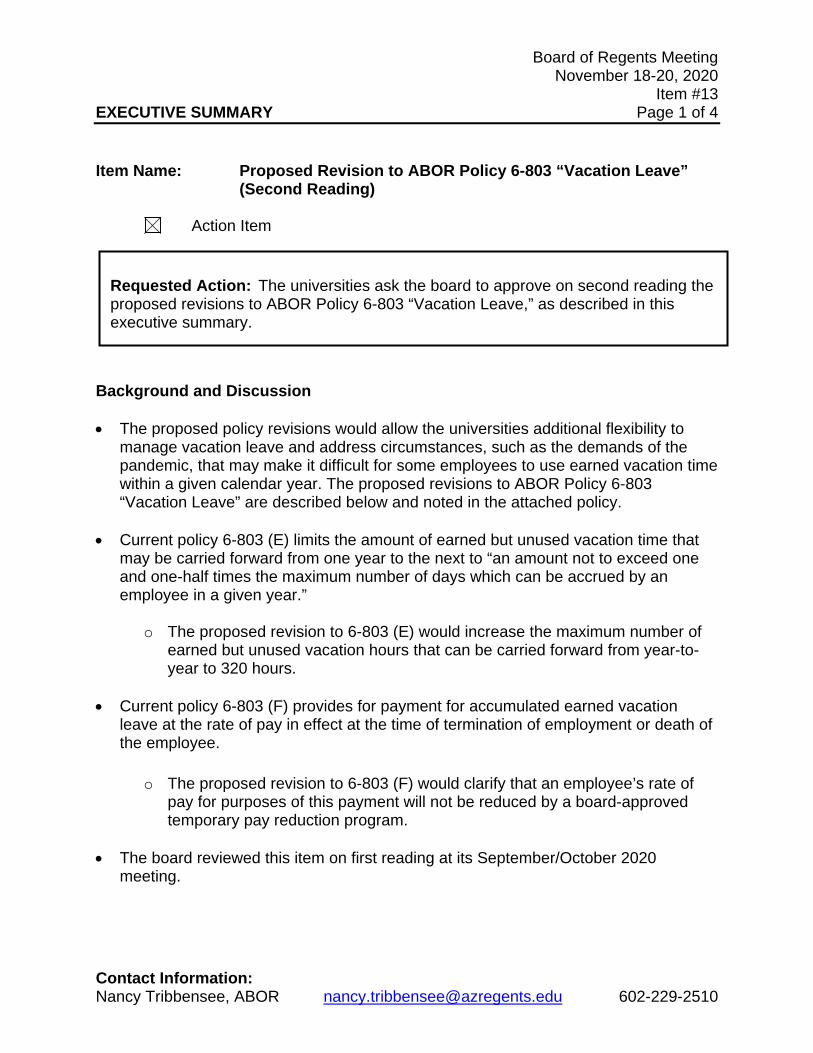
Board of Regents Meeting November 18-20, 2020
Item #13 EXECUTIVE SUMMARY Page 1 of 4
Contact Information: Nancy Tribbensee, ABOR [email protected] 602-229-2510
Item Name: Proposed Revision to ABOR Policy 6-803 “Vacation Leave”
(Second Reading)
Action Item
Background and Discussion • The proposed policy revisions would allow the universities additional flexibility to
manage vacation leave and address circumstances, such as the demands of the pandemic, that may make it difficult for some employees to use earned vacation time within a given calendar year. The proposed revisions to ABOR Policy 6-803 “Vacation Leave” are described below and noted in the attached policy.
• Current policy 6-803 (E) limits the amount of earned but unused vacation time that may be carried forward from one year to the next to “an amount not to exceed one and one-half times the maximum number of days which can be accrued by an employee in a given year.”
o The proposed revision to 6-803 (E) would increase the maximum number of
earned but unused vacation hours that can be carried forward from year-to-year to 320 hours.
• Current policy 6-803 (F) provides for payment for accumulated earned vacation
leave at the rate of pay in effect at the time of termination of employment or death of the employee.
o The proposed revision to 6-803 (F) would clarify that an employee’s rate of
pay for purposes of this payment will not be reduced by a board-approved temporary pay reduction program.
• The board reviewed this item on first reading at its September/October 2020
meeting.
Requested Action: The universities ask the board to approve on second reading the proposed revisions to ABOR Policy 6-803 “Vacation Leave,” as described in this executive summary.

Board of Regents Meeting November 18-20, 2020
Item #13 EXECUTIVE SUMMARY Page 2 of 4 Committee Review and Recommendation
The Finance, Capital and Resources Committee reviewed this item at its September 10, 2020 meeting and recommended forwarding to the full board for first reading and subsequent approval.
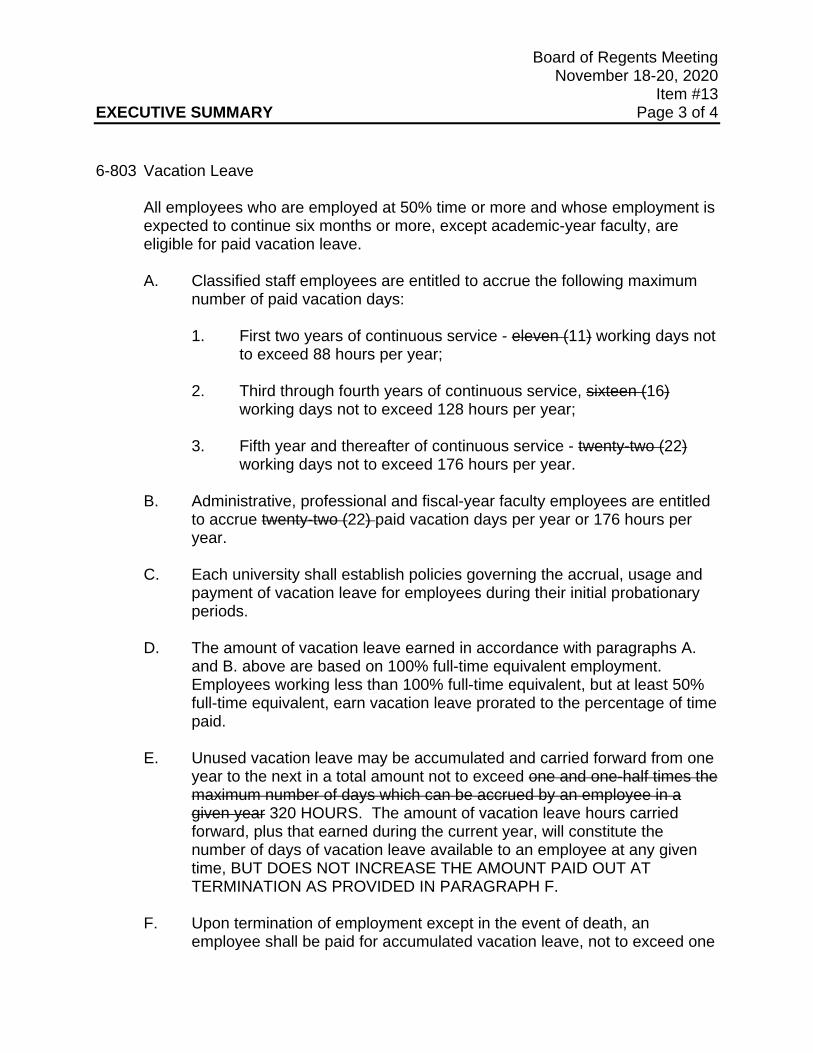
Board of Regents Meeting November 18-20, 2020
Item #13 EXECUTIVE SUMMARY Page 3 of 4 6-803 Vacation Leave
All employees who are employed at 50% time or more and whose employment is expected to continue six months or more, except academic-year faculty, are eligible for paid vacation leave.
A. Classified staff employees are entitled to accrue the following maximum
number of paid vacation days:
1. First two years of continuous service - eleven (11) working days not to exceed 88 hours per year;
2. Third through fourth years of continuous service, sixteen (16)
working days not to exceed 128 hours per year;
3. Fifth year and thereafter of continuous service - twenty-two (22) working days not to exceed 176 hours per year.
B. Administrative, professional and fiscal-year faculty employees are entitled
to accrue twenty-two (22) paid vacation days per year or 176 hours per year.
C. Each university shall establish policies governing the accrual, usage and
payment of vacation leave for employees during their initial probationary periods.
D. The amount of vacation leave earned in accordance with paragraphs A.
and B. above are based on 100% full-time equivalent employment. Employees working less than 100% full-time equivalent, but at least 50% full-time equivalent, earn vacation leave prorated to the percentage of time paid.
E. Unused vacation leave may be accumulated and carried forward from one
year to the next in a total amount not to exceed one and one-half times the maximum number of days which can be accrued by an employee in a given year 320 HOURS. The amount of vacation leave hours carried forward, plus that earned during the current year, will constitute the number of days of vacation leave available to an employee at any given time, BUT DOES NOT INCREASE THE AMOUNT PAID OUT AT TERMINATION AS PROVIDED IN PARAGRAPH F.
F. Upon termination of employment except in the event of death, an
employee shall be paid for accumulated vacation leave, not to exceed one
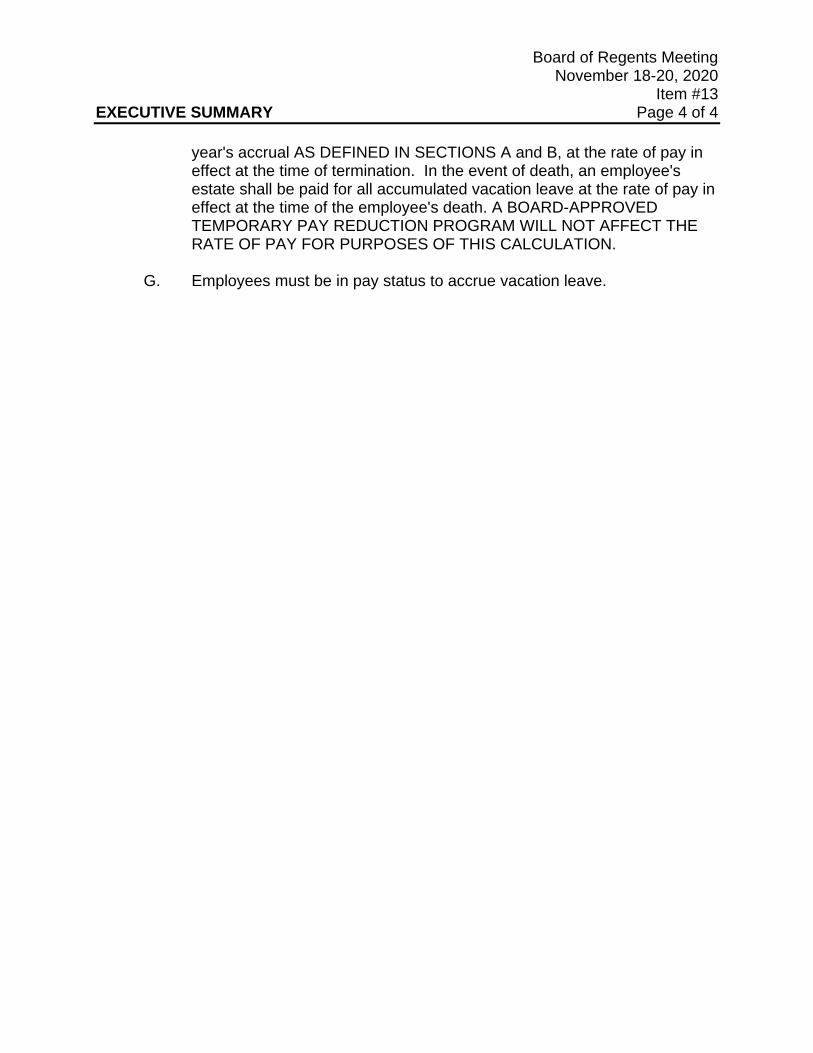
Board of Regents Meeting November 18-20, 2020
Item #13 EXECUTIVE SUMMARY Page 4 of 4
year's accrual AS DEFINED IN SECTIONS A and B, at the rate of pay in effect at the time of termination. In the event of death, an employee's estate shall be paid for all accumulated vacation leave at the rate of pay in effect at the time of the employee's death. A BOARD-APPROVED TEMPORARY PAY REDUCTION PROGRAM WILL NOT AFFECT THE RATE OF PAY FOR PURPOSES OF THIS CALCULATION.
G. Employees must be in pay status to accrue vacation leave.
Board of Regents Meeting November 18-20, 2020
Item #14 EXECUTIVE SUMMARY Page 1 of 8
Contact Information: Lisa Rulney, UArizona [email protected] 520-621-5977
Item Name: FY 2021 Capital Development Plan (UArizona)
Action Item
Previous Board Action • FY 2022 – 2024 Capital Improvement Plan October 2020 • The UArizona FY 2021 CDP contains no new projects for approval while the
University focuses on completing its existing high-priority projects and mitigating the significant safety and financial impacts of the pandemic.
Prior Year Activity • Two (2) capital projects totaling $47,000,000 were substantially completed in
the last 12 months.
• Seven (7) capital projects, totaling $401,000,000 began or were under construction activity in the last 12 months.
• Detail on completed and ongoing projects are listed in Exhibit 1.
Overview and Alignment with Enterprise and University Goals and Objectives
• In light of the pandemic, UArizona capital development goals continue to be the
completion of its existing high-priority projects.
Capital Development Plan Projects
• No projects are being proposed for CDP approval so information has not been included in Exhibits 2 – 4 and Project Justification Reports have not been included.
Requested Action: The University of Arizona (UArizona) is submitting no new projects as part of its Capital Development Plan and therefore requires no action to be taken, as described in this executive summary.
Board of Regents Meeting November 18-20, 2020
Item #14 EXECUTIVE SUMMARY Page 2 of 8 Fiscal Impact and Management • There is no additional fiscal impact resultant from UArizona’s FY 2021 CDP. Committee Review and Recommendation The Finance, Capital and Resources Committee reviewed this item at its November 5, 2020 meeting and recommended forwarding to the full board for review. Statutory/Policy Requirements • Pursuant to Arizona Board of Regents Policy Chapter 7-107, each university
shall submit an annual CDP for the upcoming year in accordance with the calendar approved by the executive director of the board.
• CDPs are reviewed by the Finance, Capital and Resources Committee and
approved by the board. • Approval of the CDP allows universities to complete design, execute construction and
financing agreements, and begin construction as outlined in policy.
Board of Regents Meeting November 18-20, 2020
Item #14 EXECUTIVE SUMMARY Page 3 of 8
EXHIBIT 1
UNIVERSITY OF ARIZONA CAPITAL PROJECT STATUS REPORT
Project Name
Gross Square Feet
Total Budget
Percent Work
Completed**
Percent Total
Expended**
Gift Target
Percent to Gift
Target**
Date Last
Board Approval
Original /Revised
Occupancy Date
Ongoing Projects
Student Success District 201,346 $81,000,000 70% 67% $20,000,000 73% Jun 17 Nov 21
Phoenix Biomedical Sciences Partnership 3rd & 4th Floor Finish
Shell Space
46,100
$34,000,000
43%
35%
NA
NA
Nov 18
Feb 21
Applied Research Building / Campus
Infrastructure
89,000
$85,000,000 / $16,000,000
5%
5%
NA
NA
Nov 19
Jul 23
Grand Challenges Research Building
115,000
$99,000,000
5%
5%
NA
NA
Nov 19
Jan 24
Chemistry Building Renovations
75,000
$42,000,000
4%
4%
NA
NA
Nov 19
Nov 22
Center for Integrative Medicine
30,000
$20,000,000
3%
3%
$20,000,000
35%
Nov 19
Apr 22
Facilities Management
Relocation and Consolidation Facility
70,000
$24,000,000
1%
1%
NA
NA
Nov 19
Apr 22
Ongoing Project Totals
$401,000,00
0
$40,000,000
Completed Projects College of Pharmacy
Skaggs Building Addition and Renovation
30,000
$26,000,000
97%
93%
$10,000,000
100%
Feb 18
Nov 19
Campus Deferred Maintenance 2019
Varies
$21,000,000
93%
90%
NA
NA
Nov 18
Jul 20
Completed Project Totals $47,000,000 $10,000,000
**As of July 1, 2020
Board of Regents Meeting November 18-20, 2020
Item #14 EXECUTIVE SUMMARY Page 4 of 8
EXHIBIT 2
UNIVERSITY OF ARIZONA CAPITAL DEVELOPMENT PLAN
BOARD APPROVAL
STATUS
GROSS SQUARE
FOOTAGE
PROJECT COST
AMOUNT FINANCED
FUNDING METHOD
ANNUAL DEBT
SERVICE
FINAL MATURITY
DEBT RATIO
NEW CAPITAL PROJECTS
No New Capital Projects Being Proposed
EXHIBIT 3
CAPITAL DEVELOPMENT PLAN ANNUAL DEBT SERVICE BY FUNDING SOURCE
PROJECT
AMOUNT
FINANCED
TUI
SFE
ICR
OLF
SCI
SLP
OTH
TOTAL ANNUAL
DEBT SERVICE
NEW CAPITAL PROJECTS
No New Capital Projects Being Proposed
EXHIBIT 4
CAPITAL DEVELOPMENT PLAN ANNUAL OPERATION AND MAINTENANCE BY FUNDING SOURCE
PROJECT
TOTAL ANNUAL
O&M
TUI
SFE
ICR
OLF
GFA
FGT
DFG
OTH
NEW CAPITAL PROJECTS
No New Capital Projects Being Proposed
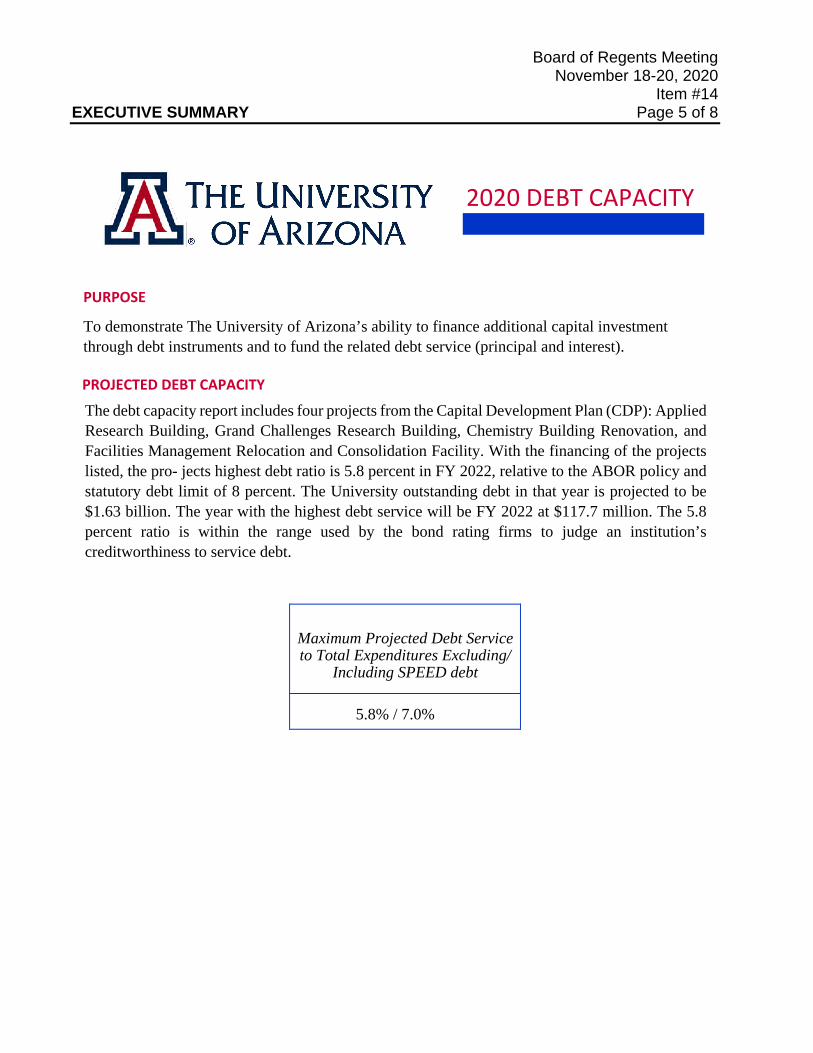
Board of Regents Meeting November 18-20, 2020
Item #14 EXECUTIVE SUMMARY Page 5 of 8
2020 DEBT CAPACITY
PURPOSE
To demonstrate The University of Arizona’s ability to finance additional capital investment through debt instruments and to fund the related debt service (principal and interest).
PROJECTED DEBT CAPACITY
The debt capacity report includes four projects from the Capital Development Plan (CDP): Applied Research Building, Grand Challenges Research Building, Chemistry Building Renovation, and Facilities Management Relocation and Consolidation Facility. With the financing of the projects listed, the pro- jects highest debt ratio is 5.8 percent in FY 2022, relative to the ABOR policy and statutory debt limit of 8 percent. The University outstanding debt in that year is projected to be $1.63 billion. The year with the highest debt service will be FY 2022 at $117.7 million. The 5.8 percent ratio is within the range used by the bond rating firms to judge an institution’s creditworthiness to service debt.
Maximum Projected Debt Service to Total Expenditures Excluding/
Including SPEED debt
5.8% / 7.0%
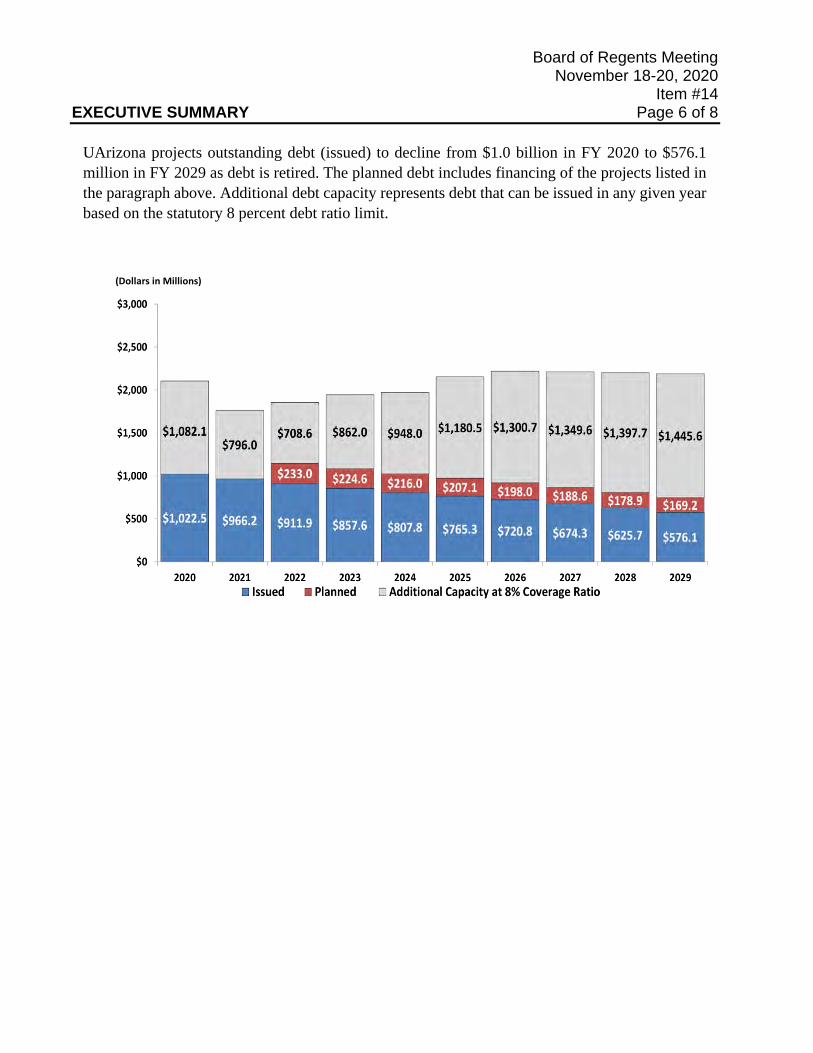
Board of Regents Meeting November 18-20, 2020
Item #14 EXECUTIVE SUMMARY Page 6 of 8
UArizona projects outstanding debt (issued) to decline from $1.0 billion in FY 2020 to $576.1 million in FY 2029 as debt is retired. The planned debt includes financing of the projects listed in the paragraph above. Additional debt capacity represents debt that can be issued in any given year based on the statutory 8 percent debt ratio limit.
(Dollars in Millions)
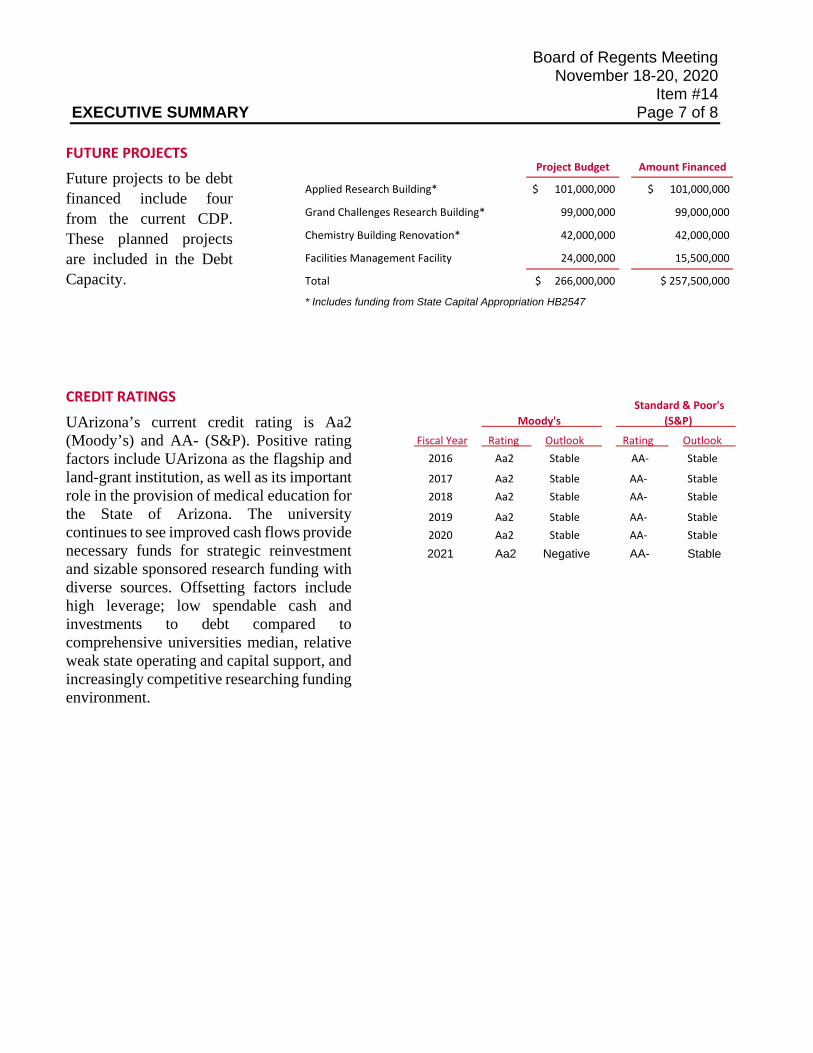
Board of Regents Meeting November 18-20, 2020
Item #14 EXECUTIVE SUMMARY Page 7 of 8
FUTURE PROJECTS
Future projects to be debt financed include four from the current CDP. These planned projects are included in the Debt Capacity.
CREDIT RATINGS
UArizona’s current credit rating is Aa2 (Moody’s) and AA- (S&P). Positive rating factors include UArizona as the flagship and land-grant institution, as well as its important role in the provision of medical education for the State of Arizona. The university continues to see improved cash flows provide necessary funds for strategic reinvestment and sizable sponsored research funding with diverse sources. Offsetting factors include high leverage; low spendable cash and investments to debt compared to comprehensive universities median, relative weak state operating and capital support, and increasingly competitive researching funding environment.
Project Budget Amount Financed
Applied Research Building* $ 101,000,000 $ 101,000,000
Grand Challenges Research Building* 99,000,000 99,000,000
Chemistry Building Renovation* 42,000,000 42,000,000
Facilities Management Facility 24,000,000 15,500,000
Total $ 266,000,000 $ 257,500,000
* Includes funding from State Capital Appropriation HB2547
Moody's
Standard & Poor's (S&P)
Fiscal Year Rating Outlook Rating Outlook 2016 Aa2 Stable AA- Stable
2017 Aa2 Stable AA- Stable 2018 Aa2 Stable AA- Stable
2019 Aa2 Stable AA- Stable 2020 Aa2 Stable AA- Stable 2021 Aa2 Negative AA- Stable
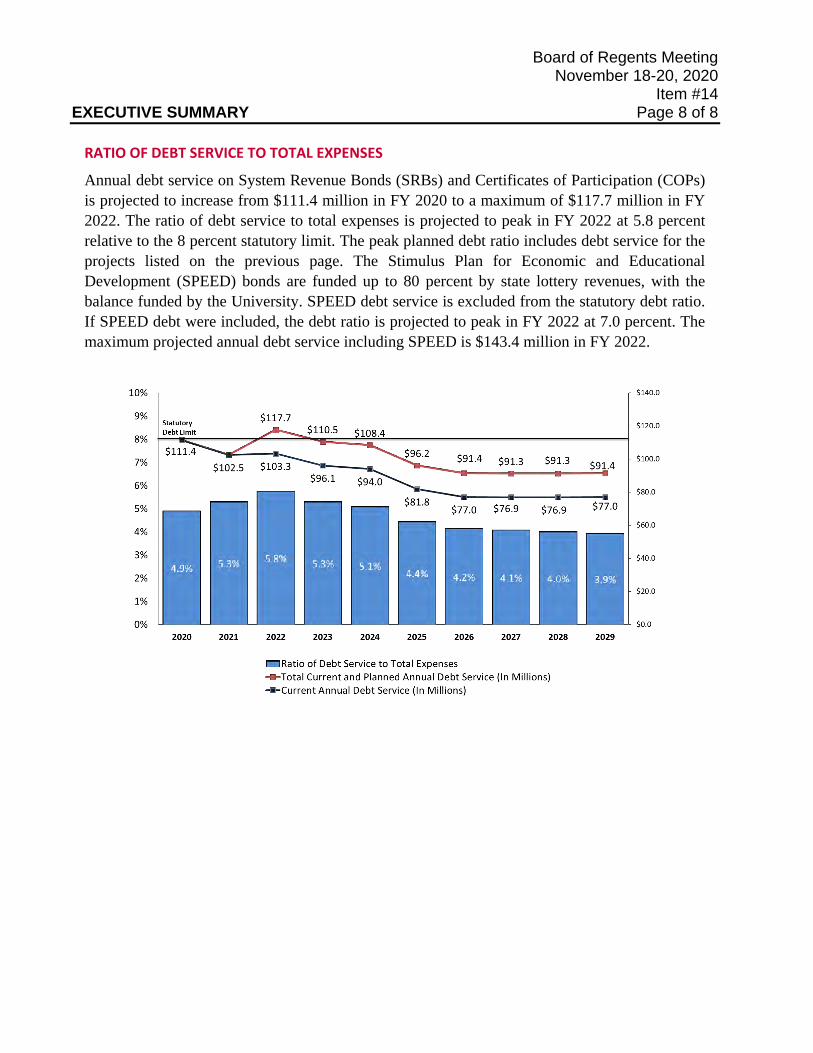
Board of Regents Meeting November 18-20, 2020
Item #14 EXECUTIVE SUMMARY Page 8 of 8
RATIO OF DEBT SERVICE TO TOTAL EXPENSES
Annual debt service on System Revenue Bonds (SRBs) and Certificates of Participation (COPs) is projected to increase from $111.4 million in FY 2020 to a maximum of $117.7 million in FY 2022. The ratio of debt service to total expenses is projected to peak in FY 2022 at 5.8 percent relative to the 8 percent statutory limit. The peak planned debt ratio includes debt service for the projects listed on the previous page. The Stimulus Plan for Economic and Educational Development (SPEED) bonds are funded up to 80 percent by state lottery revenues, with the balance funded by the University. SPEED debt service is excluded from the statutory debt ratio. If SPEED debt were included, the debt ratio is projected to peak in FY 2022 at 7.0 percent. The maximum projected annual debt service including SPEED is $143.4 million in FY 2022.
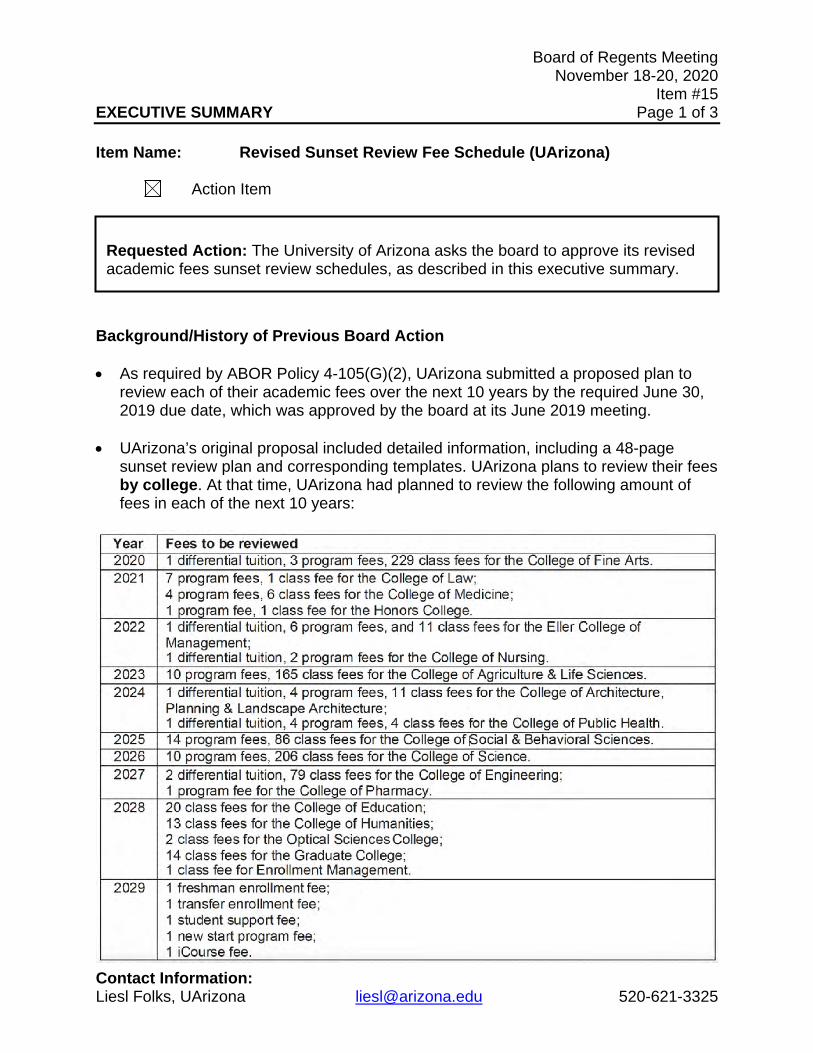
Board of Regents Meeting November 18-20, 2020
Item #15 EXECUTIVE SUMMARY Page 1 of 3
Contact Information: Liesl Folks, UArizona [email protected] 520-621-3325
Item Name: Revised Sunset Review Fee Schedule (UArizona)
Action Item
Background/History of Previous Board Action • As required by ABOR Policy 4-105(G)(2), UArizona submitted a proposed plan to
review each of their academic fees over the next 10 years by the required June 30, 2019 due date, which was approved by the board at its June 2019 meeting.
• UArizona’s original proposal included detailed information, including a 48-page sunset review plan and corresponding templates. UArizona plans to review their fees by college. At that time, UArizona had planned to review the following amount of fees in each of the next 10 years:
Requested Action: The University of Arizona asks the board to approve its revised academic fees sunset review schedules, as described in this executive summary.
Board of Regents Meeting November 18-20, 2020
Item #15 EXECUTIVE SUMMARY Page 2 of 3
Discussion
• UA is requesting an extension for the Sunset Review scheduled for FY 2020. The university understands how important it is to review university fees to ensure they are current and applicable to provide students resources to be successful. Currently there are several factors affecting the university’s ability to analyze the fees adequately and thoroughly.
• The COVID-19 pandemic has challenged leaders, faculty, and staff to find unique
and adequate alternatives on how to conduct courses remotely and safely. Additionally, the economic effects that the pandemic is having on universities, and the uncertainty of future semesters, affects the colleges’ ability and confidence in doing a proper review of their fees that truly reflects the stance of the college, the university and the real need of the students. The need of the students is affected by the pandemic, and not reflective of the resources provided by the fees. In fact, there have been several course fees refunds/waivers due to cancelled in-person activities. As a result, completing student consultation in support of any academic fee at the current time is likely to produce inaccurate and biased results.
• Therefore, UArizona is requesting for the sunset review schedule to be pushed
back by one year. This means that we will not be submitting a sunset review of academic fees for fiscal year 2020 in Spring 2021. Consequently, we will be submitting our first year of review for FY 2021 in Spring 2022 and continue with our schedule until FY 2030. If this change is approved, no academic fee at UArizona will sunset this fiscal year, fees will continue as they are unless a modification or new fee is requested through the Tuition and Fee setting process.
• The now 49-page sunset review plan and corresponding templates (originally
Attachment C) has been updated to reflect the schedule change. UArizona still plans to review their fees by college. UArizona will review the following amount of fees in each of the next 10 years:
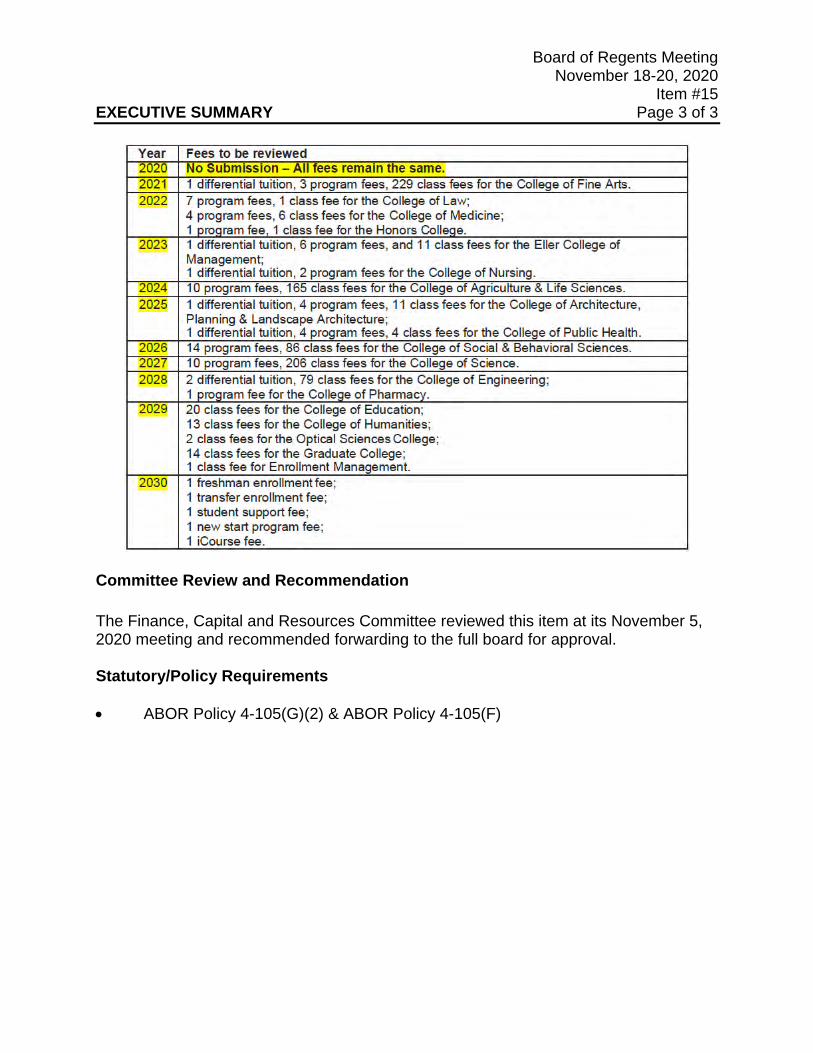
Board of Regents Meeting November 18-20, 2020
Item #15 EXECUTIVE SUMMARY Page 3 of 3
Committee Review and Recommendation
The Finance, Capital and Resources Committee reviewed this item at its November 5, 2020 meeting and recommended forwarding to the full board for approval. Statutory/Policy Requirements • ABOR Policy 4-105(G)(2) & ABOR Policy 4-105(F)

This page intentionally left blank
1 UD 10/2020 M. SESTEAGA
The University of Arizona University Fees Ten-Year Sunset Review Plan
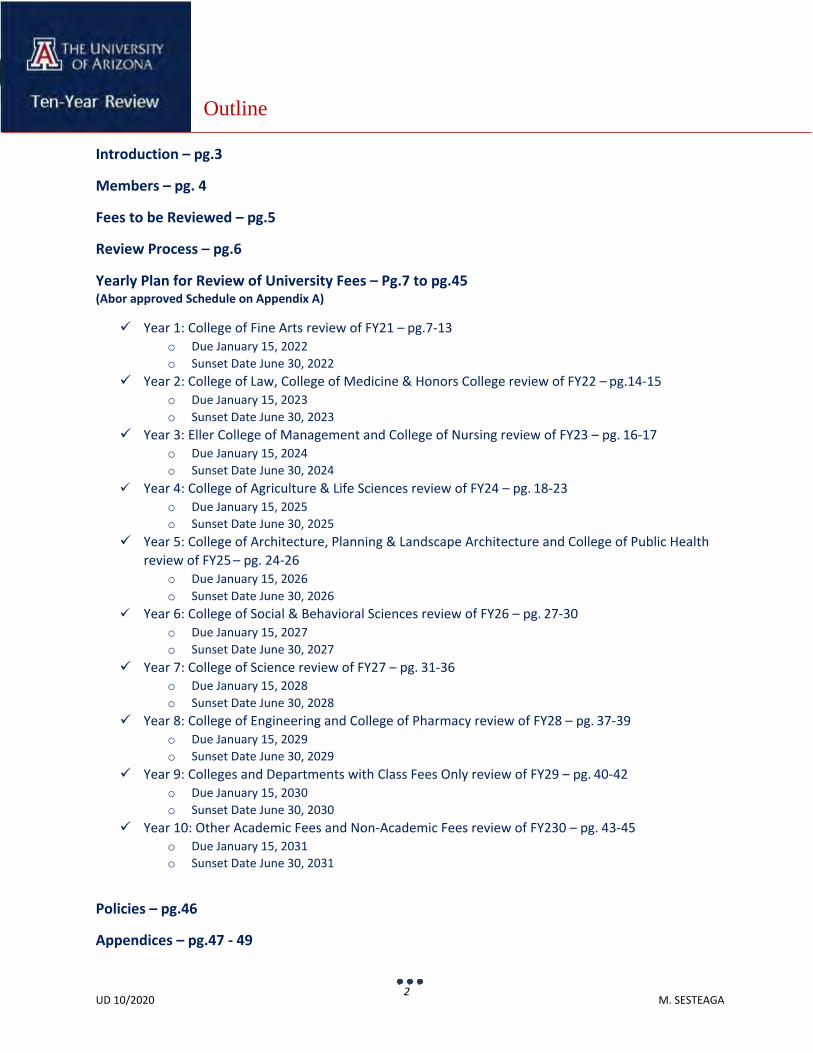
2 UD 10/2020 M. SESTEAGA
Outline
Introduction – pg.3
Members – pg. 4
Fees to be Reviewed – pg.5
Review Process – pg.6
Yearly Plan for Review of University Fees – Pg.7 to pg.45 (Abor approved Schedule on Appendix A)
Year 1: College of Fine Arts review of FY21 – pg.7-13 o Due January 15, 2022 o Sunset Date June 30, 2022
Year 2: College of Law, College of Medicine & Honors College review of FY22 – pg.14-15 o Due January 15, 2023 o Sunset Date June 30, 2023
Year 3: Eller College of Management and College of Nursing review of FY23 – pg. 16-17 o Due January 15, 2024 o Sunset Date June 30, 2024
Year 4: College of Agriculture & Life Sciences review of FY24 – pg. 18-23 o Due January 15, 2025 o Sunset Date June 30, 2025
Year 5: College of Architecture, Planning & Landscape Architecture and College of Public Health review of FY25 – pg. 24-26
o Due January 15, 2026 o Sunset Date June 30, 2026
Year 6: College of Social & Behavioral Sciences review of FY26 – pg. 27-30 o Due January 15, 2027 o Sunset Date June 30, 2027
Year 7: College of Science review of FY27 – pg. 31-36 o Due January 15, 2028 o Sunset Date June 30, 2028
Year 8: College of Engineering and College of Pharmacy review of FY28 – pg. 37-39 o Due January 15, 2029 o Sunset Date June 30, 2029
Year 9: Colleges and Departments with Class Fees Only review of FY29 – pg. 40-42 o Due January 15, 2030 o Sunset Date June 30, 2030
Year 10: Other Academic Fees and Non-Academic Fees review of FY230 – pg. 43-45 o Due January 15, 2031 o Sunset Date June 30, 2031
Policies – pg.46
Appendices – pg.47 - 49

3 UD 10/2020 M. SESTEAGA
Introduction
Sunset Review of Fees (ABOR policy 4-105(F)) (UD 02/2020).
1. Each university will develop and implement a plan to systematically review all existing academic fees as part of a sunset process. Unless otherwise specified by the board, the board must review and approve each academic fee at least once every 10 years.
2. Each university will report the academic fees reviewed in the prior calendar year, the result of the review and provide a recommendation on the continuation of the fee. Class fees that have been decreased or eliminated in the prior year by approval of the university president will also be listed in this report. The report shall be submitted to the board office on or before the date of public disclosure of recommended increases to any tuition or academic fee pursuant to policy 4-104 (A) (3).
3. Reports will be submitted on a template provided by the board office.
4. As part of the sunset review, each university shall consider whether multiple class fees within a program should be consolidated into a program fee or if multiple program fees within a college should be consolidated into a differential tuition or college fee.
Transition from Prior Policy (ABOR policy 4-105(G))
1. All fees in effect on July 1, 2018 remain in effect until the established sunset date.
2. By June 30, 2019, each university will propose a plan to review existing academic fees over the next ten years. The board will establish a sunset date for each fee as part of the review.
3. Other than class fees, academic fees that did not received board approval will sunset on July 1, 2019 unless a continuance is approved by the board.
The University of Arizona Sunset Approach
The University of Arizona (UA) will review its academic and non-academic fees on a per college basis. Each year the selected college(s) will have all their fees reviewed; this includes all the fees define on the “Fees to be Reviewed” section of this plan, and any new fees added prior to the selected college(s) review cycle. The order by which this ten-year process will take place is listed on the “Outline” section in the previous page.
UA will create a Sunset Review Board (SRB). Members of this board will include at least one ex officio representative from: The Budget Office and Planning; the Financial Services Office; the Office of the Provost; and the Graduate & Professional Student Council; and the Associate Students of the University of Arizona.
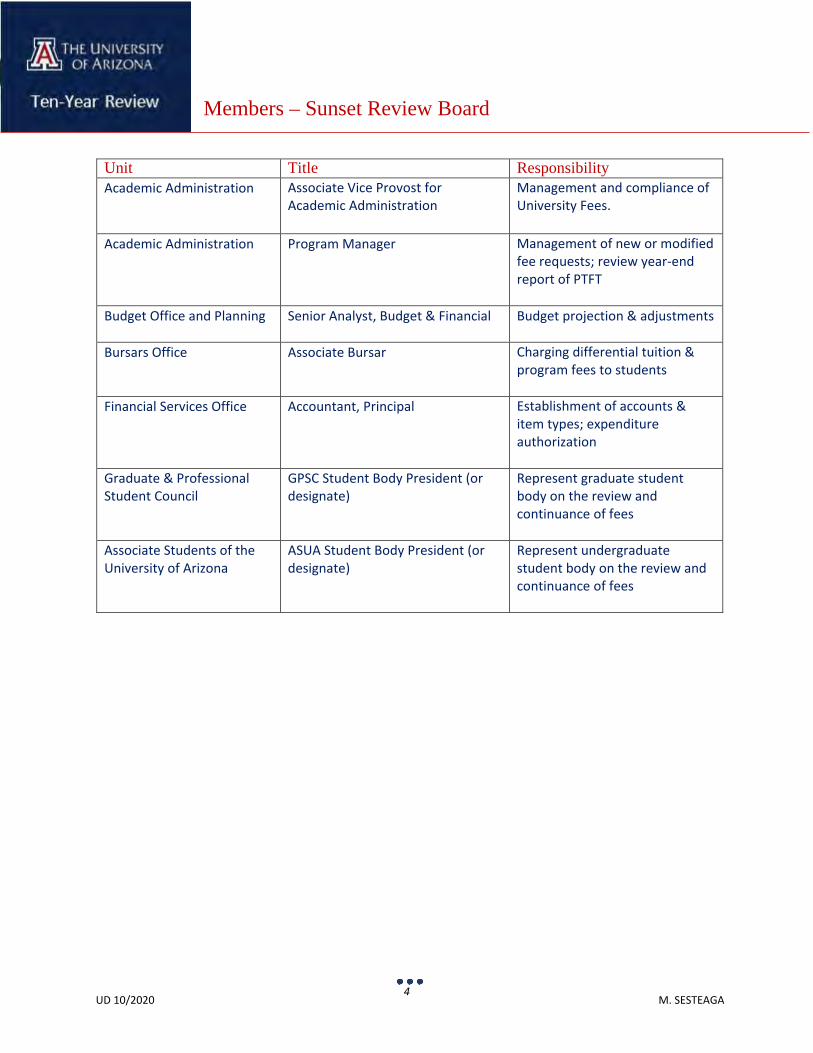
4 UD 10/2020 M. SESTEAGA
Members – Sunset Review Board
Unit Title Responsibility Academic Administration Associate Vice Provost for
Academic Administration Management and compliance of University Fees.
Academic Administration Program Manager Management of new or modified fee requests; review year-end report of PTFT
Budget Office and Planning Senior Analyst, Budget & Financial Budget projection & adjustments
Bursars Office Associate Bursar Charging differential tuition & program fees to students
Financial Services Office Accountant, Principal Establishment of accounts & item types; expenditure authorization
Graduate & Professional Student Council
GPSC Student Body President (or designate)
Represent graduate student body on the review and continuance of fees
Associate Students of the University of Arizona
ASUA Student Body President (or designate)
Represent undergraduate student body on the review and continuance of fees
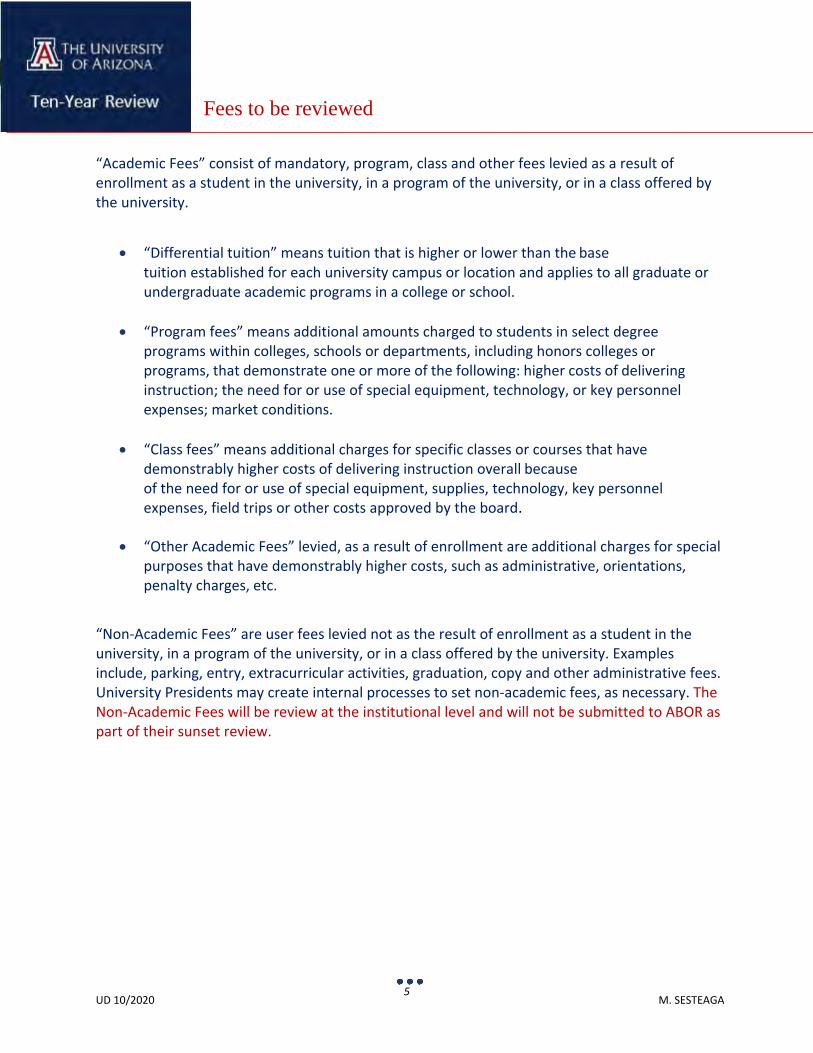
5 UD 10/2020 M. SESTEAGA
Fees to be reviewed
“Academic Fees” consist of mandatory, program, class and other fees levied as a result of enrollment as a student in the university, in a program of the university, or in a class offered by the university.
• “Differential tuition” means tuition that is higher or lower than the base tuition established for each university campus or location and applies to all graduate or undergraduate academic programs in a college or school.
• “Program fees” means additional amounts charged to students in select degree
programs within colleges, schools or departments, including honors colleges or programs, that demonstrate one or more of the following: higher costs of delivering instruction; the need for or use of special equipment, technology, or key personnel expenses; market conditions.
• “Class fees” means additional charges for specific classes or courses that have
demonstrably higher costs of delivering instruction overall because of the need for or use of special equipment, supplies, technology, key personnel expenses, field trips or other costs approved by the board.
• “Other Academic Fees” levied, as a result of enrollment are additional charges for special
purposes that have demonstrably higher costs, such as administrative, orientations, penalty charges, etc.
“Non-Academic Fees” are user fees levied not as the result of enrollment as a student in the university, in a program of the university, or in a class offered by the university. Examples include, parking, entry, extracurricular activities, graduation, copy and other administrative fees. University Presidents may create internal processes to set non-academic fees, as necessary. The Non-Academic Fees will be review at the institutional level and will not be submitted to ABOR as part of their sunset review.
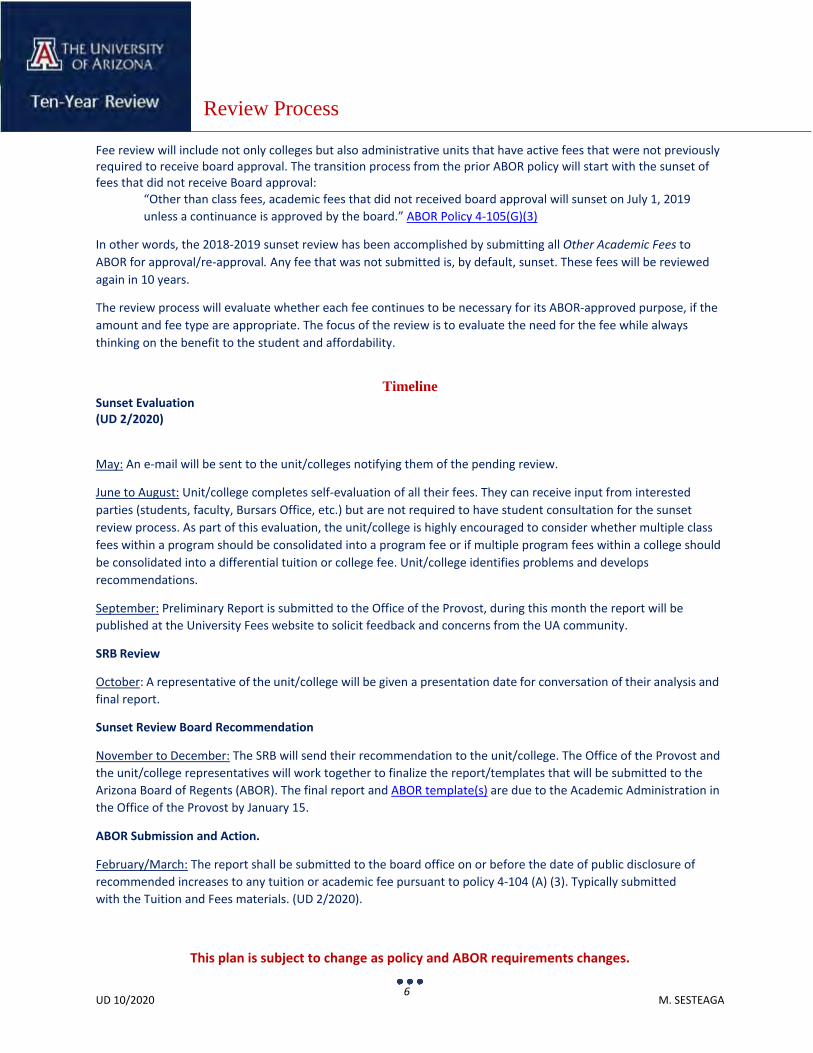
6 UD 10/2020 M. SESTEAGA
Review Process
Fee review will include not only colleges but also administrative units that have active fees that were not previously required to receive board approval. The transition process from the prior ABOR policy will start with the sunset of fees that did not receive Board approval:
“Other than class fees, academic fees that did not received board approval will sunset on July 1, 2019 unless a continuance is approved by the board.” ABOR Policy 4-105(G)(3)
In other words, the 2018-2019 sunset review has been accomplished by submitting all Other Academic Fees to ABOR for approval/re-approval. Any fee that was not submitted is, by default, sunset. These fees will be reviewed again in 10 years.
The review process will evaluate whether each fee continues to be necessary for its ABOR-approved purpose, if the amount and fee type are appropriate. The focus of the review is to evaluate the need for the fee while always thinking on the benefit to the student and affordability.
Sunset Evaluation (UD 2/2020)
Timeline
May: An e-mail will be sent to the unit/colleges notifying them of the pending review.
June to August: Unit/college completes self-evaluation of all their fees. They can receive input from interested parties (students, faculty, Bursars Office, etc.) but are not required to have student consultation for the sunset review process. As part of this evaluation, the unit/college is highly encouraged to consider whether multiple class fees within a program should be consolidated into a program fee or if multiple program fees within a college should be consolidated into a differential tuition or college fee. Unit/college identifies problems and develops recommendations.
September: Preliminary Report is submitted to the Office of the Provost, during this month the report will be published at the University Fees website to solicit feedback and concerns from the UA community.
SRB Review
October: A representative of the unit/college will be given a presentation date for conversation of their analysis and final report.
Sunset Review Board Recommendation
November to December: The SRB will send their recommendation to the unit/college. The Office of the Provost and the unit/college representatives will work together to finalize the report/templates that will be submitted to the Arizona Board of Regents (ABOR). The final report and ABOR template(s) are due to the Academic Administration in the Office of the Provost by January 15.
ABOR Submission and Action.
February/March: The report shall be submitted to the board office on or before the date of public disclosure of recommended increases to any tuition or academic fee pursuant to policy 4-104 (A) (3). Typically submitted with the Tuition and Fees materials. (UD 2/2020).
This plan is subject to change as policy and ABOR requirements changes.
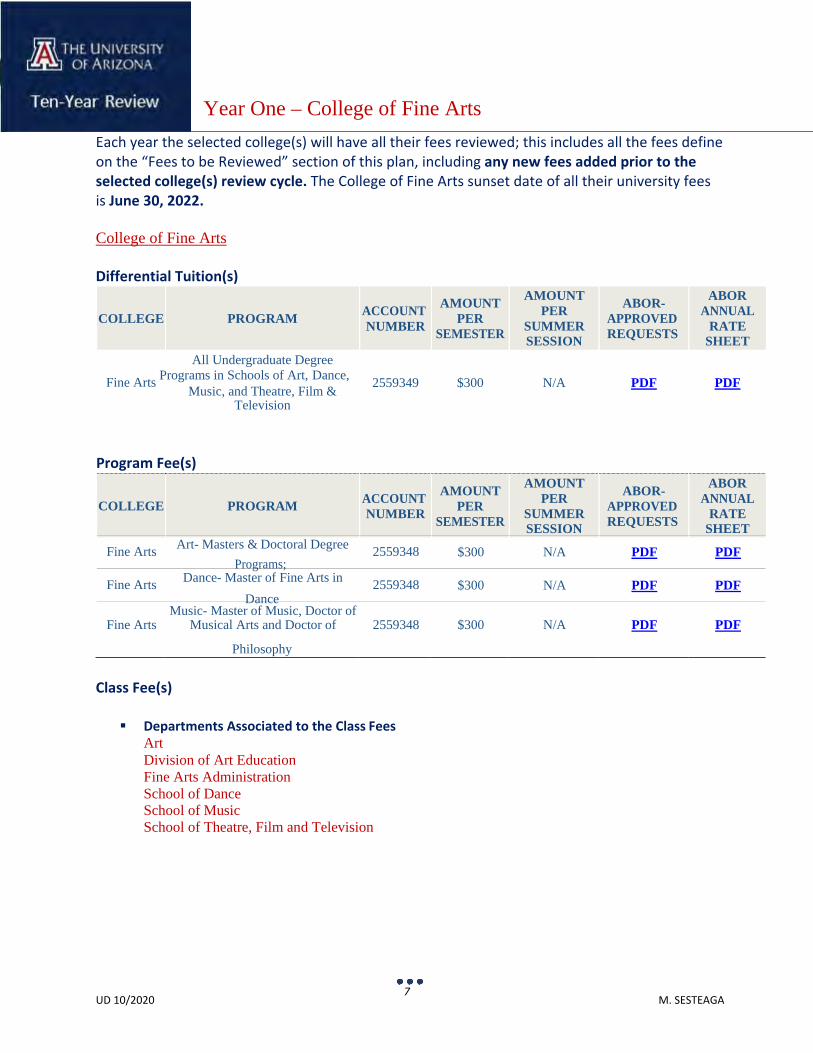
7 UD 10/2020 M. SESTEAGA
Year One – College of Fine Arts
Each year the selected college(s) will have all their fees reviewed; this includes all the fees define on the “Fees to be Reviewed” section of this plan, including any new fees added prior to the selected college(s) review cycle. The College of Fine Arts sunset date of all their university fees is June 30, 2022.
College of Fine Arts
Differential Tuition(s) COLLEGE
PROGRAM
ACCOUNT NUMBER
AMOUNT PER
SEMESTER
AMOUNT PER
SUMMER SESSION
ABOR- APPROVED REQUESTS
ABOR ANNUAL
RATE SHEET
All Undergraduate Degree
Fine Arts Programs in Schools of Art, Dance, Music, and Theatre, Film &
Television Program Fee(s)
2559349
$300
N/A
COLLEGE
PROGRAM
ACCOUNT NUMBER
AMOUNT PER
SEMESTER
AMOUNT PER
SUMMER SESSION
ABOR- APPROVED REQUESTS
ABOR ANNUAL
RATE SHEET
Programs;
Dance
Philosophy
Class Fee(s)
Departments Associated to the Class Fees
Art Division of Art Education Fine Arts Administration School of Dance School of Music School of Theatre, Film and Television
Fine Arts Art- Masters & Doctoral Degree 2559348 $300 N/A PDF PDF
Fine Arts Dance- Master of Fine Arts in 2559348 $300 N/A PDF PDF
Music- Master of Music, Doctor of Fine Arts Musical Arts and Doctor of 2559348
$300
N/A
8 UD 10/2020 M. SESTEAGA
Course Number Flat Fee Fee Purpose Fee Deposit Account ART 100A $14.00 Consumable Supplies 2498850 ART 100B $48.00 Consumable Supplies 2498850 ART 100C $42.00 Lab/Studio Supplies/Equipment 2498850 ART 100D $42.00 Lab/Studio Supplies/Equipment 2498850 ART 100E $11.00 Consumable Supplies 2498850 ART 100F $10.00 Consumable Supplies 2498850 ART 100G $42.00 Lab/Studio Supplies/Equipment 2498850 ART 100J $51.00 Models for Art Classes 2498850 ART 203 $10.00 Consumable Supplies 2498830 ART 205 $91.00 Models for Art Classes 2498870 ART 244 $100.00 Lab/Studio Supplies/Equipment 2498880 ART 246 $100.00 Lab/Studio Supplies/Equipment 2498880 ART 250 $78.00 Consumable Supplies 2498890 ART 251 $78.00 Consumable Supplies 2498890 ART 253 $80.00 Consumable Supplies 2487400 ART 255 $83.00 Consumable Supplies 2498890 ART 256 $40.00 Consumable Supplies 2487400 ART 265 $83.00 Lab/Studio Supplies/Equipment 2498860 ART 266 $75.00 Lab/Studio Supplies/Equipment 2498860 ART 273 $99.00 Lab/Studio Supplies/Equipment 2498840 ART 280 $75.00 Lab/Studio Supplies/Equipment 2498870 ART 285 $19.00 Lab/Studio Supplies/Equipment 2498870 ART 286 $97.00 Lab/Studio Supplies/Equipment 2498910 ART 287 $100.00 Lab/Studio Supplies/Equipment 2498910 ART 289 $67.00 Models for Art Classes 2487400 ART 301 $53.00 Lab/Studio Supplies/Equipment 2498870 ART 305 $91.00 Models for Art Classes 2498870 ART 326 $60.00 Lab/Studio Supplies/Equipment 2498870 ART 340 $100.00 Lab/Studio Supplies/Equipment 2498880
ART 341A $100.00 Lab/Studio Supplies/Equipment 2498880 ART 341B $100.00 Lab/Studio Supplies/Equipment 2498880 ART 341D $80.00 Consumable Supplies 2498880 ART 341E $100.00 Lab/Studio Supplies/Equipment 2498880 ART 343A $100.00 Lab/Studio Supplies/Equipment 2498880 ART 343B $100.00 Lab/Studio Supplies/Equipment 2498880 ART 344 $100.00 Lab/Studio Supplies/Equipment 2498880 ART 345 $100.00 Lab/Studio Supplies/Equipment 2498880 ART 346 $100.00 Lab/Studio Supplies/Equipment 2498880 ART 348 $100.00 Lab/Studio Supplies/Equipment 2498880 ART 349 $100.00 Lab/Studio Supplies/Equipment 2498880 ART 350 $79.00 Consumable Supplies 2498890

9 UD 10/2020 M. SESTEAGA
ART 351 $79.00 Consumable Supplies 2498890 ART 353 $79.00 Consumable Supplies 2498890 ART 355 $78.00 Consumable Supplies 2498890
ART 363A $84.00 Lab/Studio Supplies/Equipment 2498860 ART 363B $43.00 Lab/Studio Supplies/Equipment 2498860 ART 365 $79.00 Consumable Supplies 2498860 ART 366 $75.00 Consumable Supplies 2498860 ART 368 $91.00 Models for Art Classes 2498860
ART 373A $100.00 Lab/Studio Supplies/Equipment 2498840 ART 373B $97.00 Lab/Studio Supplies/Equipment 2498840 ART 380 $75.00 Models for Art Classes 2498870
ART 380A $65.00 Lab/Studio Supplies/Equipment 2498870 ART 380B $65.00 Lab/Studio Supplies/Equipment 2498870 ART 385 $30.00 Lab/Studio Supplies/Equipment 2498870 ART 386 $100.00 Lab/Studio Supplies/Equipment 2498910 ART 387 $91.00 Consumable Supplies 2498910 ART 388 $100.00 Lab/Studio Supplies/Equipment 2498910 ART 389 $67.00 Models for Art Classes 2487400 ART 401 $53.00 Consumable Supplies 2498870 ART 405 $91.00 Models for Art Classes 2498870 ART 422 $100.00 Lab/Studio Supplies/Equipment 2498880 ART 426 $60.00 Lab/Studio Supplies/Equipment 2498870
ART 437A $50.00 Consumable Supplies 2498910 ART 440 $100.00 Lab/Studio Supplies/Equipment 2498880 ART 441 $100.00 Lab/Studio Supplies/Equipment 2498880 ART 442 $100.00 Lab/Studio Supplies/Equipment 2498880 ART 443 $100.00 Lab/Studio Supplies/Equipment 2487400 ART 444 $100.00 Lab/Studio Supplies/Equipment 2498880 ART 446 $100.00 Lab/Studio Supplies/Equipment 2498860 ART 450 $40.00 Consumable Supplies 2487400 ART 451 $40.00 Consumable Supplies 2487400 ART 453 $40.00 Consumable Supplies 2487400 ART 455 $40.00 Consumable Supplies 2487400 ART 456 $99.00 Consumable Supplies 2498890
ART 462A $91.00 Models for Art Classes 2498860 ART 462D $50.00 Lab/Studio Supplies/Equipment 2498860 ART 462E $90.00 Lab/Studio Supplies/Equipment 2498860 ART 465 $98.00 Consumable Supplies 2498860 ART 466 $75.00 Consumable Supplies 2498860
ART 467B $93.00 Lab/Studio Supplies/Equipment 2498860 ART 469 $62.00 Lab/Studio Supplies/Equipment 2498860 ART 473 $100.00 Lab/Studio Supplies/Equipment 2498840
10 UD 10/2020 M. SESTEAGA
ART 480 $75.00 Models for Art Classes 2498870 ART 482A $100.00 Lab/Studio Supplies/Equipment 2498910 ART 483 $70.00 Consumable Supplies 2498910 ART 485 $30.00 Lab/Studio Supplies/Equipment 2498870 ART 486 $100.00 Lab/Studio Supplies/Equipment 2498910 ART 489 $67.00 Models for Art Classes 2487400
ART 496A $75.00 Lab/Studio Supplies/Equipment 2498870 ART 496B $100.00 Lab/Studio Supplies/Equipment 2498860 ART 496F $96.00 Field Trip 2498860 ART 501 $53.00 Lab/Studio Supplies/Equipment 2498870 ART 505 $91.00 Models for Art Classes 2498870 ART 522 $100.00 Lab/Studio Supplies/Equipment 2498880 ART 526 $60.00 Lab/Studio Supplies/Equipment 2498870
ART 537A $50.00 Consumable Supplies 2498910 ART 540 $100.00 Lab/Studio Supplies/Equipment 2498880 ART 544 $100.00 Lab/Studio Supplies/Equipment 2498880 ART 546 $100.00 Lab/Studio Supplies/Equipment 2498860 ART 549 $100.00 Lab/Studio Supplies/Equipment 2498880 ART 550 $40.00 Consumable Supplies 2487400 ART 551 $40.00 Consumable Supplies 2487400 ART 553 $40.00 Consumable Supplies 2487400 ART 555 $40.00 Consumable Supplies 2487400 ART 556 $95.00 Consumable Supplies 2498890
ART 562A $91.00 Models for Art Classes 2498860 ART 562D $50.00 Lab/Studio Supplies/Equipment 2498860 ART 562E $90.00 Lab/Studio Supplies/Equipment 2498860 ART 565 $98.00 Consumable Supplies 2498860 ART 566 $75.00 Consumable Supplies 2498860
ART 567B $93.00 Lab/Studio Supplies/Equipment 2498860 ART 569 $62.00 Lab/Studio Supplies/Equipment 2498860 ART 573 $100.00 Lab/Studio Supplies/Equipment 2498840 ART 580 $80.00 Models for Art Classes 2498870 ART 583 $70.00 Consumable Supplies 2498910 ART 585 $30.00 Lab/Studio Supplies/Equipment 2498870 ART 586 $100.00 Lab/Studio Supplies/Equipment 2498910
ART 596B $100.00 Lab/Studio Supplies/Equipment 2498860 ART 596F $96.00 Field Trip 2498860 ARE 130 $10.00 Consumable Supplies 2498830 ARE 361 $13.00 Student Teaching Support 2498830
ARE 493B $40.00 Student Teaching Support 2496710 FA 437A $50.00 Consumable Supplies 2498910 FA 537A $50.00 Consumable Supplies 2498910

11 UD 10/2020 M. SESTEAGA
DNC 112A $35.00 Accompanist 2496100 DNC 112B $35.00 Accompanist 2496100 DNC 112C $70.00 Accompanist 2496100 DNC 143 $35.00 Accompanist 2496100 DNC 145 $20.00 Accompanist 2496100
DNC 152A $35.00 Accompanist 2496100 DNC 152B $35.00 Accompanist 2496100 DNC 152C $70.00 Accompanist 2496100 DNC 177C $35.00 Accompanist 2496100 DNC 177D $35.00 Accompanist 2496100 DNC 239A $35.00 Accompanist 2496100 DNC 239B $35.00 Accompanist 2496100 DNC 240A $70.00 Accompanist 2496100 DNC 240B $70.00 Accompanist 2496100 DNC 241A $70.00 Accompanist 2496100 DNC 241B $70.00 Accompanist 2496100 DNC 340A $70.00 Accompanist 2496100 DNC 340B $70.00 Accompanist 2496100 DNC 341A $70.00 Accompanist 2496100 DNC 341B $70.00 Accompanist 2496100 DNC 439A $35.00 Accompanist 2496100 DNC 439B $35.00 Accompanist 2496100 DNC 440A $70.00 Accompanist 2496100 DNC 440B $70.00 Accompanist 2496100 DNC 441A $70.00 Accompanist 2496100 DNC 441B $70.00 Accompanist 2496100 DNC 451B $70.00 Accompanist 2496100 DNC 539A $35.00 Accompanist 2496100 DNC 539B $35.00 Accompanist 2496100 DNC 540A $70.00 Accompanist 2496100 DNC 540B $70.00 Accompanist 2496100 DNC 541A $70.00 Accompanist 2496100 DNC 541B $70.00 Accompanist 2496100 DNC 551B $70.00 Accompanist 2496100 MUS 101A $50.00 Equipment Refresh/Rental 2497400 MUS 101B $10.00 Lab/Studio Supplies/Equipment 2497400 MUS 110A $50.00 Equipment Refresh/Rental 2497400 MUS 110B $50.00 Equipment Refresh/Rental 2497400 MUS 210A $50.00 Equipment Refresh/Rental 2497400 MUS 210B $50.00 Equipment Refresh/Rental 2497400 MUS 310A $50.00 Equipment Refresh/Rental 2497400 MUS 310B $10.00 Lab/Studio Supplies/Equipment 2497400
12 UD 10/2020 M. SESTEAGA
MUS 493M $40.00 Student Teaching Support 2497400 MUSI 181 $123.00 Private Instruction 2498500 MUSI 182 $123.00 Private Instruction 2498500 MUSI 185 $185.00 Private Instruction 2498500 MUSI 282 $123.00 Private Instruction 2498500 MUSI 285 $185.00 Private Instruction 2498500 MUSI 382 $123.00 Private Instruction 2498500 MUSI 385 $185.00 Private Instruction 2498500 MUSI 482 $123.00 Private Instruction 2498500 MUSI 485 $185.00 Private Instruction 2498500 MUSI 580 $123.00 Private Instruction 2498500 MUSI 585 $185.00 Private Instruction 2498500 MUSI 685 $185.00 Private Instruction 2498500 MUSI 785 $185.00 Private Instruction 2498500 FTV 210 $100.00 Lab/Studio Supplies/Equipment 2498970
FTV 301H $40.00 Equipment Refresh/Rental 2499500 FTV 310 $100.00 Lab/Studio Supplies/Equipment 2499500
FTV 311A $100.00 Lab/Studio Supplies/Equipment 2499500 FTV 313 $100.00 Lab/Studio Supplies/Equipment 2499500
FTV 314A $110.00 Equipment Refresh/Rental 2499500 FTV 315A $110.00 Equipment Refresh/Rental 2499500 FTV 317A $100.00 Lab/Studio Supplies/Equipment 2499500 FTV 318 $50.00 Lab/Studio Supplies/Equipment 2499500 FTV 367 $100.00 Lab/Studio Supplies/Equipment 2499500 FTV 374 $50.00 Lab/Studio Supplies/Equipment 2499500 FTV 404 $95.00 Lab/Studio Supplies/Equipment 2499500
FTV 497G $75.00 Lab/Studio Supplies/Equipment 2499500 FTV 498D $135.00 Equipment Refresh/Rental 2499500 FTV 498E $135.00 Equipment Refresh/Rental 2499500 FTV 504 $95.00 Lab/Studio Supplies/Equipment 2499500 TAR 111 $10.00 Consumable Supplies 2499900 TAR 116 $10.00 Lab/Studio Supplies/Equipment 2499900
TAR 197V $80.00 Accompanist 2499900 TAR 205A $80.00 Accompanist 2499900 TAR 297V $80.00 Accompanist 2499900 TAR 319 $20.00 Consumable Supplies 2499900 TAR 401 $25.00 Lab/Studio Supplies/Equipment 2499900
TAR 402A $50.00 Lab/Studio Supplies/Equipment 2499900 TAR 403 $80.00 Accompanist 2499900 TAR 404 $80.00 Accompanist 2499900 TAR 415 $10.00 Consumable Supplies 2499900

13 UD 10/2020 M. SESTEAGA
TAR 416
$12.00 Fall semester
only.
Models for Art Classes
2499900
TAR 423 $40.00 Consumable Supplies 2499900 TAR 427 $20.00 Lab/Studio Supplies/Equipment 2499900 TAR 428 $25.00 Lab/Studio Supplies/Equipment 2499900 TAR 433 $40.00 Consumable Supplies 2499900 TAR 453 $50.00 Lab/Studio Supplies/Equipment 2499900
TAR 493B $40.00 Student Teaching Support 2499900 TAR 497V $40.00 Accompanist 2499900 TAR 501 $25.00 Lab/Studio Supplies/Equipment 2499900
TAR 502A $50.00 Lab/Studio Supplies/Equipment 2499900 TAR 503 $80.00 Accompanist 2499900 TAR 504 $80.00 Accompanist 2499900 TAR 515 $10.00 Consumable Supplies 2499900
TAR 516
$12.00 Fall semester
only.
Models for Art Classes
2499900
TAR 523 $40.00 Consumable Supplies 2499900 TAR 527 $20.00 Lab/Studio Supplies/Equipment 2499900 TAR 528 $25.00 Lab/Studio Supplies/Equipment 2499900 TAR 533 $40.00 Consumable Supplies 2499900 TAR 553 $50.00 Lab/Studio Supplies/Equipment 2499900
14 UD 10/2020 M. SESTEAGA
Each year the selected college(s) will have all their fees reviewed; this includes all the fees define on the “Fees to be Reviewed” section of this plan, including any new fees added prior to the selected college(s) review cycle. The College of Law, the College of Medicine, and the Honors College sunset date of all their university fees is June 30, 2023.
College of Law
Differential Tuition(s) N/A
Program Fee(s)
COLLEGE
PROGRAM
ACCOUNT NUMBER
AMOUNT PER
SEMESTER
AMOUNT PER
SUMMER SESSION
ABOR- APPROVED REQUESTS
ABOR ANNUAL
RATE SHEET
Law Master of Legal Studies (MLS) 2559103 $26,000 fixed $866.67/unit PDF PDF
Law
Master of Law (LLM) & Doctor of Judicial Science
(SJD)
2559104
$26,000 fixed
N/A
Law
Master of Professional Studies Indigenous Governance (MPS)
2559106
$26,000 fixed
$866.67/unit
Law Juris Doctor (JD) / resident tuition 2559100 $24,500 fixed N/A PDF PDF
Law Juris Doctor (JD) / non- resident tuition 2559101 $29,000fixed N/A PDF PDF
Law Juris Doctor with Advanced Standing (AJD), Resident 2559102 $24,500 fixed N/A PDF PDF
Law
Juris Doctor with Advanced Standing (AJD), Non-
Resident
2559102
$29,000 fixed
N/A
Class Fee(s)
Course Number Flat Fee Fee Purpose Fee Deposit Account LAW 564 $31.00 Consumable Supplies 2494850
College of Medicine
Differential Tuition(s) N/A
Year Two – College of Law, College of Medicine & Honors College
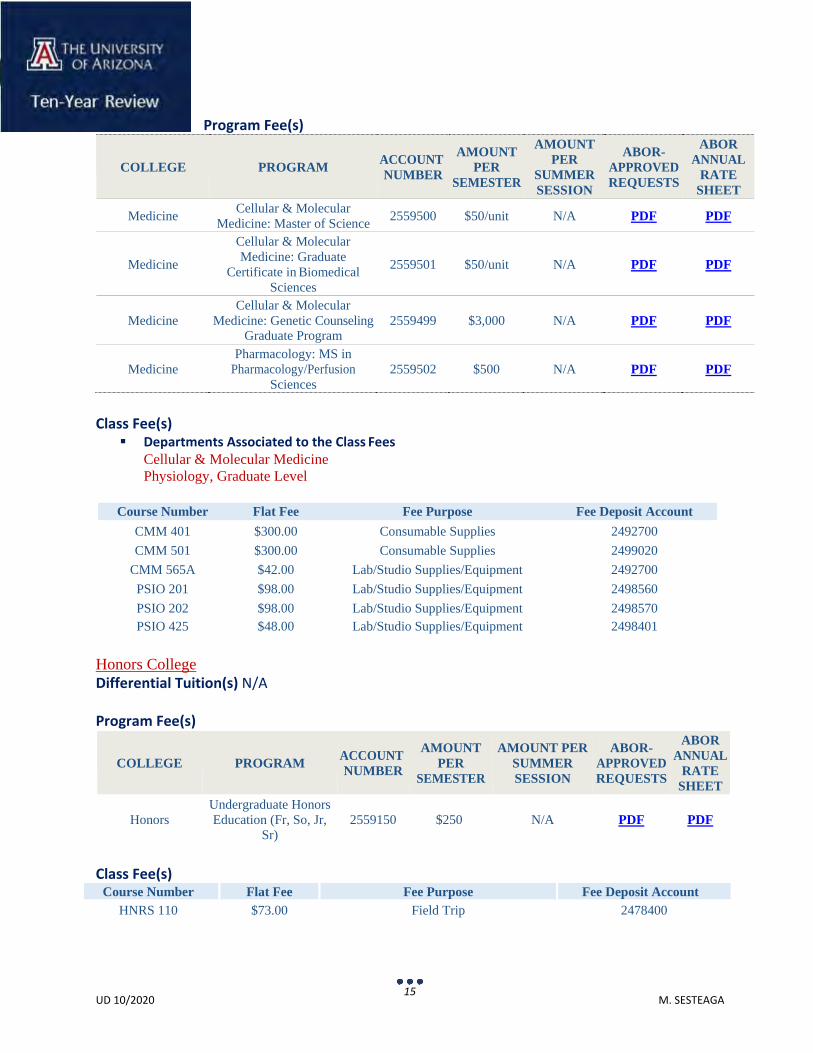
15 UD 10/2020 M. SESTEAGA
Program Fee(s)
COLLEGE
PROGRAM
ACCOUNT NUMBER
AMOUNT PER
SEMESTER
AMOUNT PER
SUMMER SESSION
ABOR- APPROVED REQUESTS
ABOR ANNUAL
RATE SHEET
Medicine Cellular & Molecular Medicine: Master of Science 2559500 $50/unit N/A PDF PDF
Medicine
Cellular & Molecular Medicine: Graduate
Certificate in Biomedical Sciences
2559501
$50/unit
N/A
Medicine
Cellular & Molecular Medicine: Genetic Counseling
Graduate Program
2559499
$3,000
N/A
Medicine
Pharmacology: MS in Pharmacology/Perfusion
Sciences
2559502
$500
N/A
Class Fee(s) Departments Associated to the Class Fees
Cellular & Molecular Medicine Physiology, Graduate Level
Course Number Flat Fee Fee Purpose Fee Deposit Account
CMM 401 $300.00 Consumable Supplies 2492700 CMM 501 $300.00 Consumable Supplies 2499020
CMM 565A $42.00 Lab/Studio Supplies/Equipment 2492700 PSIO 201 $98.00 Lab/Studio Supplies/Equipment 2498560 PSIO 202 $98.00 Lab/Studio Supplies/Equipment 2498570 PSIO 425 $48.00 Lab/Studio Supplies/Equipment 2498401
Honors College Differential Tuition(s) N/A
Program Fee(s)
COLLEGE
PROGRAM
ACCOUNT NUMBER
AMOUNT PER
SEMESTER
AMOUNT PER SUMMER SESSION
ABOR- APPROVED REQUESTS
ABOR ANNUAL
RATE SHEET
Honors
Undergraduate Honors Education (Fr, So, Jr,
Sr)
2559150
$250
N/A
Class Fee(s)
Course Number Flat Fee Fee Purpose Fee Deposit Account HNRS 110 $73.00 Field Trip 2478400
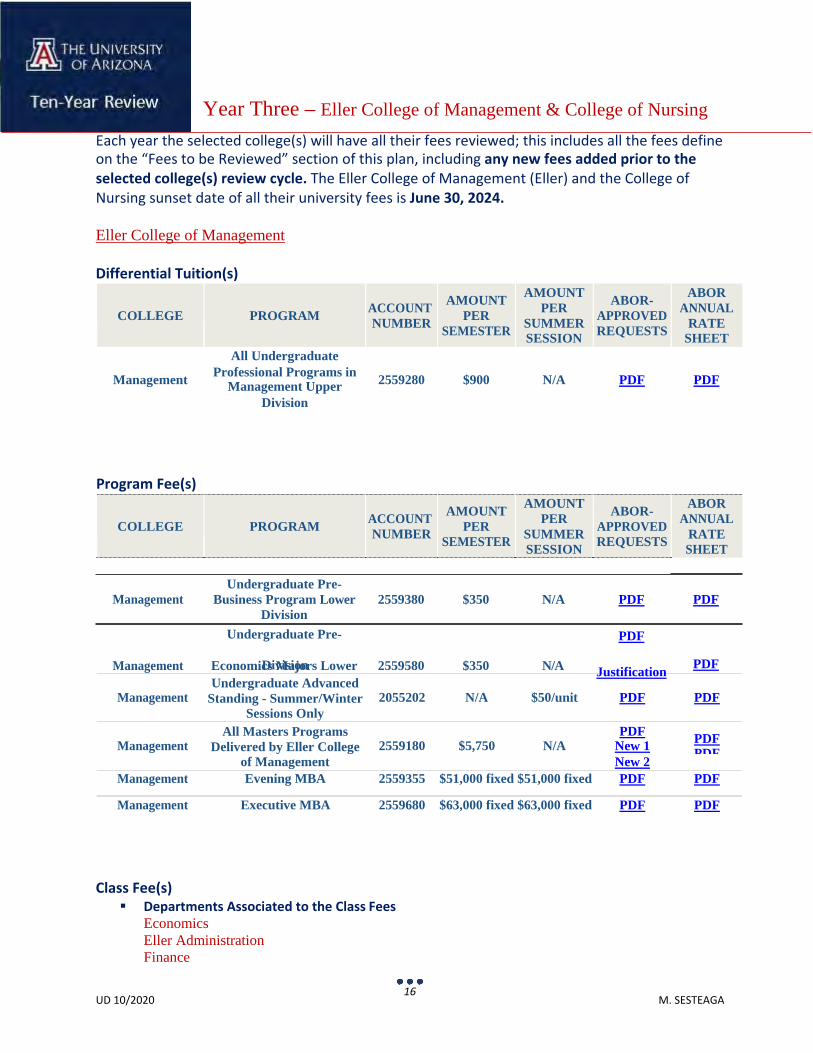
16 UD 10/2020 M. SESTEAGA
Each year the selected college(s) will have all their fees reviewed; this includes all the fees define on the “Fees to be Reviewed” section of this plan, including any new fees added prior to the selected college(s) review cycle. The Eller College of Management (Eller) and the College of Nursing sunset date of all their university fees is June 30, 2024.
Eller College of Management
Differential Tuition(s)
COLLEGE
PROGRAM
ACCOUNT NUMBER
AMOUNT PER
SEMESTER
AMOUNT PER
SUMMER SESSION
ABOR- APPROVED REQUESTS
ABOR ANNUAL
RATE SHEET
All Undergraduate
Management Professional Programs in Management Upper 2559280 $900 N/A PDF PDF
Division
Program Fee(s)
COLLEGE
PROGRAM
ACCOUNT NUMBER
AMOUNT PER
SEMESTER
AMOUNT PER
SUMMER SESSION
ABOR- APPROVED REQUESTS
ABOR ANNUAL
RATE SHEET
Management
Undergraduate Pre- Business Program Lower
Division Undergraduate Pre-
2559380 $350 N/A PDF PDF
Management Economics Majors Lower 2559580 $350 N/A Justification PDF
Class Fee(s) Departments Associated to the Class Fees
Economics Eller Administration Finance
Year Three – Eller College of Management & College of Nursing
Division
Management
Undergraduate Advanced Standing - Summer/Winter
2055202
N/A
$50/unit
PDF PDF
Sessions Only
Management
All Masters Programs Delivered by Eller College
2559180
$5,750
N/A
PDF PDF New 1 PDF
of Management New 2 Management Evening MBA 2559355 $51,000 fixed $51,000 fixed PDF PDF
Management Executive MBA 2559680 $63,000 fixed $63,000 fixed PDF PDF
17 UD 10/2020 M. SESTEAGA
Management & Organizations McGuire Center for Entrepreneurship
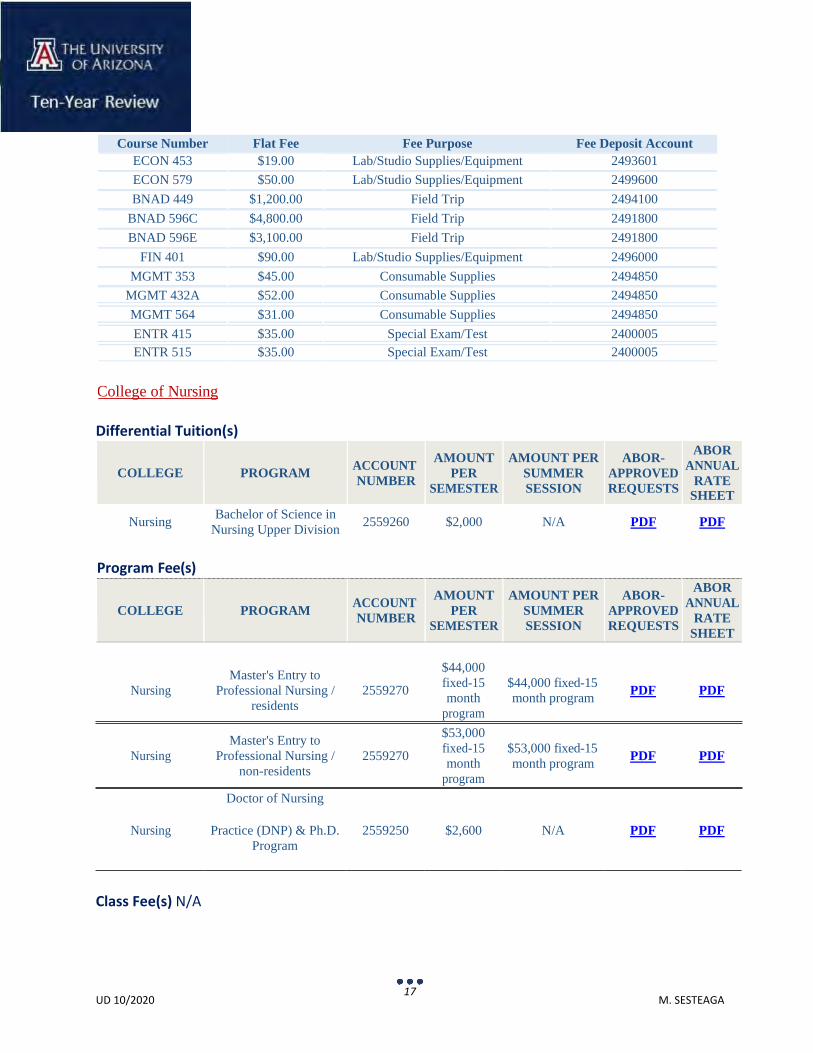
17 UD 10/2020 M. SESTEAGA
Course Number Flat Fee Fee Purpose Fee Deposit Account
ECON 453 $19.00 Lab/Studio Supplies/Equipment 2493601 ECON 579 $50.00 Lab/Studio Supplies/Equipment 2499600 BNAD 449 $1,200.00 Field Trip 2494100
BNAD 596C $4,800.00 Field Trip 2491800 BNAD 596E $3,100.00 Field Trip 2491800
FIN 401 $90.00 Lab/Studio Supplies/Equipment 2496000 MGMT 353 $45.00 Consumable Supplies 2494850
MGMT 432A $52.00 Consumable Supplies 2494850 MGMT 564 $31.00 Consumable Supplies 2494850 ENTR 415 $35.00 Special Exam/Test 2400005 ENTR 515 $35.00 Special Exam/Test 2400005
College of Nursing
Differential Tuition(s)
COLLEGE
PROGRAM
ACCOUNT NUMBER
AMOUNT PER
SEMESTER
AMOUNT PER SUMMER SESSION
ABOR- APPROVED REQUESTS
ABOR ANNUAL
RATE SHEET
Nursing
Program Fee(s)
Bachelor of Science in Nursing Upper Division 2559260 $2,000 N/A PDF PDF
COLLEGE
PROGRAM
ACCOUNT NUMBER
AMOUNT PER
SEMESTER
AMOUNT PER SUMMER SESSION
ABOR- APPROVED REQUESTS
ABOR ANNUAL
RATE SHEET
Nursing
Nursing
Master's Entry to Professional Nursing /
residents
Master's Entry to Professional Nursing /
non-residents
Doctor of Nursing
2559270
2559270
$44,000 fixed-15 month
program $53,000 fixed-15 month
program
$44,000 fixed-15 month program
$53,000 fixed-15 month program
PDF PDF
PDF PDF
Nursing Practice (DNP) & Ph.D. Program
2559250 $2,600 N/A PDF PDF
Class Fee(s) N/A
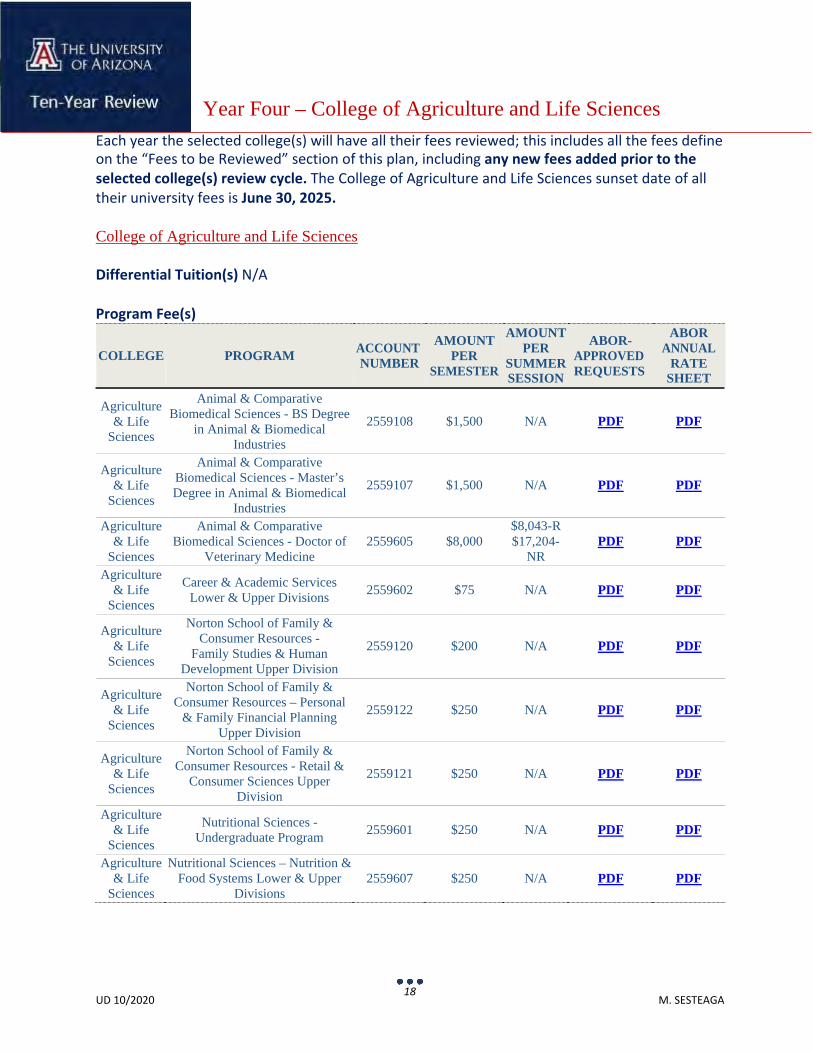
18 UD 10/2020 M. SESTEAGA
Each year the selected college(s) will have all their fees reviewed; this includes all the fees define on the “Fees to be Reviewed” section of this plan, including any new fees added prior to the selected college(s) review cycle. The College of Agriculture and Life Sciences sunset date of all their university fees is June 30, 2025.
College of Agriculture and Life Sciences
Differential Tuition(s) N/A
Program Fee(s) COLLEGE
PROGRAM
ACCOUNT NUMBER
AMOUNT PER
SEMESTER
AMOUNT PER
SUMMER SESSION
ABOR- APPROVED REQUESTS
ABOR ANNUAL
RATE SHEET
Agriculture & Life
Sciences
Animal & Comparative Biomedical Sciences - BS Degree
in Animal & Biomedical Industries
2559108
$1,500
N/A
Agriculture & Life
Sciences
Animal & Comparative Biomedical Sciences - Master’s Degree in Animal & Biomedical
Industries
2559107
$1,500
N/A
Agriculture & Life
Sciences
Animal & Comparative Biomedical Sciences - Doctor of
Veterinary Medicine
2559605
$8,000
$8,043-R $17,204-
NR
Agriculture & Life
Sciences
Career & Academic Services Lower & Upper Divisions
2559602
$75
N/A
Agriculture & Life
Sciences
Norton School of Family & Consumer Resources -
Family Studies & Human Development Upper Division
2559120
$200
N/A
Agriculture & Life
Sciences
Norton School of Family & Consumer Resources – Personal
& Family Financial Planning Upper Division
2559122
$250
N/A
Agriculture & Life
Sciences
Norton School of Family & Consumer Resources - Retail &
Consumer Sciences Upper Division
2559121
$250
N/A
Agriculture & Life
Sciences
Nutritional Sciences - Undergraduate Program
2559601
$250
N/A
Agriculture & Life
Sciences
Nutritional Sciences – Nutrition & Food Systems Lower & Upper
Divisions
2559607
$250
N/A
Year Four – College of Agriculture and Life Sciences
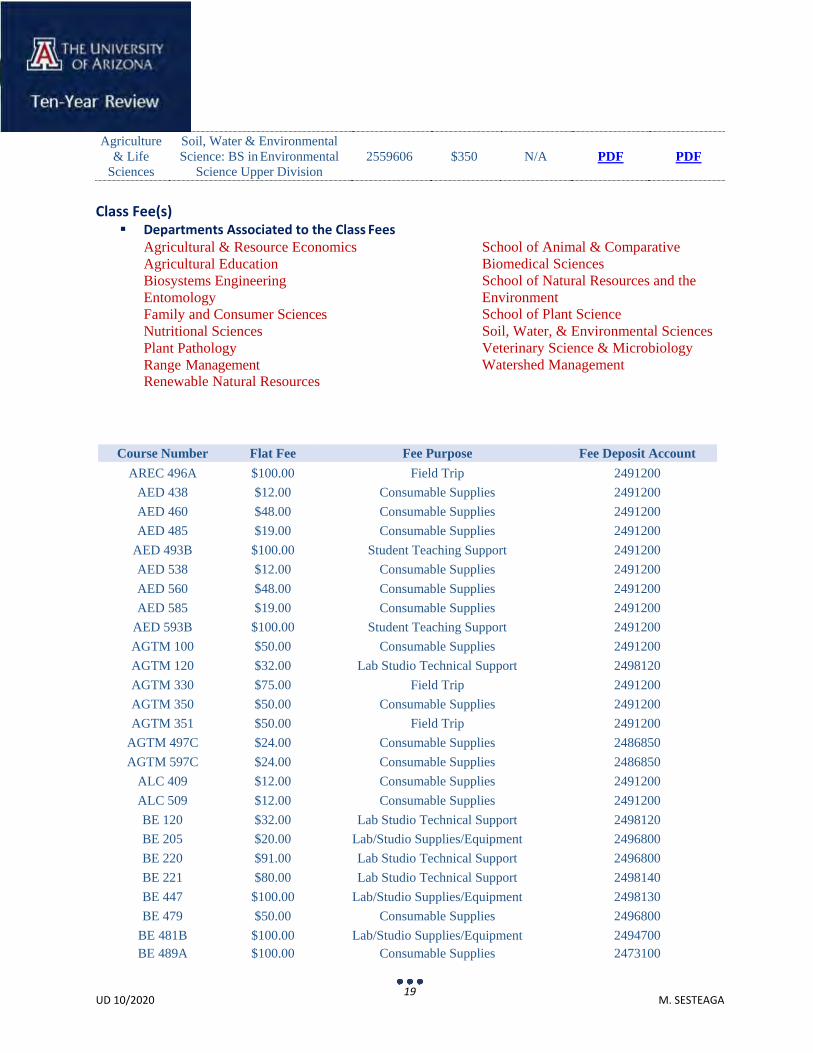
19 UD 10/2020 M. SESTEAGA
Agriculture & Life
Sciences
Soil, Water & Environmental Science: BS in Environmental
Science Upper Division
2559606
$350
N/A
Class Fee(s) Departments Associated to the Class Fees
Agricultural & Resource Economics Agricultural Education Biosystems Engineering Entomology Family and Consumer Sciences Nutritional Sciences Plant Pathology Range Management Renewable Natural Resources
School of Animal & Comparative Biomedical Sciences School of Natural Resources and the Environment School of Plant Science Soil, Water, & Environmental Sciences Veterinary Science & Microbiology Watershed Management
Course Number Flat Fee Fee Purpose Fee Deposit Account AREC 496A $100.00 Field Trip 2491200
AED 438 $12.00 Consumable Supplies 2491200 AED 460 $48.00 Consumable Supplies 2491200 AED 485 $19.00 Consumable Supplies 2491200
AED 493B $100.00 Student Teaching Support 2491200 AED 538 $12.00 Consumable Supplies 2491200 AED 560 $48.00 Consumable Supplies 2491200 AED 585 $19.00 Consumable Supplies 2491200
AED 593B $100.00 Student Teaching Support 2491200 AGTM 100 $50.00 Consumable Supplies 2491200 AGTM 120 $32.00 Lab Studio Technical Support 2498120 AGTM 330 $75.00 Field Trip 2491200 AGTM 350 $50.00 Consumable Supplies 2491200 AGTM 351 $50.00 Field Trip 2491200
AGTM 497C $24.00 Consumable Supplies 2486850 AGTM 597C $24.00 Consumable Supplies 2486850
ALC 409 $12.00 Consumable Supplies 2491200 ALC 509 $12.00 Consumable Supplies 2491200 BE 120 $32.00 Lab Studio Technical Support 2498120 BE 205 $20.00 Lab/Studio Supplies/Equipment 2496800 BE 220 $91.00 Lab Studio Technical Support 2496800 BE 221 $80.00 Lab Studio Technical Support 2498140 BE 447 $100.00 Lab/Studio Supplies/Equipment 2498130 BE 479 $50.00 Consumable Supplies 2496800
BE 481B $100.00 Lab/Studio Supplies/Equipment 2494700 BE 489A $100.00 Consumable Supplies 2473100
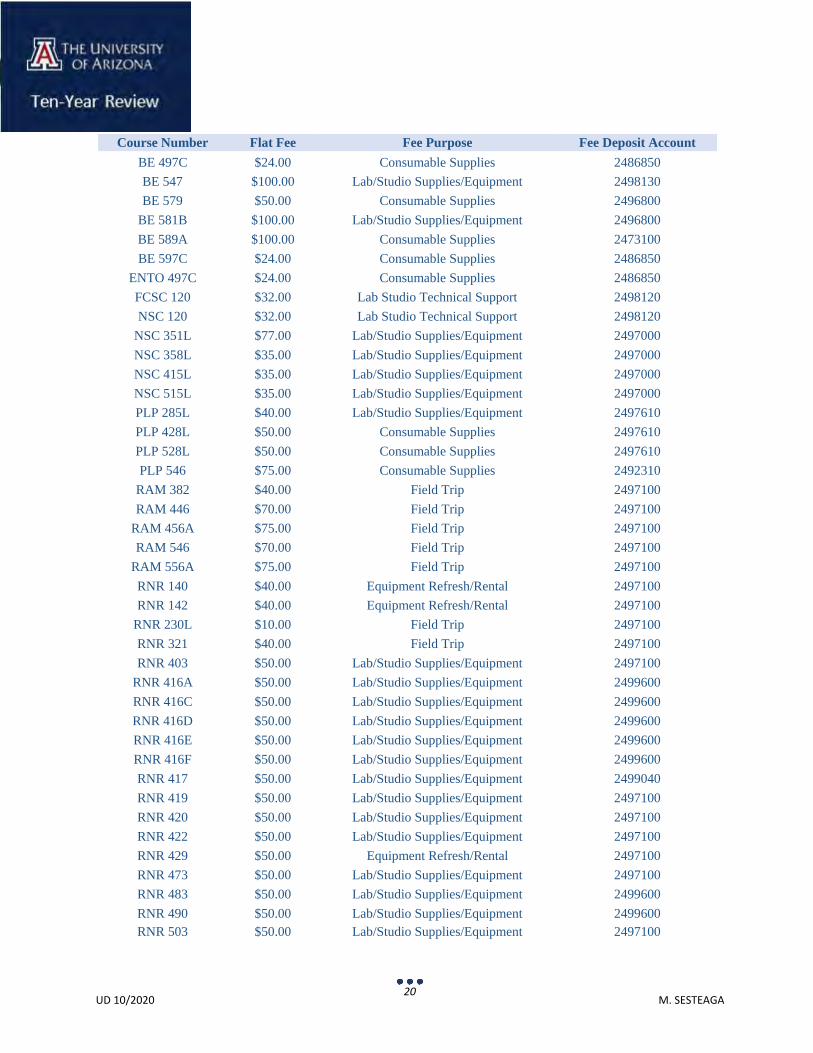
20 UD 10/2020 M. SESTEAGA
Course Number Flat Fee Fee Purpose Fee Deposit Account BE 497C $24.00 Consumable Supplies 2486850 BE 547 $100.00 Lab/Studio Supplies/Equipment 2498130 BE 579 $50.00 Consumable Supplies 2496800
BE 581B $100.00 Lab/Studio Supplies/Equipment 2496800 BE 589A $100.00 Consumable Supplies 2473100 BE 597C $24.00 Consumable Supplies 2486850
ENTO 497C $24.00 Consumable Supplies 2486850 FCSC 120 $32.00 Lab Studio Technical Support 2498120 NSC 120 $32.00 Lab Studio Technical Support 2498120
NSC 351L $77.00 Lab/Studio Supplies/Equipment 2497000 NSC 358L $35.00 Lab/Studio Supplies/Equipment 2497000 NSC 415L $35.00 Lab/Studio Supplies/Equipment 2497000 NSC 515L $35.00 Lab/Studio Supplies/Equipment 2497000 PLP 285L $40.00 Lab/Studio Supplies/Equipment 2497610 PLP 428L $50.00 Consumable Supplies 2497610 PLP 528L $50.00 Consumable Supplies 2497610 PLP 546 $75.00 Consumable Supplies 2492310
RAM 382 $40.00 Field Trip 2497100 RAM 446 $70.00 Field Trip 2497100
RAM 456A $75.00 Field Trip 2497100 RAM 546 $70.00 Field Trip 2497100
RAM 556A $75.00 Field Trip 2497100 RNR 140 $40.00 Equipment Refresh/Rental 2497100 RNR 142 $40.00 Equipment Refresh/Rental 2497100
RNR 230L $10.00 Field Trip 2497100 RNR 321 $40.00 Field Trip 2497100 RNR 403 $50.00 Lab/Studio Supplies/Equipment 2497100
RNR 416A $50.00 Lab/Studio Supplies/Equipment 2499600 RNR 416C $50.00 Lab/Studio Supplies/Equipment 2499600 RNR 416D $50.00 Lab/Studio Supplies/Equipment 2499600 RNR 416E $50.00 Lab/Studio Supplies/Equipment 2499600 RNR 416F $50.00 Lab/Studio Supplies/Equipment 2499600 RNR 417 $50.00 Lab/Studio Supplies/Equipment 2499040 RNR 419 $50.00 Lab/Studio Supplies/Equipment 2497100 RNR 420 $50.00 Lab/Studio Supplies/Equipment 2497100 RNR 422 $50.00 Lab/Studio Supplies/Equipment 2497100 RNR 429 $50.00 Equipment Refresh/Rental 2497100 RNR 473 $50.00 Lab/Studio Supplies/Equipment 2497100 RNR 483 $50.00 Lab/Studio Supplies/Equipment 2499600 RNR 490 $50.00 Lab/Studio Supplies/Equipment 2499600 RNR 503 $50.00 Lab/Studio Supplies/Equipment 2497100
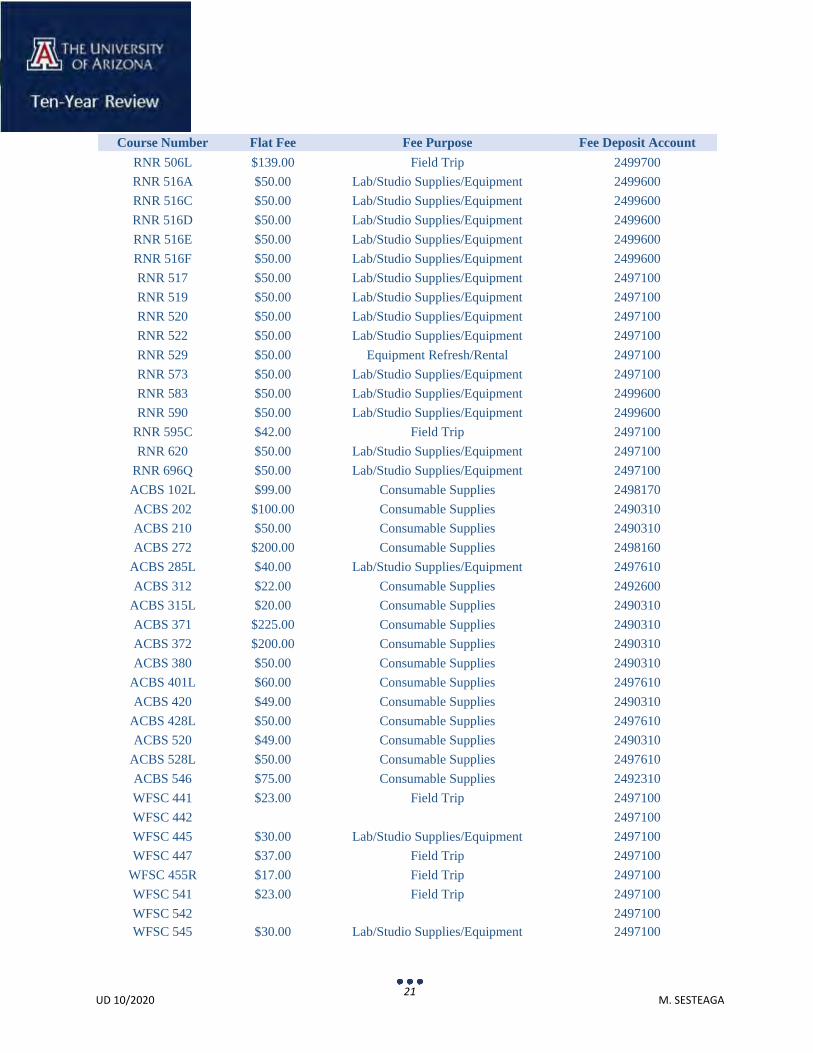
21 UD 10/2020 M. SESTEAGA
Course Number Flat Fee Fee Purpose Fee Deposit Account RNR 506L $139.00 Field Trip 2499700 RNR 516A $50.00 Lab/Studio Supplies/Equipment 2499600 RNR 516C $50.00 Lab/Studio Supplies/Equipment 2499600 RNR 516D $50.00 Lab/Studio Supplies/Equipment 2499600 RNR 516E $50.00 Lab/Studio Supplies/Equipment 2499600 RNR 516F $50.00 Lab/Studio Supplies/Equipment 2499600 RNR 517 $50.00 Lab/Studio Supplies/Equipment 2497100 RNR 519 $50.00 Lab/Studio Supplies/Equipment 2497100 RNR 520 $50.00 Lab/Studio Supplies/Equipment 2497100 RNR 522 $50.00 Lab/Studio Supplies/Equipment 2497100 RNR 529 $50.00 Equipment Refresh/Rental 2497100 RNR 573 $50.00 Lab/Studio Supplies/Equipment 2497100 RNR 583 $50.00 Lab/Studio Supplies/Equipment 2499600 RNR 590 $50.00 Lab/Studio Supplies/Equipment 2499600
RNR 595C $42.00 Field Trip 2497100 RNR 620 $50.00 Lab/Studio Supplies/Equipment 2497100
RNR 696Q $50.00 Lab/Studio Supplies/Equipment 2497100 ACBS 102L $99.00 Consumable Supplies 2498170 ACBS 202 $100.00 Consumable Supplies 2490310 ACBS 210 $50.00 Consumable Supplies 2490310 ACBS 272 $200.00 Consumable Supplies 2498160
ACBS 285L $40.00 Lab/Studio Supplies/Equipment 2497610 ACBS 312 $22.00 Consumable Supplies 2492600
ACBS 315L $20.00 Consumable Supplies 2490310 ACBS 371 $225.00 Consumable Supplies 2490310 ACBS 372 $200.00 Consumable Supplies 2490310 ACBS 380 $50.00 Consumable Supplies 2490310
ACBS 401L $60.00 Consumable Supplies 2497610 ACBS 420 $49.00 Consumable Supplies 2490310
ACBS 428L $50.00 Consumable Supplies 2497610 ACBS 520 $49.00 Consumable Supplies 2490310
ACBS 528L $50.00 Consumable Supplies 2497610 ACBS 546 $75.00 Consumable Supplies 2492310 WFSC 441 $23.00 Field Trip 2497100 WFSC 442 2497100 WFSC 445 $30.00 Lab/Studio Supplies/Equipment 2497100 WFSC 447 $37.00 Field Trip 2497100
WFSC 455R $17.00 Field Trip 2497100 WFSC 541 $23.00 Field Trip 2497100 WFSC 542 2497100 WFSC 545 $30.00 Lab/Studio Supplies/Equipment 2497100
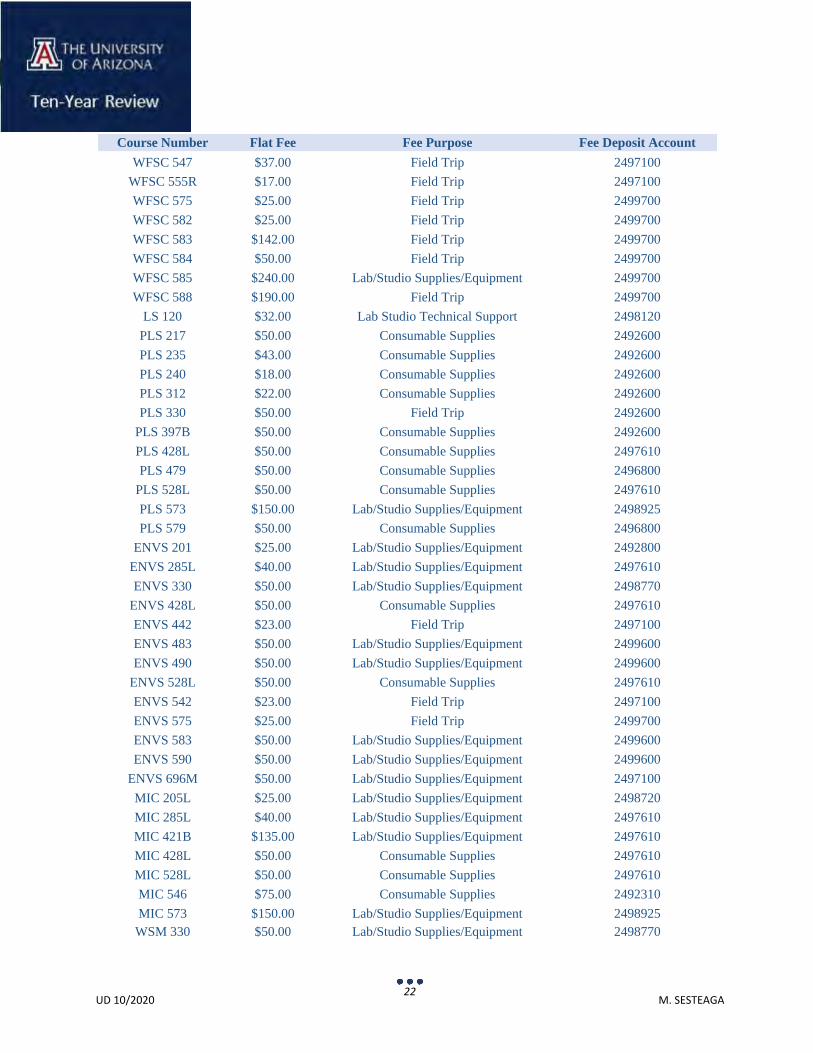
22 UD 10/2020 M. SESTEAGA
Course Number Flat Fee Fee Purpose Fee Deposit Account WFSC 547 $37.00 Field Trip 2497100
WFSC 555R $17.00 Field Trip 2497100 WFSC 575 $25.00 Field Trip 2499700 WFSC 582 $25.00 Field Trip 2499700 WFSC 583 $142.00 Field Trip 2499700 WFSC 584 $50.00 Field Trip 2499700 WFSC 585 $240.00 Lab/Studio Supplies/Equipment 2499700 WFSC 588 $190.00 Field Trip 2499700
LS 120 $32.00 Lab Studio Technical Support 2498120 PLS 217 $50.00 Consumable Supplies 2492600 PLS 235 $43.00 Consumable Supplies 2492600 PLS 240 $18.00 Consumable Supplies 2492600 PLS 312 $22.00 Consumable Supplies 2492600 PLS 330 $50.00 Field Trip 2492600
PLS 397B $50.00 Consumable Supplies 2492600 PLS 428L $50.00 Consumable Supplies 2497610 PLS 479 $50.00 Consumable Supplies 2496800
PLS 528L $50.00 Consumable Supplies 2497610 PLS 573 $150.00 Lab/Studio Supplies/Equipment 2498925 PLS 579 $50.00 Consumable Supplies 2496800
ENVS 201 $25.00 Lab/Studio Supplies/Equipment 2492800 ENVS 285L $40.00 Lab/Studio Supplies/Equipment 2497610 ENVS 330 $50.00 Lab/Studio Supplies/Equipment 2498770
ENVS 428L $50.00 Consumable Supplies 2497610 ENVS 442 $23.00 Field Trip 2497100 ENVS 483 $50.00 Lab/Studio Supplies/Equipment 2499600 ENVS 490 $50.00 Lab/Studio Supplies/Equipment 2499600
ENVS 528L $50.00 Consumable Supplies 2497610 ENVS 542 $23.00 Field Trip 2497100 ENVS 575 $25.00 Field Trip 2499700 ENVS 583 $50.00 Lab/Studio Supplies/Equipment 2499600 ENVS 590 $50.00 Lab/Studio Supplies/Equipment 2499600
ENVS 696M $50.00 Lab/Studio Supplies/Equipment 2497100 MIC 205L $25.00 Lab/Studio Supplies/Equipment 2498720 MIC 285L $40.00 Lab/Studio Supplies/Equipment 2497610 MIC 421B $135.00 Lab/Studio Supplies/Equipment 2497610 MIC 428L $50.00 Consumable Supplies 2497610 MIC 528L $50.00 Consumable Supplies 2497610 MIC 546 $75.00 Consumable Supplies 2492310 MIC 573 $150.00 Lab/Studio Supplies/Equipment 2498925
WSM 330 $50.00 Lab/Studio Supplies/Equipment 2498770
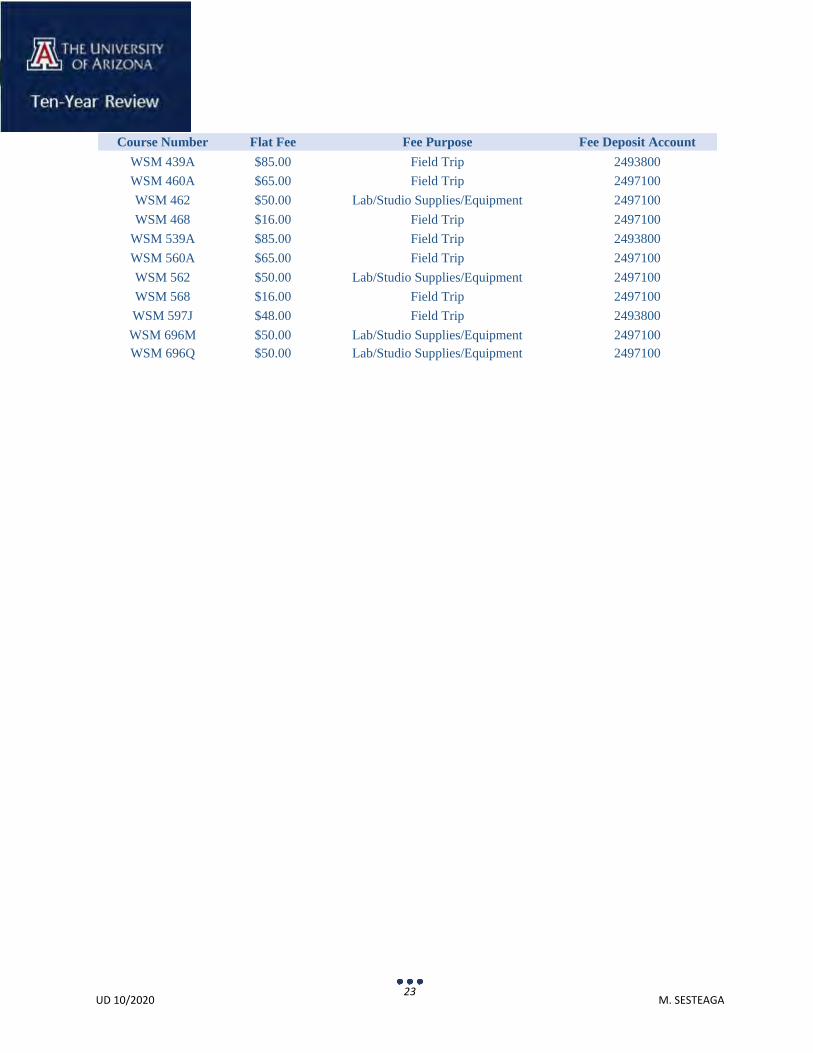
23 UD 10/2020 M. SESTEAGA
Course Number Flat Fee Fee Purpose Fee Deposit Account WSM 439A $85.00 Field Trip 2493800 WSM 460A $65.00 Field Trip 2497100 WSM 462 $50.00 Lab/Studio Supplies/Equipment 2497100 WSM 468 $16.00 Field Trip 2497100
WSM 539A $85.00 Field Trip 2493800 WSM 560A $65.00 Field Trip 2497100 WSM 562 $50.00 Lab/Studio Supplies/Equipment 2497100 WSM 568 $16.00 Field Trip 2497100 WSM 597J $48.00 Field Trip 2493800 WSM 696M $50.00 Lab/Studio Supplies/Equipment 2497100 WSM 696Q $50.00 Lab/Studio Supplies/Equipment 2497100
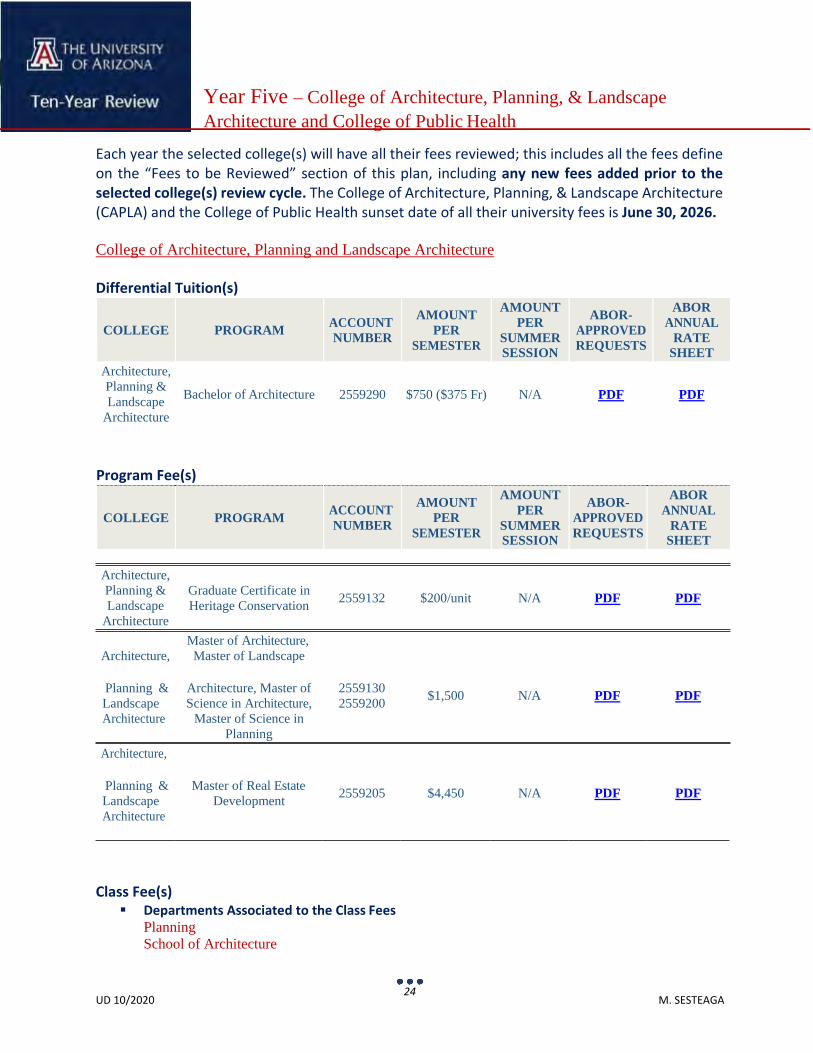
24 UD 10/2020 M. SESTEAGA
Year Five – College of Architecture, Planning, & Landscape Architecture and College of Public Health
Each year the selected college(s) will have all their fees reviewed; this includes all the fees define on the “Fees to be Reviewed” section of this plan, including any new fees added prior to the selected college(s) review cycle. The College of Architecture, Planning, & Landscape Architecture (CAPLA) and the College of Public Health sunset date of all their university fees is June 30, 2026.
College of Architecture, Planning and Landscape Architecture
Differential Tuition(s) COLLEGE
PROGRAM
ACCOUNT NUMBER
AMOUNT PER
SEMESTER
AMOUNT PER
SUMMER SESSION
ABOR- APPROVED REQUESTS
ABOR ANNUAL
RATE SHEET
Architecture, Planning & Bachelor of Architecture Landscape Architecture
Program Fee(s)
2559290
$750 ($375 Fr)
N/A
PDF PDF
COLLEGE
PROGRAM
ACCOUNT NUMBER
AMOUNT PER
SEMESTER
AMOUNT PER
SUMMER SESSION
ABOR- APPROVED REQUESTS
ABOR ANNUAL
RATE SHEET
Architecture, Planning & Landscape
Architecture
Architecture,
Graduate Certificate in Heritage Conservation
Master of Architecture, Master of Landscape
2559132 $200/unit N/A PDF PDF
Planning & Landscape Architecture
Architecture,
Architecture, Master of Science in Architecture,
Master of Science in Planning
2559130 2559200 $1,500 N/A PDF PDF
Planning & Landscape Architecture
Master of Real Estate Development 2559205 $4,450 N/A PDF PDF
Class Fee(s) Departments Associated to the Class Fees
Planning School of Architecture
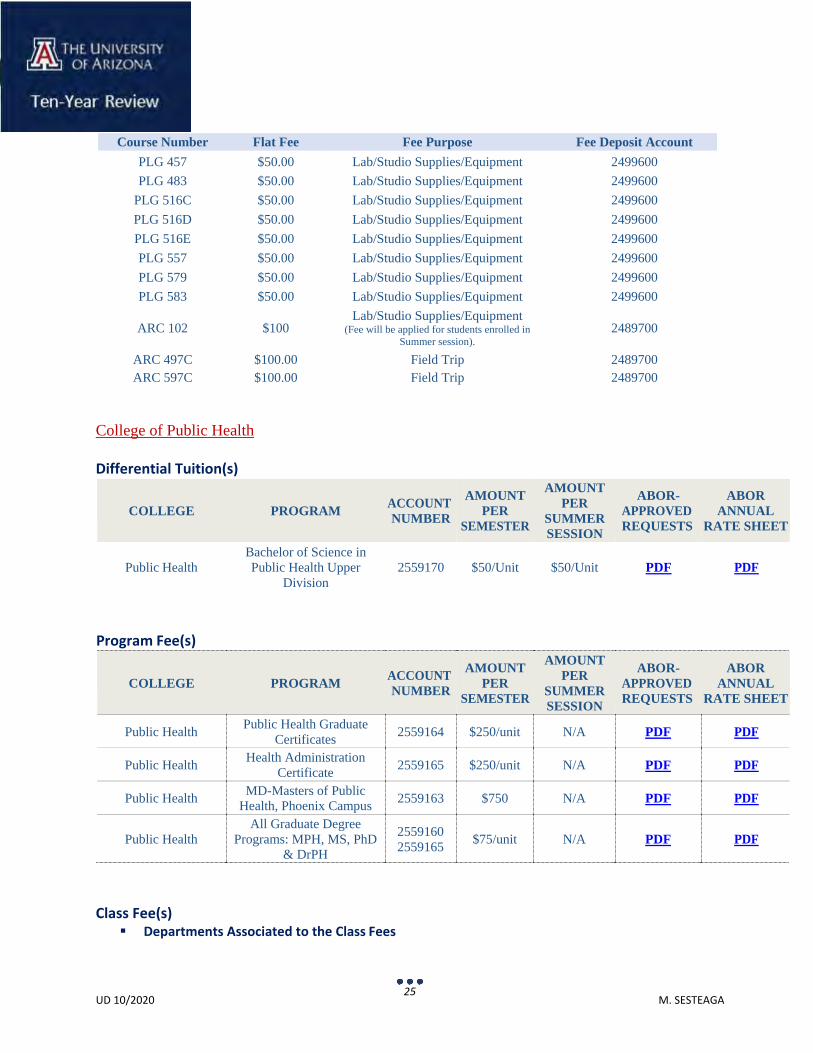
25 UD 10/2020 M. SESTEAGA
Course Number Flat Fee Fee Purpose Fee Deposit Account PLG 457 $50.00 Lab/Studio Supplies/Equipment 2499600 PLG 483 $50.00 Lab/Studio Supplies/Equipment 2499600
PLG 516C $50.00 Lab/Studio Supplies/Equipment 2499600 PLG 516D $50.00 Lab/Studio Supplies/Equipment 2499600 PLG 516E $50.00 Lab/Studio Supplies/Equipment 2499600 PLG 557 $50.00 Lab/Studio Supplies/Equipment 2499600 PLG 579 $50.00 Lab/Studio Supplies/Equipment 2499600 PLG 583 $50.00 Lab/Studio Supplies/Equipment 2499600
ARC 102
$100
Lab/Studio Supplies/Equipment (Fee will be applied for students enrolled in
Summer session).
2489700
ARC 497C $100.00 Field Trip 2489700 ARC 597C $100.00 Field Trip 2489700
College of Public Health
Differential Tuition(s)
COLLEGE
PROGRAM
ACCOUNT NUMBER
AMOUNT PER
SEMESTER
AMOUNT PER
SUMMER SESSION
ABOR- APPROVED REQUESTS
ABOR ANNUAL
RATE SHEET
Public Health
Program Fee(s)
Bachelor of Science in Public Health Upper
Division
2559170
$50/Unit
$50/Unit
COLLEGE
PROGRAM
ACCOUNT NUMBER
AMOUNT PER
SEMESTER
AMOUNT PER
SUMMER SESSION
ABOR- APPROVED REQUESTS
ABOR ANNUAL
RATE SHEET
Public Health Public Health Graduate Certificates 2559164 $250/unit N/A PDF PDF
Public Health Health Administration Certificate 2559165 $250/unit N/A PDF PDF
Public Health MD-Masters of Public Health, Phoenix Campus 2559163 $750 N/A PDF PDF
Public Health
All Graduate Degree Programs: MPH, MS, PhD
& DrPH
2559160 2559165
$75/unit
N/A
Class Fee(s) Departments Associated to the Class Fees
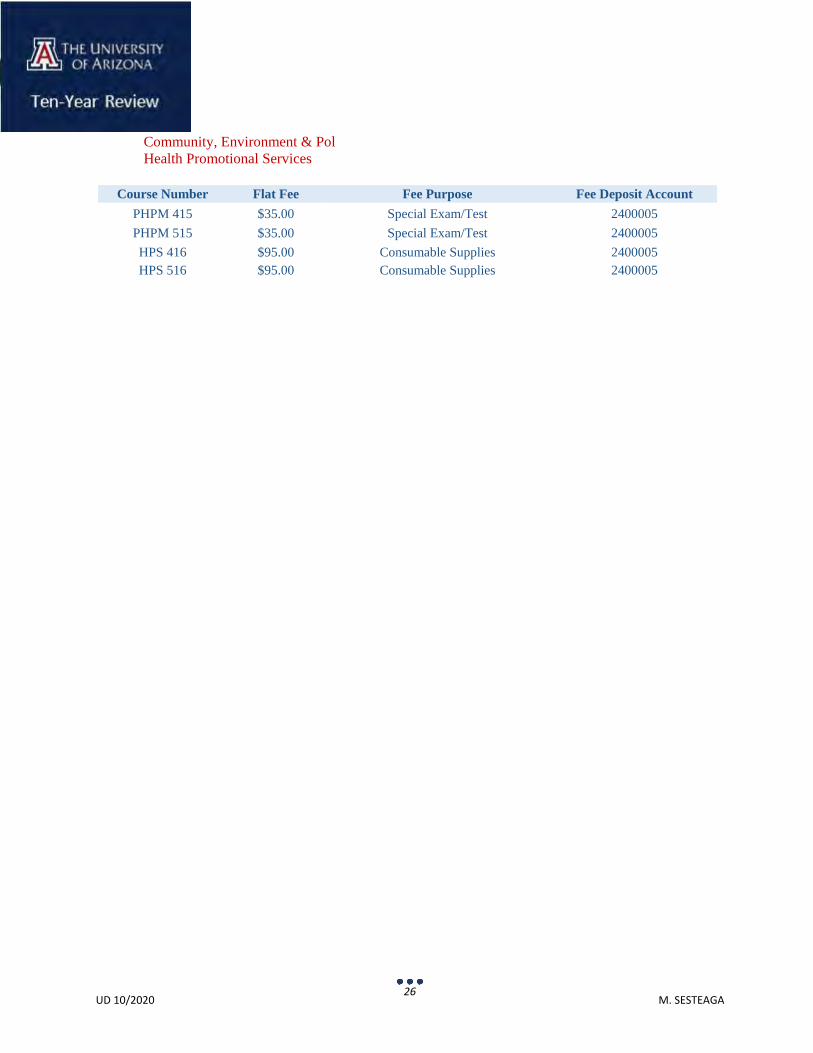
26 UD 10/2020 M. SESTEAGA
Community, Environment & Pol Health Promotional Services
Course Number Flat Fee Fee Purpose Fee Deposit Account
PHPM 415 $35.00 Special Exam/Test 2400005 PHPM 515 $35.00 Special Exam/Test 2400005 HPS 416 $95.00 Consumable Supplies 2400005 HPS 516 $95.00 Consumable Supplies 2400005
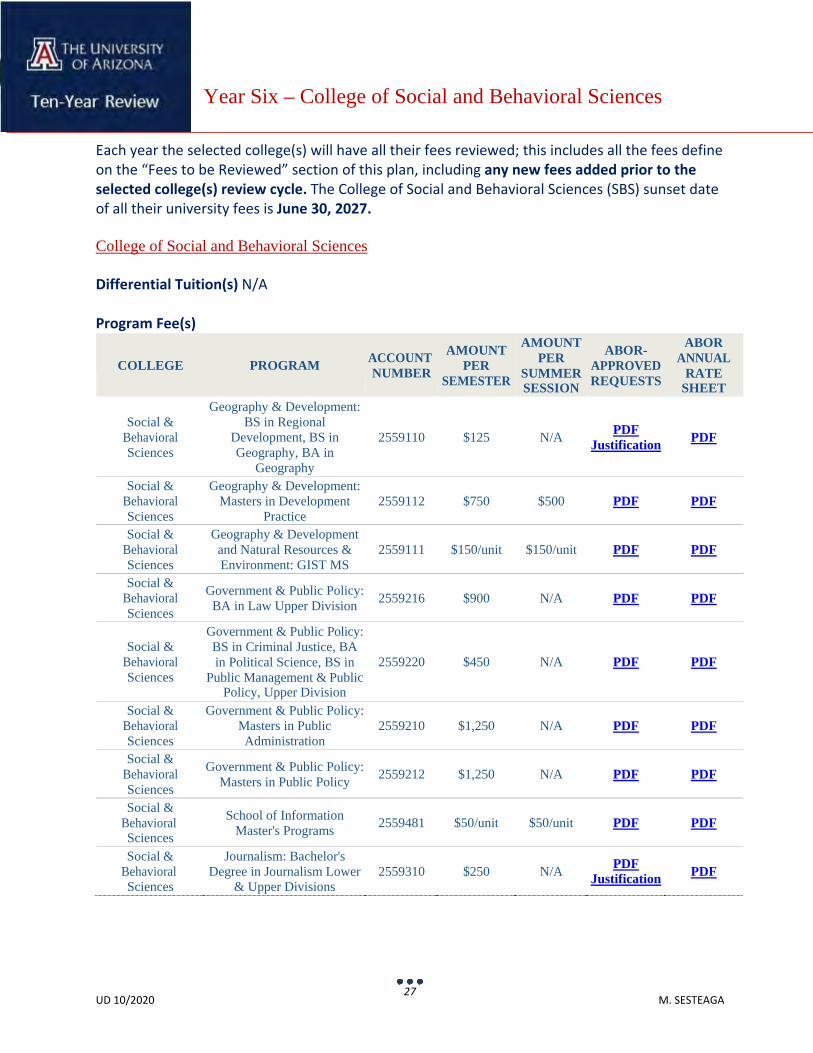
27 UD 10/2020 M. SESTEAGA
Year Six – College of Social and Behavioral Sciences
Each year the selected college(s) will have all their fees reviewed; this includes all the fees define on the “Fees to be Reviewed” section of this plan, including any new fees added prior to the selected college(s) review cycle. The College of Social and Behavioral Sciences (SBS) sunset date of all their university fees is June 30, 2027.
College of Social and Behavioral Sciences
Differential Tuition(s) N/A
Program Fee(s)
COLLEGE
PROGRAM
ACCOUNT NUMBER
AMOUNT PER
SEMESTER
AMOUNT PER
SUMMER SESSION
ABOR- APPROVED REQUESTS
ABOR ANNUAL
RATE SHEET
Social &
Behavioral Sciences
Geography & Development: BS in Regional
Development, BS in Geography, BA in
Geography
2559110
$125
N/A
Justification
Social & Behavioral Sciences
Geography & Development: Masters in Development
Practice
2559112
$750
$500
Social & Behavioral Sciences
Geography & Development and Natural Resources & Environment: GIST MS
2559111
$150/unit
$150/unit
Social & Behavioral Sciences
Government & Public Policy: BA in Law Upper Division
2559216
$900
N/A
Social &
Behavioral Sciences
Government & Public Policy: BS in Criminal Justice, BA in Political Science, BS in
Public Management & Public Policy, Upper Division
2559220
$450
N/A
Social & Behavioral Sciences
Government & Public Policy: Masters in Public Administration
2559210
$1,250
N/A
Social & Behavioral Sciences
Government & Public Policy: Masters in Public Policy
2559212
$1,250
N/A
Social & Behavioral Sciences
School of Information Master's Programs
2559481
$50/unit
$50/unit
Social & Behavioral Sciences
Journalism: Bachelor's Degree in Journalism Lower
& Upper Divisions
2559310
$250
N/A PDF
Justification
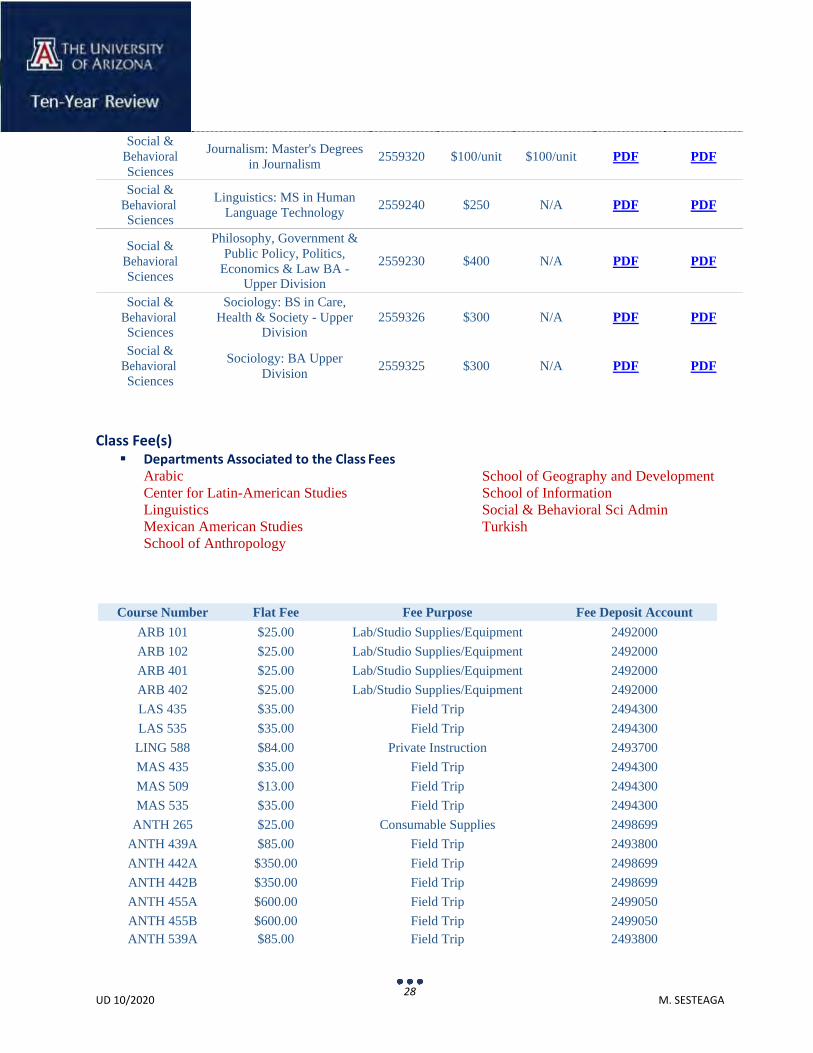
28 UD 10/2020 M. SESTEAGA
Social & Behavioral Sciences
Journalism: Master's Degrees in Journalism
2559320
$100/unit
$100/unit
Social & Behavioral Sciences
Linguistics: MS in Human Language Technology
2559240
$250
N/A
Social & Behavioral Sciences
Philosophy, Government & Public Policy, Politics,
Economics & Law BA - Upper Division
2559230
$400
N/A
Social & Behavioral Sciences
Sociology: BS in Care, Health & Society - Upper
Division
2559326
$300
N/A
Social & Behavioral Sciences
Sociology: BA Upper Division
2559325
$300
N/A
Class Fee(s) Departments Associated to the Class Fees
Arabic Center for Latin-American Studies Linguistics Mexican American Studies School of Anthropology
School of Geography and Development School of Information Social & Behavioral Sci Admin Turkish
Course Number Flat Fee Fee Purpose Fee Deposit Account ARB 101 $25.00 Lab/Studio Supplies/Equipment 2492000 ARB 102 $25.00 Lab/Studio Supplies/Equipment 2492000 ARB 401 $25.00 Lab/Studio Supplies/Equipment 2492000 ARB 402 $25.00 Lab/Studio Supplies/Equipment 2492000 LAS 435 $35.00 Field Trip 2494300 LAS 535 $35.00 Field Trip 2494300 LING 588 $84.00 Private Instruction 2493700 MAS 435 $35.00 Field Trip 2494300 MAS 509 $13.00 Field Trip 2494300 MAS 535 $35.00 Field Trip 2494300
ANTH 265 $25.00 Consumable Supplies 2498699 ANTH 439A $85.00 Field Trip 2493800 ANTH 442A $350.00 Field Trip 2498699 ANTH 442B $350.00 Field Trip 2498699 ANTH 455A $600.00 Field Trip 2499050 ANTH 455B $600.00 Field Trip 2499050 ANTH 539A $85.00 Field Trip 2493800
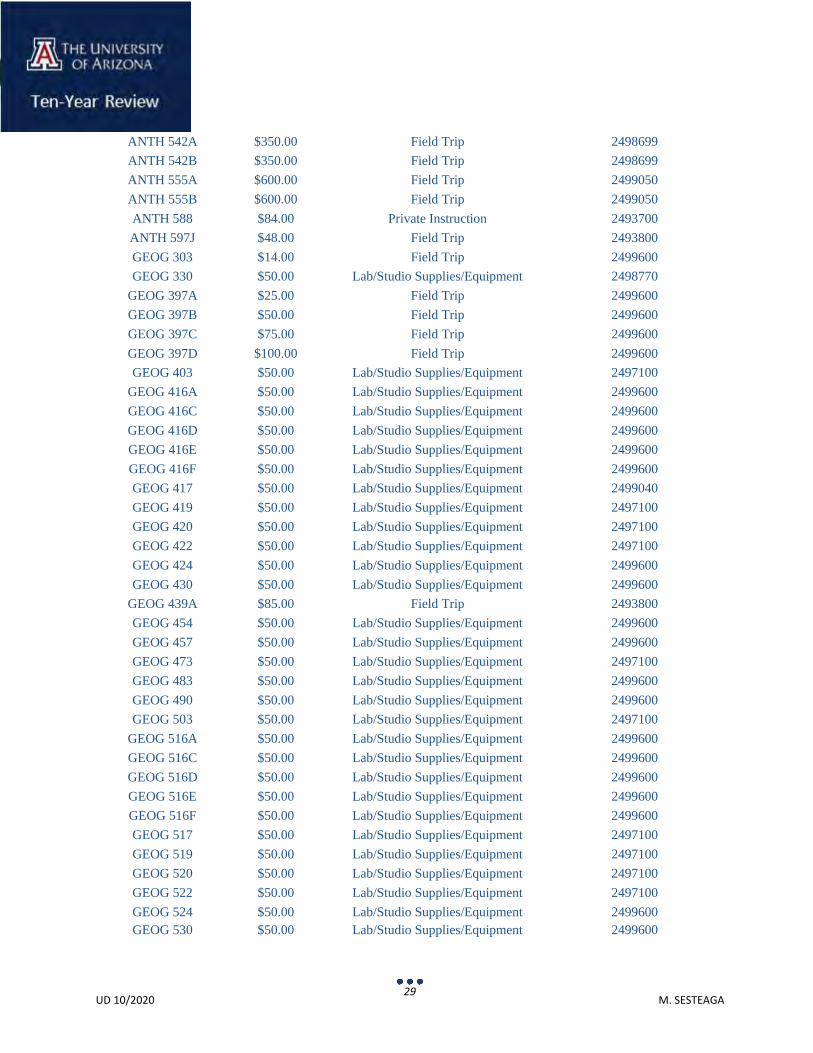
29 UD 10/2020 M. SESTEAGA
ANTH 542A $350.00 Field Trip 2498699 ANTH 542B $350.00 Field Trip 2498699 ANTH 555A $600.00 Field Trip 2499050 ANTH 555B $600.00 Field Trip 2499050 ANTH 588 $84.00 Private Instruction 2493700 ANTH 597J $48.00 Field Trip 2493800 GEOG 303 $14.00 Field Trip 2499600 GEOG 330 $50.00 Lab/Studio Supplies/Equipment 2498770
GEOG 397A $25.00 Field Trip 2499600 GEOG 397B $50.00 Field Trip 2499600 GEOG 397C $75.00 Field Trip 2499600 GEOG 397D $100.00 Field Trip 2499600 GEOG 403 $50.00 Lab/Studio Supplies/Equipment 2497100
GEOG 416A $50.00 Lab/Studio Supplies/Equipment 2499600 GEOG 416C $50.00 Lab/Studio Supplies/Equipment 2499600 GEOG 416D $50.00 Lab/Studio Supplies/Equipment 2499600 GEOG 416E $50.00 Lab/Studio Supplies/Equipment 2499600 GEOG 416F $50.00 Lab/Studio Supplies/Equipment 2499600 GEOG 417 $50.00 Lab/Studio Supplies/Equipment 2499040 GEOG 419 $50.00 Lab/Studio Supplies/Equipment 2497100 GEOG 420 $50.00 Lab/Studio Supplies/Equipment 2497100 GEOG 422 $50.00 Lab/Studio Supplies/Equipment 2497100 GEOG 424 $50.00 Lab/Studio Supplies/Equipment 2499600 GEOG 430 $50.00 Lab/Studio Supplies/Equipment 2499600
GEOG 439A $85.00 Field Trip 2493800 GEOG 454 $50.00 Lab/Studio Supplies/Equipment 2499600 GEOG 457 $50.00 Lab/Studio Supplies/Equipment 2499600 GEOG 473 $50.00 Lab/Studio Supplies/Equipment 2497100 GEOG 483 $50.00 Lab/Studio Supplies/Equipment 2499600 GEOG 490 $50.00 Lab/Studio Supplies/Equipment 2499600 GEOG 503 $50.00 Lab/Studio Supplies/Equipment 2497100
GEOG 516A $50.00 Lab/Studio Supplies/Equipment 2499600 GEOG 516C $50.00 Lab/Studio Supplies/Equipment 2499600 GEOG 516D $50.00 Lab/Studio Supplies/Equipment 2499600 GEOG 516E $50.00 Lab/Studio Supplies/Equipment 2499600 GEOG 516F $50.00 Lab/Studio Supplies/Equipment 2499600 GEOG 517 $50.00 Lab/Studio Supplies/Equipment 2497100 GEOG 519 $50.00 Lab/Studio Supplies/Equipment 2497100 GEOG 520 $50.00 Lab/Studio Supplies/Equipment 2497100 GEOG 522 $50.00 Lab/Studio Supplies/Equipment 2497100 GEOG 524 $50.00 Lab/Studio Supplies/Equipment 2499600 GEOG 530 $50.00 Lab/Studio Supplies/Equipment 2499600
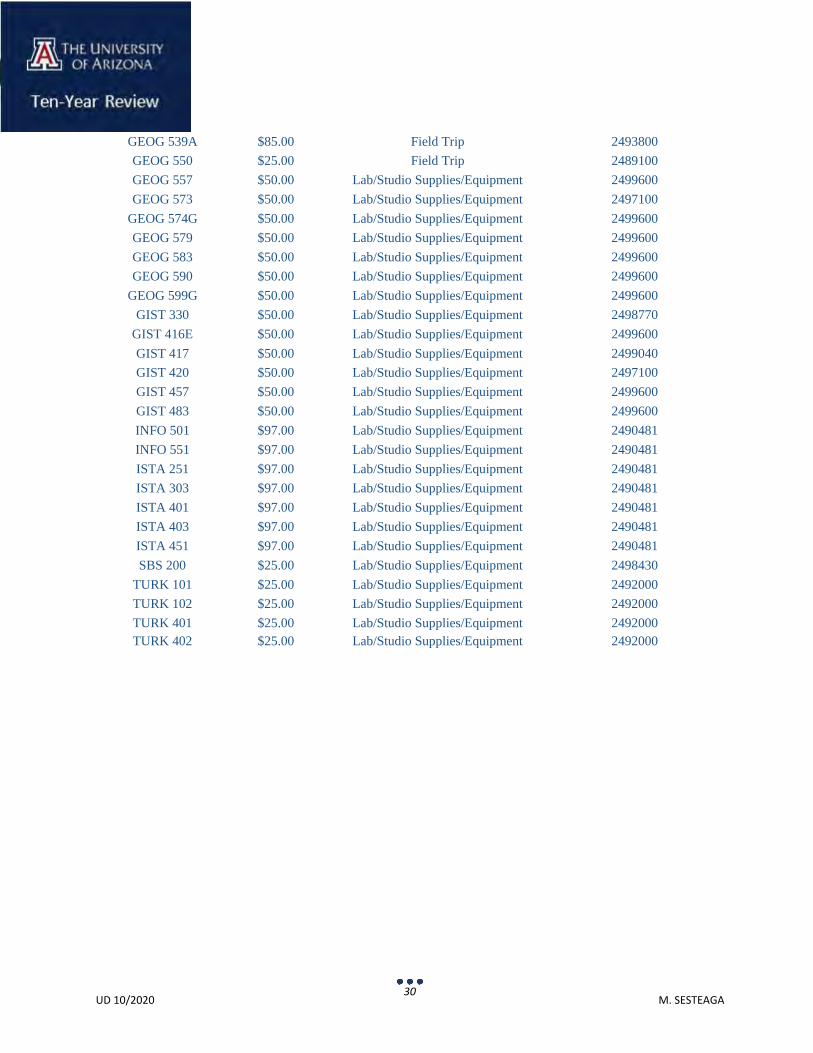
30 UD 10/2020 M. SESTEAGA
GEOG 539A $85.00 Field Trip 2493800 GEOG 550 $25.00 Field Trip 2489100 GEOG 557 $50.00 Lab/Studio Supplies/Equipment 2499600 GEOG 573 $50.00 Lab/Studio Supplies/Equipment 2497100
GEOG 574G $50.00 Lab/Studio Supplies/Equipment 2499600 GEOG 579 $50.00 Lab/Studio Supplies/Equipment 2499600 GEOG 583 $50.00 Lab/Studio Supplies/Equipment 2499600 GEOG 590 $50.00 Lab/Studio Supplies/Equipment 2499600
GEOG 599G $50.00 Lab/Studio Supplies/Equipment 2499600 GIST 330 $50.00 Lab/Studio Supplies/Equipment 2498770
GIST 416E $50.00 Lab/Studio Supplies/Equipment 2499600 GIST 417 $50.00 Lab/Studio Supplies/Equipment 2499040 GIST 420 $50.00 Lab/Studio Supplies/Equipment 2497100 GIST 457 $50.00 Lab/Studio Supplies/Equipment 2499600 GIST 483 $50.00 Lab/Studio Supplies/Equipment 2499600 INFO 501 $97.00 Lab/Studio Supplies/Equipment 2490481 INFO 551 $97.00 Lab/Studio Supplies/Equipment 2490481 ISTA 251 $97.00 Lab/Studio Supplies/Equipment 2490481 ISTA 303 $97.00 Lab/Studio Supplies/Equipment 2490481 ISTA 401 $97.00 Lab/Studio Supplies/Equipment 2490481 ISTA 403 $97.00 Lab/Studio Supplies/Equipment 2490481 ISTA 451 $97.00 Lab/Studio Supplies/Equipment 2490481 SBS 200 $25.00 Lab/Studio Supplies/Equipment 2498430
TURK 101 $25.00 Lab/Studio Supplies/Equipment 2492000 TURK 102 $25.00 Lab/Studio Supplies/Equipment 2492000 TURK 401 $25.00 Lab/Studio Supplies/Equipment 2492000 TURK 402 $25.00 Lab/Studio Supplies/Equipment 2492000
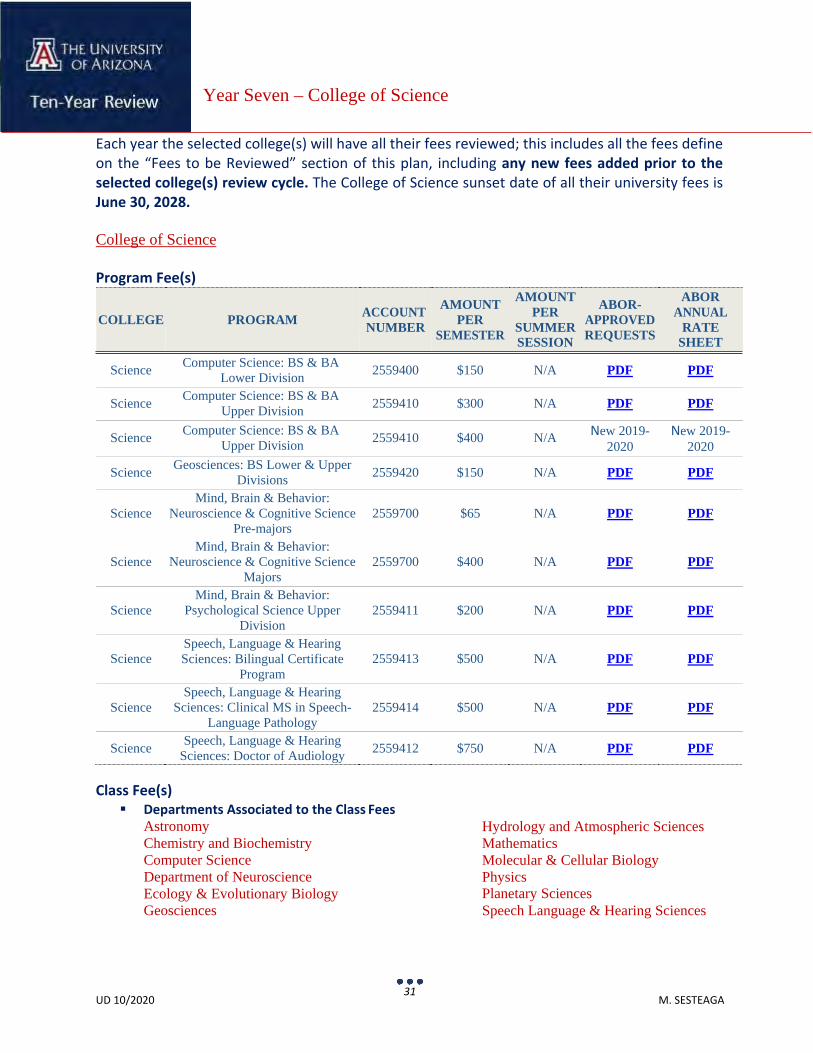
31 UD 10/2020 M. SESTEAGA
Each year the selected college(s) will have all their fees reviewed; this includes all the fees define on the “Fees to be Reviewed” section of this plan, including any new fees added prior to the selected college(s) review cycle. The College of Science sunset date of all their university fees is June 30, 2028.
College of Science
Program Fee(s) COLLEGE
PROGRAM
ACCOUNT NUMBER
AMOUNT PER
SEMESTER
AMOUNT PER
SUMMER SESSION
ABOR- APPROVED REQUESTS
ABOR ANNUAL
RATE SHEET
Science Computer Science: BS & BA Lower Division 2559400 $150 N/A PDF PDF
Science Computer Science: BS & BA Upper Division 2559410 $300 N/A PDF PDF
Science Computer Science: BS & BA Upper Division 2559410 $400 N/A New 2019-
2020 New 2019-
2020
Science Geosciences: BS Lower & Upper Divisions 2559420 $150 N/A PDF PDF
Science
Mind, Brain & Behavior: Neuroscience & Cognitive Science
Pre-majors
2559700
$65
N/A
Science
Mind, Brain & Behavior: Neuroscience & Cognitive Science
Majors
2559700
$400
N/A
Science
Mind, Brain & Behavior: Psychological Science Upper
Division
2559411
$200
N/A
Science
Speech, Language & Hearing Sciences: Bilingual Certificate
Program
2559413
$500
N/A
Science
Speech, Language & Hearing Sciences: Clinical MS in Speech-
Language Pathology
2559414
$500
N/A
Science Speech, Language & Hearing Sciences: Doctor of Audiology 2559412 $750 N/A PDF PDF
Class Fee(s) Departments Associated to the Class Fees
Astronomy Chemistry and Biochemistry Computer Science Department of Neuroscience Ecology & Evolutionary Biology Geosciences
Hydrology and Atmospheric Sciences Mathematics Molecular & Cellular Biology Physics Planetary Sciences Speech Language & Hearing Sciences
Year Seven – College of Science
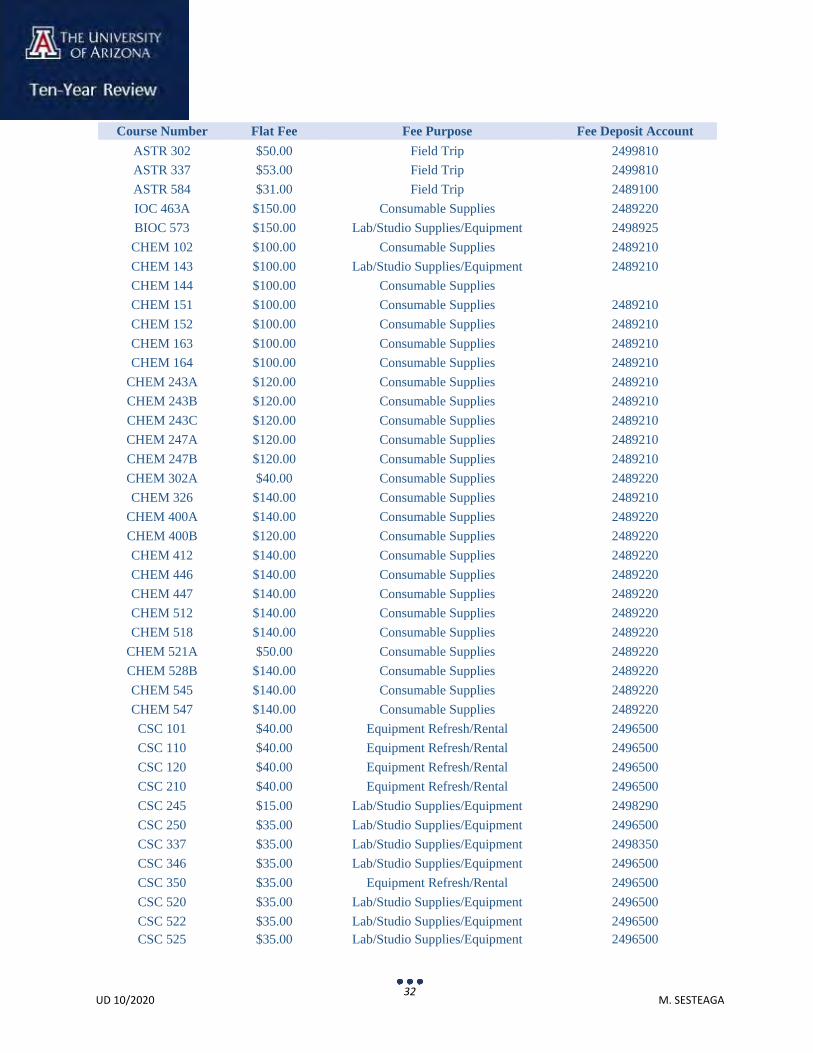
32 UD 10/2020 M. SESTEAGA
Course Number Flat Fee Fee Purpose Fee Deposit Account
ASTR 302 $50.00 Field Trip 2499810 ASTR 337 $53.00 Field Trip 2499810 ASTR 584 $31.00 Field Trip 2489100 IOC 463A $150.00 Consumable Supplies 2489220 BIOC 573 $150.00 Lab/Studio Supplies/Equipment 2498925 CHEM 102 $100.00 Consumable Supplies 2489210 CHEM 143 $100.00 Lab/Studio Supplies/Equipment 2489210 CHEM 144 $100.00 Consumable Supplies
CHEM 151 $100.00 Consumable Supplies 2489210 CHEM 152 $100.00 Consumable Supplies 2489210 CHEM 163 $100.00 Consumable Supplies 2489210 CHEM 164 $100.00 Consumable Supplies 2489210
CHEM 243A $120.00 Consumable Supplies 2489210 CHEM 243B $120.00 Consumable Supplies 2489210 CHEM 243C $120.00 Consumable Supplies 2489210 CHEM 247A $120.00 Consumable Supplies 2489210 CHEM 247B $120.00 Consumable Supplies 2489210 CHEM 302A $40.00 Consumable Supplies 2489220 CHEM 326 $140.00 Consumable Supplies 2489210
CHEM 400A $140.00 Consumable Supplies 2489220 CHEM 400B $120.00 Consumable Supplies 2489220 CHEM 412 $140.00 Consumable Supplies 2489220 CHEM 446 $140.00 Consumable Supplies 2489220 CHEM 447 $140.00 Consumable Supplies 2489220 CHEM 512 $140.00 Consumable Supplies 2489220 CHEM 518 $140.00 Consumable Supplies 2489220
CHEM 521A $50.00 Consumable Supplies 2489220 CHEM 528B $140.00 Consumable Supplies 2489220 CHEM 545 $140.00 Consumable Supplies 2489220 CHEM 547 $140.00 Consumable Supplies 2489220 CSC 101 $40.00 Equipment Refresh/Rental 2496500 CSC 110 $40.00 Equipment Refresh/Rental 2496500 CSC 120 $40.00 Equipment Refresh/Rental 2496500 CSC 210 $40.00 Equipment Refresh/Rental 2496500 CSC 245 $15.00 Lab/Studio Supplies/Equipment 2498290 CSC 250 $35.00 Lab/Studio Supplies/Equipment 2496500 CSC 337 $35.00 Lab/Studio Supplies/Equipment 2498350 CSC 346 $35.00 Lab/Studio Supplies/Equipment 2496500 CSC 350 $35.00 Equipment Refresh/Rental 2496500 CSC 520 $35.00 Lab/Studio Supplies/Equipment 2496500 CSC 522 $35.00 Lab/Studio Supplies/Equipment 2496500 CSC 525 $35.00 Lab/Studio Supplies/Equipment 2496500
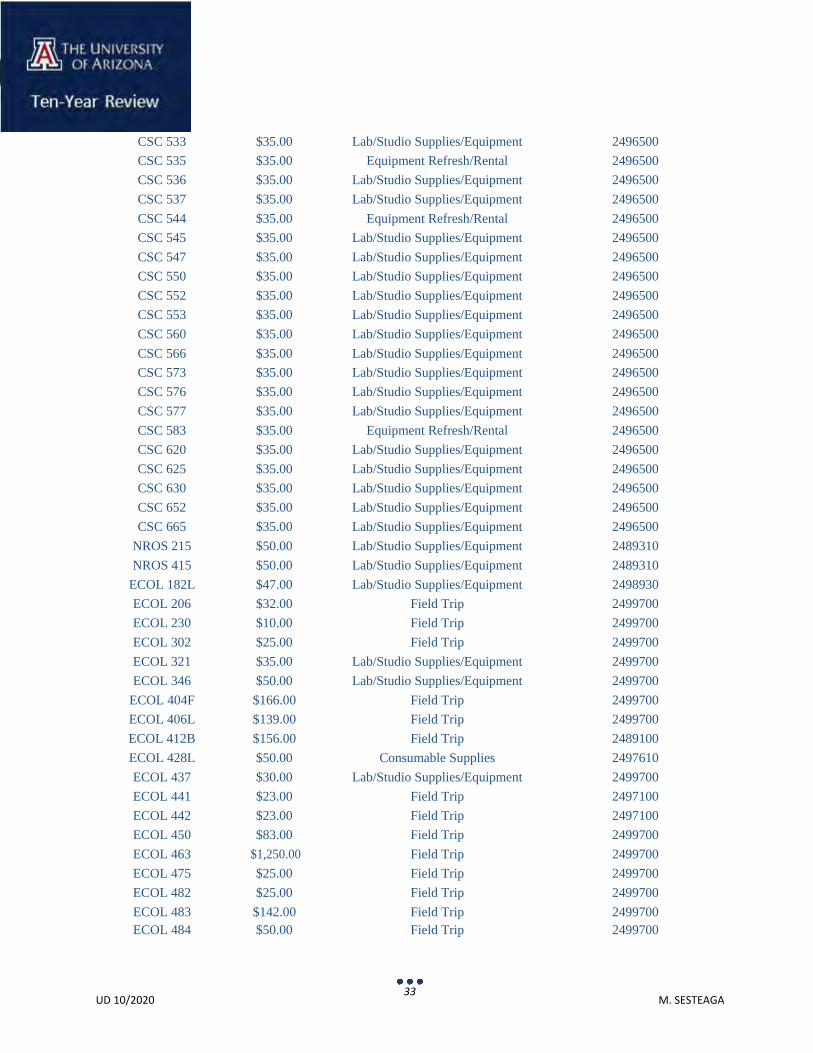
33 UD 10/2020 M. SESTEAGA
CSC 533 $35.00 Lab/Studio Supplies/Equipment 2496500 CSC 535 $35.00 Equipment Refresh/Rental 2496500 CSC 536 $35.00 Lab/Studio Supplies/Equipment 2496500 CSC 537 $35.00 Lab/Studio Supplies/Equipment 2496500 CSC 544 $35.00 Equipment Refresh/Rental 2496500 CSC 545 $35.00 Lab/Studio Supplies/Equipment 2496500 CSC 547 $35.00 Lab/Studio Supplies/Equipment 2496500 CSC 550 $35.00 Lab/Studio Supplies/Equipment 2496500 CSC 552 $35.00 Lab/Studio Supplies/Equipment 2496500 CSC 553 $35.00 Lab/Studio Supplies/Equipment 2496500 CSC 560 $35.00 Lab/Studio Supplies/Equipment 2496500 CSC 566 $35.00 Lab/Studio Supplies/Equipment 2496500 CSC 573 $35.00 Lab/Studio Supplies/Equipment 2496500 CSC 576 $35.00 Lab/Studio Supplies/Equipment 2496500 CSC 577 $35.00 Lab/Studio Supplies/Equipment 2496500 CSC 583 $35.00 Equipment Refresh/Rental 2496500 CSC 620 $35.00 Lab/Studio Supplies/Equipment 2496500 CSC 625 $35.00 Lab/Studio Supplies/Equipment 2496500 CSC 630 $35.00 Lab/Studio Supplies/Equipment 2496500 CSC 652 $35.00 Lab/Studio Supplies/Equipment 2496500 CSC 665 $35.00 Lab/Studio Supplies/Equipment 2496500
NROS 215 $50.00 Lab/Studio Supplies/Equipment 2489310 NROS 415 $50.00 Lab/Studio Supplies/Equipment 2489310
ECOL 182L $47.00 Lab/Studio Supplies/Equipment 2498930 ECOL 206 $32.00 Field Trip 2499700 ECOL 230 $10.00 Field Trip 2499700 ECOL 302 $25.00 Field Trip 2499700 ECOL 321 $35.00 Lab/Studio Supplies/Equipment 2499700 ECOL 346 $50.00 Lab/Studio Supplies/Equipment 2499700
ECOL 404F $166.00 Field Trip 2499700 ECOL 406L $139.00 Field Trip 2499700 ECOL 412B $156.00 Field Trip 2489100 ECOL 428L $50.00 Consumable Supplies 2497610 ECOL 437 $30.00 Lab/Studio Supplies/Equipment 2499700 ECOL 441 $23.00 Field Trip 2497100 ECOL 442 $23.00 Field Trip 2497100 ECOL 450 $83.00 Field Trip 2499700 ECOL 463 $1,250.00 Field Trip 2499700 ECOL 475 $25.00 Field Trip 2499700 ECOL 482 $25.00 Field Trip 2499700 ECOL 483 $142.00 Field Trip 2499700 ECOL 484 $50.00 Field Trip 2499700
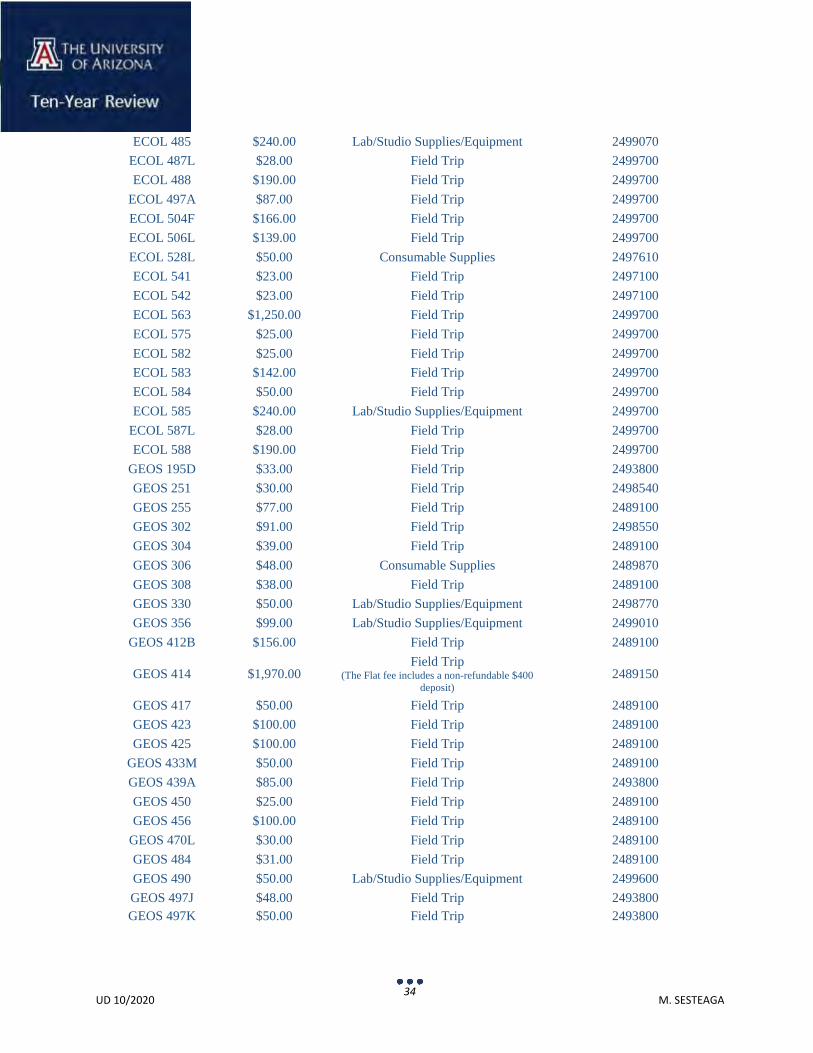
34 UD 10/2020 M. SESTEAGA
ECOL 485 $240.00 Lab/Studio Supplies/Equipment 2499070 ECOL 487L $28.00 Field Trip 2499700 ECOL 488 $190.00 Field Trip 2499700
ECOL 497A $87.00 Field Trip 2499700 ECOL 504F $166.00 Field Trip 2499700 ECOL 506L $139.00 Field Trip 2499700 ECOL 528L $50.00 Consumable Supplies 2497610 ECOL 541 $23.00 Field Trip 2497100 ECOL 542 $23.00 Field Trip 2497100 ECOL 563 $1,250.00 Field Trip 2499700 ECOL 575 $25.00 Field Trip 2499700 ECOL 582 $25.00 Field Trip 2499700 ECOL 583 $142.00 Field Trip 2499700 ECOL 584 $50.00 Field Trip 2499700 ECOL 585 $240.00 Lab/Studio Supplies/Equipment 2499700
ECOL 587L $28.00 Field Trip 2499700 ECOL 588 $190.00 Field Trip 2499700
GEOS 195D $33.00 Field Trip 2493800 GEOS 251 $30.00 Field Trip 2498540 GEOS 255 $77.00 Field Trip 2489100 GEOS 302 $91.00 Field Trip 2498550 GEOS 304 $39.00 Field Trip 2489100 GEOS 306 $48.00 Consumable Supplies 2489870 GEOS 308 $38.00 Field Trip 2489100 GEOS 330 $50.00 Lab/Studio Supplies/Equipment 2498770 GEOS 356 $99.00 Lab/Studio Supplies/Equipment 2499010
GEOS 412B $156.00 Field Trip 2489100
GEOS 414
$1,970.00 Field Trip
(The Flat fee includes a non-refundable $400 deposit)
2489150
GEOS 417 $50.00 Field Trip 2489100 GEOS 423 $100.00 Field Trip 2489100 GEOS 425 $100.00 Field Trip 2489100
GEOS 433M $50.00 Field Trip 2489100 GEOS 439A $85.00 Field Trip 2493800 GEOS 450 $25.00 Field Trip 2489100 GEOS 456 $100.00 Field Trip 2489100
GEOS 470L $30.00 Field Trip 2489100 GEOS 484 $31.00 Field Trip 2489100 GEOS 490 $50.00 Lab/Studio Supplies/Equipment 2499600 GEOS 497J $48.00 Field Trip 2493800 GEOS 497K $50.00 Field Trip 2493800
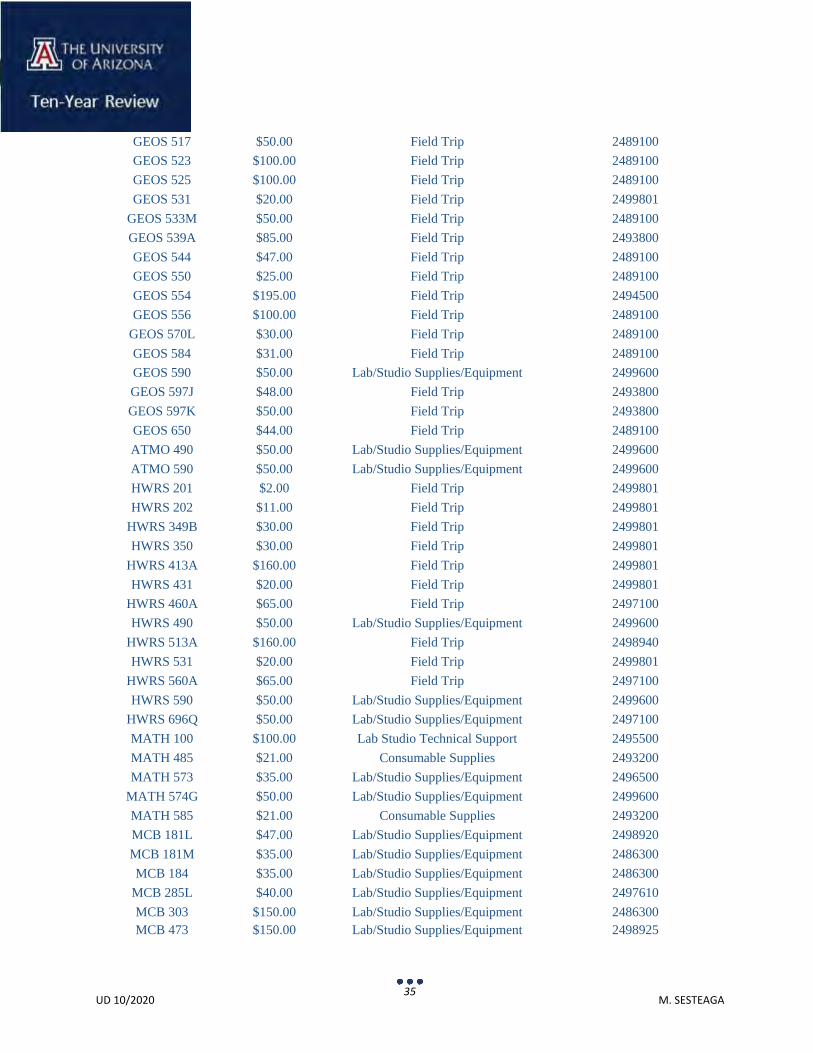
35 UD 10/2020 M. SESTEAGA
GEOS 517 $50.00 Field Trip 2489100 GEOS 523 $100.00 Field Trip 2489100 GEOS 525 $100.00 Field Trip 2489100 GEOS 531 $20.00 Field Trip 2499801
GEOS 533M $50.00 Field Trip 2489100 GEOS 539A $85.00 Field Trip 2493800 GEOS 544 $47.00 Field Trip 2489100 GEOS 550 $25.00 Field Trip 2489100 GEOS 554 $195.00 Field Trip 2494500 GEOS 556 $100.00 Field Trip 2489100
GEOS 570L $30.00 Field Trip 2489100 GEOS 584 $31.00 Field Trip 2489100 GEOS 590 $50.00 Lab/Studio Supplies/Equipment 2499600 GEOS 597J $48.00 Field Trip 2493800 GEOS 597K $50.00 Field Trip 2493800 GEOS 650 $44.00 Field Trip 2489100 ATMO 490 $50.00 Lab/Studio Supplies/Equipment 2499600 ATMO 590 $50.00 Lab/Studio Supplies/Equipment 2499600 HWRS 201 $2.00 Field Trip 2499801 HWRS 202 $11.00 Field Trip 2499801
HWRS 349B $30.00 Field Trip 2499801 HWRS 350 $30.00 Field Trip 2499801
HWRS 413A $160.00 Field Trip 2499801 HWRS 431 $20.00 Field Trip 2499801
HWRS 460A $65.00 Field Trip 2497100 HWRS 490 $50.00 Lab/Studio Supplies/Equipment 2499600
HWRS 513A $160.00 Field Trip 2498940 HWRS 531 $20.00 Field Trip 2499801
HWRS 560A $65.00 Field Trip 2497100 HWRS 590 $50.00 Lab/Studio Supplies/Equipment 2499600
HWRS 696Q $50.00 Lab/Studio Supplies/Equipment 2497100 MATH 100 $100.00 Lab Studio Technical Support 2495500 MATH 485 $21.00 Consumable Supplies 2493200 MATH 573 $35.00 Lab/Studio Supplies/Equipment 2496500
MATH 574G $50.00 Lab/Studio Supplies/Equipment 2499600 MATH 585 $21.00 Consumable Supplies 2493200 MCB 181L $47.00 Lab/Studio Supplies/Equipment 2498920 MCB 181M $35.00 Lab/Studio Supplies/Equipment 2486300 MCB 184 $35.00 Lab/Studio Supplies/Equipment 2486300
MCB 285L $40.00 Lab/Studio Supplies/Equipment 2497610 MCB 303 $150.00 Lab/Studio Supplies/Equipment 2486300 MCB 473 $150.00 Lab/Studio Supplies/Equipment 2498925
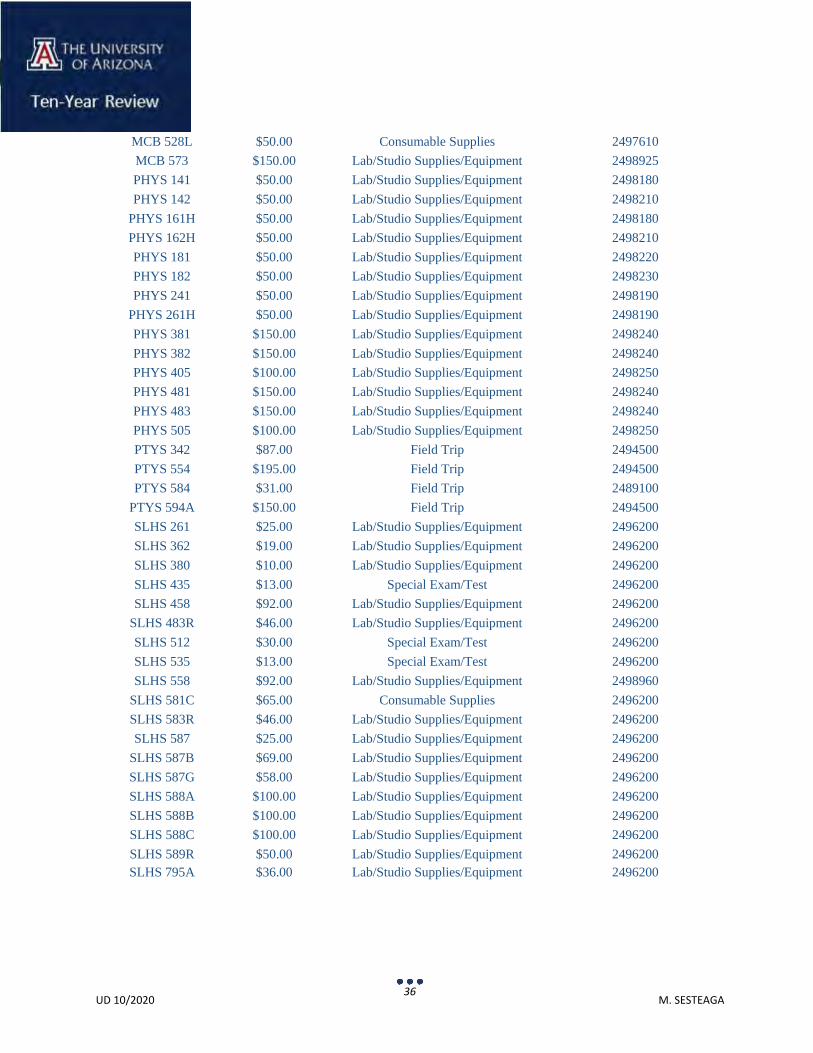
36 UD 10/2020 M. SESTEAGA
MCB 528L $50.00 Consumable Supplies 2497610 MCB 573 $150.00 Lab/Studio Supplies/Equipment 2498925 PHYS 141 $50.00 Lab/Studio Supplies/Equipment 2498180 PHYS 142 $50.00 Lab/Studio Supplies/Equipment 2498210
PHYS 161H $50.00 Lab/Studio Supplies/Equipment 2498180 PHYS 162H $50.00 Lab/Studio Supplies/Equipment 2498210 PHYS 181 $50.00 Lab/Studio Supplies/Equipment 2498220 PHYS 182 $50.00 Lab/Studio Supplies/Equipment 2498230 PHYS 241 $50.00 Lab/Studio Supplies/Equipment 2498190
PHYS 261H $50.00 Lab/Studio Supplies/Equipment 2498190 PHYS 381 $150.00 Lab/Studio Supplies/Equipment 2498240 PHYS 382 $150.00 Lab/Studio Supplies/Equipment 2498240 PHYS 405 $100.00 Lab/Studio Supplies/Equipment 2498250 PHYS 481 $150.00 Lab/Studio Supplies/Equipment 2498240 PHYS 483 $150.00 Lab/Studio Supplies/Equipment 2498240 PHYS 505 $100.00 Lab/Studio Supplies/Equipment 2498250 PTYS 342 $87.00 Field Trip 2494500 PTYS 554 $195.00 Field Trip 2494500 PTYS 584 $31.00 Field Trip 2489100
PTYS 594A $150.00 Field Trip 2494500 SLHS 261 $25.00 Lab/Studio Supplies/Equipment 2496200 SLHS 362 $19.00 Lab/Studio Supplies/Equipment 2496200 SLHS 380 $10.00 Lab/Studio Supplies/Equipment 2496200 SLHS 435 $13.00 Special Exam/Test 2496200 SLHS 458 $92.00 Lab/Studio Supplies/Equipment 2496200
SLHS 483R $46.00 Lab/Studio Supplies/Equipment 2496200 SLHS 512 $30.00 Special Exam/Test 2496200 SLHS 535 $13.00 Special Exam/Test 2496200 SLHS 558 $92.00 Lab/Studio Supplies/Equipment 2498960
SLHS 581C $65.00 Consumable Supplies 2496200 SLHS 583R $46.00 Lab/Studio Supplies/Equipment 2496200 SLHS 587 $25.00 Lab/Studio Supplies/Equipment 2496200
SLHS 587B $69.00 Lab/Studio Supplies/Equipment 2496200 SLHS 587G $58.00 Lab/Studio Supplies/Equipment 2496200 SLHS 588A $100.00 Lab/Studio Supplies/Equipment 2496200 SLHS 588B $100.00 Lab/Studio Supplies/Equipment 2496200 SLHS 588C $100.00 Lab/Studio Supplies/Equipment 2496200 SLHS 589R $50.00 Lab/Studio Supplies/Equipment 2496200 SLHS 795A $36.00 Lab/Studio Supplies/Equipment 2496200
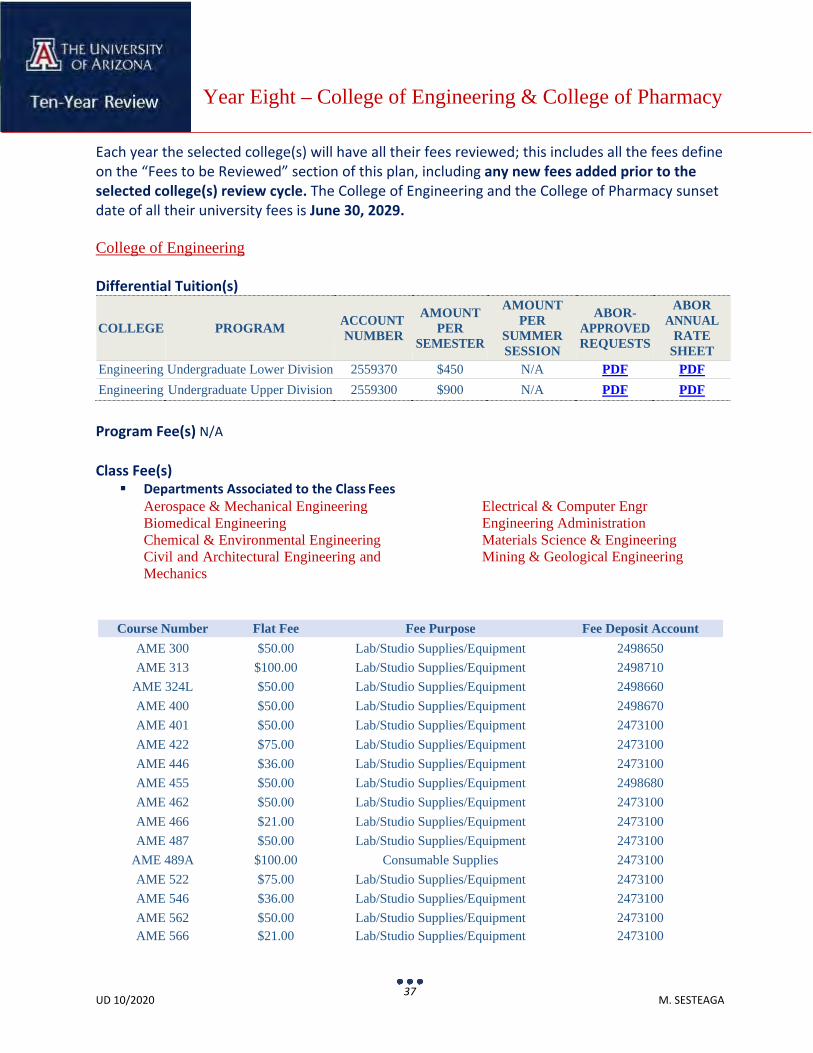
37 UD 10/2020 M. SESTEAGA
Each year the selected college(s) will have all their fees reviewed; this includes all the fees define on the “Fees to be Reviewed” section of this plan, including any new fees added prior to the selected college(s) review cycle. The College of Engineering and the College of Pharmacy sunset date of all their university fees is June 30, 2029.
College of Engineering
Differential Tuition(s) COLLEGE
PROGRAM
ACCOUNT NUMBER
AMOUNT PER
SEMESTER
AMOUNT PER
SUMMER SESSION
ABOR- APPROVED REQUESTS
ABOR ANNUAL
RATE SHEET
Engineering Undergraduate Lower Division 2559370 $450 N/A PDF PDF Engineering Undergraduate Upper Division 2559300 $900 N/A PDF PDF
Program Fee(s) N/A
Class Fee(s) Departments Associated to the Class Fees
Aerospace & Mechanical Engineering Biomedical Engineering Chemical & Environmental Engineering Civil and Architectural Engineering and Mechanics
Electrical & Computer Engr Engineering Administration Materials Science & Engineering Mining & Geological Engineering
Course Number Flat Fee Fee Purpose Fee Deposit Account
AME 300 $50.00 Lab/Studio Supplies/Equipment 2498650 AME 313 $100.00 Lab/Studio Supplies/Equipment 2498710
AME 324L $50.00 Lab/Studio Supplies/Equipment 2498660 AME 400 $50.00 Lab/Studio Supplies/Equipment 2498670 AME 401 $50.00 Lab/Studio Supplies/Equipment 2473100 AME 422 $75.00 Lab/Studio Supplies/Equipment 2473100 AME 446 $36.00 Lab/Studio Supplies/Equipment 2473100 AME 455 $50.00 Lab/Studio Supplies/Equipment 2498680 AME 462 $50.00 Lab/Studio Supplies/Equipment 2473100 AME 466 $21.00 Lab/Studio Supplies/Equipment 2473100 AME 487 $50.00 Lab/Studio Supplies/Equipment 2473100
AME 489A $100.00 Consumable Supplies 2473100 AME 522 $75.00 Lab/Studio Supplies/Equipment 2473100 AME 546 $36.00 Lab/Studio Supplies/Equipment 2473100 AME 562 $50.00 Lab/Studio Supplies/Equipment 2473100 AME 566 $21.00 Lab/Studio Supplies/Equipment 2473100
Year Eight – College of Engineering & College of Pharmacy
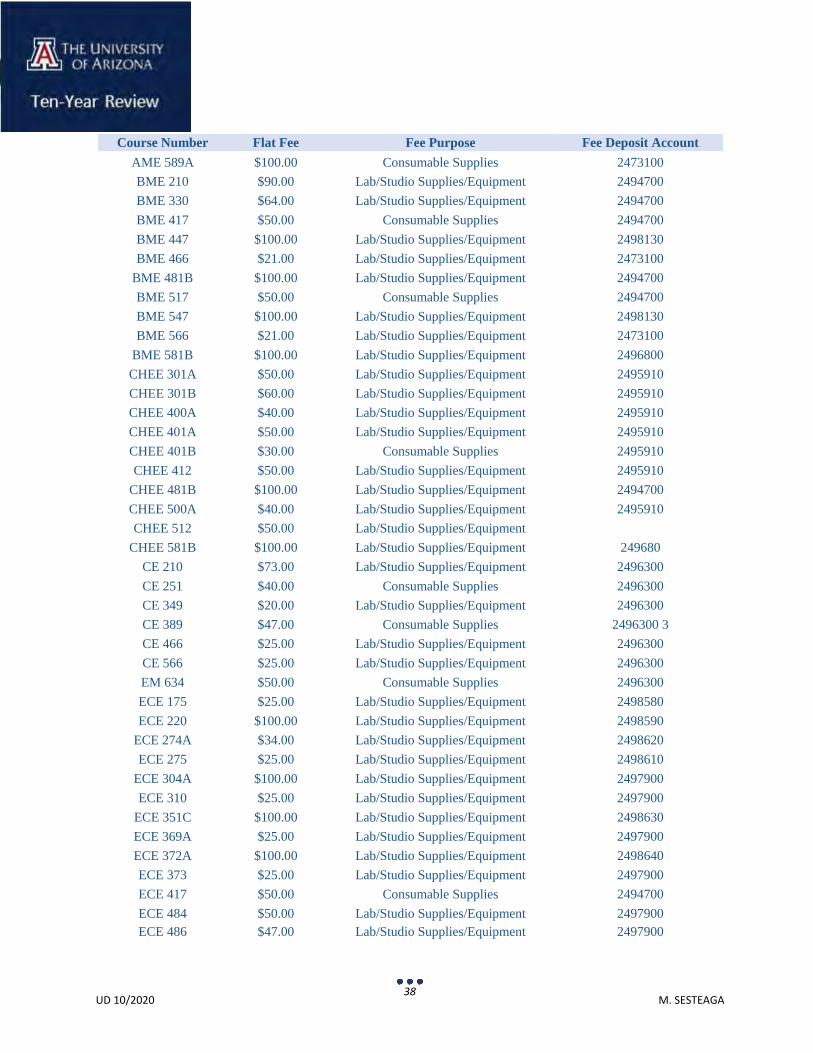
38 UD 10/2020 M. SESTEAGA
Course Number Flat Fee Fee Purpose Fee Deposit Account AME 589A $100.00 Consumable Supplies 2473100 BME 210 $90.00 Lab/Studio Supplies/Equipment 2494700 BME 330 $64.00 Lab/Studio Supplies/Equipment 2494700 BME 417 $50.00 Consumable Supplies 2494700 BME 447 $100.00 Lab/Studio Supplies/Equipment 2498130 BME 466 $21.00 Lab/Studio Supplies/Equipment 2473100
BME 481B $100.00 Lab/Studio Supplies/Equipment 2494700 BME 517 $50.00 Consumable Supplies 2494700 BME 547 $100.00 Lab/Studio Supplies/Equipment 2498130 BME 566 $21.00 Lab/Studio Supplies/Equipment 2473100
BME 581B $100.00 Lab/Studio Supplies/Equipment 2496800 CHEE 301A $50.00 Lab/Studio Supplies/Equipment 2495910 CHEE 301B $60.00 Lab/Studio Supplies/Equipment 2495910 CHEE 400A $40.00 Lab/Studio Supplies/Equipment 2495910 CHEE 401A $50.00 Lab/Studio Supplies/Equipment 2495910 CHEE 401B $30.00 Consumable Supplies 2495910 CHEE 412 $50.00 Lab/Studio Supplies/Equipment 2495910
CHEE 481B $100.00 Lab/Studio Supplies/Equipment 2494700 CHEE 500A $40.00 Lab/Studio Supplies/Equipment 2495910 CHEE 512 $50.00 Lab/Studio Supplies/Equipment
CHEE 581B $100.00 Lab/Studio Supplies/Equipment 249680 CE 210 $73.00 Lab/Studio Supplies/Equipment 2496300 CE 251 $40.00 Consumable Supplies 2496300 CE 349 $20.00 Lab/Studio Supplies/Equipment 2496300 CE 389 $47.00 Consumable Supplies 2496300 3 CE 466 $25.00 Lab/Studio Supplies/Equipment 2496300 CE 566 $25.00 Lab/Studio Supplies/Equipment 2496300 EM 634 $50.00 Consumable Supplies 2496300 ECE 175 $25.00 Lab/Studio Supplies/Equipment 2498580 ECE 220 $100.00 Lab/Studio Supplies/Equipment 2498590
ECE 274A $34.00 Lab/Studio Supplies/Equipment 2498620 ECE 275 $25.00 Lab/Studio Supplies/Equipment 2498610
ECE 304A $100.00 Lab/Studio Supplies/Equipment 2497900 ECE 310 $25.00 Lab/Studio Supplies/Equipment 2497900
ECE 351C $100.00 Lab/Studio Supplies/Equipment 2498630 ECE 369A $25.00 Lab/Studio Supplies/Equipment 2497900 ECE 372A $100.00 Lab/Studio Supplies/Equipment 2498640 ECE 373 $25.00 Lab/Studio Supplies/Equipment 2497900 ECE 417 $50.00 Consumable Supplies 2494700 ECE 484 $50.00 Lab/Studio Supplies/Equipment 2497900 ECE 486 $47.00 Lab/Studio Supplies/Equipment 2497900
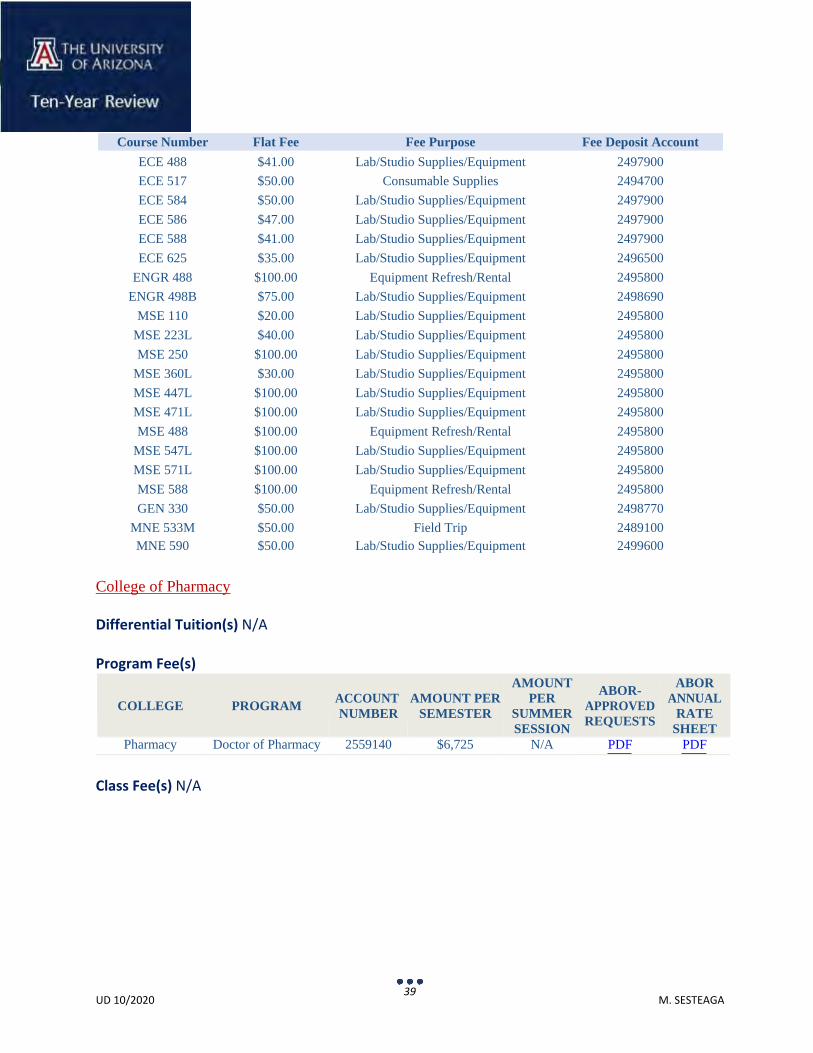
39 UD 10/2020 M. SESTEAGA
Course Number Flat Fee Fee Purpose Fee Deposit Account ECE 488 $41.00 Lab/Studio Supplies/Equipment 2497900 ECE 517 $50.00 Consumable Supplies 2494700 ECE 584 $50.00 Lab/Studio Supplies/Equipment 2497900 ECE 586 $47.00 Lab/Studio Supplies/Equipment 2497900 ECE 588 $41.00 Lab/Studio Supplies/Equipment 2497900 ECE 625 $35.00 Lab/Studio Supplies/Equipment 2496500
ENGR 488 $100.00 Equipment Refresh/Rental 2495800 ENGR 498B $75.00 Lab/Studio Supplies/Equipment 2498690
MSE 110 $20.00 Lab/Studio Supplies/Equipment 2495800 MSE 223L $40.00 Lab/Studio Supplies/Equipment 2495800 MSE 250 $100.00 Lab/Studio Supplies/Equipment 2495800
MSE 360L $30.00 Lab/Studio Supplies/Equipment 2495800 MSE 447L $100.00 Lab/Studio Supplies/Equipment 2495800 MSE 471L $100.00 Lab/Studio Supplies/Equipment 2495800 MSE 488 $100.00 Equipment Refresh/Rental 2495800
MSE 547L $100.00 Lab/Studio Supplies/Equipment 2495800 MSE 571L $100.00 Lab/Studio Supplies/Equipment 2495800 MSE 588 $100.00 Equipment Refresh/Rental 2495800 GEN 330 $50.00 Lab/Studio Supplies/Equipment 2498770
MNE 533M $50.00 Field Trip 2489100 MNE 590 $50.00 Lab/Studio Supplies/Equipment 2499600
College of Pharmacy
Differential Tuition(s) N/A
Program Fee(s)
COLLEGE
PROGRAM
ACCOUNT NUMBER
AMOUNT PER
SEMESTER
AMOUNT PER
SUMMER SESSION
ABOR- APPROVED REQUESTS
ABOR ANNUAL
RATE SHEET
Pharmacy Doctor of Pharmacy 2559140 $6,725 N/A PDF PDF
Class Fee(s) N/A
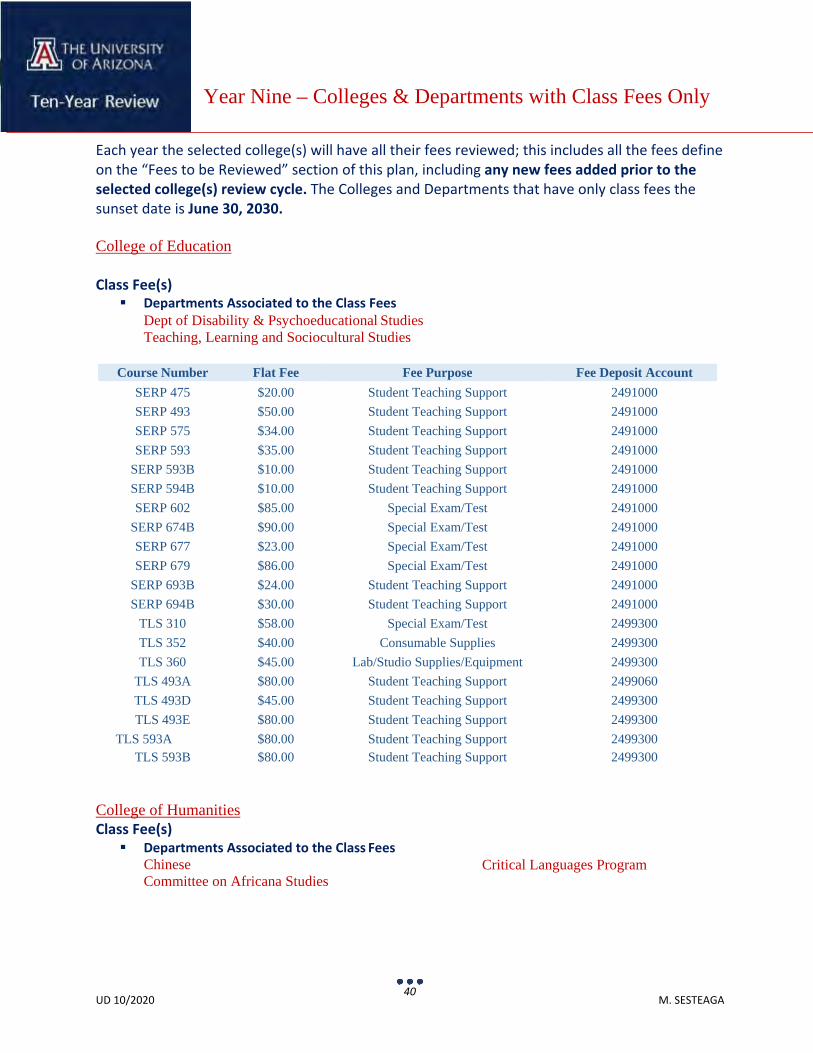
40 UD 10/2020 M. SESTEAGA
Year Nine – Colleges & Departments with Class Fees Only
Each year the selected college(s) will have all their fees reviewed; this includes all the fees define on the “Fees to be Reviewed” section of this plan, including any new fees added prior to the selected college(s) review cycle. The Colleges and Departments that have only class fees the sunset date is June 30, 2030.
College of Education
Class Fee(s) Departments Associated to the Class Fees
Dept of Disability & Psychoeducational Studies Teaching, Learning and Sociocultural Studies
Course Number Flat Fee Fee Purpose Fee Deposit Account
SERP 475 $20.00 Student Teaching Support 2491000 SERP 493 $50.00 Student Teaching Support 2491000 SERP 575 $34.00 Student Teaching Support 2491000 SERP 593 $35.00 Student Teaching Support 2491000
SERP 593B $10.00 Student Teaching Support 2491000 SERP 594B $10.00 Student Teaching Support 2491000 SERP 602 $85.00 Special Exam/Test 2491000
SERP 674B $90.00 Special Exam/Test 2491000 SERP 677 $23.00 Special Exam/Test 2491000 SERP 679 $86.00 Special Exam/Test 2491000
SERP 693B $24.00 Student Teaching Support 2491000 SERP 694B $30.00 Student Teaching Support 2491000
TLS 310 $58.00 Special Exam/Test 2499300 TLS 352 $40.00 Consumable Supplies 2499300 TLS 360 $45.00 Lab/Studio Supplies/Equipment 2499300
TLS 493A $80.00 Student Teaching Support 2499060 TLS 493D $45.00 Student Teaching Support 2499300 TLS 493E $80.00 Student Teaching Support 2499300
TLS 593A $80.00 Student Teaching Support 2499300 TLS 593B $80.00 Student Teaching Support 2499300
College of Humanities Class Fee(s) Departments Associated to the Class Fees
Chinese Committee on Africana Studies
Critical Languages Program
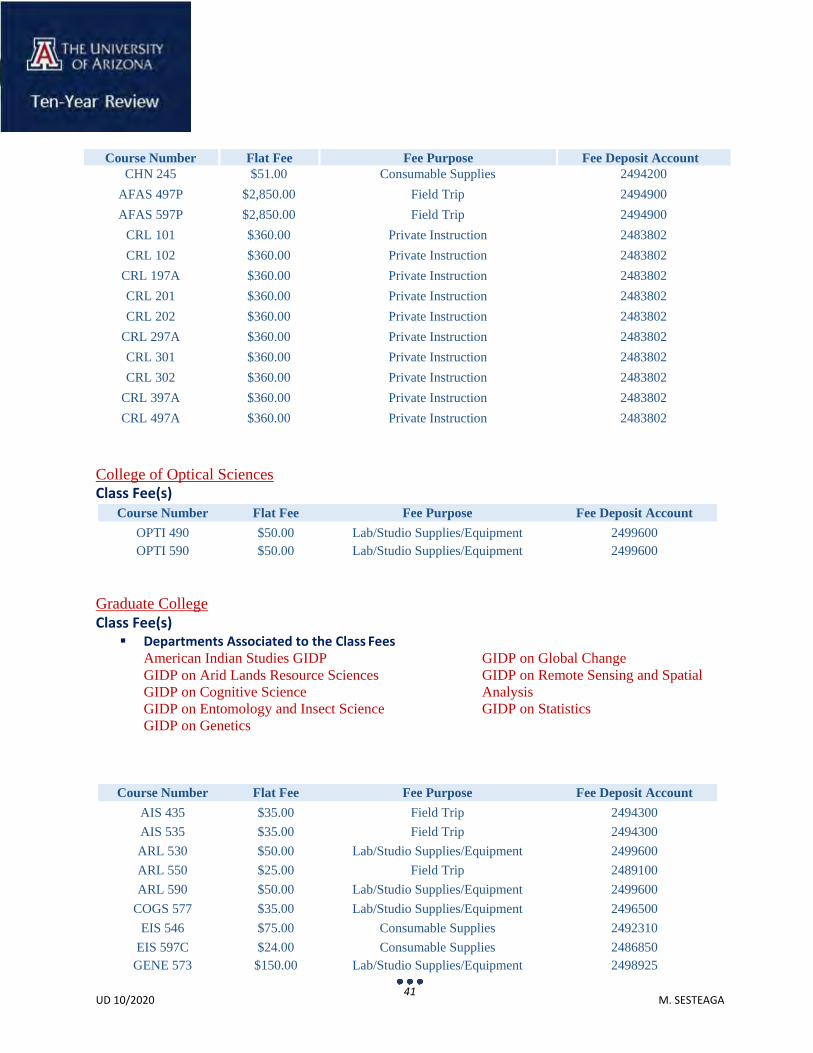
41 UD 10/2020 M. SESTEAGA
Course Number Flat Fee Fee Purpose Fee Deposit Account CHN 245 $51.00 Consumable Supplies 2494200
AFAS 497P $2,850.00 Field Trip 2494900 AFAS 597P $2,850.00 Field Trip 2494900
CRL 101 $360.00 Private Instruction 2483802 CRL 102 $360.00 Private Instruction 2483802
CRL 197A $360.00 Private Instruction 2483802 CRL 201 $360.00 Private Instruction 2483802 CRL 202 $360.00 Private Instruction 2483802
CRL 297A $360.00 Private Instruction 2483802 CRL 301 $360.00 Private Instruction 2483802 CRL 302 $360.00 Private Instruction 2483802
CRL 397A $360.00 Private Instruction 2483802 CRL 497A $360.00 Private Instruction 2483802
College of Optical Sciences Class Fee(s)
Course Number Flat Fee Fee Purpose Fee Deposit Account OPTI 490 $50.00 Lab/Studio Supplies/Equipment 2499600 OPTI 590 $50.00 Lab/Studio Supplies/Equipment 2499600
Graduate College Class Fee(s) Departments Associated to the Class Fees
American Indian Studies GIDP GIDP on Arid Lands Resource Sciences GIDP on Cognitive Science GIDP on Entomology and Insect Science GIDP on Genetics
GIDP on Global Change GIDP on Remote Sensing and Spatial Analysis GIDP on Statistics
Course Number Flat Fee Fee Purpose Fee Deposit Account AIS 435 $35.00 Field Trip 2494300 AIS 535 $35.00 Field Trip 2494300 ARL 530 $50.00 Lab/Studio Supplies/Equipment 2499600 ARL 550 $25.00 Field Trip 2489100 ARL 590 $50.00 Lab/Studio Supplies/Equipment 2499600
COGS 577 $35.00 Lab/Studio Supplies/Equipment 2496500 EIS 546 $75.00 Consumable Supplies 2492310
EIS 597C $24.00 Consumable Supplies 2486850 GENE 573 $150.00 Lab/Studio Supplies/Equipment 2498925
42 UD 10/2020 M. SESTEAGA
GC 530 $50.00 Lab/Studio Supplies/Equipment 2499600 REM 490 $50.00 Lab/Studio Supplies/Equipment 2499600 REM 590 $50.00 Lab/Studio Supplies/Equipment 2499600
STAT 574G $50.00 Lab/Studio Supplies/Equipment 2499600 STAT 579 $50.00 Lab/Studio Supplies/Equipment 2499600
Class Fee(s)
Enrollment Management (before Student Affairs and Enrollment Management) Departments Associated to the Class Fees
Vice President Student Affairs
Course Number Flat Fee Fee Purpose Fee Deposit Account SAS 100AX $91.00 Private Instruction 2477240
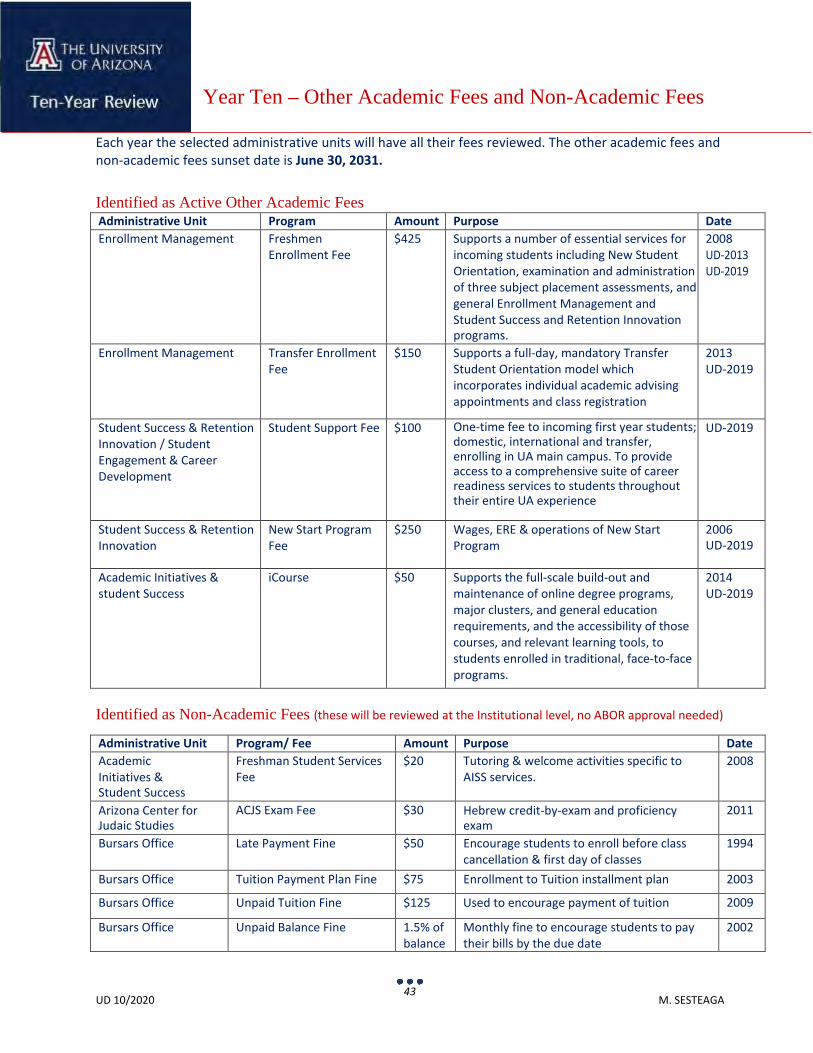
43 UD 10/2020 M. SESTEAGA
Each year the selected administrative units will have all their fees reviewed. The other academic fees and non-academic fees sunset date is June 30, 2031.
Identified as Active Other Academic Fees Administrative Unit Program Amount Purpose Date Enrollment Management Freshmen
Enrollment Fee $425 Supports a number of essential services for
incoming students including New Student Orientation, examination and administration of three subject placement assessments, and general Enrollment Management and Student Success and Retention Innovation programs.
2008 UD-2013 UD-2019
Enrollment Management Transfer Enrollment Fee
$150 Supports a full-day, mandatory Transfer Student Orientation model which incorporates individual academic advising appointments and class registration
2013 UD-2019
Student Success & Retention Innovation / Student Engagement & Career Development
Student Support Fee $100 One-time fee to incoming first year students; domestic, international and transfer, enrolling in UA main campus. To provide access to a comprehensive suite of career readiness services to students throughout their entire UA experience
UD-2019
Student Success & Retention Innovation
New Start Program Fee
$250 Wages, ERE & operations of New Start Program
2006 UD-2019
Academic Initiatives & student Success
iCourse $50 Supports the full-scale build-out and maintenance of online degree programs, major clusters, and general education requirements, and the accessibility of those courses, and relevant learning tools, to students enrolled in traditional, face-to-face programs.
2014 UD-2019
Identified as Non-Academic Fees (these will be reviewed at the Institutional level, no ABOR approval needed)
Administrative Unit Program/ Fee Amount Purpose Date Academic Initiatives & Student Success
Freshman Student Services Fee
$20 Tutoring & welcome activities specific to AISS services.
2008
Arizona Center for Judaic Studies
ACJS Exam Fee $30 Hebrew credit-by-exam and proficiency exam
2011
Bursars Office Late Payment Fine $50 Encourage students to enroll before class cancellation & first day of classes
1994
Bursars Office Tuition Payment Plan Fine $75 Enrollment to Tuition installment plan 2003
Bursars Office Unpaid Tuition Fine $125 Used to encourage payment of tuition 2009
Bursars Office Unpaid Balance Fine 1.5% of balance
Monthly fine to encourage students to pay their bills by the due date
2002
Year Ten – Other Academic Fees and Non-Academic Fees
44 UD 10/2020 M. SESTEAGA
Bursars Office Return Check Fee $25 Fine for the administrative cost of processing a returned check
Ars 12- 671
College of Medicine
Disability Insurance $24 Disability insurance for medical students 2012
College of Medicine
Application Fee $75 Decrease application fee from $100 to $75 2010
College of Medicine
Second-Year Medical Student Fee
$80 Offset cost of educational practice assessments and educational testing bank
2011
Dean of Students Diversion Enrollment Fee $100 Diversion program w/UAPD & Pima County Attorney’s Office
2006
Dean of Students Fraternity & Sorority Programs
$30 Greek Auxiliary Membership Fee 2012
Department of Mathematics
Textbook Fee $125 Replacement and/or administrative costs for lost or non-returned books
2008
Enrollment Management
International Admission – Application Fee
$85 Application Fee to cover administrative costs 2006
Eller College of Management
Undergraduate Program – Administrative Fee
$10 Administration & printing of Strong Interest Inventory
2006
Eller College of Management
Undergraduate Program – Development Fee
$10 Career exploration & leadership development
2003
Eller College of Management
Professional Admissions Fee $55 Professional Admissions, Management and Development.
2015
Enrollment Management
Admissions-Application Fee $65 Recruitment of non-resident undergraduates 2006
Enrollment Management
Admissions-Instant Access Fee for Transfer Students
$20 “On the spot” admission decisions for transfer students
2008
Enrollment Management
Admissions-SALT Center $150 Student & parent participation in SALT orientation
2010
Enrollment Management
Late Application Processing Fee
$50 For college or department requests that complete undergraduate applications, be accepted for term after deadline
2012
Financial Services Office
Cat Card Fee $25 Replacement Cat Cards 2001
Nursing Commitment Deposit $100 Non-refundable commitment deposit for students accepting admission to PhD and DNP programs
2012
Office of Scholarships and Financial Aid
Temporary Loan Application Fee
$25 Charge for the administrative cost of processing a temp loan
1988
Office of the Registrar Transcript Fee $15 $15 over-the-counter transcripts, $10 online orders, $2 unofficial transcripts
2012
45 UD 10/2020 M. SESTEAGA
Office of the Registrar Grad Degree Candidacy $35 Final degree audit & diploma production & distribution
2004
Office of the Registrar Undergraduate Candidacy $50 Undergraduate graduation services 2004
Office of the Registrar Undergraduate Late Application to Candidacy
$50 Late penalty for students who do not meet the deadline for application to degree candidacy
2012
Residence Life Community living workshops fee
$50 Optional Residential education workshops 2012
Residence Life Behavioral Education Fee $75 Behavioral Education Fee is used for guidance on proper behavior on community living.
2012
Residence Life Overdue Sanction Fee $75 Overdue Sanction Fee 2012
Testing Office Multiple Tests Various CLEP, GMAT, GRE, LSAT, MAT, MCAT, MPRE, SAT & more
2002
The Department of Linguistics
Exam $100 Language Exams to establish second year proficiency in language not taught on campus
2009
UA Global International Student Fee $200 Assessed to students in order for UA to maintain compliance with Federally Mandated SEVIS System and additional administrative and professional support
2006
UA Global International Student Compliance Fee
$125 U $75 G
Legacy fee for international orientation; fee assessed to Non-Degree seeking students only
2011
UA Global International Sponsored Students Fee
$500 or 600
Administrative Fee charged to agency or government sponsor - Fee is not charged to students
2011
University Libraries Annual Business Cards $100 Library cards for non-UA affiliated community members
2002
University Libraries Annual Business Card Renewal
$40 Renewal of library cards for non-UA affiliated community members
2002
University Libraries Dissertations $75 Purchase & process microfilming of student theses
2002
University Libraries Lost Books $100 Average replacement cost of lost books & processing fee
2002
University Libraries Service Charges $35 AIST Billing Charge 2009 University Libraries Service Charges $25 Lost/Missing Book Processing 2009 University Libraries Service Charges $8/sq. ft DDT Large Format Printing 2009 University Libraries Service Charges $20 DDT High Resolution Scans 2009 University Libraries Service Charges $29 DDT Power Point Scan 2009 University Libraries Service Charges $25 DDT A/V Production 2009 University Libraries Service Charges $75 CCP High Resolution Scans 2009
Any new fees added prior to the selected administrative units review cycle will also be reviewed. To view the templates to be submitted to ABOR go to the Appendices.
46 UD 10/2020 M. SESTEAGA
Policies
Policy Manual Chapter 4 – Student Fees, Residency, Financial Aid
To view the full board policy manual visit ABOR website. The policies below were modified and/or created (4-105) and approved by the board as of November 16, 2018, updated April 2019 and updated again in February 2020.
4-101 - Tuition and Fees Definitions
4-103 -Proposals for Tuition and Fees
4-104 - Procedure for Setting Tuition and Fees
4-105 - Fees
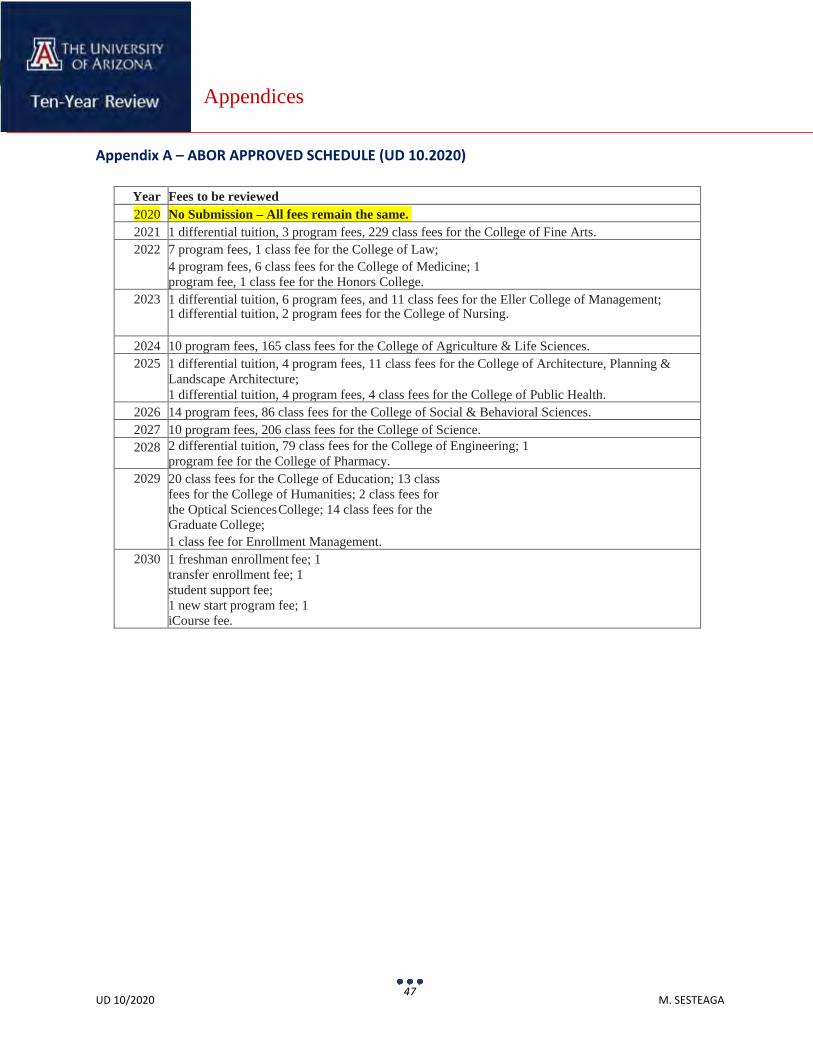
47 UD 10/2020 M. SESTEAGA
Appendices
Appendix A – ABOR APPROVED SCHEDULE (UD 10.2020)
Year Fees to be reviewed 2020 No Submission – All fees remain the same. 2021 1 differential tuition, 3 program fees, 229 class fees for the College of Fine Arts. 2022 7 program fees, 1 class fee for the College of Law;
4 program fees, 6 class fees for the College of Medicine; 1 program fee, 1 class fee for the Honors College.
2023 1 differential tuition, 6 program fees, and 11 class fees for the Eller College of Management; 1 differential tuition, 2 program fees for the College of Nursing.
2024 10 program fees, 165 class fees for the College of Agriculture & Life Sciences. 2025 1 differential tuition, 4 program fees, 11 class fees for the College of Architecture, Planning &
Landscape Architecture; 1 differential tuition, 4 program fees, 4 class fees for the College of Public Health.
2026 14 program fees, 86 class fees for the College of Social & Behavioral Sciences. 2027 10 program fees, 206 class fees for the College of Science. 2028 2 differential tuition, 79 class fees for the College of Engineering; 1
program fee for the College of Pharmacy. 2029 20 class fees for the College of Education; 13 class
fees for the College of Humanities; 2 class fees for the Optical Sciences College; 14 class fees for the Graduate College; 1 class fee for Enrollment Management.
2030 1 freshman enrollment fee; 1 transfer enrollment fee; 1 student support fee; 1 new start program fee; 1 iCourse fee.
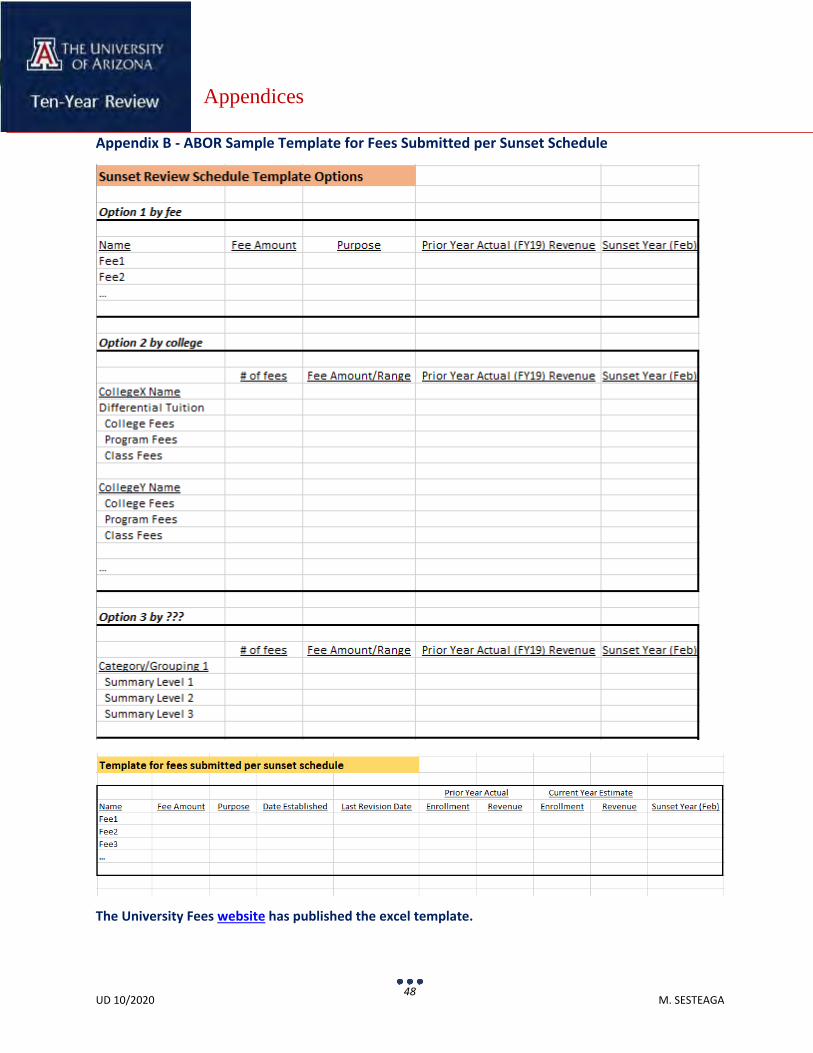
48 UD 10/2020 M. SESTEAGA
Appendices
Appendix B - ABOR Sample Template for Fees Submitted per Sunset Schedule
The University Fees website has published the excel template.
49 UD 10/2020 M. SESTEAGA
Appendices
Appendix C – Current List of Fees
Program Fees & Differential Tuition (PFDT) For a list of current and active PFDT visit the University Fees website.
Class Fees (CF) For a list of current and active CF visit the Office of the Registrar website.
Other Academic Fees (OAF) For a list of current and active OAF visit this section in the University Fees website.
Non-Academic Fees (NAF) For a list of current and active NAF visit this section in the University Fees website.
For any questions pertaining this review plan please contact the University Fees Manager.
Board of Regents Meeting November 18-20, 2020
Item #16 EXECUTIVE SUMMARY Page 1 of 14
Contact Information: Morgan R. Olsen, ASU [email protected] 480-727-9920
Item Name: Amended Capital Development Plan (ASU)
Action Item
Previous Board Action • FY 2022-2024 Capital Improvement Plan October 2020 Overview and Alignment with Enterprise and University Goals and Objectives • The ASU Amended CDP includes one project totaling $115.0 million.
• This new project to construct a multi-purpose arena to support multiple Sun Devil
Athletics intercollegiate sports, university events and community events is in addition to the four new projects totaling $71.2 million approved as part of ASU’s CDP at the February 2020 meeting, and the $53.6 million approved for two new projects at the June 2020 meeting.
• ASU has developed this Amended CDP in alignment with the university’s campus
master plan, enterprise and university strategic goals and objectives, and the Novus Innovation District master development plan.
• The primary institutional priorities supported by this Amended CDP include: Community Service: Serving Arizona communities is an integral aspect of the
university’s mission and its programs. Enhancing and expanding the university’s local impact and social embeddedness is vital to improving the quality of life and economic prosperity in Arizona.
Student Support and Engagement: The proposed project will advance the
university’s mission to enhance student development and learning to national leadership levels. This project will foster student engagement in programs, events and activities that will enhance their learning and personal development by connecting them with their campus and community, building leadership skills,
Requested Action: Arizona State University asks the board to approve its Amended Capital Development Plan, which includes one new project and totals $115.0 million, as described in this executive summary.
Board of Regents Meeting November 18-20, 2020
Item #16 EXECUTIVE SUMMARY Page 2 of 14
fostering involvement in experiential learning opportunities and preparing them for academic, personal and career success.
Capital Development Plan Project • The following new project is proposed for Amended CDP approval:
Multipurpose Arena
• Additional detail on project costs, financing and scope can be found in the tables in
Exhibits 2 and 3 and the individual Project Justification Report attached at the end.
Fiscal Impact and Management • The Multipurpose Arena will cost a total of $115.0 million and will be debt-financed
with system revenue bonds amortized over an approximate thirty-year term.
• ASU will: a) sell one or more series of System Revenue Bonds to finance the project, as
identified in Exhibit 2, costs of issuance, capitalized interest, and payments to a bond insurer or other credit enhancer, provided such payments result in a benefit that exceeds the amount of such payments;
b) sell bonds at a price at, above or below par, on a tax-exempt or taxable basis, in one or more series, at a fixed or variable rate of interest;
c) enter into necessary agreements, including those related to bond insurance or other credit enhancement agreements; and
d) utilize a financial advisor, bond counsel and bond trustee for the financing. The system revenue bonds will be marketed and sold on a negotiated basis, either to one or more investment banking firms currently in a pool of bond underwriters procured by the three state universities or by the State of Arizona or by a direct sale to a bank or banks or other financial institutions.
• Debt Ratio Impact: Based upon the project included in this Amended CDP and the
projects included in the previous Amended CDP, Annual CDP, and the first year of the Capital Improvement Plan (CIP), the university’s projected debt ratio is expected to reach its maximum in FY 2023 at 5.0 percent excluding SPEED debt and 5.4 percent including SPEED debt.
• The tables in Exhibits 2 and 3 provide detail on project financing, funding sources and debt ratio impact.
Board of Regents Meeting November 18-20, 2020
Item #16 EXECUTIVE SUMMARY Page 3 of 14 Committee Review and Recommendation
The Finance, Capital and Resources Committee reviewed this item at its November 5, 2020 meeting and recommended forwarding to the full board for approval. Statutory/Policy Requirements • Pursuant to Arizona Board of Regents Policy 7-107 (E), each university shall submit
an amendment to the CDP for projects requiring budget and/or scope increases and for new projects added outside of the regular CDP.
• Amended CDPs are reviewed by the Finance, Capital and Resources Committee and approved by the board.
• Approval of the CDP and its amendments allows the university to complete design and planning, execute construction and financing agreements, and begin construction as outlined in policy.
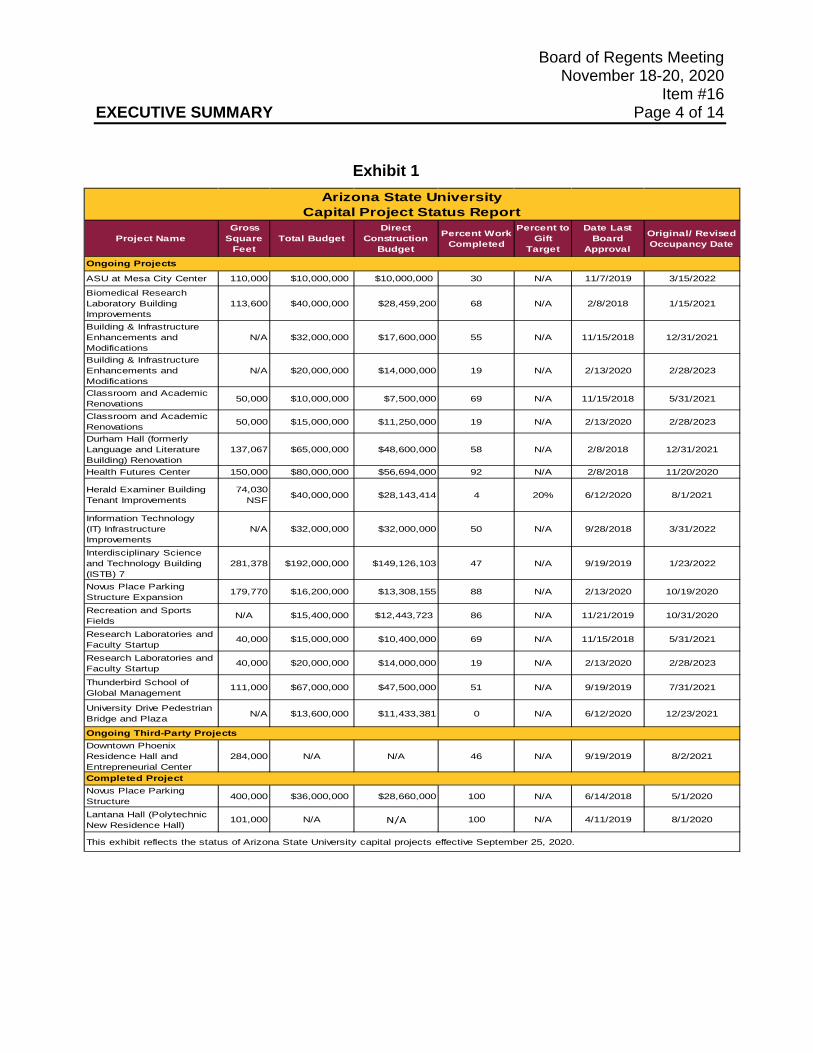
Board of Regents Meeting November 18-20, 2020
Item #16 EXECUTIVE SUMMARY Page 4 of 14
Exhibit 1
Project NameGross
Square Feet
Total BudgetDirect
Construction Budget
Percent Work Completed
Percent to Gift
Target
Date Last Board
Approval
Original/ Revised Occupancy Date
ASU at Mesa City Center 110,000 $10,000,000 $10,000,000 30 N/A 11/7/2019 3/15/2022
Biomedical Research Laboratory Building Improvements
113,600 $40,000,000 $28,459,200 68 N/A 2/8/2018 1/15/2021
Building & Infrastructure Enhancements and Modifications
N/A $32,000,000 $17,600,000 55 N/A 11/15/2018 12/31/2021
Building & Infrastructure Enhancements and Modifications
N/A $20,000,000 $14,000,000 19 N/A 2/13/2020 2/28/2023
Classroom and Academic Renovations 50,000 $10,000,000 $7,500,000 69 N/A 11/15/2018 5/31/2021
Classroom and Academic Renovations 50,000 $15,000,000 $11,250,000 19 N/A 2/13/2020 2/28/2023
Durham Hall (formerly Language and Literature Building) Renovation
137,067 $65,000,000 $48,600,000 58 N/A 2/8/2018 12/31/2021
Health Futures Center 150,000 $80,000,000 $56,694,000 92 N/A 2/8/2018 11/20/2020
Herald Examiner Building Tenant Improvements
74,030 NSF $40,000,000 $28,143,414 4 20% 6/12/2020 8/1/2021
Information Technology (IT) Infrastructure Improvements
N/A $32,000,000 $32,000,000 50 N/A 9/28/2018 3/31/2022
Interdisciplinary Science and Technology Building (ISTB) 7
281,378 $192,000,000 $149,126,103 47 N/A 9/19/2019 1/23/2022
Novus Place Parking Structure Expansion
179,770 $16,200,000 $13,308,155 88 N/A 2/13/2020 10/19/2020
Recreation and Sports Fields
N/A $15,400,000 $12,443,723 86 N/A 11/21/2019 10/31/2020
Research Laboratories and Faculty Startup
40,000 $15,000,000 $10,400,000 69 N/A 11/15/2018 5/31/2021
Research Laboratories and Faculty Startup
40,000 $20,000,000 $14,000,000 19 N/A 2/13/2020 2/28/2023
Thunderbird School of Global Management
111,000 $67,000,000 $47,500,000 51 N/A 9/19/2019 7/31/2021
University Drive Pedestrian Bridge and Plaza N/A $13,600,000 $11,433,381 0 N/A 6/12/2020 12/23/2021
Downtown Phoenix Residence Hall and Entrepreneurial Center
284,000 N/A N/A 46 N/A 9/19/2019 8/2/2021
Novus Place Parking Structure 400,000 $36,000,000 $28,660,000 100 N/A 6/14/2018 5/1/2020
Lantana Hall (Polytechnic New Residence Hall)
101,000 N/A N/A 100 N/A 4/11/2019 8/1/2020
Ongoing Projects
Arizona State University Capital Project Status Report
This exhibit reflects the status of Arizona State University capital projects effective September 25, 2020.
Ongoing Third-Party Projects
Completed Project
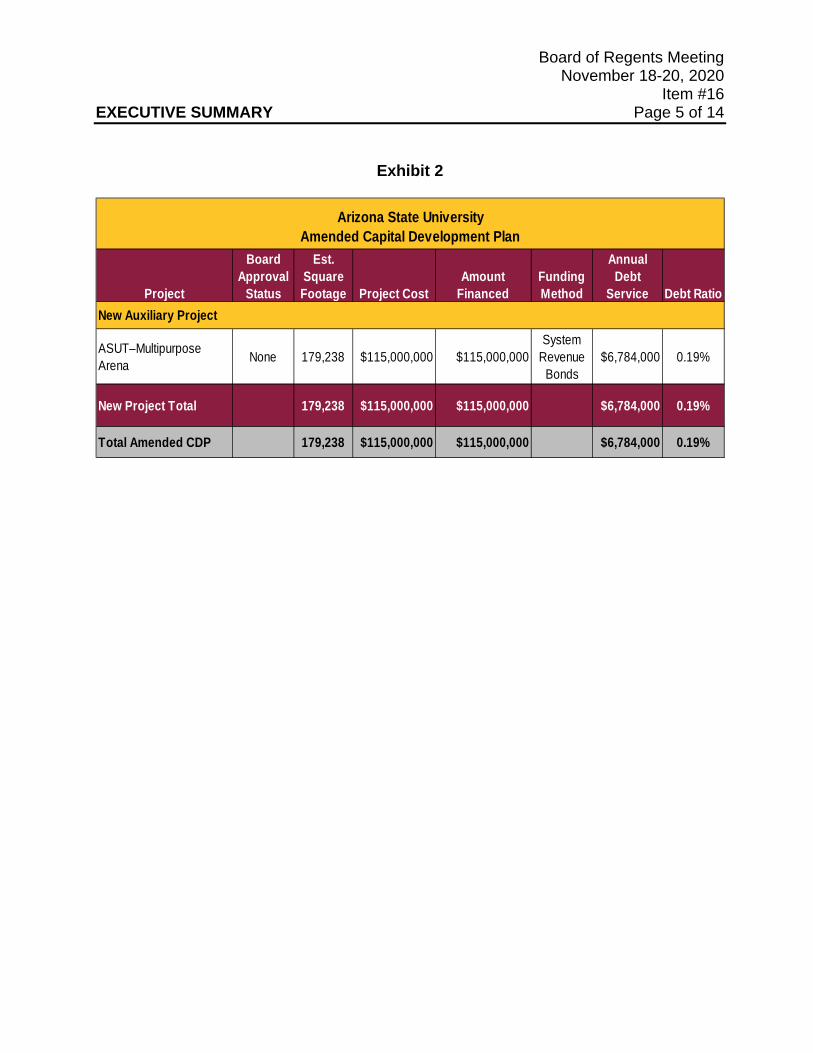
Board of Regents Meeting November 18-20, 2020
Item #16 EXECUTIVE SUMMARY Page 5 of 14
Exhibit 2
Project
Board Approval
Status
Est. Square Footage Project Cost
Amount Financed
Funding Method
Annual Debt
Service Debt Ratio
ASUT–Multipurpose Arena None 179,238 $115,000,000 $115,000,000
System Revenue
Bonds$6,784,000 0.19%
New Project Total 179,238 $115,000,000 $115,000,000 $6,784,000 0.19%
Total Amended CDP 179,238 $115,000,000 $115,000,000 $6,784,000 0.19%
Arizona State UniversityAmended Capital Development Plan
New Auxiliary Project
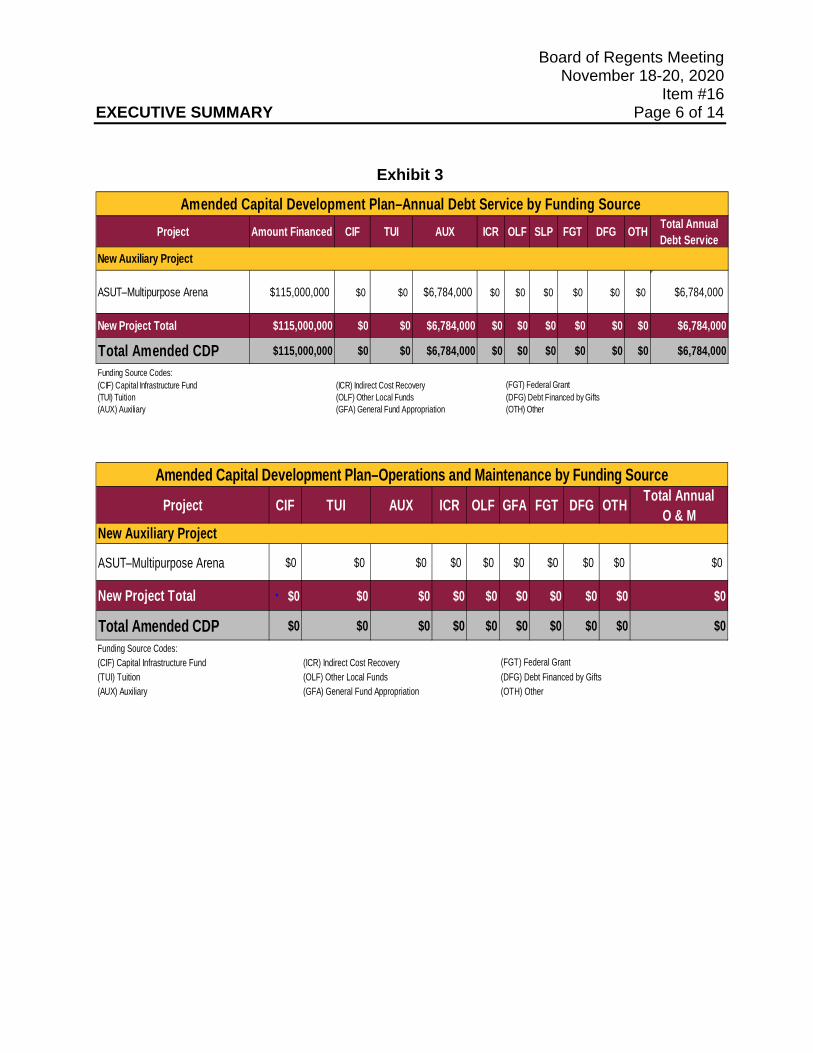
Board of Regents Meeting November 18-20, 2020
Item #16 EXECUTIVE SUMMARY Page 6 of 14
Exhibit 3
Project Amount Financed CIF TUI AUX ICR OLF SLP FGT DFG OTH Total Annual Debt Service
ASUT–Multipurpose Arena $115,000,000 $0 $0 $6,784,000 $0 $0 $0 $0 $0 $0 $6,784,000
New Project Total $115,000,000 $0 $0 $6,784,000 $0 $0 $0 $0 $0 $0 $6,784,000
Total Amended CDP $115,000,000 $0 $0 $6,784,000 $0 $0 $0 $0 $0 $0 $6,784,000 Funding Source Codes:(CIF) Capital Infrastructure Fund (ICR) Indirect Cost Recovery (FGT) Federal Grant(TUI) Tuition (OLF) Other Local Funds (DFG) Debt Financed by Gifts(AUX) Auxiliary (GFA) General Fund Appropriation (OTH) Other
Amended Capital Development Plan–Annual Debt Service by Funding Source
New Auxiliary Project
Project CIF TUI AUX ICR OLF GFA FGT DFG OTH Total Annual O & M
ASUT–Multipurpose Arena $0 $0 $0 $0 $0 $0 $0 $0 $0 $0
New Project Total $0 $0 $0 $0 $0 $0 $0 $0 $0 $0
Total Amended CDP $0 $0 $0 $0 $0 $0 $0 $0 $0 $0 Funding Source Codes:(CIF) Capital Infrastructure Fund (ICR) Indirect Cost Recovery (FGT) Federal Grant(TUI) Tuition (OLF) Other Local Funds (DFG) Debt Financed by Gifts(AUX) Auxiliary (GFA) General Fund Appropriation (OTH) Other
Amended Capital Development Plan–Operations and Maintenance by Funding Source
New Auxiliary Project
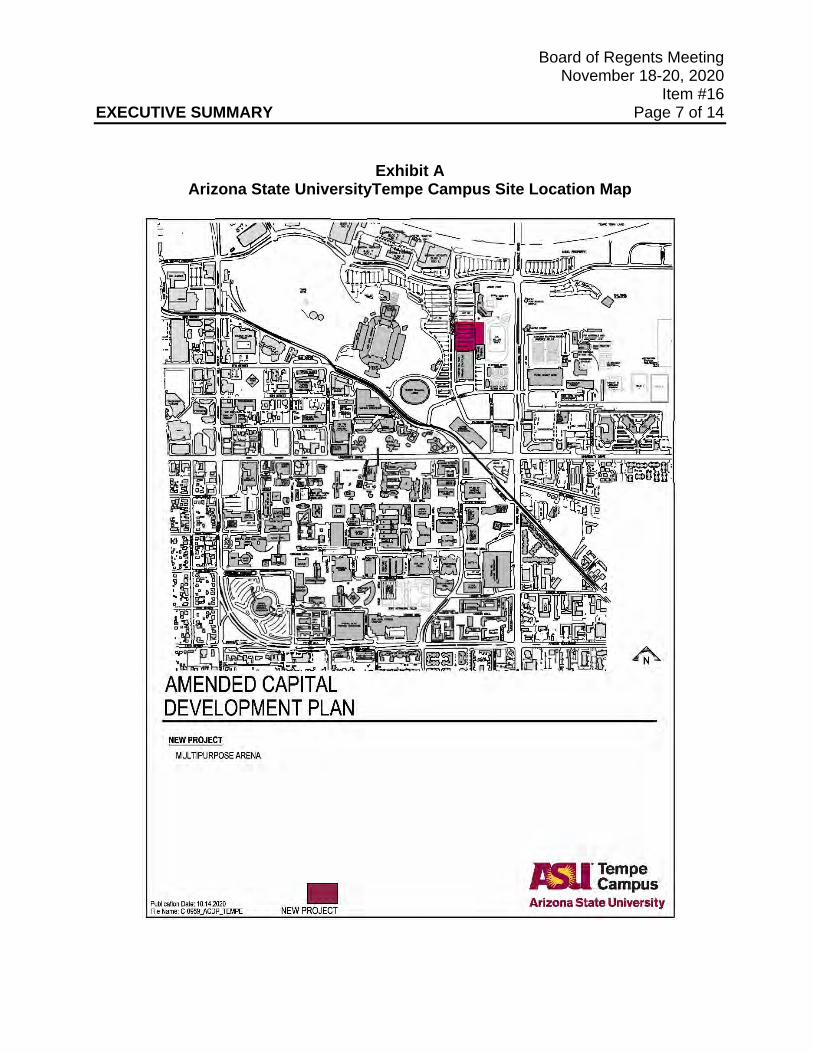
Board of Regents Meeting November 18-20, 2020
Item #16 EXECUTIVE SUMMARY Page 7 of 14
Exhibit A Arizona State UniversityTempe Campus Site Location Map
Board of Regents Meeting November 18-20, 2020
Item #16 EXECUTIVE SUMMARY Page 8 of 14
Arizona State University Amended Capital Development Plan–Project Justification Report
Multipurpose Arena
Previous Board Action • FY 2022-2024 Capital Improvement Plan October 2020 Project Justification/Description/Scope • The Multipurpose Arena is designed to accommodate a wide range of community,
entertainment and intercollegiate athletic uses. Working with industry design and construction experts, the arena can be transformed for concerts, lectures, large-scale meetings and a variety of Sun Devil athletic events.
• Sun Devil Athletics has established the goal of providing excellent performance venues and support facilities for all student-athletes. This goal supports ASU’s charter in a number of ways, including by increasing student, alumni and community engagement and enhancing our local impact and social embeddedness.
• The Sun Devil men’s ice hockey team currently rents ice time for both practice and games at Oceanside Arena in Tempe, which is suboptimal for team development and community engagement. Student and community engagement has been high and demand for seating has been greater than the capacity of the venue for years.
• The Multipurpose Arena will complement the existing larger-scale event venues at ASU with its medium-sized seating capacity, enabling community, corporate and ASU groups from a few thousand to tens of thousands to gather for a variety of needs.
• In May 2019, the university conducted a formal public solicitation for proposals to design, construct and operate a stand-alone Multipurpose Arena. This approach will benefit the university, as experienced, specialized companies will be responsible for the construction and operation of the facility, including the attraction of non-university events that will generate needed incremental revenue.
• The proposed project plan will locate the Multipurpose Arena on a site north of the
existing South Packard Drive parking structure, south of the existing solar power parasol and east of Sun Devil Stadium, as depicted on the attached map as Exhibit B. This location reinforces South Packard Drive as the home for major Sun Devil athletics programs, including football, basketball and ice hockey. The location of the Multipurpose Arena also will have an accretive impact to the development of the Novus
Board of Regents Meeting November 18-20, 2020
Item #16 EXECUTIVE SUMMARY Page 9 of 14
Innovation Corridor by creating a unique center of activity along Novus Place, north of the current Phase III developments.
• Construction of the approximately 179,238 gross-square-foot Multipurpose Arena will address the needs of the NCAA Division I Sun Devil men’s ice hockey program, host Sun Devil wrestling and gymnastics competitions, and include a second sheet of ice. The second ice surface will provide the community with a practice and competition location for regional youth and adult hockey clubs, as well as a practice ice sheet for the Sun Devil hockey team. The arena design will be flexible and include portable hardwood sports courts, allowing the facility to accommodate other arena sports, including Sun Devil volleyball. Additionally, the arena design will allow for family shows, concerts and other public events to be hosted to enhance community engagement.
• The facility will include approximately 5,000 seats with premium seating for enhanced revenue generation, including twenty private suites, nine loges and two group suites. The event level of the arena will house a club for premium seating, locker rooms, press facilities and arena support spaces. The facility is sited to integrate with and provide access to the retail spaces planned along Novus Place, while maximizing future Novus development opportunities in support of the master development plan for the Novus Innovation Corridor.
• The Multipurpose Arena will be managed by a third-party operator that is a national venue management and event programming company. The operator will leverage its extensive relationships in the entertainment industry to bring revenue-generating events, such as concerts, athletic events, eSports competitions, family programs and instructional clinics to the Multipurpose Arena.
Project Delivery Method and Process • During the RFP process, ASU received four proposals and all four were interviewed.
The proposals included four developers and three operators. ASU has issued a notice of intent to award the development contract to Mortenson and the management contract to a nationally recognized third-party operator.
• This project will be delivered through the Design-Build delivery method under a development and construction agreement with Mortenson, a nationally recognized arena contractor. This approach was selected to streamline project delivery, identify potential cost savings and alleviate potentially adversarial project environments.
Board of Regents Meeting November 18-20, 2020
Item #16 EXECUTIVE SUMMARY Page 10 of 14 Project Status and Schedule • General construction is scheduled to begin when the design is complete and after all
approvals are in place. Project substantial completion is targeted for December 2022. Project Cost • The total budget for this project is $115.0 million. • The estimated construction cost for the approximately 179,238 gross-square-foot
(gsf) multipurpose arena is $510 per gsf. The estimated total project cost is $642 per gsf and includes construction costs, site development costs, FF&E and soft costs.
Fiscal Impact and Financing Plan • The $115.0 million project budget will be debt-financed with ASU system revenue
bonds amortized over an approximate thirty-year term. Auxiliary funds, including facility revenues, charitable gifts and, in the longer term, Athletic Facilities District revenues will fund the debt service.
• During the construction period for the project, ASU may capitalize interest, providing time for the revenues that will pay debt service, which are dependent on arena completion, to be realized.
• The third-party operator will be responsible for all operations and maintenance costs for the Multipurpose Arena.
• Debt Ratio Impact: The projected incremental debt ratio impact for this project is
0.19 percent.
Occupancy Plan • No backfill plan is associated with this project.
Board of Regents Meeting November 18-20, 2020
Item #16 EXECUTIVE SUMMARY Page 11 of 14 Statutory/Policy Requirements • ABOR Policy 7-102 (B) requires committee review and board approval of all capital
projects with an estimated total project cost of $10,000,000 or more, including information technology and third-party projects.
• ABOR Policy 7-107 (E) requires Amended CDP approval for new projects added outside of the regular CDP.
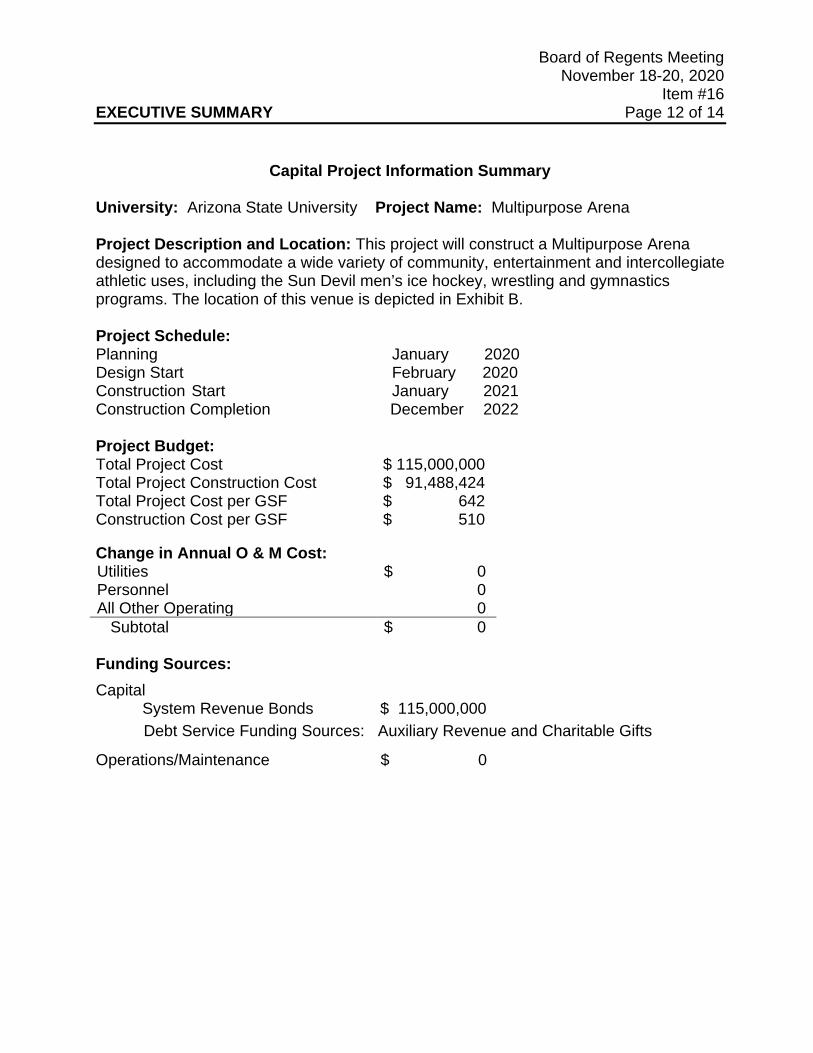
Board of Regents Meeting November 18-20, 2020
Item #16 EXECUTIVE SUMMARY Page 12 of 14
Capital Project Information Summary
University: Arizona State University Project Name: Multipurpose Arena
Project Description and Location: This project will construct a Multipurpose Arena designed to accommodate a wide variety of community, entertainment and intercollegiate athletic uses, including the Sun Devil men’s ice hockey, wrestling and gymnastics programs. The location of this venue is depicted in Exhibit B.
Project Schedule: Planning January 2020 Design Start February 2020 Construction Start January 2021 Construction Completion December 2022
Project Budget: Total Project Cost $ 115,000,000 Total Project Construction Cost $ 91,488,424 Total Project Cost per GSF $ 642 Construction Cost per GSF $ 510
Change in Annual O & M Cost: Utilities $ 0 Personnel 0 All Other Operating 0 Subtotal $ 0 Funding Sources: Capital System Revenue Bonds $ 115,000,000
Debt Service Funding Sources: Auxiliary Revenue and Charitable Gifts
Operations/Maintenance $ 0
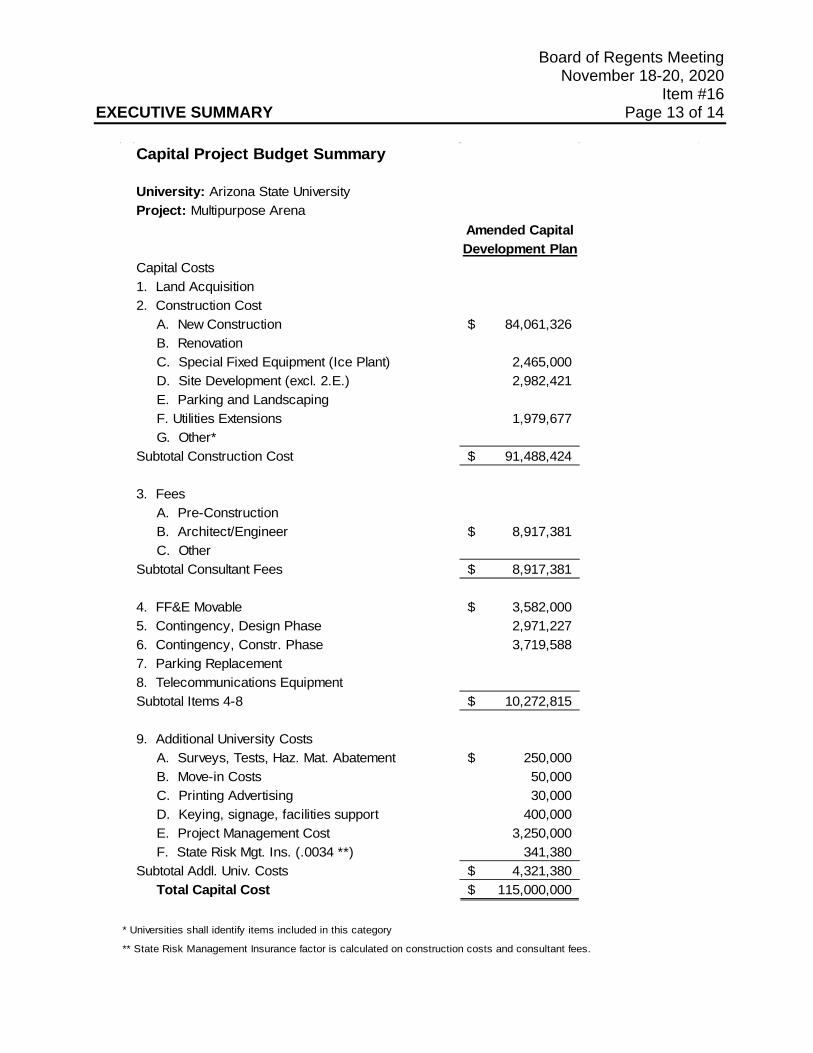
Board of Regents Meeting November 18-20, 2020
Item #16 EXECUTIVE SUMMARY Page 13 of 14
Capital Project Budget Summary
University: Arizona State University Project: Multipurpose Arena
Amended CapitalDevelopment Plan
Capital Costs1. Land Acquisition2. Construction Cost A. New Construction 84,061,326$ B. Renovation C. Special Fixed Equipment (Ice Plant) 2,465,000 D. Site Development (excl. 2.E.) 2,982,421 E. Parking and Landscaping F. Utilities Extensions 1,979,677 G. Other*Subtotal Construction Cost 91,488,424$
3. Fees A. Pre-Construction B. Architect/Engineer 8,917,381$ C. Other Subtotal Consultant Fees 8,917,381$
4. FF&E Movable 3,582,000$ 5. Contingency, Design Phase 2,971,227 6. Contingency, Constr. Phase 3,719,588 7. Parking Replacement8. Telecommunications EquipmentSubtotal Items 4-8 10,272,815$
9. Additional University Costs A. Surveys, Tests, Haz. Mat. Abatement 250,000$ B. Move-in Costs 50,000 C. Printing Advertising 30,000 D. Keying, signage, facilities support 400,000 E. Project Management Cost 3,250,000 F. State Risk Mgt. Ins. (.0034 **) 341,380 Subtotal Addl. Univ. Costs 4,321,380$ Total Capital Cost 115,000,000$
* Universities shall identify items included in this category
** State Risk Management Insurance factor is calculated on construction costs and consultant fees.
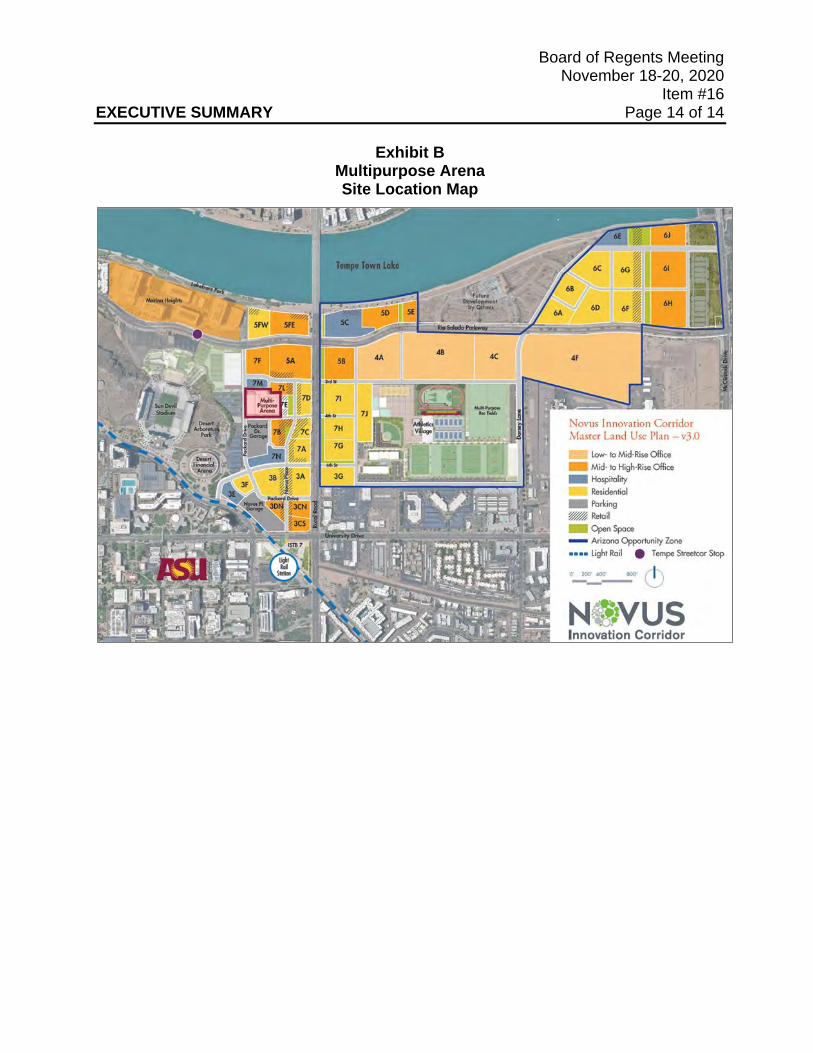
Board of Regents Meeting November 18-20, 2020
Item #16 EXECUTIVE SUMMARY Page 14 of 14
Exhibit B Multipurpose Arena Site Location Map
Board of Regents Meeting November 18-20, 2020
Item #17 EXECUTIVE SUMMARY Page 1 of 6
Contact Information: Mary Adelman, ABOR [email protected] 602-229-2523
Item Name: Premium Payment, Health and Dependent Care Cafeteria Plan
Action Item
Background/History of Previous Board Action • The board’s Premium Payment, Health and Dependent Care Plan allows
participants to contribute a portion of their compensation on a pre-tax basis to their account and receive reimbursements for uninsured medical care expenses and dependent care expenses.
• Board staff has received legal advice regarding the cafeteria plan from its tax
counsel Mr. Charles Whetstine, who has prepared the proposed amendment to the plan document.
• The Plan is maintained by the board pursuant to the provisions of A.R.S. §15-
1626G. As such, the Plan is not a State-provided benefit plan.
• In October 2013, the Internal Revenue Service issued guidance allowing participants to rollover up to $500 in Health FSA Account funds to the following plan year. Any excess up to $500 can be used for health care expenses in the following plan year. This provision was added to the plan effective January 1, 2016.
• In September 2015, the Plan was amended to clarify the period a participant may receive reimbursement for Health FSA expenses following termination of employment.
Discussion
• The Fifth Amendment starts on page 3 of this executive summary. • The proposed amendment addresses the following three items related to COVID-
19 relief efforts:
Requested Action: The board office asks the board to approve the Fifth Amendment to the Premium Payment, Health and Dependent Care Cafeteria Plan, as described in this executive summary.
Board of Regents Meeting November 18-20, 2020
Item #17 EXECUTIVE SUMMARY Page 2 of 6
o This first item is authorized by recent guidance from the Internal Revenue Service and allows participants to make election changes for contributions to their Health FSA and Dependent Care Accounts only for calendar year 2020 outside of the open enrollment period and without a qualified life event.
These next two items are recommended to allow participants additional time to incur and submit claims for reimbursement under the Plan due to disruption caused by COVID-19.
o Extend the deadline for submitting plan year 2019 claims from April 30,
2020 to June 30, 2020.
o Add a two month and 15-day grace period for the Dependent Care Plan for plan years ending December 31, 2020 and December 31, 2021. This will allow participants an additional two and a half months to incur eligible Dependent Care Expenses for reimbursement.
• Effective January 1, 2020 the Code expanded eligible over the counter
medication that can be reimbursed from a Health FSA. This language conforms the Plan to allow for these reimbursements.
• Effective January 1, 2020 the Code allowed for the automatic increase of the
maximum Health FSA carryover amount. The proposed language will conform the Plan to this change. For Plan Year 2021 the carryover will increase from $500 to $550.
Committee Review and Recommendation
The Finance, Capital and Resources Committee reviewed this item at its November 5, 2020 meeting and recommended forwarding to the full board for approval. Statutory/Policy Requirements • Internal Revenue Code of 1986 (the Code)
Board of Regents Meeting November 18-20, 2020
Item #17 EXECUTIVE SUMMARY Page 3 of 6
FIFTH AMENDMENT TO THE ARIZONA BOARD OF REGENTS PREMIUM
PAYMENT, HEALTH AND DEPENDENT CARE CAFETERIA PLAN
As Amended and Restated Effective January 1, 2010
WHEREAS, the Arizona Board of Regents (the “Board") adopted The
Arizona Board of Regents Premium Payment, Health and Dependent Care Cafeteria
Plan (the “Plan”), originally effective as of April 1, 1991, and thereafter amended and
restated the Plan, effective January 1, 2010, to provide certain cafeteria plan benefits to
its employees; and
WHEREAS, the Board is authorized, pursuant to Section 15.3 of the Plan,
to adopt amendments to the Plan; and
WHEREAS, in response to the 2019 novel coronavirus (COVID-19)
outbreak, the IRS issued Notice 2020-29 permitting certain prospective midyear election
changes for amounts contributed by Participants to their Health FSA and
DCAP Accounts;
WHEREAS, Code § 106(f) was amended by the CARES Act (Pub. L. No.
116-136, §3702 (2020)) permitting the reimbursement of over-the-counter drugs from a
Participant’s Health FSA Account;
WHEREAS, the IRS has issued Notice 2020-33 increasing the carryover
limit of unused amounts remaining as of the end of the Plan Year in a Participant’s
Health FSA to 20% of the maximum annual benefit amount that a Participant may elect
to receive under the Plan in the form of reimbursement for Medical Care Expenses under
Board of Regents Meeting November 18-20, 2020
Item #17 EXECUTIVE SUMMARY Page 4 of 6 Code § 125(i) (as increased by cost-of-living adjustments announced by the IRS
pursuant to the provisions of Code § 125(i)(2));
WHEREAS, the Board wishes to amend the Plan to (1) permit prospective
midyear election changes for amounts contributed by Participants to their Health FSA
and DCAP Accounts; (2) permit the reimbursement of over-the-counter drugs from a
Participant’s Health FSA Account, (3) increase the carryover limit of unused amounts
remaining as of the end of the Plan Year in a Participant’s Health FSA, (4) extend the
period a Participant may apply for reimbursement from the Participant’s Health FSA
and DCAP Accounts for claims incurred during the 2019 Plan Year and (5) provide for
a Grace Period following the close of the 2020 and 2021 Plan Years for a Participant to
incur Dependent Care Expenses that may be reimbursed from the Participant’s DCAP
Account for the previous Plan Year; and
WHEREAS, the Board has determined that these amendments are
required to assure the Plan’s successful operation and administration and to maintain
qualification of the Plan.
NOW, THEREFORE, pursuant to the authority granted to the Board in
Section 15.3 of the Plan, the Plan is hereby amended as follows:
1. Additional Election Changes in Calendar Year 2020. Notwith- standing any other provisions in the Plan to the contrary, effective as of the dates when these provisions were put into operation but during calendar year 2020 only:
a. An Eligible Employee may on a prospective basis revoke an election, make a new election, or decrease or increase an existing election regarding the Health FSA. The Plan Administrator may further determine the extent to which such changes are permitted and applied. Any change allowed shall not permit a revocation or decrease in election below the amount already reimbursed.
Board of Regents Meeting November 18-20, 2020
Item #17 EXECUTIVE SUMMARY Page 5 of 6
b. An Eligible Employee may on a prospective basis revoke an election, make a new election, or decrease or increase an existing election regarding the DCAP. The Plan Administrator may further determine the extent to which such changes are permitted and applied.
2. Reimbursement of Over-the-Counter Drugs. Effective for Medical Care Expenses incurred on and after January 1, 2020, Appendix A, which itemizes the “Medical Care Expenses” that are excluded and not eligible for reimbursement from the Health FSA Accounts of Participants, is amended by removing the requirement added by paragraph 5 of the First Amendment to the Plan (dated September 23, 2010 and effective January 1, 2011) that a medicine or drug shall be considered Medical Care Expenses only if the medicine or drug is a prescribed drug. Accordingly, effective January 1, 2020, a Participant may be reimbursed from the Participant’s Health FSA Account for over-the-counter drugs.
3. Indexing of Maximum Health FSA Carryover Amount. For Plan Years beginning on or after January 1, 2020, the maximum unused amount remaining in a Participant’s Health FSA Account at the end of a Plan Year that can be carried over and used to reimburse the Participant for Medical Care Expenses that are incurred during the next Plan Year shall be automatically increased to an amount equal to twenty percent (20%) of the maximum Health FSA salary reduction contribution under Code §125(i) (as increased by cost-of-living adjustments announced by the IRS pursuant to the provisions of Code § 125(i)(2)) for the Plan Year from which the amounts are carried over. Thus, the maximum unused amount that can be carried over from the Plan Year beginning January 1, 2020 to the Plan Year beginning January 1, 2021 is $550.
4. Deadline for Submitting Claims. Notwithstanding the April 30, 2020 deadline set forth in Sections 7.7(b) and 9.7(b) of the Plan, a Participant shall have until June 30, 2020 to apply for reimbursement for Health FSA and DCAP Benefits for the Plan Year ending December 31, 2019. Effective for Plan Years beginning on and after January 1, 2020, the deadline to apply for reimbursement for Health FSA and DCAP Benefits shall again be April 30 of the following Plan Year.
5. Grace Period for Dependent Care Expenses. Section 9.4 of the Plan is amended by adding a new Section 9.4€, that will be effective and apply only for Plan Years Ending December 31, 2020 and December 31, 2021, to read as follows:
“(e) Grace Periods; Special Rules for Claims Incurred During a Grace
Period. Notwithstanding any contrary provision in this Plan (particularly Section 9.6) and subject to the conditions of Sections 9.4(b), an individual may be reimbursed for Dependent Care Expenses incurred during a Grace Period from amounts remaining in the Participant’s DCAP Account at the end of the Plan Year to which that Grace Period relates (“Prior Plan Year DCAP Amounts”) if he or she is a Participant in the Plan with DCAP coverage that is in effect on the last day of that Plan Year. This Section 9.4(e) shall be administered as follows:
Board of Regents Meeting November 18-20, 2020
Item #17 EXECUTIVE SUMMARY Page 6 of 6
• ‘Grace Period’ means the period that begins immediately following the close of a Plan Year and ends on the day that is two months plus 15 days following the close of that Plan Year.
• Prior Plan Year DCAP Amounts may not be cashed out or converted to any other taxable or nontaxable benefit. For example, Prior Plan Year DCAP Amounts may not be used to reimburse Medical Care Expenses.
• Dependent Care Expenses incurred during a Grace Period and approved
for reimbursement in accordance with Section 9.7 will be reimbursed first from any available Prior Plan Year DCAP Amounts and then from any amounts that are available to reimburse expenses that are incurred during the current Plan Year. An individual's Prior Plan Year DCAP Amounts will be debited for any reimbursement of Dependent Care Expenses incurred during the Grace Period that is made from such Prior Plan Year DCAP Amounts.
• Claims for reimbursement of Dependent Care Expenses incurred during
a Grace Period must be submitted no later than the April 30 following the close of the Plan Year to which the Grace Period relates in order to be reimbursed from Prior Plan Year DCAP Amounts. Any Prior Plan Year DCAP Amounts that remain after all reimbursements have been made for the Plan Year and its related Grace Period shall not be carried over to reimburse the Participant for expenses incurred in any subsequent period. The Participant will forfeit all rights with respect to these amounts, which will be subject to the Plan's provisions regarding forfeitures in Section 9.6.”
6. In all other respects, the Plan, as amended, is hereby affirmed.
Board of Regents Meeting November 18-20, 2020
Item #18 EXECUTIVE SUMMARY Page 1 of 4
Contact Information: Nancy Tribbensee, ABOR [email protected] 602-229-2510
Item Name: Proposed Revision to ABOR Policy 1-117 (Naming of Facilities and Programmatic Units for Individuals or Organizations) and Incorporation and Repeal of the Guidelines For Assigning the Names of Individuals, Families or Organizations to Campus Facilities or Programmatic Units (First Reading)
Action Item
Background and Discussion • Currently the board has a policy on naming facilities and programmatic units and a
separate set of guidelines that provide additional detail on implementation. The purpose of this proposal is to incorporate the current guidelines into the existing policy to create a single point of reference. Once incorporated into the policy, the separate guidelines will be repealed.
• The attached updated policy incorporates the guidelines and also provides that the
university president has the authority to determine the conditions under which a facility or unit may be re-named or a previously assigned name may be rescinded.
Committee Review and Recommendation
The Finance, Capital and Resources Committee reviewed this item at its November 5, 2020 meeting and recommended forwarding to the full board for consideration.
Requested Action: The board office asks the board for consideration on first reading proposed revisions to ABOR Policy 1-117 “Naming of Facilities and Programmatic Units for Individuals or Organizations” and the proposed incorporation and repeal of the Guidelines for Assigning the Names of Individuals, Families or Organizations to Campus Facilities or Programmatic Units as described in this executive summary.
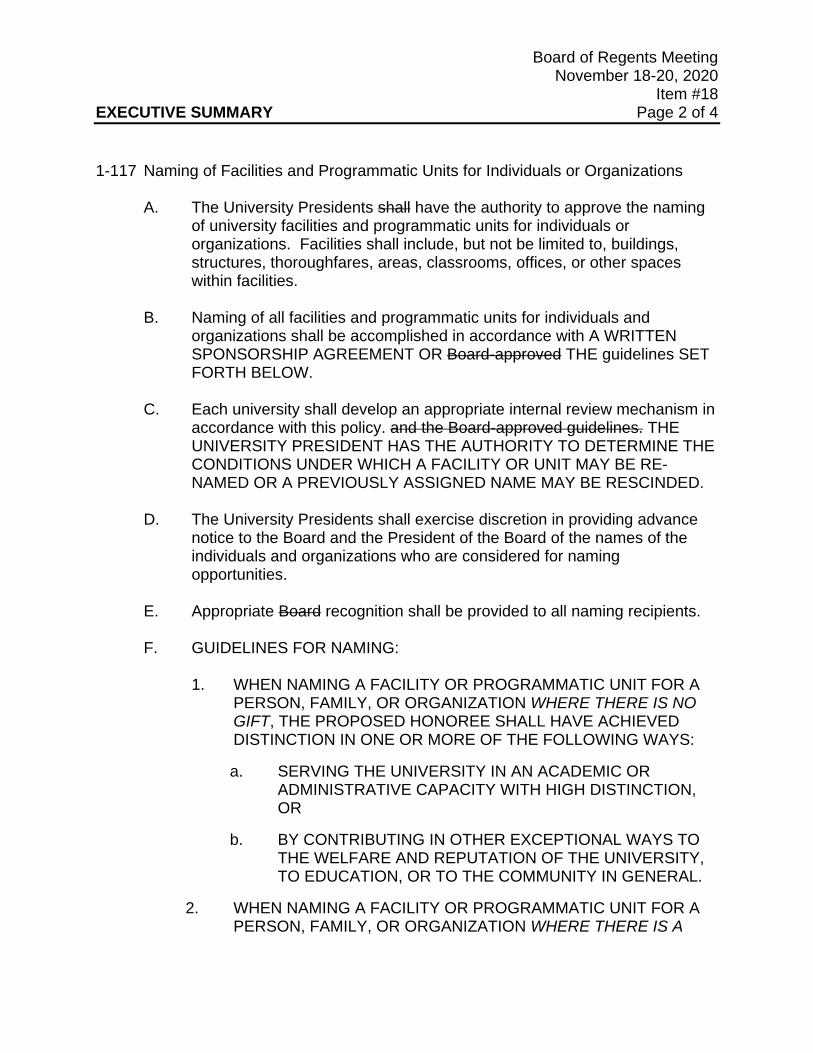
Board of Regents Meeting November 18-20, 2020
Item #18 EXECUTIVE SUMMARY Page 2 of 4
1-117 Naming of Facilities and Programmatic Units for Individuals or Organizations
A. The University Presidents shall have the authority to approve the naming of university facilities and programmatic units for individuals or organizations. Facilities shall include, but not be limited to, buildings, structures, thoroughfares, areas, classrooms, offices, or other spaces within facilities.
B. Naming of all facilities and programmatic units for individuals and
organizations shall be accomplished in accordance with A WRITTEN SPONSORSHIP AGREEMENT OR Board-approved THE guidelines SET FORTH BELOW.
C. Each university shall develop an appropriate internal review mechanism in
accordance with this policy. and the Board-approved guidelines. THE UNIVERSITY PRESIDENT HAS THE AUTHORITY TO DETERMINE THE CONDITIONS UNDER WHICH A FACILITY OR UNIT MAY BE RE-NAMED OR A PREVIOUSLY ASSIGNED NAME MAY BE RESCINDED.
D. The University Presidents shall exercise discretion in providing advance
notice to the Board and the President of the Board of the names of the individuals and organizations who are considered for naming opportunities.
E. Appropriate Board recognition shall be provided to all naming recipients. F. GUIDELINES FOR NAMING:
1. WHEN NAMING A FACILITY OR PROGRAMMATIC UNIT FOR A PERSON, FAMILY, OR ORGANIZATION WHERE THERE IS NO GIFT, THE PROPOSED HONOREE SHALL HAVE ACHIEVED DISTINCTION IN ONE OR MORE OF THE FOLLOWING WAYS:
a. SERVING THE UNIVERSITY IN AN ACADEMIC OR ADMINISTRATIVE CAPACITY WITH HIGH DISTINCTION, OR
b. BY CONTRIBUTING IN OTHER EXCEPTIONAL WAYS TO THE WELFARE AND REPUTATION OF THE UNIVERSITY, TO EDUCATION, OR TO THE COMMUNITY IN GENERAL.
2. WHEN NAMING A FACILITY OR PROGRAMMATIC UNIT FOR A PERSON, FAMILY, OR ORGANIZATION WHERE THERE IS A
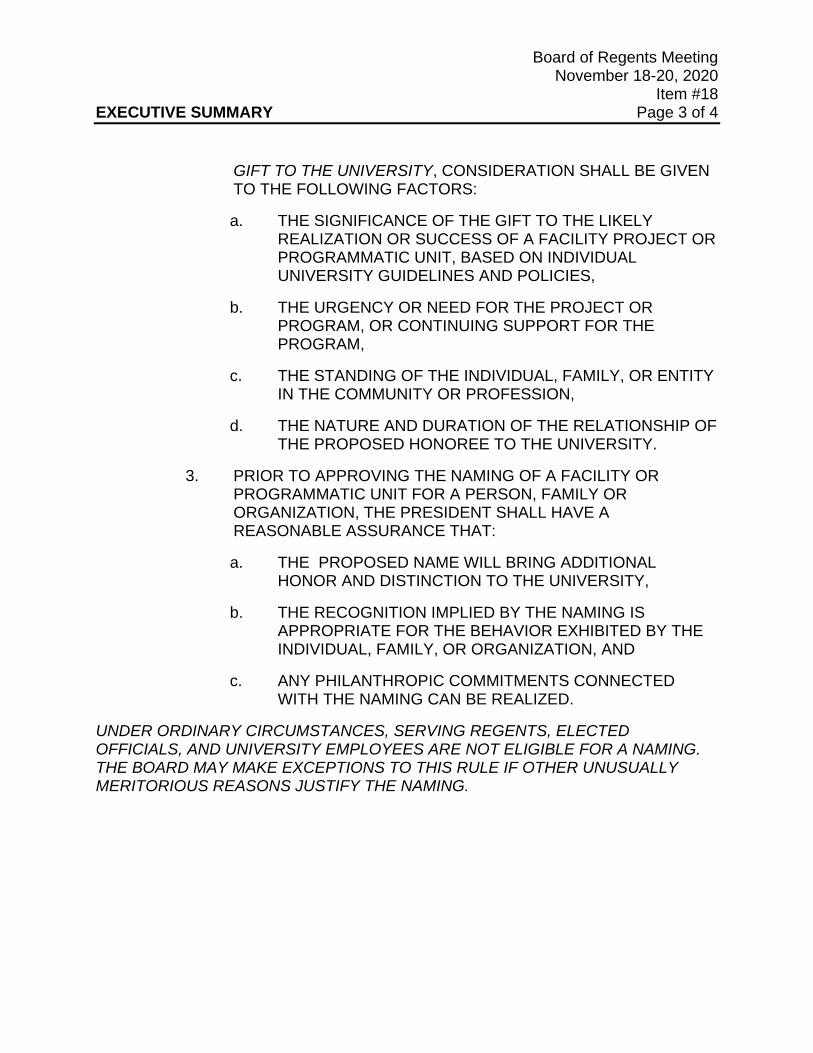
Board of Regents Meeting November 18-20, 2020
Item #18 EXECUTIVE SUMMARY Page 3 of 4
GIFT TO THE UNIVERSITY, CONSIDERATION SHALL BE GIVEN TO THE FOLLOWING FACTORS:
a. THE SIGNIFICANCE OF THE GIFT TO THE LIKELY REALIZATION OR SUCCESS OF A FACILITY PROJECT OR PROGRAMMATIC UNIT, BASED ON INDIVIDUAL UNIVERSITY GUIDELINES AND POLICIES,
b. THE URGENCY OR NEED FOR THE PROJECT OR PROGRAM, OR CONTINUING SUPPORT FOR THE PROGRAM,
c. THE STANDING OF THE INDIVIDUAL, FAMILY, OR ENTITY IN THE COMMUNITY OR PROFESSION,
d. THE NATURE AND DURATION OF THE RELATIONSHIP OF THE PROPOSED HONOREE TO THE UNIVERSITY.
3. PRIOR TO APPROVING THE NAMING OF A FACILITY OR PROGRAMMATIC UNIT FOR A PERSON, FAMILY OR ORGANIZATION, THE PRESIDENT SHALL HAVE A REASONABLE ASSURANCE THAT:
a. THE PROPOSED NAME WILL BRING ADDITIONAL HONOR AND DISTINCTION TO THE UNIVERSITY,
b. THE RECOGNITION IMPLIED BY THE NAMING IS APPROPRIATE FOR THE BEHAVIOR EXHIBITED BY THE INDIVIDUAL, FAMILY, OR ORGANIZATION, AND
c. ANY PHILANTHROPIC COMMITMENTS CONNECTED WITH THE NAMING CAN BE REALIZED.
UNDER ORDINARY CIRCUMSTANCES, SERVING REGENTS, ELECTED OFFICIALS, AND UNIVERSITY EMPLOYEES ARE NOT ELIGIBLE FOR A NAMING. THE BOARD MAY MAKE EXCEPTIONS TO THIS RULE IF OTHER UNUSUALLY MERITORIOUS REASONS JUSTIFY THE NAMING.
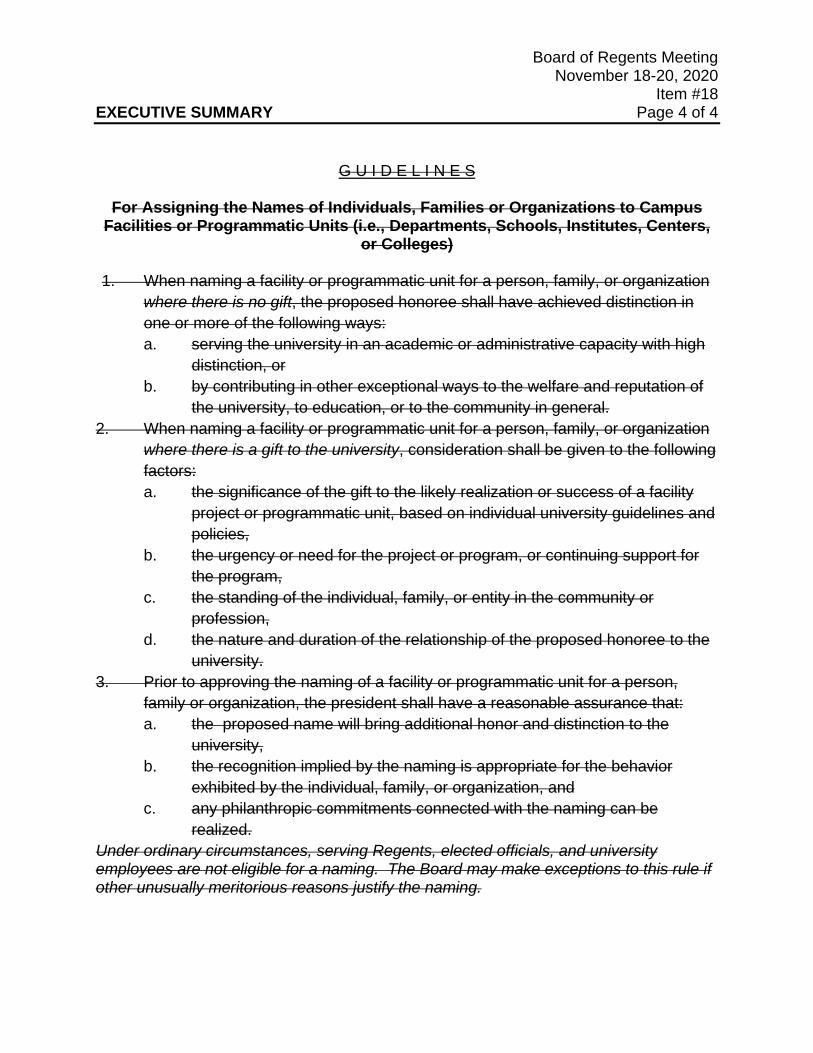
Board of Regents Meeting November 18-20, 2020
Item #18 EXECUTIVE SUMMARY Page 4 of 4
G U I D E L I N E S
For Assigning the Names of Individuals, Families or Organizations to Campus
Facilities or Programmatic Units (i.e., Departments, Schools, Institutes, Centers, or Colleges)
1. When naming a facility or programmatic unit for a person, family, or organization
where there is no gift, the proposed honoree shall have achieved distinction in one or more of the following ways: a. serving the university in an academic or administrative capacity with high
distinction, or b. by contributing in other exceptional ways to the welfare and reputation of
the university, to education, or to the community in general. 2. When naming a facility or programmatic unit for a person, family, or organization
where there is a gift to the university, consideration shall be given to the following factors: a. the significance of the gift to the likely realization or success of a facility
project or programmatic unit, based on individual university guidelines and policies,
b. the urgency or need for the project or program, or continuing support for the program,
c. the standing of the individual, family, or entity in the community or profession,
d. the nature and duration of the relationship of the proposed honoree to the university.
3. Prior to approving the naming of a facility or programmatic unit for a person, family or organization, the president shall have a reasonable assurance that: a. the proposed name will bring additional honor and distinction to the
university, b. the recognition implied by the naming is appropriate for the behavior
exhibited by the individual, family, or organization, and c. any philanthropic commitments connected with the naming can be
realized. Under ordinary circumstances, serving Regents, elected officials, and university employees are not eligible for a naming. The Board may make exceptions to this rule if other unusually meritorious reasons justify the naming.
Board of Regents Meeting November 18-19, 2020
Item #19 EXECUTIVE SUMMARY Page 1 of 1
Contact Information: Samantha Blevins, ABOR [email protected] 602-229-2535
Item Name: Approve Use of Funds Bequeathed to the University of Arizona
Action Item
Background/History of Previous Board Action • ABOR policy does not require board approval of bequests by decedents.
• However the Trust Estate of the decedent left a gift of 2% of her estate,
approximately $300,000 to the University of Arizona “for what purpose deemed appropriate by a joint decision between the board...[ and the Dean of the College of Humanities at the University of Arizona].”
• Dean Alain-Philippe Durand has proposed creating an endowed fund to award
and support outstanding research in the Humanities. • The proposal has been approved by Provost Folks and President Robbins. Discussion The Decedent’s estate sent a check to the University of Arizona. The check conditioned the expenditure of funds upon a joint decision by the University and the board. As, such the university has proposed using the bequest to support research in the Humanities and seeks the board’s approval. Committee Review and Recommendation Given the unique nature of the bequest, this has not appeared, nor is required to appear, before a committee for review.
Requested Action: The board office asks the board to approve use of funds bequeathed to the University of Arizona.

This page intentionally left blank
Board of Regents Meeting November 18-20, 2020
Item #20 EXECUTIVE SUMMARY Page 1 of 4
Contact Information: Chad Sampson, ABOR [email protected] 602-229-2512
Item Name: Report on the Academic Affairs and Educational Attainment Committee Meeting
Action Item
Agenda Highlights Academic Affairs and Educational Attainment Committee
November 5, 2020
1. Update on Department of Education The committee received an update from Arizona Superintendent of Public Instruction, Kathy Hoffman.
2. Proposed Revision to ABOR Policy 2-210 “General Education” (First Reading) The committee reviewed the revisions to ABOR Policy 2-210 “General Education”. The board office asked the committee to vote to send to the board for first reading clarifying policy amendments to ABOR Policy 2-210. These revisions had been prompted by a discussion between the university presidents and the board, universities’ questions about how the General Education policy ought to be construed and applied, and concern from the board that the policy be implemented as they intended. The revisions:
• Clarify that the knowledge, skills, and intellectual habits specified in the General Education policy are not simply a menu of curriculum options, but are requirements of all undergraduate students;
• Provide more specific elaboration of the content that should be covered under “American Institutions” and civic knowledge requirements; and
• Permit a broader variety of General Education assessment instruments beyond rubrics alone.
Committee members engaged in a robust discussion with the university provosts regarding the language clarifying the content that should be covered under “American Institutions” and civic knowledge requirements.
Requested Action: The board office asks the board to review the report of the November 5, 2020 Academic Affairs and Educational Attainment Committee.
Board of Regents Meeting November 18-20, 2020
Item #20 EXECUTIVE SUMMARY Page 2 of 4
Outcomes and Assignments: The committee recommended forwarding the policy to the board for first reading.
3. Discussion of Arizona State University’s Enterprise-wide Metric Targets and Strategic Forecast Measures
The committee engaged in a discussion with Arizona State University regarding Enterprise-wide Metric Targets and Strategic Forecast Measures.
Outcomes and Assignments: A regent working group and the board office will continue to work with Arizona State University regarding its proposed enterprise-wide metric targets and strategic forecasts. The committee expects to revisit the proposed targets in its January meeting in anticipation of adopting the proposed topics in the spring of 2021.
4. Discussion of the University of Arizona’s Institutional University Metrics The committee engaged in a discussion with the University of Arizona regarding proposed Institutional University Metrics. The University of Arizona’s institutional university metrics are intended to reflect its distinct missions and role in Arizona’s public university system. The institutional metrics are organized around four broad goals. Each goal is underpinned by a set of metrics and measures that capture different dimensions of performance against the overall goal.
Outcomes and Assignments: The committee expects to revisit the University of Arizona’s proposed institutional metrics at its February meeting in anticipation of adopting the proposed topics in the spring of 2021.
5. Fall Enrollment Report
Board of Regents Meeting November 18-20, 2020
Item #20 EXECUTIVE SUMMARY Page 3 of 4
The committee reviewed the Fall Enrollment Report, which provides enrollment data for students attending Arizona’s Public Universities in the 2020-21 academic year and updates 5-year enrollment trends.
Outcomes and Assignments: The committee recommended that the board approve the Fall Enrollment Report.
6. Proposed Revision to ABOR Policy 2-223 “Academic Locations, Programs and Organizational Units” (First Reading) [Formerly “Academic Strategic Plan”]
The committee reviewed the policy revisions and engaged in a discussion with the university provosts and senior leaders regarding the specific policy revisions, including:
• Requiring a university to seek board approval before opening a new academic location anywhere in the world;
• Requiring a university to provide notice and engage in consultation with the other Arizona public universities before offering a new academic program or opening a new location within Arizona;
• Requiring a university to provide notice and consultation with the other Arizona public universities when a university wants to provide a novel combination of existing degrees and locations within Arizona;
• Establishing timeframes and a process of providing notice and consultation with the board;
• Utilizing a board arbitration process to resolve differences that cannot be resolved among the parties;
• Eliminating the prohibition preventing universities from offering 100-200 level courses in a location if overlapping programming is already being offered by an Arizona community college; and
• Removing the requirement that the universities maintain and submit “academic strategic plans.” Outcomes and Assignments: The committee recommended forwarding to the board for first reading.
7. Request for New Academic Programs for Arizona State University The committee reviewed and discussed Arizona State University’s proposed new
Board of Regents Meeting November 18-20, 2020
Item #20 EXECUTIVE SUMMARY Page 4 of 4
programs for nine graduate degrees and four undergraduate degrees for implementation in the 2021-2022 academic year.
Outcomes and Assignments: The committee recommended that the board approve the proposed new academic programs for Arizona State University.
8. Request for New Academic Programs for Northern Arizona University
The committee reviewed and discussed Northern Arizona University’s proposed new graduate program for implementation in the 2021-2022 academic year.
Outcomes and Assignments: The committee recommended that the board approve the proposed new academic program for Northern Arizona University.
9. Request for Credit Exception for Northern Arizona University Report
The committee reviewed and discussed Northern Arizona University’s proposed credit exception.
Outcomes and Assignments: The committee recommended that the board approve the proposed credit exception to the community college credit limit for Northern Arizona University.
10. Request for New Academic Programs for the University of Arizona
The committee reviewed and discussed the University of Arizona proposed new undergraduate programs for implementation in the spring of 2021.
Outcomes and Assignments: The committee recommended that the board approve the proposed new academic program requests for the University of Arizona.

Board of Regents Meeting November 18-20, 2020
Item #21 EXECUTIVE SUMMARY Page 1 of 8
Contact Information: Helen Baxendale, ABOR [email protected] 602-229-2529 Chad Sampson, ABOR [email protected] 602-229-2512
Item Name: Proposed Revision to ABOR Policy 2-210 “General Education”
(First Reading)
Action Item
Background/History of Previous Board Action The proposed policy revision clarifies policy amendments to ABOR Policy 2-210. These revisions have been prompted by a discussion between the university presidents and the board, universities’ questions about how the General Education Policy ought to be construed and applied, and concern from the board that the policy be implemented as they intend. The revisions:
• Clarify that the knowledge, skills, and intellectual habits specified in the General Education policy are not simply a menu of curriculum options, but are requirements of all students
• Provide more specific elaboration of the content that should be covered under “American Institutions” and civic knowledge requirements
• Permit a broader variety of General Education assessment instruments beyond rubrics alone.
Discussion Discussion between the board office, Regents, and university leadership in recent months has revealed uncertainty as to whether the knowledge, skills, and intellectual habits identified in the General Education Policy 2-210 apply to every single student or to the totality of General Education curricula. The attached revisions provide clear direction that the policy is not simply a curriculum menu, but a mandated set of knowledge, skills, and attributes with which all students must engage. University personnel have also sought clarification on the sorts of topics that fall under the rubric of “American Institutions, including economic theory and US history” and “civic knowledge.” The attached revisions provide more specific elaboration on this matter.
Requested Action: The board office asks the board to review on first reading the proposed revision to ABOR Policy 2-210 “General Education”.
Board of Regents Meeting November 18-20, 2020
Item #21 EXECUTIVE SUMMARY Page 2 of 8 A further revision pertains to General Education assessment. The current policy specifies rubrics as the sole means of assessing General Education learning outcomes. In the attached revision “rubrics” is changed to “robust assessment instruments” to enable more flexibility in devising appropriate means of measuring General Education attainment. Committee Review and Recommendation The Academic Affairs and Educational Attainment Committee reviewed this item at its November 5, 2020 meeting, and recommended forwarding the item to the full board for approval. Statutory/Policy Requirements ABOR policy 2-210
Board of Regents Meeting November 18-20, 2020
Item #21 EXECUTIVE SUMMARY Page 3 of 8
2-210 General Education Purpose Undergraduate education at the university level should lead to graduating an educated person. The university’s education programs should represent the distinctiveness of the university while providing graduates with the knowledge, including concepts, skills, competencies, and intellectual habits that prepare them to take their place in our republic and the world. It should prepare graduates to pursue careers or advanced degrees, and participate fully as informed citizens in a robust constitutional democracy based in values of individual freedom, self-reliance, and equality under the law, diversity, inclusion and constructive dialog through civil discourse. As advances in technology also promote exponential increases in human knowledge, graduates need the foundational cognitive and behavioral skills necessary to adapt quickly to change. In this environment of rapidly evolving knowledge, universities should design general education and majors such that graduates’ persistence, resiliency and adaptability are realized via the whole of the curriculum. Persistence, resiliency and adaptability are not acquired through a single course. For this reason, the knowledge, concepts, general skills, and intellectual habits transcend any individual course and must be scaffolded throughout the curriculum that composes an academic program. A general education program alongside a student’s major(s), therefore, provide a holistic, comprehensive undergraduate education. It is expected that learning opportunities across a student’s entire undergraduate education build upon each other in an integrative manner that promotes the cumulative progression of skills and a substantial body of knowledge that reflects a breadth and depth of perspectives. Beyond knowledge acquisition, the learning process takes place through the progression to the degree. Within a student’s overall education, a general education program must offer a coherent set of learning opportunities that provide students with a foundation of knowledge and skills that helps them to place their chosen areas of study within a wider context and prepares them to be productive citizens. To do so, students must understand how the traditional branches of knowledge can be situated within a broad perspective that enables them to comprehend change, cultures and diverse experiences, and local and global regions. Students must be challenged to apply course content with the expectation that their knowledge and skills lead them to think critically, innovatively, and creatively, to reason quantitatively, to communicate effectively, to understand and use rhetorical skills, and to collaborate in solving problems. Constructive engagement with complex challenges requireS that today’s graduates develop the ability to integrate knowledge and perspectives across disciplines and
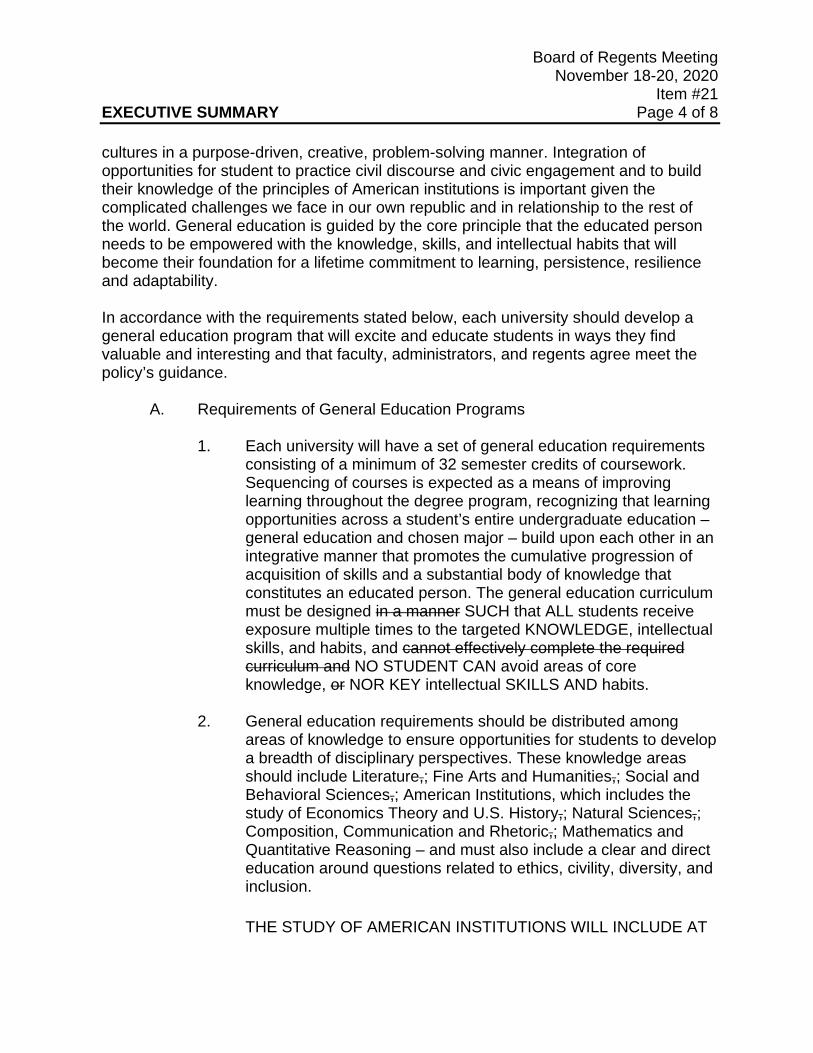
Board of Regents Meeting November 18-20, 2020
Item #21 EXECUTIVE SUMMARY Page 4 of 8 cultures in a purpose-driven, creative, problem-solving manner. Integration of opportunities for student to practice civil discourse and civic engagement and to build their knowledge of the principles of American institutions is important given the complicated challenges we face in our own republic and in relationship to the rest of the world. General education is guided by the core principle that the educated person needs to be empowered with the knowledge, skills, and intellectual habits that will become their foundation for a lifetime commitment to learning, persistence, resilience and adaptability. In accordance with the requirements stated below, each university should develop a general education program that will excite and educate students in ways they find valuable and interesting and that faculty, administrators, and regents agree meet the policy’s guidance.
A. Requirements of General Education Programs
1. Each university will have a set of general education requirements consisting of a minimum of 32 semester credits of coursework. Sequencing of courses is expected as a means of improving learning throughout the degree program, recognizing that learning opportunities across a student’s entire undergraduate education – general education and chosen major – build upon each other in an integrative manner that promotes the cumulative progression of acquisition of skills and a substantial body of knowledge that constitutes an educated person. The general education curriculum must be designed in a manner SUCH that ALL students receive exposure multiple times to the targeted KNOWLEDGE, intellectual skills, and habits, and cannot effectively complete the required curriculum and NO STUDENT CAN avoid areas of core knowledge, or NOR KEY intellectual SKILLS AND habits.
2. General education requirements should be distributed among
areas of knowledge to ensure opportunities for students to develop a breadth of disciplinary perspectives. These knowledge areas should include Literature,; Fine Arts and Humanities,; Social and Behavioral Sciences,; American Institutions, which includes the study of Economics Theory and U.S. History,; Natural Sciences,; Composition, Communication and Rhetoric,; Mathematics and Quantitative Reasoning – and must also include a clear and direct education around questions related to ethics, civility, diversity, and inclusion.
THE STUDY OF AMERICAN INSTITUTIONS WILL INCLUDE AT
Board of Regents Meeting November 18-20, 2020
Item #21 EXECUTIVE SUMMARY Page 5 of 8
A MINIMUM AN UNDERSTANDING OF HOW THE HISTORY OF THE UNITED STATES CONTINUES TO SHAPE THE PRESENT, THE BASIC PRINCIPLES OF AMERICAN CONSTITUTIONAL DEMOCRACY AND HOW THEY ARE APPLIED UNDER A REPUBLICAN FORM OF GOVERNMENT, AN UNDERSTANDING OF THE UNITED STATES CONSTITUTION AND MAJOR AMERICAN CONSTITUTIONAL DEBATES AND DEVELOPMENTS, KNOWLEDGE OF THE ESSENTIAL FOUNDING DOCUMENTS AND HOW THEY HAVE SHAPED THE NATURE AND FUNCTIONS OF AMERICAN INSTITUTIONS OF SELF-GOVERNANCE, AN UNDERSTANDING OF LANDMARK SUPREME COURT CASES AND THEIR EFFECTS ON LAW AND SOCIETY, AN UNDERSTANDING OF THE CIVIC VIRTUES NECESSARRY FOR EFFECTIVE CITIZENSHIP AND CIVIC PARTICIPATION IN A SELF-GOVERNING SOCIETY – FOR EXAMPLE, THE ABILITY TO ENGAGE IN CIVIL DIALOG AND TO DISAGREE CIVILLY, AND THE BASIC ECONOMIC KNOWLEDGE NECESSARY TO CRITICALLY ASSESS PUBLIC POLICY OPTIONS AND TO INFORM PROFESSIONAL AND PERSONAL DECISIONS.
3. Each university will incorporate skills-based learning outcomes into
its general education program. These skills/competencies will include written and oral communication, critical thinking, teamwork, intercultural competency, application of ideas to real-world situations, and time management. These skills/competencies will also integrate the teaching of life skills that respond to the realities of 21st century, including, as examples, information and data literacy, differentiation among fact, inference, and judgment, and civic engagement and civil discourse grounded in fundamental civic knowledge.
4. A general education program should also challenge students to
develop the intellectual habits that define an educated person. Each university should include development of these habits throughout its general education coursework. Examples of intellectual habits that characterize educated persons include the following: intellectual integrity; understanding of reasoning and evidence; open-mindedness to different views and the ability to suspend judgment until convincing evidence is available or until the bases for these differences are understood; an appetite for the pursuit of truth with the personal characteristics of initiative, humility, curiosity and intellectual commitment; and the willingness
Board of Regents Meeting November 18-20, 2020
Item #21 EXECUTIVE SUMMARY Page 6 of 8
5. to pursue a line of inquiry to its logical conclusion no matter how uncomfortable the conclusion.
B. General Education Design and Assessment
1. Universities will engage in continuous assessment. Assessment
processes will demonstrate graduates ASCERTAIN THE EXTENT TO WHICH GRADUATES HAVE ACQUIRED THE INTENDED CONCEPTS AND COMPETENCIES. ASSESSMENT FINDINGS WILL BE USED TO INFORM CONTINUOUS IMPROVEMENT EFFORTS.
a. Acquired the intended concepts and competencies; b. Achieved the learning objectives regarding the concepts,
skills, and abilities of program graduates; and c. Focused on continuous improvement efforts to help the
program better achieve these learning objectives. 2. Each university will recognize the learning outcomes (concepts
and competencies) associated with general education and the major are cumulative and not based on isolated projects or single courses. Skills are developed by repetition and sequencing that cultivate the development of knowledge and competencies.
3. Each university will recognize that general education contributes to the whole of the educated person. Courses from majors and electives provide the broader frame of learning in which students engage their education coupled with the larger learning environment of the university with speakers, clubs, and other opportunities to engage ideas, activities and issues. Thus, evaluation of general education is also part and parcel of the review of the learning objectives of each degree program and those outcomes are reflected in the academic program reviews.
4. Each university will establish a schedule to evaluate its general education program to ensure that, within the identified categories of knowledge, the essential learning outcomes and intellectual qualities are acquired by graduates. This process is intended to assure that concepts and competencies are being taught with sufficient rigor, depth and breadth to realize the graduation of educated persons and knowledgeable engaged citizens. Effective
Board of Regents Meeting November 18-20, 2020
Item #21 EXECUTIVE SUMMARY Page 7 of 8
5. assessment depends fundamentally upon measurement and does not rely exclusively on a single project or capstone courses. It includes the identification of learning outcomes, the assessment methods, and the internal and external measures that will inform curricular refinements and allow faculty and administrators to reconsider programs that do not meet expectations in terms of learned concepts and competencies. It also includes measurement of the extent to which graduates have acquired the intended concepts and skills that represent the distinctive university’s expectations for an educated person.
6. Each university will utilize rubrics ROBUST ASSESSMENT INSTRUMENTS, based on national standards or locally developed, to gauge whether students master the essential learning outcomes and intellectual qualities that are outlined in the policy.
7. As required by the board from time-to-time, each university will report on its general education evaluation process and the results of those evaluations; and periodic programmatic evaluations will demonstrate that the concepts and competencies are learned and that programmatic changes are informed by the process.
C. Community College Transfer Students
1. Each university’s general education program requirement is satisfied by an Arizona Public Community College transfer student’s completion of the Arizona General Education Curriculum (AGEC) before transferring to an Arizona public university. The articulation agreements are discussed and supported by AZ Transfer, a consortium of academic administrators from the three universities, Arizona public and tribal community colleges, and the board.
2. Each university will work with Arizona community college systems
to develop pathways that satisfy general education requirements.
D. Satisfying the General Education Requirement by Other Means
1. Customarily, the general education requirements are met through completion of the university’s general education programs, but these requirements may be met through innovative board approved programs that meet the same learning outcomes
Board of Regents Meeting November 18-20, 2020
Item #21 EXECUTIVE SUMMARY Page 8 of 8
specified in these guidelines. 2. Universities are encouraged to allow students to obtain general
education credit by other means such as advanced placement (“AP”), international baccalaureate (“IB”), college level examination programs (“CLEP”), prior learning assessments, recognized assessment of military service proficiencies, and departmental challenge examinations. General education requirement satisfaction will be evaluated on a case-by-case basis for any students who transfer to an Arizona public university.
Board of Regents Meeting November 18-20, 2020
Item #22 EXECUTIVE SUMMARY Page 1 of 1
Contact Information: Chad Sampson, ABOR [email protected] 602-229-2512
Item Name: Fall Enrollment Report
Action Item
Background and Discussion The attached fall enrollment report provides enrollment data for students attending Arizona’s Public Universities in the 2020-21 academic year and updates 5-year enrollment trends. The report includes twenty-first day headcount and forty-fifth day FTE enrollment data for each university for fiscal year 2021 (Fall 2020). The report counts student enrollment across all education delivery modalities, including online and extended campuses. The report further disaggregates the data into undergraduate, graduate and total enrollment. The report further presents the data by full-time and part-time student enrollment semester credit hours, course level and residency status. Committee Review and Recommendation The Academic Affairs and Educational Attainment Committee reviewed this item at its November 5, 2020 meeting, and recommended forwarding the item to the full board for approval. Statutory/Policy Requirements A.R.S. §15-1466.01 Calculation of Full-Time Equivalent Student Enrollment A.R.S. §15-1661 Annual Appropriation, et al. A.R.S. §15-1626 General Administrative Powers and Duties of Board A.R.S. §15-1802 In-State Student Status A.R.S. §15-1803 Alien In-State Student Status ABOR Policy 2-122 requires that each university shall report to the Board headcount and FTE enrollment data.
Requested Action: The board office asks the board to approve the Fiscal Year 2021 Fall Enrollment Report.

This page intentionally left blank
FISCAL YEAR 2021
FALL ENROLLMENT REPORT
This report provides enrollment data for students attending Arizona’s public universities in the 2020-21 academic year and updates multi-year enrollment trends. Twenty-first day headcount and 45th-day full-time equivalent (FTE) enrollment data is provided for each university and their campuses.
Within higher education, enrollment is generally expressed in student headcount or FTE terms. Student headcount is reported for the purposes of determining educational scale and measurement against metric goals. Headcount is defined as the number of full- or part-time individual students registered at a university for at least one credit hour on the 21st day of instruction. Student headcount is considered a broad measure of a university’s educational reach, reflecting the number of individuals the university is educating at one time.
Student FTE has historically been used for calculating state funding and to determine how university revenues are budgeted among colleges, schools, departments and programs. FTE is generally defined as a measurement of credit hours equal to one full-time student enrolled for one academic year. Arizona’s student FTE enrollment is computed according to A.R.S. §15-1661 and board policy and guidelines.
The enrollment analysis within this report uses student headcount numbers unless specifically identified as using an FTE calculation. Student enrollment is counted across all education delivery modalities, including online and extended campuses. The report further disaggregates the data into undergraduate, graduate and total enrollment. Data is presented by demographics, full-time and part-time student enrollment semester credit hours, and residency status.
A B O U T T H E A R I Z O N A B O A R D O F R E G E N T SThe Arizona Board of Regents is committed to ensuring access for qualified residents of Arizona to undergraduate and graduate institutions; promoting the discovery, application, and dissemination of new knowledge; extending the benefits of university activities to Arizona’s citizens outside the university; and maximizing the benefits derived from the state’s investment in education.
M E M B E R SLarry Penley, ChairLyndel Manson, Chair ElectKarrin Taylor Robson, SecretaryRon Shoopman, TreasurerBill RidenourFred DuValKathryn Hackett KingCecilia MataAnthony Rusk, Student RegentNikhil Dave, Student RegentGov. Doug Ducey, Ex-OfficioSuperintendent Kathy Hoffman, Ex-Officio
A B O U T T H I S R E P O R T
A B O R E X E C U T I V E D I R E C T O RJohn Arnold
TA B L E O F C O N T E N T S4
6
7
9
10
28
46
Executive Summary
Key Takeaways
Arizona Public Universities Enterprise Enrollment Trends
Arizona Public Universities Total Enrollment
Arizona State University
Northern Arizona University
University of Arizona
4 | FALL ENROLLMENT REPORT
Postsecondary enrollment is an integral component of advancing the state’s goal to increase educational attainment and is a key focus for the board and universities as the state transitions to an economy where the majority of job skills demand education past high school, and most jobs that pay well require a four-year college degree.1 Reporting enrollment is a necessary step in ensuring that Arizona’s public universities are meeting their mission to provide access and produce the number of degrees required to support and improve Arizona’s economy.
In fall 2020 – which falls within fiscal year 2021 – enrollment at Arizona’s public universities increased with notable growth in the number of students taking online programs. In contrast, on campus traditional immersion student enrollment has slowed. There are several reasons for the slower on-campus enrollment growth, including Arizona’s demographic shift and the global COVID-19 pandemic.
COVID-19 Pandemic Impacted Arizona Public Universities’ Enrollment and Student MixIn the shadow of the COVID-19 pandemic, Arizona’s public universities’ total enrollment increased at a slower rate than in previous years. The impact of COVID-19 on Arizona’s public universities enrollment was, however, less severe than at many other institutions.2 During fall 2020, total student enrollment at Arizona’s public universities was 204,460, a 4.5 percent increase over fall 2019. Much of that increase was due to substantial increases in online enrollment.
The pandemic impacted the universities’ student enrollment mix – the number of international, out-of-state and in-state students that enrolled. The universities saw increases in their online programs but slower enrollment in out-of-state and international immersion student – traditional students taking in-person classes.
Arizona’s Demographic Changes Pose Challenges to Future Enrollment Increases In addition to the immediate enrollment shifts resulting from the current pandemic, future undergraduate enrollment increases may become progressively more difficult as a result of declining Arizona birth rates during the Great Recession. Total K-12 enrollment is projected to be flat for the next few years and then begin to decline. Depending on net migration, the decline is expected to occur no later than 2025.3 Without increases in the percentage of Arizona high school graduates that choose to enroll in a four-year degree program, demographic reductions may impact Arizona’s long-term educational attainment levels.
Declining enrollment impacts the universities’ financial models. As state support per student has been reduced, Arizona’s public universities funded a greater percentage of their
E X E C U T I V E S U M M A RY
1 Georgetown University Center on Education and the Workforce, Good Jobs are Back found at https://cew.georgetown.edu/cew-reports/goodjobsareback/#resources.2 See McKinsey Report – COVID-19 and U.S. higher education enrollment: Preparing leaders for fall, May 2020 found at https://www.mckinsey.com/industries/public-and-social-sector/our-insights/covid-19-and-us-higher-education-enrollment-preparing-leaders-for-fall#.3 See Western Interstate Commission For Higher Education Report Knocking on the College Door dashboard found at https://knocking.wiche.edu/state-profiles and 2017 Report at https://www.wiche.edu/wp-content/uploads/2018/10/2017JulyDataInsightsKnocking-WesternFINAL.pdf
FALL ENROLLMENT REPORT | 5
operations through tuition and other entrepreneurial sources of revenue. Arizona’s divestment in public higher education has resulted in the board and universities focusing on the number of students enrolled at each institution as well as the mix of resident, non-resident and international students to ensure the universities remain financially strong. The slowing enrollment and the change in enrollment mix places greater financial pressure on the universities.
Total Enrollment Continues to Climb Due to Online EnrollmentOnline degree program students now comprise 32.5 percent of the system’s total enrollment. At Arizona State University, which has the largest online enrollment, approximately one in two students is enrolled in an online program. This does not include the number of traditional immersion students that are taking asynchronous or synchronous courses due to the pandemic. Similarly, approximately one in two of Northern Arizona University graduate students is completing an online program.
Online education at the University of Arizona is anticipated to continue to expand in 2021 and beyond with the university’s affiliation with the University of Arizona Global Campus, an independent nonprofit corporation that will operate as a separate institution accredited by the WASC Senior College and University Commission. University of Arizona Global Campus is projected to enroll 35,000 students next year. These online enrollment increases may be accelerating due to the global pandemic, but Arizona’s public university system has seen significant growth in online programs for years, largely fueled by ASU online.
Since fiscal year 2017, online degree program enrollment within Arizona’s public universities increased by 98.7 percent. In contrast, the system’s traditional on-campus enrollment growth has slowed. There are 116,162 traditional immersion undergraduates enrolled on-campus – a 2.0 percent year-over-year decrease. On-campus graduate degrees also saw a 3.8 percent decrease from fiscal year 2020.
Enrollment of Historically Underrepresented Populations Continues to IncreaseEnrollment of historically underrepresented populations – Blacks, Hispanics and Native Americans – has increased by 8.9. percent from fall 2019, continuing a trend of continuous enrollment growth. In fiscal year 2021, 7,923 Black undergraduate students were enrolled in Arizona’s public universities. Arizona’s public universities also enrolled 41,904 Hispanic undergraduate students and 2,280 Native American undergraduates.
Due to the continued increase in enrollment of Hispanic undergraduate students, UArizona is currently designated a Hispanic-Serving Institutions (HSI) by the U.S Department of Education. NAU’s Yuma location is also currently designated an HSI and NAU’s Flagstaff campus is on track to receive this status in the next round of HSI designations. The designation is awarded to institutions with undergraduate FTE enrollment that is made up of at least 25 percent Hispanic students.
6 | FALL ENROLLMENT REPORT
K E Y TA K E A W AY S
• In fall 2020, 204,460 students enrolled in Arizona’s public universities. This is the largest enrollment in Arizona’s public universities history, but the current pandemic and future demographic trends pose challenges to continued efforts to increase enrollment and educational attainment.
• Fiscal year 2021 enrollment increased 4.5 percent year-over-year. Much of the enrollment increase was in online programs.
• All three of the universities have seen online student enrollment growth, but the growth has been especially significant at ASU, which now enrolls 53,993 online students. The universities’ 66,421 online students comprise 32.5 percent of enrollment.
• Arizona public universities first-time student enrollment declined year-over-year. First-time student enrollment decreased 3.6 percent year-over-year from 28,821 in fiscal year 2020 to 27,785 in fiscal year 2021.
• On-campus undergraduate enrollment is down at all three institutions. On-campus enrollment decreased 2.0 percent year-over-year from 118,561 in fiscal year 2020 to 116,162 in fiscal year 2021.
• Arizona’s public universities saw a 1.6 percent increase in Arizona resident enrollment.
• Arizona’s public universities currently enroll 98,266 non-resident and international students, a 7.8 percent increase from fiscal year 2020.
• Enrollment of Black, Hispanic and Native American students continues to increase. Students from historically underrepresented populations currently comprise 30 percent of enrollment at the universities – an 8.8 percent increase from fall 2019 and 33.9 percent increase from fiscal year 2017. UArizona is already designated a Hispanic-Serving Institutions and NAU’s Flagstaff campus is on track to achieve HSI status in the next designation.
• The undergraduate degree program with the largest enrollment at ASU is business with 8,855 students currently enrolled, biomedical sciences at NAU with 1,146 students and psychology at UArizona with 1,822 students.
• The master’s degree program with the largest enrollment at ASU is special education with 2,426 students currently enrolled, organizational leadership at NAU with 244 students and business administration at UArizona with 506 students.
• Arizona’s public universities have approximately 4,495 students enrolled in degree programs at statewide learning centers.
FALL ENROLLMENT REPORT | 7
A R I Z O N A P U B L I C U N I V E R S I T Y E N T E R P R I S E E N R O L L M E N T T R E N D S
Arizona’s public universities enrolled 204,460 students in fall 2020. This is a 4.5 percent year-over-year increase from fall 2019.
Since fiscal year 2017, undergraduate enrollment grew 17.5 percent from 140,014 to 164,543. Graduate enrollment also increased during that time - 24.3 percent from 32,118 to 39,917.
This fall, the majority of undergraduate students enrolled in Arizona’s public universities were Arizona residents. These 90,238 resident students were joined by 74,305 non-resident students of which 6,503 were international students.
Arizona State University ASU enrolled 103,609 undergraduate students, a 7.1 percent increase of 6,883 students from fiscal year 2020. Arizona residents comprised 49.6 percent of ASU’s undergraduate students in fiscal year 2021. Of the 52,184 non-resident students enrolled, 4,337 or 8.3 percent are international students.
ASU enrolls 39.1 percent of its students in online degree programs – 18.1 of which are Arizona residents. ASU’s undergraduate online degree program enrollment was 40,485 in fall 2020, which is a 21.2 percent increase from fiscal year 2020. ASU online degree programs enrollment is comprised of three-quarters undergraduate and one-quarter graduate students with 40,485 online undergraduates and 13,508 online graduate students.
In fiscal year 2021, ASU enrolled 491 students in statewide learning centers throughout Arizona, including locations in Gila Valley, Lake Havasu and Yuma.
ASU’s undergraduate students are 54.4 percent female, and 30.9 percent are from historically underrepresented student populations – Black, Hispanic or Native American, which is a 10.3 percent enrollment increase from fiscal year 2020 and a 48.8 percentage increase over fiscal year 2017.
ASU’s graduate enrollment for this fall semester is 25,179, surpassing last year’s graduate enrollment by 1,954 students or 8.4 percent.ASU’s FTE enrollment is calculated at 117,492 – 91.2 percent of headcount enrollment.
Northern Arizona UniversityNAU enrolled 25,228 undergraduate students, a 4.8 percent enrollment loss (1,283 students) from fiscal year 2020. Arizona residents comprised 65.5 percent of NAU’s undergraduate students in fiscal year 2021. Of the 8,712 non-resident students enrolled, 493 or 5.7 percent are international students.
NAU enrolls 20.1 percent of its students in an online degree programs – 60.1 percent of which are Arizona residents. NAU’s online and degree programs enrollment without
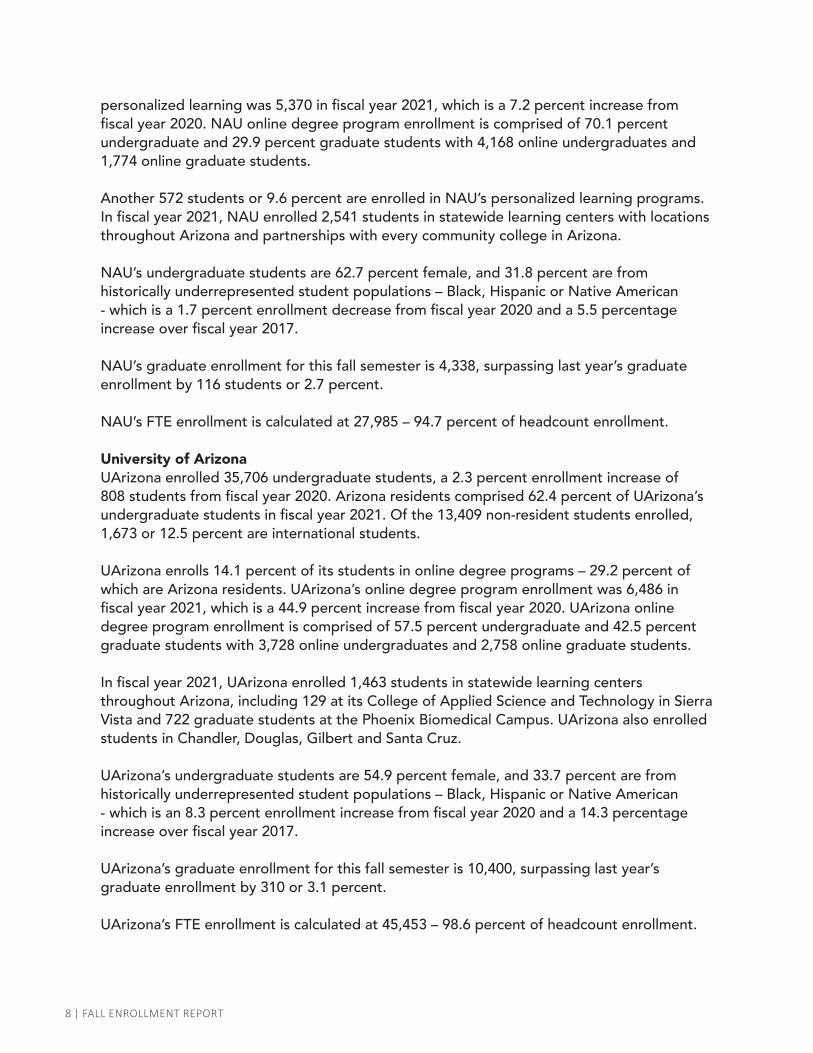
8 | FALL ENROLLMENT REPORT
personalized learning was 5,370 in fiscal year 2021, which is a 7.2 percent increase from fiscal year 2020. NAU online degree program enrollment is comprised of 70.1 percent undergraduate and 29.9 percent graduate students with 4,168 online undergraduates and 1,774 online graduate students.
Another 572 students or 9.6 percent are enrolled in NAU’s personalized learning programs.In fiscal year 2021, NAU enrolled 2,541 students in statewide learning centers with locations throughout Arizona and partnerships with every community college in Arizona.
NAU’s undergraduate students are 62.7 percent female, and 31.8 percent are from historically underrepresented student populations – Black, Hispanic or Native American - which is a 1.7 percent enrollment decrease from fiscal year 2020 and a 5.5 percentage increase over fiscal year 2017.
NAU’s graduate enrollment for this fall semester is 4,338, surpassing last year’s graduate enrollment by 116 students or 2.7 percent.
NAU’s FTE enrollment is calculated at 27,985 – 94.7 percent of headcount enrollment.
University of ArizonaUArizona enrolled 35,706 undergraduate students, a 2.3 percent enrollment increase of 808 students from fiscal year 2020. Arizona residents comprised 62.4 percent of UArizona’s undergraduate students in fiscal year 2021. Of the 13,409 non-resident students enrolled, 1,673 or 12.5 percent are international students.
UArizona enrolls 14.1 percent of its students in online degree programs – 29.2 percent of which are Arizona residents. UArizona’s online degree program enrollment was 6,486 in fiscal year 2021, which is a 44.9 percent increase from fiscal year 2020. UArizona online degree program enrollment is comprised of 57.5 percent undergraduate and 42.5 percent graduate students with 3,728 online undergraduates and 2,758 online graduate students. In fiscal year 2021, UArizona enrolled 1,463 students in statewide learning centers throughout Arizona, including 129 at its College of Applied Science and Technology in Sierra Vista and 722 graduate students at the Phoenix Biomedical Campus. UArizona also enrolled students in Chandler, Douglas, Gilbert and Santa Cruz.
UArizona’s undergraduate students are 54.9 percent female, and 33.7 percent are from historically underrepresented student populations – Black, Hispanic or Native American - which is an 8.3 percent enrollment increase from fiscal year 2020 and a 14.3 percentage increase over fiscal year 2017.
UArizona’s graduate enrollment for this fall semester is 10,400, surpassing last year’s graduate enrollment by 310 or 3.1 percent.
UArizona’s FTE enrollment is calculated at 45,453 – 98.6 percent of headcount enrollment.
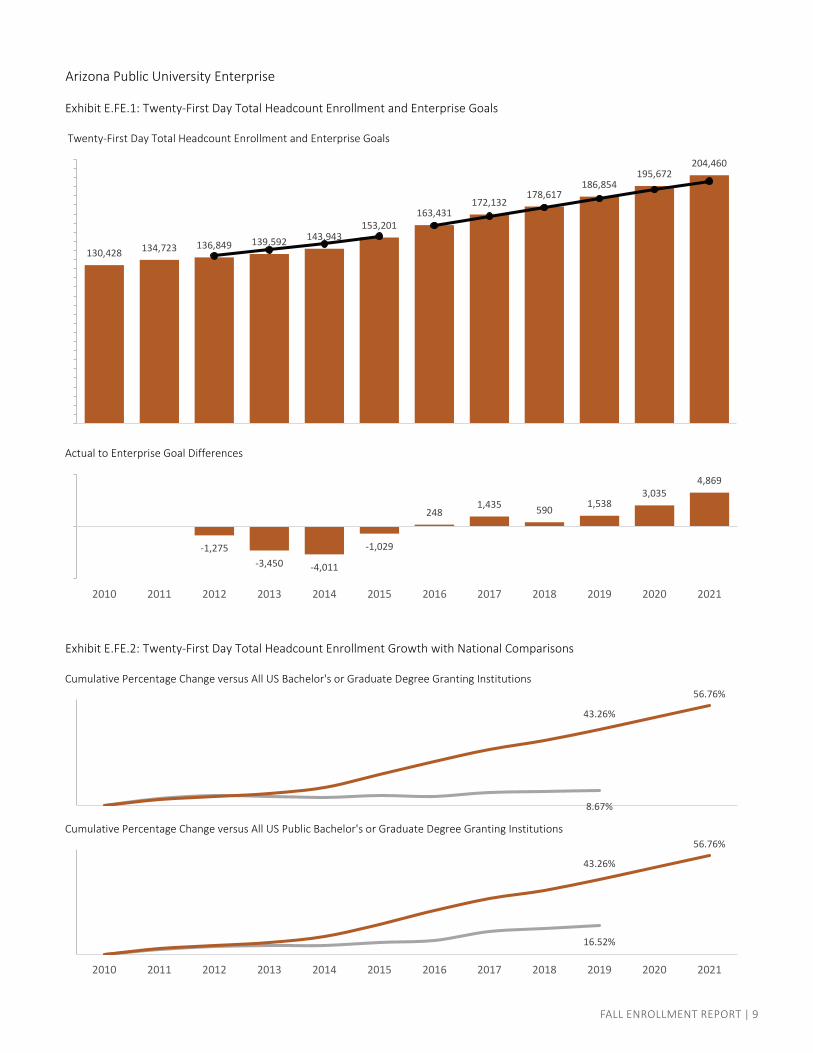
FALL ENROLLMENT REPORT | 9
Arizona Public University Enterprise
Exhibit E.FE.1: Twenty-First Day Total Headcount Enrollment and Enterprise Goals
Twenty-First Day Total Headcount Enrollment and Enterprise Goals
Actual to Enterprise Goal Differences
Exhibit E.FE.2: Twenty-First Day Total Headcount Enrollment Growth with National Comparisons
Cumulative Percentage Change versus All US Bachelor's or Graduate Degree Granting Institutions
Cumulative Percentage Change versus All US Public Bachelor's or Graduate Degree Granting Institutions
-1,275-3,450 -4,011
-1,029
2481,435 590 1,538
3,0354,869
2010 2011 2012 2013 2014 2015 2016 2017 2018 2019 2020 2021
130,428 134,723 136,849 139,592 143,943153,201
163,431172,132
178,617186,854
195,672204,460
8.67%
43.26%
56.76%
16.52%
43.26%
56.76%
2010 2011 2012 2013 2014 2015 2016 2017 2018 2019 2020 2021
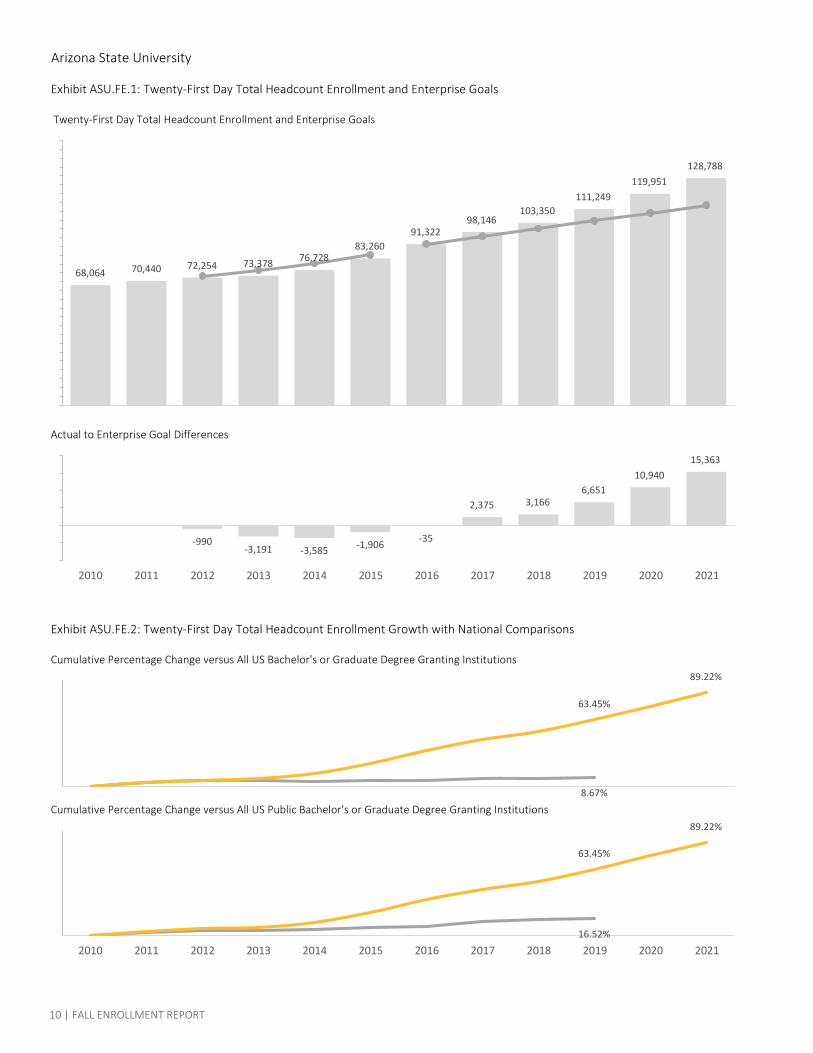
Arizona State University
Exhibit ASU.FE.1: Twenty-First Day Total Headcount Enrollment and Enterprise Goals
Twenty-First Day Total Headcount Enrollment and Enterprise Goals
Actual to Enterprise Goal Differences
Exhibit ASU.FE.2: Twenty-First Day Total Headcount Enrollment Growth with National Comparisons
Cumulative Percentage Change versus All US Bachelor's or Graduate Degree Granting Institutions
Cumulative Percentage Change versus All US Public Bachelor's or Graduate Degree Granting Institutions
-990-3,191 -3,585 -1,906 -35
2,375 3,1666,651
10,94015,363
2010 2011 2012 2013 2014 2015 2016 2017 2018 2019 2020 2021
68,064 70,440 72,254 73,378 76,72883,260
91,32298,146
103,350111,249
119,951128,788
8.67%
63.45%
89.22%
16.52%
63.45%
89.22%
2010 2011 2012 2013 2014 2015 2016 2017 2018 2019 2020 2021
10 | FALL ENROLLMENT REPORT
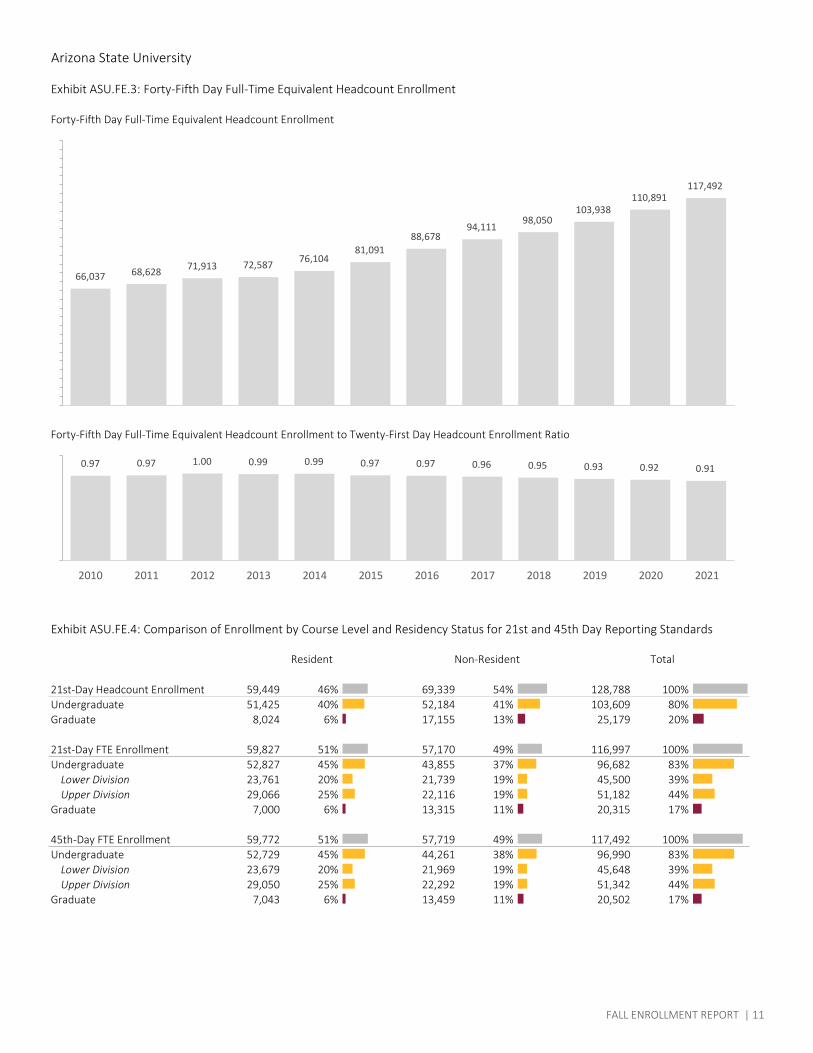
Arizona State University
Exhibit ASU.FE.3: Forty-Fifth Day Full-Time Equivalent Headcount Enrollment
Forty-Fifth Day Full-Time Equivalent Headcount Enrollment
Forty-Fifth Day Full-Time Equivalent Headcount Enrollment to Twenty-First Day Headcount Enrollment Ratio
Exhibit ASU.FE.4: Comparison of Enrollment by Course Level and Residency Status for 21st and 45th Day Reporting Standards
21st-Day Headcount Enrollment 59,449 46% 69,339 54% 128,788 100%Undergraduate 51,425 40% 52,184 41% 103,609 80%Graduate 8,024 6% 17,155 13% 25,179 20%
21st-Day FTE Enrollment 59,827 51% 57,170 49% 116,997 100%Undergraduate 52,827 45% 43,855 37% 96,682 83%
Lower Division 23,761 20% 21,739 19% 45,500 39%Upper Division 29,066 25% 22,116 19% 51,182 44%
Graduate 7,000 6% 13,315 11% 20,315 17%
45th-Day FTE Enrollment 59,772 51% 57,719 49% 117,492 100%Undergraduate 52,729 45% 44,261 38% 96,990 83%
Lower Division 23,679 20% 21,969 19% 45,648 39%Upper Division 29,050 25% 22,292 19% 51,342 44%
Graduate 7,043 6% 13,459 11% 20,502 17%
Resident Non-Resident Total
0.97 0.97 1.00 0.99 0.99 0.97 0.97 0.96 0.95 0.93 0.92 0.91
2010 2011 2012 2013 2014 2015 2016 2017 2018 2019 2020 2021
66,037 68,628 71,913 72,587 76,10481,091
88,67894,111
98,050103,938
110,891117,492
FALL ENROLLMENT REPORT | 11
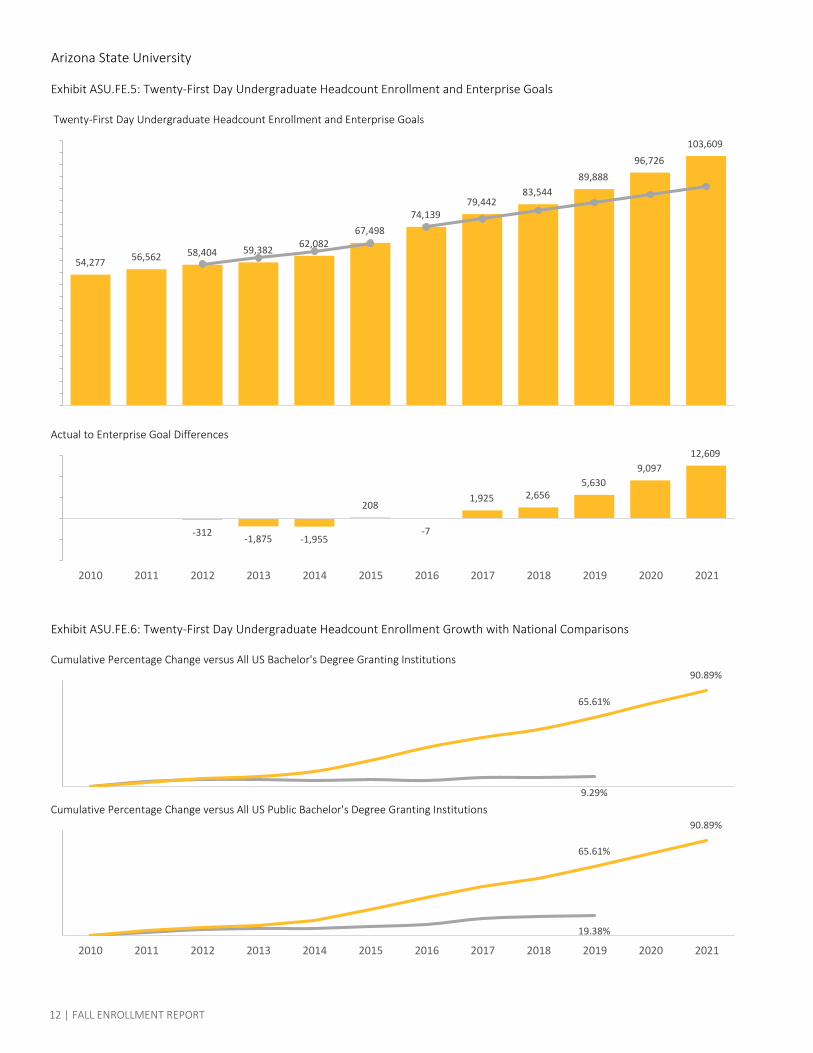
Arizona State University
Exhibit ASU.FE.5: Twenty-First Day Undergraduate Headcount Enrollment and Enterprise Goals
Twenty-First Day Undergraduate Headcount Enrollment and Enterprise Goals
Actual to Enterprise Goal Differences
Exhibit ASU.FE.6: Twenty-First Day Undergraduate Headcount Enrollment Growth with National Comparisons
Cumulative Percentage Change versus All US Bachelor's Degree Granting Institutions
Cumulative Percentage Change versus All US Public Bachelor's Degree Granting Institutions
-312-1,875 -1,955
208
-7
1,925 2,6565,630
9,09712,609
2010 2011 2012 2013 2014 2015 2016 2017 2018 2019 2020 2021
54,277 56,562 58,404 59,382 62,08267,498
74,13979,442
83,54489,888
96,726
103,609
9.29%
65.61%
90.89%
19.38%
65.61%
90.89%
2010 2011 2012 2013 2014 2015 2016 2017 2018 2019 2020 2021
12 | FALL ENROLLMENT REPORT
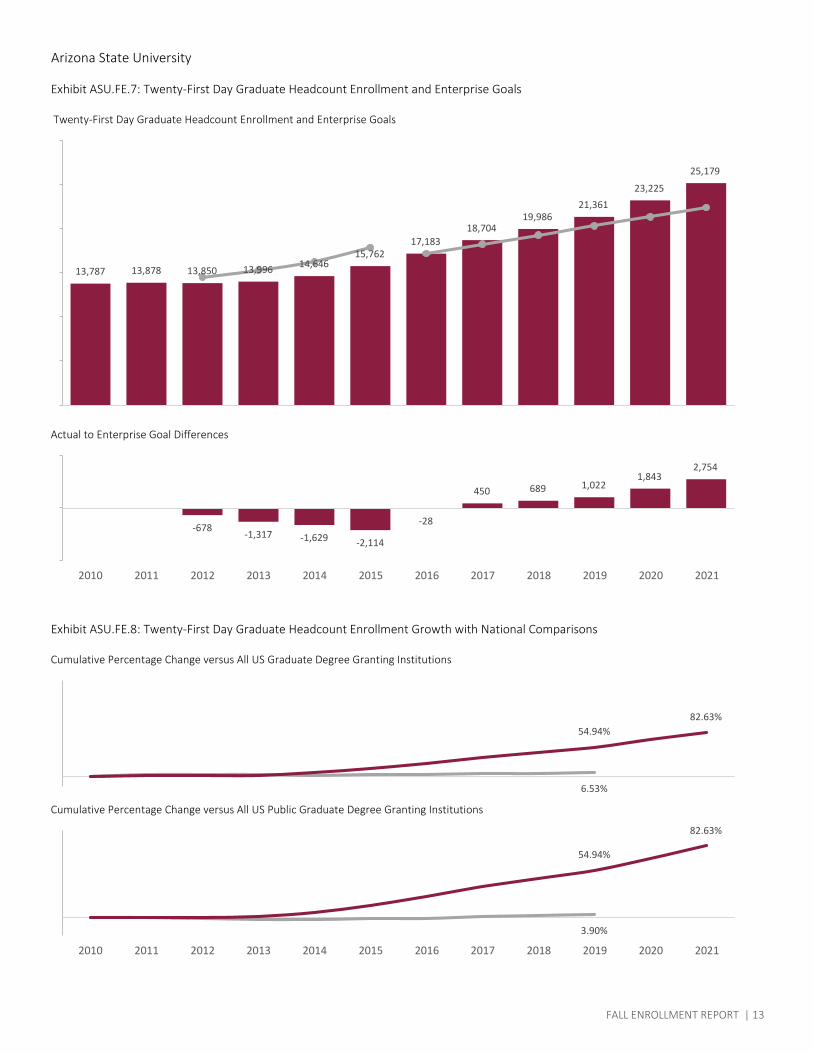
Arizona State University
Exhibit ASU.FE.7: Twenty-First Day Graduate Headcount Enrollment and Enterprise Goals
Twenty-First Day Graduate Headcount Enrollment and Enterprise Goals
Actual to Enterprise Goal Differences
Exhibit ASU.FE.8: Twenty-First Day Graduate Headcount Enrollment Growth with National Comparisons
Cumulative Percentage Change versus All US Graduate Degree Granting Institutions
Cumulative Percentage Change versus All US Public Graduate Degree Granting Institutions
-678-1,317 -1,629 -2,114
-28
450 689 1,0221,843
2,754
2010 2011 2012 2013 2014 2015 2016 2017 2018 2019 2020 2021
13,787 13,878 13,850 13,996 14,64615,762
17,18318,704
19,98621,361
23,225
25,179
6.53%
54.94%82.63%
3.90%
54.94%
82.63%
2010 2011 2012 2013 2014 2015 2016 2017 2018 2019 2020 2021
FALL ENROLLMENT REPORT | 13
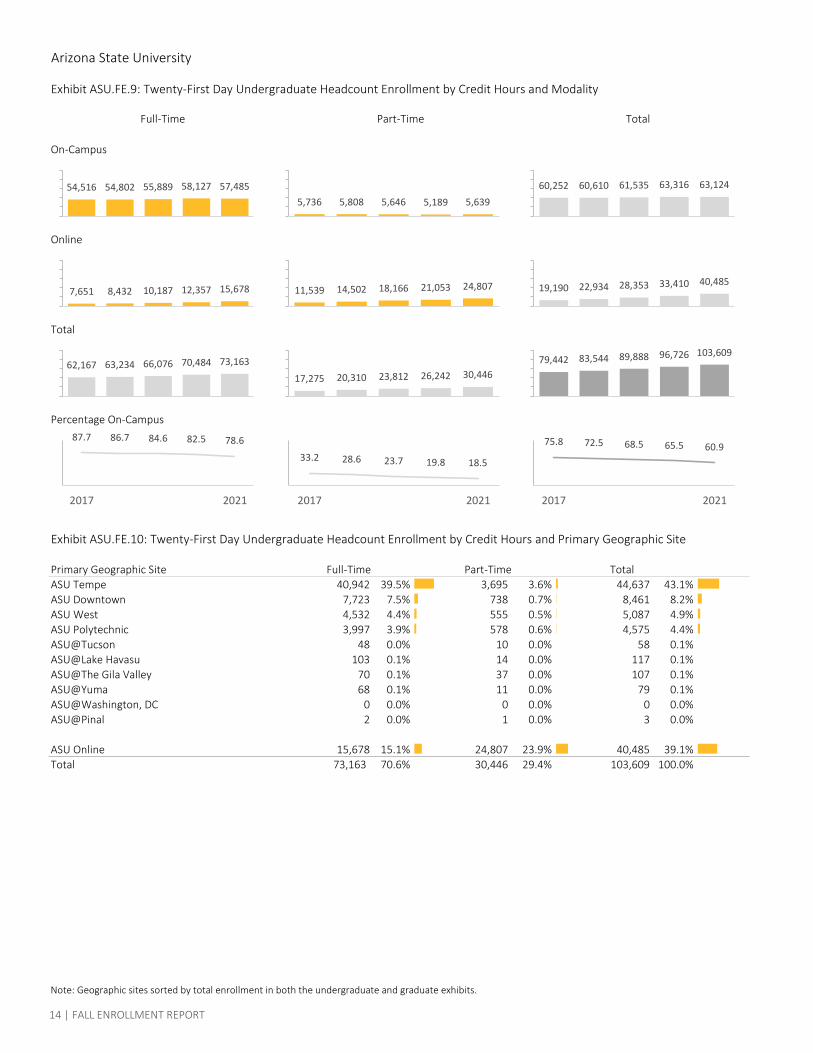
Arizona State University
Exhibit ASU.FE.9: Twenty-First Day Undergraduate Headcount Enrollment by Credit Hours and Modality
On-Campus
Online
Total
Percentage On-Campus
Exhibit ASU.FE.10: Twenty-First Day Undergraduate Headcount Enrollment by Credit Hours and Primary Geographic Site
Primary Geographic Site Full-Time Part-Time TotalASU Tempe 40,942 39.5% 3,695 3.6% 44,637 43.1%ASU Downtown 7,723 7.5% 738 0.7% 8,461 8.2%ASU West 4,532 4.4% 555 0.5% 5,087 4.9%ASU Polytechnic 3,997 3.9% 578 0.6% 4,575 4.4%ASU@Tucson 48 0.0% 10 0.0% 58 0.1%ASU@Lake Havasu 103 0.1% 14 0.0% 117 0.1%ASU@The Gila Valley 70 0.1% 37 0.0% 107 0.1%ASU@Yuma 68 0.1% 11 0.0% 79 0.1%ASU@Washington, DC 0 0.0% 0 0.0% 0 0.0%ASU@Pinal 2 0.0% 1 0.0% 3 0.0%
ASU Online 15,678 15.1% 24,807 23.9% 40,485 39.1%Total 73,163 70.6% 30,446 29.4% 103,609 100.0%
Note: Geographic sites sorted by total enrollment in both the undergraduate and graduate exhibits.
54,516 54,802 55,889 58,127 57,4855,736 5,808 5,646 5,189 5,639
60,252 60,610 61,535 63,316 63,124
7,651 8,432 10,187 12,357 15,678 11,539 14,502 18,166 21,053 24,807 19,190 22,934 28,353 33,410 40,485
62,167 63,234 66,076 70,484 73,163
17,275 20,310 23,812 26,242 30,44679,442 83,544 89,888 96,726 103,609
87.7 86.7 84.6 82.5 78.6
2017 2021
33.2 28.6 23.7 19.8 18.5
2017 2021
75.8 72.5 68.5 65.5 60.9
2017 2021
Full-Time Part-Time Total
14 | FALL ENROLLMENT REPORT
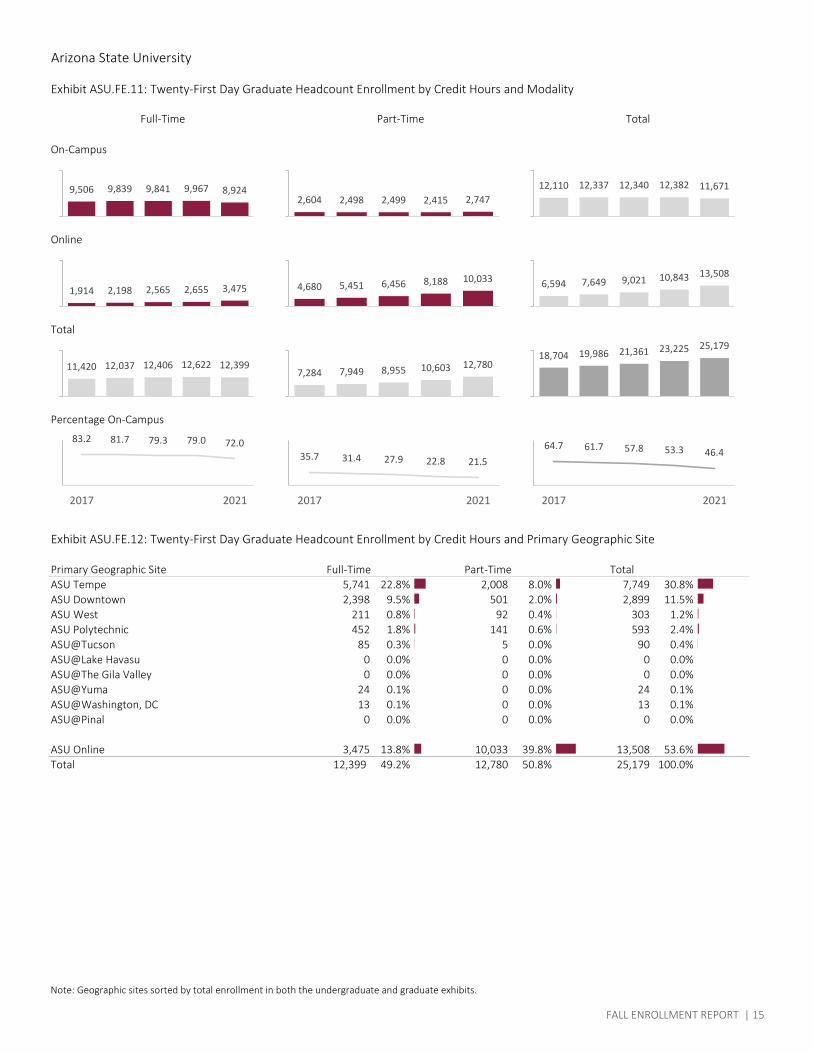
Arizona State University
Exhibit ASU.FE.11: Twenty-First Day Graduate Headcount Enrollment by Credit Hours and Modality
On-Campus
Online
Total
Percentage On-Campus
Exhibit ASU.FE.12: Twenty-First Day Graduate Headcount Enrollment by Credit Hours and Primary Geographic Site
Primary Geographic Site Full-Time Part-Time TotalASU Tempe 5,741 22.8% 2,008 8.0% 7,749 30.8%ASU Downtown 2,398 9.5% 501 2.0% 2,899 11.5%ASU West 211 0.8% 92 0.4% 303 1.2%ASU Polytechnic 452 1.8% 141 0.6% 593 2.4%ASU@Tucson 85 0.3% 5 0.0% 90 0.4%ASU@Lake Havasu 0 0.0% 0 0.0% 0 0.0%ASU@The Gila Valley 0 0.0% 0 0.0% 0 0.0%ASU@Yuma 24 0.1% 0 0.0% 24 0.1%ASU@Washington, DC 13 0.1% 0 0.0% 13 0.1%ASU@Pinal 0 0.0% 0 0.0% 0 0.0%
ASU Online 3,475 13.8% 10,033 39.8% 13,508 53.6%Total 12,399 49.2% 12,780 50.8% 25,179 100.0%
Note: Geographic sites sorted by total enrollment in both the undergraduate and graduate exhibits.
9,506 9,839 9,841 9,967 8,9242,604 2,498 2,499 2,415 2,747
12,110 12,337 12,340 12,382 11,671
1,914 2,198 2,565 2,655 3,475 4,680 5,451 6,456 8,188 10,033 6,594 7,649 9,021 10,843 13,508
11,420 12,037 12,406 12,622 12,3997,284 7,949 8,955 10,603 12,780
18,704 19,986 21,361 23,225 25,179
83.2 81.7 79.3 79.0 72.0
2017 2021
35.7 31.4 27.9 22.8 21.5
2017 2021
64.7 61.7 57.8 53.3 46.4
2017 2021
Full-Time Part-Time Total
FALL ENROLLMENT REPORT | 15
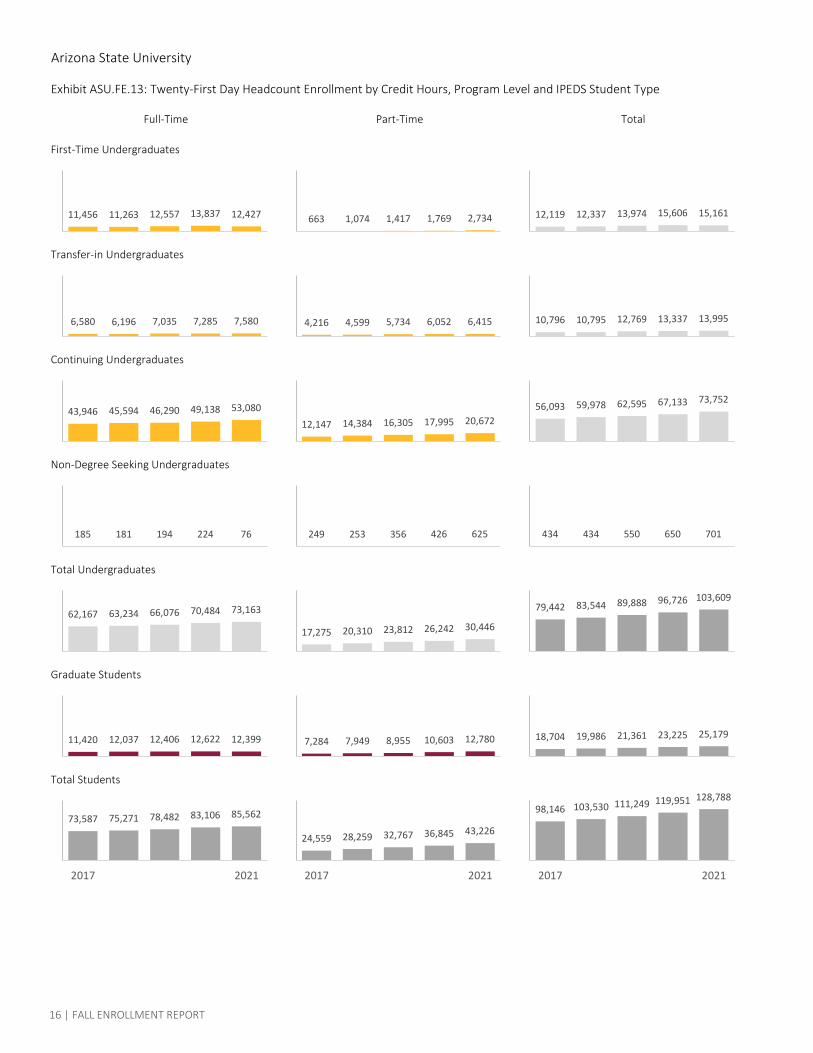
Arizona State University
Exhibit ASU.FE.13: Twenty-First Day Headcount Enrollment by Credit Hours, Program Level and IPEDS Student Type
First-Time Undergraduates
Transfer-in Undergraduates
Continuing Undergraduates
Non-Degree Seeking Undergraduates
Total Undergraduates
Graduate Students
Total Students
Full-Time Part-Time Total
62,167 63,234 66,076 70,484 73,163
17,275 20,310 23,812 26,242 30,446
79,442 83,544 89,888 96,726 103,609
73,587 75,271 78,482 83,106 85,562
2017 2021
11,456 11,263 12,557 13,837 12,427 663 1,074 1,417 1,769 2,734 12,119 12,337 13,974 15,606 15,161
6,580 6,196 7,035 7,285 7,580 4,216 4,599 5,734 6,052 6,415 10,796 10,795 12,769 13,337 13,995
43,946 45,594 46,290 49,138 53,080
12,147 14,384 16,305 17,995 20,67256,093 59,978 62,595 67,133 73,752
185 181 194 224 76 249 253 356 426 625 434 434 550 650 701
11,420 12,037 12,406 12,622 12,399 7,284 7,949 8,955 10,603 12,780 18,704 19,986 21,361 23,225 25,179
24,559 28,259 32,767 36,845 43,226
2017 2021
98,146 103,530 111,249 119,951 128,788
2017 2021
16 | FALL ENROLLMENT REPORT
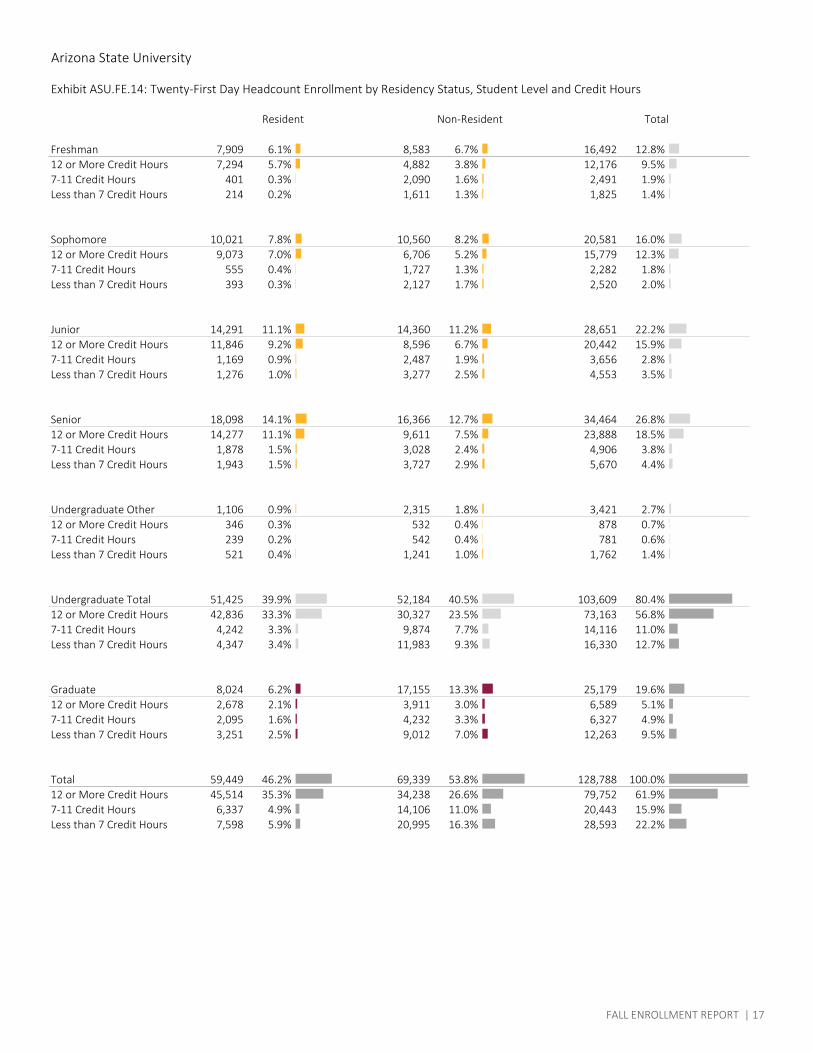
Arizona State University
Exhibit ASU.FE.14: Twenty-First Day Headcount Enrollment by Residency Status, Student Level and Credit Hours
Freshman 7,909 6.1% 8,583 6.7% 16,492 12.8%12 or More Credit Hours 7,294 5.7% 4,882 3.8% 12,176 9.5%7-11 Credit Hours 401 0.3% 2,090 1.6% 2,491 1.9%Less than 7 Credit Hours 214 0.2% 1,611 1.3% 1,825 1.4%
Sophomore 10,021 7.8% 10,560 8.2% 20,581 16.0%12 or More Credit Hours 9,073 7.0% 6,706 5.2% 15,779 12.3%7-11 Credit Hours 555 0.4% 1,727 1.3% 2,282 1.8%Less than 7 Credit Hours 393 0.3% 2,127 1.7% 2,520 2.0%
Junior 14,291 11.1% 14,360 11.2% 28,651 22.2%12 or More Credit Hours 11,846 9.2% 8,596 6.7% 20,442 15.9%7-11 Credit Hours 1,169 0.9% 2,487 1.9% 3,656 2.8%Less than 7 Credit Hours 1,276 1.0% 3,277 2.5% 4,553 3.5%
Senior 18,098 14.1% 16,366 12.7% 34,464 26.8%12 or More Credit Hours 14,277 11.1% 9,611 7.5% 23,888 18.5%7-11 Credit Hours 1,878 1.5% 3,028 2.4% 4,906 3.8%Less than 7 Credit Hours 1,943 1.5% 3,727 2.9% 5,670 4.4%
Undergraduate Other 1,106 0.9% 2,315 1.8% 3,421 2.7%12 or More Credit Hours 346 0.3% 532 0.4% 878 0.7%7-11 Credit Hours 239 0.2% 542 0.4% 781 0.6%Less than 7 Credit Hours 521 0.4% 1,241 1.0% 1,762 1.4%
Undergraduate Total 51,425 39.9% 52,184 40.5% 103,609 80.4%12 or More Credit Hours 42,836 33.3% 30,327 23.5% 73,163 56.8%7-11 Credit Hours 4,242 3.3% 9,874 7.7% 14,116 11.0%Less than 7 Credit Hours 4,347 3.4% 11,983 9.3% 16,330 12.7%
Graduate 8,024 6.2% 17,155 13.3% 25,179 19.6%12 or More Credit Hours 2,678 2.1% 3,911 3.0% 6,589 5.1%7-11 Credit Hours 2,095 1.6% 4,232 3.3% 6,327 4.9%Less than 7 Credit Hours 3,251 2.5% 9,012 7.0% 12,263 9.5%
Total 59,449 46.2% 69,339 53.8% 128,788 100.0%12 or More Credit Hours 45,514 35.3% 34,238 26.6% 79,752 61.9%7-11 Credit Hours 6,337 4.9% 14,106 11.0% 20,443 15.9%Less than 7 Credit Hours 7,598 5.9% 20,995 16.3% 28,593 22.2%
Resident Non-Resident Total
FALL ENROLLMENT REPORT | 17
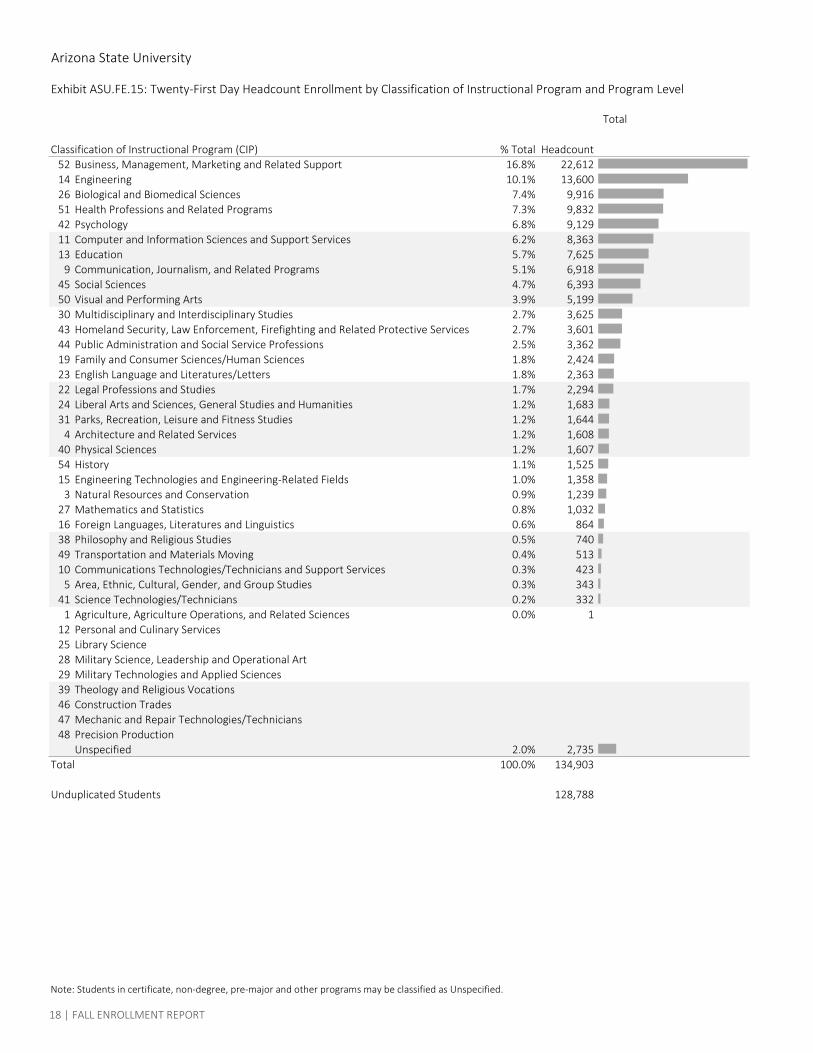
Arizona State University
Exhibit ASU.FE.15: Twenty-First Day Headcount Enrollment by Classification of Instructional Program and Program Level
Classification of Instructional Program (CIP) % Total Headcount52 Business, Management, Marketing and Related Support 16.8% 22,61214 Engineering 10.1% 13,60026 Biological and Biomedical Sciences 7.4% 9,91651 Health Professions and Related Programs 7.3% 9,83242 Psychology 6.8% 9,12911 Computer and Information Sciences and Support Services 6.2% 8,36313 Education 5.7% 7,625
9 Communication, Journalism, and Related Programs 5.1% 6,91845 Social Sciences 4.7% 6,39350 Visual and Performing Arts 3.9% 5,19930 Multidisciplinary and Interdisciplinary Studies 2.7% 3,62543 Homeland Security, Law Enforcement, Firefighting and Related Protective Services 2.7% 3,60144 Public Administration and Social Service Professions 2.5% 3,36219 Family and Consumer Sciences/Human Sciences 1.8% 2,42423 English Language and Literatures/Letters 1.8% 2,36322 Legal Professions and Studies 1.7% 2,29424 Liberal Arts and Sciences, General Studies and Humanities 1.2% 1,68331 Parks, Recreation, Leisure and Fitness Studies 1.2% 1,644
4 Architecture and Related Services 1.2% 1,60840 Physical Sciences 1.2% 1,60754 History 1.1% 1,52515 Engineering Technologies and Engineering-Related Fields 1.0% 1,358
3 Natural Resources and Conservation 0.9% 1,23927 Mathematics and Statistics 0.8% 1,03216 Foreign Languages, Literatures and Linguistics 0.6% 86438 Philosophy and Religious Studies 0.5% 74049 Transportation and Materials Moving 0.4% 51310 Communications Technologies/Technicians and Support Services 0.3% 423
5 Area, Ethnic, Cultural, Gender, and Group Studies 0.3% 34341 Science Technologies/Technicians 0.2% 332
1 Agriculture, Agriculture Operations, and Related Sciences 0.0% 112 Personal and Culinary Services25 Library Science28 Military Science, Leadership and Operational Art29 Military Technologies and Applied Sciences39 Theology and Religious Vocations46 Construction Trades47 Mechanic and Repair Technologies/Technicians48 Precision Production
Unspecified 2.0% 2,735Total 100.0% 134,903
Unduplicated Students 128,788
Total
Note: Students in certificate, non-degree, pre-major and other programs may be classified as Unspecified.
18 | FALL ENROLLMENT REPORT
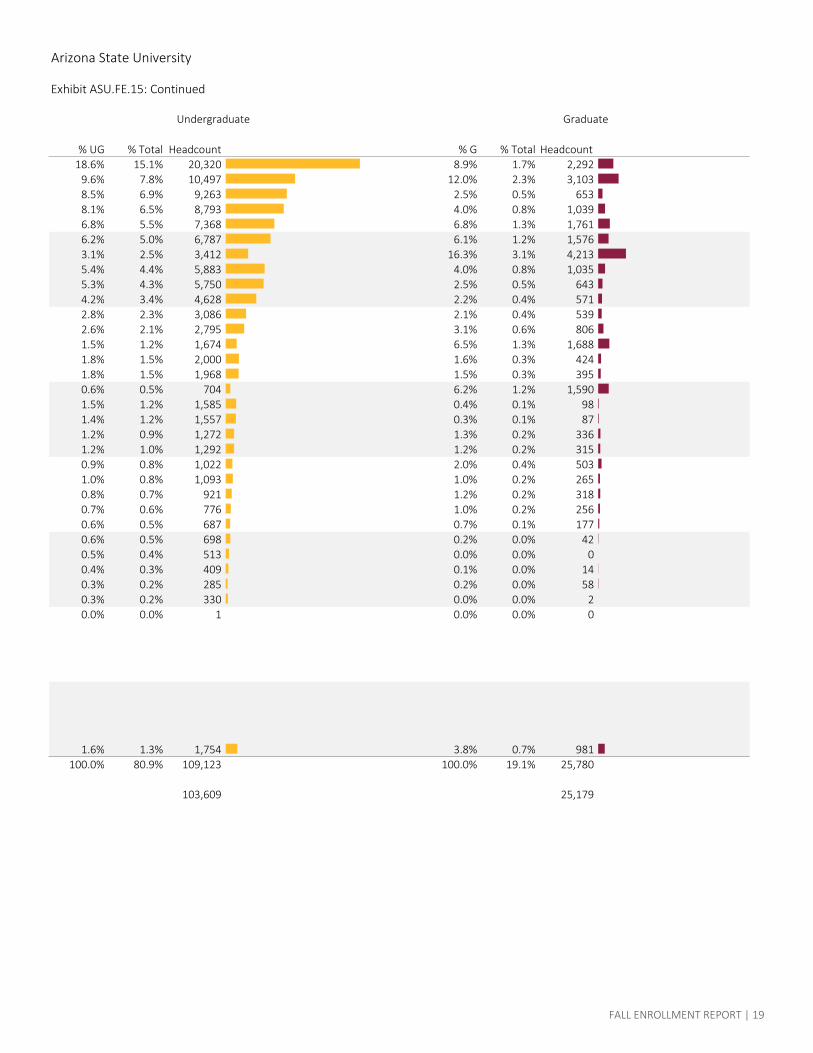
Arizona State University
Exhibit ASU.FE.15: Continued
% UG % Total Headcount % G % Total Headcount18.6% 15.1% 20,320 8.9% 1.7% 2,292
9.6% 7.8% 10,497 12.0% 2.3% 3,1038.5% 6.9% 9,263 2.5% 0.5% 6538.1% 6.5% 8,793 4.0% 0.8% 1,0396.8% 5.5% 7,368 6.8% 1.3% 1,7616.2% 5.0% 6,787 6.1% 1.2% 1,5763.1% 2.5% 3,412 16.3% 3.1% 4,2135.4% 4.4% 5,883 4.0% 0.8% 1,0355.3% 4.3% 5,750 2.5% 0.5% 6434.2% 3.4% 4,628 2.2% 0.4% 5712.8% 2.3% 3,086 2.1% 0.4% 5392.6% 2.1% 2,795 3.1% 0.6% 8061.5% 1.2% 1,674 6.5% 1.3% 1,6881.8% 1.5% 2,000 1.6% 0.3% 4241.8% 1.5% 1,968 1.5% 0.3% 3950.6% 0.5% 704 6.2% 1.2% 1,5901.5% 1.2% 1,585 0.4% 0.1% 981.4% 1.2% 1,557 0.3% 0.1% 871.2% 0.9% 1,272 1.3% 0.2% 3361.2% 1.0% 1,292 1.2% 0.2% 3150.9% 0.8% 1,022 2.0% 0.4% 5031.0% 0.8% 1,093 1.0% 0.2% 2650.8% 0.7% 921 1.2% 0.2% 3180.7% 0.6% 776 1.0% 0.2% 2560.6% 0.5% 687 0.7% 0.1% 1770.6% 0.5% 698 0.2% 0.0% 420.5% 0.4% 513 0.0% 0.0% 00.4% 0.3% 409 0.1% 0.0% 140.3% 0.2% 285 0.2% 0.0% 580.3% 0.2% 330 0.0% 0.0% 20.0% 0.0% 1 0.0% 0.0% 0
1.6% 1.3% 1,754 3.8% 0.7% 981100.0% 80.9% 109,123 100.0% 19.1% 25,780
103,609 25,179
Undergraduate Graduate
FALL ENROLLMENT REPORT | 19
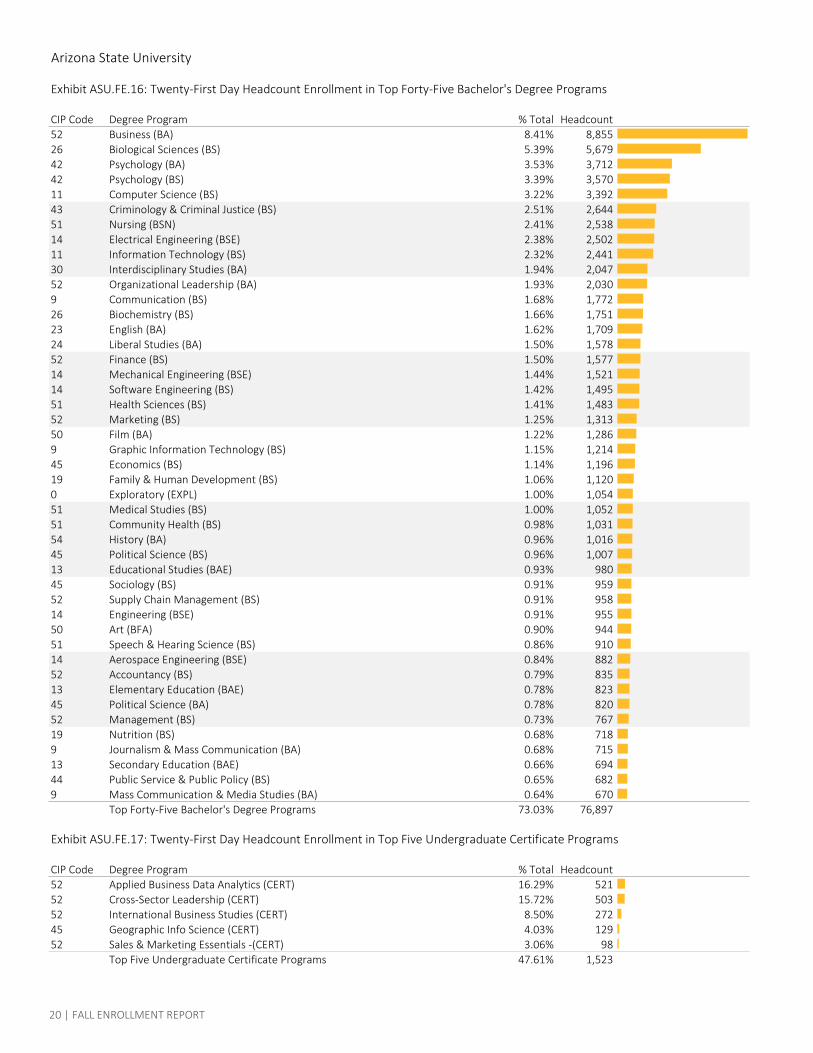
Arizona State University
Exhibit ASU.FE.16: Twenty-First Day Headcount Enrollment in Top Forty-Five Bachelor's Degree Programs
CIP Code Degree Program % Total Headcount52 Business (BA) 8.41% 8,85526 Biological Sciences (BS) 5.39% 5,67942 Psychology (BA) 3.53% 3,71242 Psychology (BS) 3.39% 3,57011 Computer Science (BS) 3.22% 3,39243 Criminology & Criminal Justice (BS) 2.51% 2,64451 Nursing (BSN) 2.41% 2,53814 Electrical Engineering (BSE) 2.38% 2,50211 Information Technology (BS) 2.32% 2,44130 Interdisciplinary Studies (BA) 1.94% 2,04752 Organizational Leadership (BA) 1.93% 2,0309 Communication (BS) 1.68% 1,77226 Biochemistry (BS) 1.66% 1,75123 English (BA) 1.62% 1,70924 Liberal Studies (BA) 1.50% 1,57852 Finance (BS) 1.50% 1,57714 Mechanical Engineering (BSE) 1.44% 1,52114 Software Engineering (BS) 1.42% 1,49551 Health Sciences (BS) 1.41% 1,48352 Marketing (BS) 1.25% 1,31350 Film (BA) 1.22% 1,2869 Graphic Information Technology (BS) 1.15% 1,21445 Economics (BS) 1.14% 1,19619 Family & Human Development (BS) 1.06% 1,1200 Exploratory (EXPL) 1.00% 1,05451 Medical Studies (BS) 1.00% 1,05251 Community Health (BS) 0.98% 1,03154 History (BA) 0.96% 1,01645 Political Science (BS) 0.96% 1,00713 Educational Studies (BAE) 0.93% 98045 Sociology (BS) 0.91% 95952 Supply Chain Management (BS) 0.91% 95814 Engineering (BSE) 0.91% 95550 Art (BFA) 0.90% 94451 Speech & Hearing Science (BS) 0.86% 91014 Aerospace Engineering (BSE) 0.84% 88252 Accountancy (BS) 0.79% 83513 Elementary Education (BAE) 0.78% 82345 Political Science (BA) 0.78% 82052 Management (BS) 0.73% 76719 Nutrition (BS) 0.68% 7189 Journalism & Mass Communication (BA) 0.68% 71513 Secondary Education (BAE) 0.66% 69444 Public Service & Public Policy (BS) 0.65% 6829 Mass Communication & Media Studies (BA) 0.64% 670
Top Forty-Five Bachelor's Degree Programs 73.03% 76,897
Exhibit ASU.FE.17: Twenty-First Day Headcount Enrollment in Top Five Undergraduate Certificate Programs
CIP Code Degree Program % Total Headcount52 Applied Business Data Analytics (CERT) 16.29% 52152 Cross-Sector Leadership (CERT) 15.72% 50352 International Business Studies (CERT) 8.50% 27245 Geographic Info Science (CERT) 4.03% 12952 Sales & Marketing Essentials -(CERT) 3.06% 98
Top Five Undergraduate Certificate Programs 47.61% 1,523
20 | FALL ENROLLMENT REPORT
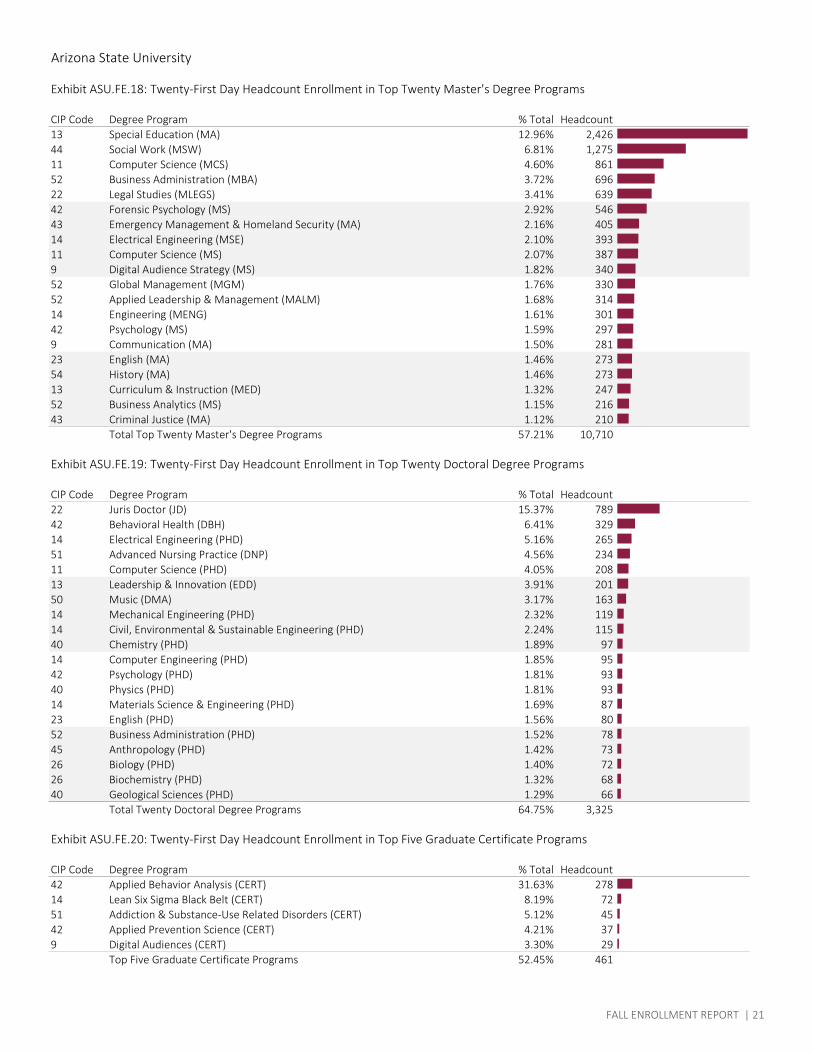
Arizona State University
Exhibit ASU.FE.18: Twenty-First Day Headcount Enrollment in Top Twenty Master's Degree Programs
CIP Code Degree Program % Total Headcount13 Special Education (MA) 12.96% 2,42644 Social Work (MSW) 6.81% 1,27511 Computer Science (MCS) 4.60% 86152 Business Administration (MBA) 3.72% 69622 Legal Studies (MLEGS) 3.41% 63942 Forensic Psychology (MS) 2.92% 54643 Emergency Management & Homeland Security (MA) 2.16% 40514 Electrical Engineering (MSE) 2.10% 39311 Computer Science (MS) 2.07% 3879 Digital Audience Strategy (MS) 1.82% 34052 Global Management (MGM) 1.76% 33052 Applied Leadership & Management (MALM) 1.68% 31414 Engineering (MENG) 1.61% 30142 Psychology (MS) 1.59% 2979 Communication (MA) 1.50% 28123 English (MA) 1.46% 27354 History (MA) 1.46% 27313 Curriculum & Instruction (MED) 1.32% 24752 Business Analytics (MS) 1.15% 21643 Criminal Justice (MA) 1.12% 210
Total Top Twenty Master's Degree Programs 57.21% 10,710
Exhibit ASU.FE.19: Twenty-First Day Headcount Enrollment in Top Twenty Doctoral Degree Programs
CIP Code Degree Program % Total Headcount22 Juris Doctor (JD) 15.37% 78942 Behavioral Health (DBH) 6.41% 32914 Electrical Engineering (PHD) 5.16% 26551 Advanced Nursing Practice (DNP) 4.56% 23411 Computer Science (PHD) 4.05% 20813 Leadership & Innovation (EDD) 3.91% 20150 Music (DMA) 3.17% 16314 Mechanical Engineering (PHD) 2.32% 11914 Civil, Environmental & Sustainable Engineering (PHD) 2.24% 11540 Chemistry (PHD) 1.89% 9714 Computer Engineering (PHD) 1.85% 9542 Psychology (PHD) 1.81% 9340 Physics (PHD) 1.81% 9314 Materials Science & Engineering (PHD) 1.69% 8723 English (PHD) 1.56% 8052 Business Administration (PHD) 1.52% 7845 Anthropology (PHD) 1.42% 7326 Biology (PHD) 1.40% 7226 Biochemistry (PHD) 1.32% 6840 Geological Sciences (PHD) 1.29% 66
Total Twenty Doctoral Degree Programs 64.75% 3,325
Exhibit ASU.FE.20: Twenty-First Day Headcount Enrollment in Top Five Graduate Certificate Programs
CIP Code Degree Program % Total Headcount42 Applied Behavior Analysis (CERT) 31.63% 27814 Lean Six Sigma Black Belt (CERT) 8.19% 7251 Addiction & Substance-Use Related Disorders (CERT) 5.12% 4542 Applied Prevention Science (CERT) 4.21% 379 Digital Audiences (CERT) 3.30% 29
Top Five Graduate Certificate Programs 52.45% 461
FALL ENROLLMENT REPORT | 21
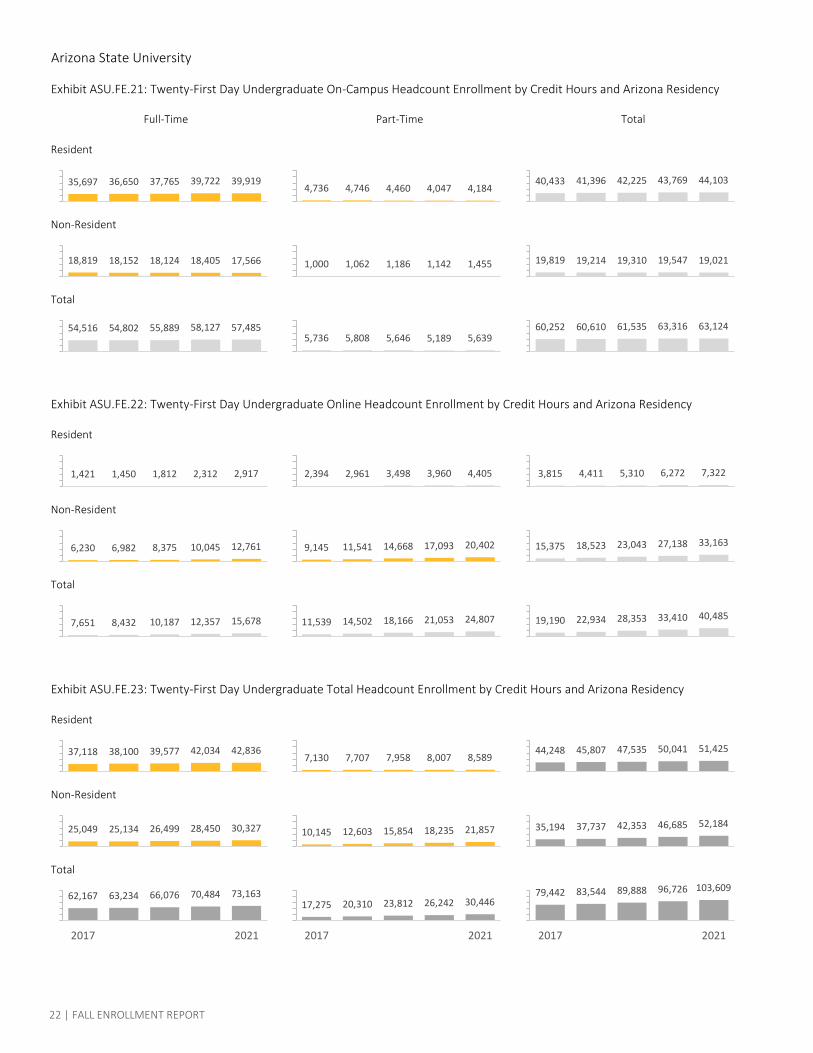
Arizona State University
Exhibit ASU.FE.21: Twenty-First Day Undergraduate On-Campus Headcount Enrollment by Credit Hours and Arizona Residency
Resident
Non-Resident
Total
Exhibit ASU.FE.22: Twenty-First Day Undergraduate Online Headcount Enrollment by Credit Hours and Arizona Residency
Resident
Non-Resident
Total
Exhibit ASU.FE.23: Twenty-First Day Undergraduate Total Headcount Enrollment by Credit Hours and Arizona Residency
Resident
Non-Resident
Total
Full-Time Part-Time Total
35,697 36,650 37,765 39,722 39,919
18,819 18,152 18,124 18,405 17,566
54,516 54,802 55,889 58,127 57,485
1,421 1,450 1,812 2,312 2,917
6,230 6,982 8,375 10,045 12,761
37,118 38,100 39,577 42,034 42,836
25,049 25,134 26,499 28,450 30,327
62,167 63,234 66,076 70,484 73,163
2017 2021
4,736 4,746 4,460 4,047 4,184
1,000 1,062 1,186 1,142 1,455
5,736 5,808 5,646 5,189 5,639
2,394 2,961 3,498 3,960 4,405
9,145 11,541 14,668 17,093 20,402
7,130 7,707 7,958 8,007 8,589
10,145 12,603 15,854 18,235 21,857
17,275 20,310 23,812 26,242 30,446
2017 2021
40,433 41,396 42,225 43,769 44,103
19,819 19,214 19,310 19,547 19,021
60,252 60,610 61,535 63,316 63,124
3,815 4,411 5,310 6,272 7,322
15,375 18,523 23,043 27,138 33,163
44,248 45,807 47,535 50,041 51,425
35,194 37,737 42,353 46,685 52,184
79,442 83,544 89,888 96,726 103,609
2017 2021
7,651 8,432 10,187 12,357 15,678 11,539 14,502 18,166 21,053 24,807 19,190 22,934 28,353 33,410 40,485
22 | FALL ENROLLMENT REPORT
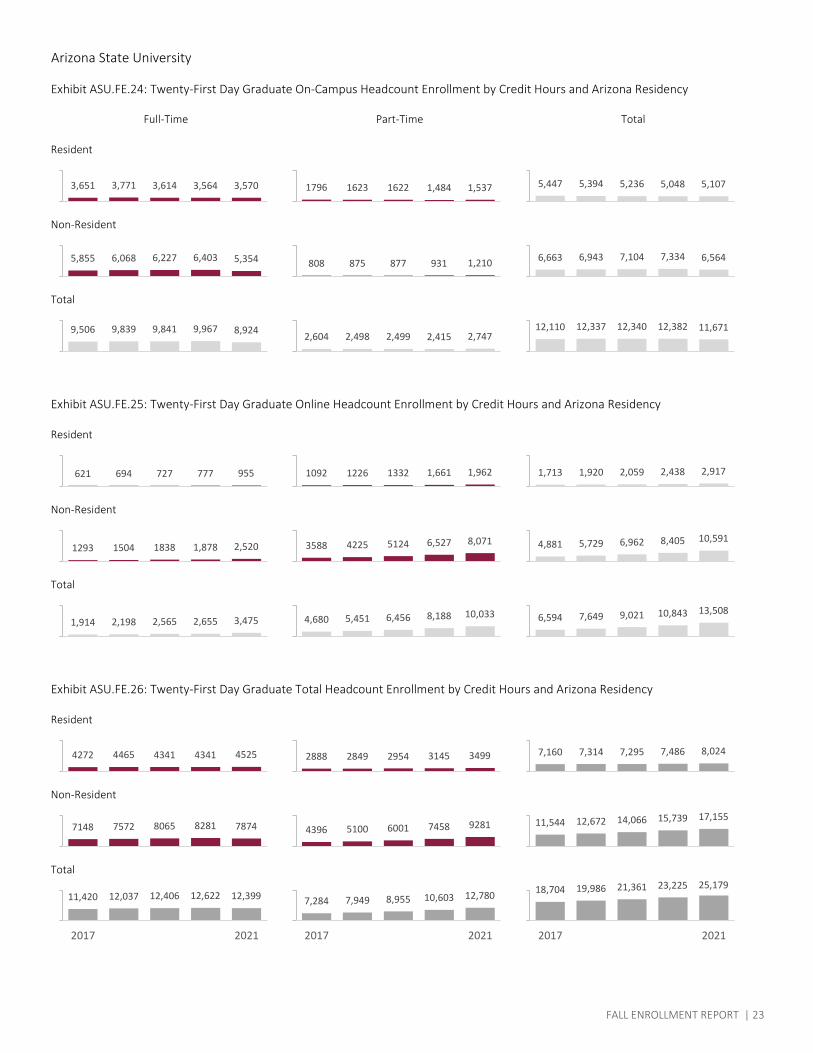
Arizona State University
Exhibit ASU.FE.24: Twenty-First Day Graduate On-Campus Headcount Enrollment by Credit Hours and Arizona Residency
Resident
Non-Resident
Total
Exhibit ASU.FE.25: Twenty-First Day Graduate Online Headcount Enrollment by Credit Hours and Arizona Residency
Resident
Non-Resident
Total
Exhibit ASU.FE.26: Twenty-First Day Graduate Total Headcount Enrollment by Credit Hours and Arizona Residency
Resident
Non-Resident
Total
Full-Time Part-Time Total
3,651 3,771 3,614 3,564 3,570
5,855 6,068 6,227 6,403 5,354
9,506 9,839 9,841 9,967 8,924
621 694 727 777 955
1293 1504 1838 1,878 2,520
4272 4465 4341 4341 4525
7148 7572 8065 8281 7874
11,420 12,037 12,406 12,622 12,399
2017 2021
1796 1623 1622 1,484 1,537
808 875 877 931 1,210
2,604 2,498 2,499 2,415 2,747
1092 1226 1332 1,661 1,962
3588 4225 5124 6,527 8,071
2888 2849 2954 3145 3499
4396 5100 6001 7458 9281
7,284 7,949 8,955 10,603 12,780
2017 2021
5,447 5,394 5,236 5,048 5,107
6,663 6,943 7,104 7,334 6,564
12,110 12,337 12,340 12,382 11,671
1,713 1,920 2,059 2,438 2,917
4,881 5,729 6,962 8,405 10,591
7,160 7,314 7,295 7,486 8,024
11,544 12,672 14,066 15,739 17,155
18,704 19,986 21,361 23,225 25,179
2017 2021
1,914 2,198 2,565 2,655 3,475 4,680 5,451 6,456 8,188 10,033 6,594 7,649 9,021 10,843 13,508
FALL ENROLLMENT REPORT | 23
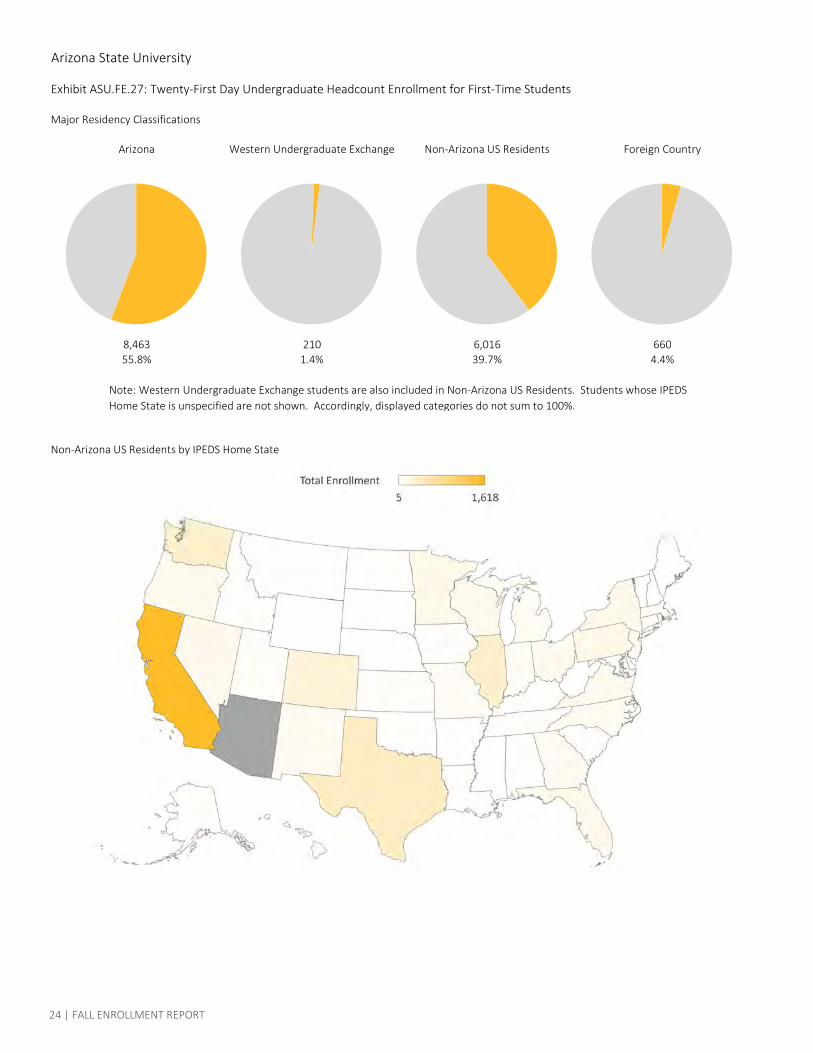
Arizona State University
Exhibit ASU.FE.27: Twenty-First Day Undergraduate Headcount Enrollment for First-Time Students
Major Residency Classifications
8,463 210 6,016 66055.8% 1.4% 39.7% 4.4%
Non-Arizona US Residents by IPEDS Home State
Arizona Western Undergraduate Exchange Non-Arizona US Residents Foreign Country
Note: Western Undergraduate Exchange students are also included in Non-Arizona US Residents. Students whose IPEDS Home State is unspecified are not shown. Accordingly, displayed categories do not sum to 100%.
24 | FALL ENROLLMENT REPORT
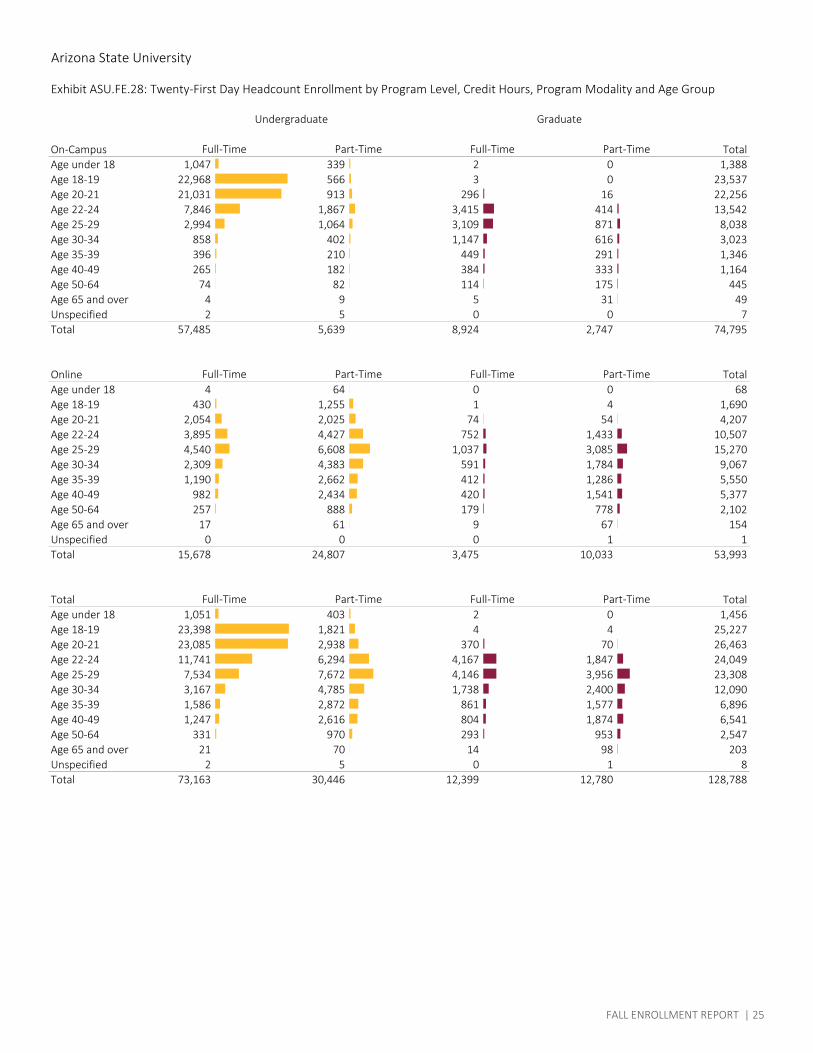
Arizona State University
Exhibit ASU.FE.28: Twenty-First Day Headcount Enrollment by Program Level, Credit Hours, Program Modality and Age Group
On-Campus TotalAge under 18 1,047 339 2 0 1,388Age 18-19 22,968 566 3 0 23,537Age 20-21 21,031 913 296 16 22,256Age 22-24 7,846 1,867 3,415 414 13,542Age 25-29 2,994 1,064 3,109 871 8,038Age 30-34 858 402 1,147 616 3,023Age 35-39 396 210 449 291 1,346Age 40-49 265 182 384 333 1,164Age 50-64 74 82 114 175 445Age 65 and over 4 9 5 31 49Unspecified 2 5 0 0 7Total 57,485 5,639 8,924 2,747 74,795
Online TotalAge under 18 4 64 0 0 68Age 18-19 430 1,255 1 4 1,690Age 20-21 2,054 2,025 74 54 4,207Age 22-24 3,895 4,427 752 1,433 10,507Age 25-29 4,540 6,608 1,037 3,085 15,270Age 30-34 2,309 4,383 591 1,784 9,067Age 35-39 1,190 2,662 412 1,286 5,550Age 40-49 982 2,434 420 1,541 5,377Age 50-64 257 888 179 778 2,102Age 65 and over 17 61 9 67 154Unspecified 0 0 0 1 1Total 15,678 24,807 3,475 10,033 53,993
Total TotalAge under 18 1,051 403 2 0 1,456Age 18-19 23,398 1,821 4 4 25,227Age 20-21 23,085 2,938 370 70 26,463Age 22-24 11,741 6,294 4,167 1,847 24,049Age 25-29 7,534 7,672 4,146 3,956 23,308Age 30-34 3,167 4,785 1,738 2,400 12,090Age 35-39 1,586 2,872 861 1,577 6,896Age 40-49 1,247 2,616 804 1,874 6,541Age 50-64 331 970 293 953 2,547Age 65 and over 21 70 14 98 203Unspecified 2 5 0 1 8Total 73,163 30,446 12,399 12,780 128,788
Full-Time Part-Time Full-Time Part-Time
Full-Time Part-Time Full-Time Part-Time
Full-Time Part-Time Full-Time Part-Time
Undergraduate Graduate
FALL ENROLLMENT REPORT | 25
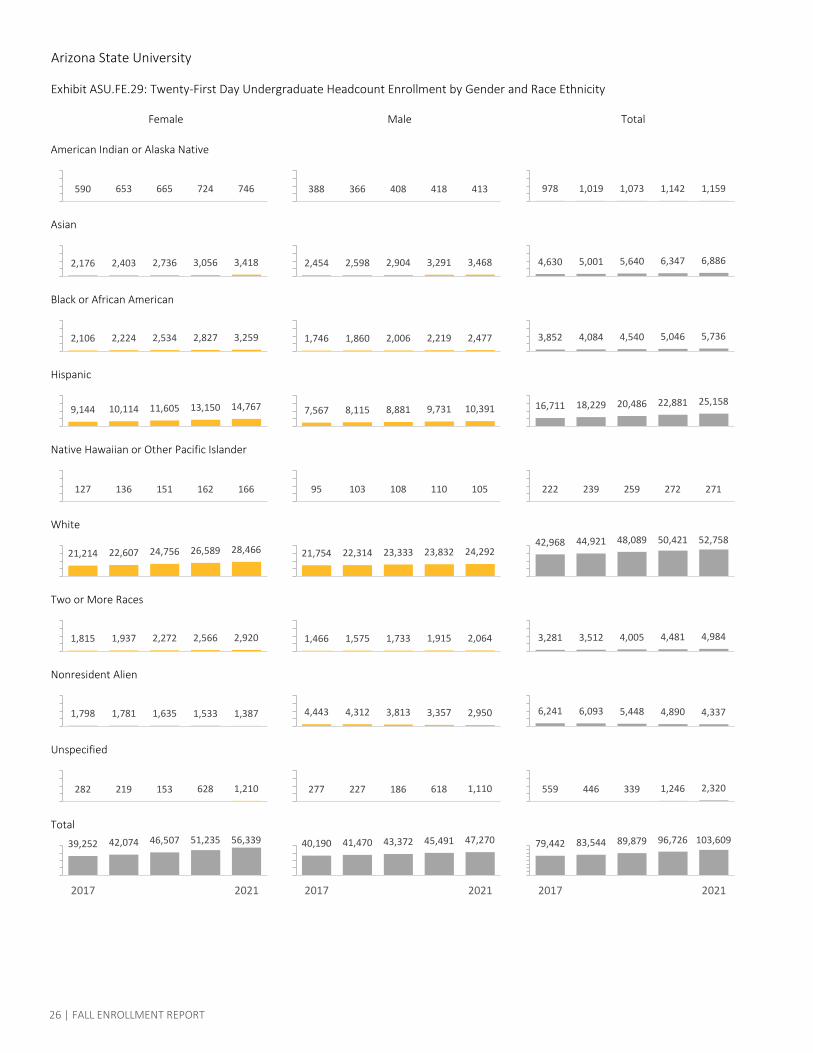
Arizona State University
Exhibit ASU.FE.29: Twenty-First Day Undergraduate Headcount Enrollment by Gender and Race Ethnicity
American Indian or Alaska Native
Asian
Black or African American
Hispanic
Native Hawaiian or Other Pacific Islander
White
Two or More Races
Nonresident Alien
Unspecified
Total
Female Male Total
39,252 42,074 46,507 51,235 56,339
2017 2021
282 219 153 628 1,210
40,190 41,470 43,372 45,491 47,270
2017 2021
277 227 186 618 1,110 559 446 339 1,246 2,320
1,798 1,781 1,635 1,533 1,387 4,443 4,312 3,813 3,357 2,950 6,241 6,093 5,448 4,890 4,337
1,815 1,937 2,272 2,566 2,920 1,466 1,575 1,733 1,915 2,064 3,281 3,512 4,005 4,481 4,984
21,214 22,607 24,756 26,589 28,466 21,754 22,314 23,333 23,832 24,29242,968 44,921 48,089 50,421 52,758
127 136 151 162 166 95 103 108 110 105 222 239 259 272 271
9,144 10,114 11,605 13,150 14,767 7,567 8,115 8,881 9,731 10,391 16,711 18,229 20,486 22,881 25,158
2,106 2,224 2,534 2,827 3,259 1,746 1,860 2,006 2,219 2,477 3,852 4,084 4,540 5,046 5,736
2,176 2,403 2,736 3,056 3,418 2,454 2,598 2,904 3,291 3,468 4,630 5,001 5,640 6,347 6,886
590 653 665 724 746 388 366 408 418 413 978 1,019 1,073 1,142 1,159
79,442 83,544 89,879 96,726 103,609
2017 2021
26 | FALL ENROLLMENT REPORT
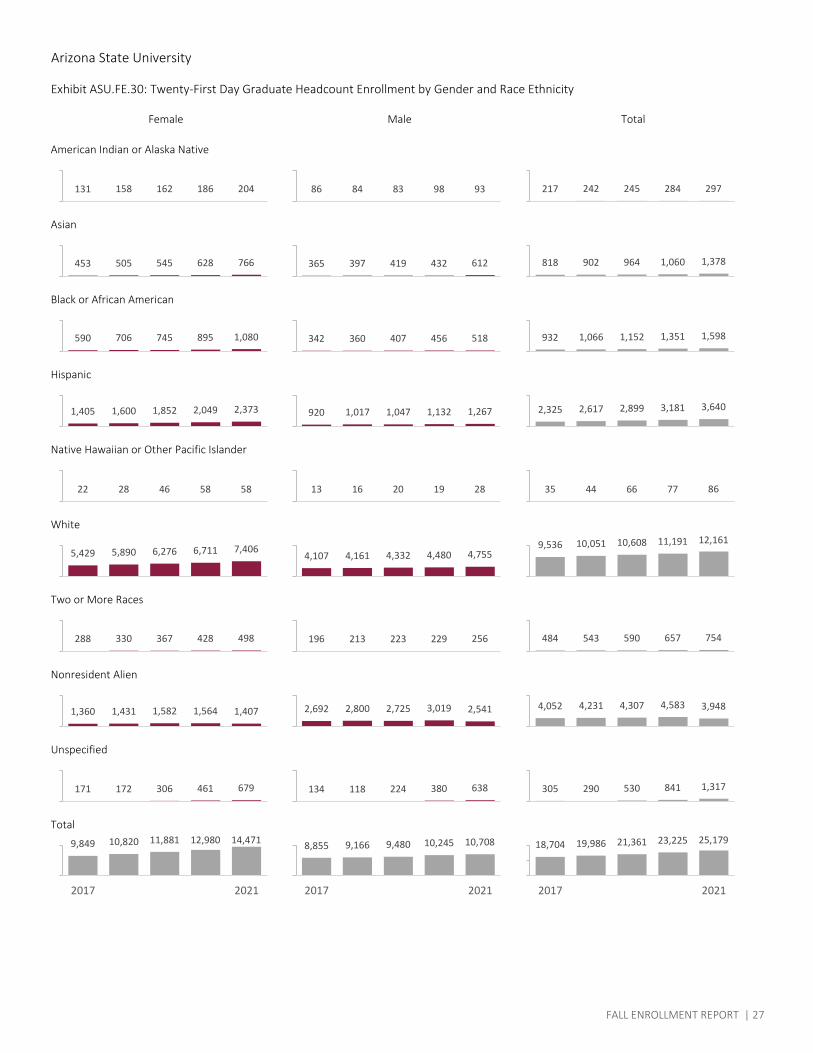
Arizona State University
Exhibit ASU.FE.30: Twenty-First Day Graduate Headcount Enrollment by Gender and Race Ethnicity
American Indian or Alaska Native
Asian
Black or African American
Hispanic
Native Hawaiian or Other Pacific Islander
White
Two or More Races
Nonresident Alien
Unspecified
Total
Female Male Total
9,849 10,820 11,881 12,980 14,471
2017 2021
171 172 306 461 679
8,855 9,166 9,480 10,245 10,708
2017 2021
134 118 224 380 638 305 290 530 841 1,317
1,360 1,431 1,582 1,564 1,407 2,692 2,800 2,725 3,019 2,541 4,052 4,231 4,307 4,583 3,948
288 330 367 428 498 196 213 223 229 256 484 543 590 657 754
5,429 5,890 6,276 6,711 7,4064,107 4,161 4,332 4,480 4,755
9,536 10,051 10,608 11,191 12,161
22 28 46 58 58 13 16 20 19 28 35 44 66 77 86
1,405 1,600 1,852 2,049 2,373 920 1,017 1,047 1,132 1,267 2,325 2,617 2,899 3,181 3,640
590 706 745 895 1,080 342 360 407 456 518 932 1,066 1,152 1,351 1,598
453 505 545 628 766 365 397 419 432 612 818 902 964 1,060 1,378
131 158 162 186 204 86 84 83 98 93 217 242 245 284 297
18,704 19,986 21,361 23,225 25,179
2017 2021
FALL ENROLLMENT REPORT | 27
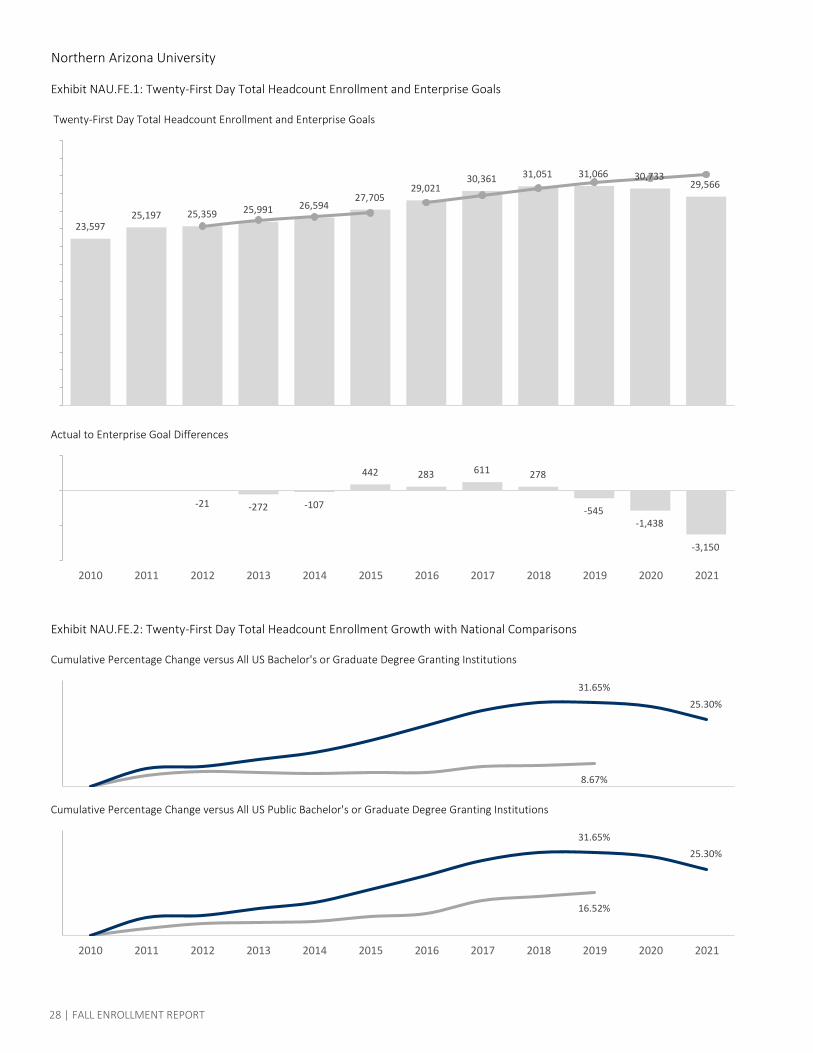
Northern Arizona University
Exhibit NAU.FE.1: Twenty-First Day Total Headcount Enrollment and Enterprise Goals
Twenty-First Day Total Headcount Enrollment and Enterprise Goals
Actual to Enterprise Goal Differences
Exhibit NAU.FE.2: Twenty-First Day Total Headcount Enrollment Growth with National Comparisons
Cumulative Percentage Change versus All US Bachelor's or Graduate Degree Granting Institutions
Cumulative Percentage Change versus All US Public Bachelor's or Graduate Degree Granting Institutions
-21 -272 -107
442 283 611 278
-545-1,438
-3,150
2010 2011 2012 2013 2014 2015 2016 2017 2018 2019 2020 2021
23,59725,197 25,359 25,991 26,594
27,70529,021
30,361 31,051 31,066 30,73329,566
8.67%
31.65%
25.30%
16.52%
31.65%
25.30%
2010 2011 2012 2013 2014 2015 2016 2017 2018 2019 2020 2021
28 | FALL ENROLLMENT REPORT
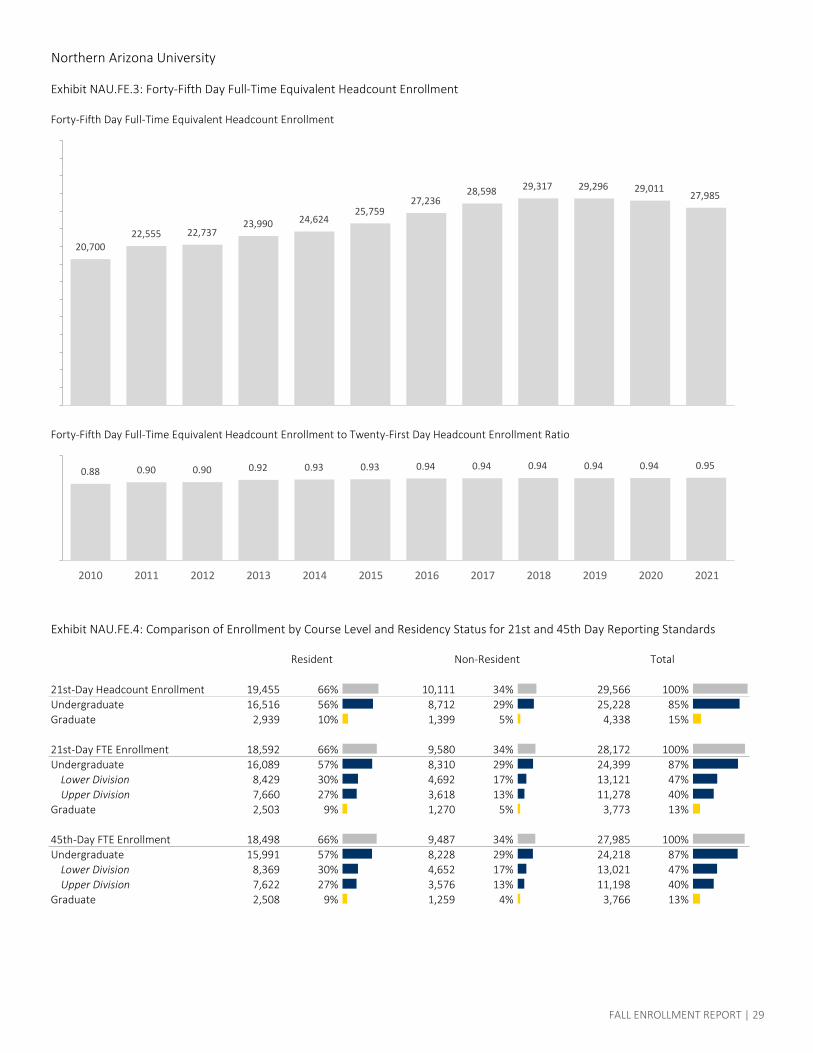
Northern Arizona University
Exhibit NAU.FE.3: Forty-Fifth Day Full-Time Equivalent Headcount Enrollment
Forty-Fifth Day Full-Time Equivalent Headcount Enrollment
Forty-Fifth Day Full-Time Equivalent Headcount Enrollment to Twenty-First Day Headcount Enrollment Ratio
Exhibit NAU.FE.4: Comparison of Enrollment by Course Level and Residency Status for 21st and 45th Day Reporting Standards
21st-Day Headcount Enrollment 19,455 66% 10,111 34% 29,566 100%Undergraduate 16,516 56% 8,712 29% 25,228 85%Graduate 2,939 10% 1,399 5% 4,338 15%
21st-Day FTE Enrollment 18,592 66% 9,580 34% 28,172 100%Undergraduate 16,089 57% 8,310 29% 24,399 87%
Lower Division 8,429 30% 4,692 17% 13,121 47%Upper Division 7,660 27% 3,618 13% 11,278 40%
Graduate 2,503 9% 1,270 5% 3,773 13%
45th-Day FTE Enrollment 18,498 66% 9,487 34% 27,985 100%Undergraduate 15,991 57% 8,228 29% 24,218 87%
Lower Division 8,369 30% 4,652 17% 13,021 47%Upper Division 7,622 27% 3,576 13% 11,198 40%
Graduate 2,508 9% 1,259 4% 3,766 13%
Resident Non-Resident Total
0.88 0.90 0.90 0.92 0.93 0.93 0.94 0.94 0.94 0.94 0.94 0.95
2010 2011 2012 2013 2014 2015 2016 2017 2018 2019 2020 2021
20,70022,555 22,737
23,990 24,62425,759
27,23628,598 29,317 29,296 29,011
27,985
FALL ENROLLMENT REPORT | 29
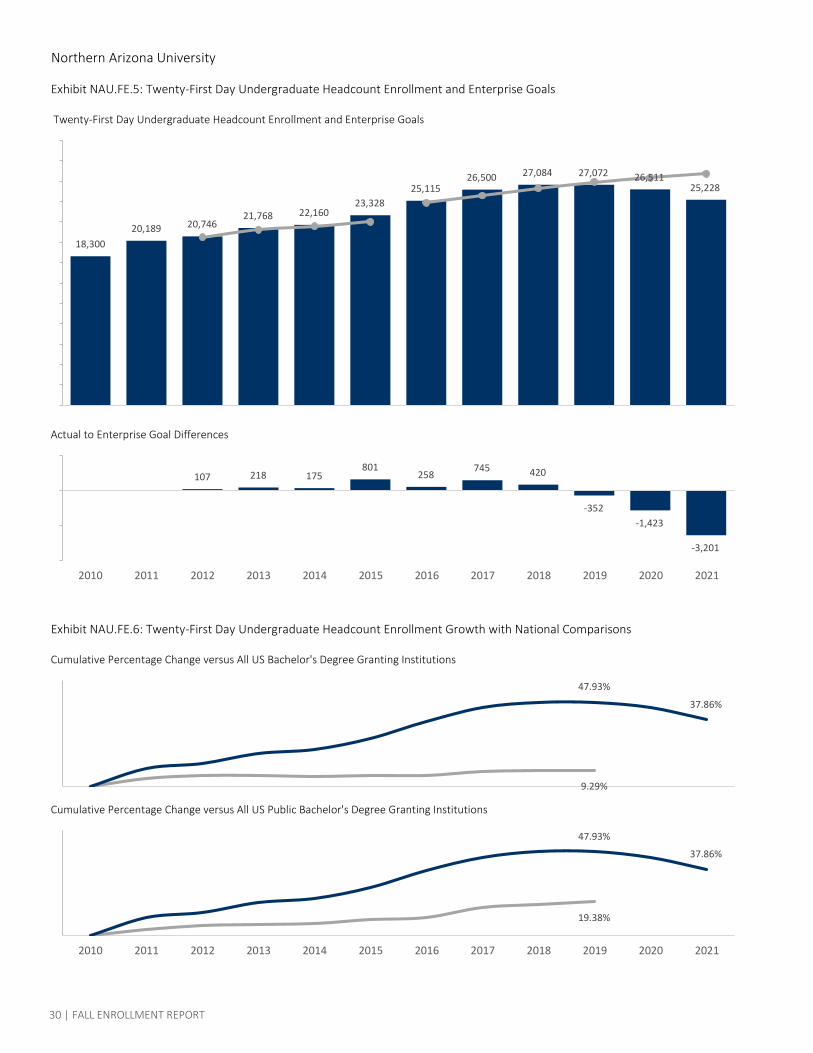
Northern Arizona University
Exhibit NAU.FE.5: Twenty-First Day Undergraduate Headcount Enrollment and Enterprise Goals
Twenty-First Day Undergraduate Headcount Enrollment and Enterprise Goals
Actual to Enterprise Goal Differences
Exhibit NAU.FE.6: Twenty-First Day Undergraduate Headcount Enrollment Growth with National Comparisons
Cumulative Percentage Change versus All US Bachelor's Degree Granting Institutions
Cumulative Percentage Change versus All US Public Bachelor's Degree Granting Institutions
107 218 175801
258745 420
-352-1,423
-3,201
2010 2011 2012 2013 2014 2015 2016 2017 2018 2019 2020 2021
18,30020,189 20,746
21,768 22,16023,328
25,11526,500 27,084 27,072 26,511
25,228
9.29%
47.93%
37.86%
19.38%
47.93%
37.86%
2010 2011 2012 2013 2014 2015 2016 2017 2018 2019 2020 2021
30 | FALL ENROLLMENT REPORT
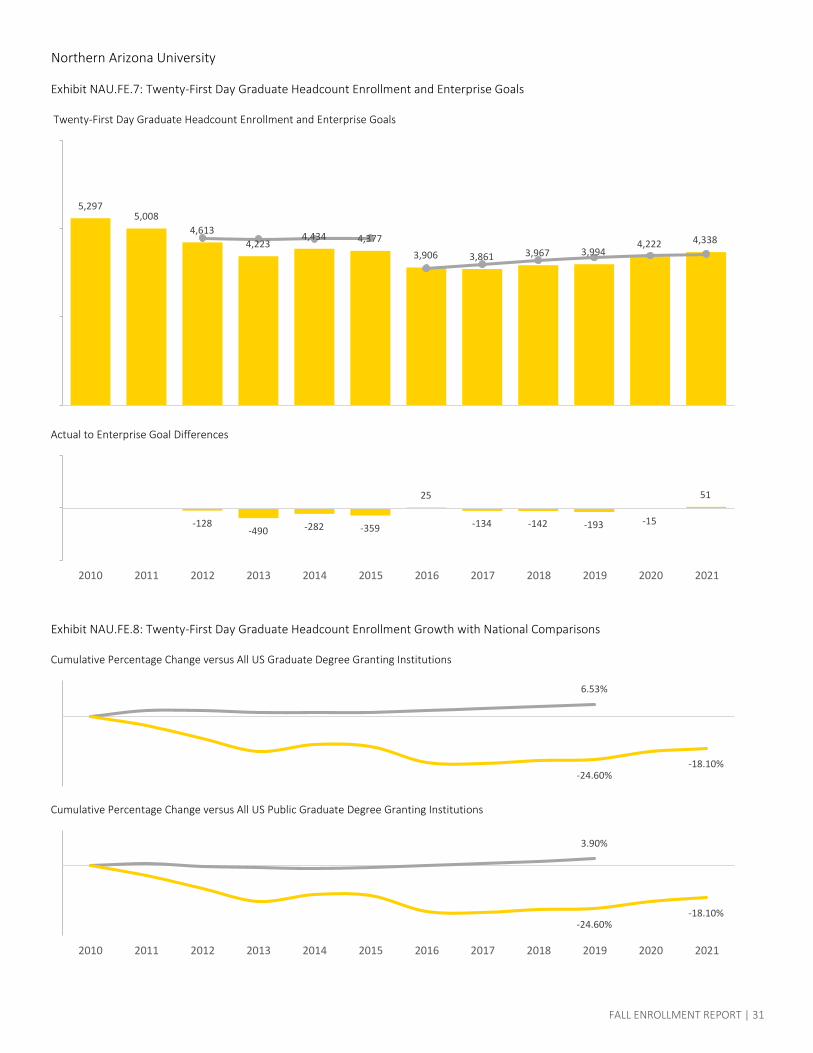
Northern Arizona University
Exhibit NAU.FE.7: Twenty-First Day Graduate Headcount Enrollment and Enterprise Goals
Twenty-First Day Graduate Headcount Enrollment and Enterprise Goals
Actual to Enterprise Goal Differences
Exhibit NAU.FE.8: Twenty-First Day Graduate Headcount Enrollment Growth with National Comparisons
Cumulative Percentage Change versus All US Graduate Degree Granting Institutions
Cumulative Percentage Change versus All US Public Graduate Degree Granting Institutions
-128-490 -282 -359
25
-134 -142 -193 -15
51
2010 2011 2012 2013 2014 2015 2016 2017 2018 2019 2020 2021
5,2975,008
4,6134,223
4,434 4,377
3,906 3,861 3,967 3,9944,222 4,338
6.53%
-24.60%-18.10%
3.90%
-24.60%-18.10%
2010 2011 2012 2013 2014 2015 2016 2017 2018 2019 2020 2021
FALL ENROLLMENT REPORT | 31
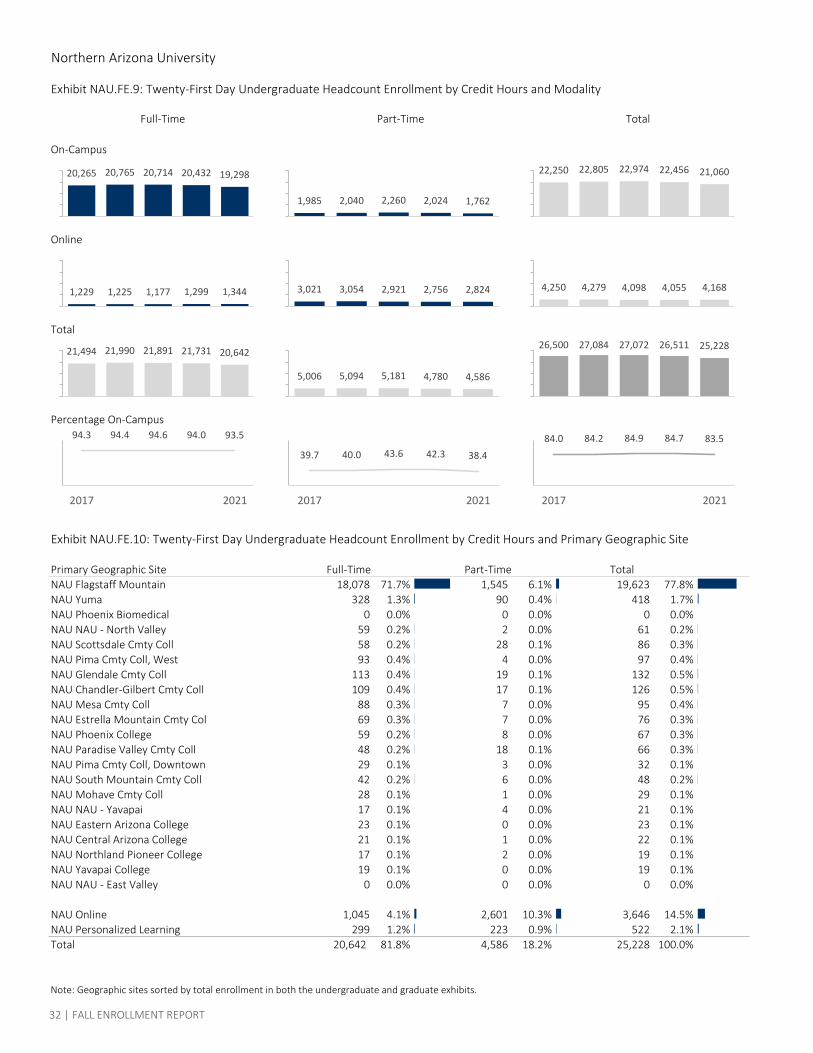
Northern Arizona University
Exhibit NAU.FE.9: Twenty-First Day Undergraduate Headcount Enrollment by Credit Hours and Modality
On-Campus
Online
Total
Percentage On-Campus
Exhibit NAU.FE.10: Twenty-First Day Undergraduate Headcount Enrollment by Credit Hours and Primary Geographic Site
Primary Geographic Site Full-Time Part-Time TotalNAU Flagstaff Mountain 18,078 71.7% 1,545 6.1% 19,623 77.8%NAU Yuma 328 1.3% 90 0.4% 418 1.7%NAU Phoenix Biomedical 0 0.0% 0 0.0% 0 0.0%NAU NAU - North Valley 59 0.2% 2 0.0% 61 0.2%NAU Scottsdale Cmty Coll 58 0.2% 28 0.1% 86 0.3%NAU Pima Cmty Coll, West 93 0.4% 4 0.0% 97 0.4%NAU Glendale Cmty Coll 113 0.4% 19 0.1% 132 0.5%NAU Chandler-Gilbert Cmty Coll 109 0.4% 17 0.1% 126 0.5%NAU Mesa Cmty Coll 88 0.3% 7 0.0% 95 0.4%NAU Estrella Mountain Cmty Col 69 0.3% 7 0.0% 76 0.3%NAU Phoenix College 59 0.2% 8 0.0% 67 0.3%NAU Paradise Valley Cmty Coll 48 0.2% 18 0.1% 66 0.3%NAU Pima Cmty Coll, Downtown 29 0.1% 3 0.0% 32 0.1%NAU South Mountain Cmty Coll 42 0.2% 6 0.0% 48 0.2%NAU Mohave Cmty Coll 28 0.1% 1 0.0% 29 0.1%NAU NAU - Yavapai 17 0.1% 4 0.0% 21 0.1%NAU Eastern Arizona College 23 0.1% 0 0.0% 23 0.1%NAU Central Arizona College 21 0.1% 1 0.0% 22 0.1%NAU Northland Pioneer College 17 0.1% 2 0.0% 19 0.1%NAU Yavapai College 19 0.1% 0 0.0% 19 0.1%NAU NAU - East Valley 0 0.0% 0 0.0% 0 0.0%
NAU Online 1,045 4.1% 2,601 10.3% 3,646 14.5%NAU Personalized Learning 299 1.2% 223 0.9% 522 2.1%Total 20,642 81.8% 4,586 18.2% 25,228 100.0%
Note: Geographic sites sorted by total enrollment in both the undergraduate and graduate exhibits.
20,265 20,765 20,714 20,432 19,298
1,985 2,040 2,260 2,024 1,762
22,250 22,805 22,974 22,456 21,060
1,229 1,225 1,177 1,299 1,344 3,021 3,054 2,921 2,756 2,824 4,250 4,279 4,098 4,055 4,168
21,494 21,990 21,891 21,731 20,642
5,006 5,094 5,181 4,780 4,586
26,500 27,084 27,072 26,511 25,228
94.3 94.4 94.6 94.0 93.5
2017 2021
39.7 40.0 43.6 42.3 38.4
2017 2021
84.0 84.2 84.9 84.7 83.5
2017 2021
Full-Time Part-Time Total
32 | FALL ENROLLMENT REPORT
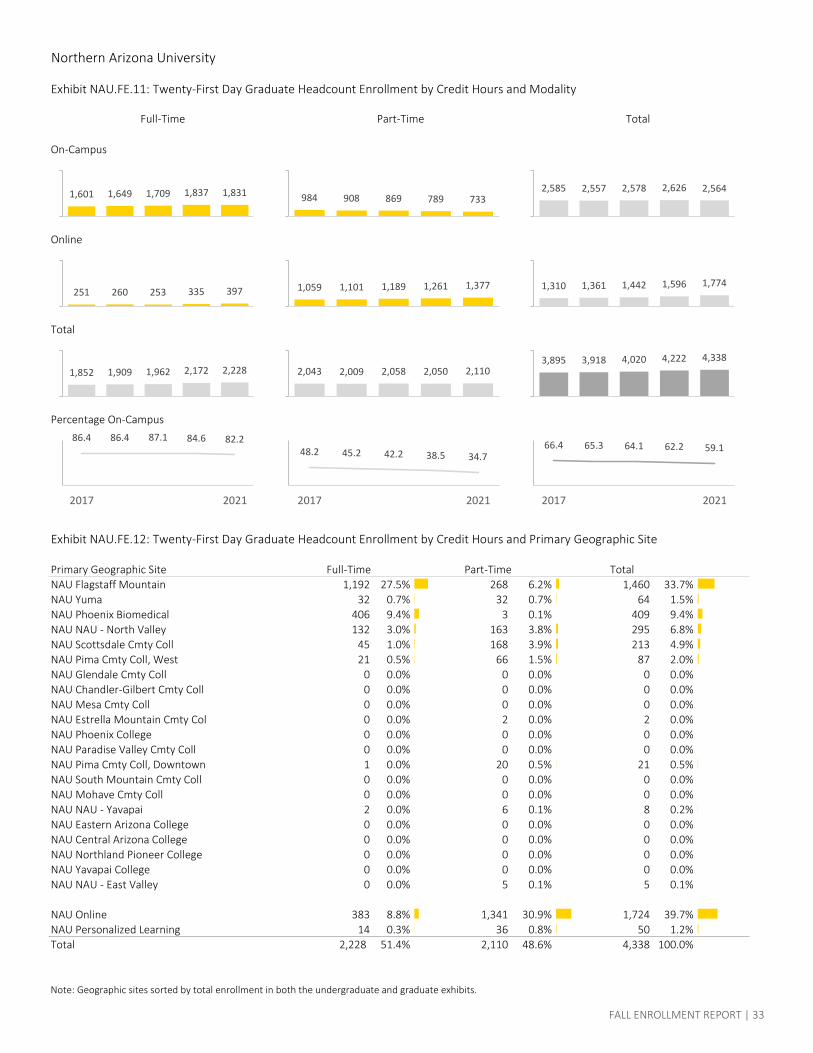
Northern Arizona University
Exhibit NAU.FE.11: Twenty-First Day Graduate Headcount Enrollment by Credit Hours and Modality
On-Campus
Online
Total
Percentage On-Campus
Exhibit NAU.FE.12: Twenty-First Day Graduate Headcount Enrollment by Credit Hours and Primary Geographic Site
Primary Geographic Site Full-Time Part-Time TotalNAU Flagstaff Mountain 1,192 27.5% 268 6.2% 1,460 33.7%NAU Yuma 32 0.7% 32 0.7% 64 1.5%NAU Phoenix Biomedical 406 9.4% 3 0.1% 409 9.4%NAU NAU - North Valley 132 3.0% 163 3.8% 295 6.8%NAU Scottsdale Cmty Coll 45 1.0% 168 3.9% 213 4.9%NAU Pima Cmty Coll, West 21 0.5% 66 1.5% 87 2.0%NAU Glendale Cmty Coll 0 0.0% 0 0.0% 0 0.0%NAU Chandler-Gilbert Cmty Coll 0 0.0% 0 0.0% 0 0.0%NAU Mesa Cmty Coll 0 0.0% 0 0.0% 0 0.0%NAU Estrella Mountain Cmty Col 0 0.0% 2 0.0% 2 0.0%NAU Phoenix College 0 0.0% 0 0.0% 0 0.0%NAU Paradise Valley Cmty Coll 0 0.0% 0 0.0% 0 0.0%NAU Pima Cmty Coll, Downtown 1 0.0% 20 0.5% 21 0.5%NAU South Mountain Cmty Coll 0 0.0% 0 0.0% 0 0.0%NAU Mohave Cmty Coll 0 0.0% 0 0.0% 0 0.0%NAU NAU - Yavapai 2 0.0% 6 0.1% 8 0.2%NAU Eastern Arizona College 0 0.0% 0 0.0% 0 0.0%NAU Central Arizona College 0 0.0% 0 0.0% 0 0.0%NAU Northland Pioneer College 0 0.0% 0 0.0% 0 0.0%NAU Yavapai College 0 0.0% 0 0.0% 0 0.0%NAU NAU - East Valley 0 0.0% 5 0.1% 5 0.1%
NAU Online 383 8.8% 1,341 30.9% 1,724 39.7%NAU Personalized Learning 14 0.3% 36 0.8% 50 1.2%Total 2,228 51.4% 2,110 48.6% 4,338 100.0%
Note: Geographic sites sorted by total enrollment in both the undergraduate and graduate exhibits.
1,601 1,649 1,709 1,837 1,831 984 908 869 789 7332,585 2,557 2,578 2,626 2,564
251 260 253 335 397 1,059 1,101 1,189 1,261 1,377 1,310 1,361 1,442 1,596 1,774
1,852 1,909 1,962 2,172 2,228 2,043 2,009 2,058 2,050 2,1103,895 3,918 4,020 4,222 4,338
86.4 86.4 87.1 84.6 82.2
2017 2021
48.2 45.2 42.2 38.5 34.7
2017 2021
66.4 65.3 64.1 62.2 59.1
2017 2021
Full-Time Part-Time Total
FALL ENROLLMENT REPORT | 33
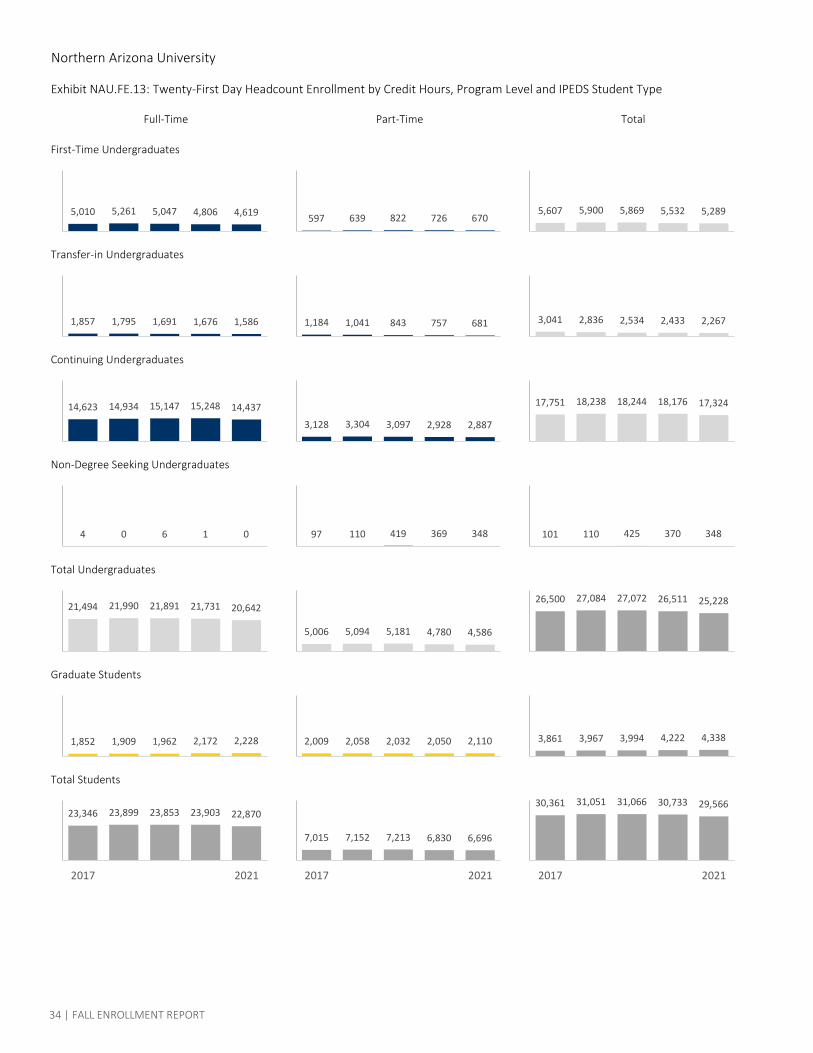
Northern Arizona University
Exhibit NAU.FE.13: Twenty-First Day Headcount Enrollment by Credit Hours, Program Level and IPEDS Student Type
First-Time Undergraduates
Transfer-in Undergraduates
Continuing Undergraduates
Non-Degree Seeking Undergraduates
Total Undergraduates
Graduate Students
Total Students
Full-Time Part-Time Total
21,494 21,990 21,891 21,731 20,642
5,006 5,094 5,181 4,780 4,586
26,500 27,084 27,072 26,511 25,228
23,346 23,899 23,853 23,903 22,870
2017 2021
5,010 5,261 5,047 4,806 4,619 597 639 822 726 6705,607 5,900 5,869 5,532 5,289
1,857 1,795 1,691 1,676 1,586 1,184 1,041 843 757 681 3,041 2,836 2,534 2,433 2,267
14,623 14,934 15,147 15,248 14,437
3,128 3,304 3,097 2,928 2,887
17,751 18,238 18,244 18,176 17,324
4 0 6 1 0 97 110 419 369 348 101 110 425 370 348
1,852 1,909 1,962 2,172 2,228 2,009 2,058 2,032 2,050 2,110 3,861 3,967 3,994 4,222 4,338
7,015 7,152 7,213 6,830 6,696
2017 2021
30,361 31,051 31,066 30,733 29,566
2017 2021
34 | FALL ENROLLMENT REPORT
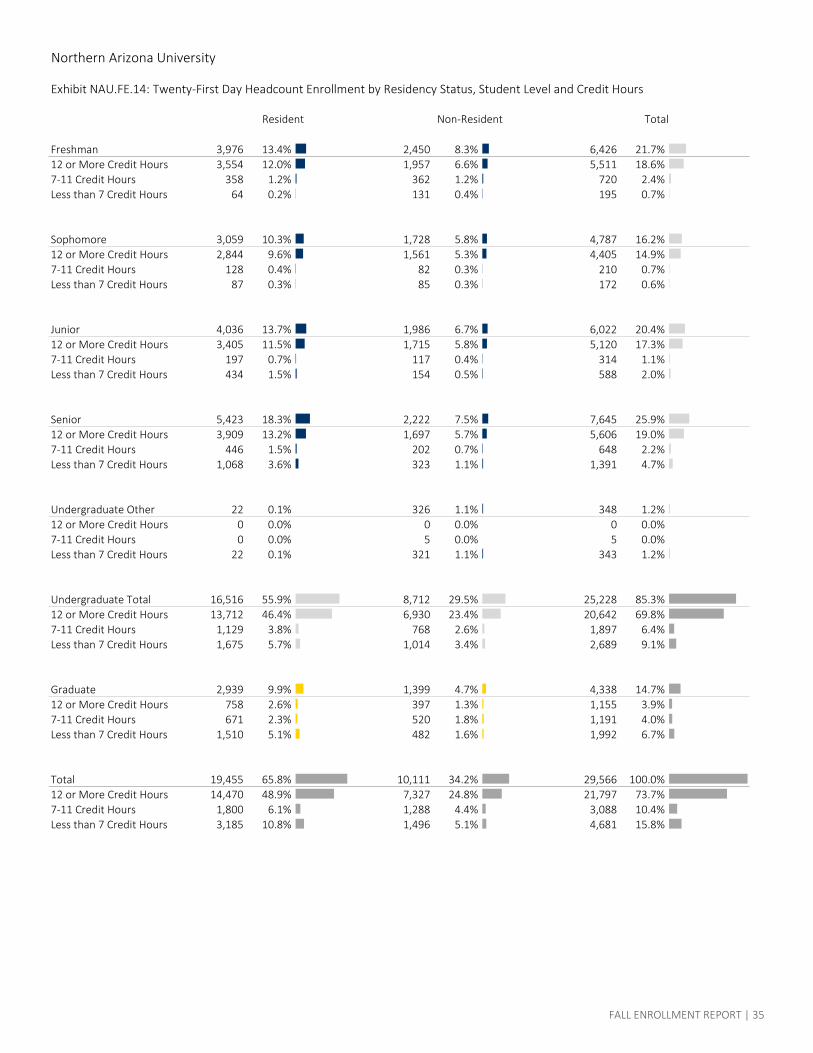
Northern Arizona University
Exhibit NAU.FE.14: Twenty-First Day Headcount Enrollment by Residency Status, Student Level and Credit Hours
Freshman 3,976 13.4% 2,450 8.3% 6,426 21.7%12 or More Credit Hours 3,554 12.0% 1,957 6.6% 5,511 18.6%7-11 Credit Hours 358 1.2% 362 1.2% 720 2.4%Less than 7 Credit Hours 64 0.2% 131 0.4% 195 0.7%
Sophomore 3,059 10.3% 1,728 5.8% 4,787 16.2%12 or More Credit Hours 2,844 9.6% 1,561 5.3% 4,405 14.9%7-11 Credit Hours 128 0.4% 82 0.3% 210 0.7%Less than 7 Credit Hours 87 0.3% 85 0.3% 172 0.6%
Junior 4,036 13.7% 1,986 6.7% 6,022 20.4%12 or More Credit Hours 3,405 11.5% 1,715 5.8% 5,120 17.3%7-11 Credit Hours 197 0.7% 117 0.4% 314 1.1%Less than 7 Credit Hours 434 1.5% 154 0.5% 588 2.0%
Senior 5,423 18.3% 2,222 7.5% 7,645 25.9%12 or More Credit Hours 3,909 13.2% 1,697 5.7% 5,606 19.0%7-11 Credit Hours 446 1.5% 202 0.7% 648 2.2%Less than 7 Credit Hours 1,068 3.6% 323 1.1% 1,391 4.7%
Undergraduate Other 22 0.1% 326 1.1% 348 1.2%12 or More Credit Hours 0 0.0% 0 0.0% 0 0.0%7-11 Credit Hours 0 0.0% 5 0.0% 5 0.0%Less than 7 Credit Hours 22 0.1% 321 1.1% 343 1.2%
Undergraduate Total 16,516 55.9% 8,712 29.5% 25,228 85.3%12 or More Credit Hours 13,712 46.4% 6,930 23.4% 20,642 69.8%7-11 Credit Hours 1,129 3.8% 768 2.6% 1,897 6.4%Less than 7 Credit Hours 1,675 5.7% 1,014 3.4% 2,689 9.1%
Graduate 2,939 9.9% 1,399 4.7% 4,338 14.7%12 or More Credit Hours 758 2.6% 397 1.3% 1,155 3.9%7-11 Credit Hours 671 2.3% 520 1.8% 1,191 4.0%Less than 7 Credit Hours 1,510 5.1% 482 1.6% 1,992 6.7%
Total 19,455 65.8% 10,111 34.2% 29,566 100.0%12 or More Credit Hours 14,470 48.9% 7,327 24.8% 21,797 73.7%7-11 Credit Hours 1,800 6.1% 1,288 4.4% 3,088 10.4%Less than 7 Credit Hours 3,185 10.8% 1,496 5.1% 4,681 15.8%
Resident Non-Resident Total
FALL ENROLLMENT REPORT | 35

Northern Arizona University
Exhibit NAU.FE.15: Twenty-First Day Headcount Enrollment by Classification of Instructional Program and Program Level
Classification of Instructional Program (CIP) % Total Headcount52 Business, Management, Marketing and Related Support 15.7% 5,02651 Health Professions and Related Programs 15.6% 4,97713 Education 12.8% 4,11026 Biological and Biomedical Sciences 7.0% 2,23045 Social Sciences 6.4% 2,05342 Psychology 6.1% 1,96514 Engineering 4.6% 1,470
9 Communication, Journalism, and Related Programs 4.2% 1,33030 Multidisciplinary and Interdisciplinary Studies 4.0% 1,274
3 Natural Resources and Conservation 3.3% 1,04650 Visual and Performing Arts 3.0% 95831 Parks, Recreation, Leisure and Fitness Studies 2.8% 90124 Liberal Arts and Sciences, General Studies and Humanities 2.7% 86444 Public Administration and Social Service Professions 2.5% 80711 Computer and Information Sciences and Support Services 2.2% 69540 Physical Sciences 2.1% 67323 English Language and Literatures/Letters 1.6% 50316 Foreign Languages, Literatures and Linguistics 1.2% 37827 Mathematics and Statistics 0.7% 20841 Science Technologies/Technicians 0.5% 16854 History 0.5% 15022 Legal Professions and Studies 0.2% 7243 Homeland Security, Law Enforcement, Firefighting and Related Protective Services 0.2% 63
5 Area, Ethnic, Cultural, Gender, and Group Studies 0.1% 4538 Philosophy and Religious Studies 0.1% 32
1 Agriculture, Agriculture Operations, and Related Sciences4 Architecture and Related Services
10 Communications Technologies/Technicians and Support Services12 Personal and Culinary Services15 Engineering Technologies and Engineering-Related Fields19 Family and Consumer Sciences/Human Sciences25 Library Science28 Military Science, Leadership and Operational Art29 Military Technologies and Applied Sciences39 Theology and Religious Vocations46 Construction Trades47 Mechanic and Repair Technologies/Technicians48 Precision Production49 Transportation and Materials Moving
Unspecified 0.0% 2Total 100.0% 32,000
Unduplicated Students 29,566
Note: Students in certificate, non-degree, pre-major and other programs may be classified as Unspecified.
Total
36 | FALL ENROLLMENT REPORT
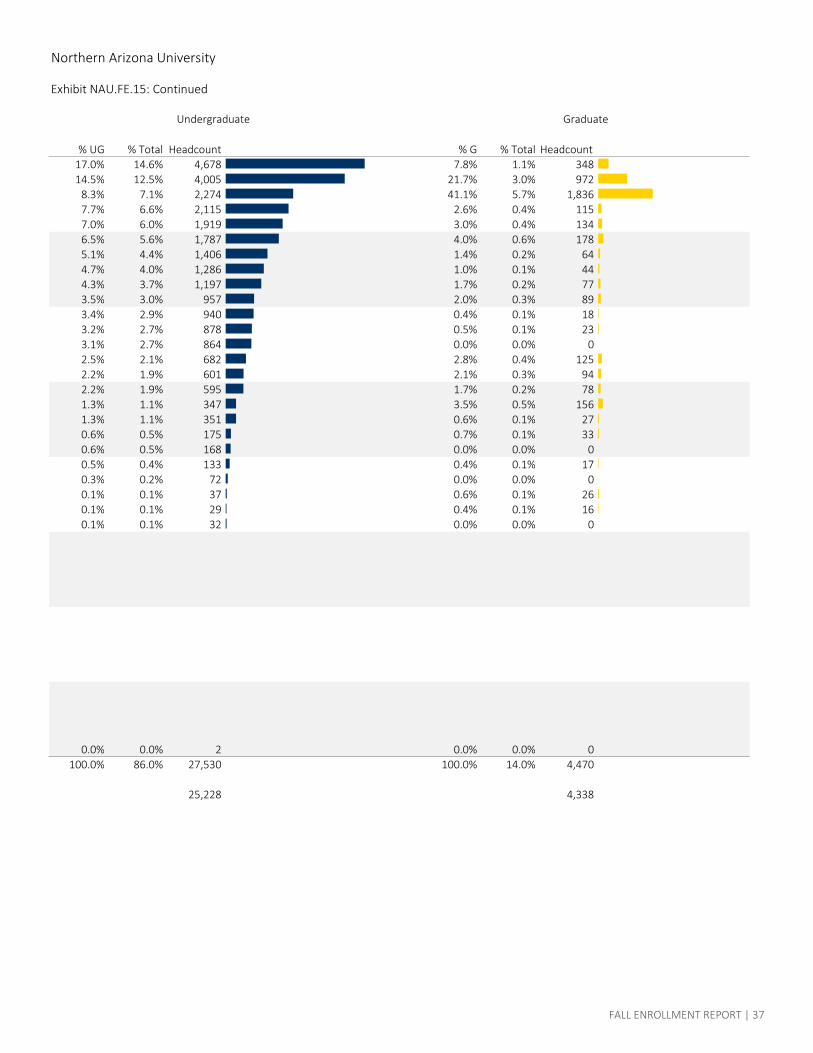
Northern Arizona University
Exhibit NAU.FE.15: Continued
% UG % Total Headcount % G % Total Headcount17.0% 14.6% 4,678 7.8% 1.1% 34814.5% 12.5% 4,005 21.7% 3.0% 972
8.3% 7.1% 2,274 41.1% 5.7% 1,8367.7% 6.6% 2,115 2.6% 0.4% 1157.0% 6.0% 1,919 3.0% 0.4% 1346.5% 5.6% 1,787 4.0% 0.6% 1785.1% 4.4% 1,406 1.4% 0.2% 644.7% 4.0% 1,286 1.0% 0.1% 444.3% 3.7% 1,197 1.7% 0.2% 773.5% 3.0% 957 2.0% 0.3% 893.4% 2.9% 940 0.4% 0.1% 183.2% 2.7% 878 0.5% 0.1% 233.1% 2.7% 864 0.0% 0.0% 02.5% 2.1% 682 2.8% 0.4% 1252.2% 1.9% 601 2.1% 0.3% 942.2% 1.9% 595 1.7% 0.2% 781.3% 1.1% 347 3.5% 0.5% 1561.3% 1.1% 351 0.6% 0.1% 270.6% 0.5% 175 0.7% 0.1% 330.6% 0.5% 168 0.0% 0.0% 00.5% 0.4% 133 0.4% 0.1% 170.3% 0.2% 72 0.0% 0.0% 00.1% 0.1% 37 0.6% 0.1% 260.1% 0.1% 29 0.4% 0.1% 160.1% 0.1% 32 0.0% 0.0% 0
0.0% 0.0% 2 0.0% 0.0% 0100.0% 86.0% 27,530 100.0% 14.0% 4,470
25,228 4,338
Undergraduate Graduate
FALL ENROLLMENT REPORT | 37
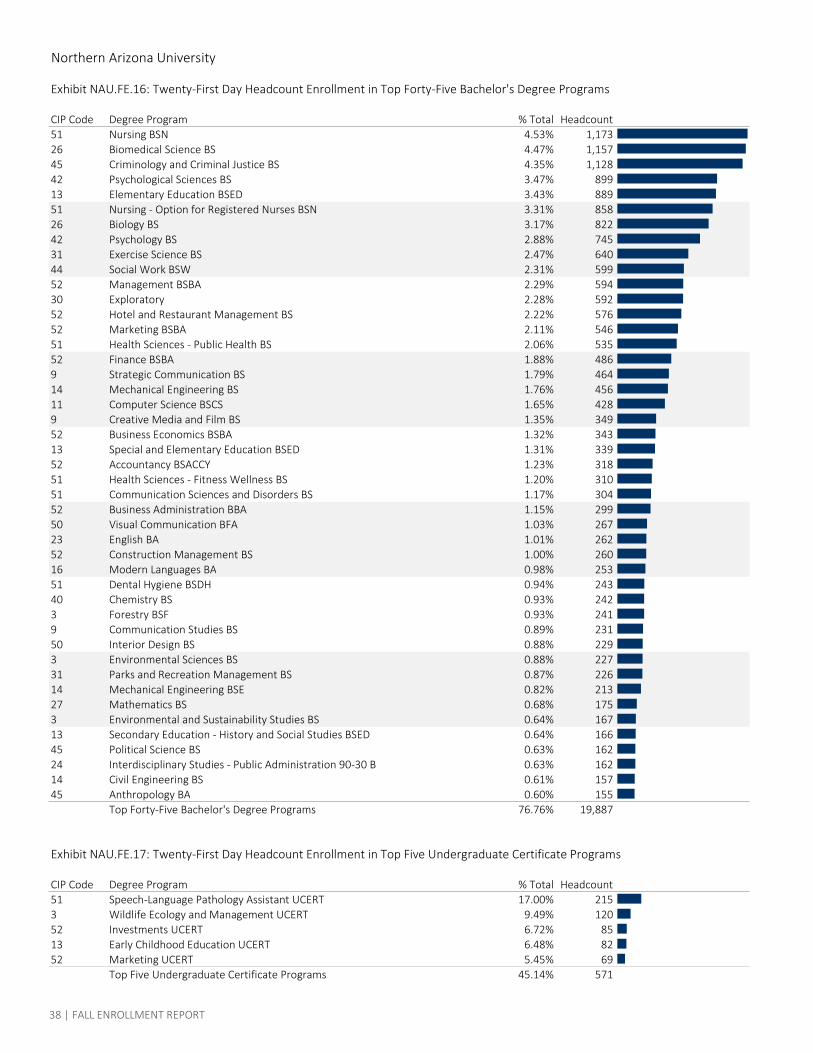
Northern Arizona University
Exhibit NAU.FE.16: Twenty-First Day Headcount Enrollment in Top Forty-Five Bachelor's Degree Programs
CIP Code Degree Program % Total Headcount51 Nursing BSN 4.53% 1,17326 Biomedical Science BS 4.47% 1,15745 Criminology and Criminal Justice BS 4.35% 1,12842 Psychological Sciences BS 3.47% 89913 Elementary Education BSED 3.43% 88951 Nursing - Option for Registered Nurses BSN 3.31% 85826 Biology BS 3.17% 82242 Psychology BS 2.88% 74531 Exercise Science BS 2.47% 64044 Social Work BSW 2.31% 59952 Management BSBA 2.29% 59430 Exploratory 2.28% 59252 Hotel and Restaurant Management BS 2.22% 57652 Marketing BSBA 2.11% 54651 Health Sciences - Public Health BS 2.06% 53552 Finance BSBA 1.88% 4869 Strategic Communication BS 1.79% 46414 Mechanical Engineering BS 1.76% 45611 Computer Science BSCS 1.65% 4289 Creative Media and Film BS 1.35% 34952 Business Economics BSBA 1.32% 34313 Special and Elementary Education BSED 1.31% 33952 Accountancy BSACCY 1.23% 31851 Health Sciences - Fitness Wellness BS 1.20% 31051 Communication Sciences and Disorders BS 1.17% 30452 Business Administration BBA 1.15% 29950 Visual Communication BFA 1.03% 26723 English BA 1.01% 26252 Construction Management BS 1.00% 26016 Modern Languages BA 0.98% 25351 Dental Hygiene BSDH 0.94% 24340 Chemistry BS 0.93% 2423 Forestry BSF 0.93% 2419 Communication Studies BS 0.89% 23150 Interior Design BS 0.88% 2293 Environmental Sciences BS 0.88% 22731 Parks and Recreation Management BS 0.87% 22614 Mechanical Engineering BSE 0.82% 21327 Mathematics BS 0.68% 1753 Environmental and Sustainability Studies BS 0.64% 16713 Secondary Education - History and Social Studies BSED 0.64% 16645 Political Science BS 0.63% 16224 Interdisciplinary Studies - Public Administration 90-30 B 0.63% 16214 Civil Engineering BS 0.61% 15745 Anthropology BA 0.60% 155
Top Forty-Five Bachelor's Degree Programs 76.76% 19,887
Exhibit NAU.FE.17: Twenty-First Day Headcount Enrollment in Top Five Undergraduate Certificate Programs
CIP Code Degree Program % Total Headcount51 Speech-Language Pathology Assistant UCERT 17.00% 2153 Wildlife Ecology and Management UCERT 9.49% 12052 Investments UCERT 6.72% 8513 Early Childhood Education UCERT 6.48% 8252 Marketing UCERT 5.45% 69
Top Five Undergraduate Certificate Programs 45.14% 571
38 | FALL ENROLLMENT REPORT

Northern Arizona University
Exhibit NAU.FE.18: Twenty-First Day Headcount Enrollment in Top Twenty Master's Degree Programs
CIP Code Degree Program % Total Headcount52 Organizational Leadership M 7.88% 24413 Educational Leadership - Principal K-12 MED 7.26% 22513 Educational Leadership - Community College/Higher Education MED 5.23% 16251 Clinical Speech - Language Pathology MS 4.62% 14313 Clinical Mental Health Counseling MA 4.00% 12413 Human Relations MED 3.81% 11851 Nursing - Family Nurse Practitioner MS 3.29% 10251 Physician Assistant Studies MPAS 3.20% 9913 Special Education MED 2.36% 7313 Elementary Education - Certification MED 2.29% 7113 Educational Leadership - Instructional Leadership K-12 School Leadership MED 2.23% 6913 Counseling - School Counseling MED 2.16% 6713 Educational Technology MED 2.13% 6613 ESL and Bilingual Education - Bilingual MED 1.94% 6042 School Psychology EDS 1.71% 5313 Special Education - Mild/Moderate Disabilities Certified MED 1.65% 5126 Biology MS 1.58% 4944 Social Work MSW 1.45% 4551 Athletic Training MS 1.45% 4523 English - Literature MA 1.39% 43
Total Top Twenty Master's Degree Programs 61.62% 1,909
Exhibit NAU.FE.19: Twenty-First Day Headcount Enrollment in Top Twenty Doctoral Degree Programs
CIP Code Degree Program % Total Headcount51 Physical Therapy - Entry Level DPT 27.69% 29351 Occupational Therapy OTD 12.67% 13413 Educational Leadership - Community College / Higher Education Administration EDD 7.84% 8313 Educational Leadership - K-12 Administration EDD 7.37% 7842 Clinical Psychology PSYD 6.71% 7111 Informatics and Computing PHD 6.33% 6726 Biology PHD 6.24% 6613 Curriculum and Instruction PHD 5.67% 6051 Interdisciplinary Health PHD 2.65% 2816 Applied Linguistics PHD 2.55% 2742 Combined Counseling/School Psychology PHD 2.55% 2740 Astronomy and Planetary Science PHD 2.55% 273 Forest Science PHD 1.80% 1914 Earth Sciences and Environmental Sustainability PHD 1.61% 1745 Political Science PHD 1.51% 1640 Applied Physics and Materials Science PHD 1.32% 1451 Nursing Practice DNP 0.95% 1014 Bioengineering PHD 0.95% 1014 Mechanical Engineering PHD 0.57% 613 Curriculum and Instruction EDD 0.19% 2
Total Twenty Doctoral Degree Programs 99.53% 1,053
Exhibit NAU.FE.20: Twenty-First Day Headcount Enrollment in Top Five Graduate Certificate Programs
CIP Code Degree Program % Total Headcount13 Principal GCERT 15.13% 4113 Positive Behavior Support GCERT 15.13% 4143 Leadership in Criminal Justice Administration GCERT 9.59% 2645 Geographic Information Systems GCERT 7.75% 2151 Post-Master's Family Nurse Practitioner GCERT 5.90% 16
Top Five Graduate Certificate Programs 53.51% 145
FALL ENROLLMENT REPORT | 39
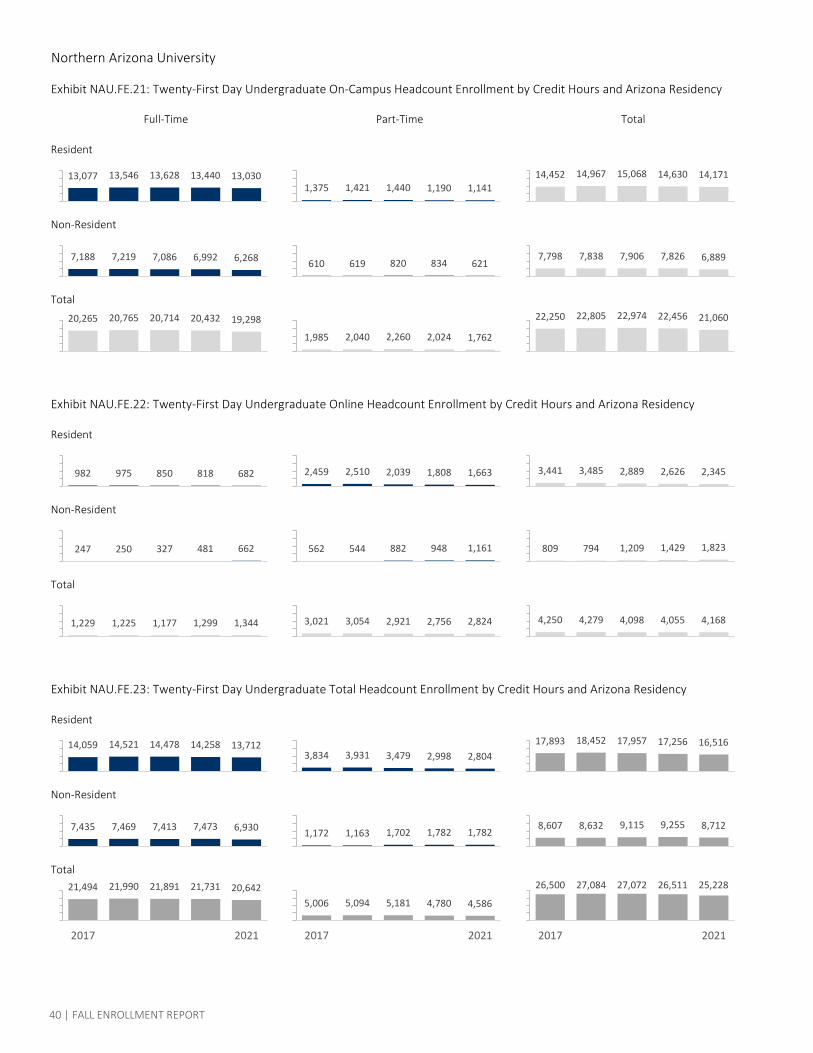
Northern Arizona University
Exhibit NAU.FE.21: Twenty-First Day Undergraduate On-Campus Headcount Enrollment by Credit Hours and Arizona Residency
Resident
Non-Resident
Total
Exhibit NAU.FE.22: Twenty-First Day Undergraduate Online Headcount Enrollment by Credit Hours and Arizona Residency
Resident
Non-Resident
Total
Exhibit NAU.FE.23: Twenty-First Day Undergraduate Total Headcount Enrollment by Credit Hours and Arizona Residency
Resident
Non-Resident
Total
Full-Time Part-Time Total
13,077 13,546 13,628 13,440 13,030
7,188 7,219 7,086 6,992 6,268
20,265 20,765 20,714 20,432 19,298
982 975 850 818 682
247 250 327 481 662
14,059 14,521 14,478 14,258 13,712
7,435 7,469 7,413 7,473 6,930
21,494 21,990 21,891 21,731 20,642
2017 2021
1,375 1,421 1,440 1,190 1,141
610 619 820 834 621
1,985 2,040 2,260 2,024 1,762
2,459 2,510 2,039 1,808 1,663
562 544 882 948 1,161
3,834 3,931 3,479 2,998 2,804
1,172 1,163 1,702 1,782 1,782
5,006 5,094 5,181 4,780 4,586
2017 2021
14,452 14,967 15,068 14,630 14,171
7,798 7,838 7,906 7,826 6,889
22,250 22,805 22,974 22,456 21,060
3,441 3,485 2,889 2,626 2,345
809 794 1,209 1,429 1,823
17,893 18,452 17,957 17,256 16,516
8,607 8,632 9,115 9,255 8,712
26,500 27,084 27,072 26,511 25,228
2017 2021
1,229 1,225 1,177 1,299 1,344 3,021 3,054 2,921 2,756 2,824 4,250 4,279 4,098 4,055 4,168
40 | FALL ENROLLMENT REPORT
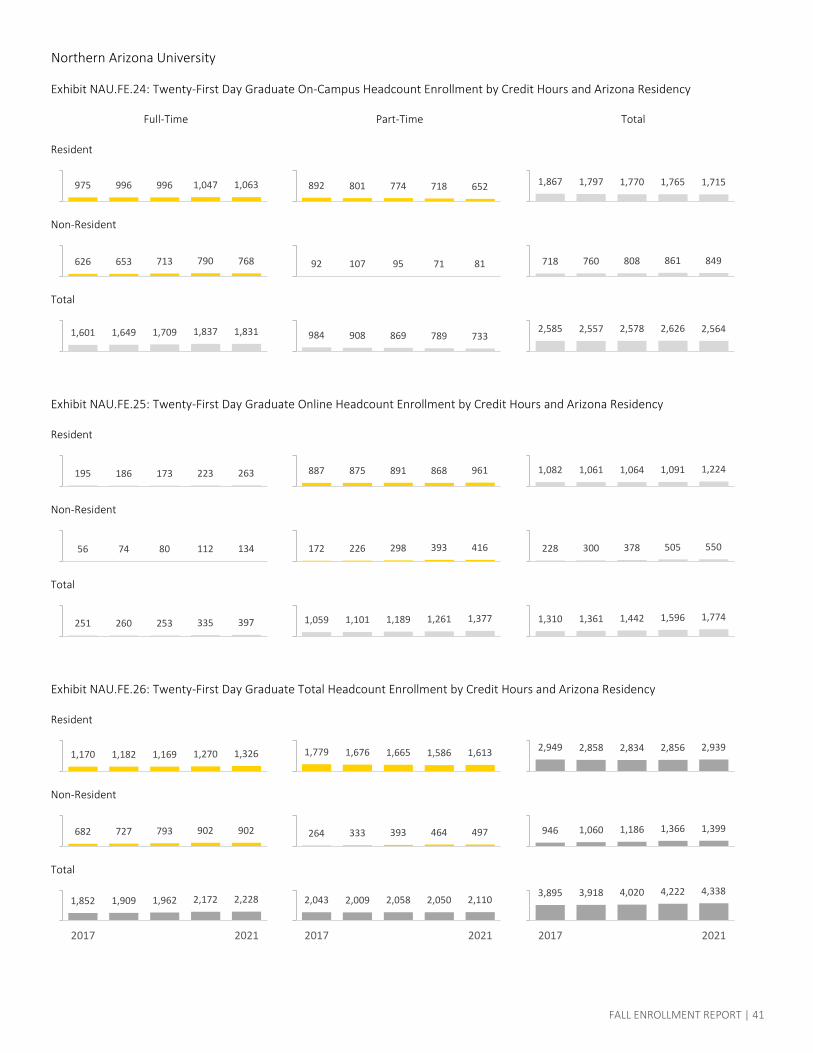
Northern Arizona University
Exhibit NAU.FE.24: Twenty-First Day Graduate On-Campus Headcount Enrollment by Credit Hours and Arizona Residency
Resident
Non-Resident
Total
Exhibit NAU.FE.25: Twenty-First Day Graduate Online Headcount Enrollment by Credit Hours and Arizona Residency
Resident
Non-Resident
Total
Exhibit NAU.FE.26: Twenty-First Day Graduate Total Headcount Enrollment by Credit Hours and Arizona Residency
Resident
Non-Resident
Total
Full-Time Part-Time Total
975 996 996 1,047 1,063
626 653 713 790 768
1,601 1,649 1,709 1,837 1,831
195 186 173 223 263
56 74 80 112 134
1,170 1,182 1,169 1,270 1,326
682 727 793 902 902
1,852 1,909 1,962 2,172 2,228
2017 2021
892 801 774 718 652
92 107 95 71 81
984 908 869 789 733
887 875 891 868 961
172 226 298 393 416
1,779 1,676 1,665 1,586 1,613
264 333 393 464 497
2,043 2,009 2,058 2,050 2,110
2017 2021
1,867 1,797 1,770 1,765 1,715
718 760 808 861 849
2,585 2,557 2,578 2,626 2,564
1,082 1,061 1,064 1,091 1,224
228 300 378 505 550
2,949 2,858 2,834 2,856 2,939
946 1,060 1,186 1,366 1,399
3,895 3,918 4,020 4,222 4,338
2017 2021
251 260 253 335 397 1,059 1,101 1,189 1,261 1,377 1,310 1,361 1,442 1,596 1,774
FALL ENROLLMENT REPORT | 41
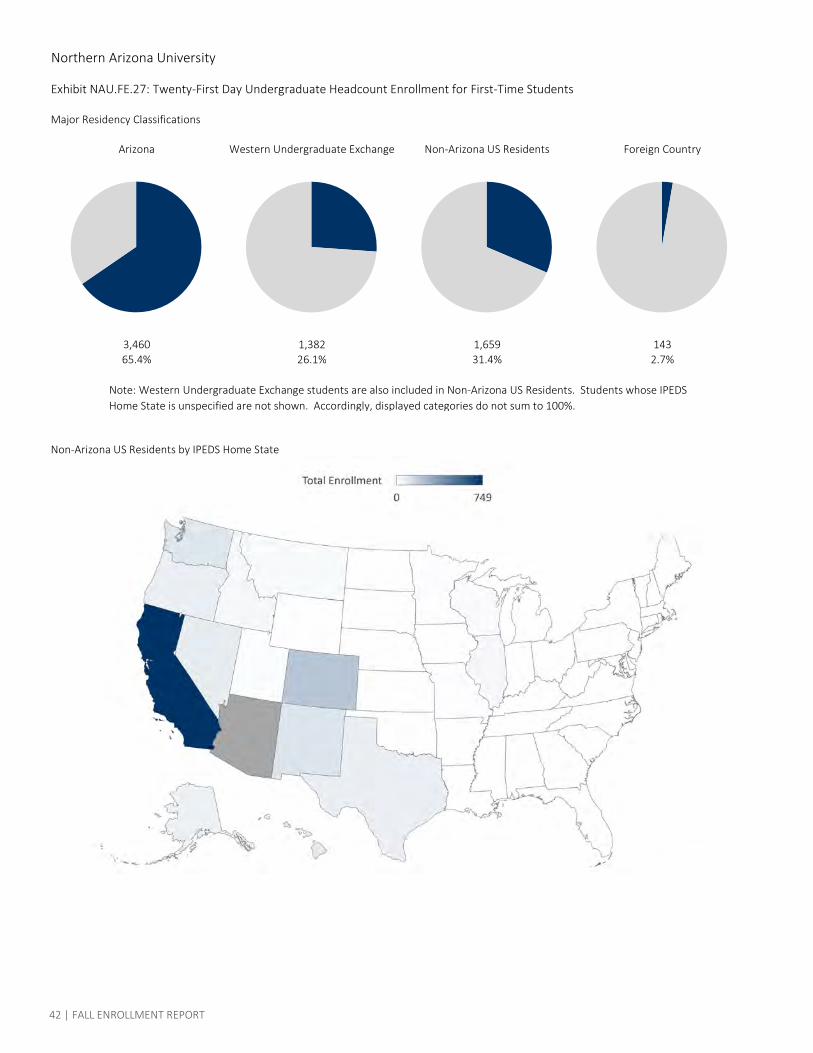
Northern Arizona University
Exhibit NAU.FE.27: Twenty-First Day Undergraduate Headcount Enrollment for First-Time Students
Major Residency Classifications
3,460 1,382 1,659 14365.4% 26.1% 31.4% 2.7%
Non-Arizona US Residents by IPEDS Home State
Arizona Western Undergraduate Exchange Non-Arizona US Residents Foreign Country
Note: Western Undergraduate Exchange students are also included in Non-Arizona US Residents. Students whose IPEDS Home State is unspecified are not shown. Accordingly, displayed categories do not sum to 100%.
42 | FALL ENROLLMENT REPORT
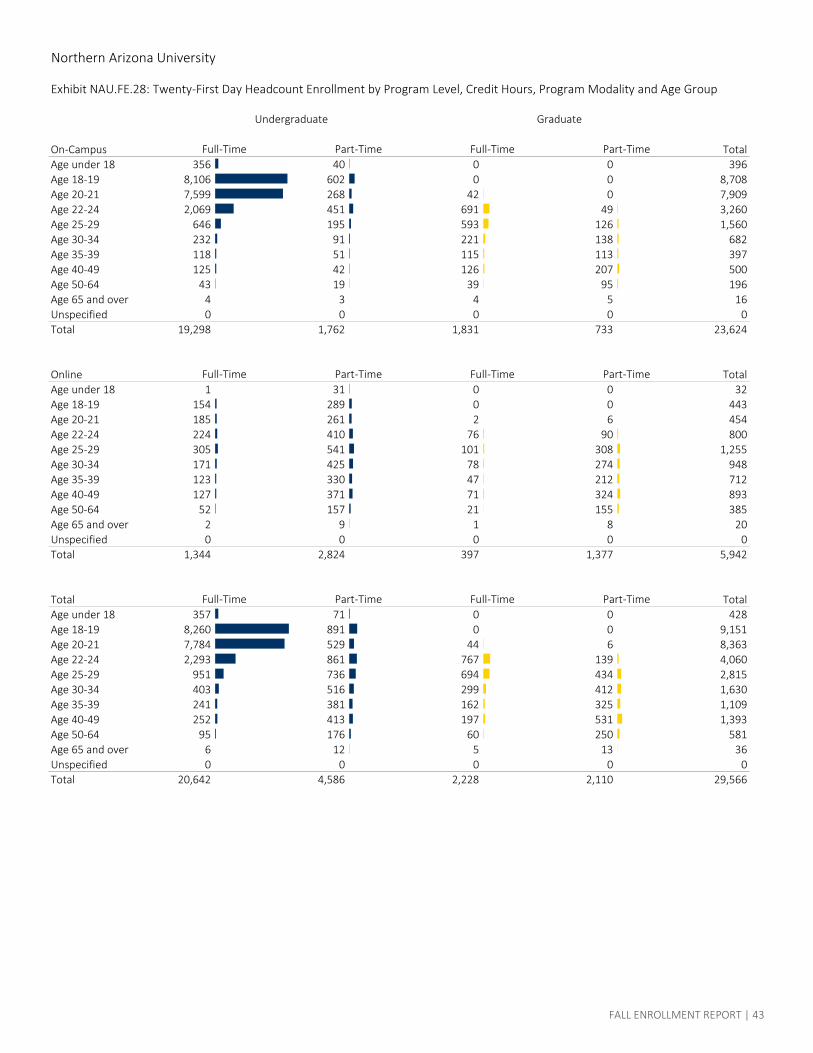
Northern Arizona University
Exhibit NAU.FE.28: Twenty-First Day Headcount Enrollment by Program Level, Credit Hours, Program Modality and Age Group
On-Campus TotalAge under 18 356 40 0 0 396Age 18-19 8,106 602 0 0 8,708Age 20-21 7,599 268 42 0 7,909Age 22-24 2,069 451 691 49 3,260Age 25-29 646 195 593 126 1,560Age 30-34 232 91 221 138 682Age 35-39 118 51 115 113 397Age 40-49 125 42 126 207 500Age 50-64 43 19 39 95 196Age 65 and over 4 3 4 5 16Unspecified 0 0 0 0 0Total 19,298 1,762 1,831 733 23,624
Online TotalAge under 18 1 31 0 0 32Age 18-19 154 289 0 0 443Age 20-21 185 261 2 6 454Age 22-24 224 410 76 90 800Age 25-29 305 541 101 308 1,255Age 30-34 171 425 78 274 948Age 35-39 123 330 47 212 712Age 40-49 127 371 71 324 893Age 50-64 52 157 21 155 385Age 65 and over 2 9 1 8 20Unspecified 0 0 0 0 0Total 1,344 2,824 397 1,377 5,942
Total TotalAge under 18 357 71 0 0 428Age 18-19 8,260 891 0 0 9,151Age 20-21 7,784 529 44 6 8,363Age 22-24 2,293 861 767 139 4,060Age 25-29 951 736 694 434 2,815Age 30-34 403 516 299 412 1,630Age 35-39 241 381 162 325 1,109Age 40-49 252 413 197 531 1,393Age 50-64 95 176 60 250 581Age 65 and over 6 12 5 13 36Unspecified 0 0 0 0 0Total 20,642 4,586 2,228 2,110 29,566
Full-Time Part-Time Full-Time Part-Time
Full-Time Part-Time Full-Time Part-Time
Undergraduate Graduate
Full-Time Part-Time Full-Time Part-Time
FALL ENROLLMENT REPORT | 43
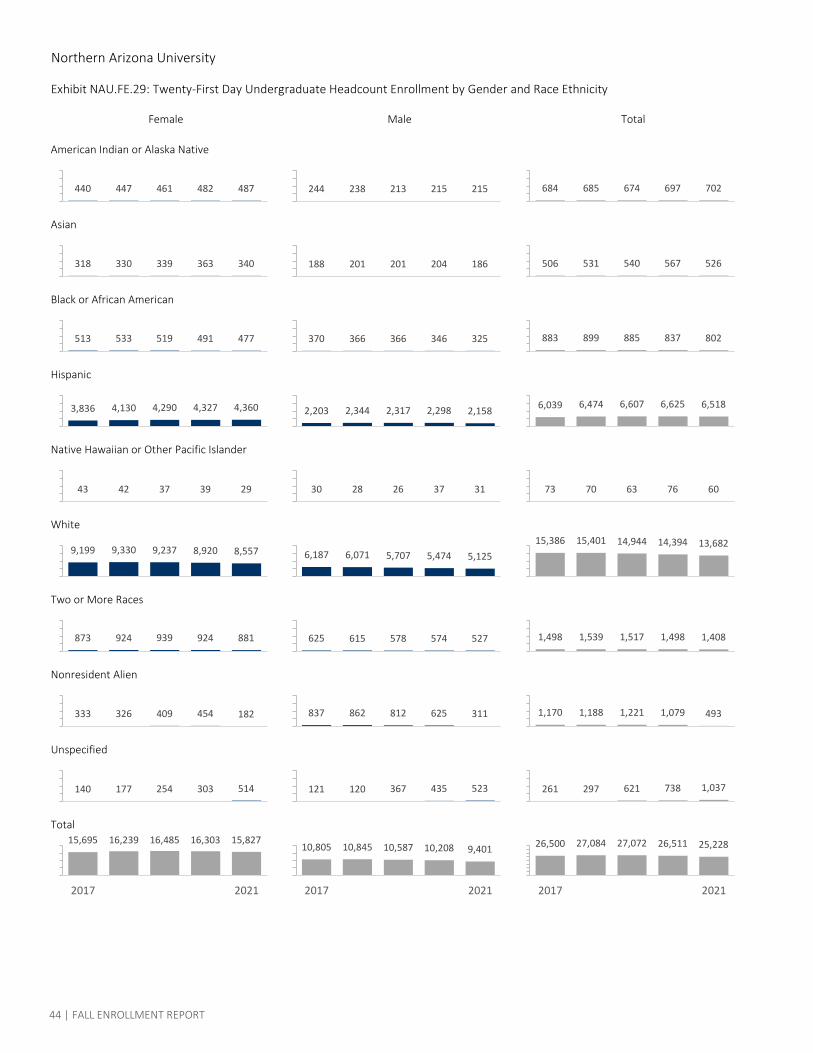
Northern Arizona University
Exhibit NAU.FE.29: Twenty-First Day Undergraduate Headcount Enrollment by Gender and Race Ethnicity
American Indian or Alaska Native
Asian
Black or African American
Hispanic
Native Hawaiian or Other Pacific Islander
White
Two or More Races
Nonresident Alien
Unspecified
Total
Female Male Total
15,695 16,239 16,485 16,303 15,827
2017 2021
140 177 254 303 514
10,805 10,845 10,587 10,208 9,401
2017 2021
121 120 367 435 523 261 297 621 738 1,037
333 326 409 454 182 837 862 812 625 311 1,170 1,188 1,221 1,079 493
873 924 939 924 881 625 615 578 574 527 1,498 1,539 1,517 1,498 1,408
9,199 9,330 9,237 8,920 8,557 6,187 6,071 5,707 5,474 5,12515,386 15,401 14,944 14,394 13,682
43 42 37 39 29 30 28 26 37 31 73 70 63 76 60
3,836 4,130 4,290 4,327 4,360 2,203 2,344 2,317 2,298 2,158 6,039 6,474 6,607 6,625 6,518
513 533 519 491 477 370 366 366 346 325 883 899 885 837 802
318 330 339 363 340 188 201 201 204 186 506 531 540 567 526
440 447 461 482 487 244 238 213 215 215 684 685 674 697 702
26,500 27,084 27,072 26,511 25,228
2017 2021
44 | FALL ENROLLMENT REPORT
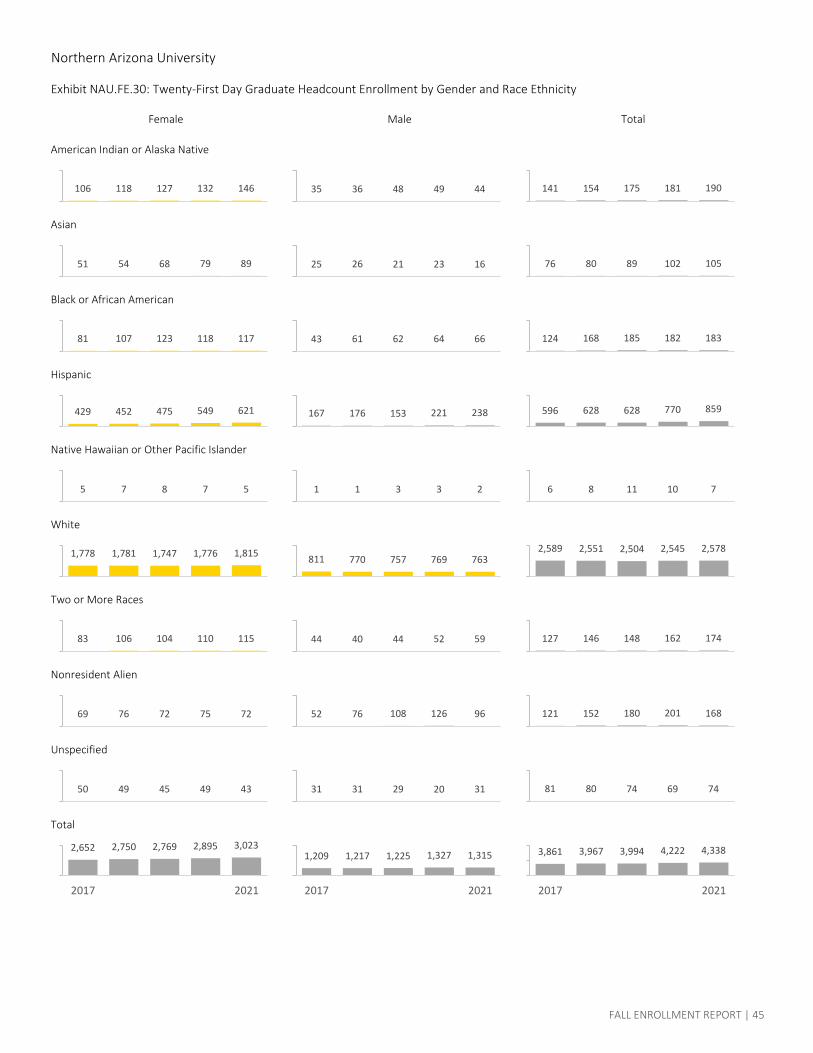
Northern Arizona University
Exhibit NAU.FE.30: Twenty-First Day Graduate Headcount Enrollment by Gender and Race Ethnicity
American Indian or Alaska Native
Asian
Black or African American
Hispanic
Native Hawaiian or Other Pacific Islander
White
Two or More Races
Nonresident Alien
Unspecified
Total
Female Male Total
2,652 2,750 2,769 2,895 3,023
2017 2021
50 49 45 49 43
1,209 1,217 1,225 1,327 1,315
2017 2021
31 31 29 20 31 81 80 74 69 74
69 76 72 75 72 52 76 108 126 96 121 152 180 201 168
83 106 104 110 115 44 40 44 52 59 127 146 148 162 174
1,778 1,781 1,747 1,776 1,815 811 770 757 769 7632,589 2,551 2,504 2,545 2,578
5 7 8 7 5 1 1 3 3 2 6 8 11 10 7
429 452 475 549 621 167 176 153 221 238 596 628 628 770 859
81 107 123 118 117 43 61 62 64 66 124 168 185 182 183
51 54 68 79 89 25 26 21 23 16 76 80 89 102 105
106 118 127 132 146 35 36 48 49 44 141 154 175 181 190
3,861 3,967 3,994 4,222 4,338
2017 2021
FALL ENROLLMENT REPORT | 45
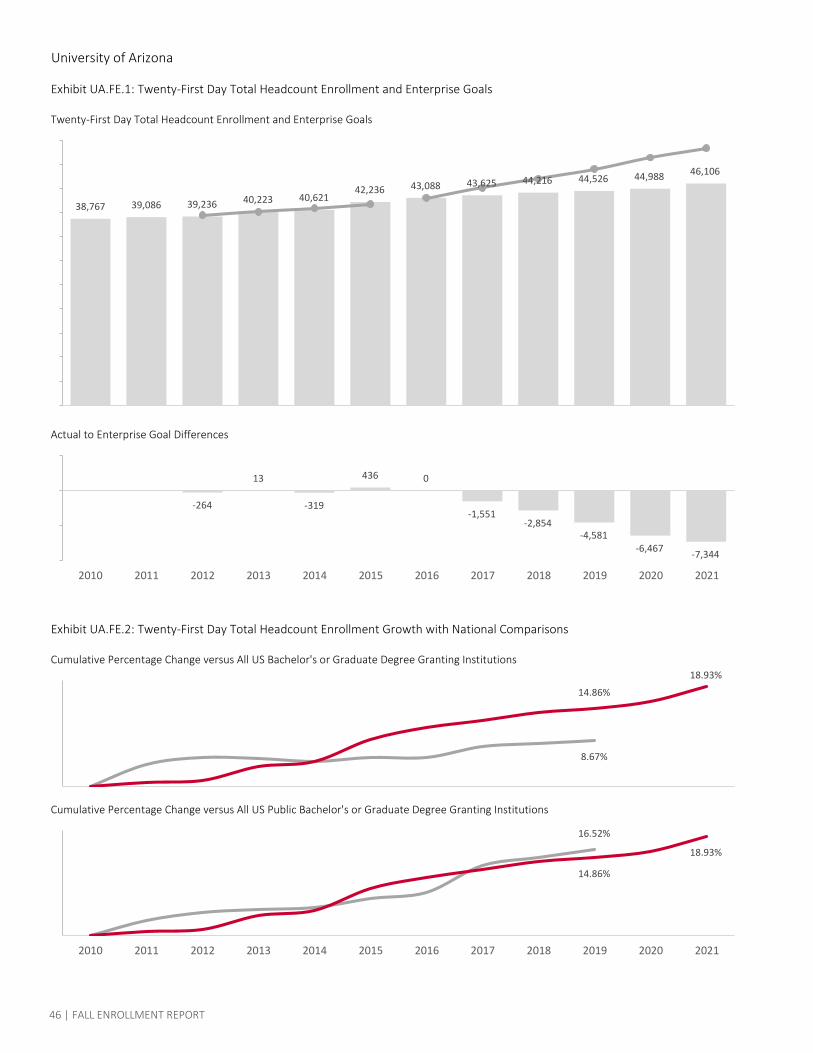
University of Arizona
Exhibit UA.FE.1: Twenty-First Day Total Headcount Enrollment and Enterprise Goals
Twenty-First Day Total Headcount Enrollment and Enterprise Goals
Actual to Enterprise Goal Differences
Exhibit UA.FE.2: Twenty-First Day Total Headcount Enrollment Growth with National Comparisons
Cumulative Percentage Change versus All US Bachelor's or Graduate Degree Granting Institutions
Cumulative Percentage Change versus All US Public Bachelor's or Graduate Degree Granting Institutions
-264
13
-319
436 0
-1,551-2,854
-4,581-6,467 -7,344
2010 2011 2012 2013 2014 2015 2016 2017 2018 2019 2020 2021
38,767 39,086 39,236 40,223 40,62142,236 43,088 43,625 44,216 44,526 44,988 46,106
8.67%
14.86%
18.93%
16.52%
14.86%
18.93%
2010 2011 2012 2013 2014 2015 2016 2017 2018 2019 2020 2021
46 | FALL ENROLLMENT REPORT
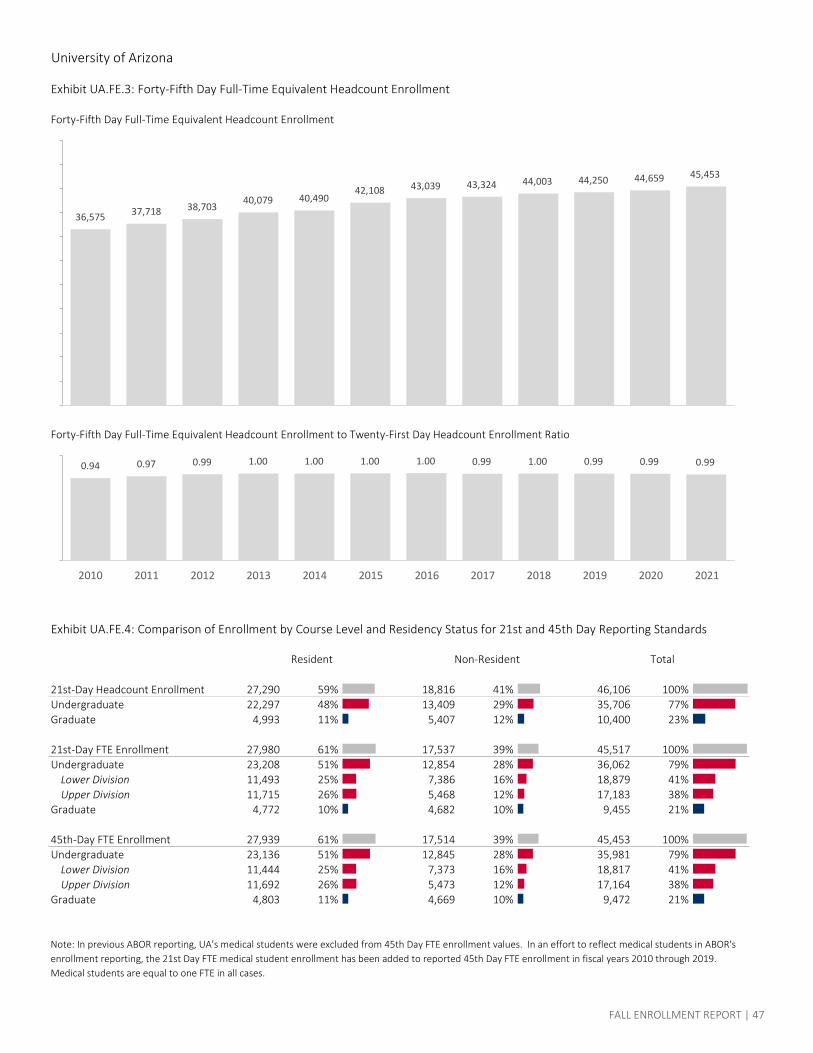
University of Arizona
Exhibit UA.FE.3: Forty-Fifth Day Full-Time Equivalent Headcount Enrollment
Forty-Fifth Day Full-Time Equivalent Headcount Enrollment
Forty-Fifth Day Full-Time Equivalent Headcount Enrollment to Twenty-First Day Headcount Enrollment Ratio
Exhibit UA.FE.4: Comparison of Enrollment by Course Level and Residency Status for 21st and 45th Day Reporting Standards
21st-Day Headcount Enrollment 27,290 59% 18,816 41% 46,106 100%Undergraduate 22,297 48% 13,409 29% 35,706 77%Graduate 4,993 11% 5,407 12% 10,400 23%
21st-Day FTE Enrollment 27,980 61% 17,537 39% 45,517 100%Undergraduate 23,208 51% 12,854 28% 36,062 79%
Lower Division 11,493 25% 7,386 16% 18,879 41%Upper Division 11,715 26% 5,468 12% 17,183 38%
Graduate 4,772 10% 4,682 10% 9,455 21%
45th-Day FTE Enrollment 27,939 61% 17,514 39% 45,453 100%Undergraduate 23,136 51% 12,845 28% 35,981 79%
Lower Division 11,444 25% 7,373 16% 18,817 41%Upper Division 11,692 26% 5,473 12% 17,164 38%
Graduate 4,803 11% 4,669 10% 9,472 21%
Resident Non-Resident Total
Note: In previous ABOR reporting, UA's medical students were excluded from 45th Day FTE enrollment values. In an effort to reflect medical students in ABOR's enrollment reporting, the 21st Day FTE medical student enrollment has been added to reported 45th Day FTE enrollment in fiscal years 2010 through 2019. Medical students are equal to one FTE in all cases.
0.94 0.97 0.99 1.00 1.00 1.00 1.00 0.99 1.00 0.99 0.99 0.99
2010 2011 2012 2013 2014 2015 2016 2017 2018 2019 2020 2021
36,575 37,718 38,70340,079 40,490
42,108 43,039 43,324 44,003 44,250 44,659 45,453
FALL ENROLLMENT REPORT | 47
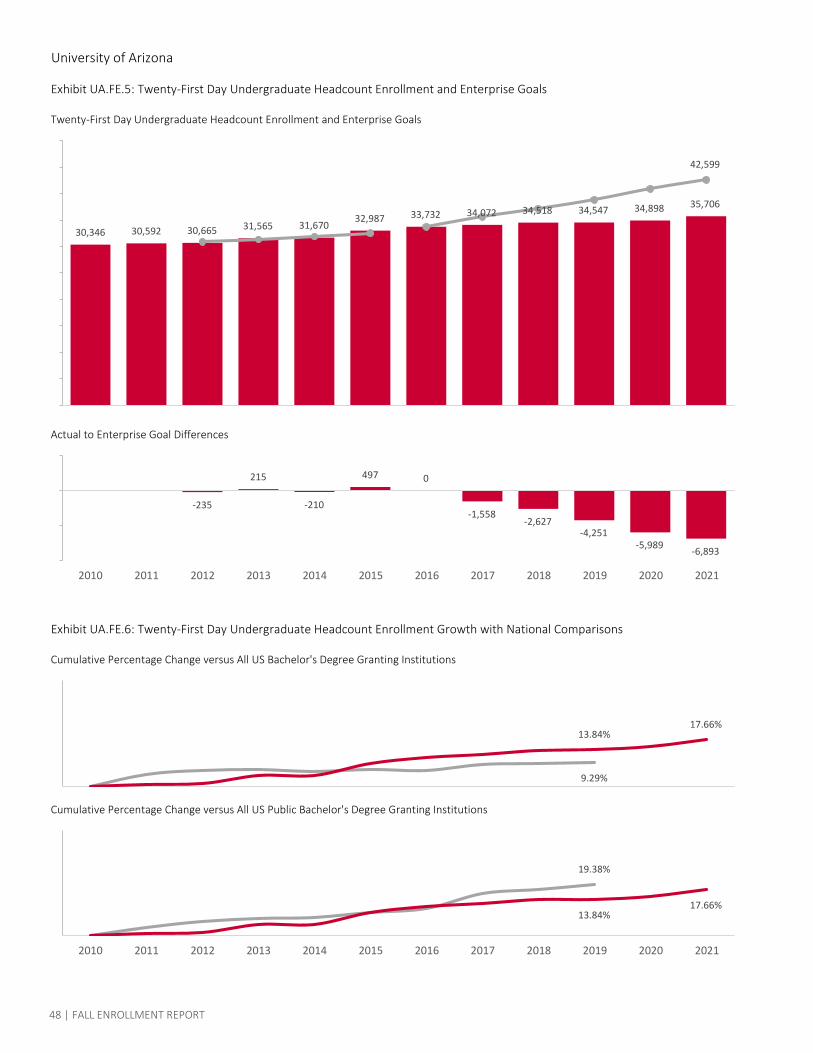
University of Arizona
Exhibit UA.FE.5: Twenty-First Day Undergraduate Headcount Enrollment and Enterprise Goals
Twenty-First Day Undergraduate Headcount Enrollment and Enterprise Goals
Actual to Enterprise Goal Differences
Exhibit UA.FE.6: Twenty-First Day Undergraduate Headcount Enrollment Growth with National Comparisons
Cumulative Percentage Change versus All US Bachelor's Degree Granting Institutions
Cumulative Percentage Change versus All US Public Bachelor's Degree Granting Institutions
-235
215
-210
497 0
-1,558-2,627
-4,251-5,989 -6,893
2010 2011 2012 2013 2014 2015 2016 2017 2018 2019 2020 2021
30,346 30,592 30,665 31,565 31,67032,987 33,732 34,072 34,518 34,547 34,898 35,706
42,599
9.29%
13.84%17.66%
19.38%
13.84%17.66%
2010 2011 2012 2013 2014 2015 2016 2017 2018 2019 2020 2021
48 | FALL ENROLLMENT REPORT
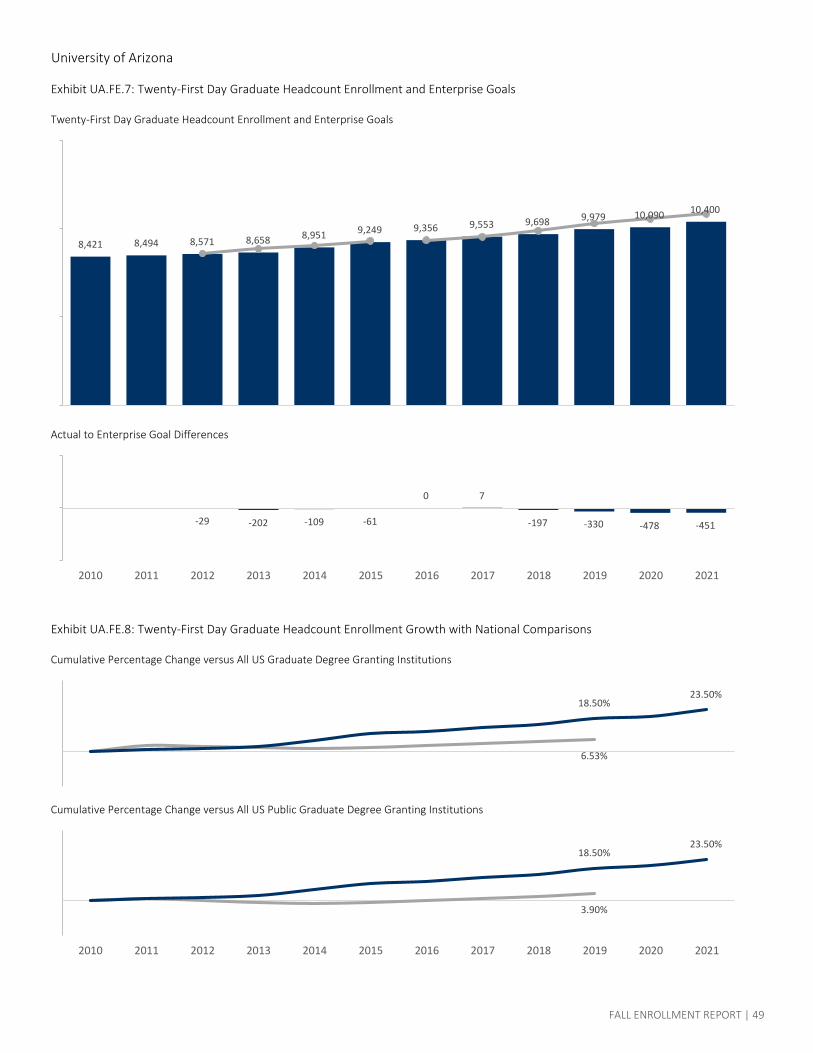
University of Arizona
Exhibit UA.FE.7: Twenty-First Day Graduate Headcount Enrollment and Enterprise Goals
Twenty-First Day Graduate Headcount Enrollment and Enterprise Goals
Actual to Enterprise Goal Differences
Exhibit UA.FE.8: Twenty-First Day Graduate Headcount Enrollment Growth with National Comparisons
Cumulative Percentage Change versus All US Graduate Degree Granting Institutions
Cumulative Percentage Change versus All US Public Graduate Degree Granting Institutions
-29 -202 -109 -61
0 7
-197 -330 -478 -451
2010 2011 2012 2013 2014 2015 2016 2017 2018 2019 2020 2021
8,421 8,494 8,571 8,658 8,951 9,249 9,356 9,553 9,698 9,979 10,090 10,400
6.53%
18.50%23.50%
3.90%
18.50%23.50%
2010 2011 2012 2013 2014 2015 2016 2017 2018 2019 2020 2021
FALL ENROLLMENT REPORT | 49
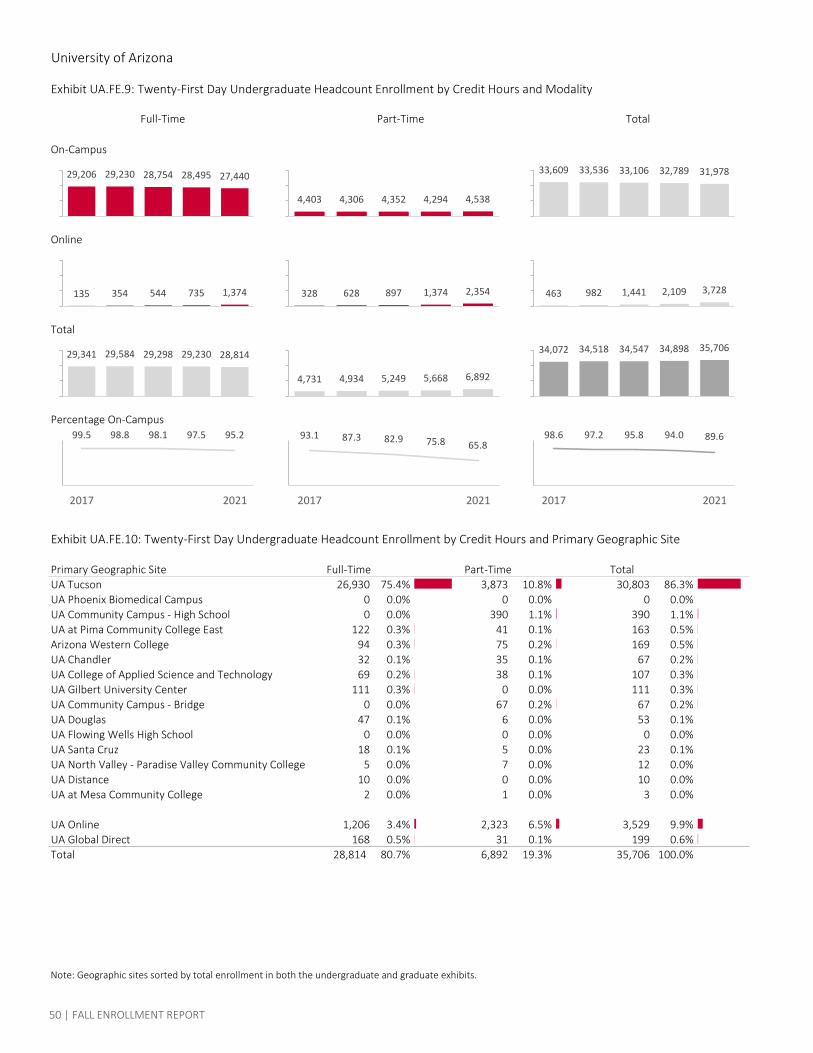
University of Arizona
Exhibit UA.FE.9: Twenty-First Day Undergraduate Headcount Enrollment by Credit Hours and Modality
On-Campus
Online
Total
Percentage On-Campus
Exhibit UA.FE.10: Twenty-First Day Undergraduate Headcount Enrollment by Credit Hours and Primary Geographic Site
Primary Geographic Site Full-Time Part-Time TotalUA Tucson 26,930 75.4% 3,873 10.8% 30,803 86.3%UA Phoenix Biomedical Campus 0 0.0% 0 0.0% 0 0.0%UA Community Campus - High School 0 0.0% 390 1.1% 390 1.1%UA at Pima Community College East 122 0.3% 41 0.1% 163 0.5%Arizona Western College 94 0.3% 75 0.2% 169 0.5%UA Chandler 32 0.1% 35 0.1% 67 0.2%UA College of Applied Science and Technology 69 0.2% 38 0.1% 107 0.3%UA Gilbert University Center 111 0.3% 0 0.0% 111 0.3%UA Community Campus - Bridge 0 0.0% 67 0.2% 67 0.2%UA Douglas 47 0.1% 6 0.0% 53 0.1%UA Flowing Wells High School 0 0.0% 0 0.0% 0 0.0%UA Santa Cruz 18 0.1% 5 0.0% 23 0.1%UA North Valley - Paradise Valley Community College 5 0.0% 7 0.0% 12 0.0%UA Distance 10 0.0% 0 0.0% 10 0.0%UA at Mesa Community College 2 0.0% 1 0.0% 3 0.0%
UA Online 1,206 3.4% 2,323 6.5% 3,529 9.9%UA Global Direct 168 0.5% 31 0.1% 199 0.6%Total 28,814 80.7% 6,892 19.3% 35,706 100.0%
Note: Geographic sites sorted by total enrollment in both the undergraduate and graduate exhibits.
29,206 29,230 28,754 28,495 27,440
4,403 4,306 4,352 4,294 4,538
33,609 33,536 33,106 32,789 31,978
135 354 544 735 1,374 328 628 897 1,374 2,354 463 982 1,441 2,109 3,728
29,341 29,584 29,298 29,230 28,814
4,731 4,934 5,249 5,668 6,892
34,072 34,518 34,547 34,898 35,706
99.5 98.8 98.1 97.5 95.2
2017 2021
93.1 87.3 82.9 75.8 65.8
2017 2021
98.6 97.2 95.8 94.0 89.6
2017 2021
Full-Time Part-Time Total
50 | FALL ENROLLMENT REPORT
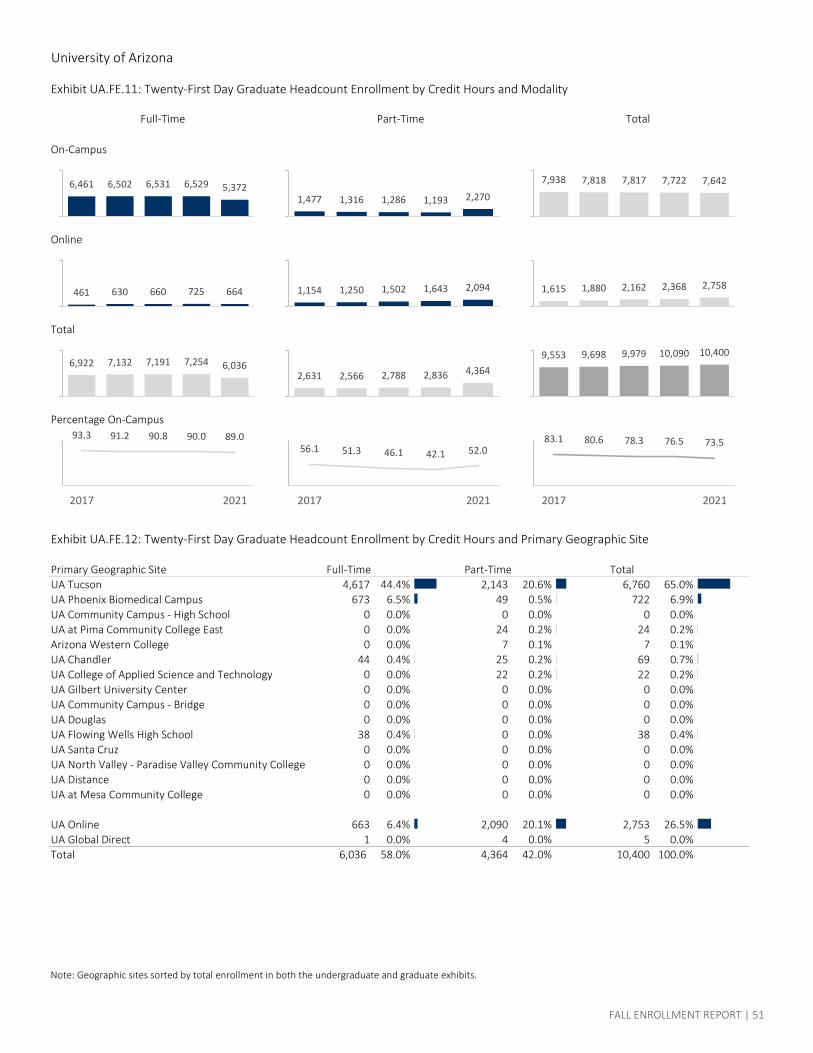
University of Arizona
Exhibit UA.FE.11: Twenty-First Day Graduate Headcount Enrollment by Credit Hours and Modality
On-Campus
Online
Total
Percentage On-Campus
Exhibit UA.FE.12: Twenty-First Day Graduate Headcount Enrollment by Credit Hours and Primary Geographic Site
Primary Geographic Site Full-Time Part-Time TotalUA Tucson 4,617 44.4% 2,143 20.6% 6,760 65.0%UA Phoenix Biomedical Campus 673 6.5% 49 0.5% 722 6.9%UA Community Campus - High School 0 0.0% 0 0.0% 0 0.0%UA at Pima Community College East 0 0.0% 24 0.2% 24 0.2%Arizona Western College 0 0.0% 7 0.1% 7 0.1%UA Chandler 44 0.4% 25 0.2% 69 0.7%UA College of Applied Science and Technology 0 0.0% 22 0.2% 22 0.2%UA Gilbert University Center 0 0.0% 0 0.0% 0 0.0%UA Community Campus - Bridge 0 0.0% 0 0.0% 0 0.0%UA Douglas 0 0.0% 0 0.0% 0 0.0%UA Flowing Wells High School 38 0.4% 0 0.0% 38 0.4%UA Santa Cruz 0 0.0% 0 0.0% 0 0.0%UA North Valley - Paradise Valley Community College 0 0.0% 0 0.0% 0 0.0%UA Distance 0 0.0% 0 0.0% 0 0.0%UA at Mesa Community College 0 0.0% 0 0.0% 0 0.0%
UA Online 663 6.4% 2,090 20.1% 2,753 26.5%UA Global Direct 1 0.0% 4 0.0% 5 0.0%Total 6,036 58.0% 4,364 42.0% 10,400 100.0%
Note: Geographic sites sorted by total enrollment in both the undergraduate and graduate exhibits.
6,461 6,502 6,531 6,529 5,3721,477 1,316 1,286 1,193 2,270
7,938 7,818 7,817 7,722 7,642
461 630 660 725 664 1,154 1,250 1,502 1,643 2,094 1,615 1,880 2,162 2,368 2,758
6,922 7,132 7,191 7,254 6,0362,631 2,566 2,788 2,836 4,364
9,553 9,698 9,979 10,090 10,400
93.3 91.2 90.8 90.0 89.0
2017 2021
56.1 51.3 46.1 42.1 52.0
2017 2021
83.1 80.6 78.3 76.5 73.5
2017 2021
Full-Time Part-Time Total
FALL ENROLLMENT REPORT | 51
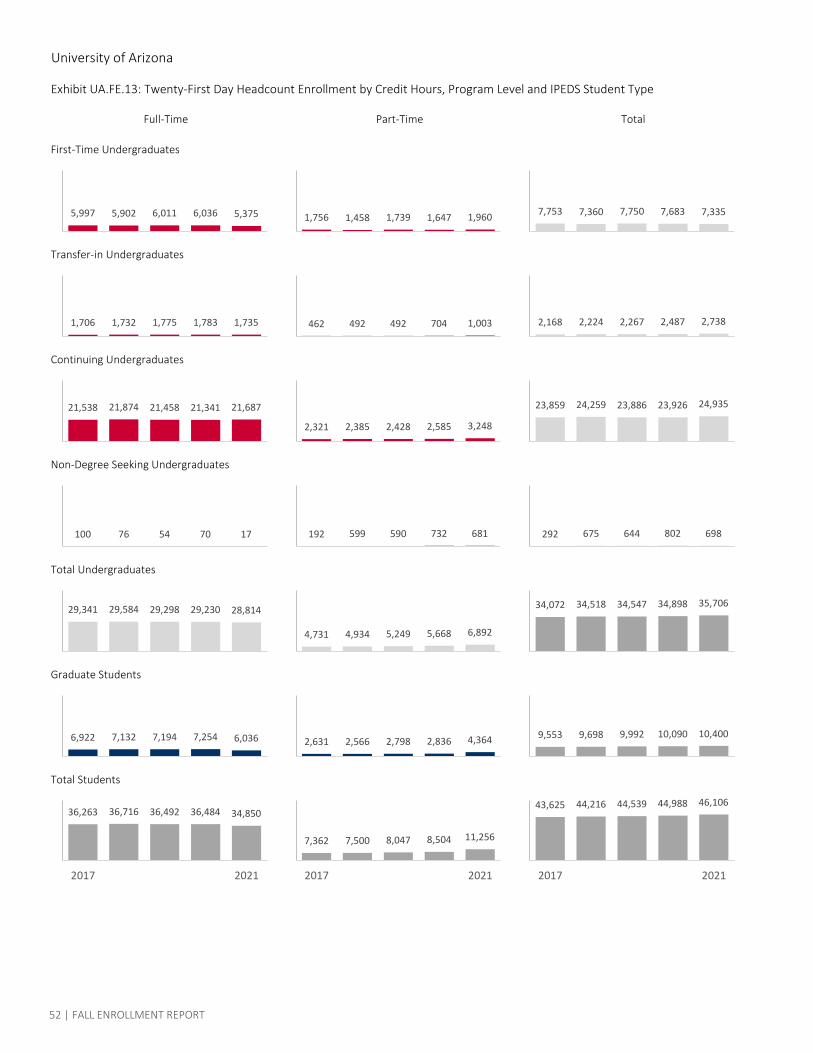
University of Arizona
Exhibit UA.FE.13: Twenty-First Day Headcount Enrollment by Credit Hours, Program Level and IPEDS Student Type
First-Time Undergraduates
Transfer-in Undergraduates
Continuing Undergraduates
Non-Degree Seeking Undergraduates
Total Undergraduates
Graduate Students
Total Students
Full-Time Part-Time Total
29,341 29,584 29,298 29,230 28,814
4,731 4,934 5,249 5,668 6,892
34,072 34,518 34,547 34,898 35,706
36,263 36,716 36,492 36,484 34,850
2017 2021
5,997 5,902 6,011 6,036 5,375 1,756 1,458 1,739 1,647 1,960 7,753 7,360 7,750 7,683 7,335
1,706 1,732 1,775 1,783 1,735 462 492 492 704 1,003 2,168 2,224 2,267 2,487 2,738
21,538 21,874 21,458 21,341 21,687
2,321 2,385 2,428 2,585 3,248
23,859 24,259 23,886 23,926 24,935
100 76 54 70 17 192 599 590 732 681 292 675 644 802 698
6,922 7,132 7,194 7,254 6,036 2,631 2,566 2,798 2,836 4,364 9,553 9,698 9,992 10,090 10,400
7,362 7,500 8,047 8,504 11,256
2017 2021
43,625 44,216 44,539 44,988 46,106
2017 2021
52 | FALL ENROLLMENT REPORT
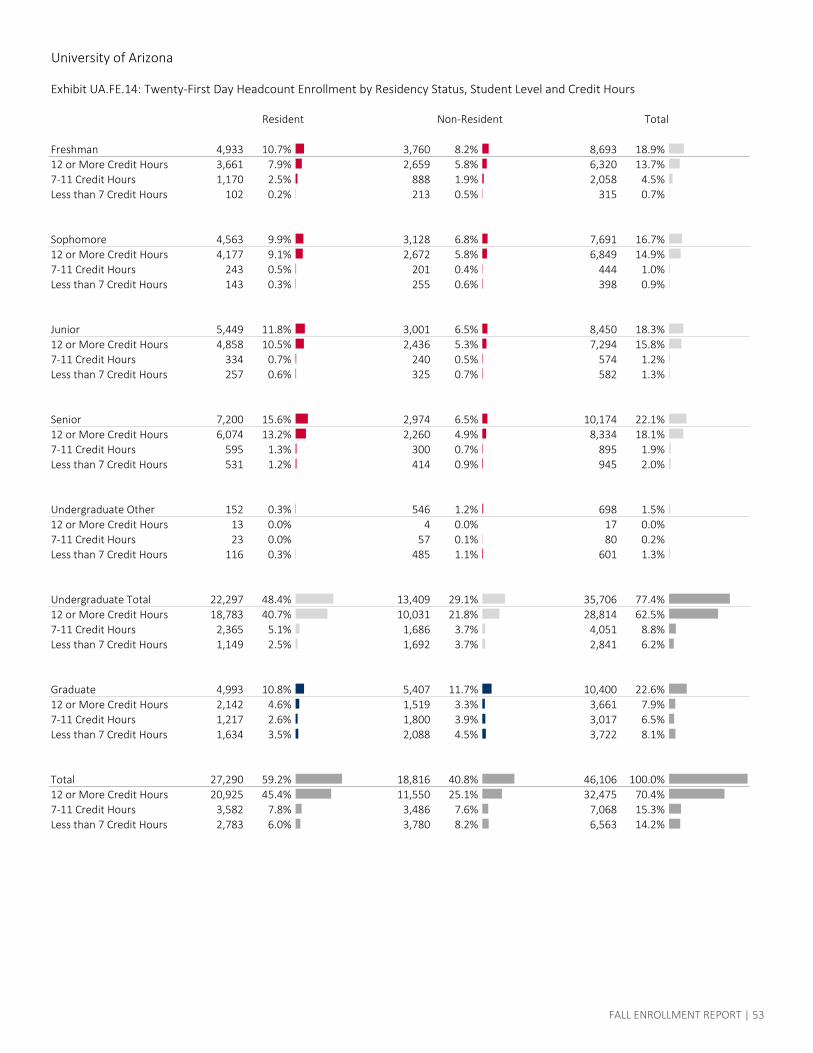
University of Arizona
Exhibit UA.FE.14: Twenty-First Day Headcount Enrollment by Residency Status, Student Level and Credit Hours
Freshman 4,933 10.7% 3,760 8.2% 8,693 18.9%12 or More Credit Hours 3,661 7.9% 2,659 5.8% 6,320 13.7%7-11 Credit Hours 1,170 2.5% 888 1.9% 2,058 4.5%Less than 7 Credit Hours 102 0.2% 213 0.5% 315 0.7%
Sophomore 4,563 9.9% 3,128 6.8% 7,691 16.7%12 or More Credit Hours 4,177 9.1% 2,672 5.8% 6,849 14.9%7-11 Credit Hours 243 0.5% 201 0.4% 444 1.0%Less than 7 Credit Hours 143 0.3% 255 0.6% 398 0.9%
Junior 5,449 11.8% 3,001 6.5% 8,450 18.3%12 or More Credit Hours 4,858 10.5% 2,436 5.3% 7,294 15.8%7-11 Credit Hours 334 0.7% 240 0.5% 574 1.2%Less than 7 Credit Hours 257 0.6% 325 0.7% 582 1.3%
Senior 7,200 15.6% 2,974 6.5% 10,174 22.1%12 or More Credit Hours 6,074 13.2% 2,260 4.9% 8,334 18.1%7-11 Credit Hours 595 1.3% 300 0.7% 895 1.9%Less than 7 Credit Hours 531 1.2% 414 0.9% 945 2.0%
Undergraduate Other 152 0.3% 546 1.2% 698 1.5%12 or More Credit Hours 13 0.0% 4 0.0% 17 0.0%7-11 Credit Hours 23 0.0% 57 0.1% 80 0.2%Less than 7 Credit Hours 116 0.3% 485 1.1% 601 1.3%
Undergraduate Total 22,297 48.4% 13,409 29.1% 35,706 77.4%12 or More Credit Hours 18,783 40.7% 10,031 21.8% 28,814 62.5%7-11 Credit Hours 2,365 5.1% 1,686 3.7% 4,051 8.8%Less than 7 Credit Hours 1,149 2.5% 1,692 3.7% 2,841 6.2%
Graduate 4,993 10.8% 5,407 11.7% 10,400 22.6%12 or More Credit Hours 2,142 4.6% 1,519 3.3% 3,661 7.9%7-11 Credit Hours 1,217 2.6% 1,800 3.9% 3,017 6.5%Less than 7 Credit Hours 1,634 3.5% 2,088 4.5% 3,722 8.1%
Total 27,290 59.2% 18,816 40.8% 46,106 100.0%12 or More Credit Hours 20,925 45.4% 11,550 25.1% 32,475 70.4%7-11 Credit Hours 3,582 7.8% 3,486 7.6% 7,068 15.3%Less than 7 Credit Hours 2,783 6.0% 3,780 8.2% 6,563 14.2%
Resident Non-Resident Total
FALL ENROLLMENT REPORT | 53
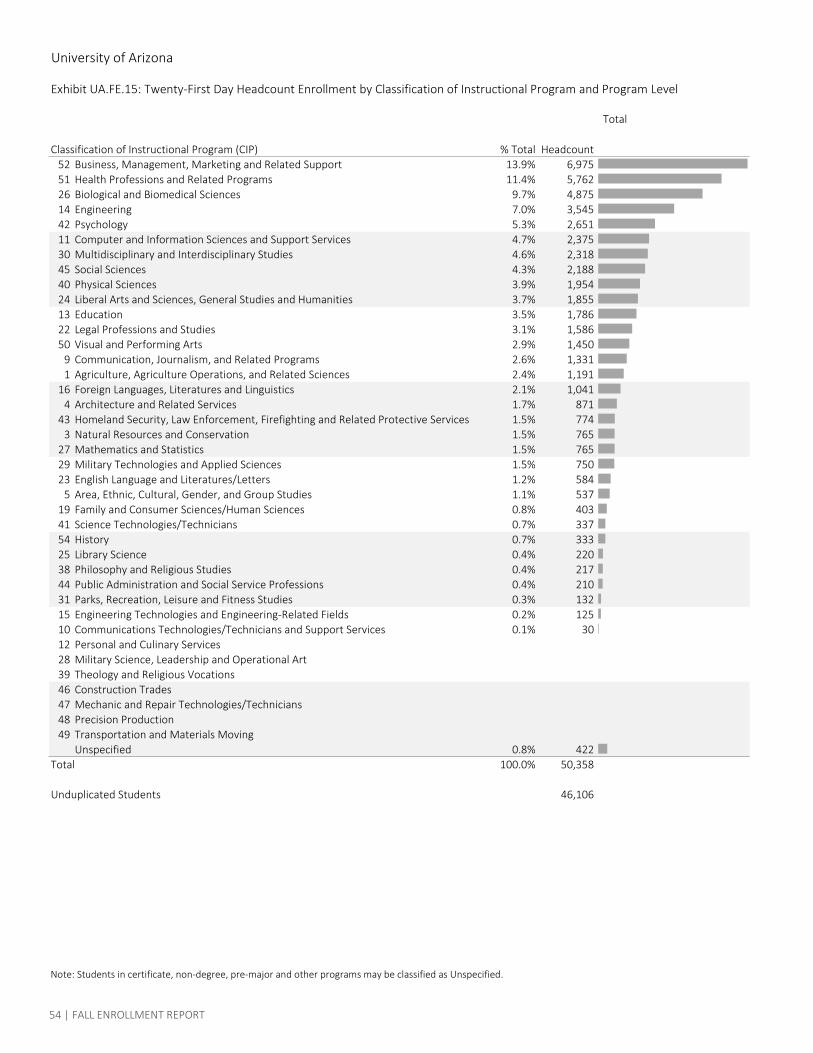
University of Arizona
Exhibit UA.FE.15: Twenty-First Day Headcount Enrollment by Classification of Instructional Program and Program Level
Classification of Instructional Program (CIP) % Total Headcount52 Business, Management, Marketing and Related Support 13.9% 6,97551 Health Professions and Related Programs 11.4% 5,76226 Biological and Biomedical Sciences 9.7% 4,87514 Engineering 7.0% 3,54542 Psychology 5.3% 2,65111 Computer and Information Sciences and Support Services 4.7% 2,37530 Multidisciplinary and Interdisciplinary Studies 4.6% 2,31845 Social Sciences 4.3% 2,18840 Physical Sciences 3.9% 1,95424 Liberal Arts and Sciences, General Studies and Humanities 3.7% 1,85513 Education 3.5% 1,78622 Legal Professions and Studies 3.1% 1,58650 Visual and Performing Arts 2.9% 1,450
9 Communication, Journalism, and Related Programs 2.6% 1,3311 Agriculture, Agriculture Operations, and Related Sciences 2.4% 1,191
16 Foreign Languages, Literatures and Linguistics 2.1% 1,0414 Architecture and Related Services 1.7% 871
43 Homeland Security, Law Enforcement, Firefighting and Related Protective Services 1.5% 7743 Natural Resources and Conservation 1.5% 765
27 Mathematics and Statistics 1.5% 76529 Military Technologies and Applied Sciences 1.5% 75023 English Language and Literatures/Letters 1.2% 584
5 Area, Ethnic, Cultural, Gender, and Group Studies 1.1% 53719 Family and Consumer Sciences/Human Sciences 0.8% 40341 Science Technologies/Technicians 0.7% 33754 History 0.7% 33325 Library Science 0.4% 22038 Philosophy and Religious Studies 0.4% 21744 Public Administration and Social Service Professions 0.4% 21031 Parks, Recreation, Leisure and Fitness Studies 0.3% 13215 Engineering Technologies and Engineering-Related Fields 0.2% 12510 Communications Technologies/Technicians and Support Services 0.1% 3012 Personal and Culinary Services28 Military Science, Leadership and Operational Art39 Theology and Religious Vocations46 Construction Trades47 Mechanic and Repair Technologies/Technicians48 Precision Production49 Transportation and Materials Moving
Unspecified 0.8% 422Total 100.0% 50,358
Unduplicated Students 46,106
Total
Note: Students in certificate, non-degree, pre-major and other programs may be classified as Unspecified.
54 | FALL ENROLLMENT REPORT
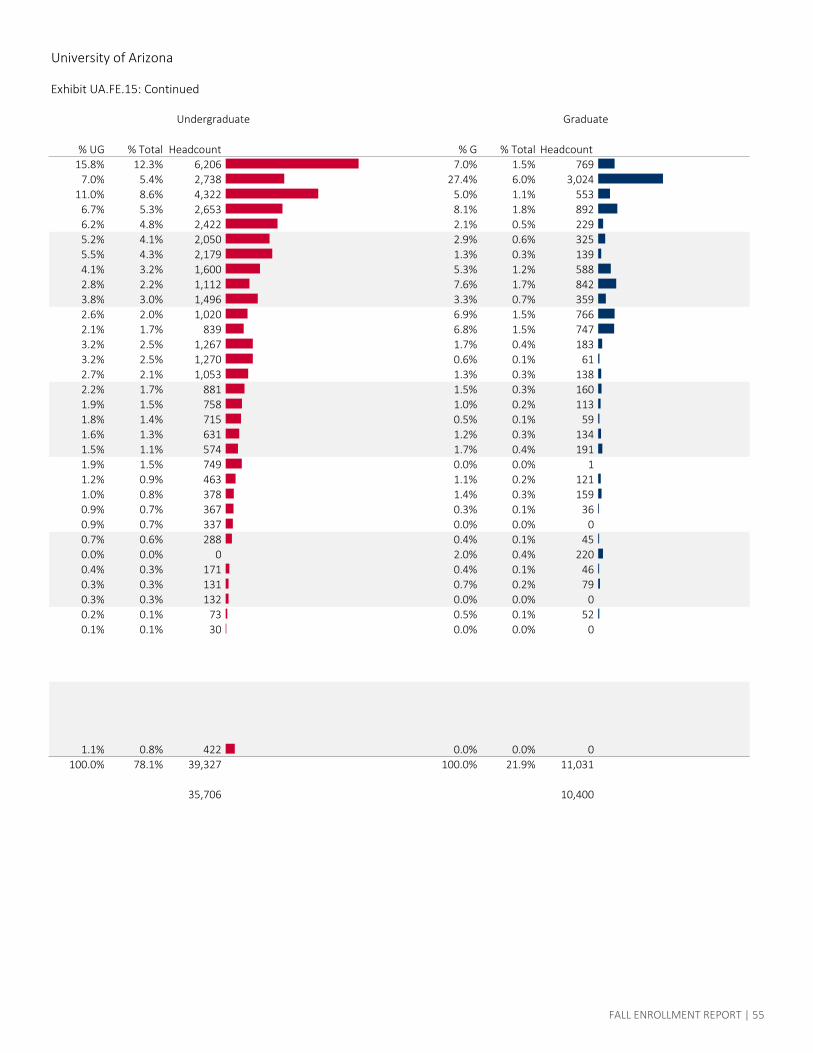
University of Arizona
Exhibit UA.FE.15: Continued
% UG % Total Headcount % G % Total Headcount15.8% 12.3% 6,206 7.0% 1.5% 769
7.0% 5.4% 2,738 27.4% 6.0% 3,02411.0% 8.6% 4,322 5.0% 1.1% 553
6.7% 5.3% 2,653 8.1% 1.8% 8926.2% 4.8% 2,422 2.1% 0.5% 2295.2% 4.1% 2,050 2.9% 0.6% 3255.5% 4.3% 2,179 1.3% 0.3% 1394.1% 3.2% 1,600 5.3% 1.2% 5882.8% 2.2% 1,112 7.6% 1.7% 8423.8% 3.0% 1,496 3.3% 0.7% 3592.6% 2.0% 1,020 6.9% 1.5% 7662.1% 1.7% 839 6.8% 1.5% 7473.2% 2.5% 1,267 1.7% 0.4% 1833.2% 2.5% 1,270 0.6% 0.1% 612.7% 2.1% 1,053 1.3% 0.3% 1382.2% 1.7% 881 1.5% 0.3% 1601.9% 1.5% 758 1.0% 0.2% 1131.8% 1.4% 715 0.5% 0.1% 591.6% 1.3% 631 1.2% 0.3% 1341.5% 1.1% 574 1.7% 0.4% 1911.9% 1.5% 749 0.0% 0.0% 11.2% 0.9% 463 1.1% 0.2% 1211.0% 0.8% 378 1.4% 0.3% 1590.9% 0.7% 367 0.3% 0.1% 360.9% 0.7% 337 0.0% 0.0% 00.7% 0.6% 288 0.4% 0.1% 450.0% 0.0% 0 2.0% 0.4% 2200.4% 0.3% 171 0.4% 0.1% 460.3% 0.3% 131 0.7% 0.2% 790.3% 0.3% 132 0.0% 0.0% 00.2% 0.1% 73 0.5% 0.1% 520.1% 0.1% 30 0.0% 0.0% 0
1.1% 0.8% 422 0.0% 0.0% 0100.0% 78.1% 39,327 100.0% 21.9% 11,031
35,706 10,400
Undergraduate Graduate
FALL ENROLLMENT REPORT | 55
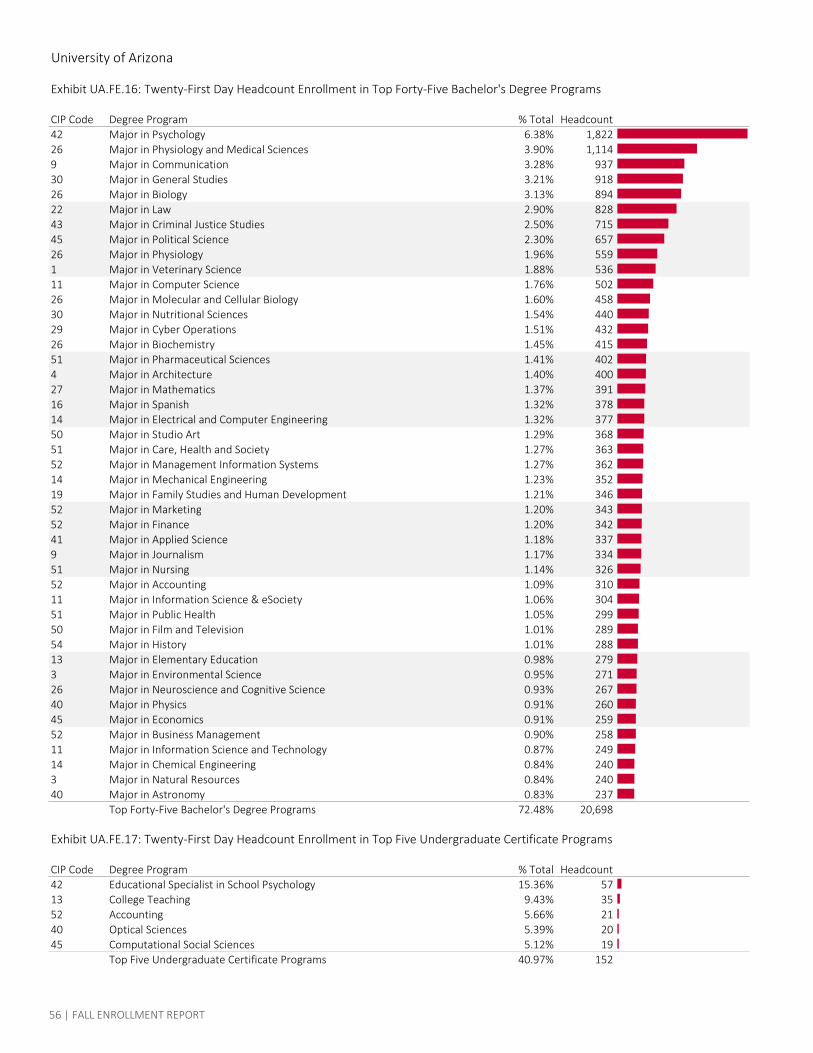
University of Arizona
Exhibit UA.FE.16: Twenty-First Day Headcount Enrollment in Top Forty-Five Bachelor's Degree Programs
CIP Code Degree Program % Total Headcount42 Major in Psychology 6.38% 1,82226 Major in Physiology and Medical Sciences 3.90% 1,1149 Major in Communication 3.28% 93730 Major in General Studies 3.21% 91826 Major in Biology 3.13% 89422 Major in Law 2.90% 82843 Major in Criminal Justice Studies 2.50% 71545 Major in Political Science 2.30% 65726 Major in Physiology 1.96% 5591 Major in Veterinary Science 1.88% 53611 Major in Computer Science 1.76% 50226 Major in Molecular and Cellular Biology 1.60% 45830 Major in Nutritional Sciences 1.54% 44029 Major in Cyber Operations 1.51% 43226 Major in Biochemistry 1.45% 41551 Major in Pharmaceutical Sciences 1.41% 4024 Major in Architecture 1.40% 40027 Major in Mathematics 1.37% 39116 Major in Spanish 1.32% 37814 Major in Electrical and Computer Engineering 1.32% 37750 Major in Studio Art 1.29% 36851 Major in Care, Health and Society 1.27% 36352 Major in Management Information Systems 1.27% 36214 Major in Mechanical Engineering 1.23% 35219 Major in Family Studies and Human Development 1.21% 34652 Major in Marketing 1.20% 34352 Major in Finance 1.20% 34241 Major in Applied Science 1.18% 3379 Major in Journalism 1.17% 33451 Major in Nursing 1.14% 32652 Major in Accounting 1.09% 31011 Major in Information Science & eSociety 1.06% 30451 Major in Public Health 1.05% 29950 Major in Film and Television 1.01% 28954 Major in History 1.01% 28813 Major in Elementary Education 0.98% 2793 Major in Environmental Science 0.95% 27126 Major in Neuroscience and Cognitive Science 0.93% 26740 Major in Physics 0.91% 26045 Major in Economics 0.91% 25952 Major in Business Management 0.90% 25811 Major in Information Science and Technology 0.87% 24914 Major in Chemical Engineering 0.84% 2403 Major in Natural Resources 0.84% 24040 Major in Astronomy 0.83% 237
Top Forty-Five Bachelor's Degree Programs 72.48% 20,698
Exhibit UA.FE.17: Twenty-First Day Headcount Enrollment in Top Five Undergraduate Certificate Programs
CIP Code Degree Program % Total Headcount42 Educational Specialist in School Psychology 15.36% 5713 College Teaching 9.43% 3552 Accounting 5.66% 2140 Optical Sciences 5.39% 2045 Computational Social Sciences 5.12% 19
Top Five Undergraduate Certificate Programs 40.97% 152
56 | FALL ENROLLMENT REPORT
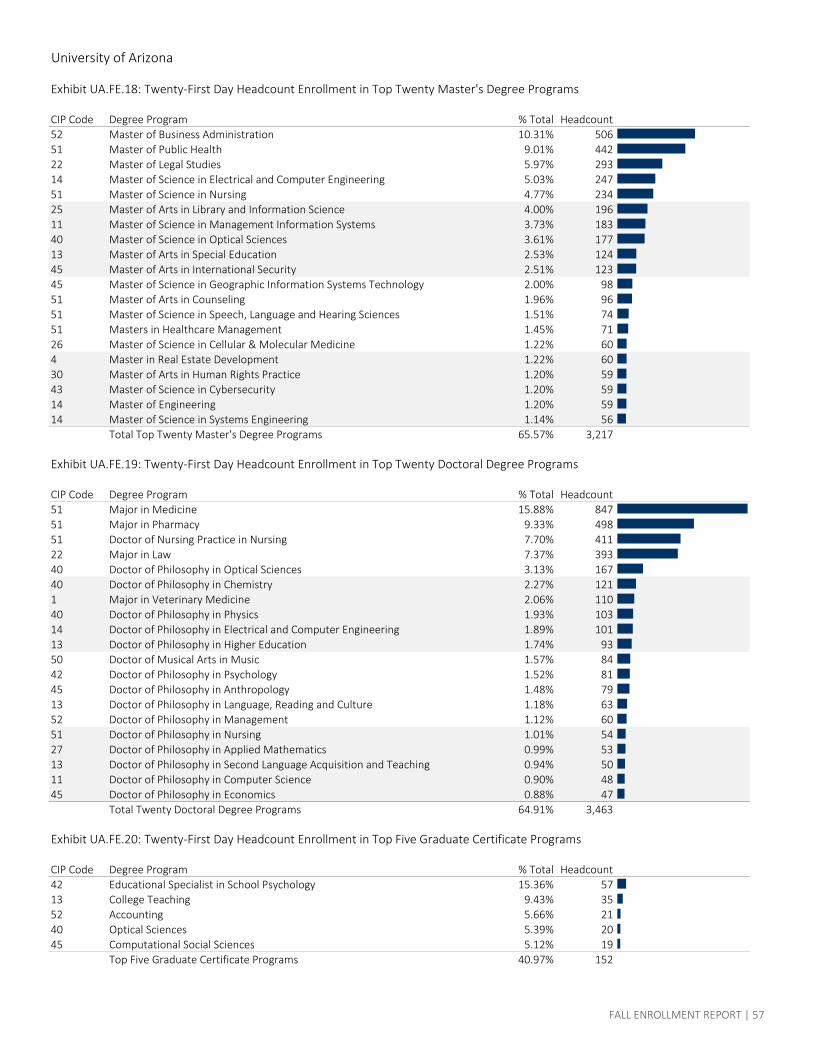
University of Arizona
Exhibit UA.FE.18: Twenty-First Day Headcount Enrollment in Top Twenty Master's Degree Programs
CIP Code Degree Program % Total Headcount52 Master of Business Administration 10.31% 50651 Master of Public Health 9.01% 44222 Master of Legal Studies 5.97% 29314 Master of Science in Electrical and Computer Engineering 5.03% 24751 Master of Science in Nursing 4.77% 23425 Master of Arts in Library and Information Science 4.00% 19611 Master of Science in Management Information Systems 3.73% 18340 Master of Science in Optical Sciences 3.61% 17713 Master of Arts in Special Education 2.53% 12445 Master of Arts in International Security 2.51% 12345 Master of Science in Geographic Information Systems Technology 2.00% 9851 Master of Arts in Counseling 1.96% 9651 Master of Science in Speech, Language and Hearing Sciences 1.51% 7451 Masters in Healthcare Management 1.45% 7126 Master of Science in Cellular & Molecular Medicine 1.22% 604 Master in Real Estate Development 1.22% 6030 Master of Arts in Human Rights Practice 1.20% 5943 Master of Science in Cybersecurity 1.20% 5914 Master of Engineering 1.20% 5914 Master of Science in Systems Engineering 1.14% 56
Total Top Twenty Master's Degree Programs 65.57% 3,217
Exhibit UA.FE.19: Twenty-First Day Headcount Enrollment in Top Twenty Doctoral Degree Programs
CIP Code Degree Program % Total Headcount51 Major in Medicine 15.88% 84751 Major in Pharmacy 9.33% 49851 Doctor of Nursing Practice in Nursing 7.70% 41122 Major in Law 7.37% 39340 Doctor of Philosophy in Optical Sciences 3.13% 16740 Doctor of Philosophy in Chemistry 2.27% 1211 Major in Veterinary Medicine 2.06% 11040 Doctor of Philosophy in Physics 1.93% 10314 Doctor of Philosophy in Electrical and Computer Engineering 1.89% 10113 Doctor of Philosophy in Higher Education 1.74% 9350 Doctor of Musical Arts in Music 1.57% 8442 Doctor of Philosophy in Psychology 1.52% 8145 Doctor of Philosophy in Anthropology 1.48% 7913 Doctor of Philosophy in Language, Reading and Culture 1.18% 6352 Doctor of Philosophy in Management 1.12% 6051 Doctor of Philosophy in Nursing 1.01% 5427 Doctor of Philosophy in Applied Mathematics 0.99% 5313 Doctor of Philosophy in Second Language Acquisition and Teaching 0.94% 5011 Doctor of Philosophy in Computer Science 0.90% 4845 Doctor of Philosophy in Economics 0.88% 47
Total Twenty Doctoral Degree Programs 64.91% 3,463
Exhibit UA.FE.20: Twenty-First Day Headcount Enrollment in Top Five Graduate Certificate Programs
CIP Code Degree Program % Total Headcount42 Educational Specialist in School Psychology 15.36% 5713 College Teaching 9.43% 3552 Accounting 5.66% 2140 Optical Sciences 5.39% 2045 Computational Social Sciences 5.12% 19
Top Five Graduate Certificate Programs 40.97% 152
FALL ENROLLMENT REPORT | 57
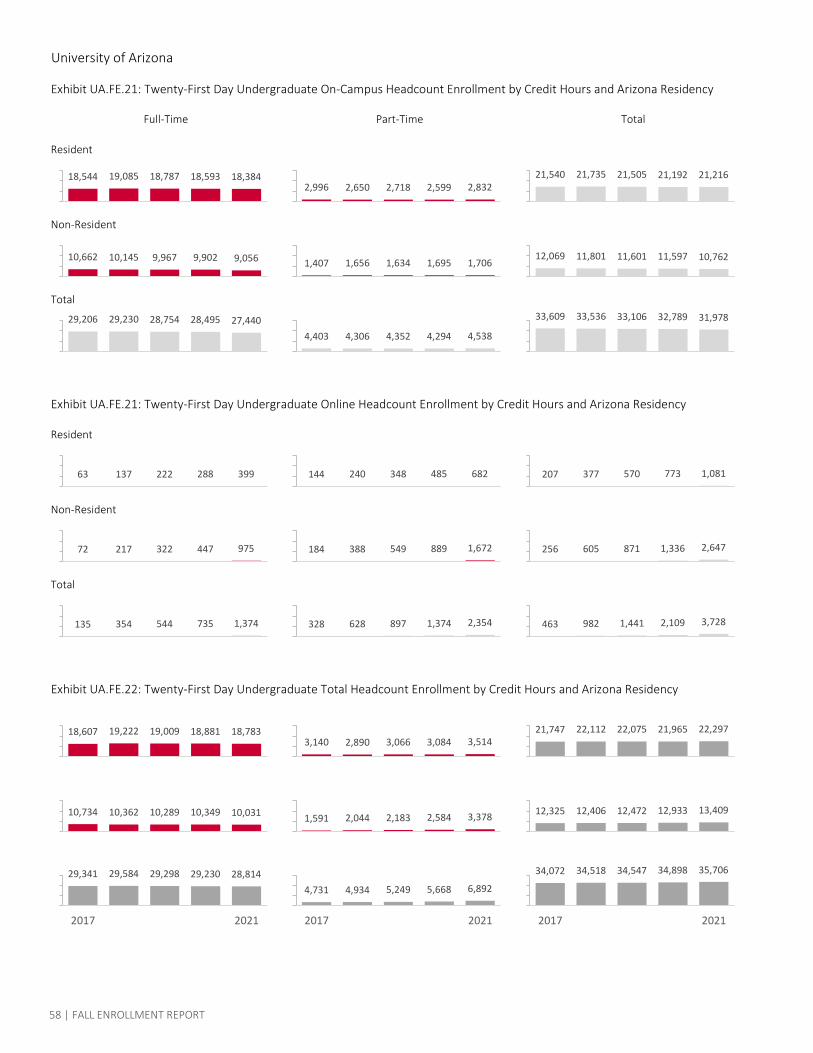
University of Arizona
Exhibit UA.FE.21: Twenty-First Day Undergraduate On-Campus Headcount Enrollment by Credit Hours and Arizona Residency
Resident
Non-Resident
Total
Exhibit UA.FE.21: Twenty-First Day Undergraduate Online Headcount Enrollment by Credit Hours and Arizona Residency
Resident
Non-Resident
Total
Exhibit UA.FE.22: Twenty-First Day Undergraduate Total Headcount Enrollment by Credit Hours and Arizona Residency
Resident
Non-Resident
Total
Full-Time Part-Time Total
18,544 19,085 18,787 18,593 18,384
10,662 10,145 9,967 9,902 9,056
29,206 29,230 28,754 28,495 27,440
63 137 222 288 399
72 217 322 447 975
18,607 19,222 19,009 18,881 18,783
10,734 10,362 10,289 10,349 10,031
29,341 29,584 29,298 29,230 28,814
2017 2021
2,996 2,650 2,718 2,599 2,832
1,407 1,656 1,634 1,695 1,706
4,403 4,306 4,352 4,294 4,538
144 240 348 485 682
184 388 549 889 1,672
3,140 2,890 3,066 3,084 3,514
1,591 2,044 2,183 2,584 3,378
4,731 4,934 5,249 5,668 6,892
2017 2021
21,540 21,735 21,505 21,192 21,216
12,069 11,801 11,601 11,597 10,762
33,609 33,536 33,106 32,789 31,978
207 377 570 773 1,081
256 605 871 1,336 2,647
21,747 22,112 22,075 21,965 22,297
12,325 12,406 12,472 12,933 13,409
34,072 34,518 34,547 34,898 35,706
2017 2021
135 354 544 735 1,374 328 628 897 1,374 2,354 463 982 1,441 2,109 3,728
58 | FALL ENROLLMENT REPORT
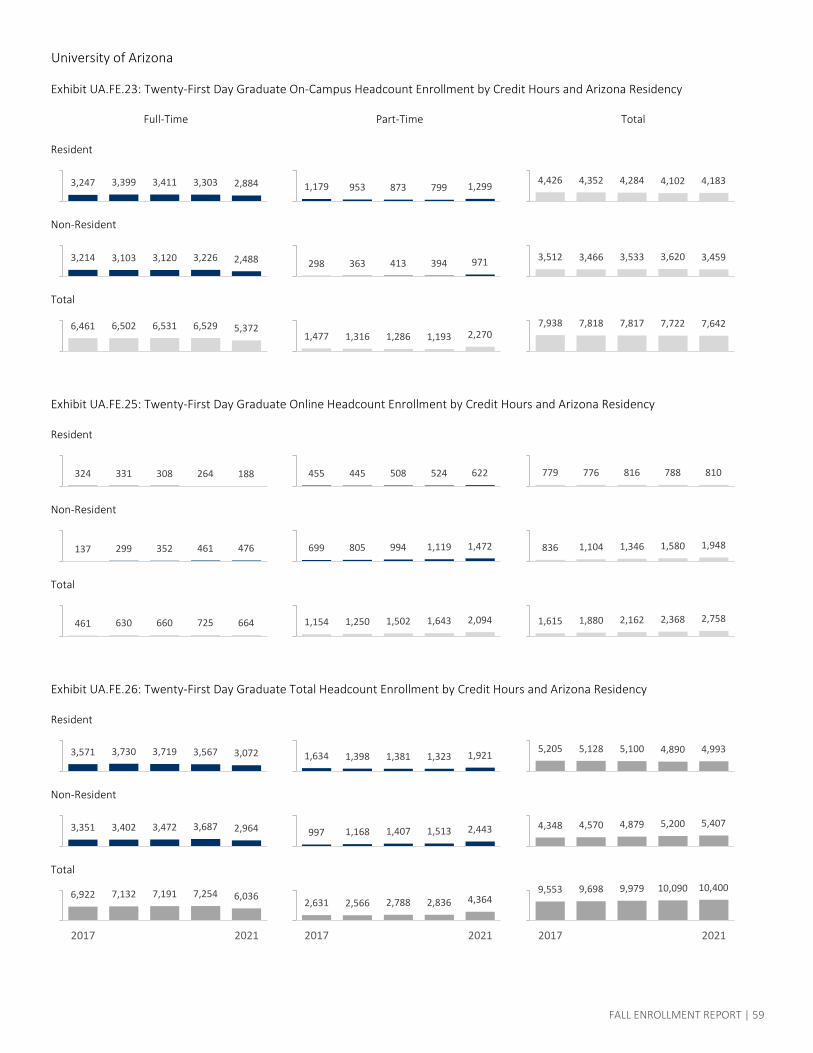
University of Arizona
Exhibit UA.FE.23: Twenty-First Day Graduate On-Campus Headcount Enrollment by Credit Hours and Arizona Residency
Resident
Non-Resident
Total
Exhibit UA.FE.25: Twenty-First Day Graduate Online Headcount Enrollment by Credit Hours and Arizona Residency
Resident
Non-Resident
Total
Exhibit UA.FE.26: Twenty-First Day Graduate Total Headcount Enrollment by Credit Hours and Arizona Residency
Resident
Non-Resident
Total
Full-Time Part-Time Total
3,247 3,399 3,411 3,303 2,884
3,214 3,103 3,120 3,226 2,488
6,461 6,502 6,531 6,529 5,372
324 331 308 264 188
137 299 352 461 476
3,571 3,730 3,719 3,567 3,072
3,351 3,402 3,472 3,687 2,964
6,922 7,132 7,191 7,254 6,036
2017 2021
1,179 953 873 799 1,299
298 363 413 394 971
1,477 1,316 1,286 1,193 2,270
455 445 508 524 622
699 805 994 1,119 1,472
1,634 1,398 1,381 1,323 1,921
997 1,168 1,407 1,513 2,443
2,631 2,566 2,788 2,836 4,364
2017 2021
4,426 4,352 4,284 4,102 4,183
3,512 3,466 3,533 3,620 3,459
7,938 7,818 7,817 7,722 7,642
779 776 816 788 810
836 1,104 1,346 1,580 1,948
5,205 5,128 5,100 4,890 4,993
4,348 4,570 4,879 5,200 5,407
9,553 9,698 9,979 10,090 10,400
2017 2021
461 630 660 725 664 1,154 1,250 1,502 1,643 2,094 1,615 1,880 2,162 2,368 2,758
FALL ENROLLMENT REPORT | 59
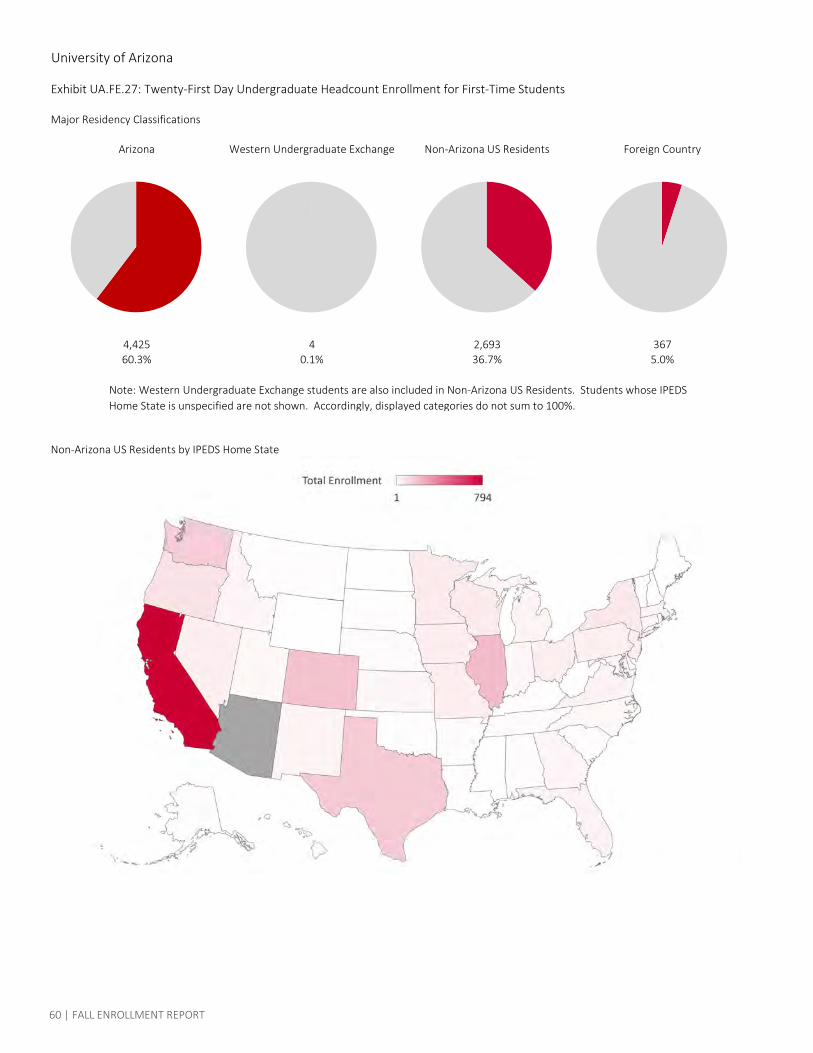
University of Arizona
Exhibit UA.FE.27: Twenty-First Day Undergraduate Headcount Enrollment for First-Time Students
Major Residency Classifications
4,425 4 2,693 36760.3% 0.1% 36.7% 5.0%
Non-Arizona US Residents by IPEDS Home State
Arizona Western Undergraduate Exchange Non-Arizona US Residents Foreign Country
Note: Western Undergraduate Exchange students are also included in Non-Arizona US Residents. Students whose IPEDS Home State is unspecified are not shown. Accordingly, displayed categories do not sum to 100%.
60 | FALL ENROLLMENT REPORT
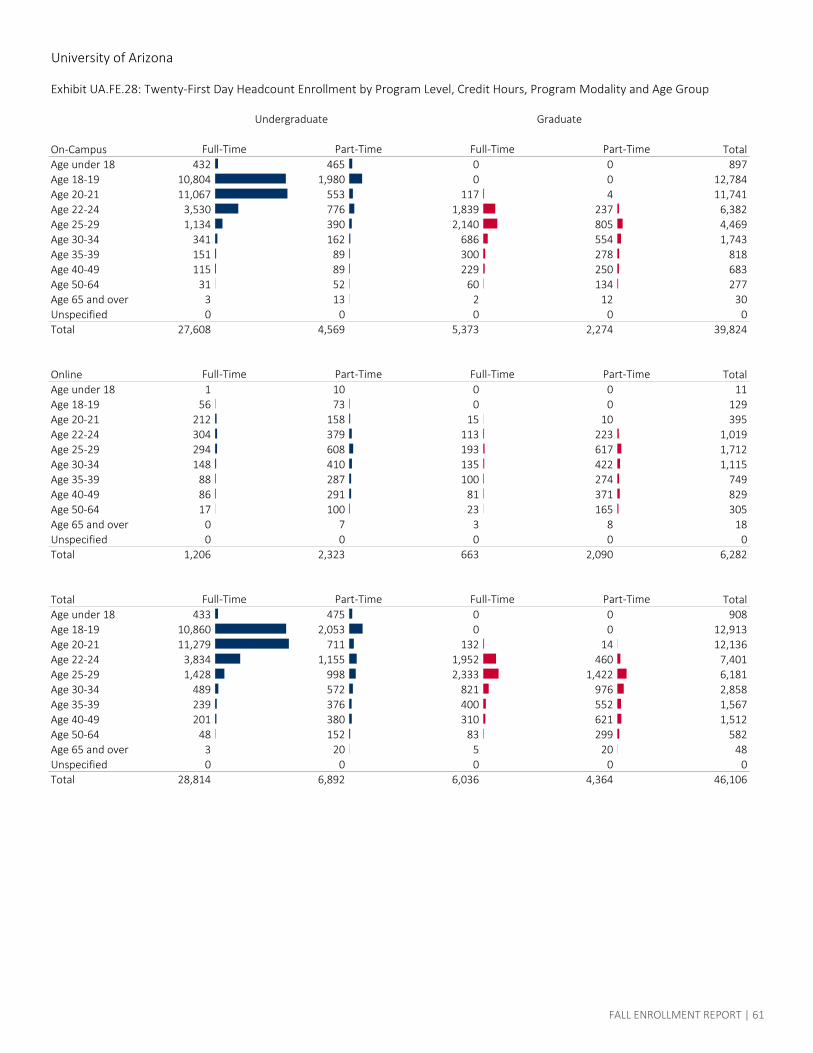
University of Arizona
Exhibit UA.FE.28: Twenty-First Day Headcount Enrollment by Program Level, Credit Hours, Program Modality and Age Group
On-Campus TotalAge under 18 432 465 0 0 897Age 18-19 10,804 1,980 0 0 12,784Age 20-21 11,067 553 117 4 11,741Age 22-24 3,530 776 1,839 237 6,382Age 25-29 1,134 390 2,140 805 4,469Age 30-34 341 162 686 554 1,743Age 35-39 151 89 300 278 818Age 40-49 115 89 229 250 683Age 50-64 31 52 60 134 277Age 65 and over 3 13 2 12 30Unspecified 0 0 0 0 0Total 27,608 4,569 5,373 2,274 39,824
Online TotalAge under 18 1 10 0 0 11Age 18-19 56 73 0 0 129Age 20-21 212 158 15 10 395Age 22-24 304 379 113 223 1,019Age 25-29 294 608 193 617 1,712Age 30-34 148 410 135 422 1,115Age 35-39 88 287 100 274 749Age 40-49 86 291 81 371 829Age 50-64 17 100 23 165 305Age 65 and over 0 7 3 8 18Unspecified 0 0 0 0 0Total 1,206 2,323 663 2,090 6,282
Total TotalAge under 18 433 475 0 0 908Age 18-19 10,860 2,053 0 0 12,913Age 20-21 11,279 711 132 14 12,136Age 22-24 3,834 1,155 1,952 460 7,401Age 25-29 1,428 998 2,333 1,422 6,181Age 30-34 489 572 821 976 2,858Age 35-39 239 376 400 552 1,567Age 40-49 201 380 310 621 1,512Age 50-64 48 152 83 299 582Age 65 and over 3 20 5 20 48Unspecified 0 0 0 0 0Total 28,814 6,892 6,036 4,364 46,106
Full-Time Part-Time Full-Time Part-Time
Full-Time Part-Time Full-Time Part-Time
Undergraduate Graduate
Full-Time Part-Time Full-Time Part-Time
FALL ENROLLMENT REPORT | 61
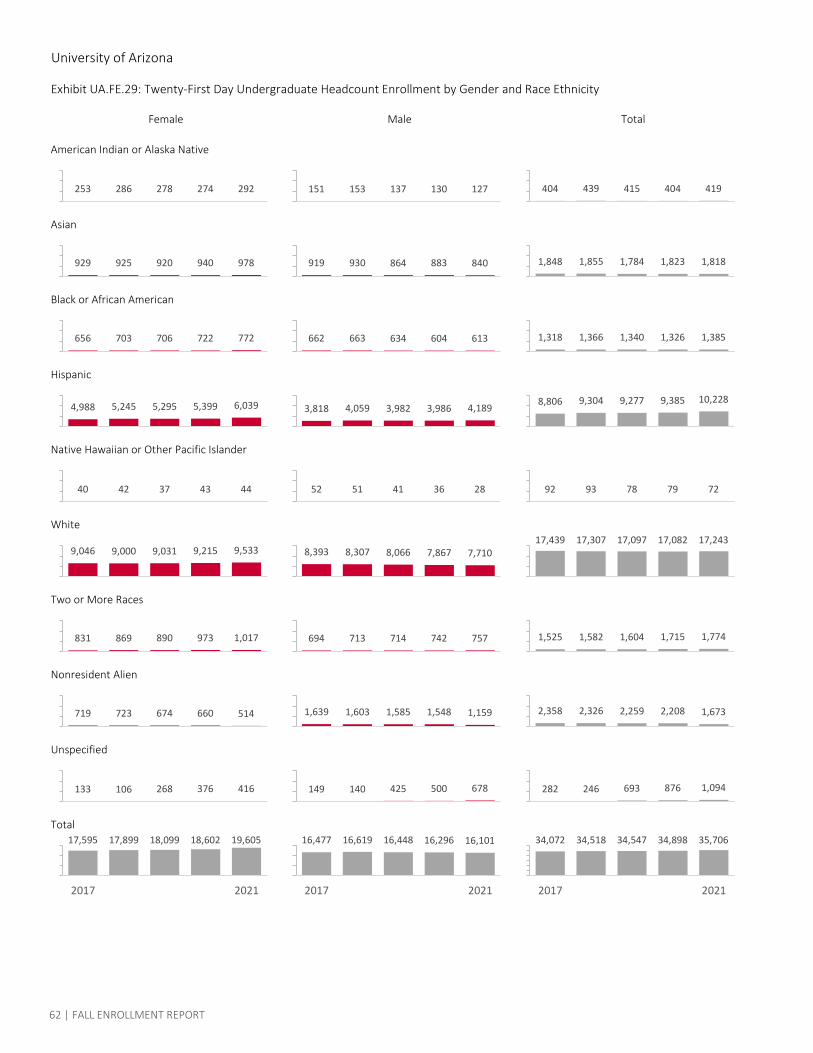
University of Arizona
Exhibit UA.FE.29: Twenty-First Day Undergraduate Headcount Enrollment by Gender and Race Ethnicity
American Indian or Alaska Native
Asian
Black or African American
Hispanic
Native Hawaiian or Other Pacific Islander
White
Two or More Races
Nonresident Alien
Unspecified
Total
TotalMaleFemale
17,595 17,899 18,099 18,602 19,605
2017 2021
133 106 268 376 416
16,477 16,619 16,448 16,296 16,101
2017 2021
149 140 425 500 678 282 246 693 876 1,094
719 723 674 660 514 1,639 1,603 1,585 1,548 1,159 2,358 2,326 2,259 2,208 1,673
831 869 890 973 1,017 694 713 714 742 757 1,525 1,582 1,604 1,715 1,774
9,046 9,000 9,031 9,215 9,533 8,393 8,307 8,066 7,867 7,71017,439 17,307 17,097 17,082 17,243
40 42 37 43 44 52 51 41 36 28 92 93 78 79 72
4,988 5,245 5,295 5,399 6,039 3,818 4,059 3,982 3,986 4,1898,806 9,304 9,277 9,385 10,228
656 703 706 722 772 662 663 634 604 613 1,318 1,366 1,340 1,326 1,385
929 925 920 940 978 919 930 864 883 840 1,848 1,855 1,784 1,823 1,818
253 286 278 274 292 151 153 137 130 127 404 439 415 404 419
34,072 34,518 34,547 34,898 35,706
2017 2021
62 | FALL ENROLLMENT REPORT
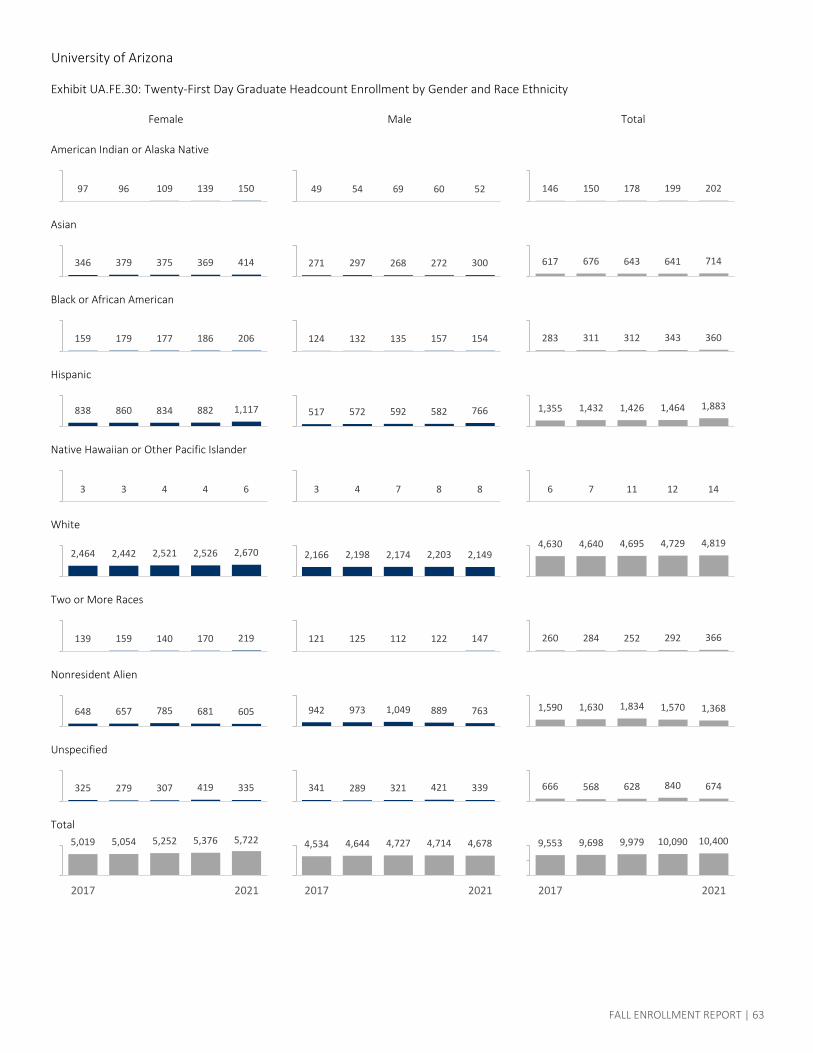
University of Arizona
Exhibit UA.FE.30: Twenty-First Day Graduate Headcount Enrollment by Gender and Race Ethnicity
American Indian or Alaska Native
Asian
Black or African American
Hispanic
Native Hawaiian or Other Pacific Islander
White
Two or More Races
Nonresident Alien
Unspecified
Total
Female Male Total
5,019 5,054 5,252 5,376 5,722
2017 2021
325 279 307 419 335
4,534 4,644 4,727 4,714 4,678
2017 2021
341 289 321 421 339 666 568 628 840 674
648 657 785 681 605 942 973 1,049 889 763 1,590 1,630 1,834 1,570 1,368
139 159 140 170 219 121 125 112 122 147 260 284 252 292 366
2,464 2,442 2,521 2,526 2,670 2,166 2,198 2,174 2,203 2,1494,630 4,640 4,695 4,729 4,819
3 3 4 4 6 3 4 7 8 8 6 7 11 12 14
838 860 834 882 1,117 517 572 592 582 766 1,355 1,432 1,426 1,464 1,883
159 179 177 186 206 124 132 135 157 154 283 311 312 343 360
346 379 375 369 414 271 297 268 272 300 617 676 643 641 714
97 96 109 139 150 49 54 69 60 52 146 150 178 199 202
9,553 9,698 9,979 10,090 10,400
2017 2021
FALL ENROLLMENT REPORT | 63

2700 N. CENTRAL AVE. | PHOENIX, AZ 85004 | AZREGENTS.EDU
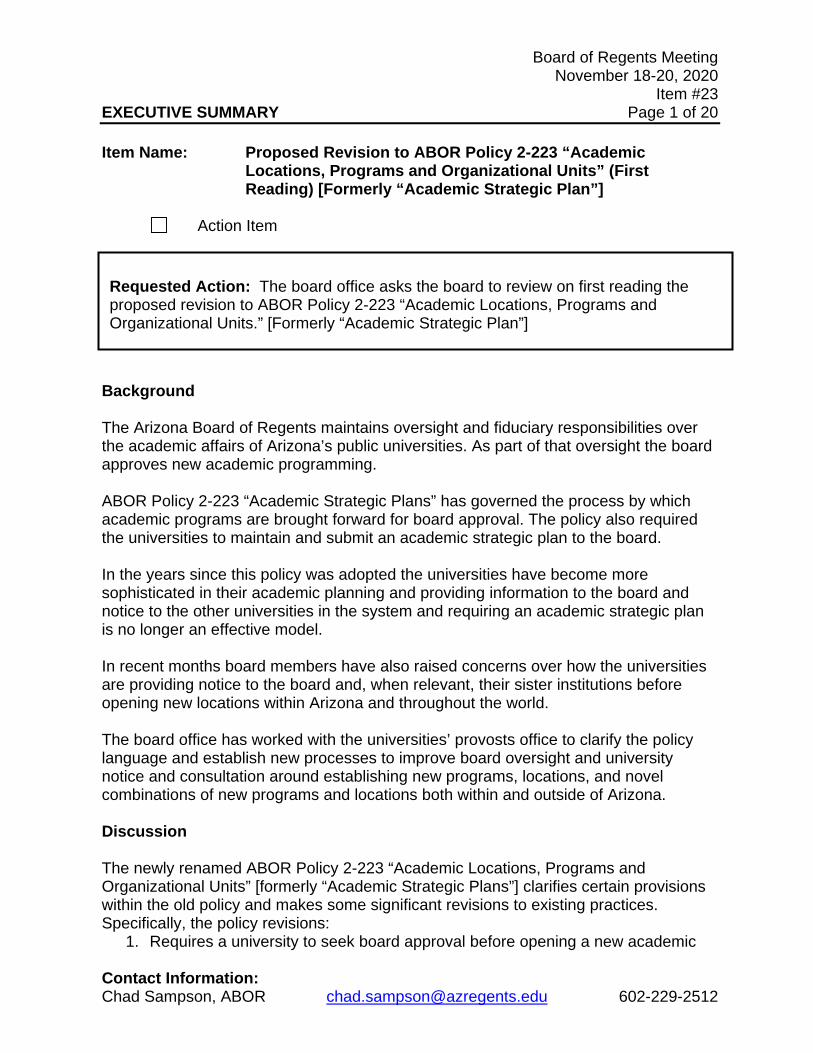
Board of Regents Meeting November 18-20, 2020
Item #23 EXECUTIVE SUMMARY Page 1 of 20
Contact Information: Chad Sampson, ABOR [email protected] 602-229-2512
Item Name: Proposed Revision to ABOR Policy 2-223 “Academic Locations, Programs and Organizational Units” (First Reading) [Formerly “Academic Strategic Plan”]
Action Item
Background The Arizona Board of Regents maintains oversight and fiduciary responsibilities over the academic affairs of Arizona’s public universities. As part of that oversight the board approves new academic programming. ABOR Policy 2-223 “Academic Strategic Plans” has governed the process by which academic programs are brought forward for board approval. The policy also required the universities to maintain and submit an academic strategic plan to the board. In the years since this policy was adopted the universities have become more sophisticated in their academic planning and providing information to the board and notice to the other universities in the system and requiring an academic strategic plan is no longer an effective model. In recent months board members have also raised concerns over how the universities are providing notice to the board and, when relevant, their sister institutions before opening new locations within Arizona and throughout the world. The board office has worked with the universities’ provosts office to clarify the policy language and establish new processes to improve board oversight and university notice and consultation around establishing new programs, locations, and novel combinations of new programs and locations both within and outside of Arizona. Discussion The newly renamed ABOR Policy 2-223 “Academic Locations, Programs and Organizational Units” [formerly “Academic Strategic Plans”] clarifies certain provisions within the old policy and makes some significant revisions to existing practices. Specifically, the policy revisions:
1. Requires a university to seek board approval before opening a new academic
Requested Action: The board office asks the board to review on first reading the proposed revision to ABOR Policy 2-223 “Academic Locations, Programs and Organizational Units.” [Formerly “Academic Strategic Plan”]
Board of Regents Meeting
November 18-20, 2020 Item #23
EXECUTIVE SUMMARY Page 2 of 20
location anywhere in the world; 2. Requires a university to provide notice and engage in consultation with the other
Arizona public universities before offering a new academic program or opening a new location within Arizona;
3. Requires a university to provide notice and consultation with the other Arizona public universities when a university wants to provide a novel combination of existing degrees and locations within Arizona;
4. Establishes timeframes and a process around providing notice to and consultation;
5. Establishes a process for the board through its academic affairs committee to arbitrate and resolve differences that cannot be resolved through consultation;
6. Clarifies language around what information a university must provide to the board before offering a new program or establishing a new location;
7. Eliminates the prohibition preventing universities from offering 100-200 level courses in a location if overlapping programming is already being offered by an Arizona community college; and
8. Removes the requirement that the universities maintain and submit “academic strategic plans.”
The revised policy continues to require the board to approve all new academic programs wherever offered and requires the board executive director to continue to approve academic unit and program name changes and the discontinuation of academic programs. Committee Review and Recommendation The Academic Affairs and Educational Attainment Committee reviewed this item at its November 5, 2020 meeting, and recommended forwarding to the full board for first reading and subsequent approval. Statutory/Policy Requirements A.R.S. §15-1626 “General Administrative Powers and Duties of the Board”
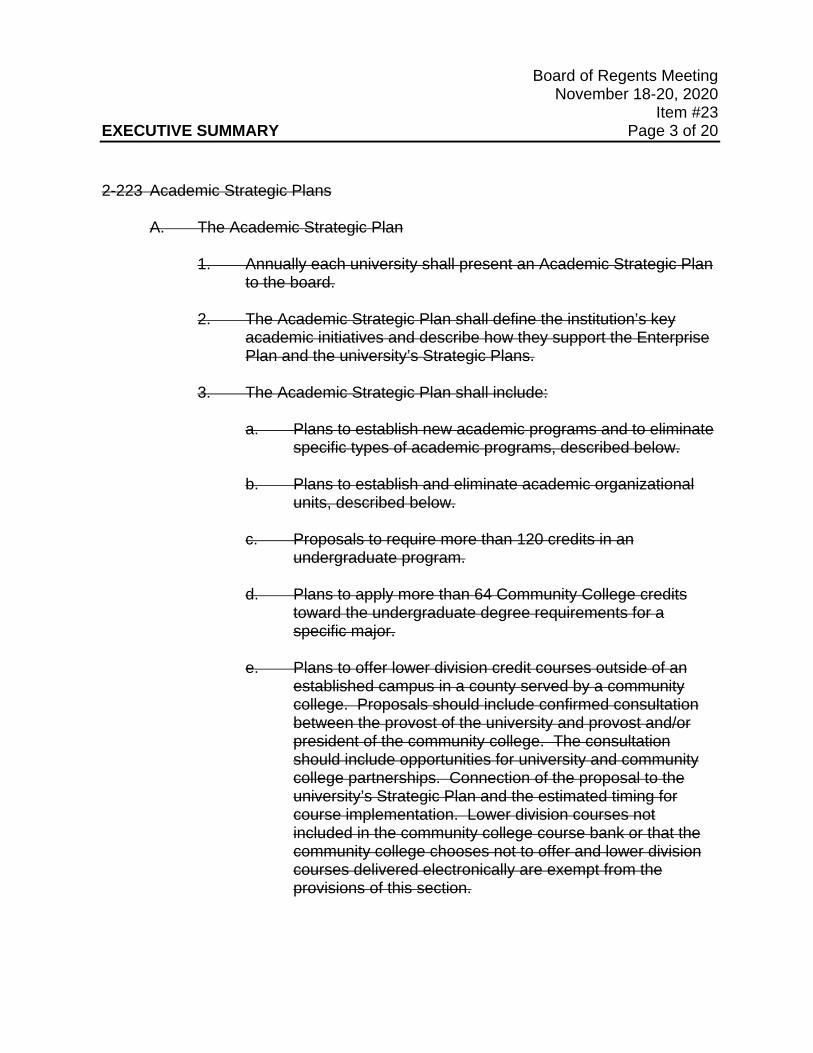
Board of Regents Meeting
November 18-20, 2020 Item #23
EXECUTIVE SUMMARY Page 3 of 20 2-223 Academic Strategic Plans
A. The Academic Strategic Plan
1. Annually each university shall present an Academic Strategic Plan to the board.
2. The Academic Strategic Plan shall define the institution’s key
academic initiatives and describe how they support the Enterprise Plan and the university’s Strategic Plans.
3. The Academic Strategic Plan shall include:
a. Plans to establish new academic programs and to eliminate specific types of academic programs, described below.
b. Plans to establish and eliminate academic organizational units, described below.
c. Proposals to require more than 120 credits in an
undergraduate program.
d. Plans to apply more than 64 Community College credits toward the undergraduate degree requirements for a specific major.
e. Plans to offer lower division credit courses outside of an
established campus in a county served by a community college. Proposals should include confirmed consultation between the provost of the university and provost and/or president of the community college. The consultation should include opportunities for university and community college partnerships. Connection of the proposal to the university’s Strategic Plan and the estimated timing for course implementation. Lower division courses not included in the community college course bank or that the community college chooses not to offer and lower division courses delivered electronically are exempt from the provisions of this section.
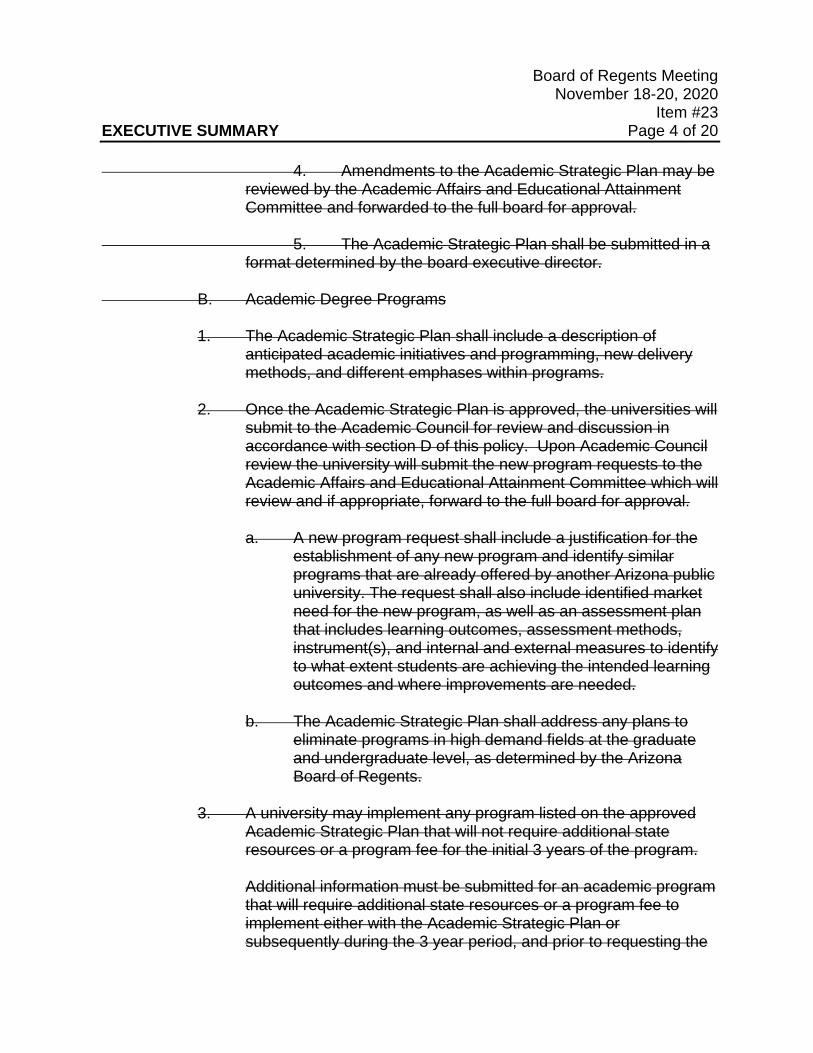
Board of Regents Meeting
November 18-20, 2020 Item #23
EXECUTIVE SUMMARY Page 4 of 20 4. Amendments to the Academic Strategic Plan may be
reviewed by the Academic Affairs and Educational Attainment Committee and forwarded to the full board for approval.
5. The Academic Strategic Plan shall be submitted in a
format determined by the board executive director. B. Academic Degree Programs
1. The Academic Strategic Plan shall include a description of anticipated academic initiatives and programming, new delivery methods, and different emphases within programs.
2. Once the Academic Strategic Plan is approved, the universities will submit to the Academic Council for review and discussion in accordance with section D of this policy. Upon Academic Council review the university will submit the new program requests to the Academic Affairs and Educational Attainment Committee which will review and if appropriate, forward to the full board for approval. a. A new program request shall include a justification for the
establishment of any new program and identify similar programs that are already offered by another Arizona public university. The request shall also include identified market need for the new program, as well as an assessment plan that includes learning outcomes, assessment methods, instrument(s), and internal and external measures to identify to what extent students are achieving the intended learning outcomes and where improvements are needed.
b. The Academic Strategic Plan shall address any plans to
eliminate programs in high demand fields at the graduate and undergraduate level, as determined by the Arizona Board of Regents.
3. A university may implement any program listed on the approved
Academic Strategic Plan that will not require additional state resources or a program fee for the initial 3 years of the program.
Additional information must be submitted for an academic program that will require additional state resources or a program fee to implement either with the Academic Strategic Plan or subsequently during the 3 year period, and prior to requesting the
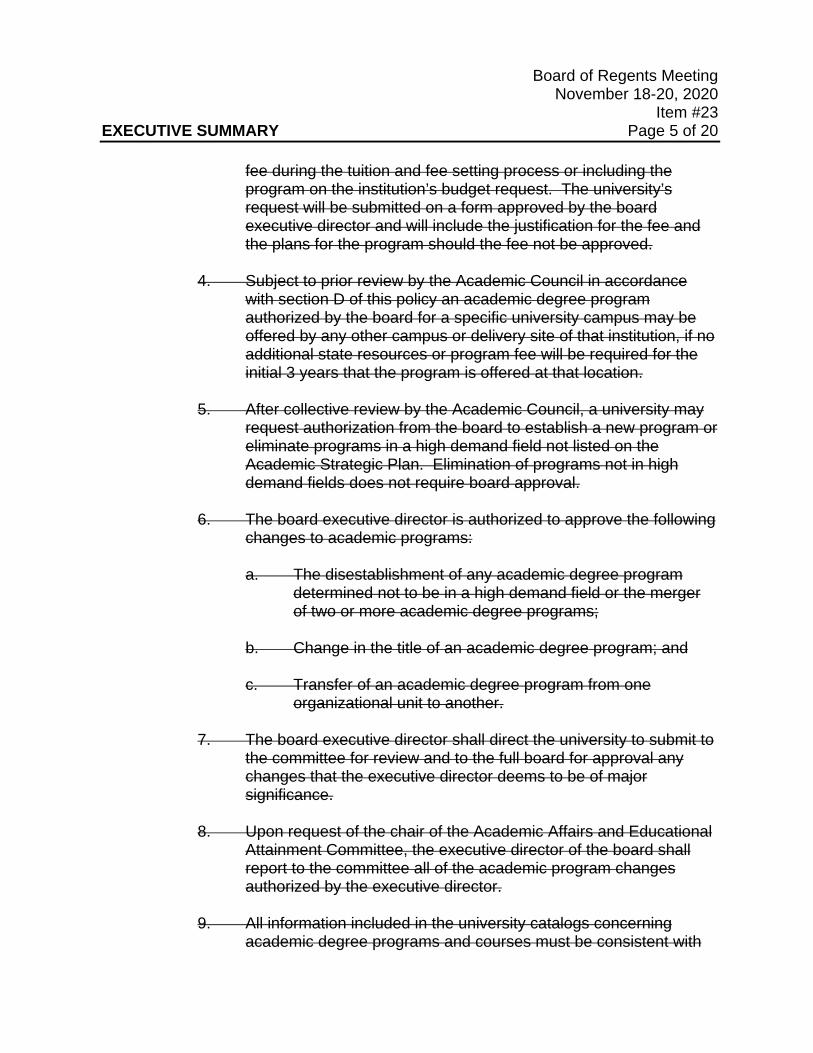
Board of Regents Meeting
November 18-20, 2020 Item #23
EXECUTIVE SUMMARY Page 5 of 20
fee during the tuition and fee setting process or including the program on the institution’s budget request. The university’s request will be submitted on a form approved by the board executive director and will include the justification for the fee and the plans for the program should the fee not be approved.
4. Subject to prior review by the Academic Council in accordance with section D of this policy an academic degree program authorized by the board for a specific university campus may be offered by any other campus or delivery site of that institution, if no additional state resources or program fee will be required for the initial 3 years that the program is offered at that location.
5. After collective review by the Academic Council, a university may request authorization from the board to establish a new program or eliminate programs in a high demand field not listed on the Academic Strategic Plan. Elimination of programs not in high demand fields does not require board approval.
6. The board executive director is authorized to approve the following changes to academic programs:
a. The disestablishment of any academic degree program
determined not to be in a high demand field or the merger of two or more academic degree programs;
b. Change in the title of an academic degree program; and
c. Transfer of an academic degree program from one organizational unit to another.
7. The board executive director shall direct the university to submit to
the committee for review and to the full board for approval any changes that the executive director deems to be of major significance.
8. Upon request of the chair of the Academic Affairs and Educational Attainment Committee, the executive director of the board shall report to the committee all of the academic program changes authorized by the executive director.
9. All information included in the university catalogs concerning
academic degree programs and courses must be consistent with
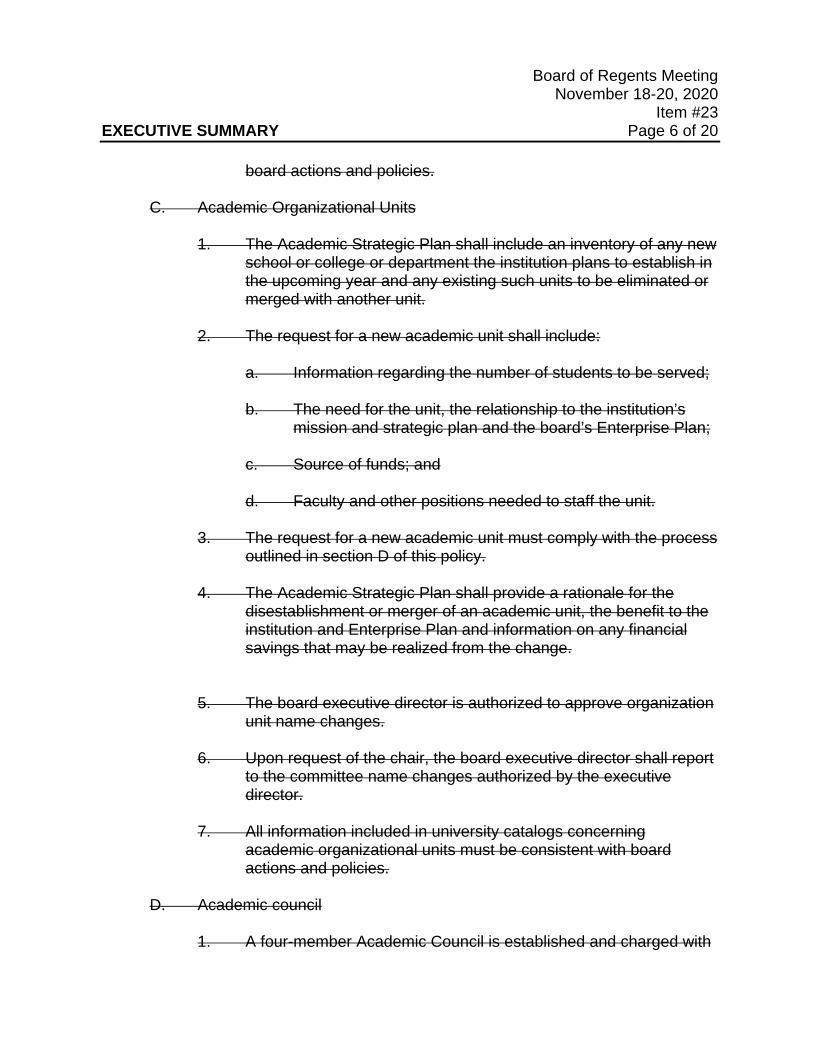
Board of Regents Meeting
November 18-20, 2020 Item #23
EXECUTIVE SUMMARY Page 6 of 20
board actions and policies. C. Academic Organizational Units
1. The Academic Strategic Plan shall include an inventory of any new school or college or department the institution plans to establish in the upcoming year and any existing such units to be eliminated or merged with another unit.
2. The request for a new academic unit shall include:
a. Information regarding the number of students to be served;
b. The need for the unit, the relationship to the institution’s mission and strategic plan and the board’s Enterprise Plan;
c. Source of funds; and
d. Faculty and other positions needed to staff the unit.
3. The request for a new academic unit must comply with the process
outlined in section D of this policy.
4. The Academic Strategic Plan shall provide a rationale for the disestablishment or merger of an academic unit, the benefit to the institution and Enterprise Plan and information on any financial savings that may be realized from the change.
5. The board executive director is authorized to approve organization
unit name changes.
6. Upon request of the chair, the board executive director shall report to the committee name changes authorized by the executive director.
7. All information included in university catalogs concerning
academic organizational units must be consistent with board actions and policies.
D. Academic council
1. A four-member Academic Council is established and charged with
Board of Regents Meeting
November 18-20, 2020 Item #23
EXECUTIVE SUMMARY Page 7 of 20
collaborating and coordinating academic program activities. Academic Council membership consists of the universities’ chief academic officers and one designee from ABOR.
2. The Academic Council’s purpose is to support the EEC in
enterprise planning and management with regard to academic programming. This council is a managerial working group and not an ABOR subcommittee.
3. Prior to the universities submitting new program requests and new
academic units to the Academic Affairs and Educational Attainment Committee for review and to the board for approval, the Academic Council will collaboratively review and discuss such requests.
4. The Academic Council may meet as often as necessary, but at
least once each academic year, to conduct such reviews and to discuss anticipated changes to each university’s academic strategic plan.
5. Prior to publicly announcing any new program or existing
program’s expansion in a new Arizona location, an institution will provide notice of the program to the members of the Academic Council.
6. The process delineated in this subsection d does not apply to new
online or international programs or expansion of existing online or international programs.
2-223 ACADEMIC LOCATIONS, DEGREE PROGRAMS AND ORGANIZATIONAL UNITS
A. NEW ACADEMIC LOCATIONS IN ARIZONA
1. FROM TIME TO TIME, A UNIVERSITY MAY DESIRE TO OPEN A NEW PHYSICAL ACADEMIC LOCATION IN ARIZONA. a. ‘PHYSICAL ACADEMIC LOCATION’ DENOTES A
CAMPUS, STATEWIDE LEARNING CENTER, SITE OR DISCRETE LOCALITY WITHIN ARIZONA WHERE A UNIVERSITY OFFERS A DEGREE PROGRAM ON-LOCATION.
Board of Regents Meeting
November 18-20, 2020 Item #23
EXECUTIVE SUMMARY Page 8 of 20
b. A NEW PHYSICAL ACADEMIC LOCATION IN ARIZONA IS A PLACE IN ARIZONA SEPARATE FROM ANY EXISTING CAMPUS, STATEWIDE LEARNING CENTER, SITE OR DISCRETE LOCALITY WHERE INSTRUCTION TAKES PLACE AND STUDENTS CAN COMPLETE 50 PERCENT OR MORE OF THE COURSES LEADING TO A DEGREE PROGRAM.
c. THIS POLICY DOES NOT APPLY TO SOLELY ONLINE
PROGRAMS.
2. PRIOR TO PUBLICLY ANNOUNCING, MARKETING, SOLICITING APPLICATIONS FOR, OR DELIVERING ANY DEGREE AT A NEW LOCATION WITHIN ARIZONA, A UNIVERSITY MUST FOLLOW THE PROCESS DESCRIBED IN THIS POLICY.
3. A PROPOSING UNIVERSITY’S REQUEST TO OPEN A NEW
ACADEMIC LOCATION WITHIN ARIZONA MUST INCLUDE:
a. AN ANALYSIS OF THE PROSPECTIVE STUDENT MARKET SERVED BY THE DEGREE OFFERINGS AT THE NEW LOCATION, INCLUDING PROJECTED ENROLLMENT FIGURES FOR THE FIRST THREE YEARS OF OPERATION;
b. DETAILS OF ANY PARTNERING INSTITUTIONS OR
ENTITIES AND THE TERMS OF ANY PARTNERSHIP AGREEMENT(S);
c. ESTIMATED TIMELINES FOR OPENING; AND d. A FINANCIAL PLAN AND BUDGET DETAILING THE
INSTITUTIONAL COSTS AND BENEFITS ASSOCIATED WITH ESTABLISHING AND OPERATING AT THE NEW LOCATION.
4. UPON RECEIPT OF A REQUEST TO OPEN A NEW ARIZONA
LOCATION, THE BOARD OFFICE WILL PLACE THE MATTER ON THE NEXT REGULARLY SCHEDULED ACADEMIC COUNCIL AGENDA FOR A CONSULTATIVE DISCUSSION.
Board of Regents Meeting
November 18-20, 2020 Item #23
EXECUTIVE SUMMARY Page 9 of 20
5. A UNIVERSITY PROPOSING A NEW LOCATION WITHIN ARIZONA MUST PROVIDE WRITTEN NOTICE TO, AND CONSULT WITH, THE OTHER ARIZONA PUBLIC UNIVERSITIES.
6. NOTICE AND CONSULTATION MUST ADHERE TO THE
FOLLOWING PROTOCOLS: a. THE BOARD OFFICE WILL DEVELOP THE NOTICE
CRITERIA AND FORMAT AND HAVE DISCRETION AS TO WHETHER A PROPOSING UNIVERSITY HAS SUBMITTED PROPER WRITTEN NOTICE.
b. WRITTEN NOTICE MAY BE PROVIDED ELECTRONICALLY.
7. A UNIVERSITY THAT RECEIVES PROPER NOTICE FROM A
PROPOSING UNIVERSITY OF AN INTENT TO OPEN A NEW LOCATION WITHIN ARIZONA MUST RESPOND IN WRITING DETAILING ANY OBJECTIONS TO THE PROPOSING UNIVERSITY WITHIN 7 DAYS. ANY WRITTEN OBJECTION MAY BE PROVIDED TO THE ACADEMIC AFFAIRS COMMITTEE AS PART OF THE COMMITTEE MATERIALS ACCOMPANYING THE PROPOSING UNIVERSITY’S REQUEST FOR A NEW LOCATION.
8. FAILURE TO PROVIDE WRITTEN OBJECTION TO THE
PROPOSING UNIVERSITY WITHIN 7 DAYS OF RECEIVING NOTICE WILL BE CONSIDERED CONSTRUCTIVE ASSENT TO THE PROPOSING UNIVERSITY’S NEW LOCATION.
9. UPON RECEIVING THE PROPOSING UNIVERSITY’S
REQUEST, THE ACADEMIC AFFAIRS AND EDUCATIONAL ATTAINMENT COMMITTEE WILL CONSIDER THE PROPOSING UNIVERSITY’S REQUEST AT ITS NEXT REGULARLY SCHEDULED COMMITTEE MEETING, AND ANY WRITTEN OBJECTIONS FROM THE OTHER UNIVERSITIES AND MAKE A RECOMMENDATION TO THE BOARD THAT IT APPROVE, REJECT OR MODIFY THE NEW LOCATION PROPOSAL.
10. UPON RECEIVING THE COMMITTEE’S RECOMMENDATION,
THE BOARD WILL VOTE ON THE PROPOSAL OF THE NEW LOCATION AT A REGULARLY SCHEDULED BOARD MEETING.
Board of Regents Meeting
November 18-20, 2020 Item #23
EXECUTIVE SUMMARY Page 10 of 20
11. A NEW ACADEMIC LOCATION REQUIRES A MAJORITY VOTE
OF THE BOARD PRIOR TO OPENING. B. NEW ACADEMIC LOCATIONS OUTSIDE ARIZONA
1. FROM TIME TO TIME, A UNIVERSITY MAY DESIRE TO OPEN A
NEW PHYSICAL ACADEMIC LOCATION OUTSIDE OF ARIZONA.
a. ‘PHYSICAL ACADEMIC LOCATION’ DENOTES A
CAMPUS, STATEWIDE LEARNING CENTER, SITE OR DISCRETE LOCALITY OUTSIDE OF ARIZONA WHERE A UNIVERSITY OFFERS ON-LOCATION ACADEMIC DEGREE PROGRAMMING.
b. A NEW PHYSICAL ACADEMIC LOCATION OUTSIDE
ARIZONA IS A PLACE OUTSIDE ARIZONA SEPARATE FROM ANY EXISTING CAMPUS, STATEWIDE LEARNING CENTER, SITE OR DISCRETE LOCALITY WHERE INSTRUCTION TAKES PLACE AND STUDENTS CAN COMPLETE 50 PERCENT OR MORE OF THE COURSES LEADING TO A DEGREE PROGRAM.
c. THIS POLICY DOES NOT APPLY TO SOLELY ONLINE
PROGRAMS. 2. PRIOR TO PUBLICLY ANNOUNCING, MARKETING,
SOLICITING APPLICATIONS FOR, OR DELIVERING ANY ACADEMIC DEGREE PROGRAM AT A NEW LOCATION OUTSIDE ARIZONA, A UNIVERSITY MUST FOLLOW THE PROCESS DESCRIBED IN THIS POLICY.
3. A REQUEST TO OPEN A NEW ACADEMIC LOCATION
OUTSIDE ARIZONA MUST INCLUDE:
a. AN ANALYSIS OF THE PROSPECTIVE STUDENT MARKET SERVED BY THE DEGREE OR CERTIFICATE OFFERINGS AT THE NEW LOCATION, INCLUDING PROJECTED ENROLLMENT FIGURES FOR THE FIRST THREE YEARS OF OPERATION;
Board of Regents Meeting
November 18-20, 2020 Item #23
EXECUTIVE SUMMARY Page 11 of 20
b. DETAILS OF ANY PARTNERING INSTITUTIONS OR ENTITIES AND THE TERMS OF ANY PARTNERSHIP AGREEMENT(S);
c. ESTIMATED TIMELINES FOR OPENING; AND d. A FINANCIAL PLAN AND BUDGET DETAILING THE
INSTITUTIONAL COSTS AND BENEFITS ASSOCIATED WITH ESTABLISHING AND OPERATING AT THE NEW LOCATION.
4. UPON RECEIVING THE REQUEST, THE ACADEMIC AFFAIRS
AND EDUCATIONAL ATTAINMENT COMMITTEE WILL CONSIDER THE PROPOSING UNIVERSITY’S REQUEST AND MAKE A RECOMMENDATION TO THE BOARD THAT IT APPROVE, REJECT OR MODIFY THE PROPOSING UNIVERSITY’S NEW LOCATION REQUEST.
5. UPON RECEIVING THE COMMITTEE’S RECOMMENDATION,
THE BOARD WILL VOTE ON THE PROPOSAL OF THE NEW LOCATION OUTSIDE OF ARIZONA AT A REGULARLY SCHEDULED BOARD MEETING.
6. A NEW ACADEMIC LOCATION REQUIRES A MAJORITY VOTE
OF THE BOARD PRIOR TO OPENING. C. NEW ACADEMIC DEGREE PROGRAMS
1. FROM TIME TO TIME, A UNIVERSITY MAY DESIRE TO OFFER
A NEW ACADEMIC DEGREE PROGRAM. 2. PRIOR TO PUBLICLY ANNOUNCING, MARKETING,
SOLICITING APPLICATIONS FOR, OR DELIVERING A NEW ACADEMIC DEGREE, A UNIVERSITY MUST OBTAIN BOARD APPROVAL IN A PUBLIC MEETING.
3. A REQUEST FOR A NEW ACADEMIC DEGREE PROGRAM
MUST INCLUDE:
a. A DESCRIPTION OF THE ACADEMIC DEGREE, DELIVERY METHODS, LOCATION, AND MAJOR.
b. PROJECTED ENROLLMENT FIGURES FOR THE FIRST
THREE YEARS OF OPERATION;
Board of Regents Meeting
November 18-20, 2020 Item #23
EXECUTIVE SUMMARY Page 12 of 20
c. AN ANALYSIS OF THE LABOR MARKET DEMAND FOR
THE NEW DEGREE, INCLUDING SPECIFIC DATA ON THE EMPLOYMENT PROSPECTS FOR GRADUATES OF THE NEW DEGREE;
d. THE NUMBER OF CREDIT HOURS TO COMPLETE THE
DEGREE; e. ANTICIPATED STUDENT ACADEMIC FEES
ASSOCIATED WITH THE NEW DEGREE; f. A DESCRIPTION OF NEW RESOURCES NECESSARY
FOR ESTABLISHING AND OPERATING THE NEW DEGREE;
g. A CLEAR DESCRIPTION OF LEARNING OUTCOMES
AND THE METHODS THAT WILL BE USED TO ASSESS LEARNING OUTCOMES;
h. WHERE APPLICABLE, A LIST OF SIMILAR DEGREES
THAT ARE ALREADY OFFERED BY OTHER ARIZONA PUBLIC UNIVERSITIES.
4. A UNIVERSITY PROPOSING A NEW DEGREE WITHIN
ARIZONA MUST PROVIDE WRITTEN NOTICE TO, AND CONSULT WITH, THE OTHER ARIZONA PUBLIC UNIVERSITIES.
5. NOTICE AND CONSULTATION MUST ADHERE TO THE
FOLLOWING PROTOCOLS:
a. THE BOARD OFFICE WILL DEVELOP THE NOTICE CRITERIA AND FORMAT. THE BOARD OFFICE WILL HAVE DISCRETION AS TO WHETHER A PROPOSING UNIVERSITY HAS SUBMITTED PROPER WRITTEN NOTICE.
b. WRITTEN NOTICE MAY BE PROVIDED
ELECTRONICALLY.
6. UPON RECEIPT OF PROPER WRITTEN NOTICE OF THE NEW DEGREE PROGRAM REQUEST, THE BOARD OFFICE WILL
Board of Regents Meeting
November 18-20, 2020 Item #23
EXECUTIVE SUMMARY Page 13 of 20
PLACE THE MATTER ON THE NEXT REGULARLY SCHEDULED ACADEMIC COUNCIL AGENDA FOR CONSULTATIVE DISCUSSION.
7. THE UNIVERSITY MUST PROVIDE NOTICE 14 DAYS PRIOR TO THE ACADEMIC AFFAIRS AND EDUCATIONAL ATTAINMENT COMMITTEE MATERIALS ARE DISTRIBUTED TO THE COMMITTEE.
8. UPON RECEIVING PROPER WRITTEN NOTICE OF A NEW
DEGREE PROGRAM REQUEST, A UNIVERSITY’S CHIEF ACADEMIC OFFICER HAS 7 DAYS TO PROVIDE A WRITTEN OBJECTION TO THE PROPOSING UNIVERSITY AND THE BOARD OFFICE DETAILING ANY OBJECTION TO THE PROPOSED NEW DEGREE PROGRAM. THE RESPONSE MAY BE SHARED WITH THE COMMITTEE AS PART OF THE COMMITTEE MATERIALS.
9. FAILURE TO PROVIDE A WRITTEN OBJECTION DETAILING
CONCERNS IS DEEMED TO BE CONSTRUCTIVE ASSENT TO THE NEW DEGREE PROGRAM.
10. IF ANOTHER PUBLIC UNIVERSITY OBJECTS TO THE NEW
DEGREE PROGRAM, THE PROPOSING UNIVERSITY MUST MAKE A GOOD FAITH EFFORT TO ADDRESS THE CONCERNS DETAILED IN THE WRITTEN OBJECTION PRIOR TO HAVING THE NEW DEGREE PROGRAM CONSIDERED BY THE ACADEMIC AFFAIRS AND EDUCATIONAL ATTAINMENT COMMITTEE. EVIDENCE OF GOOD FAITH EFFORT MAY BE SUPPLIED AT THE REQUEST OF THE CHAIR OF THE ACADEMIC AFFAIRS AND EDUCATIONAL ATTAINMENT COMMITTEE.
11. THE COMMITTEE WILL MAKE A RECOMMENDATION TO THE
BOARD TO APPROVE, REJECT OR MODIFY THE NEW ACADEMIC DEGREE PROGRAM.
12. UPON RECEIVING THE COMMITTEE’S RECOMMENDATION,
THE BOARD WILL VOTE ON THE NEW ACADEMIC DEGREE AT A REGULARLY SCHEDULED BOARD MEETING.
13. A NEW ACADEMIC DEGREE PROGRAM REQUIRES A
MAJORITY VOTE OF THE BOARD PRIOR TO PUBLICLY
Board of Regents Meeting
November 18-20, 2020 Item #23
EXECUTIVE SUMMARY Page 14 of 20
ANNOUNCING, MARKETING, SOLICITING APPLICATIONS FOR, OR DELIVERING A NEW ACADEMIC DEGREE PROGRAM.
14. ALL ACADEMIC DEGREE PROGRAM INFORMATION
INCLUDED IN UNIVERSITY CATALOGS AND MARKETING MATERIALS MUST BE CONSISTENT WITH BOARD ACTIONS TAKEN IN ACCORDANCE WITH THIS POLICY.
D. NEW COMBINATIONS OF DEGREE AND LOCATIONS WITHIN
ARIZONA
1. FROM TIME -TO -TIME, A UNIVERSITY MAY DESIRE TO OFFER A NOVEL COMBINATION OF AN EXISTING DEGREE PROGRAM AT AN EXISTING LOCATION WITHIN ARIZONA.
2. PRIOR TO PUBLICLY ANNOUNCING, MARKETING,
SOLICITING APPLICATIONS FOR, OR DELIVERING A NOVEL COMBINATION OF A BOARD APPROVED PROGRAM AT A BOARD APPROVED LOCATION THE UNIVERSITY MUST PROVIDE NOTICE TO, AND CONSULT WITH, THE OTHER ARIZONA PUBLIC UNIVERSITIES.
3. NOTICE AND CONSULTATION MUST ADHERE TO THE
FOLLOWING PROTOCOLS:
a. THE BOARD OFFICE WILL DEVELOP THE NOTICE CRITERIA AND FORMAT. THE BOARD OFFICE WILL HAVE DISCRETION AS TO WHETHER A PROPOSING UNIVERSITY HAS SUBMITTED PROPER WRITTEN NOTICE.
b. WRITTEN NOTICE MAY BE PROVIDED
ELECTRONICALLY.
4. FOLLOWING PROPER NOTICE FROM A PROPOSING UNIVERSITY, ANY OBJECTIONS MUST BE MADE IN WRITING WITHIN 7 DAYS.
5. FAILURE TO OBJECT TO THE REQUESTING UNIVERSITY
PROPOSAL WITHIN 7 DAYS OF RECEIVING NOTICE WILL BE CONSIDERED CONSTRUCTIVE ASSENT AND THE PROPOSING UNIVERSITY MAY IMMEDIATELY PROCEED
Board of Regents Meeting
November 18-20, 2020 Item #23
EXECUTIVE SUMMARY Page 15 of 20
WITH OFFERING THE NOVEL COMBINATION OF AN APPROVED DEGREE AT THE NEW LOCATION.
6. IF ANOTHER UNIVERSITY OBJECTS, THE PROPOSING
UNIVERSITY MUST MAKE A GOOD FAITH EFFORT TO ADDRESS THE CONCERNS DETAILED IN THE WRITTEN OBJECTION. EVIDENCE OF THE PROPOSING UNIVERSITY’S GOOD FAITH EFFORT TO CONSULT AND RESOLVE THE CONCERNS OF THE OBJECTING UNIVERSITY MAY BE SUPPLIED AT THE REQUEST OF THE CHAIR OF THE ACADEMIC AFFAIRS AND EDUCATIONAL ATTAINMENT COMMITTEE.
7. UPON RECEIVING AN OBJECTION TO THE NOVEL
COMBINATION OF DEGREE AND LOCATION, BOARD STAFF WILL PLACE THE PROPOSAL ON THE NEXT REGULARLY SCHEDULED ACADEMIC AFFAIR AND EDUCATIONAL ATTAINMENT COMMITTEE AGENDA.
8. THE COMMITTEE WILL TAKE-UP THE PROPOSAL AND WILL
MAKE A RECOMMENDATION TO THE BOARD TO APPROVE, REJECT OR MODIFY THE NOVEL COMBINATION OF DEGREE AND LOCATION.
9. UPON RECEIVING THE COMMITTEE’S RECOMMENDATION,
THE BOARD WILL VOTE ON THE PROPOSAL AT A REGULARLY SCHEDULED BOARD MEETING. APPROVAL REQUIRES A MAJORITY VOTE OF THE BOARD.
10. ALL ACADEMIC DEGREE PROGRAM INFORMATION
INCLUDED IN UNIVERSITY CATALOGS AND MARKETING MATERIALS MUST BE CONSISTENT WITH BOARD ACTIONS TAKEN IN ACCORDANCE WITH THIS SECTION OF THE POLICY.
E. DISESTABLISHMENT, RENAMING, OR TRANSFER OF AN ACADEMIC
DEGREE PROGRAM
1. FROM TIME TO TIME, A UNIVERSITY MAY WISH TO DISESTABLISH, RENAME, OR TRANSFER BETWEEN ORGANIZATION UNITS AN ACADEMIC DEGREE PROGRAM.
Board of Regents Meeting
November 18-20, 2020 Item #23
EXECUTIVE SUMMARY Page 16 of 20
2. THE BOARD EXECUTIVE DIRECTOR MUST APPROVE THE DEGREE PROGRAM DISESTABLISHMENT, RENAMING, OR TRANSFER.
3. THE BOARD EXECUTIVE DIRECTOR MAY DIRECT THE
UNIVERSITY TO SUBMIT TO THE ACADEMIC AFFAIRS AND EDUCATIONAL ATTAINMENT COMMITTEE FOR REVIEW AND BOARD APPROVAL ANY CHANGES THAT THE EXECUTIVE DIRECTOR DEEMS TO BE OF MAJOR SIGNIFICANCE.
4. UPON REQUEST OF THE CHAIR OF THE ACADEMIC AFFAIRS
AND EDUCATIONAL ATTAINMENT COMMITTEE, THE BOARD EXECUTIVE DIRECTOR WILL REPORT TO THE COMMITTEE FOR ANY SPECIFIED TIMEFRAME, THE ACADEMIC PROGRAM CHANGES AUTHORIZED UNDER THIS SECTION OF THE POLICY.
5. ALL INFORMATION INCLUDED IN THE UNIVERSITY
CATALOGS CONCERNING ACADEMIC PROGRAMS AND COURSES MUST BE CONSISTENT WITH BOARD ACTIONS TAKEN IN ACCORDANCE WITH THIS SECTION OF THE POLICY.
F. MATERIAL REVISIONS TO EXISTING ACADEMIC PROGRAM CREDIT
REQUIREMENTS
1. FROM TIME TO TIME, A UNIVERSITY MAY WISH TO REVISE A DEGREE PROGRAM TO:
a. REQUIRE MORE THAN 120 CREDITS IN AN UNDERGRADUATE PROGRAM; OR
b. APPLY MORE THAN 64 COMMUNITY COLLEGE CREDITS TOWARD THE UNDERGRADUATE DEGREE REQUIREMENTS FOR A SPECIFIC MAJOR.
2. PRIOR TO PUBLICLY ANNOUNCING, MARKETING,
SOLICITING APPLICATIONS FOR, OR DELIVERING AN ACADEMIC PROGRAM WITH MATERIAL REVISIONS TO THE EXISTING CREDIT REQUIREMENTS, A UNIVERSITY MUST OBTAIN BOARD APPROVAL IN A PUBLIC MEETING.
Board of Regents Meeting
November 18-20, 2020 Item #23
EXECUTIVE SUMMARY Page 17 of 20
3. THE REQUEST WILL EXPLAIN THE NEED TO REVISE CREDIT REQUIREMENTS.
4. UPON RECEIVING A REQUEST TO REVISE CREDIT
REQUIREMENT, THE COMMITTEE CHAIR WILL PLACE THE REQUEST ON THE AGENDA OF THE NEXT REGULARLY SCHEDULED MEETING. THE COMMITTEE WILL MAKE A RECOMMENDATION TO THE BOARD TO APPROVE, REJECT OR MODIFY THE REQUEST.
5. UPON RECEIVING THE COMMITTEE’S RECOMMENDATION,
THE BOARD WILL VOTE ON THE REQUEST AT A REGULARLY SCHEDULED BOARD MEETING.
G. ACADEMIC ORGANIZATIONAL UNITS
1. FROM TIME TO TIME, A UNIVERSITY MAY DESIRE TO
ESTABLISH A NEW ACADEMIC ORGANIZATIONAL UNIT AS DEFINED IN ABOR POLICY 2-222.
2. A UNIVERSITY MUST OBTAIN BOARD APPROVAL IN A
PUBLIC MEETING PRIOR TO PUBLICLY ANNOUNCING THE ESTABLISHMENT OF A NEW ACADEMIC ORGANIZATIONAL UNIT.
3. TO OBTAIN APPROVAL FOR A NEW ORGANIZATIONAL UNIT
THE UNIVERSITIES MUST LODGE A REQUEST WITH THE BOARD OFFICE
4. UPON RECEIVING THE REQUEST TO ESTABLISH A NEW
ORGANIZATIONAL UNIT, THE COMMITTEE CHAIR WILL PLACE THE REQUEST ON THE NEXT REGULARLY SCHEDULED ACADEMIC AFFAIRS AND EDUCATIONAL ATTAINMENT COMMITTEE AGENDA.
5. A REQUEST TO ESTABLISH A NEW ORGANIZATIONAL UNIT
MUST INCLUDE THE FOLLOWING INFORMATION:
a. THE RATIONALE FOR THE NEW UNIT AND ITS RELATIONSHIP TO THE UNIVERSITY’S MISSION AND ENTERPRISE GOALS;
b. THE NUMBER OF STUDENTS TO BE SERVED;
Board of Regents Meeting
November 18-20, 2020 Item #23
EXECUTIVE SUMMARY Page 18 of 20
c. THE NUMBER OF FACULTY AND OTHER POSITIONS
NEEDED FOR THE UNIT TO OPERATE; AND d. HOW THE NEW UNIT WILL BE FUNDED.
6. THE BOARD OFFICE WILL DEVELOP A STANDARD FORMAT
FOR REQUESTS. 7. THE COMMITTEE WILL MAKE A RECOMMENDATION TO THE
BOARD TO APPROVE, REJECT OR MODIFY THE REQUEST FOR A NEW ORGANIZATIONAL UNIT.
8. UPON RECEIVING THE COMMITTEE’S RECOMMENDATION,
THE BOARD WILL VOTE ON THE REQUEST FOR A NEW ORGANIZATIONAL UNIT AT A REGULARLY SCHEDULED BOARD MEETING.
9. A NEW ORGANIZATIONAL UNIT REQUIRES A MAJORITY
VOTE OF THE BOARD. H. DISESTABLISHMENT, MERGER OR RENAMING OF AN ACADEMIC
ORGANIZATIONAL UNIT
1. FROM TIME TO TIME A UNIVERSITY MAY DESIRE TO DISESTABLISH, MERGE OR RENAME AN ACADEMIC UNIT.
2. THE BOARD EXECUTIVE DIRECTOR MUST APPROVAL THE
DISESTABLISHMENT, MERGER OR RENAMING OF AN ACADEMIC UNIT.
3. A PROPOSAL TO DISESTABLISH OR MERGE AN ACADEMIC
UNIT MUST:
a. PROVIDE A RATIONALE FOR THE PROPOSED DISESTABLISHMENT OR MERGER OF AN ACADEMIC UNIT;
b. OUTLINE THE BENEFIT TO THE UNIVERSITY; AND c. PROVIDE INFORMATION ON ANY FINANCIAL SAVINGS
THAT MAY BE REALIZED FROM THE CHANGE.
Board of Regents Meeting
November 18-20, 2020 Item #23
EXECUTIVE SUMMARY Page 19 of 20
d. EXPLAIN HOW STUDENTS, FACULTY, AND STAFF WILL BE IMPACTED BY THE PROPOSED CHANGE
4. THE BOARD EXECUTIVE DIRECTOR IS AUTHORIZED TO
APPROVE ORGANIZATION UNIT NAME OR TITLE CHANGES.
5. UPON REQUEST OF THE CHAIR, THE BOARD EXECUTIVE DIRECTOR WILL REPORT TO THE ACADEMIC AFFAIRS AND EDUCATIONAL ATTAINMENT COMMITTEE NAME CHANGES AUTHORIZED BY THE EXECUTIVE DIRECTOR.
6. ALL INFORMATION CONCERNING ACADEMIC ORGANIZATIONAL UNITS INCLUDED IN UNIVERSITY CATALOGS MUST BE CONSISTENT WITH THIS SECTION OF THE POLICY.
I. ACADEMIC LOCATION AND PROGRAM INVENTORIES
1. THE UNIVERSITY WILL KEEP AN UP TO DATE INVENTORY OF
ACADEMIC LOCATIONS AND PROGRAMS. 2. EACH YEAR THE UNIVERSITIES WILL SUBMIT TO THE
BOARD OFFICE:
a. AN ACADEMIC PROGRAM INVENTORY LISTING ALL ACADEMIC PROGRAMS IN WHICH STUDENTS ARE CURRENTLY ENROLLED; AND
b. THE ENROLLMENT, LOCATION, DELIVERY METHOD,
MODALITY AND OTHER REQUESTED INFORMATION FOR EACH ACADEMIC PROGRAM LISTED IN THE INVENTORY.
3. THE BOARD OFFICE WILL DEVELOP AND MAINTAIN A
COMMON FORMAT FOR SUBMISSIONS.
J. ACADEMIC COUNCIL 1. A FOUR-MEMBER ACADEMIC COUNCIL IS ESTABLISHED AND
CHARGED WITH COLLABORATING AND COORDINATING ACADEMIC PROGRAM ACTIVITIES AMONG ARIZONA’S PUBLIC UNIVERSITIES.
Board of Regents Meeting
November 18-20, 2020 Item #23
EXECUTIVE SUMMARY Page 20 of 20
2. ACADEMIC COUNCIL MEMBERSHIP CONSISTS OF THE UNIVERSITIES’ CHIEF ACADEMIC OFFICERS AND ONE ABOR DESIGNEE.
3. THE ACADEMIC COUNCIL’S PURPOSE IS TO SUPPORT THE ENTERPRISE EXECUTIVE COMMITTEE IN ENTERPRISE PLANNING AND MANAGEMENT WITH REGARDS TO ACADEMIC PROGRAMMING. THIS COUNCIL IS A MANAGERIAL WORKING GROUP AND NOT AN ABOR SUBCOMMITTEE.
4. THE ACADEMIC COUNCIL MAY MEET AS OFTEN AS NECESSARY, BUT AT LEAST ONCE PRIOR TO EACH REGULARLY SCHEDULED ACADEMIC AFFAIRS AND EDUCATIONAL ATTAINMENT COMMITTEE.
Board of Regents Meeting November 18-20, 2020
Item #24 EXECUTIVE SUMMARY Page 1 of 76
Contact Information: Mark S. Searle, ASU [email protected] 480-965-9585 Chad Sampson, ABOR [email protected] 602-229-2512
Item Name: Request for New Academic Programs for Arizona State
University
Action Item
Background/History of Previous Board Action As provided in the board policy, new program requests may be submitted throughout the year with the approval of the Academic Affairs and Educational Attainment Committee. Discussion Arizona State University seeks to add new programs for implementation in the 2021-2022 Academic Year. This request is for new academic programs:
• Master of Science in Marketing and Customer Experience Management • Master of Fine Arts in Art Education • Doctor of Philosophy in Population Health • Master of Science in Strength and Conditioning • Master of Project Management • Master of Human Resources and Employment Law • Master of Science in Addiction Psychology • Master of Science in Crime Analysis • Master of Science in Futures and Design • Bachelor of Arts in Education in Early Childhood Education • Bachelor of Arts in Education in Physical Education • Bachelor of Arts in Culture, Technology and Environment • Bachelor of Arts in Race, Culture and Democracy
Degree planning at ASU is founded on the Charter: ASU is a comprehensive public research university, measured not by whom it excludes, but by whom it includes and how they succeed; advancing research and discovery of public value; and assuming fundamental responsibility for the economic, social, cultural and overall health of the communities it serves.
Requested Action: Arizona State University asks the board to approve the new program requests effective in the 2021-2022 academic year.
Board of Regents Meeting November 18-20, 2020
Item #24 EXECUTIVE SUMMARY Page 2 of 76 All academic degree programs go through multiple review and approval processes to ensure their currency, quality, and relevance. Each year, the Provost initiates the academic planning process. The academic deans, in consultation with the directors of the academic units, submit information on all proposed new degrees, concentrations, minors, and certificates for the ensuing year, as well as changes to existing degree titles, program disestablishments, and creation of new organizations, organizational changes and disestablishments. Once reviewed and approved by the Provost, these initiatives begin the review process, including, as applicable, the curriculum committees in the academic unit, college, Graduate College, and University Senate. At each level, a substantive review of the proposed program is completed to ensure quality and to avoid redundancy with other programs. At any step in the approval process, programs can be tabled and/or returned to the academic unit for further clarification and/or revision. The provost reviews all resources involved in program development, both in the college offering the degree program and other colleges offering supporting courses. The distribution of the institution’s resources, including faculty, infrastructure, administration and support staff, are reviewed to optimize and maximize capacity. In addition, the university invests annually in academic units based on enrollment growth, allowing academic units to expand capacity, with the additional funds invested in strategic hiring. The academic units also receive increasing revenue from summer and online operations which provides resources for the initiatives. The new degree programs advance business, health, society, sciences and the arts at the graduate level through degrees in marketing and customer experience management, project management, human resources and employment law, population health, addiction psychology, strength and conditioning, crime analysis, art education, and futures and design. At the undergraduate level, the degrees advance education, culture and technology, and democracy. In keeping with the 2020 Operational and Financial Review Enterprise Plan, the degree proposals are aligned strategically with our design aspirations to leverage our place, transform society, value entrepreneurship, include use-inspired research, enable student success, fuse intellectual disciplines, be socially embedded, and engage students with issues locally, nationally and internationally. Committee Review and Recommendation The Academic Affairs and Educational Attainment Committee reviewed this item at its November 5, 2020 meeting, and recommended forwarding the item to the full board for approval. Statutory/Policy Requirements ABOR Policy 2-223.A, “The Academic Strategic Plan”

Board of Regents Meeting November 18-20, 2020
Item #24 EXECUTIVE SUMMARY Page 3 of 76
University: Arizona State University Proposed New Program Degree College/School Page Number
Graduate Programs
Marketing and Customer Experience Management
MS W. P. Carey School of Business 4
Art Education MFA Herberger Institute for Design and the Arts
9
Population Health PhD College of Health Solutions 14
Strength and Conditioning MS College of Health Solutions 20
Master of Project Management
MPM College of Integrative Sciences and Arts
25
Master of Human Resources and Employment Law
MHREL Sandra Day O’Connor College of Law
31
Addiction Psychology MS The College of Liberal Arts and Sciences
37
Crime Analysis MS Watts College of Public Service and Community Solutions
43
Futures and Design MS College of Global Futures 48
Undergraduate Programs
Early Childhood Education BAE Mary Lou Fulton Teachers College 54
Physical Education BAE Mary Lou Fulton Teachers College 60
Culture, Technology and Environment
BA The College of Liberal Arts and Sciences
67
Race, Culture and Democracy
BA College of Integrative Sciences and Arts; The College of Liberal Arts and Sciences; New College of Interdisciplinary Arts and Sciences
72
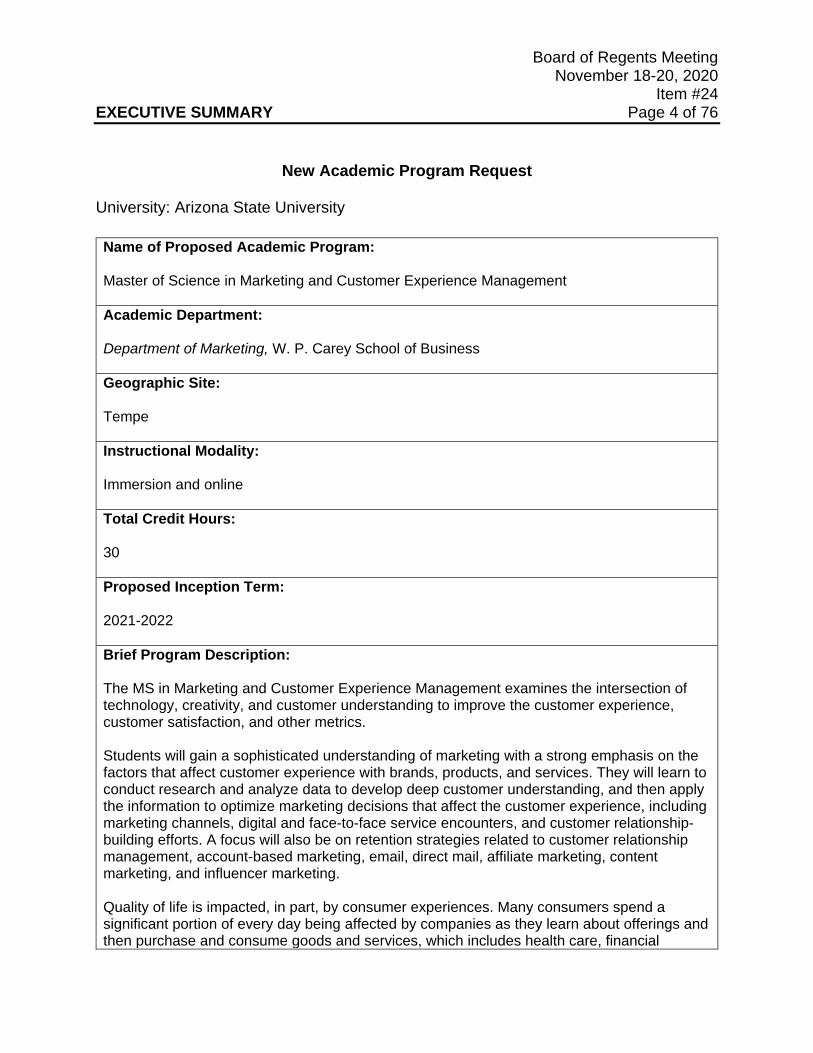
Board of Regents Meeting November 18-20, 2020
Item #24 EXECUTIVE SUMMARY Page 4 of 76
New Academic Program Request
University: Arizona State University Name of Proposed Academic Program: Master of Science in Marketing and Customer Experience Management Academic Department: Department of Marketing, W. P. Carey School of Business Geographic Site: Tempe Instructional Modality: Immersion and online Total Credit Hours: 30 Proposed Inception Term: 2021-2022 Brief Program Description: The MS in Marketing and Customer Experience Management examines the intersection of technology, creativity, and customer understanding to improve the customer experience, customer satisfaction, and other metrics. Students will gain a sophisticated understanding of marketing with a strong emphasis on the factors that affect customer experience with brands, products, and services. They will learn to conduct research and analyze data to develop deep customer understanding, and then apply the information to optimize marketing decisions that affect the customer experience, including marketing channels, digital and face-to-face service encounters, and customer relationship-building efforts. A focus will also be on retention strategies related to customer relationship management, account-based marketing, email, direct mail, affiliate marketing, content marketing, and influencer marketing. Quality of life is impacted, in part, by consumer experiences. Many consumers spend a significant portion of every day being affected by companies as they learn about offerings and then purchase and consume goods and services, which includes health care, financial
Board of Regents Meeting November 18-20, 2020
Item #24 EXECUTIVE SUMMARY Page 5 of 76 services, and others that have strong implications for their well-being. The MS in Marketing and Customer Experience Management will help business professionals develop the skills needed to create experiences that are customer-focused and lead to increased customer satisfaction and well-being, which benefit both consumers and companies. This is consistent with ASU's charter to emphasize contributions to the economic, social, cultural, and overall health of the communities it serves. A true focus on improving the customer experience requires an emphasis on innovation and entrepreneurial thinking to continue to enhance customer value. It also necessitates a focus on the experience of all consumers, many of whom are currently neglected, which has the potential to play an important role in transforming society. Finally, students enrolled in the program will obtain unique knowledge on the emerging experience economy and will be better equipped for opportunities that exist within that economy. Specialized master's program courses may focus on topics such as Excelling at the Customer Experience, Creating Digital Experiences, Product Management, Digital Marketing, Marketing Analytics, and Customer Insights, and Innovations in Marketing. Learning Outcomes and Assessment Plan:
Learning Outcome 1: Students will demonstrate graduate-level proficiency in critical thinking related to marketing and customer experience management issues.
● Concepts: Elements of critical thinking outlined in the Paul-Elder framework of critical thinking: thought and reasoning, intellectual standards and intellectual traits; effective decision-making; marketing planning and execution, as well as customer experience management.
● Competencies: Students will be able to identify, examine, organize and evaluate information relevant to marketing and customer experience management issues, integrate diverse and/or contradictory perspectives on these issues, and transfer and apply knowledge to make sound marketing and customer experience management focused decisions. Ability to use the Paul-Elder framework of critical thinking in identifying three cohesive components, which are traits of advanced critical thinking that can be applied to multiple subjects. This framework is noteworthy because improves the quality of skillfully solving problems on any content, subject or problem that they are presented. (Paul and Elder, 2001).
● Assessment Methods: Students will complete a case in MKT 580 Project Leadership - From Ambiguity to Impact that requires them to identify, examine, organize and evaluate information relevant to an issue, integrate diverse and /or contradictory perspectives, and transfer and apply knowledge to make sound marketing and customer experience management decisions. The Program Director, the Department Chair, and the Associate Department Chair will review student responses to the assessment case presented in the course against the rubric to evaluate performance on critical thinking to assess graduate-level proficiency.
Board of Regents Meeting November 18-20, 2020
Item #24 EXECUTIVE SUMMARY Page 6 of 76
● Measures: Faculty designed rubrics will be utilized to evaluate students’ ability to demonstrate the competencies identified to meet outcome 1. The findings will be reviewed along with course feedback and an improvement plan developed in conjunction with discussion with faculty teaching the program’s coursework. Rubrics will be continually refined based on assessment outcomes and feedback.
Learning Outcome 2: Students will demonstrate graduate-level proficiency in communication related to marketing and customer experience management issues.
● Concepts: Principles of effective writing in marketing planning and execution, and customer experience management. ● Competencies: Ability to write effectively through the use of appropriate, clear and logical organizing structure and the use of acceptable style and grammar when communicating about marketing and customer experience management issues. ● Assessment Methods: In capstone course MKT 580 Project Leadership - From Ambiguity to Impact, students will complete an individual written case assignment that requires them to communicate effectively, provide appropriate clear and logical organizing structure and use acceptable style and grammar. Students will be evaluated using rubrics that will determine if the student successfully mastered the skills to write clearly and effectively based on their performance in the case study. ● Measures: A faculty designed rubric will be utilized to evaluate students’ ability to demonstrate the competencies identified to meet outcome 2. The department will compile the results of the case studies which be reviewed by the Program Director, the Department Chair and the Associate Chair and an improvement plan will be developed in conjunction with discussions with faculty teaching in the program.
Learning Outcome 3: Students will demonstrate graduate-level proficiency in discipline-specific knowledge related to marketing and customer experience management.
● Concepts: Key marketing concepts with a focus on marketing strategy (segmentation, targeting, positioning) and marketing mix/tactics (product, price, place, promotion, people, physical evidence, process), along with an emphasis on the customer experience. ● Competencies: Ability to develop a marketing plan for a brand that details marketing strategy and marketing mix decisions aimed at enhancing a brand as well as key aspects of the customer experience. ● Assessment Methods: Students will complete an individual written assignment that requires them to create a marketing plan to enhance a brand completed in capstone course MKT 580 Project Leadership - From Ambiguity to Impact. Students will be evaluated using rubrics that will determine if the student successfully mastered the skills to successfully develop a marketing plan.
Board of Regents Meeting November 18-20, 2020
Item #24 EXECUTIVE SUMMARY Page 7 of 76
● Measures: A faculty designed rubric will be utilized to evaluate students’ ability to demonstrate the competencies identified to meet outcome 3. The department will compile the results of the marketing plans which be reviewed by the Program Director, the Department Chair and the Associate Chair and an improvement plan will be developed in conjunction with discussions with faculty teaching in the program. The program will be continuously refined based on the findings.
Learning Outcome 4: Students will demonstrate graduate-level proficiency in ethical leadership related to marketing and customer experience management.
● Concepts: Principles of ethical decision making related to marketing planning and execution, and customer experience management. ● Competencies: Ability to identify ethical issues related to marketing and customer experience management, be able to evaluate alternative actions based on different ethical standards, and be able to make ethical decisions concerning marketing and customer experience management. ● Assessment Methods: Students will identify and analyze ethical issues and develop recommendations for a case presented in capstone course MKT 580: Project Leadership - From Ambiguity to Impact. Students will develop a written report with their recommendations and present their findings. Students will be evaluated using rubrics that will determine if the student successfully mastered the skills to successfully analyze ethical issues in the case study presented in the capstone course. ● Measures: A faculty designed rubric will be utilized to evaluate students’ ability to demonstrate the competencies identified to meet outcome 4. The department will compile the results of the case studies which be reviewed by the Program Director, the Department Chair and the Associate Chair and an improvement plan will be developed in conjunction with discussions with faculty teaching in the program. The program will be continuously refined based on the findings.
Projected Enrollment for the First Three Years: First Year: 20 Second Year: 40 Third Year: 60 Evidence of Market Demand:
Overall jobs for marketing managers are expected to grow 8% by 2028, according to the Bureau of Labor Statistics. This is a faster pace than all other jobs, which are projected to grow by 5% by 2028. The Bureau of Labor Statistics report notes, "With Internet-based advertising becoming more important, advertising managers who can navigate the digital world should have the best prospects." As noted in a recent report by Forrester, 76% of executives indicate that improving the customer experience is a key priority and there are
Board of Regents Meeting November 18-20, 2020
Item #24 EXECUTIVE SUMMARY Page 8 of 76 many companies that have created a C-level role tasked with overseeing it (Yohn 2019, Harvard Business Review article, “Why Every Company Needs a Chief Experience Officer). This suggests an increased focus on skills related to customer experience management.
At the present, of the top 20 graduate programs in marketing in the United States as ranked by U.S. World & News Report, only eight of them offer a specialized master's in marketing, none of which are fully online. When looking at the top 20 online MBA programs in the country, while seven have a specialized marketing-related master's, only two of them are fully online. Similar Programs Offered at Arizona Public Universities: In Arizona, only the University of Arizona has an MS in Marketing, but it is not available online. At ASU, the Walter Cronkite School of Journalism and Mass Communication offers an MS in Digital Audience Strategy, which is related to digital marketing but is focused more narrowly on the strategies and tactics related to growing digital audiences. Overall, an online master's degree focused on marketing with an emphasis on customer experience management will be one of a very few online specialized marketing master's degrees offered at a top business school, and the only one with an emphasis on developing skills related to creating excellent customer experiences. New Resources Required? (i.e. faculty and administrative positions; infrastructure, etc.): The school is currently hiring one tenure-track faculty through reallocation of existing resources and will supplement with existing lecturers, tenured/tenure track faculty and clinical faculty. Program Fee Required? YES ☒ NO ☐ Estimated Amount: $8,125 per semester; $16,250 (total) Program Fee Justification: Program fees are needed to enhance the quality of the student experience. The program fee is used to fund enhancements to the curriculum through investments in academic services to engage students throughout their program to the first-time students’ express interest in the program, the application process, when students are admitted, through to their degree completion. This exceptional support contributes to high student retention and academic success. Specialized Accreditation? YES ☐ NO ☒ Accreditor: None
Board of Regents Meeting November 18-20, 2020
Item #24 EXECUTIVE SUMMARY Page 9 of 76
New Academic Program Request
University: Arizona State University Name of Proposed Academic Program: Master of Fine Arts in Art Education Academic Department: School of Art, Herberger Institute for Design and the Arts Geographic Site: Downtown Phoenix and Tempe campus Instructional Modality: Immersion and online Total Credit Hours: 60 Proposed Inception Term: 2021-2022 Brief Program Description: The low-residency MFA in Art Education is a 3-year terminal degree offered through a range of modalities for full-time art educators, including iCourses, remote synchronized learning, and an intensive 8-week on-campus in-person studio session in the summer. The degree provides graduate students with the opportunity to develop a cohesive body of artwork with individual guidance by the School of Art’s world-renowned faculty; expand their pedagogical practice with contemporary art and education theory; and study with a community of art teachers sharing ideas, studio experiences, and experimental processes. The program extends the charter of ASU by assuming fundamental responsibility for the social and cultural health of our communities, as well as extending the mission of the School of Art by contributing to the social engagement and creative practices of art educators. The curriculum of the MFA in Art Education recognizes the artistry of individual studio practice and classroom pedagogical design, and culminates in a final project that includes both an applied classroom experience and a studio exhibition. While many K-12 art educators would like to pursue a terminal studio art degree, residency requirements during fall and spring typically conflict with K-12 school schedules. One of ASU’s primary goals is to “maintain the fundamental principle of accessibility to all students qualified to study at a research
Board of Regents Meeting November 18-20, 2020
Item #24 EXECUTIVE SUMMARY Page 10 of 76 university.” This innovative low-residency model provides scheduling flexibility while maintaining the high-quality standards of a rigorous MFA program. Learning Outcomes and Assessment Plan: Learning Outcome 1: Students will understand relationships between a range of contemporary art and education theories and practices that utilize traditional, performative, and conceptual art approaches to engage in critical global questions related to social, environmental, economic, and cultural issues.
● Concepts: Art as a tool for learning and positive social change, social, political and environmental arts research methods, material experimentation, performance, and creative writing, as well as socially-engaged public performances.
● Competencies: Ability to engage in visual and cultural analysis, and examine how art and cultural action communicates, reflects, and educates for positive social change. Students will develop critical thinking and communication skills through written and verbal critiques, and explore and apply a range of conceptual frames related to ecological attunement, global interconnectedness, social, economic, and gender issues, technological experimentation, embodied learning, and cultural inquiry.
● Assessment Methods: Students will write a research paper that reflects learning outcomes, including an in-depth literature review of significant examples of artistic research and intervention with analysis of relationships and impacts on social and cultural conditions. The research paper in ARE 520 Concepts and Methods in Arts-Based Research should demonstrate that the student has satisfactorily met expectations in the competency area of content knowledge based on a rubric developed by members of the School of Art faculty. Content knowledge is evaluated by a demonstration of knowledge and the understanding of current issues in Art Education.
Students will also create a portfolio of work throughout their program that will be the foundation of their written thesis in ARE 599 Thesis. The thesis will include a written description and evaluation of their studio work, evidence of their classroom engagement project, exhibition documentation, and a reflection addressing artistic, theoretical, and cultural connections. The work will be assessed for the competency area of written communication, specifically the written description and evaluation of their studio work, and the reflection, based on a rubric developed by members of the School of Art faculty. The competency areas we evaluate include successfully demonstrating an application of strong written communication skills with a thorough explanation of the theoretical, cultural, and artistic connections and processes in their studio work and pedagogical activation.
● Measures: Based on faculty-developed rubrics, students will demonstrate an understanding of art theory and contemporary art education research through written communication skills, depth of analysis, classroom engagement, and artistic practice. Rubrics will be continually refined based on assessment outcomes and feedback.
Board of Regents Meeting November 18-20, 2020
Item #24 EXECUTIVE SUMMARY Page 11 of 76 Learning Outcome 2: Students will gain familiarity with a range of traditional qualitative and experimental arts-based research methodologies. Students will be able to evaluate relationships between research methods to choose and design innovative approaches.
● Concepts: Methods of qualitative inquiry, including artistic research methods that utilize visual art, embodied inquiry, creative writing, digital technologies, and hybrid forms to critically examine global issues in formal and informal learning spaces, aligning with socially-based, community-engaged, and activist-driven contemporary art practices.
● Competencies: Ability to use traditional qualitative inquiry methods, such as interviews, narratives, case studies, focus groups, and collecting historical and demographic data. They will engage in personal and community-focused research using emerging and experimental arts-based research methodologies, and evaluate seminal research and design an arts-based research project employing appropriate methods to engage with pressing local and global issues.
● Assessment Methods: Students will write a research paper that reflects learning outcomes, including an in-depth literature review of significant examples of artistic research and intervention with analysis of relationships and impacts on social and cultural conditions. The research paper in ARE 520 Concepts and Methods in Arts-Based Research should demonstrate that the student has satisfactorily met expectations in the competency area of research methodology based on a rubric developed by members of the School of Art faculty. The competency areas evaluated include effectively analyzing connections between research methodology, pedagogical design, and studio practice.
Students develop a thesis proposal applying arts-based research methodologies to investigate a critical contemporary issue through their studio art practice and a pedagogy implementation with participants. Students should successfully defend their written thesis proposal on their first attempt with an interdisciplinary committee of faculty. The competency areas evaluated include evidence of a strong understanding of contemporary art and theory, strong articulation of issues being investigated, and alignment between research methodology, pedagogical design, and studio practice.
● Measures: Based on faculty-developed rubrics, students will demonstrate an understanding of art theory and contemporary art education research through written communication skills, depth of analysis, classroom engagement, and artistic practice. Rubrics will be continually refined based on assessment outcomes and feedback.
Learning Outcome 3: Students build on their teaching experience and expand their pedagogical practice by designing and executing concept-driven art education experiences that connect pressing global questions though local place-based inquiry.
● Concepts: Experimental pedagogical designs and inquiry-driven techniques that challenge teacher/learner hierarchies; the craft of teaching as performance; curriculum-building as a conceptual art practice; critical power relations through decolonizing education approaches; methods of qualitative inquiry; artistic research
Board of Regents Meeting November 18-20, 2020
Item #24 EXECUTIVE SUMMARY Page 12 of 76
methods that utilize visual art, embodied inquiry, creative writing, using digital technologies, and hybrid forms to critically examine global issues in formal and informal learning spaces, aligning with socially-based, community-engaged, and activist-driven contemporary art practices.
● Competencies: Ability to develop a series of experimental art lessons that are inquiry-driven and place-based. Lessons will include participatory teaching methods, with a flipped classroom, student-driven investigation, and experimentation with nontraditional art techniques and materials. Graduates will have experience and mentorship regarding pedagogical experimentation in their courses and in students’ places of employment because students enrolled in the MFA program must also be currently teaching in a formal learning environment.
● Assessment Methods: Students develop a thesis proposal applying arts-based research methodologies to investigate a critical contemporary issue through their studio art practice and a pedagogy implementation with participants. Students should successfully defend their written thesis proposal on their first attempt with an interdisciplinary committee of faculty. With a focus on competency area curriculum design, faculty evaluate the innovative nature of their curriculum design and its relevance to the population involved; evidence of strong understanding of contemporary art and theory, strong articulation of issues being investigated, and alignment between research methodology, pedagogical design, and studio practice.
Students will create a thesis portfolio, which includes a written description and evaluation of their studio work, evidence of their classroom engagement project, thesis exhibition documentation, and a culminating reflection paper addressing artistic, theoretical, and cultural connections. Students will successfully complete the classroom engagement project having satisfactorily met expectations of the competency areas evaluated, based on a rubric developed by members of the School of Art faculty. The competency areas we evaluate include the quality of engagement, the impact of engagement, and the overall content alignment with contemporary art processes which includes successful analysis of connections to contemporary art and pedagogical concepts.
● Measures: Based on faculty-developed rubrics, students will demonstrate an understanding of art theory and contemporary art education research through written communication skills, depth of analysis, classroom engagement and their artistic practice. Rubrics will be continually refined based on assessment outcomes and feedback.
Projected Enrollment for the First Three Years: First Year: 5 Second Year: 8 Third Year: 12
Board of Regents Meeting November 18-20, 2020
Item #24 EXECUTIVE SUMMARY Page 13 of 76 Evidence of Market Demand: The low-residency MFA in Art Education is being developed in response to a growing demand among art educators for a low-residency degree that balances studio work with academic studies. The University of Utah is one of the only programs across the country that offers an MFA in Art Education, and it is an on-campus program specifically focused on Community-Based Art. ASU’s program is one-of-a-kind and uniquely innovative. According to Emsi Analytics reporting, there are no distance learning MFA degrees in Art Education in the nation. In 2018, only 11 institutions in the country offered online Art Education MA degree programs. Since 2017, job postings in Art Education have been trending up at .8% with 69,994 annual postings. A bachelor’s degree with state licensure is required to teach art in most K-12 settings. Our primary market is currently employed art educators interested in enhancing their artistic and pedagogical practices, while they gain a competitive edge in the field and potentially increase their pay bracket. According to the Bureau of Labor Statistics, in 2017, 95,110 art educators were employed with a rise of 2.1% and they earned an annual mean wage of $78,000 with a rise of 1.2%. Similar Programs Offered at Arizona Public Universities: The University of Arizona and the School of Art at ASU offer on-campus MA degrees in Art Education, and the University of Arizona also offers a PhD in Art Education. Both universities also offer traditional studio MFA degrees, but neither school offers a low-residency Art Education MFA. The current MA in Art Education at ASU prepares students for traditional research methods and academic writing that culminates in a master thesis. The Art Education MFA would be studio driven with active classroom research, culminating in art exhibitions. Northern Arizona University offers an on-campus and online MEd in Education. No MFA programs in Art Education are offered in our region and no low-residency Art Education MFA programs are offered in the nation. New Resources Required? (i.e. faculty and administrative positions; infrastructure, etc.): None Program Fee Required? YES ☒ NO ☐ Estimated Amount: $20 per credit hour Program Fee Justification: The requested program fee will fund the technical, personnel, and course development needs necessary to support a low-residency program. Throughout the fall and spring semesters, students take courses virtually or at-a-distance and in-person during the summer. This fee will fund the software and technical requirements as well as personnel and course development. Specialized Accreditation? YES ☐ NO ☒ Accreditor: None
Board of Regents Meeting November 18-20, 2020
Item #24 EXECUTIVE SUMMARY Page 14 of 76
New Academic Program Request
University: Arizona State University Name of Proposed Academic Program: Doctor of Philosophy in Population Health Academic Department: College of Health Solutions Geographic Site: Downtown Phoenix campus Instructional Modality: Immersion and online Total Credit Hours: 84 Proposed Inception Term: 2021-2022 Brief Program Description: The mission of the PhD in Population Health is to provide students with a comprehensive, rigorous academic core of knowledge and professional skills that prepare them to become educators, researchers and leaders dedicated to advocating, promoting and achieving improvements in population health. The program is designed to ensure that students can integrate and analyze the complex biological, behavioral, social and economic factors and systems that impact the health of populations through academic coursework and community engagement. Students will also learn to employ advanced analytic approaches to investigate multiple data sources, and also develop, implement and study programs and initiatives to improve the health of populations. This blend of academic and experiential learning will prepare students for future careers in the rapidly changing and interconnected field of population health. In the United States, it is clear that health care costs are unsustainable, and the systems needed to optimize the health of populations are in flux. Approximately 5% of the population accounts for 50% of health care costs, and 30-50% of disease is preventable. Thus, there is great need to both increase prevention efforts via traditional public health approaches and
Board of Regents Meeting November 18-20, 2020
Item #24 EXECUTIVE SUMMARY Page 15 of 76 provide improved and more efficient health care to assure that the health care system can be most effective. Improved disease prevention and health care requires systemic changes across all stakeholders in the health system including governments, health care providers, businesses that purchase health care, communities and individuals. At the same time, broader social changes must be optimized to foster total population health improvements. For example, newer technologies (e.g., wearable technologies, smart phones and applications) and rapidly changing informatics infrastructures (e.g., electronic medical record systems, social media) are transforming and fostering complex networks that may be optimized to improve health. This program will address the Institute of Medicine’s recommendation that a paradigm shift is needed to address the health of populations via an integration between primary care and public health via a collaboration between public and private organizations. To quote the institute, “the integration of primary care and public health holds great promise as a way to improve the health of society.” There is no other academic program in Arizona that is dedicated to this focus. The approach supports ASU’s charter by focusing on the health of our community and addressing complex system-level challenges through interdisciplinary collaboration, in particular with stakeholders dedicated to education, research and practice on the interplay of health care, business practices, social determinants, genetics, public health practices, academic and other factors that impact the health of populations. It also builds on strong expertise within ASU pertaining to science of health care delivery, geographic information systems (GIS) analyses pertaining to health, dissemination and implementation science, health informatics, complexity science and other disciplines. Learning Outcomes and Assessment Plan Learning Outcome 1: Graduates of the PhD in Population Health will be able to conduct an in-depth analysis and evaluation of complex systems that impact population health outcomes.
● Concepts: Principles of systems science, modeling, and computation theory; Structural and functional aspects of systems that impact population health outcomes. ● Competencies: Ability to analyze the complex system of factors and interrelationships (e.g. inequity, income, education, health care system, built and policy environments, shifting demographic trends) that differentially affect the health of diverse populations. Appraise the role of collaborative networks for knowledge flow and decision-making. Examine informatics data from a variety of sources that together impact population health outcomes. Employ dissemination and implementation theory and research methods to address complex challenges to population health. Develop and implement research to achieve solutions to population health issues using systems principles. ● Assessment Methods: Students will be assessed via a final exam on their ability to analyze complex systems data related to population health during a first-year health informatics course. Students will be assessed on their ability to develop and implement research to achieve solutions to population health issues using systems principles on the population health doctoral dissertation. Students will complete an

Board of Regents Meeting November 18-20, 2020
Item #24 EXECUTIVE SUMMARY Page 16 of 76
exit survey that assesses their sense of preparedness to apply population systems-thinking perspectives in work environments relevant to their career. ● Measures: Students will be measured on their ability to critically analyze complex systems and use systems principles to conduct research relevant to population health through independent research courses evaluated with faculty-developed rubrics and dissertation work. Rubrics will be continually refined based on assessment outcomes and feedback.
Learning Outcome 2: Graduates will be able to demonstrate proficiency in the use of analytical skills to evaluate research and data relevant to population health.
● Concepts: Principles of biostatistics, epidemiology, research design and methodology, informatics, and other knowledge management technologies (e.g. geographical information systems). ● Competencies: Ability to implement diverse study designs, data collection methodologies, and data analysis techniques to address a complex population health problem. Demonstrate proficiency in the use of research design and statistical software packages to organize, describe, and analyze data from multiple sources (e.g. healthcare systems, geographical information systems, governmental and nonprofit organizations, communities, and businesses). ● Assessment Methods: Students will be assessed on their proficiency to implement diverse research methodologies during their first-year population health written progressive exam on research methods. Students will be assessed on their ability to integrate principles from different knowledge management technologies and their proficiency to progressive exam on statistics. Students will complete an exit survey that will assess their sense of proficiency in the use of analytical skills to evaluate data relevant to population health. ● Measures: Students will be measured on their ability to integrate principles from different knowledge management technologies and their proficiency to implement diverse data collection and analytic approaches through a variety of projects evaluated with faculty-developed rubrics and dissertation work. Rubrics will be continually refined based on assessment outcomes and feedback.
Learning Outcome 3: Graduates will be able to conduct an in-depth analysis and evaluation of health determinants that impact population health outcomes.
● Concepts: Social, environmental and policy determinants of health that impact population health outcomes.
● Competencies: Ability to analyze, critique, and investigate how social, environmental and policy determinants of health - as reflected in the diversity of individuals and subgroups identified through a shared culture, language, health status, organization, location, or literacy - influence policies, programs, services, and the
Board of Regents Meeting November 18-20, 2020
Item #24 EXECUTIVE SUMMARY Page 17 of 76
health of populations. Develop and implement evidence-based dissemination and implementation approaches to improve population health outcomes. ● Assessment Methods: Students will be assessed on their ability to analyze, critique, and investigate how social, environmental and policy determinants of health influence the health of populations during the first-year population health research methods, as well as ethics and policy courses. Students will be assessed on the ability to develop and implement evidence-based dissemination and implementation approaches to improve population health outcomes using principles of social determinants of health during their doctoral dissertation. Students will complete an exit survey that will assess students on their sense preparedness to apply social determinants of health methods and data in work environments relevant to their career. ● Measures: Students will be measured on their ability to critically analyze, critique, and investigate how social, physical and policy environments influence the health of populations and its related policies, programs, and services through independent research courses evaluated with faculty-developed rubrics and dissertation work. Rubrics will be continually refined based on assessment outcomes and feedback.
Learning Outcome 4: Graduates will be able to use research methods and practices to analyze, synthesize, and evaluate factors, structures, and functions in communities that can affect total population health.
● Concepts: Factors, structures, and functions in communities that can affect total population health (e.g., community health assessment, needs assessment, community health improvement, and action planning). ● Competencies: Ability to analyze, summarize, evaluate, and propose solutions to social, organizational, built, and policy environment factors and interrelationships of structures and functions in communities that can affect population health. ● Assessment Methods: Students will be assessed on their ability to conduct an in-depth program evaluation during the 2nd year via a comprehensive exam. Students will be assessed on their ability to propose solutions to current issues in population health during a yearly research grant submission to either internal or external sponsors. Students will complete an exit survey that will assess their sense of preparedness to use research methods and practices to analyze, synthesize, and evaluate factors, structures, and functions in communities that can affect total population health. ● Measures: Students will be measured on their ability to conduct an in-depth program evaluation and propose solutions to current issues in population health through performance on a comprehensive exam and independent research, as evaluated by faculty-developed rubrics and program committees. Rubrics will be continually refined based on assessment outcomes and feedback.
Board of Regents Meeting November 18-20, 2020
Item #24 EXECUTIVE SUMMARY Page 18 of 76 Projected Enrollment for the First Three Years: First Year: 2 Second Year: 5 Third Year: 9 Evidence of Market Demand: Population health growth potential is based on labor and market demands for the field of population health and related fields. According to the Integrated Postsecondary Education Data System (IPEDS), there were a total of 10,769 public health (51.2201) completions at 236 campuses of which 60% were at the master’s or doctoral levels in 2017. There were 22,201 job postings related to public health which is a 4,618 year-over-year change compared to the previous year, according to Burning Glass. The Bureau of Labor Statistics states there was a 4.1% change in year-over year employment, a 6.8% increase in 3-year historic growth (compound annual growth rate), and a 6% increase in 5-year historic growth (compound annual growth rate) for public health. The 10-Year forecast for compound annual growth rate is 1.7%. In addition, Google Search trends for public health were 287,601 over 3 months representing a 7.6% year-over-year change. According to Emsi Analyst data, the term “population health” appeared in 36,331 unique job postings from January 2019 to June 2019, excluding job postings that included the field of nursing. The top 20 organizations posting population health positions were health care provider organizations (e.g. Dignity Health, Banner Health), insurers, and universities. Other organizations seeking trainees in population health include pharmaceutical companies and businesses becoming engaged in the health field (e.g. Amazon). Cities are also posting thousands of jobs in population health, including Phoenix, which posted 428 unique positions that included population health in the description (7th highest in the nation). The types of occupations for which those trained in population health can expect to apply include medical and health services managers, management analysts, health services director, medical assistant, research analyst, etc. These overall scores and job postings demonstrate strong-to-moderate growth potential based on labor and market demands for the field of population health. Similar Programs Offered at Arizona Public Universities: Arizona State University: PhD in Global Health Northern Arizona University: PhD in Interdisciplinary Health University of Arizona: DrPH and PhD in Public Health These programs have some similar characteristics, but none have the same systems approach for educating and conducting research. They also do not fit the new field of population health in the way that is being proposed for this new academic program as defined
Board of Regents Meeting November 18-20, 2020
Item #24 EXECUTIVE SUMMARY Page 19 of 76 by the Institute of Medicine, i.e., “the integration of primary care and public health holds great promise as a way to improve the health of society.” Public health is focused on government-sponsored activities (I.e., vaccinations, diagnostic testing, examination of environmental pathogens, food safety, etc.) at the population level. The field of population health studies the outcomes of health and their determinants, including social determinants (access to health care, education, transportation, healthy behavior), the provision of preventive and primary health care, precision health (the personalization of health) as well as factors within the domain of public health. The similar programs listed focus more specifically on the field of public health. The PhD in Population Health is broader than public health alone and aims to bridge public health and health care systems to achieve positive health outcomes for local populations. This goal will be accomplished by viewing health outcomes through a systems-thinking approach across nontraditional sectors (industry, government, academia, health care, public health) with a concentrated focus on health equity, data analytics, dissemination and implementation, and social determinants of health. As noted by the Centers for Disease Control and Prevention, “public health works to protect and improve the health of communities through policy recommendations, health education and outreach, and research for disease detection and injury prevention […] population health provides an opportunity for health care systems, agencies and organizations to work together in order to improve the health outcomes of the communities they serve.” New Resources Required? (i.e. faculty and administrative positions; infrastructure, etc.): Three new faculty in epidemiology, health analytics and system science research will be hired using reallocated college resources. Program Fee Required? YES ☒ NO ☐ Estimated Amount: $2500 per semester Program Fee Justification: The cost of delivering this new program is higher due to the necessity for specialized technical support, software, and staff. This will involve a software engineer, server and other technology resources, academic advising and other support staff. Additionally, a large time commitment will be required by faculty to provide students access to experiential activities, such as citizen science and practicums. Specialized Accreditation? YES ☐ NO ☒ Accreditor: Not applicable.
Board of Regents Meeting November 18-20, 2020
Item #24 EXECUTIVE SUMMARY Page 20 of 76
New Academic Program Request
University: Arizona State University Name of Proposed Academic Program: Master of Science in Strength and Conditioning Academic Department: College of Health Solutions Geographic Site: Downtown Phoenix campus Instructional Modality: Immersion and online Total Credit Hours: 30 Proposed Inception Term: 2021-2022 Brief Program Description: The field of strength and conditioning focuses on understanding and optimizing physical abilities for active groups including athletic and tactical populations. Optimizing human health and performance for athletic competitors and occupational athletes is often overlooked in the broader health community, and the ability to work with individuals at close to maximum effort requires specialized knowledge and skills related to these specific populations. As such, the National Strength and Conditioning Association will require specified preparation for strength and conditioning coaches by 2030 to promote advanced training and understanding of human physiology and movement mechanics. The specification will include completing a National Strength and Conditioning Association accredited master's or bachelor’s degree program. This master’s degree will enable ASU to be recognized and ranked nationally as the standard for education in the strength and conditioning field, fulfilling the university mission for national standing in education. Additionally, this degree will fulfill requirements for graduates to obtain advanced level certification through the association and sit for the Certified Performance and Sport Scientist (CPSS) certification exam. Students will be well-equipped with the knowledge to properly utilize the advances in health and performance monitoring systems to optimize exercise program development. Graduates
Board of Regents Meeting November 18-20, 2020
Item #24 EXECUTIVE SUMMARY Page 21 of 76 of this degree will be able to appropriately tailor programs to the need of the individual and will receive practical experience to hone their coaching skills and motivate individuals to achieve higher workloads and improved performance. Students will utilize their skills to make an impact on the local community who will look to ASU as a resource in the strength and conditioning field. The MS in Strength and Conditioning program will prepare students to become leaders in sports performance and will utilize college connections in the growing field of athletics and performance. Learning Outcomes and Assessment Plan: Learning Outcome 1: Graduates will demonstrate competence in the analysis of performance-related skills and abilities specific to each individual and/or sport.
● Concepts: Performance-related skills, athlete needs based on sport, predisposition to injury, National Strength and Conditioning Association needs analysis methods. ● Competencies: Ability to demonstrate skills of both biomechanical and physiological lab and field testing of athletes while assessing sport specific needs through both qualitative and quantitative measurement and monitoring. Apply the scientific method as they utilize high-accuracy tools to analyze and interpret athlete biometric data and training data. ● Assessment Methods: Within their first year, students will identify appropriate measurement variables based on the athletes and sport, to create an evidence-based performance assessment for a team. Within the first semester, students will construct a detailed needs analysis to demonstrate their competence with utilizing these methods and required tools as a final project in the SSP 501 Data Collection, Analysis, and Interpretation in Strength and Conditioning course. Faculty teaching KIN 540 Sports Biomechanics will assess students’ performance and collect data on the case study report required in the course. Data will be analyzed to determine the stated amount students are successful on the case study report. In addition, scores from the rubric evaluating student performance in SSP 534 Measurement and Monitoring in Sport and Fitness and SSP 501 Data Collection, Analysis and Interpretation in Strength and Conditioning will be collected by our instructional design team to determine combined total scores. ● Measures: Rubrics will be utilized to evaluate students’ ability to demonstrate the competencies identified to meet outcome 1. The portfolio of findings will be reviewed along with course feedback and an improvement plan developed in conjunction with discussions with faculty teaching the program’s coursework. Rubrics will be developed by faculty and continually refined based on assessment outcomes and feedback.
Learning Outcome 2: Graduates will demonstrate the ability to evaluate the performance needs for populations in sport or tactical (police, military, firefighter) roles and create advanced strength and conditioning programs to enhance performance and reduce participant's risk of injury.
Board of Regents Meeting November 18-20, 2020
Item #24 EXECUTIVE SUMMARY Page 22 of 76
● Concepts: Needs of different populations, strength and conditioning programs based on theories of periodization, and design of evidence-based programs following the guidelines outlined by the National Strength and Conditioning Association. ● Competencies: Ability to perform sport and tactical athlete assessment data analysis and interpretation, and implement a variety of strength and conditioning programming theories. Competence in physiological systems of the body, and metabolic and muscular adaptations of resistance training. ● Assessment Methods: In the first year of their program, students will successfully complete the final exam in KIN 530 Exercise and Sport Physiology. The final exam will be structured to ensure it is an accurate reflection of the knowledge and competencies required to attain a Certified Strength and Conditioning Specialist (CSCS) certification through the National Strength and Conditioning Association. In the second year of the program, students will demonstrate the ability to practically apply the foundational scientific principles by completing the total program final case study assignment in the EXW/SSP 530 Theory and Application of Resistance Training. Faculty teaching KIN 530 Exercise and Sport Physiology will be collecting data on student performance. Data will be analyzed to determine student success on the final exam. Scores from the rubric in SSP 530 Theory and Application of Resistance Training will be pulled by our instructional design team to determine combined total scores on the final case study assignment. ● Measures: Rubrics will be utilized to evaluate students’ ability to demonstrate the competencies identified to meet outcome 2. The portfolio of findings will be reviewed along with course feedback and an improvement plan developed in conjunction with discussions with faculty teaching the program’s coursework. Rubrics will be developed by faculty and continually refined based on assessment outcomes and feedback.
Learning Outcome 3: Graduates will be able to appropriately identify and apply the correct coaching intervention based on their evaluation of the participant and create original solutions to performance needs.
● Concepts: Communication skills, coaching and leadership theories, knowledge of scientific principles, evaluation and interpretation of testing results, and application of athlete programming philosophies. ● Competencies: Ability to analyze athlete performance needs, interpret test results, utilize relative training theories to create evidenced based training programs. Successfully use communication and leadership skills to implement and coach appropriate training practices. ● Assessment Methods: In the second year of the program, students will complete an internship experience and be evaluated by their site supervisor. Students will demonstrate competency in skills related to coaching a participant on performance enhancement and reducing injury. At the end of the first year in the program, students will apply the correct coaching intervention by successfully completing case studies throughout the SSP 560 Coaching Science course. Faculty overseeing experiential
Board of Regents Meeting November 18-20, 2020
Item #24 EXECUTIVE SUMMARY Page 23 of 76
learning (internship) will be collecting data from site supervisors to make sure requirements are met. Scores from the rubric in SSP 560 Coaching Science will be pulled by our instructional design team to determine combined total scores. ● Measures: Rubrics will be utilized to evaluate students’ ability to demonstrate the competencies identified to meet outcome 3. The portfolio of findings will be reviewed along with course feedback and an improvement plan developed in conjunction with discussions with faculty teaching the program’s coursework. Rubrics will be developed by faculty and continually refined based on assessment outcomes and feedback.
Projected Enrollment for the First Three Years: First Year: 12 Second Year: 28 Third Year: 40 Evidence of Market Demand: Career options for this degree include opportunities as a strength and conditioning professional in the high school, collegiate, professional and private sector markets. In addition, students will be prepared for careers in tactical performance training with local, state and government agencies including police, firefighters and military personnel. According to Burning Glass there are 27,901 job postings related to strength and conditioning which is a 4,848 year-over-year change compared to the previous year. The Bureau of Labor Statistics states there was a 6% change in year-over-year employment, 9.9% increase in 3-year historic growth (compound annual growth rate), and a 6.3% increase in 5-year historic growth (compound annual growth rate). Emsi Analyst projects an increase in jobs related to this area from 996,336 in 2017 to 1,122,769 in 2024 which is an increase of 126,433 jobs (12.7% increase). According to Emsi data, there were 116,228 unique job postings from January 2019 to June 2019 within this field. “Sport and Fitness Administration/Management” was searched 75,150 times in a 3-month period according to Google Search which is a 10.4% year-over-year change. According to the Integrated Postsecondary Education Data System (IPEDS), there were a total of 4,556 completions (an 8% year-over-year change) at 148 campuses of which 27 percent were at the master's or doctoral degree level in 2017. Similar Programs Offered at Arizona Public Universities: There are currently no existing graduate programs in the state of Arizona that offer specialization in the strength and conditioning area. The current MS degree in Exercise and Wellness offers a focus area that covers the use of physical activity to improve health in participants, but does not have a focus in high-activity participants that this degree will offer.
Board of Regents Meeting November 18-20, 2020
Item #24 EXECUTIVE SUMMARY Page 24 of 76 New Resources Required? (i.e. faculty and administrative positions; infrastructure, etc.): Specialized faculty, specialized equipment, advising and support staff will be required. When accreditation becomes available starting in 2022, it is possible the accrediting body will have additional requirements that will necessitate additional resources. However, what those requirements might be is currently unknown to us at this time. In addition to the requested fee, current College of Health Solutions resources will be reallocated to fund these additions. Program Fee Required? YES ☒ NO ☐ Estimated Amount: $2,500 per semester Program Fee Justification: The cost of delivering this new program is higher due to both student support services to provide student support and specialized equipment needed to properly train students in strength and conditioning techniques. Specialized Accreditation? YES ☒ NO ☐ Accreditor: The National Strength and Conditioning Association will begin accrediting programs for strength and conditioning in Spring 2022, with mandatory accreditation required to become a certified strength and conditioning specialist by 2030. This degree program has been designed to meet the requirements of the proposed accreditation standards and will be eligible for early participation in the accreditation process, allowing ASU to be one of the pioneers in this field.
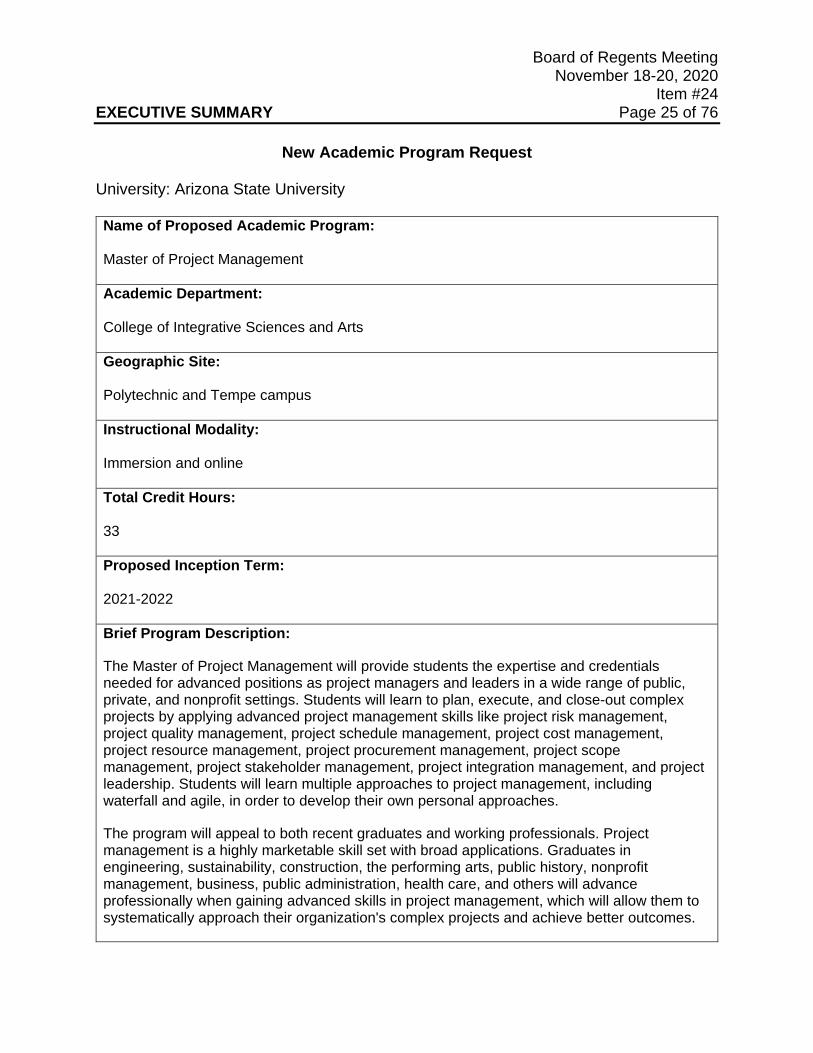
Board of Regents Meeting November 18-20, 2020
Item #24 EXECUTIVE SUMMARY Page 25 of 76
New Academic Program Request
University: Arizona State University Name of Proposed Academic Program: Master of Project Management Academic Department: College of Integrative Sciences and Arts Geographic Site: Polytechnic and Tempe campus Instructional Modality: Immersion and online Total Credit Hours: 33 Proposed Inception Term: 2021-2022 Brief Program Description:
The Master of Project Management will provide students the expertise and credentials needed for advanced positions as project managers and leaders in a wide range of public, private, and nonprofit settings. Students will learn to plan, execute, and close-out complex projects by applying advanced project management skills like project risk management, project quality management, project schedule management, project cost management, project resource management, project procurement management, project scope management, project stakeholder management, project integration management, and project leadership. Students will learn multiple approaches to project management, including waterfall and agile, in order to develop their own personal approaches.
The program will appeal to both recent graduates and working professionals. Project management is a highly marketable skill set with broad applications. Graduates in engineering, sustainability, construction, the performing arts, public history, nonprofit management, business, public administration, health care, and others will advance professionally when gaining advanced skills in project management, which will allow them to systematically approach their organization's complex projects and achieve better outcomes.
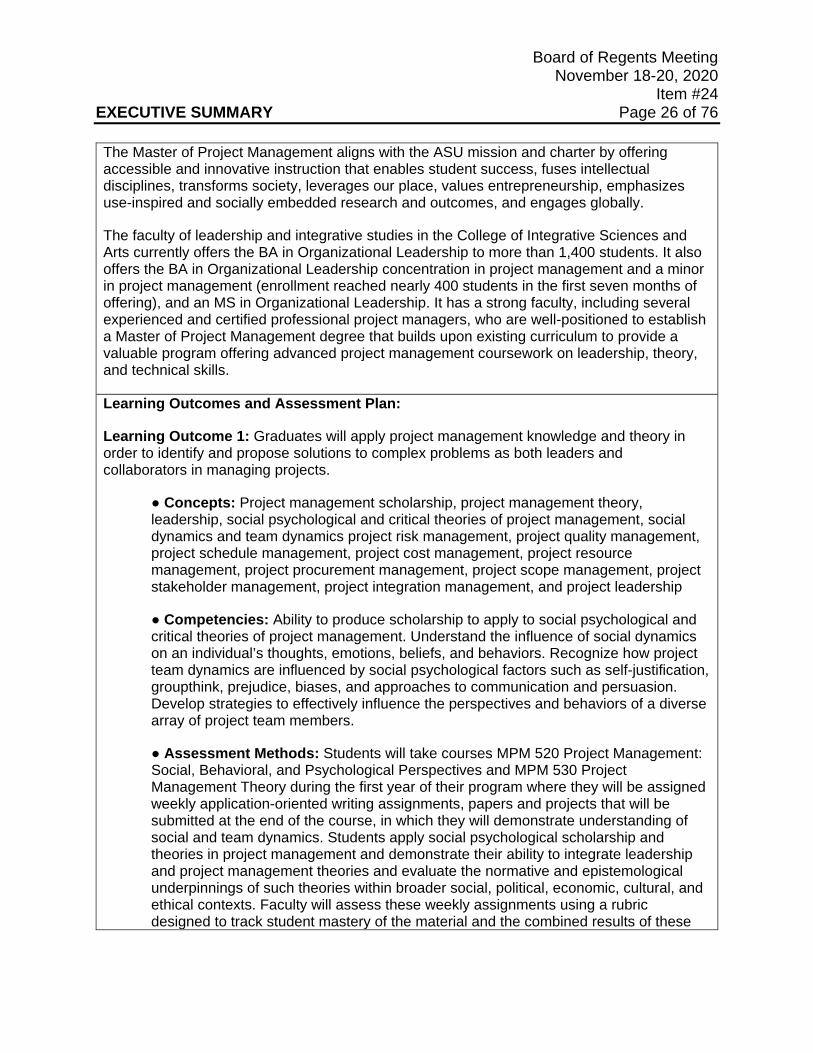
Board of Regents Meeting November 18-20, 2020
Item #24 EXECUTIVE SUMMARY Page 26 of 76 The Master of Project Management aligns with the ASU mission and charter by offering accessible and innovative instruction that enables student success, fuses intellectual disciplines, transforms society, leverages our place, values entrepreneurship, emphasizes use-inspired and socially embedded research and outcomes, and engages globally.
The faculty of leadership and integrative studies in the College of Integrative Sciences and Arts currently offers the BA in Organizational Leadership to more than 1,400 students. It also offers the BA in Organizational Leadership concentration in project management and a minor in project management (enrollment reached nearly 400 students in the first seven months of offering), and an MS in Organizational Leadership. It has a strong faculty, including several experienced and certified professional project managers, who are well-positioned to establish a Master of Project Management degree that builds upon existing curriculum to provide a valuable program offering advanced project management coursework on leadership, theory, and technical skills.
Learning Outcomes and Assessment Plan:
Learning Outcome 1: Graduates will apply project management knowledge and theory in order to identify and propose solutions to complex problems as both leaders and collaborators in managing projects.
● Concepts: Project management scholarship, project management theory, leadership, social psychological and critical theories of project management, social dynamics and team dynamics project risk management, project quality management, project schedule management, project cost management, project resource management, project procurement management, project scope management, project stakeholder management, project integration management, and project leadership
● Competencies: Ability to produce scholarship to apply to social psychological and critical theories of project management. Understand the influence of social dynamics on an individual’s thoughts, emotions, beliefs, and behaviors. Recognize how project team dynamics are influenced by social psychological factors such as self-justification, groupthink, prejudice, biases, and approaches to communication and persuasion. Develop strategies to effectively influence the perspectives and behaviors of a diverse array of project team members.
● Assessment Methods: Students will take courses MPM 520 Project Management: Social, Behavioral, and Psychological Perspectives and MPM 530 Project Management Theory during the first year of their program where they will be assigned weekly application-oriented writing assignments, papers and projects that will be submitted at the end of the course, in which they will demonstrate understanding of social and team dynamics. Students apply social psychological scholarship and theories in project management and demonstrate their ability to integrate leadership and project management theories and evaluate the normative and epistemological underpinnings of such theories within broader social, political, economic, cultural, and ethical contexts. Faculty will assess these weekly assignments using a rubric designed to track student mastery of the material and the combined results of these
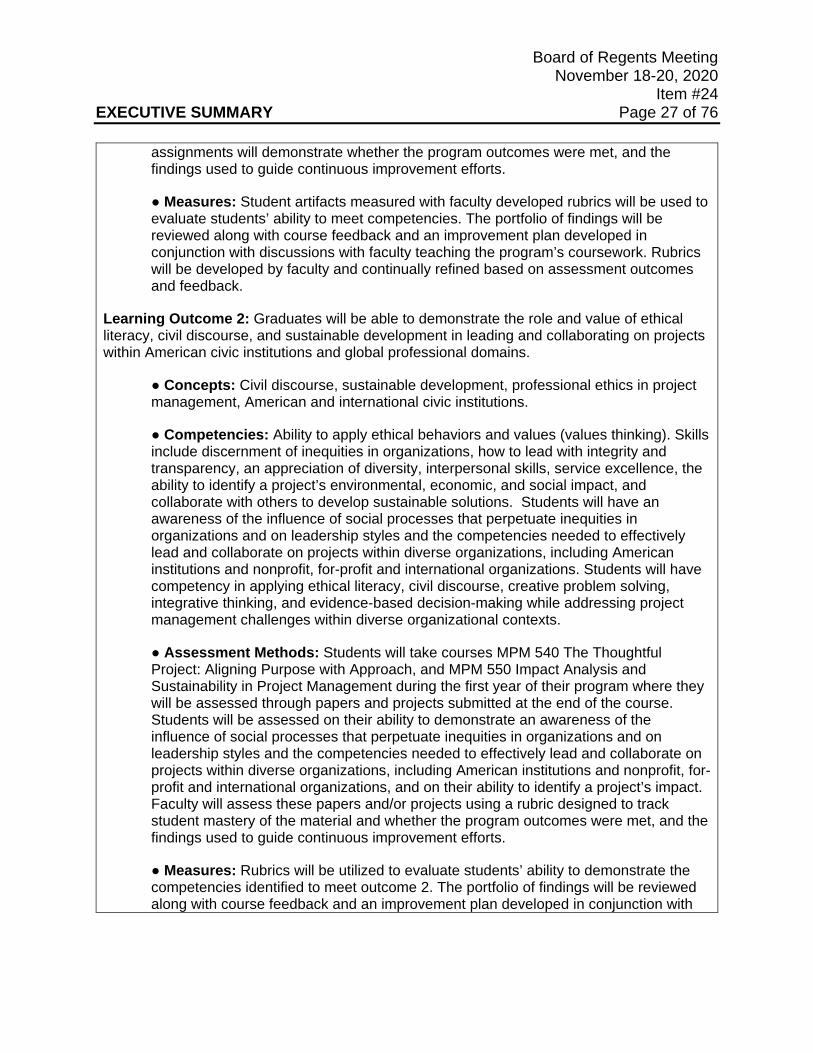
Board of Regents Meeting November 18-20, 2020
Item #24 EXECUTIVE SUMMARY Page 27 of 76
assignments will demonstrate whether the program outcomes were met, and the findings used to guide continuous improvement efforts.
● Measures: Student artifacts measured with faculty developed rubrics will be used to evaluate students’ ability to meet competencies. The portfolio of findings will be reviewed along with course feedback and an improvement plan developed in conjunction with discussions with faculty teaching the program’s coursework. Rubrics will be developed by faculty and continually refined based on assessment outcomes and feedback.
Learning Outcome 2: Graduates will be able to demonstrate the role and value of ethical literacy, civil discourse, and sustainable development in leading and collaborating on projects within American civic institutions and global professional domains.
● Concepts: Civil discourse, sustainable development, professional ethics in project management, American and international civic institutions.
● Competencies: Ability to apply ethical behaviors and values (values thinking). Skills include discernment of inequities in organizations, how to lead with integrity and transparency, an appreciation of diversity, interpersonal skills, service excellence, the ability to identify a project’s environmental, economic, and social impact, and collaborate with others to develop sustainable solutions. Students will have an awareness of the influence of social processes that perpetuate inequities in organizations and on leadership styles and the competencies needed to effectively lead and collaborate on projects within diverse organizations, including American institutions and nonprofit, for-profit and international organizations. Students will have competency in applying ethical literacy, civil discourse, creative problem solving, integrative thinking, and evidence-based decision-making while addressing project management challenges within diverse organizational contexts.
● Assessment Methods: Students will take courses MPM 540 The Thoughtful Project: Aligning Purpose with Approach, and MPM 550 Impact Analysis and Sustainability in Project Management during the first year of their program where they will be assessed through papers and projects submitted at the end of the course. Students will be assessed on their ability to demonstrate an awareness of the influence of social processes that perpetuate inequities in organizations and on leadership styles and the competencies needed to effectively lead and collaborate on projects within diverse organizations, including American institutions and nonprofit, for- profit and international organizations, and on their ability to identify a project’s impact. Faculty will assess these papers and/or projects using a rubric designed to track student mastery of the material and whether the program outcomes were met, and the findings used to guide continuous improvement efforts.
● Measures: Rubrics will be utilized to evaluate students’ ability to demonstrate the competencies identified to meet outcome 2. The portfolio of findings will be reviewed along with course feedback and an improvement plan developed in conjunction with
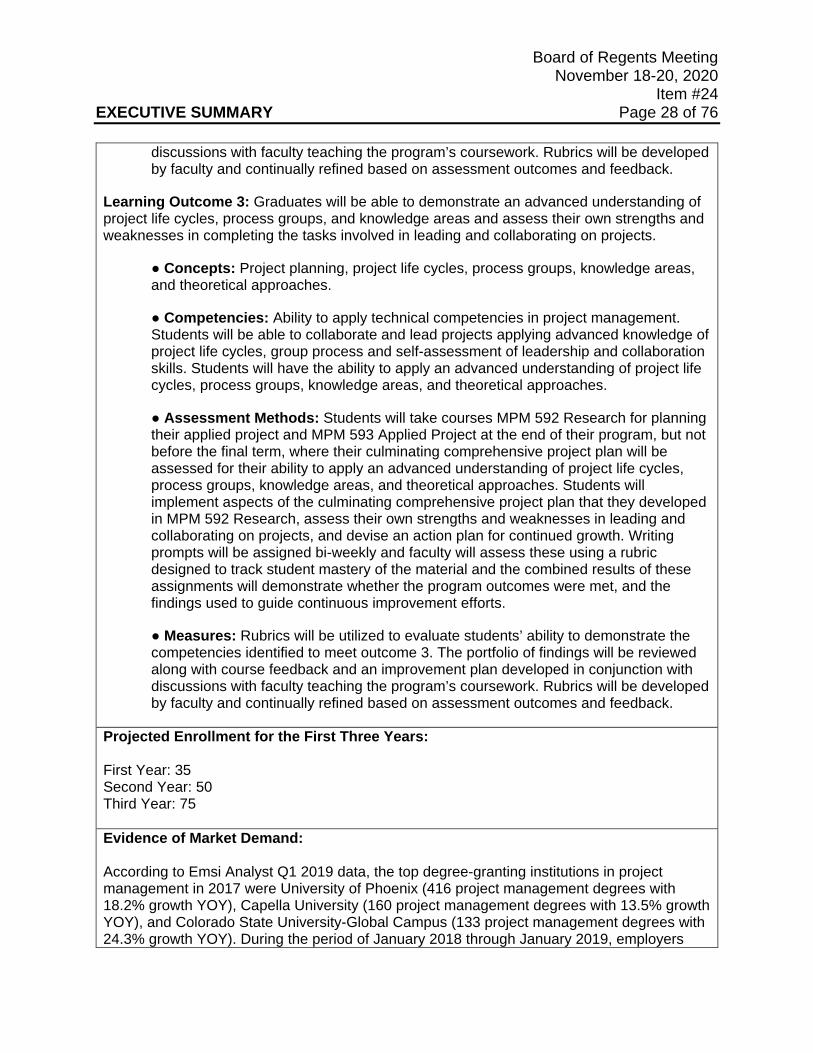
Board of Regents Meeting November 18-20, 2020
Item #24 EXECUTIVE SUMMARY Page 28 of 76
discussions with faculty teaching the program’s coursework. Rubrics will be developed by faculty and continually refined based on assessment outcomes and feedback.
Learning Outcome 3: Graduates will be able to demonstrate an advanced understanding of project life cycles, process groups, and knowledge areas and assess their own strengths and weaknesses in completing the tasks involved in leading and collaborating on projects.
● Concepts: Project planning, project life cycles, process groups, knowledge areas, and theoretical approaches.
● Competencies: Ability to apply technical competencies in project management. Students will be able to collaborate and lead projects applying advanced knowledge of project life cycles, group process and self-assessment of leadership and collaboration skills. Students will have the ability to apply an advanced understanding of project life cycles, process groups, knowledge areas, and theoretical approaches.
● Assessment Methods: Students will take courses MPM 592 Research for planning their applied project and MPM 593 Applied Project at the end of their program, but not before the final term, where their culminating comprehensive project plan will be assessed for their ability to apply an advanced understanding of project life cycles, process groups, knowledge areas, and theoretical approaches. Students will implement aspects of the culminating comprehensive project plan that they developed in MPM 592 Research, assess their own strengths and weaknesses in leading and collaborating on projects, and devise an action plan for continued growth. Writing prompts will be assigned bi-weekly and faculty will assess these using a rubric designed to track student mastery of the material and the combined results of these assignments will demonstrate whether the program outcomes were met, and the findings used to guide continuous improvement efforts.
● Measures: Rubrics will be utilized to evaluate students’ ability to demonstrate the competencies identified to meet outcome 3. The portfolio of findings will be reviewed along with course feedback and an improvement plan developed in conjunction with discussions with faculty teaching the program’s coursework. Rubrics will be developed by faculty and continually refined based on assessment outcomes and feedback.
Projected Enrollment for the First Three Years: First Year: 35 Second Year: 50 Third Year: 75 Evidence of Market Demand: According to Emsi Analyst Q1 2019 data, the top degree-granting institutions in project management in 2017 were University of Phoenix (416 project management degrees with 18.2% growth YOY), Capella University (160 project management degrees with 13.5% growth YOY), and Colorado State University-Global Campus (133 project management degrees with 24.3% growth YOY). During the period of January 2018 through January 2019, employers
Board of Regents Meeting November 18-20, 2020
Item #24 EXECUTIVE SUMMARY Page 29 of 76 posted 372,243 jobs under the title of “project manager (management)” and 129,890 jobs under the title of “project managers (computer and mathematical).” 15,202 postings required Project Management Professional Certification and 5,404 required Project Management Institute (PMI) Certification. The Project Management Institute found that "between 2010 and 2020 an estimated 15.7 million new project management jobs will be added globally, reaching an economic impact of over $18 trillion, across seven project-intensive industries." The study concluded that the demand for project management professions would increase from 5.4 million jobs in 2010 in the United States to 6.1 million jobs in 2020. In addition, the study found that project- orientated occupations were making on average $98,000 annually in 2010, while non-project oriented occupations were making $54,000 annually in 2010 (https://www.pmi.org/-/media/pmi/documents/public/pdf/business-solutions/project-management-skills-gap-report.pdf). According to the Bureau of Labor Statistics the data on project management is folded into many careers including cost estimators, but most often are associated with construction management. The data indicates that project managers earn more in urban settings than in rural settings and the median income for a project manager was $96,000 in 2006. (https://www.bls.gov/careeroutlook/2006/summer/art03.pdf). Similar Programs Offered at Arizona Public Universities: University of Arizona has an Organizational Leadership, Master with an emphasis in Project Management in the disciplines of Business and Administration. New Resources Required? (i.e. faculty and administrative positions; infrastructure, etc.): College of Integrative Sciences and Arts staff will be able to administer the new degree with no additional resources. The need for additional faculty or faculty associates will be evaluated every year based upon enrollment demand. Program Fee Required? YES ☒ NO ☐ Estimated Amount: $160 per credit hour Program Fee Justification: A substantial portion of the fees will fund the enhancement of curriculum, maintain small class size, provide student support, fund scholarships and other honoraria. The program fee revenue will also be used to fund networking opportunities for students, travel and professional development. All of these items will enhance student marketability in a competitive and growing job market. Other comparable Master of Project Management program fees range from $600 to $2,500 per credit hour. However, we believe charging a lower fee will draw students to the program and still allow for effective administration.
Board of Regents Meeting November 18-20, 2020
Item #24 EXECUTIVE SUMMARY Page 30 of 76 Specialized Accreditation? YES ☒ NO ☐ Accreditor: The Global Accreditation Center for Project Management Education Programs (GAC) is an independent academic accreditation body with policies, procedures and standards for project, program, portfolio management and related programs at the bachelor's, post graduate and doctoral degree levels (https://www.pmi.org/global-accreditation-center/about-gac). While this program does not lead to direct accreditation, graduates of this program will be well prepared to test for this accreditation.
Board of Regents Meeting November 18-20, 2020
Item #24 EXECUTIVE SUMMARY Page 31 of 76
New Academic Program Request
University: Arizona State University Name of Proposed Academic Program: Master of Human Resources and Employment Law Academic Department: Sandra Day O'Connor College of Law Geographic Site: Downtown Phoenix campus Instructional Modality: Immersion and online Total Credit Hours: 30 Proposed Inception Term: 2021-2022 Brief Program Description: The Master of Human Resources and Employment Law degree develops graduates who identify legal issues and analyze and solve critical human resources problems facing organizations. There is an increased need for graduates who are prepared professionals aware of the complex legal and regulatory framework affecting the recruitment, hiring, maintenance, promotion, and employment termination in the public and private sectors. Human resources and employment management has historically emerged from a business administration curriculum. However, with the increased impact of employment law shaping the human resources field, the profession recognizes the importance of law and local, state, and federal regulations in human resource management. This degree has a strong focus on the legal aspect of human resource management and employment. Students will demonstrate an understanding of U.S. law, legal structures, and legal reasoning when making informed decisions regarding complex human resource problems. The degree speaks to ASU's design aspirations of the fusion of intellectual disciplines and use-inspired research. A few years ago, the Sandra Day O’Connor College of Law identified a glaring need for a non-Juris Doctor graduate program that trained human resources professionals to understand the complex legal and regulatory framework of employment law. The Sandra Day O’Connor
Board of Regents Meeting November 18-20, 2020
Item #24 EXECUTIVE SUMMARY Page 32 of 76 College of Law debuted the Human Resources and Employment Law emphasis under its Master of Legal Studies digital-immersion degree in 2017. The Master of Legal Studies, Human Resources and Employment Law emphasis has been a success since its launch in 2017. From fall 2018 to date, this program has yielded hundreds of applications submitted, and an average of 22 newly enrolled students for each term (Summer/Spring/Fall) over that span. The yearly cohort of new Master of Legal Studies, Human Resources and Employment Law students has reached a level of volume that warrants converting the emphasis area into a new degree. The creation of the new degree, Master of Human Resources and Employment Law, would allow the law school to tailor, enhance, and allocate curricular, advising, and career services resources specifically to the new degree's student body, which would lead to more efficient college administration and better overall student satisfaction and outcomes for this cohort. Learning Outcomes and Assessment Plan:
Learning Outcome 1: Graduates of the Master of Human Resources and Employment Law will demonstrate competency in analysis of legal issues in the Human Resources profession.
● Concepts: Human resources and employment law, wage and benefits, discrimination and harassment, workplace privacy, managing employees, the hiring process, leave, workplace safety, and employment termination.
● Competencies: Ability to analyze and apply the complex legal and regulatory framework affecting the recruitment, hiring, maintenance, promotion, and termination of employees and independent contractors.
● Assessment Methods: A summative assessment of the direct measurement of students’ legal analysis skills will be assessed each semester at the completion of the required coursework. Examination results will be collected and summarized by the Manager, Online Learning, and reported to the program faculty and administration for review and analysis of program outcomes. An indirect measurement survey of students’ perception of their critical thinking skill development (Graduate/Law Student Report Card Survey) will be administered annually. Alternatively, a student focus group survey may be used. Data will be collected and summarized by the Director of Institutional Reporting and Assessment and forwarded to program faculty and administration for review and analysis of program outcomes.
● Measures: Rubrics will be utilized to evaluate students’ ability to demonstrate the competencies identified to meet outcome 1. Students' work in SDO 541 Human Resources specifically will be assessed using an adopted rubric from the Society for Human Resource Management (SHRM). The rubric will measure knowledge of legal issue identification in HR, analysis of HR legal issues. The portfolio of findings will be reviewed along with course feedback and an improvement plan developed in conjunction with discussions with faculty teaching the program’s coursework. Rubrics will be developed by faculty and continually refined based on assessment outcomes and feedback.
Board of Regents Meeting November 18-20, 2020
Item #24 EXECUTIVE SUMMARY Page 33 of 76 Learning Outcome 2: Graduates of the Master of Human Resources and Employment Law will demonstrate an understanding of U.S. law, legal structures, and legal reasoning in written communications.
● Concepts: Rule synthesis, issue identification, analytical reasoning, legal writing style, citation format, and objective and persuasive legal writing.
● Competencies: Ability to identify and analyze legal issues and develop effective written communications in a legal context. Students will be able to identify and analyze legal structure, issues, and reasoning through rule synthesis and dispassionate analysis within the Issue, Rule, Application, Conclusion (IRAC) essay exercises. Students will have proficiency in using legal reasoning to develop the resolution of one or more legal issues.
● Assessment Methods: The faculty will administer various formative assessment essay exercises throughout the required foundation courses such as SDO 501 US Law & Legal Analysis. Data will be collected and summarized by the Manager, Online Learning, and reported to the program faculty and administration for review and analysis of program outcomes. An indirect measurement survey (Graduate/Law School Student Report Card) of students’ perception of their writing skill development will be administered annually. Alternatively, a student focus group survey may be used. Data will be collected and summarized by the Director of Institutional Reporting and Assessment and forwarded to program faculty and administration which will be analyzed and used for continuous program improvement.
● Measures: Rubrics will be utilized to evaluate students’ ability to demonstrate the competencies identified to meet outcome 2. The portfolio of findings will be reviewed along with course feedback and an improvement plan developed in conjunction with discussions with faculty teaching the program’s coursework. Rubrics will be developed by faculty and continually refined based on assessment outcomes and feedback.
Learning Outcome 3: Students completing the capstone course for the Master of Human Resources and Employment Law degree will meet the academic qualifications for the Society of Human Resource Management (SHRM) certification exam.
● Concepts: Change management, compensation and benefits, employee and labor relations, globalization, employment law, HR career planning, HR role in organizations, HR information systems, job analysis and design, managing a diverse workforce, metrics and measurement of HR, organizational development, performance management, strategic HR, staffing, training and development, workforce planning and talent management, workforce health, safety, and security.
● Competencies: Ability to demonstrate proficiency in all academic content and competency area requirements for Society of Human Resource Management program accreditation.
● Assessment Methods: Students will be assessed using faculty developed rubrics for their capstone exams and projects that identify attributes matching accreditation
Board of Regents Meeting November 18-20, 2020
Item #24 EXECUTIVE SUMMARY Page 34 of 76
society core competencies. The instructor will rate each project in terms of attributes on a scale, providing a direct measure for assessing program outcomes and successful performance. The rubrics will be administered at the end of each semester. Results will be tabulated and analyzed by the Manager, Online Learning to identify areas that are satisfactory and areas needing improvement. An indirect measurement survey (Graduate/Law Student Report Card) of students’ perception of their professional skill development will be administered annually. Data will be collected and summarized by the Director of Institutional Reporting and Assessment and forwarded to program faculty and administration for review. Data will be shared each semester with program faculty and administration for review.
● Measures: Rubrics will be utilized to evaluate students’ ability to demonstrate the competencies identified to meet outcome 3. The portfolio of findings will be reviewed along with course feedback and an improvement plan developed in conjunction with discussions with faculty teaching the program’s coursework. Rubrics will be developed by faculty and continually refined based on assessment outcomes and feedback.
Projected Enrollment for the First Three Years: First Year: 50 Second Year: 80 Third Year: 90 Evidence of Market Demand: According to data from Emsi Analyst, offering the Master of Human Resources and Employment Law degree will support a growing need for employers hiring human resources professionals across all industries. Their data shows strong regional (9.4%) and national (5.9%) job growth over the next five years. The Bureau of Labor Statistics 10-year (2018-2028) occupational labor projections for Human Resource Managers (11-3121) show a 7.1% increase in jobs and a 2019 median annual wage of $116,720. A search conducted in the Law School Admissions Council database identifies law schools across the country that offer employment law coursework, certificates, concentrations, and joint degrees. Only a few peer law schools, such as the University of Washington's Master of Jurisprudence in Human Resources and Employment Law, and Florida State University's Juris Master in Human Relations and Employment Law, offer related degrees to the proposed ASU degree. This demonstrates limited institutional competition and an opportunity for working professionals to pursue a degree through distance and non-distance mediums from a law school with a U.S. World News & Reports #24 national ranking. The Sandra Day O’Connor College of Law has already proven the market exists for the Human Resources and Employment Law degree. This request will formalize a pathway through our current curriculum that has shown great growth in the last three years. This growth has caused our current class sections of the four courses in the emphasis to fill regularly, requiring us to begin offering each course twice per academic year instead of once.
Board of Regents Meeting November 18-20, 2020
Item #24 EXECUTIVE SUMMARY Page 35 of 76 The following job titles from the Bureau of Labor and Statistics are prospective career opportunities for the Master of Human Resources and Employment Law graduate: 11-3121 Human Resources Managers, 13-1071 Human Resources Specialists, 11-1021 General and Operations Managers, 43-4161 Human Resources Assistants, Except Payroll and Timekeeping, 11-9199 Managers, All Other, 13-1199 Business Operations Specialists, All Other, 11-3111 Compensation and Benefits Managers, 13-1151 Training and Development Specialists. Similar Programs Offered at Arizona Public Universities: Undergraduate degrees in human resources can be found in Arizona public institutions. However, there currently are no graduate degrees offered. The University of Arizona and Arizona State University offer concurrent graduate degrees in Business Administration and the Juris Doctor or Master of Legal Studies. No existing program in the state of Arizona offers what the Master of Human Resources and Employment Law will offer. A portion of the general concepts and competencies can be derived piecemeal from MBA or Business Management programs in the Arizona Public University system, but no program focuses on the significant legal and regulatory issues inherent to the field. The Master of Human Resources and Employment Law would offer a condensed, focused curriculum reducing time and expenses for the student. Additionally, it would offer a distance alternative to the aforementioned degrees. New Resources Required? (i.e. faculty and administrative positions; infrastructure, etc.): The majority of programmatic resource needs will be met through the extension of current resources. A large portion of the projected student body, as current Master of Legal Studies campus and digital-immersion students, are already being served by our current faculty, staff, and college services. Existing curriculum, infrastructure, faculty, and staff services will be extended to meet the needs of the degree cohort(s). Program Fee Required? YES ☒ NO ☐ Estimated Amount: Campus Immersion Program Fee: $725 per credit hour or $21,750 a year (30 credits) for resident, nonresident, and international students. Online: $658 per credit hour or $19,740 per year (30 credits). Program Fee Justification: The new program fee will pay for course-related services including instructional design, video recording and editing, administrative services associated with offering the required courses. It will also help to fund student support services including academic advising and administrative services associated with student support. The cost of the program would still be at market rates. Revenues from the fees will support improvements in quality of the program through investments in faculty and faculty development, curriculum creation and redevelopment, accreditation with a national industry certification organization, and enhancements to basic educational infrastructure including information technology. The program fee structure is in line with the competitive marketplace for a degree like this, and the
Board of Regents Meeting November 18-20, 2020
Item #24 EXECUTIVE SUMMARY Page 36 of 76 fixed cost-per-credit caters to our established student population of working professionals that likely will be attending part-time. Specialized Accreditation? YES ☒ NO ☐ Accreditor: This program will need acquiescence from the American Bar Association, which accredits law schools. The ABA only accredits the JD degree at the law school, but as part of that accreditation, they enforce Standard 105 (see ABA Standards and Rules of Procedure for Approval of Law Schools). Rule 105 (12) requires their acquiescence when we “…establish a new or different program leading to a degree other than a JD degree.:” When evaluating acquiescence, they only evaluate whether “the law school demonstrates that the change will not detract from the law school’s ability to remain in compliance with the standard” for the JD degree.”

Board of Regents Meeting November 18-20, 2020
Item #24 EXECUTIVE SUMMARY Page 37 of 76
New Academic Program Request
University: Arizona State University Name of Proposed Academic Program: Master of Science in Addiction Psychology
Academic Department: Department of Psychology, The College of Liberal Arts and Sciences
Geographic Site: Tempe campus
Instructional Modality: Immersion and online
Total Credit Hours: 45
Proposed Inception Term: 2022-2023
Brief Program Description: The MS in Addiction Psychology provides the knowledge, skills, and experience necessary to pursue state licensure and provide addiction treatment. Substance use and addiction constitute one of the largest preventable health problems facing the U.S. today, but less than 20% of those in need receive any substance-use treatment, and only a small fraction of those in treatment receive evidence-based treatment. This gap between treatment research and current practices is due in large part to deficits in the education and training available in the field of addictions. The addiction psychology program is consistent with ASU’s Mission and Goals, and will help to further ASU’s design aspirations. This program will improve the overall health of communities in Arizona and beyond, by advancing the transfer of scientific knowledge to clinical practice, thereby increasing the public's access to evidence-based addiction
Board of Regents Meeting November 18-20, 2020
Item #24 EXECUTIVE SUMMARY Page 38 of 76 treatment. The program pairs state-of-the-art research from internationally recognized experts in addictions with clinical expertise from licensed psychologists and licensed addiction counselors with decades of experience providing addiction treatment. This combination of research and clinical expertise will distinguish our program from existing addiction programs and will help to establish our program as a leader in the addiction field. The Department of Psychology has the nation's longest, continuously funded, NIH T-32 training grant in addictions, and our department has collaborated with the School of Social Work, Counseling and Counseling Psychology, and the College of Health Solutions on multiple Substance Abuse and Mental Health Services Administration (SAMHSA), and Health Resources and Services Administration (HRSA) funded grants focused on addiction treatment education. These collaborations and expertise will be incorporated into the master’s program. The program will also have a substantial impact in our community and beyond, by providing additional addiction treatment in our community and nationally as part of our training program, and by increasing the number of expertly-trained addictions counselors who can help meet the needs of our society to prevent and treat addictions. Licensure/Certification The program will meet the educational requirements for licensure or certification in all 50 states. There are additional licensure requirements not met by the program, including a passing score on a state-administered licensing exam and one-to-two years of supervised practice subsequent to degree completion. There are no states that exclude online education as long as the program is offered by an accredited university.
Learning Outcomes and Assessment Plan: Learning Outcome 1: Graduates will be able to integrate and apply knowledge and theory to a comprehensive client treatment plan that aligns with the skills and knowledge needed to successfully meet the national accreditation educational standards for addiction.
● Concepts: Current models and theories of addiction, effects of psychoactive substances, substance-related problems, scientifically supported models of treatment, helping strategies and continuing care.
● Competencies: Ability to differentiate between a variety of models and theories of addiction, including cognitive behavioral therapy, motivational interviewing, and 12-step facilitation. Evaluate the behavioral, psychological, physical health, and social effects of psychoactive substances on the person using and significant others. Differentiate practices and outcomes of the most generally accepted and scientifically supported models of treatment, recovery, relapse prevention, and continuing care for addiction and other substance-related problems. Evaluate available research and outcome data and apply this knowledge to clinical practice.
● Assessment Methods: Students will be assessed through major projects in the treatment-related courses, (Evidence-based Treatment Interventions, Group Therapy, and Family and Adolescent Treatment), which will demonstrate domain-specific understanding of required course content. Final projects require students to evaluate
Board of Regents Meeting November 18-20, 2020
Item #24 EXECUTIVE SUMMARY Page 39 of 76
and discriminate between evidence-based treatments, and then adapt and integrate treatments to specific clients. Students will also successfully complete a scholarly culminating project that evaluates existing research on addiction treatment, identifies gaps in the literature, and generates a study or recommendations that contribute to the field of addiction psychology.
● Measures: Faculty rubrics will be used to measure students' final projects. A scholarly culminating project will be measured using a rubric assessing students’ ability to evaluate existing research. The findings will be reviewed along with course feedback and an improvement plan developed in conjunction with discussions with faculty teaching the program’s coursework. Rubrics will be continually refined based on assessment outcomes and feedback.
Learning Outcome 2: Graduates will apply and demonstrate competency in knowledge, attitudes, and skills they have gained through coursework and by providing addiction treatment in their supervised practicum setting.
● Concepts: Helping strategies, treatment modalities, treatment services, cultural awareness.
● Competencies: Ability to implement a variety of helping strategies for reducing the negative effects of substance use, abuse, and dependence. Integrate helping strategies and treatment modalities with consideration for the client’s stage of dependence, change, or recovery. Modify treatment services to the personal and cultural identity and language of the client.
● Assessment Methods: Students will successfully complete a supervised practicum experience in an addiction treatment setting. Supervision will guide students' implementation of evidence-based treatments, as well as facilitate students' abilities to modify and integrate treatments for specific problems or clients. Documentation from an approved clinical supervisor of 300 practicum hours completed in an addiction treatment setting will be provided. In addition, supervisor evaluation of student performance on practicum competency benchmarks will be created, which include the ability to establish and maintain effective therapeutic relationships, develop evidence-based intervention plans, implement interventions informed by current scientific literature, demonstrate the ability to apply relevant research to clinical decision-making, modify and adapt evidence-based approaches effectively when a clear evidence-base is lacking, evaluate intervention effectiveness and adapt intervention goals and methods consistent with ongoing evaluation.
● Measures: Supervisors will document successful completion of practicum requirements and will submit the competency benchmarks evaluation form using faculty developed rubrics. The findings will be reviewed along with supervisor feedback and an improvement plan developed in conjunction with discussions with faculty teaching the program’s coursework. Rubrics will be continually refined based on assessment outcomes and feedback.
Board of Regents Meeting November 18-20, 2020
Item #24 EXECUTIVE SUMMARY Page 40 of 76 Learning Outcome 3: Graduates will have competency in the knowledge, attitudes, and skills they have gained through coursework and practicum experience in order to obtain state certification or licensure as an addiction counselor.
● Concepts: Students must demonstrate competency in the following domains in order to pass the national International Certification and Reciprocity Consortium Advanced Alcohol and Drug Counselor licensing exam: 1) Screening, Assessment, and Engagement, 2) Treatment Planning, Collaboration, and Referral, 3) Counseling and Education, and 4) Professional and Ethical Responsibilities.
● Competencies: Ability to develop and maintain a therapeutic relationship. Use validated measures to screen and assess mental and substance-use disorders. Provide consultation and referral for medication assisted treatment. Effectively evaluate levels of harm and risk. Formulate diagnoses and develop case conceptualizations. Use patient placement criteria. Demonstrate effective documentation skills to communicate findings. Develop collaborative treatment plans. Facilitate referrals and access to community resources. Conduct ongoing outcome evaluation. Apply evidence-based, culturally competent treatment strategies. Utilize individual, group, and family treatment strategies. Demonstrate ability to provide accurate education about addiction and recovery. Provide trauma-informed care. Adhere to established professional codes of ethics and standards of practice as well as jurisdictional rules and regulations. Demonstrate cultural competence. Engage in ongoing professional development and maintain awareness of advances in research. Utilize supervision and consultation. Advocate for clients, addiction services, and recovery.
● Assessment Methods: A component of the culminating project will include administration of a practice exam that will be used to assess preparation for the state certification or licensure. Graduates will be contacted to complete a yearly survey to determine whether they have passed the licensing exam, obtained licensure, and provide feedback on the effectiveness of their educational training.
● Measures: Prior to graduation, successfully pass the practice exam. Successfully pass the national licensing exam within one year of graduation. Obtain state certification or licensure as an addiction counselor within three years of graduation. Training effectiveness surveys will be evaluated to identify areas for improvement in coursework and training.
Projected Enrollment for the First Three Years: First Year: 15 Second Year: 40 Third Year: 55
Board of Regents Meeting November 18-20, 2020
Item #24 EXECUTIVE SUMMARY Page 41 of 76 Evidence of Market Demand: Addiction and substance abuse are one of America’s top public health problems and there is a growing need for a well-trained workforce. The Health Resources and Services Administration (HRSA) has identified a crucial need for behavioral health professionals with expertise and skills to provide opioid and other substance use disorder prevention, treatment and recovery services (HRSA, 2019). The administration’s Opioid Workforce Expansion Program has awarded more than 58 million dollars to better prepare behavioral health professionals to treat substance-use disorders. Ongoing funding opportunities indicate a continued need for training in addictions treatment. Locally, the Department of Psychology is frequently contacted by agencies in Arizona, such as the Department of Corrections, looking for addiction counselors. At a national level, the U.S. Bureau of Labor Statistics expects employment of substance abuse counselors to grow 22% from 2018 to 2028, much faster than other occupations (https://www.bls.gov/ooh/community-and-social-service/substance-abuse-behavioral-disorder-and-mental-health-counselors.htm#tab-6). Job prospects are expected to be very good for counselors who are licensed. Students who complete this degree and obtain licensure can find employment in substance abuse treatment centers, community mental health agencies, integrated health-primary care settings, criminal justice, hospitals, high school and university counseling centers, and military and veterans’ affairs hospitals.
Similar Programs Offered at Arizona Public Universities: There are no master’s programs offered by Arizona public universities that provide specialized training in addiction counseling. Grand Canyon University is the only educational institution in Arizona that offers a MS in Addiction Counseling, but this program is not certified by the Arizona Board of Behavioral Health Examiners.
New Resources Required? (i.e. faculty and administrative positions; infrastructure, etc.): Outside of the requested program fee, the current resources will be sufficient to offer this program.
Program Fee Required? YES ☒ NO ☐ Estimated Amount: $300 per credit hour ($3600 per semester) Program Fee Justification: The MS in Addiction Psychology is a clinically oriented program that meets the educational and training requirements to become a licensed addiction counselor. There are two additional requirements for licensure beyond coursework: 1) supervised clinical experience in an addiction treatment setting, and 2) passing a licensing exam. These additional requirements are very time and resource intensive, and represent an additional need not required of master’s programs in most fields. Dedicated staff are needed to provide students with the support necessary to be successful in the addiction psychology program, and subsequently become licensed to provide addiction treatment. A $300 per-credit-hour program fee is

Board of Regents Meeting November 18-20, 2020
Item #24 EXECUTIVE SUMMARY Page 42 of 76 needed to support these staff. Three staff positions will be needed: 1) a program director ($90,000), 2) a practicum coordinator ($70,000), 3) four practicum monitors ($65,000 each X 4 = $260,000), 4) an advisor ($55,000), and 5) a support staff ($51,500). At full enrollment of 45 students, the program fee will cover these three positions. Prior to full enrollment, one to two staff members will split the responsibilities.
Specialized Accreditation? YES ☒ NO ☐ Accreditor: Addiction counseling licensure in the state of Arizona is overseen by the Arizona Board of Behavioral Health Examiners. The board certifies educational programs that meet licensure requirements, but the board has not certified any graduate-level programs for addiction counselor licensure. The MS in Addiction Psychology meets all of the requirements for licensure and certification through the Arizona Board of Behavioral Health Examiners. The master’s program will also seek national accreditation with the National Addiction Studies Accreditation Commission (NASAC) and the National Association for Alcoholism and Drug Abuse Counselors (NAADAC). The program meets all requirements for both of these organizations. National accreditation with these organizations will enable students to qualify for addiction counselor licensure in all 50 states, and many countries.
Board of Regents Meeting November 18-20, 2020
Item #24 EXECUTIVE SUMMARY Page 43 of 76
New Academic Program Request
University: Arizona State University Name of Proposed Academic Program: Master of Science in Crime Analysis Academic Department: School of Criminology and Criminal Justice, Watts College of Public Service and Community Solutions Geographic Site: Downtown Phoenix campus Instructional Modality: Immersion and online Total Credit Hours: 33 Proposed Inception Term: 2021-2022 Brief Program Description: The School of Criminology and Criminal Justice seeks to offer a MS in Crime Analysis. Crime analysis is a highly specialized area that involves the systematic study of crime and disorder using sociodemographic, spatial, and temporal factors to assist the police in criminal apprehension, crime and disorder reduction, crime prevention, and evaluation. Most law enforcement officers are quite knowledgeable about criminal justice, but not necessarily about crime analysis. Indeed, most crime analysts are not sworn law enforcement officers. The degree program would focus on the theories, methods, and specific skill sets needed to be an effective crime analyst as distinct from the other areas within criminal justice, generally, or even within policing, specifically. This includes qualitative and quantitative analysis of crime data using tools that are not the focus of any our existing degree programs, such as Crime Prevention Through Environmental Design, the use of Geographic Information System (GIS) software for crime mapping purposes, the use of Social Network Analysis (SNA) software to determine links within criminal networks, and the systematic processing of criminal intelligence. Students will receive state-of-the-art education in a variety of crime analysis
Board of Regents Meeting November 18-20, 2020
Item #24 EXECUTIVE SUMMARY Page 44 of 76 topics such as crime mapping, statistical tools in crime analysis, social networking, and data management. In concurrence with ASU's initiatives towards becoming an international leader, the MS in Crime Analysis will provide students with the skills and credentials necessary to prepare them to enter fields specializing in crime analysis at a global scale.
Learning Outcomes and Assessment Plan: Learning Outcome 1: Graduates will demonstrate the essential qualifications for employment in crime analysis and related occupations by critically applying theories of crime and place in relation to the whole of criminological theory.
● Concepts: Problem-solving methods, key terminology in the field of crime analysis, principles and theories of crime analysis, knowledge of key products produced by crime analysts to meet qualifications required of a professional crime analyst.
● Competencies: Ability to apply real-world application of the SARA model (Scanning, Analysis, Response and Assessment) to identify recurring problems of concern to the public and crime analysts. Identify the consequences of crime, and develop broad goals as a response to community issues. Possess a broad understanding of criminological theory across micro and macro levels, most importantly theories of crime and place, and the intersection of opportunity and suitable targets.
● Process: Student mastery, assessed by course exams and completion of projects, will meet the requisites required for qualification and proficiency in the field of crime analysis. Students will submit a final applied project demonstrating the principles of crime analysis, which will then be assessed using faculty-developed rubrics. These findings will be used for the improvement of future course design.
● Measures: Rubrics will be utilized to evaluate students’ ability to demonstrate the competencies identified to meet outcome 1. The findings will be reviewed along with course feedback and an improvement plan developed in conjunction with discussions with faculty teaching the program’s coursework. Rubrics will be continually refined based on assessment outcomes and feedback.
Learning Outcome 2: Graduates will be able to use the fundamental methods and technologies required to produce valid and reliable crime analysis information of utility to policymakers and practitioners.
● Concepts: Research design and data analysis. Interpretation of statistical data using state-of-the-art technology and methods. Data management, linking data sources, and creating data visualizations.
● Competencies: Understand how to access, search, and utilize law enforcement databases, as well as identify relevant data to be collected. Proficiency in ArcMap (or
Board of Regents Meeting November 18-20, 2020
Item #24 EXECUTIVE SUMMARY Page 45 of 76
equivalent software) used for cartography basics, analysis of density maps, and testing/transforming accuracy of data points.
● Assessment Process: Students will be assessed in their final culminating experience projects which will show the ability to produce high-level research and data with fundamentals relevant to the advancement of crime analysis in practice and in policy. Faculty-developed rubrics will measure student results. All students will complete the final applied project and data will be used by faculty for future improvement of course design.
● Measures: Rubrics will be utilized to evaluate students’ ability to demonstrate the competencies identified to meet outcome 2. The findings will be reviewed along with course feedback and an improvement plan developed in conjunction with discussions with faculty teaching the program’s coursework. Rubrics will be continually refined based on assessment outcomes and feedback.
Learning Outcome 3: Graduates will be able to communicate and present the results of crime analysis orally and in writing.
● Concepts: Qualitative data and multivariate statistics, survey construction and testing, communication of findings and developing data products for distinct audiences.
● Competencies: Ability to present data suitable for communities and command staff, as well as line-level data. Demonstrate proficiency in professional presentation and publication of research findings obtained via mastery of downloading, cleaning, analyzing, and interpreting administrative and spatial data.
● Assessment Process: Attainment of skills in authorship and oratory presentation of advanced topics and findings relevant to crime analysis will be assessed by the ability to effectively present findings written and orally in class final projects. Faculty-developed rubrics will measure proficiency of student presentations and will also be used for improvements in future course design.
● Measures: Rubrics will be utilized to evaluate students’ ability to demonstrate the competencies identified to meet outcome 3. The findings will be reviewed along with course feedback and an improvement plan developed in conjunction with discussions with faculty teaching the program’s coursework. Rubrics will be continually refined based on assessment outcomes and feedback.
Projected Enrollment for the First Three Years: First Year: 30 Second Year: 60 Third Year: 90
Board of Regents Meeting November 18-20, 2020
Item #24 EXECUTIVE SUMMARY Page 46 of 76 Evidence of Market Demand: The MS in Crime Analysis is being developed in response to student demand due to strong career outlooks in the field. As criminal justice agencies worldwide are increasing their reliance on data-driven decision-making, they are hiring more personnel to fulfill their needs. There is a growing demand for crime analysts in Latin America and the Caribbean in particular, with nations seeking platforms for educating and training future and current crime analysts (InSight Crime, 2020). JobHero.com (2020) states that there will be “rapid growth” in this career field. Recruiter.com (2018) projects an annual increase of at least 2.29% in the need for crime analysts with median starting salaries at just over $47,000. Graduates of this program should expect to find employment within government agencies such as local law enforcement; the Department of Homeland Security (DHS), which comprises several agencies, including the Secret Service, Coast Guard, and Customs and Border Protection (CBP); adult and juvenile probation; courts; corrections agencies; and prosecutor's offices. Most of the personnel in this field work at the local, state, or federal level to implement and maintain public and national safety. Some crime analysts will also work for private organizations that deal with emergency response, law enforcement, and information technology. Careers in crime analysis may fall under the category of forensic technicians, defined by the Bureau of Labor Statistics as a "broad occupational title that encompasses many forensic specialties, where workers collect, identify, classify, and analyze evidence for criminal investigations" (Bureau of Labor Statistics, 2020). Employment of forensic science technicians is projected to grow 14% from 2018 to 2028, much faster than the average for all occupations, with a median salary of $59,150 per year (Bureau of Labor Statistics, 2020). Careers for graduates may also fall under the category of criminal investigators. Careers in this field are expected to increase between 5 and 9% through 2026, with a median salary of $81,920 (Bureau of Labor Statistics, 2018).
Similar Programs Offered at Arizona Public Universities: No other comparable MS programs are currently offered at Arizona Public Universities.
New Resources Required? (i.e. faculty and administrative positions; infrastructure, etc.): The department already offers select courses in these areas, but will create a small number of new courses to round-out the degree requirements. Because expertise to do so already exists among our current faculty, no substantial resources are needed to launch this program.
Program Fee Required? YES ☒ NO ☐ Estimated Amount: $100 per credit hour Program Fee Justification: The fee will provide special training in software programs that are frequently updated. It will
Board of Regents Meeting November 18-20, 2020
Item #24 EXECUTIVE SUMMARY Page 47 of 76 support small sections to allow for courses to support hands-on learning with these complex pieces of software, as well as with the other skills and technologies used in crime analysis. Additionally, because the field evolves rapidly, the fee will be used to support ongoing instructional design and redesign effects that harness the newest tools of crime analysis as they become available. Finally, the fee will help provide instruction and mentoring from working professionals who can convey both conceptual and pragmatic information to enrolled students.
Specialized Accreditation? YES ☐ NO ☒ Accreditor: Not applicable.
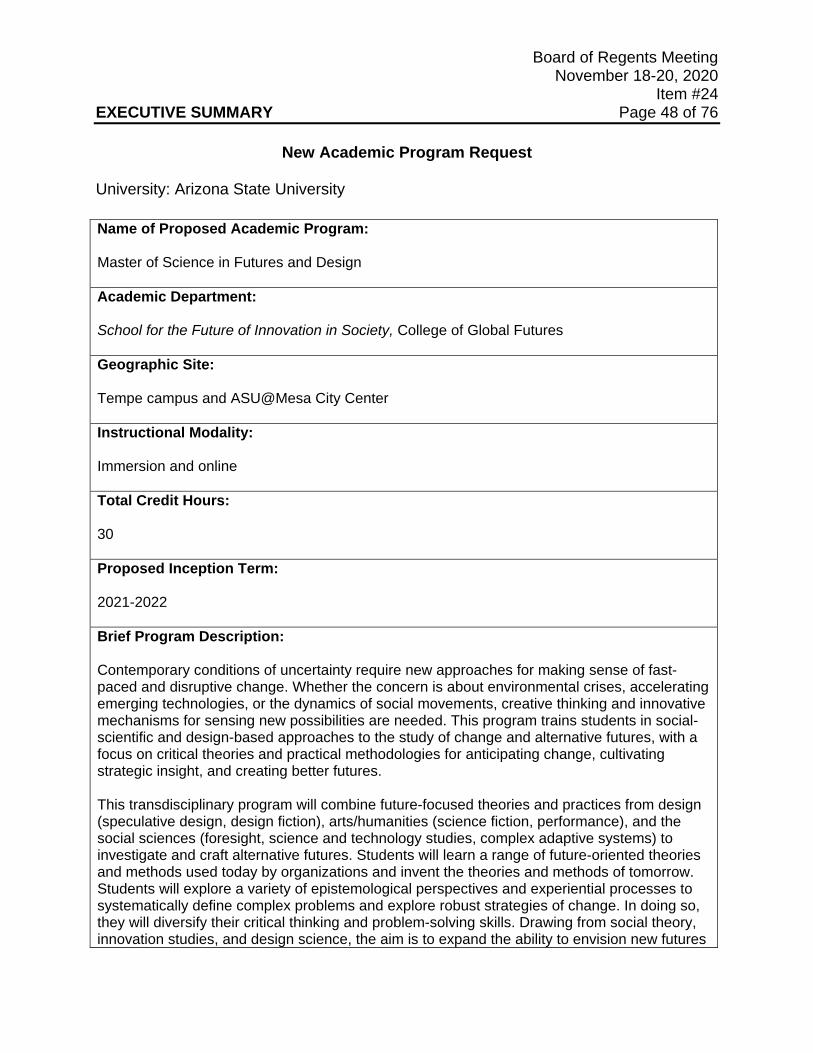
Board of Regents Meeting November 18-20, 2020
Item #24 EXECUTIVE SUMMARY Page 48 of 76
New Academic Program Request
University: Arizona State University Name of Proposed Academic Program: Master of Science in Futures and Design Academic Department: School for the Future of Innovation in Society, College of Global Futures Geographic Site: Tempe campus and ASU@Mesa City Center Instructional Modality: Immersion and online Total Credit Hours: 30 Proposed Inception Term: 2021-2022 Brief Program Description: Contemporary conditions of uncertainty require new approaches for making sense of fast-paced and disruptive change. Whether the concern is about environmental crises, accelerating emerging technologies, or the dynamics of social movements, creative thinking and innovative mechanisms for sensing new possibilities are needed. This program trains students in social-scientific and design-based approaches to the study of change and alternative futures, with a focus on critical theories and practical methodologies for anticipating change, cultivating strategic insight, and creating better futures. This transdisciplinary program will combine future-focused theories and practices from design (speculative design, design fiction), arts/humanities (science fiction, performance), and the social sciences (foresight, science and technology studies, complex adaptive systems) to investigate and craft alternative futures. Students will learn a range of future-oriented theories and methods used today by organizations and invent the theories and methods of tomorrow. Students will explore a variety of epistemological perspectives and experiential processes to systematically define complex problems and explore robust strategies of change. In doing so, they will diversify their critical thinking and problem-solving skills. Drawing from social theory, innovation studies, and design science, the aim is to expand the ability to envision new futures
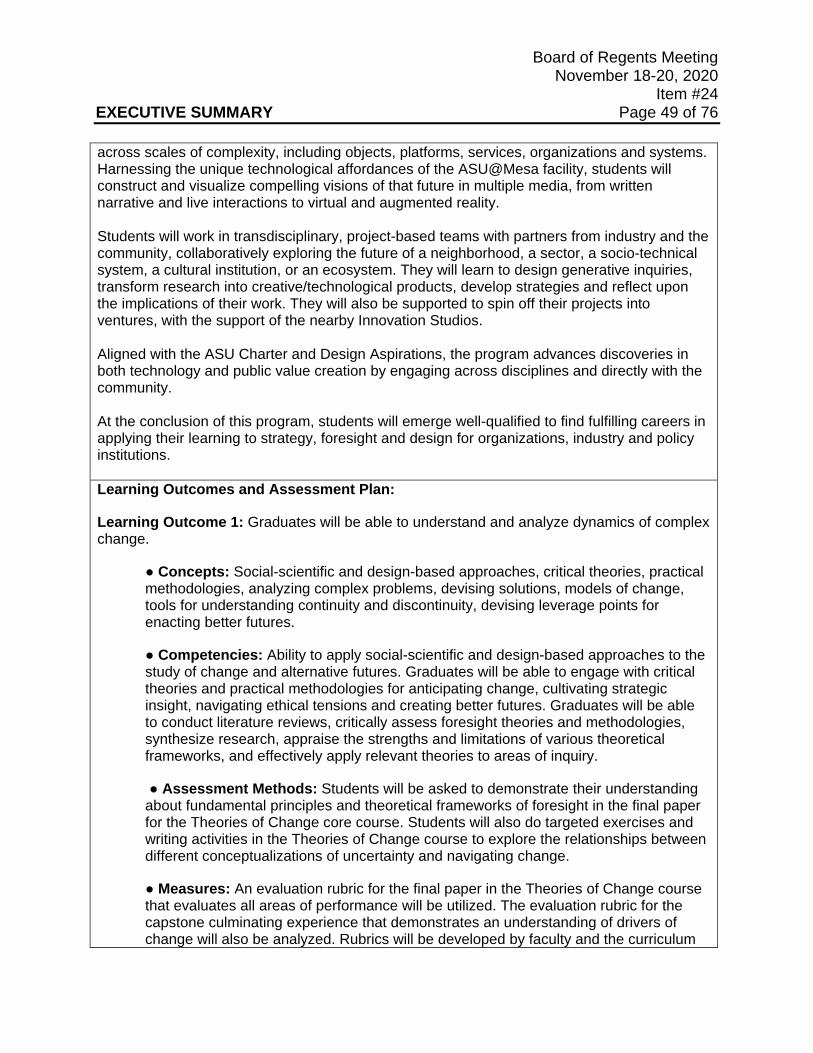
Board of Regents Meeting November 18-20, 2020
Item #24 EXECUTIVE SUMMARY Page 49 of 76 across scales of complexity, including objects, platforms, services, organizations and systems. Harnessing the unique technological affordances of the ASU@Mesa facility, students will construct and visualize compelling visions of that future in multiple media, from written narrative and live interactions to virtual and augmented reality. Students will work in transdisciplinary, project-based teams with partners from industry and the community, collaboratively exploring the future of a neighborhood, a sector, a socio-technical system, a cultural institution, or an ecosystem. They will learn to design generative inquiries, transform research into creative/technological products, develop strategies and reflect upon the implications of their work. They will also be supported to spin off their projects into ventures, with the support of the nearby Innovation Studios. Aligned with the ASU Charter and Design Aspirations, the program advances discoveries in both technology and public value creation by engaging across disciplines and directly with the community. At the conclusion of this program, students will emerge well-qualified to find fulfilling careers in applying their learning to strategy, foresight and design for organizations, industry and policy institutions. Learning Outcomes and Assessment Plan:
Learning Outcome 1: Graduates will be able to understand and analyze dynamics of complex change.
● Concepts: Social-scientific and design-based approaches, critical theories, practical methodologies, analyzing complex problems, devising solutions, models of change, tools for understanding continuity and discontinuity, devising leverage points for enacting better futures.
● Competencies: Ability to apply social-scientific and design-based approaches to the study of change and alternative futures. Graduates will be able to engage with critical theories and practical methodologies for anticipating change, cultivating strategic insight, navigating ethical tensions and creating better futures. Graduates will be able to conduct literature reviews, critically assess foresight theories and methodologies, synthesize research, appraise the strengths and limitations of various theoretical frameworks, and effectively apply relevant theories to areas of inquiry.
● Assessment Methods: Students will be asked to demonstrate their understanding about fundamental principles and theoretical frameworks of foresight in the final paper for the Theories of Change core course. Students will also do targeted exercises and writing activities in the Theories of Change course to explore the relationships between different conceptualizations of uncertainty and navigating change.
● Measures: An evaluation rubric for the final paper in the Theories of Change course that evaluates all areas of performance will be utilized. The evaluation rubric for the capstone culminating experience that demonstrates an understanding of drivers of change will also be analyzed. Rubrics will be developed by faculty and the curriculum
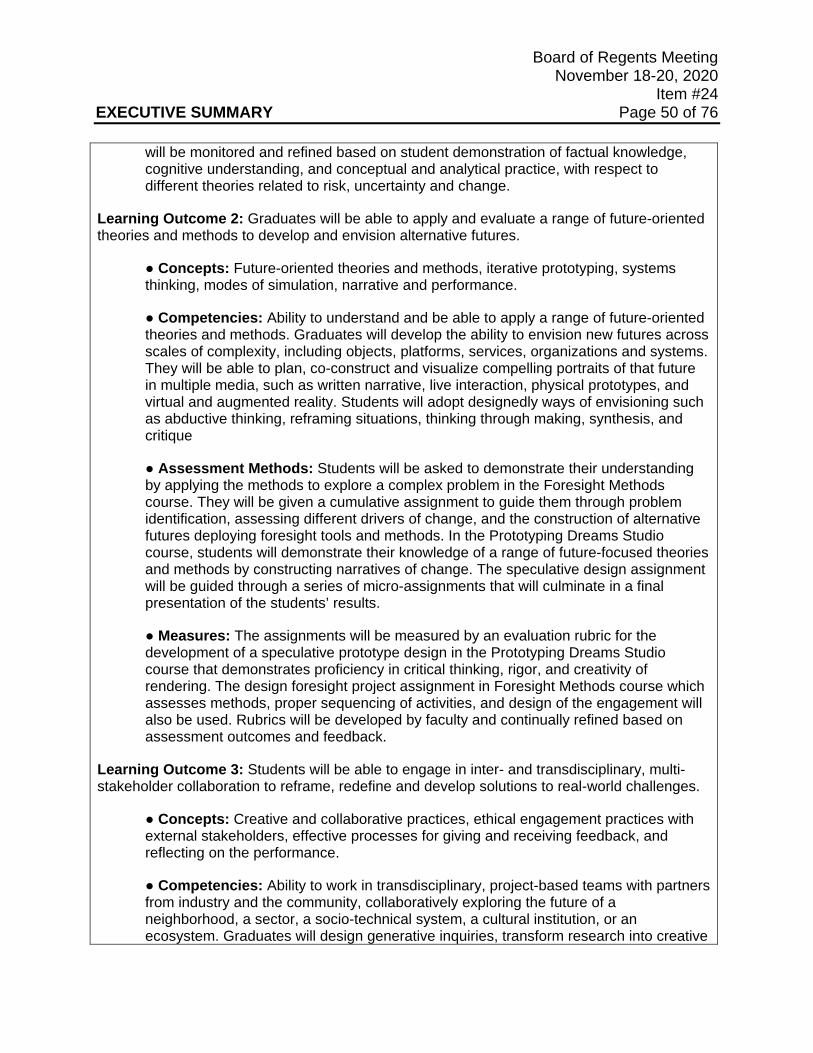
Board of Regents Meeting November 18-20, 2020
Item #24 EXECUTIVE SUMMARY Page 50 of 76
will be monitored and refined based on student demonstration of factual knowledge, cognitive understanding, and conceptual and analytical practice, with respect to different theories related to risk, uncertainty and change.
Learning Outcome 2: Graduates will be able to apply and evaluate a range of future-oriented theories and methods to develop and envision alternative futures.
● Concepts: Future-oriented theories and methods, iterative prototyping, systems thinking, modes of simulation, narrative and performance.
● Competencies: Ability to understand and be able to apply a range of future-oriented theories and methods. Graduates will develop the ability to envision new futures across scales of complexity, including objects, platforms, services, organizations and systems. They will be able to plan, co-construct and visualize compelling portraits of that future in multiple media, such as written narrative, live interaction, physical prototypes, and virtual and augmented reality. Students will adopt designedly ways of envisioning such as abductive thinking, reframing situations, thinking through making, synthesis, and critique
● Assessment Methods: Students will be asked to demonstrate their understanding by applying the methods to explore a complex problem in the Foresight Methods course. They will be given a cumulative assignment to guide them through problem identification, assessing different drivers of change, and the construction of alternative futures deploying foresight tools and methods. In the Prototyping Dreams Studio course, students will demonstrate their knowledge of a range of future-focused theories and methods by constructing narratives of change. The speculative design assignment will be guided through a series of micro-assignments that will culminate in a final presentation of the students’ results.
● Measures: The assignments will be measured by an evaluation rubric for the development of a speculative prototype design in the Prototyping Dreams Studio course that demonstrates proficiency in critical thinking, rigor, and creativity of rendering. The design foresight project assignment in Foresight Methods course which assesses methods, proper sequencing of activities, and design of the engagement will also be used. Rubrics will be developed by faculty and continually refined based on assessment outcomes and feedback.
Learning Outcome 3: Students will be able to engage in inter- and transdisciplinary, multi-stakeholder collaboration to reframe, redefine and develop solutions to real-world challenges.
● Concepts: Creative and collaborative practices, ethical engagement practices with external stakeholders, effective processes for giving and receiving feedback, and reflecting on the performance.
● Competencies: Ability to work in transdisciplinary, project-based teams with partners from industry and the community, collaboratively exploring the future of a neighborhood, a sector, a socio-technical system, a cultural institution, or an ecosystem. Graduates will design generative inquiries, transform research into creative
Board of Regents Meeting November 18-20, 2020
Item #24 EXECUTIVE SUMMARY Page 51 of 76
or technological products, develop strategies and reflect upon the implications of their work.
● Assessment Methods: Throughout the program students will have to apply their knowledge about creativity and collaboration into practice, evaluate a variety of methodological and design choices, and co-create generative inquiries. As part of the capstone project, students will have their work seen and evaluated by community or industry stakeholders they are collaborating with, will learn to assess other peer projects using evaluative rubrics, and will learn to give and receive peer feedback related to their contributions with the view of improvement. Students will create a final project presentation of the capstone project that demonstrates their mastery of collaboration in transdisciplinary teams.
● Measures: The program will be measured by evaluation of the final project and presentation in the Prototyping Dreams Studio by faculty panel and external stakeholder evaluation rubrics for the final product of the capstone course. Peer evaluation rubric of individual contributions to the group in the capstone final project course will also be used. Rubrics will be continually refined based on assessment outcomes and feedback.
Projected Enrollment for the First Three Years: First Year: 15 Second Year: 30 Third Year: 40 (steady state) Evidence of Market Demand: Evaluating market demand for this degree is difficult because the traditional sources of job data do not have a category that squarely overlaps with the skills delivered by the degree. But, there is increasing demand for professionals trained in navigating uncertainty, scenario planning, and strategically coping with disruptive change. Our graduates will gain these skills and be strong candidates for jobs like: Principal User Experience Designer, Foresight Researcher, Director of Futures Strategy, Futurist, and Strategic Planner. Organizations hiring such positions include: World Economic Forum, World Energy Council, Mercy Corps, Verizon, Amazon, Ginkgo Bioworks, Mercedes-Benz, Autodesk, Google, Shell, Pepsi, and CannonDesign. Bain and Associates found that over half of Fortune 500 companies use scenario planning and a survey by the Corporate Strategy Board revealed major corporations face professional shortcomings related to: challenging assumptions about the future, identifying discontinuous change, and adapting resiliently to rapid change. Universities in Europe, Asia, and the Middle East are responding by creating programs that incorporate future studies. The U.S. is slower, but there are three: University of Hawaii (Manoa)’s Master of Arts in Alternative Futures, The Ontario College of Art and Design University’s Master of Design in Strategic Foresight and Innovation, and University of Houston’s Master of Science in Foresight. Executive education programs are being run by consultancies like the Institute for the Future.
Board of Regents Meeting November 18-20, 2020
Item #24 EXECUTIVE SUMMARY Page 52 of 76 As none of the job titles listed above are included in Emsi Analyst or Department of Labor data, jobs were analyzed in categories that program graduates could contribute to. Emsi Analyst Summary: Labor market demand was based on the target occupations of market research analysts and marketing specialists (13-1161), management analysts (13-1111) and marketing managers (11-2021). There were an estimated 58,099 annual openings for jobs within these sectors in 2019 with a projected growth of 11% between 2019 and 2024. Current job opportunities are relatively evenly spread across the U.S. Relevant skills related to the MS in Futures and Design include strategic planning, strategic management, presentations, forecasting, change management, innovation, communication, research, and problem solving. U.S. Department of Labor Summary: Labor market demand was based on the target occupations of social scientists and related workers (19-3099), operations research analysts (15-2031) and social science research assistants (19-4061). Between 2019 and 2029, the jobs market across these three categories is projected to grow from 188,700 jobs to 222,500 jobs (an increase of 18%). Annual openings across all three categories is projected to be 21,000 per year. Similar Programs Offered at Arizona Public Universities: In conducting a competitive analysis of degree offerings, concentrations, and majors, the proposed MS in Futures and Design does not have any direct competitors in the state of Arizona. The explicit focus on developing, exploring, and using futures is unique. The degree does, however, draw on expertise and tools developed and used by a wide variety of disciplines and as such there are degree programs that may overlap in part. As noted in the description above, this transdisciplinary program draws on practices from design, arts/humanities, and the social sciences to explore and craft alternative futures. Some of the places a prospective student could get training in some of these specific skills include: Design and Media Arts: ASU has a robust set of programs in design and media arts. The master's degree will draw on this strength for one core course and several electives. These programs do not, however, integrate robust training in futures scenarios, which will be the core of this new program. PhD in Design, Environment and the Arts https://design.asu.edu/degree-programs/design-environment-and-the-arts MA in Digital Culture https://herbergerinstitute.asu.edu/node/40620 PhD in Media Arts and Sciences https://herbergerinstitute.asu.edu/node/40634 Certificate in Socially Engaged Practice in Design and the Arts https://herbergerinstitute.asu.edu/node/40625 Visual Communication Design
Board of Regents Meeting November 18-20, 2020
Item #24 EXECUTIVE SUMMARY Page 53 of 76 https://herbergerinstitute.asu.edu/node/40616 Arts/Humanities: The Certificate in Digital Humanities has some overlap with the proposed degree in that they meld technical and social values. The aim of the programs, however, is different in that the proposed degree integrates social science research with humanities research to develop and use alternative futures. Certificate in Digital Humanities https://webapp4.asu.edu/programs/t5/majorinfo/ASU00/LACDHGRCT/graduate/false New Resources Required? (i.e. faculty and administrative positions; infrastructure, etc.): None required. Program Fee Required? YES ☒ NO ☐ Estimated Amount: $100 per credit hour Program Fee Justification: This amount represents both the minimum necessary to fund annual updates and refreshes of technologies critical to the delivery of the degree content. Routine expenditures of fee revenue will include: computing equipment, specialized technologies (motion capture, head mounted displays for virtual reality, etc.), software licensing, project funding for community-engaged activities, personnel for technology support, and staff costs. Specialized Accreditation? YES ☐ NO ☒ Accreditor: Not applicable.
Board of Regents Meeting November 18-20, 2020
Item #24 EXECUTIVE SUMMARY Page 54 of 76
New Academic Program Request
University: Arizona State University Name of Proposed Academic Program: Bachelor of Arts in Education in Early Childhood Education Academic Department: Division of Teacher Preparation, Mary Lou Fulton Teachers College Geographic Site: Polytechnic, Tempe, Downtown Phoenix and West campus Instructional Modality: Immersion and online Total Credit Hours: 120 Proposed Inception Term: 2021-2022 Brief Program Description: The BAE in Early Childhood Education prepares individuals to meet the educational, behavioral, and social emotional needs of children ages birth to age 8 or grade 3 while meeting Arizona certification requirements. Students will focus on child development and best practices in early childhood education, including the skills to create enriched, inclusive learning environments; instructional design, planning and facilitation; and assess, monitor and report the progress of young children. Students will also learn techniques and approaches to engage with children's family members for the growth and development of young children. Professional experience with young children in educational settings and classrooms will be provided before graduation. This program replaces the current BAE in Early Childhood and Early Childhood Special Education dual-certification program to allow students more options and flexibility. For example, students desiring the dual certification can achieve it by completing the special education specialization to earn certification in early childhood and early childhood special education; those with interests in other areas can select another area of interest or specialization, including the arts, educating multilingual learners, autism spectrum disorders, or STEM.
Board of Regents Meeting November 18-20, 2020
Item #24 EXECUTIVE SUMMARY Page 55 of 76 Learning Outcomes and Assessment Plan: Learning Outcome 1: Students will learn how to use integrated pedagogies to collaborate, create, implement, and assess a positive, equitable, safe, and inclusive educational environment for a diverse student population for the promotion of academic, behavioral, and social-emotional development and growth.
● Concepts: Child development, learning, social development, behavioral development, and anti-bias education, as well as evidence- and research-based instructional practices.
● Competencies: Graduates will have the knowledge and skills to construct classroom learning centers for young children that incorporate academic learning, social-emotional learning through the arts (visual arts, drama, dance, music, and movement) to enrich young students learning through an inquiry unit by selecting appropriate materials such as books, creating video read- alouds, integrating materials relevant to diverse families and communities, and engaging students’ creativity through art.
● Assessment Methods: In ECD 417 Arts Integration, students will complete an authentic Read Aloud assignment that demonstrates ability to select age appropriate books, ask developmentally and appropriately challenging questions, and incorporate arts-based strategies. Upper-division students will also design a classroom learning center that could be used in an early childhood (PK-3rd grade) educational setting, which incorporates language, literacy, and the arts. These experiences will provide students the opportunity to apply course content related to cultivating creativity in a learning environment in order to promote developmentally appropriate practice in an integrated language, literacy, and the arts learning context. The rubrics are created using research-based recommendations aligned with professional standards (NAEYC, Council for Exceptional Children - Division for Early Childhood) for high-quality, multimodal, literacy experiences for young children. Data will be collected through appropriate video recording (read aloud) and permanent products students will post in the University Learning Management System.
● Measures: Results from the scoring rubrics will be examined for patterns in competence with specific components of the practice to guide course instruction as part of continuous improvement efforts.
Learning Outcome 2: Students will learn how to reflect, set goals, make action plans, and monitor progress for personal growth and professional development; teacher identity, teacher wellness, principled innovation, advocacy, equitable and inclusive practices.
● Concepts: Principles and practices of teacher identity and teacher wellness; equitable and inclusive dispositions and practices, on-going engagement in reflection and professional learning.
● Competencies: Graduates will have the knowledge, skills, and dispositions to engage in practice for on-going professional learning to be a principled educator who
Board of Regents Meeting November 18-20, 2020
Item #24 EXECUTIVE SUMMARY Page 56 of 76
identifies educational challenges or dilemmas, interrogates biases and assumptions, and challenges current thinking and practice to generate new ideas and solutions.
● Assessment Methods: In the professional experiences in the student’s junior and senior years, the lead teacher (i.e., mentor teacher in the professional experience) measures early childhood development teacher candidates' professional knowledge, skills, and dispositions using the Mary Lou Fulton Teachers College Professionalism Rubric based on direct observation and record accumulated results over the course of the experience. Teacher candidates will complete the Professional Learning Plan to develop a professional learning plan to improve their practice, address biases, and grow as principled educators; and engage in and reflect on self-selected professional learning activities. The Mary Lou Fulton Teachers College Professionalism Rubric (2011) is drawn from the Framework for Teaching (Danielson, 2007) and is aligned with national teaching standards (InTASC). Teacher candidates are evaluated on three broad areas with relevant indicators for each area. The rubric includes professionalism, growing and developing professionally, maintaining accurate records, and home-school communication. The Professionalism Rubric has a 5-point scale, with scores of 2 or 3 required for passing field experiences and student teaching courses (higher scores indicating greater proficiency).
● Measures: The Principal Innovation (2020) framework will be used to determine how the Professionalism Rubric needs to be redeveloped to better address the current conceptualizations of professional development and growth of teachers. Data will be collected through the learning management system used by students, lead teachers (mentors) and faculty. Students will also post permanent products in the University Learning Management System. Results from the scoring rubrics of all students will be aggregated to examine progress within a year and across time and to guide continuous improvement efforts. The college will make specific recommendations for program improvement based on patterns in students’ scores and comments on refinement and strengths.
Learning Outcome 3: Students will learn how to engage in collaborative cycles of inquiry that address multiple and competing perspectives regarding a problem of practice associated with local issues and consistent with global issues. Identify a reasoned analysis informed by major theories and evidence-based practices.
● Concepts: Theories of educational assessment, formative and summative measurement of learning, data literacy.
● Competencies: Graduates will have the knowledge, skills, and dispositions to identify and utilize multiple data sources, including observations, interviews, and permanent products that consider the diverse needs of their students to make informed decisions (e.g., modifying instruction and/or assessments, referring students for specialized programming). Students will examine educational evidence and research to understand persistent problems in education including bias and cultural-appropriateness of data sources to plan for cognitive, behavioral and social-emotional instruction for diverse learners.
Board of Regents Meeting November 18-20, 2020
Item #24 EXECUTIVE SUMMARY Page 57 of 76
● Assessment Methods: During the students’ junior year experience, students will be assessed using a rubric developed using expected evidence-based practices (i.e., NAEYC, CEC- Division for Early Childhood). Early childhood development teacher candidates will complete and submit the Assessment Action Project in the TEL 318 course that assesses their ability to collect and analyze assessment data to produce instructional objectives for students. Teacher candidates will also demonstrate their ability to collect, interpret and communicate multiple sources of data (indirect and direct measures) to inform socially valid intervention plans in collaboration with stakeholders (e.g., multidisciplinary teams and families) in a Functional Behavioral Assessment (FBA) and Behavior Intervention Plan (BIP) report The FBA/BIP report rubric is based on the Individuals with Disabilities Act (IDEA, 2004) requirements for this process.
● Measures: Results from the scoring rubrics will be examined for patterns in competence with specific components of the practice to guide course instruction as part of the development of continuous improvement efforts that will be addressed by the MLFTC Continuous Improvement Topical Action Group (TAG).
Learning Outcome 4: Students will develop an understanding of key concepts and competencies around American institutions, economics and history; civil discourse and civic knowledge; and, ethics and ethical reasoning. Incorporate these concepts in learning experiences for students.
● Concepts: Economic development, public services, schools as American Institutions, history of public education in America, community institutions that support education, policies of American education; the role of schools to prepare civic literate citizens, government structures that make up American society, patterns of discourse that contribute to the discourse of citizens; and, ethics, social justice, development of sustainable relationships of schools and communities, development of equitable opportunity to learn for all students.
● Competencies: Graduates will be proficient in incorporating concepts of education in America from a historical perspective across the curriculum, articulating the importance of human rights perspectives in schools and teaching as represented in the outcomes of curricular experiences, and will negotiate multiple perspectives of the purposes of schooling with parents and communities. They will develop and implement learning experiences for students that model the engagement and behavior of civically-minded people. Graduates will embody ethical behaviors and perspectives by including the perspective that all students can learn in their curriculum and instruction.
● Assessment Methods: Students will research and present in TEL 111 Exploration of Education on the impact of legislation and policies on a historical educational topic including the background of the policy, how it has spanned over time, and the impact today. In the same course, students will explore current trends that are affecting educational environments, present opposing sides on the topic, and develop a critical voice about the topic. In TEL 171 Professional Educator Series: Equity in Education, students will analyze educational issues relevant to one sociocultural marker or the
Board of Regents Meeting November 18-20, 2020
Item #24 EXECUTIVE SUMMARY Page 58 of 76
intersectionality of multiple socio-cultural markers with the aim to understand and propose solutions to issues of equity that impact individuals and groups who are systematically disadvantaged.
● Measures: Students will be assessed using a staff developed rubric that references components of the Association of American Colleges and Universities criteria on each assessment area. In addition, graduates from the program need to develop evidence of Interstate Teacher Assessment and Support Consortium standard 5 that addresses the ability to apply their understanding and practices in content areas around American Institutions, Economics and History; standard 9, Professional Learning and Ethical Practice as they develop and implement learning experiences for students; and standard 10, Leadership and Collaboration as they negotiate differing perspective of teaching with diverse learners.
Projected Enrollment for the First Three Years: First Year: 50 Second Year: 100 Third Year: 125 Evidence of Market Demand: Market demand for qualified certified early childhood teachers is expected to be high and sustained both in Arizona and nationally. The U.S. Bureau of Labor Statistics states the employment of preschool teachers is projected to grow 7% from 2018 to 2028, faster than the average for all occupations. Growth is expected due to a continued focus on the importance of early childhood education. Additional requirements for early childhood educators is evident in the increased responsibility of educators to children at this young age as reported by The New York Times Aug. 2019 article. This article references a 2016 American Educational Research Association study that shows that preschool and kindergarten classrooms have rapidly become more academically oriented. Emsi Analyst statistics show 71,119 unique job postings that require a bachelor's degree in early education for early childhood positions were posted from 2018-2020. These positions include child care teachers, preschool teachers, kindergarten teachers, Head Start teachers, lead Teachers, teacher assistants, educators. The median salary is listed as $39,800. When running the same analysis that included the need only for a high school or associate's degree, the search yielded 68,552 unique job postings and the median salary dropped to $31,900. Similar Programs Offered at Arizona Public Universities: Two other public state institutions offer a program focusing on early childhood education. Northern Arizona University offers the Bachelor of Education in Early Childhood Education (Flagstaff, Yuma and online), and the University of Arizona offers the Master of Arts in Teaching and Teacher Education with a concentration in Early Childhood Education (campus-
Board of Regents Meeting November 18-20, 2020
Item #24 EXECUTIVE SUMMARY Page 59 of 76 based). Nationally, many peer institutions offer programs in early childhood education, either as a degree or concentration. ASU currently offers an established MEd in Early Childhood program. New Resources Required? (i.e. faculty and administrative positions; infrastructure, etc.): Currently Mary Lou Fulton Teachers College offers a dual-certification program for Early Childhood Education with Special Education (BAE ECS/SPE); no additional budget expenditure is anticipated. No new books, library holdings, equipment, laboratory space or personnel will be required at this time. Faculty currently teaching in the BAE in Early Childhood/Special Education dual-certification program would be reassigned to teach in the BAE in Early Childhood Education. Staff positions that support that program, including admissions specialists, advisors, university supervisors and instructional designers, would continue in their current roles and shift their focus to the BAE in Early Childhood Education. Program Fee Required? YES ☐ NO ☒ Estimated Amount: None Program Fee Justification: Not applicable. Specialized Accreditation? YES ☒ NO ☐ Accreditor: The Arizona Department of Education approves programs leading to state certification. The approval allows the university to provide institutional recommendations to students upon successful program completion. This eliminates the need for the Arizona Department of Education to conduct a transcript analysis to examine if certification requirements for education and clinical experience are met.
Board of Regents Meeting November 18-20, 2020
Item #24 EXECUTIVE SUMMARY Page 60 of 76
New Academic Program Request University: Arizona State University
Name of Proposed Academic Program: Bachelor of Arts in Education in Physical Education Academic Department: Division of Teacher Preparation, Mary Lou Fulton Teachers College Geographic Site: Polytechnic, Tempe, Downtown Phoenix and West campus Instructional Modality: Immersion and online Total Credit Hours: 120 Proposed Inception Term: 2021-2022 Brief Program Description: The BAE in Physical Education program will produce PreK-12 certified physical education professionals who play a central role in ensuring that future generations of Arizona children and youth have the skills and knowledge to lead physically active and healthy lives. Students will take foundational coursework in the areas of growth and motor development, movement activities, and lifelong physical fitness, and develop skill in instructional design and lesson planning, including modifications, and accommodations for the PreK-12 student. Instruction will not be limited to elementary, secondary and adaptive physical education methods, and will include skills in the learning environment, including classroom management, assessing, monitoring and reporting progress, as well as understanding professional responsibility and ethical conduct. This places the degree squarely in the center of Arizona State University's mission, as reflected in its charter. Aiding in developing an active and healthy citizenry is an essential public value. Our current concentration in physical education only allows students to become certified in 6-12 grades. This offering will allow undergraduate students to become certified through the Arizona Department of Education in grades PreK-12 Physical Education, opening up the option for students who desire to teach in the lower grades. The BAE in Physical Education will replace the existing BAE in Secondary Education with a concentration in
Board of Regents Meeting November 18-20, 2020
Item #24 EXECUTIVE SUMMARY Page 61 of 76 Physical Education, and it will not be limited to secondary education settings. Students in the current degree program will be given the opportunity to complete their program of study. Learning Outcomes and Assessment Plan: Learning Outcome 1: Graduates will collaborate, create, and implement a positive, equitable, safe, and inclusive educational environment for a diverse student population focused on the promotion of academic, behavioral, and social-emotional development and growth in physical education.
● Concepts: Sport pedagogy, fitness education, motor development, motor learning, and exercise physiology.
● Competencies: Graduates will have the skills and knowledge to plan appropriate lessons and units of instruction that provide all students with appropriate learning tasks, specifically within the psychomotor domain. Those lessons will provide all students with appropriate learning tasks using sport pedagogy-specific instructional strategies, and graduates will employ authentic assessment strategies to determine students’ progress toward learning in the psychomotor domain. Graduates will use evidence-based instructional skills, including but not limited to task presentation, provision of appropriate motor performance and behavior feedback, use of visual demonstrations, active supervision of learners, and adjusting for learner differences. Use of these competencies is based on program graduates building the requisite professional knowledge. Graduates will be able to design appropriate practice tasks that are inclusive of all students, shaping authentic learning tasks, employing analytical observation skills to assess students’ motor performance (i.e., critical performance elements, skill phases, common performance errors, and appropriate learning task progressions). Use of these competencies is based on program graduates building the requisite specialized subject matter content knowledge
● Assessment Methods: Students will develop several portfolio artifacts that include a program design project, a full unit/season plan, and selected lesson plans that include feedback from mentor teachers. Assessments that provide the students the opportunity to develop these artifacts are incorporated in assignments in PPE 396 Clinical Experience: Physical Education Elementary (Grades 1-8), PPE 397 Clinical Experience: Physical Education Secondary (Grades 6-12), PPE 477 Student Teaching: Physical Education Elementary (Grades 1-8), and PPE 478 Student Teaching: Physical Education Secondary (Grades 6-12) . These assignments directly correlate with Arizona Professional Teaching Standards, Standards 3 (Planning and Implementation), and 4 (Instructional Delivery and Management). Additionally, The National Evaluation Series (NES) Professional Knowledge Exam and Subject Area Content Knowledge Exam would serve as indicators of learned student competencies addressing Standards 1 (Content and Foundational Knowledge) and 2 (Skillfulness and Health-Related Fitness).
● Measures: Review of graduates’ evidence presented in their professional portfolios are created during terms 5 through 8 of the students’ academic career. Embedded assignments that showcase the students’ proficiency as dictated by the National
Board of Regents Meeting November 18-20, 2020
Item #24 EXECUTIVE SUMMARY Page 62 of 76
Physical Education Beginning Teacher Standards 3 and 4 are rated at the end of each semester by program faculty. Performance metrics are calculated and disseminated for review purposes. Possible adjustments to course curriculum content and sequences are then determined from this final review. In addition, program graduates are required to pass the NES Professional Knowledge Exam and NES Subject Area Content Knowledge Exam.
Learning Outcome 2: Physical education program graduates shall demonstrate professional responsibility for continuous development that focuses on self-improvement as an educator, helps to improve the physical education profession and encourages on-going proactive advocacy in support of the field, their program, students, students’ families, and the surrounding communities. Physical education program graduates will demonstrate professional growth, leadership, advocacy, and ethics.
● Concepts: The principles and practices of teacher identity, teacher wellness, equitable and inclusive dispositions and practices, the intersectionality between professional ethics and school-based laws.
● Competencies: Graduates will develop the skills and knowledge necessary to effectively further their education as professional teachers by demonstrating on-going engagement in reflection and professional learning. They will effectively plan, and implement expanded school-based physical activity programming, including social marketing to promote physical activity, and targeting all students throughout the school day. Graduates will be able to engage in actions of ethical responsibility to advocate for appropriate services for all individuals and establish the professional conditions and resources that will improve learning outcomes and life-long practices in physical health and well-being. Graduates will effectively engage in proactive advocacy by developing culturally relevant thinking. They will put their thoughts into action by presenting their ideas in a formal event such as a school board meeting, in the context of meeting with and formally presenting before a school board.
● Assessment Methods: Graduates develop artifacts for their professional portfolios during terms 5-8 that adhere to the principles of the SHAPE America National Beginning Teacher Standard 5 (Value of Physical Activity); creating expanded school-based curriculum such as physical activity breaks or before-after/during school activity programming, and Standard 6 (Professional Responsibilities); attending professional conferences, workshops, etc. that lies outside of the scope of the professional physical education program.
● Measures: Professional portfolios are created during terms 5 through 8 of the students’ academic career. Embedded assignments, as dictated by the National Physical Education for Beginning Teacher Standards 5 and 6, are rated at the end of each semester by program faculty. Course curriculum content assessments align with the stated sections of the National Standards and also include a biography, resume, and personal philosophical statement on instructing physical education classes. Yearly student mean averages for the SHAPE America Standards for Beginning
Board of Regents Meeting November 18-20, 2020
Item #24 EXECUTIVE SUMMARY Page 63 of 76
Physical Educators and the TAP Rubric are calculated and retained in order to provide guidance primarily for establishing continual improvement goals.
Learning Outcome 3: Acting as an educator scholar, physical education program graduates shall apply advanced knowledge and creative-thinking skills to address challenges they encounter (e.g., social, behavioral, cultural) by imagining new solutions and creating positive physical health changes that support their schools, students, families, and the broader community.
● Concepts: Tolerance for ambiguity, learner development, characteristics of physical health and the challenges students encounter as they develop, principles of learning, Principled Innovation Practices (MLFTC, 2020), teacher identity, and equitable and inclusive dispositions and practices, constructing relevant information and educational evidence and research to better understand persisting problems in physical education.
● Competencies: Graduates will become reflective practitioners to better understand how to work with diverse groups of students. They need to become familiar with current technology and determine its accessibility and applicability for use with all students in physical education. They need to be able to engage in collaborative inquiry with other teachers to address a relevant problem of practice by identifying and utilizing multiple data sources, examining competing perspectives, imagining new concepts, and forming new solutions guided by principles and research that provide the ability to create positive change for learners.
● Assessment Methods: The professional portfolio that students construct and refine during terms 5-8 include artifacts that demonstrate graduates’ knowledge and skills relative to effective verbal and nonverbal communication skills that convey respect, sensitivity, and equity across learners. These artifacts include narrative reports and collected data on interaction patterns of teacher candidates with their students. Reflections on student growth in these areas are emphasized. The professional portfolio includes artifacts that demonstrate graduates’ knowledge and skills relative to their ability to analyze motor skills and performance concepts through multiple means (e.g., visual observation, technology) in order to provide specific, congruent feedback to enhance student learning.
● Measures: Students’ embedded assignments, as dictated by the National Physical Education for Beginning Teacher Standard 2, undergo a formal review at the end of each term (5-8) by program faculty and clinical supervisors. Using a five-point rating scale, clinical supervisors review assignments for evidence of a student’s effective use of verbal and nonverbal communication skills that properly convey the ideas of maintaining healthy habits to support schools and their adjacent communities.
Learning Outcome 4: Students will develop an understanding of key concepts and competencies around American institutions, economics and history; civil discourse and civic knowledge; and, ethics and ethical reasoning. Incorporate these concepts in learning experiences for students.
Board of Regents Meeting November 18-20, 2020
Item #24 EXECUTIVE SUMMARY Page 64 of 76
● Concepts: Economic development, public services, schools as American Institutions, history of public education in America, community institutions that support education, policies of American education; role of schools to prepare civic literate citizens, government structures that make up American society, patterns of discourse that contribute to the discourse of citizens; and, ethics, social justice, development of sustainable relationships of schools and communities, development of equitable opportunity to learn for all students.
● Competencies: Graduates will be proficient in incorporating concepts of education in America from a historical perspective across the curriculum, articulating the importance of human rights perspectives in schools and teaching as represented in the outcomes of curricular experiences, and will negotiate multiple perspectives of the purposes of schooling with parents and communities. They will develop and implement learning experiences for students that model the engagement and behavior of civically minded people. Graduates will embody ethical behaviors and perspectives by including the perspective that all students can learn in their curriculum and instruction.
● Assessment Methods: Students will research and present in TEL 111 Exploration of Education on the impact of legislation and policies on a historical educational topic including the background of the policy, how it has spanned over time, and the impact today. In the same course, students will explore current trends that are affecting educational environments, present opposing sides on the topic, and develop a critical voice about the topic. In TEL 171 Professional Educator Series: Equity in Education, students will analyze educational issues relevant to one sociocultural marker or the intersectionality of multiple socio-cultural markers with the aim to understand and propose solutions to issues of equity that impact individuals and groups who are systematically disadvantaged.
● Measure: Students will be assessed using a staff developed rubric that references components of the Association of American Colleges and Universities criteria on each assessment area. In addition, graduates from the program need to develop evidence of Interstate Teacher Assessment and Support Consortium standard 5 that addresses the ability to apply their understanding and practices in content areas around American Institutions, Economics and History; standard 9, Professional Learning and Ethical Practice as they develop and implement learning experiences for students; and standard 10, Leadership and Collaboration as they negotiate differing perspective of teaching with diverse learners.
Projected Enrollment for the First Three Years: First Year: 30 Second Year: 50 Third Year: 75
Board of Regents Meeting November 18-20, 2020
Item #24 EXECUTIVE SUMMARY Page 65 of 76 Evidence of Market Demand: The market demand for physical education teachers is expected to be high and sustained both in Arizona and nationally. According to the National Center for Education Statistics annual report, "The Condition of Education 2019," K-12 student enrollment continues to increase across public, charter and private school systems. Although rates vary from state to state, Arizona is projected to double the U.S. average at a 4% growth rate of public elementary and secondary school enrollment from 2016-2028. At the same time, there continues to be a significant teacher shortage across the entire Arizona education system. The Arizona School Personnel Administrators Association reported in August 2019 that 20.78 percent of teacher positions remained vacant after the school year began and that an additional 48.3% of teacher positions were filled by individuals not meeting standard teacher requirements. This need will continue to increase as teachers reach retirement age. Graduates of the BAE in Physical Education PreK-12 program are able to pursue teacher certification for preschool through high school grade levels. The U.S. Bureau of Labor Statistics estimates the following growth in employment between 2018-2028: 7% for preschool teachers; 3% for elementary and middle school teachers; 4% for high school teachers. Emsi Analyst job posting analytics show that between February 2018-2020 there were more than 5,900 unique postings for the career title of "Physical Education Teacher" that also required a bachelor's degree. Employer job posting trends from 2017-2019 show growth among the yearly peak of job postings: 750 postings in July 2017; 821 postings in July 2018; 1,023 postings in July 2019. This degree also prepares students for jobs beyond a traditional teacher position. Graduates can start careers related to health and fitness in a variety of titles such as coach, fitness instructor, wellness coordinator or personal trainer. For these specific career titles, Emsi Analyst job posting analytics show more than 19,500 unique postings between February 2018-2020 that also require a bachelor's degree. The top hiring industry for these titles is "educational services." "Teaching" is listed as one of the top five common skills that employers seek. This underscores the marketability of job candidates with a BAE in Physical Education degree, even for roles outside of a K-12 teacher position. The U.S. Bureau of Labor Statistics predicts high demand for these positions as well, expecting a 13% growth for fitness trainers and instructors and 8% growth for recreation workers from 2018-2028. Similar Programs Offered at Arizona Public Universities: Northern Arizona University offers a similar program through a Bachelor of Science in Physical Education that allows students to become a certified Physical Education teacher in the state of Arizona. New Resources Required? (i.e. faculty and administrative positions; infrastructure, etc.): The BAE in Physical Education will replace the existing BAE in Secondary Education with a concentration in Physical Education. All materials and resources allocated for the current BAE in Secondary Education (Physical Education) will be used for this BAE in Physical Education. Faculty and staff assigned to the current program will be reassigned to support the new degree.
Board of Regents Meeting November 18-20, 2020
Item #24 EXECUTIVE SUMMARY Page 66 of 76 Program Fee Required? YES ☐ NO ☒ Estimated Amount: None Program Fee Justification: Not applicable. Specialized Accreditation? YES ☒ NO ☐ Accreditor: The Arizona Department of Education approves programs leading to state certification. The approval allows the university to provide institutional recommendations to students upon successful program completion. This eliminates the need for the Arizona Department of Education to conduct a transcript analysis to examine if certification requirements for education and clinical experience are met.
Board of Regents Meeting November 18-20, 2020
Item #24 EXECUTIVE SUMMARY Page 67 of 76
New Academic Program Request
University: Arizona State University
Name of Proposed Academic Program:
Bachelor of Arts in Culture, Technology and Environment
Academic Department:
Department of English, The College of Liberal Arts and Sciences
In collaboration with the School of International Letters and Cultures and the School of Historical, Philosophical & Religious Studies
Geographic Site: Tempe campus
Instructional Modality: Immersion and online
Total Credit Hours:
120
Proposed Inception Term:
2021-2022
Brief Program Description:
The BA in Culture, Technology and Environment will produce students who can apply the tools of historical, ethical, literary and cultural studies to technological and environmental questions. The program will allow students to engage with historical, ethical, literary, linguistic or rhetorical, and cultural dimensions of humans as part of the environments they inhabit and the role that culture and technology play in facilitating relationships within communities and between the human and the nonhuman. Students will become familiar with concepts and topics such as environmental justice, the earth as actor, critical food studies, sustainability, intergenerational justice, indigenous approaches to the natural environment, technology as solution and detriment, religious ideas about the environment, activist movements, literary and game-based world-building, and ideas of nature and the environment across cultures and language traditions. This combination of content knowledge and life skills will create a resilient citizen who can address cultural, ethical, technological and environmental challenges to
Board of Regents Meeting November 18-20, 2020
Item #24 EXECUTIVE SUMMARY Page 68 of 76
American institutions in a range of careers in the nonprofit sector, public institutions, and commercial industry.
Learning Outcomes and Assessment Plan: Learning Outcome 1: Students will learn how to apply the essentials of culture, technology and environment. They will have developed linguistic competence, digital literacy, and skills in critical thinking, the formation of argument, and clear communication.
● Concepts: Culture, technology, environment, language, nature, diversity
● Competencies: Graduates will be able to explain the intersections of culture, technology and environment encompassing knowledge and principles of American institutions, including the study of economics and U.S. history.
● Assessment Methods: Students’ competencies with regard to this learning outcome will be assessed via a project in the CTE 301 core course, “Intersections of Culture, Technology and Environment”. In this project, students will apply the essentials of culture, technology and the environment to a specific problem, past or present, drawn from the history and/or institutions of American society. Projects will be scored using a standardized rubric designed collaboratively by program faculty. The principal assessment criteria will be the extent to which students demonstrate their linguistic competence, digital literacy, skills in critical thinking, formation of argument, and clarity of communication.
● Measures: Results from scoring rubrics of all students will be aggregated to examine for patterns in competence and guide continuous improvements of the program.
Learning Outcome 2: Students will learn how to analyze and evaluate the intersections of culture, technology and environment. They will have developed scientific, historical and social understanding; the art of researching and weighing evidence; the use of case-histories; rhetorical force in the presentation of argument.
● Concepts: The Anthropocene, environmental justice, sustainability, indigenous approaches to the natural environment, religious ideas about the environment, ideas of nature and the environment across cultures and language traditions.
● Competencies: Students will be able to research and weigh evidence, and use case-histories in the development of arguments through civil discourse and in the context of civic knowledge. Students will demonstrate competency in communication and rhetoric.
● Assessment Methods: Students’ competencies with regard to this learning outcome will be assessed via their performance in the final paper of the newly designed core course CTE 301 Intersections of Culture, Technology and Environment, which will advance upon the newly designed introductory survey course CTE 101
Board of Regents Meeting November 18-20, 2020
Item #24 EXECUTIVE SUMMARY Page 69 of 76
Introduction to Culture, Technology and Environment. Their research paper will incorporate and analyze data and case studies from diverse sources and disciplines to make an argument about the intersections of culture, technology and environment, which will be used to assess this learning outcome. A standardized rubric evaluating a student's ability to analyze data, to construct an argument and to engage in civil discourse will be created by program faculty and applied for this assessment.
● Measures: Results from the scoring rubrics will be examined for patterns in competence as part of the development of continuous improvement efforts that will be addressed in annual reviews of the assessment plan.
Learning Outcome 3: Students will learn how to create experimental and/or real-world exemplifications of culture, technology and environment as forces for change, with a particular emphasis on the creation of a more just future, preparing them to transform society in a world of climate change, ecological instability, rapid but unequal technological innovation, and environmental injustice. They will have mastered essential elements of environmental science and data literacy.
● Concepts: Applied ethics, environmental and social justice, activism, futurology, data analysis.
● Competencies: Students will achieve competence in the field of applied ethics and ethical reasoning, with a particular focus on the ethical and social dimensions of medical decision-making, biological and genetic engineering, and the rapid growth of artificial intelligence. Students will be aware of diverse perspectives on cultural and environmental questions and how competing perspectives can be synthesized to transform society.
● Assessment Methods: Students’ competencies with regard to this learning outcome will be assessed via their performance in their Senior year capstone project CTE 401. The principal criterion of assessment will be the extent to which they create experimental and/or real-world exemplifications of culture, technology and environment as forces for change via their fieldwork or internship, whilst bringing to bear the ethical and social dimensions of the problems and issues that they address. A standardized rubric evaluating a student's ability to create, experiment and innovate via the central task in their fieldwork or internship, applying the cross-disciplinary methods learned in the degree, will be created by program faculty and applied for this assessment.
● Measures: Success will be measured annually by means of rigorous review of the capstone course CTE 401, which will involve fieldwork and internships. Indirect measures include feedback from external collaborators and organizations offering internships will be incorporated and responded to, leading to ever-increasing improvement.
Board of Regents Meeting November 18-20, 2020
Item #24 EXECUTIVE SUMMARY Page 70 of 76
Projected Enrollment for the First Three Years: First Year: 20 Second Year: 40 Third Year: 80
Evidence of Market Demand: O*Net lists almost all jobs in the Green Economy Sector (environmental lawyer; lobbyist; NGO worker) as bright outlook. The same outlook applied for “media and communications workers,” an excellent fit for someone with this diverse background in writing, analysis, digital humanities, and environmental issues. Emsi Analyst statistics show 9,221 unique postings in the period from 2016 to 2020 for jobs throughout the U.S. requiring a bachelor’s degree and skills in environmentalism, environmental ethics, environmental governance, and related fields that will be highlighted in this degree. The median advertised salary was $62,100, and top occupations include public relations and fundraising managers, project managers, human resources managers, community and social services managers, management analysts, and naturalists. Top industries for hiring include manufacturing, educational services, and public administration. The top common skills sought by employers in this area are communications, leadership, and planning, all skills emphasized in this transdisciplinary humanities degree. The degree is also aligned with the career success skills articulated by employers represented at the National Humanities Alliance “Study the Humanities” project site. According to the data assembled within the NHA Toolkit (https://www.studythehumanities.org/valued_skills) employers seek “skills the Humanities cultivate” and which this new major is designed around: oral and written communication, critical thinking, teamwork with diverse groups, ethical judgement, complex problem solving, and foreign language skills (https://www.studythehumanities.org/point_1_valued_skills).
Similar Programs Offered at Arizona Public Universities:
No degree in Arizona combines culture, technology and the environment from a humanities perspective as does this proposed degree. Existing degrees tend to focus on one of the three elements, not a combination of all three; existing degrees tend to be from a science or social science perspective, not a humanities one.
The most similar programs offered at Arizona Public Universities are:
1. University of Arizona BA in Environmental Studies focuses on human-environment interactions from a social science perspective, not a humanities approach;
2. Northern Arizona University BA in Environment and Sustainability takes a science-based approach
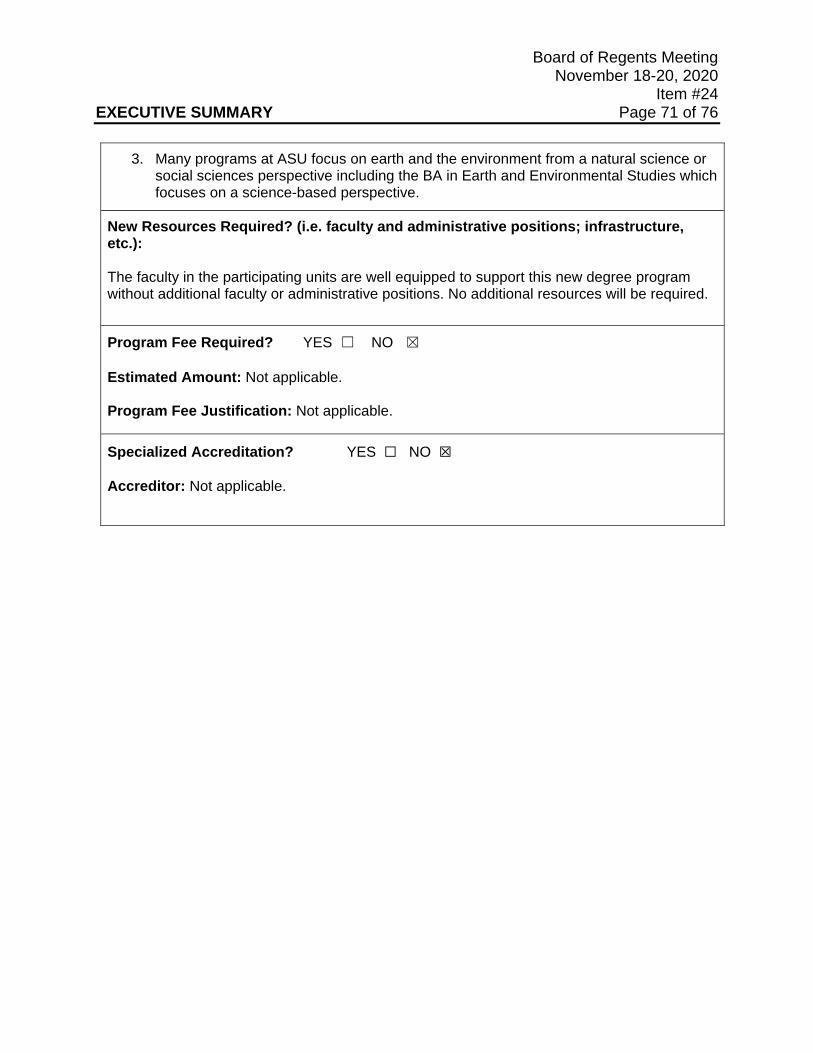
Board of Regents Meeting November 18-20, 2020
Item #24 EXECUTIVE SUMMARY Page 71 of 76
3. Many programs at ASU focus on earth and the environment from a natural science or social sciences perspective including the BA in Earth and Environmental Studies which focuses on a science-based perspective.
New Resources Required? (i.e. faculty and administrative positions; infrastructure, etc.): The faculty in the participating units are well equipped to support this new degree program without additional faculty or administrative positions. No additional resources will be required.
Program Fee Required? YES ☐ NO ☒ Estimated Amount: Not applicable. Program Fee Justification: Not applicable.
Specialized Accreditation? YES ☐ NO ☒ Accreditor: Not applicable.
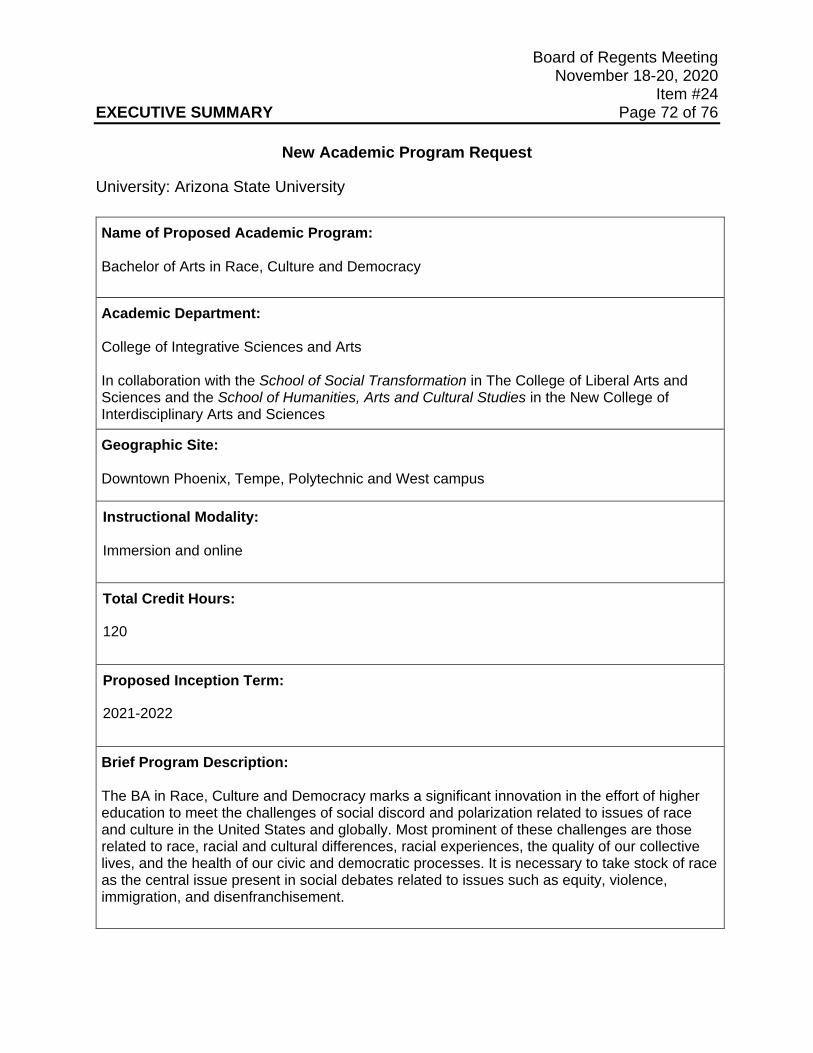
Board of Regents Meeting November 18-20, 2020
Item #24 EXECUTIVE SUMMARY Page 72 of 76
New Academic Program Request
University: Arizona State University Name of Proposed Academic Program: Bachelor of Arts in Race, Culture and Democracy
Academic Department: College of Integrative Sciences and Arts In collaboration with the School of Social Transformation in The College of Liberal Arts and Sciences and the School of Humanities, Arts and Cultural Studies in the New College of Interdisciplinary Arts and Sciences
Geographic Site: Downtown Phoenix, Tempe, Polytechnic and West campus
Instructional Modality: Immersion and online
Total Credit Hours:
120
Proposed Inception Term:
2021-2022
Brief Program Description:
The BA in Race, Culture and Democracy marks a significant innovation in the effort of higher education to meet the challenges of social discord and polarization related to issues of race and culture in the United States and globally. Most prominent of these challenges are those related to race, racial and cultural differences, racial experiences, the quality of our collective lives, and the health of our civic and democratic processes. It is necessary to take stock of race as the central issue present in social debates related to issues such as equity, violence, immigration, and disenfranchisement.
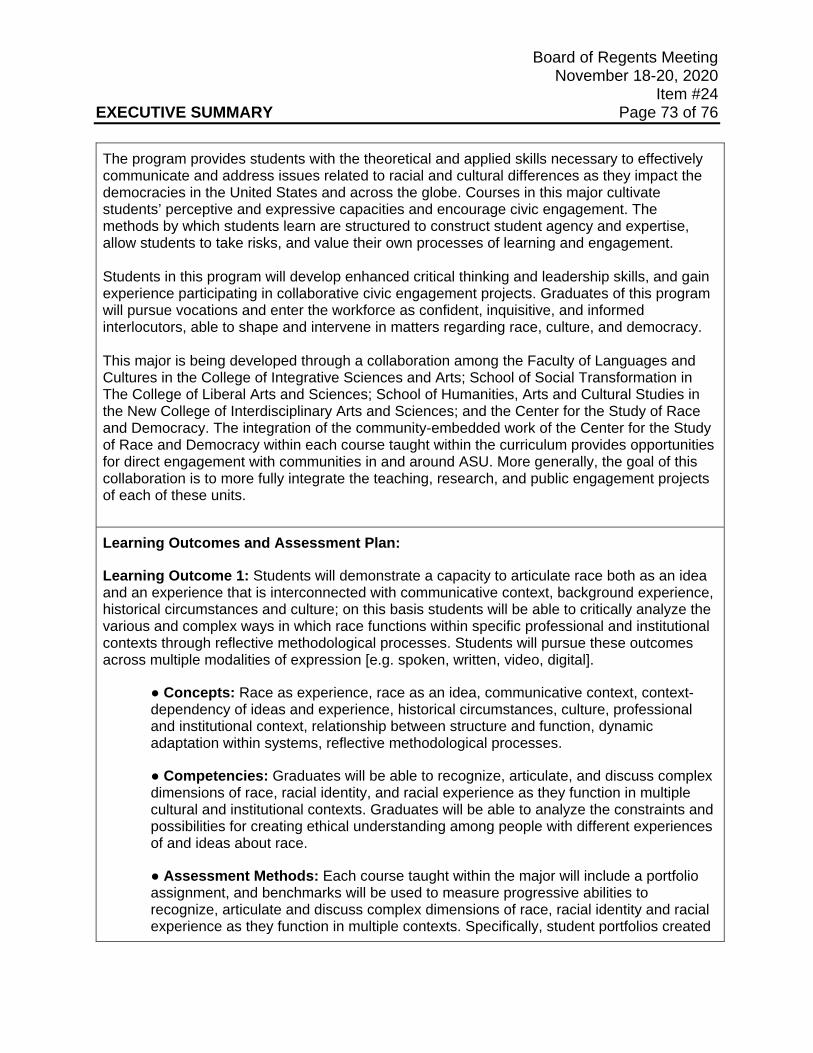
Board of Regents Meeting November 18-20, 2020
Item #24 EXECUTIVE SUMMARY Page 73 of 76 The program provides students with the theoretical and applied skills necessary to effectively communicate and address issues related to racial and cultural differences as they impact the democracies in the United States and across the globe. Courses in this major cultivate students’ perceptive and expressive capacities and encourage civic engagement. The methods by which students learn are structured to construct student agency and expertise, allow students to take risks, and value their own processes of learning and engagement. Students in this program will develop enhanced critical thinking and leadership skills, and gain experience participating in collaborative civic engagement projects. Graduates of this program will pursue vocations and enter the workforce as confident, inquisitive, and informed interlocutors, able to shape and intervene in matters regarding race, culture, and democracy.
This major is being developed through a collaboration among the Faculty of Languages and Cultures in the College of Integrative Sciences and Arts; School of Social Transformation in The College of Liberal Arts and Sciences; School of Humanities, Arts and Cultural Studies in the New College of Interdisciplinary Arts and Sciences; and the Center for the Study of Race and Democracy. The integration of the community-embedded work of the Center for the Study of Race and Democracy within each course taught within the curriculum provides opportunities for direct engagement with communities in and around ASU. More generally, the goal of this collaboration is to more fully integrate the teaching, research, and public engagement projects of each of these units.
Learning Outcomes and Assessment Plan:
Learning Outcome 1: Students will demonstrate a capacity to articulate race both as an idea and an experience that is interconnected with communicative context, background experience, historical circumstances and culture; on this basis students will be able to critically analyze the various and complex ways in which race functions within specific professional and institutional contexts through reflective methodological processes. Students will pursue these outcomes across multiple modalities of expression [e.g. spoken, written, video, digital].
● Concepts: Race as experience, race as an idea, communicative context, context-dependency of ideas and experience, historical circumstances, culture, professional and institutional context, relationship between structure and function, dynamic adaptation within systems, reflective methodological processes.
● Competencies: Graduates will be able to recognize, articulate, and discuss complex dimensions of race, racial identity, and racial experience as they function in multiple cultural and institutional contexts. Graduates will be able to analyze the constraints and possibilities for creating ethical understanding among people with different experiences of and ideas about race.
● Assessment Methods: Each course taught within the major will include a portfolio assignment, and benchmarks will be used to measure progressive abilities to recognize, articulate and discuss complex dimensions of race, racial identity and racial experience as they function in multiple contexts. Specifically, student portfolios created
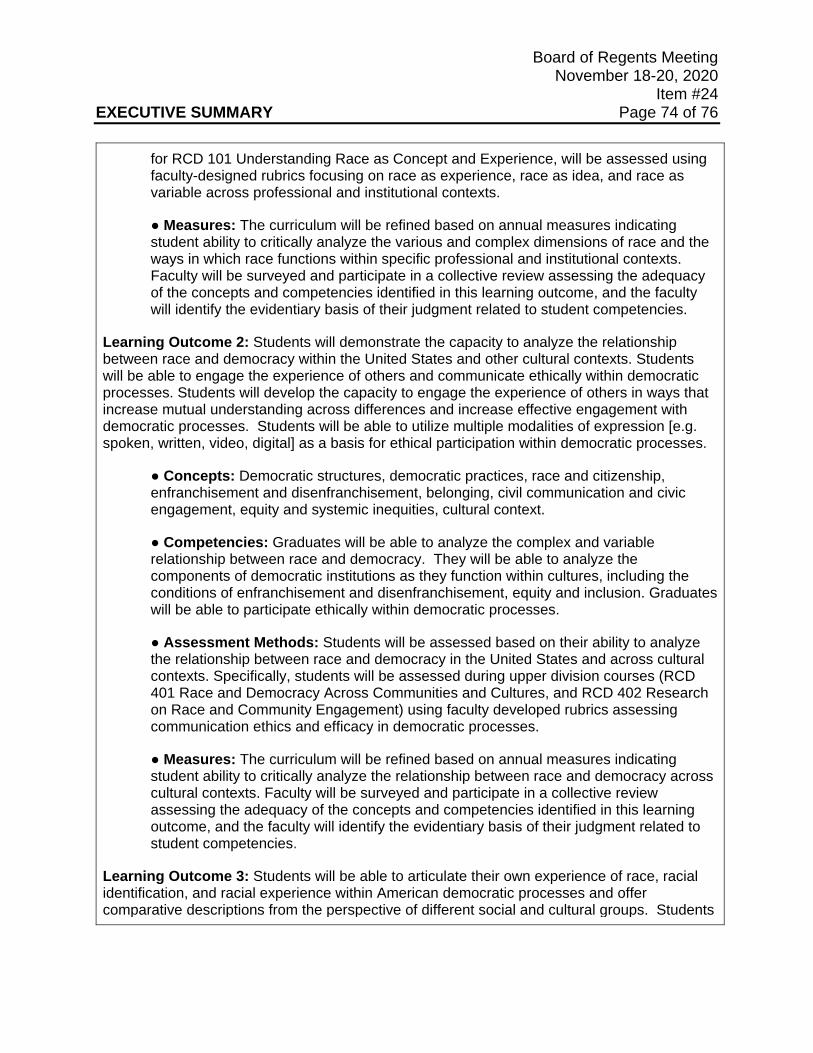
Board of Regents Meeting November 18-20, 2020
Item #24 EXECUTIVE SUMMARY Page 74 of 76
for RCD 101 Understanding Race as Concept and Experience, will be assessed using faculty-designed rubrics focusing on race as experience, race as idea, and race as variable across professional and institutional contexts.
● Measures: The curriculum will be refined based on annual measures indicating student ability to critically analyze the various and complex dimensions of race and the ways in which race functions within specific professional and institutional contexts. Faculty will be surveyed and participate in a collective review assessing the adequacy of the concepts and competencies identified in this learning outcome, and the faculty will identify the evidentiary basis of their judgment related to student competencies.
Learning Outcome 2: Students will demonstrate the capacity to analyze the relationship between race and democracy within the United States and other cultural contexts. Students will be able to engage the experience of others and communicate ethically within democratic processes. Students will develop the capacity to engage the experience of others in ways that increase mutual understanding across differences and increase effective engagement with democratic processes. Students will be able to utilize multiple modalities of expression [e.g. spoken, written, video, digital] as a basis for ethical participation within democratic processes.
● Concepts: Democratic structures, democratic practices, race and citizenship, enfranchisement and disenfranchisement, belonging, civil communication and civic engagement, equity and systemic inequities, cultural context.
● Competencies: Graduates will be able to analyze the complex and variable relationship between race and democracy. They will be able to analyze the components of democratic institutions as they function within cultures, including the conditions of enfranchisement and disenfranchisement, equity and inclusion. Graduates will be able to participate ethically within democratic processes.
● Assessment Methods: Students will be assessed based on their ability to analyze the relationship between race and democracy in the United States and across cultural contexts. Specifically, students will be assessed during upper division courses (RCD 401 Race and Democracy Across Communities and Cultures, and RCD 402 Research on Race and Community Engagement) using faculty developed rubrics assessing communication ethics and efficacy in democratic processes.
● Measures: The curriculum will be refined based on annual measures indicating student ability to critically analyze the relationship between race and democracy across cultural contexts. Faculty will be surveyed and participate in a collective review assessing the adequacy of the concepts and competencies identified in this learning outcome, and the faculty will identify the evidentiary basis of their judgment related to student competencies.
Learning Outcome 3: Students will be able to articulate their own experience of race, racial identification, and racial experience within American democratic processes and offer comparative descriptions from the perspective of different social and cultural groups. Students
Board of Regents Meeting November 18-20, 2020
Item #24 EXECUTIVE SUMMARY Page 75 of 76 will be able to work effectively across multiple modalities of expression [e.g. spoken, written, video, digital].
● Concepts: Experience of American democratic processes, racial identification, cross-cultural understanding, cross-racial understanding, historical and institutional structures.
● Competencies: Graduates will understand the many components of democratic institutions as they function across diverse communities within the American context. Graduates will be able to recognize and analyze the relationship between their own experience and democracy in the American context, and offer comparative analyses of the experiences of others. Students will be able to communicate ethically and effectively in democratic processes across diverse communities within the United States and other cultural contexts. Students will be able to work effectively across multiple modalities of expression [e.g. spoken, written, video, digital].
● Assessment Methods: Students will be assessed based on their ability to analyze their own participation in the American democratic processes, and/or democracies in other cultures. Faculty designed rubrics will be used to assess progressive abilities to recognize and respect differing perspectives as central to ethical engagements within democracy in the United States. Student created community engagement projects required for RCD 402 Research on Race and Engaging Communities will be used as a basis for this assessment.
● Measures: Direct measures will be based on community engagement projects conducted in RCD 402 Research on Race and Community Engagement. The curriculum will be refined based on annual measures indicating student ability to critically analyze their own participation in democratic processes. Faculty will be surveyed and participate in a collective review assessing the adequacy of the concepts and competencies identified in this learning outcome, and the faculty will identify the evidentiary basis of their judgment related to student competencies.
Projected Enrollment for the First Three Years:
First Year: 20 Second Year: 40 Third Year: 80
Evidence of Market Demand: According to the U.S. Bureau of Labor Statistics, Community and Social Service Managers have a 17% growth factor for job outlook for the coming decade (2019-2029). This “much faster than average” growth also carries a 2019 median pay of $67,150 per year. The typical entry-level education for this profession is a bachelor’s degree. The Race, Culture and Democracy BA will provide excellent preparation for this profession designing and implementing programs related to diversity, inclusion and community engagement in school
Board of Regents Meeting November 18-20, 2020
Item #24 EXECUTIVE SUMMARY Page 76 of 76 systems, nonprofit organizations, and state, county and city agencies. (https://www.bls.gov/ooh/management/social-and-community-service-managers.htm).
Human resources specialist is another profession appropriate for graduates with a bachelor’s degree in Race, Culture and Democracy as diversity officers and in the design and implementation of programs related to diversity, inclusion and community engagement. According to the U.S. Bureau of Labor Statistics, human resources specialists have a 7% growth factor for job outlook for the coming decade (2019-2029). According to the US Bureau of Labor Statistics, 7% growth over ten years is “faster than average.” The 2019 median pay for this position is $61,920. (https://www.bls.gov/ooh/business-and-financial/human-resources-specialists.htm).
Emsi Analyst data support the U.S. Bureau of Labor Statistics’ assessment that community and social services managers, human resources specialists and similar occupations have a project growth rate of 8.3%
Similar Programs Offered at Arizona Public Universities:
No similar programs are offered at the University of Arizona or Northern Arizona University.
New Resources Required? (i.e. faculty and administrative positions; infrastructure, etc.):
The faculty in the participating colleges are well equipped to support this new degree program without additional faculty or administrative positions. No additional resources will be required.
Program Fee Required? YES ☐ NO ☒ Estimated Amount: Not applicable. Program Fee Justification: Not applicable.
Specialized Accreditation? YES ☐ NO ☒ Accreditor: Not applicable.
Board of Regents Meeting November 18-20, 2020
Item #25 EXECUTIVE SUMMARY Page 1 of 6
Contact Information: Diane Stearns, NAU [email protected] 928-523-2230 Chad Sampson, ABOR [email protected] 602-229-2512
Item Name: New Academic Program Request for Northern Arizona University
Action Item
Background/History of Previous Board Action As provided in board policy, new program requests may be submitted throughout the year with the approval of the Academic Affairs and Educational Attainment Committee. Discussion Northern Arizona University seeks to add one new program for implementation in the 2021-2022 academic year. This request is for the following new academic program:
• Master of Science in Geographic Information Science with Remote Sensing All academic degree programs go through multiple review and approval processes to ensure their currency, quality, and relevance. The Provost initiates the academic planning process. The academic deans, in consultation with the directors of the academic units, submit information on all proposed new degrees, concentrations, minors, and certificates, as well as any changes to existing degree credits, titles, program disestablishments, and creation of new organizations, organizational changes and disestablishments. Proposals are reviewed, as applicable, by the Provost and the Provost’s Academic Leadership Council which includes representatives from all the colleges, University Senate, and the Graduate College. Each proposal is reviewed to ensure quality and to avoid redundancy with other programs, and all proposals go through the university review process, including, as applicable, the curriculum committees in the academic unit, college, Graduate College, and University Senate. The Provost reviews all resources involved in the program development and delivery of all academic initiatives to ensure appropriate distribution of the institution’s resources to optimize and maximize capacity. At any step in the approval process, programs can be tabled and/or returned to the academic unit for further clarification and/or revision.
Requested Action: Northern Arizona University asks the board to approve the new program requests effective in the 2021-2022 academic year.

Board of Regents Meeting November 18-20 2020
Item #25 EXECUTIVE SUMMARY Page 2 of 6 Committee Review and Recommendation The Academic Affairs and Educational Attainment Committee reviewed this item at its November 5, 2020 meeting, and recommended forwarding the item to the full board for approval. Statutory/Policy Requirements ABOR Policy 2-223.A – the Academic Strategic Plan
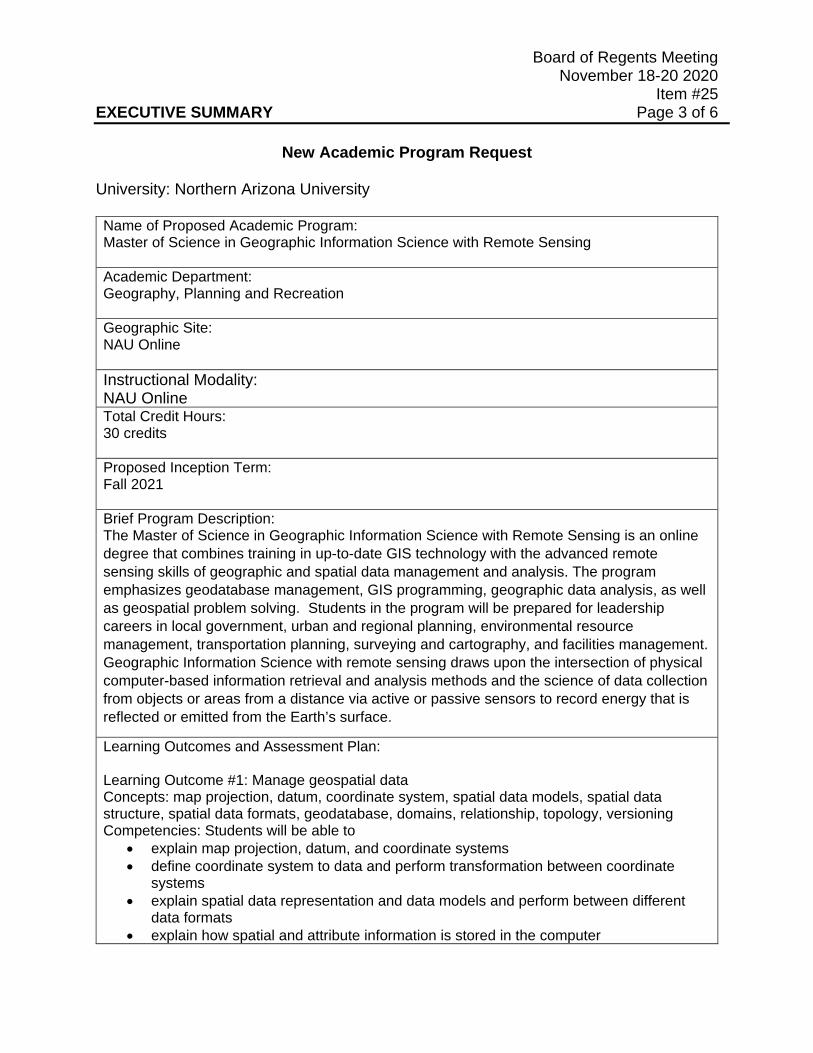
Board of Regents Meeting November 18-20 2020
Item #25 EXECUTIVE SUMMARY Page 3 of 6
New Academic Program Request
University: Northern Arizona University Name of Proposed Academic Program: Master of Science in Geographic Information Science with Remote Sensing Academic Department: Geography, Planning and Recreation Geographic Site: NAU Online Instructional Modality: NAU Online Total Credit Hours: 30 credits Proposed Inception Term: Fall 2021 Brief Program Description: The Master of Science in Geographic Information Science with Remote Sensing is an online degree that combines training in up-to-date GIS technology with the advanced remote sensing skills of geographic and spatial data management and analysis. The program emphasizes geodatabase management, GIS programming, geographic data analysis, as well as geospatial problem solving. Students in the program will be prepared for leadership careers in local government, urban and regional planning, environmental resource management, transportation planning, surveying and cartography, and facilities management. Geographic Information Science with remote sensing draws upon the intersection of physical computer-based information retrieval and analysis methods and the science of data collection from objects or areas from a distance via active or passive sensors to record energy that is reflected or emitted from the Earth’s surface.
Learning Outcomes and Assessment Plan: Learning Outcome #1: Manage geospatial data Concepts: map projection, datum, coordinate system, spatial data models, spatial data structure, spatial data formats, geodatabase, domains, relationship, topology, versioning Competencies: Students will be able to
• explain map projection, datum, and coordinate systems • define coordinate system to data and perform transformation between coordinate
systems • explain spatial data representation and data models and perform between different
data formats • explain how spatial and attribute information is stored in the computer

Board of Regents Meeting November 18-20 2020
Item #25 EXECUTIVE SUMMARY Page 4 of 6
• compile, create, and edit geospatial data • work with personal, file, and enterprise geodatabase • create and work with attribute domains, relationships, topology, and versions in
enterprise geodatabase Preparation: GIS/RS core courses GSP 531, GSP 533, Capstone Assessment: Laboratory exercises, exam, capstone project/presentation Learning Outcome #2: Analyze geospatial data and provide decision making support Concepts: vector-based spatial analysis, raster-based spatial analysis, map algebra, geoprocessing tools, spatial modeling Competencies: Students will be able to
• develop spatial analysis procedures • prepare and preprocess data for spatial analysis • perform vector-based and raster-based analysis • effectively find and use geoprocessing tools • perform raster-based analysis using map algebra • interpret analysis results
Preparation: GIS/RS core courses GSP 531, GSP 533 and GSP 420 Capstone Assessment: Laboratory exercises, exam, capstone project/presentation Learning Outcome #3: Develop GIS applications for the area of interest Concepts: data source, data format, data quality, workflow, geoprocessing, cartographic model, Python scripting, tool development, output. Competencies: Students will be able to:
• identify problems, goals, and objectives of GIS applications • source data that are in appropriate format and quality for the applications • develop strategies and workflows for solving the problem • develop cartographic models to implement the strategies and workflow • implement the cartographic models using ArcGIS geoprocessing tools and
ModelBuilder • creating Python script to implement geoprocessing automation • develop custom tools using Python scripts • interpret model output
Preparation: GIS/RS core courses GSP 533, GSP 535 and Capstone Assessment: Laboratory exercises, course projects, capstone project/presentation Learning Outcome #4: Manage GIS projects (course projects and capstone project) Concepts: problem analysis, goals and objectives, methodology, analysis, result interpretation, management/policy recommendation, project plan, project report Competencies: Students will be able to:
• describe the project • identify problems, goals, and objectives of projects • develop strategies, methodology, and procedures • prepare data that meet demands of projects • solve problems by analyzing data • interpret and discuss the analysis results
Board of Regents Meeting November 18-20 2020
Item #25 EXECUTIVE SUMMARY Page 5 of 6
• provide management or policy recommendations • develop project plan including resources and timeline • create professional project reports
Preparation: GIS/RS core courses GSP 533,GSP 536 and Capstone Assessment: Laboratory exercises, Course projects, capstone project/presentation Learning Outcome #5: Create maps from data and publish maps on the web Concepts: web map service, web feature service, protocol, server-client model, GML, GeoJSON, ArcGIS online, StoryMaps, java script Competencies: Students will be able to:
• explain the server-client model in web mapping • explain web map service and web feature service protocol • explain and use vector data formats GML and GeoJSON for web GIS • publish maps on the web using ArcGIS online, StoryMaps, and leaflet • client-side map customization using java scripts and css
Preparation: GIS/RS core courses GSP 531, GSP 533, Capstone Assessment: Laboratory exercises, exam, capstone project/presentation Learning Outcome #6: Perform high level remote sensing and photogrammetry analysis Concepts: platform, sensor, radiation, signature, supervised classification, unsupervised classification, environment/resource monitoring Competencies: Students will be able to:
• explain basic concepts of remote sensing including platforms, sensors, properties electromagnetic radiation, etc.
• effectively use popular and publicly available remotely sensed data sources • perform imagery data processing and visualization • perform supervised and unsupervised classifications • interpret imagery data • develop environment/resource monitoring applications
Preparation: GIS/RS core courses GSP 520 and Capstone Assessment: Laboratory exercises, exam, capstone project Projected Enrollment for the First Three Years:
1st yr. 2nd yr. 3rd yr. 15 30 35
Evidence of Market Demand: The importance of geospatial technologies, GIS mapping and spatial data analysis has never found a greater purpose than in our current emergency situation with the COVID-19 pandemic. The use of GIS dashboards have been helping the government and public relay accurate and timely location information. Through these dashboards (https://coronavirus.jhu.edu/map.html) users are able to view key information such as recovered cases, confirmed cases, demographic implications, regional occurrences, etc. and are able to help government organizations make informed decisions. A spatial understanding is extremely important to effectively manage and control a pandemic. The NAU Geospatial
Board of Regents Meeting November 18-20 2020
Item #25 EXECUTIVE SUMMARY Page 6 of 6 Research and Information Lab used a similar outreach opportunity to inform government and the public during the Museum Fire of 2019. GIS is highly dispersed across sectors within the workforce. For example, government, environment and natural resources industries rely on GIS for decision-making. The gisgeography.com website lists 1000 applications of GIS from precision farming, natural resource management, urban planning, to self-driving vehicle technology. The wide spectrum of applications of GIS indicate a big job market in a wide range of industries. GIS and remote sensing (RS) were classified by the US Bureau of Labor Statistics as “new and emerging” fields, in part because of their importance to the “green” jobs sectors. Job openings for GIS and RS scientists, technicians, and technologists were projected to grow between three and nine percent between 2010 and 2020, while median salaries for these positions continue to rise (https://www.esri.com/about/newsroom/arcnews/getting-a-job-in-geography-and-gis/).
In 2014-2017, GIS Manager and GIS Developer were two highly demanded job titles according to the gisgeography.com job posting statistics. This suggests that the demand for GIS personnel with advanced training will continue to be high, and it is a strong justification for us to develop a new accelerated online M.S. program oriented to professionals from all industries of employment. Similar Programs Offered at Arizona Public Universities: University of Arizona M.S. in Geographic Information Systems Technology program Arizona State University Master of Advanced Study in Geographic Information Systems Our program is unique in that it will offer a high level of Remote Sensing curriculum, focused on satellite imagery, sonar systems and LIDAR. This will serve (for example) foresters needing to map large forest fires from space; climate scientists tracking changing environmental conditions over time; astronomers mapping landforms on Mars; urban planners mapping sprawl and shift in metropolitan areas; civil engineers analyzing the conditions of roads/bridges, etc. New Resources Required? (i.e. faculty and administrative positions; infrastructure, etc.): This program complements our GIS Master’s degree in Geographic Information Science Administration (FLG and online) that is ranked #2 by BestCollegeReviews.org for best Master’s Geographic Information Systems online degrees, with enrollments of 19 (F20), 18 (F19), 23 (F18). No new resources are needed because this program builds upon existing resources within the Department of Geography, Planning, and Recreation, which currently provides a comprehensive GIS curriculum with existing faculty offering the necessary knowledge and skills. Program Fee Required? YES � NO �X Estimated Amount: External Accreditation? YES � NO �X
Board of Regents Meeting November 18-20, 2020
Item #26 EXECUTIVE SUMMARY Page 1 of 3
Contact Information: Diane Stearns, NAU [email protected] 928-523-2230 Chad Sampson, ABOR [email protected] 602-229-2512
Item Name: Request for Credit Exception for Northern Arizona University
Action Item
Background/History of Previous Board Action As provided in board policy, program requests may be submitted throughout the year with the approval of the Academic Affairs and Educational Attainment Committee. Discussion Northern Arizona University seeks to allow an exception to the 64 community college transfer credit limit to allow 75 community college credits toward the following 120 credit program:
• Health Sciences: Fitness Wellness, Bachelor of Science All academic program changes go through multiple review and approval processes to ensure their currency, quality, and relevance. The academic deans, in consultation with the directors of the academic units, submit information on all proposed new degrees, concentrations, minors, and certificates, as well as any changes to existing degree credits, titles, program disestablishments, and creation of new organizations, organizational changes and disestablishments. Proposals are reviewed, as applicable, by the Provost and the Provost’s Academic Leadership Council which includes representatives from all the colleges, University Senate, and the Graduate College. Each proposal is reviewed to ensure quality and to avoid redundancy with other programs, and all proposals go through the university review process, including, as applicable, the curriculum committees in the academic unit, college, Graduate College, and University Senate. The Provost reviews all resources involved in the program development and delivery of all academic initiatives to ensure appropriate distribution of the institution’s resources to optimize and maximize capacity. At any step in the approval process, programs can be tabled and/or returned to the academic unit for further clarification and/or revision. Committee Review and Recommendation The Academic Affairs and Educational Attainment Committee reviewed this item at its November 5, 2020 meeting, and recommended forwarding the item to the full board for approval.
Requested Action: Northern Arizona University asks the board to approve an exception to the community college transfer credit limit.
Board of Regents Meeting November 18-20, 2020
Item #26 EXECUTIVE SUMMARY Page 2 of 3 Statutory/Policy Requirements ABOR Policy 2-223.A – the Academic Strategic Plan
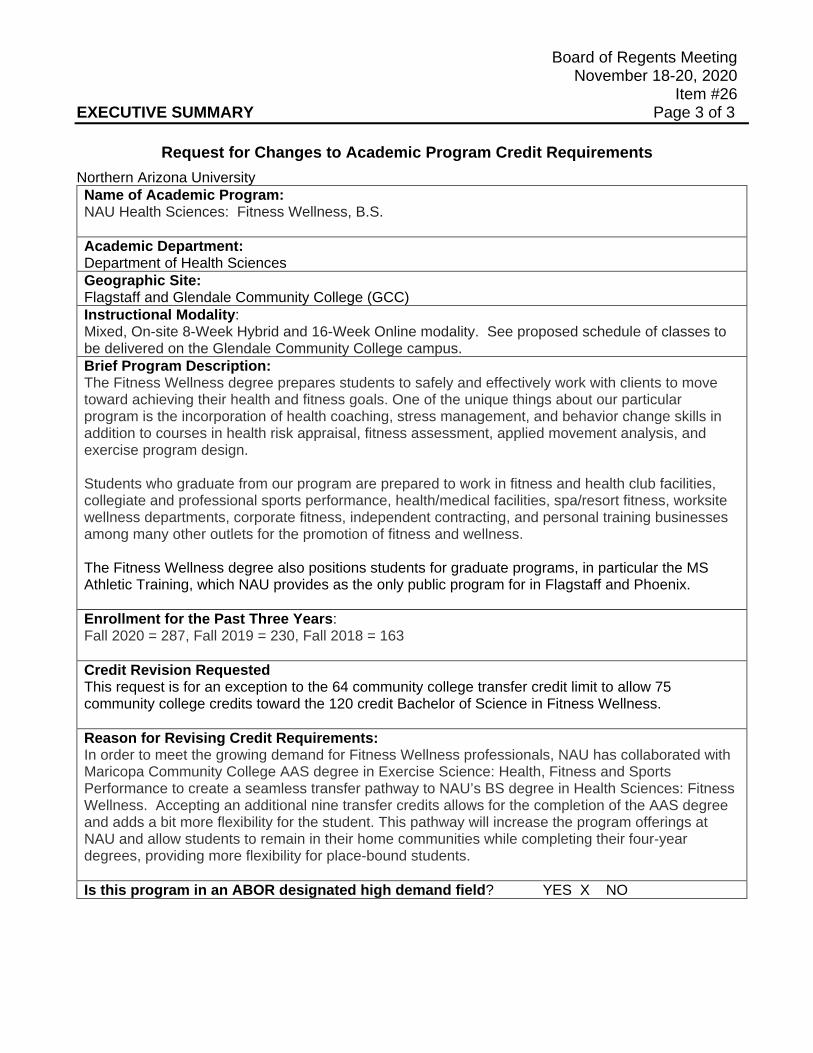
Board of Regents Meeting November 18-20, 2020
Item #26 EXECUTIVE SUMMARY Page 3 of 3
Request for Changes to Academic Program Credit Requirements
Northern Arizona University Name of Academic Program: NAU Health Sciences: Fitness Wellness, B.S. Academic Department: Department of Health Sciences Geographic Site: Flagstaff and Glendale Community College (GCC) Instructional Modality: Mixed, On-site 8-Week Hybrid and 16-Week Online modality. See proposed schedule of classes to be delivered on the Glendale Community College campus. Brief Program Description: The Fitness Wellness degree prepares students to safely and effectively work with clients to move toward achieving their health and fitness goals. One of the unique things about our particular program is the incorporation of health coaching, stress management, and behavior change skills in addition to courses in health risk appraisal, fitness assessment, applied movement analysis, and exercise program design. Students who graduate from our program are prepared to work in fitness and health club facilities, collegiate and professional sports performance, health/medical facilities, spa/resort fitness, worksite wellness departments, corporate fitness, independent contracting, and personal training businesses among many other outlets for the promotion of fitness and wellness. The Fitness Wellness degree also positions students for graduate programs, in particular the MS Athletic Training, which NAU provides as the only public program for in Flagstaff and Phoenix. Enrollment for the Past Three Years: Fall 2020 = 287, Fall 2019 = 230, Fall 2018 = 163 Credit Revision Requested This request is for an exception to the 64 community college transfer credit limit to allow 75 community college credits toward the 120 credit Bachelor of Science in Fitness Wellness. Reason for Revising Credit Requirements: In order to meet the growing demand for Fitness Wellness professionals, NAU has collaborated with Maricopa Community College AAS degree in Exercise Science: Health, Fitness and Sports Performance to create a seamless transfer pathway to NAU’s BS degree in Health Sciences: Fitness Wellness. Accepting an additional nine transfer credits allows for the completion of the AAS degree and adds a bit more flexibility for the student. This pathway will increase the program offerings at NAU and allow students to remain in their home communities while completing their four-year degrees, providing more flexibility for place-bound students. Is this program in an ABOR designated high demand field? YES X NO

This page intentionally left blank
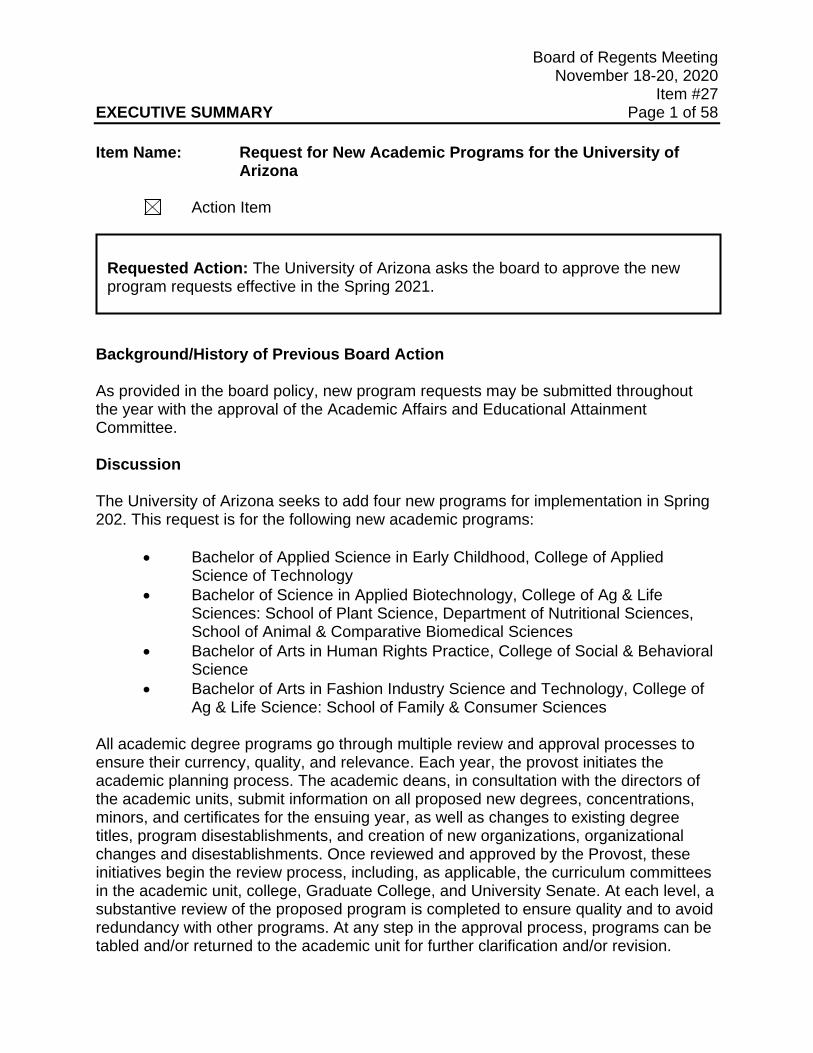
Board of Regents Meeting November 18-20, 2020
Item #27 EXECUTIVE SUMMARY Page 1 of 58 Item Name: Request for New Academic Programs for the University of
Arizona
Action Item Background/History of Previous Board Action As provided in the board policy, new program requests may be submitted throughout the year with the approval of the Academic Affairs and Educational Attainment Committee. Discussion The University of Arizona seeks to add four new programs for implementation in Spring 202. This request is for the following new academic programs:
• Bachelor of Applied Science in Early Childhood, College of Applied Science of Technology
• Bachelor of Science in Applied Biotechnology, College of Ag & Life Sciences: School of Plant Science, Department of Nutritional Sciences, School of Animal & Comparative Biomedical Sciences
• Bachelor of Arts in Human Rights Practice, College of Social & Behavioral Science
• Bachelor of Arts in Fashion Industry Science and Technology, College of Ag & Life Science: School of Family & Consumer Sciences
All academic degree programs go through multiple review and approval processes to ensure their currency, quality, and relevance. Each year, the provost initiates the academic planning process. The academic deans, in consultation with the directors of the academic units, submit information on all proposed new degrees, concentrations, minors, and certificates for the ensuing year, as well as changes to existing degree titles, program disestablishments, and creation of new organizations, organizational changes and disestablishments. Once reviewed and approved by the Provost, these initiatives begin the review process, including, as applicable, the curriculum committees in the academic unit, college, Graduate College, and University Senate. At each level, a substantive review of the proposed program is completed to ensure quality and to avoid redundancy with other programs. At any step in the approval process, programs can be tabled and/or returned to the academic unit for further clarification and/or revision.
Requested Action: The University of Arizona asks the board to approve the new program requests effective in the Spring 2021.
Board of Regents Meeting November 18-20, 2020
Item #27 EXECUTIVE SUMMARY Page 2 of 58 Committee Review and Recommendation The Academic Affairs and Educational Attainment Committee reviewed this item at its November 5, 2020 meeting, and recommended forwarding the item to the full board for approval. Statutory/Policy Requirements ABOR Policy 2-223.A, “The Academic Strategic Plan”
Board of Regents Meeting November 18-20, 2020
Item #27 EXECUTIVE SUMMARY Page 3 of 58
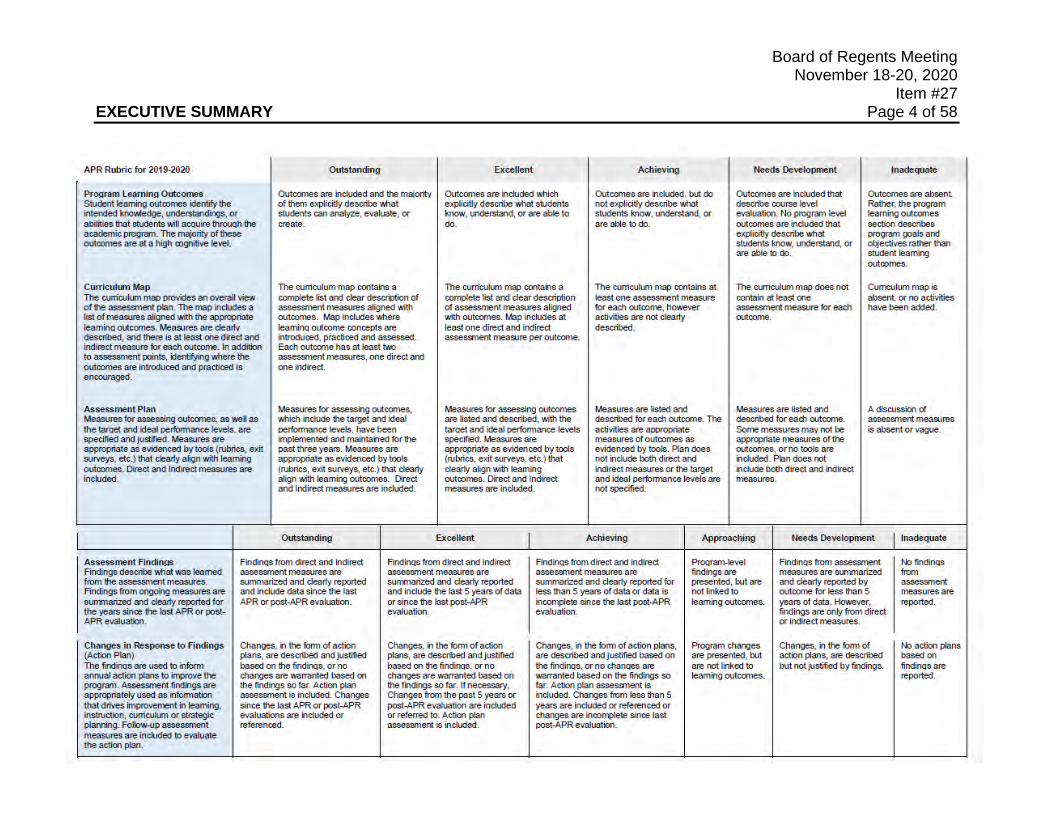
Board of Regents Meeting November 18-20, 2020
Item #27 EXECUTIVE SUMMARY Page 4 of 58
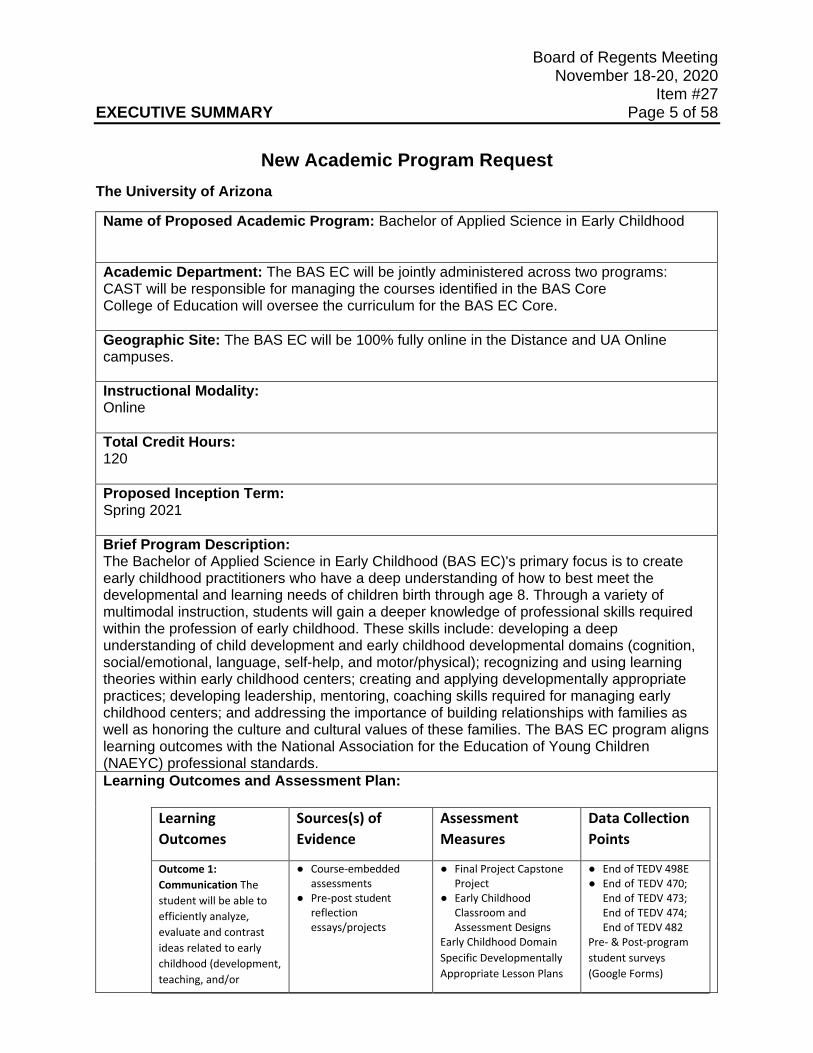
Board of Regents Meeting November 18-20, 2020
Item #27 EXECUTIVE SUMMARY Page 5 of 58
New Academic Program Request The University of Arizona
Name of Proposed Academic Program: Bachelor of Applied Science in Early Childhood
Academic Department: The BAS EC will be jointly administered across two programs: CAST will be responsible for managing the courses identified in the BAS Core College of Education will oversee the curriculum for the BAS EC Core.
Geographic Site: The BAS EC will be 100% fully online in the Distance and UA Online campuses.
Instructional Modality: Online
Total Credit Hours: 120
Proposed Inception Term: Spring 2021
Brief Program Description: The Bachelor of Applied Science in Early Childhood (BAS EC)'s primary focus is to create early childhood practitioners who have a deep understanding of how to best meet the developmental and learning needs of children birth through age 8. Through a variety of multimodal instruction, students will gain a deeper knowledge of professional skills required within the profession of early childhood. These skills include: developing a deep understanding of child development and early childhood developmental domains (cognition, social/emotional, language, self-help, and motor/physical); recognizing and using learning theories within early childhood centers; creating and applying developmentally appropriate practices; developing leadership, mentoring, coaching skills required for managing early childhood centers; and addressing the importance of building relationships with families as well as honoring the culture and cultural values of these families. The BAS EC program aligns learning outcomes with the National Association for the Education of Young Children (NAEYC) professional standards. Learning Outcomes and Assessment Plan:
Learning Outcomes
Sources(s) of Evidence
Assessment Measures
Data Collection Points
Outcome 1: Communication The student will be able to efficiently analyze, evaluate and contrast ideas related to early childhood (development, teaching, and/or
● Course-embedded assessments
● Pre-post student reflectionessays/projects
● Final Project CapstoneProject
● Early ChildhoodClassroom andAssessment Designs
Early Childhood Domain Specific Developmentally Appropriate Lesson Plans
● End of TEDV 498E● End of TEDV 470;
End of TEDV 473; End of TEDV 474; End of TEDV 482
Pre- & Post-program student surveys (Google Forms)
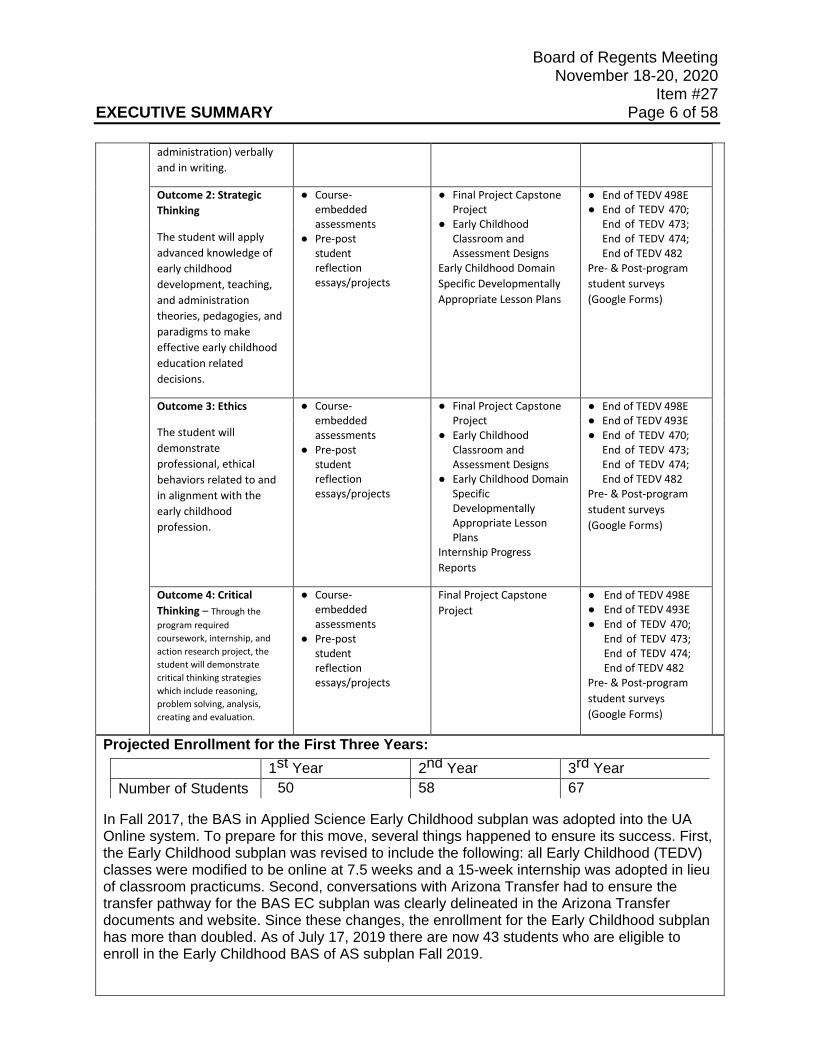
Board of Regents Meeting November 18-20, 2020 Item #27 EXECUTIVE SUMMARY Page 6 of 58 administration) verbally
and in writing.
Outcome 2: Strategic Thinking
● Course-embedded assessments
● Pre-post student reflection essays/projects
● Final Project Capstone Project
● Early Childhood Classroom and Assessment Designs
Early Childhood Domain Specific Developmentally Appropriate Lesson Plans
● End of TEDV 498E ● End of TEDV 470;
End of TEDV 473; End of TEDV 474; End of TEDV 482
Pre- & Post-program student surveys (Google Forms)
The student will apply advanced knowledge of early childhood development, teaching, and administration theories, pedagogies, and paradigms to make effective early childhood education related decisions.
Outcome 3: Ethics ● Course-embedded assessments
● Pre-post student reflection essays/projects
● Final Project Capstone Project
● Early Childhood Classroom and Assessment Designs
● Early Childhood Domain Specific Developmentally Appropriate Lesson Plans
Internship Progress Reports
● End of TEDV 498E ● End of TEDV 493E ● End of TEDV 470;
End of TEDV 473; End of TEDV 474; End of TEDV 482
Pre- & Post-program student surveys (Google Forms)
The student will demonstrate professional, ethical behaviors related to and in alignment with the early childhood profession.
Outcome 4: Critical Thinking – Through the program required coursework, internship, and action research project, the student will demonstrate critical thinking strategies which include reasoning, problem solving, analysis, creating and evaluation.
● Course-embedded assessments
● Pre-post student reflection essays/projects
Final Project Capstone Project
● End of TEDV 498E ● End of TEDV 493E ● End of TEDV 470;
End of TEDV 473; End of TEDV 474; End of TEDV 482
Pre- & Post-program student surveys (Google Forms)
Projected Enrollment for the First Three Years: In Fall 2017, the BAS in Applied Science Early Childhood subplan was adopted into the UA Online system. To prepare for this move, several things happened to ensure its success. First, the Early Childhood subplan was revised to include the following: all Early Childhood (TEDV) classes were modified to be online at 7.5 weeks and a 15-week internship was adopted in lieu of classroom practicums. Second, conversations with Arizona Transfer had to ensure the transfer pathway for the BAS EC subplan was clearly delineated in the Arizona Transfer documents and website. Since these changes, the enrollment for the Early Childhood subplan has more than doubled. As of July 17, 2019 there are now 43 students who are eligible to enroll in the Early Childhood BAS of AS subplan Fall 2019.
1st Year 2nd Year 3rd Year Number of Students 50 58 67
Board of Regents Meeting November 18-20, 2020
Item #27 EXECUTIVE SUMMARY Page 7 of 58
Evidence of Market Demand: Current evidence of student interest in and demand for the BAS in Early Childhood is based on student data from Arizona community colleges and current Bureau of Labor Statistics. Listed below are Arizona community college statistics related to potential BAS EC students in UA’s serving areas, as well as degrees at community colleges that are eligible to do a 2 + 2 articulation with this BAS degree: . ● In 2019, 35 students received AAS degrees in Early Childhood and 6 received an AA inEarly Childhood.● 2017, Central Arizona College graduated 16 students with AAS degrees in EC and only 2students with Associate of Arts in EC.● In 2018, Cochise graduated 1,261 students with AAS degrees, of which only 7 were ECEmajors.● 2016 statistics from Rio Salado indicated 300+ students in AAS early childhood, and 60 inearly childhood administration.● Arizona Western College, in 2016, had 107 students enrolled in AAS early childhood.
Workforce: Using data derived from the Burning Glass Technologies reports, in Arizona 1,922 jobs for early childcare educators (including directors of early childhood centers) was posted in the past 12 months and the job market is expected to increase by 28%. Given these statistics and the statistics from the above-mentioned state higher education institutions, the need for workforce individuals is greater than the output from these institutions. Thus, a need for a BAS program aligned to AAS degrees from community colleges. Similar Programs Offered at Arizona Public Universities: NAU offers a BAS in EC (AGEC required for admissions. UA BAS requires AAS in EC) ASU offers a BAE in EC with Teacher Certification (UA BAS EC will not offer certification) Certification refers to Arizona Early Education Teaching Certification. New Resources Required? (i.e. faculty and administrative positions; infrastructure, etc.): None. Just an MOU between UA CAST and UA COE to outline departmental responsibilities. Program Fee/Differentiated Tuition Required? YES X∆ NO ∆
Estimated Amount:
Program Fee/Differentiated Tuition Justification: BAS EC students will be fully online. Thus, some students will enter program via a UA distant location such as Sierra Vista, Yuma, or Chandler and the rest of the students will enter via UA Online.
Specialized Accreditation? YES ∆ NO X
Accreditor: NA
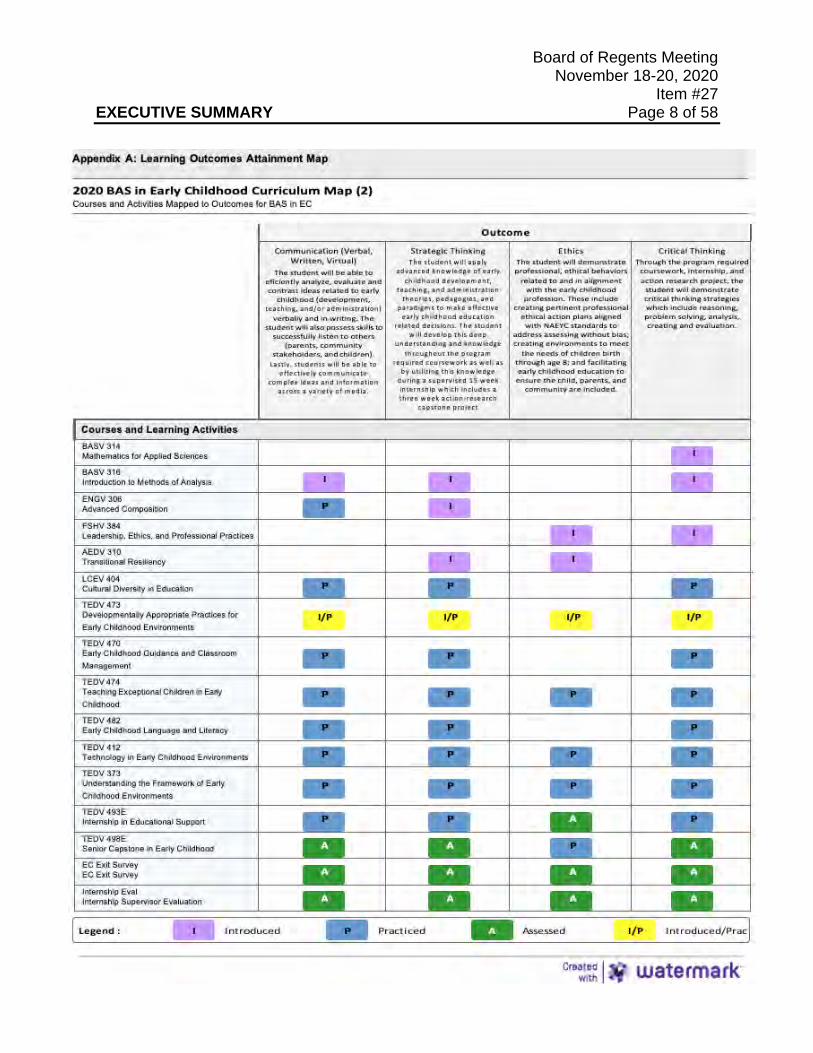
Board of Regents Meeting November 18-20, 2020
Item #27 EXECUTIVE SUMMARY Page 8 of 58
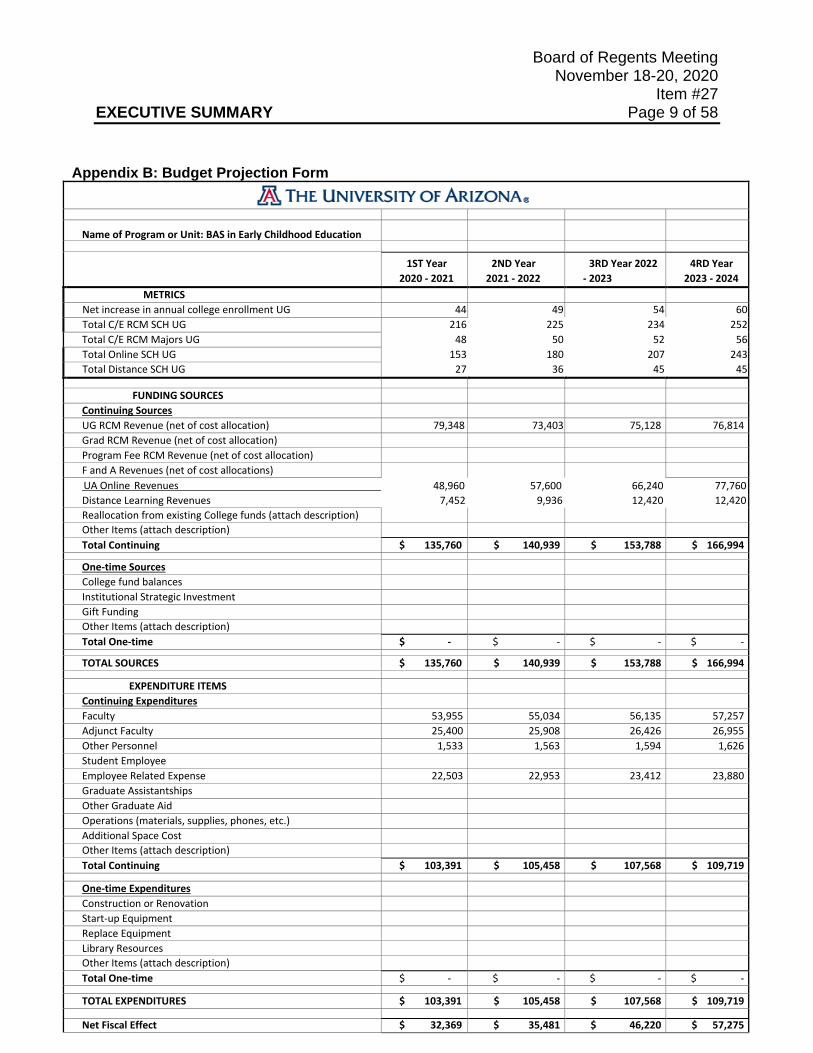
Board of Regents Meeting November 18-20, 2020
Item #27 EXECUTIVE SUMMARY Page 9 of 58
Appendix B: Budget Projection Form
Name of Program or Unit: BAS in Early Childhood Education
1ST Year 2020 - 2021
2ND Year 2021 - 2022
3RD Year 2022 - 2023
4RD Year 2023 - 2024
METRICS Net increase in annual college enrollment UG 44 49 54 60 Total C/E RCM SCH UG 216 225 234 252 Total C/E RCM Majors UG 48 50 52 56 Total Online SCH UG 153 180 207 243 Total Distance SCH UG 27 36 45 45
FUNDING SOURCES Continuing Sources UG RCM Revenue (net of cost allocation) 79,348 73,403 75,128 76,814 Grad RCM Revenue (net of cost allocation) Program Fee RCM Revenue (net of cost allocation) F and A Revenues (net of cost allocations) UA Online Revenues 48,960 57,600 66,240 77,760 Distance Learning Revenues 7,452 9,936 12,420 12,420 Reallocation from existing College funds (attach description) Other Items (attach description) Total Continuing $ 135,760 $ 140,939 $ 153,788 $ 166,994
One-time Sources College fund balances Institutional Strategic Investment Gift Funding Other Items (attach description) Total One-time $ - $ - $ - $ -
TOTAL SOURCES $ 135,760 $ 140,939 $ 153,788 $ 166,994
EXPENDITURE ITEMS Continuing Expenditures Faculty 53,955 55,034 56,135 57,257 Adjunct Faculty 25,400 25,908 26,426 26,955 Other Personnel 1,533 1,563 1,594 1,626 Student Employee Employee Related Expense 22,503 22,953 23,412 23,880 Graduate Assistantships Other Graduate Aid Operations (materials, supplies, phones, etc.) Additional Space Cost Other Items (attach description) Total Continuing $ 103,391 $ 105,458 $ 107,568 $ 109,719
One-time Expenditures Construction or Renovation Start-up Equipment Replace Equipment Library Resources Other Items (attach description) Total One-time $ - $ - $ - $ -
TOTAL EXPENDITURES $ 103,391 $ 105,458 $ 107,568 $ 109,719
Net Fiscal Effect $ 32,369 $ 35,481 $ 46,220 $ 57,275
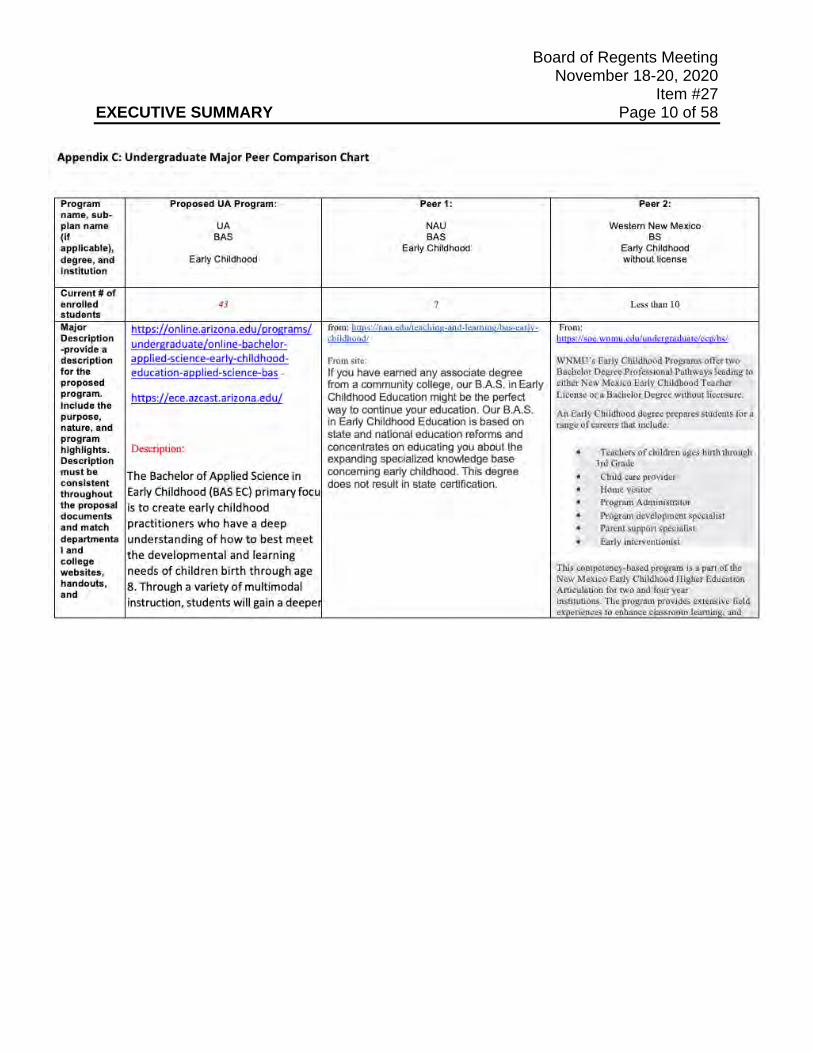
Board of Regents Meeting November 18-20, 2020
Item #27 EXECUTIVE SUMMARY Page 10 of 58
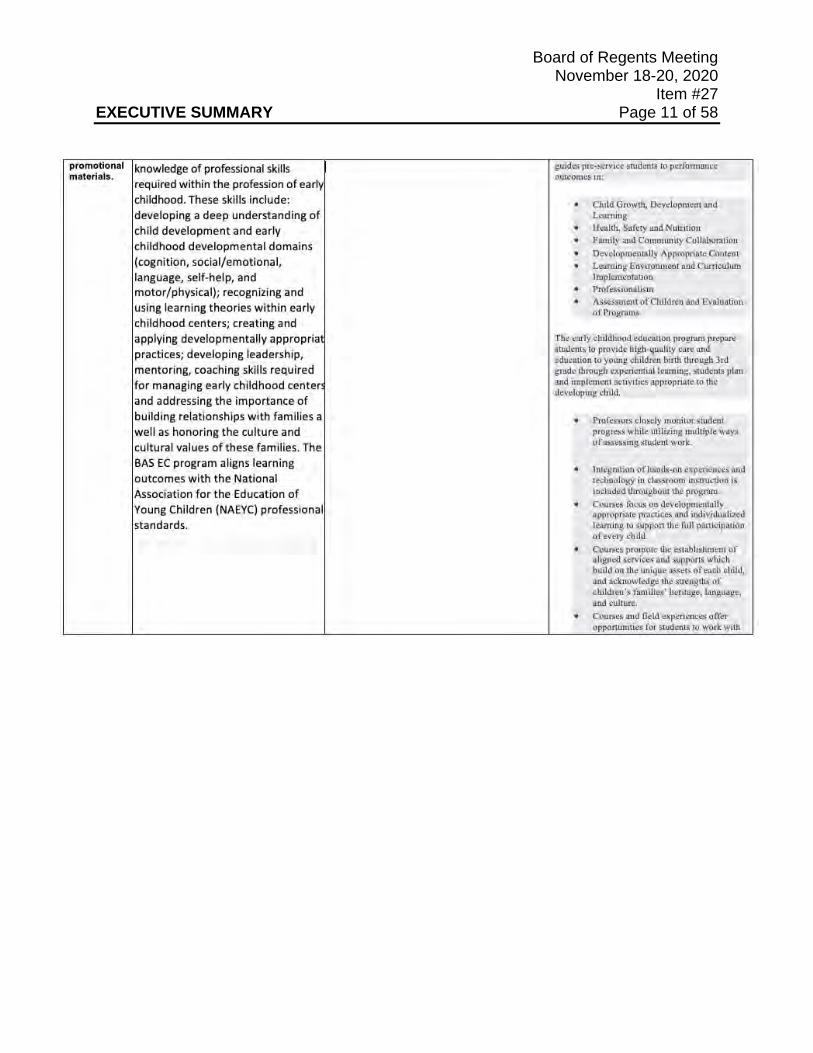
Board of Regents Meeting November 18-20, 2020
Item #27 EXECUTIVE SUMMARY Page 11 of 58
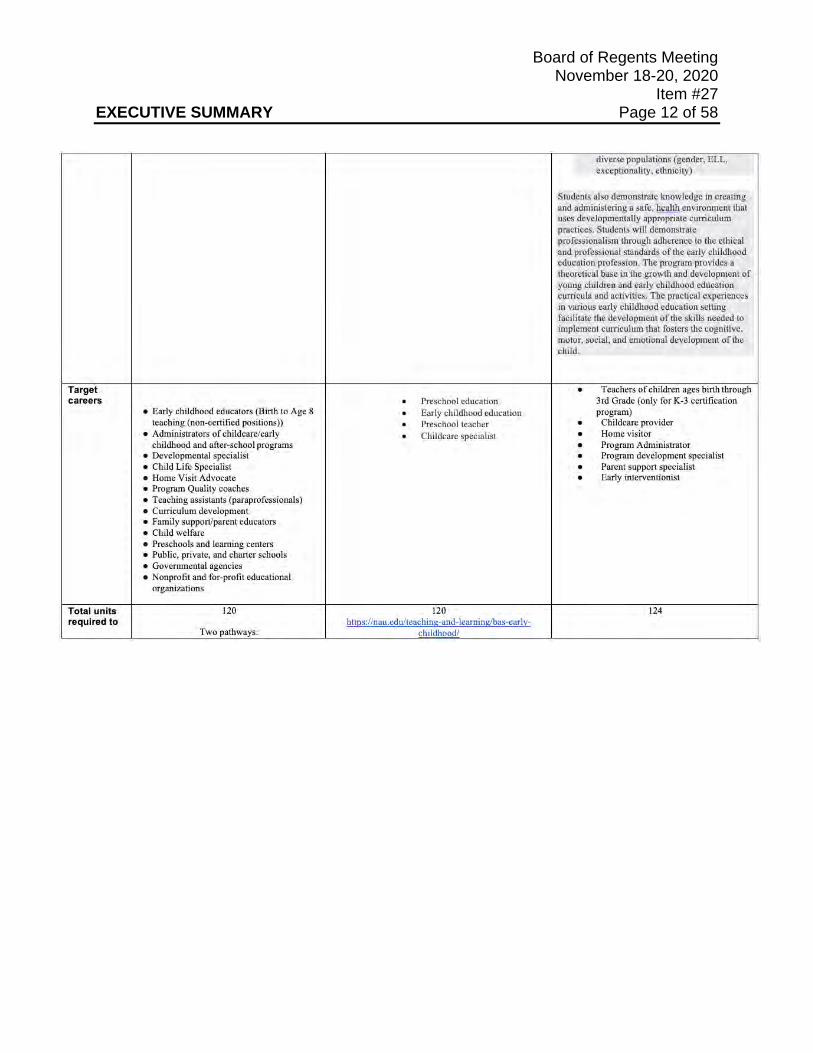
Board of Regents Meeting November 18-20, 2020
Item #27 EXECUTIVE SUMMARY Page 12 of 58
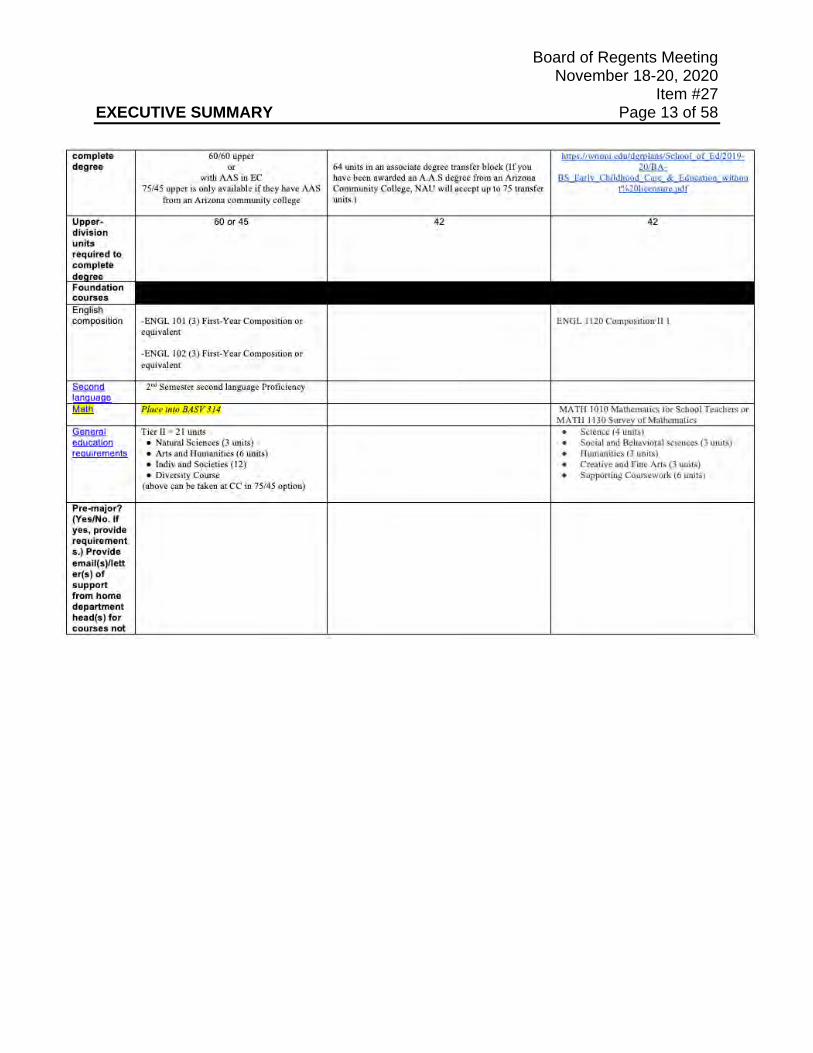
Board of Regents Meeting November 18-20, 2020
Item #27 EXECUTIVE SUMMARY Page 13 of 58
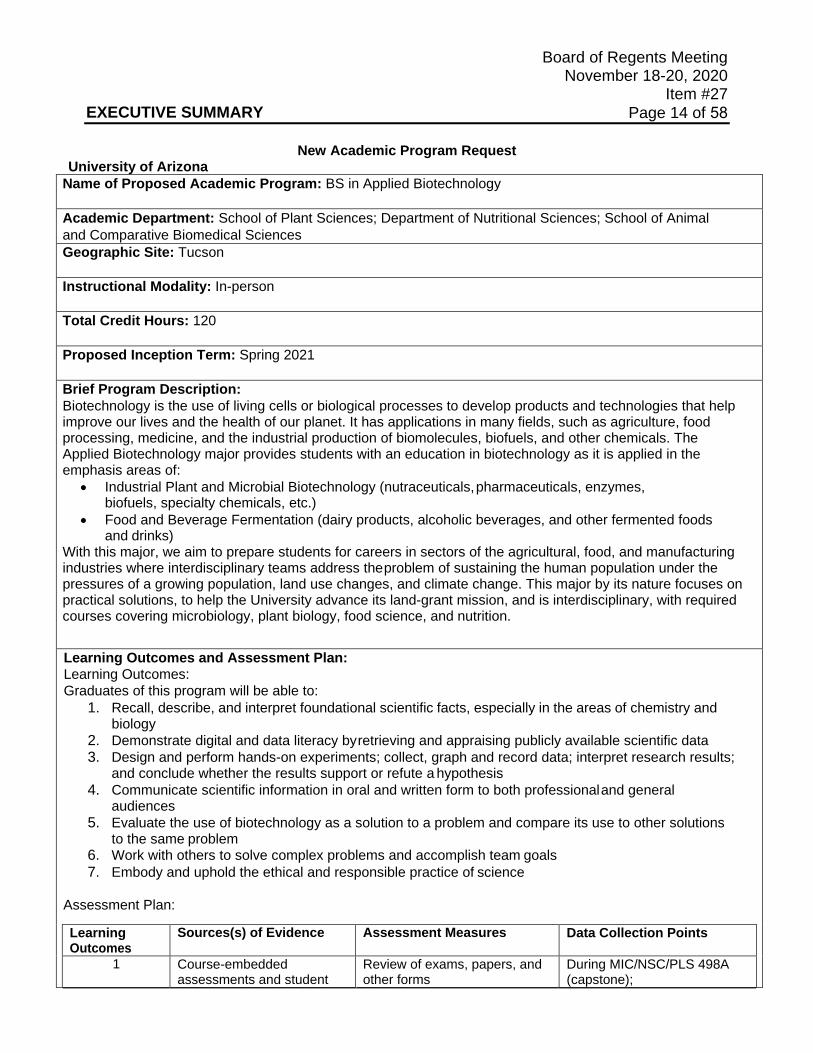
EXECUTIVE SUMMARY
Board of Regents Meeting November 18-20, 2020
Item #27 Page 14 of 58
New Academic Program Request University of Arizona
Name of Proposed Academic Program: BS in Applied Biotechnology
Academic Department: School of Plant Sciences; Department of Nutritional Sciences; School of Animal and Comparative Biomedical Sciences Geographic Site: Tucson
Instructional Modality: In-person
Total Credit Hours: 120
Proposed Inception Term: Spring 2021
Brief Program Description: Biotechnology is the use of living cells or biological processes to develop products and technologies that help improve our lives and the health of our planet. It has applications in many fields, such as agriculture, food processing, medicine, and the industrial production of biomolecules, biofuels, and other chemicals. The Applied Biotechnology major provides students with an education in biotechnology as it is applied in the emphasis areas of:
• Industrial Plant and Microbial Biotechnology (nutraceuticals, pharmaceuticals, enzymes,biofuels, specialty chemicals, etc.)
• Food and Beverage Fermentation (dairy products, alcoholic beverages, and other fermented foodsand drinks)
With this major, we aim to prepare students for careers in sectors of the agricultural, food, and manufacturing industries where interdisciplinary teams address the problem of sustaining the human population under the pressures of a growing population, land use changes, and climate change. This major by its nature focuses on practical solutions, to help the University advance its land-grant mission, and is interdisciplinary, with required courses covering microbiology, plant biology, food science, and nutrition.
Learning Outcomes and Assessment Plan: Learning Outcomes: Graduates of this program will be able to:
1. Recall, describe, and interpret foundational scientific facts, especially in the areas of chemistry andbiology
2. Demonstrate digital and data literacy by retrieving and appraising publicly available scientific data3. Design and perform hands-on experiments; collect, graph and record data; interpret research results;
and conclude whether the results support or refute a hypothesis4. Communicate scientific information in oral and written form to both professional and general
audiences5. Evaluate the use of biotechnology as a solution to a problem and compare its use to other solutions
to the same problem6. Work with others to solve complex problems and accomplish team goals7. Embody and uphold the ethical and responsible practice of science
Assessment Plan:
Learning Outcomes
Sources(s) of Evidence Assessment Measures Data Collection Points
1 Course-embedded assessments and student
Review of exams, papers, and other forms
During MIC/NSC/PLS 498A (capstone);
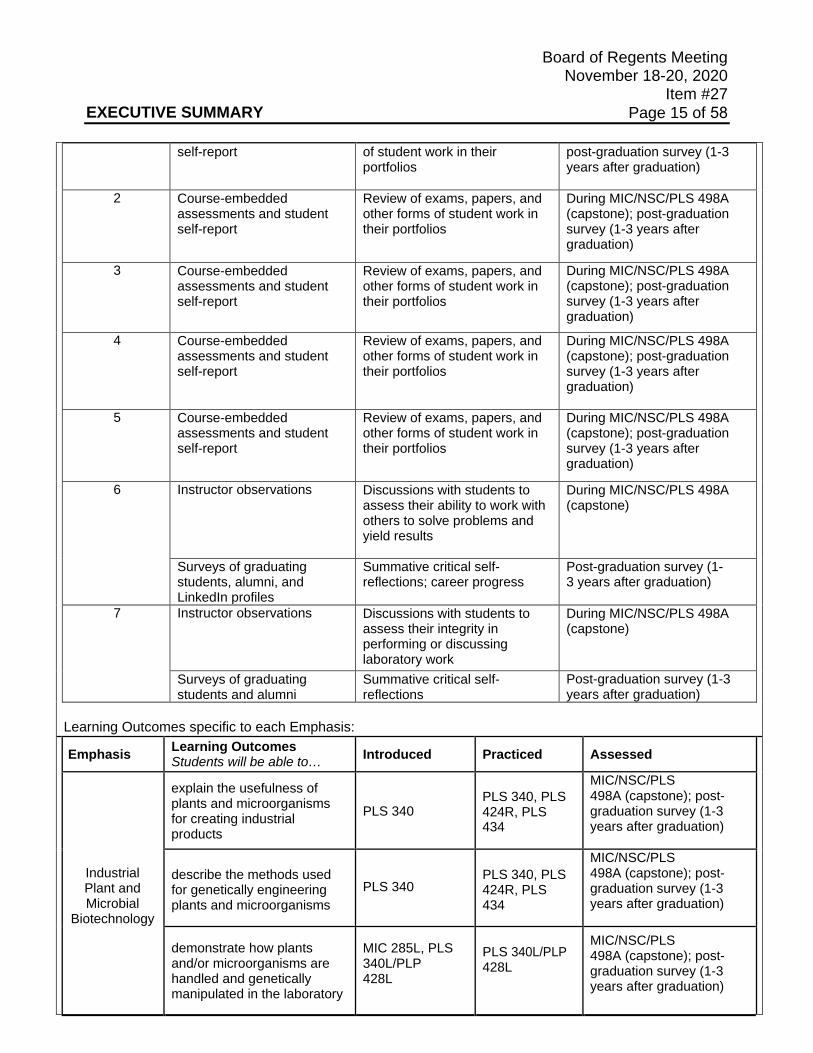
EXECUTIVE SUMMARY
Board of Regents Meeting November 18-20, 2020
Item #27 Page 15 of 58
self-report of student work in their portfolios
post-graduation survey (1-3 years after graduation)
2 Course-embedded assessments and student self-report
Review of exams, papers, and other forms of student work in their portfolios
During MIC/NSC/PLS 498A (capstone); post-graduation survey (1-3 years after graduation)
3 Course-embedded assessments and student self-report
Review of exams, papers, and other forms of student work in their portfolios
During MIC/NSC/PLS 498A (capstone); post-graduation survey (1-3 years after graduation)
4 Course-embedded assessments and student self-report
Review of exams, papers, and other forms of student work in their portfolios
During MIC/NSC/PLS 498A (capstone); post-graduation survey (1-3 years after graduation)
5 Course-embedded assessments and student self-report
Review of exams, papers, and other forms of student work in their portfolios
During MIC/NSC/PLS 498A (capstone); post-graduation survey (1-3 years after graduation)
6 Instructor observations Discussions with students to assess their ability to work with others to solve problems and yield results
During MIC/NSC/PLS 498A (capstone)
Surveys of graduating students, alumni, and LinkedIn profiles
Summative critical self- reflections; career progress
Post-graduation survey (1-3 years after graduation)
7 Instructor observations Discussions with students to assess their integrity in performing or discussing laboratory work
During MIC/NSC/PLS 498A (capstone)
Surveys of graduating students and alumni
Summative critical self- reflections
Post-graduation survey (1-3 years after graduation)
Learning Outcomes specific to each Emphasis:
Emphasis Learning Outcomes Students will be able to… Introduced Practiced Assessed
Industrial Plant and Microbial
Biotechnology
explain the usefulness of plants and microorganisms for creating industrial products
PLS 340 PLS 340, PLS 424R, PLS 434
MIC/NSC/PLS 498A (capstone); post-graduation survey (1-3 years after graduation)
describe the methods used for genetically engineering plants and microorganisms
PLS 340 PLS 340, PLS 424R, PLS 434
MIC/NSC/PLS 498A (capstone); post-graduation survey (1-3 years after graduation)
demonstrate how plants and/or microorganisms are handled and genetically manipulated in the laboratory
MIC 285L, PLS 340L/PLP 428L
PLS 340L/PLP 428L
MIC/NSC/PLS 498A (capstone); post-graduation survey (1-3 years after graduation)
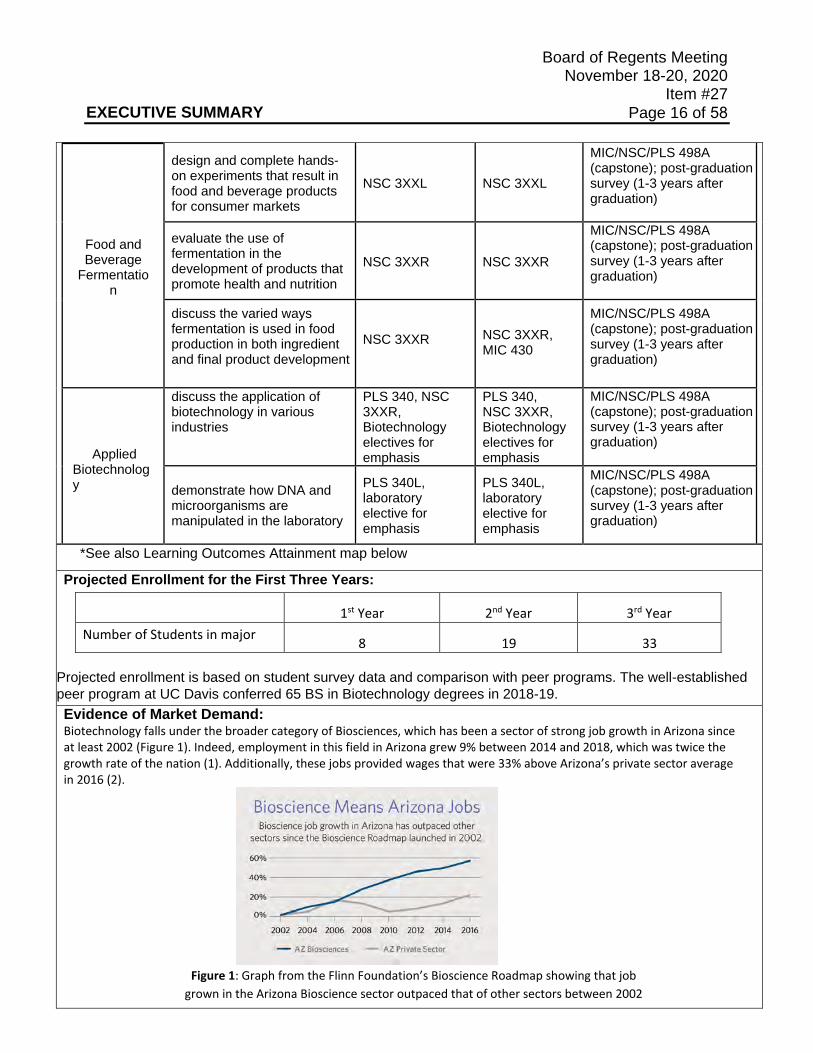
EXECUTIVE SUMMARY
Board of Regents Meeting November 18-20, 2020
Item #27 Page 16 of 58
Food and Beverage
Fermentation
design and complete hands- on experiments that result in food and beverage products for consumer markets
NSC 3XXL NSC 3XXL
MIC/NSC/PLS 498A (capstone); post-graduation survey (1-3 years after graduation)
evaluate the use of fermentation in the development of products that promote health and nutrition
NSC 3XXR NSC 3XXR
MIC/NSC/PLS 498A (capstone); post-graduation survey (1-3 years after graduation)
discuss the varied ways fermentation is used in food production in both ingredient and final product development
NSC 3XXR NSC 3XXR, MIC 430
MIC/NSC/PLS 498A (capstone); post-graduation survey (1-3 years after graduation)
Applied Biotechnology
discuss the application of biotechnology in various industries
PLS 340, NSC 3XXR, Biotechnology electives for emphasis
PLS 340, NSC 3XXR, Biotechnology electives for emphasis
MIC/NSC/PLS 498A (capstone); post-graduation survey (1-3 years after graduation)
demonstrate how DNA and microorganisms are manipulated in the laboratory
PLS 340L, laboratory elective for emphasis
PLS 340L, laboratory elective for emphasis
MIC/NSC/PLS 498A (capstone); post-graduation survey (1-3 years after graduation)
*See also Learning Outcomes Attainment map below
Projected Enrollment for the First Three Years:
Projected enrollment is based on student survey data and comparison with peer programs. The well-established peer program at UC Davis conferred 65 BS in Biotechnology degrees in 2018-19. Evidence of Market Demand: Biotechnology falls under the broader category of Biosciences, which has been a sector of strong job growth in Arizona since at least 2002 (Figure 1). Indeed, employment in this field in Arizona grew 9% between 2014 and 2018, which was twice the growth rate of the nation (1). Additionally, these jobs provided wages that were 33% above Arizona’s private sector average in 2016 (2).
Figure 1: Graph from the Flinn Foundation’s Bioscience Roadmap showing that job grown in the Arizona Bioscience sector outpaced that of other sectors between 2002
1st Year 2nd Year 3rd Year Number of Students in major 8 19 33
EXECUTIVE SUMMARY
Board of Regents Meeting November 18-20, 2020
Item #27 Page 17 of 58
and 2016 (2). One of the goals of the Foundations’ Roadmap is to increase and improve the ‘talent pipeline’ in the Biosciences in Arizona.
Biotechnology as a specific field is expected to see continued job growth in the next 10 years both nationally (~8% growth) and in Arizona (~8.4%) (3).
US Bureau of Labor Statistics: “Employment of biological technicians is projected to grow 7 percent from 2018 to 2028, faster than the average for all occupations.
Continued growth in biotechnology and medical research is expected to increase demand for these workers.” (4)
In the Tucson/Oro Valley area specifically, there are several established biotechnology-adjacent companies, such as biomedical diagnostics companies (e.g. Accelerate Diagnostics, Roche, and HTG Molecular Diagnostics). There is also ongoing development in this area, such as at the Oro Valley Innovation Labs (5) and UA Tech Park at The Bridges (6), that has the potential to increase the local job market in the coming years. We anticipate that many of our graduates might find employment out of state, such as in the major biotechnology hubs of the San Francisco Bay area, Boston, and the Research Triangle area in North Carolina. In the San Francisco Bay area alone, there are biotechnology companies in the medical (e.g. Amgen and Genentech), food (e.g. Impossible Foods, Clara Foods, Prime Roots, and Memphis Meats), and industrial and plant product (e.g. Genencor and Demetrix) subsectors. Other companies in California that might hire our graduates are the many wineries, breweries, and cheese/dairy product factories there. This concentration of biotechnology-related companies in California might make this Applied Biotechnology major appeal to some of our out-of- State students from California who are looking to return to their hometown with a job-ready degree.
Biotechnology is not a particularly common Bachelor’s degree subject in the United States, possibly because 4-year universities in this country have historically focused on the basic biological sciences instead of applied biological sciences. However, there are a few universities that have relatively large Biotechnology programs such as the UA peer institute, University of California-Davis. According to the National Center for Education Statistics, UC-Davis conferred 65 BS in Biotechnology degrees in 2018- 2019 (7; Validate reported 52 degrees for 2018 (3)). The University of Houstoconferred the most degrees in this field in the same time period: 75 (3). Other institutions that conferred BS in Biotechnology degrees in 2018-2019 include Indiana University, Oregon State University, University of Georgia-Athensand University of Nebraska Omaha, which each conferred 12 to 19 degrees in this period (8).
In Fall 2019, UA students in PLS 170C2 (Introductory Biotechnology general education course), MCB/MIC/PLS 340 (Introduction to Biotechnology), MIC 350 (Core Concepts in Molecular Microbiology), MIC 450 (Veterinary Microbiology), and NSC 351R (Fundamentals of Food Science) were polled via a Qualtrics survey to gauge their interest in an Applied Biotechnology major and minor. Overall, 70 students responded to the survey. Of those, 38 (54%) said they were “moderately” or “extremely” likely to have chosen Applied Biotechnology as a major at the time they entered the UA and 12 (17%) were “moderately” or “extremely” likely to choose the major ‘now’ (many students who responded were Juniors or Seniors and thus far along in their current majors). When polled on their interest in anApplied Biotechnology minor, 42 (60%) were “moderately” or “extremely” likely to have chosen Applied Biotechnology as a minor at some point in their undergraduate education. These data, shown in Figure 2, encouraged us to continue to plan both the major and the minor and suggest that there will be interest from students in declaring a major or minor in Applied Biotechnology.
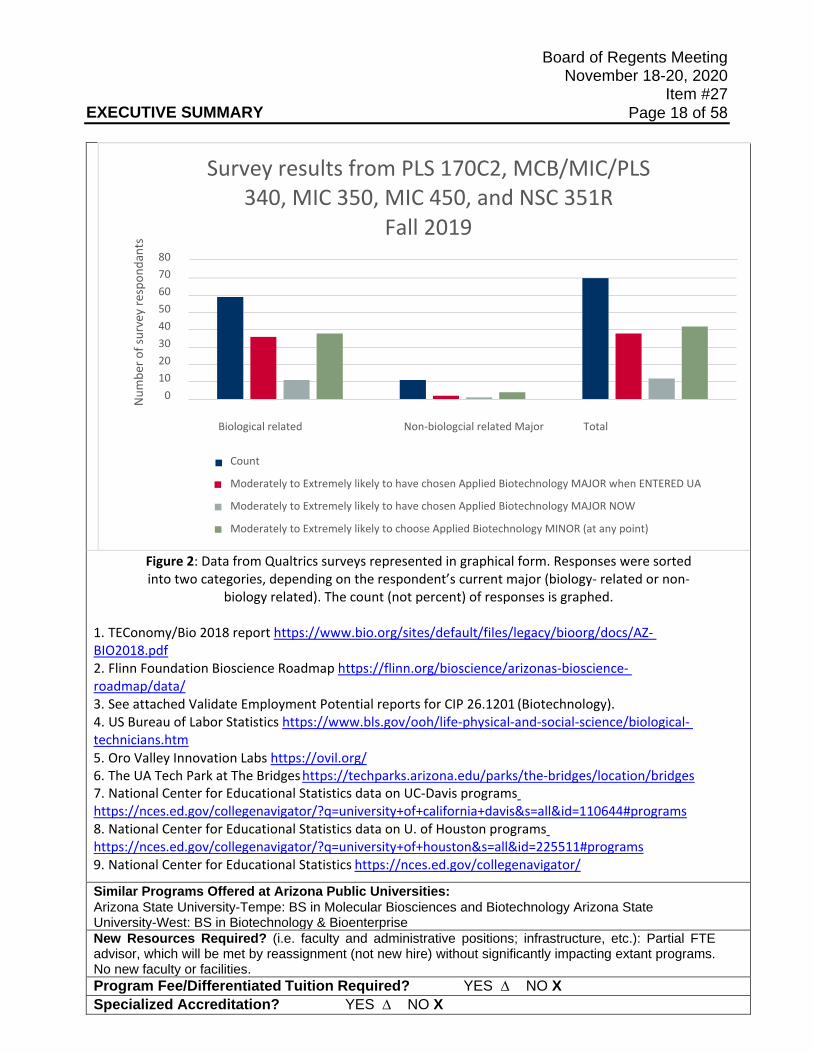
EXECUTIVE SUMMARY
Board of Regents Meeting November 18-20, 2020
Item #27 Page 18 of 58
Num
ber o
f sur
vey
resp
onda
nts
Survey results from PLS 170C2, MCB/MIC/PLS 340, MIC 350, MIC 450, and NSC 351R
Fall 2019 80 70 60 50 40 30 20 10
0
Biological related Non-biologcial related Major Total
Count
Moderately to Extremely likely to have chosen Applied Biotechnology MAJOR when ENTERED UA
Moderately to Extremely likely to have chosen Applied Biotechnology MAJOR NOW
Moderately to Extremely likely to choose Applied Biotechnology MINOR (at any point)
Figure 2: Data from Qualtrics surveys represented in graphical form. Responses were sorted into two categories, depending on the respondent’s current major (biology- related or non-
biology related). The count (not percent) of responses is graphed.
1. TEConomy/Bio 2018 report https://www.bio.org/sites/default/files/legacy/bioorg/docs/AZ- BIO2018.pdf2. Flinn Foundation Bioscience Roadmap https://flinn.org/bioscience/arizonas-bioscience- roadmap/data/3. See attached Validate Employment Potential reports for CIP 26.1201 (Biotechnology).4. US Bureau of Labor Statistics https://www.bls.gov/ooh/life-physical-and-social-science/biological- technicians.htm5. Oro Valley Innovation Labs https://ovil.org/6. The UA Tech Park at The Bridges https://techparks.arizona.edu/parks/the-bridges/location/bridges7. National Center for Educational Statistics data on UC-Davis programshttps://nces.ed.gov/collegenavigator/?q=university+of+california+davis&s=all&id=110644#programs8. National Center for Educational Statistics data on U. of Houston programshttps://nces.ed.gov/collegenavigator/?q=university+of+houston&s=all&id=225511#programs9. National Center for Educational Statistics https://nces.ed.gov/collegenavigator/
Similar Programs Offered at Arizona Public Universities: Arizona State University-Tempe: BS in Molecular Biosciences and Biotechnology Arizona State University-West: BS in Biotechnology & Bioenterprise New Resources Required? (i.e. faculty and administrative positions; infrastructure, etc.): Partial FTE advisor, which will be met by reassignment (not new hire) without significantly impacting extant programs. No new faculty or facilities. Program Fee/Differentiated Tuition Required? YES ∆ NO X Specialized Accreditation? YES ∆ NO X
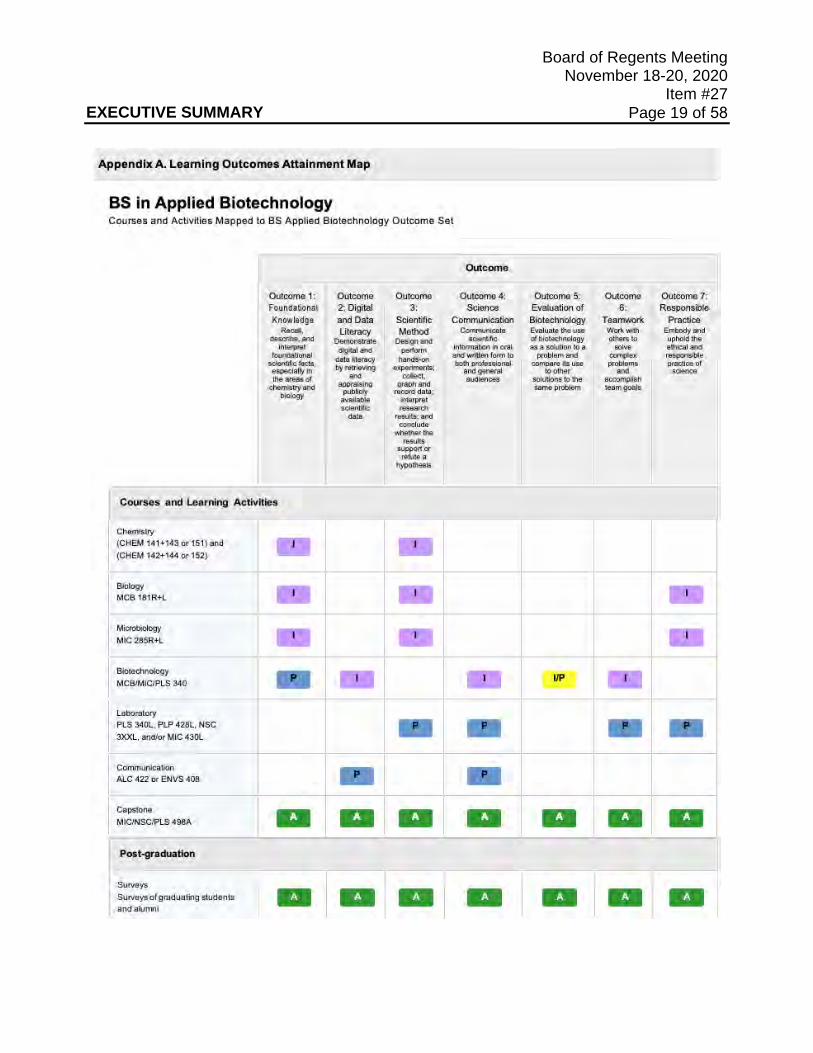
EXECUTIVE SUMMARY
Board of Regents Meeting November 18-20, 2020
Item #27 Page 19 of 58
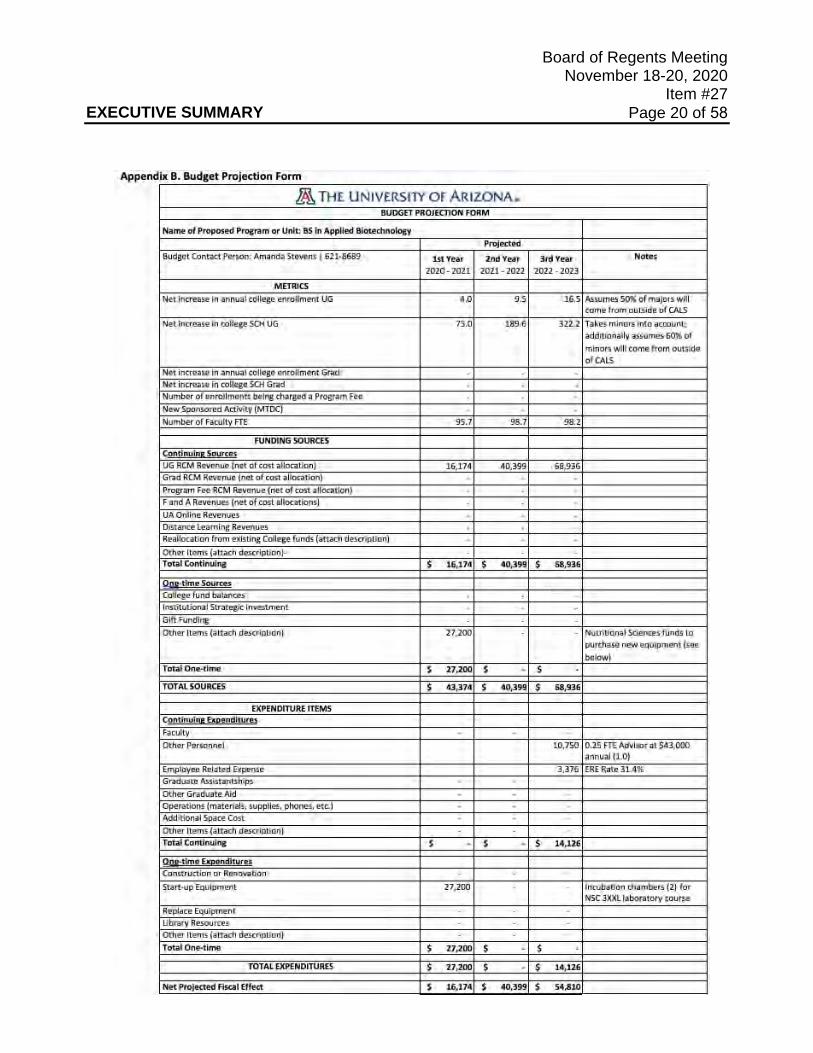
EXECUTIVE SUMMARY
Board of Regents Meeting November 18-20, 2020
Item #27 Page 20 of 58
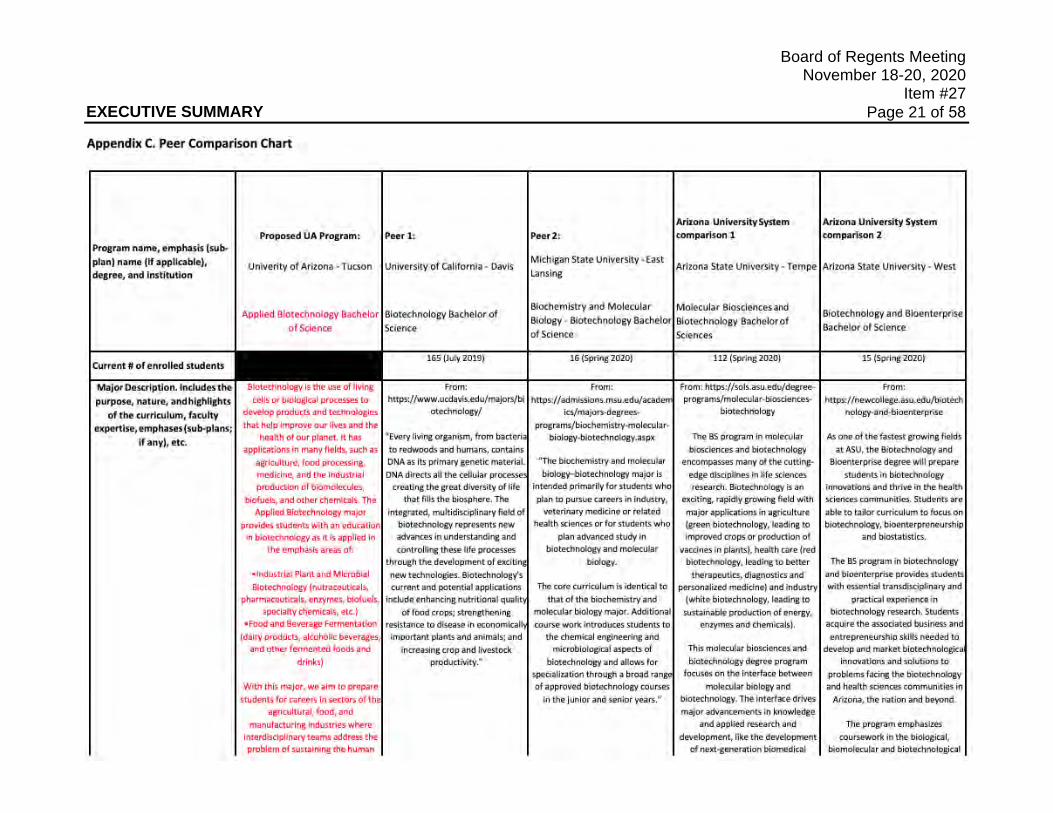
EXECUTIVE SUMMARY
Board of Regents Meeting November 18-20, 2020
Item #27 Page 21 of 58
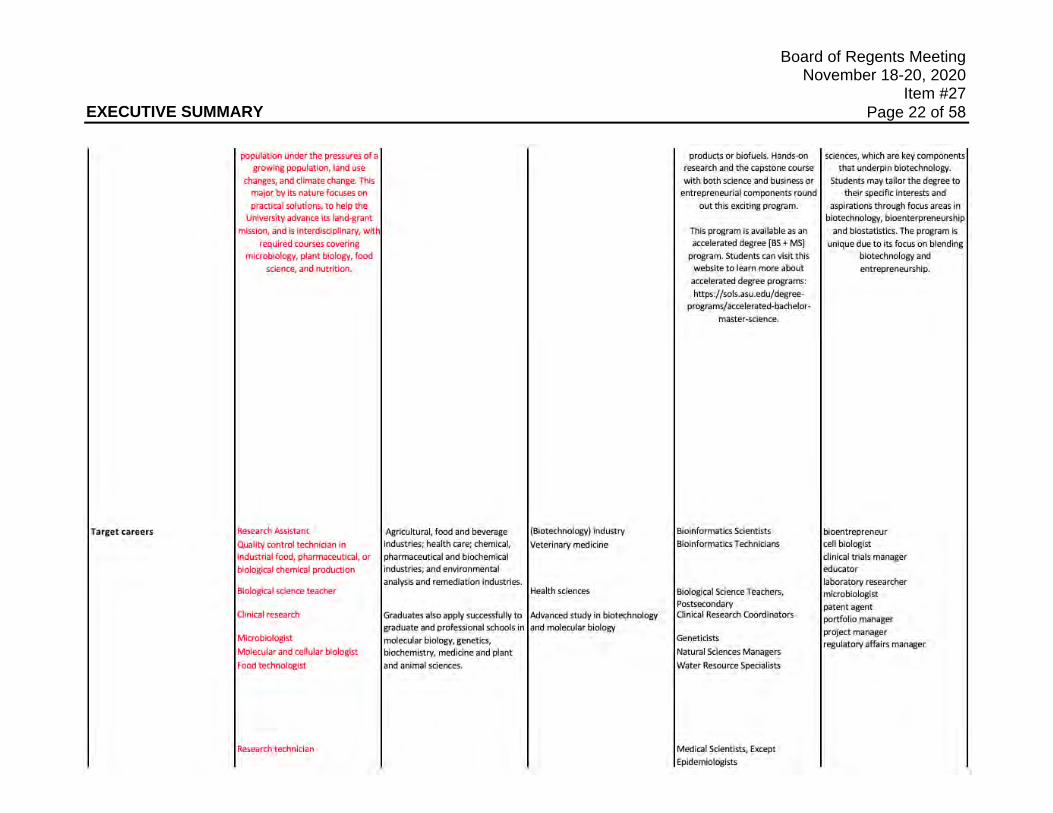
EXECUTIVE SUMMARY
Board of Regents Meeting November 18-20, 2020
Item #27 Page 22 of 58
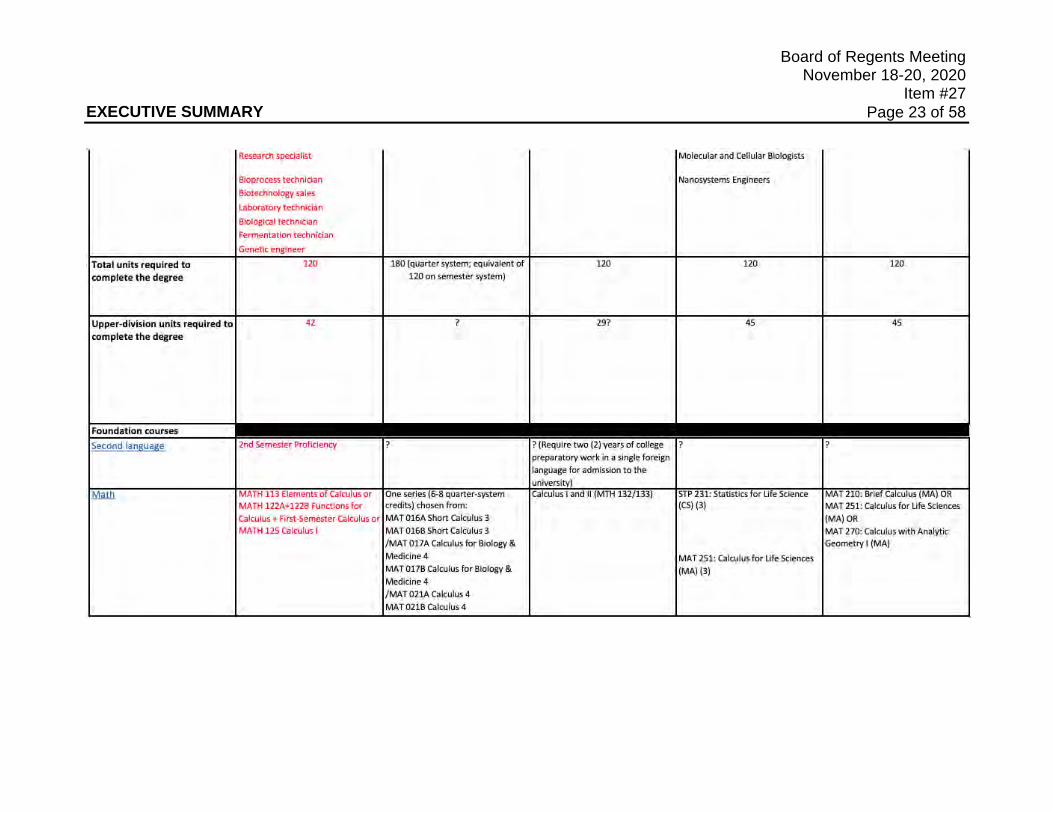
EXECUTIVE SUMMARY
Board of Regents Meeting November 18-20, 2020
Item #27 Page 23 of 58
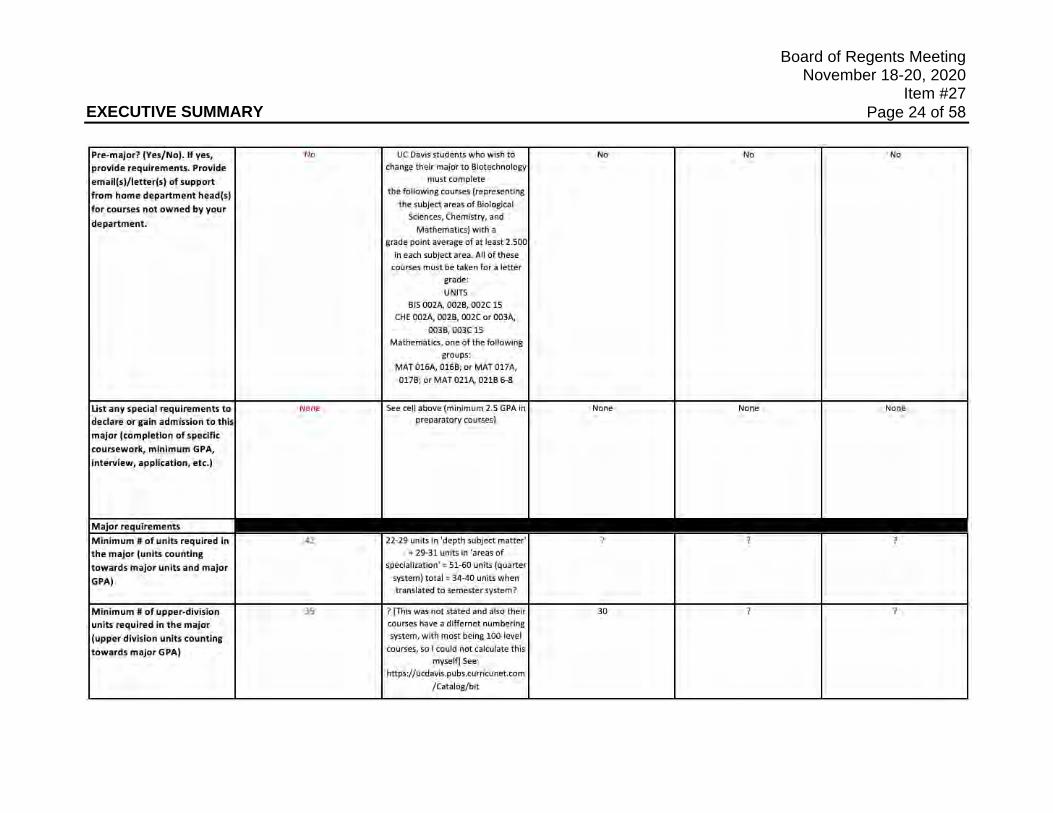
EXECUTIVE SUMMARY
Board of Regents Meeting November 18-20, 2020
Item #27 Page 24 of 58
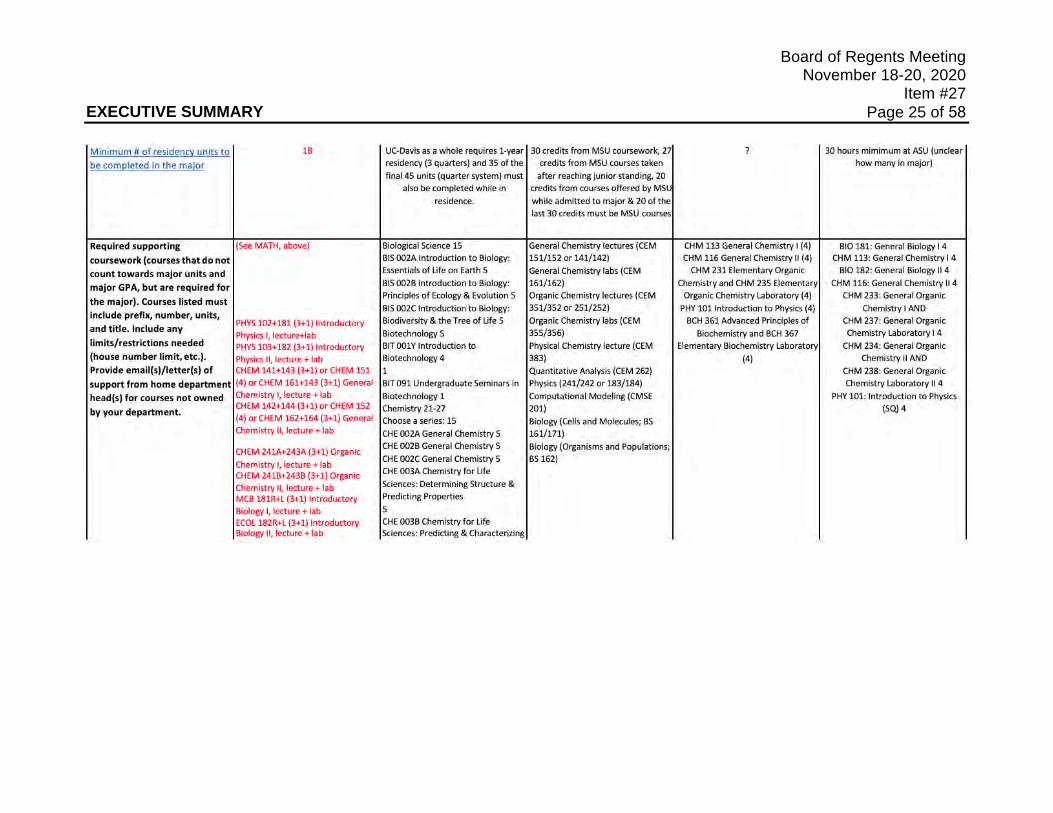
EXECUTIVE SUMMARY
Board of Regents Meeting November 18-20, 2020
Item #27 Page 25 of 58
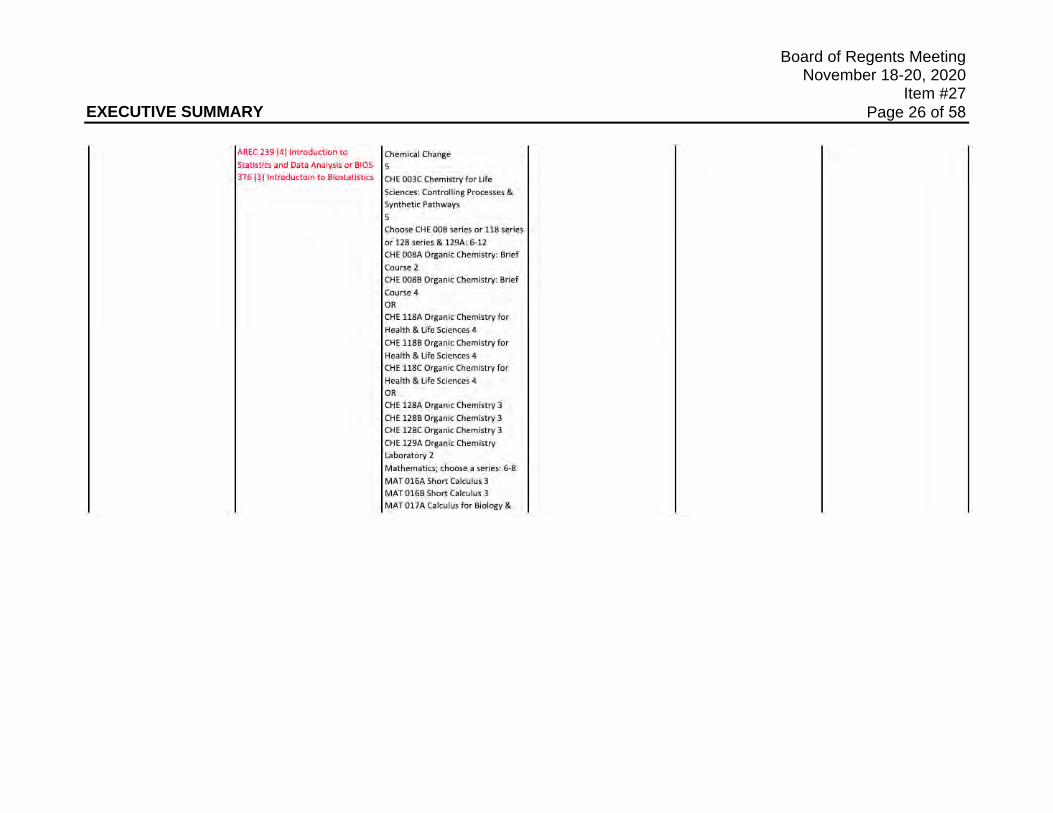
EXECUTIVE SUMMARY
Board of Regents Meeting November 18-20, 2020
Item #27 Page 26 of 58
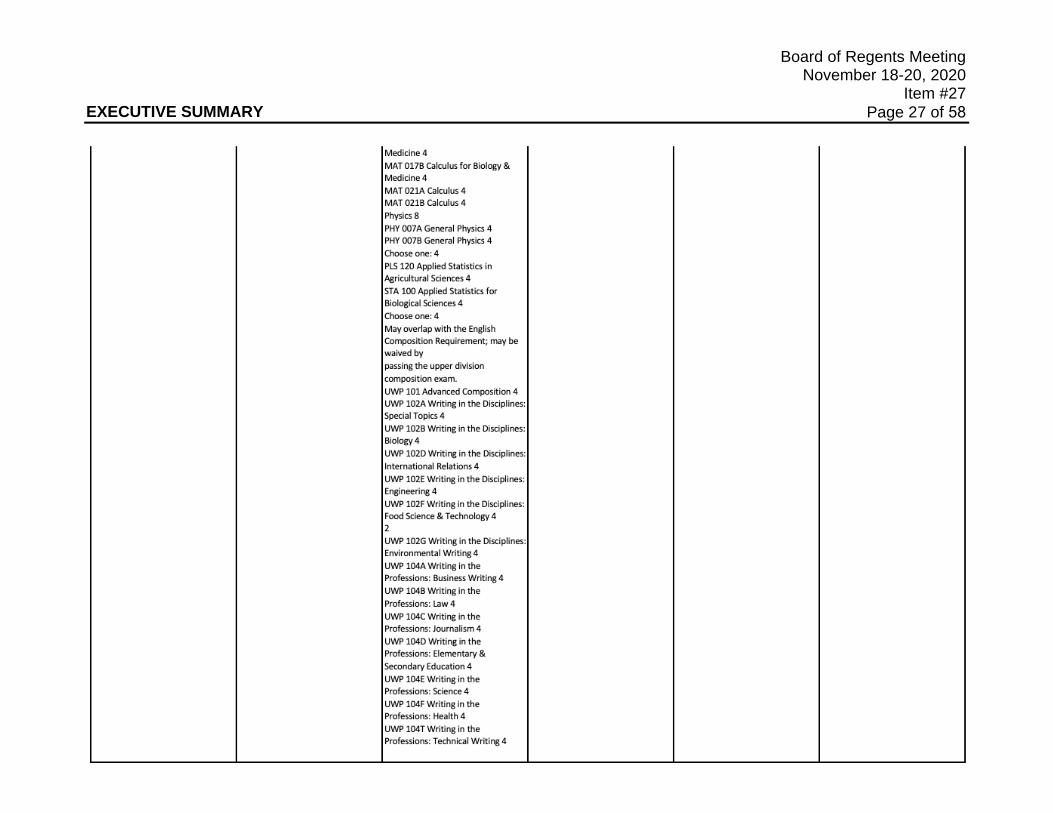
EXECUTIVE SUMMARY
Board of Regents Meeting November 18-20, 2020
Item #27 Page 27 of 58
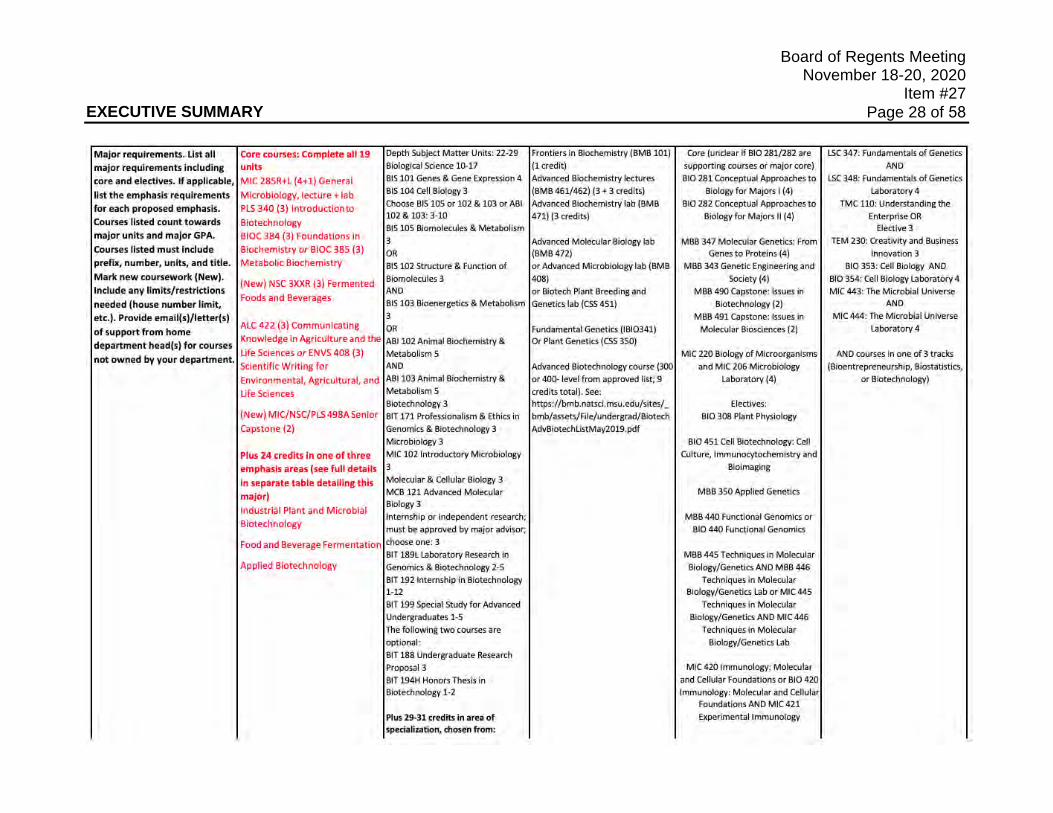
EXECUTIVE SUMMARY
Board of Regents Meeting November 18-20, 2020
Item #27 Page 28 of 58
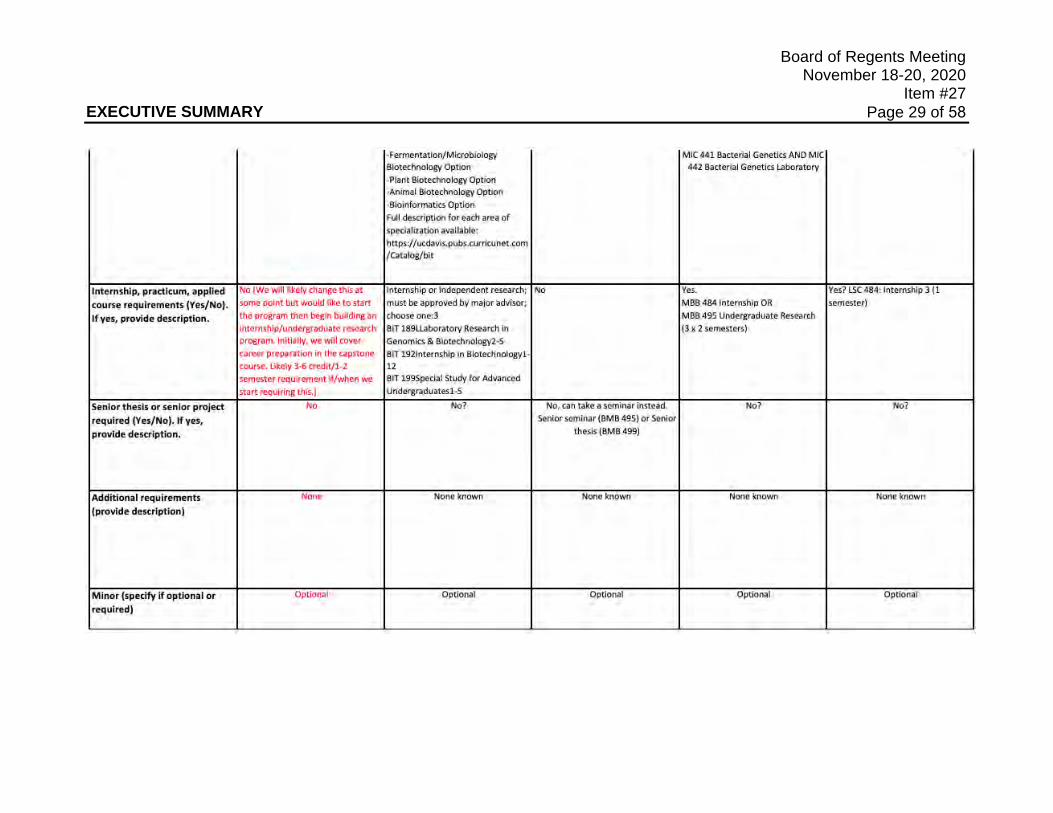
EXECUTIVE SUMMARY
Board of Regents Meeting November 18-20, 2020
Item #27 Page 29 of 58
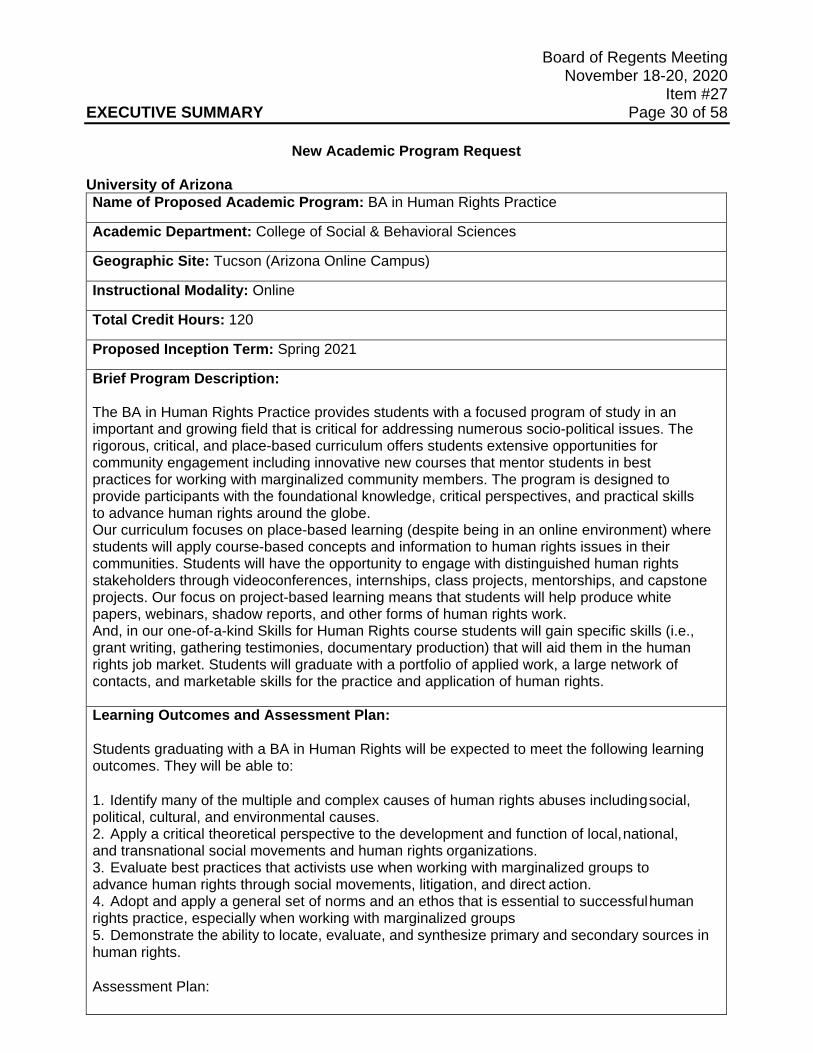
Board of Regents Meeting November 18-20, 2020
Item #27 EXECUTIVE SUMMARY Page 30 of 58
New Academic Program Request
University of Arizona Name of Proposed Academic Program: BA in Human Rights Practice
Academic Department: College of Social & Behavioral Sciences
Geographic Site: Tucson (Arizona Online Campus)
Instructional Modality: Online
Total Credit Hours: 120
Proposed Inception Term: Spring 2021
Brief Program Description:
The BA in Human Rights Practice provides students with a focused program of study in an important and growing field that is critical for addressing numerous socio-political issues. The rigorous, critical, and place-based curriculum offers students extensive opportunities for community engagement including innovative new courses that mentor students in best practices for working with marginalized community members. The program is designed to provide participants with the foundational knowledge, critical perspectives, and practical skills to advance human rights around the globe. Our curriculum focuses on place-based learning (despite being in an online environment) where students will apply course-based concepts and information to human rights issues in their communities. Students will have the opportunity to engage with distinguished human rights stakeholders through videoconferences, internships, class projects, mentorships, and capstone projects. Our focus on project-based learning means that students will help produce white papers, webinars, shadow reports, and other forms of human rights work. And, in our one-of-a-kind Skills for Human Rights course students will gain specific skills (i.e., grant writing, gathering testimonies, documentary production) that will aid them in the human rights job market. Students will graduate with a portfolio of applied work, a large network of contacts, and marketable skills for the practice and application of human rights.
Learning Outcomes and Assessment Plan:
Students graduating with a BA in Human Rights will be expected to meet the following learning outcomes. They will be able to:
1. Identify many of the multiple and complex causes of human rights abuses including social,political, cultural, and environmental causes.2. Apply a critical theoretical perspective to the development and function of local, national,and transnational social movements and human rights organizations.3. Evaluate best practices that activists use when working with marginalized groups toadvance human rights through social movements, litigation, and direct action.4. Adopt and apply a general set of norms and an ethos that is essential to successful humanrights practice, especially when working with marginalized groups5. Demonstrate the ability to locate, evaluate, and synthesize primary and secondary sources inhuman rights.
Assessment Plan:

Board of Regents Meeting November 18-20, 2020 Item #27 EXECUTIVE SUMMARY Page 31 of 58 Learning Outcomes Sources(s) of
Evidence Assessment Measures
Data Collection Points
1. Identify many of the multiple and complex causes of human rights abuses including social, political, cultural, and environmental causes.
Course embedded assessment, evaluation of capstone or internship, exit survey, alumni survey
Exams, papers, and group projects. Self-reflection of capstone or internship Student and alumni surveys
End of each course Completion of capstone or internship. Completion of program and several years afterwards.
2. Apply a critical theoretical perspective in analyzing the development and function of local, national, and transnational social movements and human rights organizations.
Course embedded assessment, evaluation of capstone or internship, exit survey, alumni survey
Exams, papers, and group projects. Self-reflection of capstone or internship Student and alumni surveys
End of each course, especially HRTS 400 and 401
Completion of program and several years afterwards.
3. Evaluate best practices that activists use when working with marginalized groups to advance human rights through social movements, litigation, and direct action.
Course embedded assessment, evaluation of capstone or internship, exit survey, alumni survey
Exams, papers, and group projects. Self-reflection of capstone or internship Student and alumni surveys
End of each course, especially HRTS 400 and 401
End of Capstone or Internship Completion of program and several years afterwards.
4. Adopt and apply a general set of norms and an ethos that is essential to successful human rights practice, especially when working with marginalized groups
Course embedded assessment, evaluation of capstone or internship, exit survey, alumni survey
Project-based group work in classes. Self-reflection of capstone or internship Student and alumni surveys
End of HRTS 205, HRTS 400 and 401
End of Capstone or Internship Completion of program and several years afterwards.
5. Demonstrate the ability to locate, evaluate, and synthesize primary and secondary sources in human rights.
Course embedded assessment, evaluation of capstone or internship, exit survey, alumni survey
Papers, discussion boards, and other coursework. Evaluation of capstone (optional) Student and alumni surveys
End of each class Self-reflection of capstone or internship Completion of program and several years afterwards
*See also Learning Outcomes Attainment map below Projected Enrollment for the First Three Years: These projections were derived from comparing our program to other Online campus programs within the College of Social & Behavioral Sciences, such as the BA degrees in Law, Communication, and Information Science & eSociety, and the BS degrees in GIS Technology, and Care, Health & Society. Because of the large shift in support for online education, if a
1st Year 2nd Year 3rd Year Number of Students in major 20 40 60
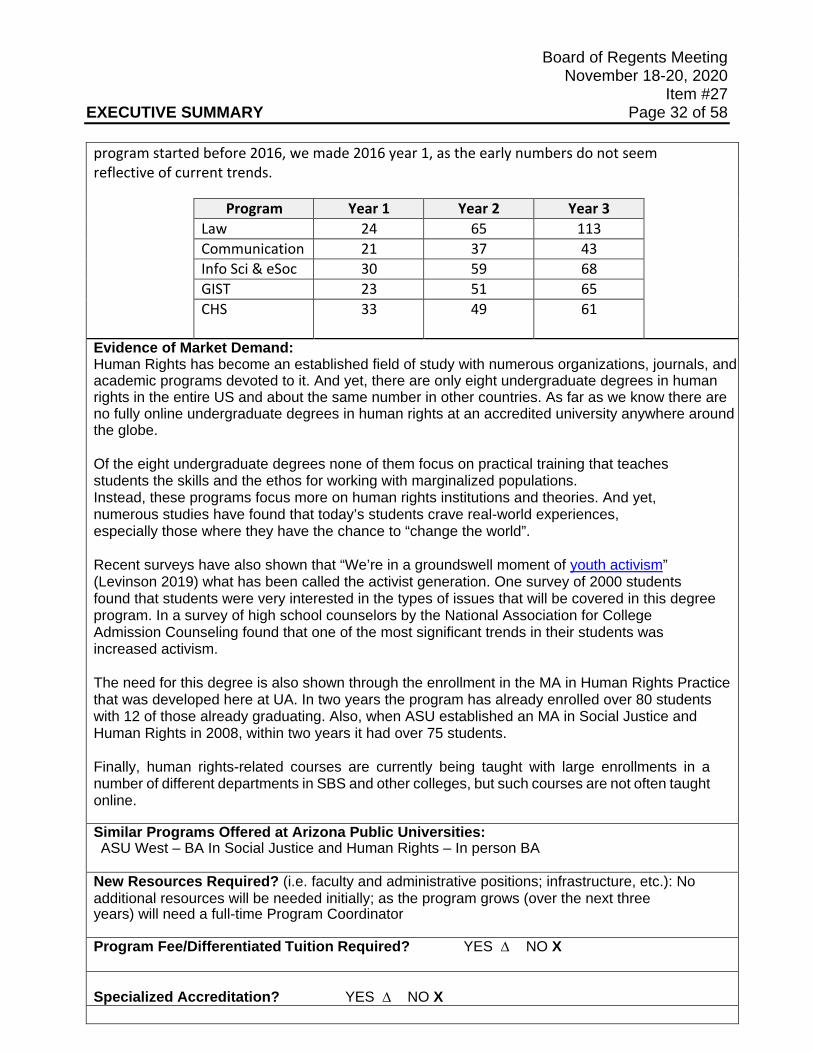
Board of Regents Meeting November 18-20, 2020 Item #27 EXECUTIVE SUMMARY Page 32 of 58
program started before 2016, we made 2016 year 1, as the early numbers do not seem reflective of current trends.
Program Year 1 Year 2 Year 3 Law 24 65 113 Communication 21 37 43 Info Sci & eSoc 30 59 68 GIST 23 51 65 CHS 33 49 61
Evidence of Market Demand: Human Rights has become an established field of study with numerous organizations, journals, and academic programs devoted to it. And yet, there are only eight undergraduate degrees in human rights in the entire US and about the same number in other countries. As far as we know there are no fully online undergraduate degrees in human rights at an accredited university anywhere around the globe.
Of the eight undergraduate degrees none of them focus on practical training that teaches students the skills and the ethos for working with marginalized populations. Instead, these programs focus more on human rights institutions and theories. And yet, numerous studies have found that today’s students crave real-world experiences, especially those where they have the chance to “change the world”.
Recent surveys have also shown that “We’re in a groundswell moment of youth activism” (Levinson 2019) what has been called the activist generation. One survey of 2000 students found that students were very interested in the types of issues that will be covered in this degree program. In a survey of high school counselors by the National Association for College Admission Counseling found that one of the most significant trends in their students was increased activism.
The need for this degree is also shown through the enrollment in the MA in Human Rights Practice that was developed here at UA. In two years the program has already enrolled over 80 students with 12 of those already graduating. Also, when ASU established an MA in Social Justice and Human Rights in 2008, within two years it had over 75 students.
Finally, human rights-related courses are currently being taught with large enrollments in a number of different departments in SBS and other colleges, but such courses are not often taught online.
Similar Programs Offered at Arizona Public Universities: ASU West – BA In Social Justice and Human Rights – In person BA
New Resources Required? (i.e. faculty and administrative positions; infrastructure, etc.): No additional resources will be needed initially; as the program grows (over the next three years) will need a full-time Program Coordinator Program Fee/Differentiated Tuition Required? YES ∆ NO X Specialized Accreditation? YES ∆ NO X
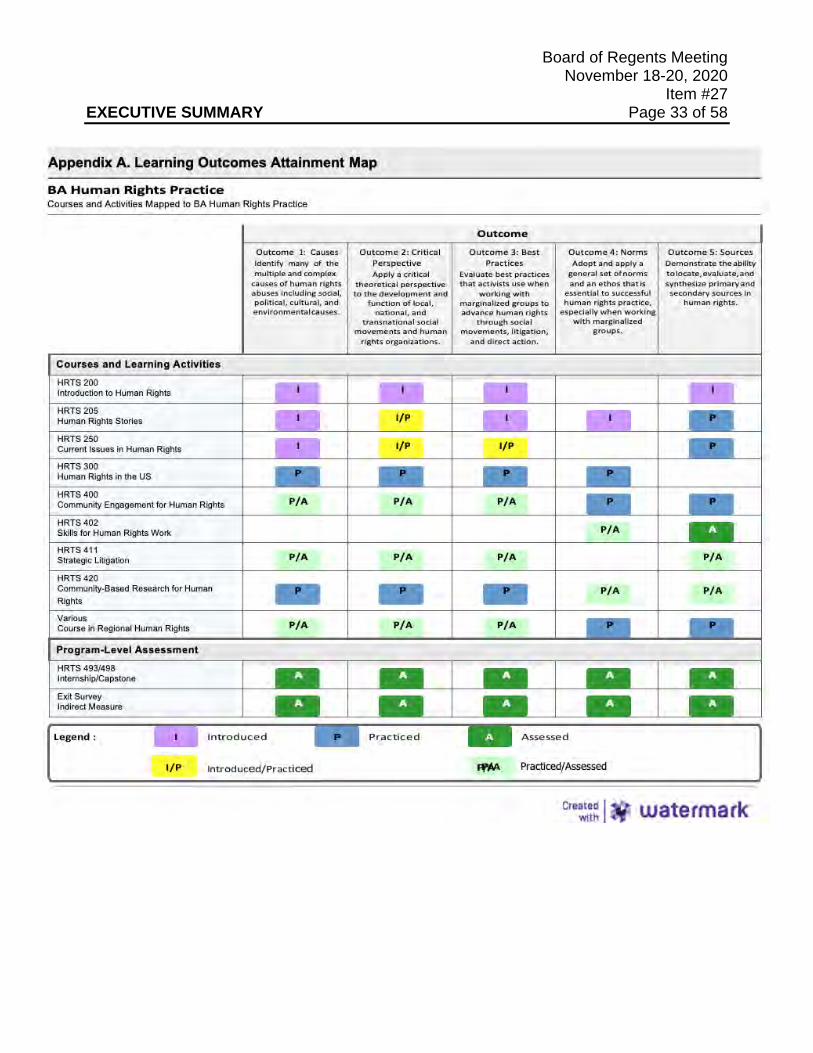
Board of Regents Meeting November 18-20, 2020 Item #27 EXECUTIVE SUMMARY Page 33 of 58
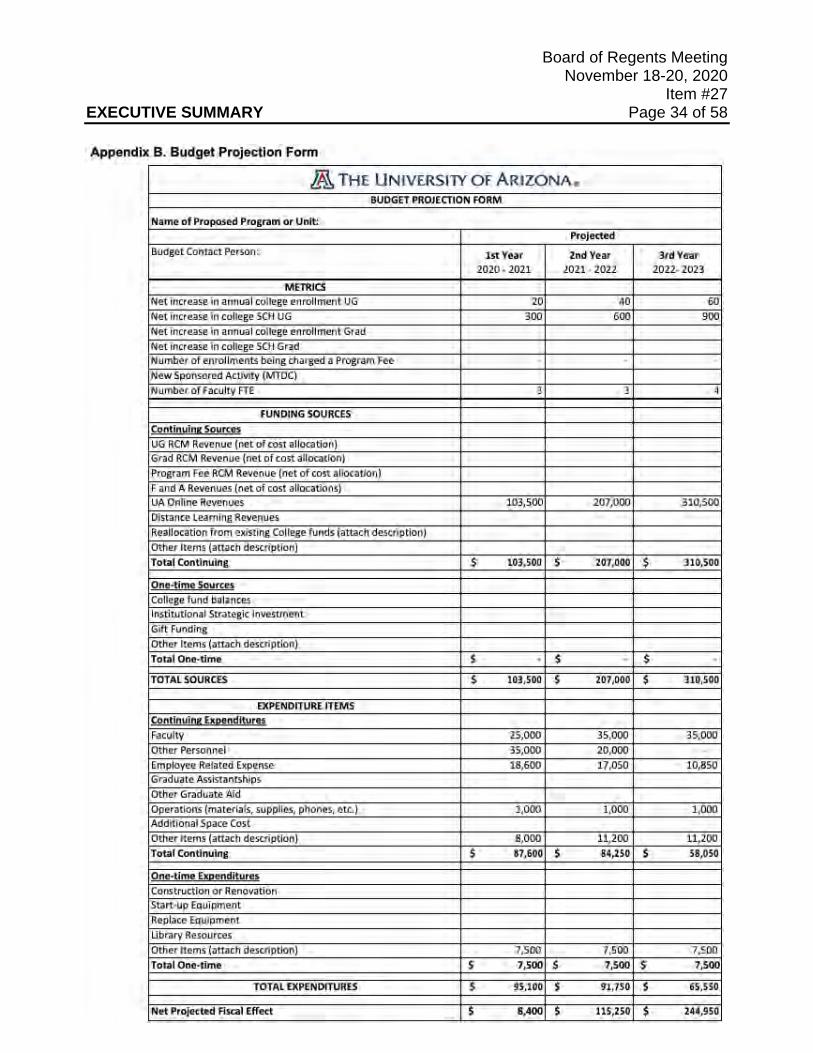
Board of Regents Meeting November 18-20, 2020 Item #27 EXECUTIVE SUMMARY Page 34 of 58
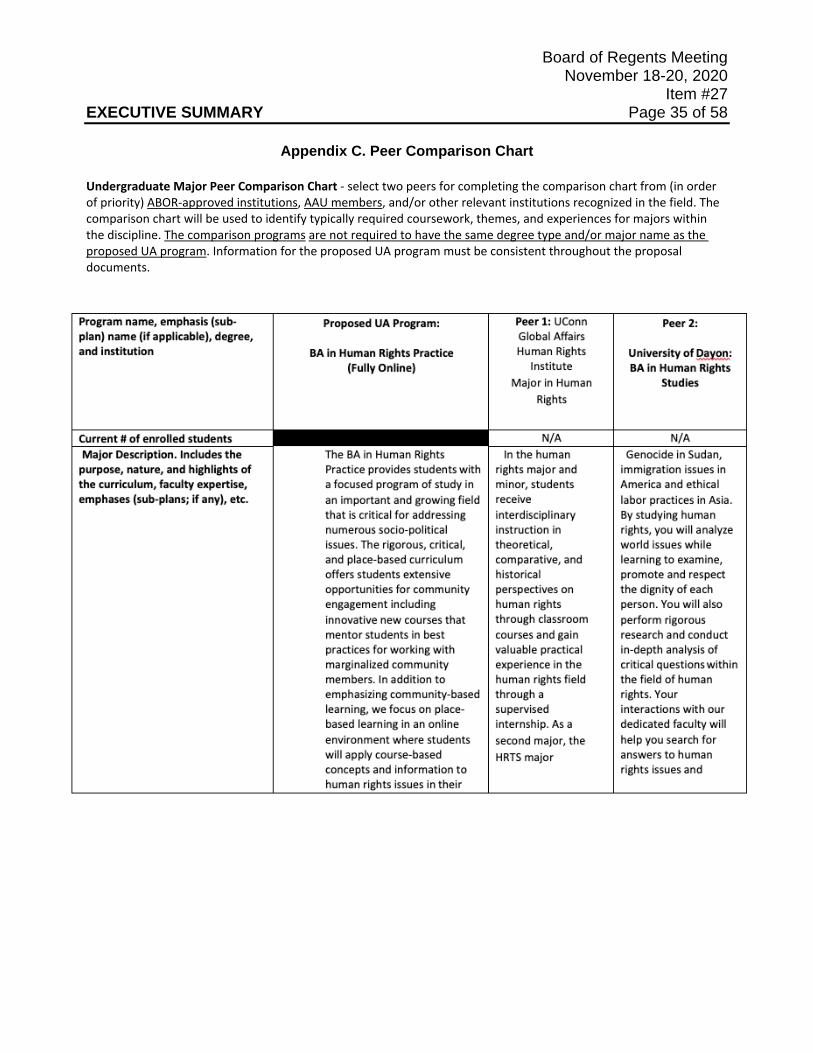
Board of Regents Meeting November 18-20, 2020 Item #27 EXECUTIVE SUMMARY Page 35 of 58
Appendix C. Peer Comparison Chart Undergraduate Major Peer Comparison Chart - select two peers for completing the comparison chart from (in order of priority) ABOR-approved institutions, AAU members, and/or other relevant institutions recognized in the field. The comparison chart will be used to identify typically required coursework, themes, and experiences for majors within the discipline. The comparison programs are not required to have the same degree type and/or major name as the proposed UA program. Information for the proposed UA program must be consistent throughout the proposal documents.
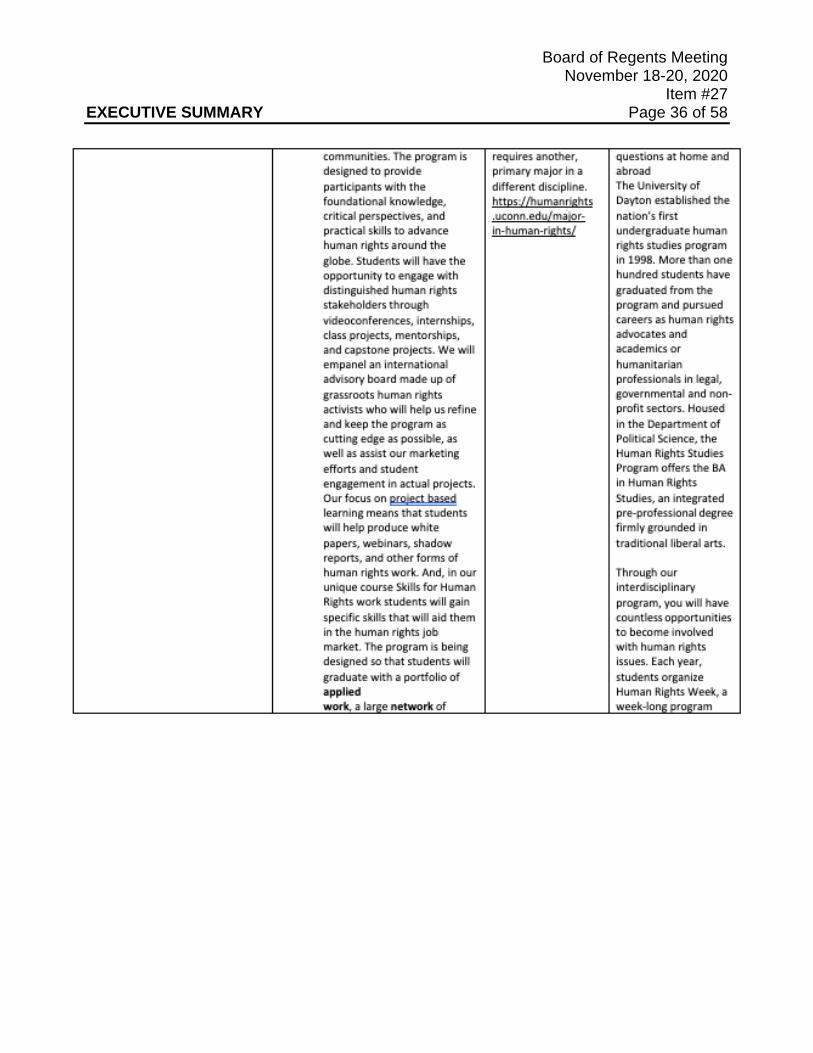
Board of Regents Meeting November 18-20, 2020 Item #27 EXECUTIVE SUMMARY Page 36 of 58
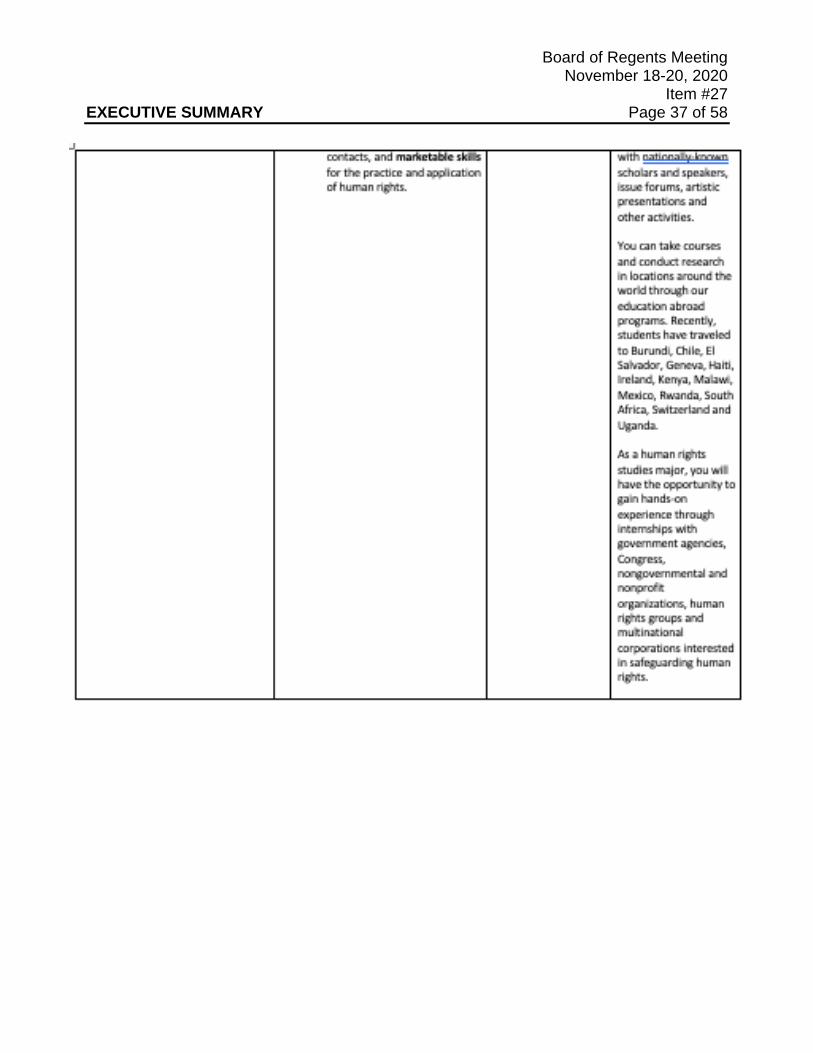
Board of Regents Meeting November 18-20, 2020 Item #27 EXECUTIVE SUMMARY Page 37 of 58
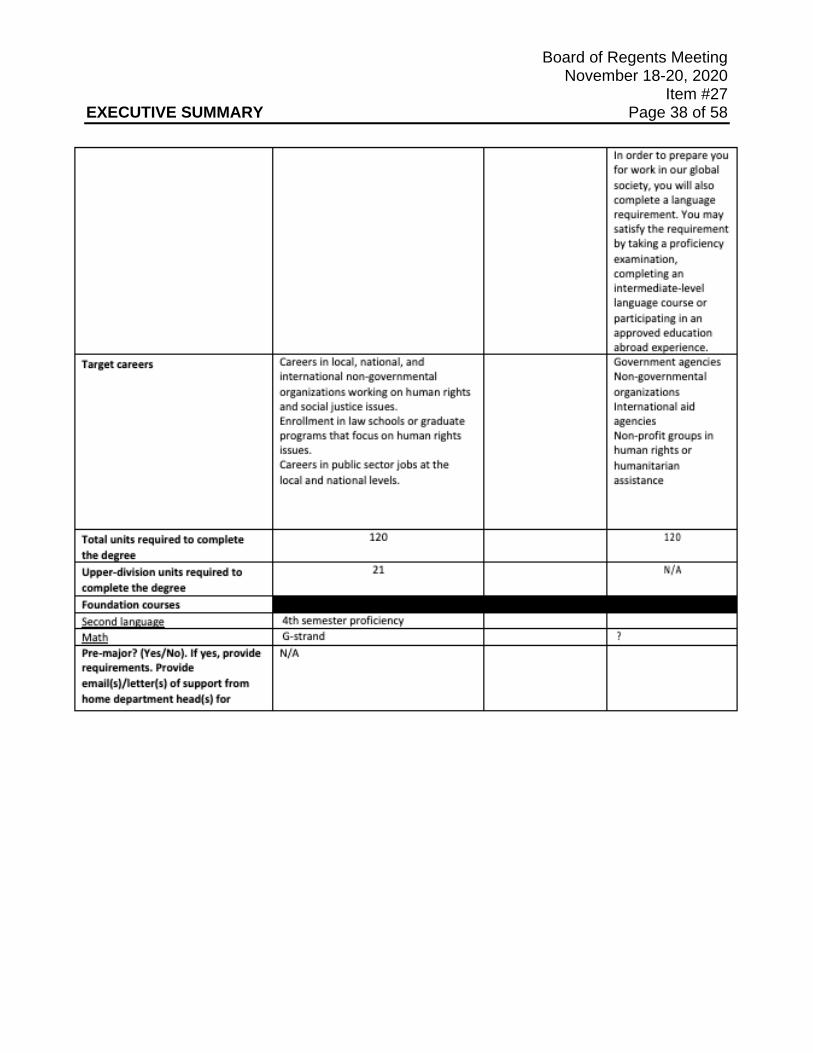
Board of Regents Meeting November 18-20, 2020 Item #27 EXECUTIVE SUMMARY Page 38 of 58
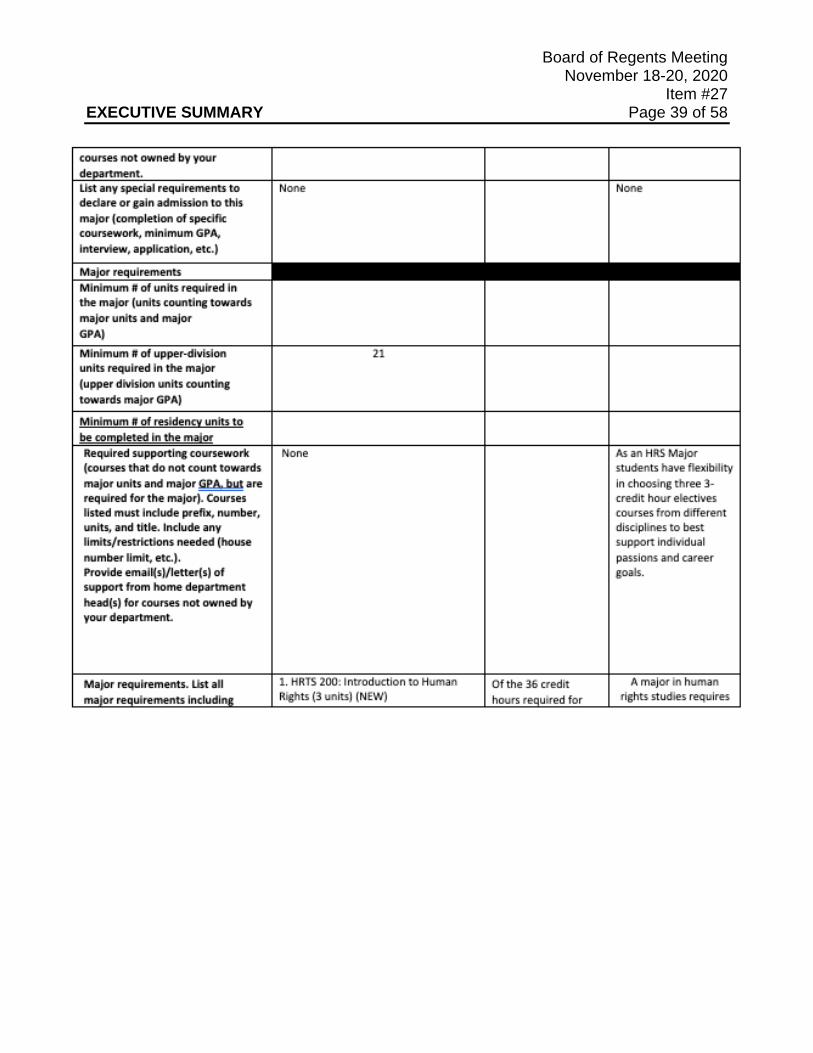
Board of Regents Meeting November 18-20, 2020 Item #27 EXECUTIVE SUMMARY Page 39 of 58
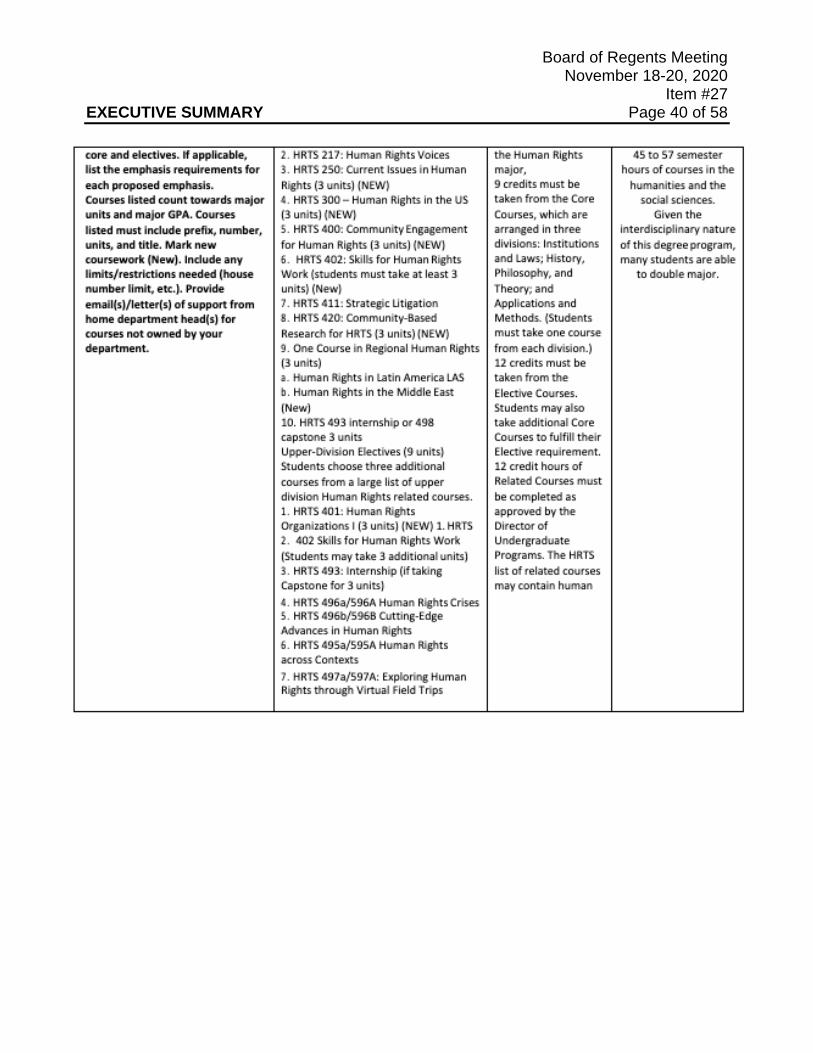
Board of Regents Meeting November 18-20, 2020 Item #27 EXECUTIVE SUMMARY Page 40 of 58
Board of Regents Meeting November 18-20, 2020 Item #27 EXECUTIVE SUMMARY Page 41 of 58
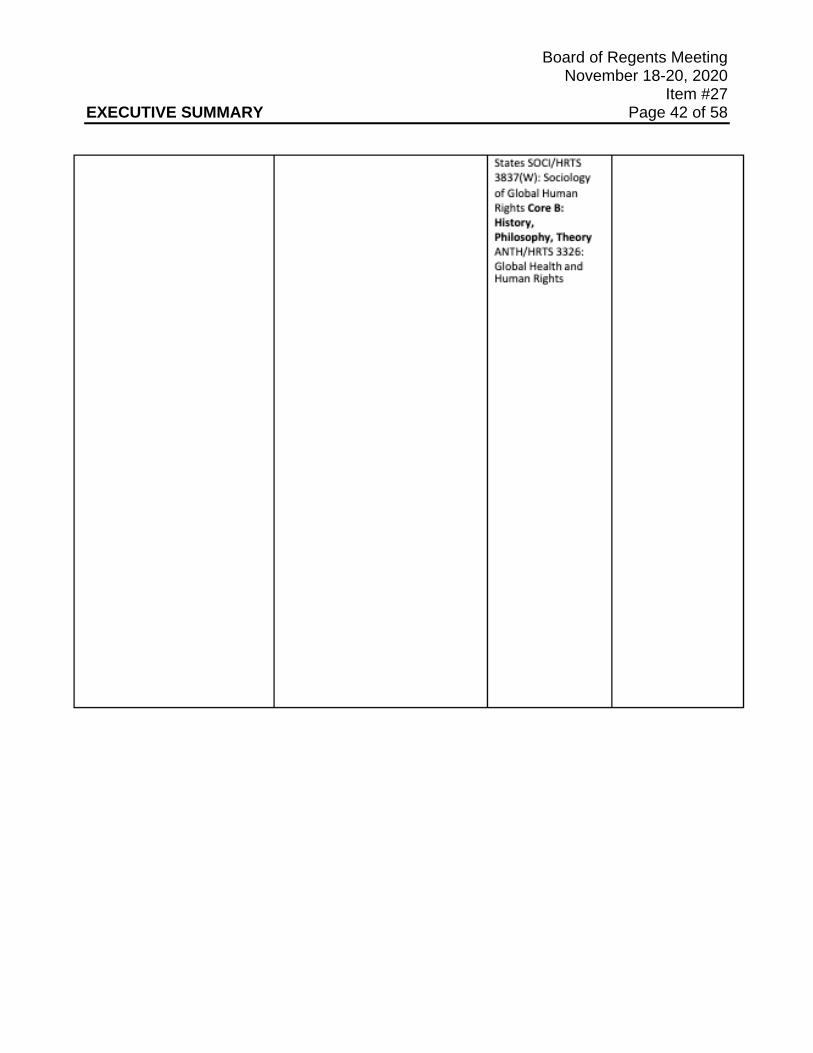
Board of Regents Meeting November 18-20, 2020 Item #27 EXECUTIVE SUMMARY Page 42 of 58
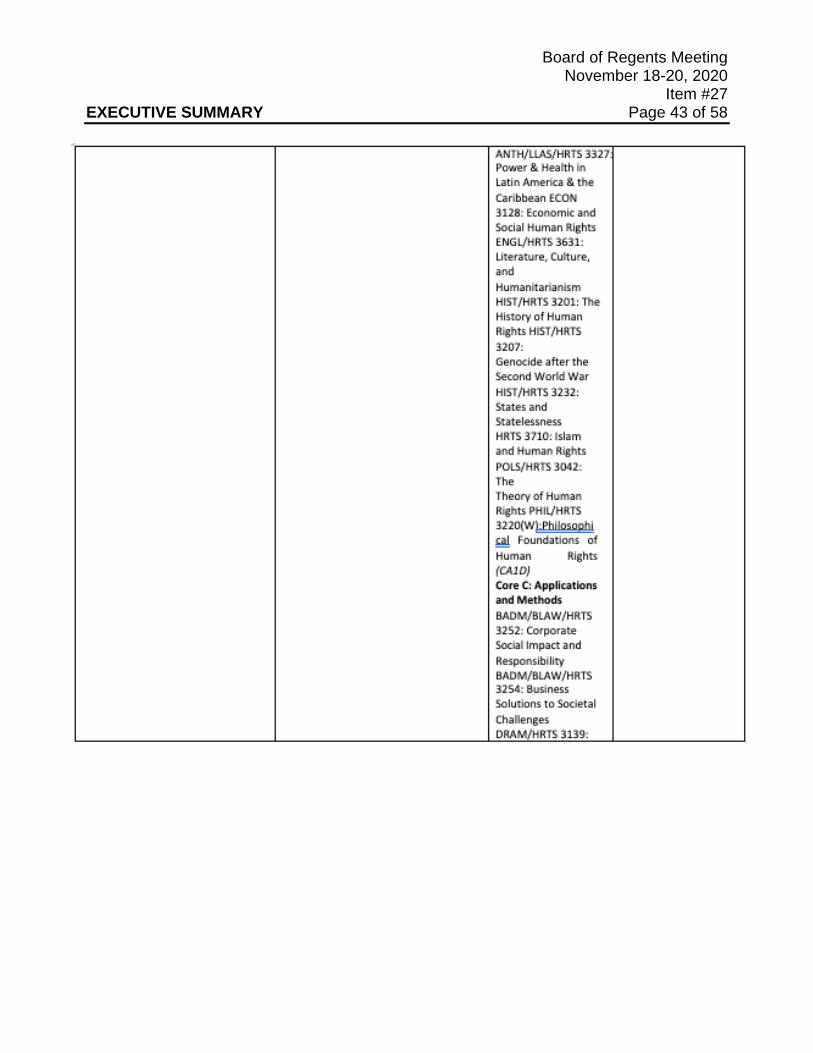
Board of Regents Meeting November 18-20, 2020 Item #27 EXECUTIVE SUMMARY Page 43 of 58
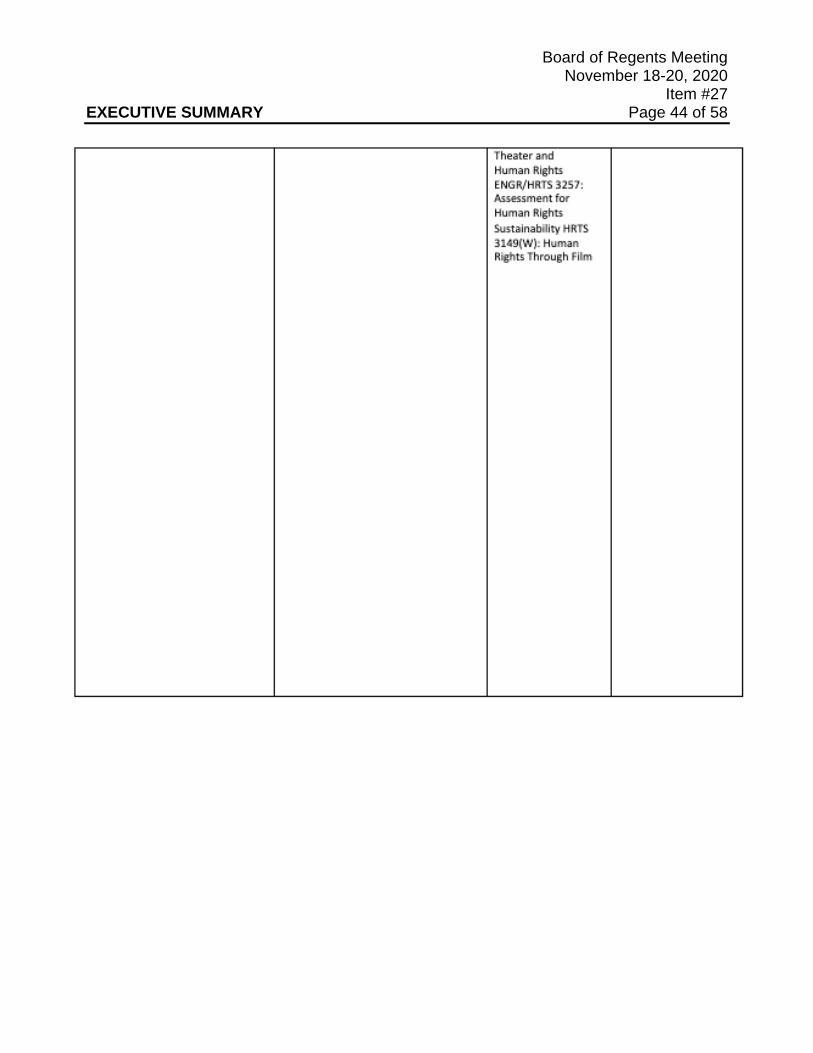
Board of Regents Meeting November 18-20, 2020 Item #27 EXECUTIVE SUMMARY Page 44 of 58
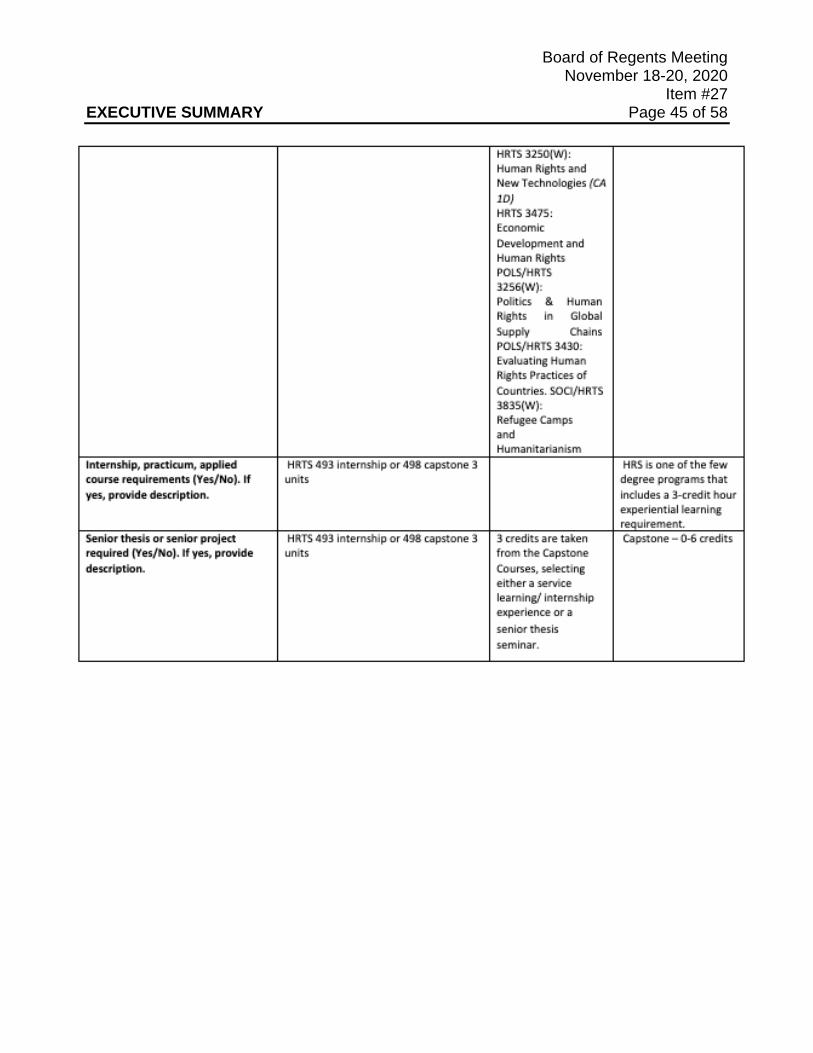
Board of Regents Meeting November 18-20, 2020 Item #27 EXECUTIVE SUMMARY Page 45 of 58
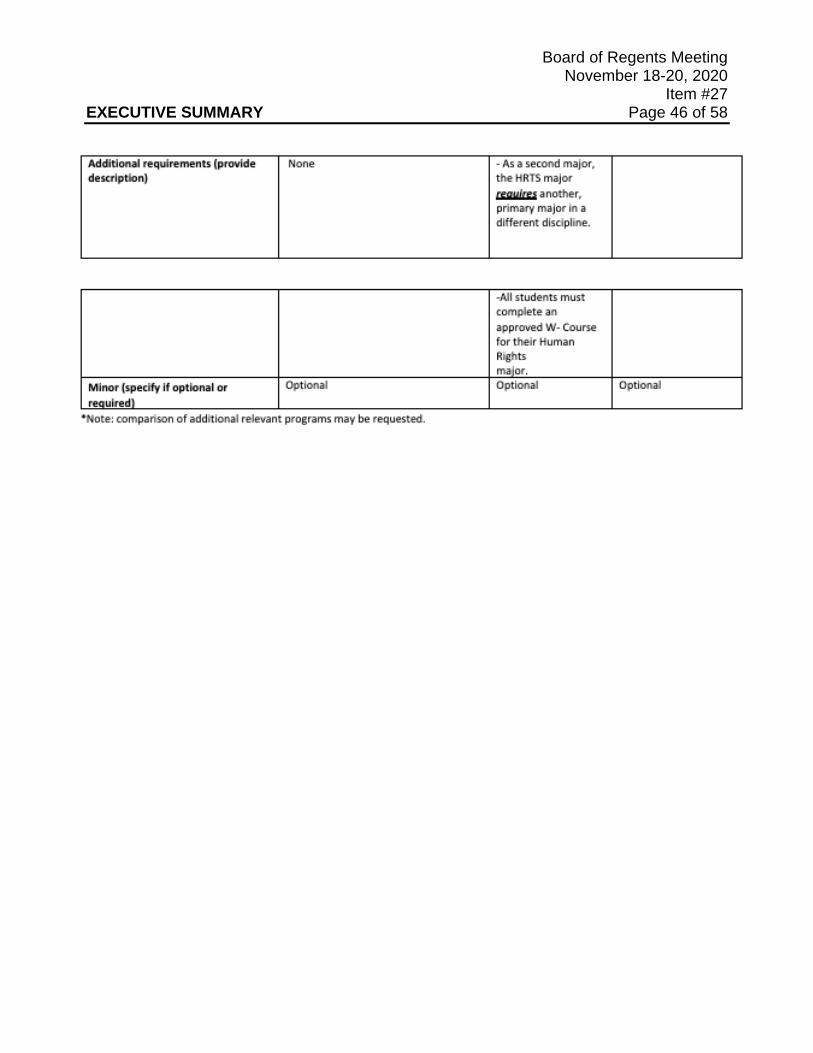
Board of Regents Meeting November 18-20, 2020 Item #27 EXECUTIVE SUMMARY Page 46 of 58
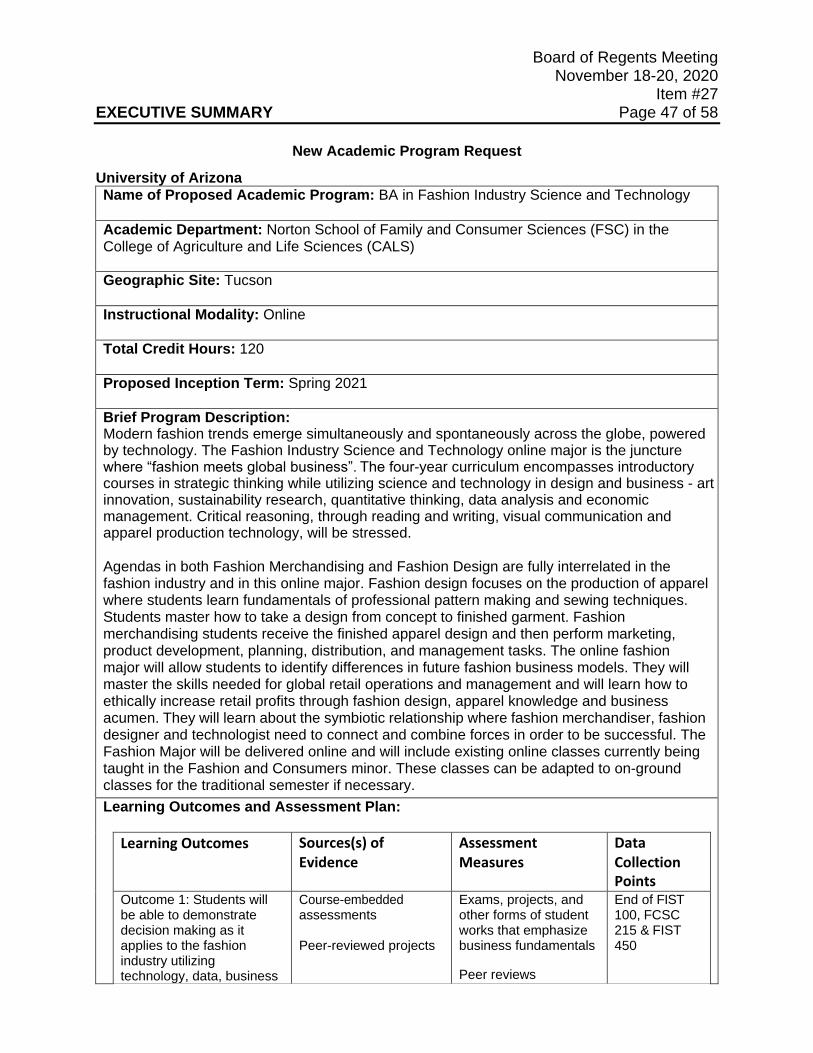
Board of Regents Meeting November 18-20, 2020 Item #27 EXECUTIVE SUMMARY Page 47 of 58
New Academic Program Request
University of Arizona Name of Proposed Academic Program: BA in Fashion Industry Science and Technology
Academic Department: Norton School of Family and Consumer Sciences (FSC) in the College of Agriculture and Life Sciences (CALS)
Geographic Site: Tucson
Instructional Modality: Online
Total Credit Hours: 120
Proposed Inception Term: Spring 2021
Brief Program Description: Modern fashion trends emerge simultaneously and spontaneously across the globe, powered by technology. The Fashion Industry Science and Technology online major is the juncture where “fashion meets global business”. The four-year curriculum encompasses introductory courses in strategic thinking while utilizing science and technology in design and business - art innovation, sustainability research, quantitative thinking, data analysis and economic management. Critical reasoning, through reading and writing, visual communication and apparel production technology, will be stressed.
Agendas in both Fashion Merchandising and Fashion Design are fully interrelated in the fashion industry and in this online major. Fashion design focuses on the production of apparel where students learn fundamentals of professional pattern making and sewing techniques. Students master how to take a design from concept to finished garment. Fashion merchandising students receive the finished apparel design and then perform marketing, product development, planning, distribution, and management tasks. The online fashion major will allow students to identify differences in future fashion business models. They will master the skills needed for global retail operations and management and will learn how to ethically increase retail profits through fashion design, apparel knowledge and business acumen. They will learn about the symbiotic relationship where fashion merchandiser, fashion designer and technologist need to connect and combine forces in order to be successful. The Fashion Major will be delivered online and will include existing online classes currently being taught in the Fashion and Consumers minor. These classes can be adapted to on-ground classes for the traditional semester if necessary. Learning Outcomes and Assessment Plan:
Learning Outcomes Sources(s) of Evidence
Assessment Measures
Data Collection Points
Outcome 1: Students will be able to demonstrate decision making as it applies to the fashion industry utilizing technology, data, business
Course-embedded assessments
Peer-reviewed projects
Exams, projects, and other forms of student works that emphasize business fundamentals
Peer reviews
End of FIST 100, FCSC 215 & FIST 450
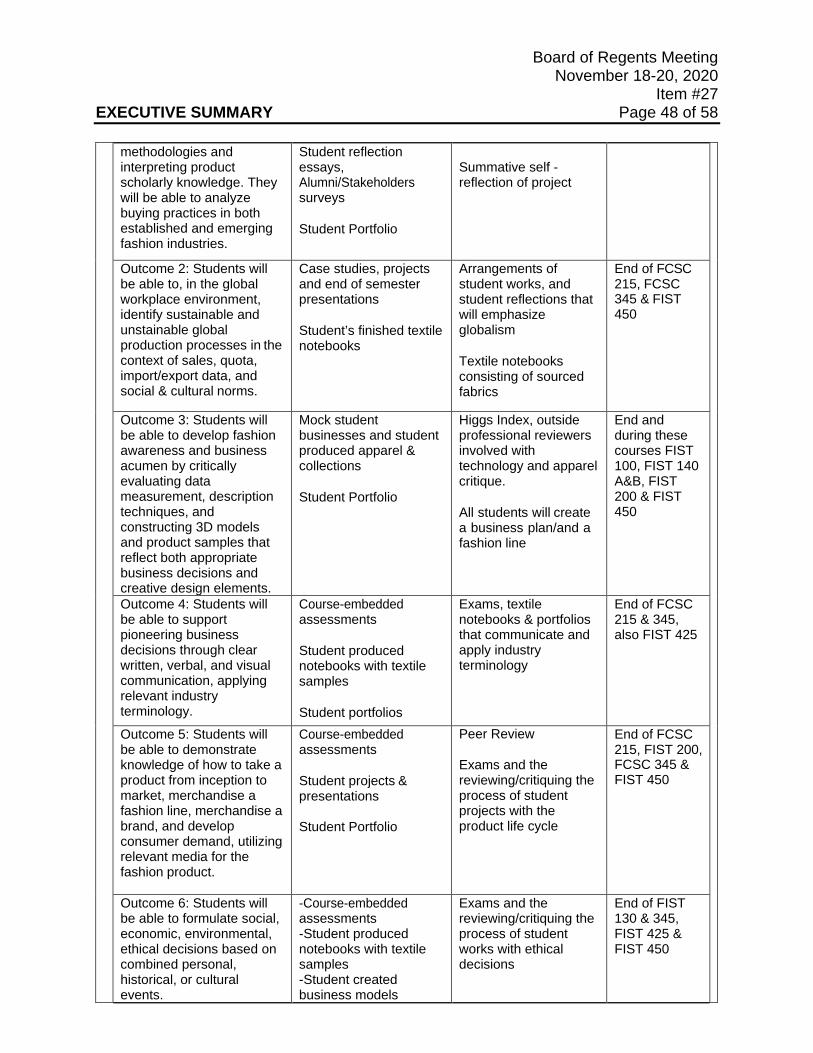
Board of Regents Meeting November 18-20, 2020 Item #27 EXECUTIVE SUMMARY Page 48 of 58
methodologies and interpreting product scholarly knowledge. They will be able to analyze buying practices in both established and emerging fashion industries.
Student reflection essays, Alumni/Stakeholders surveys
Student Portfolio
Summative self - reflection of project
Outcome 2: Students will be able to, in the global workplace environment, identify sustainable and unstainable global production processes in the context of sales, quota, import/export data, and social & cultural norms.
Case studies, projects and end of semester presentations
Student’s finished textile notebooks
Arrangements of student works, and student reflections that will emphasize globalism
Textile notebooks consisting of sourced fabrics
End of FCSC 215, FCSC 345 & FIST 450
Outcome 3: Students will be able to develop fashion awareness and business acumen by critically evaluating data measurement, description techniques, and constructing 3D models and product samples that reflect both appropriate business decisions and creative design elements.
Mock student businesses and student produced apparel & collections
Student Portfolio
Higgs Index, outside professional reviewers involved with technology and apparel critique.
All students will create a business plan/and a fashion line
End and during these courses FIST 100, FIST 140 A&B, FIST 200 & FIST 450
Outcome 4: Students will be able to support pioneering business decisions through clear written, verbal, and visual communication, applying relevant industry terminology.
Course-embedded assessments
Student produced notebooks with textile samples
Student portfolios
Exams, textile notebooks & portfolios that communicate and apply industry terminology
End of FCSC 215 & 345, also FIST 425
Outcome 5: Students will be able to demonstrate knowledge of how to take a product from inception to market, merchandise a fashion line, merchandise a brand, and develop consumer demand, utilizing relevant media for the fashion product.
Course-embedded assessments
Student projects & presentations
Student Portfolio
Peer Review Exams and the reviewing/critiquing the process of student projects with the product life cycle
End of FCSC 215, FIST 200, FCSC 345 & FIST 450
Outcome 6: Students will be able to formulate social, economic, environmental, ethical decisions based on combined personal, historical, or cultural events.
-Course-embedded assessments -Student produced notebooks with textile samples -Student created business models
Exams and the reviewing/critiquing the process of student works with ethical decisions
End of FIST 130 & 345, FIST 425 & FIST 450
Board of Regents Meeting November 18-20, 2020 Item #27 EXECUTIVE SUMMARY Page 49 of 58
Student Portfolio
*See also Learning Outcomes Attainment Map below
Projected Enrollment for the First Three Years:
Evidence used to determine projected enrollment numbers: Currently, the Fashion and Consumers minor (offered online during summer) has 168 students enrolled. It’s expected that half or more of these students will join the major once it is offered. A survey conducted of students in the introductory fashion courses indicated 73.5% would be interested in pursuing the major. It’s also expected that the program will attract new students to the university, as a new area of study with the reach and accessibility of online learning. Evidence of Market Demand: Fashions may change, but fashion, with a global worth of $2.5 trillion and projected annual growth of 4.3% (McKinsey & Co., 2019) is and will remain a major global industry.
The United States employs more than 1.8 million people (U.S. Congress JEC, 2019 ) in careers as fashion designers, art directors, information analysts, business operations specialists, buyers, pattern makers and designers in industries such as apparel and textile manufacturing, apparel, piece goods, and notions merchant wholesalers, clothing and clothing accessories stores, electronic shopping houses, information, professional, scientific, and technical services, and specialized design services (Table 1).
Consumer expenditures for clothing and footwear contributed $391.5 billion, in 2018, to GDP, accounting for 13.6% of nondurable goods consumption. These expenditures have grown 17.7% over the past seven years (Chart 1).
But while the industry is a powerful economic force, there is no denying that the fashion industry is changing. According to a survey by McKinsey & Co. (2019), executives described the industry as becoming digital, and fast. They also identified challenges facing the industry, such as: (1) dealing with volatility, uncertainty, and shifts in the global economy, and (2) the need to achieve greater sustainability and transparency.
These results make a clear case for a major that can meet the labor demands of a growing industry by producing graduates with data-analysis and decision-making skills, fashion awareness and business acumen and a global awareness.
While the pace of change in the fashion industry is remarkable, many of the occupations it encompasses are relatively immune to replacement by automated processes and artificial intelligences. According to landmark research by Frey and Osborne (2013), art directors, fashion designers, pattern makers, and purchasing managers have among the lowest probabilities of being replaced by computerized processes across all detailed occupation groups in the U.S. Thus, graduates will be well positioned to take advantage of new job openings in the coming decades.
Artificial intelligences are unlikely to be strong competitors for these jobs because they require high levels of creativity, problem-solving and advanced-digital skills, as well as social intelligence.
1st Year 2nd Year 3rd Year Number of Students in major 100 200 300
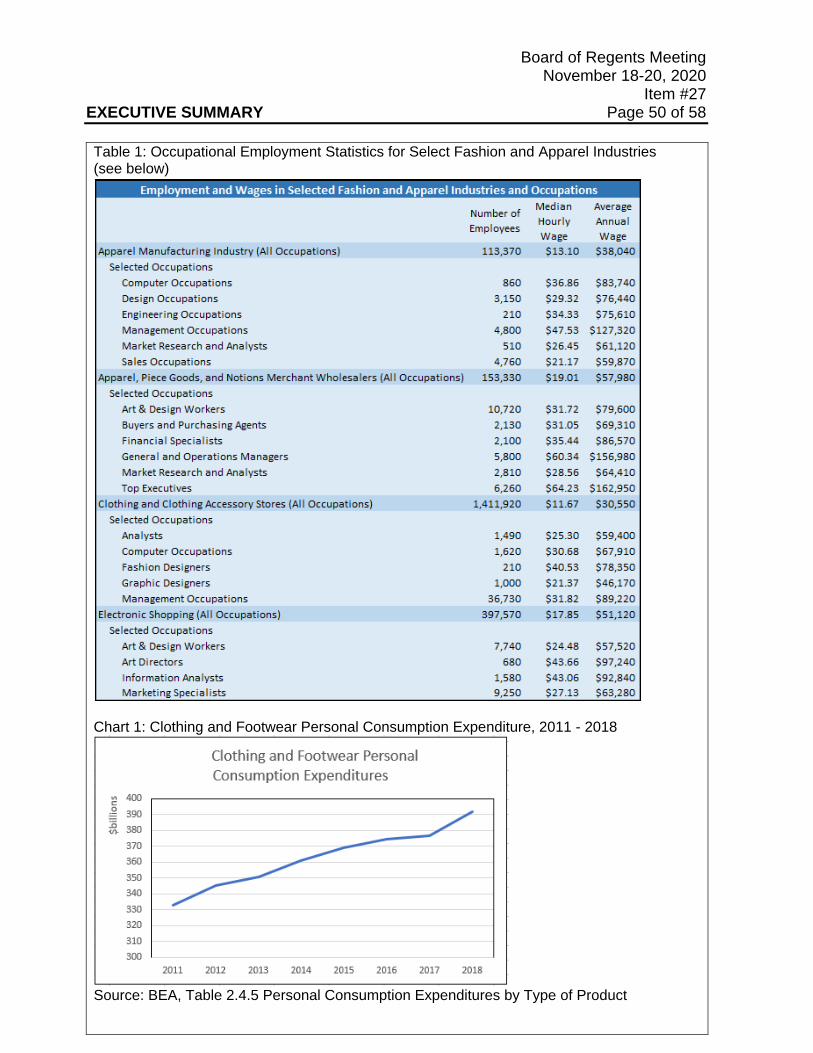
Board of Regents Meeting November 18-20, 2020 Item #27 EXECUTIVE SUMMARY Page 50 of 58 Table 1: Occupational Employment Statistics for Select Fashion and Apparel Industries (see below)
Chart 1: Clothing and Footwear Personal Consumption Expenditure, 2011 - 2018
Source: BEA, Table 2.4.5 Personal Consumption Expenditures by Type of Product
Board of Regents Meeting November 18-20, 2020 Item #27 EXECUTIVE SUMMARY Page 51 of 58 References Frey, C.B. & Osborne, M.A. (2013). The future of employment: how susceptible are jobs to computerization? Technology Forecasting and Social Change, 114, 254-280. McKinsey & Company, 2019. The State of Fashion 2019. Retrieved from: https://www.mckinsey.com/industries/retail/our-insights/the-state-of-fashion-2019-a-year-of- awakening U.S. Congress Joint Economic Committee, 2019. The Economic Impact of the Fashion Industry. Similar Programs Offered at Arizona Public Universities:
The proposed Fashion Industry Science and Technology (FIST) program will be the first online fashion program offered in the state of Arizona. This program will emphasize the use of data analysis, digital software skills and ethical practices. The closest traditional fashion programs offered in the Arizona Public Universities are listed below and the description are copied from each school websites:
University of Arizona: The BA in Applied Humanities provides students interested in fields such as business, fashion, public health, and design -- all among the most dynamic careers in the world today, and marked by sustained high job availability according to the World Economic Forum's Global Challenge Insight Report -- with a transdisciplinary education combining professional skills in these areas with the cognitive, creative, international, interpersonal, and intercultural skills taught in the humanities, skills that offer a vital edge in these and other rapidly changing professions. Students will also study and practice the variety of organizational, collaborative, and leadership skills that are most often used in administrative contexts, including the development of mission/vision/outreach plans, commercial sponsorships, customer and project management, and public speaking. [Note: The major offers a Fashion emphasis, which uses 18 units of coursework offered by Norton School for the Fashion and Consumers minor.]
Arizona State University (ASU): The BA in Fashion is located at the Tempe campus. It is in the College/School of Herberger Institute for Design and the Arts. The fashion program at ASU combines history, business practices and hands-on studio experience to prepare students for a variety of roles in this global industry. Gaining a proficiency in illustration skills, fluency with materials, traditional techniques and digital technologies, students are prepared for interdisciplinary collaborations through focus tracks in marketing and merchandising, wearable technology, sustainability, management and leadership, international experience, and fashion and culture. In the capstone experience, students develop a substantial project within their focus area. Opportunities for internships and study abroad further advance students' professional goals.
New Resources Required? (i.e. faculty and administrative positions; infrastructure, etc.): There are no anticipated existing physical facilities needed for the online major. As the program develops and expand there will be software to purchase on Product Life Management, and other new technical software for fashion industries. Other support needed, next three years: a) Academic advising support .25 FTE b) Stipend for program administration .15 FTE c) ITAA membership $150/year d) Adjunct hires at $5,000 per course e) TPAC accreditation $500.00 f) New software as it develops for the fashion industry
Board of Regents Meeting November 18-20, 2020 Item #27 EXECUTIVE SUMMARY Page 52 of 58 Additional faculty: Need for additional faculty will include a POP hire to teach the new Apparel Influencer course and serve as back-up for other classes in the major and established minor. We are currently in the process of a spousal hire at 1.0 FTE. A current lecturer will increase from .25 to 1.0 FTE. Adjunct professors as needed. Adjunct lecturer in order to teach the new class in Adobe multimedia classes .25 FTE.
Program Fee/Differentiated Tuition Required? YES X NO ∆
Estimated Amount: $250.00
Program Fee Justification: Program fees will directly be tied to professional development resources, courses, and opportunities available to students once they reach advanced standing. These opportunities include the experiential learning and electives which integrate technology with hands-on development. In addition, students within the major will have access to the sewing lab and apparel construction technology and tools. The program fee will be assessed once they reach advanced standing and will be assessed once students enroll in FCSC 345.
Specialized Accreditation? YES X NO ∆ After one year of the major being active, we will be applying for an accreditation through TAPAC. TAPAC, the Textile and Apparel Programs Accreditation Commission, is the official accrediting organization for baccalaureate level programs in textiles, apparel, and related areas. The Purpose of TAPAC is to establish standards for the recognition of textile and apparel- related programs and through a peer review process, evaluate the characteristics and performance of individual programs against these established standards. Emphasis in the standards is on assessment of student learning outcomes and the program attributes that contribute to achievement of student learning outcomes. The Vision of TAPAC is to ensure outstanding higher education that advances excellence of the textile and apparel profession. The Mission of TAPAC is to provide quality assessment and quality enhancement of programs in textiles and apparel and related areas. Programs Eligible for TAPAC accreditation consideration include higher education programs in Textiles and Apparel and Related Areas. The Commission recognizes that a single program name does not accommodate all configurations of relevant curricula. Textiles and Apparel programs or programs in Related Areas that have content areas compatible with the TAPAC academic standards may be eligible for TAPAC accreditation.
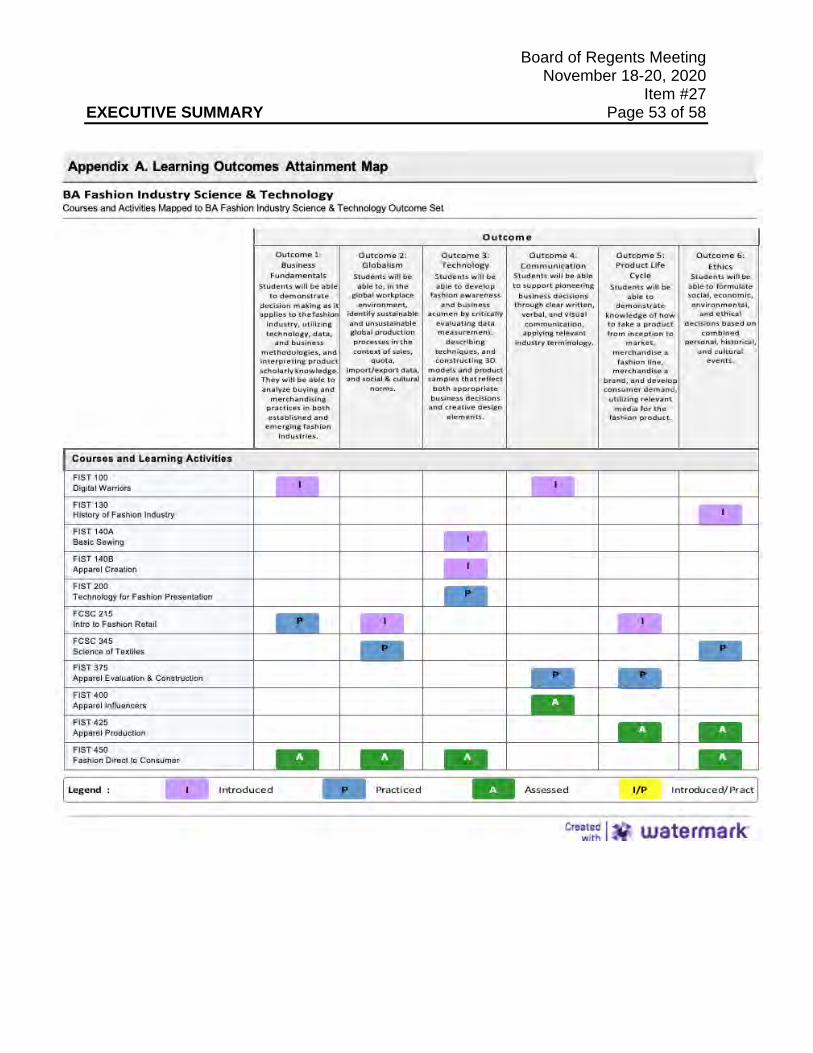
Board of Regents Meeting November 18-20, 2020 Item #27 EXECUTIVE SUMMARY Page 53 of 58
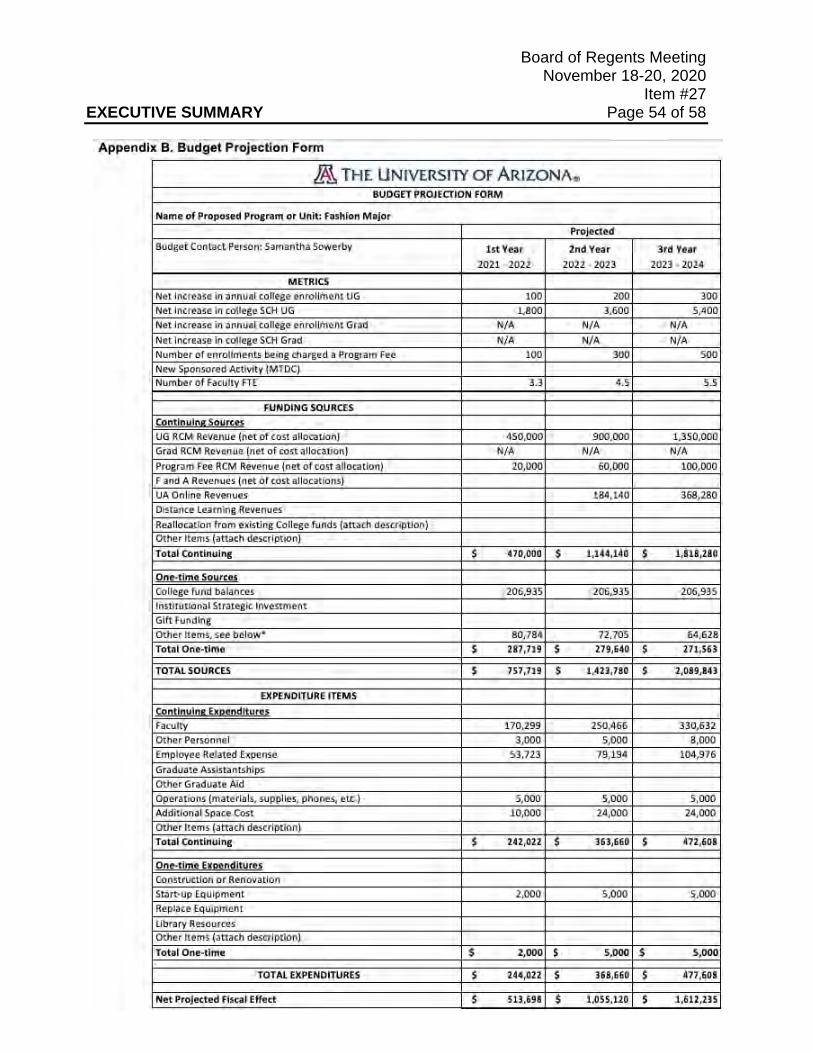
Board of Regents Meeting November 18-20, 2020 Item #27 EXECUTIVE SUMMARY Page 54 of 58
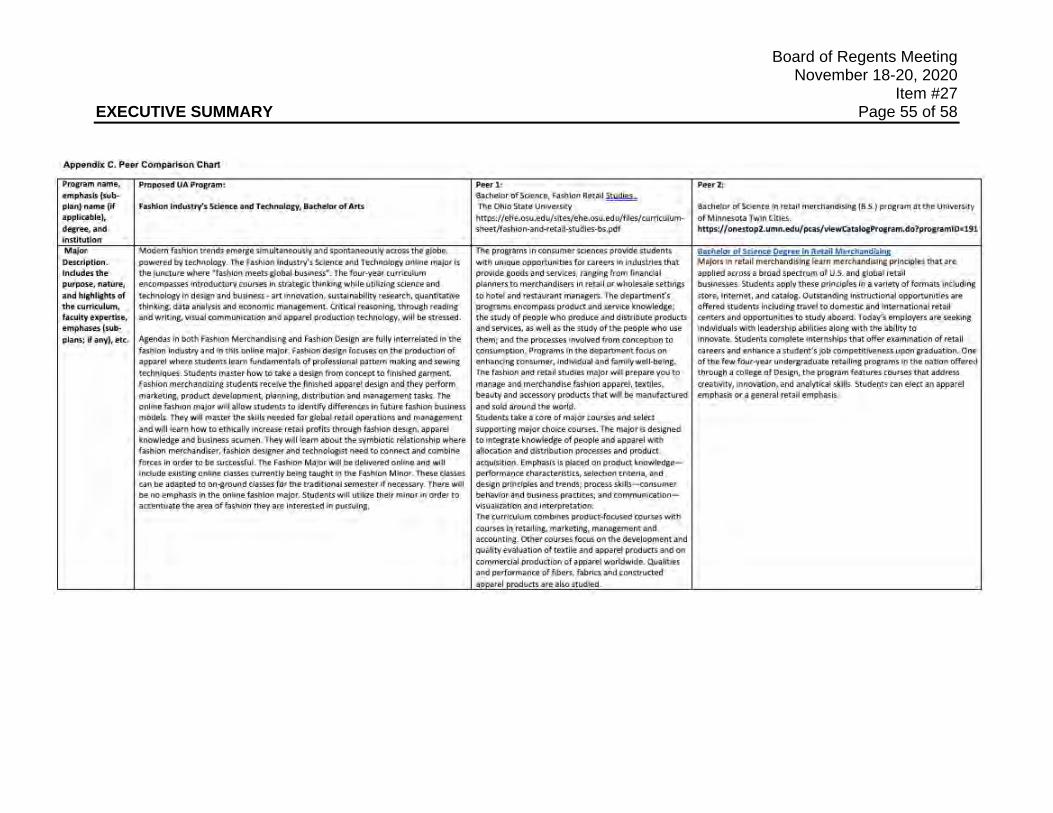
Board of Regents Meeting November 18-20, 2020 Item #27 EXECUTIVE SUMMARY Page 55 of 58
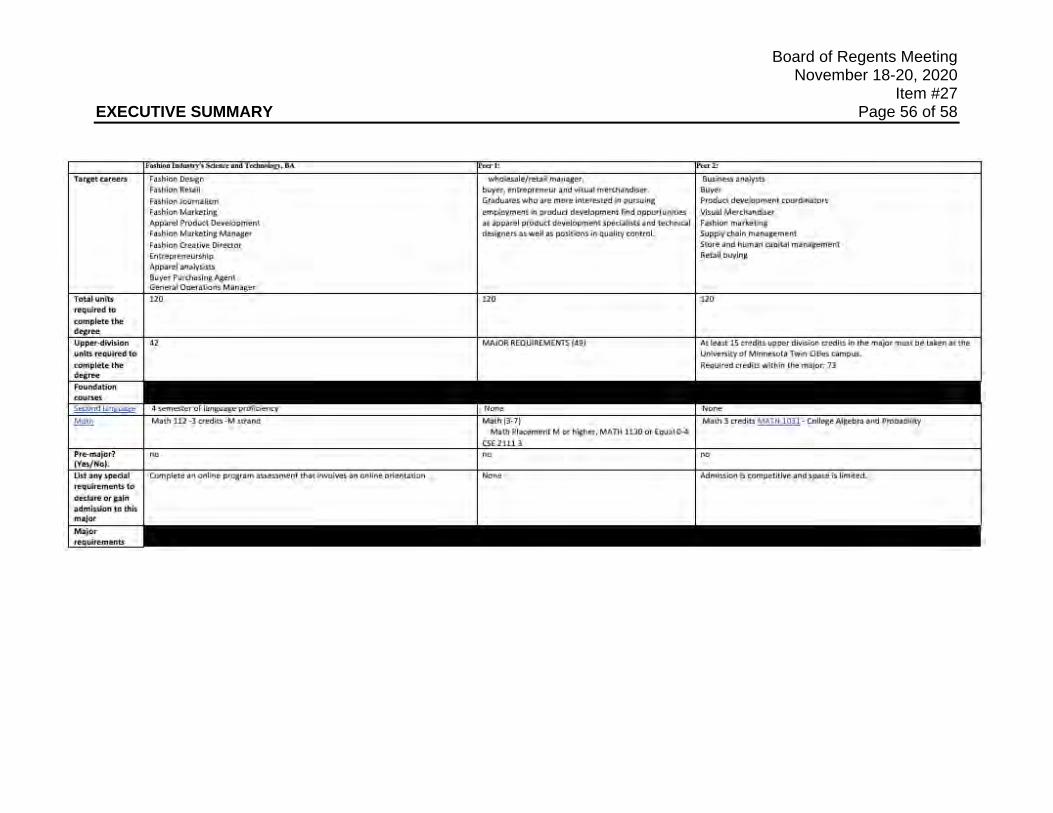
Board of Regents Meeting November 18-20, 2020 Item #27 EXECUTIVE SUMMARY Page 56 of 58
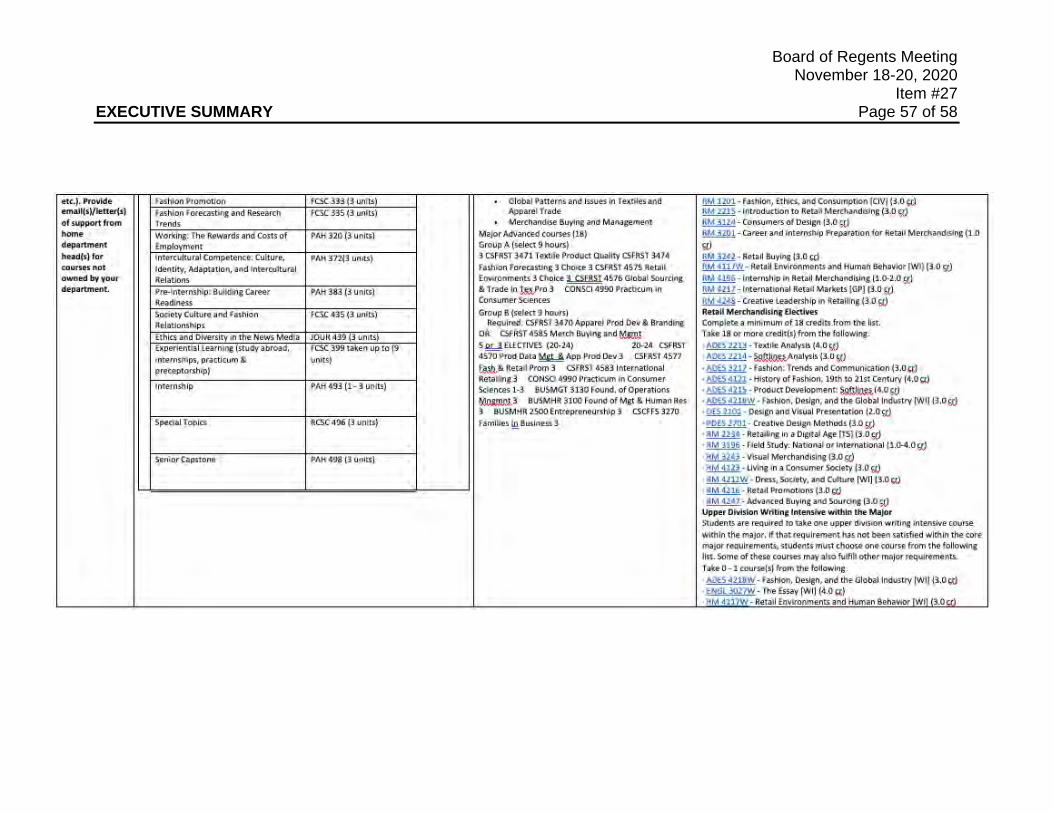
Board of Regents Meeting November 18-20, 2020 Item #27 EXECUTIVE SUMMARY Page 57 of 58
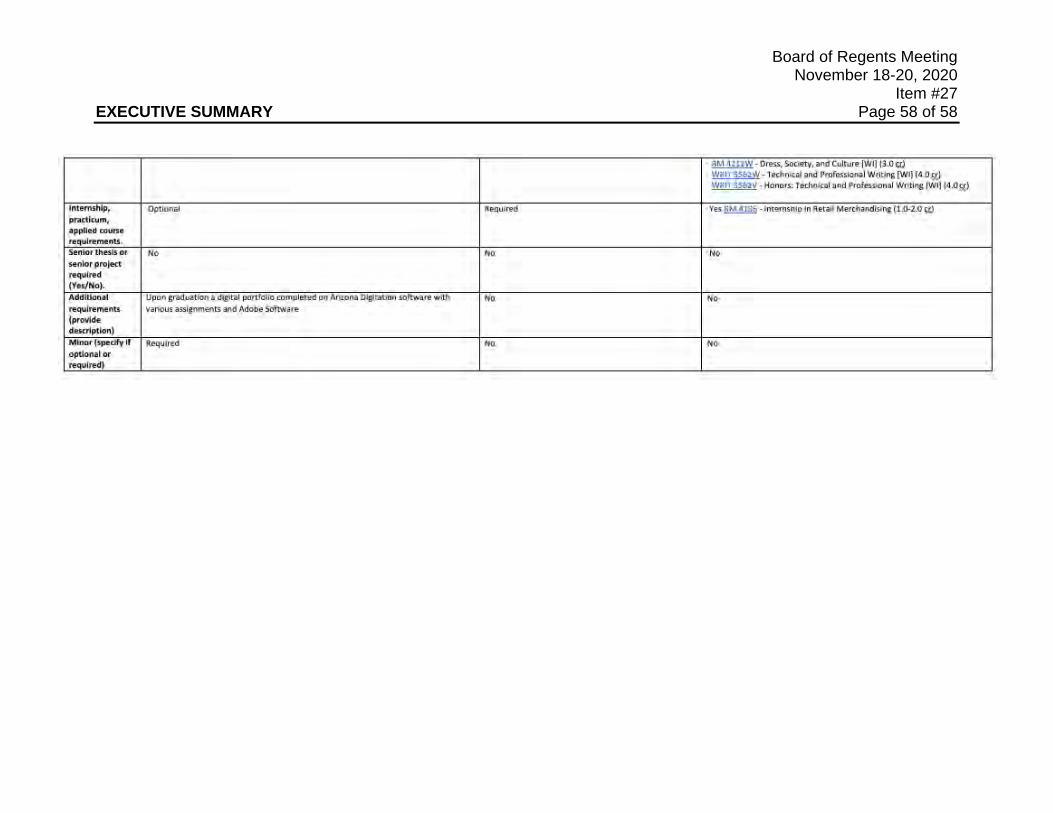
Board of Regents Meeting November 18-20, 2020 Item #27 EXECUTIVE SUMMARY Page 58 of 58
Board of Regents Meeting November 18-20, 2020
Item #28 EXECUTIVE SUMMARY Page 1 of 1
Contact Information: Chad Sampson, ABOR [email protected] 602-229-2512
Item Name: Fiscal Year 2020 Financial Aid Report
Action Item Background and Discussion The Arizona Board of Regents fiscal year 2020 Financial Aid Report provides financial aid trends and analysis for Arizona’s public universities. It also serves as an important tool for the board as it continues to address higher education access and affordability. Data for the report was obtained from Arizona’s public universities. All years referred to in this report are fiscal years, unless otherwise noted. The report is included with these materials. Statutory/Policy Requirements A.R.S. §15-1650 “Annual financial aid report”
Requested Action: The board office asks the board to approve the Fiscal Year 2020 Financial Aid Report.

This page intentionally left blank
FISCAL YEAR 2020
FINANCIALAID REPORT
The Arizona Board of Regents fiscal year 2020 Financial Aid Report, filed in compliance with A.R.S. §15-1650, provides detailed information on financial aid trends at Arizona’s public universities. This report is an important tool for the board as it continues to address higher education access and affordability issues. Data was obtained from Arizona’s public universities – Arizona State University, Northern Arizona University and the University of Arizona. Supplementary information is from the U.S. Department of Education, U.S. Census Bureau 2019 Community Survey and the Integrated Postsecondary Education Data System (IPEDS). All years referenced in this report are fiscal years, unless otherwise indicated.
A B O U T T H E A R I Z O N A B O A R D O F R E G E N T SThe Arizona Board of Regents is committed to ensuring access for qualified residents of Arizona to undergraduate and graduate institutions; promoting the discovery, application, and dissemination of knowledge; extending the benefits of university activities to Arizona’s citizens outside the university; and maximizing the benefits derived from the state’s investment in education.
M E M B E R S
Larry Penley, ChairLyndel Manson, Chair ElectKarrin Taylor Robson, SecretaryRon Shoopman, TreasurerBill RidenourFred DuValKathryn Hackett KingCecilia MataAnthony Rusk, Student RegentNikhil Dave, Student RegentGov. Doug Ducey, Ex-OfficioSuperintendent Kathy Hoffman, Ex-Officio
A B O U T T H I S R E P O R T
A B O R E X E C U T I V E D I R E C T O R
John Arnold
TA B L E O F C O N T E N T S
2
15
31
47
Arizona Public University Enterprise Fast Facts
Arizona State University
Northern Arizona University
University of Arizona
1 | F INANCIAL AID REPORT
Financial aid remains essential for students at Arizona’s public universities. The primary goalof financial aid programs is to ensure a university education at Arizona’s public universitiesremains financially accessible to all academically eligible Arizona students. Several indicatorssuggest the public universities are meeting this objective in 2020:
• While more students are relying on financial aid, default rates for students at Arizona’s public universities are below the national average and remain the lowest among all Arizona higher education institutions.1
• Debt upon graduation for students in Arizona with financial aid loans remains low compared to other public universities.2 Concerted efforts by the board and the universities have led to real savings for students and increased tuition predictability and transparency.
• Only 11 states in the union have lower rates of student loan debt than Arizona. University graduates are also more likely to be employed and have stronger earning power five years after graduation – even after accounting for student loan repayments.3
Additional key findings from the 2020 Financial Aid Report include:
• Since 2016, systemwide financial aid from all sources has increased 28 percent from $2.4 billion to $3.1 billion, outpacing enrollment growth of 20 percent over the same period.
• The number of Pell-Grant eligible students attending Arizona’s public universities continues to rise with enrollment growth, while the percentage of the national student population that is Pell eligible has declined as the number of students entering higher education has decreased.4
• Average need awards for undergraduates continue to increase. Since 2016, these are up 16 percent.
• Forty-four percent of ASU, 44 percent of NAU and 52 percent of UArizona undergraduate students graduate with no debt.
• In 2020, Arizona’s public universities collectively provided $981.2 million in institutional gift aid. Since 2016, total institutional gift aid has increased $358.9 million or 58 percent.
Additional data is available at azregents.edu.
E X E C U T I V E S U M M A RY
1 U.S. Department of Education (2019). Official Cohort Default Rates for Schools. Available: https://www2.ed.gov/offices/OSFAP/defaultmanagement/cdr.html2 Lendedu (2019). Average Student Loan Debt Statistics by School by State 2019. Available: https://lendedu.com/student-loan-debt-by-school-by-state-2019/ 3 Carnevale, A. P., Cheah, B., Hanson, A. R., (2015) The Economic Value of College Majors, Washington, D.C: Georgetown University Centre on Education and the Workforce. Available: https://cew.georgetown.edu/wp-content/uploads/Exec-Summary-web-B.pdf Taylor, P., Fry, R., Oates, R. (2014). The Rising Cost of Not Going to College, Pew Research Center. Available: https://www.pewsocialtrends.org/2014/02/11/the-rising-cost-of-not-going-to-college/4 College Board (2019). Pell grants: recipients, maximum Pell and average Pell. Available: https://research.collegeboard.org/trends/student-aid/figures-tables/pell-grants-recipients-maximum-pell-and-average-pell
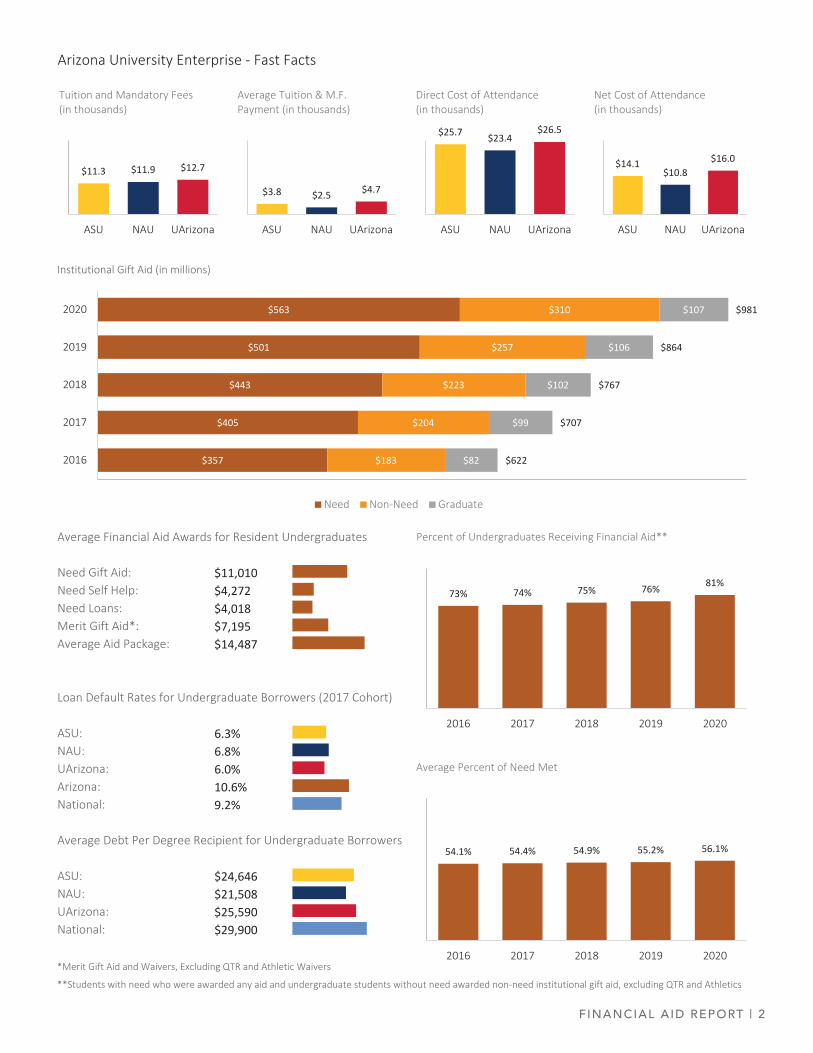
FINANCIAL AID REPORT | 2
Arizona University Enterprise ‐ Fast Facts
Institutional Gift Aid (in millions)
Average Financial Aid Awards for Resident Undergraduates
Need Gift Aid: $11,010Need Self Help: $4,272Need Loans: $4,018Merit Gift Aid*: $7,195Average Aid Package: $14,487
Loan Default Rates for Undergraduate Borrowers (2017 Cohort)
ASU: 6.3%NAU: 6.8%UArizona: 6.0%Arizona: 10.6%National: 9.2%
Average Debt Per Degree Recipient for Undergraduate Borrowers
ASU: $24,646NAU: $21,508UArizona: $25,590National: $29,900
*Merit Gift Aid and Waivers, Excluding QTR and Athletic Waivers
**Students with need who were awarded any aid and undergraduate students without need awarded non‐need institutional gift aid, excluding QTR and Athletics
73% 74% 75% 76% 81%
2016 2017 2018 2019 2020
Percent of Undergraduates Receiving Financial Aid**
54.1% 54.4% 54.9% 55.2% 56.1%
2016 2017 2018 2019 2020
Average Percent of Need Met
$11.3 $11.9 $12.7
ASU NAU UArizona
Tuition and Mandatory Fees (in thousands)
$3.8 $2.5 $4.7
ASU NAU UArizona
Average Tuition & M.F. Payment (in thousands)
$25.7 $23.4$26.5
ASU NAU UArizona
Direct Cost of Attendance(in thousands)
$14.1$10.8
$16.0
ASU NAU UArizona
Net Cost of Attendance(in thousands)
$357
$405
$443
$501
$563
$183
$204
$223
$257
$310
$82
$99
$102
$106
$107
$622
$707
$767
$864
$981
2016
2017
2018
2019
2020
Need Non‐Need Graduate
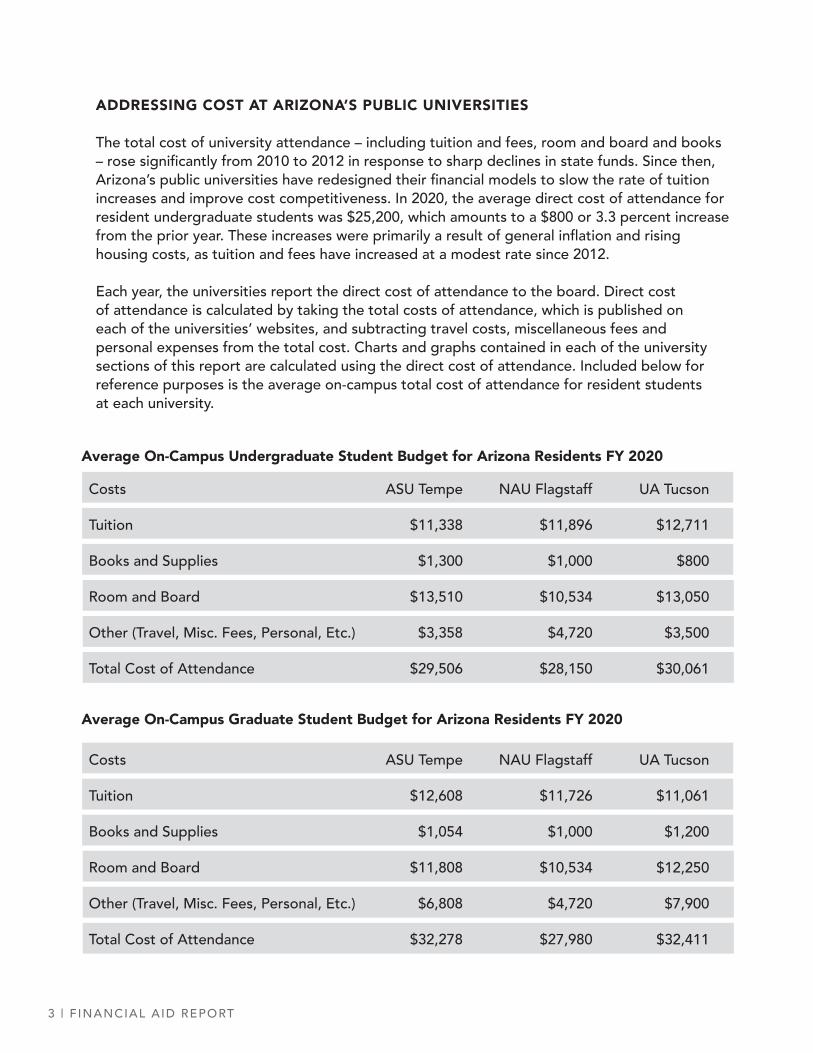
3 | F INANCIAL AID REPORT
ADDRESSING COST AT ARIZONA’S PUBLIC UNIVERSITIES
The total cost of university attendance – including tuition and fees, room and board and books – rose significantly from 2010 to 2012 in response to sharp declines in state funds. Since then, Arizona’s public universities have redesigned their financial models to slow the rate of tuition increases and improve cost competitiveness. In 2020, the average direct cost of attendance for resident undergraduate students was $25,200, which amounts to a $800 or 3.3 percent increase from the prior year. These increases were primarily a result of general inflation and rising housing costs, as tuition and fees have increased at a modest rate since 2012.
Each year, the universities report the direct cost of attendance to the board. Direct cost of attendance is calculated by taking the total costs of attendance, which is published on each of the universities’ websites, and subtracting travel costs, miscellaneous fees and personal expenses from the total cost. Charts and graphs contained in each of the university sections of this report are calculated using the direct cost of attendance. Included below for reference purposes is the average on-campus total cost of attendance for resident students at each university.
Average On-Campus Undergraduate Student Budget for Arizona Residents FY 2020
Costs
Tuition
Books and Supplies
Room and Board
Other (Travel, Misc. Fees, Personal, Etc.)
Total Cost of Attendance
ASU Tempe
$11,338
$1,300
$13,510
$3,358
$29,506
NAU Flagstaff
$11,896
$1,000
$10,534
$4,720
$28,150
UA Tucson
$12,711
$800
$13,050
$3,500
$30,061
Average On-Campus Graduate Student Budget for Arizona Residents FY 2020
Costs
Tuition
Books and Supplies
Room and Board
Other (Travel, Misc. Fees, Personal, Etc.)
Total Cost of Attendance
ASU Tempe
$12,608
$1,054
$11,808
$6,808
$32,278
NAU Flagstaff
$11,726
$1,000
$10,534
$4,720
$27,980
UA Tucson
$11,061
$1,200
$12,250
$7,900
$32,411
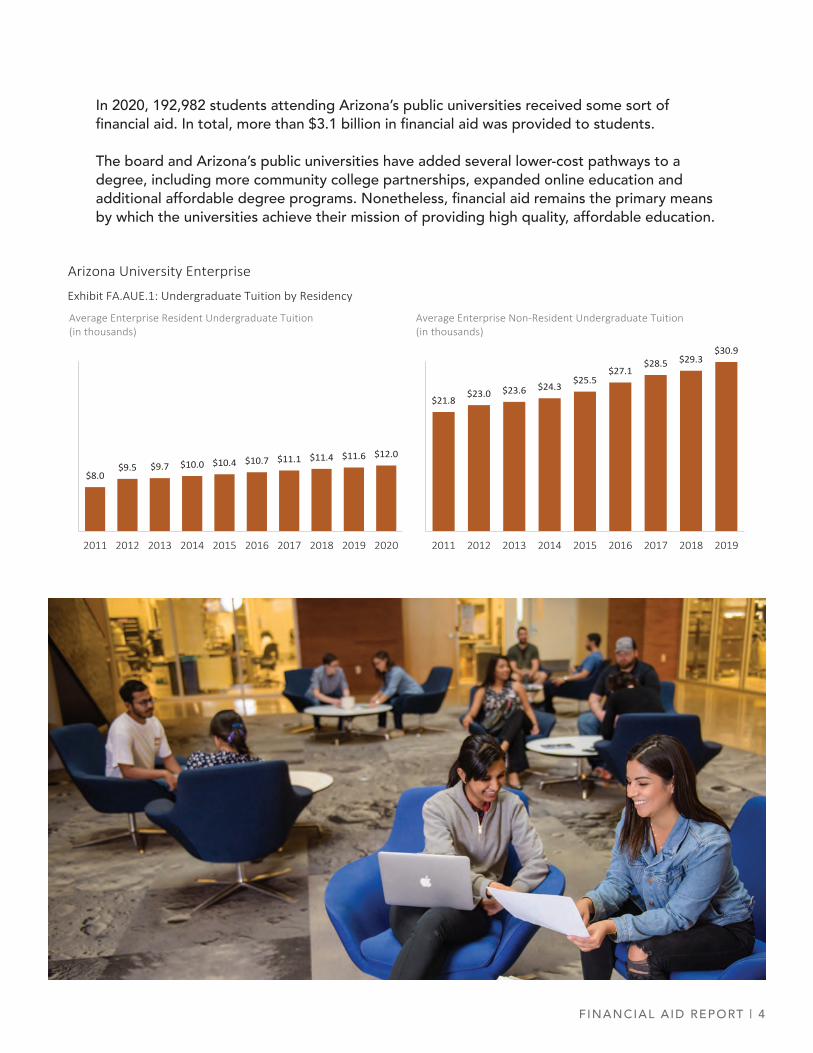
FINANCIAL AID REPORT | 4
In 2020, 192,982 students attending Arizona’s public universities received some sort of financial aid. In total, more than $3.1 billion in financial aid was provided to students.
The board and Arizona’s public universities have added several lower-cost pathways to a degree, including more community college partnerships, expanded online education and additional affordable degree programs. Nonetheless, financial aid remains the primary means by which the universities achieve their mission of providing high quality, affordable education.
Arizona University Enterprise
Exhibit FA.AUE.1: Undergraduate Tuition by Residency
$8.0$9.5 $9.7 $10.0 $10.4 $10.7 $11.1 $11.4 $11.6 $12.0
2011 2012 2013 2014 2015 2016 2017 2018 2019 2020
Average Enterprise Resident Undergraduate Tuition (in thousands)
$21.8$23.0 $23.6 $24.3
$25.5$27.1
$28.5 $29.3$30.9
2011 2012 2013 2014 2015 2016 2017 2018 2019
Average Enterprise Non‐Resident Undergraduate Tuition (in thousands)
5 | F INANCIAL AID REPORT
F I N A N C I A L A I D
ARIZONA PUBLIC UNIVERSITIES’ EDUCATION FINANCING MODEL
The total cost of attendance is determined by:
• Expected family contribution: Families are expected to contribute based on their available resources as defined by a federal formula that considers parental income and assets, family size, number of family members in college and other factors. Families with limited means are not expected to contribute.
• Grants from federal and state programs: Students are expected to apply for all
applicable federal and state grant programs to help cover the cost of attendance. • A reasonable student contribution from work and borrowing: Students are expected
to contribute toward the cost of their education through manageable levels of work and/or borrowing.
• University Financial Aid Needed
Once the above items are taken into consideration, a student’s financial need is determined and their eligibility for all forms of financial aid is assessed. Based upon this assessment, a financial aid award package is created that considers the student’s qualifications for scholarship awards and eligibility for grants.
Providing access to education for students across the socio-economic spectrum is vital to Arizona’s economic future. As the demographics of Arizona’s college-going population shift, more students require financial aid to make ends meet. Research shows that students who are overburdened financially are significantly less likely to persist through graduation.5 Financial aid awards are therefore imperative to the universities enterprise goals for student success and raising educational attainment.
AWARDING AID GOVERNED BY PRINCIPLES
• Financial aid determinations should acknowledge the total cost of attendance, including resident student fees, living expenses, books and supplies, transportation and health care.
• Financing an education at an Arizona public university is a shared endeavor between students, families, federal and state governments, and the universities.
Gift aid from institutional and other sources significantly reduces the cost of obtaining a degree for the vast majority of students. In 2020, financial aid awards from all sources (institutional, federal, state and philanthropy) reduced the cost of attendance for Arizona resident undergraduates by an average of 45.2 percent at ASU; 53.8 percent at NAU; and 39.6 percent at UArizona.
5 Nguyen, T.D., Kramer, J.W., & Evans, B. J. (2018). The Effects of Grant Aid on Student Persistence and Degree Attainment: A Systematic Review and Meta-Analysis of the Causal Evidence (CEPA Working Paper No.18-04). Retrieved from Stanford Center for Education Policy Analysis: http://cepa.stanford.edu/wp18-04
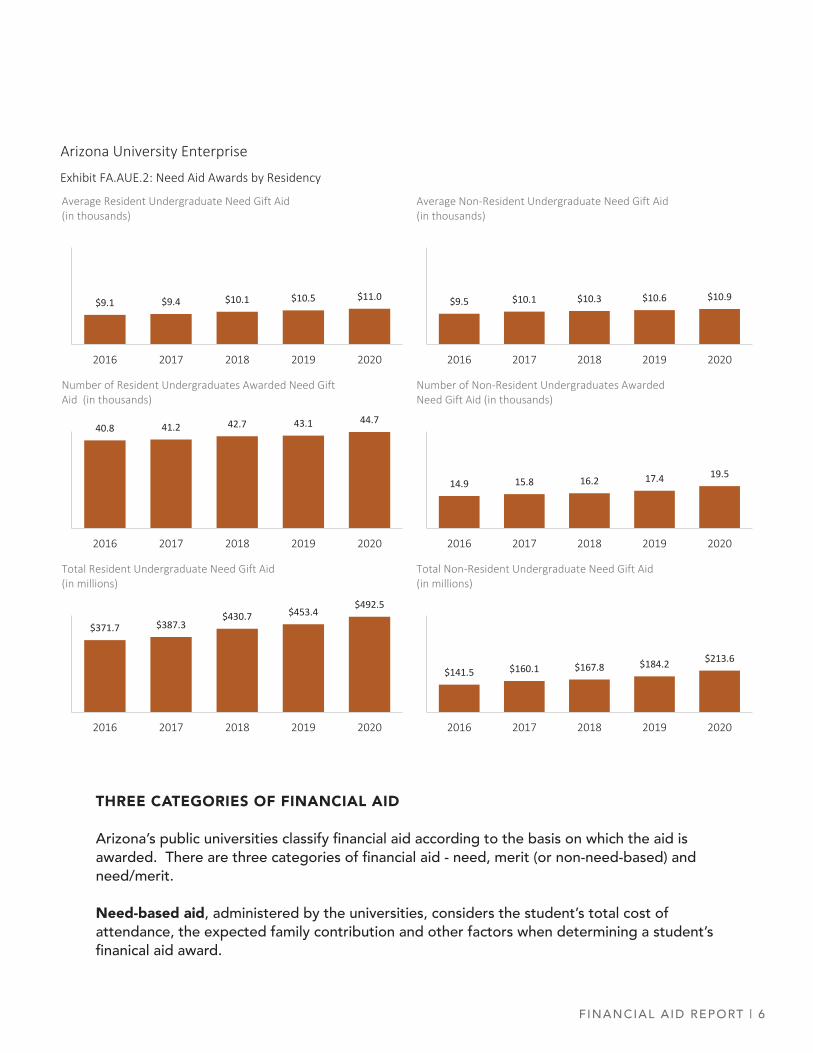
FINANCIAL AID REPORT | 6
THREE CATEGORIES OF FINANCIAL AID
Arizona’s public universities classify financial aid according to the basis on which the aid is awarded. There are three categories of financial aid - need, merit (or non-need-based) and need/merit.
Need-based aid, administered by the universities, considers the student’s total cost of attendance, the expected family contribution and other factors when determining a student’s finanical aid award.
Arizona University Enterprise
Exhibit FA.AUE.2: Need Aid Awards by Residency
$9.1 $9.4 $10.1 $10.5 $11.0
2016 2017 2018 2019 2020
Average Resident Undergraduate Need Gift Aid (in thousands)
$9.5 $10.1 $10.3 $10.6 $10.9
2016 2017 2018 2019 2020
Average Non‐Resident Undergraduate Need Gift Aid (in thousands)
40.8 41.2 42.7 43.1 44.7
2016 2017 2018 2019 2020
Number of Resident Undergraduates Awarded Need Gift Aid (in thousands)
14.9 15.8 16.2 17.4 19.5
2016 2017 2018 2019 2020
Number of Non‐Resident Undergraduates Awarded Need Gift Aid (in thousands)
$371.7 $387.3$430.7 $453.4
$492.5
2016 2017 2018 2019 2020
Total Resident Undergraduate Need Gift Aid (in millions)
$141.5 $160.1 $167.8 $184.2 $213.6
2016 2017 2018 2019 2020
Total Non‐Resident Undergraduate Need Gift Aid (in millions)
7 | F INANCIAL AID REPORT
In 2020, $806.5 million in need-based gift aid awards were provided to 81,065 students – 51.7 percent of all degree seeking students enrolled in Arizona’s public universities. Of this amount, $492.5 million was provided to 44,729 resident students. Since 2016, funding provided to resident students for need-based gift aid has increased by $120.8 million or 33 percent. The average amount of need-based gift aid awarded per student has increased 16.3 percent from $8,558 to $9,949.
Despite increases in both the total amount of need-based aid and the average award amount, the average percentage of need met for resident students has remained relatively flat. Rising costs of attendance eroded the proportion of need met, despite more financial aid dollars awarded. The average amount of financial need that is met for an average resident student is 65 percent. By comparison, the amount of financial need met for an average non-resident student is 53 percent.
Merit or non-need based aid includes scholarships, grants and gifts that are awarded solely on the basis of academic achievement or other demonstrated merit. These awards provide competitive levels of support to attract and retain highly talented students. In 2019, 39,069 merit-based awards were dispersed totaling $275 million. Of this amount, 19,629 awards were provided to resident students totaling $129.1 million.
Need/merit-based aid is awarded to students with demonstrated need and merit. These awards provide meritorious students with limited means opportunities to pursue a public university education in Arizona. In 2019, 58,489 awards were distributed totaling $292.9 million.
TYPES OF FINANCIAL AID There are two types of financial aid – gift and self-help aid. Gift aid, often referred to as scholarships or grants, does not need to be paid back. In 2020, gift aid was awarded to 192,982 Arizona public university enterprise students. Since 2016, gift aid has increased by $497.6 million or 45 percent.
Self-help aid is generally comprised of federal work-study and student loans from governments, banks or other lending institutions. In 2020, self-help aid was available to 107,816 enterprise students. Self-help aid has increased by $119.8 million or 12 percent since 2016.
SOURCES OF FINANCIAL AID
Financial aid for students at Arizona’s public universities comes from a variety of sources including the federal government, the universities, private entities and state government.
Federal Financial AidThe federal government is the primary source of both gift and self-help financial aid. In 2020, federally funded gift aid totaled $365 million and was provided to 76,879 students. Federally funded gift aid has increased by $104.6 million – 40 percent since 2016.
FINANCIAL AID REPORT | 8
The majority of federal gift aid is administered through the Pell Grant program, which provides grants to undergraduate students with financial need to help pay the costs of attending postsecondary institutions. Pell Grants are the first financial aid awarded before eligibility for other federal student-aid programs is determined. Pell Grant amounts are determined by educational costs and the family’s ability to contribute. In 2019-20 the maximum Pell Grant award was $6,195.
The total number of Pell-eligible students attending Arizona’s public universities continues to rise. In 2020, there were 55,276 Pell-eligible undergraduate students enrolled in Arizona’s public universities, a 20.5 percent increase since 2016. The federal Pell Grant program provided $266.9 million or 73.1 percent of all federal gift aid in 2020.
Federally funded self-help aid totaled $872.6 million in 2020. Of this total, federal student loans accounted for $859.9 million and were offered to 88,250 enterprise students. Since 2016, the amount of federal student loans awarded increased by $83 million or 10.7 percent and the number of students borrowing through federal student loan programs increased by 4,869 or 5.8 percent.
In addition to federal student loans, $12.7 million in federally funded self-help aid was provided in 2020 through federal work-study, which offers federally subsidized part-time jobs to help students pay for part of their college costs. In total, 4,040 enterprise students in 2020 received financial aid through federal work-study.
Institutional Financial AidIn 2020, Arizona’s public universities collectively provided $981.2 million in institutional gift aid to 133,145 students. Institutional aid is the second largest source of financial aid for enterprise students. This category of aid encompasses grants and scholarships that universities offer prospective students and may include academic scholarships, leadership grants, achievement grants, art and music scholarships, special talent grants, athletic grants and need-based grants.
Since 2016, total institutional gift aid has increased significantly by $358.9 million or 57.7 percent. The number of students receiving institutional gift aid increased by 39,866 or 42.7 percent – significantly outpacing enrollment growth. This dramatic increase represents a shift from a low financial-aid model to a high financial-aid model. Under this new model, growth in institutional gift aid has dramatically exceeded growth in federal student loans.
9 | F INANCIAL AID REPORT
Regents Set-AsideThe Regents Set-Aside is a percentage of board-designated tuition revenue retained or “set aside” at each university for awards to students with demonstrated financial need.
Current board policy stipulates the Regents Set-Aside amount for each university at 14 percent of the resident tuition for the academic year multiplied by the resident amount of tuition paid in full by resident and non-resident students at a minimum.
Regents Set-Aside awards are considered gift aid and the universities award these funds to students with demonstrated financial need as part of their financial-aid award package. Priority is given to undergraduate Arizona resident students. In 2020, the universities awarded $274.8 million in Regents Set-Aside funds to students.
Since 2016, the Regents Set-Aside for residents has increased by $69.3 million or 34 percent. The number of recipients has increased by 8,858 or 24 percent. In 2021, the Regents Set-Aside for residents is projected to grow by $4 million or 2.3 percent and by 1,240 recipients or 2.7 percent.
Private Financial AidIn recent years, financial aid awards from private or external sources have also increased. Since 2016, private or external gift aid has risen from $202.3 million to $222.3 million, an increase of 9.9 percent. In 2020, gift aid from private or external sources was awarded to 35,692 enterprise students – an increase of 7,052 students in the past five years.
Private loans totaling $381.4 million were provided to 21,764 students in 2020. Private loans have increased $64.8 million or 21 percent since 2016 with 2,389 additional students borrowing.
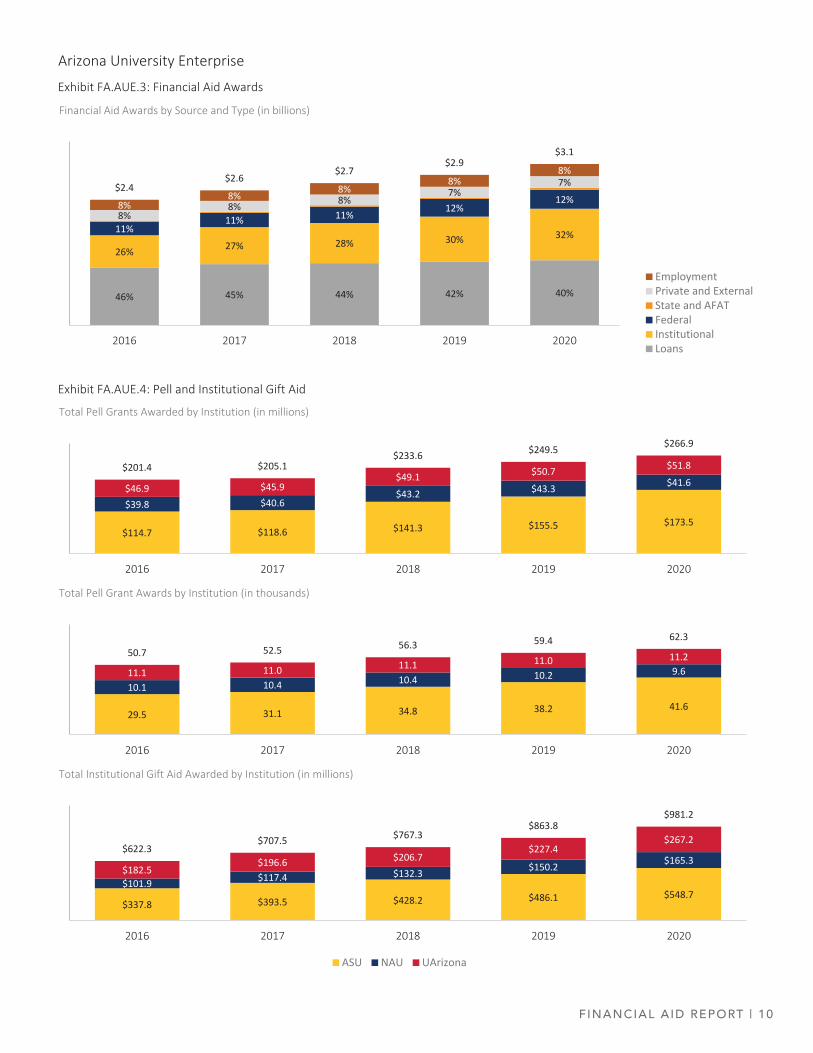
FINANCIAL AID REPORT | 10
Arizona University Enterprise
Exhibit FA.AUE.3: Financial Aid Awards
Exhibit FA.AUE.4: Pell and Institutional Gift Aid
46% 45% 44% 42% 40%
26% 27% 28% 30% 32%11%11% 11% 12%
12%8%
8% 8%7%
7%
8%8% 8%
8%8%
$2.4$2.6
$2.7$2.9
$3.1
2016 2017 2018 2019 2020
Financial Aid Awards by Source and Type (in billions)
EmploymentPrivate and ExternalState and AFATFederalInstitutionalLoans
$114.7 $118.6 $141.3 $155.5 $173.5$39.8 $40.6
$43.2 $43.3 $41.6$46.9 $45.9$49.1 $50.7 $51.8$201.4 $205.1$233.6 $249.5 $266.9
2016 2017 2018 2019 2020
Total Pell Grants Awarded by Institution (in millions)
29.5 31.1 34.8 38.2 41.6
10.1 10.4 10.4 10.2 9.611.1 11.0 11.1 11.0 11.250.7 52.5 56.3 59.4 62.3
2016 2017 2018 2019 2020
Total Pell Grant Awards by Institution (in thousands)
$337.8 $393.5 $428.2 $486.1 $548.7$101.9 $117.4 $132.3 $150.2 $165.3$182.5
$196.6 $206.7$227.4
$267.2$622.3
$707.5 $767.3$863.8
$981.2
2016 2017 2018 2019 2020
Total Institutional Gift Aid Awarded by Institution (in millions)
ASU NAU UArizona
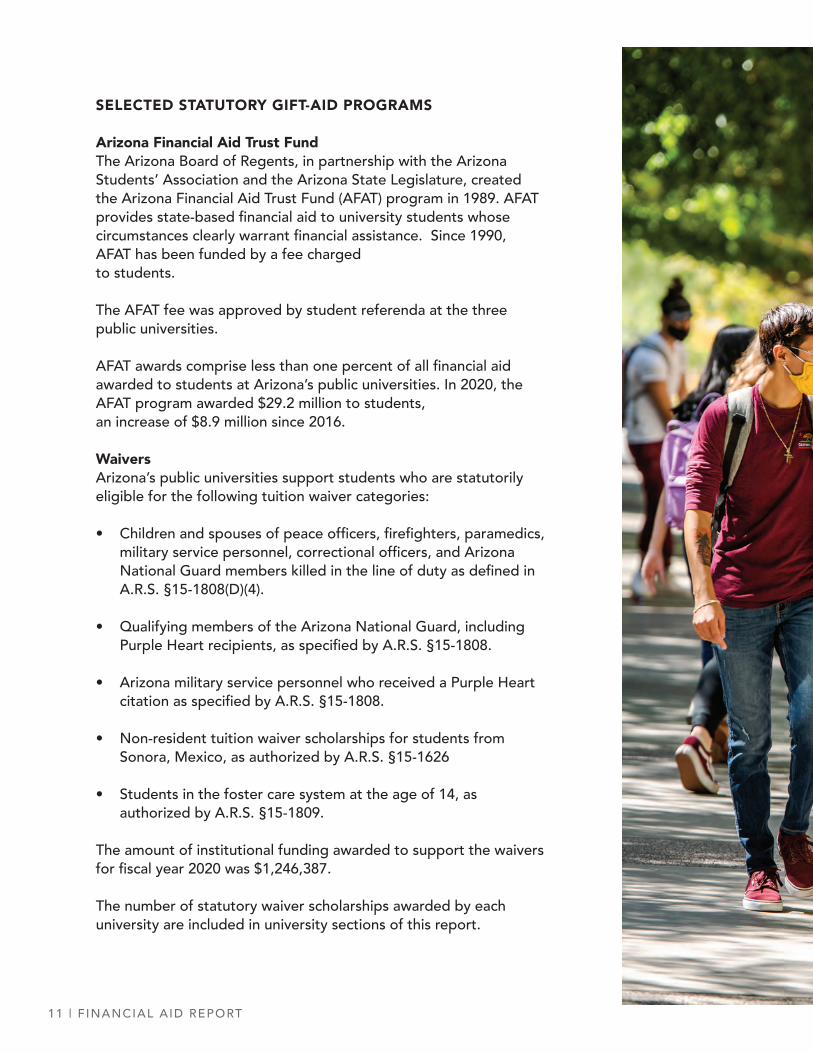
11 | F INANCIAL AID REPORT
SELECTED STATUTORY GIFT-AID PROGRAMS
Arizona Financial Aid Trust FundThe Arizona Board of Regents, in partnership with the Arizona Students’ Association and the Arizona State Legislature, created the Arizona Financial Aid Trust Fund (AFAT) program in 1989. AFAT provides state-based financial aid to university students whose circumstances clearly warrant financial assistance. Since 1990, AFAT has been funded by a fee charged to students.
The AFAT fee was approved by student referenda at the three public universities.
AFAT awards comprise less than one percent of all financial aid awarded to students at Arizona’s public universities. In 2020, the AFAT program awarded $29.2 million to students, an increase of $8.9 million since 2016.
WaiversArizona’s public universities support students who are statutorily eligible for the following tuition waiver categories:
• Children and spouses of peace officers, firefighters, paramedics, military service personnel, correctional officers, and Arizona National Guard members killed in the line of duty as defined in A.R.S. §15-1808(D)(4).
• Qualifying members of the Arizona National Guard, including Purple Heart recipients, as specified by A.R.S. §15-1808.
• Arizona military service personnel who received a Purple Heart citation as specified by A.R.S. §15-1808.
• Non-resident tuition waiver scholarships for students from Sonora, Mexico, as authorized by A.R.S. §15-1626
• Students in the foster care system at the age of 14, as authorized by A.R.S. §15-1809.
The amount of institutional funding awarded to support the waivers for fiscal year 2020 was $1,246,387.
The number of statutory waiver scholarships awarded by each university are included in university sections of this report.
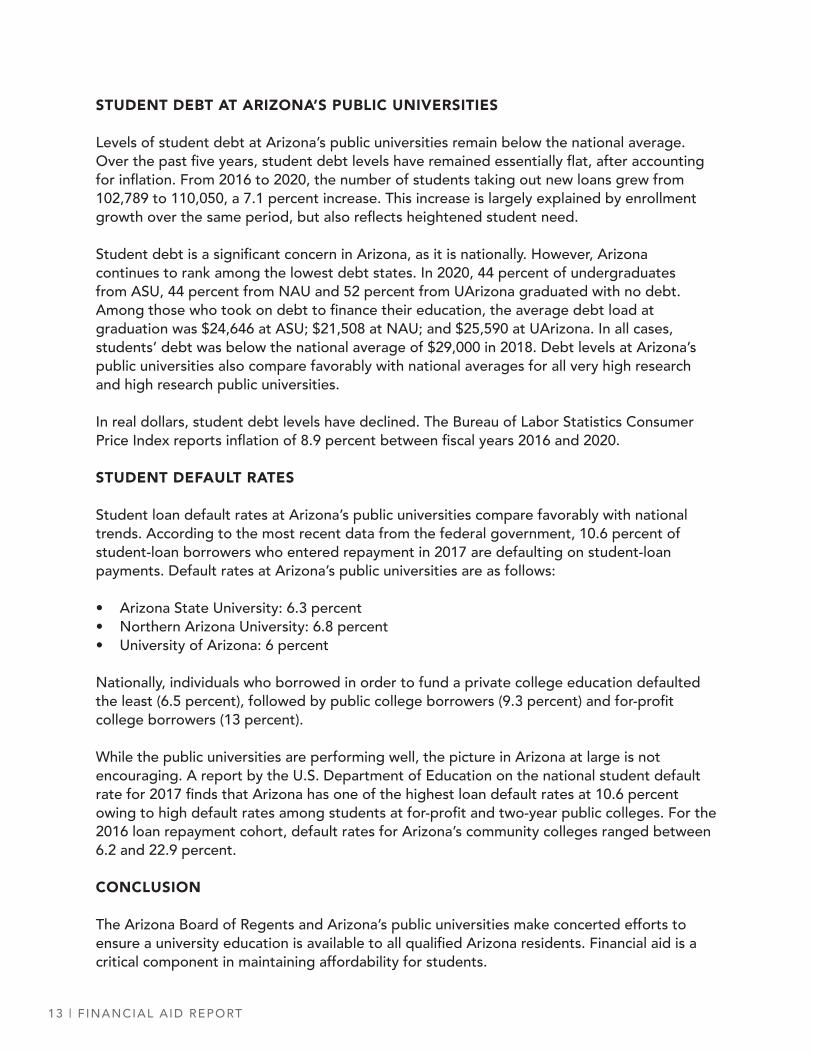
13 | F INANCIAL AID REPORT
STUDENT DEBT AT ARIZONA’S PUBLIC UNIVERSITIES
Levels of student debt at Arizona’s public universities remain below the national average. Over the past five years, student debt levels have remained essentially flat, after accounting for inflation. From 2016 to 2020, the number of students taking out new loans grew from 102,789 to 110,050, a 7.1 percent increase. This increase is largely explained by enrollment growth over the same period, but also reflects heightened student need.
Student debt is a significant concern in Arizona, as it is nationally. However, Arizona continues to rank among the lowest debt states. In 2020, 44 percent of undergraduates from ASU, 44 percent from NAU and 52 percent from UArizona graduated with no debt. Among those who took on debt to finance their education, the average debt load at graduation was $24,646 at ASU; $21,508 at NAU; and $25,590 at UArizona. In all cases, students’ debt was below the national average of $29,000 in 2018. Debt levels at Arizona’s public universities also compare favorably with national averages for all very high research and high research public universities.
In real dollars, student debt levels have declined. The Bureau of Labor Statistics Consumer Price Index reports inflation of 8.9 percent between fiscal years 2016 and 2020.
STUDENT DEFAULT RATES
Student loan default rates at Arizona’s public universities compare favorably with national trends. According to the most recent data from the federal government, 10.6 percent of student-loan borrowers who entered repayment in 2017 are defaulting on student-loan payments. Default rates at Arizona’s public universities are as follows:
• Arizona State University: 6.3 percent• Northern Arizona University: 6.8 percent• University of Arizona: 6 percent
Nationally, individuals who borrowed in order to fund a private college education defaulted the least (6.5 percent), followed by public college borrowers (9.3 percent) and for-profit college borrowers (13 percent).
While the public universities are performing well, the picture in Arizona at large is not encouraging. A report by the U.S. Department of Education on the national student default rate for 2017 finds that Arizona has one of the highest loan default rates at 10.6 percent owing to high default rates among students at for-profit and two-year public colleges. For the 2016 loan repayment cohort, default rates for Arizona’s community colleges ranged between 6.2 and 22.9 percent.
CONCLUSION
The Arizona Board of Regents and Arizona’s public universities make concerted efforts to ensure a university education is available to all qualified Arizona residents. Financial aid is a critical component in maintaining affordability for students.
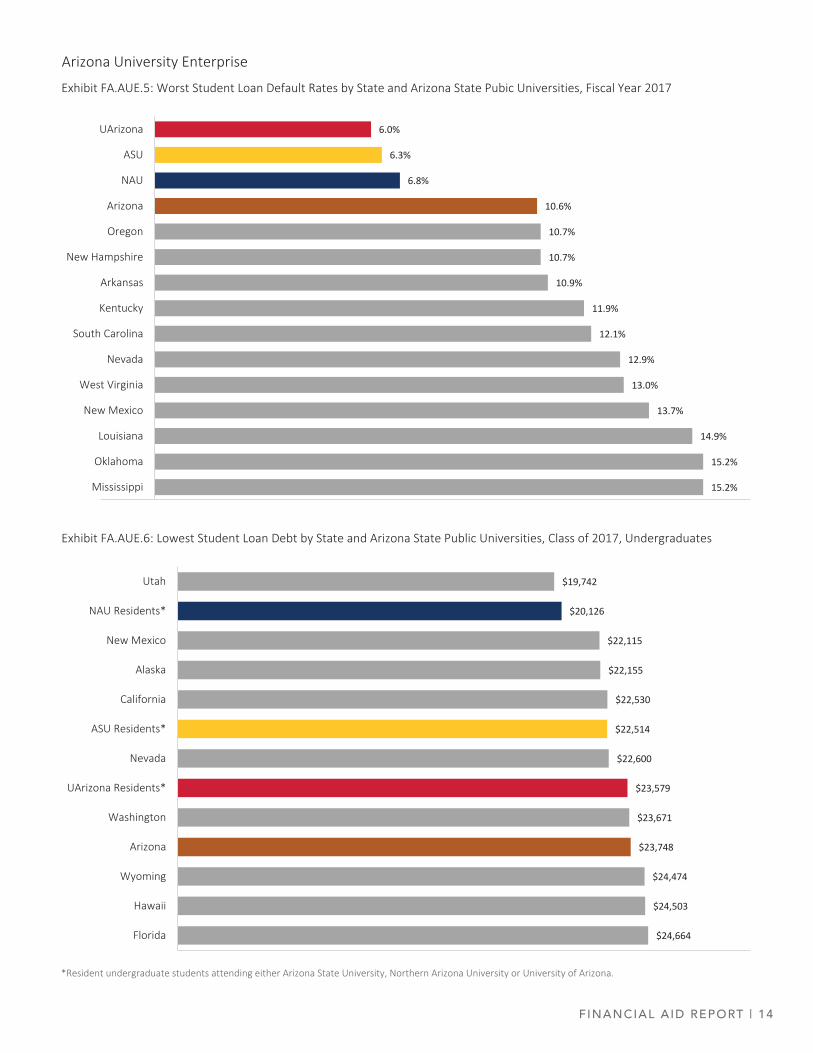
FINANCIAL AID REPORT | 14
Arizona University Enterprise
Exhibit FA.AUE.5: Worst Student Loan Default Rates by State and Arizona State Pubic Universities, Fiscal Year 2017
Exhibit FA.AUE.6: Lowest Student Loan Debt by State and Arizona State Public Universities, Class of 2017, Undergraduates
*Resident undergraduate students attending either Arizona State University, Northern Arizona University or University of Arizona.
15.2%
15.2%
14.9%
13.7%
13.0%
12.9%
12.1%
11.9%
10.9%
10.7%
10.7%
10.6%
6.8%
6.3%
6.0%
Mississippi
Oklahoma
Louisiana
New Mexico
West Virginia
Nevada
South Carolina
Kentucky
Arkansas
New Hampshire
Oregon
Arizona
NAU
ASU
UArizona
$24,664
$24,503
$24,474
$23,748
$23,671
$23,579
$22,600
$22,514
$22,530
$22,155
$22,115
$20,126
$19,742
Florida
Hawaii
Wyoming
Arizona
Washington
UArizona Residents*
Nevada
ASU Residents*
California
Alaska
New Mexico
NAU Residents*
Utah
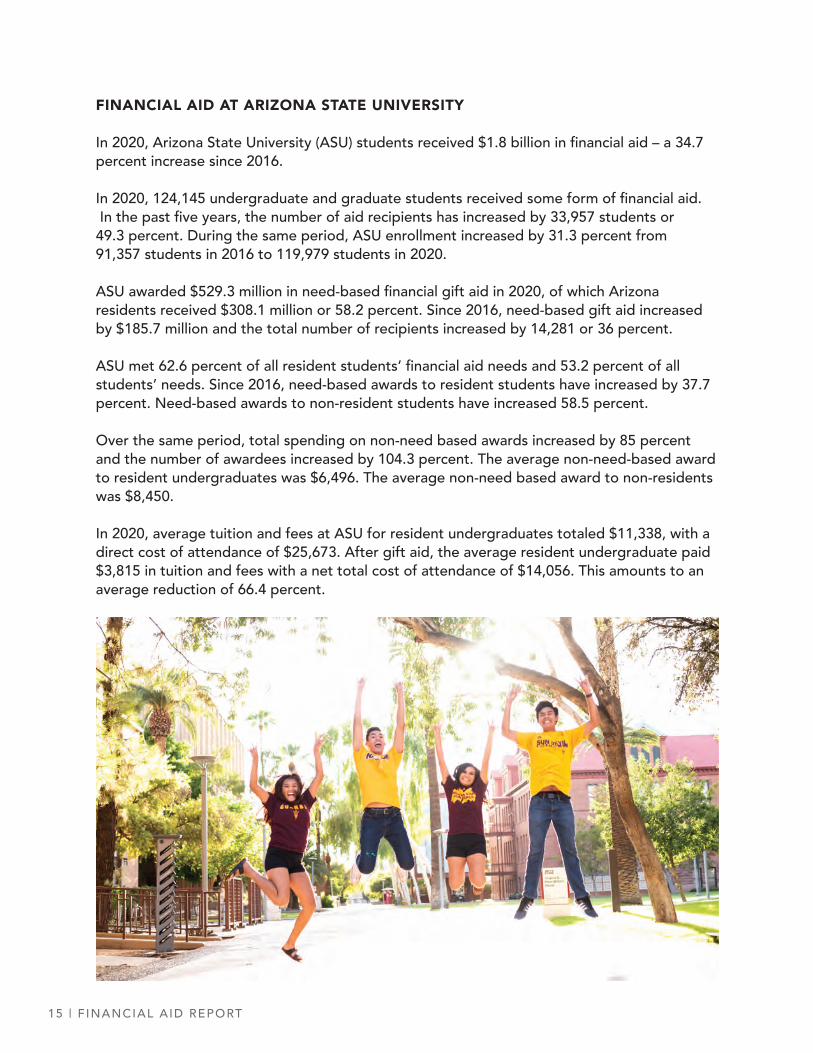
15 | F INANCIAL AID REPORT
FINANCIAL AID AT ARIZONA STATE UNIVERSITY
In 2020, Arizona State University (ASU) students received $1.8 billion in financial aid – a 34.7 percent increase since 2016.
In 2020, 124,145 undergraduate and graduate students received some form of financial aid. In the past five years, the number of aid recipients has increased by 33,957 students or 49.3 percent. During the same period, ASU enrollment increased by 31.3 percent from 91,357 students in 2016 to 119,979 students in 2020.
ASU awarded $529.3 million in need-based financial gift aid in 2020, of which Arizona residents received $308.1 million or 58.2 percent. Since 2016, need-based gift aid increased by $185.7 million and the total number of recipients increased by 14,281 or 36 percent.
ASU met 62.6 percent of all resident students’ financial aid needs and 53.2 percent of all students’ needs. Since 2016, need-based awards to resident students have increased by 37.7 percent. Need-based awards to non-resident students have increased 58.5 percent.
Over the same period, total spending on non-need based awards increased by 85 percent and the number of awardees increased by 104.3 percent. The average non-need-based award to resident undergraduates was $6,496. The average non-need based award to non-residents was $8,450.
In 2020, average tuition and fees at ASU for resident undergraduates totaled $11,338, with a direct cost of attendance of $25,673. After gift aid, the average resident undergraduate paid $3,815 in tuition and fees with a net total cost of attendance of $14,056. This amounts to an average reduction of 66.4 percent.
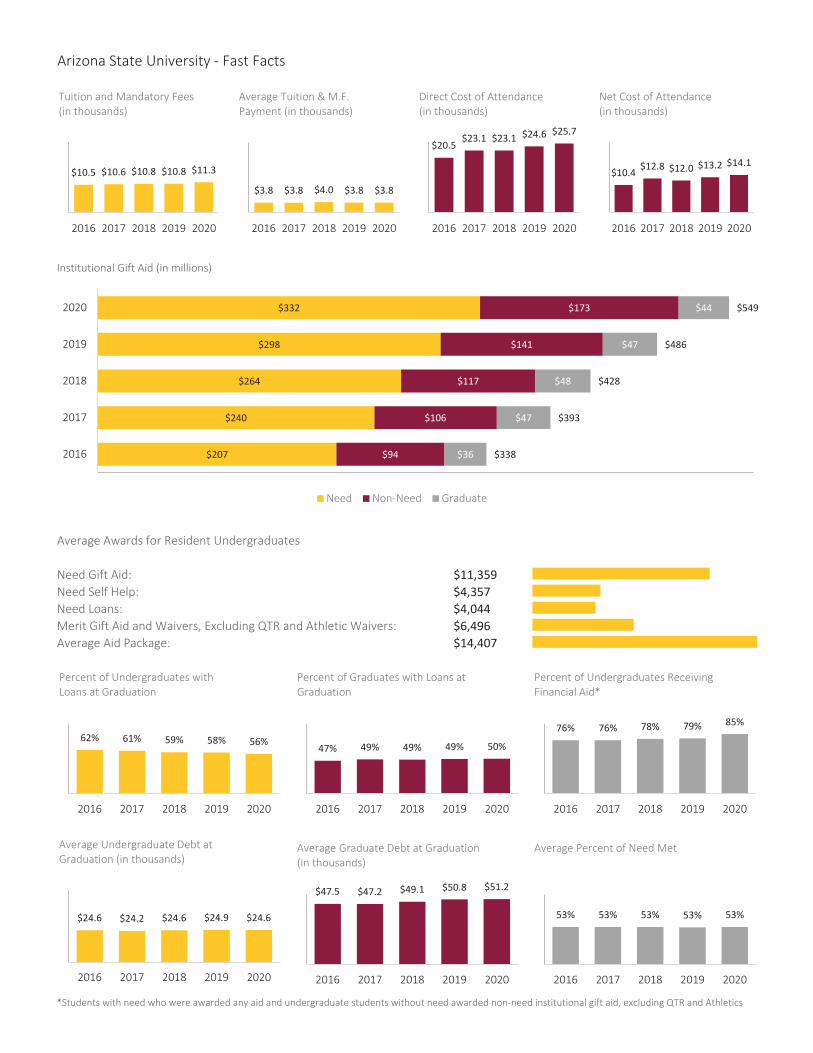
Arizona State University ‐ Fast Facts
Institutional Gift Aid (in millions)
Average Awards for Resident Undergraduates
Need Gift Aid: $11,359Need Self Help: $4,357Need Loans: $4,044Merit Gift Aid and Waivers, Excluding QTR and Athletic Waivers: $6,496Average Aid Package: $14,407
*Students with need who were awarded any aid and undergraduate students without need awarded non‐need institutional gift aid, excluding QTR and Athletics
$10.5 $10.6 $10.8 $10.8 $11.3
2016 2017 2018 2019 2020
Tuition and Mandatory Fees (in thousands)
$3.8 $3.8 $4.0 $3.8 $3.8
2016 2017 2018 2019 2020
Average Tuition & M.F. Payment (in thousands)
$20.5$23.1 $23.1 $24.6 $25.7
2016 2017 2018 2019 2020
Direct Cost of Attendance(in thousands)
$10.4 $12.8 $12.0 $13.2 $14.1
2016 2017 2018 2019 2020
Net Cost of Attendance(in thousands)
$207
$240
$264
$298
$332
$94
$106
$117
$141
$173
$36
$47
$48
$47
$44
$338
$393
$428
$486
$549
2016
2017
2018
2019
2020
Need Non‐Need Graduate
62% 61% 59% 58% 56%
2016 2017 2018 2019 2020
Percent of Undergraduates with Loans at Graduation
$24.6 $24.2 $24.6 $24.9 $24.6
2016 2017 2018 2019 2020
Average Undergraduate Debt at Graduation (in thousands)
$47.5 $47.2 $49.1 $50.8 $51.2
2016 2017 2018 2019 2020
Average Graduate Debt at Graduation(in thousands)
47% 49% 49% 49% 50%
2016 2017 2018 2019 2020
Percent of Graduates with Loans at Graduation
53% 53% 53% 53% 53%
2016 2017 2018 2019 2020
Average Percent of Need Met
76% 76% 78% 79% 85%
2016 2017 2018 2019 2020
Percent of Undergraduates Receiving Financial Aid*
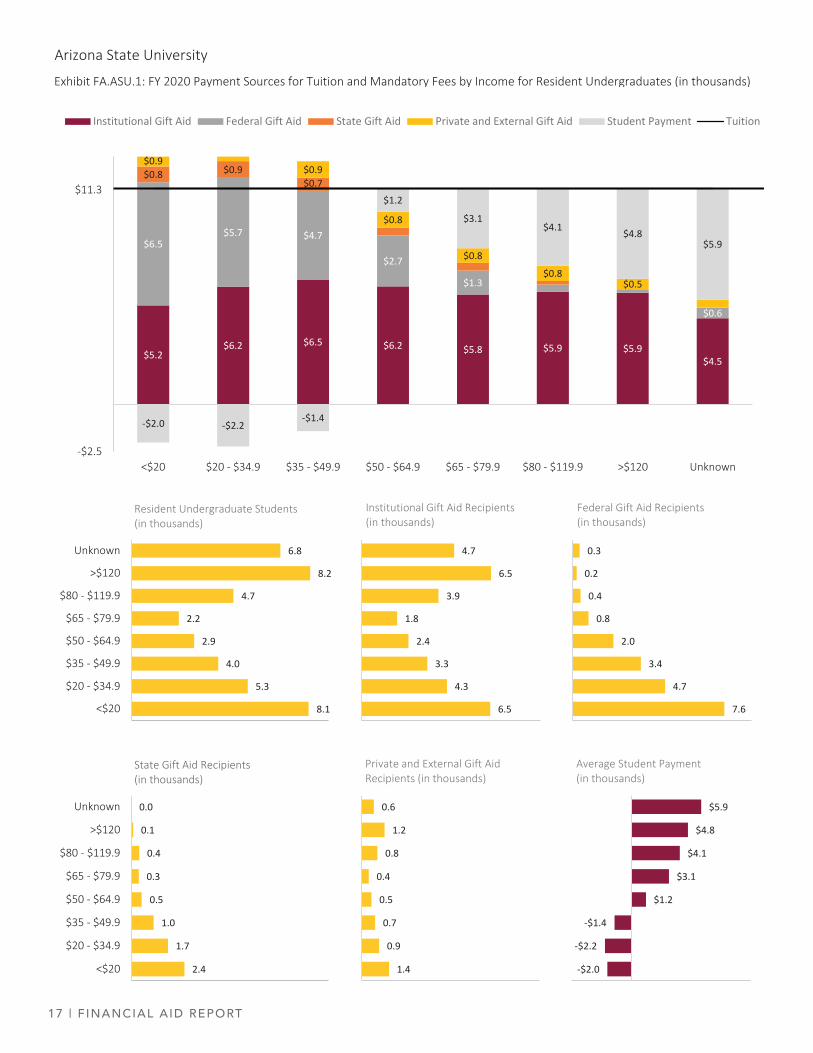
17 | F INANCIAL AID REPORT
Arizona State University
Exhibit FA.ASU.1: FY 2020 Payment Sources for Tuition and Mandatory Fees by Income for Resident Undergraduates (in thousands)
$5.2$6.2 $6.5 $6.2 $5.8 $5.9 $5.9
$4.5
$6.5$5.7 $4.7
$2.7
$1.3
$0.6
$0.8 $0.9$0.7
$0.9$0.9
$0.8
$0.8$0.8
$0.5
‐$2.0 ‐$2.2‐$1.4
$1.2
$3.1$4.1 $4.8
$5.9
‐$2.5
$11.3
<$20 $20 ‐ $34.9 $35 ‐ $49.9 $50 ‐ $64.9 $65 ‐ $79.9 $80 ‐ $119.9 >$120 Unknown
Institutional Gift Aid Federal Gift Aid State Gift Aid Private and External Gift Aid Student Payment Tuition
8.1
5.3
4.0
2.9
2.2
4.7
8.2
6.8
<$20
$20 ‐ $34.9
$35 ‐ $49.9
$50 ‐ $64.9
$65 ‐ $79.9
$80 ‐ $119.9
>$120
Unknown
Resident Undergraduate Students(in thousands)
6.5
4.3
3.3
2.4
1.8
3.9
6.5
4.7
Institutional Gift Aid Recipients(in thousands)
7.6
4.7
3.4
2.0
0.8
0.4
0.2
0.3
Federal Gift Aid Recipients(in thousands)
2.4
1.7
1.0
0.5
0.3
0.4
0.1
0.0
<$20
$20 ‐ $34.9
$35 ‐ $49.9
$50 ‐ $64.9
$65 ‐ $79.9
$80 ‐ $119.9
>$120
Unknown
State Gift Aid Recipients(in thousands)
1.4
0.9
0.7
0.5
0.4
0.8
1.2
0.6
Private and External Gift Aid Recipients (in thousands)
‐$2.0
‐$2.2
‐$1.4
$1.2
$3.1
$4.1
$4.8
$5.9
Average Student Payment(in thousands)

FINANCIAL AID REPORT | 18
Arizona State University
Exhibit FA.ASU.2: FY 2020 Direct Cost of Attendance and Average Gift Aid by Family Income for Resident Undergraduate Degree Recipients (in thousands)
Exhibit FA.ASU.3: Distribution of Resident Undergraduates by Tuition Payment Tier Over Time
Number of students broken into $1,500 bins$0 12,004 12,439 12,299 13,953 15,657 30.4%$1 ‐ $1,499 3,508 3,636 3,665 3,902 4,605 31.3%$1,500 ‐ $2,999 3,969 3,547 4,501 4,160 2,609 ‐34.3%$3,000 ‐ $4,499 2,878 2,688 1,682 1,733 3,657 27.1%$4,500 ‐ $5,999 3,325 3,071 3,781 3,411 3,594 8.1%$6,000 ‐ $7,499 3,073 3,326 1,884 2,145 1,501 ‐51.2%$7,500 ‐ $8,999 1,567 2,036 3,222 3,176 2,491 59.0%>= $9,000 299 488 1,183 1,191 3,074 928.1%No Gift Aid 6,120 5,887 5,883 5,886 4,792 ‐21.7%
Number of students broken into $3,000 bins$0 12,004 12,439 12,299 13,953 15,657 30.4%$1 ‐ $2,999 7,477 7,183 8,166 8,062 7,214 ‐3.5%$3,000 ‐ $5,999 6,203 5,759 5,463 5,144 7,251 16.9%$6,000 ‐ $8,999 4,640 5,362 5,106 5,321 3,992 ‐14.0%>= $9,000 299 488 1,183 1,191 3,074 928.1%No Gift Aid 6,120 5,887 5,883 5,886 4,792 ‐21.7%
Number of students broken into three groups ‐ paid zero, paid a reduced tuition, paid in full$0 12,004 12,439 12,299 13,953 15,657 30.4%>$0 18,619 18,792 19,918 19,718 21,531 15.6%No Gift Aid 6,120 5,887 5,883 5,886 4,792 ‐21.7%
% Growth2016 2017 2018 2019 2020
$25.7 $25.7 $25.7 $25.7 $25.7 $25.7 $25.7
Direct Cost of Attendance
$16.7 $16.9$14.4
$10.8$8.8 $8.0 $7.7
< $20 $20 ‐$34
$35 ‐$49
$50 ‐$64
$65 ‐$79
$80 ‐$119
>= $120
Total Average Gift Aid
$8.8 $9.2 $8.7 $8.1 $7.4 $7.3 $7.4
< $20 $20 ‐$34
$35 ‐$49
$50 ‐$64
$65 ‐$79
$80 ‐$119
>= $120
Average Institutional Gift Aid
$8.9 $8.8$11.3
$14.8$16.9 $17.7 $17.9
Net Cost of Attendance
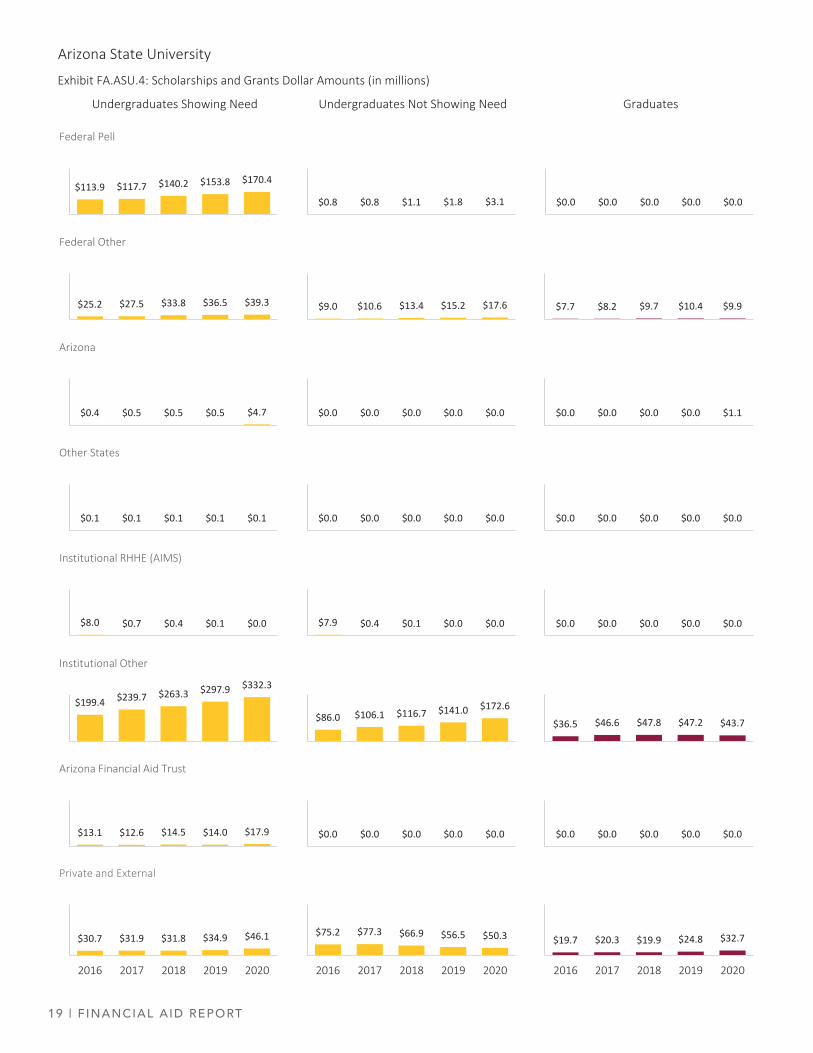
19 | F INANCIAL AID REPORT
Arizona State University
Exhibit FA.ASU.4: Scholarships and Grants Dollar Amounts (in millions)
Undergraduates Showing Need Undergraduates Not Showing Need Graduates
$0.0 $0.0 $0.0 $0.0 $0.0
$25.2 $27.5 $33.8 $36.5 $39.3
Federal Other
$7.7 $8.2 $9.7 $10.4 $9.9
$0.4 $0.5 $0.5 $0.5 $4.7
Arizona
$0.0 $0.0 $0.0 $0.0 $1.1
$0.1 $0.1 $0.1 $0.1 $0.1
Other States
$0.0 $0.0 $0.0 $0.0 $0.0
$8.0 $0.7 $0.4 $0.1 $0.0
Institutional RHHE (AIMS)
$0.0 $0.0 $0.0 $0.0 $0.0
$199.4 $239.7 $263.3 $297.9 $332.3
Institutional Other
$36.5 $46.6 $47.8 $47.2 $43.7
$13.1 $12.6 $14.5 $14.0 $17.9
Arizona Financial Aid Trust
$0.0 $0.0 $0.0 $0.0 $0.0
$30.7 $31.9 $31.8 $34.9 $46.1
2016 2017 2018 2019 2020
Private and External
$19.7 $20.3 $19.9 $24.8 $32.7
2016 2017 2018 2019 2020
$113.9 $117.7 $140.2 $153.8 $170.4
Federal Pell
$0.8 $0.8 $1.1 $1.8 $3.1
$9.0 $10.6 $13.4 $15.2 $17.6
$0.0 $0.0 $0.0 $0.0 $0.0
$0.0 $0.0 $0.0 $0.0 $0.0
$7.9 $0.4 $0.1 $0.0 $0.0
$86.0 $106.1 $116.7 $141.0 $172.6
$0.0 $0.0 $0.0 $0.0 $0.0
$75.2 $77.3 $66.9 $56.5 $50.3
2016 2017 2018 2019 2020
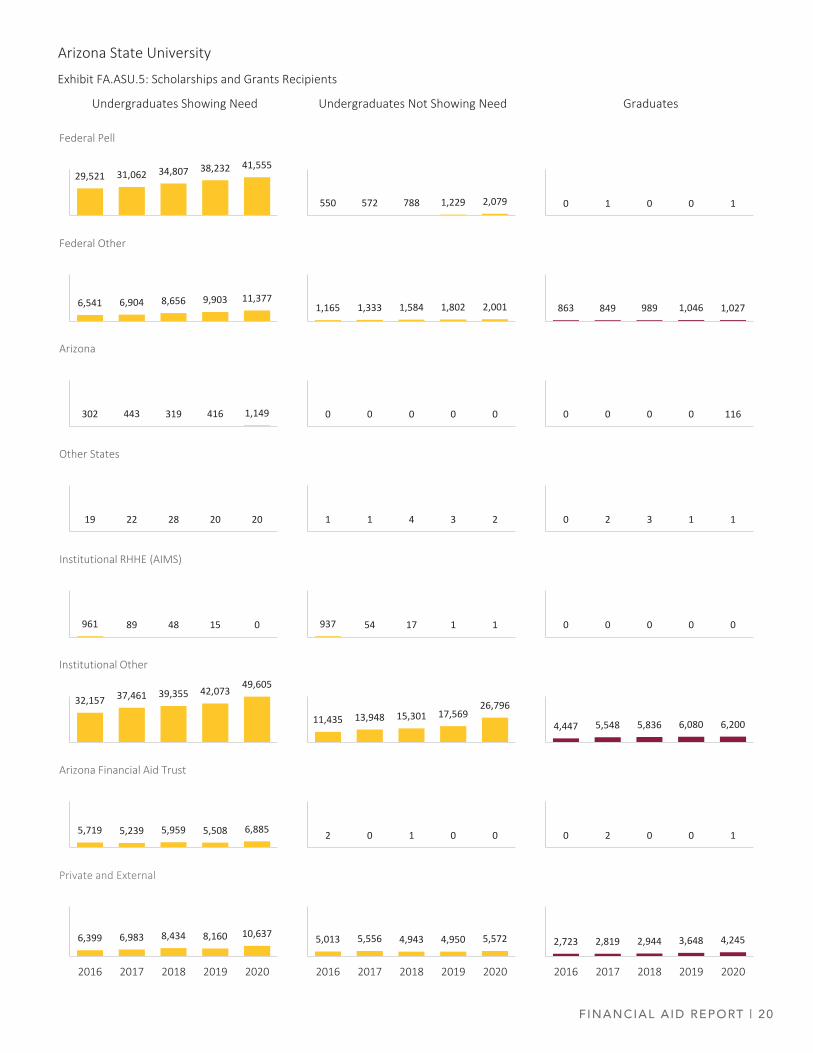
FINANCIAL AID REPORT | 20
Arizona State University
Exhibit FA.ASU.5: Scholarships and Grants Recipients
Undergraduates Showing Need Undergraduates Not Showing Need Graduates
29,521 31,062 34,807 38,232 41,555
Federal Pell
550 572 788 1,229 2,079 0 1 0 0 1
6,541 6,904 8,656 9,903 11,377
Federal Other
1,165 1,333 1,584 1,802 2,001 863 849 989 1,046 1,027
302 443 319 416 1,149
Arizona
0 0 0 0 0 0 0 0 0 116
19 22 28 20 20
Other States
1 1 4 3 2 0 2 3 1 1
961 89 48 15 0
Institutional RHHE (AIMS)
937 54 17 1 1 0 0 0 0 0
32,157 37,461 39,355 42,073 49,605
Institutional Other
11,435 13,948 15,301 17,56926,796
4,447 5,548 5,836 6,080 6,200
5,719 5,239 5,959 5,508 6,885
Arizona Financial Aid Trust
2 0 1 0 0 0 2 0 0 1
6,399 6,983 8,434 8,160 10,637
2016 2017 2018 2019 2020
Private and External
5,013 5,556 4,943 4,950 5,572
2016 2017 2018 2019 2020
2,723 2,819 2,944 3,648 4,245
2016 2017 2018 2019 2020
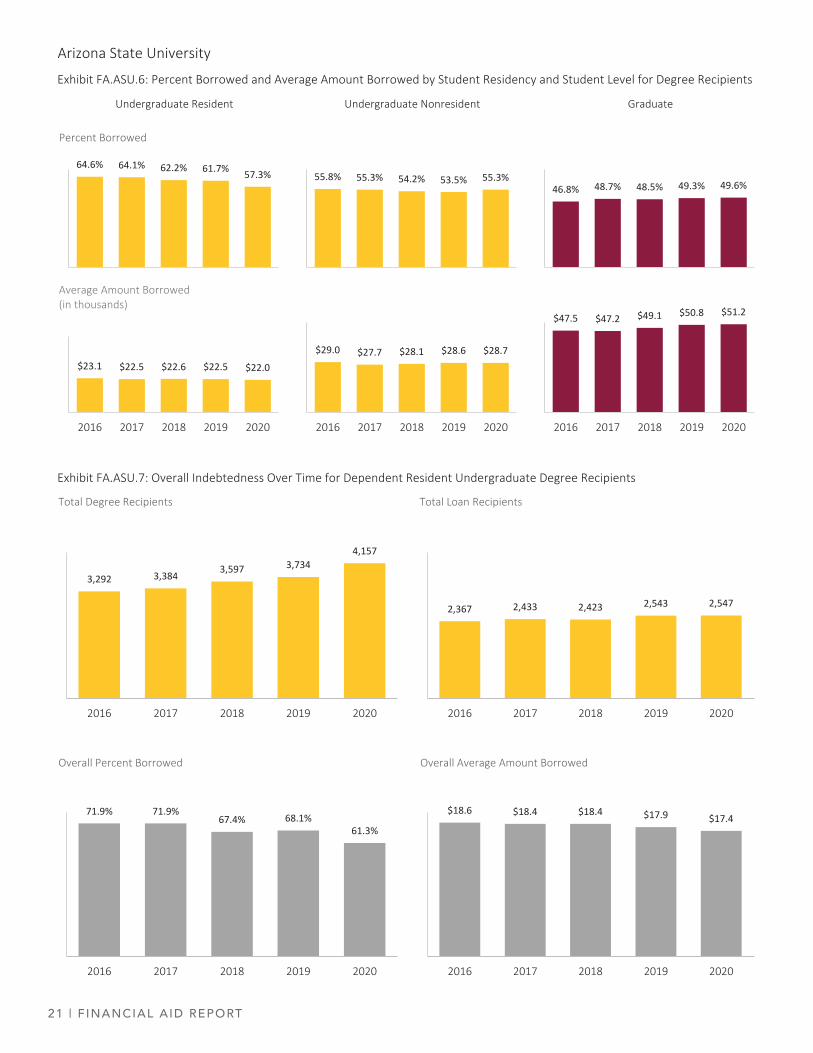
21 | F INANCIAL AID REPORT
Arizona State University
Exhibit FA.ASU.6: Percent Borrowed and Average Amount Borrowed by Student Residency and Student Level for Degree Recipients
Undergraduate Resident Undergraduate Nonresident Graduate
Exhibit FA.ASU.7: Overall Indebtedness Over Time for Dependent Resident Undergraduate Degree Recipients
64.6% 64.1% 62.2% 61.7% 57.3%
Percent Borrowed
55.8% 55.3% 54.2% 53.5% 55.3%46.8% 48.7% 48.5% 49.3% 49.6%
$23.1 $22.5 $22.6 $22.5 $22.0
2016 2017 2018 2019 2020
Average Amount Borrowed (in thousands)
$29.0 $27.7 $28.1 $28.6 $28.7
2016 2017 2018 2019 2020
$47.5 $47.2 $49.1 $50.8 $51.2
2016 2017 2018 2019 2020
3,292 3,384 3,597 3,7344,157
2016 2017 2018 2019 2020
Total Degree Recipients
2,367 2,433 2,423 2,543 2,547
2016 2017 2018 2019 2020
Total Loan Recipients
71.9% 71.9%67.4% 68.1%
61.3%
2016 2017 2018 2019 2020
Overall Percent Borrowed
$18.6 $18.4 $18.4 $17.9 $17.4
2016 2017 2018 2019 2020
Overall Average Amount Borrowed
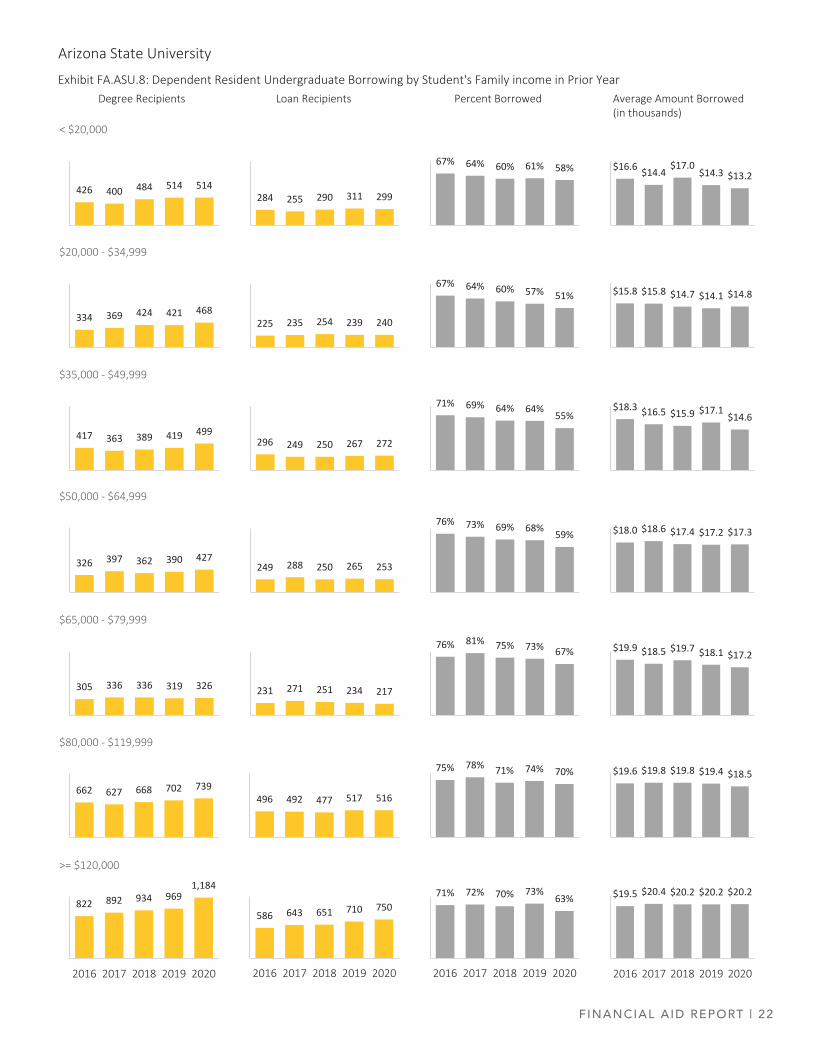
FINANCIAL AID REPORT | 22
Arizona State University
Degree Recipients Loan Recipients Percent Borrowed Average Amount Borrowed (in thousands)
Exhibit FA.ASU.8: Dependent Resident Undergraduate Borrowing by Student's Family income in Prior Year
426 400 484 514 514
< $20,000
822 892 934 9691,184
2016 2017 2018 2019 2020
>= $120,000
334 369 424 421 468
$20,000 ‐ $34,999
417 363 389 419 499
$35,000 ‐ $49,999
326 397 362 390 427
$50,000 ‐ $64,999
305 336 336 319 326
$65,000 ‐ $79,999
662 627 668 702 739
$80,000 ‐ $119,999
586 643 651 710 750
2016 2017 2018 2019 2020
284 255 290 311 299
225 235 254 239 240
296 249 250 267 272
249 288 250 265 253
231 271 251 234 217
496 492 477 517 516
$16.6 $14.4$17.0
$14.3 $13.2
$15.8 $15.8 $14.7 $14.1 $14.8
$18.3 $16.5 $15.9 $17.1 $14.6
$18.0 $18.6 $17.4 $17.2 $17.3
$19.9 $18.5 $19.7 $18.1 $17.2
$19.6 $19.8 $19.8 $19.4 $18.5
$19.5 $20.4 $20.2 $20.2 $20.2
2016 2017 2018 2019 2020
71% 72% 70% 73%63%
2016 2017 2018 2019 2020
67% 64% 60% 61% 58%
67% 64% 60% 57% 51%
71% 69% 64% 64% 55%
76% 73% 69% 68% 59%
76% 81% 75% 73% 67%
75% 78% 71% 74% 70%
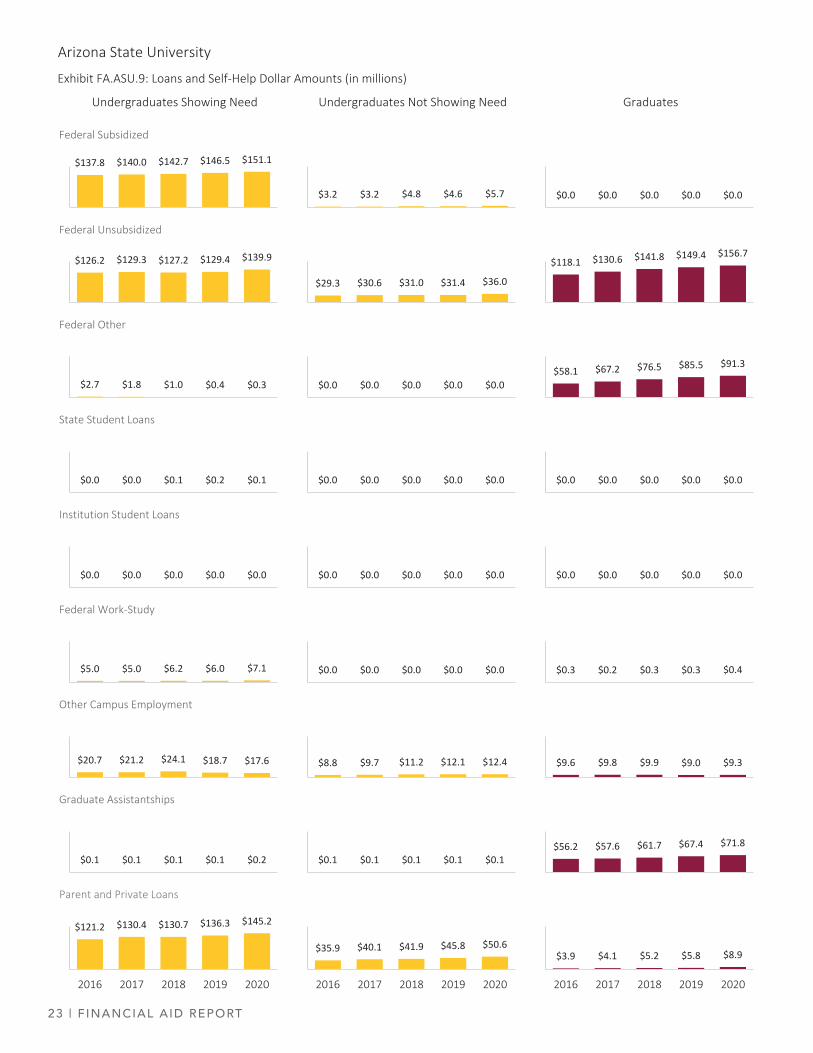
23 | F INANCIAL AID REPORT
Arizona State University
Exhibit FA.ASU.9: Loans and Self‐Help Dollar Amounts (in millions)
Undergraduates Showing Need Undergraduates Not Showing Need Graduates
$0.0 $0.0 $0.0 $0.0 $0.0
$137.8 $140.0 $142.7 $146.5 $151.1
Federal Subsidized
$3.2 $3.2 $4.8 $4.6 $5.7
$118.1 $130.6 $141.8 $149.4 $156.7$126.2 $129.3 $127.2 $129.4 $139.9
Federal Unsubsidized
$29.3 $30.6 $31.0 $31.4 $36.0
$58.1 $67.2 $76.5 $85.5 $91.3
$2.7 $1.8 $1.0 $0.4 $0.3
Federal Other
$0.0 $0.0 $0.0 $0.0 $0.0
$0.0 $0.0 $0.0 $0.0 $0.0$0.0 $0.0 $0.1 $0.2 $0.1
State Student Loans
$0.0 $0.0 $0.0 $0.0 $0.0
$0.0 $0.0 $0.0 $0.0 $0.0$0.0 $0.0 $0.0 $0.0 $0.0
Institution Student Loans
$0.0 $0.0 $0.0 $0.0 $0.0
$0.3 $0.2 $0.3 $0.3 $0.4$5.0 $5.0 $6.2 $6.0 $7.1
Federal Work‐Study
$0.0 $0.0 $0.0 $0.0 $0.0
$9.6 $9.8 $9.9 $9.0 $9.3$20.7 $21.2 $24.1 $18.7 $17.6
Other Campus Employment
$8.8 $9.7 $11.2 $12.1 $12.4
$56.2 $57.6 $61.7 $67.4 $71.8$0.1 $0.1 $0.1 $0.1 $0.2
Graduate Assistantships
$0.1 $0.1 $0.1 $0.1 $0.1
$121.2 $130.4 $130.7 $136.3 $145.2
2016 2017 2018 2019 2020
Parent and Private Loans
$35.9 $40.1 $41.9 $45.8 $50.6
2016 2017 2018 2019 2020
$3.9 $4.1 $5.2 $5.8 $8.9
2016 2017 2018 2019 2020
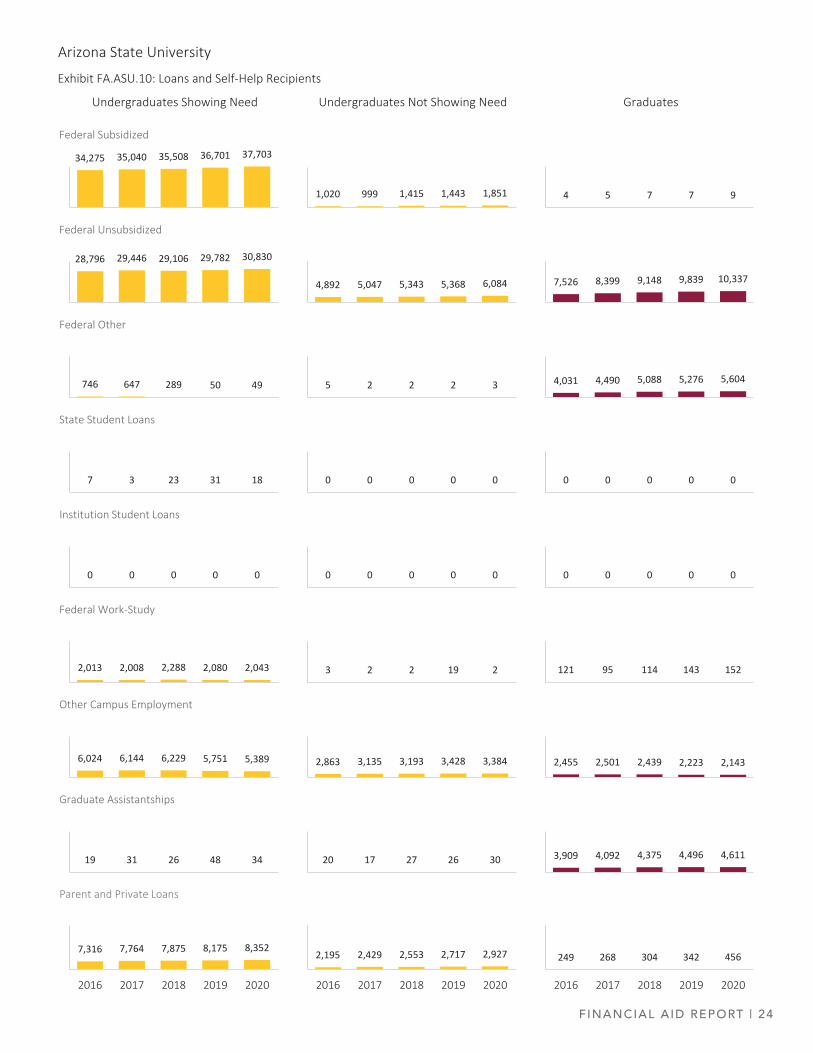
FINANCIAL AID REPORT | 24
Arizona State University
Exhibit FA.ASU.10: Loans and Self‐Help Recipients
Undergraduates Showing Need Undergraduates Not Showing Need Graduates
4 5 7 7 9
34,275 35,040 35,508 36,701 37,703
Federal Subsidized
1,020 999 1,415 1,443 1,851
7,526 8,399 9,148 9,839 10,337
28,796 29,446 29,106 29,782 30,830
Federal Unsubsidized
4,892 5,047 5,343 5,368 6,084
4,031 4,490 5,088 5,276 5,604746 647 289 50 49
Federal Other
5 2 2 2 3
0 0 0 0 07 3 23 31 18
State Student Loans
0 0 0 0 0
0 0 0 0 00 0 0 0 0
Institution Student Loans
0 0 0 0 0
121 95 114 143 1522,013 2,008 2,288 2,080 2,043
Federal Work‐Study
3 2 2 19 2
2,455 2,501 2,439 2,223 2,1436,024 6,144 6,229 5,751 5,389
Other Campus Employment
2,863 3,135 3,193 3,428 3,384
3,909 4,092 4,375 4,496 4,61119 31 26 48 34
Graduate Assistantships
20 17 27 26 30
249 268 304 342 456
2016 2017 2018 2019 2020
7,316 7,764 7,875 8,175 8,352
2016 2017 2018 2019 2020
Parent and Private Loans
2,195 2,429 2,553 2,717 2,927
2016 2017 2018 2019 2020
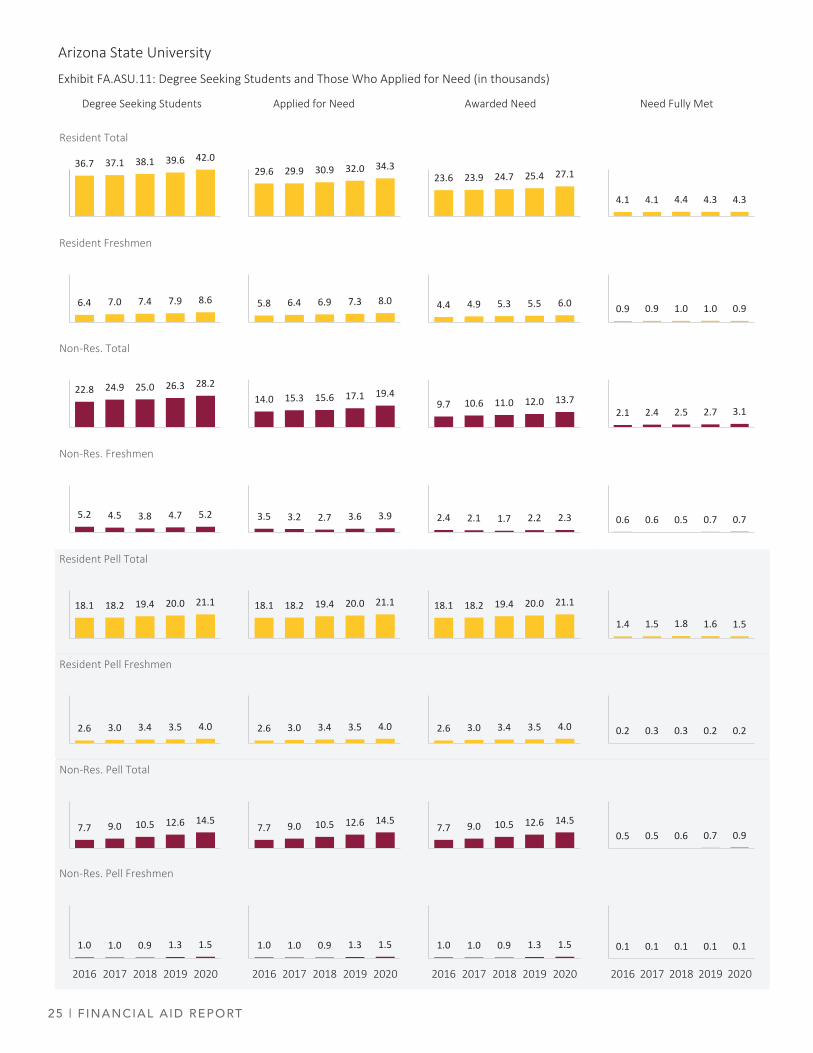
25 | F INANCIAL AID REPORT
Arizona State University
Exhibit FA.ASU.11: Degree Seeking Students and Those Who Applied for Need (in thousands)
Degree Seeking Students Applied for Need Awarded Need Need Fully Met
36.7 37.1 38.1 39.6 42.0
Resident Total
29.6 29.9 30.9 32.0 34.323.6 23.9 24.7 25.4 27.1
4.1 4.1 4.4 4.3 4.3
6.4 7.0 7.4 7.9 8.6
Resident Freshmen
5.8 6.4 6.9 7.3 8.0 4.4 4.9 5.3 5.5 6.0 0.9 0.9 1.0 1.0 0.9
22.8 24.9 25.0 26.3 28.2
Non‐Res. Total
14.0 15.3 15.6 17.1 19.49.7 10.6 11.0 12.0 13.7
2.1 2.4 2.5 2.7 3.1
5.2 4.5 3.8 4.7 5.2
Non‐Res. Freshmen
3.5 3.2 2.7 3.6 3.9 2.4 2.1 1.7 2.2 2.3 0.6 0.6 0.5 0.7 0.7
18.1 18.2 19.4 20.0 21.1
Resident Pell Total
18.1 18.2 19.4 20.0 21.1 18.1 18.2 19.4 20.0 21.1
1.4 1.5 1.8 1.6 1.5
2.6 3.0 3.4 3.5 4.0
Resident Pell Freshmen
2.6 3.0 3.4 3.5 4.0 2.6 3.0 3.4 3.5 4.0 0.2 0.3 0.3 0.2 0.2
7.7 9.0 10.5 12.6 14.5
Non‐Res. Pell Total
7.7 9.0 10.5 12.6 14.57.7 9.0 10.5 12.6 14.5
0.5 0.5 0.6 0.7 0.9
1.0 1.0 0.9 1.3 1.5
2016 2017 2018 2019 2020
Non‐Res. Pell Freshmen
1.0 1.0 0.9 1.3 1.5
2016 2017 2018 2019 2020
1.0 1.0 0.9 1.3 1.5
2016 2017 2018 2019 2020
0.1 0.1 0.1 0.1 0.1
2016 2017 2018 2019 2020
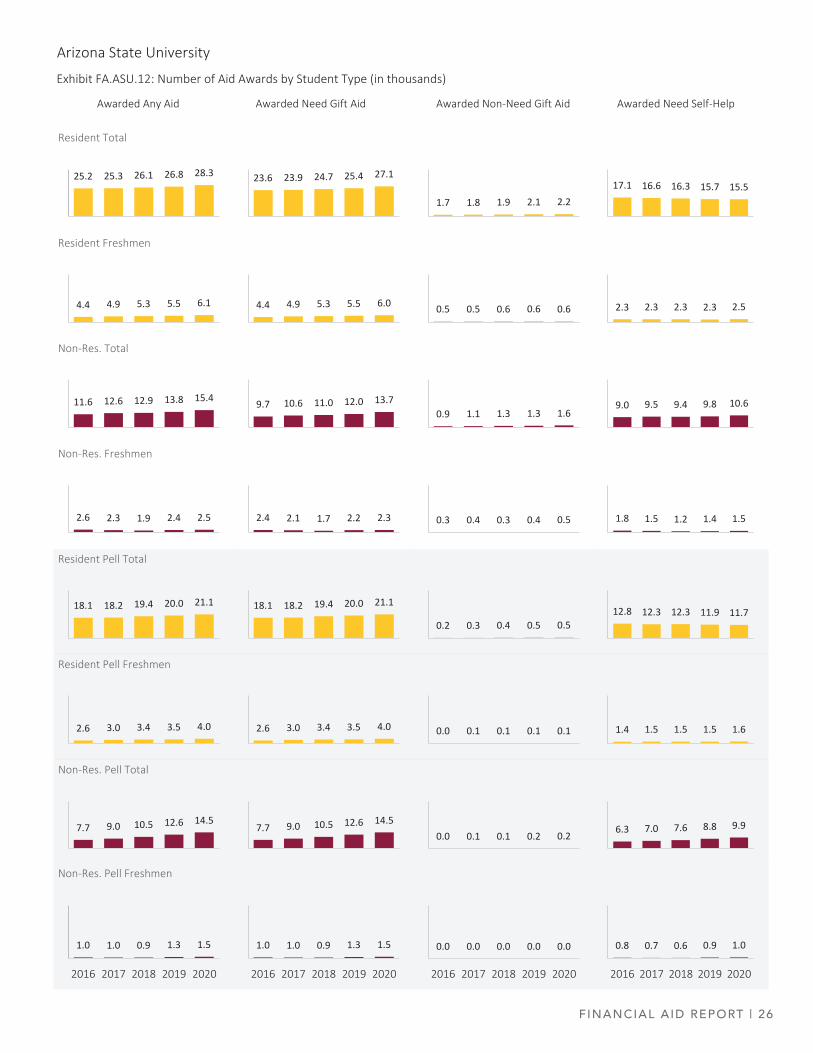
FINANCIAL AID REPORT | 26
Arizona State University
Exhibit FA.ASU.12: Number of Aid Awards by Student Type (in thousands)
Awarded Any Aid Awarded Need Gift Aid Awarded Non‐Need Gift Aid Awarded Need Self‐Help
25.2 25.3 26.1 26.8 28.3
Resident Total
23.6 23.9 24.7 25.4 27.1
1.7 1.8 1.9 2.1 2.217.1 16.6 16.3 15.7 15.5
4.4 4.9 5.3 5.5 6.1
Resident Freshmen
4.4 4.9 5.3 5.5 6.0 0.5 0.5 0.6 0.6 0.6 2.3 2.3 2.3 2.3 2.5
11.6 12.6 12.9 13.8 15.4
Non‐Res. Total
9.7 10.6 11.0 12.0 13.70.9 1.1 1.3 1.3 1.6
9.0 9.5 9.4 9.8 10.6
2.6 2.3 1.9 2.4 2.5
Non‐Res. Freshmen
2.4 2.1 1.7 2.2 2.3 0.3 0.4 0.3 0.4 0.5 1.8 1.5 1.2 1.4 1.5
18.1 18.2 19.4 20.0 21.1
Resident Pell Total
18.1 18.2 19.4 20.0 21.1
0.2 0.3 0.4 0.5 0.512.8 12.3 12.3 11.9 11.7
2.6 3.0 3.4 3.5 4.0
Resident Pell Freshmen
2.6 3.0 3.4 3.5 4.0 0.0 0.1 0.1 0.1 0.1 1.4 1.5 1.5 1.5 1.6
7.7 9.0 10.5 12.6 14.5
Non‐Res. Pell Total
7.7 9.0 10.5 12.6 14.50.0 0.1 0.1 0.2 0.2 6.3 7.0 7.6 8.8 9.9
1.0 1.0 0.9 1.3 1.5
2016 2017 2018 2019 2020
Non‐Res. Pell Freshmen
1.0 1.0 0.9 1.3 1.5
2016 2017 2018 2019 2020
0.0 0.0 0.0 0.0 0.0
2016 2017 2018 2019 2020
0.8 0.7 0.6 0.9 1.0
2016 2017 2018 2019 2020
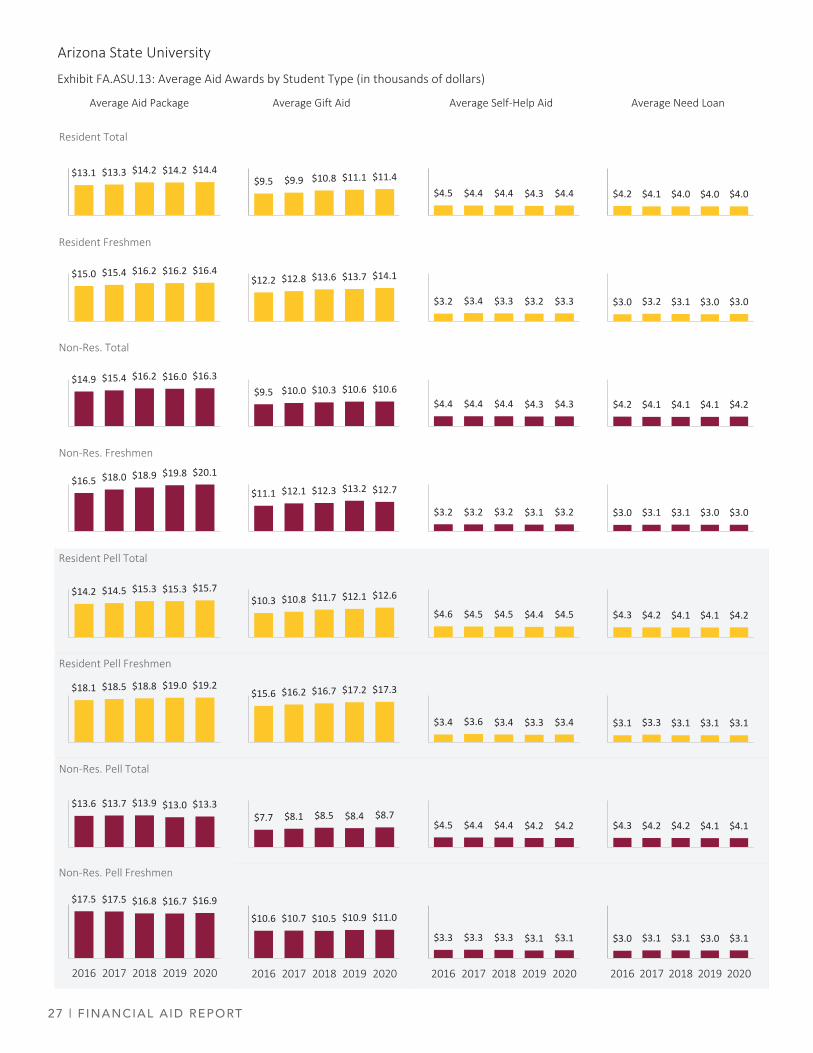
27 | F INANCIAL AID REPORT
Arizona State University
Exhibit FA.ASU.13: Average Aid Awards by Student Type (in thousands of dollars)
Average Aid Package Average Gift Aid Average Self‐Help Aid Average Need Loan
$13.1 $13.3 $14.2 $14.2 $14.4
Resident Total
$15.0 $15.4 $16.2 $16.2 $16.4
Resident Freshmen
$14.9 $15.4 $16.2 $16.0 $16.3
Non‐Res. Total
$16.5 $18.0 $18.9 $19.8 $20.1
Non‐Res. Freshmen
$14.2 $14.5 $15.3 $15.3 $15.7
Resident Pell Total
$18.1 $18.5 $18.8 $19.0 $19.2
Resident Pell Freshmen
$13.6 $13.7 $13.9 $13.0 $13.3
Non‐Res. Pell Total
$17.5 $17.5 $16.8 $16.7 $16.9
2016 2017 2018 2019 2020
Non‐Res. Pell Freshmen
$9.5 $9.9 $10.8 $11.1 $11.4$4.5 $4.4 $4.4 $4.3 $4.4 $4.2 $4.1 $4.0 $4.0 $4.0
$12.2 $12.8 $13.6 $13.7 $14.1
$3.2 $3.4 $3.3 $3.2 $3.3 $3.0 $3.2 $3.1 $3.0 $3.0
$9.5 $10.0 $10.3 $10.6 $10.6$4.4 $4.4 $4.4 $4.3 $4.3 $4.2 $4.1 $4.1 $4.1 $4.2
$11.1 $12.1 $12.3 $13.2 $12.7
$3.2 $3.2 $3.2 $3.1 $3.2 $3.0 $3.1 $3.1 $3.0 $3.0
$10.3 $10.8 $11.7 $12.1 $12.6
$4.6 $4.5 $4.5 $4.4 $4.5 $4.3 $4.2 $4.1 $4.1 $4.2
$15.6 $16.2 $16.7 $17.2 $17.3
$3.1 $3.3 $3.1 $3.1 $3.1$3.4 $3.6 $3.4 $3.3 $3.4
$7.7 $8.1 $8.5 $8.4 $8.7$4.5 $4.4 $4.4 $4.2 $4.2 $4.3 $4.2 $4.2 $4.1 $4.1
$10.6 $10.7 $10.5 $10.9 $11.0
2016 2017 2018 2019 2020
$3.3 $3.3 $3.3 $3.1 $3.1
2016 2017 2018 2019 2020
$3.0 $3.1 $3.1 $3.0 $3.1
2016 2017 2018 2019 2020
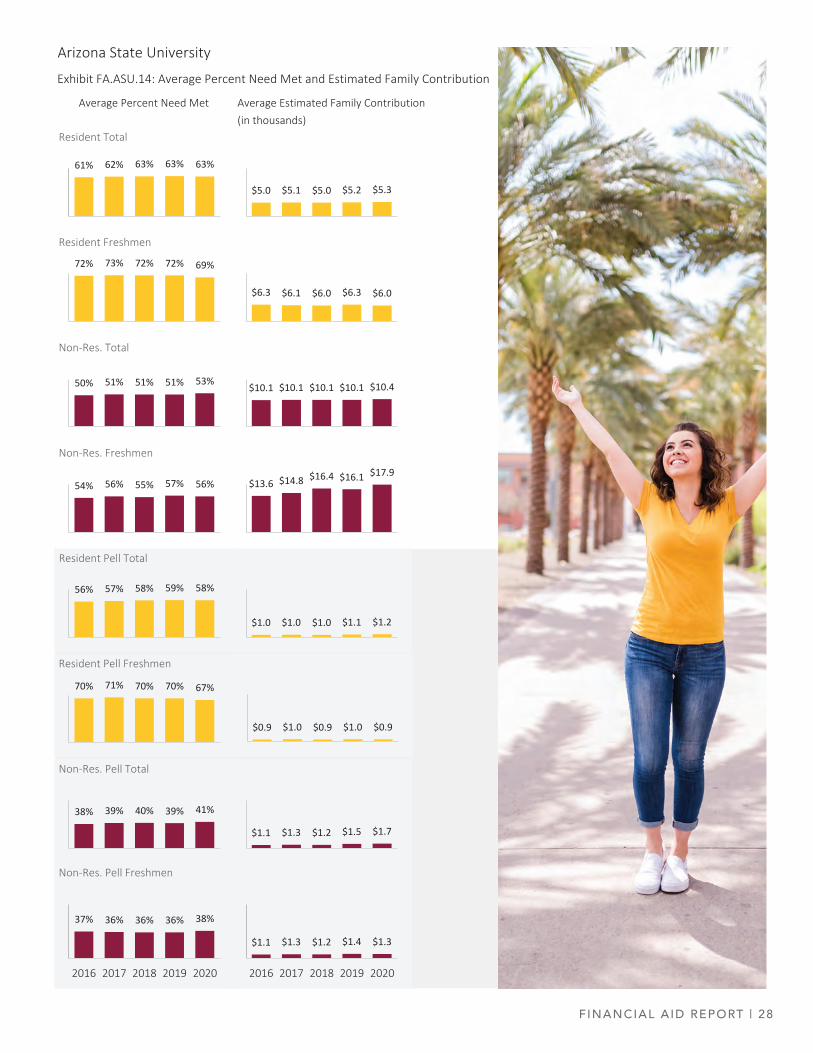
FINANCIAL AID REPORT | 28
Arizona State University
Exhibit FA.ASU.14: Average Percent Need Met and Estimated Family Contribution
Average Percent Need Met Average Estimated Family Contribution (in thousands)
61% 62% 63% 63% 63%
Resident Total
72% 73% 72% 72% 69%
Resident Freshmen
50% 51% 51% 51% 53%
Non‐Res. Total
54% 56% 55% 57% 56%
Non‐Res. Freshmen
56% 57% 58% 59% 58%
Resident Pell Total
70% 71% 70% 70% 67%
Resident Pell Freshmen
38% 39% 40% 39% 41%
Non‐Res. Pell Total
37% 36% 36% 36% 38%
2016 2017 2018 2019 2020
Non‐Res. Pell Freshmen
$5.0 $5.1 $5.0 $5.2 $5.3
$6.3 $6.1 $6.0 $6.3 $6.0
$10.1 $10.1 $10.1 $10.1 $10.4
$13.6 $14.8 $16.4 $16.1 $17.9
$1.0 $1.0 $1.0 $1.1 $1.2
$0.9 $1.0 $0.9 $1.0 $0.9
$1.1 $1.3 $1.2 $1.5 $1.7
$1.1 $1.3 $1.2 $1.4 $1.3
2016 2017 2018 2019 2020
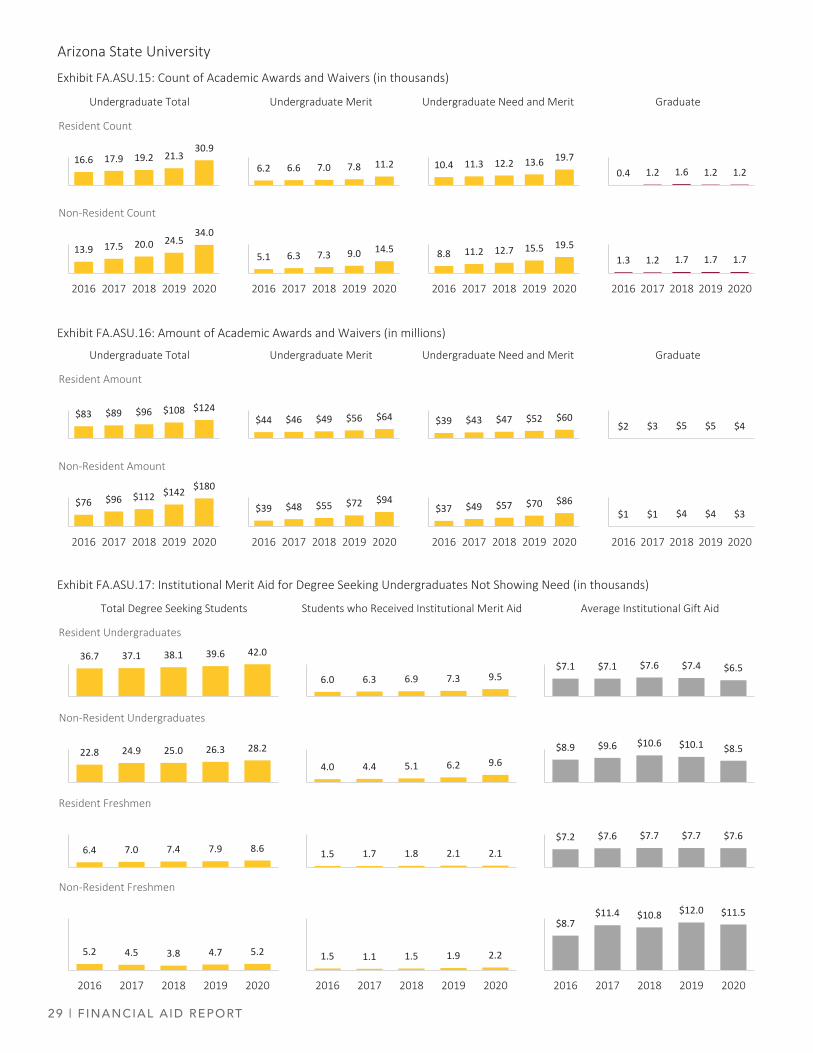
29 | F INANCIAL AID REPORT
Arizona State University
Exhibit FA.ASU.15: Count of Academic Awards and Waivers (in thousands)
Undergraduate Total Undergraduate Merit Undergraduate Need and Merit Graduate
Exhibit FA.ASU.16: Amount of Academic Awards and Waivers (in millions)
Undergraduate Total Undergraduate Merit Undergraduate Need and Merit Graduate
Exhibit FA.ASU.17: Institutional Merit Aid for Degree Seeking Undergraduates Not Showing Need (in thousands)
Total Degree Seeking Students Students who Received Institutional Merit Aid Average Institutional Gift Aid
36.7 37.1 38.1 39.6 42.0
Resident Undergraduates
6.0 6.3 6.9 7.3 9.5$7.1 $7.1 $7.6 $7.4 $6.5
22.8 24.9 25.0 26.3 28.2
Non‐Resident Undergraduates
4.0 4.4 5.1 6.2 9.6$8.9 $9.6 $10.6 $10.1 $8.5
16.6 17.9 19.2 21.330.9
Resident Count
6.2 6.6 7.0 7.8 11.2 10.4 11.3 12.2 13.6 19.70.4 1.2 1.6 1.2 1.2
13.9 17.5 20.0 24.534.0
2016 2017 2018 2019 2020
Non‐Resident Count
5.1 6.3 7.3 9.0 14.5
2016 2017 2018 2019 2020
8.8 11.2 12.7 15.5 19.5
2016 2017 2018 2019 2020
1.3 1.2 1.7 1.7 1.7
2016 2017 2018 2019 2020
$83 $89 $96 $108 $124
Resident Amount
$44 $46 $49 $56 $64 $39 $43 $47 $52 $60$2 $3 $5 $5 $4
$76 $96 $112 $142 $180
2016 2017 2018 2019 2020
Non‐Resident Amount
$39 $48 $55 $72 $94
2016 2017 2018 2019 2020
$37 $49 $57 $70 $86
2016 2017 2018 2019 2020
$1 $1 $4 $4 $3
2016 2017 2018 2019 2020
6.4 7.0 7.4 7.9 8.6
Resident Freshmen
1.5 1.7 1.8 2.1 2.1$7.2 $7.6 $7.7 $7.7 $7.6
5.2 4.5 3.8 4.7 5.2
2016 2017 2018 2019 2020
Non‐Resident Freshmen
1.5 1.1 1.5 1.9 2.2
2016 2017 2018 2019 2020
$8.7$11.4 $10.8 $12.0 $11.5
2016 2017 2018 2019 2020
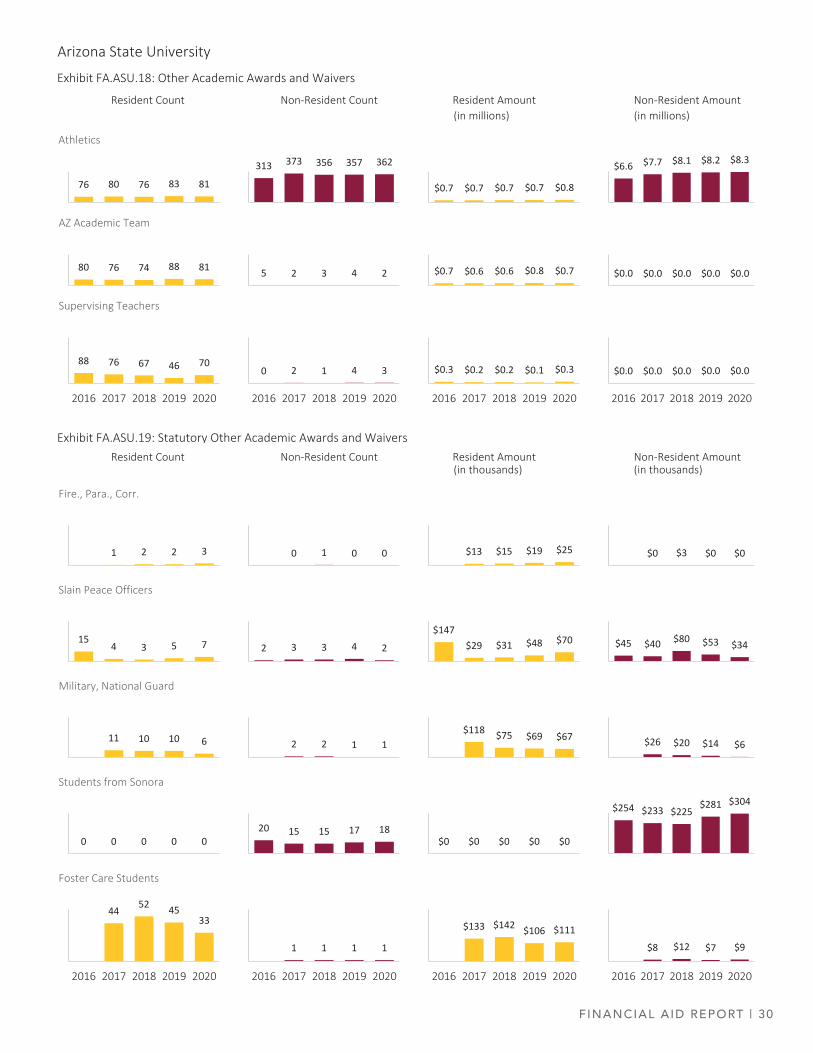
FINANCIAL AID REPORT | 30
Arizona State University
Exhibit FA.ASU.18: Other Academic Awards and Waivers
Resident Count Non‐Resident Count Resident Amount Non‐Resident Amount(in millions) (in millions)
Exhibit FA.ASU.19: Statutory Other Academic Awards and Waivers Resident Count Non‐Resident Count Resident Amount Non‐Resident Amount
(in thousands) (in thousands)
1 2 2 3
Fire., Para., Corr.
154 3 5 7
Slain Peace Officers
11 10 10 6
Military, National Guard
0 0 0 0 0
Students from Sonora
0 1 0 0
2 3 3 4 2
2 2 1 1
20 15 15 17 18
1 1 1 1
2016 2017 2018 2019 2020
$13 $15 $19 $25
$147$29 $31 $48 $70
$118 $75 $69 $67
$0 $0 $0 $0 $0
$133 $142 $106 $111
2016 2017 2018 2019 2020
$0 $3 $0 $0
$45 $40 $80 $53 $34
$26 $20 $14 $6
$254 $233 $225$281 $304
$8 $12 $7 $9
2016 2017 2018 2019 2020
44 52 4533
2016 2017 2018 2019 2020
Foster Care Students
76 80 76 83 81
Athletics
313 373 356 357 362
$0.7 $0.7 $0.7 $0.7 $0.8
$6.6 $7.7 $8.1 $8.2 $8.3
80 76 74 88 81
AZ Academic Team
5 2 3 4 2 $0.7 $0.6 $0.6 $0.8 $0.7 $0.0 $0.0 $0.0 $0.0 $0.0
0 2 1 4 3
2016 2017 2018 2019 2020
$0.3 $0.2 $0.2 $0.1 $0.3
2016 2017 2018 2019 2020
$0.0 $0.0 $0.0 $0.0 $0.0
2016 2017 2018 2019 2020
88 76 67 46 70
2016 2017 2018 2019 2020
Supervising Teachers
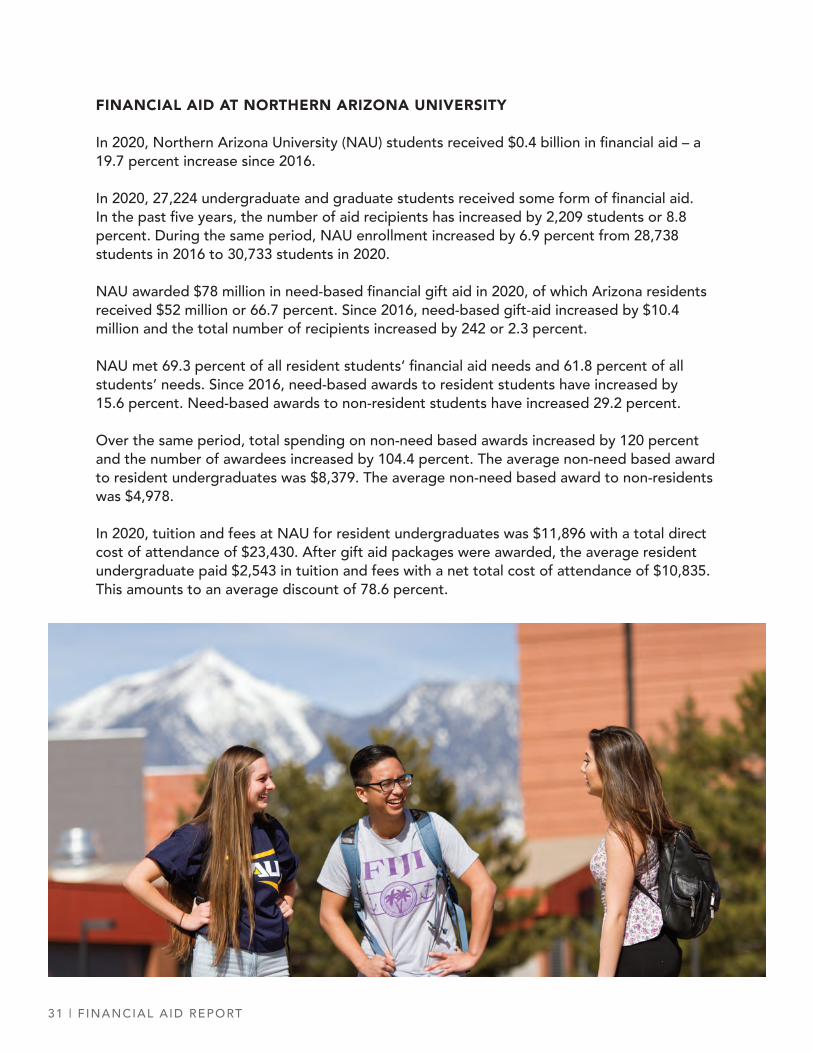
31 | F INANCIAL AID REPORT
FINANCIAL AID AT NORTHERN ARIZONA UNIVERSITY
In 2020, Northern Arizona University (NAU) students received $0.4 billion in financial aid – a 19.7 percent increase since 2016.
In 2020, 27,224 undergraduate and graduate students received some form of financial aid. In the past five years, the number of aid recipients has increased by 2,209 students or 8.8 percent. During the same period, NAU enrollment increased by 6.9 percent from 28,738 students in 2016 to 30,733 students in 2020.
NAU awarded $78 million in need-based financial gift aid in 2020, of which Arizona residents received $52 million or 66.7 percent. Since 2016, need-based gift-aid increased by $10.4 million and the total number of recipients increased by 242 or 2.3 percent.
NAU met 69.3 percent of all resident students’ financial aid needs and 61.8 percent of all students’ needs. Since 2016, need-based awards to resident students have increased by 15.6 percent. Need-based awards to non-resident students have increased 29.2 percent.
Over the same period, total spending on non-need based awards increased by 120 percent and the number of awardees increased by 104.4 percent. The average non-need based award to resident undergraduates was $8,379. The average non-need based award to non-residents was $4,978.
In 2020, tuition and fees at NAU for resident undergraduates was $11,896 with a total direct cost of attendance of $23,430. After gift aid packages were awarded, the average resident undergraduate paid $2,543 in tuition and fees with a net total cost of attendance of $10,835. This amounts to an average discount of 78.6 percent.
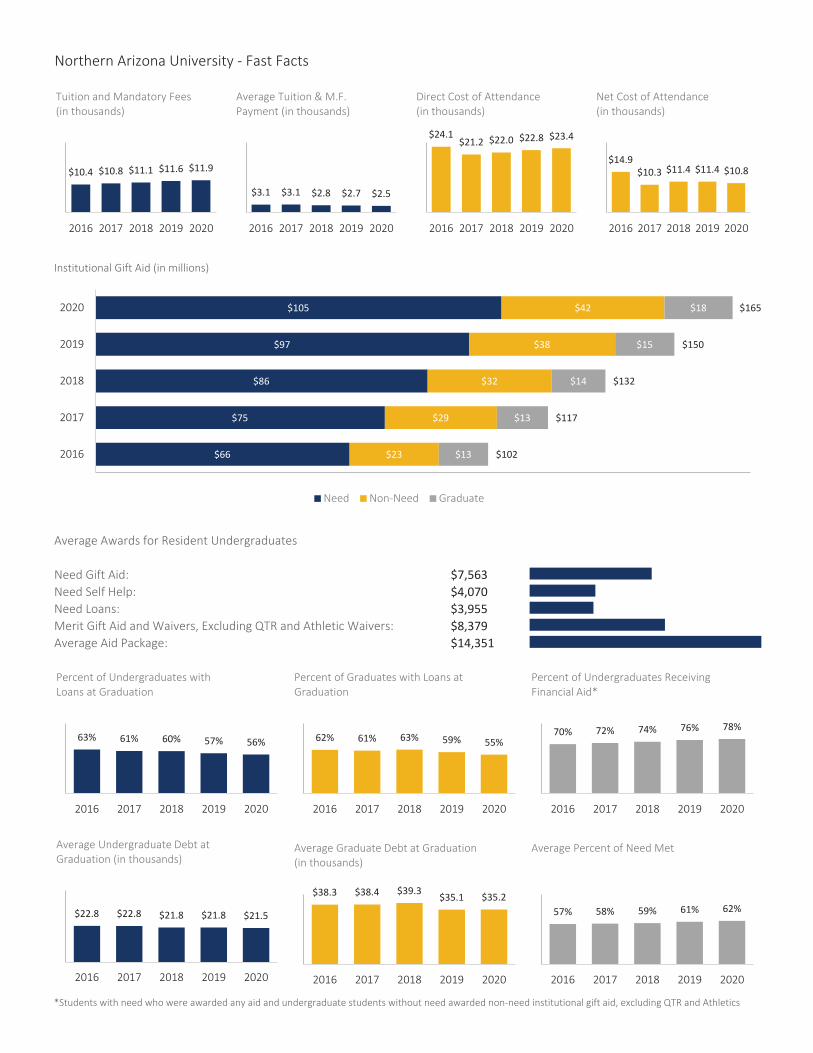
Northern Arizona University ‐ Fast Facts
Institutional Gift Aid (in millions)
Average Awards for Resident Undergraduates
Need Gift Aid: $7,563Need Self Help: $4,070Need Loans: $3,955Merit Gift Aid and Waivers, Excluding QTR and Athletic Waivers: $8,379Average Aid Package: $14,351
*Students with need who were awarded any aid and undergraduate students without need awarded non‐need institutional gift aid, excluding QTR and Athletics
$10.4 $10.8 $11.1 $11.6 $11.9
2016 2017 2018 2019 2020
Tuition and Mandatory Fees (in thousands)
$3.1 $3.1 $2.8 $2.7 $2.5
2016 2017 2018 2019 2020
Average Tuition & M.F. Payment (in thousands)
$24.1$21.2 $22.0 $22.8 $23.4
2016 2017 2018 2019 2020
Direct Cost of Attendance(in thousands)
$14.9$10.3 $11.4 $11.4 $10.8
2016 2017 2018 2019 2020
Net Cost of Attendance(in thousands)
$66
$75
$86
$97
$105
$23
$29
$32
$38
$42
$13
$13
$14
$15
$18
$102
$117
$132
$150
$165
2016
2017
2018
2019
2020
Need Non‐Need Graduate
63% 61% 60% 57% 56%
2016 2017 2018 2019 2020
Percent of Undergraduates with Loans at Graduation
$22.8 $22.8 $21.8 $21.8 $21.5
2016 2017 2018 2019 2020
Average Undergraduate Debt at Graduation (in thousands)
$38.3 $38.4 $39.3 $35.1 $35.2
2016 2017 2018 2019 2020
Average Graduate Debt at Graduation(in thousands)
62% 61% 63% 59% 55%
2016 2017 2018 2019 2020
Percent of Graduates with Loans at Graduation
57% 58% 59% 61% 62%
2016 2017 2018 2019 2020
Average Percent of Need Met
70% 72% 74% 76% 78%
2016 2017 2018 2019 2020
Percent of Undergraduates Receiving Financial Aid*
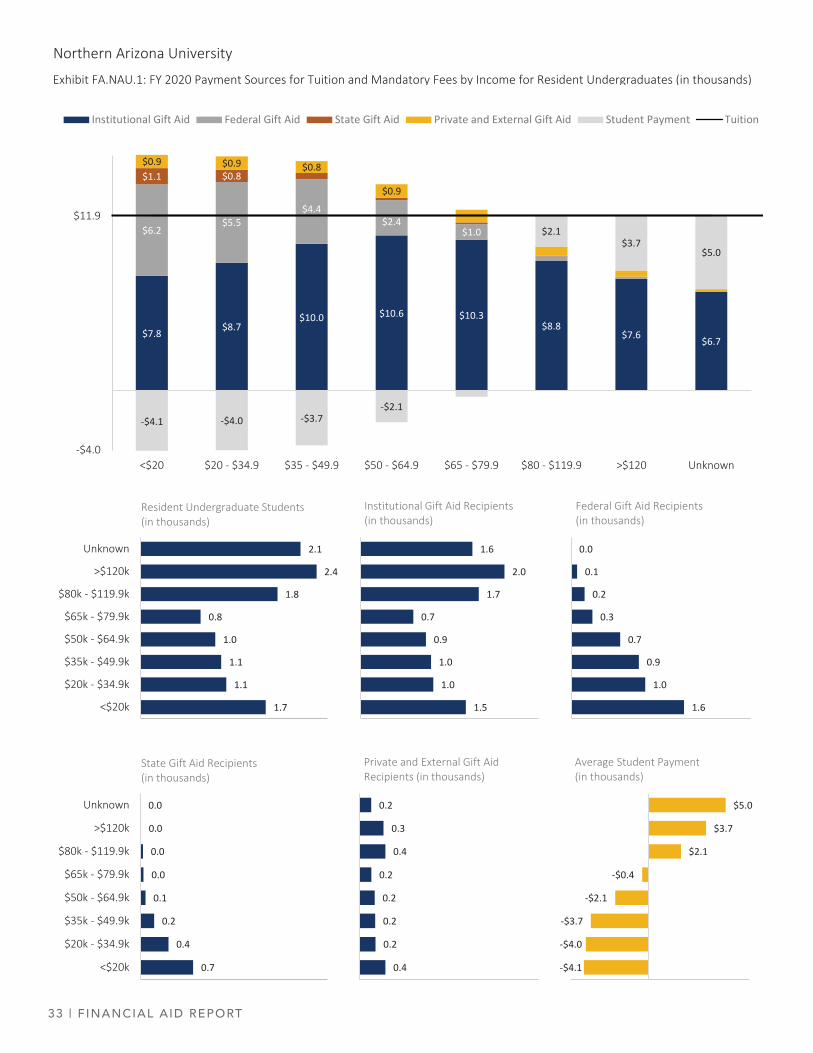
33 | F INANCIAL AID REPORT
Northern Arizona University
Exhibit FA.NAU.1: FY 2020 Payment Sources for Tuition and Mandatory Fees by Income for Resident Undergraduates (in thousands)
$7.8 $8.7$10.0 $10.6 $10.3
$8.8$7.6 $6.7
$6.2$5.5
$4.4$2.4
$1.0
$1.1 $0.8$0.9 $0.9 $0.8
$0.9
‐$4.1 ‐$4.0 ‐$3.7‐$2.1
$2.1$3.7
$5.0
‐$4.0
$11.9
<$20 $20 ‐ $34.9 $35 ‐ $49.9 $50 ‐ $64.9 $65 ‐ $79.9 $80 ‐ $119.9 >$120 Unknown
Institutional Gift Aid Federal Gift Aid State Gift Aid Private and External Gift Aid Student Payment Tuition
1.7
1.1
1.1
1.0
0.8
1.8
2.4
2.1
<$20k
$20k ‐ $34.9k
$35k ‐ $49.9k
$50k ‐ $64.9k
$65k ‐ $79.9k
$80k ‐ $119.9k
>$120k
Unknown
Resident Undergraduate Students(in thousands)
1.5
1.0
1.0
0.9
0.7
1.7
2.0
1.6
Institutional Gift Aid Recipients(in thousands)
1.6
1.0
0.9
0.7
0.3
0.2
0.1
0.0
Federal Gift Aid Recipients(in thousands)
0.7
0.4
0.2
0.1
0.0
0.0
0.0
0.0
<$20k
$20k ‐ $34.9k
$35k ‐ $49.9k
$50k ‐ $64.9k
$65k ‐ $79.9k
$80k ‐ $119.9k
>$120k
Unknown
State Gift Aid Recipients(in thousands)
0.4
0.2
0.2
0.2
0.2
0.4
0.3
0.2
Private and External Gift Aid Recipients (in thousands)
‐$4.1
‐$4.0
‐$3.7
‐$2.1
‐$0.4
$2.1
$3.7
$5.0
Average Student Payment(in thousands)
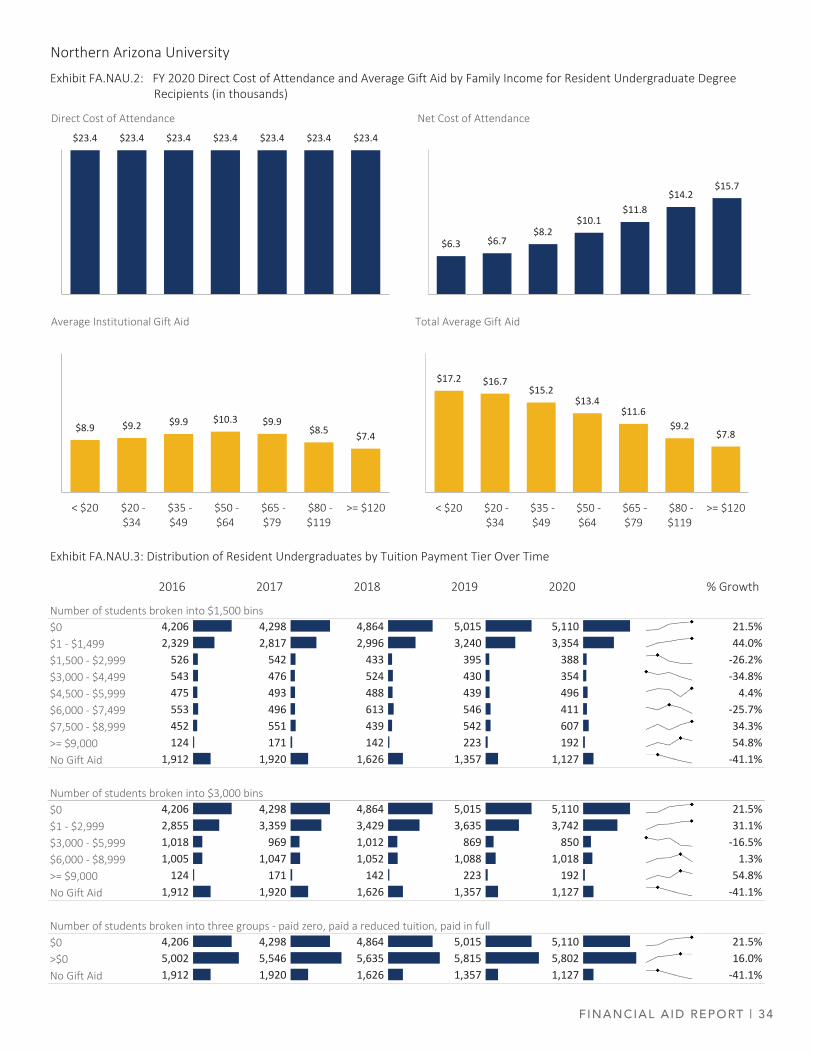
FINANCIAL AID REPORT | 34
Northern Arizona University
Exhibit FA.NAU.2: FY 2020 Direct Cost of Attendance and Average Gift Aid by Family Income for Resident Undergraduate Degree Recipients (in thousands)
Exhibit FA.NAU.3: Distribution of Resident Undergraduates by Tuition Payment Tier Over Time
Number of students broken into $1,500 bins$0 4,206 4,298 4,864 5,015 5,110 21.5%$1 ‐ $1,499 2,329 2,817 2,996 3,240 3,354 44.0%$1,500 ‐ $2,999 526 542 433 395 388 ‐26.2%$3,000 ‐ $4,499 543 476 524 430 354 ‐34.8%$4,500 ‐ $5,999 475 493 488 439 496 4.4%$6,000 ‐ $7,499 553 496 613 546 411 ‐25.7%$7,500 ‐ $8,999 452 551 439 542 607 34.3%>= $9,000 124 171 142 223 192 54.8%No Gift Aid 1,912 1,920 1,626 1,357 1,127 ‐41.1%
Number of students broken into $3,000 bins$0 4,206 4,298 4,864 5,015 5,110 21.5%$1 ‐ $2,999 2,855 3,359 3,429 3,635 3,742 31.1%$3,000 ‐ $5,999 1,018 969 1,012 869 850 ‐16.5%$6,000 ‐ $8,999 1,005 1,047 1,052 1,088 1,018 1.3%>= $9,000 124 171 142 223 192 54.8%No Gift Aid 1,912 1,920 1,626 1,357 1,127 ‐41.1%
Number of students broken into three groups ‐ paid zero, paid a reduced tuition, paid in full$0 4,206 4,298 4,864 5,015 5,110 21.5%>$0 5,002 5,546 5,635 5,815 5,802 16.0%No Gift Aid 1,912 1,920 1,626 1,357 1,127 ‐41.1%
2016 2017 2018 2019 2020 % Growth
$23.4 $23.4 $23.4 $23.4 $23.4 $23.4 $23.4
Direct Cost of Attendance
$17.2 $16.7$15.2
$13.4$11.6
$9.2$7.8
< $20 $20 ‐$34
$35 ‐$49
$50 ‐$64
$65 ‐$79
$80 ‐$119
>= $120
Total Average Gift Aid
$8.9 $9.2 $9.9 $10.3 $9.9$8.5 $7.4
< $20 $20 ‐$34
$35 ‐$49
$50 ‐$64
$65 ‐$79
$80 ‐$119
>= $120
Average Institutional Gift Aid
$6.3 $6.7$8.2
$10.1$11.8
$14.2$15.7
Net Cost of Attendance
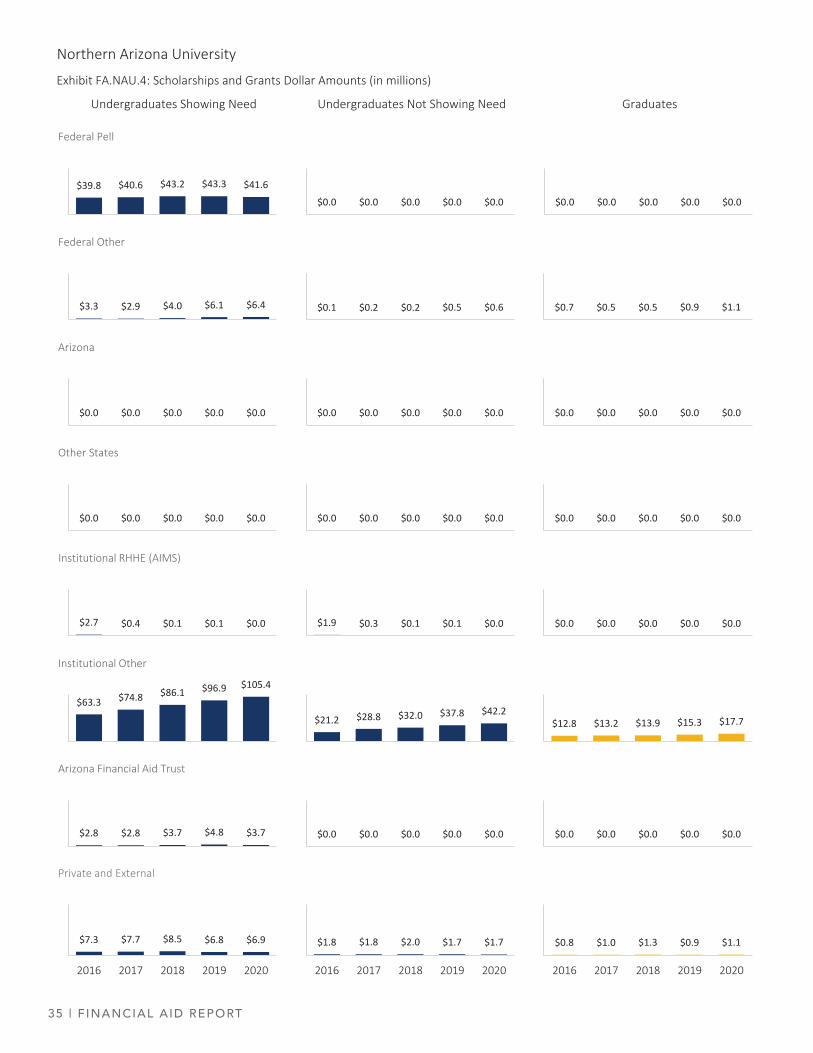
35 | F INANCIAL AID REPORT
Northern Arizona University
Exhibit FA.NAU.4: Scholarships and Grants Dollar Amounts (in millions)
Undergraduates Showing Need Undergraduates Not Showing Need Graduates
$0.0 $0.0 $0.0 $0.0 $0.0
$3.3 $2.9 $4.0 $6.1 $6.4
Federal Other
$0.7 $0.5 $0.5 $0.9 $1.1
$0.0 $0.0 $0.0 $0.0 $0.0
Arizona
$0.0 $0.0 $0.0 $0.0 $0.0
$0.0 $0.0 $0.0 $0.0 $0.0
Other States
$0.0 $0.0 $0.0 $0.0 $0.0
$2.7 $0.4 $0.1 $0.1 $0.0
Institutional RHHE (AIMS)
$0.0 $0.0 $0.0 $0.0 $0.0
$63.3 $74.8 $86.1 $96.9 $105.4
Institutional Other
$12.8 $13.2 $13.9 $15.3 $17.7
$2.8 $2.8 $3.7 $4.8 $3.7
Arizona Financial Aid Trust
$0.0 $0.0 $0.0 $0.0 $0.0
$7.3 $7.7 $8.5 $6.8 $6.9
2016 2017 2018 2019 2020
Private and External
$0.8 $1.0 $1.3 $0.9 $1.1
2016 2017 2018 2019 2020
$39.8 $40.6 $43.2 $43.3 $41.6
Federal Pell
$0.0 $0.0 $0.0 $0.0 $0.0
$0.1 $0.2 $0.2 $0.5 $0.6
$0.0 $0.0 $0.0 $0.0 $0.0
$0.0 $0.0 $0.0 $0.0 $0.0
$1.9 $0.3 $0.1 $0.1 $0.0
$21.2 $28.8 $32.0 $37.8 $42.2
$0.0 $0.0 $0.0 $0.0 $0.0
$1.8 $1.8 $2.0 $1.7 $1.7
2016 2017 2018 2019 2020
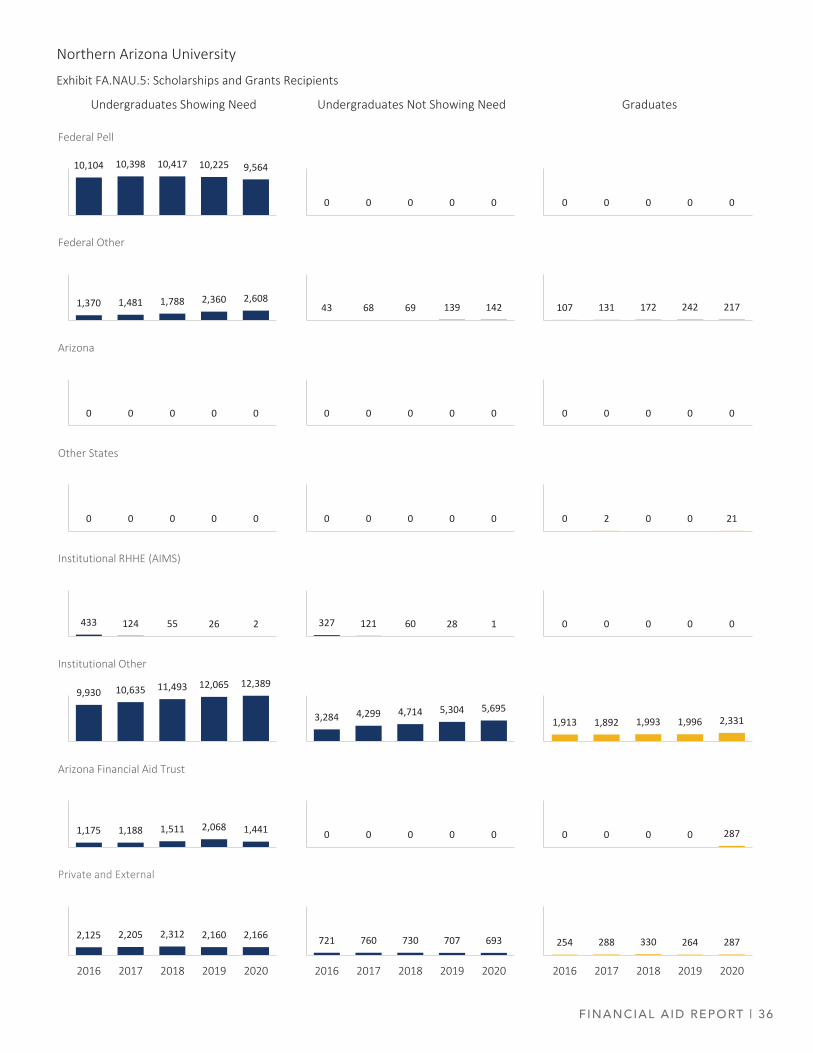
FINANCIAL AID REPORT | 36
Northern Arizona University
Exhibit FA.NAU.5: Scholarships and Grants Recipients
Undergraduates Showing Need Undergraduates Not Showing Need Graduates
10,104 10,398 10,417 10,225 9,564
Federal Pell
0 0 0 0 0 0 0 0 0 0
1,370 1,481 1,788 2,360 2,608
Federal Other
43 68 69 139 142 107 131 172 242 217
0 0 0 0 0
Arizona
0 0 0 0 0 0 0 0 0 0
0 0 0 0 0
Other States
0 0 0 0 0 0 2 0 0 21
433 124 55 26 2
Institutional RHHE (AIMS)
327 121 60 28 1 0 0 0 0 0
9,930 10,635 11,493 12,065 12,389
Institutional Other
3,284 4,299 4,714 5,304 5,6951,913 1,892 1,993 1,996 2,331
1,175 1,188 1,511 2,068 1,441
Arizona Financial Aid Trust
0 0 0 0 0 0 0 0 0 287
2,125 2,205 2,312 2,160 2,166
2016 2017 2018 2019 2020
Private and External
721 760 730 707 693
2016 2017 2018 2019 2020
254 288 330 264 287
2016 2017 2018 2019 2020
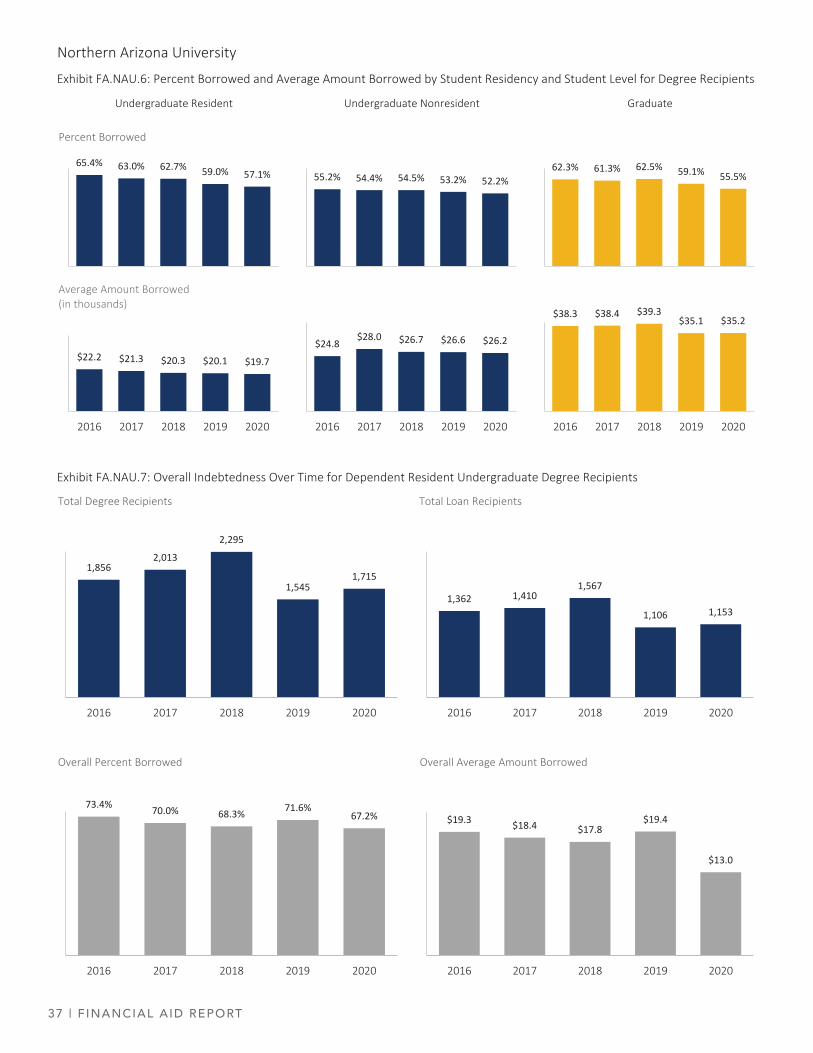
37 | F INANCIAL AID REPORT
Northern Arizona University
Exhibit FA.NAU.6: Percent Borrowed and Average Amount Borrowed by Student Residency and Student Level for Degree Recipients
Undergraduate Resident Undergraduate Nonresident Graduate
Exhibit FA.NAU.7: Overall Indebtedness Over Time for Dependent Resident Undergraduate Degree Recipients
65.4% 63.0% 62.7% 59.0% 57.1%
Percent Borrowed
55.2% 54.4% 54.5% 53.2% 52.2%62.3% 61.3% 62.5% 59.1% 55.5%
$22.2 $21.3 $20.3 $20.1 $19.7
2016 2017 2018 2019 2020
Average Amount Borrowed (in thousands)
$24.8$28.0 $26.7 $26.6 $26.2
2016 2017 2018 2019 2020
$38.3 $38.4 $39.3$35.1 $35.2
2016 2017 2018 2019 2020
1,8562,013
2,295
1,5451,715
2016 2017 2018 2019 2020
Total Degree Recipients
1,362 1,4101,567
1,106 1,153
2016 2017 2018 2019 2020
Total Loan Recipients
73.4% 70.0% 68.3% 71.6%67.2%
2016 2017 2018 2019 2020
Overall Percent Borrowed
$19.3 $18.4 $17.8$19.4
$13.0
2016 2017 2018 2019 2020
Overall Average Amount Borrowed
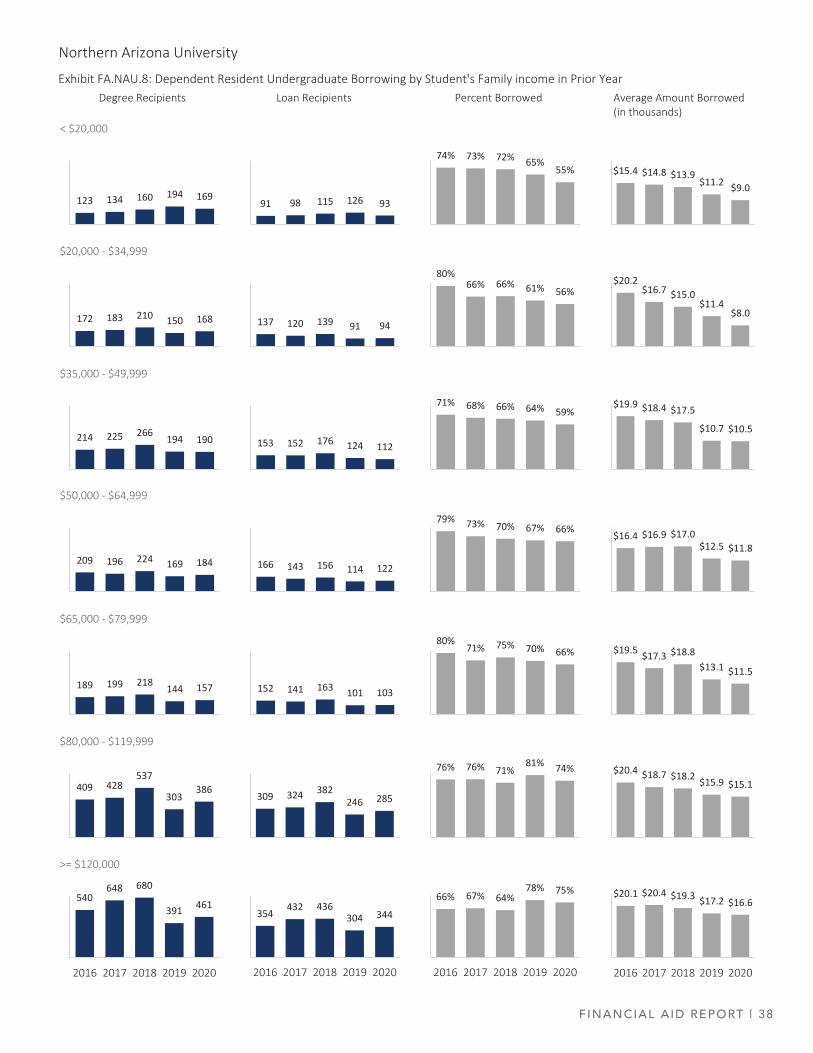
FINANCIAL AID REPORT | 38
Northern Arizona University
Degree Recipients Loan Recipients Percent Borrowed Average Amount Borrowed (in thousands)
Exhibit FA.NAU.8: Dependent Resident Undergraduate Borrowing by Student's Family income in Prior Year
123 134 160 194 169
< $20,000
540648 680
391 461
2016 2017 2018 2019 2020
>= $120,000
172 183 210 150 168
$20,000 ‐ $34,999
214 225 266 194 190
$35,000 ‐ $49,999
209 196 224 169 184
$50,000 ‐ $64,999
189 199 218 144 157
$65,000 ‐ $79,999
409 428537
303386
$80,000 ‐ $119,999
354 432 436304 344
2016 2017 2018 2019 2020
91 98 115 126 93
137 120 139 91 94
153 152 176 124 112
166 143 156 114 122
152 141 163 101 103
309 324 382246 285
$15.4 $14.8 $13.9$11.2 $9.0
$20.2$16.7 $15.0
$11.4$8.0
$19.9 $18.4 $17.5
$10.7 $10.5
$16.4 $16.9 $17.0$12.5 $11.8
$19.5 $17.3 $18.8$13.1 $11.5
$20.4 $18.7 $18.2 $15.9 $15.1
$20.1 $20.4 $19.3 $17.2 $16.6
2016 2017 2018 2019 2020
66% 67% 64%78% 75%
2016 2017 2018 2019 2020
74% 73% 72% 65%55%
80%66% 66% 61% 56%
71% 68% 66% 64% 59%
79% 73% 70% 67% 66%
80%71% 75% 70% 66%
76% 76% 71%81% 74%
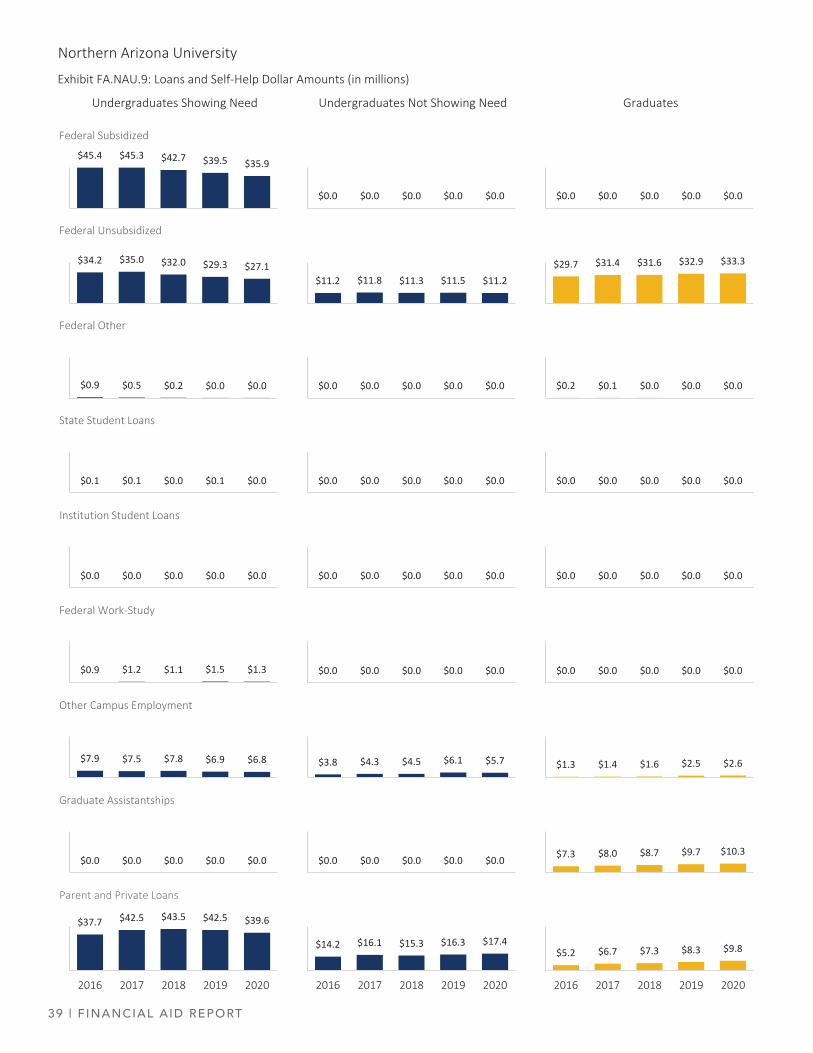
39 | F INANCIAL AID REPORT
Northern Arizona University
Exhibit FA.NAU.9: Loans and Self‐Help Dollar Amounts (in millions)
Undergraduates Showing Need Undergraduates Not Showing Need Graduates
$0.0 $0.0 $0.0 $0.0 $0.0
$45.4 $45.3 $42.7 $39.5 $35.9
Federal Subsidized
$0.0 $0.0 $0.0 $0.0 $0.0
$29.7 $31.4 $31.6 $32.9 $33.3$34.2 $35.0 $32.0 $29.3 $27.1
Federal Unsubsidized
$11.2 $11.8 $11.3 $11.5 $11.2
$0.2 $0.1 $0.0 $0.0 $0.0$0.9 $0.5 $0.2 $0.0 $0.0
Federal Other
$0.0 $0.0 $0.0 $0.0 $0.0
$0.0 $0.0 $0.0 $0.0 $0.0$0.1 $0.1 $0.0 $0.1 $0.0
State Student Loans
$0.0 $0.0 $0.0 $0.0 $0.0
$0.0 $0.0 $0.0 $0.0 $0.0$0.0 $0.0 $0.0 $0.0 $0.0
Institution Student Loans
$0.0 $0.0 $0.0 $0.0 $0.0
$0.0 $0.0 $0.0 $0.0 $0.0$0.9 $1.2 $1.1 $1.5 $1.3
Federal Work‐Study
$0.0 $0.0 $0.0 $0.0 $0.0
$1.3 $1.4 $1.6 $2.5 $2.6$7.9 $7.5 $7.8 $6.9 $6.8
Other Campus Employment
$3.8 $4.3 $4.5 $6.1 $5.7
$7.3 $8.0 $8.7 $9.7 $10.3$0.0 $0.0 $0.0 $0.0 $0.0
Graduate Assistantships
$0.0 $0.0 $0.0 $0.0 $0.0
$37.7 $42.5 $43.5 $42.5 $39.6
2016 2017 2018 2019 2020
Parent and Private Loans
$14.2 $16.1 $15.3 $16.3 $17.4
2016 2017 2018 2019 2020
$5.2 $6.7 $7.3 $8.3 $9.8
2016 2017 2018 2019 2020

FINANCIAL AID REPORT | 40
Northern Arizona University
Exhibit FA.NAU.10: Loans and Self‐Help Recipients
Undergraduates Showing Need Undergraduates Not Showing Need Graduates
0 0 0 0 0
11,163 11,283 10,753 9,965 9,049
Federal Subsidized
0 0 0 0 0
2,092 2,144 2,171 2,280 2,249
9,038 9,280 8,808 8,159 7,368
Federal Unsubsidized
1,854 1,925 1,871 1,900 1,810
88 33 1 0 0341 216 72 14 13
Federal Other
0 0 0 0 0
0 0 0 0 012 17 7 12 3
State Student Loans
0 0 0 0 0
0 0 0 0 00 0 0 0 0
Institution Student Loans
0 0 0 0 0
0 0 0 0 5564 723 657 739 644
Federal Work‐Study
0 0 0 0 0
494 493 510 618 6032,778 2,737 2,749 2,435 2,275
Other Campus Employment
1,421 1,593 1,652 1,995 1,727
634 65 668 712 7150 0 0 0 0
Graduate Assistantships
0 0 0 0 0
455 530 512 537 597
2016 2017 2018 2019 2020
2,861 3,115 3,100 3,059 2,862
2016 2017 2018 2019 2020
Parent and Private Loans
931 1,005 979 1,015 1,072
2016 2017 2018 2019 2020
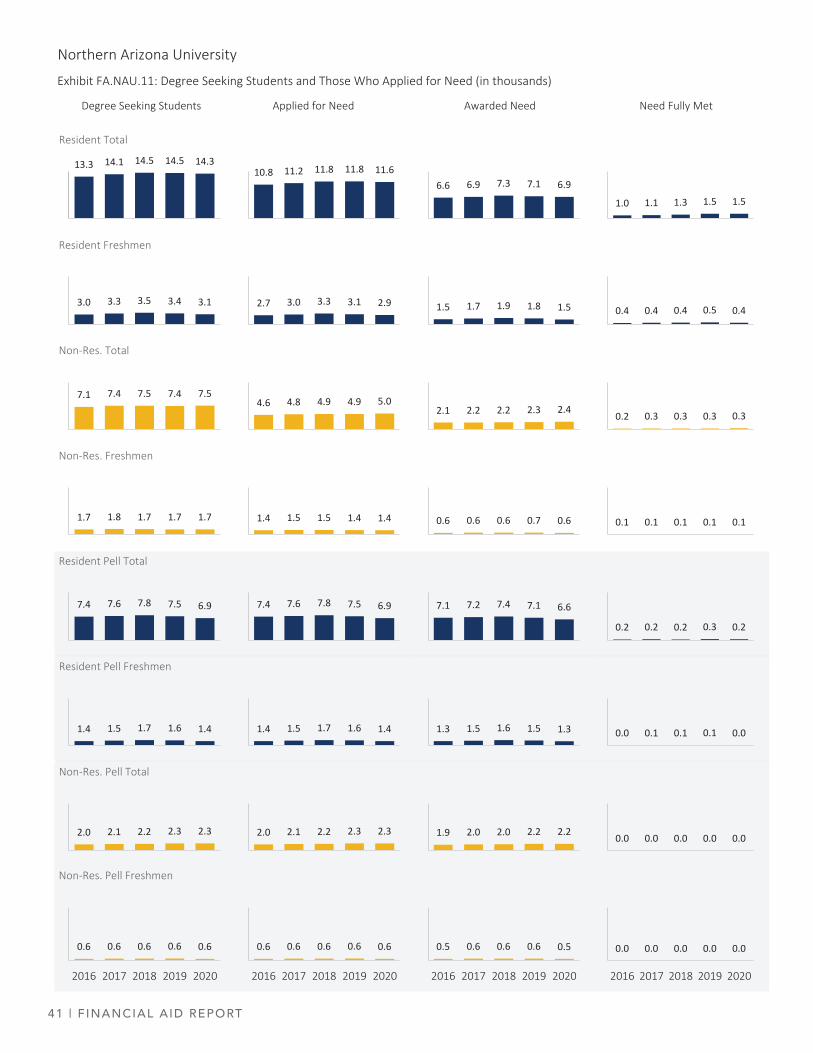
41 | F INANCIAL AID REPORT
Northern Arizona University
Exhibit FA.NAU.11: Degree Seeking Students and Those Who Applied for Need (in thousands)
Degree Seeking Students Applied for Need Awarded Need Need Fully Met
13.3 14.1 14.5 14.5 14.3
Resident Total
10.8 11.2 11.8 11.8 11.66.6 6.9 7.3 7.1 6.9
1.0 1.1 1.3 1.5 1.5
3.0 3.3 3.5 3.4 3.1
Resident Freshmen
2.7 3.0 3.3 3.1 2.9 1.5 1.7 1.9 1.8 1.5 0.4 0.4 0.4 0.5 0.4
7.1 7.4 7.5 7.4 7.5
Non‐Res. Total
4.6 4.8 4.9 4.9 5.02.1 2.2 2.2 2.3 2.4 0.2 0.3 0.3 0.3 0.3
1.7 1.8 1.7 1.7 1.7
Non‐Res. Freshmen
1.4 1.5 1.5 1.4 1.4 0.6 0.6 0.6 0.7 0.6 0.1 0.1 0.1 0.1 0.1
7.4 7.6 7.8 7.5 6.9
Resident Pell Total
7.4 7.6 7.8 7.5 6.9 7.1 7.2 7.4 7.1 6.6
0.2 0.2 0.2 0.3 0.2
1.4 1.5 1.7 1.6 1.4
Resident Pell Freshmen
1.4 1.5 1.7 1.6 1.4 1.3 1.5 1.6 1.5 1.3 0.0 0.1 0.1 0.1 0.0
2.0 2.1 2.2 2.3 2.3
Non‐Res. Pell Total
2.0 2.1 2.2 2.3 2.3 1.9 2.0 2.0 2.2 2.2 0.0 0.0 0.0 0.0 0.0
0.6 0.6 0.6 0.6 0.6
2016 2017 2018 2019 2020
Non‐Res. Pell Freshmen
0.6 0.6 0.6 0.6 0.6
2016 2017 2018 2019 2020
0.5 0.6 0.6 0.6 0.5
2016 2017 2018 2019 2020
0.0 0.0 0.0 0.0 0.0
2016 2017 2018 2019 2020
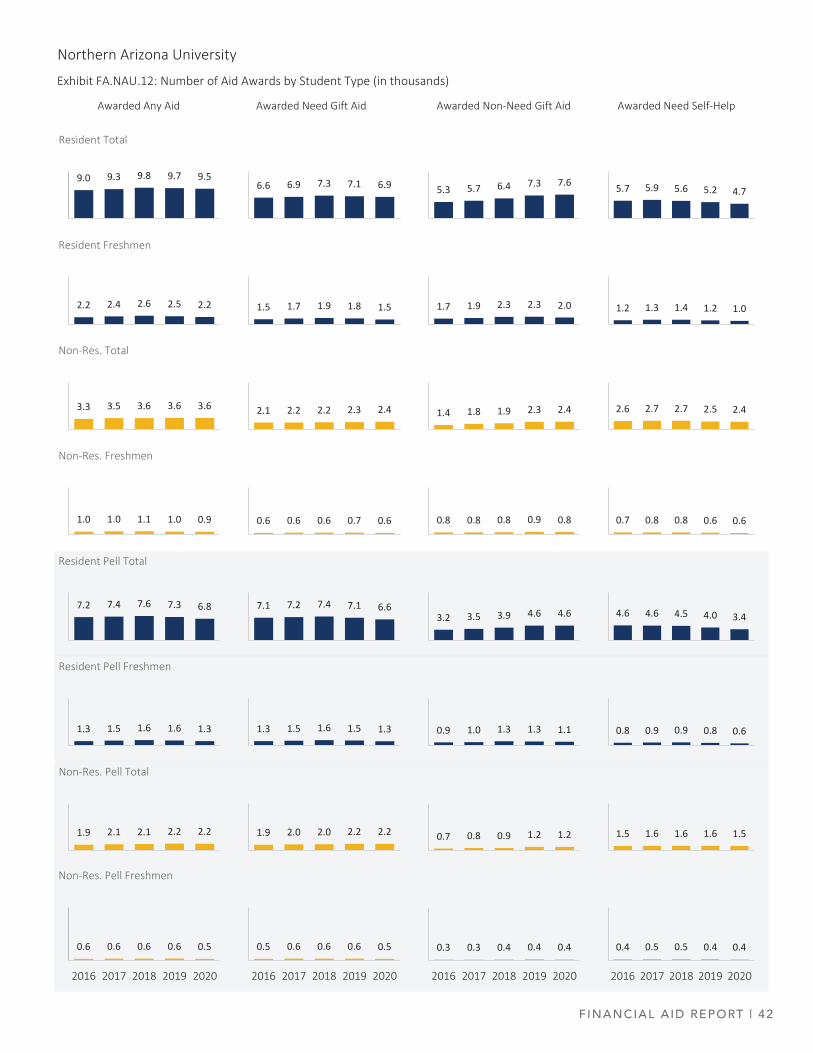
FINANCIAL AID REPORT | 42
Northern Arizona University
Exhibit FA.NAU.12: Number of Aid Awards by Student Type (in thousands)
Awarded Any Aid Awarded Need Gift Aid Awarded Non‐Need Gift Aid Awarded Need Self‐Help
9.0 9.3 9.8 9.7 9.5
Resident Total
6.6 6.9 7.3 7.1 6.9 5.3 5.7 6.4 7.3 7.6 5.7 5.9 5.6 5.2 4.7
2.2 2.4 2.6 2.5 2.2
Resident Freshmen
1.5 1.7 1.9 1.8 1.5 1.7 1.9 2.3 2.3 2.0 1.2 1.3 1.4 1.2 1.0
3.3 3.5 3.6 3.6 3.6
Non‐Res. Total
2.1 2.2 2.2 2.3 2.4 1.4 1.8 1.9 2.3 2.4 2.6 2.7 2.7 2.5 2.4
1.0 1.0 1.1 1.0 0.9
Non‐Res. Freshmen
0.6 0.6 0.6 0.7 0.6 0.8 0.8 0.8 0.9 0.8 0.7 0.8 0.8 0.6 0.6
7.2 7.4 7.6 7.3 6.8
Resident Pell Total
7.1 7.2 7.4 7.1 6.63.2 3.5 3.9 4.6 4.6 4.6 4.6 4.5 4.0 3.4
1.3 1.5 1.6 1.6 1.3
Resident Pell Freshmen
1.3 1.5 1.6 1.5 1.3 0.9 1.0 1.3 1.3 1.1 0.8 0.9 0.9 0.8 0.6
1.9 2.1 2.1 2.2 2.2
Non‐Res. Pell Total
1.9 2.0 2.0 2.2 2.2 0.7 0.8 0.9 1.2 1.2 1.5 1.6 1.6 1.6 1.5
0.6 0.6 0.6 0.6 0.5
2016 2017 2018 2019 2020
Non‐Res. Pell Freshmen
0.5 0.6 0.6 0.6 0.5
2016 2017 2018 2019 2020
0.3 0.3 0.4 0.4 0.4
2016 2017 2018 2019 2020
0.4 0.5 0.5 0.4 0.4
2016 2017 2018 2019 2020
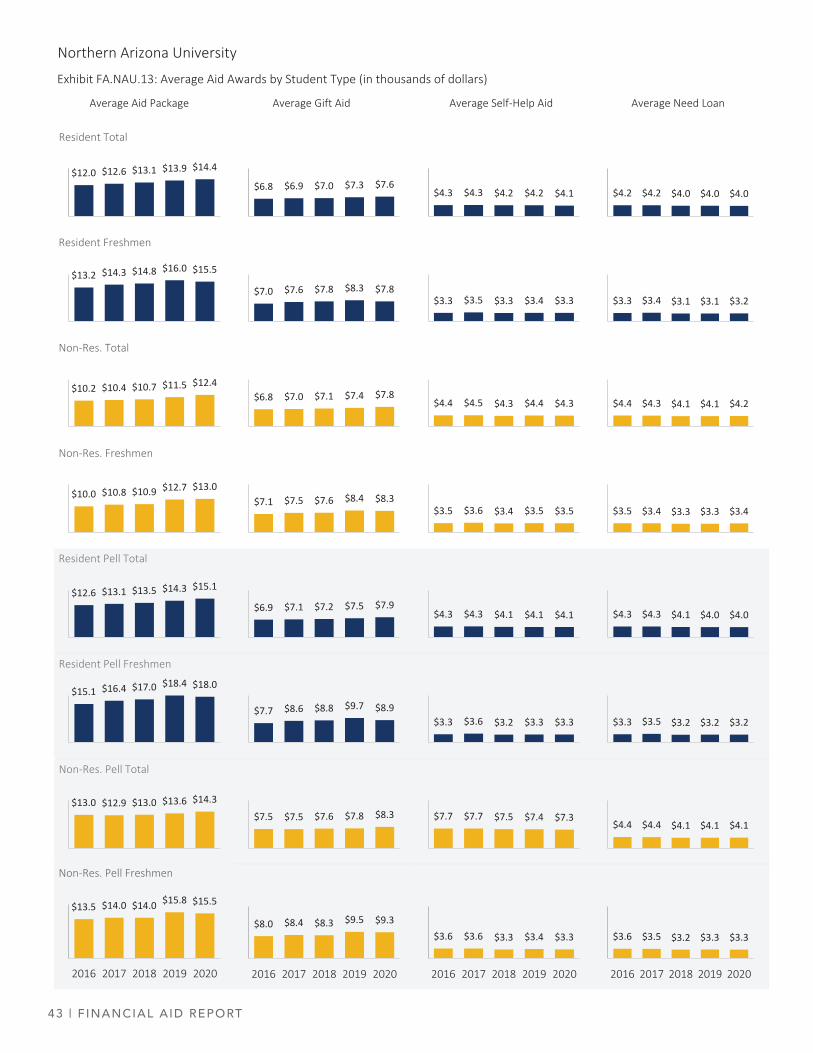
43 | F INANCIAL AID REPORT
Northern Arizona University
Exhibit FA.NAU.13: Average Aid Awards by Student Type (in thousands of dollars)
Average Aid Package Average Gift Aid Average Self‐Help Aid Average Need Loan
$12.0 $12.6 $13.1 $13.9 $14.4
Resident Total
$13.2 $14.3 $14.8 $16.0 $15.5
Resident Freshmen
$10.2 $10.4 $10.7 $11.5 $12.4
Non‐Res. Total
$10.0 $10.8 $10.9 $12.7 $13.0
Non‐Res. Freshmen
$12.6 $13.1 $13.5 $14.3 $15.1
Resident Pell Total
$15.1 $16.4 $17.0 $18.4 $18.0
Resident Pell Freshmen
$13.0 $12.9 $13.0 $13.6 $14.3
Non‐Res. Pell Total
$13.5 $14.0 $14.0 $15.8 $15.5
2016 2017 2018 2019 2020
Non‐Res. Pell Freshmen
$6.8 $6.9 $7.0 $7.3 $7.6$4.3 $4.3 $4.2 $4.2 $4.1 $4.2 $4.2 $4.0 $4.0 $4.0
$7.0 $7.6 $7.8 $8.3 $7.8$3.3 $3.5 $3.3 $3.4 $3.3 $3.3 $3.4 $3.1 $3.1 $3.2
$6.8 $7.0 $7.1 $7.4 $7.8$4.4 $4.5 $4.3 $4.4 $4.3 $4.4 $4.3 $4.1 $4.1 $4.2
$7.1 $7.5 $7.6 $8.4 $8.3$3.5 $3.6 $3.4 $3.5 $3.5 $3.5 $3.4 $3.3 $3.3 $3.4
$6.9 $7.1 $7.2 $7.5 $7.9$4.3 $4.3 $4.1 $4.1 $4.1 $4.3 $4.3 $4.1 $4.0 $4.0
$7.7 $8.6 $8.8 $9.7 $8.9$3.3 $3.5 $3.2 $3.2 $3.2$3.3 $3.6 $3.2 $3.3 $3.3
$7.5 $7.5 $7.6 $7.8 $8.3 $7.7 $7.7 $7.5 $7.4 $7.3$4.4 $4.4 $4.1 $4.1 $4.1
$8.0 $8.4 $8.3 $9.5 $9.3
2016 2017 2018 2019 2020
$3.6 $3.6 $3.3 $3.4 $3.3
2016 2017 2018 2019 2020
$3.6 $3.5 $3.2 $3.3 $3.3
2016 2017 2018 2019 2020
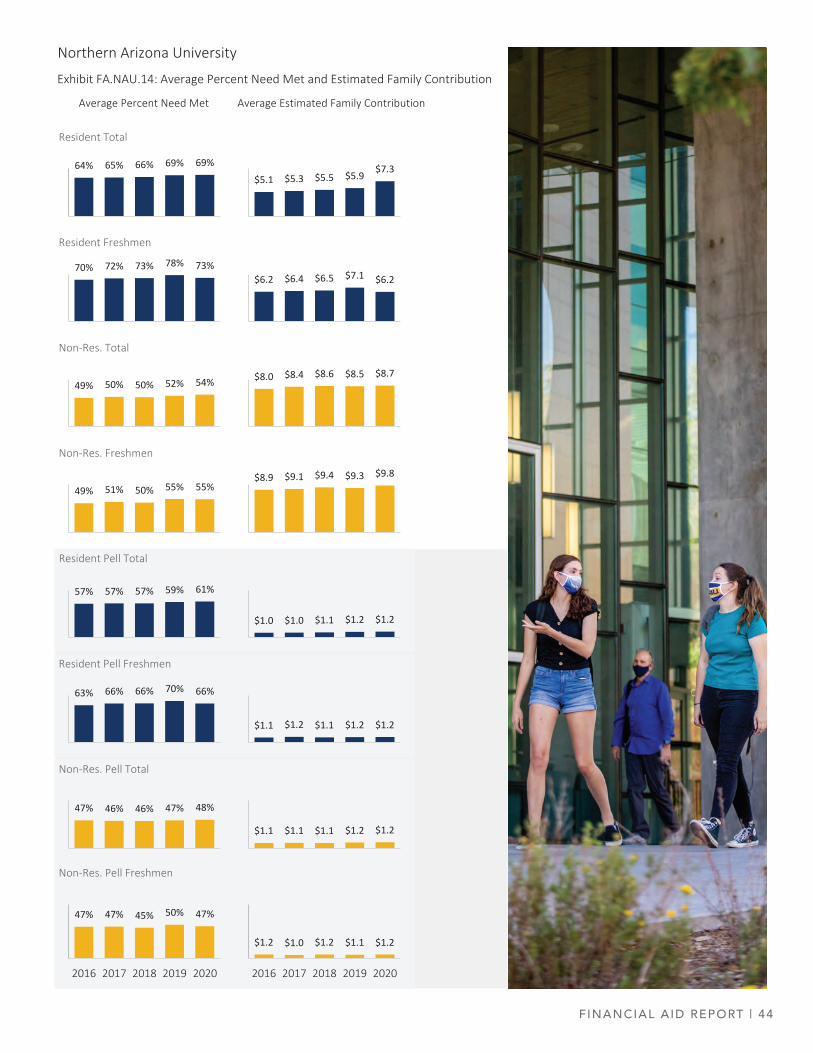
FINANCIAL AID REPORT | 44
Northern Arizona University
Exhibit FA.NAU.14: Average Percent Need Met and Estimated Family Contribution
Average Percent Need Met Average Estimated Family Contribution
64% 65% 66% 69% 69%
Resident Total
70% 72% 73% 78% 73%
Resident Freshmen
49% 50% 50% 52% 54%
Non‐Res. Total
49% 51% 50% 55% 55%
Non‐Res. Freshmen
57% 57% 57% 59% 61%
Resident Pell Total
63% 66% 66% 70% 66%
Resident Pell Freshmen
47% 46% 46% 47% 48%
Non‐Res. Pell Total
47% 47% 45% 50% 47%
2016 2017 2018 2019 2020
Non‐Res. Pell Freshmen
$5.1 $5.3 $5.5 $5.9 $7.3
$6.2 $6.4 $6.5 $7.1 $6.2
$8.0 $8.4 $8.6 $8.5 $8.7
$8.9 $9.1 $9.4 $9.3 $9.8
$1.0 $1.0 $1.1 $1.2 $1.2
$1.1 $1.2 $1.1 $1.2 $1.2
$1.1 $1.1 $1.1 $1.2 $1.2
$1.2 $1.0 $1.2 $1.1 $1.2
2016 2017 2018 2019 2020
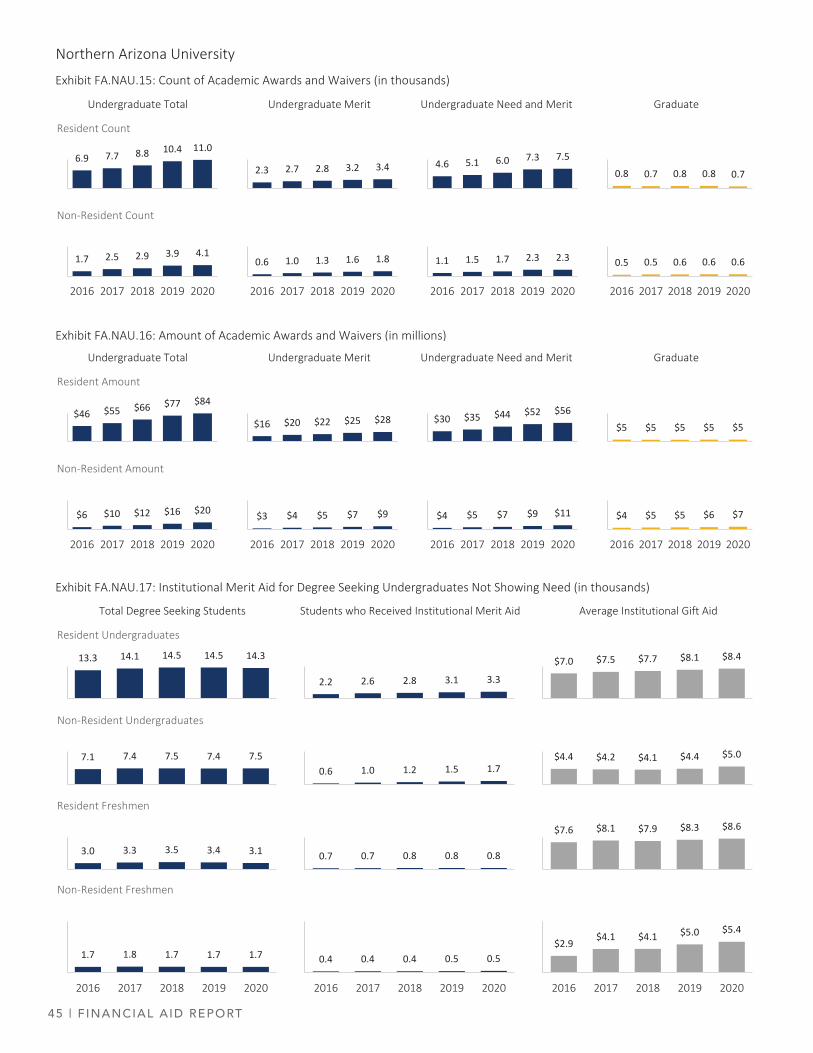
45 | F INANCIAL AID REPORT
Northern Arizona University
Exhibit FA.NAU.15: Count of Academic Awards and Waivers (in thousands)
Undergraduate Total Undergraduate Merit Undergraduate Need and Merit Graduate
Exhibit FA.NAU.16: Amount of Academic Awards and Waivers (in millions)
Undergraduate Total Undergraduate Merit Undergraduate Need and Merit Graduate
Exhibit FA.NAU.17: Institutional Merit Aid for Degree Seeking Undergraduates Not Showing Need (in thousands)
Total Degree Seeking Students Students who Received Institutional Merit Aid Average Institutional Gift Aid
13.3 14.1 14.5 14.5 14.3
Resident Undergraduates
2.2 2.6 2.8 3.1 3.3
$7.0 $7.5 $7.7 $8.1 $8.4
7.1 7.4 7.5 7.4 7.5
Non‐Resident Undergraduates
0.6 1.0 1.2 1.5 1.7$4.4 $4.2 $4.1 $4.4 $5.0
6.9 7.7 8.8 10.4 11.0
Resident Count
2.3 2.7 2.8 3.2 3.4 4.6 5.1 6.0 7.3 7.50.8 0.7 0.8 0.8 0.7
1.7 2.5 2.9 3.9 4.1
2016 2017 2018 2019 2020
Non‐Resident Count
0.6 1.0 1.3 1.6 1.8
2016 2017 2018 2019 2020
1.1 1.5 1.7 2.3 2.3
2016 2017 2018 2019 2020
0.5 0.5 0.6 0.6 0.6
2016 2017 2018 2019 2020
$46 $55 $66 $77 $84
Resident Amount
$16 $20 $22 $25 $28 $30 $35 $44 $52 $56$5 $5 $5 $5 $5
$6 $10 $12 $16 $20
2016 2017 2018 2019 2020
Non‐Resident Amount
$3 $4 $5 $7 $9
2016 2017 2018 2019 2020
$4 $5 $7 $9 $11
2016 2017 2018 2019 2020
$4 $5 $5 $6 $7
2016 2017 2018 2019 2020
3.0 3.3 3.5 3.4 3.1
Resident Freshmen
0.7 0.7 0.8 0.8 0.8
$7.6 $8.1 $7.9 $8.3 $8.6
1.7 1.8 1.7 1.7 1.7
2016 2017 2018 2019 2020
Non‐Resident Freshmen
0.4 0.4 0.4 0.5 0.5
2016 2017 2018 2019 2020
$2.9 $4.1 $4.1 $5.0 $5.4
2016 2017 2018 2019 2020
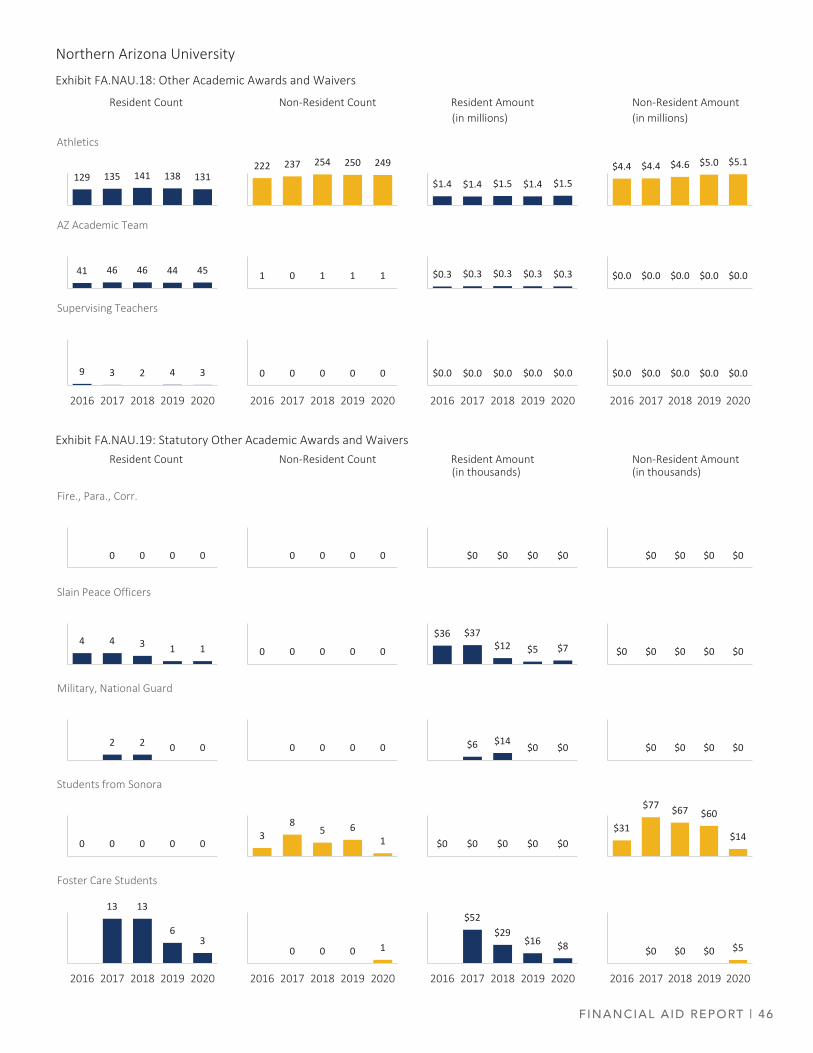
FINANCIAL AID REPORT | 46
Northern Arizona University
Exhibit FA.NAU.18: Other Academic Awards and Waivers
Resident Count Non‐Resident Count Resident Amount Non‐Resident Amount(in millions) (in millions)
Exhibit FA.NAU.19: Statutory Other Academic Awards and Waivers Resident Count Non‐Resident Count Resident Amount Non‐Resident Amount
(in thousands) (in thousands)
0 0 0 0
Fire., Para., Corr.
4 4 3 1 1
Slain Peace Officers
2 2 0 0
Military, National Guard
0 0 0 0 0
Students from Sonora
0 0 0 0
0 0 0 0 0
0 0 0 0
38
5 61
0 0 0 1
2016 2017 2018 2019 2020
$0 $0 $0 $0
$36 $37$12 $5 $7
$6 $14 $0 $0
$0 $0 $0 $0 $0
$52$29
$16 $8
2016 2017 2018 2019 2020
$0 $0 $0 $0
$0 $0 $0 $0 $0
$0 $0 $0 $0
$31
$77 $67 $60
$14
$0 $0 $0 $5
2016 2017 2018 2019 2020
13 13
63
2016 2017 2018 2019 2020
Foster Care Students
129 135 141 138 131
Athletics
222 237 254 250 249
$1.4 $1.4 $1.5 $1.4 $1.5$4.4 $4.4 $4.6 $5.0 $5.1
41 46 46 44 45
AZ Academic Team
1 0 1 1 1 $0.3 $0.3 $0.3 $0.3 $0.3 $0.0 $0.0 $0.0 $0.0 $0.0
0 0 0 0 0
2016 2017 2018 2019 2020
$0.0 $0.0 $0.0 $0.0 $0.0
2016 2017 2018 2019 2020
$0.0 $0.0 $0.0 $0.0 $0.0
2016 2017 2018 2019 2020
9 3 2 4 3
2016 2017 2018 2019 2020
Supervising Teachers
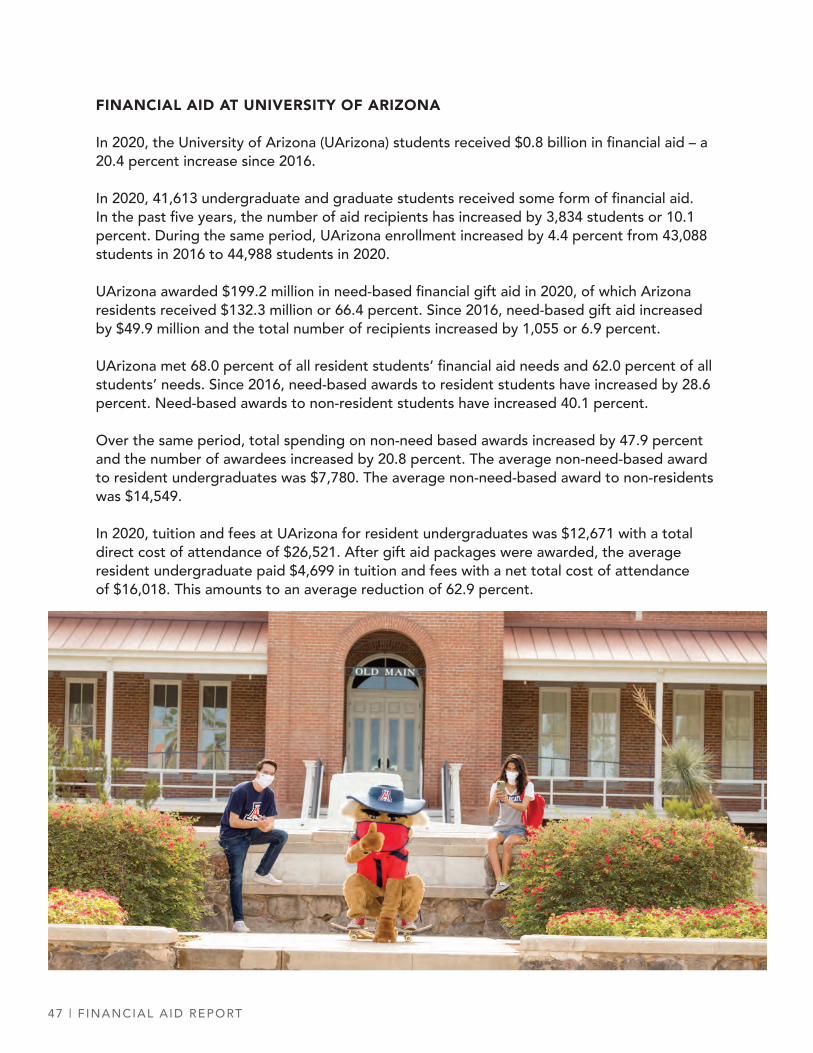
47 | F INANCIAL AID REPORT
FINANCIAL AID AT UNIVERSITY OF ARIZONA
In 2020, the University of Arizona (UArizona) students received $0.8 billion in financial aid – a 20.4 percent increase since 2016.
In 2020, 41,613 undergraduate and graduate students received some form of financial aid. In the past five years, the number of aid recipients has increased by 3,834 students or 10.1 percent. During the same period, UArizona enrollment increased by 4.4 percent from 43,088 students in 2016 to 44,988 students in 2020.
UArizona awarded $199.2 million in need-based financial gift aid in 2020, of which Arizona residents received $132.3 million or 66.4 percent. Since 2016, need-based gift aid increased by $49.9 million and the total number of recipients increased by 1,055 or 6.9 percent.
UArizona met 68.0 percent of all resident students’ financial aid needs and 62.0 percent of all students’ needs. Since 2016, need-based awards to resident students have increased by 28.6 percent. Need-based awards to non-resident students have increased 40.1 percent.
Over the same period, total spending on non-need based awards increased by 47.9 percent and the number of awardees increased by 20.8 percent. The average non-need-based award to resident undergraduates was $7,780. The average non-need-based award to non-residents was $14,549.
In 2020, tuition and fees at UArizona for resident undergraduates was $12,671 with a total direct cost of attendance of $26,521. After gift aid packages were awarded, the average resident undergraduate paid $4,699 in tuition and fees with a net total cost of attendance of $16,018. This amounts to an average reduction of 62.9 percent.
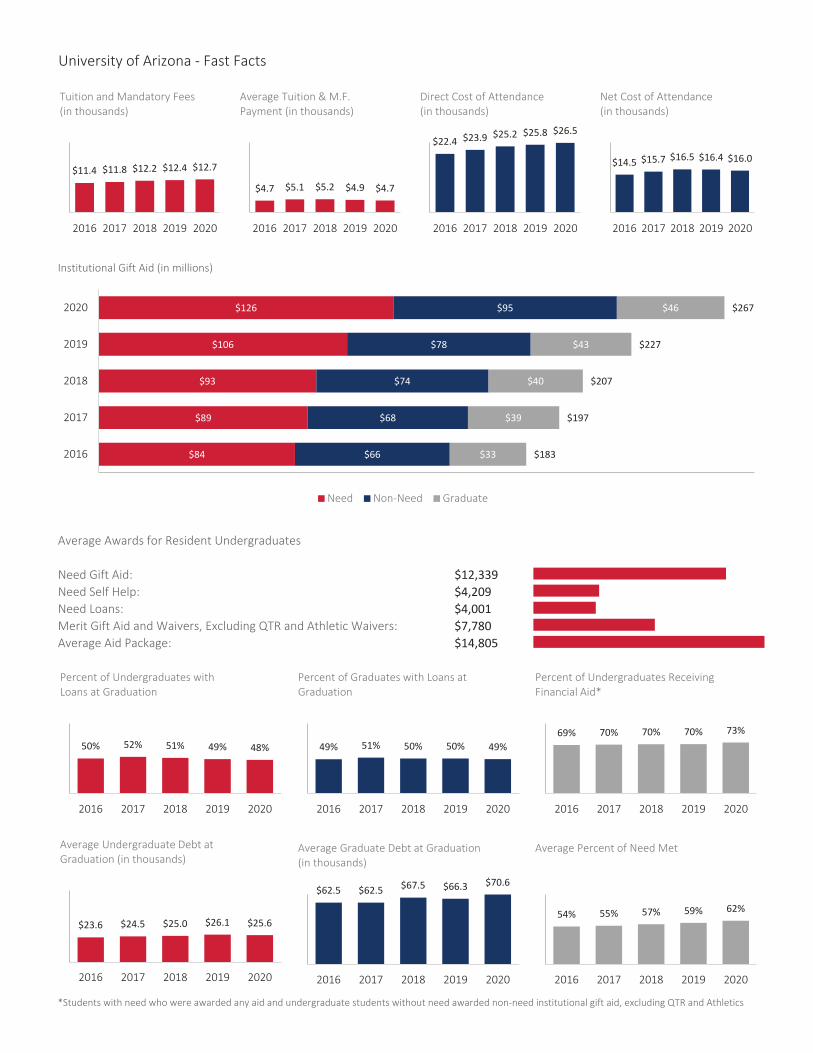
University of Arizona ‐ Fast Facts
Institutional Gift Aid (in millions)
Average Awards for Resident Undergraduates
Need Gift Aid: $12,339Need Self Help: $4,209Need Loans: $4,001Merit Gift Aid and Waivers, Excluding QTR and Athletic Waivers: $7,780Average Aid Package: $14,805
*Students with need who were awarded any aid and undergraduate students without need awarded non‐need institutional gift aid, excluding QTR and Athletics
$11.4 $11.8 $12.2 $12.4 $12.7
2016 2017 2018 2019 2020
Tuition and Mandatory Fees (in thousands)
$4.7 $5.1 $5.2 $4.9 $4.7
2016 2017 2018 2019 2020
Average Tuition & M.F. Payment (in thousands)
$22.4 $23.9 $25.2 $25.8 $26.5
2016 2017 2018 2019 2020
Direct Cost of Attendance(in thousands)
$14.5 $15.7 $16.5 $16.4 $16.0
2016 2017 2018 2019 2020
Net Cost of Attendance(in thousands)
$84
$89
$93
$106
$126
$66
$68
$74
$78
$95
$33
$39
$40
$43
$46
$183
$197
$207
$227
$267
2016
2017
2018
2019
2020
Need Non‐Need Graduate
50% 52% 51% 49% 48%
2016 2017 2018 2019 2020
Percent of Undergraduates with Loans at Graduation
$23.6 $24.5 $25.0 $26.1 $25.6
2016 2017 2018 2019 2020
Average Undergraduate Debt at Graduation (in thousands)
$62.5 $62.5 $67.5 $66.3 $70.6
2016 2017 2018 2019 2020
Average Graduate Debt at Graduation(in thousands)
49% 51% 50% 50% 49%
2016 2017 2018 2019 2020
Percent of Graduates with Loans at Graduation
54% 55% 57% 59% 62%
2016 2017 2018 2019 2020
Average Percent of Need Met
69% 70% 70% 70% 73%
2016 2017 2018 2019 2020
Percent of Undergraduates Receiving Financial Aid*
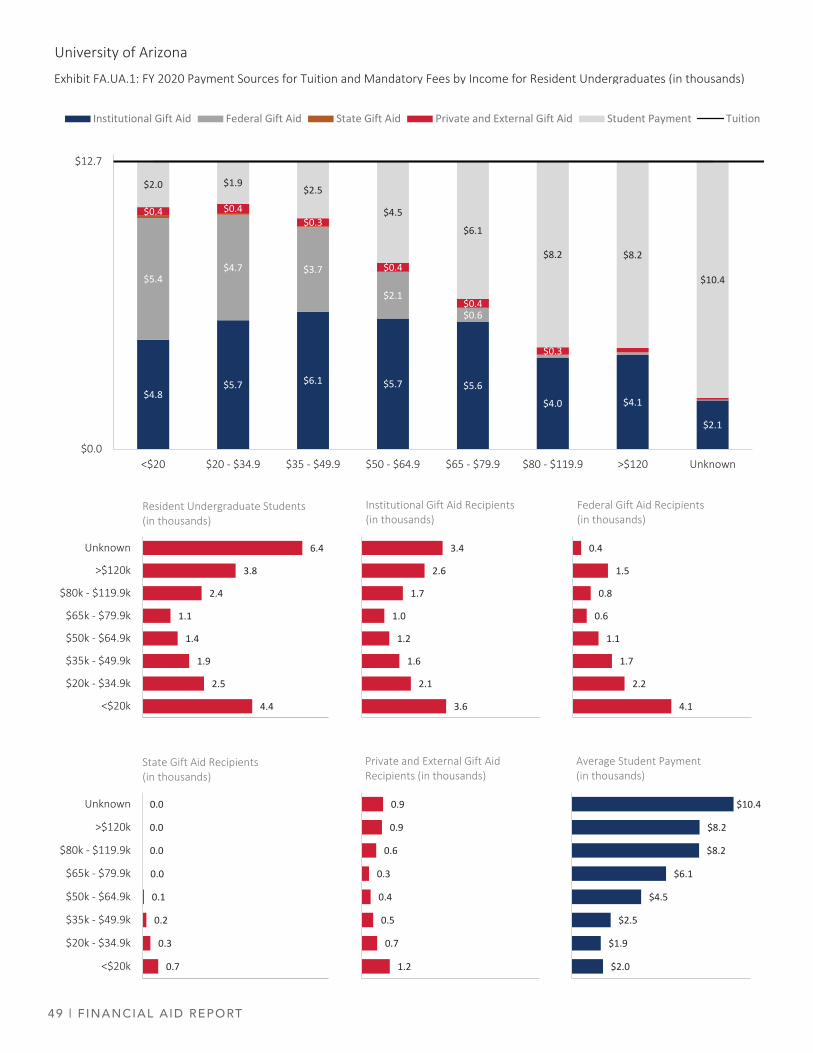
49 | F INANCIAL AID REPORT
University of Arizona
Exhibit FA.UA.1: FY 2020 Payment Sources for Tuition and Mandatory Fees by Income for Resident Undergraduates (in thousands)
$4.8$5.7 $6.1 $5.7 $5.6
$4.0 $4.1
$2.1
$5.4$4.7 $3.7
$2.1
$0.6
$0.4 $0.4$0.3
$0.4
$0.4
$0.3
$2.0 $1.9$2.5
$4.5
$6.1
$8.2 $8.2
$10.4
$0.0
$12.7
<$20 $20 ‐ $34.9 $35 ‐ $49.9 $50 ‐ $64.9 $65 ‐ $79.9 $80 ‐ $119.9 >$120 Unknown
Institutional Gift Aid Federal Gift Aid State Gift Aid Private and External Gift Aid Student Payment Tuition
4.4
2.5
1.9
1.4
1.1
2.4
3.8
6.4
<$20k
$20k ‐ $34.9k
$35k ‐ $49.9k
$50k ‐ $64.9k
$65k ‐ $79.9k
$80k ‐ $119.9k
>$120k
Unknown
Resident Undergraduate Students(in thousands)
3.6
2.1
1.6
1.2
1.0
1.7
2.6
3.4
Institutional Gift Aid Recipients(in thousands)
4.1
2.2
1.7
1.1
0.6
0.8
1.5
0.4
Federal Gift Aid Recipients(in thousands)
0.7
0.3
0.2
0.1
0.0
0.0
0.0
0.0
<$20k
$20k ‐ $34.9k
$35k ‐ $49.9k
$50k ‐ $64.9k
$65k ‐ $79.9k
$80k ‐ $119.9k
>$120k
Unknown
State Gift Aid Recipients(in thousands)
1.2
0.7
0.5
0.4
0.3
0.6
0.9
0.9
Private and External Gift Aid Recipients (in thousands)
$2.0
$1.9
$2.5
$4.5
$6.1
$8.2
$8.2
$10.4
Average Student Payment(in thousands)
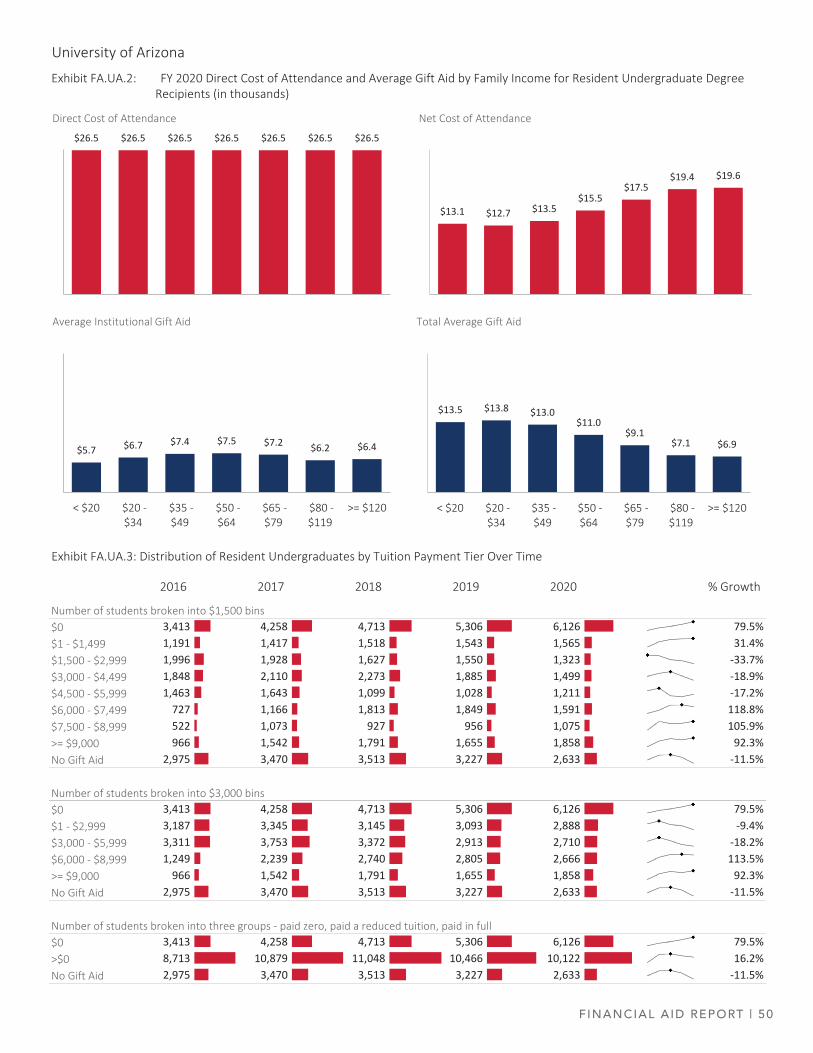
FINANCIAL AID REPORT | 50
University of Arizona
Exhibit FA.UA.2: FY 2020 Direct Cost of Attendance and Average Gift Aid by Family Income for Resident Undergraduate Degree Recipients (in thousands)
Exhibit FA.UA.3: Distribution of Resident Undergraduates by Tuition Payment Tier Over Time
Number of students broken into $1,500 bins$0 3,413 4,258 4,713 5,306 6,126 79.5%$1 ‐ $1,499 1,191 1,417 1,518 1,543 1,565 31.4%$1,500 ‐ $2,999 1,996 1,928 1,627 1,550 1,323 ‐33.7%$3,000 ‐ $4,499 1,848 2,110 2,273 1,885 1,499 ‐18.9%$4,500 ‐ $5,999 1,463 1,643 1,099 1,028 1,211 ‐17.2%$6,000 ‐ $7,499 727 1,166 1,813 1,849 1,591 118.8%$7,500 ‐ $8,999 522 1,073 927 956 1,075 105.9%>= $9,000 966 1,542 1,791 1,655 1,858 92.3%No Gift Aid 2,975 3,470 3,513 3,227 2,633 ‐11.5%
Number of students broken into $3,000 bins$0 3,413 4,258 4,713 5,306 6,126 79.5%$1 ‐ $2,999 3,187 3,345 3,145 3,093 2,888 ‐9.4%$3,000 ‐ $5,999 3,311 3,753 3,372 2,913 2,710 ‐18.2%$6,000 ‐ $8,999 1,249 2,239 2,740 2,805 2,666 113.5%>= $9,000 966 1,542 1,791 1,655 1,858 92.3%No Gift Aid 2,975 3,470 3,513 3,227 2,633 ‐11.5%
Number of students broken into three groups ‐ paid zero, paid a reduced tuition, paid in full$0 3,413 4,258 4,713 5,306 6,126 79.5%>$0 8,713 10,879 11,048 10,466 10,122 16.2%No Gift Aid 2,975 3,470 3,513 3,227 2,633 ‐11.5%
2016 2017 2018 2019 2020 % Growth
$26.5 $26.5 $26.5 $26.5 $26.5 $26.5 $26.5
Direct Cost of Attendance
$13.5 $13.8 $13.0$11.0
$9.1$7.1 $6.9
< $20 $20 ‐$34
$35 ‐$49
$50 ‐$64
$65 ‐$79
$80 ‐$119
>= $120
Total Average Gift Aid
$5.7 $6.7 $7.4 $7.5 $7.2 $6.2 $6.4
< $20 $20 ‐$34
$35 ‐$49
$50 ‐$64
$65 ‐$79
$80 ‐$119
>= $120
Average Institutional Gift Aid
$13.1 $12.7 $13.5$15.5
$17.5$19.4 $19.6
Net Cost of Attendance
51 | F INANCIAL AID REPORT
University of Arizona
Exhibit FA.UA.4: Scholarships and Grants Dollar Amounts (in millions)
Undergraduates Showing Need Undergraduates Not Showing Need Graduates
$0.2 $0.0 $0.0 $0.0 $0.0
$7.1 $7.8 $8.7 $8.4 $11.9
Federal Other
$2.4 $3.9 $3.9 $4.1 $5.1
$0.1 $0.1 $0.1 $0.1 $0.1
Arizona
$0.1 $0.0 $0.0 $0.0 $0.0
$0.0 $0.0 $0.0 $0.0 $0.0
Other States
$0.0 $0.0 $0.0 $0.0 $0.0
$1.9 $0.0 $0.0 $0.0 $0.0
Institutional RHHE (AIMS)
$0.1 $0.0 $0.0 $0.0 $0.0
$81.8 $89.2 $92.8 $106.0 $125.8
Institutional Other
$32.5 $39.0 $40.3 $43.0 $45.9
$4.4 $4.8 $8.3 $7.2 $7.5
Arizona Financial Aid Trust
$0.0 $0.0 $0.0 $0.0 $0.0
$18.1 $18.5 $19.6 $20.9 $22.0
2016 2017 2018 2019 2020
Private and External
$27.1 $25.6 $25.7 $27.9 $27.7
2016 2017 2018 2019 2020
$46.9 $45.5 $48.6 $50.3 $51.3
Federal Pell
$0.0 $0.4 $0.5 $0.5 $0.5
$3.5 $3.9 $4.1 $4.5 $6.3
$0.0 $0.0 $0.0 $0.0 $0.0
$0.0 $0.0 $0.0 $0.0 $0.0
$2.5 $0.1 $0.0 $0.0 $0.0
$63.6 $68.3 $73.6 $78.4 $95.5
$0.0 $0.0 $0.0 $0.0 $0.0
$21.6 $24.1 $28.8 $32.5 $33.9
2016 2017 2018 2019 2020
FINANCIAL AID REPORT | 52
University of Arizona
Exhibit FA.UA.5: Scholarships and Grants Recipients
Undergraduates Showing Need Undergraduates Not Showing Need Graduates
11,066 10,693 10,680 10,673 10,832
Federal Pell
0 302 377 319 348 43 0 0 1 1
1,211 1,335 1,491 3,1058,433
Federal Other
371 414 452 494 2,637258 303 302 317 1,684
218 167 113 205 104
Arizona
0 0 0 0 1 58 0 0 0 0
4 4 4 6 4
Other States
0 0 0 0 1 0 0 0 1 2
463 16 4 0 0
Institutional RHHE (AIMS)
640 23 2 0 0 22 0 0 0 0
13,575 14,173 13,751 14,243 14,483
Institutional Other
7,577 8,222 8,470 8,987 9,6154,461 5,332 5,464 5,762 6,030
706 833 1,764 1,710 1,565
Arizona Financial Aid Trust
0 0 0 1 0 0 0 0 0 0
4,515 3,960 4,350 4,788 4,938
2016 2017 2018 2019 2020
Private and External
2,977 3,172 3,501 3,637 3,803
2016 2017 2018 2019 2020
3,913 3,659 3,383 3,435 3,351
2016 2017 2018 2019 2020
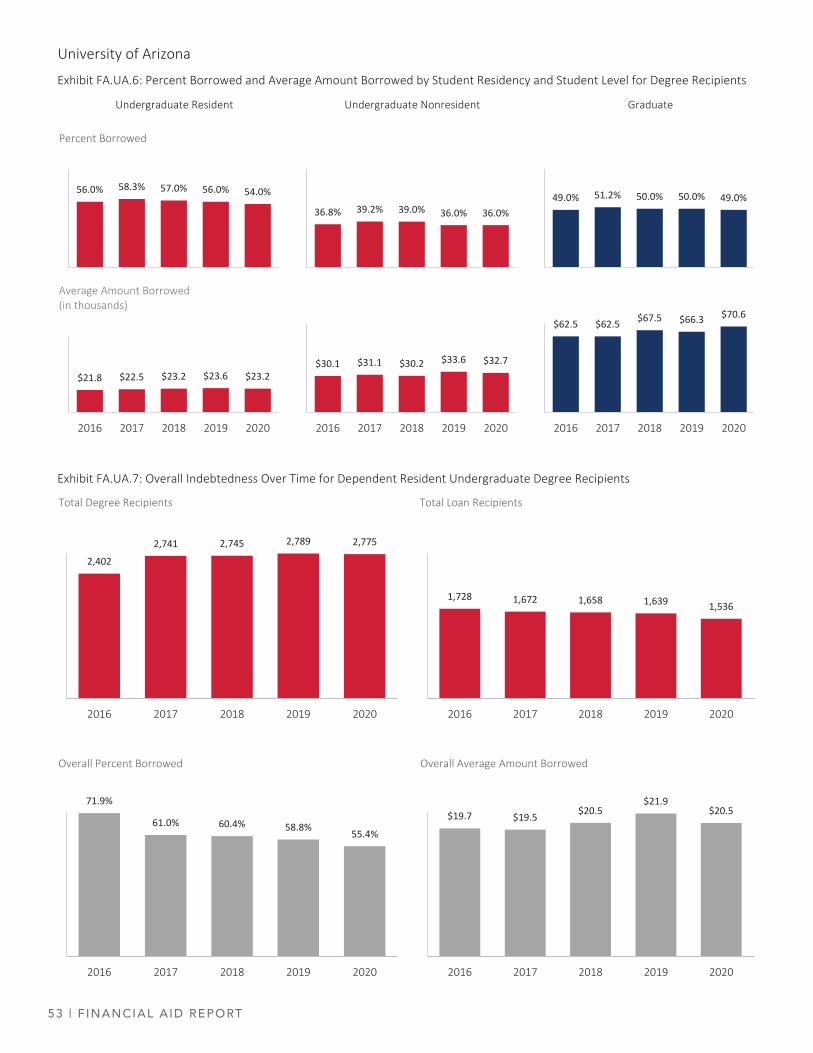
53 | F INANCIAL AID REPORT
University of Arizona
Exhibit FA.UA.6: Percent Borrowed and Average Amount Borrowed by Student Residency and Student Level for Degree Recipients
Undergraduate Resident Undergraduate Nonresident Graduate
Exhibit FA.UA.7: Overall Indebtedness Over Time for Dependent Resident Undergraduate Degree Recipients
56.0% 58.3% 57.0% 56.0% 54.0%
Percent Borrowed
36.8% 39.2% 39.0% 36.0% 36.0%49.0% 51.2% 50.0% 50.0% 49.0%
$21.8 $22.5 $23.2 $23.6 $23.2
2016 2017 2018 2019 2020
Average Amount Borrowed (in thousands)
$30.1 $31.1 $30.2 $33.6 $32.7
2016 2017 2018 2019 2020
$62.5 $62.5 $67.5 $66.3 $70.6
2016 2017 2018 2019 2020
2,4022,741 2,745 2,789 2,775
2016 2017 2018 2019 2020
Total Degree Recipients
1,728 1,672 1,658 1,639 1,536
2016 2017 2018 2019 2020
Total Loan Recipients
71.9%
61.0% 60.4% 58.8% 55.4%
2016 2017 2018 2019 2020
Overall Percent Borrowed
$19.7 $19.5 $20.5$21.9
$20.5
2016 2017 2018 2019 2020
Overall Average Amount Borrowed
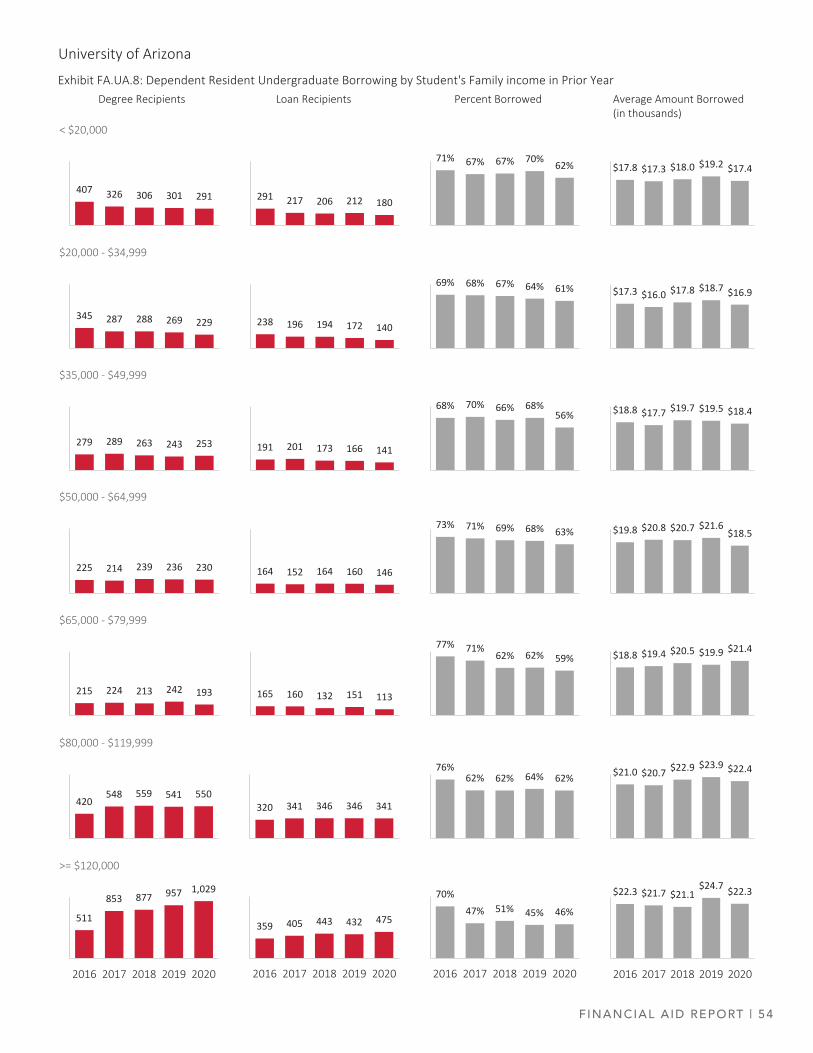
FINANCIAL AID REPORT | 54
University of Arizona
Degree Recipients Loan Recipients Percent Borrowed Average Amount Borrowed (in thousands)
Exhibit FA.UA.8: Dependent Resident Undergraduate Borrowing by Student's Family income in Prior Year
407 326 306 301 291
< $20,000
511
853 877 957 1,029
2016 2017 2018 2019 2020
>= $120,000
345 287 288 269 229
$20,000 ‐ $34,999
279 289 263 243 253
$35,000 ‐ $49,999
225 214 239 236 230
$50,000 ‐ $64,999
215 224 213 242 193
$65,000 ‐ $79,999
420548 559 541 550
$80,000 ‐ $119,999
359 405 443 432 475
2016 2017 2018 2019 2020
291 217 206 212 180
238 196 194 172 140
191 201 173 166 141
164 152 164 160 146
165 160 132 151 113
320 341 346 346 341
$17.8 $17.3 $18.0 $19.2 $17.4
$17.3 $16.0 $17.8 $18.7 $16.9
$18.8 $17.7 $19.7 $19.5 $18.4
$19.8 $20.8 $20.7 $21.6$18.5
$18.8 $19.4 $20.5 $19.9 $21.4
$21.0 $20.7 $22.9 $23.9 $22.4
$22.3 $21.7 $21.1$24.7 $22.3
2016 2017 2018 2019 2020
70%47% 51% 45% 46%
2016 2017 2018 2019 2020
71% 67% 67% 70% 62%
69% 68% 67% 64% 61%
68% 70% 66% 68%56%
73% 71% 69% 68% 63%
77% 71%62% 62% 59%
76%62% 62% 64% 62%

55 | F INANCIAL AID REPORT
University of Arizona
Exhibit FA.UA.9: Loans and Self‐Help Dollar Amounts (in millions)
Undergraduates Showing Need Undergraduates Not Showing Need Graduates
$0.2 $0.1 $0.1 $0.1 $0.0
$46.4 $46.5 $43.9 $40.9 $37.5
Federal Subsidized
$0.0 $0.7 $0.6 $0.7 $0.9
$87.9 $91.6 $92.1 $93.2 $88.5
$32.1 $32.3 $31.6 $29.7 $29.1
Federal Unsubsidized
$10.5 $11.3 $11.9 $11.5 $11.9
$1.6 $2.1 $2.8 $2.1 $3.2$1.0 $1.7 $2.4 $0.0 $0.0
Federal Other
$0.0 $0.0 $0.0 $0.0 $0.0
$0.1 $0.0 $0.1 $0.0 $0.0$0.0 $0.0 $0.1 $0.1 $0.0
State Student Loans
$0.0 $0.0 $0.0 $0.0 $0.0
$0.0 $0.0 $0.0 $0.0 $0.0$0.0 $0.0 $0.0 $0.0 $0.0
Institution Student Loans
$0.0 $0.0 $0.0 $0.0 $0.0
$0.1 $0.1 $0.1 $0.1 $0.1$2.9 $2.9 $3.2 $4.5 $3.8
Federal Work‐Study
$0.0 $0.0 $0.0 $0.0 $0.0
$3.7 $3.4 $3.4 $3.2 $2.9$13.7 $13.8 $15.5 $15.3 $15.0
Other Campus Employment
$7.3 $7.6 $9.2 $9.8 $9.4
$45.3 $47.0 $49.0 $53.7 $54.6
$0.0 $0.0 $0.1 $0.0 $0.1
Graduate Assistantships
$0.0 $0.0 $0.0 $0.0 $0.0
$73.0 $83.3 $79.4 $82.7 $76.6
2016 2017 2018 2019 2020
Parent and Private Loans
$22.7 $27.3 $29.8 $29.2 $30.2
2016 2017 2018 2019 2020
$2.8 $2.5 $2.5 $2.9 $3.3
2016 2017 2018 2019 2020
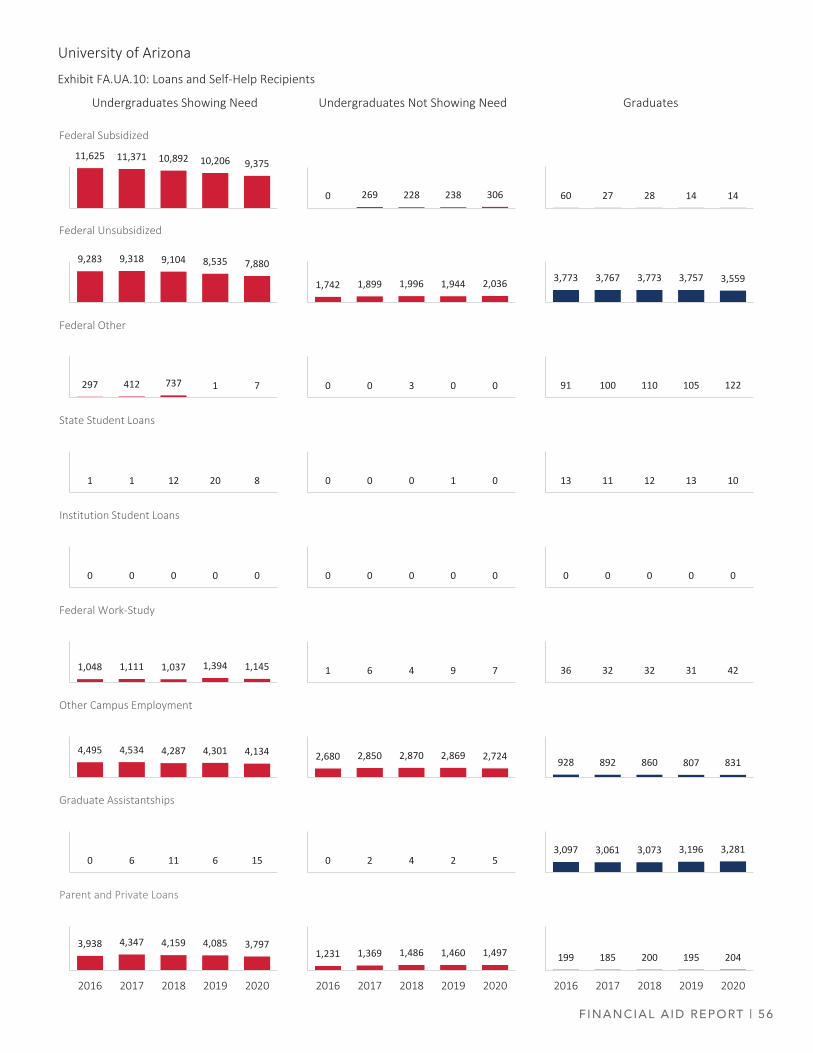
FINANCIAL AID REPORT | 56
University of Arizona
Exhibit FA.UA.10: Loans and Self‐Help Recipients
Undergraduates Showing Need Undergraduates Not Showing Need Graduates
60 27 28 14 14
11,625 11,371 10,892 10,206 9,375
Federal Subsidized
0 269 228 238 306
3,773 3,767 3,773 3,757 3,559
9,283 9,318 9,104 8,535 7,880
Federal Unsubsidized
1,742 1,899 1,996 1,944 2,036
91 100 110 105 122297 412 737 1 7
Federal Other
0 0 3 0 0
13 11 12 13 101 1 12 20 8
State Student Loans
0 0 0 1 0
0 0 0 0 00 0 0 0 0
Institution Student Loans
0 0 0 0 0
36 32 32 31 421,048 1,111 1,037 1,394 1,145
Federal Work‐Study
1 6 4 9 7
928 892 860 807 8314,495 4,534 4,287 4,301 4,134
Other Campus Employment
2,680 2,850 2,870 2,869 2,724
3,097 3,061 3,073 3,196 3,2810 6 11 6 15
Graduate Assistantships
0 2 4 2 5
199 185 200 195 204
2016 2017 2018 2019 2020
3,938 4,347 4,159 4,085 3,797
2016 2017 2018 2019 2020
Parent and Private Loans
1,231 1,369 1,486 1,460 1,497
2016 2017 2018 2019 2020
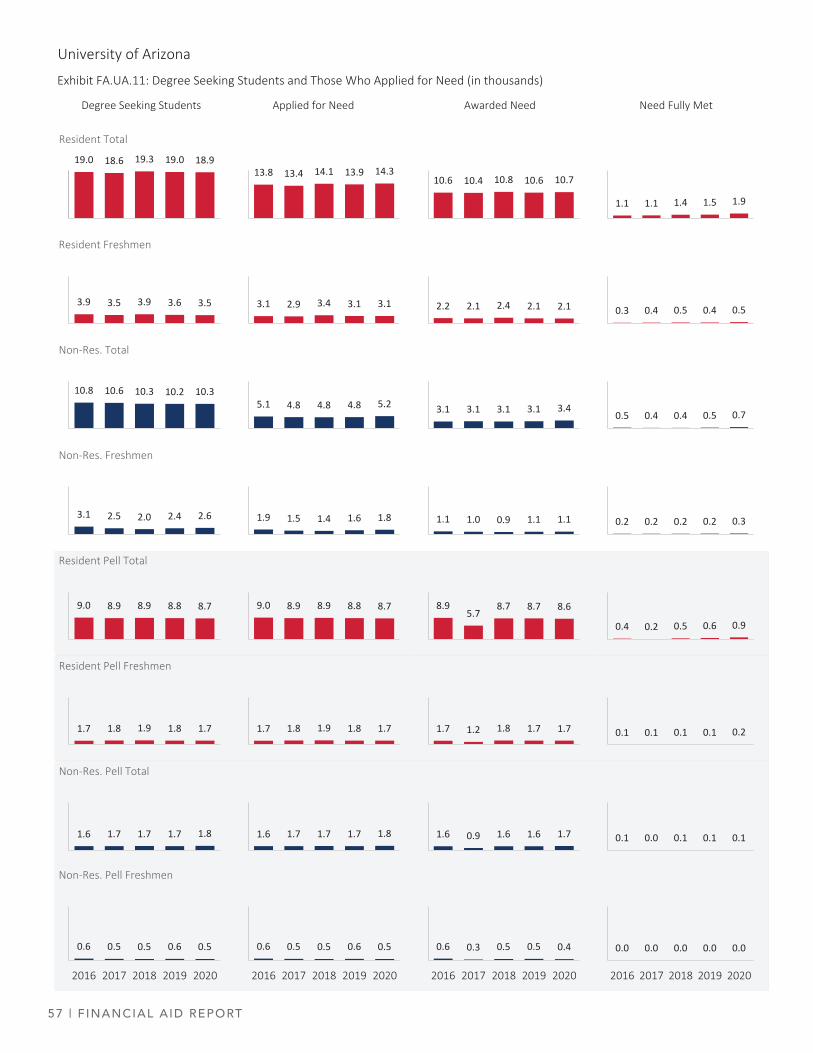
57 | F INANCIAL AID REPORT
University of Arizona
Exhibit FA.UA.11: Degree Seeking Students and Those Who Applied for Need (in thousands)
Degree Seeking Students Applied for Need Awarded Need Need Fully Met
19.0 18.6 19.3 19.0 18.9
Resident Total
13.8 13.4 14.1 13.9 14.310.6 10.4 10.8 10.6 10.7
1.1 1.1 1.4 1.5 1.9
3.9 3.5 3.9 3.6 3.5
Resident Freshmen
3.1 2.9 3.4 3.1 3.1 2.2 2.1 2.4 2.1 2.1 0.3 0.4 0.5 0.4 0.5
10.8 10.6 10.3 10.2 10.3
Non‐Res. Total
5.1 4.8 4.8 4.8 5.2 3.1 3.1 3.1 3.1 3.40.5 0.4 0.4 0.5 0.7
3.1 2.5 2.0 2.4 2.6
Non‐Res. Freshmen
1.9 1.5 1.4 1.6 1.8 1.1 1.0 0.9 1.1 1.1 0.2 0.2 0.2 0.2 0.3
9.0 8.9 8.9 8.8 8.7
Resident Pell Total
9.0 8.9 8.9 8.8 8.7 8.95.7
8.7 8.7 8.6
0.4 0.2 0.5 0.6 0.9
1.7 1.8 1.9 1.8 1.7
Resident Pell Freshmen
1.7 1.8 1.9 1.8 1.7 1.7 1.2 1.8 1.7 1.7 0.1 0.1 0.1 0.1 0.2
1.6 1.7 1.7 1.7 1.8
Non‐Res. Pell Total
1.6 1.7 1.7 1.7 1.8 1.6 0.9 1.6 1.6 1.7 0.1 0.0 0.1 0.1 0.1
0.6 0.5 0.5 0.6 0.5
2016 2017 2018 2019 2020
Non‐Res. Pell Freshmen
0.6 0.5 0.5 0.6 0.5
2016 2017 2018 2019 2020
0.6 0.3 0.5 0.5 0.4
2016 2017 2018 2019 2020
0.0 0.0 0.0 0.0 0.0
2016 2017 2018 2019 2020
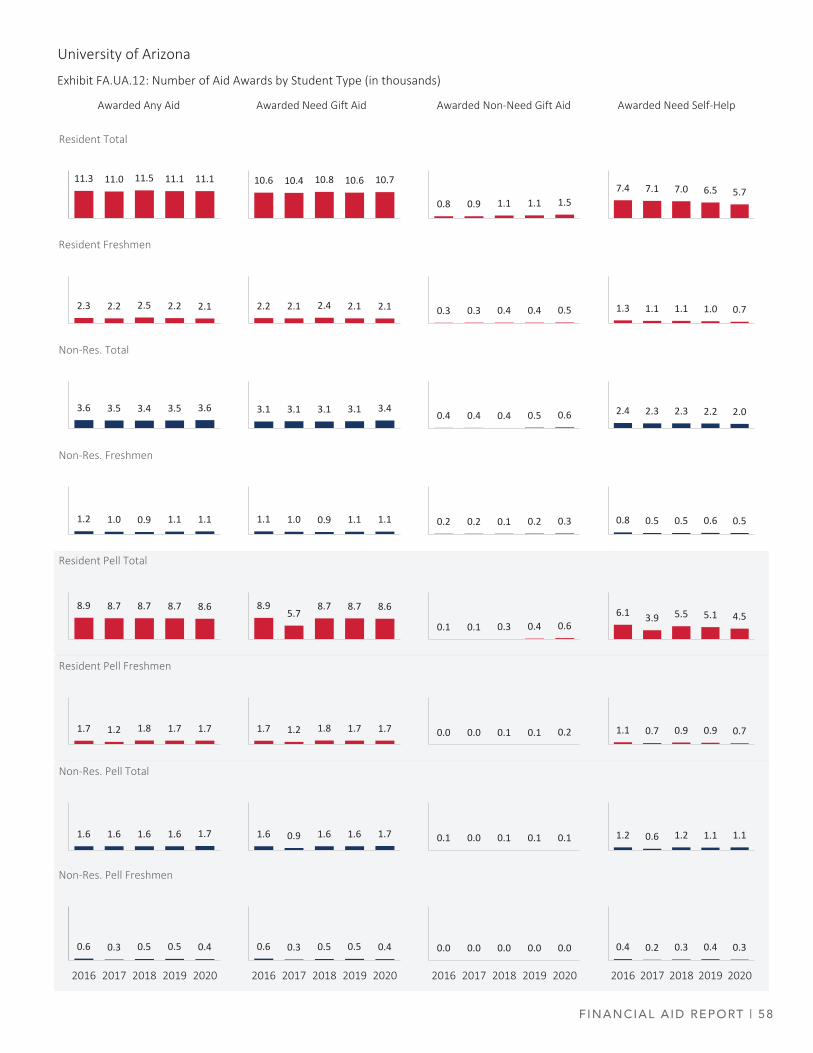
FINANCIAL AID REPORT | 58
University of Arizona
Exhibit FA.UA.12: Number of Aid Awards by Student Type (in thousands)
Awarded Any Aid Awarded Need Gift Aid Awarded Non‐Need Gift Aid Awarded Need Self‐Help
11.3 11.0 11.5 11.1 11.1
Resident Total
10.6 10.4 10.8 10.6 10.7
0.8 0.9 1.1 1.1 1.57.4 7.1 7.0 6.5 5.7
2.3 2.2 2.5 2.2 2.1
Resident Freshmen
2.2 2.1 2.4 2.1 2.1 0.3 0.3 0.4 0.4 0.5 1.3 1.1 1.1 1.0 0.7
3.6 3.5 3.4 3.5 3.6
Non‐Res. Total
3.1 3.1 3.1 3.1 3.40.4 0.4 0.4 0.5 0.6 2.4 2.3 2.3 2.2 2.0
1.2 1.0 0.9 1.1 1.1
Non‐Res. Freshmen
1.1 1.0 0.9 1.1 1.1 0.2 0.2 0.1 0.2 0.3 0.8 0.5 0.5 0.6 0.5
8.9 8.7 8.7 8.7 8.6
Resident Pell Total
8.95.7
8.7 8.7 8.6
0.1 0.1 0.3 0.4 0.66.1 3.9 5.5 5.1 4.5
1.7 1.2 1.8 1.7 1.7
Resident Pell Freshmen
1.7 1.2 1.8 1.7 1.7 0.0 0.0 0.1 0.1 0.2 1.1 0.7 0.9 0.9 0.7
1.6 1.6 1.6 1.6 1.7
Non‐Res. Pell Total
1.6 0.9 1.6 1.6 1.7 0.1 0.0 0.1 0.1 0.1 1.2 0.6 1.2 1.1 1.1
0.6 0.3 0.5 0.5 0.4
2016 2017 2018 2019 2020
Non‐Res. Pell Freshmen
0.6 0.3 0.5 0.5 0.4
2016 2017 2018 2019 2020
0.0 0.0 0.0 0.0 0.0
2016 2017 2018 2019 2020
0.4 0.2 0.3 0.4 0.3
2016 2017 2018 2019 2020
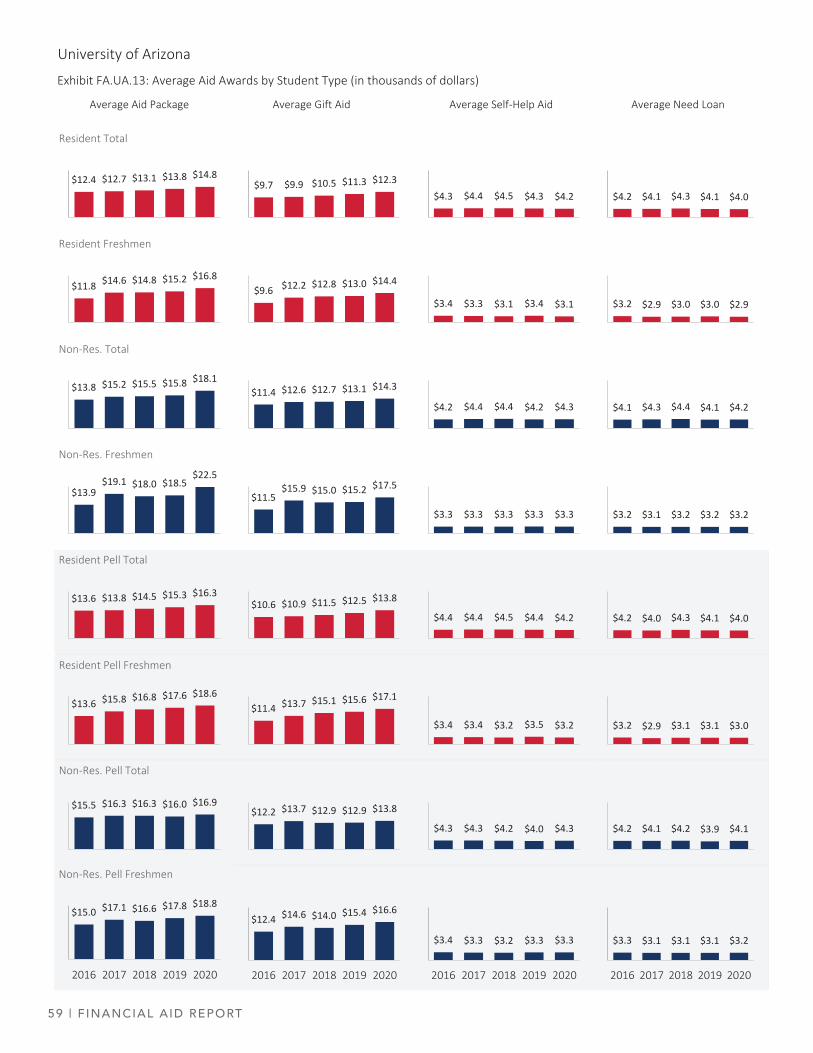
59 | F INANCIAL AID REPORT
University of Arizona
Exhibit FA.UA.13: Average Aid Awards by Student Type (in thousands of dollars)
Average Aid Package Average Gift Aid Average Self‐Help Aid Average Need Loan
$12.4 $12.7 $13.1 $13.8 $14.8
Resident Total
$11.8 $14.6 $14.8 $15.2 $16.8
Resident Freshmen
$13.8 $15.2 $15.5 $15.8 $18.1
Non‐Res. Total
$13.9$19.1 $18.0 $18.5
$22.5
Non‐Res. Freshmen
$13.6 $13.8 $14.5 $15.3 $16.3
Resident Pell Total
$13.6 $15.8 $16.8 $17.6 $18.6
Resident Pell Freshmen
$15.5 $16.3 $16.3 $16.0 $16.9
Non‐Res. Pell Total
$15.0 $17.1 $16.6 $17.8 $18.8
2016 2017 2018 2019 2020
Non‐Res. Pell Freshmen
$9.7 $9.9 $10.5 $11.3 $12.3$4.3 $4.4 $4.5 $4.3 $4.2 $4.2 $4.1 $4.3 $4.1 $4.0
$9.6 $12.2 $12.8 $13.0 $14.4
$3.4 $3.3 $3.1 $3.4 $3.1 $3.2 $2.9 $3.0 $3.0 $2.9
$11.4 $12.6 $12.7 $13.1 $14.3
$4.2 $4.4 $4.4 $4.2 $4.3 $4.1 $4.3 $4.4 $4.1 $4.2
$11.5$15.9 $15.0 $15.2 $17.5
$3.3 $3.3 $3.3 $3.3 $3.3 $3.2 $3.1 $3.2 $3.2 $3.2
$10.6 $10.9 $11.5 $12.5 $13.8
$4.4 $4.4 $4.5 $4.4 $4.2 $4.2 $4.0 $4.3 $4.1 $4.0
$11.4 $13.7 $15.1 $15.6 $17.1
$3.2 $2.9 $3.1 $3.1 $3.0$3.4 $3.4 $3.2 $3.5 $3.2
$12.2 $13.7 $12.9 $12.9 $13.8
$4.3 $4.3 $4.2 $4.0 $4.3 $4.2 $4.1 $4.2 $3.9 $4.1
$12.4 $14.6 $14.0 $15.4 $16.6
2016 2017 2018 2019 2020
$3.4 $3.3 $3.2 $3.3 $3.3
2016 2017 2018 2019 2020
$3.3 $3.1 $3.1 $3.1 $3.2
2016 2017 2018 2019 2020
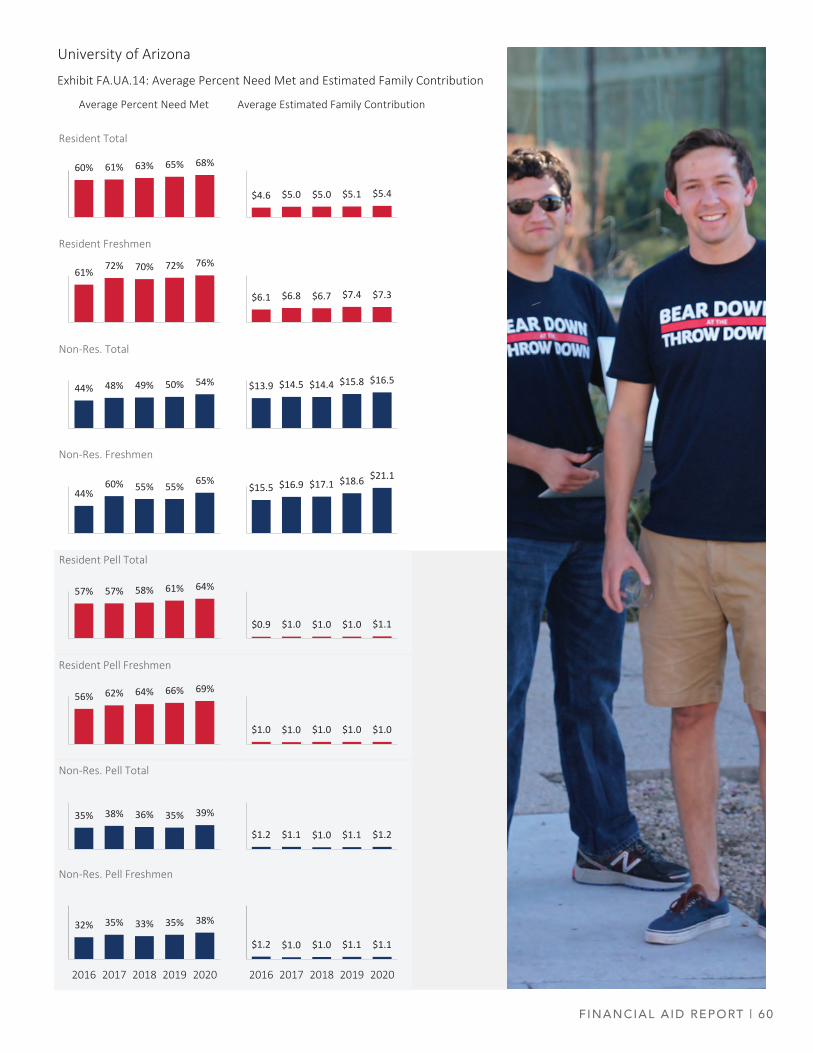
FINANCIAL AID REPORT | 60
University of Arizona
Exhibit FA.UA.14: Average Percent Need Met and Estimated Family Contribution
Average Percent Need Met Average Estimated Family Contribution
60% 61% 63% 65% 68%
Resident Total
61% 72% 70% 72% 76%
Resident Freshmen
44% 48% 49% 50% 54%
Non‐Res. Total
44%60% 55% 55% 65%
Non‐Res. Freshmen
57% 57% 58% 61% 64%
Resident Pell Total
56% 62% 64% 66% 69%
Resident Pell Freshmen
35% 38% 36% 35% 39%
Non‐Res. Pell Total
32% 35% 33% 35% 38%
2016 2017 2018 2019 2020
Non‐Res. Pell Freshmen
$4.6 $5.0 $5.0 $5.1 $5.4
$6.1 $6.8 $6.7 $7.4 $7.3
$13.9 $14.5 $14.4 $15.8 $16.5
$15.5 $16.9 $17.1 $18.6 $21.1
$0.9 $1.0 $1.0 $1.0 $1.1
$1.0 $1.0 $1.0 $1.0 $1.0
$1.2 $1.1 $1.0 $1.1 $1.2
$1.2 $1.0 $1.0 $1.1 $1.1
2016 2017 2018 2019 2020
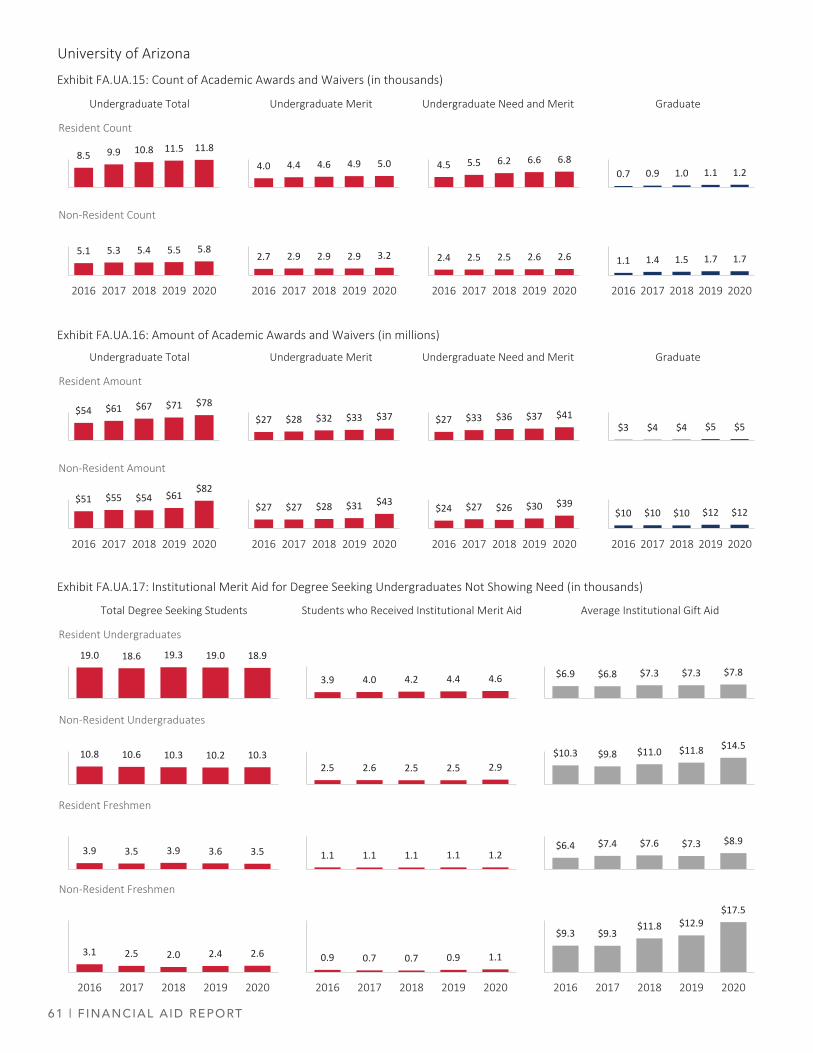
61 | F INANCIAL AID REPORT
University of Arizona
Exhibit FA.UA.15: Count of Academic Awards and Waivers (in thousands)
Undergraduate Total Undergraduate Merit Undergraduate Need and Merit Graduate
Exhibit FA.UA.16: Amount of Academic Awards and Waivers (in millions)
Undergraduate Total Undergraduate Merit Undergraduate Need and Merit Graduate
Exhibit FA.UA.17: Institutional Merit Aid for Degree Seeking Undergraduates Not Showing Need (in thousands)
Total Degree Seeking Students Students who Received Institutional Merit Aid Average Institutional Gift Aid
19.0 18.6 19.3 19.0 18.9
Resident Undergraduates
3.9 4.0 4.2 4.4 4.6 $6.9 $6.8 $7.3 $7.3 $7.8
10.8 10.6 10.3 10.2 10.3
Non‐Resident Undergraduates
2.5 2.6 2.5 2.5 2.9$10.3 $9.8 $11.0 $11.8 $14.5
8.5 9.9 10.8 11.5 11.8
Resident Count
4.0 4.4 4.6 4.9 5.0 4.5 5.5 6.2 6.6 6.80.7 0.9 1.0 1.1 1.2
5.1 5.3 5.4 5.5 5.8
2016 2017 2018 2019 2020
Non‐Resident Count
2.7 2.9 2.9 2.9 3.2
2016 2017 2018 2019 2020
2.4 2.5 2.5 2.6 2.6
2016 2017 2018 2019 2020
1.1 1.4 1.5 1.7 1.7
2016 2017 2018 2019 2020
$54 $61 $67 $71 $78
Resident Amount
$27 $28 $32 $33 $37 $27 $33 $36 $37 $41$3 $4 $4 $5 $5
$51 $55 $54 $61$82
2016 2017 2018 2019 2020
Non‐Resident Amount
$27 $27 $28 $31 $43
2016 2017 2018 2019 2020
$24 $27 $26 $30 $39
2016 2017 2018 2019 2020
$10 $10 $10 $12 $12
2016 2017 2018 2019 2020
3.9 3.5 3.9 3.6 3.5
Resident Freshmen
1.1 1.1 1.1 1.1 1.2$6.4 $7.4 $7.6 $7.3 $8.9
3.1 2.5 2.0 2.4 2.6
2016 2017 2018 2019 2020
Non‐Resident Freshmen
0.9 0.7 0.7 0.9 1.1
2016 2017 2018 2019 2020
$9.3 $9.3$11.8 $12.9
$17.5
2016 2017 2018 2019 2020
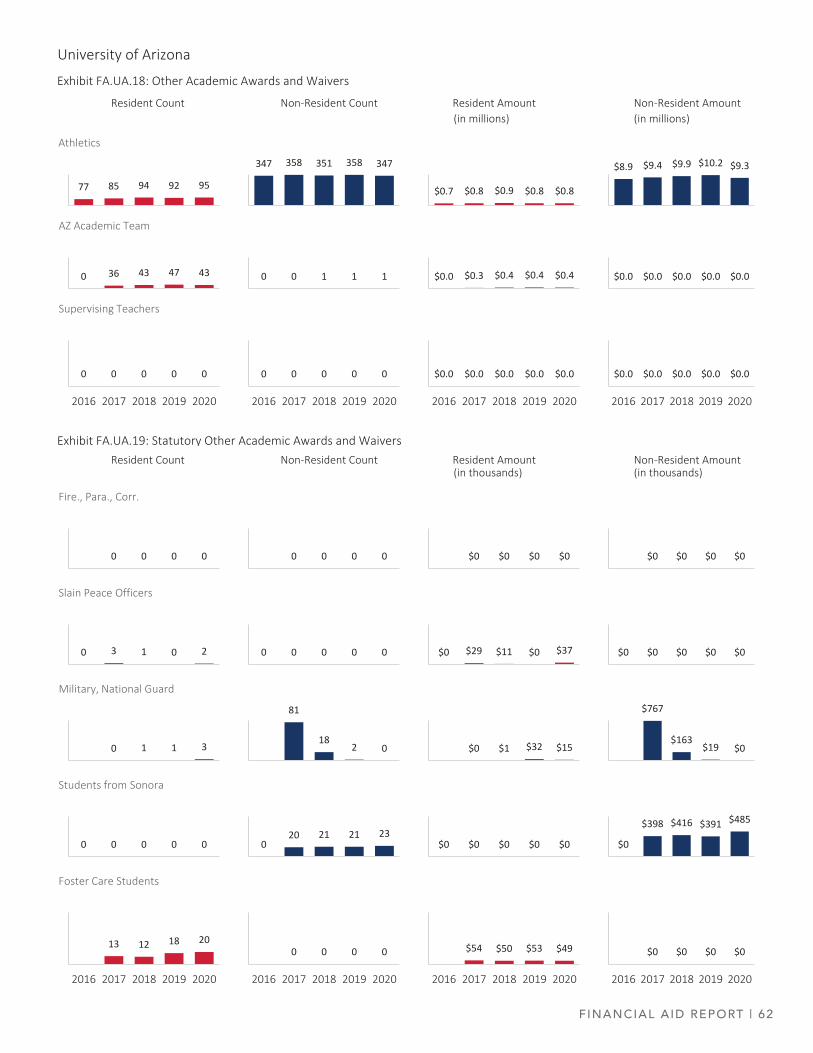
FINANCIAL AID REPORT | 62
University of Arizona
Exhibit FA.UA.18: Other Academic Awards and Waivers
Resident Count Non‐Resident Count Resident Amount Non‐Resident Amount(in millions) (in millions)
Exhibit FA.UA.19: Statutory Other Academic Awards and Waivers Resident Count Non‐Resident Count Resident Amount Non‐Resident Amount
(in thousands) (in thousands)
0 0 0 0
Fire., Para., Corr.
0 3 1 0 2
Slain Peace Officers
0 1 1 3
Military, National Guard
0 0 0 0 0
Students from Sonora
0 0 0 0
0 0 0 0 0
81
182 0
020 21 21 23
0 0 0 0
2016 2017 2018 2019 2020
$0 $0 $0 $0
$0 $29 $11 $0 $37
$0 $1 $32 $15
$0 $0 $0 $0 $0
$54 $50 $53 $49
2016 2017 2018 2019 2020
$0 $0 $0 $0
$0 $0 $0 $0 $0
$767
$163$19 $0
$0
$398 $416 $391 $485
$0 $0 $0 $0
2016 2017 2018 2019 2020
13 12 18 20
2016 2017 2018 2019 2020
Foster Care Students
77 85 94 92 95
Athletics
347 358 351 358 347
$0.7 $0.8 $0.9 $0.8 $0.8
$8.9 $9.4 $9.9 $10.2 $9.3
0 36 43 47 43
AZ Academic Team
0 0 1 1 1 $0.0 $0.3 $0.4 $0.4 $0.4 $0.0 $0.0 $0.0 $0.0 $0.0
0 0 0 0 0
2016 2017 2018 2019 2020
$0.0 $0.0 $0.0 $0.0 $0.0
2016 2017 2018 2019 2020
$0.0 $0.0 $0.0 $0.0 $0.0
2016 2017 2018 2019 2020
0 0 0 0 0
2016 2017 2018 2019 2020
Supervising Teachers

THIS PAGE IS INTENTIONALLY LEFT BLANK

THIS PAGE IS INTENTIONALLY LEFT BLANK

2700 N. CENTRAL AVE. | PHOENIX, AZ 85004 | AZREGENTS.EDU
Board of Regents Meeting November 18-20, 2020
Item #29 EXECUTIVE SUMMARY Page 1 of 2
Contact Information: Chad Sampson, ABOR [email protected] 602-229-2512 Mark Denke, ABOR [email protected] 602-229-2503
Item Name: Arizona Community College Transfer Students and Review of the 2020 Annual Report on Articulation and Transfer for Arizona Postsecondary Education
Action Item
Background Each year Arizona’s public universities and community colleges report on the progress made towards students transferring from Arizona’s public community colleges to Arizona’s public universities. Since 1996, the Arizona Board of Regents and the Arizona community colleges have reported to the Legislature on progress toward implementing a statewide model for transfer by students from community colleges to the universities, developed by the AZTransfer Steering Committee. The report is due to the Joint Legislative Budget Committee by December 15. The attached report describes the activities and accomplishments for the 2019-2020 academic year. Discussion The attached report represents a continued collaboration between Arizona’s public community colleges and universities to ensure a smooth transition for students who transfer from the community colleges to the universities. This collaboration is critical to Arizona efforts to increase the numbers of individuals with baccalaureate degrees. The report provides a snapshot of data related to student transfer among Arizona public community colleges and universities for the 2019-2020 academic year. The report also provides information on the work performed by the AZTransfer Steering Committee. AZTransfer develops and maintains web services and other resources directly related to
Requested Action: The board office asks the board to approve the annual report on articulation and transfer, to be submitted to the Joint Legislative Budget Committee (JLBC) by December 15, 2020.
Board of Regents Meeting November 18-20, 2020
Item #29 EXECUTIVE SUMMARY Page 2 of 2 operating the Arizona Transfer System and promoting transfer opportunities and programs. These tools and resources ensure faculty, staff, and students have access to transfer information from anywhere in the state.
The AZTransfer Steering Committee comes together to help students plan a seamless transfer without loss of academic credit. It does this by focusing on the Arizona General Education Curriculum (AGEC), majors and degrees, common courses, and electives, and supplement this foundation with credits earned through dual enrollment and exams. All of this effort is intended to assist community college students to seamlessly transfer to ASU through a MAPP or TAG program, NAU through The Connect 2 NAU program, the UA through the UA Bridge program or other transfer options. Statutory/Policy Requirements ARS §15-1824, “Transfer Articulation, Common Numbering, Reports.”
2020EDUCATION
T H A T W O R K S
ARIZONA’S PATHWAYS & PARTNERSHIPS:
2020 ANNUAL REPORT ON ARTICULATION AND TRANSFERFOR ARIZONA POSTSECONDARY EDUCATION
CONTENTSAbout this Report
Vision, Mission, Values
Education that Works
Services Overview
Year in Review
Fast Facts
Course Counts
Stakeholder Engagement
Articulation Task Forces
Transfer System Components
Transfer Majors
Tools & Resources
Transfer Data Reporting
Course Equivalency Report
Looking Ahead
...................................................................... 3
............................................................ 4
............................................................. 5
..................................................................... 6
............................................................................. 8
...................................................................................... 10
............................................................................ 12
................................................... 13
...................................................... 14
......................................... 16
.......................................................................... 18
................................................................... 20
...................................................... 22
.............................................. 26
......................................................................... 28
The AZTransfer Steering Committee is the coordinating body for the statewide articulation and transfer system (AZTransfer). It provides oversight of curricular alignment among public and tribal post-secondary educational institutions and helps ensure that students are appropriately prepared and have the support services required to pursue and complete a post-secondary degree program. A major goal of the AZTransfer Steering Committee is to assist with increasing the number of Arizona students who successfully complete a baccalaureate degree.
The AZTransfer Steering Committee was established in part by the Transfer Articulation Task Force Report of 1996. The Arizona Transfer System is overseen by the AZTransfer Steering Committee and includes the people, systems and infrastructure designed to ensure “…that community college students may transfer to Arizona public universities without loss of credit towards a baccalaureate degree.” (ARS 15-1824).
* Representative is also a memberof the AZTransfer Executive Committee
FOR MORE THAN 20 YEARS, academic leaders from each of Arizona’s public postsecondary institutions have collaborated to support transfer student success. Known as the AZTransfer Steering Committee, this coordinating body ensures Arizona’s students have access to efficient, seamless, and simple ways to transfer from a community college to a university in Arizona.
Born out of legislation passed in 1996, the AZTransfer Steering Committee works to fulfill a promise to provide high-quality educational pathways that lead to baccalaureate degree completion for all Arizonans. This report highlights results, services, and innovations in the 2019-2020 academic year that deliver on that promise and make education work for Arizona’s students.
AZTRANSFER | ANNUAL REPORT 3
ABOUTTHIS
REPORT
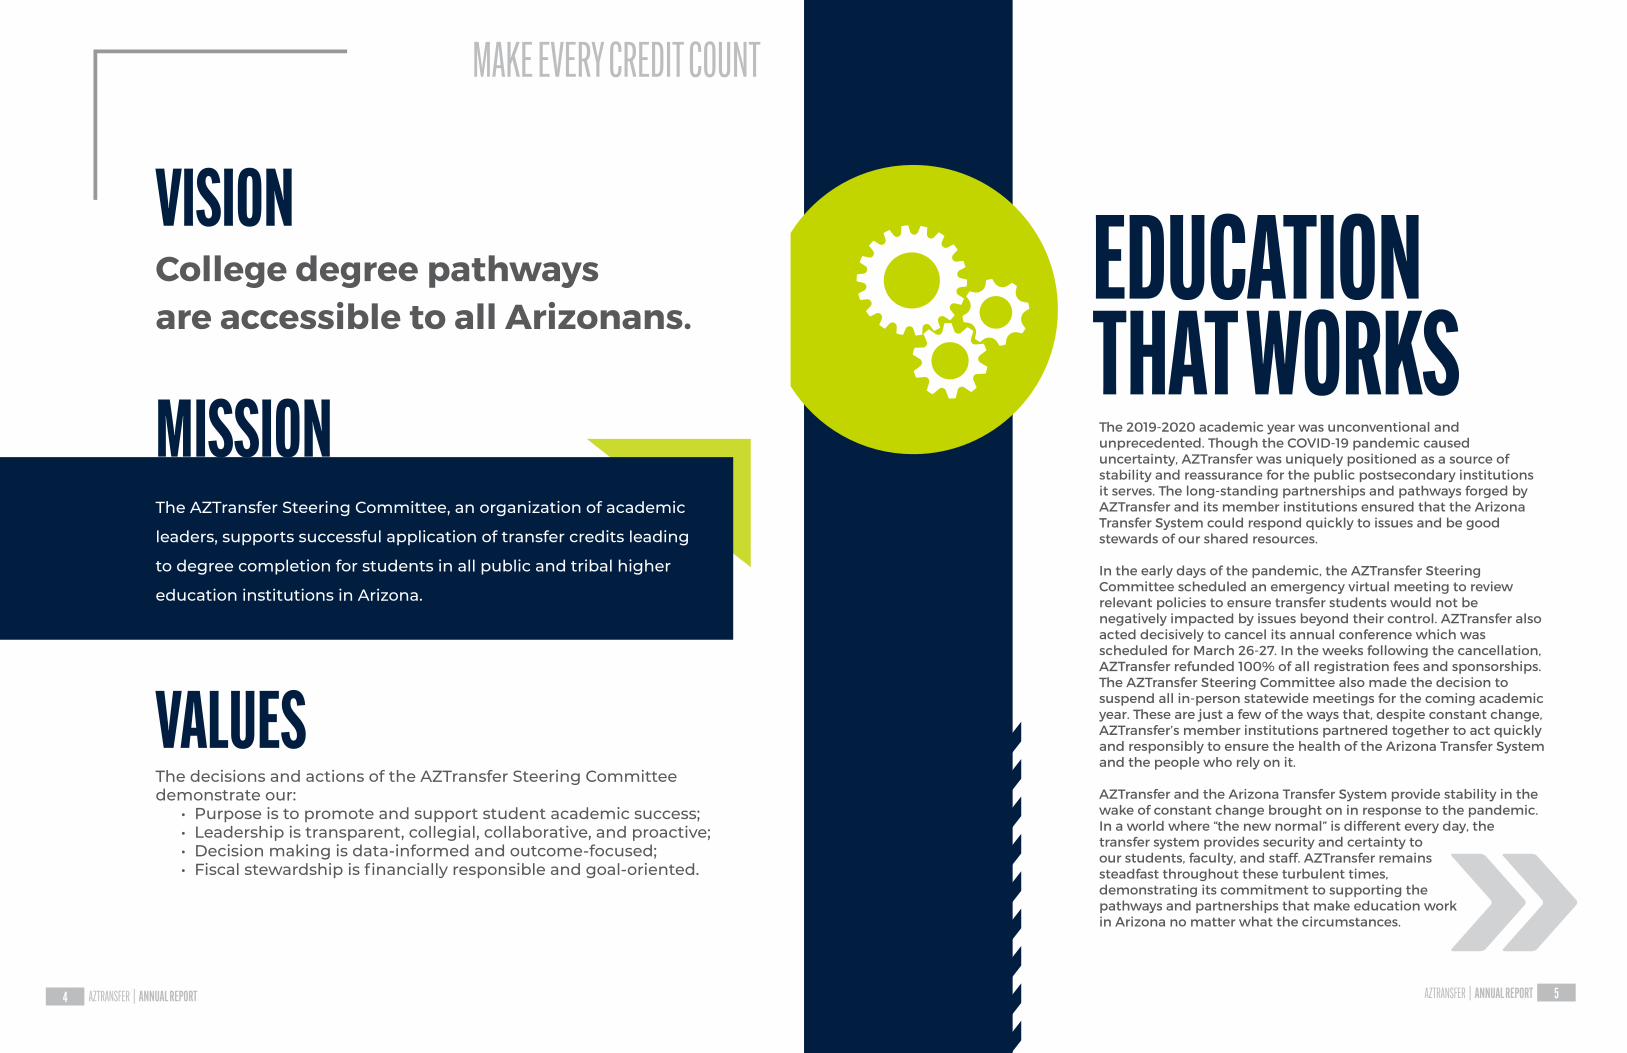
The 2019-2020 academic year was unconventional and unprecedented. Though the COVID-19 pandemic caused uncertainty, AZTransfer was uniquely positioned as a source of stability and reassurance for the public postsecondary institutions it serves. The long-standing partnerships and pathways forged by AZTransfer and its member institutions ensured that the Arizona Transfer System could respond quickly to issues and be good stewards of our shared resources.
In the early days of the pandemic, the AZTransfer Steering Committee scheduled an emergency virtual meeting to review relevant policies to ensure transfer students would not be negatively impacted by issues beyond their control. AZTransfer also acted decisively to cancel its annual conference which was scheduled for March 26-27. In the weeks following the cancellation, AZTransfer refunded 100% of all registration fees and sponsorships. The AZTransfer Steering Committee also made the decision to suspend all in-person statewide meetings for the coming academic year. These are just a few of the ways that, despite constant change, AZTransfer’s member institutions partnered together to act quickly and responsibly to ensure the health of the Arizona Transfer System and the people who rely on it.
AZTransfer and the Arizona Transfer System provide stability in the wake of constant change brought on in response to the pandemic. In a world where “the new normal” is different every day, the transfer system provides security and certainty to our students, faculty, and staff. AZTransfer remains steadfast throughout these turbulent times, demonstrating its commitment to supporting the pathways and partnerships that make education work in Arizona no matter what the circumstances.
EDUCATIONTHAT WORKS
AZTRANSFER | ANNUAL REPORT 5
The decisions and actions of the AZTransfer Steering Committee demonstrate our:
• Purpose is to promote and support student academic success;• Leadership is transparent, collegial, collaborative, and proactive;• Decision making is data-informed and outcome-focused;• Fiscal stewardship is financially responsible and goal-oriented.
College degree pathwaysare accessible to all Arizonans.
VISION
VALUES
MISSIONThe AZTransfer Steering Committee, an organization of academic
leaders, supports successful application of transfer credits leading
to degree completion for students in all public and tribal higher
education institutions in Arizona.
MAKE EVERY CREDIT COUNT
AZTRANSFER | ANNUAL REPORT4
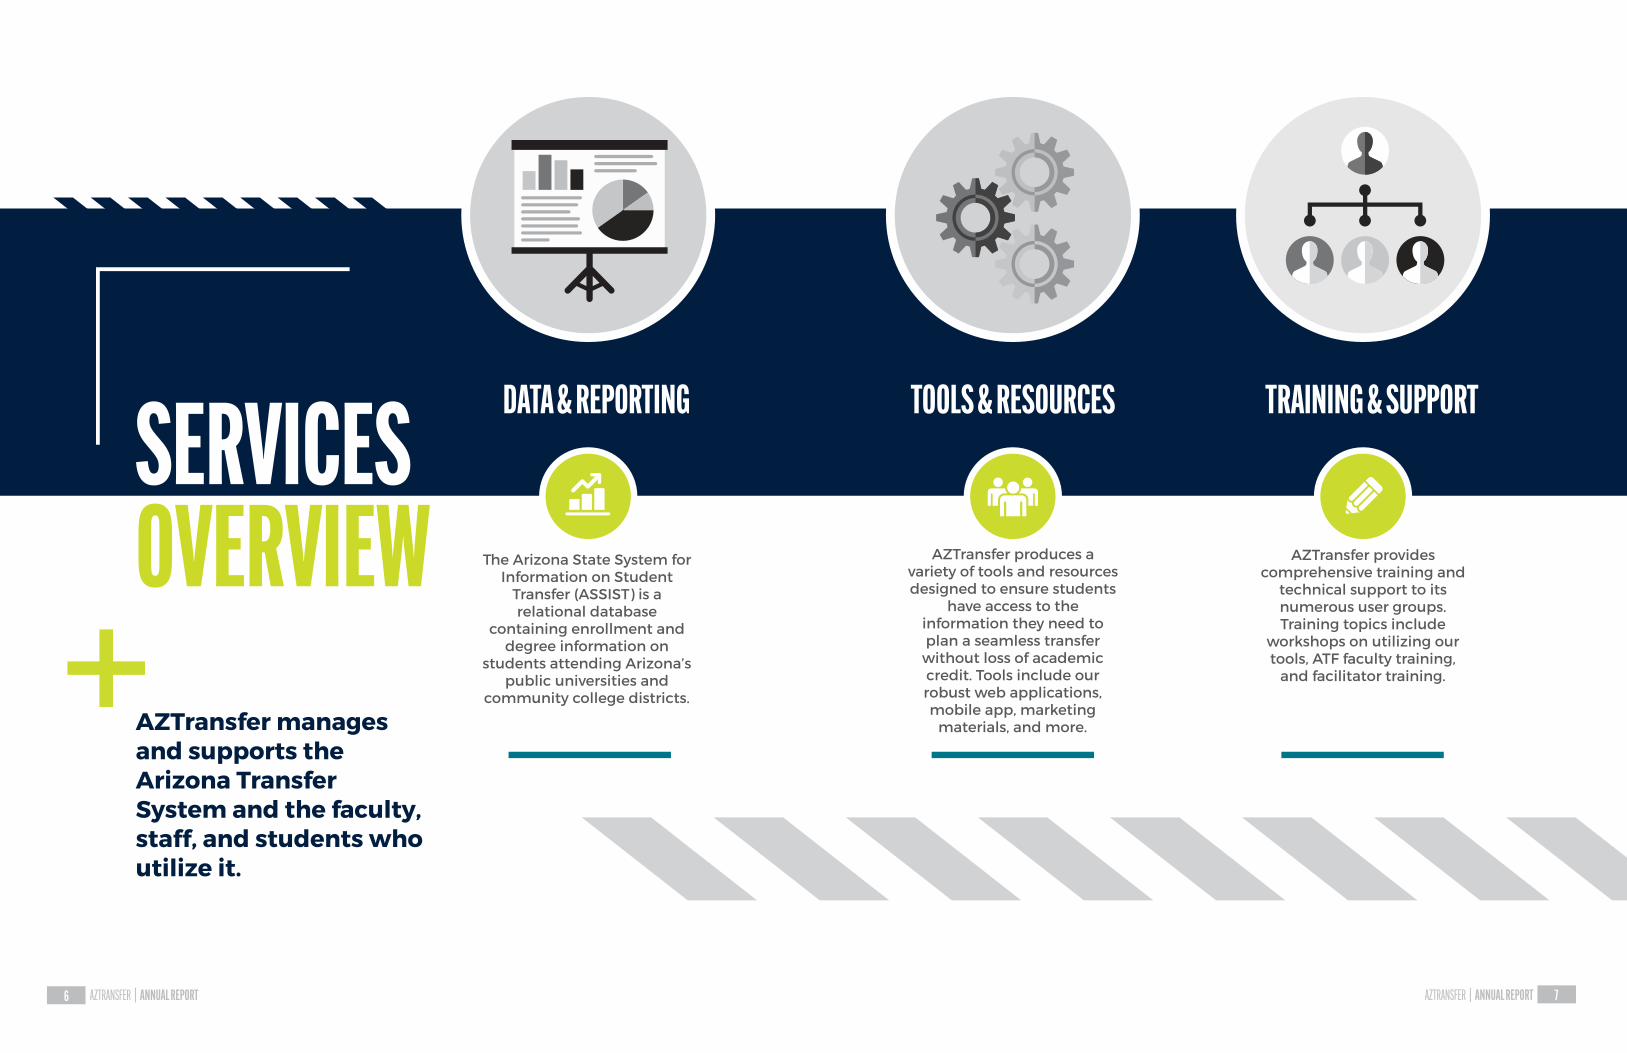
SERVICESOVERVIEW
DATA & REPORTING
The Arizona State System for Information on Student
Transfer (ASSIST) is a relational database
containing enrollment and degree information on
students attending Arizona’s public universities and
community college districts.
AZTransfer produces a variety of tools and resources designed to ensure students
have access to the information they need to plan a seamless transfer without loss of academic credit. Tools include our robust web applications, mobile app, marketing
materials, and more.
AZTransfer provides comprehensive training and
technical support to its numerous user groups. Training topics include
workshops on utilizing our tools, ATF faculty training,
and facilitator training.
TOOLS & RESOURCES TRAINING & SUPPORT
AZTRANSFER | ANNUAL REPORT6 AZTRANSFER | ANNUAL REPORT 7
AZTransfer manages and supports the Arizona Transfer System and the faculty, staff, and students who utilize it.
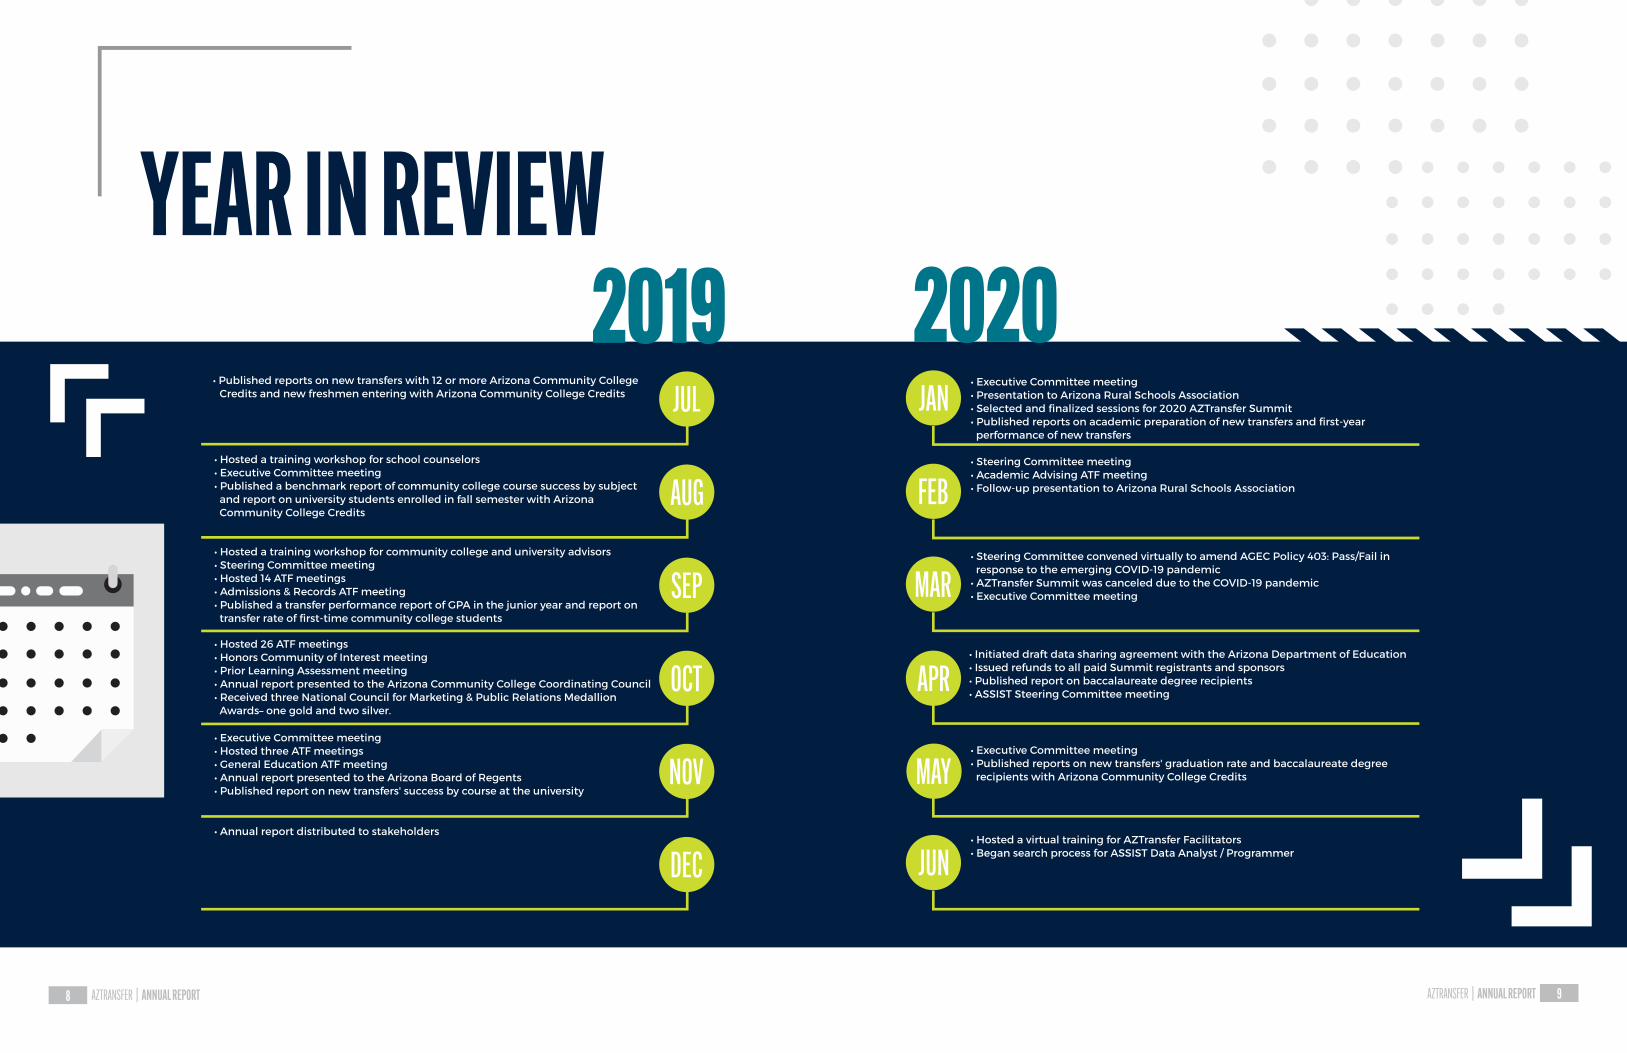
YEAR IN REVIEW2019
• Published reports on new transfers with 12 or more Arizona Community College Credits and new freshmen entering with Arizona Community College Credits
• Hosted a training workshop for school counselors• Executive Committee meeting• Published a benchmark report of community college course success by subject and report on university students enrolled in fall semester with Arizona Community College Credits
• Hosted a training workshop for community college and university advisors• Steering Committee meeting• Hosted 14 ATF meetings• Admissions & Records ATF meeting• Published a transfer performance report of GPA in the junior year and report on transfer rate of first-time community college students
• Hosted 26 ATF meetings• Honors Community of Interest meeting• Prior Learning Assessment meeting• Annual report presented to the Arizona Community College Coordinating Council• Received three National Council for Marketing & Public Relations Medallion Awards– one gold and two silver.
• Executive Committee meeting• Hosted three ATF meetings• General Education ATF meeting• Annual report presented to the Arizona Board of Regents• Published report on new transfers' success by course at the university
• Annual report distributed to stakeholders
2020• Executive Committee meeting• Presentation to Arizona Rural Schools Association• Selected and finalized sessions for 2020 AZTransfer Summit• Published reports on academic preparation of new transfers and first-year performance of new transfers
• Steering Committee meeting• Academic Advising ATF meeting• Follow-up presentation to Arizona Rural Schools Association
• Hosted a virtual training for AZTransfer Facilitators• Began search process for ASSIST Data Analyst / Programmer
• Steering Committee convened virtually to amend AGEC Policy 403: Pass/Fail in response to the emerging COVID-19 pandemic
• AZTransfer Summit was canceled due to the COVID-19 pandemic• Executive Committee meeting
• Executive Committee meeting• Published reports on new transfers' graduation rate and baccalaureate degree recipients with Arizona Community College Credits
AZTRANSFER | ANNUAL REPORT8 AZTRANSFER | ANNUAL REPORT 9
• Initiated draft data sharing agreement with the Arizona Department of Education• Issued refunds to all paid Summit registrants and sponsors• Published report on baccalaureate degree recipients• ASSIST Steering Committee meeting
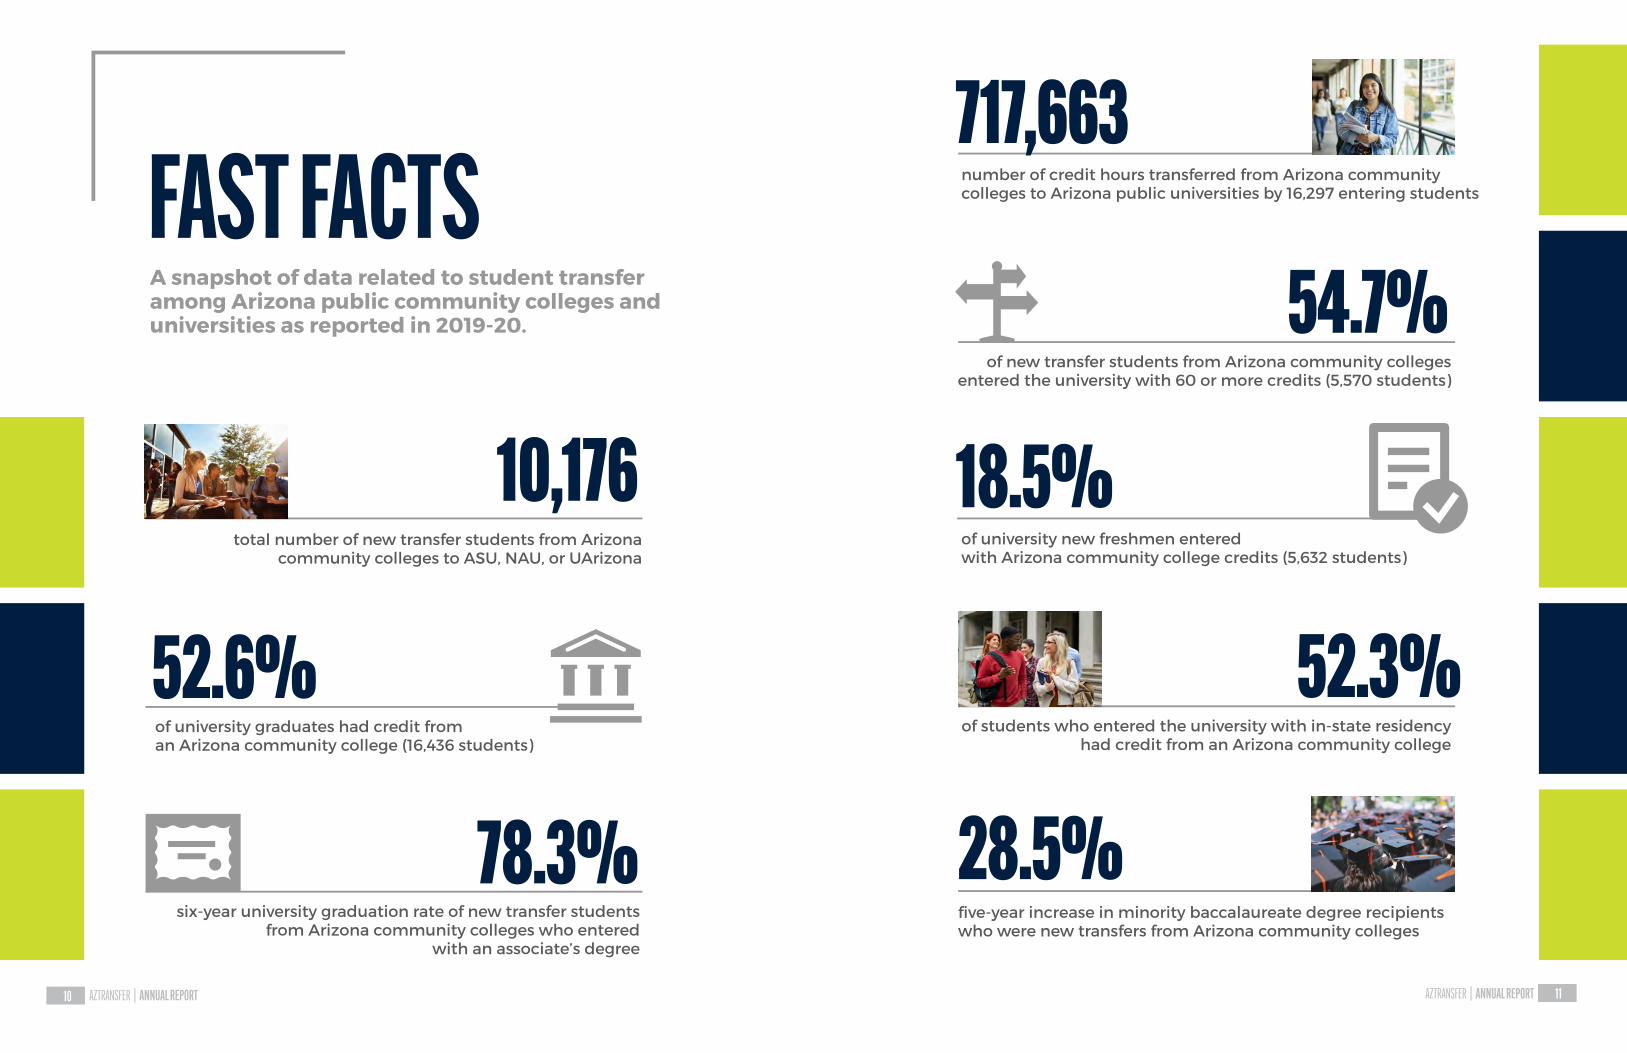
AZTRANSFER | ANNUAL REPORT10 AZTRANSFER | ANNUAL REPORT 11
FAST FACTSA snapshot of data related to student transfer among Arizona public community colleges and universities as reported in 2019-20.
10,176total number of new transfer students from Arizona
community colleges to ASU, NAU, or UArizona
52.6%of university graduates had credit froman Arizona community college (16,436 students)
78.3%six-year university graduation rate of new transfer students
from Arizona community colleges who enteredwith an associate’s degree
18.5%of university new freshmen enteredwith Arizona community college credits (5,632 students)
52.3%of students who entered the university with in-state residency
had credit from an Arizona community college
28.5%five-year increase in minority baccalaureate degree recipients who were new transfers from Arizona community colleges
717,663number of credit hours transferred from Arizona community colleges to Arizona public universities by 16,297 entering students
54.7%of new transfer students from Arizona community colleges
entered the university with 60 or more credits (5,570 students)
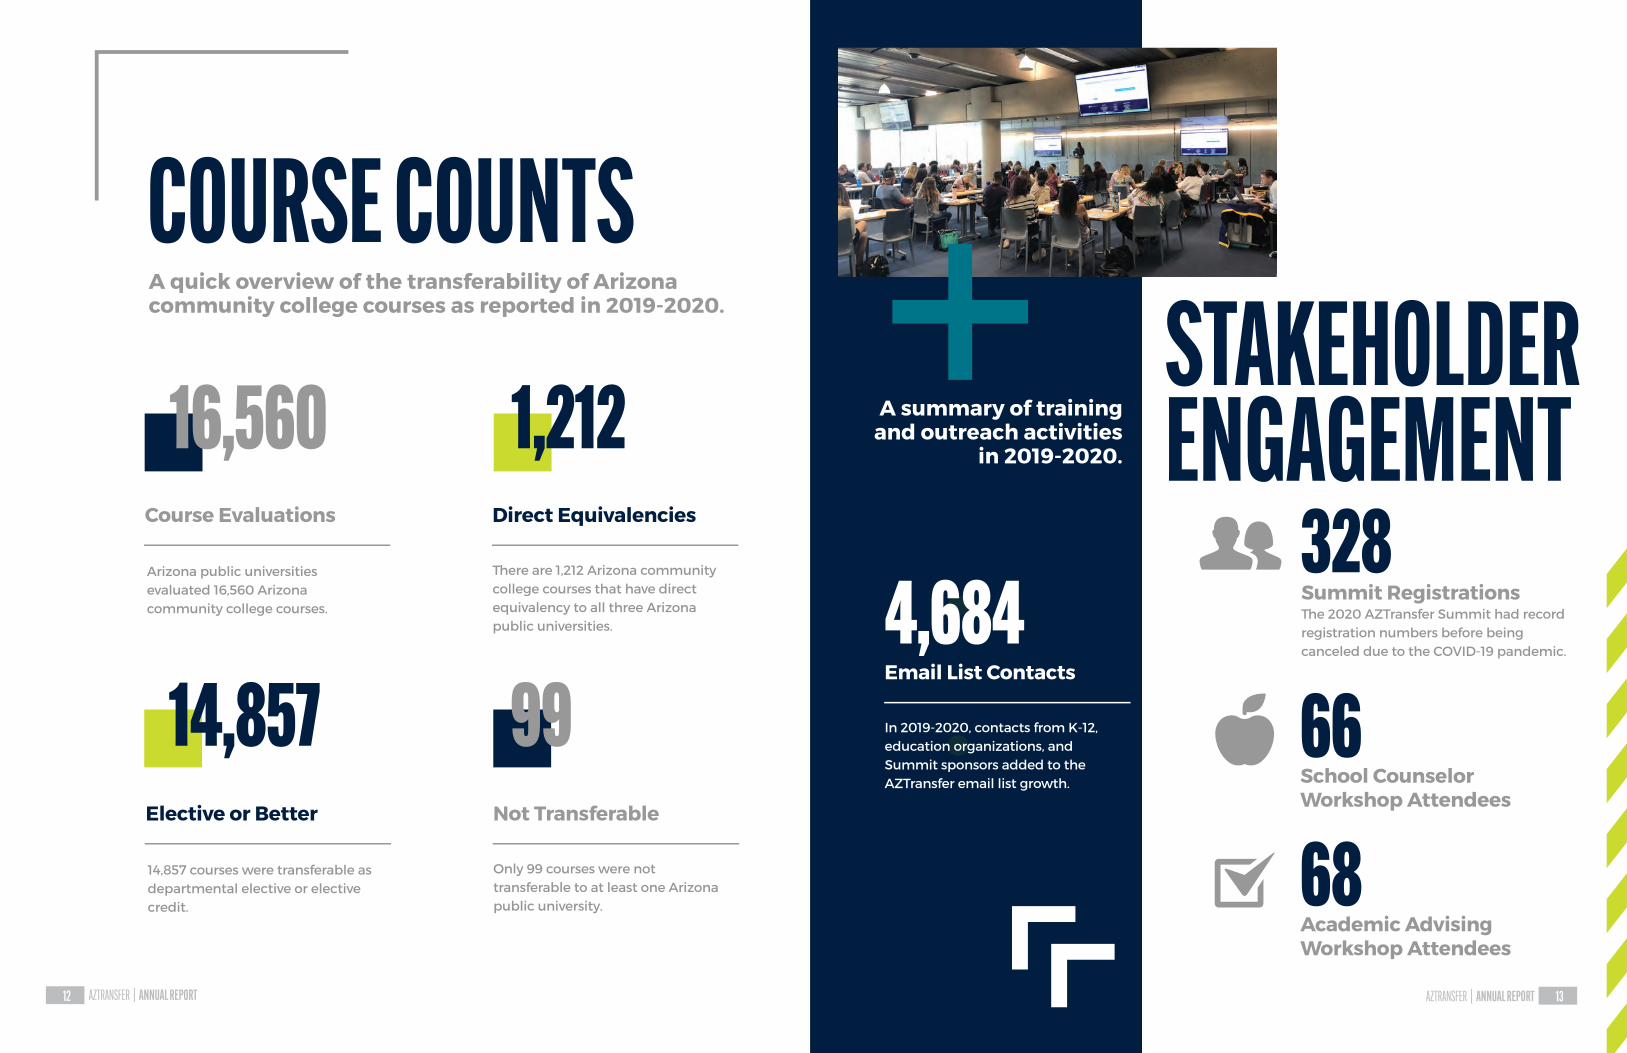
AZTRANSFER | ANNUAL REPORT12
Course Evaluations
Arizona public universities evaluated 16,560 Arizona community college courses.
There are 1,212 Arizona community college courses that have direct equivalency to all three Arizona public universities.
Direct Equivalencies
16,560 1,212
COURSE COUNTSA quick overview of the transferability of Arizona community college courses as reported in 2019-2020.
14,857 99Elective or Better
14,857 courses were transferable as departmental elective or elective credit.
Only 99 courses were not transferable to at least one Arizona public university.
Not Transferable
4,684In 2019-2020, contacts from K-12, education organizations, and Summit sponsors added to the AZTransfer email list growth.
Email List Contacts
328Summit RegistrationsThe 2020 AZTransfer Summit had record registration numbers before being canceled due to the COVID-19 pandemic.
66School Counselor Workshop Attendees
68Academic Advising Workshop Attendees
AZTRANSFER | ANNUAL REPORT 13
STAKEHOLDERENGAGEMENTA summary of training
and outreach activities in 2019-2020.
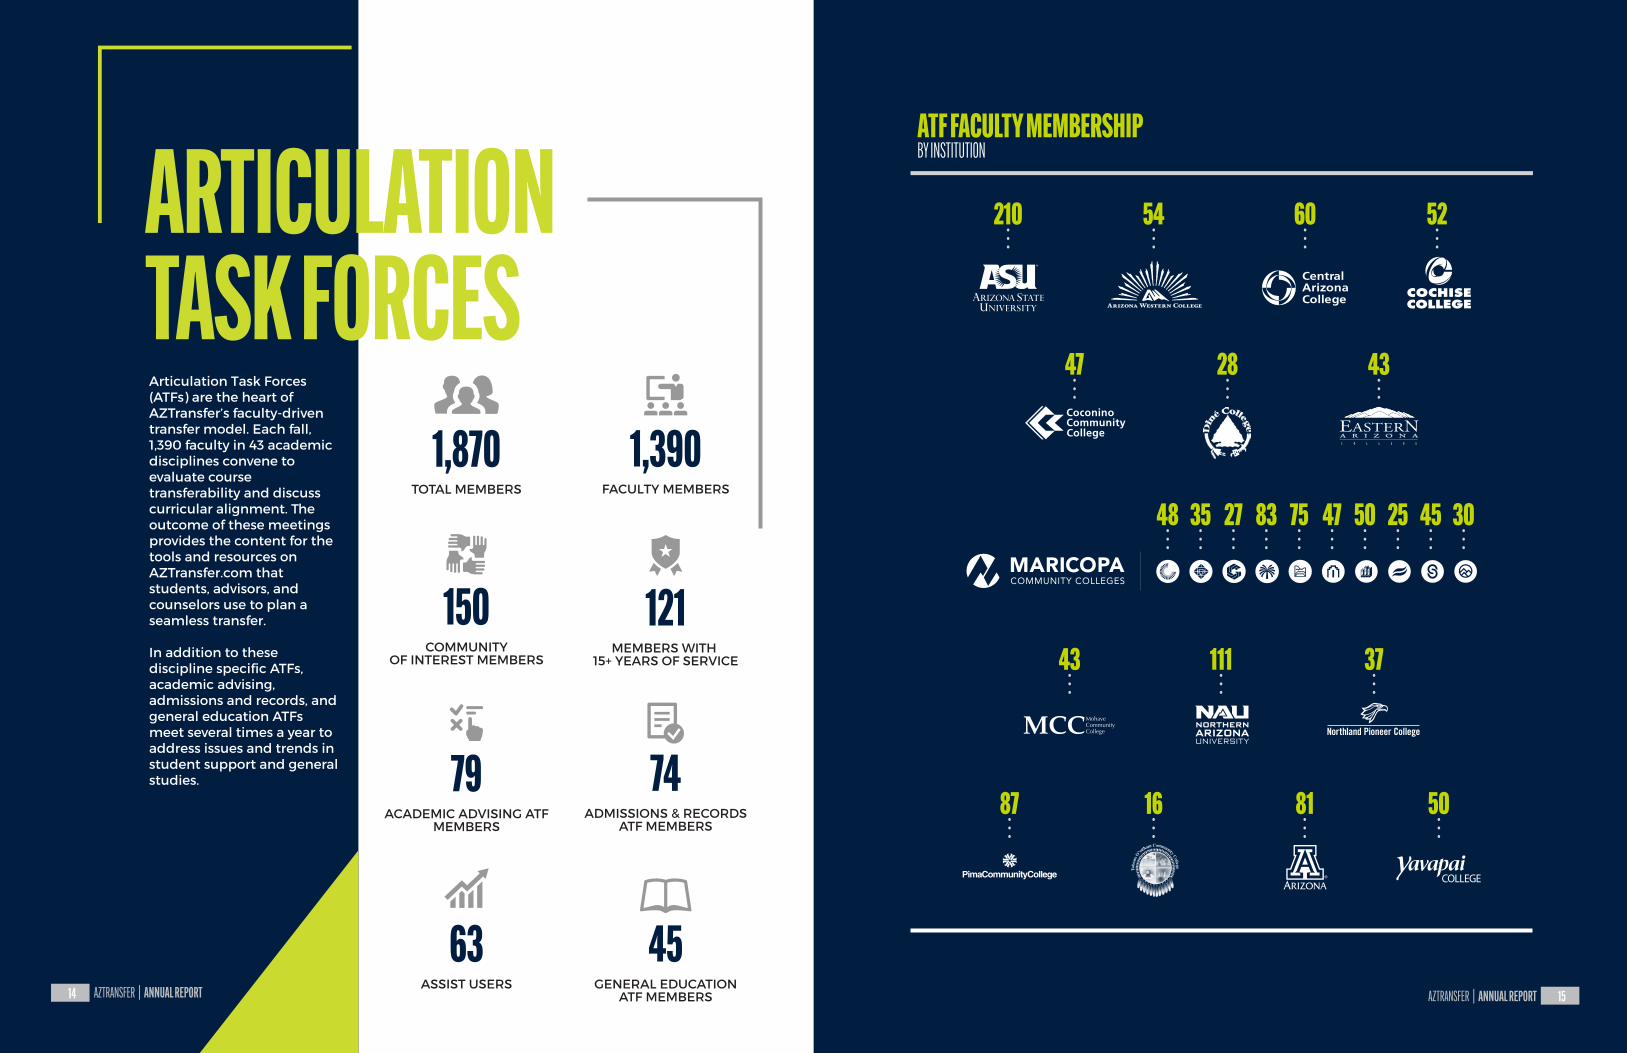
AZTRANSFER | ANNUAL REPORT 15
Articulation Task Forces (ATFs) are the heart of AZTransfer’s faculty-driven transfer model. Each fall, 1,390 faculty in 43 academic disciplines convene to evaluate course transferability and discuss curricular alignment. The outcome of these meetings provides the content for the tools and resources on AZTransfer.com that students, advisors, and counselors use to plan a seamless transfer.
In addition to these discipline specific ATFs, academic advising, admissions and records, and general education ATFs meet several times a year to address issues and trends in student support and general studies.
ARTICULATIONTASK FORCES
AZTRANSFER | ANNUAL REPORT14
1,390FACULTY MEMBERS
121MEMBERS WITH
15+ YEARS OF SERVICE
74ADMISSIONS & RECORDS
ATF MEMBERS
45GENERAL EDUCATION
ATF MEMBERS
1,870TOTAL MEMBERS
150COMMUNITY
OF INTEREST MEMBERS
63ASSIST USERS
79ACADEMIC ADVISING ATF
MEMBERS
210•••
54•••
60•••
52•••
47•••
28•••
43•••
43•••
111•••
37•••
87•••
16•••
81•••
50•••
48•••
27•••
75•••
50•••
45•••
35•••
83•••
47•••
25•••
30•••
ATF FACULTY MEMBERSHIPBY INSTITUTION
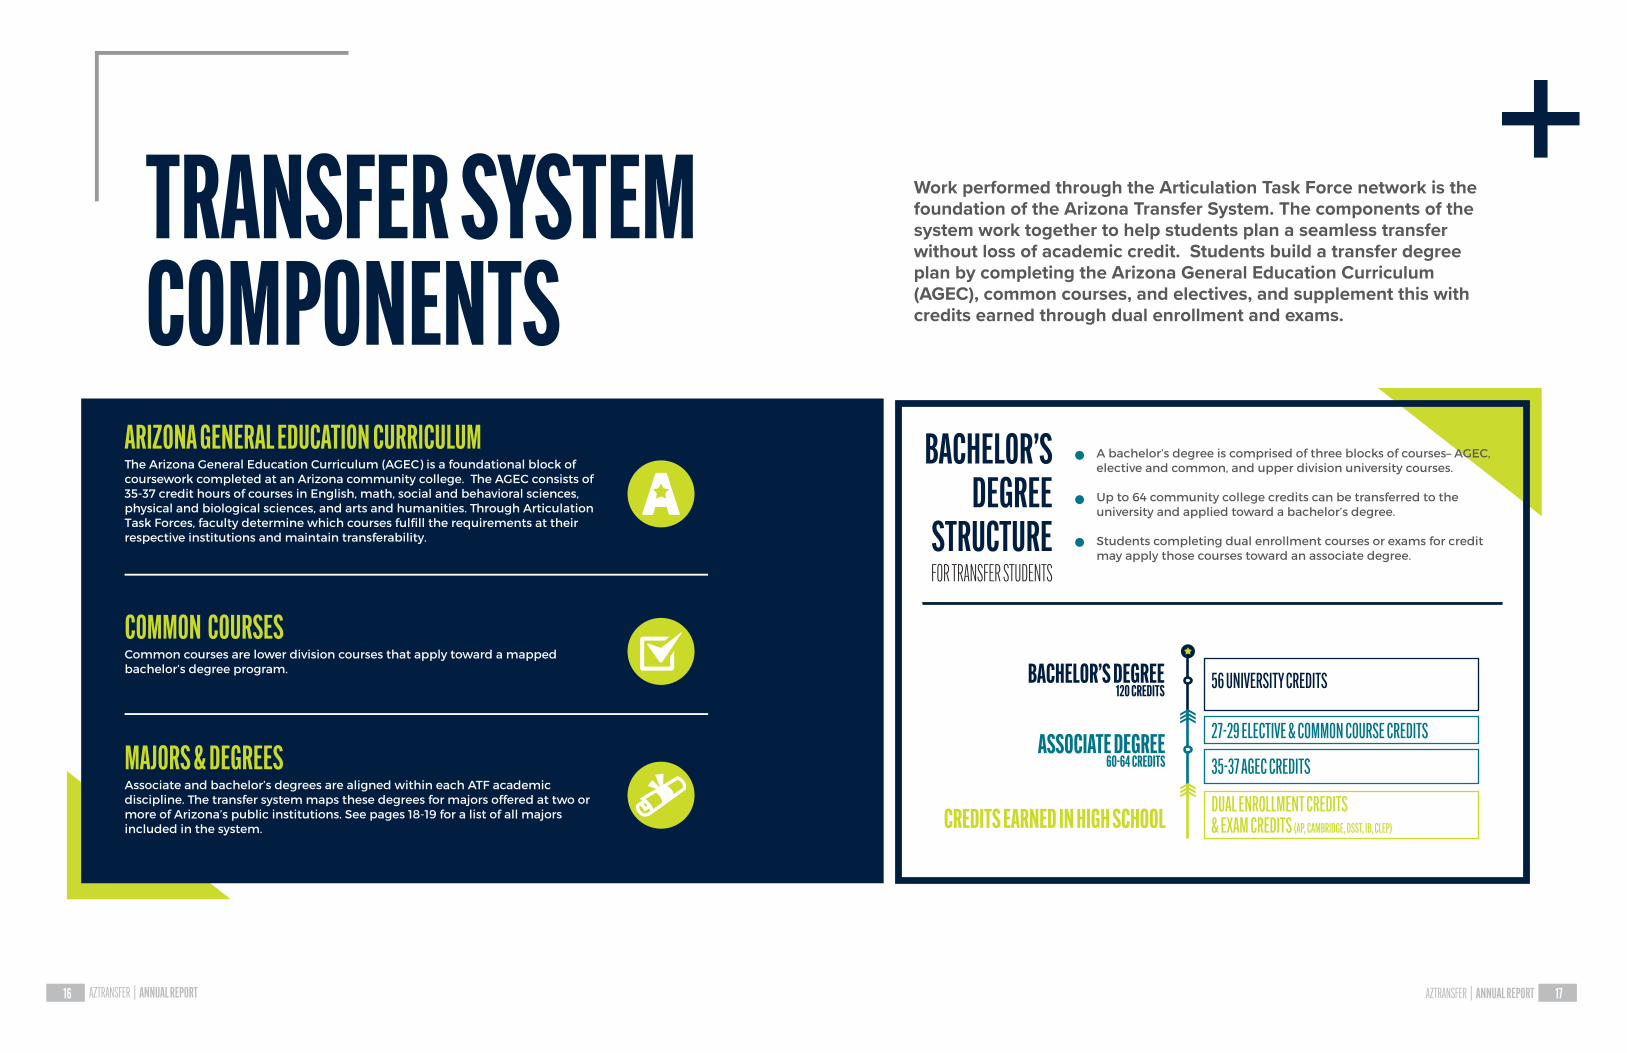
TRANSFER SYSTEMCOMPONENTS
ARIZONA GENERAL EDUCATION CURRICULUMThe Arizona General Education Curriculum (AGEC) is a foundational block of coursework completed at an Arizona community college. The AGEC consists of 35-37 credit hours of courses in English, math, social and behavioral sciences, physical and biological sciences, and arts and humanities. Through Articulation Task Forces, faculty determine which courses fulfill the requirements at their respective institutions and maintain transferability.
COMMON COURSESCommon courses are lower division courses that apply toward a mapped bachelor’s degree program.
MAJORS & DEGREESAssociate and bachelor’s degrees are aligned within each ATF academic discipline. The transfer system maps these degrees for majors offered at two or more of Arizona’s public institutions. See pages 18-19 for a list of all majors included in the system.
BACHELOR’SDEGREE
STRUCTURE
A bachelor’s degree is comprised of three blocks of courses– AGEC, elective and common, and upper division university courses.
Up to 64 community college credits can be transferred to the university and applied toward a bachelor’s degree.
Students completing dual enrollment courses or exams for credit may apply those courses toward an associate degree.
BACHELOR’S DEGREE120 CREDITS
ASSOCIATE DEGREE60-64 CREDITS
27-29 ELECTIVE & COMMON COURSE CREDITS
35-37 AGEC CREDITS
56 UNIVERSITY CREDITS
CREDITS EARNED IN HIGH SCHOOLDUAL ENROLLMENT CREDITS& EXAM CREDITS (AP, CAMBRIDGE, DSST, IB, CLEP)
AZTRANSFER | ANNUAL REPORT 17AZTRANSFER | ANNUAL REPORT16
Work performed through the Articulation Task Force network is the foundation of the Arizona Transfer System. The components of the system work together to help students plan a seamless transfer without loss of academic credit. Students build a transfer degree plan by completing the Arizona General Education Curriculum (AGEC), common courses, and electives, and supplement this with credits earned through dual enrollment and exams.
FOR TRANSFER STUDENTS

AZTRANSFER | ANNUAL REPORT 19AZTRANSFER | ANNUAL REPORT18
TRANSFER MAJORS
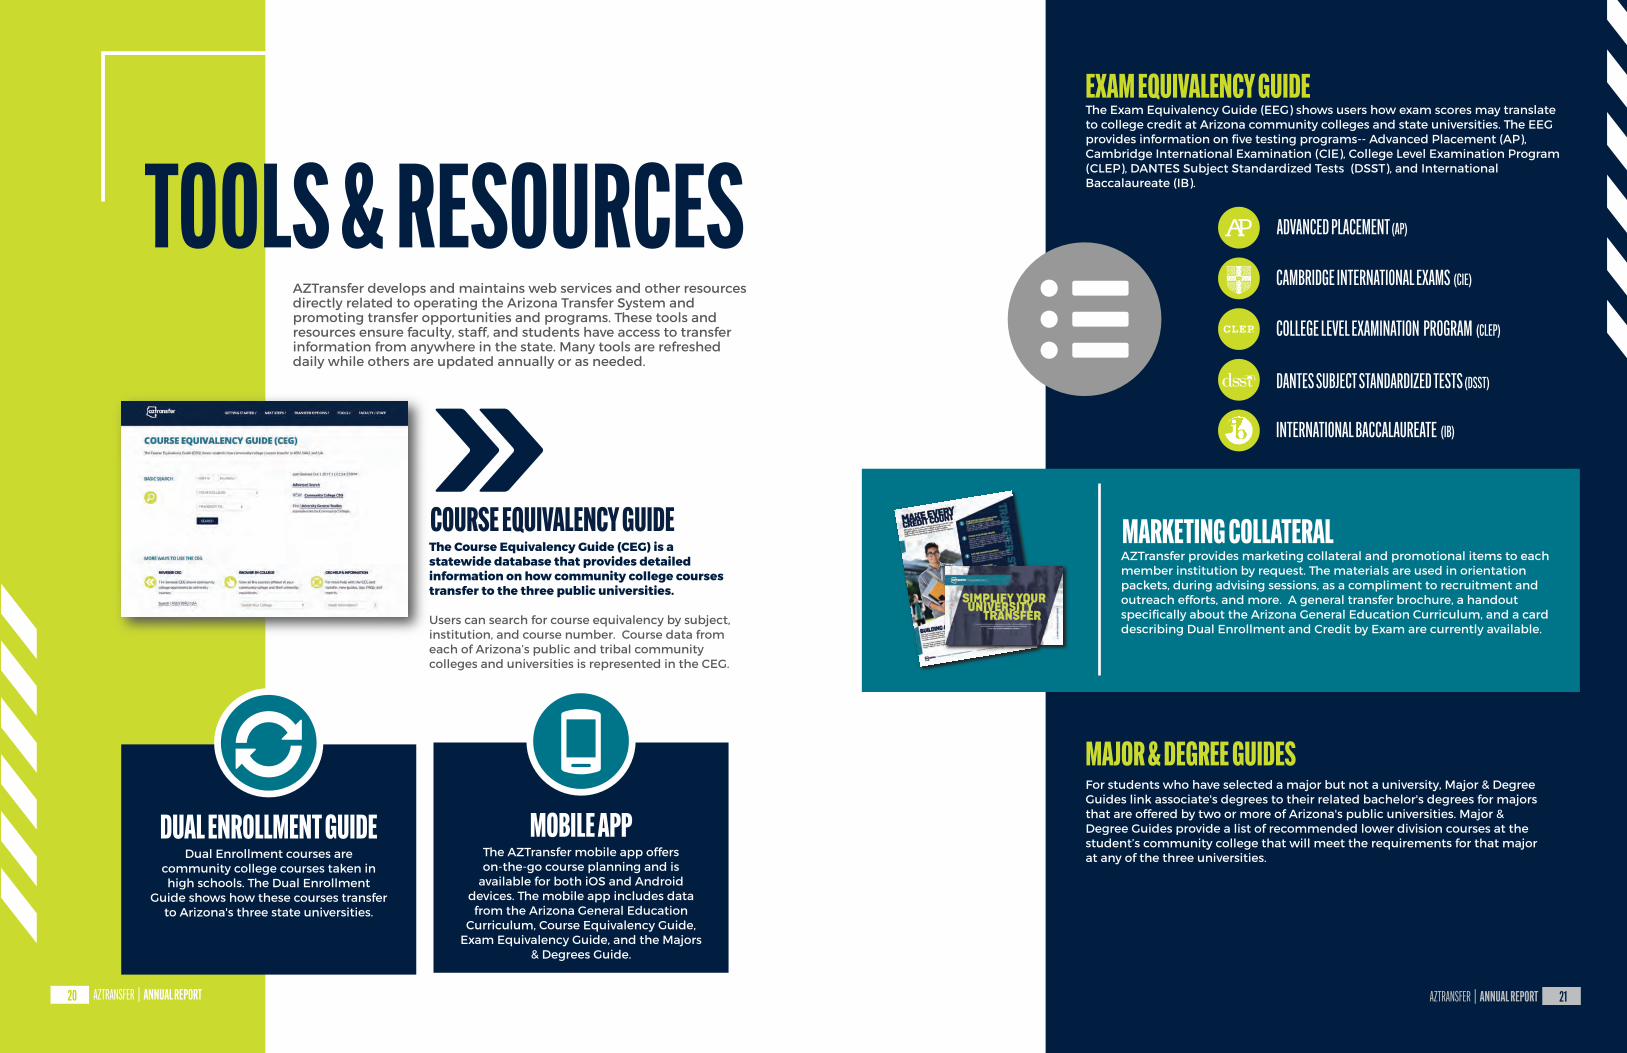
TOOLS & RESOURCESEXAM EQUIVALENCY GUIDEThe Exam Equivalency Guide (EEG) shows users how exam scores may translate to college credit at Arizona community colleges and state universities. The EEG provides information on five testing programs-- Advanced Placement (AP), Cambridge International Examination (CIE), College Level Examination Program (CLEP), DANTES Subject Standardized Tests (DSST), and International Baccalaureate (IB).
COURSE EQUIVALENCY GUIDEThe Course Equivalency Guide (CEG) is a statewide database that provides detailed information on how community college courses transfer to the three public universities.
Users can search for course equivalency by subject, institution, and course number. Course data from each of Arizona’s public and tribal community colleges and universities is represented in the CEG.
MAJOR & DEGREE GUIDESFor students who have selected a major but not a university, Major & Degree Guides link associate's degrees to their related bachelor's degrees for majors that are offered by two or more of Arizona's public universities. Major & Degree Guides provide a list of recommended lower division courses at the student’s community college that will meet the requirements for that major at any of the three universities.
AZTRANSFER | ANNUAL REPORT 21AZTRANSFER | ANNUAL REPORT20
AZTransfer develops and maintains web services and other resources directly related to operating the Arizona Transfer System and promoting transfer opportunities and programs. These tools and resources ensure faculty, staff, and students have access to transfer information from anywhere in the state. Many tools are refreshed daily while others are updated annually or as needed.
MARKETING COLLATERALAZTransfer provides marketing collateral and promotional items to each member institution by request. The materials are used in orientation packets, during advising sessions, as a compliment to recruitment and outreach efforts, and more. A general transfer brochure, a handout specifically about the Arizona General Education Curriculum, and a card describing Dual Enrollment and Credit by Exam are currently available.
DUAL ENROLLMENT GUIDEDual Enrollment courses are
community college courses taken in high schools. The Dual Enrollment
Guide shows how these courses transfer to Arizona's three state universities.
MOBILE APPThe AZTransfer mobile app offers on-the-go course planning and is
available for both iOS and Android devices. The mobile app includes data from the Arizona General Education
Curriculum, Course Equivalency Guide, Exam Equivalency Guide, and the Majors
& Degrees Guide.
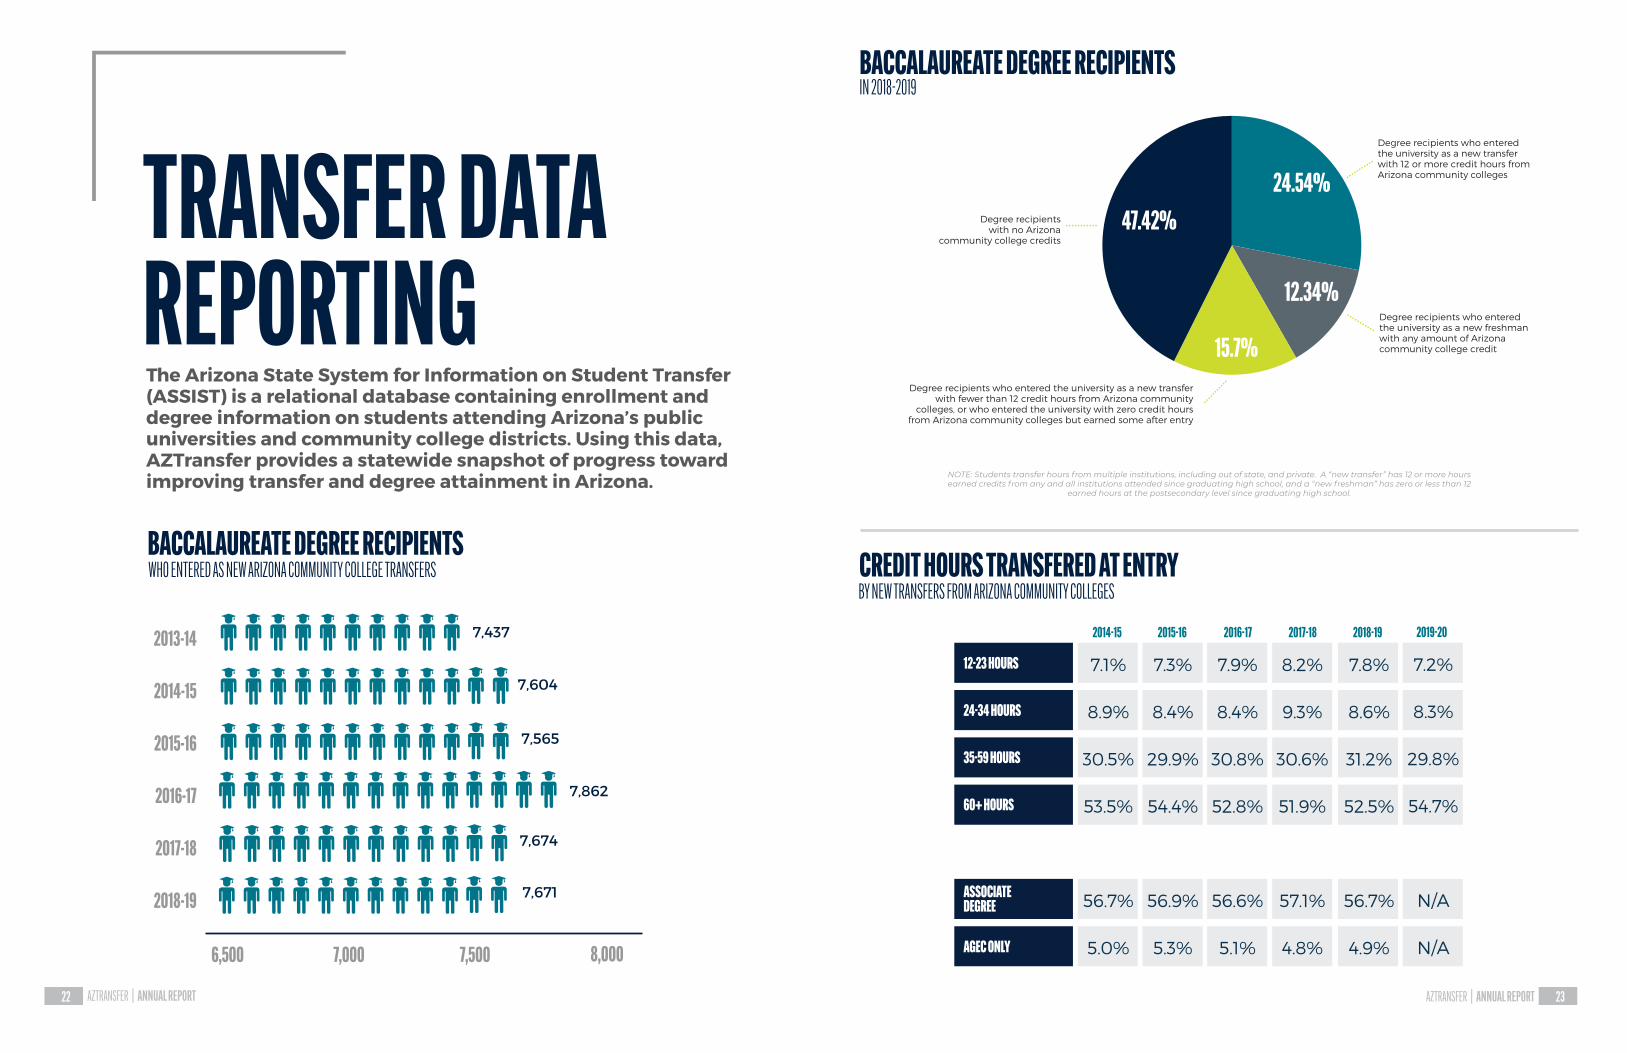
TRANSFER DATAREPORTINGThe Arizona State System for Information on Student Transfer (ASSIST) is a relational database containing enrollment and degree information on students attending Arizona’s public universities and community college districts. Using this data, AZTransfer provides a statewide snapshot of progress toward improving transfer and degree attainment in Arizona.
AZTRANSFER | ANNUAL REPORT 23AZTRANSFER | ANNUAL REPORT22
2013-14
2014-15
2015-16
2016-17
2017-18
2018-19
6,500 7,000 7,500 8,000
7,437
7,604
7,565
7,862
BACCALAUREATE DEGREE RECIPIENTSWHO ENTERED AS NEW ARIZONA COMMUNITY COLLEGE TRANSFERS
7,674
24.54%
12.34%
15.7%
47.42%
Degree recipients who entered the university as a new transferwith 12 or more credit hours from Arizona community colleges
Degree recipients who entered the university as a new freshman with any amount of Arizona community college credit
Degree recipients who entered the university as a new transfer with fewer than 12 credit hours from Arizona community
colleges, or who entered the university with zero credit hours from Arizona community colleges but earned some after entry
Degree recipientswith no Arizona
community college credits
NOTE: Students transfer hours from multiple institutions, including out of state, and private. A “new transfer” has 12 or more hours earned credits from any and all institutions attended since graduating high school, and a “new freshman” has zero or less than 12
earned hours at the postsecondary level since graduating high school.
BACCALAUREATE DEGREE RECIPIENTSIN 2018-2019
CREDIT HOURS TRANSFERED AT ENTRYBY NEW TRANSFERS FROM ARIZONA COMMUNITY COLLEGES
12-23 HOURS
24-34 HOURS
35-59 HOURS
60+ HOURS
2014-15
7.1%
8.9%
30.5%
53.5%
56.7%
5.0%
2015-16
7.3%
8.4%
29.9%
54.4%
56.9%
5.3%
2016-17
7.9%
8.4%
30.8%
52.8%
56.6%
5.1%
2017-18
8.2%
9.3%
30.6%
51.9%
57.1%
4.8%
ASSOCIATEDEGREE
AGEC ONLY
2018-19
7.8%
8.6%
31.2%
52.5%
56.7%
4.9%
2019-20
7.2%
8.3%
29.8%
54.7%
N/A
N/A
7,671
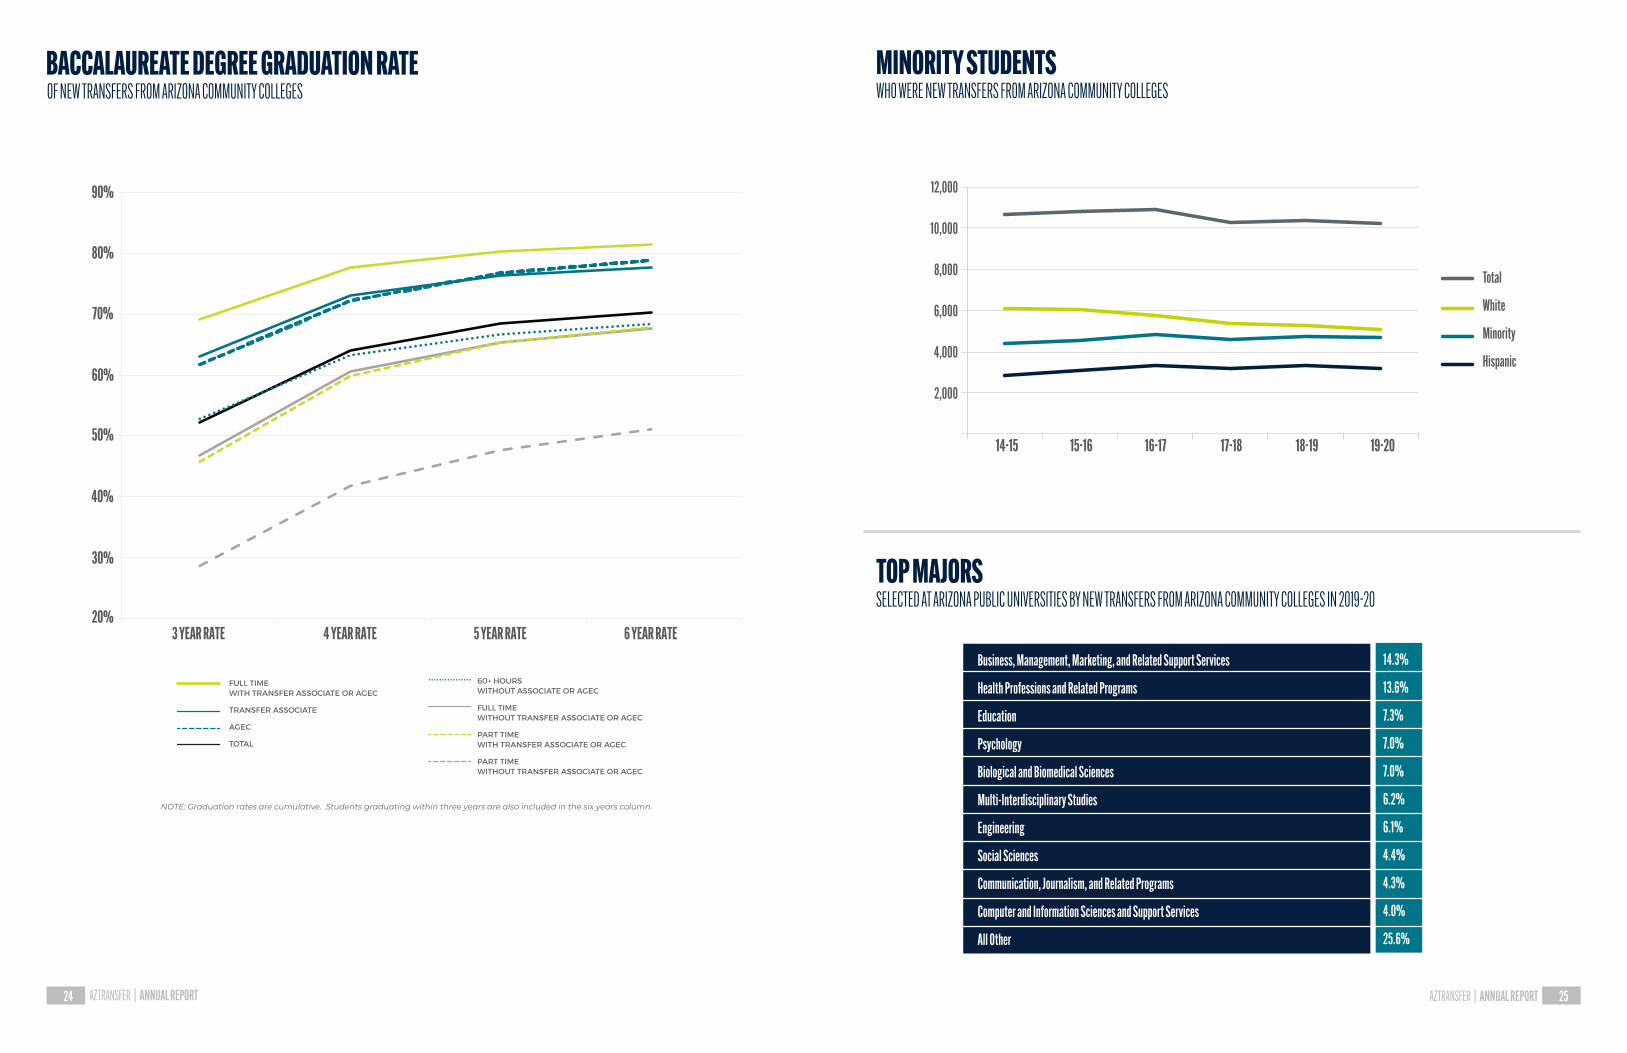
NOTE: Graduation rates are cumulative. Students graduating within three years are also included in the six years column.
FULL TIMEWITH TRANSFER ASSOCIATE OR AGEC
TRANSFER ASSOCIATE
AGEC
TOTAL
Business, Management, Marketing, and Related Support Services
Health Professions and Related Programs
Education
Psychology
Biological and Biomedical Sciences
Multi-Interdisciplinary Studies
Engineering
Social Sciences
Communication, Journalism, and Related Programs
Computer and Information Sciences and Support Services
All Other
14.3%
13.6%
7.3%
7.0%
7.0%
6.2%
6.1%
4.4%
4.3%
4.0%
25.6%
BACCALAUREATE DEGREE GRADUATION RATEOF NEW TRANSFERS FROM ARIZONA COMMUNITY COLLEGES
60+ HOURSWITHOUT ASSOCIATE OR AGEC
FULL TIMEWITHOUT TRANSFER ASSOCIATE OR AGEC
PART TIMEWITH TRANSFER ASSOCIATE OR AGEC
PART TIMEWITHOUT TRANSFER ASSOCIATE OR AGEC
................
90%
20%
30%
40%
50%
60%
70%
80%
3 YEAR RATE 4 YEAR RATE 5 YEAR RATE 6 YEAR RATE
MINORITY STUDENTSWHO WERE NEW TRANSFERS FROM ARIZONA COMMUNITY COLLEGES
TOP MAJORSSELECTED AT ARIZONA PUBLIC UNIVERSITIES BY NEW TRANSFERS FROM ARIZONA COMMUNITY COLLEGES IN 2019-20
Total
White
Minority
Hispanic
12,000
10,000
8,000
6,000
4,000
2,000
14-15 16-17 17-18 18-19 19-2015-16
AZTRANSFER | ANNUAL REPORT 25AZTRANSFER | ANNUAL REPORT24
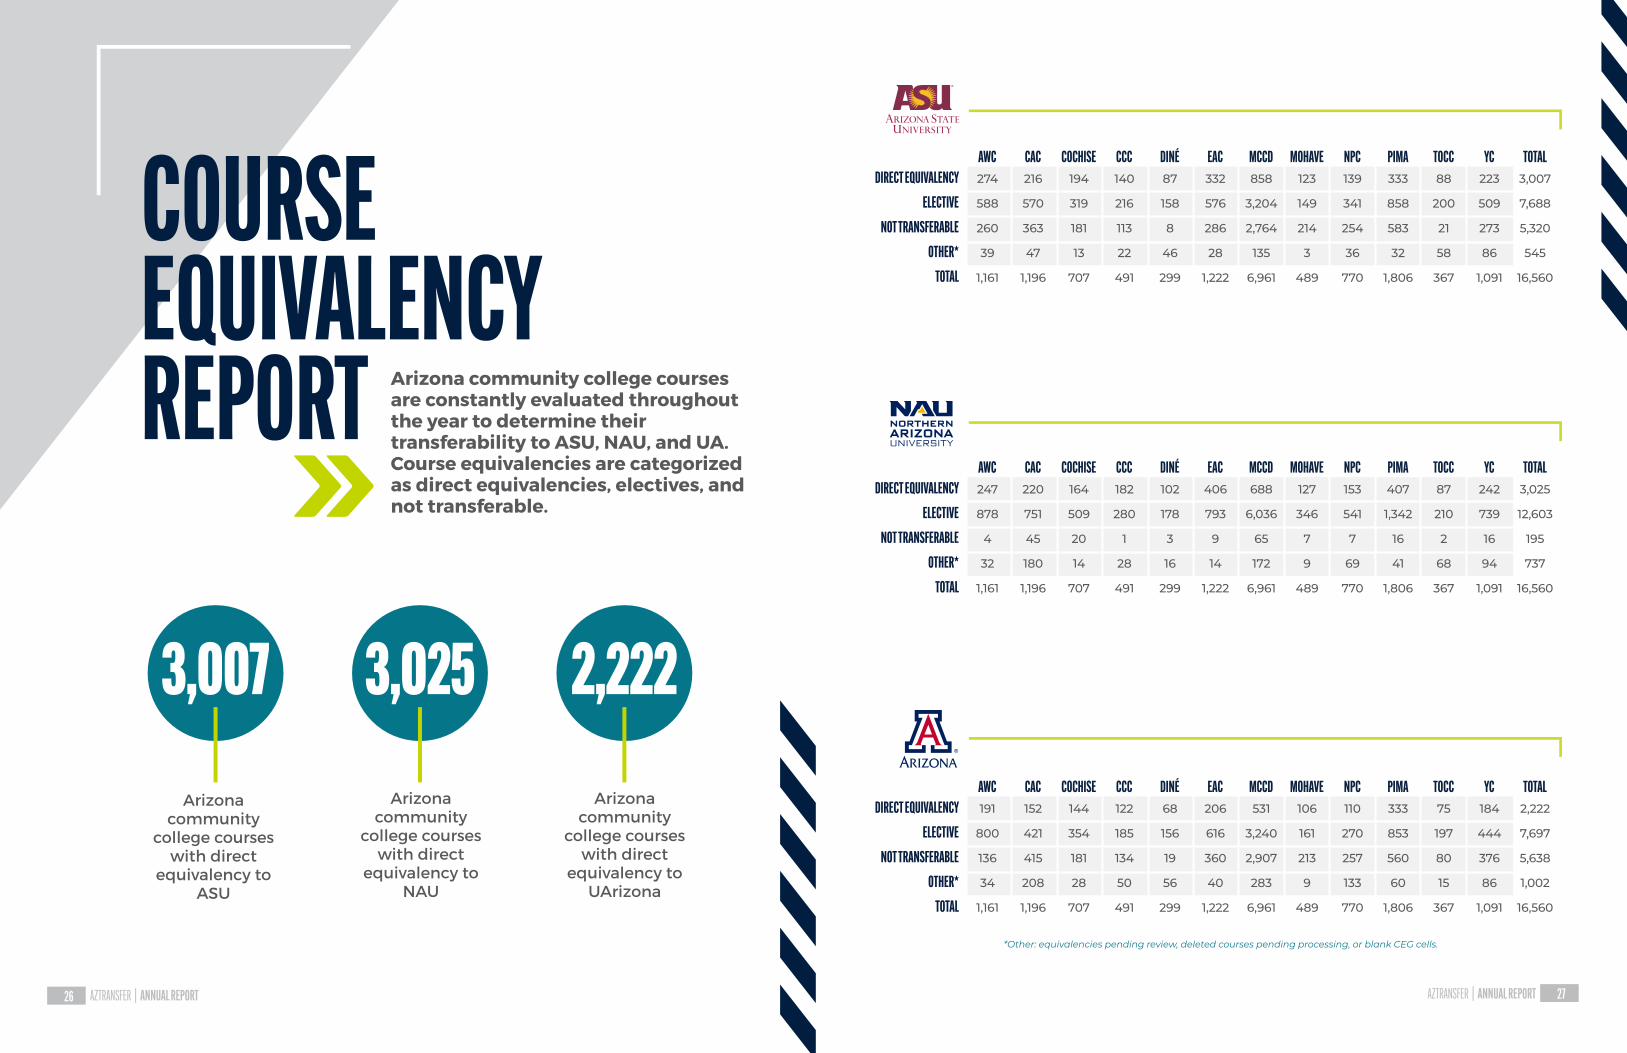
Arizona community college courses are constantly evaluated throughout the year to determine their transferability to ASU, NAU, and UA. Course equivalencies are categorized as direct equivalencies, electives, and not transferable.
COURSEEQUIVALENCYREPORT
*Other: equivalencies pending review, deleted courses pending processing, or blank CEG cells.
DIRECT EQUIVALENCY
ELECTIVE
NOT TRANSFERABLE
OTHER*
TOTAL
274
588
260
39
1,161
AWC216
570
363
47
1,196
CAC194
319
181
13
707
COCHISE140
216
113
22
491
CCC87
158
8
46
299
DINÉ858
3,204
2,764
135
6,961
MCCD123
149
214
3
489
MOHAVE139
341
254
36
770
NPC333
858
583
32
1,806
PIMA88
200
21
58
367
TOCC223
509
273
86
1,091
YC3,007
7,688
5,320
545
16,560
TOTAL332
576
286
28
1,222
EAC
DIRECT EQUIVALENCY
ELECTIVE
NOT TRANSFERABLE
OTHER*
TOTAL
247
878
4
32
1,161
AWC220
751
45
180
1,196
CAC164
509
20
14
707
COCHISE182
280
1
28
491
CCC102
178
3
16
299
DINÉ688
6,036
65
172
6,961
MCCD127
346
7
9
489
MOHAVE153
541
7
69
770
NPC407
1,342
16
41
1,806
PIMA87
210
2
68
367
TOCC242
739
16
94
1,091
YC3,025
12,603
195
737
16,560
TOTAL406
793
9
14
1,222
EAC
DIRECT EQUIVALENCY
ELECTIVE
NOT TRANSFERABLE
OTHER*
TOTAL
191
800
136
34
1,161
AWC152
421
415
208
1,196
CAC144
354
181
28
707
COCHISE122
185
134
50
491
CCC68
156
19
56
299
DINÉ531
3,240
2,907
283
6,961
MCCD106
161
213
9
489
MOHAVE110
270
257
133
770
NPC333
853
560
60
1,806
PIMA75
197
80
15
367
TOCC184
444
376
86
1,091
YC2,222
7,697
5,638
1,002
16,560
TOTAL206
616
360
40
1,222
EAC
AZTRANSFER | ANNUAL REPORT 27AZTRANSFER | ANNUAL REPORT26
Arizona community
college courses with direct
equivalency to ASU
Arizona community
college courses with direct
equivalency to NAU
Arizona community
college courses with direct
equivalency to UArizona
AZTRANSFER | ANNUAL REPORT28
LOOKINGAHEAD
A glimpse at AZTransfer’s focus and goalsfor the 2020-2021 academic year.
Leverage transfer data to inform and
engage stakeholders
Enhance and streamline
web tools to increase
ease-of-use
Increase quantity and frequency of
virtual training
Kelly RoblesExecutive Director
Katie Greisiger FrostData Programmer / Analyst
Cien LukeProgram [email protected]
Rebecca McKaySr. Director of Technology & ASSIST
Erin WoodellDirector of Marketing & Communications
2020
EDUCAT
ION TH
AT WO
RKS
2411 W 14th St.Tempe, AZ 85281
aztransfer.com
MAKE EVERY CREDIT COUNT

This page intentionally left blank
Board of Regents Meeting November 18-20, 2020
Item #30 EXECUTIVE SUMMARY Page 1 of 2
Contact Information: Richard Gfeller [email protected] 602-229-2592
Item Name: Report on the Audit Committee Meeting
Action Item
Agenda Highlights Audit Committee Meeting
November 5, 2020
1. Approval of Minutes Outcomes and Assignments:
• Regular Session minutes from the May 28, 2020 and September 10, 2020 meetings and Executive Session minutes from the November 7, 2019 meeting were approved.
2. Discussion Regarding Auditor General Audits
Outcomes and Assignments:
• The committee received an oral briefing from the Financial Audit Director of the Office of the Auditor General regarding the completed fiscal year 2020 financial audits of the universities, and received comments from the Performance Audit Director regarding the Foster Care Tuition Waivers audit follow-up report.
3. Internal Audit Review Boards Reports Outcomes and Assignments:
• The committee reviewed the written reports from the universities’ IARB chairs.
4-6. Chief Audit Executives Reports Outcomes and Assignments:
• The universities’ CAEs commented on their written activity reports.
Requested Action: The board office asks the full board to review the report of the November 5, 2020 Audit Committee meeting.
Board of Regents Meeting November 18-20, 2020
Item #30 EXECUTIVE SUMMARY Page 2 of 2
Executive Session
Pursuant to A.R.S. § 38-431.03 (A.1) and (A.2), the committee convened in executive session to:
• Review the executive session minutes of the May 28, 2020 and September 20, 2020 meetings;
• Conduct reviews of assignments with the universities’ chief audit executives.
Outcomes and Assignments:
• Both items were discussed during Executive Session.