Embed Size (px)
Citation preview
1
APPLICATION FOR FINANCIAL ASSISTANCE
FOR WATER AND WASTEW ATER INFRASTRUCTURE PROJECTS
TWDB Use Only
Name of Applicant: ________________________
Date application received: ______________
Date administratively complete: ________________
This application is comprehensive, covering all loan and grant assistance applications for waterand wastewater infrastructure financing through the various Texas Water Development Board(TWDB) programs. The format of the application is intended to expedite the review process forboth the applicant and TWDB staff. This application can be used by political subdivisions,including water supply corporations.
Please submit one double-sided original and one indexed, electronic copy, via electronic storagemedia such as CD or flash drive using MS Word, Excel and/or Adobe Acrobat.
Please submit your application to:
Texas Water Development BoardWater Supply and Infrastructure-Regional Water Planning and DevelopmentP O Box 132311700 N. Congress Avenue, 5th FloorAustin, Texas 78711-3231(78701 for courier deliveries)
A complete application consists of all of the applicable information and forms requested in thisdocument. When preparing this application please review the Application and all Guidance andForms, listed at the end.
For more information, please contact your Regional Project Implementation Team at:
http://www.twdb.texas.gov/financial/programs/swift/regional_project_teams.asp
Thank you.
2
ContentsPart A: General Information..........................................................................................................3Part B: Legal Information..............................................................................................................6Part C: Financial Information ........................................................................................................9Part D: Project Information .......................................................................................................166Part E: State Water Implementation Fund for Texas (SWIFT) Applicants Only:.......................211Part F: Economically Distressed Programs (EDAP) Applicants Only: ......................................222Part G: CWSRF/DWSRF Applicants Only ................................................................................233Part H: Documentation of “Green” Projects and Project Components........................................26Part I: Summary of attachments to application .........................................................................277Part J: Guidance and Forms.......................................................................................................29
Part A: General Information
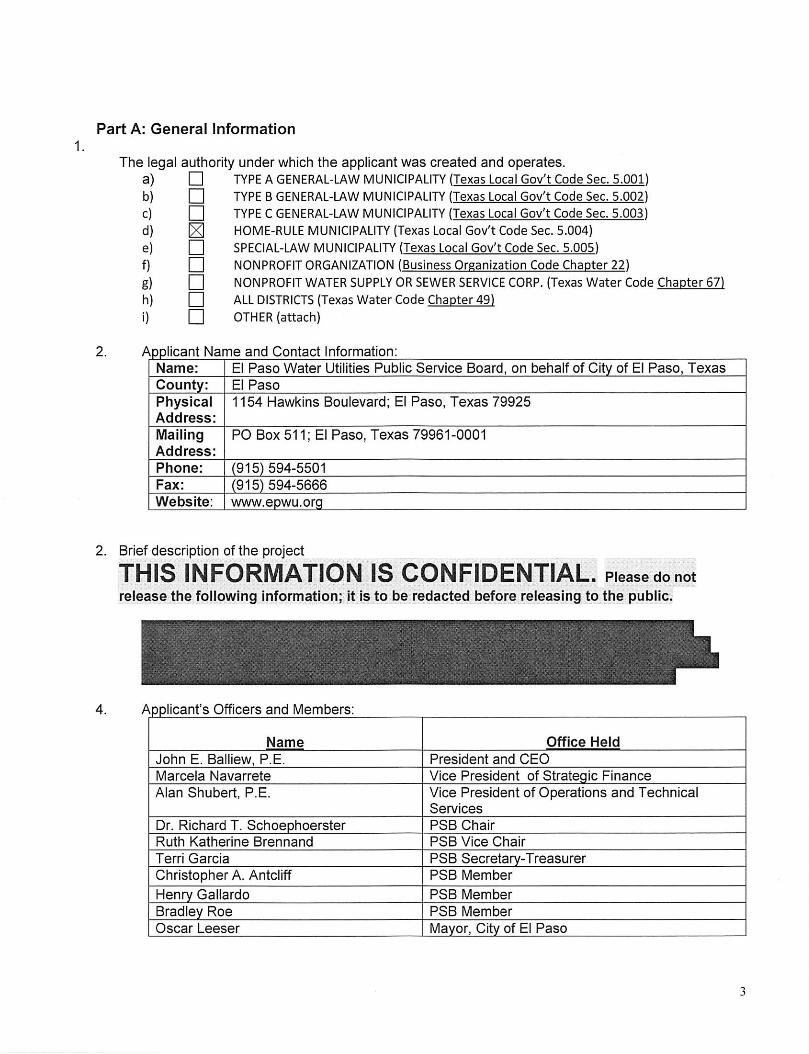
The legal authority under which the applicant was created and operates.a) • TYPE AGENERAL-LAW MUNICIPALITY (Texas Local Gov^t Code Sec. 5.QQ1)b) n TYPE BGENERAL-LAW MUNICIPALITY (Texas Local Gov^t Code Sec. 5.0021c) • TYPE CGENERAL-LAW MUNICIPALITY (Texas Local Gov't Code Sec. 5.0031d) lEI HOME-RULE MUNICIPALITY (Texas Local Gov't Code Sec. 5.004)e) Q SPECIAL-LAW MUNICIPALITY [Texas Local Gov't Code Sec. 5.0051f) Q NONPROFIT ORGANIZATION (Business Oreanlzation Code Chapter 22)g) • NONPROFIT WATER SUPPLY OR SEWER SERVICE CORP. (Texas Water Code Chapter 67)h) • ALL DISTRICTS (Texas Water Code Chapter 49)i) • OTHER (attach)
2. Applicant Name and Contact Information:Name: El Paso Water Utilities Public Service Board, on behalf of City of El Paso, TexasCounty: El PasoPhysical 1154 Hawkins Boulevard; El Paso, Texas 79925Address:
MailingAddress:
Phone:
Fax:
PO Box 511; El Paso, Texas 79961-0001
(915)594-5501(915) 594-5666
Website: | www.epwu.org
2. Brief description of the project
THIS INFORMATION IS CONFIDENTIAL. Pieascdonotrelease the following information; it is to be redacted before releasing to the public.
Applicant's Officers and Members:
NameJohn E. Balliew, P.E.Marcela NavarreteAlan Shubert, P.E.
Dr. Richard T. Schoephoerster
Ruth Katherine Brennand
Terri GarciaChristopher A. Antcliff
Henry GallardoBradley RoeOscar Leeser
Office HeldPresident and CEOVice President of Strategic FinanceVice President of Operations and TechnicalServicesPSB ChairPSB Vice ChairPSB Secretary-TreasurerPSB Member
PSB MemberPSB MemberMayor, City of El Paso
4
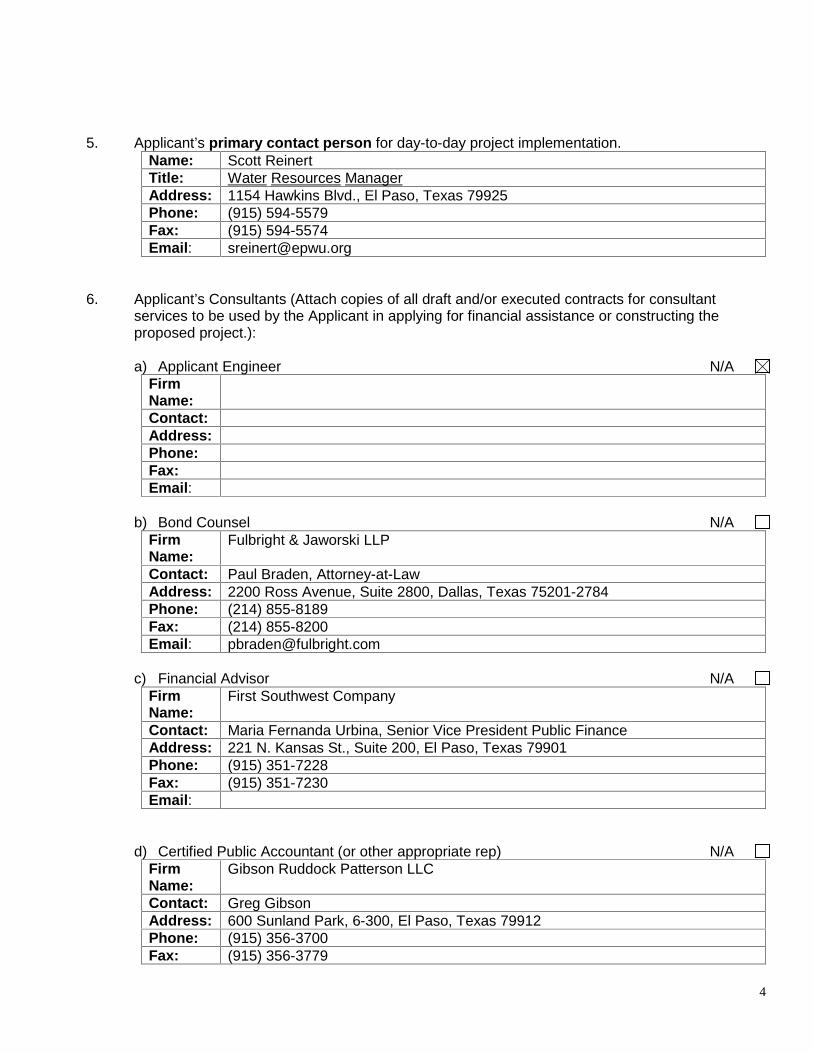
5. Applicant’s primary contact person for day-to-day project implementation.Name: Scott ReinertTitle: Water Resources ManagerAddress: 1154 Hawkins Blvd., El Paso, Texas 79925Phone: (915) 594-5579Fax: (915) 594-5574Email : [email protected]
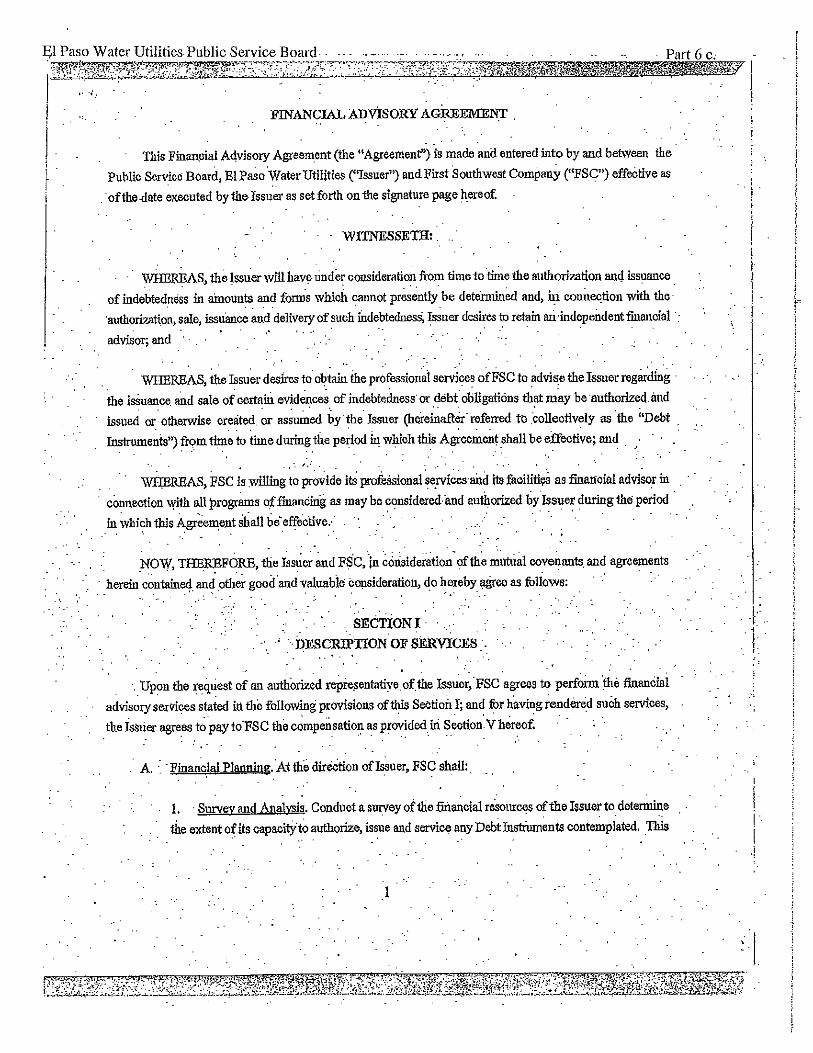
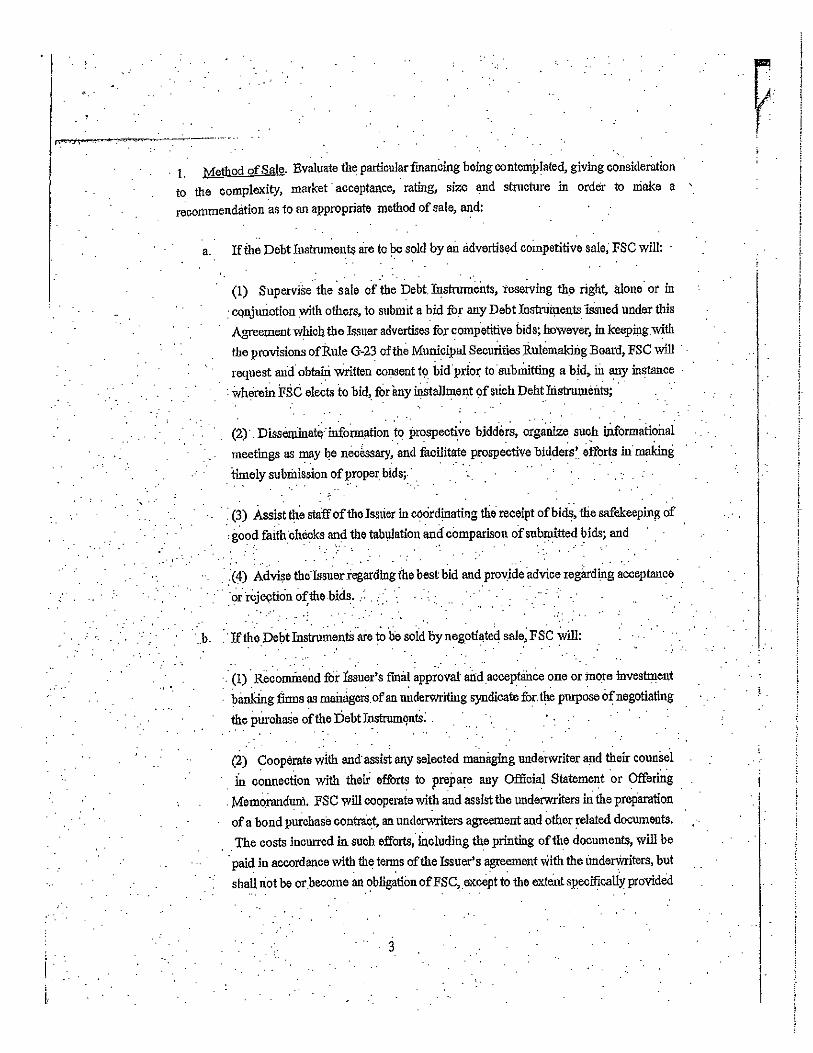
6. Applicant’s Consultants (Attach copies of all draft and/or executed contracts for consultantservices to be used by the Applicant in applying for financial assistance or constructing theproposed project.):
a) Applicant Engineer N/AFirmName:Contact:Address:Phone:Fax:Email :
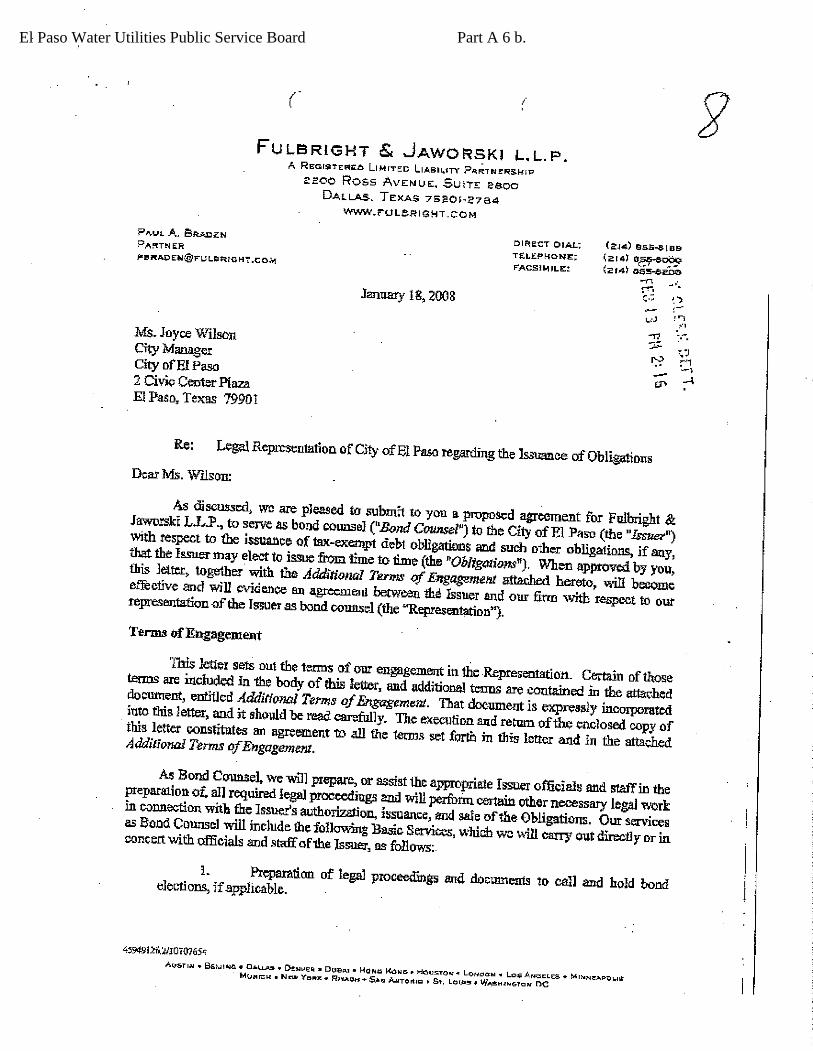
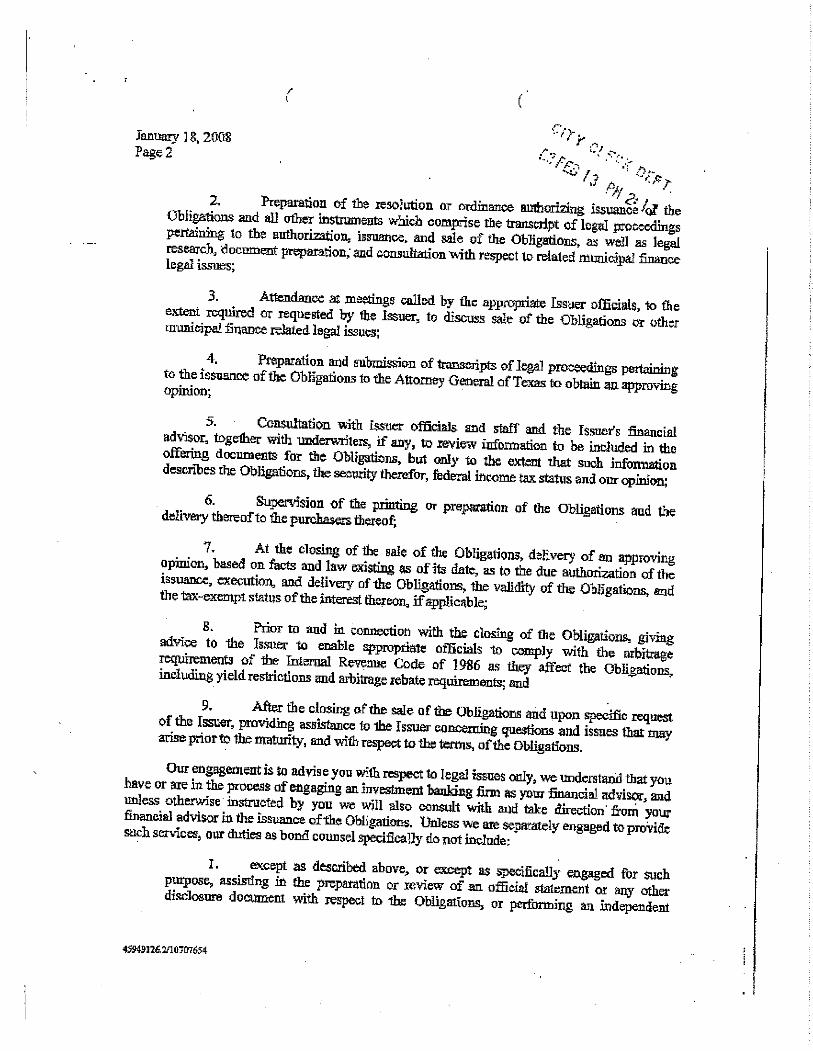
b) Bond Counsel N/AFirmName:
Fulbright & Jaworski LLP
Contact: Paul Braden, Attorney-at-LawAddress: 2200 Ross Avenue, Suite 2800, Dallas, Texas 75201-2784Phone: (214) 855-8189Fax: (214) 855-8200Email : [email protected]
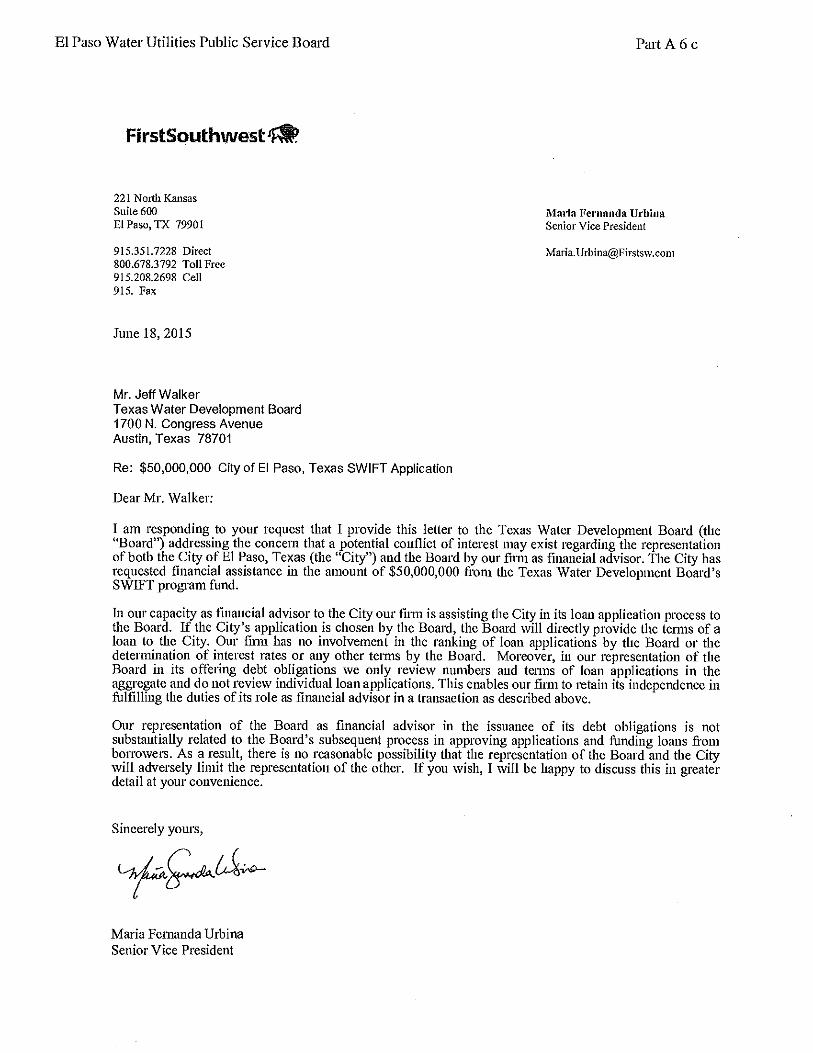
c) Financial Advisor N/AFirmName:
First Southwest Company
Contact: Maria Fernanda Urbina, Senior Vice President Public FinanceAddress: 221 N. Kansas St., Suite 200, El Paso, Texas 79901Phone: (915) 351-7228Fax: (915) 351-7230Email :
d) Certified Public Accountant (or other appropriate rep) N/AFirmName:
Gibson Ruddock Patterson LLC
Contact: Greg GibsonAddress: 600 Sunland Park, 6-300, El Paso, Texas 79912Phone: (915) 356-3700Fax: (915) 356-3779
5
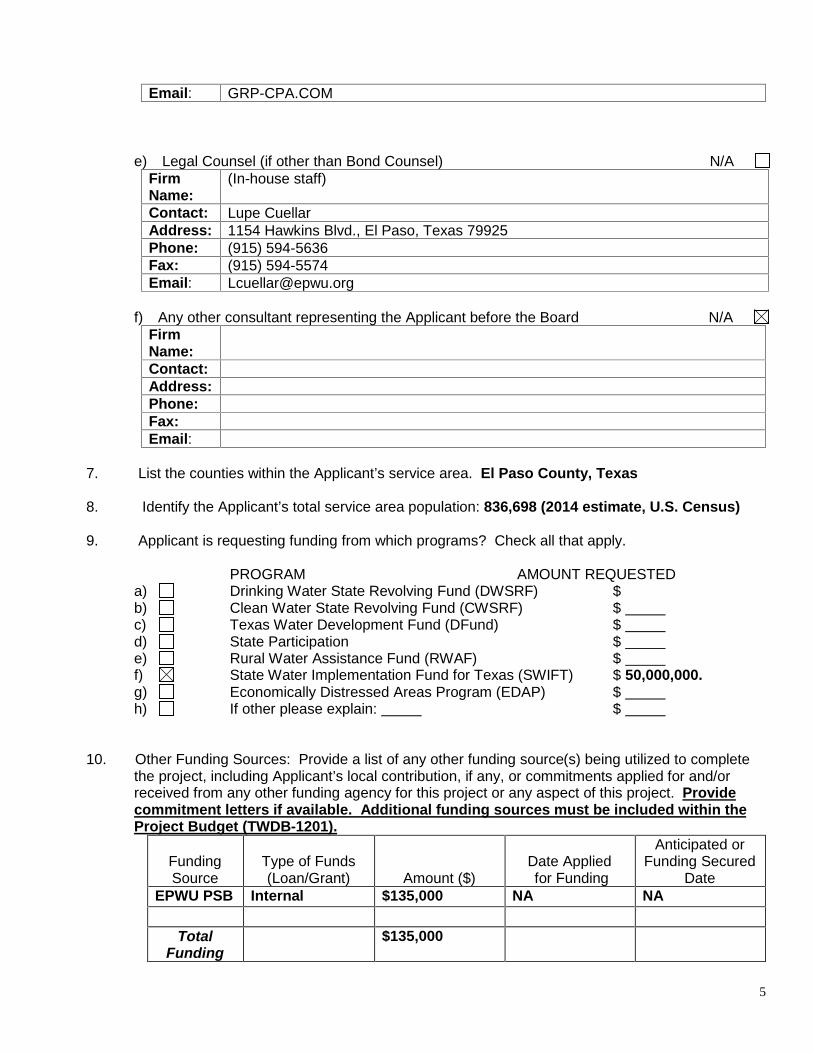
Email : GRP-CPA.COM
e) Legal Counsel (if other than Bond Counsel) N/AFirmName:
(In-house staff)
Contact: Lupe CuellarAddress: 1154 Hawkins Blvd., El Paso, Texas 79925Phone: (915) 594-5636Fax: (915) 594-5574Email : [email protected]
f) Any other consultant representing the Applicant before the Board N/AFirmName:Contact:Address:Phone:Fax:Email :
7. List the counties within the Applicant’s service area. El Paso County, Texas
8. Identify the Applicant’s total service area population: 836,698 (2014 estimate , U.S. Census)
9. Applicant is requesting funding from which programs? Check all that apply.
PROGRAM AMOUNT REQUESTEDa) Drinking Water State Revolving Fund (DWSRF) $b) Clean Water State Revolving Fund (CWSRF) $c) Texas Water Development Fund (DFund) $d) State Participation $e) Rural Water Assistance Fund (RWAF) $f) State Water Implementation Fund for Texas (SWIFT) $ 50,000,000.g) Economically Distressed Areas Program (EDAP) $h) If other please explain: $
10. Other Funding Sources: Provide a list of any other funding source(s) being utilized to completethe project, including Applicant’s local contribution, if any, or commitments applied for and/orreceived from any other funding agency for this project or any aspect of this project. Providecommitment letters if available. Additional funding sources must be included within theProject Budget (TWDB -1201).
FundingSource
Type of Funds(Loan/Grant) Amount ($)
Date Appliedfor Funding
Anticipated orFunding Secured
DateEPWU PSB Internal $135,000 NA NA
TotalFunding
$135,000
6
from AllSources
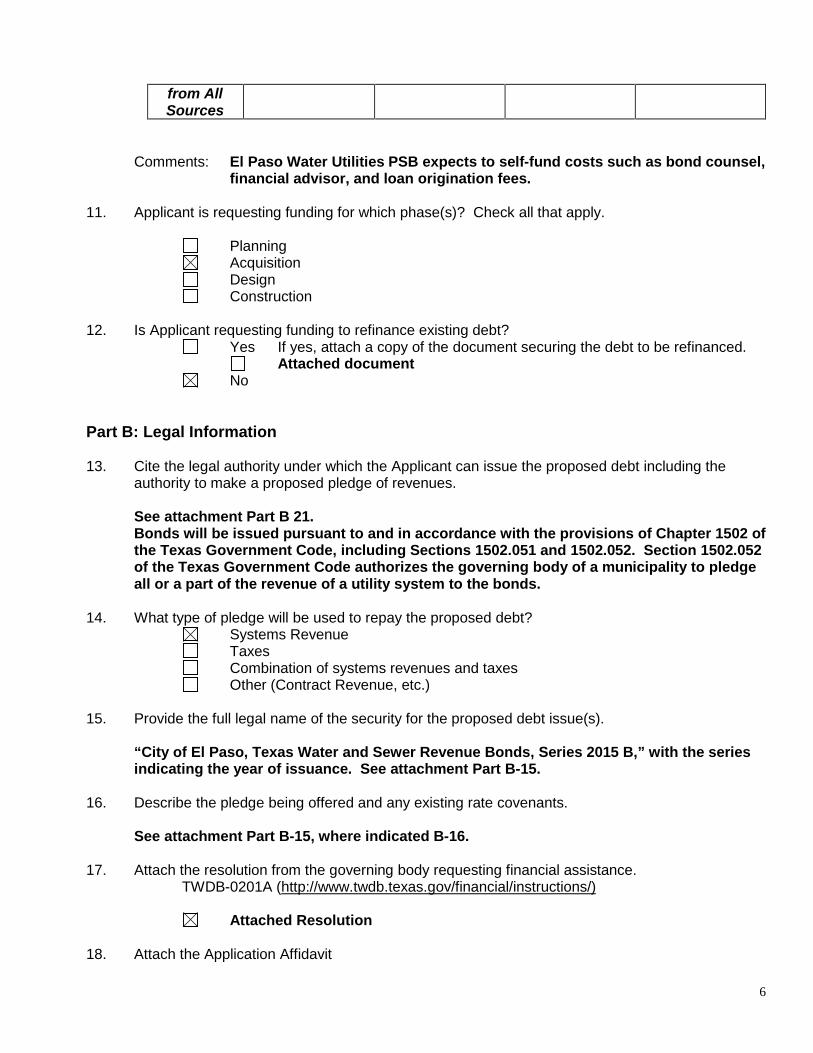
Comments: El Paso Water Utilities PSB expects to self -fund costs such as bond counsel,financial advisor, and loan origination fees.
11. Applicant is requesting funding for which phase(s)? Check all that apply.
PlanningAcquisitionDesignConstruction
12. Is Applicant requesting funding to refinance existing debt?Yes If yes, attach a copy of the document securing the debt to be refinanced.
Attached documentNo
Part B : Legal Information
13. Cite the legal authority under which the Applicant can issue the proposed debt including theauthority to make a proposed pledge of revenues.
See attachment Part B 21 .Bonds will be issued pursuant to and in accordance with the provisions of Chapter 1502 ofthe Texas Government Code, including Sections 1502.051 and 1502.052. Section 1502.052of the Texas Government Code authorizes the governing body of a mun icipality to pledgeall or a part of the revenue of a utility system to th e bonds.
14. What type of pledge will be used to repay the proposed debt?Systems RevenueTaxesCombination of systems revenues and taxesOther (Contract Revenue, etc.)
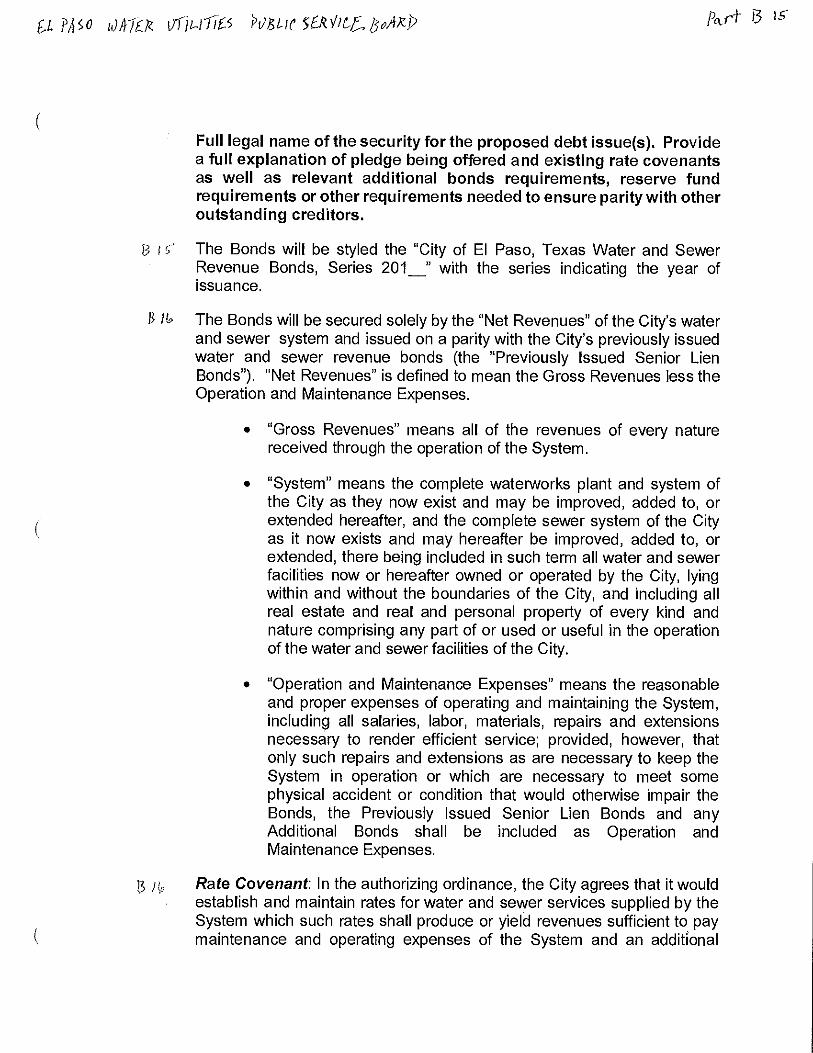
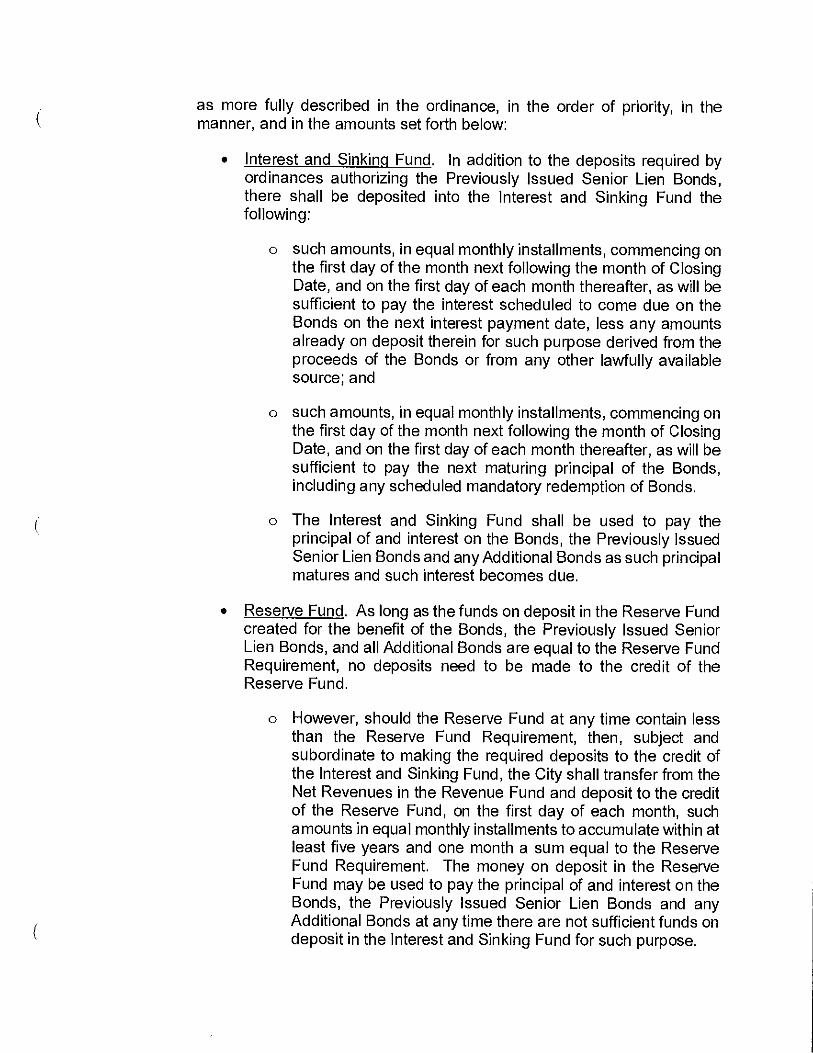
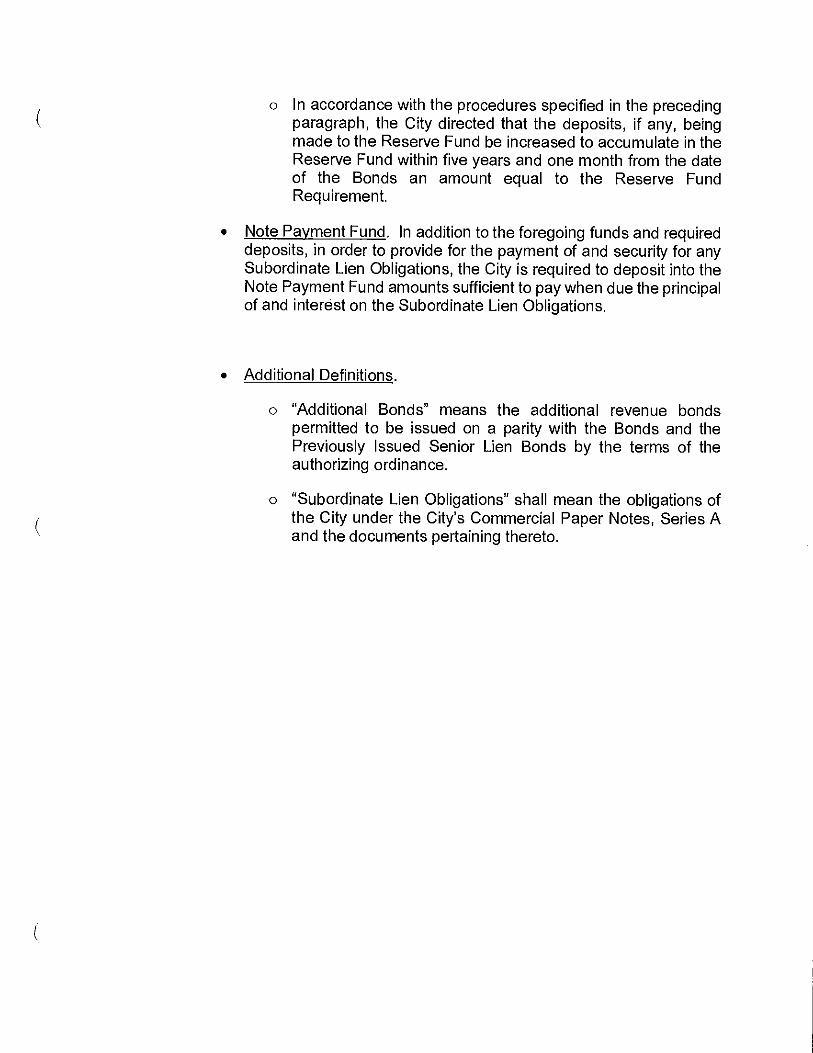
15. Provide the full legal name of the security for the proposed debt issue(s).
“ City of El Paso, Texas Water and Sewer Revenue Bonds, Series 201 5 B,” with the seriesindicating the year of issuance . See attachment Part B-15.
16. Describe the pledge being offered and any existing rate covenants.
See attachment Part B-15, where indicated B -16.
17. Attach the resolution from the governing body requesting financial assistance.TWDB-0201A (http://www.twdb.texas.gov/financial/instructions/)
Attached Resolution
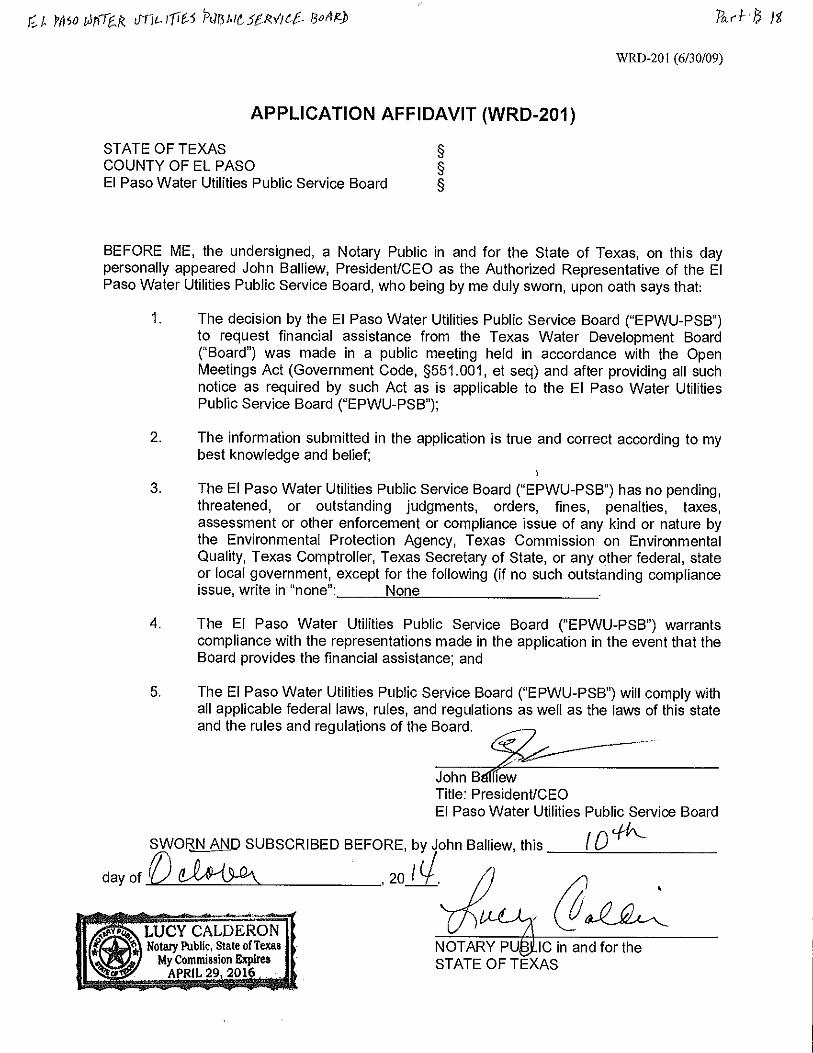
18. Attach the Application Affidavit
7
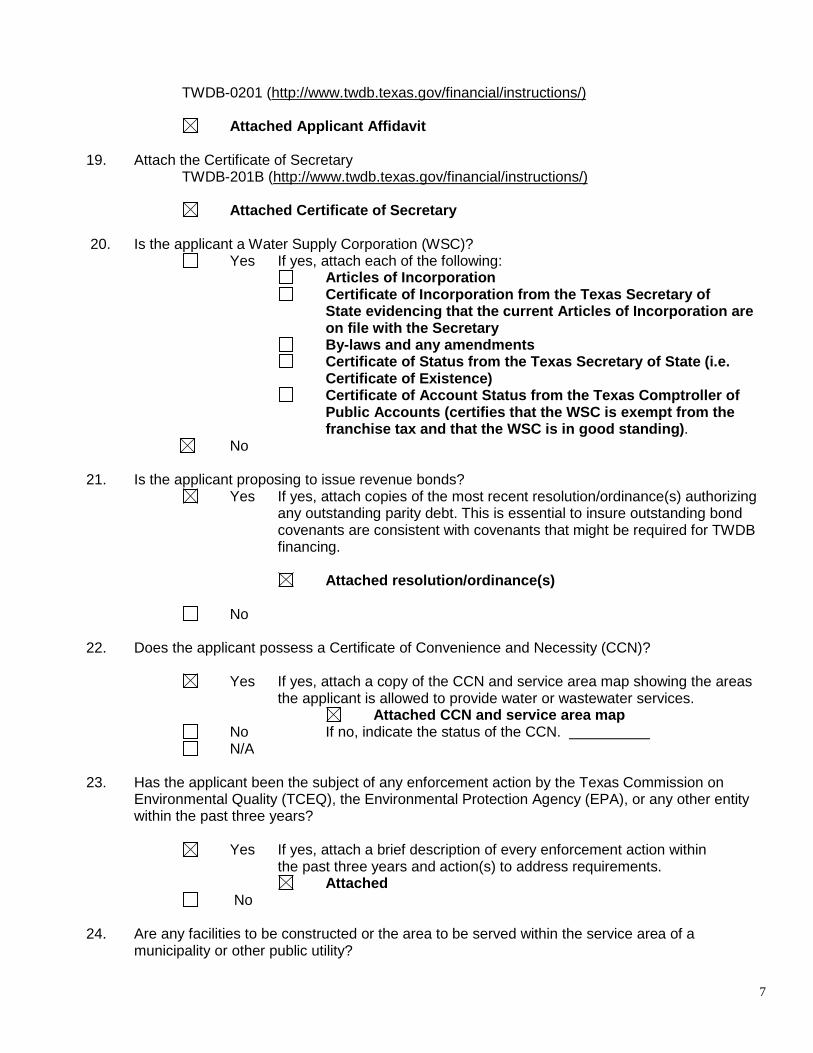
TWDB-0201 (http://www.twdb.texas.gov/financial/instructions/)
Attached Applicant Affidavit
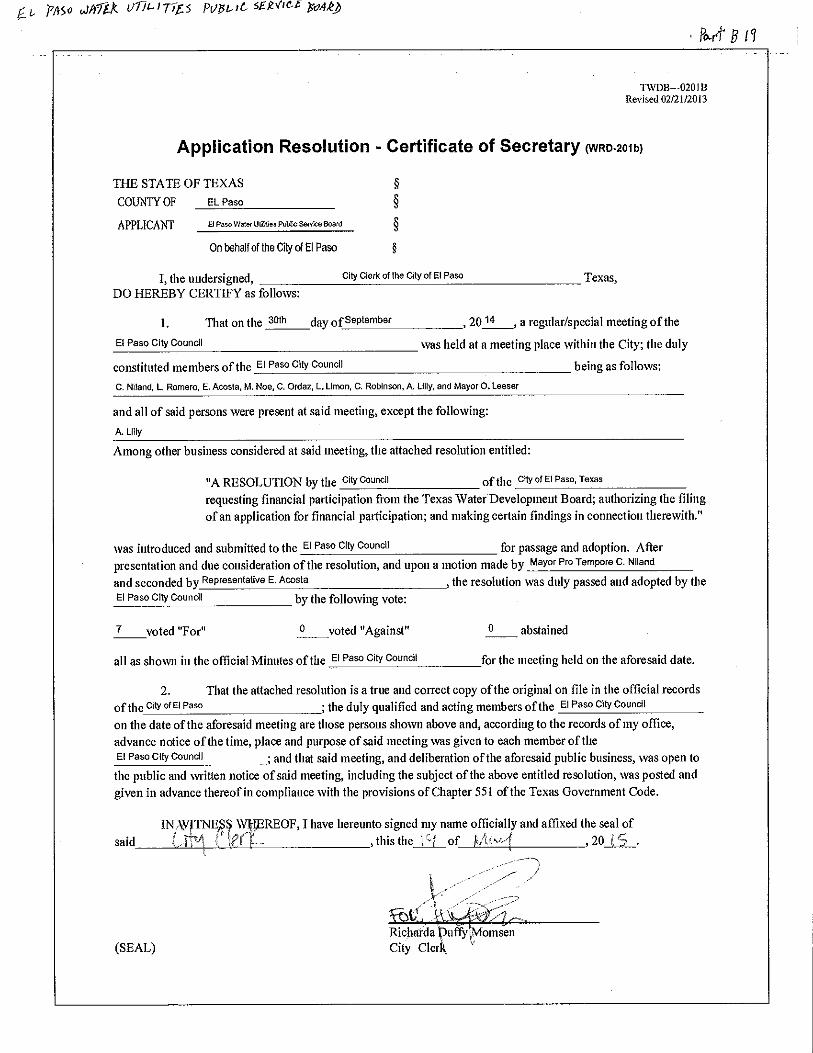
19. Attach the Certificate of SecretaryTWDB-201B (http://www.twdb.texas.gov/financial/instructions/)
Attached Certificate of Secretary
20. Is the applicant a Water Supply Corporation (WSC)?Yes If yes, attach each of the following:
Articles of IncorporationCertificate of Incorporation from the Texas Secretary ofState evidencing that the current Articles of Incorporation areon file with the SecretaryBy-laws and any amendmentsCertificate of Status from the Texas Secretary of State (i.e.Certificate of Existence)Certificate of Account Status from the Texas Comptroller ofPublic Accounts (certifies that t he WSC is exempt from thefranchise tax and that the WSC is in good standing ).
No
21. Is the applicant proposing to issue revenue bonds?Yes If yes, attach copies of the most recent resolution/ordinance(s) authorizing
any outstanding parity debt. This is essential to insure outstanding bondcovenants are consistent with covenants that might be required for TWDBfinancing.
Attached resolution/ordinance(s)
No
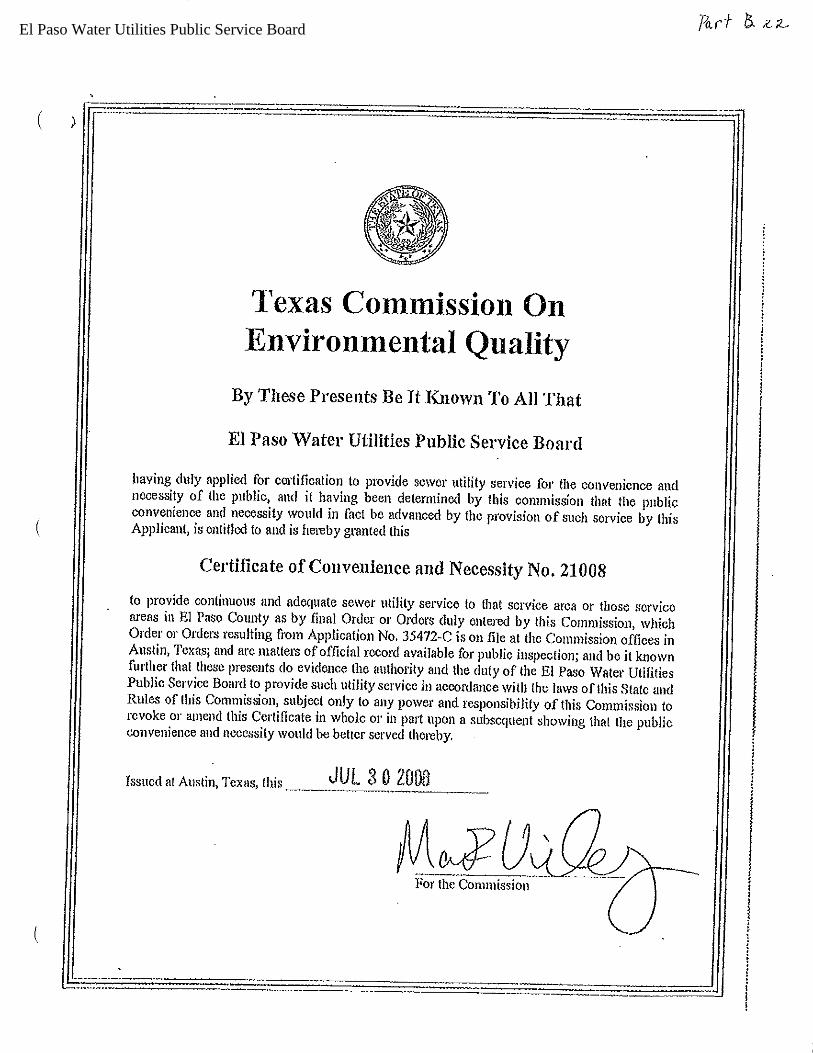
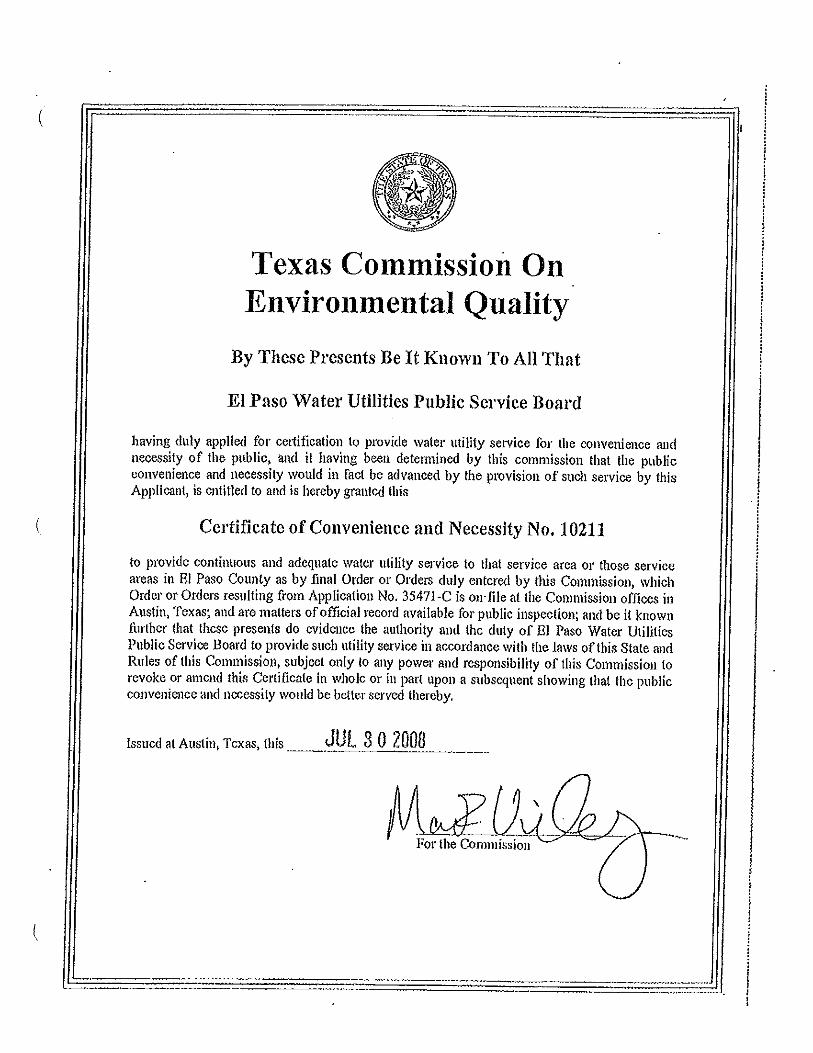
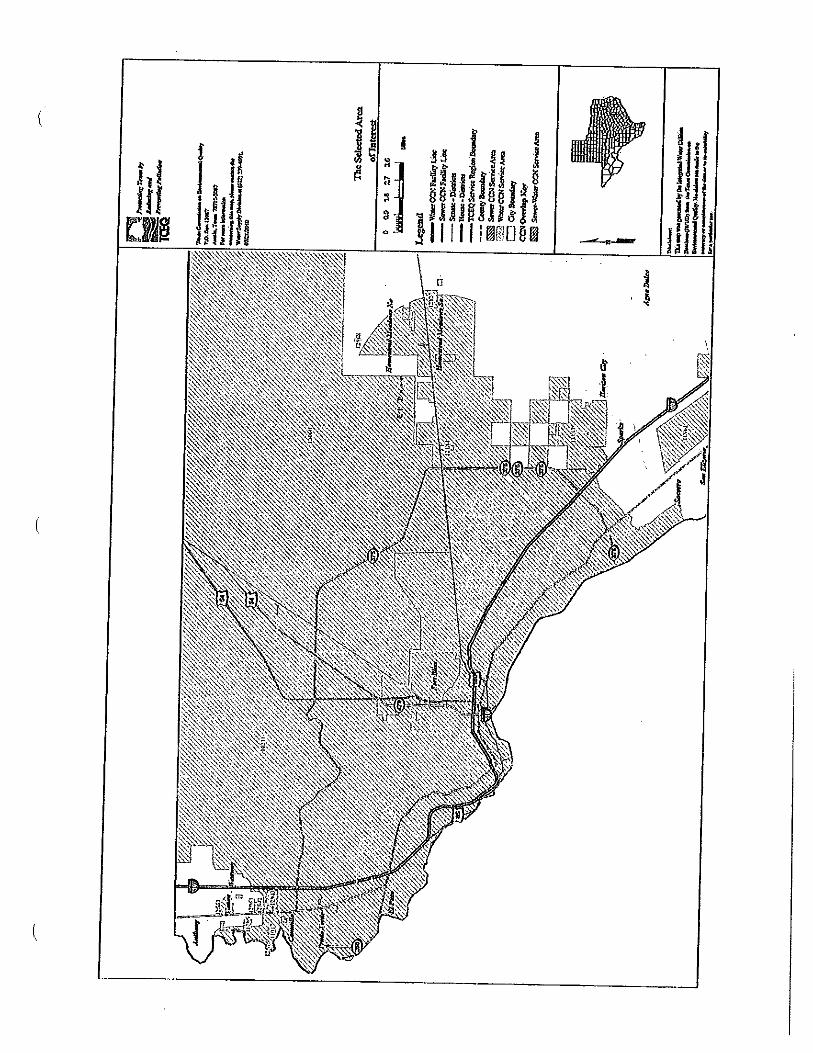
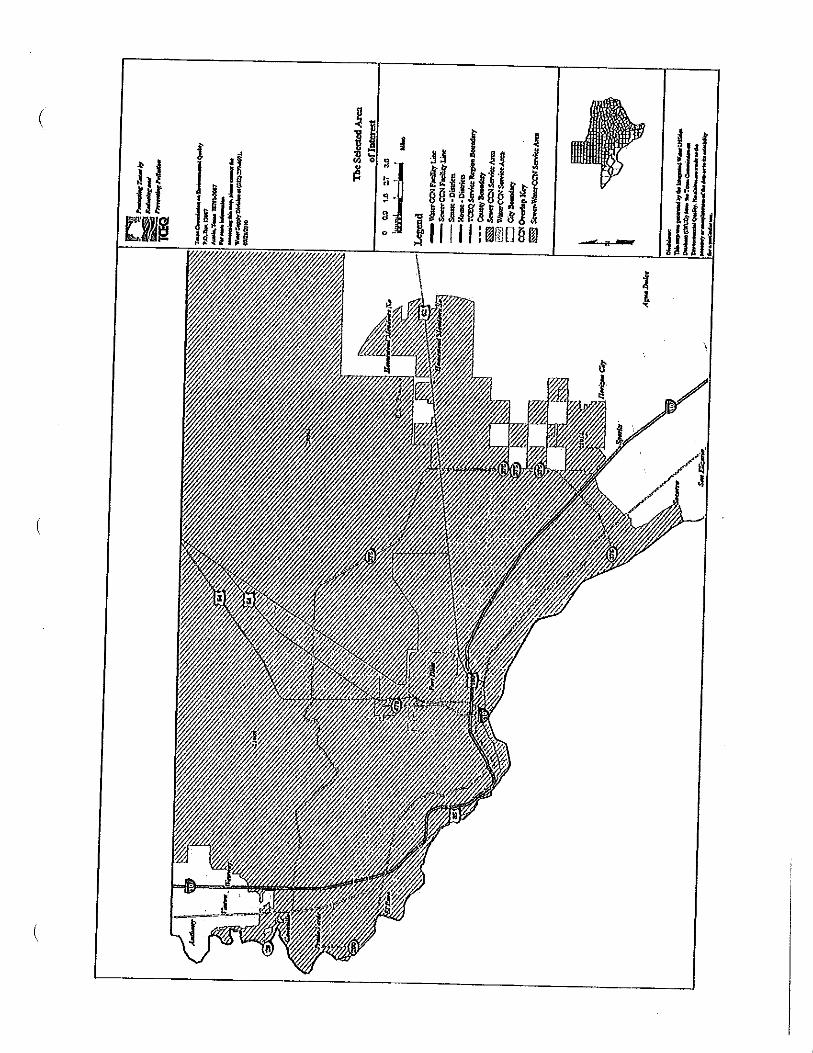
22. Does the applicant possess a Certificate of Convenience and Necessity (CCN)?
Yes If yes, attach a copy of the CCN and service area map showing the areasthe applicant is allowed to provide water or wastewater services.
Attached CCN and service area mapNo If no, indicate the status of the CCN.N/A
23. Has the applicant been the subject of any enforcement action by the Texas Commission onEnvironmental Quality (TCEQ), the Environmental Protection Agency (EPA), or any other entitywithin the past three years?
Yes If yes, attach a brief description of every enforcement action withinthe past three years and action(s) to address requirements.
AttachedNo
24. Are any facilities to be constructed or the area to be served within the service area of amunicipality or other public utility?
8
Yes If yes, has the applicant obtained an affidavit stating that the utility does notobject to the construction and operation of the services and facilities in itsservice area?
If yes, attach a copy of the affidavit.Attached affidavitIf no, provide an explanation as to why not.
No
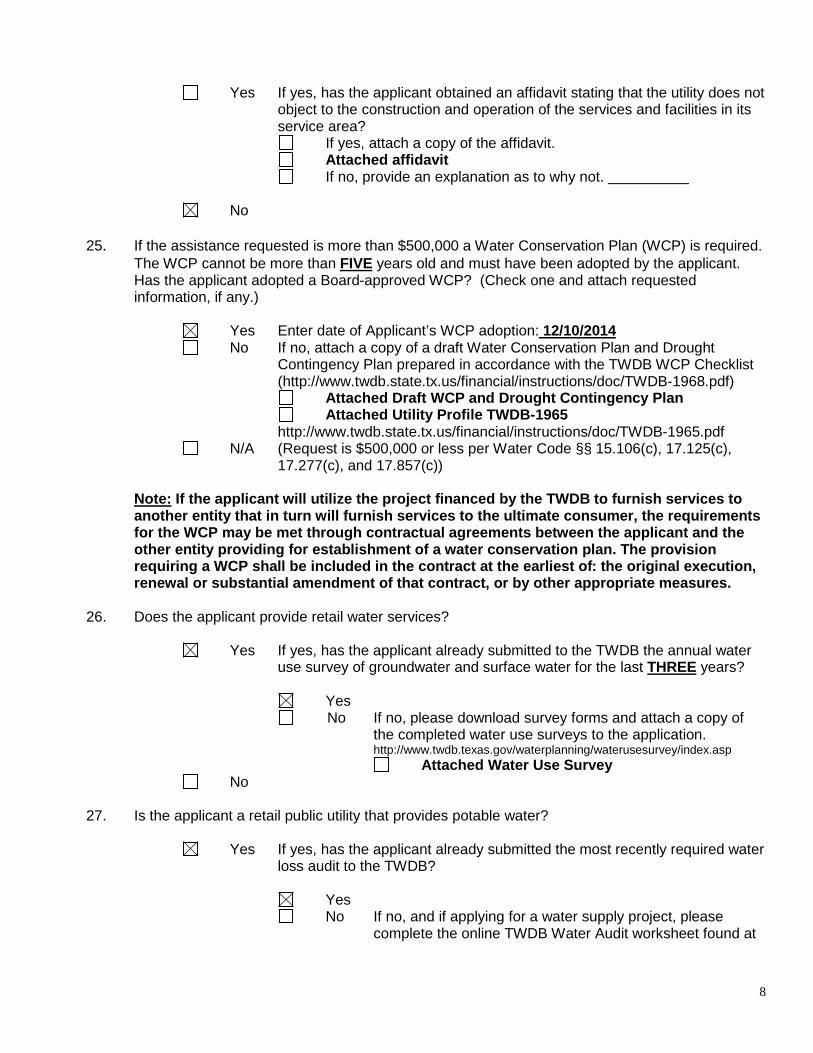
25. If the assistance requested is more than $500,000 a Water Conservation Plan (WCP) is required.The WCP cannot be more than FIVE years old and must have been adopted by the applicant.Has the applicant adopted a Board-approved WCP? (Check one and attach requestedinformation, if any.)
Yes Enter date of Applicant’s WCP adoption: 12/10/2014No If no, attach a copy of a draft Water Conservation Plan and Drought
Contingency Plan prepared in accordance with the TWDB WCP Checklist(http://www.twdb.state.tx.us/financial/instructions/doc/TWDB-1968.pdf)
Attached Draft WCP and Drought Contingency PlanAttached Utility Profile TWDB-1965
http://www.twdb.state.tx.us/financial/instructions/doc/TWDB-1965.pdfN/A (Request is $500,000 or less per Water Code §§ 15.106(c), 17.125(c),
17.277(c), and 17.857(c))
Note: If the applicant will utilize the project financed by the TWDB to furnish services toanother entity that in turn will furnish services to the ultimate consumer, the requirementsfor the WCP may be met through contractual agreements between the applicant and theother entity providing for establishment of a water con servation plan. The provisionrequiring a WCP shall be included in the contract at the earliest of : the original execution,renewal or substantial amendment of that contract, or by other appropriate measures.
26. Does the applicant provide retail water services?
Yes If yes, has the applicant already submitted to the TWDB the annual wateruse survey of groundwater and surface water for the last THREE years?
YesNo If no, please download survey forms and attach a copy of
the completed water use surveys to the application.http://www.twdb.texas.gov/waterplanning/waterusesurvey/index.asp
Attached Water Use SurveyNo
27. Is the applicant a retail public utility that provides potable water?
Yes If yes, has the applicant already submitted the most recently required waterloss audit to the TWDB?
YesNo If no, and if applying for a water supply project, please
complete the online TWDB Water Audit worksheet found at
9
http://www.twdb.texas.gov/conservation/resources/waterloss-resources.asp and attach a copy to the application.
Attached TWDB Water Audit worksheetNo
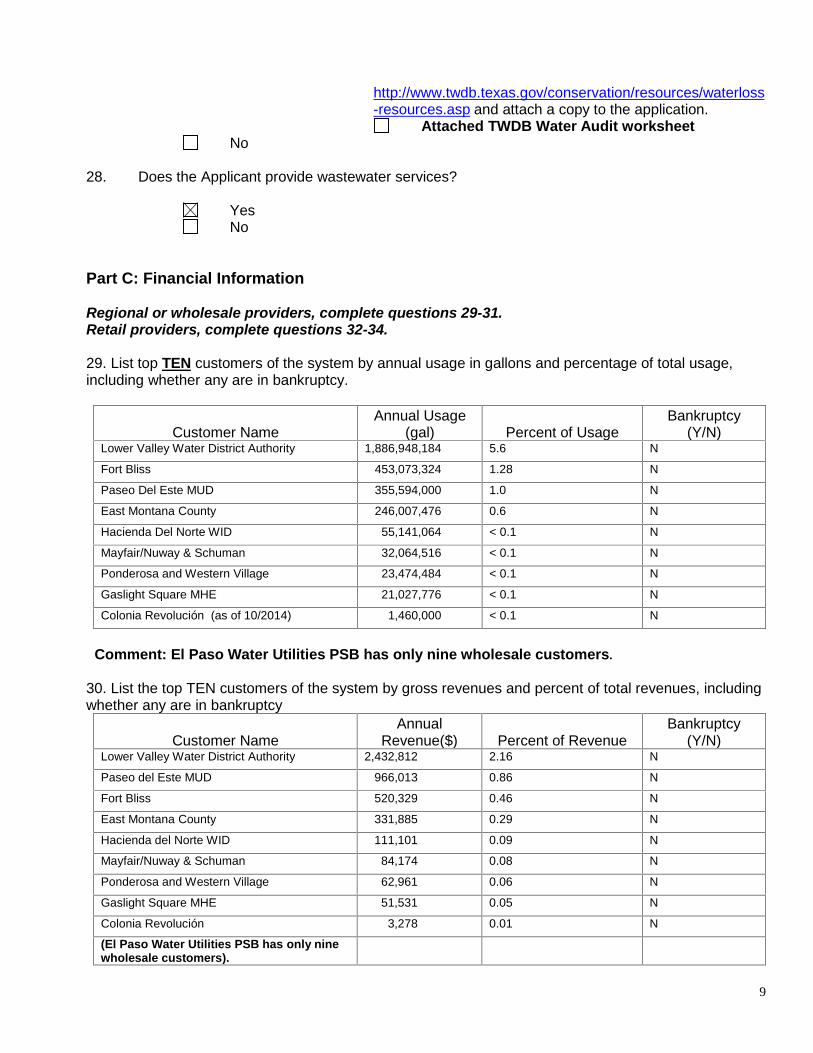
28. Does the Applicant provide wastewater services?
YesNo
Part C: Financial Information
Regional or wholesale providers, complete questions 29-31.Retail providers, complete questions 32-34.
29. List top TEN customers of the system by annual usage in gallons and percentage of total usage,including whether any are in bankruptcy.
Customer NameAnnual Usage
(gal) Percent of UsageBankruptcy
(Y/N)Lower Valley Water District Authority 1,886,948,184 5.6 N
Fort Bliss 453,073,324 1.28 N
Paseo Del Este MUD 355,594,000 1.0 N
East Montana County 246,007,476 0.6 N
Hacienda Del Norte WID 55,141,064 < 0.1 N
Mayfair/Nuway & Schuman 32,064,516 < 0.1 N
Ponderosa and Western Village 23,474,484 < 0.1 N
Gaslight Square MHE 21,027,776 < 0.1 N
Colonia Revolución (as of 10/2014) 1,460,000 < 0.1 N
Comment: El Paso W ater Utilities PSB has only nine wholesale customers .
30. List the top TEN customers of the system by gross revenues and percent of total revenues, includingwhether any are in bankruptcy
Customer NameAnnual
Revenue($) Percent of RevenueBankruptcy
(Y/N)Lower Valley Water District Authority 2,432,812 2.16 N
Paseo del Este MUD 966,013 0.86 N
Fort Bliss 520,329 0.46 N
East Montana County 331,885 0.29 N
Hacienda del Norte WID 111,101 0.09 N
Mayfair/Nuway & Schuman 84,174 0.08 N
Ponderosa and Western Village 62,961 0.06 N
Gaslight Square MHE 51,531 0.05 N
Colonia Revolución 3,278 0.01 N
(El Paso Water Utilities PSB has only ninewholesale customers ).
10
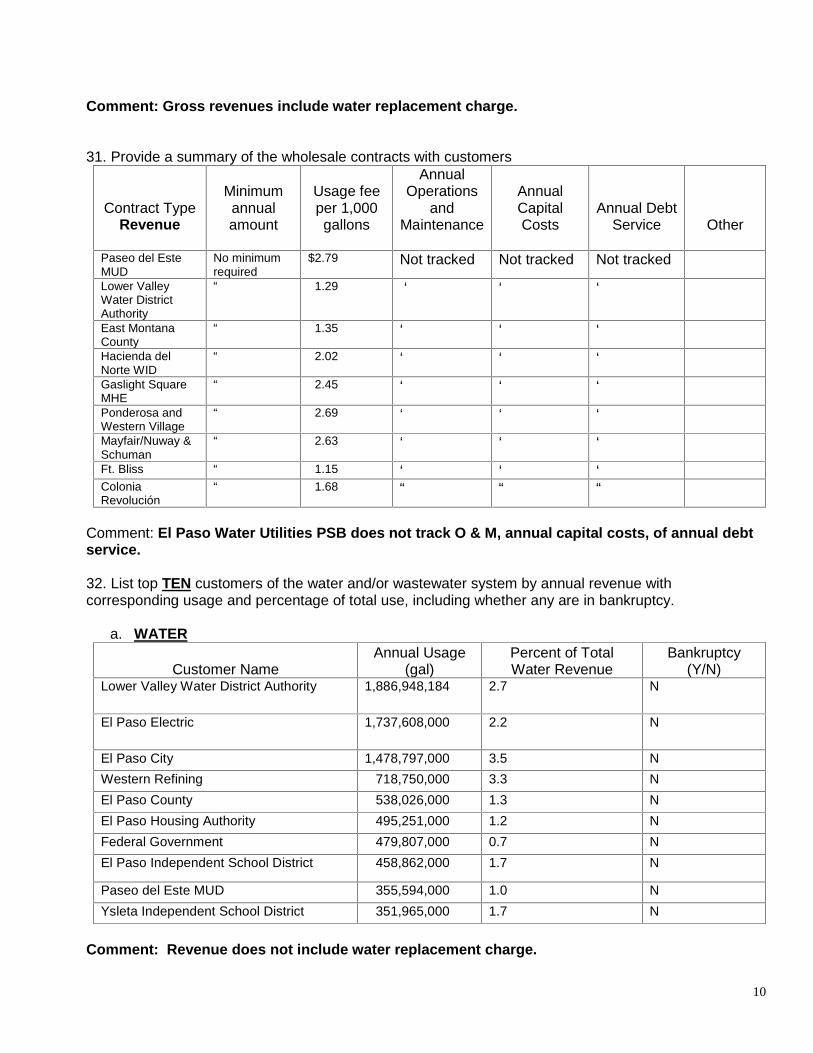
Comment: Gross revenues include water replacement charge.
31. Provide a summary of the wholesale contracts with customers
Contract TypeRevenue
Minimumannualamount
Usage feeper 1,000gallons
AnnualOperations
andMaintenance
AnnualCapitalCosts
Annual DebtService Other
Paseo del EsteMUD
No minimumrequired
$2.79 Not tracked Not tracked Not tracked
Lower ValleyWater DistrictAuthority
“ 1.29 ‘ ‘ ‘
East MontanaCounty
“ 1.35 ‘ ‘ ‘
Hacienda delNorte WID
“ 2.02 ‘ ‘ ‘
Gaslight SquareMHE
“ 2.45 ‘ ‘ ‘
Ponderosa andWestern Village
“ 2.69 ‘ ‘ ‘
Mayfair/Nuway &Schuman
“ 2.63 ‘ ‘ ‘
Ft. Bliss “ 1.15 ‘ ‘ ‘ColoniaRevolución
“ 1.68 “ “ “
Comment: El Paso Water Utilities PSB does not track O & M, annual capital costs, of annual debtservice.
32. List top TEN customers of the water and/or wastewater system by annual revenue withcorresponding usage and percentage of total use, including whether any are in bankruptcy.
a. WATER
Customer NameAnnual Usage
(gal)Percent of TotalWater Revenue
Bankruptcy(Y/N)
Lower Valley Water District Authority 1,886,948,184 2.7 N
El Paso Electric 1,737,608,000 2.2 N
El Paso City 1,478,797,000 3.5 N
Western Refining 718,750,000 3.3 N
El Paso County 538,026,000 1.3 N
El Paso Housing Authority 495,251,000 1.2 N
Federal Government 479,807,000 0.7 N
El Paso Independent School District 458,862,000 1.7 N
Paseo del Este MUD 355,594,000 1.0 N
Ysleta Independent School District 351,965,000 1.7 N
Comment: Revenue does not include water replacement charge.
11
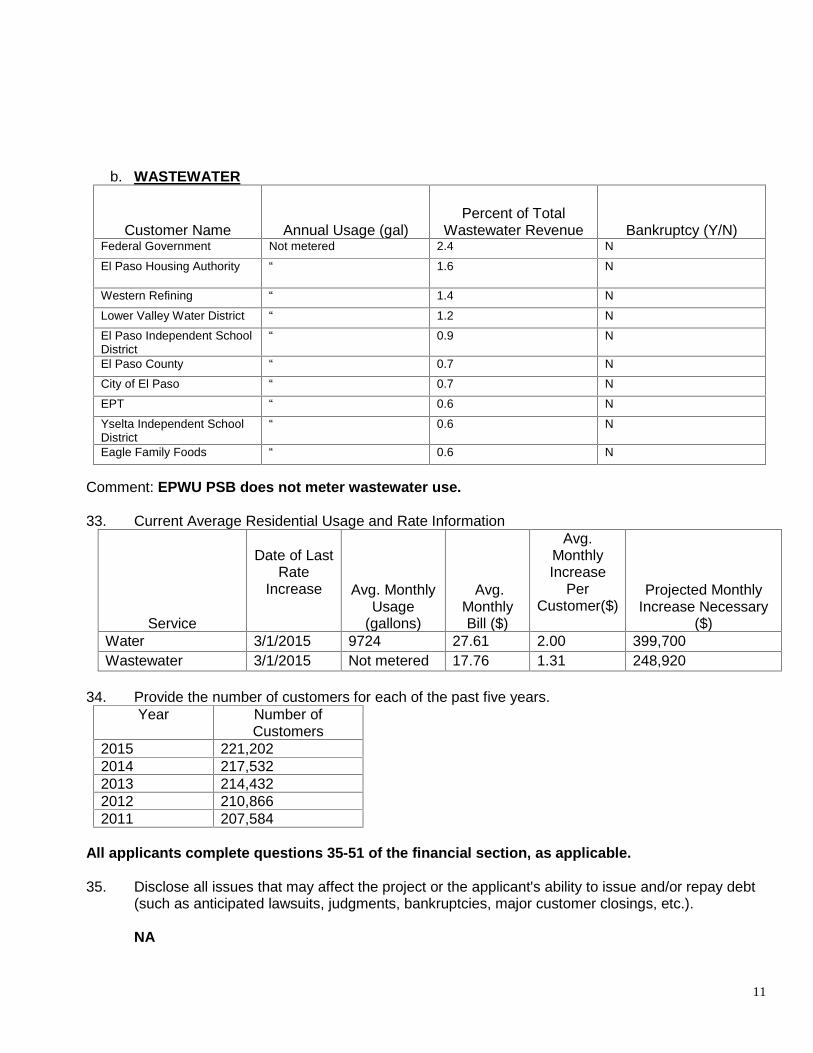
b. WASTEWATER
Customer Name Annual Usage (gal)Percent of Total
Wastewater Revenue Bankruptcy (Y/N)Federal Government Not metered 2.4 N
El Paso Housing Authority “ 1.6 N
Western Refining “ 1.4 N
Lower Valley Water District “ 1.2 N
El Paso Independent SchoolDistrict
“ 0.9 N
El Paso County “ 0.7 N
City of El Paso “ 0.7 N
EPT “ 0.6 N
Yselta Independent SchoolDistrict
“ 0.6 N
Eagle Family Foods “ 0.6 N
Comment: EPWU PSB does not meter wastewater use.
33. Current Average Residential Usage and Rate Information
Service
Date of LastRate
Increase Avg. MonthlyUsage
(gallons)
Avg.MonthlyBill ($)
Avg.MonthlyIncrease
PerCustomer($)
Projected MonthlyIncrease Necessary
($)Water 3/1/2015 9724 27.61 2.00 399,700Wastewater 3/1/2015 Not metered 17.76 1.31 248,920
34. Provide the number of customers for each of the past five years.Year Number of
Customers2015 221,2022014 217,5322013 214,4322012 210,8662011 207,584
All applicants complete questions 35-51 of the financial section, as applicable.
35. Disclose all issues that may affect the project or the applicant's ability to issue and/or repay debt(such as anticipated lawsuits, judgments, bankruptcies, major customer closings, etc.).
NA
12
36. Has the applicant ever defaulted on any debt?Yes If yes, disclose all circumstances surrounding prior default(s).No
37. Does the applicant have taxing authority?YesNo
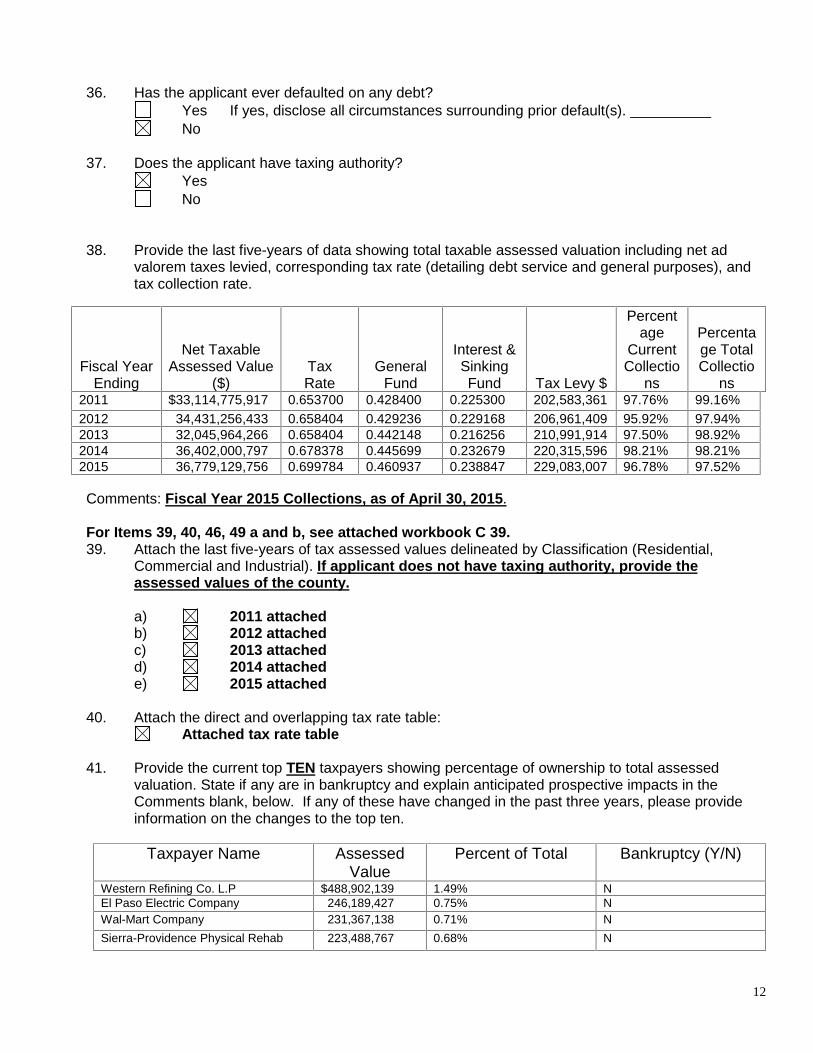
38. Provide the last five-years of data showing total taxable assessed valuation including net advalorem taxes levied, corresponding tax rate (detailing debt service and general purposes), andtax collection rate.
Comments: Fiscal Year 2015 Collections, as of April 30, 2015 .
For Items 39, 40, 46, 49 a and b, see attached workbook C 39.39. Attach the last five-years of tax assessed values delineated by Classification (Residential,
Commercial and Industrial). If applicant does not have taxing authority, provide theassessed values of the county.
a) 2011 attachedb) 2012 attachedc) 2013 attachedd) 2014 attachede) 2015 attached
40. Attach the direct and overlapping tax rate table:Attached tax rate table
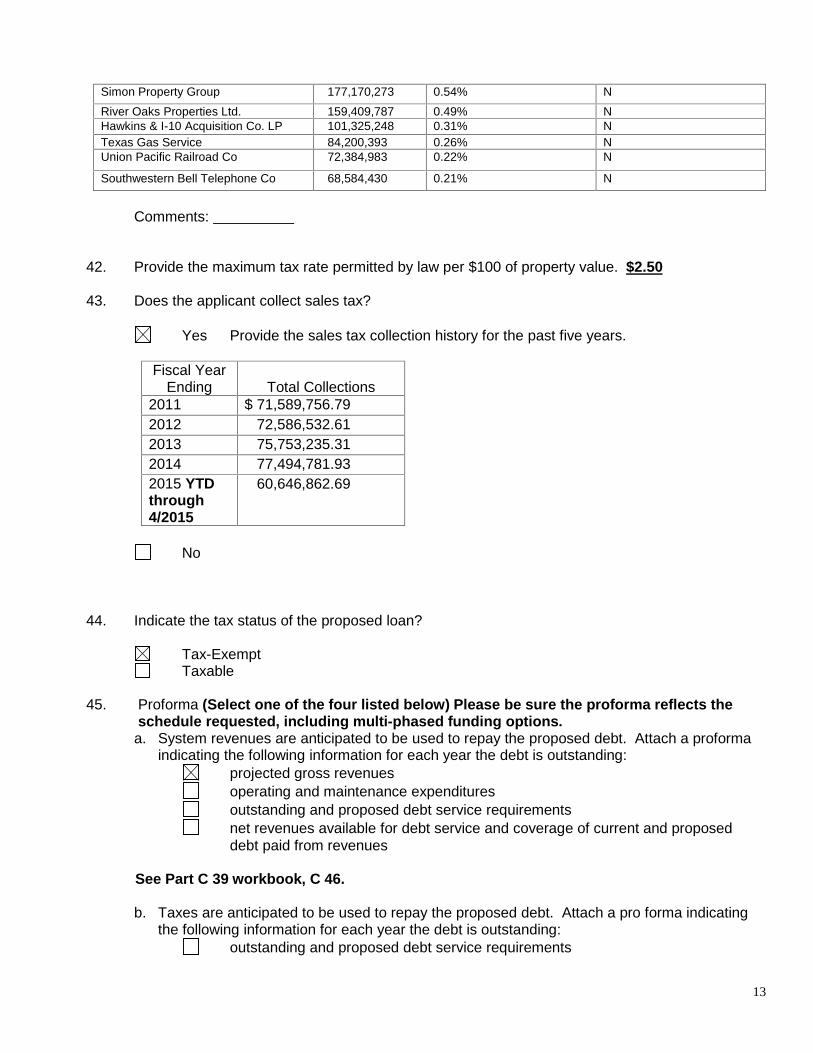
41. Provide the current top TEN taxpayers showing percentage of ownership to total assessedvaluation. State if any are in bankruptcy and explain anticipated prospective impacts in theComments blank, below. If any of these have changed in the past three years, please provideinformation on the changes to the top ten.
Taxpayer Name AssessedValue
Percent of Total Bankruptcy (Y/N)
Western Refining Co. L.P $488,902,139 1.49% NEl Paso Electric Company 246,189,427 0.75% NWal-Mart Company 231,367,138 0.71% N
Sierra-Providence Physical Rehab 223,488,767 0.68% N
Fiscal YearEnding
Net TaxableAssessed Value
($)TaxRate
GeneralFund
Interest &SinkingFund Tax Levy $
Percentage
CurrentCollectio
ns
Percentage TotalCollectio
ns2011 $33,114,775,917 0.653700 0.428400 0.225300 202,583,361 97.76% 99.16%2012 34,431,256,433 0.658404 0.429236 0.229168 206,961,409 95.92% 97.94%2013 32,045,964,266 0.658404 0.442148 0.216256 210,991,914 97.50% 98.92%2014 36,402,000,797 0.678378 0.445699 0.232679 220,315,596 98.21% 98.21%2015 36,779,129,756 0.699784 0.460937 0.238847 229,083,007 96.78% 97.52%
13
Simon Property Group 177,170,273 0.54% N
River Oaks Properties Ltd. 159,409,787 0.49% NHawkins & I-10 Acquisition Co. LP 101,325,248 0.31% NTexas Gas Service 84,200,393 0.26% NUnion Pacific Railroad Co 72,384,983 0.22% N
Southwestern Bell Telephone Co 68,584,430 0.21% N
Comments:
42. Provide the maximum tax rate permitted by law per $100 of property value. $2.50
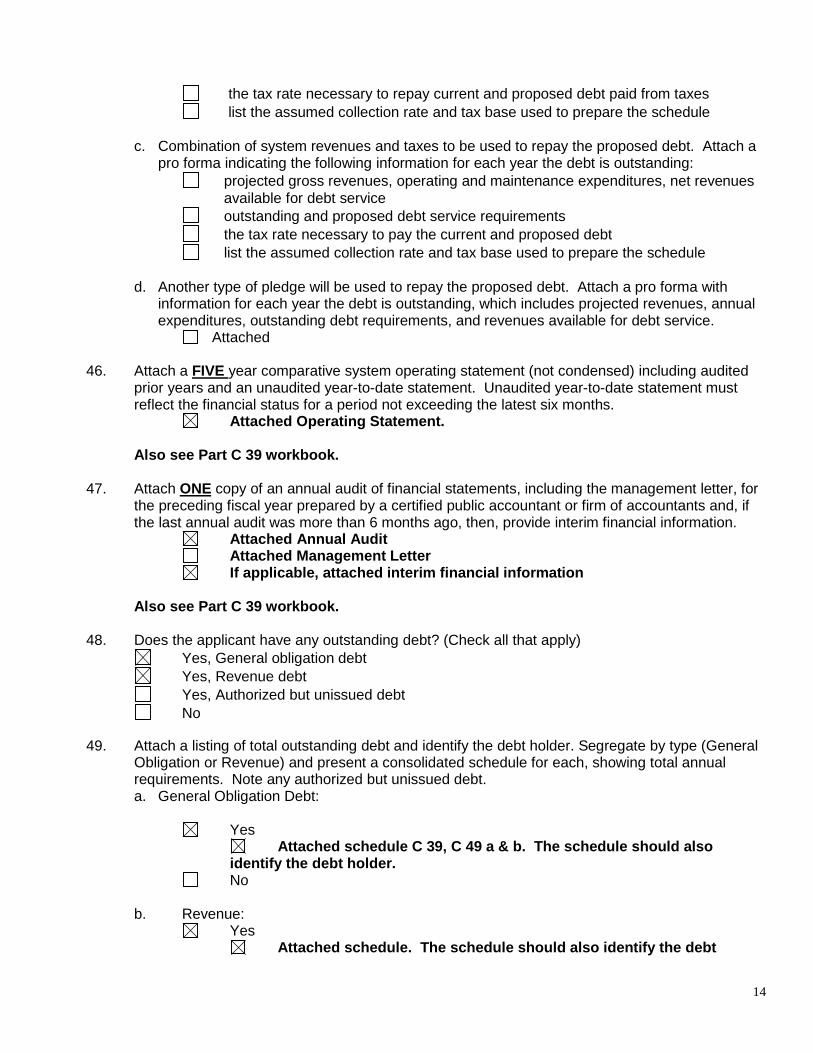
43. Does the applicant collect sales tax?
Yes Provide the sales tax collection history for the past five years.
Fiscal YearEnding Total Collections
2011 $ 71,589,756.792012 72,586,532.612013 75,753,235.312014 77,494,781.932015 YTDthrough4/2015
60,646,862.69
No
44. Indicate the tax status of the proposed loan?
Tax-ExemptTaxable
45. Proforma (Select one of the four listed below) Please be sure the proforma reflects theschedule requested, including multi -phased funding options.a. System revenues are anticipated to be used to repay the proposed debt. Attach a proforma
indicating the following information for each year the debt is outstanding:projected gross revenuesoperating and maintenance expendituresoutstanding and proposed debt service requirementsnet revenues available for debt service and coverage of current and proposeddebt paid from revenues
See Part C 39 workbook , C 46.
b. Taxes are anticipated to be used to repay the proposed debt. Attach a pro forma indicatingthe following information for each year the debt is outstanding:
outstanding and proposed debt service requirements
14
the tax rate necessary to repay current and proposed debt paid from taxeslist the assumed collection rate and tax base used to prepare the schedule
c. Combination of system revenues and taxes to be used to repay the proposed debt. Attach apro forma indicating the following information for each year the debt is outstanding:
projected gross revenues, operating and maintenance expenditures, net revenuesavailable for debt serviceoutstanding and proposed debt service requirementsthe tax rate necessary to pay the current and proposed debtlist the assumed collection rate and tax base used to prepare the schedule
d. Another type of pledge will be used to repay the proposed debt. Attach a pro forma withinformation for each year the debt is outstanding, which includes projected revenues, annualexpenditures, outstanding debt requirements, and revenues available for debt service.
Attached
46. Attach a FIVE year comparative system operating statement (not condensed) including auditedprior years and an unaudited year-to-date statement. Unaudited year-to-date statement mustreflect the financial status for a period not exceeding the latest six months.
Attached Operating Statement.
Also see Part C 39 workbook .
47. Attach ONE copy of an annual audit of financial statements, including the management letter, forthe preceding fiscal year prepared by a certified public accountant or firm of accountants and, ifthe last annual audit was more than 6 months ago, then, provide interim financial information.
Attached Annual AuditAttached Management LetterIf applicable, attached interim financial informat ion
Also see Part C 39 workbook.
48. Does the applicant have any outstanding debt? (Check all that apply)Yes, General obligation debtYes, Revenue debtYes, Authorized but unissued debtNo
49. Attach a listing of total outstanding debt and identify the debt holder. Segregate by type (GeneralObligation or Revenue) and present a consolidated schedule for each, showing total annualrequirements. Note any authorized but unissued debt.a. General Obligation Debt:
YesAttached schedule C 39, C 49 a & b. The schedule should also
identify the debt holder.No
b. Revenue:Yes
Attached schedule. The schedule should also identify the debt
15
holder.No
c. Authorized by Unissued Debt:Yes
Attached schedule. The schedule should also identify the debtholder.
No
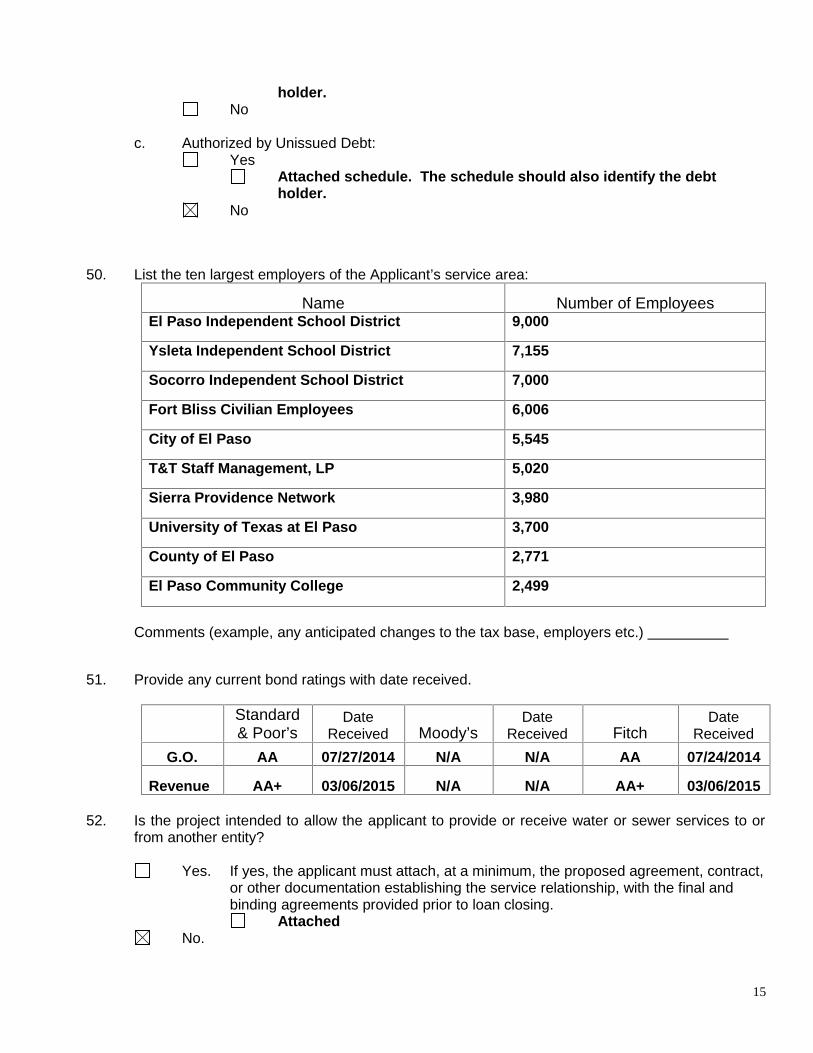
50. List the ten largest employers of the Applicant’s service area:
Name Number of EmployeesEl Paso Independent School District 9,000
Ysleta Independent School District 7,155
Socorro Independent School District 7,000
Fort Bliss Civilian Employees 6,006
City of El Paso 5,545
T&T Staff Management, LP 5,020
Sierra Providence Network 3,980
University of Texas at El Paso 3,700
County of El Paso 2,771
El Paso Community College 2,499
Comments (example, any anticipated changes to the tax base, employers etc.)
51. Provide any current bond ratings with date received.
Standard& Poor’s
DateReceived Moody’s
DateReceived Fitch
DateReceived
G.O. AA 07/27/2014 N/A N/A AA 07/24/2014
Revenue AA+ 03/06/2015 N/A N/A AA+ 03/06/2015
52. Is the project intended to allow the applicant to provide or receive water or sewer services to orfrom another entity?
Yes. If yes, the applicant must attach, at a minimum, the proposed agreement, contract,or other documentation establishing the service relationship, with the final andbinding agreements provided prior to loan closing.
AttachedNo.
16
Part D: Project Information
53. Description of Project Need (for example, is the project needed to address a current complianceissue, avoid potential compliance issues, extend service, expand capacity, etc.):
In order to address this community’s future water needs, t he El Paso Water Utilities PublicService Board, on behalf of the City of El Paso, Texas, is pursuing funding to secureunderground water resources that will provide sustainable water solutions . With thisfunding, El Paso Water Utilities P SB will acquire land and water rights necessary to meetthis goal .
54. Description of Project, including a bulleted list of project elements/components, and alternativesconsidered (including existing facilities):
See attachment s Part D 54: a. Description of Project , maps , c. Projected Draw Schedule ,and d. Alternatives Considered . Please note: because thi s application is for funding ofacquisition of land and water rights only, no plannin g or design activities are schedul ed forthis project.
Attachments D 54 a and D 54 d are confidential. The information is protected under Section552.105 of the Texas Open Records Act which protects information concerning price orlocation of property that the public entity seeks to acquire.
A complete preliminary engineering feasibility data must include:a. A description and purpose of the project, including existing facilities.
Note: CWSRF and DWSRF must address issues scored in Intended Use Plansubmittal
Attached
b. If project is for Construction only , then attach the appropriate EngineeringFeasibility Report:
NA
a) Water (TWDB-0555 athttp://www.twdb.texas.gov/financial/instructions/doc/TWDB-0555.pdf)
Attached
b) Wastewater (TWDB-0556 athttp://www.twdb.texas.gov/financial/instructions/doc/TWDB-0556.pdf)
Attached
c. SWIFT applicants must complete a Projected Draw Schedule(TWDB-1202 at http://www.twdb.texas.gov/financial/instructions/doc/TWDB-1202.xls)
See attachment Part D 54 c, Projected Draw Schedule.See attachment Part D 54 d, Alternatives Considered.
55. Water Made Available (For projects requesting a construction component):
a. New supply (acre-feet/year) ($) capital cost
o The Increase in the total annual volume of water supply that will be made available to therecipient(s) by the proposed project,
o Water Plan project examples: new groundwater wells, reservoir development, pipelines tosources.
b. New Consen/ation savings (acre-feet/year) ($) capital cost
o Annual volume of anticipated water savings resulting from implementation of the proposedconservation project including water loss) and other conservation activities,
o Water Plan project examples: municipal conservation, advanced Water Conservation, on-farm conservation, brush control. Irrigation conservation.
c. New Reuse supply (acre-feet/year) ($) capital cost
o Increase in the annual volume of (direct or indirect) reuse water supply that will be madeavailable to the recipient(s) by the proposed project.
o Water Plan project examples: direct reuse, non-potable reuse, recycled water programs.
d. Maintenance of Current Supply (acre-feet/year) ($) capital cost
o Volume of recipients' current supplies that will be maintained by implementing theproposed project
o Water Plan project examples: None. Not a water plan project. (Examples of these typeprojects: treatment rehabilitation, system storage facilities, system upgrades).
Project Location:
THIS INFORMATION IS CONFIDENTIAL. Pieaseconotrelease the following information; it is to be redacted before releasing to the public.
Attach a map of the service area and drawings as necessary to locate and describe the project.The map should show the project footprint and major project components.
^ See attachment Part D 54 a.
Attach the Census tract numbers in which the applicant's service area is within. The Censustracts within your area may be found at:http://factfinder2.census.qov/faces/nav/isf/paQes/searchresuits.xhtmi?refresh=t.
Please follow these steps:• Select Advanced Search.
• Select the Geographies button located below Topics (left side of page).• On the top of the window select the Name tab.
18
In the text box, type "All Census Tracts within___" (Fill in the blank with the nameof a County Subdivision or a Place.) Select "Go".
If your town is a County Subdivision, select the geography labeled "All CensusTracts (or parts) within City, County, State" from the Geography Results. If yourtown is a place select the geography labeled "All Census Tracts (or parts) full-or-partially within City, State" from the Geography Results.
Close the Geographies Search window. Use the Topics on the left side of the page to further refine your search or to select
a table(s) from your search results.
Attached Census tracts
58. Project Schedule:a) Requested loan closing date.
December 2015b) Estimated date to submit environmental planning documents.
Phase One Desktop Survey will be submitted October 1, 2015.c) Estimated date to submit engineering planning documents.
NA-acquisition only.d) Estimated date for completion of design.
NA-acquisition only .e) Estimated Construction start date for first contract.
NA-acquisition only.f) Estimated Construction end date for last contract.
NA-acquisition only.
59. Attach a copy of current and future populations andprojected water use or wastewater flows. Include entities to be served.
Attached -see Part D 59.
60. Attach the most current itemized project cost estimate (include all costs and funding sources).Utilize the budget format provided (TWDB-1201 athttp://www.twdb.texas.gov/financial/instructions/. If applying for pre-construction costs only (i.e.,P, A, D) then itemize only the relevant portions in the attached budget template
Attached ; please see redactions on Form TWDB -1201. THIS INFORMATION ISCONFIDENTIAL. Please do not release this information; it is to be redacted beforereleasing to the public.
61. Attach the appropriate Project Information Form:Wastewater: Attached a completed Wastewater Project Information FormWRD-253a http://www.twdb.texas.gov/financial/instructions/index.aspNA
Water: Attached a completed Water Project Information FormWRD-253d http://www.twdb.texas.gov/financial/instructions/index.aspAttached; ; please see redactions on Form WRD -253d. THIS INFORMATION ISCONFIDENTIAL. Please do not release this information; it is to be redacted beforereleasing to the public.
If the project is for Construction only, wastewater projects that involve the construction of a newplant or the expansion of an existing plant and/or associated facilities, attach evidence that anapplication for a new Texas Pollution Discharge Elimination System Permit or amendment to anexisting permit related to the proposed project has been filed with the Texas Commission onEnvironmental Quality (TCEQ). Final permit authorization must be obtained from the TCEQbefore funds can be released for construction activities.
Attached
No. Provide explanation:
If this project will result in: (a) an increase by the applicant in the use of groundwater, (b) drilling anew water well, or (c) an increase by the applicant in use of surface water, then the applicantmust demonstrate that it has acquired - by contract, ownership or lease - the necessary propertyrights, groundwater permits, and/or surface water rights sufficient for the project before funds canbe released for construction.
a) Does the applicant currently own all the property rights, groundwater permits and surfacewater rights needed for this project?
n Yes If yes, please attach the completed, appropriate form.1. WRD 208A (http;//www.twdb.texas.9ov/financial/lnstructions/index.asp) (Surface Water)
• Attached2. WRD 208B ( http://www.twdb.texas.gov/financial/instructions/index.asp) (Groundwater)
• Attached
^ No - SWIFT funding will allow us to acquire property and groundwater rights. We areaware that acquisition of additional water rights will be necessary to fully implement awater supply project.
• N/A
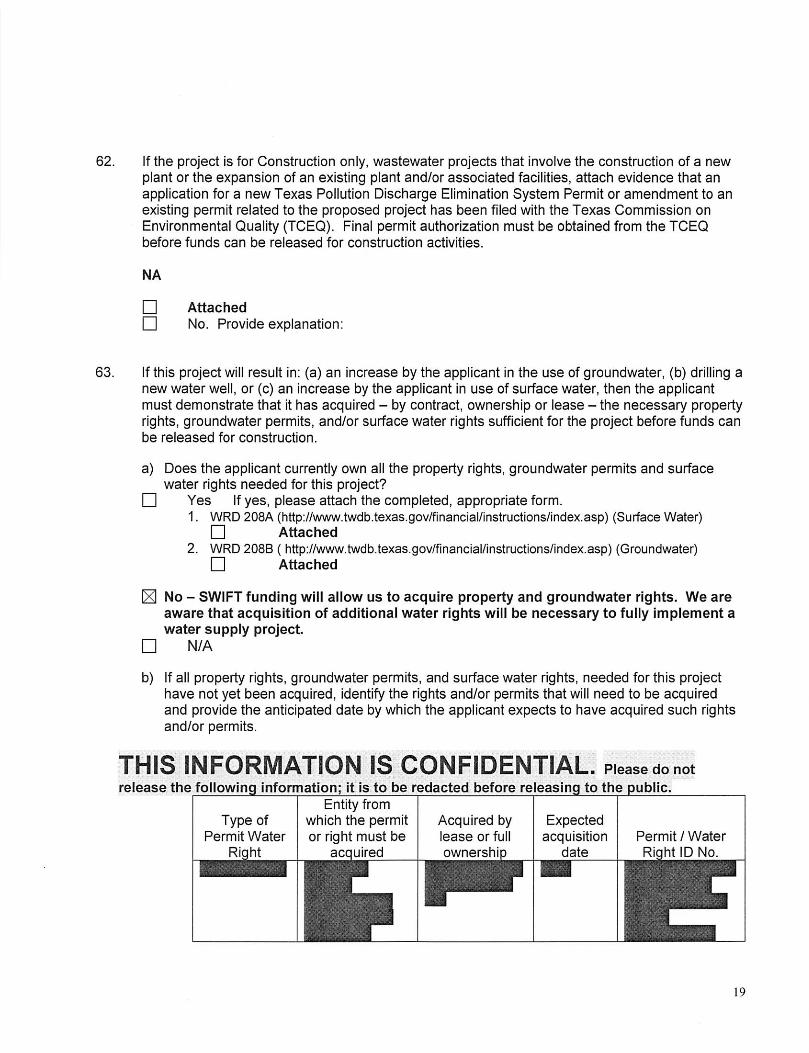
b) If all property rights, groundwater permits, and surface water rights, needed for this projecthave not yet been acquired, identify the rights and/or permits that will need to be acquiredand provide the anticipated date by which the applicant expects to have acquired such rightsand/or permits.
THIS INFORMATION IS CONFIDENTIAL. Piaasedonotrelease the following information; it is to be redacted before re easing to the public.
Entity fromType of which the permit Acquired by Expected
Permit Water or right must be lease or full acquisition Permit/WaterRiqht acquired ownership date Riqht ID No.
c) List any major permits not identified elsewhere that are necessary for completion of project.Also, list any more necessary minor permits that may involve particular difficulty due to thenature of the proposed project
Permit Issuina Entit Permit Acauired (Y/N
Has the applicant obtained all necessary land and easements for the project?• Yes. If yes, attach the site certificate {ED-101 at
http://www.twdb.texas.gov/financlal/instructions/lndex.asp• Attached
^ No. If no. fill out the table below and describe the land or easements that will need tobe acquired, provide the anticipated date by which the applicant expects to havethe land or easements, and indicate iffunding from TWDB is to be used for theacquisition.
THIS INFORMATION IS CONFIDENTIAL. Pieasedonotrelease the following information; it is to be redacted before releasing to the public.
Descriptionof Land or Entity from which Acquired by ExpectedEasement the permit or right lease or full acquisition
Permit must be acquired ownership date
To Be Funded
by TWDBYes/No
21
YesAttach a copy of the finding.No
66. Is the project potentially eligible for a Categorical Exclusion (CE)/ Determination of No Effect(DNE) because it involves only minor rehabilitation or the functional replacement of existingequipment?
YesNo
67. Are there potentially adverse environmental or social impacts that may require mitigation orextensive regulatory agency or public coordination (e.g. known impacts to properties eligible forlisting on the National Register of Historic Places; potentially significant public controversy; needfor an individual permit from the U.S. Army Corps of Engineers)?
YesIf yes, attach additional information
No At this time, the project involves only purchase of land and water rights , noconstruction or excavation . However, prior to any construction, excavation, orrehabilitation required, it is EPWU PSB policy to complete an archeological survey and,when indicated, an U .S. Army Corps of Engineer 404 Run -off Permit.
Part E: State Water Implementation Fund for Texas (SWIFT) Applicants Only :
68. Identify the type of SWIFT funding (If more than one funding option is being requested indicatethe amount of funding for each):
Deferred $Low Interest Loan $50,000,000Board Participation $
69. For multi-year funding request or phased commitments, provide a schedule reflecting the closingdates for each loan requested.
Attached
NA
70. Notice to SWIFT Applicants: Texas Water Code Sec. 15.435(h) requires all recipients offinancial assistance from the SWIFT to acknowledge any applicable legal obligations in federallaw, related to contracting with disadvantaged business enterprises, and state law, related tocontracting with historically underutilized businesses. Checking the boxes below serves as thisacknowledgement.
As an applicant for financial assistance from SWIFT, I acknowledge that this project mustcomply with any applicable legal obligations in federal law related to contracting withdisadvantaged business enterprises.
As an applicant for financial assistance from SWIFT, I acknowledge that this project mustcomply with applicable legal obligations in state law (Texas Government Code Chapter 2161 and
22
Texas Administrative Code Chapter 20, Subchapter B) related to contracting with historicallyunderutilized businesses.
71. Provide drafts of the following documents:
a. Proposed Bond OrdinanceSee Part B 21
b. Private Placement MemorandumAttached
Part F: Economically Distressed Programs (EDAP) Applicants Only: NA
In accordance with TWDB Rules (31 TAC Chapter 363), an application for EDAP will not be considereduntil the County has adopted and is enforcing the Model Subdivision Rules (MSRs) Texas Water Code §16.343. If the proposed project is within a municipality or its extraterritorial jurisdiction (ETJ), or if theapplicant is a municipality, the municipality must also have adopted and be enforcing MSRs.
72. Describe procedures for collecting monthly customer bills (include procedures for collection ofdelinquent accounts)
73. Is financing being requested for a wastewater project?Yes If yes, does the applicant have the required resolution/ordinanceestablishing a mandatory hookup policy?
Yes. If yes, attach a copy of the resolution/ordinance.Attached
No. If no, explainNo
74. Required documentation for the project area for Preliminary EDAP Eligibility (31 TAC Chapter363)
Attached documentation of inadequacy of water and/or wastewater services.Attached documentation regarding the financial resources of the residential usersin the EDAP area. Census data or documentation regarding median householdincome should be provided.Attached documentation demonstrating existence of a residence in the projectarea prior to June 1, 2005 . This could include tax records of residence, datedaerial maps, or, other documentation demonstrating existence of a residence.
75. Has the Department of State Health Services issued a determination stating a public healthnuisance exists in the project area?
23
Yes If yes, attach a copy of the determination.Attached
No If no determination exists, attach documentation demonstrating apublic health nuisance exists in the project area. (Photographs may besubmitted, but they must be labeled with location and date when taken. If the soiltypes are mentioned in the project area as an issue, include soil profile maps) Thisdocumentation will be used by TWDB staff to request a determination fromthe Department of State Health Services
Attached
76. Is this project providing new service?Yes If yes, attach plats of the affected subdivisions.
AttachedNo
77. Attach an EDAP Facility Engineering Plan/Scope of Services report that complies with therequirements of WRD-023A. http://www.twdb.texas.gov/financial/instructions/index.asp
Attache d
Part G: CWSRF/DWSRF Applicants Only - NA
Only applicants applying for funding from the CWSRF and DWSRF Programs must complete thissection.
Pursuant to Federal Funding Accountability and Transparency Act (FFATA) the applicant is required toobtain a DUNS number that will represent a universal identifier for all federal funding assistance. DUNSnumbers can be obtained from Dun and Bradstreet at http://fedgov.dnb.com/webform/
78. Applicant’s Data Universal Number System (DUNS) Number:
Pursuant to Federal Funding Accountability and Transparency Act (FFATA) the applicant is required toregister with System for Award Management (SAM) and maintain current registration at all times duringwhich the Board loan agreement is active or under consideration by the Board. Register at:https://sam.gov.
79. The applicant has registered and will maintain current SAM registration at all times during whicha federal subaward is active or under consideration by the Board.
YesNo
80. Federal Awards information:1. Did applicant receive over 80% of their revenue from Federal Awards last year?
YesNo
2. Did applicant receive over $25 million in Federal Awards last year?YesNo
3. Public does not have access to executive compensation information via SEC or IRS reports?YesNo
24
81. If applicant checked YES to ALL three boxes in 3 above, applicant is required to disclose the nameand compensation of the five most highly compensated officers.
Officer’s Name Officer’s Compensation ($)
82.Complete form WRD 213 (http://www.twdb.texas.gov/financial/instructions/index.asp) - CertificationRegarding Lobbying
Attached YesNoN/A
83. If applying for CWSRF Equivalency or DWSRF, attach the Certification Regarding Debarment,Suspension and Other Responsibility. SRF-404(http://www.twdb.texas.gov/financial/instructions/doc/SRF-404.pdf)Attached Yes
NoN/A
84. If applying for CWSRF Equivalency or DWSRF, attach the Assurances – Construction Programs.EPA-424D (http://www.twdb.texas.gov/financial/doc/EPA-424D.pdf)Attached Yes
NoN/A
85. The applicant must comply with the Davis-Bacon Act regarding prevailing wage rates. Theapplicant acknowledges that they are aware of, and will abide by, the Davis-Bacon Actrequirements.
YesNo
Further information on the Davis-Bacon requirement is available through the TWDB Guidancedocument, DB-0156 (http://www.twdb.texas.gov/financial/instructions/index.asp)
All project costs funded by the TWDB through CWSRF Equivalency or DWSRF must comply with thefederal Disadvantaged Business Enterprise (DBE) program rules and requirements. The federal DBEprogram requires a good faith effort to contract with DBE’s for all procurements including: professionaland non-professional consulting services, equipment, supplies and construction to be funded by federalequivalency dollars. Guidance and forms are found at:TWDB-0210 (http://www.twdb.texas.gov/financial/instructions/doc/TWDB-0210.pdf)
86. At a minimum, you must complete and attach the Applicant Affirmative Steps Certification andGoals. This form is required to obtain a financial assistance commitment.TWDB-0215 (http://www.twdb.texas.gov/financial/instructions/doc/TWDB-0215.pdf)Attached Yes
No
25
87. If you have already solicited contractors, complete and attach the Affirmative Steps SolicitationReport. This form is required prior to loan closing and release of any funds; therefore, if thisquestion is not applicable at this time, select N/A.TWDB-216 (http://www.twdb.texas.gov/financial/instructions/doc/TWDB-0216.pdf)Attached Yes
NoN/A
88. If you have awarded contracts to contractors, complete and attach the Loan/Grant ParticipationSummary. This form must be submitted for review prior to loan closing and release of funds. Thisform is required prior to loan closing and release of any funds; therefore, if this question is notapplicable at this time, select N/A.TWDB-0373 (http://www.twdb.texas.gov/financial/doc/TWDB-0373.pdf)Attached Yes
NoN/A
89. All Contractors that have been awarded will need to complete and attach the Prime ContractorAffirmative Steps Certification and Goals This form is required prior to loan closing and release ofany funds; therefore, if this question is not applicable at this time, select N/A.
TWDB-217 (http://www.twdb.texas.gov/financial/instructions/doc/TWDB-0217.pdf)Attached Yes
NoN/A
90. All CWSRF applicants must be a Designated Management Agency (DMA) for wastewatercollection and treatment. Please complete and attach DMA resolutions. WRD-210(http://www.twdb.texas.gov/financial/doc/WRD-210.pdf) is an example of this type of resolution.
AttachedN/A
26
Part H: Documentation of “Green” Projects and Project Components - NACWSRF and DWSRF Applicants Only
All SRF applicants must complete this section if green benefits are all or part of the project ( morethan an incidental benefit ). Project is defined as the entire project or a stand-alone component of theproject. This section is required so that the TWDB may determine whether the project qualifies as“green” pursuant to Environmental Protection Agency (EPA) Guidance.
A project (or project component) is “green” if the primary purpose qualifies under EPA Guidance as oneof the following:
a. Green Infrastructure,b. Water Efficiency-related,c. Energy Efficiency-related, ord. Environmentally Innovative.
You must use the Green Project Reserve guidance to complete this section. Current guidance may befound at: Green Project Reserve: Guidance for determining project eligibility
TWDB-0161 (http://www.twdb.texas.gov/financial/instructions/doc/TWDB-0161.pdf)
91. Does your project or a component of your project qualify as Green, per EPA guidance?YesNo
If Yes, Please complete the remainder of Section G.
92. Type of Green ProjectWater Energy Green EnvironmentallyEfficiency Efficiency Infrastructure Innovative
93. The correct worksheets must be completed.Green Project Reserve: CWSRF Green Project WorksheetsTWDB-0162 (http://www.twdb.texas.gov/financial/instructions/doc/TWDB-0162.pdf)Attached Yes
NoN/A
27
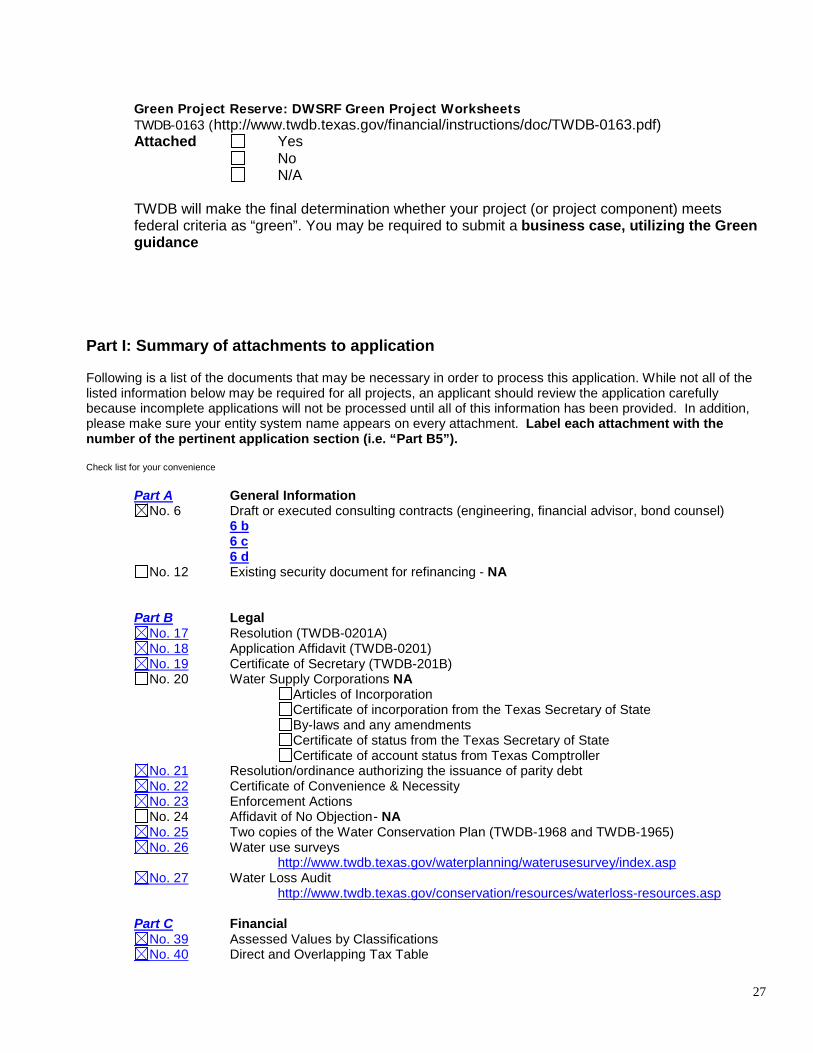
Green Project Reserve: DWSRF Green Project WorksheetsTWDB-0163 (http://www.twdb.texas.gov/financial/instructions/doc/TWDB-0163.pdf)Attached Yes
NoN/A
TWDB will make the final determination whether your project (or project component) meetsfederal criteria as “green”. You may be required to submit a business case, utilizing the Greenguidance
Part I: Summary of attachments to application
Following is a list of the documents that may be necessary in order to process this application. While not all of thelisted information below may be required for all projects, an applicant should review the application carefullybecause incomplete applications will not be processed until all of this information has been provided. In addition,please make sure your entity system name appears on every attachment. Label each attachment with thenumber of the pertinent application section (i.e. “Part B5”).
Check list for your convenience
Part A General InformationNo. 6 Draft or executed consulting contracts (engineering, financial advisor, bond counsel)
6 b6 c6 d
No. 12 Existing security document for refinancing - NA
Part B LegalNo. 17 Resolution (TWDB-0201A)No. 18 Application Affidavit (TWDB-0201)No. 19 Certificate of Secretary (TWDB-201B)No. 20 Water Supply Corporations NA
Articles of IncorporationCertificate of incorporation from the Texas Secretary of StateBy-laws and any amendmentsCertificate of status from the Texas Secretary of StateCertificate of account status from Texas Comptroller
No. 21 Resolution/ordinance authorizing the issuance of parity debtNo. 22 Certificate of Convenience & NecessityNo. 23 Enforcement ActionsNo. 24 Affidavit of No Objection- NANo. 25 Two copies of the Water Conservation Plan (TWDB-1968 and TWDB-1965)No. 26 Water use surveys
http://www.twdb.texas.gov/waterplanning/waterusesurvey/index.aspNo. 27 Water Loss Audit
http://www.twdb.texas.gov/conservation/resources/waterloss-resources.asp
Part C FinancialNo. 39 Assessed Values by ClassificationsNo. 40 Direct and Overlapping Tax Table
28
No. 45 Pro forma for each year of debt outstandingNo. 46 Five year comparative system operating statement.No. 47 Annual audit and management letterNo. 49 Outstanding debt scheduleNo. 52 Service provider contracts-NA
Part D Project InformationNo. 54a Preliminary Engineering Feasibility Data (PEFD)No. 54b Engineering Feasibility Report -NA
Water (TWDB-0555)Wastewater (TWDB-0556)
No. 54c Project Draw Schedule (TWDB-1202)Also see Part D 54 d
No. 56 Project Map-see 54 aNo. 57 Census Tract(s)No. 59 Current and future populations and projected water use or wastewater flowsNo. 60 Project Cost Estimate Budget (TWDB-1201)No. 61 Wastewater Project Information Form (WRD-253a)
Water Project Information Form (WRD-253d)No. 62 Texas Pollution Discharge Elimination System Permit- NANo. 63 If applicant has property rights and permits-NA
a. WRD-208A (Surface Water)b. WRD-208B (Groundwater)
No. 63c Additional Permits-NANo. 64 Site certificate, evidencing land ownership for the project. (ED-101)-NANo. 65 Categorical Exclusion (CE), Finding of No Significant Impact (FONSI), Record of Decision
or any other supporting document - NANo. 67 Social or environmental issues - NA
Part E State Water Implementation Fund for TexasNo. 69 Multi-year/phased commitment schedule – NANo. 71a Draft Bond Ordinance-See Part B 21No. 71b Private Placement Memorandum
Part F Economically Distressed Areas Program - NA
Part G CWSRF/DWSRF Applicants Only - NA
Part H Green Projects - NA
Miscellaneous documentsPart B 15 Full legal name of security for proposed debt issue.No. 54a Redacted- Preliminary Engineering Feasibility Data (PEFD)No. 56 Redacted-Project Map-see 54 aNo. 60 Redacted-Project Cost Estimate Budget (TWDB-1201)No. 61 Redacted-Water Project Information Form (WRD-253d)
29
Part J: Guidance and Forms
Part A General InformationCWSRF – 31 TAC 375DWSRF – 31 TAC 371EDAP and SWIFT - 31 TAC 363For more information visit, http://www.twdb.texas.gov/a bout/rules/index.asp.
Part D Project InformationState Programs - 31 TAC 363Drinking Water State Revolving Fund - 31 TAC 371Clean Water State Revolving Fund / Equivalency - 31 TAC 375Clean Water State Revolving Fund / Non-Equivalency - 31 TAC 375
Guidelines for Environmental Assessment, Clean Water Non-Equivalency (ED-001A)Clean Water EID Instructions (SRF-099)Guidelines for Environmental Assessment, State Participation, DFund, RWAF and WIF,(ED-001B)
Guidelines for Environmental Assessment, EDAP (ED-001C)Drinking Water EID Instructions (DW-001)
Part H Green Projects and Project ComponentsGreen Project Reserve: Guidance for determining project eligibility(TWDB-0161)
El Paso Water Utilities Public Service Board Part A 6 b.
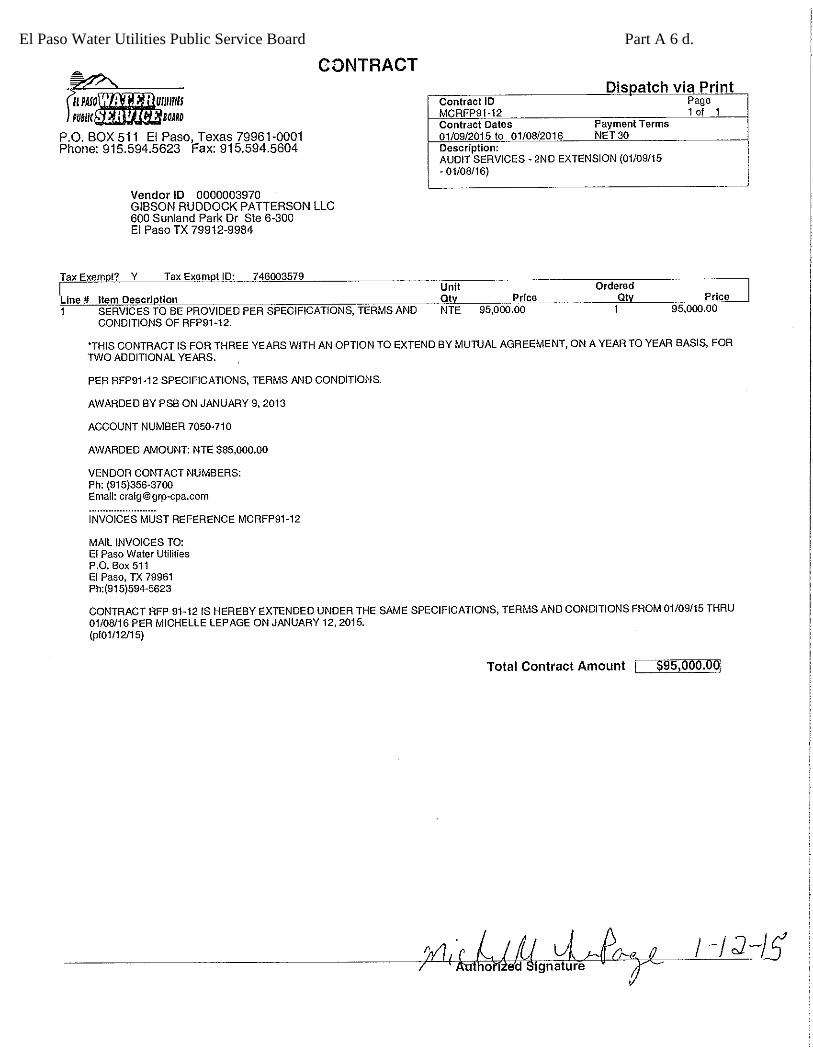
El Paso Water Utilities Public Service Board Part A 6 d.

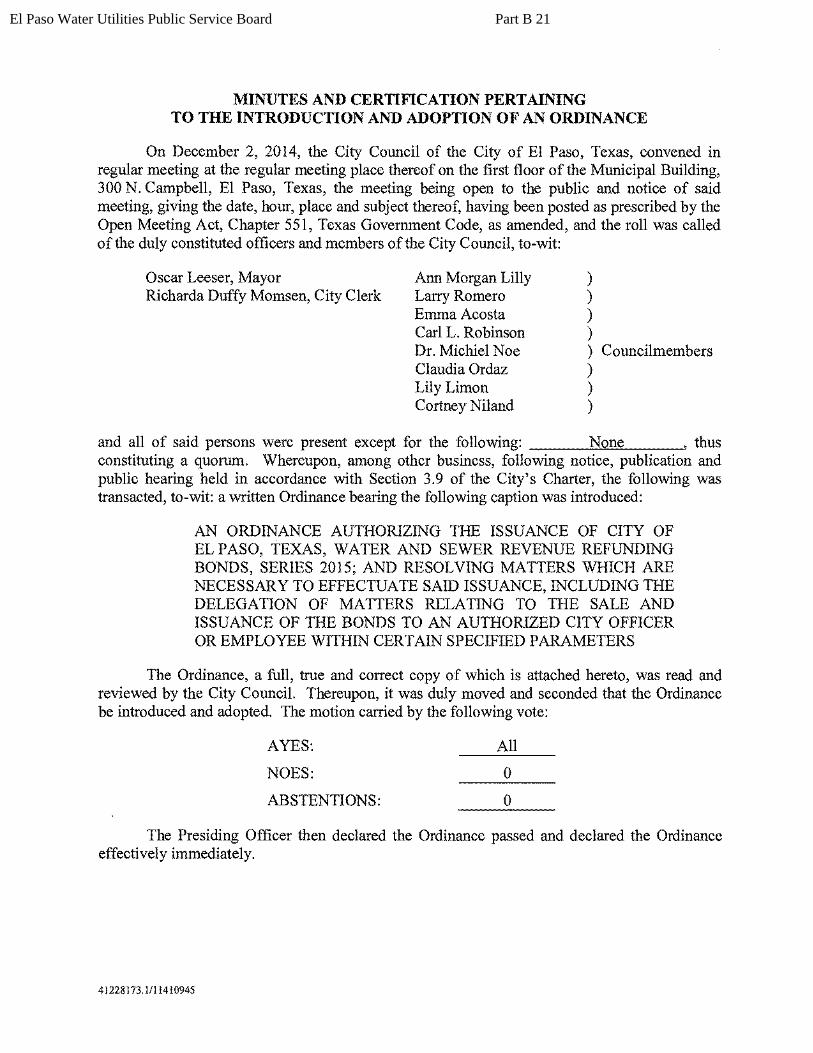
El Paso Water Utilities Public Service Board Part B 21
El Paso Water Utilities Public Service Board

Page 1
El Paso Water Utilities 2014 Water Conservation Plan As per Rule 363.15 Required Water Conservation Plan
Texas Water Development Board
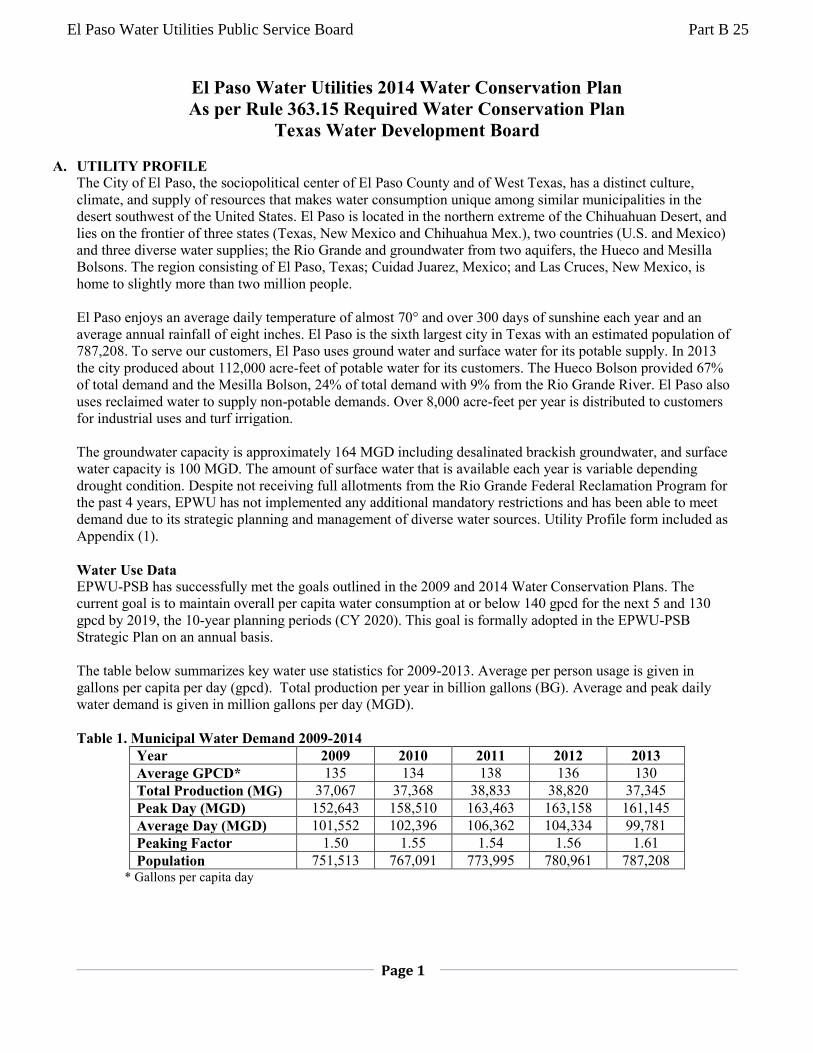
A. UTILITY PROFILE The City of El Paso, the sociopolitical center of El Paso County and of West Texas, has a distinct culture, climate, and supply of resources that makes water consumption unique among similar municipalities in the desert southwest of the United States. El Paso is located in the northern extreme of the Chihuahuan Desert, and lies on the frontier of three states (Texas, New Mexico and Chihuahua Mex.), two countries (U.S. and Mexico) and three diverse water supplies; the Rio Grande and groundwater from two aquifers, the Hueco and Mesilla Bolsons. The region consisting of El Paso, Texas; Cuidad Juarez, Mexico; and Las Cruces, New Mexico, is home to slightly more than two million people. El Paso enjoys an average daily temperature of almost 70° and over 300 days of sunshine each year and an average annual rainfall of eight inches. El Paso is the sixth largest city in Texas with an estimated population of 787,208. To serve our customers, El Paso uses ground water and surface water for its potable supply. In 2013 the city produced about 112,000 acre-feet of potable water for its customers. The Hueco Bolson provided 67% of total demand and the Mesilla Bolson, 24% of total demand with 9% from the Rio Grande River. El Paso also uses reclaimed water to supply non-potable demands. Over 8,000 acre-feet per year is distributed to customers for industrial uses and turf irrigation. The groundwater capacity is approximately 164 MGD including desalinated brackish groundwater, and surface water capacity is 100 MGD. The amount of surface water that is available each year is variable depending drought condition. Despite not receiving full allotments from the Rio Grande Federal Reclamation Program for the past 4 years, EPWU has not implemented any additional mandatory restrictions and has been able to meet demand due to its strategic planning and management of diverse water sources. Utility Profile form included as Appendix (1). Water Use Data EPWU-PSB has successfully met the goals outlined in the 2009 and 2014 Water Conservation Plans. The current goal is to maintain overall per capita water consumption at or below 140 gpcd for the next 5 and 130 gpcd by 2019, the 10-year planning periods (CY 2020). This goal is formally adopted in the EPWU-PSB Strategic Plan on an annual basis. The table below summarizes key water use statistics for 2009-2013. Average per person usage is given in gallons per capita per day (gpcd). Total production per year in billion gallons (BG). Average and peak daily water demand is given in million gallons per day (MGD). Table 1. Municipal Water Demand 2009-2014
Year 2009 2010 2011 2012 2013 Average GPCD* 135 134 138 136 130 Total Production (MG) 37,067 37,368 38,833 38,820 37,345 Peak Day (MGD) 152,643 158,510 163,463 163,158 161,145 Average Day (MGD) 101,552 102,396 106,362 104,334 99,781 Peaking Factor 1.50 1.55 1.54 1.56 1.61 Population 751,513 767,091 773,995 780,961 787,208
* Gallons per capita day
El Paso Water Utilities Public Service Board Part B 25
Page 2
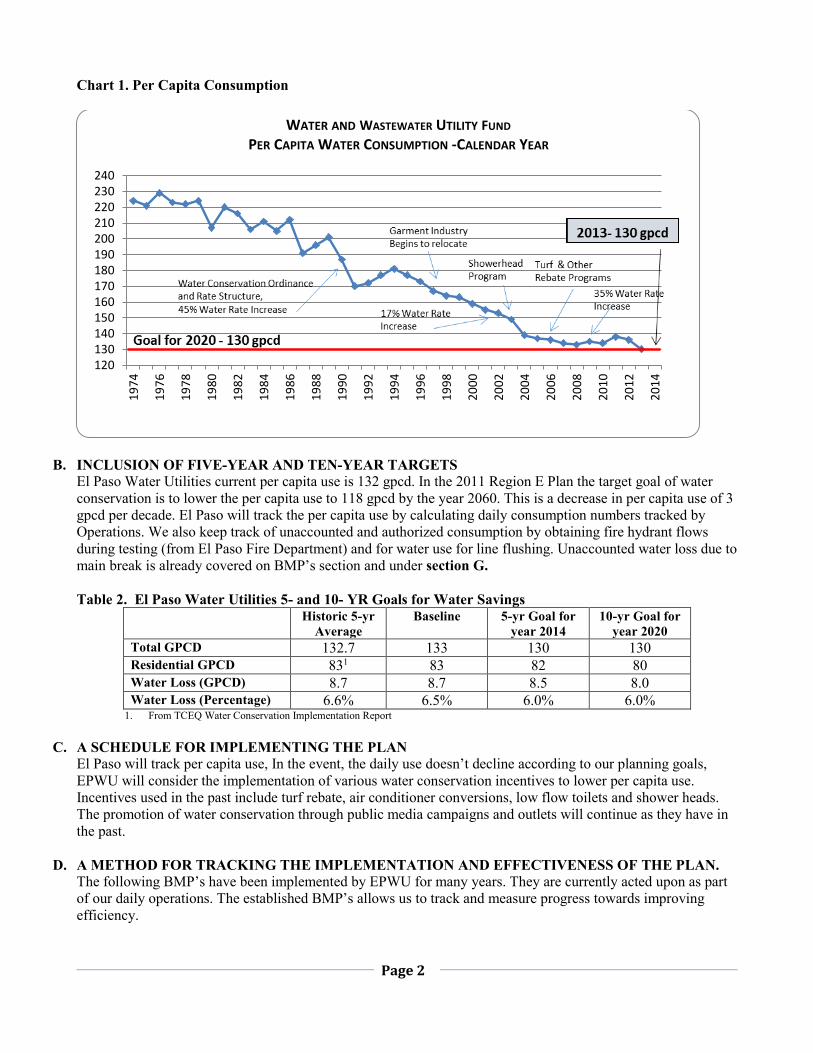
Chart 1. Per Capita Consumption
B. INCLUSION OF FIVE-YEAR AND TEN-YEAR TARGETS El Paso Water Utilities current per capita use is 132 gpcd. In the 2011 Region E Plan the target goal of water conservation is to lower the per capita use to 118 gpcd by the year 2060. This is a decrease in per capita use of 3 gpcd per decade. El Paso will track the per capita use by calculating daily consumption numbers tracked by Operations. We also keep track of unaccounted and authorized consumption by obtaining fire hydrant flows during testing (from El Paso Fire Department) and for water use for line flushing. Unaccounted water loss due to main break is already covered on BMP’s section and under section G. Table 2. El Paso Water Utilities 5- and 10- YR Goals for Water Savings
Historic 5-yr Average
Baseline 5-yr Goal for year 2014
10-yr Goal for year 2020
Total GPCD 132.7 133 130 130 Residential GPCD 831 83 82 80 Water Loss (GPCD) 8.7 8.7 8.5 8.0 Water Loss (Percentage) 6.6% 6.5% 6.0% 6.0%
1. From TCEQ Water Conservation Implementation Report
C. A SCHEDULE FOR IMPLEMENTING THE PLAN El Paso will track per capita use, In the event, the daily use doesn’t decline according to our planning goals, EPWU will consider the implementation of various water conservation incentives to lower per capita use. Incentives used in the past include turf rebate, air conditioner conversions, low flow toilets and shower heads. The promotion of water conservation through public media campaigns and outlets will continue as they have in the past.
D. A METHOD FOR TRACKING THE IMPLEMENTATION AND EFFECTIVENESS OF THE PLAN. The following BMP’s have been implemented by EPWU for many years. They are currently acted upon as part of our daily operations. The established BMP’s allows us to track and measure progress towards improving efficiency.
120130140150160170180190200210220230240
19
74
19
76
19
78
19
80
19
82
19
84
19
86
19
88
19
90
19
92
19
94
19
96
19
98
20
00
20
02
20
04
20
06
20
08
20
10
20
12
20
14
WATER AND WASTEWATER UTILITY FUND
PER CAPITAWATER CONSUMPTION -CALENDAR YEAR
Page 3
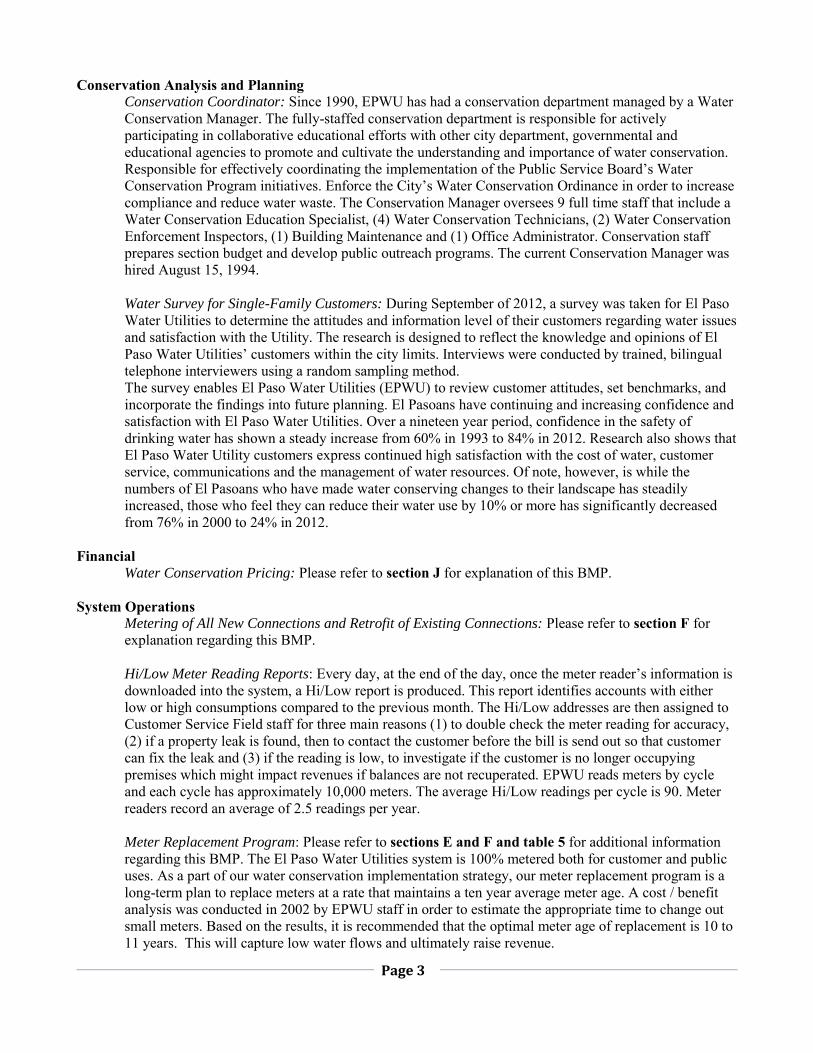
Conservation Analysis and Planning Conservation Coordinator: Since 1990, EPWU has had a conservation department managed by a Water Conservation Manager. The fully-staffed conservation department is responsible for actively participating in collaborative educational efforts with other city department, governmental and educational agencies to promote and cultivate the understanding and importance of water conservation. Responsible for effectively coordinating the implementation of the Public Service Board’s Water Conservation Program initiatives. Enforce the City’s Water Conservation Ordinance in order to increase compliance and reduce water waste. The Conservation Manager oversees 9 full time staff that include a Water Conservation Education Specialist, (4) Water Conservation Technicians, (2) Water Conservation Enforcement Inspectors, (1) Building Maintenance and (1) Office Administrator. Conservation staff prepares section budget and develop public outreach programs. The current Conservation Manager was hired August 15, 1994. Water Survey for Single-Family Customers: During September of 2012, a survey was taken for El Paso Water Utilities to determine the attitudes and information level of their customers regarding water issues and satisfaction with the Utility. The research is designed to reflect the knowledge and opinions of El Paso Water Utilities’ customers within the city limits. Interviews were conducted by trained, bilingual telephone interviewers using a random sampling method. The survey enables El Paso Water Utilities (EPWU) to review customer attitudes, set benchmarks, and incorporate the findings into future planning. El Pasoans have continuing and increasing confidence and satisfaction with El Paso Water Utilities. Over a nineteen year period, confidence in the safety of drinking water has shown a steady increase from 60% in 1993 to 84% in 2012. Research also shows that El Paso Water Utility customers express continued high satisfaction with the cost of water, customer service, communications and the management of water resources. Of note, however, is while the numbers of El Pasoans who have made water conserving changes to their landscape has steadily increased, those who feel they can reduce their water use by 10% or more has significantly decreased from 76% in 2000 to 24% in 2012.
Financial
Water Conservation Pricing: Please refer to section J for explanation of this BMP.
System Operations Metering of All New Connections and Retrofit of Existing Connections: Please refer to section F for explanation regarding this BMP. Hi/Low Meter Reading Reports: Every day, at the end of the day, once the meter reader’s information is downloaded into the system, a Hi/Low report is produced. This report identifies accounts with either low or high consumptions compared to the previous month. The Hi/Low addresses are then assigned to Customer Service Field staff for three main reasons (1) to double check the meter reading for accuracy, (2) if a property leak is found, then to contact the customer before the bill is send out so that customer can fix the leak and (3) if the reading is low, to investigate if the customer is no longer occupying premises which might impact revenues if balances are not recuperated. EPWU reads meters by cycle and each cycle has approximately 10,000 meters. The average Hi/Low readings per cycle is 90. Meter readers record an average of 2.5 readings per year. Meter Replacement Program: Please refer to sections E and F and table 5 for additional information regarding this BMP. The El Paso Water Utilities system is 100% metered both for customer and public uses. As a part of our water conservation implementation strategy, our meter replacement program is a long-term plan to replace meters at a rate that maintains a ten year average meter age. A cost / benefit analysis was conducted in 2002 by EPWU staff in order to estimate the appropriate time to change out small meters. Based on the results, it is recommended that the optimal meter age of replacement is 10 to 11 years. This will capture low water flows and ultimately raise revenue.
Page 4
Landscaping
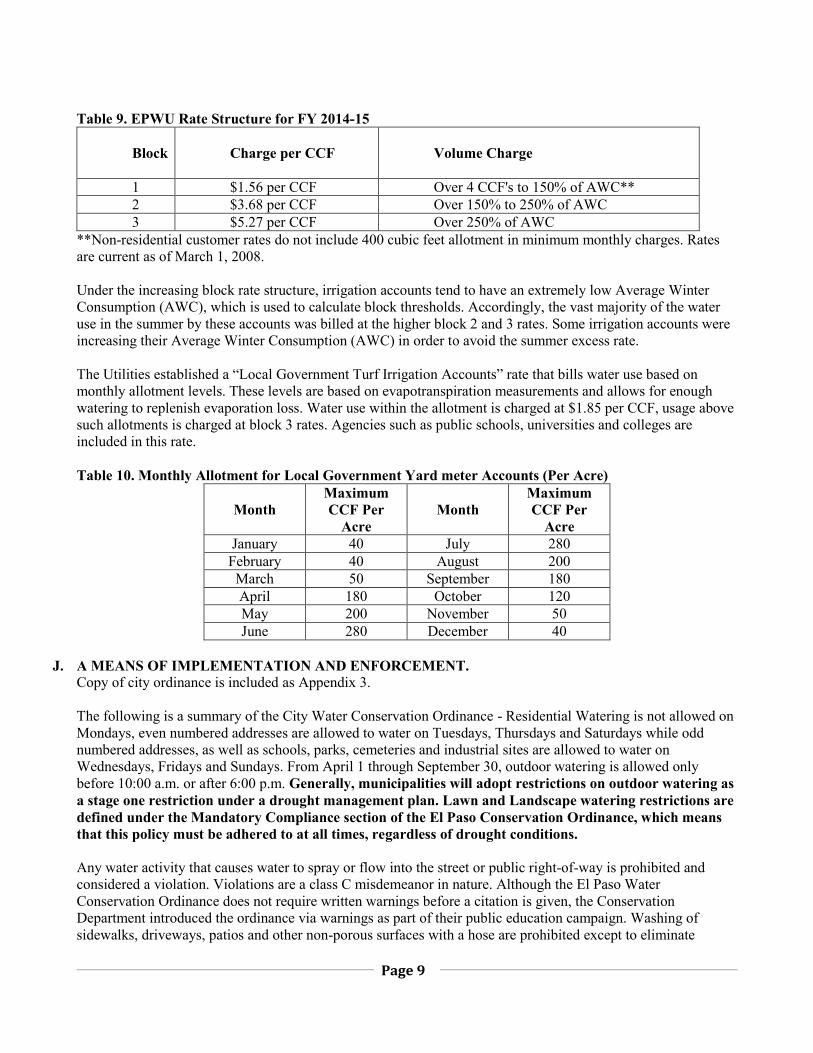
For many years, EPWU offered a Turf Rebate program that was not only successful but very popular. The utilities discontinued such rebate along with other rebates because the per capita consumption goal was achieved. The rebates ended in 2007 and per capita consumption has been maintained as shown on Chart 1 above. We continue to offer educational programs in many topics including landscaping. In April 2013, the EPWU sponsored a Water Audit Certification class for city employees and local landscapers followed by a testing and certification program, 22 attendees to the course and test. El Paso Water Utilities offers free irrigation audits upon request. Many of such requests are for city parks, school athletic fields. Indoor and Outdoor Water Use Reviews are free educational programs offered by El Paso Water Utilities Conservation Department designed to help residents and businesses save on their monthly bill by understanding how to efficiently use water indoors and outdoors. Indoor use review includes explanation of the water bill and the Average Winter Consumption (AWC), checking for toilet leaks, measure the flow of water from faucets and showerheads to determine how many gallons per minute are used, how to irrigate your lawn and apply water more efficiently, and explain the Water Conservation Ordinance. The Outdoor Water Use Review includes a site evaluation which identifies any problem areas with the irrigation system and runoff. We test for irrigation distribution uniformity to help determine the irrigation schedule. A detailed report on system management recommendations is mailed. We provide brochures containing plant lists and other plant material watering guidelines. Both reviews include making recommendations on other water conservation practices and provide brochures with water conservation information. Additionally, EPWU has implemented a Monthly Allotment for Local Government Yard meter Accounts (Per Acre), see Table 5, for the purpose of curtailing excess irrigation, especially during the hot summer months. A uniform rate of $2.01 per CCF is charged under the allotment figures, any usage by the local government turf irrigation account in excess of the monthly allotment is billed at the Block 3 rates, currently, $5.27 per CCF.
Education and Public Awareness
Public Information: Please refer to section I for explanation of this BMP. School Education: Education is an important part of the EPWU Water Conservation Program. The El Paso Water Utilities’ Carlos M. Ramirez TecH2O Water Resources Learning Center is on its 7th year of operations. The Center serves educators, students, policy makers and the public by providing meeting places and resources to promote the understanding and study of water and water issues. It includes a 250-seat auditorium, a training center, interactive exhibits, and display and demonstration projects. The TecH2O Center is ideal for regional, national and international symposiums and conferences. El Paso Water Utilities is involved in many activities to increase public awareness about its water resources. The Water Conservation Education Department strives to increase water consciousness throughout the community and area schools. The El Paso area faces unique water challenges and it is our obligation to deliver this information throughout the area to help others understand how crucial it is to work collectively as a region to address the critical water issues. Our intent is to deliver the information in a meaningful and understanding way for all age groups. The El Paso Water Utilities Water Conservation program holds workshops and training sessions throughout the community on various subjects related to water conservation. The following table demonstrates the number of educational events and attendees held at the center; the number of outreach events to schools and other venues as well as attendees for such events. We don’t foresee a substantial increment on presentations as currently we are fully staffed and there are no plans to increase staffing levels.
Page 5
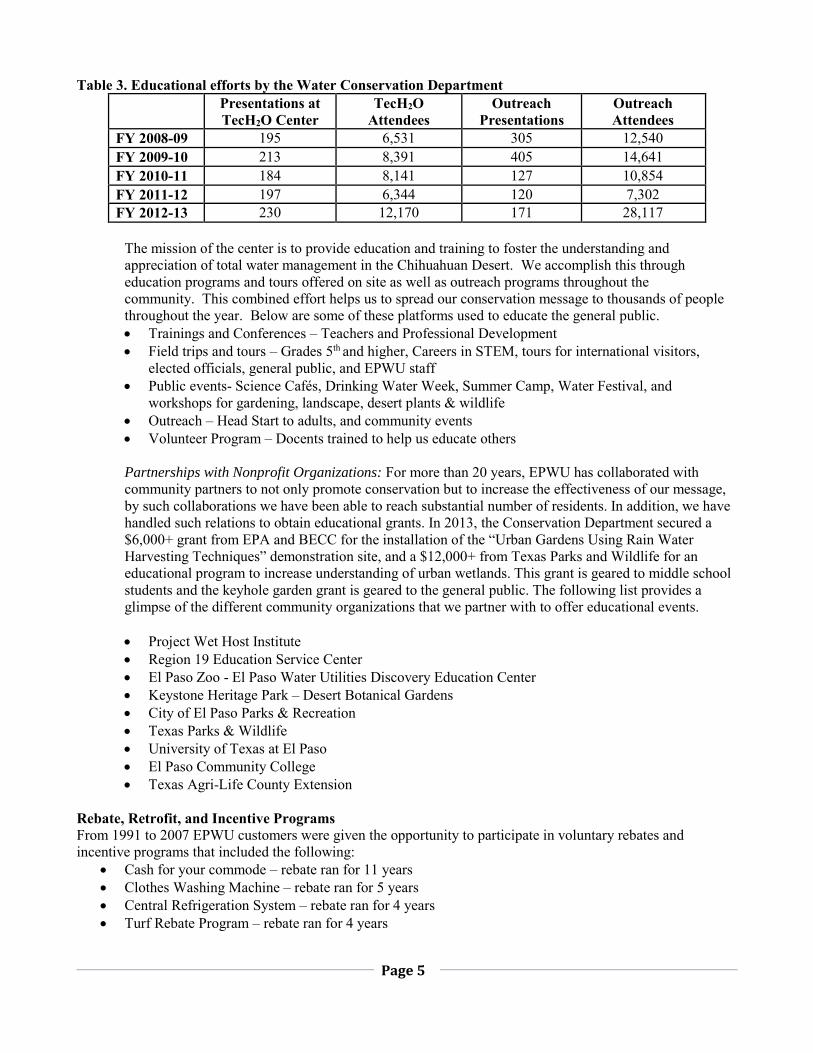
Table 3. Educational efforts by the Water Conservation Department Presentations at
TecH2O Center TecH2O
Attendees Outreach
Presentations Outreach Attendees
FY 2008-09 195 6,531 305 12,540 FY 2009-10 213 8,391 405 14,641 FY 2010-11 184 8,141 127 10,854 FY 2011-12 197 6,344 120 7,302 FY 2012-13 230 12,170 171 28,117
The mission of the center is to provide education and training to foster the understanding and appreciation of total water management in the Chihuahuan Desert. We accomplish this through education programs and tours offered on site as well as outreach programs throughout the community. This combined effort helps us to spread our conservation message to thousands of people throughout the year. Below are some of these platforms used to educate the general public. Trainings and Conferences – Teachers and Professional Development Field trips and tours – Grades 5th and higher, Careers in STEM, tours for international visitors,
elected officials, general public, and EPWU staff Public events- Science Cafés, Drinking Water Week, Summer Camp, Water Festival, and
workshops for gardening, landscape, desert plants & wildlife Outreach – Head Start to adults, and community events Volunteer Program – Docents trained to help us educate others Partnerships with Nonprofit Organizations: For more than 20 years, EPWU has collaborated with community partners to not only promote conservation but to increase the effectiveness of our message, by such collaborations we have been able to reach substantial number of residents. In addition, we have handled such relations to obtain educational grants. In 2013, the Conservation Department secured a $6,000+ grant from EPA and BECC for the installation of the “Urban Gardens Using Rain Water Harvesting Techniques” demonstration site, and a $12,000+ from Texas Parks and Wildlife for an educational program to increase understanding of urban wetlands. This grant is geared to middle school students and the keyhole garden grant is geared to the general public. The following list provides a glimpse of the different community organizations that we partner with to offer educational events. Project Wet Host Institute Region 19 Education Service Center El Paso Zoo - El Paso Water Utilities Discovery Education Center Keystone Heritage Park – Desert Botanical Gardens City of El Paso Parks & Recreation Texas Parks & Wildlife University of Texas at El Paso El Paso Community College Texas Agri-Life County Extension
Rebate, Retrofit, and Incentive Programs From 1991 to 2007 EPWU customers were given the opportunity to participate in voluntary rebates and incentive programs that included the following:
Cash for your commode – rebate ran for 11 years Clothes Washing Machine – rebate ran for 5 years Central Refrigeration System – rebate ran for 4 years Turf Rebate Program – rebate ran for 4 years
Page 6
Low-flow Showerhead distribution – EPWU had two large programs one in 2001 the other started in 2008 to present
Faucet aerators for bathrooms and kitchens – available since 1991 to present Evaporative Air Conditioner Bleed-off Clamps – available since 1991 to present Waterless Urinals for commercial and governmental accounts – distribution of free urinals ran for 3
years Hot Water On Demand – Pilot program only ran for 2 years. This was stopped due to low participation. Leak Adjustment for Low Income – Pilot program only ran for a couple of years and it was stopped due
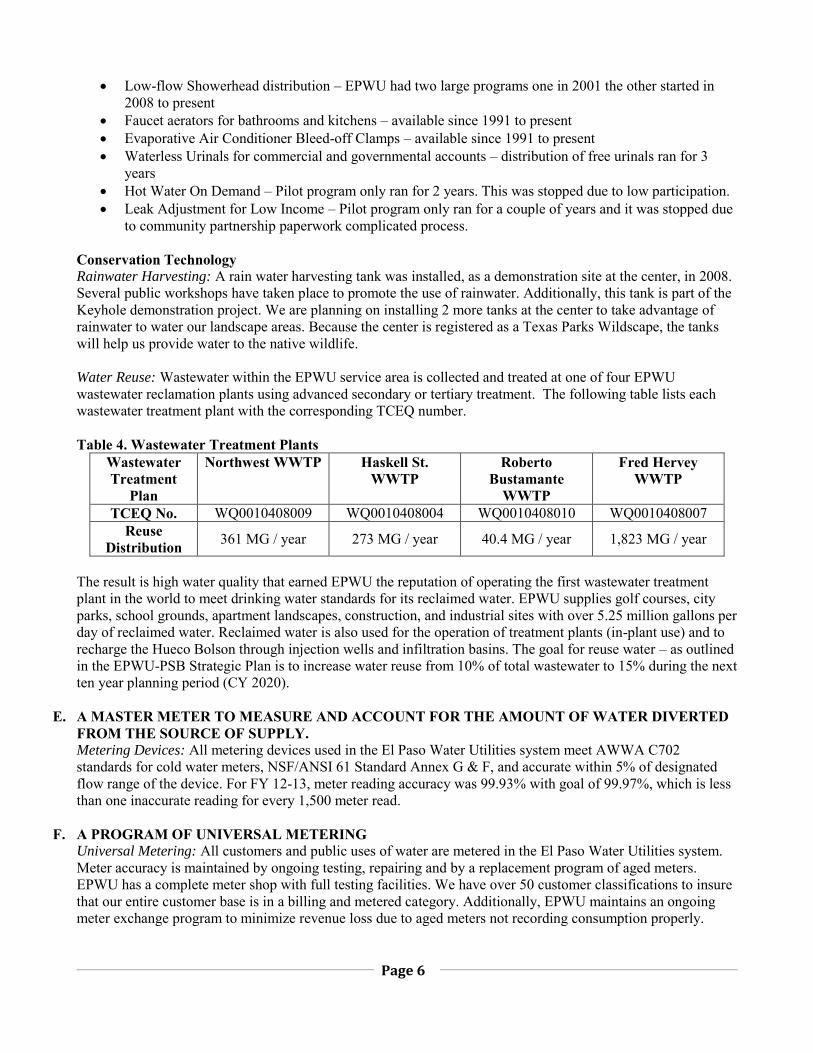
to community partnership paperwork complicated process. Conservation Technology Rainwater Harvesting: A rain water harvesting tank was installed, as a demonstration site at the center, in 2008. Several public workshops have taken place to promote the use of rainwater. Additionally, this tank is part of the Keyhole demonstration project. We are planning on installing 2 more tanks at the center to take advantage of rainwater to water our landscape areas. Because the center is registered as a Texas Parks Wildscape, the tanks will help us provide water to the native wildlife. Water Reuse: Wastewater within the EPWU service area is collected and treated at one of four EPWU wastewater reclamation plants using advanced secondary or tertiary treatment. The following table lists each wastewater treatment plant with the corresponding TCEQ number. Table 4. Wastewater Treatment Plants
Wastewater Treatment
Plan
Northwest WWTP Haskell St. WWTP
Roberto Bustamante
WWTP
Fred Hervey WWTP
TCEQ No. WQ0010408009 WQ0010408004 WQ0010408010 WQ0010408007 Reuse
Distribution 361 MG / year 273 MG / year 40.4 MG / year 1,823 MG / year
The result is high water quality that earned EPWU the reputation of operating the first wastewater treatment plant in the world to meet drinking water standards for its reclaimed water. EPWU supplies golf courses, city parks, school grounds, apartment landscapes, construction, and industrial sites with over 5.25 million gallons per day of reclaimed water. Reclaimed water is also used for the operation of treatment plants (in-plant use) and to recharge the Hueco Bolson through injection wells and infiltration basins. The goal for reuse water – as outlined in the EPWU-PSB Strategic Plan is to increase water reuse from 10% of total wastewater to 15% during the next ten year planning period (CY 2020).
E. A MASTER METER TO MEASURE AND ACCOUNT FOR THE AMOUNT OF WATER DIVERTED FROM THE SOURCE OF SUPPLY. Metering Devices: All metering devices used in the El Paso Water Utilities system meet AWWA C702 standards for cold water meters, NSF/ANSI 61 Standard Annex G & F, and accurate within 5% of designated flow range of the device. For FY 12-13, meter reading accuracy was 99.93% with goal of 99.97%, which is less than one inaccurate reading for every 1,500 meter read.
F. A PROGRAM OF UNIVERSAL METERING Universal Metering: All customers and public uses of water are metered in the El Paso Water Utilities system. Meter accuracy is maintained by ongoing testing, repairing and by a replacement program of aged meters. EPWU has a complete meter shop with full testing facilities. We have over 50 customer classifications to insure that our entire customer base is in a billing and metered category. Additionally, EPWU maintains an ongoing meter exchange program to minimize revenue loss due to aged meters not recording consumption properly.
Page 7
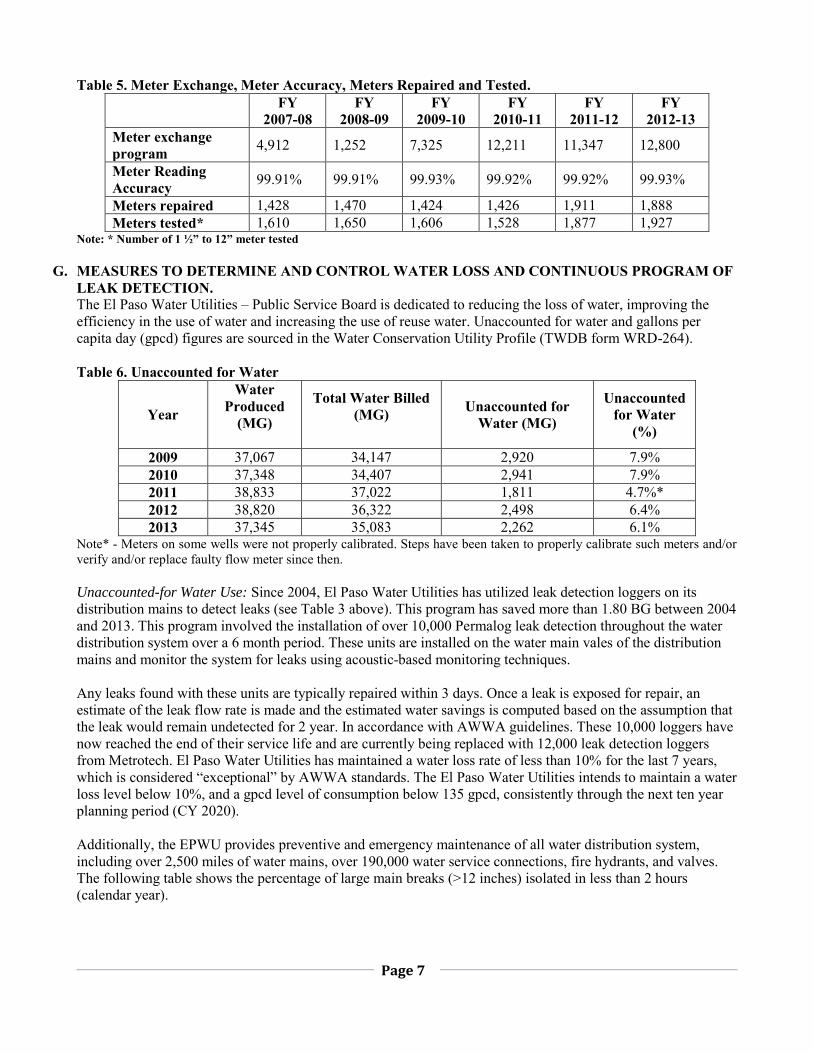
Table 5. Meter Exchange, Meter Accuracy, Meters Repaired and Tested. FY
2007-08 FY
2008-09 FY
2009-10 FY
2010-11 FY
2011-12 FY
2012-13 Meter exchange program 4,912 1,252 7,325 12,211 11,347 12,800
Meter Reading Accuracy 99.91% 99.91% 99.93% 99.92% 99.92% 99.93%
Meters repaired 1,428 1,470 1,424 1,426 1,911 1,888 Meters tested* 1,610 1,650 1,606 1,528 1,877 1,927
Note: * Number of 1 ½” to 12” meter tested
G. MEASURES TO DETERMINE AND CONTROL WATER LOSS AND CONTINUOUS PROGRAM OF LEAK DETECTION. The El Paso Water Utilities – Public Service Board is dedicated to reducing the loss of water, improving the efficiency in the use of water and increasing the use of reuse water. Unaccounted for water and gallons per capita day (gpcd) figures are sourced in the Water Conservation Utility Profile (TWDB form WRD-264). Table 6. Unaccounted for Water
Year
Water Produced
(MG)
Total Water Billed (MG)
Unaccounted for Water (MG)
Unaccounted for Water
(%)
2009 37,067 34,147 2,920 7.9% 2010 37,348 34,407 2,941 7.9% 2011 38,833 37,022 1,811 4.7%* 2012 38,820 36,322 2,498 6.4% 2013 37,345 35,083 2,262 6.1%
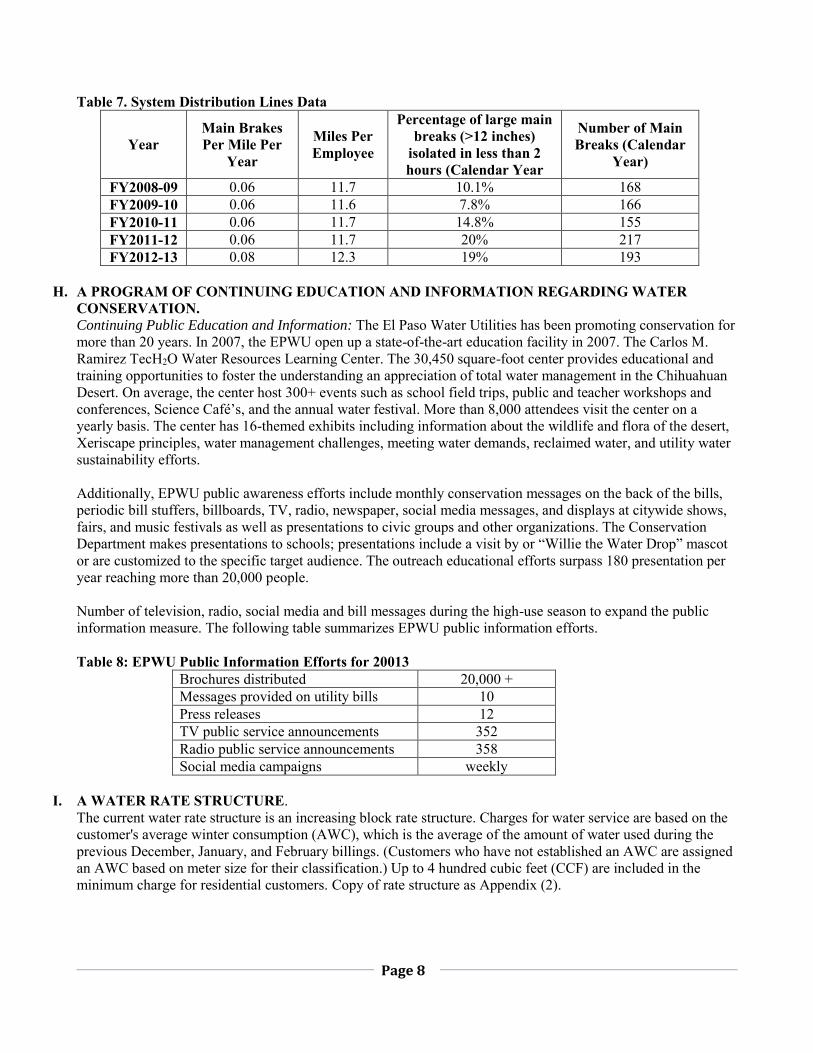
Note* - Meters on some wells were not properly calibrated. Steps have been taken to properly calibrate such meters and/or verify and/or replace faulty flow meter since then. Unaccounted-for Water Use: Since 2004, El Paso Water Utilities has utilized leak detection loggers on its distribution mains to detect leaks (see Table 3 above). This program has saved more than 1.80 BG between 2004 and 2013. This program involved the installation of over 10,000 Permalog leak detection throughout the water distribution system over a 6 month period. These units are installed on the water main vales of the distribution mains and monitor the system for leaks using acoustic-based monitoring techniques. Any leaks found with these units are typically repaired within 3 days. Once a leak is exposed for repair, an estimate of the leak flow rate is made and the estimated water savings is computed based on the assumption that the leak would remain undetected for 2 year. In accordance with AWWA guidelines. These 10,000 loggers have now reached the end of their service life and are currently being replaced with 12,000 leak detection loggers from Metrotech. El Paso Water Utilities has maintained a water loss rate of less than 10% for the last 7 years, which is considered “exceptional” by AWWA standards. The El Paso Water Utilities intends to maintain a water loss level below 10%, and a gpcd level of consumption below 135 gpcd, consistently through the next ten year planning period (CY 2020). Additionally, the EPWU provides preventive and emergency maintenance of all water distribution system, including over 2,500 miles of water mains, over 190,000 water service connections, fire hydrants, and valves. The following table shows the percentage of large main breaks (>12 inches) isolated in less than 2 hours (calendar year).
Page 8
Table 7. System Distribution Lines Data
Year Main Brakes Per Mile Per
Year
Miles Per Employee
Percentage of large main breaks (>12 inches)
isolated in less than 2 hours (Calendar Year
Number of Main Breaks (Calendar
Year)
FY2008-09 0.06 11.7 10.1% 168 FY2009-10 0.06 11.6 7.8% 166 FY2010-11 0.06 11.7 14.8% 155 FY2011-12 0.06 11.7 20% 217 FY2012-13 0.08 12.3 19% 193
H. A PROGRAM OF CONTINUING EDUCATION AND INFORMATION REGARDING WATER
CONSERVATION. Continuing Public Education and Information: The El Paso Water Utilities has been promoting conservation for more than 20 years. In 2007, the EPWU open up a state-of-the-art education facility in 2007. The Carlos M. Ramirez TecH2O Water Resources Learning Center. The 30,450 square-foot center provides educational and training opportunities to foster the understanding an appreciation of total water management in the Chihuahuan Desert. On average, the center host 300+ events such as school field trips, public and teacher workshops and conferences, Science Café’s, and the annual water festival. More than 8,000 attendees visit the center on a yearly basis. The center has 16-themed exhibits including information about the wildlife and flora of the desert, Xeriscape principles, water management challenges, meeting water demands, reclaimed water, and utility water sustainability efforts. Additionally, EPWU public awareness efforts include monthly conservation messages on the back of the bills, periodic bill stuffers, billboards, TV, radio, newspaper, social media messages, and displays at citywide shows, fairs, and music festivals as well as presentations to civic groups and other organizations. The Conservation Department makes presentations to schools; presentations include a visit by or “Willie the Water Drop” mascot or are customized to the specific target audience. The outreach educational efforts surpass 180 presentation per year reaching more than 20,000 people. Number of television, radio, social media and bill messages during the high-use season to expand the public information measure. The following table summarizes EPWU public information efforts. Table 8: EPWU Public Information Efforts for 20013
Brochures distributed 20,000 + Messages provided on utility bills 10 Press releases 12 TV public service announcements 352 Radio public service announcements 358 Social media campaigns weekly
I. A WATER RATE STRUCTURE.
The current water rate structure is an increasing block rate structure. Charges for water service are based on the customer's average winter consumption (AWC), which is the average of the amount of water used during the previous December, January, and February billings. (Customers who have not established an AWC are assigned an AWC based on meter size for their classification.) Up to 4 hundred cubic feet (CCF) are included in the minimum charge for residential customers. Copy of rate structure as Appendix (2).
Page 9
Table 9. EPWU Rate Structure for FY 2014-15
Block
Charge per CCF
Volume Charge
1 $1.56 per CCF Over 4 CCF's to 150% of AWC** 2 $3.68 per CCF Over 150% to 250% of AWC 3 $5.27 per CCF Over 250% of AWC
**Non-residential customer rates do not include 400 cubic feet allotment in minimum monthly charges. Rates are current as of March 1, 2008. Under the increasing block rate structure, irrigation accounts tend to have an extremely low Average Winter Consumption (AWC), which is used to calculate block thresholds. Accordingly, the vast majority of the water use in the summer by these accounts was billed at the higher block 2 and 3 rates. Some irrigation accounts were increasing their Average Winter Consumption (AWC) in order to avoid the summer excess rate. The Utilities established a “Local Government Turf Irrigation Accounts” rate that bills water use based on monthly allotment levels. These levels are based on evapotranspiration measurements and allows for enough watering to replenish evaporation loss. Water use within the allotment is charged at $1.85 per CCF, usage above such allotments is charged at block 3 rates. Agencies such as public schools, universities and colleges are included in this rate. Table 10. Monthly Allotment for Local Government Yard meter Accounts (Per Acre)
Month Maximum CCF Per
Acre Month
Maximum CCF Per
Acre January 40 July 280
February 40 August 200 March 50 September 180 April 180 October 120 May 200 November 50 June 280 December 40
J. A MEANS OF IMPLEMENTATION AND ENFORCEMENT.
Copy of city ordinance is included as Appendix 3. The following is a summary of the City Water Conservation Ordinance - Residential Watering is not allowed on Mondays, even numbered addresses are allowed to water on Tuesdays, Thursdays and Saturdays while odd numbered addresses, as well as schools, parks, cemeteries and industrial sites are allowed to water on Wednesdays, Fridays and Sundays. From April 1 through September 30, outdoor watering is allowed only before 10:00 a.m. or after 6:00 p.m. Generally, municipalities will adopt restrictions on outdoor watering as a stage one restriction under a drought management plan. Lawn and Landscape watering restrictions are defined under the Mandatory Compliance section of the El Paso Conservation Ordinance, which means that this policy must be adhered to at all times, regardless of drought conditions. Any water activity that causes water to spray or flow into the street or public right-of-way is prohibited and considered a violation. Violations are a class C misdemeanor in nature. Although the El Paso Water Conservation Ordinance does not require written warnings before a citation is given, the Conservation Department introduced the ordinance via warnings as part of their public education campaign. Washing of sidewalks, driveways, patios and other non-porous surfaces with a hose are prohibited except to eliminate
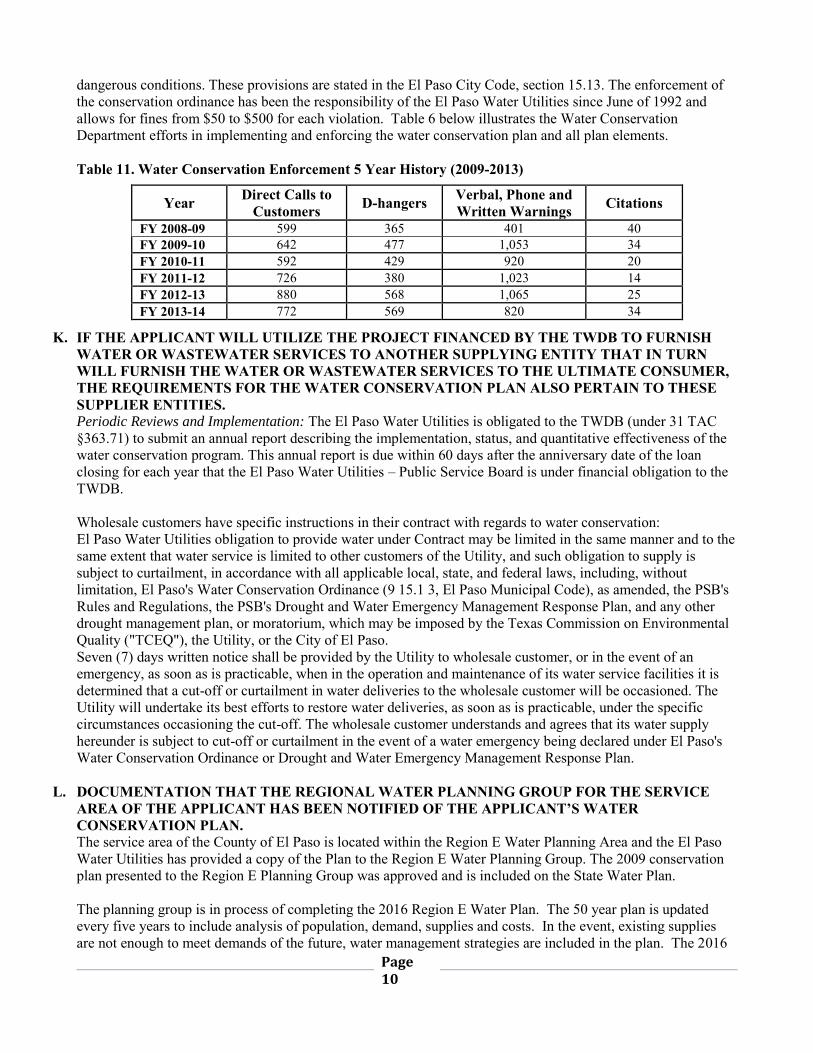
Page 10
dangerous conditions. These provisions are stated in the El Paso City Code, section 15.13. The enforcement of the conservation ordinance has been the responsibility of the El Paso Water Utilities since June of 1992 and allows for fines from $50 to $500 for each violation. Table 6 below illustrates the Water Conservation Department efforts in implementing and enforcing the water conservation plan and all plan elements. Table 11. Water Conservation Enforcement 5 Year History (2009-2013)
K. IF THE APPLICANT WILL UTILIZE THE PROJECT FINANCED BY THE TWDB TO FURNISH WATER OR WASTEWATER SERVICES TO ANOTHER SUPPLYING ENTITY THAT IN TURN WILL FURNISH THE WATER OR WASTEWATER SERVICES TO THE ULTIMATE CONSUMER, THE REQUIREMENTS FOR THE WATER CONSERVATION PLAN ALSO PERTAIN TO THESE SUPPLIER ENTITIES. Periodic Reviews and Implementation: The El Paso Water Utilities is obligated to the TWDB (under 31 TAC §363.71) to submit an annual report describing the implementation, status, and quantitative effectiveness of the water conservation program. This annual report is due within 60 days after the anniversary date of the loan closing for each year that the El Paso Water Utilities – Public Service Board is under financial obligation to the TWDB.
Wholesale customers have specific instructions in their contract with regards to water conservation: El Paso Water Utilities obligation to provide water under Contract may be limited in the same manner and to the same extent that water service is limited to other customers of the Utility, and such obligation to supply is subject to curtailment, in accordance with all applicable local, state, and federal laws, including, without limitation, El Paso's Water Conservation Ordinance (9 15.1 3, El Paso Municipal Code), as amended, the PSB's Rules and Regulations, the PSB's Drought and Water Emergency Management Response Plan, and any other drought management plan, or moratorium, which may be imposed by the Texas Commission on Environmental Quality ("TCEQ"), the Utility, or the City of El Paso. Seven (7) days written notice shall be provided by the Utility to wholesale customer, or in the event of an emergency, as soon as is practicable, when in the operation and maintenance of its water service facilities it is determined that a cut-off or curtailment in water deliveries to the wholesale customer will be occasioned. The Utility will undertake its best efforts to restore water deliveries, as soon as is practicable, under the specific circumstances occasioning the cut-off. The wholesale customer understands and agrees that its water supply hereunder is subject to cut-off or curtailment in the event of a water emergency being declared under El Paso's Water Conservation Ordinance or Drought and Water Emergency Management Response Plan.
L. DOCUMENTATION THAT THE REGIONAL WATER PLANNING GROUP FOR THE SERVICE AREA OF THE APPLICANT HAS BEEN NOTIFIED OF THE APPLICANT’S WATER CONSERVATION PLAN. The service area of the County of El Paso is located within the Region E Water Planning Area and the El Paso Water Utilities has provided a copy of the Plan to the Region E Water Planning Group. The 2009 conservation plan presented to the Region E Planning Group was approved and is included on the State Water Plan. The planning group is in process of completing the 2016 Region E Water Plan. The 50 year plan is updated every five years to include analysis of population, demand, supplies and costs. In the event, existing supplies are not enough to meet demands of the future, water management strategies are included in the plan. The 2016
Year Direct Calls to Customers D-hangers Verbal, Phone and
Written Warnings Citations
FY 2008-09 599 365 401 40 FY 2009-10 642 477 1,053 34 FY 2010-11 592 429 920 20 FY 2011-12 726 380 1,023 14 FY 2012-13 880 568 1,065 25 FY 2013-14 772 569 820 34
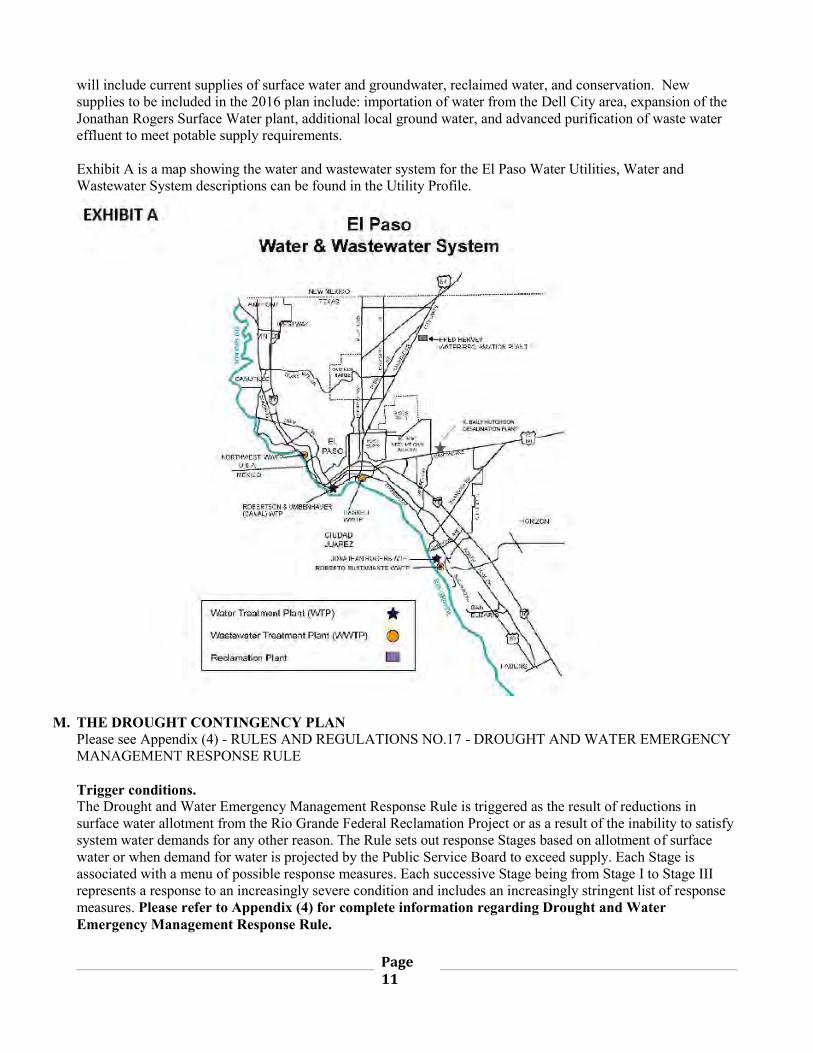
Page 11
will include current supplies of surface water and groundwater, reclaimed water, and conservation. New supplies to be included in the 2016 plan include: importation of water from the Dell City area, expansion of the Jonathan Rogers Surface Water plant, additional local ground water, and advanced purification of waste water effluent to meet potable supply requirements. Exhibit A is a map showing the water and wastewater system for the El Paso Water Utilities, Water and Wastewater System descriptions can be found in the Utility Profile.
M. THE DROUGHT CONTINGENCY PLAN Please see Appendix (4) - RULES AND REGULATIONS NO.17 - DROUGHT AND WATER EMERGENCY MANAGEMENT RESPONSE RULE Trigger conditions. The Drought and Water Emergency Management Response Rule is triggered as the result of reductions in surface water allotment from the Rio Grande Federal Reclamation Project or as a result of the inability to satisfy system water demands for any other reason. The Rule sets out response Stages based on allotment of surface water or when demand for water is projected by the Public Service Board to exceed supply. Each Stage is associated with a menu of possible response measures. Each successive Stage being from Stage I to Stage III represents a response to an increasingly severe condition and includes an increasingly stringent list of response measures. Please refer to Appendix (4) for complete information regarding Drought and Water Emergency Management Response Rule.
Page 12
WHOLESALE WATER CUSTOMERS In accordance with Texas Water Code Section 11.039, when necessary as determined by the EPWU, water deliveries to wholesale water customers shall be curtailed on a pro-rata basis. Every wholesale water contract entered into or renewed after adoption of this Rule, including contract extensions, shall include a provision that in the case of a drought or water emergency declaration, water to be distributed shall be divided in accordance with Texas Water Code Section 11.039.
Measures to inform and educate the public. Involving the public in the preparation of the drought contingency plan provides an important means for education the public about the need for the plan and its content. EPWU is prepared to launch a comprehensive public campaign to notify the public regarding the different states of the drought and/or emergency situation included but not limited to television and radio spots, newspaper articles, messages on the water bill and all social media platforms as well as “message on hold” on our telephone system. z
N. ADOPTION. There are no changes to the Drought and Water Emergency Management Response Plan (November 2002), therefore, approval by the Public Service Board is not necessary for this update.
O. REPORTING REQUIREMENTS. Identify who will be responsible for preparing the annual report on the utility profile from TWDB-1965. Loan/Grant Recipients must maintain an approved water conservation program in effect until all financial obligations to the state have been discharge and shall report annually to the executive administrator of the TWDB on the progress in implementing each of the minimum requirements in its water conservation plan and the status of any of its customer’s water conservation plan required by contract. The content and format for the annual reporting is included in the forms: Water Conservation Plan Annual Report, TWDB-1966 for retail water suppliers, TWDB-1967 for non-water suppliers and TWDB-1969 for wholesale water suppliers. The final requirement is to report annually on the effectiveness of your Plan by submitting a Water Conservation Plan Annual report every year. The Annual Report (AR) is due May 1st of every year. There are three different AS form; one for retail water suppliers, one for wholesale water suppliers, and one for non-water suppliers. The AR should be submitted using the online forms. AR tutorials are provided to assist with submitting these forms. Once your plan is submitted, TWDB staff will review your Plan for completeness. Additional comments or questions should be directed to [email protected] For information and assistance for utilities requesting TWDB financial assistance contact:
Water Conservation Plans
Texas Water Development Board P.O. Box 13231
Austin, Texas 78711-3231 [email protected]
(512) 463-7955
Page 13
APPENDIX LIST
I. 2014 Utility Profile form that was submitted to the TCEQ for El Paso Water Utilities
II. Current Rate Structure
III. City of El Paso Water Conservation Ordinance
IV. Rules and Regulation NO.17 – Drought and Water Emergency Management Response Rule
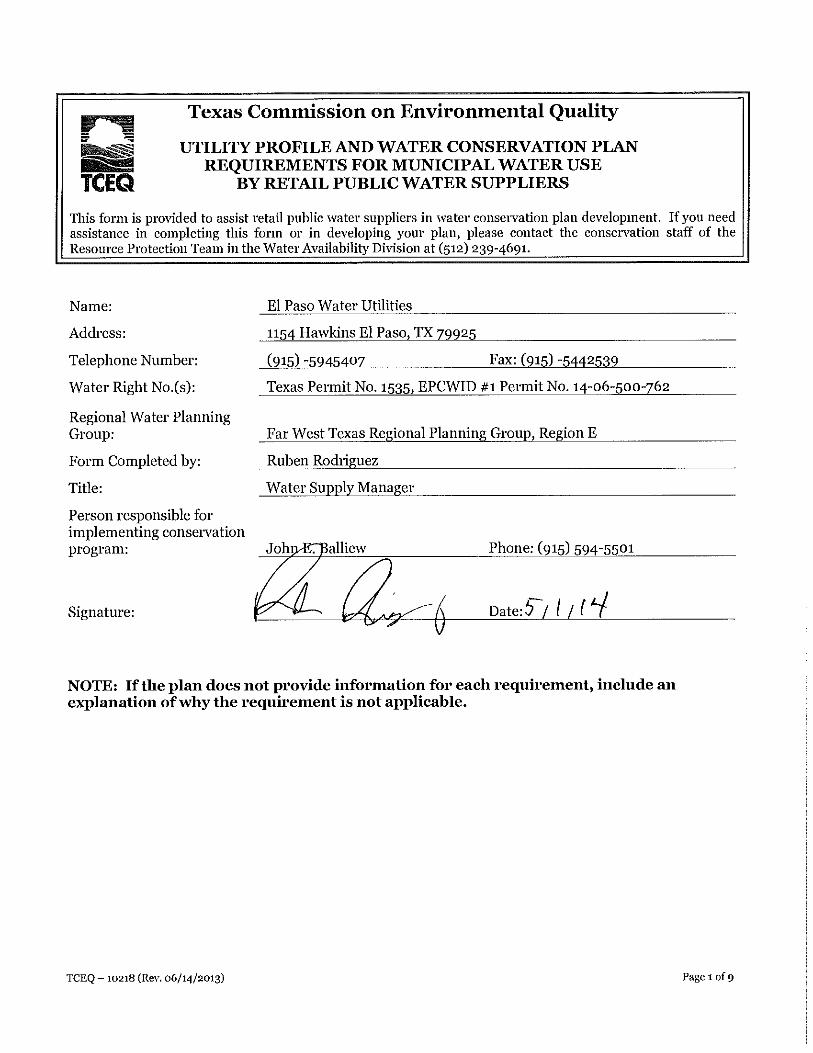
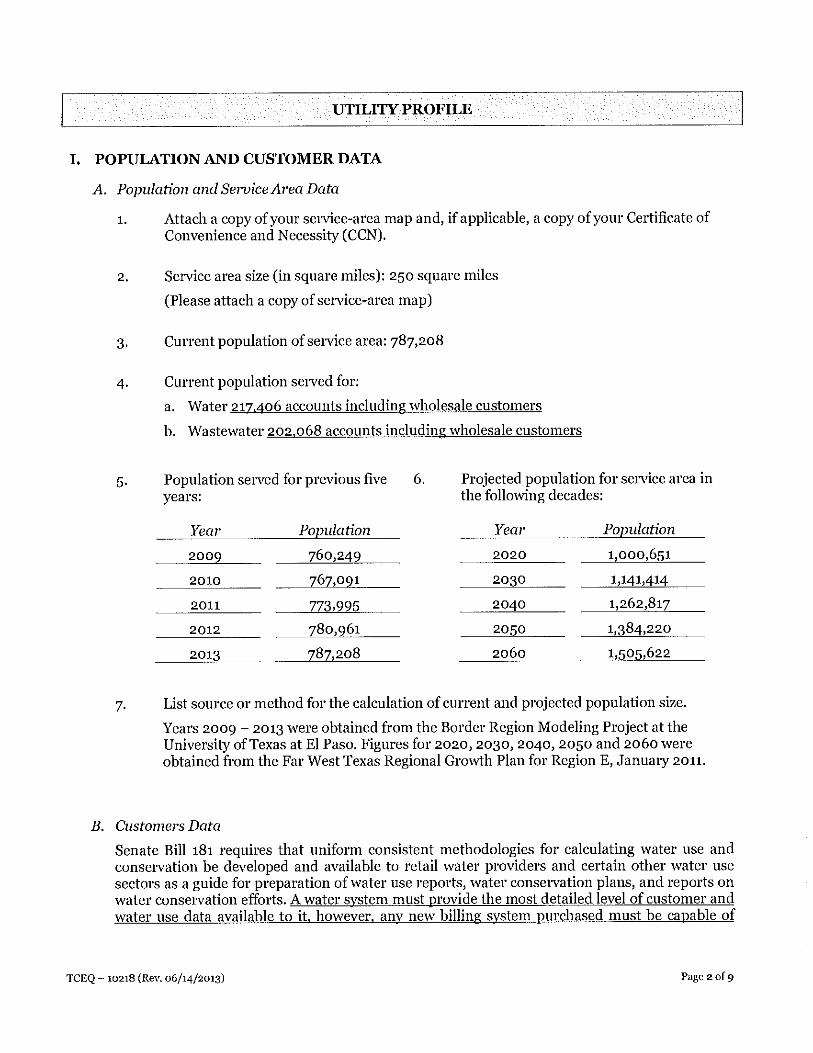
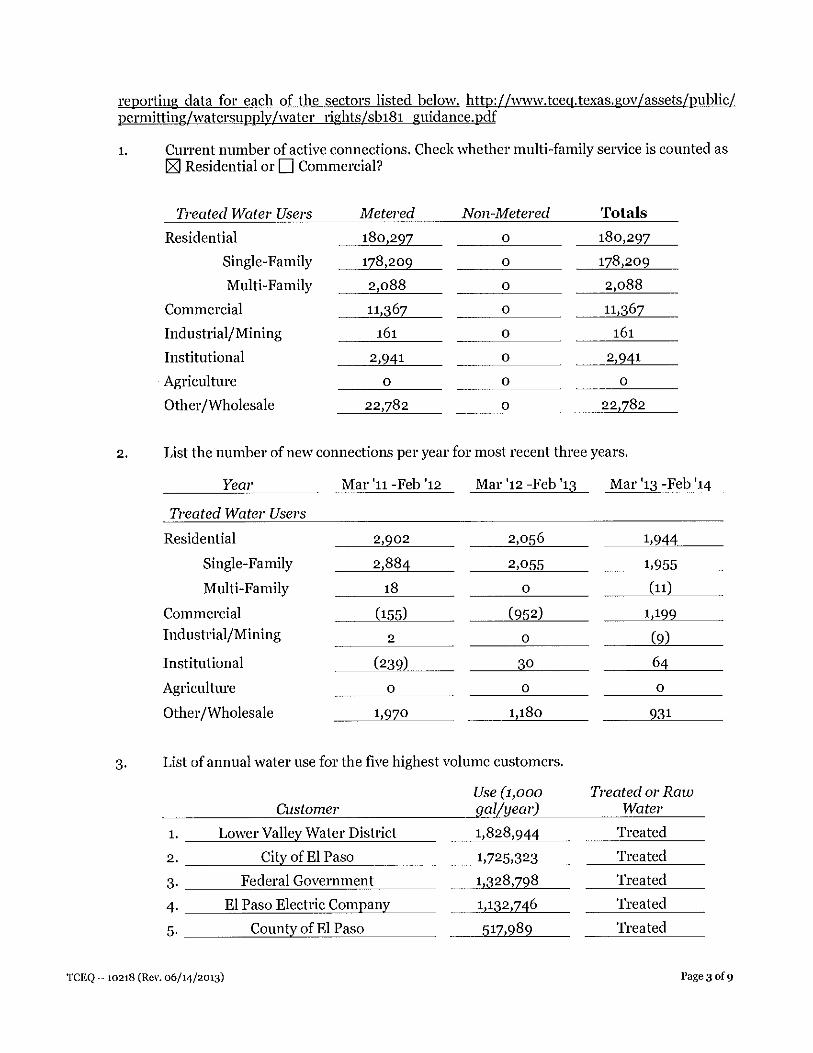
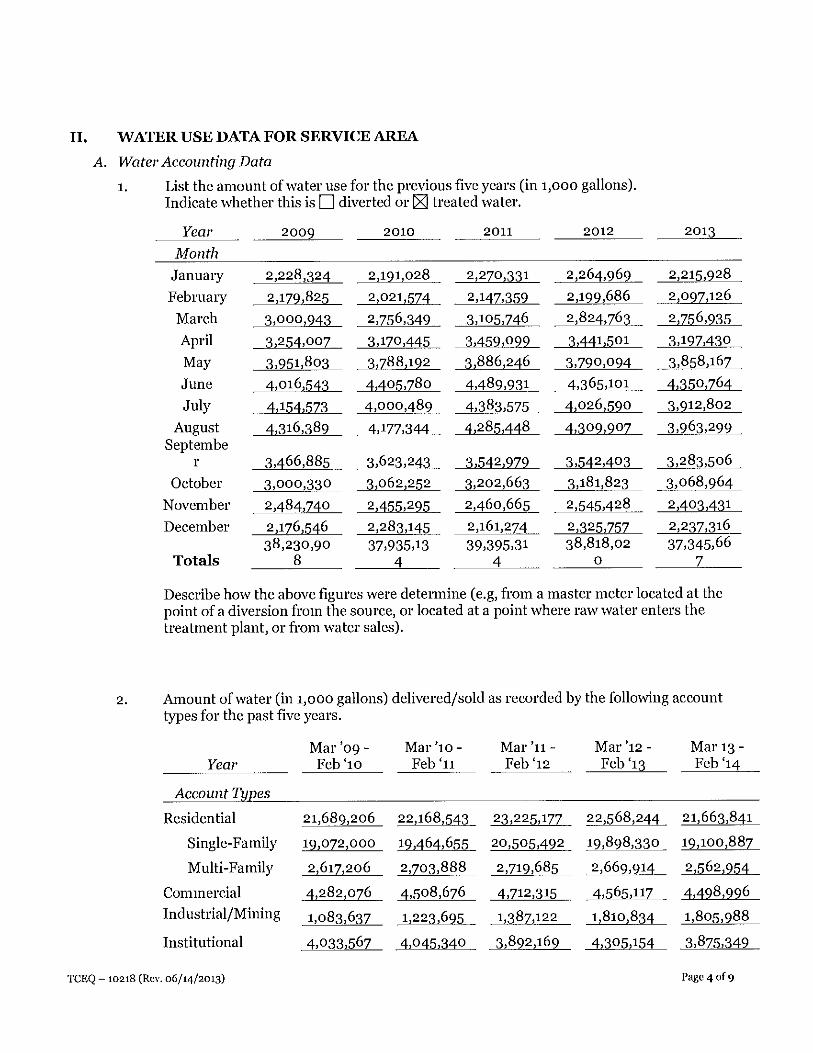
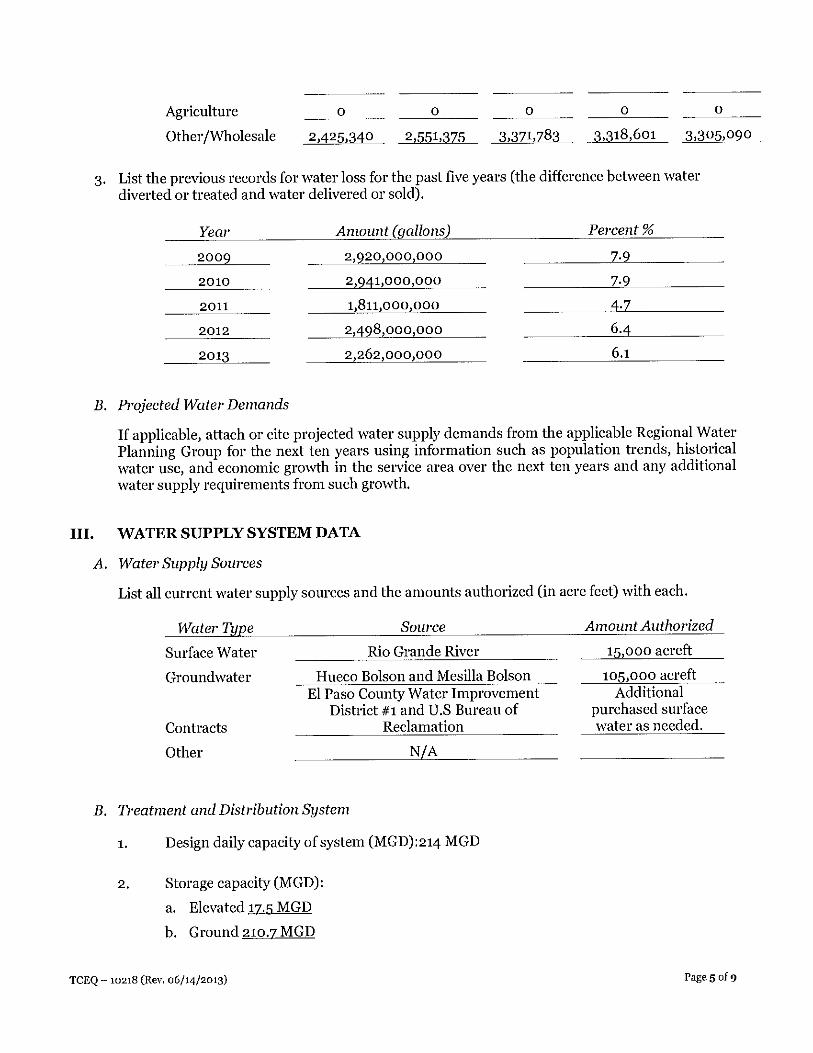
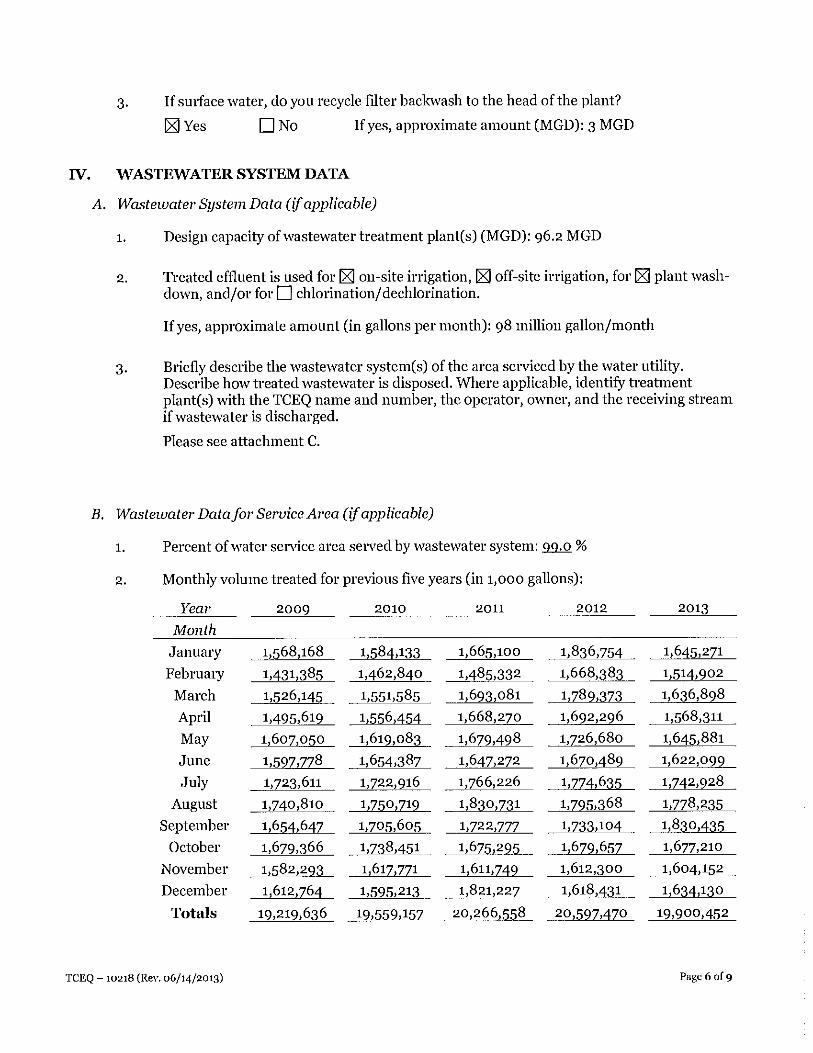
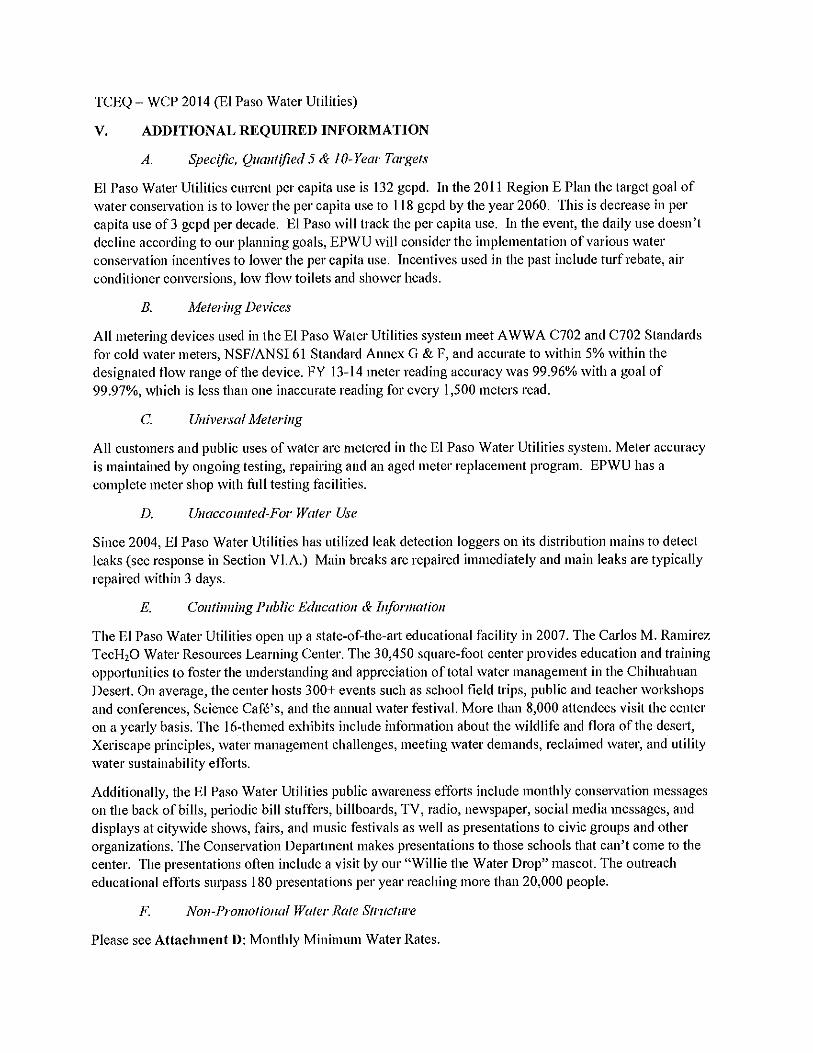
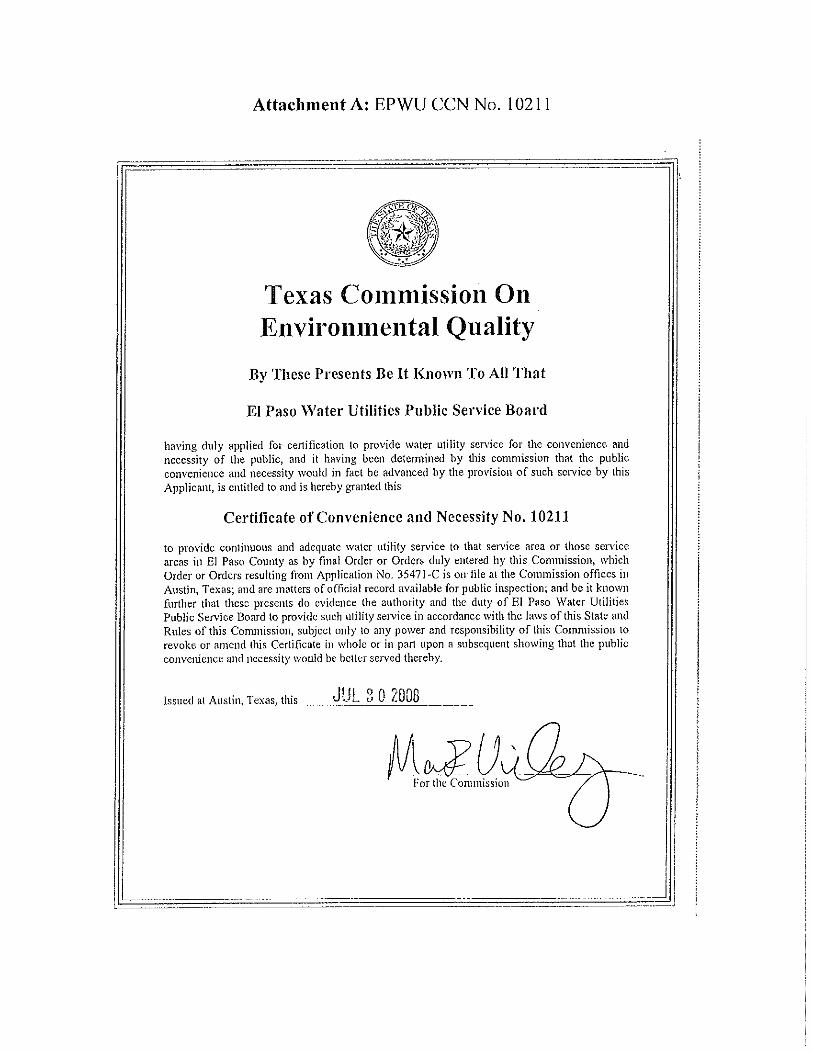
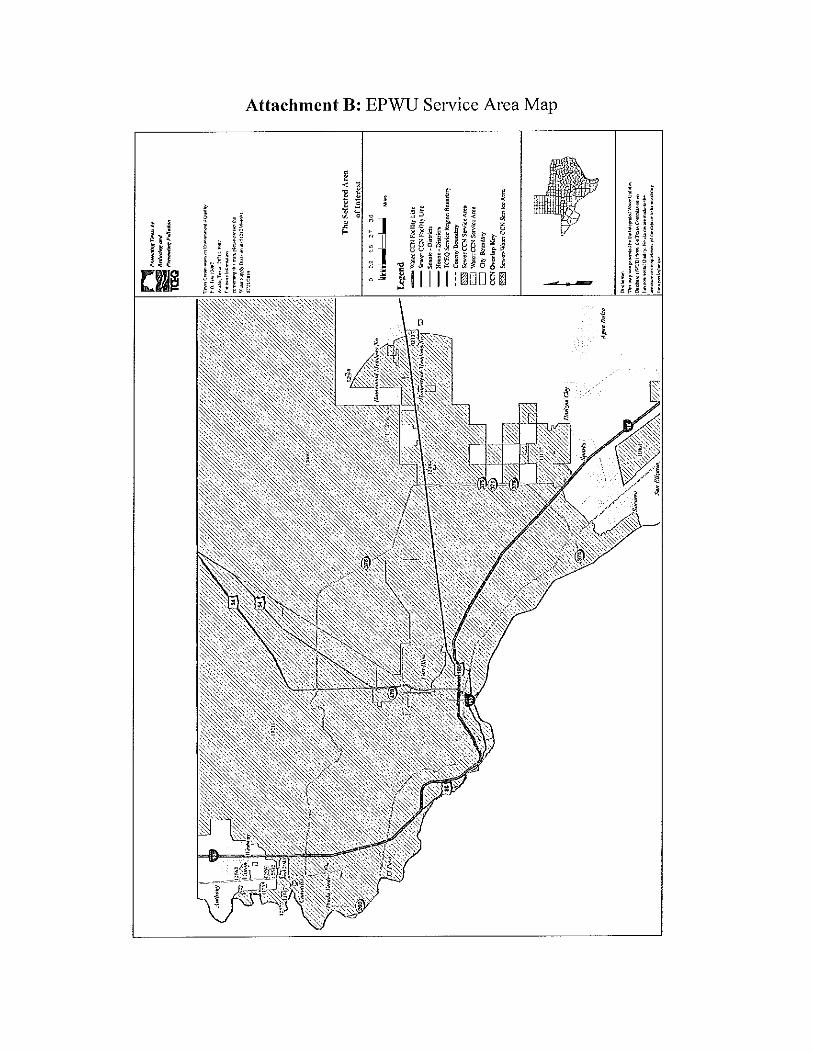
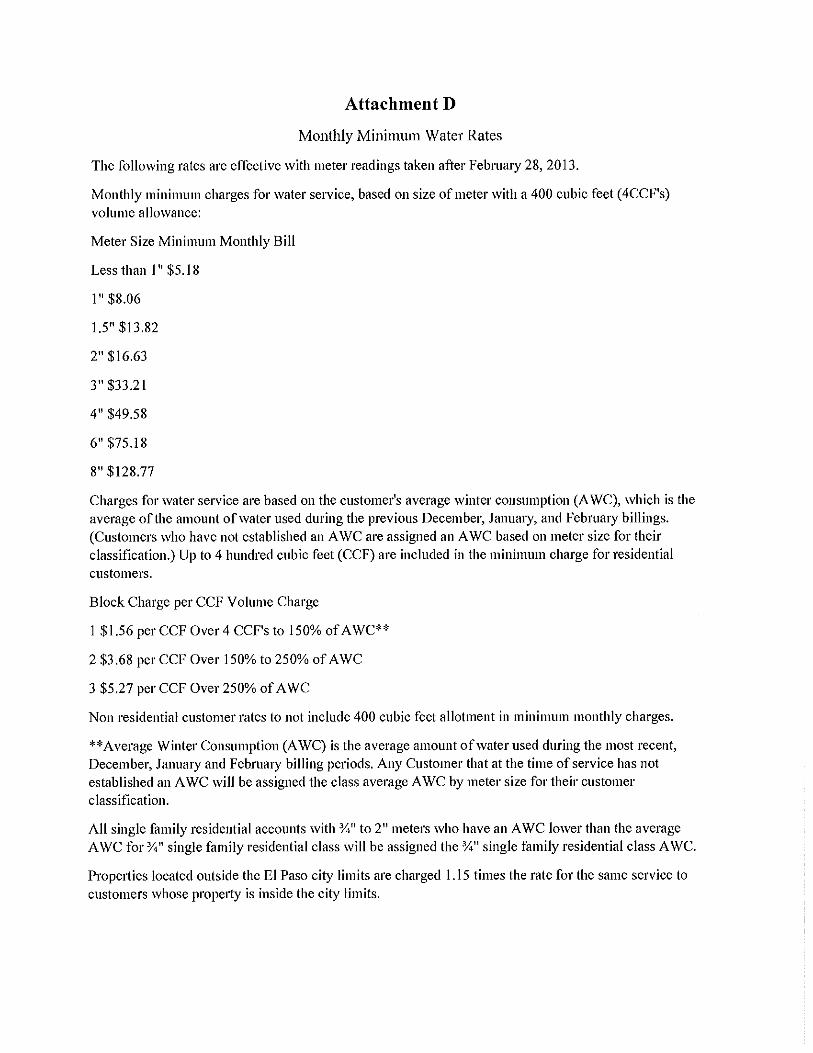


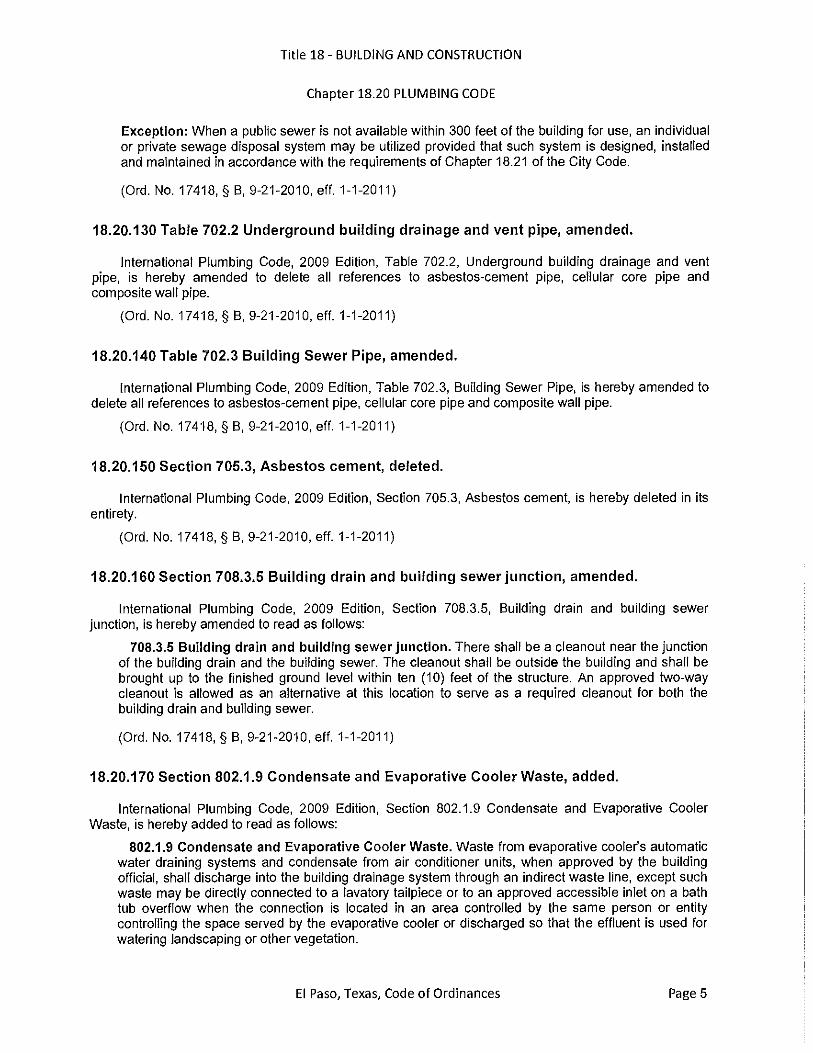
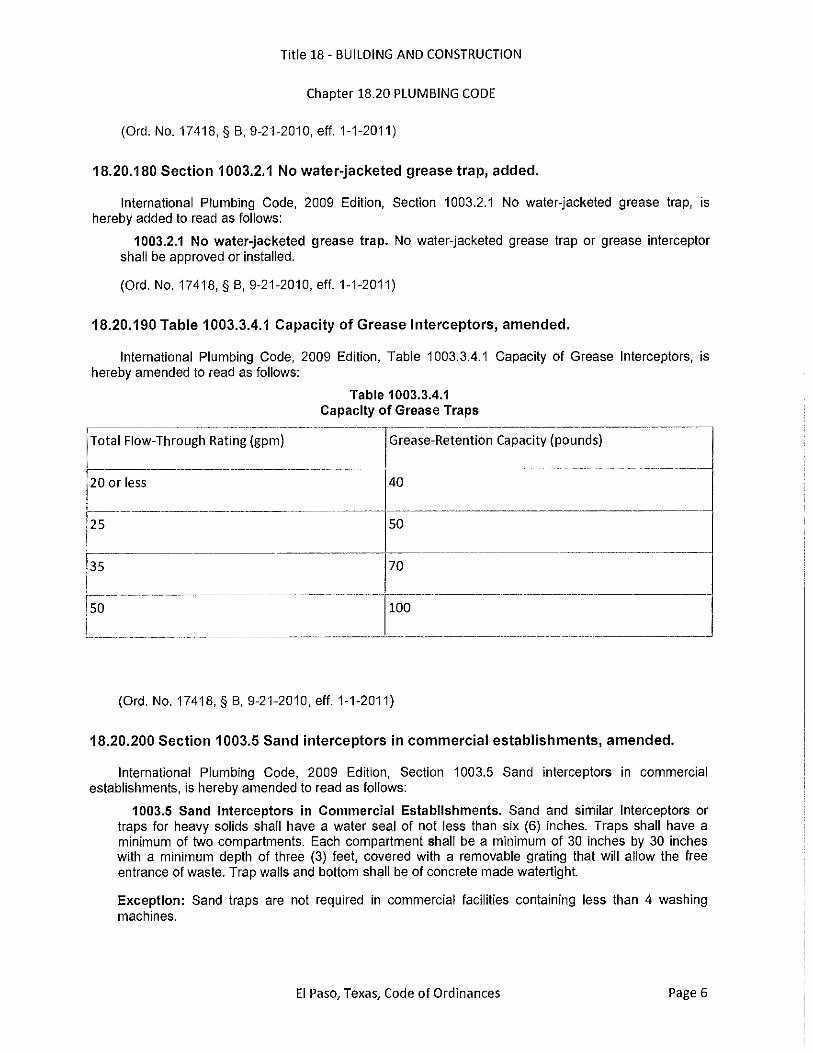
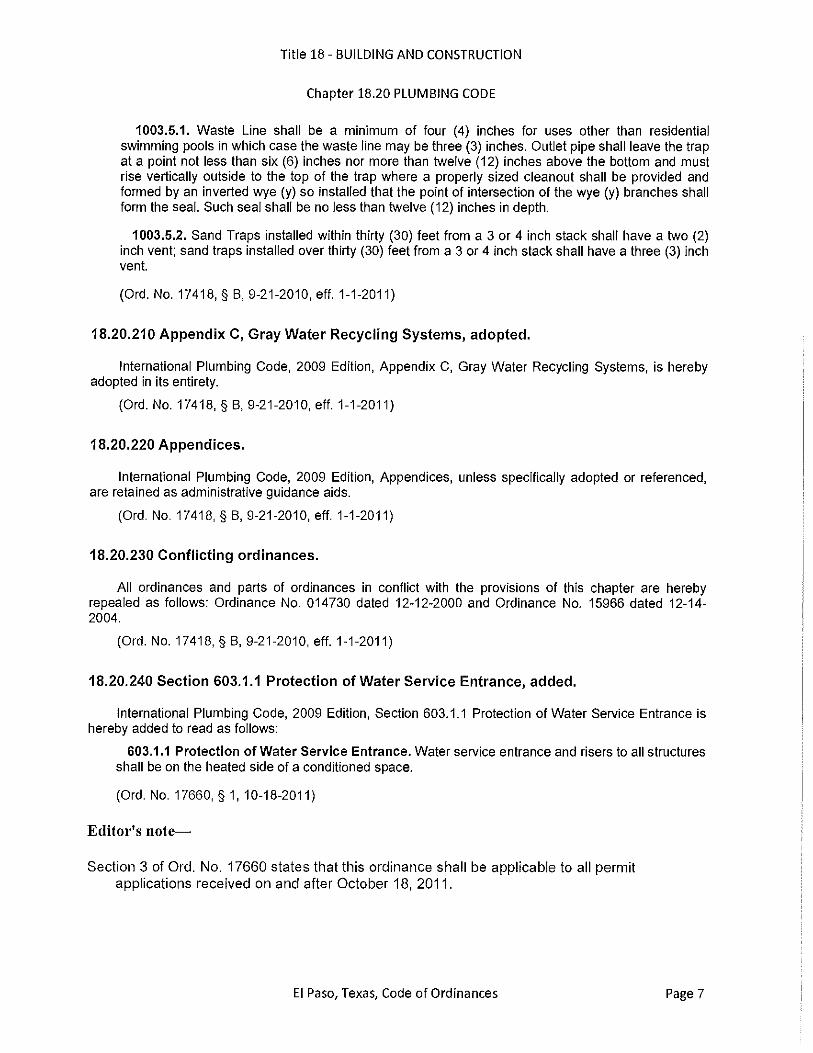
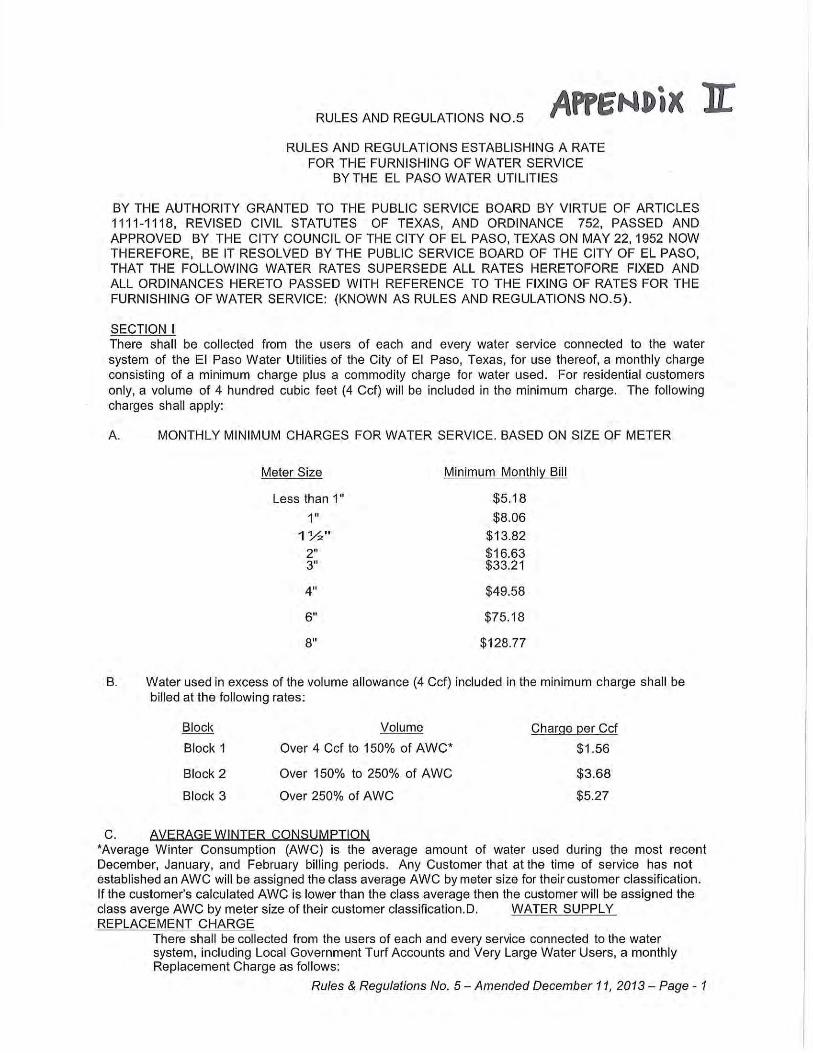
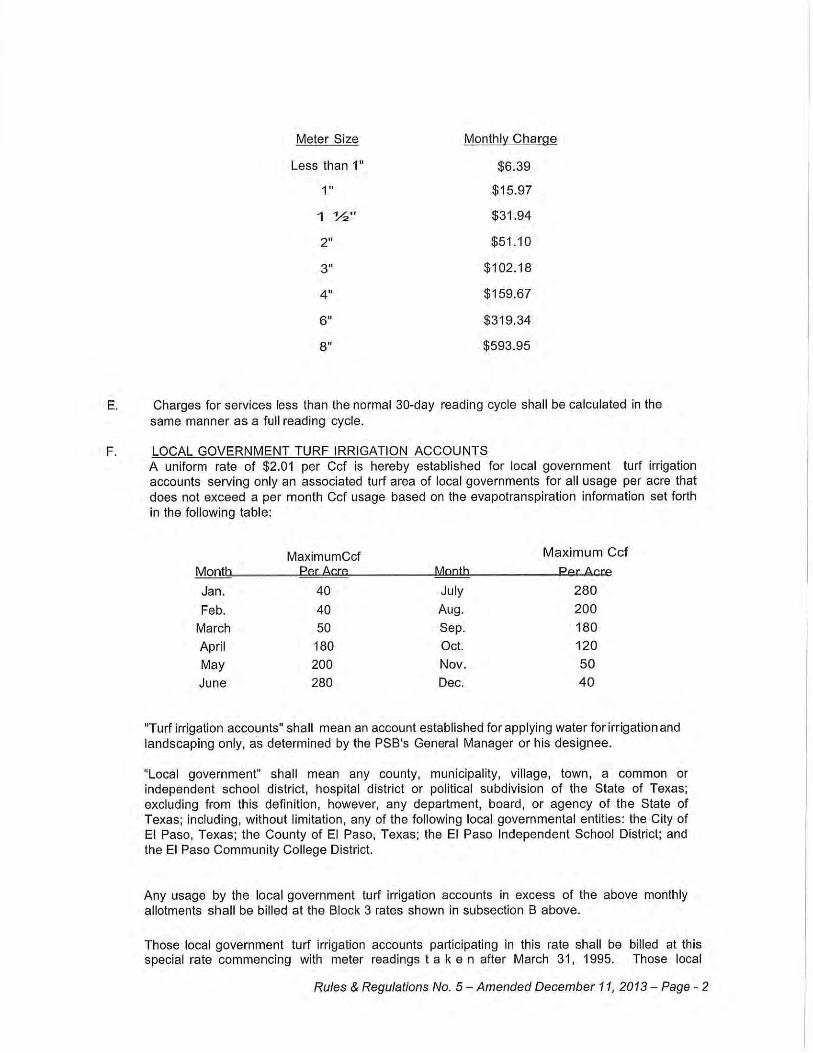
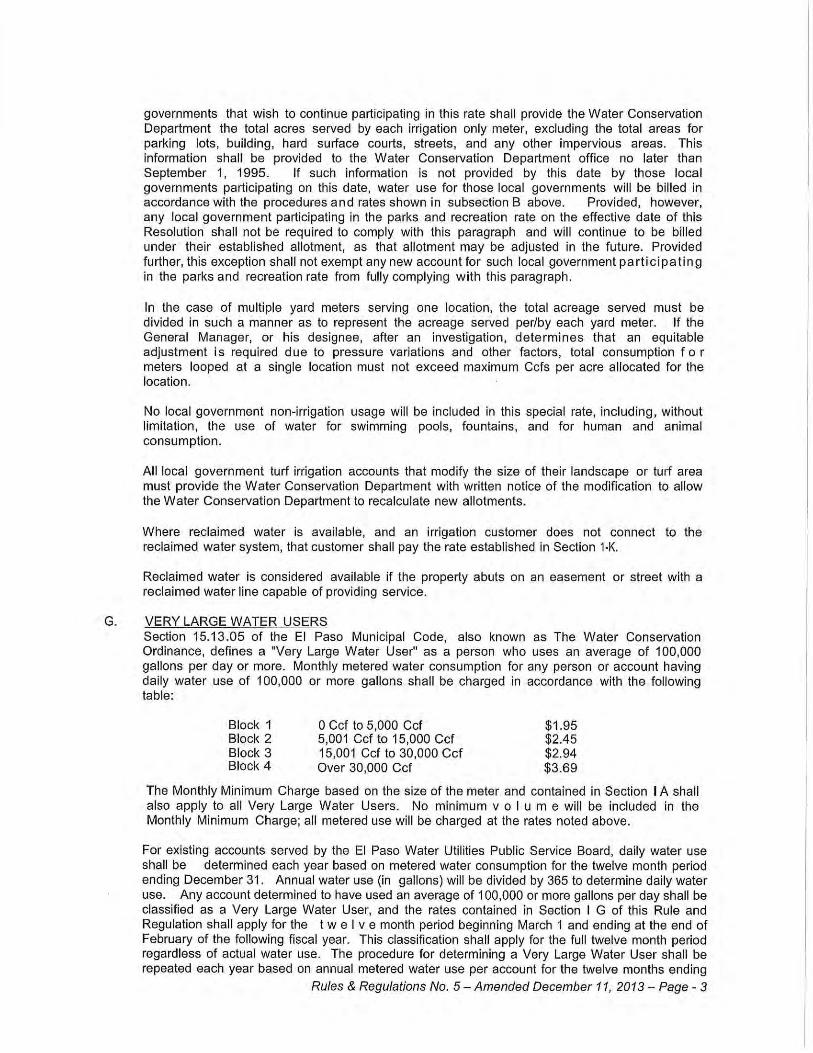
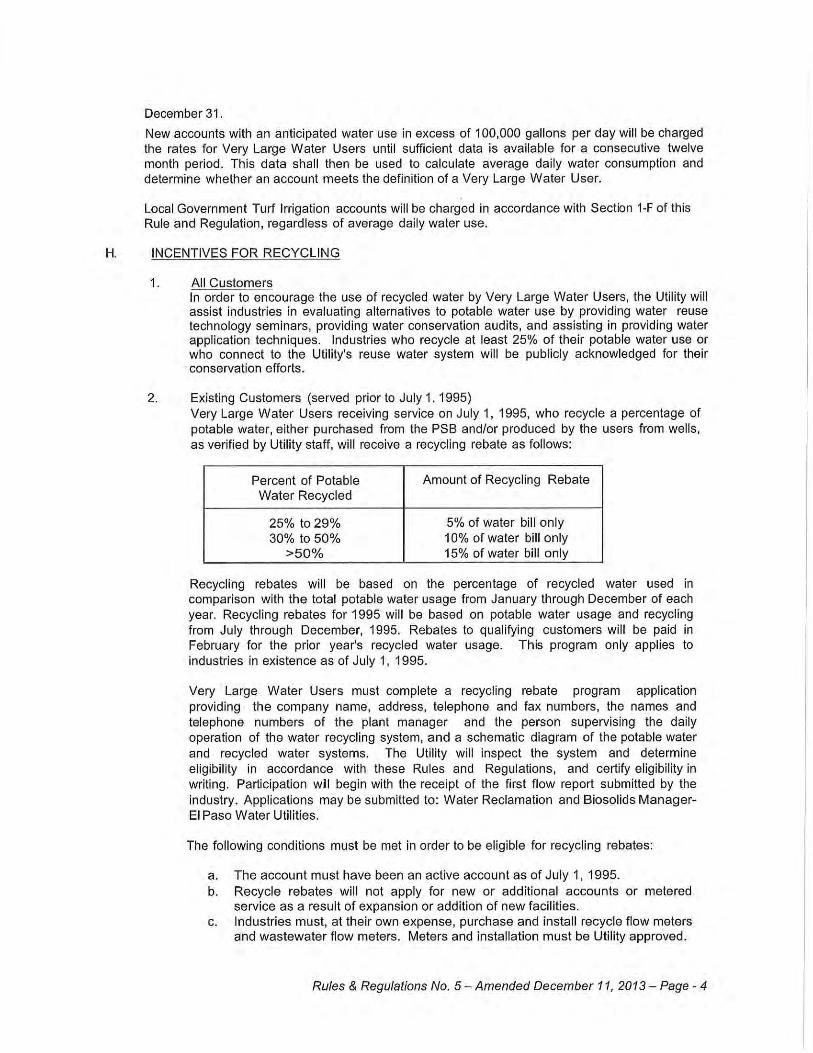
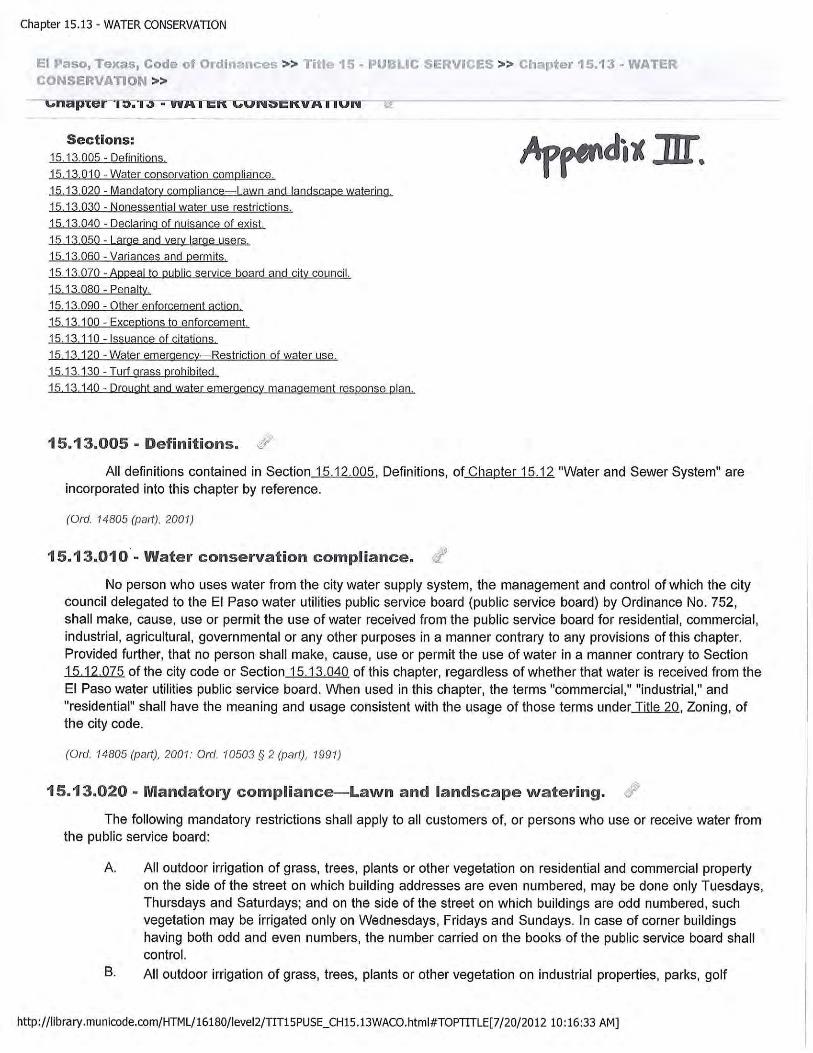

El Paso Water Utilities Public Service Board
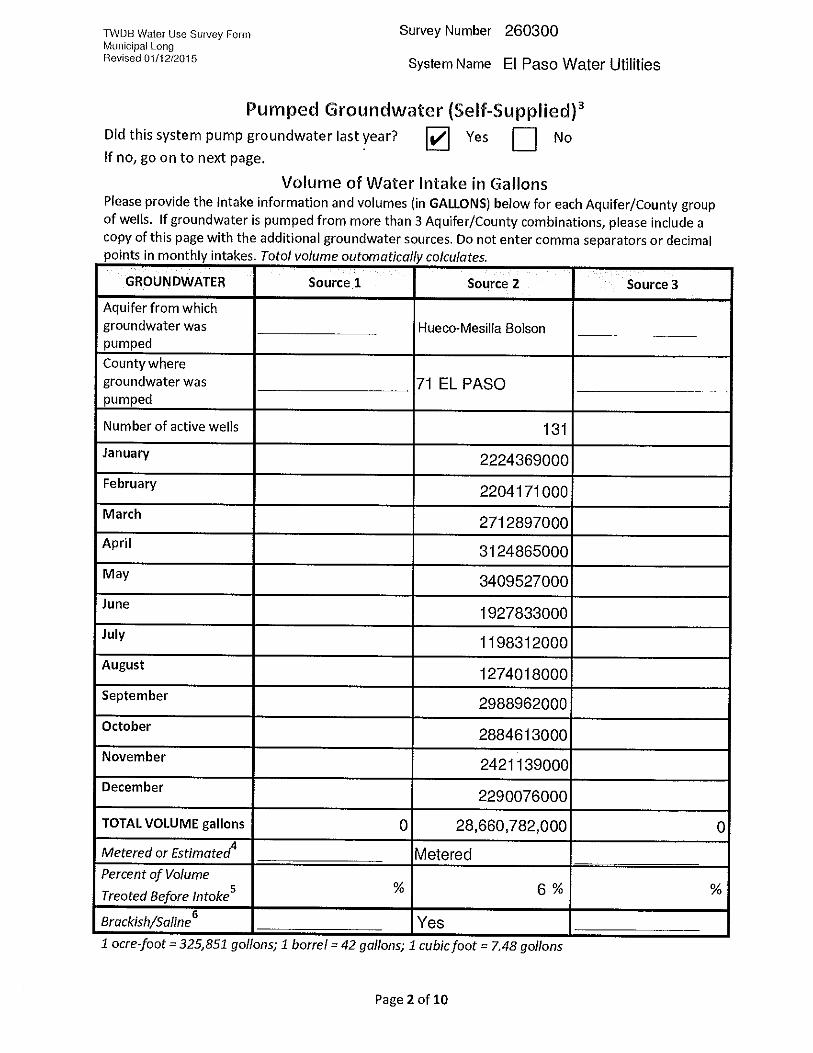
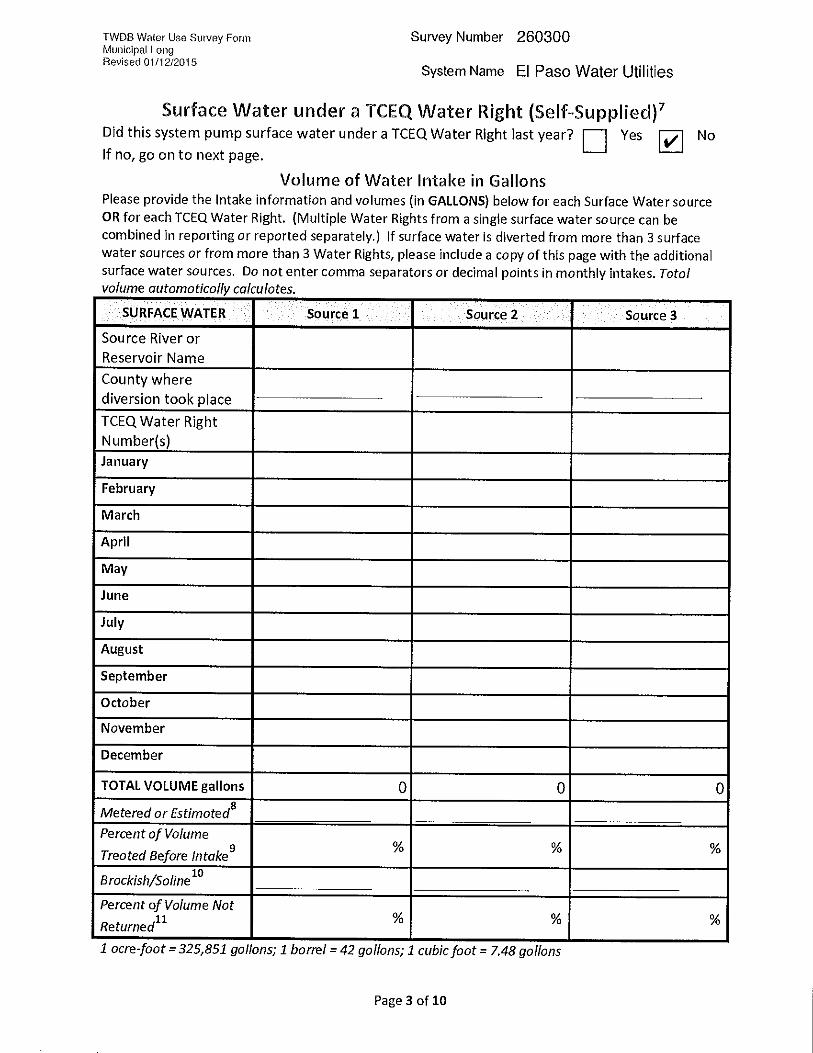
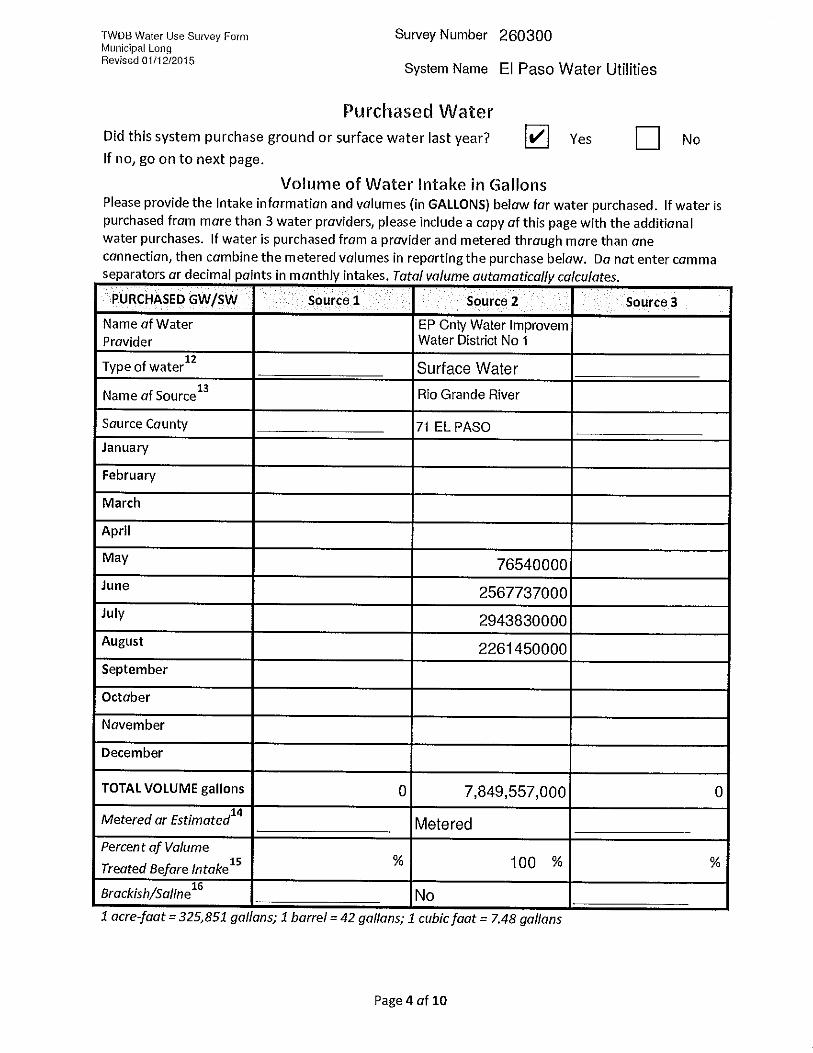
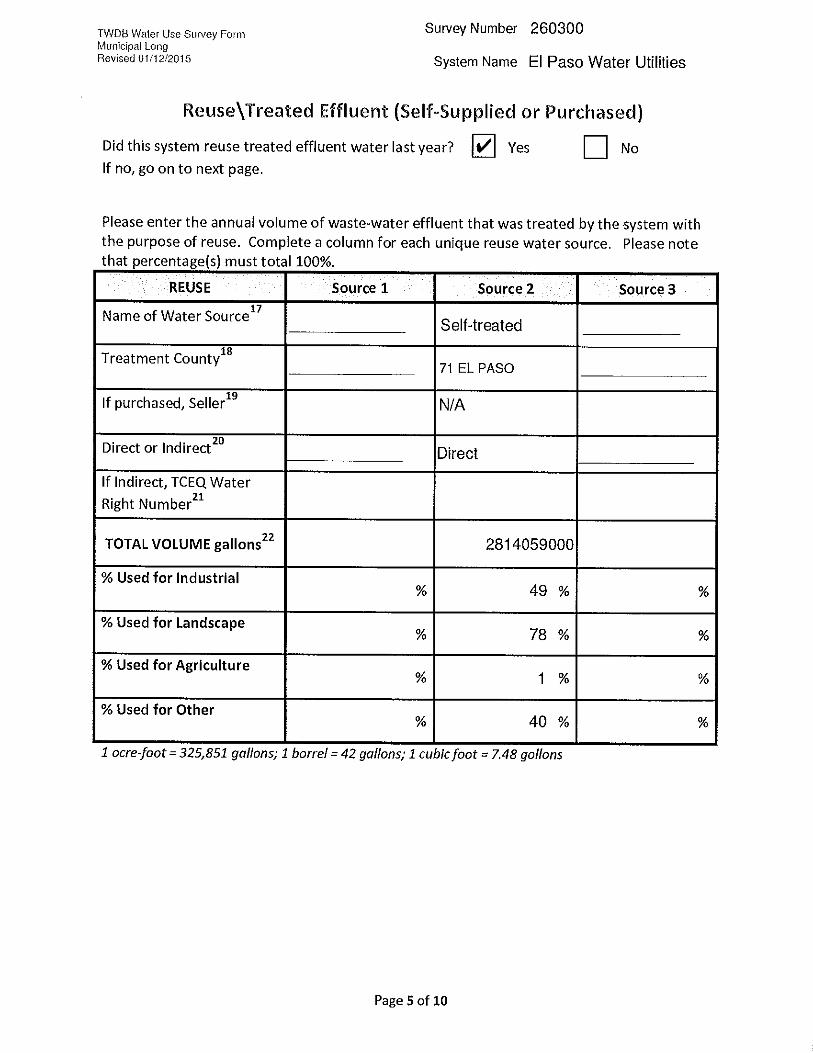
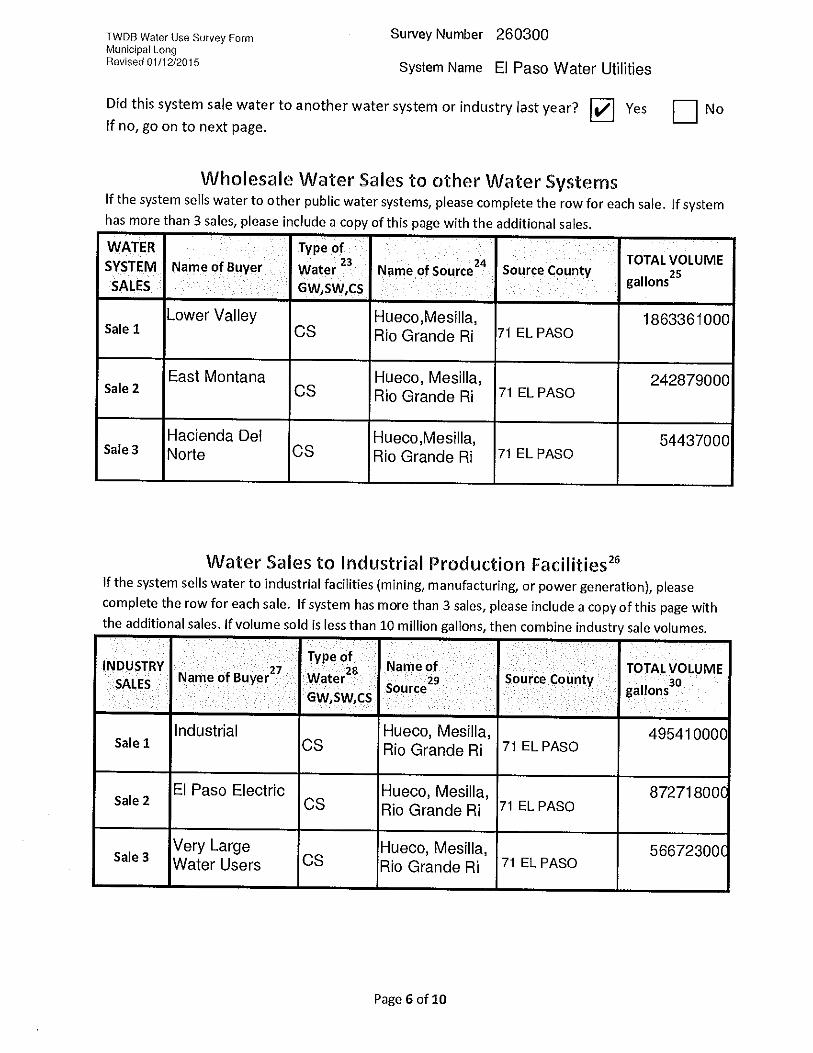
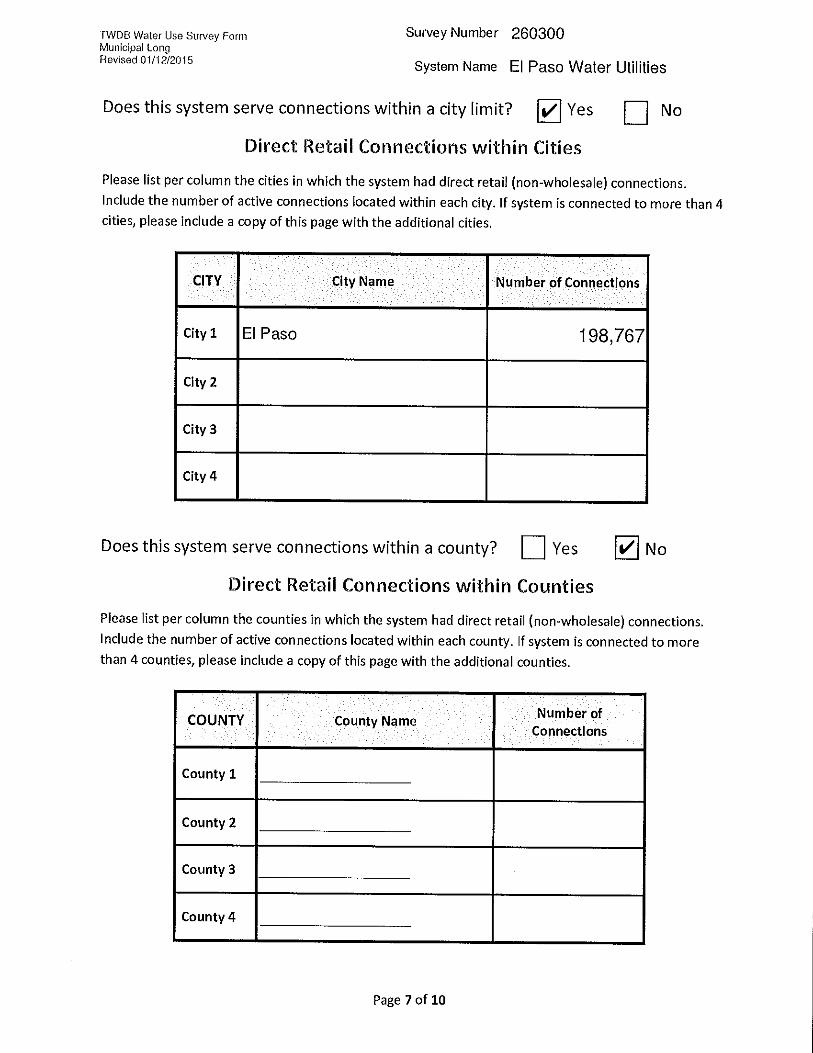
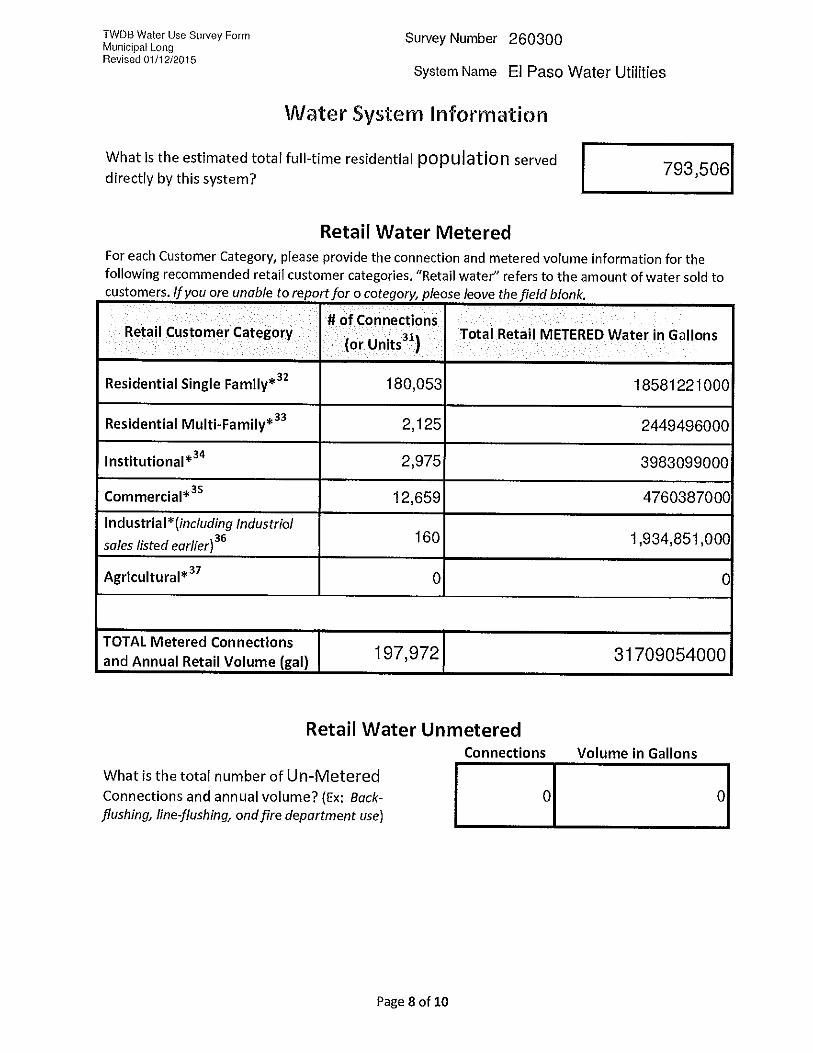
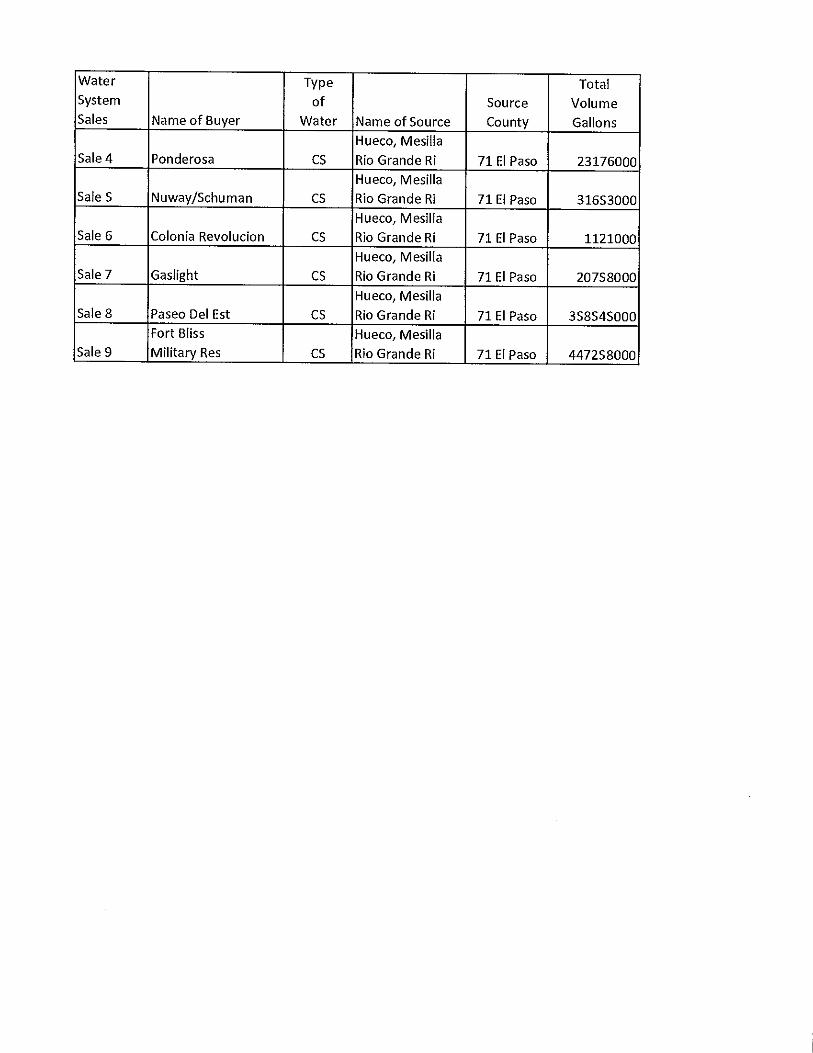
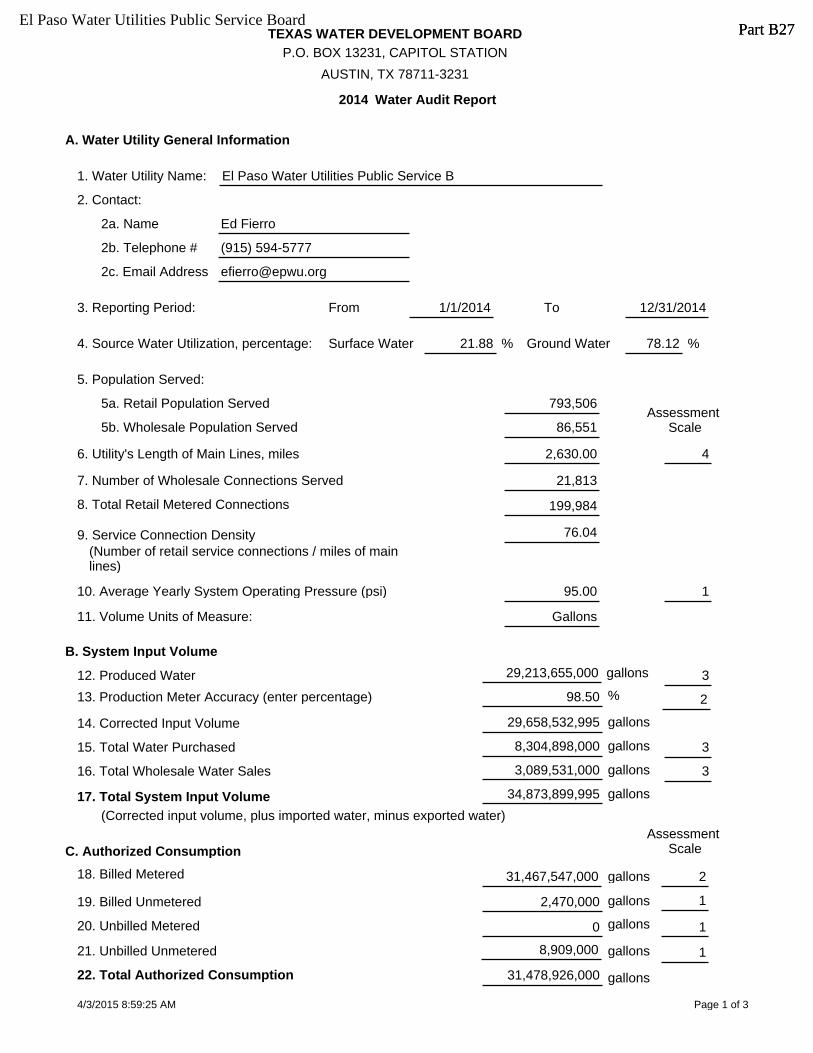
A. Water Utility General Information
1. Water Utility Name:
2. Contact:
2a. Name Ed Fierro
2b. Telephone # (915) 594-5777
2c. Email Address [email protected]
El Paso Water Utilities Public Service B
3. Reporting Period: From 1/1/2014 To 12/31/2014
4. Source Water Utilization, percentage: 21.88 %Surface Water Ground Water 78.12 %
5. Population Served:
5a. Retail Population Served 793,506
5b. Wholesale Population Served 86,551
6. Utility's Length of Main Lines, miles 2,630.00
7. Number of Wholesale Connections Served 21,813
8. Total Retail Metered Connections 199,984
9. Service Connection Density(Number of retail service connections / miles of main lines)
76.04
10. Average Yearly System Operating Pressure (psi) 95.00
11. Volume Units of Measure: Gallons
Assessment Scale
4
1
B. System Input Volume
Assessment Scale
12. Produced Water 29,213,655,000 3
13. Production Meter Accuracy (enter percentage) 98.50 2
14. Corrected Input Volume 29,658,532,995
15. Total Water Purchased 8,304,898,000 3
%
16. Total Wholesale Water Sales 3,089,531,000 3
17. Total System Input Volume 34,873,899,995
(Corrected input volume, plus imported water, minus exported water)
C. Authorized Consumption
18. Billed Metered 31,467,547,000 2
19. Billed Unmetered 2,470,000 1
20. Unbilled Metered 0 1
21. Unbilled Unmetered 8,909,000 1
22. Total Authorized Consumption 31,478,926,000
gallons
gallons
gallons
gallons
gallons
gallons
gallons
gallons
gallons
gallons
Page 1 of 34/3/2015 8:59:25 AM
TEXAS WATER DEVELOPMENT BOARDP.O. BOX 13231, CAPITOL STATION
AUSTIN, TX 78711-3231
2014 Water Audit Report
Part B27Part B27El Paso Water Utilities Public Service Board
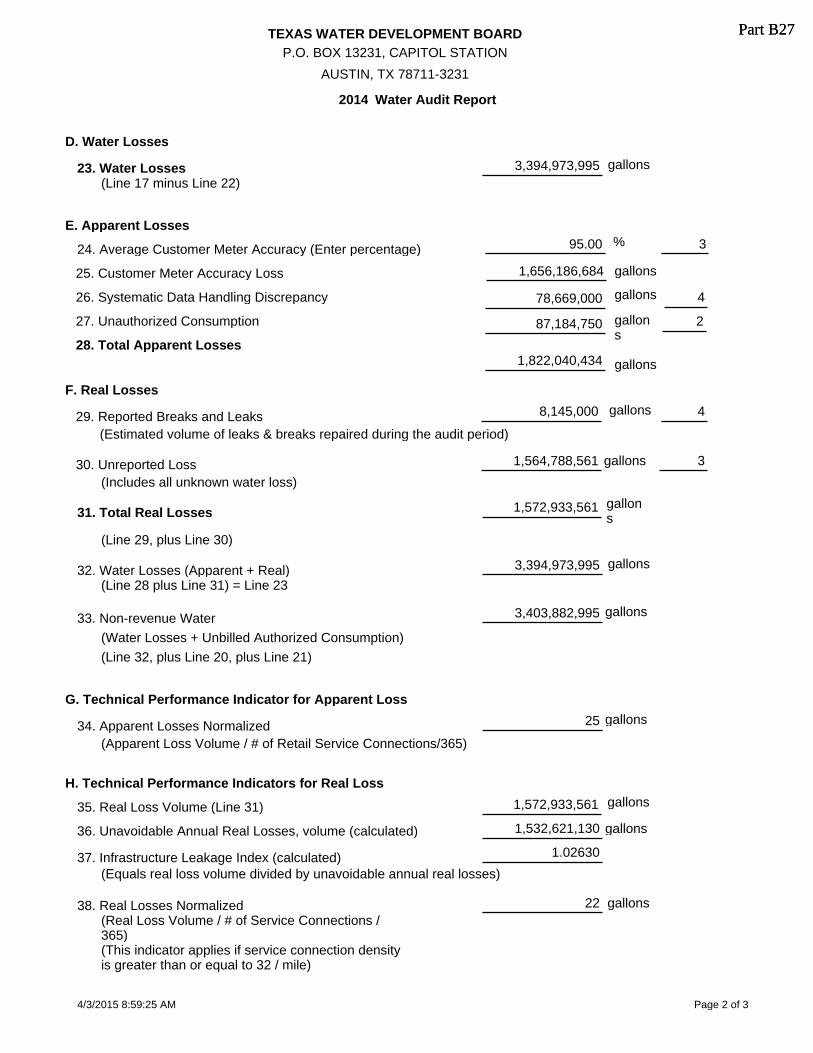
D. Water Losses
23. Water Losses 3,394,973,995
E. Apparent Losses
24. Average Customer Meter Accuracy (Enter percentage) 95.00 %
25. Customer Meter Accuracy Loss 1,656,186,684
3
26. Systematic Data Handling Discrepancy 78,669,000 4
27. Unauthorized Consumption 87,184,750 2
28. Total Apparent Losses1,822,040,434
F. Real Losses
29. Reported Breaks and Leaks 8,145,000 4
30. Unreported Loss
(Estimated volume of leaks & breaks repaired during the audit period)
1,564,788,561 3
(Includes all unknown water loss)
31. Total Real Losses 1,572,933,561
32. Water Losses (Apparent + Real) 3,394,973,995
33. Non-revenue Water 3,403,882,995
G. Technical Performance Indicator for Apparent Loss
(Apparent Loss Volume / # of Retail Service Connections/365)
25
H. Technical Performance Indicators for Real Loss
35. Real Loss Volume (Line 31) 1,572,933,561
36. Unavoidable Annual Real Losses, volume (calculated) 1,532,621,130
37. Infrastructure Leakage Index (calculated) 1.02630
(Real Loss Volume / # of Service Connections / 365)
22
(This indicator applies if service connection density is greater than or equal to 32 / mile)
(Line 17 minus Line 22)
(Line 29, plus Line 30)
(Line 28 plus Line 31) = Line 23
(Water Losses + Unbilled Authorized Consumption)
(Line 32, plus Line 20, plus Line 21)
34. Apparent Losses Normalized
(Equals real loss volume divided by unavoidable annual real losses)
38. Real Losses Normalized
gallons
gallons
gallons
gallons
gallons
gallons
gallons
gallons
gallons
gallons
gallons
gallons
gallons
gallons
Page 2 of 34/3/2015 8:59:25 AM
TEXAS WATER DEVELOPMENT BOARDP.O. BOX 13231, CAPITOL STATION
AUSTIN, TX 78711-3231
2014 Water Audit Report
Part B27Part B27
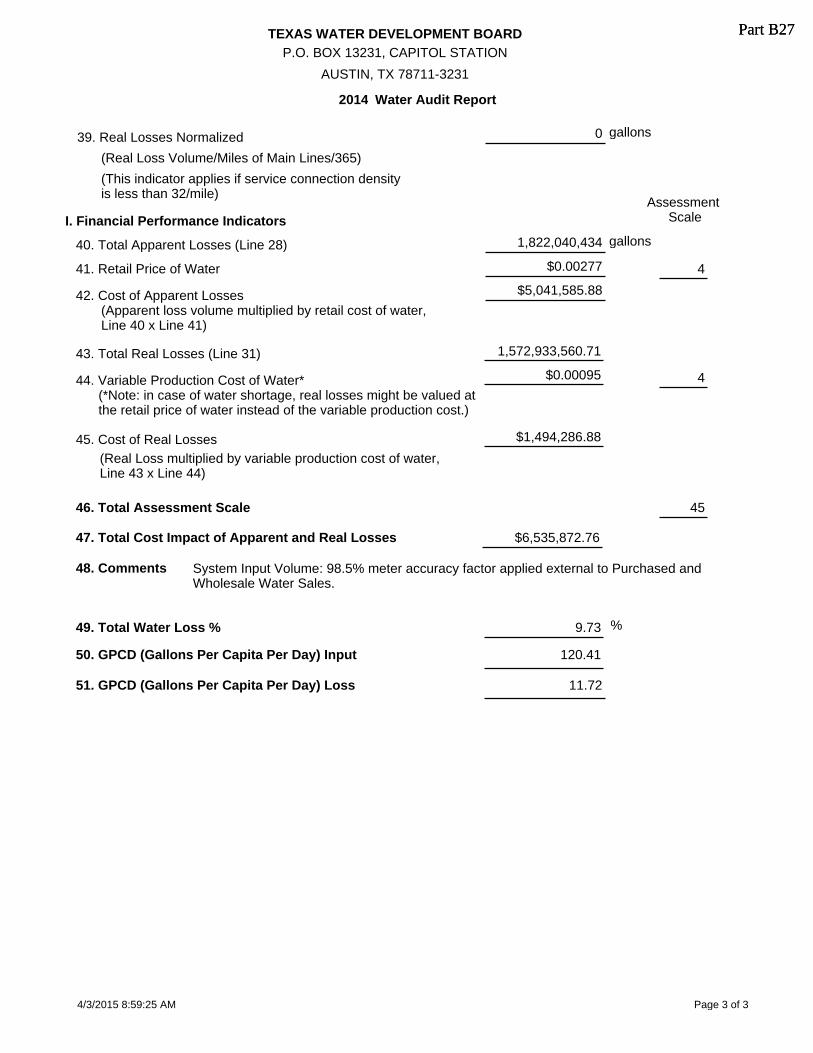
46. Total Assessment Scale 45
(Real Loss Volume/Miles of Main Lines/365)
0
(This indicator applies if service connection density is less than 32/mile)
I. Financial Performance Indicators
40. Total Apparent Losses (Line 28) 1,822,040,434
41. Retail Price of Water $0.00277
42. Cost of Apparent Losses $5,041,585.88
(Apparent loss volume multiplied by retail cost of water, Line 40 x Line 41)
43. Total Real Losses (Line 31) 1,572,933,560.71
44. Variable Production Cost of Water* $0.00095
45. Cost of Real Losses $1,494,286.88
(Real Loss multiplied by variable production cost of water, Line 43 x Line 44)
47. Total Cost Impact of Apparent and Real Losses $6,535,872.76
(*Note: in case of water shortage, real losses might be valued at the retail price of water instead of the variable production cost.)
39. Real Losses Normalized
Assessment Scale
4
4
gallons
gallons
48. Comments System Input Volume: 98.5% meter accuracy factor applied external to Purchased and Wholesale Water Sales.
49. Total Water Loss % 9.73 %
50. GPCD (Gallons Per Capita Per Day) Input
51. GPCD (Gallons Per Capita Per Day) Loss
120.41
11.72
Page 3 of 34/3/2015 8:59:25 AM
TEXAS WATER DEVELOPMENT BOARDP.O. BOX 13231, CAPITOL STATION
AUSTIN, TX 78711-3231
2014 Water Audit Report
Part B27Part B27
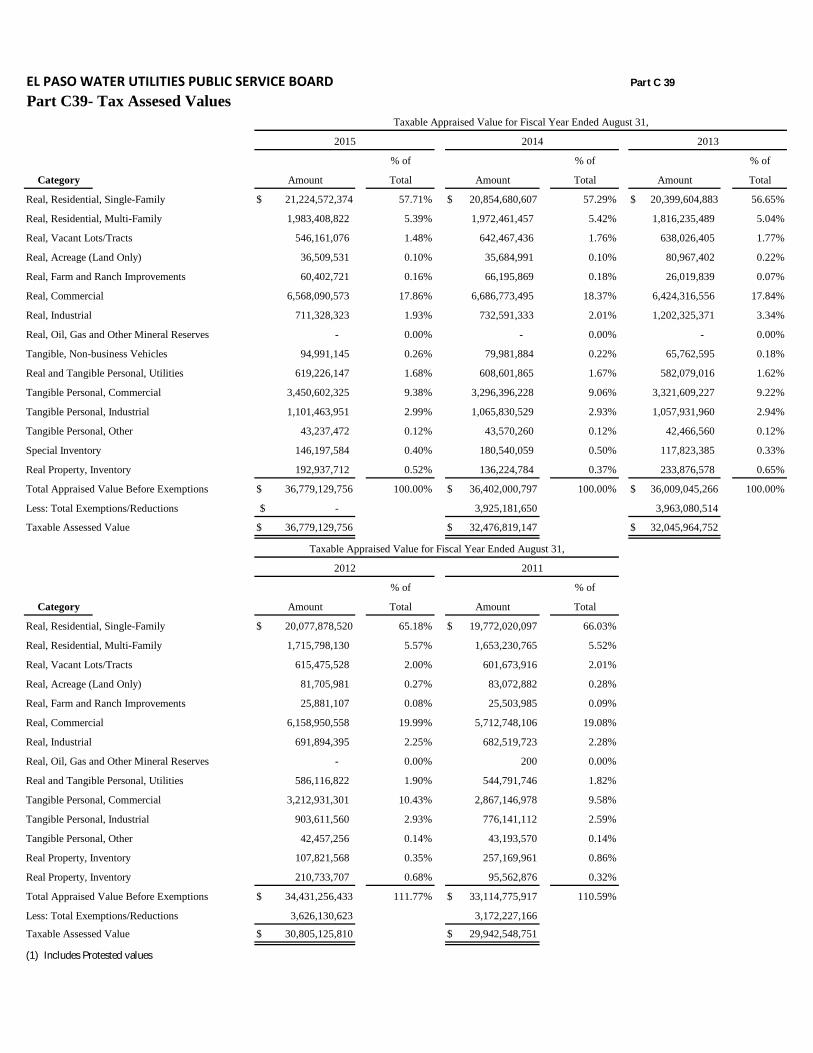
EL PASO WATER UTILITIES PUBLIC SERVICE BOARD Part C 39
Part C39- Tax Assesed Values Taxable Appraised Value for Fiscal Year Ended August 31,
2015 2014 2013
% of % of % of
Category Amount Total Amount Total Amount Total
Real, Residential, Single-Family 21,224,572,374$ 57.71% 20,854,680,607$ 57.29% 20,399,604,883$ 56.65%
Real, Residential, Multi-Family 1,983,408,822 5.39% 1,972,461,457 5.42% 1,816,235,489 5.04%
Real, Vacant Lots/Tracts 546,161,076 1.48% 642,467,436 1.76% 638,026,405 1.77%
Real, Acreage (Land Only) 36,509,531 0.10% 35,684,991 0.10% 80,967,402 0.22%
Real, Farm and Ranch Improvements 60,402,721 0.16% 66,195,869 0.18% 26,019,839 0.07%
Real, Commercial 6,568,090,573 17.86% 6,686,773,495 18.37% 6,424,316,556 17.84%
Real, Industrial 711,328,323 1.93% 732,591,333 2.01% 1,202,325,371 3.34%
Real, Oil, Gas and Other Mineral Reserves - 0.00% - 0.00% - 0.00%
Tangible, Non-business Vehicles 94,991,145 0.26% 79,981,884 0.22% 65,762,595 0.18%
Real and Tangible Personal, Utilities 619,226,147 1.68% 608,601,865 1.67% 582,079,016 1.62%
Tangible Personal, Commercial 3,450,602,325 9.38% 3,296,396,228 9.06% 3,321,609,227 9.22%
Tangible Personal, Industrial 1,101,463,951 2.99% 1,065,830,529 2.93% 1,057,931,960 2.94%
Tangible Personal, Other 43,237,472 0.12% 43,570,260 0.12% 42,466,560 0.12%
Special Inventory 146,197,584 0.40% 180,540,059 0.50% 117,823,385 0.33%
Real Property, Inventory 192,937,712 0.52% 136,224,784 0.37% 233,876,578 0.65%
Total Appraised Value Before Exemptions 36,779,129,756$ 100.00% 36,402,000,797$ 100.00% 36,009,045,266$ 100.00%
Less: Total Exemptions/Reductions -$ 3,925,181,650 3,963,080,514
Taxable Assessed Value 36,779,129,756$ 32,476,819,147$ 32,045,964,752$
Taxable Appraised Value for Fiscal Year Ended August 31,
2012 2011
% of % of
Category Amount Total Amount Total
Real, Residential, Single-Family 20,077,878,520$ 65.18% 19,772,020,097$ 66.03%
Real, Residential, Multi-Family 1,715,798,130 5.57% 1,653,230,765 5.52%
Real, Vacant Lots/Tracts 615,475,528 2.00% 601,673,916 2.01%
Real, Acreage (Land Only) 81,705,981 0.27% 83,072,882 0.28%
Real, Farm and Ranch Improvements 25,881,107 0.08% 25,503,985 0.09%
Real, Commercial 6,158,950,558 19.99% 5,712,748,106 19.08%
Real, Industrial 691,894,395 2.25% 682,519,723 2.28%
Real, Oil, Gas and Other Mineral Reserves - 0.00% 200 0.00%
Real and Tangible Personal, Utilities 586,116,822 1.90% 544,791,746 1.82%
Tangible Personal, Commercial 3,212,931,301 10.43% 2,867,146,978 9.58%
Tangible Personal, Industrial 903,611,560 2.93% 776,141,112 2.59%
Tangible Personal, Other 42,457,256 0.14% 43,193,570 0.14%
Real Property, Inventory 107,821,568 0.35% 257,169,961 0.86%
Real Property, Inventory 210,733,707 0.68% 95,562,876 0.32%
Total Appraised Value Before Exemptions 34,431,256,433$ 111.77% 33,114,775,917$ 110.59%
Less: Total Exemptions/Reductions 3,626,130,623 3,172,227,166
Taxable Assessed Value 30,805,125,810$ 29,942,548,751$
(1) Includes Protested values
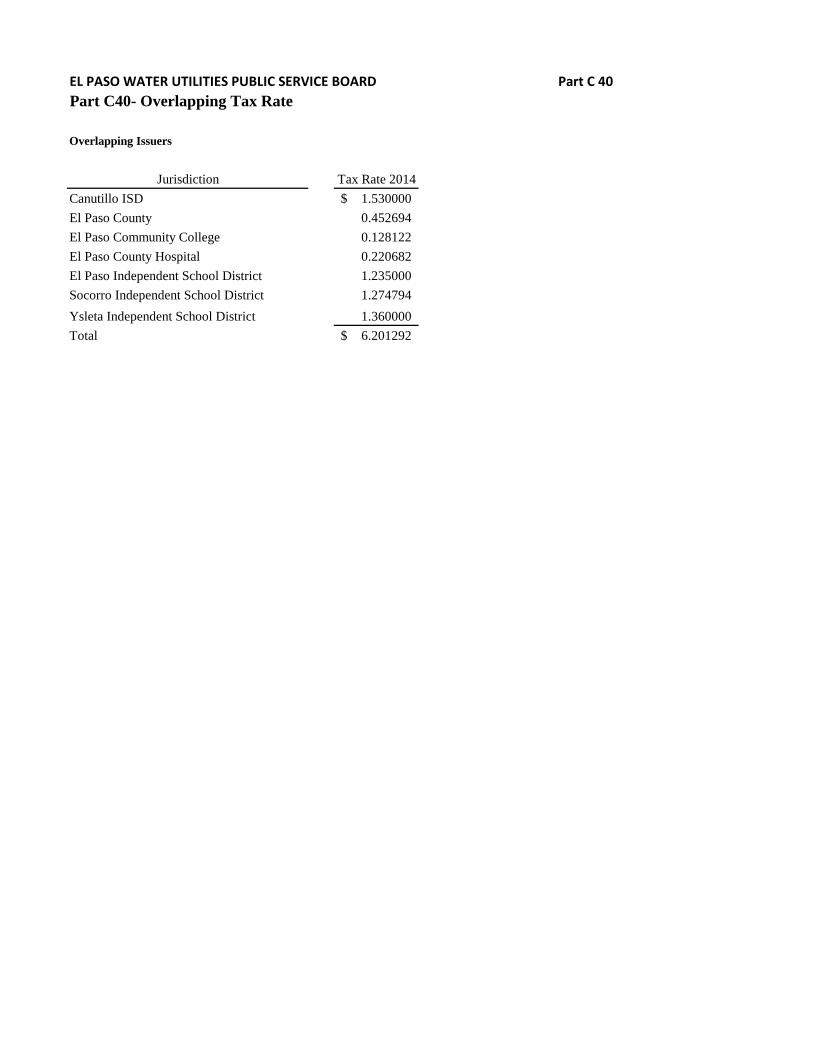
EL PASO WATER UTILITIES PUBLIC SERVICE BOARD Part C 40Part C40- Overlapping Tax Rate
Jurisdiction Tax Rate 2014
Canutillo ISD 1.530000$
El Paso County 0.452694
El Paso Community College 0.128122
El Paso County Hospital 0.220682
El Paso Independent School District 1.235000
Socorro Independent School District 1.274794
Ysleta Independent School District 1.360000
Total 6.201292$
Overlapping Issuers

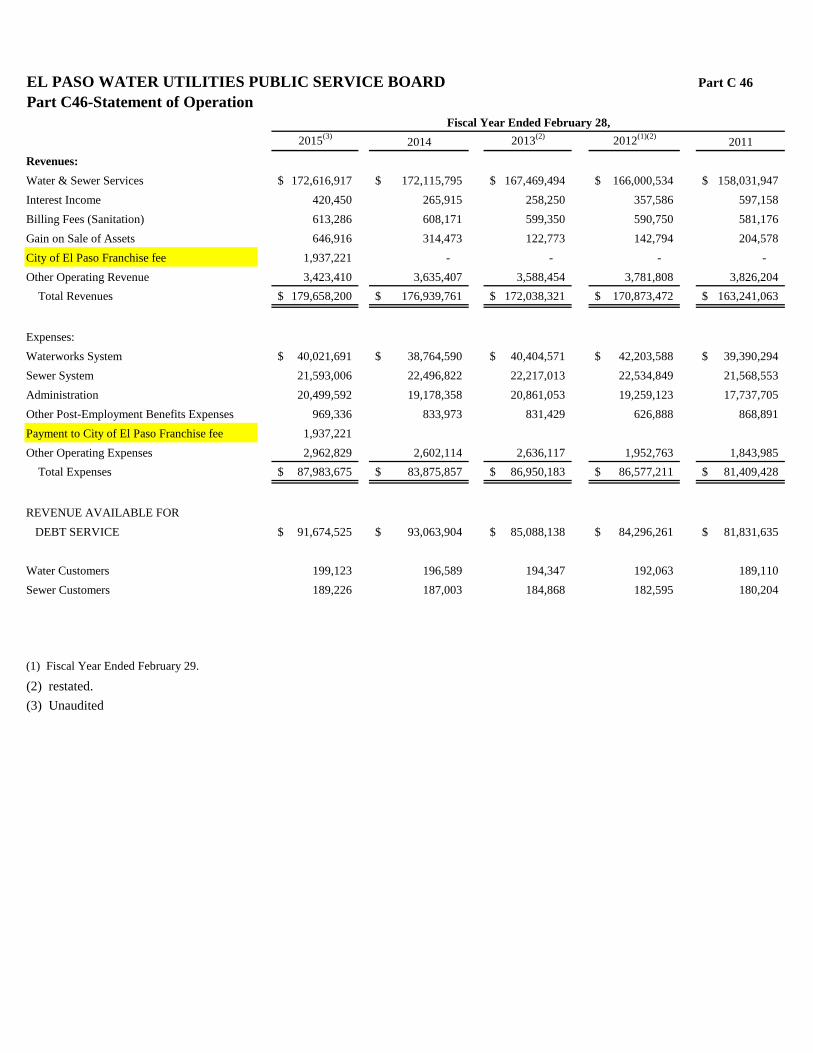
EL PASO WATER UTILITIES PUBLIC SERVICE BOARD Part C 46
Part C46-Statement of Operation
2015(3)2014 2013(2) 2012(1)(2)
2011
Revenues:
Water & Sewer Services 172,616,917$ 172,115,795$ 167,469,494$ 166,000,534$ 158,031,947$
Interest Income 420,450 265,915 258,250 357,586 597,158
Billing Fees (Sanitation) 613,286 608,171 599,350 590,750 581,176
Gain on Sale of Assets 646,916 314,473 122,773 142,794 204,578
City of El Paso Franchise fee 1,937,221 - - - -
Other Operating Revenue 3,423,410 3,635,407 3,588,454 3,781,808 3,826,204
Total Revenues 179,658,200$ 176,939,761$ 172,038,321$ 170,873,472$ 163,241,063$
Expenses:
Waterworks System 40,021,691$ 38,764,590$ 40,404,571$ 42,203,588$ 39,390,294$
Sewer System 21,593,006 22,496,822 22,217,013 22,534,849 21,568,553
Administration 20,499,592 19,178,358 20,861,053 19,259,123 17,737,705
Other Post-Employment Benefits Expenses 969,336 833,973 831,429 626,888 868,891
Payment to City of El Paso Franchise fee 1,937,221
Other Operating Expenses 2,962,829 2,602,114 2,636,117 1,952,763 1,843,985
Total Expenses 87,983,675$ 83,875,857$ 86,950,183$ 86,577,211$ 81,409,428$
REVENUE AVAILABLE FOR
DEBT SERVICE 91,674,525$ 93,063,904$ 85,088,138$ 84,296,261$ 81,831,635$
Water Customers 199,123 196,589 194,347 192,063 189,110
Sewer Customers 189,226 187,003 184,868 182,595 180,204
(1) Fiscal Year Ended February 29.
(2) restated.
(3) Unaudited
Fiscal Year Ended February 28,
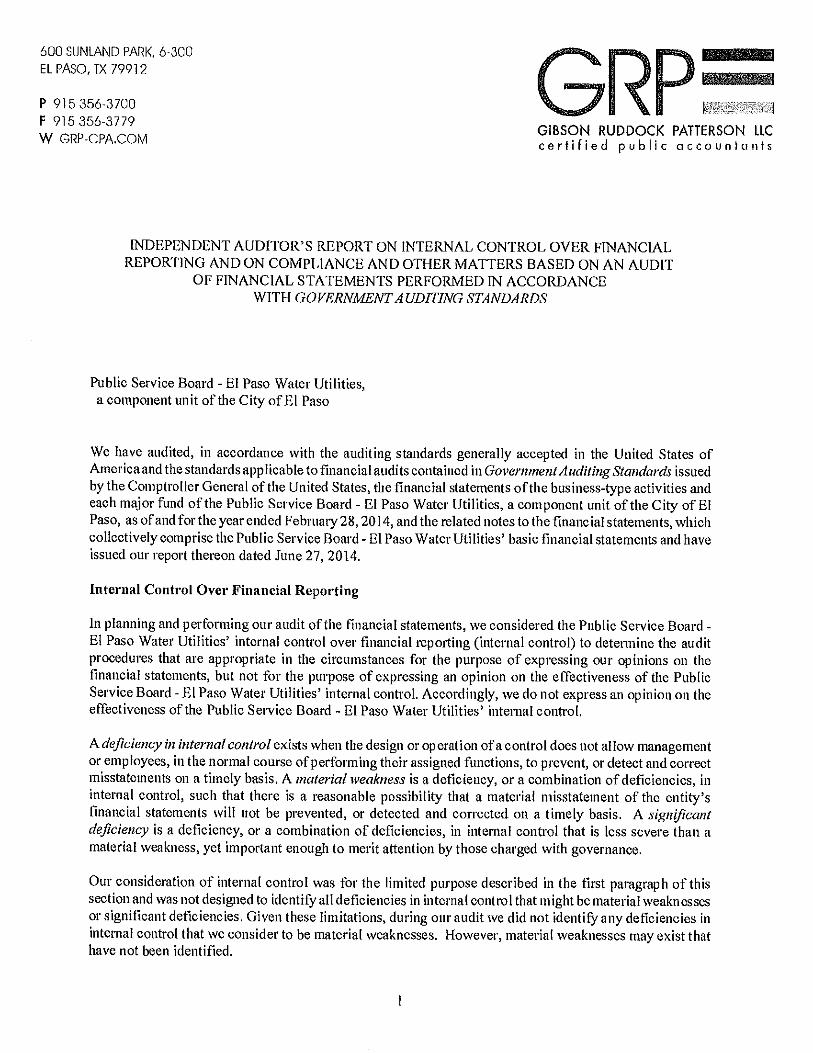
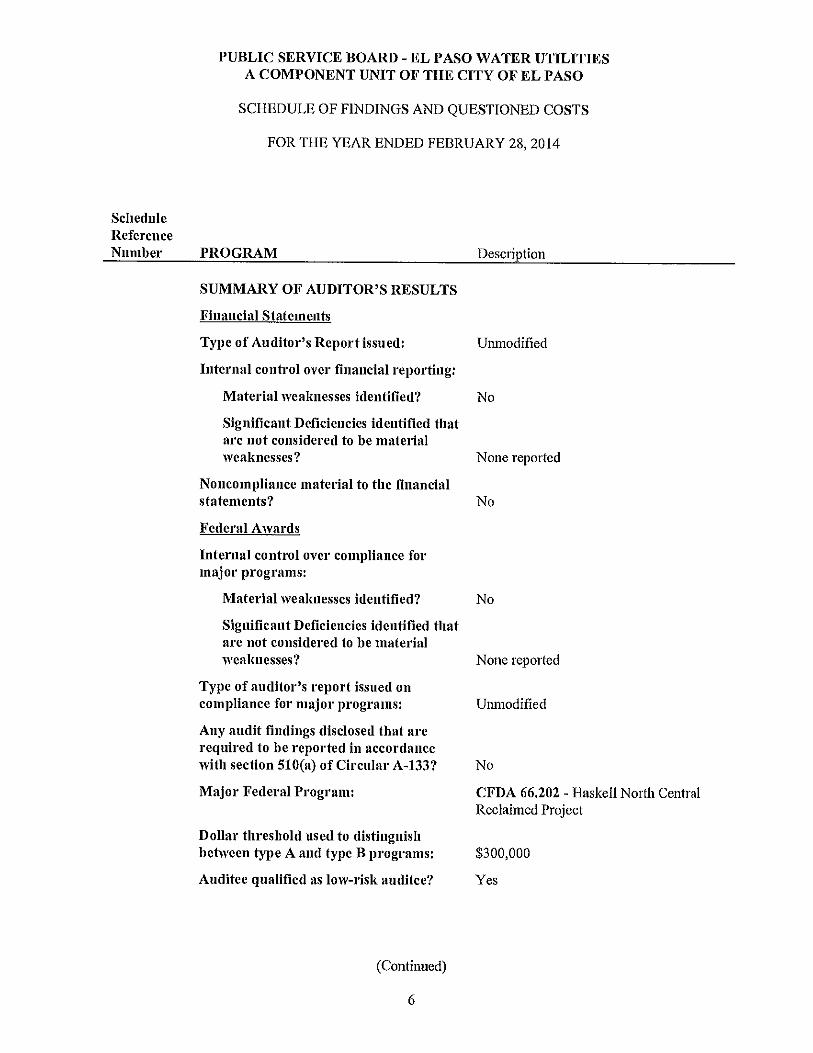
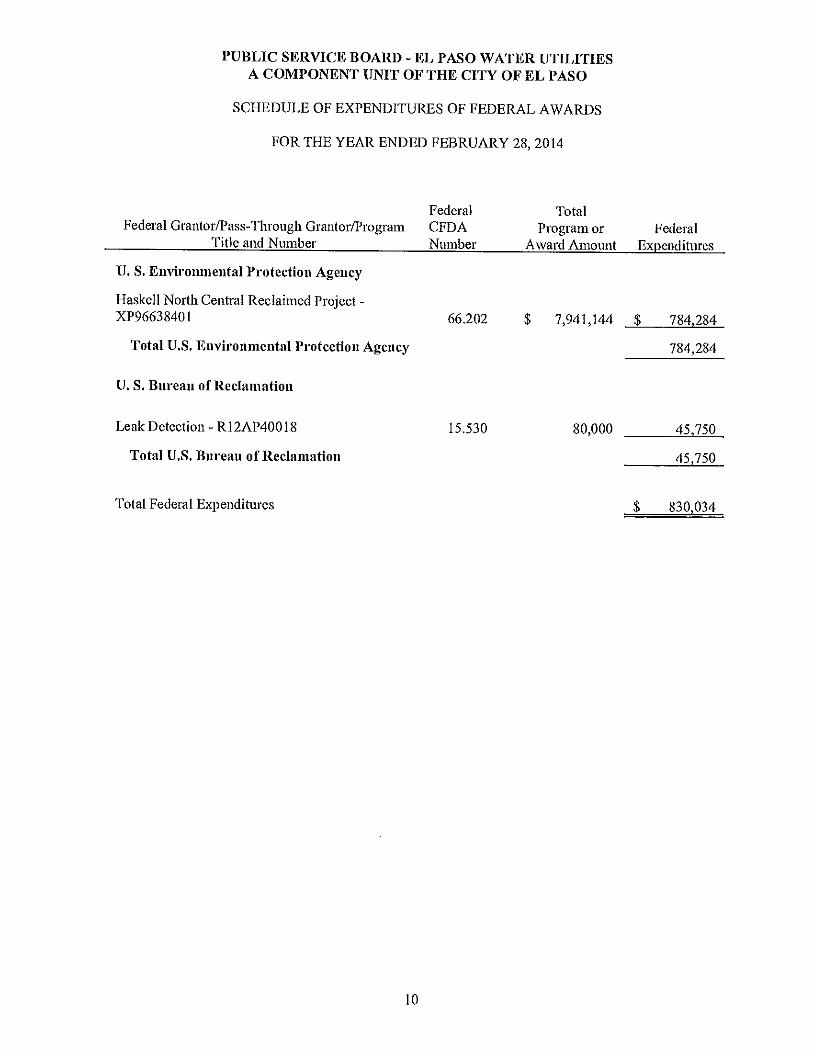
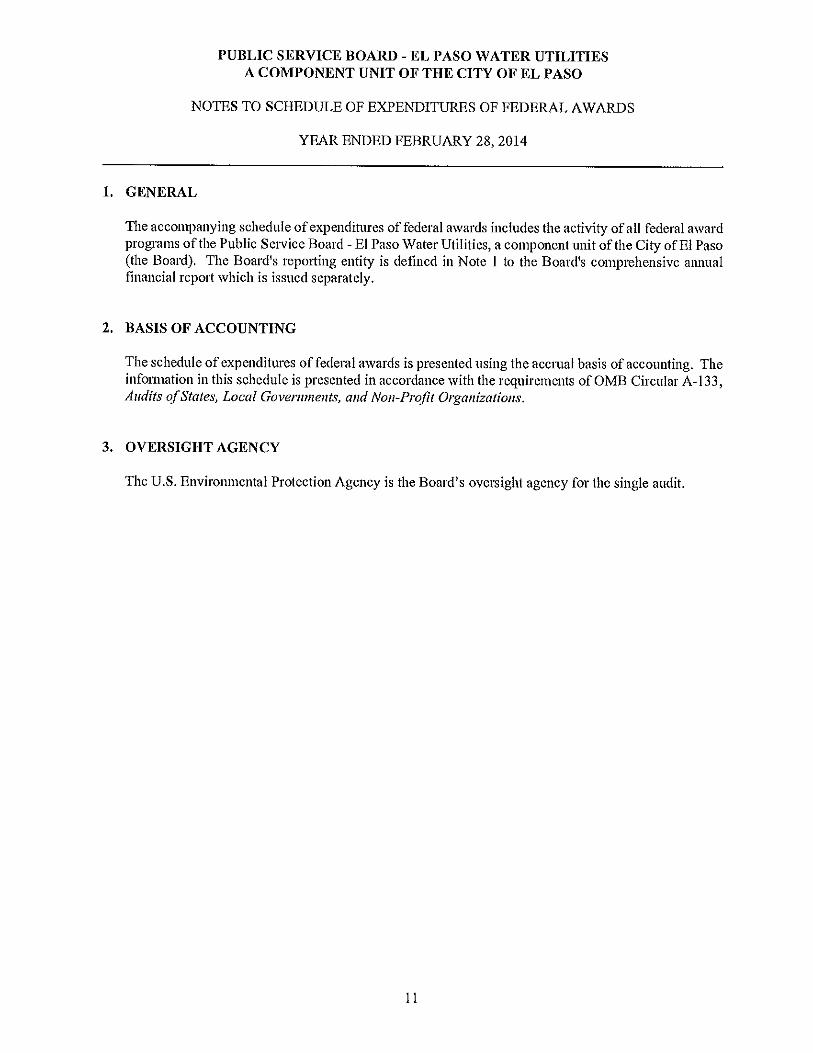

Public Service BoardEl Paso Water Utilities
A Component Unit of the City of El Paso
Comprehensive
Annual Financial Report
For the Fiscal Years EndedFebruary 28, 2014 & 2013
El Paso, Texas
Prepared by:
Departments of Finance & Accounting

PUBLIC SERVICE BOARD - EL PASO WATER UTILITIESA COMPONENT UNIT OF THE CITY OF EL PASO
Comprehensive Annual Financial ReportFor the Fiscal Years Ended February 28, 2014 & 2013
TABLE OF CONTENTS
INTRODUCTORY SECTION PageTransmittal Letter 1GFOA Certificate of Achievement for Excellence in Financial Reporting 7Organizational Chart 8List of Principal Officers and Staff 9
FINANCIAL SECTIONReport of Independent Certified Public Accountants 10Management's Discussion and Analysis 14Basic Financial Statements
Enterprise Funds Financial StatementsStatement of Net Position 29Statement of Revenues, Expenses, and Changes in Net Position 33Statement of Cash Flows 35Notes to Financial Statements 39
Required Supplementary Information for Other Post-Employment Benefits Plan Water and Wastewater Utility Fund
Schedule of Funding Progress 96Schedule of Employer Contributions 96
Municipal Drainage Utility FundSchedule of Funding Progress 97Schedule of Employer Contributions 97
Supplementary Schedules Water and Wastewater Utility Fund
Statements of Net Position 99Statements of Revenues, Expenses, and Changes in Net Position 101Statements of Cash Flows 103Schedule of Operating Revenues 105Schedule of Operating Expenses 106Schedule of Net Operating Revenue - Water & Reclaimed Water 107Schedule of Net Operating Revenue - Wastewater 108Schedule of Accounts Receivable - Government Grants & Other Receivables 109Schedule of Changes in Revenue Bonds Payable 110Schedule of Debt Service Requirements 111
Municipal Drainage Utility FundStatements of Net Position 135Statements of Revenues, Expenses, and Changes in Net Position 137Statements of Cash Flows 139Schedule of Operating Revenues 141Schedule of Operating Expenses 142Schedule of Net Operating Revenue 143Schedule of Changes in Revenue Bonds Payable 144Schedule of Debt Service Requirements 145
Schedule of Insurance Coverage 149
STATISTICAL SECTION (Unaudited) SectionFinancial Trends Information ARevenue Capacity Information BDebt Capacity Information CDemographic and Economic Information DOperating Information E
i

2
statements for the fiscal year February 28, 2014, are fairly presented in conformity with GAAP.The independent auditor’s report is presented as the first component of the financial section of thisreport.
The independent audit of the financial statements of EPWU was part of a broader, financiallymandated “Single Audit” designed to meet the special needs of federal grantor agencies. Thestandards governing Single Audit engagements require the independent auditor to report not onlyon the fair presentation of the financial statements, but also on the audited government’s internalcontrols and legal requirements involving the administration of federal awards. These reports areavailable in the EPWU’sseparately issued Single Audit Report.
Governmental Accounting Standards Board (GASB) requires that management provide a narrativeintroduction, overview, and analysis to accompany the basic financial statements in the form ofManagement’s Discussion and Analysis (MD&A). This letter of transmittal is designed tocomplement the MD&A and should be read in conjunction with it. The EPWU’sMD&A can befound immediately following the independent auditor’s report.
Profile of the Government
The El Paso Water Utilities – Public Service Board provides water, wastewater, reclaimed waterand drainage service to its customers. For financial reporting purposes, EPWU is considered acomponent unit of the City of El Paso. The PSB operates and manages EPWU on behalf of theCity of El Paso. It adopts an annual combined operating, capital and debt service budget for boththe Water and Wastewater Utility Fund and the Municipal Drainage Utility Fund, along withassociated rates and fees for services; and also issues updates to its Rules and Regulations, whichhave the force of law. EPWU recovers the cost of providing water, wastewater, reclaimed waterand drainage services primarily through user charges and fees. EPWU does not assess or collectad valorem property taxes. As part of the mission and vision statements of the Public ServiceBoard , EPWU strives to balance customer needs with proper resources and financial managementas well as regional leadership.
City of El Paso Ordinance Number 752, adopted May 22, 1952, established the Public ServiceBoard –El Paso Water Utilities. The board of trustees, known as the “Public Service Board (PSB),”was given complete management and control of the city’s water system.Ordinance Number017167 adopted August 11, 2009 increased the number of board members from five to seven. ThePSB consists of the Mayor of the City of El Paso and six residents of El Paso County, Texas. Withthe exception of the Mayor, all other trustees are appointed by the City Council and serve staggeredfour-year terms.
In June 2007, City Ordinance Number 016668 established a Municipal Drainage Utility for theCity of El Paso. The Public Service Board – El Paso Water Utilities was given completemanagement and control of the city’s drainage system,which EPWU assumed effective March 1,2008.
Mission Statement - The mission of the Public Service Board - El Paso Water Utilities is to provideour customers a sustainable water supply and the highest quality water services at a reasonablecost with excellent customer service.
3
Vision Statement- To sustain the future of the community through proper planning andimplementation of diverse and alternative strategies.
In the fall of 2013, the Public Service Board revamped its strategic plan to reflect changingconditions and identify and address new initiatives. The new strategic plan implemented theBalanced Scorecard method that includes a SWOT Analysis and integrated the mission, vision,core values, value propositions and tactical plans into one strategic plan for the Utility. Thestrategic plan was formalized with input from employees, management, board members andcommunity stakeholders.
Budget process and controls - EPWU’s fiscal year starts March 1 and runs to the last day ofFebruary. The combined operating and capital budget preparation process starts in August withsessions held by the PSB and management. In September, budget documents containing historicaland current financial and statistical data are sent to all sections along with instructions on how toprepare the operating budget and identifying new initiatives. The capital budget is prepared in asimilar fashion. Management reviews the operating and capital budgets and presents therecommended combined operating and capital budget to the Public Service Board over a series ofpublic meetings. The PSB approves the combined annual operating and capital budget andaccompanying updates to the Rules and Regulations in February, with an effective date of March1.
The budget and the annual financial report are prepared using the accrual basis of accounting.Revenue is recognized as it is earned and expenses are recognized as goods or services aredelivered. The operating budget is prepared at the object level. The object is the good or servicefor which the expenditure was made. Operating or capital budget line item transfers are done on amemorandum basis, submitted by the requesting manager to Finance. The transfer is subject toapproval by management but does not need approval by the PSB. Only the PSB can approveemergency funding authorizations and amendments to the approved operating and capital budgets.
Factors Affecting Financial Condition
The information presented in the financial statements is perhaps best understood when it isconsidered from the broader perspective of the specific environment with which the El Paso WaterUtilities operates.
Local Economy - El Paso is currently the sixth largest city in Texas and the 19th largest city inthe United States. El Paso County has an estimated population of over 850,000 people with another1.4 million in El Paso’s sister city of Juarez, Mexico. With a population of over 220,000 inSouthern New Mexico, the Borderplex region constitutes the largest international bordercommunity in the world. With the expansion of Fort Bliss, an additional 200,000 new residentswill live in the El Paso region by the year 2025.
The El Paso economy is slowly transitioning into new industries with less dependence on thetraditional manufacturing and industrial sectors. According to Forbes Magazine, El Paso rankedamong one of the best cities for income growth in the past five years and in that time, incomes forcollege graduates have steadily grown more than any other major metropolitan area. Pay has
4
increased for educated El Pasoans who are taking advantage of increased job opportunities in thehigher income earning areas in the public sector. Altogether, the El Paso economy gained over 400jobs during the year, representing an annual growth rate of 0.1% as the local economy continuesto grow, even though at a slower pace than last year.
The El Paso Tri-State region is the fifth largest manufacturing center in North America. CiudadJuarez maquilas employ about a quarter of a million workers, representing 20 percent of the totalmaquila jobs in Mexico. Roughly 25 percent of Mexico’s total production sharing output ismanufactured in Cd. Juarez. The success of the maquila program has allowed the El Paso regionto gain a globally competitive advantage in the manufacturing industry. Recent forecasts by theFederal Reserve Bank of Dallas showed a modest increase in maquila job growth throughout 2013and well into 2014.
In addition to a strong, diverse economic base, in 2013 El Paso was ranked as one of the safestlarge cities in the United States with a population of over 500,000, according to the Morgan QuitnoCorporation. El Paso has been ranked in the 2nd or 3rd spot of Safest Cities since 1997 and in 2011was ranked as the safest city. The overall crime rate has continued to decrease in recent years,despite the city’s consistentpopulation growth. El Paso is also one of the most affordable majorcities in the U.S. According to the American Chamber of Commerce Research Association(ACCRA), the cost of living in El Paso is approximately 90.4% of the national average in 2013, afavorable ranking compared to most cities in the Southwest region and most cities of similar sizeand demographics nationally.
Located in the northeastern region of El Paso, Fort Bliss currently stretches over 1.1 million acresof land, an area of land larger than the State of Rhode Island. In 2013, Fort Bliss realized a netincrease of over 37,000 active duty personnel – the largest net gain from any military installationin America. The Army also projects that approximately 16,000 spouses and 21,000 children willaccompany these personnel as they transition to El Paso. An investment of over $5 billion forconstruction projects will support the 300% base population increase by 2015. The El PasoRegional Economic Development Corporation estimated that Fort Bliss’ long term economicimpact is estimated at $7.4 billion annually. Fort Bliss is the first military post in the nation to bedesignated a Center for Renewable Energy. This designation could mean more federal fundingand private sector investment that could total to more than $400 million for the local economy. By2015, Fort Bliss will utilize solar and geothermal energy and a waste-to-energy facility. Theserenewable sources of energy could provide enough power for the base to operate completelyindependent of the local power grid.
El Paso is home to the University of Texas at El Paso (UTEP), which is the second oldest memberof the University of Texas System. It was founded in 1913 and became part of the U.T. system in1919. UTEP has been an important part of the El Paso community since it was founded as theTexas School of Mines and Metallurgy 100 years ago. In 1914, the school opened with 27 studentsand a handful of faculty and staff. UTEP has grown into a dynamic urban university that todayserves the needs of more than 23,000 students, offering 71 bachelors, 76 master and 20 doctoralprograms.
As the nation's only major research university serving a student population that is predominantlyMexican-American, UTEP has also been named one of the top five Hispanic serving institutions
5
to receive federal research money, according to the National Science Foundation (NSF). The NSFdesignated UTEP as a Model Institution for Excellence, one of only six in the country. This hasresulted in a multimillion dollar NSF grant to support UTEP's science, computer science,engineering, and mathematics programs. In April of 2013 the Senate Finance Committee inAustin, Texas voted to award UTEP $40 million in tuition revenue bonds for capital improvementsto help the university reach its goal of becoming a national research Tier 1 university.
Growth is evident in all parts of El Paso. The city has experienced growth in the challengingeconomic environment and this will remain the case during the next year. The construction of theDowntown Triple A baseball stadium, a new 600,000 square foot shopping mall, continuedhighway constructions, along with the continued Fort Bliss base expansion are examples of multi-million dollar projects that have already started and will carry on through 2014 and beyond.
Long-term financial planning - Region E was one of sixteen regions in Texas created in 1997 aspart of Senate Bill 1 which required long term water planning by region. EPWU updated its 50-year plan as part of the update in 2011 of the Region E’s 50-year water plan. This plan identifiesprojected water demand over the next 50 years and provides water supply alternatives to meetdemand. In 2013, EPWU along with other stakeholders in the Far West Texas Regional Planattended meetings to begin work on the 2016 State Water Plan. The Region E State Water Plan isincluded as part of the State Water Plan that will be submitted to the Texas Legislature. The Utilityis currently focused on a 10-year planning horizon and has identified specific projects costing over$747 million that will need to be constructed to meet the water, wastewater and reclaimed waterneeds of the El Paso region, with an additional $141 million in drainage projects to addressdeficiencies in the drainage system. It is projected that water and wastewater rates will increasean estimated 14% over the next five years to fund operations, the capital improvements programand maintain adequate cash reserves. No rate increase was implemented for FY 2014-15. In May2009, City Council adopted water and wastewater impact fees to help pay for growthinfrastructure. In fiscal year 2013-14 the Utility collected $274,000 and estimate that in futureyears between $1 - $2 million will be collected from impact fees annually. EPWU projects thatdrainage fees will have to be increased by 8% over the next five years to continue with the drainageprojects and maintenance of the system. EPWU has budgeted over $120 million in fiscal year2014-15 for water, wastewater and reclaimed water facilities to meet the growth demands of thecity and keep up with the rehabilitation of the system and $30 million for drainage facilities toimprove the drainage infrastructure throughout the city. EPWU continues to address the increasedreliance of well water and other sources of water as a result of the prolonged drought conditionsand its associated capital costs within the next ten years. During fiscal year 2014-15 the Utilitybudgeted $1 million for an advance purified water plant pilot plant to produce drinking water. Thepilot plant operation and testing program coupled with negotiations with the Texas Commissionon Environmental Quality (TCEQ) will set the operating conditions and processes for the full scalefacility. Wastewater plants are targeted for major rehabilitation over the next ten years, includingthe planned expansion of the Roberto Bustamante Wastewater Treatment Plant to start in fiscalyear 2018-19. This plant was once scheduled for expansion in 2000, but because of successfulindoor conservation, the expansion has been delayed substantially.
7
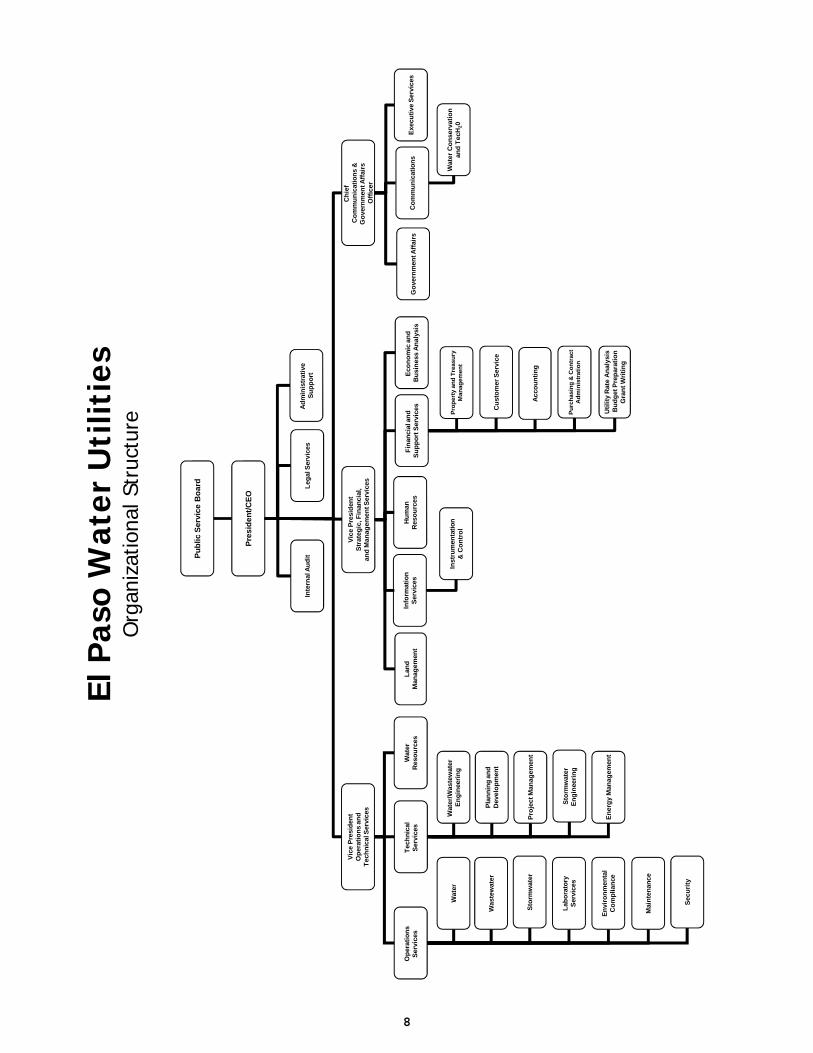
Pu
blic
Ser
vice
Bo
ard
Pre
sid
ent/
CE
O
Leg
al S
ervi
ces
El P
aso
Wat
er U
tilit
ies
Org
aniz
atio
nal S
truc
ture
Op
erat
ion
sS
ervi
ces
Sec
uri
ty
En
erg
y M
anag
emen
t
Vic
e P
resi
den
tO
per
atio
ns
and
Tec
hn
ical
Ser
vice
s
Mai
nte
nan
ce
Tec
hn
ical
Ser
vice
s
Wat
erW
ater
/Was
tew
ater
En
gin
eeri
ng
Pla
nn
ing
an
dD
evel
op
men
tW
aste
wat
er
Lab
ora
tory
Ser
vice
s
Sto
rmw
ater
En
viro
nm
enta
lC
om
plia
nce
Pro
ject
Man
agem
ent
Lan
dM
anag
emen
t
Vic
e P
resi
den
tS
trat
egic
, Fin
anci
al,
and
Man
agem
ent S
ervi
ces
Fin
anci
al a
nd
Su
pp
ort
Ser
vice
sH
um
anR
eso
urc
es
Cu
sto
mer
Ser
vice
Wat
erR
eso
urc
es
Acc
ou
nti
ng
Pro
per
ty a
nd
Tre
asu
ryM
anag
emen
t
Pu
rch
asin
g &
Co
ntr
act
Ad
min
istr
atio
n
Info
rmat
ion
Ser
vice
s
Uti
lity
Rat
e A
nal
ysis
Bu
dg
et P
rep
arat
ion
Gra
nt W
riti
ng
Sto
rmw
ater
En
gin
eeri
ng
Inte
rnal
Au
dit
Eco
no
mic
an
dB
usi
nes
s A
nal
ysis
Co
mm
un
icat
ion
s
Wat
er C
on
serv
atio
nan
d T
ecH
20
Go
vern
men
t Aff
airs
Ch
ief
Co
mm
un
icat
ion
s &
Go
vern
men
t Aff
airs
Off
icer
Exe
cuti
ve S
ervi
ces
Inst
rum
enta
tio
n&
Co
ntr
ol
Ad
min
istr
ativ
eS
up
po
rt
8
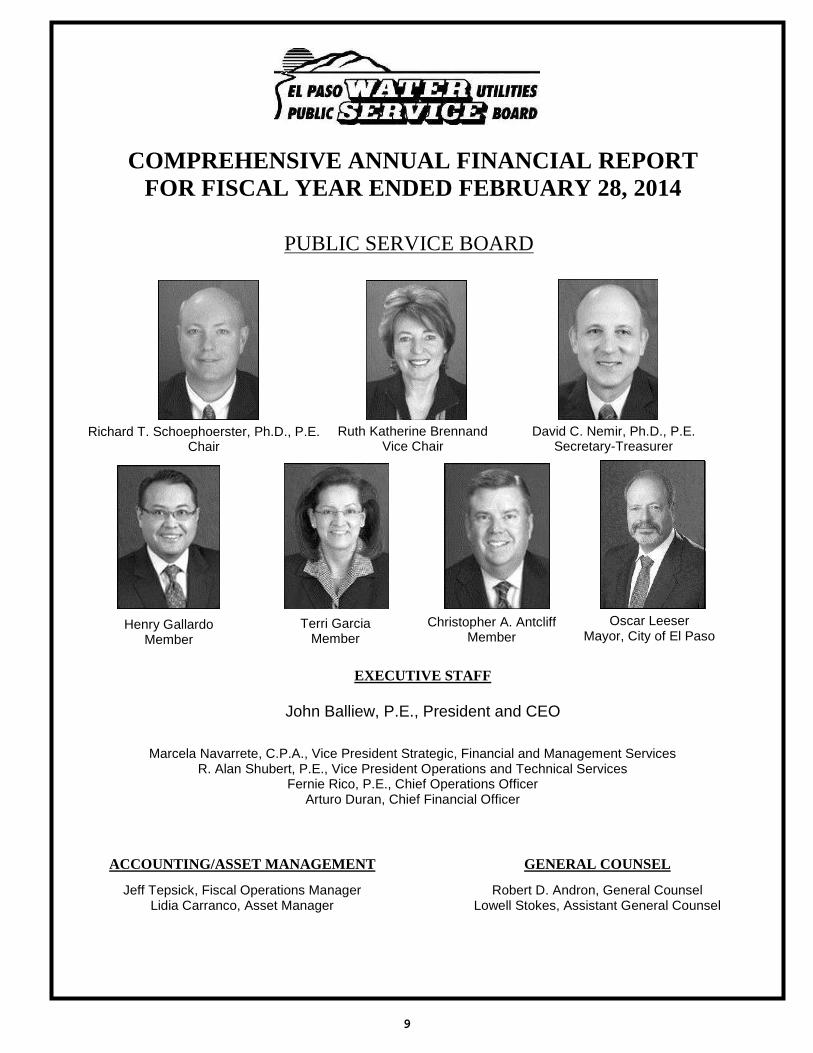
COMPREHENSIVE ANNUAL FINANCIAL REPORTFOR FISCAL YEAR ENDED FEBRUARY 28, 2014
PUBLIC SERVICE BOARD
Richard T. Schoephoerster, Ph.D., P.E.Chair
Ruth Katherine BrennandVice Chair
David C. Nemir, Ph.D., P.E.Secretary-Treasurer
Henry GallardoMember
Oscar LeeserMayor, City of El Paso
Marcela Navarrete, C.P.A., Vice President Strategic, Financial and Management ServicesR. Alan Shubert, P.E., Vice President Operations and Technical Services
Fernie Rico, P.E., Chief Operations OfficerArturo Duran, Chief Financial Officer
Terri GarciaMember
Christopher A. AntcliffMember
EXECUTIVE STAFF
John Balliew, P.E., President and CEO
ACCOUNTING/ASSET MANAGEMENT
Jeff Tepsick, Fiscal Operations ManagerLidia Carranco, Asset Manager
GENERAL COUNSEL
Robert D. Andron, General CounselLowell Stokes, Assistant General Counsel
9

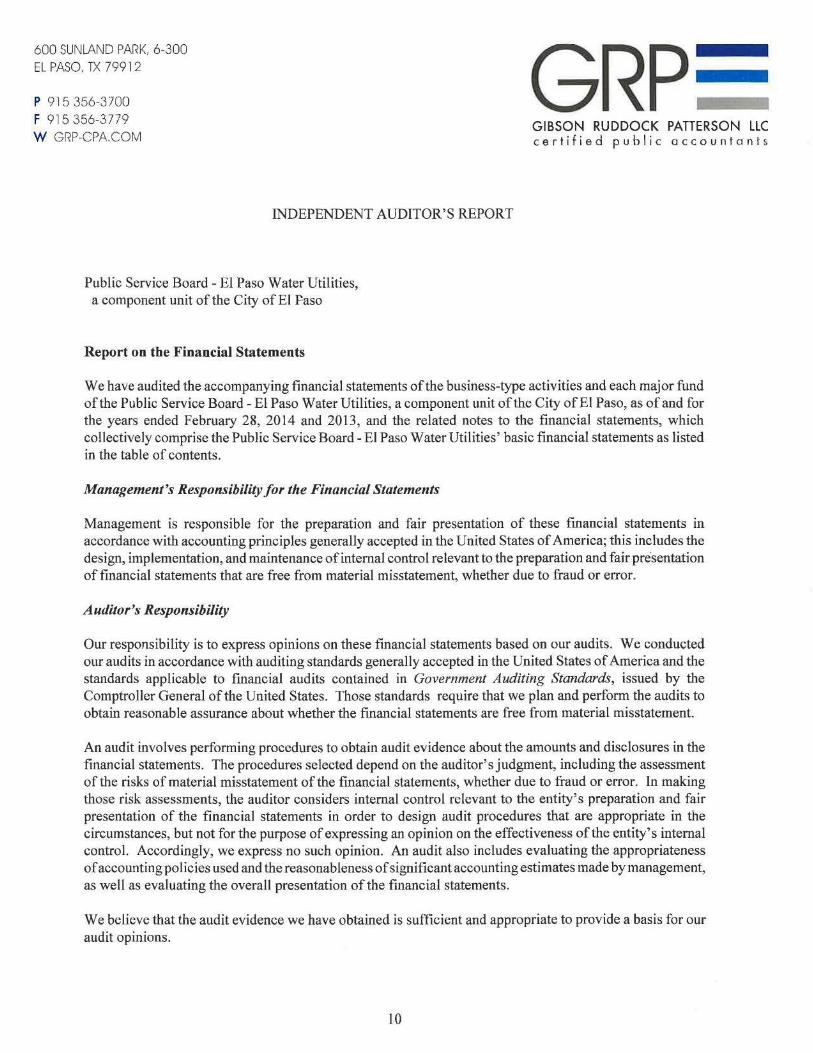
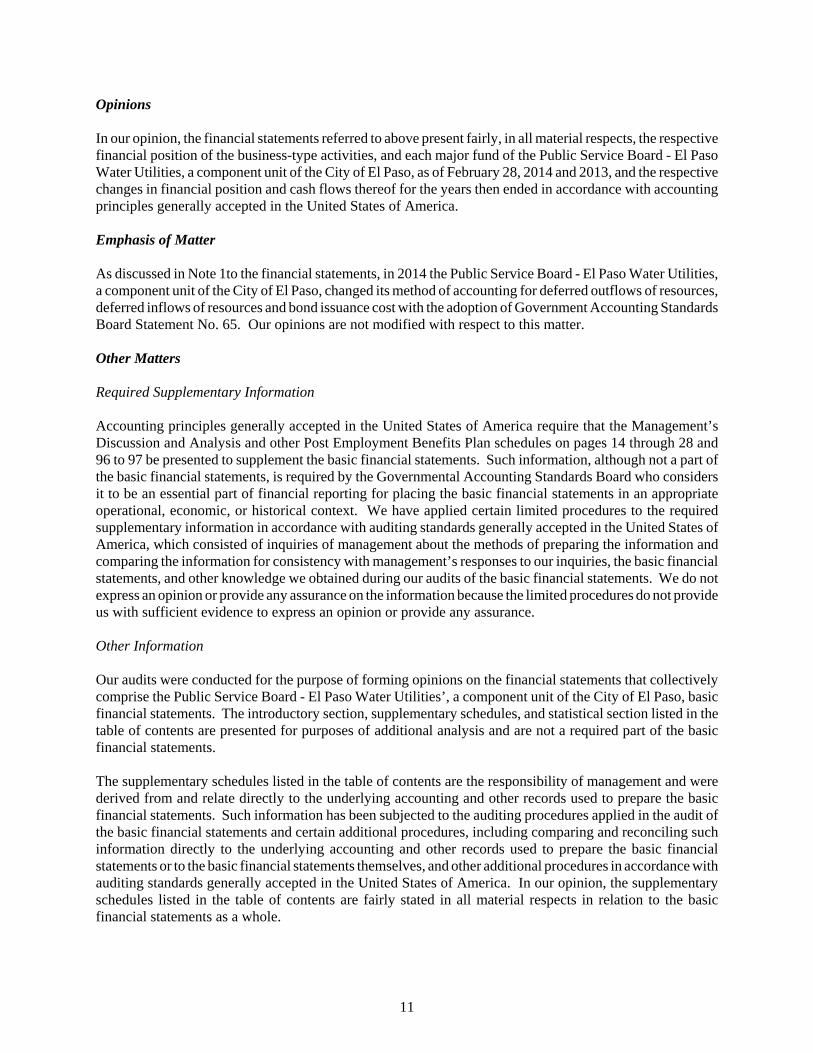
Opinions
In our opinion, the financial statements referred to above present fairly, in all material respects, the respectivefinancial position of the business-type activities, and each major fund of the Public Service Board - El PasoWater Utilities, a component unit of the City of El Paso, as of February 28, 2014 and 2013, and the respectivechanges in financial position and cash flows thereof for the years then ended in accordance with accountingprinciples generally accepted in the United States of America.
Emphasis of Matter
As discussed in Note 1to the financial statements, in 2014 the Public Service Board - El Paso Water Utilities,a component unit of the City of El Paso, changed its method of accounting for deferred outflows of resources,deferred inflows of resources and bond issuance cost with the adoption of Government Accounting StandardsBoard Statement No. 65. Our opinions are not modified with respect to this matter.
Other Matters
Required Supplementary Information
Accounting principles generally accepted in the United States of America require that the Management’sDiscussion and Analysis and other Post Employment Benefits Plan schedules on pages 14 through 28 and96 to 97 be presented to supplement the basic financial statements. Such information, although not a part ofthe basic financial statements, is required by the Governmental Accounting Standards Board who considersit to be an essential part of financial reporting for placing the basic financial statements in an appropriateoperational, economic, or historical context. We have applied certain limited procedures to the requiredsupplementary information in accordance with auditing standards generally accepted in the United States ofAmerica, which consisted of inquiries of management about the methods of preparing the information andcomparing the information for consistency with management’s responses to our inquiries, the basic financialstatements, and other knowledge we obtained during our audits of the basic financial statements. We do notexpress an opinion or provide any assurance on the information because the limited procedures do not provideus with sufficient evidence to express an opinion or provide any assurance.
Other Information
Our audits were conducted for the purpose of forming opinions on the financial statements that collectivelycomprise the Public Service Board - El Paso Water Utilities’, a component unit of the City of El Paso, basicfinancial statements. The introductory section, supplementary schedules, and statistical section listed in thetable of contents are presented for purposes of additional analysis and are not a required part of the basicfinancial statements.
The supplementary schedules listed in the table of contents are the responsibility of management and werederived from and relate directly to the underlying accounting and other records used to prepare the basicfinancial statements. Such information has been subjected to the auditing procedures applied in the audit ofthe basic financial statements and certain additional procedures, including comparing and reconciling suchinformation directly to the underlying accounting and other records used to prepare the basic financialstatements or to the basic financial statements themselves, and other additional procedures in accordance withauditing standards generally accepted in the United States of America. In our opinion, the supplementaryschedules listed in the table of contents are fairly stated in all material respects in relation to the basicfinancial statements as a whole.
11
The introductory and statistical sections have not been subjected to the auditing procedures applied in theaudit of the basic financial statements and, accordingly, we do not express an opinion or provide anyassurance on them.
Other Reporting Required by Government Auditing Standards
In accordance with Government Auditing Standards, we have also issued our separate report dated June 27,2014 on our consideration of the Public Service Board - El Paso Water Utilities’, a component unit of the Cityof El Paso, internal control over financial reporting and on our tests of its compliance with certain provisionsof laws, regulations, contracts and grant agreements, and other matters. The purpose of that report is todescribe the scope of our testing of internal control over financial reporting and compliance and the resultsof that testing, and not to provide an opinion on internal control over financial reporting or on compliance. That report is an integral part of an audit performed in accordance with Government Auditing Standards inconsidering Public Service Board - El Paso Water Utilities’ internal control over financial reporting andcompliance.
Gibson Ruddock Patterson, LLC
El Paso, TexasJune 27, 2014
12

13
14
Public Service Board - El Paso Water Utilities
Management’s Discussion and Analysis
As management of the Public Service Board - El Paso Water Utilities (EPWU), we offer readers ofthe financial statements this narrative overview and analysis of the financial activities for the fiscalyear ended February 28, 2014. EPWU consists of two funds, the Water and Wastewater Utility fundand the Municipal Drainage Utility fund. We encourage readers to consider the informationpresented here in conjunction with additional information that we have furnished in our letter oftransmittal, which can be found on pages 1-6 of this report.
Financial Highlights
The assets and deferred outflows of resources of EPWU exceeded its liabilities and deferred inflowsor resources at the close of the most recent fiscal year by $848.20 million (net position).
EPWU’s total assetsand deferred outflows of resources of $1.52 billion increased by $49.24 millionfrom 2013 to 2014 mainly due to an increase in construction work in progress of $52.62 million andan increase of $28.27 million in capital assets placed in service from the Water and WastewaterUtility.
EPWU’s total liabilities and deferred inflows or resources increased by $9.40 million during thefiscal year mainly due to an increase in accounts payable from restricted assets of $4.16 million andan increase in customer advances for construction of $5.16 million.
The debt service coverage for the Water and Wastewater Utility of 2.09 times is well above therequired 1.5 times debt service coverage as per its bond ordinance. The Municipal Drainage Utility’sdebt service coverage of 1.71 times is above the required 1.25 times as per its bond ordinance.
Overview of Financial Statements
Statements of Net Position – present information as of the end of each fiscal year on all ofEPWU’ assets,liabilities, deferred outflows and inflows of resources and total net position.This statement is useful in evaluating the financial health of EPWU.
Statements of Revenues, Expenses and Changes in Net Position – present information ofchanges in net position during the fiscal years presented. This statement is useful inevaluating if EPWU recovered all its costs through its rates and other charges.
Statements of Cash Flows – provides information for the fiscal years presented of cash flowsfrom operating, capital and related financing and from investing activities.
Enterprise Funds – EPWU consists of two funds, the Water and Wastewater Utility fund andthe Municipal Drainage Utility fund. Enterprise Funds Statements eliminate all transactionsbetween the two funds.
Notes to financial statements – present detail information that is essential to the completeunderstanding of EPWU’sfinancial statements.
Required Supplemental Information – present information concerning EPWU’sprogress infunding its other postemployment benefit plan obligations.
Other supplemental information is provided for additional analysis and is not a required part ofthe basic financial statements.
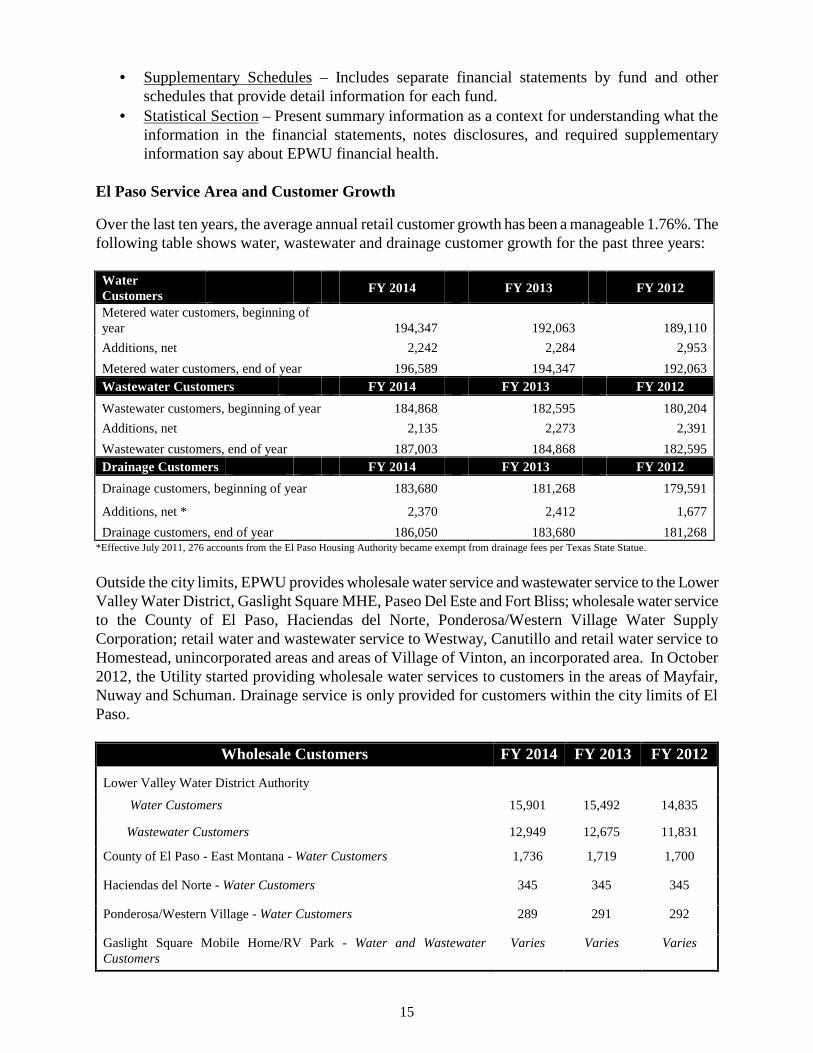
15
Supplementary Schedules – Includes separate financial statements by fund and otherschedules that provide detail information for each fund.
Statistical Section – Present summary information as a context for understanding what theinformation in the financial statements, notes disclosures, and required supplementaryinformation say about EPWU financial health.
El Paso Service Area and Customer Growth
Over the last ten years, the average annual retail customer growth has been a manageable 1.76%. Thefollowing table shows water, wastewater and drainage customer growth for the past three years:
WaterCustomers
FY 2014 FY 2013 FY 2012
Metered water customers, beginning ofyear 194,347 192,063 189,110
Additions, net 2,242 2,284 2,953
Metered water customers, end of year 196,589 194,347 192,063Wastewater Customers FY 2014 FY 2013 FY 2012
Wastewater customers, beginning of year 184,868 182,595 180,204
Additions, net 2,135 2,273 2,391
Wastewater customers, end of year 187,003 184,868 182,595Drainage Customers FY 2014 FY 2013 FY 2012
Drainage customers, beginning of year 183,680 181,268 179,591
Additions, net * 2,370 2,412 1,677
Drainage customers, end of year 186,050 183,680 181,268*Effective July 2011, 276 accounts from the El Paso Housing Authority became exempt from drainage fees per Texas State Statue.
Outside the city limits, EPWU provides wholesale water service and wastewater service to the LowerValley Water District, Gaslight Square MHE, Paseo Del Este and Fort Bliss; wholesale water serviceto the County of El Paso, Haciendas del Norte, Ponderosa/Western Village Water SupplyCorporation; retail water and wastewater service to Westway, Canutillo and retail water service toHomestead, unincorporated areas and areas of Village of Vinton, an incorporated area. In October2012, the Utility started providing wholesale water services to customers in the areas of Mayfair,Nuway and Schuman. Drainage service is only provided for customers within the city limits of ElPaso.
Wholesale Customers FY 2014 FY 2013 FY 2012
Lower Valley Water District Authority
Water Customers 15,901 15,492 14,835
Wastewater Customers 12,949 12,675 11,831
County of El Paso - East Montana - Water Customers 1,736 1,719 1,700
Haciendas del Norte - Water Customers 345 345 345
Ponderosa/Western Village - Water Customers 289 291 292
Gaslight Square Mobile Home/RV Park - Water and WastewaterCustomers
Varies Varies Varies
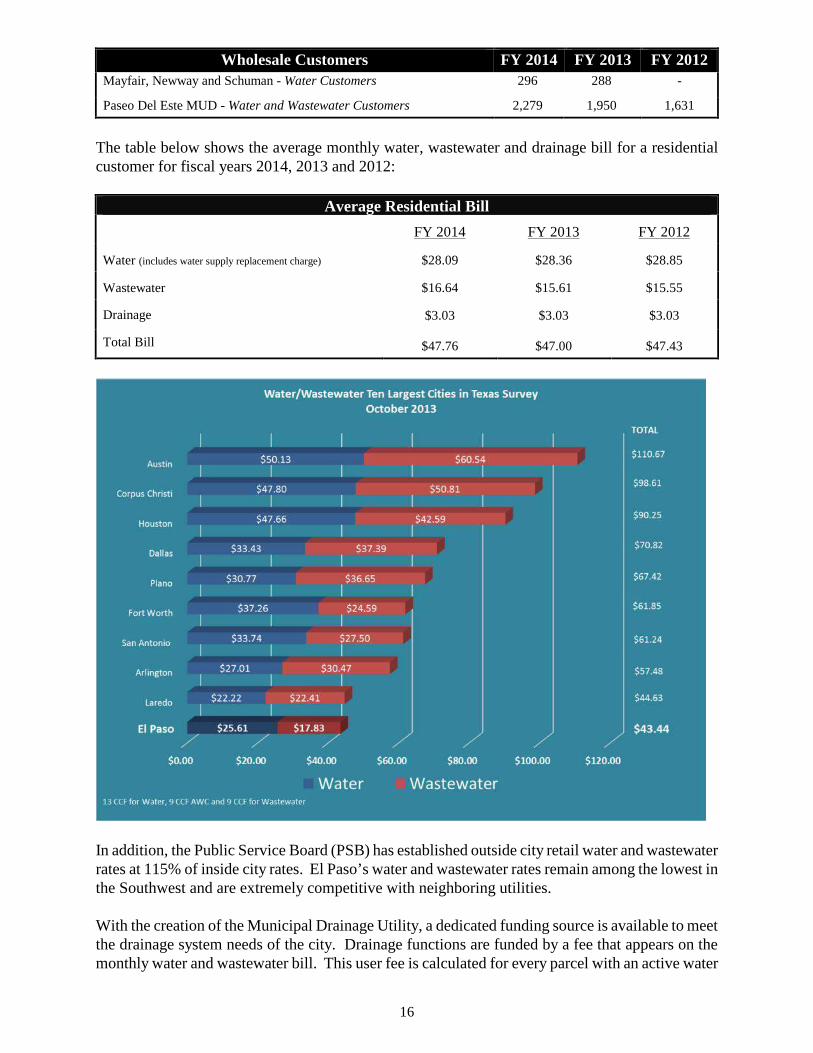
16
Wholesale Customers FY 2014 FY 2013 FY 2012Mayfair, Newway and Schuman - Water Customers 296 288 -
Paseo Del Este MUD - Water and Wastewater Customers 2,279 1,950 1,631
The table below shows the average monthly water, wastewater and drainage bill for a residentialcustomer for fiscal years 2014, 2013 and 2012:
Average Residential Bill
FY 2014 FY 2013 FY 2012
Water (includes water supply replacement charge) $28.09 $28.36 $28.85
Wastewater $16.64 $15.61 $15.55
Drainage $3.03 $3.03 $3.03
Total Bill $47.76 $47.00 $47.43
In addition, the Public Service Board (PSB) has established outside city retail water and wastewaterrates at 115% of inside city rates. El Paso’s water and wastewater rates remain among the lowest inthe Southwest and are extremely competitive with neighboring utilities.
With the creation of the Municipal Drainage Utility, a dedicated funding source is available to meetthe drainage system needs of the city. Drainage functions are funded by a fee that appears on themonthly water and wastewater bill. This user fee is calculated for every parcel with an active water
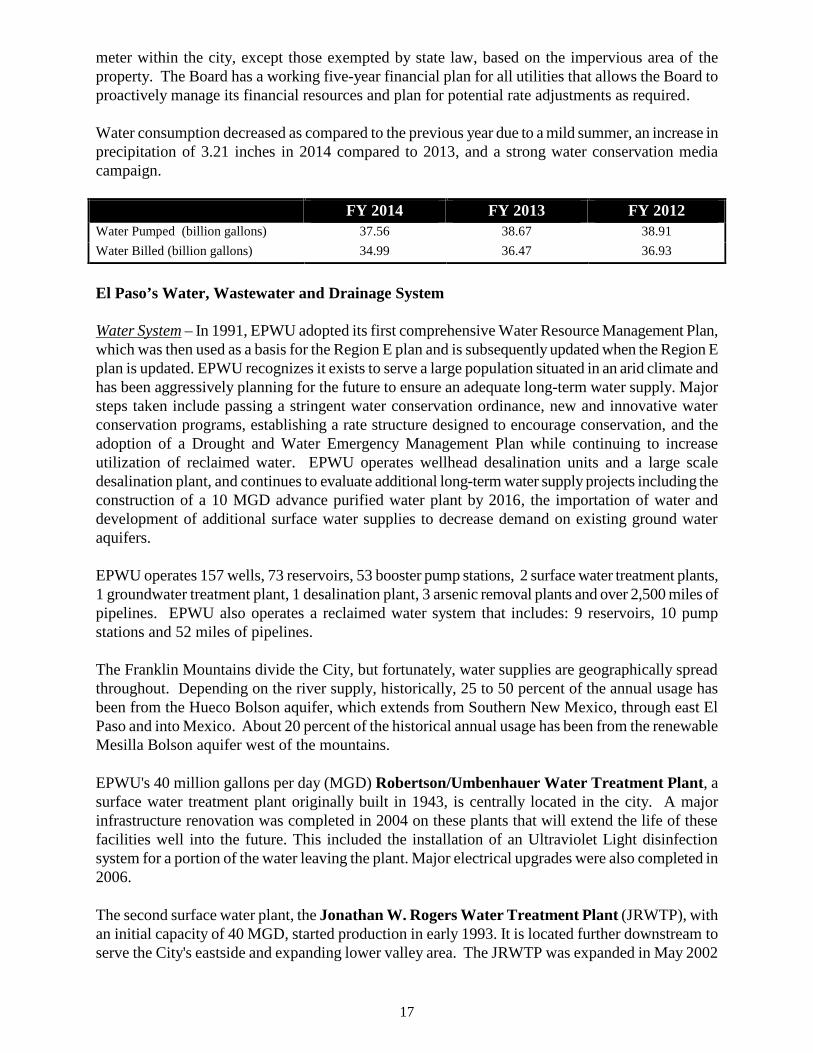
17
meter within the city, except those exempted by state law, based on the impervious area of theproperty. The Board has a working five-year financial plan for all utilities that allows the Board toproactively manage its financial resources and plan for potential rate adjustments as required.
Water consumption decreased as compared to the previous year due to a mild summer, an increase inprecipitation of 3.21 inches in 2014 compared to 2013, and a strong water conservation mediacampaign.
FY 2014 FY 2013 FY 2012Water Pumped (billion gallons) 37.56 38.67 38.91
Water Billed (billion gallons) 34.99 36.47 36.93
El Paso’s Water, Wastewater and Drainage System
Water System – In 1991, EPWU adopted its first comprehensive Water Resource Management Plan,which was then used as a basis for the Region E plan and is subsequently updated when the Region Eplan is updated. EPWU recognizes it exists to serve a large population situated in an arid climate andhas been aggressively planning for the future to ensure an adequate long-term water supply. Majorsteps taken include passing a stringent water conservation ordinance, new and innovative waterconservation programs, establishing a rate structure designed to encourage conservation, and theadoption of a Drought and Water Emergency Management Plan while continuing to increaseutilization of reclaimed water. EPWU operates wellhead desalination units and a large scaledesalination plant, and continues to evaluate additional long-term water supply projects including theconstruction of a 10 MGD advance purified water plant by 2016, the importation of water anddevelopment of additional surface water supplies to decrease demand on existing ground wateraquifers.
EPWU operates 157 wells, 73 reservoirs, 53 booster pump stations, 2 surface water treatment plants,1 groundwater treatment plant, 1 desalination plant, 3 arsenic removal plants and over 2,500 miles ofpipelines. EPWU also operates a reclaimed water system that includes: 9 reservoirs, 10 pumpstations and 52 miles of pipelines.
The Franklin Mountains divide the City, but fortunately, water supplies are geographically spreadthroughout. Depending on the river supply, historically, 25 to 50 percent of the annual usage hasbeen from the Hueco Bolson aquifer, which extends from Southern New Mexico, through east ElPaso and into Mexico. About 20 percent of the historical annual usage has been from the renewableMesilla Bolson aquifer west of the mountains.
EPWU's 40 million gallons per day (MGD) Robertson/Umbenhauer Water Treatment Plant, asurface water treatment plant originally built in 1943, is centrally located in the city. A majorinfrastructure renovation was completed in 2004 on these plants that will extend the life of thesefacilities well into the future. This included the installation of an Ultraviolet Light disinfectionsystem for a portion of the water leaving the plant. Major electrical upgrades were also completed in2006.
The second surface water plant, the Jonathan W. Rogers Water Treatment Plant (JRWTP), withan initial capacity of 40 MGD, started production in early 1993. It is located further downstream toserve the City's eastside and expanding lower valley area. The JRWTP was expanded in May 2002
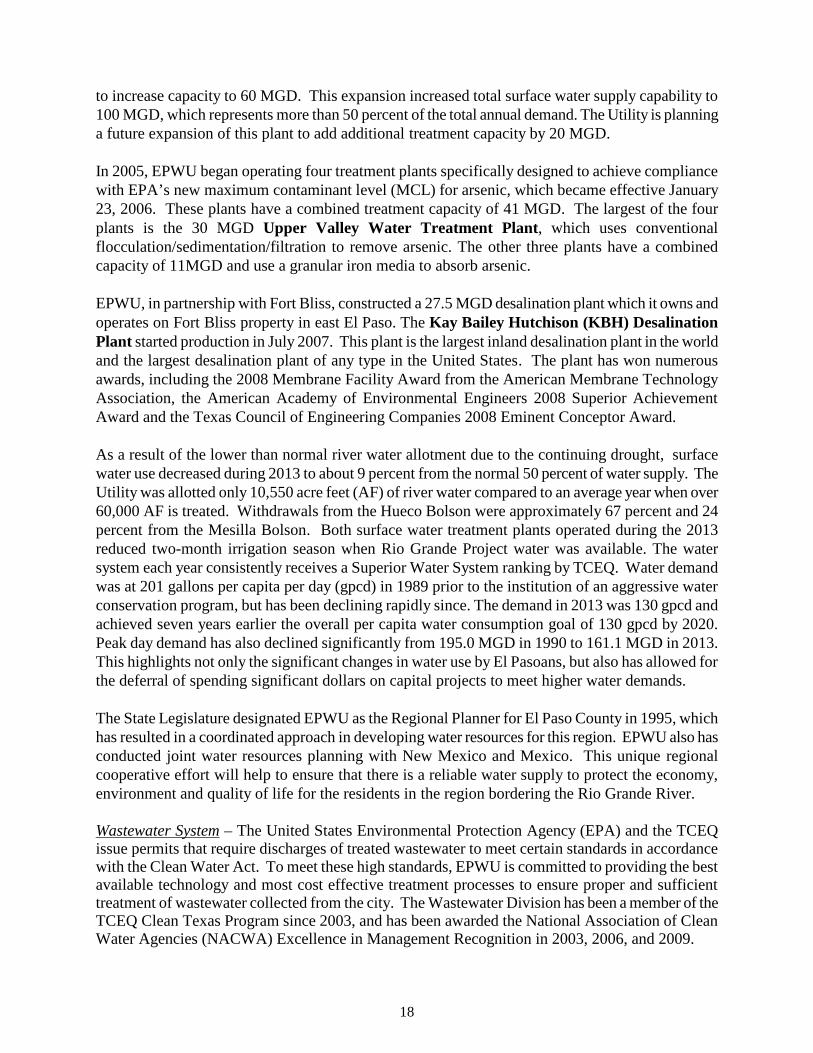
18
to increase capacity to 60 MGD. This expansion increased total surface water supply capability to100 MGD, which represents more than 50 percent of the total annual demand. The Utility is planninga future expansion of this plant to add additional treatment capacity by 20 MGD.
In 2005, EPWU began operating four treatment plants specifically designed to achieve compliancewith EPA’s new maximum contaminant level (MCL) for arsenic, which became effective January23, 2006. These plants have a combined treatment capacity of 41 MGD. The largest of the fourplants is the 30 MGD Upper Valley Water Treatment Plant, which uses conventionalflocculation/sedimentation/filtration to remove arsenic. The other three plants have a combinedcapacity of 11MGD and use a granular iron media to absorb arsenic.
EPWU, in partnership with Fort Bliss, constructed a 27.5 MGD desalination plant which it owns andoperates on Fort Bliss property in east El Paso. The Kay Bailey Hutchison (KBH) DesalinationPlant started production in July 2007. This plant is the largest inland desalination plant in the worldand the largest desalination plant of any type in the United States. The plant has won numerousawards, including the 2008 Membrane Facility Award from the American Membrane TechnologyAssociation, the American Academy of Environmental Engineers 2008 Superior AchievementAward and the Texas Council of Engineering Companies 2008 Eminent Conceptor Award.
As a result of the lower than normal river water allotment due to the continuing drought, surfacewater use decreased during 2013 to about 9 percent from the normal 50 percent of water supply. TheUtility was allotted only 10,550 acre feet (AF) of river water compared to an average year when over60,000 AF is treated. Withdrawals from the Hueco Bolson were approximately 67 percent and 24percent from the Mesilla Bolson. Both surface water treatment plants operated during the 2013reduced two-month irrigation season when Rio Grande Project water was available. The watersystem each year consistently receives a Superior Water System ranking by TCEQ. Water demandwas at 201 gallons per capita per day (gpcd) in 1989 prior to the institution of an aggressive waterconservation program, but has been declining rapidly since. The demand in 2013 was 130 gpcd andachieved seven years earlier the overall per capita water consumption goal of 130 gpcd by 2020.Peak day demand has also declined significantly from 195.0 MGD in 1990 to 161.1 MGD in 2013.This highlights not only the significant changes in water use by El Pasoans, but also has allowed forthe deferral of spending significant dollars on capital projects to meet higher water demands.
The State Legislature designated EPWU as the Regional Planner for El Paso County in 1995, whichhas resulted in a coordinated approach in developing water resources for this region. EPWU also hasconducted joint water resources planning with New Mexico and Mexico. This unique regionalcooperative effort will help to ensure that there is a reliable water supply to protect the economy,environment and quality of life for the residents in the region bordering the Rio Grande River.
Wastewater System – The United States Environmental Protection Agency (EPA) and the TCEQissue permits that require discharges of treated wastewater to meet certain standards in accordancewith the Clean Water Act. To meet these high standards, EPWU is committed to providing the bestavailable technology and most cost effective treatment processes to ensure proper and sufficienttreatment of wastewater collected from the city. The Wastewater Division has been a member of theTCEQ Clean Texas Program since 2003, and has been awarded the National Association of CleanWater Agencies (NACWA) Excellence in Management Recognition in 2003, 2006, and 2009.
19
The Roberto R. Bustamante Wastewater Treatment Plant began serving the east, southeast andlower valley parts of the city in 1991 and has a treatment capacity of 39 MGD. The plant also hasthe capability to provide reclaimed water. Since 1997, it has received twelve NACWA PeakPerformance Gold Awards and three NACWA Silver Awards. In 1994, the plant placed second inthe nation in the EPA Operations and Maintenance Excellence Awards, Large-Secondary Treatmentcategory, representing the State of Texas and EPA Region VI. The plant also received NACWA’sPlatinum Peak Performance Award for five consecutive years of compliance in 2002. The WaterEnvironment Association of Texas also judged this plant the Municipal Wastewater Treatment Plantof the Year for 2005.
The Northwest Wastewater Treatment Plant can treat 17.5 MGD of wastewater from the west andnorthwest part of the city. Since the initial start-up of the plant in 1987 and expansion to its presentcapacity in 1994, the plant has been nominated for six EPA Operations and Maintenance ExcellenceAwards and has received fourteen NACWA Gold Awards and six NACWA Silver Awards. In 1992,the plant and its personnel were also recognized for their commitment to safety by being awarded theWater Environment Federation’s George W. Burke Award for Safety. This plant first received theNACWA’s Platinum Peak Performance Award for five consecutive years of complete compliance in2003. In 2008, it received 1st Place in the National Clean Water Act Recognition Awards forOperations and Maintenance Excellence in the Large Advanced Plant Category. In 2013, the plantreceived the Platinum Fourteen Award for fourteen consecutive years of perfect permit compliance.The plant was the Texas State, Regional and National winner of the Clean Water Act O&M AwardsProgram in the Large Advanced Category. This plant also provides reclaimed water to several largeirrigation customers.
The Haskell R. Street Wastewater Treatment Plant was initially constructed in 1923. The plantserves the central part of the city and has treatment capacity of 27.7 MGD. The plant has undergoneseveral expansions and modifications in an effort to meet ever-changing environmental regulationsand to enhance the reliability of the treatment processes. In 1994 it was selected to represent theState of Texas and EPA Region VI for the nationally recognized EPA Operations and MaintenanceExcellence Award, Large-Advanced Treatment category. In 1999 a $25 million upgrade andrenovation was completed. The plant was also upgraded in 2003 to provide reclaimed water to localparks, schools, industries and golf courses. Since 1997, the plant has received ten NACWA GoldAwards and four NACWA Silver Awards. It also received the NACWA Platinum Award in 2004for being the recipient of the Gold Award for five consecutive years. It also received the NACWAPlatinum Award in 2007 for being the recipient of the Gold Award for eight consecutive years.This plant also provides reclaimed water to several large irrigation customers.
The Fred Hervey Water Reclamation Plant constructed in 1984, can treat 12 MGD of wastewaterfrom the northeast part of the city. This unique plant was one of the first in the nation to take rawsewage and treat it to drinking water standards. This reclaimed water is then used to recharge theHueco Bolson, to irrigate a local golf course and to provide the El Paso Electric Co. with coolingtower water for electric power generation. In 2011, the plant completed the last phase of a multi-yearmulti phased program to renovate and upgrade the plant for new permit requirements and expandedthe plant capacity from 10 MGD to 12 MGD. This plant has also received numerous awards,including: the 1994 AMSA Public Information and Education Award; second place in the national1994 EPA Operations and Maintenance Excellence Award, No Discharge category; and the 1998American Water Works Association’s Conservation and Reuse Award. In 1999 the plant received
20
special recognition by the El Paso Del Norte Region Mission Possible-Survival Strategies in thecategory “Protection and Preservation of the Environment”.Beginning in 2006, the Fred HerveyPlant became eligible for the NACWA awards and received the Platinum Six Award in 2012 for sixconsecutive years of perfect permit compliance.
The Wastewater Collection System Maintenance Section of EPWU received the 2007 Medal forHeroism from the Water Environment Association of Texas for their great efforts in helping the Cityduring the Storm 2006. EPWU also received the 2007 George Burke Award from the WaterEnvironment Association of Texas for a perfect safety record in the area of lift station operations.EPWU is committed to addressing the infrastructure needs and acquiring future water resources forits customers. Short and long-term planning is a vital part of meeting the current and future needs ofthis community. For these efforts, EPWU was recognized by NACWA with its third Excellence inManagement Award in 2010. This award, which is only given every three years, recognizes agenciesthat have used competitive business strategies to meet the expectations of drinking water consumersand municipal government leaders over a sustained period of time.
EPWU was one of only seven public drinking water systems that received the Platinum Award forUtility Excellence from the Association of Metropolitan Water Agencies (AMWA) in 2010. Thisaward recognizes the outstanding achievements in implementing the nationally recognized Attributesof Effectively Managed Water Sector Utilities. EPWU was recognized for performance in areas ofproduct quality, employee and leadership development, customer satisfaction, and communitysustainability.
Drainage System – Following the storms in 2006, an evaluation identified extensive damage to thedrainage system. The City of El Paso repaired the most severely damaged items. The MunicipalDrainage Utility continues to work on the remaining projects, as well as the operation andmaintenance of the system and the construction projects needed to reach an adequate level of service.EPWU developed the first ever stormwater master plan for the city and subsequently developed a tenyear capital improvement plan to address the drainage system’s deficiencies.
The drainage system currently consists of 21 storm water pump stations, 904 acres of ponds, 2,430acres of dams, 74 miles of channels, 43 miles of agricultural drains, 146 miles of storm drains andthousands of storm water drop inlets.
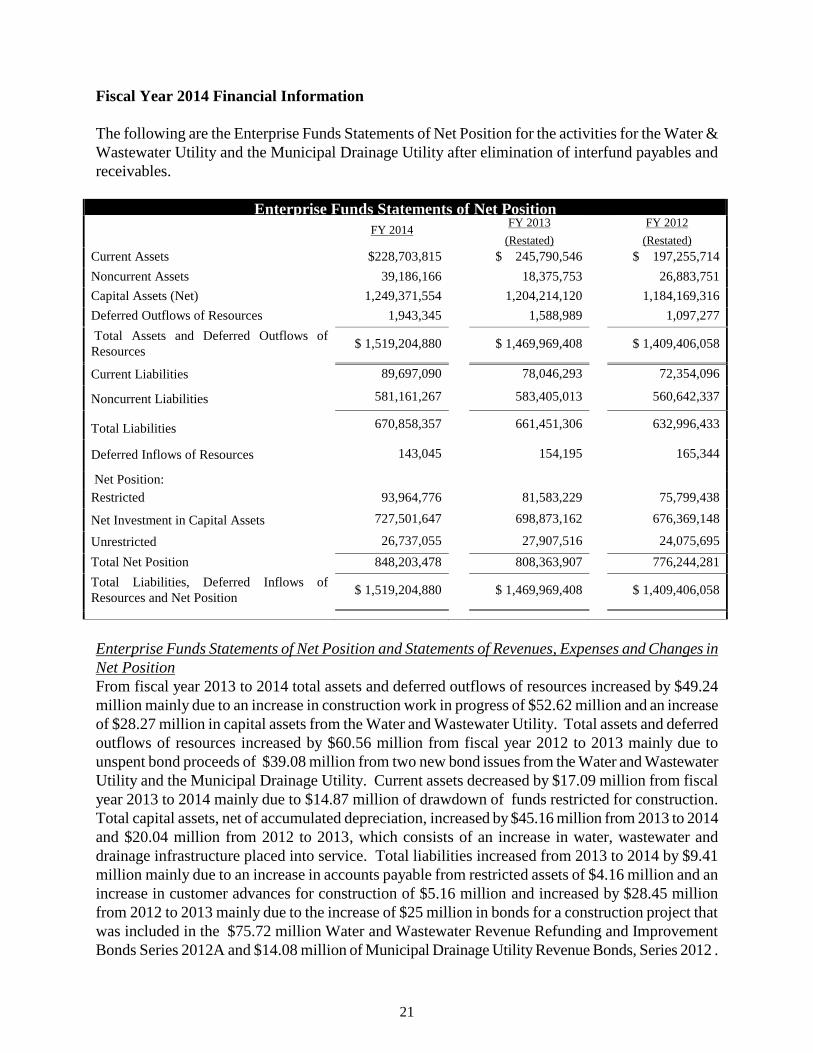
21
Fiscal Year 2014 Financial Information
The following are the Enterprise Funds Statements of Net Position for the activities for the Water &Wastewater Utility and the Municipal Drainage Utility after elimination of interfund payables andreceivables.
Enterprise Funds Statements of Net PositionFY 2014
FY 2013
(Restated)
FY 2012
(Restated)Current Assets $228,703,815 $ 245,790,546 $ 197,255,714
Noncurrent Assets 39,186,166 18,375,753 26,883,751
Capital Assets (Net) 1,249,371,554 1,204,214,120 1,184,169,316
Deferred Outflows of Resources 1,943,345 1,588,989 1,097,277
Total Assets and Deferred Outflows ofResources
$ 1,519,204,880 $ 1,469,969,408 $ 1,409,406,058
Current Liabilities 89,697,090 78,046,293 72,354,096
Noncurrent Liabilities 581,161,267 583,405,013 560,642,337
Total Liabilities 670,858,357 661,451,306 632,996,433
Deferred Inflows of Resources 143,045 154,195 165,344
Net Position:Restricted 93,964,776 81,583,229 75,799,438
Net Investment in Capital Assets 727,501,647 698,873,162 676,369,148
Unrestricted 26,737,055 27,907,516 24,075,695
Total Net Position 848,203,478 808,363,907 776,244,281
Total Liabilities, Deferred Inflows ofResources and Net Position
$ 1,519,204,880 $ 1,469,969,408 $ 1,409,406,058
Enterprise Funds Statements of Net Position and Statements of Revenues, Expenses and Changes inNet PositionFrom fiscal year 2013 to 2014 total assets and deferred outflows of resources increased by $49.24million mainly due to an increase in construction work in progress of $52.62 million and an increaseof $28.27 million in capital assets from the Water and Wastewater Utility. Total assets and deferredoutflows of resources increased by $60.56 million from fiscal year 2012 to 2013 mainly due tounspent bond proceeds of $39.08 million from two new bond issues from the Water and WastewaterUtility and the Municipal Drainage Utility. Current assets decreased by $17.09 million from fiscalyear 2013 to 2014 mainly due to $14.87 million of drawdown of funds restricted for construction.Total capital assets, net of accumulated depreciation, increased by $45.16 million from 2013 to 2014and $20.04 million from 2012 to 2013, which consists of an increase in water, wastewater anddrainage infrastructure placed into service. Total liabilities increased from 2013 to 2014 by $9.41million mainly due to an increase in accounts payable from restricted assets of $4.16 million and anincrease in customer advances for construction of $5.16 million and increased by $28.45 millionfrom 2012 to 2013 mainly due to the increase of $25 million in bonds for a construction project thatwas included in the $75.72 million Water and Wastewater Revenue Refunding and ImprovementBonds Series 2012A and $14.08 million of Municipal Drainage Utility Revenue Bonds, Series 2012 .
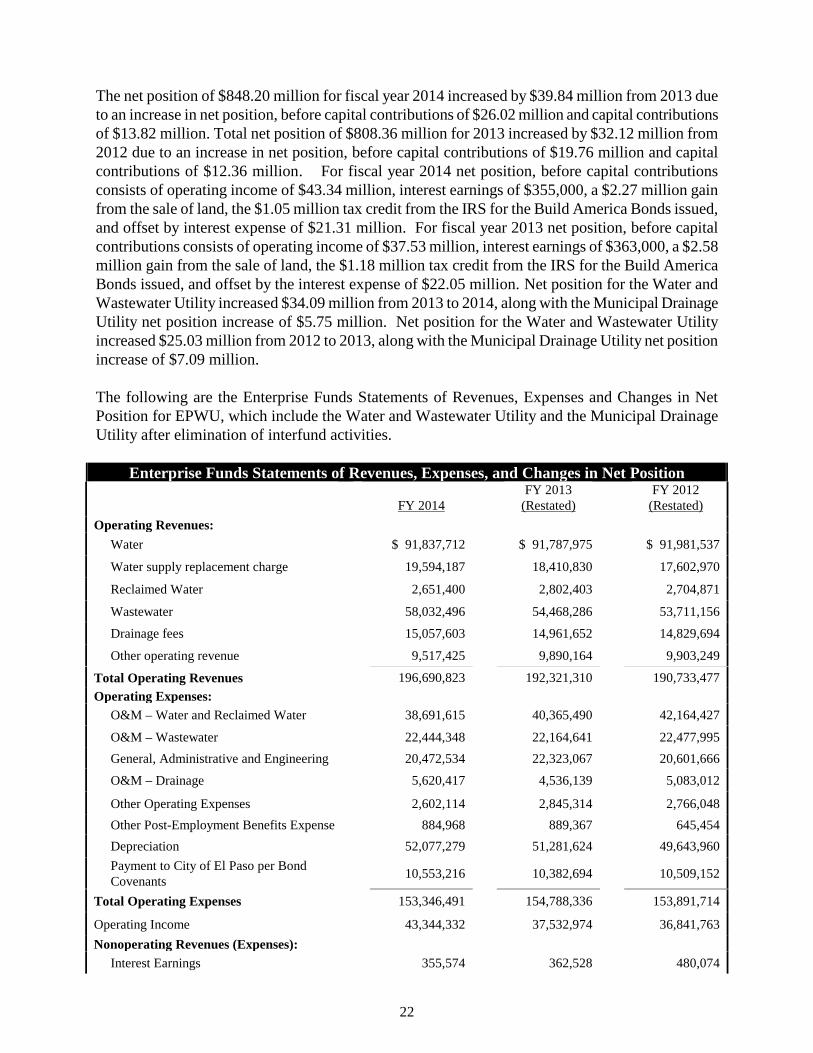
22
The net position of $848.20 million for fiscal year 2014 increased by $39.84 million from 2013 dueto an increase in net position, before capital contributions of $26.02 million and capital contributionsof $13.82 million. Total net position of $808.36 million for 2013 increased by $32.12 million from2012 due to an increase in net position, before capital contributions of $19.76 million and capitalcontributions of $12.36 million. For fiscal year 2014 net position, before capital contributionsconsists of operating income of $43.34 million, interest earnings of $355,000, a $2.27 million gainfrom the sale of land, the $1.05 million tax credit from the IRS for the Build America Bonds issued,and offset by interest expense of $21.31 million. For fiscal year 2013 net position, before capitalcontributions consists of operating income of $37.53 million, interest earnings of $363,000, a $2.58million gain from the sale of land, the $1.18 million tax credit from the IRS for the Build AmericaBonds issued, and offset by the interest expense of $22.05 million. Net position for the Water andWastewater Utility increased $34.09 million from 2013 to 2014, along with the Municipal DrainageUtility net position increase of $5.75 million. Net position for the Water and Wastewater Utilityincreased $25.03 million from 2012 to 2013, along with the Municipal Drainage Utility net positionincrease of $7.09 million.
The following are the Enterprise Funds Statements of Revenues, Expenses and Changes in NetPosition for EPWU, which include the Water and Wastewater Utility and the Municipal DrainageUtility after elimination of interfund activities.
Enterprise Funds Statements of Revenues, Expenses, and Changes in Net Position
FY 2014FY 2013
(Restated)FY 2012
(Restated)
Operating Revenues:
Water $ 91,837,712 $ 91,787,975 $ 91,981,537
Water supply replacement charge 19,594,187 18,410,830 17,602,970
Reclaimed Water 2,651,400 2,802,403 2,704,871
Wastewater 58,032,496 54,468,286 53,711,156
Drainage fees 15,057,603 14,961,652 14,829,694
Other operating revenue 9,517,425 9,890,164 9,903,249
Total Operating Revenues 196,690,823 192,321,310 190,733,477
Operating Expenses:O&M – Water and Reclaimed Water 38,691,615 40,365,490 42,164,427
O&M – Wastewater 22,444,348 22,164,641 22,477,995
General, Administrative and Engineering 20,472,534 22,323,067 20,601,666
O&M – Drainage 5,620,417 4,536,139 5,083,012
Other Operating Expenses 2,602,114 2,845,314 2,766,048
Other Post-Employment Benefits Expense 884,968 889,367 645,454
Depreciation 52,077,279 51,281,624 49,643,960
Payment to City of El Paso per BondCovenants
10,553,216 10,382,694 10,509,152
Total Operating Expenses 153,346,491 154,788,336 153,891,714
Operating Income 43,344,332 37,532,974 36,841,763
Nonoperating Revenues (Expenses):Interest Earnings 355,574 362,528 480,074
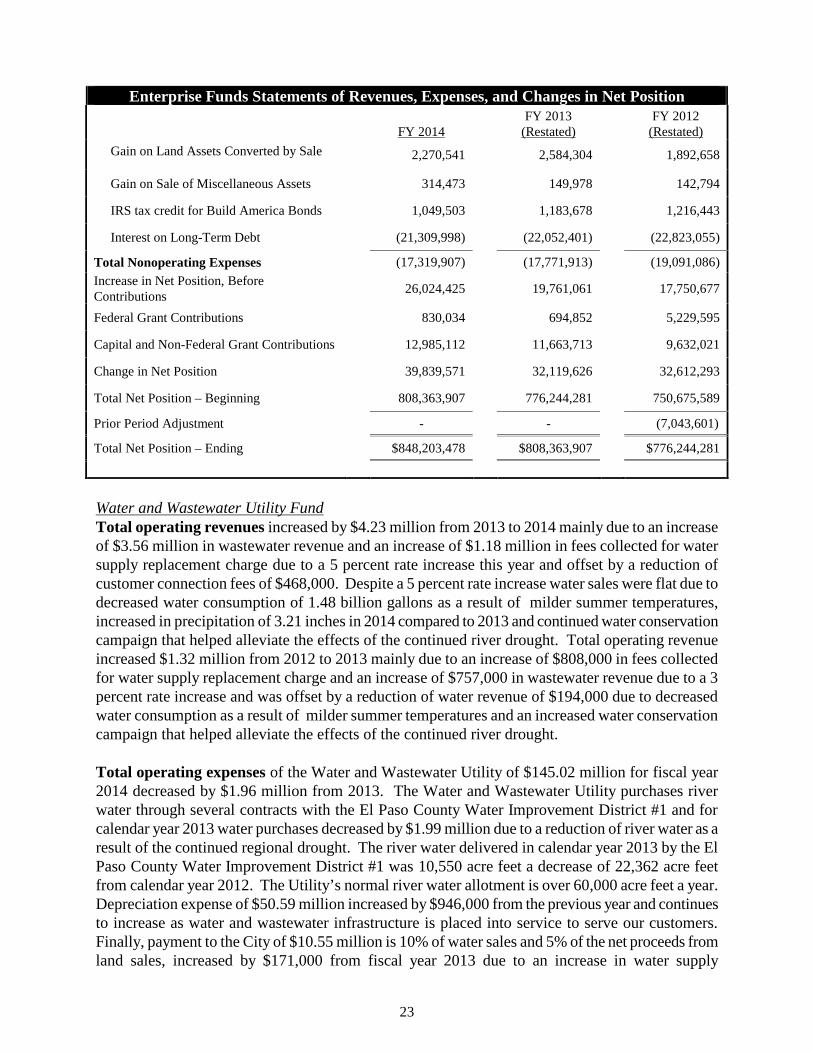
23
Enterprise Funds Statements of Revenues, Expenses, and Changes in Net Position
FY 2014FY 2013
(Restated)FY 2012
(Restated)
Gain on Land Assets Converted by Sale 2,270,541 2,584,304 1,892,658
Gain on Sale of Miscellaneous Assets 314,473 149,978 142,794
IRS tax credit for Build America Bonds 1,049,503 1,183,678 1,216,443
Interest on Long-Term Debt (21,309,998) (22,052,401) (22,823,055)
Total Nonoperating Expenses (17,319,907) (17,771,913) (19,091,086)
Increase in Net Position, BeforeContributions
26,024,425 19,761,061 17,750,677
Federal Grant Contributions 830,034 694,852 5,229,595
Capital and Non-Federal Grant Contributions 12,985,112 11,663,713 9,632,021
Change in Net Position 39,839,571 32,119,626 32,612,293
Total Net Position – Beginning 808,363,907 776,244,281 750,675,589
Prior Period Adjustment - - (7,043,601)
Total Net Position – Ending $848,203,478 $808,363,907 $776,244,281
Water and Wastewater Utility FundTotal operating revenues increased by $4.23 million from 2013 to 2014 mainly due to an increaseof $3.56 million in wastewater revenue and an increase of $1.18 million in fees collected for watersupply replacement charge due to a 5 percent rate increase this year and offset by a reduction ofcustomer connection fees of $468,000. Despite a 5 percent rate increase water sales were flat due todecreased water consumption of 1.48 billion gallons as a result of milder summer temperatures,increased in precipitation of 3.21 inches in 2014 compared to 2013 and continued water conservationcampaign that helped alleviate the effects of the continued river drought. Total operating revenueincreased $1.32 million from 2012 to 2013 mainly due to an increase of $808,000 in fees collectedfor water supply replacement charge and an increase of $757,000 in wastewater revenue due to a 3percent rate increase and was offset by a reduction of water revenue of $194,000 due to decreasedwater consumption as a result of milder summer temperatures and an increased water conservationcampaign that helped alleviate the effects of the continued river drought.
Total operating expenses of the Water and Wastewater Utility of $145.02 million for fiscal year2014 decreased by $1.96 million from 2013. The Water and Wastewater Utility purchases riverwater through several contracts with the El Paso County Water Improvement District #1 and forcalendar year 2013 water purchases decreased by $1.99 million due to a reduction of river water as aresult of the continued regional drought. The river water delivered in calendar year 2013 by the ElPaso County Water Improvement District #1 was 10,550 acre feet a decrease of 22,362 acre feetfrom calendar year 2012. The Utility’s normal river water allotment is over 60,000 acre feet a year.Depreciation expense of $50.59 million increased by $946,000 from the previous year and continuesto increase as water and wastewater infrastructure is placed into service to serve our customers.Finally, payment to the City of $10.55 million is 10% of water sales and 5% of the net proceeds fromland sales, increased by $171,000 from fiscal year 2013 due to an increase in water supply
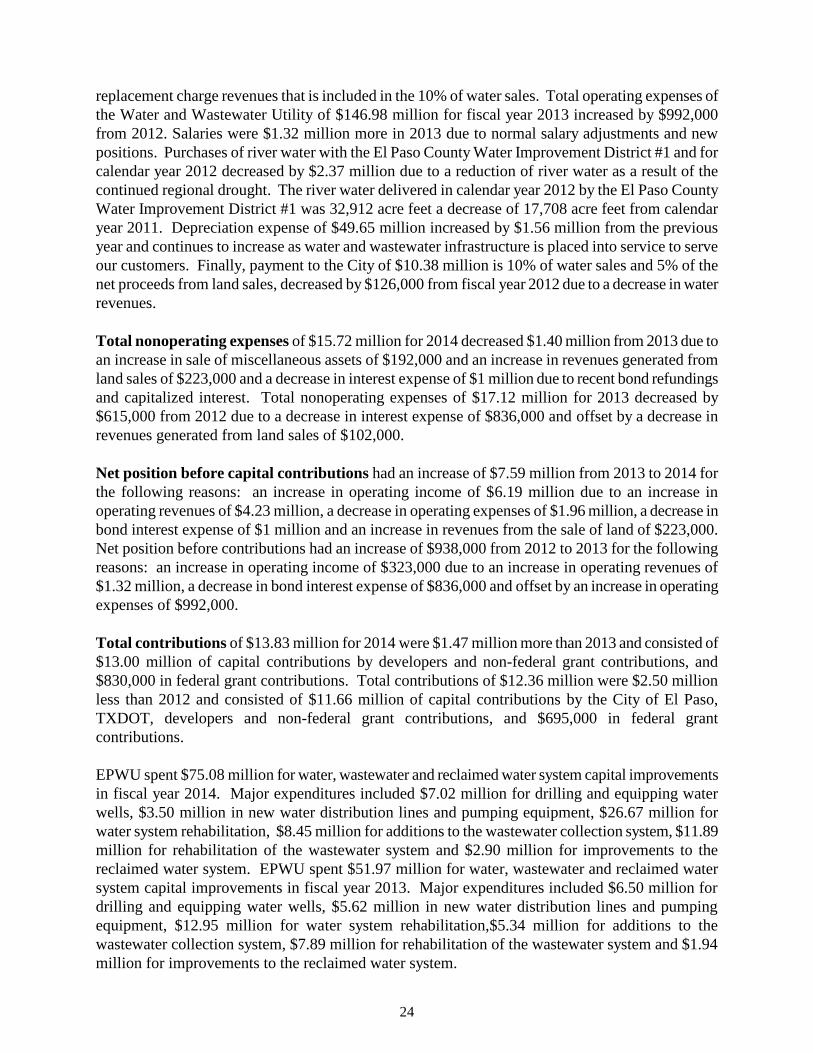
24
replacement charge revenues that is included in the 10% of water sales. Total operating expenses ofthe Water and Wastewater Utility of $146.98 million for fiscal year 2013 increased by $992,000from 2012. Salaries were $1.32 million more in 2013 due to normal salary adjustments and newpositions. Purchases of river water with the El Paso County Water Improvement District #1 and forcalendar year 2012 decreased by $2.37 million due to a reduction of river water as a result of thecontinued regional drought. The river water delivered in calendar year 2012 by the El Paso CountyWater Improvement District #1 was 32,912 acre feet a decrease of 17,708 acre feet from calendaryear 2011. Depreciation expense of $49.65 million increased by $1.56 million from the previousyear and continues to increase as water and wastewater infrastructure is placed into service to serveour customers. Finally, payment to the City of $10.38 million is 10% of water sales and 5% of thenet proceeds from land sales, decreased by $126,000 from fiscal year 2012 due to a decrease in waterrevenues.
Total nonoperating expenses of $15.72 million for 2014 decreased $1.40 million from 2013 due toan increase in sale of miscellaneous assets of $192,000 and an increase in revenues generated fromland sales of $223,000 and a decrease in interest expense of $1 million due to recent bond refundingsand capitalized interest. Total nonoperating expenses of $17.12 million for 2013 decreased by$615,000 from 2012 due to a decrease in interest expense of $836,000 and offset by a decrease inrevenues generated from land sales of $102,000.
Net position before capital contributions had an increase of $7.59 million from 2013 to 2014 forthe following reasons: an increase in operating income of $6.19 million due to an increase inoperating revenues of $4.23 million, a decrease in operating expenses of $1.96 million, a decrease inbond interest expense of $1 million and an increase in revenues from the sale of land of $223,000.Net position before contributions had an increase of $938,000 from 2012 to 2013 for the followingreasons: an increase in operating income of $323,000 due to an increase in operating revenues of$1.32 million, a decrease in bond interest expense of $836,000 and offset by an increase in operatingexpenses of $992,000.
Total contributions of $13.83 million for 2014 were $1.47 million more than 2013 and consisted of$13.00 million of capital contributions by developers and non-federal grant contributions, and$830,000 in federal grant contributions. Total contributions of $12.36 million were $2.50 millionless than 2012 and consisted of $11.66 million of capital contributions by the City of El Paso,TXDOT, developers and non-federal grant contributions, and $695,000 in federal grantcontributions.
EPWU spent $75.08 million for water, wastewater and reclaimed water system capital improvementsin fiscal year 2014. Major expenditures included $7.02 million for drilling and equipping waterwells, $3.50 million in new water distribution lines and pumping equipment, $26.67 million forwater system rehabilitation, $8.45 million for additions to the wastewater collection system, $11.89million for rehabilitation of the wastewater system and $2.90 million for improvements to thereclaimed water system. EPWU spent $51.97 million for water, wastewater and reclaimed watersystem capital improvements in fiscal year 2013. Major expenditures included $6.50 million fordrilling and equipping water wells, $5.62 million in new water distribution lines and pumpingequipment, $12.95 million for water system rehabilitation,$5.34 million for additions to thewastewater collection system, $7.89 million for rehabilitation of the wastewater system and $1.94million for improvements to the reclaimed water system.
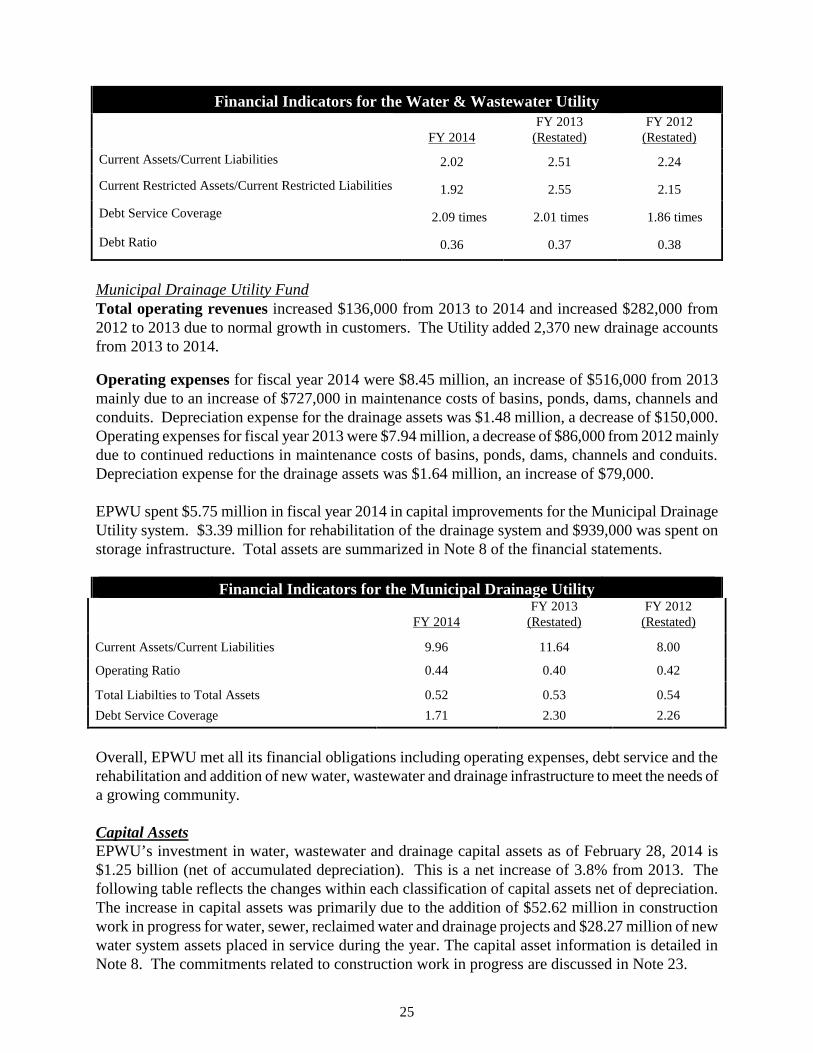
25
Financial Indicators for the Water & Wastewater Utility
FY 2014FY 2013
(Restated)FY 2012
(Restated)
Current Assets/Current Liabilities 2.02 2.51 2.24
Current Restricted Assets/Current Restricted Liabilities 1.92 2.55 2.15
Debt Service Coverage 2.09 times 2.01 times 1.86 times
Debt Ratio 0.36 0.37 0.38
Municipal Drainage Utility FundTotal operating revenues increased $136,000 from 2013 to 2014 and increased $282,000 from2012 to 2013 due to normal growth in customers. The Utility added 2,370 new drainage accountsfrom 2013 to 2014.
Operating expenses for fiscal year 2014 were $8.45 million, an increase of $516,000 from 2013mainly due to an increase of $727,000 in maintenance costs of basins, ponds, dams, channels andconduits. Depreciation expense for the drainage assets was $1.48 million, a decrease of $150,000.Operating expenses for fiscal year 2013 were $7.94 million, a decrease of $86,000 from 2012 mainlydue to continued reductions in maintenance costs of basins, ponds, dams, channels and conduits.Depreciation expense for the drainage assets was $1.64 million, an increase of $79,000.
EPWU spent $5.75 million in fiscal year 2014 in capital improvements for the Municipal DrainageUtility system. $3.39 million for rehabilitation of the drainage system and $939,000 was spent onstorage infrastructure. Total assets are summarized in Note 8 of the financial statements.
Financial Indicators for the Municipal Drainage Utility
FY 2014FY 2013
(Restated)FY 2012
(Restated)
Current Assets/Current Liabilities 9.96 11.64 8.00
Operating Ratio 0.44 0.40 0.42
Total Liabilties to Total Assets 0.52 0.53 0.54
Debt Service Coverage 1.71 2.30 2.26
Overall, EPWU met all its financial obligations including operating expenses, debt service and therehabilitation and addition of new water, wastewater and drainage infrastructure to meet the needs ofa growing community.
Capital AssetsEPWU’s investment in water, wastewater and drainage capital assets as of February 28, 2014 is$1.25 billion (net of accumulated depreciation). This is a net increase of 3.8% from 2013. Thefollowing table reflects the changes within each classification of capital assets net of depreciation.The increase in capital assets was primarily due to the addition of $52.62 million in constructionwork in progress for water, sewer, reclaimed water and drainage projects and $28.27 million of newwater system assets placed in service during the year. The capital asset information is detailed inNote 8. The commitments related to construction work in progress are discussed in Note 23.
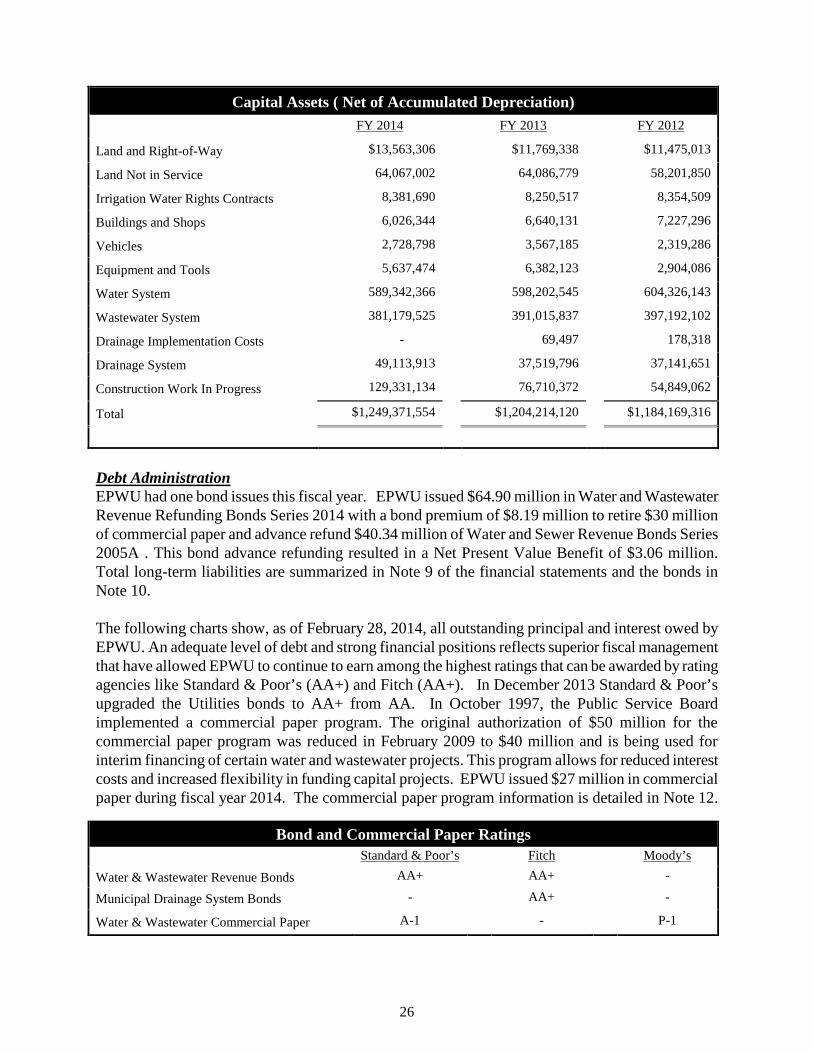
26
Capital Assets ( Net of Accumulated Depreciation)FY 2014 FY 2013 FY 2012
Land and Right-of-Way $13,563,306 $11,769,338 $11,475,013
Land Not in Service 64,067,002 64,086,779 58,201,850
Irrigation Water Rights Contracts 8,381,690 8,250,517 8,354,509
Buildings and Shops 6,026,344 6,640,131 7,227,296
Vehicles 2,728,798 3,567,185 2,319,286
Equipment and Tools 5,637,474 6,382,123 2,904,086
Water System 589,342,366 598,202,545 604,326,143
Wastewater System 381,179,525 391,015,837 397,192,102
Drainage Implementation Costs - 69,497 178,318
Drainage System 49,113,913 37,519,796 37,141,651
Construction Work In Progress 129,331,134 76,710,372 54,849,062
Total $1,249,371,554 $1,204,214,120 $1,184,169,316
Debt AdministrationEPWU had one bond issues this fiscal year. EPWU issued $64.90 million in Water and WastewaterRevenue Refunding Bonds Series 2014 with a bond premium of $8.19 million to retire $30 millionof commercial paper and advance refund $40.34 million of Water and Sewer Revenue Bonds Series2005A . This bond advance refunding resulted in a Net Present Value Benefit of $3.06 million.Total long-term liabilities are summarized in Note 9 of the financial statements and the bonds inNote 10.
The following charts show, as of February 28, 2014, all outstanding principal and interest owed byEPWU. An adequate level of debt and strong financial positions reflects superior fiscal managementthat have allowed EPWU to continue to earn among the highest ratings that can be awarded by ratingagencies like Standard & Poor’s (AA+) and Fitch (AA+). In December 2013 Standard & Poor’supgraded the Utilities bonds to AA+ from AA. In October 1997, the Public Service Boardimplemented a commercial paper program. The original authorization of $50 million for thecommercial paper program was reduced in February 2009 to $40 million and is being used forinterim financing of certain water and wastewater projects. This program allows for reduced interestcosts and increased flexibility in funding capital projects. EPWU issued $27 million in commercialpaper during fiscal year 2014. The commercial paper program information is detailed in Note 12.
Bond and Commercial Paper RatingsStandard & Poor’s Fitch Moody’s
Water & Wastewater Revenue Bonds AA+ AA+ -
Municipal Drainage System Bonds - AA+ -
Water & Wastewater Commercial Paper A-1 - P-1
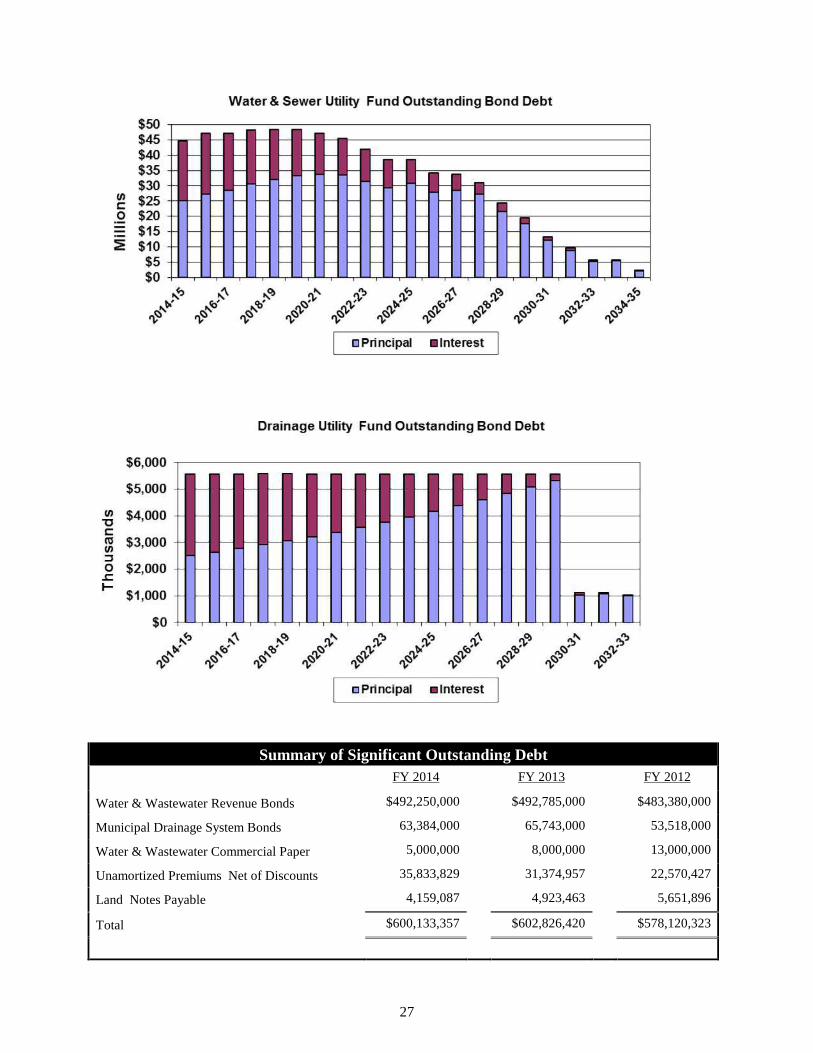
27
Summary of Significant Outstanding DebtFY 2014 FY 2013 FY 2012
Water & Wastewater Revenue Bonds $492,250,000 $492,785,000 $483,380,000
Municipal Drainage System Bonds 63,384,000 65,743,000 53,518,000
Water & Wastewater Commercial Paper 5,000,000 8,000,000 13,000,000
Unamortized Premiums Net of Discounts 35,833,829 31,374,957 22,570,427
Land Notes Payable 4,159,087 4,923,463 5,651,896
Total $600,133,357 $602,826,420 $578,120,323
28
Economic Factors and Next Year’s Budget and Rates
Continued regional drought will have an effect on the estimated river water delivered forcalendar year 2014. The estimated allocation for 2014 is 24,900 acre feet which is less thanhalf of our normal allotment of approximately 60,000 acre feet.
In 2013, the El Paso MSA home sales increased by 4.0% with median sales prices decreasingby 1.5% according to the Texas A&M Real Estate Center. The number of months Single-Family Housing remained in inventory increased from 7.1 months to 7.6 months during thesame period.
EPWU has included in the budget for fiscal year 2014-15 one new bond issue for the Water& Wastewater Utility that will take long commercial paper notes. The Municipal DrainageUtility budget did not include any new bond issues for fiscal year 2014-15 and will use priorbond issues to fund stormwater infrastructure improvements.
Due to the 2005 BRAC realignment, Fort Bliss, Texas, will add an additional an estimated28,000 troops and 37,000 family members in 2014.
EPWU has planned and prepared to meet growth and will partially finance growth projectswith the water and wastewater impact fees that were adopted by the City Council in May2009. In April 2014 City Council approved impact fees with no rate increase and willreevaluate possible rate increase next year.
All of these factors were taken into consideration in preparing EPWU’s budget for fiscal year 2014-15. The Water and Wastewater Utility and the Drainage Utility adopted a budget with no rateincrease. EPWU will continue to look for efficiencies, refinancing debt and cutting costs wheneverpossible.
Request for Information
The financial report is designed to provide a general overview of the El Paso Water Utilities’finances and for all those with an interest in the government’s finances. Questions concerning any ofthe information provided in this report, or requests for additional financial information, should beaddressed to the Chief Financial Officer, 1154 Hawkins, 79925 or email [email protected].
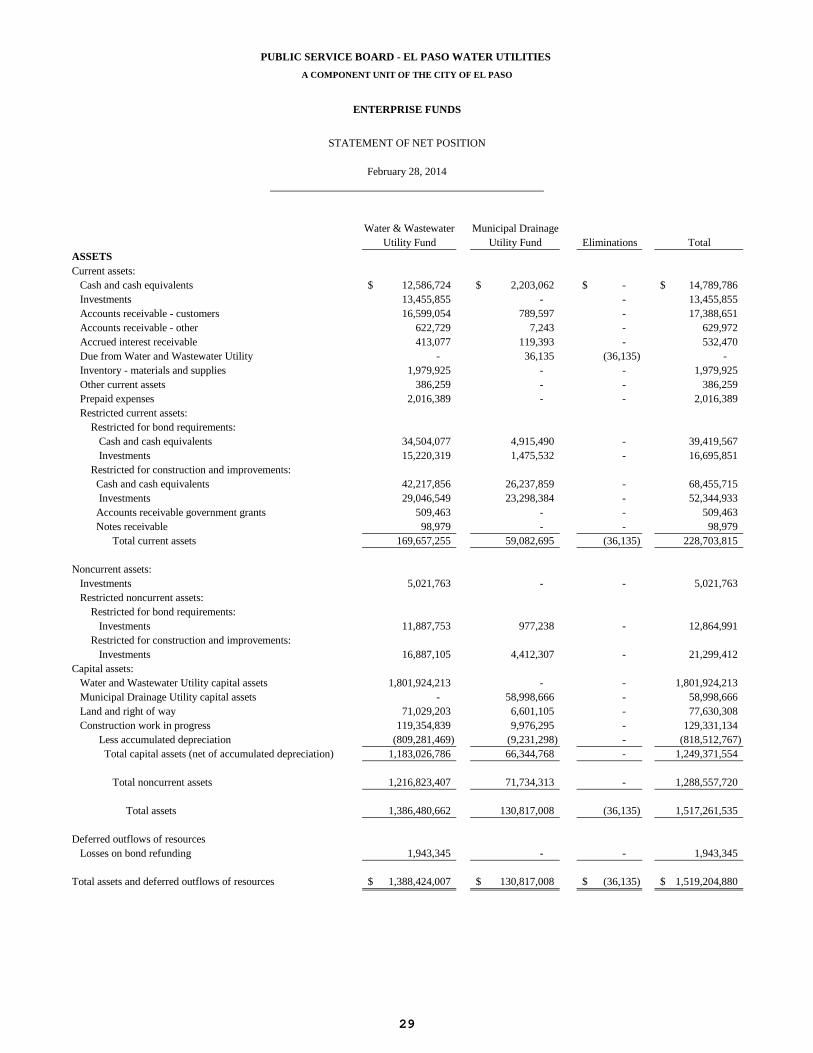
Water & Wastewater Municipal DrainageUtility Fund Utility Fund Eliminations Total
ASSETSCurrent assets: Cash and cash equivalents 12,586,724$ 2,203,062$ -$ 14,789,786$ Investments 13,455,855 - - 13,455,855 Accounts receivable - customers 16,599,054 789,597 - 17,388,651 Accounts receivable - other 622,729 7,243 - 629,972 Accrued interest receivable 413,077 119,393 - 532,470 Due from Water and Wastewater Utility - 36,135 (36,135) - Inventory - materials and supplies 1,979,925 - - 1,979,925 Other current assets 386,259 - - 386,259 Prepaid expenses 2,016,389 - - 2,016,389 Restricted current assets: Restricted for bond requirements: Cash and cash equivalents 34,504,077 4,915,490 - 39,419,567 Investments 15,220,319 1,475,532 - 16,695,851 Restricted for construction and improvements: Cash and cash equivalents 42,217,856 26,237,859 - 68,455,715 Investments 29,046,549 23,298,384 - 52,344,933 Accounts receivable government grants 509,463 - - 509,463 Notes receivable 98,979 - - 98,979 Total current assets 169,657,255 59,082,695 (36,135) 228,703,815
Noncurrent assets: Investments 5,021,763 - - 5,021,763 Restricted noncurrent assets: Restricted for bond requirements: Investments 11,887,753 977,238 - 12,864,991 Restricted for construction and improvements: Investments 16,887,105 4,412,307 - 21,299,412Capital assets: Water and Wastewater Utility capital assets 1,801,924,213 - - 1,801,924,213 Municipal Drainage Utility capital assets - 58,998,666 - 58,998,666 Land and right of way 71,029,203 6,601,105 - 77,630,308 Construction work in progress 119,354,839 9,976,295 - 129,331,134 Less accumulated depreciation (809,281,469) (9,231,298) - (818,512,767) Total capital assets (net of accumulated depreciation) 1,183,026,786 66,344,768 - 1,249,371,554
Total noncurrent assets 1,216,823,407 71,734,313 - 1,288,557,720
Total assets 1,386,480,662 130,817,008 (36,135) 1,517,261,535
Deferred outflows of resources Losses on bond refunding 1,943,345 - - 1,943,345
Total assets and deferred outflows of resources 1,388,424,007$ 130,817,008$ (36,135)$ 1,519,204,880$
PUBLIC SERVICE BOARD - EL PASO WATER UTILITIES
A COMPONENT UNIT OF THE CITY OF EL PASO
ENTERPRISE FUNDS
STATEMENT OF NET POSITION
February 28, 2014
29
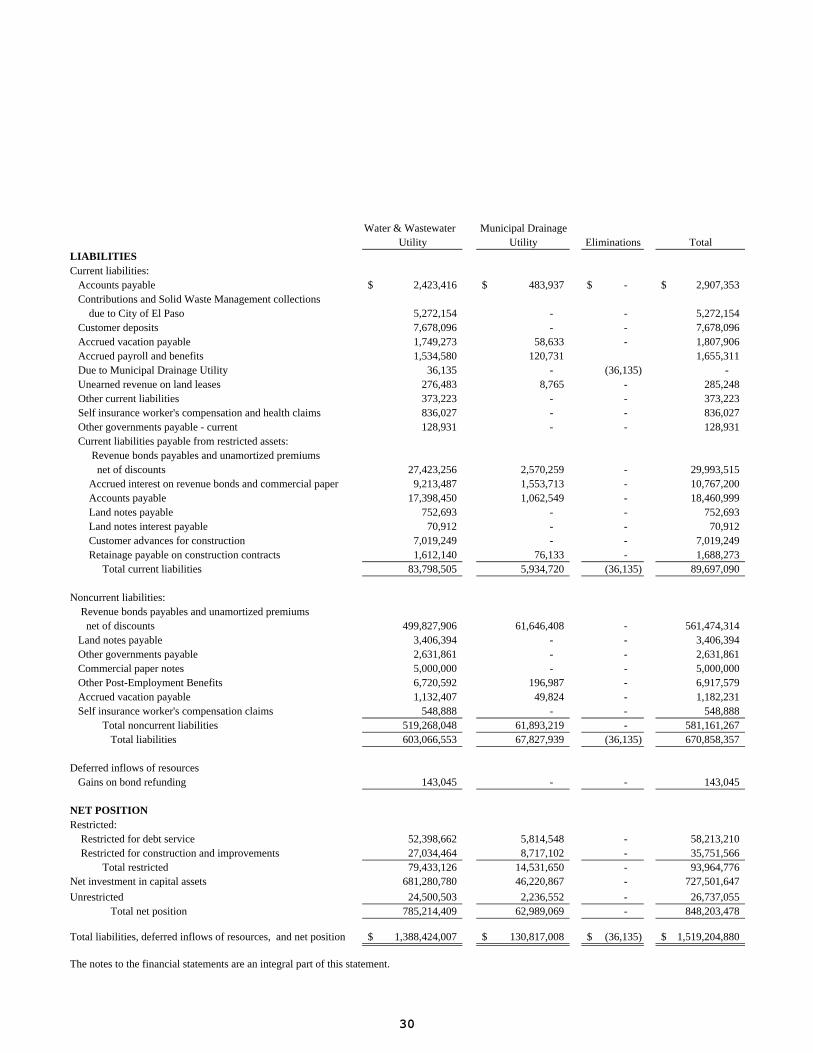
Water & Wastewater Municipal DrainageUtility Utility Eliminations Total
LIABILITIESCurrent liabilities: Accounts payable 2,423,416$ 483,937$ -$ 2,907,353$ Contributions and Solid Waste Management collections due to City of El Paso 5,272,154 - - 5,272,154 Customer deposits 7,678,096 - - 7,678,096 Accrued vacation payable 1,749,273 58,633 - 1,807,906 Accrued payroll and benefits 1,534,580 120,731 1,655,311 Due to Municipal Drainage Utility 36,135 - (36,135) - Unearned revenue on land leases 276,483 8,765 - 285,248 Other current liabilities 373,223 - - 373,223 Self insurance worker's compensation and health claims 836,027 - - 836,027 Other governments payable - current 128,931 - - 128,931 Current liabilities payable from restricted assets: Revenue bonds payables and unamortized premiums net of discounts 27,423,256 2,570,259 - 29,993,515 Accrued interest on revenue bonds and commercial paper 9,213,487 1,553,713 - 10,767,200 Accounts payable 17,398,450 1,062,549 - 18,460,999 Land notes payable 752,693 - - 752,693 Land notes interest payable 70,912 - - 70,912 Customer advances for construction 7,019,249 - - 7,019,249 Retainage payable on construction contracts 1,612,140 76,133 - 1,688,273 Total current liabilities 83,798,505 5,934,720 (36,135) 89,697,090
Noncurrent liabilities: Revenue bonds payables and unamortized premiums net of discounts 499,827,906 61,646,408 - 561,474,314 Land notes payable 3,406,394 - - 3,406,394 Other governments payable 2,631,861 - - 2,631,861 Commercial paper notes 5,000,000 - - 5,000,000 Other Post-Employment Benefits 6,720,592 196,987 - 6,917,579 Accrued vacation payable 1,132,407 49,824 - 1,182,231 Self insurance worker's compensation claims 548,888 - - 548,888 Total noncurrent liabilities 519,268,048 61,893,219 - 581,161,267 Total liabilities 603,066,553 67,827,939 (36,135) 670,858,357
Deferred inflows of resources Gains on bond refunding 143,045 - - 143,045
NET POSITIONRestricted: Restricted for debt service 52,398,662 5,814,548 - 58,213,210 Restricted for construction and improvements 27,034,464 8,717,102 - 35,751,566 Total restricted 79,433,126 14,531,650 - 93,964,776Net investment in capital assets 681,280,780 46,220,867 - 727,501,647
Unrestricted 24,500,503 2,236,552 - 26,737,055 Total net position 785,214,409 62,989,069 - 848,203,478
Total liabilities, deferred inflows of resources, and net position 1,388,424,007$ 130,817,008$ (36,135)$ 1,519,204,880$
The notes to the financial statements are an integral part of this statement.
30
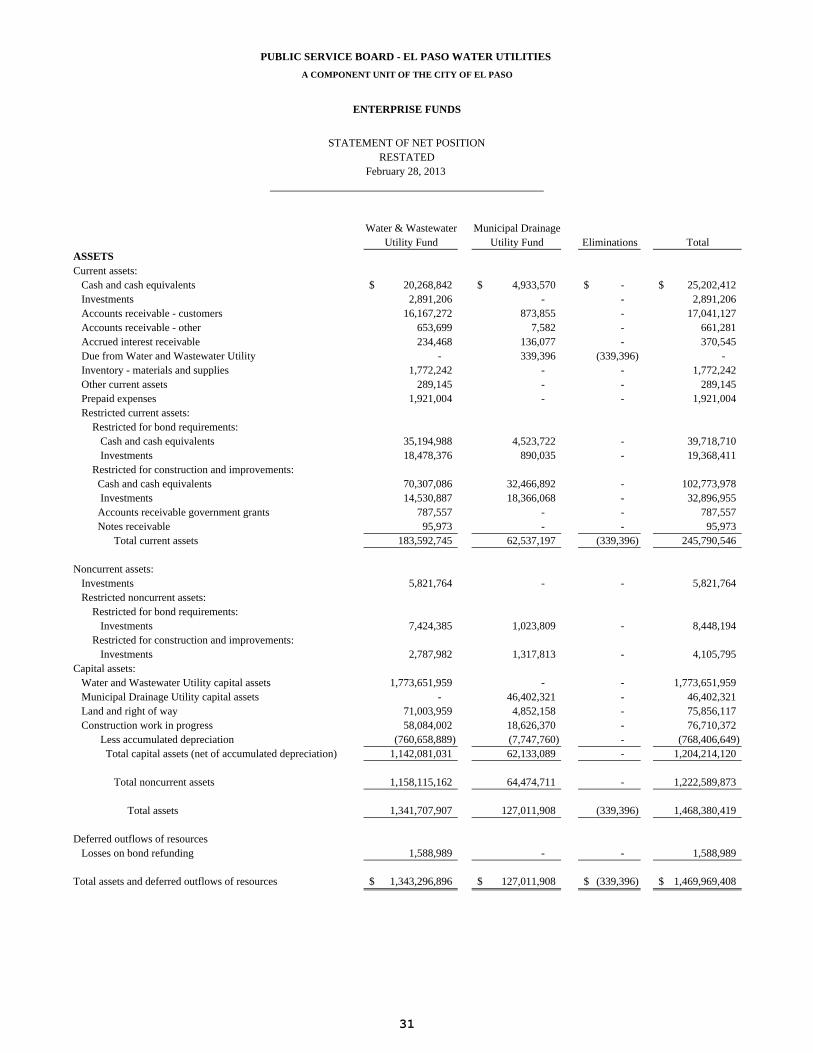
Water & Wastewater Municipal DrainageUtility Fund Utility Fund Eliminations Total
ASSETSCurrent assets: Cash and cash equivalents 20,268,842$ 4,933,570$ -$ 25,202,412$ Investments 2,891,206 - - 2,891,206 Accounts receivable - customers 16,167,272 873,855 - 17,041,127 Accounts receivable - other 653,699 7,582 - 661,281 Accrued interest receivable 234,468 136,077 - 370,545 Due from Water and Wastewater Utility - 339,396 (339,396) - Inventory - materials and supplies 1,772,242 - - 1,772,242 Other current assets 289,145 - - 289,145 Prepaid expenses 1,921,004 - - 1,921,004 Restricted current assets: Restricted for bond requirements: Cash and cash equivalents 35,194,988 4,523,722 - 39,718,710 Investments 18,478,376 890,035 - 19,368,411 Restricted for construction and improvements: Cash and cash equivalents 70,307,086 32,466,892 - 102,773,978 Investments 14,530,887 18,366,068 - 32,896,955 Accounts receivable government grants 787,557 - - 787,557 Notes receivable 95,973 - - 95,973 Total current assets 183,592,745 62,537,197 (339,396) 245,790,546
Noncurrent assets: Investments 5,821,764 - - 5,821,764 Restricted noncurrent assets: Restricted for bond requirements: Investments 7,424,385 1,023,809 - 8,448,194 Restricted for construction and improvements: Investments 2,787,982 1,317,813 - 4,105,795Capital assets: Water and Wastewater Utility capital assets 1,773,651,959 - - 1,773,651,959 Municipal Drainage Utility capital assets - 46,402,321 - 46,402,321 Land and right of way 71,003,959 4,852,158 - 75,856,117 Construction work in progress 58,084,002 18,626,370 - 76,710,372 Less accumulated depreciation (760,658,889) (7,747,760) - (768,406,649) Total capital assets (net of accumulated depreciation) 1,142,081,031 62,133,089 - 1,204,214,120
Total noncurrent assets 1,158,115,162 64,474,711 - 1,222,589,873
Total assets 1,341,707,907 127,011,908 (339,396) 1,468,380,419
Deferred outflows of resources Losses on bond refunding 1,588,989 - - 1,588,989
Total assets and deferred outflows of resources 1,343,296,896$ 127,011,908$ (339,396)$ 1,469,969,408$
RESTATED
PUBLIC SERVICE BOARD - EL PASO WATER UTILITIES
A COMPONENT UNIT OF THE CITY OF EL PASO
ENTERPRISE FUNDS
STATEMENT OF NET POSITION
February 28, 2013
31
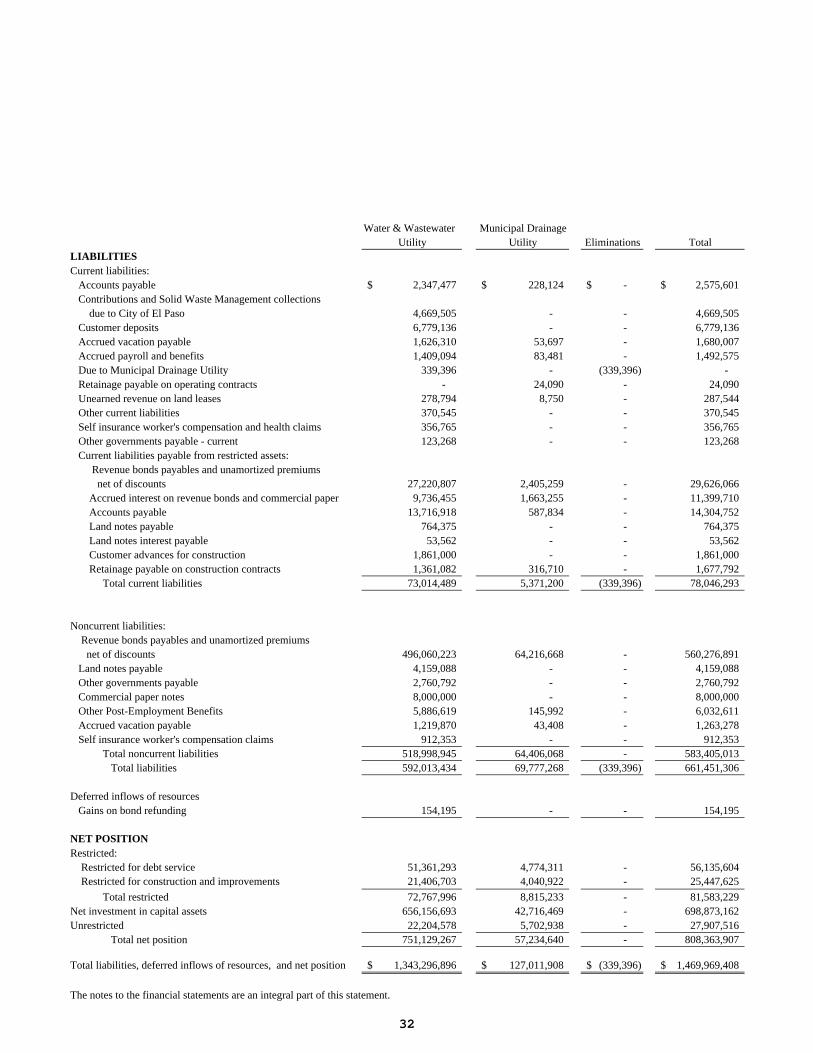
Water & Wastewater Municipal DrainageUtility Utility Eliminations Total
LIABILITIESCurrent liabilities: Accounts payable 2,347,477$ 228,124$ -$ 2,575,601$ Contributions and Solid Waste Management collections due to City of El Paso 4,669,505 - - 4,669,505 Customer deposits 6,779,136 - - 6,779,136 Accrued vacation payable 1,626,310 53,697 - 1,680,007 Accrued payroll and benefits 1,409,094 83,481 - 1,492,575 Due to Municipal Drainage Utility 339,396 - (339,396) - Retainage payable on operating contracts - 24,090 - 24,090 Unearned revenue on land leases 278,794 8,750 - 287,544 Other current liabilities 370,545 - - 370,545 Self insurance worker's compensation and health claims 356,765 - - 356,765 Other governments payable - current 123,268 - - 123,268 Current liabilities payable from restricted assets: Revenue bonds payables and unamortized premiums net of discounts 27,220,807 2,405,259 - 29,626,066 Accrued interest on revenue bonds and commercial paper 9,736,455 1,663,255 - 11,399,710 Accounts payable 13,716,918 587,834 - 14,304,752 Land notes payable 764,375 - - 764,375 Land notes interest payable 53,562 - - 53,562 Customer advances for construction 1,861,000 - - 1,861,000 Retainage payable on construction contracts 1,361,082 316,710 - 1,677,792 Total current liabilities 73,014,489 5,371,200 (339,396) 78,046,293
Noncurrent liabilities: Revenue bonds payables and unamortized premiums net of discounts 496,060,223 64,216,668 - 560,276,891 Land notes payable 4,159,088 - - 4,159,088 Other governments payable 2,760,792 - - 2,760,792 Commercial paper notes 8,000,000 - - 8,000,000 Other Post-Employment Benefits 5,886,619 145,992 - 6,032,611 Accrued vacation payable 1,219,870 43,408 - 1,263,278 Self insurance worker's compensation claims 912,353 - - 912,353 Total noncurrent liabilities 518,998,945 64,406,068 - 583,405,013 Total liabilities 592,013,434 69,777,268 (339,396) 661,451,306
Deferred inflows of resources Gains on bond refunding 154,195 - - 154,195
NET POSITIONRestricted: Restricted for debt service 51,361,293 4,774,311 - 56,135,604 Restricted for construction and improvements 21,406,703 4,040,922 - 25,447,625
Total restricted 72,767,996 8,815,233 - 81,583,229Net investment in capital assets 656,156,693 42,716,469 - 698,873,162Unrestricted 22,204,578 5,702,938 - 27,907,516 Total net position 751,129,267 57,234,640 - 808,363,907
Total liabilities, deferred inflows of resources, and net position 1,343,296,896$ 127,011,908$ (339,396)$ 1,469,969,408$
The notes to the financial statements are an integral part of this statement.
32
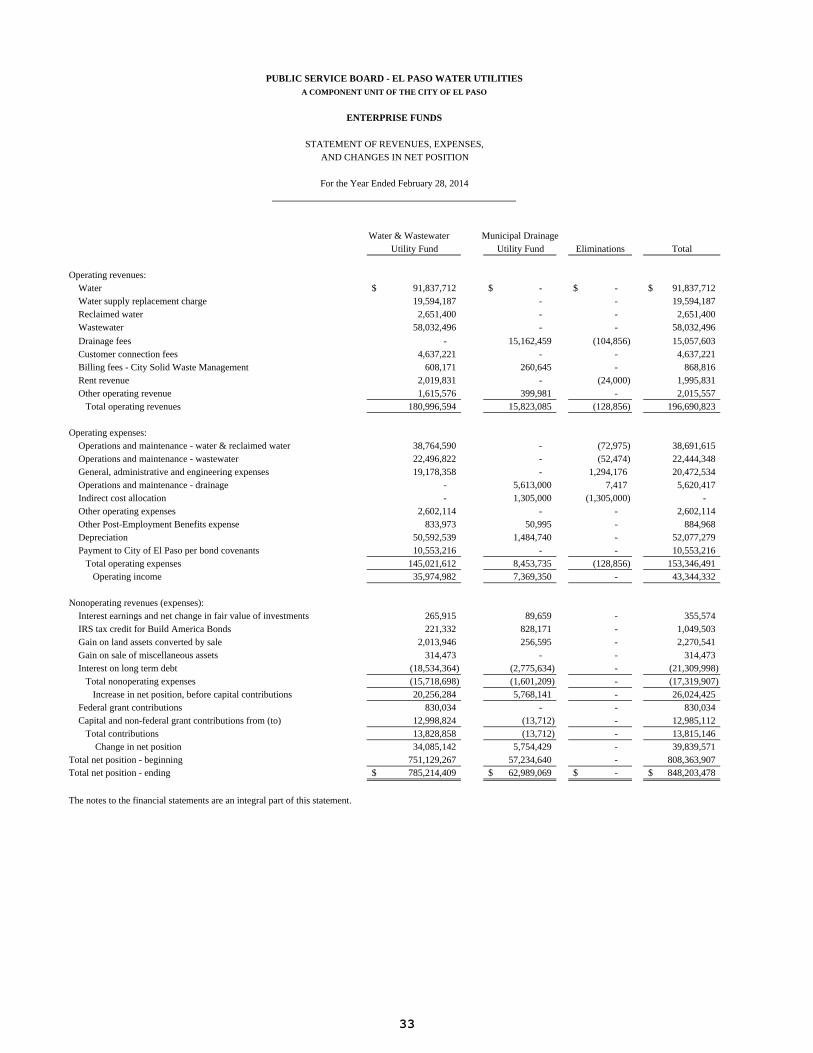
Water & Wastewater Municipal DrainageUtility Fund Utility Fund Eliminations Total
Operating revenues: Water 91,837,712$ -$ -$ 91,837,712$ Water supply replacement charge 19,594,187 - - 19,594,187 Reclaimed water 2,651,400 - - 2,651,400 Wastewater 58,032,496 - - 58,032,496
Drainage fees - 15,162,459 (104,856) 15,057,603 Customer connection fees 4,637,221 - - 4,637,221 Billing fees - City Solid Waste Management 608,171 260,645 - 868,816 Rent revenue 2,019,831 - (24,000) 1,995,831 Other operating revenue 1,615,576 399,981 - 2,015,557 Total operating revenues 180,996,594 15,823,085 (128,856) 196,690,823
Operating expenses: Operations and maintenance - water & reclaimed water 38,764,590 - (72,975) 38,691,615 Operations and maintenance - wastewater 22,496,822 - (52,474) 22,444,348 General, administrative and engineering expenses 19,178,358 - 1,294,176 20,472,534 Operations and maintenance - drainage - 5,613,000 7,417 5,620,417 Indirect cost allocation - 1,305,000 (1,305,000) - Other operating expenses 2,602,114 - - 2,602,114 Other Post-Employment Benefits expense 833,973 50,995 - 884,968 Depreciation 50,592,539 1,484,740 - 52,077,279 Payment to City of El Paso per bond covenants 10,553,216 - - 10,553,216 Total operating expenses 145,021,612 8,453,735 (128,856) 153,346,491 Operating income 35,974,982 7,369,350 - 43,344,332
Nonoperating revenues (expenses): Interest earnings and net change in fair value of investments 265,915 89,659 - 355,574 IRS tax credit for Build America Bonds 221,332 828,171 - 1,049,503 Gain on land assets converted by sale 2,013,946 256,595 - 2,270,541 Gain on sale of miscellaneous assets 314,473 - - 314,473 Interest on long term debt (18,534,364) (2,775,634) - (21,309,998) Total nonoperating expenses (15,718,698) (1,601,209) - (17,319,907) Increase in net position, before capital contributions 20,256,284 5,768,141 - 26,024,425 Federal grant contributions 830,034 - - 830,034 Capital and non-federal grant contributions from (to) 12,998,824 (13,712) - 12,985,112 Total contributions 13,828,858 (13,712) - 13,815,146 Change in net position 34,085,142 5,754,429 - 39,839,571Total net position - beginning 751,129,267 57,234,640 - 808,363,907Total net position - ending 785,214,409$ 62,989,069$ -$ 848,203,478$
The notes to the financial statements are an integral part of this statement.
For the Year Ended February 28, 2014
PUBLIC SERVICE BOARD - EL PASO WATER UTILITIESA COMPONENT UNIT OF THE CITY OF EL PASO
ENTERPRISE FUNDS
STATEMENT OF REVENUES, EXPENSES,AND CHANGES IN NET POSITION
33
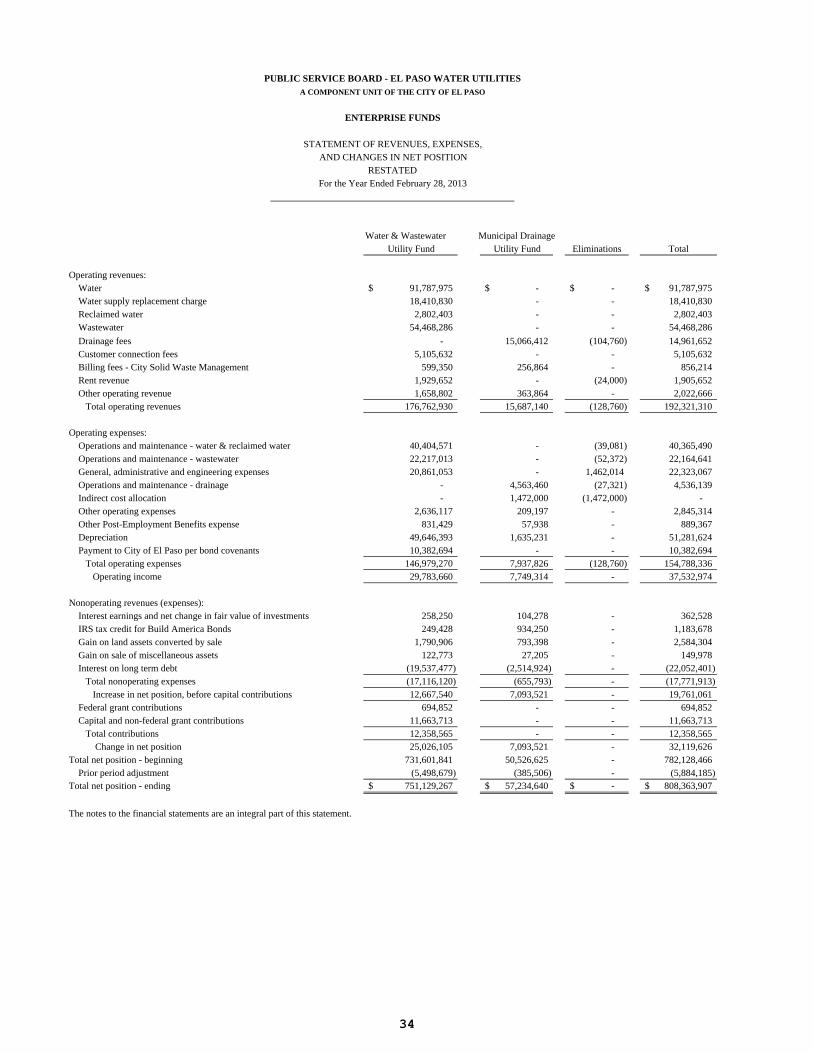
Water & Wastewater Municipal DrainageUtility Fund Utility Fund Eliminations Total
Operating revenues: Water 91,787,975$ -$ -$ 91,787,975$ Water supply replacement charge 18,410,830 - - 18,410,830 Reclaimed water 2,802,403 - - 2,802,403 Wastewater 54,468,286 - - 54,468,286
Drainage fees - 15,066,412 (104,760) 14,961,652 Customer connection fees 5,105,632 - - 5,105,632 Billing fees - City Solid Waste Management 599,350 256,864 - 856,214 Rent revenue 1,929,652 - (24,000) 1,905,652 Other operating revenue 1,658,802 363,864 - 2,022,666 Total operating revenues 176,762,930 15,687,140 (128,760) 192,321,310
Operating expenses: Operations and maintenance - water & reclaimed water 40,404,571 - (39,081) 40,365,490 Operations and maintenance - wastewater 22,217,013 - (52,372) 22,164,641 General, administrative and engineering expenses 20,861,053 - 1,462,014 22,323,067 Operations and maintenance - drainage - 4,563,460 (27,321) 4,536,139 Indirect cost allocation - 1,472,000 (1,472,000) - Other operating expenses 2,636,117 209,197 - 2,845,314 Other Post-Employment Benefits expense 831,429 57,938 - 889,367 Depreciation 49,646,393 1,635,231 - 51,281,624 Payment to City of El Paso per bond covenants 10,382,694 - - 10,382,694 Total operating expenses 146,979,270 7,937,826 (128,760) 154,788,336 Operating income 29,783,660 7,749,314 - 37,532,974
Nonoperating revenues (expenses): Interest earnings and net change in fair value of investments 258,250 104,278 - 362,528 IRS tax credit for Build America Bonds 249,428 934,250 - 1,183,678 Gain on land assets converted by sale 1,790,906 793,398 - 2,584,304 Gain on sale of miscellaneous assets 122,773 27,205 - 149,978 Interest on long term debt (19,537,477) (2,514,924) - (22,052,401) Total nonoperating expenses (17,116,120) (655,793) - (17,771,913) Increase in net position, before capital contributions 12,667,540 7,093,521 - 19,761,061 Federal grant contributions 694,852 - - 694,852 Capital and non-federal grant contributions 11,663,713 - - 11,663,713 Total contributions 12,358,565 - - 12,358,565 Change in net position 25,026,105 7,093,521 - 32,119,626Total net position - beginning 731,601,841 50,526,625 - 782,128,466 Prior period adjustment (5,498,679) (385,506) - (5,884,185)Total net position - ending 751,129,267$ 57,234,640$ -$ 808,363,907$
The notes to the financial statements are an integral part of this statement.
RESTATEDFor the Year Ended February 28, 2013
PUBLIC SERVICE BOARD - EL PASO WATER UTILITIESA COMPONENT UNIT OF THE CITY OF EL PASO
ENTERPRISE FUNDS
STATEMENT OF REVENUES, EXPENSES,AND CHANGES IN NET POSITION
34
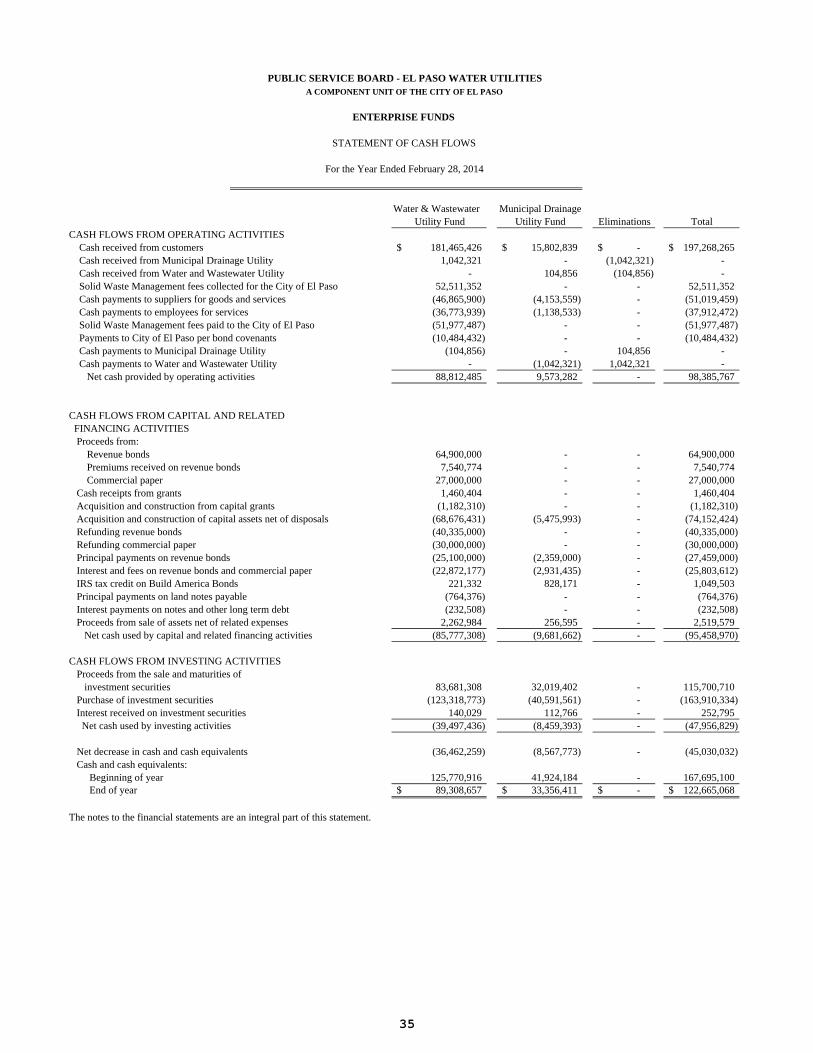
Water & Wastewater Municipal DrainageUtility Fund Utility Fund Eliminations Total
CASH FLOWS FROM OPERATING ACTIVITIES Cash received from customers 181,465,426$ 15,802,839$ -$ 197,268,265$ Cash received from Municipal Drainage Utility 1,042,321 - (1,042,321) - Cash received from Water and Wastewater Utility - 104,856 (104,856) - Solid Waste Management fees collected for the City of El Paso 52,511,352 - - 52,511,352 Cash payments to suppliers for goods and services (46,865,900) (4,153,559) - (51,019,459) Cash payments to employees for services (36,773,939) (1,138,533) - (37,912,472) Solid Waste Management fees paid to the City of El Paso (51,977,487) - - (51,977,487) Payments to City of El Paso per bond covenants (10,484,432) - - (10,484,432) Cash payments to Municipal Drainage Utility (104,856) - 104,856 - Cash payments to Water and Wastewater Utility - (1,042,321) 1,042,321 - Net cash provided by operating activities 88,812,485 9,573,282 - 98,385,767
CASH FLOWS FROM CAPITAL AND RELATED FINANCING ACTIVITIES Proceeds from: Revenue bonds 64,900,000 - - 64,900,000 Premiums received on revenue bonds 7,540,774 - - 7,540,774 Commercial paper 27,000,000 - - 27,000,000 Cash receipts from grants 1,460,404 - - 1,460,404 Acquisition and construction from capital grants (1,182,310) - - (1,182,310) Acquisition and construction of capital assets net of disposals (68,676,431) (5,475,993) - (74,152,424) Refunding revenue bonds (40,335,000) - - (40,335,000) Refunding commercial paper (30,000,000) - - (30,000,000) Principal payments on revenue bonds (25,100,000) (2,359,000) - (27,459,000) Interest and fees on revenue bonds and commercial paper (22,872,177) (2,931,435) - (25,803,612) IRS tax credit on Build America Bonds 221,332 828,171 - 1,049,503 Principal payments on land notes payable (764,376) - - (764,376) Interest payments on notes and other long term debt (232,508) - - (232,508) Proceeds from sale of assets net of related expenses 2,262,984 256,595 - 2,519,579 Net cash used by capital and related financing activities (85,777,308) (9,681,662) - (95,458,970)
CASH FLOWS FROM INVESTING ACTIVITIES Proceeds from the sale and maturities of investment securities 83,681,308 32,019,402 - 115,700,710 Purchase of investment securities (123,318,773) (40,591,561) - (163,910,334) Interest received on investment securities 140,029 112,766 - 252,795 Net cash used by investing activities (39,497,436) (8,459,393) - (47,956,829)
Net decrease in cash and cash equivalents (36,462,259) (8,567,773) - (45,030,032) Cash and cash equivalents: Beginning of year 125,770,916 41,924,184 - 167,695,100 End of year 89,308,657$ 33,356,411$ -$ 122,665,068$
The notes to the financial statements are an integral part of this statement.
PUBLIC SERVICE BOARD - EL PASO WATER UTILITIESA COMPONENT UNIT OF THE CITY OF EL PASO
ENTERPRISE FUNDS
STATEMENT OF CASH FLOWS
For the Year Ended February 28, 2014
35
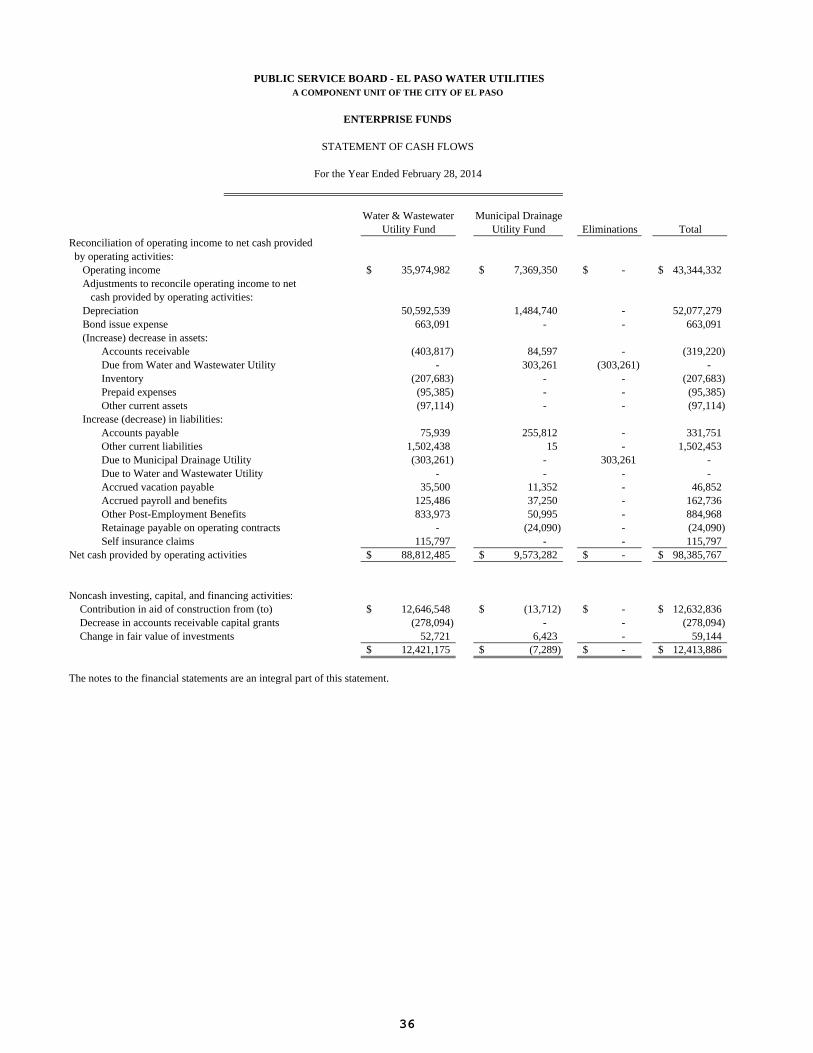
Water & Wastewater Municipal DrainageUtility Fund Utility Fund Eliminations Total
Reconciliation of operating income to net cash provided by operating activities: Operating income 35,974,982$ 7,369,350$ -$ 43,344,332$ Adjustments to reconcile operating income to net cash provided by operating activities: Depreciation 50,592,539 1,484,740 - 52,077,279 Bond issue expense 663,091 - - 663,091 (Increase) decrease in assets: Accounts receivable (403,817) 84,597 - (319,220) Due from Water and Wastewater Utility - 303,261 (303,261) - Inventory (207,683) - - (207,683) Prepaid expenses (95,385) - - (95,385) Other current assets (97,114) - - (97,114) Increase (decrease) in liabilities: Accounts payable 75,939 255,812 - 331,751 Other current liabilities 1,502,438 15 - 1,502,453 Due to Municipal Drainage Utility (303,261) - 303,261 - Due to Water and Wastewater Utility - - - - Accrued vacation payable 35,500 11,352 - 46,852 Accrued payroll and benefits 125,486 37,250 - 162,736 Other Post-Employment Benefits 833,973 50,995 - 884,968 Retainage payable on operating contracts - (24,090) - (24,090) Self insurance claims 115,797 - - 115,797Net cash provided by operating activities 88,812,485$ 9,573,282$ -$ 98,385,767$
Noncash investing, capital, and financing activities: Contribution in aid of construction from (to) 12,646,548$ (13,712)$ -$ 12,632,836$ Decrease in accounts receivable capital grants (278,094) - - (278,094) Change in fair value of investments 52,721 6,423 - 59,144
12,421,175$ (7,289)$ -$ 12,413,886$
The notes to the financial statements are an integral part of this statement.
PUBLIC SERVICE BOARD - EL PASO WATER UTILITIESA COMPONENT UNIT OF THE CITY OF EL PASO
ENTERPRISE FUNDS
STATEMENT OF CASH FLOWS
For the Year Ended February 28, 2014
36
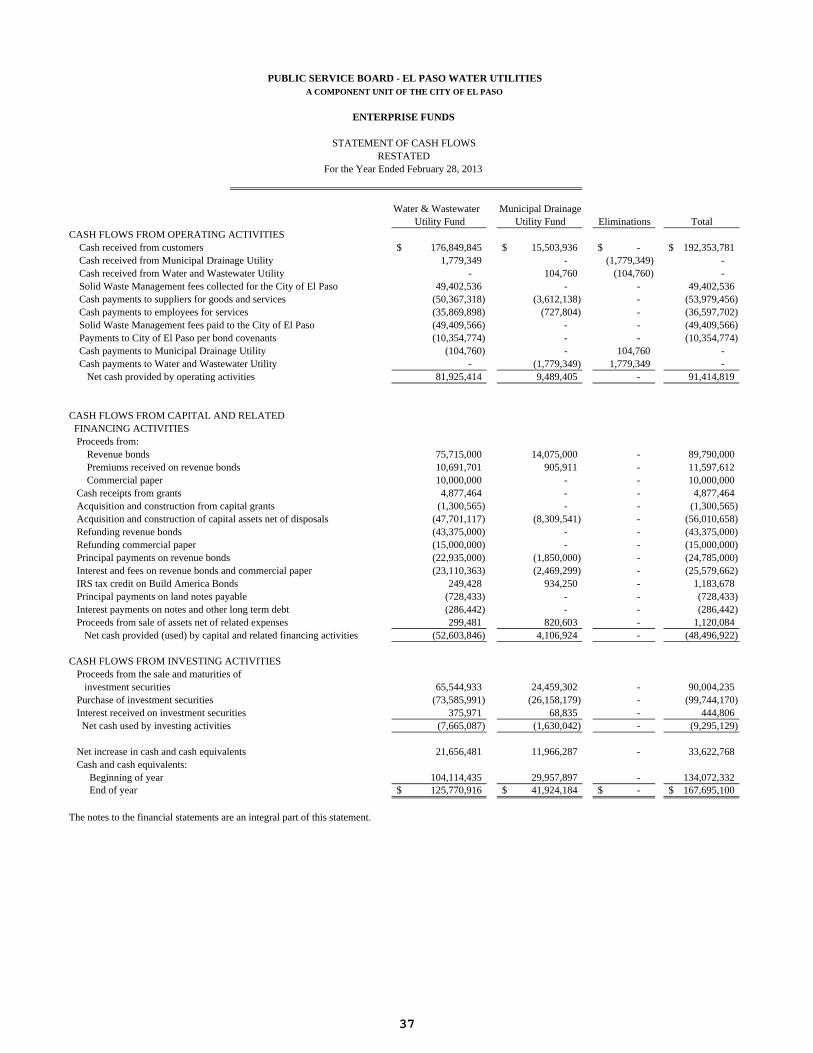
Water & Wastewater Municipal DrainageUtility Fund Utility Fund Eliminations Total
CASH FLOWS FROM OPERATING ACTIVITIES Cash received from customers 176,849,845$ 15,503,936$ -$ 192,353,781$ Cash received from Municipal Drainage Utility 1,779,349 - (1,779,349) - Cash received from Water and Wastewater Utility - 104,760 (104,760) - Solid Waste Management fees collected for the City of El Paso 49,402,536 - - 49,402,536 Cash payments to suppliers for goods and services (50,367,318) (3,612,138) - (53,979,456) Cash payments to employees for services (35,869,898) (727,804) - (36,597,702) Solid Waste Management fees paid to the City of El Paso (49,409,566) - - (49,409,566) Payments to City of El Paso per bond covenants (10,354,774) - - (10,354,774) Cash payments to Municipal Drainage Utility (104,760) - 104,760 - Cash payments to Water and Wastewater Utility - (1,779,349) 1,779,349 - Net cash provided by operating activities 81,925,414 9,489,405 - 91,414,819
CASH FLOWS FROM CAPITAL AND RELATED FINANCING ACTIVITIES Proceeds from: Revenue bonds 75,715,000 14,075,000 - 89,790,000 Premiums received on revenue bonds 10,691,701 905,911 - 11,597,612 Commercial paper 10,000,000 - - 10,000,000 Cash receipts from grants 4,877,464 - - 4,877,464 Acquisition and construction from capital grants (1,300,565) - - (1,300,565) Acquisition and construction of capital assets net of disposals (47,701,117) (8,309,541) - (56,010,658) Refunding revenue bonds (43,375,000) - - (43,375,000) Refunding commercial paper (15,000,000) - - (15,000,000) Principal payments on revenue bonds (22,935,000) (1,850,000) - (24,785,000) Interest and fees on revenue bonds and commercial paper (23,110,363) (2,469,299) - (25,579,662) IRS tax credit on Build America Bonds 249,428 934,250 - 1,183,678 Principal payments on land notes payable (728,433) - - (728,433) Interest payments on notes and other long term debt (286,442) - - (286,442) Proceeds from sale of assets net of related expenses 299,481 820,603 - 1,120,084 Net cash provided (used) by capital and related financing activities (52,603,846) 4,106,924 - (48,496,922)
CASH FLOWS FROM INVESTING ACTIVITIES Proceeds from the sale and maturities of investment securities 65,544,933 24,459,302 - 90,004,235 Purchase of investment securities (73,585,991) (26,158,179) - (99,744,170) Interest received on investment securities 375,971 68,835 - 444,806 Net cash used by investing activities (7,665,087) (1,630,042) - (9,295,129)
Net increase in cash and cash equivalents 21,656,481 11,966,287 - 33,622,768 Cash and cash equivalents: Beginning of year 104,114,435 29,957,897 - 134,072,332 End of year 125,770,916$ 41,924,184$ -$ 167,695,100$
The notes to the financial statements are an integral part of this statement.
PUBLIC SERVICE BOARD - EL PASO WATER UTILITIESA COMPONENT UNIT OF THE CITY OF EL PASO
ENTERPRISE FUNDS
STATEMENT OF CASH FLOWS
For the Year Ended February 28, 2013RESTATED
37
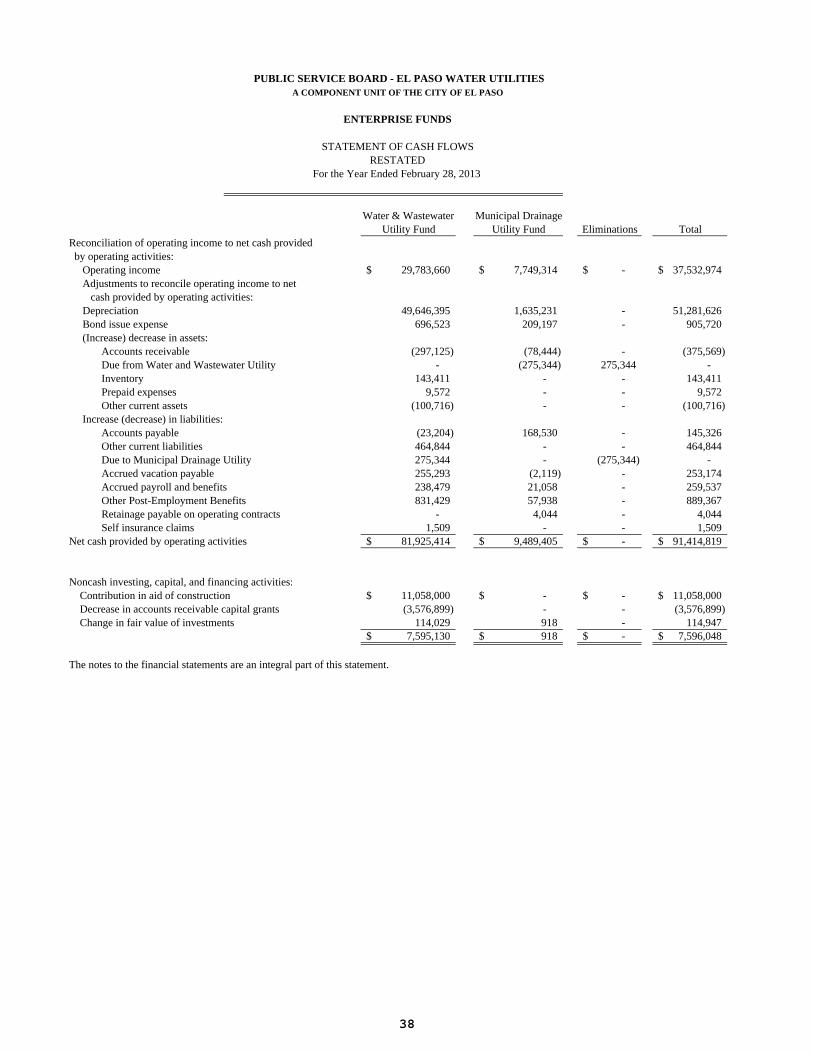
Water & Wastewater Municipal DrainageUtility Fund Utility Fund Eliminations Total
Reconciliation of operating income to net cash provided by operating activities: Operating income 29,783,660$ 7,749,314$ -$ 37,532,974$ Adjustments to reconcile operating income to net cash provided by operating activities: Depreciation 49,646,395 1,635,231 - 51,281,626 Bond issue expense 696,523 209,197 - 905,720 (Increase) decrease in assets: Accounts receivable (297,125) (78,444) - (375,569) Due from Water and Wastewater Utility - (275,344) 275,344 - Inventory 143,411 - - 143,411 Prepaid expenses 9,572 - - 9,572 Other current assets (100,716) - - (100,716) Increase (decrease) in liabilities: Accounts payable (23,204) 168,530 - 145,326 Other current liabilities 464,844 - - 464,844 Due to Municipal Drainage Utility 275,344 - (275,344) - Accrued vacation payable 255,293 (2,119) - 253,174 Accrued payroll and benefits 238,479 21,058 - 259,537 Other Post-Employment Benefits 831,429 57,938 - 889,367 Retainage payable on operating contracts - 4,044 - 4,044 Self insurance claims 1,509 - - 1,509Net cash provided by operating activities 81,925,414$ 9,489,405$ -$ 91,414,819$
Noncash investing, capital, and financing activities: Contribution in aid of construction 11,058,000$ -$ -$ 11,058,000$ Decrease in accounts receivable capital grants (3,576,899) - - (3,576,899) Change in fair value of investments 114,029 918 - 114,947
7,595,130$ 918$ -$ 7,596,048$
The notes to the financial statements are an integral part of this statement.
PUBLIC SERVICE BOARD - EL PASO WATER UTILITIESA COMPONENT UNIT OF THE CITY OF EL PASO
ENTERPRISE FUNDS
STATEMENT OF CASH FLOWS
For the Year Ended February 28, 2013RESTATED
38
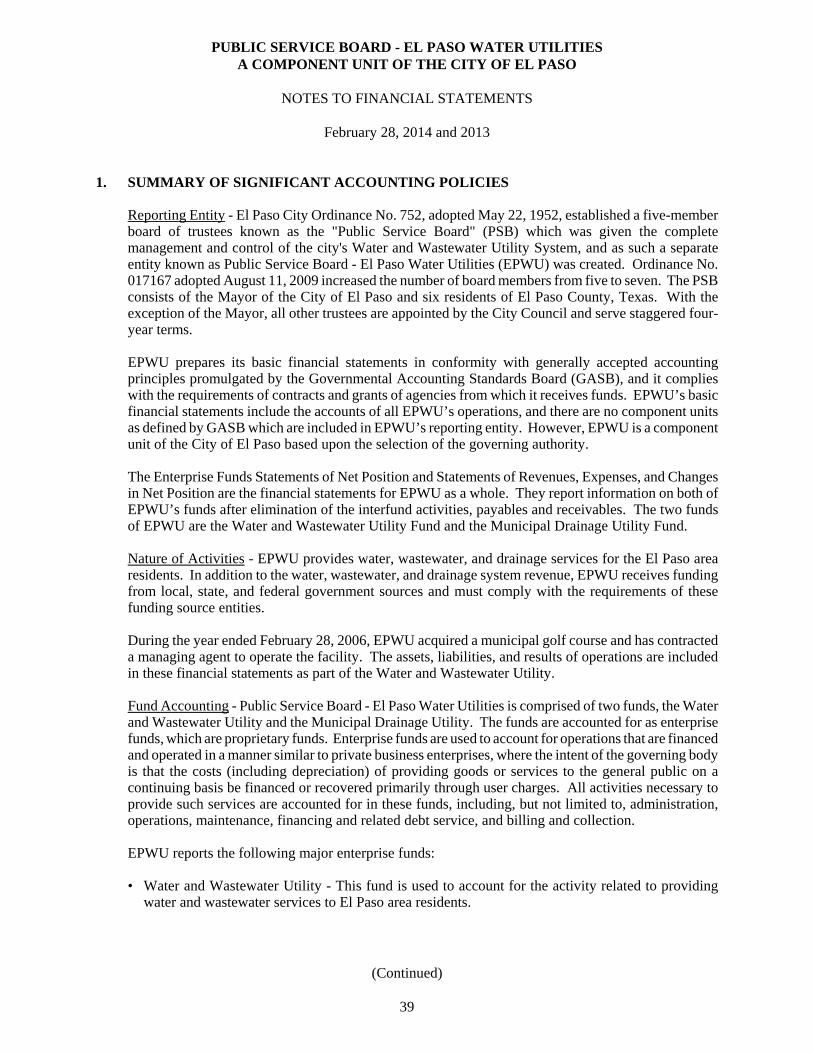
PUBLIC SERVICE BOARD - EL PASO WATER UTILITIESA COMPONENT UNIT OF THE CITY OF EL PASO
NOTES TO FINANCIAL STATEMENTS
February 28, 2014 and 2013
1. SUMMARY OF SIGNIFICANT ACCOUNTING POLICIES
Reporting Entity - El Paso City Ordinance No. 752, adopted May 22, 1952, established a five-memberboard of trustees known as the "Public Service Board" (PSB) which was given the completemanagement and control of the city's Water and Wastewater Utility System, and as such a separateentity known as Public Service Board - El Paso Water Utilities (EPWU) was created. Ordinance No.017167 adopted August 11, 2009 increased the number of board members from five to seven. The PSBconsists of the Mayor of the City of El Paso and six residents of El Paso County, Texas. With theexception of the Mayor, all other trustees are appointed by the City Council and serve staggered four-year terms.
EPWU prepares its basic financial statements in conformity with generally accepted accountingprinciples promulgated by the Governmental Accounting Standards Board (GASB), and it complieswith the requirements of contracts and grants of agencies from which it receives funds. EPWU’s basicfinancial statements include the accounts of all EPWU’s operations, and there are no component unitsas defined by GASB which are included in EPWU’s reporting entity. However, EPWU is a componentunit of the City of El Paso based upon the selection of the governing authority.
The Enterprise Funds Statements of Net Position and Statements of Revenues, Expenses, and Changesin Net Position are the financial statements for EPWU as a whole. They report information on both ofEPWU’s funds after elimination of the interfund activities, payables and receivables. The two fundsof EPWU are the Water and Wastewater Utility Fund and the Municipal Drainage Utility Fund.
Nature of Activities - EPWU provides water, wastewater, and drainage services for the El Paso arearesidents. In addition to the water, wastewater, and drainage system revenue, EPWU receives fundingfrom local, state, and federal government sources and must comply with the requirements of thesefunding source entities.
During the year ended February 28, 2006, EPWU acquired a municipal golf course and has contracteda managing agent to operate the facility. The assets, liabilities, and results of operations are includedin these financial statements as part of the Water and Wastewater Utility.
Fund Accounting - Public Service Board - El Paso Water Utilities is comprised of two funds, the Waterand Wastewater Utility and the Municipal Drainage Utility. The funds are accounted for as enterprisefunds, which are proprietary funds. Enterprise funds are used to account for operations that are financedand operated in a manner similar to private business enterprises, where the intent of the governing bodyis that the costs (including depreciation) of providing goods or services to the general public on acontinuing basis be financed or recovered primarily through user charges. All activities necessary toprovide such services are accounted for in these funds, including, but not limited to, administration,operations, maintenance, financing and related debt service, and billing and collection.
EPWU reports the following major enterprise funds:
• Water and Wastewater Utility - This fund is used to account for the activity related to providingwater and wastewater services to El Paso area residents.
(Continued)
39
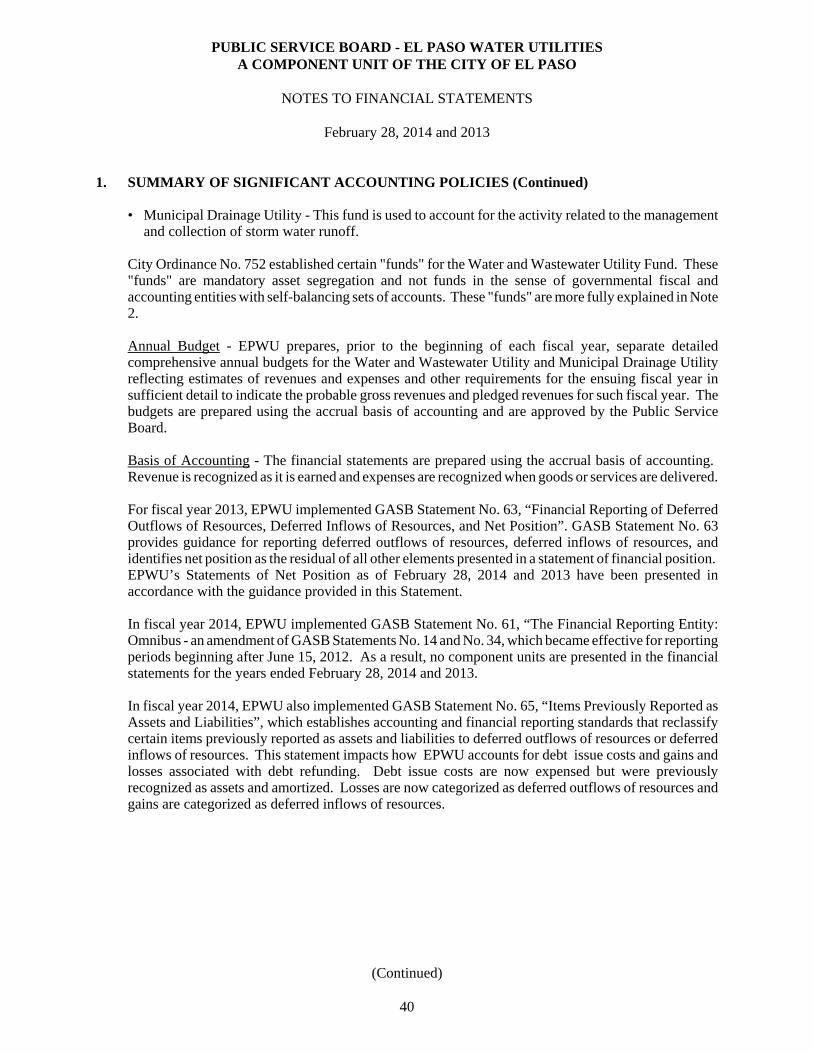
PUBLIC SERVICE BOARD - EL PASO WATER UTILITIESA COMPONENT UNIT OF THE CITY OF EL PASO
NOTES TO FINANCIAL STATEMENTS
February 28, 2014 and 2013
1. SUMMARY OF SIGNIFICANT ACCOUNTING POLICIES (Continued)
• Municipal Drainage Utility - This fund is used to account for the activity related to the managementand collection of storm water runoff.
City Ordinance No. 752 established certain "funds" for the Water and Wastewater Utility Fund. These"funds" are mandatory asset segregation and not funds in the sense of governmental fiscal andaccounting entities with self-balancing sets of accounts. These "funds" are more fully explained in Note2.
Annual Budget - EPWU prepares, prior to the beginning of each fiscal year, separate detailedcomprehensive annual budgets for the Water and Wastewater Utility and Municipal Drainage Utilityreflecting estimates of revenues and expenses and other requirements for the ensuing fiscal year insufficient detail to indicate the probable gross revenues and pledged revenues for such fiscal year. Thebudgets are prepared using the accrual basis of accounting and are approved by the Public ServiceBoard.
Basis of Accounting - The financial statements are prepared using the accrual basis of accounting. Revenue is recognized as it is earned and expenses are recognized when goods or services are delivered.
For fiscal year 2013, EPWU implemented GASB Statement No. 63, “Financial Reporting of DeferredOutflows of Resources, Deferred Inflows of Resources, and Net Position”. GASB Statement No. 63provides guidance for reporting deferred outflows of resources, deferred inflows of resources, andidentifies net position as the residual of all other elements presented in a statement of financial position. EPWU’s Statements of Net Position as of February 28, 2014 and 2013 have been presented inaccordance with the guidance provided in this Statement.
In fiscal year 2014, EPWU implemented GASB Statement No. 61, “The Financial Reporting Entity:Omnibus - an amendment of GASB Statements No. 14 and No. 34, which became effective for reportingperiods beginning after June 15, 2012. As a result, no component units are presented in the financialstatements for the years ended February 28, 2014 and 2013.
In fiscal year 2014, EPWU also implemented GASB Statement No. 65, “Items Previously Reported asAssets and Liabilities”, which establishes accounting and financial reporting standards that reclassifycertain items previously reported as assets and liabilities to deferred outflows of resources or deferredinflows of resources. This statement impacts how EPWU accounts for debt issue costs and gains andlosses associated with debt refunding. Debt issue costs are now expensed but were previouslyrecognized as assets and amortized. Losses are now categorized as deferred outflows of resources andgains are categorized as deferred inflows of resources.
(Continued)
40
PUBLIC SERVICE BOARD - EL PASO WATER UTILITIESA COMPONENT UNIT OF THE CITY OF EL PASO
NOTES TO FINANCIAL STATEMENTS
February 28, 2014 and 2013
1. SUMMARY OF SIGNIFICANT ACCOUNTING POLICIES (Continued)
Proprietary funds distinguish operating revenues and expenses from nonoperating items. Operatingrevenues and expenses generally result from providing services and producing and delivering goods inconnection with a proprietary fund’s principal ongoing operations. The principal operating revenuesof EPWU are charges to customers for sales and services. EPWU also recognizes as operating revenuethe portion of tap fees intended to recover the cost of connecting new customers to the system. Inaddition, EPWU acts as a billing and collecting agent on behalf of the City of El Paso for solid wastecollection, and an administrative fee is recognized as operating revenue for this service. Operatingexpenses include the cost of sales and services, administrative expenses, and depreciation on capitalassets as well as payments to the City of El Paso based upon a percent of water sales. All revenues andexpenses not meeting this definition are reported as nonoperating revenues and expenses.
When both restricted and unrestricted resources are available for use, it is EPWU’s policy to userestricted resources first, then unrestricted resources as they are needed.
Use of Estimates - Preparation of these financial statements in conformity with generally acceptedaccounting principles requires the use of management’s estimates and assumptions that affect thereported amounts of assets and liabilities at the date of the financial statements and the reported amountsof revenues and expenses during the reporting period. Actual results could differ from those estimates.
Cash Flows Statement - For purposes of the statement of cash flows, EPWU considers all highly liquidinvestments with an original maturity of three months or less when purchased to be cash equivalents.
Investments - All investments with an original maturity greater than one year from date of purchase arestated at fair value based on quoted market prices as of year end. Investments with an original maturityof less than one year are reported at amortized cost. Premiums and discounts on investments areamortized or accreted using the straight-line method, which approximates the interest method, over theterms of the related securities. It is the intent of management to hold securities until maturity, and thesecurities not available within a year after year-end are considered non-current.
Realized gains or losses resulting from the sale of investments are determined by the specific cost ofthe securities sold.
Inventory - Materials and Supplies - EPWU reports inventories of supplies at the lower of cost (averagecost) or market. Supplies are recorded as expenses when they are consumed.
Restricted Assets - Based upon certain bond covenants and other requirements, EPWU is required toestablish and maintain prescribed amounts of resources (consisting of cash and temporary investments)that can be used only to service outstanding debt and other activities specifically restricted (constructionand improvements).
(Continued)
41
PUBLIC SERVICE BOARD - EL PASO WATER UTILITIESA COMPONENT UNIT OF THE CITY OF EL PASO
NOTES TO FINANCIAL STATEMENTS
February 28, 2014 and 2013
1. SUMMARY OF SIGNIFICANT ACCOUNTING POLICIES (Continued)
Capital Assets - Capital assets include assets with an individual cost of $5,000 or more and an estimateduseful life in excess of one year. Utility plant and drainage asset additions are recorded at cost, whichincludes materials, labor, overhead, and interest capitalized during construction. Overhead consists ofinternal costs that are clearly related to the acquisition of capital assets. Assets acquired throughcontributions, such as from developers, are capitalized and recorded at estimated fair value as of the dateof donation. Included in capital assets are intangible assets, which consist of purchased water rights andland easements. It is the policy of EPWU to capitalize infrastructure assets. Maintenance and repairsthat do not add to the value or life of the asset are charged to operating expense. Major plantreplacements are capitalized.
EPWU records depreciation of capital assets in service on the straight-line method at amounts estimatedto amortize costs of assets over their estimated useful lives. At the time of retirement of capital assets,the allowance for depreciation is charged with the original cost of the asset and the cost of removal.
The following estimated useful lives are used in providing for depreciation of capital assets:
Building and shops 25 - 33 yearsVehicles and heavy equipment 5 yearsEquipment and tools 3 - 33 yearsWater plant 10 - 50 yearsWastewater plant 5 - 50 yearsWater rights contract 75 yearsDrainage system 50 - 100 years
Vacation and Sick Pay - Full time, permanent Public Service Board - El Paso Water Utilities employeesearn vacation leave as follows:
Years Employed Vacation Leave1 - 5 12 days/year6- 15 17 days/year
Over 15 20 days/year
Permanent EPWU employees who work 40 hours per week can accumulate a total of 400 vacation leavehours. As of February 28, 2014 and 2013, EPWU's total vacation leave liability was $2,990,137 and$2,943,285, respectively.
Vacation payable for the Water and Wastewater Utility is as follows:
2014 2013
Total payable, beginning of year $ 2,846,180 $ 2,590,887 Vacation earned 1,913,241 1,901,442 Vacation used (1,877,741) (1,646,149)
Total payable, end of year $ 2,881,680 $ 2,846,180
(Continued)
42
PUBLIC SERVICE BOARD - EL PASO WATER UTILITIESA COMPONENT UNIT OF THE CITY OF EL PASO
NOTES TO FINANCIAL STATEMENTS
February 28, 2014 and 2013
1. SUMMARY OF SIGNIFICANT ACCOUNTING POLICIES (Continued)
Vacation payable for the Municipal Drainage Utility is as follows:
2014 2013
Total payable, beginning of year $ 97,105 $ 99,224 Vacation earned 76,153 49,265 Vacation used (64,801) (51,384)
Total payable, end of year $ 108,457 $ 97,105
Sick leave is earned at a rate of 15 days per year for permanent, full time EPWU employees, with anunlimited accumulation of days. EPWU does not record any liability for sick pay as employees are notreimbursed upon termination.
Vacation is recorded as an expense and related liability in the year earned. Sick pay is recorded as anexpense in the year incurred.
2. CITY ORDINANCE NO. 752
On May 22, 1952, City Ordinance No. 752 created the Public Service Board - El Paso Water Utilitiesfor the purpose of providing water and wastewater services that are reported in the Water andWastewater Utility Fund. This ordinance authorized the issuance of a series of Revenue Bonds entitled"City of El Paso, Texas, Water and Sewer Revenue Bonds Series 1952 (the Series 1952 Bonds)," andthe City reserved the right and option in the 1952 resolution to issue, under certain conditions, additionalbonds on a parity as to lien and right with the Series 1952 Bonds. This bond ordinance has beenamended as a result of subsequent bond issues, but still contains the following key covenants.
Ordinance No. 752, as amended, requires that gross revenues of the System be applied in sequence to:(a) current expenses of maintenance and operations; (b) debt service and reserve requirements; (c)capital expenditures, or unexpected or extraordinary repairs or replacements, or for any other lawfulpurpose. The following funds have been established to account for the application of the grossrevenues: (i) Water and Sewer Revenue Bonds Waterworks and Sewage Fund; (ii) Water and SewerRevenue Bonds Interest and Sinking Fund; (iii) Water and Sewer Revenue Bonds Reserve Fund; and(iv) Water and Sewer Improvement Fund. All revenues of every nature received through operations ofthe System shall be paid into the Waterworks and Sewage Fund. The Bond Funds are required tocontain an amount of money and investments equal to the principal and interest requirements during thefiscal year.
Ordinance No. 752 also requires that EPWU maintain rates sufficient to produce or yield revenues toproduce in each fiscal year an amount adequate to pay all expenses incurred for the operations andmaintenance of the System as such expenses shall accrue during the year and to produce an additionalamount equal to 150% of the aggregate amount required to be paid in such year for principal andinterest and redemption premiums on bonds payable from the Bond Funds.
(Continued)
43
PUBLIC SERVICE BOARD - EL PASO WATER UTILITIESA COMPONENT UNIT OF THE CITY OF EL PASO
NOTES TO FINANCIAL STATEMENTS
February 28, 2014 and 2013
2. CITY ORDINANCE NO. 752 (Continued)
Ordinance No. 752 also provides that EPWU will permit no free water or services to be supplied to theCity or to any other user. However, the ordinance requires that 10% of the total amounts received byEPWU from the sale of water be paid to the City Treasurer. The money so received by the CityTreasurer may be expended by the City under the direction of the City Council for any purpose forwhich revenues of the System may legally be used under the laws of the State of Texas.
3. CITY ORDINANCE NO. 016668 ESTABLISHMENT OF A MUNICIPAL DRAINAGE UTILITYSYSTEM
On June 19, 2007, the City of El Paso adopted Ordinance #016668 establishing a Municipal DrainageUtility System. The ordinance states that the Public Service Board - El Paso Water Utilities shall havecomplete authority and control of the management and operation of the Municipal Drainage Utility onbehalf of the City. The Municipal Drainage Utility is necessary and essential to ensure that themanagement and control of the storm water runoff adequately protects the health, safety, and welfareof the citizens of the City. EPWU assumed full responsibility and control of the Municipal DrainageUtility as of March 1, 2008. City personnel, equipment, and all assets of the Drainage System including infrastructure and land were transferred to EPWU. EPWU began billing drainage fees to fund theoperating and capital expenses of the Municipal Drainage Utility as of March 1, 2008.
The Ordinance further states that the Board shall prepare a Master Stormwater Management Plan whichshall be approved by the City Council. In developing the Stormwater Plan, the Board shall take intoaccount the use of open space as natural drainage and to the extent reasonably possible preserve theCity’s open spaces, greenways, arroyos and wilderness areas in their natural state. The Board shallallocate an amount equal to 10% of the System’s annual drainage utility fee revenues for Green Projectswhich have the potential dual purposes of stormwater management and preservation of the City’s openspaces, greenways, arroyos and wilderness areas. Since March 1, 2008, $9,206,591 has been set asidefor the 10% for Green Projects and as of February 28, 2014, $3,446,200 has been spent including thepurchase of 202.658 acres for $2,465,000 on March 31, 2010.
The Ordinance also requires that a drainage utility fee be imposed on each improved parcel within theCity for services and facilities provided by the System, except as to exemptions provided for by law orby the ordinance. At least once a year beginning with the City’s Fiscal Year ending August 31, 2009,the Board shall present to the City Council a report on the status of the system.
Ordinance #016668 also requires that the revenues collected from drainage utility fees must besegregated and completely identifiable from other City or Board accounts. The Board has adopted adebt service coverage ratio of 1.25 times for all Municipal Drainage Utility bonds which is included inthe bond ordinances for such bonds.
(Continued)
44
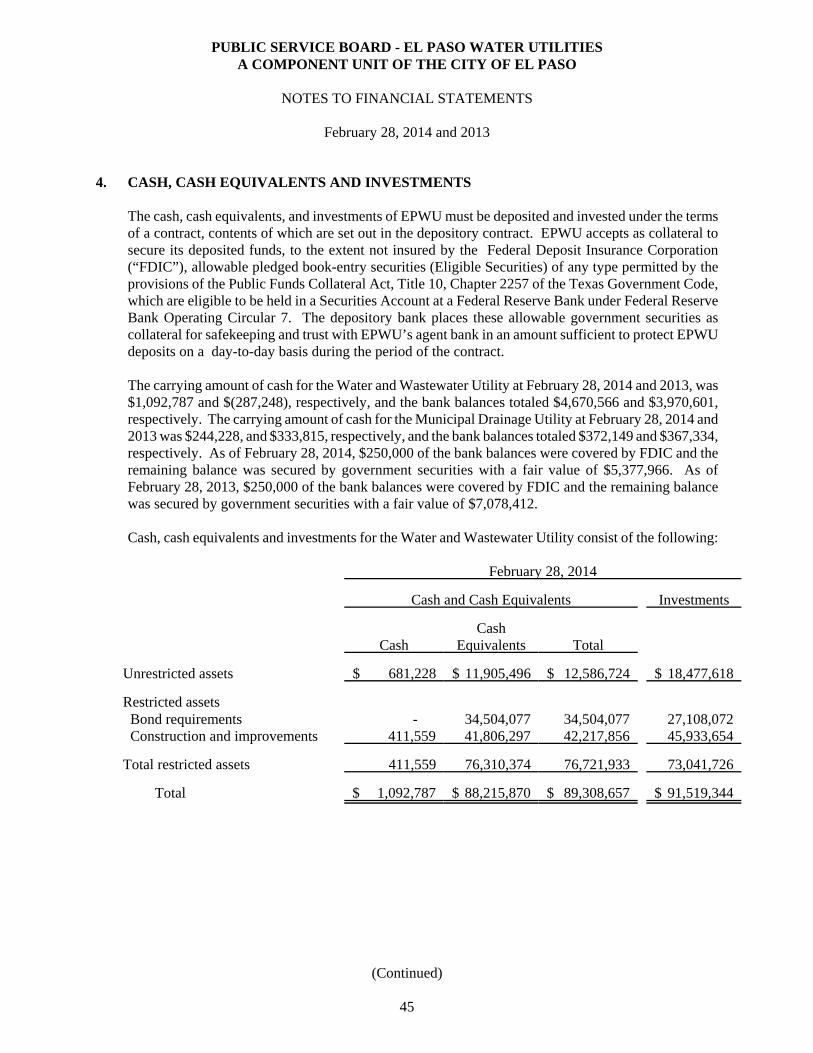
PUBLIC SERVICE BOARD - EL PASO WATER UTILITIESA COMPONENT UNIT OF THE CITY OF EL PASO
NOTES TO FINANCIAL STATEMENTS
February 28, 2014 and 2013
4. CASH, CASH EQUIVALENTS AND INVESTMENTS
The cash, cash equivalents, and investments of EPWU must be deposited and invested under the termsof a contract, contents of which are set out in the depository contract. EPWU accepts as collateral tosecure its deposited funds, to the extent not insured by the Federal Deposit Insurance Corporation(“FDIC”), allowable pledged book-entry securities (Eligible Securities) of any type permitted by theprovisions of the Public Funds Collateral Act, Title 10, Chapter 2257 of the Texas Government Code,which are eligible to be held in a Securities Account at a Federal Reserve Bank under Federal ReserveBank Operating Circular 7. The depository bank places these allowable government securities ascollateral for safekeeping and trust with EPWU’s agent bank in an amount sufficient to protect EPWUdeposits on a day-to-day basis during the period of the contract.
The carrying amount of cash for the Water and Wastewater Utility at February 28, 2014 and 2013, was$1,092,787 and $(287,248), respectively, and the bank balances totaled $4,670,566 and $3,970,601,respectively. The carrying amount of cash for the Municipal Drainage Utility at February 28, 2014 and2013 was $244,228, and $333,815, respectively, and the bank balances totaled $372,149 and $367,334,respectively. As of February 28, 2014, $250,000 of the bank balances were covered by FDIC and theremaining balance was secured by government securities with a fair value of $5,377,966. As ofFebruary 28, 2013, $250,000 of the bank balances were covered by FDIC and the remaining balancewas secured by government securities with a fair value of $7,078,412.
Cash, cash equivalents and investments for the Water and Wastewater Utility consist of the following:
February 28, 2014
Cash and Cash Equivalents Investments
CashCash
Equivalents Total
Unrestricted assets $ 681,228 $ 11,905,496 $ 12,586,724 $ 18,477,618
Restricted assets Bond requirements - 34,504,077 34,504,077 27,108,072 Construction and improvements 411,559 41,806,297 42,217,856 45,933,654
Total restricted assets 411,559 76,310,374 76,721,933 73,041,726
Total $ 1,092,787 $ 88,215,870 $ 89,308,657 $ 91,519,344
(Continued)
45
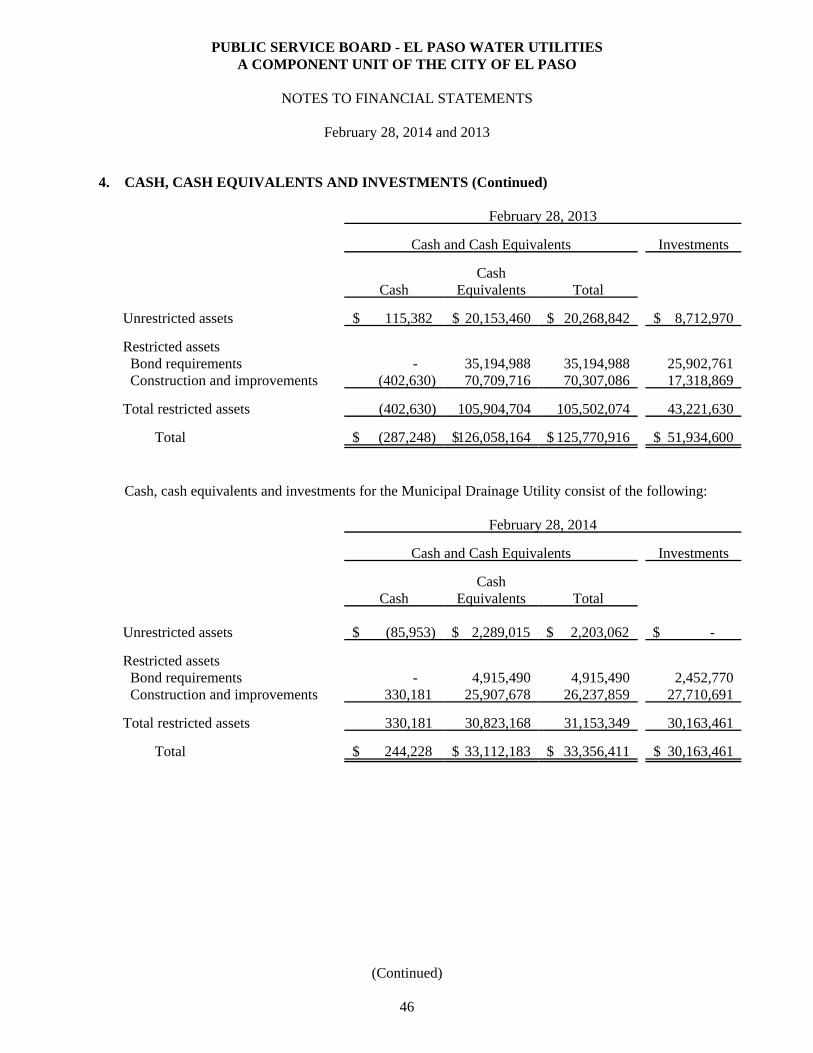
PUBLIC SERVICE BOARD - EL PASO WATER UTILITIESA COMPONENT UNIT OF THE CITY OF EL PASO
NOTES TO FINANCIAL STATEMENTS
February 28, 2014 and 2013
4. CASH, CASH EQUIVALENTS AND INVESTMENTS (Continued)
February 28, 2013
Cash and Cash Equivalents Investments
CashCash
Equivalents Total
Unrestricted assets $ 115,382 $ 20,153,460 $ 20,268,842 $ 8,712,970
Restricted assets Bond requirements - 35,194,988 35,194,988 25,902,761 Construction and improvements (402,630) 70,709,716 70,307,086 17,318,869
Total restricted assets (402,630) 105,904,704 105,502,074 43,221,630
Total $ (287,248) $126,058,164 $ 125,770,916 $ 51,934,600
Cash, cash equivalents and investments for the Municipal Drainage Utility consist of the following:
February 28, 2014
Cash and Cash Equivalents Investments
CashCash
Equivalents Total
Unrestricted assets $ (85,953) $ 2,289,015 $ 2,203,062 $ -
Restricted assets Bond requirements - 4,915,490 4,915,490 2,452,770 Construction and improvements 330,181 25,907,678 26,237,859 27,710,691
Total restricted assets 330,181 30,823,168 31,153,349 30,163,461
Total $ 244,228 $ 33,112,183 $ 33,356,411 $ 30,163,461
(Continued)
46
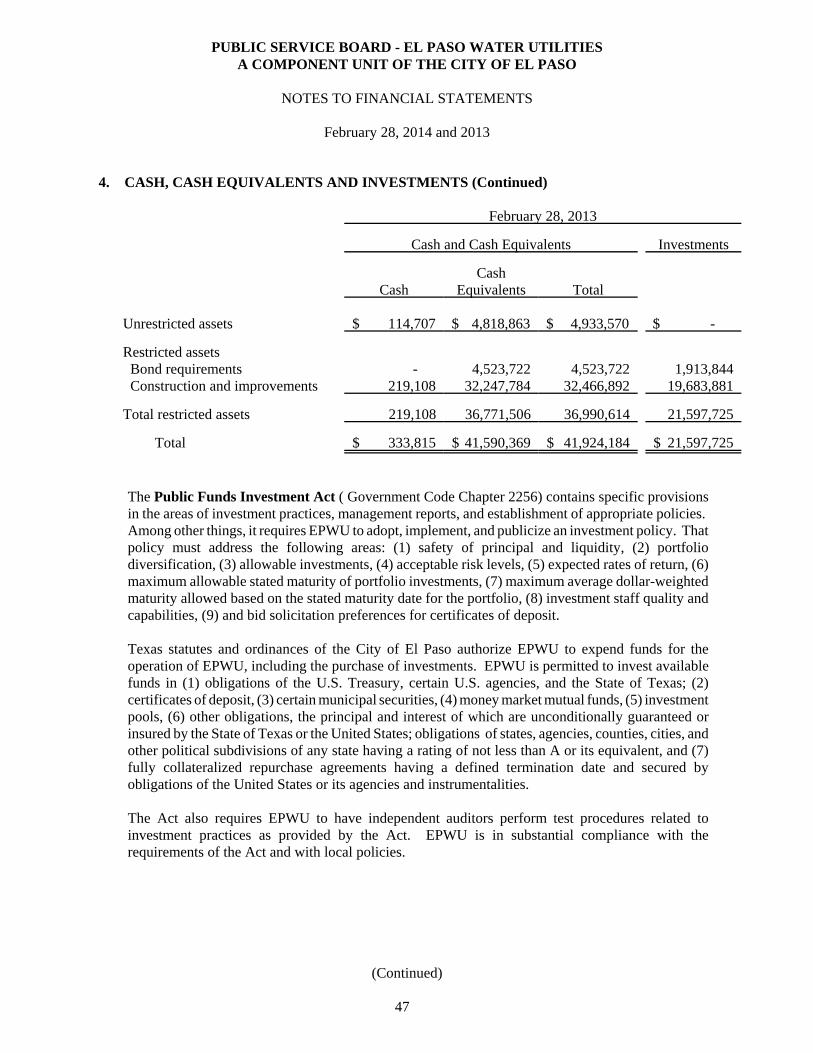
PUBLIC SERVICE BOARD - EL PASO WATER UTILITIESA COMPONENT UNIT OF THE CITY OF EL PASO
NOTES TO FINANCIAL STATEMENTS
February 28, 2014 and 2013
4. CASH, CASH EQUIVALENTS AND INVESTMENTS (Continued)
February 28, 2013
Cash and Cash Equivalents Investments
CashCash
Equivalents Total
Unrestricted assets $ 114,707 $ 4,818,863 $ 4,933,570 $ -
Restricted assets Bond requirements - 4,523,722 4,523,722 1,913,844 Construction and improvements 219,108 32,247,784 32,466,892 19,683,881
Total restricted assets 219,108 36,771,506 36,990,614 21,597,725
Total $ 333,815 $ 41,590,369 $ 41,924,184 $ 21,597,725
The Public Funds Investment Act ( Government Code Chapter 2256) contains specific provisionsin the areas of investment practices, management reports, and establishment of appropriate policies. Among other things, it requires EPWU to adopt, implement, and publicize an investment policy. Thatpolicy must address the following areas: (1) safety of principal and liquidity, (2) portfoliodiversification, (3) allowable investments, (4) acceptable risk levels, (5) expected rates of return, (6)maximum allowable stated maturity of portfolio investments, (7) maximum average dollar-weightedmaturity allowed based on the stated maturity date for the portfolio, (8) investment staff quality andcapabilities, (9) and bid solicitation preferences for certificates of deposit.
Texas statutes and ordinances of the City of El Paso authorize EPWU to expend funds for theoperation of EPWU, including the purchase of investments. EPWU is permitted to invest availablefunds in (1) obligations of the U.S. Treasury, certain U.S. agencies, and the State of Texas; (2)certificates of deposit, (3) certain municipal securities, (4) money market mutual funds, (5) investmentpools, (6) other obligations, the principal and interest of which are unconditionally guaranteed orinsured by the State of Texas or the United States; obligations of states, agencies, counties, cities, andother political subdivisions of any state having a rating of not less than A or its equivalent, and (7)fully collateralized repurchase agreements having a defined termination date and secured byobligations of the United States or its agencies and instrumentalities.
The Act also requires EPWU to have independent auditors perform test procedures related toinvestment practices as provided by the Act. EPWU is in substantial compliance with therequirements of the Act and with local policies.
(Continued)
47
PUBLIC SERVICE BOARD - EL PASO WATER UTILITIESA COMPONENT UNIT OF THE CITY OF EL PASO
NOTES TO FINANCIAL STATEMENTS
February 28, 2014 and 2013
4. CASH, CASH EQUIVALENTS AND INVESTMENTS (Continued)
EPWU participates in TEXPOOL, which is a government investment pool in the State of Texas. TheState Comptroller of Public Accounts maintains oversight responsibility for TEXPOOL. Thisresponsibility includes the ability to influence operations, designation of management andaccountability for fiscal matters. Federated Investors manage the daily operations of the pool undera contract with the Comptroller. Although TEXPOOL is not registered with the SEC as investmentcompanies, it operates in a manner consistent with the SEC’s Rule 2(a)7 of the Investment CompanyAct of 1940. GASB allows 2(a)7-like pools to use amortized cost (which excludes unrealized gainsand losses) rather than fair value to report net assets to compute share price. The fair value ofEPWU’s position in TEXPOOL is the same as the value of TEXPOOL shares.
EPWU also participates in TexSTAR which is an investment service created by local governments forlocal governments. TexSTAR was organized in conformity with the interlocal cooperation Act,Chapter 791 of the Texas Government Code, and the Public Funds Investment Act, Chapter 2256 ofthe Texas Government Code. These acts provide for the creation of public funds investment poolssuch as TexSTAR and authorize eligible governmental entities to invest their public funds ininvestment pools.
State statutes permit EPWU to enter into certain repurchase agreements. That is, a sale of securitieswith a simultaneous agreement to repurchase them in the future at the same price plus a contract rateof interest. All sales of investments under reverse repurchase agreements must be for fixed terms. Ininvesting the proceeds of reverse repurchase agreements, the term to maturity of the investments isthe same as the term of reverse repurchase agreement. During fiscal years 2014 and 2013, EPWU didnot enter into any reverse repurchase agreements.
(Continued)
48
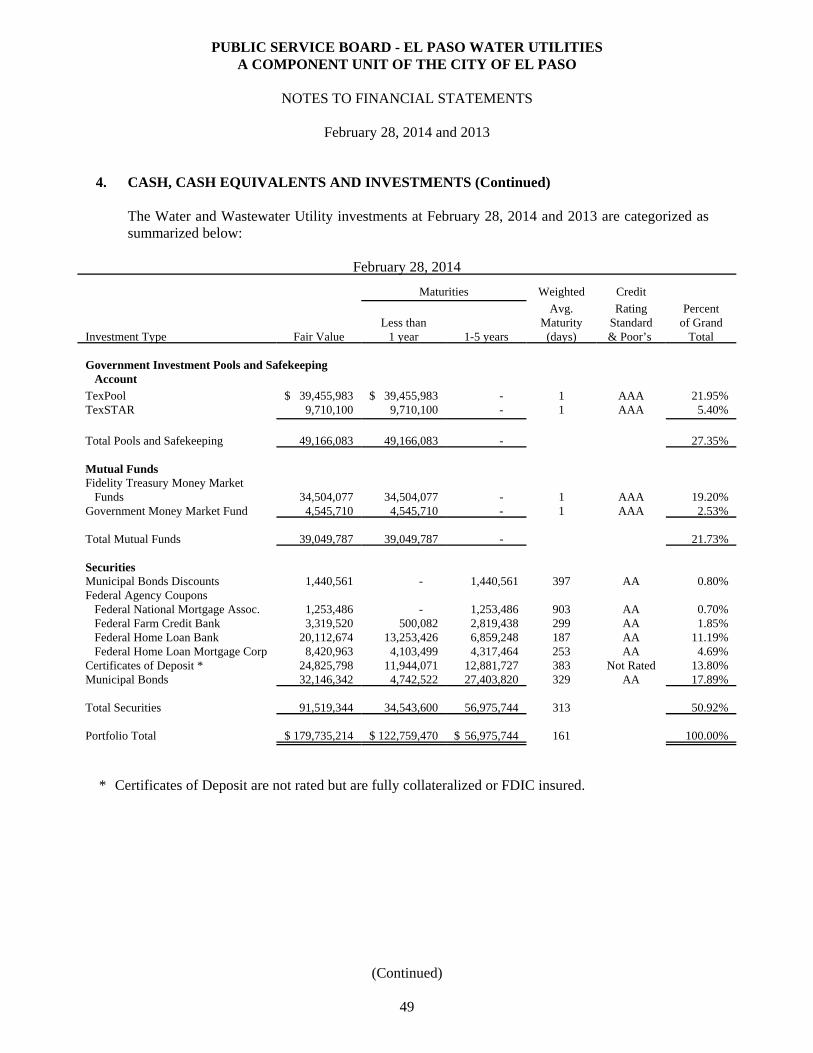
PUBLIC SERVICE BOARD - EL PASO WATER UTILITIESA COMPONENT UNIT OF THE CITY OF EL PASO
NOTES TO FINANCIAL STATEMENTS
February 28, 2014 and 2013
4. CASH, CASH EQUIVALENTS AND INVESTMENTS (Continued)
The Water and Wastewater Utility investments at February 28, 2014 and 2013 are categorized assummarized below:
February 28, 2014
Maturities Weighted Credit
Investment Type Fair ValueLess than
1 year 1-5 years
Avg.Maturity
(days)
RatingStandard& Poor’s
Percentof Grand
Total
Government Investment Pools and Safekeeping AccountTexPool $ 39,455,983 $ 39,455,983 - 1 AAA 21.95%TexSTAR 9,710,100 9,710,100 - 1 AAA 5.40%
Total Pools and Safekeeping 49,166,083 49,166,083 - 27.35%
Mutual FundsFidelity Treasury Money Market Funds 34,504,077 34,504,077 - 1 AAA 19.20%Government Money Market Fund 4,545,710 4,545,710 - 1 AAA 2.53%
Total Mutual Funds 39,049,787 39,049,787 - 21.73%
SecuritiesMunicipal Bonds Discounts 1,440,561 - 1,440,561 397 AA 0.80%Federal Agency Coupons Federal National Mortgage Assoc. 1,253,486 - 1,253,486 903 AA 0.70% Federal Farm Credit Bank 3,319,520 500,082 2,819,438 299 AA 1.85% Federal Home Loan Bank 20,112,674 13,253,426 6,859,248 187 AA 11.19% Federal Home Loan Mortgage Corp 8,420,963 4,103,499 4,317,464 253 AA 4.69%Certificates of Deposit * 24,825,798 11,944,071 12,881,727 383 Not Rated 13.80%Municipal Bonds 32,146,342 4,742,522 27,403,820 329 AA 17.89%
Total Securities 91,519,344 34,543,600 56,975,744 313 50.92%
Portfolio Total $ 179,735,214 $ 122,759,470 $ 56,975,744 161 100.00%
* Certificates of Deposit are not rated but are fully collateralized or FDIC insured.
(Continued)
49
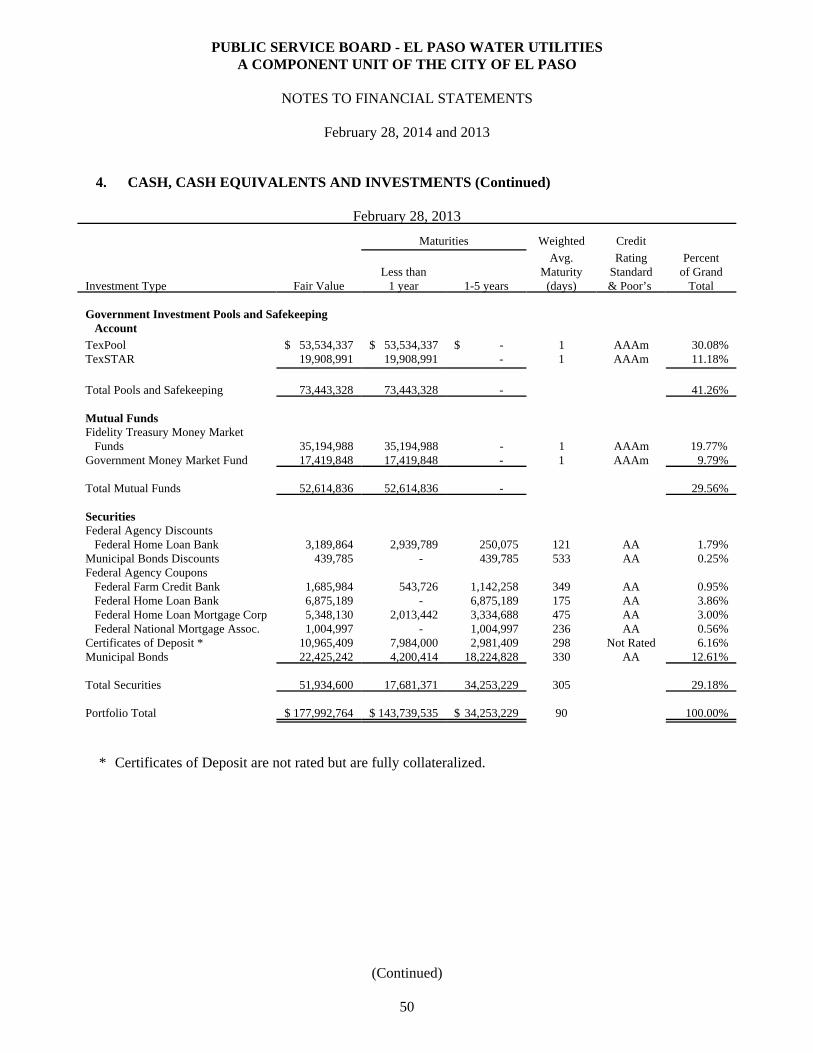
PUBLIC SERVICE BOARD - EL PASO WATER UTILITIESA COMPONENT UNIT OF THE CITY OF EL PASO
NOTES TO FINANCIAL STATEMENTS
February 28, 2014 and 2013
4. CASH, CASH EQUIVALENTS AND INVESTMENTS (Continued)
February 28, 2013
Maturities Weighted Credit
Investment Type Fair ValueLess than
1 year 1-5 years
Avg.Maturity
(days)
RatingStandard& Poor’s
Percentof Grand
Total
Government Investment Pools and Safekeeping AccountTexPool $ 53,534,337 $ 53,534,337 $ - 1 AAAm 30.08%TexSTAR 19,908,991 19,908,991 - 1 AAAm 11.18%
Total Pools and Safekeeping 73,443,328 73,443,328 - 41.26%
Mutual FundsFidelity Treasury Money Market Funds 35,194,988 35,194,988 - 1 AAAm 19.77%Government Money Market Fund 17,419,848 17,419,848 - 1 AAAm 9.79%
Total Mutual Funds 52,614,836 52,614,836 - 29.56%
SecuritiesFederal Agency Discounts Federal Home Loan Bank 3,189,864 2,939,789 250,075 121 AA 1.79%Municipal Bonds Discounts 439,785 - 439,785 533 AA 0.25%Federal Agency Coupons Federal Farm Credit Bank 1,685,984 543,726 1,142,258 349 AA 0.95% Federal Home Loan Bank 6,875,189 - 6,875,189 175 AA 3.86% Federal Home Loan Mortgage Corp 5,348,130 2,013,442 3,334,688 475 AA 3.00% Federal National Mortgage Assoc. 1,004,997 - 1,004,997 236 AA 0.56%Certificates of Deposit * 10,965,409 7,984,000 2,981,409 298 Not Rated 6.16%Municipal Bonds 22,425,242 4,200,414 18,224,828 330 AA 12.61%
Total Securities 51,934,600 17,681,371 34,253,229 305 29.18%
Portfolio Total $ 177,992,764 $ 143,739,535 $ 34,253,229 90 100.00%
* Certificates of Deposit are not rated but are fully collateralized.
(Continued)
50
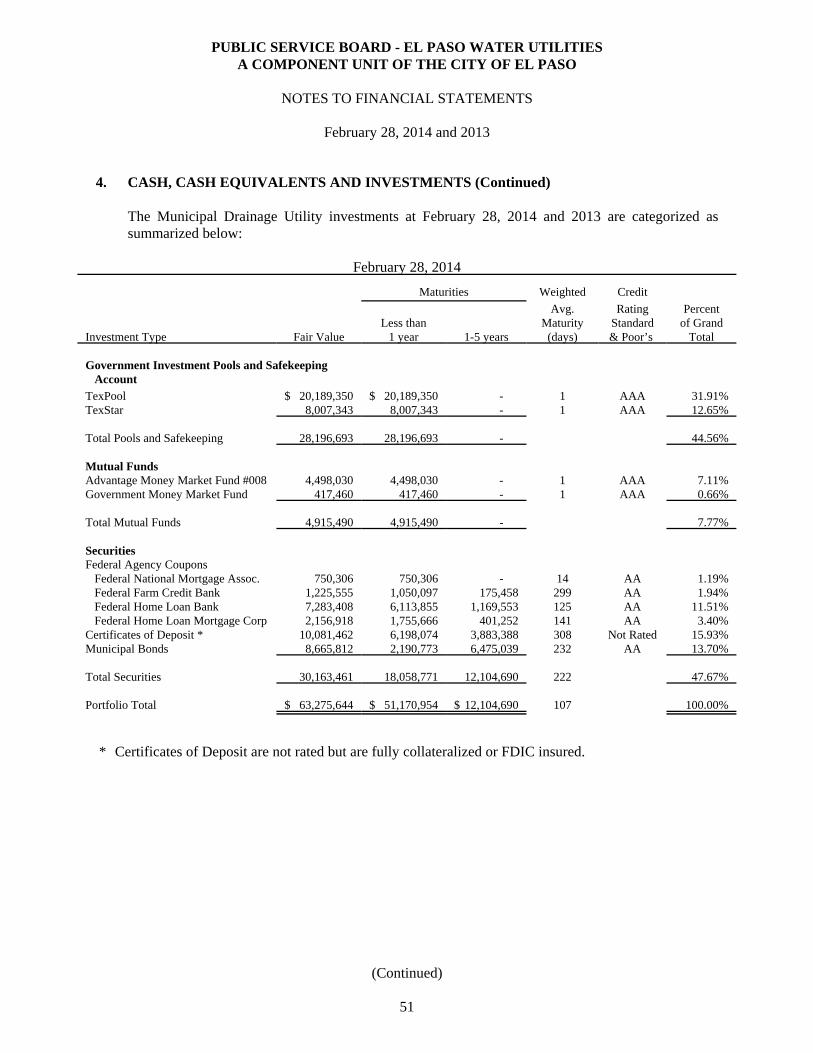
PUBLIC SERVICE BOARD - EL PASO WATER UTILITIESA COMPONENT UNIT OF THE CITY OF EL PASO
NOTES TO FINANCIAL STATEMENTS
February 28, 2014 and 2013
4. CASH, CASH EQUIVALENTS AND INVESTMENTS (Continued)
The Municipal Drainage Utility investments at February 28, 2014 and 2013 are categorized assummarized below:
February 28, 2014
Maturities Weighted Credit
Investment Type Fair ValueLess than
1 year 1-5 years
Avg.Maturity
(days)
RatingStandard& Poor’s
Percentof Grand
Total
Government Investment Pools and Safekeeping AccountTexPool $ 20,189,350 $ 20,189,350 - 1 AAA 31.91%TexStar 8,007,343 8,007,343 - 1 AAA 12.65%
Total Pools and Safekeeping 28,196,693 28,196,693 - 44.56%
Mutual FundsAdvantage Money Market Fund #008 4,498,030 4,498,030 - 1 AAA 7.11%Government Money Market Fund 417,460 417,460 - 1 AAA 0.66%
Total Mutual Funds 4,915,490 4,915,490 - 7.77%
SecuritiesFederal Agency Coupons Federal National Mortgage Assoc. 750,306 750,306 - 14 AA 1.19% Federal Farm Credit Bank 1,225,555 1,050,097 175,458 299 AA 1.94% Federal Home Loan Bank 7,283,408 6,113,855 1,169,553 125 AA 11.51% Federal Home Loan Mortgage Corp 2,156,918 1,755,666 401,252 141 AA 3.40%Certificates of Deposit * 10,081,462 6,198,074 3,883,388 308 Not Rated 15.93%Municipal Bonds 8,665,812 2,190,773 6,475,039 232 AA 13.70%
Total Securities 30,163,461 18,058,771 12,104,690 222 47.67%
Portfolio Total $ 63,275,644 $ 51,170,954 $ 12,104,690 107 100.00%
* Certificates of Deposit are not rated but are fully collateralized or FDIC insured.
(Continued)
51
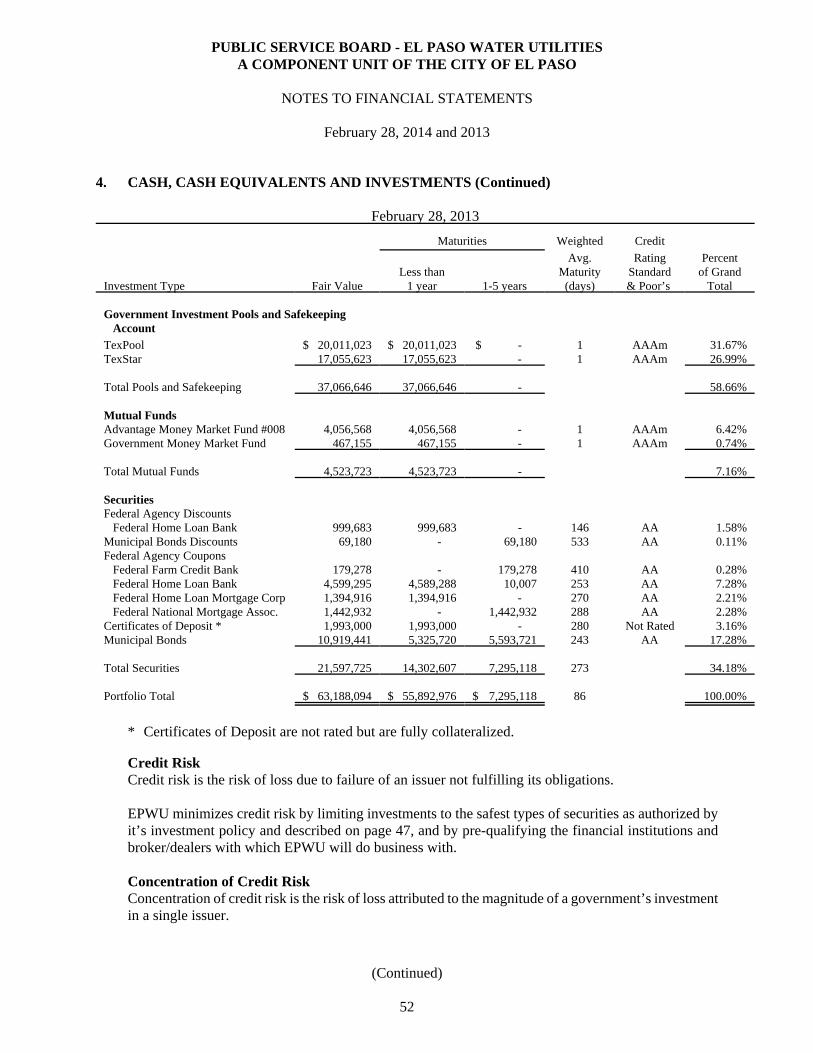
PUBLIC SERVICE BOARD - EL PASO WATER UTILITIESA COMPONENT UNIT OF THE CITY OF EL PASO
NOTES TO FINANCIAL STATEMENTS
February 28, 2014 and 2013
4. CASH, CASH EQUIVALENTS AND INVESTMENTS (Continued)
February 28, 2013
Maturities Weighted Credit
Investment Type Fair ValueLess than
1 year 1-5 years
Avg.Maturity
(days)
RatingStandard& Poor’s
Percentof Grand
Total
Government Investment Pools and Safekeeping AccountTexPool $ 20,011,023 $ 20,011,023 $ - 1 AAAm 31.67%TexStar 17,055,623 17,055,623 - 1 AAAm 26.99%
Total Pools and Safekeeping 37,066,646 37,066,646 - 58.66%
Mutual FundsAdvantage Money Market Fund #008 4,056,568 4,056,568 - 1 AAAm 6.42%Government Money Market Fund 467,155 467,155 - 1 AAAm 0.74%
Total Mutual Funds 4,523,723 4,523,723 - 7.16%
SecuritiesFederal Agency Discounts Federal Home Loan Bank 999,683 999,683 - 146 AA 1.58%Municipal Bonds Discounts 69,180 - 69,180 533 AA 0.11%Federal Agency Coupons Federal Farm Credit Bank 179,278 - 179,278 410 AA 0.28% Federal Home Loan Bank 4,599,295 4,589,288 10,007 253 AA 7.28% Federal Home Loan Mortgage Corp 1,394,916 1,394,916 - 270 AA 2.21% Federal National Mortgage Assoc. 1,442,932 - 1,442,932 288 AA 2.28%Certificates of Deposit * 1,993,000 1,993,000 - 280 Not Rated 3.16%Municipal Bonds 10,919,441 5,325,720 5,593,721 243 AA 17.28%
Total Securities 21,597,725 14,302,607 7,295,118 273 34.18%
Portfolio Total $ 63,188,094 $ 55,892,976 $ 7,295,118 86 100.00%
* Certificates of Deposit are not rated but are fully collateralized.
Credit RiskCredit risk is the risk of loss due to failure of an issuer not fulfilling its obligations.
EPWU minimizes credit risk by limiting investments to the safest types of securities as authorized byit’s investment policy and described on page 47, and by pre-qualifying the financial institutions andbroker/dealers with which EPWU will do business with.
Concentration of Credit RiskConcentration of credit risk is the risk of loss attributed to the magnitude of a government’s investmentin a single issuer.
(Continued)
52
PUBLIC SERVICE BOARD - EL PASO WATER UTILITIESA COMPONENT UNIT OF THE CITY OF EL PASO
NOTES TO FINANCIAL STATEMENTS
February 28, 2014 and 2013
4. CASH, CASH EQUIVALENTS AND INVESTMENTS (Continued)
EPWU minimizes concentration of credit risk by diversifying the investment portfolio so that potentiallosses on individual securities will be minimized. In addition, they also invest in securities with varyingmaturities, and are continuously investing a portion of the portfolio in readily available funds such aslocal government investment pools (LGIPs) and money market funds.
Diversification by investment type shall be established by the following maximum percentages ofinvestment type to the total EPWU portfolio:
U.S. Government Securities 100%State, Agencies, Counties, Cities, and other 50%Certificates of Deposit 50%Money Market Mutual Funds 80%Eligible Investment Pools 100%
Custodial Credit RiskCustodial credit risk for deposits is the risk that, in the event of the failure of a depository financialinstitution, EPWU will not be able to recover deposits or collateral securities that are in the possessionof an outside party. For investments, the custodial credit risk, is the risk that, in the event of the failureof the counterparty to a transaction, EPWU will not be able to recover the value of the investment orcollateral securities that are in the possession of an outside party.
EPWU minimizes depository custodial credit risk by depositing and investing under the terms of acontract, contents of which are set out in the depository contract. The depository bank places approvedpledged securities for safekeeping and trust with EPWU’s agent bank in an amount sufficient to protectEPWU funds on a day-to-day basis during the period of the contract. The pledge of approved securitiesis waived only to the extent of the depository bank’s dollar amount of Federal Deposit InsuranceCorporation (“FDIC”) insurance.
EPWU minimizes investment custodial credit risk by requiring that all collateral securities be held bya third party institution. EPWU requires full collateralization of all EPWU investments, other thaninvestments which are obligations of the U.S. government and its agencies and instrumentalities, or bythe Federal Reserve Bank, except the collateral for certificates of deposits in banks. The collateral forcertificates of deposits in banks will be registered in EPWU’s name in the bank’s trust department or,alternatively, in a Federal Reserve Bank account in EPWU’s name.
Interest Rate RiskInterest rate risk is the risk that changes in the market interest rates will adversely affect the fair valueof investments.
(Continued)
53
PUBLIC SERVICE BOARD - EL PASO WATER UTILITIESA COMPONENT UNIT OF THE CITY OF EL PASO
NOTES TO FINANCIAL STATEMENTS
February 28, 2014 and 2013
4. CASH, CASH EQUIVALENTS AND INVESTMENTS (Continued)
EPWU minimizes interest rate risk by structuring the investment portfolio so that securities mature tomeet cash requirements for ongoing operations, thereby avoiding the need to sell securities on the openmarket prior to maturity. It is also minimized by investing operating funds primarily in shorter-termsecurities, money market mutual funds, or similar investment pools. The core of investments are limitedto relatively low risk securities in anticipation of earning a fair return relative to the risk being assumed. The operating funds portfolio should have a weighted average maturity less than 270 days with amaximum of two years.
Foreign Currency RiskForeign currency risk is the risk that changes in exchange rates will adversely affect the fair value ofan investment or a deposit.
EPWU does not directly invest in foreign securities; however, the escrow accounts money market fundmight invest a minimal amount of the fund’s portfolio in foreign securities.
5. RECEIVABLES
No reserve has been provided for doubtful accounts as EPWU charges directly to income those accountsdetermined to be uncollectible. The accounts written off for the Water and Wastewater Utility duringthe years ended February 28, 2014 and 2013, totaled $567,104 and $598,471, respectively. The write-off for the Municipal Drainage Utility for fiscal year ending February 28, 2014 and 2013, totaled$44,861, and $59,799, respectively. Management is of the opinion that any additional losses resultingfrom the collection of notes and accounts receivable will not be material.
The Public Service Board - El Paso Water Utilities uses the cycle method of billing customers forservices. Under this method, customer billings are made by specified cycles established for the servicearea and each cycle billed on a specific day each month. For financial reporting purposes, billings madein March which relate to services provided for the month of February are included in customer accountsreceivable as unbilled charges. These amounts are summarized as follows for the fiscal years includedin the accompanying financial statements:
2014 2013
Water and Wastewater UtilityWater $ 2,221,352 $ 1,874,752 Wastewater 1,987,671 1,988,125
Total unbilled accounts receivable $ 4,209,023 $ 3,862,877
(Continued)
54
PUBLIC SERVICE BOARD - EL PASO WATER UTILITIESA COMPONENT UNIT OF THE CITY OF EL PASO
NOTES TO FINANCIAL STATEMENTS
February 28, 2014 and 2013
6. INTERFUND BALANCES AND CHARGES
Interfund Balances - The following interfund balances are the result of normal operations and areperiodically cleared out. Management intends to pay these balances within one year.
February 28, 2014
Due FromOther Funds
Due to Other Funds
Water and Wastewater Utility $ - $ 36,135 Municipal Drainage Utility 36,135 -
Total $ 36,135 $ 36,135
February 28, 2013
Due FromOther Funds
Due to Other Funds
Water and Wastewater Utility $ - $ 339,396 Municipal Drainage Utility 339,396 -
Total $ 339,396 $ 339,396
Interfund Charges - The following eliminations were done in order to eliminate duplicate transactionsat the overall entity level for revenue and expenses between the two funds.
February 28, 2014
Water andWastewater
Utility
MunicipalDrainage
Utility
Drainage fee revenue $ - $ 104,856 Rent Revenue 24,000 - Operation and maintenance - drainage - 7,417 Operations and maintenance - water and reclaimed water (72,975) - Operations and maintenance - wastewater (52,474) - General, administrative and engineering 1,294,176 - Indirect cost allocation - (1,305,000)
Total $ 1,192,727 $ (1,192,727)
(Continued)
55
PUBLIC SERVICE BOARD - EL PASO WATER UTILITIESA COMPONENT UNIT OF THE CITY OF EL PASO
NOTES TO FINANCIAL STATEMENTS
February 28, 2014 and 2013
6. INTERFUND BALANCES AND CHARGES (Continued)February 28, 2013
Water andWastewater
Utility
MunicipalDrainage
Utility
Drainage fee revenue $ - $ 104,760 Rent Revenue 24,000 - Operation and maintenance - drainage - (27,321)Operations and maintenance - water and reclaimed water (39,081) - Operations and maintenance - wastewater (52,372) - General, administrative and engineering 1,462,014 - Indirect cost allocation - (1,472,000)
Total $ 1,394,561 $ (1,394,561)
Indirect Cost Allocation - The indirect cost allocation from the Water and Wastewater Utility to theMunicipal Drainage Utility is to pay for indirect costs that the Water and Wastewater Utility incursrelated to the general and administrative functions to manage the Municipal Drainage Utility. For fiscalyears 2014 and 2013, the revised budgeted and actual indirect cost were $1,305,000 and $1,472,000,respectively. During the budget process the indirect cost allocation will be adjusted based on estimatedindirect costs.
7. WATER AND WASTEWATER UTILITY GOVERNMENT GRANTS RECEIVABLE
The Water and Wastewater Utility had $509,463 and $787,557 in government grants receivable foryears ended February 28, 2014 and 2013.
Government Grant Projects 2014 2013
Federal GrantsNorth Central Reclaimed - EPA#XP96638401 $ 25,599 $ 506,360 Leak Detection - USBR#R12AP40018 80,000 34,250
Non Federal GrantsDesalination Concentrate Management - WaterReuse Foundation WRF11-09 35,641 178,859 Turf Estates Construction - TWDB 310,548 10,601 Canutillo 1st Time Users Area 1 - TWDB 16,609 22,608 Canutillo 1st Time Users Area 2 - TWDB 41,066 34,879
Totals $ 509,463 $ 787,557
(Continued)
56
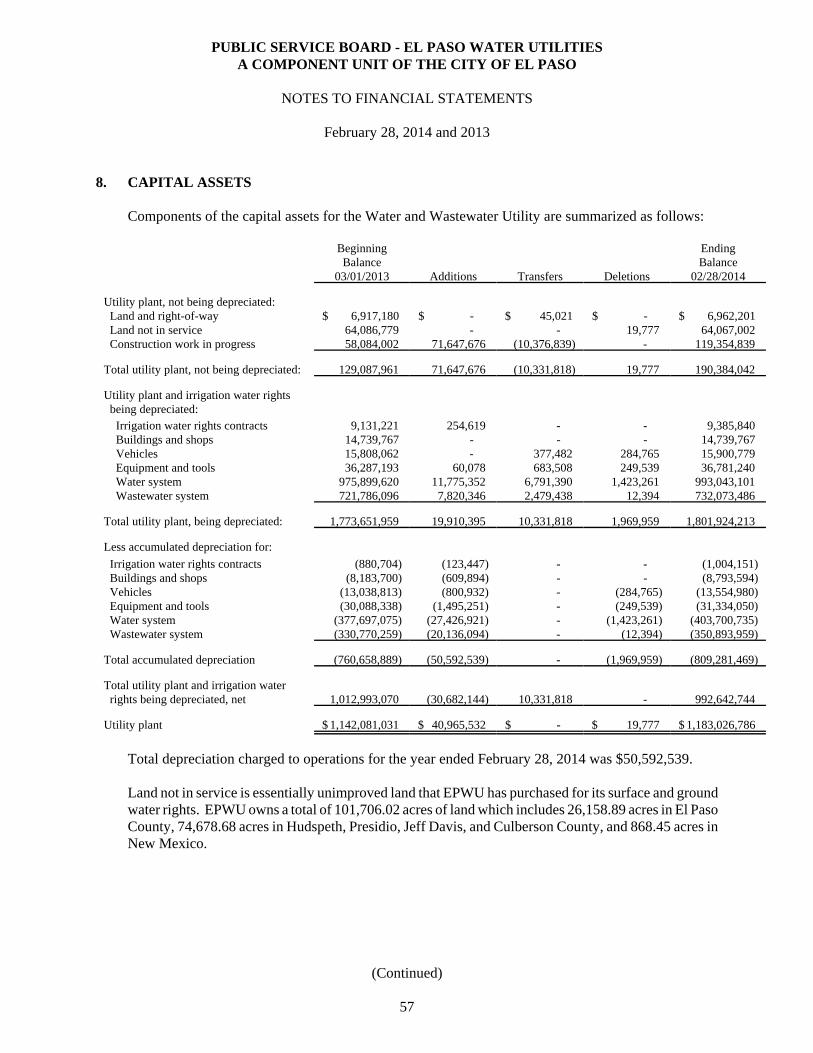
PUBLIC SERVICE BOARD - EL PASO WATER UTILITIESA COMPONENT UNIT OF THE CITY OF EL PASO
NOTES TO FINANCIAL STATEMENTS
February 28, 2014 and 2013
8. CAPITAL ASSETS
Components of the capital assets for the Water and Wastewater Utility are summarized as follows:
BeginningBalance
03/01/2013 Additions Transfers Deletions
EndingBalance
02/28/2014
Utility plant, not being depreciated: Land and right-of-way $ 6,917,180 $ - $ 45,021 $ - $ 6,962,201 Land not in service 64,086,779 - - 19,777 64,067,002 Construction work in progress 58,084,002 71,647,676 (10,376,839) - 119,354,839
Total utility plant, not being depreciated: 129,087,961 71,647,676 (10,331,818) 19,777 190,384,042
Utility plant and irrigation water rights being depreciated: Irrigation water rights contracts 9,131,221 254,619 - - 9,385,840 Buildings and shops 14,739,767 - - - 14,739,767 Vehicles 15,808,062 - 377,482 284,765 15,900,779 Equipment and tools 36,287,193 60,078 683,508 249,539 36,781,240 Water system 975,899,620 11,775,352 6,791,390 1,423,261 993,043,101 Wastewater system 721,786,096 7,820,346 2,479,438 12,394 732,073,486 Total utility plant, being depreciated: 1,773,651,959 19,910,395 10,331,818 1,969,959 1,801,924,213
Less accumulated depreciation for:
Irrigation water rights contracts (880,704) (123,447) - - (1,004,151) Buildings and shops (8,183,700) (609,894) - - (8,793,594) Vehicles (13,038,813) (800,932) - (284,765) (13,554,980) Equipment and tools (30,088,338) (1,495,251) - (249,539) (31,334,050) Water system (377,697,075) (27,426,921) - (1,423,261) (403,700,735) Wastewater system (330,770,259) (20,136,094) - (12,394) (350,893,959)
Total accumulated depreciation (760,658,889) (50,592,539) - (1,969,959) (809,281,469)
Total utility plant and irrigation water rights being depreciated, net 1,012,993,070 (30,682,144) 10,331,818 - 992,642,744
Utility plant $ 1,142,081,031 $ 40,965,532 $ - $ 19,777 $ 1,183,026,786
Total depreciation charged to operations for the year ended February 28, 2014 was $50,592,539.
Land not in service is essentially unimproved land that EPWU has purchased for its surface and groundwater rights. EPWU owns a total of 101,706.02 acres of land which includes 26,158.89 acres in El PasoCounty, 74,678.68 acres in Hudspeth, Presidio, Jeff Davis, and Culberson County, and 868.45 acres inNew Mexico.
(Continued)
57
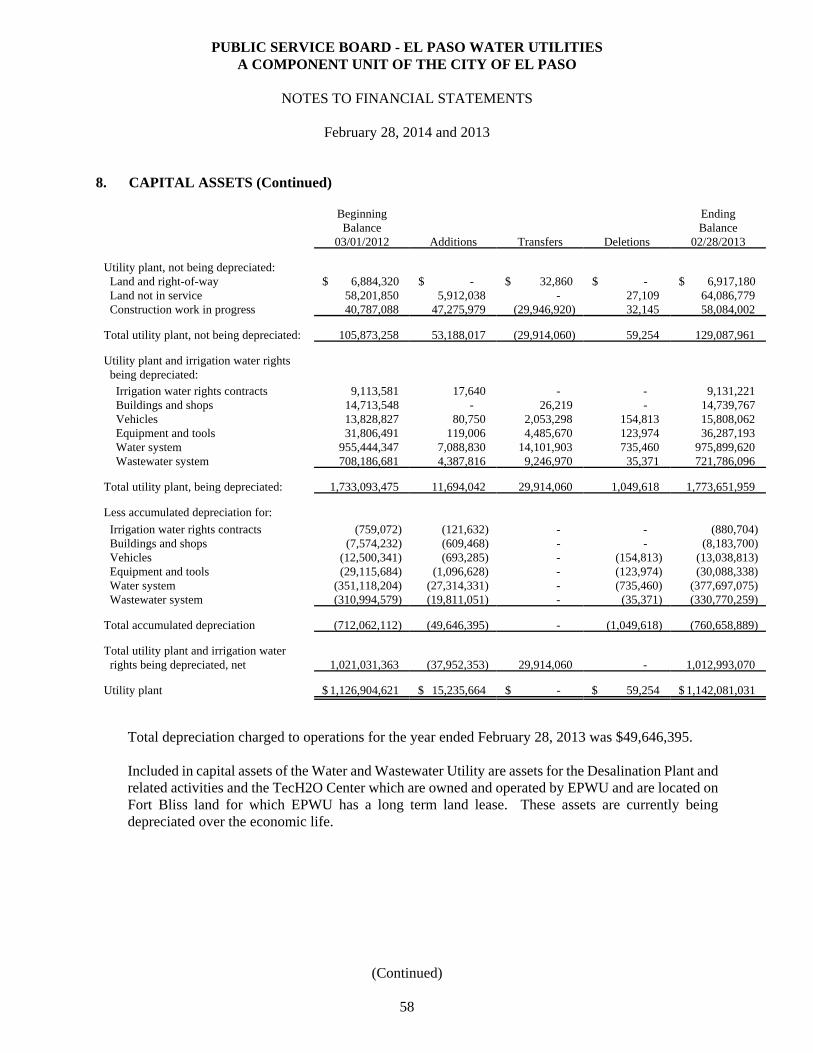
8. CAPITAL ASSETS (Continued)
PUBLIC SERVICE BOARD - EL PASO WATER UTILITIESA COMPONENT UNIT OF THE CITY OF EL PASO
NOTES TO FINANCIAL STATEMENTS
February 28, 2014 and 2013
BeginningBalance
03/01/2012 Additions Transfers Deletions
EndingBalance
02/28/2013
Utility plant, not being depreciated: Land and right-of-way $ 6,884,320 $ - $ 32,860 $ - $ 6,917,180 Land not in service 58,201,850 5,912,038 - 27,109 64,086,779 Construction work in progress 40,787,088 47,275,979 (29,946,920) 32,145 58,084,002
Total utility plant, not being depreciated: 105,873,258 53,188,017 (29,914,060) 59,254 129,087,961
Utility plant and irrigation water rights being depreciated: Irrigation water rights contracts 9,113,581 17,640 - - 9,131,221 Buildings and shops 14,713,548 - 26,219 - 14,739,767 Vehicles 13,828,827 80,750 2,053,298 154,813 15,808,062 Equipment and tools 31,806,491 119,006 4,485,670 123,974 36,287,193 Water system 955,444,347 7,088,830 14,101,903 735,460 975,899,620 Wastewater system 708,186,681 4,387,816 9,246,970 35,371 721,786,096 Total utility plant, being depreciated: 1,733,093,475 11,694,042 29,914,060 1,049,618 1,773,651,959
Less accumulated depreciation for:
Irrigation water rights contracts (759,072) (121,632) - - (880,704) Buildings and shops (7,574,232) (609,468) - - (8,183,700) Vehicles (12,500,341) (693,285) - (154,813) (13,038,813) Equipment and tools (29,115,684) (1,096,628) - (123,974) (30,088,338) Water system (351,118,204) (27,314,331) - (735,460) (377,697,075) Wastewater system (310,994,579) (19,811,051) - (35,371) (330,770,259)
Total accumulated depreciation (712,062,112) (49,646,395) - (1,049,618) (760,658,889)
Total utility plant and irrigation water rights being depreciated, net 1,021,031,363 (37,952,353) 29,914,060 - 1,012,993,070
Utility plant $ 1,126,904,621 $ 15,235,664 $ - $ 59,254 $ 1,142,081,031
Total depreciation charged to operations for the year ended February 28, 2013 was $49,646,395.
Included in capital assets of the Water and Wastewater Utility are assets for the Desalination Plant andrelated activities and the TecH2O Center which are owned and operated by EPWU and are located onFort Bliss land for which EPWU has a long term land lease. These assets are currently beingdepreciated over the economic life.
(Continued)
58
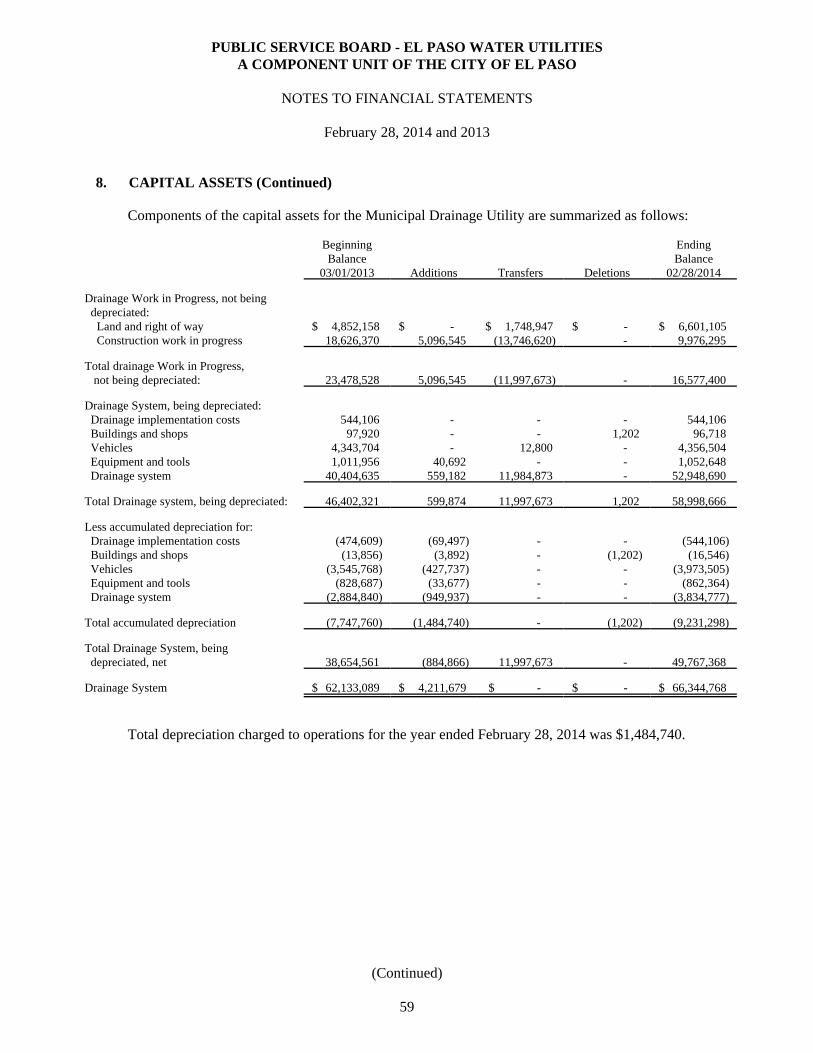
8. CAPITAL ASSETS (Continued)
PUBLIC SERVICE BOARD - EL PASO WATER UTILITIESA COMPONENT UNIT OF THE CITY OF EL PASO
NOTES TO FINANCIAL STATEMENTS
February 28, 2014 and 2013
Components of the capital assets for the Municipal Drainage Utility are summarized as follows:
BeginningBalance
03/01/2013 Additions Transfers Deletions
EndingBalance
02/28/2014
Drainage Work in Progress, not being depreciated: Land and right of way $ 4,852,158 $ - $ 1,748,947 $ - $ 6,601,105 Construction work in progress 18,626,370 5,096,545 (13,746,620) - 9,976,295
Total drainage Work in Progress, not being depreciated: 23,478,528 5,096,545 (11,997,673) - 16,577,400
Drainage System, being depreciated: Drainage implementation costs 544,106 - - - 544,106 Buildings and shops 97,920 - - 1,202 96,718 Vehicles 4,343,704 - 12,800 - 4,356,504 Equipment and tools 1,011,956 40,692 - - 1,052,648 Drainage system 40,404,635 559,182 11,984,873 - 52,948,690 Total Drainage system, being depreciated: 46,402,321 599,874 11,997,673 1,202 58,998,666
Less accumulated depreciation for: Drainage implementation costs (474,609) (69,497) - - (544,106) Buildings and shops (13,856) (3,892) - (1,202) (16,546) Vehicles (3,545,768) (427,737) - - (3,973,505) Equipment and tools (828,687) (33,677) - - (862,364) Drainage system (2,884,840) (949,937) - - (3,834,777)
Total accumulated depreciation (7,747,760) (1,484,740) - (1,202) (9,231,298)
Total Drainage System, being depreciated, net 38,654,561 (884,866) 11,997,673 - 49,767,368
Drainage System $ 62,133,089 $ 4,211,679 $ - $ - $ 66,344,768
Total depreciation charged to operations for the year ended February 28, 2014 was $1,484,740.
(Continued)
59
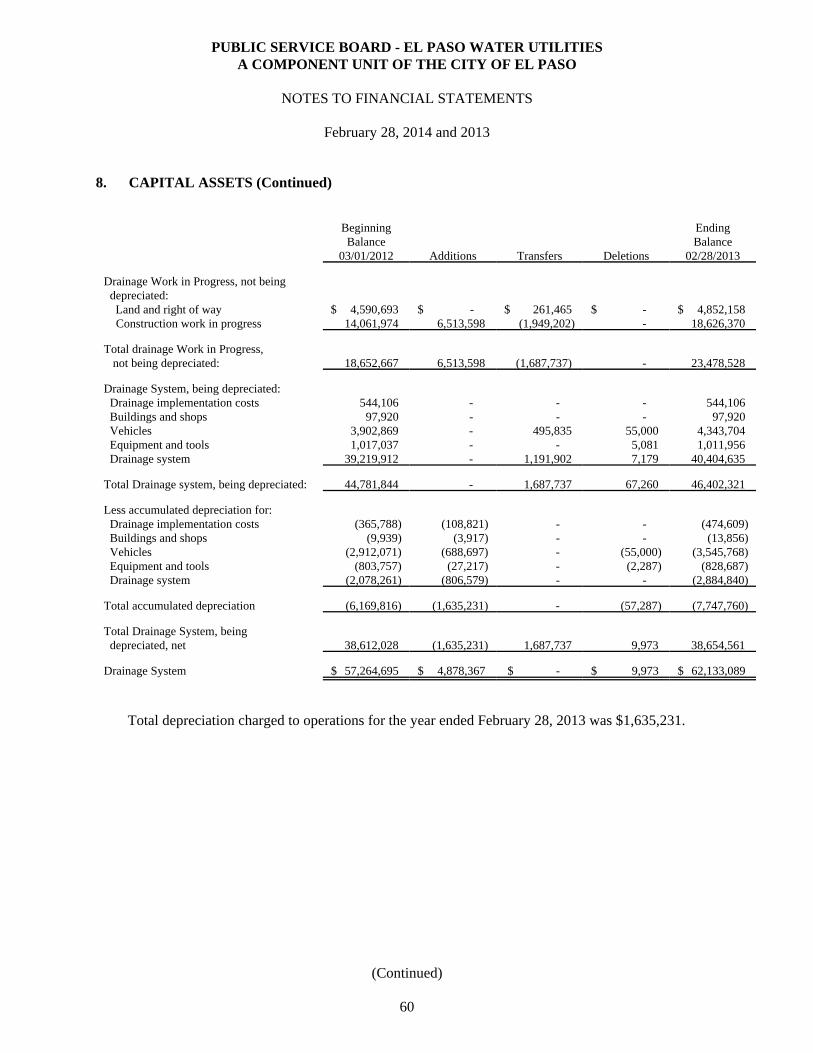
8. CAPITAL ASSETS (Continued)
PUBLIC SERVICE BOARD - EL PASO WATER UTILITIESA COMPONENT UNIT OF THE CITY OF EL PASO
NOTES TO FINANCIAL STATEMENTS
February 28, 2014 and 2013
BeginningBalance
03/01/2012 Additions Transfers Deletions
EndingBalance
02/28/2013
Drainage Work in Progress, not being depreciated: Land and right of way $ 4,590,693 $ - $ 261,465 $ - $ 4,852,158 Construction work in progress 14,061,974 6,513,598 (1,949,202) - 18,626,370
Total drainage Work in Progress, not being depreciated: 18,652,667 6,513,598 (1,687,737) - 23,478,528
Drainage System, being depreciated: Drainage implementation costs 544,106 - - - 544,106 Buildings and shops 97,920 - - - 97,920 Vehicles 3,902,869 - 495,835 55,000 4,343,704 Equipment and tools 1,017,037 - - 5,081 1,011,956 Drainage system 39,219,912 - 1,191,902 7,179 40,404,635 Total Drainage system, being depreciated: 44,781,844 - 1,687,737 67,260 46,402,321
Less accumulated depreciation for: Drainage implementation costs (365,788) (108,821) - - (474,609) Buildings and shops (9,939) (3,917) - - (13,856) Vehicles (2,912,071) (688,697) - (55,000) (3,545,768) Equipment and tools (803,757) (27,217) - (2,287) (828,687) Drainage system (2,078,261) (806,579) - - (2,884,840)
Total accumulated depreciation (6,169,816) (1,635,231) - (57,287) (7,747,760)
Total Drainage System, being depreciated, net 38,612,028 (1,635,231) 1,687,737 9,973 38,654,561
Drainage System $ 57,264,695 $ 4,878,367 $ - $ 9,973 $ 62,133,089
Total depreciation charged to operations for the year ended February 28, 2013 was $1,635,231.
(Continued)
60
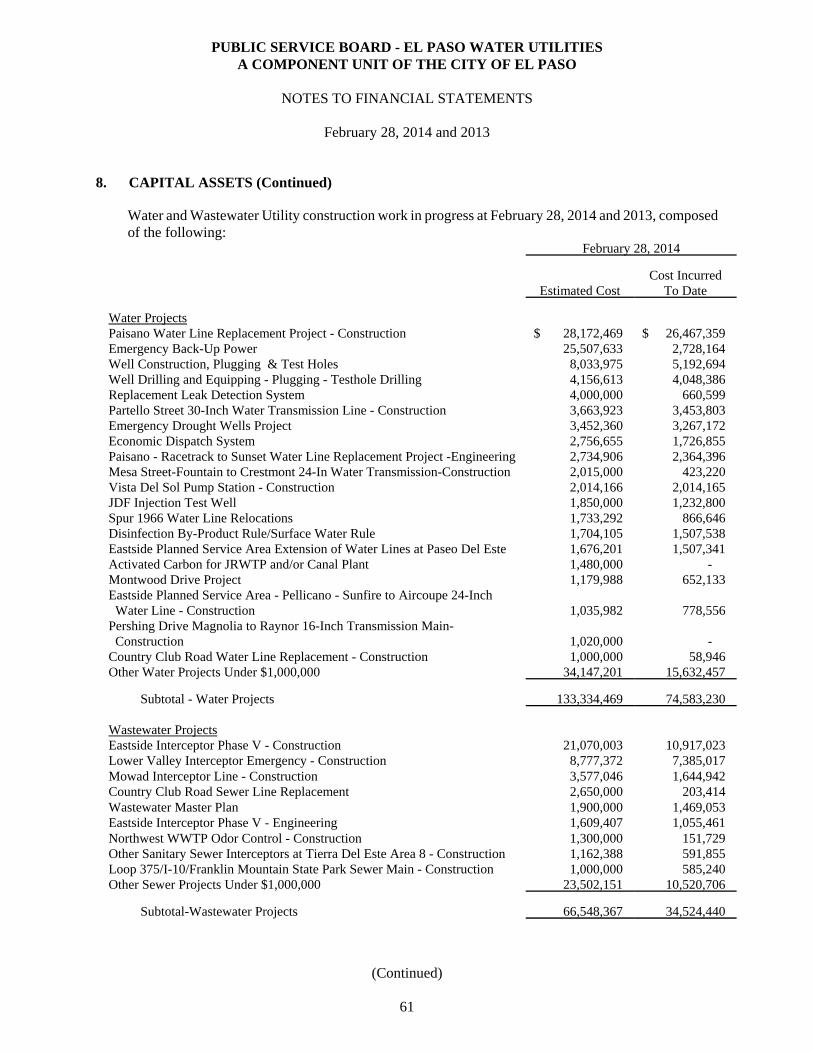
8. CAPITAL ASSETS (Continued)
PUBLIC SERVICE BOARD - EL PASO WATER UTILITIESA COMPONENT UNIT OF THE CITY OF EL PASO
NOTES TO FINANCIAL STATEMENTS
February 28, 2014 and 2013
Water and Wastewater Utility construction work in progress at February 28, 2014 and 2013, composedof the following:
February 28, 2014
Estimated CostCost Incurred
To Date
Water Projects Paisano Water Line Replacement Project - Construction $ 28,172,469 $ 26,467,359 Emergency Back-Up Power 25,507,633 2,728,164 Well Construction, Plugging & Test Holes 8,033,975 5,192,694 Well Drilling and Equipping - Plugging - Testhole Drilling 4,156,613 4,048,386 Replacement Leak Detection System 4,000,000 660,599 Partello Street 30-Inch Water Transmission Line - Construction 3,663,923 3,453,803 Emergency Drought Wells Project 3,452,360 3,267,172 Economic Dispatch System 2,756,655 1,726,855 Paisano - Racetrack to Sunset Water Line Replacement Project -Engineering 2,734,906 2,364,396 Mesa Street-Fountain to Crestmont 24-In Water Transmission-Construction 2,015,000 423,220 Vista Del Sol Pump Station - Construction 2,014,166 2,014,165 JDF Injection Test Well 1,850,000 1,232,800 Spur 1966 Water Line Relocations 1,733,292 866,646 Disinfection By-Product Rule/Surface Water Rule 1,704,105 1,507,538 Eastside Planned Service Area Extension of Water Lines at Paseo Del Este 1,676,201 1,507,341 Activated Carbon for JRWTP and/or Canal Plant 1,480,000 - Montwood Drive Project 1,179,988 652,133 Eastside Planned Service Area - Pellicano - Sunfire to Aircoupe 24-Inch Water Line - Construction 1,035,982 778,556 Pershing Drive Magnolia to Raynor 16-Inch Transmission Main- Construction 1,020,000 - Country Club Road Water Line Replacement - Construction 1,000,000 58,946 Other Water Projects Under $1,000,000 34,147,201 15,632,457
Subtotal - Water Projects 133,334,469 74,583,230
Wastewater Projects Eastside Interceptor Phase V - Construction 21,070,003 10,917,023 Lower Valley Interceptor Emergency - Construction 8,777,372 7,385,017 Mowad Interceptor Line - Construction 3,577,046 1,644,942 Country Club Road Sewer Line Replacement 2,650,000 203,414 Wastewater Master Plan 1,900,000 1,469,053 Eastside Interceptor Phase V - Engineering 1,609,407 1,055,461 Northwest WWTP Odor Control - Construction 1,300,000 151,729 Other Sanitary Sewer Interceptors at Tierra Del Este Area 8 - Construction 1,162,388 591,855 Loop 375/I-10/Franklin Mountain State Park Sewer Main - Construction 1,000,000 585,240 Other Sewer Projects Under $1,000,000 23,502,151 10,520,706
Subtotal-Wastewater Projects 66,548,367 34,524,440
(Continued)
61
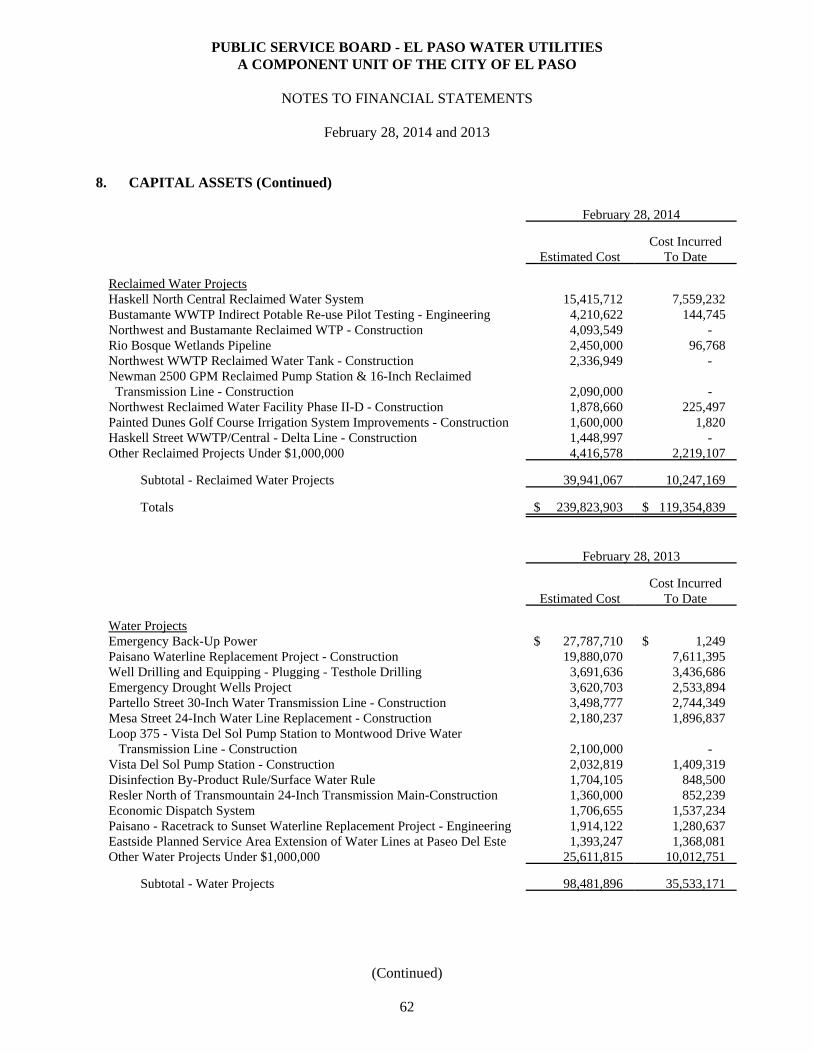
8. CAPITAL ASSETS (Continued)
PUBLIC SERVICE BOARD - EL PASO WATER UTILITIESA COMPONENT UNIT OF THE CITY OF EL PASO
NOTES TO FINANCIAL STATEMENTS
February 28, 2014 and 2013
February 28, 2014
Estimated CostCost Incurred
To Date
Reclaimed Water ProjectsHaskell North Central Reclaimed Water System 15,415,712 7,559,232 Bustamante WWTP Indirect Potable Re-use Pilot Testing - Engineering 4,210,622 144,745 Northwest and Bustamante Reclaimed WTP - Construction 4,093,549 - Rio Bosque Wetlands Pipeline 2,450,000 96,768 Northwest WWTP Reclaimed Water Tank - Construction 2,336,949 - Newman 2500 GPM Reclaimed Pump Station & 16-Inch Reclaimed Transmission Line - Construction 2,090,000 - Northwest Reclaimed Water Facility Phase II-D - Construction 1,878,660 225,497 Painted Dunes Golf Course Irrigation System Improvements - Construction 1,600,000 1,820 Haskell Street WWTP/Central - Delta Line - Construction 1,448,997 - Other Reclaimed Projects Under $1,000,000 4,416,578 2,219,107
Subtotal - Reclaimed Water Projects 39,941,067 10,247,169
Totals $ 239,823,903 $ 119,354,839
February 28, 2013
Estimated CostCost Incurred
To Date
Water Projects Emergency Back-Up Power $ 27,787,710 $ 1,249 Paisano Waterline Replacement Project - Construction 19,880,070 7,611,395 Well Drilling and Equipping - Plugging - Testhole Drilling 3,691,636 3,436,686 Emergency Drought Wells Project 3,620,703 2,533,894 Partello Street 30-Inch Water Transmission Line - Construction 3,498,777 2,744,349 Mesa Street 24-Inch Water Line Replacement - Construction 2,180,237 1,896,837 Loop 375 - Vista Del Sol Pump Station to Montwood Drive Water Transmission Line - Construction 2,100,000 - Vista Del Sol Pump Station - Construction 2,032,819 1,409,319 Disinfection By-Product Rule/Surface Water Rule 1,704,105 848,500 Resler North of Transmountain 24-Inch Transmission Main-Construction 1,360,000 852,239 Economic Dispatch System 1,706,655 1,537,234 Paisano - Racetrack to Sunset Waterline Replacement Project - Engineering 1,914,122 1,280,637 Eastside Planned Service Area Extension of Water Lines at Paseo Del Este 1,393,247 1,368,081 Other Water Projects Under $1,000,000 25,611,815 10,012,751
Subtotal - Water Projects 98,481,896 35,533,171
(Continued)
62
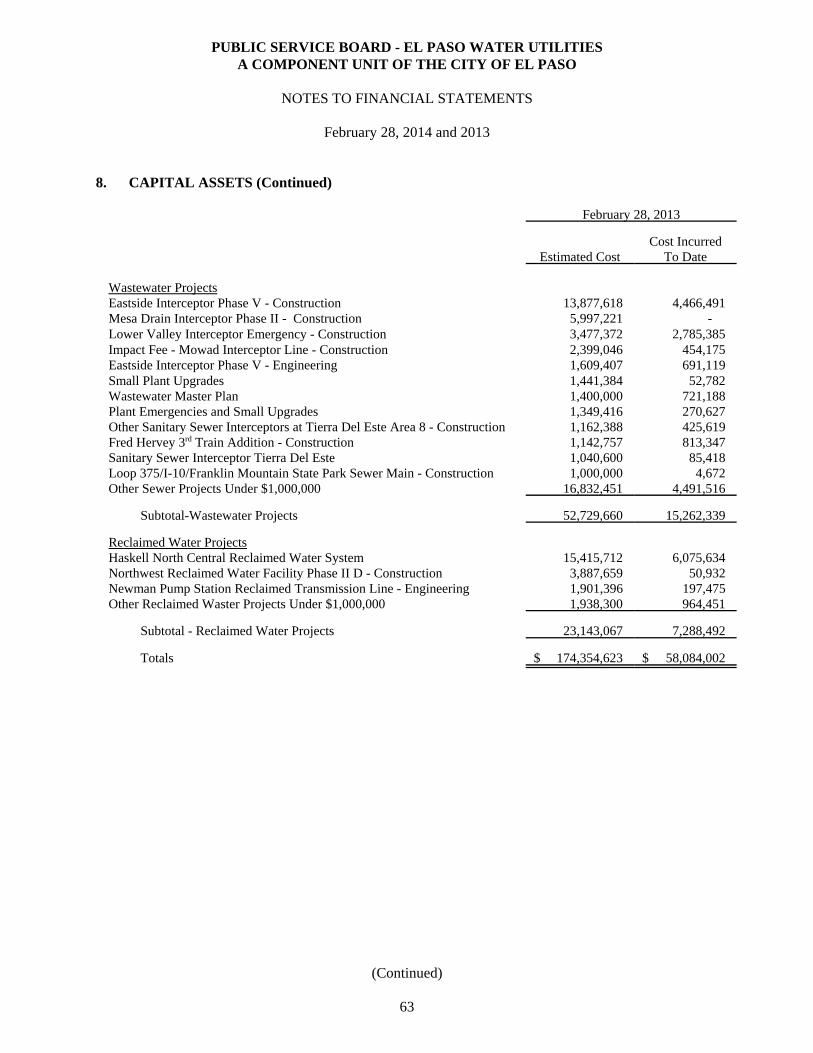
8. CAPITAL ASSETS (Continued)
PUBLIC SERVICE BOARD - EL PASO WATER UTILITIESA COMPONENT UNIT OF THE CITY OF EL PASO
NOTES TO FINANCIAL STATEMENTS
February 28, 2014 and 2013
February 28, 2013
Estimated CostCost Incurred
To Date
Wastewater Projects Eastside Interceptor Phase V - Construction 13,877,618 4,466,491 Mesa Drain Interceptor Phase II - Construction 5,997,221 - Lower Valley Interceptor Emergency - Construction 3,477,372 2,785,385 Impact Fee - Mowad Interceptor Line - Construction 2,399,046 454,175 Eastside Interceptor Phase V - Engineering 1,609,407 691,119 Small Plant Upgrades 1,441,384 52,782 Wastewater Master Plan 1,400,000 721,188 Plant Emergencies and Small Upgrades 1,349,416 270,627 Other Sanitary Sewer Interceptors at Tierra Del Este Area 8 - Construction 1,162,388 425,619 Fred Hervey 3rd Train Addition - Construction 1,142,757 813,347 Sanitary Sewer Interceptor Tierra Del Este 1,040,600 85,418 Loop 375/I-10/Franklin Mountain State Park Sewer Main - Construction 1,000,000 4,672 Other Sewer Projects Under $1,000,000 16,832,451 4,491,516
Subtotal-Wastewater Projects 52,729,660 15,262,339
Reclaimed Water ProjectsHaskell North Central Reclaimed Water System 15,415,712 6,075,634 Northwest Reclaimed Water Facility Phase II D - Construction 3,887,659 50,932 Newman Pump Station Reclaimed Transmission Line - Engineering 1,901,396 197,475 Other Reclaimed Waster Projects Under $1,000,000 1,938,300 964,451
Subtotal - Reclaimed Water Projects 23,143,067 7,288,492
Totals $ 174,354,623 $ 58,084,002
(Continued)
63
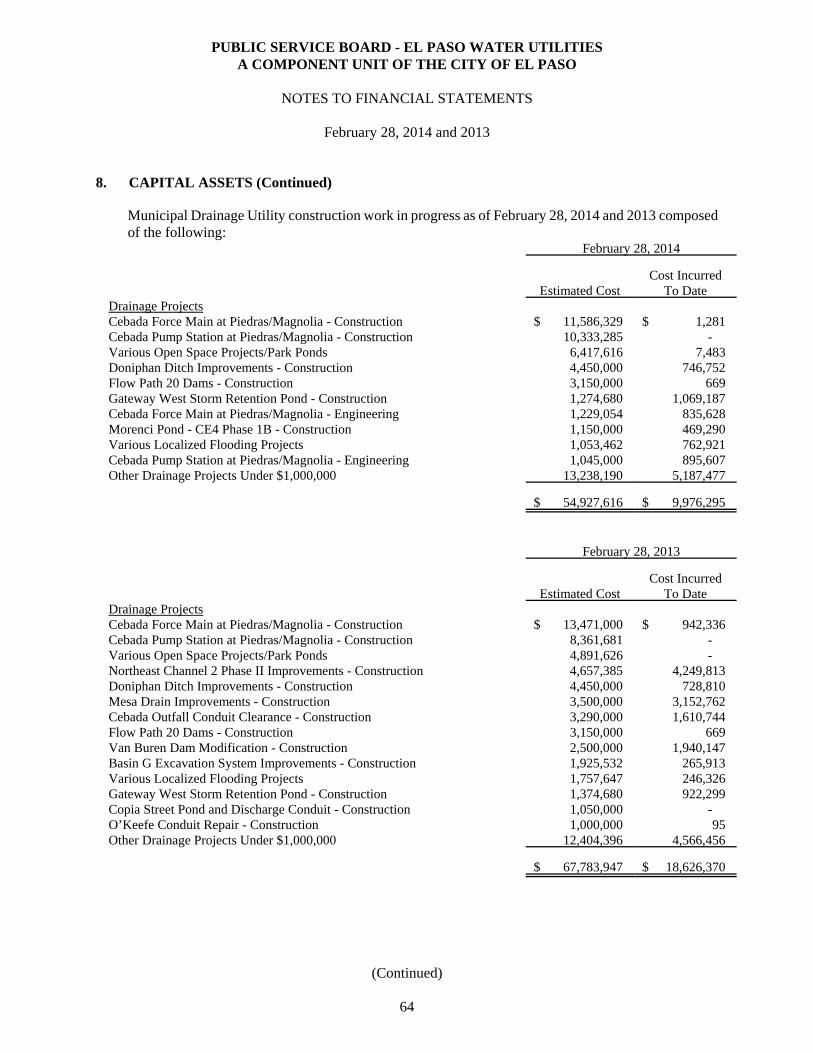
8. CAPITAL ASSETS (Continued)
PUBLIC SERVICE BOARD - EL PASO WATER UTILITIESA COMPONENT UNIT OF THE CITY OF EL PASO
NOTES TO FINANCIAL STATEMENTS
February 28, 2014 and 2013
Municipal Drainage Utility construction work in progress as of February 28, 2014 and 2013 composedof the following:
February 28, 2014
Estimated CostCost Incurred
To DateDrainage ProjectsCebada Force Main at Piedras/Magnolia - Construction $ 11,586,329 $ 1,281 Cebada Pump Station at Piedras/Magnolia - Construction 10,333,285 - Various Open Space Projects/Park Ponds 6,417,616 7,483 Doniphan Ditch Improvements - Construction 4,450,000 746,752 Flow Path 20 Dams - Construction 3,150,000 669 Gateway West Storm Retention Pond - Construction 1,274,680 1,069,187 Cebada Force Main at Piedras/Magnolia - Engineering 1,229,054 835,628 Morenci Pond - CE4 Phase 1B - Construction 1,150,000 469,290 Various Localized Flooding Projects 1,053,462 762,921 Cebada Pump Station at Piedras/Magnolia - Engineering 1,045,000 895,607 Other Drainage Projects Under $1,000,000 13,238,190 5,187,477
$ 54,927,616 $ 9,976,295
February 28, 2013
Estimated CostCost Incurred
To DateDrainage ProjectsCebada Force Main at Piedras/Magnolia - Construction $ 13,471,000 $ 942,336 Cebada Pump Station at Piedras/Magnolia - Construction 8,361,681 - Various Open Space Projects/Park Ponds 4,891,626 - Northeast Channel 2 Phase II Improvements - Construction 4,657,385 4,249,813 Doniphan Ditch Improvements - Construction 4,450,000 728,810 Mesa Drain Improvements - Construction 3,500,000 3,152,762 Cebada Outfall Conduit Clearance - Construction 3,290,000 1,610,744 Flow Path 20 Dams - Construction 3,150,000 669 Van Buren Dam Modification - Construction 2,500,000 1,940,147 Basin G Excavation System Improvements - Construction 1,925,532 265,913 Various Localized Flooding Projects 1,757,647 246,326 Gateway West Storm Retention Pond - Construction 1,374,680 922,299 Copia Street Pond and Discharge Conduit - Construction 1,050,000 - O’Keefe Conduit Repair - Construction 1,000,000 95 Other Drainage Projects Under $1,000,000 12,404,396 4,566,456
$ 67,783,947 $ 18,626,370
(Continued)
64
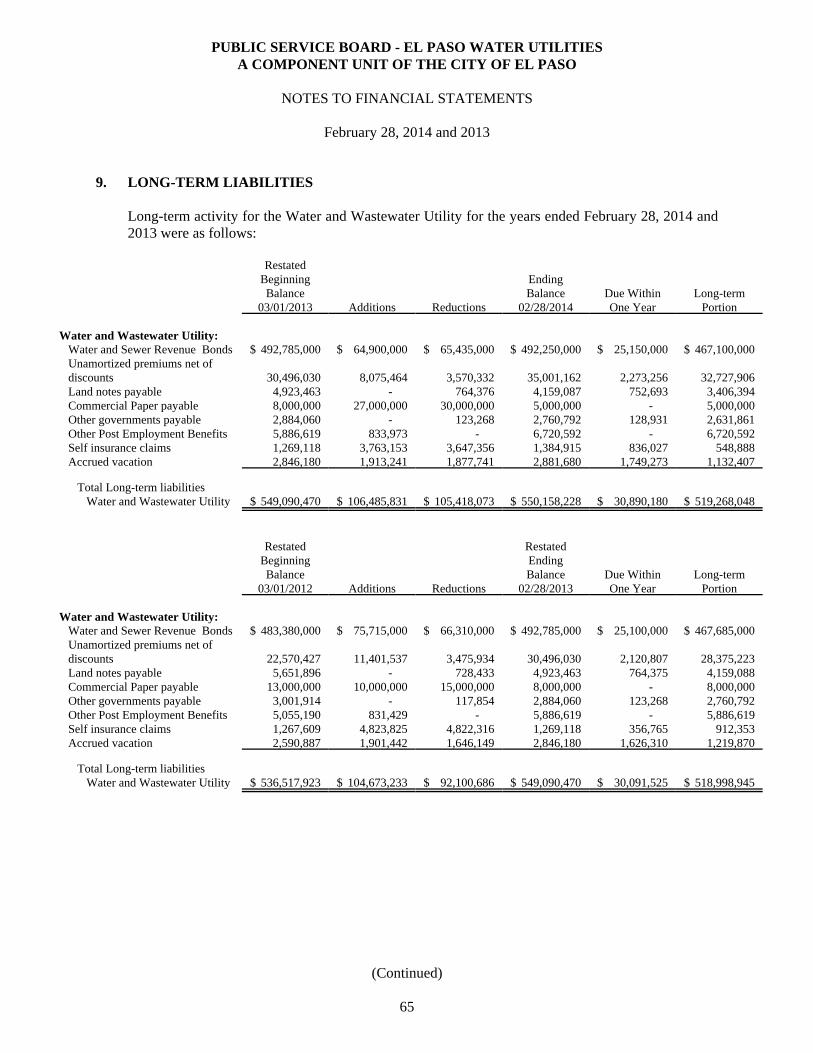
PUBLIC SERVICE BOARD - EL PASO WATER UTILITIESA COMPONENT UNIT OF THE CITY OF EL PASO
NOTES TO FINANCIAL STATEMENTS
February 28, 2014 and 2013
9. LONG-TERM LIABILITIES
Long-term activity for the Water and Wastewater Utility for the years ended February 28, 2014 and2013 were as follows:
RestatedBeginningBalance
03/01/2013 Additions Reductions
EndingBalance
02/28/2014Due WithinOne Year
Long-termPortion
Water and Wastewater Utility: Water and Sewer Revenue Bonds $ 492,785,000 $ 64,900,000 $ 65,435,000 $ 492,250,000 $ 25,150,000 $ 467,100,000 Unamortized premiums net of discounts 30,496,030 8,075,464 3,570,332 35,001,162 2,273,256 32,727,906 Land notes payable 4,923,463 - 764,376 4,159,087 752,693 3,406,394 Commercial Paper payable 8,000,000 27,000,000 30,000,000 5,000,000 - 5,000,000 Other governments payable 2,884,060 - 123,268 2,760,792 128,931 2,631,861 Other Post Employment Benefits 5,886,619 833,973 - 6,720,592 - 6,720,592 Self insurance claims 1,269,118 3,763,153 3,647,356 1,384,915 836,027 548,888 Accrued vacation 2,846,180 1,913,241 1,877,741 2,881,680 1,749,273 1,132,407
Total Long-term liabilities Water and Wastewater Utility $ 549,090,470 $ 106,485,831 $ 105,418,073 $ 550,158,228 $ 30,890,180 $ 519,268,048
RestatedBeginningBalance
03/01/2012 Additions Reductions
RestatedEndingBalance
02/28/2013Due WithinOne Year
Long-termPortion
Water and Wastewater Utility: Water and Sewer Revenue Bonds $ 483,380,000 $ 75,715,000 $ 66,310,000 $ 492,785,000 $ 25,100,000 $ 467,685,000 Unamortized premiums net of discounts 22,570,427 11,401,537 3,475,934 30,496,030 2,120,807 28,375,223 Land notes payable 5,651,896 - 728,433 4,923,463 764,375 4,159,088 Commercial Paper payable 13,000,000 10,000,000 15,000,000 8,000,000 - 8,000,000 Other governments payable 3,001,914 - 117,854 2,884,060 123,268 2,760,792 Other Post Employment Benefits 5,055,190 831,429 - 5,886,619 - 5,886,619 Self insurance claims 1,267,609 4,823,825 4,822,316 1,269,118 356,765 912,353 Accrued vacation 2,590,887 1,901,442 1,646,149 2,846,180 1,626,310 1,219,870
Total Long-term liabilities Water and Wastewater Utility $ 536,517,923 $ 104,673,233 $ 92,100,686 $ 549,090,470 $ 30,091,525 $ 518,998,945
(Continued)
65
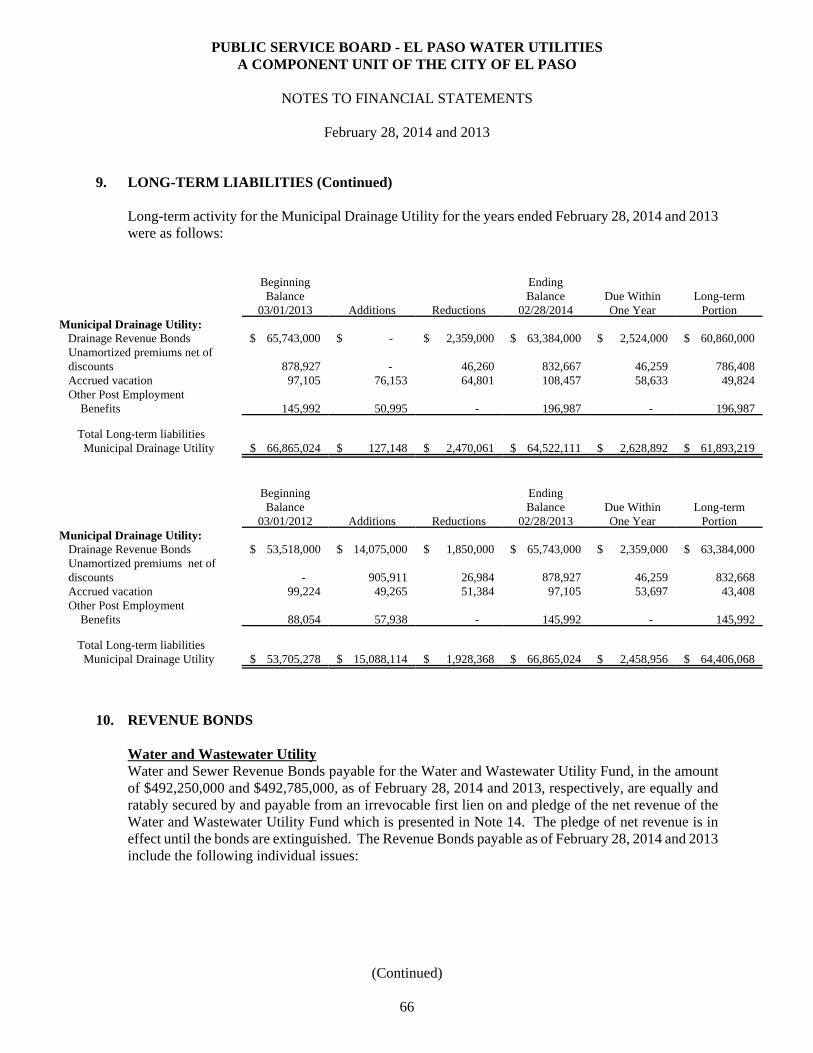
PUBLIC SERVICE BOARD - EL PASO WATER UTILITIESA COMPONENT UNIT OF THE CITY OF EL PASO
NOTES TO FINANCIAL STATEMENTS
February 28, 2014 and 2013
9. LONG-TERM LIABILITIES (Continued)
Long-term activity for the Municipal Drainage Utility for the years ended February 28, 2014 and 2013were as follows:
BeginningBalance
03/01/2013 Additions Reductions
EndingBalance
02/28/2014Due WithinOne Year
Long-termPortion
Municipal Drainage Utility: Drainage Revenue Bonds $ 65,743,000 $ - $ 2,359,000 $ 63,384,000 $ 2,524,000 $ 60,860,000 Unamortized premiums net of discounts 878,927 - 46,260 832,667 46,259 786,408 Accrued vacation 97,105 76,153 64,801 108,457 58,633 49,824 Other Post Employment Benefits 145,992 50,995 - 196,987 - 196,987
Total Long-term liabilities Municipal Drainage Utility $ 66,865,024 $ 127,148 $ 2,470,061 $ 64,522,111 $ 2,628,892 $ 61,893,219
BeginningBalance
03/01/2012 Additions Reductions
EndingBalance
02/28/2013Due WithinOne Year
Long-termPortion
Municipal Drainage Utility: Drainage Revenue Bonds $ 53,518,000 $ 14,075,000 $ 1,850,000 $ 65,743,000 $ 2,359,000 $ 63,384,000 Unamortized premiums net of discounts - 905,911 26,984 878,927 46,259 832,668 Accrued vacation 99,224 49,265 51,384 97,105 53,697 43,408 Other Post Employment Benefits 88,054 57,938 - 145,992 - 145,992
Total Long-term liabilities Municipal Drainage Utility $ 53,705,278 $ 15,088,114 $ 1,928,368 $ 66,865,024 $ 2,458,956 $ 64,406,068
10. REVENUE BONDS
Water and Wastewater UtilityWater and Sewer Revenue Bonds payable for the Water and Wastewater Utility Fund, in the amountof $492,250,000 and $492,785,000, as of February 28, 2014 and 2013, respectively, are equally andratably secured by and payable from an irrevocable first lien on and pledge of the net revenue of theWater and Wastewater Utility Fund which is presented in Note 14. The pledge of net revenue is ineffect until the bonds are extinguished. The Revenue Bonds payable as of February 28, 2014 and 2013include the following individual issues:
(Continued)
66
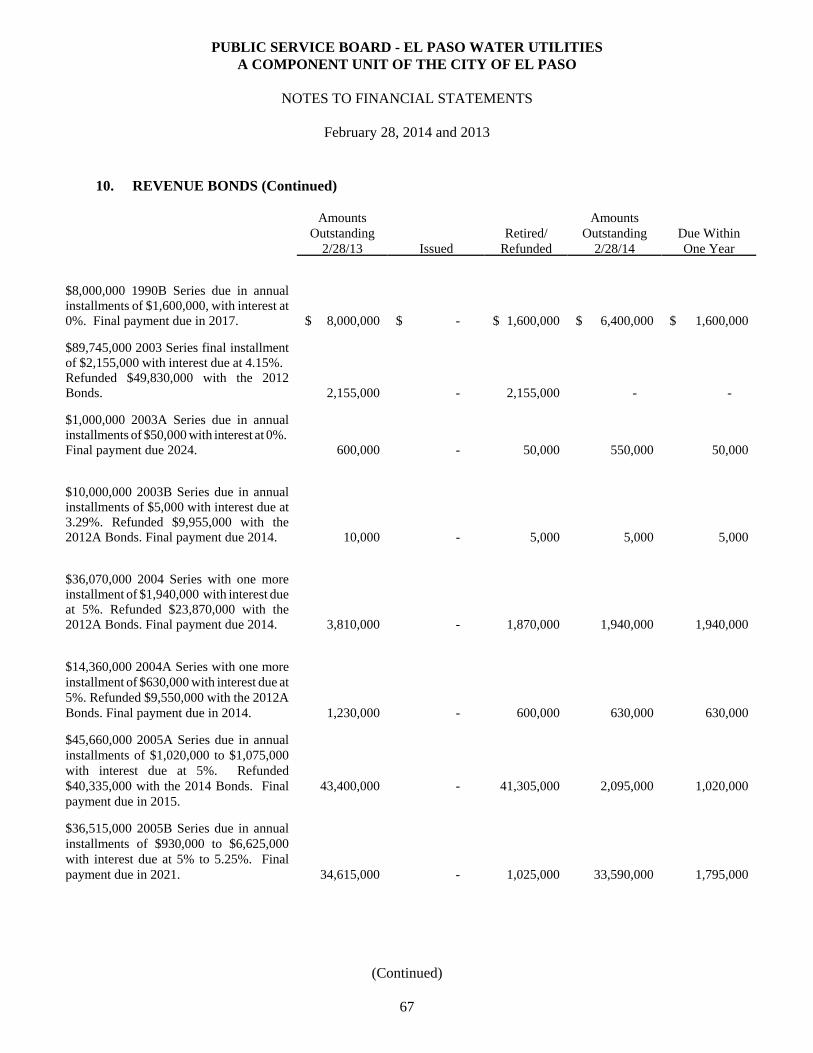
10. REVENUE BONDS (Continued)
PUBLIC SERVICE BOARD - EL PASO WATER UTILITIESA COMPONENT UNIT OF THE CITY OF EL PASO
NOTES TO FINANCIAL STATEMENTS
February 28, 2014 and 2013
AmountsOutstanding
2/28/13 IssuedRetired/
Refunded
AmountsOutstanding
2/28/14Due WithinOne Year
$8,000,000 1990B Series due in annualinstallments of $1,600,000, with interest at0%. Final payment due in 2017. $ 8,000,000 $ - $ 1,600,000 $ 6,400,000 $ 1,600,000
$89,745,000 2003 Series final installmentof $2,155,000 with interest due at 4.15%. Refunded $49,830,000 with the 2012Bonds. 2,155,000 - 2,155,000 - -
$1,000,000 2003A Series due in annualinstallments of $50,000 with interest at 0%. Final payment due 2024. 600,000 - 50,000 550,000 50,000
$10,000,000 2003B Series due in annualinstallments of $5,000 with interest due at3.29%. Refunded $9,955,000 with the2012A Bonds. Final payment due 2014. 10,000 - 5,000 5,000 5,000
$36,070,000 2004 Series with one moreinstallment of $1,940,000 with interest dueat 5%. Refunded $23,870,000 with the2012A Bonds. Final payment due 2014. 3,810,000 - 1,870,000 1,940,000 1,940,000
$14,360,000 2004A Series with one moreinstallment of $630,000 with interest due at5%. Refunded $9,550,000 with the 2012ABonds. Final payment due in 2014. 1,230,000 - 600,000 630,000 630,000
$45,660,000 2005A Series due in annualinstallments of $1,020,000 to $1,075,000with interest due at 5%. Refunded$40,335,000 with the 2014 Bonds. Finalpayment due in 2015.
43,400,000 - 41,305,000 2,095,000 1,020,000
$36,515,000 2005B Series due in annualinstallments of $930,000 to $6,625,000with interest due at 5% to 5.25%. Finalpayment due in 2021. 34,615,000 - 1,025,000 33,590,000 1,795,000
(Continued)
67
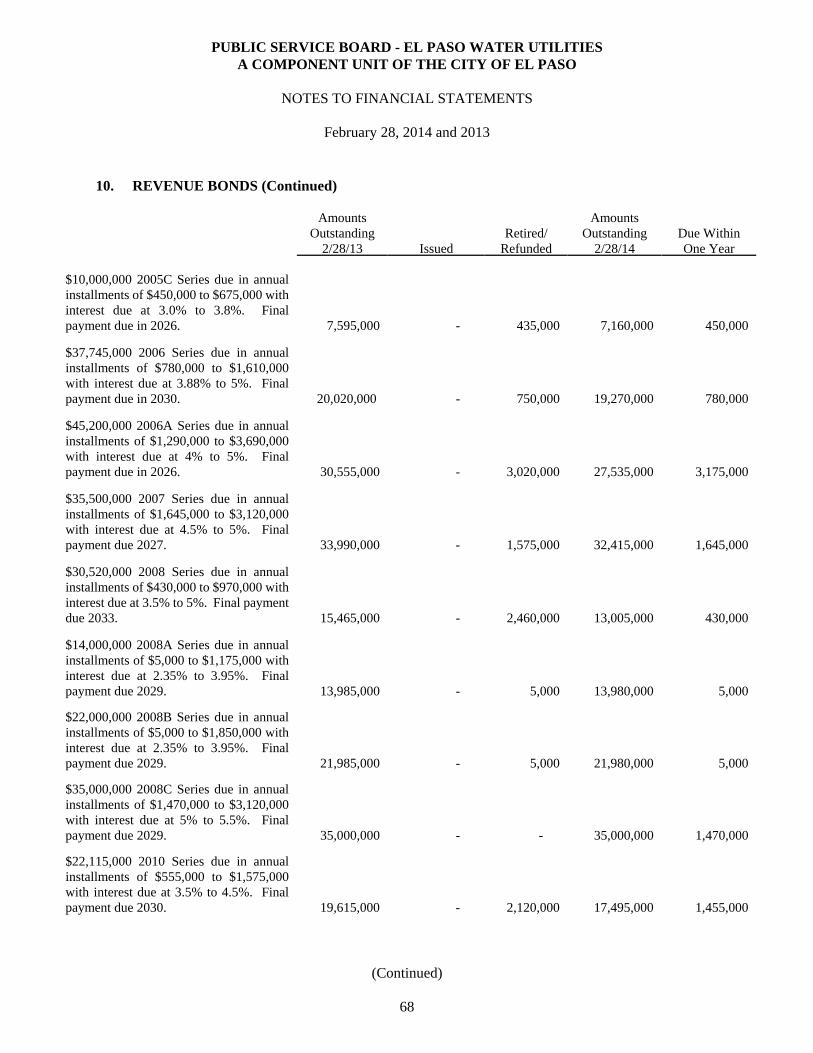
10. REVENUE BONDS (Continued)
PUBLIC SERVICE BOARD - EL PASO WATER UTILITIESA COMPONENT UNIT OF THE CITY OF EL PASO
NOTES TO FINANCIAL STATEMENTS
February 28, 2014 and 2013
AmountsOutstanding
2/28/13 IssuedRetired/
Refunded
AmountsOutstanding
2/28/14Due WithinOne Year
$10,000,000 2005C Series due in annualinstallments of $450,000 to $675,000 withinterest due at 3.0% to 3.8%. Finalpayment due in 2026. 7,595,000 - 435,000 7,160,000 450,000
$37,745,000 2006 Series due in annualinstallments of $780,000 to $1,610,000with interest due at 3.88% to 5%. Finalpayment due in 2030. 20,020,000 - 750,000 19,270,000 780,000
$45,200,000 2006A Series due in annualinstallments of $1,290,000 to $3,690,000with interest due at 4% to 5%. Finalpayment due in 2026. 30,555,000 - 3,020,000 27,535,000 3,175,000
$35,500,000 2007 Series due in annualinstallments of $1,645,000 to $3,120,000with interest due at 4.5% to 5%. Finalpayment due 2027. 33,990,000 - 1,575,000 32,415,000 1,645,000
$30,520,000 2008 Series due in annualinstallments of $430,000 to $970,000 withinterest due at 3.5% to 5%. Final paymentdue 2033. 15,465,000 - 2,460,000 13,005,000 430,000
$14,000,000 2008A Series due in annualinstallments of $5,000 to $1,175,000 withinterest due at 2.35% to 3.95%. Finalpayment due 2029. 13,985,000 - 5,000 13,980,000 5,000
$22,000,000 2008B Series due in annualinstallments of $5,000 to $1,850,000 withinterest due at 2.35% to 3.95%. Finalpayment due 2029. 21,985,000 - 5,000 21,980,000 5,000
$35,000,000 2008C Series due in annualinstallments of $1,470,000 to $3,120,000with interest due at 5% to 5.5%. Finalpayment due 2029. 35,000,000 - - 35,000,000 1,470,000
$22,115,000 2010 Series due in annualinstallments of $555,000 to $1,575,000with interest due at 3.5% to 4.5%. Finalpayment due 2030. 19,615,000 - 2,120,000 17,495,000 1,455,000
(Continued)
68
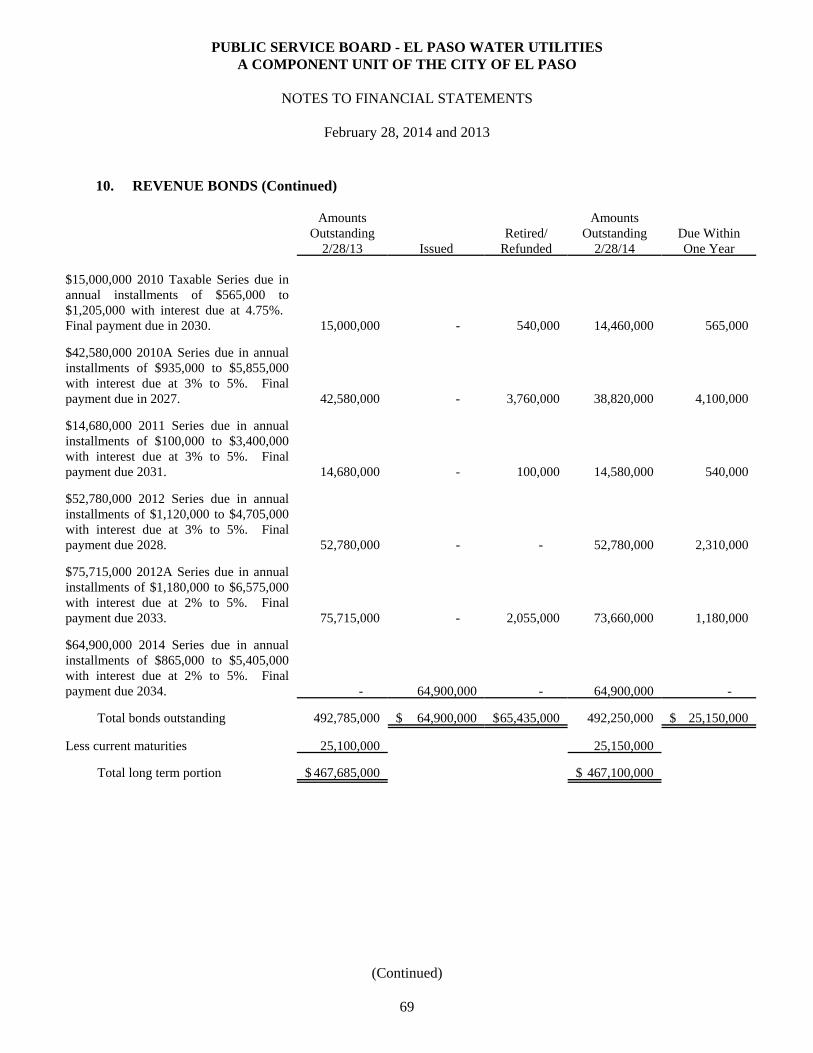
10. REVENUE BONDS (Continued)
PUBLIC SERVICE BOARD - EL PASO WATER UTILITIESA COMPONENT UNIT OF THE CITY OF EL PASO
NOTES TO FINANCIAL STATEMENTS
February 28, 2014 and 2013
AmountsOutstanding
2/28/13 IssuedRetired/
Refunded
AmountsOutstanding
2/28/14Due WithinOne Year
$15,000,000 2010 Taxable Series due inannual installments of $565,000 to$1,205,000 with interest due at 4.75%. Final payment due in 2030. 15,000,000 - 540,000 14,460,000 565,000
$42,580,000 2010A Series due in annualinstallments of $935,000 to $5,855,000with interest due at 3% to 5%. Finalpayment due in 2027. 42,580,000 - 3,760,000 38,820,000 4,100,000
$14,680,000 2011 Series due in annualinstallments of $100,000 to $3,400,000with interest due at 3% to 5%. Finalpayment due 2031. 14,680,000 - 100,000 14,580,000 540,000
$52,780,000 2012 Series due in annualinstallments of $1,120,000 to $4,705,000with interest due at 3% to 5%. Finalpayment due 2028. 52,780,000 - - 52,780,000 2,310,000
$75,715,000 2012A Series due in annualinstallments of $1,180,000 to $6,575,000with interest due at 2% to 5%. Finalpayment due 2033. 75,715,000 - 2,055,000 73,660,000 1,180,000
$64,900,000 2014 Series due in annualinstallments of $865,000 to $5,405,000with interest due at 2% to 5%. Finalpayment due 2034. - 64,900,000 - 64,900,000 -
Total bonds outstanding 492,785,000 $ 64,900,000 $65,435,000 492,250,000 $ 25,150,000
Less current maturities 25,100,000 25,150,000
Total long term portion $ 467,685,000 $ 467,100,000
(Continued)
69
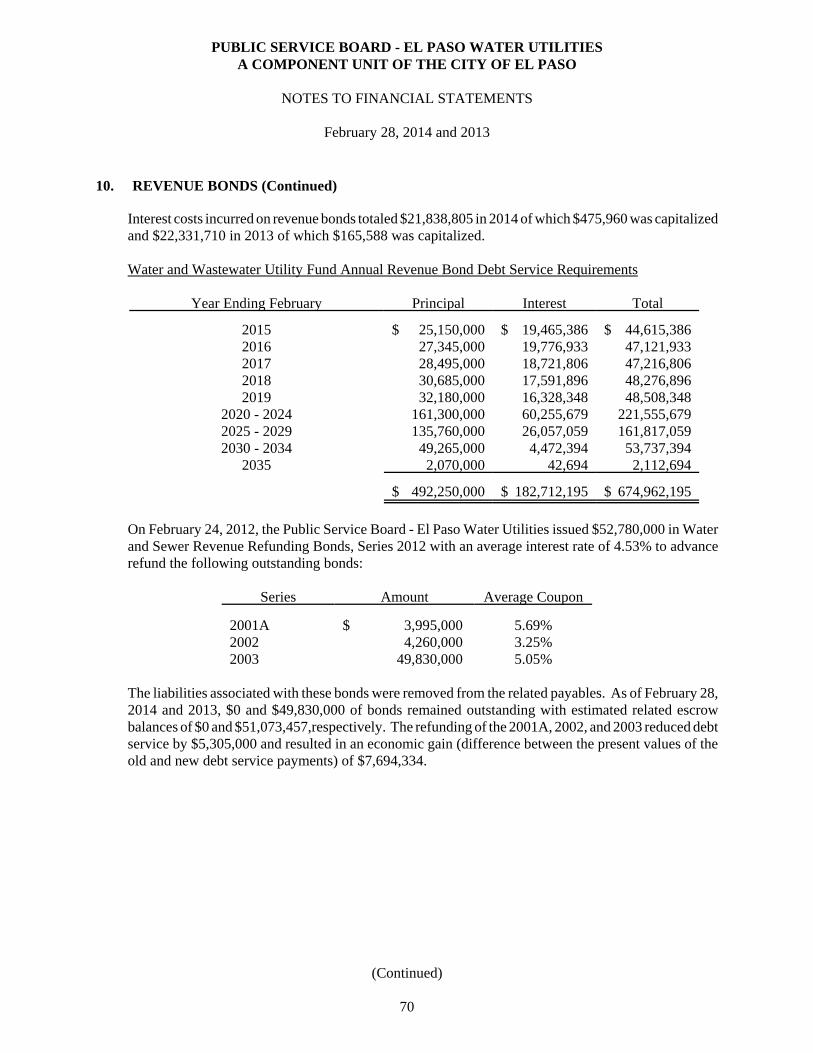
10. REVENUE BONDS (Continued)
PUBLIC SERVICE BOARD - EL PASO WATER UTILITIESA COMPONENT UNIT OF THE CITY OF EL PASO
NOTES TO FINANCIAL STATEMENTS
February 28, 2014 and 2013
Interest costs incurred on revenue bonds totaled $21,838,805 in 2014 of which $475,960 was capitalizedand $22,331,710 in 2013 of which $165,588 was capitalized.
Water and Wastewater Utility Fund Annual Revenue Bond Debt Service Requirements
Year Ending February Principal Interest Total
2015 $ 25,150,000 $ 19,465,386 $ 44,615,3862016 27,345,000 19,776,933 47,121,9332017 28,495,000 18,721,806 47,216,8062018 30,685,000 17,591,896 48,276,8962019 32,180,000 16,328,348 48,508,348
2020 - 2024 161,300,000 60,255,679 221,555,6792025 - 2029 135,760,000 26,057,059 161,817,0592030 - 2034 49,265,000 4,472,394 53,737,394
2035 2,070,000 42,694 2,112,694
$ 492,250,000 $ 182,712,195 $ 674,962,195
On February 24, 2012, the Public Service Board - El Paso Water Utilities issued $52,780,000 in Waterand Sewer Revenue Refunding Bonds, Series 2012 with an average interest rate of 4.53% to advancerefund the following outstanding bonds:
Series Amount Average Coupon
2001A $ 3,995,000 5.69%2002 4,260,000 3.25%2003 49,830,000 5.05%
The liabilities associated with these bonds were removed from the related payables. As of February 28,2014 and 2013, $0 and $49,830,000 of bonds remained outstanding with estimated related escrowbalances of $0 and $51,073,457,respectively. The refunding of the 2001A, 2002, and 2003 reduced debtservice by $5,305,000 and resulted in an economic gain (difference between the present values of theold and new debt service payments) of $7,694,334.
(Continued)
70
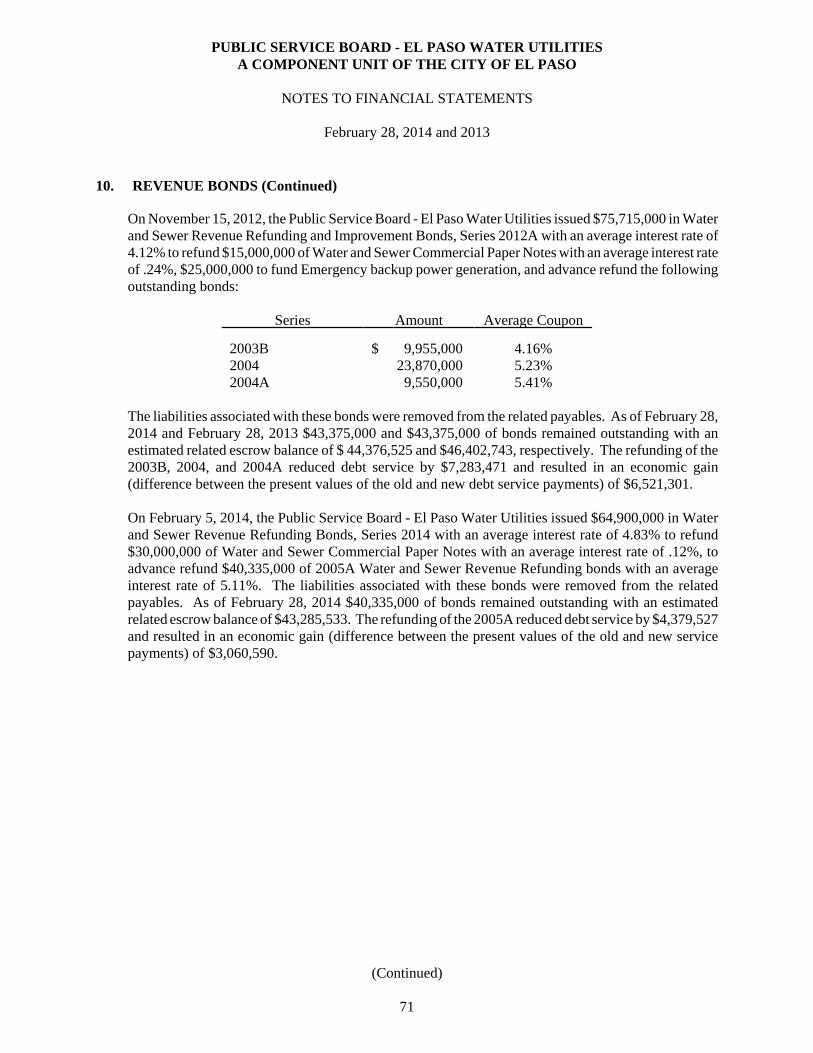
10. REVENUE BONDS (Continued)
PUBLIC SERVICE BOARD - EL PASO WATER UTILITIESA COMPONENT UNIT OF THE CITY OF EL PASO
NOTES TO FINANCIAL STATEMENTS
February 28, 2014 and 2013
On November 15, 2012, the Public Service Board - El Paso Water Utilities issued $75,715,000 in Waterand Sewer Revenue Refunding and Improvement Bonds, Series 2012A with an average interest rate of4.12% to refund $15,000,000 of Water and Sewer Commercial Paper Notes with an average interest rateof .24%, $25,000,000 to fund Emergency backup power generation, and advance refund the followingoutstanding bonds:
Series Amount Average Coupon
2003B $ 9,955,000 4.16%2004 23,870,000 5.23%2004A 9,550,000 5.41%
The liabilities associated with these bonds were removed from the related payables. As of February 28,2014 and February 28, 2013 $43,375,000 and $43,375,000 of bonds remained outstanding with anestimated related escrow balance of $ 44,376,525 and $46,402,743, respectively. The refunding of the2003B, 2004, and 2004A reduced debt service by $7,283,471 and resulted in an economic gain(difference between the present values of the old and new debt service payments) of $6,521,301.
On February 5, 2014, the Public Service Board - El Paso Water Utilities issued $64,900,000 in Waterand Sewer Revenue Refunding Bonds, Series 2014 with an average interest rate of 4.83% to refund$30,000,000 of Water and Sewer Commercial Paper Notes with an average interest rate of .12%, toadvance refund $40,335,000 of 2005A Water and Sewer Revenue Refunding bonds with an averageinterest rate of 5.11%. The liabilities associated with these bonds were removed from the relatedpayables. As of February 28, 2014 $40,335,000 of bonds remained outstanding with an estimatedrelated escrow balance of $43,285,533. The refunding of the 2005A reduced debt service by $4,379,527and resulted in an economic gain (difference between the present values of the old and new servicepayments) of $3,060,590.
(Continued)
71
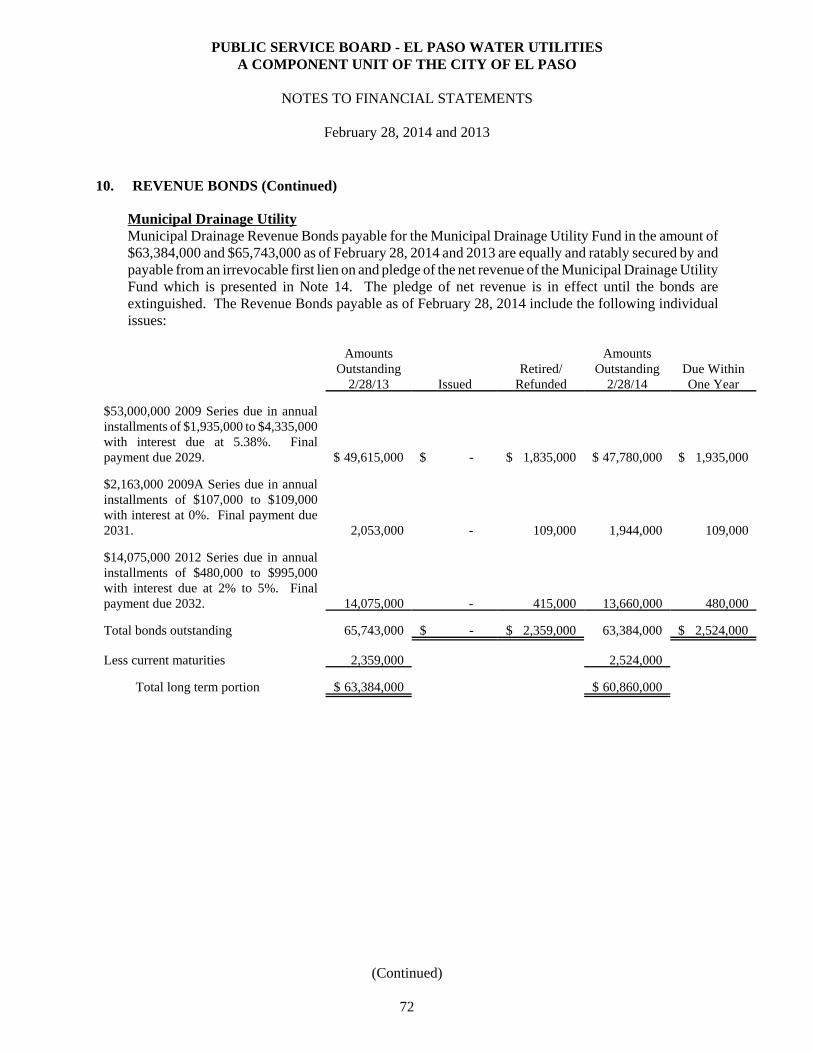
10. REVENUE BONDS (Continued)
PUBLIC SERVICE BOARD - EL PASO WATER UTILITIESA COMPONENT UNIT OF THE CITY OF EL PASO
NOTES TO FINANCIAL STATEMENTS
February 28, 2014 and 2013
Municipal Drainage UtilityMunicipal Drainage Revenue Bonds payable for the Municipal Drainage Utility Fund in the amount of$63,384,000 and $65,743,000 as of February 28, 2014 and 2013 are equally and ratably secured by andpayable from an irrevocable first lien on and pledge of the net revenue of the Municipal Drainage UtilityFund which is presented in Note 14. The pledge of net revenue is in effect until the bonds areextinguished. The Revenue Bonds payable as of February 28, 2014 include the following individualissues:
AmountsOutstanding
2/28/13 IssuedRetired/
Refunded
AmountsOutstanding
2/28/14Due WithinOne Year
$53,000,000 2009 Series due in annualinstallments of $1,935,000 to $4,335,000with interest due at 5.38%. Finalpayment due 2029. $ 49,615,000 $ - $ 1,835,000 $ 47,780,000 $ 1,935,000
$2,163,000 2009A Series due in annualinstallments of $107,000 to $109,000with interest at 0%. Final payment due2031. 2,053,000 - 109,000 1,944,000 109,000
$14,075,000 2012 Series due in annualinstallments of $480,000 to $995,000with interest due at 2% to 5%. Finalpayment due 2032. 14,075,000 - 415,000 13,660,000 480,000
Total bonds outstanding 65,743,000 $ - $ 2,359,000 63,384,000 $ 2,524,000
Less current maturities 2,359,000 2,524,000
Total long term portion $ 63,384,000 $ 60,860,000
(Continued)
72
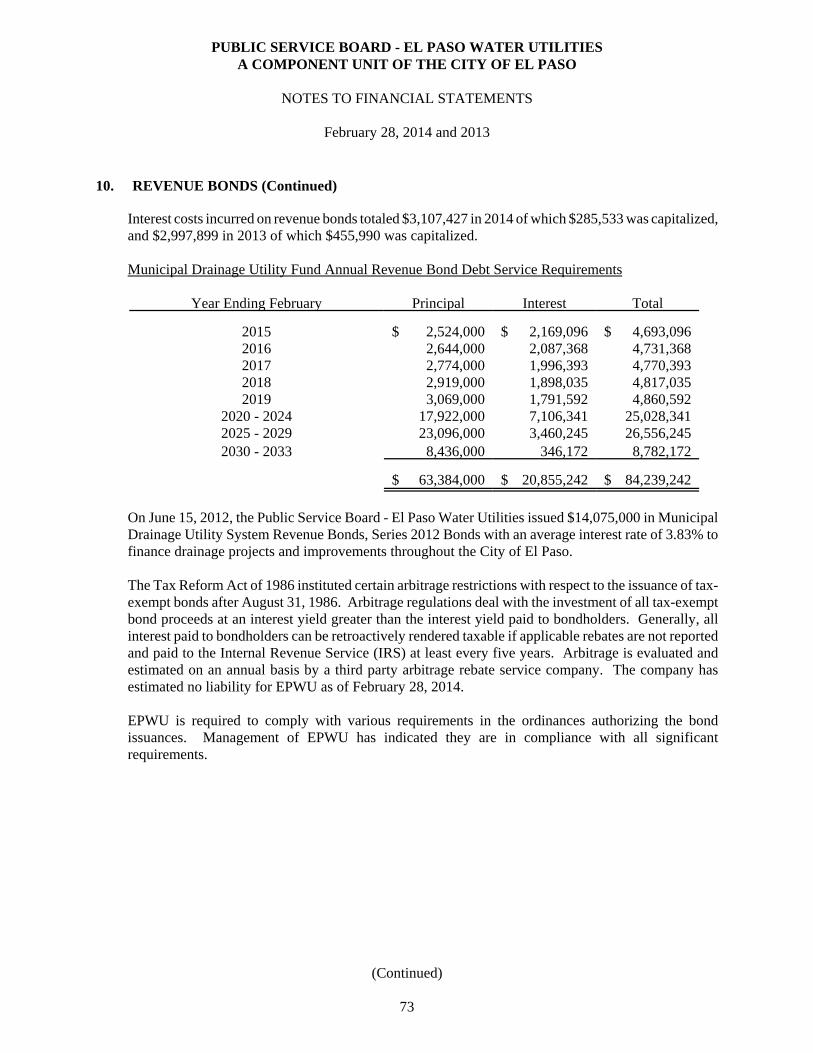
10. REVENUE BONDS (Continued)
PUBLIC SERVICE BOARD - EL PASO WATER UTILITIESA COMPONENT UNIT OF THE CITY OF EL PASO
NOTES TO FINANCIAL STATEMENTS
February 28, 2014 and 2013
Interest costs incurred on revenue bonds totaled $3,107,427 in 2014 of which $285,533 was capitalized,and $2,997,899 in 2013 of which $455,990 was capitalized.
Municipal Drainage Utility Fund Annual Revenue Bond Debt Service Requirements
Year Ending February Principal Interest Total
2015 $ 2,524,000 $ 2,169,096 $ 4,693,0962016 2,644,000 2,087,368 4,731,3682017 2,774,000 1,996,393 4,770,3932018 2,919,000 1,898,035 4,817,0352019 3,069,000 1,791,592 4,860,592
2020 - 2024 17,922,000 7,106,341 25,028,3412025 - 2029 23,096,000 3,460,245 26,556,2452030 - 2033 8,436,000 346,172 8,782,172
$ 63,384,000 $ 20,855,242 $ 84,239,242
On June 15, 2012, the Public Service Board - El Paso Water Utilities issued $14,075,000 in MunicipalDrainage Utility System Revenue Bonds, Series 2012 Bonds with an average interest rate of 3.83% tofinance drainage projects and improvements throughout the City of El Paso.
The Tax Reform Act of 1986 instituted certain arbitrage restrictions with respect to the issuance of tax-exempt bonds after August 31, 1986. Arbitrage regulations deal with the investment of all tax-exemptbond proceeds at an interest yield greater than the interest yield paid to bondholders. Generally, allinterest paid to bondholders can be retroactively rendered taxable if applicable rebates are not reportedand paid to the Internal Revenue Service (IRS) at least every five years. Arbitrage is evaluated andestimated on an annual basis by a third party arbitrage rebate service company. The company hasestimated no liability for EPWU as of February 28, 2014.
EPWU is required to comply with various requirements in the ordinances authorizing the bondissuances. Management of EPWU has indicated they are in compliance with all significantrequirements.
(Continued)
73
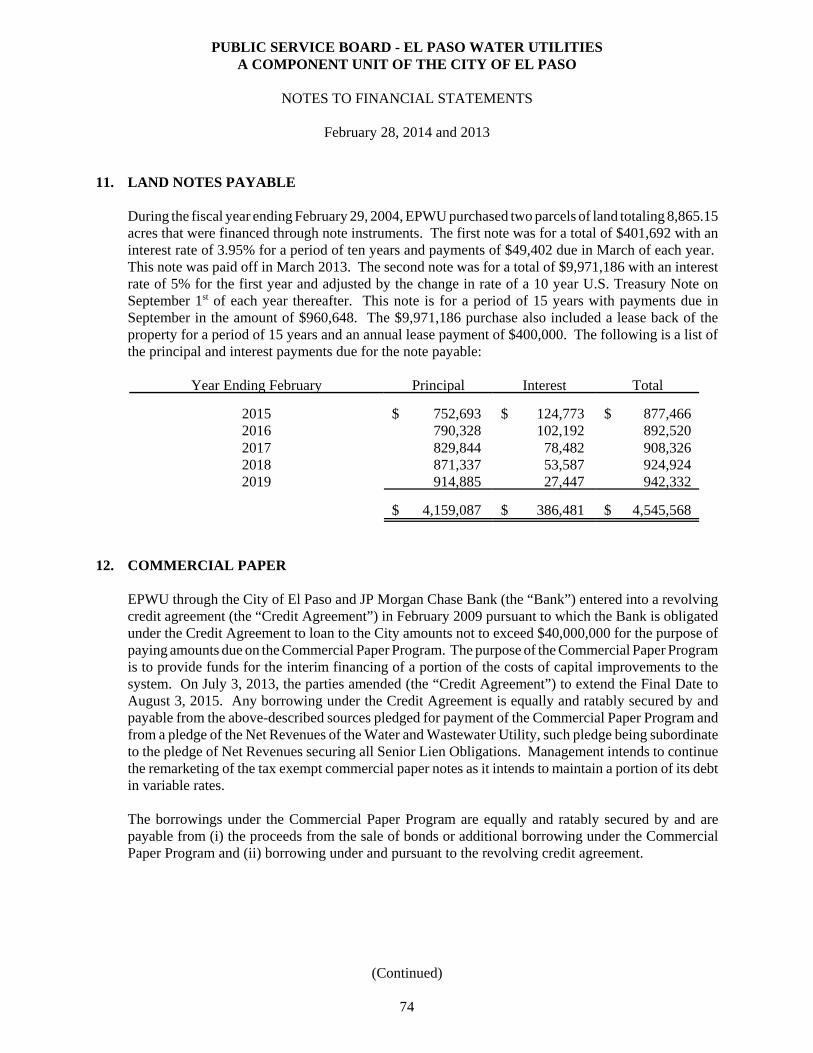
PUBLIC SERVICE BOARD - EL PASO WATER UTILITIESA COMPONENT UNIT OF THE CITY OF EL PASO
NOTES TO FINANCIAL STATEMENTS
February 28, 2014 and 2013
11. LAND NOTES PAYABLE
During the fiscal year ending February 29, 2004, EPWU purchased two parcels of land totaling 8,865.15acres that were financed through note instruments. The first note was for a total of $401,692 with aninterest rate of 3.95% for a period of ten years and payments of $49,402 due in March of each year. This note was paid off in March 2013. The second note was for a total of $9,971,186 with an interestrate of 5% for the first year and adjusted by the change in rate of a 10 year U.S. Treasury Note onSeptember 1st of each year thereafter. This note is for a period of 15 years with payments due inSeptember in the amount of $960,648. The $9,971,186 purchase also included a lease back of theproperty for a period of 15 years and an annual lease payment of $400,000. The following is a list ofthe principal and interest payments due for the note payable:
Year Ending February Principal Interest Total
2015 $ 752,693 $ 124,773 $ 877,4662016 790,328 102,192 892,5202017 829,844 78,482 908,3262018 871,337 53,587 924,9242019 914,885 27,447 942,332
$ 4,159,087 $ 386,481 $ 4,545,568
12. COMMERCIAL PAPER
EPWU through the City of El Paso and JP Morgan Chase Bank (the “Bank”) entered into a revolvingcredit agreement (the “Credit Agreement”) in February 2009 pursuant to which the Bank is obligatedunder the Credit Agreement to loan to the City amounts not to exceed $40,000,000 for the purpose ofpaying amounts due on the Commercial Paper Program. The purpose of the Commercial Paper Programis to provide funds for the interim financing of a portion of the costs of capital improvements to thesystem. On July 3, 2013, the parties amended (the “Credit Agreement”) to extend the Final Date toAugust 3, 2015. Any borrowing under the Credit Agreement is equally and ratably secured by andpayable from the above-described sources pledged for payment of the Commercial Paper Program andfrom a pledge of the Net Revenues of the Water and Wastewater Utility, such pledge being subordinateto the pledge of Net Revenues securing all Senior Lien Obligations. Management intends to continuethe remarketing of the tax exempt commercial paper notes as it intends to maintain a portion of its debtin variable rates.
The borrowings under the Commercial Paper Program are equally and ratably secured by and arepayable from (i) the proceeds from the sale of bonds or additional borrowing under the CommercialPaper Program and (ii) borrowing under and pursuant to the revolving credit agreement.
(Continued)
74
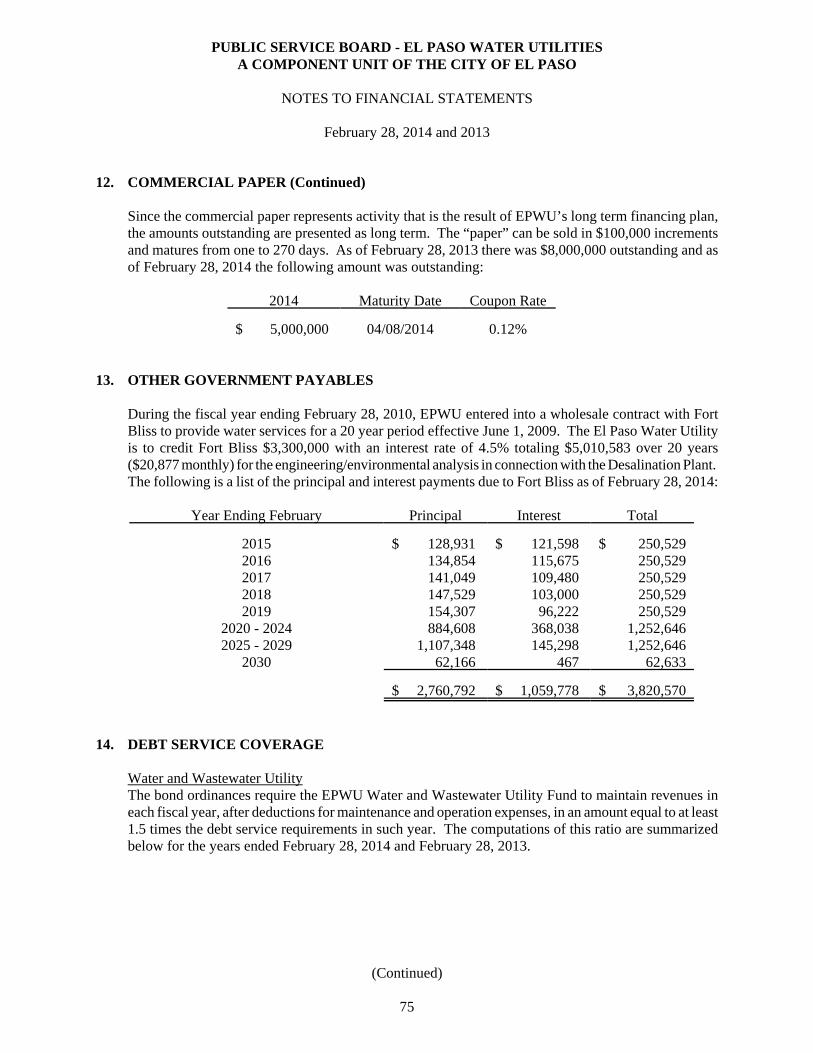
PUBLIC SERVICE BOARD - EL PASO WATER UTILITIESA COMPONENT UNIT OF THE CITY OF EL PASO
NOTES TO FINANCIAL STATEMENTS
February 28, 2014 and 2013
12. COMMERCIAL PAPER (Continued)
Since the commercial paper represents activity that is the result of EPWU’s long term financing plan,the amounts outstanding are presented as long term. The “paper” can be sold in $100,000 incrementsand matures from one to 270 days. As of February 28, 2013 there was $8,000,000 outstanding and asof February 28, 2014 the following amount was outstanding:
2014 Maturity Date Coupon Rate
$ 5,000,000 04/08/2014 0.12%
13. OTHER GOVERNMENT PAYABLES
During the fiscal year ending February 28, 2010, EPWU entered into a wholesale contract with FortBliss to provide water services for a 20 year period effective June 1, 2009. The El Paso Water Utilityis to credit Fort Bliss $3,300,000 with an interest rate of 4.5% totaling $5,010,583 over 20 years($20,877 monthly) for the engineering/environmental analysis in connection with the Desalination Plant. The following is a list of the principal and interest payments due to Fort Bliss as of February 28, 2014:
Year Ending February Principal Interest Total
2015 $ 128,931 $ 121,598 $ 250,5292016 134,854 115,675 250,5292017 141,049 109,480 250,5292018 147,529 103,000 250,5292019 154,307 96,222 250,529
2020 - 2024 884,608 368,038 1,252,6462025 - 2029 1,107,348 145,298 1,252,646
2030 62,166 467 62,633
$ 2,760,792 $ 1,059,778 $ 3,820,570
14. DEBT SERVICE COVERAGE
Water and Wastewater UtilityThe bond ordinances require the EPWU Water and Wastewater Utility Fund to maintain revenues ineach fiscal year, after deductions for maintenance and operation expenses, in an amount equal to at least1.5 times the debt service requirements in such year. The computations of this ratio are summarizedbelow for the years ended February 28, 2014 and February 28, 2013.
(Continued)
75
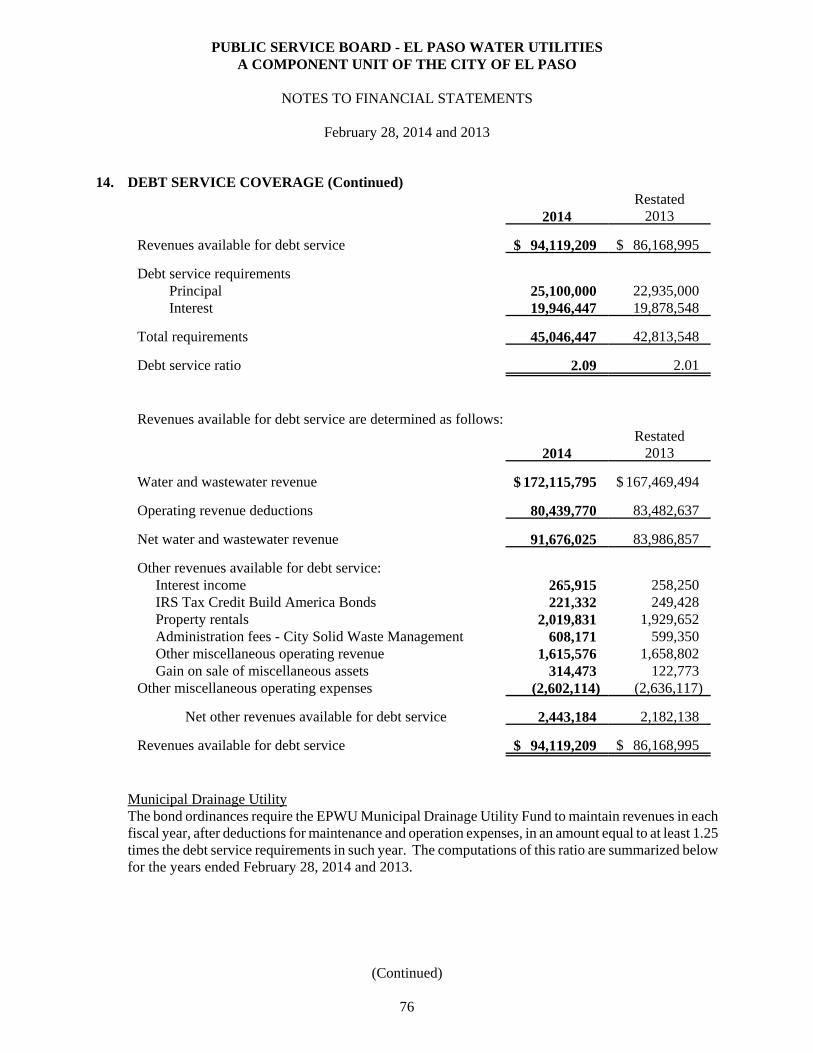
PUBLIC SERVICE BOARD - EL PASO WATER UTILITIESA COMPONENT UNIT OF THE CITY OF EL PASO
NOTES TO FINANCIAL STATEMENTS
February 28, 2014 and 2013
14. DEBT SERVICE COVERAGE (Continued)
2014Restated
2013
Revenues available for debt service $ 94,119,209 $ 86,168,995
Debt service requirementsPrincipal 25,100,000 22,935,000 Interest 19,946,447 19,878,548
Total requirements 45,046,447 42,813,548
Debt service ratio 2.09 2.01
Revenues available for debt service are determined as follows:
2014Restated
2013
Water and wastewater revenue $ 172,115,795 $ 167,469,494
Operating revenue deductions 80,439,770 83,482,637
Net water and wastewater revenue 91,676,025 83,986,857
Other revenues available for debt service: Interest income 265,915 258,250 IRS Tax Credit Build America Bonds 221,332 249,428 Property rentals 2,019,831 1,929,652 Administration fees - City Solid Waste Management 608,171 599,350 Other miscellaneous operating revenue 1,615,576 1,658,802 Gain on sale of miscellaneous assets 314,473 122,773 Other miscellaneous operating expenses (2,602,114) (2,636,117)
Net other revenues available for debt service 2,443,184 2,182,138
Revenues available for debt service $ 94,119,209 $ 86,168,995
Municipal Drainage UtilityThe bond ordinances require the EPWU Municipal Drainage Utility Fund to maintain revenues in eachfiscal year, after deductions for maintenance and operation expenses, in an amount equal to at least 1.25times the debt service requirements in such year. The computations of this ratio are summarized belowfor the years ended February 28, 2014 and 2013.
(Continued)
76
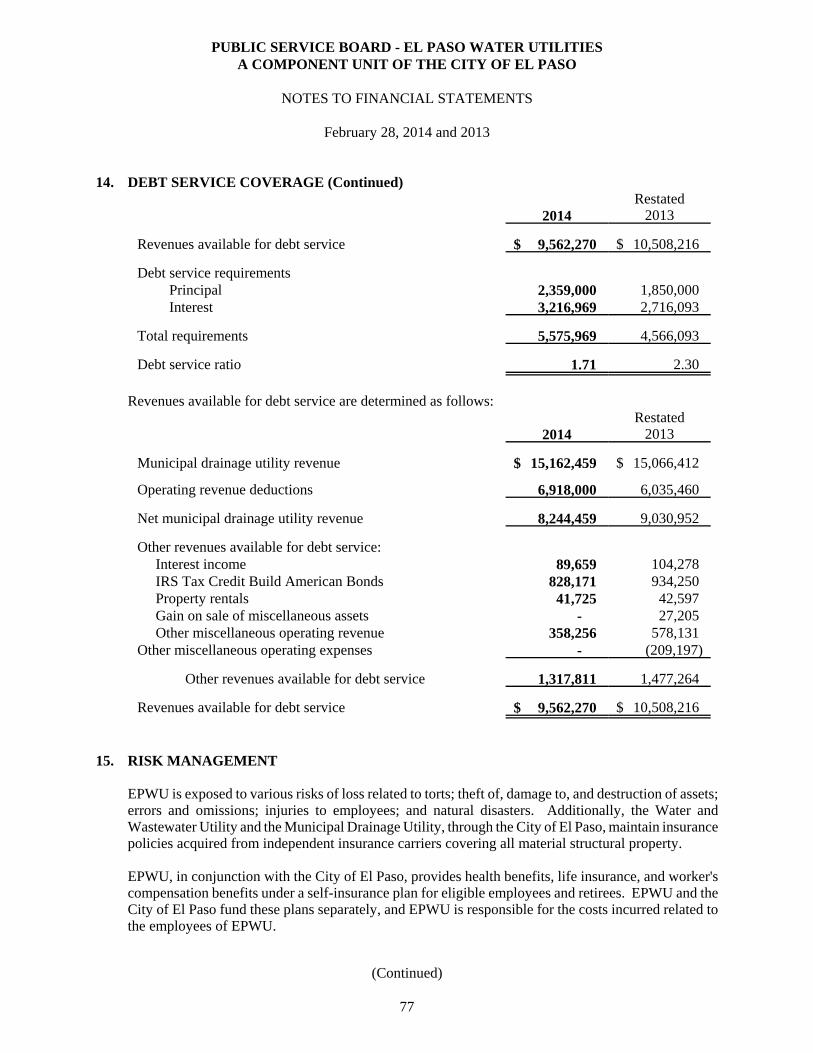
PUBLIC SERVICE BOARD - EL PASO WATER UTILITIESA COMPONENT UNIT OF THE CITY OF EL PASO
NOTES TO FINANCIAL STATEMENTS
February 28, 2014 and 2013
14. DEBT SERVICE COVERAGE (Continued)
2014Restated
2013
Revenues available for debt service $ 9,562,270 $ 10,508,216
Debt service requirementsPrincipal 2,359,000 1,850,000 Interest 3,216,969 2,716,093
Total requirements 5,575,969 4,566,093
Debt service ratio 1.71 2.30
Revenues available for debt service are determined as follows:
2014Restated
2013
Municipal drainage utility revenue $ 15,162,459 $ 15,066,412
Operating revenue deductions 6,918,000 6,035,460
Net municipal drainage utility revenue 8,244,459 9,030,952
Other revenues available for debt service: Interest income 89,659 104,278 IRS Tax Credit Build American Bonds 828,171 934,250 Property rentals 41,725 42,597 Gain on sale of miscellaneous assets - 27,205 Other miscellaneous operating revenue 358,256 578,131 Other miscellaneous operating expenses - (209,197)
Other revenues available for debt service 1,317,811 1,477,264
Revenues available for debt service $ 9,562,270 $ 10,508,216
15. RISK MANAGEMENT
EPWU is exposed to various risks of loss related to torts; theft of, damage to, and destruction of assets;errors and omissions; injuries to employees; and natural disasters. Additionally, the Water andWastewater Utility and the Municipal Drainage Utility, through the City of El Paso, maintain insurancepolicies acquired from independent insurance carriers covering all material structural property.
EPWU, in conjunction with the City of El Paso, provides health benefits, life insurance, and worker'scompensation benefits under a self-insurance plan for eligible employees and retirees. EPWU and theCity of El Paso fund these plans separately, and EPWU is responsible for the costs incurred related tothe employees of EPWU.
(Continued)
77
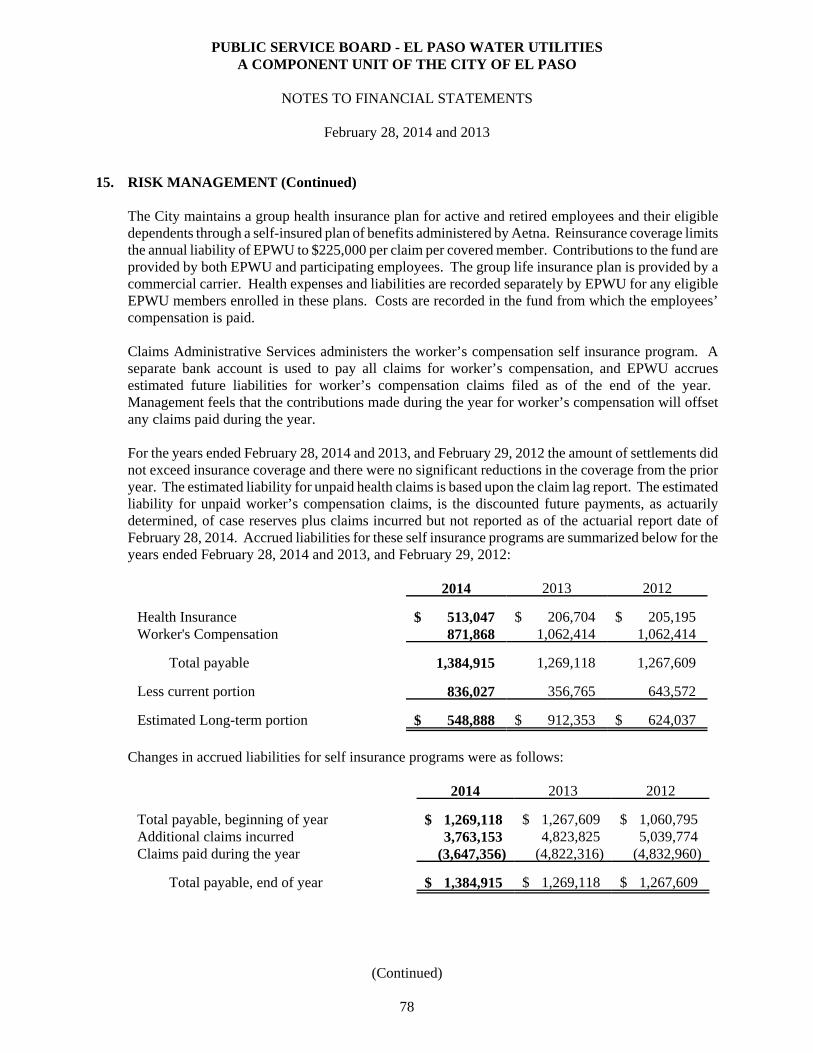
PUBLIC SERVICE BOARD - EL PASO WATER UTILITIESA COMPONENT UNIT OF THE CITY OF EL PASO
NOTES TO FINANCIAL STATEMENTS
February 28, 2014 and 2013
15. RISK MANAGEMENT (Continued)
The City maintains a group health insurance plan for active and retired employees and their eligibledependents through a self-insured plan of benefits administered by Aetna. Reinsurance coverage limitsthe annual liability of EPWU to $225,000 per claim per covered member. Contributions to the fund areprovided by both EPWU and participating employees. The group life insurance plan is provided by acommercial carrier. Health expenses and liabilities are recorded separately by EPWU for any eligibleEPWU members enrolled in these plans. Costs are recorded in the fund from which the employees’compensation is paid.
Claims Administrative Services administers the worker’s compensation self insurance program. Aseparate bank account is used to pay all claims for worker’s compensation, and EPWU accruesestimated future liabilities for worker’s compensation claims filed as of the end of the year. Management feels that the contributions made during the year for worker’s compensation will offsetany claims paid during the year.
For the years ended February 28, 2014 and 2013, and February 29, 2012 the amount of settlements didnot exceed insurance coverage and there were no significant reductions in the coverage from the prioryear. The estimated liability for unpaid health claims is based upon the claim lag report. The estimatedliability for unpaid worker’s compensation claims, is the discounted future payments, as actuarilydetermined, of case reserves plus claims incurred but not reported as of the actuarial report date ofFebruary 28, 2014. Accrued liabilities for these self insurance programs are summarized below for theyears ended February 28, 2014 and 2013, and February 29, 2012:
2014 2013 2012
Health Insurance $ 513,047 $ 206,704 $ 205,195 Worker's Compensation 871,868 1,062,414 1,062,414
Total payable 1,384,915 1,269,118 1,267,609
Less current portion 836,027 356,765 643,572
Estimated Long-term portion $ 548,888 $ 912,353 $ 624,037
Changes in accrued liabilities for self insurance programs were as follows:
2014 2013 2012
Total payable, beginning of year $ 1,269,118 $ 1,267,609 $ 1,060,795 Additional claims incurred 3,763,153 4,823,825 5,039,774 Claims paid during the year (3,647,356) (4,822,316) (4,832,960)
Total payable, end of year $ 1,384,915 $ 1,269,118 $ 1,267,609
(Continued)
78
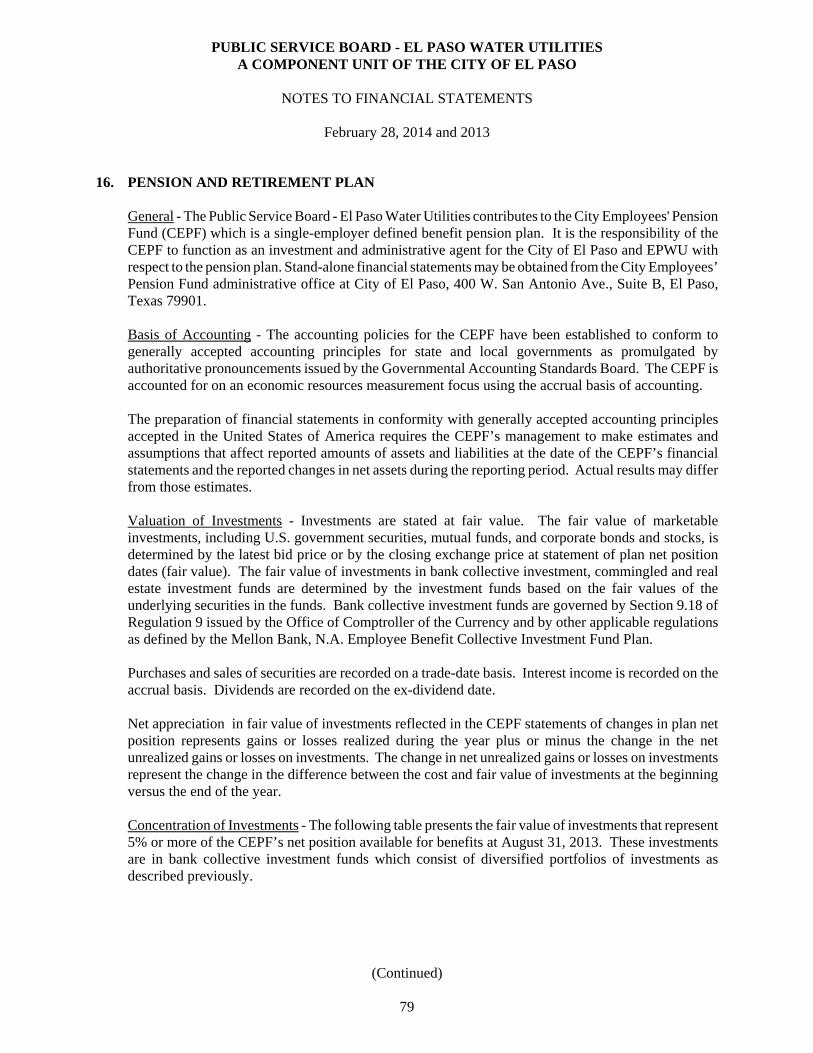
PUBLIC SERVICE BOARD - EL PASO WATER UTILITIESA COMPONENT UNIT OF THE CITY OF EL PASO
NOTES TO FINANCIAL STATEMENTS
February 28, 2014 and 2013
16. PENSION AND RETIREMENT PLAN
General - The Public Service Board - El Paso Water Utilities contributes to the City Employees' PensionFund (CEPF) which is a single-employer defined benefit pension plan. It is the responsibility of theCEPF to function as an investment and administrative agent for the City of El Paso and EPWU withrespect to the pension plan. Stand-alone financial statements may be obtained from the City Employees’Pension Fund administrative office at City of El Paso, 400 W. San Antonio Ave., Suite B, El Paso,Texas 79901.
Basis of Accounting - The accounting policies for the CEPF have been established to conform togenerally accepted accounting principles for state and local governments as promulgated byauthoritative pronouncements issued by the Governmental Accounting Standards Board. The CEPF isaccounted for on an economic resources measurement focus using the accrual basis of accounting.
The preparation of financial statements in conformity with generally accepted accounting principlesaccepted in the United States of America requires the CEPF’s management to make estimates andassumptions that affect reported amounts of assets and liabilities at the date of the CEPF’s financialstatements and the reported changes in net assets during the reporting period. Actual results may differfrom those estimates.
Valuation of Investments - Investments are stated at fair value. The fair value of marketableinvestments, including U.S. government securities, mutual funds, and corporate bonds and stocks, isdetermined by the latest bid price or by the closing exchange price at statement of plan net positiondates (fair value). The fair value of investments in bank collective investment, commingled and realestate investment funds are determined by the investment funds based on the fair values of theunderlying securities in the funds. Bank collective investment funds are governed by Section 9.18 ofRegulation 9 issued by the Office of Comptroller of the Currency and by other applicable regulationsas defined by the Mellon Bank, N.A. Employee Benefit Collective Investment Fund Plan.
Purchases and sales of securities are recorded on a trade-date basis. Interest income is recorded on theaccrual basis. Dividends are recorded on the ex-dividend date.
Net appreciation in fair value of investments reflected in the CEPF statements of changes in plan netposition represents gains or losses realized during the year plus or minus the change in the netunrealized gains or losses on investments. The change in net unrealized gains or losses on investmentsrepresent the change in the difference between the cost and fair value of investments at the beginningversus the end of the year.
Concentration of Investments - The following table presents the fair value of investments that represent5% or more of the CEPF’s net position available for benefits at August 31, 2013. These investmentsare in bank collective investment funds which consist of diversified portfolios of investments asdescribed previously.
(Continued)
79
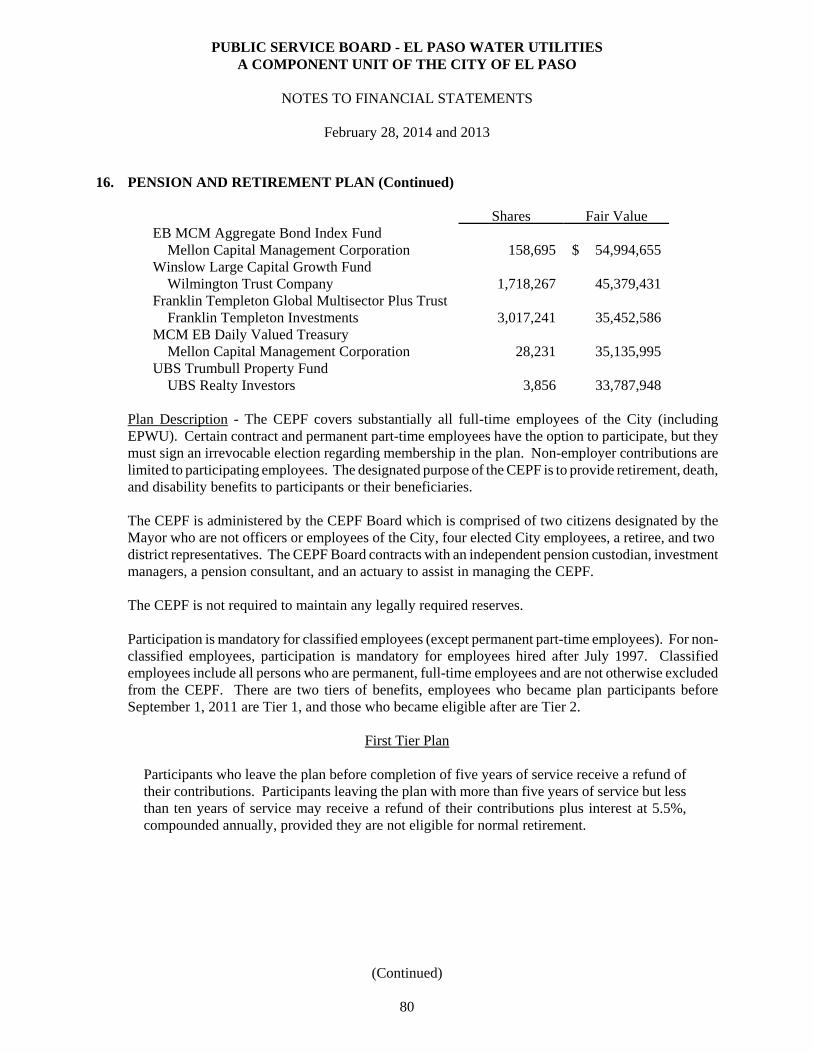
PUBLIC SERVICE BOARD - EL PASO WATER UTILITIESA COMPONENT UNIT OF THE CITY OF EL PASO
NOTES TO FINANCIAL STATEMENTS
February 28, 2014 and 2013
16. PENSION AND RETIREMENT PLAN (Continued)
Shares Fair ValueEB MCM Aggregate Bond Index Fund Mellon Capital Management Corporation 158,695 $ 54,994,655Winslow Large Capital Growth Fund Wilmington Trust Company 1,718,267 45,379,431Franklin Templeton Global Multisector Plus Trust Franklin Templeton Investments 3,017,241 35,452,586MCM EB Daily Valued Treasury Mellon Capital Management Corporation 28,231 35,135,995UBS Trumbull Property Fund UBS Realty Investors 3,856 33,787,948
Plan Description - The CEPF covers substantially all full-time employees of the City (includingEPWU). Certain contract and permanent part-time employees have the option to participate, but theymust sign an irrevocable election regarding membership in the plan. Non-employer contributions arelimited to participating employees. The designated purpose of the CEPF is to provide retirement, death,and disability benefits to participants or their beneficiaries.
The CEPF is administered by the CEPF Board which is comprised of two citizens designated by theMayor who are not officers or employees of the City, four elected City employees, a retiree, and two district representatives. The CEPF Board contracts with an independent pension custodian, investmentmanagers, a pension consultant, and an actuary to assist in managing the CEPF.
The CEPF is not required to maintain any legally required reserves.
Participation is mandatory for classified employees (except permanent part-time employees). For non-classified employees, participation is mandatory for employees hired after July 1997. Classifiedemployees include all persons who are permanent, full-time employees and are not otherwise excludedfrom the CEPF. There are two tiers of benefits, employees who became plan participants beforeSeptember 1, 2011 are Tier 1, and those who became eligible after are Tier 2.
First Tier Plan
Participants who leave the plan before completion of five years of service receive a refund oftheir contributions. Participants leaving the plan with more than five years of service but lessthan ten years of service may receive a refund of their contributions plus interest at 5.5%,compounded annually, provided they are not eligible for normal retirement.
(Continued)
80
PUBLIC SERVICE BOARD - EL PASO WATER UTILITIESA COMPONENT UNIT OF THE CITY OF EL PASO
NOTES TO FINANCIAL STATEMENTS
February 28, 2014 and 2013
16. PENSION AND RETIREMENT PLAN (Continued)
Participants become fully vested after reaching forty years of age and ten years of service offorty-five years of age and seven years of service. Normal retirement is the earlier of (i) fifty-five years of age with ten years of service, or (ii) sixty years of age with seven years of serviceor (iii) thirty years of service regardless of age. Participants who have met the minimumvesting requirements may retire but defer receiving pension payments until they reach normalretirement age. Alternatively, such vested participants may elect an early retirement which willprovide an actuarially reduced pension benefit payment upon termination.
Persons retiring and eligible to receive benefits receive monthly pension payments in theamount of 2.5% of final wages defined as the greatest of (i) 2.5% of the average monthly grossearnings received by the employee during the three years immediately prior to retirement, (ii)2.5% of the average monthly base salary received by the employee during the year immediatelyprior to retirement, or (iii) 2.5% of the monthly base salary for the month immediately prior toretirement, multiplied by the number of completed years of service, plus .2083 of 1% of suchaverage for each additional completed or fractional part of a month of service.
Second Tier Plan
Participants who leave the plan before completion of seven years of service receive a refundof their contributions. Participants leaving the plan with more than seven years of service butless than ten years of service may receive a refund of their contributions plus interest at 3%,compounded annually, provided they are not eligible for normal retirement.
Participants become vested after reaching 45 years of age and 7 years of service. Normalretirement is the earlier of (i) sixty years of age with seven years of service, or (ii) thirty-fiveyears of service regardless of age. Participants who have met the minimum vestingrequirements may retire but defer receiving pension payments until they reach normalretirement age. Alternatively, such vested participants may elect an early retirement which willprovide an actuarially reduced pension benefit payment upon termination. Persons retiring andeligible to receive benefits receive monthly pension payments in the amount of 2.25% of theaverage monthly gross earnings received by the employee during the three years immediatelyprior to retirement, plus .1875 of 1% of such average for each additional completed or fractionalpart of a month of service, limited to 90% of the three year average final pay.
A pension benefit is available to surviving spouses and dependents. The plan includes no automaticincrease in retirement benefits; however, the Board, at its discretion after consideration of a recentactuarial review of the funding status, may provide ad hoc cost of living or other increases in retirementbenefits.
(Continued)
81
PUBLIC SERVICE BOARD - EL PASO WATER UTILITIESA COMPONENT UNIT OF THE CITY OF EL PASO
NOTES TO FINANCIAL STATEMENTS
February 28, 2014 and 2013
16. PENSION AND RETIREMENT PLAN (Continued)
Membership in the above described pension plan is as follows as of August 31, 2013:
Retirees and beneficiaries receiving benefits 2,545 Terminated plan members entitled to but not yet receiving benefits 82 Active plan members 4,208
Total 6,835
Contributions - Contribution rates for the CEPF are based upon local statutes and are not actuariallydetermined. However, each time a new actuarial valuation is performed, contribution requirements arecompared to the actuarially determined amount necessary to fund service costs and amortize theunfunded actuarial accrued liability (using entry-age-normal cost method) over 30 years. As of the mostrecent actuarial valuation, the contribution rate was 22.1% of annual covered payroll.
EPWU’s gross payroll for fiscal years ended 2014, 2013, and 2012, were $32,572,161, $31,140,855,and $30,608,423, respectively. The portion attributable to eligible employees covered by the pensionplan for fiscal years ended 2014, 2013, and 2012 were $31,870,410, $30,838,768, and $30,127,747,respectively. Covered payroll refers to all compensation paid by EPWU to active employees coveredby the City PERS on which contributions to the pension are based.
Total contributions into the plan represent 22.1% of wages paid to eligible employees of which 13.45%was contributed by EPWU and 8.65% was contributed by the employees on a pre-tax basis. Totalcontributions for fiscal years ended 2014, 2013, and 2012 were $6,888,257, $6,391,868, and$5,969,718, respectively. EPWU contributed a total of $4,183,125, $3,865,481, and $3,593,168, andemployees contributed $2,705,132, $2,526,387, and $2,376,550, for fiscal years ended 2014, 2013, and 2012, respectively. EPWU contributed 100% of the annual required contributions in the City of El PasoPension plan for each of the fiscal years ended 2014, 2013, and 2012.
Securities Lending - The CEPF enters into securities lending transactions with broker/dealers for whichfees are paid to the CEPF. The CEPF Board may legally and contractually authorize the use of CEPF’ssecurities for lending transactions. The securities involved in the lending transactions continue to berecorded at fair value. Parameters are established by the CEPF’s investment guidelines for securitieslending transactions. These guidelines require that all securities lending occur with specifiedbroker/dealers and that securities be collateralized using U.S. issuer securities at 102% and non U.S.issuer securities at 105% of the fair value of the securities. U.S. issuer securities used as collateral aremarked to fair value on a daily basis to evaluate whether the collateralization requirements of the fairvalue of investments is always maintained. The CEPF may not pledge or sell the collateral securitiesexcept on default of the borrower. Because of this, CEPF administration believes there is some minimalcredit risk associated with securities lending transactions. There is no loss indemnification providedto the CEPF by the investment managers or broker/dealers. As of August 31, 2013, the fair value ofsecurities loaned to others, consisted of:
Corporate Stocks $ 20,943,954
(Continued)
82
PUBLIC SERVICE BOARD - EL PASO WATER UTILITIESA COMPONENT UNIT OF THE CITY OF EL PASO
NOTES TO FINANCIAL STATEMENTS
February 28, 2014 and 2013
16. PENSION AND RETIREMENT PLAN (Continued)
Annual Pension Cost and Net Pension Obligation - The annual pension cost and net pension obligationto CEPF for the years ended August 31, 2013, 2012, and 2011 are shown below. Since the annual costand obligation of the pension plan are the responsibility of the City of El Paso, these amounts arerecorded in its financial statements. EPWU is a participant of the plan and contributes to the plan butdoes not have any liability associated with the pension plan.
Year
AnnualRequired
Contribution(ARC)
Interest onNPO
Adjustmentto
ARCAnnual
Pension CostContributions
Made
Increase(Decrease) in
NPONet PensionObligation
8/31/2013 21,075,292 98,880 (73,695) 21,100,477 20,502,828 597,649 1,916,045 8/31/2012 19,605,418 96,690 (67,408) 19,634,700 19,524,934 109,766 1,318,396 8/31/2011 18,356,531 62,556 (43,611) 18,375,476 17,948,799 426,677 1,208,630
The percentage of Annual Pension Cost Contributed for the above three years is 97.2%, 99.4%, and97.7%, respectively.
Schedule of Funding Progress:
Actuarialvaluation date
(1)Actuarialvalue of assets
(2)Actuarialaccruedliability(AAL)
entry age
(3)Unfunded
AAL(UAAL)
(2) - (1)
(4)Funded
ratio (1) : (2)
(5)Covered payroll
(6)UAAL as apercentageof covered
payroll (3) : (5)
(dollars inthousands)
(dollars inthousands)
(dollars inthousands)
(dollars inthousands)
9-1-2012 581,725 788,204 206,479 73.8% 147,740 139.8%9-1-2010 569,723 709,997 140,274 80.2% 143,107 98.0%9-1-2008 552,815 631,591 78,776 87.5% 136,508 57.7%
The information presented in the schedule of funding progress was determined as part of actuarialvaluations at the date indicated. Additional information as of the latest actuarial valuation follows:
Actuarial Valuation Date September 1, 2012Actuarial Cost Method Entry AgeAsset Valuation Method Five-year smoothedAssumed Inflation Rate 3.5%Assumed Investment Rate of Return 7.5%Assumed Projected Salary Increases 4.0% - 5.7%Assumed Cost of Living Adjustment Partial 13th CheckAmortization Method Level percent openRemaining Amortization Period 21 yearsFactors that significantly affect the identification of trends None
(Continued)
83
PUBLIC SERVICE BOARD - EL PASO WATER UTILITIESA COMPONENT UNIT OF THE CITY OF EL PASO
NOTES TO FINANCIAL STATEMENTS
February 28, 2014 and 2013
16. PENSION AND RETIREMENT PLAN (Continued)
Actuarial valuations of an ongoing plan involve estimates of the value of reported amounts andassumptions about the probability of occurrence of events far into the future. Actuariallydetermined amounts are subject to revision as actual results are compared with past expectations andnew estimates are made about the future. The schedule of funding progress presents multi-year trendinformation about whether the actuarial value of plan assets is increasing or decreasing over timerelative to the actuarial accrued liabilities for benefits.
Projections of benefits for financial reporting purposes are based on the substantive plan (the plan asunderstood by the employer and the plan members) and include the types of benefits provided at thetime of each valuation and the historical pattern of sharing of benefit costs between the employer andplan members to that point. The actuarial methods and assumptions used include techniques that aredesigned to reduce the effects of short-term volatility in actuarial accrued liabilities and the actuarial value of assets, consistent with the long-term perspective of the calculations.
17. POST EMPLOYMENT BENEFITS OTHER THAN PENSIONS
The City (including the Public Service Board - El Paso Water Utilities) sponsors and administers aninformal single-employer defined benefit healthcare plan. Texas statute provides that retirees from amunicipality with a population of 25,000 or more and that receive retirement benefits from a municipalretirement plan are entitled to purchase continued health benefits coverage for the retiree and theretiree’s dependents unless the retiree is eligible for group health benefits coverage through anotheremployer. The State of Texas has the authority to establish and amend the requirements of this statute. The City does not issue stand alone financial statements of the healthcare plan but all requiredinformation is presented in this report.
The Plan provides certain health care benefits for retired employees, their spouses, and dependents. Substantially all of EPWU’s employees may become eligible for those benefits if they reach normalretirement age while working for EPWU. Retiree coverage is the same as the coverage provided toactive City employees and for retirees under 65. Retirees over 65 are covered through a MedicareAdvantage Plan. The contribution requirements of plan members are established by City ordinance andmay be amended as needed. Retirees pay premiums ranging from $106 per month to $1,319 per monthdepending on the coverage elected. The cost of retiree health care benefits is recognized as an expenseas liabilities are incurred. Of 2,533 retirees eligible (including the City and EPWU), there were 868retirees covered under this plan at August 31, 2013. Dependent coverage was provided for 390 of theretirees, respectively. Total benefits (including the City and EPWU) paid for retirees during the yearended August 31, 2013 and 2012 was approximately $1,920,450 and $6,227,298, respectively.
(Continued)
84
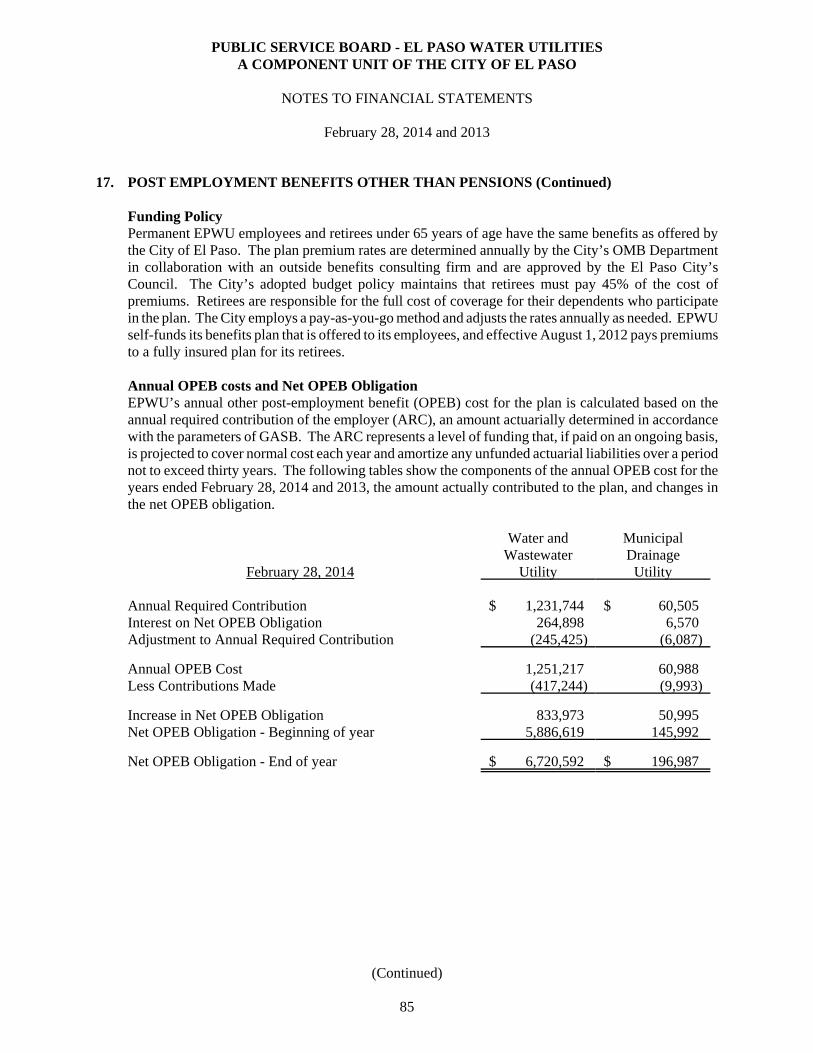
PUBLIC SERVICE BOARD - EL PASO WATER UTILITIESA COMPONENT UNIT OF THE CITY OF EL PASO
NOTES TO FINANCIAL STATEMENTS
February 28, 2014 and 2013
17. POST EMPLOYMENT BENEFITS OTHER THAN PENSIONS (Continued)
Funding PolicyPermanent EPWU employees and retirees under 65 years of age have the same benefits as offered bythe City of El Paso. The plan premium rates are determined annually by the City’s OMB Departmentin collaboration with an outside benefits consulting firm and are approved by the El Paso City’sCouncil. The City’s adopted budget policy maintains that retirees must pay 45% of the cost ofpremiums. Retirees are responsible for the full cost of coverage for their dependents who participatein the plan. The City employs a pay-as-you-go method and adjusts the rates annually as needed. EPWUself-funds its benefits plan that is offered to its employees, and effective August 1, 2012 pays premiumsto a fully insured plan for its retirees.
Annual OPEB costs and Net OPEB ObligationEPWU’s annual other post-employment benefit (OPEB) cost for the plan is calculated based on theannual required contribution of the employer (ARC), an amount actuarially determined in accordancewith the parameters of GASB. The ARC represents a level of funding that, if paid on an ongoing basis,is projected to cover normal cost each year and amortize any unfunded actuarial liabilities over a periodnot to exceed thirty years. The following tables show the components of the annual OPEB cost for theyears ended February 28, 2014 and 2013, the amount actually contributed to the plan, and changes inthe net OPEB obligation.
February 28, 2014
Water andWastewater
Utility
MunicipalDrainage
Utility
Annual Required Contribution $ 1,231,744 $ 60,505 Interest on Net OPEB Obligation 264,898 6,570 Adjustment to Annual Required Contribution (245,425) (6,087)
Annual OPEB Cost 1,251,217 60,988 Less Contributions Made (417,244) (9,993)
Increase in Net OPEB Obligation 833,973 50,995 Net OPEB Obligation - Beginning of year 5,886,619 145,992
Net OPEB Obligation - End of year $ 6,720,592 $ 196,987
(Continued)
85
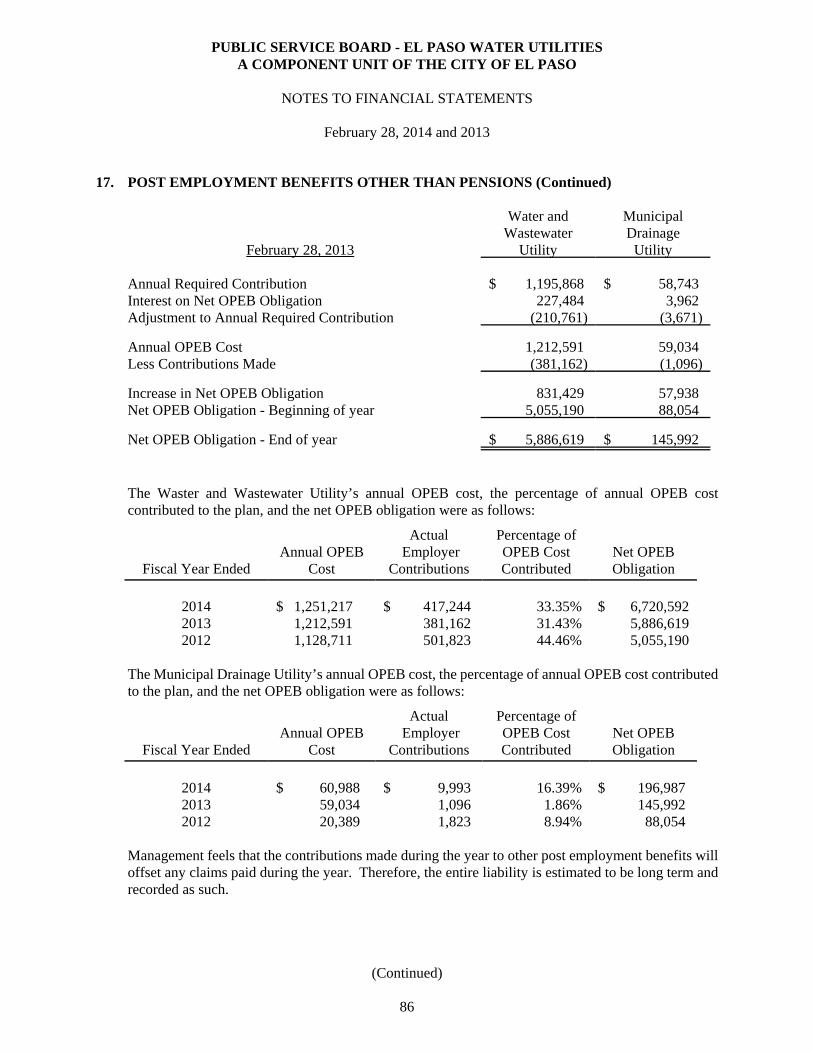
PUBLIC SERVICE BOARD - EL PASO WATER UTILITIESA COMPONENT UNIT OF THE CITY OF EL PASO
NOTES TO FINANCIAL STATEMENTS
February 28, 2014 and 2013
17. POST EMPLOYMENT BENEFITS OTHER THAN PENSIONS (Continued)
February 28, 2013
Water andWastewater
Utility
MunicipalDrainage
Utility
Annual Required Contribution $ 1,195,868 $ 58,743 Interest on Net OPEB Obligation 227,484 3,962 Adjustment to Annual Required Contribution (210,761) (3,671)
Annual OPEB Cost 1,212,591 59,034 Less Contributions Made (381,162) (1,096)
Increase in Net OPEB Obligation 831,429 57,938 Net OPEB Obligation - Beginning of year 5,055,190 88,054
Net OPEB Obligation - End of year $ 5,886,619 $ 145,992
The Waster and Wastewater Utility’s annual OPEB cost, the percentage of annual OPEB costcontributed to the plan, and the net OPEB obligation were as follows:
Fiscal Year EndedAnnual OPEB
Cost
Actual Employer
Contributions
Percentage ofOPEB CostContributed
Net OPEBObligation
2014 $ 1,251,217 $ 417,244 33.35% $ 6,720,5922013 1,212,591 381,162 31.43% 5,886,6192012 1,128,711 501,823 44.46% 5,055,190
The Municipal Drainage Utility’s annual OPEB cost, the percentage of annual OPEB cost contributedto the plan, and the net OPEB obligation were as follows:
Fiscal Year EndedAnnual OPEB
Cost
Actual Employer
Contributions
Percentage ofOPEB CostContributed
Net OPEBObligation
2014 $ 60,988 $ 9,993 16.39% $ 196,987 2013 59,034 1,096 1.86% 145,992 2012 20,389 1,823 8.94% 88,054
Management feels that the contributions made during the year to other post employment benefits willoffset any claims paid during the year. Therefore, the entire liability is estimated to be long term andrecorded as such.
(Continued)
86
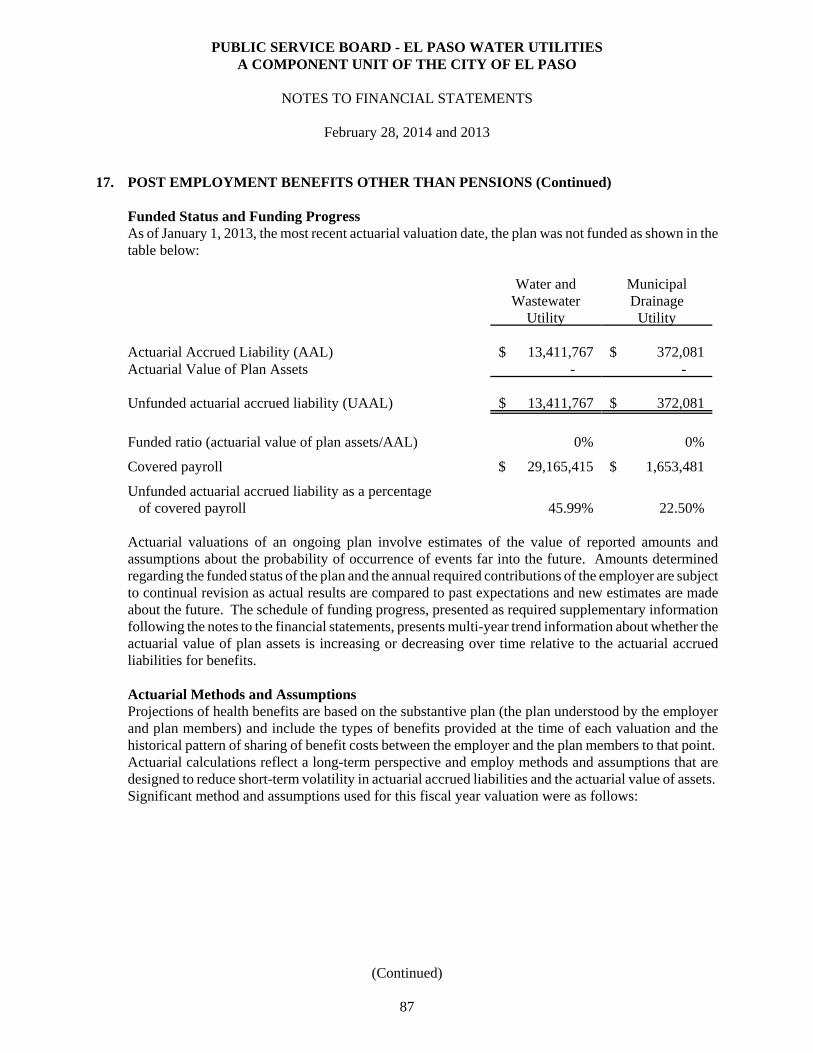
PUBLIC SERVICE BOARD - EL PASO WATER UTILITIESA COMPONENT UNIT OF THE CITY OF EL PASO
NOTES TO FINANCIAL STATEMENTS
February 28, 2014 and 2013
17. POST EMPLOYMENT BENEFITS OTHER THAN PENSIONS (Continued)
Funded Status and Funding ProgressAs of January 1, 2013, the most recent actuarial valuation date, the plan was not funded as shown in thetable below:
Water andWastewater
Utility
MunicipalDrainage
Utility
Actuarial Accrued Liability (AAL) $ 13,411,767 $ 372,081Actuarial Value of Plan Assets - -
Unfunded actuarial accrued liability (UAAL) $ 13,411,767 $ 372,081
Funded ratio (actuarial value of plan assets/AAL) 0% 0%
Covered payroll $ 29,165,415 $ 1,653,481
Unfunded actuarial accrued liability as a percentage of covered payroll 45.99% 22.50%
Actuarial valuations of an ongoing plan involve estimates of the value of reported amounts andassumptions about the probability of occurrence of events far into the future. Amounts determinedregarding the funded status of the plan and the annual required contributions of the employer are subjectto continual revision as actual results are compared to past expectations and new estimates are madeabout the future. The schedule of funding progress, presented as required supplementary informationfollowing the notes to the financial statements, presents multi-year trend information about whether theactuarial value of plan assets is increasing or decreasing over time relative to the actuarial accruedliabilities for benefits.
Actuarial Methods and AssumptionsProjections of health benefits are based on the substantive plan (the plan understood by the employerand plan members) and include the types of benefits provided at the time of each valuation and thehistorical pattern of sharing of benefit costs between the employer and the plan members to that point. Actuarial calculations reflect a long-term perspective and employ methods and assumptions that aredesigned to reduce short-term volatility in actuarial accrued liabilities and the actuarial value of assets. Significant method and assumptions used for this fiscal year valuation were as follows:
(Continued)
87
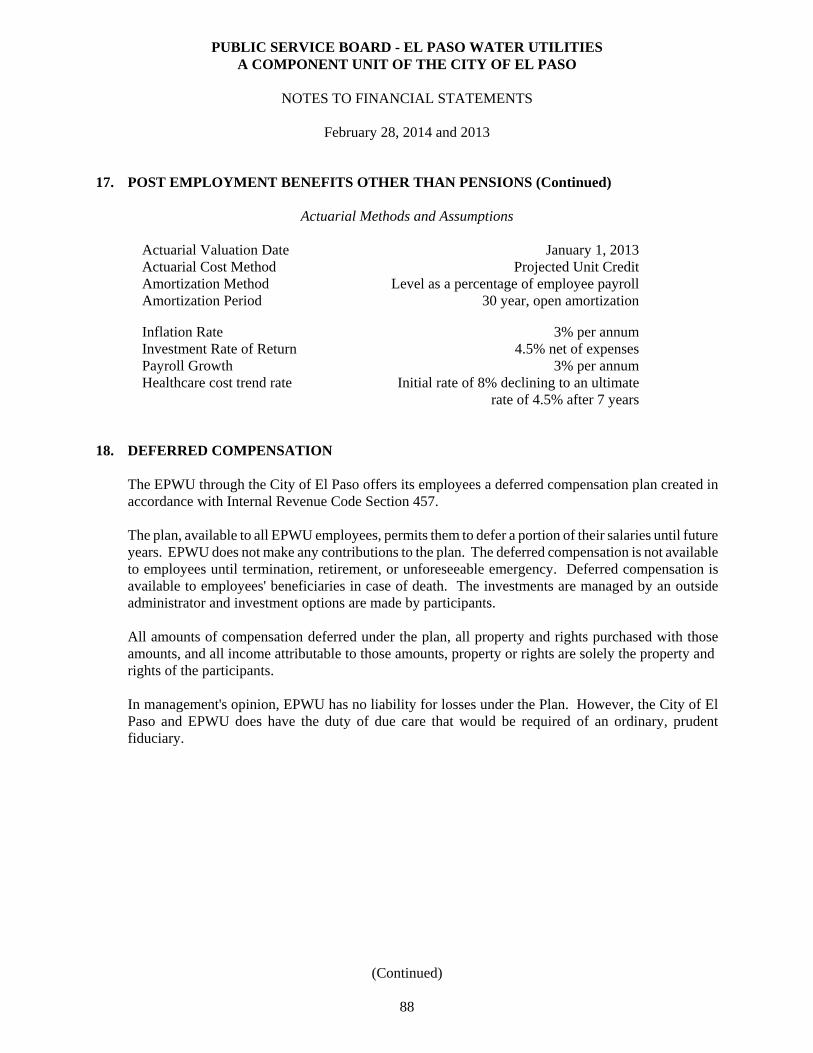
PUBLIC SERVICE BOARD - EL PASO WATER UTILITIESA COMPONENT UNIT OF THE CITY OF EL PASO
NOTES TO FINANCIAL STATEMENTS
February 28, 2014 and 2013
17. POST EMPLOYMENT BENEFITS OTHER THAN PENSIONS (Continued)
Actuarial Methods and Assumptions
Actuarial Valuation Date January 1, 2013Actuarial Cost Method Projected Unit CreditAmortization Method Level as a percentage of employee payrollAmortization Period 30 year, open amortization
Inflation Rate 3% per annumInvestment Rate of Return 4.5% net of expensesPayroll Growth 3% per annumHealthcare cost trend rate Initial rate of 8% declining to an ultimate
rate of 4.5% after 7 years
18. DEFERRED COMPENSATION
The EPWU through the City of El Paso offers its employees a deferred compensation plan created inaccordance with Internal Revenue Code Section 457.
The plan, available to all EPWU employees, permits them to defer a portion of their salaries until futureyears. EPWU does not make any contributions to the plan. The deferred compensation is not availableto employees until termination, retirement, or unforeseeable emergency. Deferred compensation isavailable to employees' beneficiaries in case of death. The investments are managed by an outsideadministrator and investment options are made by participants.
All amounts of compensation deferred under the plan, all property and rights purchased with thoseamounts, and all income attributable to those amounts, property or rights are solely the property and rights of the participants.
In management's opinion, EPWU has no liability for losses under the Plan. However, the City of ElPaso and EPWU does have the duty of due care that would be required of an ordinary, prudentfiduciary.
(Continued)
88
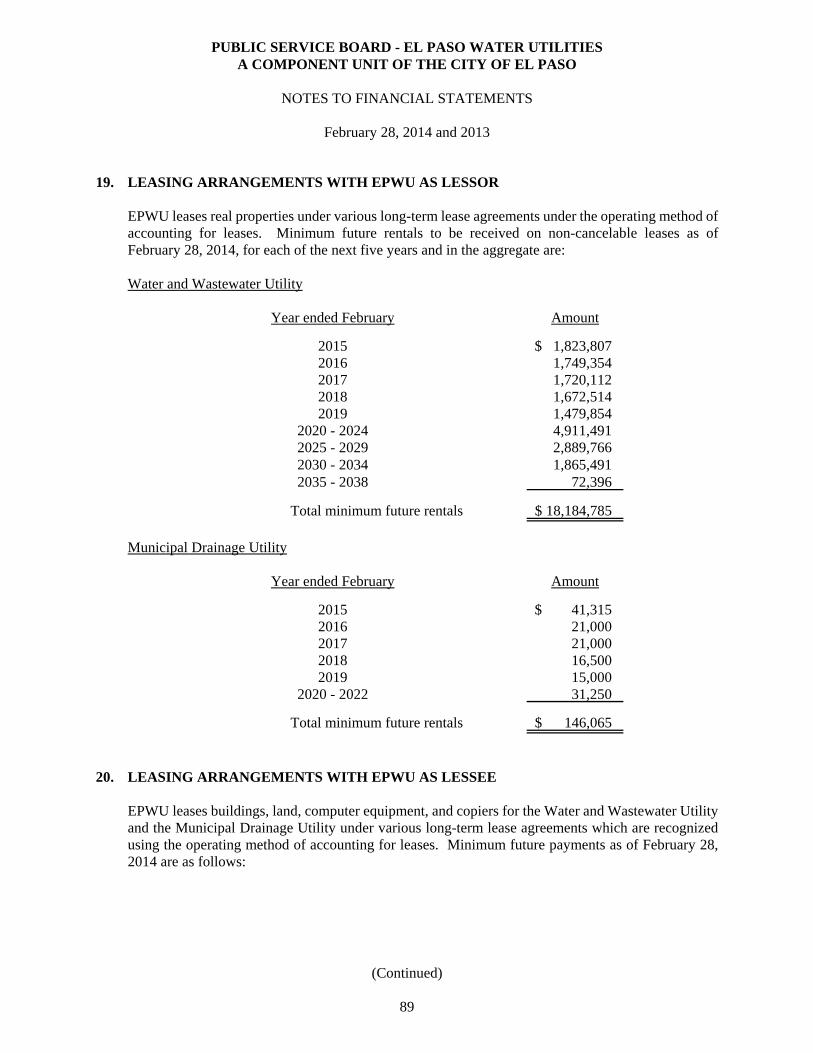
PUBLIC SERVICE BOARD - EL PASO WATER UTILITIESA COMPONENT UNIT OF THE CITY OF EL PASO
NOTES TO FINANCIAL STATEMENTS
February 28, 2014 and 2013
19. LEASING ARRANGEMENTS WITH EPWU AS LESSOR
EPWU leases real properties under various long-term lease agreements under the operating method ofaccounting for leases. Minimum future rentals to be received on non-cancelable leases as ofFebruary 28, 2014, for each of the next five years and in the aggregate are:
Water and Wastewater Utility
Year ended February Amount
2015 $ 1,823,807 2016 1,749,354 2017 1,720,112 2018 1,672,514 2019 1,479,854
2020 - 2024 4,911,491 2025 - 2029 2,889,766 2030 - 2034 1,865,491 2035 - 2038 72,396
Total minimum future rentals $ 18,184,785
Municipal Drainage Utility
Year ended February Amount
2015 $ 41,315 2016 21,000 2017 21,000 2018 16,500 2019 15,000
2020 - 2022 31,250
Total minimum future rentals $ 146,065
20. LEASING ARRANGEMENTS WITH EPWU AS LESSEE
EPWU leases buildings, land, computer equipment, and copiers for the Water and Wastewater Utilityand the Municipal Drainage Utility under various long-term lease agreements which are recognizedusing the operating method of accounting for leases. Minimum future payments as of February 28,2014 are as follows:
(Continued)
89
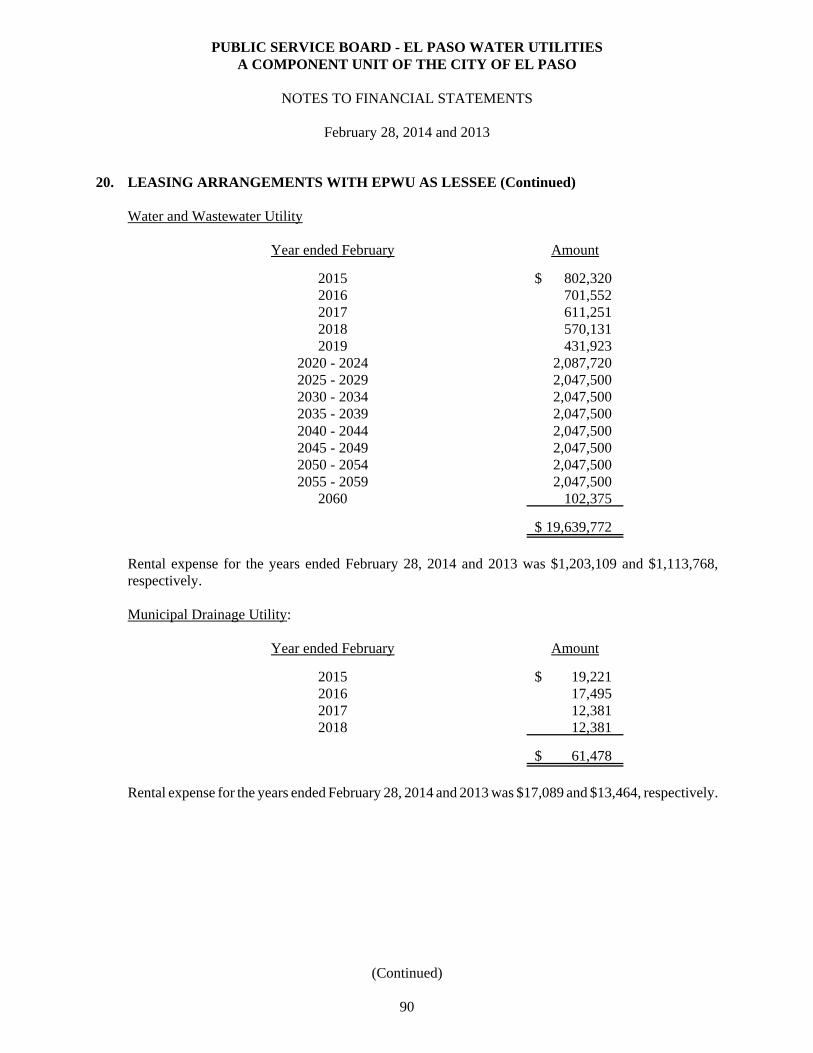
PUBLIC SERVICE BOARD - EL PASO WATER UTILITIESA COMPONENT UNIT OF THE CITY OF EL PASO
NOTES TO FINANCIAL STATEMENTS
February 28, 2014 and 2013
20. LEASING ARRANGEMENTS WITH EPWU AS LESSEE (Continued)
Water and Wastewater Utility
Year ended February Amount
2015 $ 802,320 2016 701,552 2017 611,251 2018 570,131 2019 431,923
2020 - 2024 2,087,720 2025 - 2029 2,047,500 2030 - 2034 2,047,500 2035 - 2039 2,047,500 2040 - 2044 2,047,500 2045 - 2049 2,047,500 2050 - 2054 2,047,500 2055 - 2059 2,047,500
2060 102,375
$ 19,639,772
Rental expense for the years ended February 28, 2014 and 2013 was $1,203,109 and $1,113,768,respectively.
Municipal Drainage Utility:
Year ended February Amount
2015 $ 19,221 2016 17,495 2017 12,381 2018 12,381
$ 61,478
Rental expense for the years ended February 28, 2014 and 2013 was $17,089 and $13,464, respectively.
(Continued)
90
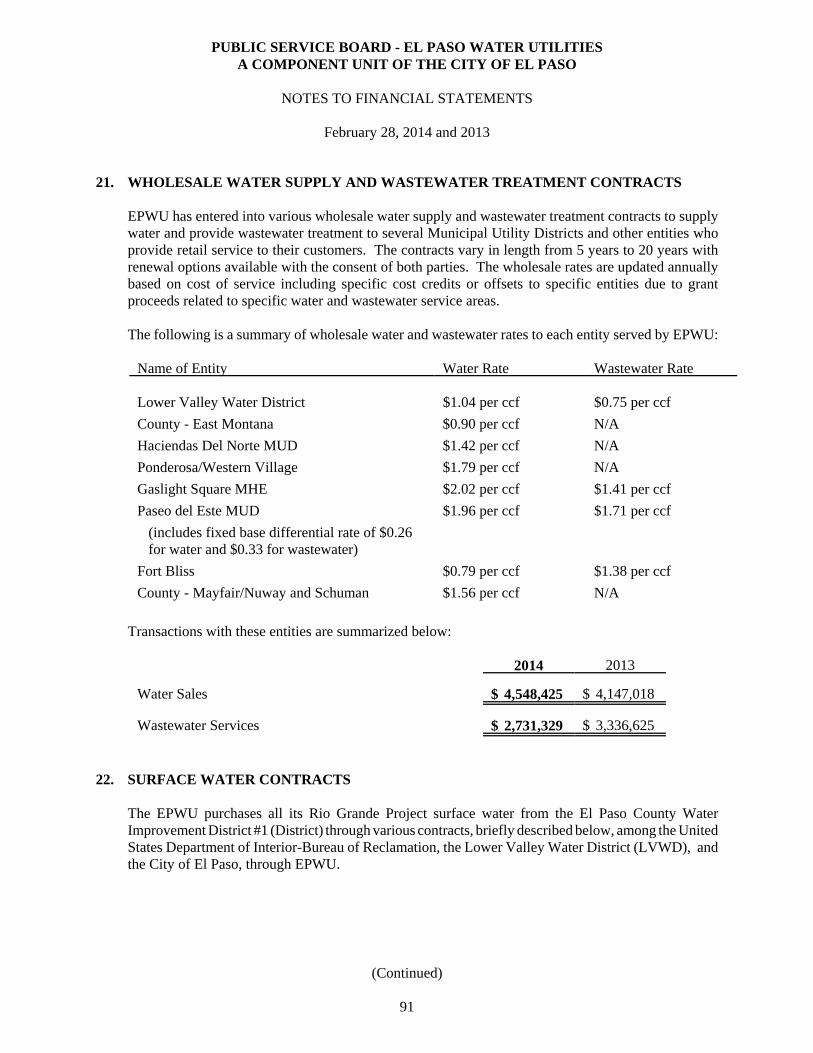
PUBLIC SERVICE BOARD - EL PASO WATER UTILITIESA COMPONENT UNIT OF THE CITY OF EL PASO
NOTES TO FINANCIAL STATEMENTS
February 28, 2014 and 2013
21. WHOLESALE WATER SUPPLY AND WASTEWATER TREATMENT CONTRACTS
EPWU has entered into various wholesale water supply and wastewater treatment contracts to supplywater and provide wastewater treatment to several Municipal Utility Districts and other entities whoprovide retail service to their customers. The contracts vary in length from 5 years to 20 years withrenewal options available with the consent of both parties. The wholesale rates are updated annuallybased on cost of service including specific cost credits or offsets to specific entities due to grantproceeds related to specific water and wastewater service areas.
The following is a summary of wholesale water and wastewater rates to each entity served by EPWU:
Name of Entity Water Rate Wastewater Rate
Lower Valley Water District $1.04 per ccf $0.75 per ccf
County - East Montana $0.90 per ccf N/A
Haciendas Del Norte MUD $1.42 per ccf N/A
Ponderosa/Western Village $1.79 per ccf N/A
Gaslight Square MHE $2.02 per ccf $1.41 per ccf
Paseo del Este MUD $1.96 per ccf $1.71 per ccf
(includes fixed base differential rate of $0.26for water and $0.33 for wastewater)
Fort Bliss $0.79 per ccf $1.38 per ccf
County - Mayfair/Nuway and Schuman $1.56 per ccf N/A
Transactions with these entities are summarized below:
2014 2013
Water Sales $ 4,548,425 $ 4,147,018
Wastewater Services $ 2,731,329 $ 3,336,625
22. SURFACE WATER CONTRACTS
The EPWU purchases all its Rio Grande Project surface water from the El Paso County WaterImprovement District #1 (District) through various contracts, briefly described below, among the UnitedStates Department of Interior-Bureau of Reclamation, the Lower Valley Water District (LVWD), andthe City of El Paso, through EPWU.
(Continued)
91
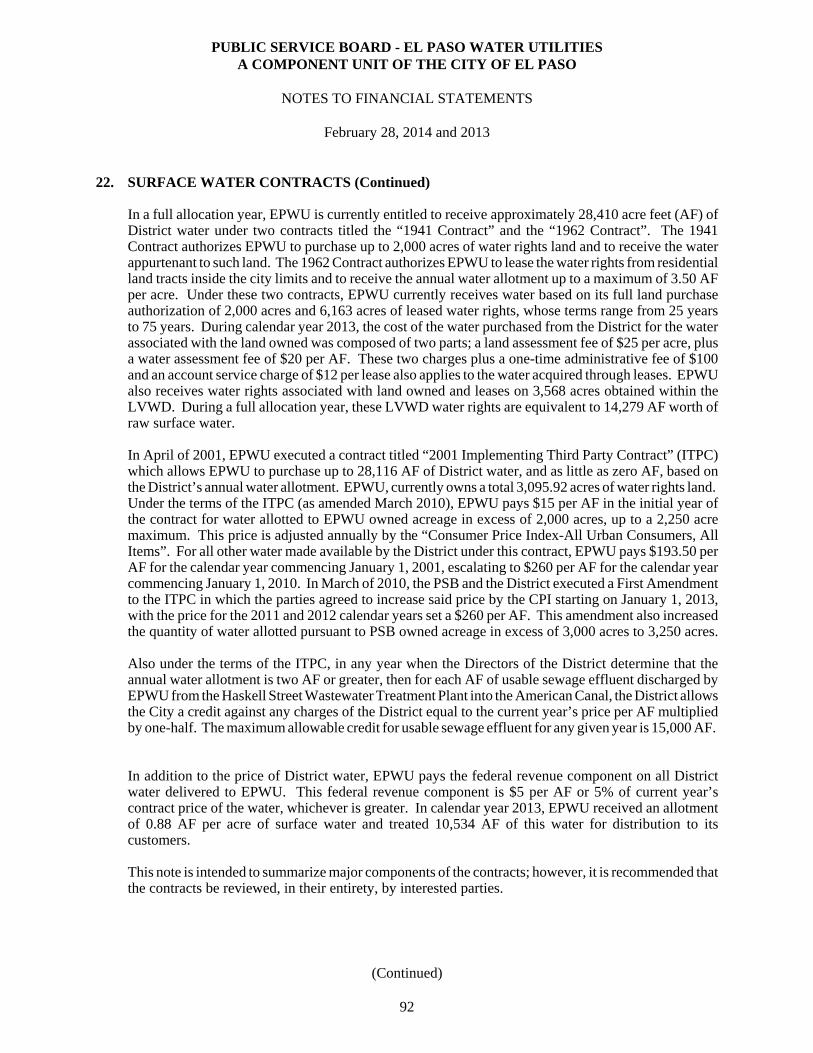
PUBLIC SERVICE BOARD - EL PASO WATER UTILITIESA COMPONENT UNIT OF THE CITY OF EL PASO
NOTES TO FINANCIAL STATEMENTS
February 28, 2014 and 2013
22. SURFACE WATER CONTRACTS (Continued)
In a full allocation year, EPWU is currently entitled to receive approximately 28,410 acre feet (AF) ofDistrict water under two contracts titled the “1941 Contract” and the “1962 Contract”. The 1941Contract authorizes EPWU to purchase up to 2,000 acres of water rights land and to receive the waterappurtenant to such land. The 1962 Contract authorizes EPWU to lease the water rights from residentialland tracts inside the city limits and to receive the annual water allotment up to a maximum of 3.50 AFper acre. Under these two contracts, EPWU currently receives water based on its full land purchaseauthorization of 2,000 acres and 6,163 acres of leased water rights, whose terms range from 25 yearsto 75 years. During calendar year 2013, the cost of the water purchased from the District for the waterassociated with the land owned was composed of two parts; a land assessment fee of $25 per acre, plusa water assessment fee of $20 per AF. These two charges plus a one-time administrative fee of $100and an account service charge of $12 per lease also applies to the water acquired through leases. EPWUalso receives water rights associated with land owned and leases on 3,568 acres obtained within theLVWD. During a full allocation year, these LVWD water rights are equivalent to 14,279 AF worth ofraw surface water.
In April of 2001, EPWU executed a contract titled “2001 Implementing Third Party Contract” (ITPC)which allows EPWU to purchase up to 28,116 AF of District water, and as little as zero AF, based onthe District’s annual water allotment. EPWU, currently owns a total 3,095.92 acres of water rights land. Under the terms of the ITPC (as amended March 2010), EPWU pays $15 per AF in the initial year ofthe contract for water allotted to EPWU owned acreage in excess of 2,000 acres, up to a 2,250 acremaximum. This price is adjusted annually by the “Consumer Price Index-All Urban Consumers, AllItems”. For all other water made available by the District under this contract, EPWU pays $193.50 perAF for the calendar year commencing January 1, 2001, escalating to $260 per AF for the calendar yearcommencing January 1, 2010. In March of 2010, the PSB and the District executed a First Amendmentto the ITPC in which the parties agreed to increase said price by the CPI starting on January 1, 2013,with the price for the 2011 and 2012 calendar years set a $260 per AF. This amendment also increasedthe quantity of water allotted pursuant to PSB owned acreage in excess of 3,000 acres to 3,250 acres.
Also under the terms of the ITPC, in any year when the Directors of the District determine that theannual water allotment is two AF or greater, then for each AF of usable sewage effluent discharged byEPWU from the Haskell Street Wastewater Treatment Plant into the American Canal, the District allowsthe City a credit against any charges of the District equal to the current year’s price per AF multipliedby one-half. The maximum allowable credit for usable sewage effluent for any given year is 15,000 AF.
In addition to the price of District water, EPWU pays the federal revenue component on all Districtwater delivered to EPWU. This federal revenue component is $5 per AF or 5% of current year’scontract price of the water, whichever is greater. In calendar year 2013, EPWU received an allotmentof 0.88 AF per acre of surface water and treated 10,534 AF of this water for distribution to itscustomers.
This note is intended to summarize major components of the contracts; however, it is recommended thatthe contracts be reviewed, in their entirety, by interested parties.
(Continued)
92
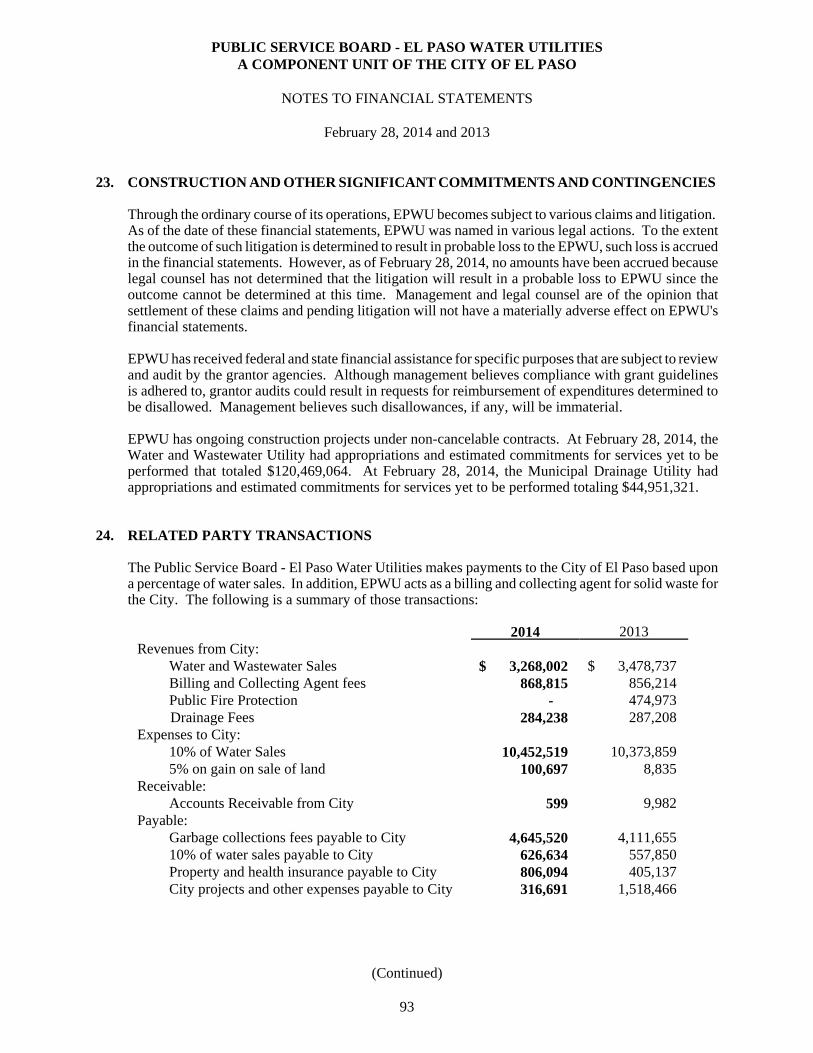
PUBLIC SERVICE BOARD - EL PASO WATER UTILITIESA COMPONENT UNIT OF THE CITY OF EL PASO
NOTES TO FINANCIAL STATEMENTS
February 28, 2014 and 2013
23. CONSTRUCTION AND OTHER SIGNIFICANT COMMITMENTS AND CONTINGENCIES
Through the ordinary course of its operations, EPWU becomes subject to various claims and litigation. As of the date of these financial statements, EPWU was named in various legal actions. To the extentthe outcome of such litigation is determined to result in probable loss to the EPWU, such loss is accruedin the financial statements. However, as of February 28, 2014, no amounts have been accrued becauselegal counsel has not determined that the litigation will result in a probable loss to EPWU since theoutcome cannot be determined at this time. Management and legal counsel are of the opinion thatsettlement of these claims and pending litigation will not have a materially adverse effect on EPWU'sfinancial statements.
EPWU has received federal and state financial assistance for specific purposes that are subject to reviewand audit by the grantor agencies. Although management believes compliance with grant guidelinesis adhered to, grantor audits could result in requests for reimbursement of expenditures determined tobe disallowed. Management believes such disallowances, if any, will be immaterial.
EPWU has ongoing construction projects under non-cancelable contracts. At February 28, 2014, theWater and Wastewater Utility had appropriations and estimated commitments for services yet to beperformed that totaled $120,469,064. At February 28, 2014, the Municipal Drainage Utility hadappropriations and estimated commitments for services yet to be performed totaling $44,951,321.
24. RELATED PARTY TRANSACTIONS
The Public Service Board - El Paso Water Utilities makes payments to the City of El Paso based upona percentage of water sales. In addition, EPWU acts as a billing and collecting agent for solid waste forthe City. The following is a summary of those transactions:
2014 2013Revenues from City:
Water and Wastewater Sales $ 3,268,002 $ 3,478,737 Billing and Collecting Agent fees 868,815 856,214 Public Fire Protection - 474,973
Drainage Fees 284,238 287,208 Expenses to City:
10% of Water Sales 10,452,519 10,373,859 5% on gain on sale of land 100,697 8,835
Receivable:Accounts Receivable from City 599 9,982
Payable:Garbage collections fees payable to City 4,645,520 4,111,655 10% of water sales payable to City 626,634 557,850 Property and health insurance payable to City 806,094 405,137 City projects and other expenses payable to City 316,691 1,518,466
(Continued)
93
PUBLIC SERVICE BOARD - EL PASO WATER UTILITIESA COMPONENT UNIT OF THE CITY OF EL PASO
NOTES TO FINANCIAL STATEMENTS
February 28, 2014 and 2013
25. RESTRICTED NET POSITION
Amounts have been restricted for construction projects and for payment of bonded debt.
26. RECLASSIFICATIONS
Certain amounts presented in the prior year data have been reclassified in order to be consistent withthe current year’s presentation.
27. PRIOR PERIOD RESTATEMENT AND ADJUSTMENTS
In fiscal year 2014, EPWU adopted GASB Statement No. 65 (GASB 65), Items Previously Reported as Assets and Liabilities. GASB 65 affects the way EPWU accounts for debt issue costs and reportslosses associated with debt refunding. Previously, the applicable guidance dictated that EPWUcapitalize debt issue costs and amortize them over the life of the debt. Debt issue costs are now treatedas an expense in the period incurred. Loss on debt refunding is now reported as a deferred outflow ofresource instead of a reduction to outstanding debt in the Statement of Net Position. GASB 65 requiresall periods presented to be restated to conform to the new requirements. As such, the financialstatements as of February 28, 2013 have been restated, and a prior period adjustment was made in fiscalyear 2013 for prior years that reduced the net position for the Water and Wastewater Utility Fund by$5,498,679 and the Municipal Drainage Fund by $385,506.
In addition, the estimated gain on a land transfer was restated for the year ended February 28, 2013which reduced the net position for the Water and Wastewater Utility Fund for fiscal year 2013 in theamount of $913,442.
94

95
REQUIRED SUPPLEMENTARY INFORMATION
FOR
OTHER POST-EMPLOYMENT BENEFITS PLAN
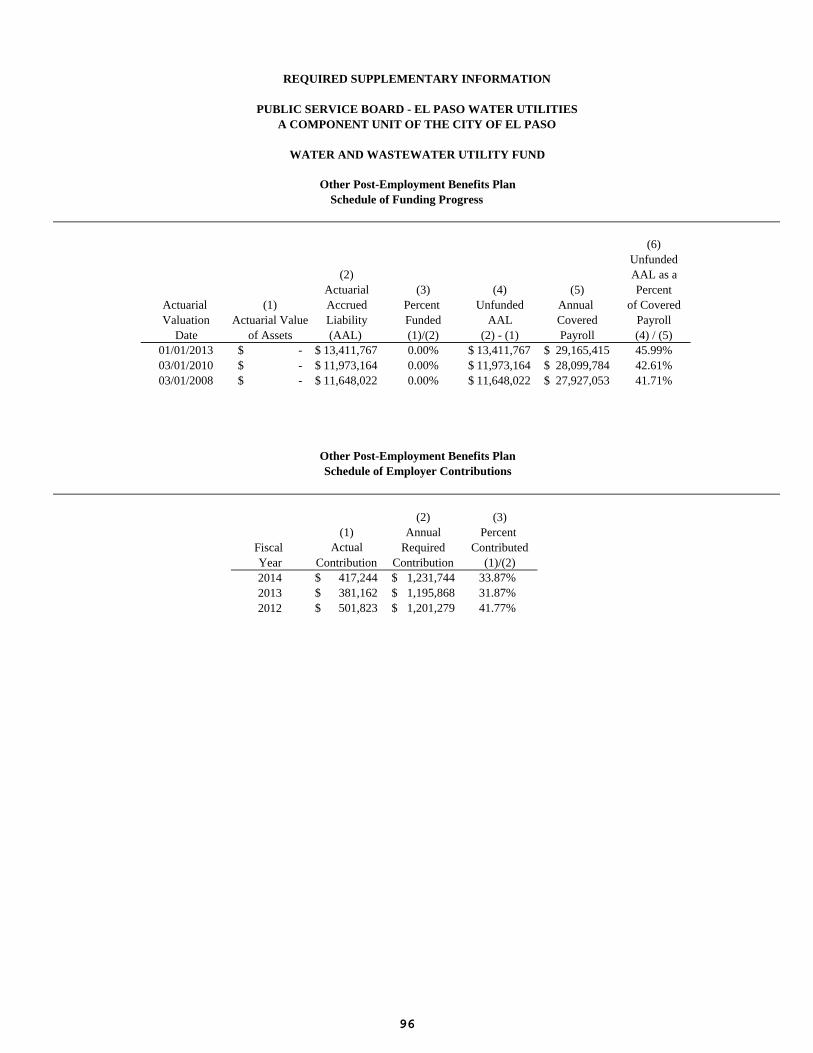
(6)Unfunded
(2) AAL as aActuarial (3) (4) (5) Percent
Actuarial (1) Accrued Percent Unfunded Annual of CoveredValuation Actuarial Value Liability Funded AAL Covered Payroll
Date of Assets (AAL) (1)/(2) (2) - (1) Payroll (4) / (5)01/01/2013 -$ 13,411,767$ 0.00% 13,411,767$ 29,165,415$ 45.99%03/01/2010 -$ 11,973,164$ 0.00% 11,973,164$ 28,099,784$ 42.61%03/01/2008 -$ 11,648,022$ 0.00% 11,648,022$ 27,927,053$ 41.71%
(2) (3)(1) Annual Percent
Fiscal Actual Required ContributedYear Contribution Contribution (1)/(2)2014 417,244$ 1,231,744$ 33.87%2013 381,162$ 1,195,868$ 31.87%2012 501,823$ 1,201,279$ 41.77%
Other Post-Employment Benefits PlanSchedule of Employer Contributions
REQUIRED SUPPLEMENTARY INFORMATION
PUBLIC SERVICE BOARD - EL PASO WATER UTILITIESA COMPONENT UNIT OF THE CITY OF EL PASO
WATER AND WASTEWATER UTILITY FUND
Other Post-Employment Benefits PlanSchedule of Funding Progress
96
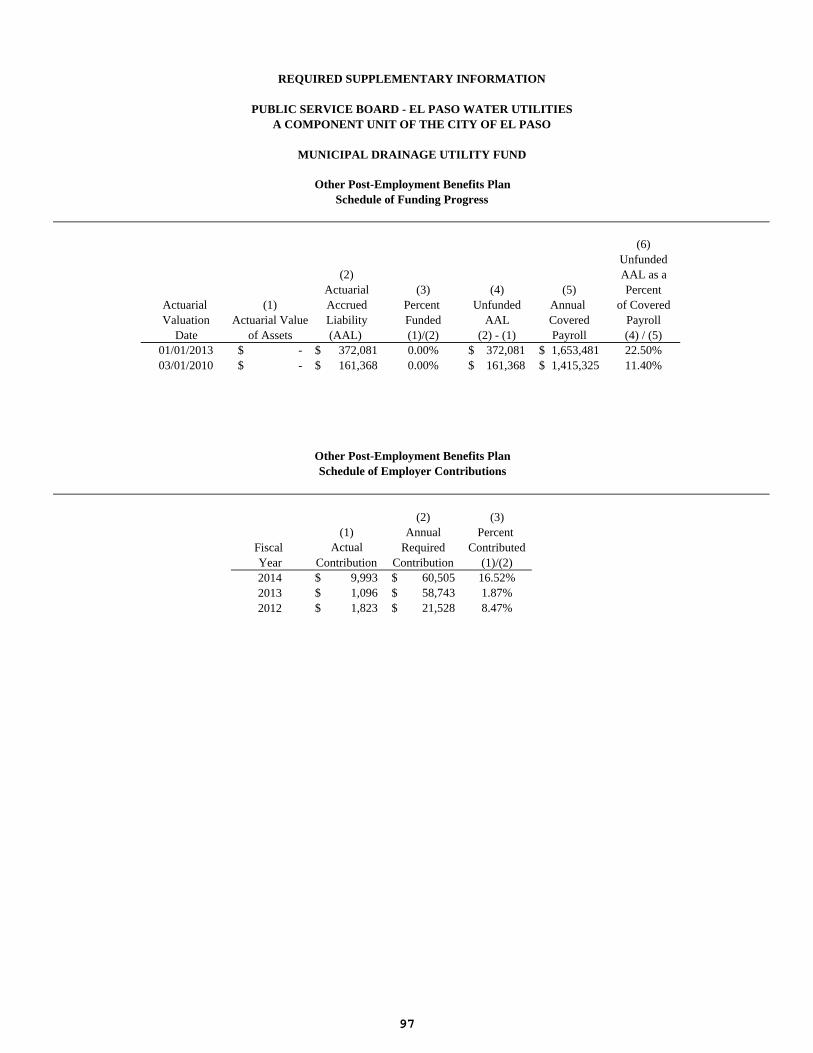
(6)Unfunded
(2) AAL as aActuarial (3) (4) (5) Percent
Actuarial (1) Accrued Percent Unfunded Annual of CoveredValuation Actuarial Value Liability Funded AAL Covered Payroll
Date of Assets (AAL) (1)/(2) (2) - (1) Payroll (4) / (5)01/01/2013 -$ 372,081$ 0.00% 372,081$ 1,653,481$ 22.50%03/01/2010 -$ 161,368$ 0.00% 161,368$ 1,415,325$ 11.40%
(2) (3)(1) Annual Percent
Fiscal Actual Required ContributedYear Contribution Contribution (1)/(2)2014 9,993$ 60,505$ 16.52%2013 1,096$ 58,743$ 1.87%2012 1,823$ 21,528$ 8.47%
Other Post-Employment Benefits PlanSchedule of Employer Contributions
REQUIRED SUPPLEMENTARY INFORMATION
PUBLIC SERVICE BOARD - EL PASO WATER UTILITIESA COMPONENT UNIT OF THE CITY OF EL PASO
MUNICIPAL DRAINAGE UTILITY FUND
Other Post-Employment Benefits Plan Schedule of Funding Progress
97

98
SUPPLEMENTARY SCHEDULES
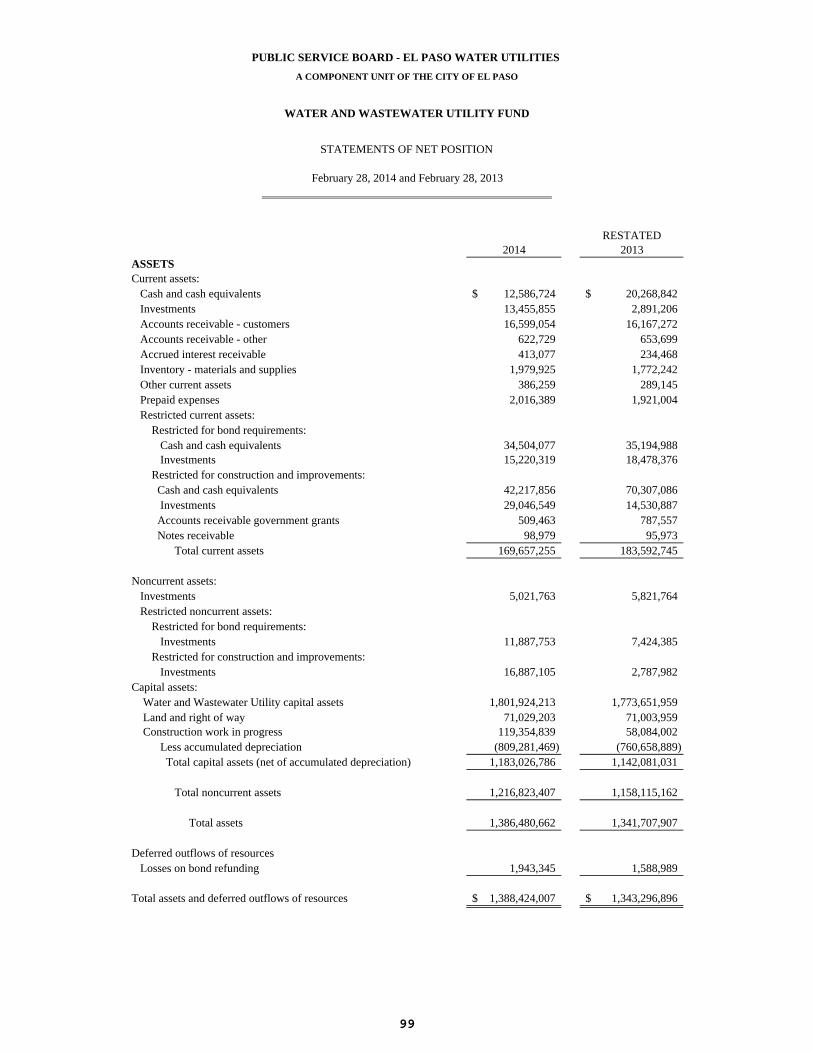
PUBLIC SERVICE BOARD - EL PASO WATER UTILITIES
A COMPONENT UNIT OF THE CITY OF EL PASO
WATER AND WASTEWATER UTILITY FUND
February 28, 2014 and February 28, 2013
RESTATED2014 2013
ASSETSCurrent assets: Cash and cash equivalents 12,586,724$ 20,268,842$ Investments 13,455,855 2,891,206 Accounts receivable - customers 16,599,054 16,167,272 Accounts receivable - other 622,729 653,699 Accrued interest receivable 413,077 234,468 Inventory - materials and supplies 1,979,925 1,772,242 Other current assets 386,259 289,145 Prepaid expenses 2,016,389 1,921,004 Restricted current assets: Restricted for bond requirements: Cash and cash equivalents 34,504,077 35,194,988 Investments 15,220,319 18,478,376 Restricted for construction and improvements: Cash and cash equivalents 42,217,856 70,307,086 Investments 29,046,549 14,530,887 Accounts receivable government grants 509,463 787,557 Notes receivable 98,979 95,973 Total current assets 169,657,255 183,592,745
Noncurrent assets: Investments 5,021,763 5,821,764 Restricted noncurrent assets: Restricted for bond requirements: Investments 11,887,753 7,424,385 Restricted for construction and improvements: Investments 16,887,105 2,787,982Capital assets: Water and Wastewater Utility capital assets 1,801,924,213 1,773,651,959 Land and right of way 71,029,203 71,003,959 Construction work in progress 119,354,839 58,084,002 Less accumulated depreciation (809,281,469) (760,658,889) Total capital assets (net of accumulated depreciation) 1,183,026,786 1,142,081,031
Total noncurrent assets 1,216,823,407 1,158,115,162
Total assets 1,386,480,662 1,341,707,907
Deferred outflows of resources Losses on bond refunding 1,943,345 1,588,989
Total assets and deferred outflows of resources 1,388,424,007$ 1,343,296,896$
STATEMENTS OF NET POSITION
99
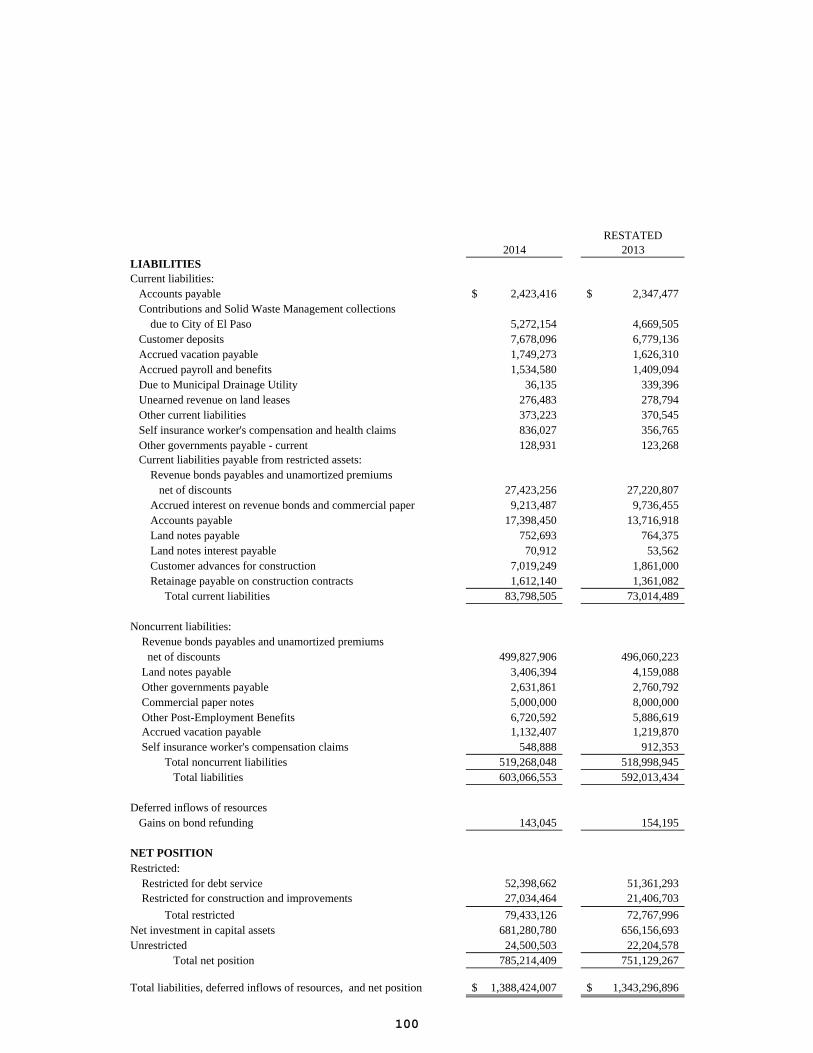
RESTATED2014 2013
LIABILITIESCurrent liabilities: Accounts payable 2,423,416$ 2,347,477$ Contributions and Solid Waste Management collections due to City of El Paso 5,272,154 4,669,505 Customer deposits 7,678,096 6,779,136 Accrued vacation payable 1,749,273 1,626,310 Accrued payroll and benefits 1,534,580 1,409,094 Due to Municipal Drainage Utility 36,135 339,396 Unearned revenue on land leases 276,483 278,794 Other current liabilities 373,223 370,545 Self insurance worker's compensation and health claims 836,027 356,765 Other governments payable - current 128,931 123,268 Current liabilities payable from restricted assets: Revenue bonds payables and unamortized premiums net of discounts 27,423,256 27,220,807 Accrued interest on revenue bonds and commercial paper 9,213,487 9,736,455 Accounts payable 17,398,450 13,716,918 Land notes payable 752,693 764,375 Land notes interest payable 70,912 53,562 Customer advances for construction 7,019,249 1,861,000 Retainage payable on construction contracts 1,612,140 1,361,082 Total current liabilities 83,798,505 73,014,489
Noncurrent liabilities: Revenue bonds payables and unamortized premiums net of discounts 499,827,906 496,060,223 Land notes payable 3,406,394 4,159,088 Other governments payable 2,631,861 2,760,792 Commercial paper notes 5,000,000 8,000,000 Other Post-Employment Benefits 6,720,592 5,886,619 Accrued vacation payable 1,132,407 1,219,870 Self insurance worker's compensation claims 548,888 912,353 Total noncurrent liabilities 519,268,048 518,998,945 Total liabilities 603,066,553 592,013,434
Deferred inflows of resources Gains on bond refunding 143,045 154,195
NET POSITIONRestricted: Restricted for debt service 52,398,662 51,361,293 Restricted for construction and improvements 27,034,464 21,406,703
Total restricted 79,433,126 72,767,996Net investment in capital assets 681,280,780 656,156,693Unrestricted 24,500,503 22,204,578 Total net position 785,214,409 751,129,267
Total liabilities, deferred inflows of resources, and net position 1,388,424,007$ 1,343,296,896$
100
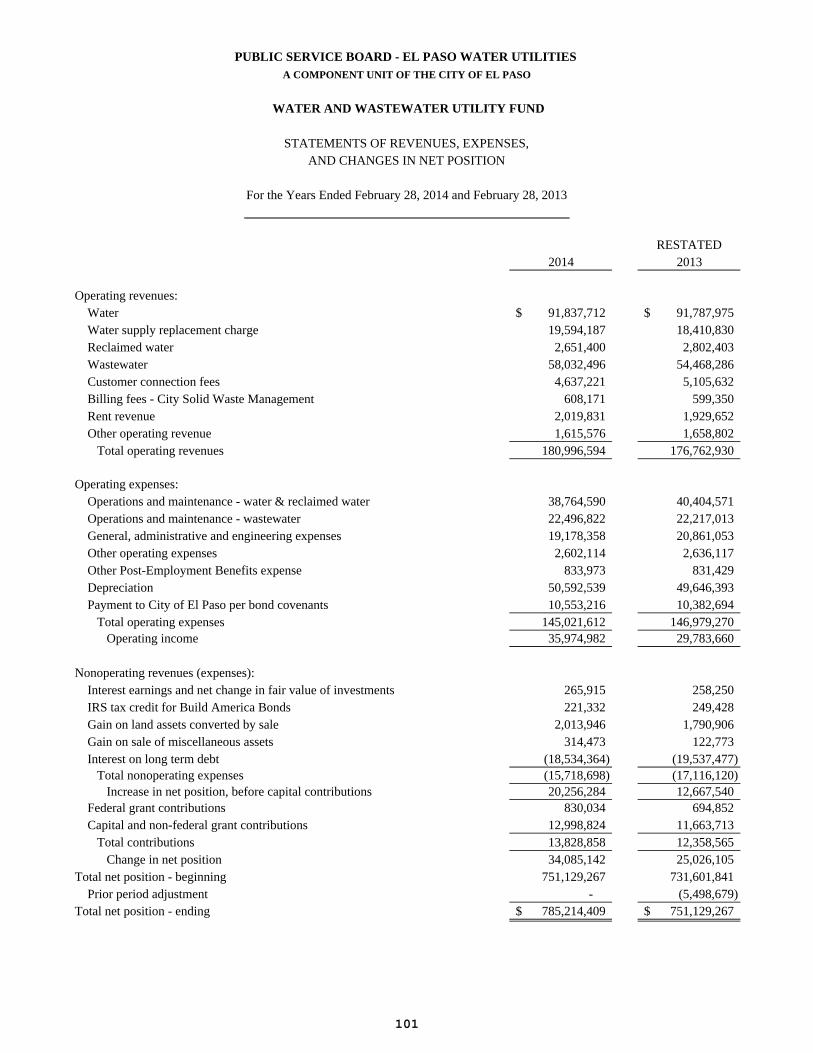
A COMPONENT UNIT OF THE CITY OF EL PASO
WATER AND WASTEWATER UTILITY FUND
STATEMENTS OF REVENUES, EXPENSES,AND CHANGES IN NET POSITION
For the Years Ended February 28, 2014 and February 28, 2013
RESTATED2014 2013
Operating revenues: Water 91,837,712$ 91,787,975$ Water supply replacement charge 19,594,187 18,410,830 Reclaimed water 2,651,400 2,802,403 Wastewater 58,032,496 54,468,286 Customer connection fees 4,637,221 5,105,632 Billing fees - City Solid Waste Management 608,171 599,350 Rent revenue 2,019,831 1,929,652 Other operating revenue 1,615,576 1,658,802 Total operating revenues 180,996,594 176,762,930
Operating expenses: Operations and maintenance - water & reclaimed water 38,764,590 40,404,571 Operations and maintenance - wastewater 22,496,822 22,217,013 General, administrative and engineering expenses 19,178,358 20,861,053 Other operating expenses 2,602,114 2,636,117 Other Post-Employment Benefits expense 833,973 831,429 Depreciation 50,592,539 49,646,393 Payment to City of El Paso per bond covenants 10,553,216 10,382,694 Total operating expenses 145,021,612 146,979,270 Operating income 35,974,982 29,783,660
Nonoperating revenues (expenses): Interest earnings and net change in fair value of investments 265,915 258,250 IRS tax credit for Build America Bonds 221,332 249,428 Gain on land assets converted by sale 2,013,946 1,790,906 Gain on sale of miscellaneous assets 314,473 122,773 Interest on long term debt (18,534,364) (19,537,477) Total nonoperating expenses (15,718,698) (17,116,120) Increase in net position, before capital contributions 20,256,284 12,667,540 Federal grant contributions 830,034 694,852 Capital and non-federal grant contributions 12,998,824 11,663,713 Total contributions 13,828,858 12,358,565 Change in net position 34,085,142 25,026,105Total net position - beginning 751,129,267 731,601,841 Prior period adjustment - (5,498,679)Total net position - ending 785,214,409$ 751,129,267$
PUBLIC SERVICE BOARD - EL PASO WATER UTILITIES
101

102
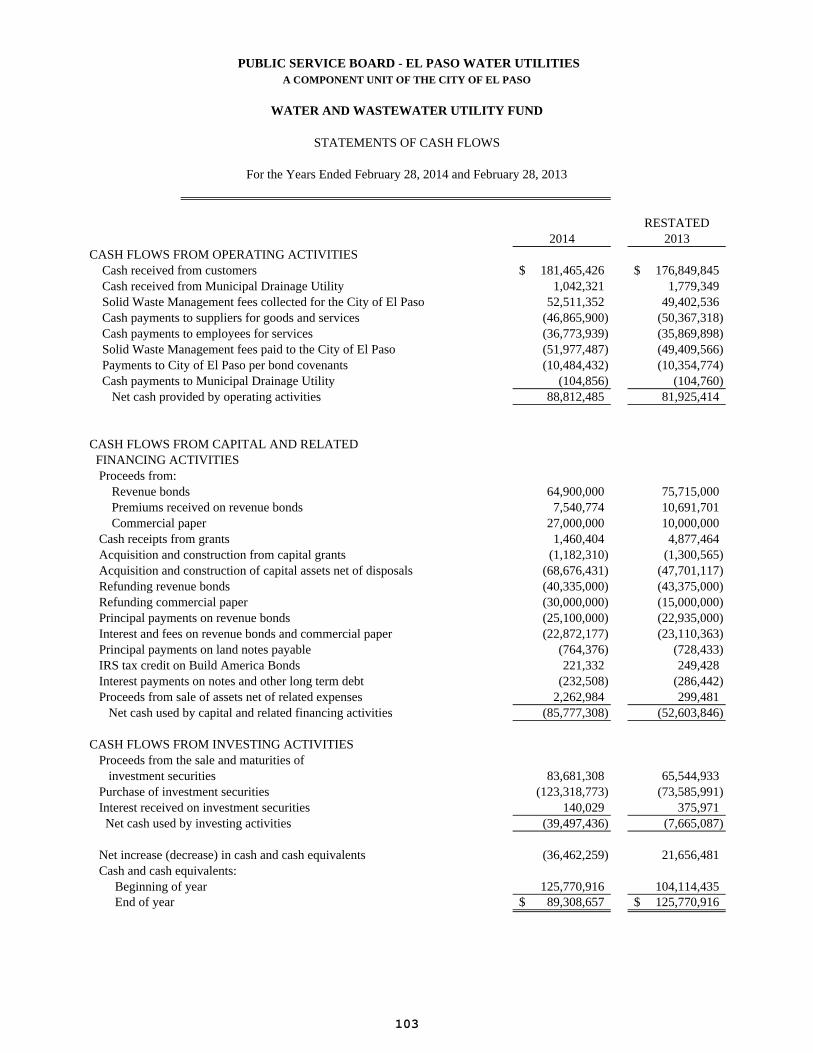
PUBLIC SERVICE BOARD - EL PASO WATER UTILITIESA COMPONENT UNIT OF THE CITY OF EL PASO
WATER AND WASTEWATER UTILITY FUND
STATEMENTS OF CASH FLOWS
For the Years Ended February 28, 2014 and February 28, 2013
RESTATED2014 2013
CASH FLOWS FROM OPERATING ACTIVITIES Cash received from customers 181,465,426$ 176,849,845$ Cash received from Municipal Drainage Utility 1,042,321 1,779,349 Solid Waste Management fees collected for the City of El Paso 52,511,352 49,402,536 Cash payments to suppliers for goods and services (46,865,900) (50,367,318) Cash payments to employees for services (36,773,939) (35,869,898) Solid Waste Management fees paid to the City of El Paso (51,977,487) (49,409,566) Payments to City of El Paso per bond covenants (10,484,432) (10,354,774) Cash payments to Municipal Drainage Utility (104,856) (104,760) Net cash provided by operating activities 88,812,485 81,925,414
CASH FLOWS FROM CAPITAL AND RELATED FINANCING ACTIVITIES Proceeds from: Revenue bonds 64,900,000 75,715,000 Premiums received on revenue bonds 7,540,774 10,691,701 Commercial paper 27,000,000 10,000,000 Cash receipts from grants 1,460,404 4,877,464 Acquisition and construction from capital grants (1,182,310) (1,300,565) Acquisition and construction of capital assets net of disposals (68,676,431) (47,701,117) Refunding revenue bonds (40,335,000) (43,375,000) Refunding commercial paper (30,000,000) (15,000,000) Principal payments on revenue bonds (25,100,000) (22,935,000) Interest and fees on revenue bonds and commercial paper (22,872,177) (23,110,363) Principal payments on land notes payable (764,376) (728,433) IRS tax credit on Build America Bonds 221,332 249,428 Interest payments on notes and other long term debt (232,508) (286,442) Proceeds from sale of assets net of related expenses 2,262,984 299,481 Net cash used by capital and related financing activities (85,777,308) (52,603,846)
CASH FLOWS FROM INVESTING ACTIVITIES Proceeds from the sale and maturities of investment securities 83,681,308 65,544,933 Purchase of investment securities (123,318,773) (73,585,991) Interest received on investment securities 140,029 375,971 Net cash used by investing activities (39,497,436) (7,665,087)
Net increase (decrease) in cash and cash equivalents (36,462,259) 21,656,481 Cash and cash equivalents: Beginning of year 125,770,916 104,114,435 End of year 89,308,657$ 125,770,916$
103
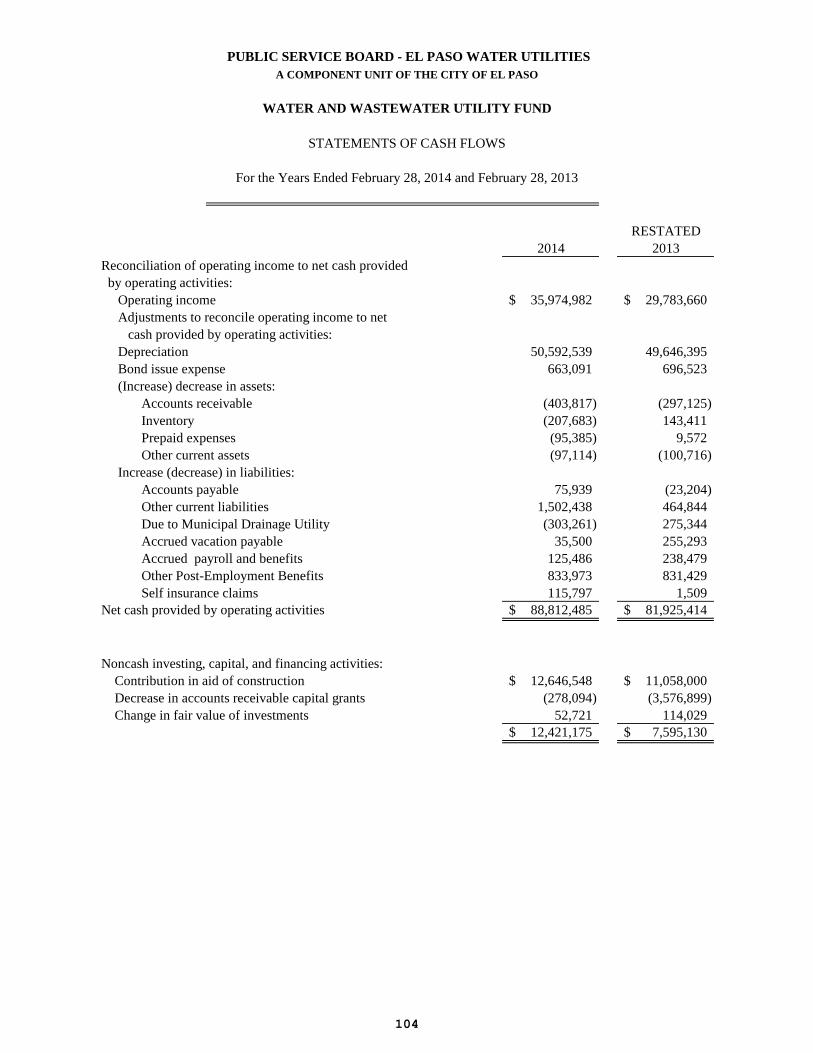
PUBLIC SERVICE BOARD - EL PASO WATER UTILITIESA COMPONENT UNIT OF THE CITY OF EL PASO
WATER AND WASTEWATER UTILITY FUND
STATEMENTS OF CASH FLOWS
For the Years Ended February 28, 2014 and February 28, 2013
RESTATED2014 2013
Reconciliation of operating income to net cash provided by operating activities: Operating income 35,974,982$ 29,783,660$ Adjustments to reconcile operating income to net cash provided by operating activities: Depreciation 50,592,539 49,646,395 Bond issue expense 663,091 696,523 (Increase) decrease in assets: Accounts receivable (403,817) (297,125) Inventory (207,683) 143,411 Prepaid expenses (95,385) 9,572 Other current assets (97,114) (100,716) Increase (decrease) in liabilities: Accounts payable 75,939 (23,204) Other current liabilities 1,502,438 464,844 Due to Municipal Drainage Utility (303,261) 275,344 Accrued vacation payable 35,500 255,293 Accrued payroll and benefits 125,486 238,479 Other Post-Employment Benefits 833,973 831,429 Self insurance claims 115,797 1,509Net cash provided by operating activities 88,812,485$ 81,925,414$
Noncash investing, capital, and financing activities: Contribution in aid of construction 12,646,548$ 11,058,000$ Decrease in accounts receivable capital grants (278,094) (3,576,899) Change in fair value of investments 52,721 114,029
12,421,175$ 7,595,130$
104
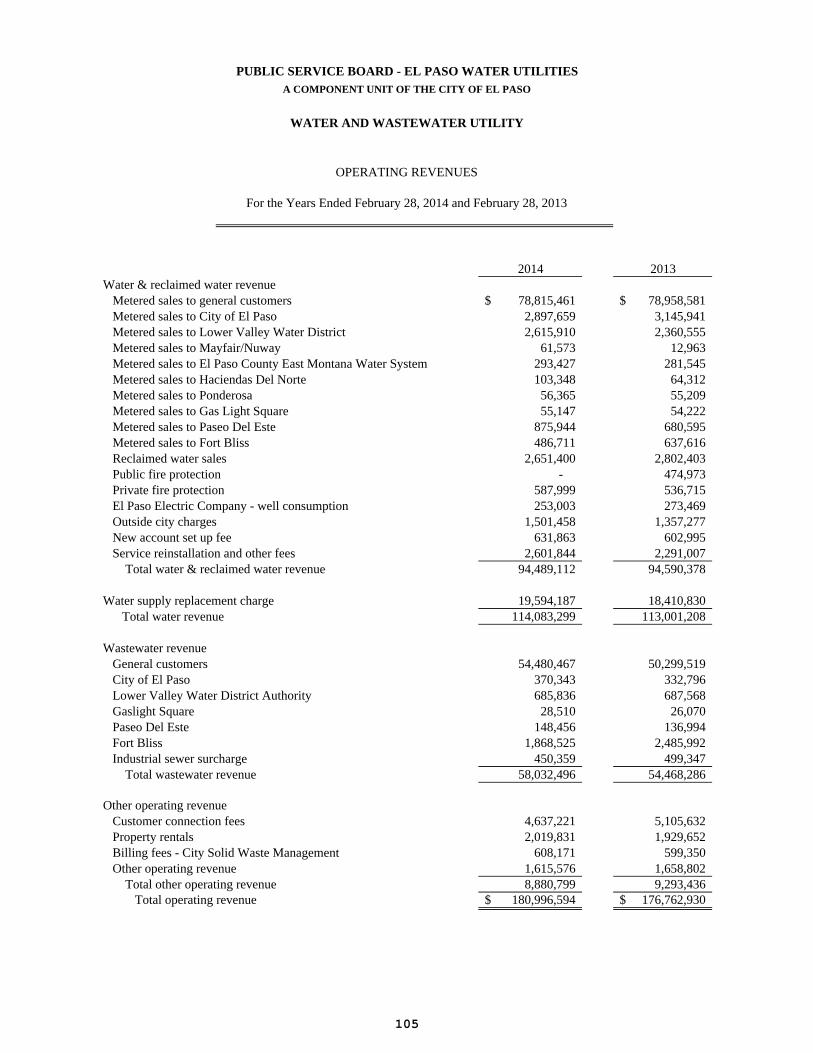
PUBLIC SERVICE BOARD - EL PASO WATER UTILITIESA COMPONENT UNIT OF THE CITY OF EL PASO
WATER AND WASTEWATER UTILITY
OPERATING REVENUES
For the Years Ended February 28, 2014 and February 28, 2013
2014 2013Water & reclaimed water revenue Metered sales to general customers 78,815,461$ 78,958,581$ Metered sales to City of El Paso 2,897,659 3,145,941 Metered sales to Lower Valley Water District 2,615,910 2,360,555 Metered sales to Mayfair/Nuway 61,573 12,963 Metered sales to El Paso County East Montana Water System 293,427 281,545 Metered sales to Haciendas Del Norte 103,348 64,312 Metered sales to Ponderosa 56,365 55,209 Metered sales to Gas Light Square 55,147 54,222 Metered sales to Paseo Del Este 875,944 680,595 Metered sales to Fort Bliss 486,711 637,616 Reclaimed water sales 2,651,400 2,802,403 Public fire protection - 474,973 Private fire protection 587,999 536,715 El Paso Electric Company - well consumption 253,003 273,469 Outside city charges 1,501,458 1,357,277 New account set up fee 631,863 602,995 Service reinstallation and other fees 2,601,844 2,291,007 Total water & reclaimed water revenue 94,489,112 94,590,378
Water supply replacement charge 19,594,187 18,410,830 Total water revenue 114,083,299 113,001,208
Wastewater revenue General customers 54,480,467 50,299,519 City of El Paso 370,343 332,796 Lower Valley Water District Authority 685,836 687,568 Gaslight Square 28,510 26,070 Paseo Del Este 148,456 136,994 Fort Bliss 1,868,525 2,485,992 Industrial sewer surcharge 450,359 499,347 Total wastewater revenue 58,032,496 54,468,286
Other operating revenue Customer connection fees 4,637,221 5,105,632 Property rentals 2,019,831 1,929,652 Billing fees - City Solid Waste Management 608,171 599,350 Other operating revenue 1,615,576 1,658,802 Total other operating revenue 8,880,799 9,293,436 Total operating revenue 180,996,594$ 176,762,930$
105
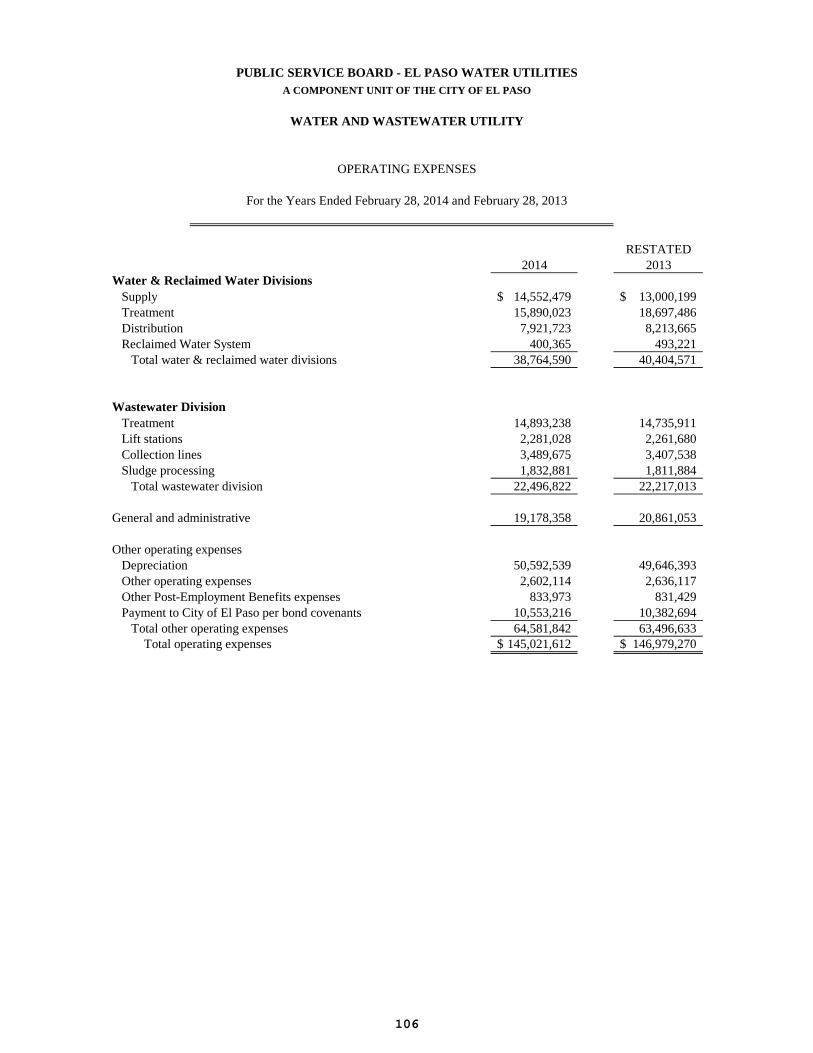
OPERATING EXPENSES
For the Years Ended February 28, 2014 and February 28, 2013
RESTATED2014 2013
Water & Reclaimed Water Divisions Supply 14,552,479$ 13,000,199$ Treatment 15,890,023 18,697,486 Distribution 7,921,723 8,213,665 Reclaimed Water System 400,365 493,221 Total water & reclaimed water divisions 38,764,590 40,404,571
Wastewater Division Treatment 14,893,238 14,735,911 Lift stations 2,281,028 2,261,680 Collection lines 3,489,675 3,407,538 Sludge processing 1,832,881 1,811,884 Total wastewater division 22,496,822 22,217,013
General and administrative 19,178,358 20,861,053
Other operating expenses Depreciation 50,592,539 49,646,393 Other operating expenses 2,602,114 2,636,117 Other Post-Employment Benefits expenses 833,973 831,429 Payment to City of El Paso per bond covenants 10,553,216 10,382,694 Total other operating expenses 64,581,842 63,496,633 Total operating expenses 145,021,612$ 146,979,270$
WATER AND WASTEWATER UTILITY
A COMPONENT UNIT OF THE CITY OF EL PASO
PUBLIC SERVICE BOARD - EL PASO WATER UTILITIES
106
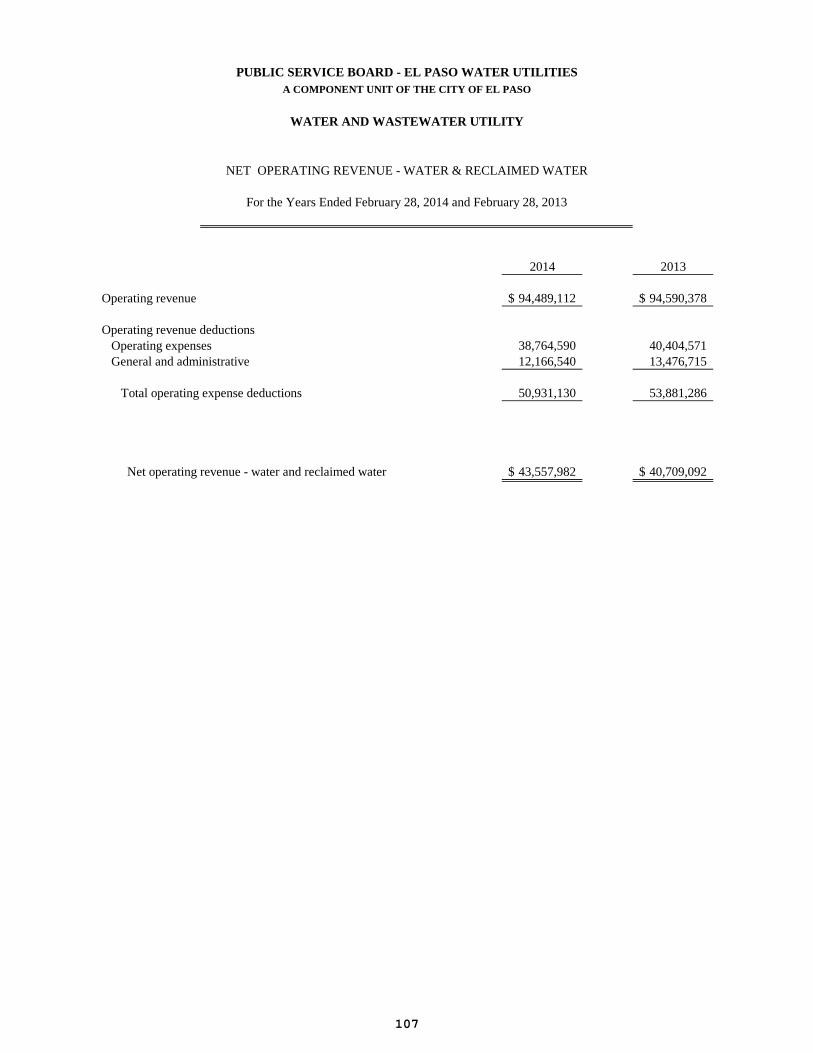
PUBLIC SERVICE BOARD - EL PASO WATER UTILITIESA COMPONENT UNIT OF THE CITY OF EL PASO
WATER AND WASTEWATER UTILITY
NET OPERATING REVENUE - WATER & RECLAIMED WATER
For the Years Ended February 28, 2014 and February 28, 2013
2014 2013
Operating revenue 94,489,112$ 94,590,378$
Operating revenue deductions Operating expenses 38,764,590 40,404,571 General and administrative 12,166,540 13,476,715
Total operating expense deductions 50,931,130 53,881,286
Net operating revenue - water and reclaimed water 43,557,982$ 40,709,092$
107
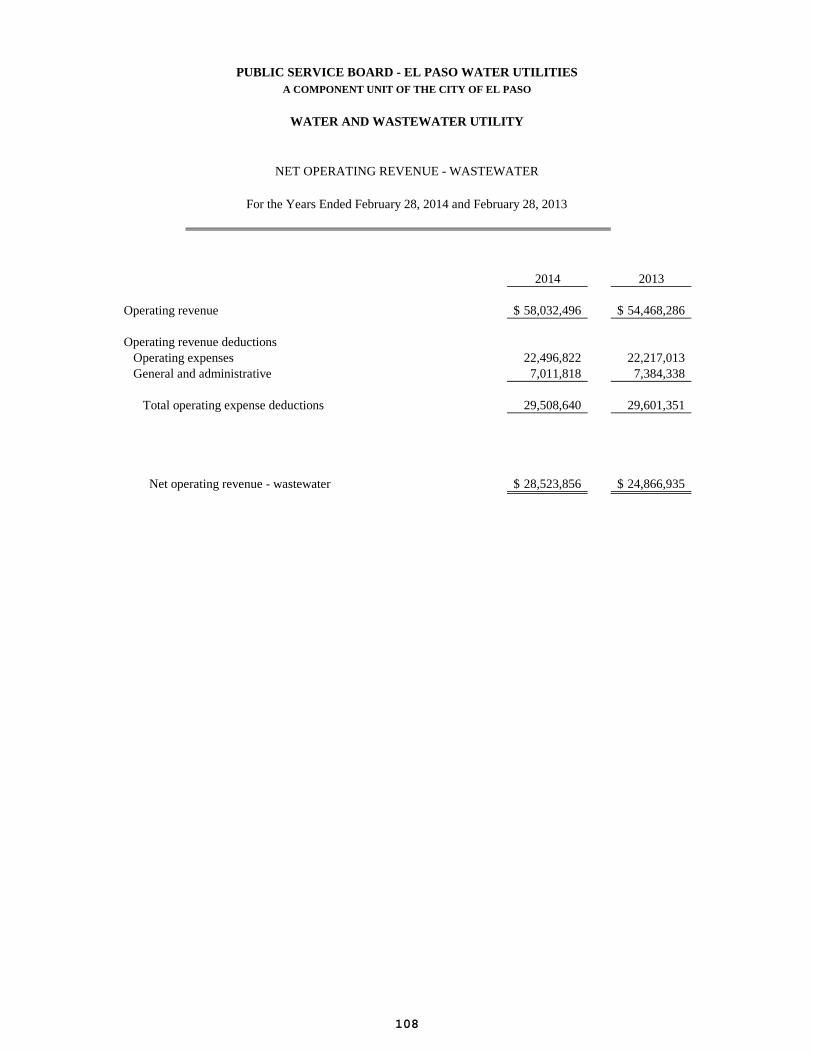
PUBLIC SERVICE BOARD - EL PASO WATER UTILITIESA COMPONENT UNIT OF THE CITY OF EL PASO
WATER AND WASTEWATER UTILITY
NET OPERATING REVENUE - WASTEWATER
For the Years Ended February 28, 2014 and February 28, 2013
2014 2013
Operating revenue 58,032,496$ 54,468,286$
Operating revenue deductions Operating expenses 22,496,822 22,217,013 General and administrative 7,011,818 7,384,338
Total operating expense deductions 29,508,640 29,601,351
Net operating revenue - wastewater 28,523,856$ 24,866,935$
108
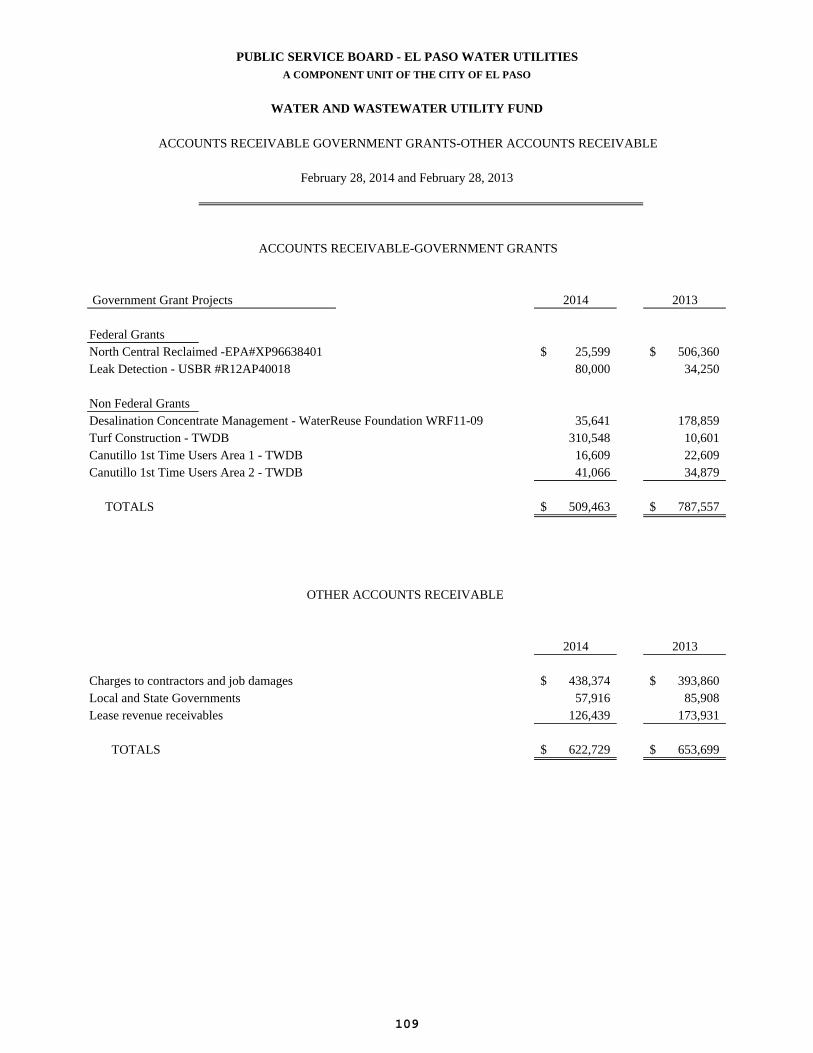
PUBLIC SERVICE BOARD - EL PASO WATER UTILITIESA COMPONENT UNIT OF THE CITY OF EL PASO
WATER AND WASTEWATER UTILITY FUND
February 28, 2014 and February 28, 2013
Government Grant Projects 2014 2013
Federal GrantsNorth Central Reclaimed -EPA#XP96638401 25,599$ 506,360$Leak Detection - USBR #R12AP40018 80,000 34,250
Non Federal GrantsDesalination Concentrate Management - WaterReuse Foundation WRF11-09 35,641 178,859Turf Construction - TWDB 310,548 10,601Canutillo 1st Time Users Area 1 - TWDB 16,609 22,609Canutillo 1st Time Users Area 2 - TWDB 41,066 34,879
TOTALS 509,463$ 787,557$
OTHER ACCOUNTS RECEIVABLE
2014 2013
Charges to contractors and job damages 438,374$ 393,860$Local and State Governments 57,916 85,908Lease revenue receivables 126,439 173,931
TOTALS 622,729$ 653,699$
ACCOUNTS RECEIVABLE-GOVERNMENT GRANTS
ACCOUNTS RECEIVABLE GOVERNMENT GRANTS-OTHER ACCOUNTS RECEIVABLE
109
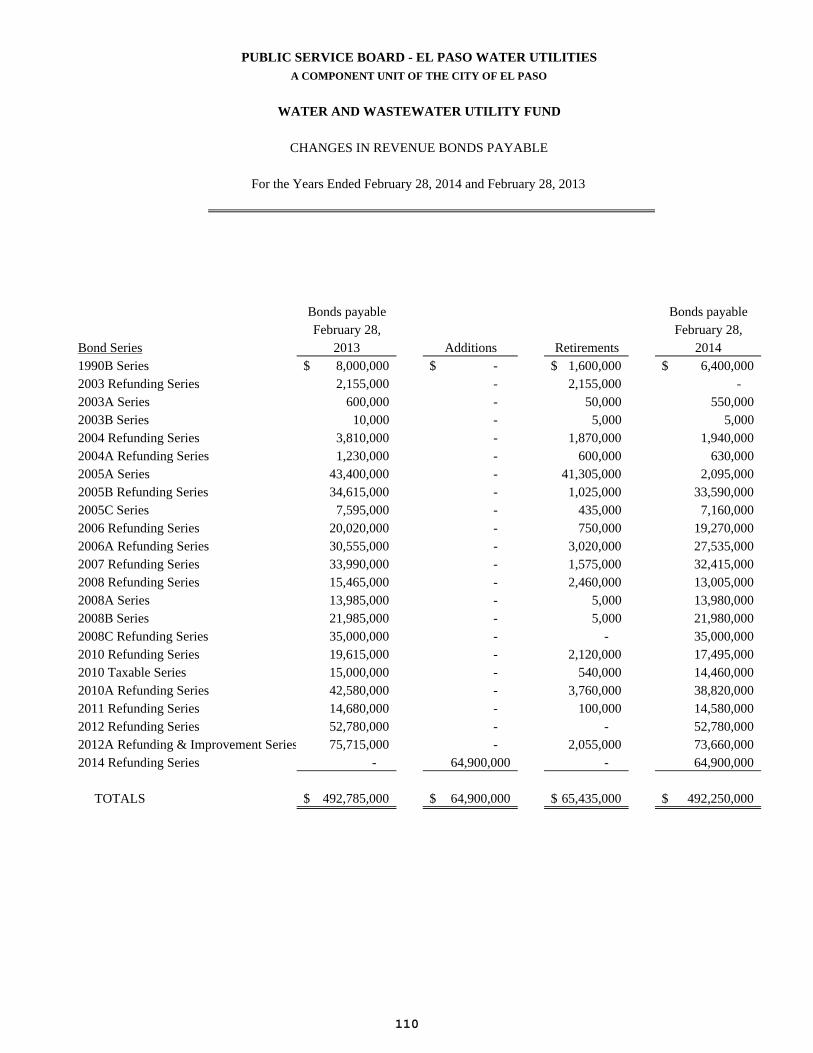
PUBLIC SERVICE BOARD - EL PASO WATER UTILITIESA COMPONENT UNIT OF THE CITY OF EL PASO
WATER AND WASTEWATER UTILITY FUND
CHANGES IN REVENUE BONDS PAYABLE
For the Years Ended February 28, 2014 and February 28, 2013
Bonds payable Bonds payableFebruary 28, February 28,
Bond Series 2013 Additions Retirements 20141990B Series 8,000,000$ -$ 1,600,000$ 6,400,000$2003 Refunding Series 2,155,000 - 2,155,000 -2003A Series 600,000 - 50,000 550,0002003B Series 10,000 - 5,000 5,0002004 Refunding Series 3,810,000 - 1,870,000 1,940,0002004A Refunding Series 1,230,000 - 600,000 630,0002005A Series 43,400,000 - 41,305,000 2,095,0002005B Refunding Series 34,615,000 - 1,025,000 33,590,0002005C Series 7,595,000 - 435,000 7,160,0002006 Refunding Series 20,020,000 - 750,000 19,270,0002006A Refunding Series 30,555,000 - 3,020,000 27,535,0002007 Refunding Series 33,990,000 - 1,575,000 32,415,0002008 Refunding Series 15,465,000 - 2,460,000 13,005,0002008A Series 13,985,000 - 5,000 13,980,0002008B Series 21,985,000 - 5,000 21,980,0002008C Refunding Series 35,000,000 - - 35,000,0002010 Refunding Series 19,615,000 - 2,120,000 17,495,0002010 Taxable Series 15,000,000 - 540,000 14,460,0002010A Refunding Series 42,580,000 - 3,760,000 38,820,0002011 Refunding Series 14,680,000 - 100,000 14,580,0002012 Refunding Series 52,780,000 - - 52,780,0002012A Refunding & Improvement Series 75,715,000 - 2,055,000 73,660,0002014 Refunding Series - 64,900,000 - 64,900,000
TOTALS 492,785,000$ 64,900,000$ 65,435,000$ 492,250,000$
110
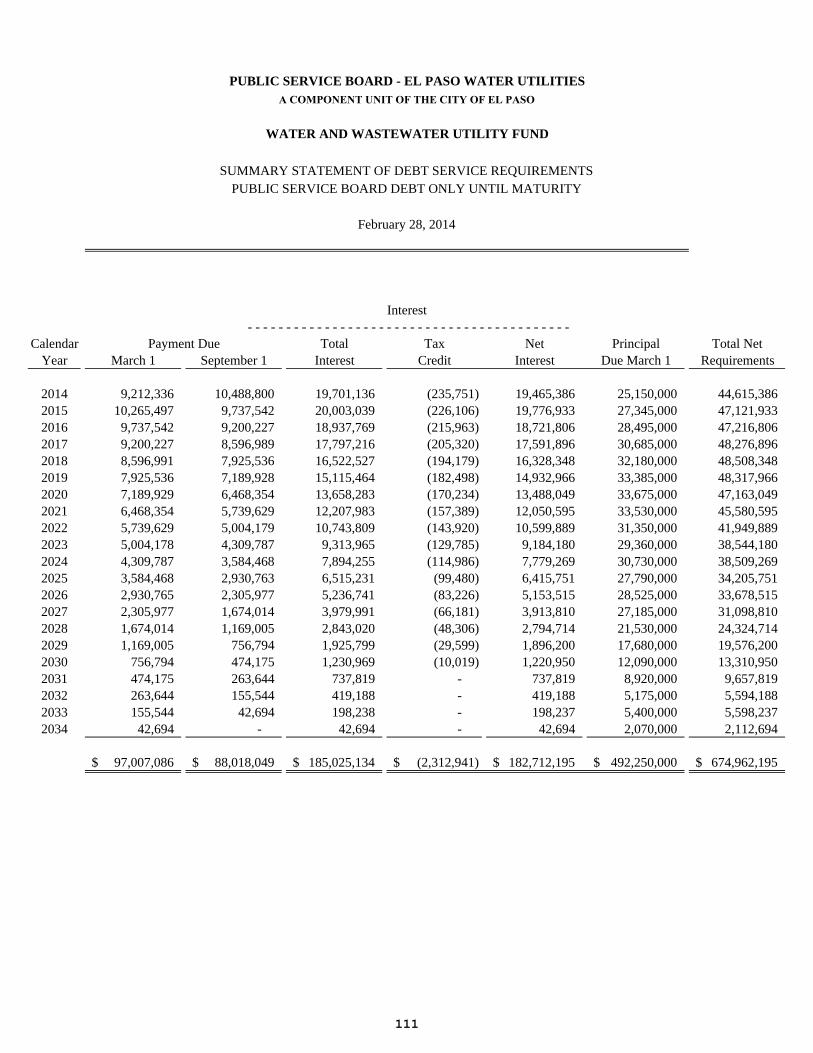
Calendar Total Tax Net Principal Total NetYear March 1 September 1 Interest Credit Interest Due March 1 Requirements
2014 9,212,336 10,488,800 19,701,136 (235,751) 19,465,386 25,150,000 44,615,3862015 10,265,497 9,737,542 20,003,039 (226,106) 19,776,933 27,345,000 47,121,9332016 9,737,542 9,200,227 18,937,769 (215,963) 18,721,806 28,495,000 47,216,8062017 9,200,227 8,596,989 17,797,216 (205,320) 17,591,896 30,685,000 48,276,8962018 8,596,991 7,925,536 16,522,527 (194,179) 16,328,348 32,180,000 48,508,3482019 7,925,536 7,189,928 15,115,464 (182,498) 14,932,966 33,385,000 48,317,9662020 7,189,929 6,468,354 13,658,283 (170,234) 13,488,049 33,675,000 47,163,0492021 6,468,354 5,739,629 12,207,983 (157,389) 12,050,595 33,530,000 45,580,5952022 5,739,629 5,004,179 10,743,809 (143,920) 10,599,889 31,350,000 41,949,8892023 5,004,178 4,309,787 9,313,965 (129,785) 9,184,180 29,360,000 38,544,1802024 4,309,787 3,584,468 7,894,255 (114,986) 7,779,269 30,730,000 38,509,2692025 3,584,468 2,930,763 6,515,231 (99,480) 6,415,751 27,790,000 34,205,7512026 2,930,765 2,305,977 5,236,741 (83,226) 5,153,515 28,525,000 33,678,5152027 2,305,977 1,674,014 3,979,991 (66,181) 3,913,810 27,185,000 31,098,8102028 1,674,014 1,169,005 2,843,020 (48,306) 2,794,714 21,530,000 24,324,7142029 1,169,005 756,794 1,925,799 (29,599) 1,896,200 17,680,000 19,576,2002030 756,794 474,175 1,230,969 (10,019) 1,220,950 12,090,000 13,310,9502031 474,175 263,644 737,819 - 737,819 8,920,000 9,657,8192032 263,644 155,544 419,188 - 419,188 5,175,000 5,594,1882033 155,544 42,694 198,238 - 198,237 5,400,000 5,598,2372034 42,694 - 42,694 - 42,694 2,070,000 2,112,694
97,007,086$ 88,018,049$ 185,025,134$ (2,312,941)$ 182,712,195$ 492,250,000$ 674,962,195$
Payment Due
PUBLIC SERVICE BOARD - EL PASO WATER UTILITIESA COMPONENT UNIT OF THE CITY OF EL PASO
WATER AND WASTEWATER UTILITY FUND
SUMMARY STATEMENT OF DEBT SERVICE REQUIREMENTSPUBLIC SERVICE BOARD DEBT ONLY UNTIL MATURITY
February 28, 2014
Interest- - - - - - - - - - - - - - - - - - - - - - - - - - - - - - - - - - - - - - - - - -
111
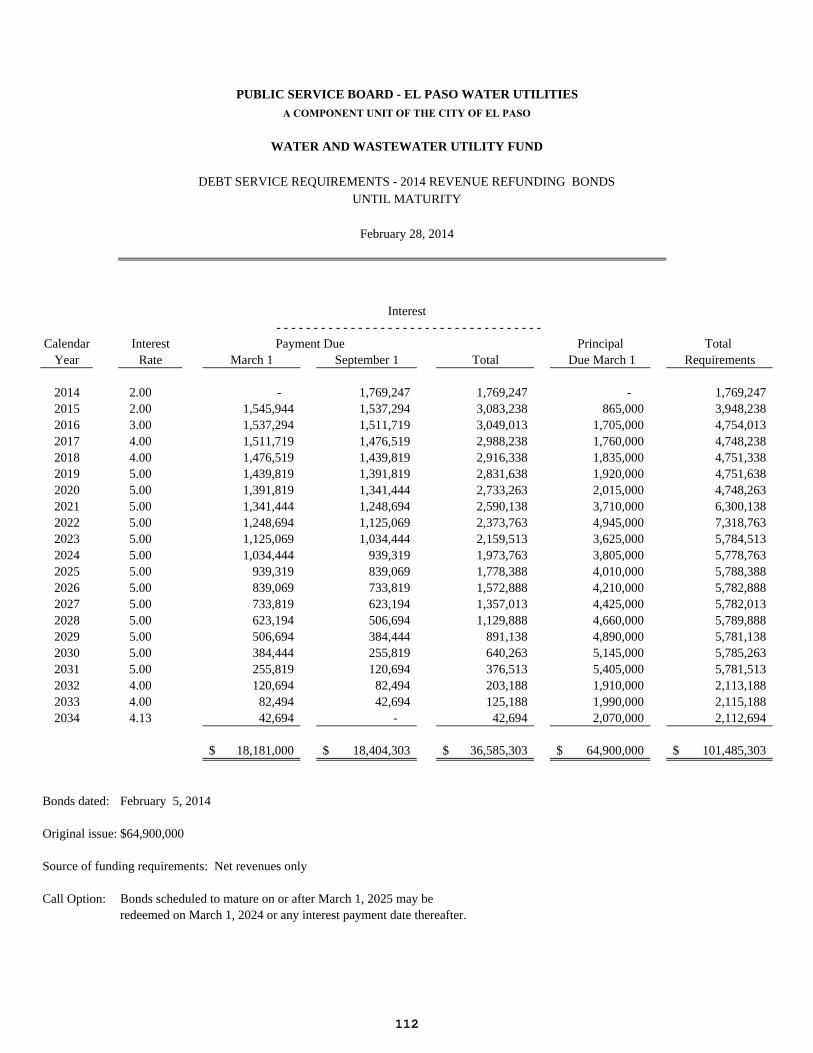
Calendar Interest Principal TotalYear Rate March 1 September 1 Total Due March 1 Requirements
2014 2.00 - 1,769,247 1,769,247 - 1,769,2472015 2.00 1,545,944 1,537,294 3,083,238 865,000 3,948,2382016 3.00 1,537,294 1,511,719 3,049,013 1,705,000 4,754,0132017 4.00 1,511,719 1,476,519 2,988,238 1,760,000 4,748,2382018 4.00 1,476,519 1,439,819 2,916,338 1,835,000 4,751,3382019 5.00 1,439,819 1,391,819 2,831,638 1,920,000 4,751,6382020 5.00 1,391,819 1,341,444 2,733,263 2,015,000 4,748,2632021 5.00 1,341,444 1,248,694 2,590,138 3,710,000 6,300,1382022 5.00 1,248,694 1,125,069 2,373,763 4,945,000 7,318,7632023 5.00 1,125,069 1,034,444 2,159,513 3,625,000 5,784,5132024 5.00 1,034,444 939,319 1,973,763 3,805,000 5,778,7632025 5.00 939,319 839,069 1,778,388 4,010,000 5,788,3882026 5.00 839,069 733,819 1,572,888 4,210,000 5,782,8882027 5.00 733,819 623,194 1,357,013 4,425,000 5,782,0132028 5.00 623,194 506,694 1,129,888 4,660,000 5,789,8882029 5.00 506,694 384,444 891,138 4,890,000 5,781,1382030 5.00 384,444 255,819 640,263 5,145,000 5,785,2632031 5.00 255,819 120,694 376,513 5,405,000 5,781,5132032 4.00 120,694 82,494 203,188 1,910,000 2,113,1882033 4.00 82,494 42,694 125,188 1,990,000 2,115,1882034 4.13 42,694 - 42,694 2,070,000 2,112,694
18,181,000$ 18,404,303$ 36,585,303$ 64,900,000$ 101,485,303$
Bonds dated: February 5, 2014
Original issue:
Source of funding requirements: Net revenues only
Call Option: Bonds scheduled to mature on or after March 1, 2025 may beredeemed on March 1, 2024 or any interest payment date thereafter.
Interest- - - - - - - - - - - - - - - - - - - - - - - - - - - - - - - - - - - -Payment Due
$64,900,000
PUBLIC SERVICE BOARD - EL PASO WATER UTILITIESA COMPONENT UNIT OF THE CITY OF EL PASO
WATER AND WASTEWATER UTILITY FUND
DEBT SERVICE REQUIREMENTS - 2014 REVENUE REFUNDING BONDSUNTIL MATURITY
February 28, 2014
112
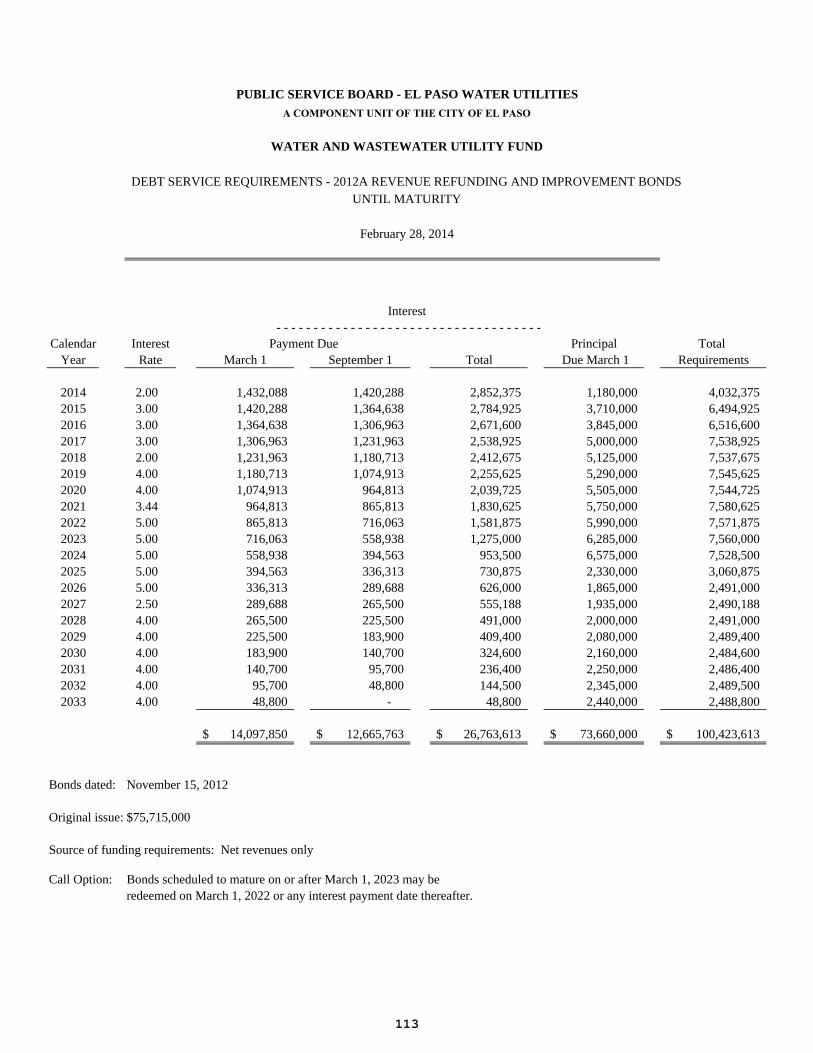
Calendar Interest Principal TotalYear Rate March 1 September 1 Total Due March 1 Requirements
2014 2.00 1,432,088 1,420,288 2,852,375 1,180,000 4,032,3752015 3.00 1,420,288 1,364,638 2,784,925 3,710,000 6,494,9252016 3.00 1,364,638 1,306,963 2,671,600 3,845,000 6,516,6002017 3.00 1,306,963 1,231,963 2,538,925 5,000,000 7,538,9252018 2.00 1,231,963 1,180,713 2,412,675 5,125,000 7,537,6752019 4.00 1,180,713 1,074,913 2,255,625 5,290,000 7,545,6252020 4.00 1,074,913 964,813 2,039,725 5,505,000 7,544,7252021 3.44 964,813 865,813 1,830,625 5,750,000 7,580,6252022 5.00 865,813 716,063 1,581,875 5,990,000 7,571,8752023 5.00 716,063 558,938 1,275,000 6,285,000 7,560,0002024 5.00 558,938 394,563 953,500 6,575,000 7,528,5002025 5.00 394,563 336,313 730,875 2,330,000 3,060,8752026 5.00 336,313 289,688 626,000 1,865,000 2,491,0002027 2.50 289,688 265,500 555,188 1,935,000 2,490,1882028 4.00 265,500 225,500 491,000 2,000,000 2,491,0002029 4.00 225,500 183,900 409,400 2,080,000 2,489,4002030 4.00 183,900 140,700 324,600 2,160,000 2,484,6002031 4.00 140,700 95,700 236,400 2,250,000 2,486,4002032 4.00 95,700 48,800 144,500 2,345,000 2,489,5002033 4.00 48,800 - 48,800 2,440,000 2,488,800
14,097,850$ 12,665,763$ 26,763,613$ 73,660,000$ 100,423,613$
Bonds dated: November 15, 2012
Original issue:
Source of funding requirements: Net revenues only
Call Option: Bonds scheduled to mature on or after March 1, 2023 may beredeemed on March 1, 2022 or any interest payment date thereafter.
Payment Due
$75,715,000
PUBLIC SERVICE BOARD - EL PASO WATER UTILITIESA COMPONENT UNIT OF THE CITY OF EL PASO
WATER AND WASTEWATER UTILITY FUND
DEBT SERVICE REQUIREMENTS - 2012A REVENUE REFUNDING AND IMPROVEMENT BONDSUNTIL MATURITY
February 28, 2014
Interest- - - - - - - - - - - - - - - - - - - - - - - - - - - - - - - - - - - -
113
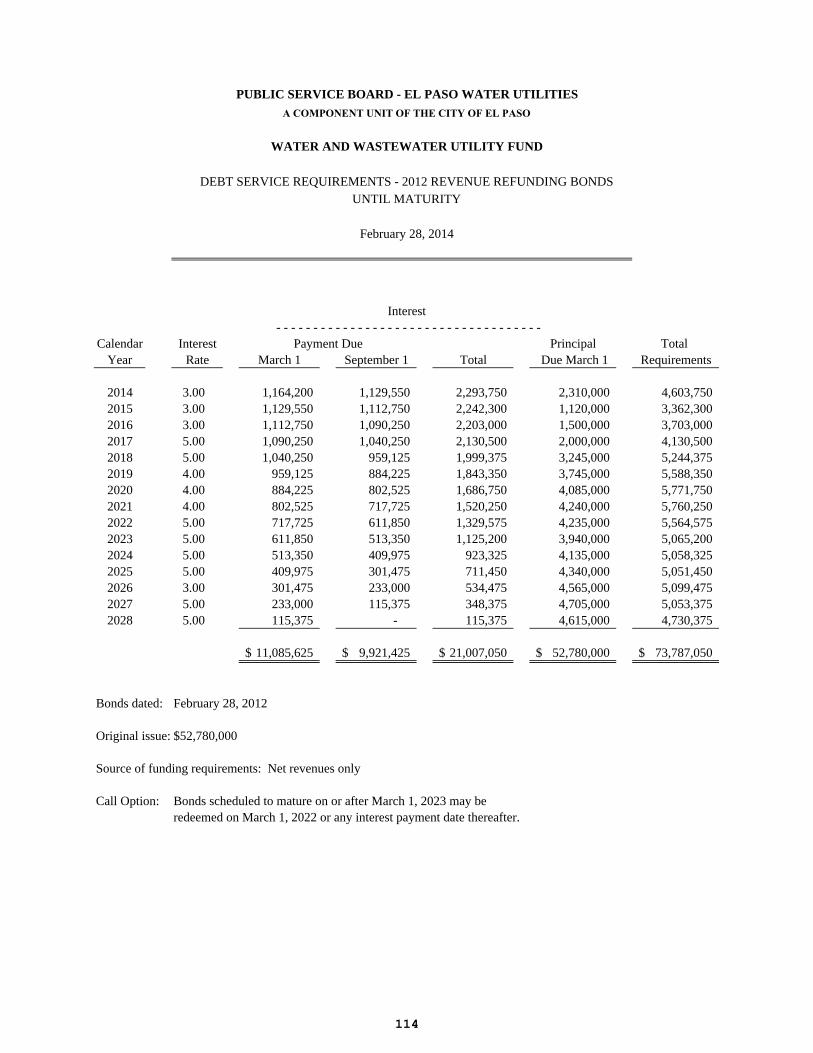
Calendar Interest Principal TotalYear Rate March 1 September 1 Total Due March 1 Requirements
2014 3.00 1,164,200 1,129,550 2,293,750 2,310,000 4,603,7502015 3.00 1,129,550 1,112,750 2,242,300 1,120,000 3,362,3002016 3.00 1,112,750 1,090,250 2,203,000 1,500,000 3,703,0002017 5.00 1,090,250 1,040,250 2,130,500 2,000,000 4,130,5002018 5.00 1,040,250 959,125 1,999,375 3,245,000 5,244,3752019 4.00 959,125 884,225 1,843,350 3,745,000 5,588,3502020 4.00 884,225 802,525 1,686,750 4,085,000 5,771,7502021 4.00 802,525 717,725 1,520,250 4,240,000 5,760,2502022 5.00 717,725 611,850 1,329,575 4,235,000 5,564,5752023 5.00 611,850 513,350 1,125,200 3,940,000 5,065,2002024 5.00 513,350 409,975 923,325 4,135,000 5,058,3252025 5.00 409,975 301,475 711,450 4,340,000 5,051,4502026 3.00 301,475 233,000 534,475 4,565,000 5,099,4752027 5.00 233,000 115,375 348,375 4,705,000 5,053,3752028 5.00 115,375 - 115,375 4,615,000 4,730,375
11,085,625$ 9,921,425$ 21,007,050$ 52,780,000$ 73,787,050$
Bonds dated: February 28, 2012
Original issue:
Source of funding requirements: Net revenues only
Call Option:redeemed on March 1, 2022 or any interest payment date thereafter.Bonds scheduled to mature on or after March 1, 2023 may be
Payment Due
$52,780,000
PUBLIC SERVICE BOARD - EL PASO WATER UTILITIESA COMPONENT UNIT OF THE CITY OF EL PASO
WATER AND WASTEWATER UTILITY FUND
DEBT SERVICE REQUIREMENTS - 2012 REVENUE REFUNDING BONDSUNTIL MATURITY
February 28, 2014
Interest- - - - - - - - - - - - - - - - - - - - - - - - - - - - - - - - - - - -
114
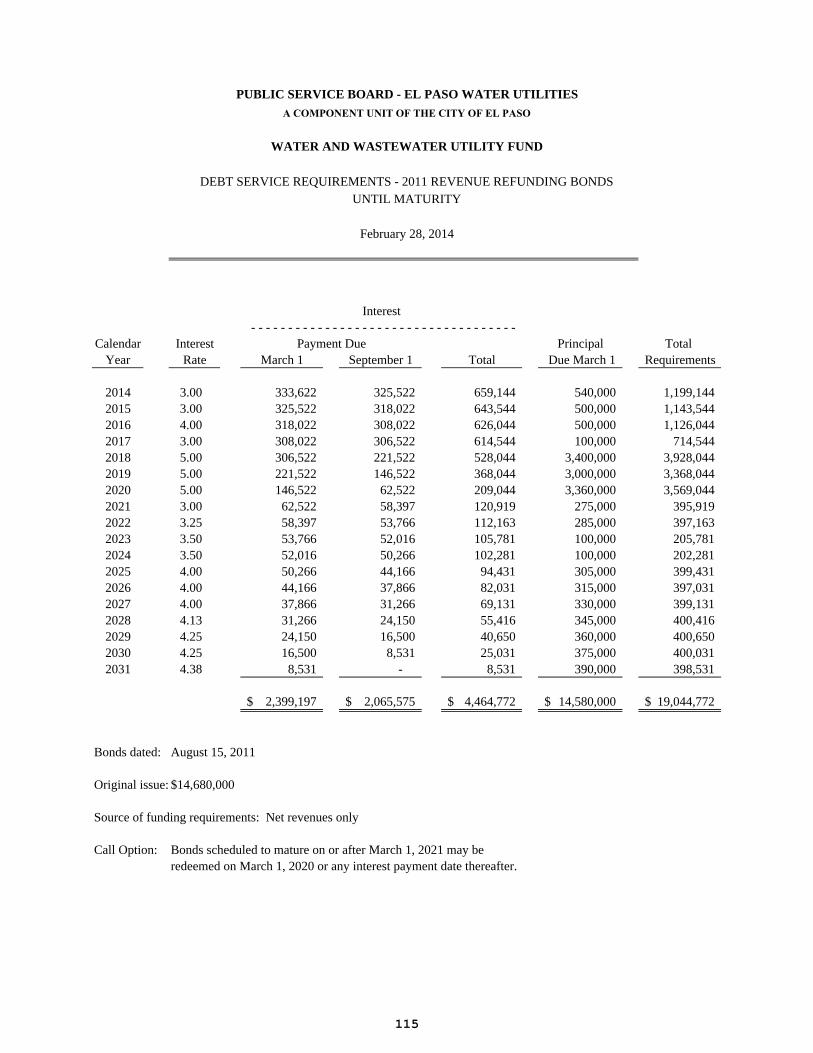
Calendar Interest Principal TotalYear Rate March 1 September 1 Total Due March 1 Requirements
2014 3.00 333,622 325,522 659,144 540,000 1,199,1442015 3.00 325,522 318,022 643,544 500,000 1,143,5442016 4.00 318,022 308,022 626,044 500,000 1,126,0442017 3.00 308,022 306,522 614,544 100,000 714,5442018 5.00 306,522 221,522 528,044 3,400,000 3,928,0442019 5.00 221,522 146,522 368,044 3,000,000 3,368,0442020 5.00 146,522 62,522 209,044 3,360,000 3,569,0442021 3.00 62,522 58,397 120,919 275,000 395,9192022 3.25 58,397 53,766 112,163 285,000 397,1632023 3.50 53,766 52,016 105,781 100,000 205,7812024 3.50 52,016 50,266 102,281 100,000 202,2812025 4.00 50,266 44,166 94,431 305,000 399,4312026 4.00 44,166 37,866 82,031 315,000 397,0312027 4.00 37,866 31,266 69,131 330,000 399,1312028 4.13 31,266 24,150 55,416 345,000 400,4162029 4.25 24,150 16,500 40,650 360,000 400,6502030 4.25 16,500 8,531 25,031 375,000 400,0312031 4.38 8,531 - 8,531 390,000 398,531
2,399,197$ 2,065,575$ 4,464,772$ 14,580,000$ 19,044,772$
Bonds dated: August 15, 2011
Original issue:
Source of funding requirements: Net revenues only
Call Option: Bonds scheduled to mature on or after March 1, 2021 may beredeemed on March 1, 2020 or any interest payment date thereafter.
Interest- - - - - - - - - - - - - - - - - - - - - - - - - - - - - - - - - - - -
Payment Due
$14,680,000
PUBLIC SERVICE BOARD - EL PASO WATER UTILITIESA COMPONENT UNIT OF THE CITY OF EL PASO
WATER AND WASTEWATER UTILITY FUND
DEBT SERVICE REQUIREMENTS - 2011 REVENUE REFUNDING BONDSUNTIL MATURITY
February 28, 2014
115
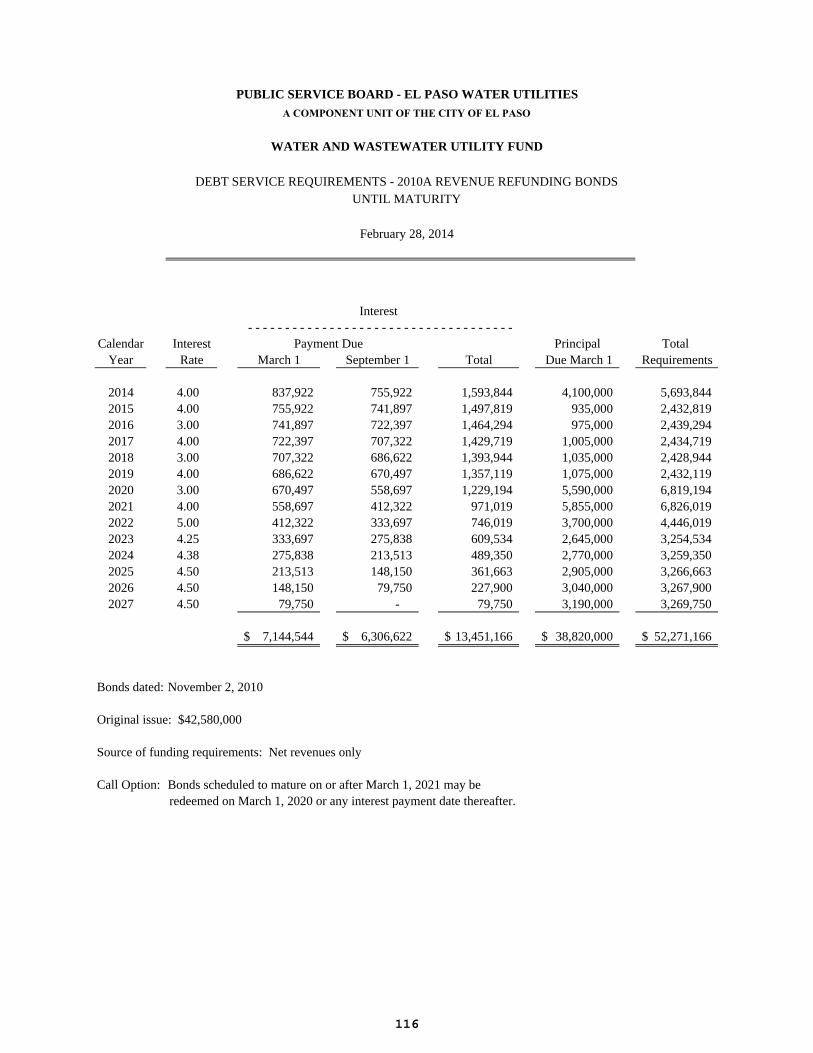
Calendar Interest Principal TotalYear Rate March 1 September 1 Total Due March 1 Requirements
2014 4.00 837,922 755,922 1,593,844 4,100,000 5,693,8442015 4.00 755,922 741,897 1,497,819 935,000 2,432,8192016 3.00 741,897 722,397 1,464,294 975,000 2,439,2942017 4.00 722,397 707,322 1,429,719 1,005,000 2,434,7192018 3.00 707,322 686,622 1,393,944 1,035,000 2,428,9442019 4.00 686,622 670,497 1,357,119 1,075,000 2,432,1192020 3.00 670,497 558,697 1,229,194 5,590,000 6,819,1942021 4.00 558,697 412,322 971,019 5,855,000 6,826,0192022 5.00 412,322 333,697 746,019 3,700,000 4,446,0192023 4.25 333,697 275,838 609,534 2,645,000 3,254,5342024 4.38 275,838 213,513 489,350 2,770,000 3,259,3502025 4.50 213,513 148,150 361,663 2,905,000 3,266,6632026 4.50 148,150 79,750 227,900 3,040,000 3,267,9002027 4.50 79,750 - 79,750 3,190,000 3,269,750
7,144,544$ 6,306,622$ 13,451,166$ 38,820,000$ 52,271,166$
Bonds dated: November 2, 2010
Original issue: $42,580,000
Source of funding requirements: Net revenues only
Call Option: Bonds scheduled to mature on or after March 1, 2021 may beredeemed on March 1, 2020 or any interest payment date thereafter.
Interest- - - - - - - - - - - - - - - - - - - - - - - - - - - - - - - - - - - -
Payment Due
PUBLIC SERVICE BOARD - EL PASO WATER UTILITIESA COMPONENT UNIT OF THE CITY OF EL PASO
WATER AND WASTEWATER UTILITY FUND
DEBT SERVICE REQUIREMENTS - 2010A REVENUE REFUNDING BONDSUNTIL MATURITY
February 28, 2014
116
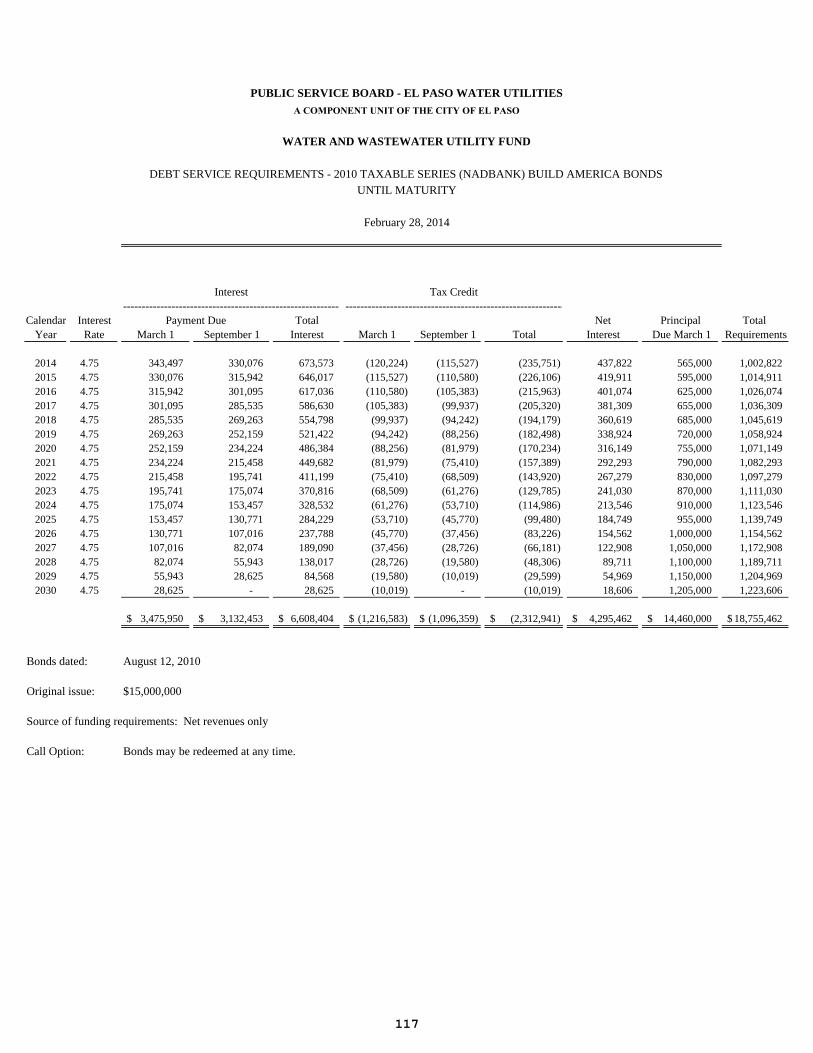
---------------------------------------------------------- -----------------------------------------------------------Calendar Interest Total Net Principal Total
Year Rate March 1 September 1 Interest March 1 September 1 Total Interest Due March 1 Requirements
2014 4.75 343,497 330,076 673,573 (120,224) (115,527) (235,751) 437,822 565,000 1,002,8222015 4.75 330,076 315,942 646,017 (115,527) (110,580) (226,106) 419,911 595,000 1,014,9112016 4.75 315,942 301,095 617,036 (110,580) (105,383) (215,963) 401,074 625,000 1,026,0742017 4.75 301,095 285,535 586,630 (105,383) (99,937) (205,320) 381,309 655,000 1,036,3092018 4.75 285,535 269,263 554,798 (99,937) (94,242) (194,179) 360,619 685,000 1,045,6192019 4.75 269,263 252,159 521,422 (94,242) (88,256) (182,498) 338,924 720,000 1,058,9242020 4.75 252,159 234,224 486,384 (88,256) (81,979) (170,234) 316,149 755,000 1,071,1492021 4.75 234,224 215,458 449,682 (81,979) (75,410) (157,389) 292,293 790,000 1,082,2932022 4.75 215,458 195,741 411,199 (75,410) (68,509) (143,920) 267,279 830,000 1,097,2792023 4.75 195,741 175,074 370,816 (68,509) (61,276) (129,785) 241,030 870,000 1,111,0302024 4.75 175,074 153,457 328,532 (61,276) (53,710) (114,986) 213,546 910,000 1,123,5462025 4.75 153,457 130,771 284,229 (53,710) (45,770) (99,480) 184,749 955,000 1,139,7492026 4.75 130,771 107,016 237,788 (45,770) (37,456) (83,226) 154,562 1,000,000 1,154,5622027 4.75 107,016 82,074 189,090 (37,456) (28,726) (66,181) 122,908 1,050,000 1,172,9082028 4.75 82,074 55,943 138,017 (28,726) (19,580) (48,306) 89,711 1,100,000 1,189,7112029 4.75 55,943 28,625 84,568 (19,580) (10,019) (29,599) 54,969 1,150,000 1,204,9692030 4.75 28,625 - 28,625 (10,019) - (10,019) 18,606 1,205,000 1,223,606
3,475,950$ 3,132,453$ 6,608,404$ (1,216,583)$ (1,096,359)$ (2,312,941)$ 4,295,462$ 14,460,000$ 18,755,462$
Bonds dated:
Original issue:
Call Option: Bonds may be redeemed at any time.
Source of funding requirements: Net revenues only
$15,000,000
August 12, 2010
PUBLIC SERVICE BOARD - EL PASO WATER UTILITIES
A COMPONENT UNIT OF THE CITY OF EL PASO
WATER AND WASTEWATER UTILITY FUND
DEBT SERVICE REQUIREMENTS - 2010 TAXABLE SERIES (NADBANK) BUILD AMERICA BONDSUNTIL MATURITY
February 28, 2014
Interest Tax Credit
Payment Due
117
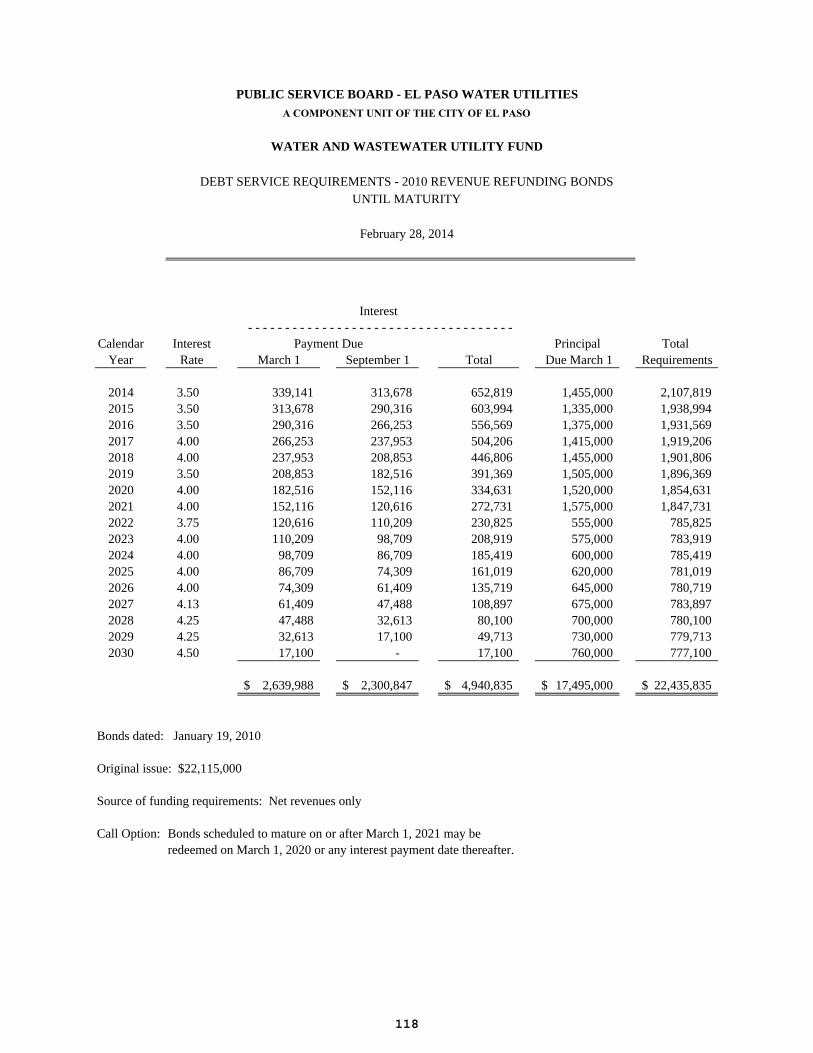
Calendar Interest Principal TotalYear Rate March 1 September 1 Total Due March 1 Requirements
2014 3.50 339,141 313,678 652,819 1,455,000 2,107,8192015 3.50 313,678 290,316 603,994 1,335,000 1,938,9942016 3.50 290,316 266,253 556,569 1,375,000 1,931,5692017 4.00 266,253 237,953 504,206 1,415,000 1,919,2062018 4.00 237,953 208,853 446,806 1,455,000 1,901,8062019 3.50 208,853 182,516 391,369 1,505,000 1,896,3692020 4.00 182,516 152,116 334,631 1,520,000 1,854,6312021 4.00 152,116 120,616 272,731 1,575,000 1,847,7312022 3.75 120,616 110,209 230,825 555,000 785,8252023 4.00 110,209 98,709 208,919 575,000 783,9192024 4.00 98,709 86,709 185,419 600,000 785,4192025 4.00 86,709 74,309 161,019 620,000 781,0192026 4.00 74,309 61,409 135,719 645,000 780,7192027 4.13 61,409 47,488 108,897 675,000 783,8972028 4.25 47,488 32,613 80,100 700,000 780,1002029 4.25 32,613 17,100 49,713 730,000 779,7132030 4.50 17,100 - 17,100 760,000 777,100
2,639,988$ 2,300,847$ 4,940,835$ 17,495,000$ 22,435,835$
Bonds dated: January 19, 2010
Original issue: $22,115,000
Source of funding requirements: Net revenues only
Call Option: Bonds scheduled to mature on or after March 1, 2021 may beredeemed on March 1, 2020 or any interest payment date thereafter.
Interest- - - - - - - - - - - - - - - - - - - - - - - - - - - - - - - - - - - -
Payment Due
PUBLIC SERVICE BOARD - EL PASO WATER UTILITIESA COMPONENT UNIT OF THE CITY OF EL PASO
WATER AND WASTEWATER UTILITY FUND
DEBT SERVICE REQUIREMENTS - 2010 REVENUE REFUNDING BONDSUNTIL MATURITY
February 28, 2014
118
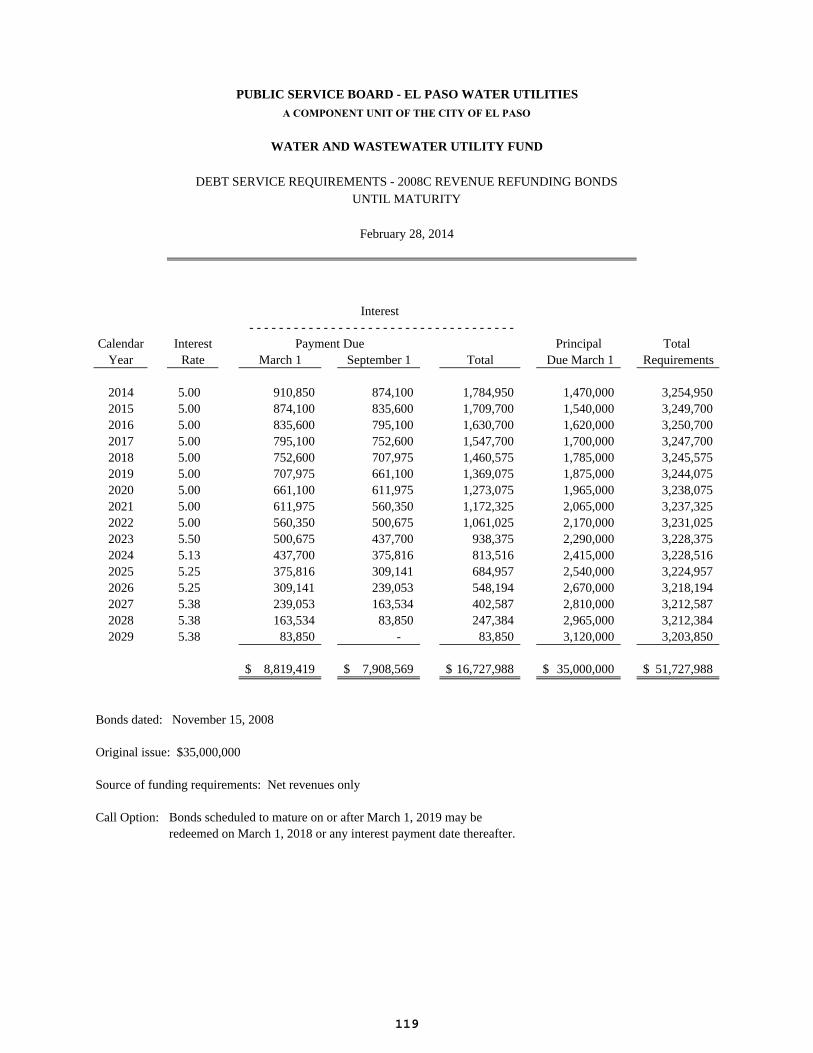
Calendar Interest Principal TotalYear Rate March 1 September 1 Total Due March 1 Requirements
2014 5.00 910,850 874,100 1,784,950 1,470,000 3,254,9502015 5.00 874,100 835,600 1,709,700 1,540,000 3,249,7002016 5.00 835,600 795,100 1,630,700 1,620,000 3,250,7002017 5.00 795,100 752,600 1,547,700 1,700,000 3,247,7002018 5.00 752,600 707,975 1,460,575 1,785,000 3,245,5752019 5.00 707,975 661,100 1,369,075 1,875,000 3,244,0752020 5.00 661,100 611,975 1,273,075 1,965,000 3,238,0752021 5.00 611,975 560,350 1,172,325 2,065,000 3,237,3252022 5.00 560,350 500,675 1,061,025 2,170,000 3,231,0252023 5.50 500,675 437,700 938,375 2,290,000 3,228,3752024 5.13 437,700 375,816 813,516 2,415,000 3,228,5162025 5.25 375,816 309,141 684,957 2,540,000 3,224,9572026 5.25 309,141 239,053 548,194 2,670,000 3,218,1942027 5.38 239,053 163,534 402,587 2,810,000 3,212,5872028 5.38 163,534 83,850 247,384 2,965,000 3,212,3842029 5.38 83,850 - 83,850 3,120,000 3,203,850
8,819,419$ 7,908,569$ 16,727,988$ 35,000,000$ 51,727,988$
Bonds dated: November 15, 2008
Original issue: $35,000,000
Source of funding requirements: Net revenues only
Call Option: Bonds scheduled to mature on or after March 1, 2019 may beredeemed on March 1, 2018 or any interest payment date thereafter.
- - - - - - - - - - - - - - - - - - - - - - - - - - - - - - - - - - - -Payment Due
Interest
WATER AND WASTEWATER UTILITY FUND
PUBLIC SERVICE BOARD - EL PASO WATER UTILITIESA COMPONENT UNIT OF THE CITY OF EL PASO
DEBT SERVICE REQUIREMENTS - 2008C REVENUE REFUNDING BONDSUNTIL MATURITY
February 28, 2014
119

Calendar Interest Principal TotalYear Rate March 1 September 1 Total Due March 1 Requirements
2014 2.35 375,144 375,085 750,229 5,000 755,2292015 2.50 375,085 360,897 735,982 1,135,000 1,870,9822016 2.65 360,897 345,329 706,226 1,175,000 1,881,2262017 2.80 345,329 328,319 673,648 1,215,000 1,888,6482018 2.90 328,319 310,049 638,368 1,260,000 1,898,3682019 3.10 310,049 289,821 599,870 1,305,000 1,904,8702020 3.20 289,821 268,221 558,042 1,350,000 1,908,0422021 3.30 268,221 245,121 513,342 1,400,000 1,913,3422022 3.40 245,121 220,556 465,677 1,445,000 1,910,6772023 3.50 220,556 194,306 414,862 1,500,000 1,914,8622024 3.65 194,306 165,927 360,233 1,555,000 1,915,2332025 3.75 165,927 135,740 301,667 1,610,000 1,911,6672026 3.80 135,740 104,105 239,845 1,665,000 1,904,8452027 3.85 104,105 70,899 175,004 1,725,000 1,900,0042028 3.85 70,899 36,538 107,437 1,785,000 1,892,4372029 3.95 36,538 - 36,538 1,850,000 1,886,538
3,826,057$ 3,450,913$ 7,276,970$ 21,980,000$ 29,256,970$
Bonds dated: August 15, 2008
Original issue: $22,000,000
Source of funding requirements: Net revenues only
Call Option: Bonds scheduled to mature on or after March 1, 2019 may beredeemed on March 1, 2018 or any interest payment date thereafter.
Payment Due
WATER AND WASTEWATER UTILITY FUND
Interest- - - - - - - - - - - - - - - - - - - - - - - - - - - - - - - - - - - -
PUBLIC SERVICE BOARD - EL PASO WATER UTILITIESA COMPONENT UNIT OF THE CITY OF EL PASO
DEBT SERVICE REQUIREMENTS - 2008B REVENUE (CWSRF) BONDSUNTIL MATURITY
February 28, 2014
120
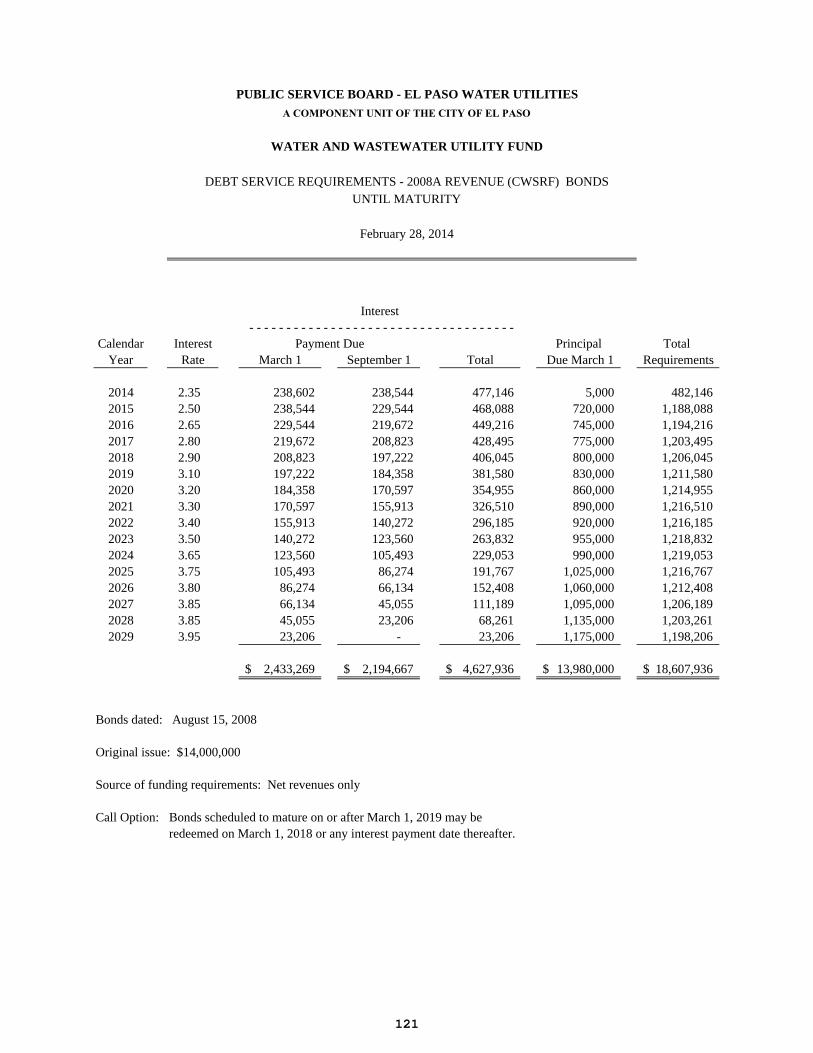
Calendar Interest Principal TotalYear Rate March 1 September 1 Total Due March 1 Requirements
2014 2.35 238,602 238,544 477,146 5,000 482,1462015 2.50 238,544 229,544 468,088 720,000 1,188,0882016 2.65 229,544 219,672 449,216 745,000 1,194,2162017 2.80 219,672 208,823 428,495 775,000 1,203,4952018 2.90 208,823 197,222 406,045 800,000 1,206,0452019 3.10 197,222 184,358 381,580 830,000 1,211,5802020 3.20 184,358 170,597 354,955 860,000 1,214,9552021 3.30 170,597 155,913 326,510 890,000 1,216,5102022 3.40 155,913 140,272 296,185 920,000 1,216,1852023 3.50 140,272 123,560 263,832 955,000 1,218,8322024 3.65 123,560 105,493 229,053 990,000 1,219,0532025 3.75 105,493 86,274 191,767 1,025,000 1,216,7672026 3.80 86,274 66,134 152,408 1,060,000 1,212,4082027 3.85 66,134 45,055 111,189 1,095,000 1,206,1892028 3.85 45,055 23,206 68,261 1,135,000 1,203,2612029 3.95 23,206 - 23,206 1,175,000 1,198,206
2,433,269$ 2,194,667$ 4,627,936$ 13,980,000$ 18,607,936$
Bonds dated: August 15, 2008
Original issue: $14,000,000
Source of funding requirements: Net revenues only
Call Option: Bonds scheduled to mature on or after March 1, 2019 may beredeemed on March 1, 2018 or any interest payment date thereafter.
Interest- - - - - - - - - - - - - - - - - - - - - - - - - - - - - - - - - - - -
Payment Due
WATER AND WASTEWATER UTILITY FUND
PUBLIC SERVICE BOARD - EL PASO WATER UTILITIESA COMPONENT UNIT OF THE CITY OF EL PASO
DEBT SERVICE REQUIREMENTS - 2008A REVENUE (CWSRF) BONDSUNTIL MATURITY
February 28, 2014
121
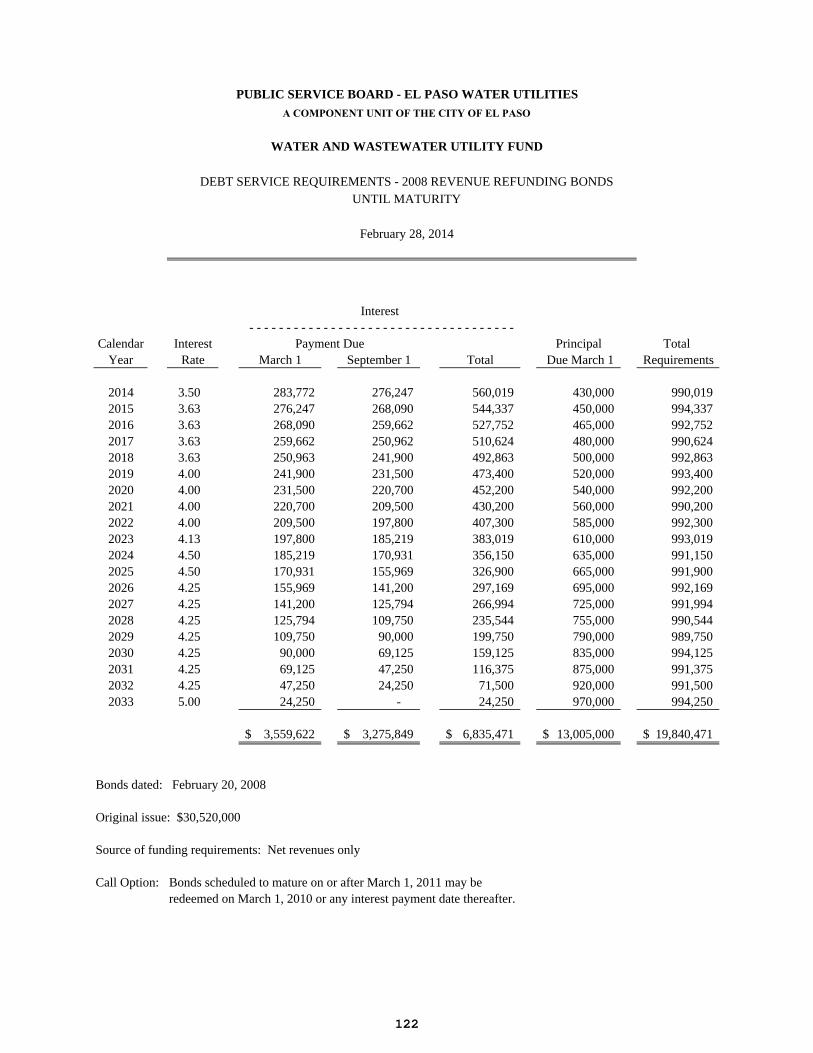
Calendar Interest Principal TotalYear Rate March 1 September 1 Total Due March 1 Requirements
2014 3.50 283,772 276,247 560,019 430,000 990,0192015 3.63 276,247 268,090 544,337 450,000 994,3372016 3.63 268,090 259,662 527,752 465,000 992,7522017 3.63 259,662 250,962 510,624 480,000 990,6242018 3.63 250,963 241,900 492,863 500,000 992,8632019 4.00 241,900 231,500 473,400 520,000 993,4002020 4.00 231,500 220,700 452,200 540,000 992,2002021 4.00 220,700 209,500 430,200 560,000 990,2002022 4.00 209,500 197,800 407,300 585,000 992,3002023 4.13 197,800 185,219 383,019 610,000 993,0192024 4.50 185,219 170,931 356,150 635,000 991,1502025 4.50 170,931 155,969 326,900 665,000 991,9002026 4.25 155,969 141,200 297,169 695,000 992,1692027 4.25 141,200 125,794 266,994 725,000 991,9942028 4.25 125,794 109,750 235,544 755,000 990,5442029 4.25 109,750 90,000 199,750 790,000 989,7502030 4.25 90,000 69,125 159,125 835,000 994,1252031 4.25 69,125 47,250 116,375 875,000 991,3752032 4.25 47,250 24,250 71,500 920,000 991,5002033 5.00 24,250 - 24,250 970,000 994,250
3,559,622$ 3,275,849$ 6,835,471$ 13,005,000$ 19,840,471$
Bonds dated: February 20, 2008
Original issue: $30,520,000
Source of funding requirements: Net revenues only
Call Option: Bonds scheduled to mature on or after March 1, 2011 may beredeemed on March 1, 2010 or any interest payment date thereafter.
Interest- - - - - - - - - - - - - - - - - - - - - - - - - - - - - - - - - - - -
Payment Due
WATER AND WASTEWATER UTILITY FUND
PUBLIC SERVICE BOARD - EL PASO WATER UTILITIESA COMPONENT UNIT OF THE CITY OF EL PASO
DEBT SERVICE REQUIREMENTS - 2008 REVENUE REFUNDING BONDSUNTIL MATURITY
February 28, 2014
122
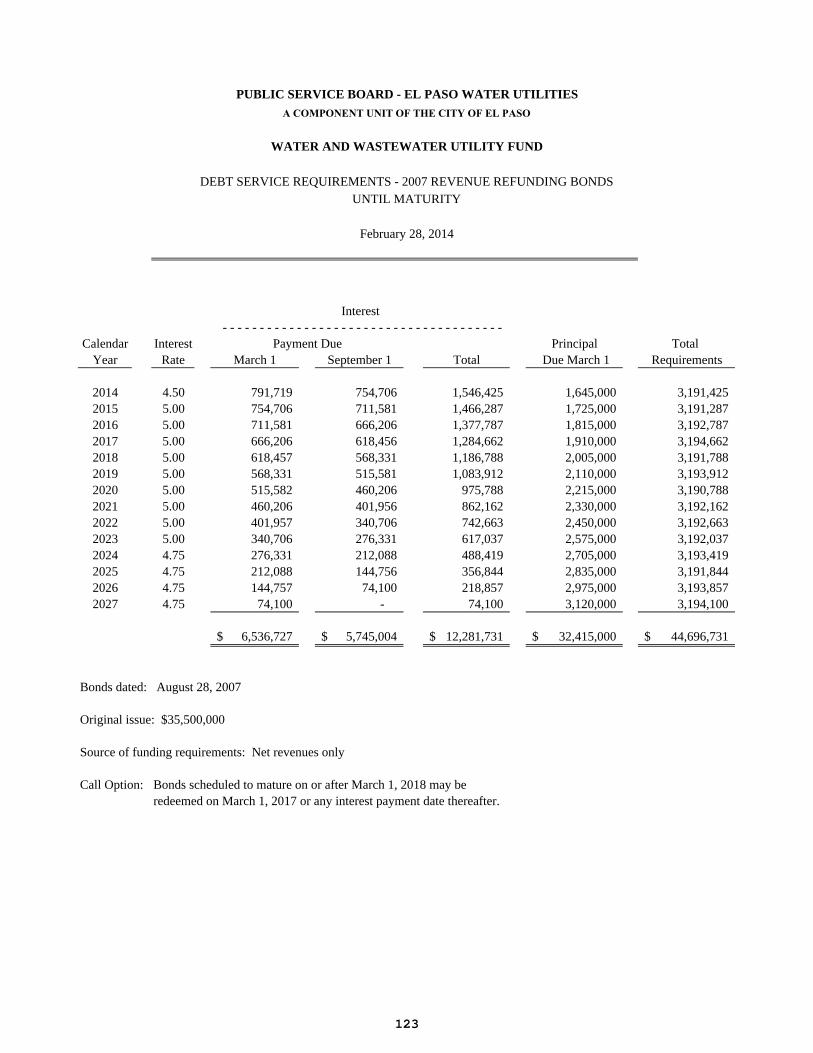
Calendar Interest Principal TotalYear Rate March 1 September 1 Total Due March 1 Requirements
2014 4.50 791,719 754,706 1,546,425 1,645,000 3,191,4252015 5.00 754,706 711,581 1,466,287 1,725,000 3,191,2872016 5.00 711,581 666,206 1,377,787 1,815,000 3,192,7872017 5.00 666,206 618,456 1,284,662 1,910,000 3,194,6622018 5.00 618,457 568,331 1,186,788 2,005,000 3,191,7882019 5.00 568,331 515,581 1,083,912 2,110,000 3,193,9122020 5.00 515,582 460,206 975,788 2,215,000 3,190,7882021 5.00 460,206 401,956 862,162 2,330,000 3,192,1622022 5.00 401,957 340,706 742,663 2,450,000 3,192,6632023 5.00 340,706 276,331 617,037 2,575,000 3,192,0372024 4.75 276,331 212,088 488,419 2,705,000 3,193,4192025 4.75 212,088 144,756 356,844 2,835,000 3,191,8442026 4.75 144,757 74,100 218,857 2,975,000 3,193,8572027 4.75 74,100 - 74,100 3,120,000 3,194,100
6,536,727$ 5,745,004$ 12,281,731$ 32,415,000$ 44,696,731$
Bonds dated: August 28, 2007
Original issue: $35,500,000
Source of funding requirements: Net revenues only
Call Option: Bonds scheduled to mature on or after March 1, 2018 may beredeemed on March 1, 2017 or any interest payment date thereafter.
Payment Due
Interest- - - - - - - - - - - - - - - - - - - - - - - - - - - - - - - - - - - - - -
WATER AND WASTEWATER UTILITY FUND
PUBLIC SERVICE BOARD - EL PASO WATER UTILITIESA COMPONENT UNIT OF THE CITY OF EL PASO
DEBT SERVICE REQUIREMENTS - 2007 REVENUE REFUNDING BONDSUNTIL MATURITY
February 28, 2014
123
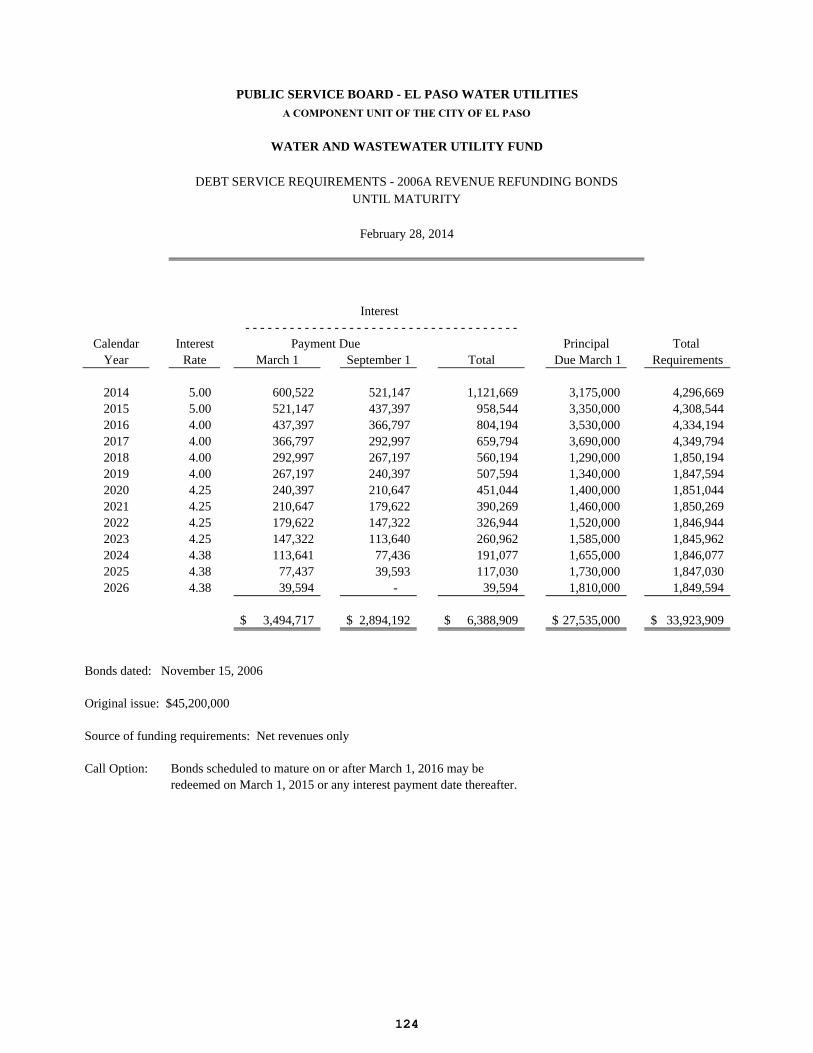
Calendar Interest Principal TotalYear Rate March 1 September 1 Total Due March 1 Requirements
2014 5.00 600,522 521,147 1,121,669 3,175,000 4,296,6692015 5.00 521,147 437,397 958,544 3,350,000 4,308,5442016 4.00 437,397 366,797 804,194 3,530,000 4,334,1942017 4.00 366,797 292,997 659,794 3,690,000 4,349,7942018 4.00 292,997 267,197 560,194 1,290,000 1,850,1942019 4.00 267,197 240,397 507,594 1,340,000 1,847,5942020 4.25 240,397 210,647 451,044 1,400,000 1,851,0442021 4.25 210,647 179,622 390,269 1,460,000 1,850,2692022 4.25 179,622 147,322 326,944 1,520,000 1,846,9442023 4.25 147,322 113,640 260,962 1,585,000 1,845,9622024 4.38 113,641 77,436 191,077 1,655,000 1,846,0772025 4.38 77,437 39,593 117,030 1,730,000 1,847,0302026 4.38 39,594 - 39,594 1,810,000 1,849,594
3,494,717$ 2,894,192$ 6,388,909$ 27,535,000$ 33,923,909$
Bonds dated: November 15, 2006
Original issue: $45,200,000
Source of funding requirements: Net revenues only
Call Option: Bonds scheduled to mature on or after March 1, 2016 may beredeemed on March 1, 2015 or any interest payment date thereafter.
Interest- - - - - - - - - - - - - - - - - - - - - - - - - - - - - - - - - - - - -
Payment Due
WATER AND WASTEWATER UTILITY FUND
PUBLIC SERVICE BOARD - EL PASO WATER UTILITIESA COMPONENT UNIT OF THE CITY OF EL PASO
DEBT SERVICE REQUIREMENTS - 2006A REVENUE REFUNDING BONDSUNTIL MATURITY
February 28, 2014
124
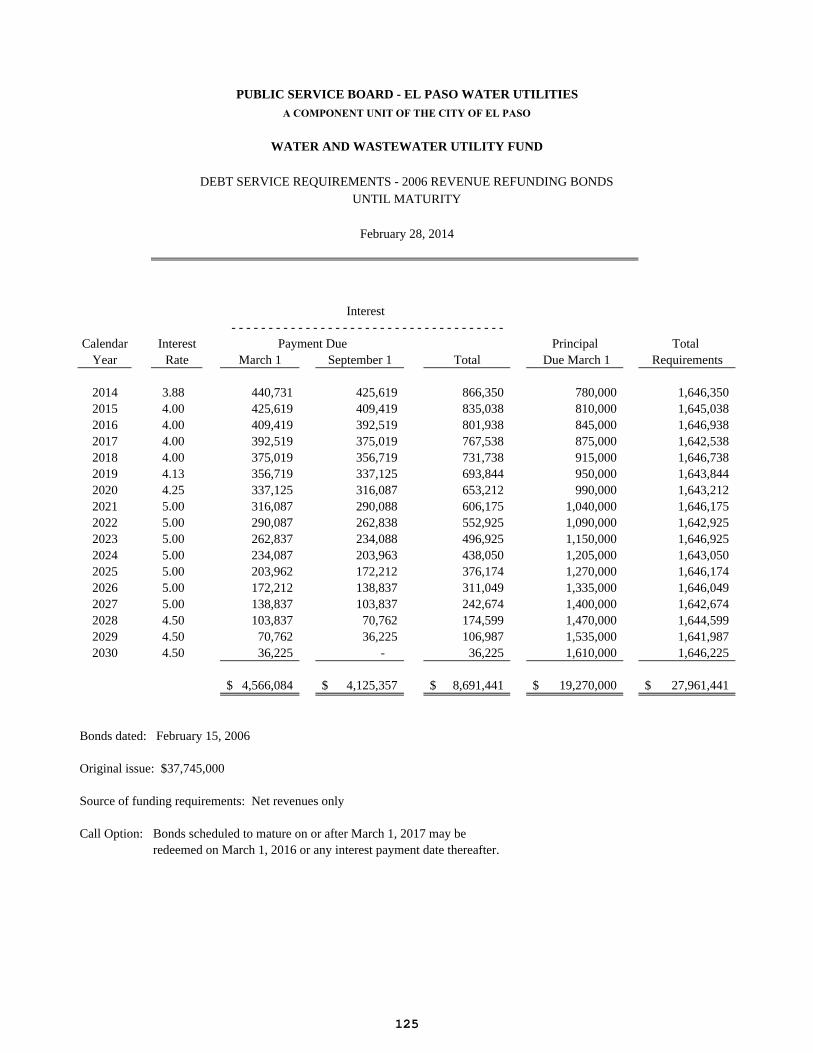
Calendar Interest Principal TotalYear Rate March 1 September 1 Total Due March 1 Requirements
2014 3.88 440,731 425,619 866,350 780,000 1,646,3502015 4.00 425,619 409,419 835,038 810,000 1,645,0382016 4.00 409,419 392,519 801,938 845,000 1,646,9382017 4.00 392,519 375,019 767,538 875,000 1,642,5382018 4.00 375,019 356,719 731,738 915,000 1,646,7382019 4.13 356,719 337,125 693,844 950,000 1,643,8442020 4.25 337,125 316,087 653,212 990,000 1,643,2122021 5.00 316,087 290,088 606,175 1,040,000 1,646,1752022 5.00 290,087 262,838 552,925 1,090,000 1,642,9252023 5.00 262,837 234,088 496,925 1,150,000 1,646,9252024 5.00 234,087 203,963 438,050 1,205,000 1,643,0502025 5.00 203,962 172,212 376,174 1,270,000 1,646,1742026 5.00 172,212 138,837 311,049 1,335,000 1,646,0492027 5.00 138,837 103,837 242,674 1,400,000 1,642,6742028 4.50 103,837 70,762 174,599 1,470,000 1,644,5992029 4.50 70,762 36,225 106,987 1,535,000 1,641,9872030 4.50 36,225 - 36,225 1,610,000 1,646,225
4,566,084$ 4,125,357$ 8,691,441$ 19,270,000$ 27,961,441$
Bonds dated: February 15, 2006
Original issue: $37,745,000
Source of funding requirements: Net revenues only
Call Option: Bonds scheduled to mature on or after March 1, 2017 may beredeemed on March 1, 2016 or any interest payment date thereafter.
Interest- - - - - - - - - - - - - - - - - - - - - - - - - - - - - - - - - - - - -
Payment Due
WATER AND WASTEWATER UTILITY FUND
PUBLIC SERVICE BOARD - EL PASO WATER UTILITIESA COMPONENT UNIT OF THE CITY OF EL PASO
DEBT SERVICE REQUIREMENTS - 2006 REVENUE REFUNDING BONDSUNTIL MATURITY
February 28, 2014
125

Calendar Interest Principal TotalYear Rate March 1 September 1 Total Due March 1 Requirements
2014 3.00 124,326 117,576 241,902 450,000 691,9022015 3.10 117,576 110,369 227,945 465,000 692,9452016 3.20 110,369 102,769 213,138 475,000 688,1382017 3.25 102,769 94,725 197,494 495,000 692,4942018 3.35 94,725 86,183 180,908 510,000 690,9082019 3.40 86,183 77,258 163,441 525,000 688,4412020 3.45 77,258 67,856 145,114 545,000 690,1142021 3.50 67,856 58,056 125,912 560,000 685,9122022 3.60 58,056 47,616 105,672 580,000 685,6722023 3.65 47,616 36,575 84,191 605,000 689,1912024 3.70 36,575 25,013 61,588 625,000 686,5882025 3.75 25,013 12,825 37,838 650,000 687,8382026 3.80 12,825 - 12,825 675,000 687,825
961,147$ 836,821$ 1,797,968$ 7,160,000$ 8,957,968$
Bonds dated: April 1, 2005
Original issue: $10,000,000
Source of funding requirements: Net revenues only
Call Option: Bonds scheduled to mature on or after March 1, 2015 may beredeemed on March 1, 2014 or any interest payment date thereafter.
Payment Due
UNTIL MATURITYDEBT SERVICE REQUIREMENTS - 2005C REVENUE (CWSRF) BONDS
February 28, 2014
PUBLIC SERVICE BOARD - EL PASO WATER UTILITIESA COMPONENT UNIT OF THE CITY OF EL PASO
WATER AND WASTEWATER UTILITY FUND
Interest- - - - - - - - - - - - - - - - - - - - - - - - - - - - - - - - - - - - -
126
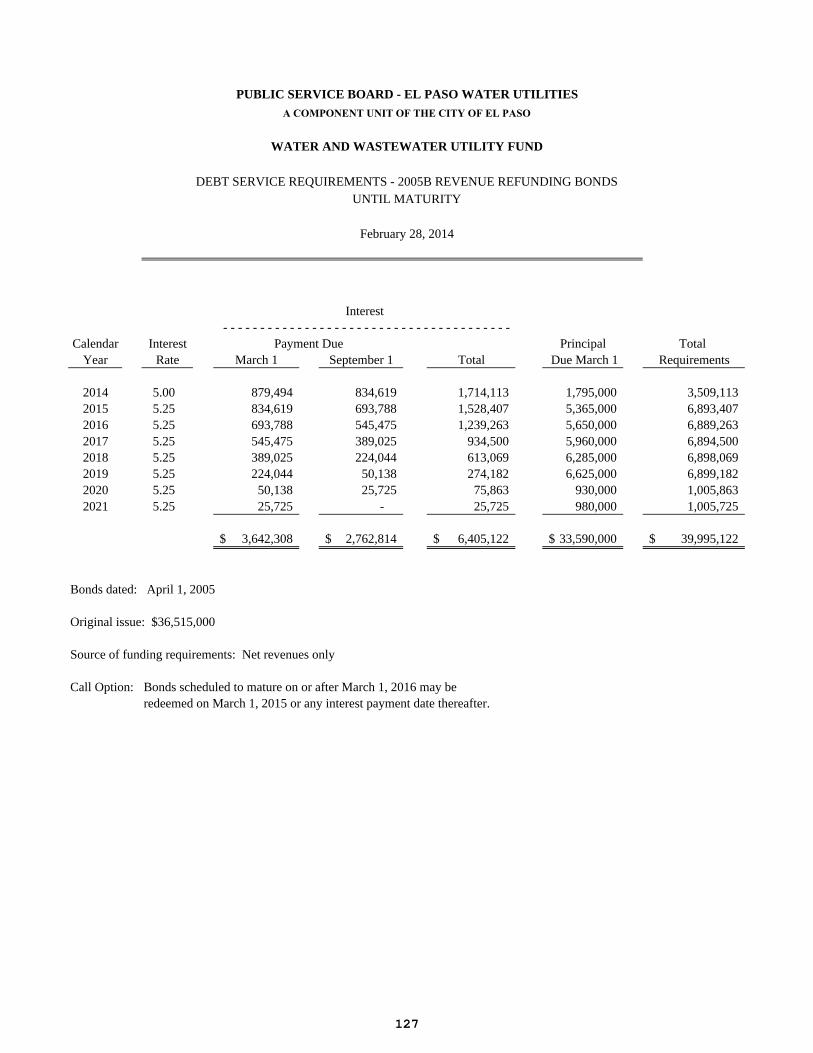
Calendar Interest Principal TotalYear Rate March 1 September 1 Total Due March 1 Requirements
2014 5.00 879,494 834,619 1,714,113 1,795,000 3,509,1132015 5.25 834,619 693,788 1,528,407 5,365,000 6,893,4072016 5.25 693,788 545,475 1,239,263 5,650,000 6,889,2632017 5.25 545,475 389,025 934,500 5,960,000 6,894,5002018 5.25 389,025 224,044 613,069 6,285,000 6,898,0692019 5.25 224,044 50,138 274,182 6,625,000 6,899,1822020 5.25 50,138 25,725 75,863 930,000 1,005,8632021 5.25 25,725 - 25,725 980,000 1,005,725
3,642,308$ 2,762,814$ 6,405,122$ 33,590,000$ 39,995,122$
Bonds dated: April 1, 2005
Original issue: $36,515,000
Source of funding requirements: Net revenues only
Call Option: Bonds scheduled to mature on or after March 1, 2016 may beredeemed on March 1, 2015 or any interest payment date thereafter.
- - - - - - - - - - - - - - - - - - - - - - - - - - - - - - - - - - - - - - -Payment Due
UNTIL MATURITY
WATER AND WASTEWATER UTILITY FUND
PUBLIC SERVICE BOARD - EL PASO WATER UTILITIESA COMPONENT UNIT OF THE CITY OF EL PASO
DEBT SERVICE REQUIREMENTS - 2005B REVENUE REFUNDING BONDS
February 28, 2014
Interest
127
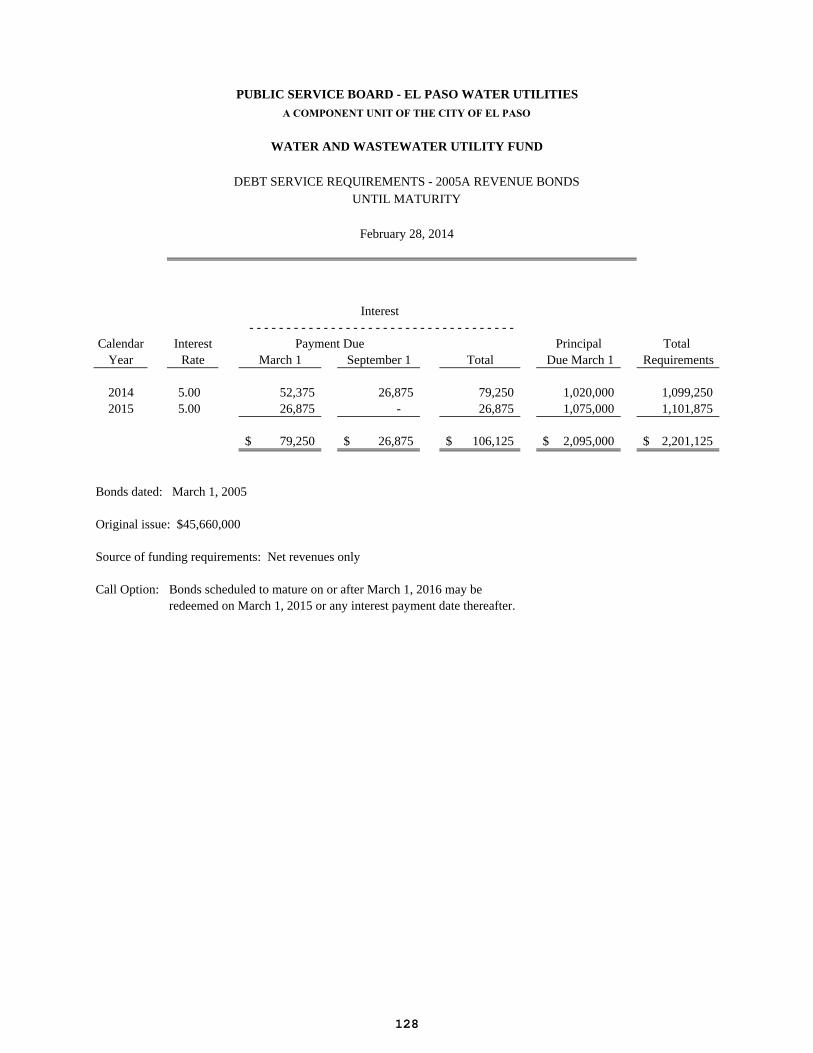
Calendar Interest Principal TotalYear Rate March 1 September 1 Total Due March 1 Requirements
2014 5.00 52,375 26,875 79,250 1,020,000 1,099,2502015 5.00 26,875 - 26,875 1,075,000 1,101,875
79,250$ 26,875$ 106,125$ 2,095,000$ 2,201,125$
Bonds dated: March 1, 2005
Original issue: $45,660,000
Source of funding requirements: Net revenues only
Call Option: Bonds scheduled to mature on or after March 1, 2016 may beredeemed on March 1, 2015 or any interest payment date thereafter.
Interest- - - - - - - - - - - - - - - - - - - - - - - - - - - - - - - - - - - -
Payment Due
WATER AND WASTEWATER UTILITY FUND
PUBLIC SERVICE BOARD - EL PASO WATER UTILITIESA COMPONENT UNIT OF THE CITY OF EL PASO
DEBT SERVICE REQUIREMENTS - 2005A REVENUE BONDSUNTIL MATURITY
February 28, 2014
128
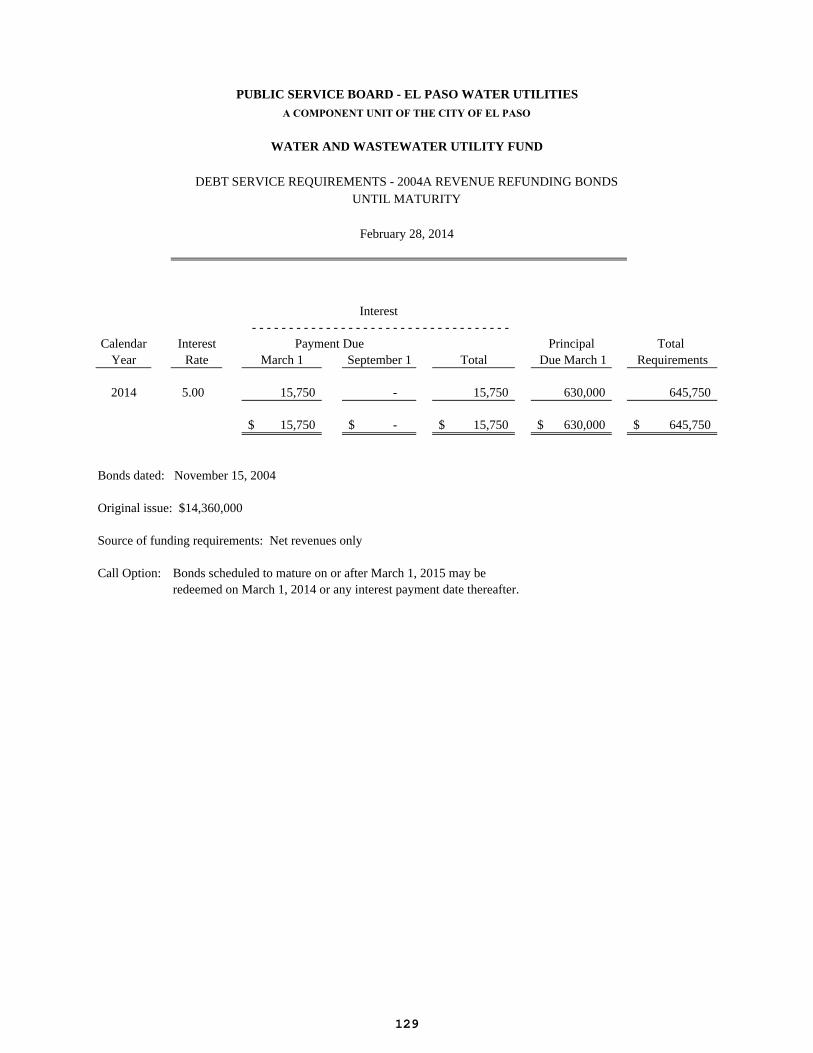
Calendar Interest Principal TotalYear Rate March 1 September 1 Total Due March 1 Requirements
2014 5.00 15,750 - 15,750 630,000 645,750
15,750$ -$ 15,750$ 630,000$ 645,750$
Bonds dated: November 15, 2004
Original issue: $14,360,000
Source of funding requirements: Net revenues only
Call Option: Bonds scheduled to mature on or after March 1, 2015 may beredeemed on March 1, 2014 or any interest payment date thereafter.
- - - - - - - - - - - - - - - - - - - - - - - - - - - - - - - - - - -Payment Due
UNTIL MATURITY
WATER AND WASTEWATER UTILITY FUND
PUBLIC SERVICE BOARD - EL PASO WATER UTILITIESA COMPONENT UNIT OF THE CITY OF EL PASO
DEBT SERVICE REQUIREMENTS - 2004A REVENUE REFUNDING BONDS
February 28, 2014
Interest
129
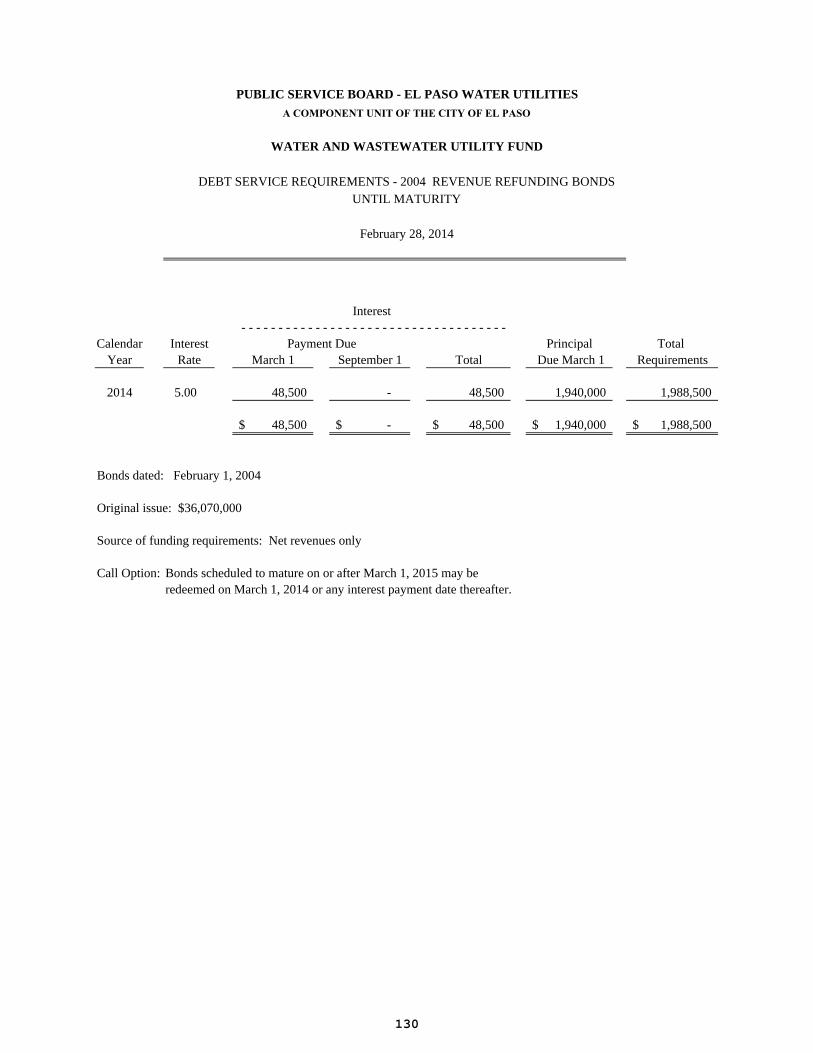
Calendar Interest Principal TotalYear Rate March 1 September 1 Total Due March 1 Requirements
2014 5.00 48,500 - 48,500 1,940,000 1,988,500
48,500$ -$ 48,500$ 1,940,000$ 1,988,500$
Bonds dated: February 1, 2004
Original issue: $36,070,000
Source of funding requirements: Net revenues only
Call Option: Bonds scheduled to mature on or after March 1, 2015 may beredeemed on March 1, 2014 or any interest payment date thereafter.
Interest- - - - - - - - - - - - - - - - - - - - - - - - - - - - - - - - - - - -
Payment Due
WATER AND WASTEWATER UTILITY FUND
PUBLIC SERVICE BOARD - EL PASO WATER UTILITIESA COMPONENT UNIT OF THE CITY OF EL PASO
DEBT SERVICE REQUIREMENTS - 2004 REVENUE REFUNDING BONDSUNTIL MATURITY
February 28, 2014
130
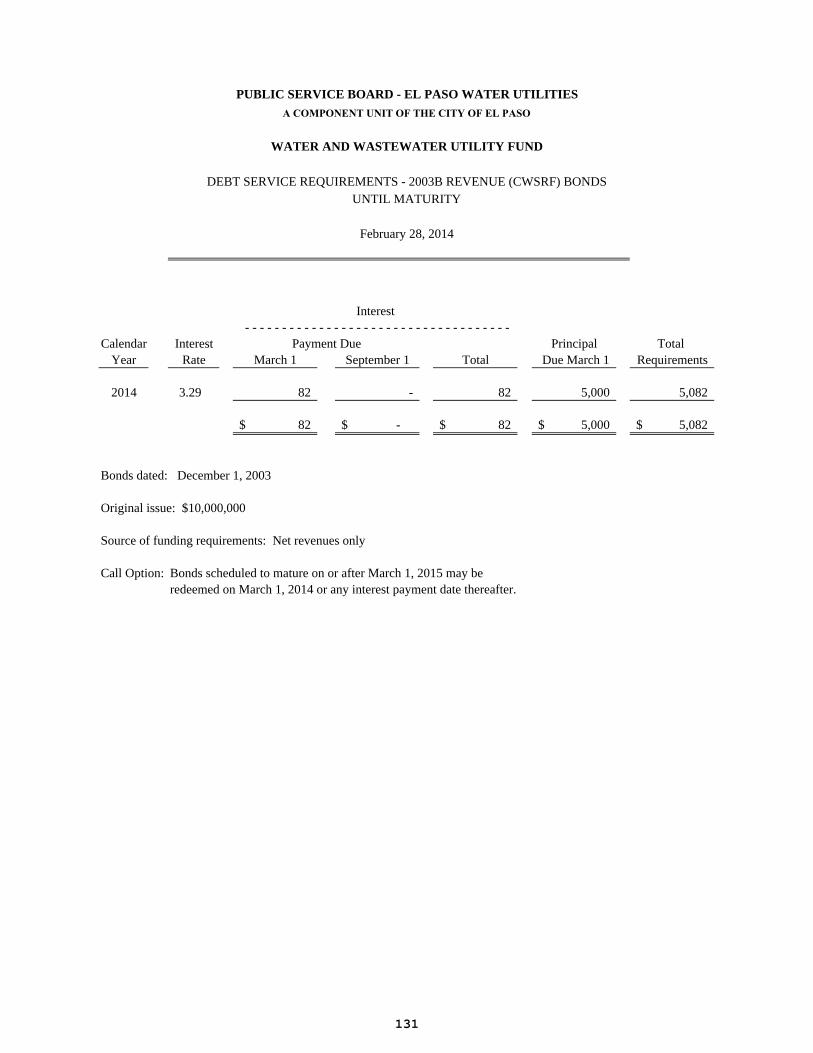
Calendar Interest Principal TotalYear Rate March 1 September 1 Total Due March 1 Requirements
2014 3.29 82 - 82 5,000 5,082
82$ -$ 82$ 5,000$ 5,082$
Bonds dated: December 1, 2003
Original issue: $10,000,000
Source of funding requirements: Net revenues only
Call Option: Bonds scheduled to mature on or after March 1, 2015 may beredeemed on March 1, 2014 or any interest payment date thereafter.
- - - - - - - - - - - - - - - - - - - - - - - - - - - - - - - - - - - -Payment Due
UNTIL MATURITY
WATER AND WASTEWATER UTILITY FUND
PUBLIC SERVICE BOARD - EL PASO WATER UTILITIESA COMPONENT UNIT OF THE CITY OF EL PASO
DEBT SERVICE REQUIREMENTS - 2003B REVENUE (CWSRF) BONDS
February 28, 2014
Interest
131
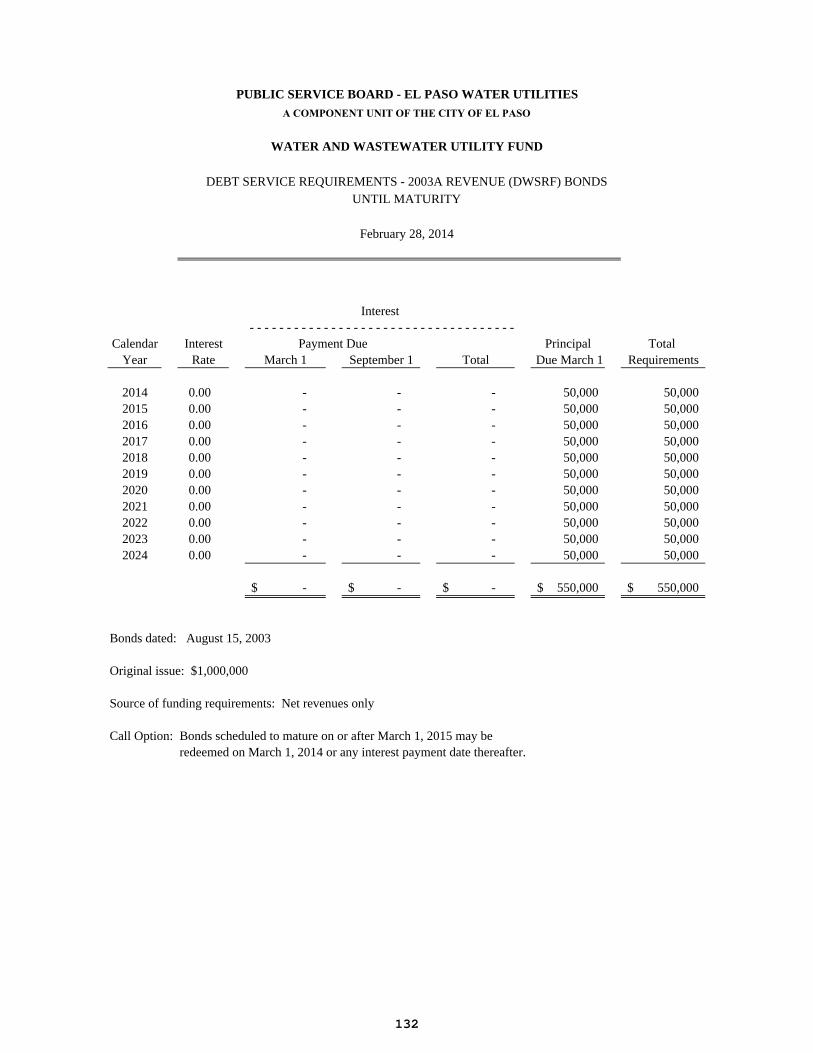
Calendar Interest Principal TotalYear Rate March 1 September 1 Total Due March 1 Requirements
2014 0.00 - - - 50,000 50,0002015 0.00 - - - 50,000 50,0002016 0.00 - - - 50,000 50,0002017 0.00 - - - 50,000 50,0002018 0.00 - - - 50,000 50,0002019 0.00 - - - 50,000 50,0002020 0.00 - - - 50,000 50,0002021 0.00 - - - 50,000 50,0002022 0.00 - - - 50,000 50,0002023 0.00 - - - 50,000 50,0002024 0.00 - - - 50,000 50,000
-$ -$ -$ 550,000$ 550,000$
Bonds dated: August 15, 2003
Original issue: $1,000,000
Source of funding requirements: Net revenues only
Call Option: Bonds scheduled to mature on or after March 1, 2015 may beredeemed on March 1, 2014 or any interest payment date thereafter.
- - - - - - - - - - - - - - - - - - - - - - - - - - - - - - - - - - - -Payment Due
WATER AND WASTEWATER UTILITY FUND
DEBT SERVICE REQUIREMENTS - 2003A REVENUE (DWSRF) BONDS
PUBLIC SERVICE BOARD - EL PASO WATER UTILITIESA COMPONENT UNIT OF THE CITY OF EL PASO
UNTIL MATURITY
February 28, 2014
Interest
132
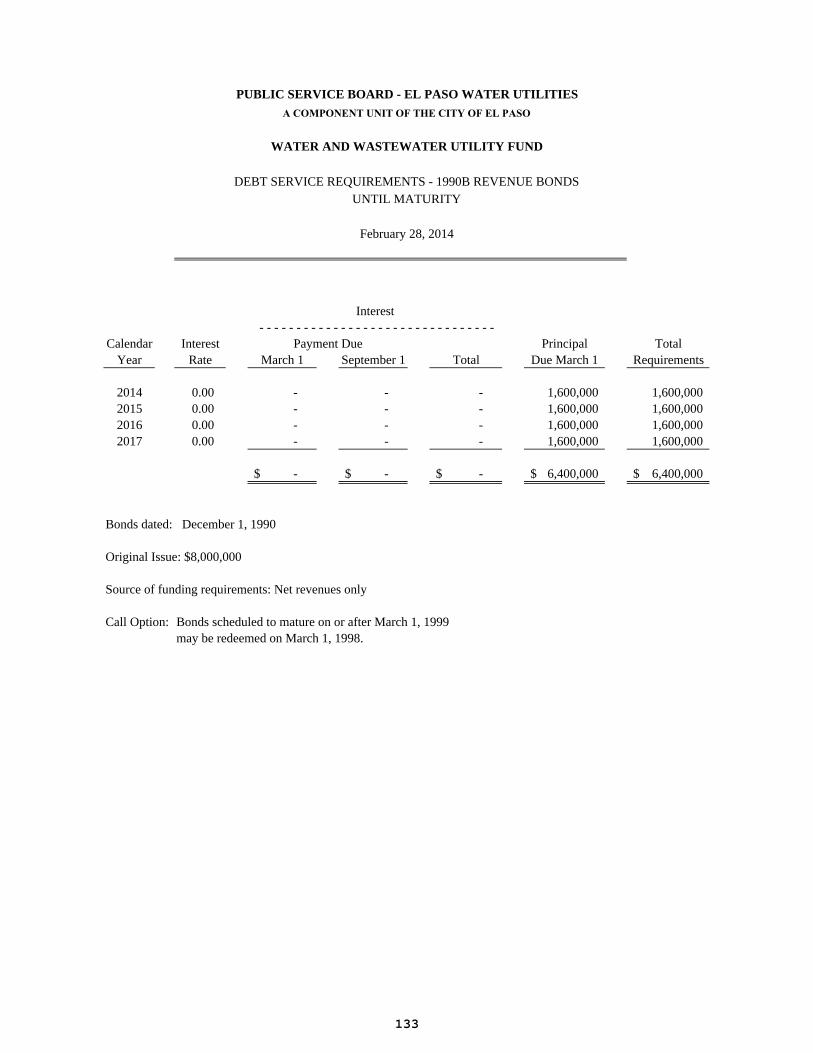
Calendar Interest Principal TotalYear Rate March 1 September 1 Total Due March 1 Requirements
2014 0.00 - - - 1,600,000 1,600,0002015 0.00 - - - 1,600,000 1,600,0002016 0.00 - - - 1,600,000 1,600,0002017 0.00 - - - 1,600,000 1,600,000
-$ -$ -$ 6,400,000$ 6,400,000$
Bonds dated: December 1, 1990
Original Issue: $8,000,000
Source of funding requirements: Net revenues only
Call Option: Bonds scheduled to mature on or after March 1, 1999may be redeemed on March 1, 1998.
Payment Due
PUBLIC SERVICE BOARD - EL PASO WATER UTILITIESA COMPONENT UNIT OF THE CITY OF EL PASO
WATER AND WASTEWATER UTILITY FUND
UNTIL MATURITY
February 28, 2014
Interest- - - - - - - - - - - - - - - - - - - - - - - - - - - - - - - -
DEBT SERVICE REQUIREMENTS - 1990B REVENUE BONDS
133

134
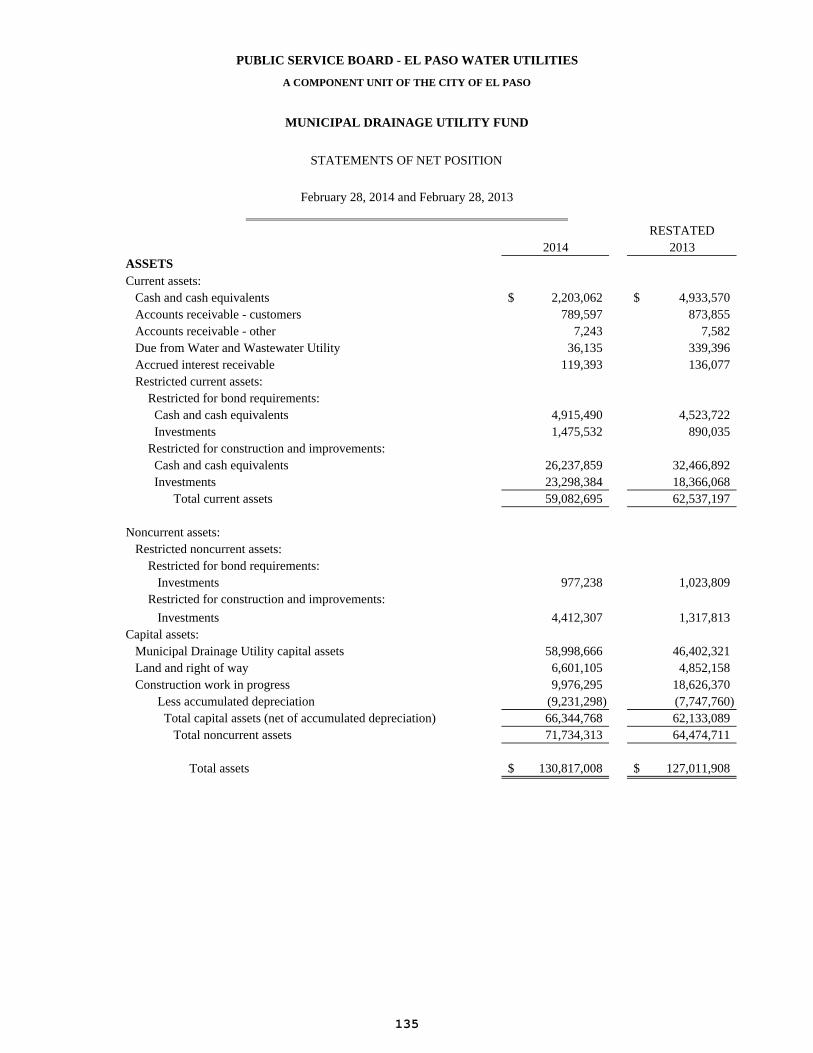
RESTATED2014 2013
ASSETSCurrent assets: Cash and cash equivalents 2,203,062$ 4,933,570$ Accounts receivable - customers 789,597 873,855 Accounts receivable - other 7,243 7,582 Due from Water and Wastewater Utility 36,135 339,396 Accrued interest receivable 119,393 136,077 Restricted current assets: Restricted for bond requirements: Cash and cash equivalents 4,915,490 4,523,722 Investments 1,475,532 890,035 Restricted for construction and improvements: Cash and cash equivalents 26,237,859 32,466,892 Investments 23,298,384 18,366,068 Total current assets 59,082,695 62,537,197
Noncurrent assets: Restricted noncurrent assets: Restricted for bond requirements: Investments 977,238 1,023,809 Restricted for construction and improvements:
Investments 4,412,307 1,317,813Capital assets: Municipal Drainage Utility capital assets 58,998,666 46,402,321 Land and right of way 6,601,105 4,852,158 Construction work in progress 9,976,295 18,626,370 Less accumulated depreciation (9,231,298) (7,747,760) Total capital assets (net of accumulated depreciation) 66,344,768 62,133,089 Total noncurrent assets 71,734,313 64,474,711
Total assets 130,817,008$ 127,011,908$
PUBLIC SERVICE BOARD - EL PASO WATER UTILITIES
A COMPONENT UNIT OF THE CITY OF EL PASO
MUNICIPAL DRAINAGE UTILITY FUND
STATEMENTS OF NET POSITION
February 28, 2014 and February 28, 2013
135
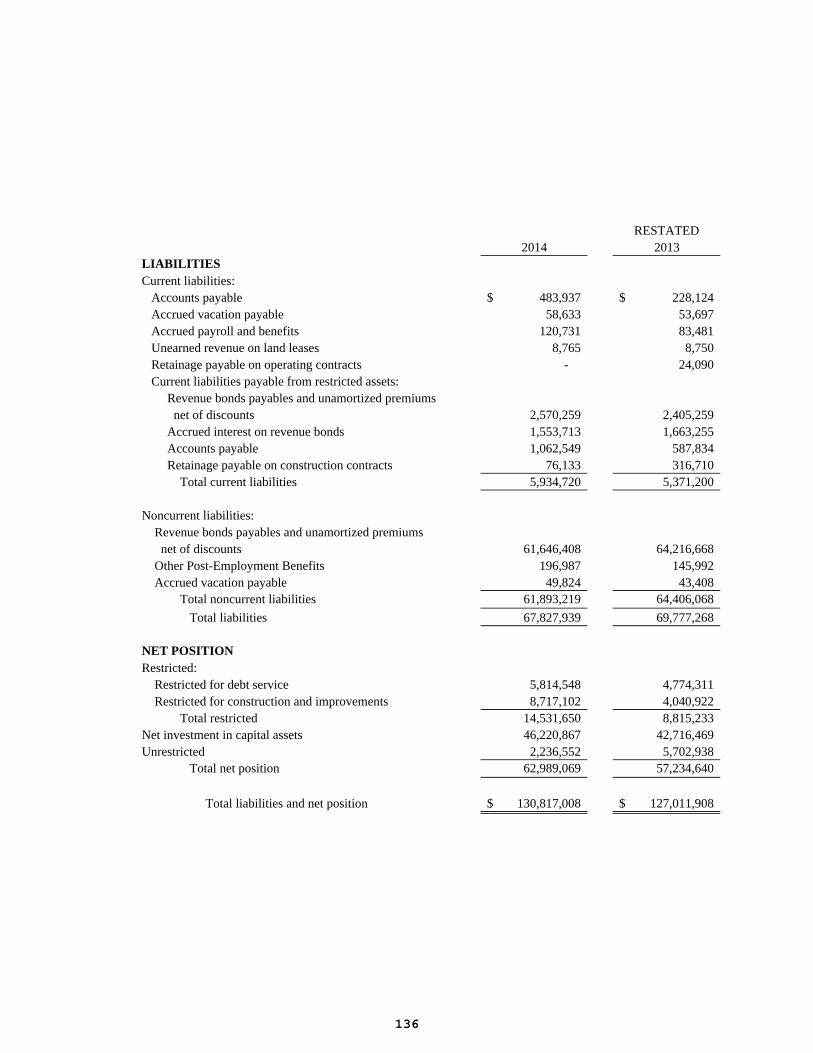
RESTATED2014 2013
LIABILITIESCurrent liabilities: Accounts payable 483,937$ 228,124$ Accrued vacation payable 58,633 53,697 Accrued payroll and benefits 120,731 83,481 Unearned revenue on land leases 8,765 8,750 Retainage payable on operating contracts - 24,090 Current liabilities payable from restricted assets: Revenue bonds payables and unamortized premiums net of discounts 2,570,259 2,405,259 Accrued interest on revenue bonds 1,553,713 1,663,255 Accounts payable 1,062,549 587,834 Retainage payable on construction contracts 76,133 316,710 Total current liabilities 5,934,720 5,371,200
Noncurrent liabilities: Revenue bonds payables and unamortized premiums net of discounts 61,646,408 64,216,668 Other Post-Employment Benefits 196,987 145,992 Accrued vacation payable 49,824 43,408 Total noncurrent liabilities 61,893,219 64,406,068
Total liabilities 67,827,939 69,777,268
NET POSITIONRestricted: Restricted for debt service 5,814,548 4,774,311 Restricted for construction and improvements 8,717,102 4,040,922 Total restricted 14,531,650 8,815,233Net investment in capital assets 46,220,867 42,716,469Unrestricted 2,236,552 5,702,938 Total net position 62,989,069 57,234,640
Total liabilities and net position 130,817,008$ 127,011,908$
136
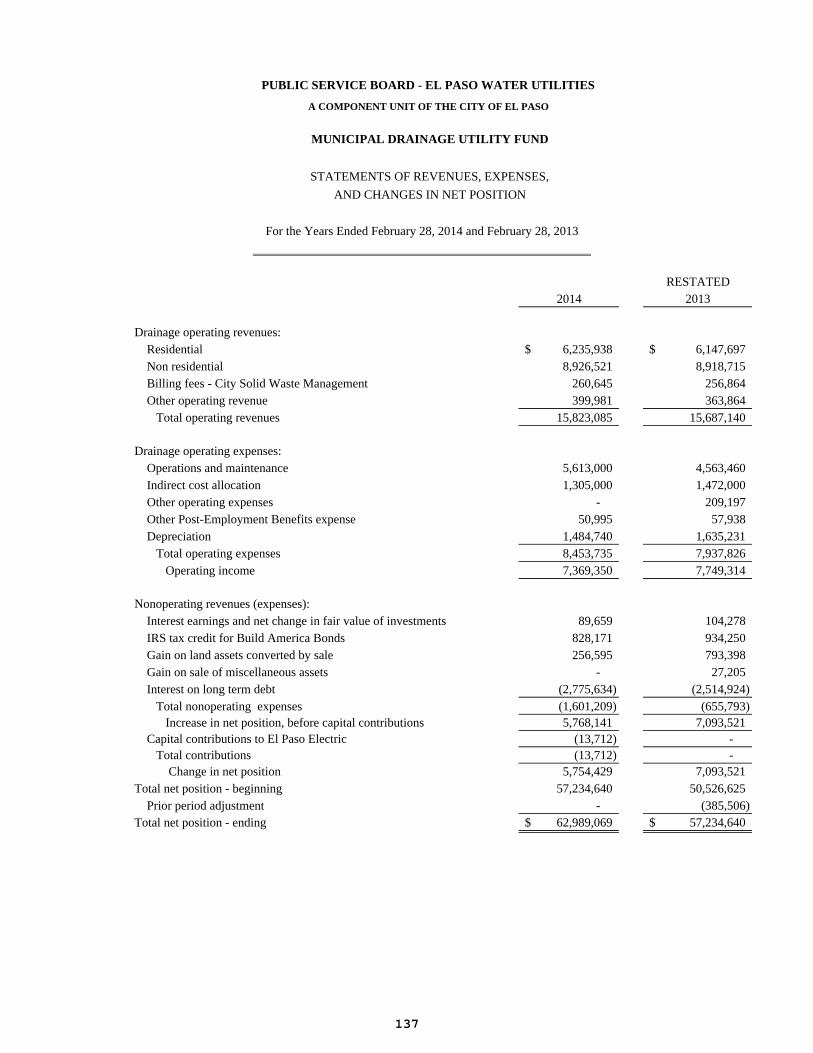
RESTATED2014 2013
Drainage operating revenues: Residential 6,235,938$ 6,147,697$ Non residential 8,926,521 8,918,715 Billing fees - City Solid Waste Management 260,645 256,864 Other operating revenue 399,981 363,864 Total operating revenues 15,823,085 15,687,140
Drainage operating expenses: Operations and maintenance 5,613,000 4,563,460 Indirect cost allocation 1,305,000 1,472,000 Other operating expenses - 209,197 Other Post-Employment Benefits expense 50,995 57,938 Depreciation 1,484,740 1,635,231 Total operating expenses 8,453,735 7,937,826 Operating income 7,369,350 7,749,314
Nonoperating revenues (expenses): Interest earnings and net change in fair value of investments 89,659 104,278 IRS tax credit for Build America Bonds 828,171 934,250 Gain on land assets converted by sale 256,595 793,398 Gain on sale of miscellaneous assets - 27,205 Interest on long term debt (2,775,634) (2,514,924) Total nonoperating expenses (1,601,209) (655,793) Increase in net position, before capital contributions 5,768,141 7,093,521 Capital contributions to El Paso Electric (13,712) - Total contributions (13,712) - Change in net position 5,754,429 7,093,521Total net position - beginning 57,234,640 50,526,625 Prior period adjustment - (385,506)Total net position - ending 62,989,069$ 57,234,640$
PUBLIC SERVICE BOARD - EL PASO WATER UTILITIES
A COMPONENT UNIT OF THE CITY OF EL PASO
MUNICIPAL DRAINAGE UTILITY FUND
STATEMENTS OF REVENUES, EXPENSES,
AND CHANGES IN NET POSITION
For the Years Ended February 28, 2014 and February 28, 2013
137

138
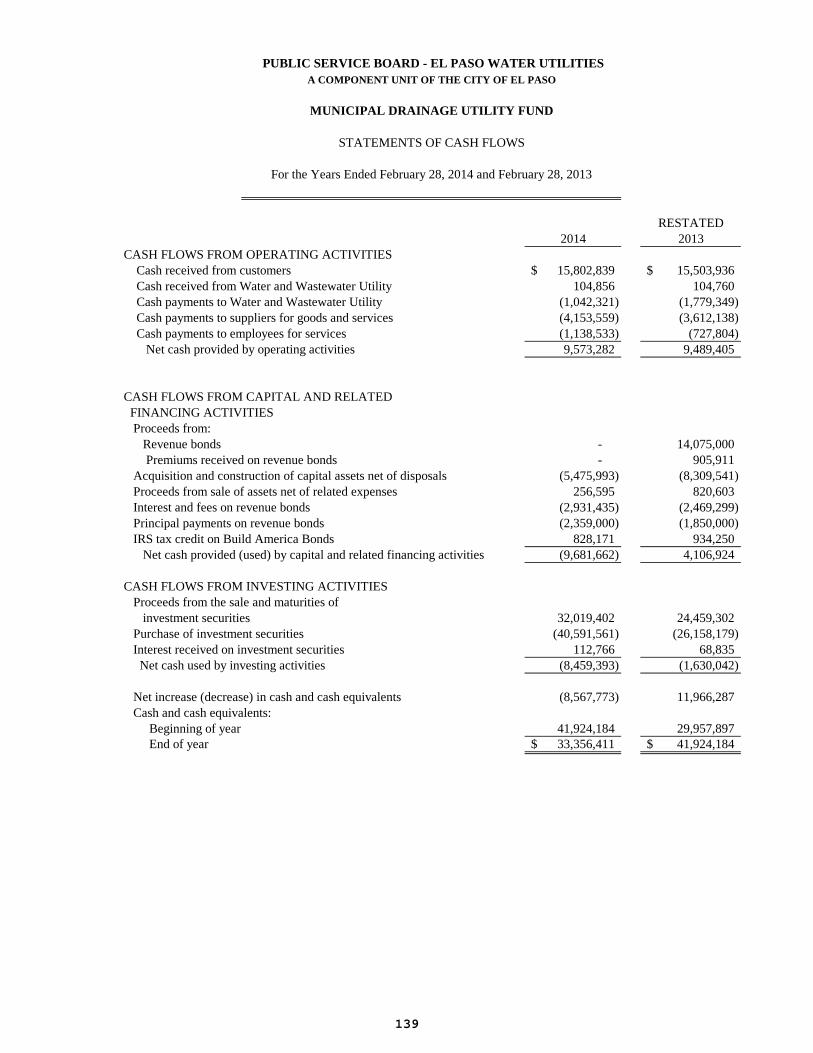
RESTATED2014 2013
CASH FLOWS FROM OPERATING ACTIVITIES Cash received from customers 15,802,839$ 15,503,936$ Cash received from Water and Wastewater Utility 104,856 104,760 Cash payments to Water and Wastewater Utility (1,042,321) (1,779,349) Cash payments to suppliers for goods and services (4,153,559) (3,612,138) Cash payments to employees for services (1,138,533) (727,804) Net cash provided by operating activities 9,573,282 9,489,405
CASH FLOWS FROM CAPITAL AND RELATED FINANCING ACTIVITIES Proceeds from: Revenue bonds - 14,075,000 Premiums received on revenue bonds - 905,911 Acquisition and construction of capital assets net of disposals (5,475,993) (8,309,541) Proceeds from sale of assets net of related expenses 256,595 820,603 Interest and fees on revenue bonds (2,931,435) (2,469,299) Principal payments on revenue bonds (2,359,000) (1,850,000) IRS tax credit on Build America Bonds 828,171 934,250 Net cash provided (used) by capital and related financing activities (9,681,662) 4,106,924
CASH FLOWS FROM INVESTING ACTIVITIES Proceeds from the sale and maturities of investment securities 32,019,402 24,459,302 Purchase of investment securities (40,591,561) (26,158,179) Interest received on investment securities 112,766 68,835 Net cash used by investing activities (8,459,393) (1,630,042)
Net increase (decrease) in cash and cash equivalents (8,567,773) 11,966,287 Cash and cash equivalents: Beginning of year 41,924,184 29,957,897 End of year 33,356,411$ 41,924,184$
PUBLIC SERVICE BOARD - EL PASO WATER UTILITIESA COMPONENT UNIT OF THE CITY OF EL PASO
STATEMENTS OF CASH FLOWS
For the Years Ended February 28, 2014 and February 28, 2013
MUNICIPAL DRAINAGE UTILITY FUND
139
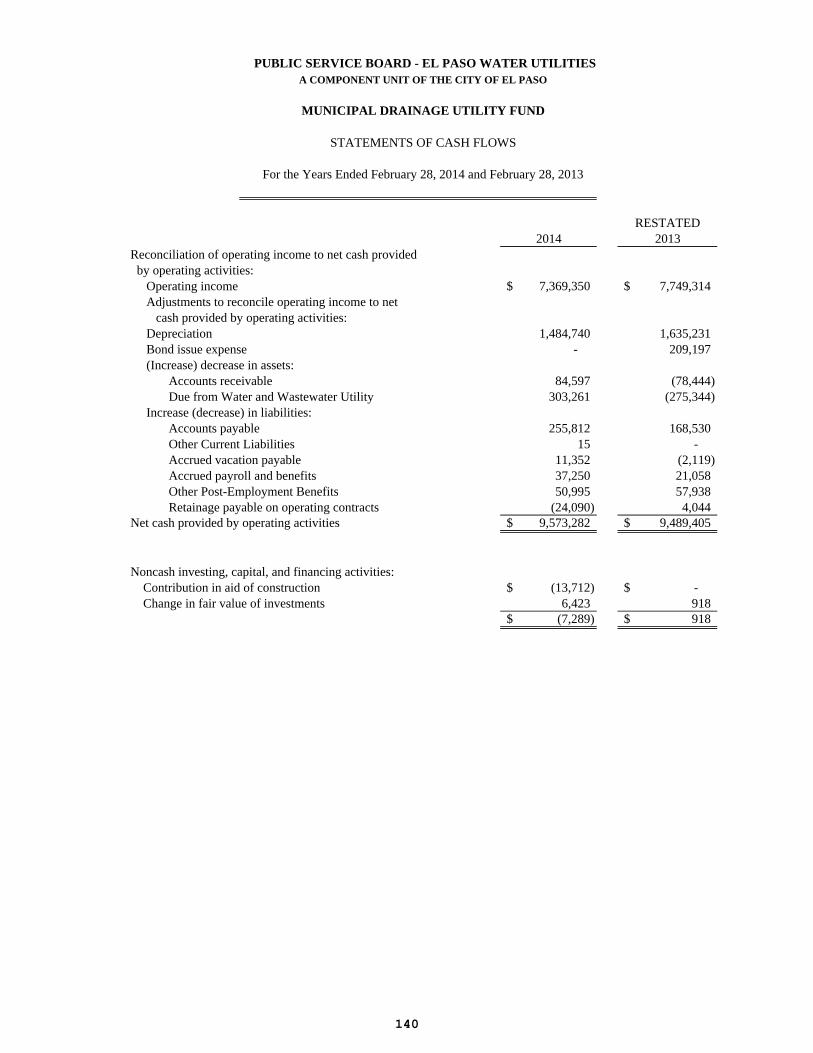
RESTATED2014 2013
Reconciliation of operating income to net cash provided by operating activities: Operating income 7,369,350$ 7,749,314$ Adjustments to reconcile operating income to net cash provided by operating activities: Depreciation 1,484,740 1,635,231 Bond issue expense - 209,197 (Increase) decrease in assets: Accounts receivable 84,597 (78,444) Due from Water and Wastewater Utility 303,261 (275,344) Increase (decrease) in liabilities: Accounts payable 255,812 168,530 Other Current Liabilities 15 - Accrued vacation payable 11,352 (2,119) Accrued payroll and benefits 37,250 21,058 Other Post-Employment Benefits 50,995 57,938 Retainage payable on operating contracts (24,090) 4,044Net cash provided by operating activities 9,573,282$ 9,489,405$
Noncash investing, capital, and financing activities: Contribution in aid of construction (13,712)$ -$ Change in fair value of investments 6,423 918
(7,289)$ 918$
PUBLIC SERVICE BOARD - EL PASO WATER UTILITIESA COMPONENT UNIT OF THE CITY OF EL PASO
MUNICIPAL DRAINAGE UTILITY FUND
STATEMENTS OF CASH FLOWS
For the Years Ended February 28, 2014 and February 28, 2013
140
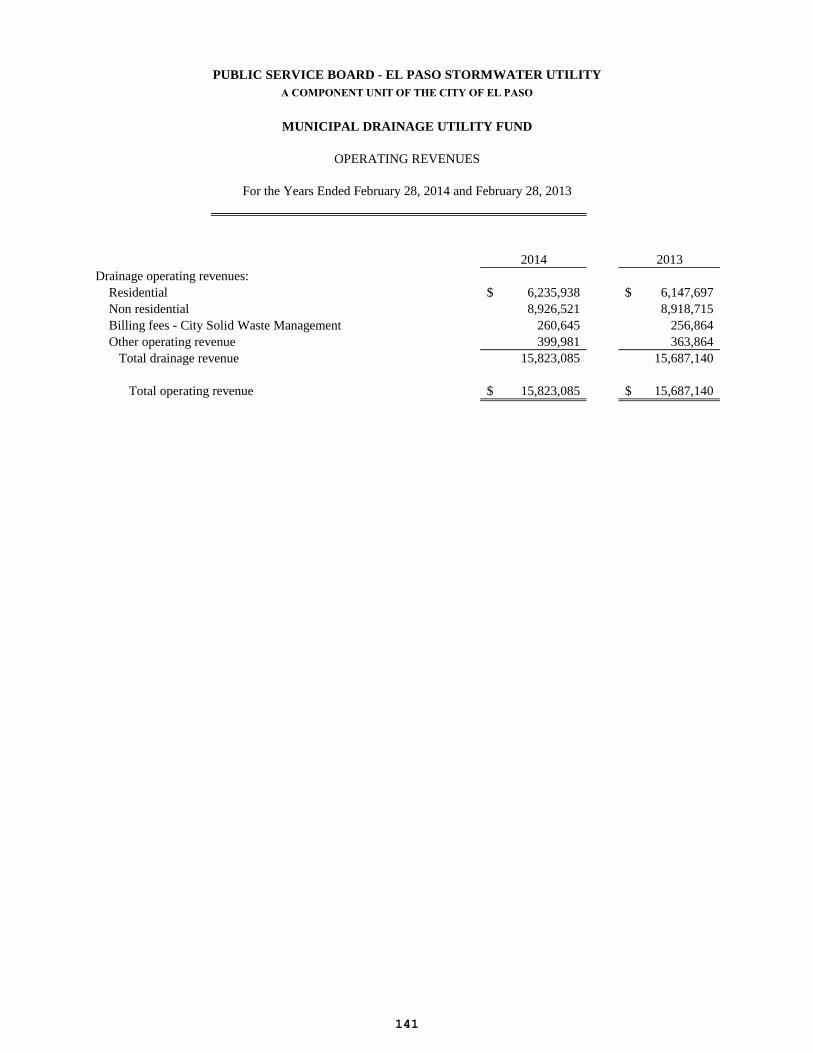
PUBLIC SERVICE BOARD - EL PASO STORMWATER UTILITYA COMPONENT UNIT OF THE CITY OF EL PASO
MUNICIPAL DRAINAGE UTILITY FUND
OPERATING REVENUES
For the Years Ended February 28, 2014 and February 28, 2013
2014 2013Drainage operating revenues: Residential 6,235,938$ 6,147,697$ Non residential 8,926,521 8,918,715 Billing fees - City Solid Waste Management 260,645 256,864 Other operating revenue 399,981 363,864 Total drainage revenue 15,823,085 15,687,140
Total operating revenue 15,823,085$ 15,687,140$
141
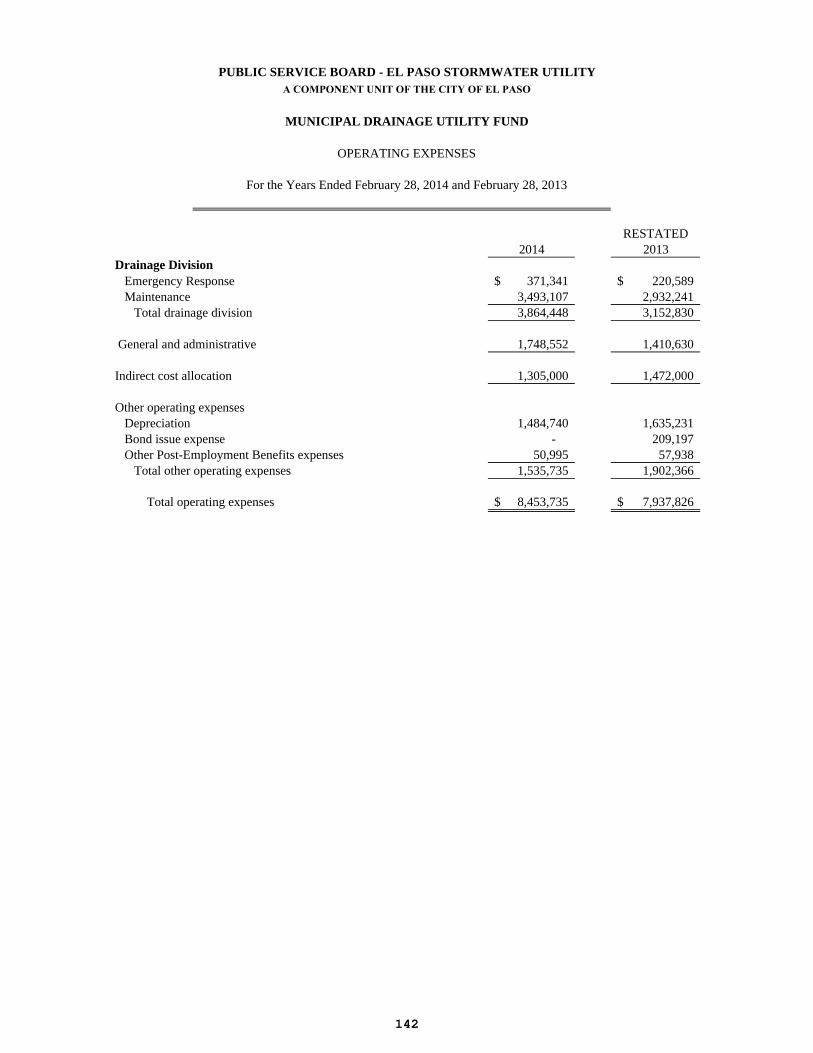
PUBLIC SERVICE BOARD - EL PASO STORMWATER UTILITYA COMPONENT UNIT OF THE CITY OF EL PASO
MUNICIPAL DRAINAGE UTILITY FUND
OPERATING EXPENSES
For the Years Ended February 28, 2014 and February 28, 2013
RESTATED2014 2013
Drainage Division Emergency Response 371,341$ 220,589$ Maintenance 3,493,107 2,932,241 Total drainage division 3,864,448 3,152,830
General and administrative 1,748,552 1,410,630
Indirect cost allocation 1,305,000 1,472,000
Other operating expenses Depreciation 1,484,740 1,635,231 Bond issue expense - 209,197 Other Post-Employment Benefits expenses 50,995 57,938 Total other operating expenses 1,535,735 1,902,366
Total operating expenses 8,453,735$ 7,937,826$
142
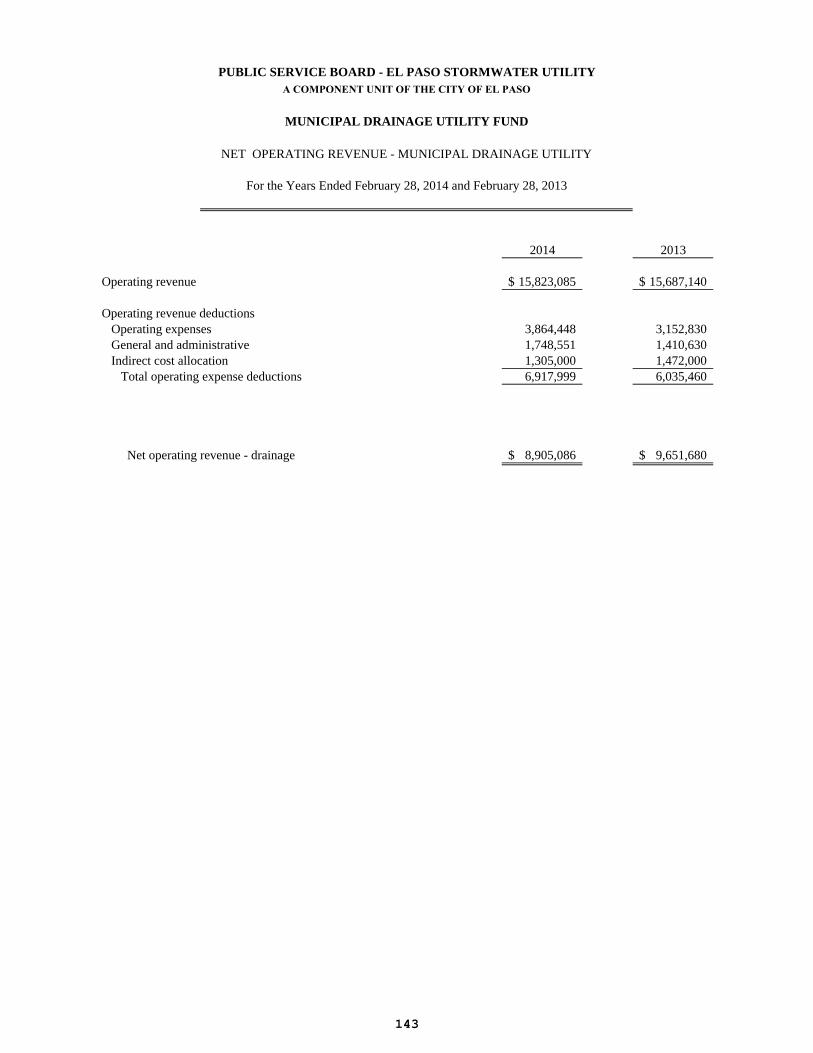
PUBLIC SERVICE BOARD - EL PASO STORMWATER UTILITYA COMPONENT UNIT OF THE CITY OF EL PASO
MUNICIPAL DRAINAGE UTILITY FUND
NET OPERATING REVENUE - MUNICIPAL DRAINAGE UTILITY
For the Years Ended February 28, 2014 and February 28, 2013
2014 2013
Operating revenue 15,823,085$ 15,687,140$
Operating revenue deductions Operating expenses 3,864,448 3,152,830 General and administrative 1,748,551 1,410,630 Indirect cost allocation 1,305,000 1,472,000 Total operating expense deductions 6,917,999 6,035,460
Net operating revenue - drainage 8,905,086$ 9,651,680$
143
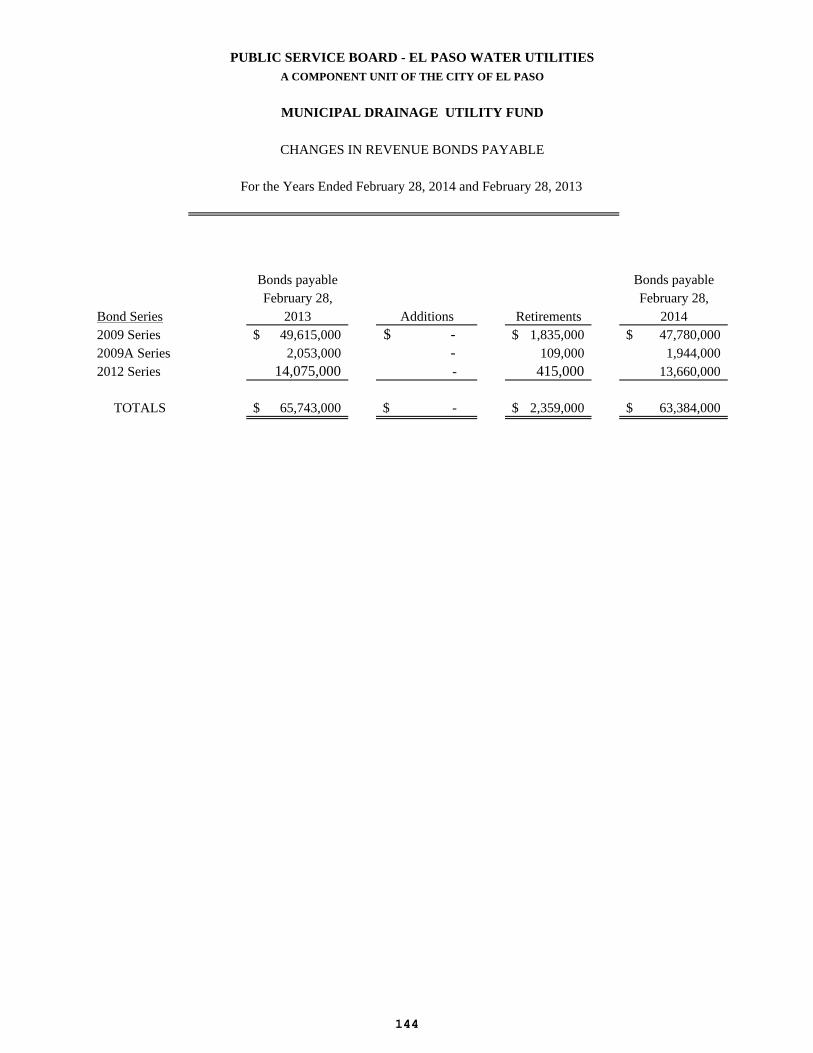
PUBLIC SERVICE BOARD - EL PASO WATER UTILITIESA COMPONENT UNIT OF THE CITY OF EL PASO
MUNICIPAL DRAINAGE UTILITY FUND
CHANGES IN REVENUE BONDS PAYABLE
For the Years Ended February 28, 2014 and February 28, 2013
Bonds payable Bonds payableFebruary 28, February 28,
Bond Series 2013 Additions Retirements 20142009 Series 49,615,000$ -$ 1,835,000$ 47,780,000$2009A Series 2,053,000 - 109,000 1,944,0002012 Series 14,075,000 - 415,000 13,660,000
TOTALS 65,743,000$ -$ 2,359,000$ 63,384,000$
144
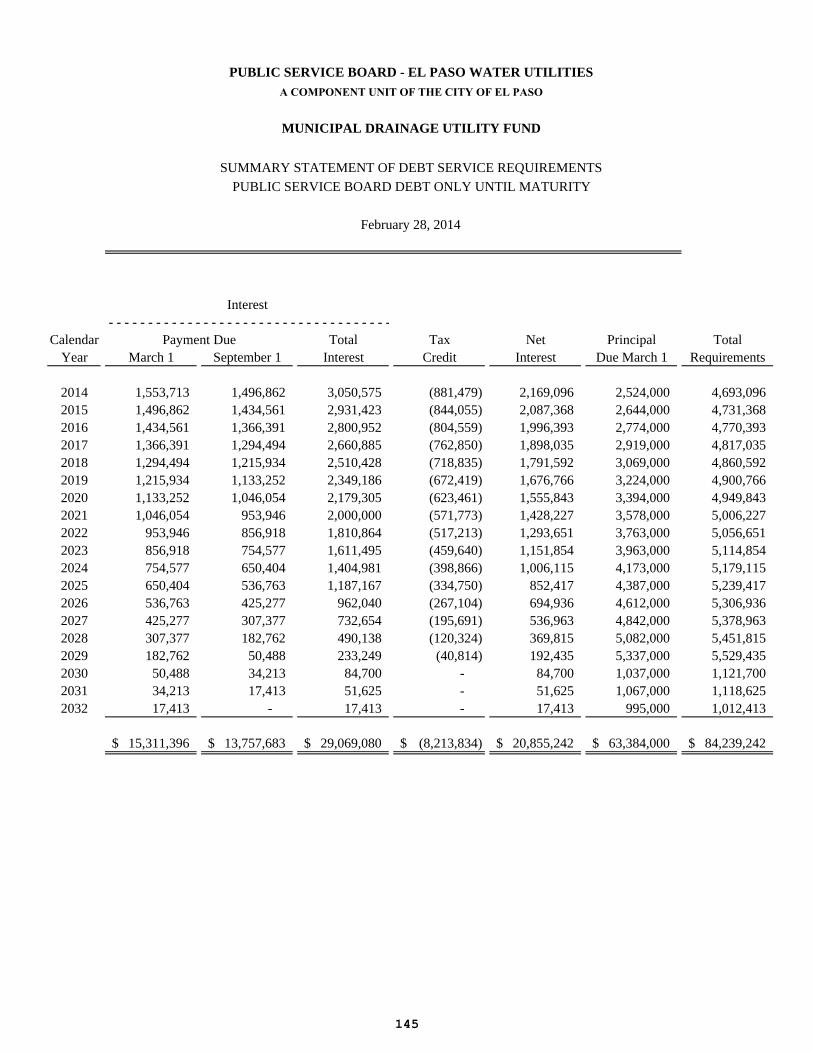
Calendar Total Tax Net Principal TotalYear March 1 September 1 Interest Credit Interest Due March 1 Requirements
2014 1,553,713 1,496,862 3,050,575 (881,479) 2,169,096 2,524,000 4,693,0962015 1,496,862 1,434,561 2,931,423 (844,055) 2,087,368 2,644,000 4,731,3682016 1,434,561 1,366,391 2,800,952 (804,559) 1,996,393 2,774,000 4,770,3932017 1,366,391 1,294,494 2,660,885 (762,850) 1,898,035 2,919,000 4,817,0352018 1,294,494 1,215,934 2,510,428 (718,835) 1,791,592 3,069,000 4,860,5922019 1,215,934 1,133,252 2,349,186 (672,419) 1,676,766 3,224,000 4,900,7662020 1,133,252 1,046,054 2,179,305 (623,461) 1,555,843 3,394,000 4,949,8432021 1,046,054 953,946 2,000,000 (571,773) 1,428,227 3,578,000 5,006,2272022 953,946 856,918 1,810,864 (517,213) 1,293,651 3,763,000 5,056,6512023 856,918 754,577 1,611,495 (459,640) 1,151,854 3,963,000 5,114,8542024 754,577 650,404 1,404,981 (398,866) 1,006,115 4,173,000 5,179,1152025 650,404 536,763 1,187,167 (334,750) 852,417 4,387,000 5,239,4172026 536,763 425,277 962,040 (267,104) 694,936 4,612,000 5,306,9362027 425,277 307,377 732,654 (195,691) 536,963 4,842,000 5,378,9632028 307,377 182,762 490,138 (120,324) 369,815 5,082,000 5,451,8152029 182,762 50,488 233,249 (40,814) 192,435 5,337,000 5,529,4352030 50,488 34,213 84,700 - 84,700 1,037,000 1,121,7002031 34,213 17,413 51,625 - 51,625 1,067,000 1,118,6252032 17,413 - 17,413 - 17,413 995,000 1,012,413
15,311,396$ 13,757,683$ 29,069,080$ (8,213,834)$ 20,855,242$ 63,384,000$ 84,239,242$
Interest- - - - - - - - - - - - - - - - - - - - - - - - - - - - - - - - - - - - - - - - - -
Payment Due
PUBLIC SERVICE BOARD - EL PASO WATER UTILITIESA COMPONENT UNIT OF THE CITY OF EL PASO
MUNICIPAL DRAINAGE UTILITY FUND
SUMMARY STATEMENT OF DEBT SERVICE REQUIREMENTS
PUBLIC SERVICE BOARD DEBT ONLY UNTIL MATURITY
February 28, 2014
145
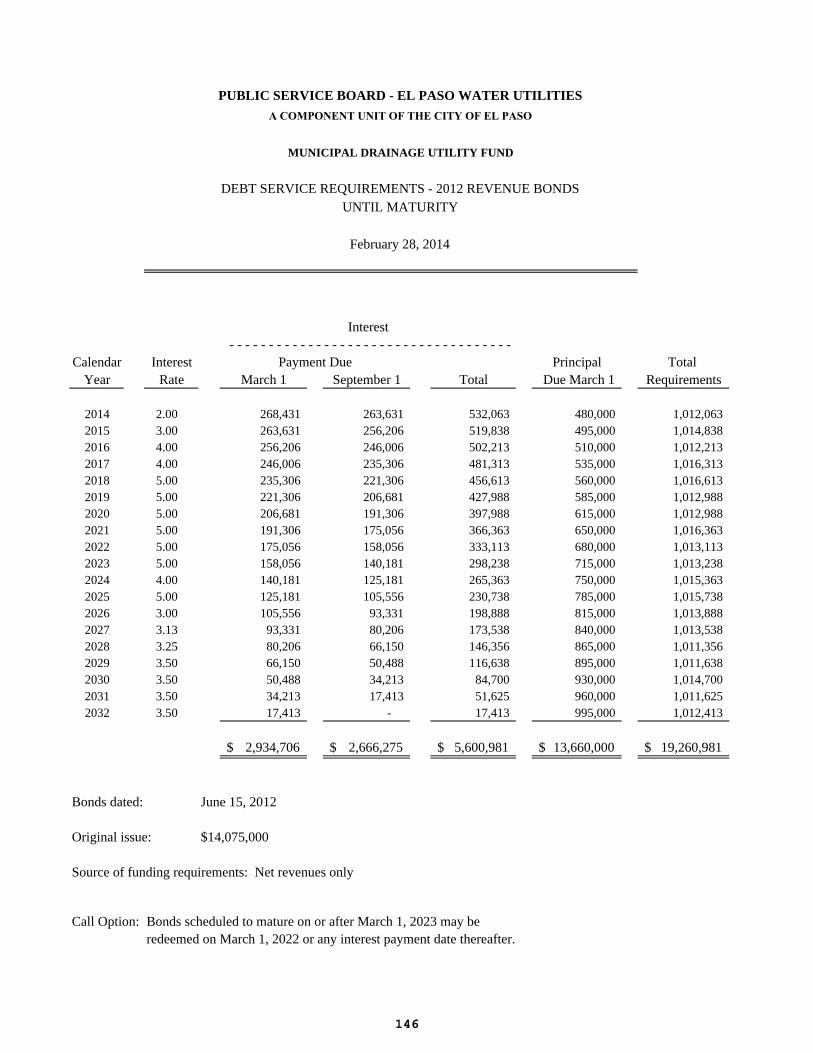
Calendar Interest Principal TotalYear Rate March 1 September 1 Total Due March 1 Requirements
2014 2.00 268,431 263,631 532,063 480,000 1,012,0632015 3.00 263,631 256,206 519,838 495,000 1,014,8382016 4.00 256,206 246,006 502,213 510,000 1,012,2132017 4.00 246,006 235,306 481,313 535,000 1,016,3132018 5.00 235,306 221,306 456,613 560,000 1,016,6132019 5.00 221,306 206,681 427,988 585,000 1,012,9882020 5.00 206,681 191,306 397,988 615,000 1,012,9882021 5.00 191,306 175,056 366,363 650,000 1,016,3632022 5.00 175,056 158,056 333,113 680,000 1,013,1132023 5.00 158,056 140,181 298,238 715,000 1,013,2382024 4.00 140,181 125,181 265,363 750,000 1,015,3632025 5.00 125,181 105,556 230,738 785,000 1,015,7382026 3.00 105,556 93,331 198,888 815,000 1,013,8882027 3.13 93,331 80,206 173,538 840,000 1,013,5382028 3.25 80,206 66,150 146,356 865,000 1,011,3562029 3.50 66,150 50,488 116,638 895,000 1,011,6382030 3.50 50,488 34,213 84,700 930,000 1,014,7002031 3.50 34,213 17,413 51,625 960,000 1,011,6252032 3.50 17,413 - 17,413 995,000 1,012,413
2,934,706$ 2,666,275$ 5,600,981$ 13,660,000$ 19,260,981$
Bonds dated:
Original issue:
Source of funding requirements: Net revenues only
Call Option: Bonds scheduled to mature on or after March 1, 2023 may beredeemed on March 1, 2022 or any interest payment date thereafter.
$14,075,000
June 15, 2012
Interest- - - - - - - - - - - - - - - - - - - - - - - - - - - - - - - - - - - -
Payment Due
February 28, 2014
PUBLIC SERVICE BOARD - EL PASO WATER UTILITIES
A COMPONENT UNIT OF THE CITY OF EL PASO
MUNICIPAL DRAINAGE UTILITY FUND
DEBT SERVICE REQUIREMENTS - 2012 REVENUE BONDSUNTIL MATURITY
146
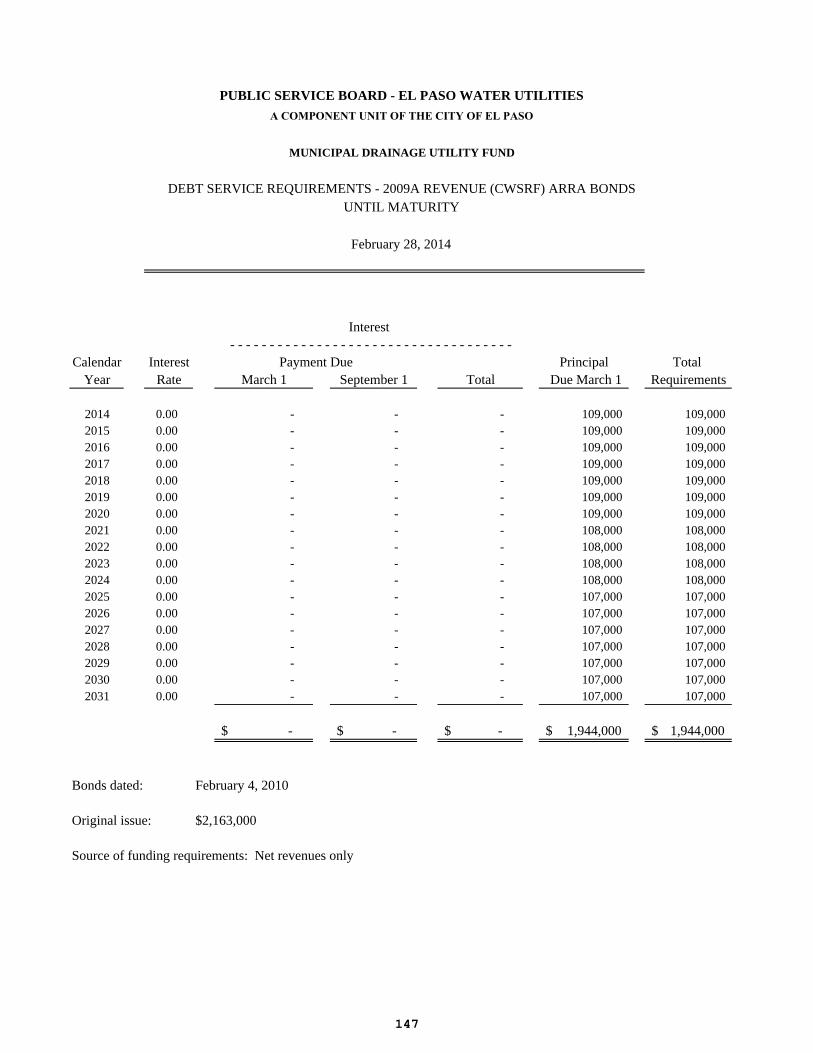
Calendar Interest Principal TotalYear Rate March 1 September 1 Total Due March 1 Requirements
2014 0.00 - - - 109,000 109,0002015 0.00 - - - 109,000 109,0002016 0.00 - - - 109,000 109,0002017 0.00 - - - 109,000 109,0002018 0.00 - - - 109,000 109,0002019 0.00 - - - 109,000 109,0002020 0.00 - - - 109,000 109,0002021 0.00 - - - 108,000 108,0002022 0.00 - - - 108,000 108,0002023 0.00 - - - 108,000 108,0002024 0.00 - - - 108,000 108,0002025 0.00 - - - 107,000 107,0002026 0.00 - - - 107,000 107,0002027 0.00 - - - 107,000 107,0002028 0.00 - - - 107,000 107,0002029 0.00 - - - 107,000 107,0002030 0.00 - - - 107,000 107,0002031 0.00 - - - 107,000 107,000
-$ -$ -$ 1,944,000$ 1,944,000$
Bonds dated:
Original issue:
Source of funding requirements: Net revenues only
February 28, 2014
PUBLIC SERVICE BOARD - EL PASO WATER UTILITIES
A COMPONENT UNIT OF THE CITY OF EL PASO
MUNICIPAL DRAINAGE UTILITY FUND
DEBT SERVICE REQUIREMENTS - 2009A REVENUE (CWSRF) ARRA BONDSUNTIL MATURITY
Interest- - - - - - - - - - - - - - - - - - - - - - - - - - - - - - - - - - - -
Payment Due
February 4, 2010
$2,163,000
147
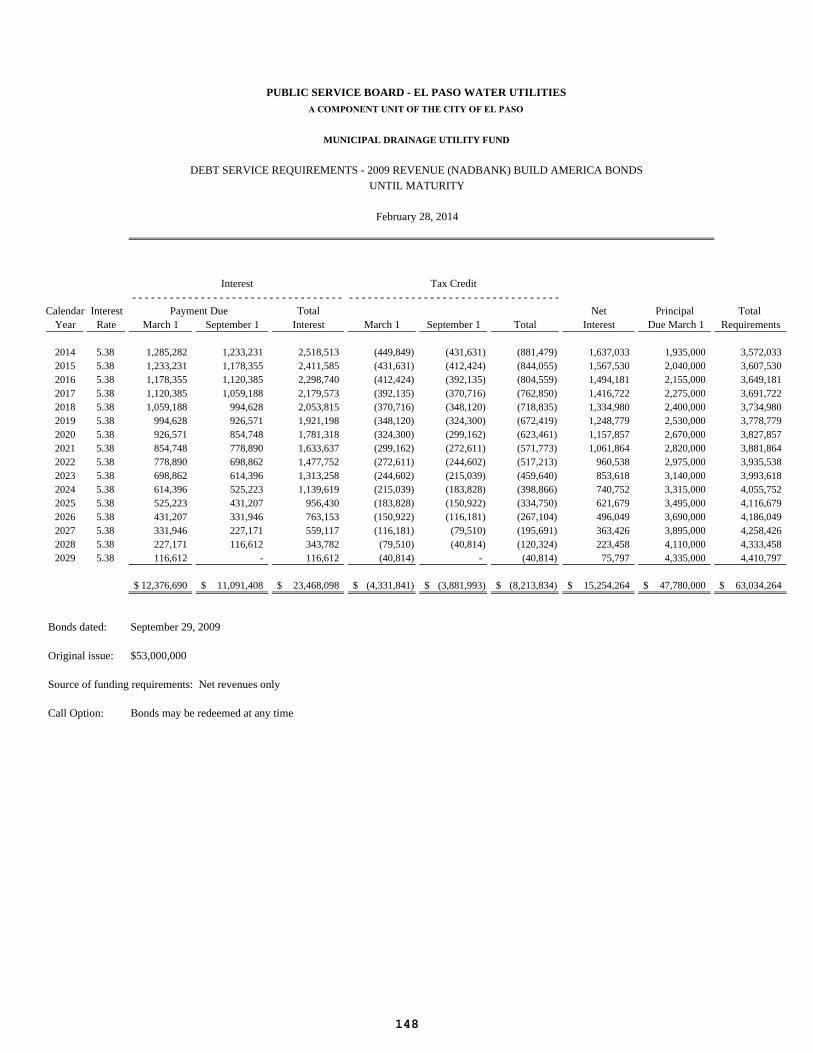
Calendar Interest Total Net Principal TotalYear Rate March 1 September 1 Interest March 1 September 1 Total Interest Due March 1 Requirements
2014 5.38 1,285,282 1,233,231 2,518,513 (449,849) (431,631) (881,479) 1,637,033 1,935,000 3,572,0332015 5.38 1,233,231 1,178,355 2,411,585 (431,631) (412,424) (844,055) 1,567,530 2,040,000 3,607,5302016 5.38 1,178,355 1,120,385 2,298,740 (412,424) (392,135) (804,559) 1,494,181 2,155,000 3,649,1812017 5.38 1,120,385 1,059,188 2,179,573 (392,135) (370,716) (762,850) 1,416,722 2,275,000 3,691,7222018 5.38 1,059,188 994,628 2,053,815 (370,716) (348,120) (718,835) 1,334,980 2,400,000 3,734,9802019 5.38 994,628 926,571 1,921,198 (348,120) (324,300) (672,419) 1,248,779 2,530,000 3,778,7792020 5.38 926,571 854,748 1,781,318 (324,300) (299,162) (623,461) 1,157,857 2,670,000 3,827,8572021 5.38 854,748 778,890 1,633,637 (299,162) (272,611) (571,773) 1,061,864 2,820,000 3,881,8642022 5.38 778,890 698,862 1,477,752 (272,611) (244,602) (517,213) 960,538 2,975,000 3,935,5382023 5.38 698,862 614,396 1,313,258 (244,602) (215,039) (459,640) 853,618 3,140,000 3,993,6182024 5.38 614,396 525,223 1,139,619 (215,039) (183,828) (398,866) 740,752 3,315,000 4,055,7522025 5.38 525,223 431,207 956,430 (183,828) (150,922) (334,750) 621,679 3,495,000 4,116,6792026 5.38 431,207 331,946 763,153 (150,922) (116,181) (267,104) 496,049 3,690,000 4,186,0492027 5.38 331,946 227,171 559,117 (116,181) (79,510) (195,691) 363,426 3,895,000 4,258,4262028 5.38 227,171 116,612 343,782 (79,510) (40,814) (120,324) 223,458 4,110,000 4,333,4582029 5.38 116,612 - 116,612 (40,814) - (40,814) 75,797 4,335,000 4,410,797
12,376,690$ 11,091,408$ 23,468,098$ (4,331,841)$ (3,881,993)$ (8,213,834)$ 15,254,264$ 47,780,000$ 63,034,264$
Bonds dated:
Original issue:
Source of funding requirements: Net revenues only
Call Option: Bonds may be redeemed at any time
February 28, 2014
- - - - - - - - - - - - - - - - - - - - - - - - - - - - - - - - - - - -
PUBLIC SERVICE BOARD - EL PASO WATER UTILITIES
A COMPONENT UNIT OF THE CITY OF EL PASO
MUNICIPAL DRAINAGE UTILITY FUND
DEBT SERVICE REQUIREMENTS - 2009 REVENUE (NADBANK) BUILD AMERICA BONDSUNTIL MATURITY
$53,000,000
Payment Due
Interest
September 29, 2009
- - - - - - - - - - - - - - - - - - - - - - - - - - - - - - - - - - - -Tax Credit
148
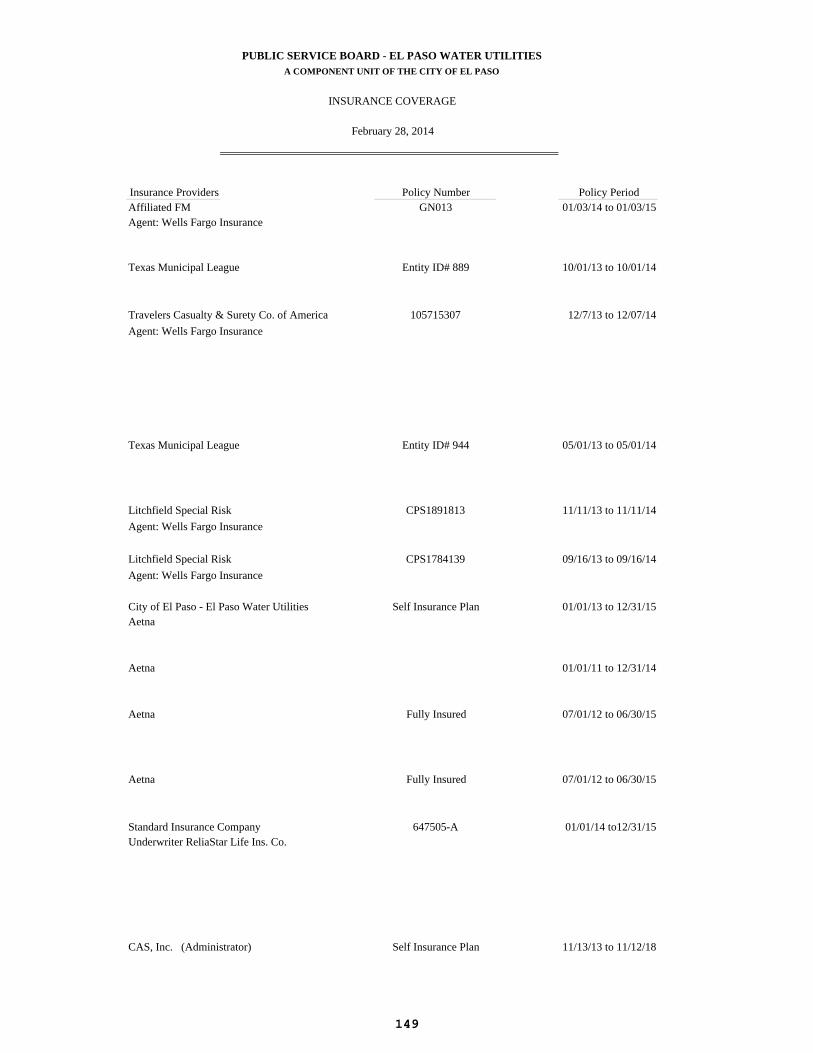
PUBLIC SERVICE BOARD - EL PASO WATER UTILITIES PUBLIC SERVICE BOARD - EL PASO WATER UTILITIESA COMPONENT UNIT OF THE CITY OF EL PASO A COMPONENT UNIT OF THE CITY OF EL PASO
INSURANCE COVERAGE INSURANCE COVERAGE
February 28, 2014 February 28, 2014
Insurance Providers Policy Number Policy PeriodAffiliated FM GN013 01/03/14 to 01/03/15Agent: Wells Fargo Insurance
Texas Municipal League Entity ID# 889 10/01/13 to 10/01/14
Travelers Casualty & Surety Co. of America 105715307 12/7/13 to 12/07/14
Agent: Wells Fargo Insurance
Texas Municipal League Entity ID# 944 05/01/13 to 05/01/14
Litchfield Special Risk CPS1891813 11/11/13 to 11/11/14
Agent: Wells Fargo Insurance
Litchfield Special Risk CPS1784139 09/16/13 to 09/16/14
Agent: Wells Fargo Insurance
City of El Paso - El Paso Water Utilities Self Insurance Plan 01/01/13 to 12/31/15Aetna
Aetna 01/01/11 to 12/31/14
Aetna Fully Insured 07/01/12 to 06/30/15
Aetna Fully Insured 07/01/12 to 06/30/15
Standard Insurance Company 647505-A 01/01/14 to12/31/15Underwriter ReliaStar Life Ins. Co.
CAS, Inc. (Administrator) Self Insurance Plan 11/13/13 to 11/12/18
149
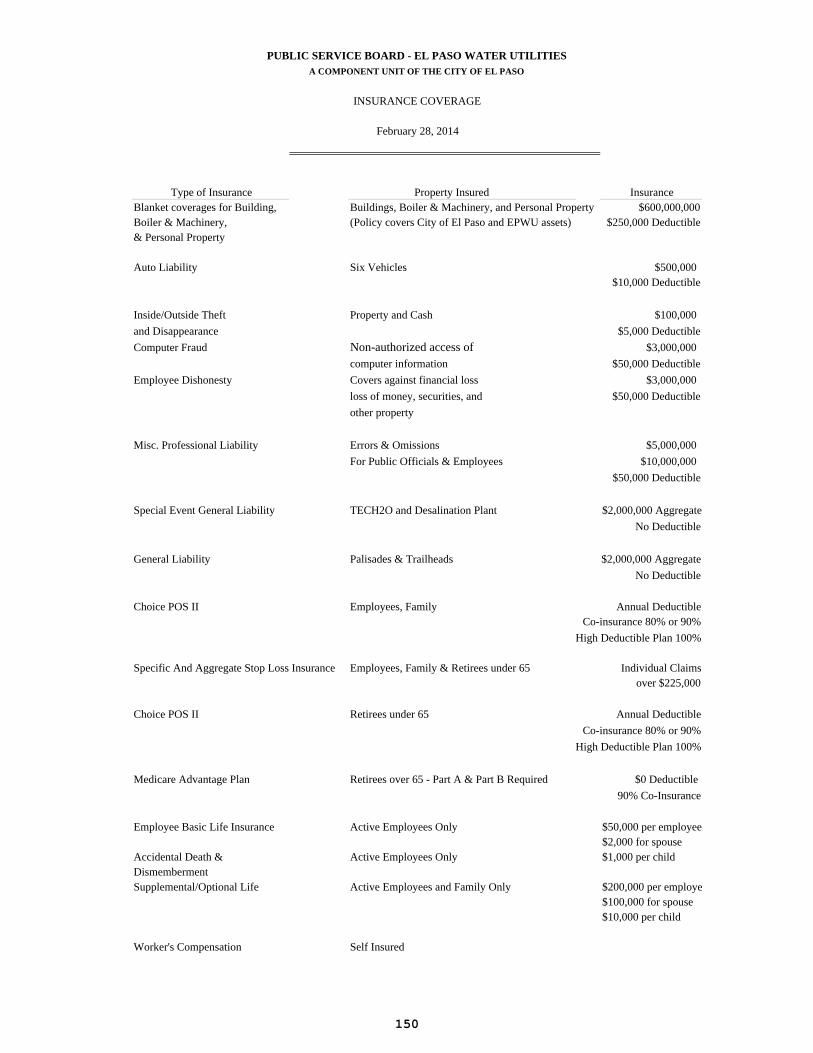
PUBLIC SERVICE BOARD - EL PASO WATER UTILITIESA COMPONENT UNIT OF THE CITY OF EL PASO
INSURANCE COVERAGE
February 28, 2014
Type of Insurance Property Insured InsuranceBlanket coverages for Building, Buildings, Boiler & Machinery, and Personal Property $600,000,000Boiler & Machinery, (Policy covers City of El Paso and EPWU assets) $250,000 Deductible& Personal Property
Auto Liability Six Vehicles $500,000 $10,000 Deductible
Inside/Outside Theft Property and Cash $100,000
and Disappearance $5,000 Deductible
Computer Fraud Non-authorized access of $3,000,000
computer information $50,000 Deductible
Employee Dishonesty Covers against financial loss $3,000,000
loss of money, securities, and $50,000 Deductible
other property
Misc. Professional Liability Errors & Omissions $5,000,000
For Public Officials & Employees $10,000,000
$50,000 Deductible
Special Event General Liability TECH2O and Desalination Plant $2,000,000 Aggregate
No Deductible
General Liability Palisades & Trailheads $2,000,000 Aggregate
No Deductible
Choice POS II Employees, Family Annual DeductibleCo-insurance 80% or 90%
High Deductible Plan 100%
Specific And Aggregate Stop Loss Insurance Employees, Family & Retirees under 65 Individual Claimsover $225,000
Choice POS II Retirees under 65 Annual Deductible
Co-insurance 80% or 90%
High Deductible Plan 100%
Medicare Advantage Plan Retirees over 65 - Part A & Part B Required $0 Deductible
90% Co-Insurance
Employee Basic Life Insurance Active Employees Only $50,000 per employee$2,000 for spouse
Accidental Death & Active Employees Only $1,000 per childDismembermentSupplemental/Optional Life Active Employees and Family Only $200,000 per employee
$100,000 for spouse$10,000 per child
Worker's Compensation Self Insured
150

STATISTICAL SECTION

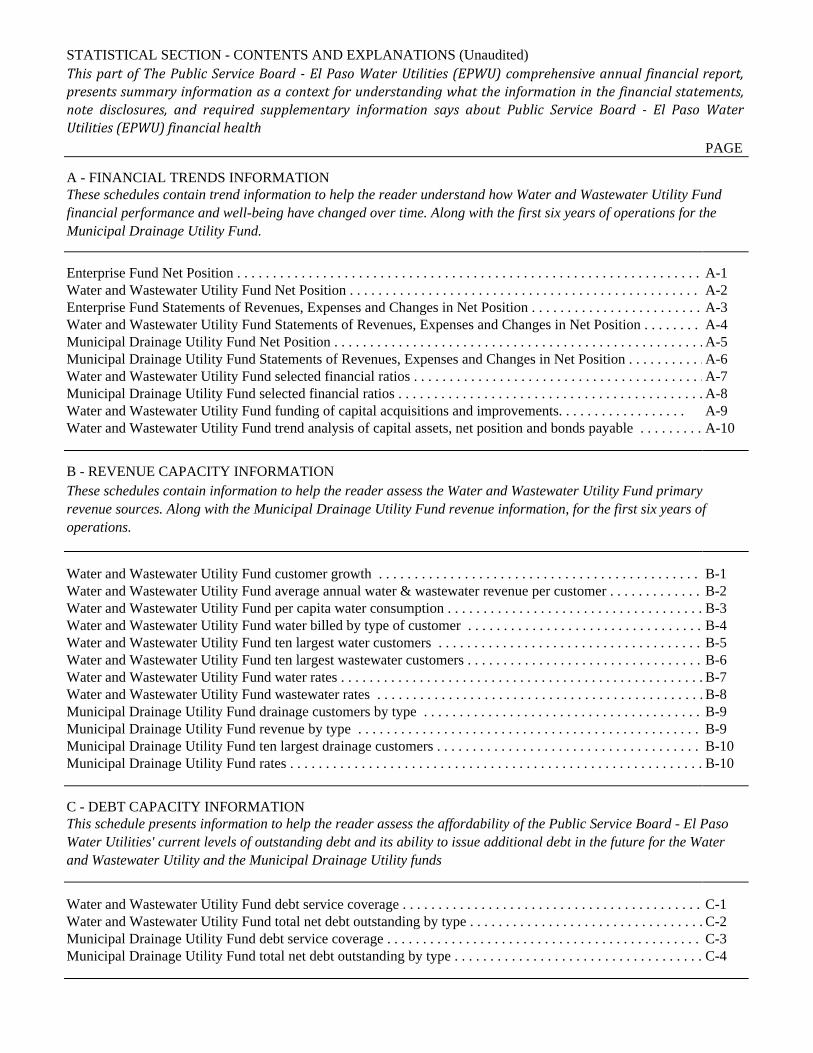
STATISTICAL SECTION - CONTENTS AND EXPLANATIONS (Unaudited)
PAGE
Enterprise Fund Net Position . . . . . . . . . . . . . . . . . . . . . . . . . . . . . . . . . . . . . . . . . . . . . . . . . . . . . . . . . . . . . . . . . . . . . . . . . . . . . . .A-1Water and Wastewater Utility Fund Net Position . . . . . . . . . . . . . . . . . . . . . . . . . . . . . . . . . . . . . . . . . . . . . . . . . . . . . . . . . . . . . . . . . . . . . . . . . . . . . . .A-2Enterprise Fund Statements of Revenues, Expenses and Changes in Net Position . . . . . . . . . . . . . . . . . . . . . . . . . . . . . . . . . . . . . . . . . . . . . . . . . . . .A-3Water and Wastewater Utility Fund Statements of Revenues, Expenses and Changes in Net Position . . . . . . . . . . . . . . . . . . . . . . . . . . . . . . . . . . . . . . . . . . . . . . . . . . . .A-4Municipal Drainage Utility Fund Net Position . . . . . . . . . . . . . . . . . . . . . . . . . . . . . . . . . . . . . . . . . . . . . . . . . . . . . . . . . . . . . . . . . . . . . . . . . . . . . . . . . . . . . . . . . . . . . . . . . . . . . . . . .A-5Municipal Drainage Utility Fund Statements of Revenues, Expenses and Changes in Net Position . . . . . . . . . . . . . . . . . . . . . . . . . . . . . . . . . . . . . . . . . . . . . . . . . . . . . . . . . . . . . . . . . . . . . . . . . . . . . . . . . . . . . . . . . . . . . . .A-6Water and Wastewater Utility Fund selected financial ratios . . . . . . . . . . . . . . . . . . . . . . . . . . . . . . . . . . . . . . . . . . . . . . . . . . . . . . . . . . . . . . . . . . .A-7Municipal Drainage Utility Fund selected financial ratios . . . . . . . . . . . . . . . . . . . . . . . . . . . . . . . . . . . . . . . . . . . . . . . . . . . . . . . . . . . . . . . . . . .A-8
A-9Water and Wastewater Utility Fund trend analysis of capital assets, net position and bonds payable . . . . . . . . . . . . . . . . . . . . . . . . . . . . . . . . . . . . . . . . . . . . .A-10
B - REVENUE CAPACITY INFORMATION
Water and Wastewater Utility Fund customer growth . . . . . . . . . . . . . . . . . . . . . . . . . . . . . . . . . . . . . . . . . . . . . . . . . . . . . . . . . . . . . . . . . . . . . . . . .B-1Water and Wastewater Utility Fund average annual water & wastewater revenue per customer . . . . . . . . . . . . . . . . . . . . . . . . . . . . . . . . . . . .B-2Water and Wastewater Utility Fund per capita water consumption . . . . . . . . . . . . . . . . . . . . . . . . . . . . . . . . . . . . . . . . . . . . . . . . . . . . .B-3Water and Wastewater Utility Fund water billed by type of customer . . . . . . . . . . . . . . . . . . . . . . . . . . . . . . . . . . . . . . . . . . . . . . . . . . .B-4Water and Wastewater Utility Fund ten largest water customers . . . . . . . . . . . . . . . . . . . . . . . . . . . . . . . . . . . . . . . . . . . . . . . . . . . . . . . . . . . . . . . . .B-5Water and Wastewater Utility Fund ten largest wastewater customers . . . . . . . . . . . . . . . . . . . . . . . . . . . . . . . . . . . . . . . . . . . . . . . . . . . . . . . . . . .B-6Water and Wastewater Utility Fund water rates . . . . . . . . . . . . . . . . . . . . . . . . . . . . . . . . . . . . . . . . . . . . . . . . . . . . . . . . . . . . . . . . . .B-7Water and Wastewater Utility Fund wastewater rates . . . . . . . . . . . . . . . . . . . . . . . . . . . . . . . . . . . . . . . . . . . . . . . . . . . . . . . . . . . . . . . . . .B-8Municipal Drainage Utility Fund drainage customers by type . . . . . . . . . . . . . . . . . . . . . . . . . . . . . . . . . . . . . . . . . . . . . . . . . . . . . . . . . . . . . . . . . .B-9Municipal Drainage Utility Fund revenue by type . . . . . . . . . . . . . . . . . . . . . . . . . . . . . . . . . . . . . . . . . . . . . . . . . . . . . . . . . . . . . . . . . . . . . . . . . .B-9Municipal Drainage Utility Fund ten largest drainage customers . . . . . . . . . . . . . . . . . . . . . . . . . . . . . . . . . . . . . . . . . . . . . . . . . . . . . . . . . . . . . . . . . . . . . . . . . . . . . . . . . . . .B-10Municipal Drainage Utility Fund rates . . . . . . . . . . . . . . . . . . . . . . . . . . . . . . . . . . . . . . . . . . . . . . . . . . . . . . . . . . . . . . . . . . . . . . . . . . . . . . . . . . . .B-10
C - DEBT CAPACITY INFORMATION
Water and Wastewater Utility Fund debt service coverage . . . . . . . . . . . . . . . . . . . . . . . . . . . . . . . . . . . . . . . . . . . . . . . . . . . . . . . . . . . . . . . . . . . . . . . . . . .C-1Water and Wastewater Utility Fund total net debt outstanding by type . . . . . . . . . . . . . . . . . . . . . . . . . . . . . . . . . . . . . . . . . . . . . . . . . . . . . . . . . .C-2Municipal Drainage Utility Fund debt service coverage . . . . . . . . . . . . . . . . . . . . . . . . . . . . . . . . . . . . . . . . . . . . . . . . . . . . . . . . . . . . . . . . . . . . . . . . . . .C-3Municipal Drainage Utility Fund total net debt outstanding by type . . . . . . . . . . . . . . . . . . . . . . . . . . . . . . . . . . . . . . . . . . . . . . . . . . . . . . . . . .C-4
This schedule presents information to help the reader assess the affordability of the Public Service Board - El PasoWater Utilities' current levels of outstanding debt and its ability to issue additional debt in the future for the Waterand Wastewater Utility and the Municipal Drainage Utility funds
These schedules contain information to help the reader assess the Water and Wastewater Utility Fund primaryrevenue sources. Along with the Municipal Drainage Utility Fund revenue information, for the first six years ofoperations.
This part of The Public Service Board - El Paso Water Utilities (EPWU) comprehensive annual financial report,presents summary information as a context for understanding what the information in the financial statements,note disclosures, and required supplementary information says about Public Service Board - El Paso WaterUtilities (EPWU) financial health
A - FINANCIAL TRENDS INFORMATIONThese schedules contain trend information to help the reader understand how Water and Wastewater Utility Fundfinancial performance and well-being have changed over time. Along with the first six years of operations for theMunicipal Drainage Utility Fund.
Water and Wastewater Utility Fund funding of capital acquisitions and improvements. . . . . . . . . . . . . . . . . .
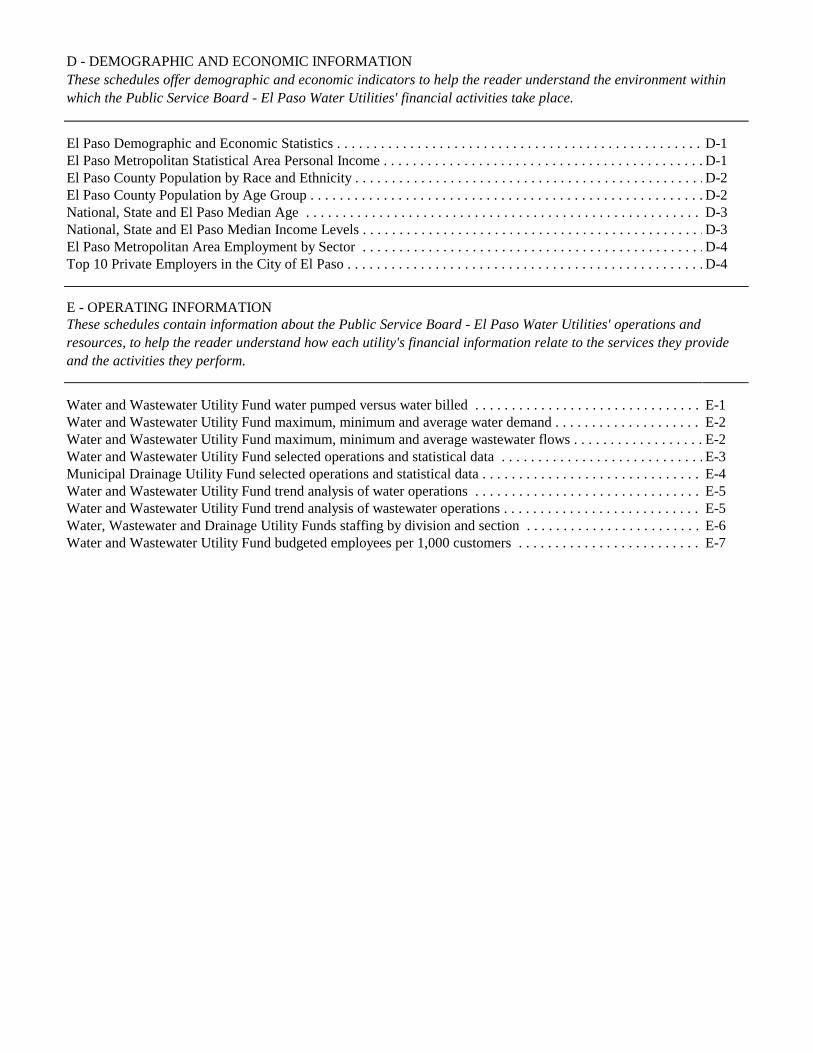
D - DEMOGRAPHIC AND ECONOMIC INFORMATION
El Paso Demographic and Economic Statistics . . . . . . . . . . . . . . . . . . . . . . . . . . . . . . . . . . . . . . . . . . . . . . . . . . . . . . . . . . . . . . . . . . . . . . . . . . . . . . . . . . . . . . . . . . . . . . . . . . . . . . .D-1El Paso Metropolitan Statistical Area Personal Income . . . . . . . . . . . . . . . . . . . . . . . . . . . . . . . . . . . . . . . . . . . . . . . . . . . . . . . . . . . . . . . . . .D-1El Paso County Population by Race and Ethnicity . . . . . . . . . . . . . . . . . . . . . . . . . . . . . . . . . . . . . . . . . . . . . . . . . . . . . . . . . . . . . . . . . . .D-2El Paso County Population by Age Group . . . . . . . . . . . . . . . . . . . . . . . . . . . . . . . . . . . . . . . . . . . . . . . . . . . . . . . . . . . . . . . . . . . . . . . . . . . . . . .D-2National, State and El Paso Median Age . . . . . . . . . . . . . . . . . . . . . . . . . . . . . . . . . . . . . . . . . . . . . . . . . . . . . . . . . . . . . . . . . . . . . . . . . . . . . . . .D-3National, State and El Paso Median Income Levels . . . . . . . . . . . . . . . . . . . . . . . . . . . . . . . . . . . . . . . . . . . . . . . . . . . . . . . . . . . . . . . . . . .D-3El Paso Metropolitan Area Employment by Sector . . . . . . . . . . . . . . . . . . . . . . . . . . . . . . . . . . . . . . . . . . . . . . . . . . . . . . . . . . . . . . . . . . . .D-4Top 10 Private Employers in the City of El Paso . . . . . . . . . . . . . . . . . . . . . . . . . . . . . . . . . . . . . . . . . . . . . . . . . . . . . . . . . . . . . . . . . .D-4
E - OPERATING INFORMATION
Water and Wastewater Utility Fund water pumped versus water billed . . . . . . . . . . . . . . . . . . . . . . . . . . . . . . . . . . . . . . . . . . . . . . . . . . . . . . . . . . . . . . . . . . .E-1Water and Wastewater Utility Fund maximum, minimum and average water demand . . . . . . . . . . . . . . . . . . . . . . . . . . . . . . . . . . . . . . . . . . . . . . . . . . . . . . . . . . . . . . . . . . . . .E-2Water and Wastewater Utility Fund maximum, minimum and average wastewater flows . . . . . . . . . . . . . . . . . . . . . . . . . . . . . . . . . . . . . . . . . . . . . . . . . . . . . . . . . . . . . . . . . .E-2Water and Wastewater Utility Fund selected operations and statistical data . . . . . . . . . . . . . . . . . . . . . . . . . . . . . . . . . . . . . . . . . . . . . . . . . . . . . . . . . . . . . . . . . .E-3Municipal Drainage Utility Fund selected operations and statistical data . . . . . . . . . . . . . . . . . . . . . . . . . . . . . . . . . . . . . . . . . . . . . . . . . . . . . . . . . . . . . . . . . .E-4Water and Wastewater Utility Fund trend analysis of water operations . . . . . . . . . . . . . . . . . . . . . . . . . . . . . . . . . . . . . . . . . . . . . . . . . . . . . . . . . . . . . . . . . .E-5Water and Wastewater Utility Fund trend analysis of wastewater operations . . . . . . . . . . . . . . . . . . . . . . . . . . . . . . . . . . . . . . . . . . . . . . . . . . . . . . . . . . . . . . . . . .E-5Water, Wastewater and Drainage Utility Funds staffing by division and section . . . . . . . . . . . . . . . . . . . . . . . . . . . . . . . . . . . . . . . . . . . . . . . . . . . . . . . . . . . . . . . . . .E-6Water and Wastewater Utility Fund budgeted employees per 1,000 customers . . . . . . . . . . . . . . . . . . . . . . . . . . . . . . . . . . . . . . . . . . . . . . . . . . . . . . . . . . . . . . . . . .E-7
These schedules contain information about the Public Service Board - El Paso Water Utilities' operations andresources, to help the reader understand how each utility's financial information relate to the services they provideand the activities they perform.
These schedules offer demographic and economic indicators to help the reader understand the environment withinwhich the Public Service Board - El Paso Water Utilities' financial activities take place.
Water and Wastewater Utility's financial performance and well-being have changed over time.
A - FINANCIAL TRENDS INFORMATIONThese schedules contain trend information to help the reader understand how
Along with the first six years of operations for the Municipal Drainage Utility Fund.

Water and Wastewater Utility's financial performance and well-being have changed over time.
A - FINANCIAL TRENDS INFORMATIONThese schedules contain trend information to help the reader understand how
Along with the first six years of operations for the Municipal Drainage Utility Fund.
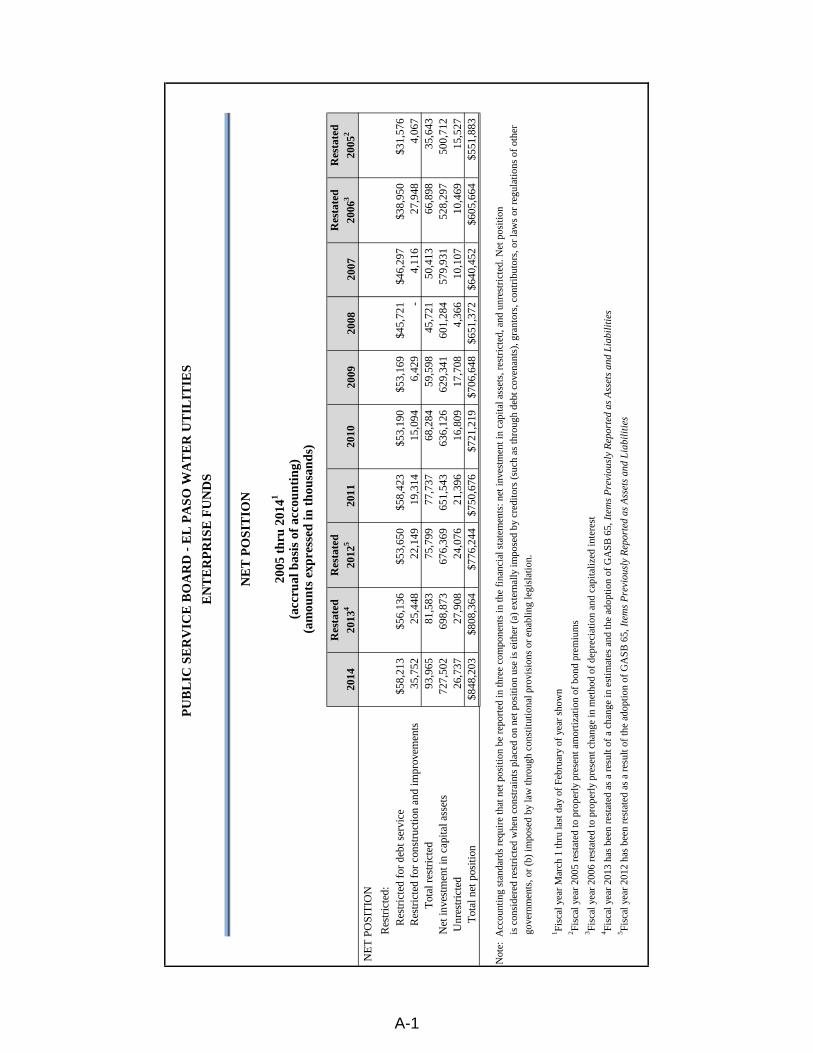
2014
Res
tate
d
2013
4R
esta
ted
2012
520
1120
1020
0920
0820
07
Res
tate
d
2006
3R
esta
ted
2005
2
NE
T P
OSI
TIO
N
Res
tric
ted:
R
estr
icte
d fo
r de
bt s
ervi
ce$5
8,21
3$5
6,13
6$5
3,65
0$5
8,42
3$5
3,19
0$5
3,16
9$4
5,72
1$4
6,29
7$3
8,95
0$3
1,57
6
Res
tric
ted
for
cons
truc
tion
and
impr
ovem
ents
35,7
5225
,448
22,1
4919
,314
15,0
946,
429
-4,
116
27,9
484,
067
T
otal
res
tric
ted
93,9
6581
,583
75,7
9977
,737
68,2
8459
,598
45,7
2150
,413
66,8
9835
,643
Net
inve
stm
ent i
n ca
pita
l ass
ets
727,
502
698,
873
676,
369
651,
543
636,
126
629,
341
601,
284
579,
931
528,
297
500,
712
Unr
estr
icte
d26
,737
27,9
0824
,076
21,3
9616
,809
17,7
084,
366
10,1
0710
,469
15,5
27
Tot
al n
et p
ositi
on$8
48,2
03$8
08,3
64$7
76,2
44$7
50,6
76$7
21,2
19$7
06,6
48$6
51,3
72$6
40,4
52$6
05,6
64$5
51,8
83
Not
e: A
ccou
ntin
g st
anda
rds
requ
ire
that
net
pos
itio
n be
rep
orte
d in
thre
e co
mpo
nent
s in
the
fina
ncia
l sta
tem
ents
: net
inve
stm
ent i
n ca
pita
l ass
ets,
res
tric
ted,
and
unr
estr
icte
d. N
et p
osit
ion
is c
onsi
dere
d re
stri
cted
whe
n co
nstr
aint
s pl
aced
on
net p
osit
ion
use
is e
ithe
r (a
) ex
tern
ally
impo
sed
by c
redi
tors
(su
ch a
s th
roug
h de
bt c
oven
ants
), g
rant
ors,
con
trib
utor
s, o
r la
ws
or r
egul
atio
ns o
f ot
her
gove
rnm
ents
, or
(b)
impo
sed
by la
w th
roug
h co
nsti
tuti
onal
pro
visi
ons
or e
nabl
ing
legi
slat
ion.
1 Fisc
al y
ear
Mar
ch 1
thru
last
day
of
Febr
uary
of
year
sho
wn
2 Fisc
al y
ear
2005
res
tate
d to
pro
perl
y pr
esen
t am
orti
zati
on o
f bo
nd p
rem
ium
s3 Fi
scal
yea
r 20
06 r
esta
ted
to p
rope
rly
pres
ent c
hang
e in
met
hod
of d
epre
ciat
ion
and
capi
taliz
ed in
tere
st4 Fi
scal
yea
r 20
13 h
as b
een
rest
ated
as
a re
sult
of a
cha
nge
in e
stim
ates
and
the
adop
tion
of
GA
SB
65,
Item
s P
revi
ousl
y R
epor
ted
as A
sset
s an
d L
iabi
liti
es5 Fi
scal
yea
r 20
12 h
as b
een
rest
ated
as
a re
sult
of th
e ad
opti
on o
f G
AS
B 6
5,It
ems
Pre
viou
sly
Rep
orte
d as
Ass
ets
and
Lia
bili
ties
PU
BL
IC S
ER
VIC
E B
OA
RD
- E
L P
ASO
WA
TE
R U
TIL
ITIE
S
EN
TE
RP
RIS
E F
UN
DS
2005
thr
u 20
141
(acc
rual
bas
is o
f ac
coun
ting
)(a
mou
nts
expr
esse
d in
tho
usan
ds)
NE
T P
OSI
TIO
N
A-1
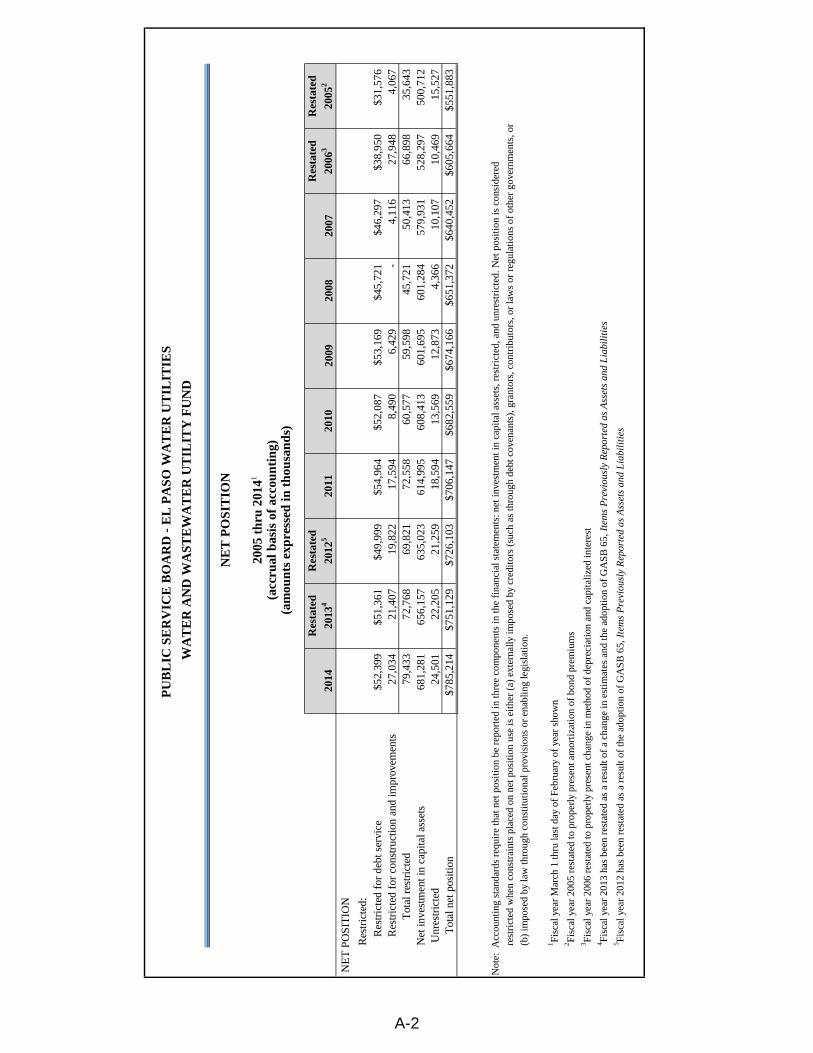
2014
Res
tate
d
2013
4R
esta
ted
2012
520
1120
1020
0920
0820
07
Res
tate
d
2006
3R
esta
ted
2005
2
NE
T P
OSI
TIO
N
Res
tric
ted:
R
estr
icte
d fo
r de
bt s
ervi
ce$5
2,39
9$5
1,36
1$4
9,99
9$5
4,96
4$5
2,08
7$5
3,16
9$4
5,72
1$4
6,29
7$3
8,95
0$3
1,57
6
Res
tric
ted
for
cons
truc
tion
and
impr
ovem
ents
27,0
3421
,407
19,8
2217
,594
8,49
06,
429
-4,
116
27,9
484,
067
T
otal
res
tric
ted
79,4
3372
,768
69,8
2172
,558
60,5
7759
,598
45,7
2150
,413
66,8
9835
,643
Net
inve
stm
ent i
n ca
pita
l ass
ets
681,
281
656,
157
635,
023
614,
995
608,
413
601,
695
601,
284
579,
931
528,
297
500,
712
Unr
estr
icte
d24
,501
22,2
0521
,259
18,5
9413
,569
12,8
734,
366
10,1
0710
,469
15,5
27
Tot
al n
et p
ositi
on$7
85,2
14$7
51,1
29$7
26,1
03$7
06,1
47$6
82,5
59$6
74,1
66$6
51,3
72$6
40,4
52$6
05,6
64$5
51,8
83
Not
e: A
ccou
ntin
g st
anda
rds
requ
ire
that
net
pos
itio
n be
rep
orte
d in
thre
e co
mpo
nent
s in
the
fina
ncia
l sta
tem
ents
: net
inve
stm
ent i
n ca
pita
l ass
ets,
res
tric
ted,
and
unr
estr
icte
d. N
et p
osit
ion
is c
onsi
dere
d
rest
rict
ed w
hen
cons
trai
nts
plac
ed o
n ne
t pos
itio
n us
e is
eit
her
(a)
exte
rnal
ly im
pose
d by
cre
dito
rs (
such
as
thro
ugh
debt
cov
enan
ts),
gra
ntor
s, c
ontr
ibut
ors,
or
law
s or
reg
ulat
ions
of
othe
r go
vern
men
ts, o
r
(b)
impo
sed
by la
w th
roug
h co
nsti
tuti
onal
pro
visi
ons
or e
nabl
ing
legi
slat
ion.
1 Fisc
al y
ear
Mar
ch 1
thru
last
day
of
Febr
uary
of
year
sho
wn
2 Fisc
al y
ear
2005
res
tate
d to
pro
perl
y pr
esen
t am
orti
zati
on o
f bo
nd p
rem
ium
s3 Fi
scal
yea
r 20
06 r
esta
ted
to p
rope
rly
pres
ent c
hang
e in
met
hod
of d
epre
ciat
ion
and
capi
taliz
ed in
tere
st4 Fi
scal
yea
r 20
13 h
as b
een
rest
ated
as
a re
sult
of a
cha
nge
in e
stim
ates
and
the
adop
tion
of
GA
SB
65,
Item
s P
revi
ousl
y R
epor
ted
as A
sset
s an
d L
iabi
liti
es5 Fi
scal
yea
r 20
12 h
as b
een
rest
ated
as
a re
sult
of th
e ad
opti
on o
f G
AS
B 6
5,It
ems
Pre
viou
sly
Rep
orte
d as
Ass
ets
and
Lia
bili
ties
(am
ount
s ex
pres
sed
in t
hous
ands
)
PU
BL
IC S
ER
VIC
E B
OA
RD
- E
L P
ASO
WA
TE
R U
TIL
ITIE
S
WA
TE
R A
ND
WA
STE
WA
TE
R U
TIL
ITY
FU
ND
NE
T P
OSI
TIO
N
2005
thr
u 20
141
(acc
rual
bas
is o
f ac
coun
ting
)
A-2
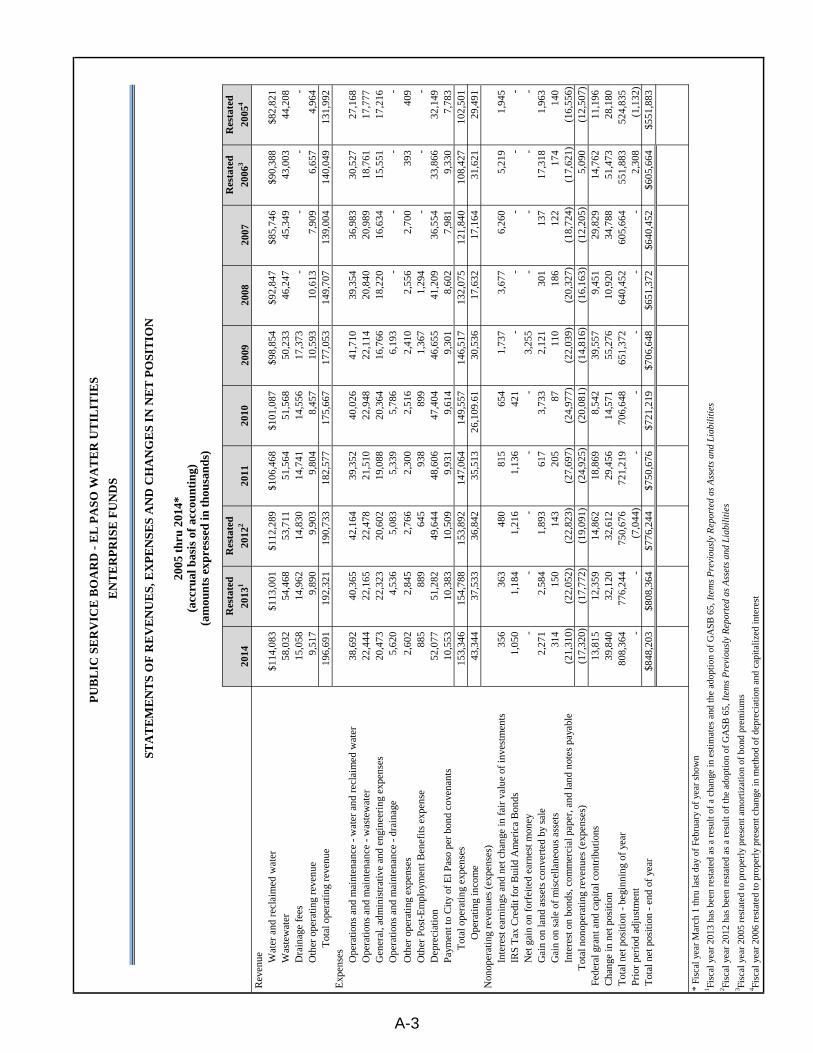
2014
Res
tate
d
2013
1
Res
tate
d
2012
220
1120
1020
0920
0820
07
Res
tate
d
2006
3
Res
tate
d
2005
4
Rev
enue W
ater
and
rec
laim
ed w
ater
$114
,083
$113
,001
$112
,289
$106
,468
$101
,087
$98,
854
$92,
847
$85,
746
$90,
388
$82,
821
Was
tew
ater
58,0
3254
,468
53,7
1151
,564
51,5
6850
,233
46,2
4745
,349
43,0
0344
,208
Dra
inag
e fe
es15
,058
14,9
6214
,830
14,7
4114
,556
17,3
73-
--
-O
ther
ope
ratin
g re
venu
e9,
517
9,89
09,
903
9,80
48,
457
10,5
9310
,613
7,90
96,
657
4,96
4
T
otal
ope
ratin
g re
venu
e19
6,69
119
2,32
119
0,73
318
2,57
717
5,66
717
7,05
314
9,70
713
9,00
414
0,04
913
1,99
2 E
xpen
ses
Ope
ratio
ns a
nd m
aint
enan
ce -
wat
er a
nd r
ecla
imed
wat
er38
,692
40,3
6542
,164
39,3
5240
,026
41,7
1039
,354
36,9
8330
,527
27,1
68O
pera
tions
and
mai
nten
ance
- w
aste
wat
er22
,444
22,1
6522
,478
21,5
1022
,948
22,1
1420
,840
20,9
8918
,761
17,7
77G
ener
al, a
dmin
istr
ativ
e an
d en
gine
erin
g ex
pens
es20
,473
22,3
2320
,602
19,0
8820
,364
16,7
6618
,220
16,6
3415
,551
17,2
16O
pera
tions
and
mai
nten
ance
- dr
aina
ge5,
620
4,53
65,
083
5,33
95,
786
6,19
3-
--
-
Oth
er o
pera
ting
expe
nses
2,60
22,
845
2,76
62,
300
2,51
62,
410
2,55
62,
700
393
409
Oth
er P
ost-
Em
ploy
men
t Ben
efits
exp
ense
885
889
645
938
899
1,36
71,
294
--
-D
epre
ciat
ion
52,0
7751
,282
49,6
4448
,606
47,4
0446
,655
41,2
0936
,554
33,8
6632
,149
Paym
ent t
o C
ity o
f E
l Pas
o pe
r bo
nd c
oven
ants
10,5
5310
,383
10,5
099,
931
9,61
49,
301
8,60
27,
981
9,33
07,
783
T
otal
ope
ratin
g ex
pens
es15
3,34
615
4,78
815
3,89
214
7,06
414
9,55
714
6,51
713
2,07
512
1,84
010
8,42
710
2,50
1
Ope
ratin
g in
com
e43
,344
37,5
3336
,842
35,5
1326
,109
.61
30,5
3617
,632
17,1
6431
,621
29,4
91 N
onop
erat
ing
reve
nues
(ex
pens
es)
Inte
rest
ear
ning
s an
d ne
t cha
nge
in f
air
valu
e of
inve
stm
ents
356
363
480
815
654
1,73
73,
677
6,26
05,
219
1,94
5IR
S T
ax C
redi
t for
Bui
ld A
mer
ica
Bon
ds1,
050
1,18
41,
216
1,13
642
1-
--
--
Net
gai
n on
for
feite
d ea
rnes
t mon
ey-
--
--
3,25
5-
--
-G
ain
on la
nd a
sset
s co
nver
ted
by s
ale
2,27
12,
584
1,89
361
73,
733
2,12
130
113
717
,318
1,96
3G
ain
on s
ale
of m
isce
llane
ous
asse
ts31
415
014
320
587
110
186
122
174
140
Inte
rest
on
bond
s, c
omm
erci
al p
aper
, and
land
not
es p
ayab
le(2
1,31
0)(2
2,05
2)(2
2,82
3)(2
7,69
7)(2
4,97
7)(2
2,03
9)(2
0,32
7)(1
8,72
4)(1
7,62
1)(1
6,55
6)
T
otal
non
oper
atin
g re
venu
es (
expe
nses
)(1
7,32
0)(1
7,77
2)(1
9,09
1)(2
4,92
5)(2
0,08
1)(1
4,81
6)(1
6,16
3)(1
2,20
5)5,
090
(12,
507)
Fed
eral
gra
nt a
nd c
apita
l con
trib
utio
ns13
,815
12,3
5914
,862
18,8
698,
542
39,5
579,
451
29,8
2914
,762
11,1
96 C
hang
e in
net
pos
ition
39,8
4032
,120
32,6
1229
,456
14,5
7155
,276
10,9
2034
,788
51,4
7328
,180
Tot
al n
et p
ositi
on -
begi
nnin
g of
yea
r80
8,36
477
6,24
475
0,67
672
1,21
970
6,64
865
1,37
264
0,45
260
5,66
455
1,88
352
4,83
5 P
rior
per
iod
adju
stm
ent
--
(7,0
44)
--
--
-2,
308
(1,1
32)
Tot
al n
et p
ositi
on -
end
of y
ear
$848
,203
$808
,364
$776
,244
$750
,676
$721
,219
$706
,648
$651
,372
$640
,452
$605
,664
$551
,883
* Fi
scal
yea
r M
arch
1 th
ru la
st d
ay o
f Fe
brua
ry o
f ye
ar s
how
n1 Fi
scal
yea
r 20
13 h
as b
een
rest
ated
as
a re
sult
of
a ch
ange
in e
stim
ates
and
the
adop
tion
of
GA
SB 6
5,It
ems
Pre
viou
sly
Rep
orte
d as
Ass
ets
and
Lia
bili
ties
2 Fisc
al y
ear
2012
has
bee
n re
stat
ed a
s a
resu
lt o
f th
e ad
opti
on o
f G
ASB
65,
Item
s P
revi
ousl
y R
epor
ted
as A
sset
s an
d L
iabi
liti
es3 Fi
scal
yea
r 20
05 r
esta
ted
to p
rope
rly
pres
ent a
mor
tiza
tion
of
bond
pre
miu
ms
4 Fisc
al y
ear
2006
res
tate
d to
pro
perl
y pr
esen
t cha
nge
in m
etho
d of
dep
reci
atio
n an
d ca
pita
lize
d in
tere
st
(am
ount
s ex
pres
sed
in t
hous
ands
)
PU
BL
IC S
ER
VIC
E B
OA
RD
- E
L P
ASO
WA
TE
R U
TIL
ITIE
S
EN
TE
RP
RIS
E F
UN
DS
STA
TE
ME
NT
S O
F R
EV
EN
UE
S, E
XP
EN
SES
AN
D C
HA
NG
ES
IN N
ET
PO
SIT
ION
2005
thr
u 20
14*
(acc
rual
bas
is o
f ac
coun
ting
)
A-3
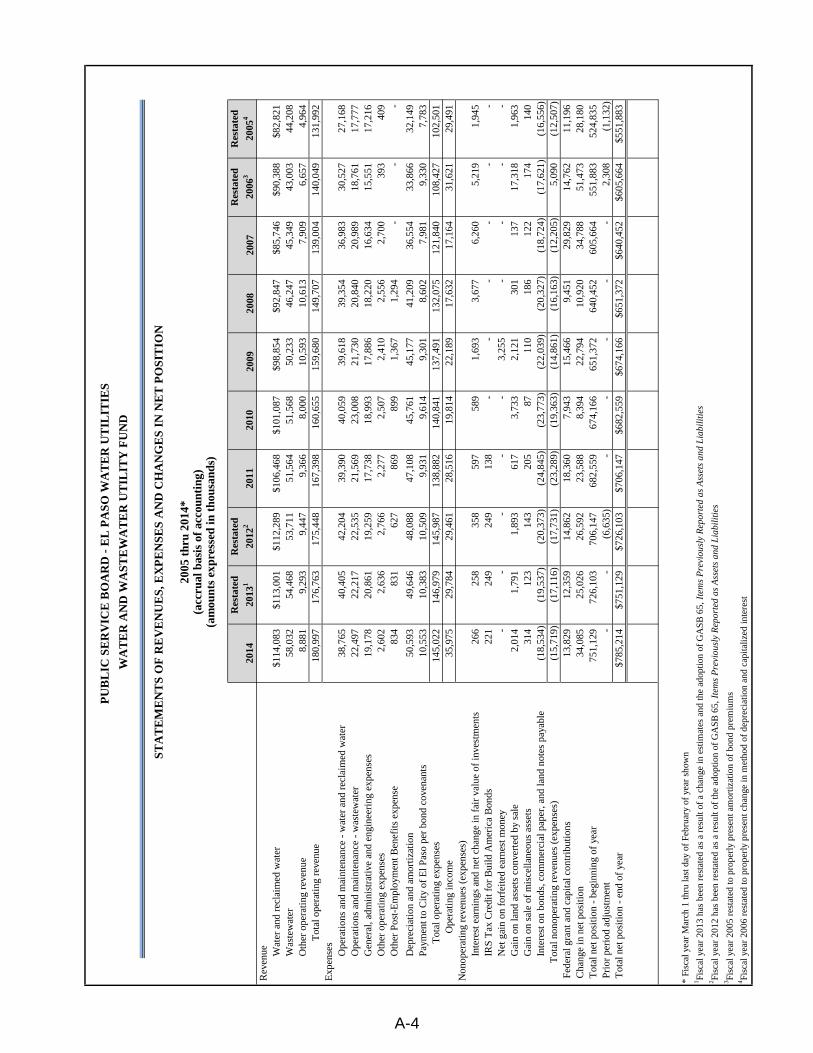
2014
Res
tate
d
2013
1
Res
tate
d
2012
220
1120
1020
0920
0820
07
Res
tate
d
2006
3
Res
tate
d
2005
4
Rev
enue W
ater
and
rec
laim
ed w
ater
$114
,083
$113
,001
$112
,289
$106
,468
$101
,087
$98,
854
$92,
847
$85,
746
$90,
388
$82,
821
Was
tew
ater
58,0
3254
,468
53,7
1151
,564
51,5
6850
,233
46,2
4745
,349
43,0
0344
,208
Oth
er o
pera
ting
rev
enue
8,88
19,
293
9,44
79,
366
8,00
010
,593
10,6
137,
909
6,65
74,
964
Tot
al o
pera
ting
rev
enue
180,
997
176,
763
175,
448
167,
398
160,
655
159,
680
149,
707
139,
004
140,
049
131,
992
Exp
ense
sO
pera
tion
s an
d m
aint
enan
ce -
wat
er a
nd r
ecla
imed
wat
er38
,765
40,4
0542
,204
39,3
9040
,059
39,6
1839
,354
36,9
8330
,527
27,1
68O
pera
tion
s an
d m
aint
enan
ce -
was
tew
ater
22,4
9722
,217
22,5
3521
,569
23,0
0821
,730
20,8
4020
,989
18,7
6117
,777
Gen
eral
, adm
inis
trat
ive
and
engi
neer
ing
expe
nses
19,1
7820
,861
19,2
5917
,738
18,9
9317
,886
18,2
2016
,634
15,5
5117
,216
Oth
er o
pera
ting
exp
ense
s2,
602
2,63
62,
766
2,27
72,
507
2,41
02,
556
2,70
039
340
9O
ther
Pos
t-E
mpl
oym
ent B
enef
its
expe
nse
834
831
627
869
899
1,36
71,
294
--
-
Dep
reci
atio
n an
d am
orti
zati
on50
,593
49,6
4648
,088
47,1
0845
,761
45,1
7741
,209
36,5
5433
,866
32,1
49P
aym
ent t
o C
ity
of E
l Pas
o pe
r bo
nd c
oven
ants
10,5
5310
,383
10,5
099,
931
9,61
49,
301
8,60
27,
981
9,33
07,
783
T
otal
ope
rati
ng e
xpen
ses
145,
022
146,
979
145,
987
138,
882
140,
841
137,
491
132,
075
121,
840
108,
427
102,
501
O
pera
ting
inco
me
35,9
7529
,784
29,4
6128
,516
19,8
1422
,189
17,6
3217
,164
31,6
2129
,491
Non
oper
atin
g re
venu
es (
expe
nses
)In
tere
st e
arni
ngs
and
net c
hang
e in
fai
r va
lue
of in
vest
men
ts26
625
835
859
758
91,
693
3,67
76,
260
5,21
91,
945
IRS
Tax
Cre
dit f
or B
uild
Am
eric
a B
onds
221
249
249
138
--
--
--
Net
gai
n on
for
feit
ed e
arne
st m
oney
--
--
-3,
255
--
--
Gai
n on
land
ass
ets
conv
erte
d by
sal
e2,
014
1,79
11,
893
617
3,73
32,
121
301
137
17,3
181,
963
Gai
n on
sal
e of
mis
cella
neou
s as
sets
314
123
143
205
8711
018
612
217
414
0In
tere
st o
n bo
nds,
com
mer
cial
pap
er, a
nd la
nd n
otes
pay
able
(18,
534)
(19,
537)
(20,
373)
(24,
845)
(23,
773)
(22,
039)
(20,
327)
(18,
724)
(17,
621)
(16,
556)
Tot
al n
onop
erat
ing
reve
nues
(ex
pens
es)
(15,
719)
(17,
116)
(17,
731)
(23,
289)
(19,
363)
(14,
861)
(16,
163)
(12,
205)
5,09
0(1
2,50
7) F
eder
al g
rant
and
cap
ital
con
trib
utio
ns13
,829
12,3
5914
,862
18,3
607,
943
15,4
669,
451
29,8
2914
,762
11,1
96 C
hang
e in
net
pos
itio
n34
,085
25,0
2626
,592
23,5
888,
394
22,7
9410
,920
34,7
8851
,473
28,1
80 T
otal
net
pos
itio
n -
begi
nnin
g of
yea
r75
1,12
972
6,10
370
6,14
768
2,55
967
4,16
665
1,37
264
0,45
260
5,66
455
1,88
352
4,83
5 P
rior
per
iod
adju
stm
ent
--
(6,6
35)
--
--
-2,
308
(1,1
32)
Tot
al n
et p
osit
ion
- en
d of
yea
r$7
85,2
14$7
51,1
29$7
26,1
03$7
06,1
47$6
82,5
59$6
74,1
66$6
51,3
72$6
40,4
52$6
05,6
64$5
51,8
83
* Fi
scal
yea
r M
arch
1 th
ru la
st d
ay o
f Fe
brua
ry o
f ye
ar s
how
n1 Fi
scal
yea
r 20
13 h
as b
een
rest
ated
as
a re
sult
of a
cha
nge
in e
stim
ates
and
the
adop
tion
of G
AS
B 6
5,It
ems
Pre
viou
sly
Rep
orte
d as
Ass
ets
and
Lia
bilit
ies
2 Fisc
al y
ear
2012
has
bee
n re
stat
ed a
s a
resu
lt of
the
adop
tion
of G
AS
B 6
5,It
ems
Pre
viou
sly
Rep
orte
d as
Ass
ets
and
Lia
bilit
ies
3 Fisc
al y
ear
2005
res
tate
d to
pro
perl
y pr
esen
t am
ortiz
atio
n of
bon
d pr
emiu
ms
4 Fisc
al y
ear
2006
res
tate
d to
pro
perl
y pr
esen
t cha
nge
in m
etho
d of
dep
reci
atio
n an
d ca
pita
lized
inte
rest
(am
ount
s ex
pres
sed
in t
hous
ands
)
PU
BL
IC S
ER
VIC
E B
OA
RD
- E
L P
ASO
WA
TE
R U
TIL
ITIE
S
WA
TE
R A
ND
WA
STE
WA
TE
R U
TIL
ITY
FU
ND
STA
TE
ME
NT
S O
F R
EV
EN
UE
S, E
XP
EN
SES
AN
D C
HA
NG
ES
IN N
ET
PO
SIT
ION
2005
thr
u 20
14*
(acc
rual
bas
is o
f ac
coun
ting
)
A-4
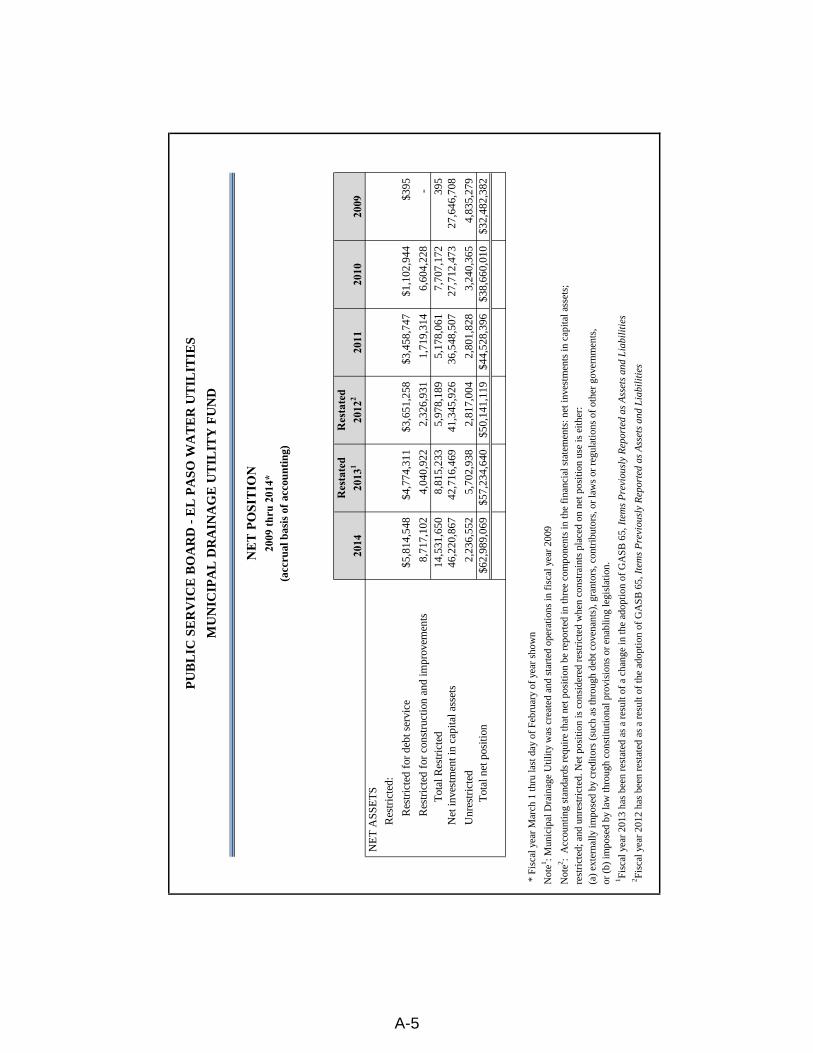
2014
Res
tate
d20
131
Res
tate
d20
122
2011
2010
2009
NE
T A
SSE
TS
Res
tric
ted:
R
estr
icte
d fo
r de
bt s
ervi
ce$5
,814
,548
$4,7
74,3
11$3
,651
,258
$3,4
58,7
47$1
,102
,944
$395
R
estr
icte
d fo
r co
nstr
uctio
n an
d im
prov
emen
ts8,
717,
102
4,04
0,92
22,
326,
931
1,71
9,31
46,
604,
228
-
T
otal
Res
tric
ted
14,5
31,6
508,
815,
233
5,97
8,18
95,
178,
061
7,70
7,17
239
5N
et in
vest
men
t in
capi
tal a
sset
s46
,220
,867
42,7
16,4
6941
,345
,926
36,5
48,5
0727
,712
,473
27,6
46,7
08
Unr
estr
icte
d2,
236,
552
5,70
2,93
82,
817,
004
2,80
1,82
83,
240,
365
4,83
5,27
9
T
otal
net
pos
ition
$62,
989,
069
$57,
234,
640
$50,
141,
119
$44,
528,
396
$38,
660,
010
$32,
482,
382
*
Fis
cal y
ear
Mar
ch 1
thru
last
day
of
Febr
uary
of
year
sho
wn
Not
e1 : Mun
icip
al D
rain
age
Uti
lity
was
cre
ated
and
sta
rted
ope
rati
ons
in f
isca
l yea
r 20
09
Not
e2 : A
ccou
ntin
g st
anda
rds
requ
ire
that
net
pos
itio
n be
rep
orte
d in
thre
e co
mpo
nent
s in
the
fina
ncia
l sta
tem
ents
: net
inve
stm
ents
in c
apit
al a
sset
s;
(a)
exte
rnal
ly im
pose
d by
cre
dito
rs (
such
as
thro
ugh
debt
cov
enan
ts),
gra
ntor
s, c
ontr
ibut
ors,
or
law
s or
reg
ulat
ions
of
othe
r go
vern
men
ts,
or (
b) im
pose
d by
law
thro
ugh
cons
titu
tion
al p
rovi
sion
s or
ena
blin
g le
gisl
atio
n.1 Fi
scal
yea
r 20
13 h
as b
een
rest
ated
as
a re
sult
of a
cha
nge
in th
e ad
opti
on o
f G
AS
B 6
5,It
ems
Pre
viou
sly
Rep
orte
d as
Ass
ets
and
Lia
bili
ties
2 Fisc
al y
ear
2012
has
bee
n re
stat
ed a
s a
resu
lt of
the
adop
tion
of
GA
SB
65,
Item
s P
revi
ousl
y R
epor
ted
as A
sset
s an
d L
iabi
liti
es
PU
BL
IC S
ER
VIC
E B
OA
RD
- E
L P
ASO
WA
TE
R U
TIL
ITIE
S
MU
NIC
IPA
L D
RA
INA
GE
UT
ILIT
Y F
UN
D
rest
rict
ed; a
nd u
nres
tric
ted.
Net
pos
itio
n is
con
side
red
rest
rict
ed w
hen
cons
trai
nts
plac
ed o
n ne
t pos
itio
n us
e is
eit
her:
2009
thru
201
4*N
ET
PO
SIT
ION
(acc
rual
bas
is o
f ac
coun
ting
)
A-5
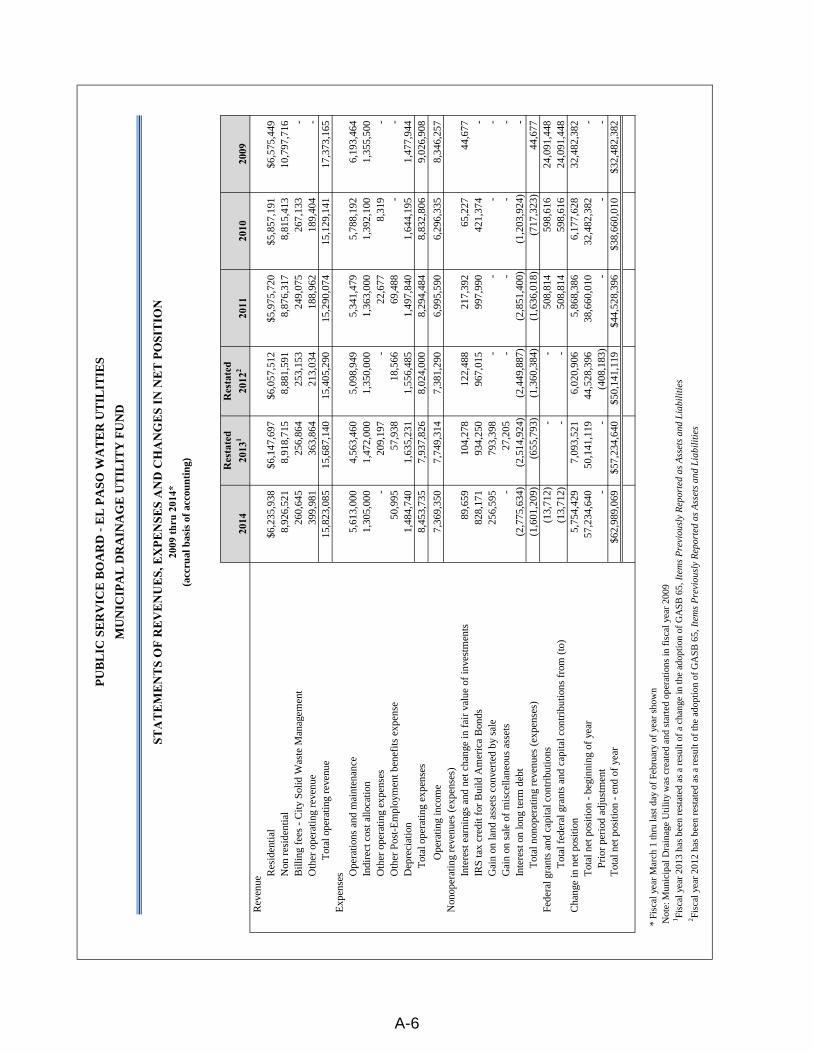
2014
Res
tate
d20
131
Res
tate
d20
122
2011
2010
2009
Rev
enue
Res
iden
tial
$6,2
35,9
38$6
,147
,697
$6,0
57,5
12$5
,975
,720
$5,8
57,1
91$6
,575
,449
Non
res
iden
tial
8,92
6,52
18,
918,
715
8,88
1,59
18,
876,
317
8,81
5,41
310
,797
,716
Bill
ing
fees
- C
ity S
olid
Was
te M
anag
emen
t26
0,64
525
6,86
425
3,15
324
9,07
526
7,13
3-
Oth
er o
pera
ting
reve
nue
399,
981
363,
864
213,
034
188,
962
189,
404
-
T
otal
ope
ratin
g re
venu
e15
,823
,085
15,6
87,1
4015
,405
,290
15,2
90,0
7415
,129
,141
17,3
73,1
65E
xpen
ses O
pera
tions
and
mai
nten
ance
5,61
3,00
04,
563,
460
5,09
8,94
95,
341,
479
5,78
8,19
26,
193,
464
Indi
rect
cos
t allo
catio
n1,
305,
000
1,47
2,00
01,
350,
000
1,36
3,00
01,
392,
100
1,35
5,50
0O
ther
ope
ratin
g ex
pens
es-
209,
197
-22
,677
8,31
9-
Oth
er P
ost-
Em
ploy
men
t ben
efits
exp
ense
50,9
9557
,938
18,5
6669
,488
--
Dep
reci
atio
n1,
484,
740
1,63
5,23
11,
556,
485
1,49
7,84
01,
644,
195
1,47
7,94
4
Tot
al o
pera
ting
expe
nses
8,45
3,73
57,
937,
826
8,02
4,00
08,
294,
484
8,83
2,80
69,
026,
908
Ope
ratin
g in
com
e7,
369,
350
7,74
9,31
47,
381,
290
6,99
5,59
06,
296,
335
8,34
6,25
7N
onop
erat
ing
reve
nues
(ex
pens
es)
Inte
rest
ear
ning
s an
d ne
t cha
nge
in f
air
valu
e of
inve
stm
ents
89,6
5910
4,27
812
2,48
821
7,39
265
,227
44,6
77IR
S ta
x cr
edit
for
Bui
ld A
mer
ica
Bon
ds82
8,17
193
4,25
096
7,01
599
7,99
042
1,37
4-
Gai
n on
land
ass
ets
conv
erte
d by
sal
e25
6,59
579
3,39
8-
--
-G
ain
on s
ale
of m
isce
llane
ous
asse
ts-
27,2
05-
--
-In
tere
st o
n lo
ng te
rm d
ebt
(2,7
75,6
34)
(2,5
14,9
24)
(2,4
49,8
87)
(2,8
51,4
00)
(1,2
03,9
24)
-
Tot
al n
onop
erat
ing
reve
nues
(ex
pens
es)
(1,6
01,2
09)
(655
,793
)(1
,360
,384
)(1
,636
,018
)(7
17,3
23)
44,6
77Fe
dera
l gra
nts
and
capi
tal c
ontr
ibut
ions
(13,
712)
--
508,
814
598,
616
24,0
91,4
48
Tot
al f
eder
al g
rant
s an
d ca
pita
l con
trib
utio
ns f
rom
(to
)(1
3,71
2)-
-50
8,81
459
8,61
624
,091
,448
Cha
nge
in n
et p
ositi
on5,
754,
429
7,09
3,52
16,
020,
906
5,86
8,38
66,
177,
628
32,4
82,3
82T
otal
net
pos
ition
- b
egin
ning
of
year
57,2
34,6
4050
,141
,119
44,5
28,3
9638
,660
,010
32,4
82,3
82-
P
rior
per
iod
adju
stm
ent
--
(408
,183
)-
--
Tot
al n
et p
ositi
on -
end
of
year
$62,
989,
069
$57,
234,
640
$50,
141,
119
$44,
528,
396
$38,
660,
010
$32,
482,
382
* F
isca
l yea
r M
arch
1 th
ru la
st d
ay o
f Fe
brua
ry o
f ye
ar s
how
n
1 Fisc
al y
ear
2013
has
bee
n re
stat
ed a
s a
resu
lt of
a c
hang
e in
the
adop
tion
of G
ASB
65,
Item
s P
revi
ousl
y R
epor
ted
as A
sset
s an
d L
iabi
liti
es2 Fi
scal
yea
r 20
12 h
as b
een
rest
ated
as
a re
sult
of th
e ad
optio
n of
GA
SB 6
5,It
ems
Pre
viou
sly
Rep
orte
d as
Ass
ets
and
Lia
bili
ties
PU
BL
IC S
ER
VIC
E B
OA
RD
- E
L P
ASO
WA
TE
R U
TIL
ITIE
S
MU
NIC
IPA
L D
RA
INA
GE
UT
ILIT
Y F
UN
D
Not
e: M
unic
ipal
Dra
inag
e U
tility
was
cre
ated
and
sta
rted
ope
ratio
ns in
fis
cal y
ear
2009
2009
thru
201
4*(a
ccru
al b
asis
of
acco
unti
ng)
STA
TEM
ENTS
OF
REV
ENU
ES, E
XPE
NSE
S A
ND
CH
AN
GES
IN N
ET P
OSI
TIO
N
A-6
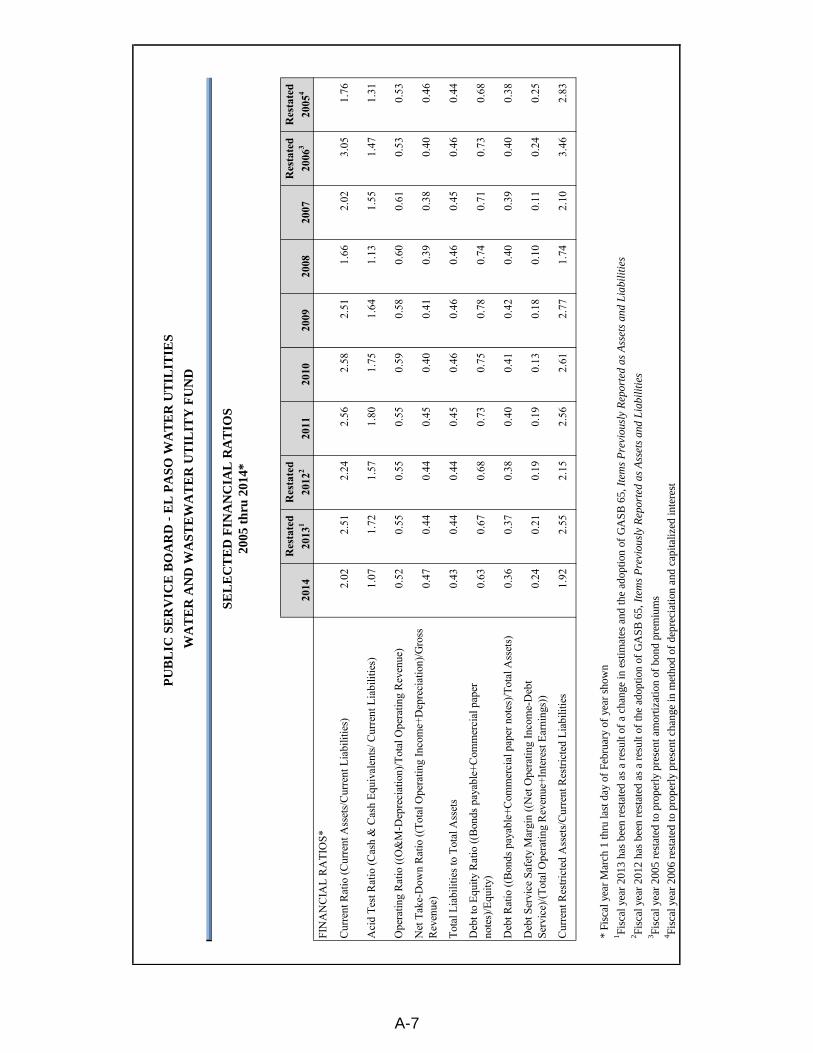
2014
Res
tate
d20
131
Res
tate
d20
122
2011
2010
2009
2008
2007
Res
tate
d20
063
Res
tate
d20
054
FIN
AN
CIA
L R
ATI
OS*
2.02
2.51
2.24
2.56
2.58
2.51
1.66
2.02
3.05
1.76
1.07
1.72
1.57
1.80
1.75
1.64
1.13
1.55
1.47
1.31
0.52
0.55
0.55
0.55
0.59
0.58
0.60
0.61
0.53
0.53
0.47
0.44
0.44
0.45
0.40
0.41
0.39
0.38
0.40
0.46
0.43
0.44
0.44
0.45
0.46
0.46
0.46
0.45
0.46
0.44
0.63
0.67
0.68
0.73
0.75
0.78
0.74
0.71
0.73
0.68
0.36
0.37
0.38
0.40
0.41
0.42
0.40
0.39
0.40
0.38
0.24
0.21
0.19
0.19
0.13
0.18
0.10
0.11
0.24
0.25
1.92
2.55
2.15
2.56
2.61
2.77
1.74
2.10
3.46
2.83
* Fi
scal
yea
r M
arch
1 th
ru la
st d
ay o
f Fe
brua
ry o
f ye
ar s
how
n1 Fi
scal
yea
r 20
13 h
as b
een
rest
ated
as
a re
sult
of a
cha
nge
in e
stim
ates
and
the
adop
tion
of G
ASB
65,
Item
s P
revi
ousl
y R
epor
ted
as A
sset
s an
d L
iabi
litie
s2 Fi
scal
yea
r 20
12 h
as b
een
rest
ated
as
a re
sult
of th
e ad
optio
n of
GA
SB 6
5,It
ems
Pre
viou
sly
Rep
orte
d as
Ass
ets
and
Lia
bilit
ies
3 Fisc
al y
ear
2005
res
tate
d to
pro
perl
y pr
esen
t am
ortiz
atio
n of
bon
d pr
emiu
ms
4 Fisc
al y
ear
2006
res
tate
d to
pro
perl
y pr
esen
t cha
nge
in m
etho
d of
dep
reci
atio
n an
d ca
pita
lized
inte
rest
Cur
rent
Res
trict
ed A
sset
s/C
urre
nt R
estri
cted
Lia
bilit
ies
Cur
rent
Rat
io (C
urre
nt A
sset
s/C
urre
nt L
iabi
litie
s)
Aci
d Te
st R
atio
(Cas
h &
Cas
h Eq
uiva
lent
s/ C
urre
nt L
iabi
litie
s)
Ope
ratin
g R
atio
((O
&M
-Dep
reci
atio
n)/T
otal
Ope
ratin
g R
even
ue)
Net
Tak
e-D
own
Rat
io ((
Tota
l Ope
ratin
g In
com
e+D
epre
ciat
ion)
/Gro
ssR
even
ue)
Tota
l Lia
bilit
ies t
o To
tal A
sset
s
Deb
t to
Equi
ty R
atio
((B
onds
pay
able
+Com
mer
cial
pap
erno
tes)
/Equ
ity)
Deb
t Rat
io ((
Bon
ds p
ayab
le+C
omm
erci
al p
aper
not
es)/T
otal
Ass
ets)
PU
BL
IC S
ER
VIC
E B
OA
RD
- E
L P
ASO
WA
TE
R U
TIL
ITIE
S
WA
TE
R A
ND
WA
STE
WA
TE
R U
TIL
ITY
FU
ND
SEL
EC
TE
D F
INA
NC
IAL
RA
TIO
S20
05 t
hru
2014
*
Deb
t Ser
vice
Saf
ety
Mar
gin
((N
et O
pera
ting
Inco
me-
Deb
tSe
rvic
e)/(T
otal
Ope
ratin
g R
even
ue+I
nter
est E
arni
ngs)
)
A-7
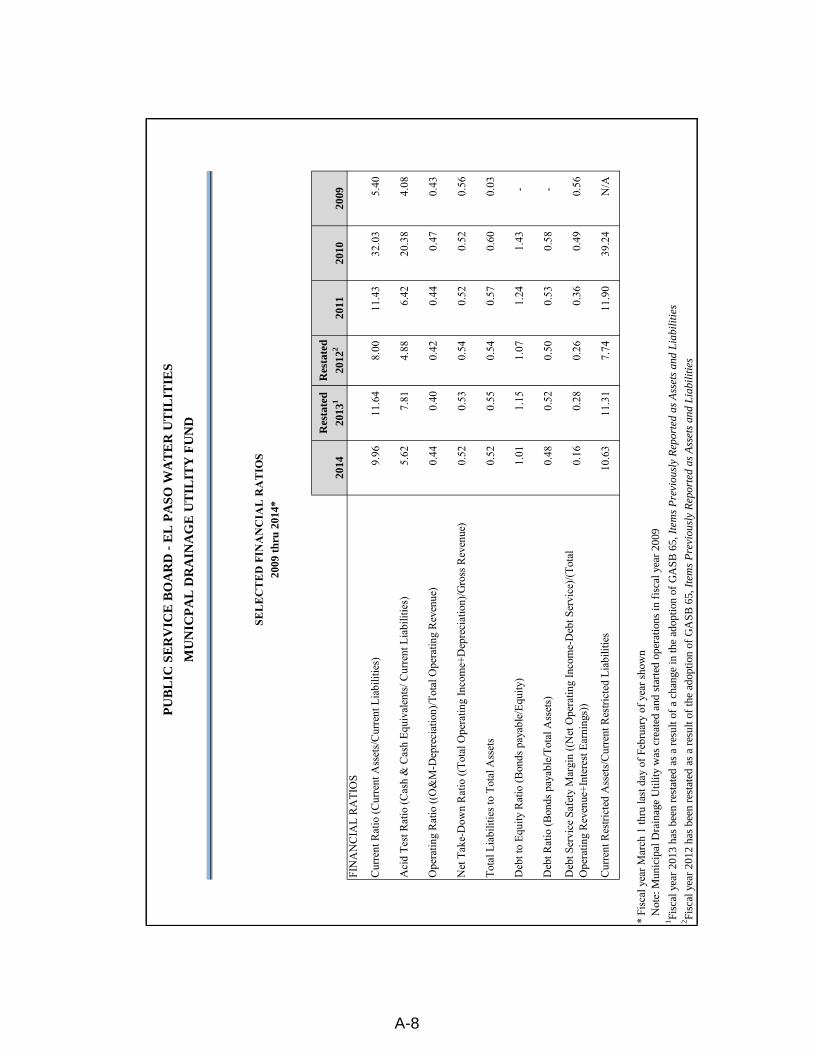
2014
Res
tate
d
2013
1R
esta
ted
2012
220
1120
1020
09FI
NA
NC
IAL
RA
TIO
S
9.96
11.6
48.
0011
.43
32.0
35.
40
5.62
7.81
4.88
6.42
20.3
84.
08
0.44
0.40
0.42
0.44
0.47
0.43
0.52
0.53
0.54
0.52
0.52
0.56
0.52
0.55
0.54
0.57
0.60
0.03
1.01
1.15
1.07
1.24
1.43
-
0.48
0.52
0.50
0.53
0.58
-
0.16
0.28
0.26
0.36
0.49
0.56
10.6
311
.31
7.74
11.9
039
.24
N/A
* Fi
scal
yea
r Mar
ch 1
thru
last
day
of F
ebru
ary
of y
ear s
how
nN
ote:
Mun
icip
al D
rain
age
Util
ity w
as c
reat
ed a
nd s
tart
ed o
pera
tions
in f
isca
l yea
r 20
091 Fi
scal
yea
r 20
13 h
as b
een
rest
ated
as
a re
sult
of a
cha
nge
in th
e ad
optio
n of
GA
SB 6
5,It
ems
Pre
viou
sly
Rep
orte
d as
Ass
ets
and
Lia
bilit
ies
2 Fisc
al y
ear
2012
has
bee
n re
stat
ed a
s a
resu
lt of
the
adop
tion
of G
ASB
65,
Item
s P
revi
ousl
y R
epor
ted
as A
sset
s an
d L
iabi
litie
s
SEL
EC
TE
D F
INA
NC
IAL
RA
TIO
S20
09 t
hru
2014
*
PU
BL
IC S
ER
VIC
E B
OA
RD
- E
L P
ASO
WA
TE
R U
TIL
ITIE
S
MU
NIC
PA
L D
RA
INA
GE
UT
ILIT
Y F
UN
D
Deb
t to
Equi
ty R
atio
(Bon
ds p
ayab
le/E
quity
)
Deb
t Rat
io (B
onds
pay
able
/Tot
al A
sset
s)
Deb
t Ser
vice
Saf
ety
Mar
gin
((N
et O
pera
ting
Inco
me-
Deb
t Ser
vice
)/(To
tal
Ope
ratin
g R
even
ue+I
nter
est E
arni
ngs)
)
Cur
rent
Res
trict
ed A
sset
s/C
urre
nt R
estri
cted
Lia
bilit
ies
Cur
rent
Rat
io (C
urre
nt A
sset
s/C
urre
nt L
iabi
litie
s)
Aci
d Te
st R
atio
(Cas
h &
Cas
h Eq
uiva
lent
s/ C
urre
nt L
iabi
litie
s)
Ope
ratin
g R
atio
((O
&M
-Dep
reci
atio
n)/T
otal
Ope
ratin
g R
even
ue)
Net
Tak
e-D
own
Rat
io ((
Tota
l Ope
ratin
g In
com
e+D
epre
ciat
ion)
/Gro
ss R
even
ue)
Tota
l Lia
bilit
ies t
o To
tal A
sset
s
A-8
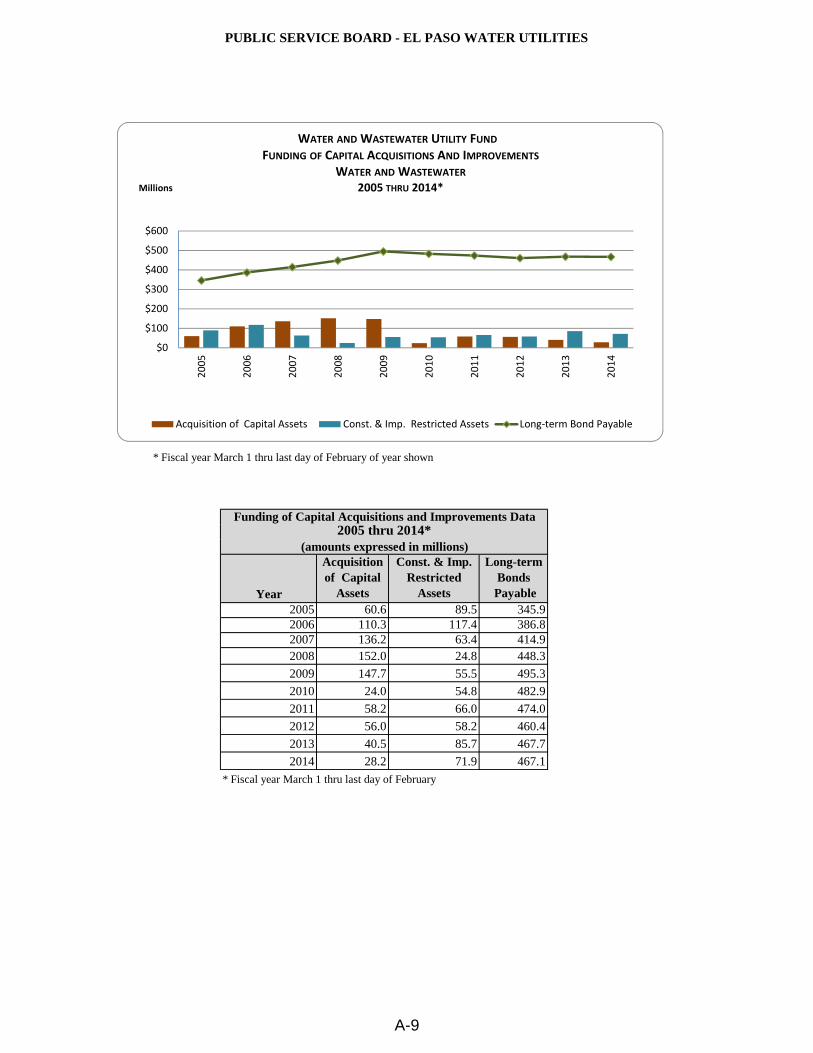
PUBLIC SERVICE BOARD - EL PASO WATER UTILITIES
* Fiscal year March 1 thru last day of February of year shown
Year
Acquisitionof Capital
Assets
Const. & Imp.Restricted
Assets
Long-termBonds
Payable2005 60.6 89.5 345.92006 110.3 117.4 386.82007 136.2 63.4 414.92008 152.0 24.8 448.3
2009 147.7 55.5 495.3
2010 24.0 54.8 482.9
2011 58.2 66.0 474.0
2012 56.0 58.2 460.4
2013 40.5 85.7 467.7
2014 28.2 71.9 467.1
* Fiscal year March 1 thru last day of February
Funding of Capital Acquisitions and Improvements Data2005 thru 2014*
(amounts expressed in millions)
$0
$100
$200
$300
$400
$500
$600
2005
2006
2007
2008
2009
2010
2011
2012
2013
2014
Acquisition of Capital Assets Const. & Imp. Restricted Assets Long-term Bond Payable
WATER AND WASTEWATER UTILITY FUNDFUNDING OF CAPITAL ACQUISITIONS AND IMPROVEMENTS
WATER AND WASTEWATER2005 THRU 2014*Millions
A-9
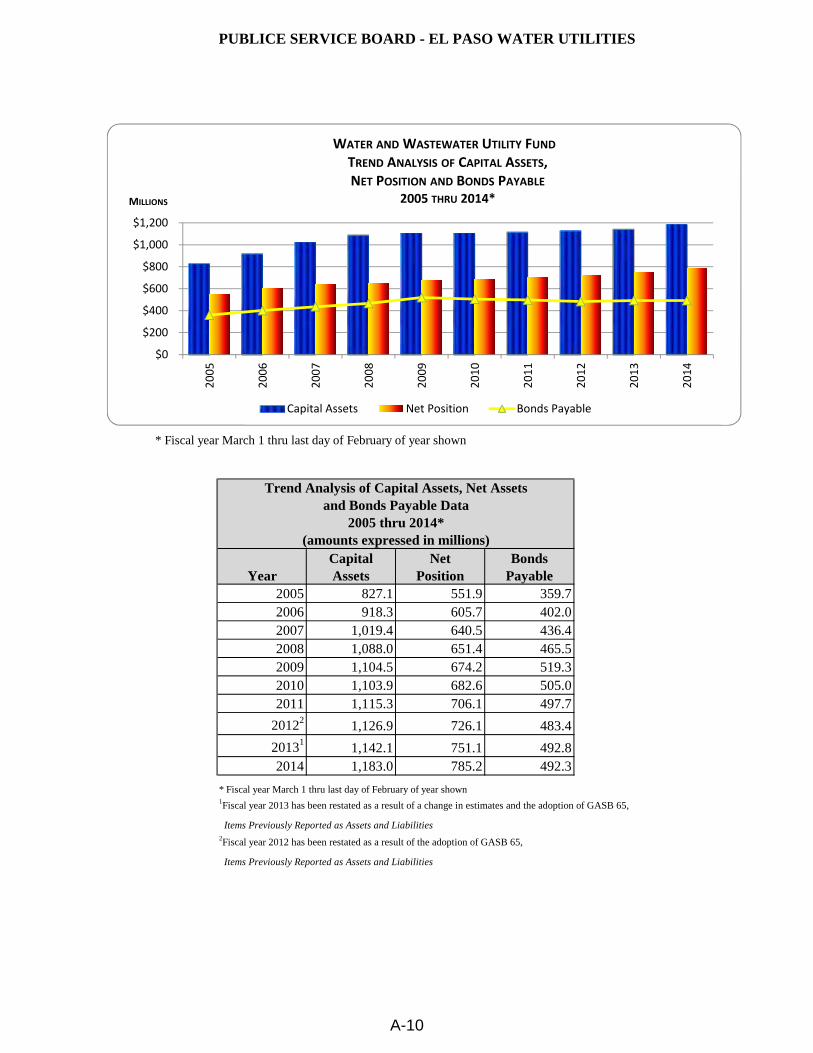
PUBLICE SERVICE BOARD - EL PASO WATER UTILITIES
* Fiscal year March 1 thru last day of February of year shown
YearCapitalAssets
NetPosition
BondsPayable
2005 827.1 551.9 359.72006 918.3 605.7 402.02007 1,019.4 640.5 436.42008 1,088.0 651.4 465.52009 1,104.5 674.2 519.32010 1,103.9 682.6 505.02011 1,115.3 706.1 497.7
20122 1,126.9 726.1 483.4
20131 1,142.1 751.1 492.82014 1,183.0 785.2 492.3
* Fiscal year March 1 thru last day of February of year shown1Fiscal year 2013 has been restated as a result of a change in estimates and the adoption of GASB 65,
Items Previously Reported as Assets and Liabilities2Fiscal year 2012 has been restated as a result of the adoption of GASB 65,
Items Previously Reported as Assets and Liabilities
Trend Analysis of Capital Assets, Net Assetsand Bonds Payable Data
(amounts expressed in millions)2005 thru 2014*
$0
$200
$400
$600
$800
$1,000
$1,20020
05
2006
2007
2008
2009
2010
2011
2012
2013
2014
Capital Assets Net Position Bonds Payable
WATER AND WASTEWATER UTILITY FUNDTREND ANALYSIS OF CAPITAL ASSETS,NET POSITION AND BONDS PAYABLE
2005 THRU 2014*MILLIONS
A-10
B - REVENUE CAPACITY INFORMATIONThese schedules contain information to help the reader assess the Water and Wastewater
Utility's primary revenue sources. Along with the Municipal Drainage Utility's
revenue information, for the first six years of operations.

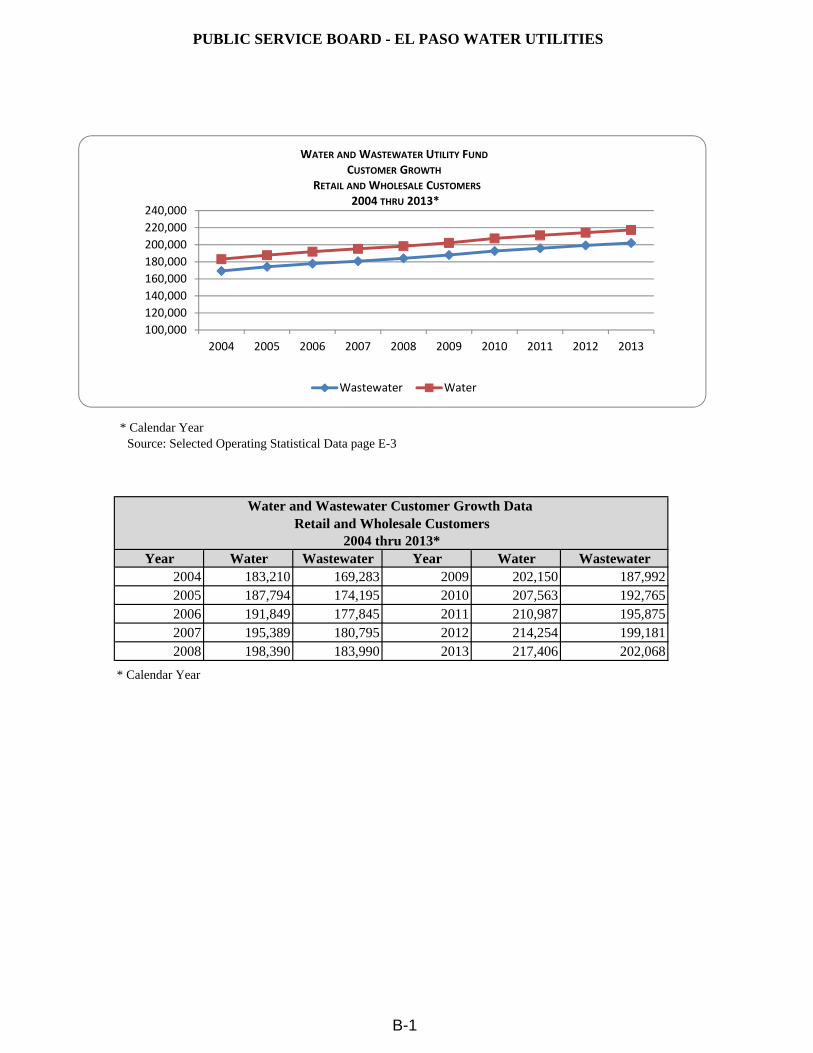
PUBLIC SERVICE BOARD - EL PASO WATER UTILITIES
* Calendar YearSource: Selected Operating Statistical Data page E-3
Year Water Wastewater Year Water Wastewater2004 183,210 169,283 2009 202,150 187,9922005 187,794 174,195 2010 207,563 192,7652006 191,849 177,845 2011 210,987 195,8752007 195,389 180,795 2012 214,254 199,1812008 198,390 183,990 2013 217,406 202,068
* Calendar Year
Water and Wastewater Customer Growth Data
2004 thru 2013*Retail and Wholesale Customers
100,000120,000140,000160,000180,000200,000220,000240,000
2004 2005 2006 2007 2008 2009 2010 2011 2012 2013
Wastewater Water
WATER AND WASTEWATER UTILITY FUNDCUSTOMER GROWTH
RETAIL AND WHOLESALE CUSTOMERS2004 THRU 2013*
B-1
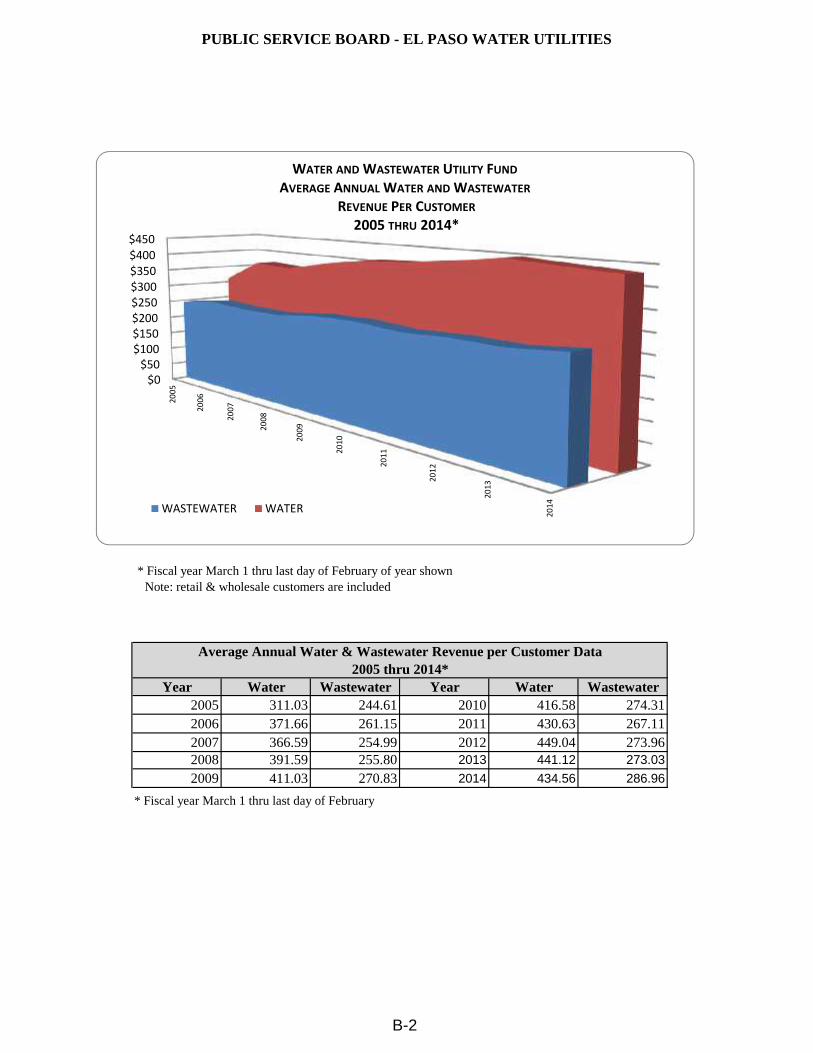
PUBLIC SERVICE BOARD - EL PASO WATER UTILITIES
* Fiscal year March 1 thru last day of February of year shownNote: retail & wholesale customers are included
Year Water Wastewater Year Water Wastewater2005 311.03 244.61 2010 416.58 274.312006 371.66 261.15 2011 430.63 267.112007 366.59 254.99 2012 449.04 273.962008 391.59 255.80 2013 441.12 273.03
2009 411.03 270.83 2014 434.56 286.96
* Fiscal year March 1 thru last day of February
Average Annual Water & Wastewater Revenue per Customer Data2005 thru 2014*
$0$50
$100$150$200$250$300$350$400$450
2005
2006
2007
2008
2009
2010
2011
2012
2013
2014WASTEWATER WATER
WATER AND WASTEWATER UTILITY FUNDAVERAGE ANNUAL WATER AND WASTEWATER
REVENUE PER CUSTOMER2005 THRU 2014*
B-2
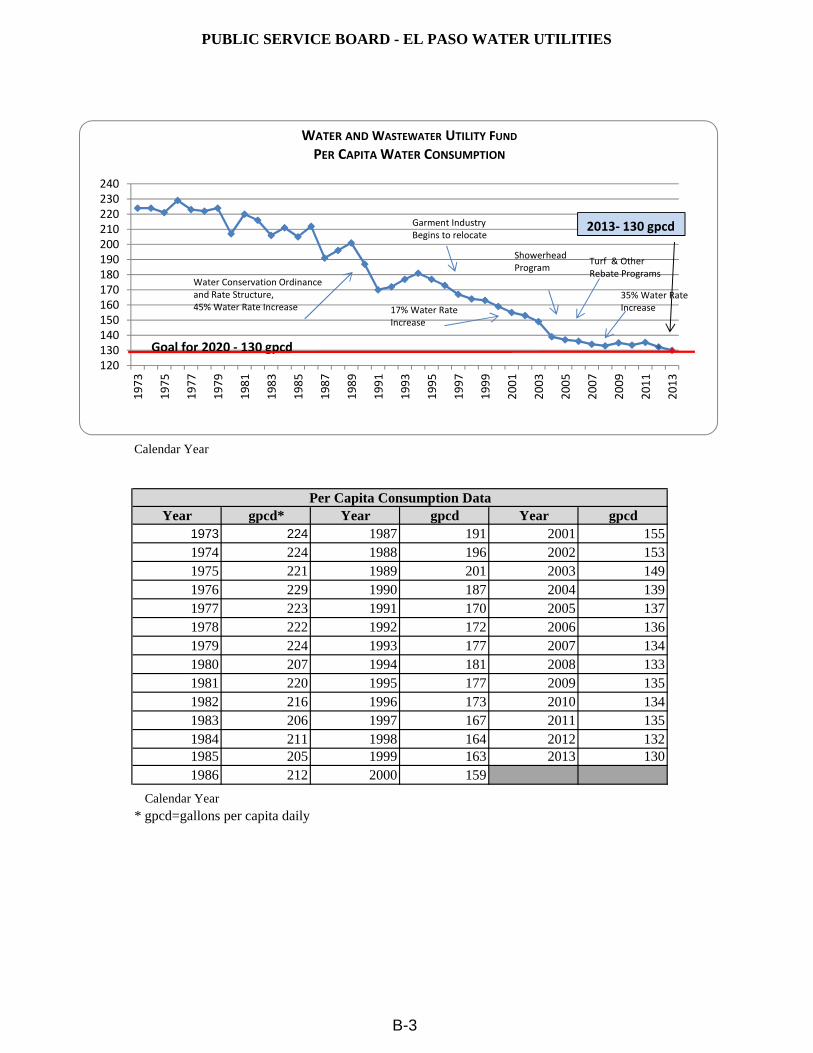
PUBLIC SERVICE BOARD - EL PASO WATER UTILITIES
Calendar Year
Year gpcd* Year gpcd Year gpcd1973 224 1987 191 2001 1551974 224 1988 196 2002 1531975 221 1989 201 2003 1491976 229 1990 187 2004 1391977 223 1991 170 2005 1371978 222 1992 172 2006 1361979 224 1993 177 2007 1341980 207 1994 181 2008 1331981 220 1995 177 2009 1351982 216 1996 173 2010 1341983 206 1997 167 2011 1351984 211 1998 164 2012 1321985 205 1999 163 2013 1301986 212 2000 159
Calendar Year* gpcd=gallons per capita daily
Per Capita Consumption Data
120130140150160170180190200210220230240
1973
1975
1977
1979
1981
1983
1985
1987
1989
1991
1993
1995
1997
1999
2001
2003
2005
2007
2009
2011
2013
WATER AND WASTEWATER UTILITY FUND
PER CAPITA WATER CONSUMPTION
Water Conservation Ordinanceand Rate Structure,45% Water Rate Increase
Garment IndustryBegins to relocate
ShowerheadProgram
Turf & OtherRebate Programs
35% Water RateIncrease17% Water Rate
Increase
Goal for 2020 - 130 gpcd
2013- 130 gpcd
B-3
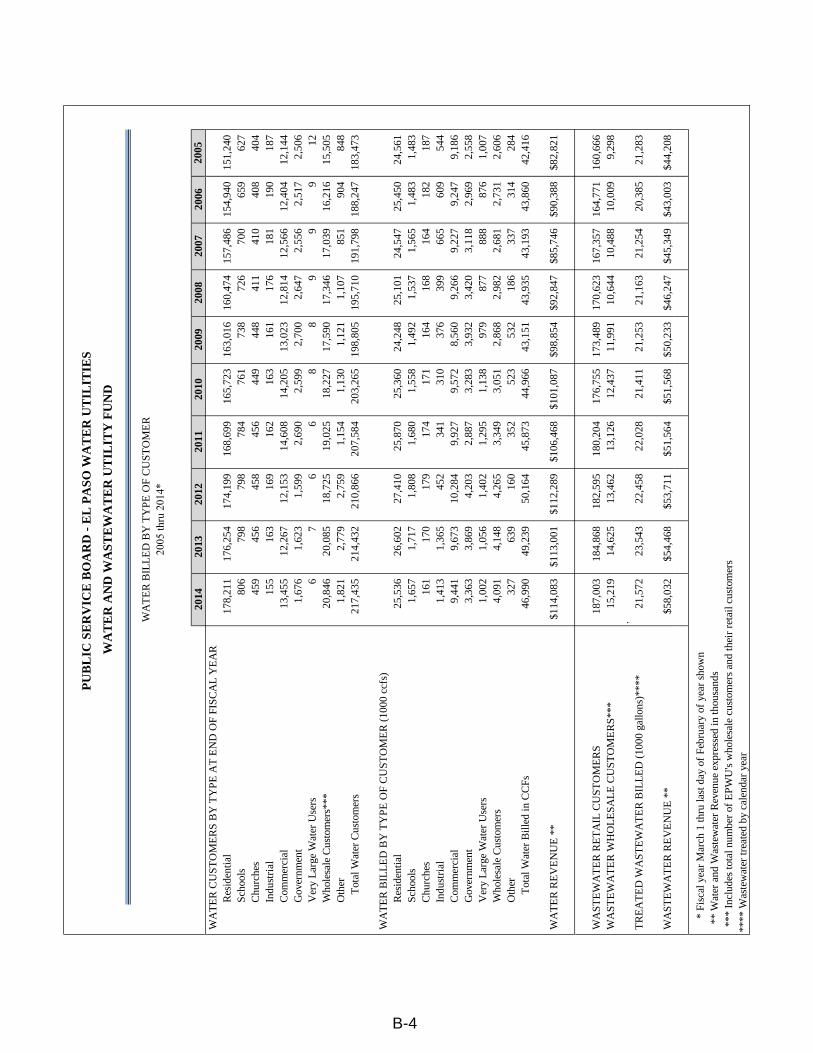
2014
2013
2012
2011
2010
2009
2008
2007
2006
2005
WA
TE
R C
US
TO
ME
RS
BY
TY
PE
AT
EN
D O
F FI
SC
AL
YE
AR
Res
iden
tial
178,
211
176,
254
174,
199
168,
699
165,
723
163,
016
160,
474
157,
486
154,
940
151,
240
Sch
ools
806
798
798
784
761
738
726
700
659
627
Chu
rche
s45
945
645
845
644
944
841
141
040
840
4In
dust
rial
155
163
169
162
163
161
176
181
190
187
Com
mer
cial
13,4
5512
,267
12,1
5314
,608
14,2
0513
,023
12,8
1412
,566
12,4
0412
,144
Gov
ernm
ent
1,67
61,
623
1,59
92,
690
2,59
92,
700
2,64
72,
556
2,51
72,
506
Ver
y L
arge
Wat
er U
sers
67
66
88
99
912
Who
lesa
le C
usto
mer
s***
20,8
4620
,085
18,7
2519
,025
18,2
2717
,590
17,3
4617
,039
16,2
1615
,505
Oth
er1,
821
2,77
92,
759
1,15
41,
130
1,12
11,
107
851
904
848
T
otal
Wat
er C
usto
mer
s21
7,43
521
4,43
221
0,86
620
7,58
420
3,26
519
8,80
519
5,71
019
1,79
818
8,24
718
3,47
3
WA
TE
R B
ILL
ED
BY
TY
PE
OF
CU
ST
OM
ER
(10
00 c
cfs)
Res
iden
tial
25,5
3626
,602
27,4
1025
,870
25,3
6024
,248
25,1
0124
,547
25,4
5024
,561
Sch
ools
1,65
71,
717
1,80
81,
680
1,55
81,
492
1,53
71,
565
1,48
31,
483
Chu
rche
s16
117
017
917
417
116
416
816
418
218
7In
dust
rial
1,41
31,
365
452
341
310
376
399
665
609
544
Com
mer
cial
9,44
19,
673
10,2
849,
927
9,57
28,
560
9,26
69,
227
9,24
79,
186
Gov
ernm
ent
3,36
33,
869
4,20
32,
887
3,28
33,
932
3,42
03,
118
2,96
92,
558
Ver
y L
arge
Wat
er U
sers
1,00
21,
056
1,40
21,
295
1,13
897
987
788
887
61,
007
Who
lesa
le C
usto
mer
s4,
091
4,14
84,
265
3,34
93,
051
2,86
82,
982
2,68
12,
731
2,60
6O
ther
327
639
160
352
523
532
186
337
314
284
T
otal
Wat
er B
illed
in C
CFs
46,9
9049
,239
50,1
6445
,873
44,9
6643
,151
43,9
3543
,193
43,8
6042
,416
WA
TE
R R
EV
EN
UE
**
$114
,083
$113
,001
$112
,289
$106
,468
$101
,087
$98,
854
$92,
847
$85,
746
$90,
388
$82,
821
WA
ST
EW
AT
ER
RE
TA
IL C
US
TO
ME
RS
187,
003
184,
868
182,
595
180,
204
176,
755
173,
489
170,
623
167,
357
164,
771
160,
666
WA
ST
EW
AT
ER
WH
OL
ES
AL
E C
US
TO
ME
RS
***
15,2
1914
,625
13,4
6213
,126
12,4
3711
,991
10,6
4410
,488
10,0
099,
298
. T
RE
AT
ED
WA
ST
EW
AT
ER
BIL
LE
D (
1000
gal
lons
)***
*21
,572
23,5
4322
,458
22,0
2821
,411
21,2
5321
,163
21,2
5420
,385
21,2
83
WA
ST
EW
AT
ER
RE
VE
NU
E *
*$5
8,03
2$5
4,46
8$5
3,71
1$5
1,56
4$5
1,56
8$5
0,23
3$4
6,24
7$4
5,34
9$4
3,00
3$4
4,20
8
*
Fis
cal y
ear
Mar
ch 1
thru
last
day
of
Febr
uary
of
year
sho
wn
**
Wat
er a
nd W
aste
wat
er R
even
ue e
xpre
ssed
in th
ousa
nds
***
Inc
lude
s to
tal n
umbe
r of
EP
WU
's w
hole
sale
cus
tom
ers
and
thei
r re
tail
cust
omer
s**
** W
aste
wat
er tr
eate
d by
cal
enda
r ye
ar
PU
BL
IC S
ER
VIC
E B
OA
RD
- E
L P
ASO
WA
TE
R U
TIL
ITIE
S
WA
TE
R A
ND
WA
STE
WA
TE
R U
TIL
ITY
FU
ND
WA
TE
R B
ILL
ED
BY
TY
PE
OF
CU
ST
OM
ER
2005
thru
201
4*
B-4
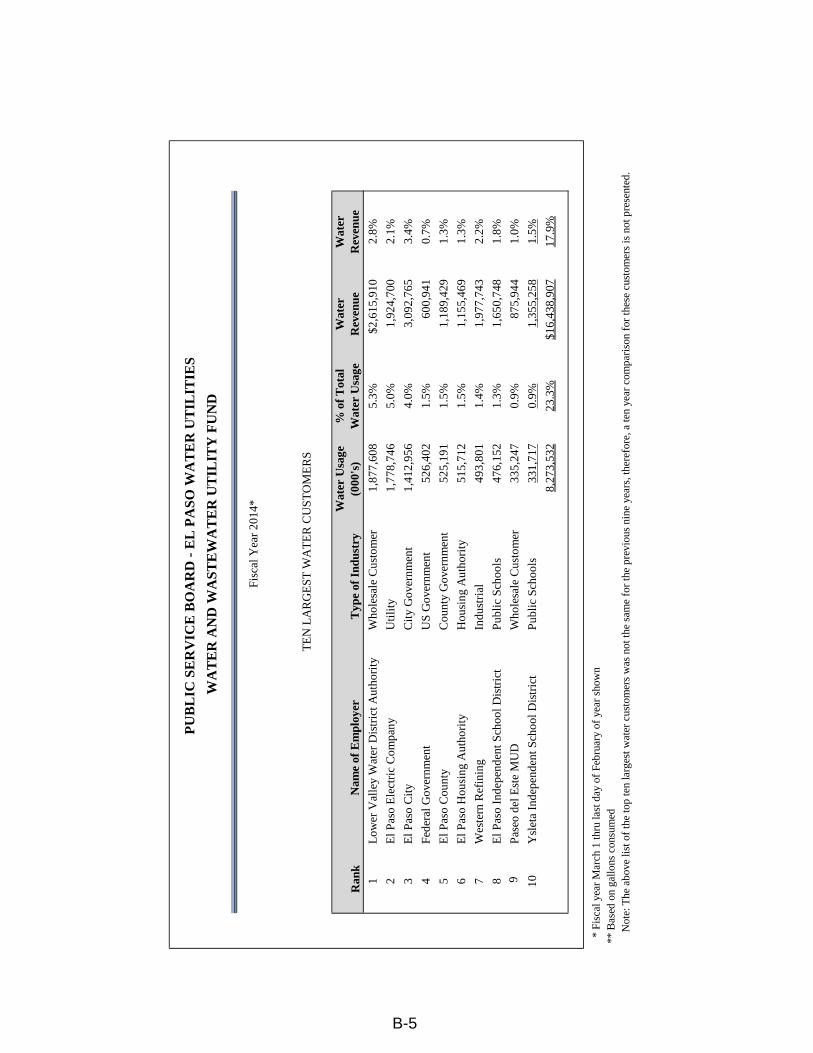
Ran
kN
ame
of E
mpl
oyer
Typ
e of
Ind
ustr
yW
ater
Usa
ge(0
00's
)%
of
Tot
alW
ater
Usa
geW
ater
Rev
enue
% o
f T
otal
Wat
erR
even
ue
1L
ower
Val
ley
Wat
er D
istr
ict A
utho
rity
Who
lesa
le C
usto
mer
1,87
7,60
85.
3%$2
,615
,910
2.8%
2E
l Pas
o E
lect
ric
Com
pany
Uti
lity
1,77
8,74
65.
0%1,
924,
700
2.1%
3E
l Pas
o C
ity
Cit
y G
over
nmen
t1,
412,
956
4.0%
3,09
2,76
53.
4%
4F
eder
al G
over
nmen
tU
S G
over
nmen
t52
6,40
21.
5%60
0,94
10.
7%
5E
l Pas
o C
ount
yC
ount
y G
over
nmen
t52
5,19
11.
5%1,
189,
429
1.3%
6E
l Pas
o H
ousi
ng A
utho
rity
Hou
sing
Aut
hori
ty51
5,71
21.
5%1,
155,
469
1.3%
7W
este
rn R
efin
ing
Indu
stri
al49
3,80
11.
4%1,
977,
743
2.2%
8E
l Pas
o In
depe
nden
t Sch
ool D
istr
ict
Pub
lic
Sch
ools
476,
152
1.3%
1,65
0,74
81.
8%9
Pas
eo d
el E
ste
MU
DW
hole
sale
Cus
tom
er33
5,24
70.
9%87
5,94
41.
0%
10Y
slet
a In
depe
nden
t Sch
ool D
istr
ict
Pub
lic
Sch
ools
331,
717
0.9%
1,35
5,25
81.
5%
8,27
3,53
223
.3%
$16,
438,
907
17.9
%
* Fi
scal
yea
r M
arch
1 th
ru la
st d
ay o
f Fe
brua
ry o
f ye
ar s
how
n *
* B
ased
on
gallo
ns c
onsu
med
Not
e: T
he a
bove
list
of
the
top
ten
larg
est w
ater
cus
tom
ers
was
not
the
sam
e fo
r th
e pr
evio
us n
ine
year
s, th
eref
ore,
a te
n ye
ar c
ompa
riso
n fo
r th
ese
cust
omer
s is
not
pre
sent
ed.
PU
BL
IC S
ER
VIC
E B
OA
RD
- E
L P
ASO
WA
TE
R U
TIL
ITIE
S
WA
TE
R A
ND
WA
STE
WA
TE
R U
TIL
ITY
FU
ND
Fis
cal Y
ear
2014
*
TE
N L
AR
GE
ST
WA
TE
R C
US
TO
ME
RS
B-5
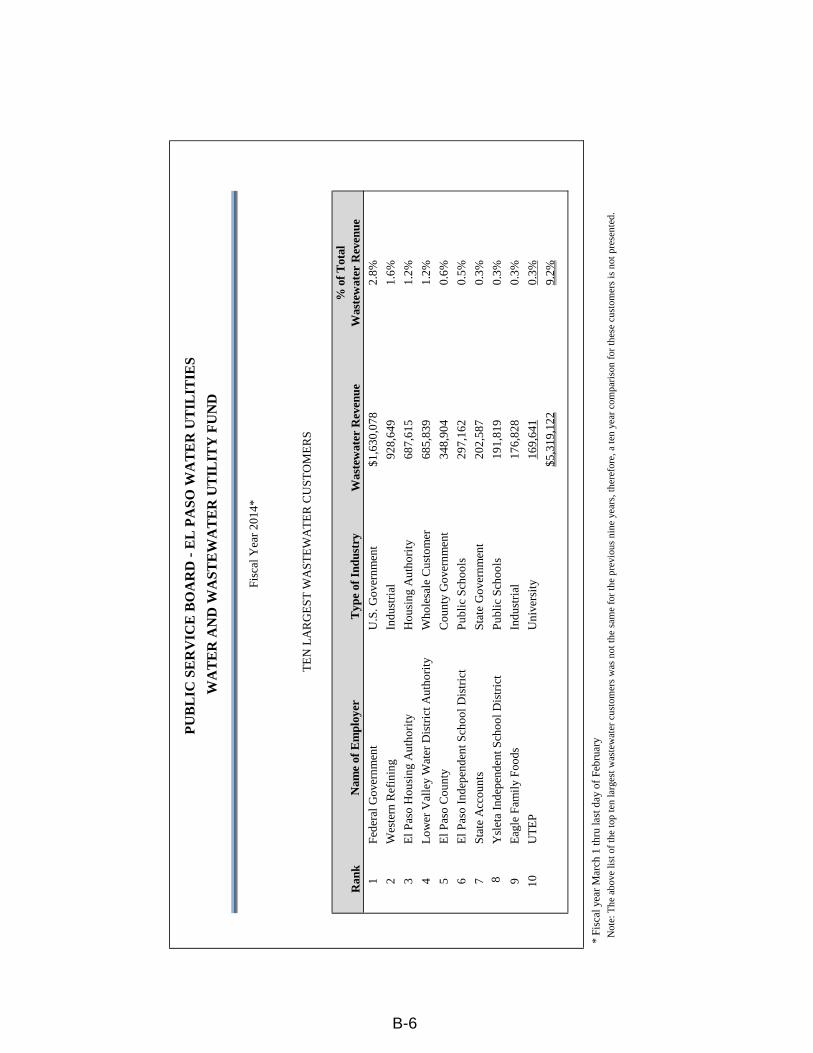
Ran
kN
ame
of E
mpl
oyer
Typ
e of
Ind
ustr
y
1F
eder
al G
over
nmen
tU
.S. G
over
nmen
t
2W
este
rn R
efin
ing
Indu
stri
al
3E
l Pas
o H
ousi
ng A
utho
rity
Hou
sing
Aut
hori
ty
4L
ower
Val
ley
Wat
er D
istr
ict A
utho
rity
Who
lesa
le C
usto
mer
5E
l Pas
o C
ount
yC
ount
y G
over
nmen
t
6E
l Pas
o In
depe
nden
t Sch
ool D
istr
ict
Pub
lic
Sch
ools
7S
tate
Acc
ount
sS
tate
Gov
ernm
ent
8Y
slet
a In
depe
nden
t Sch
ool D
istr
ict
Pub
lic
Sch
ools
9E
agle
Fam
ily
Foo
dsIn
dust
rial
10U
TE
PU
nive
rsit
y
* F
isca
l yea
r M
arch
1 th
ru la
st d
ay o
f Fe
brua
ryN
ote:
The
abo
ve li
st o
f th
e to
p te
n la
rges
t was
tew
ater
cus
tom
ers
was
not
the
sam
e fo
r th
e pr
evio
us n
ine
year
s, th
eref
ore,
a te
n ye
ar c
ompa
riso
n fo
r th
ese
cust
omer
s is
not
pre
sent
ed.
WA
TE
R A
ND
WA
STE
WA
TE
R U
TIL
ITY
FU
ND
PU
BL
IC S
ER
VIC
E B
OA
RD
- E
L P
ASO
WA
TE
R U
TIL
ITIE
S
$5,3
19,1
22
Fis
cal Y
ear
2014
*
TE
N L
AR
GE
ST
WA
ST
EW
AT
ER
CU
ST
OM
ER
S
Was
tew
ater
Rev
enue
% o
f T
otal
Was
tew
ater
Rev
enue
297,
162
202,
587
191,
819
176,
828
169,
641
$1,6
30,0
78
928,
649
687,
615
685,
839
348,
904
2.8%
1.6%
1.2%
1.2%
0.6%
9.2%
0.5%
0.3%
0.3%
0.3%
0.3%
B-6
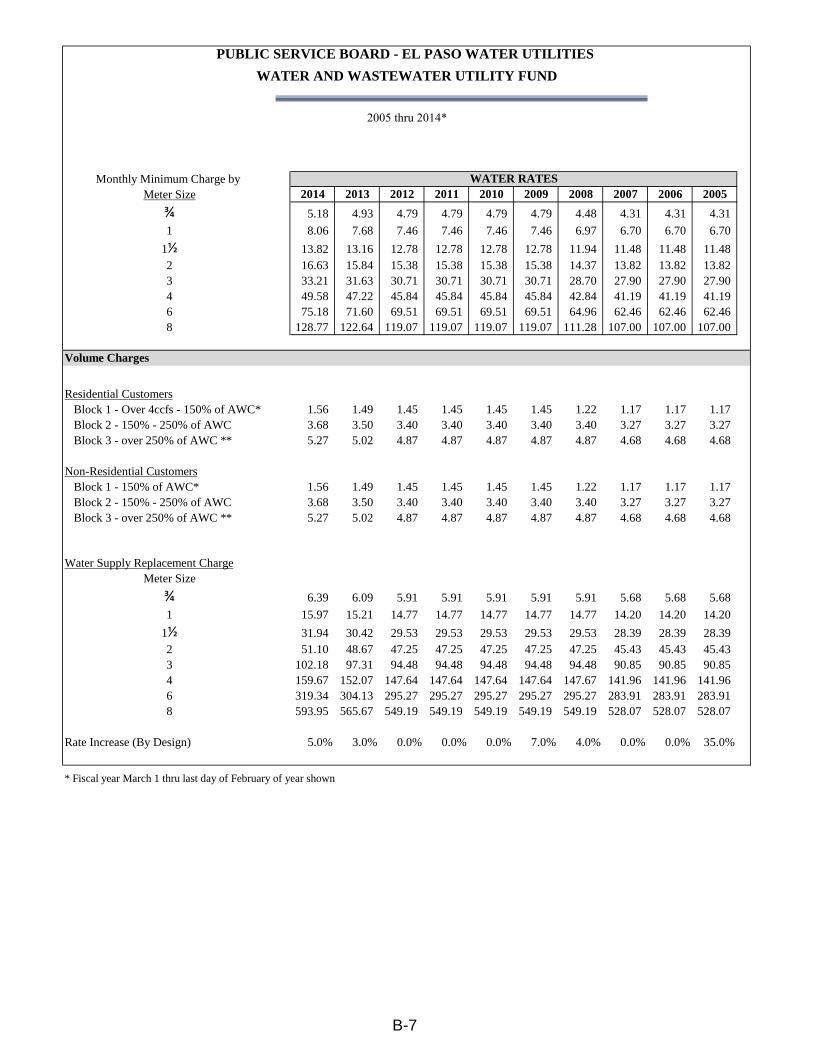
Monthly Minimum Charge byMeter Size 2014 2013 2012 2011 2010 2009 2008 2007 2006 2005
¾ 5.18 4.93 4.79 4.79 4.79 4.79 4.48 4.31 4.31 4.31
1 8.06 7.68 7.46 7.46 7.46 7.46 6.97 6.70 6.70 6.70
1½ 13.82 13.16 12.78 12.78 12.78 12.78 11.94 11.48 11.48 11.482 16.63 15.84 15.38 15.38 15.38 15.38 14.37 13.82 13.82 13.823 33.21 31.63 30.71 30.71 30.71 30.71 28.70 27.90 27.90 27.904 49.58 47.22 45.84 45.84 45.84 45.84 42.84 41.19 41.19 41.196 75.18 71.60 69.51 69.51 69.51 69.51 64.96 62.46 62.46 62.468 128.77 122.64 119.07 119.07 119.07 119.07 111.28 107.00 107.00 107.00
Volume Charges
Residential Customers Block 1 - Over 4ccfs - 150% of AWC* 1.56 1.49 1.45 1.45 1.45 1.45 1.22 1.17 1.17 1.17 Block 2 - 150% - 250% of AWC 3.68 3.50 3.40 3.40 3.40 3.40 3.40 3.27 3.27 3.27 Block 3 - over 250% of AWC ** 5.27 5.02 4.87 4.87 4.87 4.87 4.87 4.68 4.68 4.68
Non-Residential Customers Block 1 - 150% of AWC* 1.56 1.49 1.45 1.45 1.45 1.45 1.22 1.17 1.17 1.17 Block 2 - 150% - 250% of AWC 3.68 3.50 3.40 3.40 3.40 3.40 3.40 3.27 3.27 3.27 Block 3 - over 250% of AWC ** 5.27 5.02 4.87 4.87 4.87 4.87 4.87 4.68 4.68 4.68
Water Supply Replacement ChargeMeter Size
¾ 6.39 6.09 5.91 5.91 5.91 5.91 5.91 5.68 5.68 5.68
1 15.97 15.21 14.77 14.77 14.77 14.77 14.77 14.20 14.20 14.20
1½ 31.94 30.42 29.53 29.53 29.53 29.53 29.53 28.39 28.39 28.392 51.10 48.67 47.25 47.25 47.25 47.25 47.25 45.43 45.43 45.433 102.18 97.31 94.48 94.48 94.48 94.48 94.48 90.85 90.85 90.854 159.67 152.07 147.64 147.64 147.64 147.64 147.67 141.96 141.96 141.966 319.34 304.13 295.27 295.27 295.27 295.27 295.27 283.91 283.91 283.918 593.95 565.67 549.19 549.19 549.19 549.19 549.19 528.07 528.07 528.07
Rate Increase (By Design) 5.0% 3.0% 0.0% 0.0% 0.0% 7.0% 4.0% 0.0% 0.0% 35.0%
* Fiscal year March 1 thru last day of February of year shown
PUBLIC SERVICE BOARD - EL PASO WATER UTILITIES
WATER AND WASTEWATER UTILITY FUND
2005 thru 2014*
WATER RATES
B-7
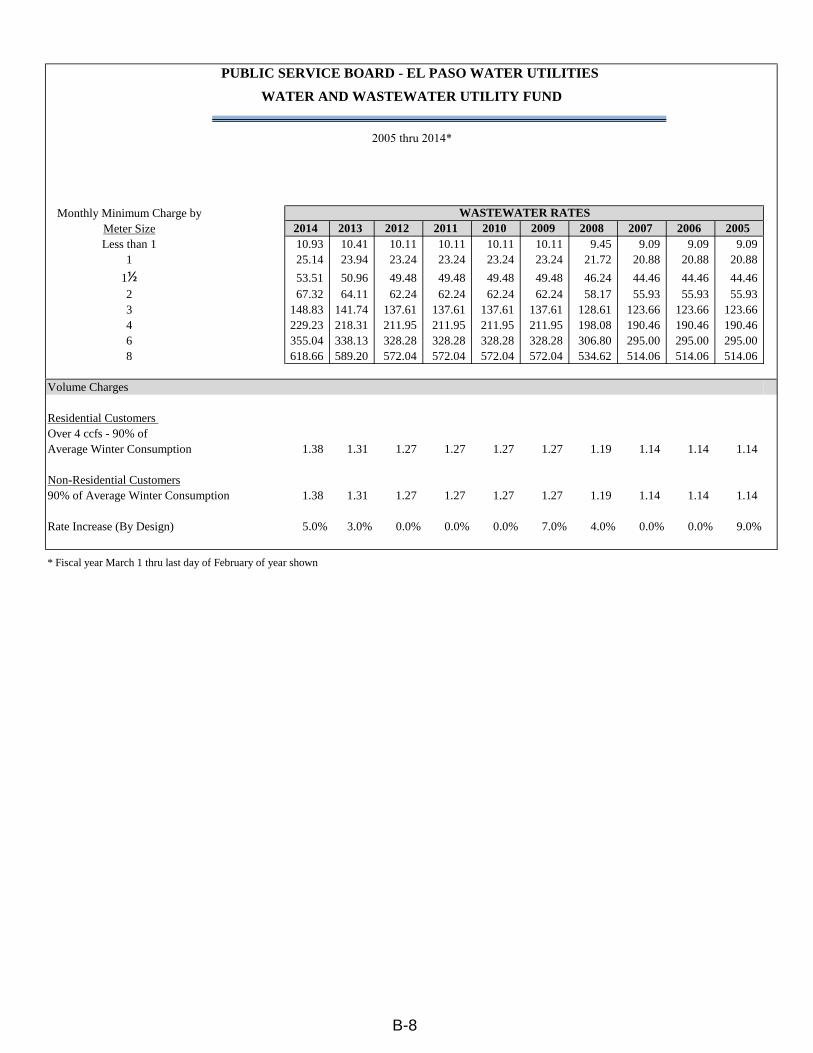
Monthly Minimum Charge byMeter Size 2014 2013 2012 2011 2010 2009 2008 2007 2006 2005Less than 1 10.93 10.41 10.11 10.11 10.11 10.11 9.45 9.09 9.09 9.09
1 25.14 23.94 23.24 23.24 23.24 23.24 21.72 20.88 20.88 20.88
1½ 53.51 50.96 49.48 49.48 49.48 49.48 46.24 44.46 44.46 44.462 67.32 64.11 62.24 62.24 62.24 62.24 58.17 55.93 55.93 55.933 148.83 141.74 137.61 137.61 137.61 137.61 128.61 123.66 123.66 123.664 229.23 218.31 211.95 211.95 211.95 211.95 198.08 190.46 190.46 190.466 355.04 338.13 328.28 328.28 328.28 328.28 306.80 295.00 295.00 295.008 618.66 589.20 572.04 572.04 572.04 572.04 534.62 514.06 514.06 514.06
Volume Charges
Residential CustomersOver 4 ccfs - 90% ofAverage Winter Consumption 1.38 1.31 1.27 1.27 1.27 1.27 1.19 1.14 1.14 1.14
Non-Residential Customers90% of Average Winter Consumption 1.38 1.31 1.27 1.27 1.27 1.27 1.19 1.14 1.14 1.14
Rate Increase (By Design) 5.0% 3.0% 0.0% 0.0% 0.0% 7.0% 4.0% 0.0% 0.0% 9.0%
* Fiscal year March 1 thru last day of February of year shown
PUBLIC SERVICE BOARD - EL PASO WATER UTILITIES
WATER AND WASTEWATER UTILITY FUND
2005 thru 2014*
WASTEWATER RATES
B-8
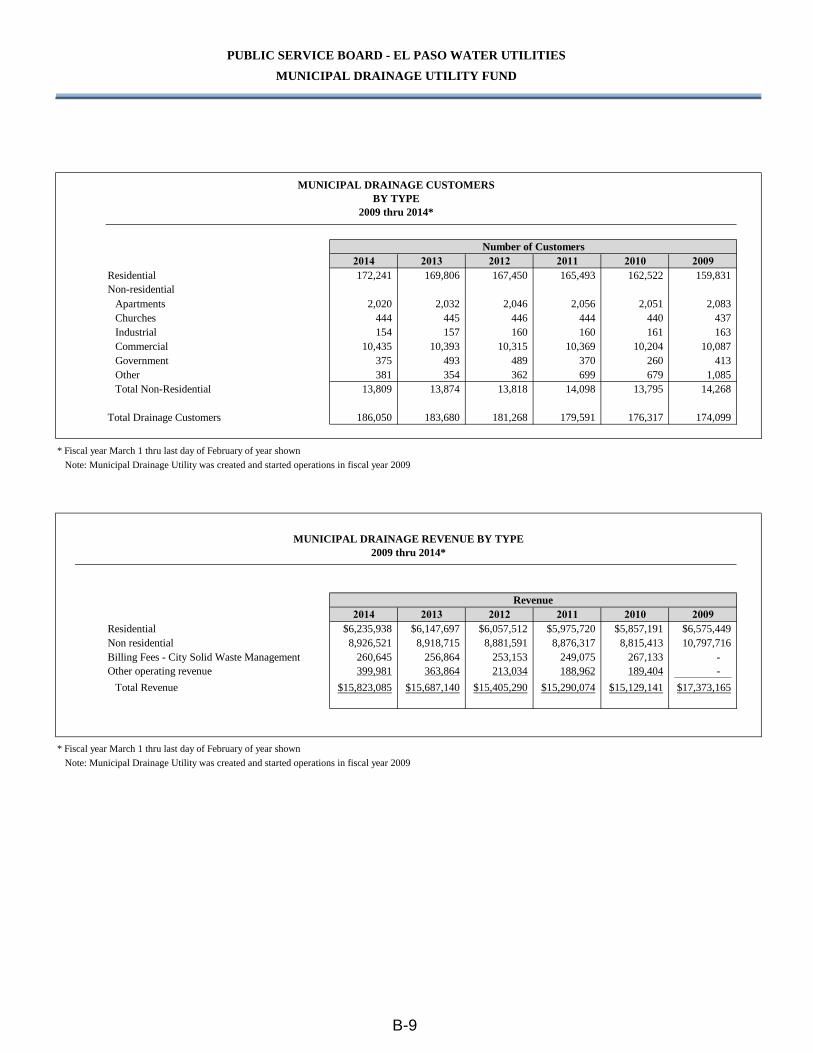
2014 2013 2012 2011 2010 2009Residential 172,241 169,806 167,450 165,493 162,522 159,831Non-residential
Apartments 2,020 2,032 2,046 2,056 2,051 2,083Churches 444 445 446 444 440 437Industrial 154 157 160 160 161 163Commercial 10,435 10,393 10,315 10,369 10,204 10,087Government 375 493 489 370 260 413Other 381 354 362 699 679 1,085Total Non-Residential 13,809 13,874 13,818 14,098 13,795 14,268
Total Drainage Customers 186,050 183,680 181,268 179,591 176,317 174,099
* Fiscal year March 1 thru last day of February of year shown
Note: Municipal Drainage Utility was created and started operations in fiscal year 2009
2014 2013 2012 2011 2010 2009Residential $6,235,938 $6,147,697 $6,057,512 $5,975,720 $5,857,191 $6,575,449Non residential 8,926,521 8,918,715 8,881,591 8,876,317 8,815,413 10,797,716Billing Fees - City Solid Waste Management 260,645 256,864 253,153 249,075 267,133 -Other operating revenue 399,981 363,864 213,034 188,962 189,404 -
Total Revenue $15,823,085 $15,687,140 $15,405,290 $15,290,074 $15,129,141 $17,373,165
* Fiscal year March 1 thru last day of February of year shown
Note: Municipal Drainage Utility was created and started operations in fiscal year 2009
Revenue
PUBLIC SERVICE BOARD - EL PASO WATER UTILITIES
MUNICIPAL DRAINAGE UTILITY FUND
MUNICIPAL DRAINAGE CUSTOMERSBY TYPE
2009 thru 2014*
MUNICIPAL DRAINAGE REVENUE BY TYPE2009 thru 2014*
Number of Customers
B-9
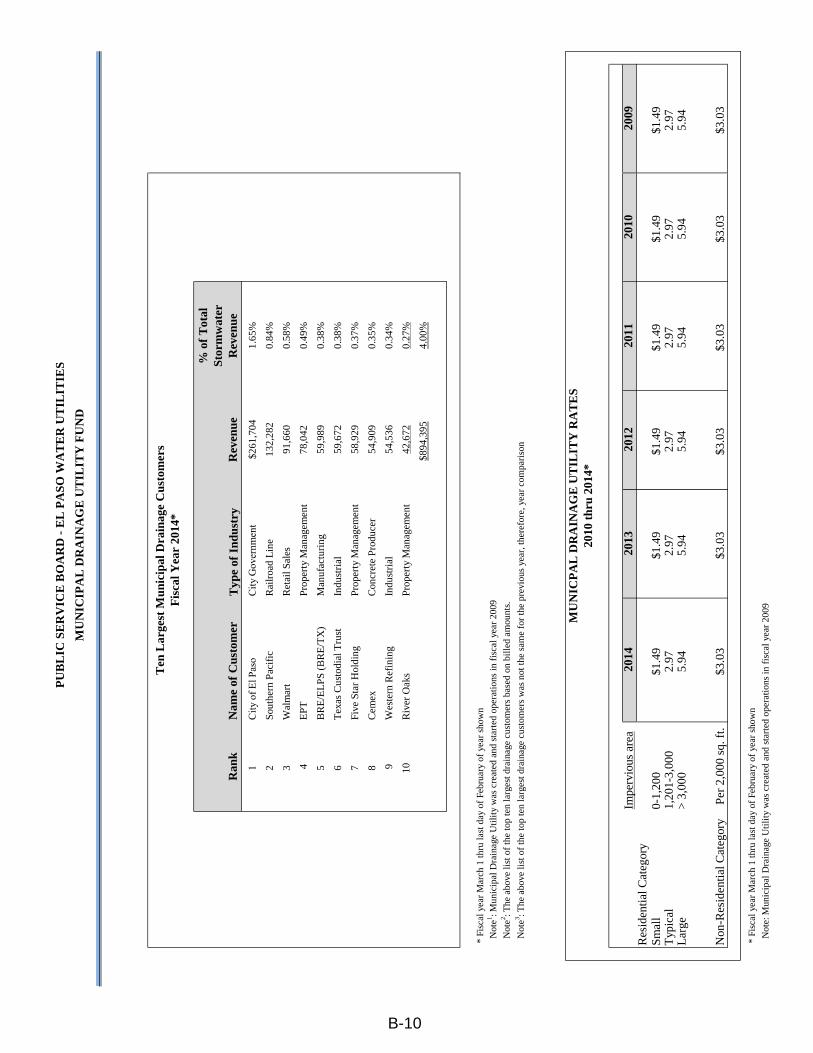
Ran
kN
ame
of C
usto
mer
Typ
e of
Ind
ustr
yR
even
ue
% o
f T
otal
Stor
mw
ater
Rev
enue
1C
ity o
f El P
aso
City
Gov
ernm
ent
$261
,704
1.65
%
2So
uthe
rn P
acif
icR
ailr
oad
Lin
e13
2,28
20.
84%
3W
alm
art
Ret
ail S
ales
91,6
600.
58%
4E
PTPr
oper
ty M
anag
emen
t78
,042
0.49
%
5B
RE
/EL
PS (
BR
E/T
X)
Man
ufac
turi
ng59
,989
0.38
%
6T
exas
Cus
todi
al T
rust
Indu
stri
al59
,672
0.38
%
7Fi
ve S
tar
Hol
ding
Prop
erty
Man
agem
ent
58,9
290.
37%
8C
emex
Con
cret
e Pr
oduc
er54
,909
0.35
%
9W
este
rn R
efin
ing
Indu
stri
al54
,536
0.34
%
10R
iver
Oak
sPr
oper
ty M
anag
emen
t42
,672
0.27
%
$894
,395
4.00
%
* F
isca
l yea
r M
arch
1 th
ru la
st d
ay o
f Fe
brua
ry o
f ye
ar s
how
nN
ote1 : M
unic
ipal
Dra
inag
e U
tili
ty w
as c
reat
ed a
nd s
tart
ed o
pera
tion
s in
fis
cal y
ear
2009
Not
e2 : The
abo
ve li
st o
f th
e to
p te
n la
rges
t dra
inag
e cu
stom
ers
base
d on
bil
led
amou
nts.
Impe
rvio
us a
rea
2014
2013
2012
2011
2010
2009
Res
iden
tial C
ateg
ory
Smal
l0-
1,20
0$1
.49
$1.4
9$1
.49
$1.4
9$1
.49
$1.4
9T
ypic
al1,
201-
3,00
02.
972.
972.
972.
972.
972.
97L
arge
> 3
,000
5.94
5.94
5.94
5.94
5.94
5.94
Non
-Res
iden
tial C
ateg
ory
Per
2,0
00 s
q. f
t.$3
.03
$3.0
3$3
.03
$3.0
3$3
.03
$3.0
3
* F
isca
l yea
r M
arch
1 th
ru la
st d
ay o
f Fe
brua
ry o
f ye
ar s
how
n
Not
e: M
unic
ipal
Dra
inag
e U
tili
ty w
as c
reat
ed a
nd s
tart
ed o
pera
tion
s in
fis
cal y
ear
2009
MU
NIC
PA
L D
RA
INA
GE
UT
ILIT
Y R
AT
ES
2010
thr
u 20
14*
N
ote3 : T
he a
bove
list
of
the
top
ten
larg
est d
rain
age
cust
omer
s w
as n
ot th
e sa
me
for
the
prev
ious
yea
r, th
eref
ore,
yea
r co
mpa
riso
n
Ten
Lar
gest
Mun
icip
al D
rain
age
Cus
tom
ers
Fis
cal Y
ear
2014
*
PU
BL
IC S
ER
VIC
E B
OA
RD
- E
L P
ASO
WA
TE
R U
TIL
ITIE
S
MU
NIC
IPA
L D
RA
INA
GE
UT
ILIT
Y F
UN
D
B-10
C - DEBT CAPACITY INFORMATIONThis schedule presents information to help the reader assess the affordability of the Public Service Board -
El Paso Water Utilities' current levels of outstanding debt and its ability to issue additional debt
in the future for the Water and Wastewater Utility and the Municipal Drainage Utility funds.

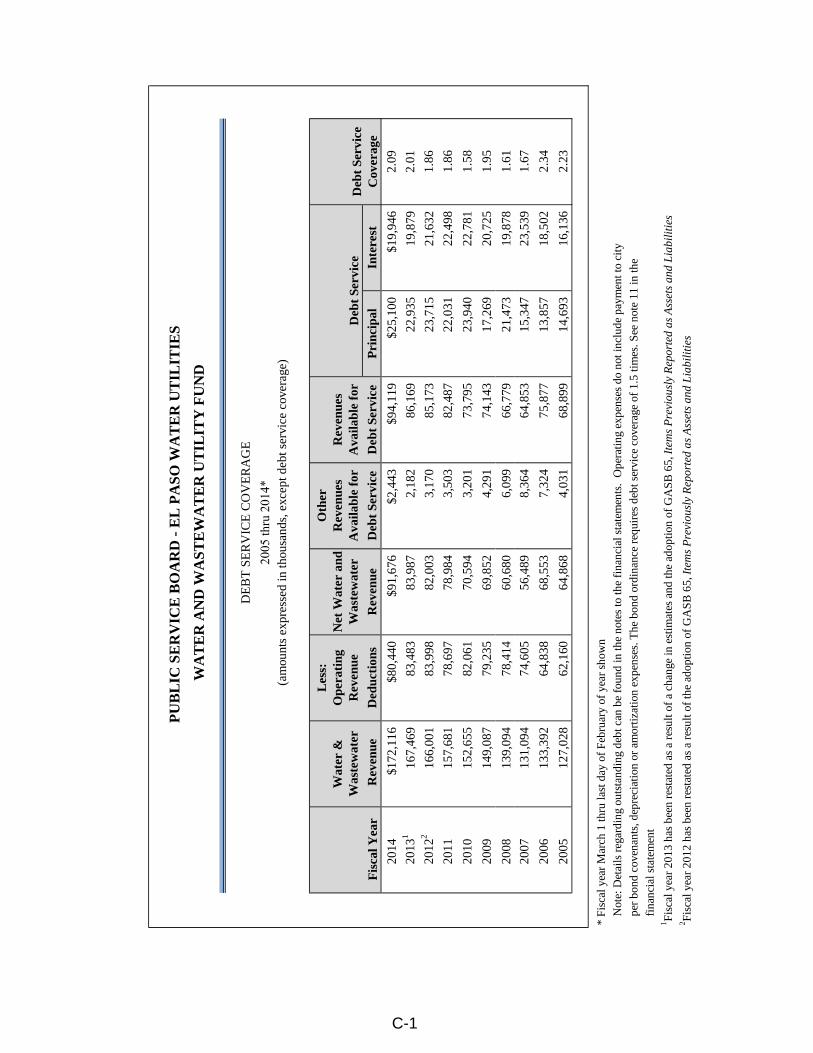
Wat
er &
Was
tew
ater
Les
s:O
pera
ting
Rev
enue
Net
Wat
er a
ndW
aste
wat
er
Oth
erR
even
ues
Ava
ilabl
e fo
rR
even
ues
Ava
ilabl
e fo
r
Fis
cal Y
ear
Rev
enue
Ded
ucti
ons
Rev
enue
Deb
t Se
rvic
eD
ebt
Serv
ice
Pri
ncip
alIn
tere
st
2014
$172
,116
$80,
440
$91,
676
$2,4
43$9
4,11
9$2
5,10
0$1
9,94
62.
09
2013
116
7,46
983
,483
83,9
872,
182
86,1
6922
,935
19,8
792.
01
2012
216
6,00
183
,998
82,0
033,
170
85,1
7323
,715
21,6
321.
86
2011
157,
681
78,6
9778
,984
3,50
382
,487
22,0
3122
,498
1.86
2010
152,
655
82,0
6170
,594
3,20
173
,795
23,9
4022
,781
1.58
2009
149,
087
79,2
3569
,852
4,29
174
,143
17,2
6920
,725
1.95
2008
139,
094
78,4
1460
,680
6,09
966
,779
21,4
7319
,878
1.61
2007
131,
094
74,6
0556
,489
8,36
464
,853
15,3
4723
,539
1.67
2006
133,
392
64,8
3868
,553
7,32
475
,877
13,8
5718
,502
2.34
2005
127,
028
62,1
6064
,868
4,03
168
,899
14,6
9316
,136
2.23
* F
isca
l yea
r M
arch
1 th
ru la
st d
ay o
f F
ebru
ary
of y
ear
show
n
Not
e: D
etai
ls r
egar
ding
out
stan
ding
deb
t can
be
foun
d in
the
note
s to
the
fina
ncia
l sta
tem
ents
. O
pera
ting
expe
nses
do
not i
nclu
de p
aym
ent t
o ci
ty
per
bond
cov
enan
ts, d
epre
ciat
ion
or a
mor
tizat
ion
expe
nses
. The
bon
d or
dina
nce
requ
ires
deb
t ser
vice
cov
erag
e of
1.5
tim
es. S
ee n
ote
11 in
the
fina
ncia
l sta
tem
ent
1 Fis
cal y
ear
2013
has
bee
n re
stat
ed a
s a
resu
lt of
a c
hang
e in
est
imat
es a
nd th
e ad
optio
n of
GA
SB
65,
Item
s P
revi
ousl
y R
epor
ted
as A
sset
s an
d L
iabi
litie
s2 F
isca
l yea
r 20
12 h
as b
een
rest
ated
as
a re
sult
of th
e ad
optio
n of
GA
SB
65,
Item
s P
revi
ousl
y R
epor
ted
as A
sset
s an
d L
iabi
litie
s
Deb
t Se
rvic
eC
over
age
Deb
t Se
rvic
e
PU
BL
IC S
ER
VIC
E B
OA
RD
- E
L P
ASO
WA
TE
R U
TIL
ITIE
S
WA
TE
R A
ND
WA
STE
WA
TE
R U
TIL
ITY
FU
ND
DE
BT
SE
RV
ICE
CO
VE
RA
GE
2005
thru
201
4*(a
mou
nts
expr
esse
d in
thou
sand
s, e
xcep
t deb
t ser
vice
cov
erag
e)
C-1
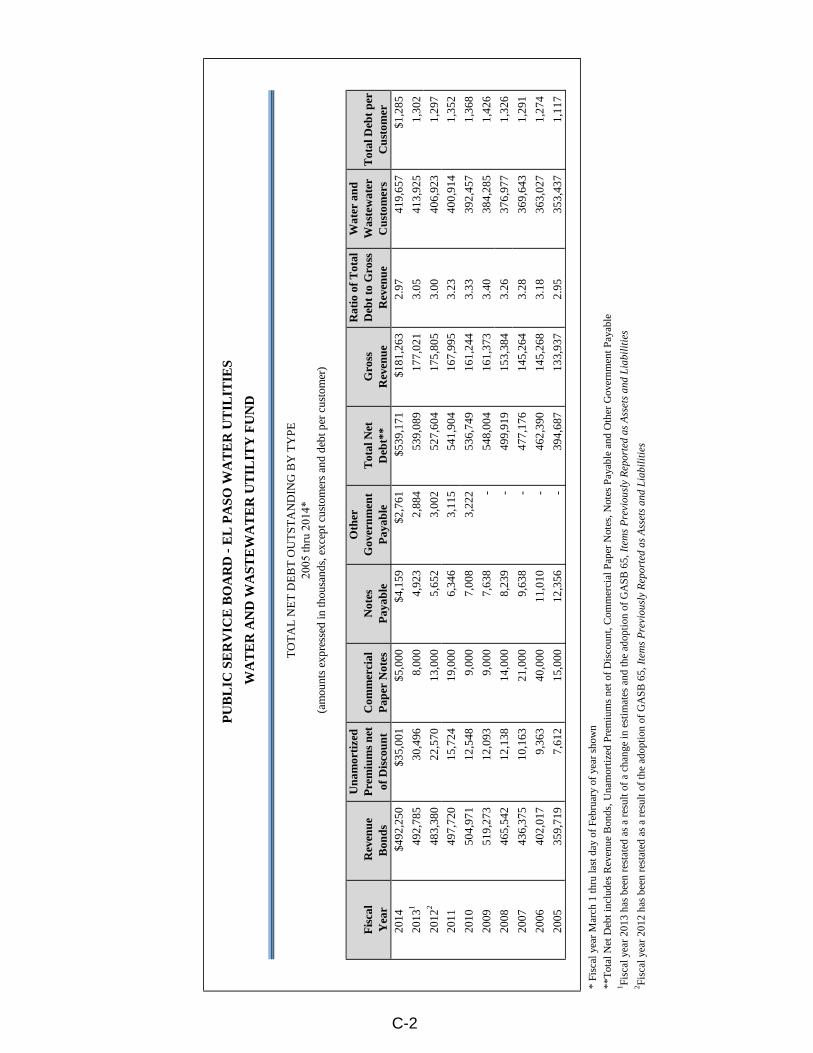
Fis
cal
Yea
r R
even
ueB
onds
Una
mor
tize
dP
rem
ium
s ne
tof
Dis
coun
tC
omm
erci
alP
aper
Not
esN
otes
Pay
able
Oth
erG
over
nmen
tP
ayab
leT
otal
Net
Deb
t**
Gro
ssR
even
ue
Rat
io o
f T
otal
Deb
t to
Gro
ssR
even
ue
Wat
er a
ndW
aste
wat
erC
usto
mer
sT
otal
Deb
t per
Cus
tom
er20
14$4
92,2
50$3
5,00
1$5
,000
$4,1
59$2
,761
$539
,171
$181
,263
2.97
419,
657
$1,2
85
2013
149
2,78
530
,496
8,00
04,
923
2,88
453
9,08
917
7,02
13.
0541
3,92
51,
302
2012
248
3,38
022
,570
13,0
005,
652
3,00
252
7,60
417
5,80
53.
0040
6,92
31,
297
2011
497,
720
15,7
2419
,000
6,34
63,
115
541,
904
167,
995
3.23
400,
914
1,35
2
2010
504,
971
12,5
489,
000
7,00
83,
222
536,
749
161,
244
3.33
392,
457
1,36
8
2009
519,
273
12,0
939,
000
7,63
8-
548,
004
161,
373
3.40
384,
285
1,42
6
2008
465,
542
12,1
3814
,000
8,23
9-
499,
919
153,
384
3.26
376,
977
1,32
6
2007
436,
375
10,1
6321
,000
9,63
8-
477,
176
145,
264
3.28
369,
643
1,29
1
2006
402,
017
9,36
340
,000
11,0
10-
462,
390
145,
268
3.18
363,
027
1,27
4
2005
359,
719
7,61
215
,000
12,3
56-
394,
687
133,
937
2.95
353,
437
1,11
7
* Fi
scal
yea
r M
arch
1 th
ru la
st d
ay o
f Fe
brua
ry o
f ye
ar s
how
n
**T
otal
Net
Deb
t inc
lude
s R
even
ue B
onds
, Una
mor
tize
d Pr
emiu
ms
net o
f D
isco
unt,
Com
mer
cial
Pap
er N
otes
, Not
es P
ayab
le a
nd O
ther
Gov
ernm
ent P
ayab
le1 Fi
scal
yea
r 20
13 h
as b
een
rest
ated
as
a re
sult
of a
cha
nge
in e
stim
ates
and
the
adop
tion
of
GA
SB 6
5,It
ems
Pre
viou
sly
Rep
orte
d as
Ass
ets
and
Lia
bili
ties
2 Fisc
al y
ear
2012
has
bee
n re
stat
ed a
s a
resu
lt of
the
adop
tion
of
GA
SB 6
5,It
ems
Pre
viou
sly
Rep
orte
d as
Ass
ets
and
Lia
bili
ties
PU
BL
IC S
ER
VIC
E B
OA
RD
- E
L P
ASO
WA
TE
R U
TIL
ITIE
S
WA
TE
R A
ND
WA
STE
WA
TE
R U
TIL
ITY
FU
ND
TO
TA
L N
ET
DE
BT
OU
TS
TA
ND
ING
BY
TY
PE
2005
thru
201
4*(a
mou
nts
expr
esse
d in
thou
sand
s, e
xcep
t cus
tom
ers
and
debt
per
cus
tom
er)
C-2
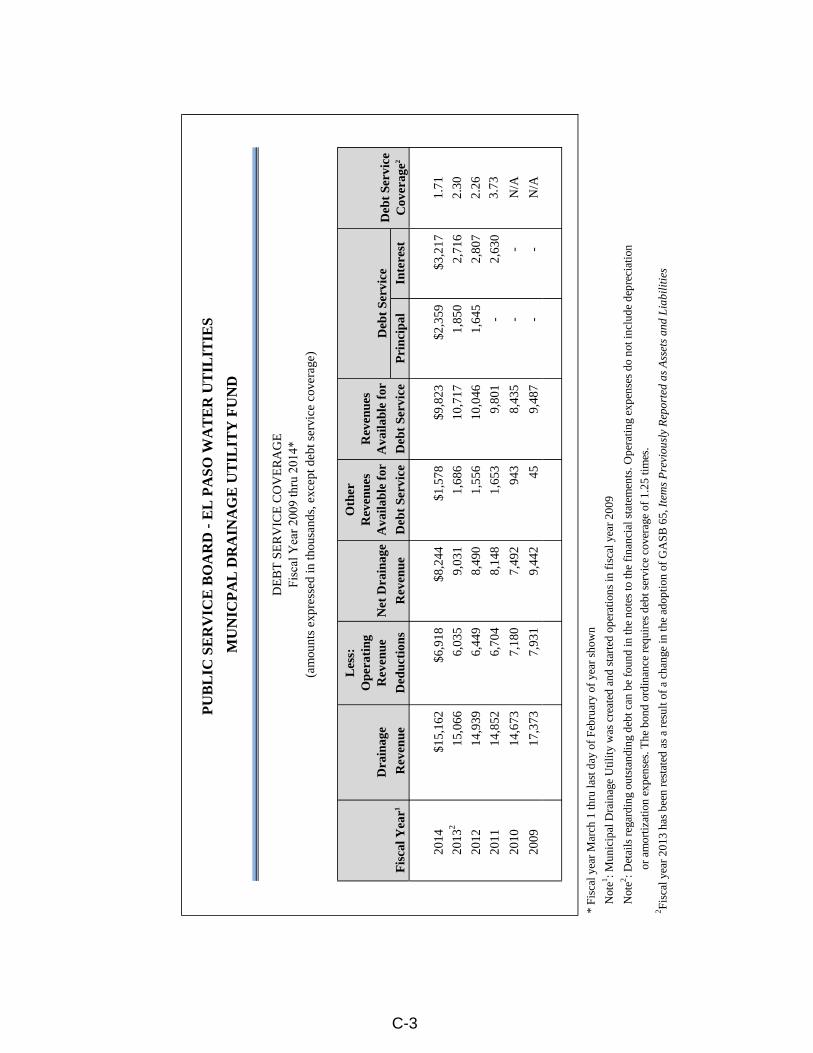
Dra
inag
e
Les
s:O
pera
ting
Rev
enue
Net
Dra
inag
e
Oth
erR
even
ues
Ava
ilabl
e fo
rR
even
ues
Ava
ilabl
e fo
r
Fis
cal Y
ear1
Rev
enue
Ded
ucti
ons
Rev
enue
Deb
t Se
rvic
eD
ebt
Serv
ice
Pri
ncip
alIn
tere
st
2014
$15,
162
$6,9
18$8
,244
$1,5
78$9
,823
$2,3
59$3
,217
1.71
2013
215
,066
6,03
59,
031
1,68
610
,717
1,85
02,
716
2.30
2012
14,9
396,
449
8,49
01,
556
10,0
461,
645
2,80
72.
26
2011
14,8
526,
704
8,14
81,
653
9,80
1-
2,63
03.
73
2010
14,6
737,
180
7,49
294
38,
435
--
N/A
2009
17,3
737,
931
9,44
245
9,48
7-
-N
/A
* F
isca
l yea
r M
arch
1 th
ru la
st d
ay o
f F
ebru
ary
of y
ear
show
n
Not
e1 : Mun
icip
al D
rain
age
Util
ity w
as c
reat
ed a
nd s
tart
ed o
pera
tions
in f
isca
l yea
r 20
09
Not
e2 : Det
ails
reg
ardi
ng o
utst
andi
ng d
ebt c
an b
e fo
und
in th
e no
tes
to th
e fi
nanc
ial s
tate
men
ts. O
pera
ting
expe
nses
do
not i
nclu
de d
epre
ciat
ion
or a
mor
tizat
ion
expe
nses
. The
bon
d or
dina
nce
requ
ires
deb
t ser
vice
cov
erag
e of
1.2
5 tim
es.
2 Fis
cal y
ear
2013
has
bee
n re
stat
ed a
s a
resu
lt of
a c
hang
e in
the
adop
tion
of G
AS
B 6
5,It
ems
Pre
viou
sly
Rep
orte
d as
Ass
ets
and
Lia
bilit
ies
Deb
t Se
rvic
eD
ebt
Serv
ice
Cov
erag
e2
PU
BL
IC S
ER
VIC
E B
OA
RD
- E
L P
ASO
WA
TE
R U
TIL
ITIE
S
MU
NIC
PA
L D
RA
INA
GE
UT
ILIT
Y F
UN
D
DE
BT
SE
RV
ICE
CO
VE
RA
GE
Fisc
al Y
ear 2
009
thru
201
4*(a
mou
nts
expr
esse
d in
thou
sand
s, e
xcep
t deb
t ser
vice
cov
erag
e)
C-3
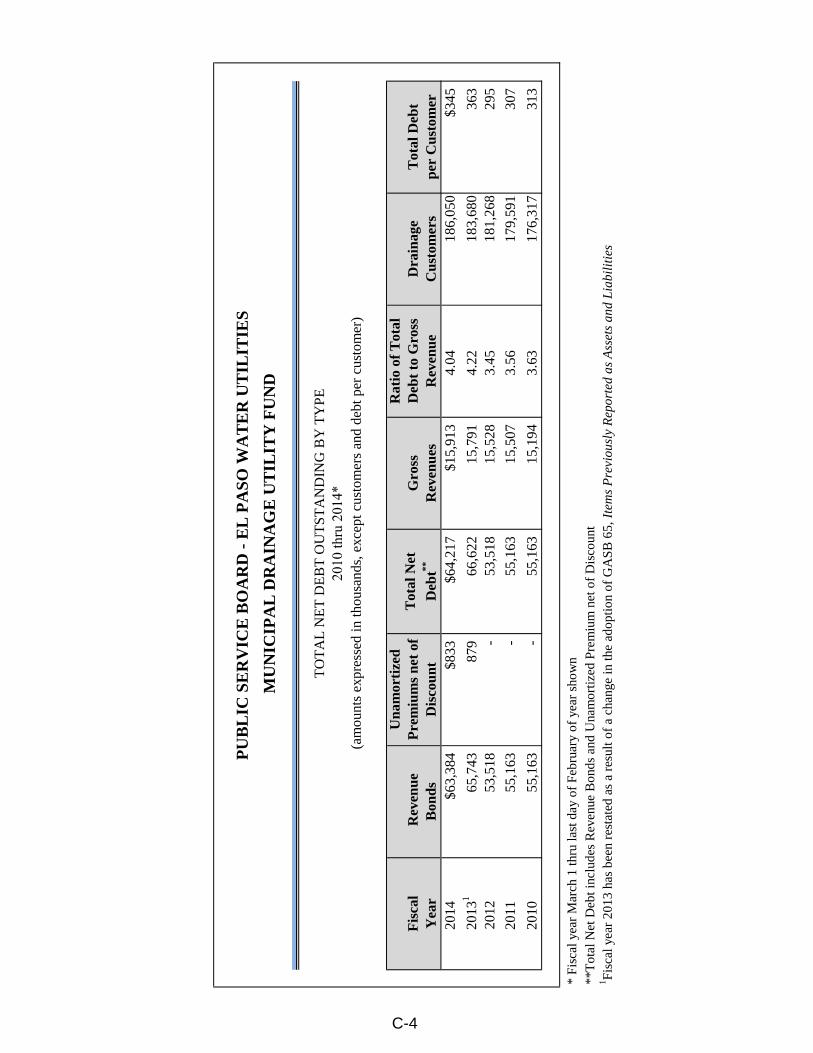
Fis
cal
Yea
r R
even
ueB
onds
Una
mor
tize
dP
rem
ium
s ne
t of
Dis
coun
t
Tot
al N
et
Deb
t**G
ross
Rev
enue
s
Rat
io o
f T
otal
Deb
t to
Gro
ssR
even
ueD
rain
age
Cus
tom
ers
Tot
al D
ebt
per
Cus
tom
er20
14$6
3,38
4$8
33$6
4,21
7$1
5,91
34.
0418
6,05
0$3
45
2013
165
,743
879
66,6
2215
,791
4.22
183,
680
363
2012
53,5
18-
53,5
1815
,528
3.45
181,
268
295
2011
55,1
63-
55,1
6315
,507
3.56
179,
591
307
2010
55,1
63-
55,1
6315
,194
3.63
176,
317
313
* Fi
scal
yea
r M
arch
1 th
ru la
st d
ay o
f Fe
brua
ry o
f ye
ar s
how
n**
Tot
al N
et D
ebt i
nclu
des
Rev
enue
Bon
ds a
nd U
nam
ortiz
ed P
rem
ium
net
of
Dis
coun
t1 Fi
scal
yea
r 20
13 h
as b
een
rest
ated
as
a re
sult
of a
cha
nge
in th
e ad
optio
n of
GA
SB 6
5,It
ems
Pre
viou
sly
Rep
orte
d as
Ass
ets
and
Lia
bili
ties
PU
BL
IC S
ER
VIC
E B
OA
RD
- E
L P
ASO
WA
TE
R U
TIL
ITIE
S
MU
NIC
IPA
L D
RA
INA
GE
UT
ILIT
Y F
UN
D
TO
TA
L N
ET
DE
BT
OU
TST
AN
DIN
G B
Y T
YPE
2010
thru
201
4*(a
mou
nts
expr
esse
d in
thou
sand
s, e
xcep
t cus
tom
ers
and
debt
per
cus
tom
er)
C-4
D - DEMOGRAPHIC AND ECONOMIC INFORMATIONThese schedules offer demographic and economic indicators to help the reader understand
the environment within which the Public Service Board - El Paso Water Utilities'
financial activities take place.

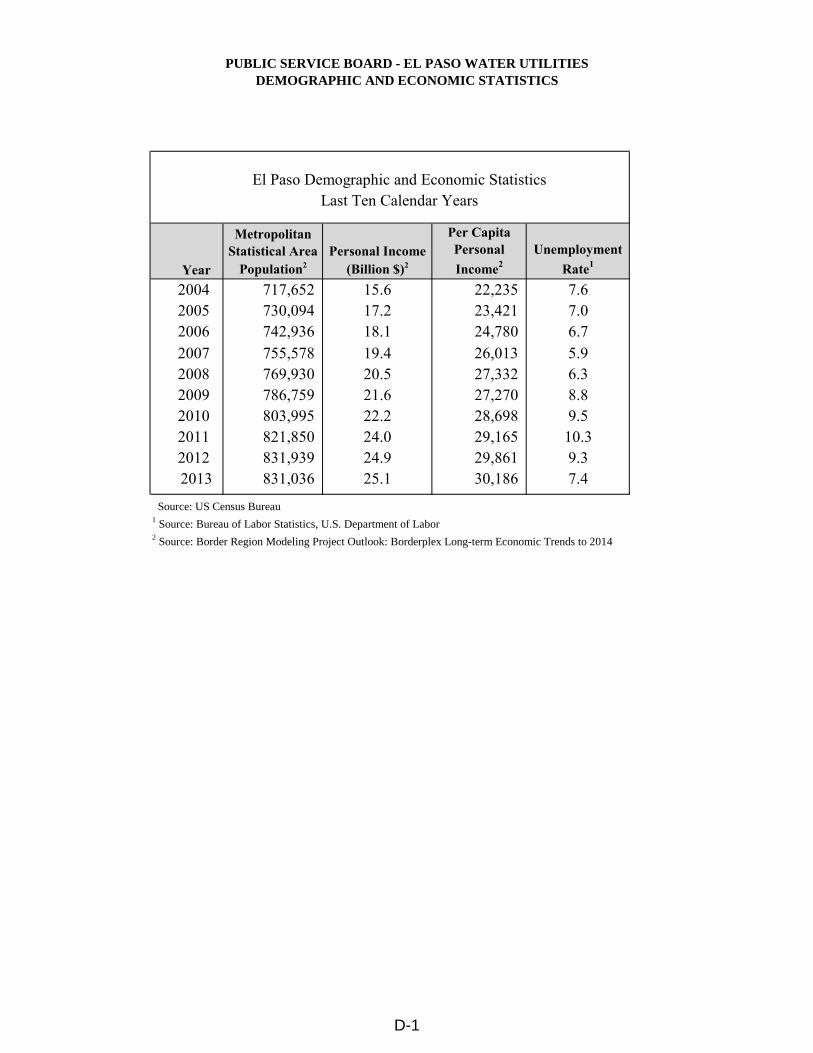
PUBLIC SERVICE BOARD - EL PASO WATER UTILITIESDEMOGRAPHIC AND ECONOMIC STATISTICS
El Paso Demographic and Economic StatisticsLast Ten Calendar Years
Year
MetropolitanStatistical Area
Population2Personal Income
(Billion $)2
Per CapitaPersonalIncome2
UnemploymentRate1
2004 717,652 15.6 22,235 7.62005 730,094 17.2 23,421 7.02006 742,936 18.1 24,780 6.72007 755,578 19.4 26,013 5.92008 769,930 20.5 27,332 6.32009 786,759 21.6 27,270 8.82010 803,995 22.2 28,698 9.52011 821,850 24.0 29,165 10.32012 831,939 24.9 29,861 9.32013 831,036 25.1 30,186 7.4
Source: US Census Bureau1 Source: Bureau of Labor Statistics, U.S. Department of Labor2 Source: Border Region Modeling Project Outlook: Borderplex Long-term Economic Trends to 2014
D-1
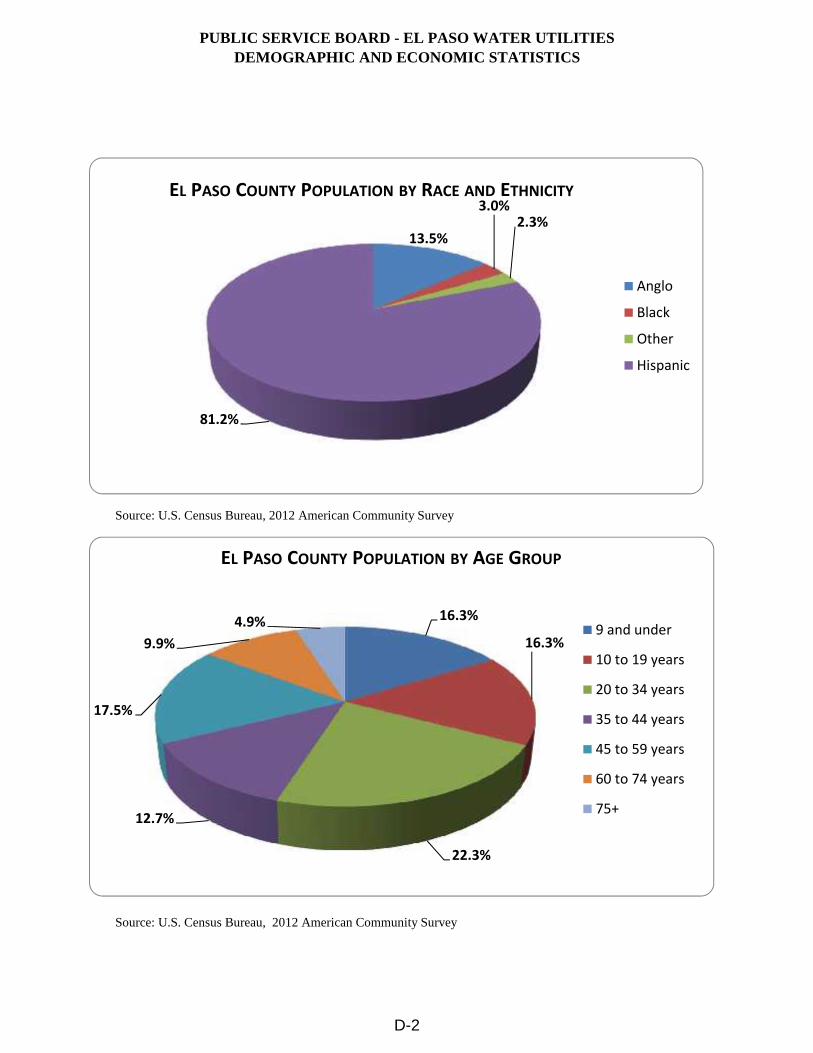
PUBLIC SERVICE BOARD - EL PASO WATER UTILITIESDEMOGRAPHIC AND ECONOMIC STATISTICS
Source: U.S. Census Bureau, 2012 American Community Survey
Source: U.S. Census Bureau, 2012 American Community Survey
13.5%
3.0%2.3%
81.2%
Anglo
Black
Other
Hispanic
EL PASO COUNTY POPULATION BY RACE AND ETHNICITY
16.3%
16.3%
22.3%
12.7%
17.5%
9.9%4.9% 9 and under
10 to 19 years
20 to 34 years
35 to 44 years
45 to 59 years
60 to 74 years
75+
EL PASO COUNTY POPULATION BY AGE GROUP
D-2
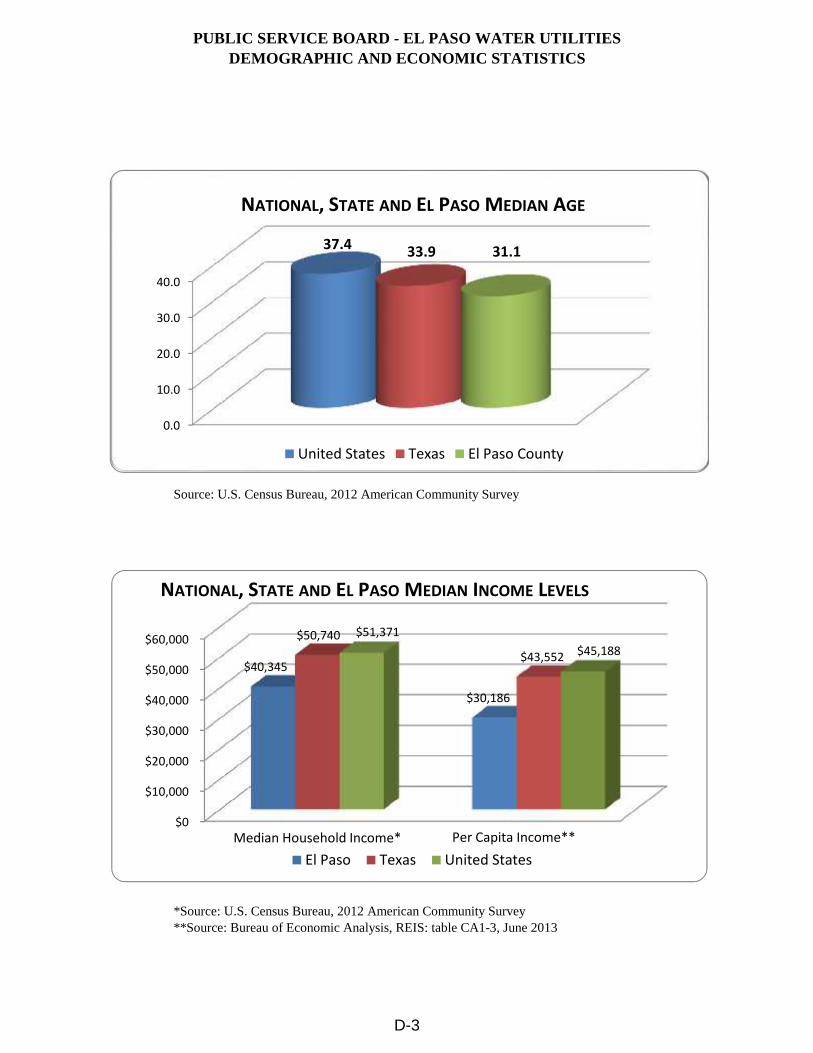
PUBLIC SERVICE BOARD - EL PASO WATER UTILITIESDEMOGRAPHIC AND ECONOMIC STATISTICS
Source: U.S. Census Bureau, 2012 American Community Survey
*Source: U.S. Census Bureau, 2012 American Community Survey**Source: Bureau of Economic Analysis, REIS: table CA1-3, June 2013
0.0
10.0
20.0
30.0
40.0
37.4 33.9 31.1
United States Texas El Paso County
NATIONAL, STATE AND EL PASO MEDIAN AGE
$0
$10,000
$20,000
$30,000
$40,000
$50,000
$60,000
$40,345
$50,740 $51,371
$30,186
$43,552 $45,188
El Paso Texas United StatesMedian Household Income* Per Capita Income**
NATIONAL, STATE AND EL PASO MEDIAN INCOME LEVELS
D-3
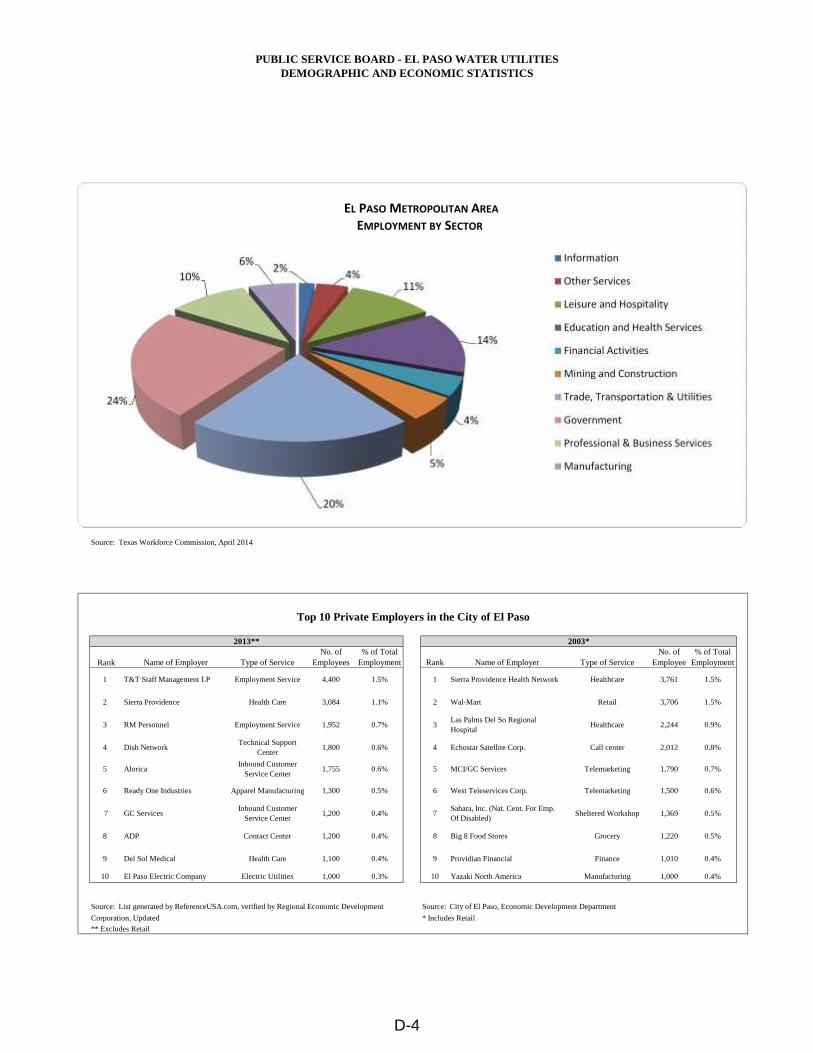
PUBLIC SERVICE BOARD - EL PASO WATER UTILITIESDEMOGRAPHIC AND ECONOMIC STATISTICS
Source: Texas Workforce Commission, April 2014
Rank Name of Employer Type of ServiceNo. of
Employees% of Total
Employment Rank Name of Employer Type of ServiceNo. of
Employee% of Total
Employment
1 T&T Staff Management LP Employment Service 4,400 1.5% 1 Sierra Providence Health Network Healthcare 3,761 1.5%
2 Sierra Providence Health Care 3,084 1.1% 2 Wal-Mart Retail 3,706 1.5%
3 RM Personnel Employment Service 1,952 0.7% 3Las Palms Del So RegionalHospital
Healthcare 2,244 0.9%
4 Dish NetworkTechnical Support
Center1,800 0.6% 4 Echostar Satellite Corp. Call center 2,012 0.8%
5 AloricaInbound Customer
Service Center1,755 0.6% 5 MCI/GC Services Telemarketing 1,790 0.7%
6 Ready One Industries Apparel Manufacturing 1,300 0.5% 6 West Teleservices Corp. Telemarketing 1,500 0.6%
7 GC ServicesInbound Customer
Service Center1,200 0.4% 7
Sahara, Inc. (Nat. Cent. For Emp.Of Disabled)
Sheltered Workshop 1,369 0.5%
8 ADP Contact Center 1,200 0.4% 8 Big 8 Food Stores Grocery 1,220 0.5%
9 Del Sol Medical Health Care 1,100 0.4% 9 Providian Financial Finance 1,010 0.4%
10 El Paso Electric Company Electric Utilities 1,000 0.3% 10 Yazaki North America Manufacturing 1,000 0.4%
Source: List generated by ReferenceUSA.com, verified by Regional Economic Development Source: City of El Paso, Economic Development Department
Corporation, Updated * Includes Retail** Excludes Retail
Top 10 Private Employers in the City of El Paso
2013** 2003*
2% 4%11%
14%
4%
5%
20%
24%
10%6% Information
Other Services
Leisure and Hospitality
Education and Health Services
Financial Activities
Mining and Construction
Trade, Transportation & Utilities
Government
Professional & Business Services
Manufacturing
EL PASO METROPOLITAN AREAEMPLOYMENT BY SECTOR
D-4
operations and resources, to help the reader understand how each utility's financial
information relate to the services they provide and the activities they perform.
E - OPERATING INFORMATIONThese schedules contain information about the Public Service Board - El Paso Water Utilities'

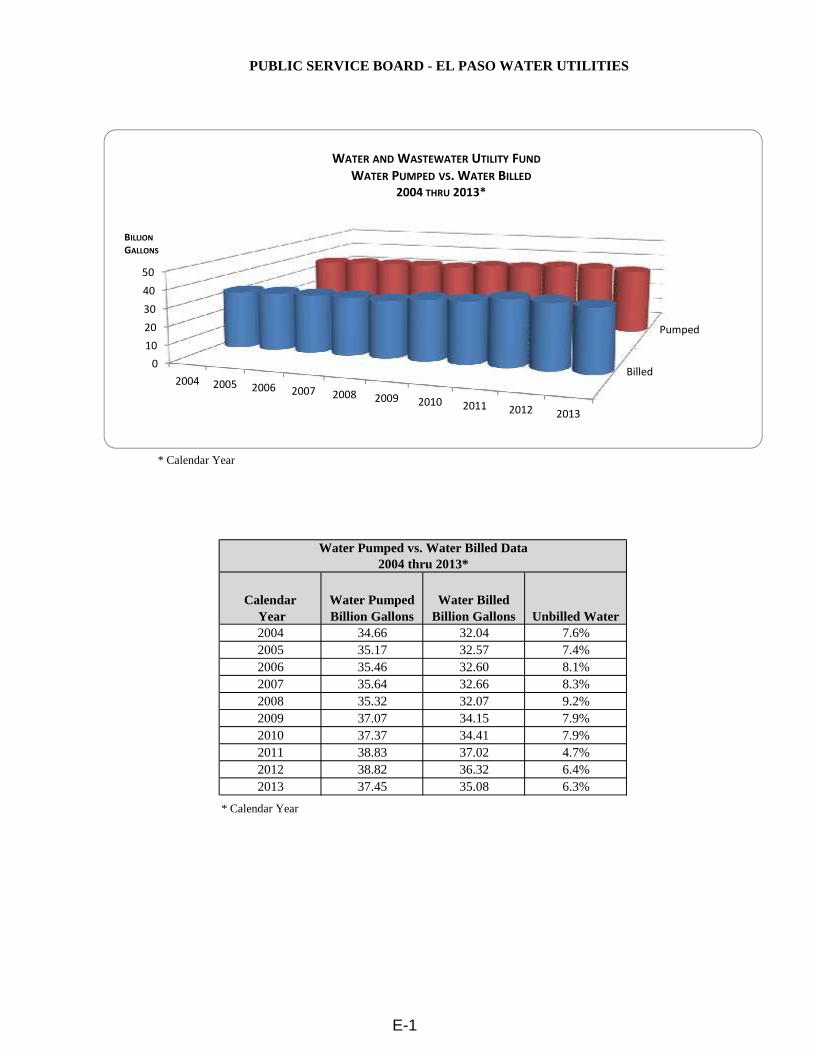
PUBLIC SERVICE BOARD - EL PASO WATER UTILITIES
* Calendar Year
Calendar Year
Water PumpedBillion Gallons
Water BilledBillion Gallons Unbilled Water
2004 34.66 32.04 7.6%2005 35.17 32.57 7.4%2006 35.46 32.60 8.1%2007 35.64 32.66 8.3%2008 35.32 32.07 9.2%2009 37.07 34.15 7.9%2010 37.37 34.41 7.9%2011 38.83 37.02 4.7%2012 38.82 36.32 6.4%2013 37.45 35.08 6.3%
* Calendar Year
2004 thru 2013*Water Pumped vs. Water Billed Data
Billed
Pumped
01020304050
2004 2005 2006 2007 2008 2009 2010 2011 2012 2013
WATER AND WASTEWATER UTILITY FUNDWATER PUMPED VS. WATER BILLED
2004 THRU 2013*
BILLIONGALLONS
E-1
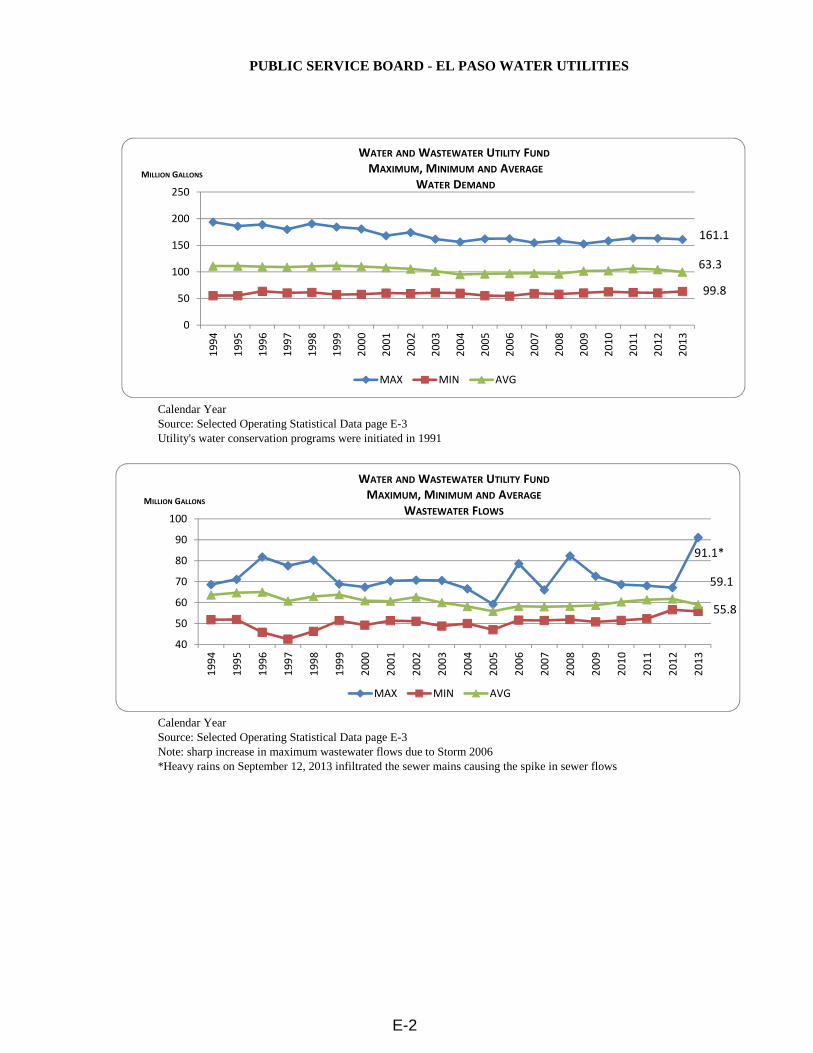
PUBLIC SERVICE BOARD - EL PASO WATER UTILITIES
Calendar YearSource: Selected Operating Statistical Data page E-3Utility's water conservation programs were initiated in 1991
Calendar YearSource: Selected Operating Statistical Data page E-3Note: sharp increase in maximum wastewater flows due to Storm 2006*Heavy rains on September 12, 2013 infiltrated the sewer mains causing the spike in sewer flows
0
50
100
150
200
250
1994
1995
1996
1997
1998
1999
2000
2001
2002
2003
2004
2005
2006
2007
2008
2009
2010
2011
2012
2013
MAX MIN AVG
WATER AND WASTEWATER UTILITY FUNDMAXIMUM, MINIMUM AND AVERAGE
WATER DEMANDMILLION GALLONS
40
50
60
70
80
90
100
1994
1995
1996
1997
1998
1999
2000
2001
2002
2003
2004
2005
2006
2007
2008
2009
2010
2011
2012
2013
MAX MIN AVG
WATER AND WASTEWATER UTILITY FUNDMAXIMUM, MINIMUM AND AVERAGE
WASTEWATER FLOWS
91.1*
59.1
55.8
161.1
99.8
63.3
MILLION GALLONS
E-2
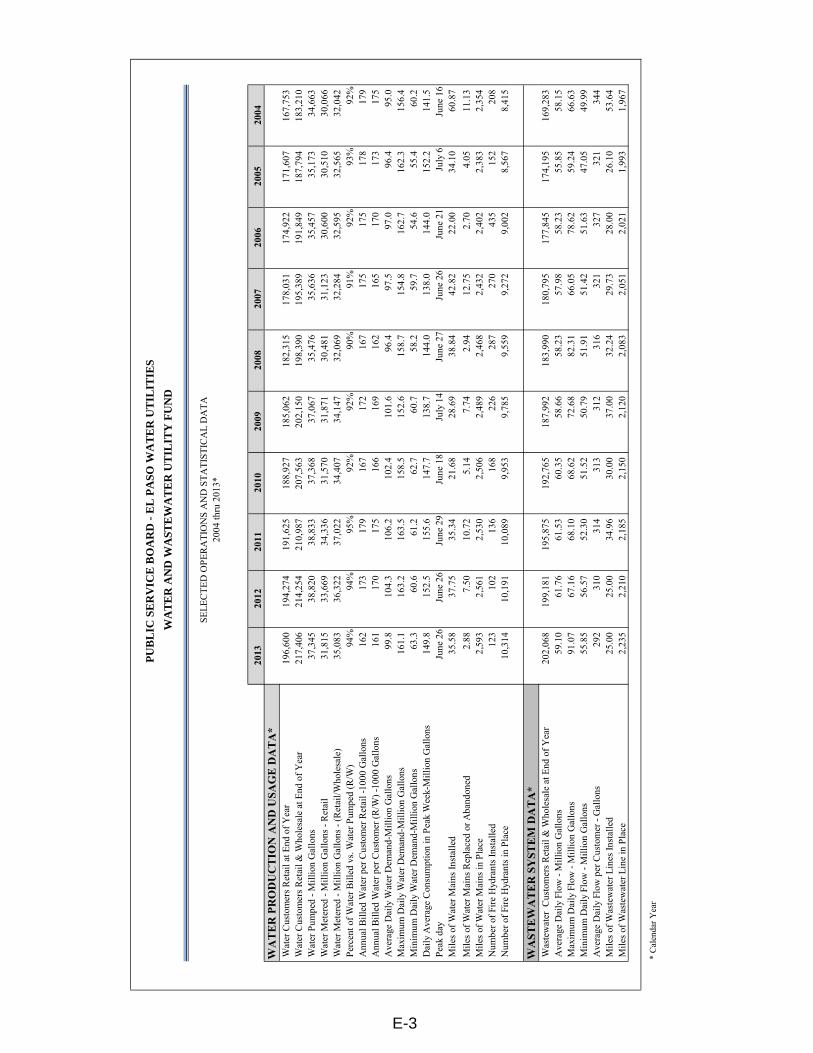
2013
2012
2011
2010
2009
2008
2007
2006
2005
2004
WA
TER
PR
OD
UC
TIO
N A
ND
USA
GE
DA
TA*
Wat
er C
usto
mer
s Ret
ail a
t End
of Y
ear
196,
600
194,
274
191,
625
188,
927
185,
062
182,
315
178,
031
174,
922
171,
607
167,
753
Wat
er C
usto
mer
s Ret
ail &
Who
lesa
le a
t End
of Y
ear
217,
406
214,
254
210,
987
207,
563
202,
150
198,
390
195,
389
191,
849
187,
794
183,
210
Wat
er P
umpe
d - M
illio
n G
allo
ns37
,345
38,8
2038
,833
37,3
6837
,067
35,4
7635
,636
35,4
5735
,173
34,6
63 W
ater
Met
ered
- M
illio
n G
allo
ns -
Ret
ail
31,8
1533
,669
34,3
3631
,570
31,8
7130
,481
31,1
2330
,600
30,5
1030
,066
Wat
er M
eter
ed -
Mill
ion
Gal
lons
- (R
etai
l/Who
lesa
le)
35,0
8336
,322
37,0
2234
,407
34,1
4732
,069
32,2
8432
,595
32,5
6532
,042
Per
cent
of W
ater
Bill
ed v
s. W
ater
Pum
ped
(R/W
)94
%94
%95
%92
%92
%90
%91
%92
%93
%92
% A
nnua
l Bill
ed W
ater
per
Cus
tom
er R
etai
l -10
00 G
allo
ns16
217
317
916
717
216
717
517
517
817
9 A
nnua
l Bill
ed W
ater
per
Cus
tom
er (R
/W) -
1000
Gal
lons
161
170
175
166
169
162
165
170
173
175
Ave
rage
Dai
ly W
ater
Dem
and-
Mill
ion
Gal
lons
99.8
104.
310
6.2
102.
410
1.6
96.4
97.5
97.0
96.4
95.0
Max
imum
Dai
ly W
ater
Dem
and-
Mill
ion
Gal
lons
161.
116
3.2
163.
515
8.5
152.
615
8.7
154.
816
2.7
162.
315
6.4
Min
imum
Dai
ly W
ater
Dem
and-
Mill
ion
Gal
lons
63.3
60.6
61.2
62.7
60.7
58.2
59.7
54.6
55.4
60.2
Dai
ly A
vera
ge C
onsu
mpt
ion
in P
eak
Wee
k-M
illio
n G
allo
ns14
9.8
152.
515
5.6
147.
713
8.7
144.
013
8.0
144.
015
2.2
141.
5 P
eak
day
June
26
June
26
June
29
June
18
July
14
June
27
June
26
June
21
July
6 Ju
ne 1
6 M
iles o
f Wat
er M
ains
Inst
alle
d35
.58
37.7
535
.34
21.6
828
.69
38.8
442
.82
22.0
034
.10
60.8
7 M
iles o
f Wat
er M
ains
Rep
lace
d or
Aba
ndon
ed2.
887.
5010
.72
5.14
7.74
2.94
12.7
52.
704.
0511
.13
Mile
s of W
ater
Mai
ns in
Pla
ce2,
593
2,56
12,
530
2,50
62,
489
2,46
82,
432
2,40
22,
383
2,35
4 N
umbe
r of F
ire H
ydra
nts I
nsta
lled
123
102
136
168
226
287
270
435
152
208
Num
ber o
f Fire
Hyd
rant
s in
Plac
e10
,314
10,1
9110
,089
9,95
39,
785
9,55
99,
272
9,00
28,
567
8,41
5
WA
STEW
ATE
R S
YST
EM D
ATA
* W
aste
wat
er C
usto
mer
s Ret
ail &
Who
lesa
le a
t End
of Y
ear
202,
068
199,
181
195,
875
192,
765
187,
992
183,
990
180,
795
177,
845
174,
195
169,
283
Ave
rage
Dai
ly F
low
- M
illio
n G
allo
ns59
.10
61.7
661
.53
60.3
558
.66
58.2
357
.98
58.2
355
.85
58.1
5 M
axim
um D
aily
Flo
w -
Mill
ion
Gal
lons
91.0
767
.16
68.1
068
.62
72.6
882
.31
66.0
578
.62
59.2
466
.63
Min
imum
Dai
ly F
low
- M
illio
n G
allo
ns55
.85
56.5
752
.30
51.5
250
.79
51.9
151
.42
51.6
347
.05
49.9
9 A
vera
ge D
aily
Flo
w p
er C
usto
mer
- G
allo
ns29
231
031
431
331
231
632
132
732
134
4 M
iles o
f Was
tew
ater
Lin
es In
stal
led
25.0
025
.00
34.9
630
.00
37.0
032
.24
29.7
328
.00
26.1
053
.64
Mile
s of W
aste
wat
er L
ine
in P
lace
2,23
52,
210
2,18
52,
150
2,12
02,
083
2,05
12,
021
1,99
31,
967
* C
alen
dar Y
ear
PU
BL
IC S
ER
VIC
E B
OA
RD
- E
L P
ASO
WA
TE
R U
TIL
ITIE
S
WA
TE
R A
ND
WA
STE
WA
TE
R U
TIL
ITY
FU
ND
SELE
CTE
D O
PER
ATI
ON
S A
ND
STA
TIST
ICA
L D
ATA
2004
thru
201
3*
E-3
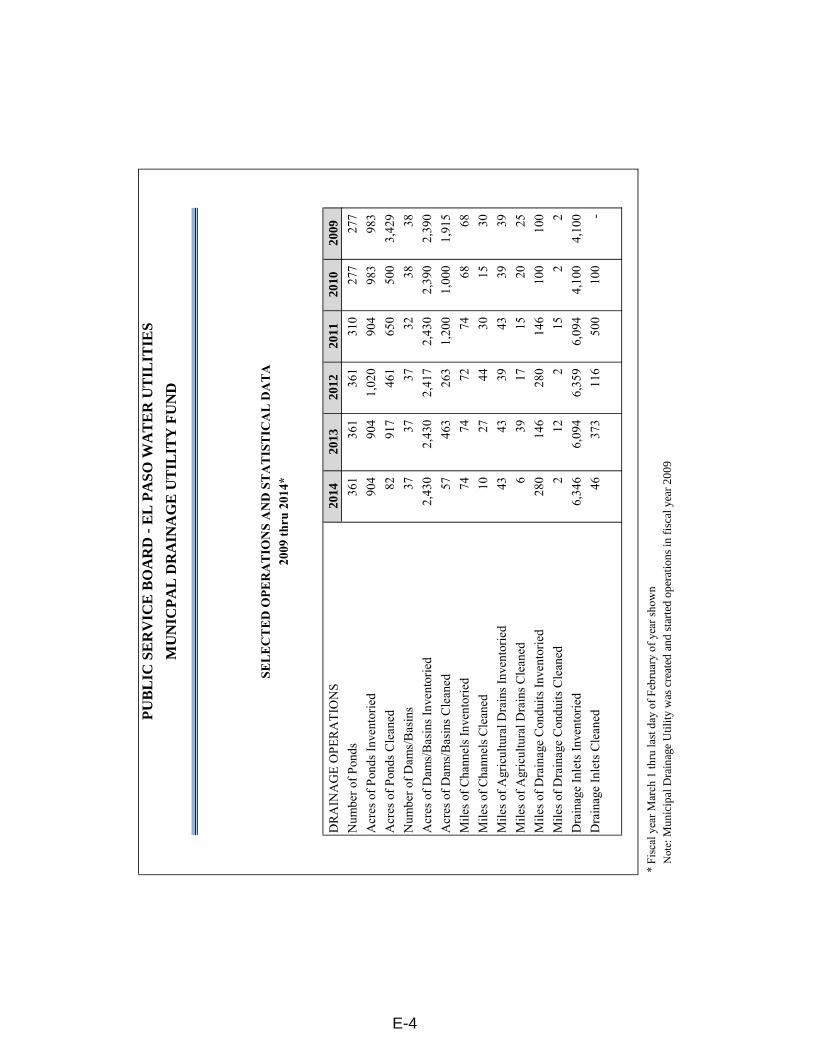
DR
AIN
AG
E O
PER
ATI
ON
S20
1420
1320
1220
1120
1020
09
Num
ber o
f Pon
ds36
136
136
131
027
727
7A
cres
of P
onds
Inve
ntor
ied
904
904
1,02
090
498
398
3A
cres
of P
onds
Cle
aned
8291
746
165
050
03,
429
Num
ber o
f Dam
s/B
asin
s37
3737
3238
38A
cres
of D
ams/
Bas
ins I
nven
torie
d2,
430
2,43
02,
417
2,43
02,
390
2,39
0A
cres
of D
ams/
Bas
ins C
lean
ed57
463
263
1,20
01,
000
1,91
5M
iles o
f Cha
nnel
s Inv
ento
ried
7474
7274
6868
Mile
s of C
hann
els C
lean
ed10
2744
3015
30M
iles o
f Agr
icul
tura
l Dra
ins I
nven
torie
d43
4339
4339
39M
iles o
f Agr
icul
tura
l Dra
ins C
lean
ed6
3917
1520
25M
iles o
f Dra
inag
e C
ondu
its In
vent
orie
d28
014
628
014
610
010
0M
iles o
f Dra
inag
e C
ondu
its C
lean
ed2
122
152
2D
rain
age
Inle
ts In
vent
orie
d6,
346
6,09
46,
359
6,09
44,
100
4,10
0D
rain
age
Inle
ts C
lean
ed46
373
116
500
100
-
* Fi
scal
yea
r Mar
ch 1
thru
last
day
of F
ebru
ary
of y
ear s
how
nN
ote :
Mun
icip
al D
rain
age
Util
ity w
as c
reat
ed a
nd s
tart
ed o
pera
tions
in f
isca
l yea
r 20
09
PU
BL
IC S
ER
VIC
E B
OA
RD
- E
L P
ASO
WA
TE
R U
TIL
ITIE
S
MU
NIC
PA
L D
RA
INA
GE
UT
ILIT
Y F
UN
D
SELE
CTE
D O
PER
ATI
ON
S A
ND
STA
TIST
ICA
L D
ATA
2009
thru
201
4*
E-4
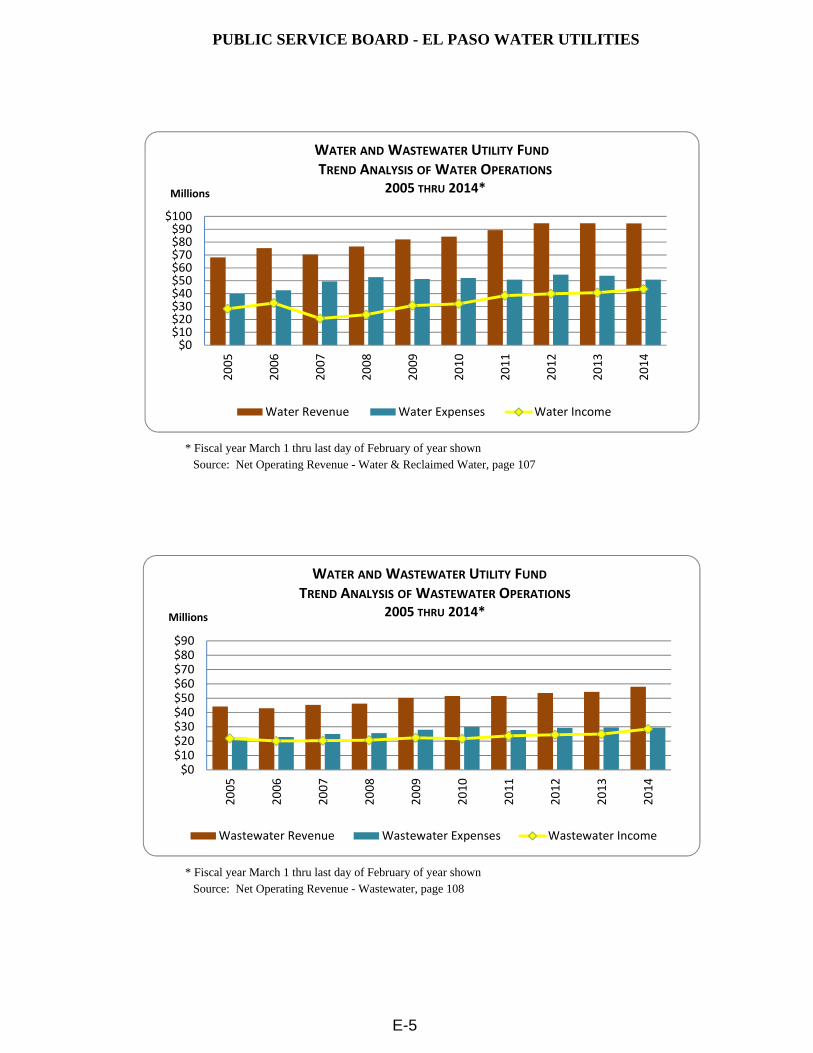
PUBLIC SERVICE BOARD - EL PASO WATER UTILITIES
*Fiscal Year March 1 of year shown thru February 28 of following year
* Fiscal year March 1 thru last day of February of year shownSource: Net Operating Revenue - Water & Reclaimed Water, page 107
* Fiscal year March 1 thru last day of February of year shownSource: Net Operating Revenue - Wastewater, page 108
$0$10$20$30$40$50$60$70$80$90
$10020
05
2006
2007
2008
2009
2010
2011
2012
2013
2014
Water Revenue Water Expenses Water Income
WATER AND WASTEWATER UTILITY FUNDTREND ANALYSIS OF WATER OPERATIONS
2005 THRU 2014*Millions
$0$10$20$30$40$50$60$70$80$90
2005
2006
2007
2008
2009
2010
2011
2012
2013
2014
Wastewater Revenue Wastewater Expenses Wastewater Income
WATER AND WASTEWATER UTILITY FUNDTREND ANALYSIS OF WASTEWATER OPERATIONS
2005 THRU 2014*Millions
E-5
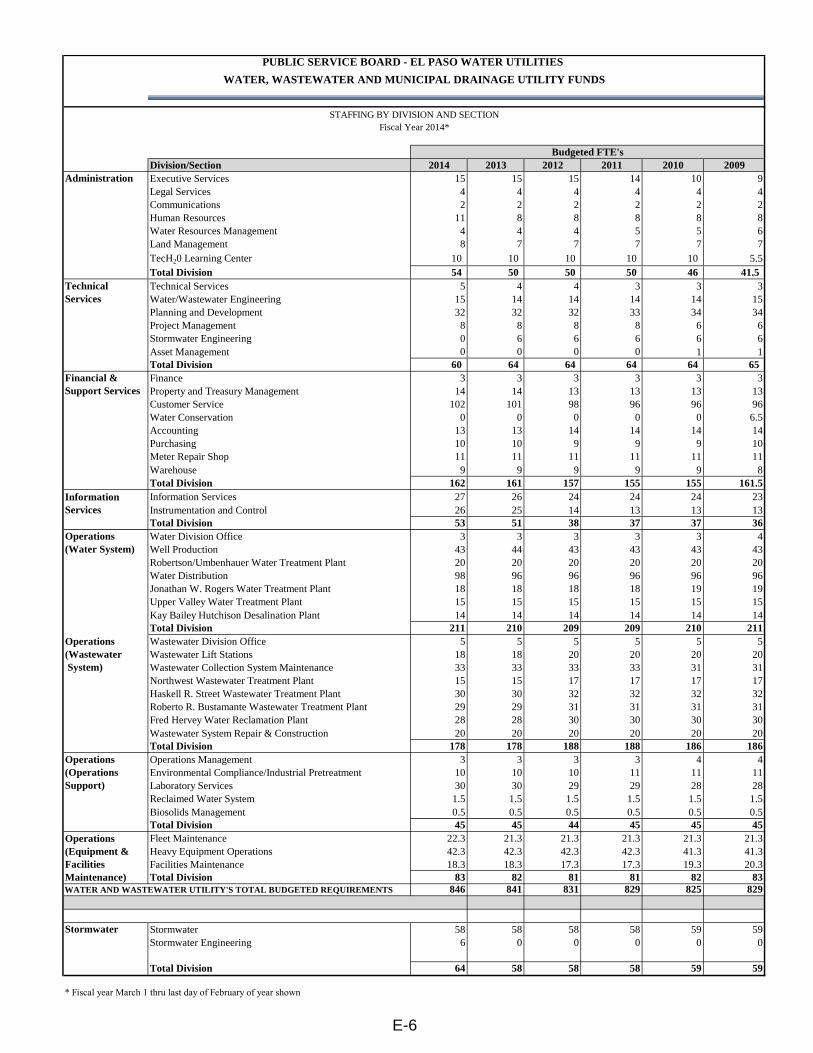
Division/Section 2014 2013 2012 2011 2010 2009Administration Executive Services 15 15 15 14 10 9
Legal Services 4 4 4 4 4 4Communications 2 2 2 2 2 2Human Resources 11 8 8 8 8 8Water Resources Management 4 4 4 5 5 6Land Management 8 7 7 7 7 7TecH20 Learning Center 10 10 10 10 10 5.5Total Division 54 50 50 50 46 41.5Technical Services 5 4 4 3 3 3Water/Wastewater Engineering 15 14 14 14 14 15Planning and Development 32 32 32 33 34 34Project Management 8 8 8 8 6 6Stormwater Engineering 0 6 6 6 6 6Asset Management 0 0 0 0 1 1Total Division 60 64 64 64 64 65Finance 3 3 3 3 3 3Property and Treasury Management 14 14 13 13 13 13Customer Service 102 101 98 96 96 96Water Conservation 0 0 0 0 0 6.5Accounting 13 13 14 14 14 14Purchasing 10 10 9 9 9 10Meter Repair Shop 11 11 11 11 11 11Warehouse 9 9 9 9 9 8Total Division 162 161 157 155 155 161.5Information Services 27 26 24 24 24 23Instrumentation and Control 26 25 14 13 13 13Total Division 53 51 38 37 37 36Water Division Office 3 3 3 3 3 4Well Production 43 44 43 43 43 43Robertson/Umbenhauer Water Treatment Plant 20 20 20 20 20 20Water Distribution 98 96 96 96 96 96Jonathan W. Rogers Water Treatment Plant 18 18 18 18 19 19Upper Valley Water Treatment Plant 15 15 15 15 15 15Kay Bailey Hutchison Desalination Plant 14 14 14 14 14 14Total Division 211 210 209 209 210 211Wastewater Division Office 5 5 5 5 5 5Wastewater Lift Stations 18 18 20 20 20 20Wastewater Collection System Maintenance 33 33 33 33 31 31Northwest Wastewater Treatment Plant 15 15 17 17 17 17Haskell R. Street Wastewater Treatment Plant 30 30 32 32 32 32Roberto R. Bustamante Wastewater Treatment Plant 29 29 31 31 31 31Fred Hervey Water Reclamation Plant 28 28 30 30 30 30Wastewater System Repair & Construction 20 20 20 20 20 20Total Division 178 178 188 188 186 186Operations Management 3 3 3 3 4 4Environmental Compliance/Industrial Pretreatment 10 10 10 11 11 11Laboratory Services 30 30 29 29 28 28Reclaimed Water System 1.5 1.5 1.5 1.5 1.5 1.5Biosolids Management 0.5 0.5 0.5 0.5 0.5 0.5Total Division 45 45 44 45 45 45Fleet Maintenance 22.3 21.3 21.3 21.3 21.3 21.3Heavy Equipment Operations 42.3 42.3 42.3 42.3 41.3 41.3Facilities Maintenance 18.3 18.3 17.3 17.3 19.3 20.3Total Division 83 82 81 81 82 83
WATER AND WASTEWATER UTILITY'S TOTAL BUDGETED REQUIREMENTS 846 841 831 829 825 829
Stormwater Stormwater 58 58 58 58 59 59Stormwater Engineering 6 0 0 0 0 0
Total Division 64 58 58 58 59 59
* Fiscal year March 1 thru last day of February of year shown
PUBLIC SERVICE BOARD - EL PASO WATER UTILITIES
WATER, WASTEWATER AND MUNICIPAL DRAINAGE UTILITY FUNDS
Operations(Equipment &FacilitiesMaintenance)
TechnicalServices
Financial &Support Services
Operations(Water System)
Operations(Wastewater System)
Operations(OperationsSupport)
InformationServices
Budgeted FTE's
STAFFING BY DIVISION AND SECTIONFiscal Year 2014*
E-6
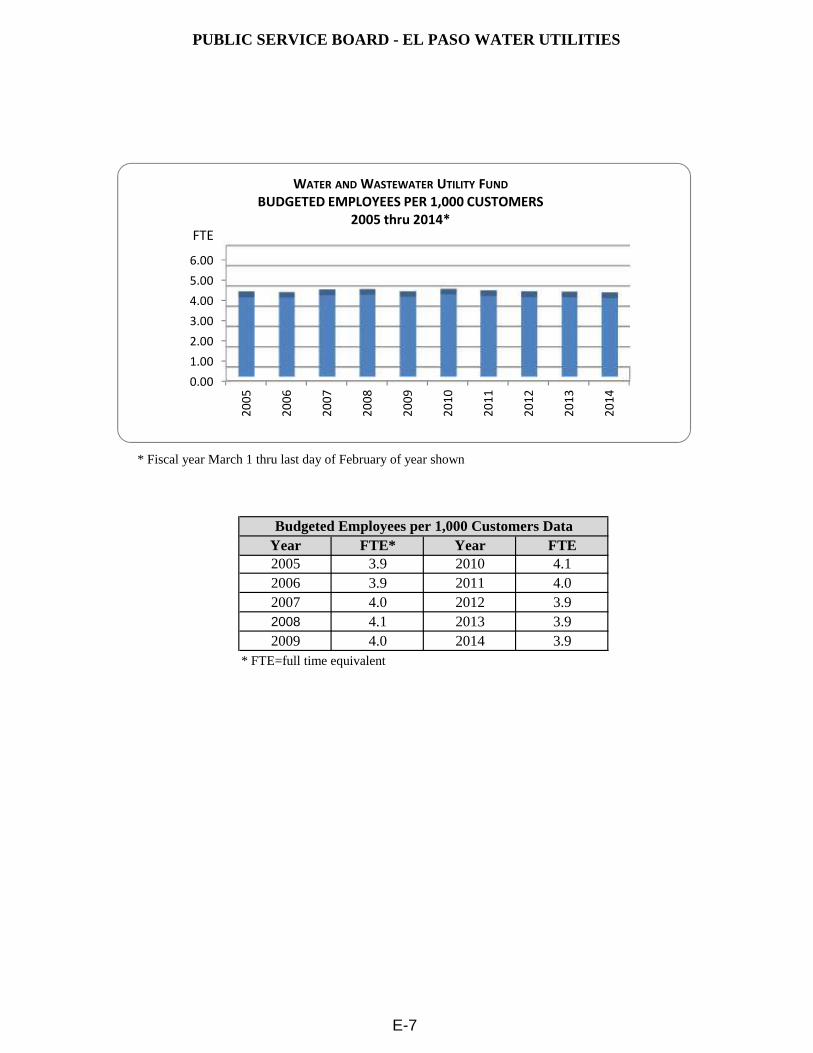
PUBLIC SERVICE BOARD - EL PASO WATER UTILITIES
* Fiscal year March 1 thru last day of February of year shown
Year FTE* Year FTE2005 3.9 2010 4.12006 3.9 2011 4.02007 4.0 2012 3.92008 4.1 2013 3.92009 4.0 2014 3.9
* FTE=full time equivalent
Budgeted Employees per 1,000 Customers Data
0.001.002.003.004.005.006.00
2005
2006
2007
2008
2009
2010
2011
2012
2013
2014
WATER AND WASTEWATER UTILITY FUNDBUDGETED EMPLOYEES PER 1,000 CUSTOMERS
2005 thru 2014*FTE
E-7

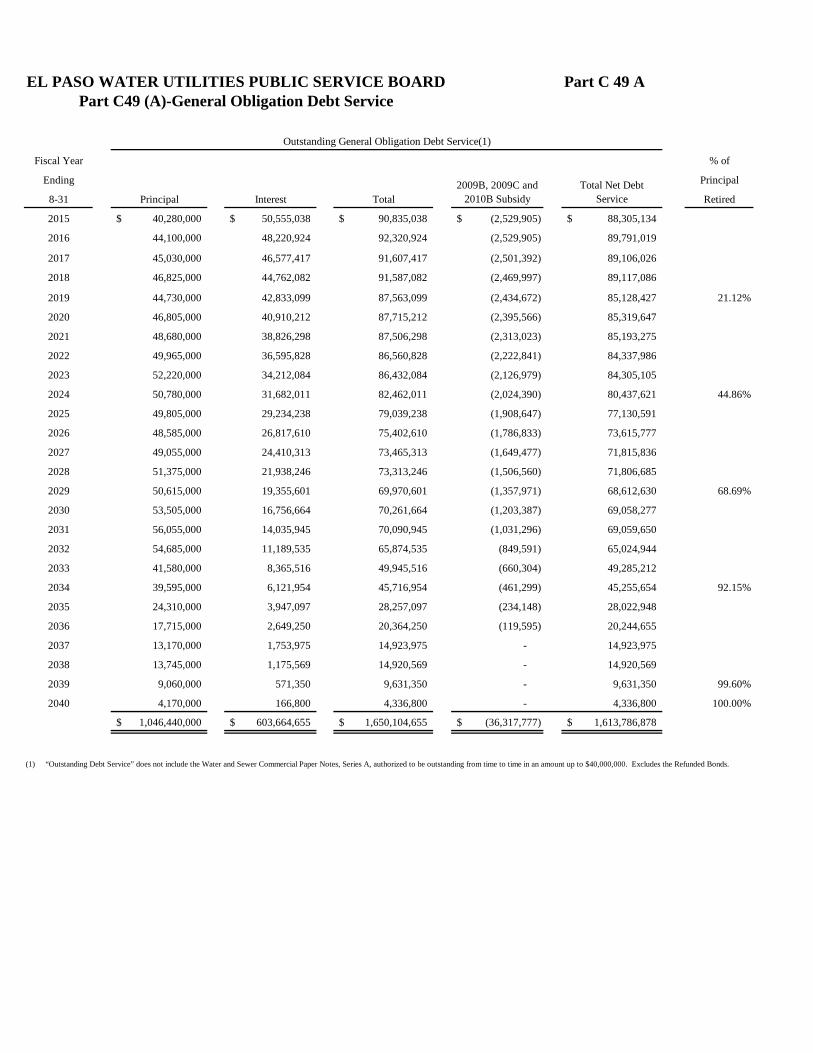
EL PASO WATER UTILITIES PUBLIC SERVICE BOARD Part C 49 A
Fiscal Year % of
Ending Principal
8-31 Principal Interest Total Retired
2015 40,280,000$ 50,555,038$ 90,835,038$ (2,529,905)$ 88,305,134$
2016 44,100,000 48,220,924 92,320,924 (2,529,905) 89,791,019
2017 45,030,000 46,577,417 91,607,417 (2,501,392) 89,106,026
2018 46,825,000 44,762,082 91,587,082 (2,469,997) 89,117,086
2019 44,730,000 42,833,099 87,563,099 (2,434,672) 85,128,427 21.12%
2020 46,805,000 40,910,212 87,715,212 (2,395,566) 85,319,647
2021 48,680,000 38,826,298 87,506,298 (2,313,023) 85,193,275
2022 49,965,000 36,595,828 86,560,828 (2,222,841) 84,337,986
2023 52,220,000 34,212,084 86,432,084 (2,126,979) 84,305,105
2024 50,780,000 31,682,011 82,462,011 (2,024,390) 80,437,621 44.86%
2025 49,805,000 29,234,238 79,039,238 (1,908,647) 77,130,591
2026 48,585,000 26,817,610 75,402,610 (1,786,833) 73,615,777
2027 49,055,000 24,410,313 73,465,313 (1,649,477) 71,815,836
2028 51,375,000 21,938,246 73,313,246 (1,506,560) 71,806,685
2029 50,615,000 19,355,601 69,970,601 (1,357,971) 68,612,630 68.69%
2030 53,505,000 16,756,664 70,261,664 (1,203,387) 69,058,277
2031 56,055,000 14,035,945 70,090,945 (1,031,296) 69,059,650
2032 54,685,000 11,189,535 65,874,535 (849,591) 65,024,944
2033 41,580,000 8,365,516 49,945,516 (660,304) 49,285,212
2034 39,595,000 6,121,954 45,716,954 (461,299) 45,255,654 92.15%
2035 24,310,000 3,947,097 28,257,097 (234,148) 28,022,948
2036 17,715,000 2,649,250 20,364,250 (119,595) 20,244,655
2037 13,170,000 1,753,975 14,923,975 - 14,923,975
2038 13,745,000 1,175,569 14,920,569 - 14,920,569
2039 9,060,000 571,350 9,631,350 - 9,631,350 99.60%
2040 4,170,000 166,800 4,336,800 - 4,336,800 100.00%
1,046,440,000$ 603,664,655$ 1,650,104,655$ (36,317,777)$ 1,613,786,878$
(1) “Outstanding Debt Service” does not include the Water and Sewer Commercial Paper Notes, Series A, authorized to be outstanding from time to time in an amount up to $40,000,000. Excludes the Refunded Bonds.
Outstanding General Obligation Debt Service(1)
2009B, 2009C and 2010B Subsidy
Total Net Debt Service
Part C49 (A)-General Obligation Debt Service
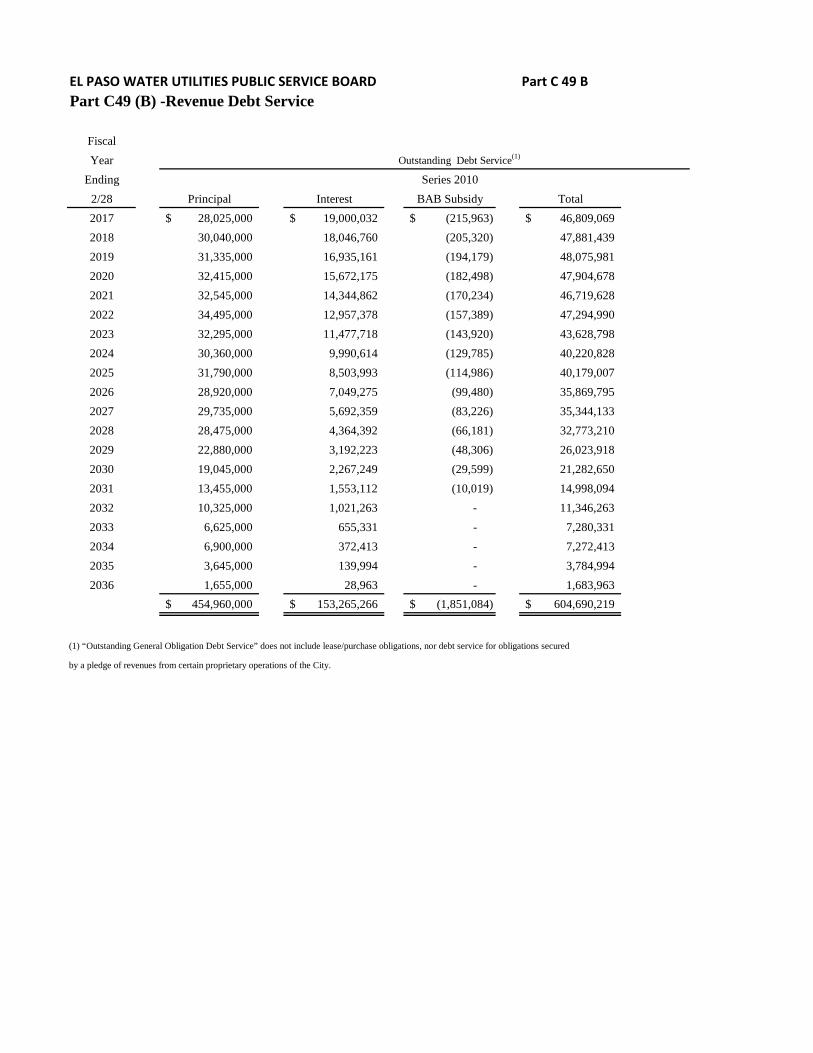
EL PASO WATER UTILITIES PUBLIC SERVICE BOARD Part C 49 BPart C49 (B) -Revenue Debt Service
Fiscal
Year
Ending Series 2010
2/28 Principal Interest BAB Subsidy Total
2017 28,025,000$ 19,000,032$ (215,963)$ 46,809,069$
2018 30,040,000 18,046,760 (205,320) 47,881,439
2019 31,335,000 16,935,161 (194,179) 48,075,981
2020 32,415,000 15,672,175 (182,498) 47,904,678
2021 32,545,000 14,344,862 (170,234) 46,719,628
2022 34,495,000 12,957,378 (157,389) 47,294,990
2023 32,295,000 11,477,718 (143,920) 43,628,798
2024 30,360,000 9,990,614 (129,785) 40,220,828
2025 31,790,000 8,503,993 (114,986) 40,179,007
2026 28,920,000 7,049,275 (99,480) 35,869,795
2027 29,735,000 5,692,359 (83,226) 35,344,133
2028 28,475,000 4,364,392 (66,181) 32,773,210
2029 22,880,000 3,192,223 (48,306) 26,023,918
2030 19,045,000 2,267,249 (29,599) 21,282,650
2031 13,455,000 1,553,112 (10,019) 14,998,094
2032 10,325,000 1,021,263 - 11,346,263
2033 6,625,000 655,331 - 7,280,331
2034 6,900,000 372,413 - 7,272,413
2035 3,645,000 139,994 - 3,784,994
2036 1,655,000 28,963 - 1,683,963
454,960,000$ 153,265,266$ (1,851,084)$ 604,690,219$
(1) “Outstanding General Obligation Debt Service” does not include lease/purchase obligations, nor debt service for obligations secured
by a pledge of revenues from certain proprietary operations of the City.
Outstanding Debt Service(1)


El Paso Water Utilities Public Service Board REDACTED Part D 54 a
THIS INFORMATION IS CONFIDENTIAL, pieasedonotrelease the following information; it is to be redacted before releasing to the public. Theinformation is protected under Section 552.105 of the Texas Open Records Act whichprotects information concerning price or location of property that the public entity seeks toacquire.
Part D 54 a. Description of Project
CONFIDENTIAL
CONFIDENTIAL
CONFIDENTIALa) A map of the service area and drawings as necessary to locate
and describe the project.
Map has been redacted
CONFIDENTIAL
El Paso Water Utilities Board Public Service Board Part D 54 a
CONFIDENTIAL
b) A project schedule including proposed timing of funding needs for phases of theproject.
Schedule should include:
• Estimated loan closing date: December 15, 2015• Estimated date to complete planning (environmental only): October 1, 2015• Estimated number of proposed Construction Contracts. None• Estimated Construction start date for first contract: NA• Estimated Construction end date for last contract: NA• SWIFT applicants must complete a Projected Draw Schedule: see attachment D 54 c.
Map has been redacted
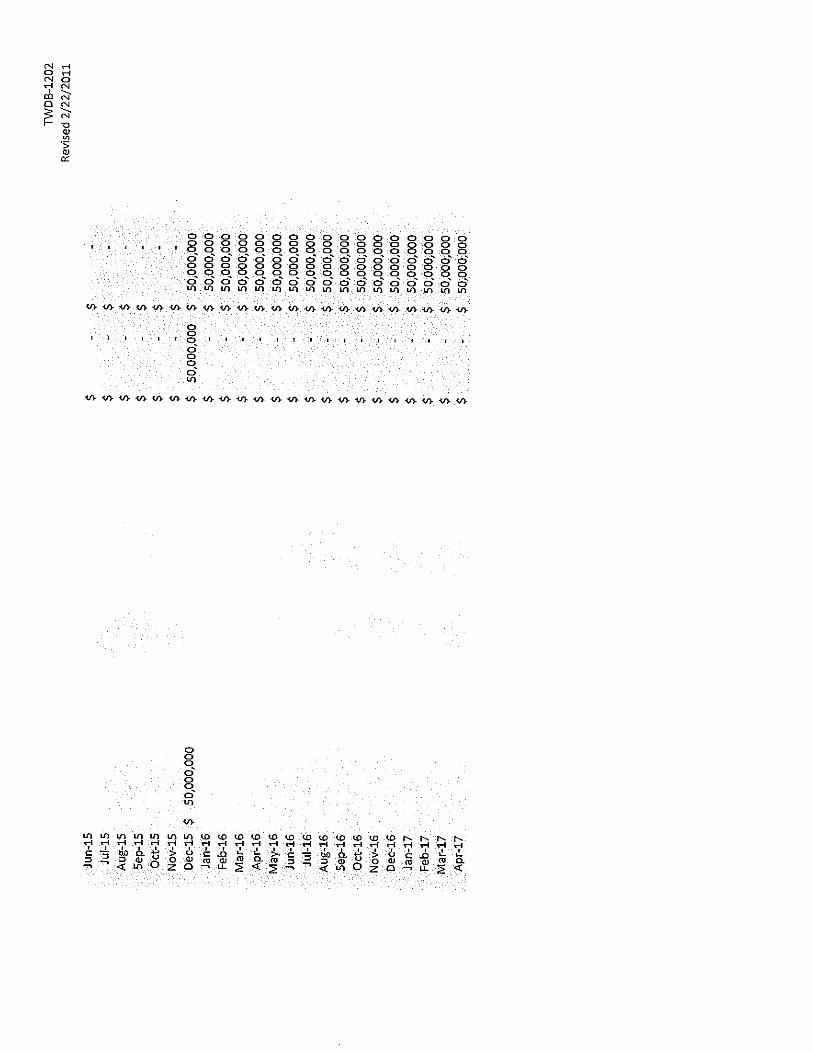
El Paso Water Utilities Public Service Board Part D 54 d
CONFIDENTIAL
D54d
A description of alternatives the applicant has considered (or to be considered during detailedplanning) and reasons for the selection of the project proposed:
CONFIDENTIAL
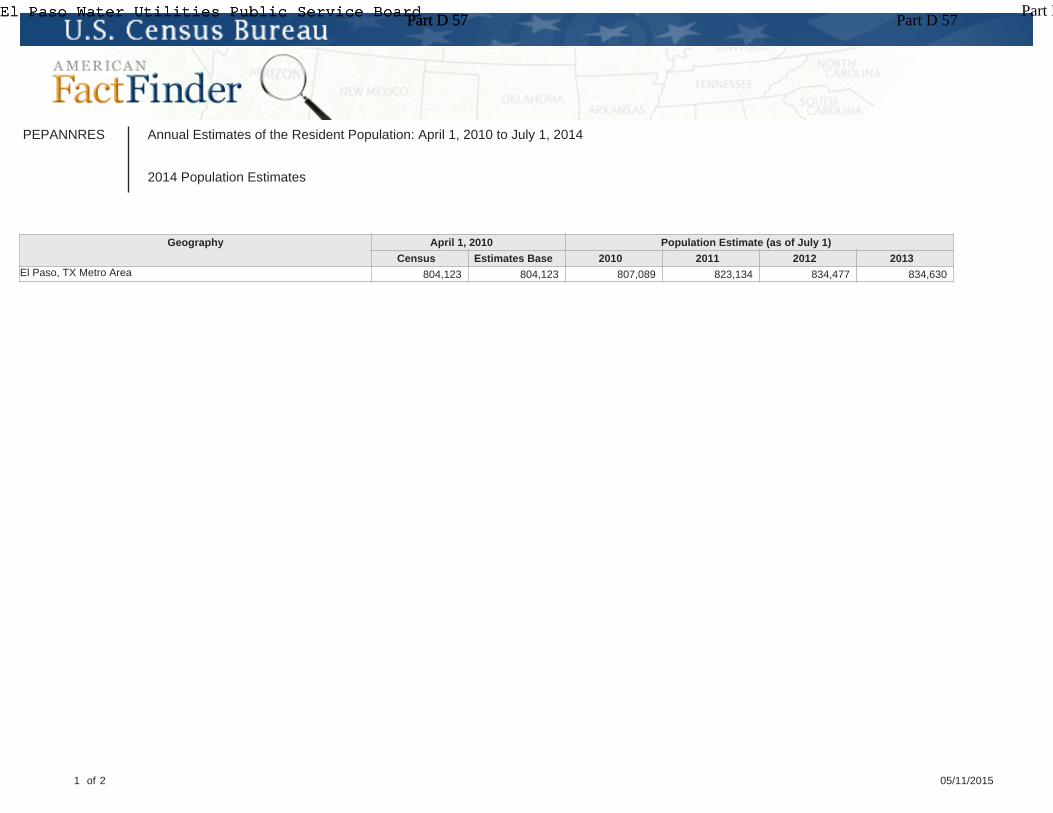
PEPANNRES Annual Estimates of the Resident Population: April 1, 2010 to July 1, 2014
2014 Population Estimates
Geography April 1, 2010 Population Estimate (as of July 1)
Census Estimates Base 2010 2011 2012 2013El Paso, TX Metro Area 804,123 804,123 807,089 823,134 834,477 834,630
1 of 2 05/11/2015
El Paso Water Utilities Public Service Board D 57 Part D 57El Paso Water Utilities Public Service Board D 57 Part D 57El Paso Water Utilities Public Service Board D 57 Part D 57 Part D 57
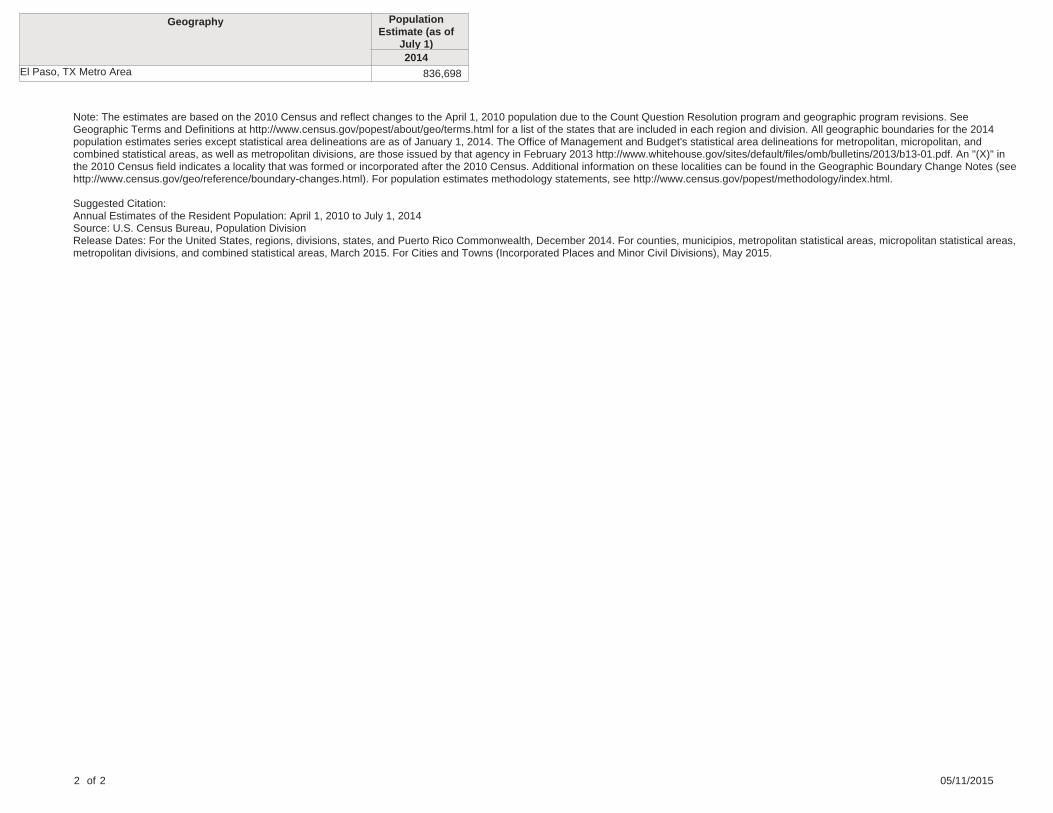
Geography PopulationEstimate (as of
July 1)2014
El Paso, TX Metro Area 836,698
Note: The estimates are based on the 2010 Census and reflect changes to the April 1, 2010 population due to the Count Question Resolution program and geographic program revisions. SeeGeographic Terms and Definitions at http://www.census.gov/popest/about/geo/terms.html for a list of the states that are included in each region and division. All geographic boundaries for the 2014population estimates series except statistical area delineations are as of January 1, 2014. The Office of Management and Budget's statistical area delineations for metropolitan, micropolitan, andcombined statistical areas, as well as metropolitan divisions, are those issued by that agency in February 2013 http://www.whitehouse.gov/sites/default/files/omb/bulletins/2013/b13-01.pdf. An "(X)" inthe 2010 Census field indicates a locality that was formed or incorporated after the 2010 Census. Additional information on these localities can be found in the Geographic Boundary Change Notes (seehttp://www.census.gov/geo/reference/boundary-changes.html). For population estimates methodology statements, see http://www.census.gov/popest/methodology/index.html.
Suggested Citation:Annual Estimates of the Resident Population: April 1, 2010 to July 1, 2014Source: U.S. Census Bureau, Population DivisionRelease Dates: For the United States, regions, divisions, states, and Puerto Rico Commonwealth, December 2014. For counties, municipios, metropolitan statistical areas, micropolitan statistical areas,metropolitan divisions, and combined statistical areas, March 2015. For Cities and Towns (Incorporated Places and Minor Civil Divisions), May 2015.
2 of 2 05/11/2015
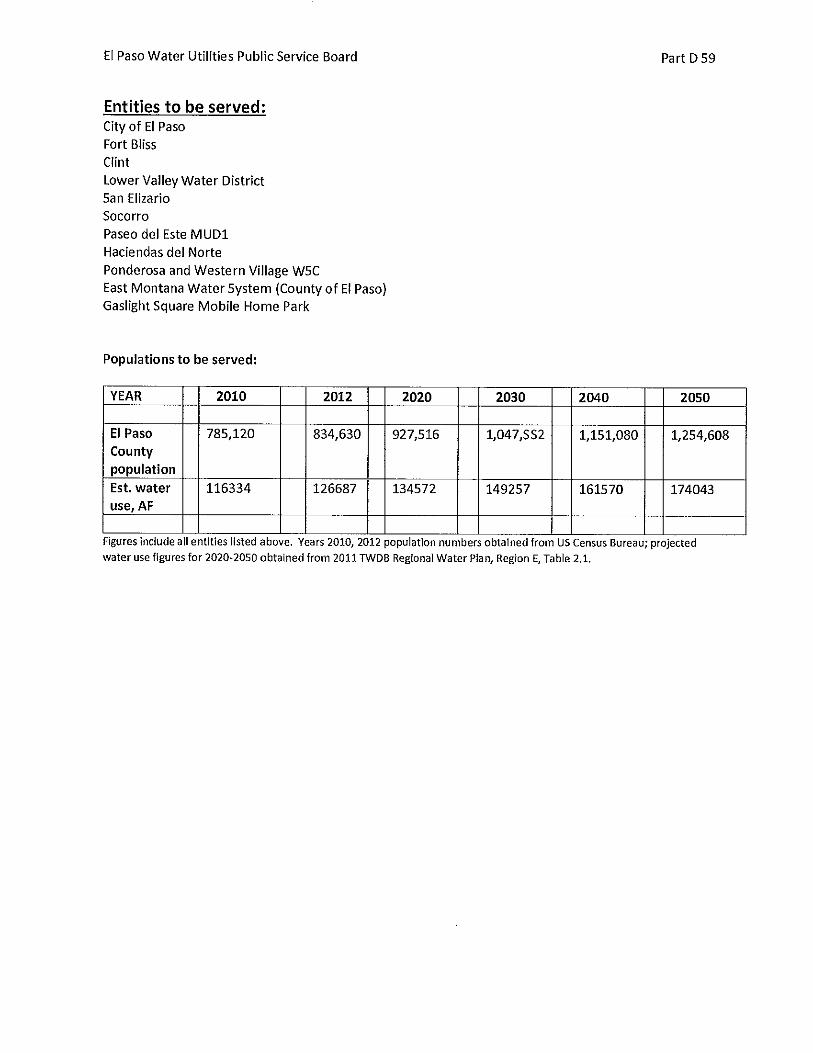
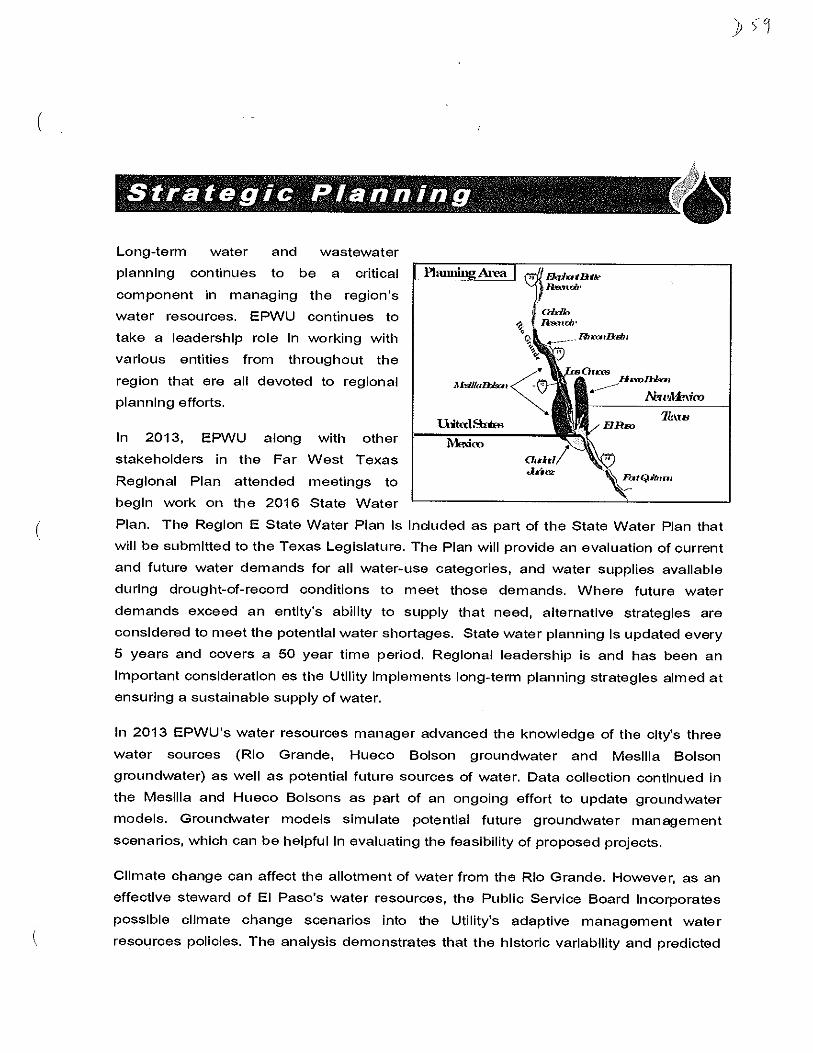
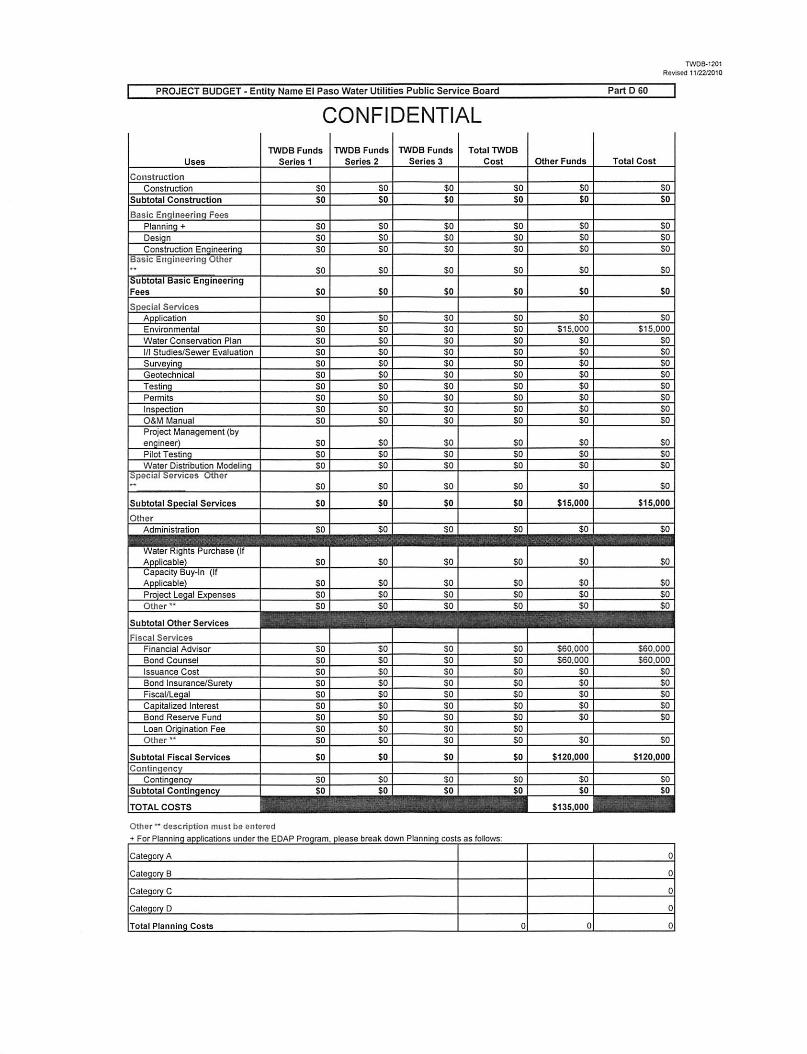
PROJECT BUDGET-Entity Name El Paso Water Utilities Public Service Board
ConstructionConstruction
Subtotal Construction
Basic Engineering FeesPlanning +DesignConstruction Engineering
Basic Engineering Other
Subtotal Basic EngineeringFees
Special ServicesApplicationEnvironmentalWater Conservation Plan
I/I Studies/Sewer Evaluation
SurveyingGeotechnicalTestingPermitsInspectionO&M ManualProject Management (byengineer)PilotTestingWater Distribution Modeling
Special Services Other
CONFIDENTIAL
TWOS Funds TWOS Funds TWDB Funds
Series 1 Series 2 Series 3
Total TWDB
Cost
Subtotal Special Services $0 $0 $0
OtherAdministration $0 $0 ^^^^^^$0
Water Rights Purchase (IfApplicable) $0 $0 $0Capacity Buy-In (IfApplicable) $0 $0 $0Project Legal Expenses $0 $0 $0Other $0 SO $0
Subtotal Other Services
Fiscal ServicesFinancial Advisor $0 SO S0_BondCounsel $0 $0 $0Issuance Cost $0 $0 $0_Bond Insurance/Surety $0 $0 $0_Fiscal/Legal $0 $0 $0_CapitalizedInterest $0 $0 $0_BondReserve Fund $0 $0 $0_LoanOrigination Fee $0 $0 $0Other $0_ $0_ $0_
Subtotal Fiscal Services $0 $0 $0Contingency
Contingency $0 SO $0Subtotal Contingency $0 $0
TOTALCOSTS
Other" description must be entered
+ For Planning applications under the EDAP Program, please break down Planning costs as follows:
Total Planning Costs
Other Funds
SO
$15,000
$0
$0
$0
$0
$0
$0
$0_SO
$120.000
$135.000
TWOB-1201
Revised 11/22/2010
$60.000
$60,000
$0
$0
$0_$0_so
$120,000
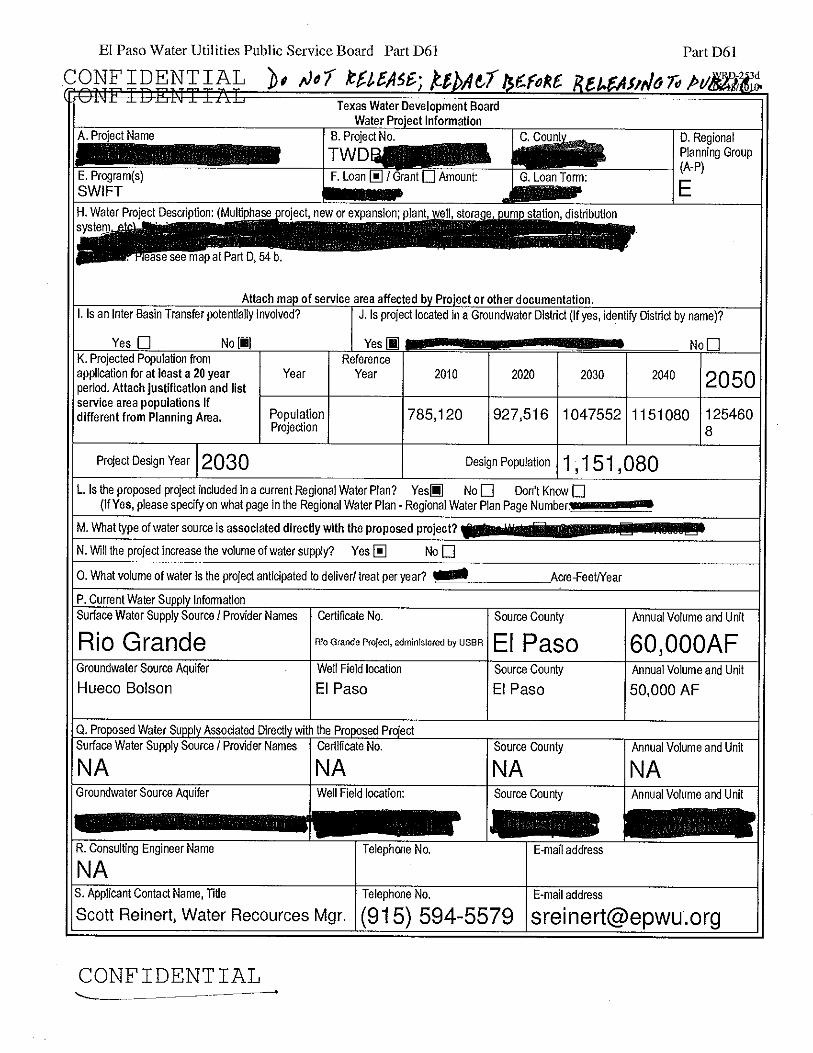
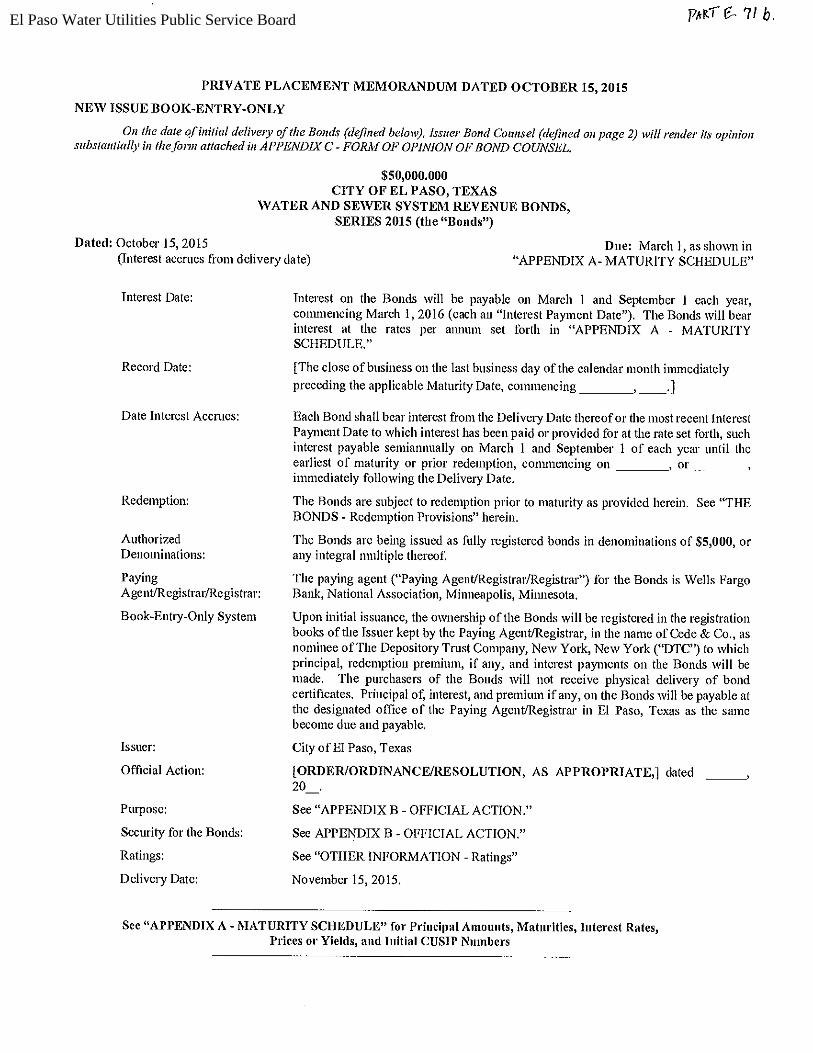
El Paso Water Utilities Public Service Board