Embed Size (px)
Citation preview
Thin Solid Films, 155 (1987) 115 124
PREPARATION AND CHARACTERIZATION l l5
A N O D I C O X I D A T I O N OF N I O B I U M IN A Q U E O U S S O L U T I O N OF W E A K O R G A N I C ACIDS
R. K. NIGAM, K. C. SINGH AND SANJEEV MAKEN
Department q['Chemistcv, Maharshi Dayanand UniversiO', Rohtak 124001. Haryana (India)
(Received December 10, 1986; accepted June 4, 1987)
Steady state kinetic data for the anodic growth of films on niobium in 0.1 N oxalic, citric and tartaric acid at different temperatures and current densities (CDs) have been obtained. The breakdown voltage of oxide films on niobium has been found to be within the range 210-290 V in oxalic acid solution, 210-355 V in tartaric acid solution and 220-355 V in citric acid solution. It depends on both CD and temperature. The constants (A and B) of Guntherschulze and Betz for the empirical relation between the ionic CD and the field have been found to depend on the nature of the electrolyte. The constant A is temperature dependent while B is temperature independent. The Tafel slope has been found to be independent of the temperature range studied. Dignam's quadratic variation of field with ionic current density was examined critically and qS, the zero field activation energy, C, the dimensionless constant,/z*, the zero-field activation dipole, W(E), the net activation energy, co*, the Morse function parameter and io, the current density were evaluated. It has been found that ~t*, co* and i 0 are temperature dependent whereas ~b, W(E) and C are temperature independent. All these parameters depend on the nature of the electrolyte. The quantity W(E) does not depend on CD while q5 and C change slightly and /t*, co* and i o change markedly with changing CD. An appreciable contribution (22~0-28~) of the quadratic term has been observed. Single-barrier theories of ionic conduction are not suitable for the present data.
1. INTRODUCTION
The kinetics of growth of thin films on metals and semiconductors can be investigated in the light of different theories of ionic conduction. Most of these theories 1 lz are based on the probabilities of the rate-controlling step for ionic conduction either at the interface or within the film. Cabrera and Mort ~ supposed the ion transport to be controlled at the boundary while Dewald 6 treated the problem allowing for an entrance barrier, a diffusion barrier and a space charge due to the mobile ionic species. In the model proposed by Bean et al. v the rate- controlling step was assumed to be within the film. It involved the homogeneous generation of defect pairs with no impurities or background space charge. There
0040-6090/87/$3.50 © Elsevier Sequoia/Printed in The Netherlands
116 R. K, NIGAM, K. SINGH, S. MAKEN
were many modifications to the models 8'9 that assumed the control of the ionic conduction to be intrinsic or at an appropriate interface. Empirically the average field strength E and current density (CD) i under steady state conditions can be related satisfactorily by the well-known equation
i = A exp(BE) (1)
where A and B are positive temperature-dependent constants. The validity of this equation has been verified at various CDs and for different organic acid solutions. Young 1° modified the relation by replacing the linear variation in E by the quadratic variation with CD as
{-(Q-otE + TE2)} i = io exp kT (2)
where Q, ~ and 7 are all positive constants. Young 11 and Dignam lz justified the quadratic term 7 E2 in eqn. (2). Dignam
explained the field dependence and also the anomalous temperature dependence of the Tafel slope ?~E/O In i for steady state anodic oxidation data, representing them by three parameters: (i) the pre-exponential factor, (ii) the activation energy and (iii) a Morse function distance parameter. If the overall rate is controlled by high field transfer of one kind of ionic species, the relation between ionic CD and field strength is given by
i = i o e x p [ - - {4) - / z 'E (1 - #*E/C4))} ] (3) k kT J where qS, #* and C are not independent constants but are related through the form of the potential energy function, making two of them independent, q5 is the zero-field activation energy, C is a dimensionless constant and #* is the zero-field activation dipole. From a comparison of eqns. (2) and (3),
~2
4~=Q # * = ~ C - 7Q
The steady state kinetic data for anodic oxidation of niobium had been obtained at different CDs and temperatures and in different media. The behaviour of Tafel slope has been examined and a critical assessment of the various ionic conduction theories with special reference to Dignam's approach has been made.
2. EXPERIMENTAL DETAILS
Niobium specimens (2 c m 2 in area) with a short tag were cut by a die from a sheet of niobium (99.9~/o purity). The edges of the specimens were abraded with fine emery paper to make them smooth. The specimen was then dipped in K O H melt to clean the surface and finally washed with distilled water. The chemical polishing of the specimen was carried out by dipping in a freshly prepared etching mixture of 98~o H z S O 4 + 70~o HNO3 +48~o H F (5:2:2 by volume) for 3-5 s and then washing with distilled water. The specimen was then placed in boiling water for about 10 min to remove a thin film of an unknown compound from the surface of the specimen.
ANODIC OXIDATION OF Nb IN WEAK ORGANIC ACIDS l l7
The tag of the specimen was covered with a thick anodic film formed in 0.1 N citric acid at room temperature. The specimen thus prepared was placed in a glass cell and was surrounded by a platinum gauze which served as a cathode during production of the oxide.
Anodic polarization of the specimen was carried out at constant current, adjusted through an electronically operated constant-current generator (General Electronics, Ambala Cantt.) designed specially for this purpose. The supply of current was cut off by an electronic control after the desired formation voltage was reached. The time for the passage of current for film formation through successive voltage intervals was recorded by an electronic timer (ET 5302, Electronics Corporat ion of India Limited, Hyderabad) which could read to +0.01 s. The chemical compounds (citric acid, tartaric acid, oxalic acid, KOH) used were of AR grade.
The thickness of the oxide film was determined by the Faraday law method. The density of niobium oxide (Nb2Os) was taken to be 4.36 g cm-3 as suggested by Holtzberg et al. 13 and the temperature coefficient of density between 0 and 70 °C has been assumed to be zero. The thickness was also measured using a Gaertner Production ellipsometer model L117 manufactured in the U.S.A.
The experiment was repeated from eight to ten times to obtain each value of E (the field strength); the reproducibility of E was very good within each set.
3. RESULTS AND DISCUSSION
3.1. Formation characteristic and breakdown voltage of anodic oxide films in various aqueous electrolytes
The rate of growth of film at different CDs and temperatures was uniform up to 150 V in oxalic, citric and tartaric acids (Fig. 1). The breakdown voltage was found to be in the range 210-290V in oxalic acid, 210-335 V in tartaric acid and 220-355 V in citric acid. It increased with increase in CD and decreased with increase in temperature. In all the three electrolytes the first breakdown (first spark voltage defined by Konopisov 14) was found to occur in the neighbourhood of 200-250 V and is independent of temperature, CD and concentration. After the first breakdown, the potential continued to rise more slowly and sparks with a crackling sound frequently appeared here and there over the anode surface. Finally, the voltage reached a maximum value. The maximum voltage was taken as the true breakdown voltage for our system. During growth the colour of the film changed from violet to blue, light red, blue, green-pink, violet, green, pink, violet-green, light green and finally violet. At the breakdown voltage the colour was dark grey and the surface was rough; this may be due to some local crystallization of N b 2 0 5 15 Satisfactory production of films occurred within the CD range of 0.5-10 mA c m - 2. It was found that 0.1 N oxalic acid electrolyte was most suitable for the production of films as well as for the study of their properties and kinetics.
3.2. Kinetics oflqlm formation in aqueous solutions of citric, tartaric and oxalic acids CDs of 0.5, l, 5 and l0 mA cm -2 were used for the production of anodic oxide
films on niobium in 0.1 N concentration of citric, tartaric and oxalic acid in the
l lg R. K. N I G A M , K. S I N G H , S. MAKEN
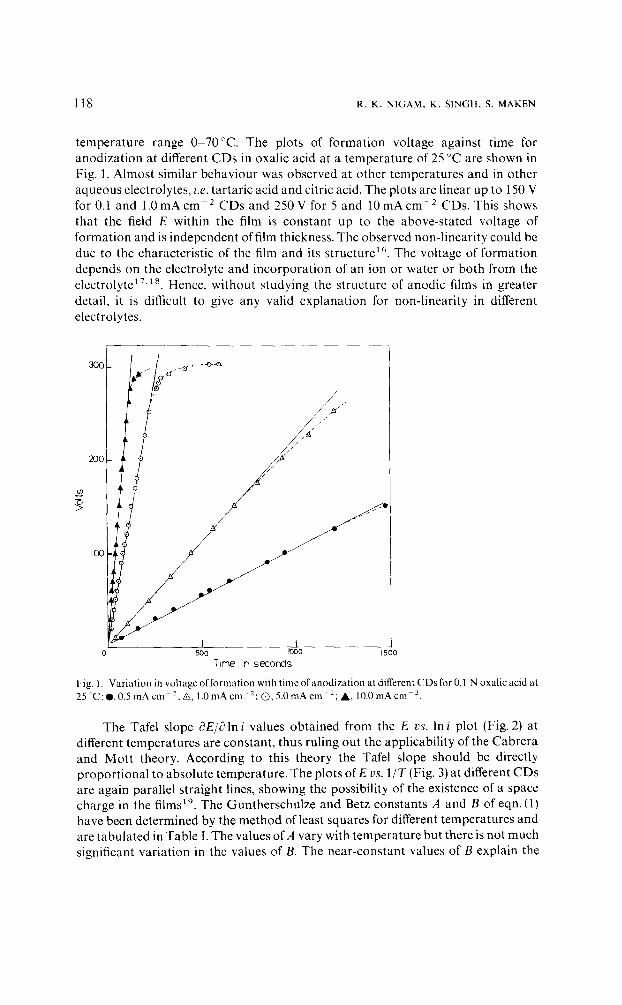
temperature range 0-70°C. The plots of formation voltage against time for anodization at different CDs in oxalic acid at a temperature of 25 °C are shown in Fig. 1. Almost similar behaviour was observed at other temperatures and in other aqueous electrolytes, i.e. tartaric acid and citric acid. The plots are linear up to 150 V for0.1 and 1.0mAcm 2 CDs and 250 V for 5 and 10mAcm - 2 C D s . T h i s s h o w s that the field E within the film is constant up to the above-stated voltage of formation and is independent of film thickness. The observed non-linearity could be due to the characteristic of the film and its structure 16. The voltage of formation depends on the electrolyte and incorporation of an ion or water or both from the electrolyte17,18. Hence, without studying the structure of anodic films in greater detail, it is difficult to give any valid explanation for non-linearity in different electrolytes.
y~
A ..,
/ . 2(3O
to
-°
100
0 500 I000 15 O0
T~me in seconds
Fig. I. Variation in voltage of formation with time ofanodization at different CPs for 0.l N oxalic acid at 25'C:O, 0.5mAcm 2:A, 1.0mAcm-2:G, 5.0mAcm-2;A, 10.0mAcm z.
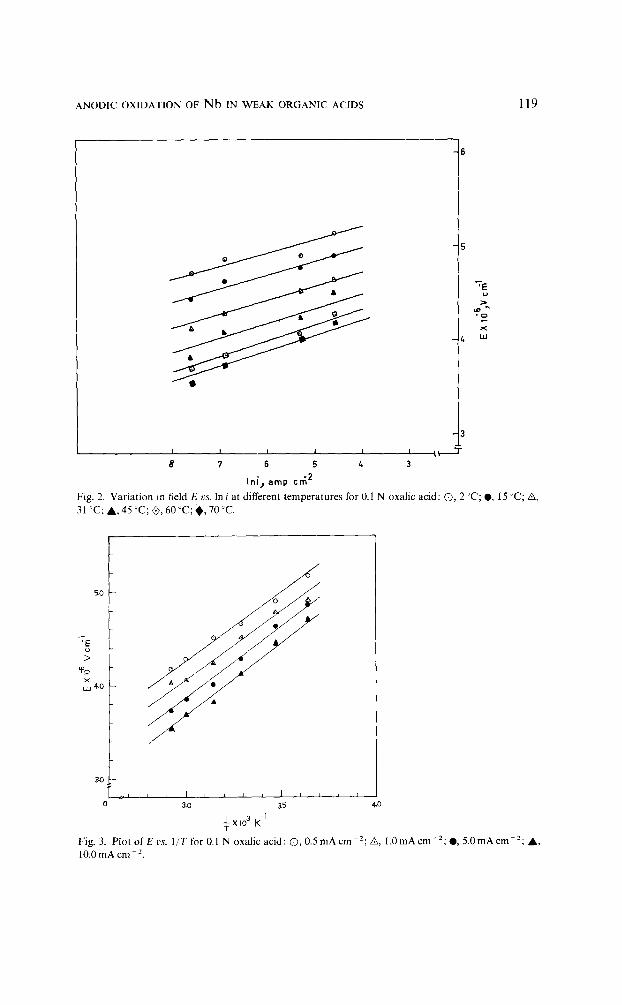
The Tafel slope BE~Sin~ values obtained from the E vs. In/ plot (Fig. 2) at different temperatures are constant, thus ruling out the applicability of the Cabrera and Mott theory. According to this theory the Tafel slope should be directly proportional to absolute temperature. The plots of E vs. I / T (Fig. 3) at different CDs are again parallel straight lines, showing the possibility of the existence of a space charge in the films 19. The Guntherschulze and Betz constants A and B of eqn. (1) have been determined by the method of least squares for different temperatures and are tabulated in Table I. The values of A vary with temperature but there is not much significant variation in the values of B. The near-constant values of B explain the
ANODIC OXIDATION OF Nb IN WEAK ORGANIC ACIDS 119
"7£ o
,.>. , o x
t, ta
3
I t I J I I ~,% 8 7 6 5 tb 3
l n i , a m p crn 2
Fig. 2. Var ia t ion in field E vs. I n / a t different t empera tu res for 0.1 N oxal ic acid: (3, 2 ° C ; e , 15 °C; ,A,
31 ~C; A , 45 :'C; ,~, 60 " C ; . , 70 °C.
5.0 0
Q
-7 E o >
"P_o
uJ 4.0
--.v~ I I I I I a l J ] I I ~ I 3-0 t5 4:0
± × io 3 K -1 T
Fig. 3. P l o t o f E vs. I / T f o r 0. ! N o x a l i c ac id : (3 , 0.5 m A c m - 2; A , 1.0 m A c m - 2; @, 5.0 m A c m - 2 ; A ,
10.0 mA cm 2.
120 R. K. NIGAM, K. SINGH, S. MAKEN
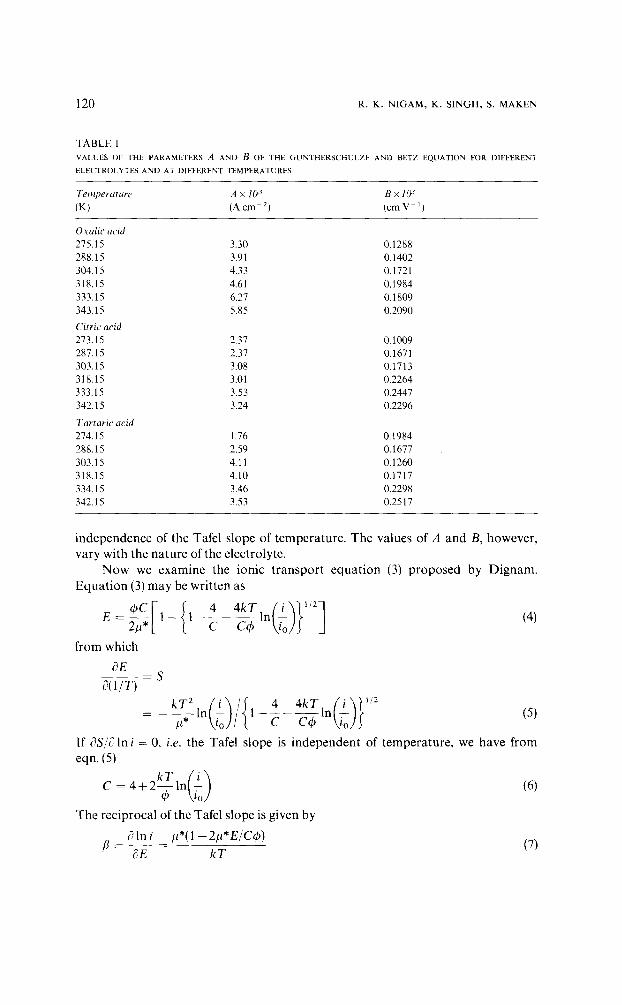
TABLE I VALUES OF THE PARAMETERS A AND B OF THE GUNTHERSCHULZE AND BETZ EQUATION FOR DIFFERENT ELECTROLYTES AND AT DIFFERENT TEMPERATURES
Temperature A x lO 3 B x 10"3 (K) {Acre -2) tcmV 1)
Oxalic acid 275.15 3.30 0.1288 288.15 3.91 0.1402 304.15 4.33 0.1721 318.15 4,61 0.1984 333.15 6.27 0.1809 343.15 5.85 0.2090
Citric acid 273.15 2.37 0.1009 287.15 2.37 0.1671 303.15 3.08 0.1713 318.15 3.01 0.2264 333.15 3.53 0.2447 342.15 3.24 0.2296
Tartaric acid 274.15 1.76 0.1984 288.15 2.59 0.1677 303.15 4.11 0.1260 318.15 4.10 0.1717 334.15 3.46 0.2298 342.15 3.53 0.2517
i n d e p e n d e n c e of the Tafe l s lope of t e m p e r a t u r e . T h e va lues of A and B, howeve r ,
v a r y wi th the n a t u r e of the e lec t ro ly te .
N o w we e x a m i n e the ion ic t r a n s p o r t e q u a t i o n (3) p r o p o s e d by D i g n a m .
E q u a t i o n (3) m a y be wr i t t en as
~ , [ { 4 4 k T - / i \ ) U 2 7
f r o m which
8E - S
8(1/T) k T 2 4 4 k T , i ~]1/2
If 8SI8 I n / = 0, i.e. the Tafe l s lope is i n d e p e n d e n t of t e m p e r a t u r e , we h a v e f r o m
eqn. (5)
T h e r ec ip roca l of the Tafe l s lope is g iven by
~?lni ~*(1-- 21a*E/CO) /3 - - (7)
~E k T
ANODIC OXIDATION OF Nb IN WEAK ORGANIC ACIDS 121
So lv ing for C,/~* and # * E / C 4 ) , we h a v e
1 2 1
c4) - ~ 1 + (10)
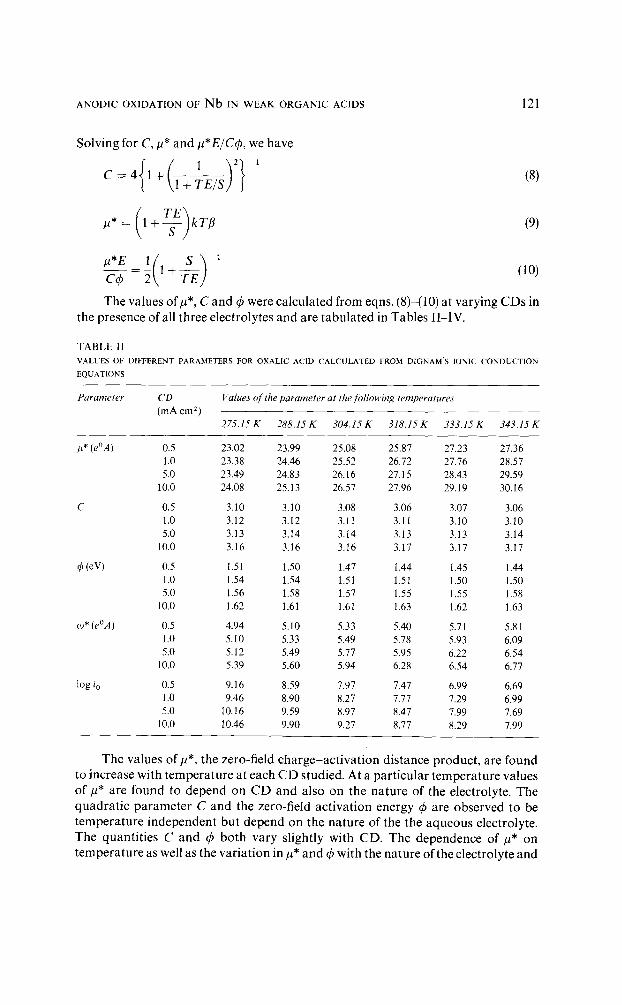
T h e va lues o f # * , C a n d 4) were ca l cu l a t ed f r o m eqns. (8)-(10) at va ry ing C D s in
the p resence o f all th ree e lec t ro ly tes a n d are t a b u l a t e d in Tab le s I I - I V .
TABLE II VALUES OF DIFFERENT PARAMETERS FOR OXALIC ACID CALCULATED FROM DIGNAMIS IONIC CONDUCTION EQUATIONS
Parameter CD (mA cm 2)
Values o f the parameter at the following temperatures
275.15 K 288.15 K 304.15 K 318.15 K 333.15 K 343.15 K
I~* (e°A) 0.5 23.02 23.99 25.08 25.87 27.23 27.36 1.0 23.38 24.46 25.52 26.72 27.76 28.57 5.0 23.49 24.83 26.16 27.15 28.43 29.59
10.0 24.08 25.13 26.57 27.96 29.19 30.16
c 0.5 3.10 3.10 3.08 3.06 3.07 3.06 1.0 3.12 3.12 3.11 3.11 3.10 3.10 5.0 3.13 3.14 3.14 3.13 3.13 3.14
10.0 3.16 3.16 3.16 3.17 3.17 3.17
~b (eV) 0.5 1.51 1.50 1.47 1.44 1.45 1.44 1.0 1.54 1.54 1.51 1.51 1.50 1.50 5.0 1.56 1.58 1.57 1.55 1.55 1.58
10.0 1.62 1.61 1.61 1.63 1.62 1.63
co* (e°A) 0.5 4.94 5.10 5.33 5.40 5.71 5.81 1.0 5.10 5.33 5.49 5.78 5.93 6.09 5.0 5.12 5.49 5.77 5.95 6.22 6.54
10.0 5.39 5.60 5.94 6.28 6.54 6.77
log i o 0.5 9.16 8.59 7.97 7.47 6.99 6.69 1.0 9.46 8.90 8.27 7.77 7.29 6.99 5.0 10.16 9.59 8.97 8.47 7.99 7.69
10.0 10.46 9.90 9.27 8.77 8.29 7.99
T h e va lues of/~*, the zero- f ie ld c h a r g e - a c t i v a t i o n d i s t ance p r o d u c t , a re found
to inc rease wi th t e m p e r a t u r e at each C D studied. At a p a r t i c u l a r t e m p e r a t u r e va lues
of /~* a re f o u n d to d e p e n d on C D a n d also on the n a t u r e o f the e lec t ro ly te . T h e
q u a d r a t i c p a r a m e t e r C a n d the zero- f ie ld a c t i v a t i o n ene rgy 4) a re o b s e r v e d to be
t e m p e r a t u r e i n d e p e n d e n t bu t d e p e n d on the n a t u r e of the the a q u e o u s e lec t ro ly te .
T h e quan t i t i e s C a n d 4> b o t h v a r y s l ight ly wi th C D . T h e d e p e n d e n c e o f #* on
t e m p e r a t u r e as well as the v a r i a t i o n in/~* a n d 4) wi th the n a t u r e of the e lec t ro ly te and
122 R. K. NIGAM, K. SINGH, S. MAKEN
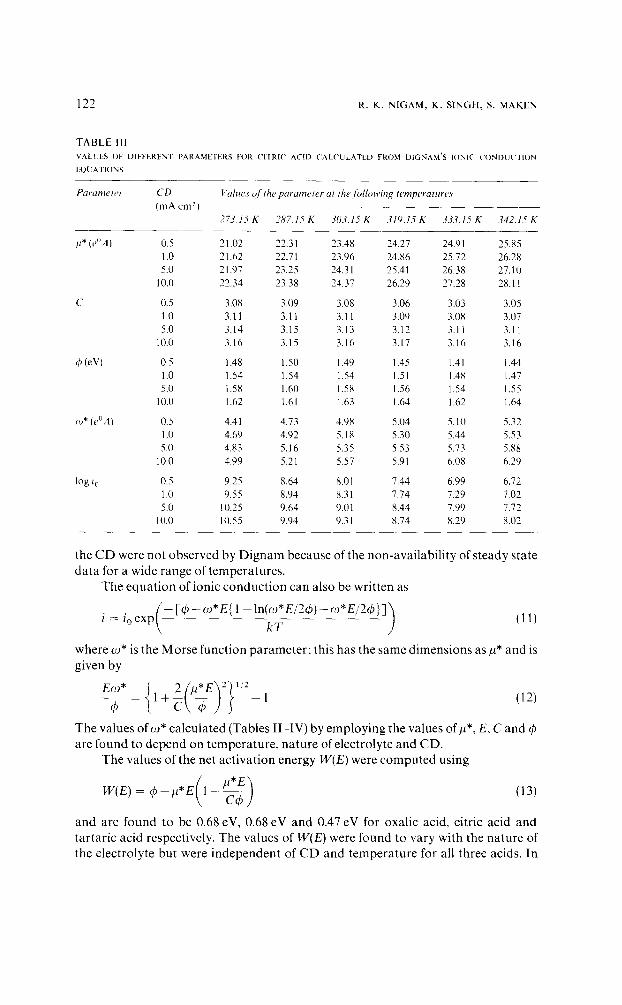
TABLE I11 VALUES OF DIFFERENT PARAMETERS FOR CITRI(" ACID C A L C U L A T E D FROM D1GNAM'S IONIC C O N D U C T I O N
EQISAT1ONS
Parameter CD (mA cm 2 )
Values (~['the parameter at the following temperatures
273.15 K 287.15 K 303.15 K 319.15 K 333.15 K 342.15 K
l~* (e~AI 0.5 21.02 22.31 23.48 24.27 24.91 25.85 1.0 21.62 22.71 23.96 24.86 25.72 26.28 5.0 21.97 23.25 24.31 25.41 26.38 27.10
10.0 22.34 23.38 24.37 26.29 27.28 28.11
C 0.5 3.08 3.09 3.08 3.06 3.03 3.05 1.0 3.11 3.11 3.11 3.09 3.08 3.07 5.0 3.14 3.15 3.13 3.12 3.11 3.11
10.0 3.16 3.15 3.16 3.17 3.16 3.16
~b (eV) 0.5 1.48 1.50 1.49 1.45 1.41 1.44 1.0 1.54 1.54 1.54 1.51 1.48 1.47 5.0 1.58 1.60 1.58 1.56 1.54 1.55
10.0 1.62 1.61 1.63 1.64 1.62 1.64
~o* (e°A) 0.5 4.41 4.73 4.98 5.04 5.10 5.32 1.0 4.69 4.92 5.18 5.30 5.44 5.53 5.0 4.83 5.16 5.35 5.53 5.73 5.88
10.0 4.99 5.21 5.57 5.91 6.08 6.29
log i 0 0.5 9.25 8.64 8.01 7.44 6.99 6.72 1.0 9.55 8.94 8.31 7.74 7.29 7.02 5.0 10.25 9.64 9.01 8.44 7.99 7.72
10.0 10.55 9.94 9.31 8.74 8.29 8.02
the CD were not observed by Dignam because of the non-availability of steady state data for a wide range of temperatures.
The equation of ionic conduction can also be written as
(_-[q5- (J)*E{ 1--ln(~o*E/2qS)-~o*E/2gp}]) (11) i = i o exp kT
where o0" is the Morse function parameter: this has the same dimensions as l** and is given by
2 ~*E 2 1,2
The values of co* calculated (Tables II-IV) by employing the values of/~*, E, C and ~b are found to depend on temperature, nature of electrolyte and CD.
The values of the net activation energy W(E) were computed using
W(E) = q5 --#*E(1 -- ~t*e'] (13) >7/
and are found to be 0.68 eV, 0.68 eV and 0.47 eV for oxalic acid, citric acid and tartaric acid respectively. The values of W(E) were found to vary with the nature of the electrolyte but were independent of CD and temperature for all three acids. In
A N O D I C O X I D A T I O N OF Nb IN W E A K O R G A N I C A C I D S 123
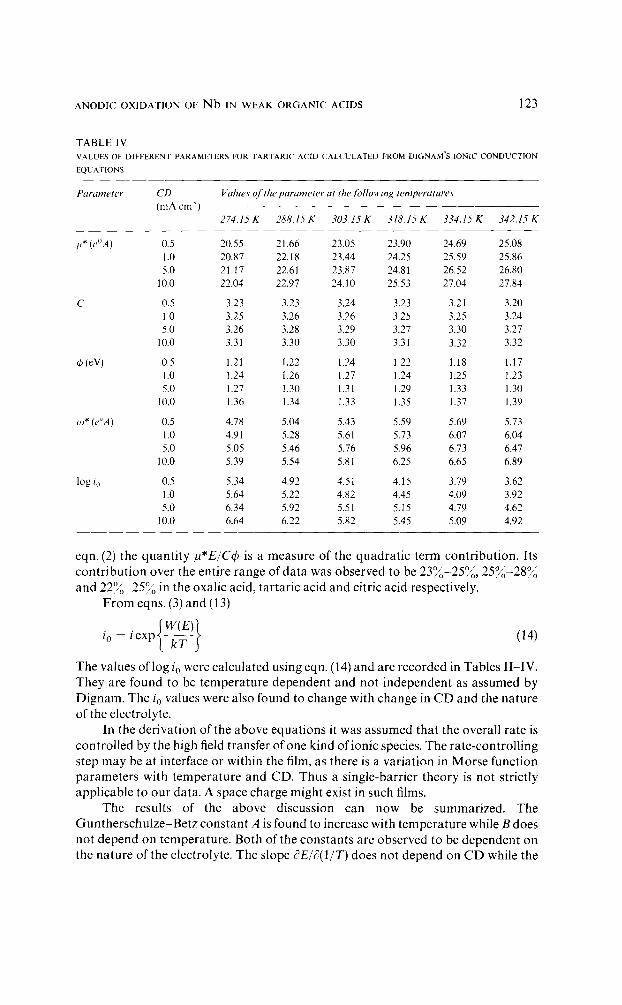
TABLE IV VALUES OF DIFFERENT PARAMETERS FOR TARTARIC ACID CALCULATED FROM DIGNAM'S IONIC CONDUCTION
EQUATIONS
Parameter CD (mA cm z )
Values o/'the parameter at theJbllowing temperatures
274.15 K 288.15 K 303.15 K 318.15 K 334.15 K 342.15 K
t~* ( e°A ) 0.5 20.55 21.66 23.05 23.90 24.69 25.08 1.0 20.87 22.18 23.44 24.25 25.59 25.86 5.0 21.17 22.61 23.87 24.81 26.52 26.80
10.0 22.04 22.97 24.10 25.53 27.04 27.84
c 0.5 3.23 3.23 3.24 3.23 3.21 3.20 1.0 3.25 3.26 3.26 3.25 3.25 3.24 5.0 3.26 3.28 3.29 3.27 3.30 3.27
10.0 3.31 3.30 3.30 3.31 3.32 3.32
05 (eV) 0.5 1.21 1.22 1.24 1.22 1.18 1.17 1.0 1.24 1.26 1.27 1.24 1.25 1.23 5.0 1.27 1.30 1.31 1.29 1.33 1.30
10.0 1.36 1.34 1.33 1.35 1.37 1.39
o)* (e°A) 0.5 4.78 5.04 5.43 5.59 5.69 5.73 1.0 4.91 5.28 5.61 5.73 6.07 6.04 5.0 5.05 5.46 5.76 5.96 6.73 6.47
10.0 5.39 5.54 5.81 6.25 6.65 6.89
log i o 0.5 5.34 4.92 4.51 4.15 3.79 3.62 1.0 5.64 5.22 4.82 4.45 4.09 3.92 5.0 6.34 5.92 5.51 5.15 4.79 4.62
10.0 6.64 6.22 5.82 5.45 5.09 4.92
eqn. (2) the quant i ty g * E / C 4 is a measure of the quadrat ic term contr ibut ion. Its con t r ibu t ion over the entire range of data was observed to be 23~o-25~, 25% -28~o and 22~o 25~o in the oxalic acid, tartaric acid and citric acid respectively.
F r o m eqns. (3) and (13)
io = i e x p { ~ ( T E)} (14)
The values of log io were calculated using eqn. (14) and are recorded in Tables I I - IV. They are found to be temperature dependent and not independent as assumed by Dignam. The io values were also found to change with change in CD and the na ture of the electrolyte.
In the derivat ion of the above equat ions it was assumed that the overall rate is control led by the high field transfer of one kind of ionic species. The rate-control l ing step may be at interface or within the film, as there is a variat ion in Morse funct ion parameters with temperature and CD. Thus a single-barrier theory is not strictly applicable to our data. A space charge might exist in such films.
The results of the above discussion can now be summarized. The Gun the r schu lze -Be tz cons tant A is found to increase with temperature while B does not depend on temperature. Both of the constants are observed to be dependent on the na ture of the electrolyte. The slope ?E/~(1/T) does not depend on CD while the
124 R. K. NIGAM, K. SINGH, S. MAKEN
Tafel slope is independent of temperature. A single-barrier Cabrera-Mott theory is not applicable to our data. The parameters ~*, c,)* and i0 are found to be temperature dependent, not independent as assumed by Dignam. However, C, ~b and W(E) are observed to be temperature independent. All these quantities depend on the nature of the electrolyte. The parameters C and W(E) do not depend on the CD, 4) changes slightly and/~*, eJ* and i0 change appreciably with increase in CD. There is an appreciable contribution of the quadratic term.
Single-barrier theories are not strictly suitable for our data and this may be due to the existence of a space charge within the films.
ACKNOWLEDGMENTS
One of the authors (S.M.) acknowledges his thanks to the Council for Scientific and Industrial Research, New Delhi, for the award of a Junior Research Fellowship. Thanks are also acknowledged to the Head of the Chemistry Department for providing laboratory facilities.
REFERENCES
[ J .W. Diggle (ed.), Oxides and Oxide Films, Vol. 1, Dekker, New York, 1972, p. 92. 2 R . K . Nigam and R. S. Chaudhary, Electrochim. Acta, 17 (1972) 1765. 3 R . K . Nigam and 1. K. Arora, Electrochim. Acta, 17 (1972) 2133. 4 R.K. NigamandI. K.Arora, lndianJ. Chem.,9(1971)578. 5 N. Cabrera and N. F. Mott, Rep. Prog. Phys., 12 (1948 1949) 163. 6 J .F . Dewald, J. Ele~trochem. Sot., 102 (19553 1. 7 C.P . Bean, J. C. Fisher and D. A. Vermilyea, Phys. Rev., 10l (19563 551. 8 M.J . Dignam. J. Electrochem. Sot'., 126 (19793 2188. 9 C .Y. Chao, L. F. Lin and D. D. Macdonald, J. Electrochem. Sot'., 128 (1981) 1187.
10 L. Young, Proc. R. Sot'. London, Ser. A, 258 (1960) 496. 11 L. Young, J. Electrochem. Soc., 110 (1963) 589. 12 M.J . Dignam, Can. J. Chem., 42 (1964) 1155. 13 F. Holtzberg, A. Reisman, M. Berry and M. Berkenblit, J. Am. Chem. Sot., 79 (1957) 2039. 14 S.I. Konopisov, Electrochim. Acta, 22 (1977) 1077. 15 N . N . Axelrod and N. Schwartz, J. Electrochem. Soc., 116 (1969) 460. 16 N. Baba and S. Tajima, Electroehim. Acta, 15 (19703 193. 17 Y. Fukuda, NtpponKagakuKaishi, 10(1974) 1868. 18 J .J . Randall, Jr., W. J. Bernard and R. R. Wilkinson, Electrochim. Acta, 10 (19653 183. 19 R.K.NigamandR. S. Chaudhary, lndianJ. Chem.,8(19703343.


