Embed Size (px)
Citation preview
Annual Status of Education Report (Rural) 2020Wave 1
Provisional
October 28, 2020
ASER 2020 Wave 1 - RuralAnnual Status of Education Report (Rural) Wave 1
Date of publication: October 28, 2020
Available on the ASER Centre website (www.asercentre.org)
Published by:ASER CentreB-4/54 Safdarjung EnclaveNew Delhi 110 029Phone: +91-11-46023612
Annual Status of Education Report (Rural) 2020Wave 1
Provisional
October 28, 2020
2
1. Partners and volunteers, Supporters, Special thanks ............................................................................................. 3
2. About ASER
• About Annual Status of Education Report (ASER) 2020 Wave 1 ........................................................................... 5
• Survey call summary ............................................................................................................................................ 7
• Survey coverage ................................................................................................................................................... 8
• Survey process summary ..................................................................................................................................... 9
• Sample design of rural ASER 2020 Wave 1 ........................................................................................................ 10
• Sample description of ASER 2020 Wave 1 ......................................................................................................... 12
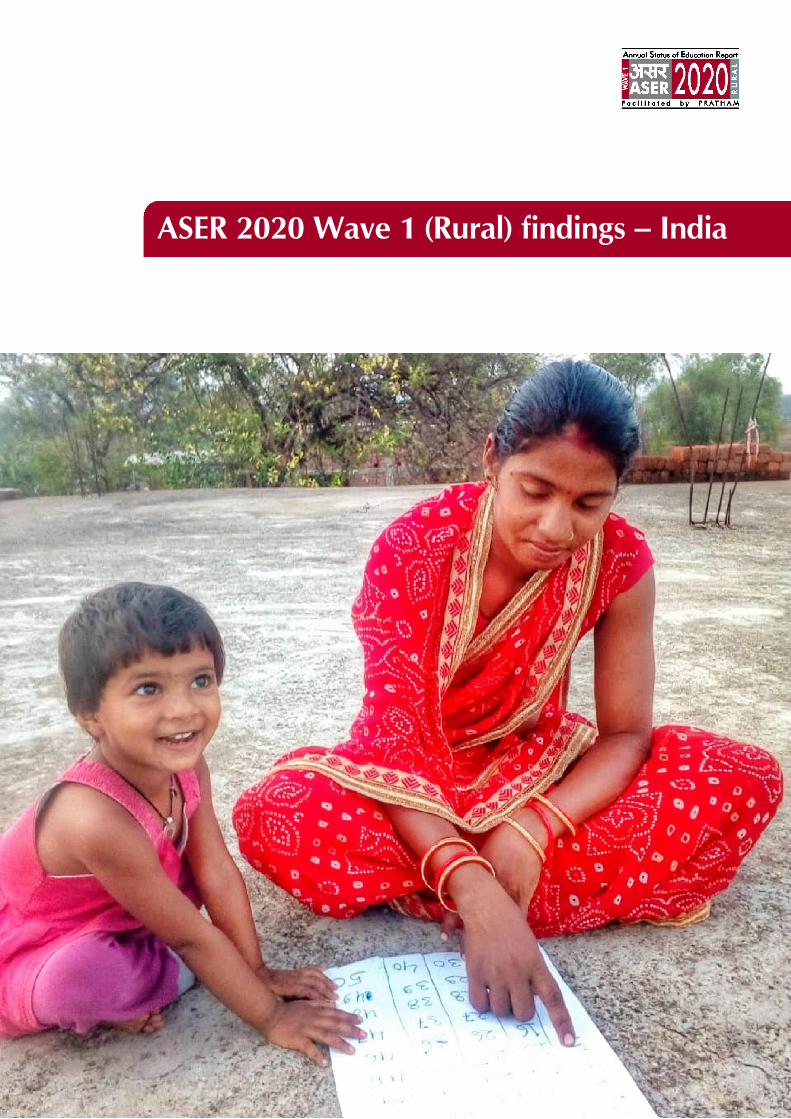
3. ASER 2020 Wave 1 (Rural) findings - India
• India ................................................................................................................................................................... 14
4. ASER 2020 Wave 1 (Rural) findings - State estimates
• State estimates .................................................................................................................................................... 28
5. ASER 2020 Wave 1 process documents
• Training ............................................................................................................................................................. 94
• Survey process ................................................................................................................................................... 96
• Quality control ................................................................................................................................................. 114
Annexure
• Learning materials shared by state governments, publicly available in September 2020 .................................. 116
Contents
3
Our heartfelt thanks to all our partner organisations and volunteers for conducting the ASER 2020 survey in their districts.
GujaratShri Sarvajanik B.S.W. and M.S.W. College, Mehsana
KeralaDepartment of Social Work, St. Thomas' College (Autonomous), Thrissur
TripuraAnanya Social Welfare & Advancement Society, North TripuraOrganization for Rural Survival, Belonia, South TripuraSudarshan Foundation, Dhalai
Local volunteers of Jammu and Kashmir, Manipur, Meghalaya, and Nagaland
Dr. Krantiben Trivedi, Principal, Shri Sarvajanik B.S.W. and M.S.W. College, Mehsana, Gujarat
Prof. Fr. Alan Tony, Department of Social Work, St. Thomas' College (Autonomous), Thrissur, Kerala
Pratham and ASER staff who conducted the survey
Our heartfelt thanks to Pratham state and program heads, Pratham teams across different verticals, and Pratham accountantswithout whose hard work and dedication ASER 2020 would not have been possible. And finally, thanks to all the familiesand teachers who interacted with us.
Bill and Melinda Gates
Foundation
Pratham USA
Tufts University
Aashay Gune
Abhay Puri
Abhi Parekh
Aishwarya Kekre
Ambrish Dongre
Amit Kaushik
Anup Mukerji
Atulan Guha
Bishwajit Bhattacharyya
G Kumeresan
Harini Kannan
Jeetwan Tripathy
Ketaki Amarapurkar Jategaonkar
Madhuri Agarwal
Mallika Sinha
Panchali Guha
Panu Pelkonen
Pranav Bhargava
Prem Yadav
Rama Mohana Turaga
Renu Seth
Rishi Kabir Bogra
Rohit Chandra
Rukmini Banerji
Sanket Ingole
Saurav Goyal
Sayli Javadekar
Shalini Mukerji and Gokul Rajan
Shobhini Mukerji
Siddharth Chawla
Sinu Akula
Sri Krishna Uppaluri
Varun Limaye
Partners and volunteers
Supporters
Special thanks to
4
About ASER
5
About ASER
Every year from 2005 to 2014, the Annual Status of Education Report (ASER) report has provided district, state, and national
estimates of the status of children's schooling and foundational learning across rural India. Children in the age group 3 to 16
were surveyed to find out their enrollment status in pre-school or school. Children in the age group 5 to 16 were assessed one-
on-one to understand their basic reading and arithmetic abilities.
Starting its second decade of existence in 2016, ASER switched to an alternate-year cycle, where the 'basic' ASER described
above is conducted every other year (2016, 2018); and in alternate years, ASER focuses on a different aspect of children's
schooling and learning. In 2017, ASER 'Beyond Basics' focused on the abilities, activities, awareness, and aspirations of
youth in the 14 to 18 age group across 28 districts in the country. In 2019, ASER 'Early Years' reported on young children's
(age 4 to 8) pre-school and school enrolment status and their abilities on a range of important developmental indicators across
26 districts in the country.
The COVID-19 crisis interrupted this alternate-year calendar, making it impossible to conduct the nationwide 'basic' ASER
that was due to be repeated in 2020. However, the urgent need to systematically examine the effects of the pandemic on
schooling and learning opportunities of children across the country was apparent.
Why ASER 2020 Wave 1?
Recent global estimates suggest that school closures, unequal access to technology-based educational inputs used for remote
learning, and other related disruptions due to the pandemic are likely to result in 'learning loss' and higher dropout rates,
aggravating existing equity gaps in education among other consequences. In India, numerous studies have been done on the
impact of the COVID-19 pandemic in the country since the first lockdown was announced in March 2020, but very few cover
children's education. Although a lot of digital content has been generated and transmitted to help children continue to learn
while at home, there is limited evidence on the extent to which this content is in fact reaching children; whether they are
engaging with it; and the impact it is having on their participation and learning.
In order to take the unprecedented pandemic-related constraints into account, but at the same time address the urgent need for
large scale nationally representative data on children's education, the ASER 2020 survey was adapted to a phone survey format
that could be conducted in multiple waves, in order to capture the effects of the pandemic on different aspects of children's
education.
What is ASER 2020 Wave 1?
The ASER 2020 Wave 1 survey was designed to be conducted at a time when schools have not yet reopened and governments
and schools are reaching out to children through a variety of remote means with diverse educational content. It explores the
provision of, and access to, remote education mechanisms and materials in rural parts of the country, and the ways in which
children, families, and educators are engaging with these from their homes.
Objectives: The ASER 2020 Wave 1 survey focuses on the following key questions regarding provision of, access to, engagement
with, and challenges concerning remote learning during school closures:
• What resources do families have to support children's learning at home?
• How are families and other community members helping children with learning activities?
• What learning materials and activities are children and families receiving from schools?
• How are families and children accessing learning materials or activities?
• Are children engaging with these learning material and activities?
About Annual Status of Education Report (ASER) 2020 Wave 1
6
• What kind of contact do teachers and children/parents have with each other?
• What kinds of challenges are families and teachers facing with regard to remote learning?
Sample: The standard operating procedure for ASER survey includes recording a contact number from each household and
school surveyed, where available. These phone numbers are used to monitor and cross-check the data collection effort in that
survey year. The ASER 2020 household survey was therefore conducted with a random sample of households with mobile
phones drawn from the ASER 2018 data set, selected to generate estimates that are representative at state and all-India levels.
In addition, head teachers or teachers from all schools in the ASER 2018 sample were included in the ASER 2020 school
survey. Extensive pilots and experiments were conducted to check the feasibility of the ASER 2018 data set as a sampling
frame for ASER 2020. For more details on sampling, see the note on Sample design of rural ASER 2020 Wave 1 on page 10.
For more details on implementation - survey training, survey data collection process and data quality control - see pages 94
to 114.
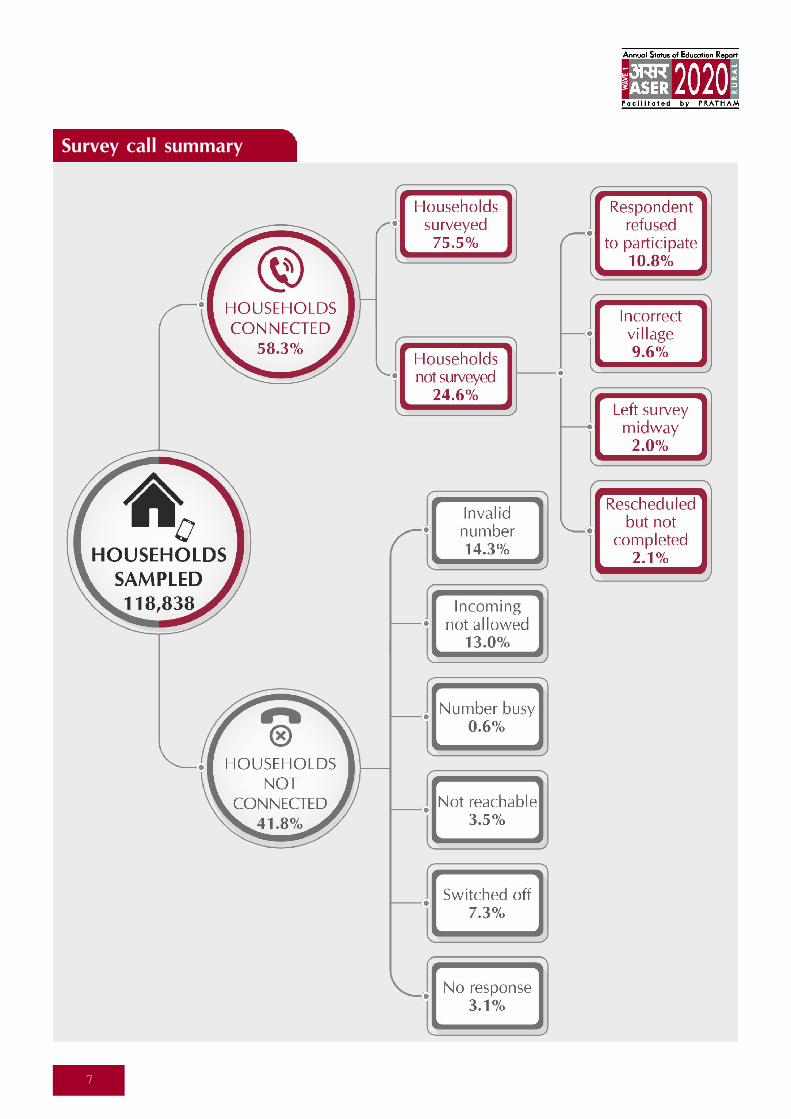
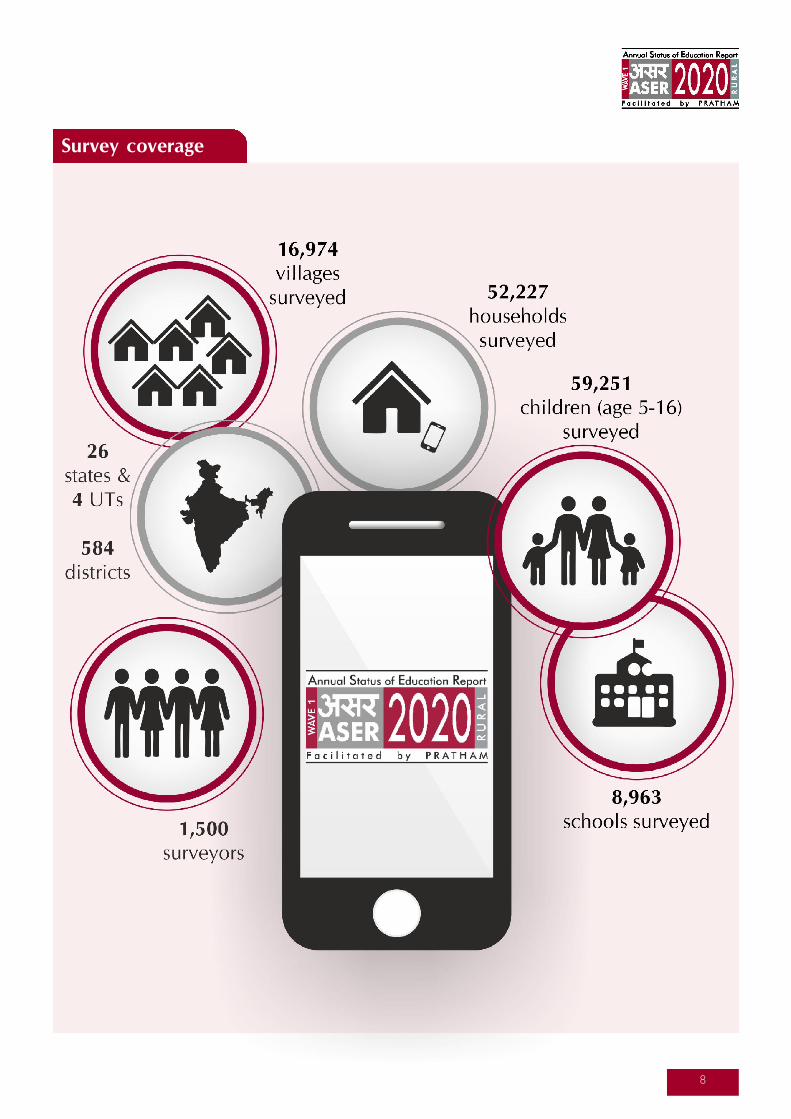
Design: To conduct the survey, phone calls were made to parents/caregivers of children aged 5-16 in 118,838 households as
well as head teachers or teachers in 16,761 schools over a span of ten days in September 2020, the sixth month of continuous
school closures across the country. Of these, the survey was completed with 52,227 households and 8,963 teachers (see
section on Survey coverage on page 8 for more details). Using standardised questionnaires, information was collected separately
for each child in the 5-16 age group in each surveyed household. For schools, information was collected for the grade
(between Std 1-8) that the teacher could provide the most information for.
This report uses the ASER 2020 survey data to explore the following areas:
• Children's enrollment: Explores patterns of enrolment and dropout among 6-16 year olds in rural India.
• Children not currently enrolled: Examines which children are currently not enrolled in school and the reasons behind this.
• Household resources: Explores whether households have key resources that can help support children's education. These
include parents' own education levels; access to technology such as TV and smartphones; and availability of textbooks.
• Learning support at home: Examines whether and how households support children during school closures. This includes
support from family members as well as other support such as paid private tuition.
• Access to and availability of learning materials: Reports whether families received learning materials or activities from
schools, and the mediums through which they accessed these.
• Children's engagement with learning materials and activities: Analyses the extent to which children actually engaged with
different kinds of materials and activities received from any source; as well as the nature of contact between families and
schools during the lockdown.
• School survey: Explores teachers' preparation for and implementation of remote teaching-learning activities with their
students, and whether they received any help from the community to support children's learning during school closures.
7
Survey call summary
8
Survey coverage
9
Survey process summary
10
Since 2005, ASER has been providing comparable estimates of learning and schooling at the elementary stage. The 'basic'
ASER, measuring foundational reading and arithmetic abilities of children in the school-going age group, was done annually
from 2005 to 2014 and on a biennial basis from 2016 onwards. Therefore, it was scheduled to be conducted in 2020. While
the design, training, monitoring and data analysis of ASER is done by ASER Centre and Pratham teams, the actual survey is
done by volunteers in the field. The first lockdown due to the COVID-19 pandemic commenced on March 22, 2020 and was
extended multiple times in a variety of ways. Given how fast the pandemic was spreading, it was soon clear that it would not
be possible to conduct a field survey in 2020, especially not with volunteers.
However, given that schools closed as early as March 2020 and are yet to open, it was also clear that it was extremely
important to conduct ASER this year to be able to gauge the impact of the pandemic on children's enrollment and learning.
Further, the impact of the pandemic on different aspects of education would be felt at different times. Therefore, ASER 2020
was designed to be conducted in multiple waves to measure different aspects of the COVID-19 impact. The first wave,
conducted during September 2020, focused on children's access to and use of learning materials during the period when
schools were closed.
The challenge of conducting a field survey during a pandemic was met by conducting a phone-based survey. However, if
estimates representative at various geographic levels were to be obtained, a sampling frame of phone numbers was required
at the All India level. Unfortunately, no such frame exists in the public domain. A possible solution to the lack of a frame was
suggested by the ASER methodology. As part of the ASER survey, phone numbers of sampled households are recorded for
monitoring and recheck purposes. Since ASER is representative at the district level its sample size is fairly large - about
350,000 households across 17,500 villages and almost 600 districts. The need for such a large sample is necessitated by
representation at the district level - to get representative estimates at the state and national levels such large sample sizes are
not necessary. For instance, NSS surveys that are representative at the state and national levels have a sample size about a third
as large as ASER.
Therefore, the ASER 2018 sample was used as a frame to draw the ASER 2020 sample that would be representative at the state
and national levels. Drawing the new sample would require adding a third stage to ASER's existing two-stage sample design,
to exclude households without mobile phones. With 90% mobile coverage in rural India, the extent of the self-selection bias
due to uncovered populations would be small. A larger problem was that the ASER 2018 sample was two years old. With
people moving, changing their mobile numbers, etc., it was possible that a large percentage of households would not be
reachable. However, pan-India pilots suggested a fairly good reach (of about 70%); extensive experiments were also conducted
to validate the frame.
In normal years, including 2018, ASER has a two-stage sample design. In the first stage, for each rural district, 30 villages are
randomly selected from the Census 2011 village directory. Villages are selected using the probability proportional to size
(PPS) sampling method. This method allows villages with larger populations to have a higher chance of being selected in the
sample. It is most useful when the first stage sampling units vary considerably in size, because it ensures that households in
larger villages have the same probability of getting into the sample as those in smaller villages, and vice versa.1, 2 In the second
stage 20 households are randomly selected in each of the 30 selected villages in the first stage – giving a total sample of 600
households per district. This sampling strategy generates a representative picture of each district. All rural districts are surveyed.
The estimates obtained are then aggregated to the state and all-India levels.3
1 Probability proportional to size (PPS) is a sampling technique in which the probability of selecting a sampling unit (village, in our case) is proportionalto the size of its population. The method works as follows: First, the cumulative population by village calculated. Second, the total householdpopulation of the district is divided by the number of sampling units (villages) to get the sampling interval (SI). Third, a random number between 1 andthe SI is chosen. This is referred to as the random start (RS). The RS denotes the site of the first village to be selected from the cumulative population.Fourth, the following series of numbers is formed: RS; RS+SI; RS+2SI; RS+3SI; …. The villages selected are those for which the cumulative populationcontains the numbers in the series.2 Most large household surveys in India, like the National Sample Survey and the National Family Health Survey also use this two-stage design and usePPS to select villages in the first stage.3 See ASER 2018 Report for a detailed discussion of the sample design.
Sample design of rural ASER 2020 Wave 1
11
ASER 2020 sampled 7 households with a mobile phone from each of the sampled ASER 2018 villages, giving a sample size
of 210 households in each rural district. While this may not be sufficient to generate precise district level estimates, it is large
enough to get good state level and national estimates. Like the standard ASER, the coverage of ASER 2020 is the rural
household population of India.
To summarize, ASER 2020 has a three-stage clustered design. In the first stage 30 households are sampled from the Census
2011 village directory using PPS. In the second stage, 20 households are randomly selected from each of the sampled villages.
And, in the third stage, 7 households with mobile phones are randomly sampled from the 20 selected households in each of
the 30 sampled villages in each rural district. All children in the age group of 5-16 years are surveyed in the households
selected in the third stage.
In normal years, including 2018, ASER surveyors also visit a government primary or upper primary school in each sampled
village, to record data on attendance and provision and usability of facilities. In each visited school, the phone number of the
headmaster or a teacher is recorded for monitoring purposes. In ASER 2020, the entire ASER 2018 school sample was retained
to explore whether schools shared learning materials during the period of school closures, how they shared this material, and
what contact they had with parents and the village community.
ASER 2020 provides estimates at the state and national levels. In order to aggregate estimates up from the district level
households have to be assigned weights --- also called inflation factors. The inflation factor corresponding to a particular
household denotes the number of households that the sampled household represents in the population. Given that 210
households are sampled in each district regardless of the size of the district, a household in a larger district will represent
many more households and, therefore, have a larger weight associated with it than one in a sparsely populated district.4
In ASER's two-stage design, the sample is self-weighting at the district level - weights are the same for all households within
a district. However, since ASER 2020 adds another stage of sampling based on mobile phone coverage, the sample is no
longer self-weighting; rather, weights will differ across villages.5 All estimates at the state and national levels are weighted,
since states have a different number of districts and villages which vary by population.
4 The inflation factor or weight associated with a household is simply the inverse of the probability of it being selected into the sample.5 The probability that household j gets selected in village i (pij) is the product of the probability that village i gets selected in the first stage (pi) and theprobability that household j gets selected in the second stage (pj(i)) and the probability that household j has a mobile phone (pj(i)m) and the probabilitythat household j gets selected in the third stage (pj(i)mi). This is given by:
where nv is the number of villages sampled in the district in the first stage, vpopi is the household population of village i, dpop is the number ofhouseholds in the district, nhi is the number of households sampled in the village in the second stage, nhim is the number of households who have amobile phone in the second stage sample and nhi3 is the number of households with mobile phones sampled in the third stage. The weight associatedwith each sampled household within a village is the inverse of the probability of selection. Note that the sum of the weights of the households will givethe district population of households and the sum of the weights for all children in the sample will approximate to the population of children in the5-16 year age group in the district.
pij = pi pj(i) pj(i)m pj(i)mi =nv
dpopnhi
vpopi
nhimnhi
nhi3nhim
vpopi
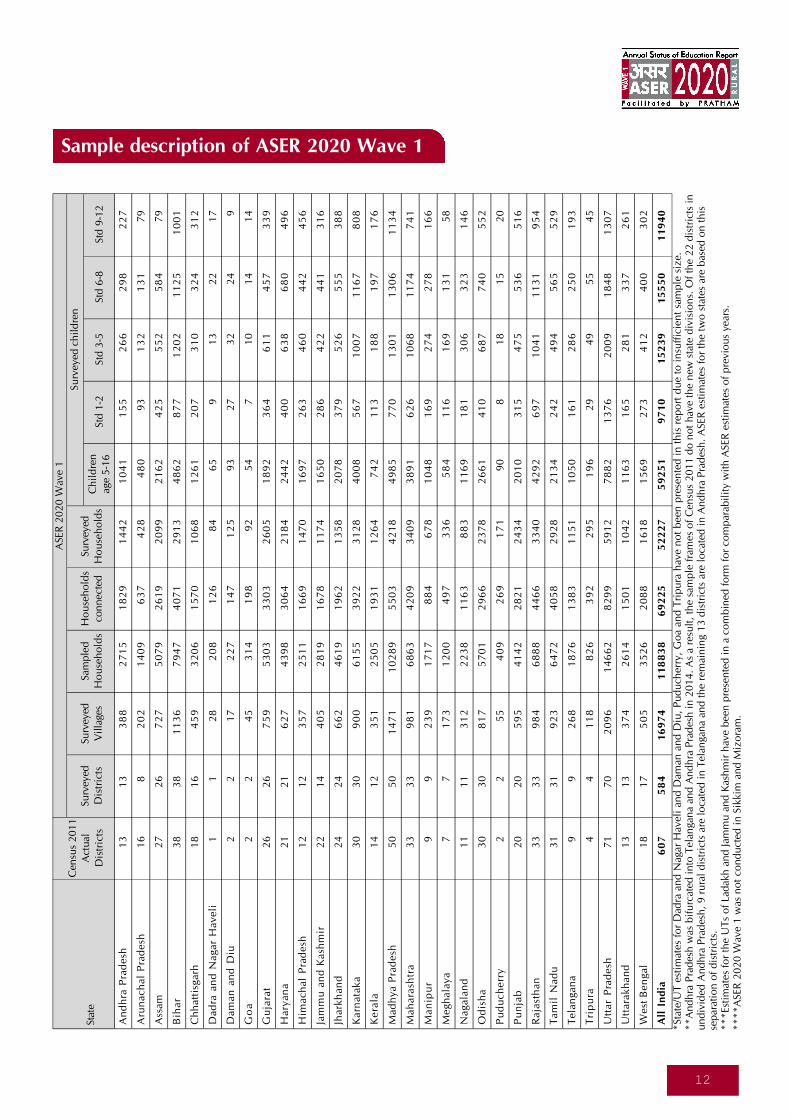
12
Sample description of ASER 2020 Wave 1
*St
ate/
UT
est
imat
es f
or
Dad
ra a
nd
Nag
ar H
avel
i an
d D
aman
an
d D
iu,
Pu
du
cher
ry,
Go
a an
d T
rip
ura
hav
e n
ot
bee
n p
rese
nte
d i
n t
his
rep
ort
du
e to
in
suff
icie
nt
sam
ple
siz
e.*
*A
nd
hra
Pra
des
h w
as b
ifu
rcat
ed in
to T
elan
gan
a an
d A
nd
hra
Pra
des
h i
n 2
01
4.
As
a re
sult
, th
e sa
mp
le f
ram
es o
f C
ensu
s 2
01
1 d
o n
ot
hav
e th
e n
ew s
tate
div
isio
ns.
Of
the
22
dis
tric
ts i
nu
nd
ivid
ed A
nd
hra
Pra
des
h,
9 r
ura
l d
istr
icts
are
lo
cate
d i
n T
elan
gan
a an
d t
he
rem
ain
ing
13
dis
tric
ts a
re l
oca
ted
in
An
dh
ra P
rad
esh
. A
SER
est
imat
es f
or
the
two
sta
tes
are
bas
ed o
n t
his
sep
arat
ion
of
dis
tric
ts.
**
*Es
tim
ates
fo
r th
e U
Ts
of
Ladak
h a
nd
Jam
mu
an
d K
ash
mir
hav
e bee
n p
rese
nte
d i
n a
co
mb
ined
fo
rm f
or
com
par
abil
ity
wit
h A
SER
est
imat
es o
f p
revi
ou
s ye
ars.
**
**
ASE
R 2
02
0 W
ave
1 w
as n
ot
con
du
cted
in
Sik
kim
an
d M
izo
ram
.
Stat
e
Cen
sus
20
11
Act
ual
Dis
tric
ts
An
dh
ra P
rad
esh
13
13
38
82
71
51
82
91
44
21
04
11
55
26
62
98
22
7
Aru
nach
al
Pra
desh
16
82
02
14
09
63
74
28
48
09
31
32
13
17
9
Ass
am2
72
67
27
50
79
26
19
20
99
21
62
42
55
52
58
47
9
Bih
ar
38
38
11
36
79
47
40
71
29
13
48
62
87
71
20
21
12
51
00
1
Ch
hatt
isgar
h1
81
64
59
32
06
15
70
10
68
12
61
20
73
10
32
43
12
Dad
ra a
nd
Nagar
Haveli
11
28
20
81
26
84
65
91
32
21
7
Dam
an
an
d D
iu2
21
72
27
14
71
25
93
27
32
24
9
Go
a2
24
53
14
19
89
25
47
10
14
14
Gu
jara
t2
62
67
59
53
03
33
03
26
05
18
92
36
46
11
45
73
39
Hary
an
a2
12
16
27
43
98
30
64
21
84
24
42
40
06
38
68
04
96
Him
ach
al
Pra
desh
12
12
35
72
51
11
66
91
47
01
69
72
63
46
04
42
45
6
Jam
mu
an
d K
ash
mir
22
14
40
52
81
91
67
81
17
41
65
02
86
42
24
41
31
6
Jhark
han
d2
42
46
62
46
19
19
62
13
58
20
78
37
95
26
55
53
88
Karn
ata
ka
30
30
90
06
15
53
92
23
12
84
00
85
67
10
07
11
67
80
8
Kera
la1
41
23
51
25
05
19
31
12
64
74
21
13
18
81
97
17
6
Mad
hya P
rad
esh
50
50
14
71
10
28
95
50
34
21
84
98
57
70
13
01
13
06
11
34
Mah
ara
shtr
a3
33
39
81
68
63
42
09
34
09
38
91
62
61
06
81
17
47
41
Man
ipu
r9
92
39
17
17
88
46
78
10
48
16
92
74
27
81
66
Megh
ala
ya
77
17
31
20
04
97
33
65
84
11
61
69
13
15
8
Nagala
nd
11
11
31
22
23
81
16
38
83
11
69
18
13
06
32
31
46
Od
ish
a3
03
08
17
57
01
29
66
23
78
26
61
41
06
87
74
05
52
Pu
du
ch
err
y2
25
54
09
26
91
71
90
81
81
52
0
Pu
nja
b2
02
05
95
41
42
28
21
24
34
20
10
31
54
75
53
65
16
Raja
sth
an
33
33
98
46
88
84
46
63
34
04
29
26
97
10
41
11
31
95
4
Tam
il N
ad
u3
13
19
23
64
72
40
58
29
28
21
34
24
24
94
56
55
29
Tela
ngan
a9
92
68
18
76
13
83
11
51
10
50
16
12
86
25
01
93
Tri
pu
ra4
41
18
82
63
92
29
51
96
29
49
55
45
Utt
ar
Pra
desh
71
70
20
96
14
66
28
29
95
91
27
88
21
37
62
00
91
84
81
30
7
Utt
ara
kh
an
d1
31
33
74
26
14
15
01
10
42
11
63
16
52
81
33
72
61
West
Ben
gal
18
17
50
53
52
62
08
81
61
81
56
92
73
41
24
00
30
2
All
In
dia
60
75
84
16
97
41
18
83
86
92
25
52
22
75
92
51
97
10
15
23
91
55
50
11
94
0
Surv
eyed
Dis
tric
tsSu
rvey
edV
illa
ges
Sam
ple
dH
ou
seh
old
sH
ou
seh
old
sco
nnec
ted
Surv
eyed
Ho
use
ho
lds
Ch
ild
ren
age
5-1
6St
d 1
-2St
d 3
-5
Surv
eyed
ch
ild
ren
ASE
R 2
02
0 W
ave
1
Std
6-8
Std
9-1
2
ASER 2020 Wave 1 (Rural) findings – India
14
India RURAL
Table 1: % Children enrolled in school. By age group,sex and school type. 2020
'Other' includes children going to Madarsa and EGS.‘Not in school’ includes children who never enrolled or are not currentlyenrolled.
Table 1 summarizes enrollment data for different age groups in the ASER 2020 sample. For children in the 6-14 age group, these datashow that overall, more than 60% of all children are enrolled in government schools and close to 30% are enrolled in private schools.
This marks a change from two years ago, when the last comparable ASER survey was conducted (Table 2).
There has been a clear shift from private to government schools between 2018 and 2020, in allgrades and among both boys and girls (Table 2). Reasons may include financial distress in householdsand/or permanent school shutdowns among the private schools.
Table 2: % Children enrolled in school. By grade, sex and school type. 2018 and 2020*
Age groupand sex
Age 6-14: All
Age 7-16: All
Age 7-10: All
Age 7-10: Boys
Age 7-10: Girls
Age 11-14: All
Age 11-14: Boys
Age 11-14: Girls
Age 15-16: All
Age 15-16: Boys
Age 15-16: Girls
Govt Pvt OtherNot inschool Total
65.8 28.8 0.8 4.6 100
65.5 28.6 0.7 5.2 100
64.3 30.5 0.8 4.4 100
60.9 33.6 0.8 4.7 100
68.1 27.0 0.8 4.1 100
68.0 27.4 0.7 3.9 100
64.5 30.9 0.7 3.9 100
71.9 23.5 0.7 3.9 100
62.1 27.3 0.6 9.9 100
60.8 29.7 0.8 8.8 100
63.6 24.8 0.5 11.1 100
*All estimates from ASER 2018 reported here were generated after excluding households without a mobile phone, in order to make these comparable withthe ASER 2020 estimates.
ANALYSIS BASED ON DATA FROM HOUSEHOLDS. 584 OUT OF 619 DISTRICTS
Children’s school enrollment
Have enrollment patterns changed as a result of the COVID-19 pandemic?
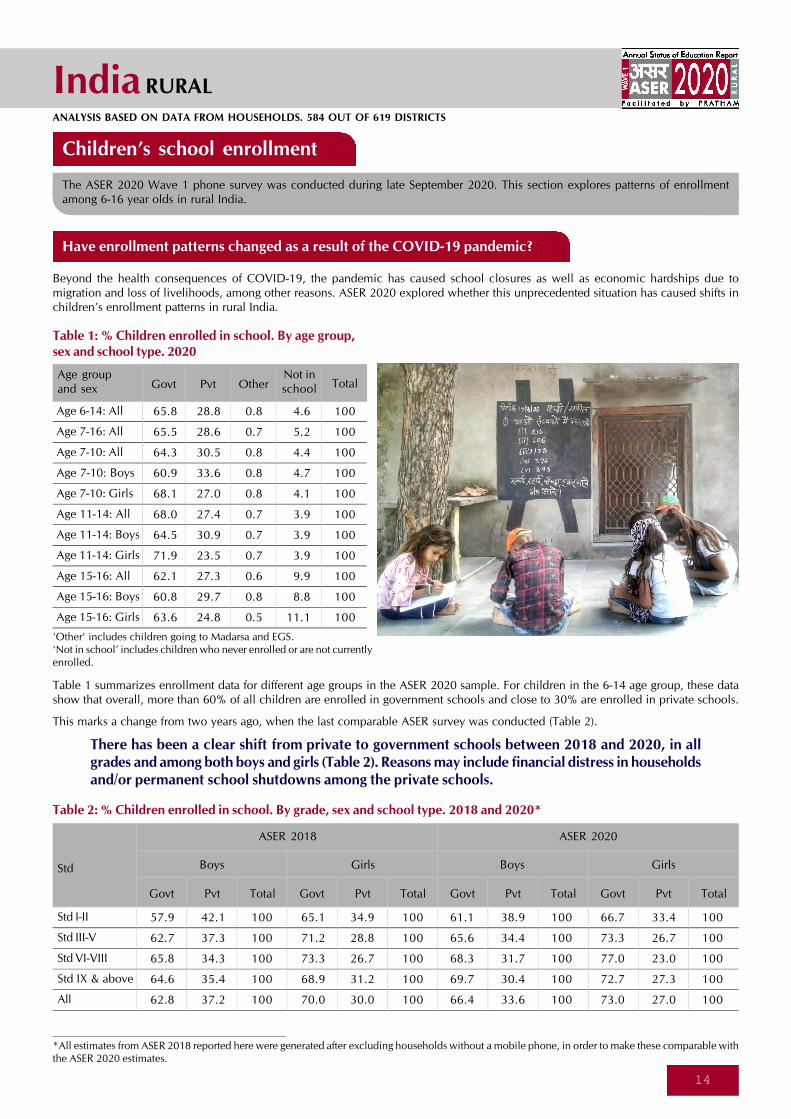
Beyond the health consequences of COVID-19, the pandemic has caused school closures as well as economic hardships due tomigration and loss of livelihoods, among other reasons. ASER 2020 explored whether this unprecedented situation has caused shifts inchildren’s enrollment patterns in rural India.
The ASER 2020 Wave 1 phone survey was conducted during late September 2020. This section explores patterns of enrollmentamong 6-16 year olds in rural India.
Std
Std I-II
Std III-V
Std VI-VIII
Std IX & above
All
Govt Pvt Total Govt Pvt Total Govt Pvt Total Govt Pvt Total
Boys Girls
ASER 2018
Boys Girls
ASER 2020
57.9 42.1 100 65.1 34.9 100 61.1 38.9 100 66.7 33.4 100
62.7 37.3 100 71.2 28.8 100 65.6 34.4 100 73.3 26.7 100
65.8 34.3 100 73.3 26.7 100 68.3 31.7 100 77.0 23.0 100
64.6 35.4 100 68.9 31.2 100 69.7 30.4 100 72.7 27.3 100
62.8 37.2 100 70.0 30.0 100 66.4 33.6 100 73.0 27.0 100
15
India RURAL
*All estimates from ASER 2018 reported here were generated after excluding households without a mobile phone, in order to make these comparable withthe ASER 2020 estimates.
Children not enrolled in school
Are fewer children enrolled in 2020 than before?
One widely anticipated consequence of the COVID-19 pandemic was that many more children would drop out of school. Althoughthe true picture will only be known once schools reopen, ASER 2020 asked whether children were currently enrolled for the schoolyear 2020-21.
Table 3: % Children not enrolled in school. By age groupand sex. 2018 and 2020*
Age 6-10
Age 11-14
Age 15-16
All
Age group
% Children
ASER 2018 ASER 2020
Boys Girls All Boys Girls All
1.8 1.8 1.8 5.3 5.2 5.3
2.9 3.6 3.2 3.9 3.9 3.9
11.4 12.6 12.0 8.8 11.1 9.9
3.7 4.2 4.0 5.3 5.7 5.5
Table 3 compares the proportion of children not enrolledin school in 2018 and 2020, separately for different agegroups. These data show that while there have indeedbeen changes in children’s enrollment status, these varyacross age groups.
• Among boys in the 6-10 age group, for example, therehas been a sharp increase in the proportion of childrennot currently enrolled, from 1.8% in 2018 to 5.3% in2020; with a similar increase among girls in this agegroup.
• However, this proportion has increased much lessamong children in the 11-14 age group, among bothboys and girls.
• The proportion of children not currently enrolled hasactually decreased over 2018 levels among the 15-16year old age group.
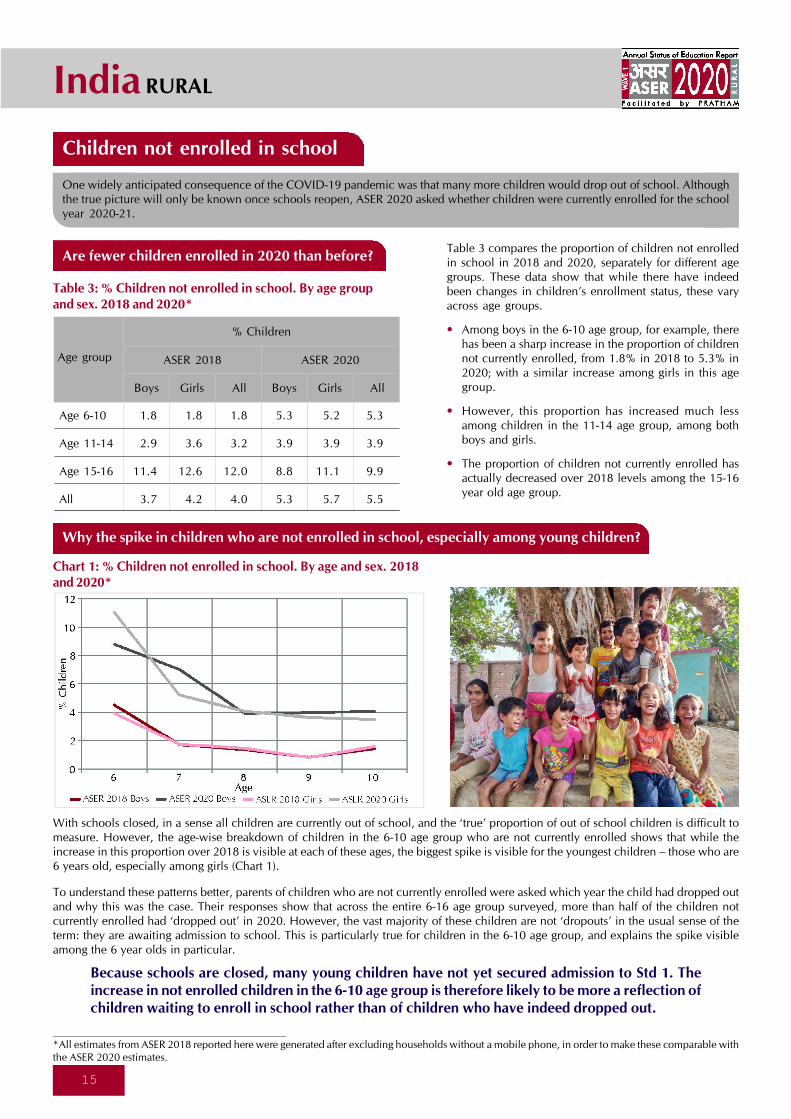
To understand these patterns better, parents of children who are not currently enrolled were asked which year the child had dropped outand why this was the case. Their responses show that across the entire 6-16 age group surveyed, more than half of the children notcurrently enrolled had ‘dropped out’ in 2020. However, the vast majority of these children are not ‘dropouts’ in the usual sense of theterm: they are awaiting admission to school. This is particularly true for children in the 6-10 age group, and explains the spike visibleamong the 6 year olds in particular.
Because schools are closed, many young children have not yet secured admission to Std 1. Theincrease in not enrolled children in the 6-10 age group is therefore likely to be more a reflection ofchildren waiting to enroll in school rather than of children who have indeed dropped out.
With schools closed, in a sense all children are currently out of school, and the ‘true’ proportion of out of school children is difficult tomeasure. However, the age-wise breakdown of children in the 6-10 age group who are not currently enrolled shows that while theincrease in this proportion over 2018 is visible at each of these ages, the biggest spike is visible for the youngest children – those who are6 years old, especially among girls (Chart 1).
Why the spike in children who are not enrolled in school, especially among young children?
Chart 1: % Children not enrolled in school. By age and sex. 2018and 2020*
16
India RURAL
Household resources
A family’s resources influence the type and amount of support they can provide for children’s learning, not only in terms of choosinga school to send their child to but in many other ways as well. ASER 2020 asked questions about selected household resources, suchas parents’ own education levels; access to technology such as TV and smartphones; and availability of textbooks for the currentgrade. Other than the availability of textbooks, ASER 2020 Wave 1 did not explore if the household had other learning materials likeother books, instructional games, etc.
Table 4: Distribution of enrolled children. By schooltype, mother’s and father’s education level. 2020
Parents’educationlevel
No schooling
Std I-V
Std VI-VIII
Std IX-X
Total
Mother
35.0 22.7 31.3 18.9 9.5 16.1
17.7 11.1 15.7 15.6 7.3 13.1
19.2 17.9 18.8 20.9 15.4 19.2
18.8 23.6 20.3 26.3 29.9 27.4
9.4 24.7 14.0 18.2 37.9 24.2
100 100 100 100 100 100
Father
% Children in % Children in
Govt Pvt Govt &Pvt
Govt Pvt Govt &Pvt
Increasingly, parents of children currently in school have beento school themselves.
In ASER 2020, for example, Table 4 shows that under a third ofmothers (31.3%) and even fewer fathers (16.6%) have noschooling.
More than half of all mothers (53.1%) andan even higher proportion of fathers(70.8%) have completed more than 5 yearsof school.
ASER does not collect information on household income, butparents’ education levels can be used as a proxy for thehousehold's socio-economic status. On average, moreeducated parents have households with higher incomes. Table5 shows, for example, that as parents’ education level increases,the likelihood that the household has a smartphone alsoincreases; and the probability that the sampled child is studyingin a government school decreases:
• Almost a quarter of all children have parents in the ‘low’education category (22.5%). The vast majority of thesechildren study in government schools (84%) and less thanhalf of their families have a smartphone (45.1%).
• Similar proportions of children have parents in the ‘high’education category (27.6%). But a far lower proportion arein government schools (53.9%), while most have familieswith a smartphone (78.7%).
Table 5: Distribution of enrolled children.By parents’ education and household resources. 2020
Parents’education
Low
Medium
High
All
22.5 45.1 84.0
49.9 60.2 71.6
27.6 78.7 53.9
100 61.9 69.5
% Children
Of these children,
% Whosehouseholds
havesmartphones
% Enrolled inGovt school
We categorize parents’ education as follows: ‘low’ parental educationincludes families where both parents have completed Std V or less(including those with no schooling). At the other end of the spectrum,the ‘high’ parental education category comprises families where bothparents have completed at least Std IX. All other parents are in the‘medium’ category where there are many possible combinations.
How much schooling do parents of children in the ASER 2020 sample have?
Std XI &above
17
India RURAL
The comparison between ASER 2018 and 2020 shows that a much higher proportion of children now come from households with asmartphone as compared to two years ago (Table 7).
Although the proportion of children from households with assets like TV and motorized vehicleschanged only slightly over the last two years, the proportion owning a smartphone increased enor-mously – from 36.5% to 61.8%.
The percentage point increase in smartphone ownership was similar in households of children enrolled in government and privateschools. Among children enrolled in both government and private schools, about 1 in every 10 households bought a new phone tosupport their children’s education after schools closed in March 2020 (Table 8). Most often parents purchased a smartphone. But evenamong children who did not have a smartphone at home, about 1 in every 10 was able to access a smartphone elsewhere, for examplefrom a neighbour.
Do children have textbooks at home?
Table 6: % Enrolled children who have textbooks fortheir current grade. By grade and school type. 2020
Std
Std I-II
Std III-V
Std VI-VIII
Std IX & above
All
Govt Pvt Govt & Pvt
79.8 69.7 76.2
85.5 72.0 81.4
86.3 73.7 82.8
82.7 73.5 80.0
84.1 72.2 80.5
Table 6 indicates that in all grades, a very high proportion ofchildren have textbooks for their current grade. For every grade,the percentage of children in government schools who havetextbooks is higher than among children in private schools.
Table 7: % Enrolled children with selected assets availableat home. By school type and asset type. 2018 and 2020*
Smartphone
TV
Householdresource
% Children
ASER 2018 ASER 2020
Govt Pvt Govt &
PvtGovt Pvt
Govt &Pvt
Motorizedvehicle
29.6 49.9 36.5 56.4 74.2 61.8
54.8 72.5 60.7 56.0 71.9 60.8
39.1 62.5 46.9 43.5 64.7 49.9
Table 8: % Enrolled children with access to smartphones. By school type. 2020
*All estimates from ASER 2018 reported here were generated after excluding households without a mobile phone, in order to make these comparable withthe ASER 2020 estimates.
Bought a newphone forchildren’s
education sincethe lockdown
began
If nosmartphone inthe household,then % children
who haveaccess to any
othersmartphone
% Children
Number of smartphones in the household If bought a new phone,then type of phone
purchased
Nosmartphone
1 23 ormore Total Regular
phoneSmartphone
Schooltype
Govt
Pvt
Govt & Pvt
43.6 43.6 9.7 3.1 100 10.2 20.1 80.6 12.6
25.8 50.3 16.7 7.2 100 13.2 15.7 83.8 13.1
38.2 45.6 11.8 4.3 100 11.1 18.5 81.7 12.7
Do children have a smartphone at home?
18
India RURAL
Do families help children while studying at home?
Table 9: % Enrolled children who receive help fromfamily members while studying at home. By grade andschool type. 2020
Std
Std I-II
Std III-V
Std VI-VIII
Std IX & above
All
Govt Pvt Govt & Pvt
78.6 86.7 81.5
75.3 81.7 77.3
70.8 79.1 73.1
66.9 71.7 68.3
72.6 80.0 74.9
Learning support for children at home
The previous section summarized what households have, in terms of the availability of some key resources that they can use tosupport children’s learning. This section examines some dimensions of what households do, in order to provide learning support tochildren during the period of school closures. This includes support from family members as well as other support such as paidprivate tuition.
Table 9 shows the proportion of children who receive help athome for learning activities.
• Taking all children across different grades together, close tothree quarters of all children receive help from family members.
• For both types of schools, more younger children receivehelp from families than older children. Overall, 81.5% childrenin Std I-II receive help from family members as compared to68.3% children in Std IX and above.
• For each grade level, private school children get more helpthan government school children. For example, for childrenin Std III-V, 75.3% government school children receive helpas compared to 81.7% of children enrolled in private schools.
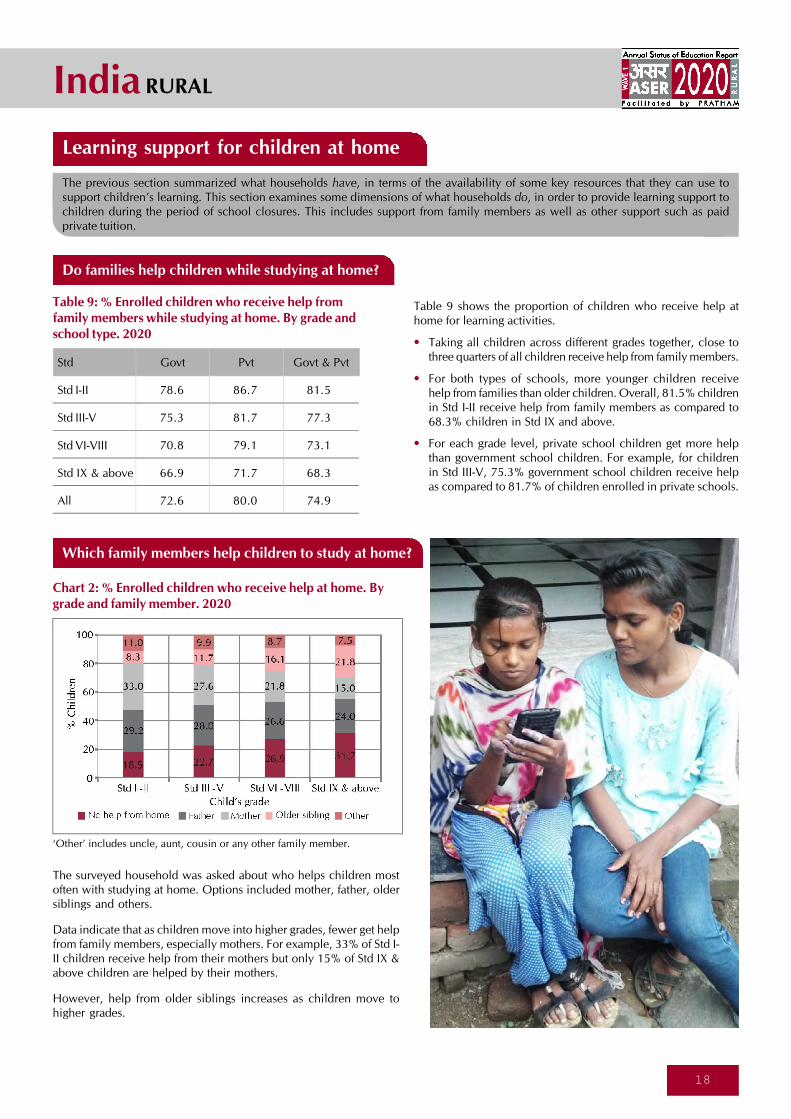
Which family members help children to study at home?
Chart 2: % Enrolled children who receive help at home. Bygrade and family member. 2020
‘Other’ includes uncle, aunt, cousin or any other family member.
The surveyed household was asked about who helps children mostoften with studying at home. Options included mother, father, oldersiblings and others.
Data indicate that as children move into higher grades, fewer get helpfrom family members, especially mothers. For example, 33% of Std I-II children receive help from their mothers but only 15% of Std IX &above children are helped by their mothers.
However, help from older siblings increases as children move tohigher grades.
19
India RURAL
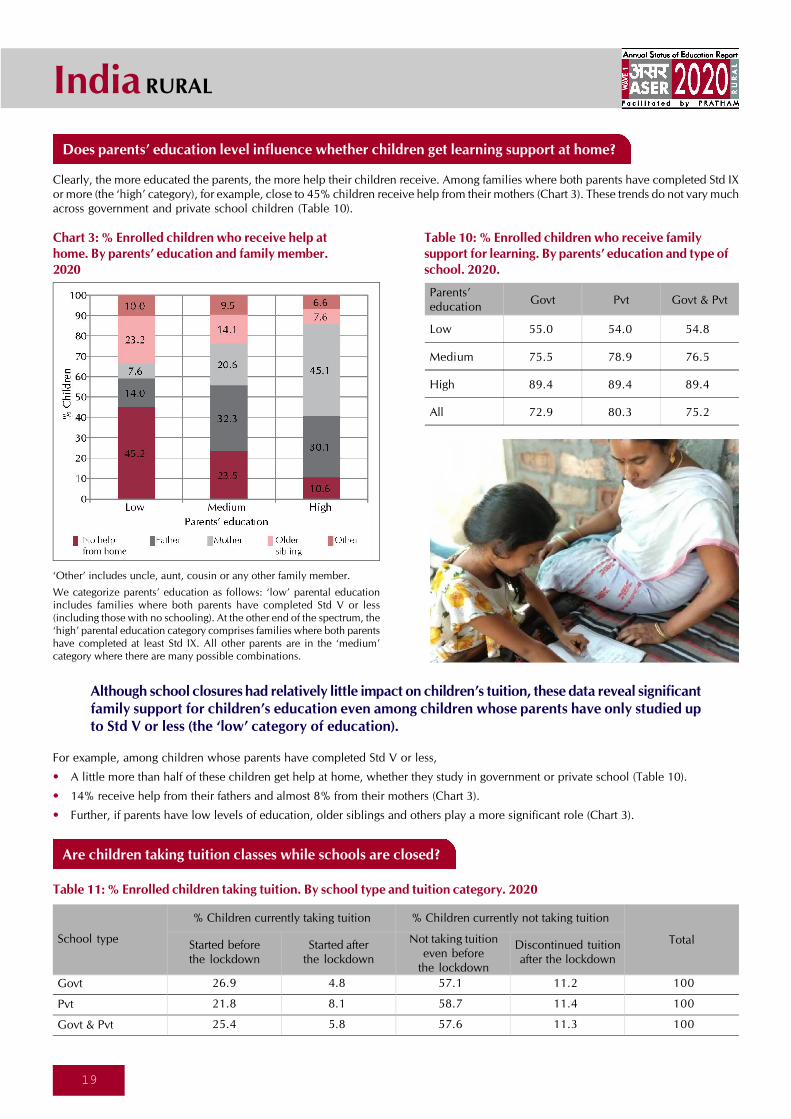
Clearly, the more educated the parents, the more help their children receive. Among families where both parents have completed Std IXor more (the ‘high’ category), for example, close to 45% children receive help from their mothers (Chart 3). These trends do not vary muchacross government and private school children (Table 10).
Chart 3: % Enrolled children who receive help athome. By parents’ education and family member.2020
Table 10: % Enrolled children who receive familysupport for learning. By parents’ education and type ofschool. 2020.
Parents’education
Low
Medium
High
All
55.0 54.0 54.8
75.5 78.9 76.5
89.4 89.4 89.4
72.9 80.3 75.2
Govt Pvt Govt & Pvt
‘Other’ includes uncle, aunt, cousin or any other family member.
We categorize parents’ education as follows: ‘low’ parental educationincludes families where both parents have completed Std V or less(including those with no schooling). At the other end of the spectrum, the‘high’ parental education category comprises families where both parentshave completed at least Std IX. All other parents are in the ‘medium’category where there are many possible combinations.
Although school closures had relatively little impact on children’s tuition, these data reveal significantfamily support for children’s education even among children whose parents have only studied upto Std V or less (the ‘low’ category of education).
For example, among children whose parents have completed Std V or less,
• A little more than half of these children get help at home, whether they study in government or private school (Table 10).
• 14% receive help from their fathers and almost 8% from their mothers (Chart 3).
• Further, if parents have low levels of education, older siblings and others play a more significant role (Chart 3).
Table 11: % Enrolled children taking tuition. By school type and tuition category. 2020
School type
Govt
Pvt
Govt & Pvt
Started beforethe lockdown
% Children currently taking tuition
26.9 4.8 57.1 11.2 100
21.8 8.1 58.7 11.4 100
25.4 5.8 57.6 11.3 100
% Children currently not taking tuition
Started afterthe lockdown
Not taking tuitioneven before
the lockdown
Discontinued tuitionafter the lockdown
Total
Are children taking tuition classes while schools are closed?
Does parents’ education level influence whether children get learning support at home?
20
India RURAL
Access to and availability of learning materials and activities
The ASER 2020 survey asked households whether schools had sent learning materials or activities for children during the week priorto the survey (the reference week), which was carried out in September 2020 when schools across the country were closed. Learningmaterials included traditional materials like textbooks and worksheets in print or virtual form; online or recorded classes; and videosor other activities sent via phone or received in person.
Did children receive any learning materials or activities during the reference week?*
Table 12: % Enrolled children who received learningmaterials/activities in the reference week. By grade andschool type. 2020
Overall, approximately one third of allenrolled children received some kind oflearning materials or activities fromtheir teachers during the referenceweek (Table 12).
A slightly larger proportion of students in higher classes receivedmaterials as compared to lower classes. For example, close to38% of high school students received materials as compared to30.8% of children in Std I-II.
A higher percentage of private school children received learningmaterials/activities as compared to government school childrenin the same grades.
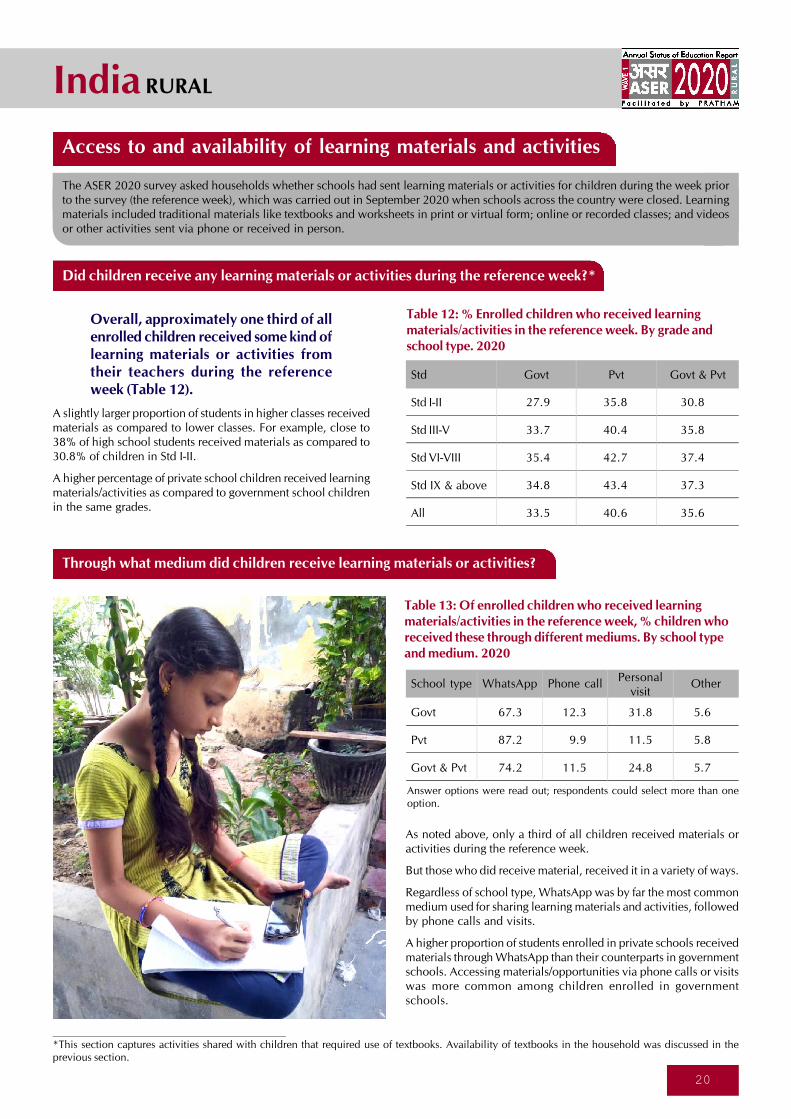
Through what medium did children receive learning materials or activities?
Std
Std I-II
Std III-V
Std VI-VIII
Std IX & above
All
Govt Pvt Govt & Pvt
27.9 35.8 30.8
33.7 40.4 35.8
35.4 42.7 37.4
34.8 43.4 37.3
33.5 40.6 35.6
Table 13: Of enrolled children who received learningmaterials/activities in the reference week, % children whoreceived these through different mediums. By school typeand medium. 2020
As noted above, only a third of all children received materials oractivities during the reference week.
But those who did receive material, received it in a variety of ways.
Regardless of school type, WhatsApp was by far the most commonmedium used for sharing learning materials and activities, followedby phone calls and visits.
A higher proportion of students enrolled in private schools receivedmaterials through WhatsApp than their counterparts in governmentschools. Accessing materials/opportunities via phone calls or visitswas more common among children enrolled in governmentschools.
School type
Govt
Pvt
Govt & Pvt
67.3 12.3 31.8 5.6
87.2 9.9 11.5 5.8
74.2 11.5 24.8 5.7
Phone callPersonal
visitOther
Answer options were read out; respondents could select more than oneoption.
*This section captures activities shared with children that required use of textbooks. Availability of textbooks in the household was discussed in theprevious section.
21
India RURAL
Table 14: Of enrolled children who received learning materials/activities in the reference week, % children who got these throughone or more mediums. By school type and number of mediums.2020
Table 15: % Enrolled children who received materials fromonly one medium. By smartphone availability and medium. 2020
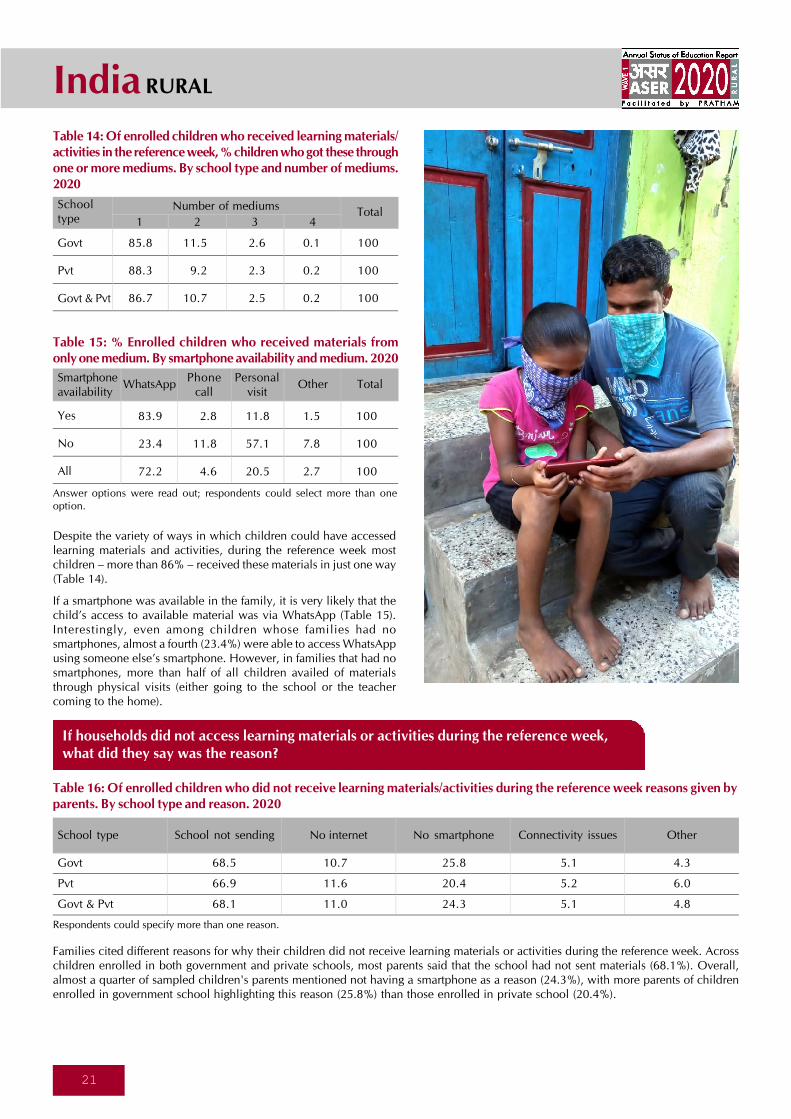
Despite the variety of ways in which children could have accessedlearning materials and activities, during the reference week mostchildren – more than 86% – received these materials in just one way(Table 14).
If a smartphone was available in the family, it is very likely that thechild’s access to available material was via WhatsApp (Table 15).Interestingly, even among children whose families had nosmartphones, almost a fourth (23.4%) were able to access WhatsAppusing someone else’s smartphone. However, in families that had nosmartphones, more than half of all children availed of materialsthrough physical visits (either going to the school or the teachercoming to the home).
Smartphoneavailability
Yes
No
All
Total
83.9 2.8 11.8 1.5 100
23.4 11.8 57.1 7.8 100
72.2 4.6 20.5 2.7 100
WhatsAppPhone
callPersonal
visitOther
If households did not access learning materials or activities during the reference week,what did they say was the reason?
Families cited different reasons for why their children did not receive learning materials or activities during the reference week. Acrosschildren enrolled in both government and private schools, most parents said that the school had not sent materials (68.1%). Overall,almost a quarter of sampled children's parents mentioned not having a smartphone as a reason (24.3%), with more parents of childrenenrolled in government school highlighting this reason (25.8%) than those enrolled in private school (20.4%).
School type
Govt
Pvt
Govt & Pvt
School not sending
68.5 10.7 25.8 5.1 4.3
66.9 11.6 20.4 5.2 6.0
68.1 11.0 24.3 5.1 4.8
No internet No smartphone Connectivity issues Other
Schooltype
Govt
Pvt
Govt & Pvt
Total
85.8 11.5 2.6 0.1 100
88.3 9.2 2.3 0.2 100
86.7 10.7 2.5 0.2 100
Number of mediums
1 2 3 4
Respondents could specify more than one reason.
Table 16: Of enrolled children who did not receive learning materials/activities during the reference week reasons given byparents. By school type and reason. 2020
Answer options were read out; respondents could select more than oneoption.
22
India RURAL
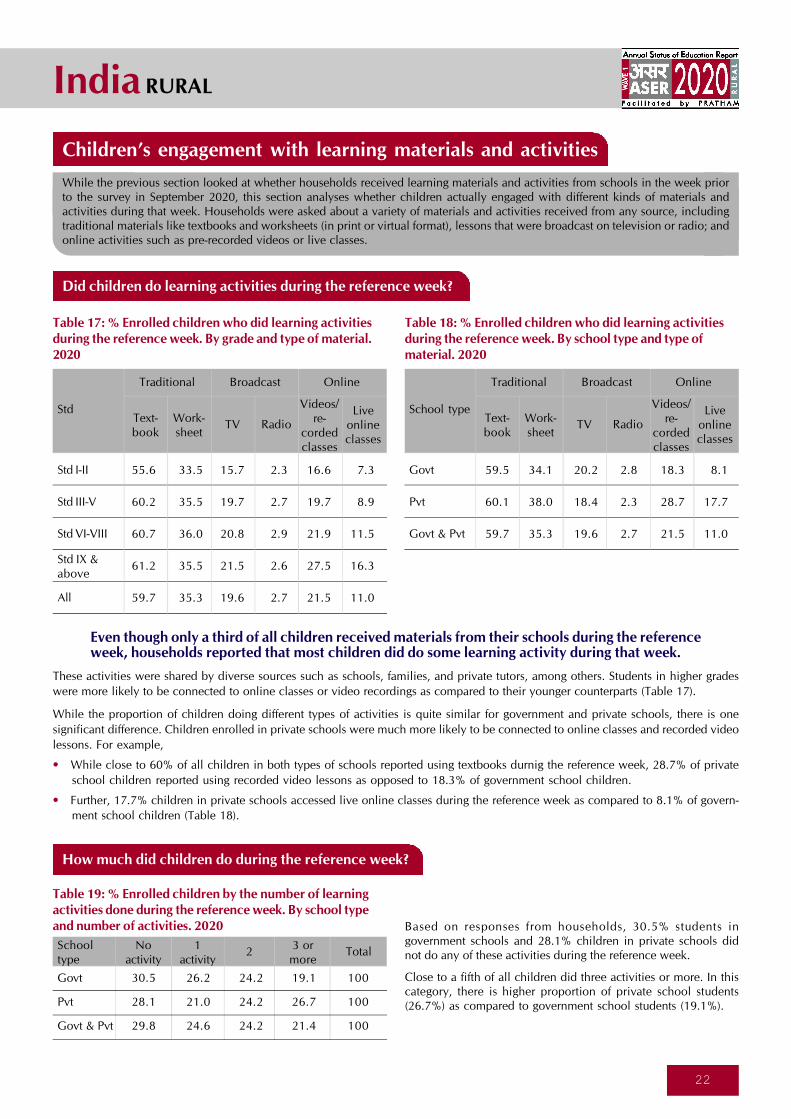
While the previous section looked at whether households received learning materials and activities from schools in the week priorto the survey in September 2020, this section analyses whether children actually engaged with different kinds of materials andactivities during that week. Households were asked about a variety of materials and activities received from any source, includingtraditional materials like textbooks and worksheets (in print or virtual format), lessons that were broadcast on television or radio; andonline activities such as pre-recorded videos or live classes.
Did children do learning activities during the reference week?
Std
Std I-II
Std III-V
Std VI-VIII
All
Traditional
55.6 33.5 15.7 2.3 16.6 7.3
60.2 35.5 19.7 2.7 19.7 8.9
60.7 36.0 20.8 2.9 21.9 11.5
61.2 35.5 21.5 2.6 27.5 16.3
59.7 35.3 19.6 2.7 21.5 11.0
Online
Text-book
Work-sheet
TV Radio
Videos/re-
cordedclasses
Liveonlineclasses
Broadcast
Table 17: % Enrolled children who did learning activitiesduring the reference week. By grade and type of material.2020
Table 18: % Enrolled children who did learning activitiesduring the reference week. By school type and type ofmaterial. 2020
School type
Govt
Pvt
Govt & Pvt
Traditional
59.5 34.1 20.2 2.8 18.3 8.1
60.1 38.0 18.4 2.3 28.7 17.7
59.7 35.3 19.6 2.7 21.5 11.0
Online
Text-book
Work-sheet
TV Radio
Videos/re-
cordedclasses
Liveonlineclasses
Broadcast
Even though only a third of all children received materials from their schools during the referenceweek, households reported that most children did do some learning activity during that week.
These activities were shared by diverse sources such as schools, families, and private tutors, among others. Students in higher grades
were more likely to be connected to online classes or video recordings as compared to their younger counterparts (Table 17).
While the proportion of children doing different types of activities is quite similar for government and private schools, there is one
significant difference. Children enrolled in private schools were much more likely to be connected to online classes and recorded video
lessons. For example,
• While close to 60% of all children in both types of schools reported using textbooks durnig the reference week, 28.7% of private
school children reported using recorded video lessons as opposed to 18.3% of government school children.
• Further, 17.7% children in private schools accessed live online classes during the reference week as compared to 8.1% of govern-
ment school children (Table 18).
Based on responses from households, 30.5% students ingovernment schools and 28.1% children in private schools didnot do any of these activities during the reference week.
Close to a fifth of all children did three activities or more. In thiscategory, there is higher proportion of private school students(26.7%) as compared to government school students (19.1%).
How much did children do during the reference week?
Table 19: % Enrolled children by the number of learningactivities done during the reference week. By school typeand number of activities. 2020
Schooltype
Govt
Pvt
Govt & Pvt
30.5 26.2 24.2 19.1 100
28.1 21.0 24.2 26.7 100
29.8 24.6 24.2 21.4 100
Noactivity
1activity
23 ormore
Total
Std IX &above
Children’s engagement with learning materials and activities
23
India RURAL
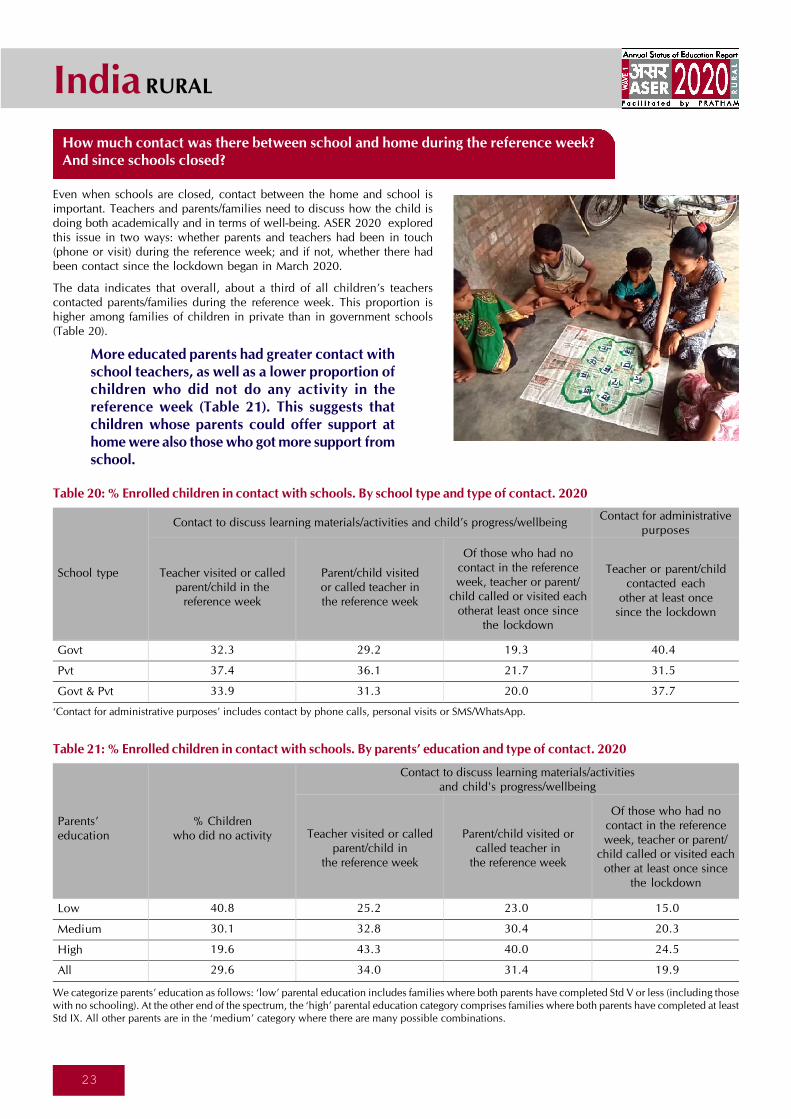
Even when schools are closed, contact between the home and school isimportant. Teachers and parents/families need to discuss how the child isdoing both academically and in terms of well-being. ASER 2020 exploredthis issue in two ways: whether parents and teachers had been in touch(phone or visit) during the reference week; and if not, whether there hadbeen contact since the lockdown began in March 2020.
The data indicates that overall, about a third of all children’s teacherscontacted parents/families during the reference week. This proportion ishigher among families of children in private than in government schools(Table 20).
More educated parents had greater contact withschool teachers, as well as a lower proportion ofchildren who did not do any activity in thereference week (Table 21). This suggests thatchildren whose parents could offer support athome were also those who got more support fromschool.
How much contact was there between school and home during the reference week?And since schools closed?
Table 20: % Enrolled children in contact with schools. By school type and type of contact. 2020
Table 21: % Enrolled children in contact with schools. By parents’ education and type of contact. 2020
32.3 29.2 19.3 40.4
37.4 36.1 21.7 31.5
33.9 31.3 20.0 37.7
School type
Govt
Pvt
Govt & Pvt
Teacher visited or calledparent/child in the
reference week
Contact to discuss learning materials/activities and child’s progress/wellbeingContact for administrative
purposes
Parent/child visitedor called teacher inthe reference week
Of those who had nocontact in the referenceweek, teacher or parent/
child called or visited eachotherat least once since
the lockdown
Teacher or parent/childcontacted each
other at least oncesince the lockdown
We categorize parents’ education as follows: ‘low’ parental education includes families where both parents have completed Std V or less (including thosewith no schooling). At the other end of the spectrum, the ‘high’ parental education category comprises families where both parents have completed at leastStd IX. All other parents are in the ‘medium’ category where there are many possible combinations.
40.8 25.2 23.0 15.0
30.1 32.8 30.4 20.3
19.6 43.3 40.0 24.5
29.6 34.0 31.4 19.9
Parents’education
Low
Medium
High
All
% Childrenwho did no activity
Contact to discuss learning materials/activitiesand child's progress/wellbeing
Teacher visited or calledparent/child in
the reference week
Parent/child visited orcalled teacher in
the reference week
Of those who had nocontact in the referenceweek, teacher or parent/
child called or visited eachother at least once since
the lockdown
‘Contact for administrative purposes’ includes contact by phone calls, personal visits or SMS/WhatsApp.
24
India RURAL
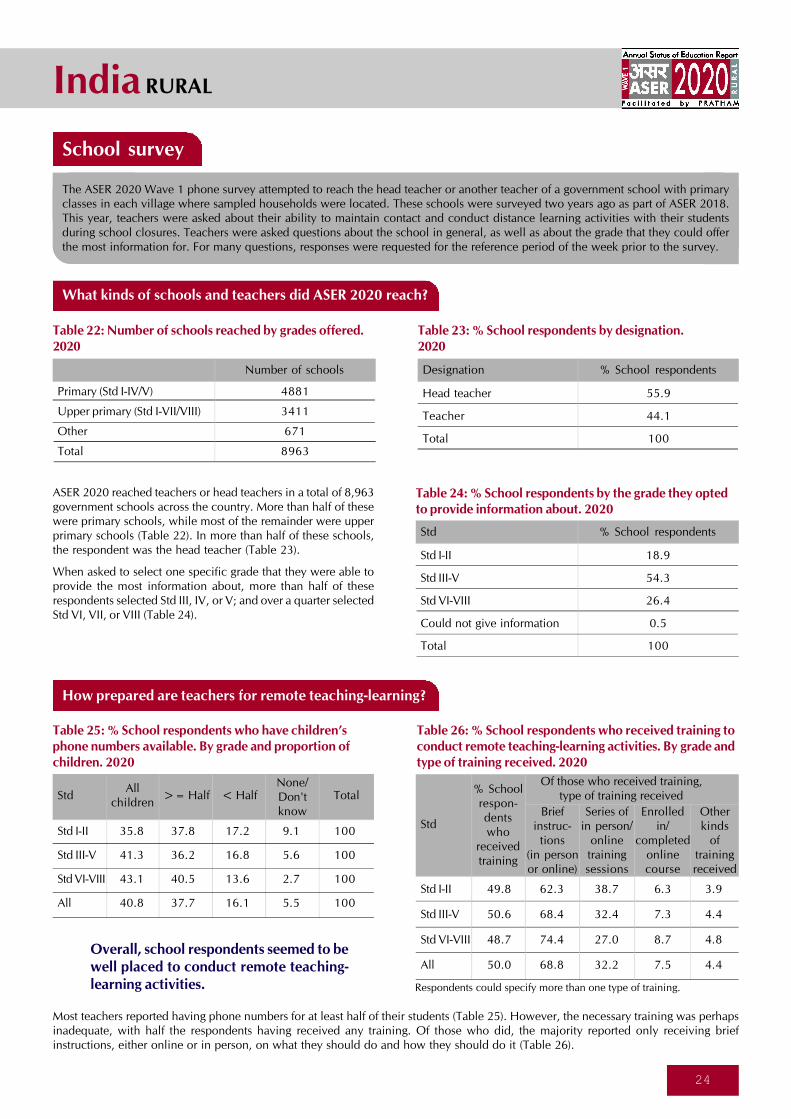
The ASER 2020 Wave 1 phone survey attempted to reach the head teacher or another teacher of a government school with primaryclasses in each village where sampled households were located. These schools were surveyed two years ago as part of ASER 2018.This year, teachers were asked about their ability to maintain contact and conduct distance learning activities with their studentsduring school closures. Teachers were asked questions about the school in general, as well as about the grade that they could offerthe most information for. For many questions, responses were requested for the reference period of the week prior to the survey.
What kinds of schools and teachers did ASER 2020 reach?
ASER 2020 reached teachers or head teachers in a total of 8,963government schools across the country. More than half of thesewere primary schools, while most of the remainder were upperprimary schools (Table 22). In more than half of these schools,the respondent was the head teacher (Table 23).
When asked to select one specific grade that they were able toprovide the most information about, more than half of theserespondents selected Std III, IV, or V; and over a quarter selectedStd VI, VII, or VIII (Table 24).
Table 25: % School respondents who have children’sphone numbers available. By grade and proportion ofchildren. 2020
Table 26: % School respondents who received training toconduct remote teaching-learning activities. By grade andtype of training received. 2020
Std
Std I-II
Std III-V
Std VI-VIII
All
35.8 37.8 17.2 9.1 100
41.3 36.2 16.8 5.6 100
43.1 40.5 13.6 2.7 100
40.8 37.7 16.1 5.5 100
Allchildren
>= Half < HalfNone/Don'tknow
Total
Table 24: % School respondents by the grade they optedto provide information about. 2020
Std
Std I-II
Std III-V
Std VI-VIII
Could not give information
Total
% School respondents
18.9
54.3
26.4
0.5
100
Std
Std I-II
Std III-V
Std VI-VIII
All
% Schoolrespon-dentswho
receivedtraining
49.8 62.3 38.7 6.3 3.9
50.6 68.4 32.4 7.3 4.4
48.7 74.4 27.0 8.7 4.8
50.0 68.8 32.2 7.5 4.4
Briefinstruc-tions
(in personor online)
Series ofin person/
onlinetrainingsessions
Otherkinds
oftrainingreceived
Of those who received training,type of training received
Overall, school respondents seemed to bewell placed to conduct remote teaching-learning activities.
Most teachers reported having phone numbers for at least half of their students (Table 25). However, the necessary training was perhapsinadequate, with half the respondents having received any training. Of those who did, the majority reported only receiving briefinstructions, either online or in person, on what they should do and how they should do it (Table 26).
How prepared are teachers for remote teaching-learning?
Table 23: % School respondents by designation.2020
Designation
Head teacher
Teacher
Total
% School respondents
55.9
44.1
100
Table 22: Number of schools reached by grades offered.2020
Primary (Std I-IV/V)
Upper primary (Std I-VII/VIII)
Other
Total
Number of schools
4881
3411
671
8963
Respondents could specify more than one type of training.
School survey
Enrolledin/
completedonlinecourse
25
India RURAL
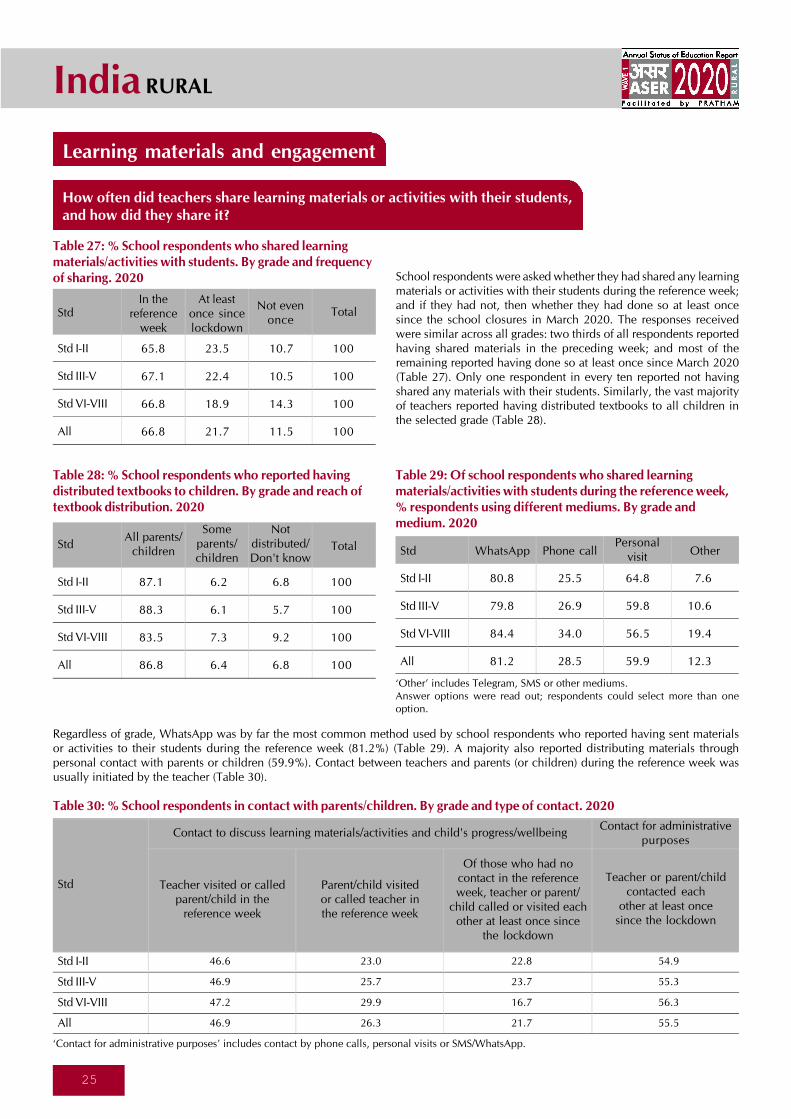
Table 27: % School respondents who shared learningmaterials/activities with students. By grade and frequencyof sharing. 2020 School respondents were asked whether they had shared any learning
materials or activities with their students during the reference week;and if they had not, then whether they had done so at least oncesince the school closures in March 2020. The responses receivedwere similar across all grades: two thirds of all respondents reportedhaving shared materials in the preceding week; and most of theremaining reported having done so at least once since March 2020(Table 27). Only one respondent in every ten reported not havingshared any materials with their students. Similarly, the vast majorityof teachers reported having distributed textbooks to all children inthe selected grade (Table 28).
Std
Std I-II
Std III-V
Std VI-VIII
All
In thereference
week
65.8 23.5 10.7 100
67.1 22.4 10.5 100
66.8 18.9 14.3 100
66.8 21.7 11.5 100
At leastonce sincelockdown
Not evenonce
Total
Table 28: % School respondents who reported havingdistributed textbooks to children. By grade and reach oftextbook distribution. 2020
Std
Std I-II
Std III-V
Std VI-VIII
All
All parents/children
87.1 6.2 6.8 100
88.3 6.1 5.7 100
83.5 7.3 9.2 100
86.8 6.4 6.8 100
Someparents/children
Notdistributed/Don't know
Total
Table 29: Of school respondents who shared learningmaterials/activities with students during the reference week,% respondents using different mediums. By grade andmedium. 2020
Std
Std I-II
Std III-V
Std VI-VIII
All
80.8 25.5 64.8 7.6
79.8 26.9 59.8 10.6
84.4 34.0 56.5 19.4
81.2 28.5 59.9 12.3
Phone callPersonal
visitOther
‘Other’ includes Telegram, SMS or other mediums.Answer options were read out; respondents could select more than oneoption.
Table 30: % School respondents in contact with parents/children. By grade and type of contact. 2020
46.6 23.0 22.8 54.9
46.9 25.7 23.7 55.3
47.2 29.9 16.7 56.3
46.9 26.3 21.7 55.5
Std
Std I-II
Std III-V
Std VI-VIII
All
Teacher visited or calledparent/child in the
reference week
Contact to discuss learning materials/activities and child's progress/wellbeingContact for administrative
purposes
Parent/child visitedor called teacher inthe reference week
Of those who had nocontact in the referenceweek, teacher or parent/
child called or visited eachother at least once since
the lockdown
Teacher or parent/childcontacted each
other at least oncesince the lockdown
‘Contact for administrative purposes’ includes contact by phone calls, personal visits or SMS/WhatsApp.
Regardless of grade, WhatsApp was by far the most common method used by school respondents who reported having sent materialsor activities to their students during the reference week (81.2%) (Table 29). A majority also reported distributing materials throughpersonal contact with parents or children (59.9%). Contact between teachers and parents (or children) during the reference week wasusually initiated by the teacher (Table 30).
Learning materials and engagement
How often did teachers share learning materials or activities with their students,and how did they share it?
26
India RURAL
Community involvement
Do teachers get help from others in the community to support children’s learning?
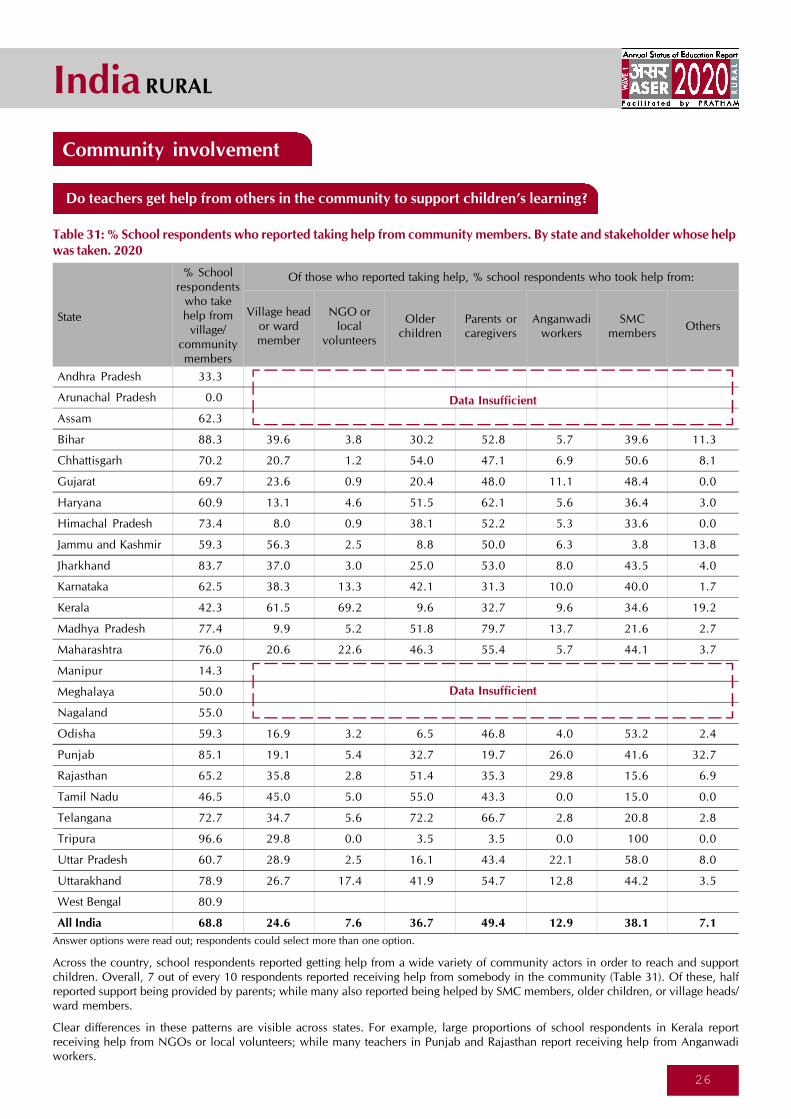
Table 31: % School respondents who reported taking help from community members. By state and stakeholder whose helpwas taken. 2020
Across the country, school respondents reported getting help from a wide variety of community actors in order to reach and supportchildren. Overall, 7 out of every 10 respondents reported receiving help from somebody in the community (Table 31). Of these, halfreported support being provided by parents; while many also reported being helped by SMC members, older children, or village heads/ward members.
Clear differences in these patterns are visible across states. For example, large proportions of school respondents in Kerala reportreceiving help from NGOs or local volunteers; while many teachers in Punjab and Rajasthan report receiving help from Anganwadiworkers.
State
Andhra Pradesh 33.3
Arunachal Pradesh 0.0
Assam 62.3
Bihar 88.3 39.6 3.8 30.2 52.8 5.7 39.6 11.3
Chhattisgarh 70.2 20.7 1.2 54.0 47.1 6.9 50.6 8.1
Gujarat 69.7 23.6 0.9 20.4 48.0 11.1 48.4 0.0
Haryana 60.9 13.1 4.6 51.5 62.1 5.6 36.4 3.0
Himachal Pradesh 73.4 8.0 0.9 38.1 52.2 5.3 33.6 0.0
Jammu and Kashmir 59.3 56.3 2.5 8.8 50.0 6.3 3.8 13.8
Jharkhand 83.7 37.0 3.0 25.0 53.0 8.0 43.5 4.0
Karnataka 62.5 38.3 13.3 42.1 31.3 10.0 40.0 1.7
Kerala 42.3 61.5 69.2 9.6 32.7 9.6 34.6 19.2
Madhya Pradesh 77.4 9.9 5.2 51.8 79.7 13.7 21.6 2.7
Maharashtra 76.0 20.6 22.6 46.3 55.4 5.7 44.1 3.7
Manipur 14.3
Meghalaya 50.0
Nagaland 55.0
Odisha 59.3 16.9 3.2 6.5 46.8 4.0 53.2 2.4
Punjab 85.1 19.1 5.4 32.7 19.7 26.0 41.6 32.7
Rajasthan 65.2 35.8 2.8 51.4 35.3 29.8 15.6 6.9
Tamil Nadu 46.5 45.0 5.0 55.0 43.3 0.0 15.0 0.0
Telangana 72.7 34.7 5.6 72.2 66.7 2.8 20.8 2.8
Tripura 96.6 29.8 0.0 3.5 3.5 0.0 100 0.0
Uttar Pradesh 60.7 28.9 2.5 16.1 43.4 22.1 58.0 8.0
Uttarakhand 78.9 26.7 17.4 41.9 54.7 12.8 44.2 3.5
West Bengal 80.9
All India 68.8 24.6 7.6 36.7 49.4 12.9 38.1 7.1
% Schoolrespondents
who takehelp from
village/communitymembers
Village heador wardmember
NGO orlocal
volunteers
Olderchildren
Parents orcaregivers
Anganwadiworkers
SMCmembers
Others
Of those who reported taking help, % school respondents who took help from:
Data Insufficient
Data Insufficient
Answer options were read out; respondents could select more than one option.
India RURAL
ASER 2020 Wave 1 (Rural) findings – State estimates
State estimates
2 8
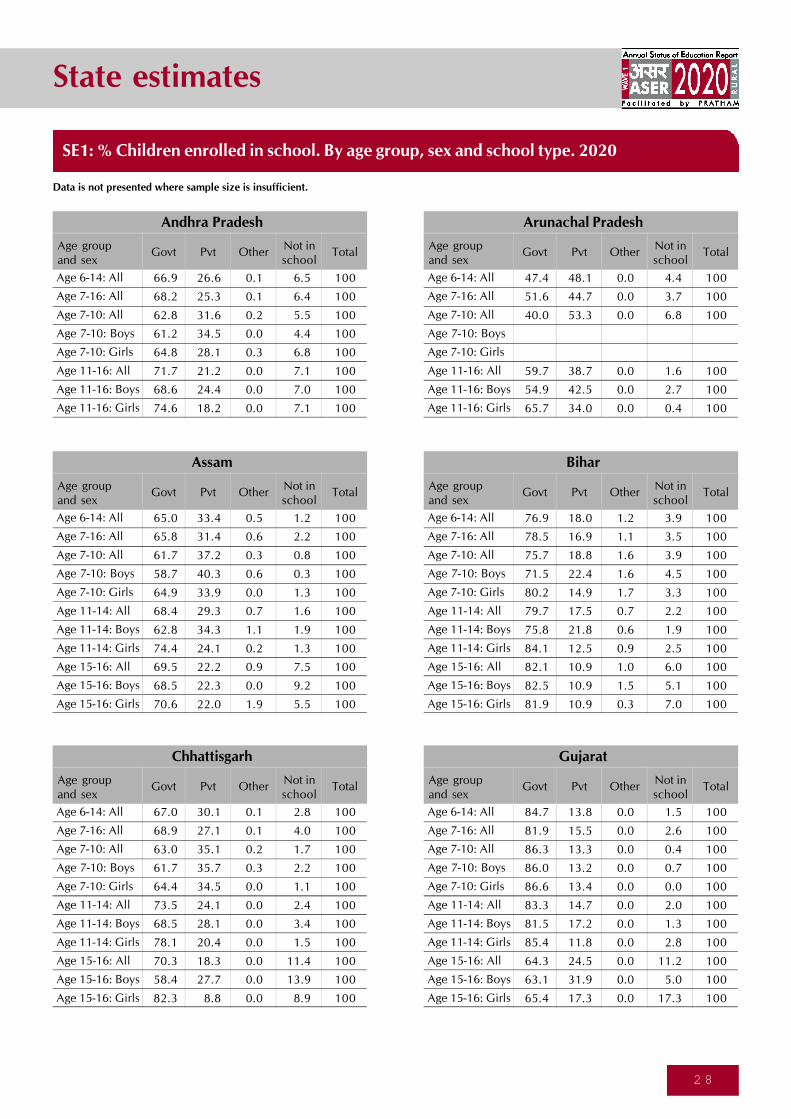
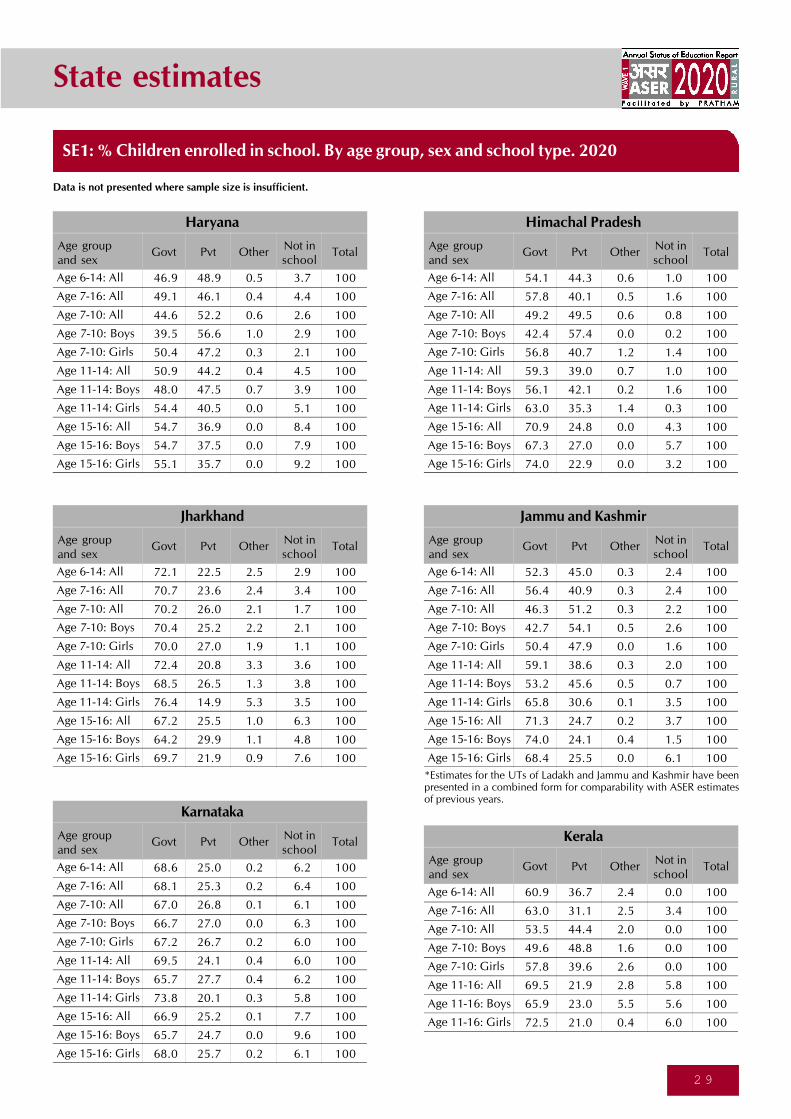
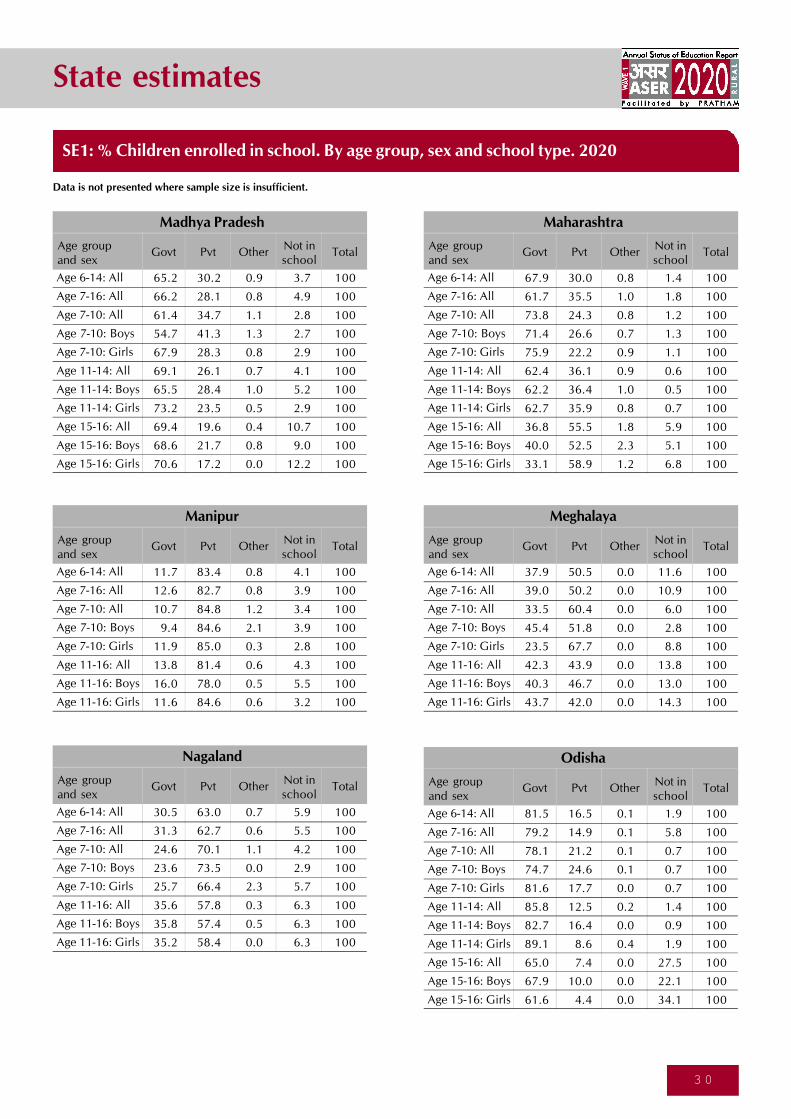
SE1: % Children enrolled in school. By age group, sex and school type. 2020
Data is not presented where sample size is insufficient.
Age groupand sex
Age 6-14: All
Age 7-16: All
Age 7-10: All
Age 7-10: Boys
Age 7-10: Girls
Age 11-16: All
Age 11-16: Boys
Age 11-16: Girls
Govt Pvt OtherNot inschool
Total
66.9 26.6 0.1 6.5 100
68.2 25.3 0.1 6.4 100
62.8 31.6 0.2 5.5 100
61.2 34.5 0.0 4.4 100
64.8 28.1 0.3 6.8 100
71.7 21.2 0.0 7.1 100
68.6 24.4 0.0 7.0 100
74.6 18.2 0.0 7.1 100
Andhra Pradesh
Age groupand sex
Age 6-14: All
Age 7-16: All
Age 7-10: All
Age 7-10: Boys
Age 7-10: Girls
Age 11-14: All
Age 11-14: Boys
Age 11-14: Girls
Age 15-16: All
Age 15-16: Boys
Age 15-16: Girls
Govt Pvt OtherNot inschool
Total
65.0 33.4 0.5 1.2 100
65.8 31.4 0.6 2.2 100
61.7 37.2 0.3 0.8 100
58.7 40.3 0.6 0.3 100
64.9 33.9 0.0 1.3 100
68.4 29.3 0.7 1.6 100
62.8 34.3 1.1 1.9 100
74.4 24.1 0.2 1.3 100
69.5 22.2 0.9 7.5 100
68.5 22.3 0.0 9.2 100
70.6 22.0 1.9 5.5 100
Assam
Age groupand sex
Age 6-14: All
Age 7-16: All
Age 7-10: All
Age 7-10: Boys
Age 7-10: Girls
Age 11-14: All
Age 11-14: Boys
Age 11-14: Girls
Age 15-16: All
Age 15-16: Boys
Age 15-16: Girls
Govt Pvt OtherNot inschool
Total
76.9 18.0 1.2 3.9 100
78.5 16.9 1.1 3.5 100
75.7 18.8 1.6 3.9 100
71.5 22.4 1.6 4.5 100
80.2 14.9 1.7 3.3 100
79.7 17.5 0.7 2.2 100
75.8 21.8 0.6 1.9 100
84.1 12.5 0.9 2.5 100
82.1 10.9 1.0 6.0 100
82.5 10.9 1.5 5.1 100
81.9 10.9 0.3 7.0 100
Bihar
Age groupand sex
Age 6-14: All
Age 7-16: All
Age 7-10: All
Age 7-10: Boys
Age 7-10: Girls
Age 11-14: All
Age 11-14: Boys
Age 11-14: Girls
Age 15-16: All
Age 15-16: Boys
Age 15-16: Girls
Govt Pvt OtherNot inschool
Total
67.0 30.1 0.1 2.8 100
68.9 27.1 0.1 4.0 100
63.0 35.1 0.2 1.7 100
61.7 35.7 0.3 2.2 100
64.4 34.5 0.0 1.1 100
73.5 24.1 0.0 2.4 100
68.5 28.1 0.0 3.4 100
78.1 20.4 0.0 1.5 100
70.3 18.3 0.0 11.4 100
58.4 27.7 0.0 13.9 100
82.3 8.8 0.0 8.9 100
Chhattisgarh
Age groupand sex
Age 6-14: All
Age 7-16: All
Age 7-10: All
Age 7-10: Boys
Age 7-10: Girls
Age 11-14: All
Age 11-14: Boys
Age 11-14: Girls
Age 15-16: All
Age 15-16: Boys
Age 15-16: Girls
Govt Pvt OtherNot inschool
Total
84.7 13.8 0.0 1.5 100
81.9 15.5 0.0 2.6 100
86.3 13.3 0.0 0.4 100
86.0 13.2 0.0 0.7 100
86.6 13.4 0.0 0.0 100
83.3 14.7 0.0 2.0 100
81.5 17.2 0.0 1.3 100
85.4 11.8 0.0 2.8 100
64.3 24.5 0.0 11.2 100
63.1 31.9 0.0 5.0 100
65.4 17.3 0.0 17.3 100
Gujarat
Age groupand sex
Age 6-14: All
Age 7-16: All
Age 7-10: All
Age 7-10: Boys
Age 7-10: Girls
Age 11-16: All
Age 11-16: Boys
Age 11-16: Girls
Govt Pvt OtherNot inschool
Total
47.4 48.1 0.0 4.4 100
51.6 44.7 0.0 3.7 100
40.0 53.3 0.0 6.8 100
59.7 38.7 0.0 1.6 100
54.9 42.5 0.0 2.7 100
65.7 34.0 0.0 0.4 100
Arunachal Pradesh
State estimates
2 9
Age groupand sex
Age 6-14: All
Age 7-16: All
Age 7-10: All
Age 7-10: Boys
Age 7-10: Girls
Age 11-14: All
Age 11-14: Boys
Age 11-14: Girls
Age 15-16: All
Age 15-16: Boys
Age 15-16: Girls
Govt Pvt OtherNot inschool
Total
46.9 48.9 0.5 3.7 100
49.1 46.1 0.4 4.4 100
44.6 52.2 0.6 2.6 100
39.5 56.6 1.0 2.9 100
50.4 47.2 0.3 2.1 100
50.9 44.2 0.4 4.5 100
48.0 47.5 0.7 3.9 100
54.4 40.5 0.0 5.1 100
54.7 36.9 0.0 8.4 100
54.7 37.5 0.0 7.9 100
55.1 35.7 0.0 9.2 100
Haryana
Age groupand sex
Age 6-14: All
Age 7-16: All
Age 7-10: All
Age 7-10: Boys
Age 7-10: Girls
Age 11-14: All
Age 11-14: Boys
Age 11-14: Girls
Age 15-16: All
Age 15-16: Boys
Age 15-16: Girls
Govt Pvt OtherNot inschool
Total
54.1 44.3 0.6 1.0 100
57.8 40.1 0.5 1.6 100
49.2 49.5 0.6 0.8 100
42.4 57.4 0.0 0.2 100
56.8 40.7 1.2 1.4 100
59.3 39.0 0.7 1.0 100
56.1 42.1 0.2 1.6 100
63.0 35.3 1.4 0.3 100
70.9 24.8 0.0 4.3 100
67.3 27.0 0.0 5.7 100
74.0 22.9 0.0 3.2 100
Himachal Pradesh
Age groupand sex
Age 6-14: All
Age 7-16: All
Age 7-10: All
Age 7-10: Boys
Age 7-10: Girls
Age 11-14: All
Age 11-14: Boys
Age 11-14: Girls
Age 15-16: All
Age 15-16: Boys
Age 15-16: Girls
Govt Pvt OtherNot inschool
Total
72.1 22.5 2.5 2.9 100
70.7 23.6 2.4 3.4 100
70.2 26.0 2.1 1.7 100
70.4 25.2 2.2 2.1 100
70.0 27.0 1.9 1.1 100
72.4 20.8 3.3 3.6 100
68.5 26.5 1.3 3.8 100
76.4 14.9 5.3 3.5 100
67.2 25.5 1.0 6.3 100
64.2 29.9 1.1 4.8 100
69.7 21.9 0.9 7.6 100
Jharkhand
Age groupand sex
Age 6-14: All
Age 7-16: All
Age 7-10: All
Age 7-10: Boys
Age 7-10: Girls
Age 11-14: All
Age 11-14: Boys
Age 11-14: Girls
Age 15-16: All
Age 15-16: Boys
Age 15-16: Girls
Govt Pvt OtherNot inschool
Total
52.3 45.0 0.3 2.4 100
56.4 40.9 0.3 2.4 100
46.3 51.2 0.3 2.2 100
42.7 54.1 0.5 2.6 100
50.4 47.9 0.0 1.6 100
59.1 38.6 0.3 2.0 100
53.2 45.6 0.5 0.7 100
65.8 30.6 0.1 3.5 100
71.3 24.7 0.2 3.7 100
74.0 24.1 0.4 1.5 100
68.4 25.5 0.0 6.1 100
Jammu and Kashmir
SE1: % Children enrolled in school. By age group, sex and school type. 2020
Data is not presented where sample size is insufficient.
Age groupand sex
Age 6-14: All
Age 7-16: All
Age 7-10: All
Age 7-10: Boys
Age 7-10: Girls
Age 11-14: All
Age 11-14: Boys
Age 11-14: Girls
Age 15-16: All
Age 15-16: Boys
Age 15-16: Girls
Govt Pvt OtherNot inschool
Total
68.6 25.0 0.2 6.2 100
68.1 25.3 0.2 6.4 100
67.0 26.8 0.1 6.1 100
66.7 27.0 0.0 6.3 100
67.2 26.7 0.2 6.0 100
69.5 24.1 0.4 6.0 100
65.7 27.7 0.4 6.2 100
73.8 20.1 0.3 5.8 100
66.9 25.2 0.1 7.7 100
65.7 24.7 0.0 9.6 100
68.0 25.7 0.2 6.1 100
Karnataka
Age groupand sex
Age 6-14: All
Age 7-16: All
Age 7-10: All
Age 7-10: Boys
Age 7-10: Girls
Age 11-16: All
Age 11-16: Boys
Age 11-16: Girls
Govt Pvt OtherNot inschool
Total
60.9 36.7 2.4 0.0 100
63.0 31.1 2.5 3.4 100
53.5 44.4 2.0 0.0 100
49.6 48.8 1.6 0.0 100
57.8 39.6 2.6 0.0 100
69.5 21.9 2.8 5.8 100
65.9 23.0 5.5 5.6 100
72.5 21.0 0.4 6.0 100
Kerala
*Estimates for the UTs of Ladakh and Jammu and Kashmir have beenpresented in a combined form for comparability with ASER estimatesof previous years.
State estimates
3 0
Age groupand sex
Age 6-14: All
Age 7-16: All
Age 7-10: All
Age 7-10: Boys
Age 7-10: Girls
Age 11-14: All
Age 11-14: Boys
Age 11-14: Girls
Age 15-16: All
Age 15-16: Boys
Age 15-16: Girls
Govt Pvt OtherNot inschool
Total
65.2 30.2 0.9 3.7 100
66.2 28.1 0.8 4.9 100
61.4 34.7 1.1 2.8 100
54.7 41.3 1.3 2.7 100
67.9 28.3 0.8 2.9 100
69.1 26.1 0.7 4.1 100
65.5 28.4 1.0 5.2 100
73.2 23.5 0.5 2.9 100
69.4 19.6 0.4 10.7 100
68.6 21.7 0.8 9.0 100
70.6 17.2 0.0 12.2 100
Madhya Pradesh
Age groupand sex
Age 6-14: All
Age 7-16: All
Age 7-10: All
Age 7-10: Boys
Age 7-10: Girls
Age 11-14: All
Age 11-14: Boys
Age 11-14: Girls
Age 15-16: All
Age 15-16: Boys
Age 15-16: Girls
Govt Pvt OtherNot inschool
Total
67.9 30.0 0.8 1.4 100
61.7 35.5 1.0 1.8 100
73.8 24.3 0.8 1.2 100
71.4 26.6 0.7 1.3 100
75.9 22.2 0.9 1.1 100
62.4 36.1 0.9 0.6 100
62.2 36.4 1.0 0.5 100
62.7 35.9 0.8 0.7 100
36.8 55.5 1.8 5.9 100
40.0 52.5 2.3 5.1 100
33.1 58.9 1.2 6.8 100
Maharashtra
Data is not presented where sample size is insufficient.
Age groupand sex
Age 6-14: All
Age 7-16: All
Age 7-10: All
Age 7-10: Boys
Age 7-10: Girls
Age 11-14: All
Age 11-14: Boys
Age 11-14: Girls
Age 15-16: All
Age 15-16: Boys
Age 15-16: Girls
Govt Pvt OtherNot inschool
Total
81.5 16.5 0.1 1.9 100
79.2 14.9 0.1 5.8 100
78.1 21.2 0.1 0.7 100
74.7 24.6 0.1 0.7 100
81.6 17.7 0.0 0.7 100
85.8 12.5 0.2 1.4 100
82.7 16.4 0.0 0.9 100
89.1 8.6 0.4 1.9 100
65.0 7.4 0.0 27.5 100
67.9 10.0 0.0 22.1 100
61.6 4.4 0.0 34.1 100
Odisha
Age groupand sex
Age 6-14: All
Age 7-16: All
Age 7-10: All
Age 7-10: Boys
Age 7-10: Girls
Age 11-16: All
Age 11-16: Boys
Age 11-16: Girls
Govt Pvt OtherNot inschool
Total
11.7 83.4 0.8 4.1 100
12.6 82.7 0.8 3.9 100
10.7 84.8 1.2 3.4 100
9.4 84.6 2.1 3.9 100
11.9 85.0 0.3 2.8 100
13.8 81.4 0.6 4.3 100
16.0 78.0 0.5 5.5 100
11.6 84.6 0.6 3.2 100
Manipur
Age groupand sex
Age 6-14: All
Age 7-16: All
Age 7-10: All
Age 7-10: Boys
Age 7-10: Girls
Age 11-16: All
Age 11-16: Boys
Age 11-16: Girls
Govt Pvt OtherNot inschool
Total
37.9 50.5 0.0 11.6 100
39.0 50.2 0.0 10.9 100
33.5 60.4 0.0 6.0 100
45.4 51.8 0.0 2.8 100
23.5 67.7 0.0 8.8 100
42.3 43.9 0.0 13.8 100
40.3 46.7 0.0 13.0 100
43.7 42.0 0.0 14.3 100
Meghalaya
Age groupand sex
Age 6-14: All
Age 7-16: All
Age 7-10: All
Age 7-10: Boys
Age 7-10: Girls
Age 11-16: All
Age 11-16: Boys
Age 11-16: Girls
Govt Pvt OtherNot inschool
Total
30.5 63.0 0.7 5.9 100
31.3 62.7 0.6 5.5 100
24.6 70.1 1.1 4.2 100
23.6 73.5 0.0 2.9 100
25.7 66.4 2.3 5.7 100
35.6 57.8 0.3 6.3 100
35.8 57.4 0.5 6.3 100
35.2 58.4 0.0 6.3 100
Nagaland
SE1: % Children enrolled in school. By age group, sex and school type. 2020
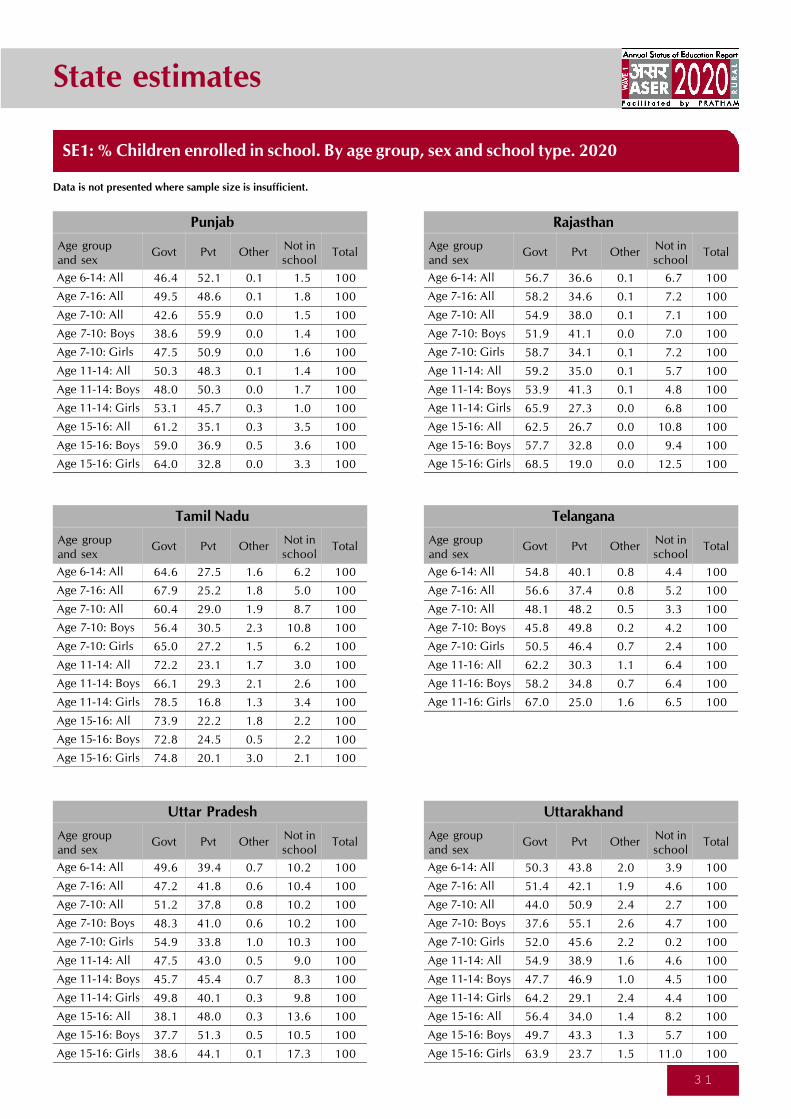
State estimates
3 1
Age groupand sex
Age 6-14: All
Age 7-16: All
Age 7-10: All
Age 7-10: Boys
Age 7-10: Girls
Age 11-14: All
Age 11-14: Boys
Age 11-14: Girls
Age 15-16: All
Age 15-16: Boys
Age 15-16: Girls
Govt Pvt OtherNot inschool
Total
46.4 52.1 0.1 1.5 100
49.5 48.6 0.1 1.8 100
42.6 55.9 0.0 1.5 100
38.6 59.9 0.0 1.4 100
47.5 50.9 0.0 1.6 100
50.3 48.3 0.1 1.4 100
48.0 50.3 0.0 1.7 100
53.1 45.7 0.3 1.0 100
61.2 35.1 0.3 3.5 100
59.0 36.9 0.5 3.6 100
64.0 32.8 0.0 3.3 100
Punjab
Age groupand sex
Age 6-14: All
Age 7-16: All
Age 7-10: All
Age 7-10: Boys
Age 7-10: Girls
Age 11-14: All
Age 11-14: Boys
Age 11-14: Girls
Age 15-16: All
Age 15-16: Boys
Age 15-16: Girls
Govt Pvt OtherNot inschool
Total
56.7 36.6 0.1 6.7 100
58.2 34.6 0.1 7.2 100
54.9 38.0 0.1 7.1 100
51.9 41.1 0.0 7.0 100
58.7 34.1 0.1 7.2 100
59.2 35.0 0.1 5.7 100
53.9 41.3 0.1 4.8 100
65.9 27.3 0.0 6.8 100
62.5 26.7 0.0 10.8 100
57.7 32.8 0.0 9.4 100
68.5 19.0 0.0 12.5 100
Rajasthan
Age groupand sex
Age 6-14: All
Age 7-16: All
Age 7-10: All
Age 7-10: Boys
Age 7-10: Girls
Age 11-14: All
Age 11-14: Boys
Age 11-14: Girls
Age 15-16: All
Age 15-16: Boys
Age 15-16: Girls
Govt Pvt OtherNot inschool
Total
64.6 27.5 1.6 6.2 100
67.9 25.2 1.8 5.0 100
60.4 29.0 1.9 8.7 100
56.4 30.5 2.3 10.8 100
65.0 27.2 1.5 6.2 100
72.2 23.1 1.7 3.0 100
66.1 29.3 2.1 2.6 100
78.5 16.8 1.3 3.4 100
73.9 22.2 1.8 2.2 100
72.8 24.5 0.5 2.2 100
74.8 20.1 3.0 2.1 100
Tamil Nadu
Data is not presented where sample size is insufficient.
Age groupand sex
Age 6-14: All
Age 7-16: All
Age 7-10: All
Age 7-10: Boys
Age 7-10: Girls
Age 11-14: All
Age 11-14: Boys
Age 11-14: Girls
Age 15-16: All
Age 15-16: Boys
Age 15-16: Girls
Govt Pvt OtherNot inschool
Total
49.6 39.4 0.7 10.2 100
47.2 41.8 0.6 10.4 100
51.2 37.8 0.8 10.2 100
48.3 41.0 0.6 10.2 100
54.9 33.8 1.0 10.3 100
47.5 43.0 0.5 9.0 100
45.7 45.4 0.7 8.3 100
49.8 40.1 0.3 9.8 100
38.1 48.0 0.3 13.6 100
37.7 51.3 0.5 10.5 100
38.6 44.1 0.1 17.3 100
Uttar Pradesh
Age groupand sex
Age 6-14: All
Age 7-16: All
Age 7-10: All
Age 7-10: Boys
Age 7-10: Girls
Age 11-14: All
Age 11-14: Boys
Age 11-14: Girls
Age 15-16: All
Age 15-16: Boys
Age 15-16: Girls
Govt Pvt OtherNot inschool
Total
50.3 43.8 2.0 3.9 100
51.4 42.1 1.9 4.6 100
44.0 50.9 2.4 2.7 100
37.6 55.1 2.6 4.7 100
52.0 45.6 2.2 0.2 100
54.9 38.9 1.6 4.6 100
47.7 46.9 1.0 4.5 100
64.2 29.1 2.4 4.4 100
56.4 34.0 1.4 8.2 100
49.7 43.3 1.3 5.7 100
63.9 23.7 1.5 11.0 100
Uttarakhand
Age groupand sex
Age 6-14: All
Age 7-16: All
Age 7-10: All
Age 7-10: Boys
Age 7-10: Girls
Age 11-16: All
Age 11-16: Boys
Age 11-16: Girls
Govt Pvt OtherNot inschool
Total
54.8 40.1 0.8 4.4 100
56.6 37.4 0.8 5.2 100
48.1 48.2 0.5 3.3 100
45.8 49.8 0.2 4.2 100
50.5 46.4 0.7 2.4 100
62.2 30.3 1.1 6.4 100
58.2 34.8 0.7 6.4 100
67.0 25.0 1.6 6.5 100
Telangana
SE1: % Children enrolled in school. By age group, sex and school type. 2020
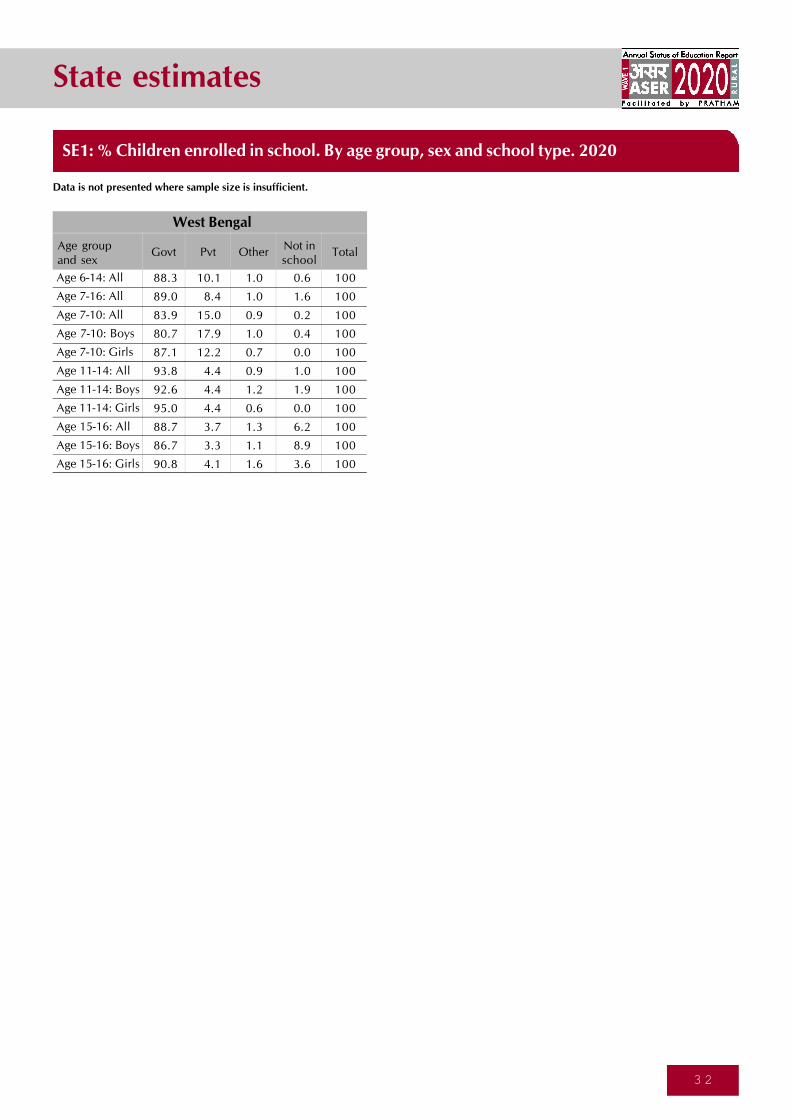
State estimates
3 2
Age groupand sex
Age 6-14: All
Age 7-16: All
Age 7-10: All
Age 7-10: Boys
Age 7-10: Girls
Age 11-14: All
Age 11-14: Boys
Age 11-14: Girls
Age 15-16: All
Age 15-16: Boys
Age 15-16: Girls
Govt Pvt OtherNot inschool
Total
88.3 10.1 1.0 0.6 100
89.0 8.4 1.0 1.6 100
83.9 15.0 0.9 0.2 100
80.7 17.9 1.0 0.4 100
87.1 12.2 0.7 0.0 100
93.8 4.4 0.9 1.0 100
92.6 4.4 1.2 1.9 100
95.0 4.4 0.6 0.0 100
88.7 3.7 1.3 6.2 100
86.7 3.3 1.1 8.9 100
90.8 4.1 1.6 3.6 100
West Bengal
Data is not presented where sample size is insufficient.
SE1: % Children enrolled in school. By age group, sex and school type. 2020
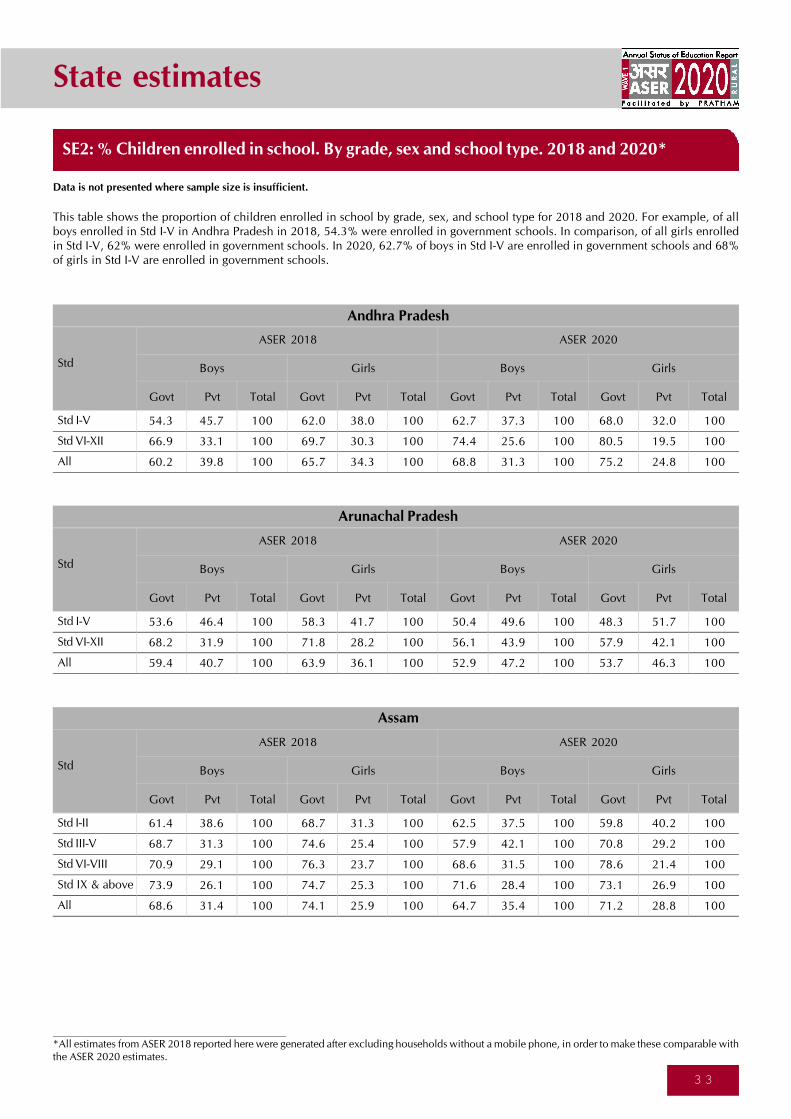
State estimates
3 3
SE2: % Children enrolled in school. By grade, sex and school type. 2018 and 2020*
Data is not presented where sample size is insufficient.
This table shows the proportion of children enrolled in school by grade, sex, and school type for 2018 and 2020. For example, of allboys enrolled in Std I-V in Andhra Pradesh in 2018, 54.3% were enrolled in government schools. In comparison, of all girls enrolledin Std I-V, 62% were enrolled in government schools. In 2020, 62.7% of boys in Std I-V are enrolled in government schools and 68%of girls in Std I-V are enrolled in government schools.
Andhra Pradesh
Std
Std I-V
Std VI-XII
All
Govt Pvt Total Govt Pvt Total Govt Pvt Total Govt Pvt Total
Boys Girls
ASER 2018
Boys Girls
ASER 2020
54.3 45.7 100 62.0 38.0 100 62.7 37.3 100 68.0 32.0 100
66.9 33.1 100 69.7 30.3 100 74.4 25.6 100 80.5 19.5 100
60.2 39.8 100 65.7 34.3 100 68.8 31.3 100 75.2 24.8 100
Arunachal Pradesh
Std
Std I-V
Std VI-XII
All
Govt Pvt Total Govt Pvt Total Govt Pvt Total Govt Pvt Total
Boys Girls
ASER 2018
Boys Girls
ASER 2020
53.6 46.4 100 58.3 41.7 100 50.4 49.6 100 48.3 51.7 100
68.2 31.9 100 71.8 28.2 100 56.1 43.9 100 57.9 42.1 100
59.4 40.7 100 63.9 36.1 100 52.9 47.2 100 53.7 46.3 100
Assam
Std
Std I-II
Std III-V
Std VI-VIII
Std IX & above
All
Govt Pvt Total Govt Pvt Total Govt Pvt Total Govt Pvt Total
Boys Girls
ASER 2018
Boys Girls
ASER 2020
61.4 38.6 100 68.7 31.3 100 62.5 37.5 100 59.8 40.2 100
68.7 31.3 100 74.6 25.4 100 57.9 42.1 100 70.8 29.2 100
70.9 29.1 100 76.3 23.7 100 68.6 31.5 100 78.6 21.4 100
73.9 26.1 100 74.7 25.3 100 71.6 28.4 100 73.1 26.9 100
68.6 31.4 100 74.1 25.9 100 64.7 35.4 100 71.2 28.8 100
*All estimates from ASER 2018 reported here were generated after excluding households without a mobile phone, in order to make these comparable withthe ASER 2020 estimates.
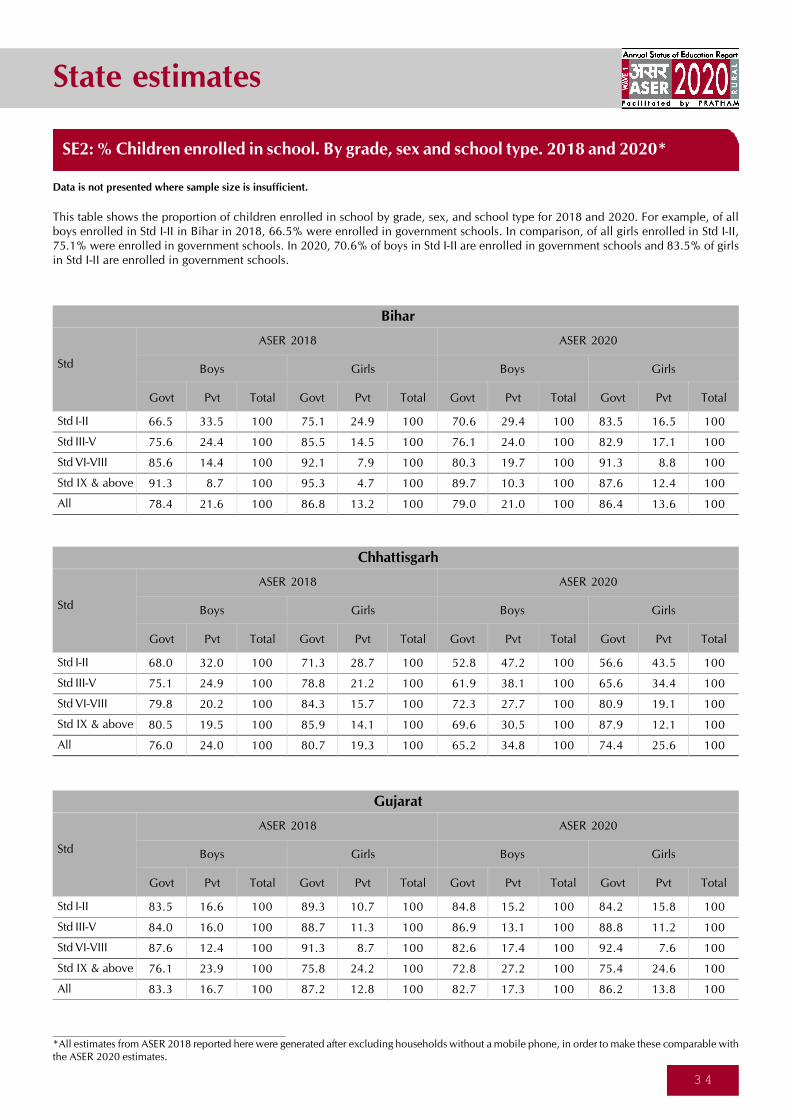
State estimates
3 4
*All estimates from ASER 2018 reported here were generated after excluding households without a mobile phone, in order to make these comparable withthe ASER 2020 estimates.
Gujarat
Std
Std I-II
Std III-V
Std VI-VIII
Std IX & above
All
Govt Pvt Total Govt Pvt Total Govt Pvt Total Govt Pvt Total
Boys Girls
ASER 2018
Boys Girls
ASER 2020
83.5 16.6 100 89.3 10.7 100 84.8 15.2 100 84.2 15.8 100
84.0 16.0 100 88.7 11.3 100 86.9 13.1 100 88.8 11.2 100
87.6 12.4 100 91.3 8.7 100 82.6 17.4 100 92.4 7.6 100
76.1 23.9 100 75.8 24.2 100 72.8 27.2 100 75.4 24.6 100
83.3 16.7 100 87.2 12.8 100 82.7 17.3 100 86.2 13.8 100
Chhattisgarh
Std
Std I-II
Std III-V
Std VI-VIII
Std IX & above
All
Govt Pvt Total Govt Pvt Total Govt Pvt Total Govt Pvt Total
Boys Girls
ASER 2018
Boys Girls
ASER 2020
68.0 32.0 100 71.3 28.7 100 52.8 47.2 100 56.6 43.5 100
75.1 24.9 100 78.8 21.2 100 61.9 38.1 100 65.6 34.4 100
79.8 20.2 100 84.3 15.7 100 72.3 27.7 100 80.9 19.1 100
80.5 19.5 100 85.9 14.1 100 69.6 30.5 100 87.9 12.1 100
76.0 24.0 100 80.7 19.3 100 65.2 34.8 100 74.4 25.6 100
Bihar
Std
Std I-II
Std III-V
Std VI-VIII
Std IX & above
All
Govt Pvt Total Govt Pvt Total Govt Pvt Total Govt Pvt Total
Boys Girls
ASER 2018
Boys Girls
ASER 2020
66.5 33.5 100 75.1 24.9 100 70.6 29.4 100 83.5 16.5 100
75.6 24.4 100 85.5 14.5 100 76.1 24.0 100 82.9 17.1 100
85.6 14.4 100 92.1 7.9 100 80.3 19.7 100 91.3 8.8 100
91.3 8.7 100 95.3 4.7 100 89.7 10.3 100 87.6 12.4 100
78.4 21.6 100 86.8 13.2 100 79.0 21.0 100 86.4 13.6 100
SE2: % Children enrolled in school. By grade, sex and school type. 2018 and 2020*
Data is not presented where sample size is insufficient.
This table shows the proportion of children enrolled in school by grade, sex, and school type for 2018 and 2020. For example, of allboys enrolled in Std I-II in Bihar in 2018, 66.5% were enrolled in government schools. In comparison, of all girls enrolled in Std I-II,75.1% were enrolled in government schools. In 2020, 70.6% of boys in Std I-II are enrolled in government schools and 83.5% of girlsin Std I-II are enrolled in government schools.
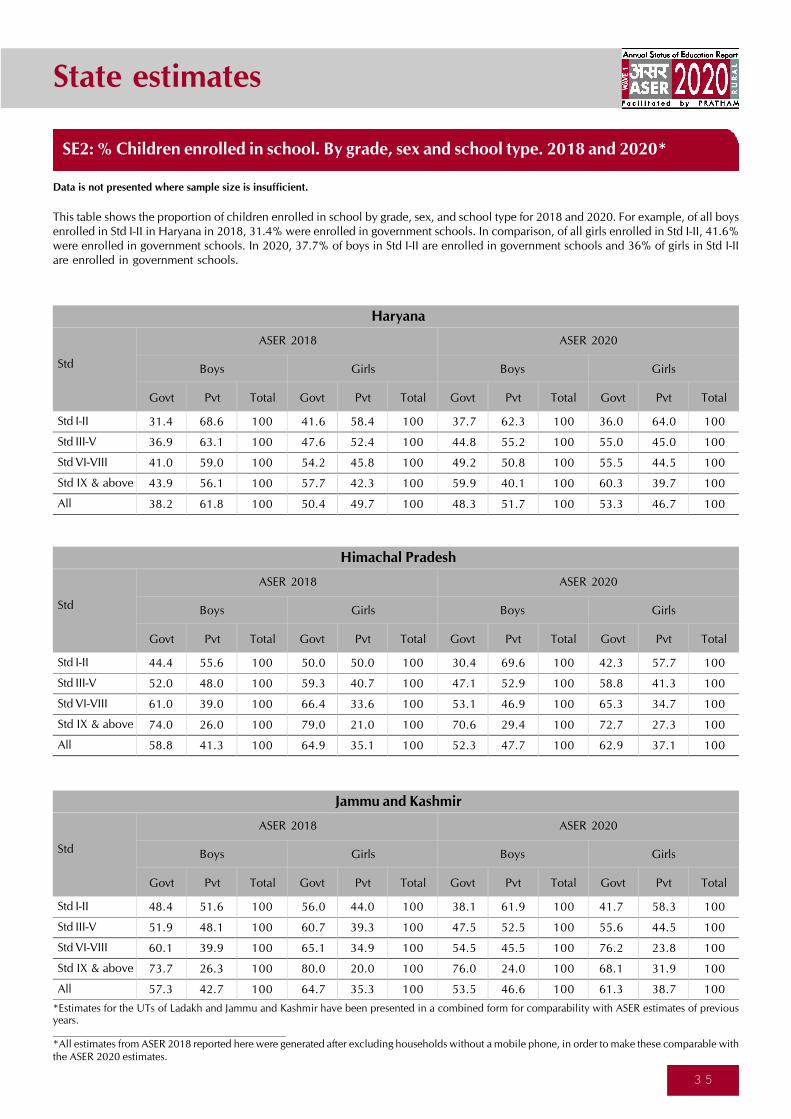
State estimates
3 5
Jammu and Kashmir
Std
Std I-II
Std III-V
Std VI-VIII
Std IX & above
All
Govt Pvt Total Govt Pvt Total Govt Pvt Total Govt Pvt Total
Boys Girls
ASER 2018
Boys Girls
ASER 2020
48.4 51.6 100 56.0 44.0 100 38.1 61.9 100 41.7 58.3 100
51.9 48.1 100 60.7 39.3 100 47.5 52.5 100 55.6 44.5 100
60.1 39.9 100 65.1 34.9 100 54.5 45.5 100 76.2 23.8 100
73.7 26.3 100 80.0 20.0 100 76.0 24.0 100 68.1 31.9 100
57.3 42.7 100 64.7 35.3 100 53.5 46.6 100 61.3 38.7 100
Himachal Pradesh
Std
Std I-II
Std III-V
Std VI-VIII
Std IX & above
All
Govt Pvt Total Govt Pvt Total Govt Pvt Total Govt Pvt Total
Boys Girls
ASER 2018
Boys Girls
ASER 2020
44.4 55.6 100 50.0 50.0 100 30.4 69.6 100 42.3 57.7 100
52.0 48.0 100 59.3 40.7 100 47.1 52.9 100 58.8 41.3 100
61.0 39.0 100 66.4 33.6 100 53.1 46.9 100 65.3 34.7 100
74.0 26.0 100 79.0 21.0 100 70.6 29.4 100 72.7 27.3 100
58.8 41.3 100 64.9 35.1 100 52.3 47.7 100 62.9 37.1 100
Haryana
Std
Std I-II
Std III-V
Std VI-VIII
Std IX & above
All
Govt Pvt Total Govt Pvt Total Govt Pvt Total Govt Pvt Total
Boys Girls
ASER 2018
Boys Girls
ASER 2020
31.4 68.6 100 41.6 58.4 100 37.7 62.3 100 36.0 64.0 100
36.9 63.1 100 47.6 52.4 100 44.8 55.2 100 55.0 45.0 100
41.0 59.0 100 54.2 45.8 100 49.2 50.8 100 55.5 44.5 100
43.9 56.1 100 57.7 42.3 100 59.9 40.1 100 60.3 39.7 100
38.2 61.8 100 50.4 49.7 100 48.3 51.7 100 53.3 46.7 100
SE2: % Children enrolled in school. By grade, sex and school type. 2018 and 2020*
Data is not presented where sample size is insufficient.
This table shows the proportion of children enrolled in school by grade, sex, and school type for 2018 and 2020. For example, of all boysenrolled in Std I-II in Haryana in 2018, 31.4% were enrolled in government schools. In comparison, of all girls enrolled in Std I-II, 41.6%were enrolled in government schools. In 2020, 37.7% of boys in Std I-II are enrolled in government schools and 36% of girls in Std I-IIare enrolled in government schools.
*All estimates from ASER 2018 reported here were generated after excluding households without a mobile phone, in order to make these comparable withthe ASER 2020 estimates.
*Estimates for the UTs of Ladakh and Jammu and Kashmir have been presented in a combined form for comparability with ASER estimates of previousyears.

State estimates
3 6
Karnataka
Std
Std I-II
Std III-V
Std VI-VIII
Std IX & above
All
Govt Pvt Total Govt Pvt Total Govt Pvt Total Govt Pvt Total
Boys Girls
ASER 2018
Boys Girls
ASER 2020
59.0 41.0 100 66.7 33.3 100 74.1 26.0 100 73.2 26.8 100
65.8 34.2 100 76.2 23.8 100 70.1 30.0 100 72.6 27.4 100
69.8 30.2 100 78.7 21.3 100 71.6 28.4 100 78.7 21.3 100
69.7 30.3 100 71.8 28.2 100 71.8 28.2 100 74.4 25.6 100
66.2 33.8 100 74.2 25.8 100 71.6 28.4 100 75.1 24.9 100
Jharkhand
Std
Std I-II
Std III-V
Std VI-VIII
Std IX & above
All
Govt Pvt Total Govt Pvt Total Govt Pvt Total Govt Pvt Total
Boys Girls
ASER 2018
Boys Girls
ASER 2020
67.7 32.3 100 76.0 24.0 100 64.1 35.9 100 71.7 28.3 100
75.0 25.0 100 82.3 17.7 100 72.0 28.0 100 77.2 22.8 100
81.2 18.8 100 84.5 15.5 100 78.2 21.8 100 84.4 15.6 100
76.7 23.4 100 78.7 21.3 100 73.6 26.4 100 80.9 19.1 100
75.1 24.9 100 80.9 19.1 100 72.3 27.7 100 79.1 20.9 100
Kerala
Std
Std I-V
Std VI-XII
All
Govt Pvt Total Govt Pvt Total Govt Pvt Total Govt Pvt Total
Boys Girls
ASER 2018
Boys Girls
ASER 2020
43.4 56.6 100 50.4 49.6 100 45.4 54.6 100 57.5 42.6 100
57.2 42.8 100 59.3 40.7 100 74.9 25.1 100 78.9 21.1 100
50.7 49.3 100 55.0 45.1 100 59.8 40.2 100 69.8 30.3 100
SE2: % Children enrolled in school. By grade, sex and school type. 2018 and 2020*
Data is not presented where sample size is insufficient.
This table shows the proportion of children enrolled in school by grade, sex, and school type for 2018 and 2020. For example, of all boysenrolled in Std I-II in Jharkhand in 2018, 67.7% were enrolled in government schools. In comparison, of all girls enrolled in Std I-II, 76%were enrolled in government schools. In 2020, 64.1% of boys in Std I-II are enrolled in government schools and 71.7% of girls in Std I-II are enrolled in government schools.
*All estimates from ASER 2018 reported here were generated after excluding households without a mobile phone, in order to make these comparable withthe ASER 2020 estimates.
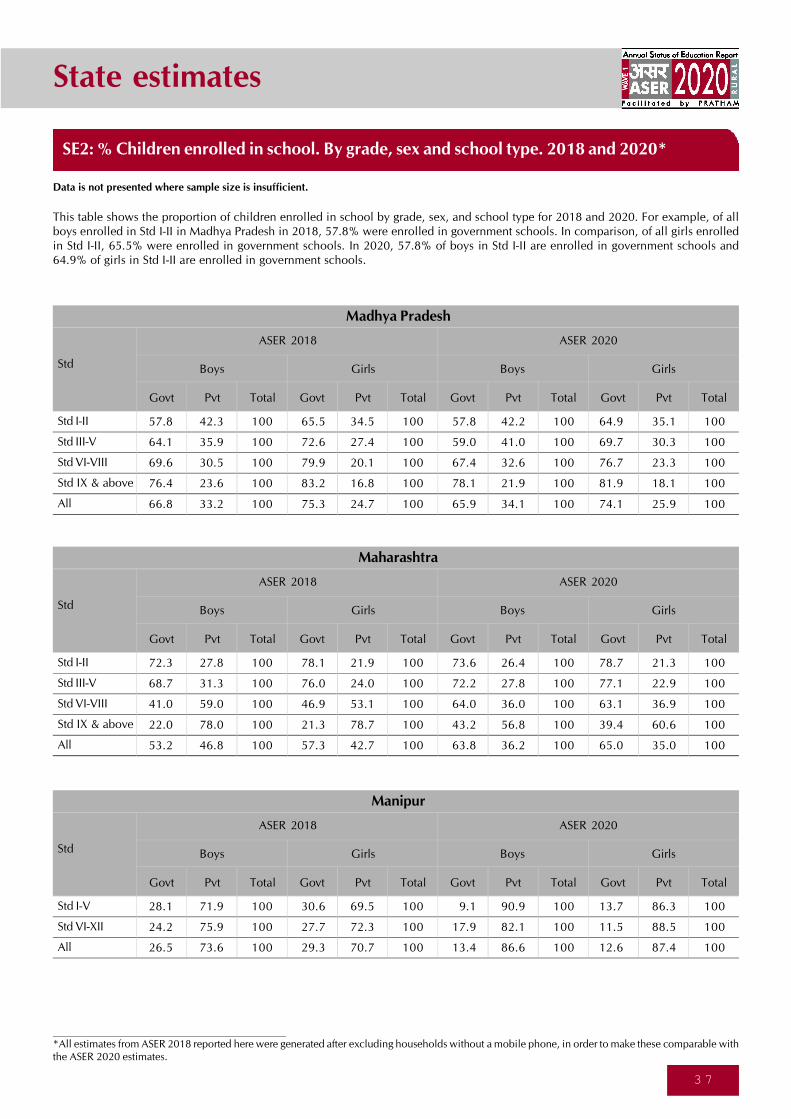
State estimates
3 7
Maharashtra
Std
Std I-II
Std III-V
Std VI-VIII
Std IX & above
All
Govt Pvt Total Govt Pvt Total Govt Pvt Total Govt Pvt Total
Boys Girls
ASER 2018
Boys Girls
ASER 2020
72.3 27.8 100 78.1 21.9 100 73.6 26.4 100 78.7 21.3 100
68.7 31.3 100 76.0 24.0 100 72.2 27.8 100 77.1 22.9 100
41.0 59.0 100 46.9 53.1 100 64.0 36.0 100 63.1 36.9 100
22.0 78.0 100 21.3 78.7 100 43.2 56.8 100 39.4 60.6 100
53.2 46.8 100 57.3 42.7 100 63.8 36.2 100 65.0 35.0 100
Madhya Pradesh
Std
Std I-II
Std III-V
Std VI-VIII
Std IX & above
All
Govt Pvt Total Govt Pvt Total Govt Pvt Total Govt Pvt Total
Boys Girls
ASER 2018
Boys Girls
ASER 2020
57.8 42.3 100 65.5 34.5 100 57.8 42.2 100 64.9 35.1 100
64.1 35.9 100 72.6 27.4 100 59.0 41.0 100 69.7 30.3 100
69.6 30.5 100 79.9 20.1 100 67.4 32.6 100 76.7 23.3 100
76.4 23.6 100 83.2 16.8 100 78.1 21.9 100 81.9 18.1 100
66.8 33.2 100 75.3 24.7 100 65.9 34.1 100 74.1 25.9 100
Manipur
Std
Std I-V
Std VI-XII
All
Govt Pvt Total Govt Pvt Total Govt Pvt Total Govt Pvt Total
Boys Girls
ASER 2018
Boys Girls
ASER 2020
28.1 71.9 100 30.6 69.5 100 9.1 90.9 100 13.7 86.3 100
24.2 75.9 100 27.7 72.3 100 17.9 82.1 100 11.5 88.5 100
26.5 73.6 100 29.3 70.7 100 13.4 86.6 100 12.6 87.4 100
SE2: % Children enrolled in school. By grade, sex and school type. 2018 and 2020*
Data is not presented where sample size is insufficient.
This table shows the proportion of children enrolled in school by grade, sex, and school type for 2018 and 2020. For example, of allboys enrolled in Std I-II in Madhya Pradesh in 2018, 57.8% were enrolled in government schools. In comparison, of all girls enrolledin Std I-II, 65.5% were enrolled in government schools. In 2020, 57.8% of boys in Std I-II are enrolled in government schools and64.9% of girls in Std I-II are enrolled in government schools.
*All estimates from ASER 2018 reported here were generated after excluding households without a mobile phone, in order to make these comparable withthe ASER 2020 estimates.
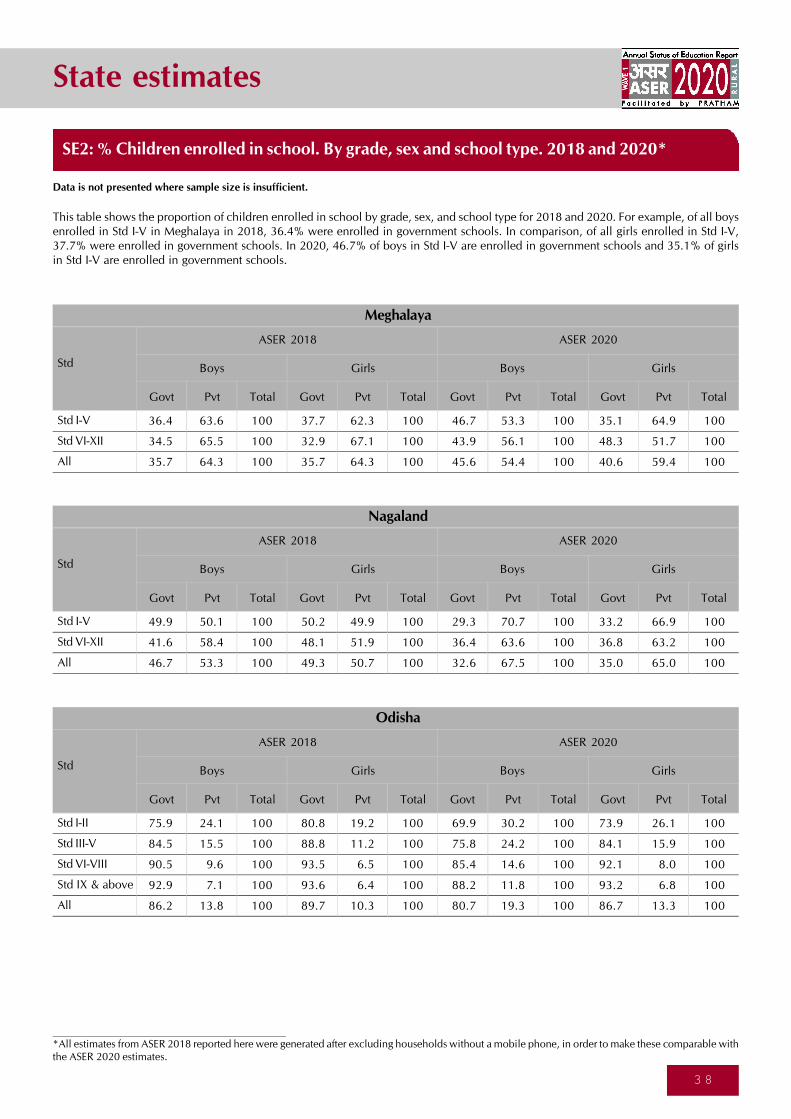
State estimates
3 8
Meghalaya
Std
Std I-V
Std VI-XII
All
Govt Pvt Total Govt Pvt Total Govt Pvt Total Govt Pvt Total
Boys Girls
ASER 2018
Boys Girls
ASER 2020
36.4 63.6 100 37.7 62.3 100 46.7 53.3 100 35.1 64.9 100
34.5 65.5 100 32.9 67.1 100 43.9 56.1 100 48.3 51.7 100
35.7 64.3 100 35.7 64.3 100 45.6 54.4 100 40.6 59.4 100
Nagaland
Std
Std I-V
Std VI-XII
All
Govt Pvt Total Govt Pvt Total Govt Pvt Total Govt Pvt Total
Boys Girls
ASER 2018
Boys Girls
ASER 2020
49.9 50.1 100 50.2 49.9 100 29.3 70.7 100 33.2 66.9 100
41.6 58.4 100 48.1 51.9 100 36.4 63.6 100 36.8 63.2 100
46.7 53.3 100 49.3 50.7 100 32.6 67.5 100 35.0 65.0 100
Odisha
Std
Std I-II
Std III-V
Std VI-VIII
Std IX & above
All
Govt Pvt Total Govt Pvt Total Govt Pvt Total Govt Pvt Total
Boys Girls
ASER 2018
Boys Girls
ASER 2020
75.9 24.1 100 80.8 19.2 100 69.9 30.2 100 73.9 26.1 100
84.5 15.5 100 88.8 11.2 100 75.8 24.2 100 84.1 15.9 100
90.5 9.6 100 93.5 6.5 100 85.4 14.6 100 92.1 8.0 100
92.9 7.1 100 93.6 6.4 100 88.2 11.8 100 93.2 6.8 100
86.2 13.8 100 89.7 10.3 100 80.7 19.3 100 86.7 13.3 100
SE2: % Children enrolled in school. By grade, sex and school type. 2018 and 2020*
Data is not presented where sample size is insufficient.
This table shows the proportion of children enrolled in school by grade, sex, and school type for 2018 and 2020. For example, of all boysenrolled in Std I-V in Meghalaya in 2018, 36.4% were enrolled in government schools. In comparison, of all girls enrolled in Std I-V,37.7% were enrolled in government schools. In 2020, 46.7% of boys in Std I-V are enrolled in government schools and 35.1% of girlsin Std I-V are enrolled in government schools.
*All estimates from ASER 2018 reported here were generated after excluding households without a mobile phone, in order to make these comparable withthe ASER 2020 estimates.
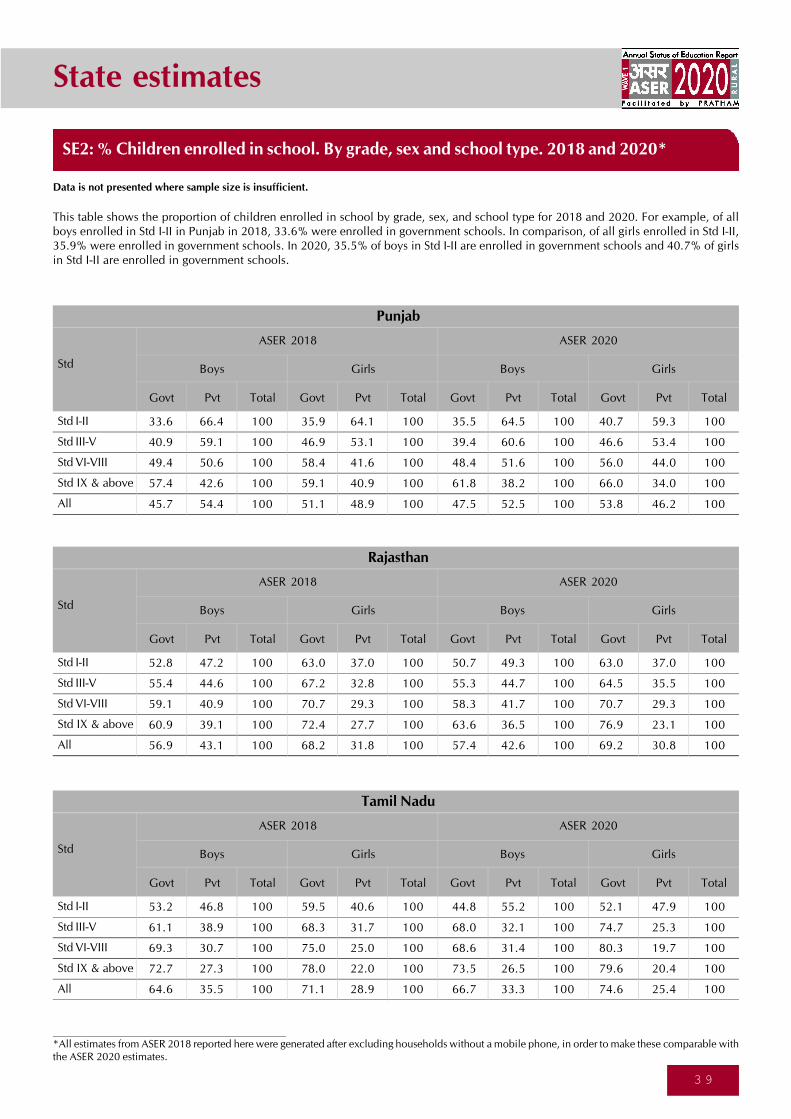
State estimates
3 9
Tamil Nadu
Std
Std I-II
Std III-V
Std VI-VIII
Std IX & above
All
Govt Pvt Total Govt Pvt Total Govt Pvt Total Govt Pvt Total
Boys Girls
ASER 2018
Boys Girls
ASER 2020
53.2 46.8 100 59.5 40.6 100 44.8 55.2 100 52.1 47.9 100
61.1 38.9 100 68.3 31.7 100 68.0 32.1 100 74.7 25.3 100
69.3 30.7 100 75.0 25.0 100 68.6 31.4 100 80.3 19.7 100
72.7 27.3 100 78.0 22.0 100 73.5 26.5 100 79.6 20.4 100
64.6 35.5 100 71.1 28.9 100 66.7 33.3 100 74.6 25.4 100
Rajasthan
Std
Std I-II
Std III-V
Std VI-VIII
Std IX & above
All
Govt Pvt Total Govt Pvt Total Govt Pvt Total Govt Pvt Total
Boys Girls
ASER 2018
Boys Girls
ASER 2020
52.8 47.2 100 63.0 37.0 100 50.7 49.3 100 63.0 37.0 100
55.4 44.6 100 67.2 32.8 100 55.3 44.7 100 64.5 35.5 100
59.1 40.9 100 70.7 29.3 100 58.3 41.7 100 70.7 29.3 100
60.9 39.1 100 72.4 27.7 100 63.6 36.5 100 76.9 23.1 100
56.9 43.1 100 68.2 31.8 100 57.4 42.6 100 69.2 30.8 100
Punjab
Std
Std I-II
Std III-V
Std VI-VIII
Std IX & above
All
Govt Pvt Total Govt Pvt Total Govt Pvt Total Govt Pvt Total
Boys Girls
ASER 2018
Boys Girls
ASER 2020
33.6 66.4 100 35.9 64.1 100 35.5 64.5 100 40.7 59.3 100
40.9 59.1 100 46.9 53.1 100 39.4 60.6 100 46.6 53.4 100
49.4 50.6 100 58.4 41.6 100 48.4 51.6 100 56.0 44.0 100
57.4 42.6 100 59.1 40.9 100 61.8 38.2 100 66.0 34.0 100
45.7 54.4 100 51.1 48.9 100 47.5 52.5 100 53.8 46.2 100
SE2: % Children enrolled in school. By grade, sex and school type. 2018 and 2020*
Data is not presented where sample size is insufficient.
This table shows the proportion of children enrolled in school by grade, sex, and school type for 2018 and 2020. For example, of allboys enrolled in Std I-II in Punjab in 2018, 33.6% were enrolled in government schools. In comparison, of all girls enrolled in Std I-II,35.9% were enrolled in government schools. In 2020, 35.5% of boys in Std I-II are enrolled in government schools and 40.7% of girlsin Std I-II are enrolled in government schools.
*All estimates from ASER 2018 reported here were generated after excluding households without a mobile phone, in order to make these comparable withthe ASER 2020 estimates.
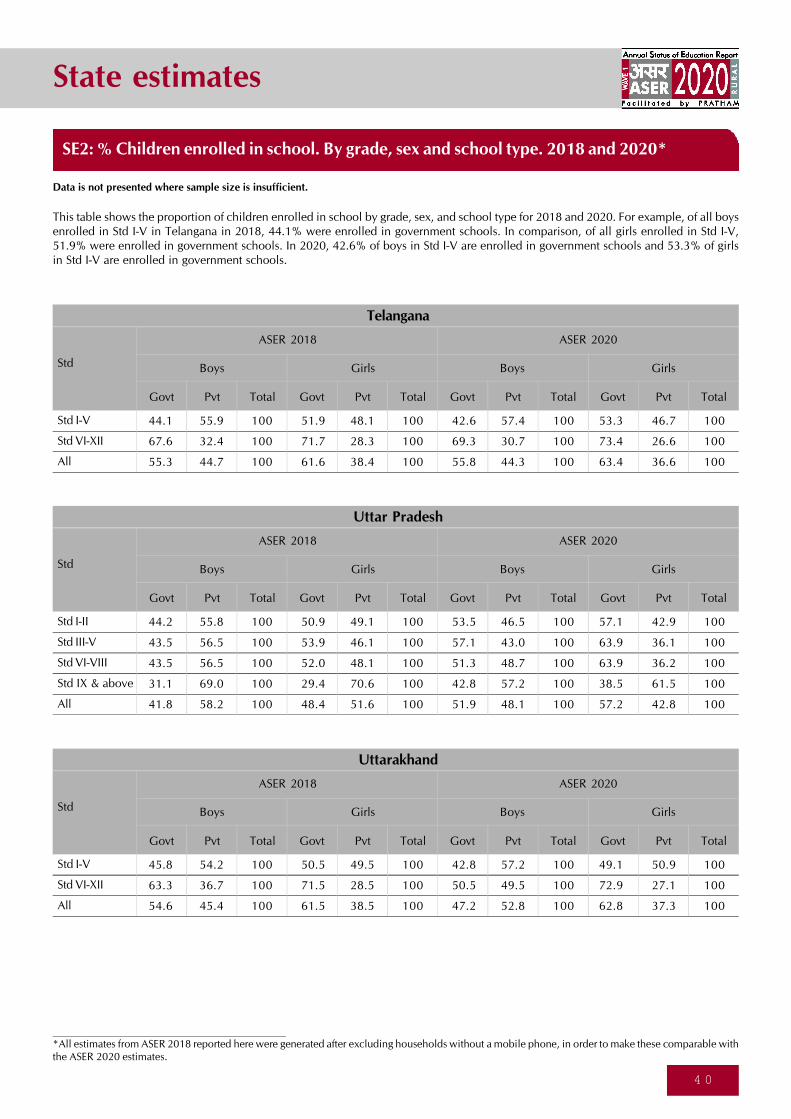
State estimates
4 0
Uttar Pradesh
Std
Std I-II
Std III-V
Std VI-VIII
Std IX & above
All
Govt Pvt Total Govt Pvt Total Govt Pvt Total Govt Pvt Total
Boys Girls
ASER 2018
Boys Girls
ASER 2020
44.2 55.8 100 50.9 49.1 100 53.5 46.5 100 57.1 42.9 100
43.5 56.5 100 53.9 46.1 100 57.1 43.0 100 63.9 36.1 100
43.5 56.5 100 52.0 48.1 100 51.3 48.7 100 63.9 36.2 100
31.1 69.0 100 29.4 70.6 100 42.8 57.2 100 38.5 61.5 100
41.8 58.2 100 48.4 51.6 100 51.9 48.1 100 57.2 42.8 100
Telangana
Std
Std I-V
Std VI-XII
All
Govt Pvt Total Govt Pvt Total Govt Pvt Total Govt Pvt Total
Boys Girls
ASER 2018
Boys Girls
ASER 2020
44.1 55.9 100 51.9 48.1 100 42.6 57.4 100 53.3 46.7 100
67.6 32.4 100 71.7 28.3 100 69.3 30.7 100 73.4 26.6 100
55.3 44.7 100 61.6 38.4 100 55.8 44.3 100 63.4 36.6 100
Uttarakhand
Std
Std I-V
Std VI-XII
All
Govt Pvt Total Govt Pvt Total Govt Pvt Total Govt Pvt Total
Boys Girls
ASER 2018
Boys Girls
ASER 2020
45.8 54.2 100 50.5 49.5 100 42.8 57.2 100 49.1 50.9 100
63.3 36.7 100 71.5 28.5 100 50.5 49.5 100 72.9 27.1 100
54.6 45.4 100 61.5 38.5 100 47.2 52.8 100 62.8 37.3 100
SE2: % Children enrolled in school. By grade, sex and school type. 2018 and 2020*
Data is not presented where sample size is insufficient.
This table shows the proportion of children enrolled in school by grade, sex, and school type for 2018 and 2020. For example, of all boysenrolled in Std I-V in Telangana in 2018, 44.1% were enrolled in government schools. In comparison, of all girls enrolled in Std I-V,51.9% were enrolled in government schools. In 2020, 42.6% of boys in Std I-V are enrolled in government schools and 53.3% of girlsin Std I-V are enrolled in government schools.
*All estimates from ASER 2018 reported here were generated after excluding households without a mobile phone, in order to make these comparable withthe ASER 2020 estimates.
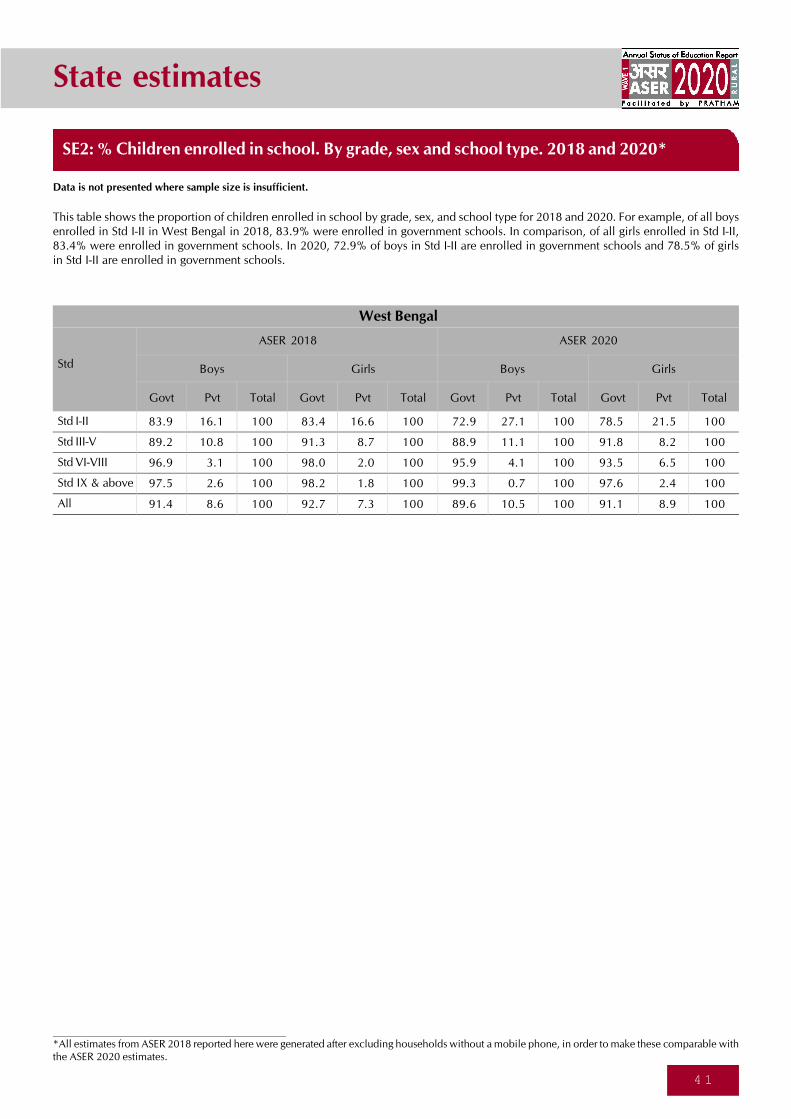
State estimates
4 1
West Bengal
Std
Std I-II
Std III-V
Std VI-VIII
Std IX & above
All
Govt Pvt Total Govt Pvt Total Govt Pvt Total Govt Pvt Total
Boys Girls
ASER 2018
Boys Girls
ASER 2020
83.9 16.1 100 83.4 16.6 100 72.9 27.1 100 78.5 21.5 100
89.2 10.8 100 91.3 8.7 100 88.9 11.1 100 91.8 8.2 100
96.9 3.1 100 98.0 2.0 100 95.9 4.1 100 93.5 6.5 100
97.5 2.6 100 98.2 1.8 100 99.3 0.7 100 97.6 2.4 100
91.4 8.6 100 92.7 7.3 100 89.6 10.5 100 91.1 8.9 100
SE2: % Children enrolled in school. By grade, sex and school type. 2018 and 2020*
Data is not presented where sample size is insufficient.
This table shows the proportion of children enrolled in school by grade, sex, and school type for 2018 and 2020. For example, of all boysenrolled in Std I-II in West Bengal in 2018, 83.9% were enrolled in government schools. In comparison, of all girls enrolled in Std I-II,83.4% were enrolled in government schools. In 2020, 72.9% of boys in Std I-II are enrolled in government schools and 78.5% of girlsin Std I-II are enrolled in government schools.
*All estimates from ASER 2018 reported here were generated after excluding households without a mobile phone, in order to make these comparable withthe ASER 2020 estimates.
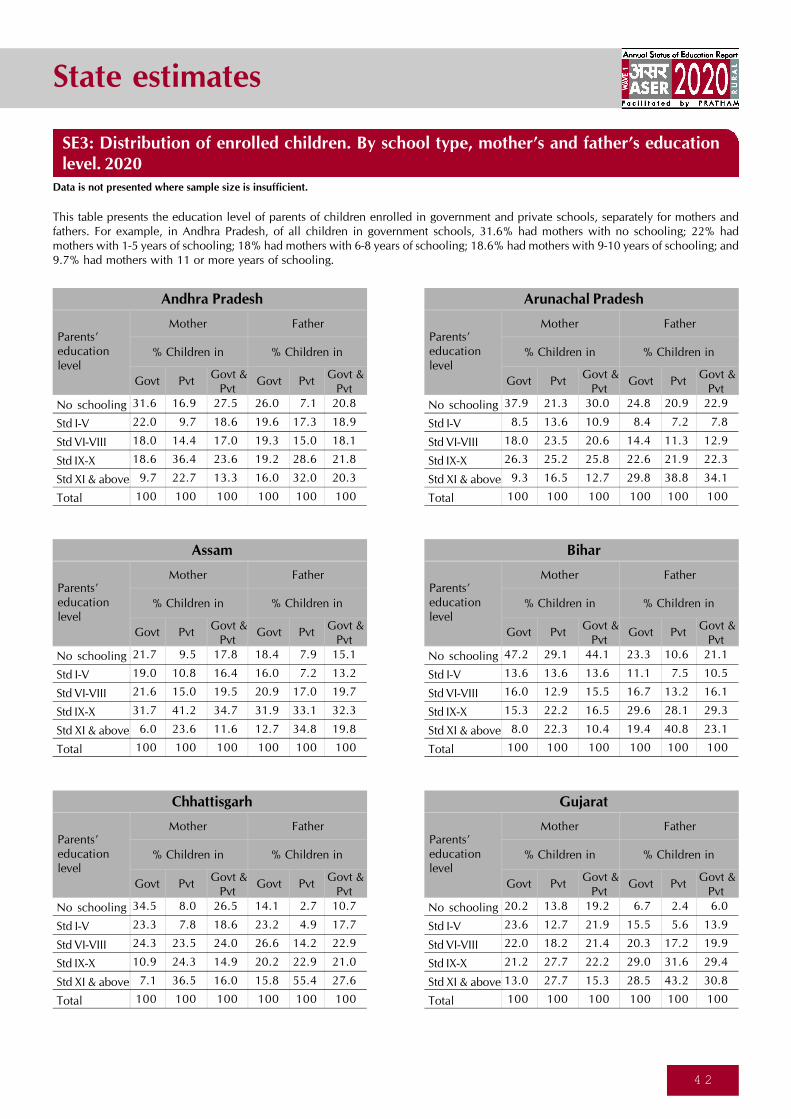
State estimates
4 2
SE3: Distribution of enrolled children. By school type, mother’s and father’s educationlevel. 2020
Data is not presented where sample size is insufficient.
This table presents the education level of parents of children enrolled in government and private schools, separately for mothers andfathers. For example, in Andhra Pradesh, of all children in government schools, 31.6% had mothers with no schooling; 22% hadmothers with 1-5 years of schooling; 18% had mothers with 6-8 years of schooling; 18.6% had mothers with 9-10 years of schooling; and9.7% had mothers with 11 or more years of schooling.
Parents’educationlevel
No schooling
Std I-V
Std VI-VIII
Std IX-X
Std XI & above
Total
Mother
31.6 16.9 27.5 26.0 7.1 20.8
22.0 9.7 18.6 19.6 17.3 18.9
18.0 14.4 17.0 19.3 15.0 18.1
18.6 36.4 23.6 19.2 28.6 21.8
9.7 22.7 13.3 16.0 32.0 20.3
100 100 100 100 100 100
Father
% Children in % Children in
Govt Pvt Govt &
PvtGovt Pvt
Govt &Pvt
Andhra Pradesh
Parents’educationlevel
No schooling
Std I-V
Std VI-VIII
Std IX-X
Std XI & above
Total
Mother
37.9 21.3 30.0 24.8 20.9 22.9
8.5 13.6 10.9 8.4 7.2 7.8
18.0 23.5 20.6 14.4 11.3 12.9
26.3 25.2 25.8 22.6 21.9 22.3
9.3 16.5 12.7 29.8 38.8 34.1
100 100 100 100 100 100
Father
% Children in % Children in
Govt Pvt Govt &
PvtGovt Pvt
Govt &Pvt
Arunachal Pradesh
Parents’educationlevel
No schooling
Std I-V
Std VI-VIII
Std IX-X
Std XI & above
Total
Mother
21.7 9.5 17.8 18.4 7.9 15.1
19.0 10.8 16.4 16.0 7.2 13.2
21.6 15.0 19.5 20.9 17.0 19.7
31.7 41.2 34.7 31.9 33.1 32.3
6.0 23.6 11.6 12.7 34.8 19.8
100 100 100 100 100 100
Father
% Children in % Children in
Govt Pvt Govt &
PvtGovt Pvt
Govt &Pvt
Assam
Parents’educationlevel
No schooling
Std I-V
Std VI-VIII
Std IX-X
Std XI & above
Total
Mother
47.2 29.1 44.1 23.3 10.6 21.1
13.6 13.6 13.6 11.1 7.5 10.5
16.0 12.9 15.5 16.7 13.2 16.1
15.3 22.2 16.5 29.6 28.1 29.3
8.0 22.3 10.4 19.4 40.8 23.1
100 100 100 100 100 100
Father
% Children in % Children in
Govt Pvt Govt &
PvtGovt Pvt
Govt &Pvt
Bihar
Parents’educationlevel
No schooling
Std I-V
Std VI-VIII
Std IX-X
Std XI & above
Total
Mother
34.5 8.0 26.5 14.1 2.7 10.7
23.3 7.8 18.6 23.2 4.9 17.7
24.3 23.5 24.0 26.6 14.2 22.9
10.9 24.3 14.9 20.2 22.9 21.0
7.1 36.5 16.0 15.8 55.4 27.6
100 100 100 100 100 100
Father
% Children in % Children in
Govt Pvt Govt &
PvtGovt Pvt
Govt &Pvt
Chhattisgarh
Parents’educationlevel
No schooling
Std I-V
Std VI-VIII
Std IX-X
Std XI & above
Total
Mother
20.2 13.8 19.2 6.7 2.4 6.0
23.6 12.7 21.9 15.5 5.6 13.9
22.0 18.2 21.4 20.3 17.2 19.9
21.2 27.7 22.2 29.0 31.6 29.4
13.0 27.7 15.3 28.5 43.2 30.8
100 100 100 100 100 100
Father
% Children in % Children in
Govt Pvt Govt &
PvtGovt Pvt
Govt &Pvt
Gujarat

State estimates
4 3
SE3: Distribution of enrolled children. By school type, mother’s and father’s educationlevel. 2020
Data is not presented where sample size is insufficient.
This table presents the education level of parents of children enrolled in government and private schools, separately for mothers andfathers. For example, in Haryana, of all children in government schools, 34.2 % had mothers with no schooling; 21.9% had mothers with1-5 years of schooling; 22.2% had mothers with 6-8 years of schooling; 12.4% had mothers with 9-10 years of schooling; and 9.3% hadmothers with 11 or more years of schooling.
Parents’educationlevel
No schooling
Std I-V
Std VI-VIII
Std IX-X
Std XI & above
Total
Mother
34.2 12.5 23.4 15.7 6.1 11.0
21.9 7.9 14.9 15.7 3.1 9.5
22.2 20.7 21.4 24.4 11.0 17.8
12.4 24.8 18.5 19.1 26.7 22.8
9.3 34.2 21.7 25.2 53.1 38.9
100 100 100 100 100 100
Father
% Children in % Children in
Govt Pvt Govt &
PvtGovt Pvt
Govt &Pvt
Haryana
Parents’educationlevel
No schooling
Std I-V
Std VI-VIII
Std IX-X
Std XI & above
Total
Mother
8.4 1.4 5.4 4.2 0.6 2.7
12.9 2.7 8.6 11.0 1.3 6.8
23.0 4.3 15.0 19.2 5.9 13.5
28.3 25.5 27.1 32.4 28.1 30.6
27.4 66.2 43.9 33.2 64.2 46.5
100 100 100 100 100 100
Father
% Children in % Children in
Govt Pvt Govt &
PvtGovt Pvt
Govt &Pvt
Himachal Pradesh
Parents’educationlevel
No schooling
Std I-V
Std VI-VIII
Std IX-X
Std XI & above
Total
Mother
62.0 40.1 52.7 27.9 10.6 20.5
6.4 8.0 7.1 7.2 2.9 5.4
14.5 9.7 12.5 18.8 15.4 17.3
11.2 19.3 14.6 28.6 34.2 31.0
6.0 22.9 13.2 17.6 36.9 25.9
100 100 100 100 100 100
Father
% Children in % Children in
Govt Pvt Govt &
PvtGovt Pvt
Govt &Pvt
Jammu and Kashmir
Parents’educationlevel
No schooling
Std I-V
Std VI-VIII
Std IX-X
Std XI & above
Total
Mother
46.0 30.2 42.1 24.6 11.4 21.3
18.3 8.7 16.0 14.6 4.8 12.2
14.6 13.6 14.4 17.6 21.8 18.6
14.3 29.8 18.1 29.3 34.0 30.5
6.9 17.7 9.5 14.0 28.0 17.5
100 100 100 100 100 100
Father
% Children in % Children in
Govt Pvt Govt &
PvtGovt Pvt
Govt &Pvt
Jharkhand
Parents’educationlevel
No schooling
Std I-V
Std VI-VIII
Std IX-X
Std XI & above
Total
Mother
31.2 13.9 26.5 23.4 13.6 20.8
15.7 7.3 13.4 15.9 6.4 13.4
19.9 16.1 18.9 20.5 16.6 19.4
23.0 37.0 26.8 26.9 31.6 28.2
10.2 25.6 14.4 13.3 31.7 18.3
100 100 100 100 100 100
Father
% Children in % Children in
Govt Pvt Govt &
PvtGovt Pvt
Govt &Pvt
Karnataka
Parents’educationlevel
No schooling
Std I-V
Std VI-VIII
Std IX-X
Std XI & above
Total
Mother
0.0 0.0 0.0 0.8 0.0 0.5
3.3 0.8 2.4 5.3 1.2 3.8
7.7 3.3 6.2 12.3 14.5 13.0
39.7 22.5 33.7 53.8 40.8 49.2
49.3 73.5 57.7 27.9 43.6 33.4
100 100 100 100 100 100
Father
% Children in % Children in
Govt Pvt Govt &
PvtGovt Pvt
Govt &Pvt
Kerala
*Estimates for the UTs of Ladakh and Jammu and Kashmir have beenpresented in a combined form for comparability with ASER estimatesof previous years.

State estimates
4 4
This table presents the education level of parents of children enrolled in government and private schools, separately for mothers andfathers. For example, in Madhya Pradesh, of all children in government schools, 40.4% had mothers with no schooling; 26.6% hadmothers with 1-5 years of schooling; 18.7% had mothers with 6-8 years of schooling; 10.4% had mothers with 9-10 years of schooling;and 3.9% had mothers with 11 or more years of schooling.
SE3: Distribution of enrolled children. By school type, mother’s and father’s educationlevel. 2020
Data is not presented where sample size is insufficient.
Parents’educationlevel
No schooling
Std I-V
Std VI-VIII
Std IX-X
Std XI & above
Total
Mother
40.4 25.5 35.9 17.9 8.4 15.0
26.6 15.5 23.3 18.2 10.1 15.7
18.7 27.1 21.2 28.5 21.4 26.3
10.4 18.5 12.9 20.5 28.7 23.0
3.9 13.4 6.7 14.9 31.5 20.0
100 100 100 100 100 100
Father
% Children in % Children in
Govt Pvt Govt &
PvtGovt Pvt
Govt &Pvt
Madhya Pradesh
Parents’educationlevel
No schooling
Std I-V
Std VI-VIII
Std IX-X
Std XI & above
Total
Mother
11.3 8.3 10.2 5.9 4.5 5.4
12.8 10.3 11.9 10.2 7.2 9.2
21.0 21.3 21.1 17.2 12.7 15.6
36.0 35.8 35.9 34.1 33.7 34.0
18.9 24.3 20.8 32.6 42.0 35.9
100 100 100 100 100 100
Father
% Children in % Children in
Govt Pvt Govt &
PvtGovt Pvt
Govt &Pvt
Maharashtra
Parents’educationlevel
No schooling
Std I-V
Std VI-VIII
Std IX-X
Std XI & above
Total
Mother
14.3 17.0 16.7 11.0 9.9 10.1
17.4 7.0 8.3 4.9 4.0 4.1
10.2 16.0 15.3 11.2 11.9 11.8
36.1 34.6 34.8 30.7 32.8 32.5
22.0 25.4 25.0 42.2 41.3 41.5
100 100 100 100 100 100
Father
% Children in % Children in
Govt Pvt Govt &
PvtGovt Pvt
Govt &Pvt
Manipur
Parents’educationlevel
No schooling
Std I-V
Std VI-VIII
Std IX-X
Std XI & above
Total
Mother
34.4 21.8 27.0 45.1 31.5 37.5
37.8 24.9 30.3 19.7 19.5 19.6
13.7 25.0 20.3 8.7 11.6 10.3
8.0 17.9 13.8 16.6 23.2 20.3
6.1 10.5 8.7 9.9 14.2 12.3
100 100 100 100 100 100
Father
% Children in % Children in
Govt Pvt Govt &
PvtGovt Pvt
Govt &Pvt
Meghalaya
Parents’educationlevel
No schooling
Std I-V
Std VI-VIII
Std IX-X
Std XI & above
Total
Mother
30.1 15.9 20.7 29.0 11.0 17.1
15.8 11.1 12.7 10.8 10.4 10.5
24.8 34.8 31.4 21.2 21.4 21.3
21.2 26.0 24.4 29.2 38.2 35.1
8.1 12.3 10.8 9.9 19.0 15.9
100 100 100 100 100 100
Father
% Children in % Children in
Govt Pvt Govt &
PvtGovt Pvt
Govt &Pvt
Nagaland
Parents’educationlevel
No schooling
Std I-V
Std VI-VIII
Std IX-X
Std XI & above
Total
Mother
17.5 2.5 15.1 10.6 3.0 9.3
20.5 7.1 18.3 19.9 3.8 17.2
21.6 13.5 20.3 17.7 11.8 16.7
31.7 51.9 34.9 34.1 44.9 35.9
8.8 25.1 11.4 17.8 36.6 20.9
100 100 100 100 100 100
Father
% Children in % Children in
Govt Pvt Govt &
PvtGovt Pvt
Govt &Pvt
Odisha
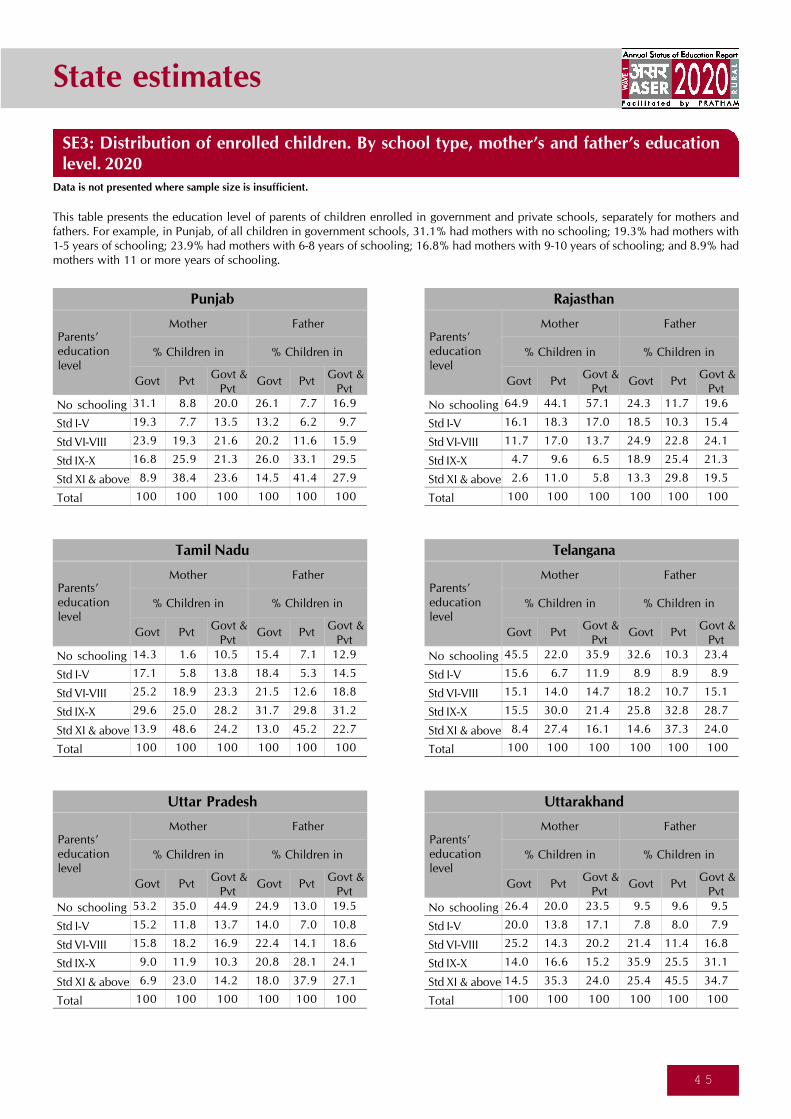
State estimates
4 5
This table presents the education level of parents of children enrolled in government and private schools, separately for mothers andfathers. For example, in Punjab, of all children in government schools, 31.1% had mothers with no schooling; 19.3% had mothers with1-5 years of schooling; 23.9% had mothers with 6-8 years of schooling; 16.8% had mothers with 9-10 years of schooling; and 8.9% hadmothers with 11 or more years of schooling.
SE3: Distribution of enrolled children. By school type, mother’s and father’s educationlevel. 2020
Data is not presented where sample size is insufficient.
Parents’educationlevel
No schooling
Std I-V
Std VI-VIII
Std IX-X
Std XI & above
Total
Mother
31.1 8.8 20.0 26.1 7.7 16.9
19.3 7.7 13.5 13.2 6.2 9.7
23.9 19.3 21.6 20.2 11.6 15.9
16.8 25.9 21.3 26.0 33.1 29.5
8.9 38.4 23.6 14.5 41.4 27.9
100 100 100 100 100 100
Father
% Children in % Children in
Govt Pvt Govt &
PvtGovt Pvt
Govt &Pvt
Punjab
Parents’educationlevel
No schooling
Std I-V
Std VI-VIII
Std IX-X
Std XI & above
Total
Mother
64.9 44.1 57.1 24.3 11.7 19.6
16.1 18.3 17.0 18.5 10.3 15.4
11.7 17.0 13.7 24.9 22.8 24.1
4.7 9.6 6.5 18.9 25.4 21.3
2.6 11.0 5.8 13.3 29.8 19.5
100 100 100 100 100 100
Father
% Children in % Children in
Govt Pvt Govt &
PvtGovt Pvt
Govt &Pvt
Rajasthan
Parents’educationlevel
No schooling
Std I-V
Std VI-VIII
Std IX-X
Std XI & above
Total
Mother
14.3 1.6 10.5 15.4 7.1 12.9
17.1 5.8 13.8 18.4 5.3 14.5
25.2 18.9 23.3 21.5 12.6 18.8
29.6 25.0 28.2 31.7 29.8 31.2
13.9 48.6 24.2 13.0 45.2 22.7
100 100 100 100 100 100
Father
% Children in % Children in
Govt Pvt Govt &
PvtGovt Pvt
Govt &Pvt
Tamil Nadu
Parents’educationlevel
No schooling
Std I-V
Std VI-VIII
Std IX-X
Std XI & above
Total
Mother
45.5 22.0 35.9 32.6 10.3 23.4
15.6 6.7 11.9 8.9 8.9 8.9
15.1 14.0 14.7 18.2 10.7 15.1
15.5 30.0 21.4 25.8 32.8 28.7
8.4 27.4 16.1 14.6 37.3 24.0
100 100 100 100 100 100
Father
% Children in % Children in
Govt Pvt Govt &
PvtGovt Pvt
Govt &Pvt
Telangana
Parents’educationlevel
No schooling
Std I-V
Std VI-VIII
Std IX-X
Std XI & above
Total
Mother
53.2 35.0 44.9 24.9 13.0 19.5
15.2 11.8 13.7 14.0 7.0 10.8
15.8 18.2 16.9 22.4 14.1 18.6
9.0 11.9 10.3 20.8 28.1 24.1
6.9 23.0 14.2 18.0 37.9 27.1
100 100 100 100 100 100
Father
% Children in % Children in
Govt Pvt Govt &
PvtGovt Pvt
Govt &Pvt
Uttar Pradesh
Parents’educationlevel
No schooling
Std I-V
Std VI-VIII
Std IX-X
Std XI & above
Total
Mother
26.4 20.0 23.5 9.5 9.6 9.5
20.0 13.8 17.1 7.8 8.0 7.9
25.2 14.3 20.2 21.4 11.4 16.8
14.0 16.6 15.2 35.9 25.5 31.1
14.5 35.3 24.0 25.4 45.5 34.7
100 100 100 100 100 100
Father
% Children in % Children in
Govt Pvt Govt &
PvtGovt Pvt
Govt &Pvt
Uttarakhand
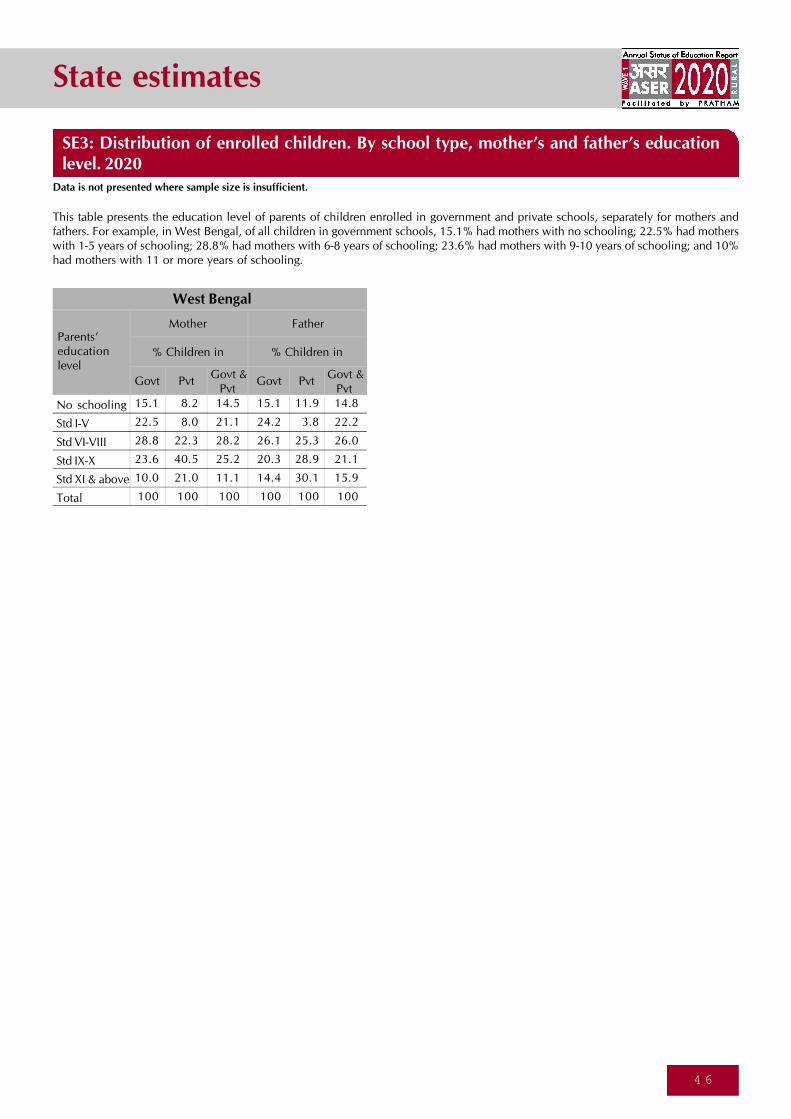
State estimates
4 6
This table presents the education level of parents of children enrolled in government and private schools, separately for mothers andfathers. For example, in West Bengal, of all children in government schools, 15.1% had mothers with no schooling; 22.5% had motherswith 1-5 years of schooling; 28.8% had mothers with 6-8 years of schooling; 23.6% had mothers with 9-10 years of schooling; and 10%had mothers with 11 or more years of schooling.
SE3: Distribution of enrolled children. By school type, mother’s and father’s educationlevel. 2020
Data is not presented where sample size is insufficient.
Parents’educationlevel
No schooling
Std I-V
Std VI-VIII
Std IX-X
Std XI & above
Total
Mother
15.1 8.2 14.5 15.1 11.9 14.8
22.5 8.0 21.1 24.2 3.8 22.2
28.8 22.3 28.2 26.1 25.3 26.0
23.6 40.5 25.2 20.3 28.9 21.1
10.0 21.0 11.1 14.4 30.1 15.9
100 100 100 100 100 100
Father
% Children in % Children in
Govt Pvt Govt &
PvtGovt Pvt
Govt &Pvt
West Bengal
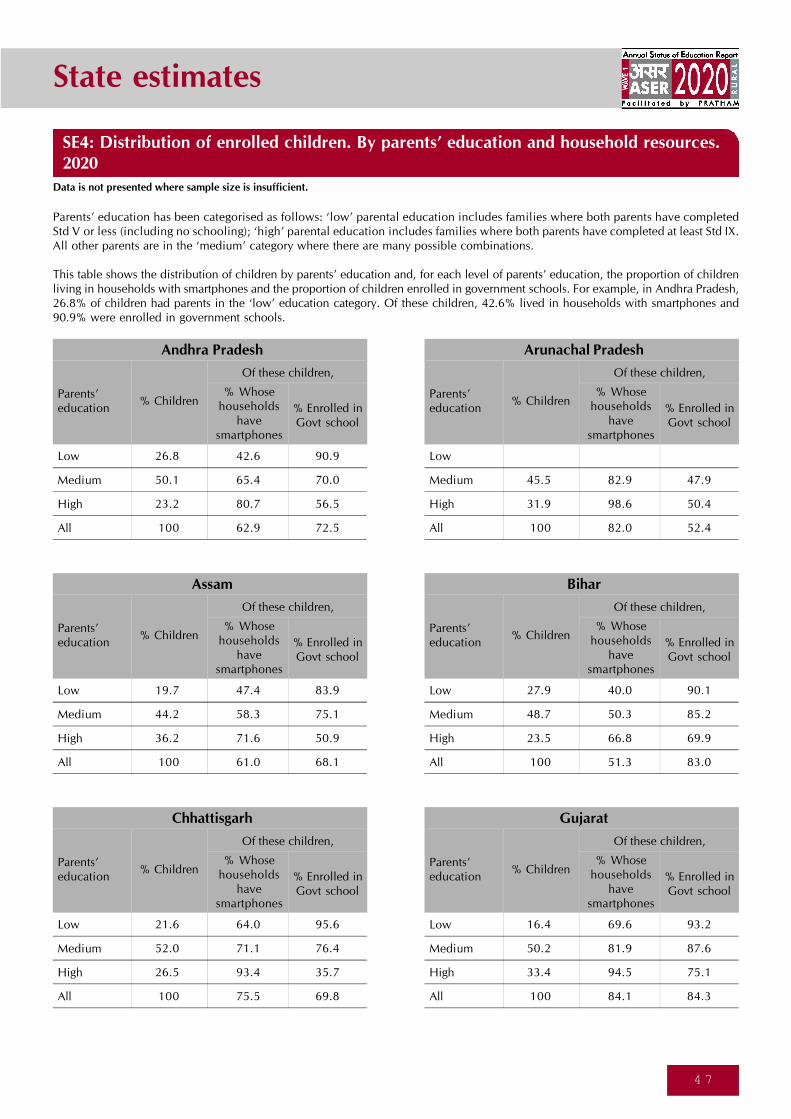
State estimates
4 7
SE4: Distribution of enrolled children. By parents’ education and household resources.2020
Data is not presented where sample size is insufficient.
Parents’ education has been categorised as follows: ‘low’ parental education includes families where both parents have completedStd V or less (including no schooling); ‘high’ parental education includes families where both parents have completed at least Std IX.All other parents are in the ‘medium’ category where there are many possible combinations.
This table shows the distribution of children by parents’ education and, for each level of parents’ education, the proportion of childrenliving in households with smartphones and the proportion of children enrolled in government schools. For example, in Andhra Pradesh,26.8% of children had parents in the ‘low’ education category. Of these children, 42.6% lived in households with smartphones and90.9% were enrolled in government schools.
Parents’education
Low
Medium
High
All
26.8 42.6 90.9
50.1 65.4 70.0
23.2 80.7 56.5
100 62.9 72.5
% Children
Of these children,
% Whosehouseholds
havesmartphones
% Enrolled inGovt school
Andhra Pradesh
Parents’education
Low
Medium
High
All
45.5 82.9 47.9
31.9 98.6 50.4
100 82.0 52.4
% Children
Of these children,
% Whosehouseholds
havesmartphones
% Enrolled inGovt school
Arunachal Pradesh
Parents’education
Low
Medium
High
All
19.7 47.4 83.9
44.2 58.3 75.1
36.2 71.6 50.9
100 61.0 68.1
% Children
Of these children,
% Whosehouseholds
havesmartphones
% Enrolled inGovt school
Assam
Parents’education
Low
Medium
High
All
27.9 40.0 90.1
48.7 50.3 85.2
23.5 66.8 69.9
100 51.3 83.0
% Children
Of these children,
% Whosehouseholds
havesmartphones
% Enrolled inGovt school
Bihar
Parents’education
Low
Medium
High
All
21.6 64.0 95.6
52.0 71.1 76.4
26.5 93.4 35.7
100 75.5 69.8
% Children
Of these children,
% Whosehouseholds
havesmartphones
% Enrolled inGovt school
Chhattisgarh
Parents’education
Low
Medium
High
All
16.4 69.6 93.2
50.2 81.9 87.6
33.4 94.5 75.1
100 84.1 84.3
% Children
Of these children,
% Whosehouseholds
havesmartphones
% Enrolled inGovt school
Gujarat
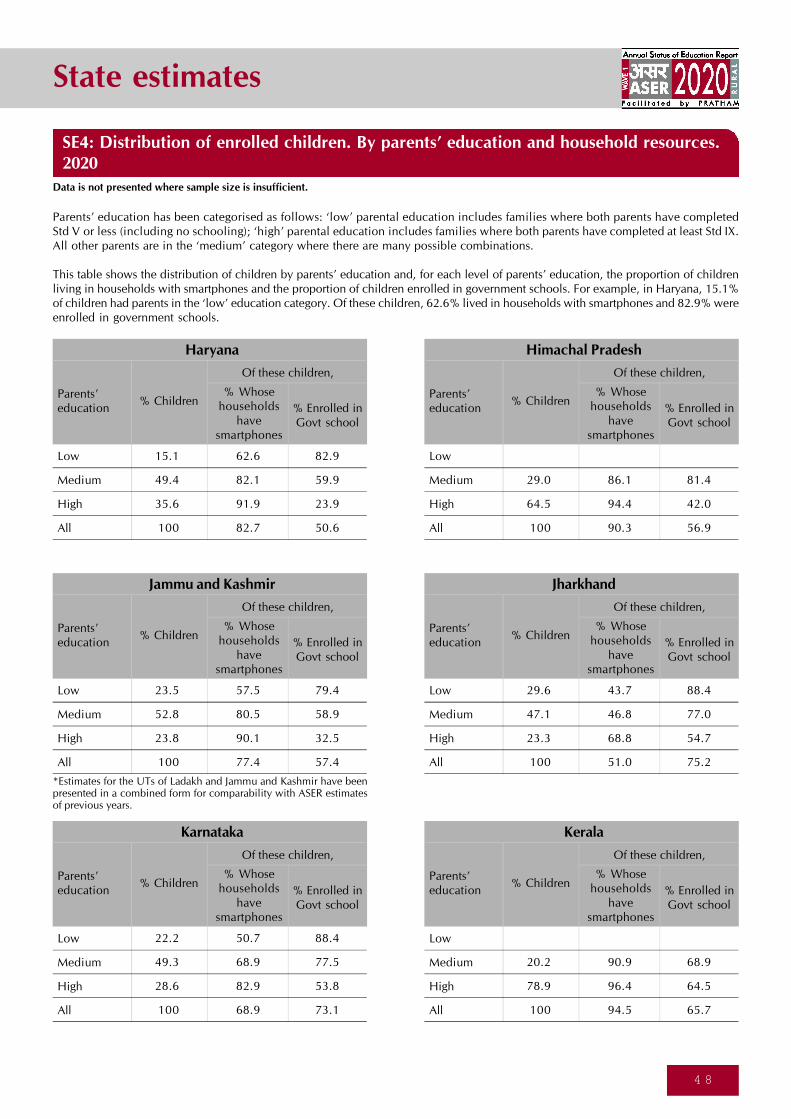
State estimates
4 8
Parents’education
Low
Medium
High
All
15.1 62.6 82.9
49.4 82.1 59.9
35.6 91.9 23.9
100 82.7 50.6
% Children
Of these children,
% Whosehouseholds
havesmartphones
% Enrolled inGovt school
Haryana
Parents’education
Low
Medium
High
All
29.0 86.1 81.4
64.5 94.4 42.0
100 90.3 56.9
% Children
Of these children,
% Whosehouseholds
havesmartphones
% Enrolled inGovt school
Himachal Pradesh
Parents’education
Low
Medium
High
All
23.5 57.5 79.4
52.8 80.5 58.9
23.8 90.1 32.5
100 77.4 57.4
% Children
Of these children,
% Whosehouseholds
havesmartphones
% Enrolled inGovt school
Jammu and Kashmir
Parents’education
Low
Medium
High
All
29.6 43.7 88.4
47.1 46.8 77.0
23.3 68.8 54.7
100 51.0 75.2
% Children
Of these children,
% Whosehouseholds
havesmartphones
% Enrolled inGovt school
Jharkhand
Parents’education
Low
Medium
High
All
22.2 50.7 88.4
49.3 68.9 77.5
28.6 82.9 53.8
100 68.9 73.1
% Children
Of these children,
% Whosehouseholds
havesmartphones
% Enrolled inGovt school
Karnataka
Parents’education
Low
Medium
High
All
20.2 90.9 68.9
78.9 96.4 64.5
100 94.5 65.7
% Children
Of these children,
% Whosehouseholds
havesmartphones
% Enrolled inGovt school
Kerala
Data is not presented where sample size is insufficient.
Parents’ education has been categorised as follows: ‘low’ parental education includes families where both parents have completedStd V or less (including no schooling); ‘high’ parental education includes families where both parents have completed at least Std IX.All other parents are in the ‘medium’ category where there are many possible combinations.
This table shows the distribution of children by parents’ education and, for each level of parents’ education, the proportion of childrenliving in households with smartphones and the proportion of children enrolled in government schools. For example, in Haryana, 15.1%of children had parents in the ‘low’ education category. Of these children, 62.6% lived in households with smartphones and 82.9% wereenrolled in government schools.
SE4: Distribution of enrolled children. By parents’ education and household resources.2020
*Estimates for the UTs of Ladakh and Jammu and Kashmir have beenpresented in a combined form for comparability with ASER estimatesof previous years.

State estimates
4 9
Data is not presented where sample size is insufficient.
Parents’ education has been categorised as follows: ‘low’ parental education includes families where both parents have completedStd V or less (including no schooling); ‘high’ parental education includes families where both parents have completed at least Std IX.All other parents are in the ‘medium’ category where there are many possible combinations.
This table shows the distribution of children by parents’ education and, for each level of parents’ education, the proportion of childrenliving in households with smartphones and the proportion of children enrolled in government schools. For example, in MadhyaPradesh, 25.9% of children had parents in the ‘low’ education category. Of these children, 51% lived in households with smartphonesand 83.3% were enrolled in government schools.
Parents’education
Low
Medium
High
All
25.9 51.0 83.3
58.3 64.1 70.1
15.8 78.3 45.5
100 63.0 69.6
% Children
Of these children,
% Whosehouseholds
havesmartphones
% Enrolled inGovt school
Madhya Pradesh
Parents’education
Low
Medium
High
All
6.9 56.4 74.8
46.4 72.0 66.2
46.7 83.5 60.6
100 76.3 64.2
% Children
Of these children,
% Whosehouseholds
havesmartphones
% Enrolled inGovt school
Maharashtra
Parents’education
Low
Medium
High
All
34.9 83.1 16.7
54.5 88.4 10.6
100 85.6 12.5
% Children
Of these children,
% Whosehouseholds
havesmartphones
% Enrolled inGovt school
Manipur
Parents’education
Low
Medium
High
All
40.6 61.9 55.2
47.4 70.1 39.0
12.0 100.0 22.5
100 70.4 43.6
% Children
Of these children,
% Whosehouseholds
havesmartphones
% Enrolled inGovt school
Meghalaya
Parents’education
Low
Medium
High
All
20.8 61.8 55.1
51.8 80.1 31.0
27.4 98.1 23.9
100 81.2 34.1
% Children
Of these children,
% Whosehouseholds
havesmartphones
% Enrolled inGovt school
Nagaland
Parents’education
Low
Medium
High
All
17.4 45.3 98.4
44.5 35.9 88.5
38.2 66.1 71.5
100 49.1 83.7
% Children
Of these children,
% Whosehouseholds
havesmartphones
% Enrolled inGovt school
Odisha
SE4: Distribution of enrolled children. By parents’ education and household resources.2020

State estimates
5 0
Data is not presented where sample size is insufficient.
Parents’ education has been categorised as follows: ‘low’ parental education includes families where both parents have completedStd V or less (including no schooling); ‘high’ parental education includes families where both parents have completed at least Std IX.All other parents are in the ‘medium’ category where there are many possible combinations.
This table shows the distribution of children by parents’ education and, for each level of parents’ education, the proportion of childrenliving in households with smartphones and the proportion of children enrolled in government schools. For example, in Punjab, 18.1%of children had parents in the ‘low’ education category. Of these children, 75.8% lived in households with smartphones and 79.5% wereenrolled in government schools.
Parents’education
Low
Medium
High
All
18.1 75.8 79.5
45.6 86.4 59.1
36.3 97.3 24.7
100 88.4 50.3
% Children
Of these children,
% Whosehouseholds
havesmartphones
% Enrolled inGovt school
Punjab
Parents’education
Low
Medium
High
All
32.3 48.7 77.8
57.5 67.6 58.2
10.2 85.2 36.2
100 63.3 62.3
% Children
Of these children,
% Whosehouseholds
havesmartphones
% Enrolled inGovt school
Rajasthan
Parents’education
Low
Medium
High
All
14.6 39.6 92.9
48.5 60.6 78.1
36.9 79.4 50.0
100 64.6 69.9
% Children
Of these children,
% Whosehouseholds
havesmartphones
% Enrolled inGovt school
Tamil Nadu
Parents’education
Low
Medium
High
All
25.6 59.7 78.4
43.2 73.0 65.8
31.2 86.1 31.4
100 73.7 58.3
% Children
Of these children,
% Whosehouseholds
havesmartphones
% Enrolled inGovt school
Telangana
Parents’education
Low
Medium
High
All
26.1 36.8 71.8
53.2 54.2 54.2
20.7 73.8 31.7
100 53.8 54.1
% Children
Of these children,
% Whosehouseholds
havesmartphones
% Enrolled inGovt school
Uttar Pradesh
Parents’education
Low
Medium
High
All
15.1 57.4 53.8
48.9 70.7 64.8
36.0 89.7 39.4
100 75.5 54.0
% Children
Of these children,
% Whosehouseholds
havesmartphones
% Enrolled inGovt school
Uttarakhand
SE4: Distribution of enrolled children. By parents’ education and household resources.2020
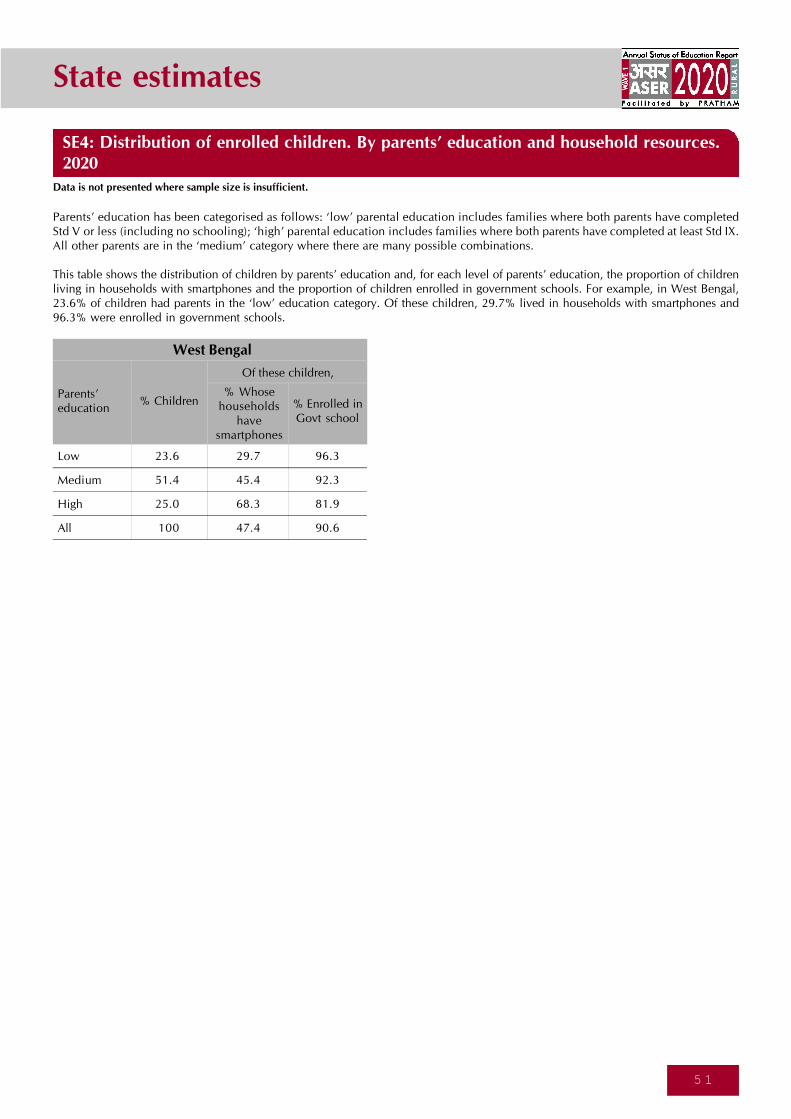
State estimates
5 1
Data is not presented where sample size is insufficient.
Parents’ education has been categorised as follows: ‘low’ parental education includes families where both parents have completedStd V or less (including no schooling); ‘high’ parental education includes families where both parents have completed at least Std IX.All other parents are in the ‘medium’ category where there are many possible combinations.
This table shows the distribution of children by parents’ education and, for each level of parents’ education, the proportion of childrenliving in households with smartphones and the proportion of children enrolled in government schools. For example, in West Bengal,23.6% of children had parents in the ‘low’ education category. Of these children, 29.7% lived in households with smartphones and96.3% were enrolled in government schools.
Parents’education
Low
Medium
High
All
23.6 29.7 96.3
51.4 45.4 92.3
25.0 68.3 81.9
100 47.4 90.6
% Children
Of these children,
% Whosehouseholds
havesmartphones
% Enrolled inGovt school
West Bengal
SE4: Distribution of enrolled children. By parents’ education and household resources.2020
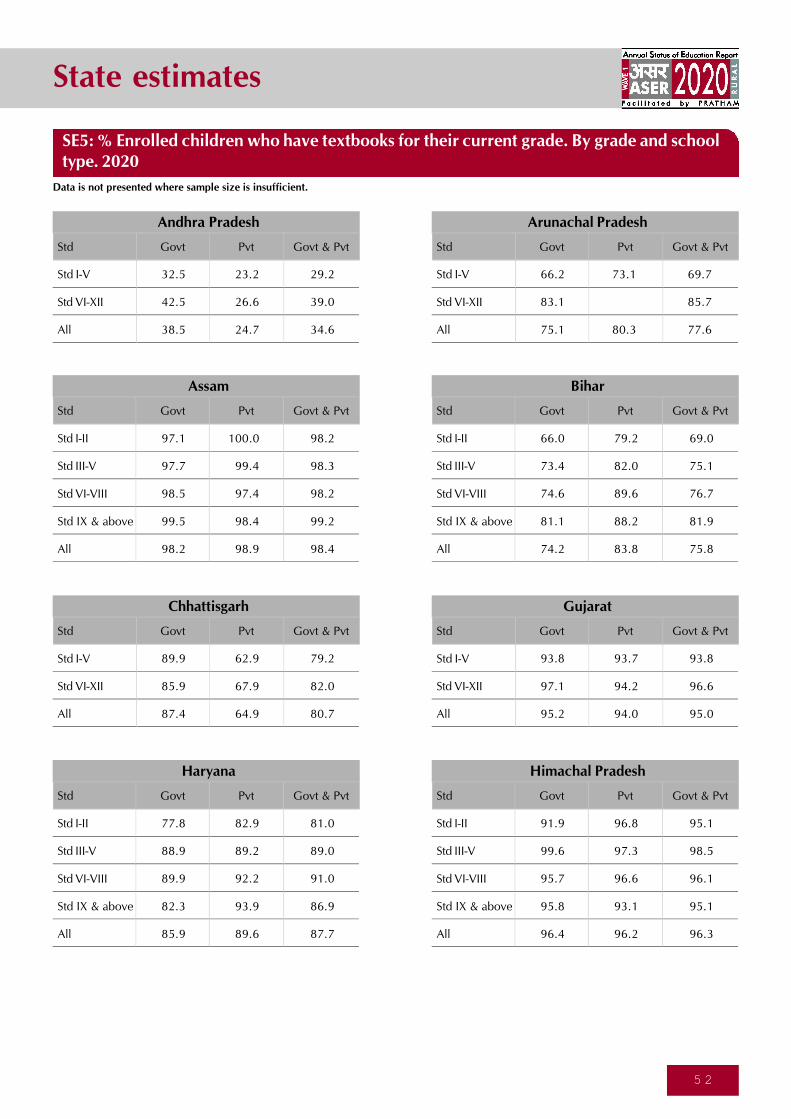
State estimates
5 2
SE5: % Enrolled children who have textbooks for their current grade. By grade and schooltype. 2020
Data is not presented where sample size is insufficient.
Std
Std I-V
Std VI-XII
All
Govt Pvt Govt & Pvt
32.5 23.2 29.2
42.5 26.6 39.0
38.5 24.7 34.6
Andhra Pradesh
Std
Std I-II
Std III-V
Std VI-VIII
Std IX & above
All
Govt Pvt Govt & Pvt
66.0 79.2 69.0
73.4 82.0 75.1
74.6 89.6 76.7
81.1 88.2 81.9
74.2 83.8 75.8
Bihar
Std
Std I-II
Std III-V
Std VI-VIII
Std IX & above
All
Govt Pvt Govt & Pvt
77.8 82.9 81.0
88.9 89.2 89.0
89.9 92.2 91.0
82.3 93.9 86.9
85.9 89.6 87.7
Haryana
Std
Std I-II
Std III-V
Std VI-VIII
Std IX & above
All
Govt Pvt Govt & Pvt
91.9 96.8 95.1
99.6 97.3 98.5
95.7 96.6 96.1
95.8 93.1 95.1
96.4 96.2 96.3
Himachal Pradesh
Std
Std I-V
Std VI-XII
All
Govt Pvt Govt & Pvt
89.9 62.9 79.2
85.9 67.9 82.0
87.4 64.9 80.7
Chhattisgarh
Std
Std I-V
Std VI-XII
All
Govt Pvt Govt & Pvt
93.8 93.7 93.8
97.1 94.2 96.6
95.2 94.0 95.0
Gujarat
Std
Std I-V
Std VI-XII
All
Govt Pvt Govt & Pvt
66.2 73.1 69.7
83.1 85.7
75.1 80.3 77.6
Arunachal Pradesh
Std
Std I-II
Std III-V
Std VI-VIII
Std IX & above
All
Govt Pvt Govt & Pvt
97.1 100.0 98.2
97.7 99.4 98.3
98.5 97.4 98.2
99.5 98.4 99.2
98.2 98.9 98.4
Assam

State estimates
5 3
Data is not presented where sample size is insufficient.
SE5: % Enrolled children who have textbooks for their current grade. By grade and schooltype. 2020
Std
Std I-II
Std III-V
Std VI-VIII
Std IX & above
All
Govt Pvt Govt & Pvt
98.6 98.7 98.7
91.5 95.9 93.7
97.8 98.7 98.1
96.1 95.5 96.0
95.7 97.3 96.4
Jammu and Kashmir
Std
Std I-II
Std III-V
Std VI-VIII
Std IX & above
All
Govt Pvt Govt & Pvt
89.8 68.1 84.1
96.5 81.8 92.3
96.9 76.4 91.7
88.9 72.8 84.7
93.9 76.0 89.1
Karnataka
Std
Std I-II
Std III-V
Std VI-VIII
Std IX & above
All
Govt Pvt Govt & Pvt
72.8 69.9 71.9
81.1 74.5 79.4
85.5 70.8 82.9
70.9 70.1 70.7
78.9 71.6 77.1
Jharkhand
Std
Std I-II
Std III-V
Std VI-VIII
Std IX & above
All
Govt Pvt Govt & Pvt
84.6 53.6 72.6
89.2 52.0 75.9
93.2 60.8 84.0
87.9 66.5 83.6
89.3 57.2 79.6
Madhya Pradesh
Std
Std I-V
Std VI-XII
All
Govt Pvt Govt & Pvt
99.3 87.7 93.6
89.1 90.3
92.9 90.0 91.9
Kerala
Std
Std I-II
Std III-V
Std VI-VIII
Std IX & above
All
Govt Pvt Govt & Pvt
84.9 60.3 79.0
92.7 75.0 88.2
88.6 82.0 86.2
63.7 62.9 63.2
86.0 71.4 80.8
Maharashtra
Std
Std I-II
Std III-V
Std VI-VIII
Std IX & above
All
Govt Pvt Govt & Pvt
96.7 96.8
98.3 98.5
96.2 96.7
97.7 98.1
99.6 97.2 97.5
Manipur
Std
Std I-V
Std VI-XII
All
Govt Pvt Govt & Pvt
96.9 98.7 97.9
96.7 97.5
97.5 97.9 97.8
Meghalaya
*Estimates for the UTs of Ladakh and Jammu and Kashmir have beenpresented in a combined form for comparability with ASER estimatesof previous years.
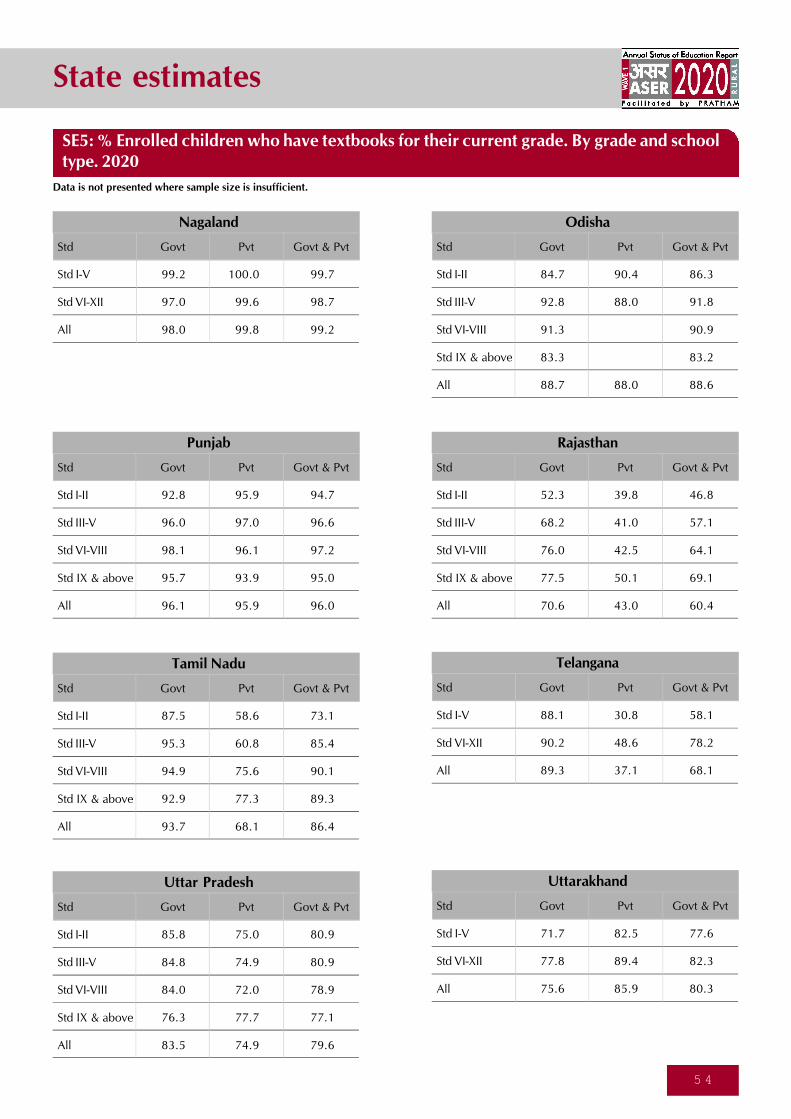
State estimates
5 4
Data is not presented where sample size is insufficient.
SE5: % Enrolled children who have textbooks for their current grade. By grade and schooltype. 2020
Std
Std I-II
Std III-V
Std VI-VIII
Std IX & above
All
Govt Pvt Govt & Pvt
92.8 95.9 94.7
96.0 97.0 96.6
98.1 96.1 97.2
95.7 93.9 95.0
96.1 95.9 96.0
Punjab
Std
Std I-II
Std III-V
Std VI-VIII
Std IX & above
All
Govt Pvt Govt & Pvt
52.3 39.8 46.8
68.2 41.0 57.1
76.0 42.5 64.1
77.5 50.1 69.1
70.6 43.0 60.4
Rajasthan
Std
Std I-II
Std III-V
Std VI-VIII
Std IX & above
All
Govt Pvt Govt & Pvt
87.5 58.6 73.1
95.3 60.8 85.4
94.9 75.6 90.1
92.9 77.3 89.3
93.7 68.1 86.4
Tamil Nadu
Std
Std I-II
Std III-V
Std VI-VIII
Std IX & above
All
Govt Pvt Govt & Pvt
85.8 75.0 80.9
84.8 74.9 80.9
84.0 72.0 78.9
76.3 77.7 77.1
83.5 74.9 79.6
Uttar Pradesh
Std
Std I-V
Std VI-XII
All
Govt Pvt Govt & Pvt
88.1 30.8 58.1
90.2 48.6 78.2
89.3 37.1 68.1
Telangana
Std
Std I-V
Std VI-XII
All
Govt Pvt Govt & Pvt
71.7 82.5 77.6
77.8 89.4 82.3
75.6 85.9 80.3
Uttarakhand
Std
Std I-II
Std III-V
Std VI-VIII
Std IX & above
All
Govt Pvt Govt & Pvt
84.7 90.4 86.3
92.8 88.0 91.8
91.3 90.9
83.3 83.2
88.7 88.0 88.6
Odisha
Std
Std I-V
Std VI-XII
All
Govt Pvt Govt & Pvt
99.2 100.0 99.7
97.0 99.6 98.7
98.0 99.8 99.2
Nagaland
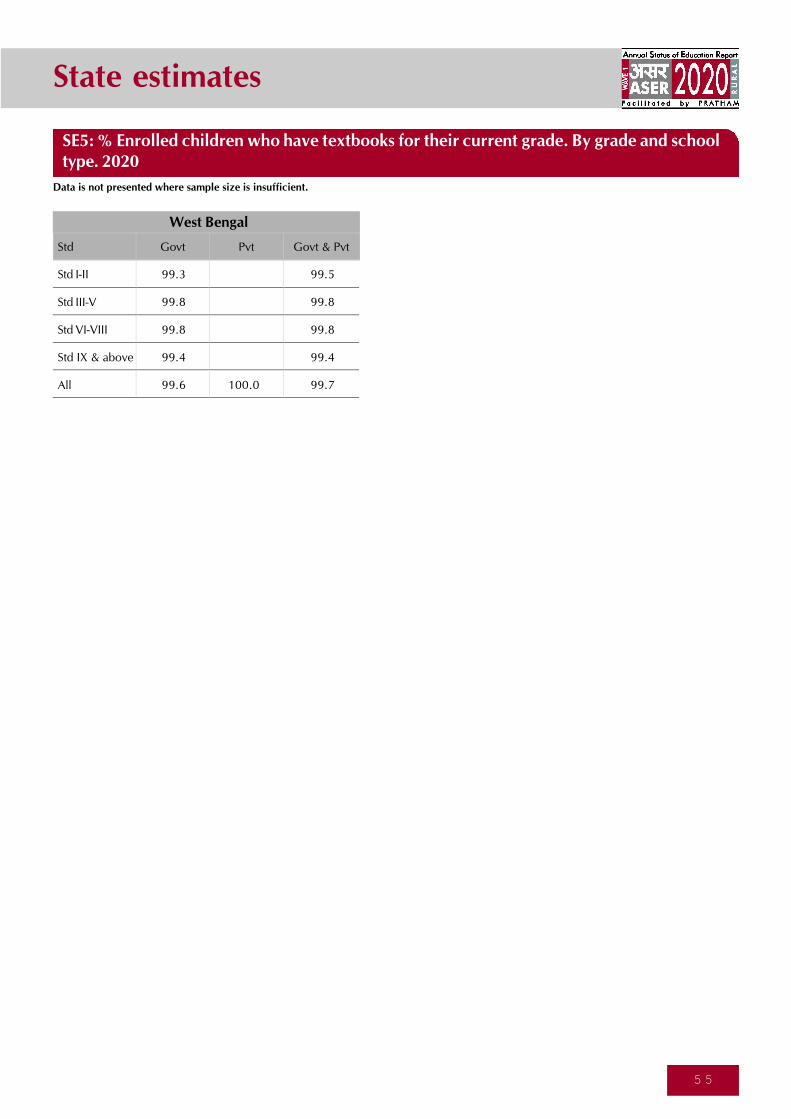
State estimates
5 5
Data is not presented where sample size is insufficient.
SE5: % Enrolled children who have textbooks for their current grade. By grade and schooltype. 2020
Std
Std I-II
Std III-V
Std VI-VIII
Std IX & above
All
Govt Pvt Govt & Pvt
99.3 99.5
99.8 99.8
99.8 99.8
99.4 99.4
99.6 100.0 99.7
West Bengal
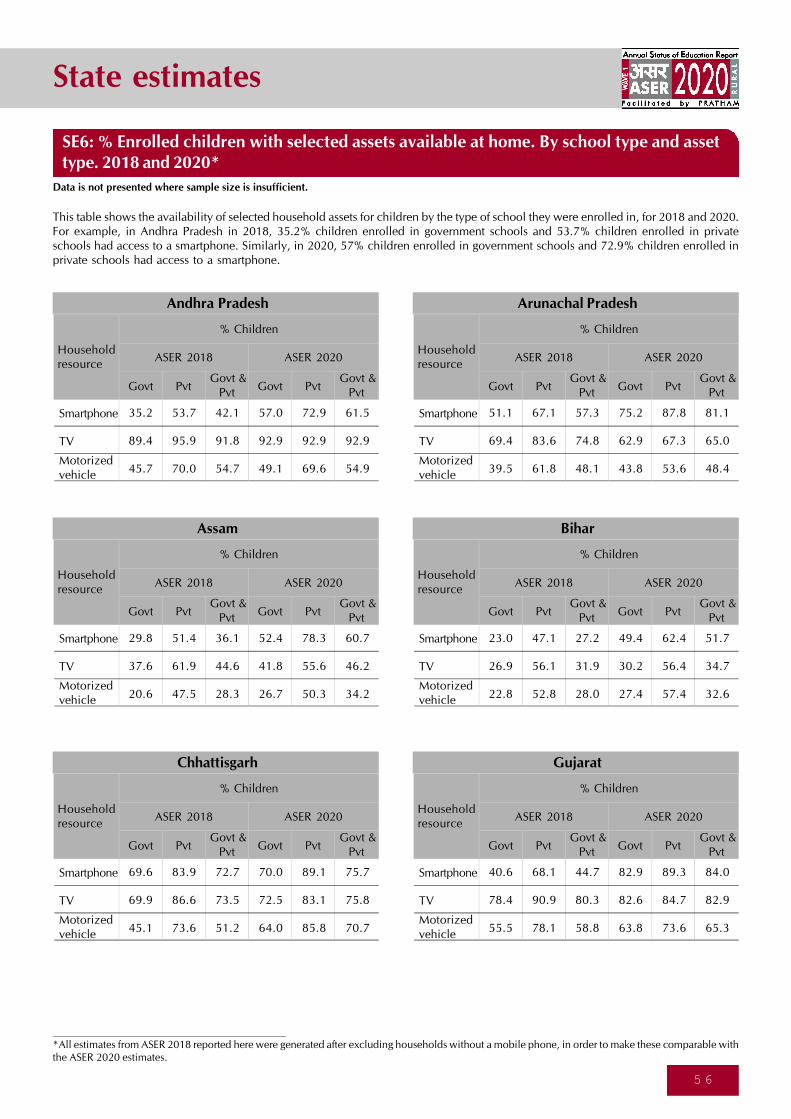
State estimates
5 6
SE6: % Enrolled children with selected assets available at home. By school type and assettype. 2018 and 2020*
Data is not presented where sample size is insufficient.
This table shows the availability of selected household assets for children by the type of school they were enrolled in, for 2018 and 2020.For example, in Andhra Pradesh in 2018, 35.2% children enrolled in government schools and 53.7% children enrolled in privateschools had access to a smartphone. Similarly, in 2020, 57% children enrolled in government schools and 72.9% children enrolled inprivate schools had access to a smartphone.
Smartphone
TV
Householdresource
% Children
ASER 2018 ASER 2020
Govt Pvt Govt &
PvtGovt Pvt
Govt &Pvt
Motorizedvehicle
35.2 53.7 42.1 57.0 72.9 61.5
89.4 95.9 91.8 92.9 92.9 92.9
45.7 70.0 54.7 49.1 69.6 54.9
Andhra Pradesh
Smartphone
TV
Householdresource
% Children
ASER 2018 ASER 2020
Govt Pvt Govt &
PvtGovt Pvt
Govt &Pvt
Motorizedvehicle
51.1 67.1 57.3 75.2 87.8 81.1
69.4 83.6 74.8 62.9 67.3 65.0
39.5 61.8 48.1 43.8 53.6 48.4
Arunachal Pradesh
Smartphone
TV
Householdresource
% Children
ASER 2018 ASER 2020
Govt Pvt Govt &
PvtGovt Pvt
Govt &Pvt
Motorizedvehicle
29.8 51.4 36.1 52.4 78.3 60.7
37.6 61.9 44.6 41.8 55.6 46.2
20.6 47.5 28.3 26.7 50.3 34.2
Assam
Smartphone
TV
Householdresource
% Children
ASER 2018 ASER 2020
Govt Pvt Govt &
PvtGovt Pvt
Govt &Pvt
Motorizedvehicle
23.0 47.1 27.2 49.4 62.4 51.7
26.9 56.1 31.9 30.2 56.4 34.7
22.8 52.8 28.0 27.4 57.4 32.6
Bihar
Smartphone
TV
Householdresource
% Children
ASER 2018 ASER 2020
Govt Pvt Govt &
PvtGovt Pvt
Govt &Pvt
Motorizedvehicle
69.6 83.9 72.7 70.0 89.1 75.7
69.9 86.6 73.5 72.5 83.1 75.8
45.1 73.6 51.2 64.0 85.8 70.7
Chhattisgarh
Smartphone
TV
Householdresource
% Children
ASER 2018 ASER 2020
Govt Pvt Govt &
PvtGovt Pvt
Govt &Pvt
Motorizedvehicle
40.6 68.1 44.7 82.9 89.3 84.0
78.4 90.9 80.3 82.6 84.7 82.9
55.5 78.1 58.8 63.8 73.6 65.3
Gujarat
*All estimates from ASER 2018 reported here were generated after excluding households without a mobile phone, in order to make these comparable withthe ASER 2020 estimates.
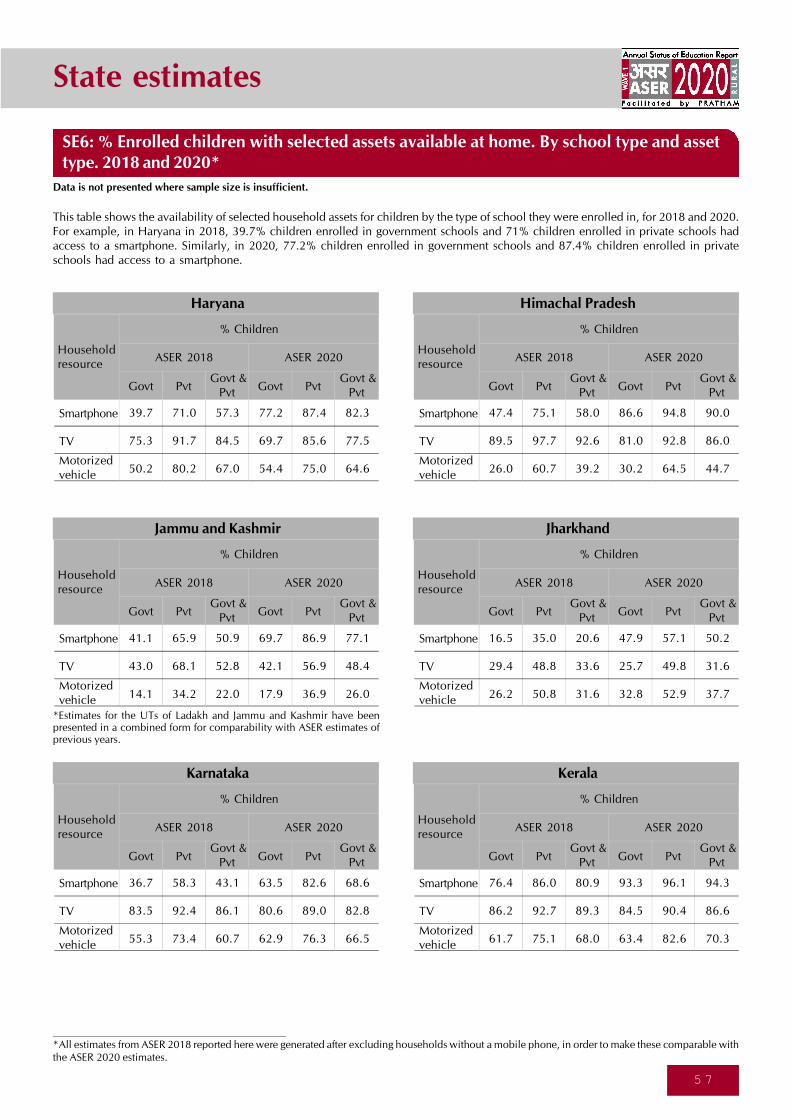
State estimates
5 7
Data is not presented where sample size is insufficient.
This table shows the availability of selected household assets for children by the type of school they were enrolled in, for 2018 and 2020.For example, in Haryana in 2018, 39.7% children enrolled in government schools and 71% children enrolled in private schools hadaccess to a smartphone. Similarly, in 2020, 77.2% children enrolled in government schools and 87.4% children enrolled in privateschools had access to a smartphone.
Smartphone
TV
Householdresource
% Children
ASER 2018 ASER 2020
Govt Pvt Govt &
PvtGovt Pvt
Govt &Pvt
Motorizedvehicle
39.7 71.0 57.3 77.2 87.4 82.3
75.3 91.7 84.5 69.7 85.6 77.5
50.2 80.2 67.0 54.4 75.0 64.6
Haryana
Smartphone
TV
Householdresource
% Children
ASER 2018 ASER 2020
Govt Pvt Govt &
PvtGovt Pvt
Govt &Pvt
Motorizedvehicle
47.4 75.1 58.0 86.6 94.8 90.0
89.5 97.7 92.6 81.0 92.8 86.0
26.0 60.7 39.2 30.2 64.5 44.7
Himachal Pradesh
Smartphone
TV
Householdresource
% Children
ASER 2018 ASER 2020
Govt Pvt Govt &
PvtGovt Pvt
Govt &Pvt
Motorizedvehicle
41.1 65.9 50.9 69.7 86.9 77.1
43.0 68.1 52.8 42.1 56.9 48.4
14.1 34.2 22.0 17.9 36.9 26.0
Jammu and Kashmir
Smartphone
TV
Householdresource
% Children
ASER 2018 ASER 2020
Govt Pvt Govt &
PvtGovt Pvt
Govt &Pvt
Motorizedvehicle
16.5 35.0 20.6 47.9 57.1 50.2
29.4 48.8 33.6 25.7 49.8 31.6
26.2 50.8 31.6 32.8 52.9 37.7
Jharkhand
Smartphone
TV
Householdresource
% Children
ASER 2018 ASER 2020
Govt Pvt Govt &
PvtGovt Pvt
Govt &Pvt
Motorizedvehicle
36.7 58.3 43.1 63.5 82.6 68.6
83.5 92.4 86.1 80.6 89.0 82.8
55.3 73.4 60.7 62.9 76.3 66.5
Karnataka
Smartphone
TV
Householdresource
% Children
ASER 2018 ASER 2020
Govt Pvt Govt &
PvtGovt Pvt
Govt &Pvt
Motorizedvehicle
76.4 86.0 80.9 93.3 96.1 94.3
86.2 92.7 89.3 84.5 90.4 86.6
61.7 75.1 68.0 63.4 82.6 70.3
Kerala
*All estimates from ASER 2018 reported here were generated after excluding households without a mobile phone, in order to make these comparable withthe ASER 2020 estimates.
SE6: % Enrolled children with selected assets available at home. By school type and assettype. 2018 and 2020*
*Estimates for the UTs of Ladakh and Jammu and Kashmir have beenpresented in a combined form for comparability with ASER estimates ofprevious years.

State estimates
5 8
Data is not presented where sample size is insufficient.
This table shows the availability of selected household assets for children by the type of school they were enrolled in, for 2018 and 2020.For example, in Madhya Pradesh in 2018, 17.1% children enrolled in government schools and 38.3% children enrolled in privateschools had access to a smartphone. Similarly, in 2020, 58.2% children enrolled in government schools and 73.2% children enrolledin private schools had access to a smartphone.
Householdresource
% Children
ASER 2018 ASER 2020
Govt Pvt Govt &
PvtGovt Pvt
Govt &Pvt
Motorizedvehicle
17.1 38.3 23.3 58.2 73.2 62.7
50.2 73.6 57.0 57.6 74.8 62.7
38.3 65.9 46.3 45.1 61.9 50.1
Madhya Pradesh
Householdresource
% Children
ASER 2018 ASER 2020
Govt Pvt Govt &
PvtGovt Pvt
Govt &Pvt
Motorizedvehicle
36.7 49.3 42.3 74.9 78.8 76.3
78.8 85.6 81.8 76.3 81.4 78.1
50.2 60.8 54.9 55.9 63.5 58.6
Maharashtra
Householdresource
% Children
ASER 2018 ASER 2020
Govt Pvt Govt &
PvtGovt Pvt
Govt &Pvt
Motorizedvehicle
40.1 58.5 53.4 80.3 84.9 84.3
51.2 76.6 69.5 52.2 62.8 61.4
19.4 40.5 34.6 35.3 46.7 45.3
Manipur
Householdresource
% Children
ASER 2018 ASER 2020
Govt Pvt Govt &
PvtGovt Pvt
Govt &Pvt
Motorizedvehicle
34.7 45.0 41.3 74.5 70.2 72.0
52.6 62.7 59.1 43.9 55.2 50.4
25.8 29.1 27.9 12.9 23.2 18.8
Meghalaya
Householdresource
% Children
ASER 2018 ASER 2020
Govt Pvt Govt &
PvtGovt Pvt
Govt &Pvt
Motorizedvehicle
36.3 62.7 50.0 70.1 87.8 81.8
49.5 75.8 63.1 45.4 67.5 60.1
22.7 41.6 32.6 12.8 31.6 25.2
Nagaland
Householdresource
% Children
ASER 2018 ASER 2020
Govt Pvt Govt &
PvtGovt Pvt
Govt &Pvt
Motorizedvehicle
23.9 41.8 26.1 44.2 75.1 49.3
59.1 83.2 62.0 65.4 79.4 67.7
38.5 70.5 42.4 42.5 71.5 47.3
Odisha
*All estimates from ASER 2018 reported here were generated after excluding households without a mobile phone, in order to make these comparable withthe ASER 2020 estimates.
SE6: % Enrolled children with selected assets available at home. By school type and assettype. 2018 and 2020*
Smartphone
TV
Smartphone
TV
Smartphone
TV
Smartphone
TV
Smartphone
TV
Smartphone
TV
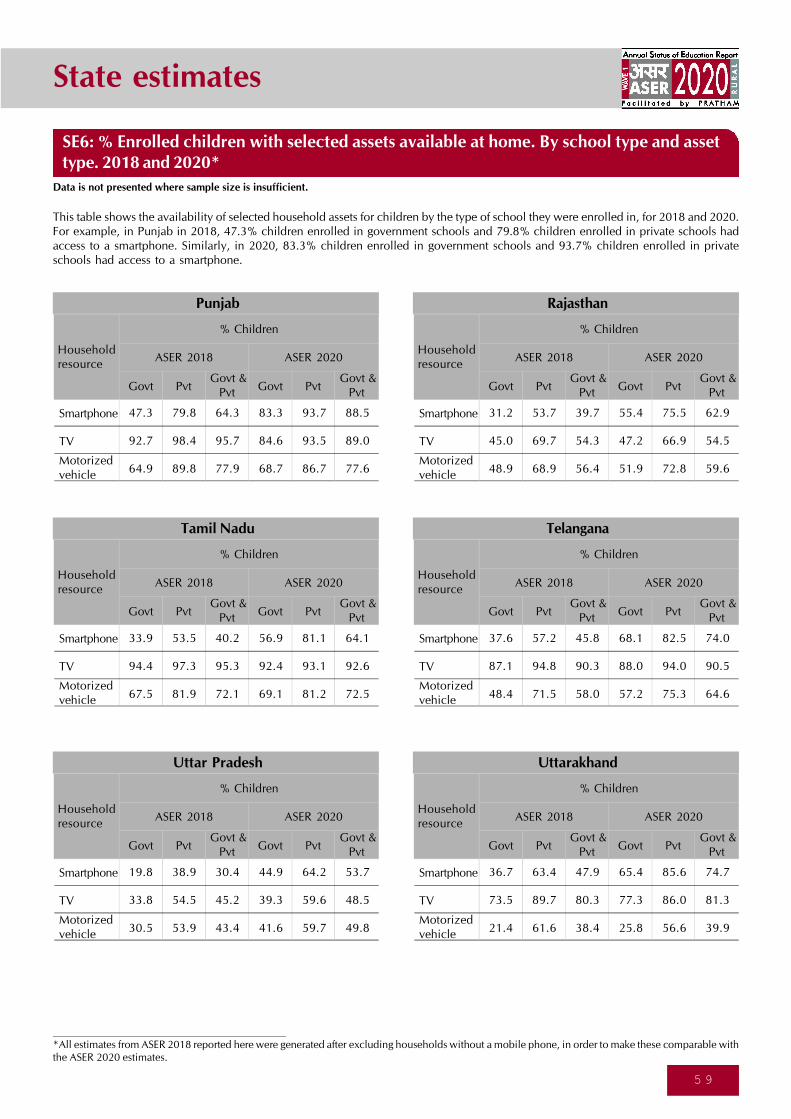
State estimates
5 9
Data is not presented where sample size is insufficient.
This table shows the availability of selected household assets for children by the type of school they were enrolled in, for 2018 and 2020.For example, in Punjab in 2018, 47.3% children enrolled in government schools and 79.8% children enrolled in private schools hadaccess to a smartphone. Similarly, in 2020, 83.3% children enrolled in government schools and 93.7% children enrolled in privateschools had access to a smartphone.
Householdresource
% Children
ASER 2018 ASER 2020
Govt Pvt Govt &
PvtGovt Pvt
Govt &Pvt
Motorizedvehicle
47.3 79.8 64.3 83.3 93.7 88.5
92.7 98.4 95.7 84.6 93.5 89.0
64.9 89.8 77.9 68.7 86.7 77.6
Punjab
Householdresource
% Children
ASER 2018 ASER 2020
Govt Pvt Govt &
PvtGovt Pvt
Govt &Pvt
Motorizedvehicle
31.2 53.7 39.7 55.4 75.5 62.9
45.0 69.7 54.3 47.2 66.9 54.5
48.9 68.9 56.4 51.9 72.8 59.6
Rajasthan
Householdresource
% Children
ASER 2018 ASER 2020
Govt Pvt Govt &
PvtGovt Pvt
Govt &Pvt
Motorizedvehicle
33.9 53.5 40.2 56.9 81.1 64.1
94.4 97.3 95.3 92.4 93.1 92.6
67.5 81.9 72.1 69.1 81.2 72.5
Tamil Nadu
Householdresource
% Children
ASER 2018 ASER 2020
Govt Pvt Govt &
PvtGovt Pvt
Govt &Pvt
Motorizedvehicle
37.6 57.2 45.8 68.1 82.5 74.0
87.1 94.8 90.3 88.0 94.0 90.5
48.4 71.5 58.0 57.2 75.3 64.6
Telangana
Householdresource
% Children
ASER 2018 ASER 2020
Govt Pvt Govt &
PvtGovt Pvt
Govt &Pvt
Motorizedvehicle
19.8 38.9 30.4 44.9 64.2 53.7
33.8 54.5 45.2 39.3 59.6 48.5
30.5 53.9 43.4 41.6 59.7 49.8
Uttar Pradesh
Householdresource
% Children
ASER 2018 ASER 2020
Govt Pvt Govt &
PvtGovt Pvt
Govt &Pvt
Motorizedvehicle
36.7 63.4 47.9 65.4 85.6 74.7
73.5 89.7 80.3 77.3 86.0 81.3
21.4 61.6 38.4 25.8 56.6 39.9
Uttarakhand
*All estimates from ASER 2018 reported here were generated after excluding households without a mobile phone, in order to make these comparable withthe ASER 2020 estimates.
SE6: % Enrolled children with selected assets available at home. By school type and assettype. 2018 and 2020*
Smartphone
TV
Smartphone
TV
Smartphone
TV
Smartphone
TV
Smartphone
TV
Smartphone
TV
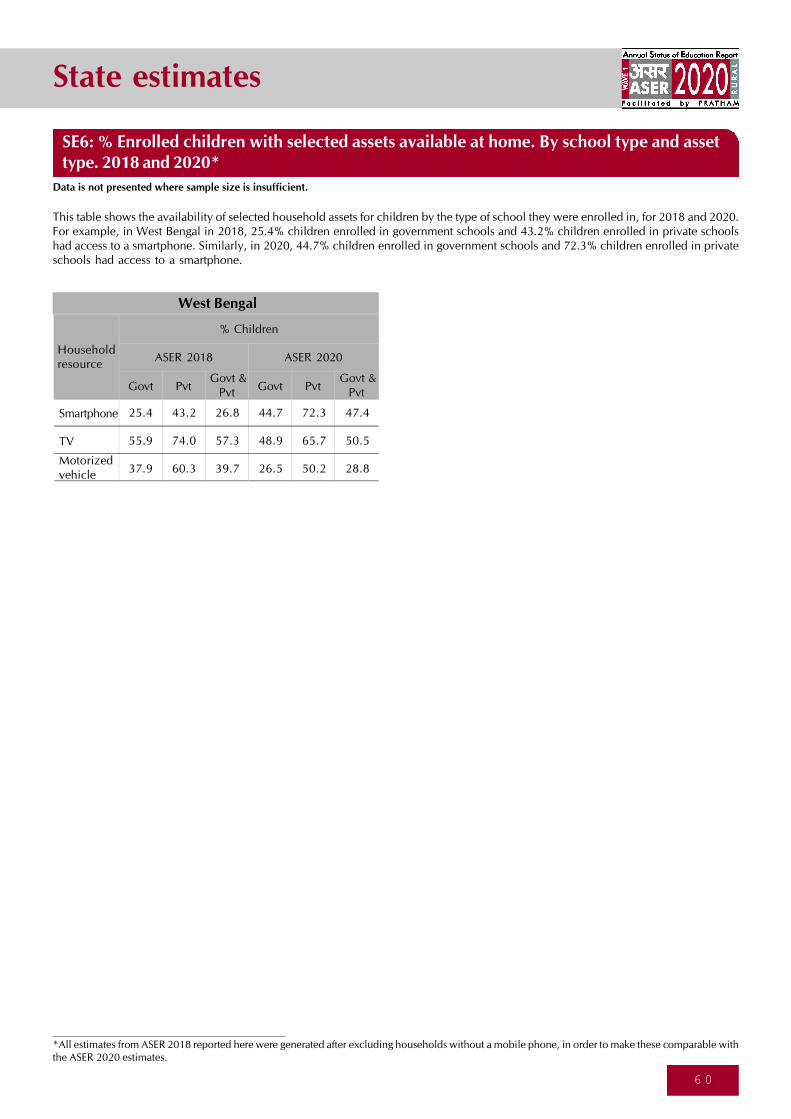
State estimates
6 0
Data is not presented where sample size is insufficient.
This table shows the availability of selected household assets for children by the type of school they were enrolled in, for 2018 and 2020.For example, in West Bengal in 2018, 25.4% children enrolled in government schools and 43.2% children enrolled in private schoolshad access to a smartphone. Similarly, in 2020, 44.7% children enrolled in government schools and 72.3% children enrolled in privateschools had access to a smartphone.
Householdresource
% Children
ASER 2018 ASER 2020
Govt Pvt Govt &
PvtGovt Pvt
Govt &Pvt
Motorizedvehicle
25.4 43.2 26.8 44.7 72.3 47.4
55.9 74.0 57.3 48.9 65.7 50.5
37.9 60.3 39.7 26.5 50.2 28.8
West Bengal
SE6: % Enrolled children with selected assets available at home. By school type and assettype. 2018 and 2020*
*All estimates from ASER 2018 reported here were generated after excluding households without a mobile phone, in order to make these comparable withthe ASER 2020 estimates.
Smartphone
TV
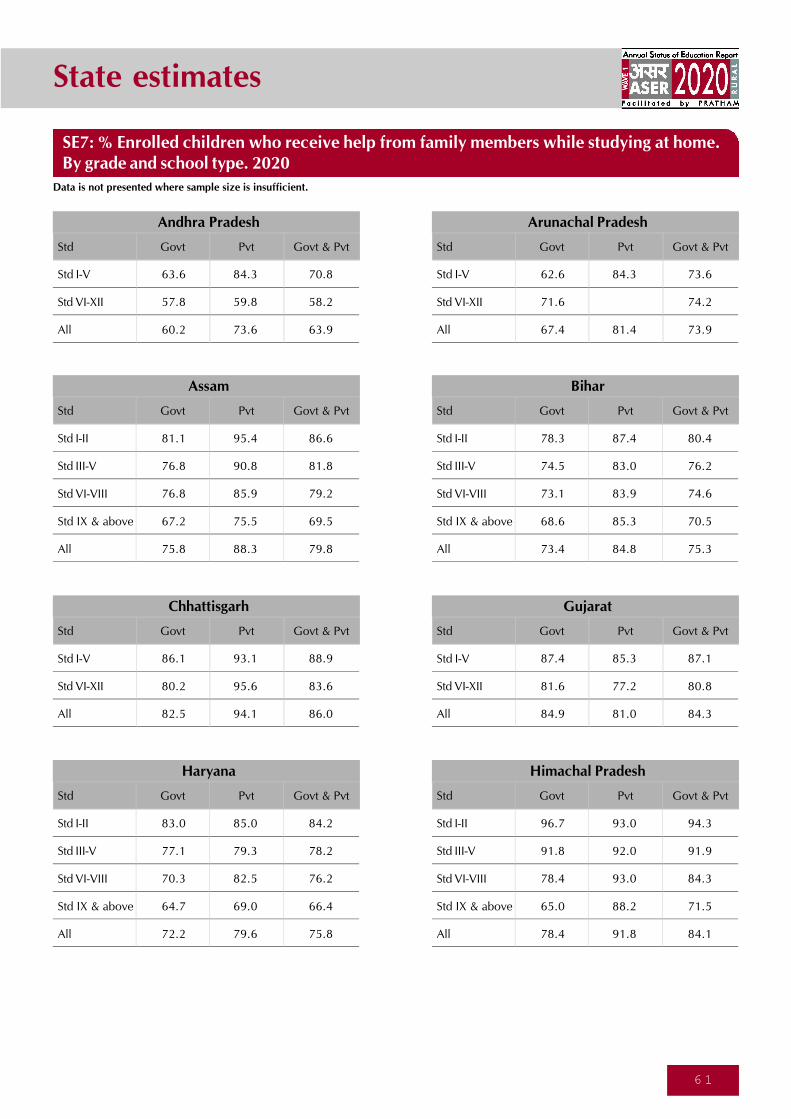
State estimates
6 1
SE7: % Enrolled children who receive help from family members while studying at home.By grade and school type. 2020
Data is not presented where sample size is insufficient.
Std
Std I-V
Std VI-XII
All
Govt Pvt Govt & Pvt
63.6 84.3 70.8
57.8 59.8 58.2
60.2 73.6 63.9
Andhra Pradesh
Std
Std I-II
Std III-V
Std VI-VIII
Std IX & above
All
Govt Pvt Govt & Pvt
78.3 87.4 80.4
74.5 83.0 76.2
73.1 83.9 74.6
68.6 85.3 70.5
73.4 84.8 75.3
Bihar
Std
Std I-II
Std III-V
Std VI-VIII
Std IX & above
All
Govt Pvt Govt & Pvt
83.0 85.0 84.2
77.1 79.3 78.2
70.3 82.5 76.2
64.7 69.0 66.4
72.2 79.6 75.8
Haryana
Std
Std I-II
Std III-V
Std VI-VIII
Std IX & above
All
Govt Pvt Govt & Pvt
96.7 93.0 94.3
91.8 92.0 91.9
78.4 93.0 84.3
65.0 88.2 71.5
78.4 91.8 84.1
Himachal Pradesh
Std
Std I-V
Std VI-XII
All
Govt Pvt Govt & Pvt
86.1 93.1 88.9
80.2 95.6 83.6
82.5 94.1 86.0
Chhattisgarh
Std
Std I-V
Std VI-XII
All
Govt Pvt Govt & Pvt
87.4 85.3 87.1
81.6 77.2 80.8
84.9 81.0 84.3
Gujarat
Std
Std I-V
Std VI-XII
All
Govt Pvt Govt & Pvt
62.6 84.3 73.6
71.6 74.2
67.4 81.4 73.9
Arunachal Pradesh
Std
Std I-II
Std III-V
Std VI-VIII
Std IX & above
All
Govt Pvt Govt & Pvt
81.1 95.4 86.6
76.8 90.8 81.8
76.8 85.9 79.2
67.2 75.5 69.5
75.8 88.3 79.8
Assam
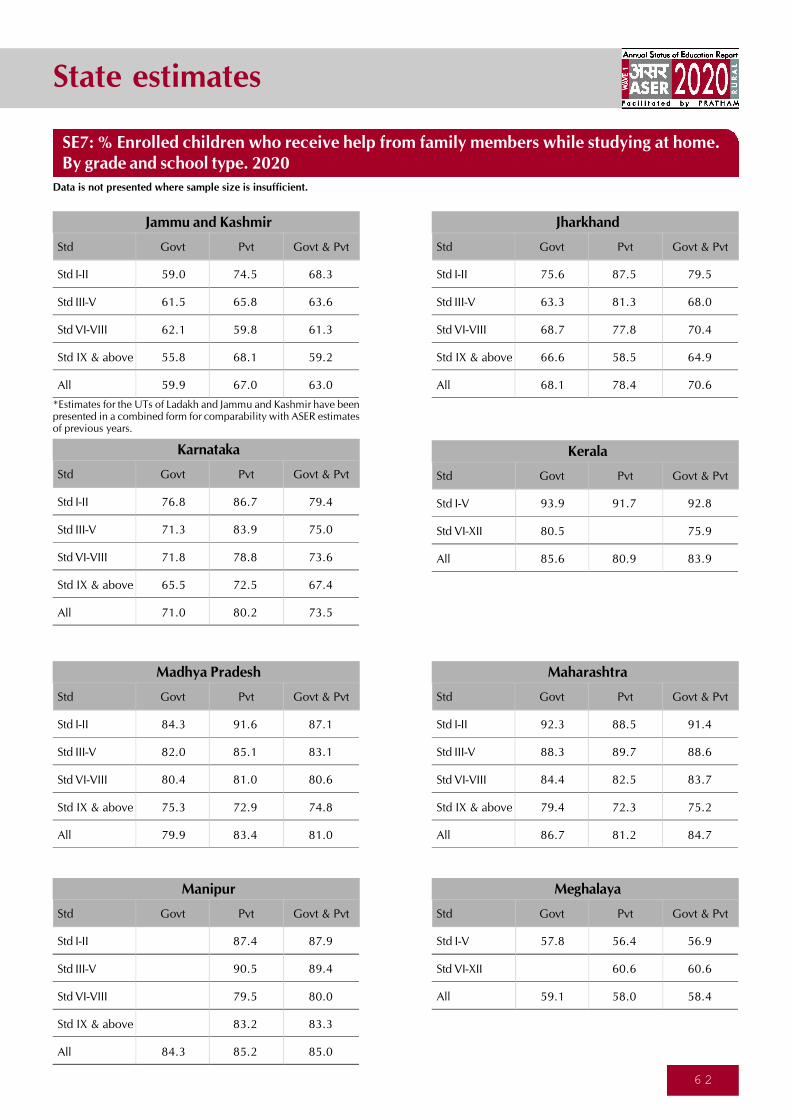
State estimates
6 2
Data is not presented where sample size is insufficient.
SE7: % Enrolled children who receive help from family members while studying at home.By grade and school type. 2020
Std
Std I-II
Std III-V
Std VI-VIII
Std IX & above
All
Govt Pvt Govt & Pvt
59.0 74.5 68.3
61.5 65.8 63.6
62.1 59.8 61.3
55.8 68.1 59.2
59.9 67.0 63.0
Jammu and Kashmir
Std
Std I-II
Std III-V
Std VI-VIII
Std IX & above
All
Govt Pvt Govt & Pvt
76.8 86.7 79.4
71.3 83.9 75.0
71.8 78.8 73.6
65.5 72.5 67.4
71.0 80.2 73.5
Karnataka
Std
Std I-II
Std III-V
Std VI-VIII
Std IX & above
All
Govt Pvt Govt & Pvt
75.6 87.5 79.5
63.3 81.3 68.0
68.7 77.8 70.4
66.6 58.5 64.9
68.1 78.4 70.6
Jharkhand
Std
Std I-II
Std III-V
Std VI-VIII
Std IX & above
All
Govt Pvt Govt & Pvt
84.3 91.6 87.1
82.0 85.1 83.1
80.4 81.0 80.6
75.3 72.9 74.8
79.9 83.4 81.0
Madhya Pradesh
Std
Std I-V
Std VI-XII
All
Govt Pvt Govt & Pvt
93.9 91.7 92.8
80.5 75.9
85.6 80.9 83.9
Kerala
Std
Std I-II
Std III-V
Std VI-VIII
Std IX & above
All
Govt Pvt Govt & Pvt
92.3 88.5 91.4
88.3 89.7 88.6
84.4 82.5 83.7
79.4 72.3 75.2
86.7 81.2 84.7
Maharashtra
Std
Std I-II
Std III-V
Std VI-VIII
Std IX & above
All
Govt Pvt Govt & Pvt
87.4 87.9
90.5 89.4
79.5 80.0
83.2 83.3
84.3 85.2 85.0
Manipur
Std
Std I-V
Std VI-XII
All
Govt Pvt Govt & Pvt
57.8 56.4 56.9
60.6 60.6
59.1 58.0 58.4
Meghalaya
*Estimates for the UTs of Ladakh and Jammu and Kashmir have beenpresented in a combined form for comparability with ASER estimatesof previous years.
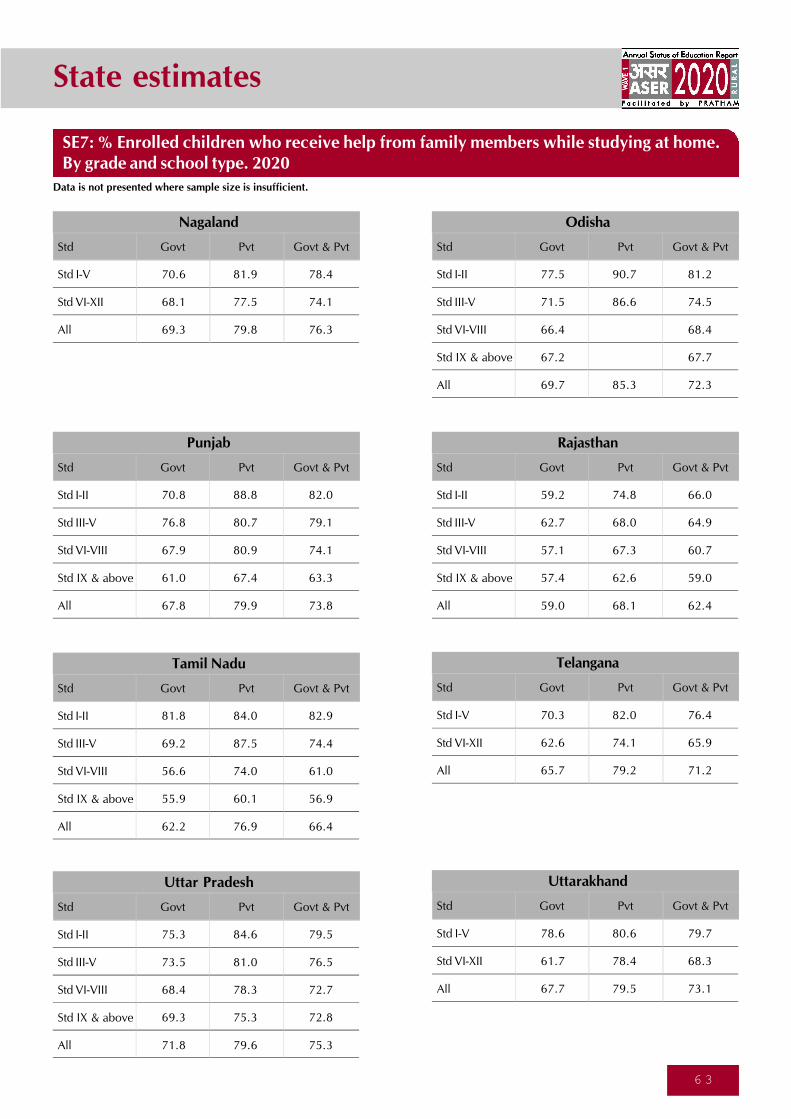
State estimates
6 3
Data is not presented where sample size is insufficient.
Std
Std I-II
Std III-V
Std VI-VIII
Std IX & above
All
Govt Pvt Govt & Pvt
70.8 88.8 82.0
76.8 80.7 79.1
67.9 80.9 74.1
61.0 67.4 63.3
67.8 79.9 73.8
Punjab
Std
Std I-II
Std III-V
Std VI-VIII
Std IX & above
All
Govt Pvt Govt & Pvt
59.2 74.8 66.0
62.7 68.0 64.9
57.1 67.3 60.7
57.4 62.6 59.0
59.0 68.1 62.4
Rajasthan
Std
Std I-II
Std III-V
Std VI-VIII
Std IX & above
All
Govt Pvt Govt & Pvt
81.8 84.0 82.9
69.2 87.5 74.4
56.6 74.0 61.0
55.9 60.1 56.9
62.2 76.9 66.4
Tamil Nadu
Std
Std I-II
Std III-V
Std VI-VIII
Std IX & above
All
Govt Pvt Govt & Pvt
75.3 84.6 79.5
73.5 81.0 76.5
68.4 78.3 72.7
69.3 75.3 72.8
71.8 79.6 75.3
Uttar Pradesh
Std
Std I-V
Std VI-XII
All
Govt Pvt Govt & Pvt
70.3 82.0 76.4
62.6 74.1 65.9
65.7 79.2 71.2
Telangana
Std
Std I-V
Std VI-XII
All
Govt Pvt Govt & Pvt
78.6 80.6 79.7
61.7 78.4 68.3
67.7 79.5 73.1
Uttarakhand
SE7: % Enrolled children who receive help from family members while studying at home.By grade and school type. 2020
Std
Std I-II
Std III-V
Std VI-VIII
Std IX & above
All
Govt Pvt Govt & Pvt
77.5 90.7 81.2
71.5 86.6 74.5
66.4 68.4
67.2 67.7
69.7 85.3 72.3
Odisha
Std
Std I-V
Std VI-XII
All
Govt Pvt Govt & Pvt
70.6 81.9 78.4
68.1 77.5 74.1
69.3 79.8 76.3
Nagaland
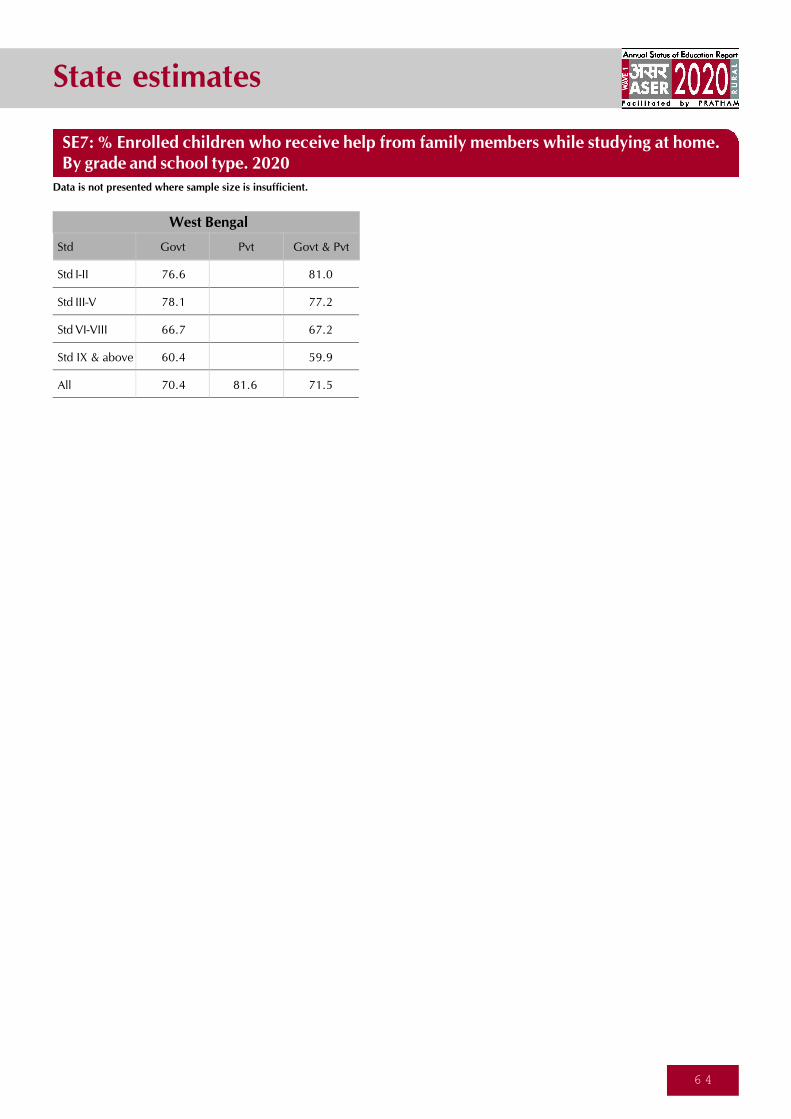
State estimates
6 4
Std
Std I-II
Std III-V
Std VI-VIII
Std IX & above
All
Govt Pvt Govt & Pvt
76.6 81.0
78.1 77.2
66.7 67.2
60.4 59.9
70.4 81.6 71.5
West Bengal
Data is not presented where sample size is insufficient.
SE7: % Enrolled children who receive help from family members while studying at home.By grade and school type. 2020
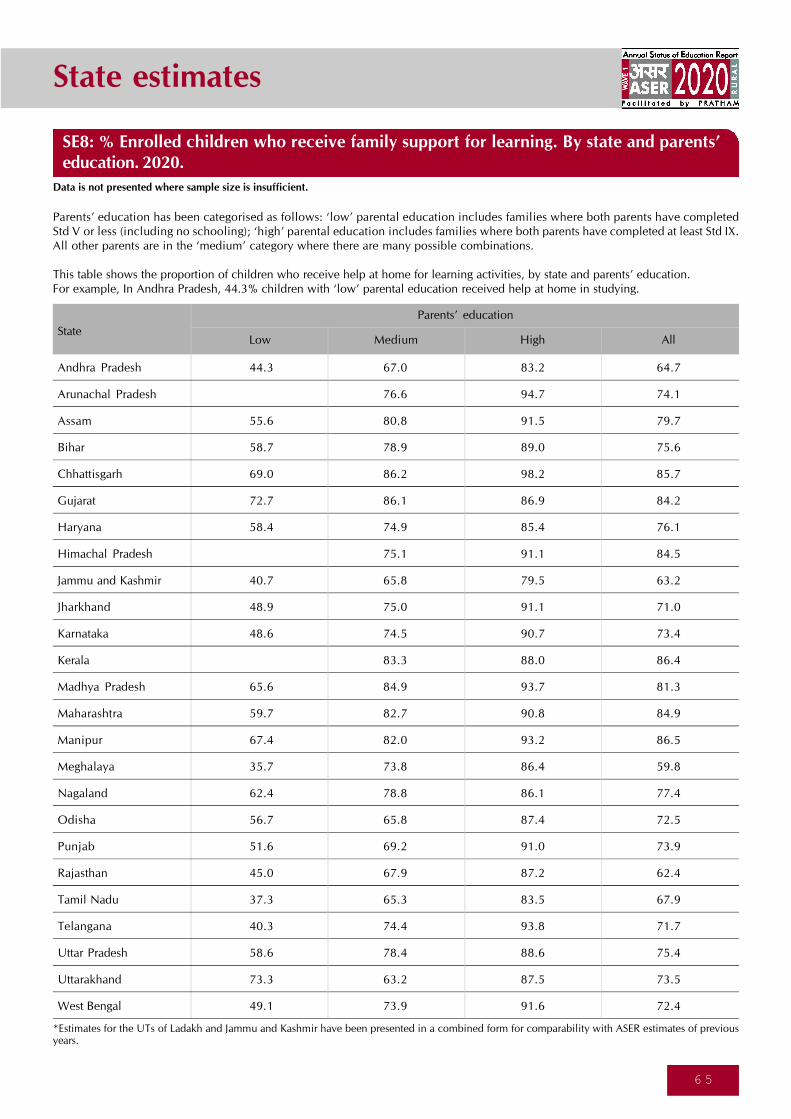
State estimates
6 5
SE8: % Enrolled children who receive family support for learning. By state and parents’education. 2020.
Data is not presented where sample size is insufficient.
Parents’ education has been categorised as follows: ‘low’ parental education includes families where both parents have completedStd V or less (including no schooling); ‘high’ parental education includes families where both parents have completed at least Std IX.All other parents are in the ‘medium’ category where there are many possible combinations.
This table shows the proportion of children who receive help at home for learning activities, by state and parents’ education.For example, In Andhra Pradesh, 44.3% children with ‘low’ parental education received help at home in studying.
State
Andhra Pradesh 44.3 67.0 83.2 64.7
Arunachal Pradesh 76.6 94.7 74.1
Assam 55.6 80.8 91.5 79.7
Bihar 58.7 78.9 89.0 75.6
Chhattisgarh 69.0 86.2 98.2 85.7
Gujarat 72.7 86.1 86.9 84.2
Haryana 58.4 74.9 85.4 76.1
Himachal Pradesh 75.1 91.1 84.5
Jammu and Kashmir 40.7 65.8 79.5 63.2
Jharkhand 48.9 75.0 91.1 71.0
Karnataka 48.6 74.5 90.7 73.4
Kerala 83.3 88.0 86.4
Madhya Pradesh 65.6 84.9 93.7 81.3
Maharashtra 59.7 82.7 90.8 84.9
Manipur 67.4 82.0 93.2 86.5
Meghalaya 35.7 73.8 86.4 59.8
Nagaland 62.4 78.8 86.1 77.4
Odisha 56.7 65.8 87.4 72.5
Punjab 51.6 69.2 91.0 73.9
Rajasthan 45.0 67.9 87.2 62.4
Tamil Nadu 37.3 65.3 83.5 67.9
Telangana 40.3 74.4 93.8 71.7
Uttar Pradesh 58.6 78.4 88.6 75.4
Uttarakhand 73.3 63.2 87.5 73.5
West Bengal 49.1 73.9 91.6 72.4
Parents’ education
Low Medium High All
*Estimates for the UTs of Ladakh and Jammu and Kashmir have been presented in a combined form for comparability with ASER estimates of previousyears.
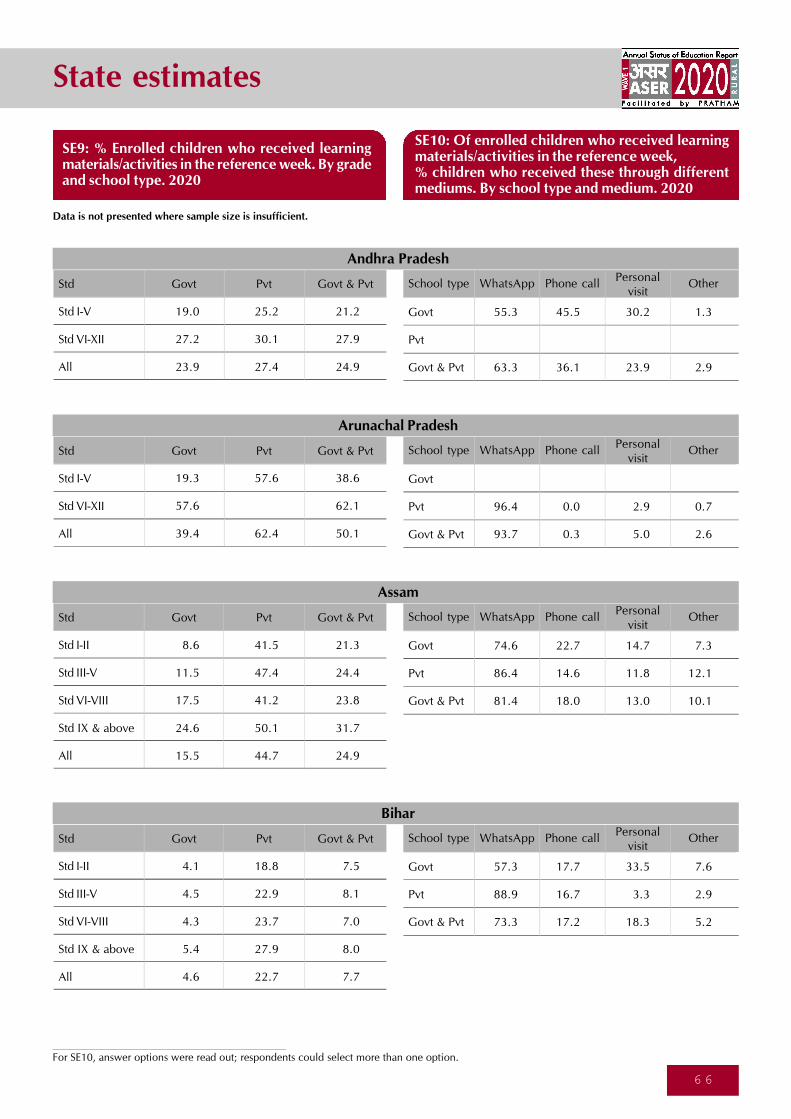
State estimates
6 6
Data is not presented where sample size is insufficient.
For SE10, answer options were read out; respondents could select more than one option.
SE9: % Enrolled children who received learningmaterials/activities in the reference week. By gradeand school type. 2020
Std
Std I-V
Std VI-XII
All
Govt Pvt Govt & Pvt
19.0 25.2 21.2
27.2 30.1 27.9
23.9 27.4 24.9
School type
Govt
Pvt
Govt & Pvt
55.3 45.5 30.2 1.3
63.3 36.1 23.9 2.9
Phone callPersonal
visitOther
Andhra Pradesh
Std
Std I-V
Std VI-XII
All
Govt Pvt Govt & Pvt School type
Govt
Pvt
Govt & Pvt
96.4 0.0 2.9 0.7
93.7 0.3 5.0 2.6
Phone callPersonal
visitOther
Arunachal Pradesh
Std
Std I-II
Std III-V
Std VI-VIII
Std IX & above
All
Govt Pvt Govt & Pvt
8.6 41.5 21.3
11.5 47.4 24.4
17.5 41.2 23.8
24.6 50.1 31.7
15.5 44.7 24.9
School type
Govt
Pvt
Govt & Pvt
74.6 22.7 14.7 7.3
86.4 14.6 11.8 12.1
81.4 18.0 13.0 10.1
Phone callPersonal
visitOther
Assam
Std
Std I-II
Std III-V
Std VI-VIII
Std IX & above
All
Govt Pvt Govt & Pvt
4.1 18.8 7.5
4.5 22.9 8.1
4.3 23.7 7.0
5.4 27.9 8.0
4.6 22.7 7.7
School type
Govt
Pvt
Govt & Pvt
57.3 17.7 33.5 7.6
88.9 16.7 3.3 2.9
73.3 17.2 18.3 5.2
Phone callPersonal
visitOther
Bihar
19.3 57.6 38.6
57.6 62.1
39.4 62.4 50.1
SE10: Of enrolled children who received learningmaterials/activities in the reference week,% children who received these through differentmediums. By school type and medium. 2020
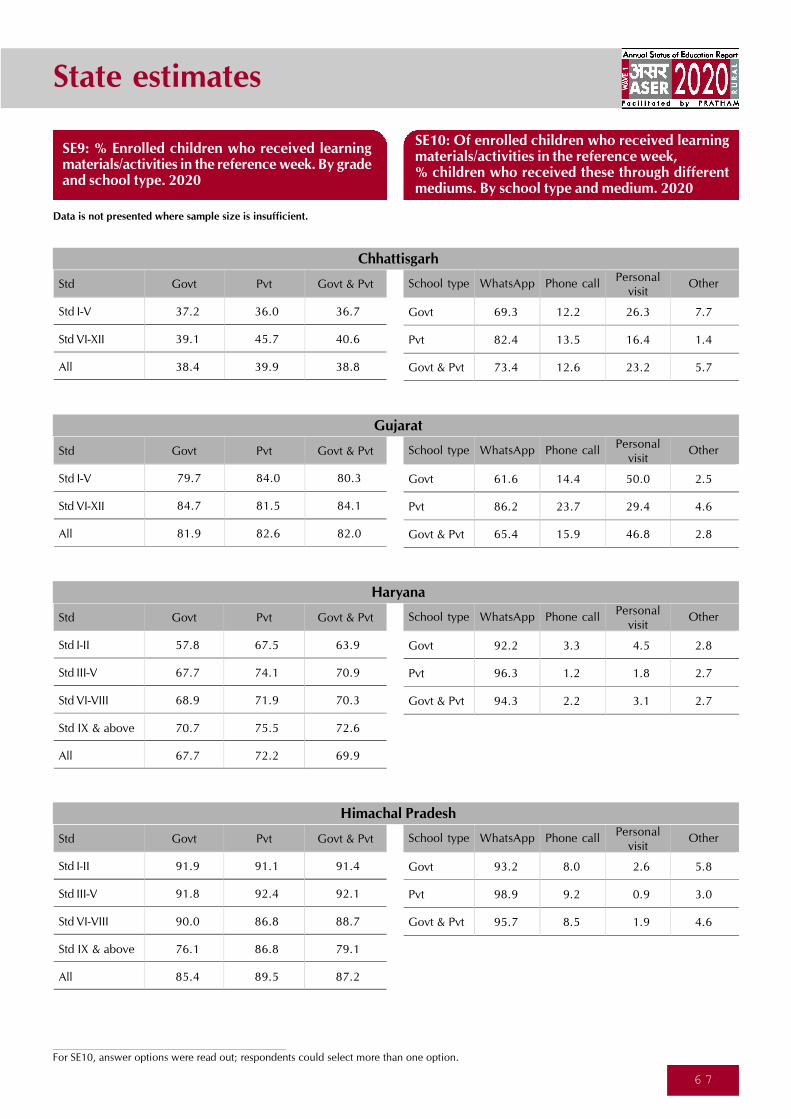
State estimates
6 7
For SE10, answer options were read out; respondents could select more than one option.
Std
Std I-V
Std VI-XII
All
Govt Pvt Govt & Pvt
37.2 36.0 36.7
39.1 45.7 40.6
38.4 39.9 38.8
School type
Govt
Pvt
Govt & Pvt
69.3 12.2 26.3 7.7
82.4 13.5 16.4 1.4
73.4 12.6 23.2 5.7
Phone callPersonal
visitOther
Chhattisgarh
Std
Std I-V
Std VI-XII
All
Govt Pvt Govt & Pvt School type
Govt
Pvt
Govt & Pvt
61.6 14.4 50.0 2.5
86.2 23.7 29.4 4.6
65.4 15.9 46.8 2.8
Phone callPersonal
visitOther
Gujarat
Std
Std I-II
Std III-V
Std VI-VIII
Std IX & above
All
Govt Pvt Govt & Pvt
57.8 67.5 63.9
67.7 74.1 70.9
68.9 71.9 70.3
70.7 75.5 72.6
67.7 72.2 69.9
School type
Govt
Pvt
Govt & Pvt
92.2 3.3 4.5 2.8
96.3 1.2 1.8 2.7
94.3 2.2 3.1 2.7
Phone callPersonal
visitOther
Haryana
Std
Std I-II
Std III-V
Std VI-VIII
Std IX & above
All
Govt Pvt Govt & Pvt
91.9 91.1 91.4
91.8 92.4 92.1
90.0 86.8 88.7
76.1 86.8 79.1
85.4 89.5 87.2
School type
Govt
Pvt
Govt & Pvt
93.2 8.0 2.6 5.8
98.9 9.2 0.9 3.0
95.7 8.5 1.9 4.6
Phone callPersonal
visitOther
Himachal Pradesh
79.7 84.0 80.3
84.7 81.5 84.1
81.9 82.6 82.0
Data is not presented where sample size is insufficient.
SE9: % Enrolled children who received learningmaterials/activities in the reference week. By gradeand school type. 2020
SE10: Of enrolled children who received learningmaterials/activities in the reference week,% children who received these through differentmediums. By school type and medium. 2020
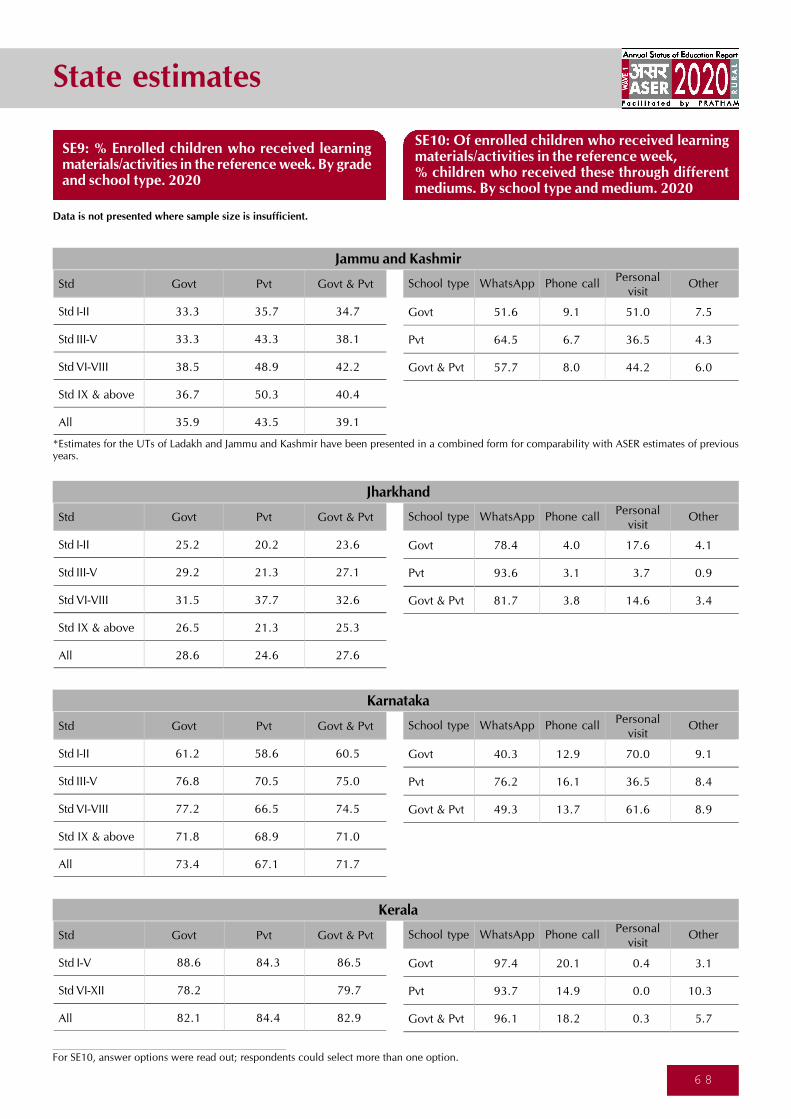
State estimates
6 8
Std
Std I-II
Std III-V
Std VI-VIII
Std IX & above
All
Govt Pvt Govt & Pvt
33.3 35.7 34.7
33.3 43.3 38.1
38.5 48.9 42.2
36.7 50.3 40.4
35.9 43.5 39.1
School type
Govt
Pvt
Govt & Pvt
51.6 9.1 51.0 7.5
64.5 6.7 36.5 4.3
57.7 8.0 44.2 6.0
Phone callPersonal
visitOther
Jammu and Kashmir
Std
Std I-II
Std III-V
Std VI-VIII
Std IX & above
All
Govt Pvt Govt & Pvt
25.2 20.2 23.6
29.2 21.3 27.1
31.5 37.7 32.6
26.5 21.3 25.3
28.6 24.6 27.6
School type
Govt
Pvt
Govt & Pvt
78.4 4.0 17.6 4.1
93.6 3.1 3.7 0.9
81.7 3.8 14.6 3.4
Phone callPersonal
visitOther
Jharkhand
Std
Std I-II
Std III-V
Std VI-VIII
Std IX & above
All
Govt Pvt Govt & Pvt
61.2 58.6 60.5
76.8 70.5 75.0
77.2 66.5 74.5
71.8 68.9 71.0
73.4 67.1 71.7
School type
Govt
Pvt
Govt & Pvt
40.3 12.9 70.0 9.1
76.2 16.1 36.5 8.4
49.3 13.7 61.6 8.9
Phone callPersonal
visitOther
Karnataka
Std
Std I-V
Std VI-XII
All
Govt Pvt Govt & Pvt School type
Govt
Pvt
Govt & Pvt
97.4 20.1 0.4 3.1
93.7 14.9 0.0 10.3
96.1 18.2 0.3 5.7
Phone callPersonal
visitOther
Kerala
88.6 84.3 86.5
78.2 79.7
82.1 84.4 82.9
For SE10, answer options were read out; respondents could select more than one option.
Data is not presented where sample size is insufficient.
SE9: % Enrolled children who received learningmaterials/activities in the reference week. By gradeand school type. 2020
*Estimates for the UTs of Ladakh and Jammu and Kashmir have been presented in a combined form for comparability with ASER estimates of previousyears.
SE10: Of enrolled children who received learningmaterials/activities in the reference week,% children who received these through differentmediums. By school type and medium. 2020
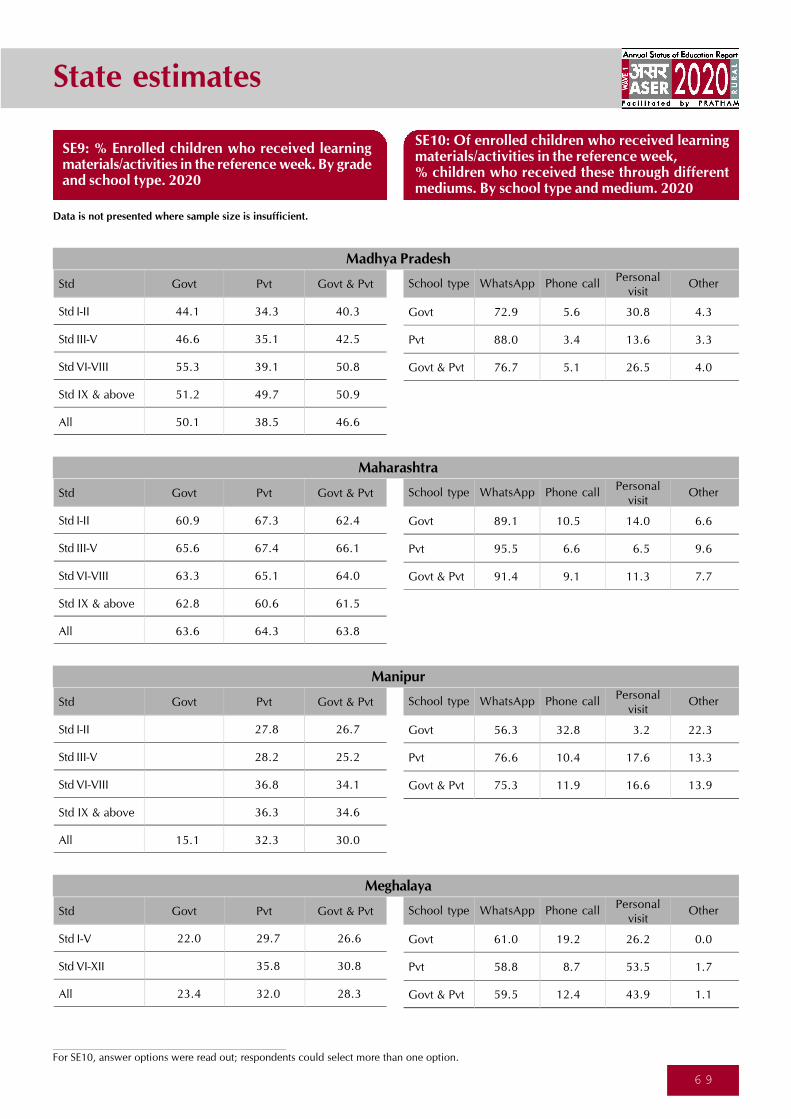
State estimates
6 9
Std
Std I-II
Std III-V
Std VI-VIII
Std IX & above
All
Govt Pvt Govt & Pvt
44.1 34.3 40.3
46.6 35.1 42.5
55.3 39.1 50.8
51.2 49.7 50.9
50.1 38.5 46.6
School type
Govt
Pvt
Govt & Pvt
72.9 5.6 30.8 4.3
88.0 3.4 13.6 3.3
76.7 5.1 26.5 4.0
Phone callPersonal
visitOther
Madhya Pradesh
Std
Std I-II
Std III-V
Std VI-VIII
Std IX & above
All
Govt Pvt Govt & Pvt
60.9 67.3 62.4
65.6 67.4 66.1
63.3 65.1 64.0
62.8 60.6 61.5
63.6 64.3 63.8
School type
Govt
Pvt
Govt & Pvt
89.1 10.5 14.0 6.6
95.5 6.6 6.5 9.6
91.4 9.1 11.3 7.7
Phone callPersonal
visitOther
Maharashtra
Std
Std I-II
Std III-V
Std VI-VIII
Std IX & above
All
Govt Pvt Govt & Pvt
27.8 26.7
28.2 25.2
36.8 34.1
36.3 34.6
15.1 32.3 30.0
School type
Govt
Pvt
Govt & Pvt
56.3 32.8 3.2 22.3
76.6 10.4 17.6 13.3
75.3 11.9 16.6 13.9
Phone callPersonal
visitOther
Manipur
Std
Std I-V
Std VI-XII
All
Govt Pvt Govt & Pvt School type
Govt
Pvt
Govt & Pvt
61.0 19.2 26.2 0.0
58.8 8.7 53.5 1.7
59.5 12.4 43.9 1.1
Phone callPersonal
visitOther
Meghalaya
22.0 29.7 26.6
35.8 30.8
23.4 32.0 28.3
For SE10, answer options were read out; respondents could select more than one option.
Data is not presented where sample size is insufficient.
SE9: % Enrolled children who received learningmaterials/activities in the reference week. By gradeand school type. 2020
SE10: Of enrolled children who received learningmaterials/activities in the reference week,% children who received these through differentmediums. By school type and medium. 2020
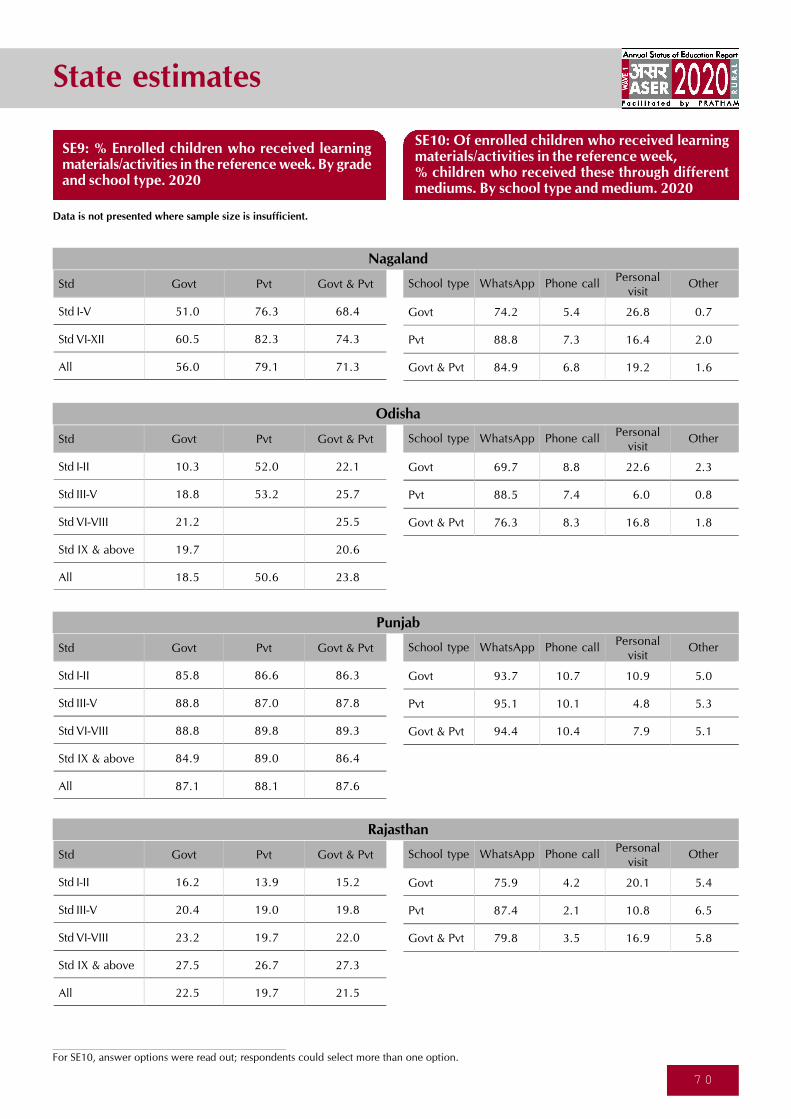
State estimates
7 0
Std
Std I-V
Std VI-XII
All
Govt Pvt Govt & Pvt
51.0 76.3 68.4
60.5 82.3 74.3
56.0 79.1 71.3
School type
Govt
Pvt
Govt & Pvt
74.2 5.4 26.8 0.7
88.8 7.3 16.4 2.0
84.9 6.8 19.2 1.6
Phone callPersonal
visitOther
Nagaland
Std
Std I-II
Std III-V
Std VI-VIII
Std IX & above
All
Govt Pvt Govt & Pvt
10.3 52.0 22.1
18.8 53.2 25.7
21.2 25.5
19.7 20.6
18.5 50.6 23.8
School type
Govt
Pvt
Govt & Pvt
69.7 8.8 22.6 2.3
88.5 7.4 6.0 0.8
76.3 8.3 16.8 1.8
Phone callPersonal
visitOther
Odisha
Std
Std I-II
Std III-V
Std VI-VIII
Std IX & above
All
Govt Pvt Govt & Pvt
85.8 86.6 86.3
88.8 87.0 87.8
88.8 89.8 89.3
84.9 89.0 86.4
87.1 88.1 87.6
School type
Govt
Pvt
Govt & Pvt
93.7 10.7 10.9 5.0
95.1 10.1 4.8 5.3
94.4 10.4 7.9 5.1
Phone callPersonal
visitOther
Punjab
Std
Std I-II
Std III-V
Std VI-VIII
Std IX & above
All
Govt Pvt Govt & Pvt
16.2 13.9 15.2
20.4 19.0 19.8
23.2 19.7 22.0
27.5 26.7 27.3
22.5 19.7 21.5
School type
Govt
Pvt
Govt & Pvt
75.9 4.2 20.1 5.4
87.4 2.1 10.8 6.5
79.8 3.5 16.9 5.8
Phone callPersonal
visitOther
Rajasthan
For SE10, answer options were read out; respondents could select more than one option.
Data is not presented where sample size is insufficient.
SE9: % Enrolled children who received learningmaterials/activities in the reference week. By gradeand school type. 2020
SE10: Of enrolled children who received learningmaterials/activities in the reference week,% children who received these through differentmediums. By school type and medium. 2020
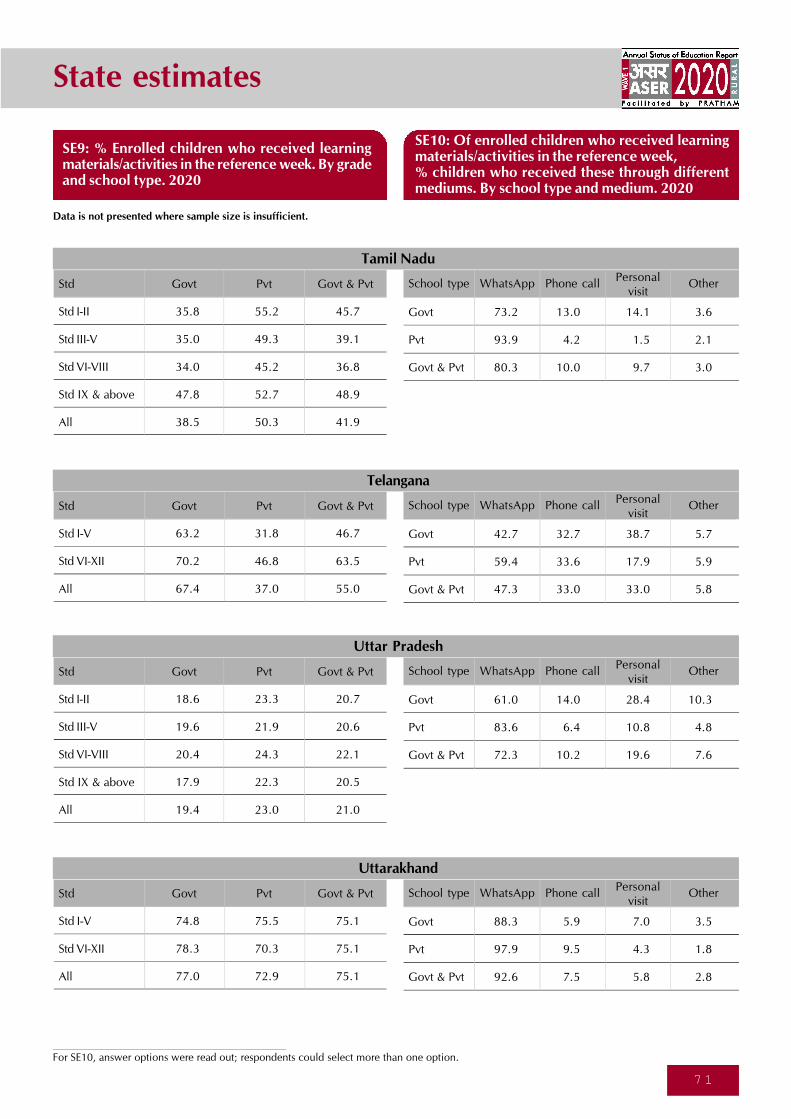
State estimates
7 1
Std
Std I-II
Std III-V
Std VI-VIII
Std IX & above
All
Govt Pvt Govt & Pvt
35.8 55.2 45.7
35.0 49.3 39.1
34.0 45.2 36.8
47.8 52.7 48.9
38.5 50.3 41.9
School type
Govt
Pvt
Govt & Pvt
73.2 13.0 14.1 3.6
93.9 4.2 1.5 2.1
80.3 10.0 9.7 3.0
Phone callPersonal
visitOther
Tamil Nadu
Std
Std I-V
Std VI-XII
All
Govt Pvt Govt & Pvt
63.2 31.8 46.7
70.2 46.8 63.5
67.4 37.0 55.0
School type
Govt
Pvt
Govt & Pvt
42.7 32.7 38.7 5.7
59.4 33.6 17.9 5.9
47.3 33.0 33.0 5.8
Phone callPersonal
visitOther
Telangana
Std
Std I-II
Std III-V
Std VI-VIII
Std IX & above
All
Govt Pvt Govt & Pvt
18.6 23.3 20.7
19.6 21.9 20.6
20.4 24.3 22.1
17.9 22.3 20.5
19.4 23.0 21.0
School type
Govt
Pvt
Govt & Pvt
61.0 14.0 28.4 10.3
83.6 6.4 10.8 4.8
72.3 10.2 19.6 7.6
Phone callPersonal
visitOther
Uttar Pradesh
Std
Std I-V
Std VI-XII
All
Govt Pvt Govt & Pvt
74.8 75.5 75.1
78.3 70.3 75.1
77.0 72.9 75.1
School type
Govt
Pvt
Govt & Pvt
88.3 5.9 7.0 3.5
97.9 9.5 4.3 1.8
92.6 7.5 5.8 2.8
Phone callPersonal
visitOther
Uttarakhand
For SE10, answer options were read out; respondents could select more than one option.
Data is not presented where sample size is insufficient.
SE9: % Enrolled children who received learningmaterials/activities in the reference week. By gradeand school type. 2020
SE10: Of enrolled children who received learningmaterials/activities in the reference week,% children who received these through differentmediums. By school type and medium. 2020
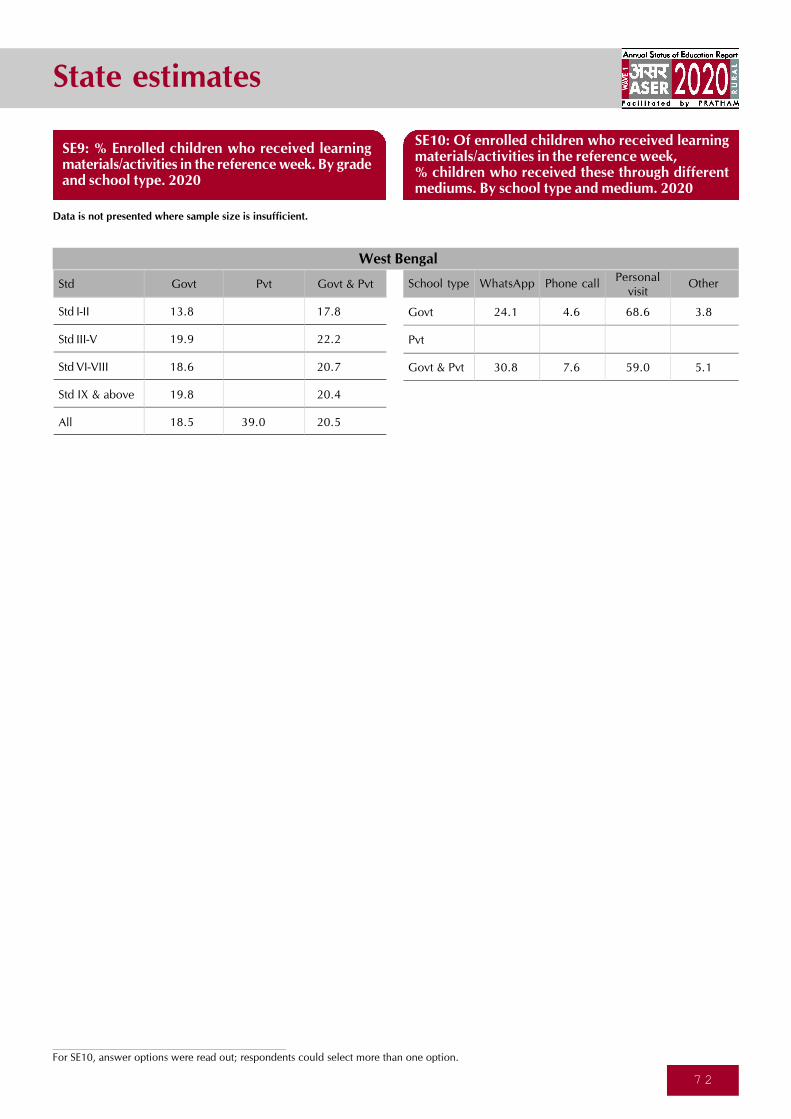
State estimates
7 2
Std
Std I-II
Std III-V
Std VI-VIII
Std IX & above
All
Govt Pvt Govt & Pvt
13.8 17.8
19.9 22.2
18.6 20.7
19.8 20.4
18.5 39.0 20.5
School type
Govt
Pvt
Govt & Pvt
24.1 4.6 68.6 3.8
30.8 7.6 59.0 5.1
Phone callPersonal
visitOther
West Bengal
For SE10, answer options were read out; respondents could select more than one option.
Data is not presented where sample size is insufficient.
SE9: % Enrolled children who received learningmaterials/activities in the reference week. By gradeand school type. 2020
SE10: Of enrolled children who received learningmaterials/activities in the reference week,% children who received these through differentmediums. By school type and medium. 2020
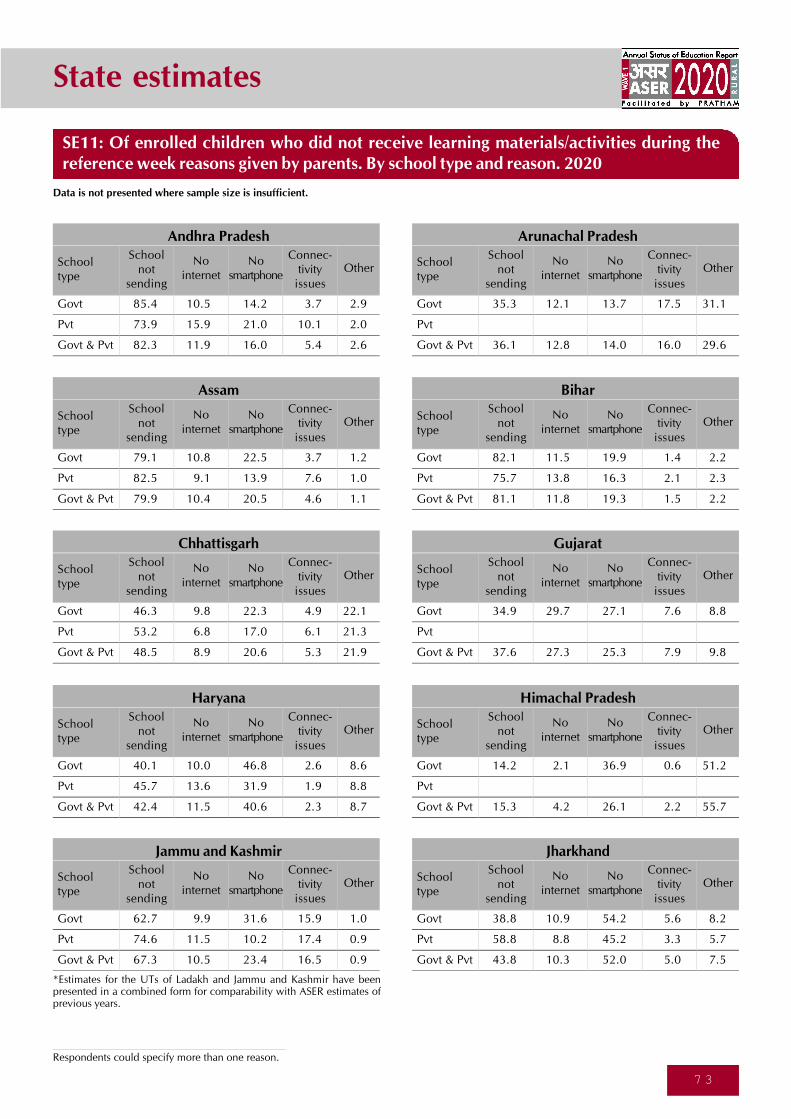
State estimates
7 3
SE11: Of enrolled children who did not receive learning materials/activities during thereference week reasons given by parents. By school type and reason. 2020
Data is not presented where sample size is insufficient.
Schooltype
Govt
Pvt
Govt & Pvt
Schoolnot
sending
85.4 10.5 14.2 3.7 2.9
73.9 15.9 21.0 10.1 2.0
82.3 11.9 16.0 5.4 2.6
Nointernet
Nosmartphone
Connec-tivity
issues
Other
Andhra Pradesh
Govt
Pvt
Govt & Pvt
Schoolnot
sending
35.3 12.1 13.7 17.5 31.1
36.1 12.8 14.0 16.0 29.6
Nointernet
Nosmartphone
Connec-tivity
issues
Other
Arunachal Pradesh
Schooltype
Govt
Pvt
Govt & Pvt
Schoolnot
sending
79.1 10.8 22.5 3.7 1.2
82.5 9.1 13.9 7.6 1.0
79.9 10.4 20.5 4.6 1.1
Nointernet
Nosmartphone
Connec-tivity
issues
Other
Assam
Schooltype
Govt
Pvt
Govt & Pvt
Schoolnot
sending
82.1 11.5 19.9 1.4 2.2
75.7 13.8 16.3 2.1 2.3
81.1 11.8 19.3 1.5 2.2
Nointernet
Nosmartphone
Connec-tivity
issues
Other
Bihar
Schooltype
Govt
Pvt
Govt & Pvt
Schoolnot
sending
46.3 9.8 22.3 4.9 22.1
53.2 6.8 17.0 6.1 21.3
48.5 8.9 20.6 5.3 21.9
Nointernet
Nosmartphone
Connec-tivity
issues
Other
Chhattisgarh
Schooltype
Govt
Pvt
Govt & Pvt
Schoolnot
sending
34.9 29.7 27.1 7.6 8.8
37.6 27.3 25.3 7.9 9.8
Nointernet
Nosmartphone
Connec-tivity
issues
Other
Gujarat
Schooltype
Govt
Pvt
Govt & Pvt
Schoolnot
sending
40.1 10.0 46.8 2.6 8.6
45.7 13.6 31.9 1.9 8.8
42.4 11.5 40.6 2.3 8.7
Nointernet
Nosmartphone
Connec-tivity
issues
Other
Haryana
Schooltype
Govt
Pvt
Govt & Pvt
Schoolnot
sending
14.2 2.1 36.9 0.6 51.2
15.3 4.2 26.1 2.2 55.7
Nointernet
Nosmartphone
Connec-tivity
issues
Other
Himachal Pradesh
Schooltype
Govt
Pvt
Govt & Pvt
Schoolnot
sending
62.7 9.9 31.6 15.9 1.0
74.6 11.5 10.2 17.4 0.9
67.3 10.5 23.4 16.5 0.9
Nointernet
Nosmartphone
Connec-tivity
issues
Other
Jammu and Kashmir
Schooltype
Govt
Pvt
Govt & Pvt
Schoolnot
sending
38.8 10.9 54.2 5.6 8.2
58.8 8.8 45.2 3.3 5.7
43.8 10.3 52.0 5.0 7.5
Nointernet
Nosmartphone
Connec-tivity
issues
Other
Jharkhand
Respondents could specify more than one reason.
Schooltype
*Estimates for the UTs of Ladakh and Jammu and Kashmir have beenpresented in a combined form for comparability with ASER estimates ofprevious years.
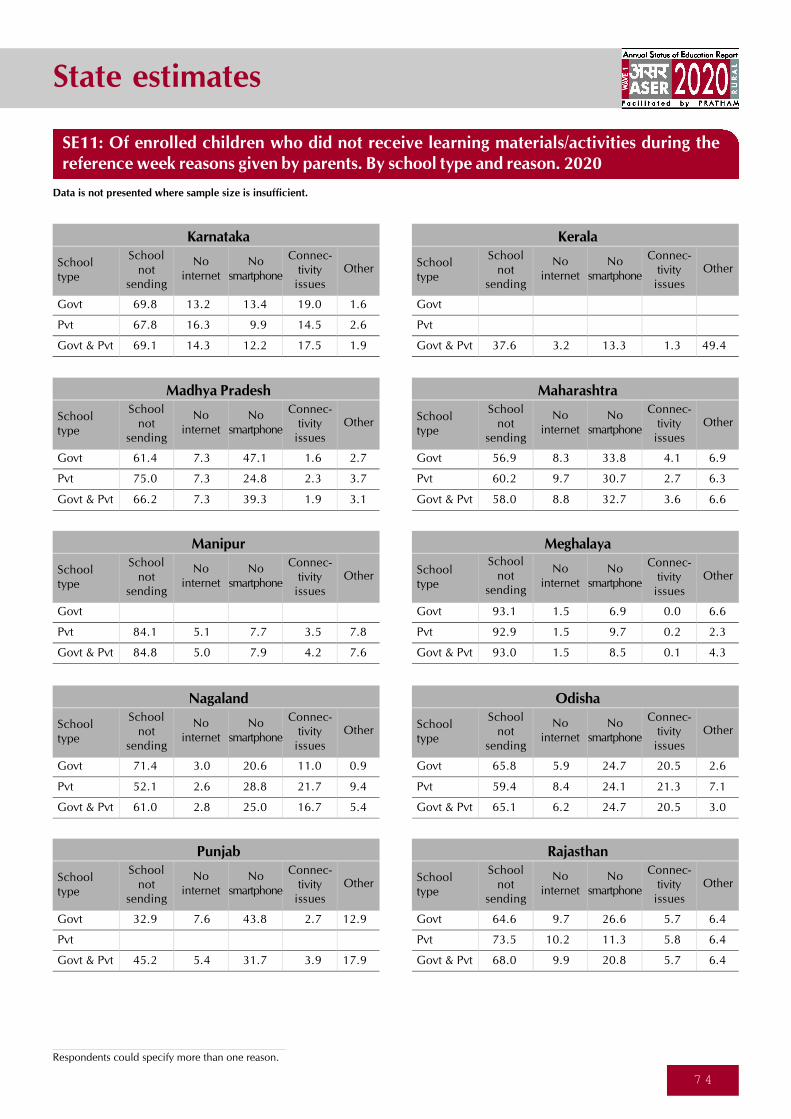
State estimates
7 4
Schooltype
Govt
Pvt
Govt & Pvt
Schoolnot
sending
69.8 13.2 13.4 19.0 1.6
67.8 16.3 9.9 14.5 2.6
69.1 14.3 12.2 17.5 1.9
Nointernet
Nosmartphone
Connec-tivity
issues
Other
Karnataka
Schooltype
Govt
Pvt
Govt & Pvt
Schoolnot
sending
37.6 3.2 13.3 1.3 49.4
Nointernet
Nosmartphone
Connec-tivity
issues
Other
Kerala
Schooltype
Govt
Pvt
Govt & Pvt
Schoolnot
sending
61.4 7.3 47.1 1.6 2.7
75.0 7.3 24.8 2.3 3.7
66.2 7.3 39.3 1.9 3.1
Nointernet
Nosmartphone
Connec-tivity
issues
Other
Madhya Pradesh
Schooltype
Govt
Pvt
Govt & Pvt
Schoolnot
sending
56.9 8.3 33.8 4.1 6.9
60.2 9.7 30.7 2.7 6.3
58.0 8.8 32.7 3.6 6.6
Nointernet
Nosmartphone
Connec-tivity
issues
Other
Maharashtra
Schooltype
Govt
Pvt
Govt & Pvt
Schoolnot
sending
84.1 5.1 7.7 3.5 7.8
84.8 5.0 7.9 4.2 7.6
Nointernet
Nosmartphone
Connec-tivity
issues
Other
Manipur
Schooltype
Govt
Pvt
Govt & Pvt
Schoolnot
sending
93.1 1.5 6.9 0.0 6.6
92.9 1.5 9.7 0.2 2.3
93.0 1.5 8.5 0.1 4.3
Nointernet
Nosmartphone
Connec-tivity
issues
Other
Meghalaya
Schooltype
Govt
Pvt
Govt & Pvt
Schoolnot
sending
71.4 3.0 20.6 11.0 0.9
52.1 2.6 28.8 21.7 9.4
61.0 2.8 25.0 16.7 5.4
Nointernet
Nosmartphone
Connec-tivity
issues
Other
Nagaland
Schooltype
Govt
Pvt
Govt & Pvt
Schoolnot
sending
65.8 5.9 24.7 20.5 2.6
59.4 8.4 24.1 21.3 7.1
65.1 6.2 24.7 20.5 3.0
Nointernet
Nosmartphone
Connec-tivity
issues
Other
Odisha
Schooltype
Govt
Pvt
Govt & Pvt
Schoolnot
sending
32.9 7.6 43.8 2.7 12.9
45.2 5.4 31.7 3.9 17.9
Nointernet
Nosmartphone
Connec-tivity
issues
Other
Punjab
Schooltype
Govt
Pvt
Govt & Pvt
Schoolnot
sending
64.6 9.7 26.6 5.7 6.4
73.5 10.2 11.3 5.8 6.4
68.0 9.9 20.8 5.7 6.4
Nointernet
Nosmartphone
Connec-tivity
issues
Other
Rajasthan
Respondents could specify more than one reason.
SE11: Of enrolled children who did not receive learning materials/activities during thereference week reasons given by parents. By school type and reason. 2020
Data is not presented where sample size is insufficient.
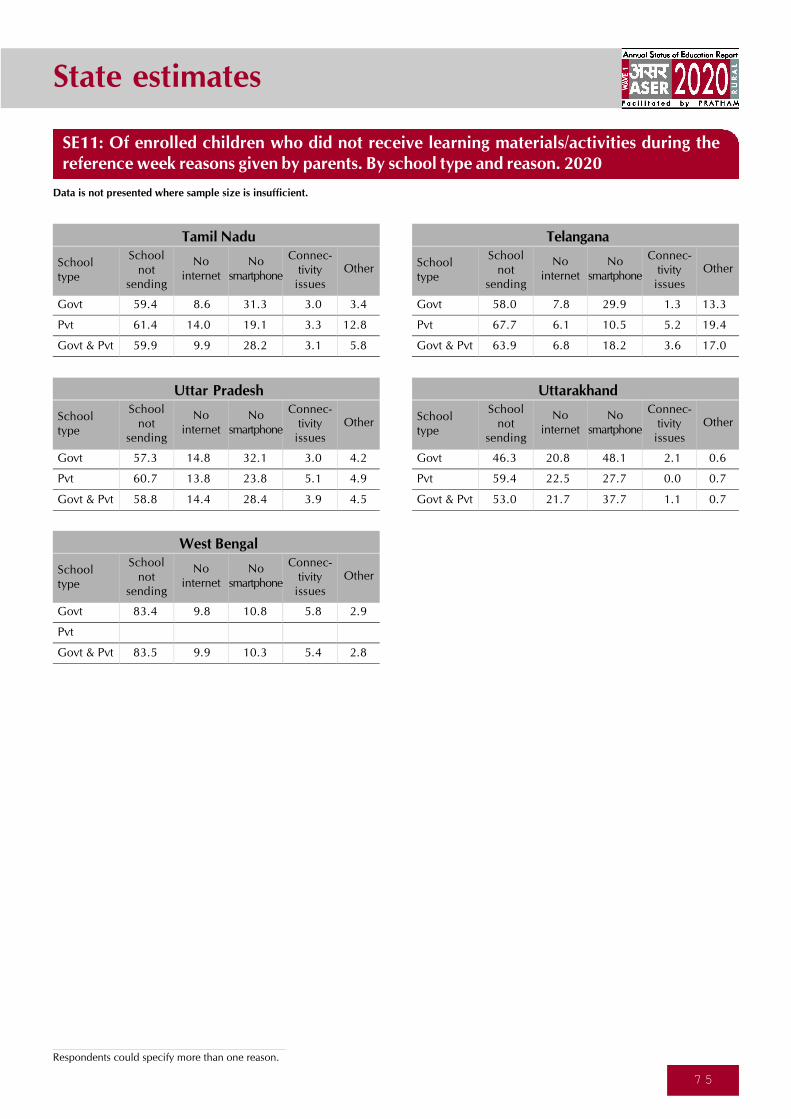
State estimates
7 5
Schooltype
Govt
Pvt
Govt & Pvt
Schoolnot
sending
59.4 8.6 31.3 3.0 3.4
61.4 14.0 19.1 3.3 12.8
59.9 9.9 28.2 3.1 5.8
Nointernet
Nosmartphone
Connec-tivity
issues
Other
Tamil Nadu
Schooltype
Govt
Pvt
Govt & Pvt
Schoolnot
sending
58.0 7.8 29.9 1.3 13.3
67.7 6.1 10.5 5.2 19.4
63.9 6.8 18.2 3.6 17.0
Nointernet
Nosmartphone
Connec-tivity
issues
Other
Telangana
Schooltype
Govt
Pvt
Govt & Pvt
Schoolnot
sending
57.3 14.8 32.1 3.0 4.2
60.7 13.8 23.8 5.1 4.9
58.8 14.4 28.4 3.9 4.5
Nointernet
Nosmartphone
Connec-tivity
issues
Other
Uttar Pradesh
Schooltype
Govt
Pvt
Govt & Pvt
Schoolnot
sending
46.3 20.8 48.1 2.1 0.6
59.4 22.5 27.7 0.0 0.7
53.0 21.7 37.7 1.1 0.7
Nointernet
Nosmartphone
Connec-tivity
issues
Other
Uttarakhand
Schooltype
Govt
Pvt
Govt & Pvt
Schoolnot
sending
83.4 9.8 10.8 5.8 2.9
83.5 9.9 10.3 5.4 2.8
Nointernet
Nosmartphone
Connec-tivity
issues
Other
West Bengal
Respondents could specify more than one reason.
SE11: Of enrolled children who did not receive learning materials/activities during thereference week reasons given by parents. By school type and reason. 2020
Data is not presented where sample size is insufficient.

State estimates
7 6
SE12: % Enrolled children who did learning activities during the reference week. By schooltype and type of material. 2020
Data is not presented where sample size is insufficient.
School type
Govt
Pvt
Govt & Pvt
Traditional
24.4 19.7 33.2 0.9 11.4 3.2
26.1 20.4 24.1 0.7 23.3 13.8
24.9 19.9 30.7 0.9 14.8 6.2
Online
Text-book
Work-sheet
TV Radio
Videos/re-
cordedclasses
Liveonlineclasses
Broadcast
Andhra Pradesh
School type
Govt
Pvt
Govt & Pvt
Traditional
50.0 19.8 15.4 0.0 26.0 15.5
66.4 46.8 9.4 2.9 39.0 22.3
57.7 32.4 12.6 1.4 32.1 18.6
Online
Text-book
Work-sheet
TV Radio
Videos/re-
cordedclasses
Liveonlineclasses
Broadcast
Arunachal Pradesh
School type
Govt
Pvt
Govt & Pvt
Traditional
48.3 15.7 5.7 2.6 9.5 3.5
62.7 27.5 7.8 2.5 20.4 12.0
52.9 19.5 6.4 2.6 13.0 6.2
Online
Text-book
Work-sheet
TV Radio
Videos/re-
cordedclasses
Liveonlineclasses
Broadcast
Assam
School type
Govt
Pvt
Govt & Pvt
Traditional
57.1 35.2 8.9 1.3 6.9 2.9
71.9 54.1 13.2 0.6 24.2 13.5
59.6 38.4 9.6 1.2 9.9 4.7
Online
Text-book
Work-sheet
TV Radio
Videos/re-
cordedclasses
Liveonlineclasses
Broadcast
Bihar
School type
Govt
Pvt
Govt & Pvt
Traditional
73.9 28.9 8.9 0.3 23.8 24.8
58.6 35.8 10.7 0.5 29.7 28.4
69.3 31.0 9.4 0.4 25.6 25.9
Online
Text-book
Work-sheet
TV Radio
Videos/re-
cordedclasses
Liveonlineclasses
Broadcast
Chhattisgarh
School type
Govt
Pvt
Govt & Pvt
Traditional
81.4 36.2 59.6 3.0 50.6 28.5
82.6 39.7 47.2 2.2 67.4 41.5
81.6 36.8 57.7 2.9 53.2 30.5
Online
Text-book
Work-sheet
TV Radio
Videos/re-
cordedclasses
Liveonlineclasses
Broadcast
Gujarat
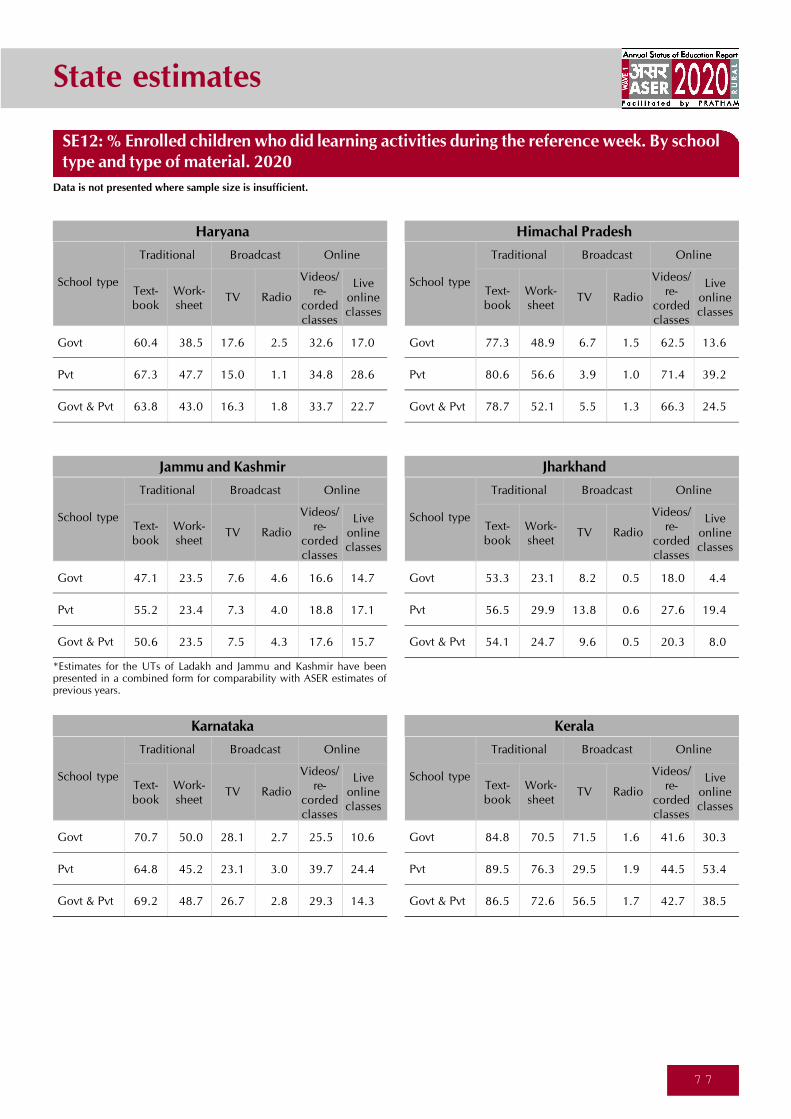
State estimates
7 7
School type
Govt
Pvt
Govt & Pvt
Traditional
60.4 38.5 17.6 2.5 32.6 17.0
67.3 47.7 15.0 1.1 34.8 28.6
63.8 43.0 16.3 1.8 33.7 22.7
Online
Text-book
Work-sheet
TV Radio
Videos/re-
cordedclasses
Liveonlineclasses
Broadcast
Haryana
School type
Govt
Pvt
Govt & Pvt
Traditional
77.3 48.9 6.7 1.5 62.5 13.6
80.6 56.6 3.9 1.0 71.4 39.2
78.7 52.1 5.5 1.3 66.3 24.5
Online
Text-book
Work-sheet
TV Radio
Videos/re-
cordedclasses
Liveonlineclasses
Broadcast
Himachal Pradesh
School type
Govt
Pvt
Govt & Pvt
Traditional
47.1 23.5 7.6 4.6 16.6 14.7
55.2 23.4 7.3 4.0 18.8 17.1
50.6 23.5 7.5 4.3 17.6 15.7
Online
Text-book
Work-sheet
TV Radio
Videos/re-
cordedclasses
Liveonlineclasses
Broadcast
Jammu and Kashmir
School type
Govt
Pvt
Govt & Pvt
Traditional
53.3 23.1 8.2 0.5 18.0 4.4
56.5 29.9 13.8 0.6 27.6 19.4
54.1 24.7 9.6 0.5 20.3 8.0
Online
Text-book
Work-sheet
TV Radio
Videos/re-
cordedclasses
Liveonlineclasses
Broadcast
Jharkhand
School type
Govt
Pvt
Govt & Pvt
Traditional
70.7 50.0 28.1 2.7 25.5 10.6
64.8 45.2 23.1 3.0 39.7 24.4
69.2 48.7 26.7 2.8 29.3 14.3
Online
Text-book
Work-sheet
TV Radio
Videos/re-
cordedclasses
Liveonlineclasses
Broadcast
Karnataka
School type
Govt
Pvt
Govt & Pvt
Traditional
84.8 70.5 71.5 1.6 41.6 30.3
89.5 76.3 29.5 1.9 44.5 53.4
86.5 72.6 56.5 1.7 42.7 38.5
Online
Text-book
Work-sheet
TV Radio
Videos/re-
cordedclasses
Liveonlineclasses
Broadcast
Kerala
SE12: % Enrolled children who did learning activities during the reference week. By schooltype and type of material. 2020
Data is not presented where sample size is insufficient.
*Estimates for the UTs of Ladakh and Jammu and Kashmir have beenpresented in a combined form for comparability with ASER estimates ofprevious years.
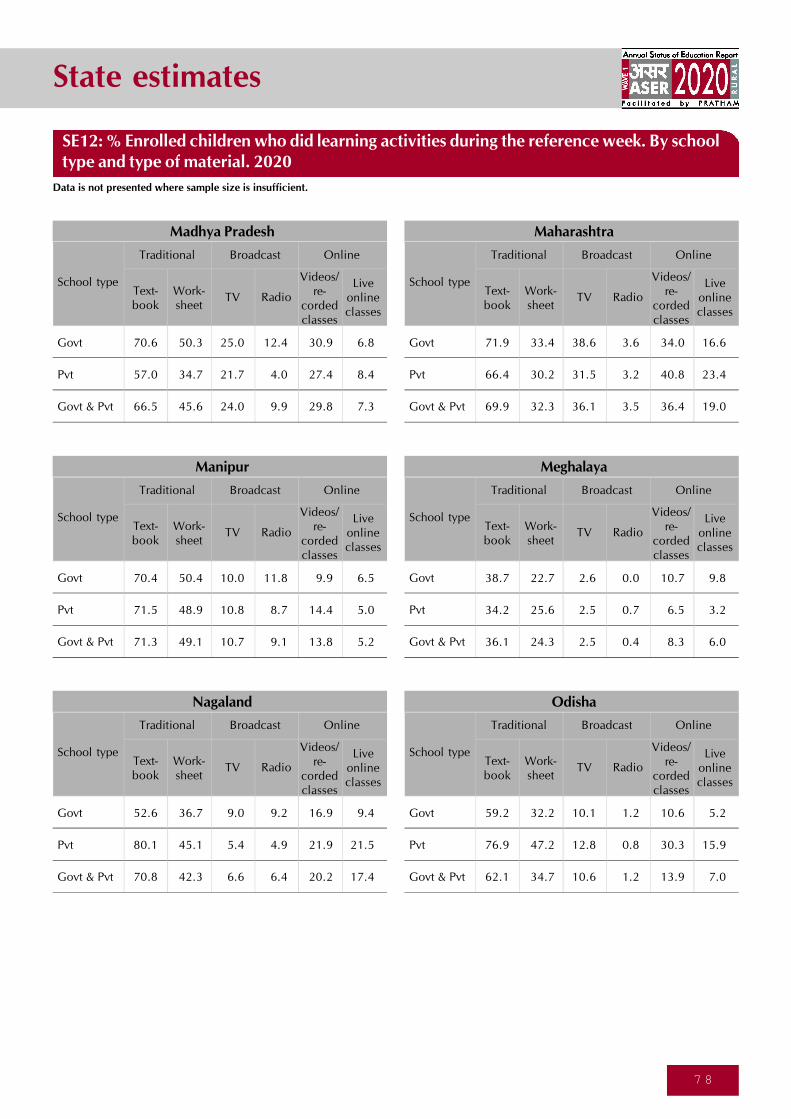
State estimates
7 8
School type
Govt
Pvt
Govt & Pvt
Traditional
70.6 50.3 25.0 12.4 30.9 6.8
57.0 34.7 21.7 4.0 27.4 8.4
66.5 45.6 24.0 9.9 29.8 7.3
Online
Text-book
Work-sheet
TV Radio
Videos/re-
cordedclasses
Liveonlineclasses
Broadcast
Madhya Pradesh
School type
Govt
Pvt
Govt & Pvt
Traditional
71.9 33.4 38.6 3.6 34.0 16.6
66.4 30.2 31.5 3.2 40.8 23.4
69.9 32.3 36.1 3.5 36.4 19.0
Online
Text-book
Work-sheet
TV Radio
Videos/re-
cordedclasses
Liveonlineclasses
Broadcast
Maharashtra
School type
Govt
Pvt
Govt & Pvt
Traditional
70.4 50.4 10.0 11.8 9.9 6.5
71.5 48.9 10.8 8.7 14.4 5.0
71.3 49.1 10.7 9.1 13.8 5.2
Online
Text-book
Work-sheet
TV Radio
Videos/re-
cordedclasses
Liveonlineclasses
Broadcast
Manipur
School type
Govt
Pvt
Govt & Pvt
Traditional
38.7 22.7 2.6 0.0 10.7 9.8
34.2 25.6 2.5 0.7 6.5 3.2
36.1 24.3 2.5 0.4 8.3 6.0
Online
Text-book
Work-sheet
TV Radio
Videos/re-
cordedclasses
Liveonlineclasses
Broadcast
Meghalaya
School type
Govt
Pvt
Govt & Pvt
Traditional
52.6 36.7 9.0 9.2 16.9 9.4
80.1 45.1 5.4 4.9 21.9 21.5
70.8 42.3 6.6 6.4 20.2 17.4
Online
Text-book
Work-sheet
TV Radio
Videos/re-
cordedclasses
Liveonlineclasses
Broadcast
Nagaland
School type
Govt
Pvt
Govt & Pvt
Traditional
59.2 32.2 10.1 1.2 10.6 5.2
76.9 47.2 12.8 0.8 30.3 15.9
62.1 34.7 10.6 1.2 13.9 7.0
Online
Text-book
Work-sheet
TV Radio
Videos/re-
cordedclasses
Liveonlineclasses
Broadcast
Odisha
SE12: % Enrolled children who did learning activities during the reference week. By schooltype and type of material. 2020
Data is not presented where sample size is insufficient.

State estimates
7 9
School type
Govt
Pvt
Govt & Pvt
Traditional
86.3 63.2 32.6 2.1 48.2 24.1
88.7 67.9 10.5 1.5 60.7 52.9
87.5 65.6 21.6 1.8 54.4 38.4
Online
Text-book
Work-sheet
TV Radio
Videos/re-
cordedclasses
Liveonlineclasses
Broadcast
Punjab
School type
Govt
Pvt
Govt & Pvt
Traditional
45.9 22.1 8.5 1.6 11.7 4.2
43.8 26.4 7.2 1.4 14.8 7.0
45.1 23.7 8.0 1.5 12.9 5.2
Online
Text-book
Work-sheet
TV Radio
Videos/re-
cordedclasses
Liveonlineclasses
Broadcast
Rajasthan
School type
Govt
Pvt
Govt & Pvt
Traditional
55.8 24.1 47.3 2.8 14.6 5.3
54.5 22.7 29.8 2.1 29.0 21.1
55.4 23.7 42.3 2.6 18.7 9.8
Online
Text-book
Work-sheet
TV Radio
Videos/re-
cordedclasses
Liveonlineclasses
Broadcast
Tamil Nadu
School type
Govt
Pvt
Govt & Pvt
Traditional
66.7 52.1 75.1 0.7 32.0 16.9
41.3 35.3 47.7 0.2 32.7 28.6
56.4 45.3 64.1 0.5 32.3 21.6
Online
Text-book
Work-sheet
TV Radio
Videos/re-
cordedclasses
Liveonlineclasses
Broadcast
Telangana
School type
Govt
Pvt
Govt & Pvt
Traditional
49.3 28.9 10.8 4.1 12.2 4.7
55.8 38.0 16.4 3.6 21.6 11.4
52.3 33.1 13.4 3.8 16.5 7.8
Online
Text-book
Work-sheet
TV Radio
Videos/re-
cordedclasses
Liveonlineclasses
Broadcast
Uttar Pradesh
School type
Govt
Pvt
Govt & Pvt
Traditional
58.9 35.9 21.1 0.4 24.8 10.9
70.5 45.3 9.5 0.5 38.0 20.3
64.2 40.2 15.8 0.5 30.9 15.3
Online
Text-book
Work-sheet
TV Radio
Videos/re-
cordedclasses
Liveonlineclasses
Broadcast
Uttarakhand
SE12: % Enrolled children who did learning activities during the reference week. By schooltype and type of material. 2020
Data is not presented where sample size is insufficient.
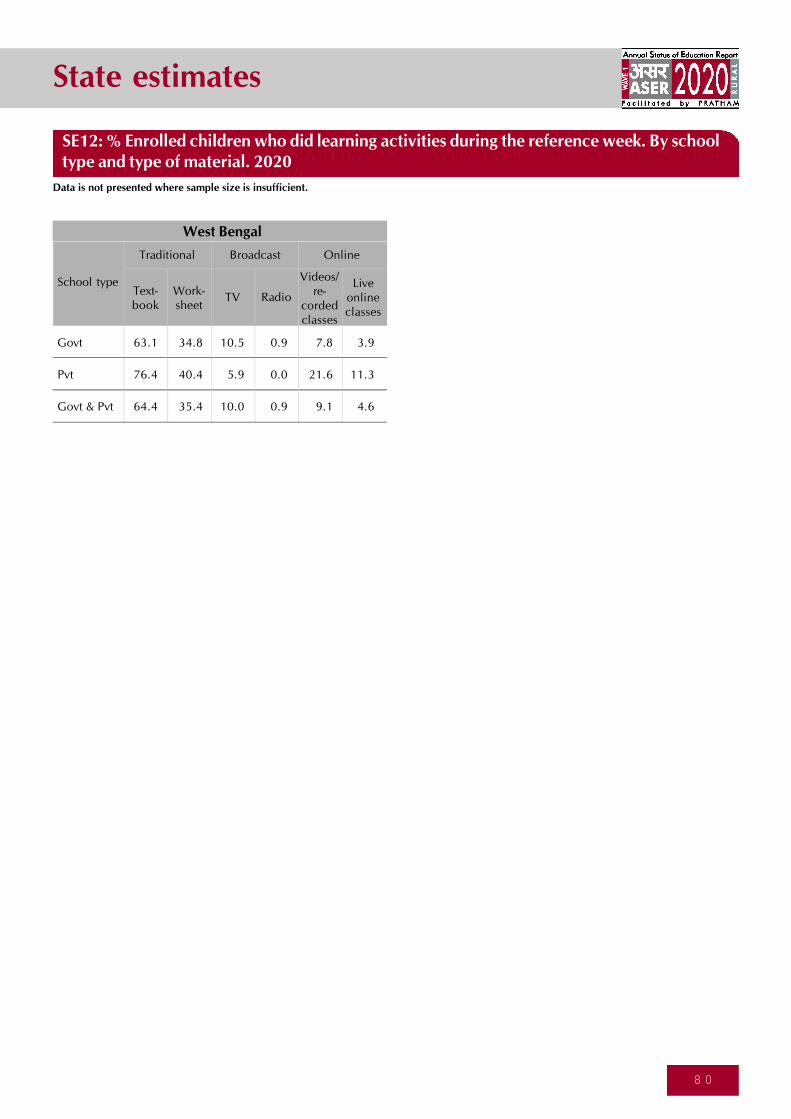
State estimates
8 0
School type
Govt
Pvt
Govt & Pvt
Traditional
63.1 34.8 10.5 0.9 7.8 3.9
76.4 40.4 5.9 0.0 21.6 11.3
64.4 35.4 10.0 0.9 9.1 4.6
Online
Text-book
Work-sheet
TV Radio
Videos/re-
cordedclasses
Liveonlineclasses
Broadcast
West Bengal
SE12: % Enrolled children who did learning activities during the reference week. By schooltype and type of material. 2020
Data is not presented where sample size is insufficient.
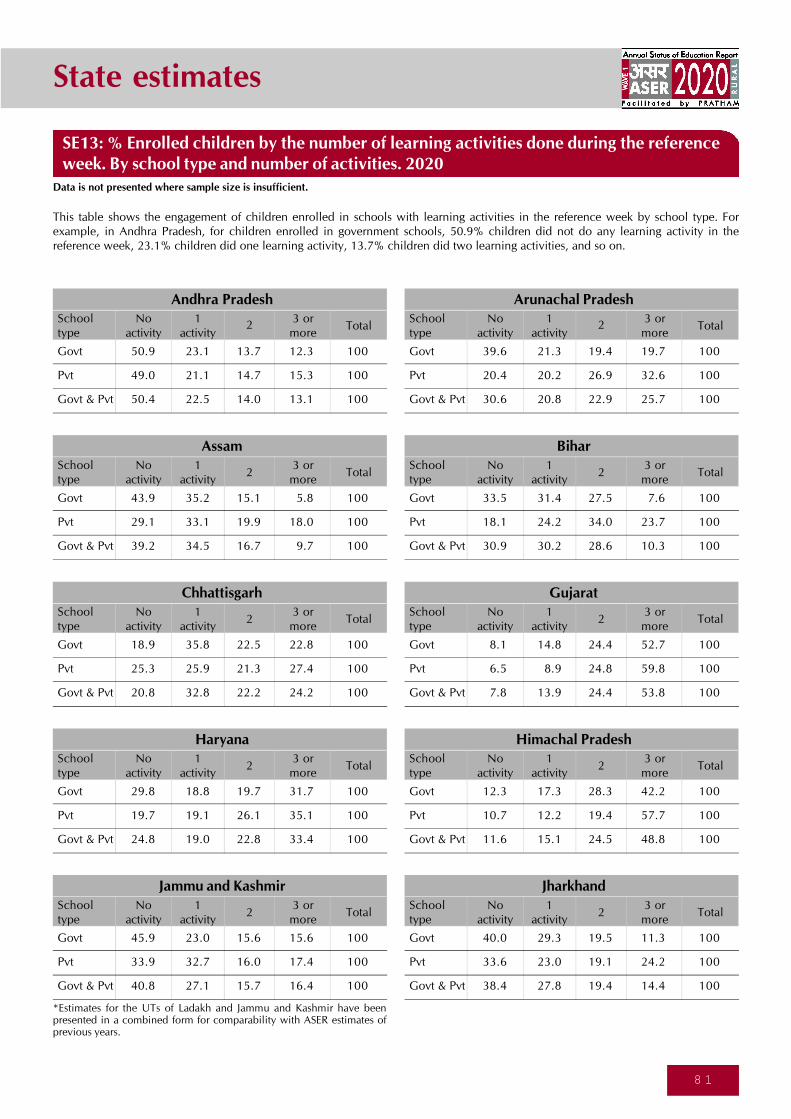
State estimates
8 1
SE13: % Enrolled children by the number of learning activities done during the referenceweek. By school type and number of activities. 2020
Data is not presented where sample size is insufficient.
This table shows the engagement of children enrolled in schools with learning activities in the reference week by school type. Forexample, in Andhra Pradesh, for children enrolled in government schools, 50.9% children did not do any learning activity in thereference week, 23.1% children did one learning activity, 13.7% children did two learning activities, and so on.
Schooltype
Govt
Pvt
Govt & Pvt
50.9 23.1 13.7 12.3 100
49.0 21.1 14.7 15.3 100
50.4 22.5 14.0 13.1 100
Noactivity
1activity
23 ormore
Total
Andhra PradeshSchooltype
Govt
Pvt
Govt & Pvt
39.6 21.3 19.4 19.7 100
20.4 20.2 26.9 32.6 100
30.6 20.8 22.9 25.7 100
Noactivity
1activity
23 ormore
Total
Arunachal Pradesh
Schooltype
Govt
Pvt
Govt & Pvt
43.9 35.2 15.1 5.8 100
29.1 33.1 19.9 18.0 100
39.2 34.5 16.7 9.7 100
Noactivity
1activity
23 ormore
Total
AssamSchooltype
Govt
Pvt
Govt & Pvt
33.5 31.4 27.5 7.6 100
18.1 24.2 34.0 23.7 100
30.9 30.2 28.6 10.3 100
Noactivity
1activity
23 ormore
Total
Bihar
Schooltype
Govt
Pvt
Govt & Pvt
18.9 35.8 22.5 22.8 100
25.3 25.9 21.3 27.4 100
20.8 32.8 22.2 24.2 100
Noactivity
1activity
23 ormore
Total
ChhattisgarhSchooltype
Govt
Pvt
Govt & Pvt
8.1 14.8 24.4 52.7 100
6.5 8.9 24.8 59.8 100
7.8 13.9 24.4 53.8 100
Noactivity
1activity
23 ormore
Total
Gujarat
Schooltype
Govt
Pvt
Govt & Pvt
29.8 18.8 19.7 31.7 100
19.7 19.1 26.1 35.1 100
24.8 19.0 22.8 33.4 100
Noactivity
1activity
23 ormore
Total
HaryanaSchooltype
Govt
Pvt
Govt & Pvt
12.3 17.3 28.3 42.2 100
10.7 12.2 19.4 57.7 100
11.6 15.1 24.5 48.8 100
Noactivity
1activity
23 ormore
Total
Himachal Pradesh
Schooltype
Govt
Pvt
Govt & Pvt
45.9 23.0 15.6 15.6 100
33.9 32.7 16.0 17.4 100
40.8 27.1 15.7 16.4 100
Noactivity
1activity
23 ormore
Total
Jammu and KashmirSchooltype
Govt
Pvt
Govt & Pvt
40.0 29.3 19.5 11.3 100
33.6 23.0 19.1 24.2 100
38.4 27.8 19.4 14.4 100
Noactivity
1activity
23 ormore
Total
Jharkhand
*Estimates for the UTs of Ladakh and Jammu and Kashmir have beenpresented in a combined form for comparability with ASER estimates ofprevious years.
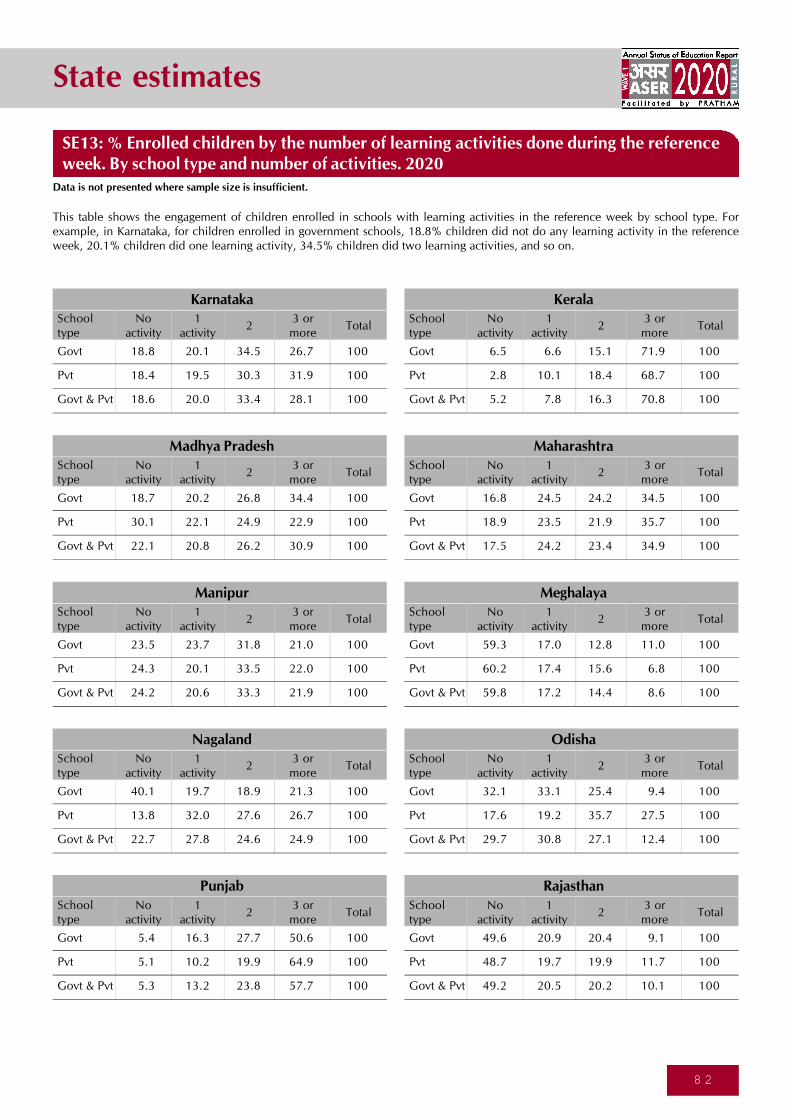
State estimates
8 2
This table shows the engagement of children enrolled in schools with learning activities in the reference week by school type. Forexample, in Karnataka, for children enrolled in government schools, 18.8% children did not do any learning activity in the referenceweek, 20.1% children did one learning activity, 34.5% children did two learning activities, and so on.
Schooltype
Govt
Pvt
Govt & Pvt
18.8 20.1 34.5 26.7 100
18.4 19.5 30.3 31.9 100
18.6 20.0 33.4 28.1 100
Noactivity
1activity
23 ormore
Total
KarnatakaSchooltype
Govt
Pvt
Govt & Pvt
6.5 6.6 15.1 71.9 100
2.8 10.1 18.4 68.7 100
5.2 7.8 16.3 70.8 100
Noactivity
1activity
23 ormore
Total
Kerala
Schooltype
Govt
Pvt
Govt & Pvt
18.7 20.2 26.8 34.4 100
30.1 22.1 24.9 22.9 100
22.1 20.8 26.2 30.9 100
Noactivity
1activity
23 ormore
Total
Madhya PradeshSchooltype
Govt
Pvt
Govt & Pvt
16.8 24.5 24.2 34.5 100
18.9 23.5 21.9 35.7 100
17.5 24.2 23.4 34.9 100
Noactivity
1activity
23 ormore
Total
Maharashtra
Schooltype
Govt
Pvt
Govt & Pvt
23.5 23.7 31.8 21.0 100
24.3 20.1 33.5 22.0 100
24.2 20.6 33.3 21.9 100
Noactivity
1activity
23 ormore
Total
ManipurSchooltype
Govt
Pvt
Govt & Pvt
59.3 17.0 12.8 11.0 100
60.2 17.4 15.6 6.8 100
59.8 17.2 14.4 8.6 100
Noactivity
1activity
23 ormore
Total
Meghalaya
Schooltype
Govt
Pvt
Govt & Pvt
40.1 19.7 18.9 21.3 100
13.8 32.0 27.6 26.7 100
22.7 27.8 24.6 24.9 100
Noactivity
1activity
23 ormore
Total
NagalandSchooltype
Govt
Pvt
Govt & Pvt
32.1 33.1 25.4 9.4 100
17.6 19.2 35.7 27.5 100
29.7 30.8 27.1 12.4 100
Noactivity
1activity
23 ormore
Total
Odisha
Schooltype
Govt
Pvt
Govt & Pvt
5.4 16.3 27.7 50.6 100
5.1 10.2 19.9 64.9 100
5.3 13.2 23.8 57.7 100
Noactivity
1activity
23 ormore
Total
PunjabSchooltype
Govt
Pvt
Govt & Pvt
49.6 20.9 20.4 9.1 100
48.7 19.7 19.9 11.7 100
49.2 20.5 20.2 10.1 100
Noactivity
1activity
23 ormore
Total
Rajasthan
SE13: % Enrolled children by the number of learning activities done during the referenceweek. By school type and number of activities. 2020
Data is not presented where sample size is insufficient.
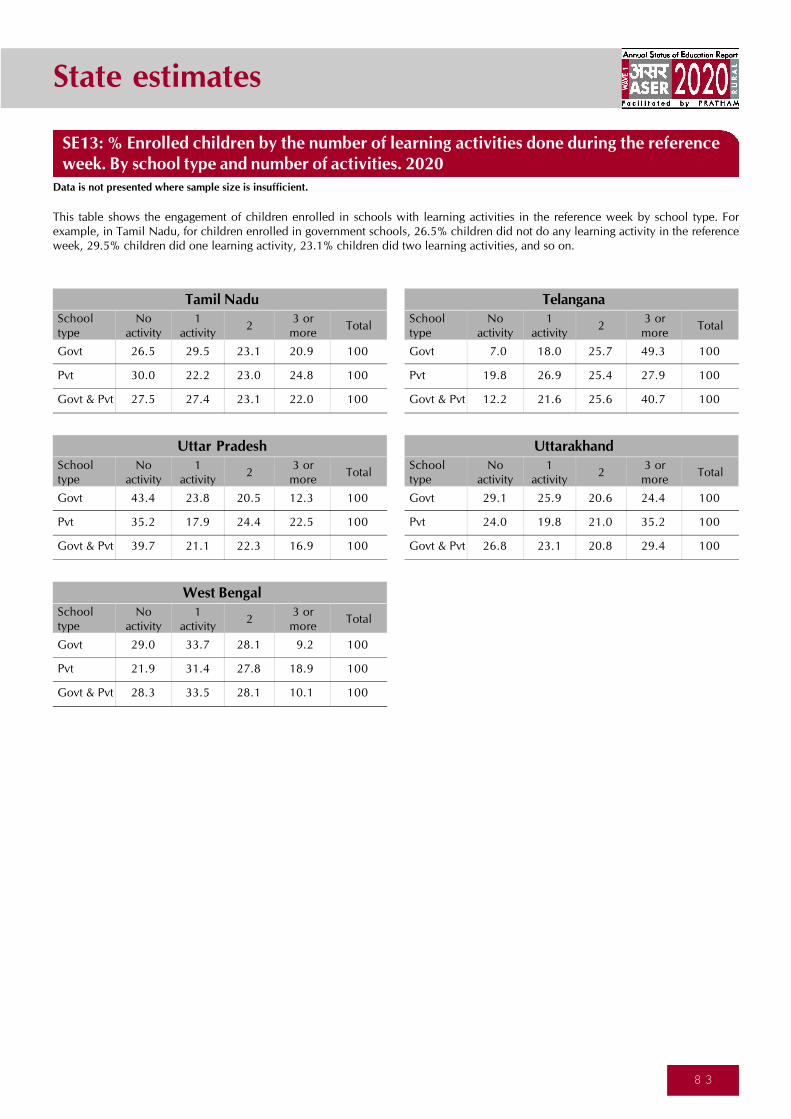
State estimates
8 3
Schooltype
Govt
Pvt
Govt & Pvt
26.5 29.5 23.1 20.9 100
30.0 22.2 23.0 24.8 100
27.5 27.4 23.1 22.0 100
Noactivity
1activity
23 ormore
Total
Tamil NaduSchooltype
Govt
Pvt
Govt & Pvt
7.0 18.0 25.7 49.3 100
19.8 26.9 25.4 27.9 100
12.2 21.6 25.6 40.7 100
Noactivity
1activity
23 ormore
Total
Telangana
Schooltype
Govt
Pvt
Govt & Pvt
43.4 23.8 20.5 12.3 100
35.2 17.9 24.4 22.5 100
39.7 21.1 22.3 16.9 100
Noactivity
1activity
23 ormore
Total
Uttar PradeshSchooltype
Govt
Pvt
Govt & Pvt
29.1 25.9 20.6 24.4 100
24.0 19.8 21.0 35.2 100
26.8 23.1 20.8 29.4 100
Noactivity
1activity
23 ormore
Total
Uttarakhand
Schooltype
Govt
Pvt
Govt & Pvt
29.0 33.7 28.1 9.2 100
21.9 31.4 27.8 18.9 100
28.3 33.5 28.1 10.1 100
Noactivity
1activity
23 ormore
Total
West Bengal
SE13: % Enrolled children by the number of learning activities done during the referenceweek. By school type and number of activities. 2020
Data is not presented where sample size is insufficient.
This table shows the engagement of children enrolled in schools with learning activities in the reference week by school type. Forexample, in Tamil Nadu, for children enrolled in government schools, 26.5% children did not do any learning activity in the referenceweek, 29.5% children did one learning activity, 23.1% children did two learning activities, and so on.

State estimates
8 4
‘Contact for administrative purposes’ includes contact by phone calls, personal visits or SMS/WhatsApp.
SE14: % Enrolled children in contact with schools. By school type and type of contact. 2020
Data is not presented where sample size is insufficient.
Households were asked about contact with teachers during the reference week. If there had been no contact, they were asked if there hadbeen any contact since the lockdown began. This table summarizes what households reported, by school type and nature of contact. Forexample, in Andhra Pradesh, of children enrolled in government school, 26.7% children’s teachers had visited or called the parent/childin the reference week, and 25.6% children or their parents had visited or called the teacher in the reference week. Of those who had nocontact during the reference week, 8.9% children/parents and teachers had called or visited each other at least once since the lockdownbegan to discuss learning materials/activities or child’s progress/wellbeing. Similarly, 36.2% children’s teachers and parents had con-tacted each other at least once since the lockdown began for administrative purposes.
26.7 25.6 8.9 36.2
28.3 24.7 10.6 28.4
27.2 25.3 9.4 34.2
School type
Govt
Pvt
Govt & Pvt
Contact to discuss learning materials/activities and child’s progress/wellbeingContact for administrative
purposes
Andhra Pradesh
Teacher visited or calledparent/child in the
reference week
Parent/child visitedor called teacher inthe reference week
Of those who had nocontact in the referenceweek, teacher or parent/
child called or visited eachotherat least once since
the lockdown
Teacher or parent/childcontacted each
other at least oncesince the lockdown
27.7 24.8 26.4 44.4
35.1 26.7 31.0 23.0
31.2 25.7 28.4 34.6
School type
Govt
Pvt
Govt & Pvt
Contact to discuss learning materials/activities and child’s progress/wellbeingContact for administrative
purposes
Arunachal Pradesh
Teacher visited or calledparent/child in the
reference week
Parent/child visitedor called teacher inthe reference week
Of those who had nocontact in the referenceweek, teacher or parent/
child called or visited eachotherat least once since
the lockdown
Teacher or parent/childcontacted each
other at least oncesince the lockdown
15.1 11.9 22.7 40.3
35.1 28.6 29.7 31.4
21.5 17.3 24.5 37.4
School type
Govt
Pvt
Govt & Pvt
Contact to discuss learning materials/activities and child’s progress/wellbeingContact for administrative
purposes
Assam
Teacher visited or calledparent/child in the
reference week
Parent/child visitedor called teacher inthe reference week
Of those who had nocontact in the referenceweek, teacher or parent/
child called or visited eachotherat least once since
the lockdown
Teacher or parent/childcontacted each
other at least oncesince the lockdown

State estimates
8 5
‘Contact for administrative purposes’ includes contact by phone calls, personal visits or SMS/WhatsApp.
Data is not presented where sample size is insufficient.
SE14: % Enrolled children in contact with schools. By school type and type of contact. 2020
Households were asked about contact with teachers during the reference week. If there had been no contact, they were asked if there hadbeen any contact since the lockdown began. This table summarizes what households reported, by school type and nature of contact. Forexample, in Bihar, of children enrolled in government school, 8.7% children’s teachers had visited or called the parent/child in thereference week, and 13.4% children or their parents had visited or called the teacher in the reference week. Of those who had no contactduring the reference week, 6.9% children/parents and teachers had called or visited each other at least once since the lockdown beganto discuss learning materials/activities or child’s progress/wellbeing. Similarly, 18% children’s teachers and parents had contacted eachother at least once since the lockdown began for administrative purposes.
8.7 13.4 6.9 18.0
26.1 31.0 9.6 14.2
11.7 16.4 7.2 17.4
School type
Govt
Pvt
Govt & Pvt
Contact to discuss learning materials/activities and child’s progress/wellbeingContact for administrative
purposes
Bihar
Teacher visited or calledparent/child in the
reference week
Parent/child visitedor called teacher inthe reference week
Of those who had nocontact in the referenceweek, teacher or parent/
child called or visited eachotherat least once since
the lockdown
Teacher or parent/childcontacted each
other at least oncesince the lockdown
37.1 30.8 37.0 55.0
38.8 44.8 30.6 36.9
37.6 35.0 35.2 49.7
School type
Govt
Pvt
Govt & Pvt
Contact to discuss learning materials/activities and child’s progress/wellbeingContact for administrative
purposes
Chhattisgarh
Teacher visited or calledparent/child in the
reference week
Parent/child visitedor called teacher inthe reference week
Of those who had nocontact in the referenceweek, teacher or parent/
child called or visited eachotherat least once since
the lockdown
Teacher or parent/childcontacted each
other at least oncesince the lockdown
74.3 53.4 25.7 49.9
68.2 63.9 39.6 30.4
73.4 55.0 28.0 47.1
School type
Govt
Pvt
Govt & Pvt
Contact to discuss learning materials/activities and child’s progress/wellbeingContact for administrative
purposes
Gujarat
Teacher visited or calledparent/child in the
reference week
Parent/child visitedor called teacher inthe reference week
Of those who had nocontact in the referenceweek, teacher or parent/
child called or visited eachotherat least once since
the lockdown
Teacher or parent/childcontacted each
other at least oncesince the lockdown

State estimates
8 6
‘Contact for administrative purposes’ includes contact by phone calls, personal visits or SMS/WhatsApp.
Data is not presented where sample size is insufficient.
SE14: % Enrolled children in contact with schools. By school type and type of contact. 2020
Households were asked about contact with teachers during the reference week. If there had been no contact, they were asked if there hadbeen any contact since the lockdown began. This table summarizes what households reported, by school type and nature of contact. Forexample, in Haryana, of children enrolled in government school, 54.9% children’s teachers had visited or called the parent/child in thereference week, and 45.5% children or their parents had visited or called the teacher in the reference week. Of those who had no contactduring the reference week, 31.9% children/parents and teachers had called or visited each other at least once since the lockdown beganto discuss learning materials/activities or child’s progress/wellbeing. Similarly, 41% children’s teachers and parents had contacted eachother at least once since the lockdown began for administrative purposes.
54.9 45.5 31.9 41.0
54.8 50.0 31.4 35.1
54.9 47.7 31.6 38.1
School type
Govt
Pvt
Govt & Pvt
Contact to discuss learning materials/activities and child’s progress/wellbeingContact for administrative
purposes
Haryana
Teacher visited or calledparent/child in the
reference week
Parent/child visitedor called teacher inthe reference week
Of those who had nocontact in the referenceweek, teacher or parent/
child called or visited eachotherat least once since
the lockdown
Teacher or parent/childcontacted each
other at least oncesince the lockdown
70.2 62.8 64.0 79.2
73.0 70.0 72.8 65.7
71.4 65.9 67.2 74.1
School type
Govt
Pvt
Govt & Pvt
Contact to discuss learning materials/activities and child’s progress/wellbeingContact for administrative
purposes
Himachal Pradesh
Teacher visited or calledparent/child in the
reference week
Parent/child visitedor called teacher inthe reference week
Of those who had nocontact in the referenceweek, teacher or parent/
child called or visited eachotherat least once since
the lockdown
Teacher or parent/childcontacted each
other at least oncesince the lockdown
30.4 31.6 11.7 35.5
30.6 36.5 15.3 31.2
30.5 33.7 13.1 33.7
School type
Govt
Pvt
Govt & Pvt
Contact to discuss learning materials/activities and child’s progress/wellbeingContact for administrative
purposes
Jammu and Kashmir
Teacher visited or calledparent/child in the
reference week
Parent/child visitedor called teacher inthe reference week
Of those who had nocontact in the referenceweek, teacher or parent/
child called or visited eachotherat least once since
the lockdown
Teacher or parent/childcontacted each
other at least oncesince the lockdown
*Estimates for the UTs of Ladakh and Jammu and Kashmir have been presented in a combined form for comparability with ASER estimates of previousyears.

State estimates
8 7
‘Contact for administrative purposes’ includes contact by phone calls, personal visits or SMS/WhatsApp.
Data is not presented where sample size is insufficient.
SE14: % Enrolled children in contact with schools. By school type and type of contact. 2020
Households were asked about contact with teachers during the reference week. If there had been no contact, they were asked if there hadbeen any contact since the lockdown began. This table summarizes what households reported, by school type and nature of contact. Forexample, in Jharkhand, of children enrolled in government school, 28.6% children’s teachers had visited or called the parent/child in thereference week, and 22.9% children or their parents had visited or called the teacher in the reference week. Of those who had no contactduring the reference week, 10.4% children/parents and teachers had called or visited each other at least once since the lockdown beganto discuss learning materials/activities or child’s progress/wellbeing. Similarly, 35.4% children’s teachers and parents had contactedeach other at least once since the lockdown began for administrative purposes.
28.6 22.9 10.4 35.4
25.3 27.8 12.0 18.0
27.8 24.1 10.8 31.5
School type
Govt
Pvt
Govt & Pvt
Contact to discuss learning materials/activities and child’s progress/wellbeingContact for administrative
purposes
Jharkhand
Teacher visited or calledparent/child in the
reference week
Parent/child visitedor called teacher inthe reference week
Of those who had nocontact in the referenceweek, teacher or parent/
child called or visited eachotherat least once since
the lockdown
Teacher or parent/childcontacted each
other at least oncesince the lockdown
61.0 55.6 23.8 56.6
55.6 54.3 25.1 45.5
59.6 55.2 24.1 53.6
School type
Govt
Pvt
Govt & Pvt
Contact to discuss learning materials/activities and child’s progress/wellbeingContact for administrative
purposes
Karnataka
Teacher visited or calledparent/child in the
reference week
Parent/child visitedor called teacher inthe reference week
Of those who had nocontact in the referenceweek, teacher or parent/
child called or visited eachotherat least once since
the lockdown
Teacher or parent/childcontacted each
other at least oncesince the lockdown
68.8 51.8 76.7 61.0
71.0 61.6 76.0 56.0
69.6 55.3 76.4 59.2
School type
Govt
Pvt
Govt & Pvt
Contact to discuss learning materials/activities and child’s progress/wellbeingContact for administrative
purposes
Kerala
Teacher visited or calledparent/child in the
reference week
Parent/child visitedor called teacher inthe reference week
Of those who had nocontact in the referenceweek, teacher or parent/
child called or visited eachotherat least once since
the lockdown
Teacher or parent/childcontacted each
other at least oncesince the lockdown
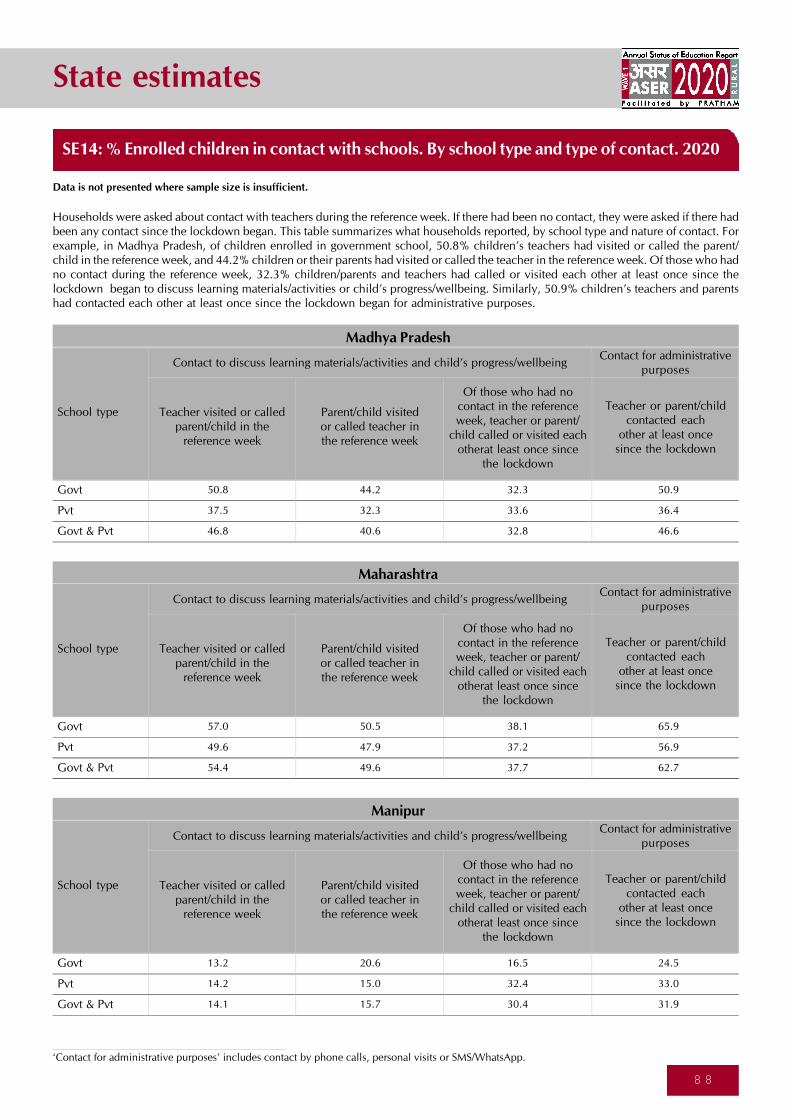
State estimates
8 8
‘Contact for administrative purposes’ includes contact by phone calls, personal visits or SMS/WhatsApp.
Data is not presented where sample size is insufficient.
SE14: % Enrolled children in contact with schools. By school type and type of contact. 2020
Households were asked about contact with teachers during the reference week. If there had been no contact, they were asked if there hadbeen any contact since the lockdown began. This table summarizes what households reported, by school type and nature of contact. Forexample, in Madhya Pradesh, of children enrolled in government school, 50.8% children’s teachers had visited or called the parent/child in the reference week, and 44.2% children or their parents had visited or called the teacher in the reference week. Of those who hadno contact during the reference week, 32.3% children/parents and teachers had called or visited each other at least once since thelockdown began to discuss learning materials/activities or child’s progress/wellbeing. Similarly, 50.9% children’s teachers and parentshad contacted each other at least once since the lockdown began for administrative purposes.
50.8 44.2 32.3 50.9
37.5 32.3 33.6 36.4
46.8 40.6 32.8 46.6
School type
Govt
Pvt
Govt & Pvt
Contact to discuss learning materials/activities and child’s progress/wellbeingContact for administrative
purposes
Madhya Pradesh
Teacher visited or calledparent/child in the
reference week
Parent/child visitedor called teacher inthe reference week
Of those who had nocontact in the referenceweek, teacher or parent/
child called or visited eachotherat least once since
the lockdown
Teacher or parent/childcontacted each
other at least oncesince the lockdown
57.0 50.5 38.1 65.9
49.6 47.9 37.2 56.9
54.4 49.6 37.7 62.7
School type
Govt
Pvt
Govt & Pvt
Contact to discuss learning materials/activities and child’s progress/wellbeingContact for administrative
purposes
Maharashtra
Teacher visited or calledparent/child in the
reference week
Parent/child visitedor called teacher inthe reference week
Of those who had nocontact in the referenceweek, teacher or parent/
child called or visited eachotherat least once since
the lockdown
Teacher or parent/childcontacted each
other at least oncesince the lockdown
13.2 20.6 16.5 24.5
14.2 15.0 32.4 33.0
14.1 15.7 30.4 31.9
School type
Govt
Pvt
Govt & Pvt
Contact to discuss learning materials/activities and child’s progress/wellbeingContact for administrative
purposes
Manipur
Teacher visited or calledparent/child in the
reference week
Parent/child visitedor called teacher inthe reference week
Of those who had nocontact in the referenceweek, teacher or parent/
child called or visited eachotherat least once since
the lockdown
Teacher or parent/childcontacted each
other at least oncesince the lockdown
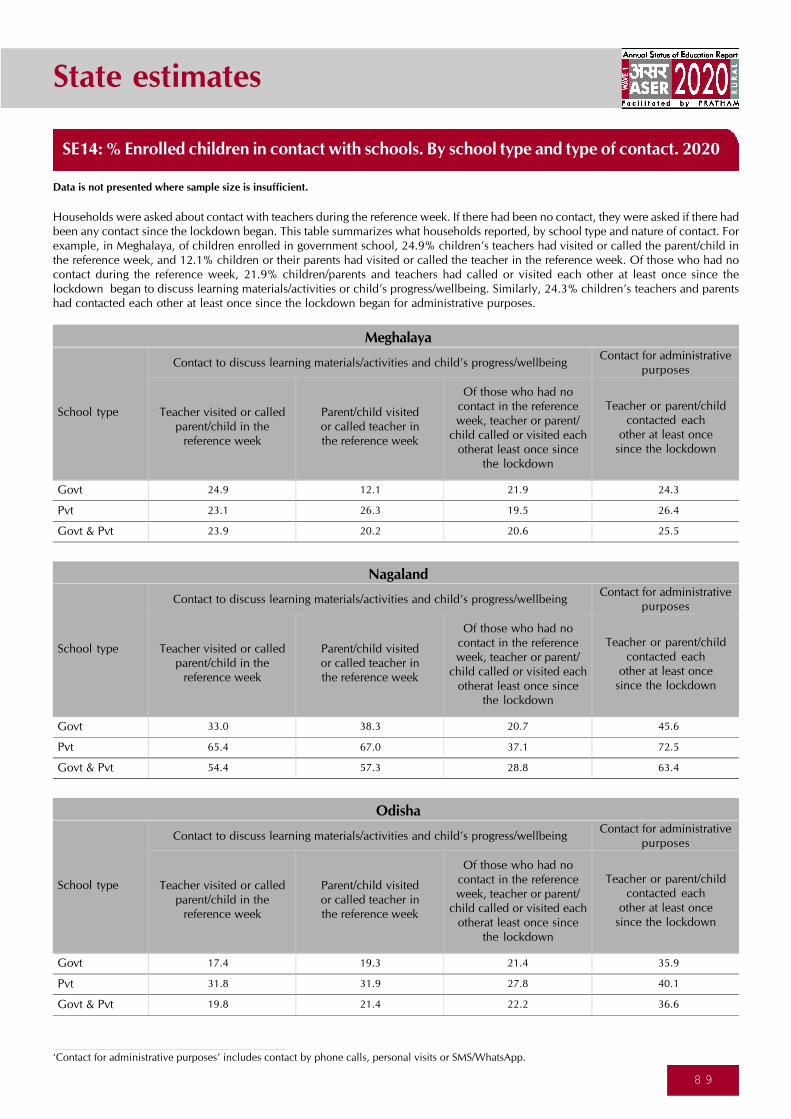
State estimates
8 9
‘Contact for administrative purposes’ includes contact by phone calls, personal visits or SMS/WhatsApp.
Data is not presented where sample size is insufficient.
SE14: % Enrolled children in contact with schools. By school type and type of contact. 2020
Households were asked about contact with teachers during the reference week. If there had been no contact, they were asked if there hadbeen any contact since the lockdown began. This table summarizes what households reported, by school type and nature of contact. Forexample, in Meghalaya, of children enrolled in government school, 24.9% children’s teachers had visited or called the parent/child inthe reference week, and 12.1% children or their parents had visited or called the teacher in the reference week. Of those who had nocontact during the reference week, 21.9% children/parents and teachers had called or visited each other at least once since thelockdown began to discuss learning materials/activities or child’s progress/wellbeing. Similarly, 24.3% children’s teachers and parentshad contacted each other at least once since the lockdown began for administrative purposes.
24.9 12.1 21.9 24.3
23.1 26.3 19.5 26.4
23.9 20.2 20.6 25.5
School type
Govt
Pvt
Govt & Pvt
Contact to discuss learning materials/activities and child’s progress/wellbeingContact for administrative
purposes
Meghalaya
Teacher visited or calledparent/child in the
reference week
Parent/child visitedor called teacher inthe reference week
Of those who had nocontact in the referenceweek, teacher or parent/
child called or visited eachotherat least once since
the lockdown
Teacher or parent/childcontacted each
other at least oncesince the lockdown
33.0 38.3 20.7 45.6
65.4 67.0 37.1 72.5
54.4 57.3 28.8 63.4
School type
Govt
Pvt
Govt & Pvt
Contact to discuss learning materials/activities and child’s progress/wellbeingContact for administrative
purposes
Nagaland
Teacher visited or calledparent/child in the
reference week
Parent/child visitedor called teacher inthe reference week
Of those who had nocontact in the referenceweek, teacher or parent/
child called or visited eachotherat least once since
the lockdown
Teacher or parent/childcontacted each
other at least oncesince the lockdown
17.4 19.3 21.4 35.9
31.8 31.9 27.8 40.1
19.8 21.4 22.2 36.6
School type
Govt
Pvt
Govt & Pvt
Contact to discuss learning materials/activities and child’s progress/wellbeingContact for administrative
purposes
Odisha
Teacher visited or calledparent/child in the
reference week
Parent/child visitedor called teacher inthe reference week
Of those who had nocontact in the referenceweek, teacher or parent/
child called or visited eachotherat least once since
the lockdown
Teacher or parent/childcontacted each
other at least oncesince the lockdown
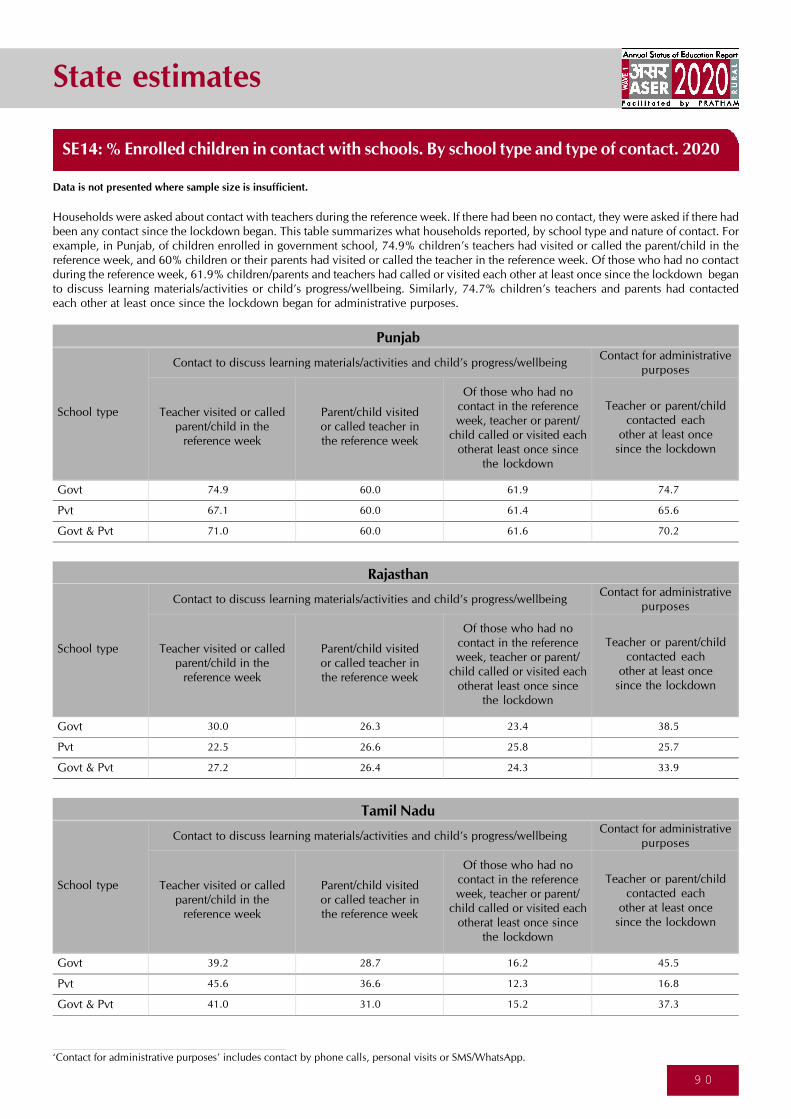
State estimates
9 0
‘Contact for administrative purposes’ includes contact by phone calls, personal visits or SMS/WhatsApp.
Data is not presented where sample size is insufficient.
SE14: % Enrolled children in contact with schools. By school type and type of contact. 2020
Households were asked about contact with teachers during the reference week. If there had been no contact, they were asked if there hadbeen any contact since the lockdown began. This table summarizes what households reported, by school type and nature of contact. Forexample, in Punjab, of children enrolled in government school, 74.9% children’s teachers had visited or called the parent/child in thereference week, and 60% children or their parents had visited or called the teacher in the reference week. Of those who had no contactduring the reference week, 61.9% children/parents and teachers had called or visited each other at least once since the lockdown beganto discuss learning materials/activities or child’s progress/wellbeing. Similarly, 74.7% children’s teachers and parents had contactedeach other at least once since the lockdown began for administrative purposes.
74.9 60.0 61.9 74.7
67.1 60.0 61.4 65.6
71.0 60.0 61.6 70.2
School type
Govt
Pvt
Govt & Pvt
Contact to discuss learning materials/activities and child’s progress/wellbeingContact for administrative
purposes
Punjab
Teacher visited or calledparent/child in the
reference week
Parent/child visitedor called teacher inthe reference week
Of those who had nocontact in the referenceweek, teacher or parent/
child called or visited eachotherat least once since
the lockdown
Teacher or parent/childcontacted each
other at least oncesince the lockdown
30.0 26.3 23.4 38.5
22.5 26.6 25.8 25.7
27.2 26.4 24.3 33.9
School type
Govt
Pvt
Govt & Pvt
Contact to discuss learning materials/activities and child’s progress/wellbeingContact for administrative
purposes
Rajasthan
Teacher visited or calledparent/child in the
reference week
Parent/child visitedor called teacher inthe reference week
Of those who had nocontact in the referenceweek, teacher or parent/
child called or visited eachotherat least once since
the lockdown
Teacher or parent/childcontacted each
other at least oncesince the lockdown
39.2 28.7 16.2 45.5
45.6 36.6 12.3 16.8
41.0 31.0 15.2 37.3
School type
Govt
Pvt
Govt & Pvt
Contact to discuss learning materials/activities and child’s progress/wellbeingContact for administrative
purposes
Tamil Nadu
Teacher visited or calledparent/child in the
reference week
Parent/child visitedor called teacher inthe reference week
Of those who had nocontact in the referenceweek, teacher or parent/
child called or visited eachotherat least once since
the lockdown
Teacher or parent/childcontacted each
other at least oncesince the lockdown

State estimates
9 1
‘Contact for administrative purposes’ includes contact by phone calls, personal visits or SMS/WhatsApp.
Data is not presented where sample size is insufficient.
SE14: % Enrolled children in contact with schools. By school type and type of contact. 2020
Households were asked about contact with teachers during the reference week. If there had been no contact, they were asked if there hadbeen any contact since the lockdown began. This table summarizes what households reported, by school type and nature of contact. Forexample, in Telangana, of children enrolled in government school, 67.5% children’s teachers had visited or called the parent/child in thereference week, and 52.4% children or their parents had visited or called the teacher in the reference week. Of those who had no contactduring the reference week, 13.8% children/parents and teachers had called or visited each other at least once since the lockdown beganto discuss learning materials/activities or child’s progress/wellbeing. Similarly, 45.2% children’s teachers and parents had contactedeach other at least once since the lockdown began for administrative purposes.
67.5 52.4 13.8 45.2
43.1 33.0 3.1 28.2
57.6 44.6 7.8 38.3
School type
Govt
Pvt
Govt & Pvt
Contact to discuss learning materials/activities and child’s progress/wellbeingContact for administrative
purposes
Telangana
Teacher visited or calledparent/child in the
reference week
Parent/child visitedor called teacher inthe reference week
Of those who had nocontact in the referenceweek, teacher or parent/
child called or visited eachotherat least once since
the lockdown
Teacher or parent/childcontacted each
other at least oncesince the lockdown
24.1 23.6 11.0 30.0
28.8 28.2 13.1 18.0
26.3 25.7 11.9 24.6
School type
Govt
Pvt
Govt & Pvt
Contact to discuss learning materials/activities and child’s progress/wellbeingContact for administrative
purposes
Uttar Pradesh
Teacher visited or calledparent/child in the
reference week
Parent/child visitedor called teacher inthe reference week
Of those who had nocontact in the referenceweek, teacher or parent/
child called or visited eachotherat least once since
the lockdown
Teacher or parent/childcontacted each
other at least oncesince the lockdown
55.4 48.9 46.9 65.0
60.6 50.4 39.5 49.3
57.8 49.6 43.7 59.2
School type
Govt
Pvt
Govt & Pvt
Contact to discuss learning materials/activities and child’s progress/wellbeingContact for administrative
purposes
Uttarakhand
Teacher visited or calledparent/child in the
reference week
Parent/child visitedor called teacher inthe reference week
Of those who had nocontact in the referenceweek, teacher or parent/
child called or visited eachotherat least once since
the lockdown
Teacher or parent/childcontacted each
other at least oncesince the lockdown
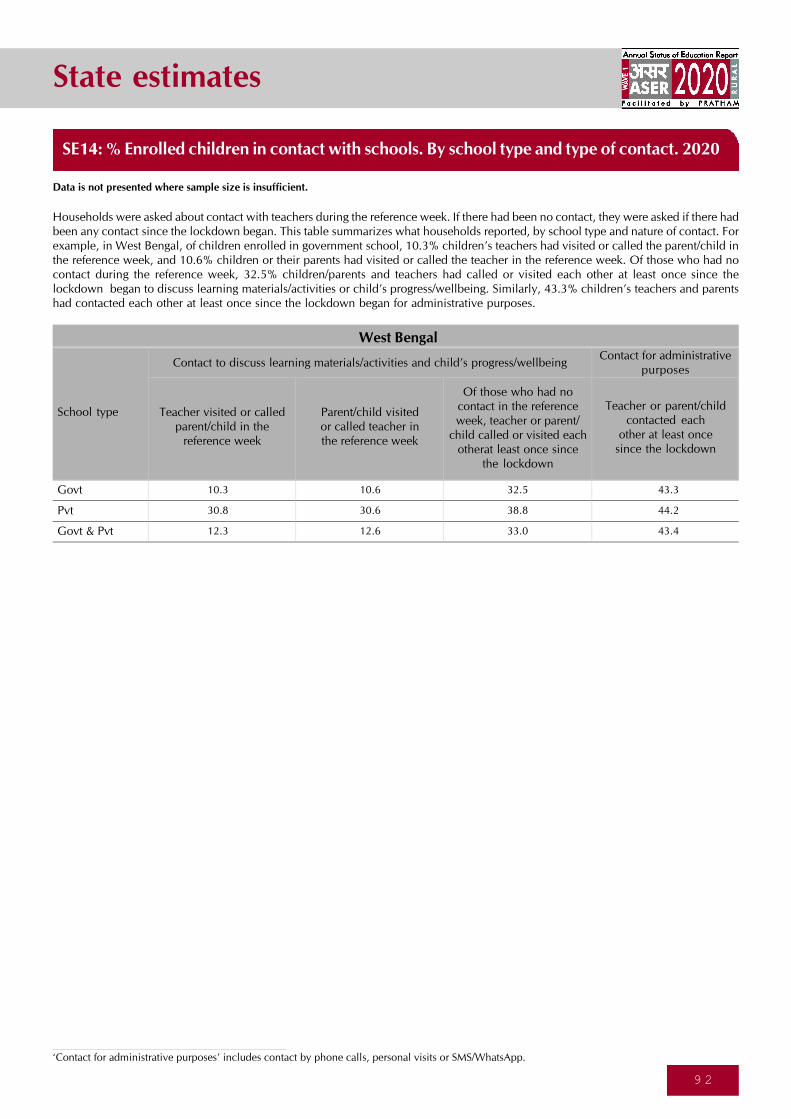
State estimates
9 2
‘Contact for administrative purposes’ includes contact by phone calls, personal visits or SMS/WhatsApp.
Data is not presented where sample size is insufficient.
SE14: % Enrolled children in contact with schools. By school type and type of contact. 2020
Households were asked about contact with teachers during the reference week. If there had been no contact, they were asked if there hadbeen any contact since the lockdown began. This table summarizes what households reported, by school type and nature of contact. Forexample, in West Bengal, of children enrolled in government school, 10.3% children’s teachers had visited or called the parent/child inthe reference week, and 10.6% children or their parents had visited or called the teacher in the reference week. Of those who had nocontact during the reference week, 32.5% children/parents and teachers had called or visited each other at least once since thelockdown began to discuss learning materials/activities or child’s progress/wellbeing. Similarly, 43.3% children’s teachers and parentshad contacted each other at least once since the lockdown began for administrative purposes.
10.3 10.6 32.5 43.3
30.8 30.6 38.8 44.2
12.3 12.6 33.0 43.4
School type
Govt
Pvt
Govt & Pvt
Contact to discuss learning materials/activities and child’s progress/wellbeingContact for administrative
purposes
West Bengal
Teacher visited or calledparent/child in the
reference week
Parent/child visitedor called teacher inthe reference week
Of those who had nocontact in the referenceweek, teacher or parent/
child called or visited eachotherat least once since
the lockdown
Teacher or parent/childcontacted each
other at least oncesince the lockdown
ASER 2020 Wave 1 process documents
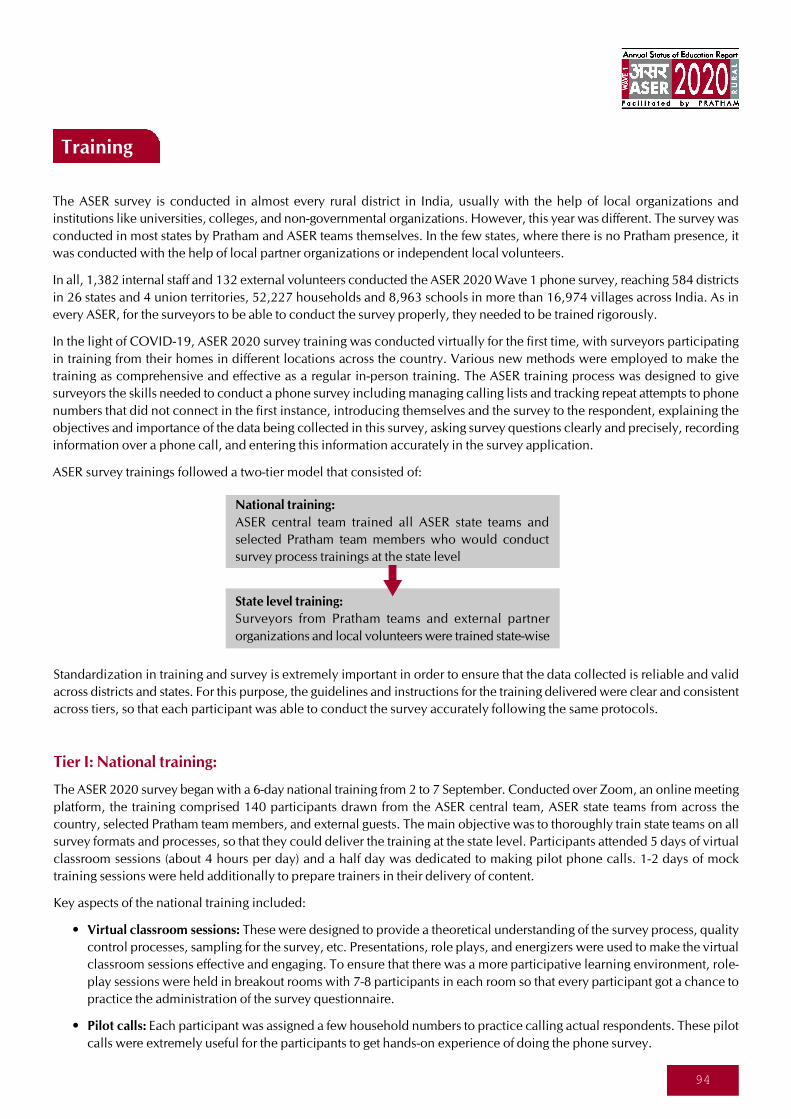
94
The ASER survey is conducted in almost every rural district in India, usually with the help of local organizations and
institutions like universities, colleges, and non-governmental organizations. However, this year was different. The survey was
conducted in most states by Pratham and ASER teams themselves. In the few states, where there is no Pratham presence, it
was conducted with the help of local partner organizations or independent local volunteers.
In all, 1,382 internal staff and 132 external volunteers conducted the ASER 2020 Wave 1 phone survey, reaching 584 districts
in 26 states and 4 union territories, 52,227 households and 8,963 schools in more than 16,974 villages across India. As in
every ASER, for the surveyors to be able to conduct the survey properly, they needed to be trained rigorously.
In the light of COVID-19, ASER 2020 survey training was conducted virtually for the first time, with surveyors participating
in training from their homes in different locations across the country. Various new methods were employed to make the
training as comprehensive and effective as a regular in-person training. The ASER training process was designed to give
surveyors the skills needed to conduct a phone survey including managing calling lists and tracking repeat attempts to phone
numbers that did not connect in the first instance, introducing themselves and the survey to the respondent, explaining the
objectives and importance of the data being collected in this survey, asking survey questions clearly and precisely, recording
information over a phone call, and entering this information accurately in the survey application.
ASER survey trainings followed a two-tier model that consisted of:
National training:
ASER central team trained all ASER state teams and
selected Pratham team members who would conduct
survey process trainings at the state level
State level training:
Surveyors from Pratham teams and external partner
organizations and local volunteers were trained state-wise
Standardization in training and survey is extremely important in order to ensure that the data collected is reliable and valid
across districts and states. For this purpose, the guidelines and instructions for the training delivered were clear and consistent
across tiers, so that each participant was able to conduct the survey accurately following the same protocols.
Tier I: National training:
The ASER 2020 survey began with a 6-day national training from 2 to 7 September. Conducted over Zoom, an online meeting
platform, the training comprised 140 participants drawn from the ASER central team, ASER state teams from across the
country, selected Pratham team members, and external guests. The main objective was to thoroughly train state teams on all
survey formats and processes, so that they could deliver the training at the state level. Participants attended 5 days of virtual
classroom sessions (about 4 hours per day) and a half day was dedicated to making pilot phone calls. 1-2 days of mock
training sessions were held additionally to prepare trainers in their delivery of content.
Key aspects of the national training included:
• Virtual classroom sessions: These were designed to provide a theoretical understanding of the survey process, quality
control processes, sampling for the survey, etc. Presentations, role plays, and energizers were used to make the virtual
classroom sessions effective and engaging. To ensure that there was a more participative learning environment, role-
play sessions were held in breakout rooms with 7-8 participants in each room so that every participant got a chance to
practice the administration of the survey questionnaire.
• Pilot calls: Each participant was assigned a few household numbers to practice calling actual respondents. These pilot
calls were extremely useful for the participants to get hands-on experience of doing the phone survey.
Training
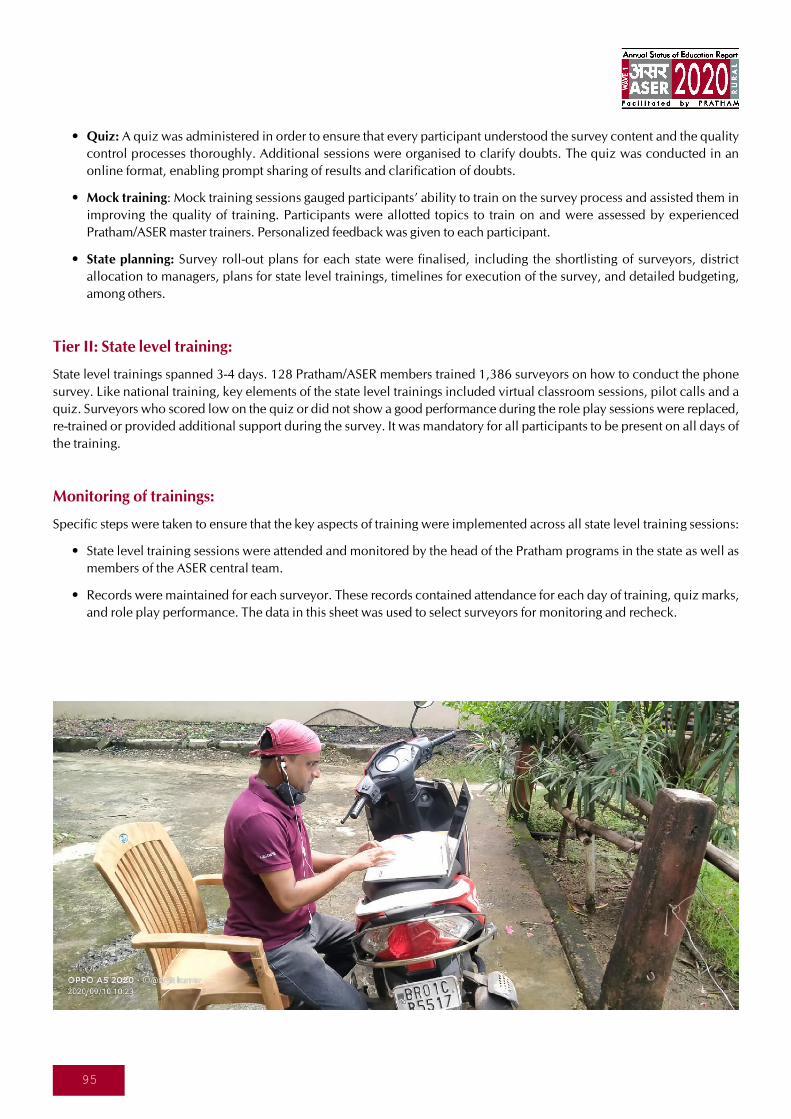
95
• Quiz: A quiz was administered in order to ensure that every participant understood the survey content and the quality
control processes thoroughly. Additional sessions were organised to clarify doubts. The quiz was conducted in an
online format, enabling prompt sharing of results and clarification of doubts.
• Mock training: Mock training sessions gauged participants’ ability to train on the survey process and assisted them in
improving the quality of training. Participants were allotted topics to train on and were assessed by experienced
Pratham/ASER master trainers. Personalized feedback was given to each participant.
• State planning: Survey roll-out plans for each state were finalised, including the shortlisting of surveyors, district
allocation to managers, plans for state level trainings, timelines for execution of the survey, and detailed budgeting,
among others.
Tier II: State level training:
State level trainings spanned 3-4 days. 128 Pratham/ASER members trained 1,386 surveyors on how to conduct the phone
survey. Like national training, key elements of the state level trainings included virtual classroom sessions, pilot calls and a
quiz. Surveyors who scored low on the quiz or did not show a good performance during the role play sessions were replaced,
re-trained or provided additional support during the survey. It was mandatory for all participants to be present on all days of
the training.
Monitoring of trainings:
Specific steps were taken to ensure that the key aspects of training were implemented across all state level training sessions:
• State level training sessions were attended and monitored by the head of the Pratham programs in the state as well as
members of the ASER central team.
• Records were maintained for each surveyor. These records contained attendance for each day of training, quiz marks,
and role play performance. The data in this sheet was used to select surveyors for monitoring and recheck.
96
Getting ready for the survey
The surveyor should keep all essential items (phone, earphones, drinking water, formats, stationery, phone charger) ready
before making the calls. She must practice and revise the introduction to be given to the respondent before making the calls.
It is important that she check all numbers to be called for the day in the call log sheets, keep all survey formats ready, and as
far as possible, sit in a quiet place with good network connectivity before starting calls.
1. Household survey
This section describes the household survey process.
• What to do when calling a household
Purpose: Surveyor introduces herself to the respondent, explains the rationale behind the household survey and how the data
will be used.
Introducing oneself on the call: Conducting a survey over the phone where neither party can see the other is difficult, and
everyone is apprehensive of cold calls - the purpose behind them, how the surveyor got the number, what will be done with
the personal information, why one should cooperate, etc. It is important to explain these things on each call in a standardized
manner:
• Who the surveyor/organization is
• How we got the respondent's number
• Why we are calling
• How we will use the information collected
• How we will keep their identity confidential.
The answers to these questions form a part of the introduction script. Surveyor uses the introduction script to introduce
herself, the organization and the survey; and to confirm that the correct person has been called by confirming the village,
block and district where they live.
Confirming the location: The call log sheets list the sampled households with their village, block, and district locations,
which were recorded during ASER 2018. The first step after the surveyor explains where she is calling from once the call
connects is to confirm whether the recorded location is correct. For this, she asks the respondent: “Are you staying in ____
village of______ block in ____ district?”. If the respondent identifies the location as correct, then the conversation is continued.
Introduction script, rationale and usage: Once the location is confirmed as correct, the surveyor clarifies how she got the
respondent’s number referring to two other surveyors who must have visited the household two years ago to conduct the ASER
2018 survey. While explaining the rationale for calling/purpose of the survey, she emphasizes the following points:
• Children's learning has been affected since schools closed due to the pandemic
• It is important to find out how children are learning at home, what support they are receiving from schools/families,
and what challenges they face
• The survey is being conducted in 1,00,000 households. The data will be collated and presented, and the respondent’s
and child’s name will be kept confidential
• The data will be useful for various stakeholders trying to support children’s learning during the pandemic.
Survey Process
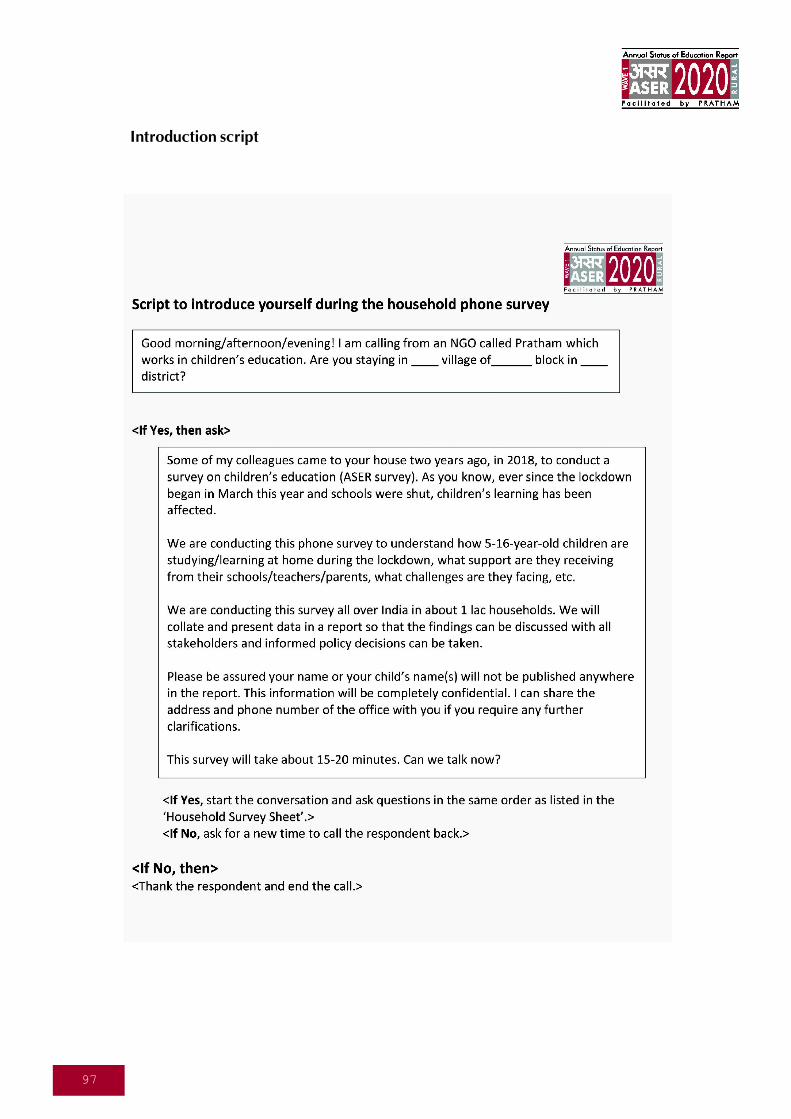
97
Introduction script
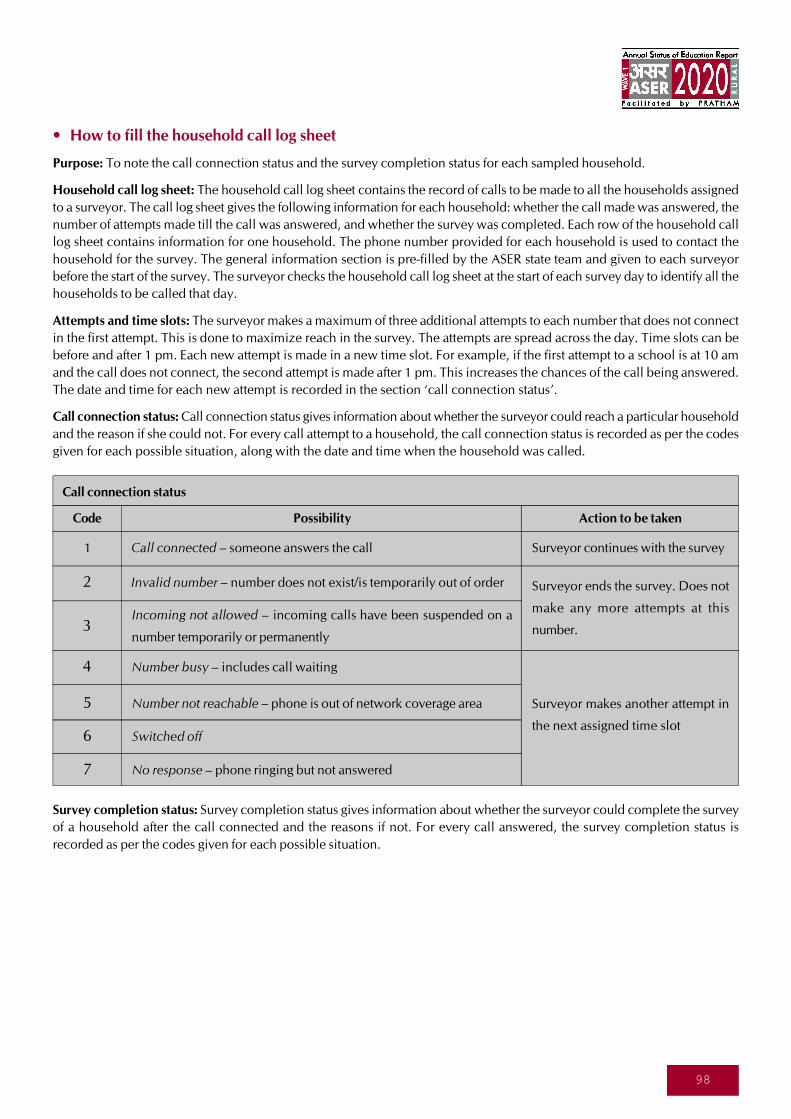
98
Survey completion status: Survey completion status gives information about whether the surveyor could complete the survey
of a household after the call connected and the reasons if not. For every call answered, the survey completion status is
recorded as per the codes given for each possible situation.
Call connection status
Code Possibility Action to be taken
1 Call connected – someone answers the call Surveyor continues with the survey
2 Invalid number – number does not exist/is temporarily out of order Surveyor ends the survey. Does not
make any more attempts at this
number.3Incoming not allowed – incoming calls have been suspended on a
number temporarily or permanently
4 Number busy – includes call waiting
Surveyor makes another attempt in
the next assigned time slot
5 Number not reachable – phone is out of network coverage area
6 Switched off
7 No response – phone ringing but not answered
• How to fill the household call log sheet
Purpose: To note the call connection status and the survey completion status for each sampled household.
Household call log sheet: The household call log sheet contains the record of calls to be made to all the households assigned
to a surveyor. The call log sheet gives the following information for each household: whether the call made was answered, the
number of attempts made till the call was answered, and whether the survey was completed. Each row of the household call
log sheet contains information for one household. The phone number provided for each household is used to contact the
household for the survey. The general information section is pre-filled by the ASER state team and given to each surveyor
before the start of the survey. The surveyor checks the household call log sheet at the start of each survey day to identify all the
households to be called that day.
Attempts and time slots: The surveyor makes a maximum of three additional attempts to each number that does not connect
in the first attempt. This is done to maximize reach in the survey. The attempts are spread across the day. Time slots can be
before and after 1 pm. Each new attempt is made in a new time slot. For example, if the first attempt to a school is at 10 am
and the call does not connect, the second attempt is made after 1 pm. This increases the chances of the call being answered.
The date and time for each new attempt is recorded in the section ‘call connection status’.
Call connection status: Call connection status gives information about whether the surveyor could reach a particular household
and the reason if she could not. For every call attempt to a household, the call connection status is recorded as per the codes
given for each possible situation, along with the date and time when the household was called.
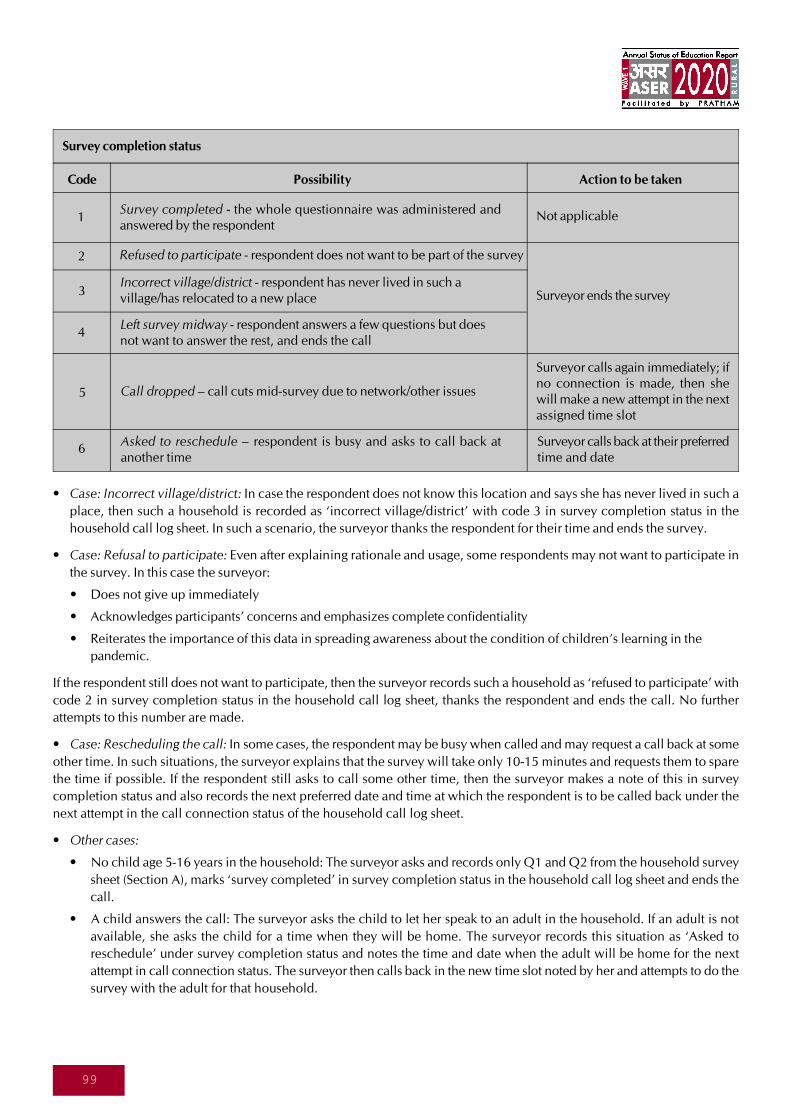
99
Survey completion status
Code Possibility Action to be taken
1Survey completed - the whole questionnaire was administered andanswered by the respondent
Not applicable
2 Refused to participate - respondent does not want to be part of the survey
Surveyor ends the survey3Incorrect village/district - respondent has never lived in such avillage/has relocated to a new place
4Left survey midway - respondent answers a few questions but doesnot want to answer the rest, and ends the call
Surveyor calls again immediately; ifno connection is made, then shewill make a new attempt in the nextassigned time slot
5 Call dropped – call cuts mid-survey due to network/other issues
6Asked to reschedule – respondent is busy and asks to call back atanother time
• Case: Incorrect village/district: In case the respondent does not know this location and says she has never lived in such a
place, then such a household is recorded as ‘incorrect village/district’ with code 3 in survey completion status in the
household call log sheet. In such a scenario, the surveyor thanks the respondent for their time and ends the survey.
• Case: Refusal to participate: Even after explaining rationale and usage, some respondents may not want to participate in
the survey. In this case the surveyor:
• Does not give up immediately
• Acknowledges participants’ concerns and emphasizes complete confidentiality
• Reiterates the importance of this data in spreading awareness about the condition of children’s learning in the
pandemic.
If the respondent still does not want to participate, then the surveyor records such a household as ‘refused to participate’ with
code 2 in survey completion status in the household call log sheet, thanks the respondent and ends the call. No further
attempts to this number are made.
• Case: Rescheduling the call: In some cases, the respondent may be busy when called and may request a call back at some
other time. In such situations, the surveyor explains that the survey will take only 10-15 minutes and requests them to spare
the time if possible. If the respondent still asks to call some other time, then the surveyor makes a note of this in survey
completion status and also records the next preferred date and time at which the respondent is to be called back under the
next attempt in the call connection status of the household call log sheet.
• Other cases:
• No child age 5-16 years in the household: The surveyor asks and records only Q1 and Q2 from the household survey
sheet (Section A), marks ‘survey completed’ in survey completion status in the household call log sheet and ends the
call.
• A child answers the call: The surveyor asks the child to let her speak to an adult in the household. If an adult is not
available, she asks the child for a time when they will be home. The surveyor records this situation as ‘Asked to
reschedule’ under survey completion status and notes the time and date when the adult will be home for the next
attempt in call connection status. The surveyor then calls back in the new time slot noted by her and attempts to do the
survey with the adult for that household.
Surveyor calls back at their preferredtime and date
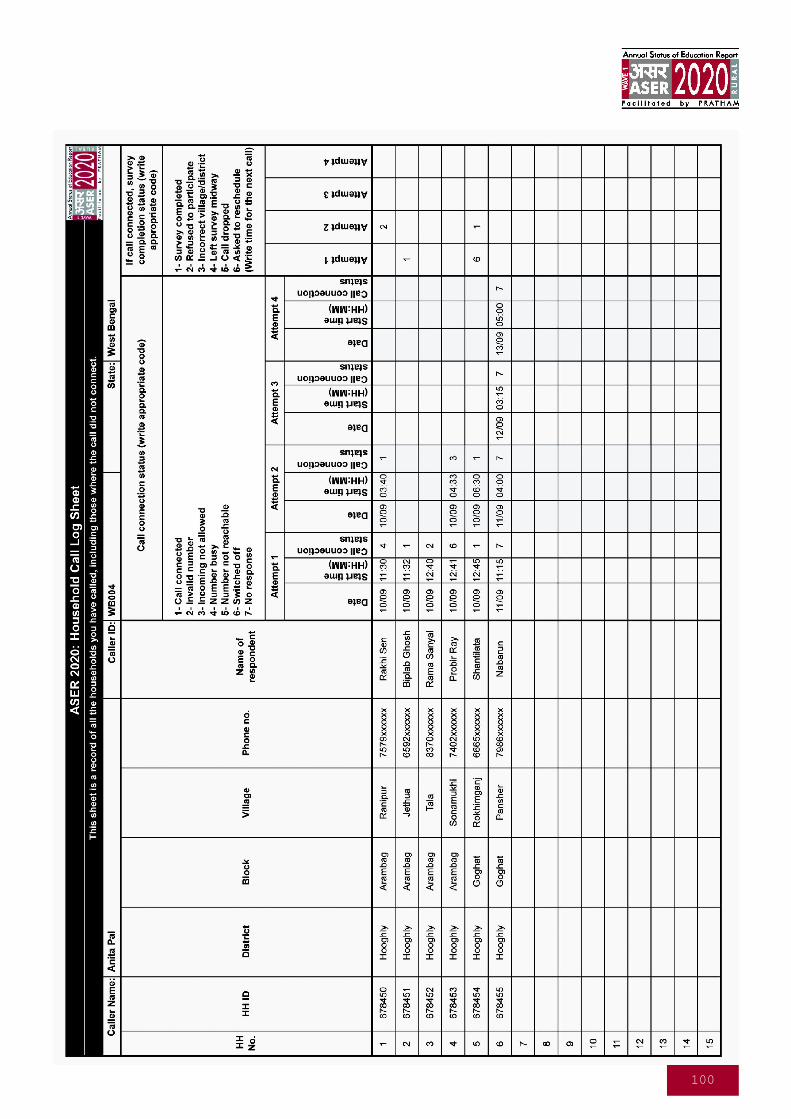
100
101
• How to record information in the household survey sheet
Purpose: To collect information about children’s access to and engagement with learning materials and activities from home;
availability of infrastructure such as TV, radio, smartphones, mobile phones, etc. to facilitate this access; support from
parents and/or teachers to facilitate learning; and challenges faced by parents/children in this process.
Surveyors keep the following in mind while conducting the survey:
• Read all questions as they are written in the household survey sheet
• Include only those children in the age group of 5-16 who eat from the same kitchen as the respondent
• If no adult is at home, a child aged 14 or above can be the respondent
• Ask the respondent whether the children being surveyed are nearby. If they are, ask to have the child sit with the
respondent while they answer the questions. In case the respondent is unsure of any answer, they can quickly ask the
child. This is only to make sure that the information provided is correct as far as possible
• Use the full phrase “since the lockdown began in March 2020” for each question where it is mentioned as such
• Note the time period carefully as “since the lockdown began” or “in the last week” while asking different questions
• For questions not applicable to a child, leave the answer option blank
• See the instructions to read out or not read out the answer options carefully in each question.
Sample information: In the first section in the household survey sheet, the surveyor enters the following sample details
carefully from the household call log sheet: the state, district, block and village the household is in, contact information for
the household, as well as the respondent's name.
Before starting the survey, the surveyor confirms that the respondent can provide information for children’s learning; if not,
she requests him/her to give the phone to someone who can.
Section A: Household information: This section captures general information about the sampled household with reference to
the number of members in the household, number of children in the age group of 5-16 (if any), and whether any of those
children migrated back to this sampled household because of the lockdown.
Section B: Child's information: This section contains name, age, sex, and enrollment for every child in the household who
eats from the respondent’s kitchen and is in the 5-16 age group.
Section C: Information for enrolled children: This section collects information about those children who are currently
enrolled in an educational institution in more detail. It comprises questions on the child’s current grade, type of school she
is enrolled in, whether she was promoted in this year, and if the child has changed the type of institution she used to attend
this year and the reason for the same.
Section D: Not enrolled children: This section collects information about those children who are currently not enrolled in
any type of school as they either never enrolled or have dropped out.
Section E: Dropout children: This section collects information pertaining to those children who have dropped out of school
in more detail. It comprises questions on the year the child dropped out, and if the child dropped out this year, then the
reason for the same. Children awaiting admission to a new grade/school are counted as ‘drop out’ for this survey. The reason
for dropping out in this case is recorded as ‘awaiting admission’.
Section F: Tuition: This section collects information on paid academic tuition (no classes on dance, music, sports, etc.) being
taken by children aged 5-16, regardless of their enrollment status. Tuition includes both online and in-person tuition. If a
child has temporarily stopped going to tuition or has irregular attendance because of being in a containment zone, etc. but has
paid the fees, then it is included as taking tuition. The section also captures changes in children’s tuition since the lockdown
began in March 2020.
Section G: Parents’ information: This section records name, age and education level of the parent(s) living with the child.
• If one or both parents have died or do not live with the child regularly, or if the child lives at some relative’s house/
boarding school away from parents, then parents’ information is not recorded.
102
• If the child lives with their step-parents, their information is included in this section.
• Highest education level for a parent that is the grade/degree which they have successfully completed is recorded. For
example, if a parent dropped out in the 2nd year of their bachelor’s degree, their highest education level is 1st year of
graduation.
Section H: Respondent’s information: This section notes down the relationship between the respondent and the children in
the household they are giving information for.
Section I: Support at home: This section looks at whether children receive any support in learning from different members of
the household and who helps most often.
Section J: Smartphone availability: Questions in this section explore the availability of a working smartphone in the household,
and whether children in households that do not have a smartphone have access to one through any other means.
Section K: School textbooks: This section looks at whether the children have school textbooks of the grade they are currently
enrolled in to study with at home.
Section L: Receipt of learning materials/activities from school: This section captures if the parent/child received any learning
materials/activity for the child in the last week from the school teacher and the medium(s) through which the parent/child
received it. If the parent/child has not received anything in the last week, then the reasons for the same are recorded.
Section M: Contact between HM/teacher and parents/children: This section captures contact between parent/child and
school teacher in the last week to discuss learning materials/activities or the child’s wellbeing. Separate questions check
whether the initiative to call or visit was taken by the teacher, parent/child or both. If this contact did not happen in the last
week, it explores if it happened at all since the lockdown started. This section also captures contact between parent/child and
school teacher since the lockdown began to discuss administrative information such as mid-day meal, school reopening, etc.
Section N: Engagement with learning materials/activities: This section captures children’s engagement in the last week. It
explores whether children did any activity involving the use of school textbooks, worksheets, online learning applications/
websites, TV, radio, etc. These questions are asked for all children aged 5-16 in the household, regardless of their enrollment
status. For every activity that the child did, information on who shared the activity with the child is included.
Section O: Challenges faced while studying at home: This section captures challenges being faced by parent/child while
studying at home.
Section P: Mid-day meal - Distribution of ration/fund: This section captures if children enrolled in an Anganwadi or government
pre-school, or in a government school (Std 1-8) received any funds or ration under the mid-day meal scheme.
Section Q: Household indicators: This section captures other information about household members and household assets:
• If any member has completed Std 12
• TV and radio (in working condition) owned by the household. Radio in smartphones is included
• Motorized 2- or 4-wheeler such as bike, scooter, car, jeep (3-wheeler is not included). Vehicles should be owned by the
household and can be used for commercial or personal purposes.
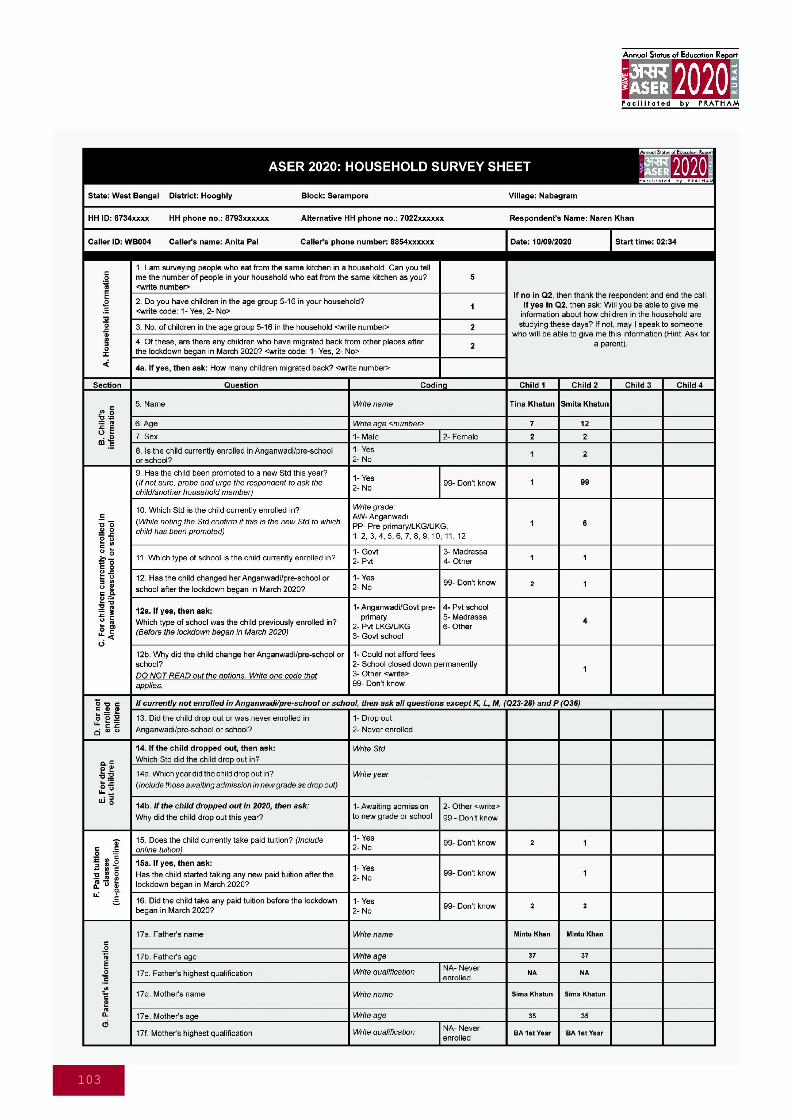
103
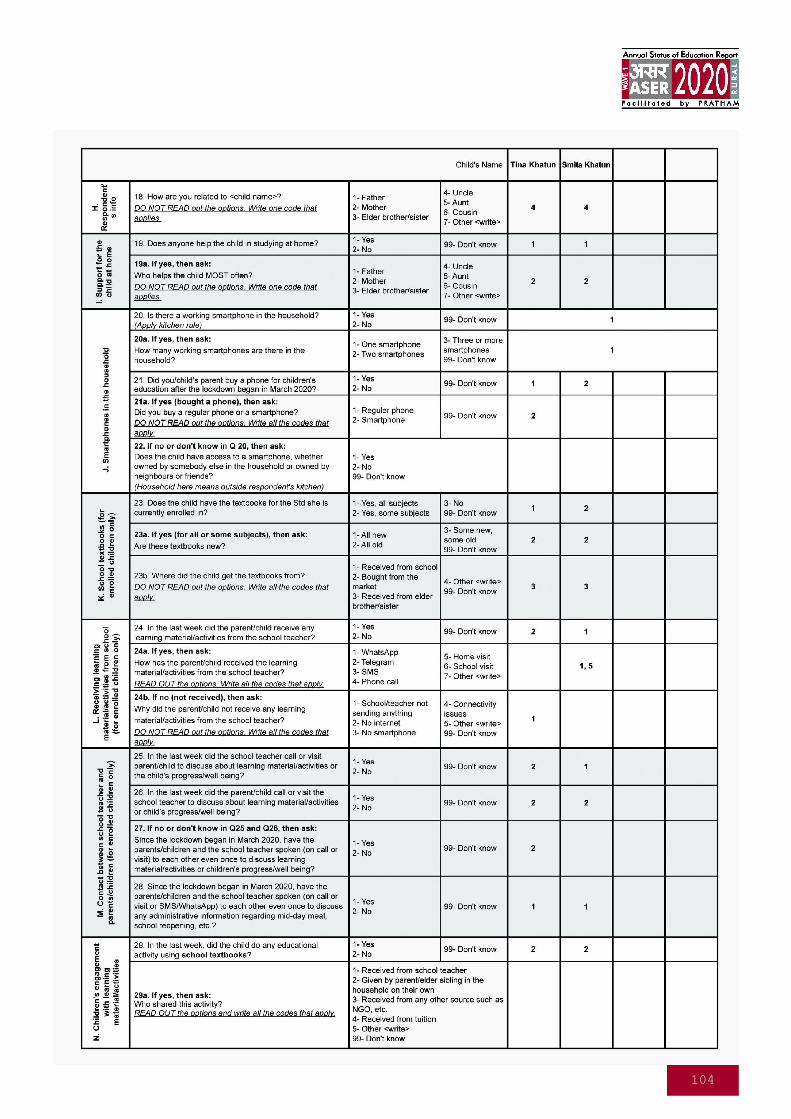
104
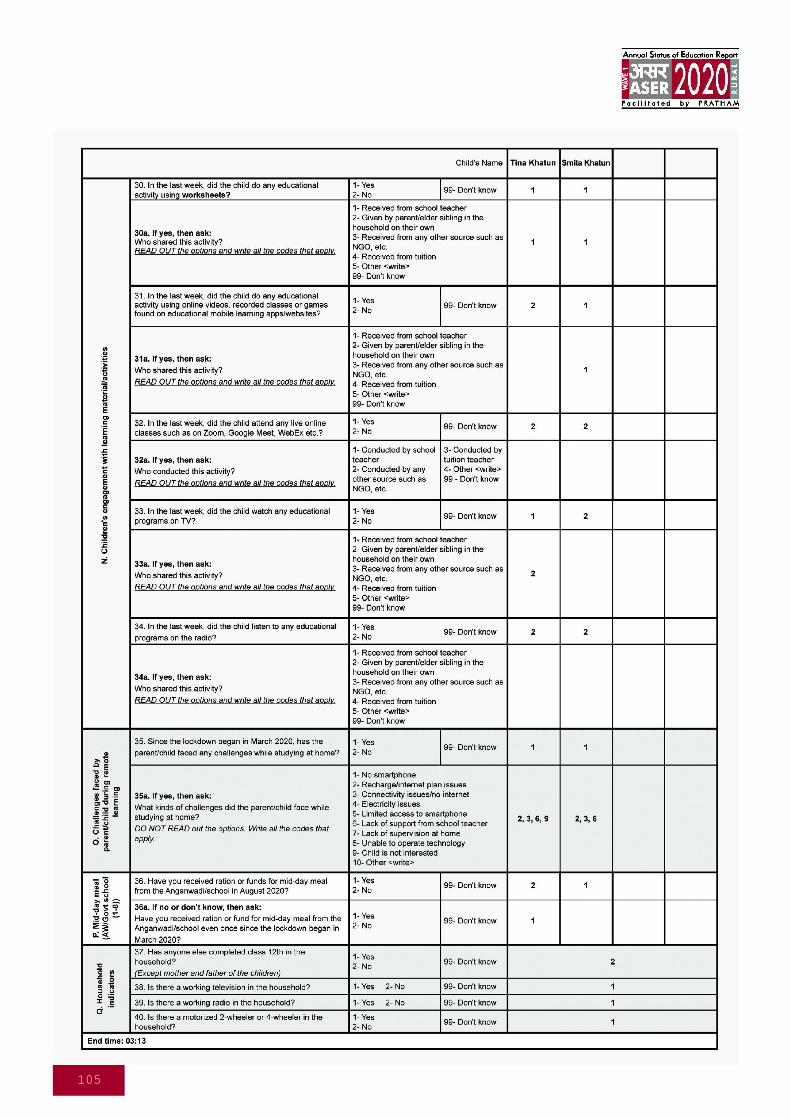
105
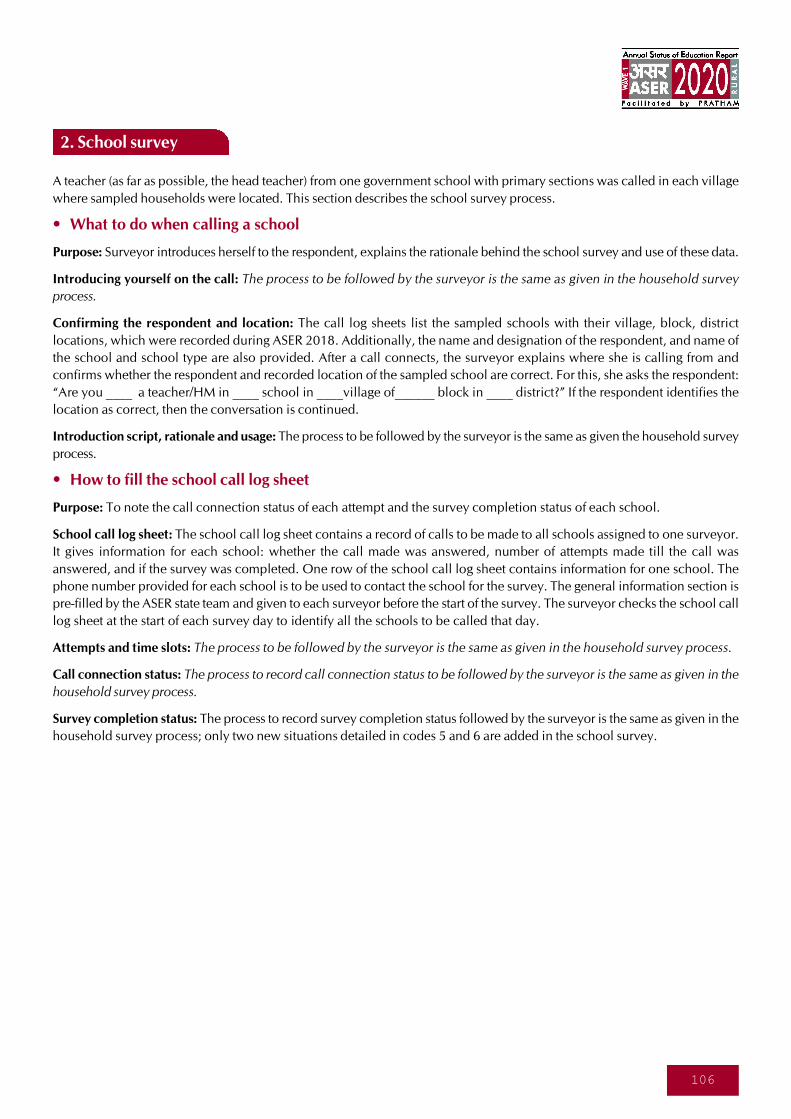
106
2. School survey
A teacher (as far as possible, the head teacher) from one government school with primary sections was called in each village
where sampled households were located. This section describes the school survey process.
• What to do when calling a school
Purpose: Surveyor introduces herself to the respondent, explains the rationale behind the school survey and use of these data.
Introducing yourself on the call: The process to be followed by the surveyor is the same as given in the household survey
process.
Confirming the respondent and location: The call log sheets list the sampled schools with their village, block, district
locations, which were recorded during ASER 2018. Additionally, the name and designation of the respondent, and name of
the school and school type are also provided. After a call connects, the surveyor explains where she is calling from and
confirms whether the respondent and recorded location of the sampled school are correct. For this, she asks the respondent:
“Are you ____ a teacher/HM in ____ school in ____village of______ block in ____ district?” If the respondent identifies the
location as correct, then the conversation is continued.
Introduction script, rationale and usage: The process to be followed by the surveyor is the same as given the household survey
process.
• How to fill the school call log sheet
Purpose: To note the call connection status of each attempt and the survey completion status of each school.
School call log sheet: The school call log sheet contains a record of calls to be made to all schools assigned to one surveyor.
It gives information for each school: whether the call made was answered, number of attempts made till the call was
answered, and if the survey was completed. One row of the school call log sheet contains information for one school. The
phone number provided for each school is to be used to contact the school for the survey. The general information section is
pre-filled by the ASER state team and given to each surveyor before the start of the survey. The surveyor checks the school call
log sheet at the start of each survey day to identify all the schools to be called that day.
Attempts and time slots: The process to be followed by the surveyor is the same as given in the household survey process.
Call connection status: The process to record call connection status to be followed by the surveyor is the same as given in the
household survey process.
Survey completion status: The process to record survey completion status followed by the surveyor is the same as given in the
household survey process; only two new situations detailed in codes 5 and 6 are added in the school survey.
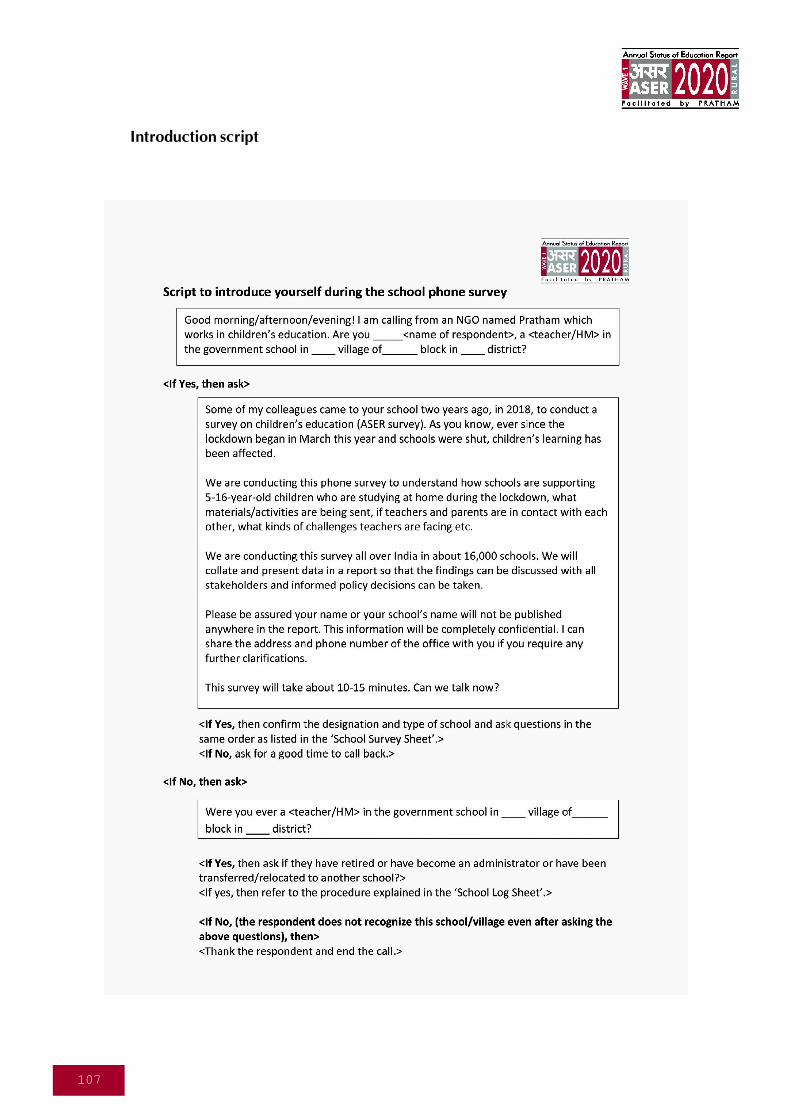
107
Introduction script
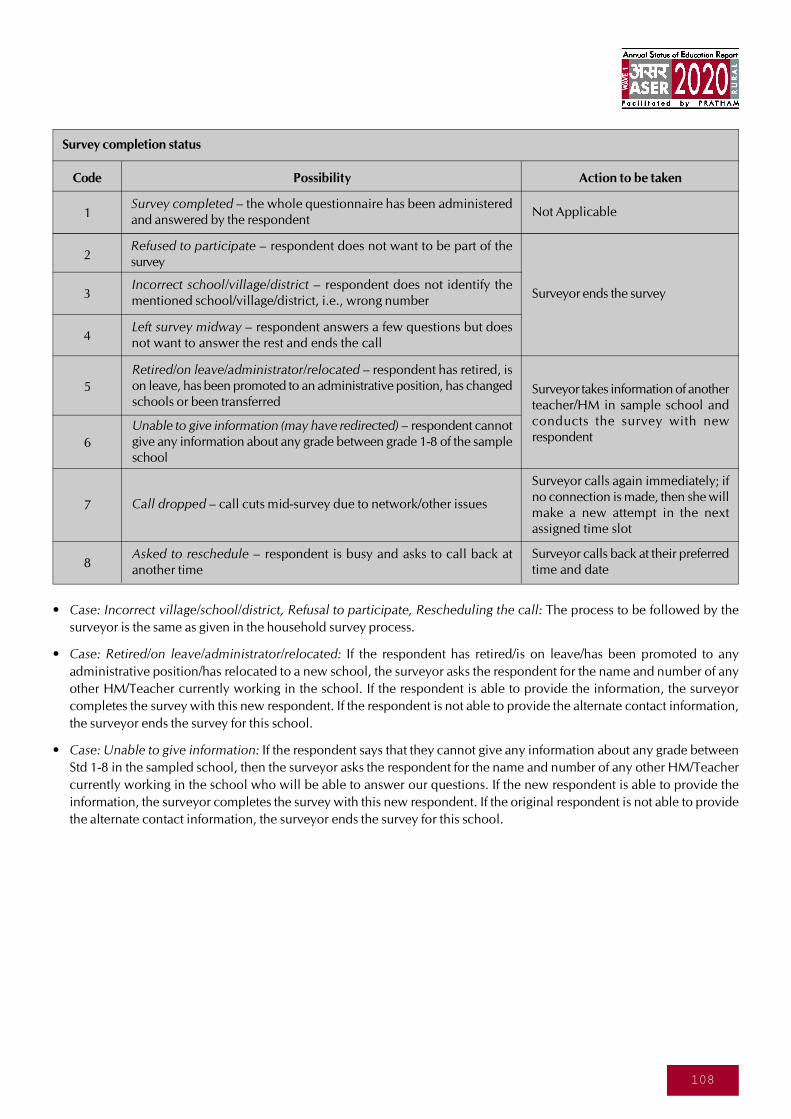
108
Survey completion status
Code Possibility Action to be taken
1Survey completed – the whole questionnaire has been administeredand answered by the respondent
Not Applicable
2Refused to participate – respondent does not want to be part of thesurvey
Surveyor ends the survey3Incorrect school/village/district – respondent does not identify thementioned school/village/district, i.e., wrong number
4Left survey midway – respondent answers a few questions but doesnot want to answer the rest and ends the call
Surveyor takes information of anotherteacher/HM in sample school andconducts the survey with newrespondent
5
Retired/on leave/administrator/relocated – respondent has retired, ison leave, has been promoted to an administrative position, has changedschools or been transferred
6
Unable to give information (may have redirected) – respondent cannotgive any information about any grade between grade 1-8 of the sampleschool
7 Call dropped – call cuts mid-survey due to network/other issues
Surveyor calls again immediately; ifno connection is made, then she willmake a new attempt in the nextassigned time slot
8Asked to reschedule – respondent is busy and asks to call back atanother time
Surveyor calls back at their preferredtime and date
• Case: Incorrect village/school/district, Refusal to participate, Rescheduling the call: The process to be followed by the
surveyor is the same as given in the household survey process.
• Case: Retired/on leave/administrator/relocated: If the respondent has retired/is on leave/has been promoted to any
administrative position/has relocated to a new school, the surveyor asks the respondent for the name and number of any
other HM/Teacher currently working in the school. If the respondent is able to provide the information, the surveyor
completes the survey with this new respondent. If the respondent is not able to provide the alternate contact information,
the surveyor ends the survey for this school.
• Case: Unable to give information: If the respondent says that they cannot give any information about any grade between
Std 1-8 in the sampled school, then the surveyor asks the respondent for the name and number of any other HM/Teacher
currently working in the school who will be able to answer our questions. If the new respondent is able to provide the
information, the surveyor completes the survey with this new respondent. If the original respondent is not able to provide
the alternate contact information, the surveyor ends the survey for this school.
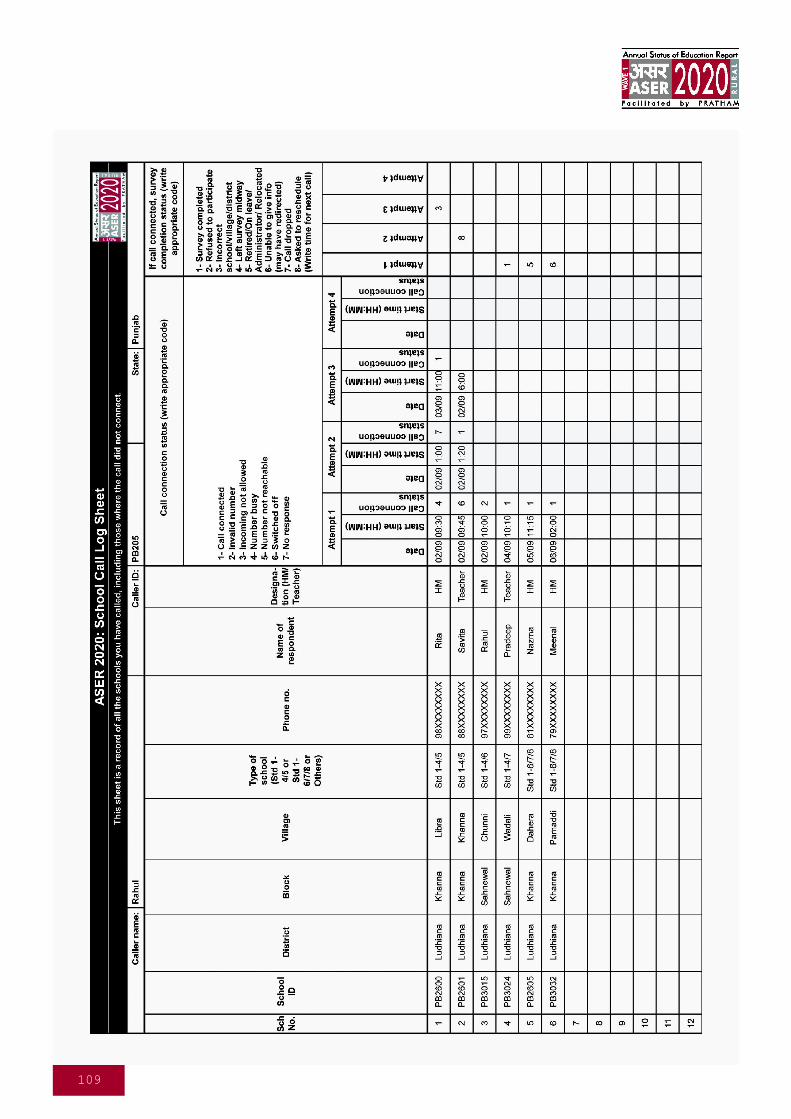
109
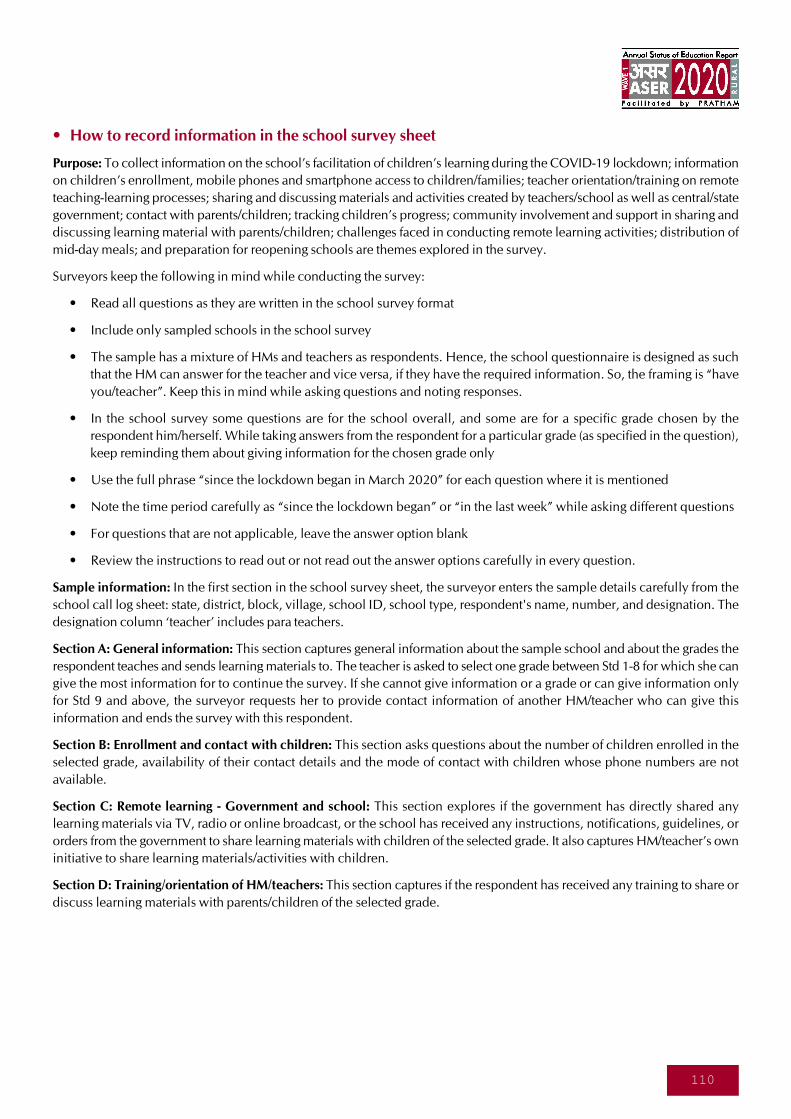
110
• How to record information in the school survey sheet
Purpose: To collect information on the school’s facilitation of children’s learning during the COVID-19 lockdown; information
on children’s enrollment, mobile phones and smartphone access to children/families; teacher orientation/training on remote
teaching-learning processes; sharing and discussing materials and activities created by teachers/school as well as central/state
government; contact with parents/children; tracking children’s progress; community involvement and support in sharing and
discussing learning material with parents/children; challenges faced in conducting remote learning activities; distribution of
mid-day meals; and preparation for reopening schools are themes explored in the survey.
Surveyors keep the following in mind while conducting the survey:
• Read all questions as they are written in the school survey format
• Include only sampled schools in the school survey
• The sample has a mixture of HMs and teachers as respondents. Hence, the school questionnaire is designed as such
that the HM can answer for the teacher and vice versa, if they have the required information. So, the framing is “have
you/teacher”. Keep this in mind while asking questions and noting responses.
• In the school survey some questions are for the school overall, and some are for a specific grade chosen by the
respondent him/herself. While taking answers from the respondent for a particular grade (as specified in the question),
keep reminding them about giving information for the chosen grade only
• Use the full phrase “since the lockdown began in March 2020” for each question where it is mentioned
• Note the time period carefully as “since the lockdown began” or “in the last week” while asking different questions
• For questions that are not applicable, leave the answer option blank
• Review the instructions to read out or not read out the answer options carefully in every question.
Sample information: In the first section in the school survey sheet, the surveyor enters the sample details carefully from the
school call log sheet: state, district, block, village, school ID, school type, respondent's name, number, and designation. The
designation column ‘teacher’ includes para teachers.
Section A: General information: This section captures general information about the sample school and about the grades the
respondent teaches and sends learning materials to. The teacher is asked to select one grade between Std 1-8 for which she can
give the most information for to continue the survey. If she cannot give information or a grade or can give information only
for Std 9 and above, the surveyor requests her to provide contact information of another HM/teacher who can give this
information and ends the survey with this respondent.
Section B: Enrollment and contact with children: This section asks questions about the number of children enrolled in the
selected grade, availability of their contact details and the mode of contact with children whose phone numbers are not
available.
Section C: Remote learning - Government and school: This section explores if the government has directly shared any
learning materials via TV, radio or online broadcast, or the school has received any instructions, notifications, guidelines, or
orders from the government to share learning materials with children of the selected grade. It also captures HM/teacher’s own
initiative to share learning materials/activities with children.
Section D: Training/orientation of HM/teachers: This section captures if the respondent has received any training to share or
discuss learning materials with parents/children of the selected grade.
111
Section E: Learning materials/activities shared with parents/children: This section captures whether the school distributed
textbooks (or funds for textbooks) to children of the selected grade, and/or asked them to watch/listen to any TV or radio
broadcast of educational programs. It also collects information on whether the respondent shared any materials with parents/
children during the last week; the different mediums used to do so; and whether they participated in creating the learning
materials.
Section F: Children’s engagement with learning materials/activities: This section collects information on the kinds of learning
materials/activities which the respondent shared with children, such as textbooks, worksheets, online videos, etc. It also
explores which activity the teacher finds most useful.
Section G: Community involvement: This section explores if the school receives help from different community members to
share or discuss learning materials/activities with children.
Section H: Learning materials/activities shared even once: This section applies to only those schools where learning materials
were not shared in the week before the survey was conducted. It captures if learning materials were shared even once since the
lockdown began in March 2020.
Section I: Contact between respondent and parents/children: This section records information about contact between parents/
children and teachers in the same manner as given in the household survey process.
Section J: Challenges: This section collects information about the challenges being faced by the respondent in sharing and/or
discussing the learning materials/activities with parents/children.
Section K: Mid-day meal ration and funds: This section focuses on the distribution of mid-day meal ration or funds by the
school to children of the selected grade. Information for ration and fund is recorded separately.
Section L: Preparations for reopening schools: This section records information about the school’s preparation for physically
reopening the school for children. Reopening the school for any one or a subset of grades is included. Reopening the school
only for teachers is not included.
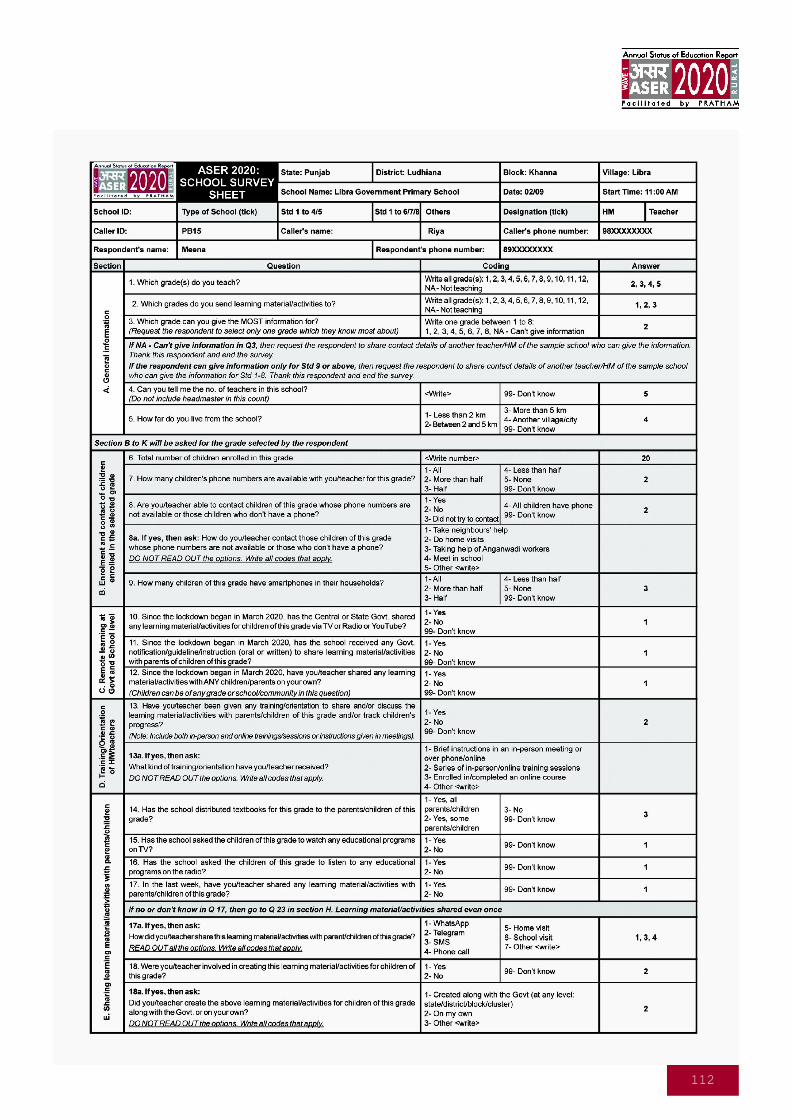
112
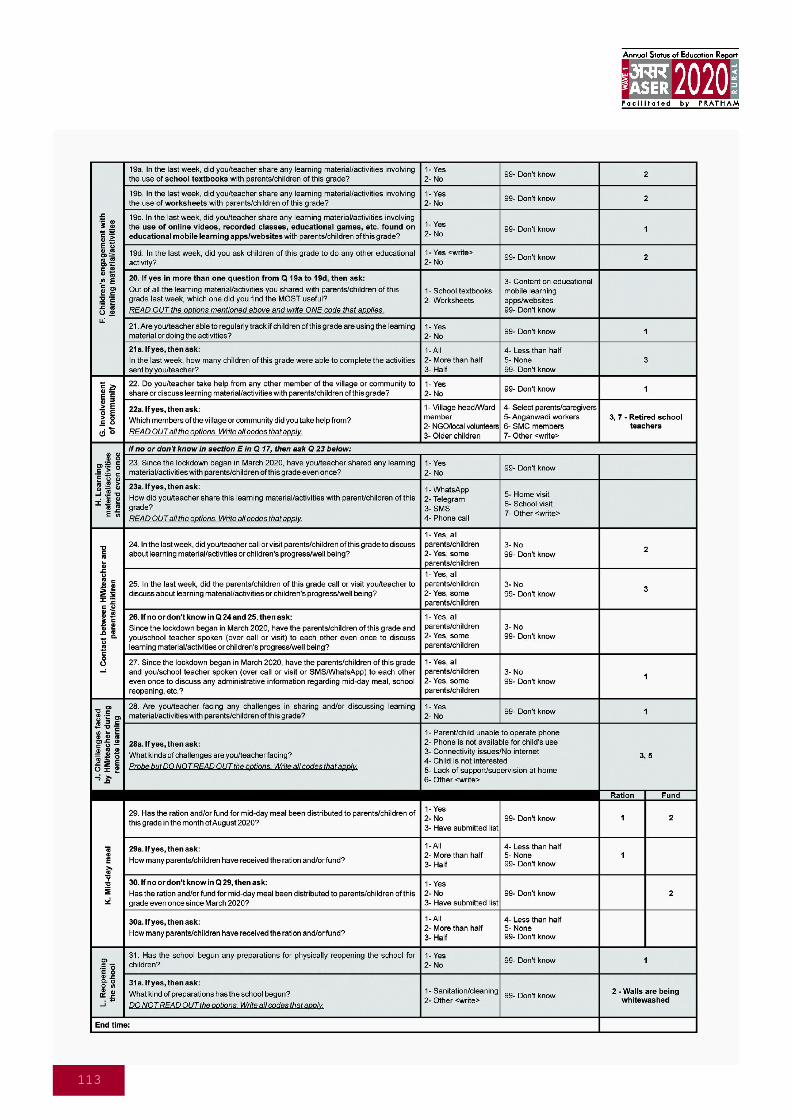
113
114
Quality control processes form an integral part of the ASER architecture, and these processes are reviewed and improved each
year in order to ensure the credibility of ASER data. For ASER 2020 Wave 1, these processes were laid out for every stage of
the survey and were executed by the Pratham/ASER state and central team members.
The quality control processes can be broadly divided into pre-survey quality control processes, internal phone-based processes,
and data entry processes.
Pre-survey quality control and phone-based processes
These comprise ‘pre-survey quality control’, ‘monitoring’, and ‘recheck’ activities.
Pre-survey quality control:
During the training, surveyors were evaluated on their attendance and performances in survey process quiz, role play and pilot
calls.
Monitoring:
During the survey, quality was controlled via oversight of phone-based activities in all districts while the survey was in
progress. One manager managed 15 surveyors. The ASER 2020 monitoring process comprised two kinds of activities:
• Call tracking sheet: Pratham/ASER state teams made phone calls to all the surveyors as the survey rolled out in a
district. Information regarding the progress of survey activities was collected during the calls and surveyors’ doubts
were clarified. This helped to provide immediate corrective action and to avoid repetition of mistakes in further calls.
Along with this, data entry on a daily basis on the survey mobile application was ensured.
• Tracking portal: Pratham/ASER state teams cross-checked the survey progress in the call tracking sheet with that on the
portal, and ensured that surveyors were making up to 3 additional attempts to households where the call did not
connect in the first instance.
Recheck:
Information collected during the survey was verified at various levels. The following recheck activities were conducted in
ASER 2020:
• Desk recheck: Pratham/ASER state teams conducted desk recheck of the survey formats filled by the surveyors. Surveyors
were divided into two groups and allotted alternate days to send two of their completed formats each day. Pratham/
ASER state teams shared prompt feedback with the surveyors in case of errors or omissions.
• Phone recheck: Based on the survey formats from desk recheck, households which needed further verification were
identified for phone recheck. Additionally, Pratham/ASER state teams randomly selected formats from 2 villages and 3
households and 1 school in each village for phone recheck.
Overall, 40% households and 49% schools surveyed in ASER 2020 were rechecked. At the end of all these layers of quality
control checks, households and schools with poor survey quality were either resurveyed or dropped from the data set.
Data entry processes
Data for the survey was recorded in printed survey formats. To compile and then process this data for analysis, it was entered
into a mobile application by the surveyors on a daily basis. For each question in the survey, rules and validations were in
place to ensure that the data entry was done efficiently.
Quality control
115
Annexure
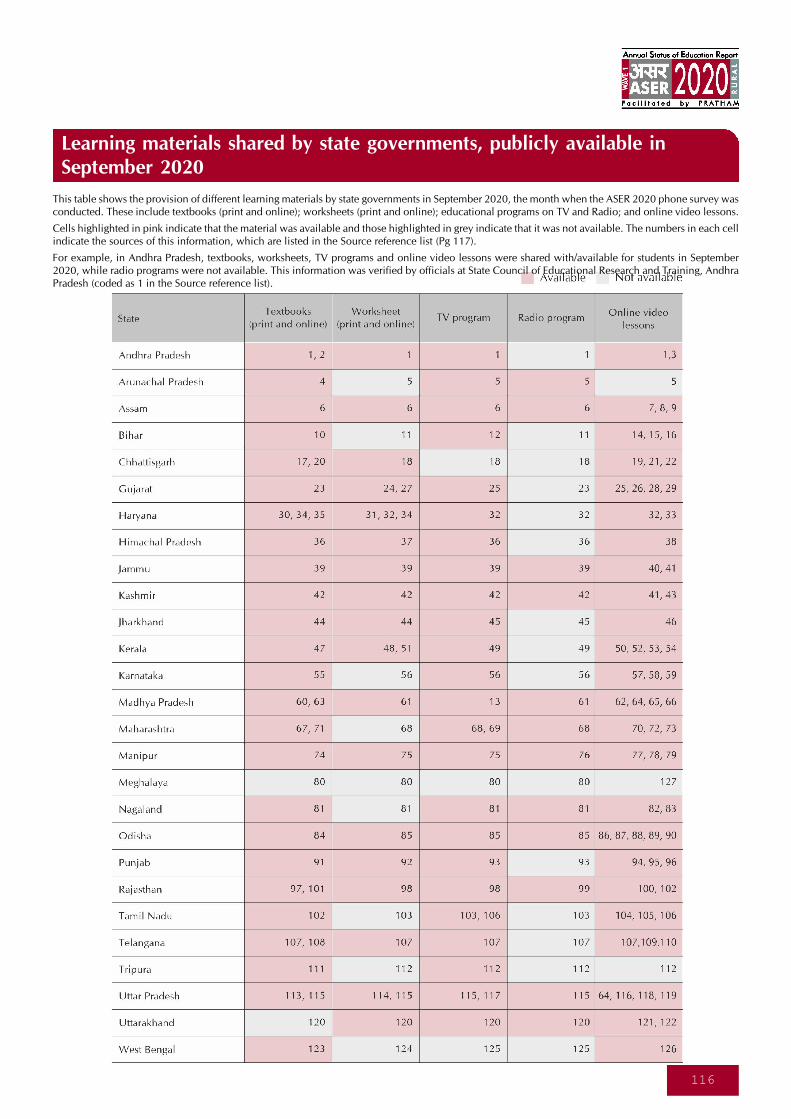
116
Learning materials shared by state governments, publicly available inSeptember 2020
This table shows the provision of different learning materials by state governments in September 2020, the month when the ASER 2020 phone survey wasconducted. These include textbooks (print and online); worksheets (print and online); educational programs on TV and Radio; and online video lessons.
Cells highlighted in pink indicate that the material was available and those highlighted in grey indicate that it was not available. The numbers in each cellindicate the sources of this information, which are listed in the Source reference list (Pg 117).
For example, in Andhra Pradesh, textbooks, worksheets, TV programs and online video lessons were shared with/available for students in September2020, while radio programs were not available. This information was verified by officials at State Council of Educational Research and Training, AndhraPradesh (coded as 1 in the Source reference list).
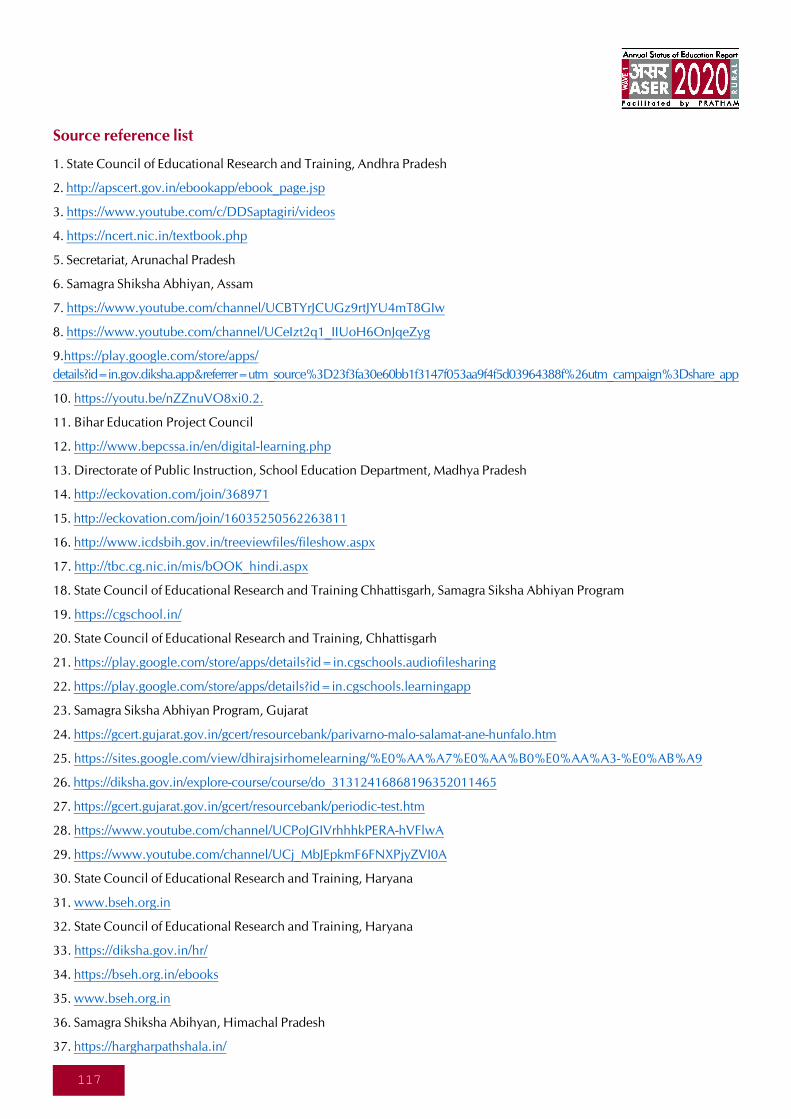
117
Source reference list
1. State Council of Educational Research and Training, Andhra Pradesh
2. http://apscert.gov.in/ebookapp/ebook_page.jsp
3. https://www.youtube.com/c/DDSaptagiri/videos
4. https://ncert.nic.in/textbook.php
5. Secretariat, Arunachal Pradesh
6. Samagra Shiksha Abhiyan, Assam
7. https://www.youtube.com/channel/UCBTYrJCUGz9rtJYU4mT8GIw
8. https://www.youtube.com/channel/UCeIzt2q1_IIUoH6OnJqeZyg
9.https://play.google.com/store/apps/
details?id=in.gov.diksha.app&referrer=utm_source%3D23f3fa30e60bb1f3147f053aa9f4f5d03964388f%26utm_campaign%3Dshare_app
10. https://youtu.be/nZZnuVO8xi0.2.
11. Bihar Education Project Council
12. http://www.bepcssa.in/en/digital-learning.php
13. Directorate of Public Instruction, School Education Department, Madhya Pradesh
14. http://eckovation.com/join/368971
15. http://eckovation.com/join/16035250562263811
16. http://www.icdsbih.gov.in/treeviewfiles/fileshow.aspx
17. http://tbc.cg.nic.in/mis/bOOK_hindi.aspx
18. State Council of Educational Research and Training Chhattisgarh, Samagra Siksha Abhiyan Program
19. https://cgschool.in/
20. State Council of Educational Research and Training, Chhattisgarh
21. https://play.google.com/store/apps/details?id=in.cgschools.audiofilesharing
22. https://play.google.com/store/apps/details?id=in.cgschools.learningapp
23. Samagra Siksha Abhiyan Program, Gujarat
24. https://gcert.gujarat.gov.in/gcert/resourcebank/parivarno-malo-salamat-ane-hunfalo.htm
25. https://sites.google.com/view/dhirajsirhomelearning/%E0%AA%A7%E0%AA%B0%E0%AA%A3-%E0%AB%A9
26. https://diksha.gov.in/explore-course/course/do_31312416868196352011465
27. https://gcert.gujarat.gov.in/gcert/resourcebank/periodic-test.htm
28. https://www.youtube.com/channel/UCPoJGIVrhhhkPERA-hVFlwA
29. https://www.youtube.com/channel/UCj_MbJEpkmF6FNXPjyZVI0A
30. State Council of Educational Research and Training, Haryana
31. www.bseh.org.in
32. State Council of Educational Research and Training, Haryana
33. https://diksha.gov.in/hr/
34. https://bseh.org.in/ebooks
35. www.bseh.org.in
36. Samagra Shiksha Abihyan, Himachal Pradesh
37. https://hargharpathshala.in/
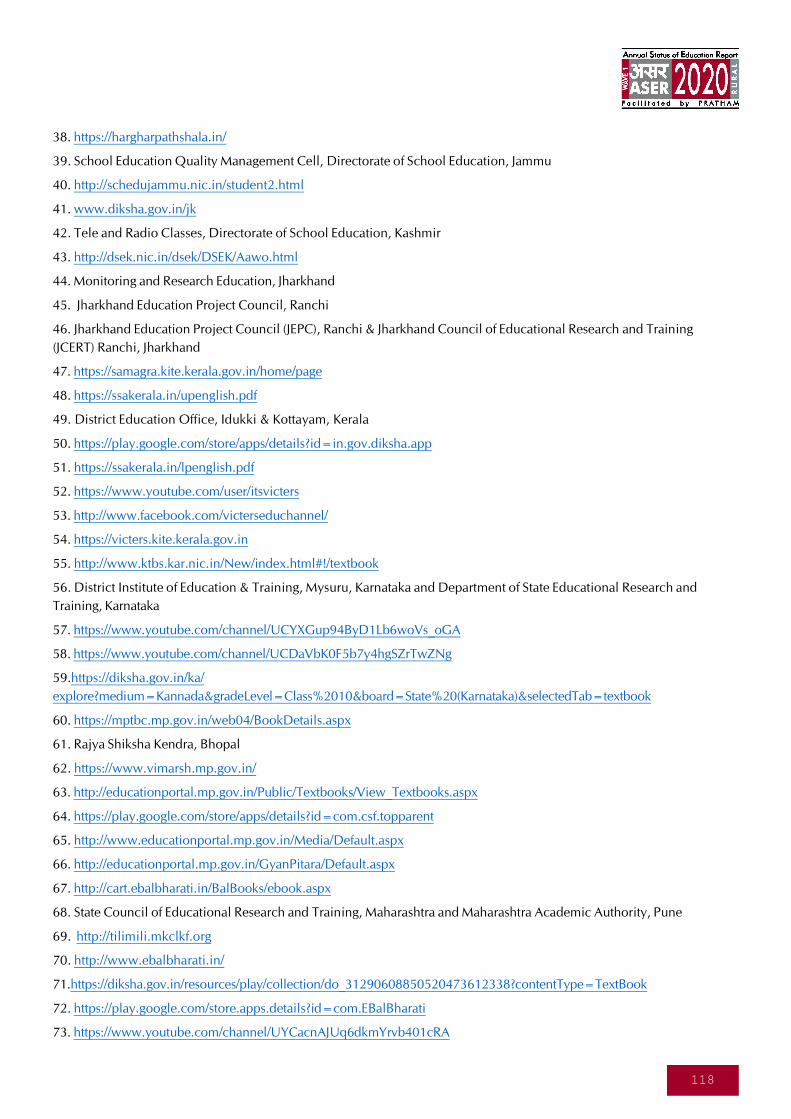
118
38. https://hargharpathshala.in/
39. School Education Quality Management Cell, Directorate of School Education, Jammu
40. http://schedujammu.nic.in/student2.html
41. www.diksha.gov.in/jk
42. Tele and Radio Classes, Directorate of School Education, Kashmir
43. http://dsek.nic.in/dsek/DSEK/Aawo.html
44. Monitoring and Research Education, Jharkhand
45. Jharkhand Education Project Council, Ranchi
46. Jharkhand Education Project Council (JEPC), Ranchi & Jharkhand Council of Educational Research and Training
(JCERT) Ranchi, Jharkhand
47. https://samagra.kite.kerala.gov.in/home/page
48. https://ssakerala.in/upenglish.pdf
49. District Education Office, Idukki & Kottayam, Kerala
50. https://play.google.com/store/apps/details?id=in.gov.diksha.app
51. https://ssakerala.in/lpenglish.pdf
52. https://www.youtube.com/user/itsvicters
53. http://www.facebook.com/victerseduchannel/
54. https://victers.kite.kerala.gov.in
55. http://www.ktbs.kar.nic.in/New/index.html#!/textbook
56. District Institute of Education & Training, Mysuru, Karnataka and Department of State Educational Research and
Training, Karnataka
57. https://www.youtube.com/channel/UCYXGup94ByD1Lb6woVs_oGA
58. https://www.youtube.com/channel/UCDaVbK0F5b7y4hgSZrTwZNg
59.https://diksha.gov.in/ka/
explore?medium=Kannada&gradeLevel=Class%2010&board=State%20(Karnataka)&selectedTab=textbook
60. https://mptbc.mp.gov.in/web04/BookDetails.aspx
61. Rajya Shiksha Kendra, Bhopal
62. https://www.vimarsh.mp.gov.in/
63. http://educationportal.mp.gov.in/Public/Textbooks/View_Textbooks.aspx
64. https://play.google.com/store/apps/details?id=com.csf.topparent
65. http://www.educationportal.mp.gov.in/Media/Default.aspx
66. http://educationportal.mp.gov.in/GyanPitara/Default.aspx
67. http://cart.ebalbharati.in/BalBooks/ebook.aspx
68. State Council of Educational Research and Training, Maharashtra and Maharashtra Academic Authority, Pune
69. http://tilimili.mkclkf.org
70. http://www.ebalbharati.in/
71.https://diksha.gov.in/resources/play/collection/do_31290608850520473612338?contentType=TextBook
72. https://play.google.com/store.apps.details?id=com.EBalBharati
73. https://www.youtube.com/channel/UYCacnAJUq6dkmYrvb401cRA
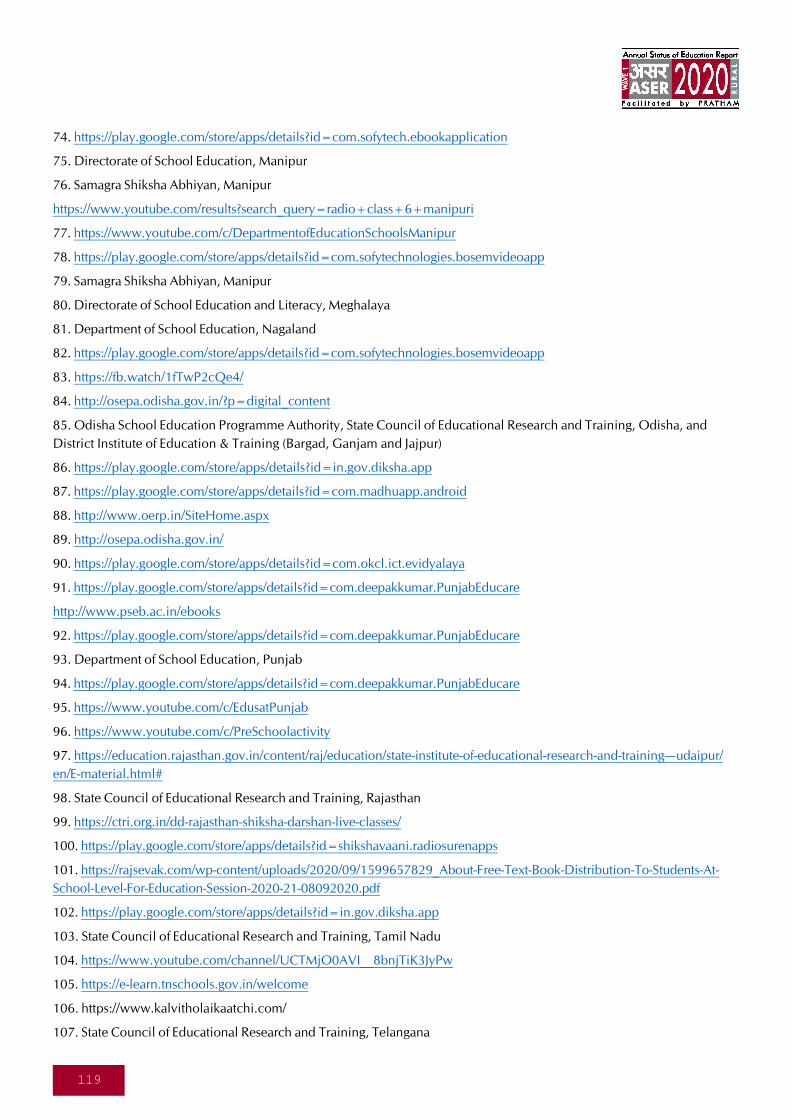
119
74. https://play.google.com/store/apps/details?id=com.sofytech.ebookapplication
75. Directorate of School Education, Manipur
76. Samagra Shiksha Abhiyan, Manipur
https://www.youtube.com/results?search_query=radio+class+6+manipuri
77. https://www.youtube.com/c/DepartmentofEducationSchoolsManipur
78. https://play.google.com/store/apps/details?id=com.sofytechnologies.bosemvideoapp
79. Samagra Shiksha Abhiyan, Manipur
80. Directorate of School Education and Literacy, Meghalaya
81. Department of School Education, Nagaland
82. https://play.google.com/store/apps/details?id=com.sofytechnologies.bosemvideoapp
83. https://fb.watch/1fTwP2cQe4/
84. http://osepa.odisha.gov.in/?p=digital_content
85. Odisha School Education Programme Authority, State Council of Educational Research and Training, Odisha, and
District Institute of Education & Training (Bargad, Ganjam and Jajpur)
86. https://play.google.com/store/apps/details?id=in.gov.diksha.app
87. https://play.google.com/store/apps/details?id=com.madhuapp.android
88. http://www.oerp.in/SiteHome.aspx
89. http://osepa.odisha.gov.in/
90. https://play.google.com/store/apps/details?id=com.okcl.ict.evidyalaya
91. https://play.google.com/store/apps/details?id=com.deepakkumar.PunjabEducare
http://www.pseb.ac.in/ebooks
92. https://play.google.com/store/apps/details?id=com.deepakkumar.PunjabEducare
93. Department of School Education, Punjab
94. https://play.google.com/store/apps/details?id=com.deepakkumar.PunjabEducare
95. https://www.youtube.com/c/EdusatPunjab
96. https://www.youtube.com/c/PreSchoolactivity
97. https://education.rajasthan.gov.in/content/raj/education/state-institute-of-educational-research-and-training—udaipur/
en/E-material.html#
98. State Council of Educational Research and Training, Rajasthan
99. https://ctri.org.in/dd-rajasthan-shiksha-darshan-live-classes/
100. https://play.google.com/store/apps/details?id=shikshavaani.radiosurenapps
101. https://rajsevak.com/wp-content/uploads/2020/09/1599657829_About-Free-Text-Book-Distribution-To-Students-At-
School-Level-For-Education-Session-2020-21-08092020.pdf
102. https://play.google.com/store/apps/details?id=in.gov.diksha.app
103. State Council of Educational Research and Training, Tamil Nadu
104. https://www.youtube.com/channel/UCTMjO0AVI__8bnjTiK3JyPw
105. https://e-learn.tnschools.gov.in/welcome
106. https://www.kalvitholaikaatchi.com/
107. State Council of Educational Research and Training, Telangana
120
108.https://diksha.gov.in/
explore?medium=Telugu&gradeLevel=Class%202&board=State%20(Telangana)&selectedTab=textbook
109. https://www.youtube.com/channel/UCcwlOchFc_WJKoCSgfDcGZQ
110. https://teachersbadi.in/mana-tv-vidya-channel-ii-live-telecast-lessons-students-schedule-instructions/
111. http://www.scerttripura.org/ebooks.php
112. State Council of Educational Research and Training, Tripura
113. http://www.scert-up.in/e-books.html
114.https://prernaup.in/Login/GyanSagar?KnowledgeRepository_Id=2&LastPhotoId=10&mode=chart
115. Samagra Shiksha Abhiyan, Uttar Pradesh
116. https://www.youtube.com/channel/UCnsflXk7nAsqADM35Ysx6qg
117. https://www.youtube.com/watch?v=-nz02sncz_4
118. https://play.google.com/store/apps/details?id=com.google.android.apps.seekh
119. https://sites.google.com/samagragovernance.in/missionprernakie-pathshala/home
120. District Institute of Education & Training, Dehradun, Uttarakhand
121. https://www.youtube.com/channel/UCx55tefMzKkaA0uDmj9g2XA/videos
122. https://youtu.be/ldVJsTiBbN0
123. https://www.ncertbooks.guru/west-bengal-board-books/
124. District Education Department, Maldah
125. Expert Committee of School Education, Department of School Education, West Bengal
126. https://banglarshiksha.gov.in/
127. Meghalaya Board of School Education
www.asercentre.orgwww.pratham.org
E-mail us at:[email protected]@pratham.org
Follow ASER Centre on Twitter,LinkedIn, Facebook, Instagram
ASER CentreB4/54 Safdarjung EnclaveNew Delhi 110 029
Phone: +91-11-46023612