Embed Size (px)
Citation preview
2019Annual Report
Refining with Vision
Company Overview04 Vision 05 Mission 06 Core Values08 CorporateInformation10 NRL at a Glance11 CorporateObjectives&DevelopmentStrategy12 Directors’Profile14 Chairman’sReview16 Directors’Report-English131 Directors’Report-Urdu
Corporate Governance30 CodeofConduct33 StatementofCompliance36 ReviewReporttotheMembers37 TermsofReference(TOR)ofAuditCommittee38 TermsofReferenceofHumanResource& Remuneration(HR&R)Committee
Stakeholders' Information41 SixYearsataGlance42 HorizontalStatementofFinancialPosition43 VerticalStatementofFinancialPosition44 HorizontalStatementofProfitorLoss45 VerticalStatementofProfitorLoss46 GraphicalRepresentation
Annual Audited Financial Statements50 Auditor’sReport55 StatementofFinancialPosition56 StatementofProfitorLoss57 StatementofProfitorLossandOther ComprehensiveIncome58 StatementofChangesinEquity59 StatementofCashFlows60 NotestotheFinancialStatements
Pattern of Shareholding, Notice & Forms110 PatternofShareholding113 NoticeofAnnualGeneralMeeting133 FormofProxy137 E-Dividend
Contents
COMPANY OVERVIEW
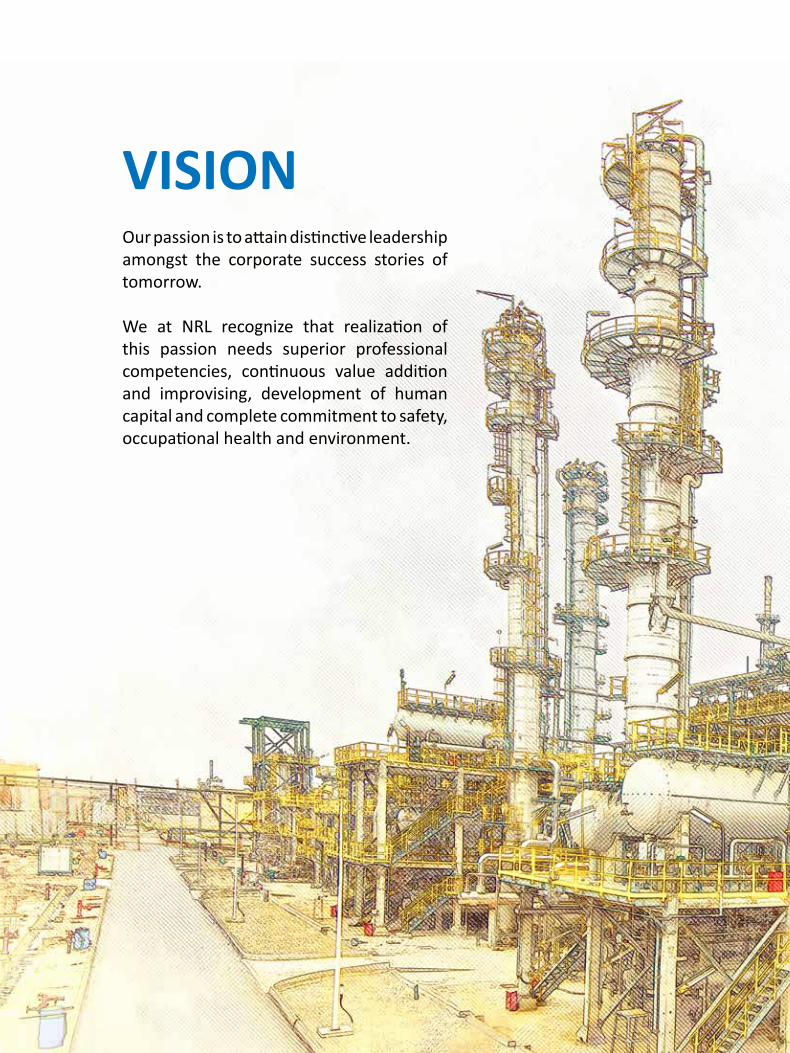
VISIONOurpassionistoattaindistinctiveleadershipamongst the corporate success stories oftomorrow.
We at NRL recognize that realization ofthis passion needs superior professionalcompetencies, continuous value additionand improvising, development of humancapitalandcompletecommitmenttosafety,occupationalhealthandenvironment.
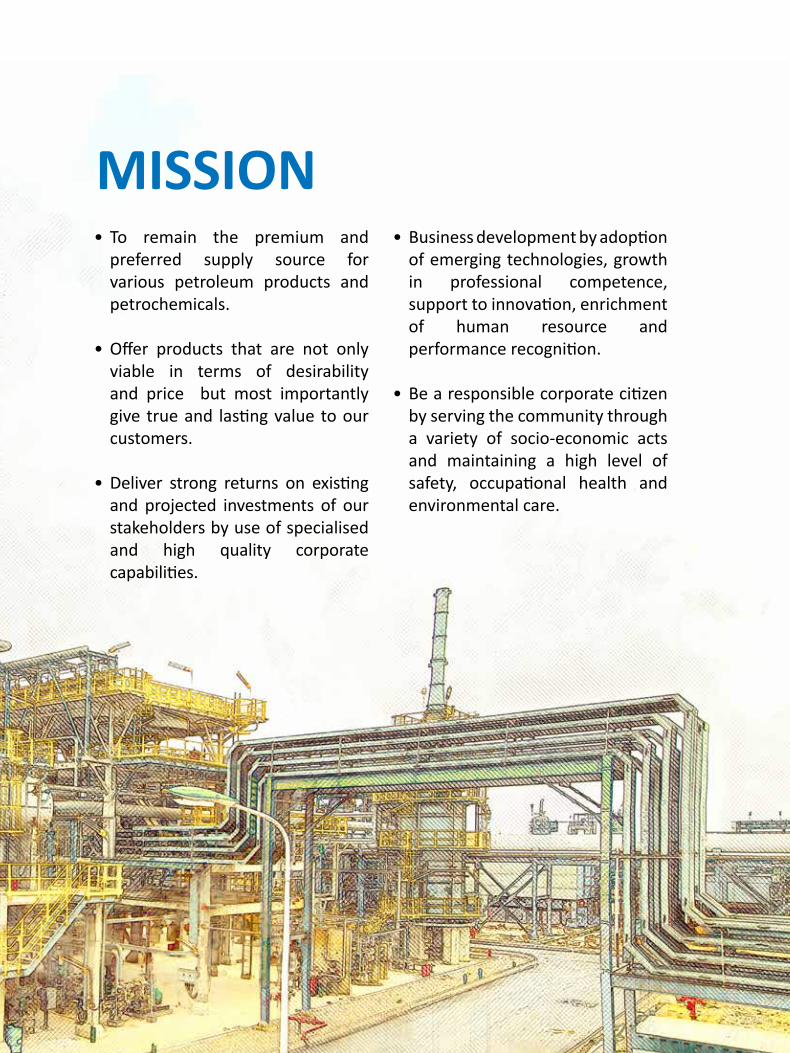
• To remain the premium andpreferred supply source forvarious petroleum products andpetrochemicals.
•Offer products that are not onlyviable in terms of desirabilityand price but most importantlygive trueand lastingvalue toourcustomers.
•Deliver strong returns on existingand projected investments of ourstakeholdersbyuseofspecialisedand high quality corporatecapabilities.
• Businessdevelopmentbyadoptionofemergingtechnologies,growthin professional competence, supporttoinnovation,enrichmentof human resource andperformancerecognition.
• Bearesponsiblecorporatecitizenbyservingthecommunitythrougha variety of socio-economic actsand maintaining a high level ofsafety, occupational health andenvironmentalcare.
MISSION
Annual Report 2019
6 National Refinery Limited
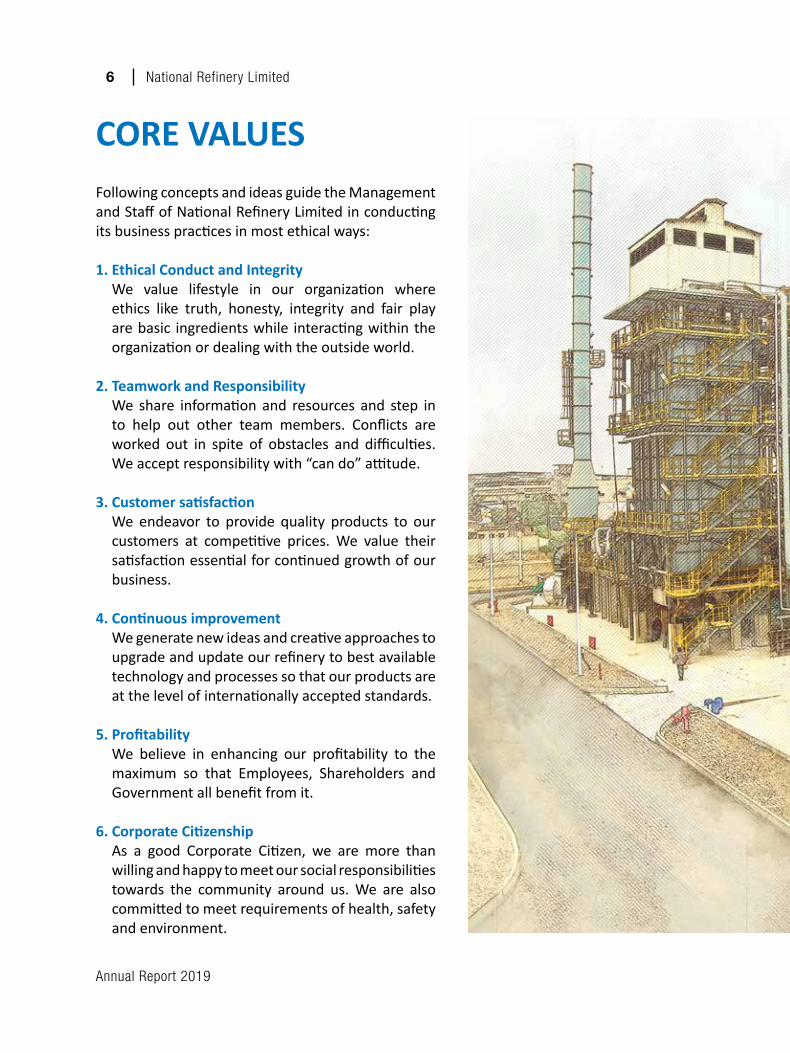
CORE VALUESFollowingconceptsandideasguidetheManagementandStaffofNationalRefineryLimitedinconductingitsbusinesspracticesinmostethicalways:
1. Ethical Conduct and Integrity We value lifestyle in our organization where
ethics like truth, honesty, integrity and fair playarebasic ingredientswhile interactingwithintheorganizationordealingwiththeoutsideworld.
2. Teamwork and Responsibility We share informationand resources and step in
to help out other team members. Conflicts areworked out in spite of obstacles and difficulties.Weacceptresponsibilitywith“cando”attitude.
3.Customersatisfaction We endeavor to provide quality products to our
customers at competitive prices.We value theirsatisfactionessentialforcontinuedgrowthofourbusiness.
4.Continuousimprovement Wegeneratenewideasandcreativeapproachesto
upgradeandupdateourrefinerytobestavailabletechnologyandprocessessothatourproductsareatthelevelofinternationallyacceptedstandards.
5.Profitability We believe in enhancing our profitability to the
maximum so that Employees, Shareholders andGovernmentallbenefitfromit.
6.CorporateCitizenship As a good Corporate Citizen, we are more than
willingandhappytomeetoursocialresponsibilitiestowards the community around us.We are alsocommittedtomeetrequirementsofhealth,safetyandenvironment.
Annual Report 2019
National Refinery Limited 7
Annual Report 2019
8 National Refinery Limited
CORPORATE INFORMATIONBoard of Directors
LaithG.PharaonAlternateDirector:ShuaibA.Malik
WaelG.PharaonAlternateDirector:BabarBashirNawaz
ShuaibA.Malik-Chairman
TariqIqbalKhan
AbdusSattar
SajidNawaz
ZakiMohamadMansoer
ChiefExecutiveOfficerJamilA.Khan
Company Secretary / CFONoumanAhmedUsmani
AuditCommitteeTariqIqbalKhan Chairman
AbdusSattar Member
BabarBashirNawaz MemberAlternateDirectorforMr.WaelG.Pharaon
ShaikhAtherAhmed Secretary
Annual Report 2019
National Refinery Limited 9
HumanResourceandRemuneration(HR&R)Committee
TariqIqbalKhan Chairman
AbdusSattar Member
BabarBashirNawaz Member Alternate DirectorforMr.WaelG.Pharaon
JamilA.Khan Member
NoumanAhmedUsmani Secretary
AuditorsA.F.Ferguson&Co.CharteredAccountants
BankersBankAL-HabibLimited NationalBankofPakistanUnitedBankLimited MeezanBankLimitedHabibBankLimited AlliedBankLimitedBankAlfalahLimited MCBBankLimitedFaysalBankLimited HabibMetropolitanBankLimitedAskariBankLimited SambaBankLimited
RegisteredOffice7-B,KorangiIndustrialArea,P.O.Box8228,Karachi-74900UAN: +92-21-111-675-675PABX: +92-21-35064981-86 +92-21-35064977-79Website: www.nrlpak.comE-mail: [email protected]
Share Registrar
CDC Share Registrar Services Limited CDCHouse,99-B,Block'B',S.M.C.H.S.,MainShahra-e-Faisal,Karachi–74400.Tel: (TollFree)0800-23275Fax: +92-21-34326053Email: [email protected]:www.cdcsrsl.com
Annual Report 2019
10 National Refinery Limited
NRL AT A GLANCEFIRST LUBE REFINERY
Designcapacity 3,976,500barrelsperyearofCrudeOilprocessingDesigncapacity 533,400barrelsperyearofLubeBaseOilsDateCommissioned June1966ProjectCost Rs.103.9million
FUEL REFINERYBEFORE RE-VAMP Designcapacity 11,385,000barrelsperyearofCrudeOilprocessingDateCommissioned April1977ProjectCost Rs.607.5million
AFTER FIRST RE-VAMP Designcapacity 16,500,000barrelsperyearofCrudeOilprocessingDateCommissioned Feburary1990ProjectCostofRevamping Rs.125.0million
AFTER SECOND RE-VAMP Designcapacity 17,490,000barrelsperyearofCrudeOilprocessingDateCommissioned March2017ProjectCostofRevamping Rs.548.0million
HSD DESULPHURIZATION AND ASSOCIATED UNITS DateCommissioned June2017ProjectCost Rs.26.82billion
NAPHTHABLOCK(ISOMERIZATIONUNIT)DateCommissioned October2017ProjectCost Rs.6.54billion
BTX UnitDesigncapacity 180,000barrelsperyearofBTXDateCommissioned April1979ProjectCost Rs.66.7million
SECOND LUBE REFINERY BEFORE RE-VAMP Designcapacity 700,000barrelsperyearofLubeBaseOilsDateCommissioned January1985ProjectCost Rs.2,082.4million
AFTER RE-VAMP Designcapacity 805,000barrelsperyearofLubeBaseOilsDateCommissioned June2007ProjectCostofRevamping Rs.585.0million
SHAREHOLDERS' EQUITYJune1966 Rs.20.0millionJune2019 Rs.33,873.5million
Annual Report 2019
National Refinery Limited 11
CORPORATE OBJECTIVES & DEVELOPMENT STRATEGYNational Refinery Limited is a petroleum refining and petrochemical complex engaged inmanufacturingandsupplyingawiderangeoffuelproducts,lubes,BTX,asphaltsandspecialtyproductsfordomesticconsumptionandexport.
NRL objectives and development strategy are aimed at achieving sustainable productivityandprofitabilityandhighstandardsofsafety,occupationalhealthandenvironmentalcare.This entails human resource re-engineering & development, enhancing value addition,implementingconservationmeasuresandcontinuinggrowththroughup-gradationofexistingaswellasadditionofnewfacilities.Inthechangingglobalenvironment,corporateobjectiveanddevelopmentstrategyhavebeendefinedtomeetthechallengesof21stCentury.
Corporate Objectives▪ Ensurethatbusinesspoliciesandtargetsareinconformitywiththenationalgoals.▪ Contributeinmeetingthecountry’sdemandofpetroleumandpetrochemicalproducts.▪ Customer’ssatisfactionbyprovidingbestvalueandqualityproducts.▪ Optimizationofthevalueofbarrelofcrudeoilandcostreductionthroughconservation
measures.▪ AchievingandmaintainingahighstandardofOccupationalHealth,SafetyandEnvironmental
care.▪ Ensurereasonablereturnontheshareholders’existingandprojectedinvestments.▪ Maintainmodernmanagementsystemsconformingtointernationalstandardsneededfor
anefficientorganization.
Development Strategy▪ Contribute in national efforts towards attaining sustainable self-efficiency in petroleum
products.▪ Human resource development by upgrading training facilities and exposure tomodern
technologies/managementtechniques.▪ BalancingandModernizationforenergyconservationandenhancedyieldofvalueadded
productsaswellasrevampingforenvironmentfriendlyproducts.▪ Expansionofrefiningcapacitybyde-bottleneckingandaddingnewfacilities.▪ Acquirenewergenerationtechnologiesfortheefficientrefineryoperationsaswellasfor
attaininghigheststandardsofOccupationalHealth,SafetyandEnvironmentalcare.▪ Acquiringself-sufficiencyinre-engineering,designandfabricationofequipments.

Annual Report 2019
12 National Refinery Limited
DIRECTORS' PROFILE
Mr. Laith G. Pharaon(Non-ExecutiveDirector)
Mr. Wael G. Pharaon(Non-ExecutiveDirector)
Chairman & DirectorAttockPetroleumLimitedTheAttockOilCompanyLimitedAttockCementPakistanLimited
DirectorPakistanOilfieldsLimitedAttockRefineryLimitedAttockGenLimitedAttockLeisure&ManagementAssociates(Pvt.)LimitedAttockSolar(Pvt.)Limited
DirectorTheAttockOilCompanyLimitedAttockCementPakistanLimitedAttockRefineryLimitedPakistanOilfieldsLimitedAttockPetroleumLimitedAttockGenLimitedAngooriHeightsDevelopment(Pvt.)LimitedMargallaFarmHousesDevelopment(Pvt.)LimitedRawalLodgesDevelopment(Pvt.)Limited
Mr. Shuaib A. MalikChairman (Non-ExecutiveDirector)
Director,Chairman&ChiefExecutiveOfficerPakistanOilfieldsLimited
Chairman & Director AttockHospital(Pvt.)LimitedAttockRefineryLimited
ChiefExecutive&DirectorAttockPetroleumLimitedTheAttockOilCompanyLimitedAttockInformationTechnologyServices(Pvt.)LimitedAngooriHeightsDevelopment(Pvt.)LimitedAttockLeisure&ManagementAssociates(Pvt.)LimitedFalconPakistan(Pvt.)LimitedAttockSolar(Pvt.)Limited
DirectorAttockCementPakistanLimitedAttockGenLimitedRawalLodgesDevelopment(Pvt.)LimitedMargallaFarmHousesDevelopment(Pvt.)Limited
ResidentRepresentativePharaonInvestmentGroupLimitedHoldingSAL
GroupChiefExecutive
ChairmanNRLManagementStaffPensionFundNRLManagementStaffGratuityFund
Name Other Engagements

Annual Report 2019
National Refinery Limited 13
Director & Managing DirectorPakistanOilfieldsLimited
DirectorAttockCementPakistanLimited
Mr.SajidNawaz(Non-ExecutiveDirector)
Mr. Zaki Mohamad Mansoer(IndependentDirector)
DirectorGlobalPartnershipsandResourceMobilizationDepartment-IslamicDevelopmentBank,Jeddah
DirectorAttockRefineryLimitedAttockPetroleumLimitedPakistanOilfieldsLimitedAttockCementPakistanLimited
Director&ChiefExecutiveAttockCementPakistanLimitedRawalLodgesDevelopment(Pvt.)Limited
DirectorAttockPetroleumLimitedAngooriHeightsDevelopment(Pvt.)LimitedMargallaFarmHousesDevelopment(Pvt.)LimitedFalconPakistan(Pvt.)LimitedAlternate DirectorAttockRefineryLimitedAttockLeisure&ManagementAssociates(Pvt.)LimitedPakistanOilfieldsLimited
Mr. Jamil A. KhanChiefExecutiveOfficer(ExecutiveDirector)
DirectorAttockRefineryLimited
Chairman NRLExecutiveStaffPostRetirementMedicalBenefitFundNRLNon-ManagementStaffGratuityFund
Trustee NRLManagementStaffPensionFundNRLOfficersProvidentFundNRLManagementStaffGratuityFundNRLWorkmenProvidentFund
Mr.AbdusSattar(Non-ExecutiveDirector)
Mr.BabarBashirNawazAlternate for Mr.WaelG.Pharaon(Non-ExecutiveDirector)
DIRECTORS' PROFILE
Mr. Tariq Iqbal Khan(IndependentDirector)
DirectorPakistanOilfieldsLimitedInternationalSteelLimitedPackagesLimitedSilkBankLimitedAWTInvestmentsLimited
Name Other Engagements

Annual Report 2019
14 National Refinery Limited
I,onbehalfoftheBoardofDirectors,welcomeyouallinthe56thAnnualGeneralMeetingofyourCompanyandpresentanannualreviewof results and audited financial statementsfortheyearendedJune30,2019.
Pakistan’s economy has been facingcontinuousproblemsforthelastfewyears.Thecountry’seconomyisunabletoachievesustainedandrapidgrowthduetostructuralissueswhichrequireseffectivemonetaryandfiscal measures to achievemacroeconomicstability. Thepersistenceof largefiscal and
current account deficits and associatedbuild-upofpublicandexternaldebtbecamethe major source of macroeconomic imbalance.Theoutgoingfiscalyear2018-19witnessedagrowthof3.29percentagainsttheambitioustargetof6.2percent.Duetoelevatedcurrentaccountdeficit,PakRupeedevaluation has resulted in substantialincreaseininflation.
Volatilityintheinternationalcrudeoilprices,asymmetrical increaseinproductpricesandsharpdevaluationofPakRupeeremainedkey
CHAIRMAN'S REVIEW
Annual Report 2019
National Refinery Limited 15
challengesforyourCompany.Theinternationalpolitical dynamics particularly sanctionson Iran has further affected the prices ofpetroleum products in the InternationalMarket. The overall economic situationalongwith deteriorating macro-economicfactorsofPakistannegativelyimpactedyourcompany’sperformance.Underthesedifficultcircumstances,yourCompanyincurredalossaftertaxofRs.8.69billioncomparedtoprofitaftertaxofRs.1.77billioninthelastyear.
FuelsegmentofyourcompanyincurredlossofRs.9.59billionascomparedtoRs.2.21billioninthepreviousyear.Profitabilitywasaffectedby huge exchange loss due to de-valuationofPak-RupeeagainstUSDollar, lastmonth’saveragebasisforproductpricesespeciallyintheperiodwhenproductandcrudeoilpricesremained highly inconsistent, custom dutypaid on imported crude oil attributable tode-regulated products and markup costincurredon short termfinance tomeet theworkingcapitalrequirementsofthecompany.Overallsegment’ssalesalsoremainedunderpressureespeciallyfurnaceoilsalesdeclinedduetolowerdemandfrompowerplantsowingto availability of alternate energy of RLNGunder long term international agreements.SalesofHSDalsowitnesseddecreasingtrendmainlyduetooveralldeclineinconsumptionatcountrylevel.
Lube segment’s after taxprofitsdeclined toRs.0.90billionascomparedtoRs.3.98billioninthelastyear.Thisisduetoincreaseinfeedcost, asymmetrical increase in lubebaseoilprices and decline in Bitumen sales volumeby 54% due to curtailment of developmentexpenditure by the Government that alsoresulted in blockage of funds due to highinventorybuild-up.
Consideringprevailingproducts’demandandpricesbeingnotdirectlyincompany’scontrol,themanagementhastakenupvariousmatterswith the Government including consistentupliftment of furnace oil and fortnightlypricing mechanism, so that refineries canearn a reasonable return. We believe thatthe Government would take reasonablesteps to support existing refineries as wellastoencouragenewinvestmentsinrefiningsector.
I believe that the steps taken by themanagement are good enough in the givencircumstancesespeciallywhenfactorsbeyondmanagement’s control predominantly hadnegative impacts as well as to initiate apositivebeginningaheadandthattheBoardonthewholefairlyplayeditsroleinenablingthe Company to curtail unending losses byprovidingappropriateguidance.
OnbehalfoftheBoardofDirectors,Iwouldlike to thank all the shareholders for theirtrust, confidence and continuous supportforthecompanyinthesedifficulttimes.Iamhopeful that country’s economic situationwould improve which alongwith somepositive measures by the Government tosupport refining industry would result inimprovementincompany’sperformance.
__________________ Shuaib A. Malik Chairman
July29,2019 Dubai
Annual Report 2019
16 National Refinery Limited
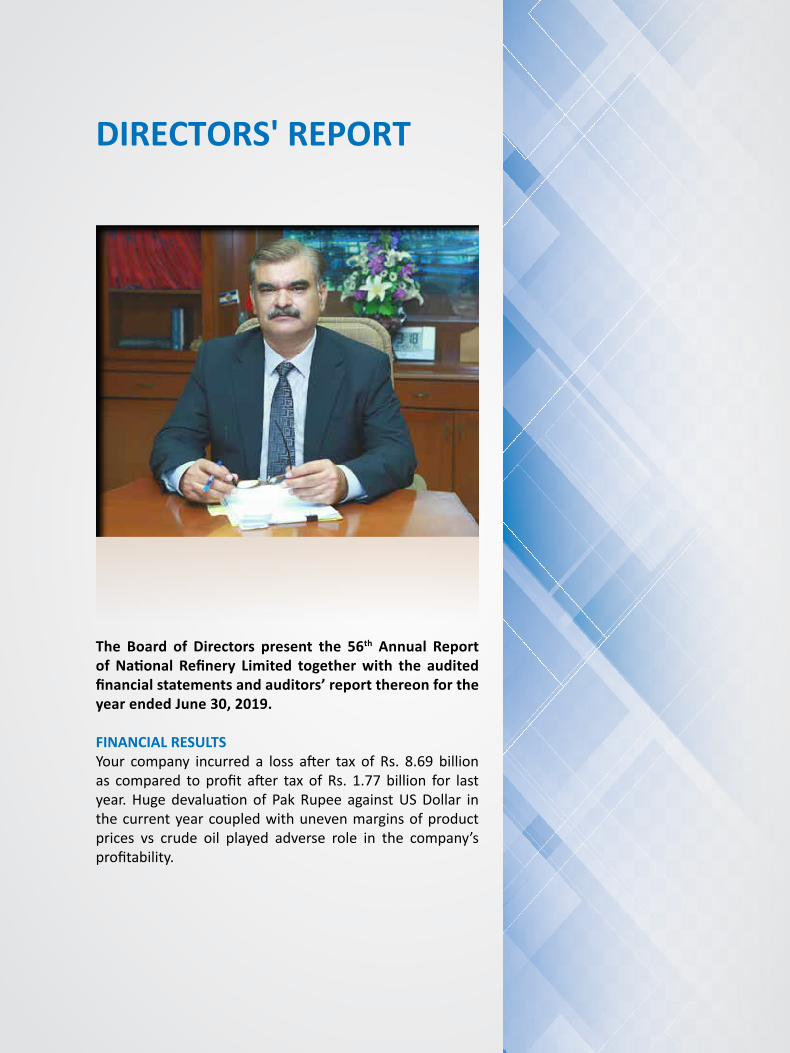
The Board of Directors present the 56th Annual Report ofNational Refinery Limited togetherwith the auditedfinancialstatementsandauditors’reportthereonfortheyear ended June 30, 2019.
FINANCIAL RESULTSYour company incurred a loss after tax of Rs. 8.69 billionas compared to profit after tax of Rs. 1.77billion for lastyear.Hugedevaluationof PakRupee againstUSDollar inthecurrentyearcoupledwithunevenmarginsofproductprices vs crude oil played adverse role in the company’sprofitability.
DIRECTORS' REPORT
Annual Report 2019
National Refinery Limited 17
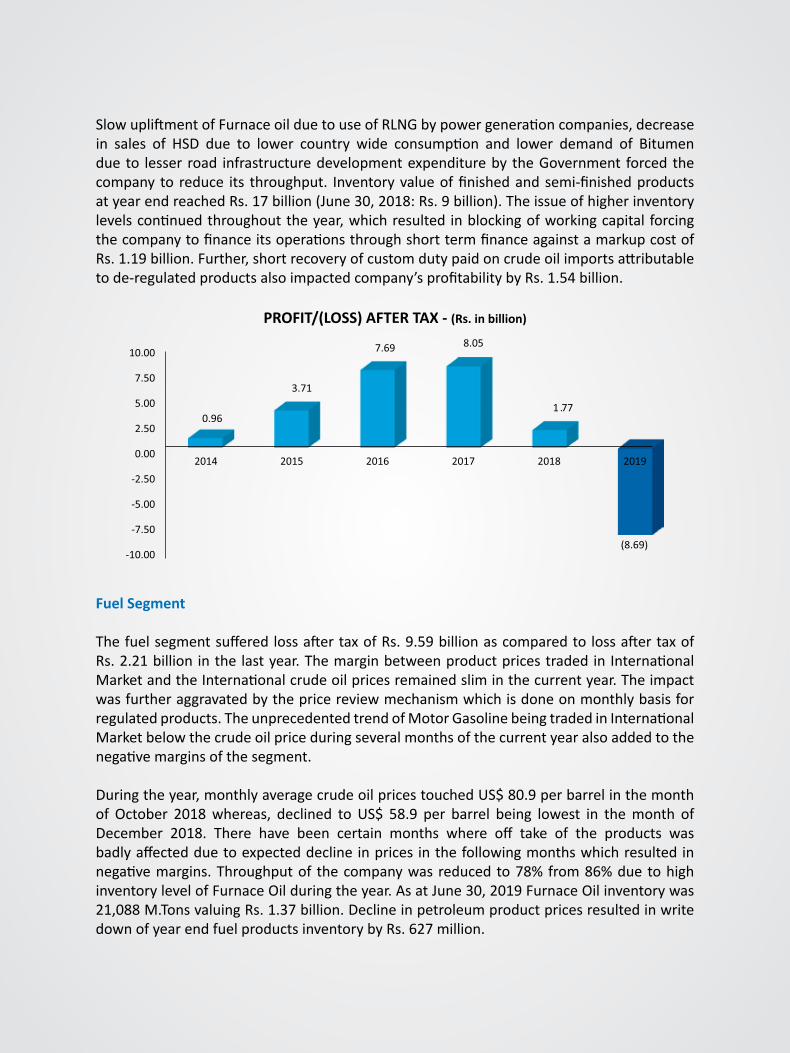
SlowupliftmentofFurnaceoilduetouseofRLNGbypowergenerationcompanies,decreasein sales of HSD due to lower country wide consumption and lower demand of Bitumendueto lesser road infrastructuredevelopmentexpenditureby theGovernment forcedthecompany to reduce its throughput. Inventoryvalueoffinishedandsemi-finishedproductsatyearendreachedRs.17billion(June30,2018:Rs.9billion).Theissueofhigherinventorylevelscontinuedthroughouttheyear,whichresulted inblockingofworkingcapital forcingthecompanytofinanceitsoperationsthroughshorttermfinanceagainstamarkupcostofRs.1.19billion.Further,shortrecoveryofcustomdutypaidoncrudeoilimportsattributabletode-regulatedproductsalsoimpactedcompany’sprofitabilitybyRs.1.54billion.
Fuel Segment
ThefuelsegmentsufferedlossaftertaxofRs.9.59billionascomparedto lossaftertaxofRs.2.21billioninthelastyear.Themarginbetweenproductpricestradedin InternationalMarketandtheInternationalcrudeoilpricesremainedsliminthecurrentyear.Theimpactwasfurtheraggravatedbythepricereviewmechanismwhichisdoneonmonthlybasisforregulatedproducts.TheunprecedentedtrendofMotorGasolinebeingtradedinInternationalMarketbelowthecrudeoilpriceduringseveralmonthsofthecurrentyearalsoaddedtothenegativemarginsofthesegment.
Duringtheyear,monthlyaveragecrudeoilpricestouchedUS$80.9perbarrelinthemonthof October 2018whereas, declined to US$ 58.9 per barrel being lowest in themonth ofDecember 2018. There have been certain months where off take of the products wasbadlyaffectedduetoexpecteddeclineinprices inthefollowingmonthswhichresultedinnegativemargins.Throughputof thecompanywasreducedto78%from86%duetohighinventorylevelofFurnaceOilduringtheyear.AsatJune30,2019FurnaceOilinventorywas21,088M.TonsvaluingRs.1.37billion.DeclineinpetroleumproductpricesresultedinwritedownofyearendfuelproductsinventorybyRs.627million.
PROFIT/(LOSS)AFTERTAX-(Rs.inbillion)
Annual Report 2019
18 National Refinery Limited
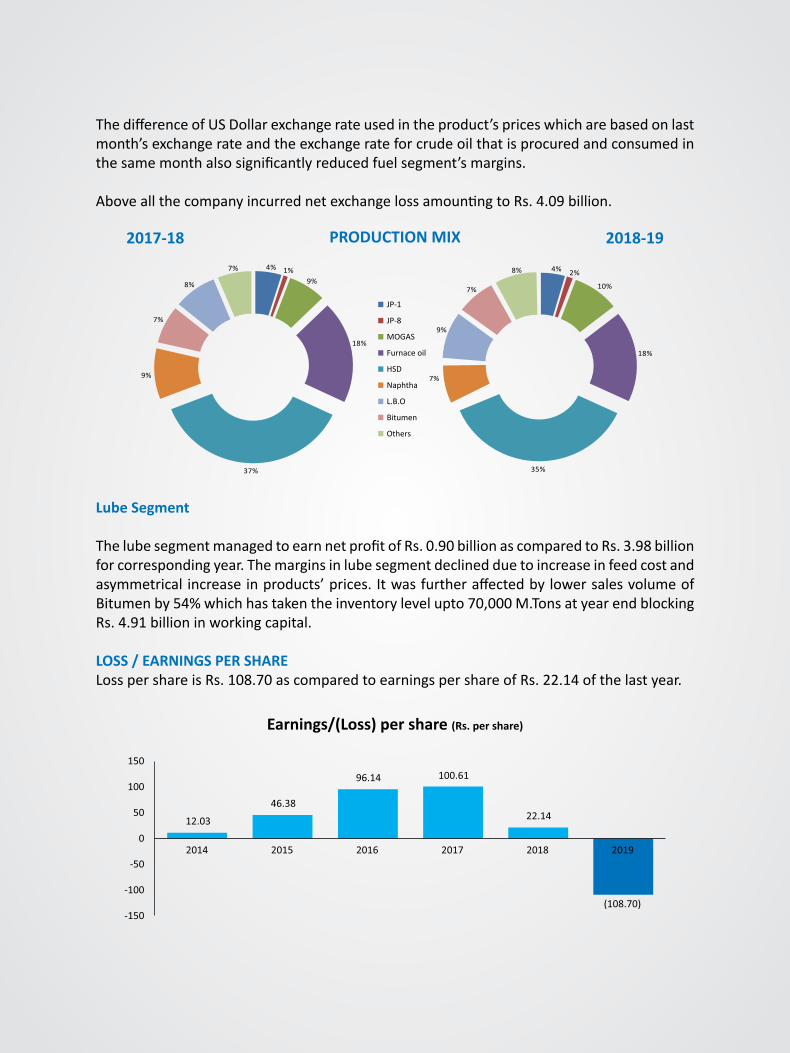
ThedifferenceofUSDollarexchangerateusedintheproduct’spriceswhicharebasedonlastmonth’sexchangerateandtheexchangerateforcrudeoilthatisprocuredandconsumedinthesamemonthalsosignificantlyreducedfuelsegment’smargins.
AboveallthecompanyincurrednetexchangelossamountingtoRs.4.09billion.
Lube Segment
ThelubesegmentmanagedtoearnnetprofitofRs.0.90billionascomparedtoRs.3.98billionforcorrespondingyear.Themarginsinlubesegmentdeclinedduetoincreaseinfeedcostandasymmetrical increaseinproducts’prices. ItwasfurtheraffectedbylowersalesvolumeofBitumenby54%whichhastakentheinventorylevelupto70,000M.TonsatyearendblockingRs.4.91billioninworkingcapital.
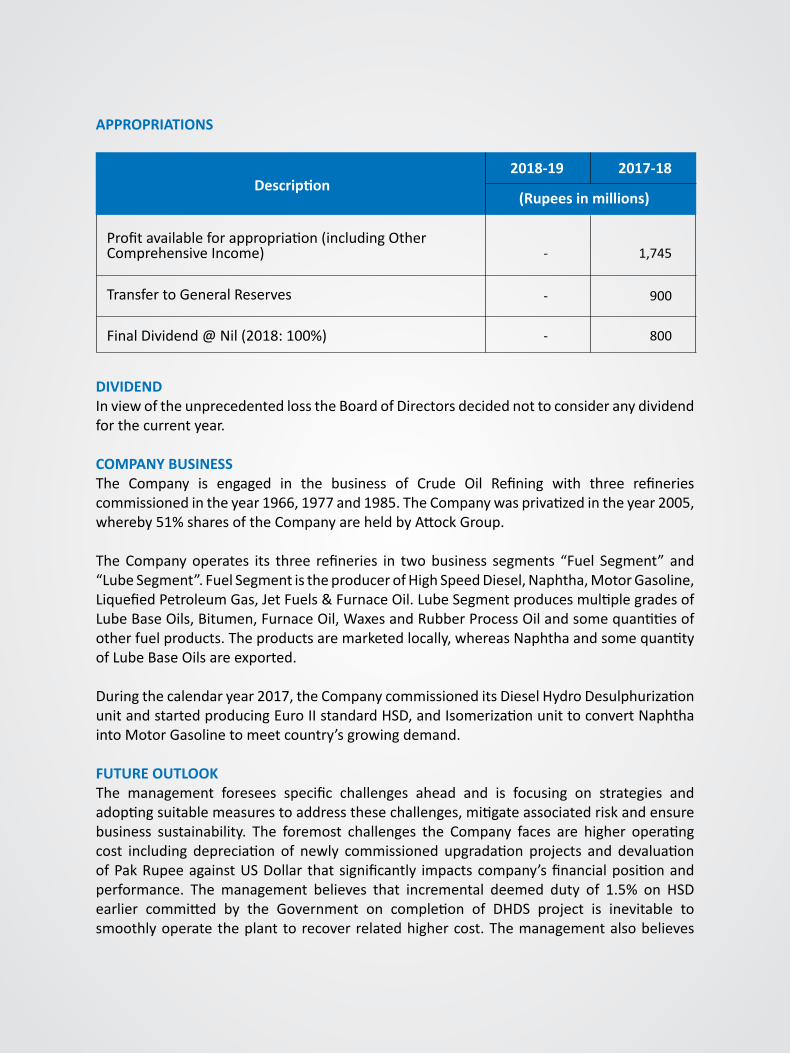
LOSS / EARNINGS PER SHARELosspershareisRs.108.70ascomparedtoearningspershareofRs.22.14ofthelastyear.
4% 2%
10%
18%
35%
7%
9%
7%
8%4% 1%9%
18%
37%
9%
7%
8%
7%
JP-1
JP-8
MOGAS
Furnace oil
HSD
Naphtha
L.B.O
Bitumen
Others
PRODUCTION MIX2017-18 2018-19
Earnings/(Loss)pershare(Rs.pershare)
Annual Report 2019
National Refinery Limited 19
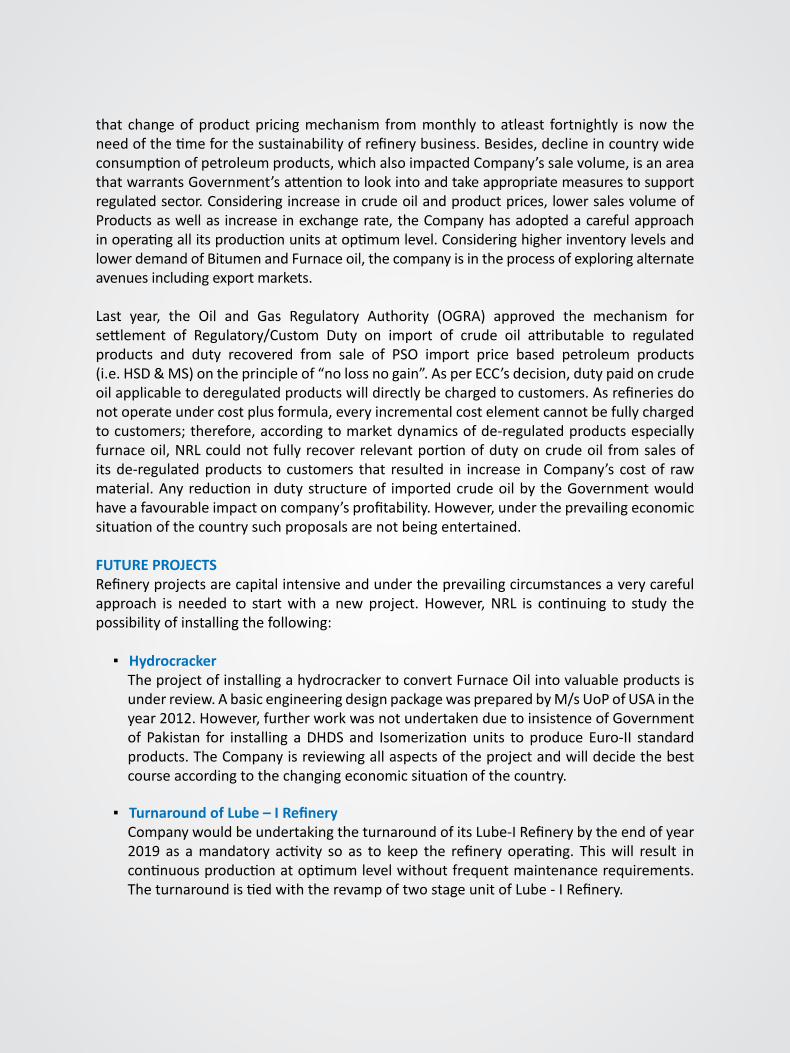
APPROPRIATIONS
2018-19
(Rupeesinmillions)Description
Profitavailableforappropriation(includingOtherComprehensiveIncome) - 1,745
TransfertoGeneralReserves - 900
FinalDividend@Nil(2018:100%) - 800
2017-18
DIVIDENDInviewoftheunprecedentedlosstheBoardofDirectorsdecidednottoconsideranydividendforthecurrentyear.
COMPANY BUSINESSThe Company is engaged in the business of Crude Oil Refining with three refineriescommissionedintheyear1966,1977and1985.TheCompanywasprivatizedintheyear2005,whereby51%sharesoftheCompanyareheldbyAttockGroup.
TheCompanyoperates its three refineries in twobusiness segments “Fuel Segment” and“LubeSegment”.FuelSegmentistheproducerofHighSpeedDiesel,Naphtha,MotorGasoline,LiquefiedPetroleumGas,JetFuels&FurnaceOil.LubeSegmentproducesmultiplegradesofLubeBaseOils,Bitumen,FurnaceOil,WaxesandRubberProcessOilandsomequantitiesofotherfuelproducts.Theproductsaremarketedlocally,whereasNaphthaandsomequantityofLubeBaseOilsareexported.
Duringthecalendaryear2017,theCompanycommissioneditsDieselHydroDesulphurizationunitandstartedproducingEuroIIstandardHSD,andIsomerizationunittoconvertNaphthaintoMotorGasolinetomeetcountry’sgrowingdemand.
FUTURE OUTLOOKThe management foresees specific challenges ahead and is focusing on strategies andadoptingsuitablemeasurestoaddressthesechallenges,mitigateassociatedriskandensurebusiness sustainability. The foremost challenges the Company faces are higher operatingcost including depreciation of newly commissioned upgradation projects and devaluationofPakRupeeagainstUSDollar thatsignificantly impactscompany’sfinancialpositionandperformance. The management believes that incremental deemed duty of 1.5% on HSDearlier committed by the Government on completion of DHDS project is inevitable tosmoothlyoperatetheplanttorecoverrelatedhighercost.Themanagementalsobelieves
Annual Report 2019
20 National Refinery Limited
that changeofproductpricingmechanism frommonthly toatleast fortnightly isnow theneedofthetimeforthesustainabilityofrefinerybusiness.Besides,declineincountrywideconsumptionofpetroleumproducts,whichalsoimpactedCompany’ssalevolume,isanareathatwarrantsGovernment’sattentiontolookintoandtakeappropriatemeasurestosupportregulatedsector.Consideringincreaseincrudeoilandproductprices,lowersalesvolumeofProductsaswellas increaseinexchangerate,theCompanyhasadoptedacarefulapproachinoperatingallitsproductionunitsatoptimumlevel.ConsideringhigherinventorylevelsandlowerdemandofBitumenandFurnaceoil,thecompanyisintheprocessofexploringalternateavenuesincludingexportmarkets.
Last year, the Oil and Gas Regulatory Authority (OGRA) approved the mechanism forsettlement of Regulatory/Custom Duty on import of crude oil attributable to regulatedproducts and duty recovered from sale of PSO import price based petroleum products(i.e.HSD&MS)ontheprincipleof“nolossnogain”.AsperECC’sdecision,dutypaidoncrudeoilapplicabletoderegulatedproductswilldirectlybechargedtocustomers.Asrefineriesdonotoperateundercostplusformula,everyincrementalcostelementcannotbefullychargedtocustomers;therefore,accordingtomarketdynamicsofde-regulatedproductsespeciallyfurnaceoil,NRLcouldnotfullyrecoverrelevantportionofdutyoncrudeoil fromsalesofitsde-regulatedproducts tocustomers that resulted in increase inCompany’s costof rawmaterial.Anyreduction indutystructureof importedcrudeoilby theGovernmentwouldhaveafavourableimpactoncompany’sprofitability.However,undertheprevailingeconomicsituationofthecountrysuchproposalsarenotbeingentertained.
FUTURE PROJECTSRefineryprojectsarecapitalintensiveandundertheprevailingcircumstancesaverycarefulapproach is needed to startwith a newproject.However,NRL is continuing to study thepossibilityofinstallingthefollowing:
▪ HydrocrackerTheprojectofinstallingahydrocrackertoconvertFurnaceOilintovaluableproductsisunderreview.AbasicengineeringdesignpackagewaspreparedbyM/sUoPofUSAintheyear2012.However,furtherworkwasnotundertakenduetoinsistenceofGovernmentof Pakistan for installing aDHDSand Isomerizationunits toproduce Euro-II standardproducts.TheCompanyisreviewingallaspectsoftheprojectandwilldecidethebestcourseaccordingtothechangingeconomicsituationofthecountry.
▪ TurnaroundofLube–IRefineryCompanywouldbeundertakingtheturnaroundofitsLube-IRefinerybytheendofyear2019 as amandatory activity so as to keep the refinery operating. Thiswill result incontinuousproductionatoptimumlevelwithoutfrequentmaintenancerequirements.TheturnaroundistiedwiththerevampoftwostageunitofLube-IRefinery.
Annual Report 2019
National Refinery Limited 21
ONGOING PROJECTSFollowingprojectsarecurrentlybeingexecutedbythecompany:
▪ TwostageunitatLube-IrefineryTheprojecthasbeenplannedtoenhancetheinstalledcrudeoilprocessingcapacityofLube-IRefineryfrom12,050Barrelperstreamday(bpsd)to17,000bpsdandvacuumfractionationcapacityfrom5,200bpsdto6,600bpsd.Thecontracthasbeenawardedto M/s. HUALU and M/s. China National Chemical Engineering No. 6 ConstructionCompanyofChinaandisexpectedtobecompletedbyJanuary2020.
▪ ReplacementofFuelrefineryandUtilitiesControlSystemwithcentralizedDistributedControl SystemsReplacement of existing control systemof fuel refinery andUtilitieswithDistributedControl System (DCS) will ensure precise quality production, high-integrity processcontrols,processsafeguardingandemergencyshutdown. Itwillalso improveprocesscontrolandmonitoringofplantparameters,availabilityofcustomizedreportsandlogsheets,andoptimumHumanresourceutilization.TheprojecthasalreadybeenawardedtoM/sYokogawaandislikelytobecompletedbyJanuary2020.
▪ New Sea Water Reverse Osmosis PlantNewseaWaterReverseOsmosisplantwithcapacityof250,000USgallonsperday isplanned tobeprocuredand installed following thecompletionofPhase-Iprojects tomeettheincreasedwaterrequirement.ProjecthasbeenawardedtoM/sAquamatchofTurkeyandisexpectedtobecompletedbyDecember2019.
COMPLETED PROJECTS – 2018-19Despite financial constraints your company successfully completed the following projectduringtheyear2018-19.
▪ 101-F-1 Air Pre-Heater ProjectInstallation of Air Pre-Heater at fuel refinery is an energy saving and environmentalfriendlyproject.Furthermore,Greenhousegasesemissionsandcarbonfootprintsaresignificantlyreduced.TheprojecthasbeencompletedandcommissionedinAugust2018atacostofRs.425million.
PRICING FORMULATheCompany’sFuelSegment is regulatedbyGovernmentunder the ImportParityPricingFormula.However,effectivefromJune1,2011,theGovernmentde-regulatedthepricesofMotorgasoline,AviationFuelandLightDieselOilwiththecappingthatthepricesannouncedbytherefineriesshouldnotexceedtheimportpricesoftherelevantproductofPakistanStateOilaverageactualimportpricesofpreviousmonthincludingincidentals.IncasethesepricesarenotavailablethenrefinerieshavetofixtheirpricesasperexistingImportParityPricingFormula.
Annual Report 2019
22 National Refinery Limited
AccordingtotheImportParityPricingformula,thedistributionofprofitsfromFuelSegmentis restricted to 50% of the paid-up capital as of July 1, 2002 and the remaining amountis to be transferred to special reserves. Refineries are not allowed to adjust losses fromspecialreservestillthecompletionofup-gradationprojects.Thematterhasalreadybeentakenupasaproposalin“DownstreamPetroleumPolicy”withthegovernmenttoremovecappingondividendpayouts.Otherwiseinvestmentinfuelsegmentisnotbeneficialtotheshareholders.
RELATIONSHIPSWecontinuetomaintainhistoryofmakingtimelypayments for thesupplyofcrudeoil toSaudiAramcoandADNOCforimportedcrudeoil.Further,paymentstootherforeignandlocaloilexplorationcompaniesoperatinginPakistanarealsobeingreleasedonregularbasis.
Wealwaysendeavortomaintaingoodrelationshipwithourlocalsuppliers,customersandotherbusinesspartnersinvolvedinthesupplychain.
KEY OPERATING AND FINANCIAL DATAKeyoperatingandfinancialdataoflastsixyears(2014-2019)isshownonpage41.
REFINERIES PRODUCTIONAccording to capacity analysis, NRL is currently the third largest refinery of Pakistanwithproductioncapacityof21.47millionbarrelsperannum.NRListheonlyrefinerycomplexinPakistanwhichincludesLubeRefinery,producingmultiplegradesofLubeBaseOilstomeetthedemandoftheCountry.
CREDIT RATINGSThe long-term entity rating of the Company is AA+ (maintained from last six years) andshort-termentityratinghavebeenmaintainedatA1+(forlastfifteenyears)byPakistanCreditRatingAgency(PACRA).Theseratingsdenoteaverylowexpectationofcreditriskemanatingfromaverystrongcapacityfortimelypaymentoffinancialcommitments.
RISK & UNCERTAINITIES▪ Thevolatilecrudeoilandproductpricesininternationalmarketmostlyresultsinnarrow
margins.InsuchcasetheCompanyperiodicallyreviewsitsproductionandsalescheduletominimizethelosses.One-monthtimelaginproducts’pricinggenerallysqueezesmarginsinincreasingpricetrend.
▪ TheCompanyfacesexchangelossesduetodevaluationofPakRupeeinmakingpaymentsofrawmaterialtosuppliersinforeigncurrencies.IftherecenttrendofPakRupeede-valuationcontinues,itwillbedifficulttocurtailhugeexchangelossesevenintheforthcomingperiodsaswell.
Annual Report 2019
National Refinery Limited 23
CORPORATE SOCIAL RESPONSIBILITYTheCompanyrealizes itssocialresponsibilitytowardsthenationaleconomyapartfromitscustomers,employeesandshareholders.Asaresponsiblecorporatecitizen,theCompanyhascontributedtodifferentsocialsegmentsoftheeconomyinvariouswaysforimprovingqualityoflifeinthecountry.Recently,CompanycontributedRs.100,000asadonationtoacharitabletrust,andRs.200,000hasbeenpaidforpromotionofeducation.
Companyisambitioustoberecognizedassocialpartnerandnotonlyascommercialentity.In this respect, the Company has kept three differently able persons on its manpowerstrengthasprescribedinSindhEmploymentRehabilitationandWelfareAct,2014andalsomadepaymentsamountingtoRs.11.47milliontoProvincialCouncilfortheRehabilitationofDisabledPersonsinlieuoflessnumberofsuchpersonsintheCompany’semployment.
EMPLOYEES & MANAGEMENT RELATIONS Therelationshipbetweenthemanagementandemployeesincludingworkers’unioncontinuedtobecordial.Theproductivityachievedreflectsthededicatedandsincerecollectiveendeavors.Inordertoprovideanopportunitytoemployeestomaintaingoodhealth,theCompanyiscontinuouslyencouragingtheSportsactivitiesattheRefinerypremisestopromoteahealthyapproachtowardslife.
OCCUPATIONAL HEALTH, SAFETY AND ENVIRONMENTNRLbeingaresponsiblecorporateentitystrives forenvironmentalcare inallourbusinessoperations.WepledgetopromoteHSEenvironmentalresponsibilityamongouremployeesandcontractorsinordertolimitthenegativeenvironmentalimpact.
Oneofthebasicmanagementpolicyinthecompanyistostrivetoofferproductsandservicesthatareclean,safe,andofhighquality.Webelievethattherealizationofthisbasicpolicyissynonymouswith fulfillingour corporate social environmental responsibility for theentireorganization.Therefore,eachandeverymemberoftheorganizationsteadily,honestlyanddiligentlyfocusesonexhibitingenvironmentalcareinalloperationalactivities.
Asanenvironmentfriendlyinitiativeitisworthmentioningtoincludesuccessfulcommissioning&InstallationofAirPre-Heateratfuelrefinerywhichisanenergysavingandenvironmentfriendlyproject.Furthermore,itwillhelpinreducingGreenhousegasesemissionsandcarbonfootprints.NRLhasensured100%compliancewithallapplicableenvironmentalregulations.TheCompanyhasacomprehensiveintegratedManagementSysteminplaceinaccordancewith the requirements of ISO 14001:2015 (Environmental Management System), OHSAS18001:2007(OccupationalSafety&HealthManagementSystem)andISO9001:2015(QualityManagementSystem).Wehaveachieved31.70millionsafeman-hourswithoutLossTimeInjury(LTI)asonJune30,2019.
Annual Report 2019
24 National Refinery Limited
Weensure that our refining activities are in linewith the occupational health safety andenvironmentallegislations,Company’sstandardoperatingproceduresandsafeworkpracticescompliancetowardsenvironmentprotection.
Weallaredeterminedandawareofourresponsibilitytowardssustainabledevelopmentandstrivingtoimprovetheenvironmentalconditionsaroundus. CONTRIBUTION TO NATIONAL EXCHEQUER Duringthefinancialyear,theCompanycontributedRs.43.4billiontotheNationalexchequerintheshapeofdirectandindirecttaxesandearnedvaluableforeignexchangeofUS$92.53millionthroughtheexportofNaphthaandLubeBaseOils.
HUMAN RESOURCE DEVELOPMENT HumanResourceoftheCompanyisplayingaverysignificantroleinachievingtheshortandlongtermcorporateandstrategicobjectivesoftheCompany.Therefore,yourCompanyfocusesspecialattentionontheirtraininganddevelopment.Variousstaffmembersattendednumerouscourses andworkshops in different technical and non-technical disciplines. In addition tohands on training programs, the Companyhas also conductedManagement Trainees andApprenticeshipprogramswheretheoreticalandpracticaltraininginRefineryoperationsandmaintenancewasimpartedwhichwillnotonlymeettheadditionalrequirementoftrainedmanpowerforoperationsoftheCompanybutwouldextendagreathelptothePetroleumRefiningindustryofthecountryintheavailabilityoftrainedmanpower.
SYSTEM OF INTERNAL FINANCIAL CONTROLThecompanyensuresthatadequateinternalcontrolsareinplaceforallitsactivitiesincludingfinancial transactions. There is an internal audit department in place which conductsregularauditstoassessif internalfinancialcontrolsareadequateindesignandhavebeenappropriatelyimplementedandmonitored.Thedirectorsofthecompanyhaveconstitutedan“AuditCommittee”thatreviewstheinternalauditdepartment’sreportsonquarterlybasis.
CORPORATE GOVERNANCETheCompanyiscommittedtogoodcorporategovernanceandhascompliedwiththeapplicableListedCompanies(CodeofCorporateGovernance)Regulations2017andstatesthat:
a) The financial statements, prepared by themanagement of the Company, present itsstateofaffairsfairly,theresultofitsoperations,changeinequityandcashflows.
b) Proper books of account have been maintained in the manner required under theCompaniesAct2017.
c) Appropriate accounting policies have been consistently applied in the preparationof financial statements. Accounting estimates are based on reasonable and prudentjudgement. During the current year the policy for classification and measurement of
Annual Report 2019
National Refinery Limited 25
financial assetsand liabilitieshasbeenchanged in compliancewith thenewlyadopted IFRS-9 ‘Financial Instruments’.Thedetailsof thechangesarediscussed innote4of the
financialstatements.
d) InternationalFinancialReportingStandards,asapplicableinPakistan,havebeenfollowedinthepreparationoffinancialstatements.
e) Thesystemofinternalcontrolissoundindesignandhasbeeneffectivelyimplementedandmonitored.
f) TherearenosignificantdoubtsupontheCompany’sabilitytocontinueasagoingconcern.
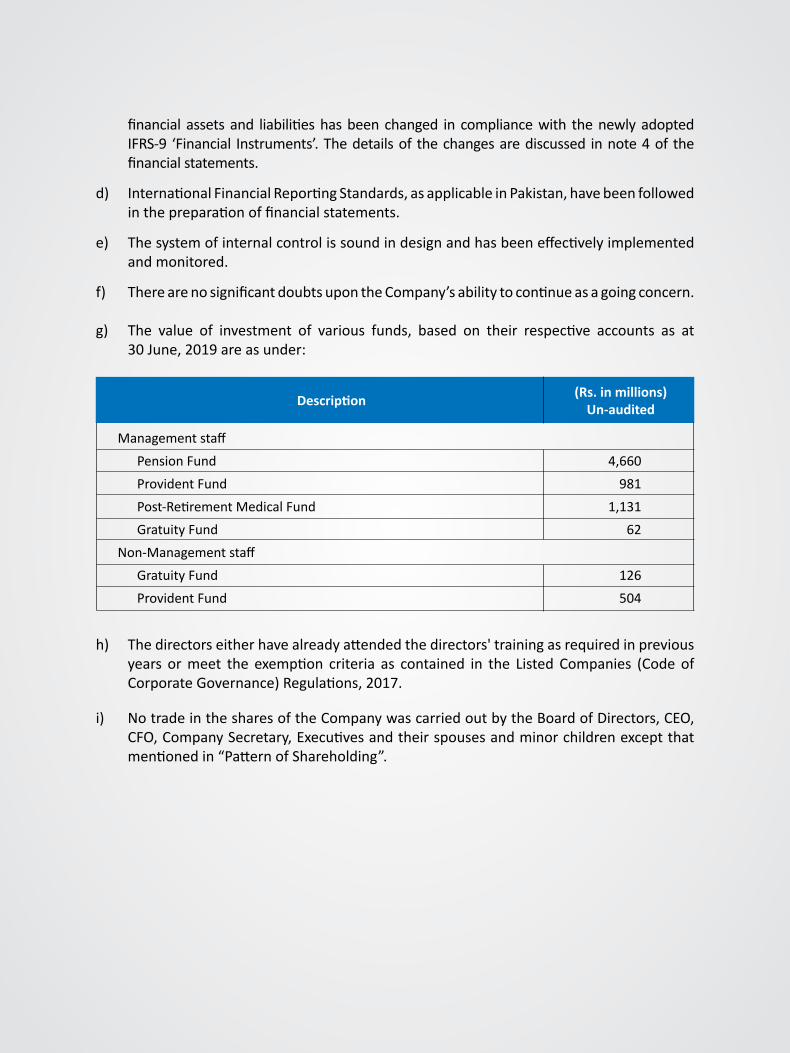
g) The value of investment of various funds, based on their respective accounts as at 30June,2019areasunder:
(Rs.inmillions)Un-auditedDescription
Managementstaff PensionFund 4,660
ProvidentFund 981 Post-RetirementMedicalFund 1,131 GratuityFund 62Non-Managementstaff GratuityFund 126 ProvidentFund 504
h) Thedirectorseitherhavealreadyattendedthedirectors'trainingasrequiredinpreviousyears ormeet the exemption criteria as contained in the Listed Companies (Code ofCorporateGovernance)Regulations,2017.
i) NotradeinthesharesoftheCompanywascarriedoutbytheBoardofDirectors,CEO,CFO,CompanySecretary,Executivesandtheirspousesandminorchildrenexceptthatmentionedin“PatternofShareholding”.
Annual Report 2019
26 National Refinery Limited
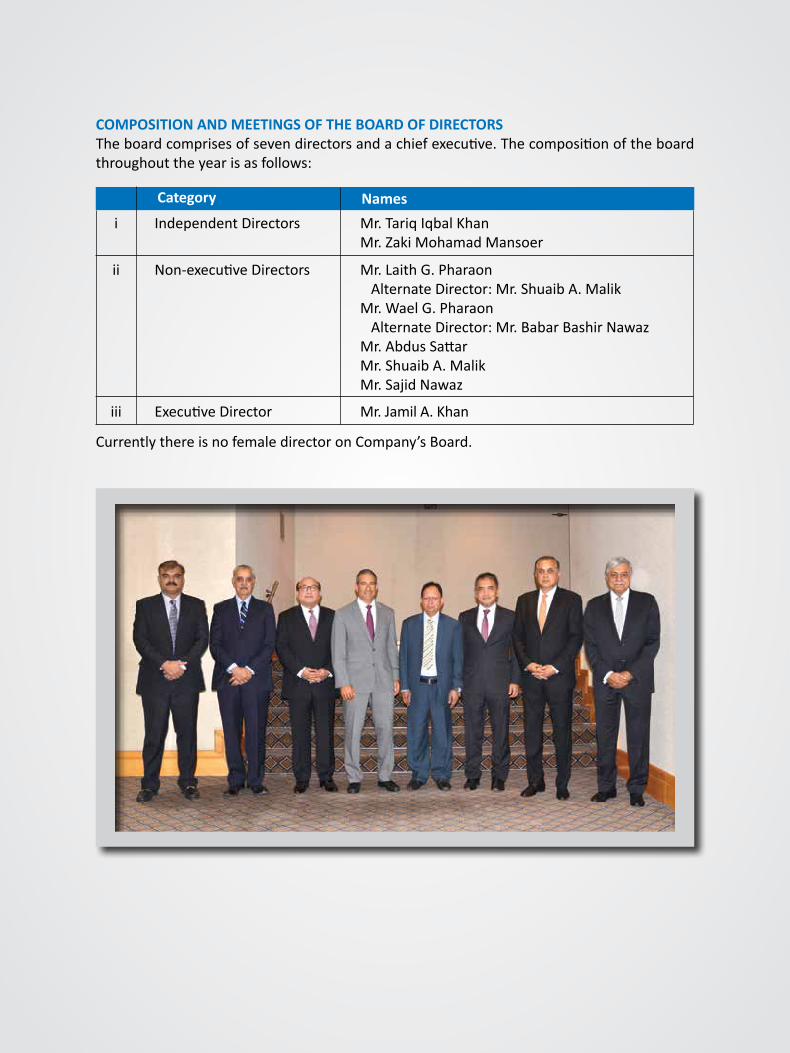
COMPOSITION AND MEETINGS OF THE BOARD OF DIRECTORS Theboardcomprisesofsevendirectorsandachiefexecutive.Thecompositionoftheboardthroughouttheyearisasfollows:
Category NamesIndependentDirectors Mr.TariqIqbalKhan
Mr.ZakiMohamadMansoer
Mr.LaithG.PharaonAlternateDirector:Mr.ShuaibA.MalikMr.WaelG.PharaonAlternateDirector:Mr.BabarBashirNawazMr.AbdusSattarMr.ShuaibA.MalikMr.SajidNawaz
Mr.JamilA.KhanExecutiveDirector
Non-executiveDirectors
i
ii
iii
CurrentlythereisnofemaledirectoronCompany’sBoard.
Annual Report 2019
National Refinery Limited 27
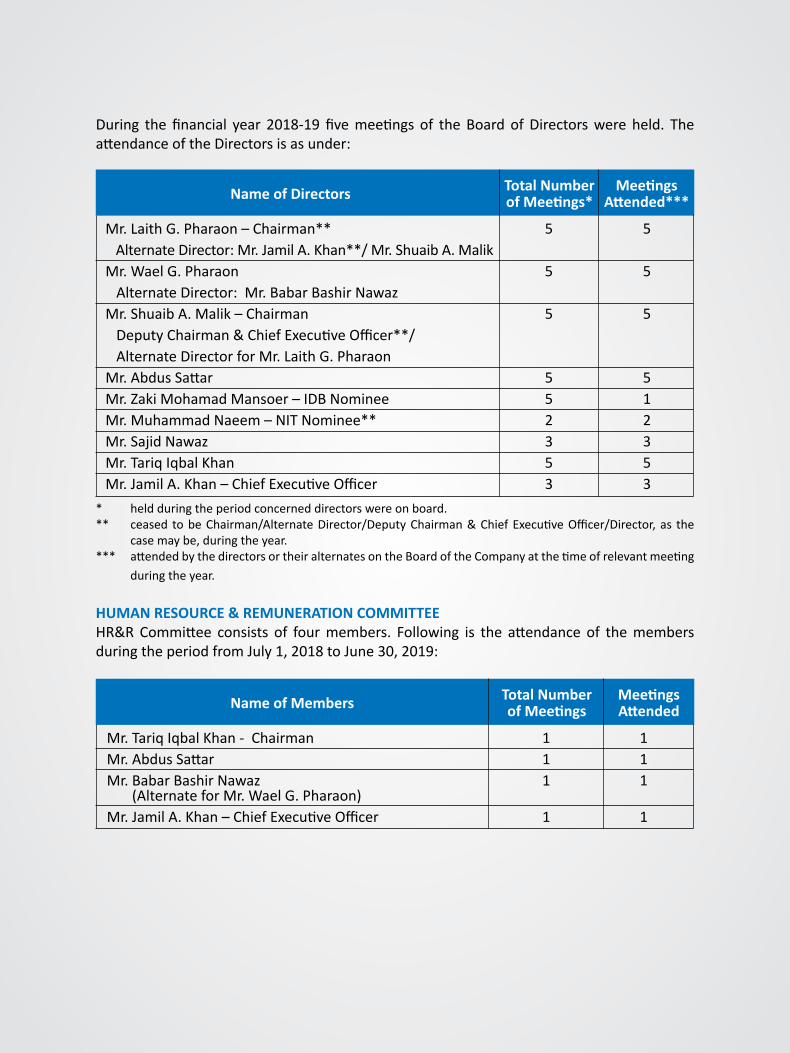
During the financial year 2018-19fivemeetings of theBoard ofDirectorswere held. TheattendanceoftheDirectorsisasunder:
Total Number ofMeetings*
MeetingsAttended***Name of Directors
Mr.LaithG.Pharaon–Chairman**AlternateDirector:Mr.JamilA.Khan**/Mr.ShuaibA.MalikMr.WaelG.PharaonAlternateDirector:Mr.BabarBashirNawazMr.ShuaibA.Malik–ChairmanDeputyChairman&ChiefExecutiveOfficer**/AlternateDirectorforMr.LaithG.PharaonMr.AbdusSattarMr.ZakiMohamadMansoer–IDBNomineeMr.MuhammadNaeem–NITNominee**Mr.SajidNawazMr.TariqIqbalKhanMr.JamilA.Khan–ChiefExecutiveOfficer
5
5
5
552353
5
5
5
512353
* heldduringtheperiodconcerneddirectorswereonboard.** ceased tobeChairman/AlternateDirector/DeputyChairman&ChiefExecutiveOfficer/Director,as the
casemaybe,duringtheyear.*** attendedbythedirectorsortheiralternatesontheBoardoftheCompanyatthetimeofrelevantmeeting
duringtheyear.
HUMAN RESOURCE & REMUNERATION COMMITTEEHR&RCommittee consists of fourmembers. Following is the attendance of themembersduringtheperiodfromJuly1,2018toJune30,2019:
Total Number ofMeetings
MeetingsAttendedName of Members
Mr.TariqIqbalKhan-ChairmanMr.AbdusSattarMr.BabarBashirNawaz(AlternateforMr.WaelG.Pharaon)Mr.JamilA.Khan–ChiefExecutiveOfficer
111
1
111
1
Annual Report 2019
28 National Refinery Limited
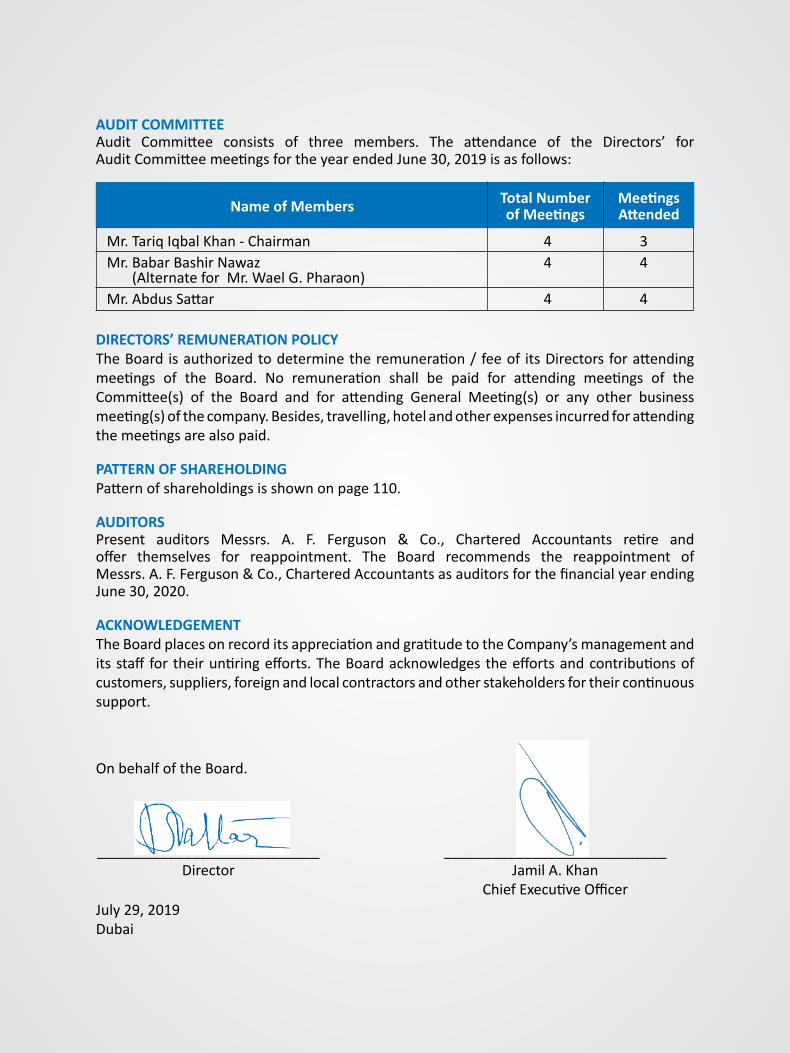
AUDIT COMMITTEEAudit Committee consists of three members. The attendance of the Directors’ forAuditCommitteemeetingsfortheyearendedJune30,2019isasfollows:
Total Number ofMeetings
MeetingsAttendedName of Members
Mr.TariqIqbalKhan-ChairmanMr.BabarBashirNawaz(AlternateforMr.WaelG.Pharaon)Mr.AbdusSattar
44
4
34
4
DIRECTORS’REMUNERATIONPOLICYTheBoard isauthorizedtodeterminetheremuneration/feeof itsDirectorsforattendingmeetings of the Board. No remuneration shall be paid for attending meetings of theCommittee(s) of the Board and for attending General Meeting(s) or any other businessmeeting(s)ofthecompany.Besides,travelling,hotelandotherexpensesincurredforattendingthemeetingsarealsopaid.
PATTERN OF SHAREHOLDINGPatternofshareholdingsisshownonpage110.
AUDITORSPresent auditors Messrs. A. F. Ferguson & Co., Chartered Accountants retire andoffer themselves for reappointment. The Board recommends the reappointment ofMessrs.A.F.Ferguson&Co.,CharteredAccountantsasauditorsforthefinancialyearendingJune30,2020.
ACKNOWLEDGEMENTTheBoardplacesonrecorditsappreciationandgratitudetotheCompany’smanagementanditsstafffortheiruntiringefforts.TheBoardacknowledgestheeffortsandcontributionsofcustomers,suppliers,foreignandlocalcontractorsandotherstakeholdersfortheircontinuoussupport.
OnbehalfoftheBoard.
July29,2019Dubai
____________________________ Director
____________________________ JamilA.Khan
ChiefExecutiveOfficer
Annual Report 2019
National Refinery Limited 29
CorporateGovernance
Annual Report 2019
30 National Refinery Limited
CODE OF CONDUCTNationalRefineryLimited(theCompany)isengagedinthemanufacturingofwiderangeofpetroleumproductswiththeobjectivetoachievesustainableproductivity,profitabilityandhigh standards of safety, occupational health and environmental care. This entails humanresourcedevelopment,enhancingvalueaddition,implementingconservationmeasuresandgrowthbyup-gradationandadditionofnewergenerationtechnologies.
The Company requires all its BoardMembers and Employees to act within the authorityconferreduponthemandinthebestinterestsoftheCompanyandobservealltheCompany’spoliciesandproceduresaswellasrelevantlawsandregulations,asareapplicableinindividualcapacityorotherwise,includingbutnotlimitedtothecorporatevalues,businessprinciplesandtheacceptableandunacceptablebehaviour(hereinaftercalledtheCompany’sCodeofConduct)embodiedinthisdocument.
TheCompanybelievesthatthecredibility,goodwillandreputeearnedovertheyearscanbemaintainedthroughcontinuedconvictioninourcorporatevaluesofhonesty,justice,integrityand respect for people. The Company strongly promotes trust, openness, teamwork andprofessionalisminitsentirebusinessactivities.
▪ Thebusinessprinciplesarederivedfromtheabovestatedcorporatevaluesandareappliedto all facets of business throughwell-established procedures. These procedures definebehaviorexpectedfromeachemployeeinthedischargeofhis/herresponsibility.
▪ NRL recognizes following obligations, which need to be discharged with best efforts,commitmentandefficiency:
• Safeguardingofshareholders’interestandasuitablereturnonequity.• Service customersbyprovidingproducts,whichoffer value in termsofprice,quality,safetyandenvironmentalimpact.
• Respecthumanrights,providecongenialworkingenvironment,offercompetitivetermsofemployment,develophumanresourceandbeanequalopportunityemployer.
• Seekmutuallybeneficialbusinessrelationshipwithcontractors,suppliersandinvestmentpartners.
▪ The Company believes that profit is essential for business survival. It is a measure ofefficiencyandthevaluethatthecustomerplacesonproductsandservicesproducedbytheCompany.
▪ TheCompanyrequireshonestyandfairnessinallaspectofitsbusinessandinitsrelationshipswithallthosewithwhomitdoesbusiness.Thedirectorindirectoffer,payment,solicitingandacceptingofbribeinanyformisundesirable.
▪ The Company is fully committed to reliability and accuracy of financial statements andtransparencyoftransactionsinaccordancewithestablishedproceduresandpractices.
Annual Report 2019
National Refinery Limited 31
▪ TheCompanydoesnotsupportanypoliticalpartyorcontributesfundstogroupshavingpolitical interests. TheCompanywill however, promote its legitimatebusiness intereststhroughtradeassociations.
▪ The Company, consistent with its commitments to sustainable developments, has asystematicapproachtothemanagementofhealth,safetyandenvironment.
▪ The Company is committed to observe laws of Pakistan and is fully aware of its socialresponsibility. It would assist the community in activities such as education, sports,environmentpreservation,trainingprograms,skillsdevelopmentandemploymentwithintheparametersofitscommercialobjectives.
▪ TheCompanysupportsfreemarketsystem.Itseekstocompetefairlyandethicallywithintheframeworkofapplicablecompetitionlawsinthecountry.TheCompanywillnotstopothersfromcompetingfreelywithit.
▪ In viewof the critical importance of its business and impact on national economy, theCompany provides all relevant information about its activities to legitimate interestedparties,subjecttoanyoverridingconstraintsofconfidentialityandcost.
▪ TheCompanyrequiresallitsboardmembersandemployeestoessentiallyavoidconflictofinterestbetweenprivatefinancialand/orotheractivitiesandtheirprofessionalroleintheconductofCompanybusiness.
▪ No board member or employee shall in any manner disclose to any person or causedisclosureofanyinformationordocuments,officialorotherwise,relatingtotheCompany,exceptthosepublished,andunlesshe/sheisauthorisedbythemanagement.
▪ All papers, books, drawings, sketches, photographs, documents and similar paperscontaining analysis, formulas, notes or information relating to the Company’s businessaffairsoroperationsshallalwaysbetreatedastheCompanyproperty,whetherpreparedbytheemployeeorotherwiseandnoemployeeshallbepermittedtocarryanyoftheseoutsidebusinesspremisesunlessspecificallyauthorisedtodosobythemanagement.
▪ TheCompany’sproperty, funds, facilitiesandservicesmustbeusedonly forauthorisedpurposes.
▪ The boardmembers or employees of the Company specifically those coming in directcontactwith the vendors doing or seeking to do businesswith the Company shall notreceive favours or incur obligations. In case any contractor/supplier to have businessrelationswith theCompanyhappen tobe a relativeof anofficialwho is entrusted theresponsibility of opening/evaluation/award of supply/contract job orwith execution orcertificationofmaterial/services,he/sheshallimmediatelybringthefacttothenoticeofManagingDirectorwhomayentrusttheresponsibilitytoanother.
Annual Report 2019
32 National Refinery Limited
▪ Eachemployeeshalldevotehis/herfulltimeandenergyexclusivelytothebusinessandinterests of the Company. In particular, no employee (including those on leave) unlessotherwise permitted by the Company, shall directly or indirectly engage in any otherprofession or business or enter the services of or be employed in any capacity for anypurposewhatsoeverand foranypartofhis/hertimebyanyotherperson,governmentdepartment,firmorcompanyand/orshallnothaveanyprivatefinancialdealingswithanyotherpersonsoffirmshavingbusinessrelationswiththecompanyforsaleorpurchaseofanymaterialsorequipmentsorsupplyoflabourorforanyotherpurpose.Everyemployeeshallholdhimselfinreadinesstoperformanydutiesrequiredofhimbyhis/hersuperiorstothebestofhis/herability.
▪ NoboardmemberoremployeeoftheCompanyshall,directlyorindirectly,dealinthesharesoftheCompanyinanymannerduringtheclosedperiod,asdeterminedandinformedbytheCompany.
▪ NoboardmemberoremployeeoftheCompanyshallpracticeinsidertrading.
Withoutprejudicetoanypenalactiondefinedinanystatute,asapplicable,againstanykindofnon-compliances/violations,non-compliancewith theCompany’sCodeofConductmayexposethepersoninvolvedtodisciplinaryactionasperCompany’srulesand/orasdeterminedbythemanagementortheBoardofDirectorsoftheCompany,asthecasemaybe,oncasetocasebasis.
OnbehalfoftheBoard
____________________SHUAIB A. MALIKDeputyChairman&ChiefExecutiveOfficer
June 18, 2012
Annual Report 2019
National Refinery Limited 33
STATEMENT OF COMPLIANCE WITH LISTED COMPANIES(CODEOFCORPORATEGOVERNANCE)REGULATIONS,2017FORTHEYEARENDEDJUNE30,2019
ThecompanyhascompliedwiththerequirementsoftheRegulationsinthefollowingmanner:
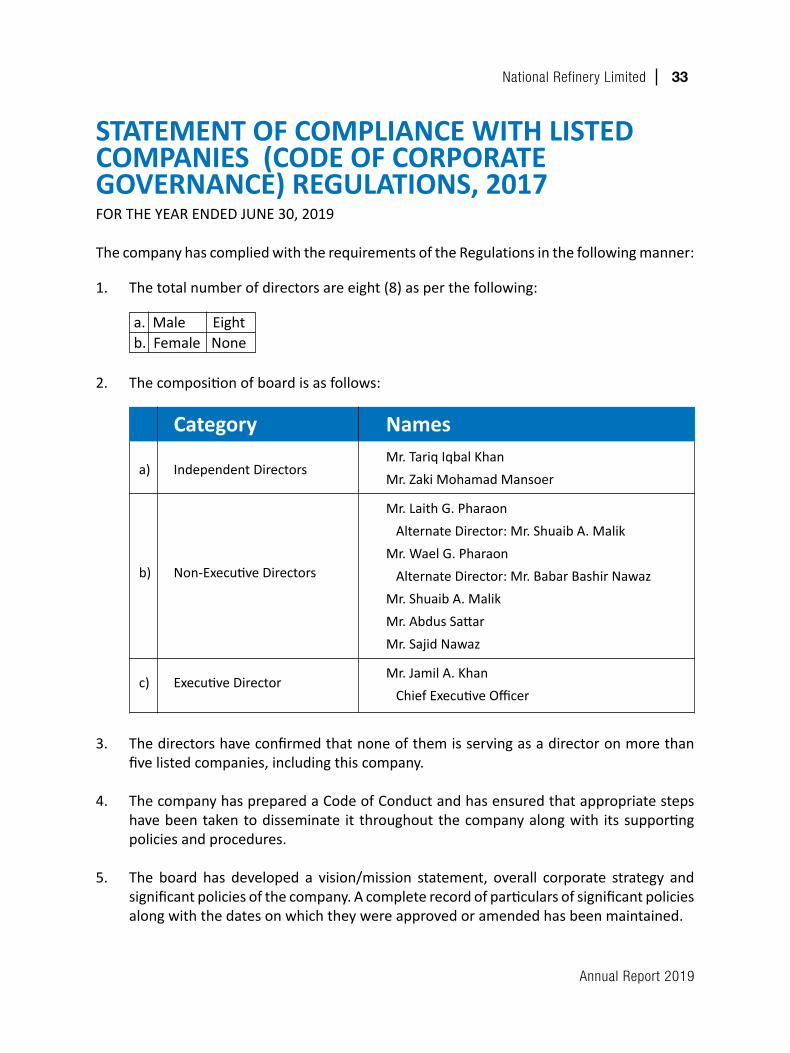
1. Thetotalnumberofdirectorsareeight(8)asperthefollowing:
a.Male Eightb.FemaleNone
2. Thecompositionofboardisasfollows:
Category
IndependentDirectorsa)
Non-ExecutiveDirectorsb)
Mr.TariqIqbalKhanMr.ZakiMohamadMansoer
Mr.LaithG.PharaonAlternateDirector:Mr.ShuaibA.MalikMr.WaelG.PharaonAlternateDirector:Mr.BabarBashirNawazMr.ShuaibA.MalikMr.AbdusSattarMr.SajidNawaz
Mr.JamilA.KhanChiefExecutiveOfficer
Names
ExecutiveDirectorc)
3. Thedirectorshaveconfirmedthatnoneofthemisservingasadirectoronmorethanfivelistedcompanies,includingthiscompany.
4. ThecompanyhaspreparedaCodeofConductandhasensuredthatappropriatestepshavebeentakentodisseminate it throughoutthecompanyalongwith itssupportingpoliciesandprocedures.
5. The board has developed a vision/mission statement, overall corporate strategy andsignificantpoliciesofthecompany.Acompleterecordofparticularsofsignificantpoliciesalongwiththedatesonwhichtheywereapprovedoramendedhasbeenmaintained.
Annual Report 2019
34 National Refinery Limited
6. Allthepowersoftheboardhavebeendulyexercisedanddecisionsonrelevantmattershavebeentakenbyboard/shareholdersasempoweredbytherelevantprovisionsoftheActandtheseRegulations.
7. Themeetingsof theboardwerepresidedoverby theChairmanand, inhisabsence,byadirectorelectedbytheboardforthispurpose.Theboardhascompliedwiththerequirements of Act and the Regulations with respect to frequency, recording andcirculatingminutesofmeetingofboard.
8. TheboardofdirectorshaveaformalpolicyandtransparentproceduresforremunerationofdirectorsinaccordancewiththeActandtheseRegulations.
9. TheDirectorswereapprisedoftheirdutiesandresponsibilitiesfromtimetotime.Thedirectors either have already attended the directors' training as required in previousyears ormeet the exemption criteria as contained in the ListedCompanies (CodeofCorporateGovernance)Regulations,2017.
10. TheboardhasapprovedappointmentofCFO,CompanySecretaryandHeadofInternalAudit, including their remuneration and terms and conditions of employment andcompliedwith relevant requirements of the Regulations. However, the CFO and theCompanySecretaryoftheCompanyisthesamepersonforwhichrelaxationhasbeengrantedbytheSecuritiesandExchangeCommissionofPakistantillOctober2019.
11. CFOandCEOdulyendorsedthefinancialstatementsbeforeapprovaloftheboard.
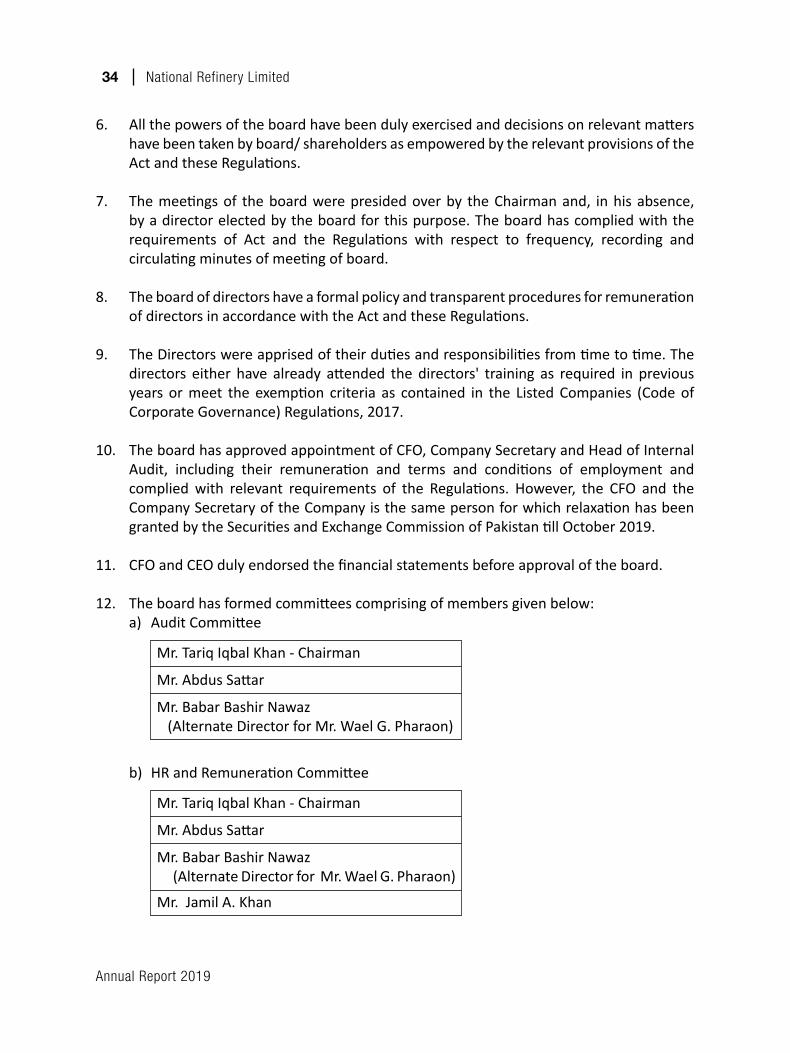
12. Theboardhasformedcommitteescomprisingofmembersgivenbelow: a)AuditCommittee
Mr.TariqIqbalKhan-Chairman
Mr.AbdusSattar
Mr.BabarBashirNawaz(AlternateDirectorforMr.WaelG.Pharaon)
b)HRandRemunerationCommittee
Mr.TariqIqbalKhan-Chairman
Mr.AbdusSattar
Mr.BabarBashirNawaz(AlternateDirectorforMr.WaelG.Pharaon)
Mr.JamilA.Khan
Annual Report 2019
National Refinery Limited 35
13. Thetermsofreferenceoftheaforesaidcommitteeshavebeenformed,documentedandadvisedtothecommitteeforcompliance.
14. Thefrequencyofmeetingsofthecommitteewereasperfollowing:a) AuditCommittee:Quarterlyb) HRandRemunerationCommittee:Yearly
15. The board has set up an effective internal audit function and that is involved in theInternalAuditonfulltimebasisrelatingtothebusinessandotheraffairsoftheCompany.
16. The statutory auditors of the company have confirmed that they have been given asatisfactoryratingunderthequalitycontrolreviewprogramoftheICAPandregisteredwithAuditOversightBoardofPakistan,thattheyoranyofthepartnersofthefirm,theirspousesandminorchildrendonotholdsharesofthecompanyandthatthefirmandall itspartnersare in compliancewith International FederationofAccountants (IFAC)guidelinesoncodeofethicsasadoptedbytheICAP.
17. ThestatutoryauditorsorthepersonsassociatedwiththemhavenotbeenappointedtoprovideotherservicesexceptinaccordancewiththeAct,theseregulationsoranyotherregulatoryrequirementandtheauditorshaveconfirmedthattheyhaveobservedIFACguidelinesinthisregard.
18. WeconfirmthatallotherrequirementsoftheRegulationshavebeencompliedwith.
OnbehalfoftheBoard
__________________ Shuaib A. MalikChairman
July29,2019
Annual Report 2019
36 National Refinery Limited
AuditReport
Annual Report 2019
National Refinery Limited 37
TERMSOFREFERENCE(TOR)OF AUDIT COMMITTEE
TheBoardhasconstitutedafullyfunctionalAuditCommittee.Thefeaturesofthetermsofreferenceof thecommittee inaccordancewith theCodeofCorporateGovernanceareasfollows:
(a) Determinationofappropriatemeasurestosafeguardthecompany’sassets;
(b) Reviewofpreliminaryannouncementsofresultspriortoexternalcommunicationandpublication;
(c) Reviewofquarterly,halfyearlyandannualfinancialstatementsofthecompany,priortotheirapprovalbytheBoardofDirectors,focusingon:
• Majorjudgmentalareas;• Significantadjustmentsresultingfromtheaudit;• Thegoingconcernassumption;• Anychangesinaccountingpoliciesandpractices;• Compliancewithapplicableaccountingstandards;• Compliancewiththecodeofcorporategovernanceregulationsandotherstatutory
andregulatoryrequirements;and• Allrelatedpartytransactions.
(d)Facilitatingtheexternalauditanddiscussionwithexternalauditorsofmajorobservationsarisingfrominterimandfinalauditsandanymatterthattheauditorsmaywishtohighlight(intheabsenceofmanagement,wherenecessary);
(e) Reviewofmanagementletterissuedbyexternalauditorsandmanagement’sresponsethereto;
(f) Ensuringcoordinationbetweentheinternalandexternalauditors;
(g) Reviewofthescopeandextentofinternalaudit,auditplan,reportingframeworkandproceduresandensuringthattheinternalauditfunctionhasadequateresourcesandisappropriatelyplaced;
(h) Considerationofmajorfindingsof internal investigationsofactivitiescharacterizedbyfraud,corruptionandabuseofpowerandmanagement'sresponsethereto;
(i) Ascertainingthattheinternalcontrolsystemsincludingfinancialandoperationalcontrols,accountingsystemsfortimelyandappropriaterecordingofpurchasesandsales,receiptsandpayments,assetsandliabilitiesandreportingstructureareadequateandeffective;
Annual Report 2019
38 National Refinery Limited
(j) Reviewofcompany’sstatementoninternalcontrolsystemspriortoendorsementbytheBoardofDirectorsandinternalauditreports;
(k) Institutingspecialprojects,valueformoneystudiesorotherinvestigationsonanymatterspecified by the Board of Directors, in consultation with the Chief Executive and toconsiderremittanceofanymattertotheexternalauditorsortoanyotherexternalbody;
(l) Determinationofcompliancewithrelevantstatutoryrequirements;
(m) Monitoring compliance with the code of corporate governance regulations andidentificationofsignificantviolationsthereof;
(n) review of arrangement for staff and management to report to audit committee inconfidence, concerns, if any, about actual or potential improprieties in financial andothermattersandrecommendinstitutingremedialandmitigatingmeasures;
(o) Recommend to the Board of Directors the appointment of external auditors, theirremoval,auditfees,theprovisionbytheexternalauditorsofanyservicepermissibletoberenderedtothecompanyinadditiontoauditofitsfinancialstatements;and
(p) ConsiderationofanyotherissueormatterasmaybeassignedbytheBoardofDirectors.
TERMS OF REFERENCE OF HUMAN RESOURCE ANDREMUNERATION(HR&R)COMMITTEE
TheBoardadoptedtheresponsibilitiescontainedinclause(xxv)oftheCode2012from(i)to(iv)astheTermsofReference(TOR)oftheHR&RCommittee.
Thecommitteeshallberesponsiblefor:
i) Recommendinghumanresourcemanagementpoliciestotheboard;
ii) Recommendingtotheboardtheselection,evaluation,compensation(includingretirementbenefits)andsuccessionplanningoftheCEO;
iii) Recommendingtotheboardtheselection,evaluation,compensation(includingretirementbenefits)ofCOO,CFO,CompanySecretaryandHeadofInternalAudit;and
iv) Consideration and approval on recommendations of CEO on such matters for keymanagementpositionswhoreportdirectlytoCEOorCOO.
Annual Report 2019
National Refinery Limited 39
Stakeholders'Information
Annual Report 2019
National Refinery Limited 41
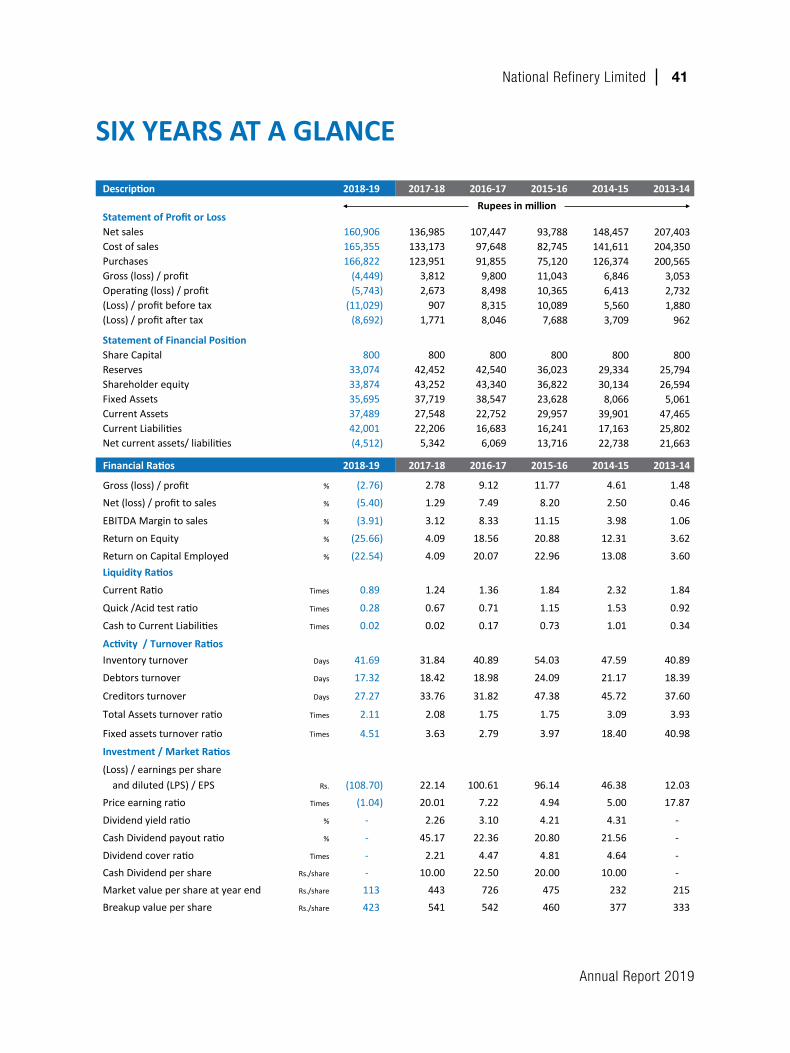
SIX YEARS AT A GLANCE
Description 2018-19 2017-18 2016-17 2015-16 2014-15 2013-14
Statement of Profit or LossNet sales 160,906 Cost of sales 165,355 Purchases 166,822 Gross (loss) / profit (4,449) Operating (loss) / profit (5,743) (Loss) / profit before tax (11,029) (Loss) / profit after tax (8,692)
Statement of Financial PositionShare Capital 800 Reserves 33,074 Shareholder equity 33,874 Fixed Assets 35,695 Current Assets 37,489 Current Liabilities 42,001 Net current assets/ liabilities (4,512)
136,985133,173123,951
3,8122,673
9071,771
80042,45243,25237,71927,54822,206
5,342
107,44797,64891,855
9,8008,4988,3158,046
80042,54043,34038,54722,75216,683
6,069
93,78882,74575,12011,04310,36510,089
7,688
80036,02336,82223,62829,95716,24113,716
148,457141,611126,374
6,8466,4135,5603,709
80029,33430,134
8,06639,90117,16322,738
207,403204,350200,565
3,0532,7321,880
962
80025,79426,594
5,06147,46525,80221,663
Financial Ratios 2018-19 2017-18 2016-17 2015-16 2014-15 2013-14
Gross (loss) / profit % (2.76) 2.78 9.12 11.77 4.61 1.48
Net (loss) / profit to sales % (5.40) 1.29 7.49 8.20 2.50 0.46
EBITDA Margin to sales % (3.91) 3.12 8.33 11.15 3.98 1.06
Return on Equity % (25.66) 4.09 18.56 20.88 12.31 3.62
Return on Capital Employed % (22.54) 4.09 20.07 22.96 13.08 3.60 Liquidity Ratios
Current Ratio Times 0.89 1.24 1.36 1.84 2.32 1.84
Quick /Acid test ratio Times 0.28 0.67 0.71 1.15 1.53 0.92
Cash to Current Liabilities Times 0.02 0.02 0.17 0.73 1.01 0.34
Activity / Turnover RatiosInventory turnover Days 41.69 31.84 40.89 54.03 47.59 40.89
Debtors turnover Days 17.32 18.42 18.98 24.09 21.17 18.39
Creditors turnover Days 27.27 33.76 31.82 47.38 45.72 37.60
Total Assets turnover ratio Times 2.11 2.08 1.75 1.75 3.09 3.93
Fixed assets turnover ratio Times 4.51 3.63 2.79 3.97 18.40 40.98
Investment / Market Ratios
(Loss) / earnings per share and diluted (LPS) / EPS Rs. (108.70) 22.14 100.61 96.14 46.38 12.03
Rupees in million
Price earning ratio Times 7.22 4.94 5.00
Dividend yield ratio % 3.10 4.21 4.31
Cash Dividend payout ratio % 22.36 20.80 21.56
Dividend cover ratio Times 4.47 4.81 4.64 Cash Dividend per share Rs./share 22.50 20.00 10.00 Market value per share at year end Rs./share 726 475 232 Breakup value per share Rs./share
(1.04)
-
-
- - 113 423
20.01
2.26
45.17
2.21 10.00
443 541 542 460 377
17.87
-
-
- - 215 333
Annual Report 2019
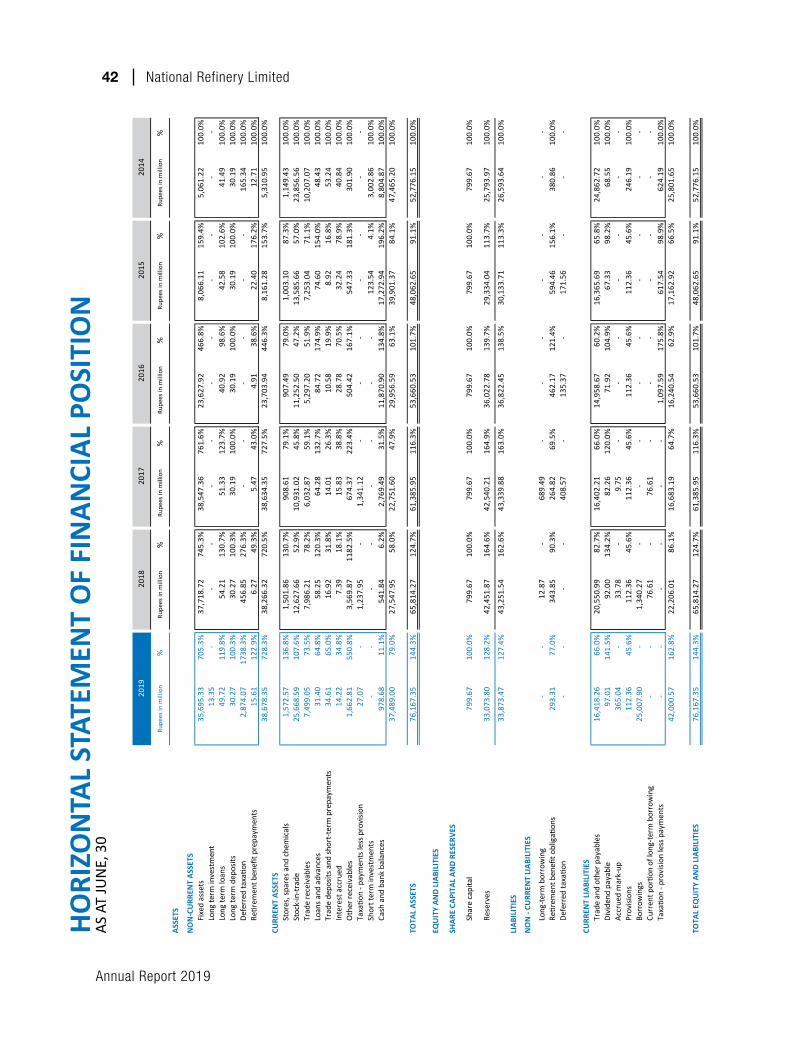
42 National Refinery LimitedHO
RIZO
NTA
L ST
ATEM
ENT
OF
FIN
ANCI
AL P
OSI
TIO
NAS
ATJUNE,30
Rup
ees
in m
illio
n %
Rup
ees
in m
illio
n %
Rup
ees
in m
illio
n %
Rup
ees
in m
illio
n %
Rup
ees
in m
illio
n %
Rup
ees
in m
illio
n %
ASSE
TS
NO
N-C
URR
ENT
ASSE
TSFi
xed
asse
ts35
,695
.33
705.
3%37
,718
.72
74
5.3%
38,5
47.3
6
761.
6%23
,627
.92
46
6.8%
8,06
6.11
15
9.4%
5,06
1.22
10
0.0%
Long
term
inve
stm
ent
13.3
5
Long
term
loan
s 49
.72
11
9.8%
54.2
1
130.
7%51
.33
12
3.7%
40.9
2
98.6
%42
.58
10
2.6%
41.4
9
100.
0%Lo
ng te
rm d
epos
its30
.27
10
0.3%
30.2
7
100.
3%30
.19
10
0.0%
30.1
9
100.
0%30
.19
10
0.0%
30.1
9
100.
0%De
ferr
ed ta
xatio
n 2,
874.
07
1738
.3%
456.
85
27
6.3%
-
-
-
-
-
-
165.
34
10
0.0%
Retir
emen
t ben
efit p
repa
ymen
ts15
.61
12
2.9%
6.27
49.3
%5.
47
43
.0%
4.91
38.6
%22
.40
17
6.2%
12.7
1
100.
0%38
,678
.35
728.
3%38
,266
.32
72
0.5%
38,6
34.3
5
727.
5%23
,703
.94
44
6.3%
8,16
1.28
15
3.7%
5,31
0.95
10
0.0%
CURR
ENT
ASSE
TS
Stor
es, s
pare
s and
che
mic
als
1,57
2.57
13
6.8%
1,50
1.86
13
0.7%
908.
61
79
.1%
907.
49
79
.0%
1,00
3.10
87
.3%
1,14
9.43
10
0.0%
Stoc
k-in
-trad
e 25
,668
.59
107.
6%12
,627
.66
52
.9%
10,9
31.0
2
45.8
%11
,252
.50
47
.2%
13,5
85.6
6
57.0
%23
,856
.56
10
0.0%
Trad
e re
ceiv
able
s7,
499.
05
73.5
%7,
986.
21
78.2
%6,
032.
87
59.1
%5,
297.
20
51.9
%7,
253.
04
71.1
%10
,207
.07
10
0.0%
Loan
s and
adv
ance
s31
.40
64
.8%
58.2
5
120.
3%64
.28
13
2.7%
84.7
2
174.
9%74
.60
15
4.0%
48.4
3
100.
0%Tr
ade
depo
sits a
nd sh
ort-t
erm
pre
paym
ents
34
.61
65
.0%
16.9
2
31.8
%14
.01
26
.3%
10.5
8
19.9
%8.
92
16
.8%
53.2
4
100.
0%In
tere
st a
ccru
ed14
.22
34
.8%
7.39
18.1
%15
.83
38
.8%
28.7
8
70.5
%32
.24
78
.9%
40.8
4
100.
0%O
ther
rece
ivab
les
1,66
2.81
55
0.8%
3,56
9.87
11
82.5
%67
4.37
223.
4%50
4.42
167.
1%54
7.33
181.
3%30
1.90
100.
0%Ta
xatio
n - p
aym
ents
less
pro
visio
n27
.07
--
--
--
--
--
--
1,23
7.95
-
1,
341.
12
-
-
-
-
-
-
-
Shor
t ter
m in
vest
men
ts-
-
-
-
-
-
-
-
12
3.54
4.1%
3,00
2.86
10
0.0%
Cash
and
ban
k ba
lanc
es
978.
6 8
11
.1%
541.
84
6.
2%2,
769.
49
31.5
%11
,870
.90
13
4.8%
17,2
72.9
4
196.
2%8,
804.
87
100.
0%37
,489
.00
79.0
%27
,547
.95
58
.0%
22,7
51.6
0
47.9
%29
,956
.59
63
.1%
39,9
01.3
7
84.1
%47
,465
.20
10
0.0%
TOTA
L AS
SETS
76
,167
.35
144.
3%65
,814
.27
12
4.7%
61,3
85.9
5
116.
3%53
,660
.53
10
1.7%
48,0
62.6
5
91.1
%52
,776
.15
10
0.0%
EQU
ITY
AND
LIAB
ILIT
IES
SHAR
E CA
PITA
L AN
D RE
SERV
ES
Shar
e ca
pita
l 79
9.67
100.
0%79
9.67
100.
0%79
9.67
100.
0%79
9.67
100.
0%79
9.67
100.
0%79
9.67
100.
0%
Rese
rves
33,0
73.8
0
12
8.2%
42,4
51.8
7
164.
6%42
,540
.21
16
4.9%
36,0
22.7
8
139.
7%29
,334
.04
11
3.7%
25,7
93.9
7
100.
0%
33,8
73.4
7
12
7.4%
43,2
51.5
4
162.
6%43
,339
.88
16
3.0%
36,8
22.4
5
138.
5%30
,133
.71
11
3.3%
26,5
93.6
4
100.
0%LI
ABIL
ITIE
S
NO
N -
CURR
ENT
LIAB
ILIT
IES
Long
-term
bor
row
ing
-
-
12.8
7
-
689.
49
-
-
Retir
emen
t ben
efit o
blig
ation
s29
3.31
77.0
%34
3.85
90.3
%26
4.82
69.5
%46
2.17
121.
4%59
4.46
156.
1%38
0.86
100.
0%De
ferr
ed ta
xatio
n -
-
-
-
40
8.57
-
135.
37
-
171.
56
-
- -
--
-
- -
CURR
ENT
LIAB
ILIT
IES
Trad
e an
d ot
her p
ayab
les
16,4
18.2
6
66
.0%
20,5
50.9
9
82.7
%16
,402
.21
66
.0%
14,9
58.6
7
60.2
%16
,365
.69
65
.8%
24,8
62.7
2
100.
0%Di
vide
nd p
ayab
le97
.01
14
1.5%
92.0
0
134.
2%82
.26
12
0.0%
71.9
2
104.
9%67
.33
98
.2%
68.5
5
100.
0%Ac
crue
d m
ark-
up36
5.04
-
33
.78
-
9.
75
-
-
-
-
-
-
-
Pr
ovisi
ons
112.
36
45
.6%
112.
36
45
.6%
112.
36
45
.6%
112.
36
45
.6%
112.
36
45
.6%
246.
19
10
0.0%
Borr
owin
gs25
,007
.90
-
1,
340.
27
-
-
-
-
-
-
-
-
-
Curr
ent p
ortio
n of
long
-term
bor
row
ing
-
-
76.6
1
-
76.6
1
-
-
-
-
-
-
-
Taxatio
n - p
rovi
sion
less
pay
men
ts-
-
-
-
-
-
1,
097.
59
175.
8%61
7.54
98.9
%62
4.19
100.
0%42
,000
.57
162.
8%22
,206
.01
86
.1%
16,6
83.1
9
64.7
%16
,240
.54
62
.9%
17,1
62.9
2
66.5
%25
,801
.65
10
0.0%
TOTA
L EQ
UIT
Y AN
D LI
ABIL
ITIE
S 76
,167
.35
144.
3%65
,814
.27
12
4.7%
61,3
85.9
5
116.
3%53
,660
.53
10
1.7%
48,0
62.6
5
91.1
%52
,776
.15
10
0.0%
2019
2018
2017
2016
2015
2014
Annual Report 2019
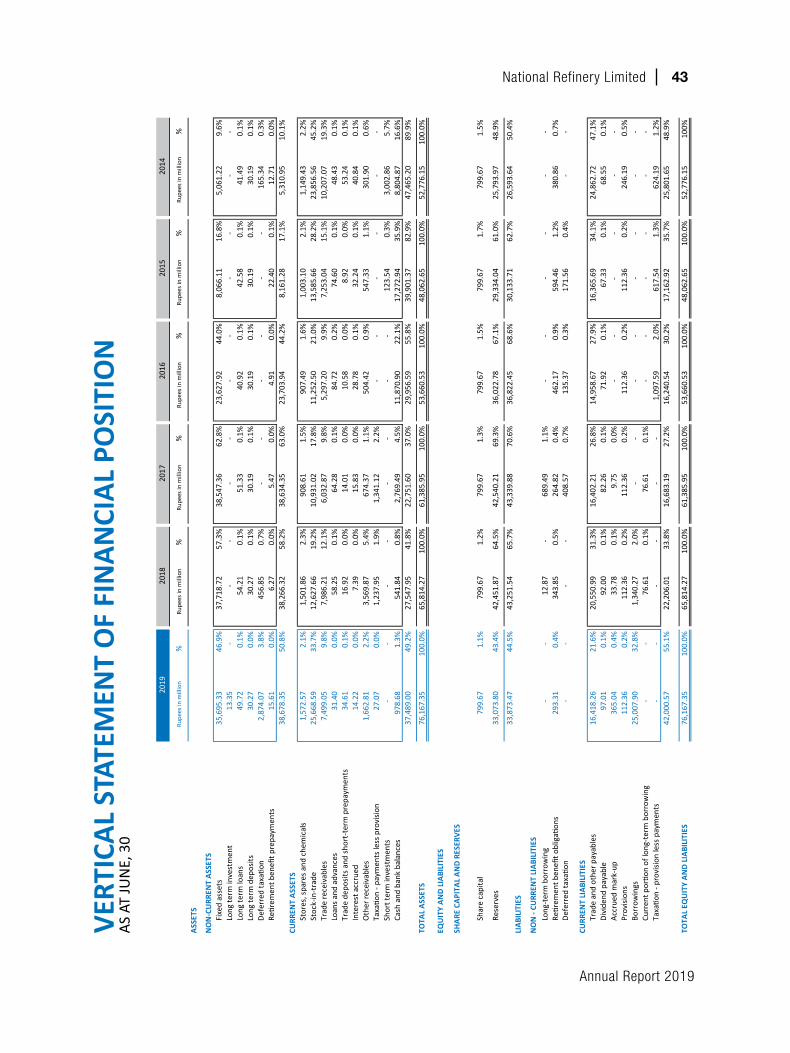
National Refinery Limited 43
VERT
ICAL
STA
TEM
ENT
OF
FIN
ANCI
AL P
OSI
TIO
N
ASATJUNE,30
Rup
ees
in m
illio
n %
Rup
ees
in m
illio
n %
Rup
ees
in m
illio
n %
Rup
ees
in m
illio
n %
Rup
ees
in m
illio
n %
Rup
ees
in m
illio
n %
ASSE
TS
NO
N-C
URR
ENT
ASSE
TSFi
xed
asse
ts35
,695
.33
46
.9%
37,7
18.7
2
57.3
%38
,547
.36
62
.8%
23,6
27.9
2
44.0
%8,
066.
11
16
.8%
5,06
1.22
9.6%
Long
term
inve
stm
ent
13.3
5
-
-
-
-
-
-
-
-
-
-
-
Long
term
loan
s 49
.72
0.
1%54
.21
0.
1%51
.33
0.
1%40
.92
0.
1%42
.58
0.
1%41
.49
0.
1%Lo
ng te
rm d
epos
its30
.27
0.
0%30
.27
0.
1%30
.19
0.
1%30
.19
0.
1%30
.19
0.
1%30
.19
0.
1%De
ferr
ed ta
xatio
n 2,
874.
07
3.
8%45
6.85
0.
7%-
-
-
-
-
-
16
5.34
0.
3%Re
tirem
ent b
enefi
t pre
paym
ents
15.6
1
0.0%
6.27
0.0%
5.47
0.0%
4.91
0.0%
22.4
0
0.1%
12.7
1
0.0%
38,6
78.3
5
50.8
%38
,266
.32
58
.2%
38,6
34.3
5
63.0
%23
,703
.94
44
.2%
8,16
1.28
17.1
%5,
310.
95
10
.1%
CURR
ENT
ASSE
TS
Stor
es, s
pare
s and
che
mic
als
1,57
2.57
2.1%
1,50
1.86
2.3%
908.
61
1.5%
907.
49
1.6%
1,00
3.10
2.1%
1,14
9.43
2.2%
Stoc
k-in
-tra
de
25,6
68.5
9
33.7
%12
,627
.66
19
.2%
10,9
31.0
2
17.8
%11
,252
.50
21
.0%
13,5
85.6
6
28.2
%23
,856
.56
45
.2%
Trad
e re
ceiv
able
s7,
499.
05
9.
8%7,
986.
21
12
.1%
6,03
2.87
9.8%
5,29
7.20
9.9%
7,25
3.04
15.1
%10
,207
.07
19
.3%
Loan
s and
adv
ance
s31
.40
0.
0%58
.25
0.
1%64
.28
0.
1%84
.72
0.
2%74
.60
0.
1%48
.43
0.
1%Tr
ade
depo
sits a
nd sh
ort-
term
pre
paym
ents
34
.61
0.
1%16
.92
0.
0%14
.01
0.
0%10
.58
0.
0%8.
92
0.
0%53
.24
0.
1%In
tere
st a
ccru
ed14
.22
0.
0%7.
39
0.
0%15
.83
0.
0%28
.78
0.
1%32
.24
0.
1%40
.84
0.
1%O
ther
rece
ivab
les
1,66
2.81
2.2%
3,56
9.87
5.4%
674.
37
1.1%
504.
42
0.9%
547.
33
1.1%
301.
90
0.6%
Taxatio
n - p
aym
ents
less
pro
visio
n27
.07
0.
0%1,
237.
95
1.
9%1,
341.
12
2.
2%-
-
-
-
-
-
Sh
ort t
erm
inve
stm
ents
-
-
-
-
-
-
-
-
123.
54
0.3%
3,00
2.86
5.7%
Cash
and
ban
k ba
lanc
es
978.
68
1.3%
541.
84
0.8%
2,76
9.49
4.5%
11,8
70.9
0
22.1
%17
,272
.94
35
.9%
8,80
4.87
16.6
%37
,489
.00
49
.2%
27,5
47.9
5
41.8
%22
,751
.60
37
.0%
29,9
56.5
9
55.8
%39
,901
.37
82
.9%
47,4
65.2
0
89.9
%
TOTA
L ASS
ETS
76,1
67.3
5
100.
0%65
,814
.27
10
0.0%
61,3
85.9
5
100.
0%53
,660
.53
10
0.0%
48,0
62.6
5
100.
0%52
,776
.15
10
0.0%
EQU
ITY
AND
LIAB
ILIT
IES
SHAR
E CA
PITA
L AN
D R
ESER
VES
Shar
e ca
pita
l 79
9.67
1.
1%79
9.67
1.
2%79
9.67
1.
3%79
9.67
1.
5%79
9.67
1.
7%79
9.67
1.
5%
Rese
rves
33,0
73.8
0
43.4
%42
,451
.87
64
.5%
42,5
40.2
1
69.3
%36
,022
.78
67
.1%
29,3
34.0
4
61.0
%25
,793
.97
48
.9%
33,8
73.4
7
44.5
%43
,251
.54
65
.7%
43,3
39.8
8
70.6
%36
,822
.45
68
.6%
30,1
33.7
1
62.7
%26
,593
.64
50
.4%
LIAB
ILIT
IES
NO
N -
CURR
ENT
LIAB
ILIT
IES
Long
-ter
m b
orro
win
g-
-
12
.87
-
68
9.49
1.
1%-
-
-
-
-
-
Re
tirem
ent b
enefi
t obl
igati
ons
293.
31
0.4%
343.
85
0.5%
264.
82
0.4%
462.
17
0.9%
594.
46
1.2%
380.
86
0.7%
Defe
rred
taxatio
n -
-
-
-
40
8.57
0.
7%13
5.37
0.
3%17
1.56
0.
4%-
-
CURR
ENT
LIAB
ILIT
IES
Trad
e an
d ot
her p
ayab
les
16,4
18.2
6
21.6
%20
,550
.99
31
.3%
16,4
02.2
1
26.8
%14
,958
.67
27
.9%
16,3
65.6
9
34.1
%24
,862
.72
47
.1%
Divi
dend
pay
able
97.0
1
0.1%
92.0
0
0.1%
82.2
6
0.1%
71.9
2
0.1%
67.3
3
0.1%
68.5
5
0.1%
Accr
ued
mar
k-up
365.
04
0.4%
33.7
8
0.1%
9.75
0.0%
Prov
ision
s11
2.36
0.
2%11
2.36
0.
2%11
2.36
0.
2%11
2.36
0.
2%11
2.36
0.
2%24
6.19
0.
5%Bo
rrow
ings
25,0
07.9
0
32.8
%1,
340.
27
2.
0%-
-
--
--
--
-
-
-
-
-
-
Cu
rren
t portio
n of
long
-ter
m b
orro
win
g-
-
76
.61
0.
1%76
.61
0.
1%-
-
-
-
-
-
Ta
xatio
n - p
rovi
sion
less
pay
men
ts-
-
-
-
-
-
1,
097.
59
2.
0%61
7.54
1.
3%62
4.19
1.
2%42
,000
.57
55
.1%
22,2
06.0
1
33.8
%16
,683
.19
27
.2%
16,2
40.5
4
30.2
%17
,162
.92
35
.7%
25,8
01.6
5
48.9
%
TOTA
L EQ
UIT
Y AN
D LI
ABIL
ITIE
S 76
,167
.35
10
0.0%
65,8
14.2
7
100.
0%61
,385
.95
10
0.0%
53,6
60.5
3
100.
0%48
,062
.65
10
0.0%
52,7
76.1
5
100%
2019
2017
2014
2016
2018
2015
Annual Report 2019
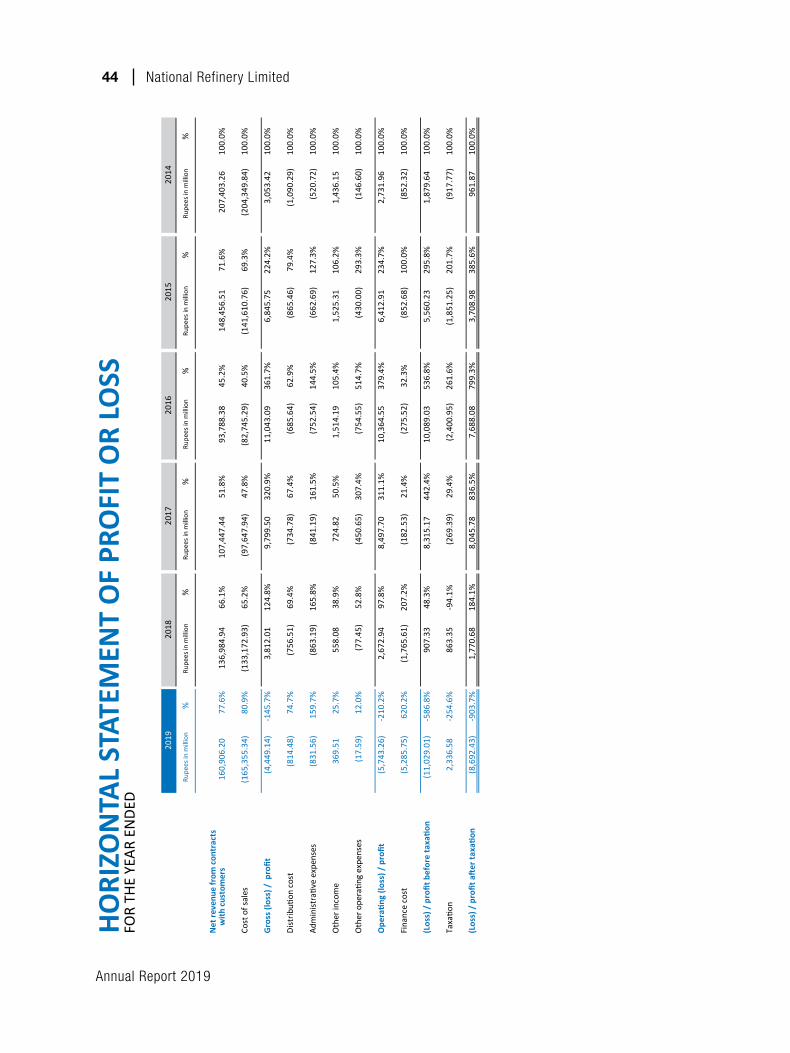
44 National Refinery Limited
HORI
ZON
TAL
STAT
EMEN
T O
F PR
OFI
T O
R LO
SS
FORTH
EYEAR
ENDE
D
Rup
ees i
n m
illio
n %
Rup
ees i
n m
illio
n %
Rup
ees i
n m
illio
n %
Rup
ees i
n m
illio
n %
Rup
ees i
n m
illio
n %
Rup
ees i
n m
illio
n %
Net
reve
nue
from
con
trac
ts
with
cus
tom
ers
160,
906.
20
77
.6%
136,
984.
94
66.1
%10
7,44
7.44
51.8
%93
,788
.38
45.2
%14
8,45
6.51
71
.6%
207,
403.
26
100.
0%
Cost
of s
ales
(165
,355
.34)
80
.9%
(133
,172
.93)
65.2
%(9
7,64
7.94
)
47
.8%
(82,
745.
29)
40.5
%(1
41,6
10.7
6)
69
.3%
(204
,349
.84)
10
0.0%
Gro
ss (l
oss)
/ p
rofit
(4,4
49.1
4)
-145
.7%
3,81
2.01
124.
8%9,
799.
50
320.
9%11
,043
.09
361.
7%6,
845.
75
22
4.2%
3,05
3.42
100.
0%
Dist
ributi
on c
ost
(814
.48)
74.7
%(7
56.5
1)
69.4
%(7
34.7
8)
67
.4%
(685
.64)
62.9
%(8
65.4
6)
79.4
%(1
,090
.29)
100.
0%
Adm
inist
rativ
e ex
pens
es(8
31.5
6)
15
9.7%
(863
.19)
16
5.8%
(841
.19)
161.
5%(7
52.5
4)
14
4.5%
(662
.69)
12
7.3%
(520
.72)
10
0.0%
Oth
er in
com
e36
9.51
25.7
%55
8.08
38
.9%
724.
82
50
.5%
1,51
4.19
10
5.4%
1,52
5.31
106.
2%1,
436.
15
10
0.0%
Oth
er o
peratin
g ex
pens
es(1
7.59
)
12.0
%(7
7.45
)
52
.8%
(450
.65)
307.
4%(7
54.5
5)
51
4.7%
(430
.00)
29
3.3%
(146
.60)
10
0.0%
Ope
ratin
g (lo
ss) /
pro
fit
(5,7
43.2
6)
-210
.2%
2,67
2.94
97.8
%8,
497.
70
311.
1%10
,364
.55
379.
4%6,
412.
91
23
4.7%
2,73
1.96
100.
0%
Fina
nce
cost
(5,2
85.7
5)
620.
2%(1
,765
.61)
207.
2%(1
82.5
3)
21
.4%
(275
.52)
32.3
%(8
52.6
8)
100.
0%(8
52.3
2)
100.
0%
(Los
s) /
pro
fit b
efor
e ta
xatio
n (1
1,02
9.01
)
-5
86.8
%90
7.33
48
.3%
8,31
5.17
44
2.4%
10,0
89.0
3
53
6.8%
5,56
0.23
295.
8%1,
879.
64
10
0.0%
Taxatio
n 2,
336.
58
-254
.6%
863.
35
-94.
1%(2
69.3
9)
29
.4%
(2,4
00.9
5)
261.
6%(1
,851
.25)
201.
7%(9
17.7
7)
100.
0%
(Los
s) /
pro
fit a
fter
taxa
tion
(8,6
92.4
3)
-903
.7%
1,77
0.68
184.
1%8,
045.
78
836.
5%7,
688.
08
799.
3%3,
708.
98
38
5.6%
961.
87
10
0.0%
2019
2014
2018
2017
2016
2015
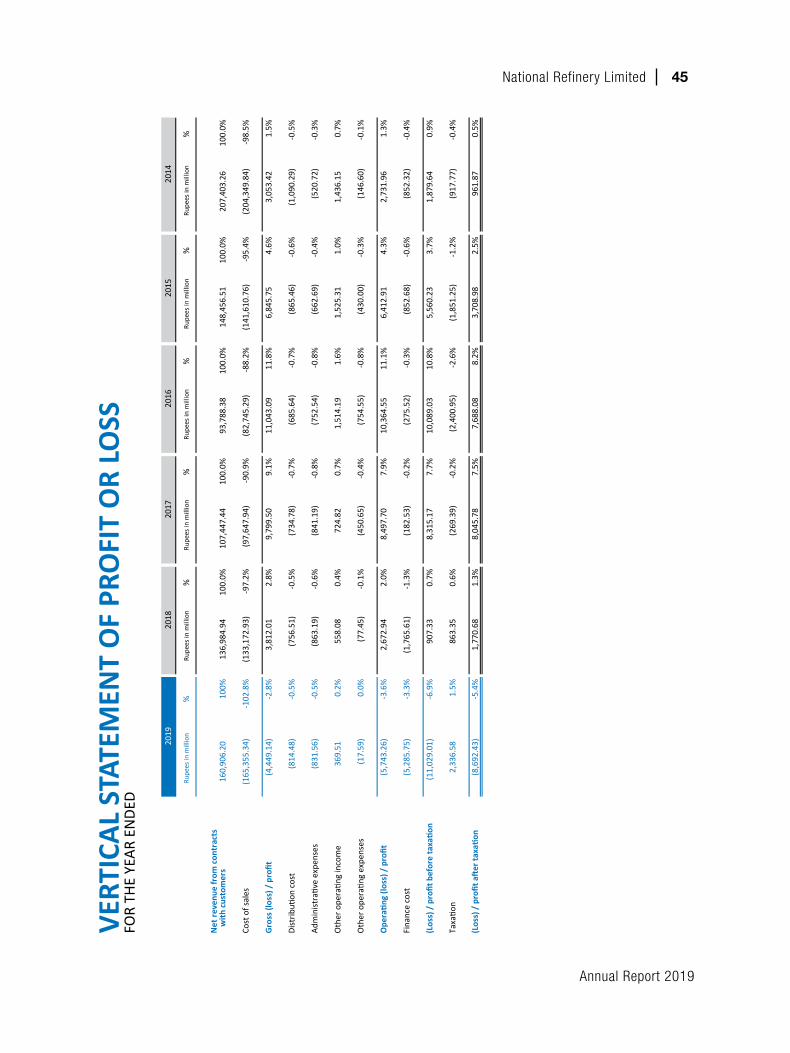
Annual Report 2019
National Refinery Limited 45
VERT
ICAL
STA
TEM
ENT
OF
PRO
FIT
OR
LOSS
FO
RTH
EYEAR
ENDE
D
Rup
ees i
n m
illio
n %
Rup
ees i
n m
illio
n %
Rup
ees i
n m
illio
n %
Rup
ees i
n m
illio
n %
Rup
ees i
n m
illio
n %
Rup
ees i
n m
illio
n %
Net
reve
nue
from
con
trac
ts
with
cus
tom
ers
160,
906.
20
10
0%13
6,98
4.94
100.
0%10
7,44
7.44
100.
0%93
,788
.38
10
0.0%
148,
456.
51
10
0.0%
207,
403.
26
100.
0%
Cost
of s
ales
(165
,355
.34)
-102
.8%
(133
,172
.93)
-97.
2%(9
7,64
7.94
)
-90.
9%(8
2,74
5.29
)
-88.
2%(1
41,6
10.7
6)
-9
5.4%
(204
,349
.84)
-9
8.5%
Gro
ss (l
oss)
/ p
rofit
(4,4
49.1
4)
-2.8
%3,
812.
01
2.
8%9,
799.
50
9.
1%11
,043
.09
11
.8%
6,84
5.75
4.6%
3,05
3.42
1.
5%
Dist
ributi
on c
ost
(814
.48)
-0.5
%(7
56.5
1)
-0
.5%
(734
.78)
-0.7
%(6
85.6
4)
-0
.7%
(865
.46)
-0.6
%(1
,090
.29)
-0.5
%
Adm
inist
rativ
e ex
pens
es(8
31.5
6)
-0
.5%
(863
.19)
-0.6
%(8
41.1
9)
-0
.8%
(752
.54)
-0.8
%(6
62.6
9)
-0
.4%
(520
.72)
-0
.3%
Oth
er o
peratin
g in
com
e36
9.51
0.
2%55
8.08
0.
4%72
4.82
0.
7%1,
514.
19
1.
6%1,
525.
31
1.
0%1,
436.
15
0.7%
Oth
er o
peratin
g ex
pens
es(1
7.59
)
0.0%
(77.
45)
-0
.1%
(450
.65)
-0.4
%(7
54.5
5)
-0
.8%
(430
.00)
-0.3
%(1
46.6
0)
-0.1
%
Ope
ratin
g (lo
ss) /
pro
fit
(5,7
43.2
6)
-3.6
%2,
672.
94
2.
0%8,
497.
70
7.
9%10
,364
.55
11
.1%
6,41
2.91
4.3%
2,73
1.96
1.
3%
Fina
nce
cost
(5,2
85.7
5)
-3.3
%(1
,765
.61)
-1
.3%
(182
.53)
-0.2
%(2
75.5
2)
-0
.3%
(852
.68)
-0.6
%(8
52.3
2)
-0.4
%
(Los
s) /
pro
fit b
efor
e ta
xatio
n (1
1,02
9.01
)
-6.9
%90
7.33
0.
7%8,
315.
17
7.
7%10
,089
.03
10
.8%
5,56
0.23
3.7%
1,87
9.64
0.
9%
Taxatio
n 2,
336.
58
1.
5%86
3.35
0.
6%(2
69.3
9)
-0
.2%
(2,4
00.9
5)
-2.6
%(1
,851
.25)
-1
.2%
(917
.77)
-0
.4%
(Los
s) /
pro
fit a
fter
taxa
tion
(8,6
92.4
3)
-5.4
%1,
770.
68
1.
3%8,
045.
78
7.
5%7,
688.
08
8.
2%3,
708.
98
2.
5%96
1.87
0.5%
2019
2016
2015
2014
2018
2017
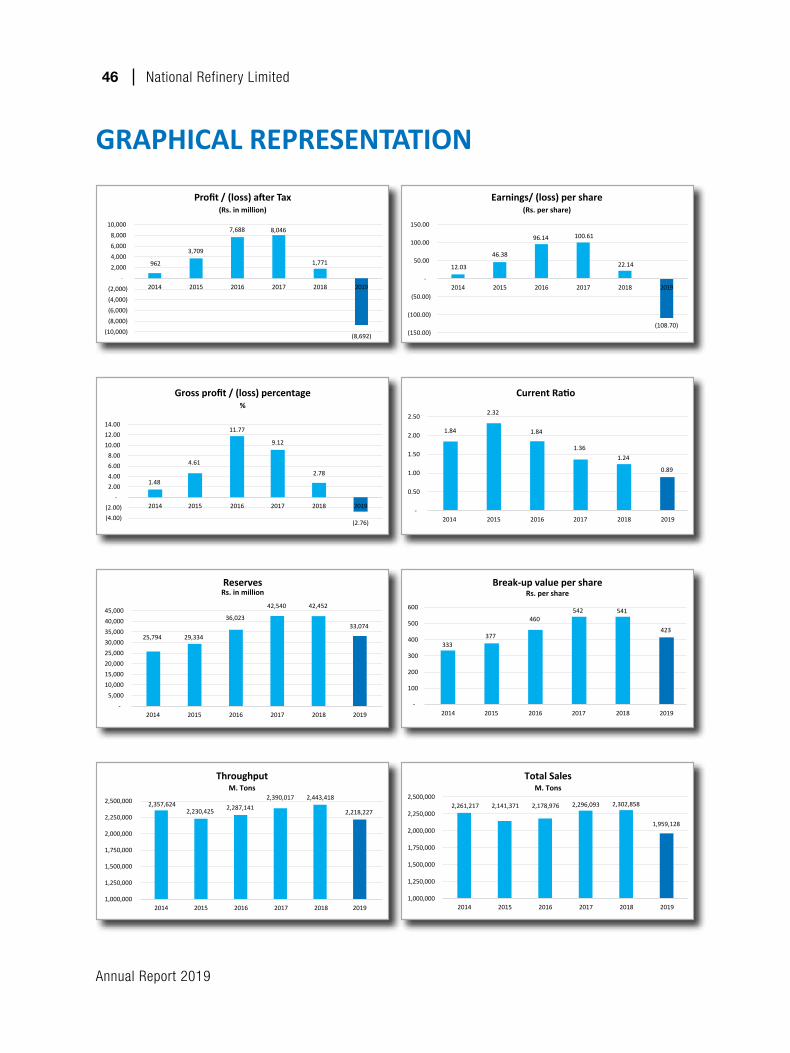
Annual Report 2019
46 National Refinery Limited
GRAPHICAL REPRESENTATION
(10,000) (8,000) (6,000) (4,000) (2,000)
-
2,000 4,000 6,000 8,000
10,000
962
2014
3,709
2015
7,688
2016
8,046
2017
1,771
2018
(8,692)
2019
Profit / (loss) after Tax(Rs. in million)
12.03
46.38
96.14 100.61
22.14
(108.70) (150.00)
(100.00)
(50.00)
-
50.00
100.00
150.00
2014 2015 2016 2017 2018 2019
Earnings/ (loss) per share(Rs. per share)
1.84
2.32
1.84
1.36 1.24
0.89
-
0.50
1.00
1.50
2.00
2.50
2014 2015 2016 2017 2018 2019
Current Ratio
M. TonsTotal Sales
Rs. in millionReserves
Rs. per shareBreak-up value per share
333 377
460 542 541
423
-
100
200
300
400
500
600
2014 2015 2016 2017 2018 2019
(4.00) (2.00)
- 2.00 4.00 6.00 8.00
10.00 12.00 14.00
1.48
2014
4.61
2015
11.77
2016
9.12
2017
2.78
2018
(2.76)
2019
%Gross profit / (loss) percentage
25,794 29,334
36,023
42,540 42,452
33,074
- 5,000
10,000 15,000 20,000 25,000 30,000 35,000 40,000 45,000
2014 2015 2016 2017 2018 2019
2,357,624 2,230,425 2,287,141
2,390,017 2,443,418
2,218,227
1,000,000
1,250,000
1,500,000
1,750,000
2,000,000
2,250,000
2,500,000
2014 2015 2016 2017 2018 2019
M. TonsThroughput
2,261,217 2,141,371 2,178,976 2,296,093 2,302,858
1,959,128
1,000,000
1,250,000
1,500,000
1,750,000
2,000,000
2,250,000
2,500,000
2014 2015 2016 2017 2018 2019
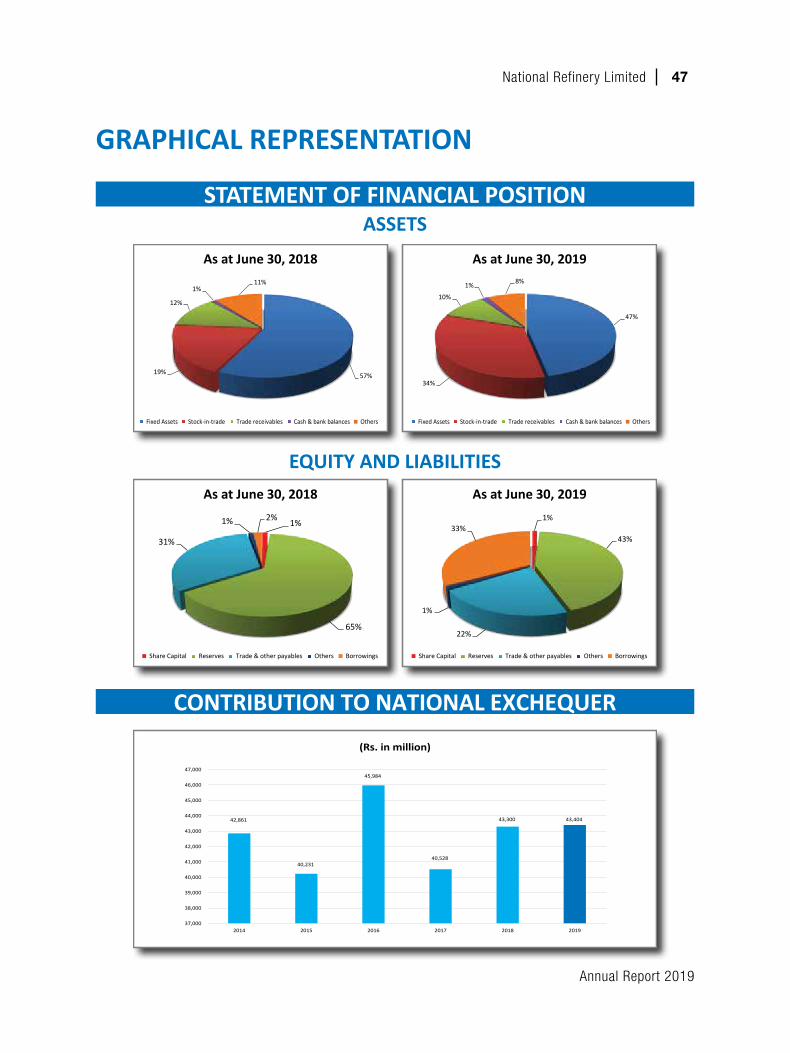
Annual Report 2019
National Refinery Limited 47
GRAPHICAL REPRESENTATION
ASSETSSTATEMENT OF FINANCIAL POSITION
CONTRIBUTION TO NATIONAL EXCHEQUER
As at June 30, 2018 As at June 30, 2019
As at June 30, 2018 As at June 30, 2019
Fixed Assets Stock-in-trade Trade receivables Cash & bank balances Others Fixed Assets Stock-in-trade Trade receivables Cash & bank balances Others
Share Capital Reserves Trade & other payables Others BorrowingsShare Capital Reserves Trade & other payables Others Borrowings
37,000
38,000
39,000
40,000
41,000
42,000
43,000
44,000
45,000
46,000
47,000
42,861
2014
40,231
2015
45,984
2016
40,528
2017
43,300
2018
43,404
2019
(Rs. in million)
47%
34%
10%
1% 8%
57%19%
12%
1%11%
1%1% 2%
31%
65%
43%
22%
1%
33%1%
As at June 30, 2018 As at June 30, 2019
As at June 30, 2018 As at June 30, 2019
Fixed Assets Stock-in-trade Trade receivables Cash & bank balances Others Fixed Assets Stock-in-trade Trade receivables Cash & bank balances Others
Share Capital Reserves Trade & other payables Others BorrowingsShare Capital Reserves Trade & other payables Others Borrowings
37,000
38,000
39,000
40,000
41,000
42,000
43,000
44,000
45,000
46,000
47,000
42,861
2014
40,231
2015
45,984
2016
40,528
2017
43,300
2018
43,404
2019
(Rs. in million)
47%
34%
10%
1% 8%
57%19%
12%
1%11%
1%1% 2%
31%
65%
43%
22%
1%
33%1%
EQUITY AND LIABILITIES
Annual Report 2019
National Refinery Limited 49
Annual AuditedFinancial Statements
Annual Report 2019
50 National Refinery Limited
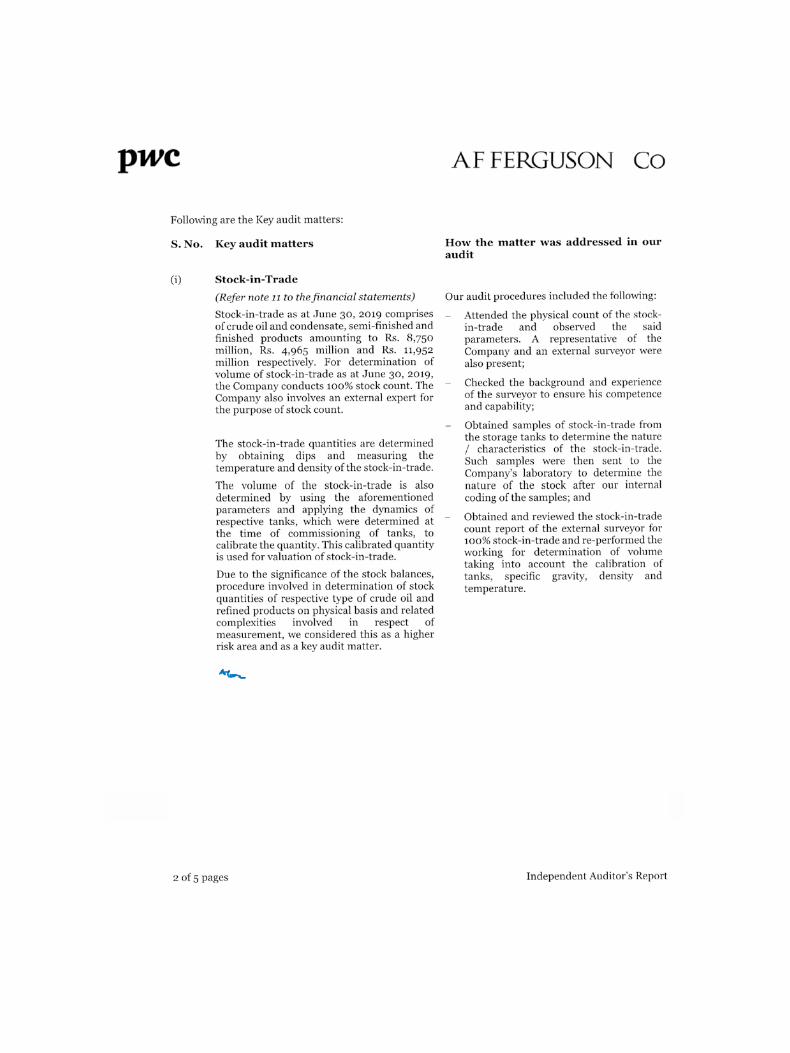
Annual Report 2019
National Refinery Limited 51

Annual Report 2019
52 National Refinery Limited

Annual Report 2019
National Refinery Limited 53

Annual Report 2019
54 National Refinery Limited
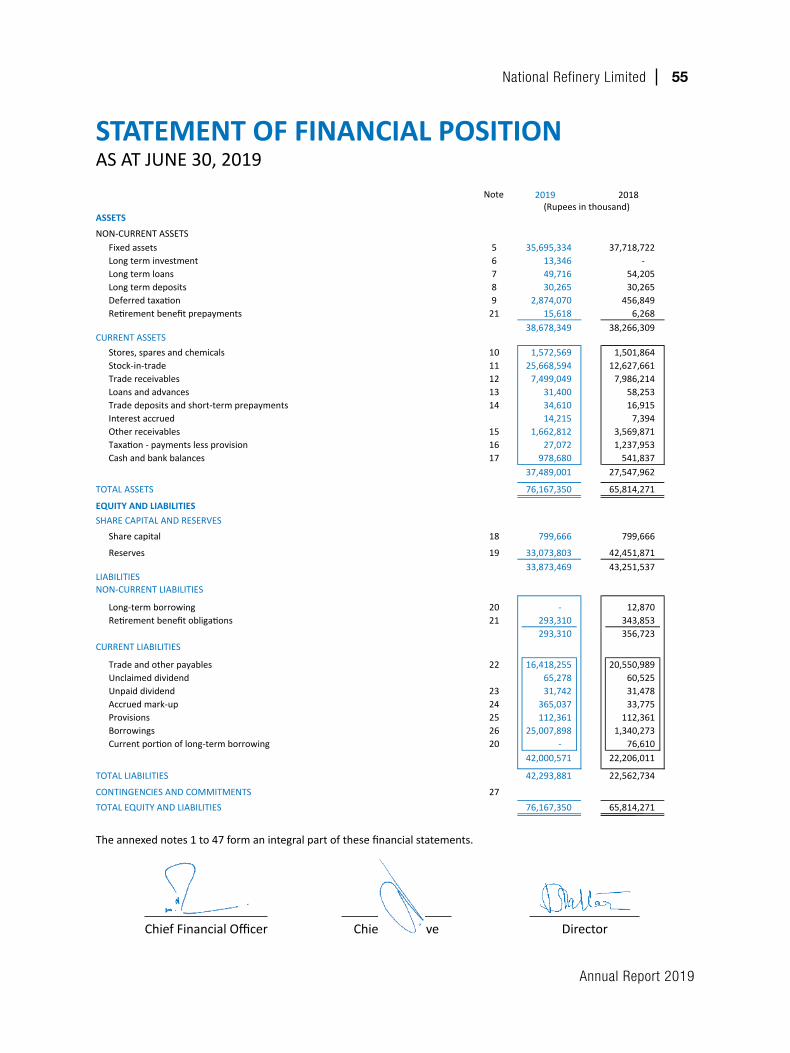
Annual Report 2019
National Refinery Limited 55
STATEMENT OF FINANCIAL POSITIONASATJUNE30,2019
Theannexednotes1to47formanintegralpartofthesefinancialstatements.
Note 2019 2018
ASSETS
NON-CURRENT ASSETSFixed assets 5 35,695,334 37,718,722 Long term investment 6 13,346 - Long term loans 7 49,716 54,205 Long term deposits 8 30,265 30,265 Deferred taxation 9 2,874,070 456,849 Retirement benefit prepayments 21 15,618 6,268
38,678,349 38,266,309 CURRENT ASSETS
Stores, spares and chemicals 10 1,572,569 1,501,864 Stock-in-trade 11 25,668,594 12,627,661 Trade receivables 12 7,499,049 7,986,214 Loans and advances 13 31,400 58,253 Trade deposits and short-term prepayments 14 34,610 16,915 Interest accrued 14,215 7,394 Other receivables 15 1,662,812 3,569,871 Taxation - payments less provision 16 27,072 1,237,953 Cash and bank balances 17 978,680 541,837
37,489,001 27,547,962
TOTAL ASSETS 76,167,350 65,814,271
EQUITY AND LIABILITIES SHARE CAPITAL AND RESERVES
Share capital 18 799,666 799,666
Reserves 19 33,073,803 42,451,871 33,873,469 43,251,537
LIABILITIES NON-CURRENT LIABILITIES
Long-term borrowing 20 - 12,870 Retirement benefit obligations 21 293,310 343,853
293,310 356,723 CURRENT LIABILITIES
Trade and other payables 22 16,418,255 20,550,989 Unclaimed dividend 65,278 60,525 Unpaid dividend 23 31,742 31,478 Accrued mark-up 24 365,037 33,775 Provisions 25 112,361 112,361 Borrowings 26 25,007,898 1,340,273 Current portion of long-term borrowing 20 - 76,610
42,000,571 22,206,011
TOTAL LIABILITIES 42,293,881 22,562,734
CONTINGENCIES AND COMMITMENTS 27TOTAL EQUITY AND LIABILITIES 76,167,350 65,814,271
(Rupees in thousand)Note 2019 2018
ASSETS
NON-CURRENT ASSETSFixed assets 5 35,695,334 37,718,722 Long term investment 6 13,346 - Long term loans 7 49,716 54,205 Long term deposits 8 30,265 30,265 Deferred taxation 9 2,874,070 456,849 Retirement benefit prepayments 21 15,618 6,268
38,678,349 38,266,309 CURRENT ASSETS
Stores, spares and chemicals 10 1,572,569 1,501,864 Stock-in-trade 11 25,668,594 12,627,661 Trade receivables 12 7,499,049 7,986,214 Loans and advances 13 31,400 58,253 Trade deposits and short-term prepayments 14 34,610 16,915 Interest accrued 14,215 7,394 Other receivables 15 1,662,812 3,569,871 Taxation - payments less provision 16 27,072 1,237,953 Cash and bank balances 17 978,680 541,837
37,489,001 27,547,962
TOTAL ASSETS 76,167,350 65,814,271
EQUITY AND LIABILITIES SHARE CAPITAL AND RESERVES
Share capital 18 799,666 799,666
Reserves 19 33,073,803 42,451,871 33,873,469 43,251,537
LIABILITIES NON-CURRENT LIABILITIES
Long-term borrowing 20 - 12,870 Retirement benefit obligations 21 293,310 343,853
293,310 356,723 CURRENT LIABILITIES
Trade and other payables 22 16,418,255 20,550,989 Unclaimed dividend 65,278 60,525 Unpaid dividend 23 31,742 31,478 Accrued mark-up 24 365,037 33,775 Provisions 25 112,361 112,361 Borrowings 26 25,007,898 1,340,273 Current portion of long-term borrowing 20 - 76,610
42,000,571 22,206,011
TOTAL LIABILITIES 42,293,881 22,562,734
CONTINGENCIES AND COMMITMENTS 27TOTAL EQUITY AND LIABILITIES 76,167,350 65,814,271
(Rupees in thousand)
ChiefFinancialOfficer DirectorChiefExecutive
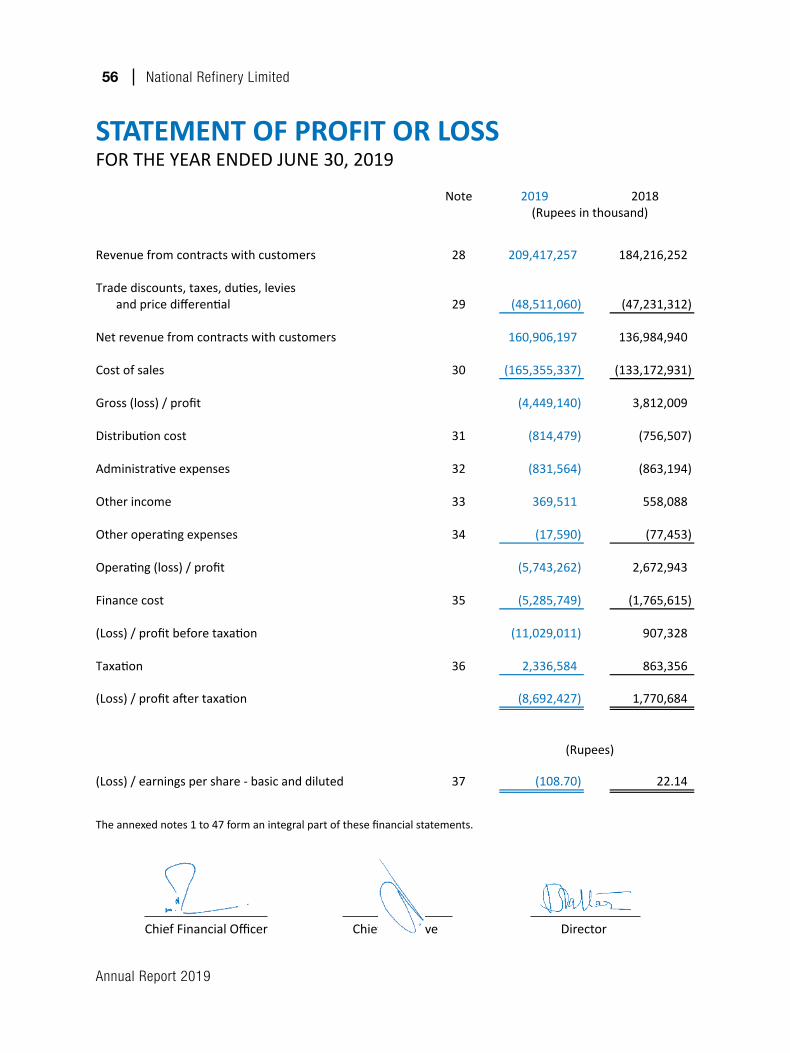
Annual Report 2019
56 National Refinery Limited
STATEMENT OF PROFIT OR LOSSFORTHEYEARENDEDJUNE30,2019
Theannexednotes1to47formanintegralpartofthesefinancialstatements.
Note 2019 2018(Rupees in thousand)
Revenue from contracts with customers 28 209,417,257 184,216,252
Trade discounts, taxes, duties, levies and price differential 29 (48,511,060) (47,231,312)
Net revenue from contracts with customers 160,906,197 136,984,940
Cost of sales 30 (165,355,337) (133,172,931)
Gross (loss) / profit (4,449,140) 3,812,009
Distribution cost 31 (814,479) (756,507)
Administrative expenses 32 (831,564) (863,194)
Other income 33 369,511 558,088
Other operating expenses 34 (17,590) (77,453)
Operating (loss) / profit (5,743,262) 2,672,943
Finance cost 35 (5,285,749) (1,765,615)
(Loss) / profit before taxation (11,029,011) 907,328
Taxation 36 2,336,584 863,356
(Loss) / profit after taxation (8,692,427) 1,770,684
(Loss) / earnings per share - basic and diluted 37 (108.70) 22.14
(Rupees)
ChiefExecutiveChiefFinancialOfficer Director
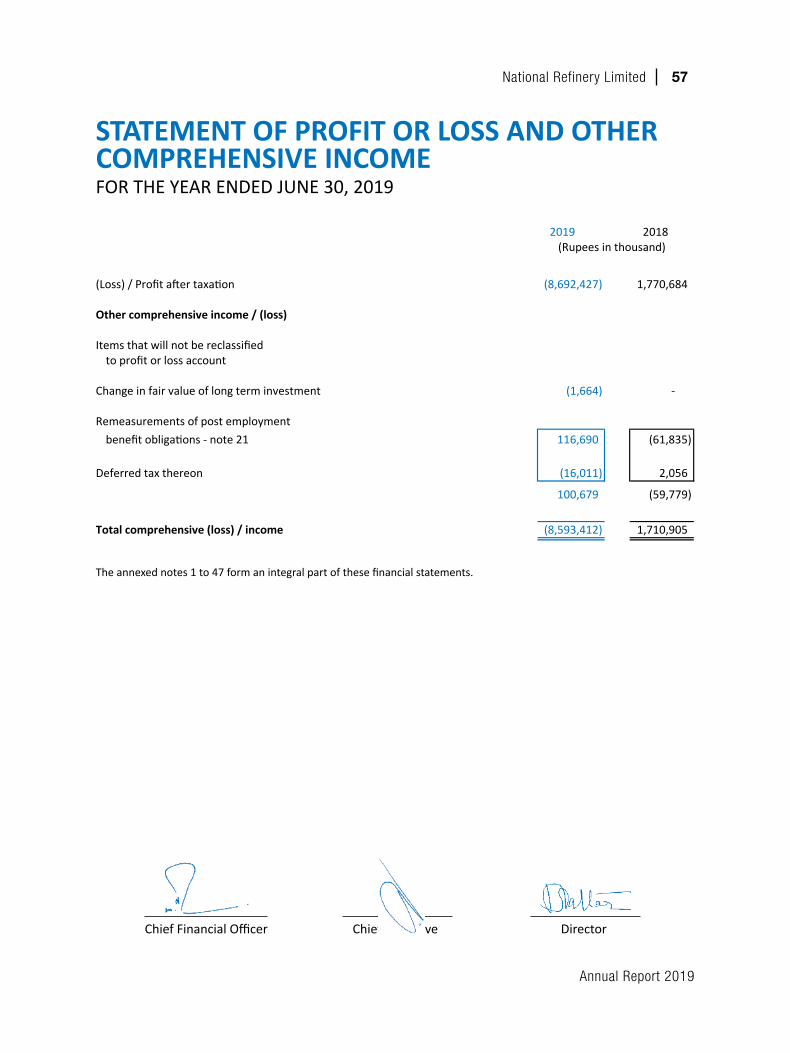
Annual Report 2019
National Refinery Limited 57
STATEMENT OF PROFIT OR LOSS AND OTHERCOMPREHENSIVE INCOMEFORTHEYEARENDEDJUNE30,2019
Theannexednotes1to47formanintegralpartofthesefinancialstatements.
2019 2018
(Loss) / Profit after taxation (8,692,427) 1,770,684
Other comprehensive income / (loss)
Items that will not be reclassified to profit or loss account
Change in fair value of long term investment (1,664) -
Remeasurements of post employment benefit obligations - note 21 116,690 (61,835)
Deferred tax thereon (16,011) 2,056
100,679 (59,779)
Total comprehensive (loss) / income (8,593,412) 1,710,905
(Rupees in thousand)
ChiefExecutiveChiefFinancialOfficer Director
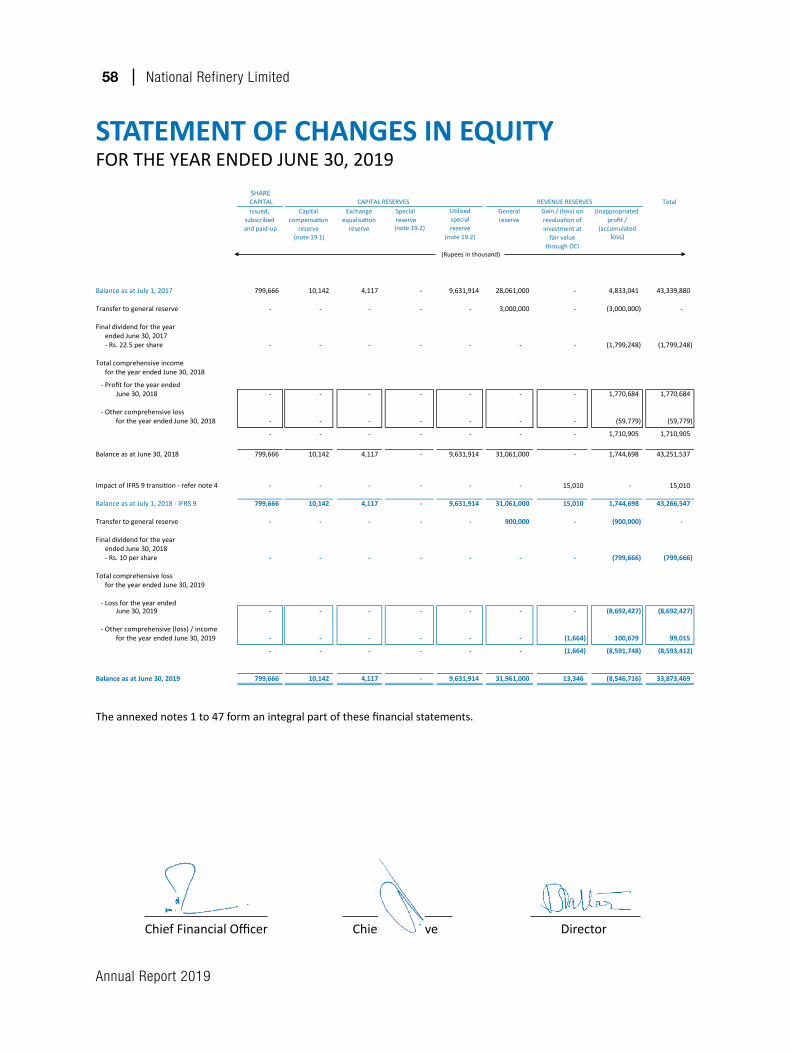
Annual Report 2019
58 National Refinery Limited
ChiefExecutiveChiefFinancialOfficer Director
STATEMENT OF CHANGES IN EQUITYFORTHEYEARENDEDJUNE30,2019
Theannexednotes1to47formanintegralpartofthesefinancialstatements.
SHARE CAPITAL Total
Issued, Capital Exchange Special Utilised General Unappropriated subscribed compensation equalisation reserve special reserve profit /and paid-up reserve reserve (note 19.2) reserve (accumulated
(note 19.1) (note 19.2) loss)
Balance as at July 1, 2017 799,666 10,142 4,117 - 9,631,914 28,061,000 - 4,833,041 43,339,880
Transfer to general reserve - - - - - 3,000,000 - (3,000,000) -
Final dividend for the year ended June 30, 2017- Rs. 22.5 per share - - - - - - - (1,799,248) (1,799,248)
Total comprehensive income for the year ended June 30, 2018
- Profit for the year ended June 30, 2018 - - - - - - - 1,770,684 1,770,684
- Other comprehensive loss for the year ended June 30, 2018 - - - - - - - (59,779) (59,779)
- - - - - - - 1,710,905 1,710,905
Balance as at June 30, 2018 799,666 10,142 4,117 - 9,631,914 31,061,000 - 1,744,698 43,251,537
Impact of IFRS 9 transition - refer note 4 - - - - - - 15,010 - 15,010
Balance as at July 1, 2018 - IFRS 9 799,666 10,142 4,117 - 9,631,914 31,061,000 15,010 1,744,698 43,266,547
Transfer to general reserve - - - - - 900,000 - (900,000) -
Final dividend for the year ended June 30, 2018- Rs. 10 per share - - - - - - - (799,666) (799,666)
Total comprehensive loss for the year ended June 30, 2019
- Loss for the year ended June 30, 2019 - - - - - - - (8,692,427) (8,692,427)
- Other comprehensive (loss) / income for the year ended June 30, 2019 - - - - - - (1,664) 100,679 99,015
- - - - - - (1,664) (8,591,748) (8,593,412)
Balance as at June 30, 2019 799,666 10,142 4,117 - 9,631,914 31,961,000 13,346 (8,546,716) 33,873,469
CAPITAL RESERVES REVENUE RESERVESGain / (loss) on revaluation of investment at
fair value through OCI
(Rupees in thousand)
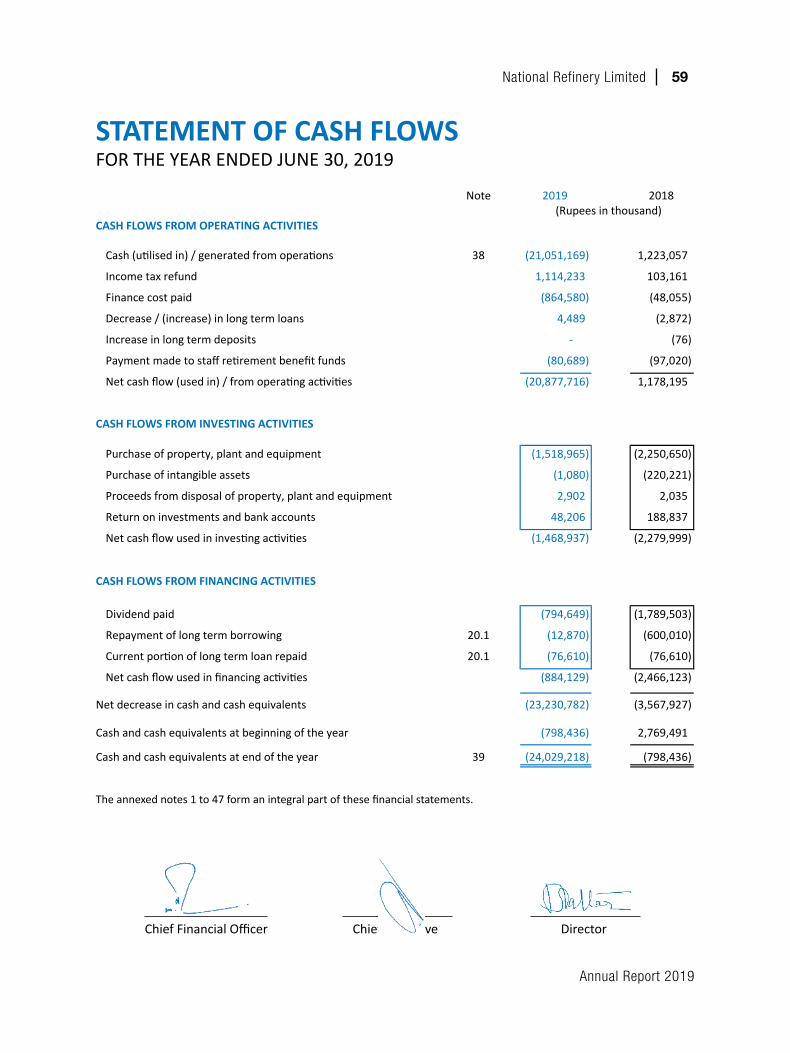
Annual Report 2019
National Refinery Limited 59
STATEMENT OF CASH FLOWSFORTHEYEARENDEDJUNE30,2019
Theannexednotes1to47formanintegralpartofthesefinancialstatements.
Note 2019 2018
CASH FLOWS FROM OPERATING ACTIVITIES
Cash (utilised in) / generated from operations 38 (21,051,169) 1,223,057
Income tax refund 1,114,233 103,161
Finance cost paid (864,580) (48,055)
Decrease / (increase) in long term loans 4,489 (2,872)
Increase in long term deposits - (76)
Payment made to staff retirement benefit funds (80,689) (97,020)
Net cash flow (used in) / from operating activities (20,877,716) 1,178,195
CASH FLOWS FROM INVESTING ACTIVITIES
Purchase of property, plant and equipment (1,518,965) (2,250,650)
Purchase of intangible assets (1,080) (220,221)
Proceeds from disposal of property, plant and equipment 2,902 2,035
Return on investments and bank accounts 48,206 188,837
Net cash flow used in investing activities (1,468,937) (2,279,999)
CASH FLOWS FROM FINANCING ACTIVITIES
Dividend paid (794,649) (1,789,503)
Repayment of long term borrowing 20.1 (12,870) (600,010)
Current portion of long term loan repaid 20.1 (76,610) (76,610)
Net cash flow used in financing activities (884,129) (2,466,123)
Net decrease in cash and cash equivalents (23,230,782) (3,567,927)
Cash and cash equivalents at beginning of the year (798,436) 2,769,491
Cash and cash equivalents at end of the year 39 (24,029,218) (798,436)
(Rupees in thousand)
ChiefExecutiveChiefFinancialOfficer Director
Annual Report 2019
60 National Refinery Limited
NOTES TO AND FORMING PART OF THE FINANCIAL STATEMENTSFORTHEYEARENDEDJUNE30,2019
1. LEGAL STATUS AND OPERATIONS
-
-
2.
a)
b)
c)
d)
3. SUMMARY OF SIGNIFICANT ACCOUNTING POLICIES
3.1 Statement of compliance
-
-
3.2 Critical accounting estimates and judgments
These financial statements have been prepared in accordance with the accounting andreporting standards as applicable in Pakistan. The accounting and reporting standardsapplicable in Pakistan comprise of:
International Financial Reporting Standards (IFRS) issued by the InternationalAccounting Standards Board (IASB) as notified under the Companies Act, 2017; and
Provisions of and directives issued under the Companies Act, 2017.
Where provisions of and directives issued under the Companies Act, 2017 differ from theIFRS, the provisions of and directives issued under the Companies Act, 2017 have beenfollowed.
The preparation of financial statements in conformity with approved accounting standards
The adoption of new accounting standards for financial instruments (IFRS 9) andrevenue from contracts with customers (IFRS 15) - Refer to note 4.
The principal accounting policies applied in the preparation of these financial statements areset out below. These policies have been consistently applied to all the years presented.
SUMMARY OF SIGNIFICANT TRANSACTIONS AND EVENTS THAT HAVE AFFECTED THE COMPANY'S FINANCIAL POSITION AND PERFORMANCE
Gross loss has been incurred as a result of lower refinery margin due to prices ininternational market and lower uplift of furnace oil.
Due to devaluation of Pak Rupee, the Company suffered net exchange loss mainly inrelation to liabilities denominated in US Dollar - Refer to note 35.
National Refinery Limited was incorporated in Pakistan on August 19, 1963 as a public limitedcompany and its shares are listed on the Pakistan Stock Exchange.
The Company is engaged in the manufacturing, production and sale of a large range ofpetroleum products. The refinery complex of the Company comprises of three refineries,consisting of two lube refineries, commissioned in 1966 and 1985, and a fuel refinery addedto the complex in 1977.
The geographical locations and addresses of the Company's business units, including plant areas under:
Refinery complex and registered office of the Company is situated at7-B Korangi Industrial Area, Karachi; and
Oil terminal at Keamari, Karachi.
Short term financing has been obtained primarily due to increase in working capitalrequirement - Refer to note 26.
Annual Report 2019
National Refinery Limited 61
NOTES TO AND FORMING PART OF THE FINANCIAL STATEMENTSFORTHEYEARENDEDJUNE30,2019
1. LEGAL STATUS AND OPERATIONS
-
-
2.
a)
b)
c)
d)
3. SUMMARY OF SIGNIFICANT ACCOUNTING POLICIES
3.1 Statement of compliance
-
-
3.2 Critical accounting estimates and judgments
These financial statements have been prepared in accordance with the accounting andreporting standards as applicable in Pakistan. The accounting and reporting standardsapplicable in Pakistan comprise of:
International Financial Reporting Standards (IFRS) issued by the InternationalAccounting Standards Board (IASB) as notified under the Companies Act, 2017; and
Provisions of and directives issued under the Companies Act, 2017.
Where provisions of and directives issued under the Companies Act, 2017 differ from theIFRS, the provisions of and directives issued under the Companies Act, 2017 have beenfollowed.
The preparation of financial statements in conformity with approved accounting standards
The adoption of new accounting standards for financial instruments (IFRS 9) andrevenue from contracts with customers (IFRS 15) - Refer to note 4.
The principal accounting policies applied in the preparation of these financial statements areset out below. These policies have been consistently applied to all the years presented.
SUMMARY OF SIGNIFICANT TRANSACTIONS AND EVENTS THAT HAVE AFFECTED THE COMPANY'S FINANCIAL POSITION AND PERFORMANCE
Gross loss has been incurred as a result of lower refinery margin due to prices ininternational market and lower uplift of furnace oil.
Due to devaluation of Pak Rupee, the Company suffered net exchange loss mainly inrelation to liabilities denominated in US Dollar - Refer to note 35.
National Refinery Limited was incorporated in Pakistan on August 19, 1963 as a public limitedcompany and its shares are listed on the Pakistan Stock Exchange.
The Company is engaged in the manufacturing, production and sale of a large range ofpetroleum products. The refinery complex of the Company comprises of three refineries,consisting of two lube refineries, commissioned in 1966 and 1985, and a fuel refinery addedto the complex in 1977.
The geographical locations and addresses of the Company's business units, including plant areas under:
Refinery complex and registered office of the Company is situated at7-B Korangi Industrial Area, Karachi; and
Oil terminal at Keamari, Karachi.
Short term financing has been obtained primarily due to increase in working capitalrequirement - Refer to note 26.
i. Taxation
ii. Post employment benefits
iii.
3.3 Changes in accounting standards, interpretations and pronouncements
(a)
IFRS 15 'Revenue from contracts with customers' - IFRS 15 replaces the previousrevenue standards: IAS 18 Revenue, IAS 11 Construction Contracts, and the relatedinterpretations on revenue recognition.
IFRS 15 introduces a single five-step model for revenue recognition and establishes acomprehensive framework for recognition of revenue from contracts with customersbased on a core principle that an entity should recognise revenue representing thetransfer of promised goods or services to customers at an amount that reflects theconsideration to which the entity expects to be entitled in exchange for those goods orservices.
The impact of changes laid down by these standards are detailed in note 4.
Estimates with respect to residual value, depreciation method and depreciable lives ofproperty, plant and equipment as disclosed in note 3.5 and 5.1 to these financialstatements. Further, the Company reviews the carrying value of assets for impairment,if any, on each reporting period.
Estimates and judgments are continually evaluated and are based on historical experienceand other factors, including expectations of future events that may have a financial impact onthe entity and that are believed to be reasonable under circumstances.
Management believes that the change in outcome of estimates would not have a materialimpact on the amounts disclosed in the financial statements.
Standards, interpretations and amendments to published approved accounting standards that became effective during the year and are relevant
Deferred taxation is recognised taking into account availability of taxable profits. Themanagement uses assumptions about future best estimates of the availability of futuretaxable profits based on available information.
Property, plant and equipment
requires the use of certain critical accounting estimates. It also requires management toexercise its judgment in the process of applying the Company's accounting policies.
The areas involving a higher degree of judgment or complexity, or areas where assumptionsand estimates are significant to the financial statements are as follows:
The Company recognises provision for income tax based on best current estimates.However, where the final tax outcome is different from the amounts that were initiallyrecorded, such differences impact the income tax provision in the period in which suchdetermination is made.
IFRS 9 'Financial instruments' - This standard replaces the guidance in IAS 39. It includes requirements on the classification and measurement of financial assets and liabilities; it also includes an expected credit loss model that replaces the current incurred loss impairment model.
Significant estimates relating to post employment benefits are disclosed in note 21.
Annual Report 2019
62 National Refinery Limited
NOTES TO AND FORMING PART OF THE FINANCIAL STATEMENTSFORTHEYEARENDEDJUNE30,2019
i. Taxation
ii. Post employment benefits
iii.
3.3 Changes in accounting standards, interpretations and pronouncements
(a)
IFRS 15 'Revenue from contracts with customers' - IFRS 15 replaces the previousrevenue standards: IAS 18 Revenue, IAS 11 Construction Contracts, and the relatedinterpretations on revenue recognition.
IFRS 15 introduces a single five-step model for revenue recognition and establishes acomprehensive framework for recognition of revenue from contracts with customersbased on a core principle that an entity should recognise revenue representing thetransfer of promised goods or services to customers at an amount that reflects theconsideration to which the entity expects to be entitled in exchange for those goods orservices.
The impact of changes laid down by these standards are detailed in note 4.
Estimates with respect to residual value, depreciation method and depreciable lives ofproperty, plant and equipment as disclosed in note 3.5 and 5.1 to these financialstatements. Further, the Company reviews the carrying value of assets for impairment,if any, on each reporting period.
Estimates and judgments are continually evaluated and are based on historical experienceand other factors, including expectations of future events that may have a financial impact onthe entity and that are believed to be reasonable under circumstances.
Management believes that the change in outcome of estimates would not have a materialimpact on the amounts disclosed in the financial statements.
Standards, interpretations and amendments to published approved accounting standards that became effective during the year and are relevant
Deferred taxation is recognised taking into account availability of taxable profits. Themanagement uses assumptions about future best estimates of the availability of futuretaxable profits based on available information.
Property, plant and equipment
requires the use of certain critical accounting estimates. It also requires management toexercise its judgment in the process of applying the Company's accounting policies.
The areas involving a higher degree of judgment or complexity, or areas where assumptionsand estimates are significant to the financial statements are as follows:
The Company recognises provision for income tax based on best current estimates.However, where the final tax outcome is different from the amounts that were initiallyrecorded, such differences impact the income tax provision in the period in which suchdetermination is made.
IFRS 9 'Financial instruments' - This standard replaces the guidance in IAS 39. It includes requirements on the classification and measurement of financial assets and liabilities; it also includes an expected credit loss model that replaces the current incurred loss impairment model.
Significant estimates relating to post employment benefits are disclosed in note 21.
(b)
(c)
3.4 Overall Valuation Policy
3.5 Property, plant and equipment
Capital work-in-progress consists of expenditure incurred and advances made in respect oftangible and intangible assets in the course of their construction and installation. Transfersare made to relevant operating assets category as and when assets are available for use.
Depreciation is charged to income using the straight-line method whereby the cost of anasset is written off over its estimated useful life at the rates stated in note 5.1 to the financialstatements. Depreciation on additions is charged from the month in which the asset is put touse and on disposals up to the month immediately preceding the disposal. Assets’ residualvalues and useful lives are reviewed, and adjusted if appropriate, at each statement offinancial position date.
The management is in the process of assessing the impact of changes laid down by thestandard on its financial statements.
These financial statements have been prepared under the historical cost convention except as otherwise disclosed in the respective accounting policies notes.
These are initially recognised at cost and are subsequently carried at cost less accumulateddepreciation and impairment, if any, except major spare parts and stand-by equipment whichare stated at cost less accumulated impairment, if any, and capital work-in-progress, whichare stated at cost.
Major spare parts and stand-by equipment qualify as property, plant and equipment whenthe Company expects to use them during more than one year. Transfers are made to relevantoperating assets category as and when such items are available for use.
The following is the new standard, that will be effective for the periods beginning on orafter January 1, 2019 that may have an impact on the financial statements of theCompany.
IFRS 16 ‘Leases’ - IFRS 16 replaces the previous lease standard: IAS 17 Leases. It willresult almost all leasesin being recognised on the statement of financial position, asthe distinction between operating and finance leases is removed. Under the newstandard, an asset (the right to use the leased item) and a financial liability to payrentals are recognsied. The only exceptions are short term and low value leases.
Standards, interpretations and amendments to published approved accounting standards that are effective but not relevant
The new standards, amendments and interpretations that are mandatory foraccounting periods beginning on or after July 1, 2018 are considered not to be relevantfor the Company's financial statements and hence have not been detailed here.
Standards, interpretations and amendments to published approved accounting standards that are not yet effective but are relevant
Annual Report 2019
National Refinery Limited 63
NOTES TO AND FORMING PART OF THE FINANCIAL STATEMENTSFORTHEYEARENDEDJUNE30,2019
3.6 Intangible assets
3.7 Financial Insturments - Initial recognition and subsequent measurement
Initial Recognition
Classification of financial assets
The Company classifies its financial instruments in the following categories:
- at fair value through profit or loss (“FVTPL”),- at fair value through other comprehensive income (“FVTOCI”), or- at amortised cost.
Financial assets that meet the following conditions are subsequently measured at amortisedcost:
An intangible asset is recognised if it is probable that future economic benefits attributable tothe asset will flow to the Company and that the cost of such asset can be measured reliably.These are stated at cost less accumulated amortisation and impairment, if any.
Costs that are directly associated with identifiable software and have probable economicbenefits exceeding the cost beyond one year, are recognised as intangible assets. Direct costsinclude the purchase cost of software, implementation cost and related overhead cost.
Intangible assets are amortised using the straight-line method over a period of three years orlicense period, whichever is shorter.
The carrying value of intangible assets are reviewed for impairment when events or changesin circumstances indicate that the carrying value may not be recoverable. If any suchindication exists and where the carrying value exceeds the estimated recoverable amount,the assets are written down to their recoverable amount.
All financial assets and liabilities are initially measured at cost which is the fair value of theconsideration given or received. These are subsequently fairmeasured at value, amortisedcost or cost as the case may be.
The Company determines the classification of financial assets at initial recognition. Theclassification of instruments (other than equity instruments) is driven by the Company’sbusiness model for managing the financial assets and their contractual cash flowcharacteristics.
The carrying value of operating assets are reviewed for impairment when events or changesin circumstances indicate that the carrying value may not be recoverable. If any suchindication exists and where the carrying value exceeds the estimated recoverable amount,the assets are written down to their recoverable amount.
Maintenance and normal repairs are charged to income as and when incurred. Majorrenewals and improvements are capitalised and the assets so replaced, if any, are retired.
Gains and losses on disposal or retirement of property, plant and equipment are recognisedin income currently.
(b)
(c)
3.4 Overall Valuation Policy
3.5 Property, plant and equipment
Capital work-in-progress consists of expenditure incurred and advances made in respect oftangible and intangible assets in the course of their construction and installation. Transfersare made to relevant operating assets category as and when assets are available for use.
Depreciation is charged to income using the straight-line method whereby the cost of anasset is written off over its estimated useful life at the rates stated in note 5.1 to the financialstatements. Depreciation on additions is charged from the month in which the asset is put touse and on disposals up to the month immediately preceding the disposal. Assets’ residualvalues and useful lives are reviewed, and adjusted if appropriate, at each statement offinancial position date.
The management is in the process of assessing the impact of changes laid down by thestandard on its financial statements.
These financial statements have been prepared under the historical cost convention except as otherwise disclosed in the respective accounting policies notes.
These are initially recognised at cost and are subsequently carried at cost less accumulateddepreciation and impairment, if any, except major spare parts and stand-by equipment whichare stated at cost less accumulated impairment, if any, and capital work-in-progress, whichare stated at cost.
Major spare parts and stand-by equipment qualify as property, plant and equipment whenthe Company expects to use them during more than one year. Transfers are made to relevantoperating assets category as and when such items are available for use.
The following is the new standard, that will be effective for the periods beginning on orafter January 1, 2019 that may have an impact on the financial statements of theCompany.
IFRS 16 ‘Leases’ - IFRS 16 replaces the previous lease standard: IAS 17 Leases. It willresult almost all leasesin being recognised on the statement of financial position, asthe distinction between operating and finance leases is removed. Under the newstandard, an asset (the right to use the leased item) and a financial liability to payrentals are recognsied. The only exceptions are short term and low value leases.
Standards, interpretations and amendments to published approved accounting standards that are effective but not relevant
The new standards, amendments and interpretations that are mandatory foraccounting periods beginning on or after July 1, 2018 are considered not to be relevantfor the Company's financial statements and hence have not been detailed here.
Standards, interpretations and amendments to published approved accounting standards that are not yet effective but are relevant
Annual Report 2019
64 National Refinery Limited
NOTES TO AND FORMING PART OF THE FINANCIAL STATEMENTSFORTHEYEARENDEDJUNE30,2019
3.6 Intangible assets
3.7 Financial Insturments - Initial recognition and subsequent measurement
Initial Recognition
Classification of financial assets
The Company classifies its financial instruments in the following categories:
- at fair value through profit or loss (“FVTPL”),- at fair value through other comprehensive income (“FVTOCI”), or- at amortised cost.
Financial assets that meet the following conditions are subsequently measured at amortisedcost:
An intangible asset is recognised if it is probable that future economic benefits attributable tothe asset will flow to the Company and that the cost of such asset can be measured reliably.These are stated at cost less accumulated amortisation and impairment, if any.
Costs that are directly associated with identifiable software and have probable economicbenefits exceeding the cost beyond one year, are recognised as intangible assets. Direct costsinclude the purchase cost of software, implementation cost and related overhead cost.
Intangible assets are amortised using the straight-line method over a period of three years orlicense period, whichever is shorter.
The carrying value of intangible assets are reviewed for impairment when events or changesin circumstances indicate that the carrying value may not be recoverable. If any suchindication exists and where the carrying value exceeds the estimated recoverable amount,the assets are written down to their recoverable amount.
All financial assets and liabilities are initially measured at cost which is the fair value of theconsideration given or received. These are subsequently fairmeasured at value, amortisedcost or cost as the case may be.
The Company determines the classification of financial assets at initial recognition. Theclassification of instruments (other than equity instruments) is driven by the Company’sbusiness model for managing the financial assets and their contractual cash flowcharacteristics.
The carrying value of operating assets are reviewed for impairment when events or changesin circumstances indicate that the carrying value may not be recoverable. If any suchindication exists and where the carrying value exceeds the estimated recoverable amount,the assets are written down to their recoverable amount.
Maintenance and normal repairs are charged to income as and when incurred. Majorrenewals and improvements are capitalised and the assets so replaced, if any, are retired.
Gains and losses on disposal or retirement of property, plant and equipment are recognisedin income currently.
Annual Report 2019
National Refinery Limited 65
NOTES TO AND FORMING PART OF THE FINANCIAL STATEMENTSFORTHEYEARENDEDJUNE30,2019
3.6 Intangible assets
3.7 Financial Insturments - Initial recognition and subsequent measurement
Initial Recognition
Classification of financial assets
The Company classifies its financial instruments in the following categories:
- at fair value through profit or loss (“FVTPL”),- at fair value through other comprehensive income (“FVTOCI”), or- at amortised cost.
Financial assets that meet the following conditions are subsequently measured at amortisedcost:
An intangible asset is recognised if it is probable that future economic benefits attributable tothe asset will flow to the Company and that the cost of such asset can be measured reliably.These are stated at cost less accumulated amortisation and impairment, if any.
Costs that are directly associated with identifiable software and have probable economicbenefits exceeding the cost beyond one year, are recognised as intangible assets. Direct costsinclude the purchase cost of software, implementation cost and related overhead cost.
Intangible assets are amortised using the straight-line method over a period of three years orlicense period, whichever is shorter.
The carrying value of intangible assets are reviewed for impairment when events or changesin circumstances indicate that the carrying value may not be recoverable. If any suchindication exists and where the carrying value exceeds the estimated recoverable amount,the assets are written down to their recoverable amount.
All financial assets and liabilities are initially measured at cost which is the fair value of theconsideration given or received. These are subsequently fairmeasured at value, amortisedcost or cost as the case may be.
The Company determines the classification of financial assets at initial recognition. Theclassification of instruments (other than equity instruments) is driven by the Company’sbusiness model for managing the financial assets and their contractual cash flowcharacteristics.
The carrying value of operating assets are reviewed for impairment when events or changesin circumstances indicate that the carrying value may not be recoverable. If any suchindication exists and where the carrying value exceeds the estimated recoverable amount,the assets are written down to their recoverable amount.
Maintenance and normal repairs are charged to income as and when incurred. Majorrenewals and improvements are capitalised and the assets so replaced, if any, are retired.
Gains and losses on disposal or retirement of property, plant and equipment are recognisedin income currently.
-
-
-
-
- at fair value through profit and loss (“FVTPL”), or- at amortised cost.
Subsequent measurement
i) Financial assets at FVTOCI
ii) Financial assets and liabilities at amortised cost
iii) Financial assets and liabilities at FVTPL
Financial assets and liabilities carried at FVTPL are initially recorded at andfair valuetransaction costs are expensed in the statement of profit or loss and othercomprehensive income. Realised and unrealised gains and losses arising from changesin the fair value of the financial assets and liabilities held at FVTPL are included in thestatement of profit or loss and other comprehensive income in the period in whichthey arise.
Where management has opted to recognise a financial liability at FVTPL, any changesassociated with the Company’s own credit risk will be recognized in othercomprehensive income/(loss). Currently, there are no financial liabilities designated atFVTPL.
By default, all other financial assets are subsequently measured at FVTPL.
Classification of financial liabilities
The Company classifies its financial liabilities in the following categories:
Financial liabilities are measured at amortised cost, unless they are required to be measuredat FVTPL (such as instruments held for trading or derivatives) or the Company has opted tomeasure them at FVTPL.
Elected investments in equity instruments at FVTOCI are initially recognized at fairvalue plus transaction costs. Subsequently, they are measured at fair value, with gainsor losses arising from changes in fair value recognised in other comprehensiveincome/(loss).
Financial assets and liabilities at amortised cost are initially recognised at fair value, andsubsequently carried at amortised cost, and in the case of financial assets, less anyimpairment.
the financial asset is held within a business model whose objective is to hold financialassets in order to collect contractual cash flows; and
the contractual terms of the financial asset give rise on specified dates to cash flowsthat are solely payments of principal and interest on the principal amount outstanding.
Financial assets that meet the following conditions are subsequently measured at FVTOCI:
the financial asset is held within a business model whose objective is achieved by bothcollecting contractual cash flows and selling the financial assets; and
the contractual terms of the financial asset give rise on specified dates to cash flowsthat are solely payments of principal and interest on the principal amount outstanding.
Annual Report 2019
66 National Refinery Limited
NOTES TO AND FORMING PART OF THE FINANCIAL STATEMENTSFORTHEYEARENDEDJUNE30,2019
-
-
-
-
- at fair value through profit and loss (“FVTPL”), or- at amortised cost.
Subsequent measurement
i) Financial assets at FVTOCI
ii) Financial assets and liabilities at amortised cost
iii) Financial assets and liabilities at FVTPL
Financial assets and liabilities carried at FVTPL are initially recorded at andfair valuetransaction costs are expensed in the statement of profit or loss and othercomprehensive income. Realised and unrealised gains and losses arising from changesin the fair value of the financial assets and liabilities held at FVTPL are included in thestatement of profit or loss and other comprehensive income in the period in whichthey arise.
Where management has opted to recognise a financial liability at FVTPL, any changesassociated with the Company’s own credit risk will be recognized in othercomprehensive income/(loss). Currently, there are no financial liabilities designated atFVTPL.
By default, all other financial assets are subsequently measured at FVTPL.
Classification of financial liabilities
The Company classifies its financial liabilities in the following categories:
Financial liabilities are measured at amortised cost, unless they are required to be measuredat FVTPL (such as instruments held for trading or derivatives) or the Company has opted tomeasure them at FVTPL.
Elected investments in equity instruments at FVTOCI are initially recognized at fairvalue plus transaction costs. Subsequently, they are measured at fair value, with gainsor losses arising from changes in fair value recognised in other comprehensiveincome/(loss).
Financial assets and liabilities at amortised cost are initially recognised at fair value, andsubsequently carried at amortised cost, and in the case of financial assets, less anyimpairment.
the financial asset is held within a business model whose objective is to hold financialassets in order to collect contractual cash flows; and
the contractual terms of the financial asset give rise on specified dates to cash flowsthat are solely payments of principal and interest on the principal amount outstanding.
Financial assets that meet the following conditions are subsequently measured at FVTOCI:
the financial asset is held within a business model whose objective is achieved by bothcollecting contractual cash flows and selling the financial assets; and
the contractual terms of the financial asset give rise on specified dates to cash flowsthat are solely payments of principal and interest on the principal amount outstanding.
Impairment of financial assets
-
-
-
Derecognition
i) Financial assets
ii) Financial liabilities
The Company considers a financial asset in default when it is more than 90 days past due.
Life time ECLs are the ECLs that results from all possible defaults events over the expected lifeof a financial instrument. 12 month ECLs are portion of ECL that result from default eventsthat are possible within 12 months after the reporting date.
ECLs are a probability weighted estimate of credit losses. Credit losses are measured as thepresent value of all cash shortfalls (i.e. the difference between cash flows due to the entity inaccordance with the contract and cash flows that the Company expects to receive).
The gross carrying amount of a financial asset is written off when the Company has noreasonable expectation of recovering a financial asset in its entirety or a portion thereof.
The Company derecognises financial assets only when the contractual rights to cashflows from the financial assets expire or when it transfers the financial assets andsubstantially all the associated risks and rewards of ownership to another entity. Onderecognition of a financial asset measured at amortised cost, the difference betweenthe asset’s carrying value and the sum of the consideration received and receivable isrecognised in profit or loss. In addition, on derecognition of an investment in a debtinstrument classified as FVTOCI, the cumulative gain or loss previously accumulated inthe investments revaluation reserve is reclassified to profit or loss. In contrast, onderecognition of an investment in equity instrument which the Company has electedon initial recognition to measure at FVTOCI, the cumulative gain or loss previouslyaccumulated in the investments revaluation reserve is not reclassified to profit or loss,but is transferred to statement of changes in equity.
The Company derecognises financial liabilities only when its obligations under the
The Company recognises loss allowance for Expected Credit Loss (ECL) on financial assetsmeasured at amortised cost at an amount equal to life time ECLs except for the following,which are measured at 12 months ECLs:
bank balances for whom credit risk (the risk of default occurring over the expected lifeof the financial instrument has not increased since the inception).
employee receivables.
other short term receivables that have not demonstrated any increase in credit risksince inception.
Loss allowance for trade receivables are always measured at an amount equal to life timeECLs.
Annual Report 2019
National Refinery Limited 67
NOTES TO AND FORMING PART OF THE FINANCIAL STATEMENTSFORTHEYEARENDEDJUNE30,2019
Impairment of financial assets
-
-
-
Derecognition
i) Financial assets
ii) Financial liabilities
The Company considers a financial asset in default when it is more than 90 days past due.
Life time ECLs are the ECLs that results from all possible defaults events over the expected lifeof a financial instrument. 12 month ECLs are portion of ECL that result from default eventsthat are possible within 12 months after the reporting date.
ECLs are a probability weighted estimate of credit losses. Credit losses are measured as thepresent value of all cash shortfalls (i.e. the difference between cash flows due to the entity inaccordance with the contract and cash flows that the Company expects to receive).
The gross carrying amount of a financial asset is written off when the Company has noreasonable expectation of recovering a financial asset in its entirety or a portion thereof.
The Company derecognises financial assets only when the contractual rights to cashflows from the financial assets expire or when it transfers the financial assets andsubstantially all the associated risks and rewards of ownership to another entity. Onderecognition of a financial asset measured at amortised cost, the difference betweenthe asset’s carrying value and the sum of the consideration received and receivable isrecognised in profit or loss. In addition, on derecognition of an investment in a debtinstrument classified as FVTOCI, the cumulative gain or loss previously accumulated inthe investments revaluation reserve is reclassified to profit or loss. In contrast, onderecognition of an investment in equity instrument which the Company has electedon initial recognition to measure at FVTOCI, the cumulative gain or loss previouslyaccumulated in the investments revaluation reserve is not reclassified to profit or loss,but is transferred to statement of changes in equity.
The Company derecognises financial liabilities only when its obligations under the
The Company recognises loss allowance for Expected Credit Loss (ECL) on financial assetsmeasured at amortised cost at an amount equal to life time ECLs except for the following,which are measured at 12 months ECLs:
bank balances for whom credit risk (the risk of default occurring over the expected lifeof the financial instrument has not increased since the inception).
employee receivables.
other short term receivables that have not demonstrated any increase in credit risksince inception.
Loss allowance for trade receivables are always measured at an amount equal to life timeECLs.
Financial assets - policy upto June 30, 2018
3.8 Off-setting of financial assets and liabilities
3.9 Stores, spares and chemicals
3.10 Stock-in-trade
3.11 Trade and other receivables
3.12 Cash and cash equivalents
Stores, spares and chemicals, except items in transit, are stated at moving average cost. Costcomprises invoice value and other direct costs. Provision is made for slow moving andobsolete items wherever necessary.
Items in transit are valued at cost comprising invoice value plus other charges incurredthereon.
Stock of crude oil is valued at lower of cost, determined on a First-In-First-Out (FIFO) basisand net realisable value. Crude oil in transit is valued at cost comprising invoice value plusother charges incurred thereon.
Stocks of semi-finished and finished products are valued at lower of cost, determined on aFIFO basis and net realisable value. Cost in relation to semi-finished and finished productsrepresents cost of crude oil and an appropriate portion of manufacturing overheads.
Net realisable value signifies the estimated selling price in the ordinary course of business lesscosts necessary to be incurred to make the sale.
Trade receivables are recognised initially at the amount of consideration that isunconditional, unless they contain significant financing components when they arerecognised at fair value. They are subsequently measured at amortised cost using theeffective interest method, less loss allowance. Refer note 3.7 for a description of theCompany’s impairment policies.
Financial assets and liabilities are off-set and the net amount is reported in the statement offinancial position if the Company has a legal right to set off the transaction and also intendseither to settle on a net basis or to realise the asset and settle the liability simultaneously.
financial liabilities are discharged, cancelled or expired. The difference between thecarrying amount of the financial liability derecognised and the consideration paid andpayable, including any non-cash assets transferred or liabilities assumed, is recognisedin the statement of profit or loss and other comprehensive income.
Trade debts and other receivables were recognised initially at fair value plus directly attributable cost, if any and subsequently, at amortised cost less impairment if any. A provision for impairment of trade and other receivable is established when there is an objective evidence that the Company will not be able to collect all amounts due according to terms of receivables. Trade receivables considered irrecoverable are written off.
Annual Report 2019
68 National Refinery Limited
NOTES TO AND FORMING PART OF THE FINANCIAL STATEMENTSFORTHEYEARENDEDJUNE30,2019
Financial assets - policy upto June 30, 2018
3.8 Off-setting of financial assets and liabilities
3.9 Stores, spares and chemicals
3.10 Stock-in-trade
3.11 Trade and other receivables
3.12 Cash and cash equivalents
Stores, spares and chemicals, except items in transit, are stated at moving average cost. Costcomprises invoice value and other direct costs. Provision is made for slow moving andobsolete items wherever necessary.
Items in transit are valued at cost comprising invoice value plus other charges incurredthereon.
Stock of crude oil is valued at lower of cost, determined on a First-In-First-Out (FIFO) basisand net realisable value. Crude oil in transit is valued at cost comprising invoice value plusother charges incurred thereon.
Stocks of semi-finished and finished products are valued at lower of cost, determined on aFIFO basis and net realisable value. Cost in relation to semi-finished and finished productsrepresents cost of crude oil and an appropriate portion of manufacturing overheads.
Net realisable value signifies the estimated selling price in the ordinary course of business lesscosts necessary to be incurred to make the sale.
Trade receivables are recognised initially at the amount of consideration that isunconditional, unless they contain significant financing components when they arerecognised at fair value. They are subsequently measured at amortised cost using theeffective interest method, less loss allowance. Refer note 3.7 for a description of theCompany’s impairment policies.
Financial assets and liabilities are off-set and the net amount is reported in the statement offinancial position if the Company has a legal right to set off the transaction and also intendseither to settle on a net basis or to realise the asset and settle the liability simultaneously.
financial liabilities are discharged, cancelled or expired. The difference between thecarrying amount of the financial liability derecognised and the consideration paid andpayable, including any non-cash assets transferred or liabilities assumed, is recognisedin the statement of profit or loss and other comprehensive income.
Trade debts and other receivables were recognised initially at fair value plus directly attributable cost, if any and subsequently, at amortised cost less impairment if any. A provision for impairment of trade and other receivable is established when there is an objective evidence that the Company will not be able to collect all amounts due according to terms of receivables. Trade receivables considered irrecoverable are written off.
3.13 Staff retirement benefits
3.13.1 Defined contribution plan
3.13.2 Defined benefit plans
The Company operates the following schemes:
The Company operates an approved contributory provident fund for all employees. Equalmonthly contributions are made, both by the Company and the employees, to the fund at therate of 10% per annum of the basic salary. The Company has no legal or constructiveobligations to pay further contributions if the fund does not hold sufficient assets to pay allemployees the benefits relating to employee service in the current and prior periods. Thecontributions are recognised as employee benefit expense when they are due.
Defined benefit plans define an amount of pension or gratuity or medical benefit that anemployee will receive on or after retirement, usually dependent on one or more factors suchas age, years of service and compensation. A defined benefit plan is a plan that is not adefined contribution plan. The liability recognised in the statement of financial position inrespect of defined benefit plans is the present value of the defined benefit obligation at theend of the reporting period less the fair value of plan assets. The defined benefit obligation iscalculated annually by an independent actuary using the projected unit credit method.
The present value of the defined benefit obligation is determined by discounting theestimated future cash outflows using interest rates of high-quality corporate bonds or themarket rates on government bonds. These are denominated in the currency in which thebenefits will be paid, and that have terms to maturity approximating the terms of the relatedbenefit obligation.
i) Funded pension scheme for permanent, regular and full time managerial andsupervisory staff of the Company who joined prior to January 01, 2012. Contributionsare made to the fund on the basis of actuarial valuation and are charged to income.The most recent valuation of the scheme was carried out as at June 30, 2019, using the‘Projected Unit Credit Method’.
ii) Funded gratuity scheme for non-management permanent employees of the Company.Provision is made annually to cover obligations under the scheme, as per actuarialvaluation. The most recent valuation of the scheme was carried out as atJune 30, 2019, using the ‘Projected Unit Credit Method’.
iii) Funded medical scheme for management employees who joined the Company prior to
Cash and cash equivalents are carried in the balance sheet at amortised cost. For the purposesof the cash flow statement, cash and cash equivalents comprise cash in hand, balances withbanks on current, savings and deposit accounts, short-term investments and loans andreceivables with original maturities of three months or less, running finance under mark-uparrangements and short-term finance.
The Company operates various post-employment schemes, including both defined benefitand defined contribution plans.
Annual Report 2019
National Refinery Limited 69
NOTES TO AND FORMING PART OF THE FINANCIAL STATEMENTSFORTHEYEARENDEDJUNE30,2019
3.13 Staff retirement benefits
3.13.1 Defined contribution plan
3.13.2 Defined benefit plans
The Company operates the following schemes:
The Company operates an approved contributory provident fund for all employees. Equalmonthly contributions are made, both by the Company and the employees, to the fund at therate of 10% per annum of the basic salary. The Company has no legal or constructiveobligations to pay further contributions if the fund does not hold sufficient assets to pay allemployees the benefits relating to employee service in the current and prior periods. Thecontributions are recognised as employee benefit expense when they are due.
Defined benefit plans define an amount of pension or gratuity or medical benefit that anemployee will receive on or after retirement, usually dependent on one or more factors suchas age, years of service and compensation. A defined benefit plan is a plan that is not adefined contribution plan. The liability recognised in the statement of financial position inrespect of defined benefit plans is the present value of the defined benefit obligation at theend of the reporting period less the fair value of plan assets. The defined benefit obligation iscalculated annually by an independent actuary using the projected unit credit method.
The present value of the defined benefit obligation is determined by discounting theestimated future cash outflows using interest rates of high-quality corporate bonds or themarket rates on government bonds. These are denominated in the currency in which thebenefits will be paid, and that have terms to maturity approximating the terms of the relatedbenefit obligation.
i) Funded pension scheme for permanent, regular and full time managerial andsupervisory staff of the Company who joined prior to January 01, 2012. Contributionsare made to the fund on the basis of actuarial valuation and are charged to income.The most recent valuation of the scheme was carried out as at June 30, 2019, using the‘Projected Unit Credit Method’.
ii) Funded gratuity scheme for non-management permanent employees of the Company.Provision is made annually to cover obligations under the scheme, as per actuarialvaluation. The most recent valuation of the scheme was carried out as atJune 30, 2019, using the ‘Projected Unit Credit Method’.
iii) Funded medical scheme for management employees who joined the Company prior to
Cash and cash equivalents are carried in the balance sheet at amortised cost. For the purposesof the cash flow statement, cash and cash equivalents comprise cash in hand, balances withbanks on current, savings and deposit accounts, short-term investments and loans andreceivables with original maturities of three months or less, running finance under mark-uparrangements and short-term finance.
The Company operates various post-employment schemes, including both defined benefitand defined contribution plans.
iv)
3.14 Compensated absences
3.15 Trade and other payables
3.16 Provisions
3.17 Taxation
3.17.1 Current
3.17.2 Deferred
Liabilities for trade and other amounts payable including amounts payable to related partiesare carried at cost which is the fair value of the consideration to be paid in the future forgoods and services received.
Provisions are recognised when the Company has a legal or constructive obligation as a resultof past events, and it is probable that an outflow of resources embodying economic benefitswill be required to settle the obligation and a reliable estimate can be made of the amount ofthe obligation. Provisions are reviewed at each statement of financial position date andadjusted to reflect the current best estimates.
The charge for current taxation is based on the taxable income for the year, determined inaccordance with the prevailing law for taxation on income, using prevailing tax rates aftertaking into account tax credits and rebates available, if any.
Funded gratuity scheme for management employees of the Company joining on orafter January 1, 2012. Provision is made annually to cover obligations under thescheme, as per actuarial valuation. The most recent valuation of the scheme wascarried out as at June 30, 2019, using the ‘Projected Unit Credit Method’.
The amount arising as a result of remeasurements are recognised in the statement offinancial position immediately, with a charge or credit to other comprehensive income in theperiods in which they occur.
Past-service costs are recognised immediately in income.
The Company accounts for compensated absences on the basis of unavailed leave balance ofeach employee at the end of the year.
Provisions are made to cover the obligations under the scheme on the basis of actuarialvaluation and are charged to income. The most recent valuation was carried outas at June 30, 2019 using the 'Projected Unit Credit Method'.
September 01, 2006. Provision is made annually to cover obligations under the scheme, by way of a charge to income, calculated in accordance with the actuarial valuation.The most recent valuation of the scheme was carried out as at June 30, 2019, using the‘Projected Unit Credit Method’.
Deferred tax is accounted for using the liability method on all temporary differences arising between the tax base of assets and liabilities and their carrying amounts in the financial statements. Deferred tax liability is generally recognised for all taxable temporary differences and deferred tax asset is recognised to the extent that it is probable that future taxable profits will be available against which the deductible temporary differences, unused tax losses and tax credits can be utilised. Deferred tax is charged or credited in the
Annual Report 2019
70 National Refinery Limited
NOTES TO AND FORMING PART OF THE FINANCIAL STATEMENTSFORTHEYEARENDEDJUNE30,2019
iv)
3.14 Compensated absences
3.15 Trade and other payables
3.16 Provisions
3.17 Taxation
3.17.1 Current
3.17.2 Deferred
Liabilities for trade and other amounts payable including amounts payable to related partiesare carried at cost which is the fair value of the consideration to be paid in the future forgoods and services received.
Provisions are recognised when the Company has a legal or constructive obligation as a resultof past events, and it is probable that an outflow of resources embodying economic benefitswill be required to settle the obligation and a reliable estimate can be made of the amount ofthe obligation. Provisions are reviewed at each statement of financial position date andadjusted to reflect the current best estimates.
The charge for current taxation is based on the taxable income for the year, determined inaccordance with the prevailing law for taxation on income, using prevailing tax rates aftertaking into account tax credits and rebates available, if any.
Funded gratuity scheme for management employees of the Company joining on orafter January 1, 2012. Provision is made annually to cover obligations under thescheme, as per actuarial valuation. The most recent valuation of the scheme wascarried out as at June 30, 2019, using the ‘Projected Unit Credit Method’.
The amount arising as a result of remeasurements are recognised in the statement offinancial position immediately, with a charge or credit to other comprehensive income in theperiods in which they occur.
Past-service costs are recognised immediately in income.
The Company accounts for compensated absences on the basis of unavailed leave balance ofeach employee at the end of the year.
Provisions are made to cover the obligations under the scheme on the basis of actuarialvaluation and are charged to income. The most recent valuation was carried outas at June 30, 2019 using the 'Projected Unit Credit Method'.
September 01, 2006. Provision is made annually to cover obligations under the scheme, by way of a charge to income, calculated in accordance with the actuarial valuation.The most recent valuation of the scheme was carried out as at June 30, 2019, using the‘Projected Unit Credit Method’.
Deferred tax is accounted for using the liability method on all temporary differences arising between the tax base of assets and liabilities and their carrying amounts in the financial statements. Deferred tax liability is generally recognised for all taxable temporary differences and deferred tax asset is recognised to the extent that it is probable that future taxable profits will be available against which the deductible temporary differences, unused tax losses and tax credits can be utilised. Deferred tax is charged or credited in the
Annual Report 2019
National Refinery Limited 71
NOTES TO AND FORMING PART OF THE FINANCIAL STATEMENTSFORTHEYEARENDEDJUNE30,2019
3.18 Revenue recognition
a)
b) Export sales are recorded on the basis of products delivered to tankers.
c)
3.19 Borrowings and their cost
3.20 Foreign currency transactions and translation
3.21 Segment reporting
Transactions in foreign currencies are converted into Pak Rupees using the exchange ratesprevailing on the dates of the transactions. All monetary assets and liabilities denominated inforeign currencies are translated into Pak Rupees using the exchange rates prevailing on thestatement of financial position date. Exchange differences are taken to income currently.
Furnace oil is sold with volume discounts based on fortnightly aggregate sales. Net revenuefrom such sale is recognised net of volume discounts.
Borrowings are recognised initially at fair value, net of transaction cost incurred.
Borrowing costs are recognised as an expense in the period in which these are incurredexcept where such costs are directly attributable to the acquisition, construction orproduction of a qualifying asset in which case such costs are capitalised as part of the cost ofthat asset.
The financial statements are presented in Pak Rupees which is the Company’s functional andpresentation currency.
Handling and storage income, pipeline charges, scrap sales, insurance commission andrental income are recognised when services are rendered.
No element of financing is deemed present as the sales are made with a credit term of21 days, which is consistent with the market practice.
The transaction price of the regulated products are determined in accordance with thedirectives of OGRA. Whereas, the transaction prices of deregulated products are agreedunder the contract with customer.
Revenue is recognised when control of the products has transferred, being when theproducts are delivered to the customer, and there is no unfulfilled obligation that could affectthe customer's acceptance of the product. Revenue is recognised as follows:
Local sales of products delivered through pipelines are recorded when products passthrough pipelines’ flange. Sale of products loaded through gantry is recognised whenproducts are loaded into tank lorries.
statement of profit or loss. Deferred tax is determined using tax rates and prevailing law for taxation on income that have been enacted or substantively enacted by the statement of financial position date and are expected to apply when the related deferred tax asset is realised or the deferred tax liability is settled.
Annual Report 2019
72 National Refinery Limited
NOTES TO AND FORMING PART OF THE FINANCIAL STATEMENTSFORTHEYEARENDEDJUNE30,2019
3.18 Revenue recognition
a)
b) Export sales are recorded on the basis of products delivered to tankers.
c)
3.19 Borrowings and their cost
3.20 Foreign currency transactions and translation
3.21 Segment reporting
Transactions in foreign currencies are converted into Pak Rupees using the exchange ratesprevailing on the dates of the transactions. All monetary assets and liabilities denominated inforeign currencies are translated into Pak Rupees using the exchange rates prevailing on thestatement of financial position date. Exchange differences are taken to income currently.
Furnace oil is sold with volume discounts based on fortnightly aggregate sales. Net revenuefrom such sale is recognised net of volume discounts.
Borrowings are recognised initially at fair value, net of transaction cost incurred.
Borrowing costs are recognised as an expense in the period in which these are incurredexcept where such costs are directly attributable to the acquisition, construction orproduction of a qualifying asset in which case such costs are capitalised as part of the cost ofthat asset.
The financial statements are presented in Pak Rupees which is the Company’s functional andpresentation currency.
Handling and storage income, pipeline charges, scrap sales, insurance commission andrental income are recognised when services are rendered.
No element of financing is deemed present as the sales are made with a credit term of21 days, which is consistent with the market practice.
The transaction price of the regulated products are determined in accordance with thedirectives of OGRA. Whereas, the transaction prices of deregulated products are agreedunder the contract with customer.
Revenue is recognised when control of the products has transferred, being when theproducts are delivered to the customer, and there is no unfulfilled obligation that could affectthe customer's acceptance of the product. Revenue is recognised as follows:
Local sales of products delivered through pipelines are recorded when products passthrough pipelines’ flange. Sale of products loaded through gantry is recognised whenproducts are loaded into tank lorries.
statement of profit or loss. Deferred tax is determined using tax rates and prevailing law for taxation on income that have been enacted or substantively enacted by the statement of financial position date and are expected to apply when the related deferred tax asset is realised or the deferred tax liability is settled.
3.22 Dividends and appropriation to general reserve
4. Change in accounting policies
i) IFRS 9 - Financial Instruments
Classifications and remeasurement
On July 1, 2018 (the date of initial application of IFRS 9), the Company’s managementhas assessed which business models apply to the financial assets held by the Companyand has classified its financial instruments into the appropriate IFRS 9 categories. Themain effects resulting from this reclassifications and adjustments are as follows:
Operating segments are reported in a manner consistent with the internal reporting providedto the chief operating decision-maker. The chief operating decision-maker, who is responsiblefor allocating resources and assessing performance of the operating segments, has beenidentified as the Chief Executive Officer of the Company.
Dividends and appropriation to general reserves are recognised in the financial statements inthe period in which these are approved.
Financial assets - July 1, 2018
Note Carrying amount as reported under IAS 39
July 1, 2018
Reclassification due to IFRS - 9
Remeasurement allowance: ECL
Carrying amount as reported under IFRS 9
July 1, 2018
Long term investment a - 15,010 - 15,010
Loans and advances 112,458 - - 112,458
Deposits 34,350 - - 34,350
Trade receivables b,c 7,986,214 - - 7,986,214
Accrued interest 7,394 - - 7,394
Other receivable 2,239,940 - - 2,239,940
Cash and bank balances 541,837 - - 541,837
10,922,193 15,010 - 10,937,203
(Rupees in 000)
IFRS 9 replaces the provisions of IAS 39 that relate to the recognition, classification and measurement of financial assets and financial liabilities, derecognition of financial instruments, impairment of financial assets and hedge accounting. The adoption of IFRS 9 Financial Instruments from July 1, 2018 resulted in changes in accounting policies and adjustments to the amounts recognised in the financial statements. The new accounting policies are set out in note 3.7 above. In accordance with the transitional provisions in IFRS 9, corresponding figures have not been restated and any adjustment to carrying amount of financial assets and liabilities were recognised in the opening retained earnings as of the transition date.
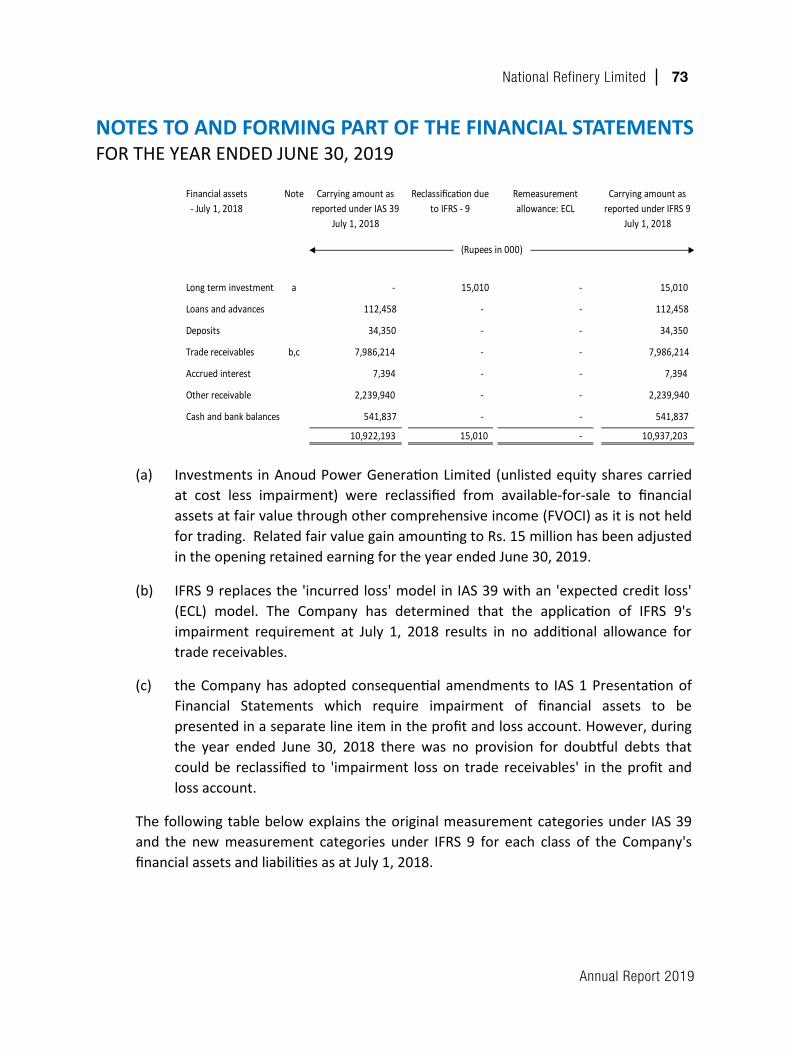
Annual Report 2019
National Refinery Limited 73
NOTES TO AND FORMING PART OF THE FINANCIAL STATEMENTSFORTHEYEARENDEDJUNE30,2019
3.22 Dividends and appropriation to general reserve
4. Change in accounting policies
i) IFRS 9 - Financial Instruments
Classifications and remeasurement
On July 1, 2018 (the date of initial application of IFRS 9), the Company’s managementhas assessed which business models apply to the financial assets held by the Companyand has classified its financial instruments into the appropriate IFRS 9 categories. Themain effects resulting from this reclassifications and adjustments are as follows:
Operating segments are reported in a manner consistent with the internal reporting providedto the chief operating decision-maker. The chief operating decision-maker, who is responsiblefor allocating resources and assessing performance of the operating segments, has beenidentified as the Chief Executive Officer of the Company.
Dividends and appropriation to general reserves are recognised in the financial statements inthe period in which these are approved.
Financial assets - July 1, 2018
Note Carrying amount as reported under IAS 39
July 1, 2018
Reclassification due to IFRS - 9
Remeasurement allowance: ECL
Carrying amount as reported under IFRS 9
July 1, 2018
Long term investment a - 15,010 - 15,010
Loans and advances 112,458 - - 112,458
Deposits 34,350 - - 34,350
Trade receivables b,c 7,986,214 - - 7,986,214
Accrued interest 7,394 - - 7,394
Other receivable 2,239,940 - - 2,239,940
Cash and bank balances 541,837 - - 541,837
10,922,193 15,010 - 10,937,203
(Rupees in 000)
IFRS 9 replaces the provisions of IAS 39 that relate to the recognition, classification and measurement of financial assets and financial liabilities, derecognition of financial instruments, impairment of financial assets and hedge accounting. The adoption of IFRS 9 Financial Instruments from July 1, 2018 resulted in changes in accounting policies and adjustments to the amounts recognised in the financial statements. The new accounting policies are set out in note 3.7 above. In accordance with the transitional provisions in IFRS 9, corresponding figures have not been restated and any adjustment to carrying amount of financial assets and liabilities were recognised in the opening retained earnings as of the transition date.
(a)
(b)
(c)
Opening balance - IAS 39
2019(Rupees in thousand)
43,251,537
15,010 Opening balance - IFRS 9 43,266,547
ii) IFRS 15 - Revenue from contracts with customers
The following table below explains the original measurement categories under IAS 39and the new measurement categories under IFRS 9 for each class of the Company'sfinancial assets and liabilities as at July 1, 2018.
The impact of these changes on the Company's statement of changes in equity is asfollows:
Reclassification of Long term investment from available from sale to FVOCI
Investments in Anoud Power Generation Limited (unlisted equity shares carriedat cost less impairment) were reclassified from available-for-sale to financialassets at fair value through other comprehensive income (FVOCI) as it is not heldfor trading. Related fair value gain amounting to Rs. 15 million has been adjustedin the opening retained earning for the year ended June 30, 2019.
the Company has adopted consequential amendments to IAS 1 Presentation ofFinancial Statements which require impairment of financial assets to bepresented in a separate line item in the profit and loss account. However, duringthe year ended June 30, 2018 there was no provision for doubtful debts thatcould be reclassified to 'impairment loss on trade receivables' in the profit andloss account.
Financial assetsLong term investment Available for sale Fair value through other
comprehensive income - 15,010 Loans and advances Loans and receivables Amortised cost 112,458 112,458 Deposits Loans and receivables Amortised cost 34,350 34,350 Trade receivables Loans and receivables Amortised cost 7,986,214 7,986,214 Accrued interest Loans and receivables Amortised cost 7,394 7,394 Other receivable Loans and receivables Amortised cost 2,239,940 2,239,940 Cash and bank balances Loans and receivables Amortised cost 541,837 541,837
Financial liabilities
Trade and other payables Other financial liabilities Other financial liabilities 17,601,300 17,601,300 Unclaimed dividend Other financial liabilities Other financial liabilities 60,525 60,525 Unpaid dividend Other financial liabilities Other financial liabilities 31,478 31,478 Accrued mark-up Other financial liabilities Other financial liabilities 33,775 33,775 Short term running finance Other financial liabilities Other financial liabilities 1,340,273 1,340,273 Long-term borrowing Other financial liabilities Other financial liabilities 89,480 89,480
Original classification under IAS 39
New classification under IFRS 9
Original amount under IAS 39
New carrying amount under IFRS 9
(Rupees in '000')
IFRS 9 replaces the 'incurred loss' model in IAS 39 with an 'expected credit loss' (ECL) model. The Company has determined that the application of IFRS 9's impairment requirement at July 1, 2018 results in no additional allowance for trade receivables.
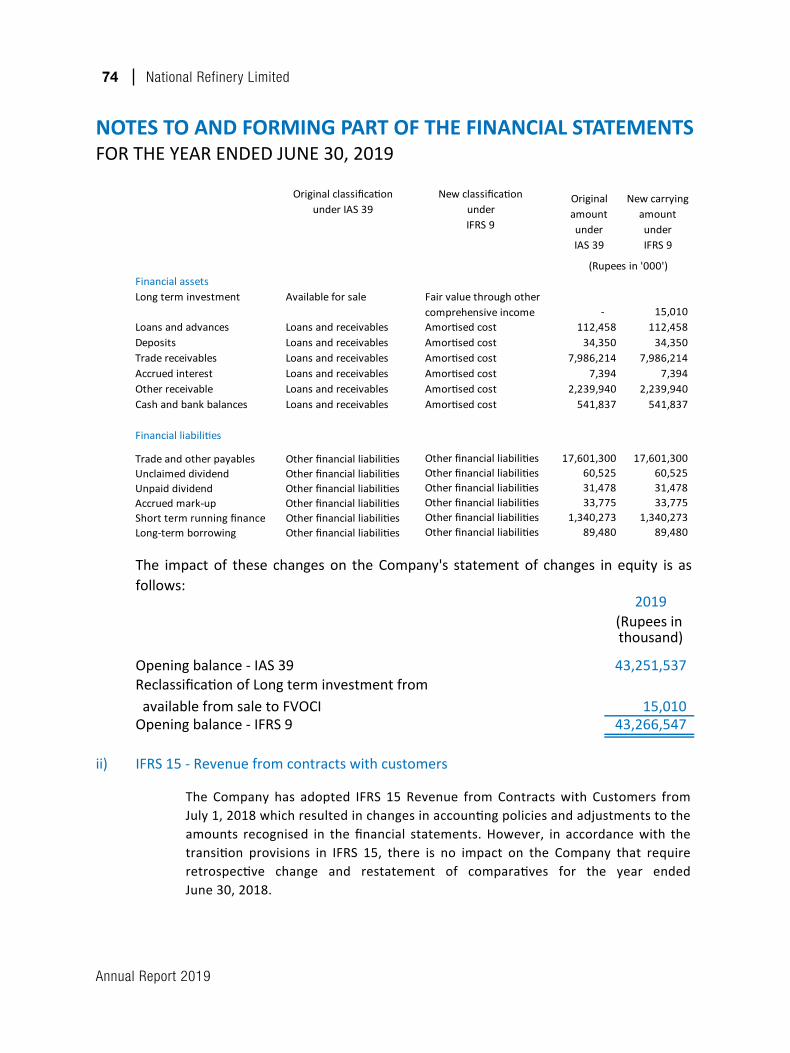
Annual Report 2019
74 National Refinery Limited
NOTES TO AND FORMING PART OF THE FINANCIAL STATEMENTSFORTHEYEARENDEDJUNE30,2019
(a)
(b)
(c)
Opening balance - IAS 39
2019(Rupees in thousand)
43,251,537
15,010 Opening balance - IFRS 9 43,266,547
ii) IFRS 15 - Revenue from contracts with customers
The following table below explains the original measurement categories under IAS 39and the new measurement categories under IFRS 9 for each class of the Company'sfinancial assets and liabilities as at July 1, 2018.
The impact of these changes on the Company's statement of changes in equity is asfollows:
Reclassification of Long term investment from available from sale to FVOCI
Investments in Anoud Power Generation Limited (unlisted equity shares carriedat cost less impairment) were reclassified from available-for-sale to financialassets at fair value through other comprehensive income (FVOCI) as it is not heldfor trading. Related fair value gain amounting to Rs. 15 million has been adjustedin the opening retained earning for the year ended June 30, 2019.
the Company has adopted consequential amendments to IAS 1 Presentation ofFinancial Statements which require impairment of financial assets to bepresented in a separate line item in the profit and loss account. However, duringthe year ended June 30, 2018 there was no provision for doubtful debts thatcould be reclassified to 'impairment loss on trade receivables' in the profit andloss account.
Financial assetsLong term investment Available for sale Fair value through other
comprehensive income - 15,010 Loans and advances Loans and receivables Amortised cost 112,458 112,458 Deposits Loans and receivables Amortised cost 34,350 34,350 Trade receivables Loans and receivables Amortised cost 7,986,214 7,986,214 Accrued interest Loans and receivables Amortised cost 7,394 7,394 Other receivable Loans and receivables Amortised cost 2,239,940 2,239,940 Cash and bank balances Loans and receivables Amortised cost 541,837 541,837
Financial liabilities
Trade and other payables Other financial liabilities Other financial liabilities 17,601,300 17,601,300 Unclaimed dividend Other financial liabilities Other financial liabilities 60,525 60,525 Unpaid dividend Other financial liabilities Other financial liabilities 31,478 31,478 Accrued mark-up Other financial liabilities Other financial liabilities 33,775 33,775 Short term running finance Other financial liabilities Other financial liabilities 1,340,273 1,340,273 Long-term borrowing Other financial liabilities Other financial liabilities 89,480 89,480
Original classification under IAS 39
New classification under IFRS 9
Original amount under IAS 39
New carrying amount under IFRS 9
(Rupees in '000')
IFRS 9 replaces the 'incurred loss' model in IAS 39 with an 'expected credit loss' (ECL) model. The Company has determined that the application of IFRS 9's impairment requirement at July 1, 2018 results in no additional allowance for trade receivables.
2019 20185. FIXED ASSETS
Property, plant and equipment- Operating assets - note 5.1 32,650,046 35,225,898 - Major spare parts and stand-by
equipment - note 5.2 337,292 297,592 - Capital work-in-progress - note 5.3 2,604,318 2,005,866
35,591,656 37,529,356 Intangible assets - note 5.4 103,678 189,366
35,695,334 37,718,722
(Rupees in thousand)
The Company has adopted IFRS 15 Revenue from Contracts with Customers from July 1, 2018 which resulted in changes in accounting policies and adjustments to the amounts recognised in the financial statements. However, in accordance with the transition provisions in IFRS 15, there is no impact on the Company that require retrospective change and restatement of comparatives for the year ended June 30, 2018.
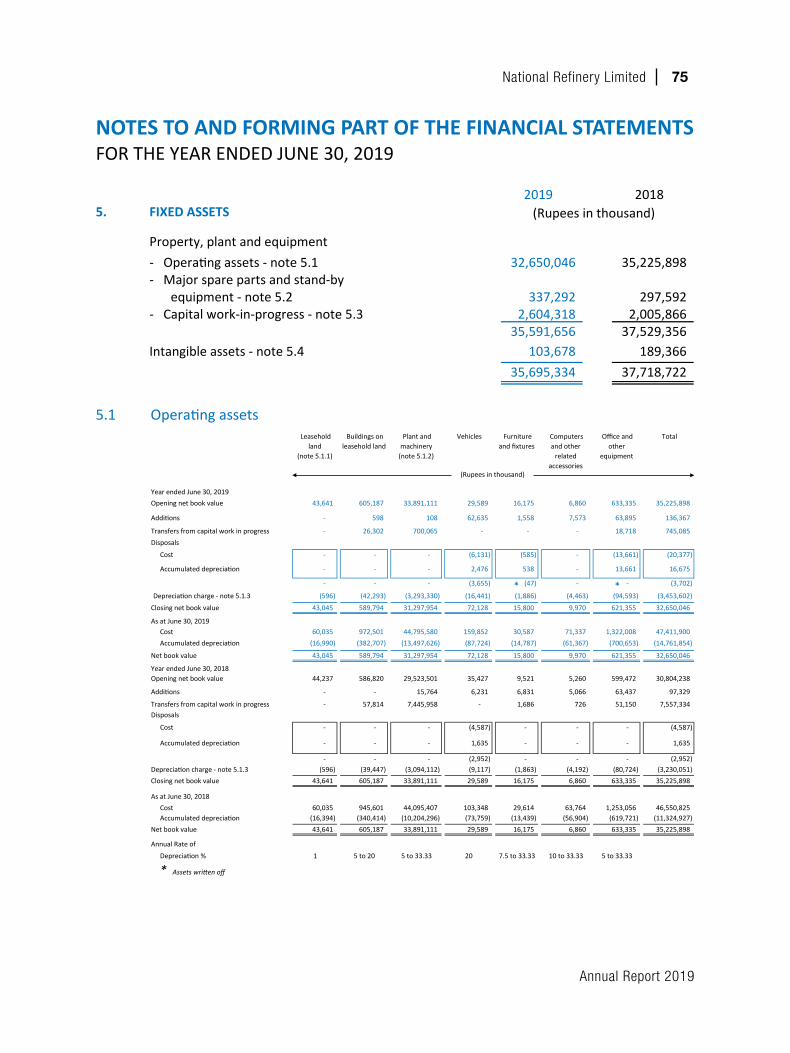
Annual Report 2019
National Refinery Limited 75
NOTES TO AND FORMING PART OF THE FINANCIAL STATEMENTSFORTHEYEARENDEDJUNE30,2019
2019 20185. FIXED ASSETS
Property, plant and equipment- Operating assets - note 5.1 32,650,046 35,225,898 - Major spare parts and stand-by
equipment - note 5.2 337,292 297,592 - Capital work-in-progress - note 5.3 2,604,318 2,005,866
35,591,656 37,529,356 Intangible assets - note 5.4 103,678 189,366
35,695,334 37,718,722
(Rupees in thousand)
The Company has adopted IFRS 15 Revenue from Contracts with Customers from July 1, 2018 which resulted in changes in accounting policies and adjustments to the amounts recognised in the financial statements. However, in accordance with the transition provisions in IFRS 15, there is no impact on the Company that require retrospective change and restatement of comparatives for the year ended June 30, 2018.
5.1 Operating assets
Year ended June 30, 2019Opening net book value 43,641 605,187 33,891,111 29,589 16,175 6,860 633,335 35,225,898
Additions - 598 108 62,635 1,558 7,573 63,895 136,367
Transfers from capital work in progress - 26,302 700,065 - - - 18,718 745,085 Disposals
Cost - - - (6,131) (585) - (13,661) (20,377)
Accumulated depreciation - - - 2,476 538 - 13,661 16,675
- - - (3,655) (47) - - (3,702)
Depreciation charge - note 5.1.3 (596) (42,293) (3,293,330) (16,441) (1,886) (4,463) (94,593) (3,453,602)
Closing net book value 43,045 589,794 31,297,954 72,128 15,800 9,970 621,355 32,650,046
As at June 30, 2019Cost 60,035 972,501 44,795,580 159,852 30,587 71,337 1,322,008 47,411,900 Accumulated depreciation (16,990) (382,707) (13,497,626) (87,724) (14,787) (61,367) (700,653) (14,761,854)
Net book value 43,045 589,794 31,297,954 72,128 15,800 9,970 621,355 32,650,046
Year ended June 30, 2018Opening net book value 44,237 586,820 29,523,501 35,427 9,521 5,260 599,472 30,804,238
Additions - - 15,764 6,231 6,831 5,066 63,437 97,329
Transfers from capital work in progress - 57,814 7,445,958 - 1,686 726 51,150 7,557,334 Disposals
Cost - - - (4,587) - - - (4,587)
Accumulated depreciation - - - 1,635 - - - 1,635
- - - (2,952) - - - (2,952) Depreciation charge - note 5.1.3 (596) (39,447) (3,094,112) (9,117) (1,863) (4,192) (80,724) (3,230,051) Closing net book value 43,641 605,187 33,891,111 29,589 16,175 6,860 633,335 35,225,898
As at June 30, 2018Cost 60,035 945,601 44,095,407 103,348 29,614 63,764 1,253,056 46,550,825 Accumulated depreciation (16,394) (340,414) (10,204,296) (73,759) (13,439) (56,904) (619,721) (11,324,927)
Net book value 43,641 605,187 33,891,111 29,589 16,175 6,860 633,335 35,225,898
Annual Rate of Depreciation % 1 5 to 20 5 to 33.33 20 7.5 to 33.33 10 to 33.33 5 to 33.33
* Assets written off
(Rupees in thousand)
Computers and other
related accessories
Office and other
equipment
Total Leasehold land
(note 5.1.1)
Buildings on leasehold land
Plant and machinery
(note 5.1.2)
Vehicles Furniture and fixtures
* *
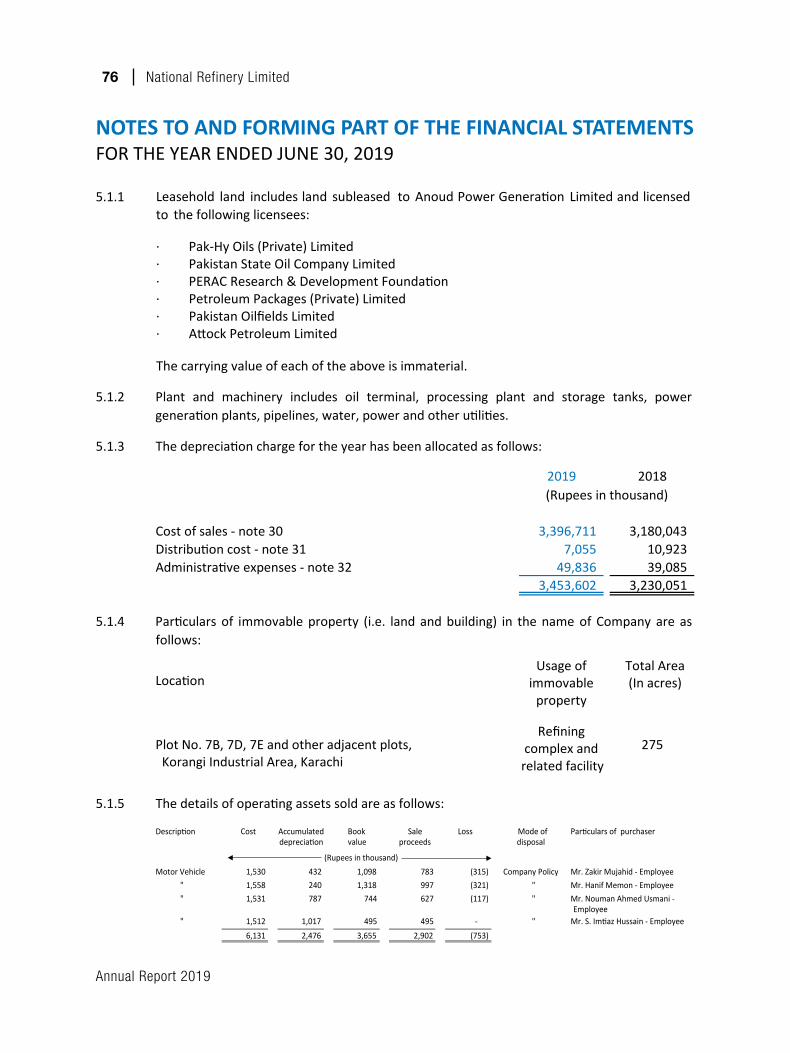
Annual Report 2019
76 National Refinery Limited
NOTES TO AND FORMING PART OF THE FINANCIAL STATEMENTSFORTHEYEARENDEDJUNE30,2019
5.1.2
5.1.3 The depreciation charge for the year has been allocated as follows:
2019 2018
Cost of sales - note 30 3,396,711 3,180,043 Distribution cost - note 31 7,055 10,923 Administrative expenses - note 32 49,836 39,085
3,453,602 3,230,051
5.1.4
Usage of immovable
property
2019 2018
5.2 Major spare parts and stand-by equipment
Gross carrying value
Balance at beginning of the year 395,092 361,004
Additions during the year 201,960 243,367
Transfers made during the year (162,897) (209,279)
Balance at end of the year 434,155 395,092
Provision for impairment - note 5.2.1 (96,863) (97,500)
Net carrying value 337,292 297,592
5.2.1
5.3 Capital work-in-progress
5.1.5 The details of operating assets sold are as follows:
(Rupees in thousand)
During the year, net reversal of provision amounting to Rs. 0.64 million(2018: Rs. 3.35 million) has been made.
Plot No. 7B, 7D, 7E and other adjacent plots, Korangi Industrial Area, Karachi
Refining complex and
related facility275
LocationTotal Area (In acres)
Plant and machinery includes oil terminal, processing plant and storage tanks, powergeneration plants, pipelines, water, power and other utilities.
(Rupees in thousand)
Particulars of immovable property (i.e. land and building) in the name of Company are asfollows:
Cost Book Sale Loss Mode of Particulars of purchaservalue proceeds disposal
Motor Vehicle 1,530 432 1,098 783 (315) Company Policy Mr. Zakir Mujahid - Employee" 1,558 240 1,318 997 (321) " Mr. Hanif Memon - Employee" 1,531 787 744 627 (117) " Mr. Nouman Ahmed Usmani -
Employee" 1,512 1,017 495 495 - " Mr. S. Imtiaz Hussain - Employee
6,131 2,476 3,655 2,902 (753)
(Rupees in thousand)
Description Accumulateddepreciation
5.1.1
· Pak-Hy Oils (Private) Limited· Pakistan State Oil Company Limited· PERAC Research & Development Foundation· Petroleum Packages (Private) Limited· Pakistan Oilfields Limited· Attock Petroleum Limited
The carrying value of each of the above is immaterial.
Leasehold land includes land subleased to Anoud Power Generation Limited and licensedto the following licensees:
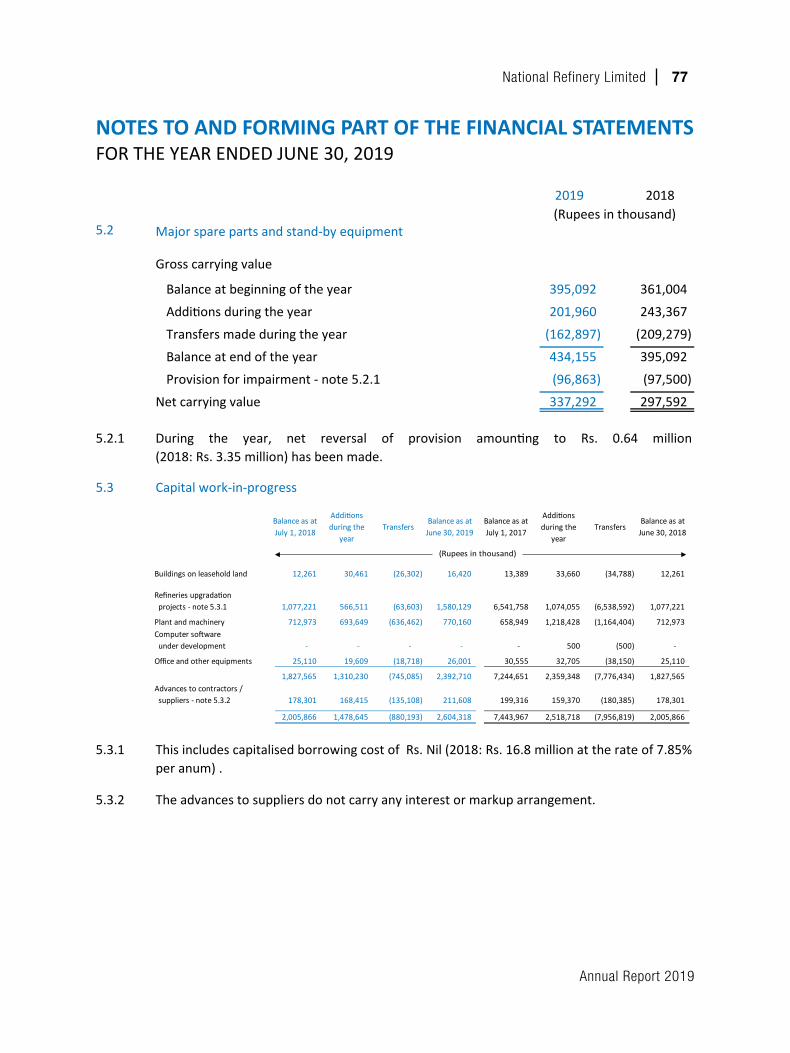
Annual Report 2019
National Refinery Limited 77
NOTES TO AND FORMING PART OF THE FINANCIAL STATEMENTSFORTHEYEARENDEDJUNE30,2019
5.1.2
5.1.3 The depreciation charge for the year has been allocated as follows:
2019 2018
Cost of sales - note 30 3,396,711 3,180,043 Distribution cost - note 31 7,055 10,923 Administrative expenses - note 32 49,836 39,085
3,453,602 3,230,051
5.1.4
Usage of immovable
property
2019 2018
5.2 Major spare parts and stand-by equipment
Gross carrying value
Balance at beginning of the year 395,092 361,004
Additions during the year 201,960 243,367
Transfers made during the year (162,897) (209,279)
Balance at end of the year 434,155 395,092
Provision for impairment - note 5.2.1 (96,863) (97,500)
Net carrying value 337,292 297,592
5.2.1
5.3 Capital work-in-progress
5.1.5 The details of operating assets sold are as follows:
(Rupees in thousand)
During the year, net reversal of provision amounting to Rs. 0.64 million(2018: Rs. 3.35 million) has been made.
Plot No. 7B, 7D, 7E and other adjacent plots, Korangi Industrial Area, Karachi
Refining complex and
related facility275
LocationTotal Area (In acres)
Plant and machinery includes oil terminal, processing plant and storage tanks, powergeneration plants, pipelines, water, power and other utilities.
(Rupees in thousand)
Particulars of immovable property (i.e. land and building) in the name of Company are asfollows:
Cost Book Sale Loss Mode of Particulars of purchaservalue proceeds disposal
Motor Vehicle 1,530 432 1,098 783 (315) Company Policy Mr. Zakir Mujahid - Employee" 1,558 240 1,318 997 (321) " Mr. Hanif Memon - Employee" 1,531 787 744 627 (117) " Mr. Nouman Ahmed Usmani -
Employee" 1,512 1,017 495 495 - " Mr. S. Imtiaz Hussain - Employee
6,131 2,476 3,655 2,902 (753)
(Rupees in thousand)
Description Accumulateddepreciation
5.1.1
· Pak-Hy Oils (Private) Limited· Pakistan State Oil Company Limited· PERAC Research & Development Foundation· Petroleum Packages (Private) Limited· Pakistan Oilfields Limited· Attock Petroleum Limited
The carrying value of each of the above is immaterial.
Leasehold land includes land subleased to Anoud Power Generation Limited and licensedto the following licensees:
5.3.1
5.3.2 The advances to suppliers do not carry any interest or markup arrangement.
2019 2018
5.4 INTANGIBLE ASSETS – Computer softwares
Net carrying value
Balance at beginning of the year 189,366 39,004
Additions during the year 1,079 1,121
Transfers during the year - 219,100
Amortisation for the year (86,767) (69,859)
Balance at end of the year 103,678 189,366
Gross carrying value
Cost 354,405 353,325
Accumulated amortisation (250,727) (163,959)
Net book value 103,678 189,366
Amortisation is charged at the rate of 33.33% per annum.
This includes capitalised borrowing cost of Rs. Nil (2018: Rs. 16.8 million at the rate of 7.85%per anum) .
(Rupees in thousand)
Balance as at July 1, 2018
Additions during the
yearTransfers
Balance as at June 30, 2019
Balance as at July 1, 2017
Additions during the
yearTransfers
Balance as at June 30, 2018
Buildings on leasehold land 12,261 30,461 (26,302) 16,420 13,389 33,660 (34,788) 12,261
Refineries upgradation projects - note 5.3.1 1,077,221 566,511 (63,603) 1,580,129 6,541,758 1,074,055 (6,538,592) 1,077,221
Plant and machinery 712,973 693,649 (636,462) 770,160 658,949 1,218,428 (1,164,404) 712,973 Computer software under development - - - - - 500 (500) -
Office and other equipments 25,110 19,609 (18,718) 26,001 30,555 32,705 (38,150) 25,110
1,827,565 1,310,230 (745,085) 2,392,710 7,244,651 2,359,348 (7,776,434) 1,827,565 Advances to contractors / suppliers - note 5.3.2 178,301 168,415 (135,108) 211,608 199,316 159,370 (180,385) 178,301
2,005,866 1,478,645 (880,193) 2,604,318 7,443,967 2,518,718 (7,956,819) 2,005,866
(Rupees in thousand)
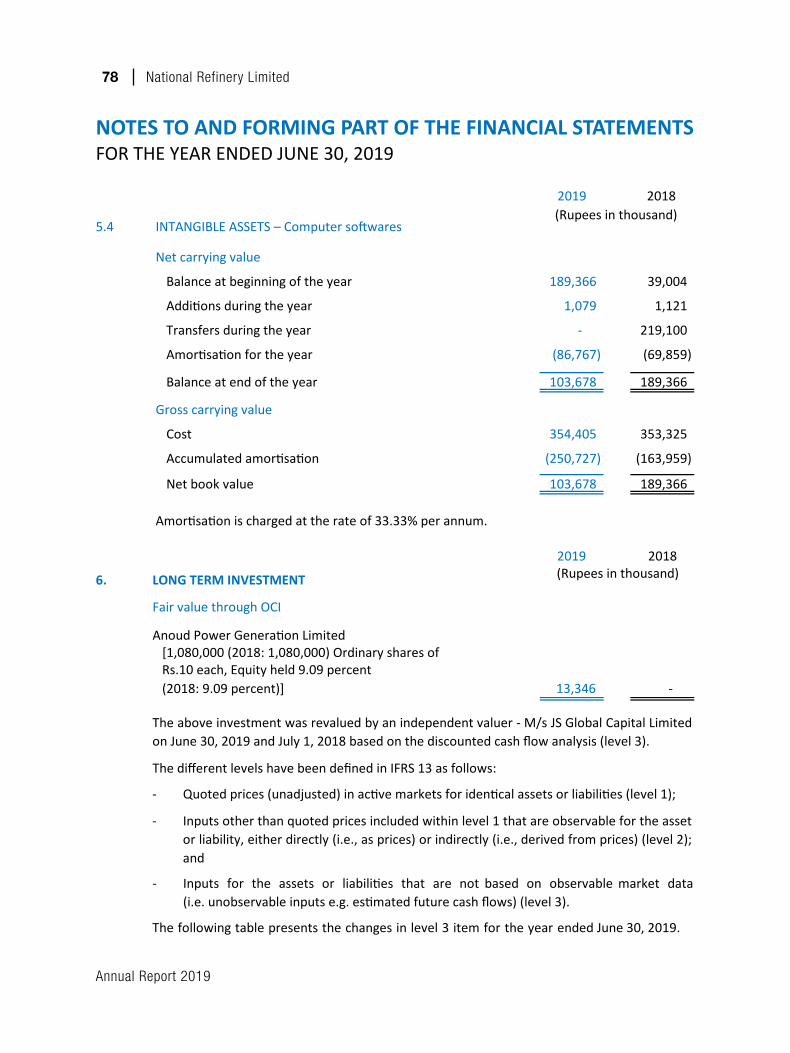
Annual Report 2019
78 National Refinery Limited
NOTES TO AND FORMING PART OF THE FINANCIAL STATEMENTSFORTHEYEARENDEDJUNE30,2019
5.3.1
5.3.2 The advances to suppliers do not carry any interest or markup arrangement.
2019 2018
5.4 INTANGIBLE ASSETS – Computer softwares
Net carrying value
Balance at beginning of the year 189,366 39,004
Additions during the year 1,079 1,121
Transfers during the year - 219,100
Amortisation for the year (86,767) (69,859)
Balance at end of the year 103,678 189,366
Gross carrying value
Cost 354,405 353,325
Accumulated amortisation (250,727) (163,959)
Net book value 103,678 189,366
Amortisation is charged at the rate of 33.33% per annum.
This includes capitalised borrowing cost of Rs. Nil (2018: Rs. 16.8 million at the rate of 7.85%per anum) .
(Rupees in thousand)
Balance as at July 1, 2018
Additions during the
yearTransfers
Balance as at June 30, 2019
Balance as at July 1, 2017
Additions during the
yearTransfers
Balance as at June 30, 2018
Buildings on leasehold land 12,261 30,461 (26,302) 16,420 13,389 33,660 (34,788) 12,261
Refineries upgradation projects - note 5.3.1 1,077,221 566,511 (63,603) 1,580,129 6,541,758 1,074,055 (6,538,592) 1,077,221
Plant and machinery 712,973 693,649 (636,462) 770,160 658,949 1,218,428 (1,164,404) 712,973 Computer software under development - - - - - 500 (500) -
Office and other equipments 25,110 19,609 (18,718) 26,001 30,555 32,705 (38,150) 25,110
1,827,565 1,310,230 (745,085) 2,392,710 7,244,651 2,359,348 (7,776,434) 1,827,565 Advances to contractors / suppliers - note 5.3.2 178,301 168,415 (135,108) 211,608 199,316 159,370 (180,385) 178,301
2,005,866 1,478,645 (880,193) 2,604,318 7,443,967 2,518,718 (7,956,819) 2,005,866
(Rupees in thousand)
6. LONG TERM INVESTMENT
Fair value through OCI
Anoud Power Generation Limited [1,080,000 (2018: 1,080,000) Ordinary shares of Rs.10 each, Equity held 9.09 percent (2018: 9.09 percent)] 13,346 -
The different levels have been defined in IFRS 13 as follows:
- Inputs for the assets or liabilities that are not based on observable market data(i.e. unobservable inputs e.g. estimated future cash flows) (level 3).
The following table presents the changes in level 3 item for the year ended June 30, 2019.
2019 2018(Rupees in thousand)
The above investment was revalued by an independent valuer - M/s JS Global Capital Limitedon June 30, 2019 and July 1, 2018 based on the discounted cash flow analysis (level 3).
- Quoted prices (unadjusted) in active markets for identical assets or liabilities (level 1);
- Inputs other than quoted prices included within level 1 that are observable for the assetor liability, either directly (i.e., as prices) or indirectly (i.e., derived from prices) (level 2);and
Opening balance July 1, 2018 - IAS 39Transfer of investment at initial date of application of IFRS 9Opening balance July 1, 2018 - IFRS 9Loss recognised during the year Closing balance June 30, 2019
-15,010 15,010 (1,664) 13,346
Unlisted equity security(Rupees in thousand)
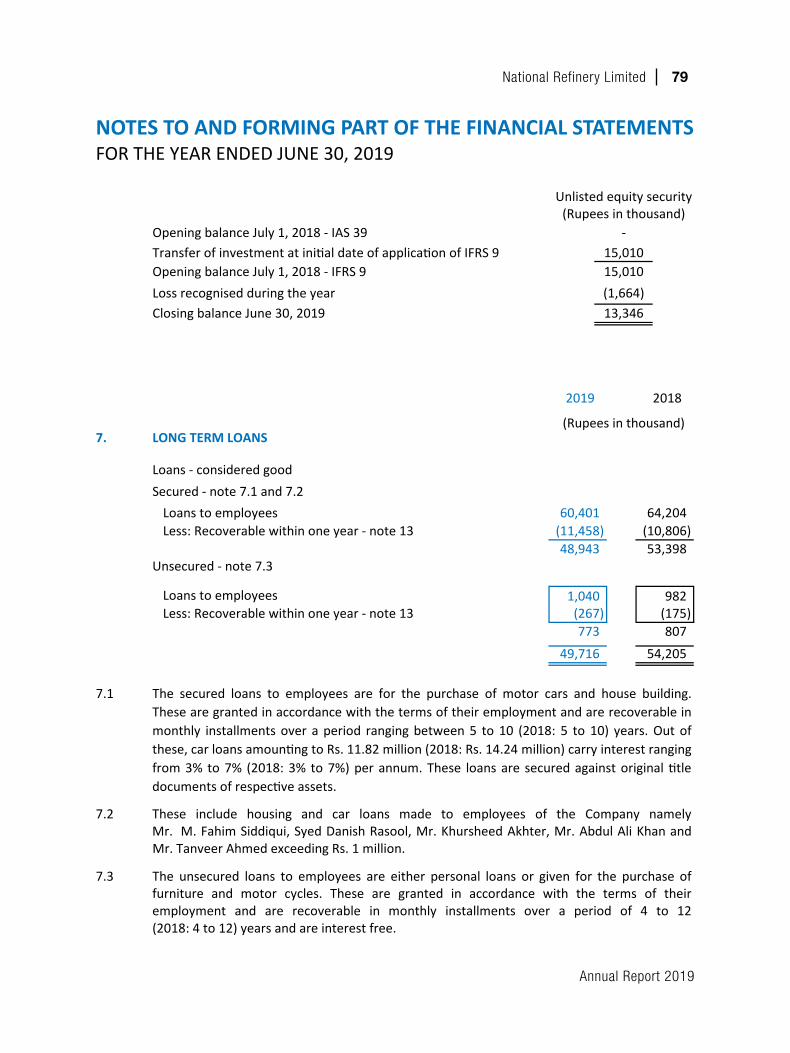
Annual Report 2019
National Refinery Limited 79
NOTES TO AND FORMING PART OF THE FINANCIAL STATEMENTSFORTHEYEARENDEDJUNE30,2019
6. LONG TERM INVESTMENT
Fair value through OCI
Anoud Power Generation Limited [1,080,000 (2018: 1,080,000) Ordinary shares of Rs.10 each, Equity held 9.09 percent (2018: 9.09 percent)] 13,346 -
The different levels have been defined in IFRS 13 as follows:
- Inputs for the assets or liabilities that are not based on observable market data(i.e. unobservable inputs e.g. estimated future cash flows) (level 3).
The following table presents the changes in level 3 item for the year ended June 30, 2019.
2019 2018(Rupees in thousand)
The above investment was revalued by an independent valuer - M/s JS Global Capital Limitedon June 30, 2019 and July 1, 2018 based on the discounted cash flow analysis (level 3).
- Quoted prices (unadjusted) in active markets for identical assets or liabilities (level 1);
- Inputs other than quoted prices included within level 1 that are observable for the assetor liability, either directly (i.e., as prices) or indirectly (i.e., derived from prices) (level 2);and
Opening balance July 1, 2018 - IAS 39Transfer of investment at initial date of application of IFRS 9Opening balance July 1, 2018 - IFRS 9Loss recognised during the year Closing balance June 30, 2019
-15,010 15,010 (1,664) 13,346
Unlisted equity security(Rupees in thousand)
7. LONG TERM LOANS
Loans - considered goodSecured - note 7.1 and 7.2
Loans to employees 60,401 64,204 Less: Recoverable within one year - note 13 (11,458) (10,806)
48,943 53,398 Unsecured - note 7.3
Loans to employees 1,040 982 Less: Recoverable within one year - note 13 (267) (175)
773 807 49,716 54,205
7.1
7.2
7.3
2019 2018
2019 2018
8. LONG TERM DEPOSITS
Utilities 14,216 14,216 Others 16,049 16,049
30,265 30,265
8.1 These deposits do not carry any mark up arrangement.
The secured loans to employees are for the purchase of motor cars and house building.These are granted in accordance with the terms of their employment and are recoverable inmonthly installments over a period ranging between 5 to 10 (2018: 5 to 10) years. Out ofthese, car loans amounting to Rs. 11.82 million (2018: Rs. 14.24 million) carry interest rangingfrom 3% to 7% (2018: 3% to 7%) per annum. These loans are secured against original titledocuments of respective assets.
These include housing and car loans made to employees of the Company namelyMr. M. Fahim Siddiqui, Syed Danish Rasool, Mr. Khursheed Akhter, Mr. Abdul Ali Khan andMr. Tanveer Ahmed exceeding Rs. 1 million.
The unsecured loans to employees are either personal loans or given for the purchase offurniture and motor cycles. These are granted in accordance with the terms of theiremployment and are recoverable in monthly installments over a period of 4 to 12(2018: 4 to 12) years and are interest free.
(Rupees in thousand)
(Rupees in thousand)
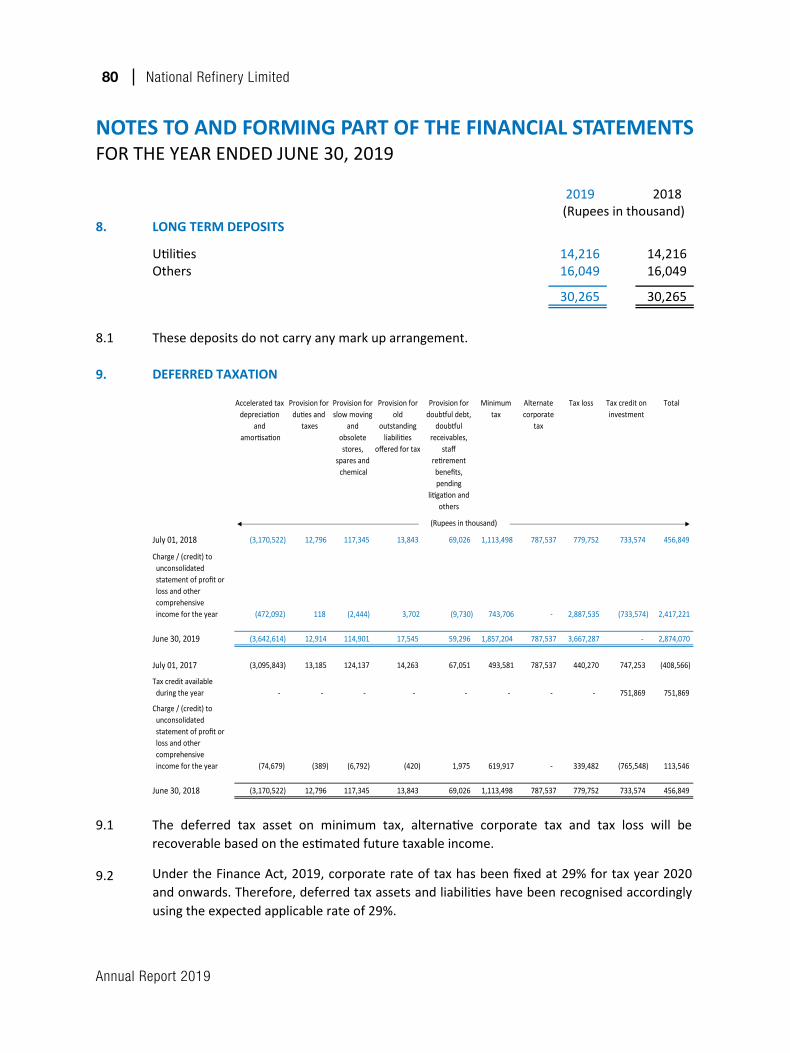
Annual Report 2019
80 National Refinery Limited
NOTES TO AND FORMING PART OF THE FINANCIAL STATEMENTSFORTHEYEARENDEDJUNE30,2019
7. LONG TERM LOANS
Loans - considered goodSecured - note 7.1 and 7.2
Loans to employees 60,401 64,204 Less: Recoverable within one year - note 13 (11,458) (10,806)
48,943 53,398 Unsecured - note 7.3
Loans to employees 1,040 982 Less: Recoverable within one year - note 13 (267) (175)
773 807 49,716 54,205
7.1
7.2
7.3
2019 2018
2019 2018
8. LONG TERM DEPOSITS
Utilities 14,216 14,216 Others 16,049 16,049
30,265 30,265
8.1 These deposits do not carry any mark up arrangement.
The secured loans to employees are for the purchase of motor cars and house building.These are granted in accordance with the terms of their employment and are recoverable inmonthly installments over a period ranging between 5 to 10 (2018: 5 to 10) years. Out ofthese, car loans amounting to Rs. 11.82 million (2018: Rs. 14.24 million) carry interest rangingfrom 3% to 7% (2018: 3% to 7%) per annum. These loans are secured against original titledocuments of respective assets.
These include housing and car loans made to employees of the Company namelyMr. M. Fahim Siddiqui, Syed Danish Rasool, Mr. Khursheed Akhter, Mr. Abdul Ali Khan andMr. Tanveer Ahmed exceeding Rs. 1 million.
The unsecured loans to employees are either personal loans or given for the purchase offurniture and motor cycles. These are granted in accordance with the terms of theiremployment and are recoverable in monthly installments over a period of 4 to 12(2018: 4 to 12) years and are interest free.
(Rupees in thousand)
(Rupees in thousand)
9.1
9.2
2019 201810. STORES, SPARES AND CHEMICALS
In hand - Stores 238,211 358,199 - Spares 1,275,193 963,681 - Chemicals 259,112 336,964
1,772,516 1,658,844 In transit 139,397 195,105
1,911,913 1,853,949 Provision for slow moving and obsolete stores,
spares and chemicals - note 10.1 (339,344) (352,085) 1,572,569 1,501,864
10.1
2019 2018
11. STOCK-IN-TRADE
Crude oil and condensate [including in transit Rs. 43.64 million (2018: Rs. 32.82 million)] 8,750,748 3,529,638
Semi-finished products 4,965,023 3,252,580 Finished products - note 11.1 11,952,823 5,845,443
25,668,594 12,627,661
11.1
The Company made a reversal of provision for slow moving and obsolete stores, spares andchemicals of Rs. 12.74 million (2018: Rs. 8.47 million).
(Rupees in thousand)
As at June 30, 2019, stock of finished products and semi-finished products have been writtendown by Rs. 519 million (2018: Rs. 19.04 million) and Rs. 109 million(2018: Nil) respectively to arrive at its net realisable value.
The deferred tax asset on minimum tax, alternative corporate tax and tax loss will berecoverable based on the estimated future taxable income.
Under the Finance Act, 2019, corporate rate of tax has been fixed at 29% for tax year 2020and onwards. Therefore, deferred tax assets and liabilities have been recognised accordinglyusing the expected applicable rate of 29%.
(Rupees in thousand)
9. DEFERRED TAXATION
Accelerated tax depreciation
and amortisation
Provision for duties and
taxes
Provision for slow moving
and obsolete stores,
spares and chemical
Provision for old
outstanding liabilities
offered for tax
Provision for doubtful debt,
doubtful receivables,
staff retirement benefits, pending
litigation and others
Minimum tax
Alternate corporate
tax
Tax loss Tax credit on investment
Total
July 01, 2018 (3,170,522) 12,796 117,345 13,843 69,026 1,113,498 787,537 779,752 733,574 456,849
Charge / (credit) to unconsolidated statement of profit or loss and other comprehensive income for the year (472,092) 118 (2,444) 3,702 (9,730) 743,706 - 2,887,535 (733,574) 2,417,221
June 30, 2019 (3,642,614) 12,914 114,901 17,545 59,296 1,857,204 787,537 3,667,287 - 2,874,070
July 01, 2017 (3,095,843) 13,185 124,137 14,263 67,051 493,581 787,537 440,270 747,253 (408,566)
Tax credit available during the year - - - - - - - - 751,869 751,869
Charge / (credit) to unconsolidated statement of profit or loss and other comprehensive income for the year (74,679) (389) (6,792) (420) 1,975 619,917 - 339,482 (765,548) 113,546
June 30, 2018 (3,170,522) 12,796 117,345 13,843 69,026 1,113,498 787,537 779,752 733,574 456,849
(Rupees in thousand)
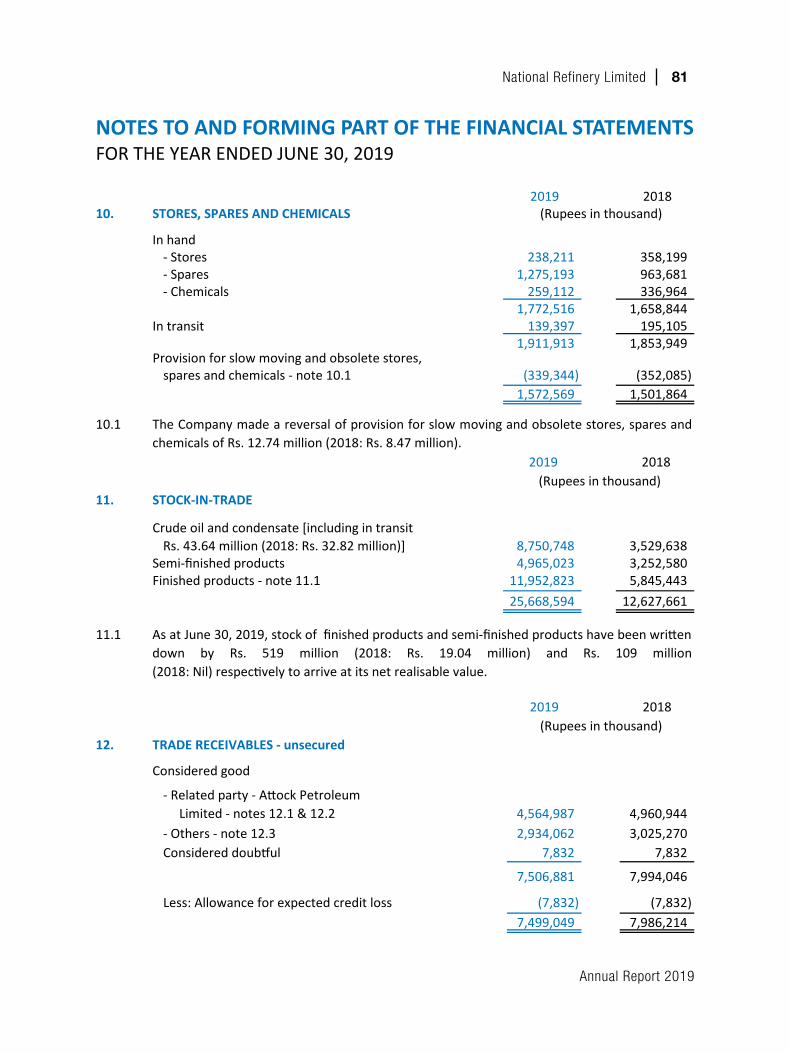
Annual Report 2019
National Refinery Limited 81
NOTES TO AND FORMING PART OF THE FINANCIAL STATEMENTSFORTHEYEARENDEDJUNE30,2019
9.1
9.2
2019 201810. STORES, SPARES AND CHEMICALS
In hand - Stores 238,211 358,199 - Spares 1,275,193 963,681 - Chemicals 259,112 336,964
1,772,516 1,658,844 In transit 139,397 195,105
1,911,913 1,853,949 Provision for slow moving and obsolete stores,
spares and chemicals - note 10.1 (339,344) (352,085) 1,572,569 1,501,864
10.1
2019 2018
11. STOCK-IN-TRADE
Crude oil and condensate [including in transit Rs. 43.64 million (2018: Rs. 32.82 million)] 8,750,748 3,529,638
Semi-finished products 4,965,023 3,252,580 Finished products - note 11.1 11,952,823 5,845,443
25,668,594 12,627,661
11.1
The Company made a reversal of provision for slow moving and obsolete stores, spares andchemicals of Rs. 12.74 million (2018: Rs. 8.47 million).
(Rupees in thousand)
As at June 30, 2019, stock of finished products and semi-finished products have been writtendown by Rs. 519 million (2018: Rs. 19.04 million) and Rs. 109 million(2018: Nil) respectively to arrive at its net realisable value.
The deferred tax asset on minimum tax, alternative corporate tax and tax loss will berecoverable based on the estimated future taxable income.
Under the Finance Act, 2019, corporate rate of tax has been fixed at 29% for tax year 2020and onwards. Therefore, deferred tax assets and liabilities have been recognised accordinglyusing the expected applicable rate of 29%.
(Rupees in thousand)
9. DEFERRED TAXATION
Accelerated tax depreciation
and amortisation
Provision for duties and
taxes
Provision for slow moving
and obsolete stores,
spares and chemical
Provision for old
outstanding liabilities
offered for tax
Provision for doubtful debt,
doubtful receivables,
staff retirement benefits, pending
litigation and others
Minimum tax
Alternate corporate
tax
Tax loss Tax credit on investment
Total
July 01, 2018 (3,170,522) 12,796 117,345 13,843 69,026 1,113,498 787,537 779,752 733,574 456,849
Charge / (credit) to unconsolidated statement of profit or loss and other comprehensive income for the year (472,092) 118 (2,444) 3,702 (9,730) 743,706 - 2,887,535 (733,574) 2,417,221
June 30, 2019 (3,642,614) 12,914 114,901 17,545 59,296 1,857,204 787,537 3,667,287 - 2,874,070
July 01, 2017 (3,095,843) 13,185 124,137 14,263 67,051 493,581 787,537 440,270 747,253 (408,566)
Tax credit available during the year - - - - - - - - 751,869 751,869
Charge / (credit) to unconsolidated statement of profit or loss and other comprehensive income for the year (74,679) (389) (6,792) (420) 1,975 619,917 - 339,482 (765,548) 113,546
June 30, 2018 (3,170,522) 12,796 117,345 13,843 69,026 1,113,498 787,537 779,752 733,574 456,849
(Rupees in thousand)
12. TRADE RECEIVABLES - unsecured
Considered good
4,564,987 4,960,944 - Others - note 12.3 2,934,062 3,025,270 Considered doubtful 7,832 7,832
7,506,881 7,994,046
Less: Allowance for expected credit loss (7,832) (7,832) 7,499,049 7,986,214
12.1
12.2
12.3
- Related party - Attock Petroleum Limited - notes 12.1 & 12.2
There are no trade debts receivable from related party that are past due or impaired.
The maximum aggregate amount due from the related party at the end of any month duringthe year was Rs. 6.44 billion (2018: Rs. 8.23 billion).
The trade receivables that are past due but not impaired is Rs. 51 thousand(2018: Rs. 51 thousand).
(Rupees in thousand)2019 2018
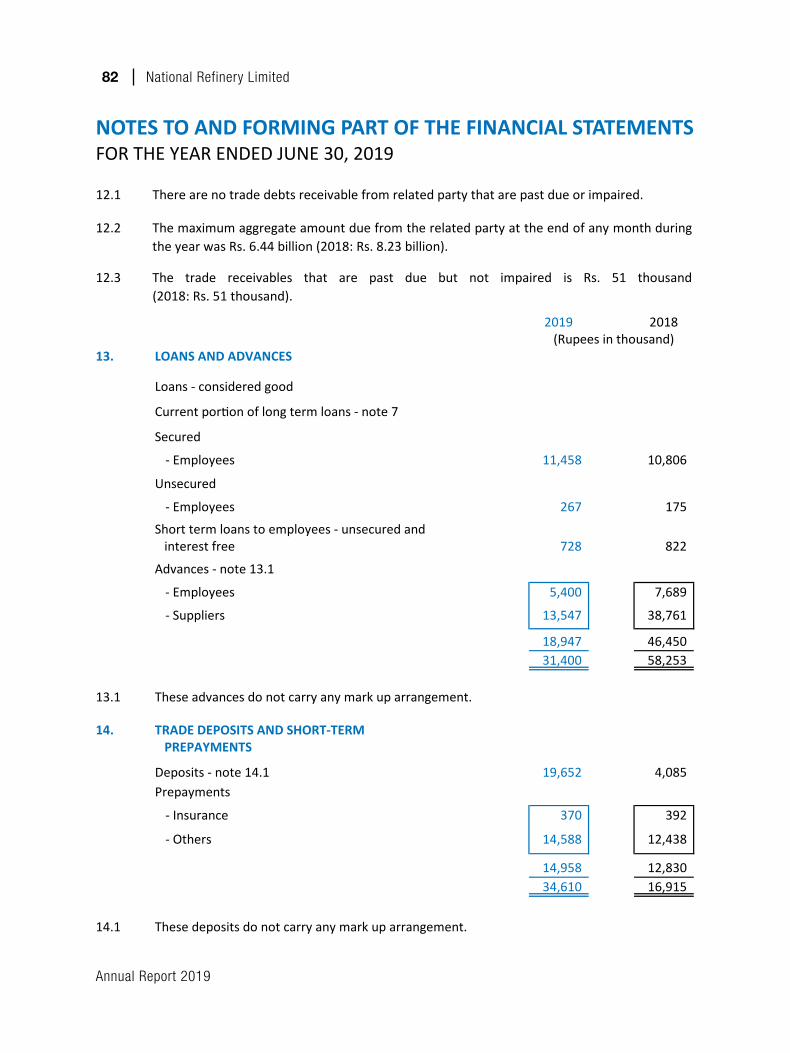
Annual Report 2019
82 National Refinery Limited
NOTES TO AND FORMING PART OF THE FINANCIAL STATEMENTSFORTHEYEARENDEDJUNE30,2019
12. TRADE RECEIVABLES - unsecured
Considered good
4,564,987 4,960,944 - Others - note 12.3 2,934,062 3,025,270 Considered doubtful 7,832 7,832
7,506,881 7,994,046
Less: Allowance for expected credit loss (7,832) (7,832) 7,499,049 7,986,214
12.1
12.2
12.3
- Related party - Attock Petroleum Limited - notes 12.1 & 12.2
There are no trade debts receivable from related party that are past due or impaired.
The maximum aggregate amount due from the related party at the end of any month duringthe year was Rs. 6.44 billion (2018: Rs. 8.23 billion).
The trade receivables that are past due but not impaired is Rs. 51 thousand(2018: Rs. 51 thousand).
(Rupees in thousand)2019 2018
2019 2018
13. LOANS AND ADVANCES
Loans - considered good
Current portion of long term loans - note 7
Secured
- Employees 11,458 10,806
Unsecured
- Employees 267 175
Short term loans to employees - unsecured and interest free 728 822
Advances - note 13.1
- Employees 5,400 7,689
- Suppliers 13,547 38,761
18,947 46,450 31,400 58,253
13.1 These advances do not carry any mark up arrangement.
14. TRADE DEPOSITS AND SHORT-TERM PREPAYMENTS
Deposits - note 14.1 19,652 4,085 Prepayments
- Insurance 370 392
- Others 14,588 12,438
14,958 12,830 34,610 16,915
14.1 These deposits do not carry any mark up arrangement.
(Rupees in thousand)
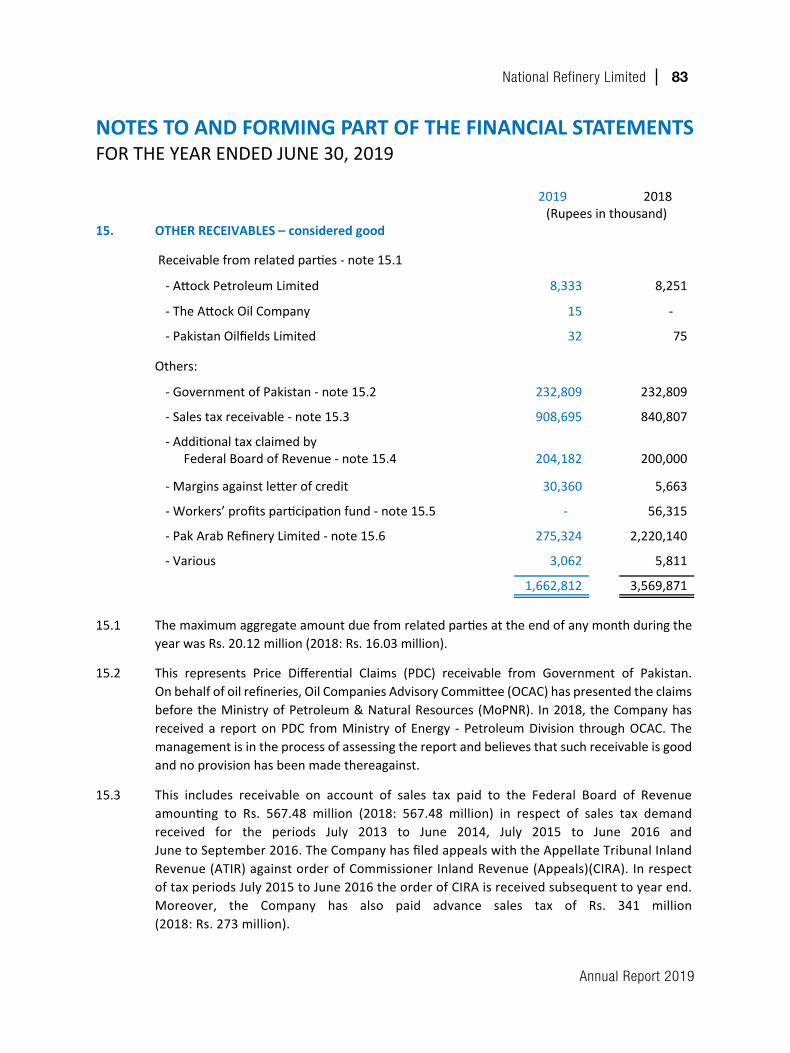
Annual Report 2019
National Refinery Limited 83
NOTES TO AND FORMING PART OF THE FINANCIAL STATEMENTSFORTHEYEARENDEDJUNE30,2019
- The Attock Oil Company 15 -
- Pakistan Oilfields Limited 32 75
Others:
- Government of Pakistan - note 15.2 232,809 232,809
- Sales tax receivable - note 15.3 908,695 840,807
- Additional tax claimed byFederal Board of Revenue - note 15.4 204,182 200,000
- Margins against letter of credit 30,360 5,663
- Workers’ profits participation fund - note 15.5 - 56,315
- Pak Arab Refinery Limited - note 15.6 275,324 2,220,140
- Various 3,062 5,811
1,662,812 3,569,871
15.1
15.2
15.3
15.4
2019 2018(Rupees in thousand)
15.5 Workers’ profits participation fund
Receivable at beginning of the year 56,315 12,341 Allocation for the year - note 34 - (48,785) Refund from fund - (12,341)
56,315 (48,785) Amount (received from) / paid to the Trustees of the Fund (56,315) 105,100 Receivable at end of the year - 56,315
This represents amount paid against the order of demand for monitoring of withholding taxesfor tax year 2016. The Company has filed an appeal with the Commissioner of Inland Revenue(Appeals) against the order.
The maximum aggregate amount due from related parties at the end of any month during theyear was Rs. 20.12 million (2018: Rs. 16.03 million).
2019 2018
15. OTHER RECEIVABLES – considered good
Receivable from related parties - note 15.1
- Attock Petroleum Limited 8,333 8,251
(Rupees in thousand)
This represents Price Differential Claims (PDC) receivable from Government of Pakistan. On behalf of oil refineries, Oil Companies Advisory Committee (OCAC) has presented the claims before the Ministry of Petroleum & Natural Resources (MoPNR). In 2018, the Company has received a report on PDC from Ministry of Energy - Petroleum Division through OCAC. The management is in the process of assessing the report and believes that such receivable is good and no provision has been made thereagainst.
This includes receivable on account of sales tax paid to the Federal Board of Revenue amounting to Rs. 567.48 million (2018: 567.48 million) in respect of sales tax demand received for the periods July 2013 to June 2014, July 2015 to June 2016 and June to September 2016. The Company has filed appeals with the Appellate Tribunal Inland Revenue (ATIR) against order of Commissioner Inland Revenue (Appeals)(CIRA). In respect of tax periods July 2015 to June 2016 the order of CIRA is received subsequent to year end. Moreover, the Company has also paid advance sales tax of Rs. 341 million (2018: Rs. 273 million).
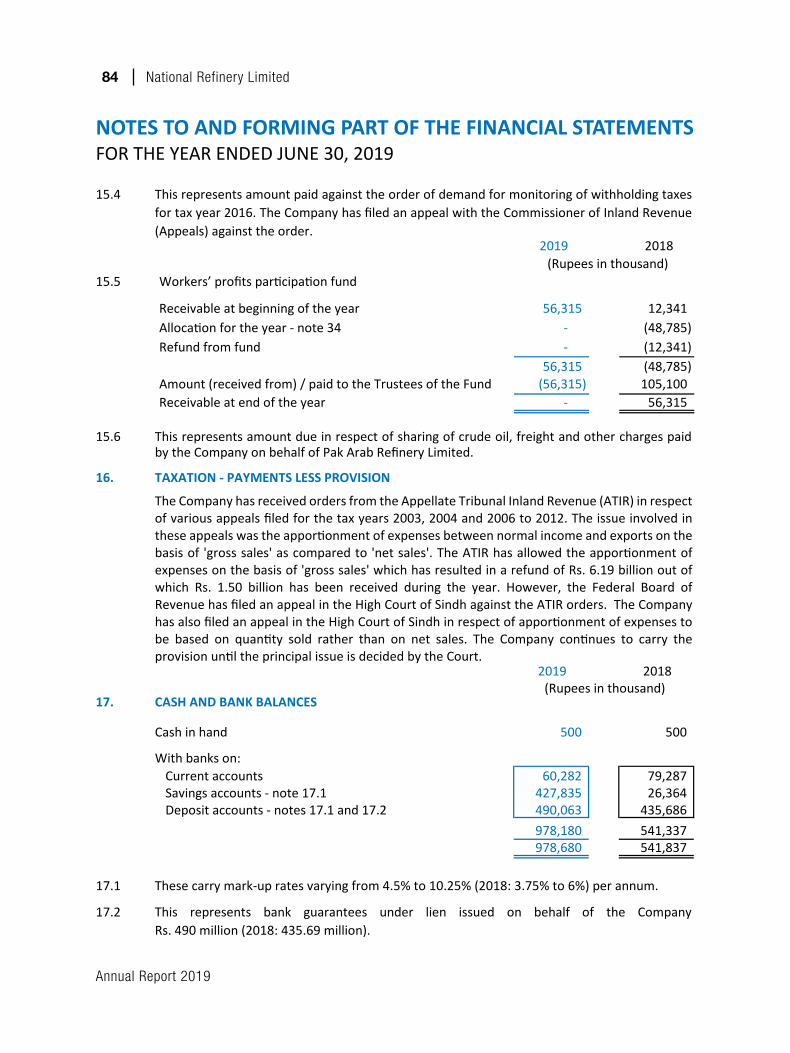
Annual Report 2019
84 National Refinery Limited
NOTES TO AND FORMING PART OF THE FINANCIAL STATEMENTSFORTHEYEARENDEDJUNE30,2019
- The Attock Oil Company 15 -
- Pakistan Oilfields Limited 32 75
Others:
- Government of Pakistan - note 15.2 232,809 232,809
- Sales tax receivable - note 15.3 908,695 840,807
- Additional tax claimed byFederal Board of Revenue - note 15.4 204,182 200,000
- Margins against letter of credit 30,360 5,663
- Workers’ profits participation fund - note 15.5 - 56,315
- Pak Arab Refinery Limited - note 15.6 275,324 2,220,140
- Various 3,062 5,811
1,662,812 3,569,871
15.1
15.2
15.3
15.4
2019 2018(Rupees in thousand)
15.5 Workers’ profits participation fund
Receivable at beginning of the year 56,315 12,341 Allocation for the year - note 34 - (48,785) Refund from fund - (12,341)
56,315 (48,785) Amount (received from) / paid to the Trustees of the Fund (56,315) 105,100 Receivable at end of the year - 56,315
This represents amount paid against the order of demand for monitoring of withholding taxesfor tax year 2016. The Company has filed an appeal with the Commissioner of Inland Revenue(Appeals) against the order.
The maximum aggregate amount due from related parties at the end of any month during theyear was Rs. 20.12 million (2018: Rs. 16.03 million).
2019 2018
15. OTHER RECEIVABLES – considered good
Receivable from related parties - note 15.1
- Attock Petroleum Limited 8,333 8,251
(Rupees in thousand)
This represents Price Differential Claims (PDC) receivable from Government of Pakistan. On behalf of oil refineries, Oil Companies Advisory Committee (OCAC) has presented the claims before the Ministry of Petroleum & Natural Resources (MoPNR). In 2018, the Company has received a report on PDC from Ministry of Energy - Petroleum Division through OCAC. The management is in the process of assessing the report and believes that such receivable is good and no provision has been made thereagainst.
This includes receivable on account of sales tax paid to the Federal Board of Revenue amounting to Rs. 567.48 million (2018: 567.48 million) in respect of sales tax demand received for the periods July 2013 to June 2014, July 2015 to June 2016 and June to September 2016. The Company has filed appeals with the Appellate Tribunal Inland Revenue (ATIR) against order of Commissioner Inland Revenue (Appeals)(CIRA). In respect of tax periods July 2015 to June 2016 the order of CIRA is received subsequent to year end. Moreover, the Company has also paid advance sales tax of Rs. 341 million (2018: Rs. 273 million).
15.6
16. TAXATION - PAYMENTS LESS PROVISION
2019 2018
17. CASH AND BANK BALANCES
Cash in hand 500 500
With banks on: Current accounts 60,282 79,287 Savings accounts - note 17.1 427,835 26,364 Deposit accounts - notes 17.1 and 17.2 490,063 435,686
978,180 541,337 978,680 541,837
17.1
17.2
2019 2018
18. SHARE CAPITAL
Number of shares
Authorised
Ordinary shares of Rs. 10 each 1,000,000 1,000,000
Issued, subscribed and paid-up
Ordinary shares ofRs. 10 each fully paid in cash 594,504 594,504
Ordinary shares ofRs. 10 each issued forconsideration other than cash 64,700 64,700
Ordinary shares ofRs. 10 each issued as fullypaid bonus shares 140,462 140,462
799,666 799,666
These carry mark-up rates varying from 4.5% to 10.25% (2018: 3.75% to 6%) per annum.
This represents bank guarantees under lien issued on behalf of the CompanyRs. 490 million (2018: 435.69 million).
(Rupees in thousand)
100,000,000
59,450,417
6,469,963
14,046,180
79,966,560
This represents amount due in respect of sharing of crude oil, freight and other charges paidby the Company on behalf of Pak Arab Refinery Limited.
(Rupees in thousand)
The Company has received orders from the Appellate Tribunal Inland Revenue (ATIR) in respect of various appeals filed for the tax years 2003, 2004 and 2006 to 2012. The issue involved in these appeals was the apportionment of expenses between normal income and exports on the basis of 'gross sales' as compared to 'net sales'. The ATIR has allowed the apportionment of expenses on the basis of 'gross sales' which has resulted in a refund of Rs. 6.19 billion out of which Rs. 1.50 billion has been received during the year. However, the Federal Board of Revenue has filed an appeal in the High Court of Sindh against the ATIR orders. The Company has also filed an appeal in the High Court of Sindh in respect of apportionment of expenses to be based on quantity sold rather than on net sales. The Company continues to carry the provision until the principal issue is decided by the Court.
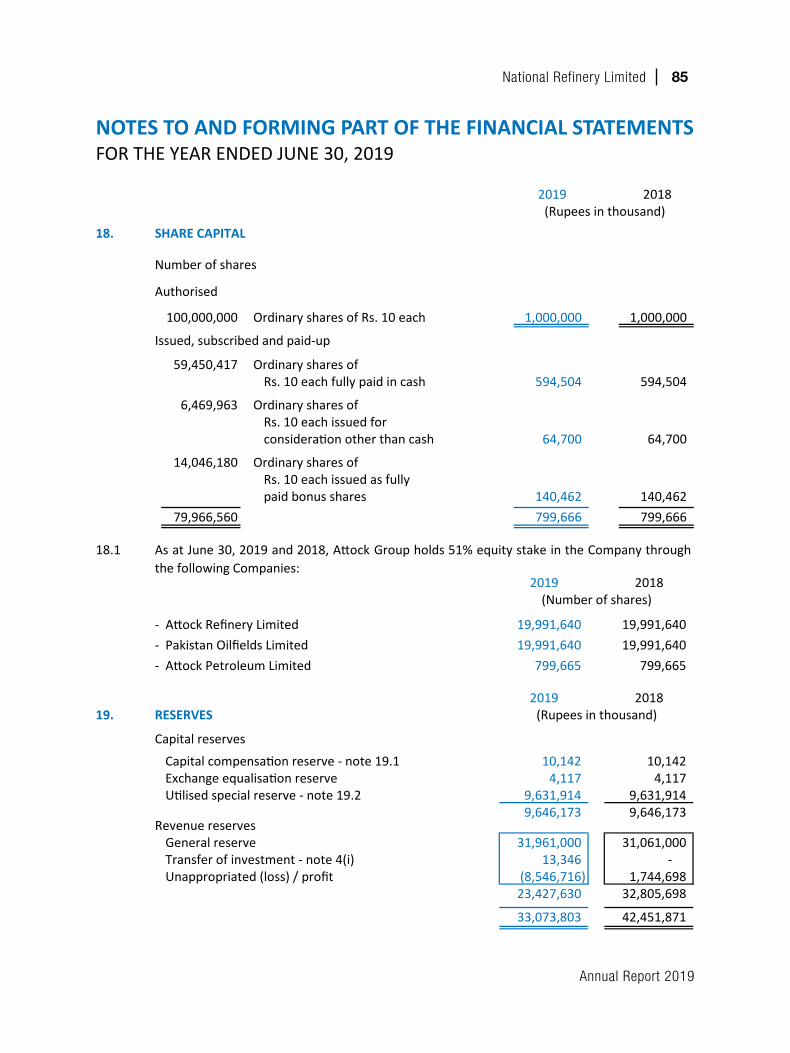
Annual Report 2019
National Refinery Limited 85
NOTES TO AND FORMING PART OF THE FINANCIAL STATEMENTSFORTHEYEARENDEDJUNE30,2019
15.6
16. TAXATION - PAYMENTS LESS PROVISION
2019 2018
17. CASH AND BANK BALANCES
Cash in hand 500 500
With banks on: Current accounts 60,282 79,287 Savings accounts - note 17.1 427,835 26,364 Deposit accounts - notes 17.1 and 17.2 490,063 435,686
978,180 541,337 978,680 541,837
17.1
17.2
2019 2018
18. SHARE CAPITAL
Number of shares
Authorised
Ordinary shares of Rs. 10 each 1,000,000 1,000,000
Issued, subscribed and paid-up
Ordinary shares ofRs. 10 each fully paid in cash 594,504 594,504
Ordinary shares ofRs. 10 each issued forconsideration other than cash 64,700 64,700
Ordinary shares ofRs. 10 each issued as fullypaid bonus shares 140,462 140,462
799,666 799,666
These carry mark-up rates varying from 4.5% to 10.25% (2018: 3.75% to 6%) per annum.
This represents bank guarantees under lien issued on behalf of the CompanyRs. 490 million (2018: 435.69 million).
(Rupees in thousand)
100,000,000
59,450,417
6,469,963
14,046,180
79,966,560
This represents amount due in respect of sharing of crude oil, freight and other charges paidby the Company on behalf of Pak Arab Refinery Limited.
(Rupees in thousand)
The Company has received orders from the Appellate Tribunal Inland Revenue (ATIR) in respect of various appeals filed for the tax years 2003, 2004 and 2006 to 2012. The issue involved in these appeals was the apportionment of expenses between normal income and exports on the basis of 'gross sales' as compared to 'net sales'. The ATIR has allowed the apportionment of expenses on the basis of 'gross sales' which has resulted in a refund of Rs. 6.19 billion out of which Rs. 1.50 billion has been received during the year. However, the Federal Board of Revenue has filed an appeal in the High Court of Sindh against the ATIR orders. The Company has also filed an appeal in the High Court of Sindh in respect of apportionment of expenses to be based on quantity sold rather than on net sales. The Company continues to carry the provision until the principal issue is decided by the Court.
18.1
2019 2018
- Attock Refinery Limited 19,991,640 19,991,640 - Pakistan Oilfields Limited 19,991,640 19,991,640 - Attock Petroleum Limited 799,665 799,665
2019 201819. RESERVES
Capital reserves
Capital compensation reserve - note 19.1 10,142 10,142 Exchange equalisation reserve 4,117 4,117 Utilised special reserve - note 19.2 9,631,914 9,631,914
9,646,173 9,646,173 Revenue reserves
General reserve 31,961,000 31,061,000 Transfer of investment - note 4(i) 13,346 - Unappropriated (loss) / profit (8,546,716) 1,744,698
23,427,630 32,805,698
33,073,803 42,451,871
19.1
19.2 This represents amounts utilised out of the Special Reserve for upgradation and expansion ofthe refinery.
As at June 30, 2019 and 2018, Attock Group holds 51% equity stake in the Company throughthe following Companies:
(Number of shares)
(Rupees in thousand)
Capital compensation reserve includes net amounts for (a) premature termination of crude oil sales, bareboat charter-party and technical assistance agreements, (b) design defects and terminated service agreements and (c) termination of bareboat charter-party and affreightment agreements.
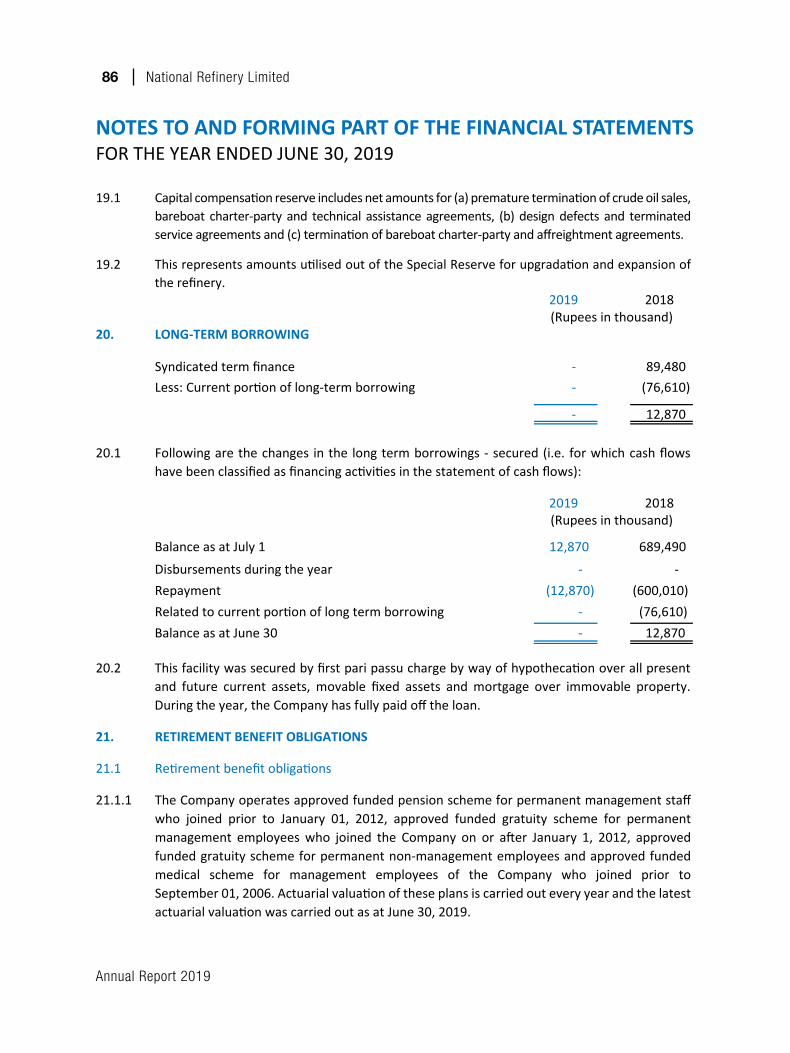
Annual Report 2019
86 National Refinery Limited
NOTES TO AND FORMING PART OF THE FINANCIAL STATEMENTSFORTHEYEARENDEDJUNE30,2019
18.1
2019 2018
- Attock Refinery Limited 19,991,640 19,991,640 - Pakistan Oilfields Limited 19,991,640 19,991,640 - Attock Petroleum Limited 799,665 799,665
2019 201819. RESERVES
Capital reserves
Capital compensation reserve - note 19.1 10,142 10,142 Exchange equalisation reserve 4,117 4,117 Utilised special reserve - note 19.2 9,631,914 9,631,914
9,646,173 9,646,173 Revenue reserves
General reserve 31,961,000 31,061,000 Transfer of investment - note 4(i) 13,346 - Unappropriated (loss) / profit (8,546,716) 1,744,698
23,427,630 32,805,698
33,073,803 42,451,871
19.1
19.2 This represents amounts utilised out of the Special Reserve for upgradation and expansion ofthe refinery.
As at June 30, 2019 and 2018, Attock Group holds 51% equity stake in the Company throughthe following Companies:
(Number of shares)
(Rupees in thousand)
Capital compensation reserve includes net amounts for (a) premature termination of crude oil sales, bareboat charter-party and technical assistance agreements, (b) design defects and terminated service agreements and (c) termination of bareboat charter-party and affreightment agreements.
2019 2018(Rupees in thousand)
20. LONG-TERM BORROWING
Syndicated term finance - 89,480 Less: Current portion of long-term borrowing - (76,610)
- 12,870
20.1
2019 2018(Rupees in thousand)
12,870 689,490
- - (12,870) (600,010) - (76,610) - 12,870
20.2
21. RETIREMENT BENEFIT OBLIGATIONS
21.1 Retirement benefit obligations
21.1.1
21.1.2
21.1.3
Following are the changes in the long term borrowings - secured (i.e. for which cash flowshave been classified as financing activities in the statement of cash flows):
Balance as at July 1
Disbursements during the yearRepaymentRelated to current portion of long term borrowingBalance as at June 30
This facility was secured by first pari passu charge by way of hypothecation over all presentand future current assets, movable fixed assets and mortgage over immovable property.During the year, the Company has fully paid off the loan.
The Company operates approved funded pension scheme for permanent management staff who joined prior to January 01, 2012, approved funded gratuity scheme for permanent management employees who joined the Company on or after January 1, 2012, approved funded gratuity scheme for permanent non-management employees and approved funded medical scheme for management employees of the Company who joined prior to September 01, 2006. Actuarial valuation of these plans is carried out every year and the latest actuarial valuation was carried out as at June 30, 2019.
Plan assets held in trust are governed by local regulations which mainly include the Trust Act, 1882; the Companies Act, 2017; Income Tax Rules, 2002 and the Rules under the trust deeds. Responsibility for governance of the Plans, including investment decisions, lies with the Board of Trustees. The Company appoints the trustees and all trustees are employees of the Company.
The latest actuarial valuation of the Plan as at June 30, 2019 was carried out using the Projected Unit Credit Method. Details of the Funds as per the actuarial valuation are as follows:
2019 2018(Rupees in thousand)
20. LONG-TERM BORROWING
Syndicated term finance - 89,480 Less: Current portion of long-term borrowing - (76,610)
- 12,870
20.1
2019 2018(Rupees in thousand)
12,870 689,490
- - (12,870) (600,010) - (76,610) - 12,870
20.2
21. RETIREMENT BENEFIT OBLIGATIONS
21.1 Retirement benefit obligations
21.1.1
21.1.2
21.1.3
Following are the changes in the long term borrowings - secured (i.e. for which cash flowshave been classified as financing activities in the statement of cash flows):
Balance as at July 1
Disbursements during the yearRepaymentRelated to current portion of long term borrowingBalance as at June 30
This facility was secured by first pari passu charge by way of hypothecation over all presentand future current assets, movable fixed assets and mortgage over immovable property.During the year, the Company has fully paid off the loan.
The Company operates approved funded pension scheme for permanent management staff who joined prior to January 01, 2012, approved funded gratuity scheme for permanent management employees who joined the Company on or after January 1, 2012, approved funded gratuity scheme for permanent non-management employees and approved funded medical scheme for management employees of the Company who joined prior to September 01, 2006. Actuarial valuation of these plans is carried out every year and the latest actuarial valuation was carried out as at June 30, 2019.
Plan assets held in trust are governed by local regulations which mainly include the Trust Act, 1882; the Companies Act, 2017; Income Tax Rules, 2002 and the Rules under the trust deeds. Responsibility for governance of the Plans, including investment decisions, lies with the Board of Trustees. The Company appoints the trustees and all trustees are employees of the Company.
The latest actuarial valuation of the Plan as at June 30, 2019 was carried out using the Projected Unit Credit Method. Details of the Funds as per the actuarial valuation are as follows:
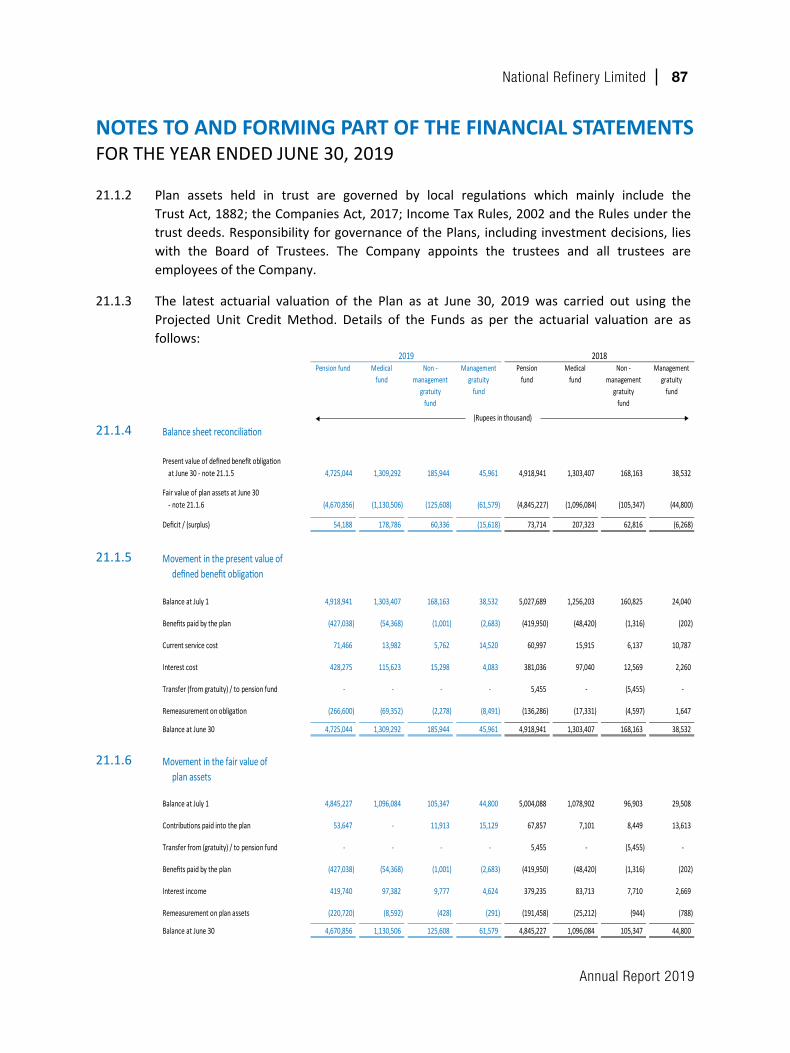
Annual Report 2019
National Refinery Limited 87
NOTES TO AND FORMING PART OF THE FINANCIAL STATEMENTSFORTHEYEARENDEDJUNE30,2019
2019 2018(Rupees in thousand)
20. LONG-TERM BORROWING
Syndicated term finance - 89,480 Less: Current portion of long-term borrowing - (76,610)
- 12,870
20.1
2019 2018(Rupees in thousand)
12,870 689,490
- - (12,870) (600,010) - (76,610) - 12,870
20.2
21. RETIREMENT BENEFIT OBLIGATIONS
21.1 Retirement benefit obligations
21.1.1
21.1.2
21.1.3
Following are the changes in the long term borrowings - secured (i.e. for which cash flowshave been classified as financing activities in the statement of cash flows):
Balance as at July 1
Disbursements during the yearRepaymentRelated to current portion of long term borrowingBalance as at June 30
This facility was secured by first pari passu charge by way of hypothecation over all presentand future current assets, movable fixed assets and mortgage over immovable property.During the year, the Company has fully paid off the loan.
The Company operates approved funded pension scheme for permanent management staff who joined prior to January 01, 2012, approved funded gratuity scheme for permanent management employees who joined the Company on or after January 1, 2012, approved funded gratuity scheme for permanent non-management employees and approved funded medical scheme for management employees of the Company who joined prior to September 01, 2006. Actuarial valuation of these plans is carried out every year and the latest actuarial valuation was carried out as at June 30, 2019.
Plan assets held in trust are governed by local regulations which mainly include the Trust Act, 1882; the Companies Act, 2017; Income Tax Rules, 2002 and the Rules under the trust deeds. Responsibility for governance of the Plans, including investment decisions, lies with the Board of Trustees. The Company appoints the trustees and all trustees are employees of the Company.
The latest actuarial valuation of the Plan as at June 30, 2019 was carried out using the Projected Unit Credit Method. Details of the Funds as per the actuarial valuation are as follows:
21.1.4
21.1.5
21.1.6
21.1.7
Balance sheet reconciliation
Present value of defined benefit obligation4,725,044 1,309,292 185,944 45,961 4,918,941 1,303,407 168,163 38,532
Fair value of plan assets at June 30- note 21.1.6 (4,670,856) (1,130,506) (125,608) (61,579) (4,845,227) (1,096,084) (105,347) (44,800)
Deficit / (surplus) 54,188 178,786 60,336 (15,618) 73,714 207,323 62,816 (6,268)
Movement in the present value of defined benefit obligation
Balance at July 1 4,918,941 1,303,407 168,163 38,532 5,027,689 1,256,203 160,825 24,040
Benefits paid by the plan (427,038) (54,368) (1,001) (2,683) (419,950) (48,420) (1,316) (202)
Current service cost 71,466 13,982 5,762 14,520 60,997 15,915 6,137 10,787
Interest cost 428,275 115,623 15,298 4,083 381,036 97,040 12,569 2,260
Transfer (from gratuity) / to pension fund - - - - 5,455 - (5,455) -
Remeasurement on obligation (266,600) (69,352) (2,278) (8,491) (136,286) (17,331) (4,597) 1,647
Balance at June 30 4,725,044 1,309,292 185,944 45,961 4,918,941 1,303,407 168,163 38,532
Movement in the fair value of plan assets
Balance at July 1 4,845,227 1,096,084 105,347 44,800 5,004,088 1,078,902 96,903 29,508
Contributions paid into the plan 53,647 - 11,913 15,129 67,857 7,101 8,449 13,613
Transfer from (gratuity) / to pension fund - - - - 5,455 - (5,455) -
Benefits paid by the plan (427,038) (54,368) (1,001) (2,683) (419,950) (48,420) (1,316) (202)
Interest income 419,740 97,382 9,777 4,624 379,235 83,713 7,710 2,669
Remeasurement on plan assets (220,720) (8,592) (428) (291) (191,458) (25,212) (944) (788)
Balance at June 30 4,670,856 1,130,506 125,608 61,579 4,845,227 1,096,084 105,347 44,800
Expense recognised in the statement of profit or loss
Current service cost 71,466 13,982 5,762 14,520 60,997 15,915 6,137 10,787
Net interest (income) / cost 8,535 18,241 5,521 (541) 1,801 13,327 4,859 (409)
Expense recognised in profit and loss account 80,001 32,223 11,283 13,979 62,798 29,242 10,996 10,378
2019 2018Pension fund Medical
fundNon -
management gratuity
fund
Management gratuity
fund
Pension fund
Medical fund
Non - management
gratuity fund
Management gratuity
fund
(Rupees in thousand)
at June 30 - note 21.1.5
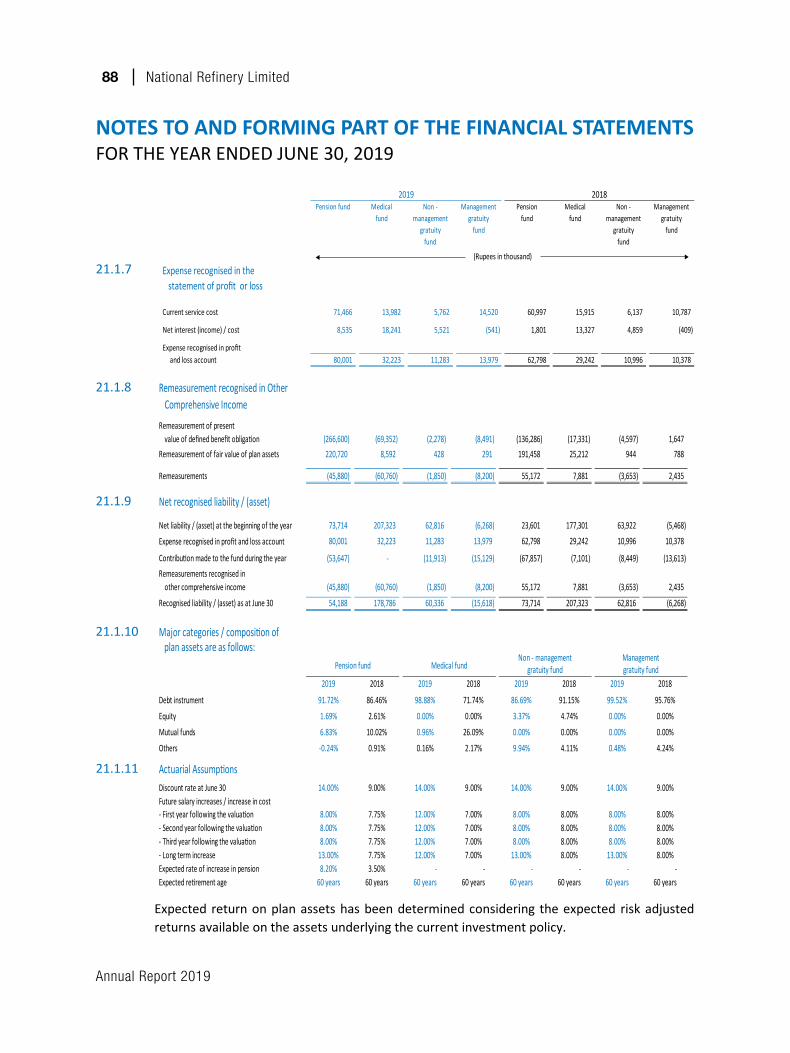
Annual Report 2019
88 National Refinery Limited
NOTES TO AND FORMING PART OF THE FINANCIAL STATEMENTSFORTHEYEARENDEDJUNE30,2019
21.1.4
21.1.5
21.1.6
21.1.7
Balance sheet reconciliation
Present value of defined benefit obligation4,725,044 1,309,292 185,944 45,961 4,918,941 1,303,407 168,163 38,532
Fair value of plan assets at June 30- note 21.1.6 (4,670,856) (1,130,506) (125,608) (61,579) (4,845,227) (1,096,084) (105,347) (44,800)
Deficit / (surplus) 54,188 178,786 60,336 (15,618) 73,714 207,323 62,816 (6,268)
Movement in the present value of defined benefit obligation
Balance at July 1 4,918,941 1,303,407 168,163 38,532 5,027,689 1,256,203 160,825 24,040
Benefits paid by the plan (427,038) (54,368) (1,001) (2,683) (419,950) (48,420) (1,316) (202)
Current service cost 71,466 13,982 5,762 14,520 60,997 15,915 6,137 10,787
Interest cost 428,275 115,623 15,298 4,083 381,036 97,040 12,569 2,260
Transfer (from gratuity) / to pension fund - - - - 5,455 - (5,455) -
Remeasurement on obligation (266,600) (69,352) (2,278) (8,491) (136,286) (17,331) (4,597) 1,647
Balance at June 30 4,725,044 1,309,292 185,944 45,961 4,918,941 1,303,407 168,163 38,532
Movement in the fair value of plan assets
Balance at July 1 4,845,227 1,096,084 105,347 44,800 5,004,088 1,078,902 96,903 29,508
Contributions paid into the plan 53,647 - 11,913 15,129 67,857 7,101 8,449 13,613
Transfer from (gratuity) / to pension fund - - - - 5,455 - (5,455) -
Benefits paid by the plan (427,038) (54,368) (1,001) (2,683) (419,950) (48,420) (1,316) (202)
Interest income 419,740 97,382 9,777 4,624 379,235 83,713 7,710 2,669
Remeasurement on plan assets (220,720) (8,592) (428) (291) (191,458) (25,212) (944) (788)
Balance at June 30 4,670,856 1,130,506 125,608 61,579 4,845,227 1,096,084 105,347 44,800
Expense recognised in the statement of profit or loss
Current service cost 71,466 13,982 5,762 14,520 60,997 15,915 6,137 10,787
Net interest (income) / cost 8,535 18,241 5,521 (541) 1,801 13,327 4,859 (409)
Expense recognised in profit and loss account 80,001 32,223 11,283 13,979 62,798 29,242 10,996 10,378
2019 2018Pension fund Medical
fundNon -
management gratuity
fund
Management gratuity
fund
Pension fund
Medical fund
Non - management
gratuity fund
Management gratuity
fund
(Rupees in thousand)
at June 30 - note 21.1.5
21.1.8
21.1.9
21.1.10
21.1.11
Expected return on plan assets has been determined considering the expected risk adjustedreturns available on the assets underlying the current investment policy.
Remeasurement recognised in OtherComprehensive Income
Remeasurement of presentvalue of defined benefit obligation (266,600) (69,352) (2,278) (8,491) (136,286) (17,331) (4,597) 1,647
Remeasurement of fair value of plan assets 220,720 8,592 428 291 191,458 25,212 944 788
Remeasurements (45,880) (60,760) (1,850) (8,200) 55,172 7,881 (3,653) 2,435
Net recognised liability / (asset)
Net liability / (asset) at the beginning of the year 73,714 207,323 62,816 (6,268) 23,601 177,301 63,922 (5,468)
Expense recognised in profit and loss account 80,001 32,223 11,283 13,979 62,798 29,242 10,996 10,378
Contribution made to the fund during the year (53,647) - (11,913) (15,129) (67,857) (7,101) (8,449) (13,613) Remeasurements recognised in
other comprehensive income (45,880) (60,760) (1,850) (8,200) 55,172 7,881 (3,653) 2,435
Recognised liability / (asset) as at June 30 54,188 178,786 60,336 (15,618) 73,714 207,323 62,816 (6,268)
Major categories / composition of plan assets are as follows:
2019 2018 2019 2018 2019 2018 2019 2018
Debt instrument 91.72% 86.46% 98.88% 71.74% 86.69% 91.15% 99.52% 95.76%
Equity 1.69% 2.61% 0.00% 0.00% 3.37% 4.74% 0.00% 0.00%
Mutual funds 6.83% 10.02% 0.96% 26.09% 0.00% 0.00% 0.00% 0.00%
Others -0.24% 0.91% 0.16% 2.17% 9.94% 4.11% 0.48% 4.24%
Actuarial AssumptionsDiscount rate at June 30 14.00% 9.00% 14.00% 9.00% 14.00% 9.00% 14.00% 9.00%Future salary increases / increase in cost- First year following the valuation 8.00% 7.75% 12.00% 7.00% 8.00% 8.00% 8.00% 8.00%- Second year following the valuation 8.00% 7.75% 12.00% 7.00% 8.00% 8.00% 8.00% 8.00%- Third year following the valuation 8.00% 7.75% 12.00% 7.00% 8.00% 8.00% 8.00% 8.00%- Long term increase 13.00% 7.75% 12.00% 7.00% 13.00% 8.00% 13.00% 8.00%Expected rate of increase in pension 8.20% 3.50% - - - - - - Expected retirement age 60 years 60 years 60 years 60 years 60 years 60 years 60 years 60 years
2019 2018Medical
fundNon -
management gratuity
fund
Managementgratuity
fund
(Rupees in thousand)
Pension fund Medical fund Non - management
gratuity fund
Management gratuity
fund
Pension fund
Pension fund Medical fundNon - management Management
gratuity fund gratuity fund
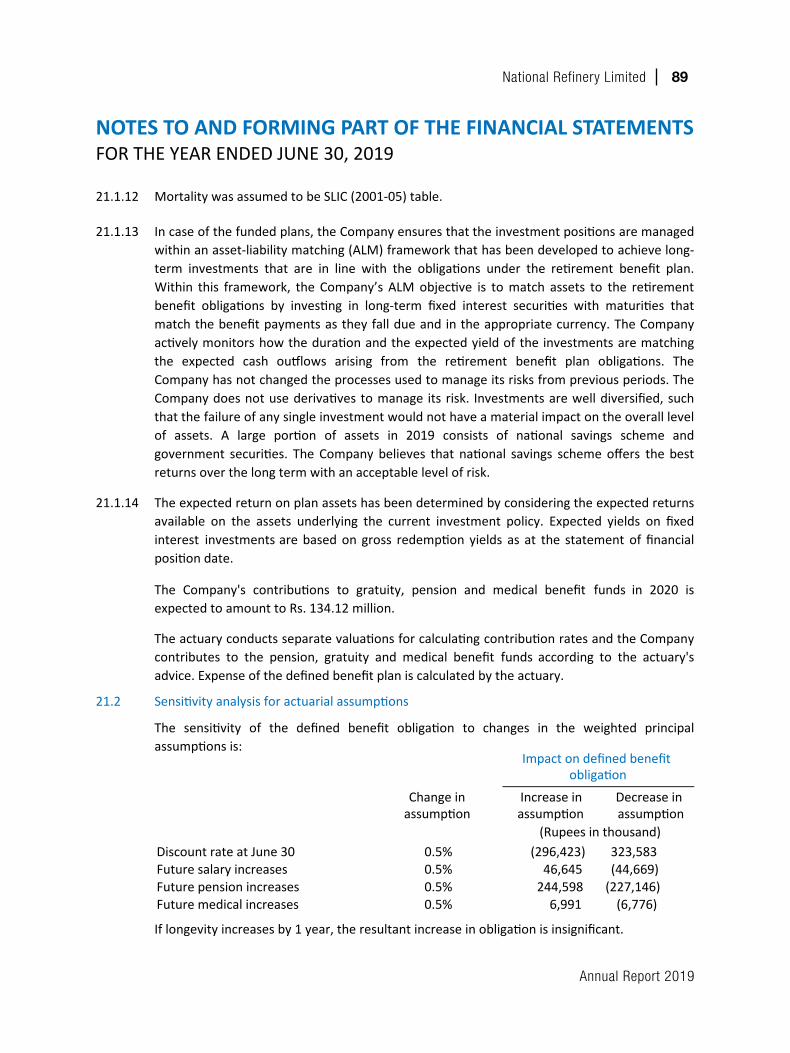
Annual Report 2019
National Refinery Limited 89
NOTES TO AND FORMING PART OF THE FINANCIAL STATEMENTSFORTHEYEARENDEDJUNE30,2019
21.1.14
21.2 Sensitivity analysis for actuarial assumptions
The methods and types of assumptions used in preparing the sensitivity analysis did notchange as compared to the previous period.
The sensitivity of the defined benefit obligation to changes in the weighted principalassumptions is:
If longevity increases by 1 year, the resultant increase in obligation is insignificant.
The above sensitivity analyses are based on a change in an assumption while holding all otherassumptions constant. In practice, this is unlikely to occur, and changes in some of theassumptions may be correlated. When calculating the sensitivity of the defined benefitobligation to significant actuarial assumptions the same method (present value of the definedbenefit obligation calculated with the projected unit credit method at the end of thereporting period) has been applied as when calculating the gratuity, pension and medicalbenefit liability recognised within the statement of financial position of the Company.
The actuary conducts separate valuations for calculating contribution rates and the Companycontributes to the pension, gratuity and medical benefit funds according to the actuary'sadvice. Expense of the defined benefit plan is calculated by the actuary.
The expected return on plan assets has been determined by considering the expected returnsavailable on the assets underlying the current investment policy. Expected yields on fixedinterest investments are based on gross redemption yields as at the statement of financialposition date.
The Company's contributions to gratuity, pension and medical benefit funds in 2020 isexpected to amount to Rs. 134.12 million.
Change in assumption
Increase in assumption
Decrease in assumption
Discount rate at June 30 0.5% (296,423) 323,583 Future salary increases 0.5% 46,645 (44,669)Future pension increases 0.5% 244,598 (227,146)Future medical increases 0.5% 6,991 (6,776)
Impact on defined benefit obligation
(Rupees in thousand)
21.3
2019 2018 2017 2016 2015
Historical informationPension fund
4,725,044 4,918,941 5,027,689 4,868,824 4,621,263
(4,670,856) (4,845,227) (5,004,088) (4,655,402) (4,074,750)
54,188 73,714 23,601 213,422 546,513
Experience Adjustments
(266,600) (136,286) 64,714 52,626 131,331 (220,720) (191,458) 155,332 12,916 (51,549)
Medical Benefit
1,309,292 1,303,407 1,256,203 1,192,467 911,422 (1,130,506) (1,096,084) (1,078,902) (983,574) (930,494)
178,786 207,323 177,301 208,893 (19,072)
Experience Adjustments
(69,352) (17,331) 7,879 221,956 (23,909) (8,592) (25,212) 22,029 (10,940) (3,932)
Gratuity fund - Non-management
185,944 168,163 160,825 164,844 171,785 Fair value of plan assets (125,608) (105,347) (96,903) (124,986) (123,834)
Deficit in the plan 60,336 62,816 63,922 39,858 47,951 Experience Adjustments
(2,278) (4,597) 26,496 (13,638) (5,589) (428) (944) 25 (2,275) (5,494)
Gratuity fund - management
45,961 38,532 24,040 12,678 6,292
(61,579) (44,800) (29,508) (17,595) (9,619) (15,618) (6,268) (5,468) (4,917) (3,327)
Experience Adjustments(8,491) 1,647 3,400 1,295 221
(291) (788) (103) (192) (272)
(Gain) / loss on obligation
(Rupees in thousand)
Present value of defined benefit obligation
Fair value of plan assets
Deficit in the plan
(Gain) / loss on obligation
(Loss) / gain on plan assets
Present value of defined benefit obligation Fair value of plan assets
Deficit / (surplus) in the plan
(Gain) / loss on obligation (Loss) / gain on plan assets
Present value of defined benefit obligation
Loss on obligation Loss on plan assets
(Loss) / gain on plan assets
Present value of defined benefit obligation
Fair value of plan assets Surplus in the plan
21.1.12
21.1.13
Mortality was assumed to be SLIC (2001-05) table.
In case of the funded plans, the Company ensures that the investment positions are managedwithin an asset-liability matching (ALM) framework that has been developed to achieve long-term investments that are in line with the obligations under the retirement benefit plan.Within this framework, the Company’s ALM objective is to match assets to the retirementbenefit obligations by investing in long-term fixed interest securities with maturities thatmatch the benefit payments as they fall due and in the appropriate currency. The Companyactively monitors how the duration and the expected yield of the investments are matchingthe expected cash outflows arising from the retirement benefit plan obligations. TheCompany has not changed the processes used to manage its risks from previous periods. TheCompany does not use derivatives to manage its risk. Investments are well diversified, suchthat the failure of any single investment would not have a material impact on the overall levelof assets. A large portion of assets in 2019 consists of national savings scheme andgovernment securities. The Company believes that national savings scheme offers the bestreturns over the long term with an acceptable level of risk.
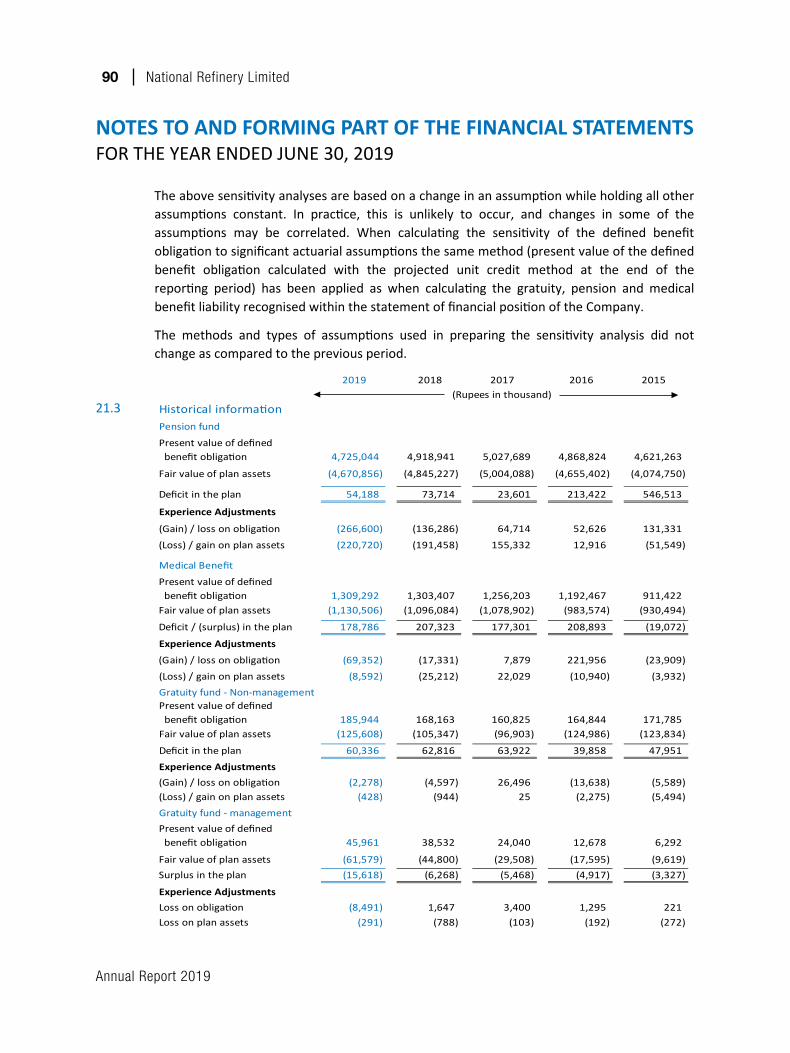
Annual Report 2019
90 National Refinery Limited
NOTES TO AND FORMING PART OF THE FINANCIAL STATEMENTSFORTHEYEARENDEDJUNE30,2019
21.1.14
21.2 Sensitivity analysis for actuarial assumptions
The methods and types of assumptions used in preparing the sensitivity analysis did notchange as compared to the previous period.
The sensitivity of the defined benefit obligation to changes in the weighted principalassumptions is:
If longevity increases by 1 year, the resultant increase in obligation is insignificant.
The above sensitivity analyses are based on a change in an assumption while holding all otherassumptions constant. In practice, this is unlikely to occur, and changes in some of theassumptions may be correlated. When calculating the sensitivity of the defined benefitobligation to significant actuarial assumptions the same method (present value of the definedbenefit obligation calculated with the projected unit credit method at the end of thereporting period) has been applied as when calculating the gratuity, pension and medicalbenefit liability recognised within the statement of financial position of the Company.
The actuary conducts separate valuations for calculating contribution rates and the Companycontributes to the pension, gratuity and medical benefit funds according to the actuary'sadvice. Expense of the defined benefit plan is calculated by the actuary.
The expected return on plan assets has been determined by considering the expected returnsavailable on the assets underlying the current investment policy. Expected yields on fixedinterest investments are based on gross redemption yields as at the statement of financialposition date.
The Company's contributions to gratuity, pension and medical benefit funds in 2020 isexpected to amount to Rs. 134.12 million.
Change in assumption
Increase in assumption
Decrease in assumption
Discount rate at June 30 0.5% (296,423) 323,583 Future salary increases 0.5% 46,645 (44,669)Future pension increases 0.5% 244,598 (227,146)Future medical increases 0.5% 6,991 (6,776)
Impact on defined benefit obligation
(Rupees in thousand)
21.3
2019 2018 2017 2016 2015
Historical informationPension fund
4,725,044 4,918,941 5,027,689 4,868,824 4,621,263
(4,670,856) (4,845,227) (5,004,088) (4,655,402) (4,074,750)
54,188 73,714 23,601 213,422 546,513
Experience Adjustments
(266,600) (136,286) 64,714 52,626 131,331 (220,720) (191,458) 155,332 12,916 (51,549)
Medical Benefit
1,309,292 1,303,407 1,256,203 1,192,467 911,422 (1,130,506) (1,096,084) (1,078,902) (983,574) (930,494)
178,786 207,323 177,301 208,893 (19,072)
Experience Adjustments
(69,352) (17,331) 7,879 221,956 (23,909) (8,592) (25,212) 22,029 (10,940) (3,932)
Gratuity fund - Non-management
185,944 168,163 160,825 164,844 171,785 Fair value of plan assets (125,608) (105,347) (96,903) (124,986) (123,834)
Deficit in the plan 60,336 62,816 63,922 39,858 47,951 Experience Adjustments
(2,278) (4,597) 26,496 (13,638) (5,589) (428) (944) 25 (2,275) (5,494)
Gratuity fund - management
45,961 38,532 24,040 12,678 6,292
(61,579) (44,800) (29,508) (17,595) (9,619) (15,618) (6,268) (5,468) (4,917) (3,327)
Experience Adjustments(8,491) 1,647 3,400 1,295 221
(291) (788) (103) (192) (272)
(Gain) / loss on obligation
(Rupees in thousand)
Present value of defined benefit obligation
Fair value of plan assets
Deficit in the plan
(Gain) / loss on obligation
(Loss) / gain on plan assets
Present value of defined benefit obligation Fair value of plan assets
Deficit / (surplus) in the plan
(Gain) / loss on obligation (Loss) / gain on plan assets
Present value of defined benefit obligation
Loss on obligation Loss on plan assets
(Loss) / gain on plan assets
Present value of defined benefit obligation
Fair value of plan assets Surplus in the plan
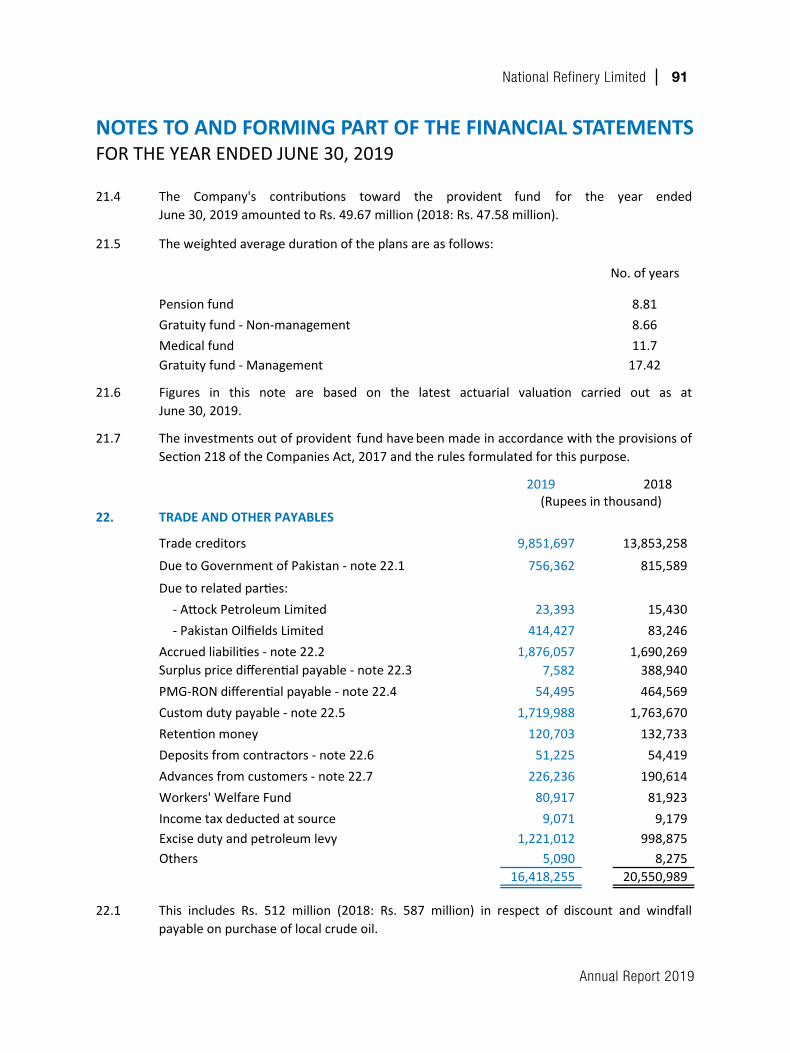
Annual Report 2019
National Refinery Limited 91
NOTES TO AND FORMING PART OF THE FINANCIAL STATEMENTSFORTHEYEARENDEDJUNE30,2019
21.4
21.5 The weighted average duration of the plans are as follows:
No. of years
Pension fund 8.81Gratuity fund - Non-management 8.66Medical fund 11.7Gratuity fund - Management 17.42
21.6
21.7
2019 2018
22. TRADE AND OTHER PAYABLES
Trade creditors 9,851,697 13,853,258
Due to Government of Pakistan - note 22.1 756,362 815,589
Due to related parties: - Attock Petroleum Limited 23,393 15,430 - Pakistan Oilfields Limited 414,427 83,246
Accrued liabilities - note 22.2 1,876,057 1,690,269 7,582 388,940
54,495 464,569 Custom duty payable - note 22.5 1,719,988 1,763,670 Retention money 120,703 132,733 Deposits from contractors - note 22.6 51,225 54,419 Advances from customers - note 22.7 226,236 190,614 Workers' Welfare Fund 80,917 81,923 Income tax deducted at source 9,071 9,179 Excise duty and petroleum levy 1,221,012 998,875 Others 5,090 8,275
16,418,255 20,550,989
22.1
22.2
(Rupees in thousand)
Surplus price differential payable - note 22.3PMG-RON differential payable - note 22.4
The Company's contributions toward the provident fund for the year endedJune 30, 2019 amounted to Rs. 49.67 million (2018: Rs. 47.58 million).
Figures in this note are based on the latest actuarial valuation carried out as atJune 30, 2019.
The investments out of provident fund have been made in accordance with the provisions ofSection 218 of the Companies Act, 2017 and the rules formulated for this purpose.
This includes Rs. 512 million (2018: Rs. 587 million) in respect of discount and windfallpayable on purchase of local crude oil.
The Honorable High Court of Sindh through its judgement dated October 26, 2016 held theGIDC Act, 2015 as ultra vires to the Constitution. The Government being aggrieved,
Annual Report 2019
92 National Refinery Limited
21.4
21.5 The weighted average duration of the plans are as follows:
No. of years
Pension fund 8.81Gratuity fund - Non-management 8.66Medical fund 11.7Gratuity fund - Management 17.42
21.6
21.7
2019 2018
22. TRADE AND OTHER PAYABLES
Trade creditors 9,851,697 13,853,258
Due to Government of Pakistan - note 22.1 756,362 815,589
Due to related parties: - Attock Petroleum Limited 23,393 15,430 - Pakistan Oilfields Limited 414,427 83,246
Accrued liabilities - note 22.2 1,876,057 1,690,269 7,582 388,940
54,495 464,569 Custom duty payable - note 22.5 1,719,988 1,763,670 Retention money 120,703 132,733 Deposits from contractors - note 22.6 51,225 54,419 Advances from customers - note 22.7 226,236 190,614 Workers' Welfare Fund 80,917 81,923 Income tax deducted at source 9,071 9,179 Excise duty and petroleum levy 1,221,012 998,875 Others 5,090 8,275
16,418,255 20,550,989
22.1
22.2
(Rupees in thousand)
Surplus price differential payable - note 22.3PMG-RON differential payable - note 22.4
The Company's contributions toward the provident fund for the year endedJune 30, 2019 amounted to Rs. 49.67 million (2018: Rs. 47.58 million).
Figures in this note are based on the latest actuarial valuation carried out as atJune 30, 2019.
The investments out of provident fund have been made in accordance with the provisions ofSection 218 of the Companies Act, 2017 and the rules formulated for this purpose.
This includes Rs. 512 million (2018: Rs. 587 million) in respect of discount and windfallpayable on purchase of local crude oil.
The Honorable High Court of Sindh through its judgement dated October 26, 2016 held theGIDC Act, 2015 as ultra vires to the Constitution. The Government being aggrieved,
NOTES TO AND FORMING PART OF THE FINANCIAL STATEMENTSFORTHEYEARENDEDJUNE30,2019
22.3
22.4
22.5
22.6
22.7
2019 2018
Opening balance 190,614 477,850 Revenue recognised during the year (20,470,279) (16,555,094) Advance received during the year 20,505,901 16,267,858 Closing balance 226,236 190,614
Advance received from customer is recognised as revenue when the performance obligationin accordance with the policy as described in note - 3.18 is satisfied.
(Rupees in thousand)
This represents the differential of custom duty levied on import of crude oil and sale ofpetroleum products based on SROs issued by the Government of Pakistan and Ministry ofEnergy (MOE). In 2018, the Oil and Gas Regulatory Authority (OGRA) in compliance with thedirectives of MOE approved a recovery mechanism for regulated products through whichrefineries will operate on no gain / loss basis on this account. OGRA directed Oil CompaniesAdvisory Committee (OCAC) to ensure implementation of the said mechanism. The Companyhas worked out the impact of such mechanism and adjusted the regulatory duty onregulated products in the trade payables and in case of regulatory duty on deregulatedproducts in the sales and cost of sales respectively.
However, after premilinary implementation of the said mechanism, due to practicalimplications, a revised procedure was devised by OGRA where recovery is made directlyfrom refinery without any adjustment of RRD factors in respective petroleum product prices.
This represents amount received from customers / contractors of the Company as a securitydeposit with reference to the contracts. Such amounts are kept in a separate bank account.
This represents amount payable in respect of surplus of High Speed Diesel (HSD) price as perPakistan State Oil Limited's (PSO) actual import price excluding ocean losses over HSD pricebased on import price parity formula in accordance with the Economic CoordinationCommittee's decision dated February 26, 2013. However, since the Company's Diesel HydroDe-sulphurisation project has successfully commenced operations on June 21, 2017, therelated liability is no longer recorded from the commencement date.
preferred Appeal against this order before the Divisional Bench of Sindh High Court inrelation to one particular Company.
The Divisional bench suspended the operations of the judgement and it was later clarified that suspension of operation of the judgement is for such particular company and it is not applicable for other companies. However, considering that GIDC Act, 2015 is still under litigation, NRL continued to provide for GIDC, which amounts to Rs. 911.62 million (2018: Rs. 705.54 million) included in accrued liabilities.
This represents a differential payable as per the defined formula in the notification PL-9 (544)/2015 dated September 5, 2016 issued by the Ministry of Petroleum & Natural Resources which requires the Oil Marketing Companies to import Premium Motor Gasoline (PMG) of 92 Research Octane Number (RON). However, under such notification, refineries are allowed to produce PMG of less than 92 RON and account for the differential.
During the year, as per approved regulatory duty mechanism, Refinery Regulatory Duty (RRD) committee of OCAC determined RRD factor per litre based on five months of August 2018 to December 2018 which was recovered through adjustment in monthly petroleum products prices.
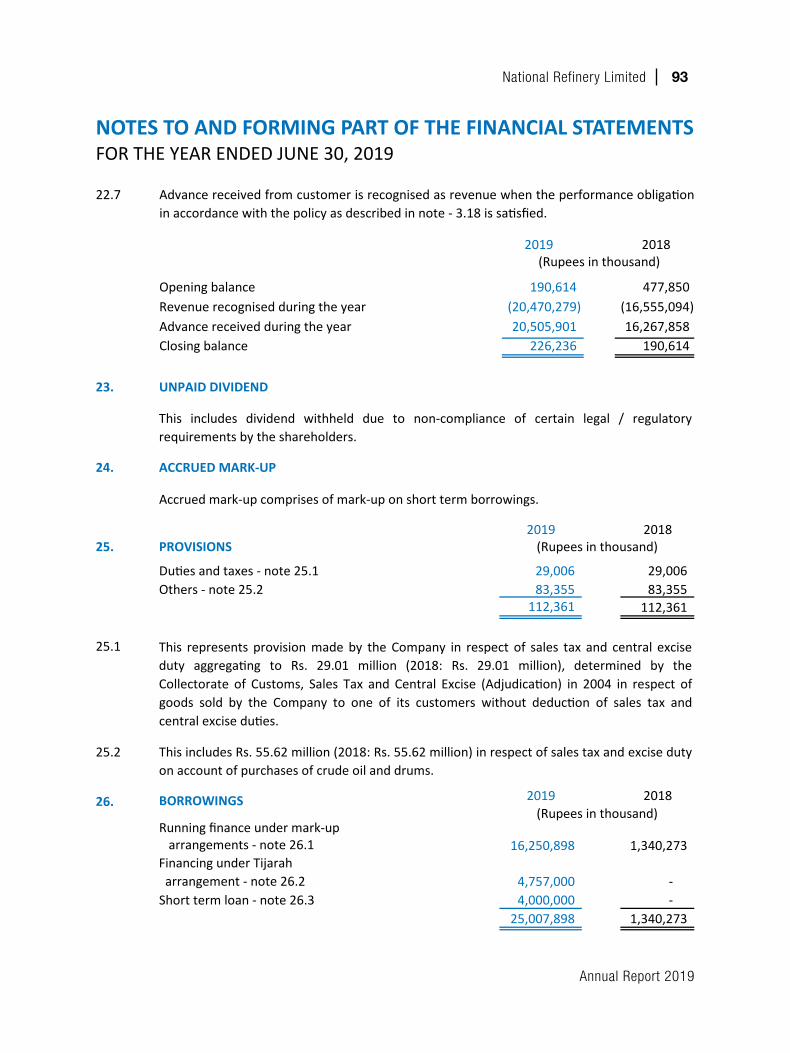
Annual Report 2019
National Refinery Limited 93
NOTES TO AND FORMING PART OF THE FINANCIAL STATEMENTSFORTHEYEARENDEDJUNE30,2019
22.3
22.4
22.5
22.6
22.7
2019 2018
Opening balance 190,614 477,850 Revenue recognised during the year (20,470,279) (16,555,094) Advance received during the year 20,505,901 16,267,858 Closing balance 226,236 190,614
Advance received from customer is recognised as revenue when the performance obligationin accordance with the policy as described in note - 3.18 is satisfied.
(Rupees in thousand)
This represents the differential of custom duty levied on import of crude oil and sale ofpetroleum products based on SROs issued by the Government of Pakistan and Ministry ofEnergy (MOE). In 2018, the Oil and Gas Regulatory Authority (OGRA) in compliance with thedirectives of MOE approved a recovery mechanism for regulated products through whichrefineries will operate on no gain / loss basis on this account. OGRA directed Oil CompaniesAdvisory Committee (OCAC) to ensure implementation of the said mechanism. The Companyhas worked out the impact of such mechanism and adjusted the regulatory duty onregulated products in the trade payables and in case of regulatory duty on deregulatedproducts in the sales and cost of sales respectively.
However, after premilinary implementation of the said mechanism, due to practicalimplications, a revised procedure was devised by OGRA where recovery is made directlyfrom refinery without any adjustment of RRD factors in respective petroleum product prices.
This represents amount received from customers / contractors of the Company as a securitydeposit with reference to the contracts. Such amounts are kept in a separate bank account.
This represents amount payable in respect of surplus of High Speed Diesel (HSD) price as perPakistan State Oil Limited's (PSO) actual import price excluding ocean losses over HSD pricebased on import price parity formula in accordance with the Economic CoordinationCommittee's decision dated February 26, 2013. However, since the Company's Diesel HydroDe-sulphurisation project has successfully commenced operations on June 21, 2017, therelated liability is no longer recorded from the commencement date.
preferred Appeal against this order before the Divisional Bench of Sindh High Court inrelation to one particular Company.
The Divisional bench suspended the operations of the judgement and it was later clarified that suspension of operation of the judgement is for such particular company and it is not applicable for other companies. However, considering that GIDC Act, 2015 is still under litigation, NRL continued to provide for GIDC, which amounts to Rs. 911.62 million (2018: Rs. 705.54 million) included in accrued liabilities.
This represents a differential payable as per the defined formula in the notification PL-9 (544)/2015 dated September 5, 2016 issued by the Ministry of Petroleum & Natural Resources which requires the Oil Marketing Companies to import Premium Motor Gasoline (PMG) of 92 Research Octane Number (RON). However, under such notification, refineries are allowed to produce PMG of less than 92 RON and account for the differential.
During the year, as per approved regulatory duty mechanism, Refinery Regulatory Duty (RRD) committee of OCAC determined RRD factor per litre based on five months of August 2018 to December 2018 which was recovered through adjustment in monthly petroleum products prices.
23. UNPAID DIVIDEND
24. ACCRUED MARK-UP
Accrued mark-up comprises of mark-up on short term borrowings.
2019 201825. PROVISIONS
Duties and taxes - note 25.1 29,006 29,006 Others - note 25.2 83,355 83,355
112,361 112,361
25.1
25.2
2019 201826. BORROWINGS
Running finance under mark-up arrangements - note 26.1 16,250,898 1,340,273
4,757,000 - Short term loan - note 26.3 4,000,000 -
25,007,898 1,340,273
26.1
26.2
26.3
26.4
26.5
27. CONTINGENCIES AND COMMITMENTS
27.1 Contingencies
27.1.1
The facilities for opening the letters of credit and guarantees as at June 30, 2019 amountedto Rs. 56.57 billion (2018: Rs. 58.16 billion) of which the amount remaining unutilised at theyear end was Rs. 41.90 billion (2018: Rs. 39.66 billion).
These facilities are secured against ranking charge on the Company’s stocks, receivables and other current assets.
(Rupees in thousand)
Financing under Tijarah arrangement - note 26.2
The facilities for running finance under mark-up arrangements with various banks amountedto Rs. 17.65 billion (2018: Rs. 7.95 billion) of which the amount remaining unutilised at theyear end was Rs. 1.40 billion (2018: Rs. 6.61 billion). The rates of mark-up applicable onrunning finance ranges from 0.15% to 1.10% above KIBOR (2018: KIBOR + 0.2%-0.25%) perannum.
This represents short term loan obtained on weekly rollover basis from a commercial bankamounting to Rs. 4 billion. The rate of mark-up applicable on this loan is based on 1 weekKIBOR + 0.10% per annum.
(Rupees in thousand)
This represents provision made by the Company in respect of sales tax and central exciseduty aggregating to Rs. 29.01 million (2018: Rs. 29.01 million), determined by theCollectorate of Customs, Sales Tax and Central Excise (Adjudication) in 2004 in respect ofgoods sold by the Company to one of its customers without deduction of sales tax andcentral excise duties.
This includes Rs. 55.62 million (2018: Rs. 55.62 million) in respect of sales tax and excise dutyon account of purchases of crude oil and drums.
This includes dividend withheld due to non-compliance of certain legal / regulatoryrequirements by the shareholders.
Claims not acknowledged by the Company as debt at the end of the year amounted to Rs. 4.51 billion (2018: Rs. 4.48 billion). These include claims accumulating to Rs. 4.34 billion (2018: Rs. 4.32 billion) in respect of late payment surcharge claimed by crude oil suppliers and Rs. 49.64 million (2018: Rs. 49.64 million) relating to freight claims.
This represents Tijarah arrangement from an Islamic bank amounting to Rs. 5 billion of which Rs. 0.24 billion remain unutilized as at the year end. The rate of mark-up applicable is based on three months KIBOR + 0.15% per annum.
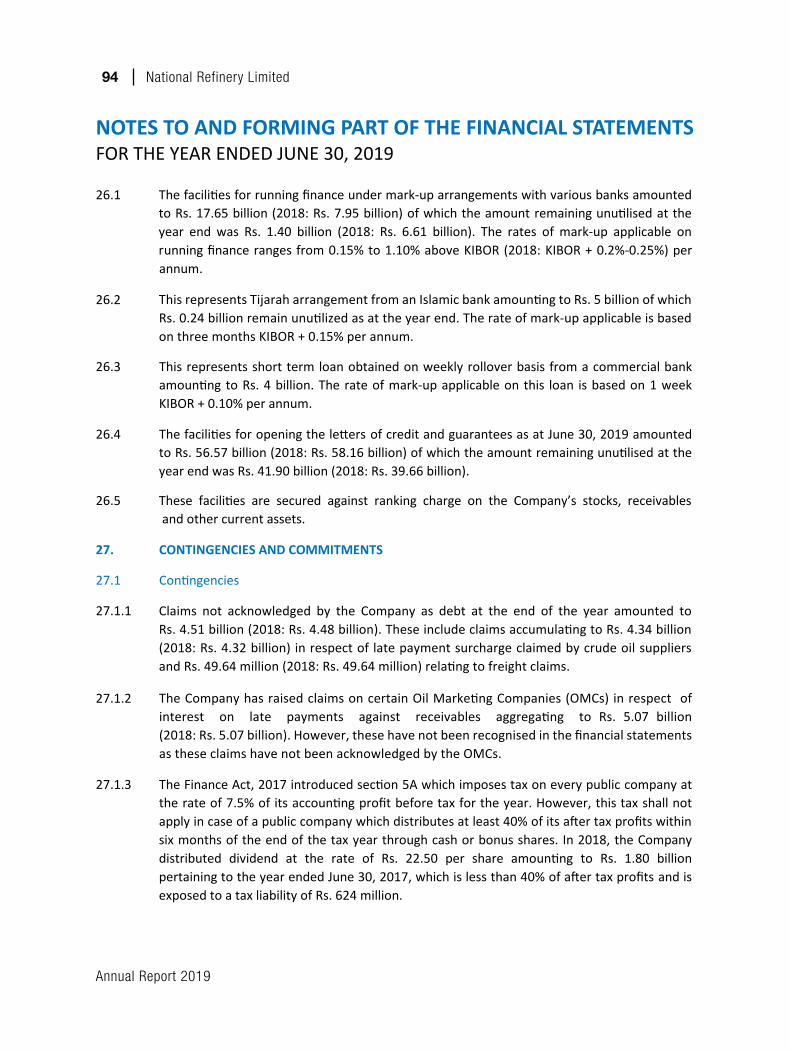
Annual Report 2019
94 National Refinery Limited
NOTES TO AND FORMING PART OF THE FINANCIAL STATEMENTSFORTHEYEARENDEDJUNE30,2019
23. UNPAID DIVIDEND
24. ACCRUED MARK-UP
Accrued mark-up comprises of mark-up on short term borrowings.
2019 201825. PROVISIONS
Duties and taxes - note 25.1 29,006 29,006 Others - note 25.2 83,355 83,355
112,361 112,361
25.1
25.2
2019 201826. BORROWINGS
Running finance under mark-up arrangements - note 26.1 16,250,898 1,340,273
4,757,000 - Short term loan - note 26.3 4,000,000 -
25,007,898 1,340,273
26.1
26.2
26.3
26.4
26.5
27. CONTINGENCIES AND COMMITMENTS
27.1 Contingencies
27.1.1
The facilities for opening the letters of credit and guarantees as at June 30, 2019 amountedto Rs. 56.57 billion (2018: Rs. 58.16 billion) of which the amount remaining unutilised at theyear end was Rs. 41.90 billion (2018: Rs. 39.66 billion).
These facilities are secured against ranking charge on the Company’s stocks, receivables and other current assets.
(Rupees in thousand)
Financing under Tijarah arrangement - note 26.2
The facilities for running finance under mark-up arrangements with various banks amountedto Rs. 17.65 billion (2018: Rs. 7.95 billion) of which the amount remaining unutilised at theyear end was Rs. 1.40 billion (2018: Rs. 6.61 billion). The rates of mark-up applicable onrunning finance ranges from 0.15% to 1.10% above KIBOR (2018: KIBOR + 0.2%-0.25%) perannum.
This represents short term loan obtained on weekly rollover basis from a commercial bankamounting to Rs. 4 billion. The rate of mark-up applicable on this loan is based on 1 weekKIBOR + 0.10% per annum.
(Rupees in thousand)
This represents provision made by the Company in respect of sales tax and central exciseduty aggregating to Rs. 29.01 million (2018: Rs. 29.01 million), determined by theCollectorate of Customs, Sales Tax and Central Excise (Adjudication) in 2004 in respect ofgoods sold by the Company to one of its customers without deduction of sales tax andcentral excise duties.
This includes Rs. 55.62 million (2018: Rs. 55.62 million) in respect of sales tax and excise dutyon account of purchases of crude oil and drums.
This includes dividend withheld due to non-compliance of certain legal / regulatoryrequirements by the shareholders.
Claims not acknowledged by the Company as debt at the end of the year amounted to Rs. 4.51 billion (2018: Rs. 4.48 billion). These include claims accumulating to Rs. 4.34 billion (2018: Rs. 4.32 billion) in respect of late payment surcharge claimed by crude oil suppliers and Rs. 49.64 million (2018: Rs. 49.64 million) relating to freight claims.
This represents Tijarah arrangement from an Islamic bank amounting to Rs. 5 billion of which Rs. 0.24 billion remain unutilized as at the year end. The rate of mark-up applicable is based on three months KIBOR + 0.15% per annum.
27.1.3
27.2 Commitments
27.2.1
2019 2018
28. REVENUE FROM CONTRACTS WITH CUSTOMERS
Local 196,942,406 170,841,034 Exports 12,474,851 13,375,218
209,417,257 184,216,252
29. TRADE DISCOUNTS, TAXES, DUTIES, LEVIES AND PRICE DIFFERENTIAL
Trade discounts 520,086 539,218 Sales tax 27,815,404 31,899,816 Excise duty 708 485 Petroleum levy 15,577,690 11,438,725 PMG-RON differential - note 22.4 349,268 335,980 Custom duty - note 22.5 4,247,904 3,017,088
48,511,060 47,231,312
Commitments outstanding for capital expenditures as at June 30, 2019 amounted toRs. 1.326 billion (2018: Rs. 1.374 billion).
(Rupees in thousand)
27.1.2
The Finance Act, 2017 introduced section 5A which imposes tax on every public company atthe rate of 7.5% of its accounting profit before tax for the year. However, this tax shall notapply in case of a public company which distributes at least 40% of its after tax profits withinsix months of the end of the tax year through cash or bonus shares. In 2018, the Companydistributed dividend at the rate of Rs. 22.50 per share amounting to Rs. 1.80 billionpertaining to the year ended June 30, 2017, which is less than 40% of after tax profits and isexposed to a tax liability of Rs. 624 million.
The Company has filed a petition in the High Court of Sindh challenging the applicability ofthe above mentioned tax. Among other grounds of appeal, the Company has taken aposition that its after tax profits for the purpose of the said section should be taken afterdeduction of transfer to Special Reserves (which is made in accordance with the approvedimport parity pricing formula approved by the Economic Coordination Committee), as thisamount is not available for distribution as dividend. The High Court of Sindh has grantedinterim stay order to the Company in this regard. The Company, based on the advice of theirconsultants, believes that even if only this contention is accepted, then the Company is notexposed to any tax liability in this respect.
Further, on February 13, 2018, exemption was granted from the application of section 5Athrough addition of clause 103 in Part IV of Second Schedule, in case where a Company hasan agreement with the Government on restriction of distribution of dividend.
The Company has raised claims on certain Oil Marketing Companies (OMCs) in respect of interest on late payments against receivables aggregating to Rs. 5.07 billion (2018: Rs. 5.07 billion). However, these have not been recognised in the financial statements as these claims have not been acknowledged by the OMCs.
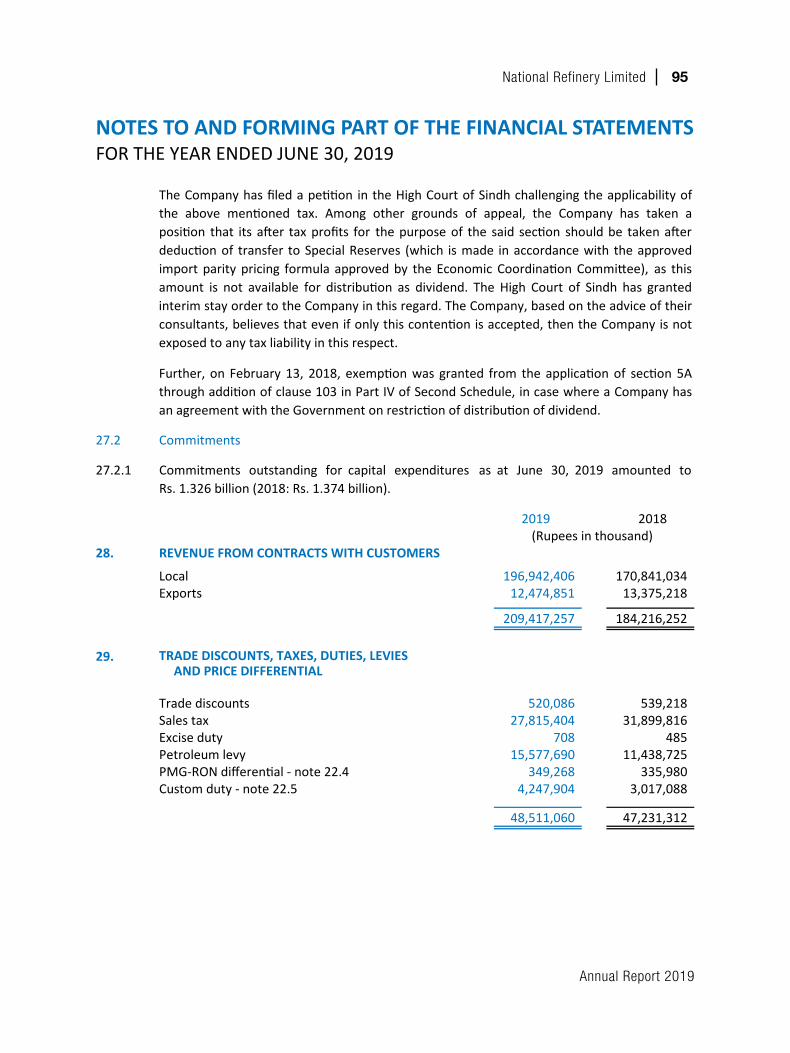
Annual Report 2019
National Refinery Limited 95
NOTES TO AND FORMING PART OF THE FINANCIAL STATEMENTSFORTHEYEARENDEDJUNE30,2019
27.1.3
27.2 Commitments
27.2.1
2019 2018
28. REVENUE FROM CONTRACTS WITH CUSTOMERS
Local 196,942,406 170,841,034 Exports 12,474,851 13,375,218
209,417,257 184,216,252
29. TRADE DISCOUNTS, TAXES, DUTIES, LEVIES AND PRICE DIFFERENTIAL
Trade discounts 520,086 539,218 Sales tax 27,815,404 31,899,816 Excise duty 708 485 Petroleum levy 15,577,690 11,438,725 PMG-RON differential - note 22.4 349,268 335,980 Custom duty - note 22.5 4,247,904 3,017,088
48,511,060 47,231,312
Commitments outstanding for capital expenditures as at June 30, 2019 amounted toRs. 1.326 billion (2018: Rs. 1.374 billion).
(Rupees in thousand)
27.1.2
The Finance Act, 2017 introduced section 5A which imposes tax on every public company atthe rate of 7.5% of its accounting profit before tax for the year. However, this tax shall notapply in case of a public company which distributes at least 40% of its after tax profits withinsix months of the end of the tax year through cash or bonus shares. In 2018, the Companydistributed dividend at the rate of Rs. 22.50 per share amounting to Rs. 1.80 billionpertaining to the year ended June 30, 2017, which is less than 40% of after tax profits and isexposed to a tax liability of Rs. 624 million.
The Company has filed a petition in the High Court of Sindh challenging the applicability ofthe above mentioned tax. Among other grounds of appeal, the Company has taken aposition that its after tax profits for the purpose of the said section should be taken afterdeduction of transfer to Special Reserves (which is made in accordance with the approvedimport parity pricing formula approved by the Economic Coordination Committee), as thisamount is not available for distribution as dividend. The High Court of Sindh has grantedinterim stay order to the Company in this regard. The Company, based on the advice of theirconsultants, believes that even if only this contention is accepted, then the Company is notexposed to any tax liability in this respect.
Further, on February 13, 2018, exemption was granted from the application of section 5Athrough addition of clause 103 in Part IV of Second Schedule, in case where a Company hasan agreement with the Government on restriction of distribution of dividend.
The Company has raised claims on certain Oil Marketing Companies (OMCs) in respect of interest on late payments against receivables aggregating to Rs. 5.07 billion (2018: Rs. 5.07 billion). However, these have not been recognised in the financial statements as these claims have not been acknowledged by the OMCs.
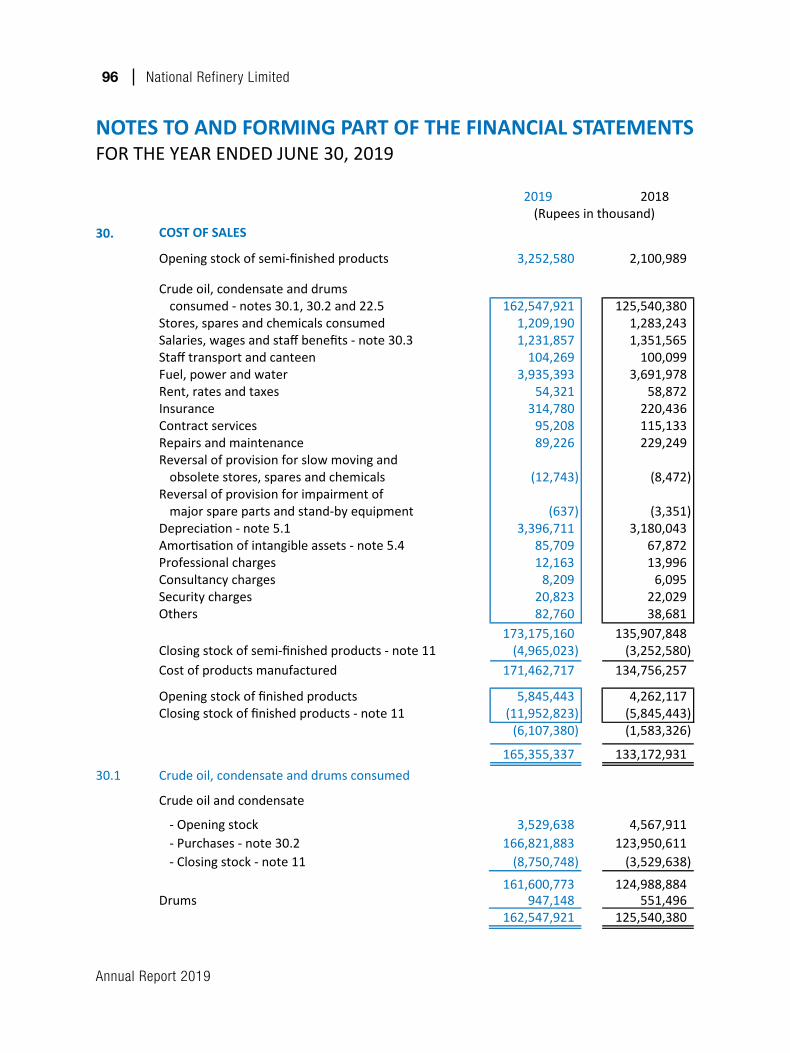
Annual Report 2019
96 National Refinery Limited
NOTES TO AND FORMING PART OF THE FINANCIAL STATEMENTSFORTHEYEARENDEDJUNE30,2019
Crude oil, condensate and drumsconsumed - notes 30.1, 30.2 and 22.5 162,547,921 125,540,380
Stores, spares and chemicals consumed 1,209,190 1,283,243 Salaries, wages and staff benefits - note 30.3 1,231,857 1,351,565 Staff transport and canteen 104,269 100,099 Fuel, power and water 3,935,393 3,691,978 Rent, rates and taxes 54,321 58,872 Insurance 314,780 220,436 Contract services 95,208 115,133 Repairs and maintenance 89,226 229,249 Reversal of provision for slow moving and
obsolete stores, spares and chemicals (12,743) (8,472) Reversal of provision for impairment of
major spare parts and stand-by equipment (637) (3,351) Depreciation - note 5.1 3,396,711 3,180,043 Amortisation of intangible assets - note 5.4 85,709 67,872 Professional charges 12,163 13,996 Consultancy charges 8,209 6,095 Security charges 20,823 22,029 Others 82,760 38,681
173,175,160 135,907,848 Closing stock of semi-finished products - note 11 (4,965,023) (3,252,580) Cost of products manufactured 171,462,717 134,756,257
Opening stock of finished products 5,845,443 4,262,117 Closing stock of finished products - note 11 (11,952,823) (5,845,443)
(6,107,380) (1,583,326)
165,355,337 133,172,931 30.1
Crude oil and condensate
- Opening stock 3,529,638 4,567,911 - Purchases - note 30.2 166,821,883 123,950,611 - Closing stock - note 11 (8,750,748) (3,529,638)
161,600,773 124,988,884 Drums 947,148 551,496
162,547,921 125,540,380
30.2
30.3 Includes Rs. 79.51 million (2018: Rs. 64.52 million) and Rs. 32.89 million(2018: Rs. 31 million) in respect of benefit and defined contribution plans respectively.
2019 2018(Rupees in thousand)
Crude oil, condensate and drums consumed
Certain crude oil and condensate purchases have been recorded based on provisional pricesdue to non-finalisation of Crude Oil Sale Purchase Agreements (COSA) and may requireadjustment in subsequent periods.
30. COST OF SALES
Opening stock of semi-finished products 3,252,580 2,100,989
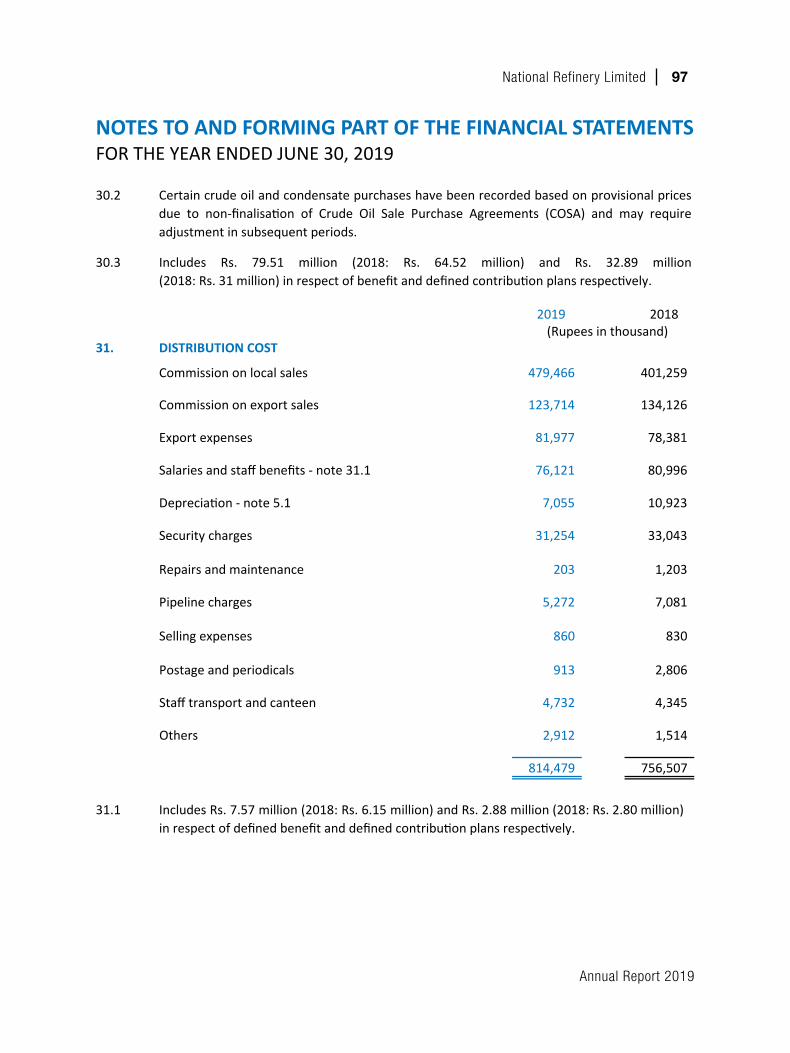
Annual Report 2019
National Refinery Limited 97
NOTES TO AND FORMING PART OF THE FINANCIAL STATEMENTSFORTHEYEARENDEDJUNE30,2019
Crude oil, condensate and drumsconsumed - notes 30.1, 30.2 and 22.5 162,547,921 125,540,380
Stores, spares and chemicals consumed 1,209,190 1,283,243 Salaries, wages and staff benefits - note 30.3 1,231,857 1,351,565 Staff transport and canteen 104,269 100,099 Fuel, power and water 3,935,393 3,691,978 Rent, rates and taxes 54,321 58,872 Insurance 314,780 220,436 Contract services 95,208 115,133 Repairs and maintenance 89,226 229,249 Reversal of provision for slow moving and
obsolete stores, spares and chemicals (12,743) (8,472) Reversal of provision for impairment of
major spare parts and stand-by equipment (637) (3,351) Depreciation - note 5.1 3,396,711 3,180,043 Amortisation of intangible assets - note 5.4 85,709 67,872 Professional charges 12,163 13,996 Consultancy charges 8,209 6,095 Security charges 20,823 22,029 Others 82,760 38,681
173,175,160 135,907,848 Closing stock of semi-finished products - note 11 (4,965,023) (3,252,580) Cost of products manufactured 171,462,717 134,756,257
Opening stock of finished products 5,845,443 4,262,117 Closing stock of finished products - note 11 (11,952,823) (5,845,443)
(6,107,380) (1,583,326)
165,355,337 133,172,931 30.1
Crude oil and condensate
- Opening stock 3,529,638 4,567,911 - Purchases - note 30.2 166,821,883 123,950,611 - Closing stock - note 11 (8,750,748) (3,529,638)
161,600,773 124,988,884 Drums 947,148 551,496
162,547,921 125,540,380
30.2
30.3 Includes Rs. 79.51 million (2018: Rs. 64.52 million) and Rs. 32.89 million(2018: Rs. 31 million) in respect of benefit and defined contribution plans respectively.
2019 2018(Rupees in thousand)
Crude oil, condensate and drums consumed
Certain crude oil and condensate purchases have been recorded based on provisional pricesdue to non-finalisation of Crude Oil Sale Purchase Agreements (COSA) and may requireadjustment in subsequent periods.
30. COST OF SALES
Opening stock of semi-finished products 3,252,580 2,100,989
Commission on export sales 123,714 134,126
Export expenses 81,977 78,381
Salaries and staff benefits - note 31.1 76,121 80,996
Depreciation - note 5.1 7,055 10,923
Security charges 31,254 33,043
Repairs and maintenance 203 1,203
Pipeline charges 5,272 7,081
Selling expenses 860 830
Postage and periodicals 913 2,806
Staff transport and canteen 4,732 4,345
Others 2,912 1,514
814,479 756,507
31.1
32. ADMINISTRATIVE EXPENSES
Salaries and staff benefits - note 32.1 483,252 524,745
Staff transport and canteen 30,577 32,355
Directors' fee 6,121 4,401
Rent, rates and taxes 6,415 6,748
Depreciation - note 5.1 49,836 39,085
Amortisation of intangible assets - note 5.4 1,058 1,987
Legal and professional charges 18,290 7,035
Printing and stationery 7,116 5,754
Contract services 57,442 68,633
Repairs and maintenance 61,144 56,554
Telecommunication 3,469 2,860
Electricity and power 4,533 4,054
Insurance 4,118 1,162
Travelling expenses 5,343 5,830
Postage and periodicals 6,602 6,896
Security charges 52,749 55,089
Others 33,499 40,006
831,564 863,194
32.1
Includes Rs. 7.57 million (2018: Rs. 6.15 million) and Rs. 2.88 million (2018: Rs. 2.80 million)in respect of defined benefit and defined contribution plans respectively.
Includes Rs. 50.41 million (2018: Rs. 42.75 million) and Rs. 13.90 million(2018: Rs. 13.78 million) in respect of defined benefit and defined contribution plansrespectively.
2019 2018
31. DISTRIBUTION COST
Commission on local sales 479,466 401,259
(Rupees in thousand)
2019 2018(Rupees in thousand)
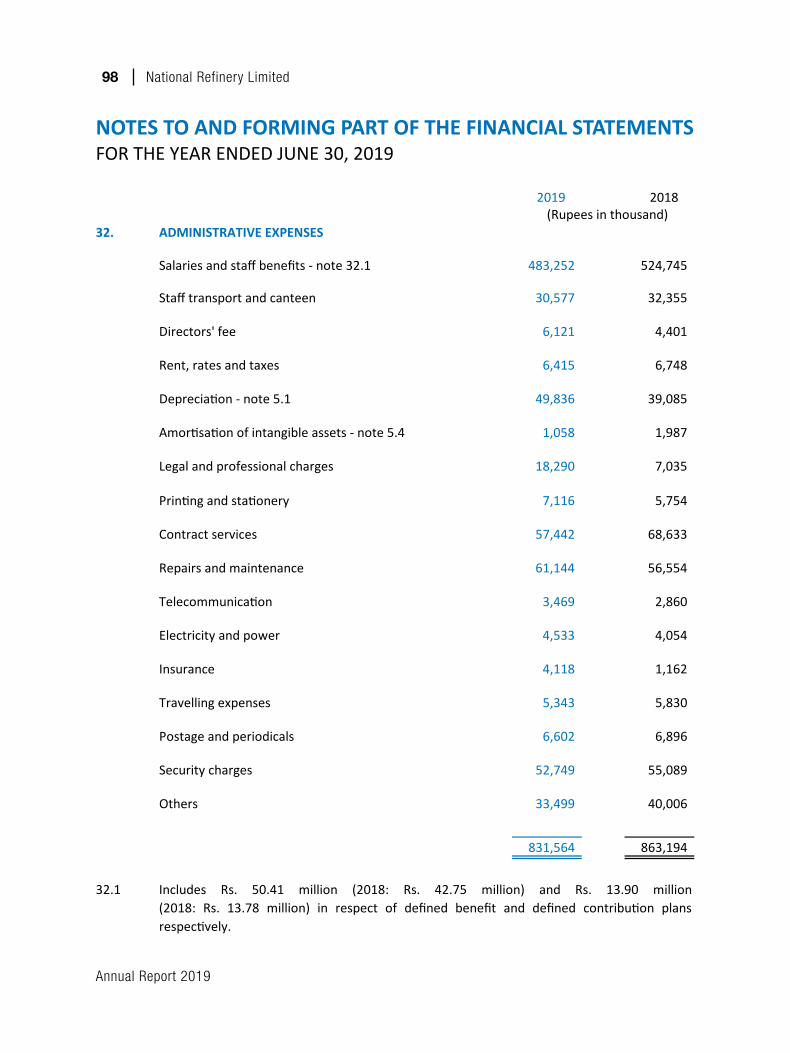
Annual Report 2019
98 National Refinery Limited
NOTES TO AND FORMING PART OF THE FINANCIAL STATEMENTSFORTHEYEARENDEDJUNE30,2019
Commission on export sales 123,714 134,126
Export expenses 81,977 78,381
Salaries and staff benefits - note 31.1 76,121 80,996
Depreciation - note 5.1 7,055 10,923
Security charges 31,254 33,043
Repairs and maintenance 203 1,203
Pipeline charges 5,272 7,081
Selling expenses 860 830
Postage and periodicals 913 2,806
Staff transport and canteen 4,732 4,345
Others 2,912 1,514
814,479 756,507
31.1
32. ADMINISTRATIVE EXPENSES
Salaries and staff benefits - note 32.1 483,252 524,745
Staff transport and canteen 30,577 32,355
Directors' fee 6,121 4,401
Rent, rates and taxes 6,415 6,748
Depreciation - note 5.1 49,836 39,085
Amortisation of intangible assets - note 5.4 1,058 1,987
Legal and professional charges 18,290 7,035
Printing and stationery 7,116 5,754
Contract services 57,442 68,633
Repairs and maintenance 61,144 56,554
Telecommunication 3,469 2,860
Electricity and power 4,533 4,054
Insurance 4,118 1,162
Travelling expenses 5,343 5,830
Postage and periodicals 6,602 6,896
Security charges 52,749 55,089
Others 33,499 40,006
831,564 863,194
32.1
Includes Rs. 7.57 million (2018: Rs. 6.15 million) and Rs. 2.88 million (2018: Rs. 2.80 million)in respect of defined benefit and defined contribution plans respectively.
Includes Rs. 50.41 million (2018: Rs. 42.75 million) and Rs. 13.90 million(2018: Rs. 13.78 million) in respect of defined benefit and defined contribution plansrespectively.
2019 2018
31. DISTRIBUTION COST
Commission on local sales 479,466 401,259
(Rupees in thousand)
2019 2018(Rupees in thousand)
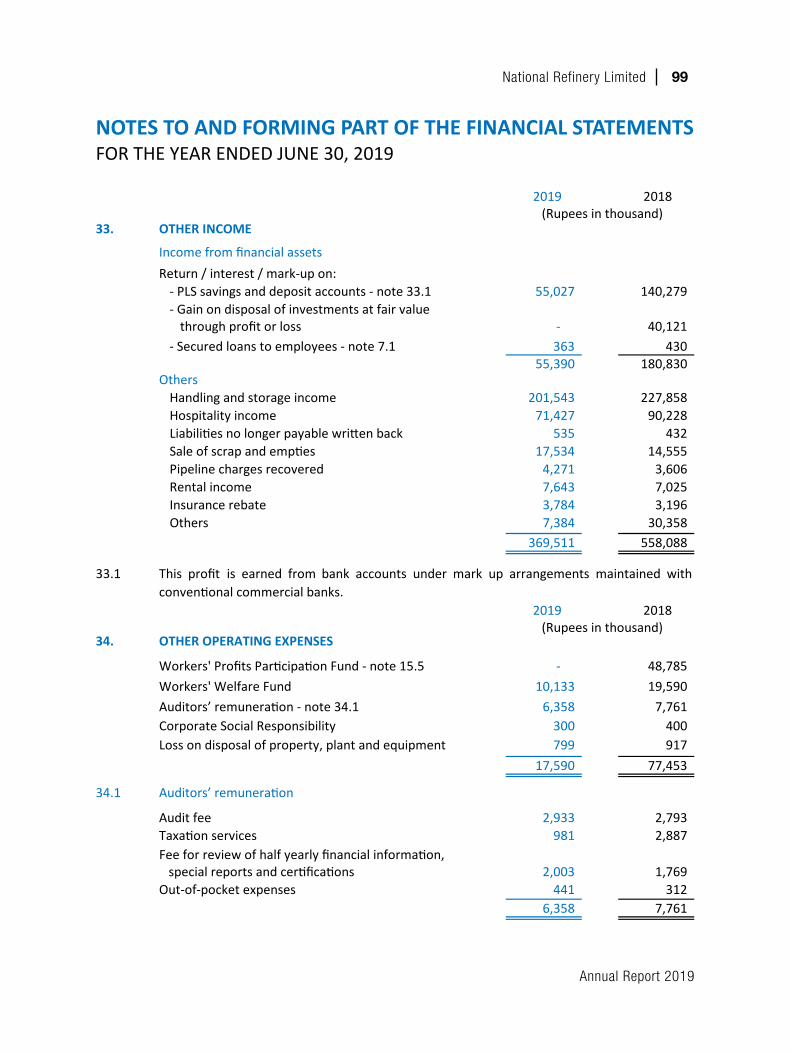
Annual Report 2019
National Refinery Limited 99
NOTES TO AND FORMING PART OF THE FINANCIAL STATEMENTSFORTHEYEARENDEDJUNE30,2019
55,390 180,830 Others
Handling and storage income 201,543 227,858 Hospitality income 71,427 90,228 Liabilities no longer payable written back 535 432 Sale of scrap and empties 17,534 14,555 Pipeline charges recovered 4,271 3,606 Rental income 7,643 7,025 Insurance rebate 3,784 3,196 Others 7,384 30,358
369,511 558,088
34. OTHER OPERATING EXPENSES
Workers' Profits Participation Fund - note 15.5 - 48,785 Workers' Welfare Fund 10,133 19,590 Auditors’ remuneration - note 34.1 6,358 7,761 Corporate Social Responsibility 300 400 Loss on disposal of property, plant and equipment 799 917
17,590 77,453
34.1 Auditors’ remuneration
Audit fee 2,933 2,793 Taxation services 981 2,887 Fee for review of half yearly financial information, special reports and certifications 2,003 1,769 Out-of-pocket expenses 441 312
6,358 7,761
35. FINANCE COST
Exchange loss - note 35.1 4,086,649 1,692,028
Mark-up on long term loan 1,795 27,922
Mark-up on running finance 1,194,047 44,158
Guarantee commission and service charges 830 862
Bank charges 2,428 645
5,285,749 1,765,615
33.1 This profit is earned from bank accounts under mark up arrangements maintained withconventional commercial banks.
2019 2018
33. OTHER INCOME
Income from financial assetsReturn / interest / mark-up on:
- PLS savings and deposit accounts - note 33.1 55,027 140,279 - Gain on disposal of investments at fair value
through profit or loss - 40,121 363 430
(Rupees in thousand)
2019 2018(Rupees in thousand)
- Secured loans to employees - note 7.1
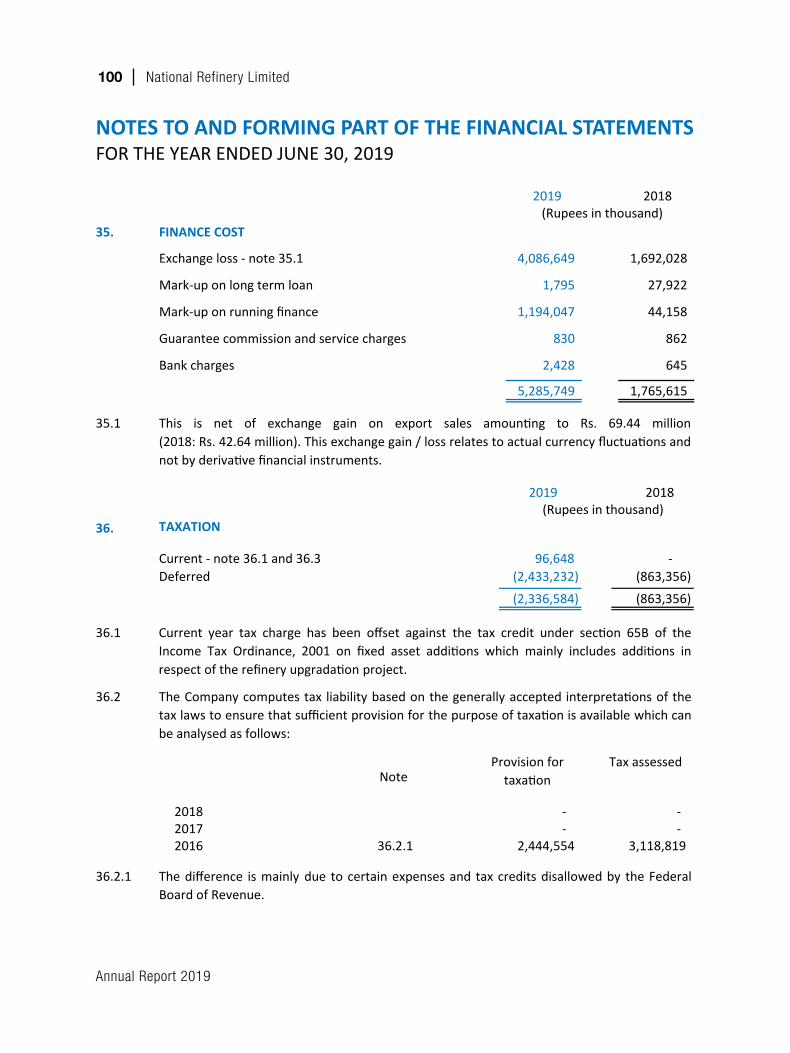
Annual Report 2019
100 National Refinery Limited
NOTES TO AND FORMING PART OF THE FINANCIAL STATEMENTSFORTHEYEARENDEDJUNE30,2019
55,390 180,830 Others
Handling and storage income 201,543 227,858 Hospitality income 71,427 90,228 Liabilities no longer payable written back 535 432 Sale of scrap and empties 17,534 14,555 Pipeline charges recovered 4,271 3,606 Rental income 7,643 7,025 Insurance rebate 3,784 3,196 Others 7,384 30,358
369,511 558,088
34. OTHER OPERATING EXPENSES
Workers' Profits Participation Fund - note 15.5 - 48,785 Workers' Welfare Fund 10,133 19,590 Auditors’ remuneration - note 34.1 6,358 7,761 Corporate Social Responsibility 300 400 Loss on disposal of property, plant and equipment 799 917
17,590 77,453
34.1 Auditors’ remuneration
Audit fee 2,933 2,793 Taxation services 981 2,887 Fee for review of half yearly financial information, special reports and certifications 2,003 1,769 Out-of-pocket expenses 441 312
6,358 7,761
35. FINANCE COST
Exchange loss - note 35.1 4,086,649 1,692,028
Mark-up on long term loan 1,795 27,922
Mark-up on running finance 1,194,047 44,158
Guarantee commission and service charges 830 862
Bank charges 2,428 645
5,285,749 1,765,615
33.1 This profit is earned from bank accounts under mark up arrangements maintained withconventional commercial banks.
2019 2018
33. OTHER INCOME
Income from financial assetsReturn / interest / mark-up on:
- PLS savings and deposit accounts - note 33.1 55,027 140,279 - Gain on disposal of investments at fair value
through profit or loss - 40,121 363 430
(Rupees in thousand)
2019 2018(Rupees in thousand)
- Secured loans to employees - note 7.1
35.1
2019 2018
36. TAXATION
Current - note 36.1 and 36.3 96,648 - Deferred (2,433,232) (863,356)
(2,336,584) (863,356)
36.1
36.2
2018 - - 2017 - - 2016 36.2.1 2,444,554 3,118,819
36.2.1
36.3 Relationship between tax expense and accounting profit 2019 2018
Accounting (loss) / profit before taxation (11,029,011) 907,328
Tax at the applicable tax rate of 29% (2018: 30%) (3,198,413) 272,198 Tax effect of Final Tax Regime 397,077 163,495 Effect of tax credits (38,731) (751,869) Effect of income taxable at lower rate (443) (6,440) Effect of change in tax rate 503,926 (540,740)
Tax income for the year (2,336,584) (863,356)
The difference is mainly due to certain expenses and tax credits disallowed by the FederalBoard of Revenue.
(Rupees in thousand)
The Company computes tax liability based on the generally accepted interpretations of thetax laws to ensure that sufficient provision for the purpose of taxation is available which canbe analysed as follows:
NoteProvision for
taxation Tax assessed
(Rupees in thousand)
Current year tax charge has been offset against the tax credit under section 65B of theIncome Tax Ordinance, 2001 on fixed asset additions which mainly includes additions inrespect of the refinery upgradation project.
This is net of exchange gain on export sales amounting to Rs. 69.44 million (2018: Rs. 42.64 million). This exchange gain / loss relates to actual currency fluctuations and not by derivative financial instruments.
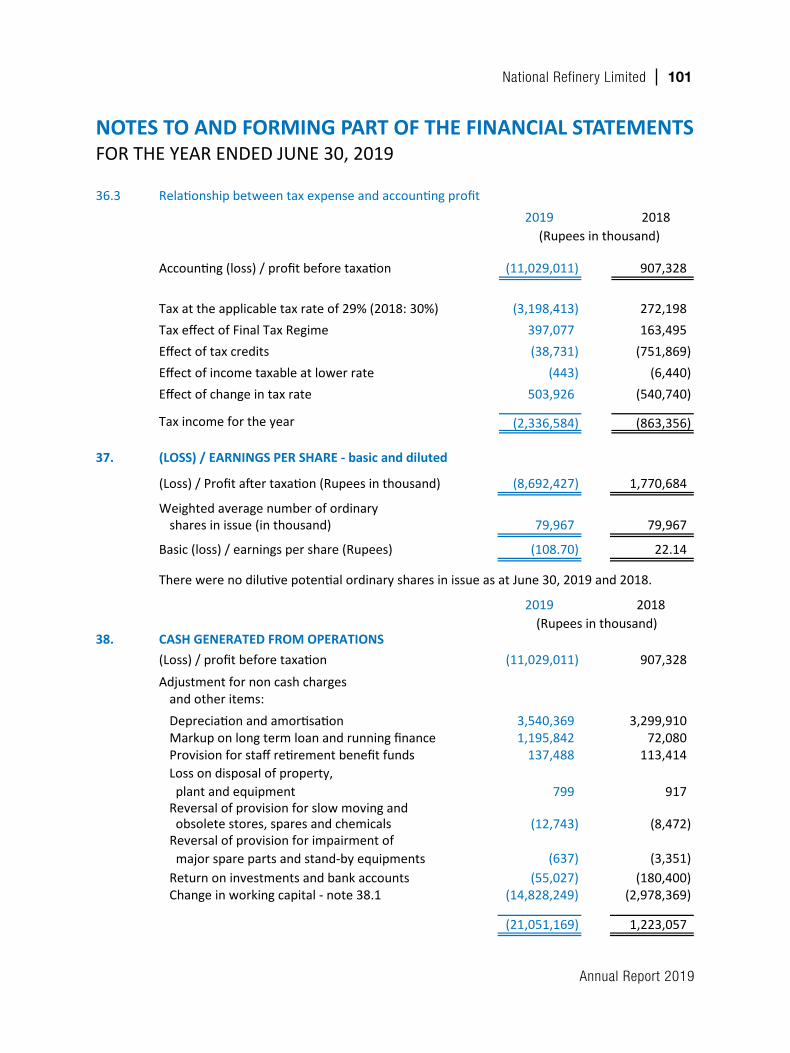
Annual Report 2019
National Refinery Limited 101
NOTES TO AND FORMING PART OF THE FINANCIAL STATEMENTSFORTHEYEARENDEDJUNE30,2019
35.1
2019 2018
36. TAXATION
Current - note 36.1 and 36.3 96,648 - Deferred (2,433,232) (863,356)
(2,336,584) (863,356)
36.1
36.2
2018 - - 2017 - - 2016 36.2.1 2,444,554 3,118,819
36.2.1
36.3 Relationship between tax expense and accounting profit 2019 2018
Accounting (loss) / profit before taxation (11,029,011) 907,328
Tax at the applicable tax rate of 29% (2018: 30%) (3,198,413) 272,198 Tax effect of Final Tax Regime 397,077 163,495 Effect of tax credits (38,731) (751,869) Effect of income taxable at lower rate (443) (6,440) Effect of change in tax rate 503,926 (540,740)
Tax income for the year (2,336,584) (863,356)
The difference is mainly due to certain expenses and tax credits disallowed by the FederalBoard of Revenue.
(Rupees in thousand)
The Company computes tax liability based on the generally accepted interpretations of thetax laws to ensure that sufficient provision for the purpose of taxation is available which canbe analysed as follows:
NoteProvision for
taxation Tax assessed
(Rupees in thousand)
Current year tax charge has been offset against the tax credit under section 65B of theIncome Tax Ordinance, 2001 on fixed asset additions which mainly includes additions inrespect of the refinery upgradation project.
This is net of exchange gain on export sales amounting to Rs. 69.44 million (2018: Rs. 42.64 million). This exchange gain / loss relates to actual currency fluctuations and not by derivative financial instruments.
shares in issue (in thousand) 79,967 79,967
Basic (loss) / earnings per share (Rupees) (108.70) 22.14
2019 2018
38. CASH GENERATED FROM OPERATIONS(Loss) / profit before taxation (11,029,011) 907,328 Adjustment for non cash charges
and other items:Depreciation and amortisation 3,540,369 3,299,910 Markup on long term loan and running finance 1,195,842 72,080 Provision for staff retirement benefit funds 137,488 113,414
799 917
(12,743) (8,472)
(637)
(3,351) Return on investments and bank accounts (55,027) (180,400)
Change in working capital - note 38.1 (14,828,249) (2,978,369)
(21,051,169) 1,223,057
38.1 Change in working capital
(Increase) / decrease in current assetsStores, spares and chemicals (57,964) (584,786) Stock-in-trade (13,040,933) (1,696,644) Trade receivables 487,165 (1,953,340) Loans and advances 26,853 6,023 Trade deposits and short-term prepayments (17,695) (2,902) Other receivables 1,907,059 (2,895,503)
(10,695,515) (7,127,152) (Decrease) / Increase in current liabilities
Trade and other payables (4,132,734) 4,148,783 (14,828,249) (2,978,369)
39. CASH AND CASH EQUIVALENTS
Cash and bank balances 978,680 541,837 Short term borrowings - note 26 (25,007,898) (1,340,273)
(24,029,218) (798,436)
Reversal of provision for impairment of major spare parts and stand-by equipments
There were no dilutive potential ordinary shares in issue as at June 30, 2019 and 2018.
(Rupees in thousand)
Loss on disposal of property, plant and equipmentReversal of provision for slow moving and obsolete stores, spares and chemicals
2019 201837. (LOSS) / EARNINGS PER SHARE - basic and diluted
(Loss) / Profit after taxation (Rupees in thousand) (8,692,427) 1,770,684
Weighted average number of ordinary
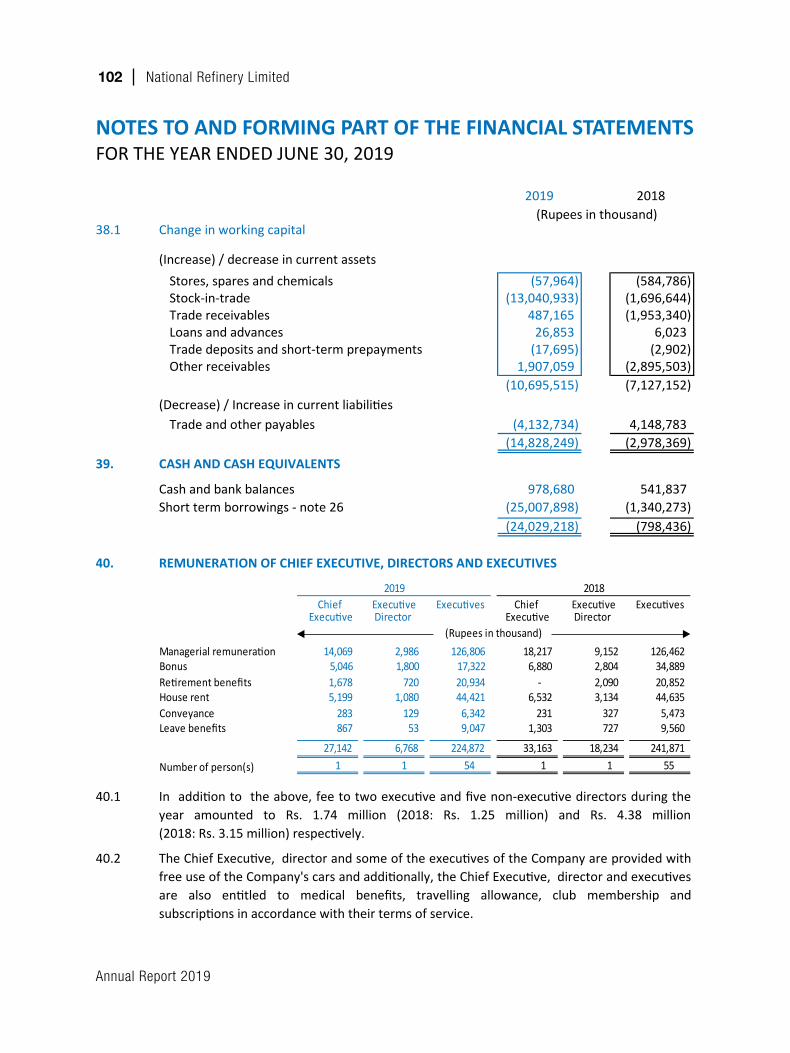
Annual Report 2019
102 National Refinery Limited
shares in issue (in thousand) 79,967 79,967
Basic (loss) / earnings per share (Rupees) (108.70) 22.14
2019 2018
38. CASH GENERATED FROM OPERATIONS(Loss) / profit before taxation (11,029,011) 907,328 Adjustment for non cash charges
and other items:Depreciation and amortisation 3,540,369 3,299,910 Markup on long term loan and running finance 1,195,842 72,080 Provision for staff retirement benefit funds 137,488 113,414
799 917
(12,743) (8,472)
(637)
(3,351) Return on investments and bank accounts (55,027) (180,400)
Change in working capital - note 38.1 (14,828,249) (2,978,369)
(21,051,169) 1,223,057
38.1 Change in working capital
(Increase) / decrease in current assetsStores, spares and chemicals (57,964) (584,786) Stock-in-trade (13,040,933) (1,696,644) Trade receivables 487,165 (1,953,340) Loans and advances 26,853 6,023 Trade deposits and short-term prepayments (17,695) (2,902) Other receivables 1,907,059 (2,895,503)
(10,695,515) (7,127,152) (Decrease) / Increase in current liabilities
Trade and other payables (4,132,734) 4,148,783 (14,828,249) (2,978,369)
39. CASH AND CASH EQUIVALENTS
Cash and bank balances 978,680 541,837 Short term borrowings - note 26 (25,007,898) (1,340,273)
(24,029,218) (798,436)
Reversal of provision for impairment of major spare parts and stand-by equipments
There were no dilutive potential ordinary shares in issue as at June 30, 2019 and 2018.
(Rupees in thousand)
Loss on disposal of property, plant and equipmentReversal of provision for slow moving and obsolete stores, spares and chemicals
2019 201837. (LOSS) / EARNINGS PER SHARE - basic and diluted
(Loss) / Profit after taxation (Rupees in thousand) (8,692,427) 1,770,684
Weighted average number of ordinary
NOTES TO AND FORMING PART OF THE FINANCIAL STATEMENTSFORTHEYEARENDEDJUNE30,2019
shares in issue (in thousand) 79,967 79,967
Basic (loss) / earnings per share (Rupees) (108.70) 22.14
2019 2018
38. CASH GENERATED FROM OPERATIONS(Loss) / profit before taxation (11,029,011) 907,328 Adjustment for non cash charges
and other items:Depreciation and amortisation 3,540,369 3,299,910 Markup on long term loan and running finance 1,195,842 72,080 Provision for staff retirement benefit funds 137,488 113,414
799 917
(12,743) (8,472)
(637)
(3,351) Return on investments and bank accounts (55,027) (180,400)
Change in working capital - note 38.1 (14,828,249) (2,978,369)
(21,051,169) 1,223,057
38.1 Change in working capital
(Increase) / decrease in current assetsStores, spares and chemicals (57,964) (584,786) Stock-in-trade (13,040,933) (1,696,644) Trade receivables 487,165 (1,953,340) Loans and advances 26,853 6,023 Trade deposits and short-term prepayments (17,695) (2,902) Other receivables 1,907,059 (2,895,503)
(10,695,515) (7,127,152) (Decrease) / Increase in current liabilities
Trade and other payables (4,132,734) 4,148,783 (14,828,249) (2,978,369)
39. CASH AND CASH EQUIVALENTS
Cash and bank balances 978,680 541,837 Short term borrowings - note 26 (25,007,898) (1,340,273)
(24,029,218) (798,436)
Reversal of provision for impairment of major spare parts and stand-by equipments
There were no dilutive potential ordinary shares in issue as at June 30, 2019 and 2018.
(Rupees in thousand)
Loss on disposal of property, plant and equipmentReversal of provision for slow moving and obsolete stores, spares and chemicals
2019 201837. (LOSS) / EARNINGS PER SHARE - basic and diluted
(Loss) / Profit after taxation (Rupees in thousand) (8,692,427) 1,770,684
Weighted average number of ordinary
40.1
40.2 The Chief Executive, director and some of the executives of the Company are provided withfree use of the Company's cars and additionally, the Chief Executive, director and executivesare also entitled to medical benefits, travelling allowance, club membership andsubscriptions in accordance with their terms of service.
Executive Executives Chief Executive ExecutivesDirector Executive Director
Managerial remuneration 14,0695,046 1,800 17,322
2,986 126,806 18,217 9,152 126,462 Bonus 6,880 2,804 34,889 Retirement benefits 1,678 720 20,934 - 2,090 20,852 House rent 5,199 1,080 44,421 6,532 3,134 44,635 Conveyance 283 129 6,342 231 327 5,473 Leave benefits 867 53 9,047 1,303 727 9,560
27,142 6,768 224,872 33,163 18,234 241,871 Number of person(s) 1 1 54 1 1 55
2019 2018Chief
Executive(Rupees in thousand)
In addition to the above, fee to two executive and five non-executive directors during the year amounted to Rs. 1.74 million (2018: Rs. 1.25 million) and Rs. 4.38 million (2018: Rs. 3.15 million) respectively.
40. REMUNERATION OF CHIEF EXECUTIVE, DIRECTORS AND EXECUTIVES
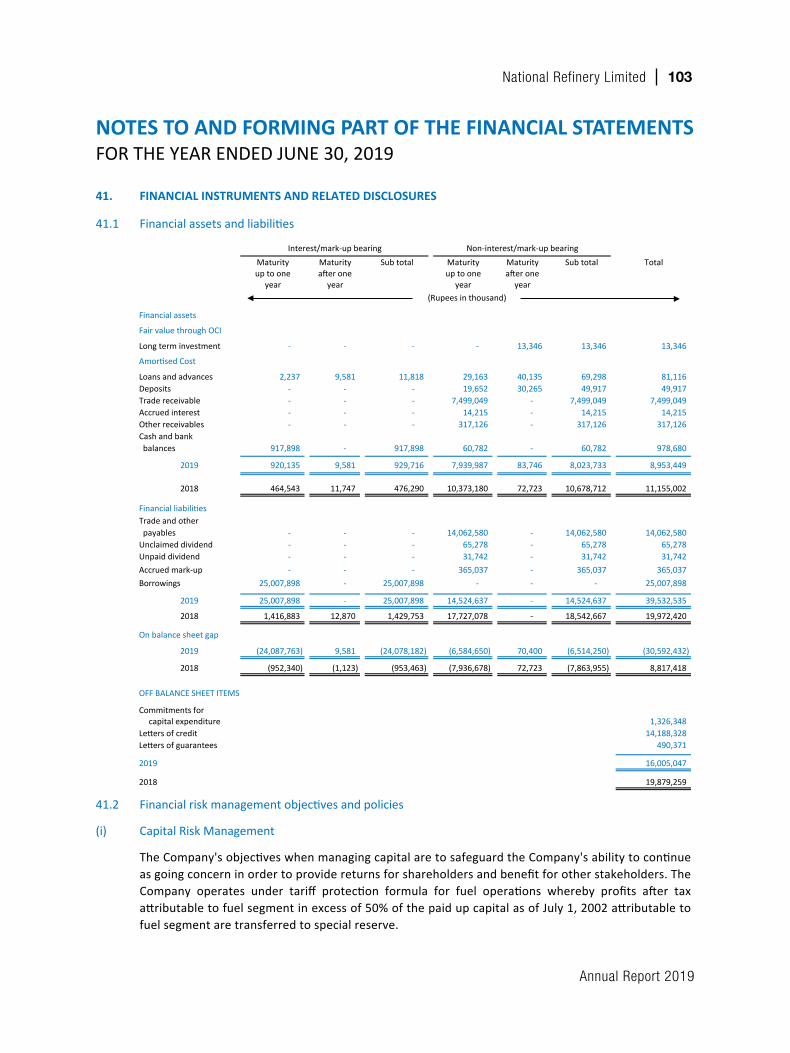
Annual Report 2019
National Refinery Limited 103
NOTES TO AND FORMING PART OF THE FINANCIAL STATEMENTSFORTHEYEARENDEDJUNE30,2019
41. FINANCIAL INSTRUMENTS AND RELATED DISCLOSURES
41.1 Financial assets and liabilities
Maturity Maturity Sub total Maturity Maturity Sub total Totalup to one after one up to one after one
year year year year
Financial assets
Amortised Cost
Loans and advances 2,237 9,581 11,818 29,163 40,135 69,298 81,116
Fair value through OCI
Long term investment 13,346 13,346 13,346
Deposits - - -
- - -
19,652 30,265 49,917 49,917 Trade receivable - - - 7,499,049 - 7,499,049 7,499,049 Accrued interest - - - 14,215 - 14,215 14,215 Other receivables - - - 317,126 - 317,126 317,126 Cash and bank balances 917,898 - 917,898 60,782 - 60,782 978,680
2019 920,135 9,581 929,716 7,939,987 83,746 8,023,733 8,953,449
2018 464,543 11,747 476,290 10,373,180 72,723 10,678,712 11,155,002
Financial liabilitiesTrade and other payables - - - 14,062,580 - 14,062,580 14,062,580 Unclaimed dividend - - - 65,278 - 65,278 65,278 Unpaid dividend - - - 31,742 - 31,742 31,742 Accrued mark-up - - - 365,037 - 365,037 365,037 Borrowings 25,007,898 - 25,007,898 -
-
- - 25,007,898
2019 25,007,898 - 25,007,898 14,524,637 - 14,524,637 39,532,535
2018 1,416,883 12,870 1,429,753 17,727,078 - 18,542,667 19,972,420
On balance sheet gap
2019 (24,087,763) 9,581 (24,078,182) (6,584,650) 70,400 (6,514,250) (30,592,432)
2018 (952,340) (1,123) (953,463) (7,936,678) 72,723 (7,863,955) 8,817,418
OFF BALANCE SHEET ITEMS
Commitments forcapital expenditure 1,326,348
Letters of credit 14,188,328 Letters of guarantees 490,371
2019 16,005,047
2018 19,879,259
41.2 Financial risk management objectives and policies
(i) Capital Risk Management
Interest/mark-up bearing Non-interest/mark-up bearing
(Rupees in thousand)
The Company's objectives when managing capital are to safeguard the Company's ability to continue as going concern in order to provide returns for shareholders and benefit for other stakeholders. The Company operates under tariff protection formula for fuel operations whereby profits after tax attributable to fuel segment in excess of 50% of the paid up capital as of July 1, 2002 attributable to fuel segment are transferred to special reserve.
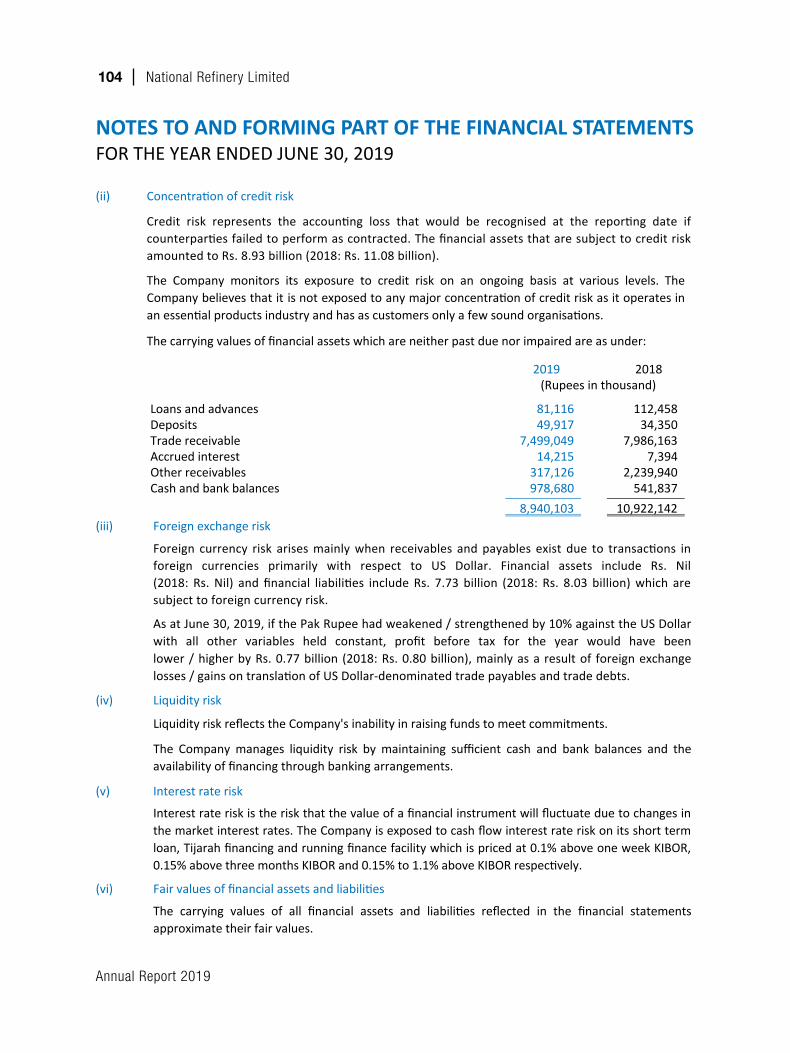
Annual Report 2019
104 National Refinery Limited
NOTES TO AND FORMING PART OF THE FINANCIAL STATEMENTSFORTHEYEARENDEDJUNE30,2019
(iii) Foreign exchange risk
(iv) Liquidity risk
(v) Interest rate risk
(vi) Fair values of financial assets and liabilities
The carrying values of all financial assets and liabilities reflected in the financial statementsapproximate their fair values.
Liquidity risk reflects the Company's inability in raising funds to meet commitments.
The Company manages liquidity risk by maintaining sufficient cash and bank balances and theavailability of financing through banking arrangements.
The Company monitors its exposure to credit risk on an ongoing basis at various levels. TheCompany believes that it is not exposed to any major concentration of credit risk as it operates inan essential products industry and has as customers only a few sound organisations.
The carrying values of financial assets which are neither past due nor impaired are as under:
2019 2018
Loans and advances 81,116 112,458 Deposits 49,917 34,350 Trade receivable 7,499,049 7,986,163 Accrued interest 14,215 7,394 Other receivables 317,126 2,239,940 Cash and bank balances 978,680 541,837
8,940,103 10,922,142
(Rupees in thousand)
Foreign currency risk arises mainly when receivables and payables exist due to transactions in foreign currencies primarily with respect to US Dollar. Financial assets include Rs. Nil (2018: Rs. Nil) and financial liabilities include Rs. 7.73 billion (2018: Rs. 8.03 billion) which are subject to foreign currency risk.
Credit risk represents the accounting loss that would be recognised at the reporting date if counterparties failed to perform as contracted. The financial assets that are subject to credit risk amounted to Rs. 8.93 billion (2018: Rs. 11.08 billion).
(ii) Concentration of credit risk
As at June 30, 2019, if the Pak Rupee had weakened / strengthened by 10% against the US Dollar with all other variables held constant, profit before tax for the year would have been lower / higher by Rs. 0.77 billion (2018: Rs. 0.80 billion), mainly as a result of foreign exchange losses / gains on translation of US Dollar-denominated trade payables and trade debts.
Interest rate risk is the risk that the value of a financial instrument will fluctuate due to changes in the market interest rates. The Company is exposed to cash flow interest rate risk on its short term loan, Tijarah financing and running finance facility which is priced at 0.1% above one week KIBOR, 0.15% above three months KIBOR and 0.15% to 1.1% above KIBOR respectively.
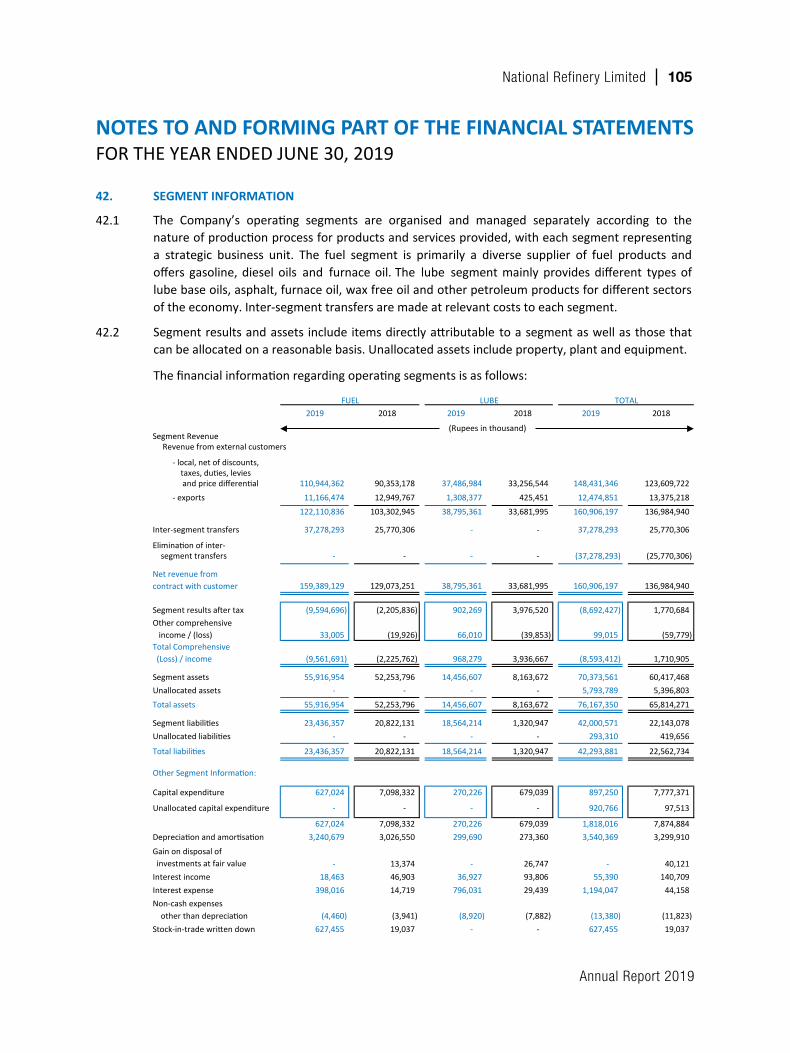
Annual Report 2019
National Refinery Limited 105
NOTES TO AND FORMING PART OF THE FINANCIAL STATEMENTSFORTHEYEARENDEDJUNE30,2019
42.1
42.2
2019 2018 2019 2018 2019 2018
Segment RevenueRevenue from external customers
- local, net of discounts, taxes, duties, levies
and price differential 110,944,362 90,353,178 37,486,984 33,256,544 148,431,346 123,609,722
- exports 11,166,474 12,949,767 1,308,377 425,451 12,474,851 13,375,218
122,110,836 103,302,945 38,795,361 33,681,995 160,906,197 136,984,940
Inter-segment transfers 37,278,293 25,770,306 - - 37,278,293 25,770,306
Elimination of inter- segment transfers - - - - (37,278,293) (25,770,306)
Net revenue from contract with customer 159,389,129 129,073,251 38,795,361 33,681,995 160,906,197 136,984,940
Segment results after tax (9,594,696) (2,205,836) 902,269 3,976,520 (8,692,427) 1,770,684 Other comprehensive income / (loss) 33,005 (19,926) 66,010 (39,853) 99,015 (59,779)
(9,561,691) (2,225,762) 968,279 3,936,667 (8,593,412) 1,710,905 Segment assets 55,916,954 52,253,796 14,456,607 8,163,672 70,373,561 60,417,468 Unallocated assets - - - - 5,793,789 5,396,803
Total assets 55,916,954 52,253,796 14,456,607 8,163,672 76,167,350 65,814,271
Segment liabilities 23,436,357 20,822,131 18,564,214 1,320,947 42,000,571 22,143,078 Unallocated liabilities - - - - 293,310 419,656
Total liabilities 23,436,357 20,822,131 18,564,214 1,320,947 42,293,881 22,562,734
Other Segment Information:
Capital expenditure 627,024 7,098,332 270,226 679,039 897,250 7,777,371
Unallocated capital expenditure - - - - 920,766 97,513
627,024 7,098,332 270,226 679,039 1,818,016 7,874,884 Depreciation and amortisation 3,240,679 3,026,550 299,690 273,360 3,540,369 3,299,910
- 13,374 - 26,747 - 40,121 Interest income 18,463 46,903 36,927 93,806 55,390 140,709 Interest expense 398,016 14,719 796,031 29,439 1,194,047 44,158 Non-cash expenses other than depreciation (4,460) (3,941) (8,920) (7,882) (13,380) (11,823) Stock-in-trade written down 627,455 19,037 - - 627,455 19,037
(Rupees in thousand)
Total Comprehensive (Loss) / income
Gain on disposal of investments at fair value
The Company’s operating segments are organised and managed separately according to thenature of production process for products and services provided, with each segment representinga strategic business unit. The fuel segment is primarily a diverse supplier of fuel products andoffers gasoline, diesel oils and furnace oil. The lube segment mainly provides different types oflube base oils, asphalt, furnace oil, wax free oil and other petroleum products for different sectorsof the economy. Inter-segment transfers are made at relevant costs to each segment.
Segment results and assets include items directly attributable to a segment as well as those thatcan be allocated on a reasonable basis. Unallocated assets include property, plant and equipment.
The financial information regarding operating segments is as follows:
FUEL LUBE TOTAL
42. SEGMENT INFORMATION
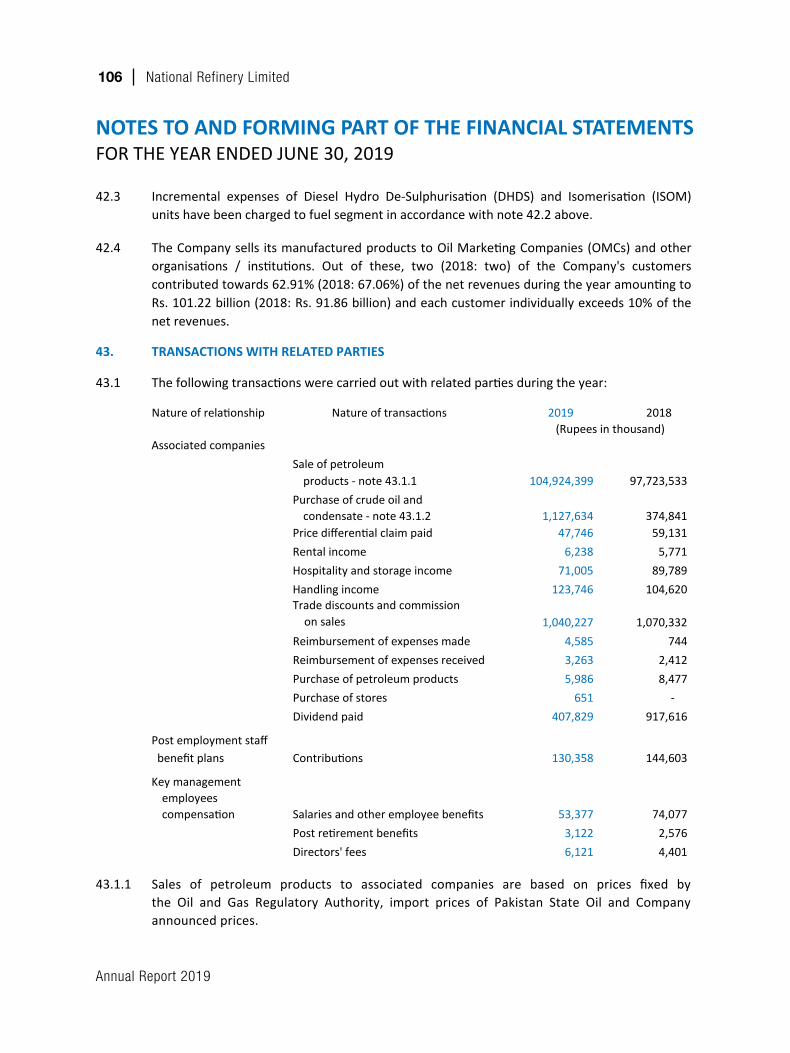
Annual Report 2019
106 National Refinery Limited
NOTES TO AND FORMING PART OF THE FINANCIAL STATEMENTSFORTHEYEARENDEDJUNE30,2019
42.3
42.4
43. TRANSACTIONS WITH RELATED PARTIES
43.1 The following transactions were carried out with related parties during the year:
Nature of relationship Nature of transactions 2019 2018
Associated companiesSale of petroleum
products - note 43.1.1 104,924,399 97,723,533 Purchase of crude oil and
condensate - note 43.1.2 1,127,634 374,841 Price differential claim paid 47,746 59,131 Rental income 6,238 5,771 Hospitality and storage income 71,005 89,789 Handling income 123,746 104,620 Trade discounts and commission on sales 1,040,227 1,070,332 Reimbursement of expenses made 4,585 744
3,263 2,412 Purchase of petroleum products 5,986 8,477 Purchase of stores 651 - Dividend paid 407,829 917,616
Post employment staff benefit plans Contributions 130,358 144,603
Key managementemployees compensation Salaries and other employee benefits 53,377 74,077
Post retirement benefits 3,122 2,576 Directors' fees 6,121 4,401
43.1.1
43.1.2
43.2
Purchase of crude oil and condensate from associated companies is based on price mechanismprovided in their respective Petroleum Concession Agreement till finalisation ofCrude Oil / Condensate Sale and Purchase Agreements.
The related party status of outstanding balances as at June 30, 2019 is included in trade receivable,other receivables and trade and other payables. These are settled in the ordinary course ofbusiness.
Incremental expenses of Diesel Hydro De-Sulphurisation (DHDS) and Isomerisation (ISOM)units have been charged to fuel segment in accordance with note 42.2 above.
The Company sells its manufactured products to Oil Marketing Companies (OMCs) and otherorganisations / institutions. Out of these, two (2018: two) of the Company's customerscontributed towards 62.91% (2018: 67.06%) of the net revenues during the year amounting toRs. 101.22 billion (2018: Rs. 91.86 billion) and each customer individually exceeds 10% of thenet revenues.
(Rupees in thousand)
Reimbursement of expenses received
Sales of petroleum products to associated companies are based on prices fixed by the Oil and Gas Regulatory Authority, import prices of Pakistan State Oil and Company announced prices.
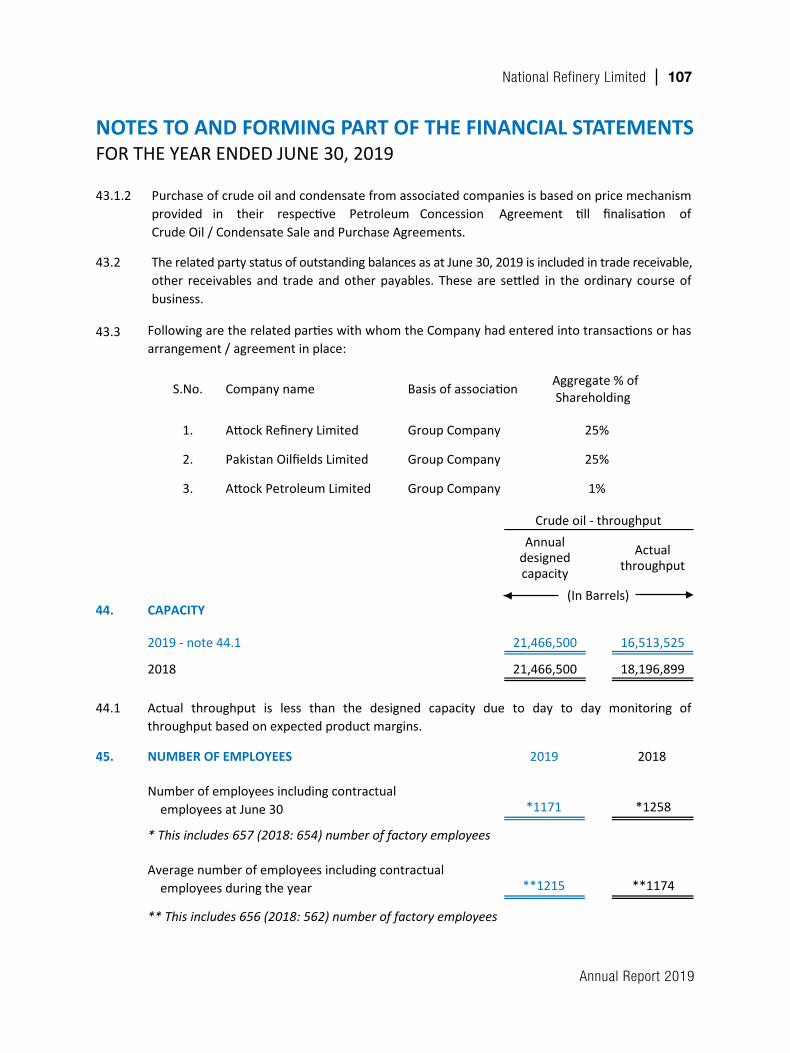
Annual Report 2019
National Refinery Limited 107
NOTES TO AND FORMING PART OF THE FINANCIAL STATEMENTSFORTHEYEARENDEDJUNE30,2019
42.3
42.4
43. TRANSACTIONS WITH RELATED PARTIES
43.1 The following transactions were carried out with related parties during the year:
Nature of relationship Nature of transactions 2019 2018
Associated companiesSale of petroleum
products - note 43.1.1 104,924,399 97,723,533 Purchase of crude oil and
condensate - note 43.1.2 1,127,634 374,841 Price differential claim paid 47,746 59,131 Rental income 6,238 5,771 Hospitality and storage income 71,005 89,789 Handling income 123,746 104,620 Trade discounts and commission on sales 1,040,227 1,070,332 Reimbursement of expenses made 4,585 744
3,263 2,412 Purchase of petroleum products 5,986 8,477 Purchase of stores 651 - Dividend paid 407,829 917,616
Post employment staff benefit plans Contributions 130,358 144,603
Key managementemployees compensation Salaries and other employee benefits 53,377 74,077
Post retirement benefits 3,122 2,576 Directors' fees 6,121 4,401
43.1.1
43.1.2
43.2
Purchase of crude oil and condensate from associated companies is based on price mechanismprovided in their respective Petroleum Concession Agreement till finalisation ofCrude Oil / Condensate Sale and Purchase Agreements.
The related party status of outstanding balances as at June 30, 2019 is included in trade receivable,other receivables and trade and other payables. These are settled in the ordinary course ofbusiness.
Incremental expenses of Diesel Hydro De-Sulphurisation (DHDS) and Isomerisation (ISOM)units have been charged to fuel segment in accordance with note 42.2 above.
The Company sells its manufactured products to Oil Marketing Companies (OMCs) and otherorganisations / institutions. Out of these, two (2018: two) of the Company's customerscontributed towards 62.91% (2018: 67.06%) of the net revenues during the year amounting toRs. 101.22 billion (2018: Rs. 91.86 billion) and each customer individually exceeds 10% of thenet revenues.
(Rupees in thousand)
Reimbursement of expenses received
Sales of petroleum products to associated companies are based on prices fixed by the Oil and Gas Regulatory Authority, import prices of Pakistan State Oil and Company announced prices.
43.3
(In Barrels)44. CAPACITY
2018
44.1
45. NUMBER OF EMPLOYEES 2019 2018
*1171 *1258
**1215 **1174
46. EVENTS OCCURRING AFTER THE STATEMENT OF FINANCIAL POSITION DATE
47. DATE OF AUTHORISATION FOR ISSUE
Number of employees including contractual employees at June 30
* This includes 657 (2018: 654) number of factory employees
Average number of employees including contractual employees during the year
** This includes 656 (2018: 562) number of factory employees
2019 - note 44.1
Actual throughput is less than the designed capacity due to day to day monitoring ofthroughput based on expected product margins.
Following are the related parties with whom the Company had entered into transactions or hasarrangement / agreement in place:
Crude oil - throughput
21,466,500
21,466,500
Annualdesignedcapacity
16,513,525
18,196,899
Actualthroughput
S.No. Company name Basis of association Aggregate % of Shareholding
1. Attock Refinery Limited Group Company 25%
2. Pakistan Oilfields Limited Group Company 25%
3. Attock Petroleum Limited Group Company 1%
The Board of Directors in its meeting held on 29 July, 2019 (i) approved transfer of Rs. Nil (2018: Rs. 900 million) from unappropriated profit to general reserve; and (ii) proposed a final cash dividend of Rs. Nil (2018: Rs. 10) per share for the year ended June 30, 2019 amounting to Rs. Nil (2018: 799.67 million).
These financial statements were authorised for issue on July 29, 2019 by the Board of Directors of the Company.
Annual Report 2019
108 National Refinery Limited
NOTES TO AND FORMING PART OF THE FINANCIAL STATEMENTSFORTHEYEARENDEDJUNE30,2019
43.3
(In Barrels)44. CAPACITY
2018
44.1
45. NUMBER OF EMPLOYEES 2019 2018
*1171 *1258
**1215 **1174
46. EVENTS OCCURRING AFTER THE STATEMENT OF FINANCIAL POSITION DATE
47. DATE OF AUTHORISATION FOR ISSUE
Number of employees including contractual employees at June 30
* This includes 657 (2018: 654) number of factory employees
Average number of employees including contractual employees during the year
** This includes 656 (2018: 562) number of factory employees
2019 - note 44.1
Actual throughput is less than the designed capacity due to day to day monitoring ofthroughput based on expected product margins.
Following are the related parties with whom the Company had entered into transactions or hasarrangement / agreement in place:
Crude oil - throughput
21,466,500
21,466,500
Annualdesignedcapacity
16,513,525
18,196,899
Actualthroughput
S.No. Company name Basis of association Aggregate % of Shareholding
1. Attock Refinery Limited Group Company 25%
2. Pakistan Oilfields Limited Group Company 25%
3. Attock Petroleum Limited Group Company 1%
The Board of Directors in its meeting held on 29 July, 2019 (i) approved transfer of Rs. Nil (2018: Rs. 900 million) from unappropriated profit to general reserve; and (ii) proposed a final cash dividend of Rs. Nil (2018: Rs. 10) per share for the year ended June 30, 2019 amounting to Rs. Nil (2018: 799.67 million).
These financial statements were authorised for issue on July 29, 2019 by the Board of Directors of the Company.
ChiefExecutiveChiefFinancialOfficer Director
Annual Report 2019
National Refinery Limited 109
Pattern ofShareholding,
Notice & Forms
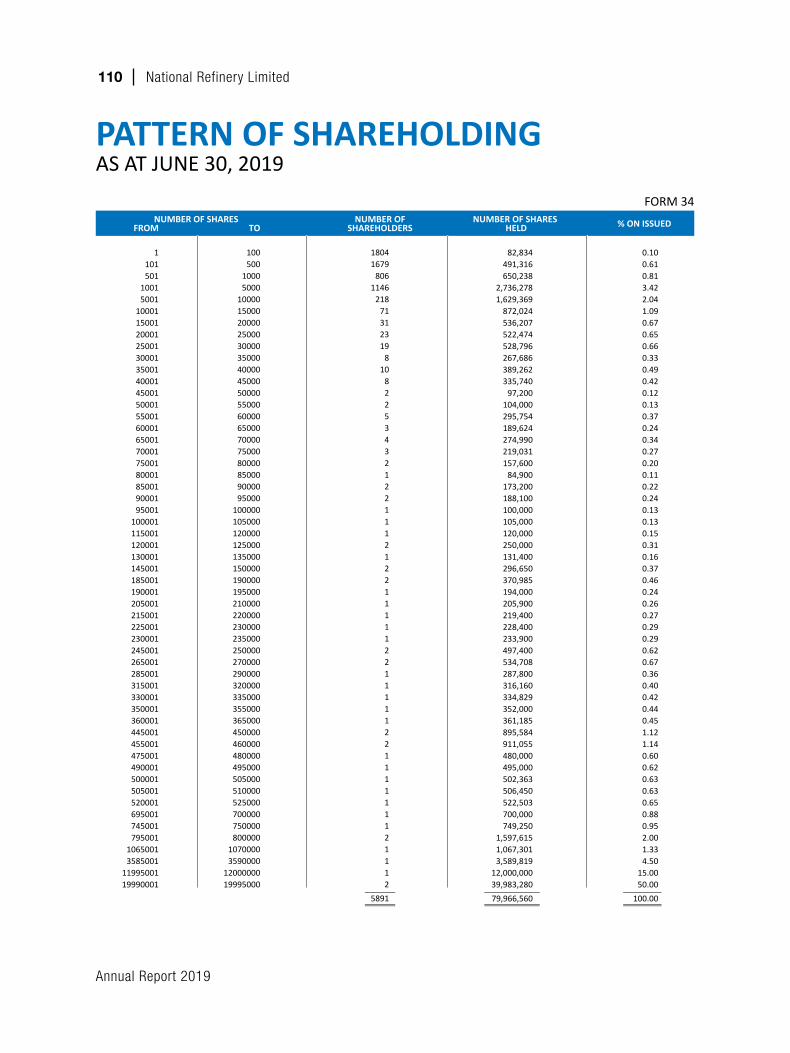
Annual Report 2019
110 National Refinery Limited
PATTERN OF SHAREHOLDINGASATJUNE30,2019
FORM34NUMBER OF SHARES
FROM TONUMBER OF
SHAREHOLDERSNUMBER OF SHARES
HELD % ON ISSUED
1101501
10015001
100011500120001250013000135001400014500150001550016000165001700017500180001850019000195001
100001115001120001130001145001185001190001205001215001225001230001245001265001285001315001330001350001360001445001455001475001490001500001505001520001695001745001795001
10650013585001
1199500119990001
100500
10005000
100001500020000250003000035000400004500050000550006000065000700007500080000850009000095000
100000105000120000125000135000150000190000195000210000220000230000235000250000270000290000320000335000355000365000450000460000480000495000505000510000525000700000750000800000
10700003590000
1200000019995000
18041679
8061146
21871312319
810
82253432122111212211111221111122111111121112
5891
82,834491,316650,238
2,736,2781,629,369
872,024536,207522,474528,796267,686389,262335,740
97,200104,000295,754189,624274,990219,031157,600
84,900173,200188,100100,000105,000120,000250,000131,400296,650370,985194,000205,900219,400228,400233,900497,400534,708287,800316,160334,829352,000361,185895,584911,055480,000495,000502,363506,450522,503700,000749,250
1,597,6151,067,3013,589,819
12,000,00039,983,28079,966,560
0.100.610.813.422.041.090.670.650.660.330.490.420.120.130.370.240.340.270.200.110.220.240.130.130.150.310.160.370.460.240.260.270.290.290.620.670.360.400.420.440.451.121.140.600.620.630.630.650.880.952.001.334.50
15.0050.00
100.00
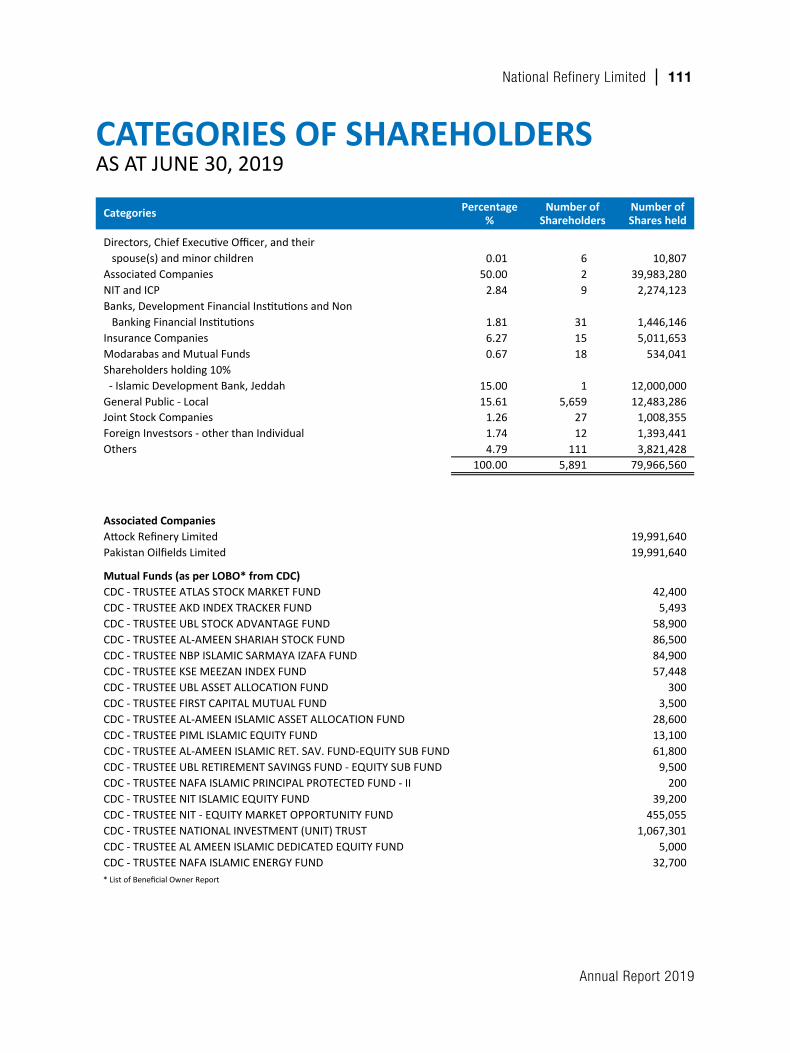
Annual Report 2019
National Refinery Limited 111
CATEGORIES OF SHAREHOLDERS ASATJUNE30,2019
Directors, Chief Executive Officer, and their spouse(s) and minor children 10,807 Associated Companies 39,983,280 NIT and ICP 2,274,123 Banks, Development Financial Institutions and Non Banking Financial Institutions 1,446,146 Insurance Companies 5,011,653 Modarabas and Mutual Funds 534,041 Shareholders holding 10% - Islamic Development Bank, Jeddah 12,000,000 General Public - Local 12,483,286 Joint Stock Companies 1,008,355 Foreign Investsors - other than Individual 1,393,441 Others 3,821,428
Number ofShareholders
Number ofShares held
Percentage%
0.0150.00
2.84
1.816.270.67
15.0015.61
1.261.744.79
100.00
6 2 9
31 15 18
1 5,659
27 12
111 5,891 79,966,560
Associated CompaniesAttock Refinery Limited 19,991,640 Pakistan Oilfields Limited 19,991,640
Mutual Funds (as per LOBO* from CDC)CDC - TRUSTEE ATLAS STOCK MARKET FUND 42,400 CDC - TRUSTEE AKD INDEX TRACKER FUND 5,493 CDC - TRUSTEE UBL STOCK ADVANTAGE FUND 58,900 CDC - TRUSTEE AL-AMEEN SHARIAH STOCK FUND 86,500 CDC - TRUSTEE NBP ISLAMIC SARMAYA IZAFA FUND 84,900 CDC - TRUSTEE KSE MEEZAN INDEX FUND 57,448 CDC - TRUSTEE UBL ASSET ALLOCATION FUND 300 CDC - TRUSTEE FIRST CAPITAL MUTUAL FUND 3,500 CDC - TRUSTEE AL-AMEEN ISLAMIC ASSET ALLOCATION FUND 28,600 CDC - TRUSTEE PIML ISLAMIC EQUITY FUND 13,100 CDC - TRUSTEE AL-AMEEN ISLAMIC RET. SAV. FUND-EQUITY SUB FUND 61,800 CDC - TRUSTEE UBL RETIREMENT SAVINGS FUND - EQUITY SUB FUND 9,500 CDC - TRUSTEE NAFA ISLAMIC PRINCIPAL PROTECTED FUND - II 200 CDC - TRUSTEE NIT ISLAMIC EQUITY FUND 39,200
455,0551,067,301
CDC - TRUSTEE AL AMEEN ISLAMIC DEDICATED EQUITY FUND 5,000 CDC - TRUSTEE NAFA ISLAMIC ENERGY FUND
CDC - TRUSTEE NIT - EQUITY MARKET OPPORTUNITY FUNDCDC - TRUSTEE NATIONAL INVESTMENT (UNIT) TRUST
32,700 * List of Beneficial Owner Report
Categories
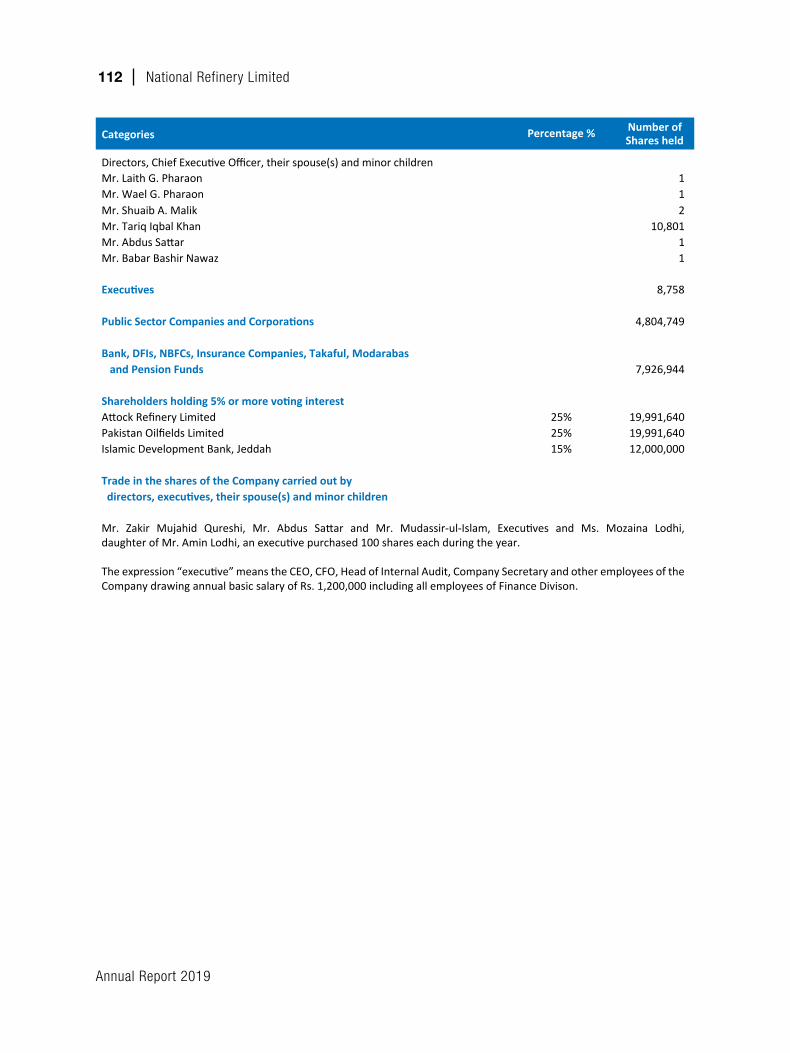
Annual Report 2019
112 National Refinery Limited
Directors, Chief Executive Officer, their spouse(s) and minor childrenMr. Laith G. Pharaon 1 Mr. Wael G. Pharaon 1
Mr. Babar Bashir Nawaz 1
Mr. Shuaib A. Malik 2 Mr. Tariq Iqbal Khan 10,801 Mr. Abdus Sattar 1
Executives 8,758
Public Sector Companies and Corporations 4,804,749
Bank, DFIs, NBFCs, Insurance Companies, Takaful, Modarabas and Pension Funds 7,926,944
Shareholders holding 5% or more voting interestAttock Refinery Limited 25% 19,991,640 Pakistan Oilfields Limited 25% 19,991,640 Islamic Development Bank, Jeddah 15% 12,000,000
Trade in the shares of the Company carried out by directors, executives, their spouse(s) and minor children
Categories Number of Shares heldPercentage %
Mr. Zakir Mujahid Qureshi, Mr. Abdus Sattar and Mr. Mudassir-ul-Islam, Executives and Ms. Mozaina Lodhi, daughter of Mr. Amin Lodhi, an executive purchased 100 shares each during the year.
The expression “executive” means the CEO, CFO, Head of Internal Audit, Company Secretary and other employees of the Company drawing annual basic salary of Rs. 1,200,000 including all employees of Finance Divison.
Annual Report 2019
National Refinery Limited 113
NOTICE OF ANNUAL GENERAL MEETINGNotice is hereby given that the Fifty Sixth (56th) Annual General Meeting of NationalRefinery Limitedwill beheldonThursday, September26,2019at1500hoursatMarriottHotel,Karachitotransactthefollowingbusiness:
ORDINARY BUSINESS
1. Toreceive,considerandapprovetheAuditedFinancialStatementsoftheCompanyfortheyearendedJune30,2019togetherwiththeReportsoftheBoardandtheAuditorsthereon.
2. To appoint Company’s auditors for the year ending June 30, 2020 and to fix theirremuneration.
3. TotransactsuchotherbusinessasmaybeplacedbeforethemeetingwiththepermissionoftheChairman.
By Order of the Board
Karachi: NoumanAhmedUsmaniDated:September03,2019 CompanySecretary
NOTES:
1. CLOSURE OF SHARE TRANSFER BOOK
TheRegisterofMembersoftheCompanywillremainclosedandnotransferofshareswillbeacceptedforregistrationfromSeptember19,2019toSeptember26,2019(bothdaysinclusive).TransfersreceivedinorderattheofficeoftheCompany’sShareRegistrar:
M/s CDC Share Registrar Services Limited CDCHouse,99-B,Block‘B’,S.M.C.H.S,MainShahra-e-Faisal,Karachi-74400.Telephone(TollFree)0800-23275/Fax:(92-21)34326053Email:[email protected]/Website:www.cdcsrsl.com
at the close of business on September 18, 2019willbetreatedintimeforthepurposeofdeterminationofentitlementtothetransferees.
Annual Report 2019
114 National Refinery Limited
2. FOR APPOINTING PROXIES
Amemberentitledtoattend,speakandvoteattheAnnualGeneralMeetingisentitledtoappointaproxytoattend,speakandvoteinsteadofhim/her.Aproxyneednotbeamember.
Proxyinordertobeeffectivemustbedulysigned,witnessed,stampedanddepositedattheofficeoftheShareRegistrarnotlessthan48hoursbeforethemeeting.
Theshareholder/proxyshallproducehis/heroriginalCNICorpassportatthetimeofthemeeting.MembersregisteredonCDCarealsorequestedtobringtheirparticulars,I.D.numbersandaccountnumbersinCDS.
CDC account holders will further have to follow the under mentioned guidelines aslaiddown inCircular1dated January26,2000 issuedby theSecuritiesandExchangeCommissionofPakistan.
A. FOR ATTENDING THE MEETING:
• Incaseofindividuals,theaccountholderorsub-accountholderand/orthepersonwhosesecuritiesareingroupaccount,andtheirregistrationdetailsareuploadedaspertheCDCRegulations,shallauthenticatehisidentitybyshowinghisoriginalComputerised National Identity Card (CNIC) or original passport at the time ofattendingtheMeeting.
• Incaseofcorporateentity,theBoardofDirectors'resolution/powerofattorneywith specimen signatureof thenominee shall be produced (unless it has beenprovidedearlier)atthetimeoftheMeeting.
B. FOR APPOINTING PROXIES:
• In case of individuals, the account holder or sub-account holder and/or thepersonwhose securities are in groupaccount, and their registrationdetails areuploadedaspertheCDCRegulations,shallsubmittheproxyformaspertheaboverequirements.
• Theproxyformshallbewitnessedbytwopersonswhosenames,addressesandCNICnumbersshallbementionedontheform.
• AttestedcopiesofCNICorthepassport,ofthebeneficialownersandtheproxyshallbefurnishedwiththeproxyform.
Annual Report 2019
National Refinery Limited 115
• TheproxyshallproducehisoriginalCNICororiginalpassportatthetimeoftheMeeting.
• Incaseofcorporateentity,theBoardofDirectors'resolution/powerofattorneywithspecimensignatureshallbesubmitted(unlessithasbeenprovidedearlier)alongwithproxyformtotheCompany.
3. VIDEO-LINK FACILITY
Atleastsevendayspriortothedateofthemeeting,onthedemandofmembersresidinginacitywhoholdatleasttenpercentofthetotalpaidupcapitaloftheCompany,thefacility of video-linkwill be provided to suchmembers in that city enabling them toparticipateintheannualgeneralmeetingthroughvideo-linkfacility.
4. FORM OF PROXY
FormofproxyisannexedattheendofannualreportaswellasavailableatCompany’swebsitei.e.,www.nrlpak.com.
5. CHANGE OF ADDRESS
Members are requested to promptly notify to the Company’s Share Registrar of anychangeintheiraddresses.
6. COMPUTERIZED NATIONAL IDENTITY CARD NUMBER / NATIONAL TAX NUMBER
Incompliancewithregulatorydirectivesissuedfromtimetotime,memberswhohavenot yet provided their Computerized National Identity Card (CNIC) Numbers and/orNationalTaxNumbers(NTN),asthecasemaybe,arerequestedtokindlyprovidecopiesoftheirvalidCNICand/orNTNcertificatesattheearliestasfollows:
• TheshareholderswhoholdCompany’sshares inphysical formarerequestedtosubmit the above information to the ShareRegistrar at the addressmentionedabove.
• Shareholders maintaining their shareholdings under Central Depository System(CDS)areadvisedtosubmittheaboveinformationdirectlytorelevantParticipant/CDCInvestorAccountService.
7. PAYMENT OF CASH DIVIDEND ELECTRONICALLY – COMPULSORY
MembersoftheCompanyareherebyrequestedtocomplywiththeprovisionsofSection242oftheCompaniesAct,2017andprovidetheparticularsoftheirbankaccountsthrough
Annual Report 2019
116 National Refinery Limited
E-DividendForm(annexedattheendofannualreportaswellasavailableatCompany’swebsitei.e.,www.nrlpak.com)aseffectivefromNovember06,2017dividendspayableincashshallonlybepaidthroughelectronicmodedirectlyintothebankaccountdesignatedbytheentitledshareholders insteadof through issuanceofDividendWarrants. In theabsenceofbankaccountdetailsor incaseof incompletedetails,theCompanywillbeconstrainedtowithholdthepaymentofcashdividend,ifany,ofthoseshareholderswhohavenotprovidedthesame.
8. DEDUCTION OF INCOME TAX AT REVISED RATES
TheratesofdeductionofincometaxunderSection150oftheIncomeTaxOrdinance,2001fromdividendpayment,ifany,effectiveJuly1,2019areasfollows:
1.
2.
RateoftaxdeductionforpersonsappearinginActiveTaxpayerList(ATL)
RateoftaxdeductionforpersonsnotappearinginActiveTaxpayerList(ATL)
15%
30%
IncaseofJointaccount,eachholderistobetreatedindividuallyasappearinginATLornotappearinginATLandtaxwillbedeductedonthebasisofshareholdingofeachjointholderasmaybenotifiedbytheshareholder,inwritingasfollows,toourShareRegistrar,or if not sonotified,each jointholder shall beassumed tohaveanequalnumberofshares.
TheCNIC/NTNnumberisnowmandatoryandisrequiredforcheckingthetaxstatusaspertheActiveTaxpayerListissuedandupdatedbytheFederalBoardofRevenue(FBR)inatimelymanner.
9. EXEMPTION FROM DEDUCTION OF INCOME TAX/ZAKAT
Membersseekingexemptionfromdeductionofincometaxorareeligiblefordeductionatareducedratearerequestedtosubmitavalidtaxexemptioncertificateornecessarydocumentaryevidenceasthecasemaybe.Membersdesiringnon-deductionofzakatarealsorequestedtosubmitavaliddeclarationfornon-deductionofzakat.
Annual Report 2019
National Refinery Limited 117
10. UNCLAIMED SHARES / DIVIDEND TO VEST WITH THE FEDERAL GOVERNMENT
Members of the Company are informed that in compliance with the provisions ofSection244oftheCompaniesAct,2017,shares/dividendwhichremainunclaimedorunpaidforaperiodofthreeyearsfromthedateitisdueandpayablewillbevestedwiththeFederalGovernmentafterlapseofthetimeperiodasprescribedbytheSecuritiesandExchangeCommissionofPakistan(SECP),ifnoclaimismadebyrespectivemembers.Accordingly,allthosememberswhoseshares/dividendremainunclaimedorunpaidforthementionedperiodareonceagainrequestedtolodgetheirclaimsastheCompanyhasalreadydispatchednoticesinthisrespecttoallsuchshareholdersattheirlastknownaddresses,whereavailablewiththeCompany.
11. AVAILABILITYOFAUDITEDFINANCIALSTATEMENTSONCOMPANY’SWEBSITE
TheauditedfinancialstatementsoftheCompanyfortheyearendedJune30,2019havebeenplacedattheCompany’swebsitewww.nrlpak.com.
12. TRANSMISSION OF ANNUAL REPORT ELECTRONICALLY
The SECP vide SRO 787 (1)/2014 dated September 08, 2014 has provided an optionfor shareholders to receive auditedfinancial statements alongwith noticeof annualgeneralmeetingelectronicallythroughemail.Accordingly,memberswhoareinterestedin receiving theannual reportsandnoticeofannualgeneralmeetingelectronically infuturearerequestedtosendtheiremailaddressesontheconsentformplacedontheCompany’swebsitewww.nrlpak.com,totheCompany’sShareRegistrar.TheCompanyshall,howeveradditionallyprovidehardcopiesoftheannualreporttosuchmembers,onrequest,freeofcost.
13. DEPOSIT OF PHYSICAL SHARES INTO CDC ACCOUNT
The Shareholders having physical shareholding may open CDC sub-account with anyofthebrokersorInvestorAccountdirectlywithCDCtoplacetheirphysicalsharesintoscript-less form, thiswill facilitate them inmanyways includingsafecustodyandsaleofshares,anytimetheywant,asthetradingofphysicalsharesisnotpermittedasperexisting regulations of the stock exchange. Further, Section 72 of the Act states thatafterthecommencementoftheActfromadatenotifiedbytheSECP,acompanyhavingshare capital, shall have shares inbook-entry formonly. Everyexisting company shallberequiredtoreplaceitsphysicalshareswithbook-entryforminamannerasmaybespecifiedandfromthedatenotifiedbytheSECP,withinaperiodnotexceedingfouryearsfromthecommencementoftheAct.
Annual Report 2019
118 National Refinery Limited
14. REGISTRATION WITH FEDERAL BOARD OF REVENUE
TheFederalBoardofRevenuehasinitiatedadrivetowidenthetaxnetofthecountry.ItisessentialforthesuccessofthiseffortthatlargetaxpayersfacilitateFBRinthisrespect.Therefore,allshareholderswhoarenotalreadyregisteredwithFBRarerequestedtogetthemselvesregistered,whereverapplicable.
15. MERGER OF DIFFERENT FOLIOS INTO ONE FOLIO:
As per record, some of the shareholders aremaintainingmore than one folio underthesameparticulars.Carryingtwodifferentfoliosmaybeahasslefortheshareholdersto reconcile and receive different benefits in the shape of dividends/bonus. In ordertoprovidebetter servicesand convenience, such shareholders are requested to sendrequeststotheCompany’sShareRegistrarandTransferagenttomergetheirfoliosintoonefolio.
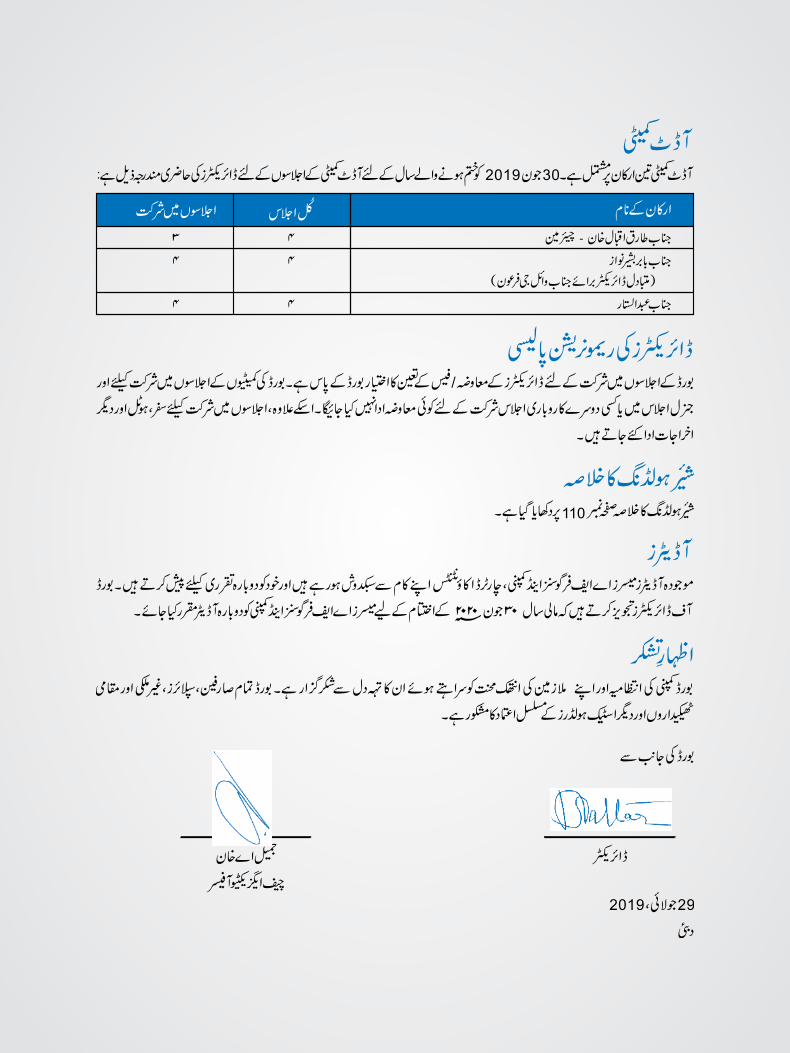
Annual Report 2019
National Refinery Limited 119
110
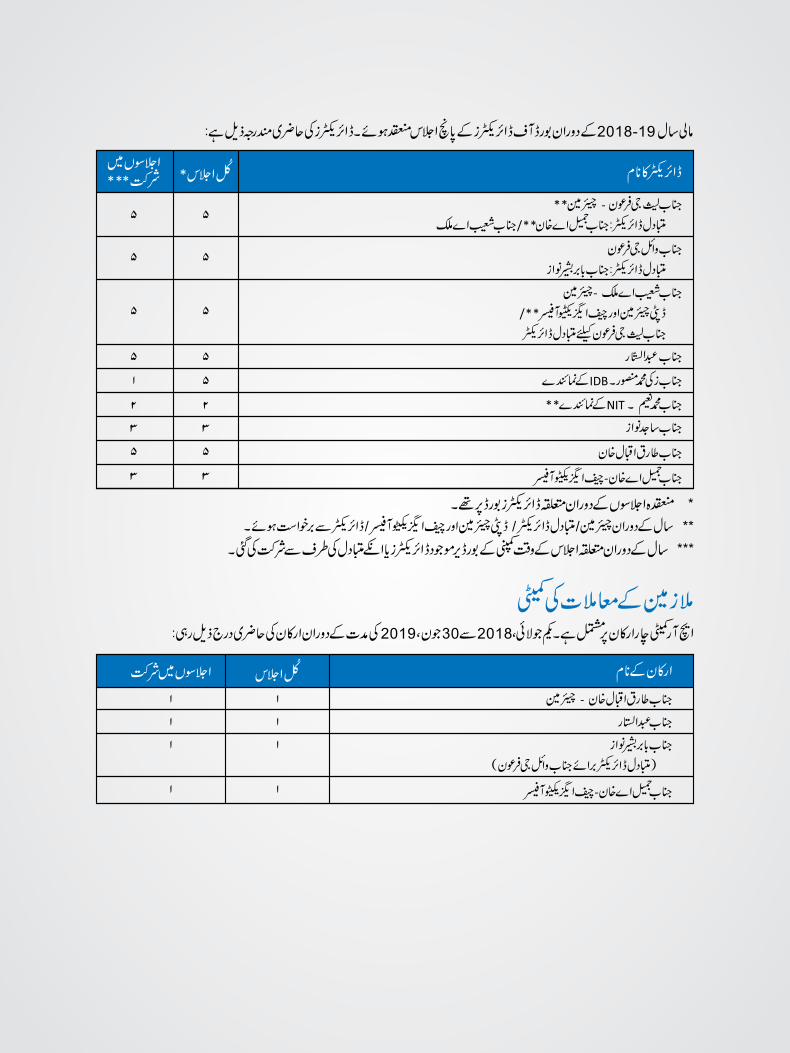
Annual Report 2019
120 National Refinery Limited
110
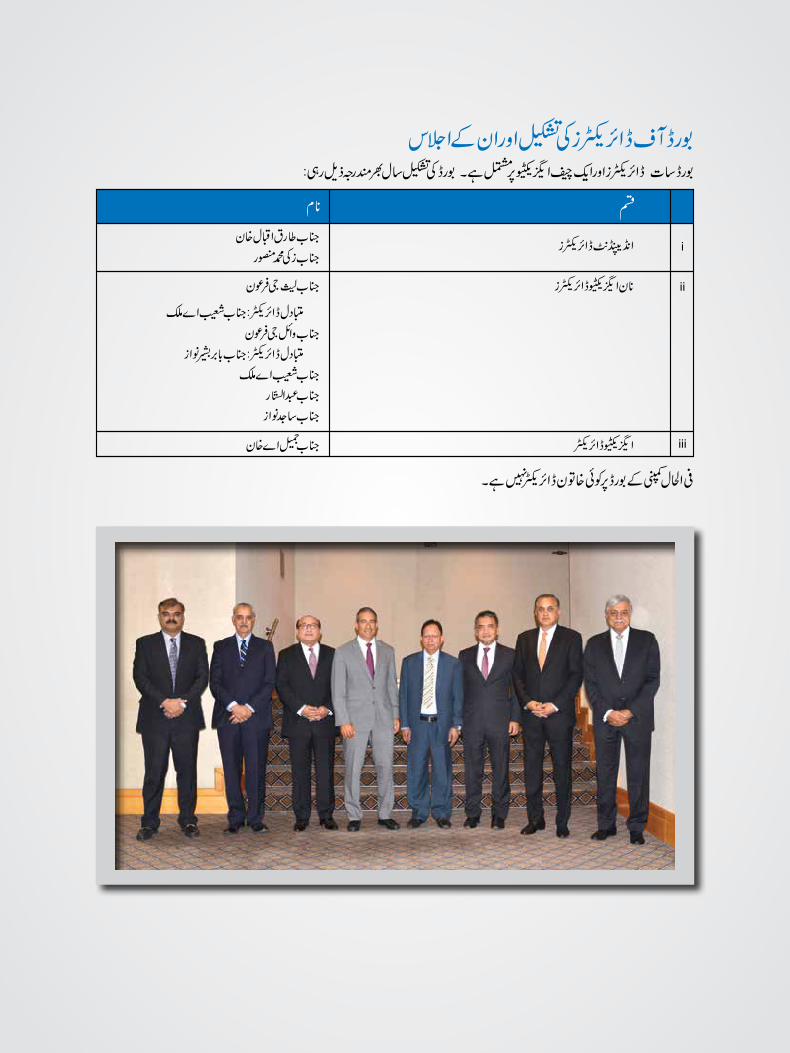
Annual Report 2019
National Refinery Limited 121
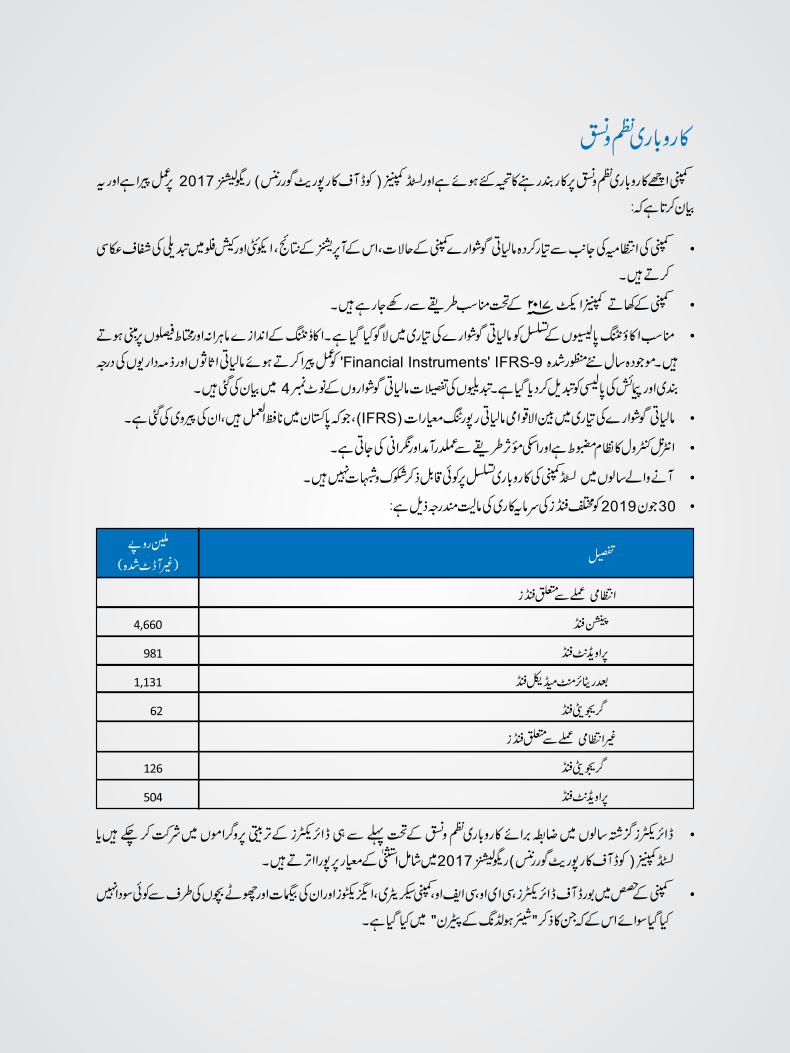
Annual Report 2019
122 National Refinery Limited
Annual Report 2019
National Refinery Limited 123
Annual Report 2019
124 National Refinery Limited
Annual Report 2019
National Refinery Limited 125
41
Annual Report 2019
126 National Refinery Limited
Annual Report 2019
National Refinery Limited 127
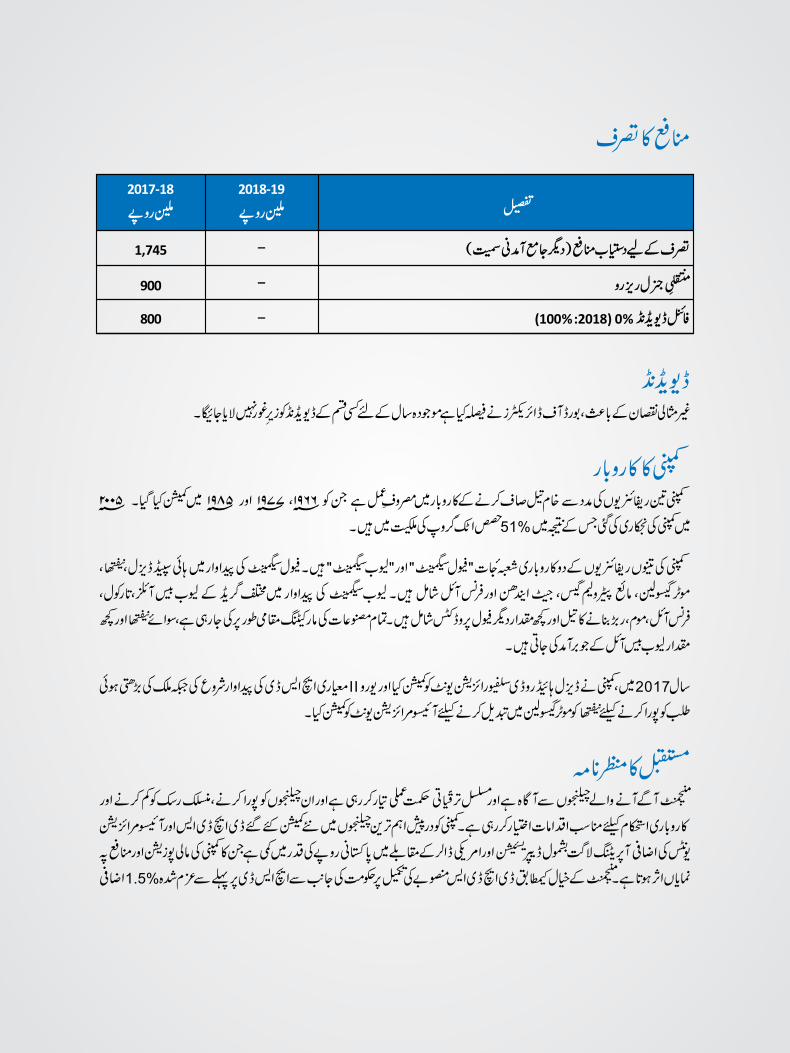
Annual Report 2019
128 National Refinery Limited
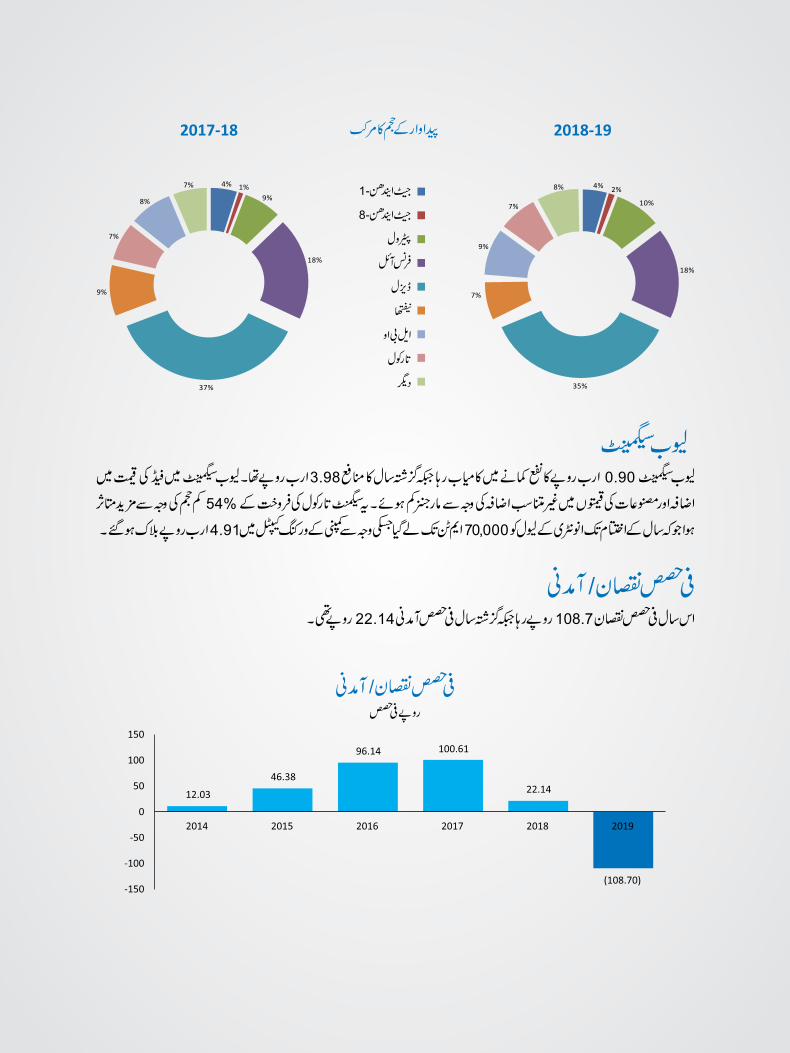
Annual Report 2019
National Refinery Limited 129
2017-18 2018-194% 1%
9%
18%
37%
9%
7%
8%
7%5% 1%7%
19%
37%
10%
8%
7%
6%
JP-1
JP-8
MOGAS
Furnace oil
HSD
Naphtha
L.B.O
Bitumen
Others
4% 2%
10%
18%
35%
7%
9%
7%
8%4% 1%9%
18%
37%
9%
7%
8%
7%
JP-1
JP-8
MOGAS
Furnace oil
HSD
Naphtha
L.B.O
Bitumen
Others
4% 2%
10%
18%
35%
7%
9%
7%
8%4% 1%9%
18%
37%
9%
7%
8%
7%
JP-1
JP-8
MOGAS
Furnace oil
HSD
Naphtha
L.B.O
Bitumen
Others
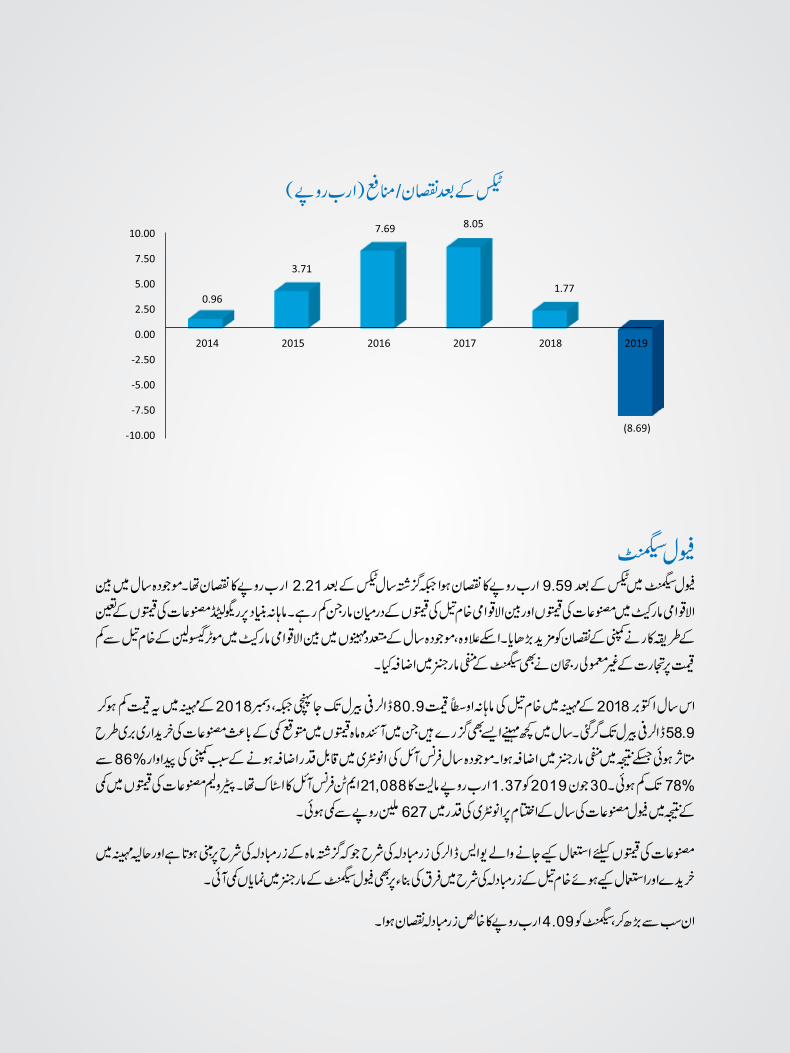
Annual Report 2019
130 National Refinery Limited
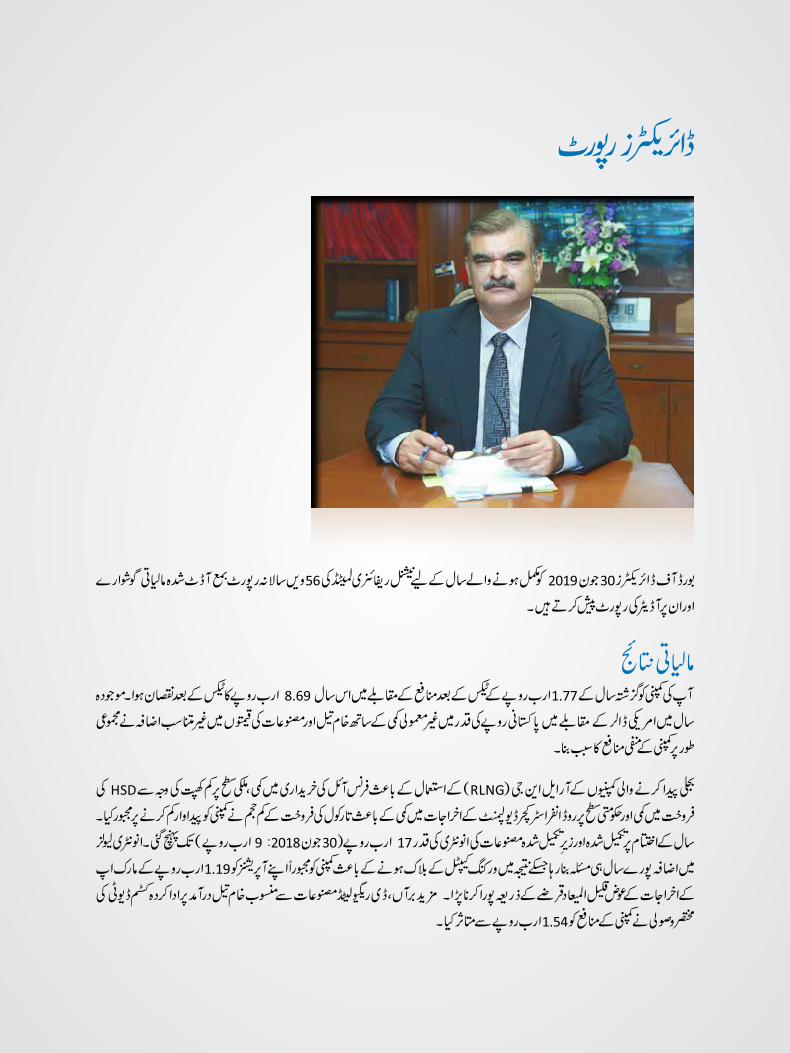
Annual Report 2019
National Refinery Limited 131
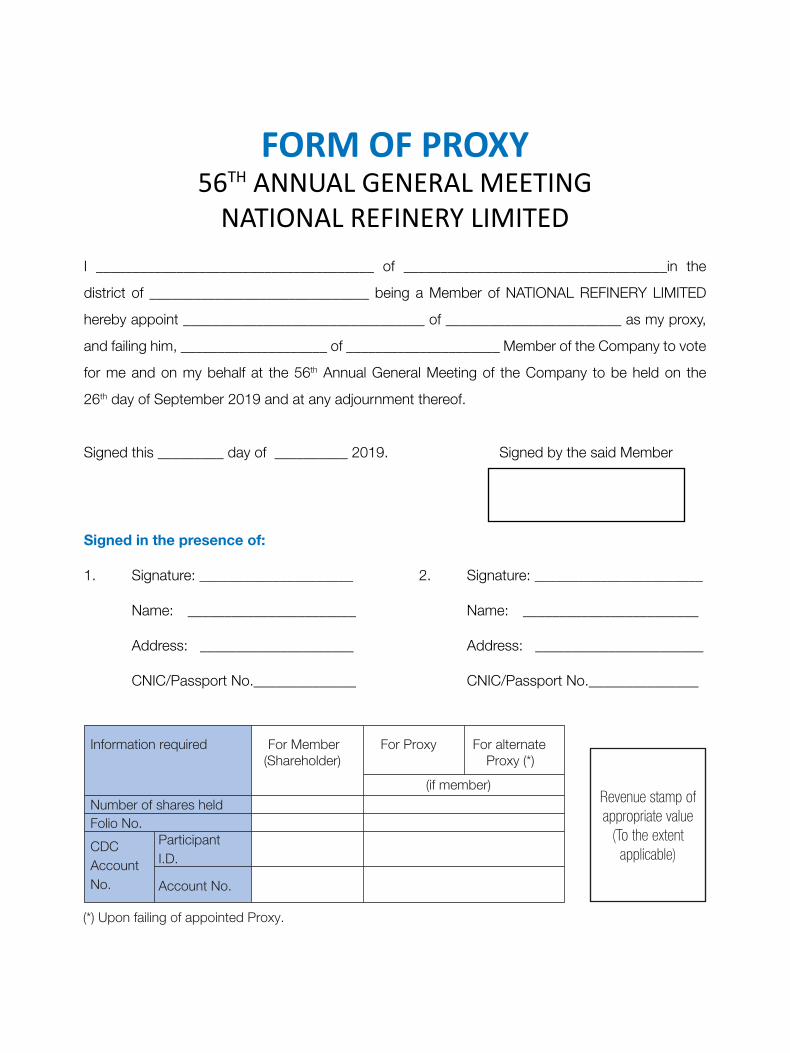
Annual Report 2019
National Refinery Limited 133
FORM OF PROXY56THANNUALGENERALMEETINGNATIONALREFINERYLIMITED
I ______________________________________ of ____________________________________in the
district of ______________________________ being a Member of NATIONAL REFINERY LIMITED
hereby appoint _________________________________ of ________________________ as my proxy,
and failing him, ____________________ of _____________________ Member of the Company to vote
for me and on my behalf at the 56th Annual General Meeting of the Company to be held on the
26th day of September 2019 and at any adjournment thereof.
Signed this _________ day of __________ 2019. Signed by the said Member
Signed in the presence of:
1. Signature: _____________________ 2. Signature: _______________________ Name: _______________________ Name: ________________________
Address: _____________________ Address: _______________________ CNIC/Passport No.______________ CNIC/Passport No._______________
Revenue stamp of appropriate value
(To the extent applicable)
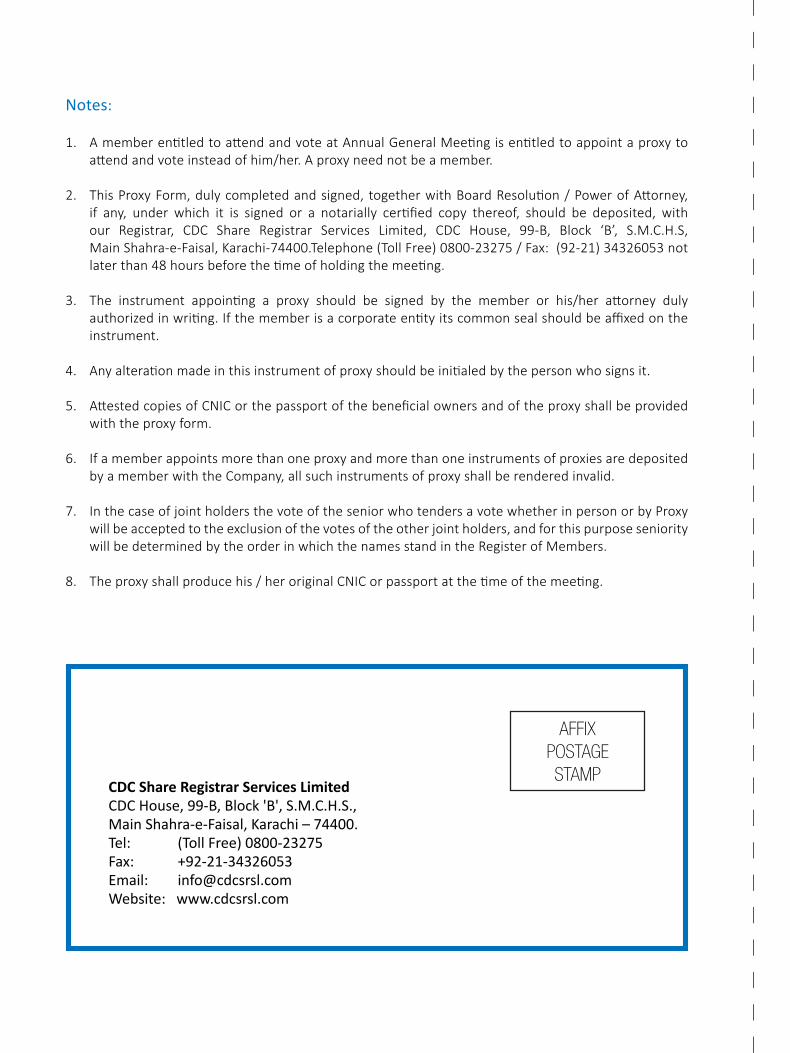
Annual Report 2019
134 National Refinery Limited
Notes:
1. A member entitled to attend and vote at Annual General Meeting is entitled to appoint a proxy to attend and vote instead of him/her. A proxy need not be a member.
2. This Proxy Form, duly completed and signed, together with Board Resolution / Power of Attorney, if any, under which it is signed or a notarially certified copy thereof, should be deposited, with our Registrar, CDC Share Registrar Services Limited, CDC House, 99-B, Block ‘B’, S.M.C.H.S,
Main Shahra-e-Faisal, Karachi-74400.Telephone (Toll Free) 0800-23275 / Fax: (92-21) 34326053 not later than 48 hours before the time of holding the meeting.
3. The instrument appointing a proxy should be signed by the member or his/her attorney duly authorized in writing. If the member is a corporate entity its common seal should be affixed on the instrument.
4. Any alteration made in this instrument of proxy should be initialed by the person who signs it.
5. Attested copies of CNIC or the passport of the beneficial owners and of the proxy shall be provided with the proxy form.
6. If a member appoints more than one proxy and more than one instruments of proxies are deposited by a member with the Company, all such instruments of proxy shall be rendered invalid.
7. In the case of joint holders the vote of the senior who tenders a vote whether in person or by Proxy will be accepted to the exclusion of the votes of the other joint holders, and for this purpose seniority will be determined by the order in which the names stand in the Register of Members.
8. The proxy shall produce his / her original CNIC or passport at the time of the meeting.
AFFIXPOSTAGE STAMP
CDC Share Registrar Services Limited CDCHouse,99-B,Block'B',S.M.C.H.S.,MainShahra-e-Faisal,Karachi–74400.Tel: (TollFree)0800-23275Fax: +92-21-34326053Email: [email protected]:www.cdcsrsl.com

Annual Report 2019
National Refinery Limited 135
0800-23275(92-21) 34326053
AFFIXPOSTAGE STAMP
CDC Share Registrar Services Limited CDCHouse,99-B,Block'B',S.M.C.H.S.,MainShahra-e-Faisal,Karachi–74400.Tel: (TollFree)0800-23275Fax: +92-21-34326053Email: [email protected]:www.cdcsrsl.com
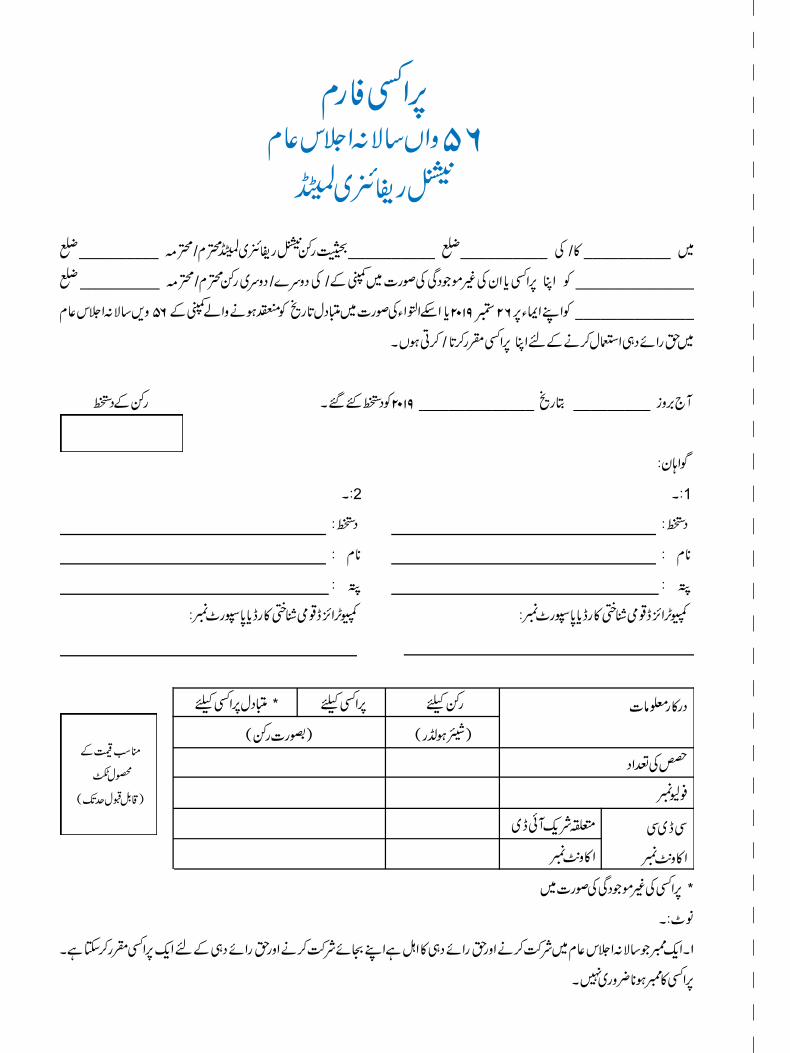
Annual Report 2019
136 National Refinery Limited
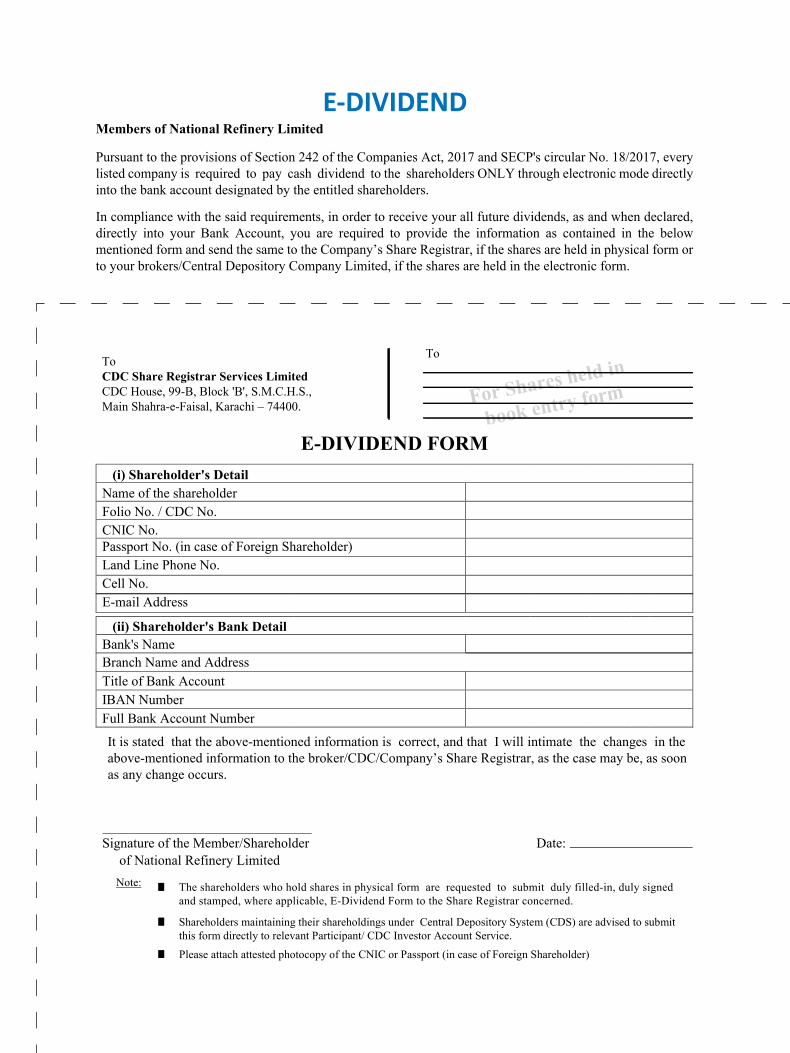
Annual Report 2019
National Refinery Limited 137
For Shares held in
book entry form
Members of National Refinery Limited
Pursuant to the provisions of Section 242 of the Companies Act, 2017 and SECP's circular No. 18/2017, every listed company is required to pay cash dividend to the shareholders ONLY through electronic mode directly into the bank account designated by the entitled shareholders.
In compliance with the said requirements, in order to receive your all future dividends, as and when declared, directly into your Bank Account, you are required to provide the information as contained in the below mentioned form and send the same to the Company’s Share Registrar, if the shares are held in physical form or to your brokers/Central Depository Company Limited, if the shares are held in the electronic form.
ToCDC Share Registrar Services Limited CDC House, 99-B, Block 'B', S.M.C.H.S., Main Shahra-e-Faisal, Karachi – 74400.
To
(i) Shareholder's Detail Name of the shareholder Folio No. / CDC No. CNIC No. Passport No. (in case of Foreign Shareholder) Land Line Phone No. Cell No.
E-mail Address
(ii) Shareholder's Bank Detail
Title of Bank Account
IBAN Number Full Bank Account Number
Bank's Name
Branch Name and Address
Signature of the Member/Shareholder
of National Refinery Limited Date:
Note: The shareholders who hold shares in physical form are requested to submit duly filled-in, duly signed and stamped, where applicable, E-Dividend Form to the Share Registrar concerned.
� Shareholders maintaining their shareholdings under Central Depository System (CDS) are advised to submit this form directly to relevant Participant/ CDC Investor Account Service.
� Please attach attested photocopy of the CNIC or Passport (in case of Foreign Shareholder)
E-DIVIDEND FORM
It is stated that the above-mentioned information is correct, and that I will intimate the changes in the above-mentioned information to the broker/CDC/Company’s Share Registrar, as the case may be, as soon as any change occurs.
E-DIVIDEND
Annual Report 2019
138 National Refinery Limited
AFFIXPOSTAGE STAMP
CDC Share Registrar Services Limited CDCHouse,99-B,Block'B',S.M.C.H.S.,MainShahra-e-Faisal,Karachi–74400.Tel: (TollFree)0800-23275Fax: +92-21-34326053Email: [email protected]:www.cdcsrsl.com


7-B, Korangi Industrial Area, Karachi-74900. UAN: 111-675-675 Website: www.nrlpak.com E-mail: [email protected]


