Embed Size (px)
Citation preview
Fifty-Third Annual Report of
the Registrar General 1974
Presented pursuant to Section 56 of the Marriages (Ireland) Act, 1844 Section 16 of the Registration of Marriages (Ireland) Act, 1863 Section 1(3) of the Births and Deaths Registration Acts (Northern Ireland) 1967 and 1973.
BELFAST HER MAJESTY'S STATIONERY OFFICE
1976

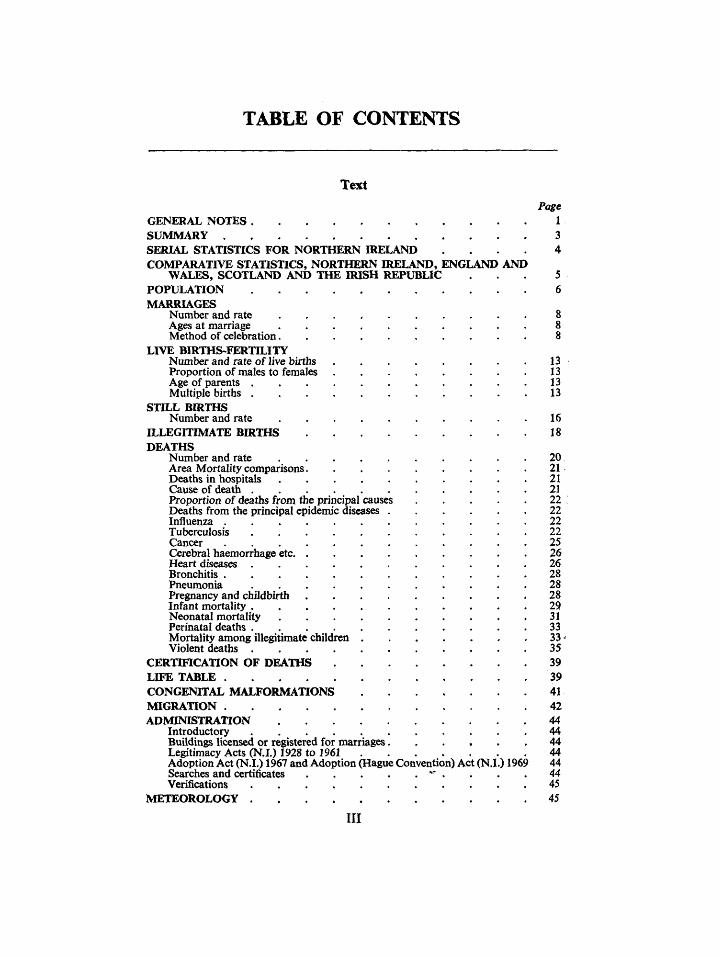
TABLE OF CONTENTS
Text Page
GENERAL NOTES 1 SUMMARY 3 SERIAL STATISTICS FOR NORTHERN IRELAND . . . . 4 COMPARATIVE STATISTICS, NORTHERN IRELAND, ENGLAND AND
WALES, SCOTLAND AND THE IRISH REPUBLIC . . . 5 POPULATION 6 MARRIAGES
Number and rate . . . , 8 Ages at marriage 8 Method of celebration 8
LIVE BIRTHS-FERTILITY Number and rate of live births 13 Proportion of males to females 13 Age of parents 13 Multiple births 13
STILL BIRTHS Number and rate 16
ILLEGITIMATE BIRTHS 18 DEATHS
Number and rate 20 Area Mortality comparisons 21 Deaths in hospitals 21 Cause of death 21 Proportion of deaths from the principal causes 22 Deaths from the principal epidemic diseases 22 Influenza 22 Tuberculosis 22 Cancer 25 Cerebral haemorrhage etc 26 Heart diseases 26 Bronchitis 28 Pneumonia 28 Pregnancy and childbirth 28 Infant mortality 29 Neonatal mortality 31 Perinatal deaths 33 Mortality among illegitimate children 33 Violent deaths 35
CERTIFICATION OF DEATHS 39 LIFE TABLE 39 CONGENITAL MALFORMATIONS 41 MIGRATION 42 ADMINISTRATION 44
Introductory 44 Buildings licensed or registered for marriages 44 Legitimacy Acts (N.L) 1928 to 1961 44 Adoption Act (N.L) 1967 and Adoption {Hague Convention) Act {N.I.) 1969 44 Searches and certificates ^ . . . . 4 4 Verifications 45
METEOROLOGY 45 III

Abbreviations: —^N.I.
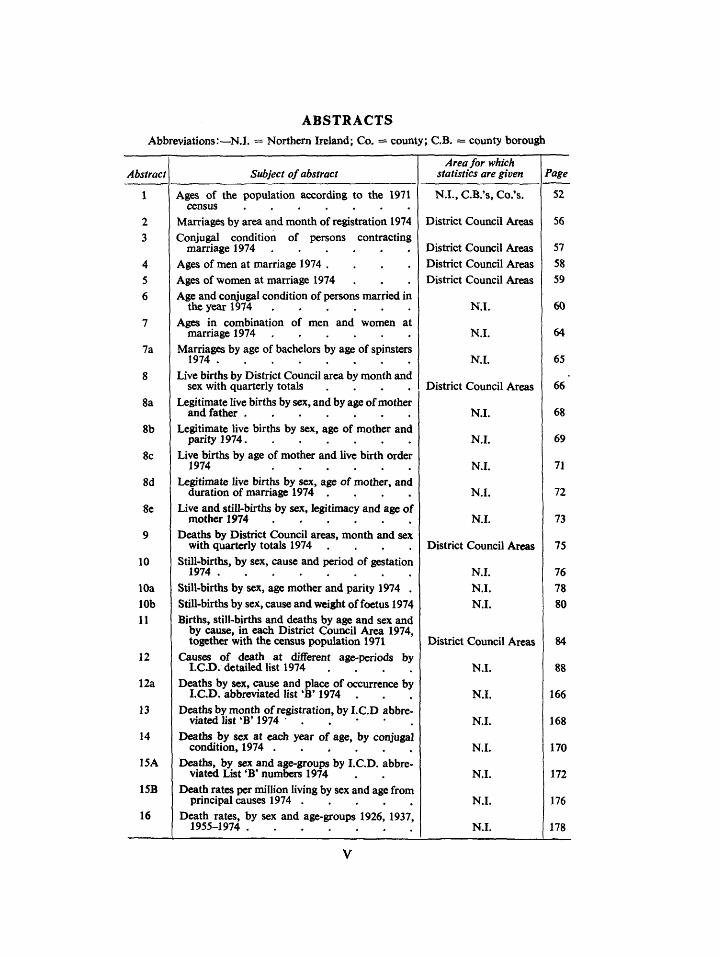
ABSTRACTS Northern Ireland; Co. = county; C.B. = county borough
Abstract
2
3
4 5 6
7
7a
8
8a
8b
8c
8d
8e
9
10
10a 10b 11
12
12a
13
14
15A
15B
16
Subject of abstract
Ages of the population according to the 1971 census
Marriages by area and month of registration 1974 Conjugal condition of persons contracting
marriage 1974 Ages of men at marriage 1974 . . . . Ages of women at marriage 1974 Age and coryugal condition of persons married in
the year 1974 Ages in combination of men and women at
marriage 1974 Marriages by age of bachelors by age of spinsters
1974 Live births by District Council area by month and
sex with quarterly totals . . . . Legitimate live births by sex, and by age of mother
and father Legitimate live births by sex, age of mother and
parity 1974 Live births by age of mother and live birth order
1974 Legitimate live births by sex, age of mother, and
duration of marriage 1974 . . . . Live and still-births by sex, legitimacy and age of
mother 1974 Deaths by District Council areas, month and sex
with quarterly totals 1974 . . . . Still-births, by sex, cause and period of gestation
1974 Still-births by sex, age mother and parity 1974 . Still-births by sex, cause and weight of foetus 1974 Births, still-births and deaths by age and sex and
by cause, in each District Council Area 1974, together with the census population 1971
Causes of death at different age-periods by LCD. detailed list 1974 . . . .
Deaths by sex, cause and place of occurrence by LCD. abbreviated list 'B' 1974 .
Deaths by month ofregistration, byl .CD abbreviated list 'B' 1974 . . • • .
Deaths by sex at each year of age, by conjugal condition, 1974
Deaths, by sex and age-groups by LCD. abbreviated List 'B' numbers 1974
Death rates per million living by sex and age from principal causes 1974
Death rates, by sex and age-groups 1926, 1937, 1955-1974
Area for which statistics are given
N.I., CB.'s, Co.'s.
District Council Areas
District Council Areas District Council Areas District Council Areas
N.I.
N.I.
N.L
District Council Areas
N.I.
N.I.
N.L
N.I.
N.I.
District Council Areas
N.L N.I. N.I.
District Council Areas
N.I.
N.I.
N.L
N.I.
N.I.
N.L
N.I.
Page
52
56
57 58 59
60
64
65
66
68
69
71
72
73
75
76 78 80
84
88
166
168
170
172
176
178
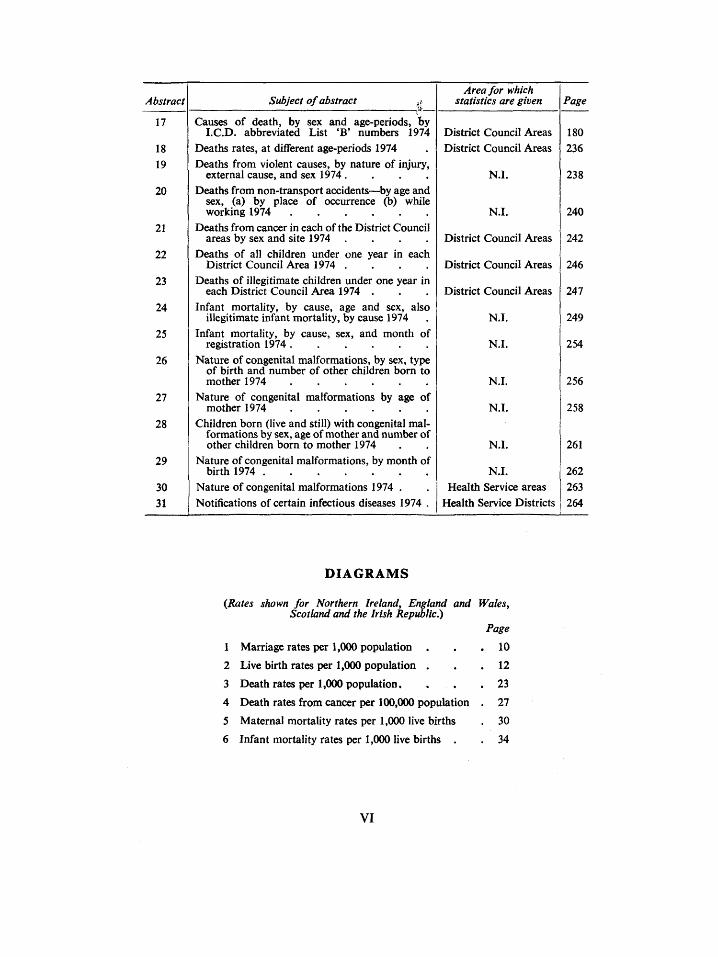
Abstract
17
18 19
20
21
22
23
24
25
26
27
28
29
30 31
Subject of abstract ^i
Causes of death, by sex and age-periods, by LCD. abbreviated List 'B' numbers 1974
Deaths rates, at different age-periods 1974 Deaths from violent causes, by nature of injury,
external cause, and sex 1974 . . . . Deaths from non-transport accidents—^by age and
sex, (a) by place of occurrence (b) while working 1974
Deaths from cancer in each of the District Council areas by sex and site 1974 . . . .
Deaths of all children under one year in each District Council Area 1974 . . . .
Deaths of illegitimate children under one year in each District Council Area 1974 .
Infant mortality, by cause, age and sex, also illegitimate infant mortality, by cause 1974
Infant mortality, by cause, sex, and month of registration 1974
Nature of congenital malformations, by sex, type of birth and number of other children bom to mother 1974
Nature of congenital malformations by age of mother 1974
Children born (live and still) with congenital malformations by sex, age of mother and number of other children born to mother 1974
Nature of congenital malformations, by month of birth 1974 .
Nature of congenital malformations 1974 . Notifications of certain infectious diseases 1974 .
Area for which statistics are given
District Council Areas District Council Areas
N.I.
N.I.
District Council Areas
District Council Areas
District Council Areas
N.I.
N.I.
N.L
N.L
N.L
N.I. Health Service areas
Health Service Districts
Page
180 236
238
240
242
246
247
249
254
256
258
261
262 263 264
DIAGRAMS
(Rates shown for Northern Ireland, England and Wales, Scotland and the Irish Republic.)
1 Marriage rates per 1,000 population .
2 Live birth rates per 1,000 population .
3 Death rates per 1,000 population.
4 Death rates from cancer per 100,000 population
5 Maternal mortality rates per 1,000 live births
6 Infant mortality rates per 1,000 live births .
10
12
23
27
30
34
VI
GENERAL NOTES
The figures contained in this Report may be regarded as superseding the provisional figures already published for the year 1974 in the Registrar General's quarterly returns.
Throughout the Report, births and deaths have been recorded according to date of registration and not to date of occurrence. They have also been allocated to the district of normal residence, if in Northern Ireland; births have been assigned to the districts containing the normal residence of parents, and deaths to the districts containing the normal residence of the deceased persons. Events occurring in Northern Ireland relating to persons whose normal residence is outside Northern Ireland have been assigned to the district of occurrence.
Rates are assessed per 1,000 of the estimated home population as at 30 June unless otherwise stated. The home population comprises the population of all types in Northern Ireland including Her Majesty's forces. Marriage rates relate to the number of marriages solemnised, and not to the number of persons married.
Comparisons with rates (births, deaths etc.) recorded in other parts of the British Isles are included in several tables and diagrams. These comparisons are substantially correct but it should be remembered that (with the exception of Diagram 3) they are crude rates only and take no account of changes in, or differences between, the age and sex structure of the populations.
Generally speaking, the classifications adopted for the purposes of this Report are the detailed and Abbreviated Lists contained in the "Manual of the International Statistical Classification of Diseases, Injuries and Causes of Death, 1965."
The term cancer, where used, refers to all maUgnant neoplasms and neoplasms of the lymphatic and haematopoietic tissues, except Hodgkin's disease, leukaemia and aleukaemia (I.C.D. Nos 201, 204-207).
Where more than one cause of death is reported, the death is classified according to the underlying cause, i.e. the disease or injury which initiated the train of morbid events leading directly to death. Tins method of classification is followed even if the deceased may have recovered from the underlying cause long before the date of death.
In the text and tables the term "stillbirth" refers to a child born after the 28th week of pregnancy and which did not breathe or show any other sign of life. Perinatal deaths are deaths of infants under one week and also includes still-births; "neonatal mortality" relates to deaths of children under 4 weeks of age and infant "mortality" to deaths of all children (including neonatal) under 1 year of age.
In general in the tables and abstracts, dots (.) are used to indicate "none'' and dashes (—) are used to indicate that information cannot be given or that the headings are not applicable.
The following tables and abstracts have been introduced in this years report:—
Tables: D Marriages, mean ages at marriage, men and women by previous marital status.
El Legitimate live births by age of mother. E2 Multiple births by age of mother, sex and type. Fl Live and still births by place of occurrence and district council
area. F3 Illegitimate live births by age of mother.
Abstracts: 7a Marriage by age of bachelors by age of spinsters. 8a Legitimate live births by sex and by age of mother and
father. 8b(i) Legitimate live births by sex, age of mother, and parity.
(ii) Legitimate live births by sex, age of mother and previous live bom children.
8c Legitimate live births by age of mother and live birth order.
8d Legitimate live births by sex, age of mother and duration of marriage.
8e Live and still-births by sex, legitimacy and age of mother. 10a Still-births by sex, age of mother and parity. 10b Still-births by sex, cause and weight of foetus. 12a Deaths by sex, cause and place of occurrence.
Tables formerly showing the old rural and urban districts now show the 26 new district council areas.
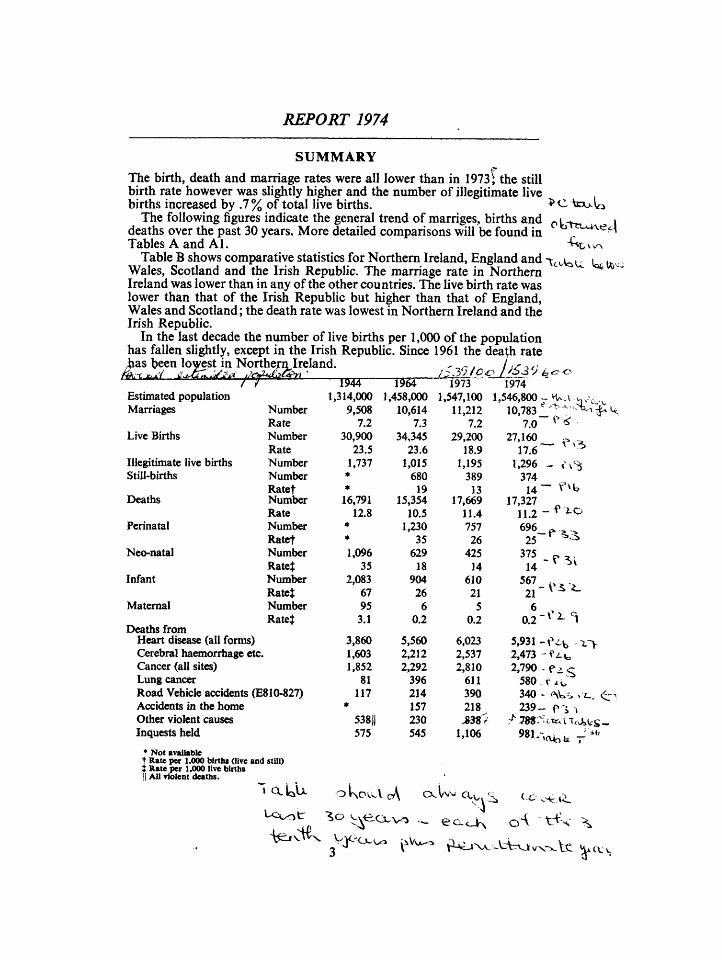
REPORT 1974
SUMMARY The birth, death and marriage rates were all lower than in 1973! the still birth rate however was sUghtly higher and the number of illegitimate live births increased by .7% of total live births. ^Cicx^U
The following figures indicate the general trend of marriges, births and (y\.-^ \ deaths over the past 30 years. More detailed comparisons will be found in , -^-^^A Tables A and Al. -^> vv>
Table B shows comparative statistics for Northern Ireland, England and "Xc u: U te^ Wales, Scotland and the Irish Republic. The marriage rate in Northern ^ Ireland was lower than in any of the other countries. The live birth rate was lower than that of the Irish Repubhc but higher than that of England, Wales and Scotland; the death rate was lowest in Northern Ireland and the Irish Republic.
In the last decade the number of live births per 1,000 of the population has fallen slightly, except in the Irish Republic. Since 1961 the death rate Ms been lowest in Northejn Ireland. . ^,., /,/- ^ c
Estimated population 1,314,000 1,458,000 1,547,100 1,546,800 - vudw,,, ,^ Marriages Number 9,508 10,614 11,212 10,7831'^ '"^^f^^
Rate 7.2 7.3 7.2 7.0 ^ "^ Live Births Number 30,900 34,345 29,200 27,160
Rate 23.5 23.6 18.9 17.6 ^ ' ^ Illegitimate live births Number 1,737 1,015 1,195 1,296 - t^'% Still-births Number * 680 389 374
Ratet * 19 13 14 "^ ^^^ Deaths Number 16,791 15,354 17,669 17,327
Rate 12.8 10.5 11.4 1 1 . 2 " ^ ^ ^ Perinatal Number * 1,230 757 6 9 6 _ p - . ^
Ratet * 35 26 25 ^ ' ^ Neo-natal Number 1,096 629 425 375 „ , ,
RateJ 35 18 14 14 ' ^ ^^ Infant Number 2,083 904 610 567 ,, .
RateJ 67 26 21 21 ^ ^ ^ Maternal Number 95 6 5 6 ,
Ratet 3.1 0.2 0.2 0.2" ' *! Deaths from
Heart disease (all forms) 3,860 5,560 6,023 5,931-\V^j . ^ > Cerebral haemorrhage etc. 1,603 2,212 2,537 2,473 i^i-t Cancer (all sites) 1,852 2,292 2,810 2,790 - f i <-Lung cancer 81 396 611 580 < Tt Road Vehicle accidents (E810-827) 117 214 390 340 - <W{> . z.. <^n Accidents in the home * 157 218 239— f ^ Other violent causes 538|| 230 .838^' ;^788--;cte.tTcasW§« Inquests held 575 545 1,106 98L t o b u —
* Not available t Rate per 1.000 births (live and still) % Rate per 1,000 live births I All violent deaths.
^
^ ^ _ ^ V'-VUXv.vJtrvjfvx-^l:^: Y CCw
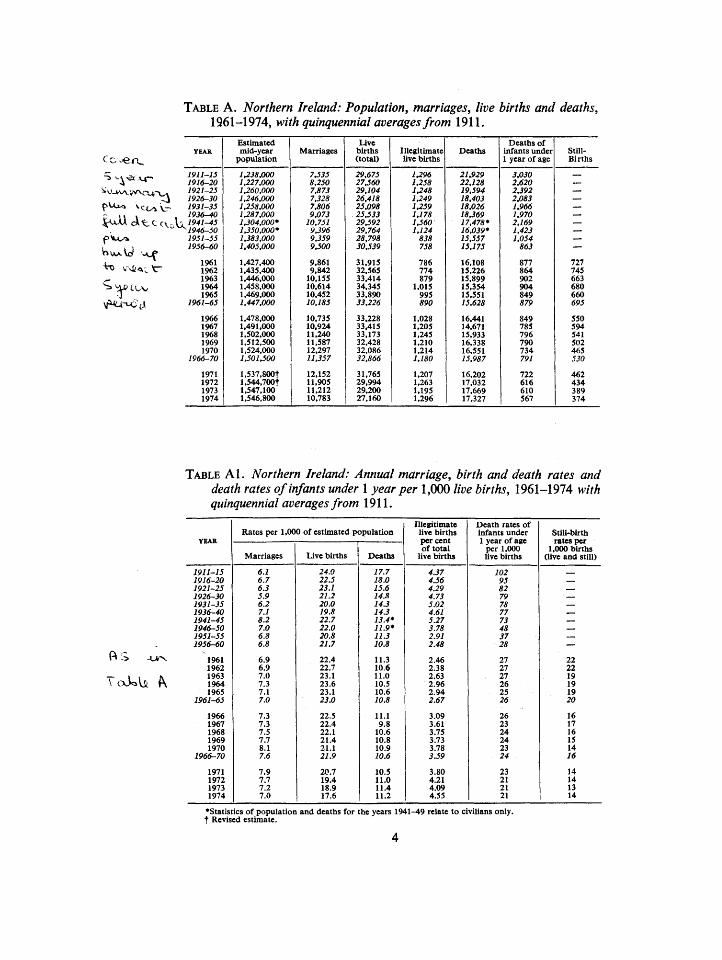
TABLE A. Northern Ireland: Population, marriages, live births and deaths, 1961-1974, with quinquennial averages from 1911.
•^ >-A ^ V C '
YEAR
1911-15 1916-20 1921-25 1926-30 1931-35
. 1936-40 U 1941-45 ^1946-50
1951-55 1956-60
1961 1962 1963 1964 1965
1961-65
1966 1967 1968 1969 1970
1966-70
1971 1972 1973 1974
Estimated mid-year
population
IMSjOOO 1,227,000 1,260,000 1,246,000 1,258,000 1,287.000 1,304.000* 1J50.000* 1.383,000 1,405.000
1.427,400 1,435,400 1.446,000 1,458,000 1,469.000 1.447,000
1,478.000 1.491,000 1.502.000 1.512,500 1,524.000 1.501,500
l,537,800t l,544.700t 1,547.100 1.546,800
Marriages
7.535 8,250 7,873 7,328 7,806 9,073
10,751 9,396 9,359 9.500
9.861 9,842
10.155 10,614 10,452 10,185
10,735 10.924 11.240 11,587 12.297 11,357
12,152 11.905 11,212 10,783
Live births (total)
29,675 27J60 29,104 26.418 25.098 25.533 29.592 29.764 28,798 30.539
31,915 32,565 33,414 34,345 33,890 33,226
33,228 33,415 33,173 32.428 32.086 32,866
31.765 29,994 29,200 27,160
Illegitimate live births
1,296 1,258 1.248 1.249 1.259 1.178 1,560 1,124
838 758
786 774 879
1,015 995 890
1.028 1.205 1,245 1,210 1.214 1,180
1.207 1,263 1,195 1,296
Deaths
21,929 22,128 19.594 18.403 18.026 18,369 17,478* 16,039* 15,557 15,175
16,108 15.226 15.899 15,354 15,551 15.628
16,441 14,671 15,933 16,338 16,551 15,987
16.202 17.032 17.669 17.327
Deaths of infants under 1 year of age
3,030 2,620 2,392 2,083 1,966 1.970 2,169 1,423 1.054
863
877 864 902 904 849 879
849 785 796 790 734 791
722 616 610 567
Still-Births
— — — — — — — — — 727 745 663 680 660 695
550 594 541 502 465 530
462 434 389 374
TABLE Al, Northern Ireland: Annual marriage, birth and death rates and death rates of infants under 1 year per 1,000 live births, 1961-1974 with quinquennial averages from 1911.
1911-15 1916-20 1921-25 1926-30 1931-35 1936-40 1941-45 1946-50 1951-55 1956-60
1961 1962 1963 1964 1965
1961-65
1966 1967 1968 1969 1970
1966-70
1971 1972 1973 1974
Rates per 1,000 of estimated population
Marriages
6.1 6.7 6.3 5.9 6.2 7.1 8.2 7.0 6.8 6.8
6.9 6.9 7.0 7.3 7.1 7.0
7.3 7.3 7.5 7.7 8.1 7.6
7.9 7.7 7.2 7.0
Live births
24.0 22.5 23.1 21.2 20.0 19.8 22.7 22.0 20.8 21.7
22.4 22.7 23.1 23.6 23.1 23.0
22.5 22.4 22.1 21.4 21.1 21.9
20.7 19.4 18.9 17.6
Deaths
17.7 18.0 15.6 14.8 14.3 14.3 13.4* 11.9* 11.3 10.8
11.3 10.6 11.0 10.5 10.6 10.8
11.1 9.8
10.6 10.8 10.9 10.6
10.5 11.0 11.4 11.2
Illegitimate live births percent of total
live births
4.37 4.56 4.29 4.73 5.02 4.61 5.27 3.78 2.91 2.48
2.46 2.38 2.63 2.96 2.94 2.67
3.09 3.61 3.75 3.73 3.78 3.59
3.80 4.21 4.09 4.55
Death rates of infants under 1 year of age
per 1,000 live births
102 95 82 79 78 77 73 48 37 28
27 27 27 26 25 26
26 23 24 24 23 24
23 21 21 21
Still-birth rates per
1,000 births (live and still)
— — 22 22 19 19 19 20
16 17 16 15 14 16
14 14 13 14
•Statistics of population and deaths for the years 1941-49 relate to civilians only. t Revised estimate.
TABLE B. Comparative statistics for Northern Ireland, England and Wales, Scotland, and the Irish Republic, 1926, 1937, 1951, 1961, 1966, 1970-1974.
MARRLVGE RATES PER 1,000 OF POPULATION
Years
1926 1937 1951 1961 1966 1970 1971 1972 1973 1974
Northern Ireland
5.8 6.7 6.9 6.9 7.3 8.1 7.9 7.7 7.2 7.0
England and Wales
7.2 8.8 8.2 7.5 8.0 8.5 8.3 8.6 8.1 7.8"
Scotland
6.4 7.7 8.1 7.8 8.1 8.3 8.1 8.1 8.1 7.9
Irish Republic
4.6 5.0 5.4 5.4 5.8 7.1 7.3 7.3 7.5 7.3*
Years
1926 1937 1951 1961 1966 1970 1971 1972 1973 1974
LIVE BIRTH
Northern Ireland
22.5 19.8 20.7 22.4 22.5 21.1 20.7 19.4 18.9 17.6
RATES PER 1,000 OF POPULATION
England and Wales
17.8 14.9 15.4 17.6 17.7 16.0 16.0 14.8 13.7 13.0*
Scotland
21.1 17.6 17.7 19.5 18.6 16.8 16.6 15.1 14.3 13.4
Irish Republic
20.6 19.2 21.2 21.2 21.6 21.0 22.8 22.4 22.5 22.3*
DEATH RATES PER 1,000 OF POPULATION
Years
1926 1937 1951 1961 1966 1970 1971 1972 1973 1974
Northern Ireland
15.0 15.1 12.8 11.3 11.1 10.9 10.5 11.0 11.4 11.2
England and Wales
11.6 12.4 12.5 12 0 11.7 11.7 11.6 12.1 11.9 11.9*
Scotland
13.1 13.9 12.9 12.3 12.3 12.2 11.8 12.5 12.4 12.4
Irish Republic
14.1 15.3 14.3 12.3 12.1 11.6 10.6 11.2 11.2 11.2*
D ex tec H:
t x
Years
1926 1937 1951 1961 1966 1970 1971 1972 1973 1974
PERINATAL, NEONATAL, AND INFANT MORTALITY RATES
Northern Ireland
tPcri-natal
— — 38 31 28 27 26 26 25
§Neo-natal
34 36 25 19 17 16 16 14 14 14
SInfant
85 77 41 27 26 23 23 21 21 21
England and Wales
tPeri-natal
60 38 32 26 23 22 22 21 15»
§Nco-natal
32 30 19 15 13 12 12 12 11 11*
llnfant
70 58 30 21 19 18 18 17 17 16*
tPeri-natal
— 44 36 29 25 24 24 22 23
Scotland
§Neo-natal
36 38 22 18 15 13 14 12 13 13
§Infant
83 80 37 26 23 20 20 19 19 19
Irish Republic
§Neonatal
27 30 25 21 16 13 12 12 13 11*
§Infant
74 73 46 31 25 20 18 18 18 17*
•Provisional. tPer 1.000 births (live and still) §Per 1,000 live births.
5
CWtcOwisecA "V^v.'N * ^ ^^
o o
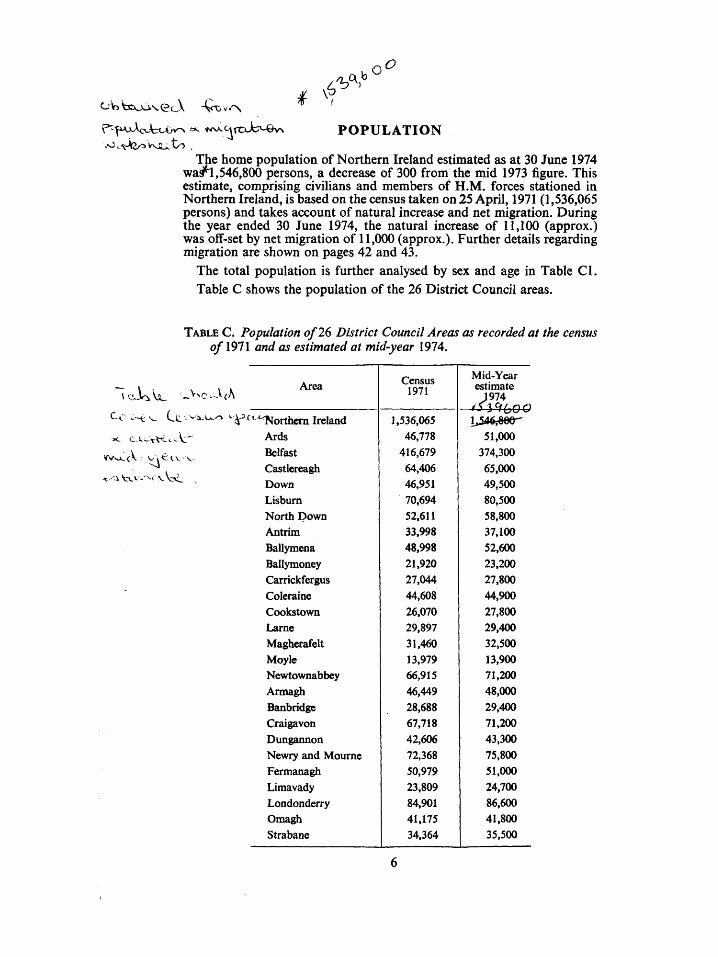
POPULATION
The home population of Northern Ireland estimated as at 30 June 1974 wa^,546,800 persons, a decrease of 300 from the mid 1973 figure. This estimate, comprising civilians and members of H.M. forces stationed in Northern Ireland, is based on the census taken on 25 April, 1971 (1,536,065 persons) and takes account of natural increase and net migration. During the year ended 30 June 1974, the natural increase of 11,100 (approx.) was off-set by net migration of 11,000 (approx.). Further details regarding migration are shown on pages 42 and 43,
The total population is further analysed by sex and age in Table CI. Table C shows the population of the 26 District Council areas.
TABLE C. Population of 26 District Council Areas as recorded at the census of 1911 and as estimated at mid-year 1974.
* ' iv.W W - ' o vA ch
Cc ... - t -^ Q' V
Area
f* "Northern Ireland Ards Belfast Castlereagh Down Lisburn North Down Antrim Ballymena Ballymoney Carrickfergus Coleraine Cookstown Larne Magherafelt Moyle Newtownabbey Armagh Banbridge Craigavon Dungannon Newry and Mourne Fermanagh Limavady Londonderry Omagh Strabane
Census 1971
1,536,065 46,778
416,679 64,406 46,951 70,694 52,611 33,998 48,998 21,920 27,044 44,608 26.070 29,897 31,460 13,979 66,915 46,449 28,688 67,718 42,606 72,368 50,979 23,809 84,901 41.175 34.364
Mid-Year estimate
1974
51,000 374,300 65,000 49,500 80,500 58,800 37,100 52,600 23,200 27,800 44,900 27,800 29,400 32,500 13,900 71,200 48,000 29,400 71,200 43,300 75,800 51,000 24,700 86,600 41,800 35,500
TABLE CI. Northern Ireland: Sex and age distribution of home population as estimated at 30 June, 1974 and percentage of total population in each age-group.
Age-group Persons % Mal« % Females % ^tLoA>
Years To t>yJ<t cVot; v \ 0-14 451,800 29.2 233,300 30.4 218,500 28.0 *
15-64 925,500 59.8 464,700 60.7 460,800 59.0 v: -VV^L .v, 65+ 169.500 11.0 680,000 8.9 101,500 13.0 ^^^^^,(71 0-4 144,700 9.3 74,800 9.7 69,900 8.9 5-9 155,600 10.1 80,400 10.5 75,200 9.6
10-14 151,500 9.8 78,100 • 10.2 73,400 9.4 15-19 133,900 8.7 69,400 9.1 64,500 8.3 20-24 113,600 7.3 60,300 7.9 53,300 6.8 25-29 105,800 6.8 55,100 7.2 50,700 6.5 30-34 93,500 6.0 47,800 6.2 45,700 5.8 35-39 84,600 5.5 42,600 5.6 42,000 5.4 40-44 81,800 5.3 40,000 5.2 41,800 5.4 45-49 82,300 5.3 39,800 5.2 42,500 5.4 50-54 84,400 5.5 40,900 5.3 43,500 5.6 55-59 72,600 4.7 35,100 4.6 37,500 4.8 60-64 73,100 4.7 33,700 4.4 39,400 5.0 65-69 62,100 4.0 27,100 3.5 35,000 4.5 70-74 48,700 3.2 19,900 2.6 28,800 3.7 75-79 32,100 2.1 12,100 1.6 20,000 2.6 80-84 16,800 1.1 5,900 0.8 10,900 1.4 85+ ^ 9.700 .6 2,900 0.4 6,800 0.9
)S3 fe,c'0 iicXw^c n-fiiLOc Totals JJi^fr^fXXT 100.0 J^S^bfT 100.0 780,900 100.0
The 1971 Census pc^mtedoii by age and sex for Northern Ireland and for District Council Areas is gtren in Abstract 1.
\ ' " > ^ ' •
493 523 720
1,736
April May June 2nd
. 1,095
. 612
. 1,153
. 2,860
July . August September 3rd .
. 1,234
. 1,527
. 1,446
. 4,207
October November December 4th .
. 787
. 597
. 596
. 1,980
MARRIAGES Number and rate Marriages registered during the year numbered 10,783 giving a rate of 6.97 per 1,000 population. The corresponding number and rate for 1973 were 11,212 and 7.25 respectively. IM0,087 (93.5 per cent.) of the total marriages both contracting P4Jti|S were single; iri^27 (3.0 per cent.) one or both were widowed and in 4j*x^9 per cent.) one or both were
rN.lv. divorced-^ Of every 1,000 persons mamed, 22 were previously divorced. ^ ^ This rate is 2 above that for 1973; comparative rates for the years 1964 and
' 1954 were 7 and 6 respectively. Further details are given in Abstracts 3 and The number of mamages celebrated in each month m 1974 was a?
i^ January LC-VVV CVA*1J(C. February
March LcxJ^^la\evev^trs.:lst
This shows that the period July to September was the most popular quarter for weddings, August heading the monthly totals with 1,527. January was the least popular month.
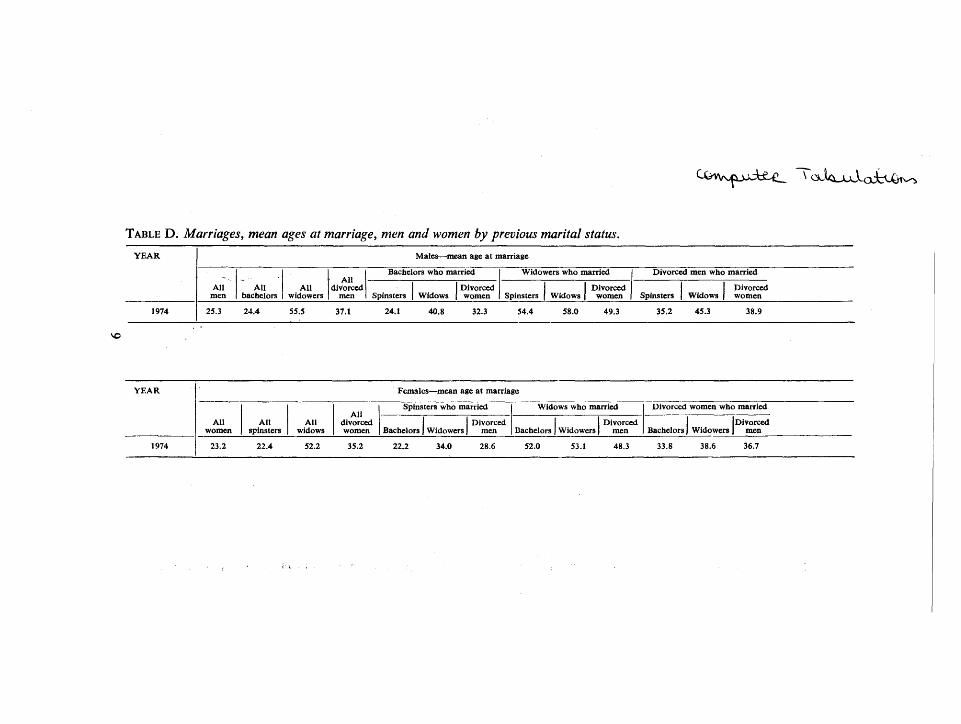
Ages at marriage Although the most popular age for marriage was 22 years for men and 21 years for women, the arithmetical average age of men marrying in 1974 was 25.3 and of women 23.2. During 1973 this age was 25.6 among men and 23.3 among women. In 1964 the average age was 27.3 for men and 24.6 for women. The mean age at marriage of persons marrying for the first time in 1974 was 24.4 years for men and 22.4 years for women. Of the contracting parties 1.1 per cent, of the husbands and 7.2 per cent, of the wives were minors (the age of majority was lowered from 21 to 18 from 1 January 1970) the relative figures for 1964 being 11.8 per cent, and 29.9 per cent. Further statistics will be found in Table D and Abstracts 4, 5, 6, 7 and 7a.
Method of celebration Table Dl shows the marriages registered during the years 1927,1937,1951,1961,1966 and 1970 to 1974 according to the form of celebration and Table D2 gives further details of marriages in 1974.
Marriages taking place in registrars' ofl&ces in the year under review represented 7.4 per cent, of the total marriages which is the same as that for the previous year.
01 .23 (4l'X
>.
8
1L.S q dO <^o ' P^^ ]oec f ^>^^
^^^^'^^V.^Ly^Jct^i^ ^ (^WJJXOJ^J^X^
TABLE D . Marriages, mean ages at marriage, men and women by previous marital status.
YEAR
1974
All men
25.3
All bachelors
24.4
All widowers
55.5
• All divorced
men !
37.1
Males—mean age at marriage
Bachelors who married
Spinsters Widows Divorced women
Widowers who married
Spinsters Widows Divorced
women |
24.1 40.8 32.3 54.4 58.0 49.3
Divorced men who married
Spinsters Widows Divorced women
35.2 45.3 38.9
VO
YEAR
1974
All women
23.2
All spinsters
22.4
All widows
52.2
All divorced women
35.2
Females—^mean age at marriage
Spinsters who married
Bachelors Widowers Divorced
men
Widows who married
Bachelors Widowers Divorced
men
22.2 34.0 28.6 52.0 53.1 48.3
Divorced women who married
Bachelors Widowers Divorced
men
33.8 38.6 36.7
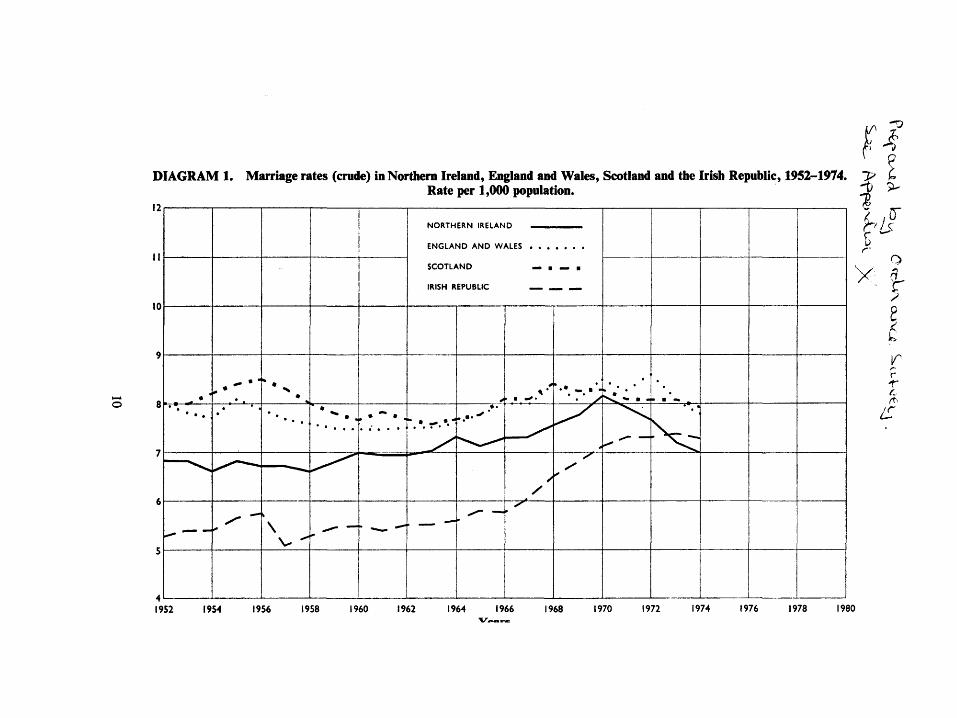
DIAGRAM 1. Marriage rates (crude) in Northern Ireland, England and Wales, Scotland and the Irish Republic, 1952-1974. Rate per 1,000 population.
12
10
QT^-^
9
•
• •
^
. . ' •
^ ^ ^
* • •
\
*• •
^
. • ' * • .
• - - ^
ENGLAND AND W
SCOTLAND ^ • . a
IRISH REPUBLIC
* • —. •• '
• "
*
. -^ X
• ' . - . • * •
< ^ • "
/ y^
^
• • - •
••,.
L r D
0" ^
. y o
r
r r f.
ir
1952 1954 1956 1958 I960 1962 1964 1966 1968 1970 1972 1974 1976 1978 1980
' Cc-'-t^f^ Ct jxou^ M ^ a ^ ^ ^r rvvolt
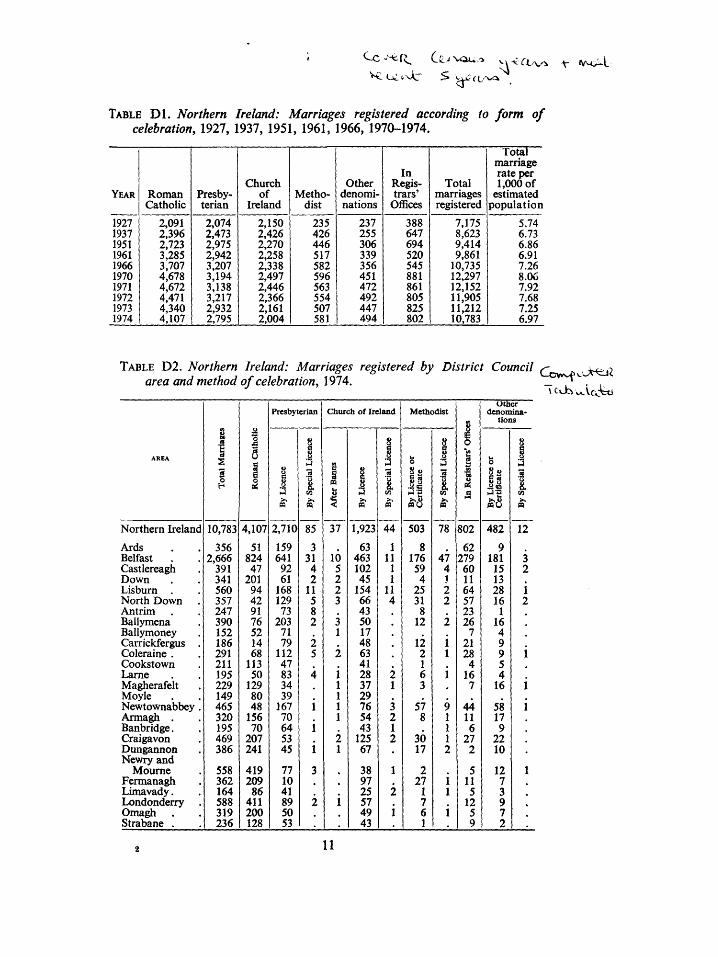
TABLE D 1 . Northern Ireland: Marriages registered according to form of celebration, 1927, 1937, 1951, 1961, 1966, 197Q-1974.
YEAR
1927 1937 1951 1961 1966 1970 1971 1972 1973 1974
Roman Catholic
2,091 2,396 2,723 3,285 3,707 4,678 4,672 4,471 4,340 4,107
Presbyterian
2,074 2,473 2,975 2,942 3,207 3,194 3,138 3,217 2,932 2,795
Church of
Ireland 2,150 2,426 2,270 2,258 2,338 2,497 2,446 2,366 2,161 2,004
Methodist
235 426 446 517 582 596 563 554 507 581
Other denominations
237 255 306 339 356 451 472 492 447 494
In Registrars'
Offices
388 647 694 520 545 881 861 805 825 802
Total marriages registered
7,175 8,623 9,414 9,861
10,735 12,297 12,152 11,905 11,212 10,783
Total marriage rate per 1,000 of
estimated population
5.74 6.73 6.86 6.91 7.26 8.06 7.92 7.68 7.25 6.97
TABLE D 2 . Northern Ireland: Marriages registered by District Council (^^^ -J^r^l area and method of celebration, 1974. -cwv^ •^^
AREA
Northern Ireland
Ards Belfast . Castlereagh Down Lisburn . North Down Antrim Ballymena Baliymoney Carrickfergus . Coleraine . Cookstown Larne Magherafelt Moyle Newtownabbey . Armagh . Banbridge. Craigavon Dungannon Newry and
Moume Fermanagh Limavady. Londonderry Omagh Strabane .
3 M
1
10,783
356 2,666
391 341 560 357 247 390 152 186 291 211 195 229 149 465 320 195 469 386
558 362 164 588 319 236
.2
1 U Ci
B o
4,107
51 824 47
201 94 42 91 76 52 14 68
113 50
129 80 48
156 70
207 241
419 209 86
411 200 128
Presbyterian
V
o ilj
>. n
2,710
159 641 92 61
168 129 73
203 71 79
112 47 83 34 39
167 70 64 53 45
77 10 41 89 50 53
8
3 "3
1 05
>> PQ
85
3 31 4 2
11 5 8 2
2 5
4
i i , 1
3 , 2
Church of Ireland
n b
37
. 10 5 2 2 3
3 1 . 2
i 1 1 1 1
2 1
, , , 1 ,
§
3 >> m
1,923
63 463 102 45
154 66 43 50 17 48 63 41 28 37 29 76 54 43
125 67
38 97 25 57 49 43
8
"3
v>
>-. m
44
1 11 1 1
11 4 ,
. ^ 2 1
3 2 1 2
1 , 2
i
Methodist
u o
'-'5 ^6
503
8 176 59 4
25 31 8
12
12 2 1 6 3 .
57 8
30 17
2 27
1 7 6 1
8
'i2 "a
I m
>> 09
78
47 4 1
2 2
2 , 1 1
i , . 9 1 1 1 2
i 1 , 1
o
2 'a
5
802
62 279 60 11 64 57 23 26
7 21 28 4
16 7 ,
44 11 6
27 2
5 11 5
12 5 9
Other denomina
tions
u O
8 « £3 3 8iJ -•c >,o PQU
482
9 181 15 13 28 16 1
16 4 9 9 5 4
16
58 17 9
22 10
12 7 3 9 7 2
8
1 1 w
>> m
12"
3 2 ^ 1 2
i
i i
1
11
K>
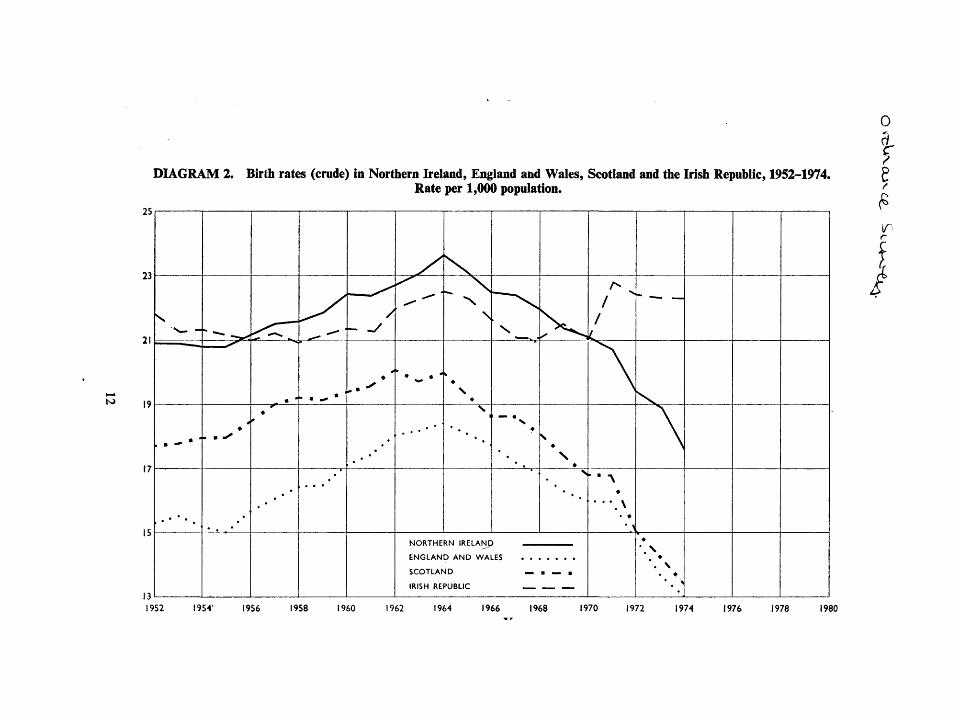
DIAGRAM 2. Birth rates (crude) in Northern Ireland, England and Wales, Scotland and the Irish Republic, 1952-1974. Rate per 1,000 population.
25
23
21
19
17
15
_ • *
4
. . .
J . • ' • . ^ •
. . .•
*
.-^
. . •
. . . • •
S
s 1
— •
• •
>
M'~'PTHEPM IRELAMp
ENGLAND AND WA
SCOTLAND ^ • a— •
IRISH REPUBLIC
/
• . ..^
-
'.y •
. \
•, <
0
IT r
/
1952 1954' 1956 1958 I960 1962 1964 1966 1968 1970 1972 1974 1976 1978 1980
January February March Qtrs.: 1st
. 2,732
. 2,137
. 2,278
. 7,147
April . May . June . 2nd .
. 2,351
. 2,338
. 2,248
. 6,937
July. . , August September 3rd . .
. 2,514
. 1,832
. 2,277
. 6,623
October November December 4th . .
FERTILITY
LIVE BIRTHS
Number and rate Live births registered during 1974 numbered 27,160, 2,040 fewer than in 1973. The birth rate was 17.6 per 1,000 of the estimated population, being 1.3 below the rate for 1973.
The monthly incidence of births was as follows: C ^c 2,403 ' \^(^<^^^
6',453^^^ . ,
Compared with 1973, each of the four quarters showed decreases of 426,'i':^\->^-^3 530, 558 and 526 respectively. ^^ J
Births registered during 1974, where the normal residence of the parents Uivvvf a>€-a was outside Northern Ireland, numbered 100 as compared with 128 in -[^\^ VccUei 1973. In 63 cases an address in the Irish Republic was given, and of these, 62 births occurred in hospitals: the 1973 figures were 70 and 69 respectively.'
Proportion of males to females Births of males in Northern Ireland in " 1974 numbered 13,987 and those of females 13,173, the proportion of male *' to female births being 1,062 *to 1,000.1 The corresponding proportions for each of the five years 1969-73 were 1,049, 1,064, 1,081, 1,078 and 1,079 respectively. Age of Parents Table El classifies legitimate live births according to the age of the mother. The maternal ag^-group which contributed the greatest i| number of live births was the group gcd 25-29.
Abstract 8a shows the legitimate live births by sex and by age of mother and father. Abstract 8b(l) shows legitimate live births by sex, age of mother and parity.
8b(ii) Legitimate live births by sex, age of mother and previous live born children.
Abstract 8c shows live births by age of mother and live birth order and Abstract 8d legitimate live births by sex, age of mother and duration of marriage. Place of Occurrence Of all live births 99.1 per cent, occurred in hospitals. ' Multiple births Up to and including 1960, the birth of one live and one still-born infant was regarded as a single birth and the birth of two live infants and one still-born infant as a twin birth. Since 1961 still-births have been registered and these are now being taken into account to obtain *' accurate figures for single and multiple births. Of the 27,160 live births, 26,586 were the product of single, 567 of twin and 7 of triple pregnancy. There were no quadruple pregnancies. Table E2 gives the multiplicity of all births.
—-— ^ lObM^
13
TABLE E. Northern Ireland: Live births, numbers and rates by District Council area, 1974.
Q do
^ l ^ ^ - O i t
r^^/^tAAfUlv^
Area
Northern Ireland Ards Belfast Castlereagh Down Lisburn North Down Antrim Ballymena Ballymoney Carrickfergus Coleraine Cookstown Lame Magherafelt Moyle Newtownabbey Armagh Banbridge Craigavon Dungannon Newry & Mourne Fermanagh Limavady Londonderry Omagh Strabane
Number
1974
27,160 1,015 5,323
672 987
1,532 901 817 988 369 470 751 502 438 579 251
1,370 873 355
1,413 940
1,515 955 540
2,020 812 772
Rate per 1,000 of the population
1974
17.6 19.9 14.2 10.3 19.9 19.0 15.3 22.0 18.8 15.9 16.9 16.7 18.1 14.9 17.8 18.1 19.2 18.2 12.1 19.8 21.7 20.0 18.7 21.9 23.3 19.4 21.7
14
TABLE E l . Northern Ireland: Legitimate, Live births by age of mother. G&v-- - p> vw- ::X- '^^-^QA^COITA • ~ vt:-..-ev \0 - i
-r^ Year
1974
Legitimate Live births by age of mother
All Ages
25,864
Numbers
<20
1,799
20-24
7,528
25-29
8,718
30-34
4,930
35-39
2,173
40-44
676
45 +
40
All Ages
100
Percentages
<20
7.0
20-24
29.1
25-29
33.7
30-34
19.1
35-39
8.4
40-44
2.6
45 +
0.1
TABLE E 2 . Multiple births {live and still), by age of mother, sex and type 1974. Ct>v
Twin Births
Triplet Births
Quadruplet Births
Live births
Male
2 1
1
3 2 1
1
Female
1 2
i
i 2 3 2 1
Single confinements Twin confinements Triplet confinements Quadruplet confinements All confinements All multiple confinements Percentage of mothers who ha multiple births
Still Births
1 1
i 2 2
d
Total
87 96 97
3 4 4
2
i
26,943 291
3
27,237 294
1.08
Legitimate
85 94 91
3 4 4
2
1
25,646 281
3
25,930 284
1.09
Illegitimate
2 2 6
1,297 10
1,307 10
0.76
<20
6 1 9
2,244 16
2,260 16
0.71
20-24
16 23 20
1 2 1
i
7,923 63
1
7,987 64
0.80
25-29
32 29 32 2 1 2
i
8,826 98
1
8,925 99
1.11
Age of mother
30-34
22 24 23
i
i
4,985 70
1
5,056 71
1.40
35-39 40^14
10 1 17 1 1 I 2
'.
2,216 709 39 4
2,255 713 39 4
1.7: 0.56
45-49 50+
i
40 1 .
4i 1
2.44
k
< <>H1T:
-\- M i . . .
STILL-BIRTHS
Number and rate The number of still-births registered in 1974 was 374 giving a rate of 14 per 1,000 births (live and still). Comparative 1974 figures in England and Wales and Scotland were 7,175 and 11 and 846 and
Co ."iN vw '\ 12 respectively. ^ Abstract 11 shows the number of still-births in administrative areas by
Ir^bt'vlatxorvssex. The number of still-bom children who would have been illegitimate had they been bora alive was 21 representing 5.6 per cent, of all still-births. Seventeen of the still-births were the product of multiple confinements further particulars of which will be found in Table E2 above. In 265 cases the births occurred after a period of less than 37 weeks gestation or the weight of the foetus was not more than 5 | lbs. Of the 374 still-births 312 were certified by doctors, 62 by mid-wives and none by coroners. Postmortem examinations were held in 49 cases. Abstract 10 shows still-births by cause, sex and period of gestation. The percentage of still-births which occurred in hospitals in 1974 was 99.5 compared with 97.4 per cent, in 1973.
TABLE F . Northern Ireland; Still-births and rates per 1,000 births (live and still) by District-council area 1974.
AREA
Northern Ireland Ards Belfast . Castlereagh Down Lisburn North Down . Antrim . Ballymena Ballymoney Carrickfergus Coleraine Cookstown Lame Magherafelt , Moyle . Newtownabbey Armagh . Banbridge Craigavon Dungannon Newry & Moume Fermanagh Limavady Londonderry . Omagh . Strabane.
Number of still-births
1974
374 25 95 28 n 15 2 2
14 19 5
5 18
3 4 6
20 7
15 15 5
39 13 8
Rate per 1,000 live and
still-births 1974
13.6 24.0 17.5 40.0 11.0 9.7 2.2 2.4
14.0 49.0 10.5
11.3 31.1
2.2 4.6
16.6 13.9 7.4 9.8
15.5 9.2
18.9 15.7 10.2
-Congenital malformations caused 114 still-births (i.e. 30.5 per cent, of the total). This group was also the main cause in 1973 when the corresponding figures were 95 and 24.4 respectively.
16
TABLE F 1 . Northern Ireland; Births (live and still) by place of occurrence and by District-council area 1974.
a-
AREA
Northern Ireland Ards Belfast . Castlereagh Down Lisburn . North Down Antrim Ballymena Ballymoney Carrickfergus . Coleraine Cookstown Lame Magherafelt Moyle Newtownabbey Armagh . Banbridge Craigavon Dungannon Newry & Moume Fermanagh Limavady Londonderry . Omagh Strabane .
All births (L&S)
27,534 1,040 5,418
700 998
1,547 903 819
1,003 393 469 756 497 443 599 253
1,369 877 361
1,433 947
1,530 970 545
2,059 825 780
At Home
254 2
28 3
21 7 9 2 1 2 1 4 6 2 3 1 7
i 1 19 12 7 2
44 67 2
Place of occurrence
NHS Hospital
27,210 1,037 5,387
693 952
1,539 891 817
1,002 390 467 752 491 441 596 252
1,361 877 359
1,432 928
1,518 962 543
1,988 757 778
NonNHS Hospital
70 1 3 4
25 1 3
i 1
i i , . 1
27 1
17
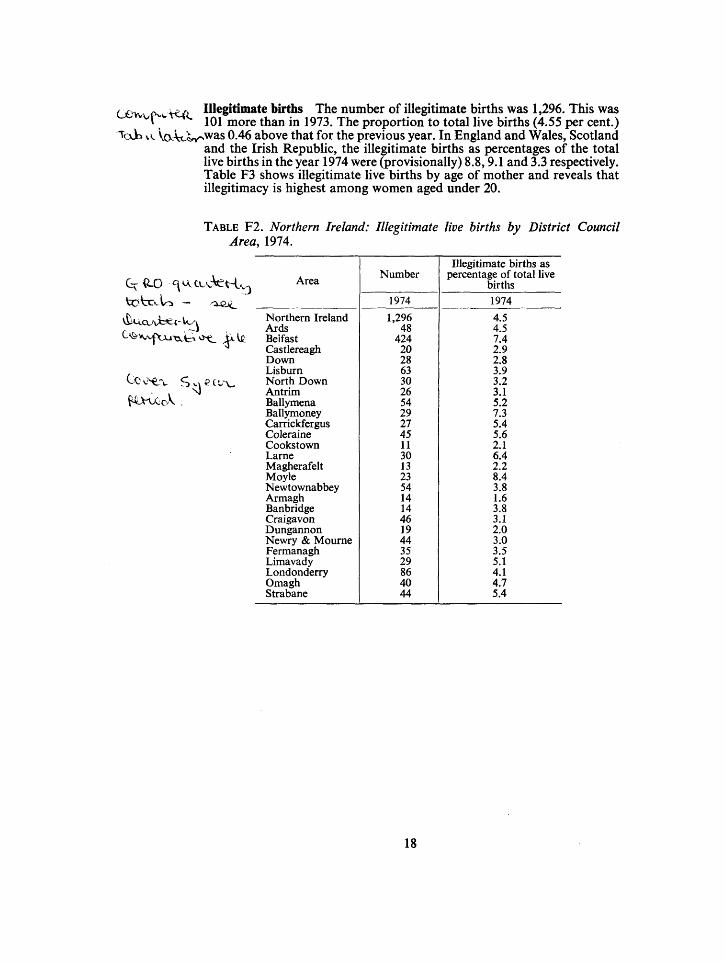
CO >w p-cK^L I**®8*timate births The number of illegitimate births was 1,296. This was * l ' ^ 101 more than in 1973. The proportion to total live births (4.55 per cent.)
TbJo vv V(x\xJW>was 0.46 above that for the previous year. In England and Wales, Scotland and the Irish Republic, the illegitimate births as percentages of the total Hve births in the year 1974 were (provisionally) 8.8,9.1 and 3.3 respectively. Table F3 shows illegitimate live births by age of mother and reveals that illegitimacy is highest among women aged under 20.
TABLE F2 . Northern Ireland: Illegitimate live births by District Council Area, 1974.
S>^.c^v
Area
Northern Ireland Ards Belfast Castlereagh Down Lisburn North Down Antrim Ballymena Ballymoney Carrickfergus Coleraine Cookstown Larne Magherafelt Moyle Newtownabbey Armagh Banbridge Craigavon Dungannon Newry & Moume Fermanagh Limavady Londonderry Omagh Strabane
Number
1974
1,296 48
424 20 28 63 30 26 54 29 27 45 11 30 13 23 54 14 14 46 19 44 35 29 86 40 44
Illegitimate births as percentage of total live
births 1974
4.5 4.5 7.4 2.9 2.8 3.9 3.2 3.1 5.2 7.3 5.4 5.6 2.1 6.4 2.2 8.4 3.8 1.6 3.8 3.1 2.0 3.0 3.5 5.1 4.1 4.7 5.4
18
TABLE F 3 . Northern Ireland: Illegitimate live births by age of mother. ^CA>€-V-^
vS Year
1974
All Ages
1,296
<20
453
20-24
439
Numbers
25-29
200
30-34
123
Illegitimate live births by age of mother
35-39
61
40-44
18
45 +
2
All Ages
100
<20
34.9
20-24
33.9
Percentages
25-29
15.4
30-34
9.5
35-39
4.7
40-44
1.4
45 +
0.2
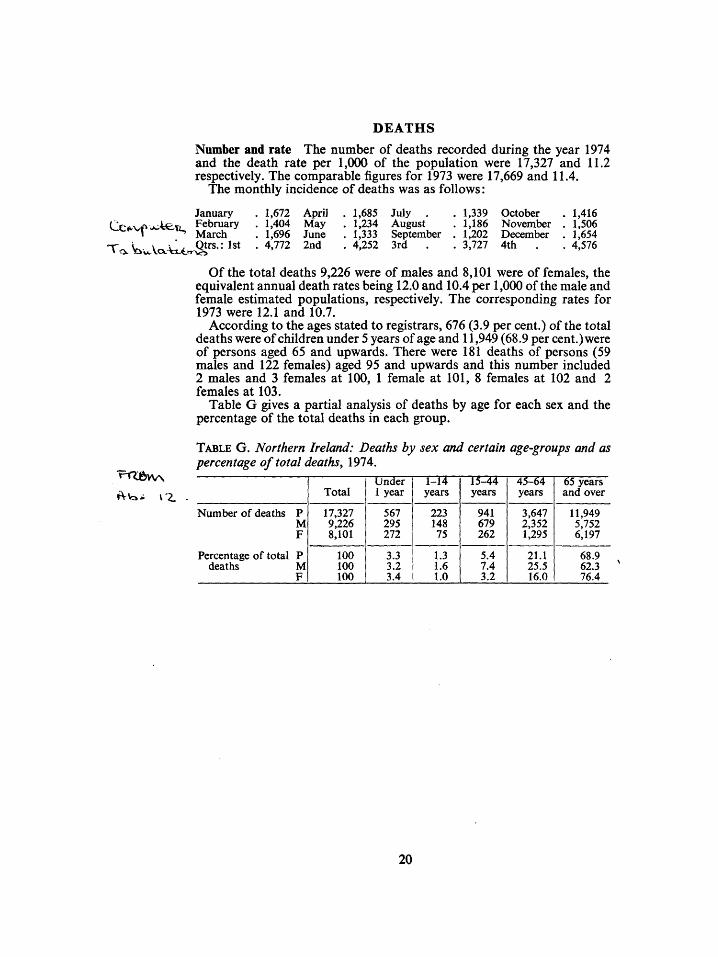
DEATHS Number and rate The number of deaths recorded during the year 1974 and the death rate per 1,000 of the population were 17,327 and 11.2 respectively. The comparable figures for 1973 were 17,669 and 11.4.
The monthly incidence of deaths was as follows:
January Cci^vf ^ t e . r ^ ^ ^ ^ ^
1,672 1,404 1,696 4,772
April May June 2nd
1,685 1,234 1,333 4,252
July . August September 3rd .
1,339 1,186 1,202 3,727
October November December 4th .
1,416 1,506 1,654 4,576
Of the total deaths 9,226 were of males and 8,101 were of females, the equivalent annual death rates being 12.0 and 10.4 per 1,000 of the male and female estimated populations, respectively. The corresponding rates for 1973 were 12.1 and 10.7.
According to the ages stated to registrars, 676 (3.9 per cent.) of the total deaths were of children under 5 years of age and 11,949 (68.9 per cent.) were of persons aged 65 and upwards. There were 181 deaths of persons (59 males and 122 females) aged 95 and upwards and this number included 2 males and 3 females at 100, 1 female at 101, 8 females at 102 and 2 females at 103.
Table G gives a partial analysis of deaths by age for each sex and the percentage of the total deaths in each group.
TABLE G. Northern Ireland: Deaths by sex and certain age-groups and as percentage of total deaths, 1974,
Number of deaths P M F
Percentage of total P deaths M
F
Total
17,327 9,226 8,101
100 100 100
Under 1 year
567 295 272
3.3 3.2 3.4
1-14 years
223 148 75 1.3 1.6 I.O
15-44 years
941 679 262
5.4 7.4 3.2
45-64 years
3,647 2,352 1,295
21.1 25.5 16.0
65 years and over
11,949 5,752 6,197
68.9 62.3 76.4
20
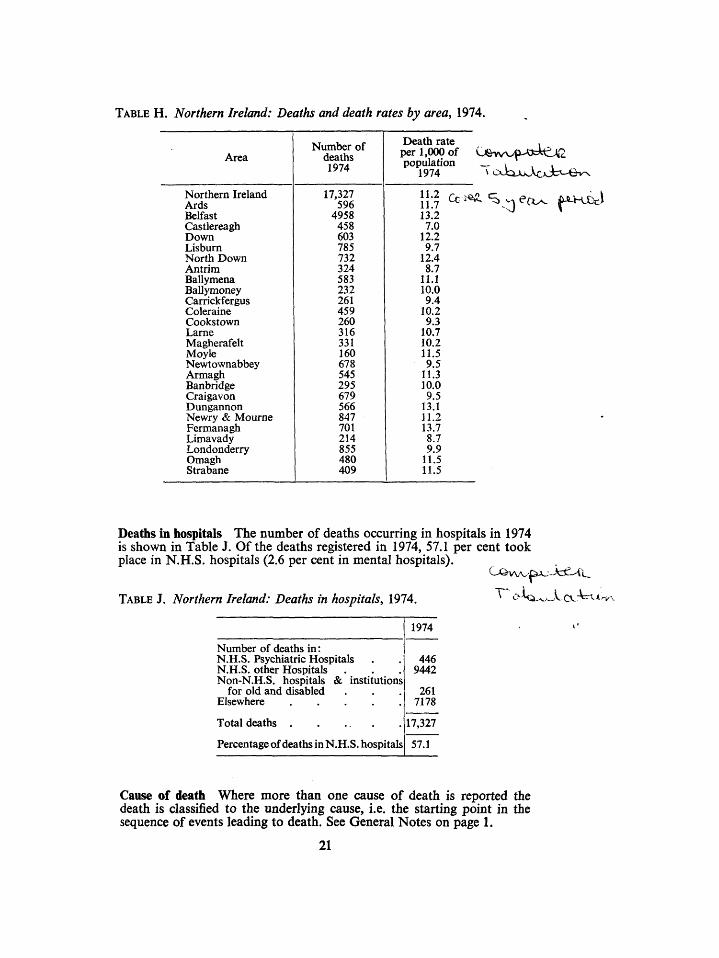
TABLE H . Northern Ireland: Deaths and death rates by area, 1974.
Area
Northern Ireland Ards Belfast Castlereagh Down Lisburn North Down Antrim Ballymena Ballymoney Carrickfergus Coleraine Cookstown Larne Magherafelt Moyle Newtownabbey Armagh Banbridge Craigavon Dungannon Newry & Mourne Fermanagh Limavady Londonderry Omagh Strabane
Number of deaths 1974
17,327 596
4958 458 603 785 732 324 583 232 261 459 260 316 331 160 678 545 295 679 566 847 701 214 855 480 409
Death rate per 1,000 of C population
1974
j | -j Cc^^ 13!2 7.0
12.2 9.7
12.4 8.7
11.1 10.0 9.4
10.2 9.3
10.7 10.2 11.5 9.5
11.3 10.0 9.5
13.1 11.2 13.7 8.7 9.9
11.5 11.5
"^ ^ O ^ M^KDci
Deaths in hospitals The number of deaths occurring in hospitals in 1974 is shown in Table J. Of the deaths registered in 1974, 57.1 per cent took place in N.H.S. hospitals (2.6 per cent in mental hospitals).
TABLE J. Northern Ireland: Deaths in hospitals, 1974. ^ C>KS^,^J^QX^^XX.VX
Number of deaths in: N.H.S. Psychiatric Hospitals N.H.S. other Hospitals . Non-N.H.S. hospitals & institutions
for old and disabled Elsewhere
Total deaths
Percentage of deaths in N.H.S. hospitals
1974
446 9442
261 7178
17,327
57.1
Cause of death Where more than one cause of death is reported the death is classified to the underlying cause, i.e. the starting point in the sequence of events leading to death. See General Notes on page 1.
21
Proportion of deaths from principal causes Heart diseases continued to bear by far the greatest proportion of the total deaths; other diseases having
A k - ^ ^^^^ proportion were cancer, cerebrovascular disease (mainly cerebral ^ ^ i Vf i- \ thrombosis and cerebral haemorrhage) and respiratory diseases.
vc5-x*^ ^^ ^ggg un(jgj. one year congenital malformations, premature birth, and o <c: i OkV L: pneumonia were the principal causes of death.
Between the ages of one and ten the highest proportions were caused by accidents, congenital malformations, cancer, Hodgkin's disease and leukaemia and pneumonia.
Between the ages of ten and twenty-four, accidents caused by far the largest proportion of deaths. The proportions from cancer, congenital malformations and Hodgkin's disease and leukaemia were also high.
Between the ages of twenty-five and forty-four the principal causes were cancer, heart diseases, accidents, suicide and cerebrovascular disease.
From age forty-five the pattern was heart diseases followed by cancer, cerebrovascular disease and respiratory diseases.
Table K shows, for each of the principal causes, the numbers of deaths and the death rates for each year since 1971.
Deaths from the principal epidemic diseases A total of 102 deaths (0.06 per *^iki»v^v^^''^"'^,000 population) fell within this group. Of these, 87 were caused by
,j J influenza, 14 by diarrhoeal diseases of children under 2 years of age,. ''•-*> '-Kx^'i •?! J ^y whooping cough and 1 acute polio-myelitis. No deaths resulted from ^v;ui^..w^,^. j g other diseases comprising this group, viz., diphtheria, smallpox, - ^ '"^ t ' typhus, typhoid fever, scarlet fever, paratyphoid fever, and measles.
^ ^ The number of deaths from the principal epidemic diseases in 1973 was ' Kfic vr., 161 and the relative rate was 0.10.
A. jjee. The notifications of certain infectious diseases for each administrative eci, t, :y^. .vdtx c ^^^^ ^^ Northern Ireland for the year 1974 are shown in Abstract 31, and
^^i^J5, tlie diseases named are those laid down by regulations (issued by the Av vi,iv>v o ' Department of Health and Social Services) as compulsorily notifiable l.v .ut(.cx^ p;^^throughout Northern Ireland.
^f^vC'c\ ^.^evcc..Influenza Ther^were 87 deaths from influenza in 1974 as against a total -uuvUt^.,tv.c-st,of 139 in 1973. The relative rates per 1,000 of the population were 0.06 5^a.U3y.v^,x (1974) and 0.09 (1973). W>-«s. c.,.i_
-.C710 c u j t"-\W r i _ Tuberculosis Deaths from this cause numbered 56 compared with 66 in 1973. The rate of 0.04 per 1,000 population is the same as that for 1973. Further details of comparable figures over the past years may be seen at a glance in Table L.
The tuberculosis death rates (provisional) for England and Wales, Scotland and the Irish Republic in 1974 were 0.03, 0.04 and 0.04 respectively. More detailed information about deaths from tuberculosis is given in Abstracts 12 and 17.
22
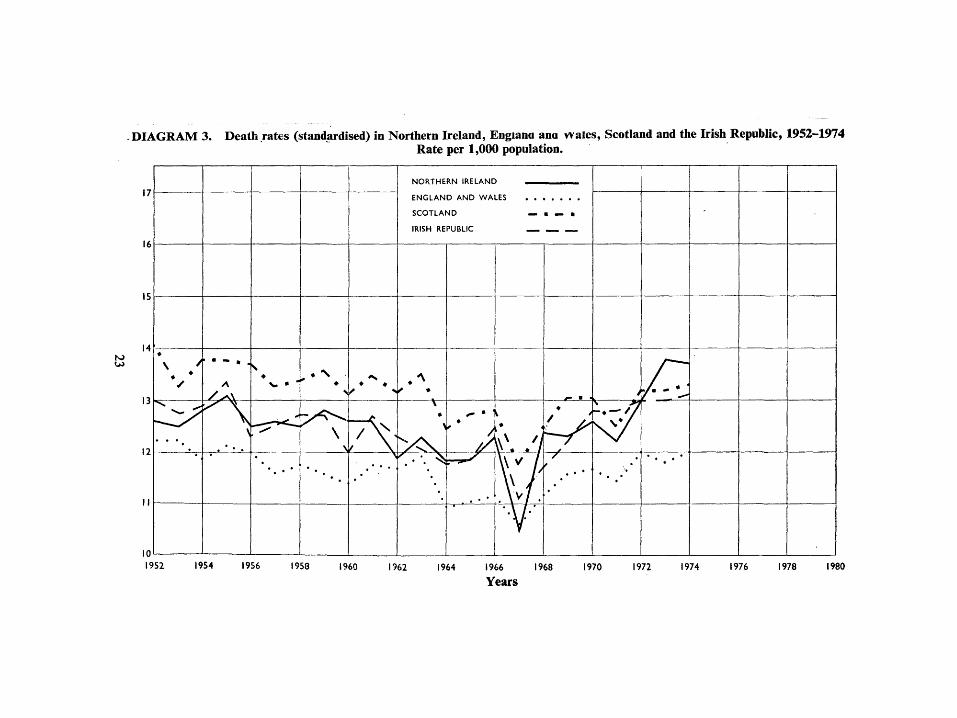
DIAGRAM 3. Death rates (standardised) in Northern Ireland, Engiana ana wales, Scotland and the Irish Republic, 1952-1974 Rate per 1,000 population.
17
16
15
14
13
12
•
" > ^
• - . .
A
\ >
' •. . •
\
• •
NORTHERN IRELANC
ENGLAND AND WA
SCOTLAND
IRISH REPUBLIC
\
>
. • '. ^
• *
\\ J • vl • ' \l'
r" • • ' / - V
/ '
'
iO
1952 1954 1956 1958 I960 1962 1964 1966 1968 1970
Years 1972 1974 1976 1978 1980
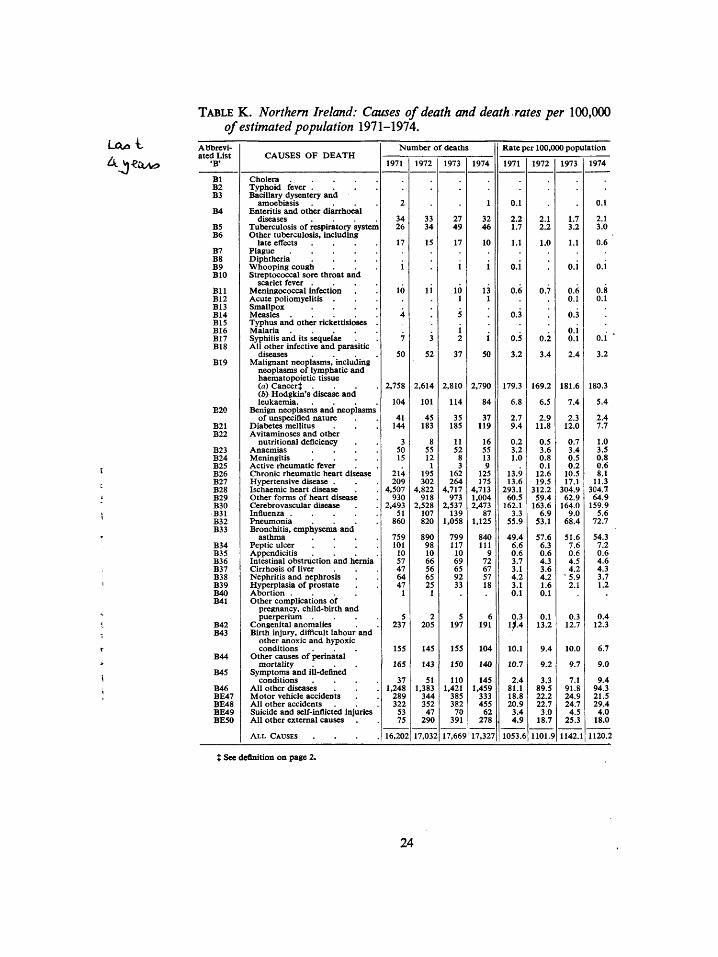
TABLE K. Northern Ireland: Causes of death and death rates per 100,000 of estimated population 1971-1974.
Abbreviated List
'B'
Bl B2 B3
B4
BS B6
B7 B8 B9 BIO
B l l B12 B13 B14 B15 B16 B17 B18
B19
B20
B21 B22
B23 B24 B25 B26 B27 B28 B29 B30 B31 B32 B33
B34 B35 B36 B37 B38 B39 B40 B41
B42 B43
B44
B45
B46 BE47 BE48 BE49 BE50
CAUSES OF DEATH
Cholera Typhoid fever . . . . Bacillary dysentery and
amoebiasis . . . . Enteritis and other diarrhoea!
diseases . . . . Tuberculosis of respiratory system Other tuberculosis, including
late effects . . . . Plague Diphtheria . . . . Whooping cough Streptococcal sore throat and
scarlet fever . . . . Meningococcal infection Acute poliomyelitis . Smallpox . . . . Measles Typhus and other rickettisioses . Malaria . . . . . Syphilis and its sequelae All other infective and parasitic
diseases . . . . Malignant neoplasms, including
neoplasms of lymphatic and haematopoietic tissue (rt) Cancer} . . . . (6) Hodgkin's disease and leukaemia. . . . .
Benign neoplasms and neoplasms of unspecified nature
Diabetes mellitus Avitaminoses and other
nutritional deficiency Anaemias . . . . Meningitis . . . . Active rheumatic fever Chronic rheumatic heart disease Hypertensive disease . Ischaemic heart disease Other forms of heart disease Cerebrovascular disease Influenza . . . . . Pneumonia . . . . Bronchitis, emphysema and
asthma . . . . Peptic ulcer . . . . Appendicitis . . . . Intestinal obstruction and hernia Cirrhosis of liver Nephritis and nephrosis Hyperplasia of prostate Abortion . . . . Other complications of
pregnancy, child-birth and puerperium . . . .
Congenital anomalies Birth injury, difficult labour and
other anoxic and hypoxic conditions
Other causes of perinatal mortality
Symptoms and ill-defined conditions . . . .
All other diseases Motor vehicle accidents All other accidents Suicide and self-inflicted injuries All other external causes
A L L CAUSES . . . .
Number of deaths
1971
2
34 26
17
i 10
4
7
50
2.758
104
41 144
3 50 15
214 209
4,507 930
2,493 51
860
759 101
10 57 47 64 47
1
5 237
155
165
37 1,248
289 322
53 75
16.202
1972
33 34
15
l i
3
52
2,614
101
45 183
8 55 12
1 195 302
4,822 918
2,528 107 820
890 98 10 66 56 65 25
1
2 205
145
143
51 1,383
344 352
47 290
17,032
1973
27 49
17
i 10
1
5
i 2
37
2,810
114
35 185
11 52
8 3
162 264
4.717 973
2.537 139
1.058
799 117
10 69 65 92 33
5 197
155
150
110 1.421
385 382
70 391
17,669
1974
1
32 46
10
i 13
1
i 50
2,790
84
37 119
16 55 13 9
125 175
4,713 1,004 2,473
87 1,125
840 111
9 72 67 57 18
6 191
104
140
145 1.459
333 455
62 278
17.327
Rate per 100.000 population
1971
0.1
2.2 1.7
1.1
o.i 0.6
0.3
0.5
3.2
179.3
6.8
2.7 9.4
0.2 3.2 1.0
13.9 13.6
293.1 60.5
162.1 3.3
55.9
49.4 6.6 0.6 3.7 3.1 4.2 3.1 0.1
0.3 1^4
10.1
10.7
2.4 81.1 18.8 20.9
3.4 4.9
1053.6
1972
2.1 2.2
1.0
0.7
0.2
3.4
169.2
6.5
2.9 11.8
0.5 3.6 0.8 0.1
12.6 19.5
312.2 59.4
163.6 6.9
53.1
57.6 6.3 0.6 4.3 3.6 4.2 1.6 0.1
0.1 13.2
9.4
9.2
3.3 89.5 22.2 22.7
3.0 18.7
1101.9
1973
1.7 3.2
1.1
O.i
0.6 0.1
0.3
O.i 0.1
2.4
181.6
7.4
2.3 12.0
0.7 3.4 0.5 0.2
10.5 17.1
304.9 62.9
164.0 9.0
68.4
51.6 7.6 0.6 4.5 4.2
'5 .9 2.1
0.3 12.7
10.0
9.7
7.1 91.8 24.9 24.7
4.5 25.3
1142.1
1974
0.1
2.1 3.0
0.6
O.i
0.8 0.1
O.i
3.2
180.3
5.4
2.4 7.7
1.0 3.5 0.8 0.6 8.1
11.3 304.7
64.9 159.9
5.6 72.7
54.3 7.2 0.6 4.6 4.3 3.7 1.2
0.4 12.3
6.7
9.0
9.4 94.3 21.5 29.4
4.0 18.0
1120.2
X See definition on page 2.
24
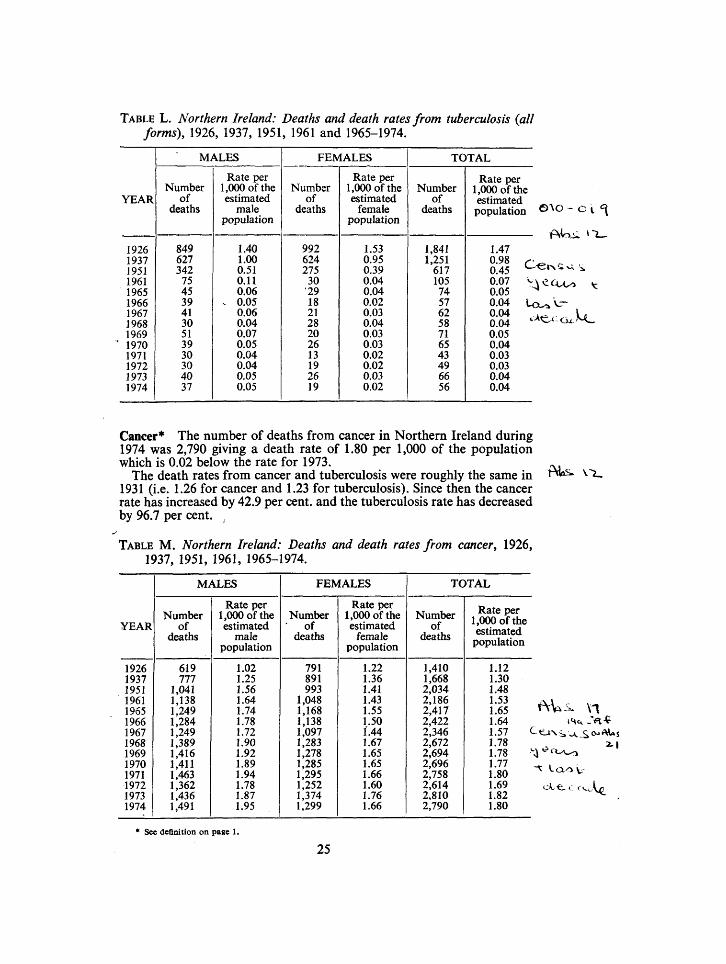
TABLE L . Northern Ireland: Deaths and death rates from tuberculosis {all forms), 1926, 1937, 1951, 1961 and 1965-1974.
YEAR
1926 1937 1951 1961 1965 1966 1967 1968 1969 1970 1971 1972 1973 1974
MALES
Number of
deaths
849 627 342
75 45 39 41 30 51 39 30 30 40 37
Rate per 1,000 of the estimated
male population
1.40 1.00 0.51 0.11 0.06
. 0.05 0.06 0.04 0.07 0.05 0.04 0.04 0.05 0.05
FEMALES
Number of
deaths
992 624 275
30 •29 18 21 28 20 26 13 19 26 19
Rate per 1,000 of the estimated
female population
1.53 0.95 0.39 0.04 0.04 0.02 0.03 0.04 0.03 0.03 0.02 0.02 0.03 0.02
TOTAL
Number of
deaths
1,841 1,251
617 105 74 57 62 58 71 65 43 49 66 56
Rate per 1,000 of the estimated
population
1.47 0.98 f 0.45 *-0.07 V 0.05 0.04 U 0.04 0.04 0.05 0.04 0.03 0.03 0.04 0.04
Cancer* The number of deaths from cancer in Northern Ireland during 1974 was 2,790 giving a death rate of 1.80 per 1,000 of the population which is 0.02 below the rate for 1973.
The death rates from cancer and tuberculosis were roughly the same in 1931 (i.e. 1.26 for cancer and 1.23 for tuberculosis). Since then the cancer rate has increased by 42.9 per cent, and the tuberculosis rate has decreased by 96.7 per cent. ,
TABLE M . Northern Ireland: Deaths and death rates from cancer^ 1926, 1937, 1951, 1961, 1965-1974.
YEAR
1926 1937 1951 1961 1965 1966 1967 1968 1969 1970 1971 1972 1973 1974
MALES
Number of
deaths
619 777
1,041 1,138 1,249 1,284 1,249 1,389 1,416 1,411 1,463 1,362 1,436 1,491
Rate per 1,000 of the estimated
male population
1.02 1.25 1.56 1.64 1.74 1.78 1.72 1.90 1.92 1.89 1.94 1.78 1.87 1.95
FEMALES
Number of
deaths
791 891 993
1,048 1,168 1,138 1,097 1,283 1,278 1,285 1,295 1,252 1,374 1,299
Rate per 1,000 of the estimated
female population
1.22 1.36 1.41 1.43 1.55 1.50 1.44 1.67 1.65 1.65 1.66 1.60 1.76 1.66
TOTAL
Number of
deaths
1,410 1,668 2,034 2,186 2,417 2,422 2,346 2,672 2,694 2,696 2,758 2,614 2,810 2,790
Rate per 1,000 of the estimated
population
1.12 1.30 1.48 1.53 1.65 1.64 1.57 <. 1.78 1.78 1.77 1.80 1.69 1.82 1.80
tMoS. VX
See definition on page 1.
25
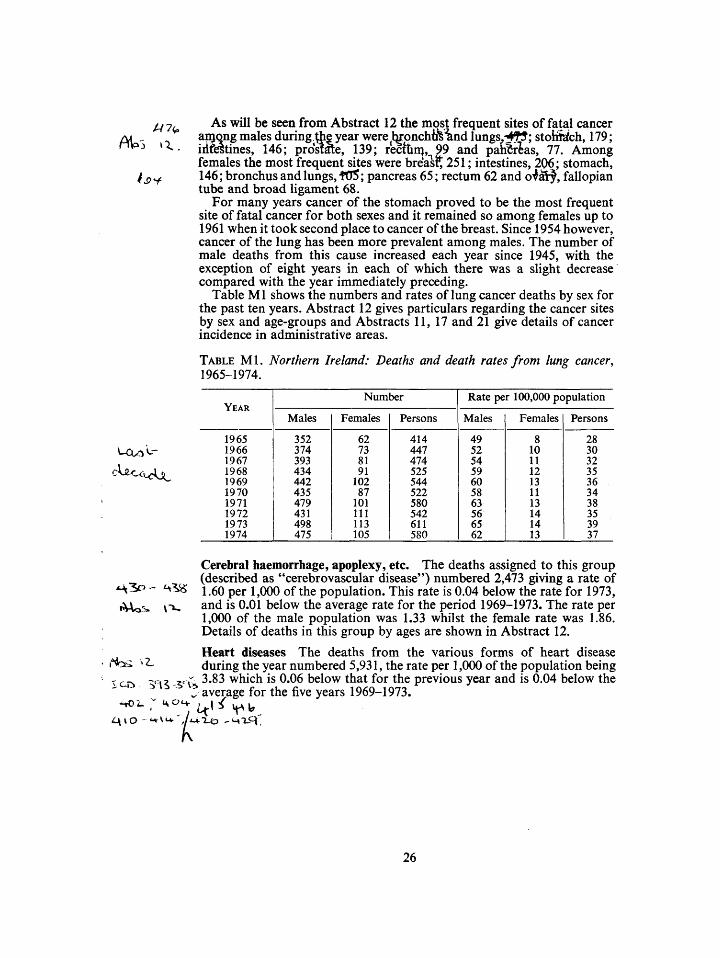
As will be seen from Abstract 12 the most frequent sites of fatal cancer aigong males during^^e year were^l^onchife^nd lungs,^4tJ; stolii^ch, 179; iiifCTtines, 146; prdsi^e, 139; recthn|,^99 and panlrlas, 77. Among females the most frequent sites were bre'a^^ 251; intestines, 206; stomach, 146; bronchus and lungs, f05; pancreas 65; rectum 62 and o^ai^, fallopian tube and broad ligament 68.
For many years cancer of the stomach proved to be the most frequent site of fatal cancer for both sexes and it remained so among females up to 1961 when it took second place to cancer of the breast. Since 1954 however, cancer of the lung has been more prevalent among males. The number of male deaths from this cause increased each year since 1945, with the exception of eight years in each of which there was a slight decrease compared with the year immediately preceding.
Table Ml shows the numbers and rates of lung cancer deaths by sex for the past ten years. Abstract 12 gives particulars regarding the cancer sites by sex and age-groups and Abstracts 11, 17 and 21 give details of cancer incidence in administrative areas.
TABLE Ml . Northern Ireland: Deaths and death rates from lung cancer, 1965-1974.
YEAR
1965 1966 1967 1968 1969 1970 1971 1972 1973 1974
Males
352 374 393 434 442 435 479 431 498 475
Number
Females
62 73 81 91
102 87
101 111 113 105
Persons
414 447 474 525 544 522 580 542 611 580
Rate per 100,000 population
Males
49 52 54 59 60 58 63 56 65 62
Females
8 10 11 12 13 11 13 14 14 13
Persons
28 30 32 35 36 34 38 35 39 37
H 3 O - ^^"6
Cerebral haemorrhage, apoplexy, etc. The deaths assigned to this group (described as "cerebrovascular disease") numbered 2,473 giving a rate of 1.60 per 1,000 of the population. This rate is 0.04 below the rate for 1973, and is 0.01 below the average rate for the period 1969-1973. The rate per 1,000 of the male population was 1.33 whilst the female rate was 1.86. Details of deaths in this group by ages are shown in Abstract 12.
Heart diseases The deaths from the various forms of heart disease during the year numbered 5,931, the rate per 1,000 of the population being
,c{: 3.83 which is 0.06 below that for the previous year and is 0.04 below the ^ average for the five years 1969-1973.
. . , ^
26
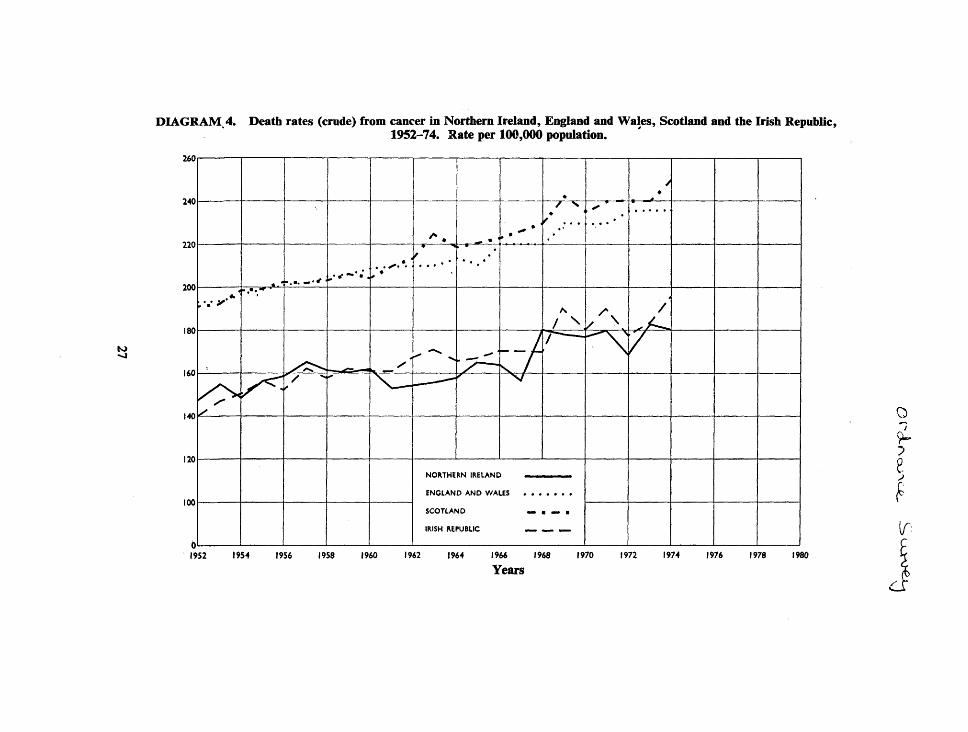
DIAGRAM 4. Death rates (crude) from cancer in Northern Ireland, England and Wales, Scotland and the Irish Republic, 1952-74. Rate per 100,000 population.
260
240
220
200
180
160
140
120
100
" . • • • * • " ... *
-X^'^^ 1 /
. f - * .
— ^ • ^ — M
"
* *
4
^ * f
*«• "^ .
* •
. . - • • ' . • • • •
. • ^
. ^ - ^
NORTHERN IRELANC
ENGLAND AND W A
SCOTLAt
IRISH RE
>ID
'UBLIC
/ T^—
—
• • • •
.^
C^-.
•
/
"""^K /
o 9-"J
I
1952 1954 1956 1958 I960 1962 1964 1966 1968 1970 1972 1974 1976 1978 1980
Years
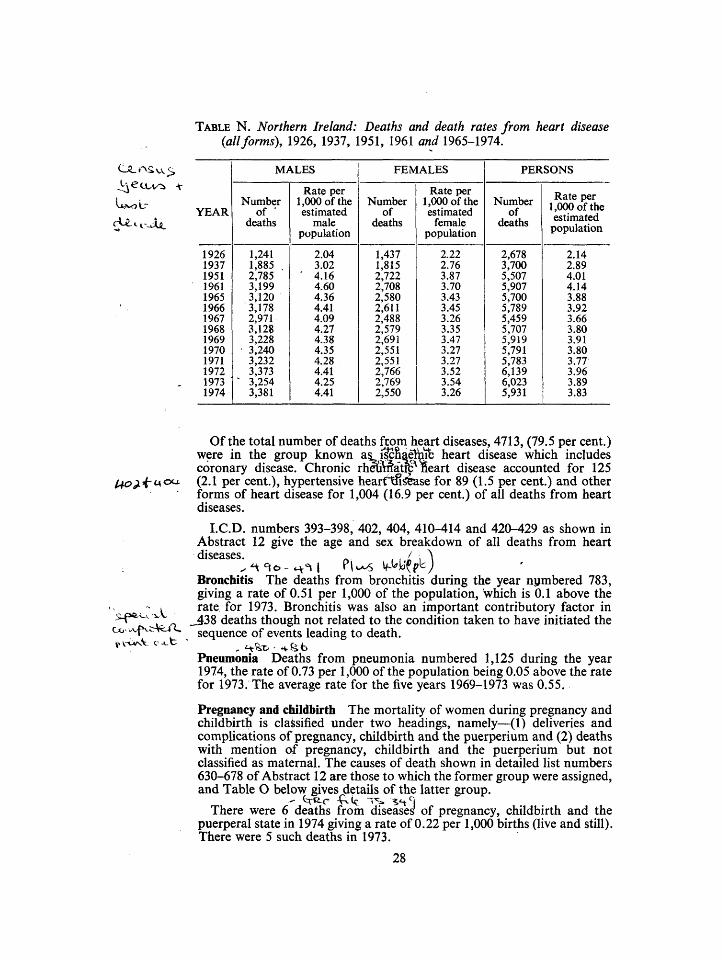
TABLE N . Northern Ireland: Deaths and death rates from heart disease (all forms), 1926, 1937, 1951, 1961 and 1965-1974.
YEAR
1926 1937 1951 1961 1965 1966 1967 1968 1969 1970 1971 1972 1973 1974
MALES
Number of •
deaths
1,241 1,885 2,785 3,199 3,120 3,178 2,971 3,128 3,228 3,240 3,232 3,373
' 3,254 3,381
Rate per 1,000 of the estimated
male population
2.04 3.02
' 4.16 4.60 4.36 4.41 4.09 4.27 4.38 4.35 4.28 4.41 4.25 4.41
FEMALES
Number of
deaths
1,437 1,815 2,722 2,708 2,580 2,611 2,488 2,579 2,691 2,551 2,551 2,766 2,769 2,550
Rate per 1,000 of the estimated
female population
2.22 2.76 3.87 3.70 3.43 3.45 3.26 3.35 3.47 3.27 3.27 3.52 3.54 3.26
PERSONS
Number of
deaths
2,678 3,700 5,507 5,907 5,700 5,789 5,459 5,707 5,919 5,791 5,783 6,139 6,023 5,931
Rate per 1,000 of the estimated
population
2.14 2.89 4.01 4.14 3.88 3.92 3.66 3.80 3.91 3.80 3.77 3.96 3.89 3.83
^o^'^acxi.
Of the total number of deaths from heart diseases, 4713, (79.5 per cent.) were in the group known as i c&aeimfc heart disease which includes coronary disease. Chronic rhdfflt^at^^ Heart disease accounted for 125 (2.1 per cent.), hypertensive hearftfis&ase for 89 (1.5 per cent.) and other forms of heart disease for 1,004 (16.9 per cent.) of all deaths from heart diseases.
LCD. numbers 393-398, 402, 404, 410-414 and 420-429 as shown in Abstract 12 give the age and sex breakdown of all deaths from heart diseases. . , , i i A
Bronchitis The deaths from bronchitis during the year nymbered 783, giving a rate of 0.51 per 1,000 of the population, which is 0.1 above the rate for 1973. Bronchitis was also an important contributory factor in
_j438 deaths though not related to the condition taken to have initiated the sequence of events leading to death.
Pneumonia Deaths from pneumonia numbered 1,125 during the year 1974, the rate of 0.73 per 1,000 of the population being 0.05 above the rate for 1973. The average rate for the five years 1969-1973 was 0.55.
Pregnancy and childbirth The mortality of women during pregnancy and childbirth is classified under two headings, namely—(1) deliveries and complications of pregnancy, childbirth and the puerperium and (2) deaths with mention of pregnancy, childbirth and the puerperium but not classified as maternal. The causes of death shown in detailed list numbers 630-678 of Abstract 12 are those to which the former group were assigned, and Table O below gives details of the latter group.
- (active - f ^ k '"=^ ^ H * ^ ! There were 6 deaths from diseases of pregnancy, childbirth and the
puerperal state in 1974 giving a rate of 0.22 per 1,000 births (live and still). There were 5 such deaths in 1973.
28
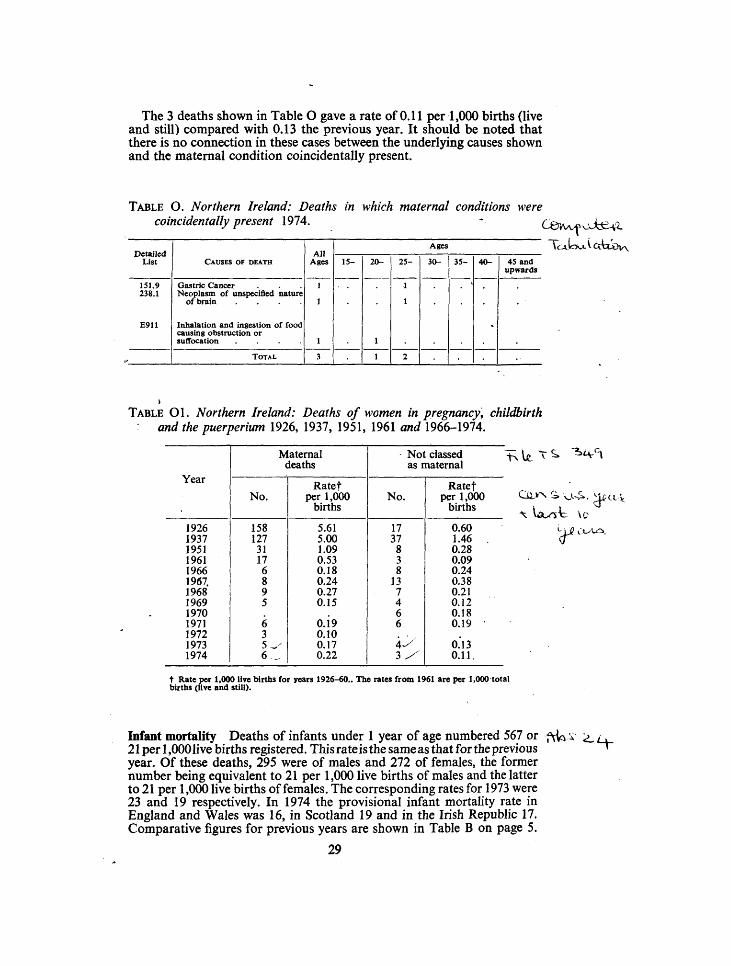
The 3 deaths shown in Table O gave a rate of 0.11 per 1,000 births (live and still) compared with 0.13 the previous year. It should be noted that there is no connection in these cases between the underlying causes shown and the maternal condition coincidentally present.
TABLE O. Northern Ireland: Deaths in which maternal conditions were coincidentally present 1974. - C&A^^Mi^l.
Detailed List
151.9 238.1
E911
CAUSES OF DEATH
Gastric Cancer Neoplasm of unspecified nature
of brain . . . .
Inhalation and ingestion of food causing obstruction or suffocation . . . .
TOTAL
All Ages
1
1
1
3
15- 20-
1
1
25-
1
1
2
Ages
30- 35- 40-
•
45 and upwards
TABLE Ol. Northern Ireland: Deaths of women in pregnancy, childbirth and the puerperium 1926, 1937, 1951, 1961 and 1966-1974.
Year
1926 1937 1951 1961 1966 1967, 1968 1969 1970 1971 1972 1973 1974
Maternal deaths
No.
158 127 31 17 6 8 9 5
6 3 5^-6 .
Ratet per 1,000
births
5.61 5.00 1.09 0.53 0.18 0.24 0.27 0.15
0.19 0.10 0.17 0.22
• Not classed as maternal
No.
17 37 8 3 8
13 7 4 6 6
4 ^ 3 /
Ratet per 1,000
births
0.60 1.46 . 0.28 0.09 0.24 0.38 0.21 0.12 0.18 0.19
0.13 0.11.
t Rate per 1,000 live births for years 1926-60.. The rates from 1961 are per 1,000 total births (live and still).
Infant mortality Deaths of infants under 1 year of age numbered 567 or f\U i ^_ i. 21 per 1,000 live births registered. This rate is the same as that for the previous *" year. Of these deaths, 295 were of males and 272 of females, the former number being equivalent to 21 per 1,000 live births of males and the latter to 21 per 1,0(K) live births of females. The corresponding rates for 1973 were 23 and 19 respectively. In 1974 the provisional infant mortality rate in England and Wales was 16, in Scotland 19 and in the Irish Republic 17. Comparative figures for previous years are shown in Table B on page 5.
29
O
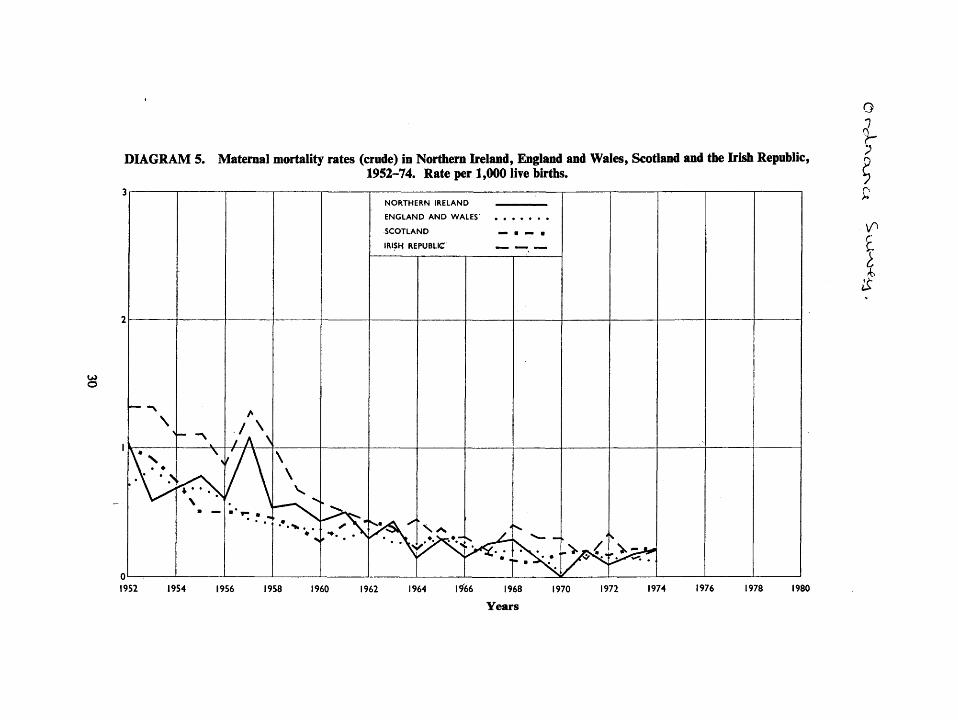
DIAGRAM 5. Maternal mortality rates (crude) in Northern Ireland, England and Wales, Scotland and the Irish Republic, 1952-74. Rate per 1,000 live births.
— -N
\
\ • \ * *
— ' N
\ >
*^^^^^^\.
• ^
7 \ /A ^
f / \
• •^ • -
\ \
N
^
« ^ ^ f
rt
NORTHERN IRELAND
ENGLAND AND WALES
SCOTLAND
IRISH RE
^ > ^ ^ "^K
PUBLIC
• . s - - » - J
' '\^ XJ><
" - • • " •
4
• . . • _
*v
— _ ^^ •
'V
'^/S^-i yOJ'^C* . ^ j : ^
i * ' ' ' ^ •
1952 1954 1956 1958 I960 1962 1964 19 66 1968 1970
Years
1972 1974 1976 1978 1980
Q
r
ST'
I
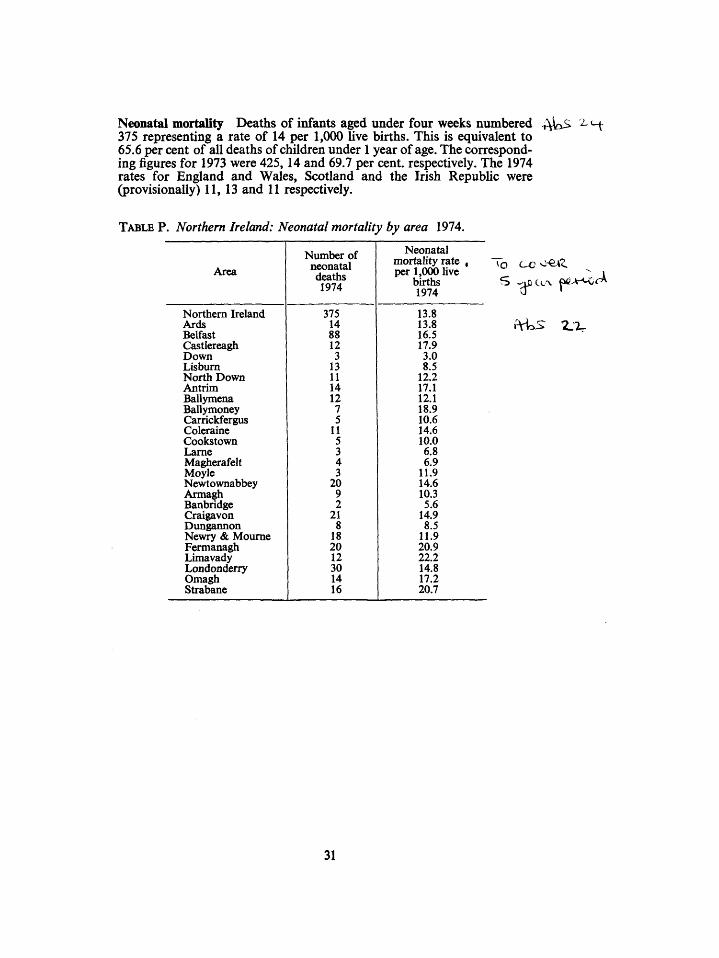
Neonatal mortality Deaths of infants aged under four weeks numbered ^^Ws ^«-( 375 representing a rate of 14 per 1,000 live births. This is equivalent to 65.6 per cent of all deaths of children under 1 year of age. The corresponding figures for 1973 were 425,14 and 69.7 per cent, respectively. The 1974 rates for England and Wales, Scotland and the Irish Republic were (provisionally) 11, 13 and 11 respectively.
TABLE P. Northern Ireland: Neonatal mortality by area 191 A.
Area
Northern Ireland Ards Belfast Castlereagh Down Lisburn North Down Antrim Ballymena Ballymoney Carrickfergus Coleraine Cookstown Lame Magherafelt Moyle Newtownabbey Armagh Banbridge Craigavon Dungannon Newry & Moume Fermanagh Limavady Londonderry Omagh Strabane
Number of
deaths 1974
375 14 88 12 3
13 11 14 12 7 5
11 5 3 4 3
20 9 2
21 8
18 20 12 30 14 16
Neonatal mortality rate , per 1,000 live
births 1974
13.8 13.8 16.5 17.9 3.0 8.5
12.2 17.1 12.1 18.9 10.6 14.6 10.0 6.8 6.9
11.9 14.6 10.3 5.6
14.9 8.5
11.9 20.9 22.2 14.8 17.2 20.7
«VkS 2.1-
31
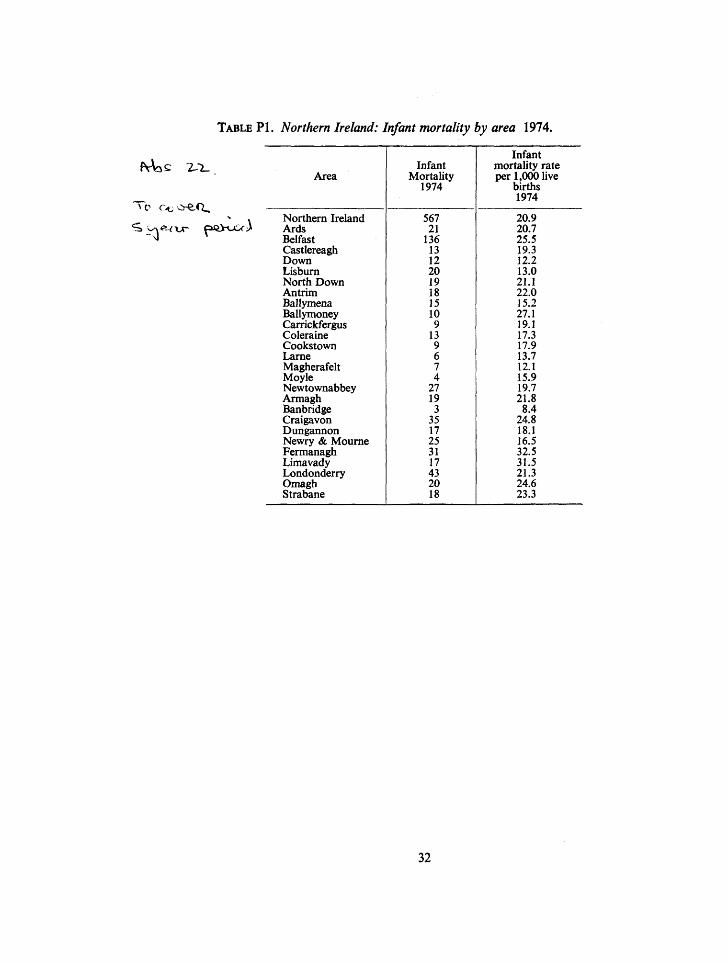
TABLE PL Northern Ireland: Infant mortality by area 1974.
Mas Z l_ Area
Northern Ireland Ards Belfast Castlereagh Down Lisburn North Down Antrim Ballymena Ballymoney Carrickfergus Coleraine Cookstown Lame Magherafelt Moyle Newtownabbey Armagh Banbridge Craigavon Dungannon Newry & Moume Fermanagh Limavady Londonderry Omagh Strabane
Infant Mortality
1974
567 21
136 13 12 20 19 18 15 10 9
13 9 6 7 4
27 19 3
35 17 25 31 17 43 20 18
Infant mortality rate per 1,000 live
births 1974
20.9 20.7 25.5 19.3 12.2 13.0 21.1 22.0 15.2 27.1 19.1 17.3 17.9 13.7 12.1 15.9 19.7 21.8 8.4
24.8 18.1 16.5 32.5 31.5 21.3 24.6 23.3
32
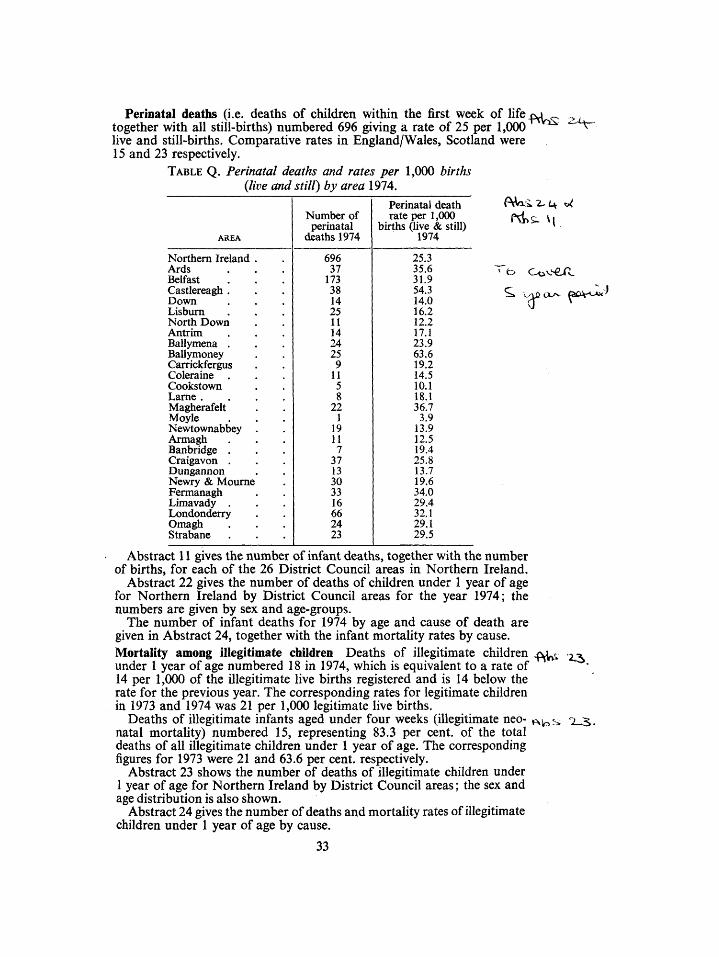
Perinatal deaths (i.e. deaths of children within the first week of life 42^10 together with all still-births) numbered 696 giving a rate of 25 per 1,000 live and still-births. Comparative rates in England/Wales, Scotland were 15 and 23 respectively.
(i.-^i-^«—
TABLE Q. Perinatal deaths and rates per 1,000 births {live and still) by area 1974.
AREA
Northern Ireland . Ards Belfast Castlereagh . Down Lisburn North Down Antrim Ballymena . Ballymoney Carrickfergus Coleraine . Cookstown Lame . Magherafelt Moyle Newtownabbey Armagh Banbridge . Craigavon . Dungannon Newry & Moume Fermanagh Limavady . Londonderry Omagh Strabane
Number of perinatal
deaths 1974
696 37
173 38 14 25 11 14 24 25 9
11 5 8
22 1
19 11 7
37 13 30 33 16 66 24 23
Perinatal death rate per 1,000
births (live & still) 1974
25.3 35.6 31.9 54.3 14.0 16.2 12.2 17.1 23.9 63.6 19.2 14.5 10.1 18.1 36.7 3.9
13.9 12.5 19.4 25.8 13.7 19.6 34.0 29.4 32.1 29.1 29.5
t ix/-^ GDV<-«<;'
Abstract 11 gives the number of infant deaths, together with the number of births, for each of the 26 District Council areas in Northern Ireland.
Abstract 22 gives the number of deaths of children under 1 year of age for Northern Ireland by District Council areas for the year 1974; the numbers are given by sex and age-groups.
The number of infant deaths for 1974 by age and cause of death are given in Abstract 24, together with the infant mortality rates by cause. Mortality among illegitimate children Deaths of illegitimate children .^i^ 2.^ under 1 year of age numbered 18 in 1974, which is equivalent to a rate of 14 per 1,000 of the illegitimate live births registered and is 14 below the rate for the previous year. The corresponding rates for legitimate children in 1973 and 1974 was 21 per 1,000 legitimate live births.
Deaths of illegitimate infants aged under four weeks (illegitimate neo- i ^^s. 1-S. natal mortahty) numbered 15, representing 83.3 per cent, of the total deaths of all illegitimate children under 1 year of age. The corresponding figures for 1973 were 21 and 63.6 per cent, respectively.
Abstract 23 shows the number of deaths of illegitimate children under 1 year of age for Northern Ireland by District Council areas; the sex and age distribution is also shown.
Abstract 24 gives the number of deaths and mortality rates of illegitimate children under 1 year of age by cause.
33
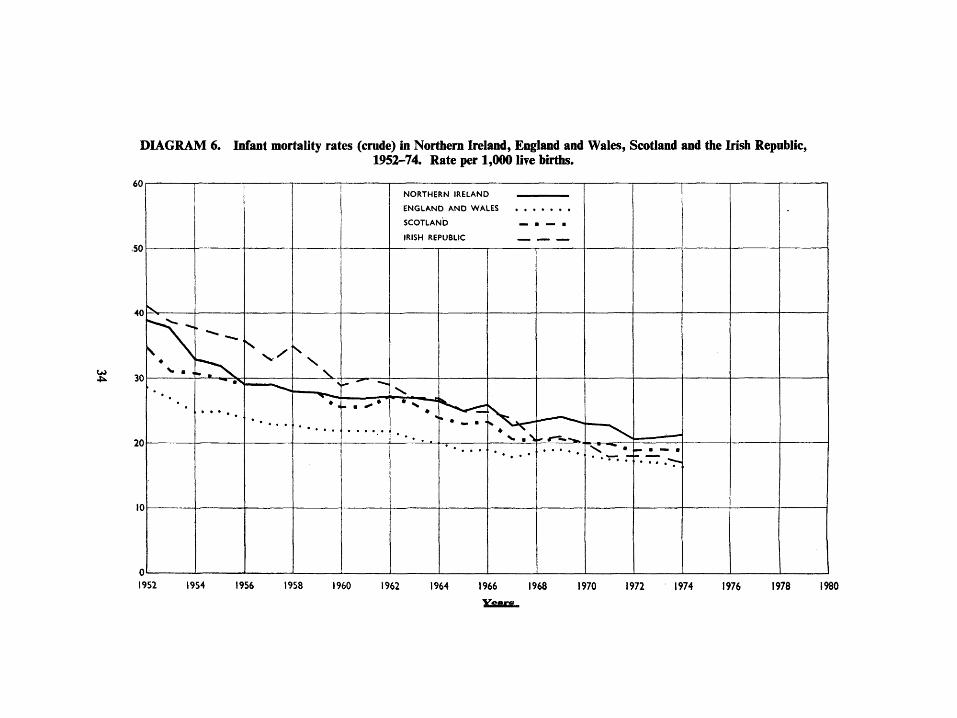
DIAGRAM 6. Infant mortality rates (crude) in Northern Ireland, England and Wales, Scotland and the Irish Republic, 1952-74. Rate per 1,000 live births.
4
60
50
40
30
20
10
V
•
• . •>
N
NORTHERN IRELANC
ENGLAND AND WA
SCOTLAND
IRISH REPUBLIC
* * • - . •
• ^
s : - . • " • — " •
1952 1954 1956 1958 I960 1962 1964 1966 1968 1970 1972 1974 1976 1978 1980
^ 3 Z.^
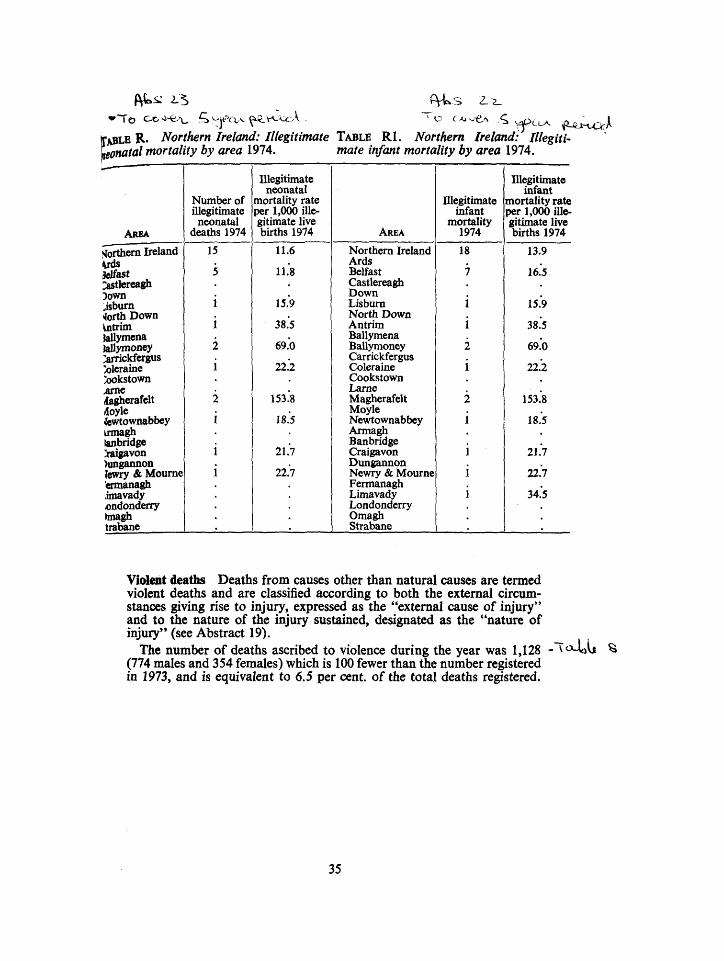
fXBLE R. Northern Ireland: Illegitimate TABLE R 1 . Northern Ireland: Illegiti-tgonatal mortality by area 1974. mate infant mnrtalitv hv area 1Q74 mate infant mortality by area 1974.
AREA
j^^rthem Ireland ^ds ^^ast >sttereagh 5own jsburn ^orth Down Vntrim )allymena tellymoney ::arrickfergus ;k)leraine :k)okstown .ame «{agfaerafelt iloyle fcwtownabbey urmagh la&bridge .Yaigavon >unga]inon lewry & Moume tooanagh .imavady ^ndonderry hnagfa t ra l^e
Number of illegitimate neonatal
deaths 1974 15
5
i i 2
2
Illegitimate neonatal
mortality rate per 1,000 illegitimate live births 1974
11.6
11,8
is's 38.5
. 69.0
. 22.2
153.8
l%.5
21.7
22.7
AREA
Northern Ireland Ards Belfast Castlereagh Down Lisburn North Down Antrim Ballymena Ballymoney Carrickfergus Coleraine Cookstown Larne Magherafelt Moyle Newtownabbey Armagh Banbridge Craigavon Dungannon Newry & Moume Fermanagh Limavady Londonderry Omagh Strabane
Illegitimate infant
mortality 1974
18
7
2
i
2
i
Illegitimate infant
mortality rate per 1,000 illegitimate live births 1974
13.9
\6.5
15.9
38.5 .
69.0 .
22.2
153.8
18.5 .
21.7
22.7 ,
34.5 .
.
Vi(dent deaths Deaths from causes other than natural causes are termed violent deaths and are classified according to both the external circumstances giving rise to injury, expressed as the "external cause of injury" and to the nature of the injury sustained, designated as the "nature of injury" (see Abstract 19),
The number of deaths ascribed to violence during the year was 1,128 (774 males and 354 females) which is 100 fewer than the number registered in 1973, and is equivalent to 6.5 per cent, of the total deaths registered.
- ^oJoij ^
35
UL^"V ^ ^e<xc^
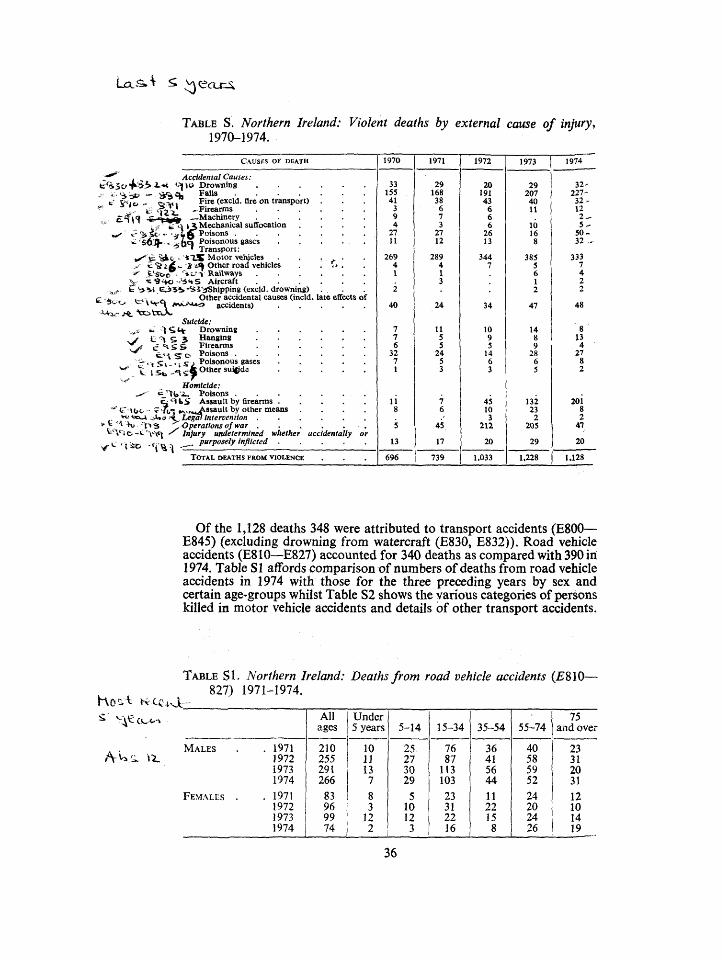
TABLE S. Northern Ireland: Violent deaths by external cause of injury, 1970-1974.
C\USitS OF DEATH
:f^ . , Accidental Causes : t ' ^ S C T ' s i * i*« ^^^'o Drowning
fc' S'^jo - t a v i Fire (excld. Arc on transport) ' ' . fc ' iVV -Firearms
£1^1 CI T -i1»iir> -^.Machinery 4 , 7 f ^ \ i 3 Mechanical suffocation
^ i?%i^'.':fifAVoisom . . . . »-'SOJ>" - ^ M Poisonous gases
^ ' Transport: • " ^ y^c - i l S t Motor vehicles V t "S i fi •- "S 4*1 Other road vehicles * i^Si»c- '"»i'" 1 Railways
V 's9'^4ci -'^iHS Aircraft ^„.: b ^ i i G.i5». -^5"5Shipping (excld. drowning)
c i ' 1 »,. - Other accidental causes (incld. late effects of t 4 c o '-n*-r<^ ^^>.**^ accidents)
Suicide: •.„x.' <t' l *> H- Drowning
e '^ S 5 Hanging c H S S Firearms 6-'A S C" Poisons .
• i <;ri • 1 s J Poisonous gases
« i ' t b i - Poisons . i^ "1W <• Assault by firearms
S^ tT *<\<.»i^'sault by other means
t H+u i ioj ^Operations of war t \<'iO-.C,'~\>--\ej| / Injury undetermined whether accidentally
- . C ' t i o '^^^ ^ purposely inflicted T%1 TOTAL DEATHS FROM VIOLENCE
33 155 41 3 9 4 27 11
269 4 1
2
40
696
1971
29 168 38 6 7 3 27 12
289 4 1 3
24
11 5 5 24 5 3
739
1972
20 191 43 6 6 6 26 13
344 7
34
45 10 3
212
20
1.033
1973
29 207 40 U
10 16
385 5 6 1 2
47
132 23 2
205
29
1974
1,228
32-227-32-12 2, 5-50. 32
333 7 4 2 2
48
201
20
1.128
Of the 1,128 deaths 348 were attributed to transport accidents (E800— E845) (excluding drowning from watercraft (E830, E832)). Road vehicle accidents (E810—E827) accounted for 340 deaths as compared with 390 in 1974. Table SI affords comparison of numbers of deaths from road vehicle accidents in 1974 with those for the three preceding years by sex and certain age-groups whilst Table S2 shows the various categories of persons killed in motor vehicle accidents and details of other transport accidents.
TABLE SI. Northern Ireland: Deaths from road vehicle accidents (£810-827) 1971-1974.
MALES
FEM.\LES .
. 1971 1972 1973 1974
. 1971 1972 1973 1974
All ages
210 255 291 266
83 96 99 74
Under 5 years
10
n 13 7
8 3
12 2
5-14
25 27 30 29
5 10 12 3
15-34
76 87
113 103
23 31 22 16
35-54
36 41 56 44
11 22 15 8
55-74
40 58 59 52
24 20 24 26
75 and over
23 31 20 31
12 10 14 19
36
»« iCtO-L QCCu^.CtC.L COLU^^^Qt^^^ ' - ^ ~ V"A . t . \v
•"^ti>i<t
Other accidents apcjmted for 440 death^^jnd ^ these deaths 227 were ascribed to falls, 32 to drowning, 82 to poi'sonsw poisonous gases, 32 to fire and heat, 5 to mechanical suffocation, 2 to machinery and 60 to other accidental causes. A detailed break-down showing non-transport accidents by sex and age-groups is given in Abstract 20.
Deaths from accidents recorded as occurring in the home numbered 239 compared with 218 in both 1973 and 1972. Most accidents in the home are occasioned by falls and it should be noted that in 1974 there were 26 deaths from falls where the place of the accident was unspecified compared with 34 in 1971. Fuller details of these and other accidents (apart from transport accidents) are given is Abstract 20.
During the year there were 62 cases of suicide (39 males and 23 females) -> compared with 70 (32 males and 38 females) in 1973, 209 deaths from /homicide and 47 from war operations. In addition there were 20 deaths in
which it was not possible to determine whether the injuries were accidentally or purposely inflicted.
'^O.l^k
TABLE S2. Deaths from transport accidents, by sex and age 191A
LCD. Numbers
E810-E823 E940
E825-E827 E941
E800-E807 E830-E838 E840-E84S
E^00-E845 E940-B941
Cause of death
Motor vehicle accident causing death to:— (o) pedestrian - M
(W pedal cyclist \M /F
(c) motor cyclist -> M ;F
(d) driver of - M motor veh- /F iclc other than motor cycle
(e) passenger in -> M motor vehicle J F
<S) other persons \M / F
Other road •> M vehicle accidents /F
Total road •> M vehicle accidents /F
Rail, air and \M water transport JF accidents
Total transport •» M accidents /F
All ages
104 52 5 1
26
79 3
34 17 n 1 7
266 74
13 2
279 76
under 1
year
i
1
1
1-4
6 1
1
7 1
7 I
5-9
10 1
1
i 1
12 2
1 1
13 3
10-14
12 1
2
i
1
i
17 1
3
20 1
15-24
11 2
14
23
11 11 4
63 13
2
65 13
1
25-34 35-44
6 2 1
3
2i 1
u i
40 3
2
42 3
5
li 1
3 1
• 2
21 2
1
22 2
45-54
11 5
3
8
1 1
23 6
23 6
55-64
12 7 i 3 8 1
3 3
2
28 12
2
30 12
65-74
12 13
3
4 1 3
1
23 14
1 1
24 15
75-84
16 15 4
i 4
2
i
28 15
1
29 15
85 and over
3 4
i
4 4
4 4
t=:V^< X ffj .o|.:.-MX
K ;<^Vv»v w-i'. , < ^
Deaths in which violence was stated to be the sequel to some other cause are correlated in Table S3. Alcoholism was, as usual, the greatest single factor in this group causing the deaths of 4 people. This figure, however, does not include deaths caused by other people who were in a state of intoxication.
37
TABLE S3. Northern Ireland: Deaths in which violence was a terminal cause, 1974.
Detailed UNDERLYING t ^ ^ r a f e ^ - S ^ ^ list CAUSE OF DEATH I g s l j ^% ^
4JS « a ** c —f» 2
303.9 Alcoholism . . . M l 1 1 1 4 F . . . .
TOTAL . M l 1 1 1 4 F . . . .
38
CERTIFICATION OF DEATHS yUl deaths must be certified by either a medical practitioner or a coroner
god Table T shows the type of certification during the year. The circum- "x^^Joi^ T stances of 2,822 deaths (16.3 per cent, of all deaths) were considered by the coroners and in 981 of these cases inquests were held. In 922 cases the deaths were certified by coroners after post-mortem examinations had proved inquests to be unnecessary.
Of the 14,505 deaths certified by medical practitioners the deceased persons were not seen after death by the practitioners in 2,539 cases
TABLE T. Northern Ireland: Deaths by certification, 1974
AREA
Nortbem Ireland . Aid* Bdfut . Caitleteagfa . Down . ListMim North Down . Antrim. Ballymena Bijlymoney . Carrickfergus Colendne Cookstown Lame . Masberafelt . Moylo . Newtownabbey Annatb BanbHdte . Cffrigavon DnnSBonon Newry and M o u m e Fermanagh LtaMtvady . Londonderry OmMfa Sttabane
Total deaths
,327 596 ,958 458 603 785 732 324 583 232 261 459 260 316 331 160 678 544 295 680 566 847 701 214 855 480 409
Certified by
medical practitioners Without
post-mortem
14,505 520
3,952 386 516 658 611 278 503 195 226 383 224 271 293 145 561 450 262 567 492 741 617 174 713 408 359
Certified by coroners
Without inquest
919 36
253 19 36 42 53 11 37
8 10 26 14 22 11
5 40 31 15 51 19 39 19 19 51 20 32
After post-mortem
922 24 406 29 27 34 44 15 21 17 8 28 12 9 6 3 44 20 8 27 16 19 34 8 30 23
981 16 347 24 24 51 24 20 22 12 17 22 10 14 21 7 33 43 10 35 39 48 31 13 61 29
10
After inquest
Co i'^^ ^ot£Lc
LIFE TABLE The expectation of life is the average number of years which would be
lived by a group of people of given age who are continuously subject to given mortality rates, usually those of a selected year or years.
The abridged life table shown as Table U is based on the mortality rates for 1972-1974 and shows the expectation of life at various age-points together with the number of persons who would survive to given age x out of 10,000 born, if subjected throughout their lives to this mortality experience.
Thus 95 per cent, of males and 98 per cent, of females would survive the first year of life; 93 per cent, of males and 97 per cent, of females would reach the age of 20; 74 per cent, of males and 86 per cent of females would reach the age of 60 and the men could then expect an average future Ufetime of 15 years compared with 19 years for women.
Based on the mortality experience of 1972-1974 the expectation of life at birth was 65.0 years for males and 73.6 years for females; at age one year the expectations were 67.3 years for males and 74.1 years for females. Table Ul affords comparison of these figures with those for certain preceding years.
39
KCXJ kil^
TABLE U. Northern Ireland: Abridged Life Table 1972-1974.
u
Age X
0
1 2 3 4
5 10 15 20
25 30 35 40
45 50 55 60
65 70 75 80
85
Males
4 10,000
9,513 9,498 9,487 9,479
9,474 9,448 9,426 9,342
9,244 9,161 9,075 8,970
8,811 8,528 8,070 7,378
6,398 5,097 3,607 2,095
892
h 64.97
67.29 66.40 65.47 64.53
63.56 58.73 53.86 49.32
44.82 40.20 35.56 30.95
26.46 22.25 18.38 14.87
11.76 9.12 6.86 5.00
3.38
Females
4 10,000
9,804 9,790 9,778 9,772
9,723 9,710 9,699 9,675
9,650 9,621 9,580 9,511
9,405 9,230 8,960 8,566
7,952 7,082 5,773 4,681
2,549
h 73 M
74.10 73.21 72.30 71.34
70.70 65.79 60.86 56.01
51.15 46.29 41.48 36.76
32.15 27,71 23.47 19.44
15.74 12.37 9.61 6.27 4.42
This abridged life table is constructed from the estimated populations and the total deaths registered during the years 1972-1974.
The column headed Ix shows the numbers who would survive to exact age x out of 10,000 bom who were subject throughout their lives to the death probabilities indicated by the mortality records for the years 1972-1974. Column Bx gives the "expectation of life"—that is the average future lifetime which would be lived by a person aged exactly x if subject to those death probabilities.
TABLE Ul. Northern Ireland: Expectation of life at birth, at one year of age and at 65 years of age for certain periods between 1890 and 1974.
Period
1890-92 1900-02 1910-12 1925-27 1936-38 1950-52 1965-67 1966-68 1967-69 1968-70 1969-71 1970-72 1971-73 1972-74
At birth
Male
46.3 47.1 50.7 55,4 57.8 65.5 68.1 68.2 68.3 67.9 67.8 67,6 67.2 65.0
Female
45.7 46.7 51.0 56,1 59,2 68.8 73.3 73.5 73.7 73.5 73.7 73.7 73.6 73.6
Expectation of life
At age one year
Male
— —
59.9 —
67.5 68.9 69.0 69.2 68.8 68.6 68.3 67.8 67.3
Female
— —
59.5 —
70.3 74.1 74.1 74.3 74.0 74.2 74.1 74.1 74.1
At age
Male
10.6 10.5 12.1 11.9 11.6 12.1 12.3 12.3 12.4 12.1 12.0 12,0 11,9 11,8
65 years
Female
10,6 10,4 12,8 12.7 12.4 13.5 15.0 15.1 15.3 15.1 15,2 15,2 15.2 15.7
The Life Tables for 1901, 1926, 1951 and 1961 are included in Section I of the Ulster Year Book, 1975, obtainable from Her Majesty's Stationery Office price £2.
40
CONGENITAL MALFORMATIONS
This section relates to children born (live or still) with any apparent deformity. The information about these congenital malformations is furnished to the Department of Health and Social Services by the health and social services boards and is classified according to the residence of the parents and not to the place of birth.
During the year 745 children were born with congenital malformations compared with 725 in 1973 and 911 in 1972. The Northern Ireland rate for 1974 was 26.6 per 1,000 births (live and still) compared with 24,5 for 1973.
S.
TABLE V. Northern Ireland: Number of congenitally malformed children by Health and Social Services District and month of birth, 1974.
Health and Social Services District Board
NORTHERN IRELAND
North Down and Ards . . . .
East Belfast and Castlereagh
North and West Belfast South Belfast
Lisburn . . . .
EASTERN BOARD
Coleraine. Ballymoney and Moyle
Antrim and Ballymena . Lame and Carriclcfergus Newtownabbey Cookstown and
• Magherafelt
NORTHERN BOARD
Armagh and Dungannon Craigavon and Banbridge Newry and Moume
SOUTHERN BOARD
Londonderry, Limavady and Strabane
Omagh Fermanagh . . . .
WESTERN BOARD
1 72
3
4 8 1 2 1
19
9 8 1 6
3
27
3 6 5
14
9 2 1
12
fc-
1 58
2
5 7 5 2 2
23
2 6
i 3
12
4 3 3
10
9 4
13
J3 Si
(« 62
3
5 3 5
16
5 2
5
3
15
3 7 4
14
10 4 3
17
1 66
3
5 10 3 6 5
32
3 1 3 3
if 2 3 3
8
6 1 2
9
Month of Birth
2 73
4
5 6 1 4 3
23
6 1
5
5
17
8 6 6
20
8 2 3
13
i 59
i
3 7 2 5 3
23
2 3 2 3
4
14
3 4 5
12
5 5
10
>>
60
4
4 6 2 2 2
20
5 5 1
4
15
4 8 2
14
7
4
11
ao
< 75
9
3 5 3 4 3
27
5 5
i 2
13
5 6 3
14
16 2 3
21
1 s.
64
6
2 5 3 6 6
28
5 2 3 1
U
3 5 4
12
« 4 1
13
1 0 0
55
i
5
5 2
15
i 6 1 4
3
19
5 5 2
12
6 2
^ 9
I 0 Z 49
1
3 8 2 1 1
16
2 4 3 2
8
19
1 3 2
6
7 1
_ 1 . 8
( 4
52
4
2 6 2
i 15
4 3 2 2
3
14
6 4 3
13
5 4 1
10
Totals
745
45
41 76 29 37 29
257
53 46 16 33
45
193
47 60 42
149
96 31 19
146
Rate*
26.6
23.1
22.0 22.7 27.4 37.0 18.7
24.3
38.1 25.2 17.4 23.9
41.0
29.2
25.4 33.5 27.5
28.9
28.3 37.6 19.6
28.2
• Per 1,000 births (live and still).
Of the 745 children born with malformations 135 (18.1 per cent.) were bom with more than one abnormality. In all, 921 separate abnormalities were recorded. Table VI shows the number of children affected by multiple abnormalities in each of the Health and Social Services districts.
41
'i>-e«>^ c V
TABLE VI. Northern Ireland: Multiple abnormalities by Health and Social Services District, 1974.
Health and Social Services District Board
North t>own and Ards
East Belfast and Castlereagh . . . .
North and West Belfast .
South Belfast . . . .
EASTERN BOARD
Coleraine, Ballymoney and Moyle . . . .
Antrim and Ballymena
Lame and Carrickfergus .
Newtownabbey
Cookstown and Masherafelt
NORTHERN BOARD
Armagh and Dungannon .
Craigavon and Banbrldge
Newry and Moume
SOUTHERN BOARD
Londonderry. Limavady and Strabane
Fermanagh . . . .
WESTERN BOARD
NORTHERN IRELAND
2 o 37
35
63
27
31
26
219
46
35
16
29
35
161
38
49
36
123
67
23
17
107
1 610
0 t3
< 37
35
63
27
31
26
219
46
35
16
29
35
161
38
49
36
123
67
23
17
107
610
2
I 7
4
13
2
4
3
33
6
10
2
8
26
9
8
5
22
21
6
1
28
109
Number of Abnormalities
1 14
8
26
4
8
6
66
12
20
4
16
52
18
16
10
44
42
12
2
56
218
1
1
15
3
1
12
15
45
a
1
1
2
2
—
3
1
4
7
4
o a <
4
4
8
8
12
4
16
28
1
1
1
1
1
2
2
4
5
1 5
5
5
5
—
10
—L
10
20
AU
3 u 45
41
76
29
37
29
257
53
46
16
33
45
193
47
60
42
149
96
31
19
146
745
0
< 54
50
89
31
47
32
303
61
58
16
41
59
235
56
74
49
179
140
41
23
204
921
Details about the nature of the malformations will be found in Abstracts 26,27,29 and 30 and data about the mother's age and the number of other children born to her are in Abstract 28.
MIGRATION
The population figures ascertained at each census enable the net migration during the inter-censal periods to be calculated. Table W shows that
. i^ during the period of approximately four and a half years between the lVi, r!x*rU^v\ censuses taken on the 9th October, 1966 and the 25th April, 1971 there was P L ^ a net outward movement of 24,838 persons to all countries including other v^ parts of the British Isles.
^ .^'L
TABLE W . Northern Irelcmd: Net migration during inter-censal period 1966-1971
Population, Census of 1966 Births, 1966-1971 . . . . Deaths, 1966-1971 . . . . Natural increase* . . . . Population 1966 plus natural increase Population, Censis of 1971 Net movement outwards .
Males
723,884 76,518 38,102 38,416
762,300 754,676
7,624
Females
760,891 72,188 34.476 37,712
798,603 781,389 17,214
Total
1,484,775 148,706 72,578 76,128
1,560,903 1,536,065
24,838 * The excess of births over deaths.
Table Wl shows the natural increase in the population for each inter-censal period since birth and death registration commenced in 1864, together with the net movement outwards and the percentage of the increase lost by migration.
TABLE Wl. Northern Ireland: Inter-censal variations in population, 1871-1971.
period
1871-1881 1881-1891 1891-1901 1901-1911 1911-1926 1926-1937 1937-1951 1951-1961 1961-1966 1966-1971
Population at beginning of
period
1,359,190 1,304,816 1,236,056 1,236,952 1,250,531 1,256,561 1,279,745 1,370,921 1,425,042 1,484,775
Natural
increase*
104,350 71,910 68,634 78,996
113,603 80,835
158,443 146,349 97,434 76,128
Net movement outwards
158,724 140,670 67,738 65,417
107,573t 57,651 67,267t 92,228 37,701 24,838
Percentage of increase lost by migration
152 196 99 83 95 71 42 63 39 33
* Excess of births over deaths. t Including deaths in H.M. Forces and Mercantile Marine which occurred outside Northern Ireland.
It is estimated that during the year ended 30 June, 1974 the net outward j ^ ^ migration amounted to 11,000 persons. ""^ ^j^*^ i .
43
C^«LO
ADMINISTRATION
Introductory The administrative functions of the Registrar General comprise the registration of births (live and still), deaths, marriages and adoptions, and the provision or supervision of machinery for dealing with preliminaries to marriages other than those according to the rites of the
Svt^c^^fiHvo Roman Catholic Church. Buildings licensed or registered for marriages The number of places of
" ^ ^\HO worship (other than those belonging to the Roman Catholic Church) in which marriages could be solemnised, as at 31st December in each of the years 1971, 1972, 1973 and 1974 are as follows:
Denomination Church of Ireland Presbyterian Methodist Others
J971 414 513 162 333
1972 414 516 163 346
1973 415 515 161 353
1974 414 516 160 369
TOTAL 1,422 1,439 1,444 1,459
Legitimacy Acts (N.I.), 1928 to 1961 Under these Acts an illegitimate child whose parents have married is, subject to certain conditions, legitimated, and the Registrar General is empowered to authorise the registration or re-registration of the birth. During 1974 the registration or re-registration of the births of 211 children was authorised, the comparative figures for 1973 and 1972 being 130 and 193 respectively. Adoption Act (N.I.)> 1967 and Adoption (Hague Convention) Act (N.I.) 1969 Registers of children adopted under the provisions of the above Acts and of the previous Adoption Acts of 1929 and 1950 are kept in the General Register Office, to which the adoption orders made by the Courts are transmitted. A certified copy of an entry in the Adopted Children Register is evidence of adoption, and is also evidence of the date of birth of the adopted child. The children whose adoptions were recorded in the Adopted Children Registers during 1974 numbered 332 whilst the figures for 1973 and 1972 were 407 and 426 respectively. Searches and certificates The original records of live births, deaths, and marriages registered in Northern Ireland were in the custody of local registration officers until 1 October 1973*, since which date the original records of births and deaths have been centralised in the General Register Office at Oxford House 49/55 Chichester Street Belfast; marriage original records are held by the local Registrars. The following statement shows the activity during 1974 by way of searches and issue of certificates from the General Register Office:—
• The date of introduction of a new system of registration in Northern Ireland: See The Births, Deaths and Marriages Registration (N.I.) Order 197J.
44
YEAR
1927
1937
1951
*1957 1958 1959 1960 1961 1962 1963 1964 1965
*1966 1967 1968 1969 1970
1971 1972 1973 1974
OFFICIAL
Searches
56
94
222
319 421 536 449 382 439 462 476 498 352 281 284 218 224
294 254 373 415
Certificates
29
88
220
305 382 521 441 375 433 450 472 493 357 273 279 210 224
286 254 377 415
Searches
109
363
1,683
2,278 2,420 2,405 2,631 2,884 3,098 2,979 2,871 3,198 3,959 3,992 4,181 4,539 4,056
3,977 4,587 7,758
23,313
PAID
Certificates
Full
112
290
1,609
2,498 2,331 2,256 2,783 2,944 3,362 3,505 3,424 3,682 4,456 4,499 4,585 4,722 4,390
4,306 4,996 8,889
26,606
Short
—
—
1,270
1,855 1,678 1,638 1,864 1,907 2,131 2,377 2,459 2,663 3,156 3,137 3,596 3,165 3,787
3,455 3,761
10,052 39,393
Fees Received
£ s. d. 19 9 0
55 2 0
317 0 6
702 12 0 673 6 6 657 1 6 779 8 0 826 17 0 928 3 6 955 13 0 937 9 6
1,017 7 0 1,587 14 0 1,730 0 6 1,810 14 6 1,832 17 0 1,773 9 0
£ P 1,712.05 1,960.40 3,766.40
12,175.22
1966. * Fees for certificates and searches were increased with effect from the 21st April, 1956 and the 1st April
Verifications Requests for the verification of particulars of events registered are received from Government Departments in connection with claims for pensions, etc. During the year the number of cases dealt with was 13,487.
METEOROLOGY The following synopsis of the weather experienced in Northern Ireland
during 1974 is furnished by the Director-General, Meteorological Office, through the Climatological and Public Records Office, Tyrone House, Ormeau Avenue, Belfast. The term average equals 100 per cent and where used it refers to the 35 year period 1916 to 1950 with respect to rainfall and to the World Meteorological Organisations standard 30 year period 1941 to 1970 for temperature and sunshine.
Tables compiled and attached give data in respect of certain stations; columns 2 and 3 give the highest and lowest air temperatures recorded on any date during the month indicated; in columns 4 and 5 the mean daily maximum and minimum air temperatures are given. There is also a table giving similar data related to Northern Ireland as a whole based on a selection of stations appropriate to the meteorological element and not necessarily those whose data are published in the preceding pages. This information smoothes out the variations experienced in different parts of the Province and therefore gives a general picture. The "Highest" and "Lowest" however refer to values from around 60 stations recording temperatures in Northern Ireland and are not restricted to the 7 stations data given in the preceding pages.
45
r\-e„ t^
Temperature is given in degrees centigrade: to convert actual values to fahrenheit multiply by 9, divide by 5 and add 32 degrees. To convert "difference from average" temperatures in the Centigrade Scale to Fahrenheit 1.0 degrees centigrade = 1.8 degrees fahrenheit.
January had above average rainfall (general value 145 per cent.), above average temperatures and below average sunshine (77 per cent.). It was the wettest, mildest and stormiest January month in some areas this century. In parts of Co. Down notably Castlewellan Forest and TuUymore Park monthly rainfall totals exceeded 300 millimetres. Deer's Meadow in the Mourne Mountains had a monthly total of 430 milHmetres.
Temperatures were well above average. It was the mildest January for at least 20 years. At Hillsboro in Co. Down it was the mildest since 1932. The unusually low frequency of frost was a very noteworthy feature. It was the stormiest January on record. Mean hourly wind speeds of 54 knots with a gust speed of 108 knots were recorded at Kilkeel, Co. Down on 12th and this gust speed was the highest recorded in Northern Ireland since records began. The severe gales of 12th caused widespread damage and serious disruption to traffic.
February was mild and wet and sunshine was below normal. Rainfall was 128 per cent., sunshine 85 per cent, and temperatures 1,2 degrees centigrade above average. There were 2 occurrences of gales in Eastern areas, 1 of fog, 1 of hail and 3 of snow or sleet. There were 5 occurrences of air frost and 12 of ground frost inland and below average frequency.
March rainfall was above average in the West but below normal elsewhere (a general value of 78 per cent.). Temperatures were below average by 0.5 degrees centigrade. Sunshine was 97 per cent, of normal. There were 3 occurrences of snow/sleet, 2 of hail, 2 of fog and 1 of gale. There were 8 occurrences of air frost and 18 of ground frost away from coasts.
April was very dry, the driest in many places since 1938. There were partial droughts and droughts in some areas between 1st and 10th and between 12th and 29th. The general value for rainfall was 41 per cent. Temperatures were about average whilst sunshine was 138 per cent and some areas had their sunniest April since 1938. Aldergrove in Co. Antrim had its sunniest April since records began in 1927. There were 2 occurrences of snow/sleet, 6 of air frost and 13 of ground frost.
May was cool, dull and wet. Rainfall was 109 per cent., sunshine 74 per cent, and temperatures were 0.5 to 1.0 degrees centigrade below normal. There were no gales, 2 occurrences of air frost and 8 of ground frost, 1 of hail and 1 of thunder.
June was cool and dry with normal amounts of sunshine. Dry spells occurred between 11th and 15th and between 20th and 28th. Rainfall was 66 per cent., sunshine 103 per cent and temperatures 1.0 degrees centigrade below average. There was 1 occurrence of air frost and 7 of groundfrost away from coasts. There were 2 occurrences of hail, 2 of thunder and 2 of fog.
July was cool and dull with just below normal rainfall. Rainfall was 97 percent., sunshine 92 per cent, and temperatures 0.7 degrees centigrade below average. It was the coolest July in a few places since 1965. There were no occurrences of air frost but 1 or 2 of ground frost in hilly areas. There was 1 occurrence of thunder, 2 of fog and no gales.
46
August had below average temperatures and below average rainfall t h o u ^ sunshine was well above normal. Rainfall was 77 per cent., sunshine 112 per cent, and temperatures were 0.2 degrees centigrade below average. There was 1 occurrence of fog, no frost, 1 of hail.
September was cold and wet though sunshine was a little above average. It was the coolest September in most places since 1952 and the wettest since 1946. In the Moume Mountains it was the wettest 1st to 24th September period on record. The period 16th to 30th September was the coldest such period this century.
Temperatures were 2.1 degrees centigrade below normal but during period 16th to 30th September they were 3.5 degrees centigrade below average. There were 2 occurrences of air frost and 6 of ground frost. There were 3 occurrences of hail, 1 of fog, 2 of gale and 3 of thunder.
October was comparatively dry though very cold. It was the coldest October generally this century. Rainfall was 60 per cent., sunshine 111 per cent, and temperatures 2.5 degrees centigrade below average. There were no occurrences of air frost but 10 of ground frost. There were 3 occurrences of hail and 1 of fog with no gales.
November was cool with above average rainfall and sunshine. Temperatures were 1.0 degrees centigrade below average. Rainfall was 105 per cent, whilst sunshine was 129 per cent. It was the sunniest November in some places this century. There were 6 occurrences of air frost and 18 of ground frost, an above average frequency. There were 3 occurrences of hail, 1 of snow/sleet, 1 of thunder and 1 of fog. Gales occurred on 23rd and 24th when some structural damage was caused and gust speeds over the 2 day period reached 60 knots and over in exposed places.
December rainfall was a little above average with a general value of 102 per cent. Sunshine was 80 per cent, and temperatures were 2.4 degrees centigrade above normal. It was the mildest December month in most places since 1934. The Christmas period 22nd to 28th December was the mildest such period this century. There were few if any occurrences of air frost and only 3 of ground frost (well below average). There were an unusually high number of days of strong to gale force winds. There were 2 or 3 occurrences of snow or sleet and it lay to depths of between 1 and 3 centimetres over higher ground. There were 3 occurrences of hail.
The year 1974 had about average rainfall with temperatures 0.2 degrees centigrade below average. Sunshine was a little above normal with a value of 102 per cent.
Features of 1974 were the wetness and storminess of January, February and the unusual mildness of the same 2 months; the very severe gales of 11th and 12th January with gusts to over 100 knots at Kilkeel, Co. Down; the very sunny April and November months; the coolness of the May to November period and in contrast the mildness of December. The wetness of September was also noteworthy. The pattern of the last 6 months of the year was not reflected in the amount of rain that fell but in the fact that during the period there were few if any sustained dry spells. Measurable rain fell on practically every day throughout the entire period August to December.
47
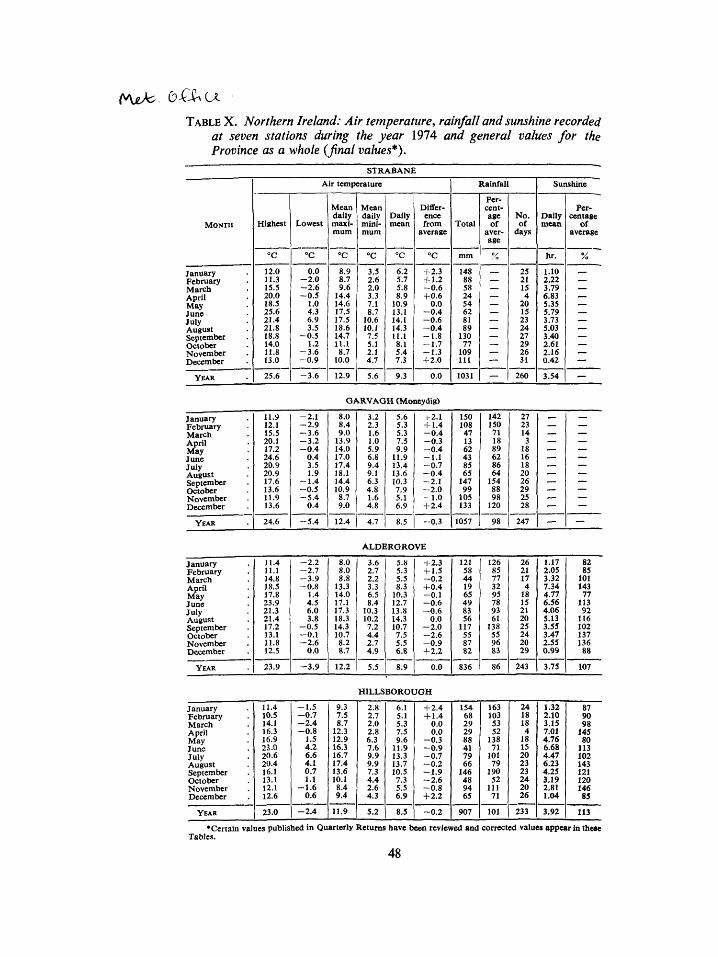
t\ji}c O-Ci CA
TABLE X. Northern Ireland: Air temperature, rainfall and sunshine recorded at seven stations during the year 1974 and general values for the Province as a whole (final values*).
STRABANE
MONTH
January February March April May
July August September October November December
YEAR
Highest
°C
12.0 11.3 15.5 20.0 18.5 25.6 21.4 21.8 18.8 14.0 11.8 13.0
25.6
Air temperature
Lowest
°C
0.0 - 2 . 0 - 2 . 6 - 0 . 5
1.0 4.3 6.9 3.5
- 0 . 5 1.2
- 3 . 6 - 0 . 9
- 3 . 6
Mean daily maximum
"C
8.9 8.7 9.6
14.4 14.6 17.5 17.5 18.6 14.7 11.1 8.7
10.0
12.9
Mean daily minimum
"C
3.5 2.6 2.0 3.3 7.1 8.7
10.6 10.1 7.5 5.1 2.1 4.7
5.6
Daily mean
°C
6.2 5.7 5.8 8.9
10.9 13.1 14.1 14.3 11.1 8.1 5.4 7.3
9.3
Dififer-ence from
average
"C
+2 .3 + 1.2 - 0 . 6 +0 .6
0.0 - 0 . 4 - 0 . 6 - 0 . 4 - 1 . 8 - 1 . 7 - 1 . 3 + 2.0
0.0
Total
mm
148 88 58 24 54 62 81 89
130 77
109 111
1031
Rainfall
Percentage of
average
%
— — — — — — — — — •
— — —
No. of
days
25 21 15 4
20 15 23 24 27 29 26 31
260
Sunshine
Daily mean
hr.
1.10 2.22 3.79 6.83 5.35 5.79 3.73 5.03 3.40 2.61 2.16 0.42
3.54
Percentage
of average
%
— — — — — — — — — — — —
GARVAGH (Moneydig)
January February March April May
July August September October November December
YEAR
11.9 12.1 15.5 20.1 17.2 24.6 20.9 20.9 17.6 13.6 11.9 13.6
24.6
- 2 . 1 - 2 . 9 - 3 . 6 - 3 . 2 - 0 . 4
0.4 3.5 1.9
- 1 . 4 - 0 . 5 - 5 . 4
0.4
- 5 . 4
8.0 8.4 9.0
13.9 14.0 17.0 17.4 18.1 14.4 10.9
8.7 9.0
12.4
3.2 2.3 1.6 1.0 5.9 6.8 9.4 9.1 6.3 4.8 1.6 4.8
4.7
5.6 5.3 5.3 7.5 9.9
11.9 13.4 13.6 10.3 7.9 5.1 6.9
8.5
-t-2.1 + 1.4 - 0 . 4 - 0 . 3 - 0 . 4 - 1 . 1 - 0 . 7 - 0 . 4 - 2 . 1 - 2 . 0 - 1 . 0 + 2 . 4
- 0 . 3
150 108 47 13 62 43 85 65
147 99
105 133
1057
142 150 71 18 89 62 86 64
154 88 98
120
98
27 23 14 3
18 16 18 20 26 29 25 28
247
— — — — — — — — — — — —
— — — — — — — — — — — —
ALDERGROVE
January February March April May
July August September October November December
YEAR
11.4 11.1 14.8 18.5 17.8 23.9 21.3 21.4 17.2 13.1 11.8 12.5
23.9
- 2 . 2 - 2 . 7 - 3 . 9 - 0 . 8
1.4 4.5 6.0 3.8
- 0 . 5 - 0 . 1 - 2 . 6
0.0
- 3 . 9
8.0 8.0 8.8
13.3 14.0 17.1 17.3 18.3 14.3 10.7 8.2 8.7
12.2
3.6 2.7 2.2 3.3 6.5 8.4
10.3 10.2 7.2 4.4 2.7 4.9
5.5
5.8 5.3 5.5 8.3
10.3 12.7 13.8 14.3 10.7 7.5 5.5 6.8
8.9
+2 .3 + 1.5 - 0 . 2 + 0 . 4 - 0 . 1 - 0 . 6 - 0 . 6
0.0 - 2 . 0 - 2 . 6 - 0 . 9 + 2.2
0.0
121 58 44 19 65 49 83 56
117 55 87 82
836
126 85 77 32 95 78 93 61
138 55 96 83
86
26 21 17 4
18 15 21 20 25 24 20 29
243
1.17 2.05 3.32 7.34 4.77 6.56 4.06 5.13 3.55 3.47 2.55 0.99
3.75
82 85
101 143 77
113 92
116 102 137 136
88
107
HILLSBOROUGH
January February March April May
July August September October November December
YEAR
11.4 10.5 14.1 16.3 16.9 23.0 20.6 20.4 16.1 13.1 12.1 12.6
23.0
- 1 . 5 - 0 . 7 - 2 . 4 - 0 . 8
1.5 4.2 6.6 4.1 0.7 1.1
- 1 . 6 0.6
- 2 . 4
9.3 7.5 8.7
12.3 12.9 16.3 16.7 17.4 13.6 10.1
8.4 9.4
11.9
2.8 2.7 2.0 2.8 6.3 7.6 9.9 9.9 7.3 4.4 2.6 4.3
5.2
6.1 5.1 5.3 7.5 9.6
11.9 13.3 13.7 10.5 7.3 5.5 6.9
8.5
+ 2.4 + 1.4
0.0 0.0
- 0 . 3 - 0 . 9 - 0 . 7 - 0 . 2 - 1 . 9 - 2 . 6 - 0 . 8 + 2 . 2
- 0 . 2
154 68 29 29 88 41 79 66
146 48 94 65
907
163 103 53 52
138 71
101 79
190 52
111 71
101
24 18 18 4
18 15 20 23 23 24 20 26
233
1.32 2.10 3.15 7.01 4.76 6.68 4.47 6.23 4.25 3.19 2,81 1.04
3.92
87 90 98
145 80
113 102 143 121 120 146 85
113
•Certain values published in Quarterly Returns have been reviewed and corrected values appear in these Tables.
48
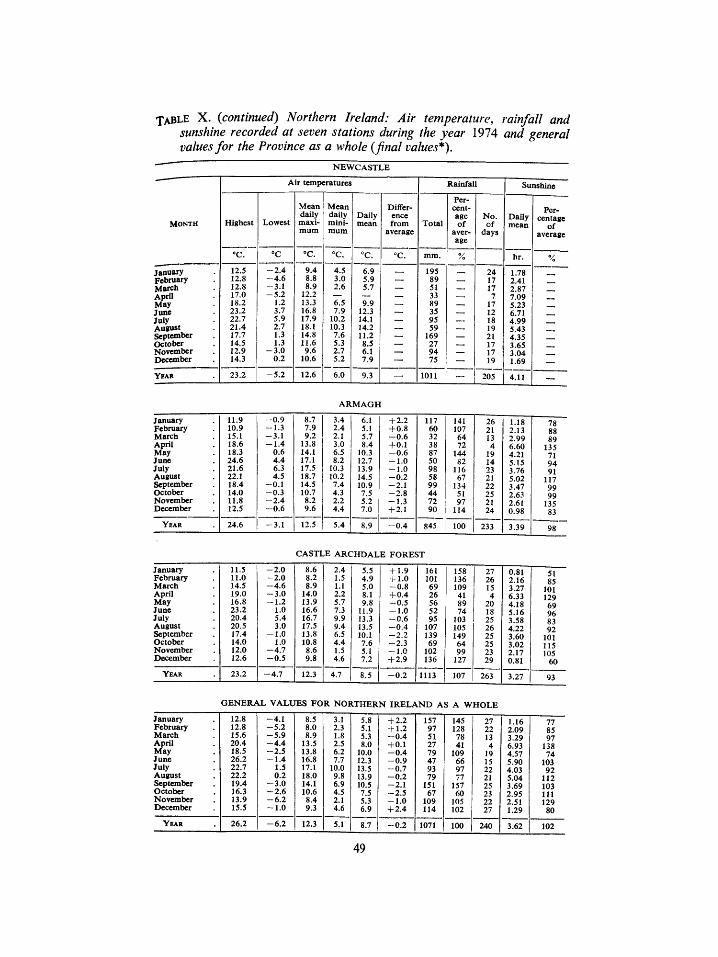
TABLE X. (continued) Northern Ireland: Air temperature, rainfall and sunshine recorded at seven stations during the year 191A and general values for the Province as a whole {final values*).
MONTH
January February March April May June July August September October November December
YEAR
Highest
"C.
12.5 12.8 12.8 17.0 18.2 23.2 22.7 21.4 17.7 14.5 12.9 14.3
23.2
A
Lowest
°C
- 2 . 4 - 4 . 6 - 3 . 1 - 5 . 2
1.2 3.7 5.9 2.7 1.3 1.3
- 3 . 0 0.2
- 5 . 2
ir temp<
Mean daily maximum
°C.
9.4 8.8 8.9
12.2 13.3 16.8 17.9 18.1 14.8 11.6 9.6
10.6
12.6
NEWCASTLE
;ratures
Mean daily minimum
°C.
4.5 3.0 2.6
— 6.5 7.9
10.2 10.3 7.6 5.3 2.7 5.2
6.0
Daily mean
°C.
6.9 5.9 5.7
— 9.9 12.3 14.1 14.2 11.2 8.5 6.1 7.9
9.3
Difference from
average
°C.
— — — — — — — — — — — —
Total
mm.
195 89 51 33 89 35 95 59
169 27 94 75
1011
Rainfall
Percentage of
average
%
— -
N o . of
days
24 17 17 7
17 12 18 19 21 17 17 19
205
Sunshine
Dally mean
hr.
1.78 2.41 2.87 7.09 5.23 6.71 4.99 5.43 4.35 3.65 3.04 1.69
4.11
of average
%
— —
ARMAGH
January February March April May June July August September October November December
YEAR
11.9 10.9 15.1 18.6 18.3 24.6 21.6 22.1 18.4 14.0 11.8 12.5
24.6
- 0 . 9 - 1 . 3 - 3 . 1 - 1 . 4
0.6 4.4 6.3 4.5
- 0 . 1 - 0 . 3 - 2 . 4 - 0 . 6
- 3 . 1
8.7 7.9 9.2
13.8 14.1 17.1 17.5 18.7 14.5 10.7 8.2 9.6
12.5
3.4 2.4 2.1 3.0 6.5 8.2
10.3 10.2 7.4 4.3 2.2 4.4
5.4
6.1 5.1 5.7 8.4
10.3 12.7 13.9 14.5 10.9 7.5 5.2 7.0
8.9
+ 2.2 + 0 . 8 - 0 . 6 + 0.1 - 0 . 6 - 1 . 0 - 1 . 0 - 0 . 2 - 2 . 1 - 2 . 8 - 1 . 3 + 2.1
- 0 . 4
117 60 32 38 87 50 98 58 99 44 72 90
845
141 107 64 72
144 82
116 67
134 51 97
114
100
26 21 13 4
19 14 23 21 22 25 21 24
233
1.18 2.13 2.99 6.60 4.21 5.15 3.76 5.02 3.47 2.63 2.61 0.98
3.39
78 88 89
135 71 94 91
117 99 99
135 83
98
CASTLE ARCHDALE FOREST
January February March April May June July August September October November December
YEAR
11.5 11.0 14.5 19.0 16.8 23.2 20.4 20.5 17.4 14.0 12.0 12.6
23.2
- 2 . 0 - 2 . 0 - 4 . 6 - 3 . 0 - 1 . 2
1.0 5.4 3.0
- 1 . 0 1.0
- 4 . 7 - 0 . 5
- 4 . 7
8.6 8.2 8.9
14.0 13.9 16.6 16.7 17.5 13.8 10.8
8.6 9.8
12.3
2.4 1.5 1.1 2.2 5.7 7.3 9.9 9.4 6.5 4.4 1.5 4.6
4.7
5.5 4.9 5.0 8.1 9.8
11.9 13.3 13.5 10.1 7.6 5.1 7.2
8.5
+ 1.9 + 1.0 - 0 . 8 + 0.4 - 0 . 5 - 1 . 0 - 0 . 6 - 0 . 4 - 2 . 2 - 2 . 3 - 1 . 0 + 2.9
- 0 . 2
161 101 69 26 56 52 95
107 139 69
102 136
1113
158 136 109 41 89 74
103 105 149 64 99
127
107
27 26 15 4
20 18 25 26 25 25 23 29
263
0.81 2.16 3.27 6.33 4.18 5.16 3.58 4.22 3.60 3.02 2.17 0.81
3.27
51 85
101 129 69 96 83 92
101 115 105
60
93
GENERAL VALUES FOR NORTHERN IRELAND AS A WHOLE
January February March April May June July August September October November December
YEAR
12.8 12.8 15.6 20.4 18.5 26.2 22.7 22.2 19.4 16.3 13.9 15.5
26.2
- 4 . 1 - 5 . 2 - 5 . 9 - 4 . 4 - 2 . 5 - 1 . 4
1.5 0.2
- 3 . 0 - 2 . 6 - 6 . 2 - 1 . 0
- 6 . 2
8.5 8.0 8.9
13.5 13.8 16.8 17.1 18.0 14.1 10.6
8.4 9.3
12.3
3.1 2.3 1.8 2.5 6.2 7.7
10.0 9.8 6.9 4.5 2.1 4.6
5.1
5.8 5.1 5.3 8.0
10.0 12.3 13.5 13.9 10.5 7.5 5.3 6.9
8.7
+ 2.2 + 1.2 - 0 . 4 + 0.1 - 0 . 4 - 0 . 9 - 0 . 7 - 0 . 2 - 2 . 1 - 2 . 5 - 1 . 0 + 2.4
- 0 . 2
157 97 51 27 79 47 93 79
151 67
109 114
1071
145 128 78 41
109 66 97 77
157 60
105 102
100
27 22 13 4
19 15 22 21 25 23 22 27
240
1.16 2.09 3.29 6.93 4.57 5.90 4.03 5.04 3.69 2.95 2.51 1.29
3.62
77 85 97
138 74
103 92
112 103 111 129
80
102
49

ABSTRACTS 1974
51
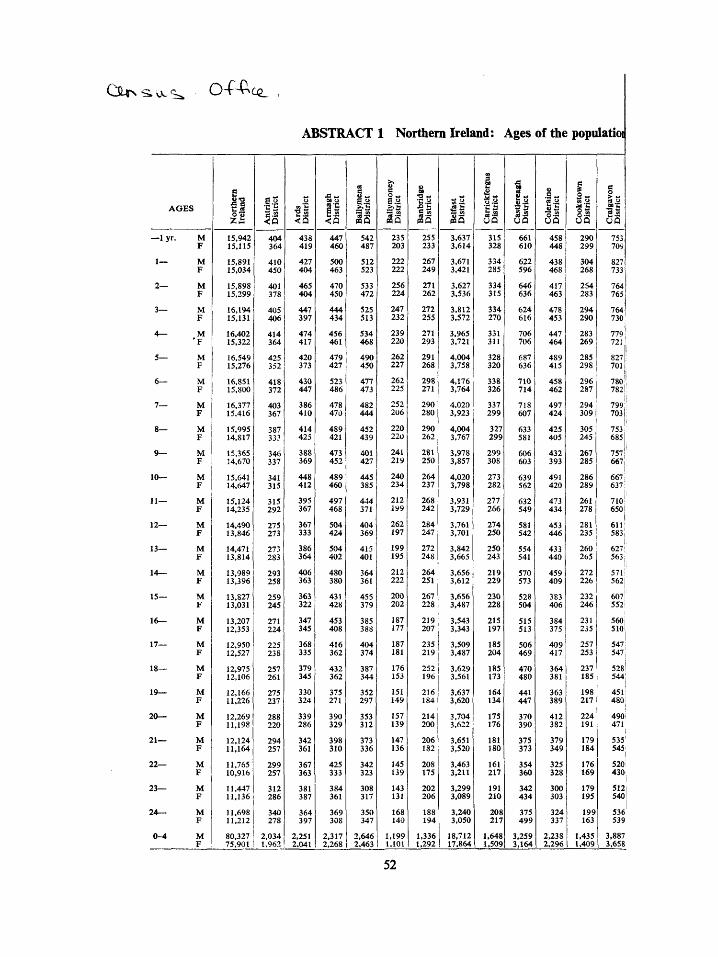
CJLTN ^v>eS:^ 044\a2_ „
AGES
-lyr.
1—
2—
3—
4—
5—
6—
7—
8—
9—
lo
ll—
12—
13—
14—
15—
16—
17—
18—
19—
20—
21—
22—
23—
24—
0-4
M F M F M F M F
M 'F M F
M F
M F
M F M F
M F M F M F M F M F
M F
M F M F
M F
M F
M F M F M F M F M F M F
s •s s oTS
15,942 15.115
15,891 15,034
15,898 15,299
16,194 15,131
16,402 15,322
16,549 15,276
16,851 15,800
16.377 15.416
15,995 14,817
15,365 14,670
15,641 14,647
15,124 14,235
14,490 13,846
14,471 13,814
13,989 13,396
13,827 13,031
13,207 12.353
12.950 12,527
12,975 12,106
12,166 11.226
12.269 11.198
12,124 11,164
11,765 10,916
11,447 11,136
11,698 11.212
80.327 75.901
•n is
la 404 364
410 450
401 378
405 406
414 364
425 352
418 372
403 367
387 333
346 337
341 315
315 292
275 273
273 283
293 258
259 245
271 224
225 238
257 261
275 237
288 220
294 257
299 257
312 286
340 278
2.034 1.962
A B S T R A C T 1 Northern Ireland:
09 U
438 419
427 404
465 404
447 397
474 417
420 373
430 447
386 410
414 423
388 369
448 412
395 367
367 333
386 364
406 363
363 322
347 345
368 335
379 345
330 324
339 286
342 361
367 363
381 387
364 397
2.251 2.041
447 460
500 463
470 450
444 434
456 461
479 427
523 486
478 470
489 421
473 452
489 460
497 468
504 424
504 402
480 380
431 428
453 408
416 362
432 362
375 271
390 329
398 310
425 333
384 361
369 308
2.317 2,268
a e
u as 542 487
512 523
533 472
525 513
534 468
490 450
477 473
482 444
452 439
401 427
445 385
444 371
404 369
415 401
364 361
455 379
385 388
404 374
387 344
352 297
353 312
373 336
342 323
308 317
350 347
2,646 2.463
a o „
235 203
222 222
256 224
247 232
239 220
262 227
262 225
252 206
220 220
241 219
240 234
212 199
262 197
199 195
212 222
200 202
187 177
187 181
176 153
151 149
157 139
147 136
145 139
143 131
168 140
1,199 1,101
•§1 PQQ
255 233
267 249
271 262
272 255
271 293
291 268
298 271
290 280
290 262
281 250
264 237
268 242
284 247
272 248
264 251
267 228
219 207
235 219
252 196
216 184
214 200
206 182
208 175
202 206
188 194
1,336 1,292
In 3,637 3,614
3,671 3,421
3,627 3.536
3,812 3,572
3,965 3.721
4,004 3.758
4.176 3,764
4,020 3,923
4,004 3,767
3,978 3,857
4,020 3.798
3,931 3,729
3,761 3,701
3,842 3,665
3,656 3,612
3,656 3,487
3,543 3,343
3,509 3,487
3,629 3,561
3,637 3,620
3,704 3.622
3.651 3,520
3,463 3,211
3,299 3,089
3,240 3,050
18.712 17.864
1
«-s
315 328
334 285
334 315
334 270
331 311
328 320
338 326
337 299
327 299
299 308
273 282
277 266
274 250
250 243
219 229
230 228
215 197
185 204
185 173
164 134
175 176
181 180
161 217
191 210
208 217
1.648 1.509
Ages of the populatioi
M
g -OQ
661 610
622 596
646 636
624 616
706 706
687 636
710 714
718 607
633 581
606 603
639 562
632 549
581 542
554 541
570 573
528 504
515 513
506 469
470 480
441 447
370 390
375 373
354 360
342 434
375 499
3,259 3,164
u .S-n o
da 458 448
438 468
417 463
478 453
447 464
489 415
458 462
497 424
425 405
432 393
491 420
473 434
453 446
433 440
459 409
383 406
384 375
409 417
364 381
363 389
412 382
379 349
325 328
300 303
324 337
2.238 2.296
0 to
63 290 299
304 268
264 283
294 290
283 269
285 298
296 287
294 309
305 245
267 285
286 289
261 278
281 235
260 265
272 226
232 246
231 235
257 253
237 185
198 217
224 191
179 184
176 169
179 195
199 163
1,435 1,409
a o > « a.a o5 753: 709;
8271 733
764 765
764 730
779 721
8271 701
1 780 7821
799' 7031
753 685
757; 6671
667 6371
7io! 650
611: 5831
627 i 563;
571 562
607 552 i
560 510
547; 547,
528' 544
451 480
490 471
535 545
520 430
512 540
536 539
3,887 3,658
52
according to the census of 1971.
II 529 494
483 451
535 480
4] 4 322
389 319
381 328
393 324
400 323
399 322
360 323
2,592 2.326
486 389
441 403
426 439
£6
552 452
493 449
513 474
556 480
527 447
518 462
484 451
481 418
442 453
438 423
430 436
401 412
425 407
375 362
404 387
482 398
481 443
448 446
476 441
490 472
466 434
482 396
493 426
441 457
444 448
443 444
441 418
452 420
426 391
406 380
382 355
327 270
325 272
298 284
305 253
264 281
254 257
2.316 2.072
498 473
457 480
497 457
« -o „
11 II
475 469
458 453
490 516
553 490
471 521
537 517
307 289
330 305
321 305
311 297
325 308
317 279
488 471
509 490
536 5i>4
517 498
501 455
530 507
518 484
548 449
518 444
502 384
394 326
398 306
345 325
341 372
327 349
371 352
2.385 2.332
289 272
309 295
322 302
E5
30
321 272
339 245
333 251
347 272
330 271
295 250
288 233
315 202
253 210
220 227
209 181
193 189
203 196
212 200
166 189
216 207
1.557 1.463
308 312
313 271
315 309
314 282
305 274
307 274
301 273
289 266
261 240
258 246
253 253
258 211
208 266
205 229
234 193
241 222
218 220
203 224
247 199
238 210
229 181
255 178
251 172
261 150
230 193
1,555 1.448
u 801 737
801 686
765 773
817 713
794 752
780 699
772 703
732 716
708 609
622 616
671 623
612 565
573 540
584 599
544 561
538 531
496 458
529 478
560 498
580 445
554 405
596 474
565 508
557 549
633 572
3.978 3.661
L 11
1,038 1.012
1.076 961
1.116 967
1.056 1.028
1,059 1.003
1.094 1,056
1.161 1.044
1,072 993
1.055 1.015
991 980
968 961
1,013 907
907 916
917 831
834 823
875
783 763
742 767
792 709
748 665
740 687
740 597
728 602
702 624
668 608
5.345 4.971
i 390 350
395 367
378 368
386 361
381 312
381 342
387 345
355 346
347 322
332 333
340 369
320 340
317 306
314 317
308 308
316 288
271 276
292 245
276 251
234 227
275 220
214 222
217 217
250 232
214 212
1,930 1.758
I 904 804
789 871
849 824
866 819
874 802
887 775
909 807
889 768
827 770
771 751
819 828
779 755
766 687
732 763
769 740
713 676
703 674
687 690
594 628
543 511
522 510
527 477
490 503
473 438
509 451
4.282 4.120
154 136
160 131
157 131
142 139
167 132
141 164
160 149
157 149
144 160
128 144
167 134
132 128
124 137
125 134
120 125
131 147
132 138
130 121
133 105
113 93
116 108
780 669
779 723
772 734
768 713
759 691
834 675
727 788
754 717
779 67 V
710 662
491 498
500 472
497 479
513 465
477 473
508 490
482 463
445 444
463 405
725 656
605 632
650 593
688 562
591 548
582 518
537 491
514 481
507 480
445 405
489 494
458 421
490 481
488 550
519 620
,871 .533
452 429
435 407
382 378
417 407
403 344
385 353
367 329
348
334
361 361
383 307
361 308
356 328
342 387
393 431
392 416
2.487 2.368
460 424
427 476
423 440
465 440
463 438
464 450
463 459
499 416
421 411
426 420
426 422
415 431
429 411
421 413
410 400
408 365
367 376
392 330
348 282
326 285
342 259
312 271
320 240
325 226
2.253 2.190
403 391
391 379
463 381
424 386
426 414
400 434
415 349
393 396
425 365
395 364
377 358
345 351
341 345
332 308
342 337
318 313
309 304
299 272
262 236
262 215
221 238
229 237
214 231
257 233
2.034 1,963
2 —
3 —
6 —
7 —
M 10— F
M 11— F
M 12-F
M 13— F
M 14— F
M 15— F
M 16— F
M 17-F
M 18— F
M 19-F
M 20— F
M 21— F
M 22— F
M 23— F
M 2 4 — F
53
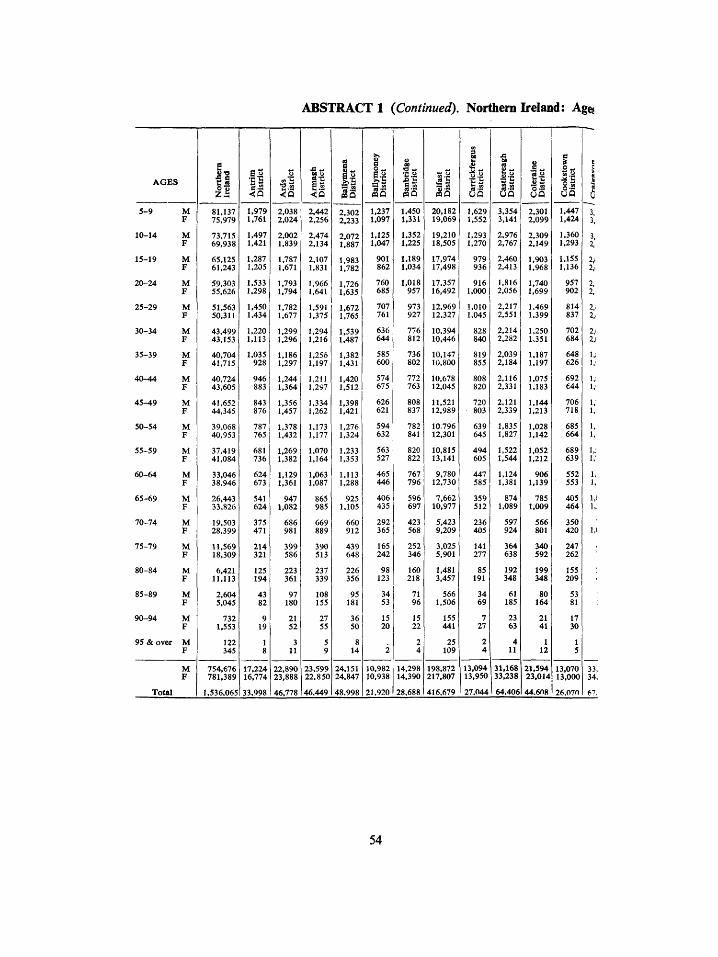
ABSTRACT 1 {Continued). Northern Ireland: Ages
AGES
5-9
10-14
15-19
20-24
25-29
30-34
35-39
40-44
45-49
50-54
55-59
60-64
65-69
70-74
75-79
80-84
85-89
90-94
95 & over
Total
M F
M F
M F
M F
M F
M F
M F
M F
M F
M F
M F
M F
M F
M F
M F
M F
M F
M F
M F
M F
s 0 O
81.137 75,979
73.715 69,938
65.125 61.243
59,303 55.626
51,563 50,311
43.499 43.153
40.704 41.715
AO.llA 43.605
41,652 44,345
39.068 40,953
37,419 41,084
33,046 38,946
26.443 33.826
19.503 28.399
11.569 18,309
6,421 11,113
2.604 5.045
732 1,553
122 345
754.676 781.389
1.536,065
^5 1.979 1.761
1,497 1.421
1,287 1.205
1.533 1.298
1.450 1.434
1.220 1,113
1.035 928
946 883
843 876
787 765
681 736
624 673
541 624
375 471
214 321
125 194
43 82
9 19
1 8
17.224 16,774
33,998
• 0 CO
^ ( 5 2,038 2,024
2,002 1,839
1.787 1.671
1.793 1.794
1.782 1.677
1.299 1.296
1.186 1.297
1.244 1,364
1,356 1,457
1,378 1,432
1,269 1,382
1,129 1,361
947 1,082
686 981
399 586
223 361
97 180
21 52
3 11
22,890 23,888
46,778
M U
2,442 2,256
2,474 2,134
2,107 1,831
1,966 1.641
1.591 1.375
1,294 1.216
1.256 1.197
1,211 1,297
1.334 1.262
1.173 1.177
1,070 1,164
1.063 1.087
865 985
669 889
390 513
237 339
108 155
27 55
5 9
23.599 22.850
46,449
I'l l as
2.302 2.233
2.072 1.887
1.983 1.782
1.726 1.635
1.672 1.765
1.539 1.487
1.382 1.431
1.420 1,512
1,398 1,421
1,276 1,324
1,233 1,353
1,113 1.288
925 1.105
660 912
439 648
226 356
95 181
36 50
8 14
24.151 24.847
48.998
1 is
1.237 1.097
1.125 1.047
901 862
760 685
707 761
636 644
585 600
574 675
626 621
594 632
563 527
465 446
406 435
292 365
165 242
98 123
34 53
15 20
2
10.982 10.938
21,920
o 00 •a -
!l pqQ 1.450 1.331
1.352 1.225
1.189 1.034
1,018 957
973 927
776 812
736 802
772 763
808 837
782 841
820 822
767 796
596 697
423 568
252 346
160 218
71 96
15 22
2 4
14.298 14.390
28.688
i'S
20.182 19.069
19.210 18.505
17.974 17,498
17,357 16,492
12,969 12,327
10,394 10,446
10,147 10,800
10,678 12,045
11,521 12,989
10.796 12,301
10,815 13,141
9,780 12,730
7,662 10,977
5.423 9.209
3,025 5,901
1,481 3,457
566 1,506
155 441
25 109
198,872 217.807
416,679
3
no
U Q 1.629 1.552
1.293 1.270
979 936
916 1.000
1.010 1.045
828 840
819 855
808 820
720 803
639 645
494 605
447 585
359 512
236 405
141 277
85 191
34 69
7 27
2 4
13.094 13,950
27.044
OQ
3,354 3,141
2,976 2,767
2,460 2,413
1,816 2,056
2,217 2,551
2,214 2.282
2,039 2,184
2,116 2,331
2,121 2,339
1,835 1,827
1,522 1,544
1.124 1.381
874 1.089
597 924
364 638
192 348
61 185
23 63
4 11
31,168 33.238
64.406
as 2.301 2.099
2,309 2,149
1.903 1,968
1.740 1.699
1,469 1,399
1,250 1,351
1,187 1,197
1,075 1,183
1,144 1,213
1.028 1.142
1.052 1.212
906 1.139
785 1,009
566 801
340 592
199 348
80 164
21 41
1 12
21.594 23.014
44.608
0 fits u
as 1.447 1.424
1.360 1.293
1,155 1,136
957 902
814 837
702 684
648 626
692 644
706 718
685 664
689 639
552 553
405 464
350 420
247 262
155 209
53 81
17 30
1 5
13.070 13.000
26.070
c
s
J 3, 3,
3, 2,
2,1 2,1
2, 2,:
2,. 2..
2,i 2.(
l,i 1;
1,: 1,'
i ; 1.!
1,: 1,1
1.; 1,'
1, 1,
1,1 1,:
i,(
;
i
33, 34,
67.
54
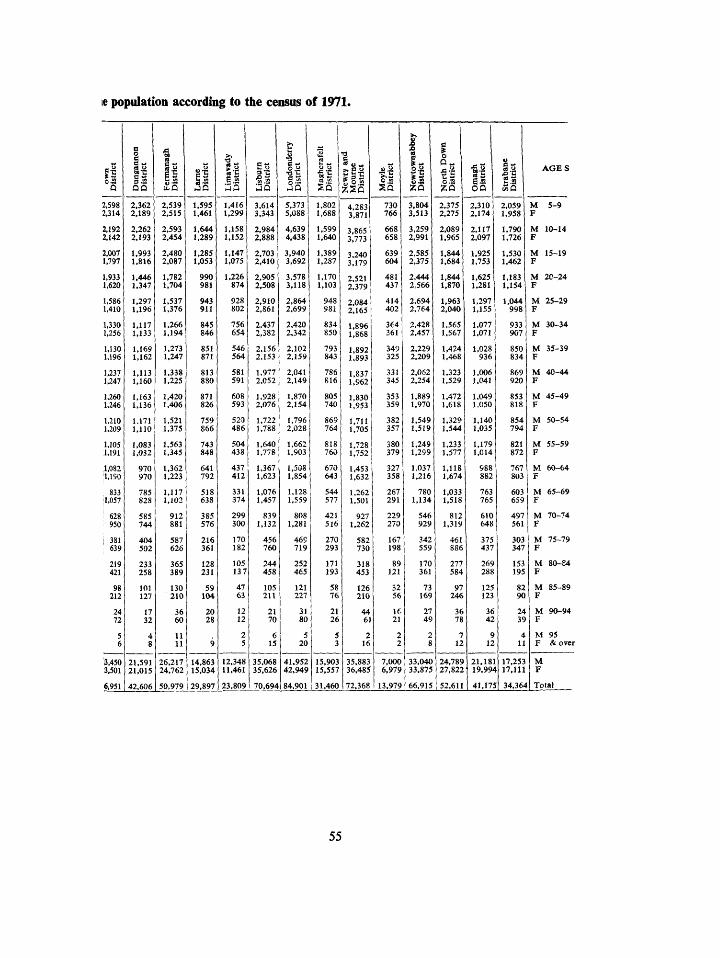
le population according to the census of 1971.
4 °5
2.598 2,314
2,192 2,142
2,007 1,797
1,933 1,620
1,586 1,410
1,330 1,256
1,130 1,196
1,237 1,247
1,260 1,246
1,210 1,209
1,105 1,191
1,082 1,190
833 :1,057
628 950
i 381 639
219 421
98 212
24 72
5 6
13,450 3,501
6,951
B O e a ^
11 2,362 2.189
2.262 2,193
1.993 1.816
1,446 1.347
1.297 1.196
1.117 1.133
1.169 1.162
1.113 1.160
1,163 1,136
1.171 1,110
1,083 1.032
970 970
785 828
585 744
404 502
233 258
101 127
17 32
4 8
21.591 21.015
42.606
•a
i l 53-2
2,539 2,515
2.593 2.454
2,480 2,087
1.782 1.704
1.537 1,376
1,266 1.194
1,273 1,247
1,338 1,225
1,420 1,406
1,521 1,375
1,563 1,345
1,362 1,223
1,117 1,102
912 881
587 626
365 389
130 210
36 60
11 11
26,217 24,762
50,979
8-
1,595 1,461
1,644 1,289
1,285 1.053
990 981
943 911
845 846
851 871
813 880
871 826
759 866
743 848
641 792
518 638
385 576
216 361
128 231
59 104
20 28
9
14.863 15.034
29.897
S.2
1.416 1,299
1,158 1,152
1,147 1.075
1,226 874
928 802
756 654
546 564
581 591
608 593
520 486
504 438
437 412
331 374
299 300
170 182
105 137
47 63
12 12
2 5
12.348 11.461
23,809
2(5 3,614 3,343
2,984 2,888
2,703 2,410
2,905 2,508
2,910 2,861
2,437 2,382
2,156 2,153
1,977 2,052
1,928 2,076
1,722 1,788
1,640 1,778
1.367 1,623
1.076 1,457
839 1,132
456 760
244 458
105 211
21 70
6 15
35,068 35,626
70,694
u u
o.i> C to
25 5,373 5.088
4,639 4,438
3.940 3.692
3.578 3,118
2.864 2.699
2,420 2,342
2,102 2,159
2.041 2.149
1.870 2,154
1,796 2,028
1,662 1,903
1,508 1,854
1.128 1,559
808 1,281
469 719
252 465
121 227
31 80
5 20
41.952 42.949
84,901
1 1-1 (0 «
1.802 1,688
1,599 1.640
1.389 1,287
1,170 1,103
948 981
834 850
793 843
786 816
805 740
869 764
818 760
670 643
544 577
421 516
270 293
171 193
58 76
21 26
5 3
15,903 15,557
31,460
Z2Q
4,283 3,871
3.865 3,773
3,240 3,179
2,521 2,379
2,084 2,165
1,896 1,868
1.892 1.893
1.837 1.962
1,830 1,953
1,711 1,705
1,728 1.752
1,453 1,632
1,262 1,501
927 1,262
582 730
318 453
126 210
44 61
2 16
35.883 36.485
72.368
730 766
668 658
639 604
481 437
414 402
364 361
349 325
331 345
353 359
382 357
380 379
327 358
267 291
229 270
167 198
89 121
32 56
16 21
2 2
7.000 6.979
13.979
>>
1 h Is 3.804 3.513
3.259 2.991
2.585 2,375
2,444 2.566
2,694 2.764
2.428 2.457
2.229 2,209
2,062 2,254
1,889 1,970
1,549 1,519
1,249 1,259
1.037 1,216
780 1,134
546 929
342 559
170 361
73 169
27 49
2 8
33,040 33.875
66,915
o
2,375 2,275
2.089 1.965
1.844 1.684
1.844 1.870
1,963 2,040
1,565 1,567
1,424 1,468
1,323 1,529
1,472 1,618
1,329 1,544
1,233 1,577
1,118 1,674
1,033 1,518
812 1,319
461 886
277 584
97 246
36 78
7 12
24,789 27,822
1 52,611
n Is 2,310 2,174
2,117 2,097
1.925 1.753
1.625 1.281
1,297 1,155
1,077 1,071
1,028 936
1.006 1,041
1,049 1.050
1,140 1,035
1,179 1,014
988 882
763 765
610 648
375 437
269 288
125 123
36 42
9 12
21.181 19.994
41.175
2.059 1.958
1,790 1,726
1.530 1.462
1.183 1.154
1.044 998
933 907
850 834
869 920
853 818
854 794
821 872
767 803
603 659
497 561
303 347
153 195
82 90
24 39
4 11
17,253 17,111
34,364
A G E S
M 5-9 F
M 10-14 F
M 15-19 F
M 20-24 F
M 25-29 F
M 30-34 F
M 35-39 F
M 40-44 F
M 45-49 F
M 50-54 F
M 55-59 F
M 60-64 F
M 65-69 F
M 70-74 F
M 75-79 F
M 80-84 F
M 85-89 F
M 90-94 F
M 95 F & over
M F
Total
55
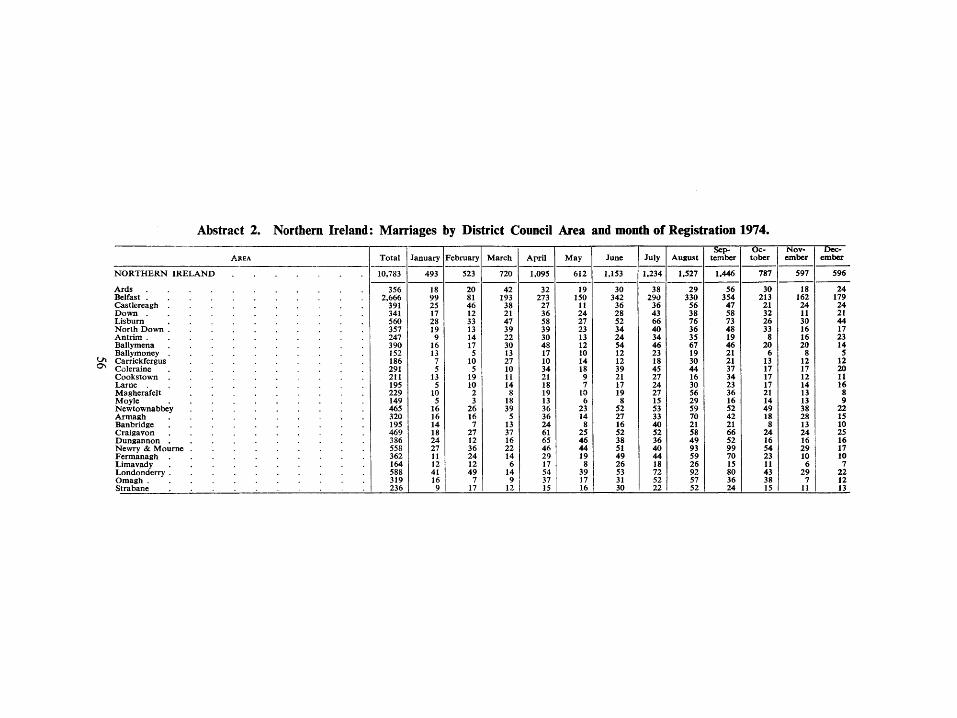
Abstract 2. Northern Ireland: Marriages by District Council Area and month of Registration 1974.
AREA
N O R T H E R N I R E L A N D
Ards Belfast . Castlereagh Down . Lisburn Nor th Down . Antrim . Ballymena Ballymoney Carrickfergus Coleraine Cookstown . Lame . Magherafelt Moyle Newtownabbey Armagh Banbridge Craigavon Dungannon . Newry & M o u m e Fermanagh . Limavady Londonderry . Omagh . Strabane
Total
10,783
356 2,666
391 341 560 357 247 390 152 186 291 211 195 229 149 465 320 195 469 386 558 362 164 588 319 236
January
493
18 99 25 17 28 19 9
16 13 7 5
13 5
10 5
16 16 14 18 24 27 11 12 41 16 9
February
523
20 81 46 12 33 13 14 17
5 10
5 19 10 2 3
26 16 7
27 12 36 24 12 49
7 17
March
720
42 193 38 21 47 39 22 30 13 27 10 11 14 8
18 39
5 13 37 16 22 14 6
14 9
12
April
1,095
32 273
27 36 58 39 30 48 17 10 34 21 18 19 13 36 36 24 61 65 46 29 17 54 37 15
May
612
19 150
11 24 27 23 13 12 10 14 18 9 7
10 6
23 14
8 25 46 44 19
8 39 17 16
June
1,153
30 342
36 28 52 34 24 54 12 12 39 21 17 19 8
52 27 16 52 38 51 49 26 53 31 30
July
1.234
38 290
36 43 66 40 34 46 23 18 45 27 24 27 15 53 33 40 52 36 40 44 18 72 52 22
August
1,527
29 330
56 38 76 36 35 67 19 30 44 16 30 56 29 59 70 21 58 49 93 59 26 92 57 52
September
1.446
56 354 47 58 73 48 19 46 21 21 37 34 23 36 16 52 42 21 66 52 99 70 15 80 36 24
October
787
30 213
21 32 26 33
8 20
6 13 17 17 17 21 14 49 18 8
24 16 54 23 11 43 38 15
November
597
18 162 24 11 30 16 16 20
8 12 17 12 14 13 13 38 28 13 24 16 29 10
6 29
7 11
December
596
24 179 24 21 44 17 23 14
5 12 20 11 16
8 9
22 15 10 25 16 17 10 7
22 12 13
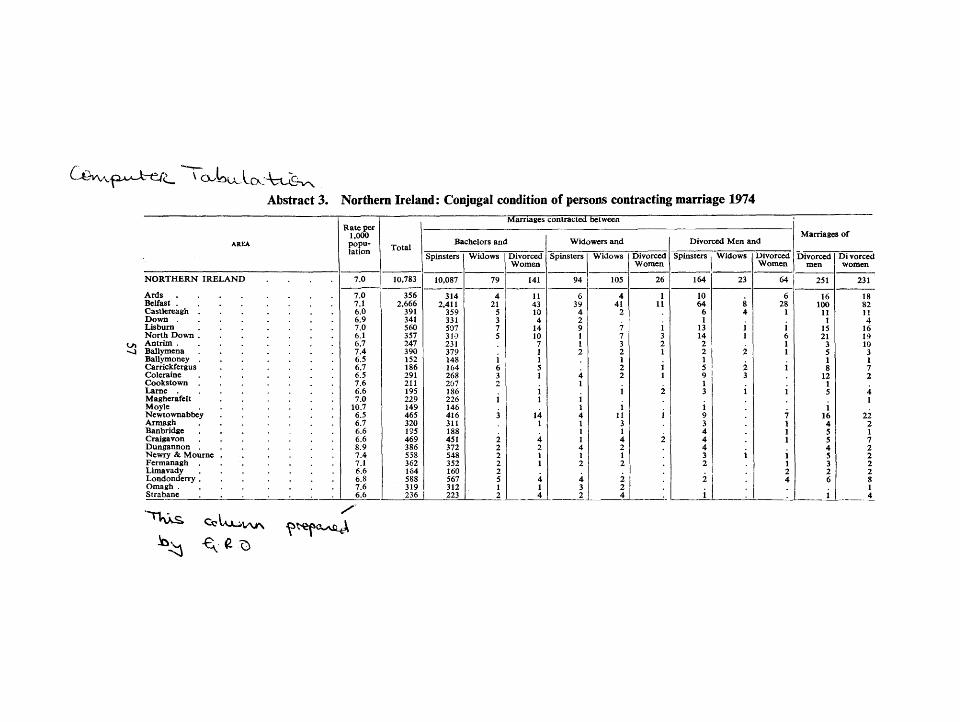
COn,vfi.^-^re/C ^ o^t>u^icx:\xi&vN Abstract 3. Northern Ireland: Conjugal condition of persons contracting marriage 1974
Kyi
' ^ ^ • ^ ^ C o l
AREA
NORTHERN IRELAND . . . .
Ards Belfast . Castlereagh . Down . Lisburn North Down . Antrim . Ballymena Ballymoney Carrickfergus Coleraine Cookstown Lame Magherafelt Moyle Newtownabbey Armagh Banbridge Craigavon Dungannon . Newry & Moume Fermanagh . Limavady Londonderry . Omagh . Strabane
Rate per 1.000 population
7.0
7.0 7.1 6.0 6.9 7.0 6.1 6.7 7.4 6.5 6.7 6.5 7.6 6.6 7.0
10.7 6.5 6.7 6.6 6.6 8.9 7.4 7.1 6.6 6.8 7.6 6.6
1
Total
10.783
356 2.666
391 341 560 357 247 390 152 186 291 211 195 229 149 465 320 195 469 386 558 362 164 588 319 236
Marriages contracted between
Bachelors and
Spinsters
10,087
314 2.411
359 331 507 310 231 379 148 164 268 207 186 226 146 416 311 188 451 372 548 352 160 567 312 223
Widows
79
4 21
5 3 7 5
i 6 3
i 3
2 2 2 2 2 5 1 2
Divorced Women
141
11 43 10
4 14 10 7 1 1 5 1 i 1
14 1
4 2 1 1
4 1 4
Widowers and
Spinsters
94
6 39
4 2 9 1 1 2
4 1
i 1 4 1 1 1 4 1 2
4 3 2
Widows
105
4 41
2
7 7 3 2 1 2 2
i i
11 3 1 4 2 1 2
2 2 4
Divorced Women
26
1 11
i 3 2 1
i 1
2
1
2
Divorced Men and
Spinsters Widows
164
10 64
6 1
13 14 2 2
1 3
i 9 3 4 4 4 3 2 2
i
23
8 4
1 1
2
2 3
1
Divorced Women
64
6 28
1
i 6 1 1
i
i
7 1 1 1
i 1 2 4
Marriages of
Divorced men
251
16 100
U 1
15 21
3 5 1 8
12 1 5
i 16 4 5 5 4 5 3 2 6
i
Di vorced women
231
18 82 11 4
16 19 10 3 1 7 2 4 1
22 2 1 7 2 2 2 2 8 1 4
<a^VA#s
^vj ^ d ^
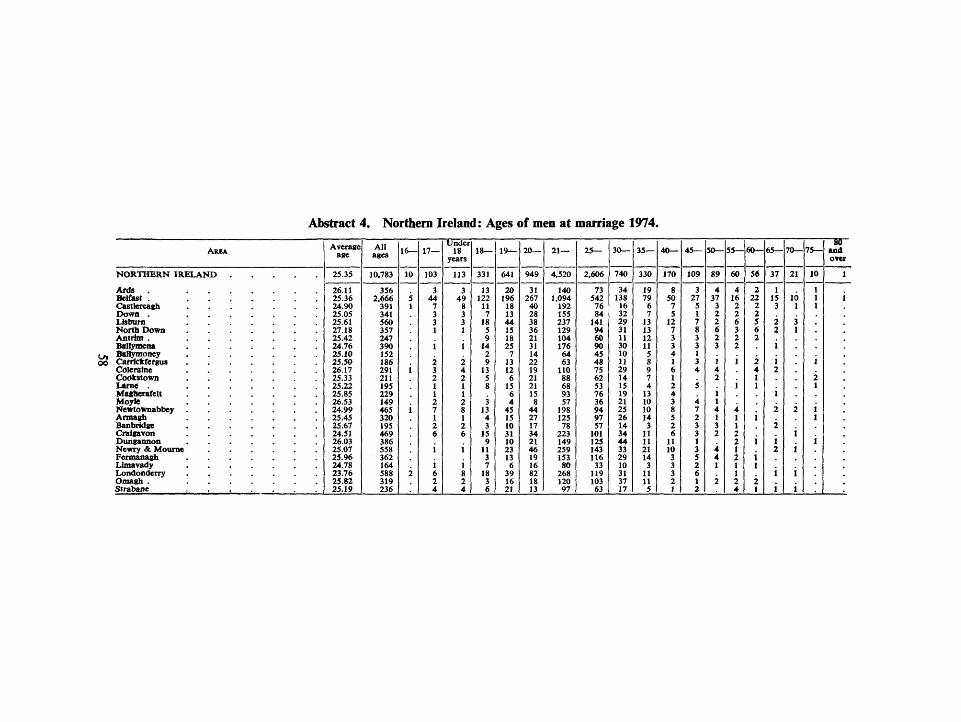
Abstract 4. Northern Ireland: Ages of men at marriage 1974.
AREA
NORTHERN IRELAND
Ards . Belfast . Custlereagh Down . Listmm North Down Antrim . Baliymena
fj^ ^aHiymoTKy o o Cartlckfcfgus
Cdleralne Cookstown Lame . Ma«!lierafett Moyie Nemownabbey Armagh Banbridge Cnigavon Dungannon Newry & Moume Fermanagh Limavady Londonderry Omagh . Strabane
Average age
25.35
26.11 25.36 24.90 25.05 25.61 27.18 25.42 24.76 25.10 25.50 26.17 25.33 25.22 25.85 26.53 24.99 25.45 25.67 24.51 26.03 25.07 25.96 24.78 23.76 25.82 25.19
All ages
10,783
356 2.666
391 341 560 357 247 390 152 186 291 211 195 229 149 465 320 195 469 386 558 362 164 588 319 236
16—
10
5 1
i
i
2
17—
103
3 44
7 3 3 1
i 2 3 2 1 1 2 7 1 2 6
i i 6 2 4
Under 18
years
113
3 49
8 3 3 1
i 2 4 2 1 1 2 8 1 2 6
i i 8 2 4
18—
331
13 122
11 7
18 5 9
14 2 9
13 5 8
3 13 4 3
15 9
11 3 7
18 3 6
19—
641
20 196
18 13 44 15 18 25
7 13 12 6
15 6 4
45 15 10 31 10 23 13 6
39 16 21
20—
949
31 267
40 28 38 36 21 31 14 22 19 21 21 15 8
44 27 17 34 21 46 19 16 82 18 13
21—
4,520
140 1,094
192 155 237 129 104 176 64 63
110 88 68 93 57
198 125 78
223 149 259 153 80
268 120 97
25—
2.606
73 542
76 84
141 94 60 90 45 48 75 62 53 76 36 94 97 57
101 125 143 116
33 119 103 63
30—
740
34 138
16 32 29 31 11 30 10 11 29 14 15 19 21 25 26 14 34 44 33 29 10 31 37 17
35—
330
19 79
6 7
13 13 12 11 5 8 9 7 4
13 10 10 14
3 11 11 21 14 3
11
n 5
40—
170
8 50
7 5
12 7 3 3 4 1 6 1 2 4 3 8 5 2 6
11 10
3 3 3 2 1
45—
109
3 27
5 1 7 8 3 3 1 3 4
5
4 7 2 3 3 1 3 5 2 6 1 2
50—
89
4 37
3 2 2 6 2 3
i 4 2
i 1 4 1 3 2
4 4 1
2
55—
60
4 16 2 2 6 3 2 2
i
i
4 1 1 2 2 1 2 1 1 2 4
60—
56
2 22
2 2 5 6 2
2 4 1 1
i
i i 1
2 1
65—
37
1 15 3
2 2
i i 2
i 2
2
i 2
i i
70—
21
10 1
3 1
2
i i
i i
75—
10
1 1 1
i 2 1
i 1
80 and over
1
i
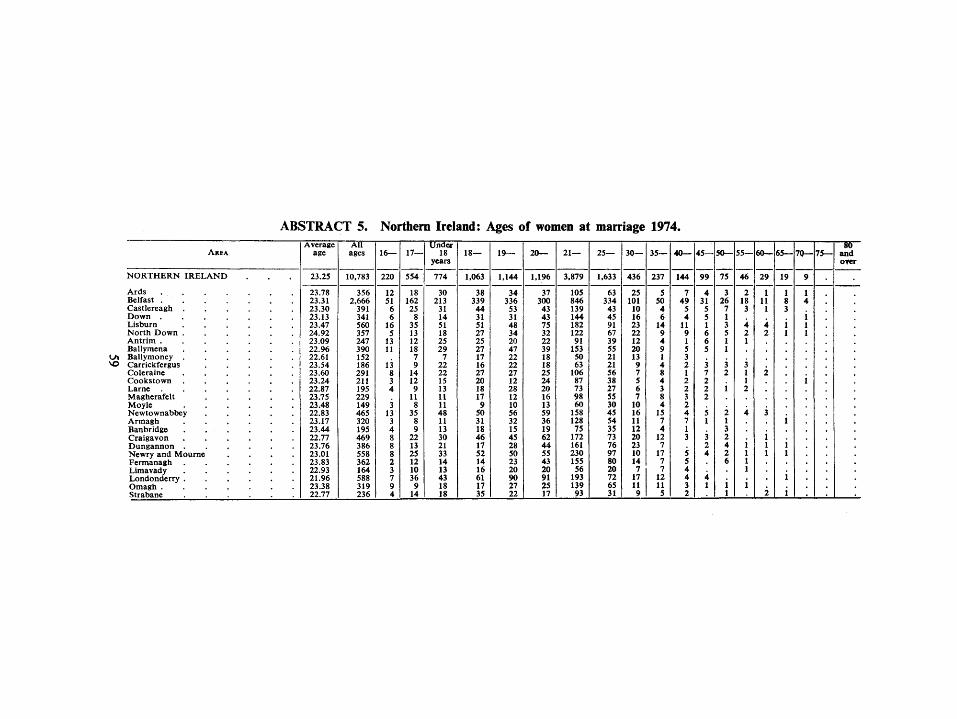
A] 5J
AREA.
N O R T H E R N I R E L A N D
Ards . . . . . . . Belfast . Castlereagh . Down . Lisburn Nor th Down . Ant r im . Ballymena
KJ\ Ballymoney . ^ Carrickfergus
Coleraine Cookstown L a m e Magherafelt Moyle Newtownabbey Armagh Banbridge Craigavon Dungannon . Newry and M o u m e Fermanagh Limavady Londonderry . Omagh . Strabane
5TRA( Average
age
23.25
23.78 23.31 23.30 23.13 23.47 24.92 23.09 22.96 22.61 23.54 23.60 23.24 22.87 23.75 23.48 22.83 23.17 23.44 22.77 23.76 23.01 23.83 22.93 21.96 23.38 22.77
TT 5. All
ages
10.783
356 2,666
391 341 560 357 247 390 152 186 291 211 195 229 149 465 320 195 469 386 558 362 164 588 319 236
Northern Ireland: Ages of women ai
16—
220
12 51
6 6
16 5
13 11
13 8 3 4
3 13 3 4 8 8 8 2 3 7 9 4
17—
554
18 162 25
8 35 13 12 18 7 9
14 12 9
11 8
35 8 9
22 13 25 12 10 36
9 14
Under 18
years
774
30 213
31 14 51 18 25 29
7 22 22 15 13 11 11 48 11 13 30 21 33 14 13 43 18 18
18—
1,063
38 339
44 31 51 27 25 27 17 16 27 20 18 17
9 50 31 18 46 17 52 14 16 61 17 35
19—
1.144
34 336
53 31 48 34 20 47 22 22 27 12 28 12 10 56 32 15 45 28 50 23 20 90 27 22
20—
1.196
37 300
43 43 75 32 22 39 18 18 25 24 20 16 13 59 36 19 62 44 55 43 20 91 25 17
2 1 —
3,879
105 846 139 144 182 122 91
153 50 63
106 87 73 98 60
158 128 75
172 161 230 155
56 193 139 93
marriage
25—
1,633
63 334
43 45 91 67 39 55 21 21 56 38 27 55 30 45 54 35 73 76 97 80 20 72 65 31
30—
436
25 101
10 16 23 22 12 20 13 9 7 5 6 7
10 16 11 12 20 23 10 14 7
17 11 9
1974.
35—
237
5 50 4 6
14 9 4 9 1 4 8 4 3 8 4
15 7 4
12 7
17 7 7
12 11 5
40—
144
7 49
5 4
11 9 1 5 3 2 1 2 2 3 2 4 7 1 3
5 5 4 4 3 2
45—
99
4 31
5 5 1 6 6 5
3 7 2 2 2
5 1
3 2 4
4 1
50—
75
3 26
7 1 3 5 1 1
3 2
i
2 1 3 2 4 2 6
i 1
55—
46
2 18 3
4 2 1
3 1 1 2
4
i 1 1 1
i
60—
29
1 11
1
4 2
2
3
i 1 1
2
65—
19
1 8 3
i 1
i
i 1
i i
70—
9
1 4
i 1 1
1
75— 80
and oTcr
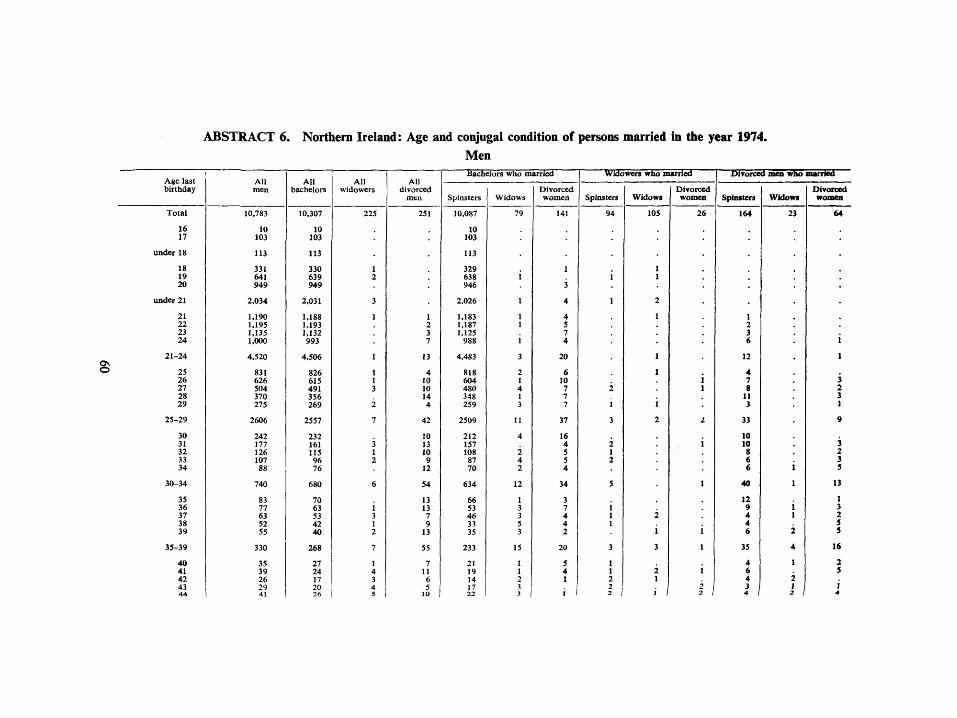
ABSTRACT 6. Northern Ireland: Age and conjugal condition of persons married in the year 1974. Men
ON
o
Age last birthday
Total
16 17
under 18
18 19 20
under 21
21 22 23 24
21-24
25 26 27 28 29
2S-29
30 31 32 33 34
30-34
35 36 37 38 39
35-39
40 41 42 43 44
All men
10.783
10 103
113
331 641 949
2.034
1.190 1.195 1.135 1.000
4.520
831 626 504 370 275
2606
242 177 126 107 88
740
83 77 63 52 55
330
35 39 26 29 41
All bachelors
10.307
10 103
113
330 639 949
2.031
1.188 1.193 1.132 993
4.506
826 615 491 356 269
2557
232 161 115 96 76
680
70 63 53 42 40
268
27 24 17 20 26
All widowers
225
1 2
3
1
1
1 1 3
2
7
3 1 2
6
i 3 1 2
7
I 4 3 4 5
All divorced
men
251
1 2 3 7
13
4 10 10 14 4
42
10 13 10 9
12
54
13 13 7 9
13
55
7 11
6 5
10
Bachelors who married
Spinsters
10.087
10 103
113
329 638 946
2.026
1.183 1.187 1.125
988
4,483
818 604 480 348 259
2509
212 157 108 87 70
634
66 53 46 33 35
233
21 19 14 17 22
Widows
79
i
1
1 1
i 3
2 1 4 1 3
U
4
2 4 2
12
1 3 3 5 3
15
1 1 2 3 3
Divorced women
141
1
3
4
4 5 7 4
20
6 10 7 7 7
37
16 4 5 5 4
34
3 7 4 4 2
20
5 4 1
i 1
Widowers who married
Spinsters
94
i
1
2
i 3
2 1 2
5
i 1 1
3
1 1 2
I \
Widow*
105
1 1
2
1
1
1
i 2
2
i 3
2 1
i 1
Divorced women
26
I
\
1
1
1
i
I 1
Divorced men wbo married
Spinsters
164
1 2 3 6
12
4 7 8
11 3
33
10 10 8 6 6
40
12 9 4 4 6
35
4 6 4 3 4 ;
Wklowa
23
i 1
i 1
2
4
1
2
i /
Divorced womm
64
i 1
3 2 3 1
9
3 2 3 5
13
1 3 2 5 5
16
2 5
i 4
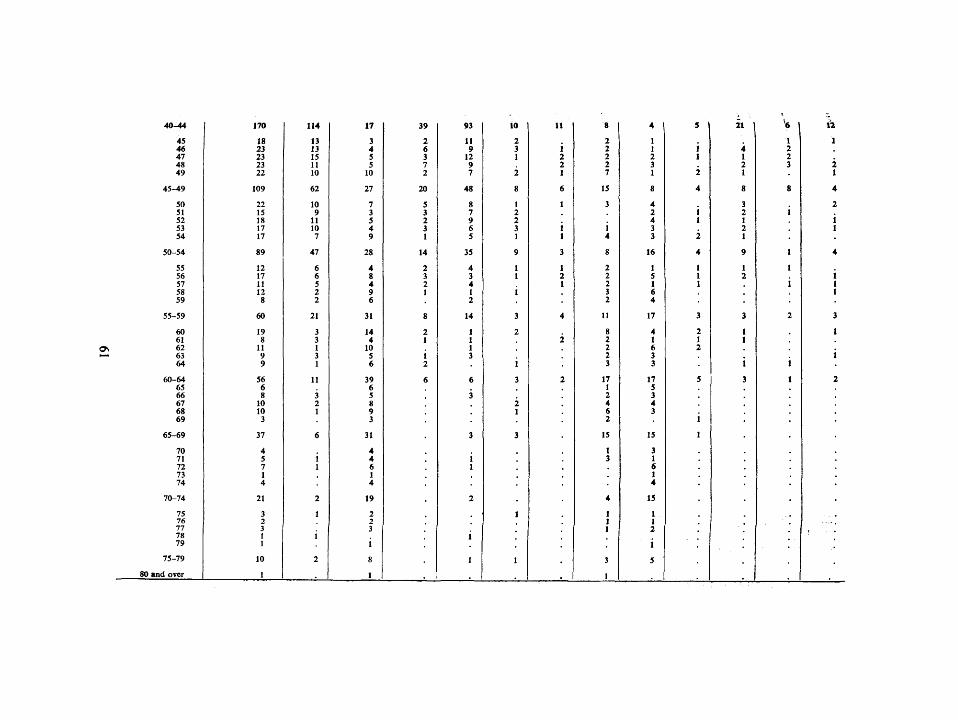
40-44 170 114 17 39 93 10 U 8 4 5 I 21 1 6 I 12
45 18 13 3 2 11 2 . 2 1 . . 1 1 46 23 13 4 6 9 3 1 2 1 1 4 2 . 47 23 15 5 3 12 1 2 2 2 1 1 2 . 48 23 11 5 7 9 . 2 2 3 . 2 3 2 49 22 10 10 2 7 2 1 7 1 2 1 . 1
45-49 109 62 27 20 48 8 6 15 8 4 8 8 4
50 22 10 7 5 8 1 1 3 4 . 3 . 2 51 15 9 3 3 7 2 . . 2 1 2 1 . 52 18 11 5 2 9 2 . . 4 1 1 . 1 53 17 10 4 3 6 3 1 1 3 . 2 . 1 54 17 7 9 1 5 1 1 4 3 2 1 . .
50-54 89 47 28 14 35 9 3 8 16 4 9 1 4
55 12 6 4 2 4 1 1 2 1 1 1 1 . 56 17 6 8 3 3 1 2 2 5 1 2 . 1 57 11 5 4 2 4 . 1 2 1 1 . 1 1 58 12 2 9 1 I 1 . 3 6 . . . 1 59 8 2 6 . 2 . . 2 4 . . . .
55-59 60 21 31 8 14 3 4 11 17 3 3 2 3
60 19 3 14 2 1 2 . 8 4 2 1 . 1 61 8 3 4 1 1 . 2 2 1 1 1 . .
CTs 62 11 1 10 . 1 . . 2 6 2 . . . H- 63 9 3 5 1 3 . . 2 3 . . . 1
64 9 1 6 2 . 1 . 3 3 . 1 1 .
60-64 56 11 39 6 6 3 2 17 17 5 3 1 2 65 6 6 . . . . 1 5 . . . . 66 8 3 5 . 3 . . 2 3 . . . . 67 10 2 8 . . 2 . 4 4 . . . . 68 10 1 9 . . 1 . 6 3 . . . . 69 3 3 . . . . 2 . 1 . . .
65-69 37 6 31 . 3 3 . 15 15 1 . . .
70 4 4 . . . . 1 3 . . . . 71 5 1 4 . 1 . . 3 1 . . . . 72 7 1 6 . 1 . . . 6 . . . . 73 1 1 . . . . . 1 . . . . 74 4 4 . . . . . 4 . . . .
70-74 21 2 19 . 2 . . 4 15 . . . .
75 3 1 2 1 . 1 1 . . . . 76 2 2 . . 1 1 . . . . 77 3 . 3 . . . 1 2 . . . . . 78 1 1 . 1 . . . . . . . . 79 1 1 . . . . . 1 . . . .
75-79 10 2 8 . 1 1 . 3 5 . . . .
80 and over 1 1 . . . . I . . . . .
ABSTRACT 6 (continued). Northern Ireland: Age and conjugal condition of persons married in the year 1974. Women
Age last birthday
Total
16 17
Under 18
18 19 20
Under 21
21 22 23 24
21-24
25 26 27 28 29
25-29
30 31 32 33 34
30-34
35 36 37 38 39
35-39
40 41 42
All women
10,783
220 554
774
1.063 1.144 1.196
4.177
1.195 1.123
852 709
3.879
517 422 281 226 187
1,633
127 97 91 54 67
436
57 57 34 54 35
237
28 30 41 18
All spinsters
10.345
219 554
773
1,063 1.143 1.194
4,173
1.192 1,120
846 701
3.859
507 414 268 206 173
1.568
114 82 75 44 52
367
42 44 25 37 23
171
16 17 25 11 1
All widows
207
1
1
i
2
2 1 2 1
6
2
3 6
11
5 4 4 1 4
18
6 6 3 3 4
22
7 7 4 1
All divorced women
231
2
2
1 2 4 7
14
8 8
10 14 14
54
8 11 12 9
11
51
9 7 6
14 8
44
5 6
12 6
Spinsters who married
Bachelors
10.087
218 553
771
1.056 1.137 1.187
4,151
1,175 1,109
840 688
3,812
495 404 263 196 164
1,522
104 75 70 37 49
335
36 37 23 31 18
145
14 13 18 6
Widows
94
2
i 3
2 2 1 1
6
2
i 2
5
2 3 1
6
2 4 2 4 1
13
1 1 3 1
Divorced men
164
1 1
2
5 6 6
19
15 9 5
12
41
10 10
5 9 7
41
8 4 4 7 3
26
4 3
2 4
13
1 3 4 4
Widows who married
Bachelors
79
1 1 2 1
5
2
4
6
4 4 2
3
13
6 3 2 1
12
5 5 2
Widowers
IDS
1
1
i
2
1
1
2 2
4
i i 2
i 1 4
6
2 2
-4 1
Divorced men
23
1
1
i 1
3
3
i
4
2
Divorced
Bachelors
141
2
2
1 2 4 6
13
5 6 8
10 8
37
7 8 8 8 6
37
6 4 2 8 2
22
3 3 8 2 2
women who married
Widowers
26
i 1
1
3
4
i
1
1
i i 3
2
•
Divorced men
64
2 2 2 4 3
13
1 3 3 1 5
13
2 3 3 6 S
19
2 1 2 3 2
45 22 12 6 4 6 6 . 4 1 1 1 2 1 46 12 8 2 2 6 1 1 2 . . 1 . 1 47 26 14 11 1 8 5 1 4 5 2 . . 1 48 20 10 8 2 6 3 1 2 2 4 1 1 . 49 19 8 5 6 5 3 . . 4 1 2 1 3
45^9 99 52 32 15 31 18 3 12 12 8 5 4 6 50 14 5 7 2 4 1 . 4 2 1 1 . 1 51 20 10 9 1 5 5 . 2 7 . . 1 . 52 14 & 3 3 5 3 . 1 1 1 3 . . 53 16 8 4 4 4 4 . . 3 1 1 2 1 54 11 4 6 1 2 1 1 2 4 . . . 1
50-54 75 35 29 11 20 14 1 9 17 3 5 3 3 55 12 8 1 3 4 2 2 . 1 . 1 2 . 56 12 4 8 . 1 3 . 1 6 1 . . . 57 4 1 2 1 . . 1 . 2 . 1 . . 58 11 3 7 1 1 2 . 1 6 . . 1 . 59 7 2 5 . . 1 1 1 4 . . . .
55-59 46 18 23 5 6 8 4 3 19 1 2 3 . 60 6 1 5 . 1 . . 1 4 . . . . 61 9 2 7 . 1 1 . . 6 1 . . . 62 6 1 5 . . 1 . 1 4 . . . .
pN 63 5 2 3 . 1 1 . 2 1 . . , . '-** 64 3 1 - 2 . . 1 . . 2 . . . .
60-64 29 7 22 . 3 4 . 4 17 1 . . .
65 4 1 3 . 1 . . . 3 . . . . 66 4 2 2 . . 2 . . 2 . . . 67 3 1 2 . . 1 . 1 1 . . . . 68 6 . 6 . . . . . 6 . . . . 69 2 1. . 1 . 1 . . . . . 1 .
65-69 19 5 13 1 1 4 . 1 12 . . 1 . 70 1 1 . . . 1 . . . . . . . 71 3 1 2 . 1 . . . 2 . . . . 72 3 . 3 . . . . . 3 . . . . 73 1 1 . . . . . 1 . . . . 74 1 1 . 1 . . . . . . . .
70-74 9 3 6 . 2 1 . . 6 . . . . 75 . '. . . . . . . . . . . . 76 . . . . . . . . . . . . . 77 . . . . . . . . . . . . . 78 . . . . . . . . . . . . . 79 . . . . . . . . . . . . .
75-79 . . . . . . . . . . . . . 80 and over I .__[ ; ; ;__] ; : ;: : : : : :_J i _
ABSTRACT 7. Northern Ireland: Ages in combination of men and women at marriage 1974.
AGES OF WIVES
____^ , ^ Total
I I 1 ' I I I i I I h u s -1&— 17— 18— 19— 2 0 — 2 1 — 2 2 — 2 3 — 24— 25— 3 0 — 35— 4 0 — 4 5 — 50— 5 5 — 6 0 — 6 5 — 7 0 — 75— 80 & bands
over /16— 4 1 3 1 1 . . . 10 16—\ 17— 28 32 25 9 4 1 2 . 1 1 . 103 17— 18— 45 85 97 55 21 12 9 2 2 2 1 . 331 18— 19— 43 105 170 132 92 41 31 15 4 6 2 641 19— 20— 27 98 207 208 196 88 60 23 11 27 3 1 949 2 1 —
> 2 1 — 26 89 186 247 201 191 118 52 32 47 1 1.190 21— ^ O 2 2 — 13 55 125 159 187 235 180 100 59 73 7 1 . 1 1.195 2 2 — J W 2 3 — 12 21 101 130 165 183 193 132 82 109 6 1 1.135 2 3 — M
O N X' 2 4 — 3 29 46 81 116 137 166 132 132 140 16 1 1 1.000 2 4 — to •P^ O Q
^ 25— 16 34 84 108 190 259 306 324 307 807 140 23 8 2,606 25— *« 5 ( 3 0 — 3 5 11 12 20 38 42 58 65 292 128 52 U 2 1 740 30—) tS 5135— 4 1 3 7 12 12 11 96 87 54 35 4 2 2 . . . . . 330 35— C CS 40— 4 1 1 3 2 3 24 32 50 30 17 3 170 40— g > 45— 1 1 . . . 5 8 29 28 24 10 2 . 1 . . . 109 45— >
z z S 50— 1 . . 2 3 16 20 21 19 4 3 . . . . 89 50— O
55— . . . . . 2 1 5 7 11 15 13 5 1 . . . 60 55— ^ 60— . . . . . . . 3 4 14 14 n 7 . 3 . . 56 60— 65— . . . . 1 1 . 4 9 7 8 7 . . . 37 65— 70— . . . . . . . 1 2 2 5 9 2 . . 21 70— 75— . . . . . . . . . . . . . 5 1 1 3 . . 10 75— 80 & 80&
\over . . . . . . . . . . . . . . . . . . 1 . . 1 over' Total wives 220 554 | 1.063 1.144 1.196 1.195 | 1.123 | 852 709 | 1.633 | 436 | 237 | 144 | 99 I 75 | 46 | 29 | 19 | 9 1 . | ; ,
ABSTRAC!!T 7a. Northern Ireland: Marriages by age of bachelors by age of spinsters 1974.
ON 1^
BACHELORS AND SPINSTERS
Age of
husband 16 17 18 19
20 21 22 23 24
<21
21—
25—
30— 35— 40— 45— 50—
55— 60— 65— 70— 75— BOSS+
AGE OF WIFE
16 17
4 28 44 43
27 26 13 12 3
146
54
16
2
Ail wives 218
1 32 85 105
98 89 55 21 29
321
194
33
5
3 25 97 170
207 186 125 99 46
502
456
81
10 3 4
1 9 55 131
208 247 158 130 80
404
615
106
11 1
1.137
4 21 91
196 198 187 164 116
312
665
188
19 3
1 1 12 41
87 190 235 183 136
142
744
250
32 5 1 1
1.175
2 9 31
60 118 180 192 164
102
654
302
38 11 2
1,109
23 24
2 15
23 51 99 129 132
40
411
322
55 10 2
1 2 4
11 31 58 81 129
18
299
299
61 8 3
<21 2 1 — 2 5 — 3 0 — 35
9 98 302 540
736 746 538 426 274
1.685
1.984
424
47 7 4
688 4.151
1 4 25 91
181 390 572 585 561
302
2.108
1.173
186 34
1 2 6
26 46 70 107 136
35
775
253 75 19 3 I
105 58 16 3 2
3,812 1.522 335 145 59
4 0 — 4 5 — 5 0 — 5 5 — 6 0 — 6 5 — 7 0 — 7 5 — 8 0 —
20
84+
AU Hut-bands
10 103 329 638
946 1.183 1.187 1.125 988
2.026
4.483
2.509
634 233 93 48 35
14 6 3 2 1
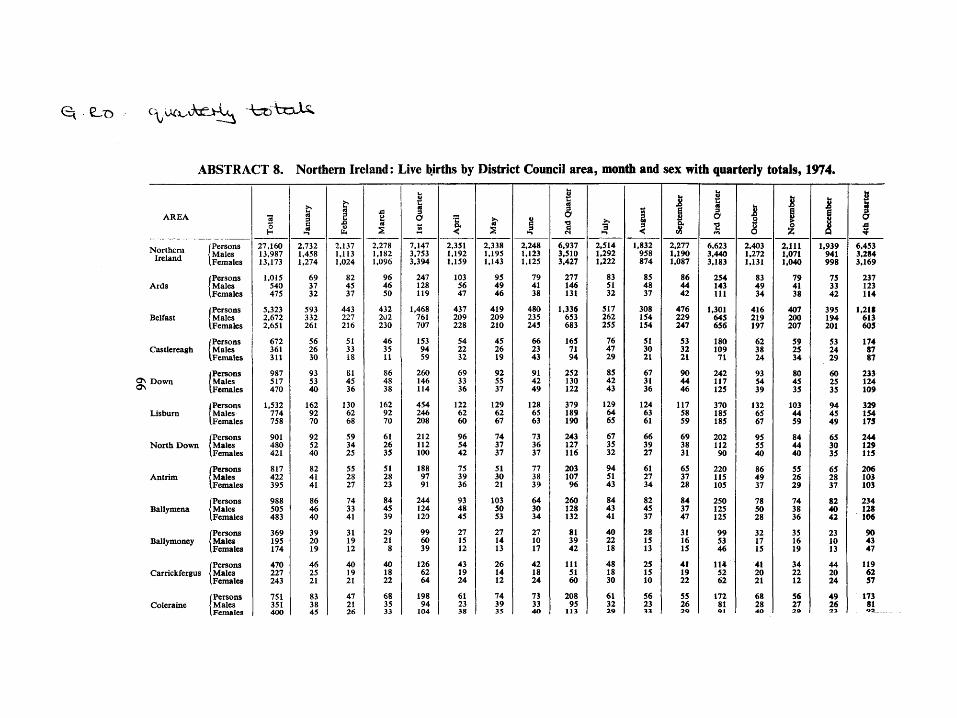
<3< e_,t> e , v>i«3f>U. -bbtcLXs.
ABSTRACT 8. Northern Ireland: Live births by District Council area, month and sex with quarterly totals, 1974.
AREA « S | ^ O : E > . S « > . i | ® | i § 0 '
M^ ..,» . (Persons 27.160 2,732 2,137 2,278 7.147 2,351 2,338 2.248 6.937 2.514 1,832 2.277 6,623 2,403 2.1U 1,939 6,453 JNorttiem Males 13,987 1,458 1,113 1,182 3.753 1,192 1,195 1.123 3,510 1.292 958 1.190 3,440 1.272 1.071 941 3.284
ireiana ^Females 13,173 1,274 1,024 1.096 3.394 1.159 1.143 1,125 3.427 1,222 874 1,087 3,183 1,131 1.040 998 3.169 (Persons 1,015 69 82 96 247 103 95 79 277 83 85 86 254 83 79 75 237
Ards (Males 540 37 45 46 128 56 49 41 146 51 48 44 143 49 41 33 123 iFemales 475 32 37 50 119 47 46 38 131 32 37 42 111 34 38 42 114 (Persons 5.323 593 443 432 1.468 437 419 480 1,336 517 308 476 1.301 416 407 395 1.218
Belfast Males 2,672 332 227 202 761 209 209 235 653 262 154 229 645 219 200 194 613 iFemalcs 2,651 261 216 230 707 228 210 245 683 255 154 247 656 197 207 201 605 (Persons 672 56 51 46 153 54 45 66 165 76 51 53 180 62 59 53 174
Castlercagh Males 361 26 33 35 94 22 26 23 71 47 30 32 109 38 25 24 87 iFemalcs 311 30 18 11 59 32 19 43 94 29 21 21 71 24 34 29 87 (Persons 987 93 81 86 260 69 92 91 252 85 67 90 242 93 80 60 233
^ Down Males 517 53 45 48 146 33 55 42 130 42 31 44 117 54 45 25 124 <^ iFemales 470 40 36 38 114 36 37 49 122 43 36 46 125 39 35 35 109
(Persons 1,532 162 130 162 454 122 129 128 379 129 124 117 370 132 103 94 329 Lisburn Males 774 92 62 92 246 62 62 65 189 64 63 58 185 65 44 45 154
iFemales 758 70 68 70 208 60 67 63 190 65 61 59 185 67 59 49 17S (Persons 901 92 59 61 212 96 74 73 243 67 66 69 202 95 84 65 244
North Down Males 480 52 34 26 112 54 37 36 127 35 39 38 112 55 44 30 129 iFemales 421 40 25 35 100 42 37 37 116 32 27 31 90 40 40 35 115 (Persons 817 82 55 51 188 75 51 77 203 94 61 65 220 86 55 65 206
Antrim Males 422 41 28 28 97 39 30 38 107 51 27 37 115 49 26 28 103 iFemales 395 41 27 23 91 36 21 39 96 43 34 28 105 37 29 37 103 (Persons 988 86 74 84 244 93 103 64 260 84 82 84 250 78 74 82 234
Ballymena Males 505 46 33 45 124 48 50 30 128 43 45 37 125 50 38 40 128 iFemales 483 40 41 39 120 45 53 34 132 41 37 47 125 28 36 42 106 (Persons 369 39 31 29 99 27 27 27 81 40 28 31 99 32 35 23 90
Ballymoncy Males 195 20 19 21 60 15 14 10 39 22 15 16 53 17 16 10 43 iFemales 174 19 12 8 39 12 13 17 42 18 13 15 46 15 19 13 47 (Persons 470 46 40 40 126 43 26 42 111 48 25 41 114 41 34 44 119
Carrickfergus Males 227 25 19 18 62 19 14 18 51 18 15 19 52 20 22 20 62 iFcmales 243 21 21 22 64 24 12 24 60 30 10 22 62 21 12 24 57 (Persons 751 83 47 68 198 61 74 73 208 61 56 55 172 68 56 49 173
Coleraine {Males 351 38 21 35 94 23 39 33 95 32 23 26 81 28 27 26 81 iFcmales 400 45 26 33 104 38 35 40 113 29 33 29 91 M> 20 as «*
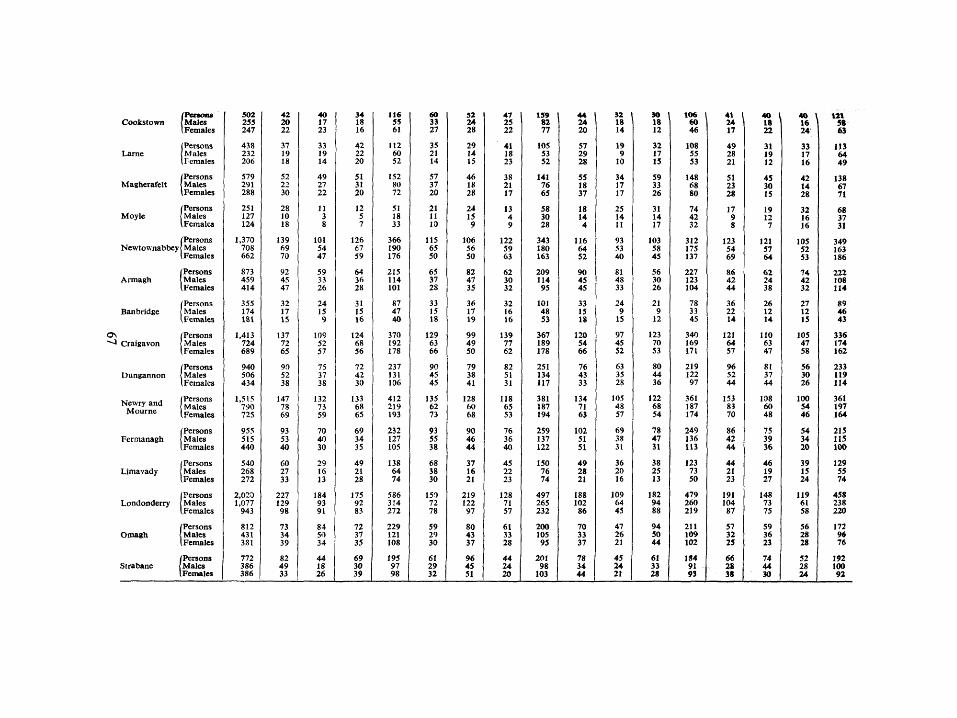
IPeaona 502 42 40 34 116 60 52 47 159 44 I 32 t 30 I 106 I 41 \ 40 \ 40 \ i n Cookstown (Males 255 20 17 18 55 33 24 25 82 24 18 18 60 24 18 16 58
(Females 247 22 23 16 61 27 28 22 77 20 14 12 46 17 22 24' 63 (Persons 438 37 33 42 112 35 29 41 105 57 19 32 108 49 31 33 113
Lame {Males 232 19 19 22 60 21 14 18 53 29 9 17 55 28 19 17 64 (Females 206 18 14 20 52 14 15 23 52 28 10 15 53 21 12 16 49 /Persons 579 52 49 51 152 57 46 38 141 55 34 59 148 51 45 42 138
MaghcrafcU {Males 291 22 27 31 80 37 18 21 76 18 17 33 68 23 30 14 67 (Females 288 30 22 20 72 20 28 17 65 37 17 26 80 28 15 28 71 /Persons 251 28 11 12 51 21 24 13 58 18 25 31 74 17 19 32 68
Moyle Males 127 10 3 5 18 11 15 4 30 14 14 14 42 9 12 16 37 (Females 124 18 8 7 33 10 9 9 28 4 11 17 32 8 7 16 31 (Persons 1,370 139 101 126 366 115 106 122 343 116 93 103 312 123 121 105 349
Newtownabbey{ Males 708 69 54 67 190 65 56 59 180 64 53 58 175 54 57 52 163 (Females 662 70 47 59 176 50 50 63 163 52 40 45 137 69 64 53 186 (Persons 873 92 59 64 215 65 82 62 209 90 81 56 227 86 62 74 222
Armagh (Males 459 45 33 36 114 37 47 30 114 45 48 30 123 42 24 42 108 (Females 414 47 26 28 101 28 35 32 95 45 33 26 104 44 38 32 114 (Persons 355 32 24 31 87 33 36 32 101 33 24 21 78 36 26 27 89
Banbridge Males 174 17 15 15 47 15 17 16 48 15 9 9 33 22 12 12 46 (Females 181 15 9 16 40 18 19 16 53 18 15 12 45 14 14 15 43
0^ (Persons 1,413 137 109 124 370 129 99 139 367 120 97 123 340 121 110 105 336 ~-> Craigavon Males 724 72 52 68 192 63 49 77 189 54 45 70 169 64 63 47 174
(Females 689 65 57 56 178 66 50 62 178 66 52 53 171 57 47 58 162 (Persons 940 90 75 72 237 90 79 82 251 76 63 80 219 96 81 56 233
Dungannon (Males 506 52 37 42 131 45 38 51 134 43 35 44 122 52 37 30 119 (Females 434 38 38 30 106 45 41 31 117 33 28 36 97 44 44 26 114
M „ A (Persons 1.515 147 132 133 412 135 128 118 381 134 105 122 361 153 108 100 361 Newry ana Males 790 78 73 68 219 62 60 65 187 71 48 68 187 83 60 54 197 Mourne (Females 725 69 59 65 193 73 68 53 194 63 57 54 174 70 48 46 164
(Persons 955 93 70 69 232 93 90 76 259 102 69 78 249 86 75 54 215 Fermanagh Males 515 53 40 34 127 55 46 36 137 51 38 47 136 42 39 34 115
(Females 440 40 30 35 105 38 44 40 122 51 31 31 113 44 36 20 100 (Persons 540 60 29 49 138 68 37 45 150 49 36 38 123 44 46 39 129
Limavady Males 268 27 16 21 64 38 16 22 76 28 20 25 73 21 19 15 55 (Females 272 33 13 28 74 30 21 23 74 21 16 13 50 23 27 24 74 (Persons 2,020 227 184 175 586 150 219 128 497 188 109 182 479 191 148 119 458
Londonderry Males 1,077 129 93 92 314 72 122 71 265 102 64 94 260 104 73 61 238 (Females 943 98 91 83 272 78 97 57 232 86 45 88 219 87 75 58 220 (Persons 812 73 84 72 229 59 80 61 200 70 47 94 211 57 59 56 172
Omagh Males 431 34 50 37 121 29 43 33 105 33 26 50 109 32 36 28 96 (Females 381 39 34 35 108 30 37 28 95 37 21 44 102 25 23 28 76 (Persons 772 82 44 69 195 61 96 44 201 78 45 61 184 66 74 52 192
Strabane (Males 386 49 18 30 97 29 45 24 98 34 24 33 91 28 44 28 100 (Females 386 33 26 39 98 32 51 20 103 44 21 28 93 38 30 24 92
^ , , — I 1 1 1 1 1 1 1 1 ! I I I
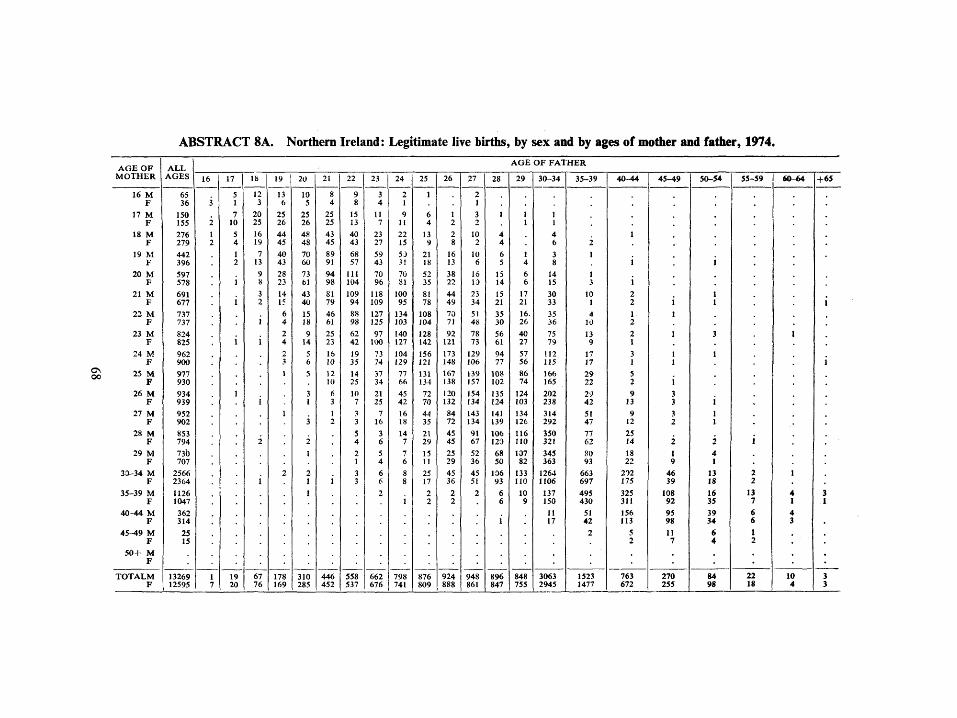
ABSTRACT 8A. Northern Ireland: Legitimate live births, by sex and by ages of mother and father, 1974.
A G E O F ALL •_ ^ ^ r ^ — M O T H E R AGES " 7 ^ ^1 18 19 20 21 22~ 23 24 25 I 26 I 27 I 28 2 9 ~ 30-34 35-39 | 40-44 45-49 50-54 55-59 I 60-64 + 6 5
16 M 65 . 5 12 13 10 8 9 3 2 1 . 2 . . . F 36 3 1 3 6 5 4 8 4 1 . . 1 . . .
17 M ISO . 7 20 25 25 25 15 11 9 6 1 3 1 1 1 F 155 2 10 25 26 26 25 13 7 11 4 2 2 . 1 1
18 M 276 1 5 16 44 48 43 40 23 22 13 2 10 4 . 4 1 F 279 2 4 19 45 48 45 43 27 15 9 8 2 4 . 6 2
19 M 442 . 1 7 40 70 89 68 59 50 21 16 10 6 1 3 1 F 396 . 2 13 43 60 91 57 43 3! 18 13 6 5 4 8 1 . 1
20 M 597 . 9 28 73 94 111 70 70 52 38 16 15 6 14 1 F 578 . 1 8 23 61 98 104 96 81 35 22 13 14 6 15 3 1 . . . . .
21 M 691 . . 3 14 43 81 109 118 100 81 44 23 15 17 30 10 2 . 1 . . . F 677 . 1 2 15 40 79 94 109 95 78 49 34 21 21 33 1 2 1 1 . . 1
22 M 737 . . . 6 15 46 88 127 134 108 70 51 35 16- 35 4 1 1 . . . . F 737 . . 1 4 18 61 98 125 103 104 71 48 30 26 36 10 2 . . . . .
23 M 824 . . 2 9 25 62 97 140 128 92 78 56 40 75 13 2 1 3 . I . F 825 . 1 1 4 14 23 42 100 127 142 121 73 61 27 79 9 1 . . . . .
24 M 962 . . 2 5 16 19 73 104 156 173 129 94 57 U2 17 3 1 1 . . . F 900 . . . 3 6 10 35 74 129 121 148 106 77 56 115 17 1 1 . . . 1
S 25 M 977 . . . 1 5 12 14 37 77 131 167 139 108 86 166 29 5 . . . . . F 930 10 25 34 66 134 138 157 102 74 165 22 2 1 . . . .
26 M 934 . 1 3 6 10 21 45 72 120 154 135 124 202 29 9 3 . . . . F 939 . . I . t 3 7 25 42 70 132 134 124 103 238 42 13 3 1 . . .
27 M 952 . . 1 1 3 7 16 44 84 143 141 134 314 51 9 3 1 . . . F 902 . . . . 3 2 3 16 18 35 72 134 139 126 292 47 12 2 1 . . .
28 M 853 5 3 14 21 45 91 106 116 350 77 25 . . . . . F 794 . . 2 2 . 4 6 7 29 45 67 123 110 321 62 14 2 2 1 . .
29 M 730 . . . . 1 . 2 5 7 15 25 52 68 107 345 80 18 1 4 . . . F 707 1 4 6 11 29 36 50 82 363 93 22 9 1
30-34 M 2566 . 2 2 3 6 8 25 45 45 106 133 1264 663 202 46 13 2 1 . F 2364 . . 1 1 1 3 6 8 17 36 51 93 110 1106 697 175 39 18 2 . .
35-39 M 1126 . . . . 1 . . 2 , 2 2 2 6 10 137 495 325 108 16 13 4 3 F 1047 1 2 2 . 6 9 150 430 311 92 35 7 1 i
40-44 M 362 11 51 156 95 39 6 4 F 314 1 . 17 42 113 98 34 6 3
45-49 M 25 2 5 11 6 1 F 15 2 7 4 2 . .
50+ M F . . . . . . .
TOTALM 13269 1 19 67 178 310 446 558 662 798 876 924 948 896 848 3063 1523 763 270 84 22 10 3 F 12595 7 20 76 169 285 452 537 676 741 809 888 861 847 755 2945 1477 672 255 98 18 4 3
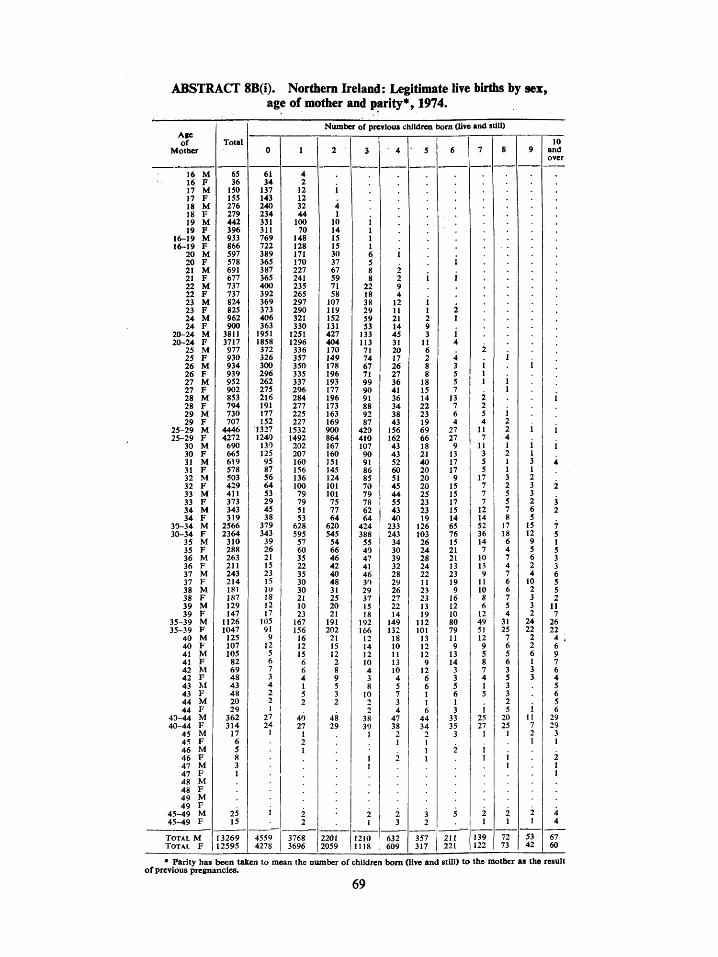
ABSTRACT 8B(i). Northern Ireland: Legitimate live births by sex, age of mother and parity"', 1974.
Age of
Mother
16 M 16 F 17 M 17 F 18 M 18 F 19 M 19 F
16-19 M 16-19 F
20 M 20 F 21 M 21 F 22 M 22 F 23 M 23 F 24 M 24 F
20-24 M 20-24 F
25 M 25 F 26 M 26 F 27 M 27 F 28 M 28 F 29 M 29 F
25-29 M 25-29 F
30 M 30 F 31 M 31 F 32 M 32 F 33 M 33 F 34 M 34 F
30-34 M 30-34 F
35 M 35 F 36 M 36 F 37 M 37 F 38 M 38 F 39 M 39 F
35-39 M 35-39 F
40 M 40 F 41 M 41 F 42 M 42 F 43 M 43 F 44 M 44 F
40-44 M 40-44 F
45 M 45 F 46 M 46 F 47 M 47 F 48 M 48 F 49 M 49 F
45-49 M 45-49 F
TOTAL M TOTAL F
Total
65 36 150 155 276 279 442 396 933 866 597 578 691 677 737 737 824 825 962 900 3811 3717 977 930 934 939 952 902 853 794 730 707
4446 4272 690 665 619 578 503 429 411 373 343 319 2566 2364 310 288 263 211 243 214 181 187 129 147 1126 1047 125 107 105 82 69 48 43 48 20 29 362 314 17 6 5 8 3 1
25 15
13269 12595
0
6 3-13 14 24( 23 33 31 76 72 38 36 38 36 40( 39 36 37 40 36 195 185 37 32 30( 29 26 27 21 19 17 15 132 124 13 12 9 8 5 6 5 2 4 3 37 34 3 2 2 1 2 1 1 1 1 1 10 9 < 1
( i
2' 2'
455< 427i
1
I 4 i 2 7 12 ) 12 ) 32 * 44 1 100 1 70 9 148 Z 128 i 171 5 170 r 227 5 241 i 235 2 265 9 297 3 290 5 321 3 330 1 1251 8 1296 2 336 5 357 ) 350 S 335 2 337 5 296 5 284 I 277 7 225 2 227 7 1532 ) 1492 ) 202 5 207 5 160 7 156 5 136 * 100 5 79 9 79 5 51 i 53 9 628 } 595 9 57 S 60 1 35 5 22 3 35 5 30 i 30 3 21 2 10 7 23 5 167
156 > 16 2 12 5 15 5 6 7 6 5 4 t 1 J 5 '- 2
7 40 t 27
1 2 1
2 2
) 3768 i 3696
Number of previotis children bom (live and still)
2
1 1 1 1 3 3 6 5 7 5 10 11 15 13 42 40 17 14 17 19< 19 17' 19 17 16 16< 90< 86i 16' 16( 15 14 12 10 10 7 7 6' 62( 54 5' 6< 4 4 4( 4 3 2 2( 2 19 2o; 2 1. i:
; i ( _ . ; 4i 25
220 2055
3
1
• 1 9 1 4 1 5 1 5 1 9 6 7 5 7 8 9 8 1 22 S 18 7 38 9 29 2 59 1 53 7 133 i 113 ) 71 9 74 i 67 5 71 i 99 7 90 5 91 i 88 i 92 ) 87 ) 420 i 410 7 107 ) 90
91 S 86 i 85
70 79
5 78 7 62 i 64 ) 424 5 388 i 55 5 40 S 47 I 41 ) 46 S 30
29 5 37 ) 15
18 192
I 166 12
) 14 > 12 I 10 I 4 > 3 5 8 ! 10 J 2
2 ? 38 > 39
1
1 1
2 1
1210 1118
• i
1 1 2 1 4 3 2( 1 2( 2' 3< 4 3( 3-! 3f 4. 15< 16: 4. 4. s; 6i 5 4. 4 5. 4. 4( 23. 24. 3 3( 3< 3: 2 2« 2( 2' 2: u 14« 13: n ic 11 i: ic
i
i
4' 3{
]
; 632 60S
\ 5
i > 2 i ? t 2 1 1 1 1 2 t 9 5 3 1 11 3 6 7 2 S 8 7 8 S 18
15 J 14 \ 22 J 23 1 19 ) 69 > 66 I 18 ) 21 > 40 ) 20
20 5 20 \ 25 5 23 » 23 ) 19 ! 126 ! 103 1 26 ) 24 ) 28 I 2 4 3 22 ) 11 J 23 7 23
13 1 19 > 112
101 13
» 12 12 9
) 12 1 6
6 1 I
t 6 44 34 2
T 1 1
3 2
357 317
6
2 1
i 4
4 3 5 5 7 13 7 6 4 27 27 9 13 17 17 9 15 15 17 15 14 65 76 15 21 21 13 23 19 9 16 12 10 80 79 11 9 13 14 3 3 5 6 1 3 33 35 3
2
5
211 221
7
i
1
1
1'
U 1 5 3 1
1( 1
1 1(
( 1 4 5 1 <
2 2
13 12-
8
I
i I S 1 :
: 7 ^
\ : 5 5 7 7 : 7 7 I t i 2 1 5 1 t 7 ) 5 ' 9 I ) ? 5
! ' ) 3 2
2 ) 5 J 7 t I 5
I 5 2 7 2 I
[
2 1
) 7 I 7.
S
I I
\ I
. \ I
5 1 ( ? 7 1 J 1 5 < X 7 t 7 ' 5 1( 5 7 5 X
2' 5 2 7 5 5 5 $ 5 5 5 2 5 ) 1 5 I
2
2 5 t 4
10 and over
1
i 4
I ! 2 J 2 3 5 2 5 5 7 2 5 » 1 5 5 5 3 2 3 X 6 ) 5 2 5 » 2 i 11 2 7 t 26 2 22 2 4 ; 2 6 5 9
7 3 6 3 4
5 6 5
1 6 29
7 29 2 3 L 1
2 1 1
2 4 [ i
5 6-r 2 60
• Parity has been taken to mean the number of children bom (live and still) to the mother as the result of previous pregnancies.
69
ABSTRACT 8B(ii). Northem Ireland: Legitimate live births by sex, age of mother and previous live born children.
Number of previous children t>om (live only) Age 1 1 1 1 1 1 1
of ToUl 10 Mother 0 1 2 3 4 5 6 7 8 9 and
over 16 M 65 61 4 • . . . 16 F 36 34 2 17 M 150 139 10 1 . . . . . . . . 17 F 155 143 12 . . . . . . . . . 18 M 276 240 32 4 . . . . . 18 F 279 237 41 1 . . . . . . . . 19 M 442 331 103 7 1 . . . . . 19 F 396 311 74 10 1 . . . . .
16-19 M 933 771 149 12 1 . . . . . . . 16-19 F 866 725 129 11 1 . . . . . . .
20 M 597 392 171 28 5 1 . . . . 20 F 578 366 173 33 5 . . 1 . . . . 21 M 691 391 230 61 7 2 21 F 677 369 237 59 9 2 1 22 M 737 405 233 70 20 9 . . . . . 22 F 737 395 265 58 17 2 . . . . . 23 M 824 376 299 103 33 12 1 . . . . 23 F 825 375 298 113 26 U 2 . . . . 24 M 962 409 329 146 57 19 1 1 . . . . 24 F 900 365 332 132 50 13 8 . . . .
20-24 M 3811 1973 1262 408 122 43 2 1 . . . . 20-24 F 3717 1870 1305 395 107 28 9 3 . . . .
25 M 977 379 336 167 67 22 4 1 1 . . . 25 F 930 332 362 142 73 16 1 3 . 1 . . 26 M 934 308 353 171 64 27 9 1 1 . . . 26 F 939 298 341 193 71 24 7 4 1 . . . 27 M 952 266 342 188 98 34 18 4 1 1 . . 27 F 902 277 305 173 85 40 14 7 . 1 . . 28 M 853 219 294 188 92 31 15 11 2 . . 1 28 F 794 191 284 171 86 33 21 6 2 . . . 29 M 730 181 232 156 92 38 19 6 5 1 . . 29 F 707 154 230 167 86 44 17 3 4 2 . .
25-29 M 4446 1353 1557 870 413 152 65 23 10 2 . 1 25-29 F 4272 1252 1522 846 401 157 60 23 7 4 . .
30 M 690 132 204 170 106 40 16 10 9 1 1 1 30 F 665 127 213 158 90 42 19 11 3 1 1 . 31 M 619 96 167 152 89 47 39 17 5 . 4 3 31 F 578 90 160 145 81 59 19 17 5 1 1 . 32 M 503 57 142 122 83 50 18 9 17 4 1 . 32 F 429 67 102 102 72 39 19 IS 8 . 3 2 33 M 411 57 79 101 79 41 28 12 6 7 1 . 33 F 373 31 78 80 74 58 21 16 6 6 . 3 34 M 343 47 52 81 61 39 26 12 13 5 6 1 34 F 319 38 54 65 68 35 20 16 11 9 3 .
30-34 M 2566 389 644 626 418 217 127 60 50 17 13 5 30-34 F 2364 353 607 550 385 233 98 75 33 17 8 5
35 M 310 39 60 53 56 33 25 17 12 6 8 1 35 F 288 27 63 65 39 29 23 22 7 3 5 5 36 M 263 22 35 48 46 38 32 17 10 9 5 1 36 F 211 15 25 41 43 33 22 14 11 2 2 3 37 M 243 23 36 40 48 29 22 20 10 6 3 6 37 F 214 17 30 49 31 27 10 19 11 6 10 4 38 M 181 11 31 29 32 29 19 8 9 6 3 4 38 F 187 18 23 27 35 28 21 16 9 5 3 2 39 M 129 12 10 20 15 23 13 14 7 3 3 9 39 F 147 19 23 21 18 13 22 8 12 4 1 6
35-39 M 1126 107 172 190 197 152 111 76 48 30 22 21 35-39 F 1047 96 164 203 166 130 98 79 50 20 21 20
40 M 125 9 16 21 13 18 13 11 12 7 1 4 40 F 107 14 11 14 14 10 12 9 12 4 2 5 41 M 105 5 17 12 10 13 12 12 6 4 6 8 41 F 82 6 6 2 13 10 11 12 9 5 1 7 4 2 M 6 9 7 7 8 4 9 12 4 8 1 3 6 4 2 F 4 8 3 5 9 2 4 7 3 3 5 3 4 4 3 M 4 3 4 2 5 7 6 5 5 1 3 1 4 4 3 F 4 8 2 5 5 8 8 2 5 4 3 1 5 4 4 M 2 0 2 3 1 2 3 1 1 . 2 . 5 4 4 F 2 9 1 2 4 6 3 3 3 1 6
40-44 M 362 27 45 47 36 49 43 33 27 17 11 27 40-44 F 314 26 27 30 39 36 38 32 31 20 8 27
45 M 17 1 1 . 1 2 2 3 1 1 2 3 45 F 6 2 . 1 1 . . . 1 1 46 M 5 1 . . 1 2 1 . . . 46 F 8 . . 1 2 1 . 1 1 . 2 47 M 3 . . 1 . . . . 1 . 1 47 F 1 . 1 48 M . . . . . . . . . . . 48 F . . . 49 M . . . . . . . . . 49 F . . . . . . . . . 45-49 M 2 5 2 1 2 2 3 5 2 2 2 4 45-49 F 1 5 2 1 3 2 . 1 1 1 4 TOTAL M 13269 4622 3830 2153 1189 615 351 198 137 68 48 58 TOTAL F 12595 4322 3756 2035 1100 587 305 212 122 62 38 56 70
CQvK>f vxtfiCl- ^ ^U^Vodbrl.O^'X
ABSTRACT 8C. Northern Ireland: Live births by age of mother and lire-birdi order*: latest available year, 1974.
order
Total live birthi
First
Second
Third
Fourth
Fifth
Sixth
Seventh
Eighth
Ninth
Tenth
Age of mother (years)
All Ages
27160
10240
7586
4188
2289
1202
656
410
259
130
200
under 15 15-19
2252
1949
278
23
2
20-24
7967
4282
2567
803
229
71
11
4
25-29
8918
2805
3079
1716
814
309
125
46
17
6
1
30-34
5053
865
1251
1176
803
450
225
135
83
34
31
35-39
2234
264
336
393
363
282
209
155
98
50
84
40-44
694
71
72
77
75
85
81
65
58
37
73
45-49
42
4
3
3
5
5
5
3
3
11
50 and over
• Live-birth order is the numerical order of the child in relation to all previous live-bom issue of the mother irrespective of whether pregnancies were nuptial or extra-nuptial.
71
ABSTRACT 8D. Northern Ireland: Legitimate live births by sex, age of mother and duration of marriage, 1974
Duration Age of mother of A l l . ,
Marriage ages 16 17 18 19 2o 21 22 23 24 25-29 30-34 35-39 40-44 45-49 50 +
MONTHS 0 M . . . . . . . . . . . . . . . . OF . . . . . . . . . . . . . . .
1-2 M 106 14 12 17 16 12 9 5 4 2 12 2 1 . . 1-2 F 135 IJ 27 27 14 14 9 12 4 4 8 4 . 2 . . 3-5 M 489 30 68 85 63 64 48 33 27 17 37 8 7 2 3-5 F 414 15 61 75 65 64 38 27 19 11 29 7 1 2 . 6-8 M 487 14 43 68 75 63 46 31 27 27 67 16 9 1 . . 6-8 F 426 8 32 65 74 47 44 35 31 21 50 14 5 . . 9-11 M 591 2 6 28 55 80 70 59 48 60 129 39 13 2 9-11 F 577 1 13 26 59 62 60 56 72 46 132 36 10 4 . YEARS ~
0 M 1673 60 129 198 209 219 173 128 106 106 245 65 30 5 0 F 1552 34 133 193 212 187 151 130 126 82 219 61 16 8 1 M 1787 4 19 59 162 194 213 210 179 156 430 107 44 10 1 F 1707 2 19 71 121 202 215 208 173 160 385 110 33 8 . 2 M 1721 1 2 15 54 130 160 191 197 191 584 136 52 8
--J 2 F 1563 3 12 47 128 157 177 186 180 5C7 128 31 6 1 3 M 1527 . 3 16 45 94 108 173 165 682 182 48 10 1 3 F 1512 . 10 50 106 144 141 199 674 144 36 7 1 4 M 1370 9 38 64 103 168 718 210 44 15 1 4 F 1281 . 1 4 8 32 48 107 138 699 184 54 6 5 M 1035 7 24 46 101 560 243 45 9 . 5F 1022 . 1 . . 12 22 63 84 582 202 45 II . ,. 6 M 846 3 9 14 41 463 262 42 12 . • . 6 F 829 . 1 1 2 6 21 37 458 241 52 10 . . 7 M 656 . 1 2 1 4 25 315 251 45 11 1 . 7 F 671 . 2 1 5 14 316 258 62 13 . 8 M 545 . 1 7 226 246 57 8 . 8 F 558 . . . . 1 2 3 225 250 67 10 9 M 440 . 1 2 2 122 228 74 10 1 9 F 399 . 1 1 3 114 201 66 12 1
10-14 M 1193 2 99 602 400 85 5 10-14 F 1082 1 . 91 548 366 75 1 15-19 M 388 . 1 33 232 116 6 15-19 F 340 . 1 . . 36 206 94 3 20-24 M 82 . . . . . . . 1 13 61 7 . 20-24 F 74 . 1 . . 1 / 1 13 50 8 25+ M 6 . . . . . . 1 . . 2 3 25+ F 5 . . . . . . . . . 1 . . 4 1 . 1 .
TOTAL M 1 13269 | 65 ISO ^ | 276 | 442^ ) 597^ 1 691 / 737 j 824 j 962 j ***6 j 2S66 j 112S j 363 I 2S J .
ABSTRACT 8£(i). Northern Ireland: Lire and still births by sex, legitimacy and age of mother, 1974.
Ase of
Mother
12 13 14
under 14
15 16 17 18 19
15-19
20 21 22 23 24
20-24
25 26 27 28 29
25-29
30 31 32 33 34
30-34
35 36 37 38 39
35-39
40 41 42 43 44
40-44
45 46 47 48 49
45-49
50 +
TOTAL
All live bir
Both sexes
186 422 689 955
2252
1291 1475 1567 1707 1927
7967
1958 1919 1894 1686 1461
8918
1385 1229 963 800 676
5053
624 482 468 376 284
2234
237 191 123 92 51
694
23 14 5
42
27160
Males
104 214 353 506
1177
661 748 789 858 999
4055
1004 963 975 875 744
4561
706 643 519 417 353
2638
325 268 250 184 132
1159
127 108 72 43 21
371
17 6 3
26
13987
ths
Females
82 208 336 449
1075
630 727 778 849 928
3912
954 956 919 811 717
4357
679 586 444 383 323
2415
299 214 218 192 152
1075
110 83 51 49 30
323
6 8 2
16
13173
Both sexes
loi 305 555 838
1799
1175 1368 1474 1649 1862
7528
1907 1873 1854 1647 1437
8718
1355 1197 932 784 662
4930
598 474 457 368 276
2173
232 187 117 91 49
676
23 13 4
40
25864
Live births
Legitimai
Males
65 150 276 442
933
597 691 737 824 962
3811
977 934 952 853 730
4446
690 619 503 411 343
2566
310 263 243 181 129
1126
125 105 69 43 20
362
17 5 3
25
13269
e
Females
36 155 279 396
866
578 677 737 825 900
3717
930 939 902 794 707
4272
665 578 429 373 319
2364
288 211 214 187 147
1047
107 82 48 48 29
314
6 8 1
15
12595
Both sexes
85 117 134 117
453
116 107 93 58 65
439
51 46 40 39 24
200
30 32 31 16 14
123
26 8 11 8 8
61
5 4 6 1 2
18
i 1
2
1296
Illegitimate
Males
39 64 77 64
244
64 57 52 34 37
244
27 29 23 22 14
115
16 24 16 6 10
72
15 5 7 3 3
33
2 3 3
i 9
i
1
718
Females
46 53 57 53
209
52 50 41 24 28
195
24 17 17 17 10
85
14 8 15 10 4
51
11 3 4 5 5
28
3 1 3 1 1
9
i
1
578
73
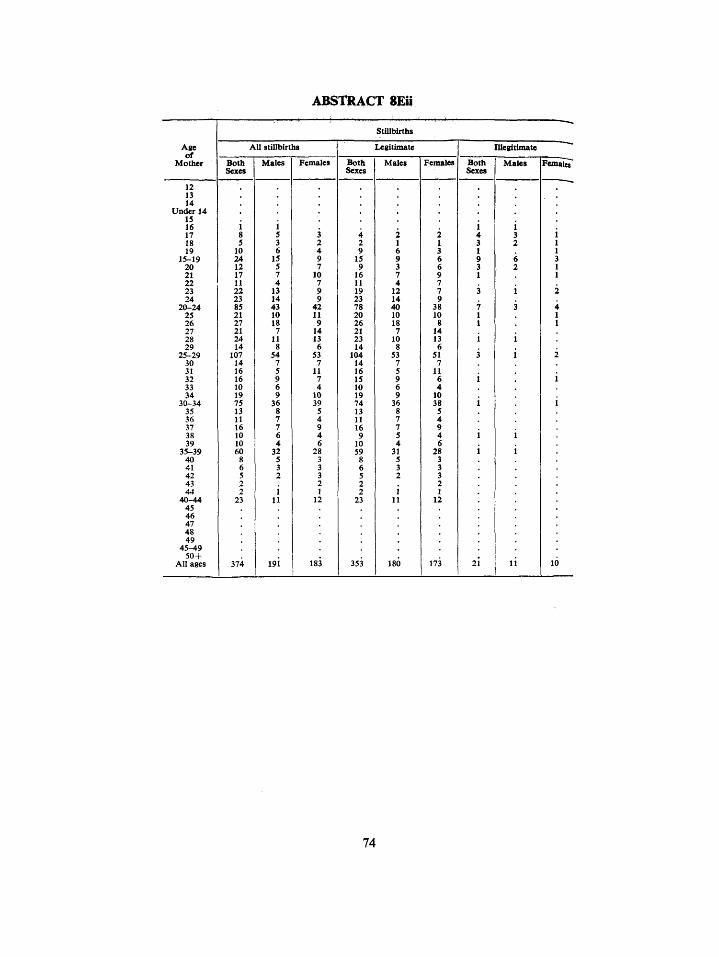
ABSTRACT 8Eii
Age of
Mother
12 13 14
Under 14 15 16 17 18 19
15-19 20 21 22 23 24
20-24 25 26 27 28 29
25-29 30 31 32 33 34
30-34 35 36 37 38 39
35-39 40 41 42 43 44
40-44 45 46 47 48 49
4 5 ^ 9 50 +
AIl ages
All stillbirths
Both Sexes
i 8 5
10 24 12 17 11 22 23 85 21 27 21 24 14
107 14 16 16 10 19 75 13 11 16 10 10 60
8 6 5 2 2
23
374
Males
1 5 3 6
15 5 7 4
13 14 43 10 18
7 11 8
54 7 5 9 6 9
36 8 7 7 6 4
32 5 3 2
i 11
191
Females
3 2 4 9 7
10 7 9 9
42 11 9
14 13 6
53 7
11 7 4
10 39
5 4 9 4 6
28 3 3 3 2 1
12
183
Both Sexes
4 2 9
15 9
16 11 19 23 78 20 26 21 23 14
104 14 16 15 10 19 74 13 11 16 9
10 59
8 6 5 2 2
23
353
Stillbirths
Legitimate
Males
2 1 6 9 3 7 4
12 14 40 10 18 7
10 8
53 7 5 9 6 9
36 8 7 7 5 4
31 5 3 2
i 11
180
Females
2 1 3 6 6 9 7 7 9
38 10
8 14 13 6
51 7
11 6 4
10 38
5 4 9 4 6
28 3 3 3 2 1
12
173
^ Illegitioiate
Both Sexes
i 4 3 1 9 3 1
3
7 1 1
;
21
Males
1 3 2
6 2
.
1
}
11
Femalei
* •
i 1 1 3 1 1
2
4 1 1
^ 1
10
74
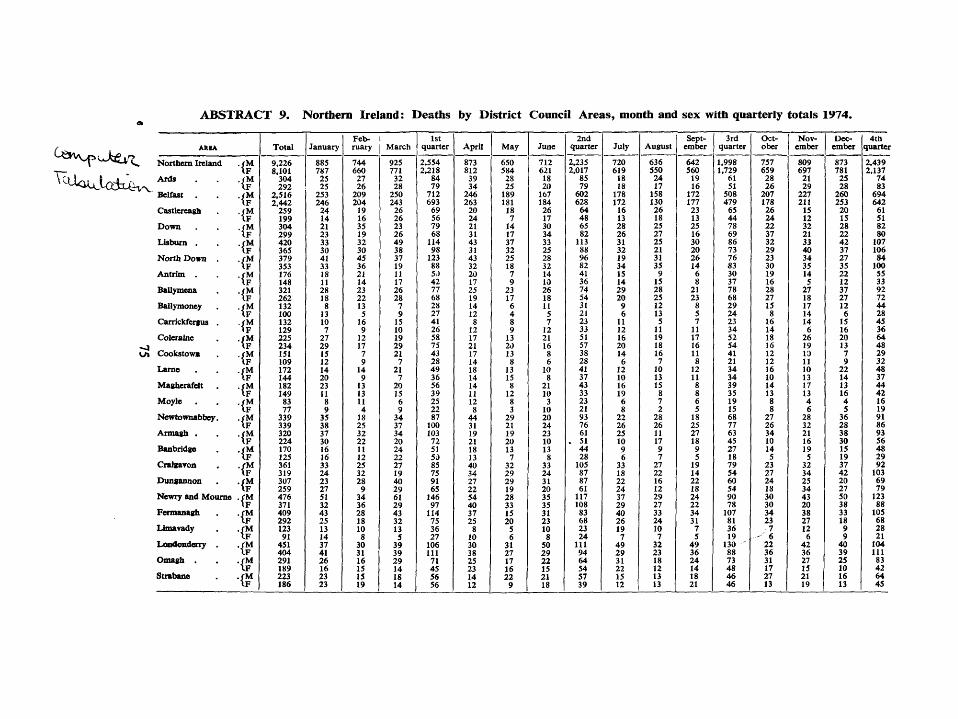
ABSTRACT 9. Northern Ireland: Deaths by District Council Areas, month and sex with quarterly totals 1974.
Feb- 1st 2nd Sept- 3rd Oct- Nov- Dec- 4th / AREA Total January ruary March quarter April May June quarter July August ember quarter ober ember ember quarter
^ ^ ^ ^ ' ' * - ^ ^ ' ^ Northern Ireland TrM 9.226 885 744 925 2.554 873 650 712 2.235 720 636 642 1.998 757 809 873 2,439 '— I F 8.101 787 660 771 2.218 812 584 621 2,017 619 550 560 1.729 659 697 781 2.137 \ O l ^ i i ^^•.. Ards , . . /M 304 25 27 32 84 39 28 18 85 18 24 19 61 28 21 25 74
'-Kl4jJ,(VjXtV->. I F 292 25 26 28 79 34 25 20 79 18 17 16 51 26 29 28 83 Belfast . . . /M 2,516 253 209 250 712 246 189 167 602 178 158 172 508 207 227 260 694
IF 2,442 246 204 243 693 263 181 184 628 172 130 177 479 178 211 253 642 Castlcreagh . ./M 259 24 19 26 69 20 18 26 64 16 26 23 65 26 15 20 61
\F 199 14 16 26 56 24 7 17 48 13 18 13 44 24 12 IS 51 Down . . ./M 304 21 35 23 79 21 14 30 65 28 25 25 78 22 32 28 82
I F 299 23 19 26 68 31 17 34 82 26 27 16 69 37 21 22 80 Lisburn . . ./M 420 33 32 49 114 43 37 33 113 31 25 30 86 32 33 42 107
IF 365 30 30 38 98 31 32 25 88 32 21 20 73 29 40 37 106 North Down . ./M 379 41 45 37 123 43 25 28 96 19 31 26 76 23 34 27 84
\F 353 33 36 19 88 32 18 32 82 34 35 14 83 30 35 35 100 Antrim . . ./M 176 18 21 U 5J 20 7 14 41 15 9 6 30 19 14 22 55
\F 148 11 14 17 42 17 9 10 36 14 15 8 37 16 5 12 33 BaUymena . ./M 321 28 23 26 77 25 23 26 74 29 28 21 78 28 27 37 92
IF 262 18 22 28 68 19 17 18 54 20 25 23 68 27 18 27 72 Ballymoney . ./M 132 8 13 7 28 14 6 U 31 9 12 8 29 15 17 12 44
IF 100 13 5 9 27 12 4 5 21 6 13 5 24 8 14 6 28 Carrickfergus . ./M 132 10 16 15 41 8 8 7 23 11 5 7 23 16 14 15 45
I F 129 7 9 10 26 12 9 12 33 12 11 11 34 14 6 16 36 Coleralne . ./M 225 27 12 19 58 17 13 21 51 16 19 17 52 18 26 20 64
^ I F 234 29 17 29 75 21 20 16 57 20 18 16 54 16 19 13 48 U» Cookstow* . ./M 151 15 7 21 43 17 13 8 38 14 16 11 41 12 10 7 29
\F 109 12 9 7 28 14 8 6 28 6 7 8 21 12 11 9 32 Lame . . ./M 172 14 14 21 49 18 13 10 41 12 10 12 34 16 10 22 48
IF 144 20 9 7 36 14 15 8 37 10 13 11 34 10 13 14 37 Maghcrafclt . ./M 182 23 13 20 56 14 8 21 43 16 15 8 39 14 17 13 44
IF 149 II 13 15 39 11 12 10 33 19 8 8 35 13 13 16 42 Moyle . , . /M 83 8 11 6 25 12 8 3 23 6 7 6 19 8 4 4 16
IF 77 9 4 9 22 8 3 10 21 8 2 5 15 8 6 5 19 Ncwtownabbey. ./M 339 35 18 34 87 44 29 20 93 22 28 18 68 27 28 36 91
IF 339 38 25 37 100 31 21 24 76 26 26 25 77 26 32 28 86 Armagh . . ./M 320 37 32 34 103 19 19 23 61 25 11 27 63 34 21 38 93
IF 224 30 22 20 72 21 20 10 . 51 10 17 18 45 10 16 30 56 Banbridge . ./M 170 16 11 24 51 18 13 13 44 9 9 9 27 14 19 15 48
IF 125 16 12 22 50 13 7 8 28 6 7 5 18 5 5 19 29 Cralgavon . ./M 361 33 25 27 85 40 32 33 105 33 27 19 79 23 32 37 92
IF 319 24 32 19 75 34 29 24 87 18 22 14 54 27 34 42 103 Dungannon , . /M 307 23 28 40 91 27 29 31 87 22 16 22 60 24 25 20 69
I F 259 27 9 29 65 22 19 20 61 24 12 18 54 18 34 27 79 Newry and Moume ./M 476 51 34 61 146 54 28 35 117 37 29 24 90 30 43 50 123
IF 371 32 36 29 97 40 33 35 108 29 27 22 78 30 20 38 88 Fermanagh . ./M 409 43 28 43 114 37 15 31 83 40 33 34 107 34 38 33 105
I F 292 25 18 32 75 25 20 23 68 26 24 31 81 23 27 18 68 Limavady . . rM 123 13 10 13 36 8 5 10 23 19 10 7 36 7 12 9 28
I F 91 14 8 5 27 10 6 8 24 7 7 5 19 - 6 6 9 21 LoadoBdeny . ,rM 451 37 30 39 106 30 31 50 111 49 32 49 130 22 42 40 104
IF 404 41 31 39 111 38 27 29 94 29 23 36 88 36 36 39 111 Omagh . . . /M 291 26 16 29 71 25 17 22 64 31 18 24 73 31 27 25 83
IF 189 16 15 14 45 23 16 15 54 22 12 14 48 17 15 10 42 Strabane . . /M 223 23 15 18 56 14 22 21 57 15 13 18 46 27 21 16 64
IF 186 23 19 14 56 12 9 18 39 12 13 21 46 13 19 13 45
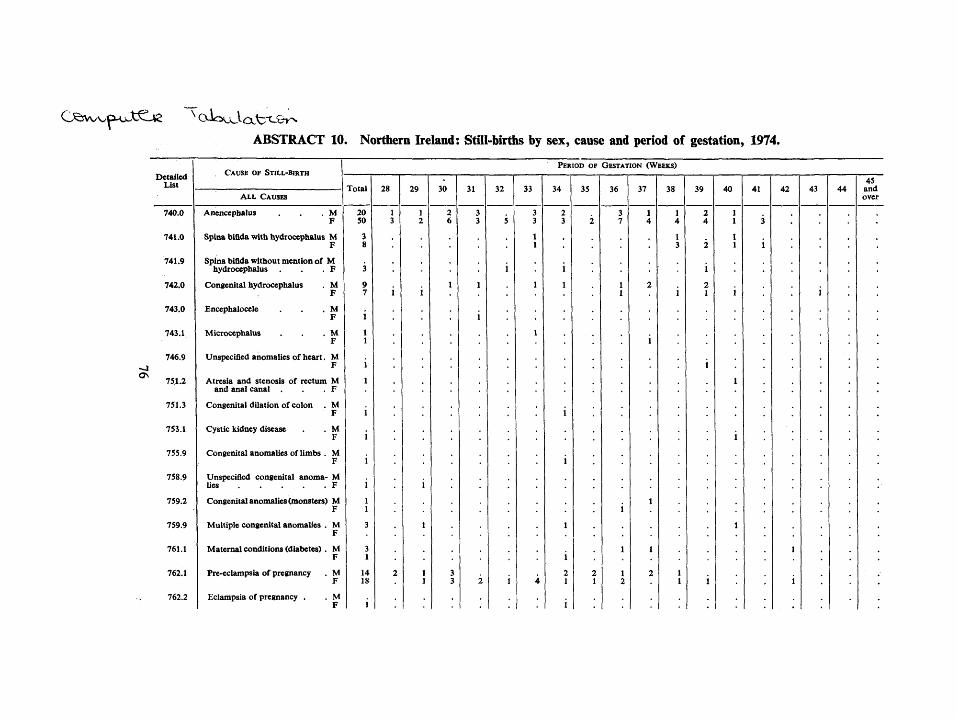
ABSTRACT 10. Northern Ireland: Still-births by sex, cause and period of gestation, 1974.
Detailed List
CAUSE OF STILL-BIRTH
A L L CAUSES
PERIOD OF GESTATION (WEEKS)
Total 28 29 30 31 32 33 34 35 36 37 38 39 40 42 43 45
and over
• J ON
740.0
741.0
741.9
742.0
743.0
743.1
746.9
751.2
751.3
753.1
755.9
758.9
759.2
759.9
761.1
762.1
762.2
Anencephalus
Spina bifida with hydrocephalus M F
Spina bifida without mention of M hydrocephalus . F
Congenital hydrocephalus . M F
Encephalocele . . . M F
Microcephalus . . M
Unspecified anomalies of heart. M F
Atresia and stenosis of rectum M and anal canal . . . F
Congenital dilation of colon . M F
Cystic kidney disease . . M
Congenital anomalies of limbs . M F
Unspecified congenital anoma- M lies F
Congenital anomalies (monsters) M F
Multiple congenital anomalies . M F
Maternal conditions (diabetes) . M F
Pre-eclampsia of pregnancy
Eclampsia of pregnancy .
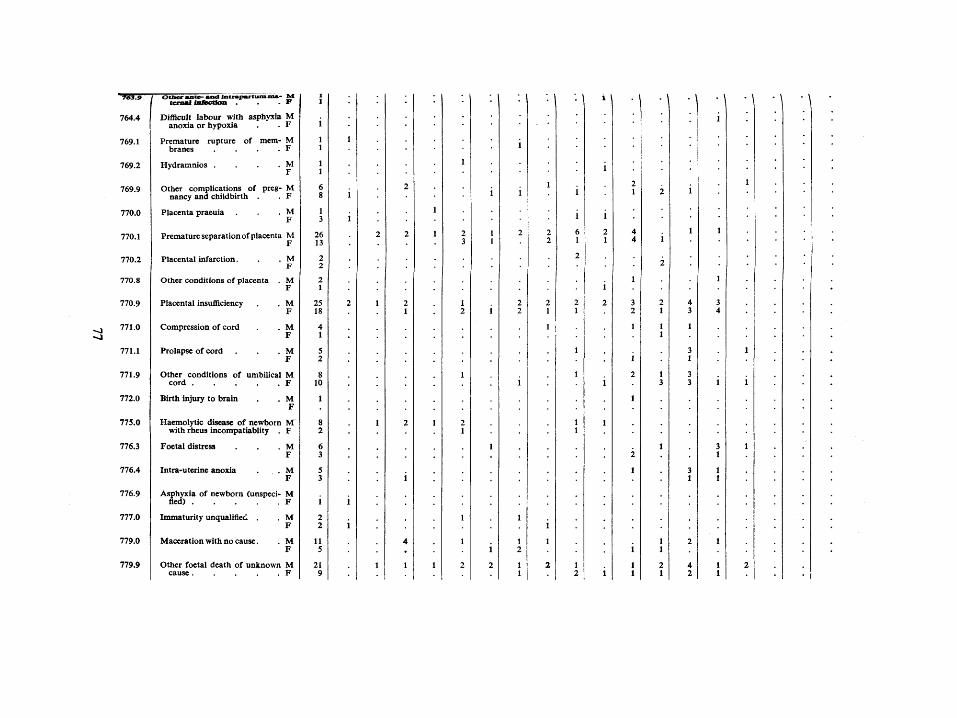
763.9
IMA
769.1
769.2
769.9
770.0
770.1
770.2
770.8
770.9
771.0
771.1
771.9
772.0
775.0
776.3
776.4
776.9
777.0
779.0
779.9
i \ \ • \
Difficult labour with asphyxia anoxia or hypoxia
Premature rupture of membranes . . . .
Hydramnios . . . .
Other complications of pregnancy and childbirth .
Placenta praeuia
Premature separation of placenta
Placental infarction.
Other conditions of placenta
Placental insufficiency
Compression of cord
Prolapse of cord
Other conditions of lunbilical cord . . . . .
Birth injury to brain
Haemolytic disease of newborn with rheus incompatiabllty .
Foetal distress
Intra-uterine anoxia
Asphyxia of newborn (unspecified)
Immaturity unqualifiec
Maceration with no cause.
Other foetal death of unknown cause . . . . .
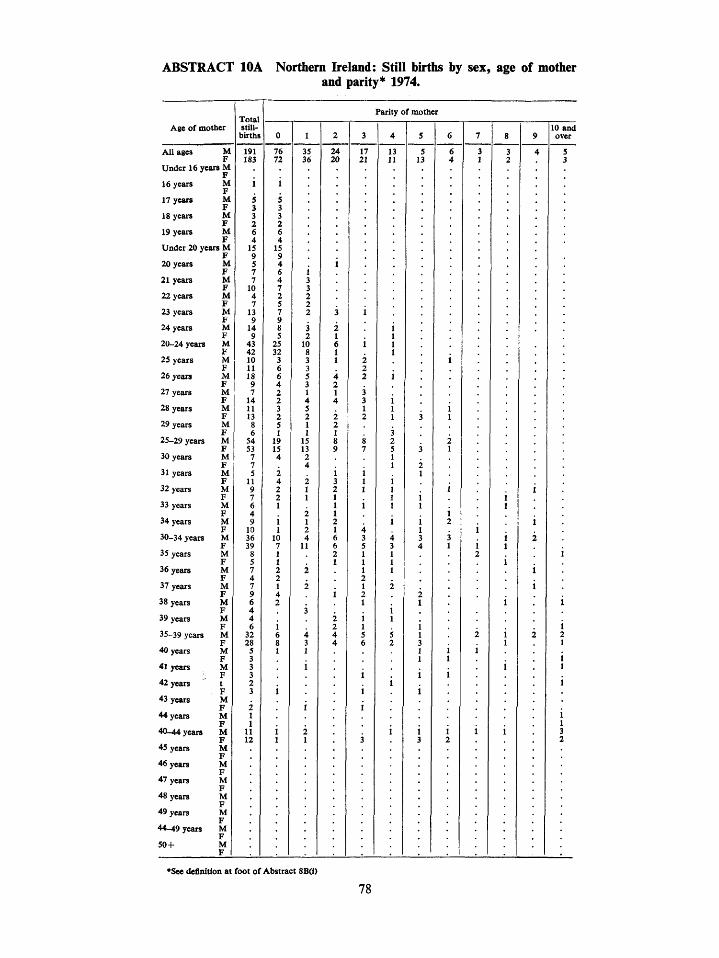
ABSTRACT lOA Northern Ireland: Still births by sex, age of mother and parity* 1974.
Age of mother Total still
births
Parity of mother
10 and over
All ages M F
Under 16 years M F
16 years M F M F M F M F
Under 20 years M F
20 years M
17 years
18 years
19 years
21 years
22 years
23 years
24 years
20-24 years
25 years
26 years
27 years
28 years
29 years
25-29 years
30 years
31 years
32 years
33 years
34 years
30-34 years
35 years
36 years
37 years
38 years
39 years
35-39 years
40 years
41 years
42 years
43 years
44 years
40-44 years
45 years
46 years
47 years
48 years
49 years
44-49 years
50+
F M F M F M F M F M F M F M F M F M F M F M F M F M F M F M F M F M F M F M F M F M F M F M F M F M F t F M F M F M F M F M F M F M F M F M F M F
191 183
76 72
5 3 3 2 6 4 15 9 5 7 7 10 4 7 13 9 14 9 43 42 10 11 18 9 7 14 11 13 8 6 54 53 7
5 3 3 2 6 4 15 9 4 6 4 7 2 5 7 9 8 5 25 32 3 6 6 4 2 2 3 2 5 1 19 15 4
1 3 3 2 2 2
3 2
10 8 3 3 5 3 1 4 5 2 1 1
15 13 2 4
2 1 1
2 1 2 4
11
24 20
•See definition at foot of Abstract 8B(i)
78

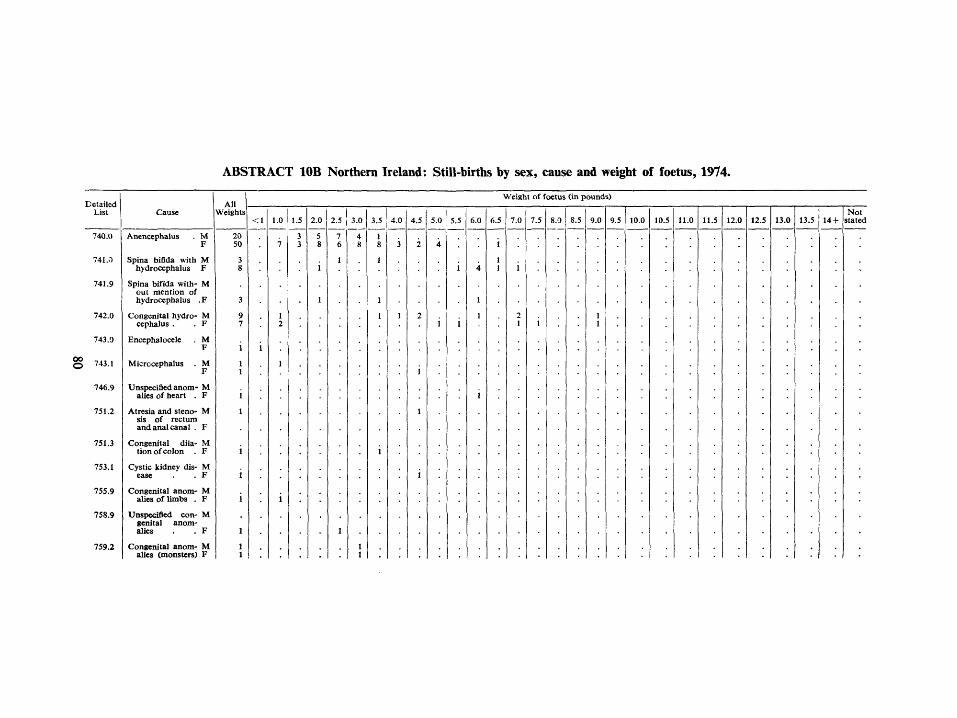
ABSTRACT lOB Northern Ireland: Still-births by sex, cause and weight of foetus, 1974.
Detailed List
740.0
741.0
741.9
742.0
743.0
§ 743.1
746.9
751.2
751.3
753.1
755.9
758.9
759.2
Cause All
Weights
Weight of foetus (in pounds)
Anencephalus
Spina bifida with M hydrocephalus F
Spina bifida with- M out mention of hydrocephalus .F
Congenital hydro- M cephalus . . F
Encephalocele . M
Microcephalus . M F
UnspeciSed anom- M alies of heart . F
Atresia and steno- M sis of rectum and anal canal . F
Congenital dila- M tion of colon . F
Cystic kidney dis- M ease . . F
Congenital anom- M alies of limbs . F
Unspecified con- M genital anomalies . . F
Congenital anom- M alies (monsters) F
2.5 I 3.0
4
10.0 12.5 13.0 13.5 14+ Not
stated
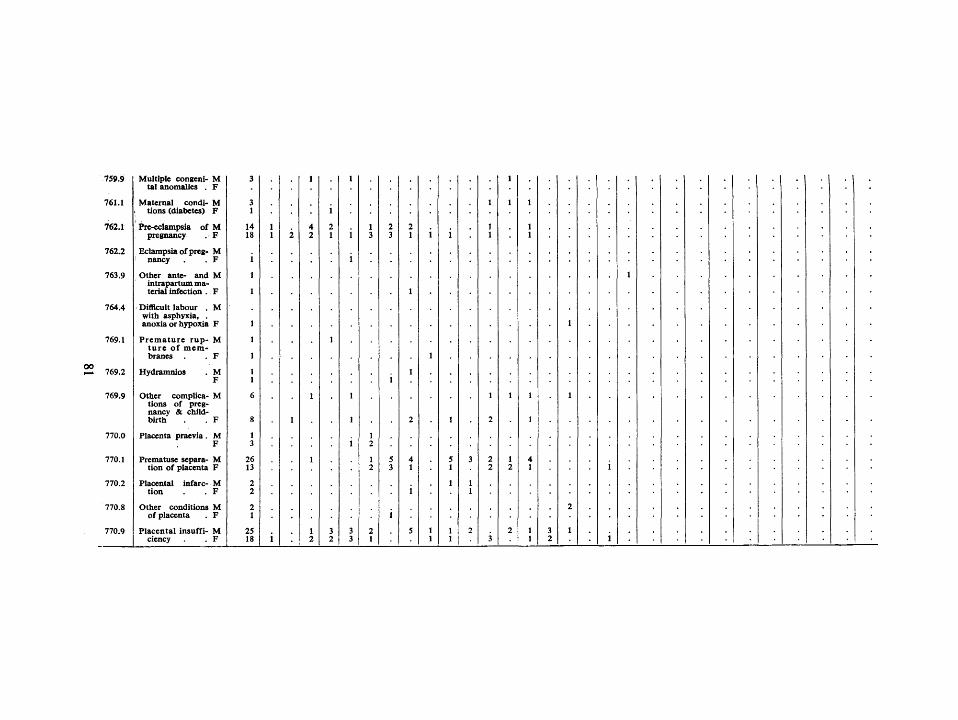
759.9
761.1
762.1
762.2
763.9
764.4
769.1
769.2
769.9
770.0
770.1
770.2
770.8
770.9
Multiple congeni- M tal anomalies . F
Maternal condi- M tions (diabetes) F
Pre-eclampsia of M pregnancy . F
Eclampsia of preg- M nancy . . F
Other ante- and M intrapartum material infection . F
Difficult labour . M with asphyxia, . anoxia or hypoxia F
Premature rup- M ture of membranes . . F
Hydramnios
Other complica- M tions of pregnancy & childbirth . F
Placenta praevia. M F
Prematuse separa- M tion of placenta F
Placental tion
infarc- M . F
Other conditions M of placenta . F
Placental insufficiency
26 13
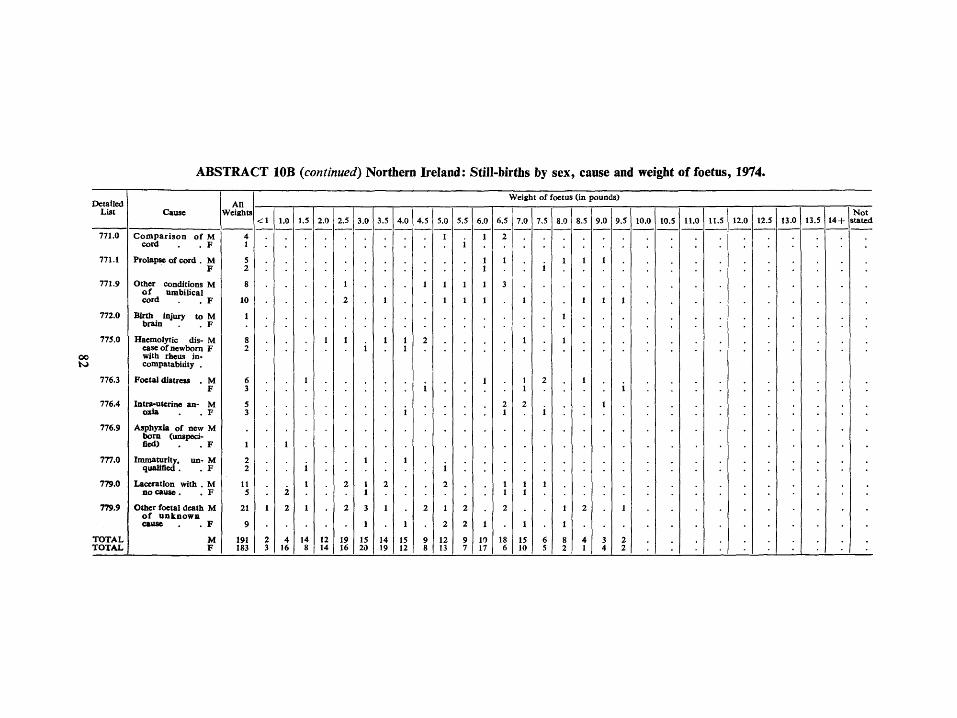
ABSTRACT lOB {continued) Northern Ireland: Still-births by sex, cause and weight of foetus, 1974.
Detailed List
771.0
771.1
771.9
772.0
775.0
OO
to 776.3
776.4
776.9
777.0
779.0
779.9
TOTAL TOTAL
Cause
C o m p a r i s o n of M cord . . F
Prolapse of cord . M F
Other conditions M o f umbilical cord . F
Birth injuty to M brain . F
Haemolytic dis- M ease of newborn F with rheus in-compatabiiity .
Foetal distress . M F
Intra-uterine an- M cola . F
Asphyxia of new M b o m (unspecified) , . F
Immaturity, un- M quaUfled . . F
Laceration with . M no cause . . F
Other foetal death M o f u n k n o w n cause . F
M F
All Weights
4 1
5 2
8
10
1
8 2
6 3
5 3
1
2 2
11 5
21
9
191 183
Weight of foetus (in pounds)
<\
1
2 3
1.0
1
2
2
4 16
1.5
1
1
1
14 8
2.0
1
12 14
2.5
.
1
2
1
2
2
19 16
3.0
1 1
3
1
15 20
3.5
1
1
2
1
14 19
4.0
1
1
15 12
4.5
1
2
i
•
2
9 8
5.0
1
1
1
2
1
2
12 13
5.5
i
1
1
* 2
2
6.0
1
1 1
1
1
1
1
10 17
6.5
2
1
3
2
1 1
2
18 6
7.0
1
1
2
1 1
15 10
7.5
.
i
2
i
8.0
1
1
1
8 2
8.5
1
1
1
2
4 1
9.0
1
1
3 4
9.5
1
1
1
2 2
10.0 10.5 11.0 11.5 12.0 12.5 13.0 13.5 14 + Not
stated

ABSTRACT 11. Northern Ireland: Births, still-births and deaths, by age, sex and cause, in each District Council area 1974, together with the census population 1971.
POPULATION, BIRTHS, STILL-BIRTHS AND
DEATHS
f\^- - Population, Census 1791
^ A Va., 5 _ Live births, total .
6JOc^tC^ W A ^ ^ • ^ ^ lUegitimate live births
Still-births, total
'^p- Illegitimate still-births
Deaths, total .
Ages at death— under 1 week
under 4 weeks
4 weeks—11 months
1 year—14 years
15 years—44years
45 years—64 years
65 years and over
754,676 781,389
13,987 13,173
718 578
191 183
9.226 8,101
163 159
191 184
22,890 23,888
540 475
304 292
198,872 217,807
2,672 2,651
233 191
49 46
2.516 2.442
148 75
679 262
2.352 1.295
5,752 6,197
5 2
11 10
79 49
199 220
33 24
204 73
688 406
1,522 1.872
31.168 33.238
361 311
259 199
79 34
148 146
23,450 23.501
517 470
3U 299
21 10
194 245
35.068 35,626
774 758
420 365
42 9
110 63
249 231
24,789 27,822
480 42!
379 353
89 43
265 289
17.224 16.774
422 395
176 148
43 24
101 105
24,151 24,847
5)5 483
321 262
233 215
i >. ct n
10,982 10,938
195 174
17 12
9 10
1
132 100
3 3
4 3
1 2
9 5
M
a O
13,094 13.950
227 243
15 12
3 2
132 129
2 2
2 3
3 1
3 2
17 5
41 24
225 234
156 182
13.070 13,000
255 247
151 109
j
Deaths from— Infective and parasitic diseases
Neoplasms (a) Cancers* C6) Other neoplasms .
Endocrine, nutritional and metabolic diseases . . . .
Diseases of blood and blood-forming organs . . . .
Mental disorders
Diseases of the nervous system and sense organs . . . .
Diseases of the circulatory system
Diseases of the respiratory system
Diseases of the digestive system .
Diseases of the genito-urinary system . . . . .
Complications of pregnancy, childbirth and the puerperium
Diseases of the skin and subcutaneous tissue
Disease of the musculoskeletal sjfstem and connective tissue
Congenital anomalies .
Certain causes of perinatal morbidity and mortality
Symptoms and ill-deflned conditions
Accidents, poisonings and violence (external cause).
155
2,790 121
189
63
12
218
9,154
2,223
417
200
6
13
58
191
244
145
1,128
4
105 3
6
3
6
334
63
16
4
3
7
7
10
25
50
851 37
55
18
2
54
2,441
740
126
47
2
6
16
45
60
26
382
5
88 4
3
1
6
229
54
14
9
1
2
2
7
6
27
4
90 2
8
1
9
344
72
9
12
2
1
5
3
8
33
10
116 2
14
3
1
30
387
109
19
9
4
10
8
4
59
3
129 2
7
4
5
423
89
18
10
1
4
8
3
29
4
48 3
5
2
1
5
178
25
5
3
11
7
4
23
1
97 3
6
4
7
358
41
11
6
5
9
9
26
39
4
1
4
119
29
5
4
4
4
2
17
5
49 1
1
1
2
137
30
3
6
2
2
4
2
16
3
71 5
5
1
7
248
57
9
5
3
3
8
7
27
2
41
3
I
153
30
4
2
5
2
3
14
*Se? deSnjtion on page 2,
ABSTRACT 11 (continued) Northern Ireland: Births, still-births and deaths by age, sex and cause in each District Council area 1974, together with the census population, 1971.
POPULATION, BIRTHS, STILL-BIRTHS AND
DEATHS
Population, Census 1971
Live births, total .
Illegitimate live births .
Still-births, total .
oo ON Illegitimate still-births .
Deaths, total
Ages at Death— under 1 week
tmder 4 weeks .
4 weeks—11 months .
1 year—14 years
15 years—44 years
45 years—64 years
65 years and over
M F
M F
M F
M F
M F
. M F
M F
M F
M F
M F
M F
M F
M F
§ 2
14.863 15.034
232 206
18 12
2 3
172 144
1 2
1 2
1 2
3 1
11 4
53 31
103 104
"a
15,903 15.557
291 288
5 8
10 8
182 149
3 1
3 1
1 2
1 2
12 6
51 25
114 113
7.000 6.979
127 124
12 11
83 77
1
1 2
i 2
2 1
18 14
60 59
Jg a
o % 4.
33.040 33.875
708 662
28 26
1 2
339 339
7 9
8 12
5 2
6 1
20 14
99 60
201 250
< 23,599 22,850
459 414
6 8
3 1
320 224
2 5
3 6
5 5
5 4
33 6
62 31
212 172
14,298 14.390
174 181
5 9
1 5
170 125
i 1 1
1
3 3
8 2
37 16
120 103
a o g '3
o 33,196 34.522
724 689
26 20
8 12
361 319
9 8
10 11
9 5
6 2
31 11
93 52
212 238
C o
i Q
21.591 21.015
506 434
12 7
2 5
1
307 259
4 2
5 3
5 4
6 2
27 9
70 41
194 200
i
35.883 36.485
790 725
21 23
7 8
1 1
476 371
7 8
8 10
4 3
7 2
43 10
111 59
303 287
•a
26,217 24.762
515 440
22 13
12 3
2 1
409 292
8 10
9 11
5 6
7 4
21 10
80 39
287 222
>. •a % .§
12.348 11.461
268 272
17 12
4 1
123 91
5 6
6 6
3 2
3 3
ID 1
33 IS
68 64
c B o
l-l 41.952 42.949
1.077 943
49 37
18 21
1 1
451 404
18 9
21 9
9 4
13 3
44 22
130 62
234 304 ,
•a o
21.181 199,94
431 381
18 22
7 6
291 189
6 5
8 6
4 2
8 1
22 4
75 37
174 139 1
1 1 17,253 17,111
386 386
20 24
6 2
1
223 186
6 9
7 9
2
2 3
14 3
49 35
149 136
Deaths from— Infective and parasitic diseases .
Neoplasms id) Cancer* (b) Other neoplasms .
Endocrine, nutritional and metabolic diseases
Diseases of blood and blood-forming organs
Mental disorders
Diseases of the nervous system and sense organs . . . .
Diseases of the circulatory system
Diseases of the respiratory system
Diseases of the digestive system .
Diseases of the genito-urinary system . . . .
oo -..J Complications of pregnancy, child
birth and the pucrperium Diseases of the skin and subcutan
eous tissue . . . .
Diseases of the musculoskeletal system and connective tissue .
Congenital anomalies
Certain causes of perinatal morbidity and mortality
Symptoms and ill-defined conditions
Accidents, poisonings and violence (external cause)
1
60 2
1
5
177
30
13
2
1
2
4
4
14 1
1
49
5
2
185
40
5
7
1
4
3
2
6
21
1
24
4
1
4
82
21
1
3
1
4
1
2
11 1
9
106 6
11
1
7
366
85
14
5
1
10
10
4
43
4
70 5
4
1
7
292
69
14
8
2
7
4
5
52
2
40 3
1
1
2
4
172
38
5
2
3
3
4
15
10
106 7
4
2
7
342
94
19
8
1
2
11
16
5
46
4
68 6
9
1
1
7
331
63
13
7
1
9
1
2
43
7
145 10
6
4
8
481
66
28
4
1
2
7
13
11
54
7
111 5
6
2
1
13
371
100
17
8
2
7
13
2
36
4
33 1
3
1
2
98
32
4
5
3
11
2
15
7
137 7
11
4
1
11
403
121
30
14
2
3
10
23
8
63
2
66 5
2
3
5
261
75
6
5
I
3
5
10
3
28
5
51 2
6
2
1
2
245
50
9
5
1
,
2
7
9
3
9
•See definition on page 2.
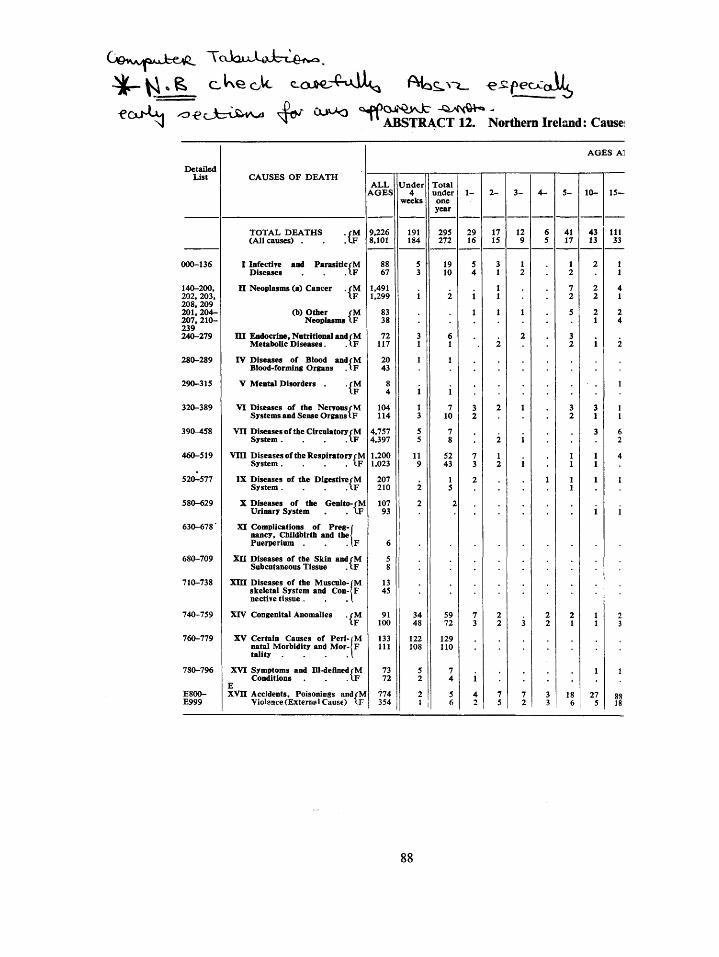
ftk^c. ^^p eoCaJbL
Aj tr- . ^ .A-.w . p". " A B S T R A C T S . Northern Ireland: Cause
Detailed List
000-136
140-200. 202. 203. 208. 209 201. 2 0 4 -207. 210-239 240-279
280-289
290-315
320-389
390-458
460-519
520-577
580-629
630-678'
680-709
710-738
740-759
760-779
780-796
E800-E999
CAUSES OF DEATH
TOTAL DEATHS . rM (All causes) . . .LF
I Infectire and ParasitlcrM Diseases . I F
II Neoplasms (a) Cancer . / M IF
(b) Other f M Neoplasms (.F
n i Endocrine. Nutritional and/M Metabolic Diseases. . I F
IV Diseases of Blood andrM Blood-forming Organs . I F
V Mental Disorders . . / M IF
VI Diseases of the Nerrons/M Systems and Sense Organs IF
V n Diseases of the Circulatory rM System. . . . I F
V m Diseases of the Respiratory rM System. . . I F
IX Diseases of the DigestirerM System. . . . I F
X Diseases of the Genito-rM Urinary System . . IF
XI Complications of Preg-r nancy. Childbirth and the/ Puerperium . [ F
X n Diseases of the Skin and rM Subcutaneous Tissue . IF
X l i l Diseases of the Musculo-[M skeletal System and Con-<F nective tissue . . . |
XIV Congenital Anomalies . rM \ F
XV Certain Causes of Peri-[M natal Morbidity and Mor-JF tality . .1
XVI Symptoms and IIl-deflnedrM Conditions . .(.F
E X V n Accidents, Poisonings and/M
Violsnce (Externa 1 Cause) IF
ALL AGES
9,226 8,101
88 67
1,491 1,299
83 38
72 117
20 43
8 4
104 114
4,757 4,397
1.200 1,023
207 210
107 93
6
5 8
13 45
91 100
133 111
73 72
774 354
Under 4
weeks
191 184
5 3
i
3 1
1
i 1 3
5 5
11 9
2
2
34 48
122 108
5 2
2 I
Total under
one year
295 272
19 10
2
6 1
1
1
7 10
7 8
52 43
1 5
2
59 72
129 110
7 4
5 6
1 -
29 16
5 4
i 1
3 2
7 3
2
7 3
i 4 2
2 -
17 15
3 1
1 1
1
2
2
2
1 2
2 2
7 5
3 -
12 9
1 2
1
2
3
7 2
4 -
6 5
2 2
3 3
5 -
41 17
1 2
7 2
5
3 2
3 2
1 1
1 1
2 1
18 6
AGES AT
10 -
43 13
2
2 2
2 1
i
3 1
3
1 1
1
i
1 1
1
27 5
1 5 -
111 33
1 1
4 1
2 4
2
1
1 1
6 2
4
1
i
2 3
1
88 18
88
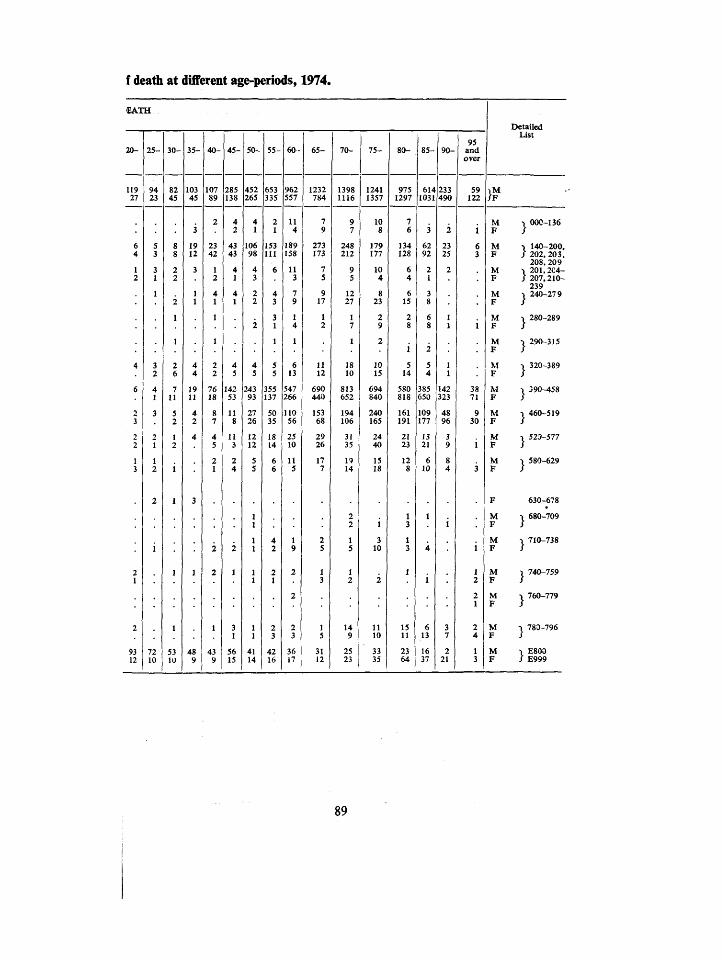
f death at different age-periods, 1974.
EATH
20-
119 27
6 4
1 2
4
6
2 3
2 2
1 3
2 1
2
93 12
2 5 -
94 23
5 3
3 1
1
3 2
4 1
3
2 1
1 2
2
1
72 10
30 -
82 45
8 8
2 2
2
1
1
2 6
7 11
5 2
1 2
i
1
1
1
53 10
35-
103 45
3
19 12
3
1 1
4 4
19 11
4 2
4
3
1
48 9
4 0 -
107 89
2
23 42
1 2
4 1
1
1
2 2
76 18
8 7
4 5
2 1
2
2
1
43 9
4 5 -
285 138
4 2
43 43
4 1
4 1
4 5
142 53
11 8
11 3
2 4
2
1
3 1
56 15
50 -
452 265
4 1
106 98
4 3
2 2
2
4 5
243 93
27 26
12 12
5 5
1 1
41 14
5S-
653 335
2 1
153 H I
6
4 3
3 1
1
5 5
355 137
50 35
18 14
6 6
4 2
2 1
2 3
42 16
60-
962 557
11 4
189 158
11 3
7 9
1 4
1
6 13
547 266
110 56
25 10
11 5
1 9
2
2
2 3
36 17
6 5 -
1232 784
7 9
273 173
7 5
9 17
1 2
H 12
690 440
153 68
29 26
17 7
2 5
1 3
1 5
31 12
7 0 -
1398 1116
9 7
248 212
9 5
12 27
1 7
1
18 10
813 652
194 106
31 35
19 14
2 2
1 5
1 2
14 9
25 23
7 5 -
1241 1357
10 8
179 177
10 4
8 23
2 9
2
10 15
694 840
240 165
24 40
15 18
i 3
10
2
11 10
33 35
80-
975 1297
7 6
134 128
6 4
6 15
2 8
i 5
14
580 818
161 191
21 23
12 8
1 3
1 3
1
15 11
23 64
85-
614 1031
3
62 92
2 1
3 8
6 8
2
5 4
385 650
109 177
13 21
6 10
1
4
i
6 13
16 37
9 0 -
233 490
2
23 25
2
1 1
1 1
142 323
48 96
3 9
8 4
3 7
2 21
95 aod over
59 122
i 6 3
38 71
9 30
i
3
i
1 2
2 1
2 4
1 3
M F
M F
M F
M F
M F
M F
M F
M F
M F
M F
M F
F
M F
M F
M F
M F
M F
M F
Detailed List
•> 000-136
I 140-200, / 202, 203.
208, 209 •» 201.2C4-/ 207.210-
239 •» 240-279
-> 280-289
•1 290-315
•1 320-389
^ 390^58
•1 460-519
•> 523-577
•> 580-629
630-678
•» 680-709
•> 710-738
1 740-759
•» 760-779
•) 780-796
\ E800 / E999
89
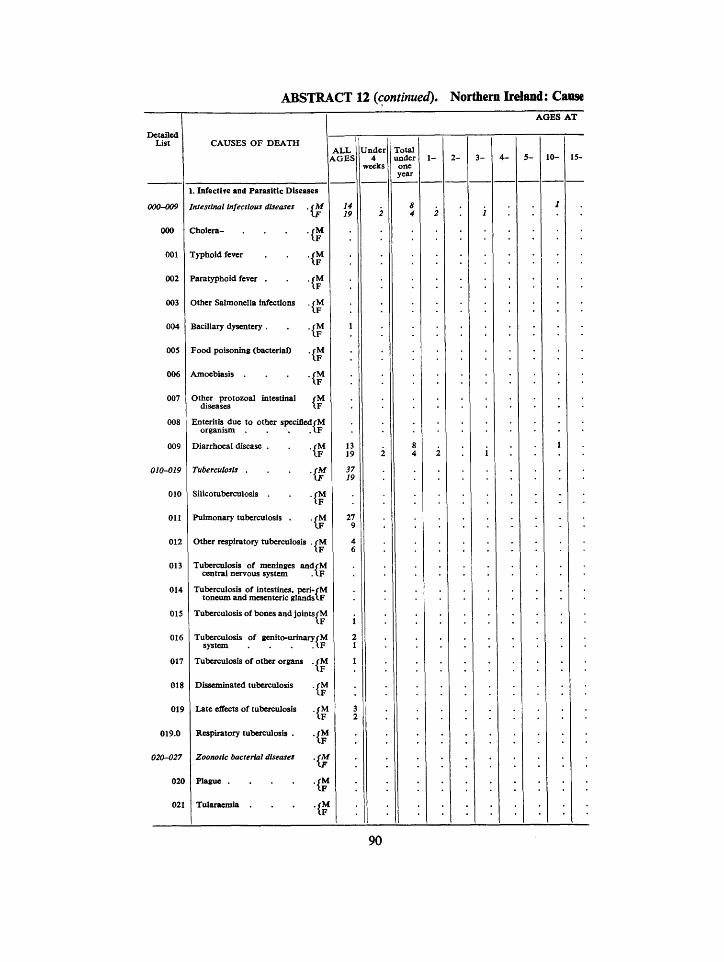
ABSTRACT 12 (continued). Northern Ireland: Cause
Detailed List
AGES A T
CAUSES OF DEATH
1. Infectife and Parasitic Diseases
000-009
000
001
002
003
004
005
006
007
008
009
010-019
010
Oil
012
013
014
015
016
017
018
019
019.0
020-027
020
021
Intestinal infectious diseases
Cholera-
Typlioid fever
Paratyphoid fever .
Other Salmonella infections
Bacillary dysentery .
Food poisoning (bacterial)
Amoebiasis .
Other protozoal intestinal diseases
.cM \F
fM
. / M IF
. / M IF
. / M I F
. / M IF
. f M IF
. / M IF
fM IF
ALL AGES
Enteritis due to other specifledfM organism . . . .(.F
Diarrhoea! disease .
Tuberculosis .
Silicotuberculosis .
Pulmonary tuberculosis
. f M I F
.CM IF
.CM IF
Other respiratory tuberculosis . / M IF
Tuberculosis of meninges andfM central nervous system . \ F
Tuberculosis of intestines, peri-fM toneum and mesenteric glandslF
Tuberculosis of bones and joints fM I F
Tuberculosis of genito-urinaiy/M system
Tuberculosis of other organs
Disseminated tuberculosis
Late effects of tuberculosis
Respiratory tuberculosis .
Zoonotic bacterial diseases
.CM I F
. / M IF
.CM I F
. f M I F
Plague fM i r
Tularaemia
IF
Under 4
weeks
Total under
one year
5 - 10 - 15
90
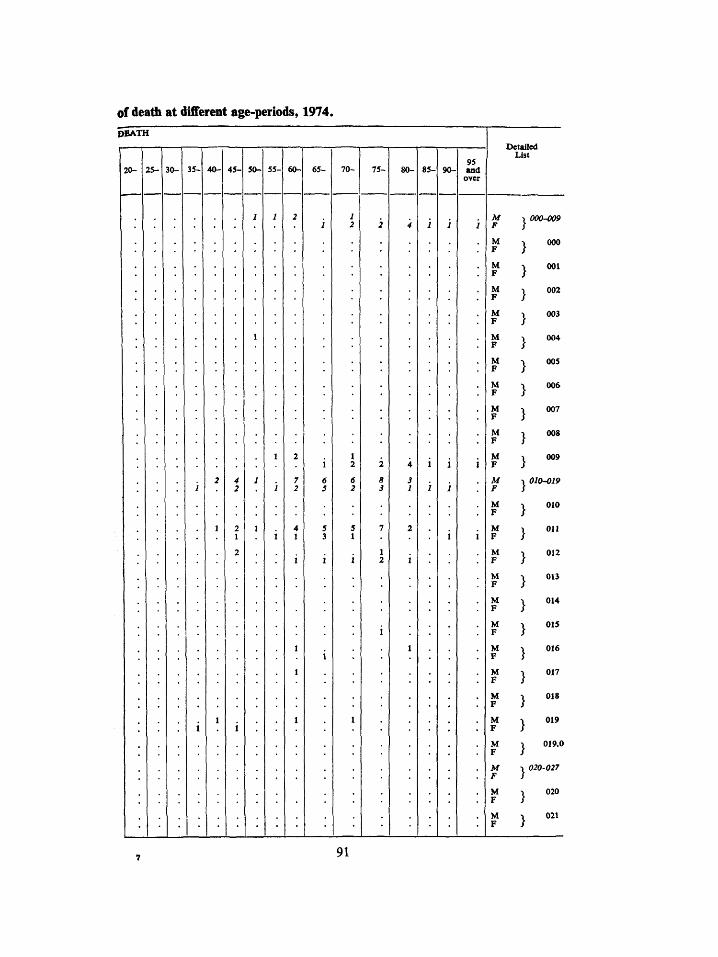
of death at different age-periods, 1974.
DEATH
r" 20- 25- 35- 40- 45- 50- 60- 65- 70- 75- 85- 90-
95 and
over
Detailed List
000-009
000
001
002
003
004
005
006
007
008
009
010-019
010
on
012
013
014
015
016
017
018
019
019.0
020-027
020
021
91
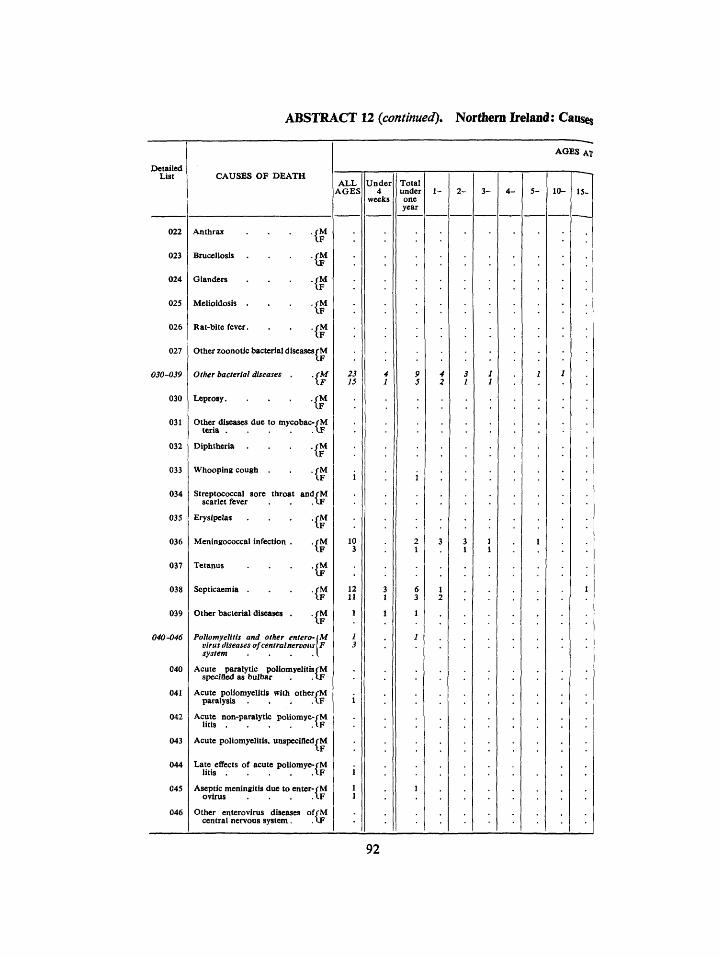
ABSTRACT 12 (continued). Northern Ireland: Causes
Detailed List
022
023
024
025
026
027
030-039
030
031
032
033
034
035
036
037
038
039
040-046
040
041
042
043
044
045
046
CAUSES OF DEATH
Anthrax
Brucellosis
Glanders
Melioidosis
Rat-bite fever
. /M IF
.fM
. /M IF
. /M \F
. /M IF
Other zoonotic bacterial diseases rM
Other bacterial leases .CM
Leprosy fM IF
Other diseases due to mycobac-rM
./M IF
./M IF
idfM
fM
teria
Diphtheria
Whooping cough
Streptococcal sore throat and/M scarlet fever
Erysipelas
Meningococcal infection
Tetanus
Septicaemia .
Other bacterial diseases
./M tF
(T . /M \F
. /M IF
Poliomyelitis and other entero-lM virus diseases of central nervous IF system . . . A
Acute paralytic poliomyelitis rM speciaed as bulbar . . (.F
Acute poliomyelitis with otherrM paralysis . . . A F
Acute non-paralytic poliomye-fM litis
Acute poliomyelitis. unspecifled/M
Late effects of acute poliomye-rM litis IF
Aseptic meningitis due to enter-rM ovirus . . . A F
Other enterovirus diseases offM central nervous system. . V.F
AGES AX
ALL AGES
Under 4
weeks
Total under one year
2 - 5- 10-
92
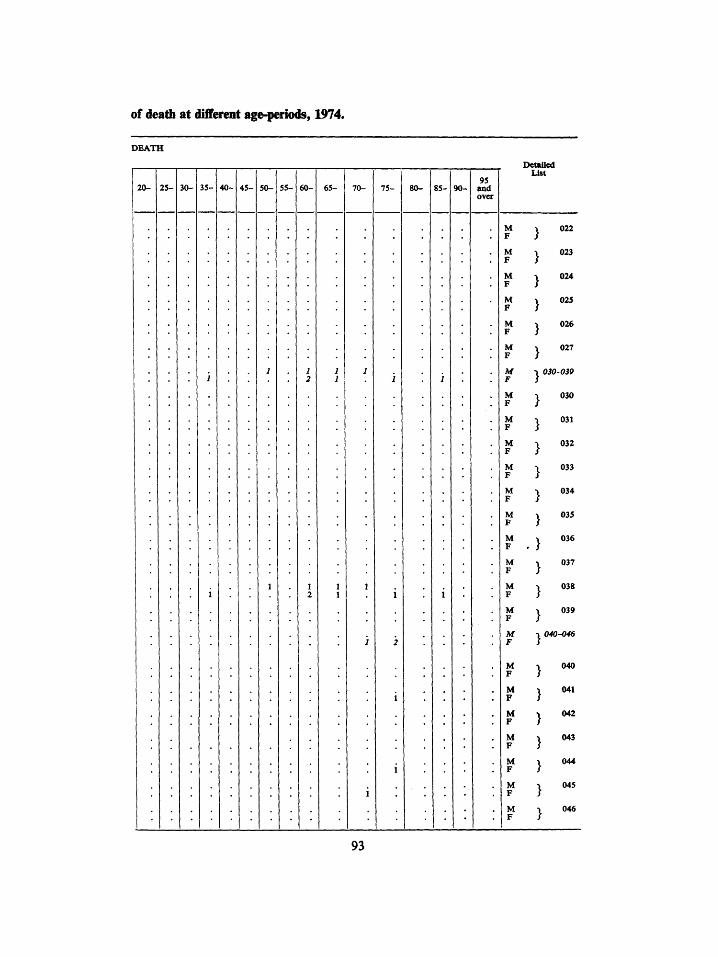
of deatii at differait age-periods, 1974.
DEATH
20- 25- 30- 35- 40- 50- 55- 70- 75- 80- 85-95
and over
Detailed List
022
023
024
025
026
027
030-039
030
031
032
033
034
035
036
037
038
039
040-046
040
041
042
043
044
045
046
93
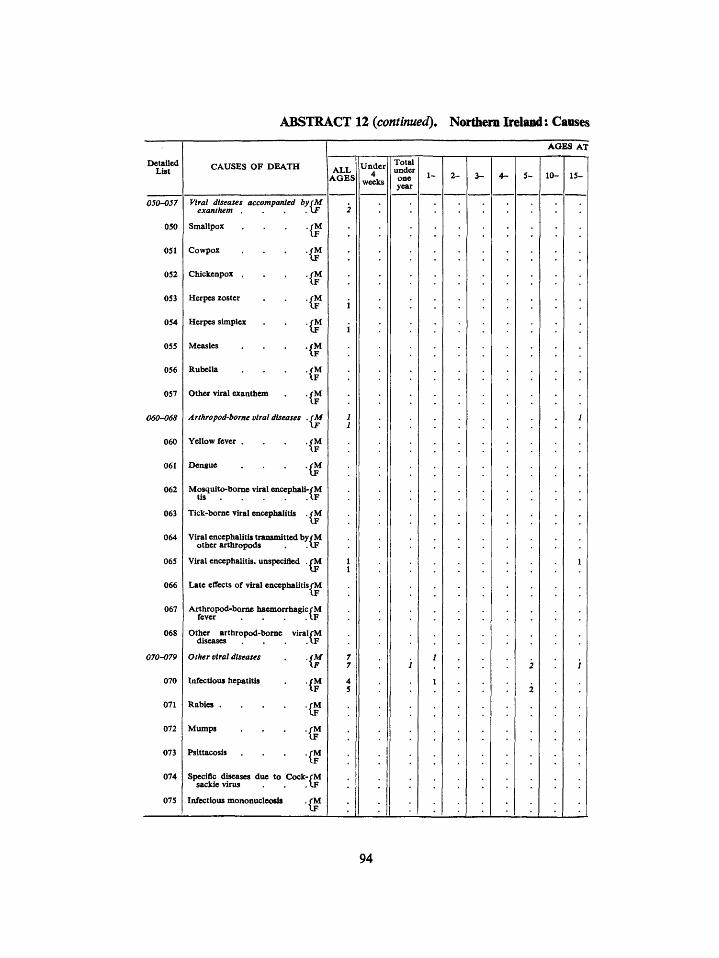
ABSTRACT 12 (continued). Northern Ireland: Causes
Detailed List
050-057
050
051
052
053
054
055
056
057
060-068
060
061
062
063
064
065
066
067
068
070-079
070
071
072
073
074
075
CAUSES OF DEATH
Viral diseases accompanied by(M exanthem . . .\F
Smallpox
Cowpox
Chickenpox .
Herpes zoster
Herpes simplex
Measles
Rubella
Other viral exanthem
./M IF
(^ . /M IF
IF
fM
./M \F
. /M IF
A rthro pod-borne viral diseases . (M \F
Yellow fever
Dengue
./M IF
Mosquito-borne viral encephali-/M tis IF
Tick-borne viral encephalitis . / M IF
Viral encephalitis transmitted by rM other arthropods . . I F
Viral encephalitis, unspecified . rM
Late effects of viral encephalitis rM
fever . . \F Arthropod-borne haemorrhagic/M
. IF
viralfM AF
M F
Other arthropod-borne diseases
Other viral diseases
Infectious hepatitis
Rabies .
Mumps
Psittacosis
Specific diseases due to sackie virus
Infectious mononucleosis
r . /M IF
. /M IF
.fM \F
Cock-fM
AGES AT
ALL AGES
Under 4
weeks
Total under one year
2 - 3- 10- 15-
94
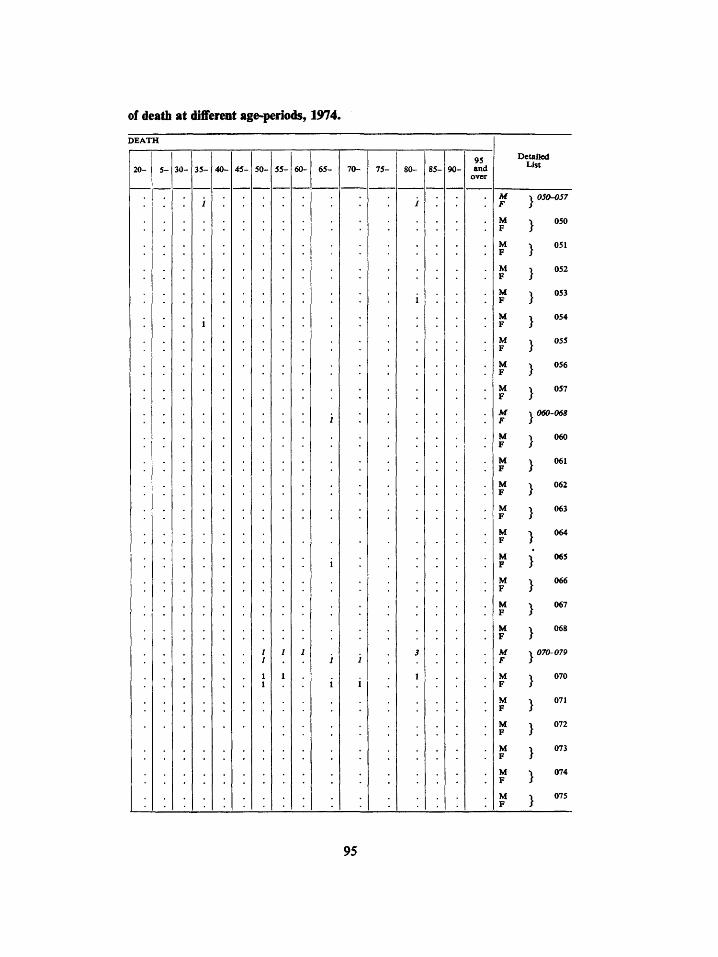
of death at differrat age^riods, 1974.
DEATH
30- 40- 45- 50- 55- 65- 75- 80- 85- 90-95 and
over
Detailed List
050-057
050
051
052
053
054
055
056
057
060-068
060
061
062
063
064
065
066
067
06S
070-079
070
071
072
073
074
075
95
ABSTRACT 12 (continued). Northern Ireland: Causes
Detailed List
076
077
078
079
080 089
080
081
082
083
084
085
086
087
088
089
090-099
090
091
092
093
094
095
096
097
098
099
CAUSES OF DEATH ALL AGES
Trachoma, active
Late effects of trachoma
./M \F
./M IF
Other vlrai diseases of the con-/M junctiva
-rr AF
Other viral diseases ./M \F
O-fJI XF
Rickettsioses and other arthro-fM pod-borne diseases
Epidemic louse-borne typhus
Other typhus .
Tick-borne rickettsiosis .
Other rickettsiosis .
Malaria
Leishmaniasis
American trypanosomiasis
Other trypanosomiasis
Relapsing fever
./M IF
.fM IF
./M IF
./M IF
(^
(^ .rM IF
M
.rM I:
Other arthropod-borne diseases rM IF
SypMlHs and other veneral di-(M seases .\F
Congenital syphilis .
Early syphilis, symptomatic
Early syphilis, latent
Cardiovascular syphilis .
F
./M IF
[f ./M IF
Syphilis of central nervous sys-f M tem ».F
Other forms of late syphilis. with/M symptoms .
Late syphilis, latent
%
(^ Other syphilis and not specified rM
IF
M Gonococcal infections
Other veneral disease
•^ rM
AGES AT
Under 4
weeks
Total under one year
10- 15-
96
of death at different age-periods, 1974.
DEATH
20- 25- 30 - 35- 40- 45- 50- 65- 70- 80- 90-95
aad over
Detailed List
076
077
078
079
080- 089
080
081
082
083
084
085
086
087
088
089
090-099
090
091
092
093
094
095
096
097
098
099
97
ABSTRACT 12 {continued). Northern Ireland: Causes
Detailed List
100-104
100
101
102
103
104
110-117
110
111
112
113
114
115
116
117
120-129
120
121
122
123
124
125
126
127
128
129
CAUSES OF DEATH
AGES AT
Other sptrochaelat diseases
Leptospirosis .
Vincent's angina
./M IF
. /M \F
Yaws fM
Pinta M
Other spirochaetal infection
Mycoses
Dermatophytosis
. /M IF
.(M \F
Dermatomycosis, other and un-/M specified
Moniliasis
Actinomycosis
Coccidioidomycosis
Histoplasmosis
Blastomycosis
Other systemic mycosis .
Helminthiases
Schistosomiasis (bilharziasis)
Other trematode infection
Hydatidosis .
Other cestode infection
Trichiniasis .
Filarial infection
Ancylostomjasis
Other intestinal helminthiasis
(M
(^
(^
if
•{f
.fM IF
ALL AGES
Other and unspecified helminthi-/M asis I F
Intestinal parasitism, unspecified rM
Under 4
weeks
Total under one year
3 - 10-
98
of death at different age-periods, 1974.
DEATH
20- 25- 30- 35- 40- 50- 55- 60- 65- 70- 75- 80- 85 90-95
and over
Detailed List
F
100-104
100
101
102
103
104
110-117
110
111
112
113
114
115
116
117
120-129
120
121
122
123
124
125
126
127
128
129
99
ABSTRACT 12 (continued). Northern Ireland: Causes
Detailed List
130-136
130
131
132
133
134
135
136
140-149
140
141
142
143
144
145
146
147
148
149
150-159
150
151
152
153
154
CAUSES OF DEATH
Other Infective and parasitic dls-^M eases
Toxoplasmosis
Trichomoniasis urogenitalis
Pediculosis .
Acariasis
Other infestation .
Sarcoidosis
. f M IF
fM IF
. / M \ F
. / M I F
. / M IF
. / M IF
AGES AT
ALL A G E S
Other and unspecified infectiverM and parasitic diseases . . (.F
n Neoplasms
Malignant neoplasm of buccal cavity and pharynx
Malignant neoplasm of lip
fM
fM
Malignant neoplasm of tongue / M \ F
Malignant neoplasm of salivary/M gland . . I F
Malignant neoplasm of gum fM IF
Malignant neoplasm of floor o f / M mouth . . . VF
Malignant neoplasm of other rM and unspecified parts of mouthlF
Malignant neoplasm of oro- /M pharynx . I F
Malignant neoplasm of naso- rM pharynx . . . . \ F
Malignant neoplasm of hypo-fM pharynx . . . . i F
Malignant neoplasm of pharynx,/M unspecified . . . . I F
Malignant neoplasm of digestive (M organs and peritoneum • • Xf
Malignant neoplasm of oeso-fM phagus . I F
Malignant neoplasm of stomach fM IF
Malignant neoplasm of small fM intestine, including duodenumlF
Malignant neoplasm of large fM intestine, except rectum . IF
Malignant neoplasm of rectumfM and rectosigmoid junction . IF
567 545
179 146
146 206
Under Total 4 under
weeks one year
1 - 2 - 3 - 5 - 1 0 -
100
of death at different age-periods, 1974.
DEATH
20- 25- 30- 35- 40- 45- SO- 55- 60- 65-
107 71
70- 85-95
and over
Detailed List
M F
M F
M F
M
130-136
130
131
132
133
134
135
136
140-149
140
141
142
143
144
145
146
147
148
149
150-169
150
151
152
153
154
101
ABSTRACT 12 (continued). Northern Ireland: Causes
Detailed List CAUSES OF DEATH
AGES AT
ALL AGES
Under 4
weeks
Total under one year
3- 5- 10-
155
156
157
158
159
160-163
160
161
162.0
162.1
163
170-174
170
171
172
173
174
180-189
180
181
182
183
185
186
Malignant neoplasm of liverrM and intrahepatic bile ductsiF specified as primary
Malignant neoplasm of gall-rM bladder and bile ducts .IF
Malignant neoplasm of pan-rM creas . .IF
Malignant neoplasm of perito-/M .. • i l r
tissue neum and retroperitoneaUF
Malignant neoplasm of un-rM specified digestive organs IF
Malignant neoplasm of resplra-(M tory system . . . I F
Malignant neoplasm of nose./M nasal cavities, middle ear andlF accessory sinuses
Malignant neoplasm of larynx/M
Trachea
Bronchus and lung
. /M IF
./M \F
Malignant neoplasm of otherrM and unspecified respiratoryXF organs . . . .
Malignant neoplasm of bone.jM connective tissue, skin andXF breast . . . .
Malignant neoplasm of bone /M IF
Malignant neoplasm of con-rM nective and other soft tissuelF
Malignant melanoma of skin/M IF
Other malignant neoplasm ofrM skin . . IF
Malignant neoplasm of breast/M
Malignant neoplasm of genlto-(M urinary organs . .\F
Malignant neoplasm of cervix uteri F
Chorionepithelioma . . F
Other malignant neoplasm of
Malignant neoplasm of ovary, fallopian tube, and broad ligament . F
Malignant neoplasm of other and unspecified female genital organs . . . F
Malignant neoplasm of prostate M
Malignant neoplasm of testis . M
493 117
10
475 104
30 272
2 251
219 198
35
38
68
18
139
5
102
of death at differeat age-periods,
DEATH
20-
1 1
1 1
1 1
1
1
1 I
1
1
2 5 -
'
1
1
1
±
30-
1
2 2
1
1
2
1 2
\
\
3 5 -
1
1 1
4 I
4 1
i 6
1
6
2 2
1
1
1
4 0 -
1
1 1
7 7
1
7 6
i i i
1
11
2 10
6
1
2
4 5 -
1
12 8
1
12 7
i 1
12
1 8
3
5
5 0 -
2
9 2
1
5 i 72
2 2
48 9
1 1
3 24
2
1
24
4 19
3
3
10
1
2
5 5 -
2
10 5
66 13
I 2
1
63 U
1
i 27
1 2
25
23
5
3
7
2
5
6 0 -
1
1 2
5 8
1 2
1
63 18
4 1
58 16
1 1
3 45
2 1
i
i 1
42
18 22
5
3
5
12
1974
6 5 -
2
3 6
17 10
2 3
1 2
110 IS
I
108 15
1
34
1
2
i
3i 33 29
3
9
10
3
17
7 0 -
1 1
2 3
16 11
2
]
92 20
1 1
91 19
2 39
i
2
1
1 36
^(5 33
4
9
11
2
20
7 5 -
4 4
9 11
50 11
1
49 10
i
22
1
i
21
39 28
4
4
9
6
32
8 0 -
2
2
3 8
i
26 4
1
25 4
/ 28
2
i 1
25
39 12
5
4
2
28
1
8 5 -
i 4 4
8 5
i
i
7 3
1
2 16
2
4
12
2 / 7
1
3
1
14
9 0 -
1 2
i
2 1
1
2
1
1
4
8 2
1
6
95 and over
i
1
3
3
Det L
M 1 F J
M "1 F J
M ^ F J
M 1 F J
M ^ F J
M 1 ^ J
M I F J
M 1 F J
M 1 F J
M 1 F J
M 1 F J
M 1 F J
M F J
M F J
M F
M F
M F
Af 1 F
F
F
F
F
F
M
M
ailed ist
, 155
, 156
, 157
, 158
, 159
, 160-163
> 160
, 161
1 162.0
1 162.1
1 163
170-174
\ 170
1 171
. 172
. 173
1 174
. 180-189
180
181
182
183
184
185
186
103
ABSTRACT 12 (continued)' Northern Ireland: Causes
]Dct&ilc(i List
187
188
1S9
190-199
190
191
192
193
194
195
196
197
198
199
200-209
200
201
202
203
204
205
206
207
208
209
j AGES AT
CAUSES OF DEATH j ALL Under
AGES 4 1 weeks
MaliRaant neoplasm of other M and unspecified male genital organs . . . .
Malignant neoplasm of bladder/M IF
Malignant neoplasm of other/M and unspecified urinarylF organs . . . .
MaUgnant neoplasm of othercM and unspecified sites . . \F
MaUgnant neoplasm of eye . / M IF
Malignant neoplasm of brain . /M \F
Malignant neoplasm of otberrM parts of nervous system 'IF
Malignant neoplasm of thyroid rM gland IF
Malignant neoplasm of other/M endocrine glands . .IF
Malignant neoplasm of iU-rM defined sites . iF
Secondary and unspecified ma-/M lignant neoplasm of lymphlF nodes
Secondary malignant neoplasm/M of respiratory and digesttvelF systems . . . .
Other secondary malignant neo-/M plasm . . . A F
Malignant neoplasm withoutrM specification of site .(.F
Neoplasms of lymphatic andfM haematopoietic tissue . . \F
Lymphosarcoma and reti-rM culumcell sarcoma .(.F
Hodgkin's disease . . rM IF
Other neoplasms of lymphoid/M tissue . . .IF
Multiple myeloma . ./M \F
Lymphatic leukaemia . . /M
Myeloid leukaemia . /M IF
Monocytic leukaemia . /M IF
Other and unspecified leukaemia rM
Polycythaemia vera ./M IF
Myelofibrosis . . . /M IF
2
46 19
27 20
117 119
3 2
27 18
6 8
2 14
3 2
14 14
2 2
31 22
2 2
27 35
94 60
11 11
7 3
6 5
16 13
10 9
25 11
2 1
12 4
1 1
4 2
i
Total under 1-one year
1
1
1
2-
1 1
3- 4- 5-
5 1
3 1
1
10-
i 1 1
1
15-
1 1
2 4
2
1
1 1
1
104
of death at different age-periods, 1974.
DEATH
35- 45- 55- 80- 85-95
and over
Detailed List
M 187
M F M F
M T
M F
M F J
M F
M F
M 1 F J
M ) F J
M 1 F J
M 1 F J
M 1 F J
M 1 F J
M •\ F J
M •) F J
M 1 F J
M 1 F J
M 1 F J
M 1 F J
M 1 F J
M 1 F J
M •) F J
M 1 F J
M 1 F J
» 188
> 189
1 190-199
I 190
1 191
1 192
. 193
1 194
. 195
1 196
I 197
1 198
1 199
1 200-209
, 200
, 201
202
, 203
204
, 205
206
207
1 208
, 209
105
ABSTRACT 12. (continued) Northern Irelaod: Causes
Detailed List
AGES AT
CAUSES OF DEATH
210-228
210
211
212
213
214
215
216
217
218
219
220
221
222
223
224
225
226
227
228
230-239
230
231
232
233
234
Benign neoplasms •{f Benign neoplasm of buccal/M
cavity and pharynx . . iF
Benign neoplasm of other partsrM of digestive system .(.F
Benign neoplasm of respiratory/M system .IF
Benign neoplasm of bone and/M cartilage A F
Lipoma ./M IF
ALL AGES
Other benign neoplasm of mus-/M cular and coimective tissue
Benign neoplasm of skin
Benign neoplasm of breast
{I . /M IF
IF
Uterine fibroma . F
Other benign neoplasm of uterus F
Benign neoplasm of ovary . F
Benign neoplasm of other female F genital organs
Benign neoplasm of male gen- M ital organs . . . .
Benign neoplasm of kidney and/M other urinary organs
Benign neoplasm of eye
ar! .IF
IF
Benign neoplasm of brain and rM other parts of nervous systemtF
Benign neoplasm of endocrinerM glands , .IF
Haemangioma and lymphan-/M gioma . I F
Benign neoplasm of other andrM unspecified organs and tissues iF
Neoplasm of unspecified nature .cM
Neoplasm of unspecified nature/M of digestive organs . IF
Neoplasm of unspecified nature rM of respiratory organs . .UP
Neoplasm of unspecified naturefM of skin and musculo-skeletalXF system . . . .
Neoplasm of unspecified nature/M of breast IF
Neoplasm of tmspecified nature of uterus . F
Under 4
weeks
Total under one year
1- 2 - 3- 5- 10- 15-
106
of death at different age-periods, 1974.
DEATH
20- 25- 3 0 - 3 5 - 40- 45- 50- 60- 65- 70- 80- 90-95
and over
Detafled
M F M F
M F
M F
M F
M F
M F
M F
M F
F
F
F
F
210-228
210
211
212
213
214
215
216
217
218
219
220
221
M
M F
M F
M F
222
223
224
225
226
227
228
230-239
230
231
232
233
234
107
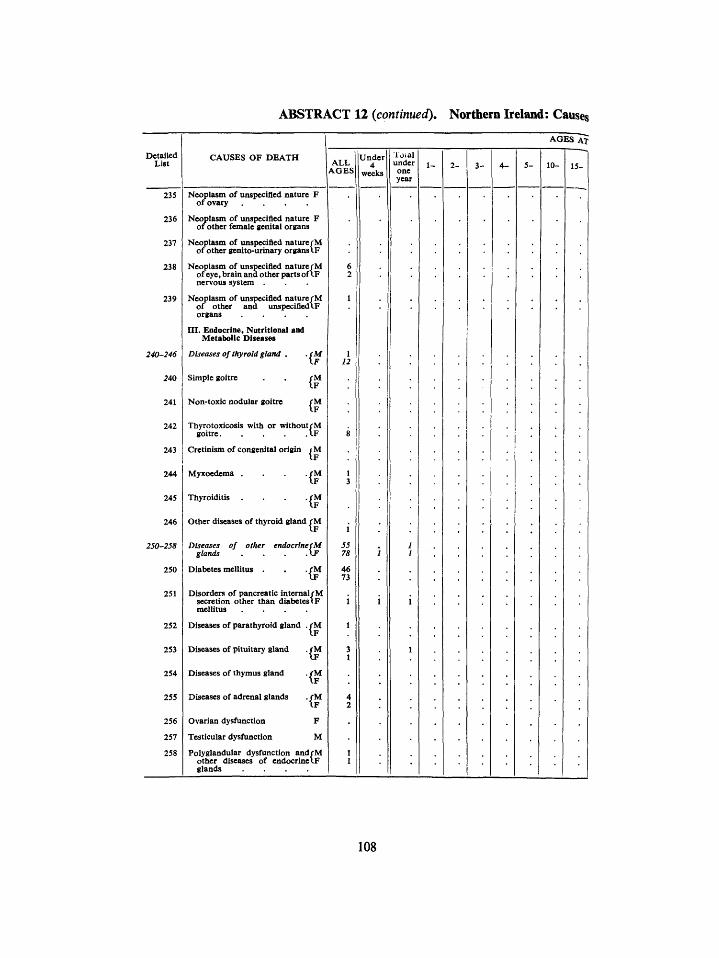
ABSTRACT 12 (continued). Northern Ireland: Causes
Detailed List
235
236
237
238
239
240-246
2AQ
241
242
•2AI
244
245
246
250-258
250
251
252
253
254
255
256
257
258
A G E S AT
CAUSES OF DEATH
Neoplasm of unspecified nature F of ovary . . . .
Neoplasm of imspecifled nature F 01 other female genital organs
Neoplasm of unspecified nature/M of other genito-urinary organs IF
Neoplasm of unspecified nature rM of eye, brain and other parts of \ F nervous system .
Neoplasm of unspecified nature/M of other and imspecifiedlF organs . . . .
i n . Endocrine. Nutritional and Metabolic Diseases
Diseases of thyroid gland .
Simple goitre
Non-toxic nodular goitre
.(M \F
rM I F
/ M IF
Thyrotoxicosis with or withoutrM goitre I F
Cretinism of congenital origin
Myxoedema .
Thyroiditis .
iM \ F
fM IF
/ M IF
Other diseases of thyroid gland rM IF
Diseases of other endocrlnecM glands . . . .KF
Diabetes mellitus (^ Disorders of pancreatic internal rM
secretion other than diabetes! F mellitus . . . .
Diseases of parathyroid gland . rM IF
Diseases of pituitary gland
Diseases of thymus gland
Diseases of adrenal glands
Ovarian dysfunction
Testicular dysfunction
. / M \ F
. / M I F
Polyglandular dysfunction andrM other diseases of endocrinelF glands . . . .
ALL AGES
Under 4
weeks
Toial under one year
108
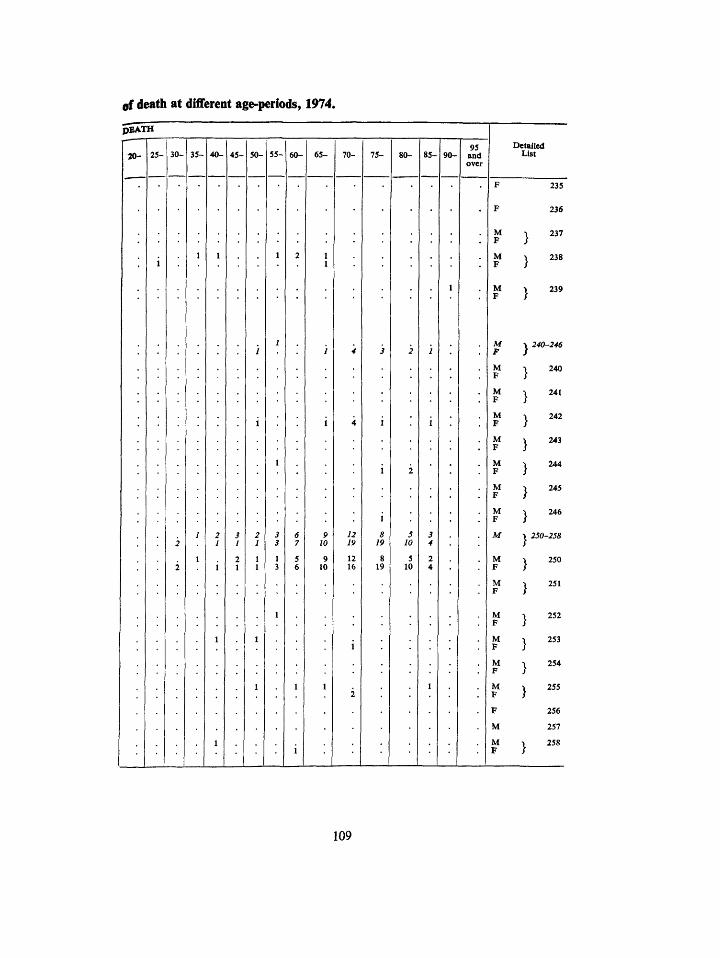
of death at different age-periods, 1974.
pEATH
»- 25- 30 35- 40- 45- 50- 55- 60- 65
19
80- 85- 90-95
and over
Detailed List
235
236
237
238
239
M F J
M 1 F
M 1 F J
M F J
M 1 F J
M 1 F J
M 1 F J
M 1 F J
M -j
M 1 F J
M -1 F J
M 1 F J
M > F j
M 1 F J
M 1 F j
F
M
M 1 F }
. 240-246
240
1 241
1 242
1 243
1 244
245
1 246
250-258
1 250
1 251
252
253
254
255
256
257
258
109
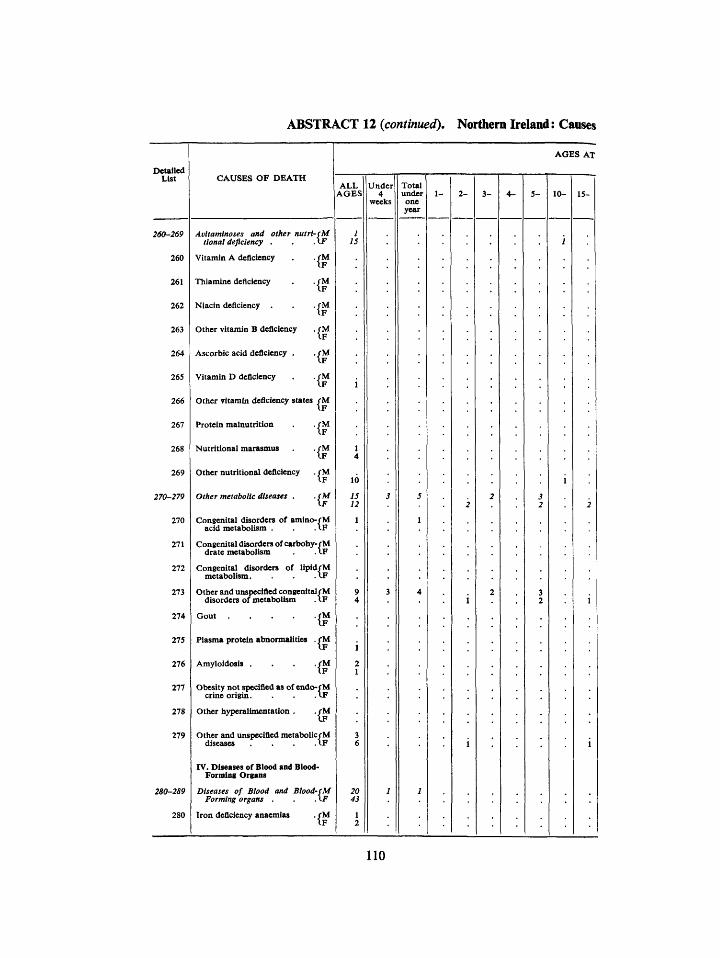
ABSTRACT 12 (continued). Northern Ireland: Causes
Detailed List
260-269
260
261
262
263
264
265
266
267
268
269
270-279
270
271
272
273
274
275
276
277
278
279
280-289
280
CAUSES OF DEATH
AGES AT
Avltaminoses and other nutrt-cM tlonaldeficiency . . .XF
Vitamin A deficiency
Thiamine deficiency
Niacin deficiency .
Other vitamin B deficiency
Ascorbic acid deficiency .
Vitamin D deficiency
./M IF
.fM IF
./M IF
./M "IF
./M IF
./M IF
Other vitamin deficiency states /M IF
Protein malnutrition
Nutritional marasmus
Other nutritional deficiency
Other metabolic diseases .
.CM
IF
(M
.(M \F
Congenital disorders of amino-fM acid metabolism . . (.F
Congenital disorders of carbohy-f M drate metabolism . XF
Congenital disorders of lipidrM metabolism. . A F
Other and unspecified congenital/ disorders of metabolism . I.
Gout /M
Plasma protein abnormalities
Amyloidosis . . . .(
M
Obesity not specified as of endo-/M IF
(U
crine origin.
Other hyperalimentation
Other and unspecified metabolicrM diseases . .tF
IV. Diseases of Blood and Blood-Forming Organs
Diseases of Blood and Blood-cM Forming organs . . .IF
Iron deficiency anaemias ./M IF
ALL AGES
Under 4
weeks
Total under one year
3-
110
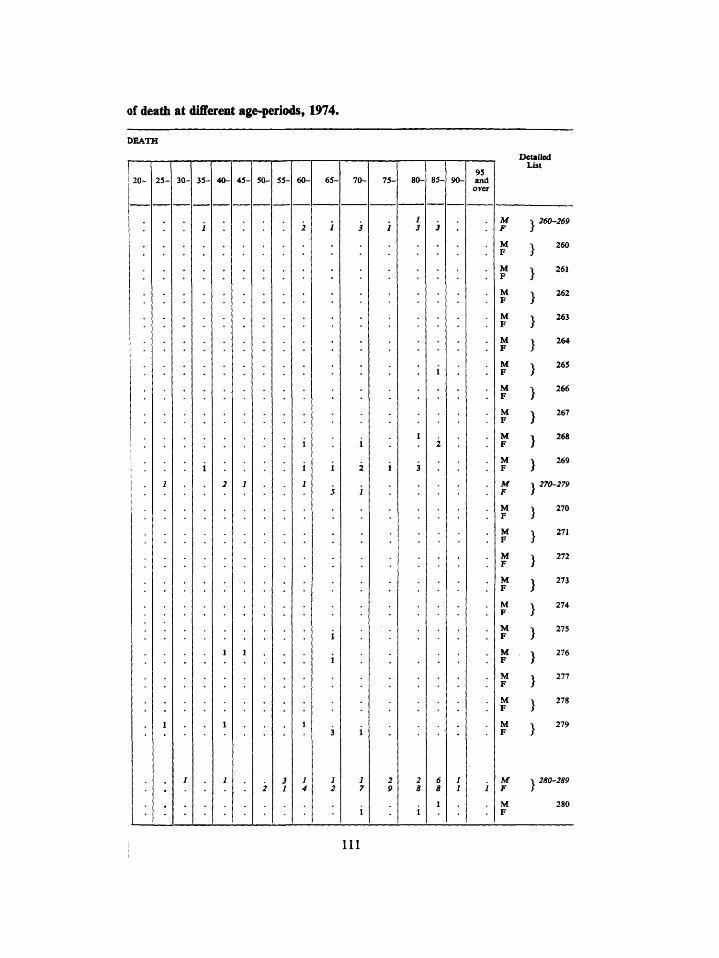
of death at different age-periods, 1974.
DEATH
20- 35- 45- 50- 60- 65- 70- 75- 80- 90-95 and over
Detailed List
260-269
260
261
262
263
264
265
266
267
268
269
270-279
270
271
272
273
274
275
276
277
278
279
280-289
111
ABSTRACT 12 {continued). Northern Ireland: Causes
Detailed List
CAUSES OF DEATH
281
282
283
284
285
286
287
288
289
290-299
290
291
292
293
294
295
296
297
298
299
300-309
300
301
302
Other deficiency anaemias ( M
AGES AT
ALL AGES
Hereditary baemolytic anaemias/M I F
Acquired haemolytic anaemias-rM
Aplastic anaemia IF
Other and unspecified anaemias fM \ F
Coagulation defects fM
Ptirpura and other haemor-|'M rhagic conditions.
Agranulocytosis • ^ Other diseases of blood and/M
blood-forming organs . . IF
V. Mental Disorders
Psychoses (r Senile and pre-senile dementia . / M
IF
Alcoholic psychosis {f Psychosis associated with intra-rM
cranial infection . . . (.F
Psychosis associated with cerebral condition
Psychosis associated with physical condition
Schizophrenia
Affective psychoses.
Paranoid states
Other psychoses
Unspecified psychosis
otherfM
otherfM . IF
. / M IF
. /M \F
./M IF
Neuroses, personality disordersfM and other non-psychotic mentalXF disorders
Neuroses
Personality disorders
Sexual deviation
. / M I F
. / • M IF
. / M I F
Under 4
weeks
Total under j _
one I year
3- 10- 15
112
of death at diff^ent age-periods, 1974.
DEATH
20- 35- 40- 50- 65- 90-95
and over
Detailed
281
282
283
284
285
286
287
288
289
M F
M F
290-299
290
291
292
293
294
295
296
297
298
299
300-309
300
301
302
113
ABSTRACT 12 (continued), Nortfaeni Ireland: Causes
Detailed List
303
304
305
306
307
308
309
310-315
310
311
312
313
314
315
320-324
320
321
322
323
324
330-333
330
331
332
333
CAUSES OF DEATH
AGES A1
ALL AGES
Alcoholism
Drag dependence
fM
./M IF
Physical disorder of persiunably rM psychogenic origin . \F
Special symptoms not elsewhere rM classified . iF
Transient situational disturban-/M ces \F
Behaviour disorders of child-/M hood .
Mental disorders not specified as rM psychotic associated withiF physical conditions
Mental retardation . •i^ Borderline mental retardation ./M
Mild mental retardation .
Moderate mental retardation
Severe mental retardation
Profound mental retardation
./M \F
./M IF
fM
Unspecified mental retardation./M
VI. Diseases of the Nerrons System and Sense Organs
Inflammatory diseases of centraUM nervous system . . VF
Meningitis . ./M \F
Phlebitis and thrombophlebitisrM of intracranial venous sinuses IF
Intracranial and intraspinalrM
Encephalitis, myelitis, and en-/M cephalomyelitis . A F
Late eflfects of intracranial ab-/M scess or >yogenic infection . IF
Hereditary and familial diseases (M of nervous system. AF
Hereditary neuromuscular dis-fM orders . .IF
Hereditary diseases of the stri-rM atopallidal system
Hereditary ataxia
i-r» .IF
./M IF
Other hereditary and familial/M diseases of nervous system .IF
Under 4
weeks
loUl under one year
3- 10- 15-
114
of deafli at differrat age-feriods, 1974.
DEATH
20- 25- 30- 35- 40- 45- 50- 55- 60- 65- 70- 80- 85- 90-95
and over
Detailed List
M F
303
304
305
306
307
308
309
310-315
310
311
312
313
314
315
320-324
320
321
322
323
324
330-333
330
331
332
333
115
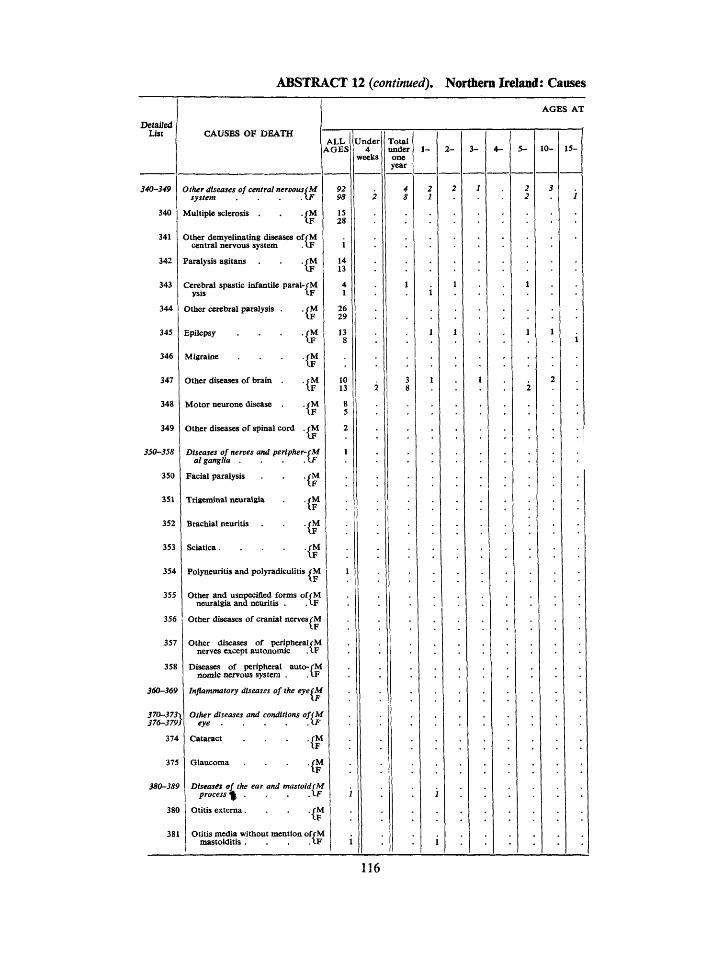
ABSTRACT 12 {continued). Northern Ireland: Causes
Detailed List
340-349
340
341
342
343
344
345
346
347
348
349
350-358
350
351
352
353
354
355
356
357
358
360-369
370-373-1 J76-379J
374
375
380-389
380
381
AGES AT
1 CAUSES OF DEATH ALL
AGES
Other diseases of central nervous(M system . . . .XF
Multiple sclerosis . . . (M IF
Other demyelinating diseases of rM central nervous system . XF
Paralysis agitans . . . f M IF
Cerebral spastic infantile paral-/M ysis \ F
Other cerebral paralysis . . rM \ F
Epilepsy . . . .fM IF
Migraine . . . . /M \ F
Other diseases of brain . . rM IF
Motor neurone disease . .rM \ F
Other diseases of spinal cord . rM I F
Diseases of nerves and peripher-(M al ganglia . . . .\F
Facial paralysis . . rM IF
Trigeminal neuralgia . rM IF
Brachial neiiritis . . . rM \ F
IF
Polyneuritis and polyradiculitis /M IF
Other and usnpecifled forms of/M neuralgia and neuritis . . IF
Other diseases of cranial nerves/M I F
92 98
15 28
i 14 13
4 1
26 29
13 8
10 13
8 5
2
1
Other diseases of peripheralrM nerves except autonomic • "-
Diseases of peripheral auto-rM nomic nervous system . . IF
Inflammatory diseases of the eyefM XF
1 Other diseases and conditions offM eye XF
Cataract . . . /M IF
Glaucoma . . /M IF
Diseases of the ear and mastoid fM process % • .XF
Otitis e x t e r n a . . . . /M IF
Otitis media without mention of rM mastoiditis . . . .<.F i
Under 4
vreeks
2
2
Total under one year
4 8
1
3 8
1-
2 1
i
1
1
1
]
2-
2
1
1
'.
3-
1
: 1
4- 5-
2 2
1
1
2
10-
3
1
2
15-
i
i
• • 1
116
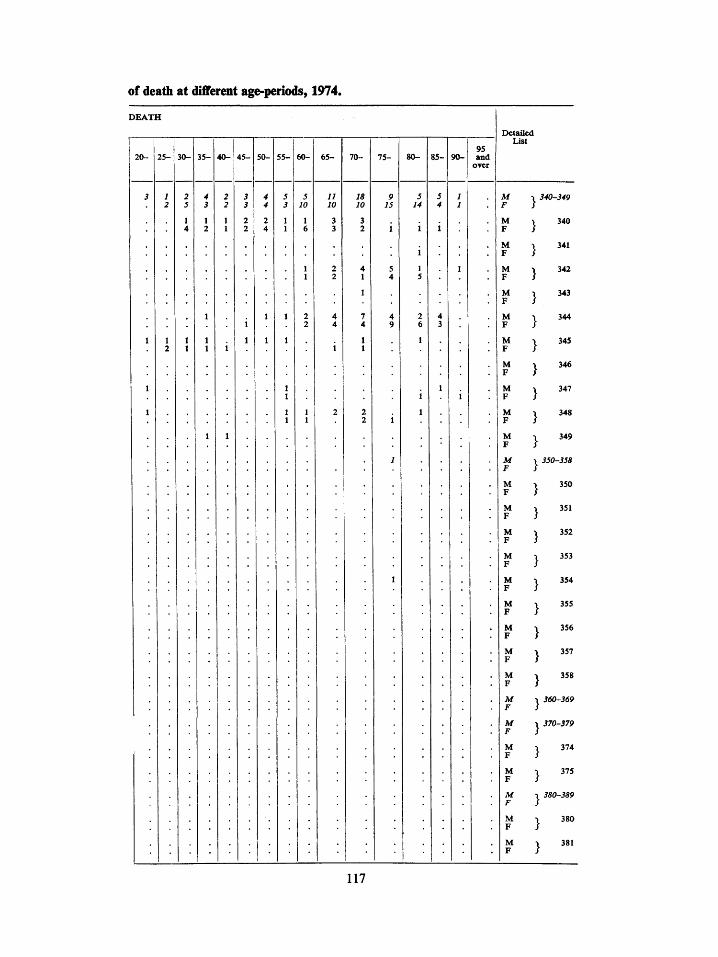
of death at different age-periods, 1974.
DEATH
25- 30- 35- 40- 45- 55- 60- 65- 70- 75- 80- 85- 90-95 and
over
Detailed List
5 10
11 10
18 10
5 14
M F
M F
M F
M F
M F
340-349
340
341
342
343
344
345
346
347
348
349
350-358
350
351
352
353
354
355
356
357
358
360-369
370-379
374
375
380-389
380
381
117
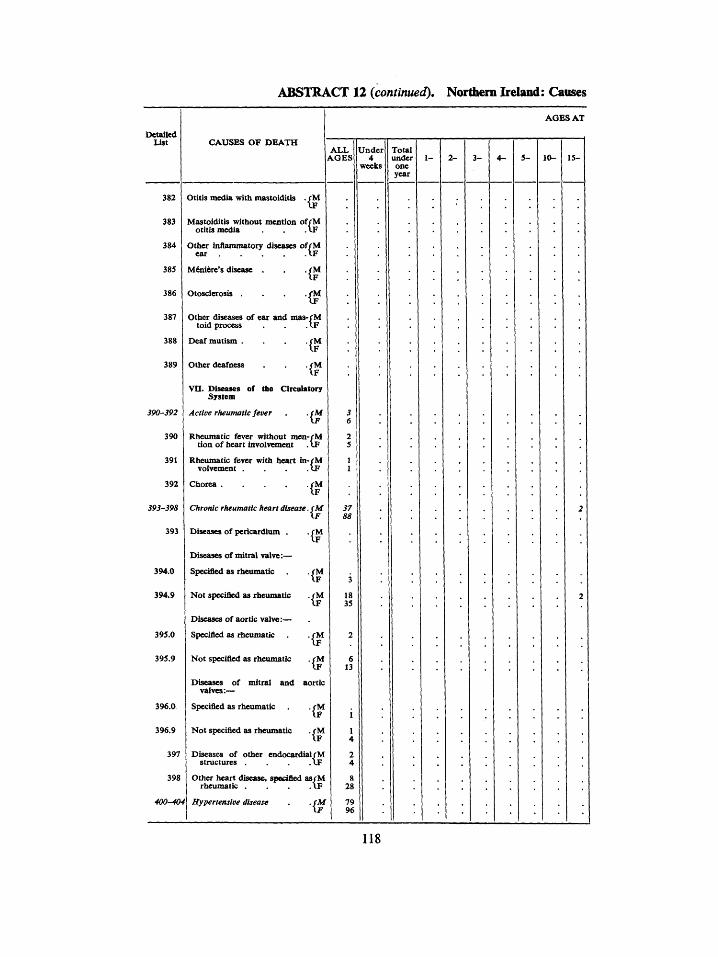
ABSTRACT 12 (continued). Northern Ireland: Causes
Detailed List CAUSES OF DEATH
382
383
384
385
386
387
388
389
390-392
390
391
392
393-398
393
394.0
394.9
395.0
395.9
396.0
396.9
397
398
400-404
Otitis media with mastoiditis •{M
Mastoiditis without mention ofrM otitis media . . tF
Other infiammatoiy diseases of/M ear IF
M£ni&re's disease .
AGES AT
ALL AGES
Otosclerosis
Other diseases of ear and mas-/M toid process
Deaf mutism .
Other deafness . rM
. IF
.rM IF
Vn. Diseases of the CtrcoUitory System
Active rheumatic fever •{^ Rheumatic fever without men-rM
tion of heart involvement
Rheumatic fever with heart in-/M volvement .
Chorea . /M IF
Chronic rheumatic heart disease. (M
Diseases of pericardium .
Diseases of mitral valve:—
Specified as rheumatic
Not specified as rheumatic
Diseases of aortic valve:—
Specified as rheimiatic
Not specified as rhetmiatic
. /M IF
. /M IF
. /M IF
Diseases of mitral and aortic valves:—
Specified as rheumatic
Not specified as rheumatic
Diseases of other endocardial/M structures .
. /M IF
. /M IF
a l ^
Other heart disease, specified as/M rheumatic . . . . IF
Hypertensive disease (M
Under 4
weeks
37
Total under one year
28
io
ns
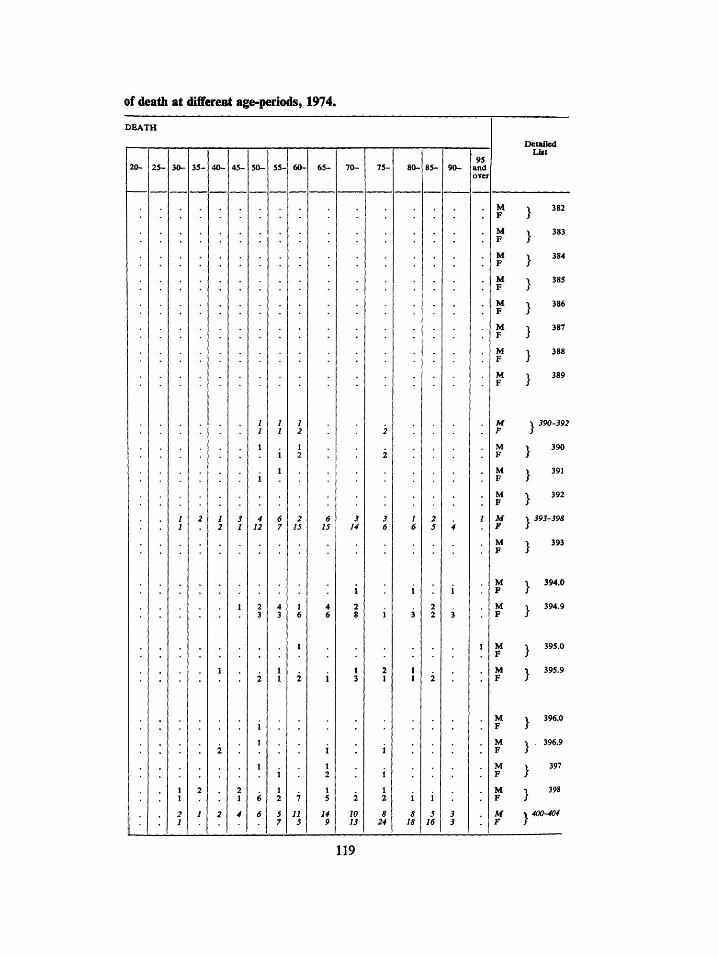
of deatii at differeot age-periods » 1974.
DEATH
2 0 - 2 5 - 3 0 -
1 1
'.
1 I
3 5 -
2
2
1
4 0 -
1 2
1
2
2
4 5 -
i I
>
t
5 0 -
/ ; 1
1
4 12
2 3
2
i 1
1
6
6
5 5 -
1
i 1
<5 7
4 3
1 1
i 1
2
7
6 0 -
1
<
2
[
? y
5
[
I
J
s
6 5 -
t L
< (
1
]
1 2
1 S
u i
i f
7 0 -
]
{
1 1
2
) r
7 5 -
2
2
3 6
i
2 1
i
i 1 2
s 24
8 0 -
<
]
I
t li
1
s
1
r
8 5 -
1
? 5
S
>
9 0 -
]
t
95 and over
1
1
Detailed List
M X 382 F /
M 1 383 F /
M ^ 384 F /
M •> 385 F /
M •> 386 F /
M \ 387 F /
M •> 388 F /
M X 389 F /
M X 390-392 F }
M X 390 F /
M \ 391 F /
M \ 392 F /
M \ 393-398 F S
M \ 393 F i
M \ 394.0 F /
M X 394.9 F /
M \ 395.0 F /
M \ 395.9 F /
M V 396.0 F f
M •» 396.9 F J
M 1 397 F /
M 1 398 F /
M \ 400-404 F f
119
ABSTRACT 12 (continued). Northern Ireland: Causes
Detailed List
400
401
402
403
404
410-414
410.0
410.9
411.0
411.9
412.0
412.9
413.0
413.9
414.0
414.9
420-429
420
421
422
423
424
AGES AT
CAUSES OF DEATH ALL Under
AGES 4 weeks
Malignant hypenension . . rM IF
Essential benign hypertension . /M IF
Hypertensive heart disease . fM IF
Hypertensive renal disease .rM
Hypertensive heart and renalrM disease . .IF
hchaemlc heart disease . (M \F
Acute myocardial Infarction:—
With hypertensive disease /M IF
Without mention of hyperten-/M sive disease. . . .vF
Other acute and sub<acute forms of ischaemic heart disease:—
With hypertensive disease . rM IF
Without mention of hyperten-fM sjve disease. . . I F
9 5
33 31
33 56
4 4
2.859 1,854
181 134
2.063 1,143
i 3 1
Chronic ischaemic heart disease:—
With hypertensive disease . /M \F
Without mention of hyperten-fM sive disease. . . .IF
Angina pectoris:—
With hypertensive disease . f M "IF
Without mention of hyperten-fM sive disease. . . iF
As3anptomatic ischaemic heart disease:—
With hypertensive disease . / M IF
Without mention of hyperten-/M sive disease. . . .IF
Other forms of heart disease . (M IF
Acute pericarditis, non-rheu-/M matic IF
Acute and sub-acute endocar-rM carditis .IF
Acute myocarditis . . . / M IF
Chronic disease of pericardiiun, rM non-rheumatic . . . iF
Chronic disease of cndocradium/M IF
1
75 46
537 525
2
2
:
452 552
6 2
3
i 1
10
J
i
• .
2
'
Total under 1- 2- 3-one year
i '. '.
'
'. '. '.
:' : :
2 2 . 1
'. '. i
4- 5- 10- 15
2
.
1 2
• \
120
of death at different age-periods, 1974.
DEATH
25- 30- 35- 40- 50- 70- 75-95
and over
Detailed List
10
462 228
344 147
477 328
346 218
378 375
263 238
100
81 94
283 160 323 216
195 193
74 106
97 126
19 M 18 F
400
401
402
403
404
410-414
410.0
410.9
411.0
411.9
412.0
412.9
413.0
413.9
420-429
422
423
424
121
ABSTRACT 12 (continued). Northern Ireland: Caoses
Detailed List
425
426
427.0
427.1
427.2
427.9
428
429
430-438
430.0
430.9
431.0
431.9
432.0
432.9
433.0
433.9
434.0
434.9
435.0
435.9
CAUSES OF DEATH
Cardiomyopathy . . . /M IF
Pulmonary heart disease . . /M IF
Symptomatic hear disease:—
Congestive heart failure . . /M \F
Left ventricular failure . /M
Heart block . . . /M \F
Other disorders of heart rhythmrM
Other myocardial insufficiency ./M IF
Ill-defined heart disease . . /M IF
Cerebrovascutar disease . . <M
Subarachnoid haemorrhage:—
With hypertension (benign) ./M \F
Without mention of hyperten-/M slon IF
Cerebral haemorrhage:—
With hypertension (benign) . f M IF
Without mention of hyperten-/M sion . . . . I F
Occlusion of pte-cerebral arteries
With hypertension (benign) . fM IF
Without mention of hyperten-/M
Orebral thrombosis:—
With hypertension (benign) ./M IF
Without mention of hyperten-fM
Cerebral embolism:—
With hypertension (benign) ./M \F
Without mention of hyperten-/M sion IF
Transient cerebral ischaemia:—
With hypertension (benign) . f M IF
Without mention of hyperten-/M
AOES AT
ALL 1 ^GES
4 2
38 21
193 223 43 48
10 6
55 51
94 184
5 5
1.021 1.452
5 16 37 51
64 107
133 178
7 3
32 33
316 450
2 1
5 8
1
Under 4
weeks
2
4 3
3 3
Total imder one year
1 2
.5 4
4 4
1-
i
2-
i
3-
i
4- 5-
7 .
10-
1
;
1
•
15-
1 2
2
1
1
122
of death at dijffer»t age-periods, 1974.
DEATH
2 0 -
1
3
2
1
2 5 -
1
1
1
30-
1
1
3
i
2
3 5 -
1 7
1 6
i
4 0 -
12 7
1
4 5
2
2 1
2
1
4 5 -
1 2
1 1
1
1
14 22
1 1
3 7
2 6
3 2
i 1 1
1
5 0 -
1
3 3
1 1
2
37 22
2 1
6 4
6 5
4 5
1
4 3
1
5 5 -
3 1
4 4
i 1
1 1
1 1
1
45 42
3
4 7
9 4
2 7
1 1
4 2
7 3
6 0 -
8 1
4 7
6 2
2
2 1
5 3
1
92 83
2
7 7
5 11
14 12
1
5 3
27 15
1
1
6 5 -
8 4
18 16
4 4
1
8 4
4 4
i 2 5 129
3
4 4
14 16
13 15
2 1
4 4
38 30
2 3
7 0 -
6 8
44 17
8 6
1
9 5
6 13
i 189 207
3
2 6
11 14
30 30
1
4 4
52 50
1
2 1
7 5 -
5 2
35 40
9 7
2 2
12 13
17 28
1
ISO 281
2
1 3
11 19
18 32
i
9 8
58 92
8 0 -
1
4 4
41 54
8 12
I
8 12
33 39
1 3
142 281
1
1 1
2 24
19 31
3 6
57 98
8 5 -
2
30 44
3 9
I 1
9 8
10 49
1
720 236
i
2 6
15 27
1
1 4
48 100
i 1 2
9 0 -
1
10 26
3 6
i 5 5
15 35
42 99
i 6 8
i 21 41
95 and
over
2 8
1
2 9
9 28
2
3 15
Det I.
M F
M F
M 1 F J
M 1 F J
M 1 F J
M 1 F J
M F
M I F J
M •\ F J
M 1 F J
M ) F J
M ^ F J
M 1 F J
M ) F J
M 1
F J
M 1 F J
M 1 F J
M 1 F J
M 1 F J
M F
M F
ailed ist
. 425
i 426
1 427.0
, 427.1
1 427.2
. 427.9
> 428
I 429
1 430-438
I 430.0
1 430.9
I 431.0
1 431.9
I 432.0
, 432.9
433.0
1 433.9
1 434.0
1 434.9
I 435.0
» 435.9
123
ABSTRACT 12 (continued). Northern Ireland: Causes
Detailed List
436.0
436.9
437.0
437.9
438.0
438.9
440-44S
440
441
442
443
444
445
446
447
448
450-458
450
451
452
453
454
AGES AT
CAUSES O F D E A T H ALL
A G E S
Acute but ill-deflned cerebrovascular disease:—
With hypertension (benign) . / M IF
Without mention of hyperten-/M sion IF
Generalized iscbaemic cerebrovascular disease:—
With hypertension (benign) . / M I F
Without mention of hyperten-fM sion I F
Other and ill-deflned cerebrovas-cualr disease:—
With hypertension (benign) . / M I F
Without mention of hyperten-fM sion I F
Diseases of arteries, arteriolescM and capillaries . . I F
Arteriosclerosis . . . / M I F
Aortic aneurysm (non-syphilitic)/M IF
Other aneurysm . (M I F
Other peripheral vascular disease/M
Arterial embolism and throm-fM bosis . . . . . I F
Gangrene . . . . / M I F
Polyarteritis nodosa and al l ied/M conditions . . . . I F
Other diseases of arteries andfM arterioles . . . . I F
Diseases of capillaries . . / M I F
Diseases of veins and lymphatics (M and other diseases of circula- \F tory s y s t e m . . . .
Pulmonary embolism and infarc-/M tion I F
Phlebitis and thrombophlebitis / M I F
Portal vein thrombosis . . / M I F
Other venous embolism andfM thrombosis . . . . \ F
Varicose veins of lower extrem-f M ities I F
255 329
100 165
232 255
127 173
U n d e r 4
weeks
Total under one year
2 - 5 -
124
of death at difliereiit age-perjods, 1974.
DEATH
20- 35- 45- 5 5 - 60- 70- 80- 85- 90-95
and over
Detailed List
436.0
436.9
437.0
437.9^
438.0
438.9
440-44S
440
441
442 V
443
444
445
446
447
44»
450-458
450
451
452
453
454
125
ABSTRACT 12 {continued)^ Northern Ireland: Causes
Detailed List
455
456
457
458
460-466
460
461
462
463
464
465
466
470-474
470
471
472
473
474
480-486
480
481
482
483
484
485
CAUSES OF DEATH
Haemorrhoids
Varicose veins of other sites
. /M \F
./M \F
Non-infective disease of tympha-rM tic channels .IF
Other diseases of circulatory rM system .IF
v m . Diseases of the Respiratory System
Acute respiratory Infections ex-(.<M cept Influenzal .XF
Acute nasopharyngitis (common/M cold) IF
Acute sinusitis
Acute pharyngitis
Acute tonsilitis
./M \F
(r . /M IF
Acute laryngitis and tracheitis . /M IF
Acute upper respiratory infec-rM tion of multiple or unspecified IF sites . . . . .
Acute bronchitis and bronchio-/M litis IF
Influenza
Influenza unqualified
Influenza with pneumonia
.(M \F
. /M IF
. /M IF
Influenza with other respiratory/M manifestations .(.F
Influenza with digestive manifes-rM tations . . .IF
Influenza with nervous manifes-yM tations
Pneumonia
Viral pneumonia
Pneumococcal pneumonia
Other bacterial pneumonia
.IF
.(M \F
./M \¥
. /M I F
Pneumonia due to other speci-rM fled organism .IF
Acute interstitial pneumonia . /M
Bronchopneumonia, uns pecifiedr
AGES AT
ALL AGES
487 638
387 561
Under 4
weetu
Total under one year
5-
126
of death at different age-periods, 1974.
DEATH
25- 30- 35- 45- 50- 55-
4 10 15 10 6 9
60- 65- 70- 75- 80-
89 103
80 81 56 29 91 122 127 70
93 131
85- 90-95 and over
Detailed List
455
456
457
458
460-466
460
461
462
463
464
465
466
470-474
470
471
472
473
474
4S0-486
480
481
482
483
484
485
127
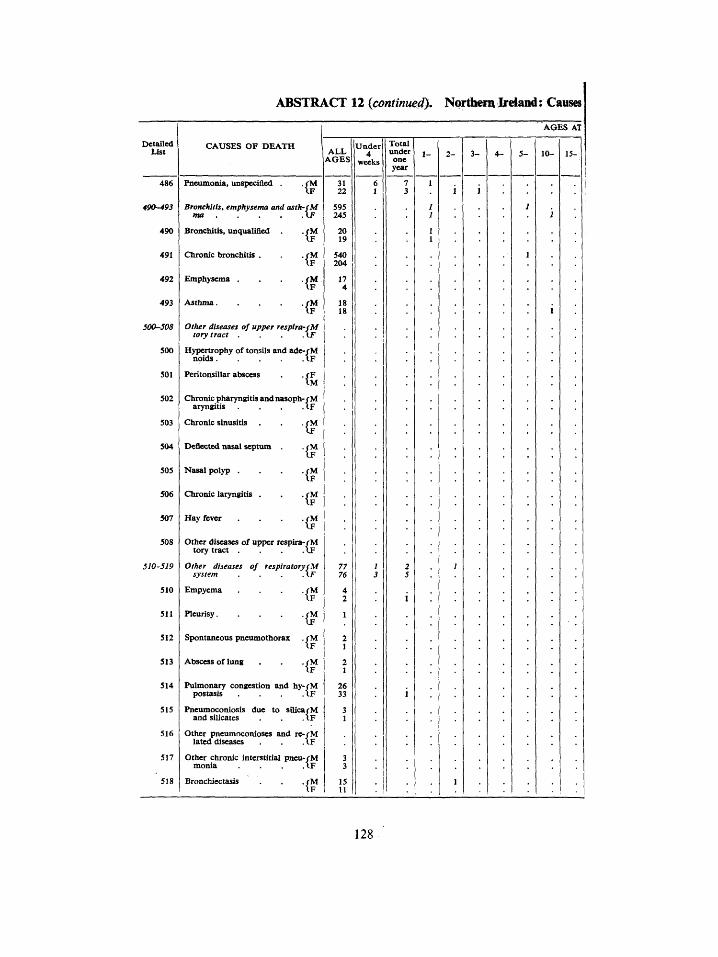
ABSTRACT 12 (continued). Northern Irdiand: Causes
Detailed List
486
490-493
490
491
492
493
500-508
500
501
502
503
504
505
506
507
508
510-519
510
511
512
513
514
515
516
517
518
CAUSES OF DEATH
AGES AT
ALL AGES
Pnetunonia, unspeciiled ,
Bronchitis, emphysema and asth-(M ma . . . .
Bronchitis, unqualified
Chronic bronchitis .
Emphysema .
A s t h m a . . . .
(^ •(M
/M
/M \F
{f
{f
31 22
595 245
20 19
540 204
17 4
18 18
Other diseases of upper respira-fM tory tract . . .IF
Hypertrophy of tonsils and ade-/M noids I F
aryngitis
Chronic sinusitis
Peritonsillar abscess
Chronic pharyngitis andnasoph-/M F
M
Deflected nasal septum
Nasal polyp .
Chronic laryngitis .
Hay fever
IM
. IF
. / M IF
. / M IF
.CM IF
. / M IF
Other diseases of upper respira-rM tory tract . . . . I F
Other diseases of respiratory/M system . . . . I F
Empyema . / M IF
Pleurisy rM
Spontaneous pneumothorax
Abscess of lung
(^
. / M IF
Pulmonary congestion and hy-fM postasis . . . . I F
Pneiunoconiosis due to silica rM and silicates . . . iF
Other pneumoconioses and re-rM lated diseases . . . \ F
Other chronic interstitial pneu-/M monia .
Bronchiectasis
Under 4
weeks
Total under one year
5 -
128
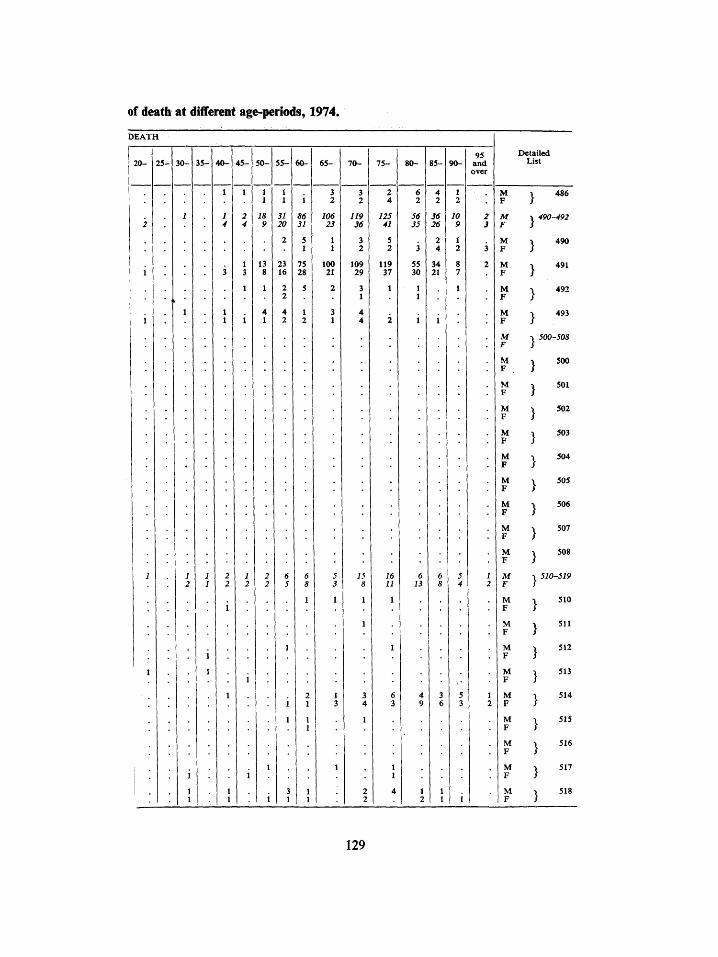
of death at different age-periods, 1974.
DEATH
20-
i .
i
i
;
1
•
2 5 - 30 -
1
>
1 2
i 1 1
35-
1 1
i 1
4 0 -
1
i 4
3
1 1
2 2
i
1 1
45-
1
2 4
1 3
1
i
- 50 -
1 1
9
13 8
1
4 1
1 2 2 2
'. i
55-
1 1
31 20
2
23 16
2 2
4 2
6 5
1
i 1
3 1
60-
i S6 31
5 1
75 28
5
1 2
( i
- 65 -
3 2
106 23
1 1
100 21
2
3 1
5
! I
2 1
1 1
1 1
7 0 -
3 2
119 36
3 2
109 25
3 1
A A
5 7
I
I 3
1
7 5 -
2 4
/2J
5 2
119 37
1
2
5 i S i
1
1
3 4
1
2 2
80 -
6 2
56 33
3
55 30
1 1
i
S 6 2 i 3
1
1
6 4 3 9
1 1
4 1 2
85-
4 2
2<S
2 4
34 21
i
6
3 6
1 1
90-
2
10 9
1 2
8 7
1
•4
95 and over
2 3
3
2
i
5 5 :
i
Detailed List
M 1 486 F /
M X 490-492 F i
M \ 490 F /
M 1 491 F /
M •> 492 F /
M 1 493 F /
M X 500-508 F i
M •> 500 F /
M ^ 501 F /
M •> 502 F /
M \ 503 F /
M \ 504 F )
M 1 505 F /
M •» 506 F /
M •> 507 F /
M \ 508 F /
M -» 510-519 F f
M -. 510 F /
M \ 511 F }
M 1 512 F /
M -1 513 F /
M •) 514 > F /
M \ 515 F /
M \ 516 F /
M \ 517 F /
M •> 518 F /
129
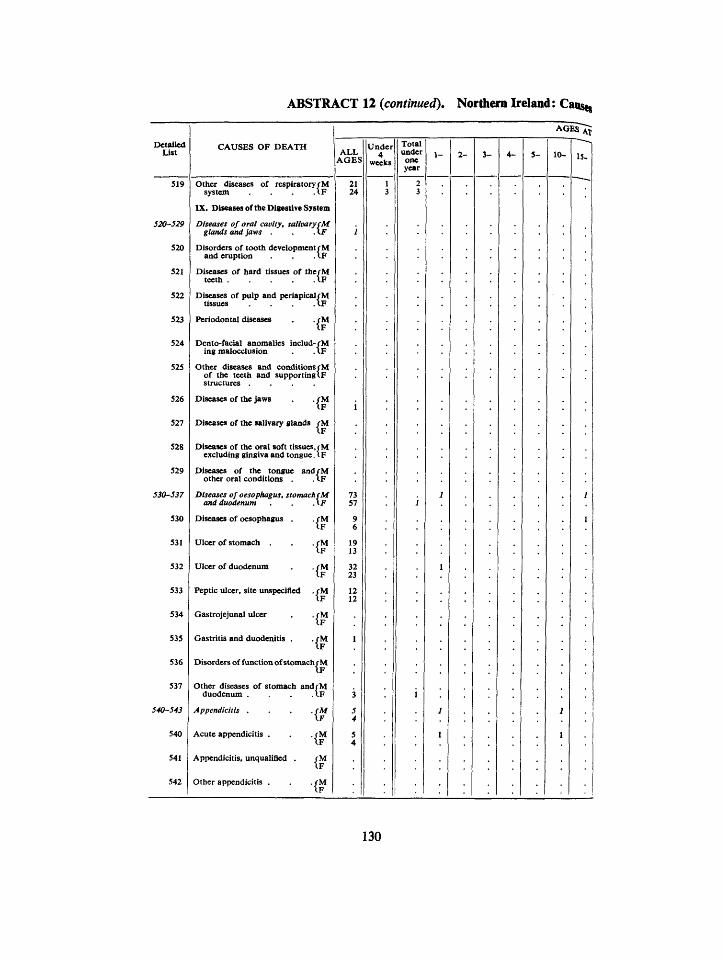
ABSTRACT 12 (continued). Northern Ireland: Caoseg
Detailed List
519
520-529
520
521
522
523
524
525
526
527
528
529
530-537
530
531
532
533
534
535
536
537
540-543
540
541
542
CAUSES OF DEATH
Ottier diseases of rcspiratoryrM system . . . I F
IX. Diseases oftlie Digestive System
Diseases of oral cavity, salivary cM glands and Jaws . . .\F
Disorders of tootli development/M and eruption . . (.F
Diseases of liard tissues of therM tectli IF
Diseases of pulp and periapical rM tissues . . \ F
Periodontal diseases IF
Dento-facial anomalies includ-rM ing malocclusion .(.F
Ottier diseases and conditionsfM of the teetti and supportinglF structures . . . .
Diseases of ttie jaws . . / M I F
Diseases of the salivary glands rM
. / M IF
Diseases of the oral soft tissues.rM excluding gingiva and tongue. t F
Diseases of the tongue and/M other oral conditions . I F
Diseases of oesophagus, stomach (M and duodenum . AF
Diseases of oesophagus .
Ulcer of stomach
Ulcer of duodenum
Peptic ulcer, site unspecified
Gastrojejunal ulcer
Gastritis and duodenitis .
. / M IF
. / M IF
fM
IF
. / M IF
Disorders of function of stomach fM
Other diseases of stomach andrM duodenum . . . IF
Appendicitis . .(M \F
Acute appendicitis .
Appendicitis, unqualified
Other appendicitis .
. / M IF / M I F
. / M IF
AGES AT
ALL AGES
Under 4
weeks
Total under
one year
3- 15-
130
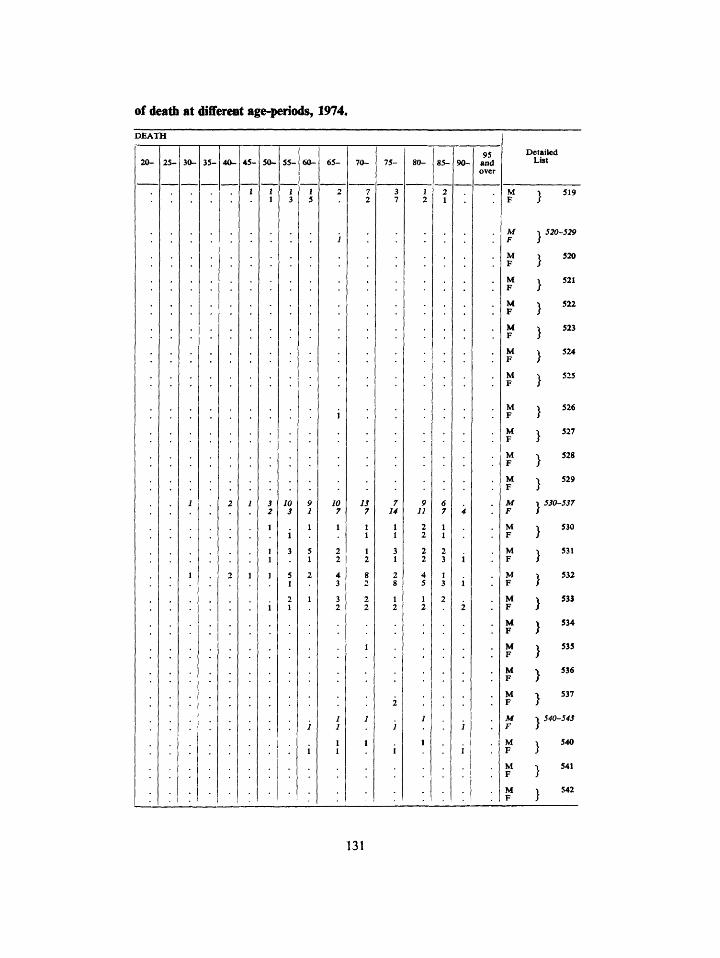
of death at differeot age-periods, 1974.
DEATH
20- 35- 45- 50- 55- 65-
13 7
7 14
85- 90-95
and over
M F
M F
M F
M F
Detailed List
519
520-529
520
521
522
523
524
525
526
527
528
529
530-537
530
531
532
533
534
535
536
537
540-543
540
541
542
131
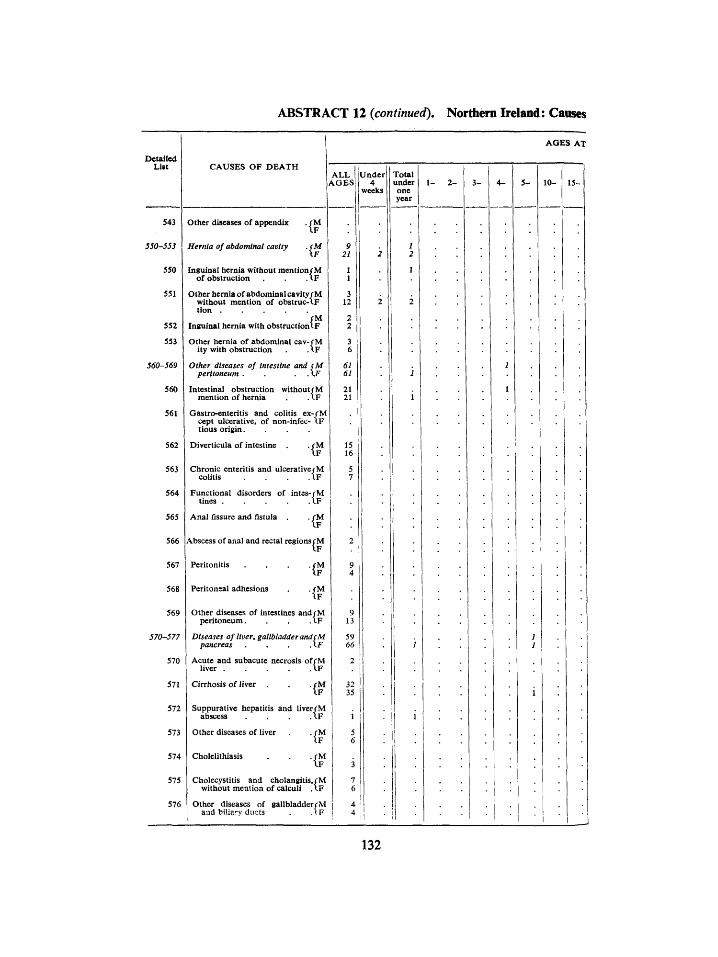
ABSTRACT 12 {continued). Northern Ireland: Causes
Detailed List
543
550-553
550
551
552
533
560-569
560
561
562
563
564
565
566
567
568
569
570-577
570
571
572
573
574
575
576
1 AGES AT
CAUSES OF DEATH
Other diseases of appendix . / M
Hernia of abdominal cavity . (M IF
Inguinal hernia without mention/M of obstruction . . . IF
Other hernia of abdominal cavity/M without mention of obstruc-(.F tion
fM Inguinal hernia with obstruction IF
Other hernia of abdominal cav-/M ity with obstruction . . IF
Other diseases of Intestine and (M peritoneum . . . .XF
Intestinal obstruction withoutrM mention of hernia . . IF
Gastro-enteritis and colitis ex-rM cept ulcerative, of non-infec- IF tious o r i g i n . . . .
Diverticula of intestine . . / M IF
Chronic enteritis and ulcerativerM colitis . . . IF
Functional disorders of intcs-rM tines I F
Anal fissure and fistula . . / M \ F
Abscess of anal and rectal regions/M IF
Peritonitis . . . / M IF
Peritoneal adhesions . . / M \ F
Other diseases of intestines andfM peritoneum. . . . IF
Diseases of liver, gallbladder and cM pancreas . . . . I f
Acute and subacute necrosis of f M liver IF
Cirrhosis of liver . . / M IF
Suppurative hepatitis and liverrM abscess . . . . \ F
Other diseases of liver . . / M IF
Cholelithiasis . . . / M IF
Cholecystitis and cholangitis.rM without mention of calculi , IF
Other diseases of gallbladderrM and biliary ducts . . IF
ALL -VGES
9 21
1 1
3 12
2 2
3 6
61 61
21 21
15 16
5 7
2
9 4
9 13
59 66
2
32 35
i 5 6
3
7 6
4 4
Under 4
weeks
2
2
:
:
i 1
Total under
one year
2
1
2
.
i
i
i
i
•
1- 2 - 3 - 4 -
1
1
5 -
:
'
1 I
1 •
10-
1
15-
132
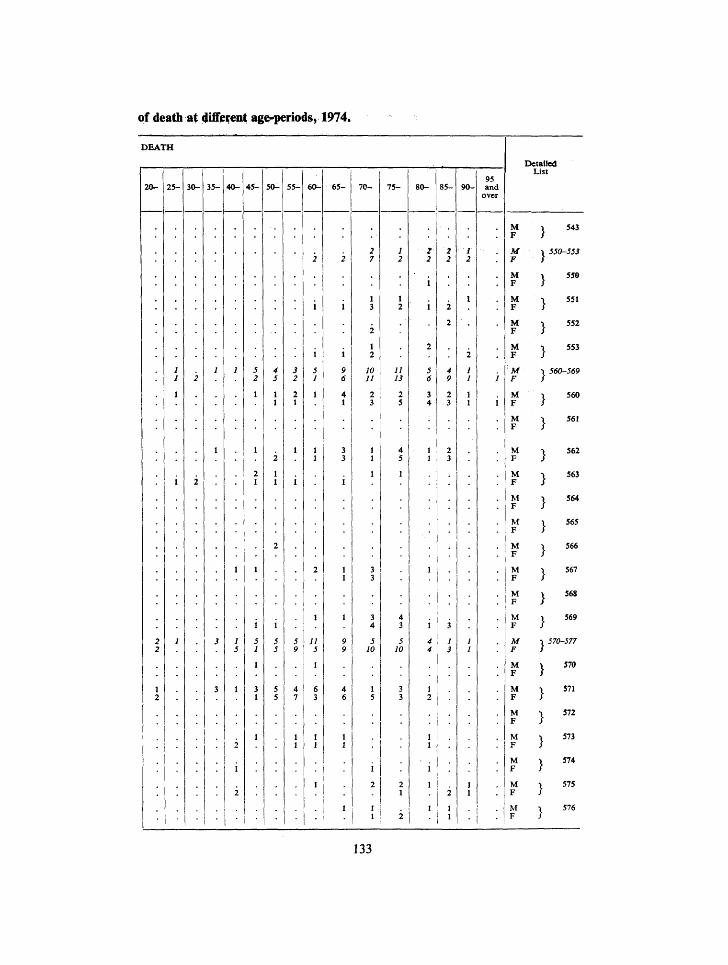
of death at 4iff ^€nt age-periods, 1974.
DEATH
2 0 -
2 2
1 2
2 5 -
1 1
1
30-
. )
;
35-
'
1
?
J
4 0 -
1 5
1
2
i
2
45 -
5 2
1
1
2 1
i 5 1
1
3 1
1
•
50-
4 5
1 1
2
1 1
2
i 5 5
5 5
5 5 -
3 2
2 1
1
i
•
5 9
4 7
1 1
60^
i
i
i 5 1
1
1 1
2
1
5
1
6 3
6 5 -
i
i
i 9 6
4 1
3 3
i
1 1
1
9 9
4 6
1 1
•
1
•
7 0 -
2 7
1 3
2
1 2
10 11
2 3
1 1
1
3 3
3 4
5 10
1 5
i 2
1 1
7 5 -
1
:
i .
ii
^
;<
80-
2-' 2
i
i
2
r 6
3 4
t 1 1
5 1
5 4 ) 4
1 ! 2
1 1
i > 1
1
85
i
- 9 0 -
> I ' 2
2
) 1
1 1
>
?
1 I 1
95 and
over
.
M F
M F
M F
M F
M F
M F
M F
M F
M F
M F
M F
M F
M F
M F
M F
M F
M F
M F
M F
M F
M F
M F
M F
M F
M F
Detailed List
1 543
•» 550-553
•» 550
•» 551
•> 552
•» 553
•> 560-569
1 560
•» 561
•> 562
•1 563
•> 564
1 565
-> 566
•> 567
1 568
1 569
•> 570-577
^ 570
•> 571
-> 572
•> 573
•» 574
•) 575
\ 576
133
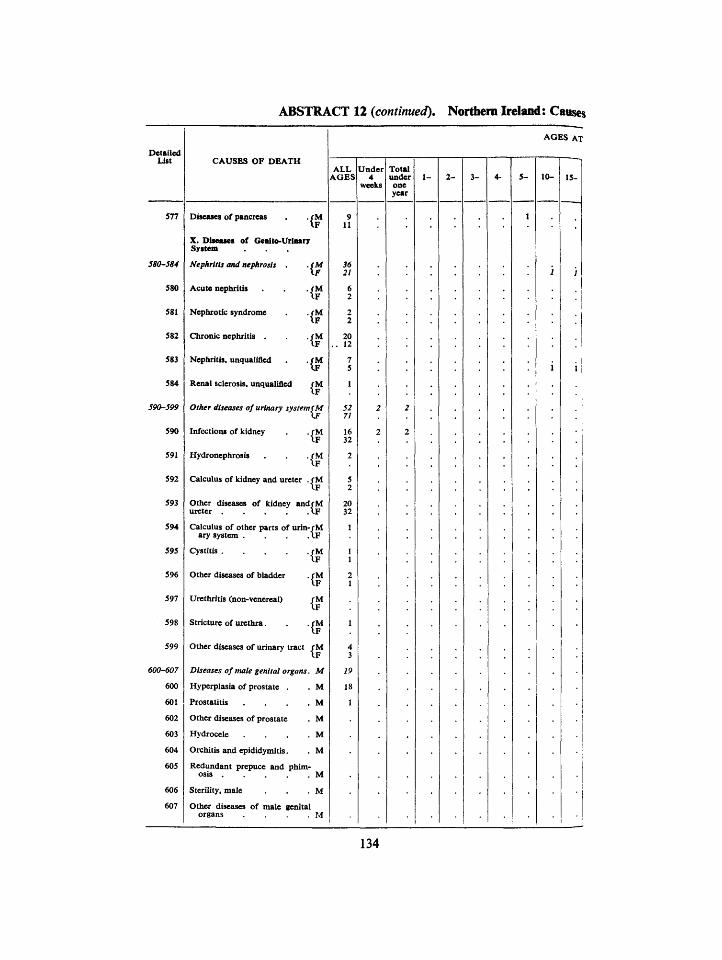
ABSTRACT 12 (continued). Northern Ireland: Causes
Detailed List CAUSES OF DEATH
AGES AT
ALL AGES
Under 4
weeks
Total under one year
5- 10-
577
580-584
580
581
582
583
584
590-599
590
591
592
593
594
595
596
597
598
599
600-607
600
601
602
603
604
605
606
607
Diseases of pancreas .fM IF
X. Diseases of Genlto-Urinarr System
Nephritis and necrosis .
Acute nephritis
Nephrotic syndrome
Chronic nephritis .
Nephritis, unqualified
Renal sclerosis, unqualified
IF
.fM IF
.fM IF
fM IF
Other diseases of urinary system (M
Infections of kidney
Hydronephrosis
(f
. /M VF
Calculus of kidney and ureter . /M IF
Other diseases of kidney andrM ureter \ F
Calculus of other parts of urin-/M ary system . . . IF
Cystitis /M IF
Other diseases of bladder . fM IF
Urethritis (non-venereal)
Stricture of urethra.
/M \ F
. /M \ F
Other diseases of urinary tract / M \ F
Diseases of male genital organs. M
M
M M
M
M
Hyperplasia of prostate
Prostatitis
Other diseases of prostate
Hydrocele
Orchitis and epididymitis
Redundant prepuce and phimosis .
Sterility, male
Other diseases of male genital
134
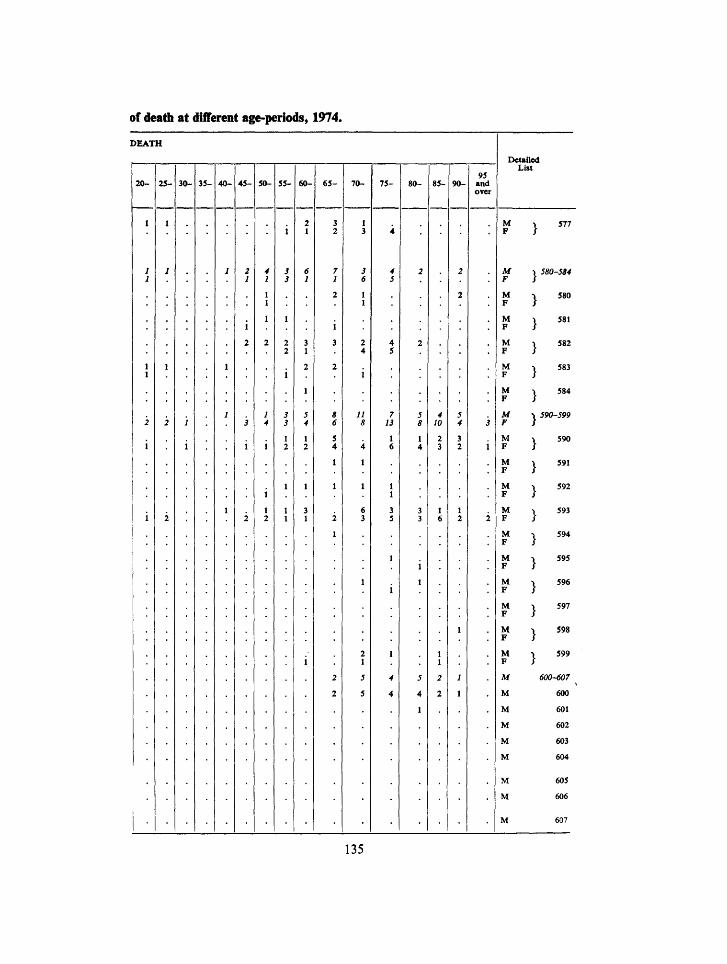
of deafli at different age-periods, 1974.
DEATH
20- 25- 30- 35- 40- 45- 50- 55- 60- 65- 70- 75- 80- 85- 90-95
and over
Deteiled List
M •» 577 F >
M F M F
M F
M F
M F
M F
M F
M F
M F
M F
M F
M F
M F
M F
M F
M F
M F
M
M
M
M
M
M
580-584
580
581
582
583
584
590-599
590
591
592
593
594
595
596
597
598
599
600-607
600
601
602
603
604
605
606
135
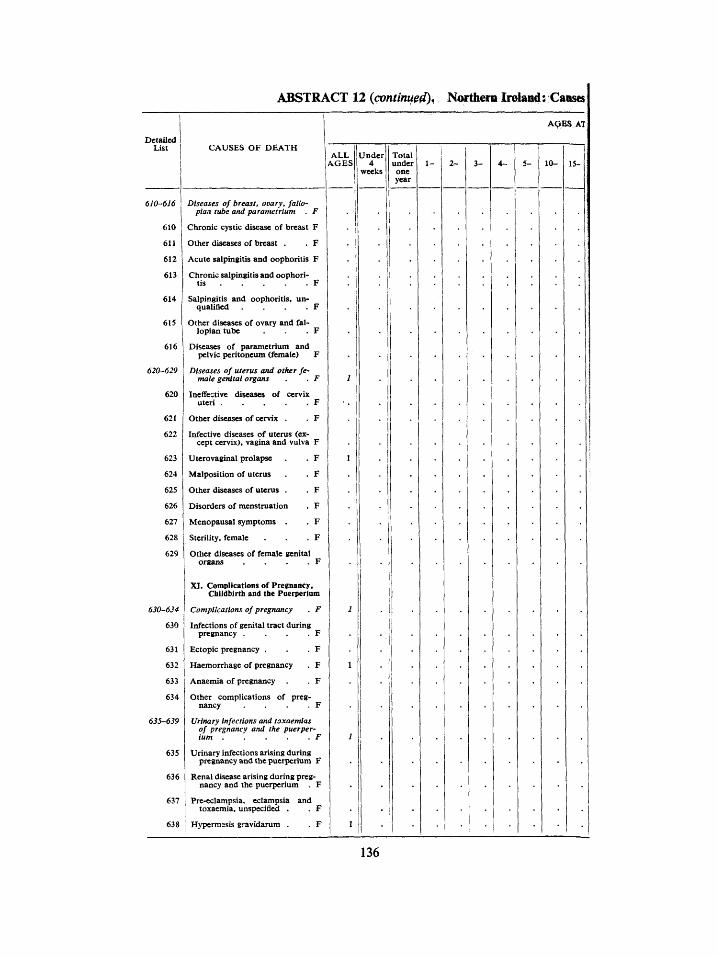
ABSTRACT 12 {continue^, Northeni Ireland; Causes
AQES AT
Detailed List
610-616
610
611
612
613
614
615
616
620-629
620
621
622
623
624
625
626
627
628
629
630-634
630
631
632
633
634
635-639
635
636
637
638
CAUSES OF DEATH
Diseases of breast, ovary, fallopian tube and parametrium . F
Chronic cystic disease of breast F
Other diseases of breast . . F
Acute salpingitis and oophoritis F
Chronic salpingitis and oophori-
Salpingitis and oophoritis, unqualified . . . . F
Other diseases of ovary and fallopian tube . F
Diseases of parametrium and pelvic peritoneum (female) F
Diseases of uterus arul other female genital organs . . F
Ineffective diseases of cervix uteri F
Other diseases of cervix . . F
Infective diseases of uterus (except cervix), vagina and vulva F
ALL AGES
Under 4
weeks
Uterovaginal prolapse
Malposition of uterus
Other diseases of uterus .
Disorders of menstruation
Menopausal symptoms .
Sterility, female
Other diseases of female genital organs . . . .
XI. Complications of Pregnancy, Childbirth and the Puerperium
Complications of pregnancy . F
Infections of genital tract during pregnancy . . . . F
Ectopic pregnancy . . . F
Haemorrhage of pregnancy . F
Anaemia of pregnancy . . F
Other complications of pregnancy . . . F
Urlruzry infections and toxaemias of pregnancy and the puerperium . . . • . F
Urinary infections arising during pregnancy and the puerperium F
Renal disease arising during pregnancy and the puerpcrium . F
Pre-cclampsia, eclampsia and toxaemia, unspecified . . F
Hypermssis gravidarum . . F
Total under one year
10-
136
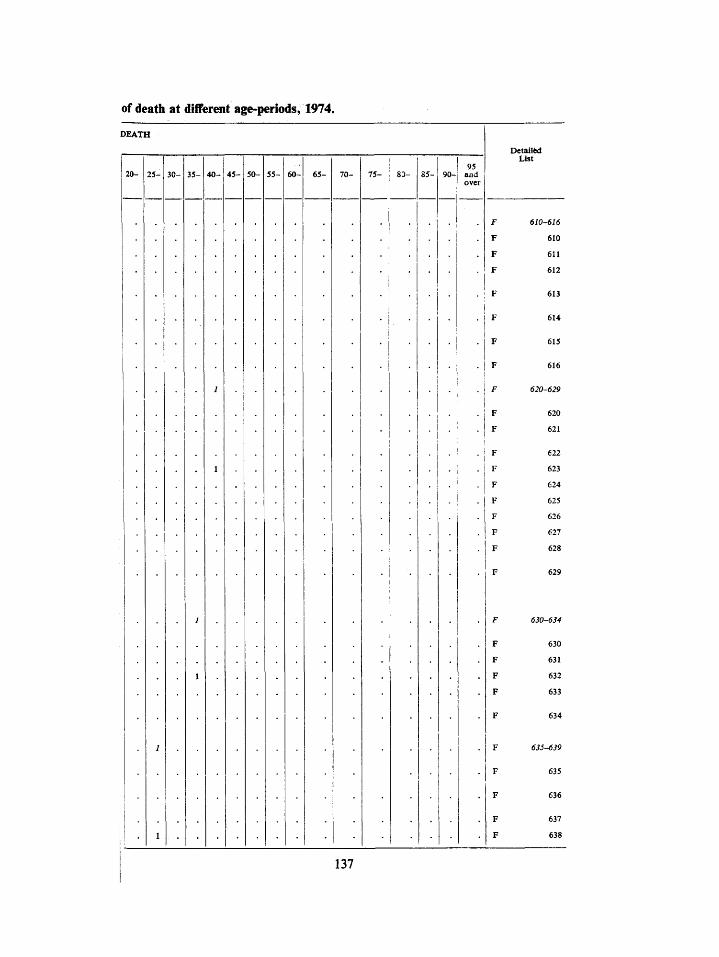
of death at different age-periods, 1974.
DEATH
30- 35- 75- 85-95
and over
Detait6d List
610-616
610
611
612
613
614
615
616
620-629
620
621
622
623
624
625
626
627
628
629
F
F
F
F
F
630-634
630
631
632
633
634
F
F
F
F
F
635-639
635
636
637
638
137
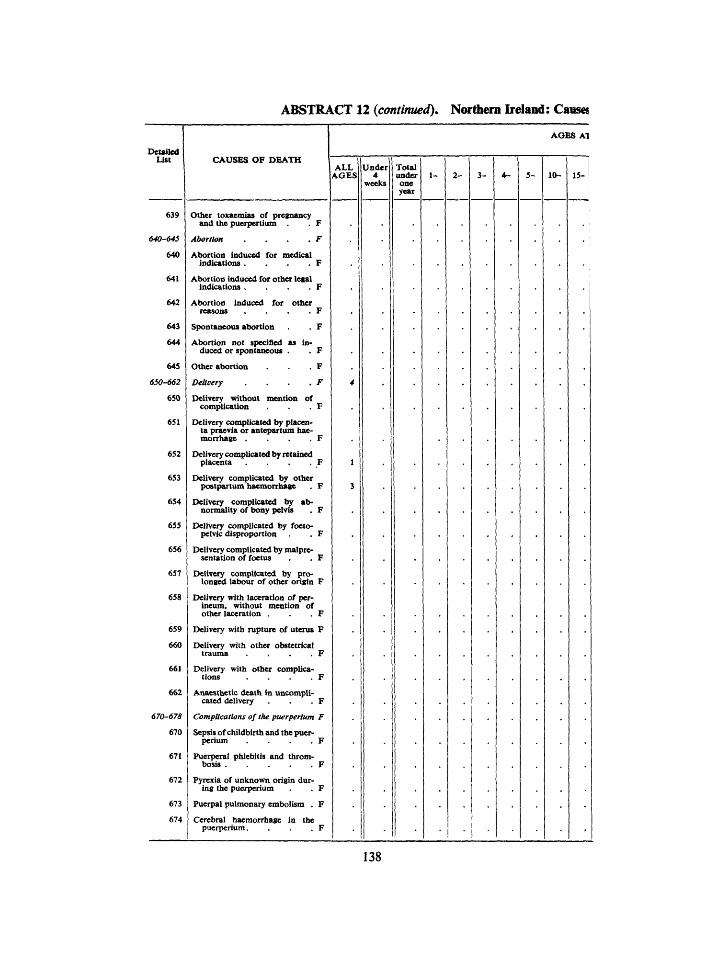
ABSTRACT 12 (continued). Northern Ireland: Causes
DetsUed List CAUSES OF DEATH
AGES A1
639
640-645
640
641
642
643
644
645
650-662
650
651
652
653
654
655
656
657
658
659
660
661
662
670-678
670
671
672
673
674
Other toxaemias of pregnancy and the puerpertium . F
Abortion . . F
Abortion induced for medical indications . . . F
Abortion induced for other legal indications . . . . F
Abortion induced for other reasons . . . F
Spontaneous abortion . F
Abortion not specified as induced or spontaneous . . F
Other abortion . F
Delivery . . . F
Delivery without mention of complication . F
Delivery complicated by placenta praevia or antepartum haemorrhage . . F
I>clivery complicated by retained placenta . . F
Delivery complicated by other postpartum haemorrhage . F
Delivery complicated by abnormality of bony pelvis . F
Delivery complicated by foeto-pelvic disproportion . F
Delivery complicated by malpre-sentation of foetus . . F
Delivery complicated by prolonged labour of other origin F
Delivery with laceration of perineum, without mention of other laceration . . . F
Delivery with rupture of uterus F
Delivery with other obstetrical trauma . . . F
Delivery with other complications . . . F
Anaesthetic death in uncomplicated delivery . . . F
Complications of the puerperlum F
Sepsis of childbirth and the puer-perium . . . F
Puerperal phlebitis and thrombosis . . . . F
Pyrexia of unknown origin during the puerperium . F
Puerpal pulmonary embolism . F
Cerebral haemorrhage in the pucrpcrium. . . . F
ALL AGES
Under 4
weeks
Total under| 1-one year
2 - 3-
138
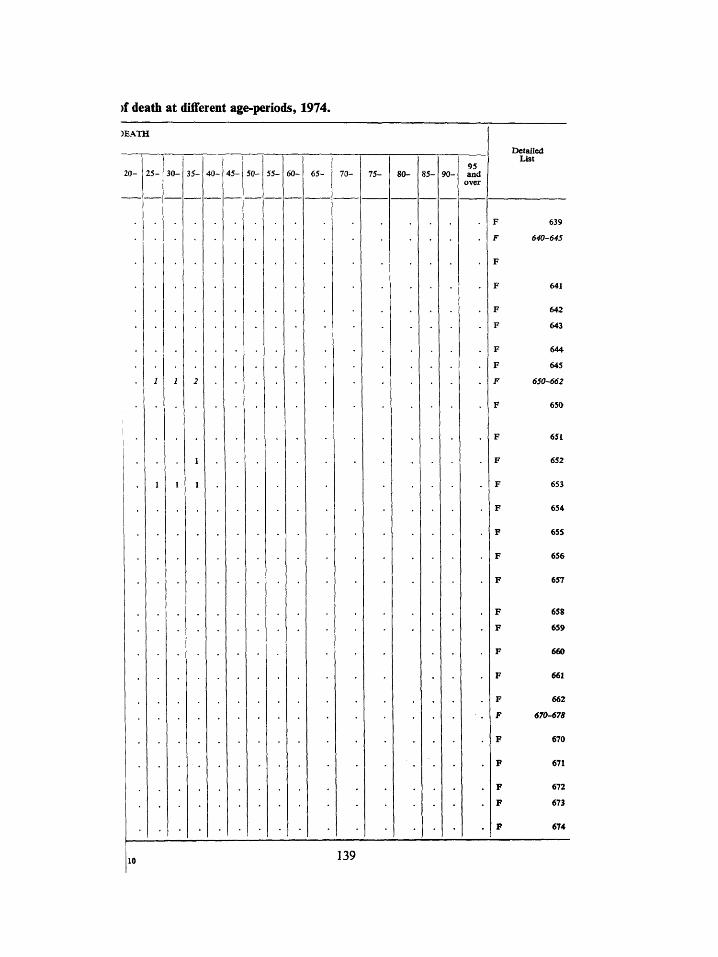
)f death at different age-periods, 1974.
>EATH
20- 25- 30- 35-
1
1 1
50- 60-1 65- 70- 80- 85- 90-95 and
over
Detailed List
10 139
639
640-645
642
643
644
645
650-662
650
F
F
F
F
F
F
F
F
F
F
F
F
F
F
F
F
F
651
652
653
654
6SS
656
657
6SS
659
660
661
662
670-678
670
671
672
673
674
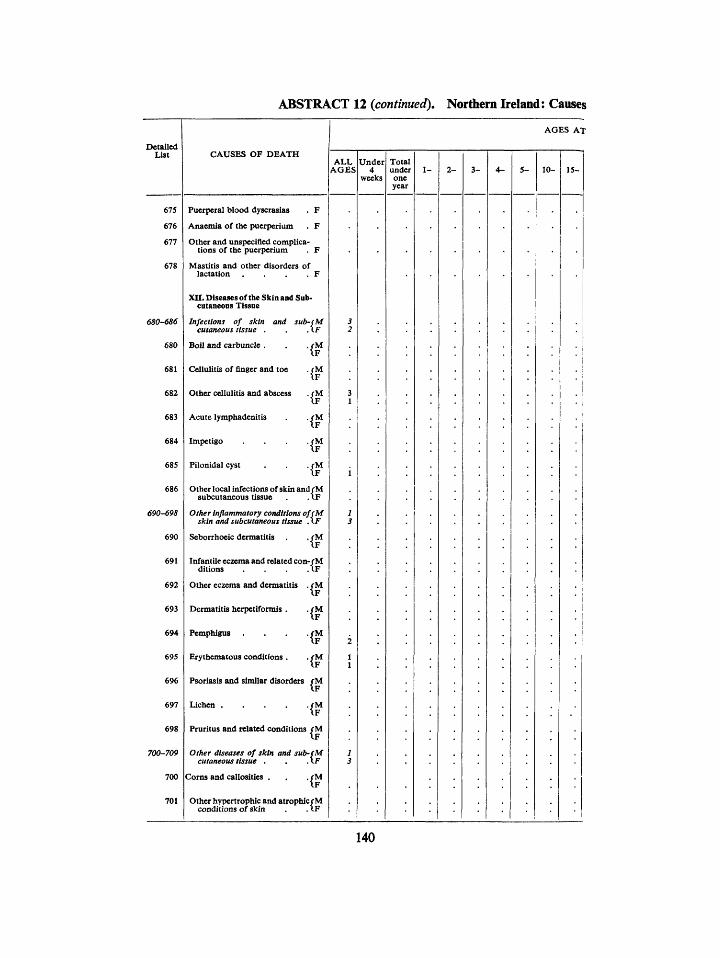
ABSTRACT 12 (continued). Northern Ireland: Causes
Detailed List CAUSES OF DEATH
AGES AT
ALL A G E S
Under 4
weeks
Total under one year
15-
675
676
677
680-686
680
681
682
683
684
685
686
690-698
690
691
692
693
694
695
696
697
698
700-709
700
701
Puerperal blood dyscrasias . F
Anaemia of the puerperium . F
Other and unspecified complications of the puerperium . F
Mastitis and other disorders of lactation . . . . F
X n . Diseases of the Skin and Subcutaneous Tissue
Infections of skin and sub-(M cutaneous tissue . . . \F
Boil and carbuncle .
Cellulitis of finger and toe
Other cellulitis and abscess
Acute lymphadenitis
Impetigo
Pilonidal cyst
. / M I F
. / M \ F
. / M IF
. / M I F
. / M \ F
. / M \ F
Other local infections of skin and fM subcutaneous tissue . \ F
Other inflammatory conditions offM skin and subcutaneous tissue .IF
Seborrhoeic dermatitis . / M IF
AF
. / M IF
Infantile eczema and related con-/M ditions
Other eczema and dermatitis
Dermatitis herpetiformis .
Pemphigus
Erythematous conditions .
. / M I F
. / M \ F
Psoriasis and similar disorders rM
Lichen / M \ F
Pruritus and related conditions / M \ F
Other diseases of skin and sub-fM cutaneous tissue .
Corns and callosities .
. 1 /
. / M
IF Other hypertrophic and atrophic/M
conditions of skin . . IF
140
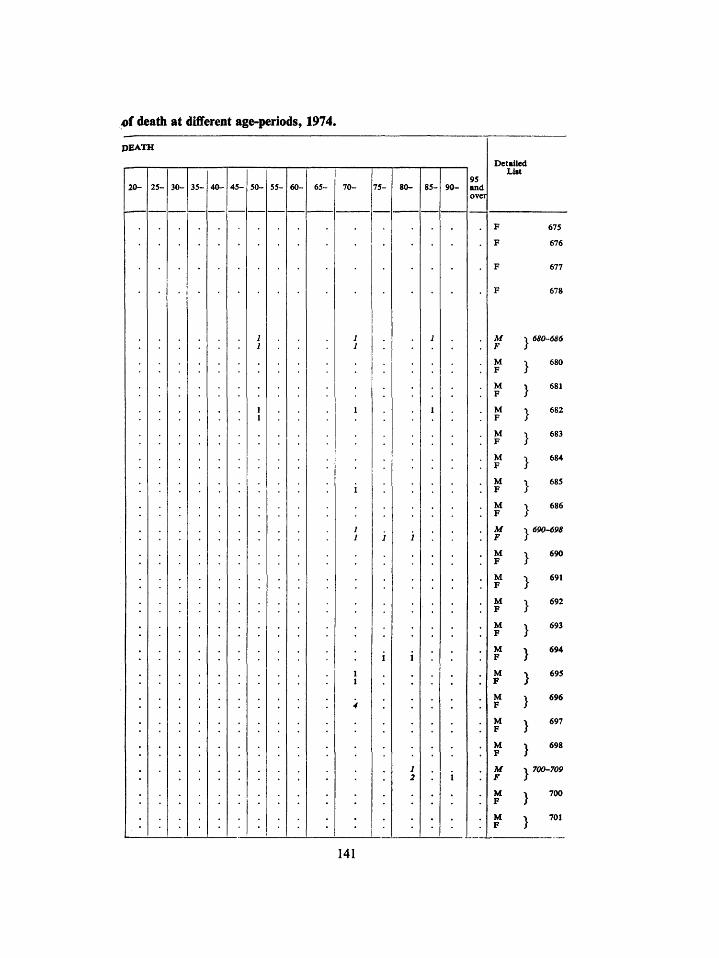
^f death at different age-periods, 1974.
DEATH
20- 25- 30- 35- 45- 65- 80- 85- 90-95 and over
Detailed List
M F
M F
675
676
677
678
6S0-6S6
680
681
682
683
684
685
686
690-698
690
691
692
693
694
695
696
697
698
700-709
700
701
141
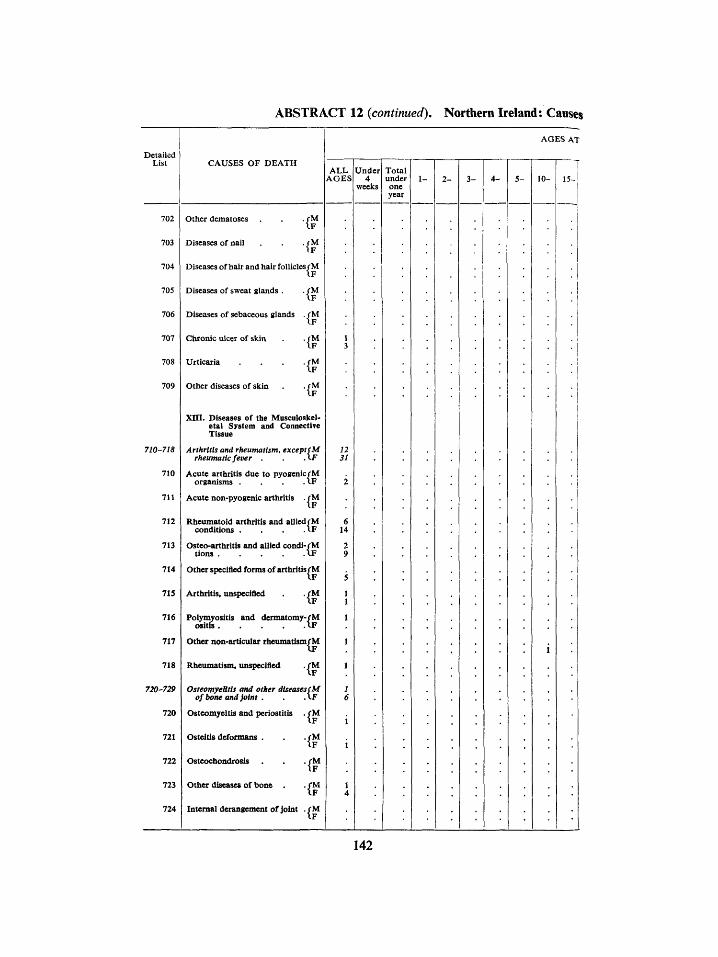
ABSTRACT 12 (continued). Northern Ireland: Causes
Detailed List CAUSES OF DEATH
AGES AT
ALL AGES
Under 4
weelcs
Total under one year
2-
702
703
704
705
706
707
708
709
710-718
710
711
712
713
714
715
716
717
718
720-729
720
721
722
723
724
Other dematoses
Diseases of nail
./M IF
./M IF
Diseases of hair and hair follicles/M IF
Diseases of sweat glands ./M IF
Diseases of sebaceous glands . /M IF
Chronic ulcer of skin
Urticaria
Other diseases of skin
./M IF
./M IF
.fM
Xm. Diseases of the Musculoskeletal System and Connective Tissue
Arthritis and rheumatism, except (M rheumatic fever . AF
Acute arthritis due to pyogenicfM organisms . . . .XF
Acute non-pyogenic arthritis . f M
Rheumatoid arthritis and allied/M conditions . . . .IF
Osteo-arthritis and allied condi-fM tions I F
Other specified forms of arthritis/M IF
Arthritis, imspecified •{¥ Polymyositis and dcrmatomy-fM
osltfs I F
Other non-articular rheumatism/M
Rheumatism, unspecified ./M IF
Osteomyelitis and other dlseasesfM of bone and Joint
Osteomyeltis and periostitis
Osteitis deformans .
Osteochondrosis
Other diseases of bone .
Internal derangement of joint
\F
. /M IF
./M IF
. /M IF
./M IF
142
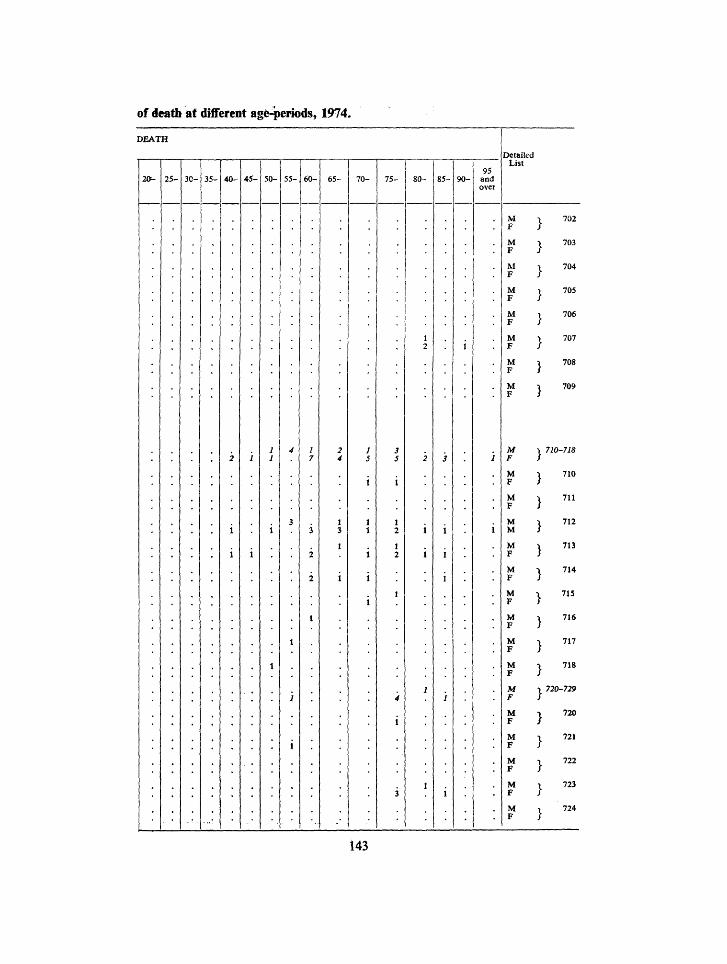
of death at different age-periods, 1974.
DEATH
2(>- 25- 3C- 35- 45- 60- 65- 75- 80- 85-95
and over
Detailed List
702
703
704
705
706
707
708
709
M 1 F J
M 1 F J
M 1 F J
M 1 M J
M 1 F J
M 1 F J
M \ F J
M 1 F J
M F J
M F J
M F
M F J
M F
M F
M F
M F
I 710-71S
1 710
. 7U
. 712
1 713
, 714
715
. 716
. 717
718
720-729
i 720
> 721
. 722
1 723
1 724
143
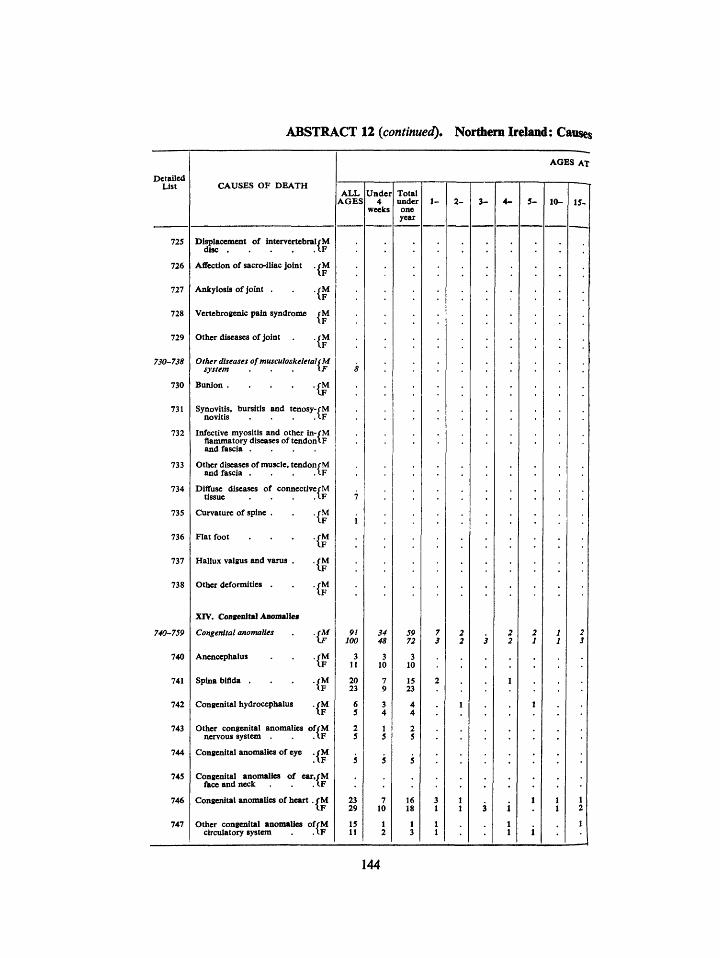
ABSTRACT 12 ^continued). Northern Ireland: Causes
Detailed List CAUSES OF DEATH
AGES AT
ALL AGES
Under 4
weeks
Total under one year
2- 3- 5- 15-
725
726
727
728
729
730-73S
730
731
732
733
734
735
736
737
738
740-759
740
741
742
743
744
745
746
747
Displacement of intervertebral/M disc I F
Affection of sacro-iliac joint . /M
Ankylosis of joint .
Vertebrosenic pain syndrome
Other diseases of joint
./M IF
/M IF
./M IF
Other diseases of musculoskeletal (M system . . . \F system
Bunion . . . . . /M
Sjrnovitis, bursitis and tenosy-fM novitis . . . I F
Infective myositis and other in-fM flammatory diseases of tendonlF and fascia . . . .
Other diseases of muscle, tendon rM and fascia . . . (.F
Diffuse diseases of connectiverM tissue . . . .(.F
Curvature of spine .
Flat foot
Hallux valgus and varus .
Other deformities .
XIV. Congenital Anomalies
Congenital anomalies
Anencephalus
Sphia bifida .
Congenital hydrocephalus
./M \F
. /M IF
(f
. /M IF
Other congenital anomalies of/M nervous system .
Congenital anomalies of eye
. /M IF
Bf/I .IF
Congenital anomalies of ear.rM face and neck .(.F
Congenital anomalies of heart . f M
Other congenital anomalies ofrM circulatory system . iF
91 100
20 23
6 5
2 5
7 9
3 4
1 5
144
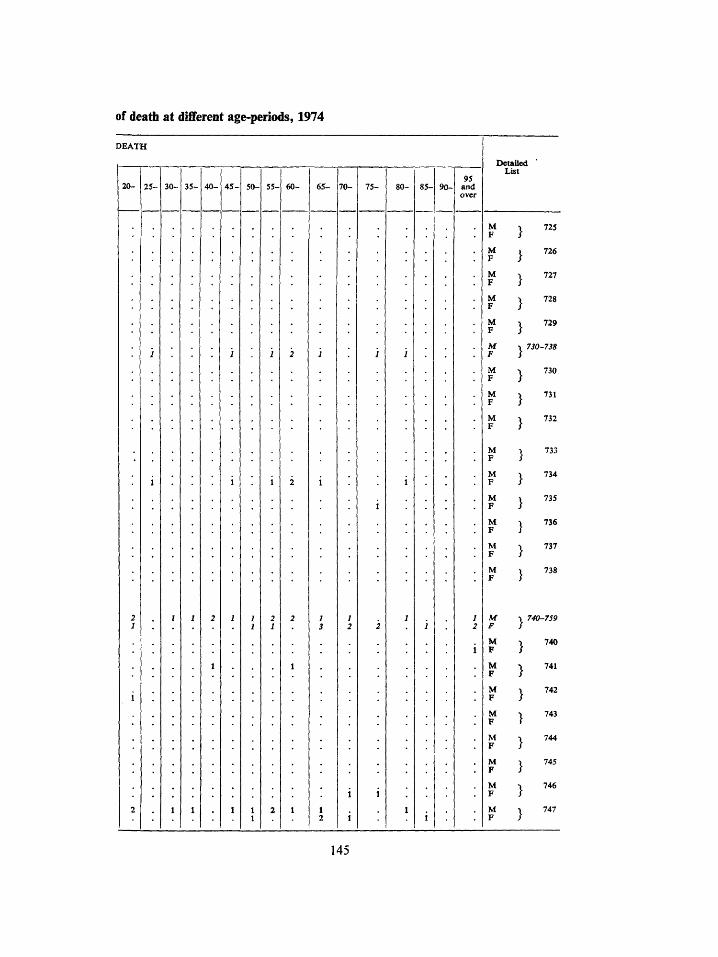
of death at different age-periods, 1974
DEATH
20- 25- 30- 35- 40- 45- 55- 60- 65- 70- 75- 90-95
and over
Detailed List
725
726
727
728
729
730-738
730
731
732
733
734
735
736
737
738
740-759
740
741
742
743
744
745
746
747
145
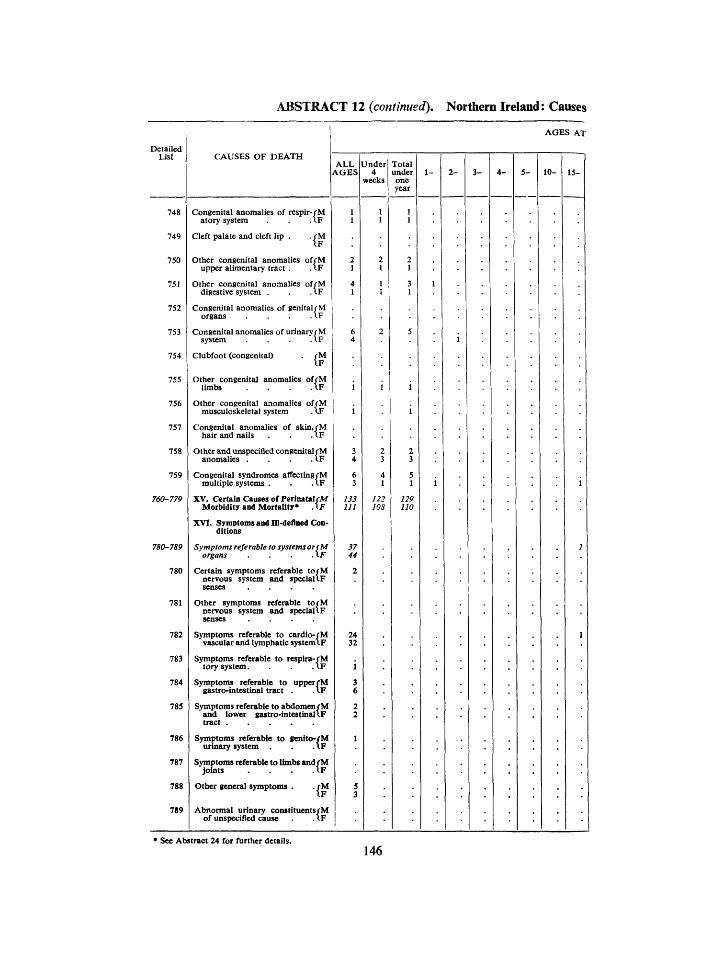
ABSTRACT 12 {continued). Northern Ireland: Causes
Detailed List
748
749
750
751
752
753
754
755
756
757
758
759
760-779
780-789
780
781
782
783
784
785
786
787
788
789
CAUSES OF DEATH
Congenital anomalies of respir-/M atory system
Cleft palate and cleft lip
. IF
. / M IF
AGES AT
ALL A G E S
Under 4
weeks
Other congenital anomalies offM upper alimentary tract . . IF
Other congenital anomalies offM digestive system . . . \ F
Congenital anomalies of genital/M organs . . . A F
Congenital anomalies of urinary^M system
Clubfoot (congenital) / M \ F
Other congenital anomalies ofrM limbs . . . . I F
Other congenital anomalies offM musculoskeletal system . IF
Congenital anomalies of skin.rM hair and nails . . I F
Other and unspecified congenital fM anomalies . . . . I F
Congenital syndromes affecting/M multiple systems . . . I F
XV. Certain Causes of Perinatal ril/ Morbidity and Mortality* AF
XVI. Symptoms and U-deflned Conditions
Symptoms referable to systems orfM organs . .\F
Certain symptoms referable torM nervous system and spcciallF senses . . . .
Other symptoms referable torM nervous system and speciallF senses . . . .
Symptoms referable to cardio-fM vascular and lymphatic systemXF
Symptoms referable to respira-/M tory system. . . . I F
Symptoms referable to upper/M gastro-intestinal tract . . 1 F
Symptoms referable to abdomen/M and lower gastro-intestinallF tract
Symptoms referable to Bcnlto-/M urinary system . . . I F
Symptoms referable to limbs and/M joints . . . . I F
Other general symptoms . . / M I F
Abnormal urinary constituents/M of unspecified cause . . IF
13S 111
Total under
one vear
122 103
129 110
10-
* See Abstract 24 for further details.
146
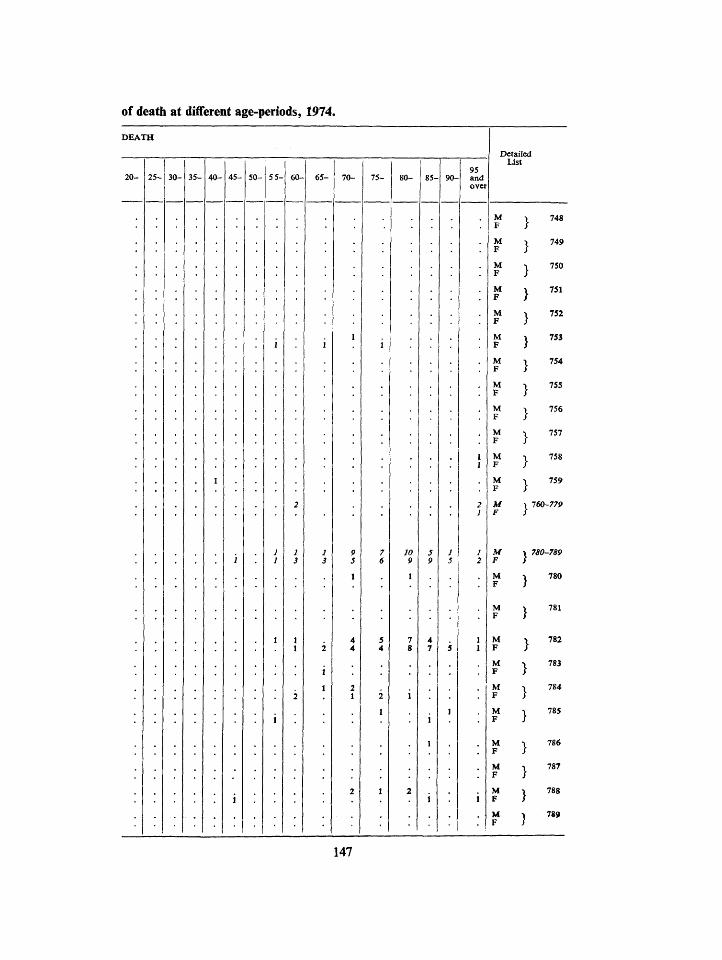
of death at different age-periods, 1974.
DEATH
2 5 - 30- 35 - 40- 4 5 - 50- 60 - 6 5 - 75- 85- 90 -
Detailed List
95 and over
F
748
749
750
751
752
753
754
755
756
757
758
759
760-779
JO 9
M F
780-789
780
781
782
783
784
785
786
787
788
789
147
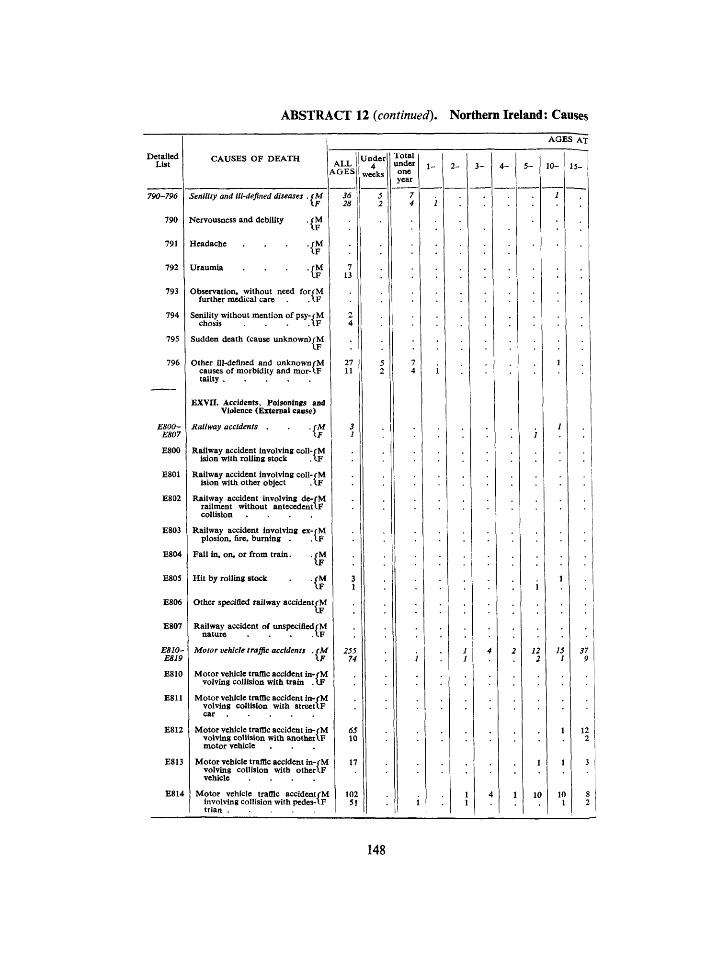
ABSTRACT 12 (continued). Northern Ireland: Causes
Detailed List
AGES AT
CAUSES OF DEATH ALL
AGES
790-796
790
791
792
793
794
795
796
E800-E807
E800
E801
E802
E803
E804
E805
E806
E807
E8I0-E819
E810
E811
E812
E813
E814
Senility and ill-defined diseases . (M \F
Nervousness and debility
Headache
Uraumia
. / M IF
. /M IF
Observation, without need for/M further medical care . . IF
Senility without mention of psy-fM chosis . . . . I F
Sudden death (cause unknown)/M
Other ill-defined and unknown/M causes of morbidity and mor-IF tality
EXVn. Accidents. Poisonings and Violence (External cause)
Railway accidents .CM IF
Railway accident involving coll-rM ision with rolling stock . 1 F
Railway accident involving coll-/M ision with other object . IF
Railway accident involving de- /M railment without antecedentiF collision . . . .
Railway accident involving ex-jM plosion, fire, burning . . IF
Fall in, on, or from train.
Hit by rolling stock
IF
. / M I F
Other specified railway accident fM
Railway accident of unspecified/M nature . IF
Motor vehicle traffic accidents . fM IF
Motor vehicle traffic accident in-rM volving collision with train . IF
Motor vehicle traffic accident in-fM volving collision with streetlF car . . . . .
Motor vehicle traffic accident in-/M volving collision with anotherlF motor vehicle
Motor vehicle traffic accident in-/ M volving collision with otherlF vehicle . . . .
Motor vehicle traffic accidentfM involving collision with pedes-t.F trian . . . . .
Under 4
weeks
25S 74
17
102 51
Total under one year
7 4
1- 3- 5 -
1 12 2
10 10 1
148
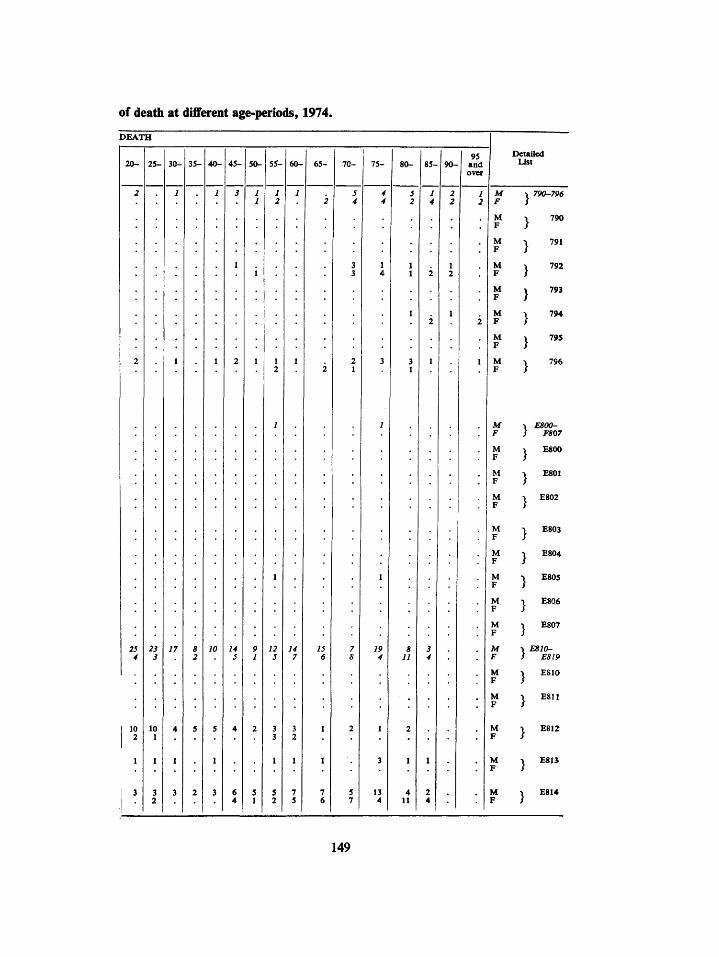
of death at different age-periods, 1974.
D E A T H
2 0 -
2i A
1 IC
1 ^ 1
1 ^
?
•
2 5 -
23 i
10 1
1
3 2
3 0 -
]
n
4
1
3
I
T
3 5 -
8 2
5
2
4 0 -
]
iC
5
1
3
/
4 5 -
3
1
2
4
6 4
5 0 -
i
1
P i
2
5 1
5 5 -
1 2
1 2
/
1
12 5
3 3
1
5 2
60-
1
1
7
3 2
1
7 5
6 5 -
2
(S
1
1
7 6
7 0 -
5 4
3 3
2 1
7
2
5 7
1
IS-
4 4
1 4
3
.
I
19 4
1
3
13 4
8 0 -
5
1 1
1
3 1
8 11
2
1
4 11
1 1 95 8 5 - 9 0 - and
over
1 4
2
2
1
3 4
1
2 4
2 2
1 2
1
1 2
2
I
Detailed U s t
M •> 790-796 F S
M •, 790 F /
M •» 791 F /
M •» 792 F /
M X 793 F /
M -1 794 F /
M ^ 795 F /
M •» 796 F /
M X E800-F J F807
M ^ E800 F /
M ^ E801 F /
M 1 E802 F /
M •» E803 F /
M I E804 F /
M 1 E805 F /
M -i E806 F /
M •» E807 F /
M \ E810-F S E8I9
M •> E810 F /
M \ E81I F /
M \ E812 F /
M •» E81J F /
M -k E814 F /
149
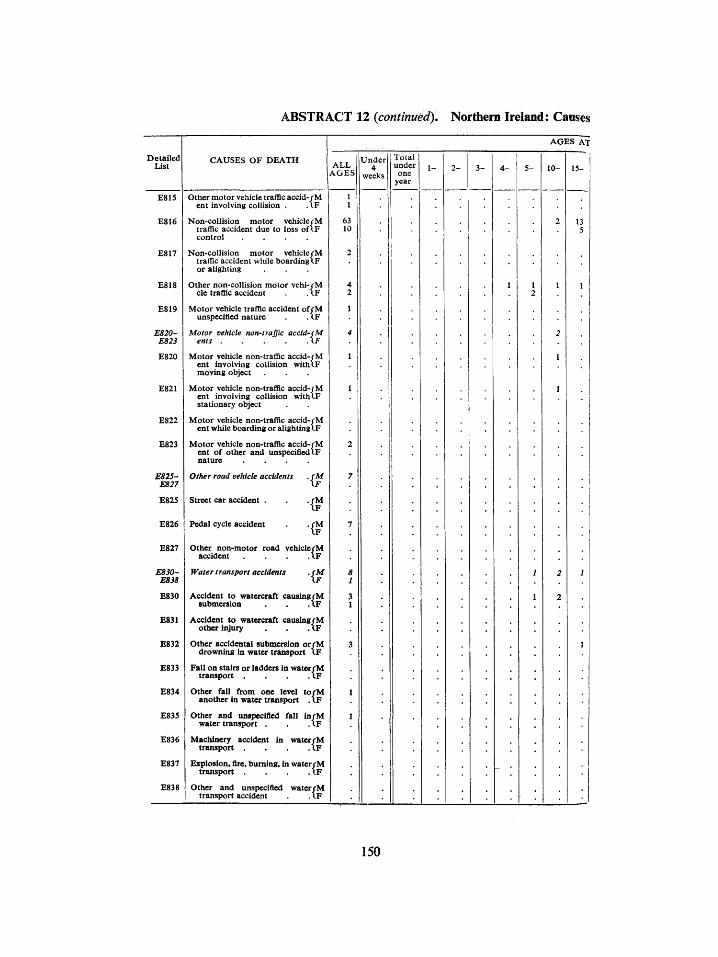
ABSTRACT 12 {continued). Northern Ireland: Causes
Detailed List
E81S
E816
E817
E818
E819
E820-E823
E820
£821
E822
E823
E825-E827
E825
E826
E827
E830-E838
E830
E831
E832
E833
E834
E835
E836
E837
E838
CAUSES OF DEATH
AGES AT
ALL AGES
Other motor vehicle traffic accid-rM ent Involving collision . . IF
Non-collision motor vehiclerM trafflc accident due to loss of IF control . . . .
Non-collision motor vehicle/M traffic accident wtule boarding IF or alighting
Other non-collision motor vehi-rM cle traffic accident . IF
Motor vehicle trafflc accident of rM unspecified nature . . IF
Motor vehicle non-traffic accld-cM ents . . . . .IF
Motor vehicle non-traffic accid-rM ent Involving collision withtF moving object
Motor vehicle non-traffic accid-/M ent involving collision withlF stationary object
Motor vehicle non-traffic accid-rM ent while boarding or alightinglF
Motor vehicle non-traffic accid-rM ent of other and unspecifiediF nature . . . .
Other road vehicle accidents
Street car accident .
Pedal cycle accident
.(M
. /M IF
. /M IF
Other non-motor road vehiclerM accident . . . IF
Water transport accidents •{^
Accident to watercraft causingrM submersion . . .t.F
Accident to watercraft causingrM other injury . . IF
Other accidental submersion orrM drowning in water transport IF
Fall on stairs or ladders in water rM transport . . . IF
Other fall from one level torM another in water transport . \F
Other and unspecified fall inrM water transport . . IF
Machinery accident in water/M transport . . . IF
Explosion, fire, burning, in water rM transport . . . IF
Other and unspecified waterrM transport accident . IF
Under 4
weeks
Total under one
year
150
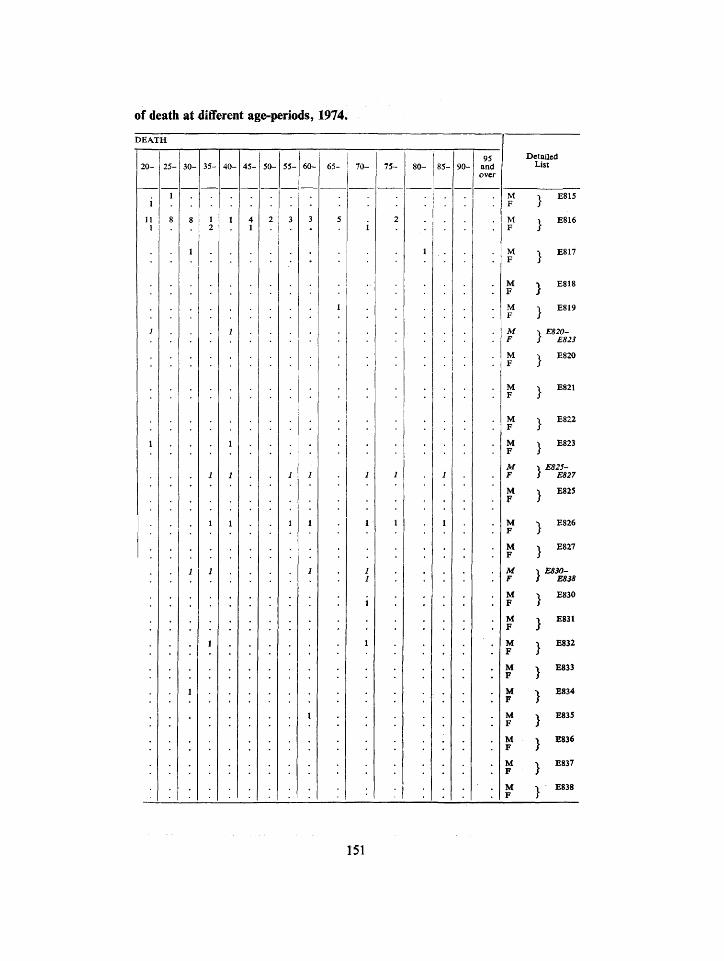
of death at different age-periods, 1974.
DEATH
25- 45- 50- 55- 65- 70- 7 5 -95
and over
M F
M F
M F
M F
Detailed List
E815
E816
E817
E818
E819
E820-£823
E820
E821
E822
E823
E825-E827
E82S
E826
E827
E830-E838
E830
E831
E832
E833
E834
E835
E836
E837
E838
151
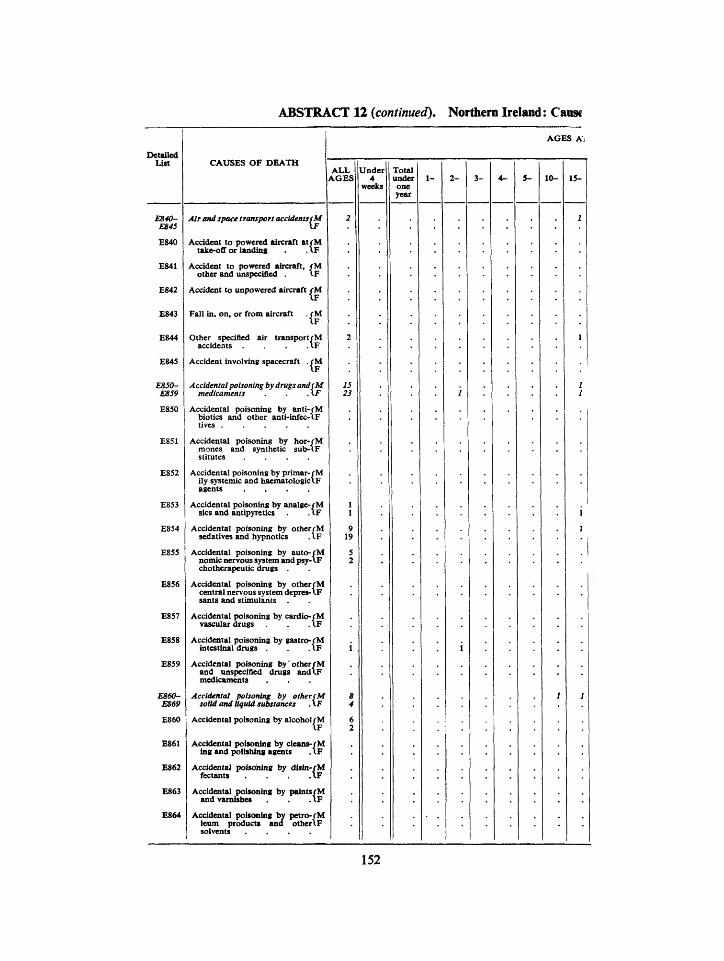
ABSTRACT 12 (continued). Northern Ireland: Cause
Detailed List
E840-E845
E840
E841
E842
£843
E844
E84S
E850-E859
E851
E852
E853
E854
E855
E856
E857
E8S8
E859
E860-ES69
E860
E861
E862
E863
E864
CAUSES OF DEATH
AGES Ai
ALL AGES
Air and space transport accidents (M XF
Accident to powered aircraft at rM talce-off or landing . .IF
Accident to powered aircraft, /M other and unspecified . IF
Accident to unpowered aircraft /M IF
Fall in, on, or from aircraft •{¥ Other specified air transportrM
accidents . . A F
Accident involving spacecraft . /M IF
Accidental poisoning by drugs andcM medicaments . .IF
Accidental poisoning by anti-/M • -Ir
lives biotics and other anti-infec-lF
Accidental poisoning by hor-fM mones and synthetic sub-iF stitutes . . . .
Accidental poisoning by primar-/M ily systemic and haematologiclF agents . . . .
Accidental poisoning by anaIge-/M sics and antipyretics . IF
Accidental poisoning by other/M sedatives and hypnotics . IF
Accidental poisoning by auto-rM nomic nervous system and psy-t-F chotherapeutic drugs
Accidental poisoning by otherrM central nervous system depres-lF sants and stimulants
Accidental poisoning by cardio-fM vascular drugs . (.F
Accidental poisoning by gastro-rM intestinal drugs . . \F
Accidental poisoning by otherrM and unspecified drugs andlF medicaments
Accidental poisoning by othertM solid and liquid substances AF
Accidental poisoning by alcohol rM \F
Accidental poisoning by cleans-rM ing and polishing agents . IF
Accidental poisoning by dlsin-rM fectants .IF
Accidental poisoning by paintsrM and varnishes .IF
Accidental poisoning by petro-rM leum products and other*.F solvents . . . .
Under 4
weeks
Total under one year
2 - 3- 5- 10-
152
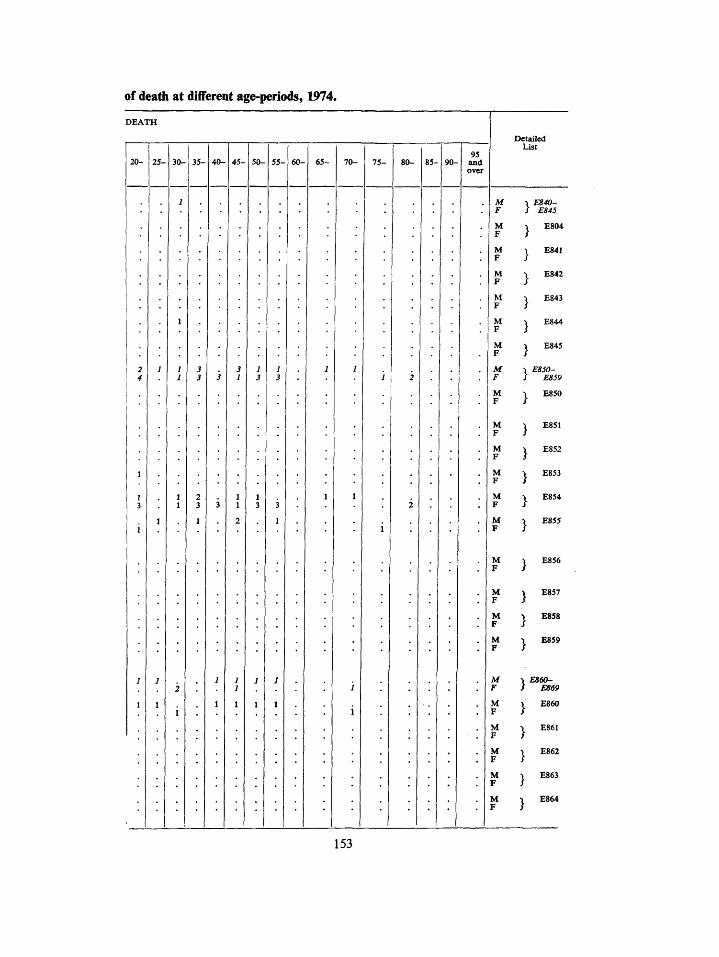
of deadi at different age-periods, 1974.
DEATH
20- 30- 35- 45- 55- 60- 75- 80- 85- 90-95
and over
Detailed List
M F
M F
M F
M F
M F
E840-£845
£804
E841
E842
E843
E844
E845
E8S0-E859
E850
E851
E852
E853
E854
E8S5
E856
E857
E858
E859
E860-E869
E860
E861
E862
E863
E864
153
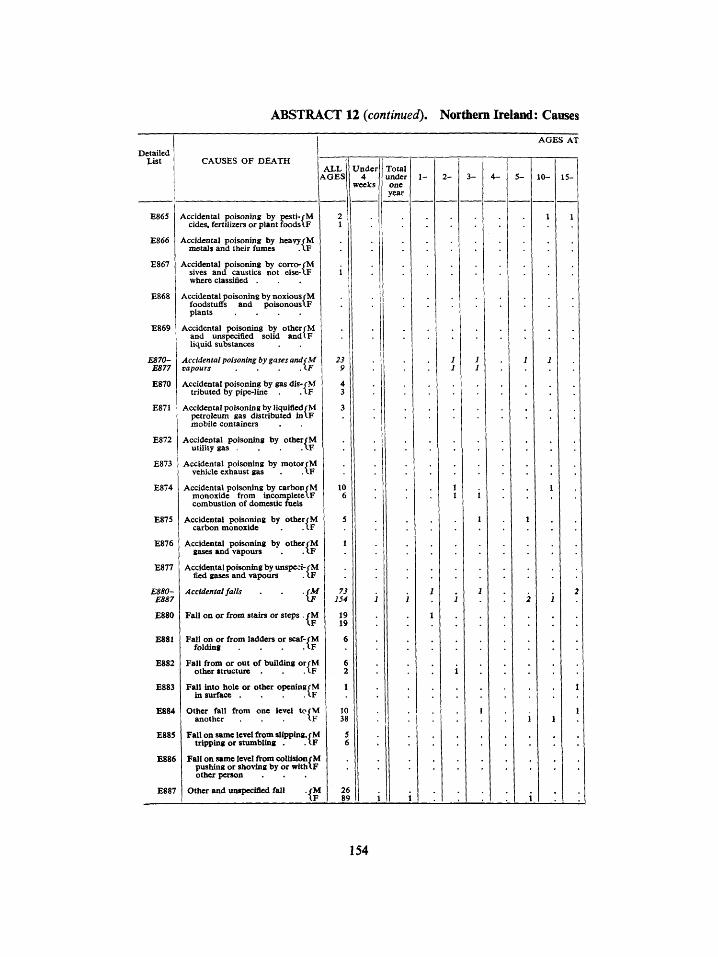
ABSTRACT 12 (continued). Northern Ireland: Causes
Detailed List CAUSES OF DEATH
AGES AT
ALL AGES
E865
E866
E867
E868
E869
E870-E877
E870
E871
E872
E873
E874
E875
E876
E877
E8S0-E887
£880
E881
E882
£883
£884
£885
£886
£887
Accidental poisoning by pesti-/M cides. fertilizers or plant foodslF
Accidental poisoning by heavy rM metals and their fumes . IF
Accidental poisoning by corro-fM sives and caustics not else-iF where classified .
Accidental poisoning by noxious/M foodstuffs and poisonouslF plants . . . .
Accidental poisoning by other/M and unspecified solid andlF liquid substances
Accidental poisoning by gases andfM vapours . . . AF
Accidental poisoning by gas dis-rM tributed by pipe-line . . IF
Accidental poisoning by liquified rM petroleum gas distributed intF mobile containers
Accidental poisoning by other/M utility gas . . . A F
Accidental poisoning by motor/M veliicle exhaust gas . . \V
Accidental poisoning by carbonrM monoxide from incompletetp combustion of domestic fuels
Accidental poisoning by other rM carbon monoxide . . IF
Accidental poisoning by otherrM gases and vapours . . (.F
Accidental poisoning by unspcci-rM fied gases and vapours . (.F
Accidental falls .(M \F
Fall on or from ladders or scaf-/M
Fall on or from stairs or steps . /M
folding . .XF
Fall from or out of building or/M other itructure .XF
Fall into hole or other openingrM in surface . . . IF
Other fall from one level tcfM another . . . «.F
Fall on same level from slipping, rM tripping or stumbling . .VB
Fall on same level from collision rM pushing or shoving by or with (.F other person
Other and unspecified fall ./M IF
Under 4
weeks
73 154
Total under one year
154
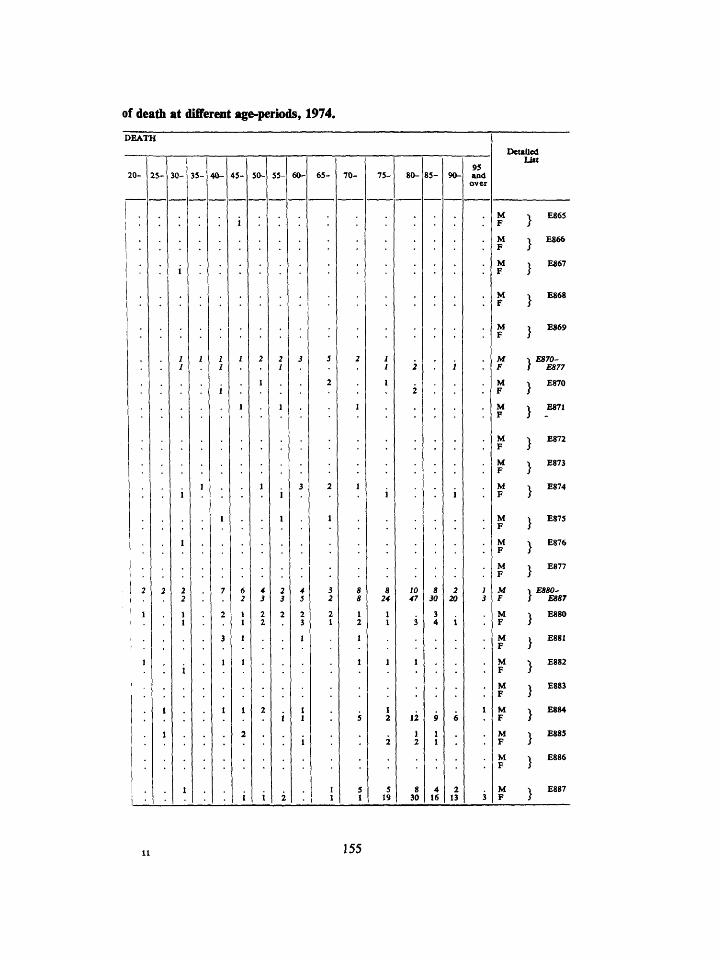
of death at different age-periods, 1974.
DEATH
25- 30- 35- 40- 45- 50- 55-
1 2
2
t 1
60- 70- 75- 80- 85- 90-95 and
over
Detailed List
£865
£866
£867
£868
E869
E870-E877
£870
£871
£872
£873
£874
£875
E876
£877
E880-E887
£880
£881
£882
£883
£884
£885
£886
£887
155
ABSTRACT 12. (continued) Northern Ireland: Causes
Detailed List
E890-E899
£890
E891
E892
E893
E894
E895
E896
E897
E898
E899
E900-E909
E900
E901
E902
E903
E904
E905
E906
E907
E908
E909
E910-E929
E910
E911
CAUSES OF DEATH
AGES AT
ALL AGES
Accidents caused by fires andfM flames . . . .<-F
Accident caused by conflagra-/M tion in private dwelling .IF
Accident caused by conflagra-rM tion in other building orlF structure . . . .
Accident caused by conflagra-/M tion not in building or struc-lF
Accident caused by ignition of fM clothing . . . .IF
Accident caused by ignition ofrM highly inflammable material . (.F
Accident caused by controUedrM fire in private dwelling . iF
Accident caused by controUed/M flie in other building or struc-lF ture
Accident caused by controlled (M fire not in building or structure <.F
Accident caused by other speci-fM fled ares or flames . .IF
Accident caused by imspecifled/M fire I F
Accidents due to natural and en-(M vironmental factors
Excessive heat
Excessive cold
High and low air pressure
Effects of travel and motion
rM
.rM IF
./M IF
./M IF
Hunger, thirst, exposure andrM neglect . . . .IF
Bites and stings of venomous/M animals and insects . . IF
Other accidents caused by ani-rM mals IF
Lightning
Cataclysm
./M IF
./M IF
Accident due to other naturalrM and environmental factors . (JF
Other accidents (^ Accidental drowning and sub-/M
mersion . . . .IF
Inhalation and ingestion of food rM causing obstruction or suffoca-XF tion
Under 4
weeks
Total under one year
5- 10- 15-
156
of death at di£Pereiit age-periods, 1974.
DEATH
20- 30- 35- 40- 45- 50- 60- 65- 70- 75- 80- 85-95 and
over
Detailed List
M F
E890-E899
E890
E891
E892
E893
E894
E895
E896
M F
M F
M F
E897
E898
E899
\E900~ E909
E900
E901
E902
E903
E904
E905
E906
E907
£908
E909
E910-E929
E910
£911
157
ABSTRACT 12 (continued). Northern Ireland: Causes
Detailed List
E912
E913
E914
E915
E916
E917
E918
E919
E920
E921
E922
E923
E924
E925
E926
E927
E928
E929
E930-E936
E930
E931
E932
E933
E934
CAUSES OF DEATH
Inhalation and ingestion of/M other object causing obstruc-lF tion or suffocation
Accidental mechanical suflfoca-rM tion IF
Foreign body entering acciden-rM tally eye and adnexa . IF
Foreign body entering acciden-fM tally other orifice. .IF
Struck accidentally by faliing/M object . . .IF
Striking against or struck accld-rM entally by objects . . IF
Caught accidentally in or be-rM tween objects . . . I F
Over-exertion and strenuousrM movements .IF
Accident caused by cutting or/M piercing instruments . .IF
Accident caused by explosion of rM pressure vessel . . .<.F
Accident caused by firearm mis-fM siles . . . .IF
Accident caused by explosive/M material . .(.F
Accident caused by hot sub-/M stance, corrosive liquid andlF steam . . . .
Accident caused by electricrM current . . \F
Accident caused by radiation . rM ^'
Vehicle accidents not elsewhersrM classifiable .(.F
Machinery accidents not else-rM where classifiable . iF
Other and unspecified accidents/M IF
Surgical and medical complica-cM ttons and misadventures . \F
Complications and misadven-/M tures in operative therapeuticlF procedures . . . .
Complications and misadven-rM tures in other and unspecifledlF therapeutic procedures
Complications and misadven-rM tures in diagnostic procedures <.F
Complications and misadven-/M tures in prophylaxis withlF bacterial vaccines
Complications and misadven-/M tures in prophylaxis with other IF vaccines . . . .
AGES AT
ALL AGES
Under 4
weeks
Total under one year
3- 4 - 5- 10- 15-
158
of deafli at different age-periods, 1974.
DEATH
20- 30- 35- 50- 70- 75- 80- 85- 90-95
and over
Detailed List
M F
E912
E913
E914
E915
E916
E917
E918
E919
E920
E921
E922
E923
E924
E925
E926
E927
E928
E929
E930-E936
E930
E931
E932
E933
E934
159
ABSTRACT 12 (continued). Northern Ireland: Causes
Detailed List CAUSES OF DEATH
AGES AT
ALL AGES
Under 4
weeks
Total under one year
3-
E935
E936
E940-E949
E940
E941
E942
E943
E944
E945
E946
E947
E948
E949
E950-E959
E950
E951
E952
E953
E954
E955
E956
E957
E958
E959
Complications and misadven-rM tures in other prophylacticlF procedures . . . .
Complications and misadven-rM tures in other non-therapeuticlF procedures . . . .
Late effects of accidental injury cM \F
Late effect of motor vehicle acci-rM dent iF
Late effect of other transport/M accident .IF
Late effect of accidental poison-rM ing IF
Late effect of accidental fall
Late effect of accident caused fire .
. /M IF
by/M
Late effect of accident due torM natural and environmentallF factors . . . .
Late effect of other accidents . /M (T Late effect of surgical operation/M
IF
Late effect of irradiation •{¥ Late effect of other surgical and/M
medical procedures . IF
Suicide and self-inflicted injury .rM IF
Suicide and self-inflicted poison-rM ing by solid or liquid sub-lF stances . . . .
Suicide and self-inflicted poison-rM ing by gases in domestic use iF
Suicide and self-inflicted poison-rM ing by other gases .IF
Suicide and self-inflicted injuryrM by hanging, strangulation andlF suffocation
Suicide and self-inflicted injuryrM by submersion (drowning) . 1 F
Suicide and self-inflicted injuiy/M by firearms and explosives .I.F
Suicide and self-inflicted injuryrM by cutting and piercing instru-t.F ments . . . .
Suicide and self-inflicted injuryrM by jumping from high place . IF
Suicide and self-inflicted injuryrM by other and unspecifledlF means . . . .
Late effect of self-inflicted injury rM
160

of death at different age-periods, 1974.
DEATH
20- 35- 55- 70- 90-95
and over
Detailed List
M F
E940-E949
E940
E941
E942
E943
E944
E945
2 I" 2
9-3
M F
E946
E947
E948
E949
E950-E959
E950
E951
E952
E953
E954
E955
E956
E957
E958
E959
161
ABSTRACT 12 (continued). Northern Ireland: Causes
Detailed List CAUSES OF DEATH
AGES AT
ALL AGES
Under 4
weeks
Total under one year
2 - 3- 5--
E960-E969
E960
E961
E962
E963
E964
E965
E966
E967
E968
E969
E970-E978
E970
E971
E972
E973
E974
E975
E976
E977
E978
E9S0-E989
E980
E981
Homicide and injury purposely (M inflicted by other persons . \F
Fight, brawl, rape ./M \F
Assault by corrosive or caustic/M substance, except poisoning . IF
Assault by poisoning ./M \ F
Assault by hanging and strangu- r M lation . . I F
Assault by submersion (drown-/M ing) I F
Assault by flrearms and explo-z'M sives I F
Assault by cutting and piercingrM instruments .IF
Assault by pushing from highrM place I F
Assault by other and unspecified/M means .IF
Late effect of injury purposelyrM inflicted by other person . IF
Legal intervention (^ Injury due to legal intervention rM
by flrearms . t.F
Injury due to legal interventionfM by explosives . . iF
Injury due to legal intervention/M by gas . . . . 1 M
Injury due to legal intervemion/M by blunt object . . iF
Injury due to legal intervcntion/M by cutting and piercing instru-lF
Injury due to legal intervention/M by other specified means . (.F
Injury due to legal intervention rM by unspecified means . . I F
Late effect of injuries due to legal/M intervention . . .IF
Legal execution . /M IF
Injury undetermined whetheracci-(M dentally or purposely inflicted \F
Poisoning by solid or liquid sub-fM stances, undetermined wheth-iF er accidentally or purposely inflicted . . . .
Poisoning by gases in domestic rM use, undetermined whetheriF accidentally or purposely inflicted . . . .
192 17
186 15
16 4
162
of death at different age-periods, 1974.
DEATH
2 5 - 30- 35- 40- 45- 5 0 - 5 5 - 6 0 - 65- 70- 75- 80- 9 0 -95 and over
Detailed List
24
10 14 2
14
M F
M F
E960-E969
E960
E961
E962
E963
E964
E965
E966
E967
E968
£969
E970-E978
E970
E971
E972
E973
E974
E975
E976
E977
E978
E980-E989
E980
E981
163
ABSTRACT 12 (continued). Northern Ireland: Causes
Detailed List
E982
E983
E984
E985
E986
E987
E988
E989
E990-E999
E990
E991
E992
E993
E994
E995
E996
E997
E998
E999
CAUSES OF DEATH ALL
AGES
Poisoning by other gases, un-rM determined whether acciden-lF tally or purposely inflicted .
Hanging and strangulation, un-/M determined whether acciden-lF tally or purposely inflicted
Submersion (drowning), unde-/M termined whether accidentally iF or purposely inflicted .
Injury by firearms and explo-rM sives, undetermined whether IF accidentally or purposely inflicted . . . .
Injury by cutting and piercing/M instruments, undetermined IF whether accidentally or purposely inflicted .
determined whether acciden-\F tally or purposely inflicted
Injury by other and unspecifledfM means, undetermined whetherlF accidentally or purposely inflicted . . . .
Late effect of injury, undeter-fM mined whether accidentally orlF purposely inflicted
Injury resulting from operatiomfM of war . . . .XF
Injury due to war operations by f M fires and configurations . \ F
Injury due to war operations by fM bullets and fragments . . IF
Injury due to war operations by f M explosion of marine weapons IF
Injury due to war operations by f M other explosion . . . IF
Injury due to war operations by rM destruction of aircraft . . IF
Injury due to war operations by rM other and imspecifled forms of I F conventional warfare .
Injury due to war operations by/M nuclear weapons . . . IF
Injury due to war operations by f M other forms of unconventionaUF warfare . . . .
Injury due to war operationsrM but occurring after cessationlF of hostilities
Late effect of injury due to war/M operations . . . . IF
AGES AT
Under 4
weeks
Total under one year
4 -
164
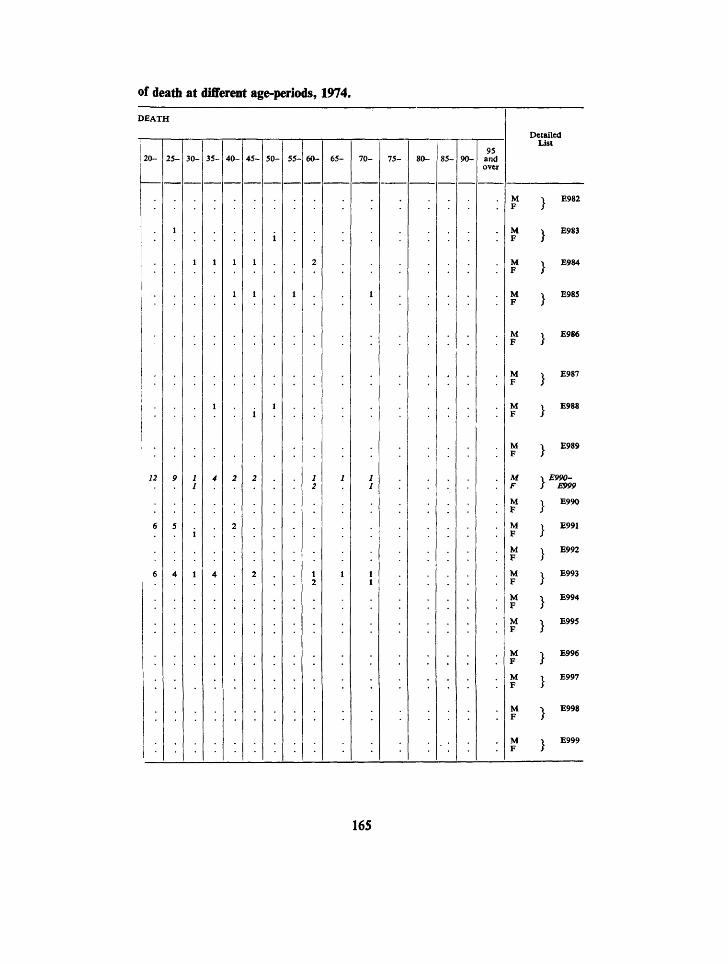
of death at different age-periods, 1974.
DEATH
! ! 2 0 -
1 .
1
!
12
6
6
2 5 -
1
P
5
4
3 0 -
1
1
i
1
35 -
1
1
4
4
4 0 -
.
1
I
2
2
4 5 -
1
1
i
2
2
5 0 -
1
1
5 5 -
1
6 0 -
2
1 2
1 2
6 5 -
1
1
7 0 -
1
1 1
1 1
7 5 - 8 0 - 8 5 - 9 0 -95
and over
Del I
M F
M F J
M F J
M F J
M 1 F J
M 1 F J
M 1 F J
M T F J
M I F J
M 1 F J
M 1 F J
M 1 F J
M ^ F J
M 1 F J
M 1 F J
M 1 F J
M 1 F J
M 1 F J
M 1 F J
ailed ist
\ E982
. E983
. E984
1 E98S
> E986
1 E987
1 E988
1 £989
1 E990-r E999
1 E990
E991
1 E992
I E993
, E994
E995
I E996
1 E997
^ E998
. E999
165
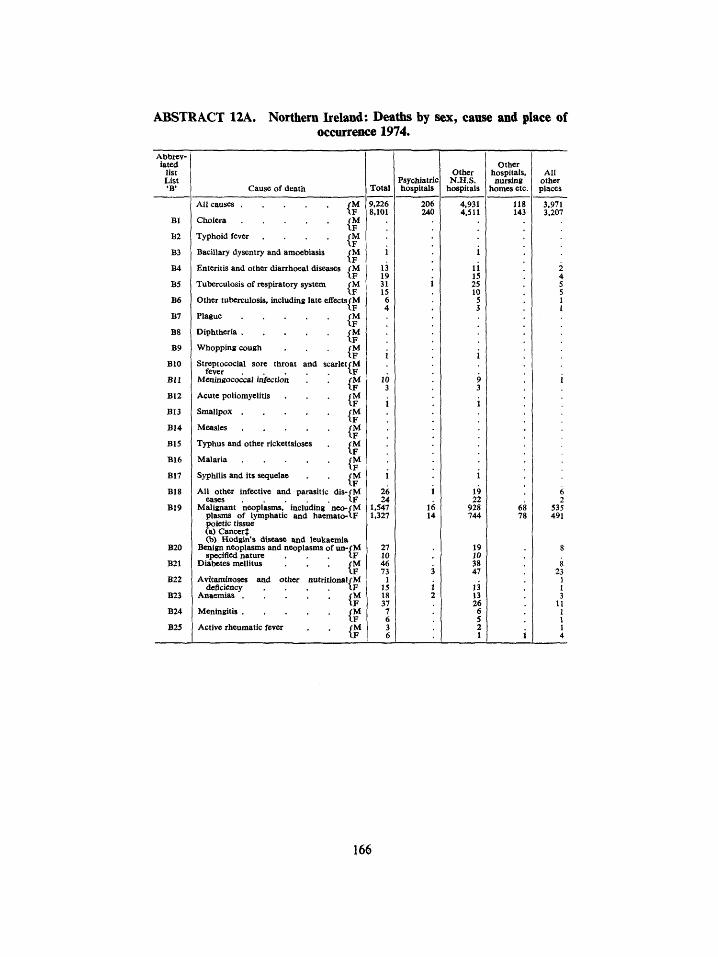
ABSTRACT 12A. Northern Ireland: Deaths by sex, cause and place of occurrence 1974.
Abbreviated
list List 'B' Cause of death Total
Psychiatric hospitals
Other N.H.S.
hospitals
Other hospitals, nursing
homes etc.
All other places
Bl
B2
B3
B4
B5
B6
B7
B8
B9
BIO
Bll
B12
BI3
B14
B15
B16
B17
B18
B19
B20
B21
B22
B23
B24
B25
Cholera
Typhoid fever . . . .
Bacillary dysentry and amoebiasis
Enteritis and other diarrhoeal diseases
Tuberculosis of respiratory system
/M \ F /M IF /M \ F CU IF /M IF fU IF Other tuberculosis, including late effects/M IF
Plague . . . . Diphtheria .
Whopping cough
IF (M IF /M IF Streptococial sore throat and scarlet/M
fever Meningococcal infection
Acute poliomyelitis
Smallpox .
Measles . . . .
Typhus and other rickettsioses
Malaria . . . .
Syphilis and its sequelae
All other infective and parasitic dis-rM eases IF
Malignant neoplasms, including neo-rM plasms of lymphatic and haemato-lF poietic tissue (a) Cancer} (b) Hodgin's disease and leukaemia
Benign neoplasms and neoplasms of im-rM specified nature . . . IF
Diabetes mellitus
Avicaminoses deficiency
Anaemias .
and other
Meningitis
Active rheumatic fever
/M IF
nutritional/M IF /M IF /M IF /M IF
9.226 8.101
1
26 24
1.S47 1,327
206 240
4.931 4.511
1
19 22
928 744
118 143
3.971 3.207
6 2
535 491
166
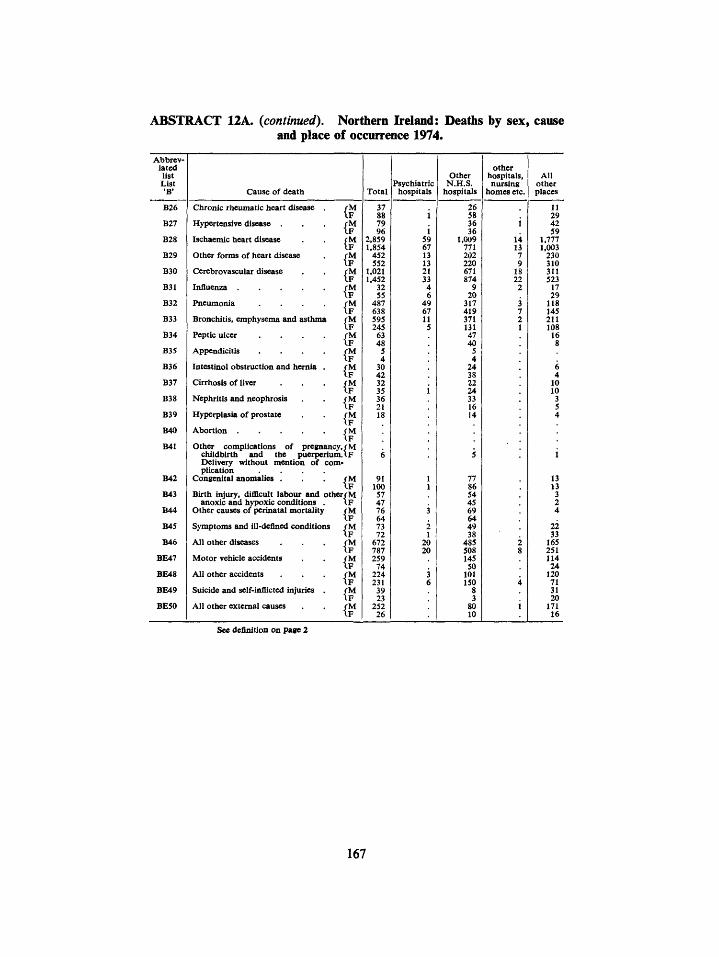
ABSTRACT 12A. (continued). Northern Ireland: Deaths by sex, cause and place of occurrrace 1974.
Abbreviated list List •B"
B26
B27
B28
B29
B30
B31
B32
B33
B34
B35
B36
B37
B38
B39
B40
B41
B42
B43
B44
B4S
B46
BE47
BE48
BE49
BESO
Cause of death
Chronic rheumatic heart disease
Hypertensive disease
Ischaemic heart disease
Other forms of heart disease
Cerebrovascular disease
Pneumonia
Bronchitis, emphysema and asthnu
Peptic ulcer
Appendicitis
Intestinol obstruction and hernia
Cirrhosis of liver
Nephritis and neophrosis
Hyperplasia of prostate
Other complications of pregn childbirth and the puerpe Delivery without mention of plication
Congenital anomalies .
Birth injury, difficult labour and anoxic and hypoxic coiuUtions
Other causes of perinatal mortality
Symptoms and ill-defined conditioi
All other diseases
Motor vehicle accidents
All other accidents
Suicide and self-inflicted injuries
All other external causes
/ M
/ M IF
{^ / M I F / M IF / M IF / M IF
IF CM IF
{^ (M IF {M (M IF fM IF
ancy.fM rium.iF com-
(M \ F
other/M IF fM IF
IS / M \F / M I F / M IF fM IF fM IF fM I F
Total
37 88 79 96
2,859 1.854
452 552
1,021 1,452
32 55
487 638 595 245
63 48
5 4
30 42 32 35 36 21 18
6
91 100 57 47 76 64 73 72
672 787 259
74 224 231
39 23
252 26
Psychiatr hospital
5 6 1 1 2 3
i
4 6' 1
' 2( 2(
<
Other c N.H.S. s hospitals
26 I 58
36 I 36 ) 1,009 7 771 ! 202 J 220 I 671 i 874 1 9 S 20 ) 317 7 419
371 ; 131
47 40
5 4
24 38 22 24 33 16 14
5
77 86 54 45 69 64
> 49 38
) 485 ) 508
145 50
1 101 > 150
8 3
80 10
other hospitals nursing
homes et
U 1.
I
1 2:
J
i
All other
c. places
11 29 42 59
1 1.777 > 1,003 1 230 > 310 i 311 I 523 > 17
29 1 118 1 145 i 211
108 16 8
6 4
10 10
3 5 4
i
13 13 3 2 4
22 33
> 165 ! 251
114 24
120 1 71
31 20
171 16
See definition on page 2
167
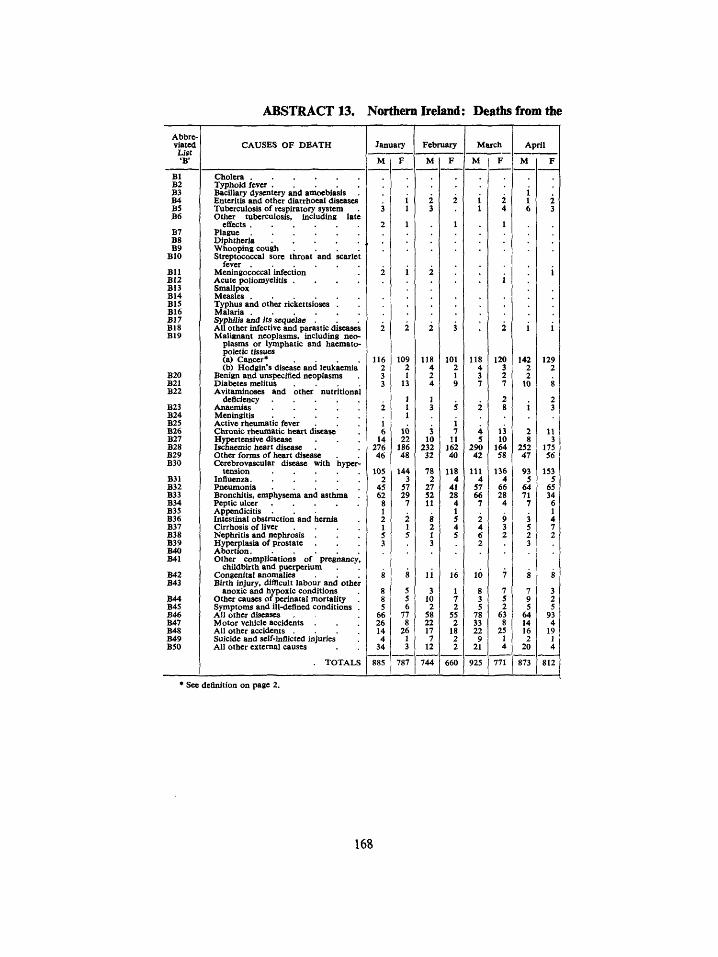
ABSTRACT 13. Northern Ireland: Deaths from the
Abbreviated
List
Bl B2 B3 B4 B5 B6
B7 B8 B9
BIO
B l l B12 B13 B14 B15 B16 S17 B18 B19
B20 B21 B22
B23 B24 B25 B26 B27 B28 B29 B30
B31 B32 B33 B34 B35 B36 B37 B38 B39 B40 B41
B42 B43
B44 B4S B46 B47 B4S B49 B50
CAUSES OF DEATH
Bacillary dysentery and amoebiasis Enteritis and other diarrhoeal diseases Tuberculosis of respiratory system Other tuberculosis, including late
Diphtheria Whooping cough . . . . Streptococcal sore throat and scarlet
Meningococcal infection Acute poliomyelitis . . . . Smallpox
Typhus and other rickettsioses .
All other infective and parastic diseases Malignant neoplasms, including neo
plasms or lymphatic and haematopoietic tissues (a) Cancer* . . . . (b) Hodgin's disease and leukaemia
Benign and unspecified neoplasms Diabetes melitus . . . . Avitaminoses and other nutritional
deficiency Anaemias . . . . . Meningitis Active rheimiatic fever Chronic rheumatic heart disease Hypertensive disease Ischaemic heart disease Other forms of heart disease Cerebrovascular disease with hyper
tension Influenza Pneumonia Bronchitis, emphysema and asthma Peptic ulcer Appendicitis Intestinal obstruction and hernia Cirrhosis of liver . . . . Nephritis and nephrosis Hyperplasia of prostate Abortion. . . . . . Other complications of pregnancy,
childbirth and puerperium Congenital anomalies Birth injury, difficult labour and other
anoxic and hypoxic conditions Other causes of perinatal mortality Symptoms and ill-defined conditions . All other diseases Motor vehicle accidents . All other accidents . . . . Suicide and self-inflicted injuries All other external causes
. TOTALS
January
M
3
2
2
2
116 2 3 3
2
i 6 14
276 46
105 2
45 62
8 1 2 1 5 3
8
8 8 5
66 26 14 4
34
88S
F
i 1
1
i
2
109 2 1
13
1 1 1
10 22
186 48
144 3
57 29
7
2 1 5
8
5 5 6
77 8
26 1 3
787
Febniary
M
2 3
2
2
118 4 2 4
1 3
3 10
232 32
78 2
27 52 11
8 2 I 3
li 3
10 2
58 22 17 7
12
744
F
2
1
3
101 2 1 9
5
i 7 11
162 40
118 4
41 28
4 1 5 4 5
16
1 7 2
55 2
18 2 2
660
March
M
i 1
118 4 3 7
2
4 5
290 42
111 4
57 66
7
2 4 6 2
10
8 3 5
78 33 22
9 21
925
F
2 4
1
i
2
120 3 2 7
2 8
13 10
164 58
136 4
66 28
4
9 3 2
7
7 5 2
63 8
25 1 4
771
April
M
1 1 6
1
142 2 2
10
i 2 8
252 47
93 5
64 71
7
3 5 2 3
8
7 9 5
64 14 16 2
20
873
F
2 3
i
1
129 2
8
2 3
11 3
175 56
153 5
65 34
6 1 4 7 2
8
3 2 5
93 4
19 1 4
812
* See definition on page 2.
168
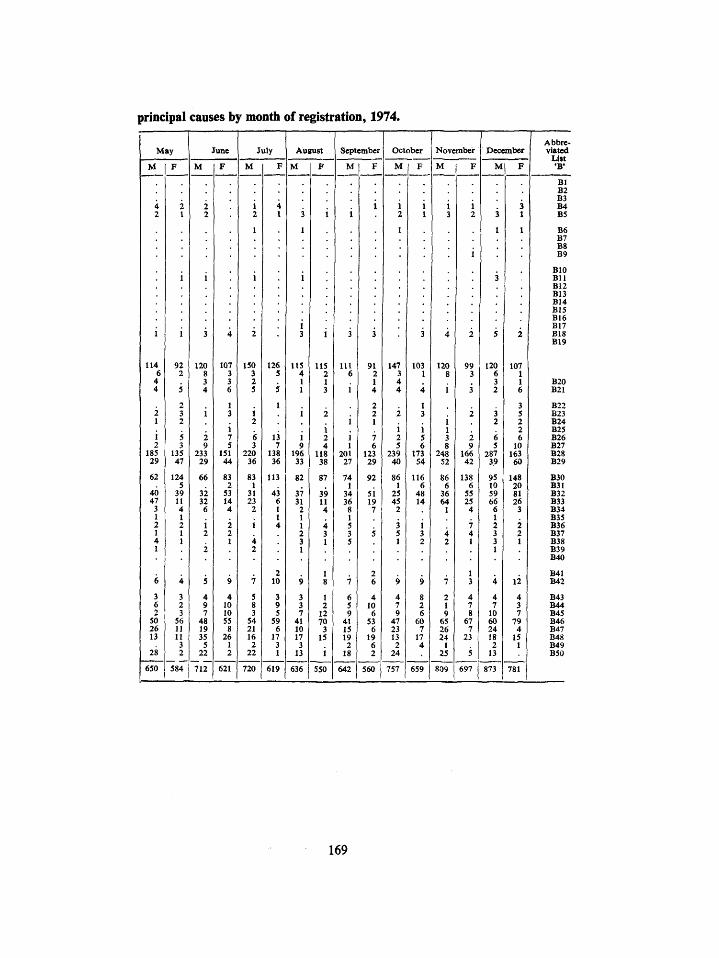
principal causes by month of registration, 1974.
May
M
4 2
i
114 6
4 4
2 1
i 2 185 29
62
40 47
3 1 2 1 4 1
6
3 6 2
50 26 13
28
650
F
2 1
i
i
92 2
5
2 3 2
5 3
135 47
124 5
39 11 4 1 2 1 1
4
3 2 3
56 11 11 3 2
584
June
M
2 2
i
3
120 8 3 4
i 2 9
233 29
66
32 32 6
i 2
2
5
4 9 7
48 19 35
5 22
712
F
4
107 3 3 6
1 3
i 7 5
151 44
83 2
53 14 4
2 2 1
9
4 10 10 55
8 26
1 2
621
July
M
i 2
1
i
2
150 3 2 5
i 2
6 3
220 36
83 1
31 23
2
i 4 2
7
5 8 3
54 21 16
2 22
720
F
4 1
126 5
5
1
13 7
138 36
113
43 6 I 1 4
2 10
3 9 5
59 6
17 3 1
619
August
M
3
1
i
i 3
U 5 4 1 1
i
i 9 196 33
82
37 31
2 1 1 2 3 1
9
3 3 7
41 10 17
3 13
636
F
i
i
115 2 1 3
2
i 2 4
118 38
87
39 11 4
4 3 1
1 8
1 2
12 70
3 15
i 550
September
M
i
3
U l 6
i
i i 1
201 27
74 1
34 36
8 1 5 3 5
7
6 5 9
41 15 19 2
18
642
F
3
91 2 1 4
2 2 1
7 6
123 29
92
51 19 7
5
2 6
4 10
6 53
6 19 6 2
560
October
M
i 2
1
147 3 4 4
2
i 2 5
239 40
86 1
25 45
2
3 5 1
9
4 7 9
47 23 13 2
24
757
F
i 1
3
103 1
4
1 3
i 5 6
173 54
116 6
48 14
i 3 2
9
8 2 6
60 7
17 4
659
November December
M
i 3
4
120 8
i
i 1 3 8
248 52
86 6
36 64
I
4 2
7
2 1 9
65 26 24
1 25
809
2
9S
3
9 16« 42
138 6
53 25
4
7 't 1
1 3
4 7 8
67 7
23
5
697
F M
I I 3
1
i
3
5
120 6 3 2
3 2
6 5
287 39
95 10 59 66
6 1 2 3 3 1
4
4 7
10 60 24 18 2
13
873
F
3 1
1
2
107 1 1 6
3 5 2 2 6
10 163
60
148 20 81 26
3
2 2 1
12
4 3 7
79 4
15 1
781
Abbre-viated
List 'B*
Bl B2 B3 B4 B5
B6 B7 Bg B9
BIO B U B12 B13 B14 B15 B16 B17 B18 B19
B20 B21
B22 B23 B24 B25 B26 B27 B28 B29
B30 B31 B32 B33 B34 B35 B36 B37 B38 B39 B40
B41 B42
B43 B44 B45 B46 B47 B48 B49 B50
169
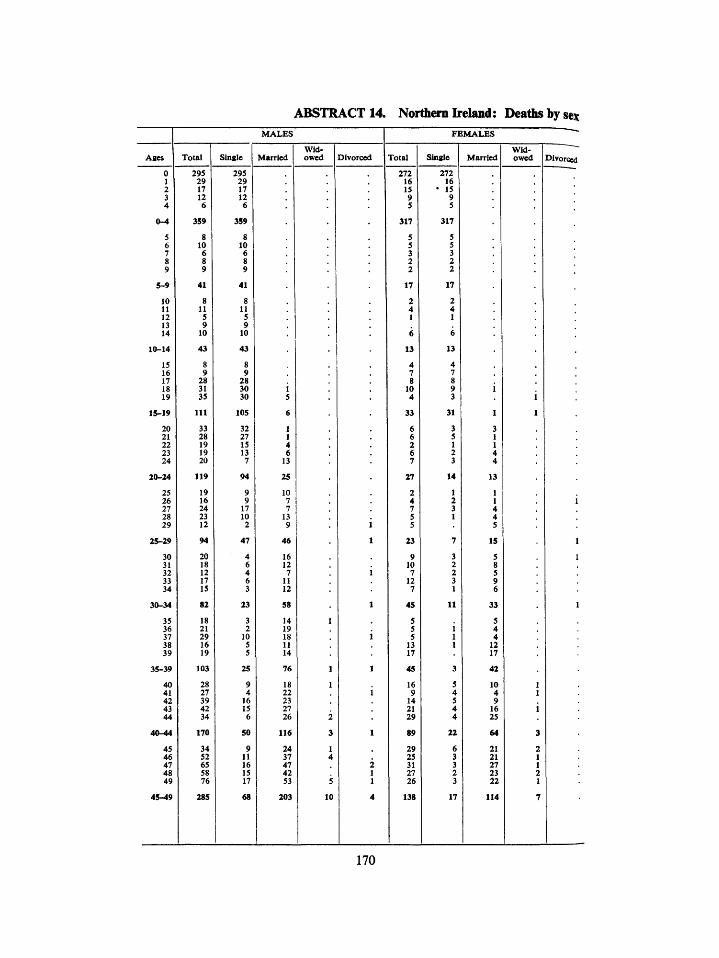
ABSTRACT 14. Northern Ireland: Deaths by sex MALES I FEMALES ^
I wid^ w i s I ~~" Ages Total Single Married owed Divorced Total Single Married owed Divorced
0 295 295 . . . 272 272 . 1 29 29 . . . 16 16 2 17 17 . 15 • 15 3 12 12 . . . 9 9 . . • 4 6 6 . . . 5 5 . . ;
0-4 359 359 . . . 317 317 . .
5 8 8 . . 5 5 . 6 10 10 . . . 5 5 . . • 7 6 6 . . . 3 3 . . •
8 8 8 . . 2 2 . . • 9 9 9 . . . 2 2 . . ;
5-9 41 41 . 17 17
10 8 8 . . 2 2 . 11 11 11 . . . 4 4 . . . 12 5 5 . . . 1 1 . . . 13 9 9 . . . . . . . . 14 10 10 . . . 6 6 . . .
10-14 43 43 . 13 13
15 8 8 . . 4 4 . . . 16 9 9 . . . 7 7 . . . 17 28 28 . . . 8 8 . . , 18 31 30 1 . . 10 9 1 . . 19 35 30 5 . 4 3 1
15-19 111 105 6 . . 33 31 1 1 .
20 33 32 1 . . 6 3 3 . . 21 28 27 1 . . 6 5 1 . . 22 19 15 4 . . 2 1 1 . . 23 19 13 6 6 2 4 24 20 7 13 . . 7 3 4 . .
20-24 119 94 25 . 27 14 13
25 19 9 10 . . 2 1 1 . . 26 16 9 7 . . 4 2 1 . 1 27 24 17 7 . . 7 3 4 28 23 10 13 . 5 1 4 29 12 2 9 1 5 5
25-29 94 47 46 1 23 7 15 1
30 20 4 16 . . 9 3 5 . 1 31 18 6 12 . 10 2 8 32 12 4 7 1 7 2 5 33 17 6 11 . 12 3 9 34 15 3 12 . . 7 1 6 . .
30-34 82 23 58 1 45 11 33 1
35 18 3 14 1 . 5 5 36 21 2 19 . . 5 1 4 . . 37 29 10 18 1 5 1 4 38 16 5 11 . 1 3 1 12 39 19 5 14 . 1 7 . 1 7
35-39 103 25 76 1 1 45 3 42 . .
40 28 9 18 1 . 16 5 10 1 . 41 27 4 22 . 1 9 4 4 1 . 42 39 16 23 . 14 5 9 43 42 15 27 . 2 1 4 16 1 44 34 6 26 2 . 29 4 25
40-44 170 50 116 3 1 89 22 64 3
45 34 9 24 1 . 29 6 21 2 . 46 52 11 37 4 . 25 3 21 1 . 47 65 16 47 . 2 31 3 27 1 48 58 15 42 1 27 2 23 2 49 76 17 53 5 1 26 3 22 1
45-49 285 68 203 10 4 138 17 114 7
170
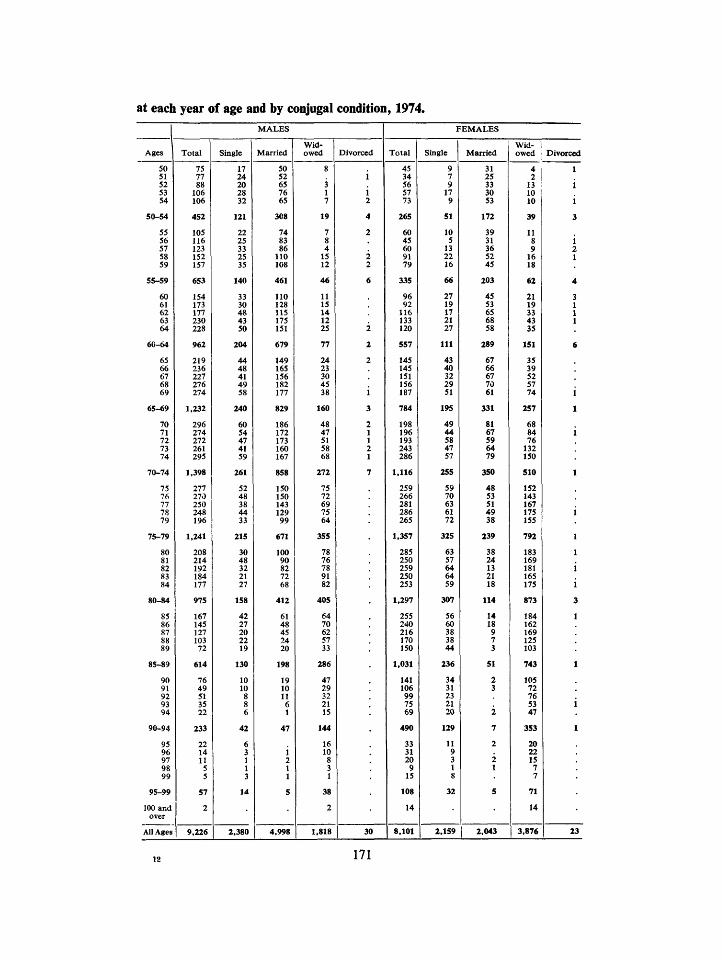
at each year of age and by conjugal condition, 1974.
Ages
50 51 52 53 54
50-54
55 56 57 58 59
55-59
60 61 62 63 64
60-64
65 66 67 68 69
65-69
70 71 72 73 74
70-74
75 76 77 78 79
75-79
80 81 82 83 84
80-84
85 86 87 88 89
85-89
90 91 92 93 94
90-94
95 96 97 98 99
95-99
100 and over
All Ages
Total
75 77 88 106 106
452
105 116 123 152 157
653
154 173 177 230 228
962
219 236 227 276 274
1.232
296 274 272 261 295
1.398
277 270 250 248 196
1.241
208 214 192 184 177
975
167 145 127 103 72
614
76 49 51 35 22
233
22 14 11 5 5
57
2
9,226
Single
17 24 20 28 32
121
22 25 33 25 35
140
33 30 48 43 50
204
44 48 41 49 58
240
60 54 47 41 59
261
52 48 38 44 33
215
30 48 32 21 27
158
42 27 20 22 19
130
10 10 8 8 6
42
6 3 1 1 3
14
2.380
MALES
Married
50 52 65 76 65
308
74 83 86 110 108
461
110 128 115 175 151
679
149 165 156 182 177
829
186 172 173 160 167
858
150 150 143 129 99
671
100 90 82 72 68
412
61 48 45 24 20
198
19 10 11 6 1
47
i 2 1 1
5
4,998
Widowed
8
3 1 7
19
7 8 4 15 12
46
11 15 14 12 25
77
24 23 30 45 38
160
48 47 51 58 68
272
75 72 69 75 64
355
78 76 78 91 82
405
64 70 62 57 33
286
47 29 32 21 15
144
16 10 8 3 1
38
2
1,818
Divorced
i i 2
4
2
2 2
6
2
2
2
i 3
2 1 1 2 1
7
30
Total
45 34 56 57 73
265
60 45 60 91 79
335
96 92 116 133 120
557
145 145 151 156 187
784
198 196 193 243 286
1.116
259 266 281 286 265
1.357
285 250 259 250 253
1.297
255 240 216 170 150
1.031
141 106 99 75 69
490
33 31 20 9 15
108
14
8,101
FEMALES
Single
9 7 9 17 9
51
10 5 13 22 16
66
27 19 17 21 27
111
43 40 32 29 51
195
49 44 58 47 57
255
59 70 63 61 72
325
63 57 64 64 59
307
56 60 38 38 44
236
34 31 23 21 20
129
11 9 3 1 8
32
2.159
Married
31 25 33 30 53
172
39 31 36 52 45
203
45 53 65 68 58
289
67 66 67 70 61
331
81 67 59 64 79
350
48 53 51 49 38
239
38 24 13 21 18
114
14 18 9 7 3
51
2 3
2
7
2
2 1
5
2,043
Widowed
4 2 13 10 10
39
11 8 9 16 18
62
21 19 33 43 35
151
35 39 52 57 74
257
68 84 76 132 150
510
152 143 167 175 155
792
183 169 181 165 175
873
184 162 169 125 103
743
105 72 76 53 47
353
20 22 15 7 7
71
14
3,876
Divorced
1
i i 3
i 2 1
4
3 1 1 1
6
i 1
i
1
i 1
1
i i 3
1
1
i 1
23
171
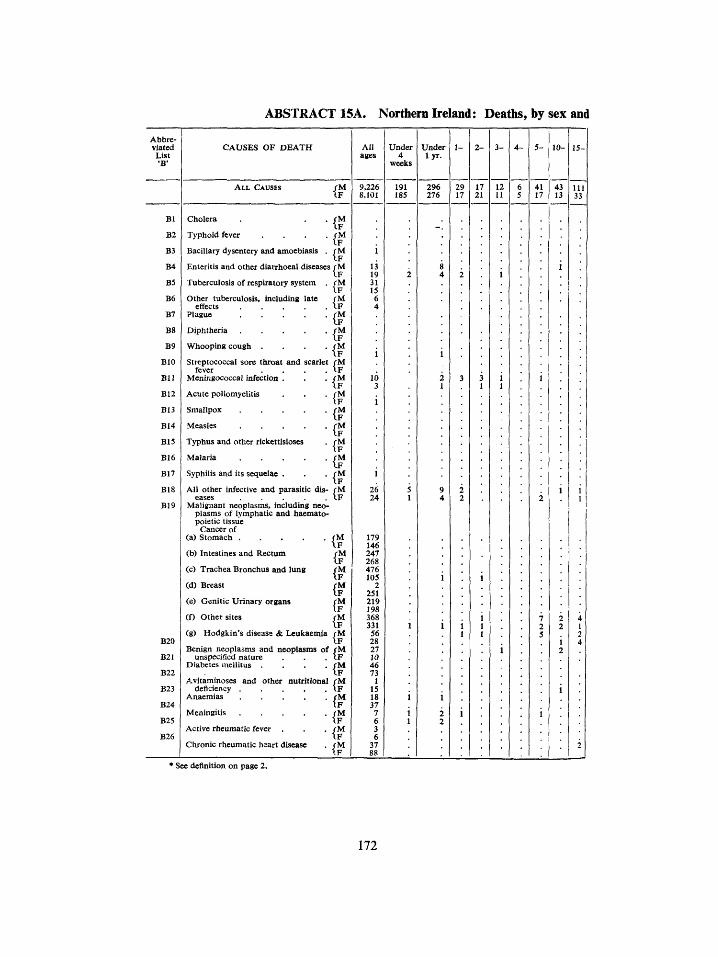
ABSTRACT 15A. Northern Ireland: Deaths, by sex and
Abbreviated
List •B"
CAUSES OF DEATH
A L L CAUSES / M IF
9,226 8,101
Under 4
weeks
191 185
Under l y r .
296 276
5 -
Bl
B2
B3
B4
B5
B6
B7
B8
B9
BIO
B l l
B12
B13
BI4
B15
B16
B17
B18
B19
B20
B21
B22
B23
B24
B25
B26
Cholera
Typhoid fever . . . .
Bacillary dysentery and amoebiasis .
Enteritis and other diarrhoeal diseases
Tuberculosis of respiratory system .
Other tuberculosis, including late effects
Plague
Diphtheria
Whooping cough .
Streptococcal sore throat and fever
Meningococcal infection .
Acute poliomyelitis
Smallpox
Measles
Typhus and other rickettisioses
Malaria . . . .
Syphilis and its sequelae .
All other infective and parasitic diseases
Malignant neoplasms, including neoplasms of lymphatic and haematopoietic tissue
Cancer of (a) Stomach
(b) Intestines and Rectum
(c) Trachea Bronchus and lung
(d) Breast
(e) Genitic Urinary organs
(f) Other sites
(g) Hodgkin's disease & Leukaemia
Benign neoplasms and neoplasms of unspecified nature
Diabetes mellitus .
Avitaminoses and other deficiency .
Anaemias
Meningitis
Active rheumatic fever
Clironic rheimiatic heart disease
nutritional
/ M IF / M IF / M \ F (M IF (M I F / M \ F
i¥ fU I F / M I F (M \ F / M I F fM \ F fM \ F fM IF fM \ F (^ / M \ F fM IF
fM \ F fM IF fM \ F fM I F fM IF fM IF fM 1.F fM IF fM "IF fM \ F fM I F fM IF fM IF fM IF
179 146 247 268 476 105
2 251 219 198 368 331
56 28 27 10 46 73
1 15 18 37
7 6 3 6
37 88
* See definition on page 2.
172
age-groups, by abbreviated list ^B' numbers, 1974.
20
11 2
1 1
1 ] A 2 1 2
- 25
9 9 7 2
t
__ 1 ]
•
- 30
4 8 3 4
I '.
i
2 1 2
J 7 3 2 1
i 2
i
i 1
- 35
2 10 5 4
2
3
i 4 1
6 2 2
10 2 2
i
i i
2
•
- 40
3 17 S 8
3 6 2 1 7 6
li 2
10 9 8
i 1 1
i
i
i 2
- 45
3 28 9 13
^
4 3
15 8
12 7
12 1 8
11 5 3 1 1
2 1
i
3 1
- 5a
5 45 8 26
t
2 1
10 9
12 16 48
9
24 4
19 32 21
4 3
i 1
i
i 1 4
12
- 55
2 65 5 33
1
25 6
19 21 64 11
25 10 23 35 25
4
2
i 3
3 1
2 1 1 6 7
- 60 65
3 962 1,23 5 556 78
2
70 - 75 80 - 85 90 -
2 1,398 1,241 975 614 233 4 1,116 1.357 1.297 1,031 490
I 1 2 2 4
4 6 5 8 2 2 4 2 2 3
2 2
29 10 33 23 58 16
42 18 22 51 45
4
7 3 5 6
2 1 4 1 2 1 2 2
15
1 3
32 13 45 31
108 15
31 33 29 55 54
3 4 4 1 9
10
i 1 2
6 15
2 3
28 29 36 45 91 19
1 36 36 33 56 50
5 3 4 2
12 16
3 1 6
3 14
1
1 2
23 28 35 41 49 1€
2i 39 28 33 43 10
3
i 8
19
i 1
7
2 3 6
I
4 1
U 2C 32 31 25
4
25 39 12 24 36
5 4 1
5 10
1 3 1 8
i 6
I I
1
€ 19 U 27
7 3
12 21
7 H 24
2 1
2 4
3 6 6
2 5
1 1 4
13 2 1
4 8 2 8 4
2
i 1
4
95 & over
59 110
1 1
2
3
i
i
Abbreviated
List 'B'
Bl
B2
B3
B4
B5
B6
B7
B8
B9
BIO
B l l
BI2
B13
B14
B15
B16
B17
B18
B19
B20
B21
B22
B23
B24
B25
B26
173
Abbreviated List 'B'
B27
B28
B29
B30
B31
B32
B33
B34
B35
B36
B37
B38
B39
B40
B41
B42
B43
B44
B45
B46
BE47
BE48
BE49
BE50
ABSTRACT 15A. (
CAUSES OF DEATH
Hypertensive disease
(a) Ischaemic heart disease with hype tension
(b) Ischaemic heart disease without hypertension
Other forms of heart disease without hypertension
(a) Cerebrovascular disease with hypertension (benign)
(b) Cerebrovascular disease without hypertension
Influenza . . . .
Pneumonia . . . .
Bronchitis, emphysema and asthma
Peptic ulcer . . . .
Appendicitis . . . .
Intestinal obstruction and hernia
Cirrhosis of liver .
Nephritis and nephrosis
Hyperplasia of prostate
Abortion
Other complications of pregnancy childbirth and puerperium .
Congenital anomalies
/ M
r-/M IF / M \ F / M \ F / M IF rM I F / M IF rM IF / M \ F / M \ F
(^ fM I F / M IF fM IF
{^
, fM IF fM IF
Birth injury, difficult labour and other fM anoxic and hypoxic conditions
Other causes of perinatal mortality
Symptoms and ill-defined conditions
All other diseases
Motor vehicle accidents .
All other accidents .
Suicide and self-inflicted injuries
All other external causes
I F fM IF fM \ F fM I F rM
fM I F fM IF rM IF
contin
All ages
79 96
256 183
2.603 1,671
452 552 153 249 868
1.203 32 55
487 638 595 245
63 48
5 4
30 42 32 35 36 21 18
6 91
100 57 47 76 64 73 72
672 787 259
74 224 231
39 23
252 26
ued)
Unde 4
week
i
1(
<
3' 4 4 4 7' 6
'
. Northern Ireland:
r Under l y r .
s
3 2
I 2
( 6 \ 4
) 49 5 35
i I 3
t 59 3 72 3 55 5 47 t 74 J 63 5 7 I 4 > 16 7 23
i > 5 5
1-
( "
i
- 2 -
2
i
2
3
.
. '.
1 2 ( 2
'. > 3 1 3
1 1
I 4 > 4
2
3 -
]
;
;
; t
\ t 3 2
4 -
2 2
,
.
I
) 1
Deaths
5 -
i 1
2 1
6 4
12 2 5 4
i
10-
2
i
i
i
i
i
1 1
i 3 1
17 I 7 3
3 1
>by
15-
i 2
2
2
2
2 3
i
4 3
37 9
11 4 1
39 5
174
sex and age-groups, by abbreviated list *B' numbers, 1974.
20-
2
3
2
1 2 1 1
2 1
2
6 2 26 4 13 5 2 1 52
^
25-
2 1 1
2
2
5 6 23 3 11 3 2 2 36 2
30-
2 1 1
3 2
2
3 3
1 1
i 4 13 17
9 7 1 2 26 1
35
1
' i
i
{ 2 12 3 3 2 2S 2
- 40-
1 2
i 4 1
3 53 1 5 1 1 1
5 1 I 7 S 7 I 2
i 3 I 1
1 4 2
t i
'. 2
i 14 15
n 14 5 4 2 14 2
45-
4
li 2 98 17 4 5 3 8 11 14
8 2 2 4 1
1
3 1 2 1
3 1 20 20 14 5 15 6 9 3 18 1
50-
6
21 3
163 39 5 8 14 7 23 15
3 7 12 18 9 2 2
1 1 5 5 4 I
i 1
i 1 20 27 9 1 18 6 4 4 10
'
55-
5 7 32 8
241 52 11 8 18 14 27 28 1 2 12 8 31 20 10 2
2 1 4 7 3 3
2 1
2 3 38 29 12 5 11 7 8 4 11
60-
11 5 42 18 348 107 29 15 19 28 73 55
4 18 13 86 31 8 1
i 1 2 6 3 6 1
2
2
2 3 52 56 14 7 14 7 1
7 3
65-
14 9 47 42 415 186 45 33 24 35 102 94 1 4 36 37 106 23 9 7 1 I 4 3 4 6 7 1 2
i 3
i 5 79 68 15 6 12 4 2 1 2 1
70-
10 13 48 38 429 290 75 52 28 42 161 165
4 59 58 119 36 11 6 1
4 10 1 5 3 6 5
i 2
14 9
122 94 7 8 15 14
3 1
75-
8 24 27 37 351 338 81 94 26 48 154 233 9 9 89 103 125 41 6 11
i 3 7 3 3 4 5 4
2
li 10 96 132 19 4 13 28 1 2
i
80-
8 18 14 24 269 299 97 126 9 42 133 239 5 12 93 131 56 35 7 9 1
5 6 I 2 2
4
15 11 77 114 8 11 13 53 1
i
85-
5 16 7 7
153 209 56 111 5 19 115 217 3 9 64 132 36 26 5 6
4 5
2
6 13 63 109 3 4 12 32
i 1
90-
3 3 1 3 46 105 34 74 2 5 40 94 2 7 31 74 10 9
4
i 2 3
2
3 7 28 48
2 21
Abbre-95 & viated over List
•B'
B27
'. B28
19 1
1
2
2(
•
2 A t
li
1 3
5 S B29 7
B30
) 7
B31 I S B32
) I B33 J
B34
B35
B36
B37
B38
B39
B40
B41
B42
B43
B44
B45 ^
B46
BE47
BE48
BE49
BE50
175
Abbreviated
List 'B'
Bl B2 B3 B4 B5 B6 B7 B8 B9
BIO
B U B12 B13 B14 B15 B16 B17 B18 B19
B20
B21 B22
B23 B24 B25 B26 B27 B28
B29 B30
B31 B32 B33 B34 B35 B36 B37 B38 B39 B40 B41
B42 B43
B44 B45 B46
BE47 BE48 BE49 BE50
ABSTRACT 15B.
CAUSES OF DEATH
Cholera . . . . . . Typhoid fever . . . . . Bacillary dysentery and amoebiasis Enteritis and other diarrhoeal diseases . Tuberculosis of respiratory system. Other tuberculosis, including late effects Plague Diphtheria . . . . . . Whooping c o u g h . . . . . Streptococcal sore throat and scarlet
fever . . . . . . Meningococcal infection Acute poliomyelitis . . . . Smallpox Measles . . . . . . Typhus and other rickettsioses Malaria . . . . . . Syphilis and its sequelae All other infective and parasitic diseases Cancer of:—
(a) Stomach . . . . . (b) Intestines and Rectum . (c) Trachea, bronchus & lung (d) Breast . . . . . (e) Genito-urinary organs . (f) Other sites (g) Hodgkin's disease & leukaemia
Benign neoplasms and neoplasms of unspecified nature . . . .
Diabetes m e l l i t u s . . . . . Avitaminoses and other nutritional
deficiency . . . . . . Anaemias . . . . . Meningitis . . . . . Active rheumatic fever Chronic rheumatic heart disease Hypertensive disease . . . . (a) Ischaemic heart disease with hyper
tension . . . . . . (b) Ischaemic heart disease without
hypertension . . . . . Other forms of heart disease (a) Cerebrovascular disease with hyper
tension ( b e n i g n ) . . . . . (b) Cerebrovascular disease without hy
pertension. . . . . . Influenza . . . . . . Pneumonia . . . . . Bronchitis, emphysema and asthma Peptic ulcer . . . . . Appendicitis . . . . . Intestinal obstruction and hernia . Cirrhosis of liver . . . . Nephritis and nephrosis Hyperplasia of prostate Abortion . . . . . . Other complications of pregnancy, child
birth and the puerperium. I3elivery without mention of complication
Congenital anomalies . . . . Birth injury, difficult labour and other
anoxic and hypoxic conditions Other causes of perintal mortality Symptoms and ill-defined conditions All other diseases . . . . Motor vehicle accidents All other accidents . . . . Suicide and self-inflicted injuries All other external causes
Northern Ireland: Death rates per million
All Ages
W
i 16 40
7
13
i 33
233 322 621
285 480
73
35 60
1 23
9 3
48 103
334
3,398 590
199
1,133 41
635 776
82 6
39 41 47 23
118
74 99 95
877 338 292
50 329
F
24 19 5
i 3 1
30
186 343 134 321 253 423
35
12 93
19 47
7 7
112 122
234
2,139 706
318
1,540 70
817 313
61 5
53 44 26
7 128
60 81 92
1,007 94
295 29 33
-M
563
140
634
70 140
140
422
3,454
70
4,159
3,877 5,216
493 1,126
352
F
300
75
75
300
75
75
150
225 150
300
2,628
225
5,407
3,530 4,731
300 1.727
75 375
1
M
115
33
16 33
16
16
99 16 16 16 16
181
132 115 181
49
F
53
35
35
17
35
35 35
35
159 17
176
17 88 17
194
5 -
M
12
87 62
12
12
24
74 149 62
12
F
26
26
13
13
13
53 26 53
~ 1 0 -
M
i:
12
25
25
25
12
12
12
12
12 38
217 89
38
27 13
13
13
13
13
13 13 40
13
:|: See definition on page 2.
176
living by sex and age, from principal causes, 1974.
1 5 -
~U F"
2 5 -
M I F
4 5 -
M r~ 5 5 - 6 5 -
"U r 7 5 -
-U F^
80 and over
~W
23
30
23 77 485 185 23 701
19 106 38
33
42 110 76 8 59
9 87 388 194 29 602
31
197 31 103 41 31
72 24 133
48 230 24
24 12
12
799 24
60
96 36 60 12 24
36
12 242 230 314 84
472
71 23 83 202 143 119 11 11
n
23
11
155
35
262 23 95 47 47
173 334 743
61 532 86
12 37
12 12 86 123
3,234 111
210
421
185 247 37
24 99 74
24
49 495 285 408 161 346
11
139 279 186 418 313 302 46
23
11 151
58
651 151
174
337 34 162 151 23
li 69 23
23 546 69 139 81 46
784 755
1.773
406 1.250 116
130 87
58 14 29 116 232
1.075
8,561 581
537
1.453 14
436 1.700 261
43 145 130
58
29 58
1.308 377 363 130 261
39
26
208 572 351 871 585 910
39 117
26 65 52 39 286 156
338
2,067 299
546
1.079 78 273 663 39 13 39 130 52
78 1,105 156 182 52 39
21 234 21
63
1.276 1.723 4,234
21 1,468 2.361 170
170 446
42
191 510
2,021
17,957 2,553
1.106
5,590 21
2,021 4,787 425 42 170 106 212 148
42
319 4,276 468 574 42 106
94
658 1.191 532
1.050 971
1.630 109
47 407
62 125
454 344
1,253
7.460 1.332
1.206
4.059 125
1,489 924 203 15
203 172 109
219 2,539 219 282 15 31
661
82 82
1.900 2.892 4.049
3.223 2.727 826
247 661
2.231
29.008 6,694
2,148
12,727 743
7.355 10,330
495
247 247 330 330
909 7,933 1,570 1.074
82
100 100 50
100
1,400 2.350 500
1.050 1.400 2.150 150
50 950
50 350
100 300
1.200
1,850
16.900 4.700
2.400
11.650 450
5.150 2,050 550 50 350 150 250
100
500 6.600 200
1.400 100 50
227 113
454
2,500 5.681 3.863 113
8,068 5,340 795
340 795
113 909
454 1.818
2,500
55,340 21.818
1.818
33.750 11.136 22.045 11,818 1.363 113
1.250 113 454 795
227
227
2,954 19,659 1,250 3.181 113 227
395 169
112
2,316 4,124 451
2,316 1,186 3,615 282
790
338 903
847 2,090
1,920
35.480 18.531
3.728
32.598 1.638
20.169 4,124 1,073
56 847 112
169
56 1,977 15,932
847 6,158
56
177
ABSTRACT 16, Northern Ireland: Death rates by sex and age-groups, 1926 1937, 1955-1974.
All YEAR ages AGES AT DEATH
I • \ i I I I I i 8 5 a n d 0-4 5-9 10-14 15-19 21-24 25-29 30-34 35-39 40-44 45-49 50-54 55-59 60-64 65-69 70-74 75-79 80-84 over
(Persons 15.0 28.0 2.7 2.1 3.2 4.4 4.8 6.1 5.9 8.5 10.9 16.0 21.0 31.1 39.3 70.2 92.1 132.4 208.4 1926 {Males 15.1 31.2 3.1 2.1 2.9 4.1 4.4 5.1 5.5 8.1 10.9 16.1 21.5 31.0 40.6 73.6 97.1 141.8 228.8
iFemales 14.9 24.8 2.4 2.1 3.6 4.8 5.2 7.1 6.3 8.9 10.9 16.0 20.5 31.2 38.0 66.8 87.1 123.0 188.1
(Persons 15.0 23.0 1.8 1.5 2.5 3.5 3.6 4.6 5.0 7.5 10.2 14.4 19.4 28.8 46.0 76.4 115.0 153.2 250.9 1937 Males 15.1 24.3 1.6 1.3 2.5 3.4 3.5 4.6 5.2 7.4 10.9 15.5 19.7 29.5 48.6 83.6 120.0 158.0 254.2
iFemales 15.0 21.7 2.1 1.7 2.6 3.7 3.8 4.7 4.8 7.7 9.5 13.3 19.1 28.1 43.5 69.3 110.0 148.5 247.6
(Persons 11.1 7.8 0.4 0.3 0.6 0.9 1.0 1.4 2.0 3.4 4.9 8.8 14.1 20.8 36.1 58.3 88.3 137.8 296.6 1955 (Males 11.6 8.3 0.5 0.4 0.8 1.1 1.2 1,7 2.2 3.8 5.4 10.9 17.9 24.1 42.1 66.2 98.3 143.0 317.8
iFemales 10.6 7.3 0.4 0.3 0.5 0.7 0.9 1.2 1.9 3.0 4.4 6.7 10.3 17.5 30.2 50.5 78.4 132.6 257.4
(Persons 10.6 7.1 0.3 0.3 0.5 0.6 0.9 1.2 2.1 3.0 4.8 8.5 13.3 22.2 33.4 56.8 85.8 139.1 257.3 1956 Males U.2 7.5 0.4 0.3 0.6 0.8 1.0 1.2 2.4 3.4 5.7 10.8 17.1 26.3 39.1 64.6 97.0 149.4 263.2
l;; IFemales 10.1 6.3 0.3 0.3 0.4 0.5 0.8 1.3 1.9 2.6 3.9 6.2 9.5 18.1 27.7 49.1 74.6 128.9 251.4
° ° (Persons 10.8 7.1 0.4 0.3 0.6 0.7 0.9 1.2 2.3 3.1 4.9 8.4 12.7 23.1 36.4 57.6 81.3 128.4 289.4 1957 Males 11.6 7.6 0.5 0.4 0.8 1.0 1.3 1.4 2.5 3.5 5.8 10.6 16.4 28.3 44.8 65.6 93.5 141.7 300.4
(Females 10.1 6.7 0.4 0.2 0.5 0.5 0.6 1.1 2.2 2.7 4.1 6.2 9.1 18.0 28.0 49.7 69.1 115.2 278.4
(Persons 10.8 6.8 0.3 0.3 0.6 0.5 0.9 1.1 1.7 3.2 4.5 8.4 13.3 22.0 34.5 57.7 89.1 128.3 278.2 1958 Males 11.6 7.7 0.4 0.5 0.8 0.8 1.2 1.3 1.7 3.7 5.6 10.1 17.3 27.3 42.7 66.6 102.1 139.7 295.6
IFemales 10.0 6.0 0.2 0.2 0.4 0.3 0.7 0.9 1.7 2.7 3.5 6.7 9.4 16.8 26.4 48.9 76.8 117.0 260.8
(Persons 10.9 6.9 0.3 0.5 0.5 0.6 0.8 1.1 1.9 2.9 5.0 8.2 13.5 21.5 36.9 58.0 89.1 124.2 311.3 1959 Males 11.6 7.2 0.3 0.6 0.7 0.9 1.1 1.3 2.3 3.4 5.9 9.9 17.7 26.8 46.1 68.9 101.4 133.2 328.8
iFemales 10.3 6.7 0.4 0.4 0.4 0.3 0.5 1.0 1.6 2.5 4.2 6.6 9.4 16.3 27.8 47.2 76.8 115.3 293.8
fPersons 10.8 6.9 0.5 0.3 0.6 0.7 0.9 1.2 1.7 2.9 5.0 8.2 12.8 22.8 32.5 57.9 91.1 124.1 297.4 1960 Males 11.4 7.6 0.6 0.4 0.9 1.1 1.1 1.5 1.8 3.3 5.6 10.0 16.3 28.7 39.2 67.2 102.5 135.9 328.8
iFemales 10.2 6.2 0.4 0.2 0.3 0.4 0.7 0.9 1.6 2.6 4.5 6.5 9.3 16.9 25.8 48.6 79.8 112.3 266.0
(Persons 11.3 6.7 0.4 0.4 0.6 0.8 1.0 1.2 1.8 2.8 4.3 8.1 12.9 22.0 35.1 56.9 92.7 142.8 245.2 1961 (Males 12.1 8.0 0.5 0.5 0.8 1.2 1.4 1.5 2.1 3.5 5.0 10.4 17.6 28.7 43.5 65.6 107.0 145.7 259.4
iFemales 10.5 5.5 0.3 0.3 0.4 0.5 0.7 1.0 1.5 2.2 3.7 5.9 8.2 15.4 26.8 48.3 78.5 140.0 231.1
(Persons 10.6 6.7 0.4 0.2 0.5 0.6 0.7 1.1 1.8 2.6 4.6 7.8 12.4 21.2 33.6 53.3 82.7 141.7 223.6 1962 (Males 11.3 6.9 0.5 0.3 0.6 0.7 0.8 1.5 1.8 3.0 5.8 9.8 16.5 28.1 42.5 61.8 93.4 156.1 235.8
(Females 9.9 6.5 0.3 0.2 0.4 0.5 0.6 0.8 1.8 2.2 3.5 5.9 8.4 14.3 24.8 44.8 72.0 127.3 211.5
(Persons 11.0 6.6 0.4 0.3 0.5 0.7 0.9 1.0 1.8 3.1 4.6 8.8 14.3 21.9 34.4 55.0 83.5 141.6 242.0 1963 Males 11.8 7.2 0.6 0.4 0.7 1.1 1.2 1.1 2.1 3.4 5.5 10.8 19.4 27.9 43.5 63.0 97.6 158.6 260.6
iFemales 10.2 6.1 0.3 0.3 0.3 0.4 0.6 1.0 1.5 2.9 3.7 6.8 9.2 16.0 25.4 47.1 69.5 124.7 223.4
(Persons 10.5 6.3 0.4 0.3 0.5 0.6 0.7 1.1 1.6 2.6 5.2 7.8 12.9 20.6 33.1 54.5 81.8 133.8 233.5 1964 {Males 11.3 7.4 0.4 0.4 0.8 0.9 1.0 1.4 1.8 3.4 6.0 10.0 16.5 26.2 42.7 65.4 92.9 148.9 233.6
iFemales 9.8 5.3 0.4 0.2 0.3 0.4 0.5 0.8 1.5 1.9 4.5 5.6 9.3 15.1 23.6 43.7 70.7 118.8 233.5
(Persons 10.6 6.1 0.5 0.2 0.4 0.6 0.6 1.2 1.9 3.0 4.6 7.7 13.2 21.4 33.0 55.0 83.0 132.6 246.5 1965 Males 11.5 6.7 0.7 0.3 0.7 0.8 0.8 1.4 2.3 3.6 5.9 9.0 17.3 28.2 44.1 66.0 93.2 149.4 270.0
iFemales 9.8 5.5 0.3 0.2 0.2 0.5 0.5 1.0 1.5 2.4 3.3 6.5 9.1 14.7 21.9 44.1 72.8 115.8 223.1
(Persons 11.1 6.2 0.4 0.3 0.7 0.8 0.8 1.0 1.7 3.1 4.5 7.8 13,3 21.6 35.4 56.3 88.9 139.7 282.8 1966 Males 12.0 6.7 0.5 0.4 0.9 1.1 1.1 1.2 2.1 3.7 5.2 9.7 18.4 28.7 46.1 67.5 102.0 159.3 314.0
iFemales 10.3 5.7 0.3 0.3 0.5 0.5 0.6 0.8 1.4 2.5 3.9 5.9 8.3 14.6 24.7 45.1 75.8 120.2 251.6
(Persons 9.8 5.5 0.3 0.3 0.5 0.7 0.7 1.1 1.5 2.6 4.3 7.5 11.6 19.5 30.6 41.4 75.9 124.2 200.1 1967 Males 10.6 5.9 0.5 0.5 0.7 1.1 0.8 1.2 1.9 3.0 5.5 9.9 15.3 25.2 38.4 43.9 87.9 144.4 218.6
iFemales 9.1 5.2 0.2 0.2 0.4 0.3 0.6 1.0 1.1 2.3 3.1 5.1 7.9 13.8 22.8 38.9 64.0 104.1 181.6
(Persons 10.6 5.4 0.3 0.3 0.5 0.6 0.7 1.1 1.5 2.8 4.7 7.0 12.6 20.9 34.2 53.9 84.4 130.2 224.7 1968 Males 11.2 6.0 0.4 0.4 0.8 0.9 1.0 1.4 1.6 3.0 5.6 8.4 16.1 27.1 43.6 66.1 97.8 152.3 233.7
iFemales 10.0 4.9 0.3 0.3 0.3 0.4 0.5 0.9 1.5 2.6 3.8 5.7 9.1 14.7 24.8 41.7 71.0 108.2 215.7
;;^ (Persons 10.8 5.5 0.4 0.3 0.5 0.7 0.9 1.0 1.2 2.9 5.1 8.0 12.8 21.9 34.5 55.4 85.5 125.8 220.8 1969 Males 11.7 6.2 0.5 0.4 0.8 1.0 1.2 1.3 1.9 3.7 6.5 10.3 16.6 28.4 43.9 68.6 103.5 143.9 225.7
iFemales 10.0 4.8 0.3 0.2 0.2 0.4 0.6 0.7 1.6 2.2 3.8 5.8 9.0 15.4 25.1 42.3 67.5 107.7 216.0
(Persons 10.9 5.1 0.4 0.3 0.4 0.7 0.8 1.0 1.7 2.9 5.1 7.9 13.5 22.2 35.6 56.5 84.3 124.9 231.6 1970 Males 11.8 5.9 0.5 0.5 0.6 1.1 1.1 1.0 2.1 3.5 6.3 9.6 17.6 29.3 46.9 70.1 99.1 145.4 247.6
iFemales 10.0 4.4 0.4 0.2 0.2 0.3 0.6 1.0 1.3 2.3 3.9 6.3 9.4 15.1 24.4 43.0 69.6 104.5 215.7
(Persons 10.5 5.3 0.3 0.3 0.7 0.8 0.7 1.0 1.6 2.8 4.5 7.2 12.5 20.3 32.7 51.8 82.1 131.8 238.6 1971 {Males 11.4 5.8 0.5 0.4 1.0 1.3 0.9 1.4 2.1 3.3 5.7 9.3 15.9 28.3 43.4 63.7 100.3 152.8 270.3
iFemales 9.7 4.8 0.2 0.2 0.4 0.3 0.5 0.6 1.1 2.3 3.4 5.1 9.2 12.4 22.0 40.0 63.9 110.8 206.9
(Persons 11.0 4.7 0.4 0.3 I.l 1.1 1.1 1.0 1.6 2.7 5.1 8.3 13.2 21.8 34.2 54.6 87.6 136.6 236.2 1972 {Males 11.8 5.3 0.5 0.4 1.8 1.8 1.5 1.3 1.9 3.3 6.3 10.6 17.8 28.8 44.7 67.4 105.7 159.0 267.3
iFemales 10.3 4.2 0.3 0.3 0.5 0.5 0.8 0.7 1.4 2.2 4.0 6.0 8.7 14.9 23.7 41.8 69.5 114.2 205.1
(Persons 11.4 4.7 0.4 0.3 1.2 1.5 1.3 1.6 2.2 2.7 5.0 8.6 13.3 21.8 34.5 54.7 91.4 140.7 267.8 1973 Males 12.1 5.3 0.5 0.5 2.0 2.5 2.1 2.5 2.6 3.1 6.1 11.6 17.3 28.0 45.6 67.8 110.2 161.5 306.3
iFemales 10.7 4.5 0.3 0.2 0.5 0.5 0.6 0.8 1.9 2.4 3.9 5.7 9.3 15.6 23.4 41.7 72.7 120.0 229.3
(Persons 11.2 4.7 0.3 0.3 1.0 1.2 1.0 1.3 1.7 3.1 5.2 8.5 13.7 21.4 33.9 54.4 85.2 142.0 275.7 1974 Males 12.0 4.8 0.5 0.5 1.6 2.0 1.7 1.7 2.4 4.2 7.2 11.0 18.6 28.5 45.5 70.2 102.6 165.1 311.7
iFemales 10.4 4.7 0.2 0.2 0.5 0.5 0.4 1.0 1.1 2.1 3.2 6.1 8.9 14.1 22.4 38.7 67.8 118.9 239.8
ABSTRACT 17. Abbreviated list numbers and equivalent detailed list numbers and causes of death (8th Revision I.C.D.).
Detailed List
Abbreviated
List 'B ' CAUSE O F D E A T H
000 001
004. 006 008. 009 010-102 013-019 020 032 033 034 036
040-043 050 055
080-083 084
090-097 Rem. 000-136
151 152-154 162 174
180-189 Rem. 140-200,
202. 203, 208, 209 201, 204-207 210-239 250
260-269 280-285 320 . -
393-398 402, 404
400. 401, 403 Pt. of 410-414 Rem. of 410^14
420-429 Pt. of 430-438 Rem. of 430^38
440-458 470-474 480-486 490-493
Rem. 460-519 531-533 540-543
550-553. 560 571
Rem. 520-577 580-534 600
640-645 630-639. 650-678
740-759 764-768, 772, 776 760-763, 769-771, 773-775, 777-779
780-796 Rem. 240-738 E810-E823 E800-E807. E825-E949 E950-E959 E960-E999
1 2 3 4 5 6 7 8 9 10 11 12 13 14 15 16 17 18 19A 19B 19C 19D 19E 19F
19G 20 21 22 23
25 26 27A 27B 28A 28B 29 30A 30B 46A 31 32 33 46B 34 35 36 37 46C 38 39 40 41 42 43 44 45 46D 47 48 49 50
Cholera Typhoid fever Bacillary dysentery and amoebiasis Enteritis and other diarrhoeal diseases Tuberculosis of respiratory system Other tuberculosis, including late effects Plague Diphtheria Whooping cough Streptococcal sore throat and scarlet fever Meningococcal infection Acute poliomyelitis Smallpox Measles Typhus and other rickettsioses Malaria Syphilis and its sequelae All other infective and parasitic diseases Cancer of:—
stomach intestines and rectum trachea, bronchus and lung breast genito-urinary organs other sites
Hodgkin's disease and leukaemia Benign neoplasms and neoplasms of unspecified nature Diabetes mellitus Avitaminoses and other nutritional deficiency Anaemias Meninsitis Active rheumatic fever Chronic rheumatic heart disease Hypertensive heart disease Other hypertensive disease Ischaemic heart disease with hypertension Ischaemic heart disease without hypertension Other forms of heart disease Cerebrovascular disease with hypertension (benign) Cerebrovascular disease without hypertension Other diseases of circulatory system Influenza Pneumonia Bronchitis, emphysema and asthma Other diseases of respiratory system Peptic ulcer Appenoictis Intestinal obstruction and hernia Cirrhosis of liver Other diseases of digestive system Nephritis and nephrosis Hyperplasia of prostate Abortion Other complications of pregnancy, childbirth and puerpcrium Congenital anomalies Birth injury, difficult labour and other anoxic and hypoxic conditions Other causes of perinatal mortality Symptoms and ill-defined conditions All other diseases Motor vehicle accidents All other accidents Suicide and self-iaflicied injuries All other external causes
180

ABSTRACT 17. Northern Ireland: Causes of death at different age-perioj.
Abbreviated
List •B'*
A L L CAUSES
Bl B2 B3 B4 B5 B6 B7 B8 89 BIO B U B12 B13 B14 BIS,, B16 B17 B18 B19A B19B B19c B19D B19E B19F B19G B20 B21 B22 B23 B24 B25 B26 B 2 7 A B 2 7 B B 2 8 A B 2 8 B B 2 9 B30A B 3 0 B B 4 6 A B31 B32 B33 B46B B34 B35 B36 B37 B46c B38 B39 B40 B41 B42 B43 B44 B45 B46D
BE47 B48
BE49 BE50
Total deaths
17.327
i 32 46 10
i 13
1
i 50 325 515 581 253 417 699
84 37
119 16 55 13 9
125 89 86
439 4,274 1,004
402 2,071
655 87
1,125 840 171 111
9 72 67
158 57 18
6 191 104 140 145 475 333 455
62 278
All ages
9,226
i 13 31
6
. 10
i 26 179 247 476
2 219 368
56 27 46
1 18 7 3
37 33 46
256 2,603
452 153 868 306
32 487 595
86 63
5 30 32 77 36 18
91 57 76 73
203 259 224
39 252
unde 4
wks
19
]
1(
3 4S lA
'
r 1-5
. mths.
84
'
]
]
]
\ 1
) 3:
1
1
1
6-11 mths.
20
\ 22 i 7
\ 1 4
i
(
;
i 4
2
iotal under l y r .
295
;
<
i
;
)
1 2
; ;
4<
; )
59 55 74
7 13
5
1-4
64
'
;
1
I
1 2 1
6 1 1 1 1 1
11
7 7
11
3
5-14
84
i
i
9 5 2
2
i
i 1
3
i 8 29 12
4
MALES
AOED
15-24 2 5 - :
230 17(
i 1
1
7
3
5 2 3 2
1
1 2 1
4
3 5
63 24
3 91
: i 1 A 1
1
1
2 1
i 1
< 1 1 1 1
1
1 1
1
i 7 40 20
3 62
4 35-^
) 27
\ I ^
1?
\ : : 1
1
3 1 2 i
6t 2 5 8 3 3
ii 3 2
4 7 1
3
i 12 19 26
7 39
W 45-54
! 737
5
.
2 > 14 > 27
60
i 5 ) 43
7 1 3
'. 1 1 7 1 9
32 261
9 17 34 14
15 20
3 3
2 8
10 6
2
4 13 23 33 13 28
55-
1.61
5' 5:
12;
2f 8( i
s ( A 1 2 i i i
lA 585
40 37
IOC 3«
1 3C
i n 12 IS
3 10 12 9
A
2 A
30 26 25
9 18
54 65 -
5 2.63(
i i 1 5
! i 6( : 8 > 19<
i 6< 5 11
i } i
i 21
2
S 11 13 95
844 120
52 263
96 1
95 225
26 20
2 8 5
25 10 7
2
15 54 22 27
2 5
74 75-
) 2.21
I I 1( I
1 ) 3-
6-) 7i
) 7i 5-1«
1 13
1 2
4 7 9
41 620 178 35
287 93 14
182 ISl 24 13
1 8 4
19 6 8
i 26 37 27 26
2 1
•
^
^•^ and over
^ ' 906
—
) •
; ' 8 ' 1 I 9
1 > 32 ' 23
i 2 2
7
3 5 3 8
218 95 7
164 62 5
101 48 12 5
6
5 2 3
i 2
li 17 3
15
i •Corresponding detailed list numbers and causes of death appear on page 132.
182
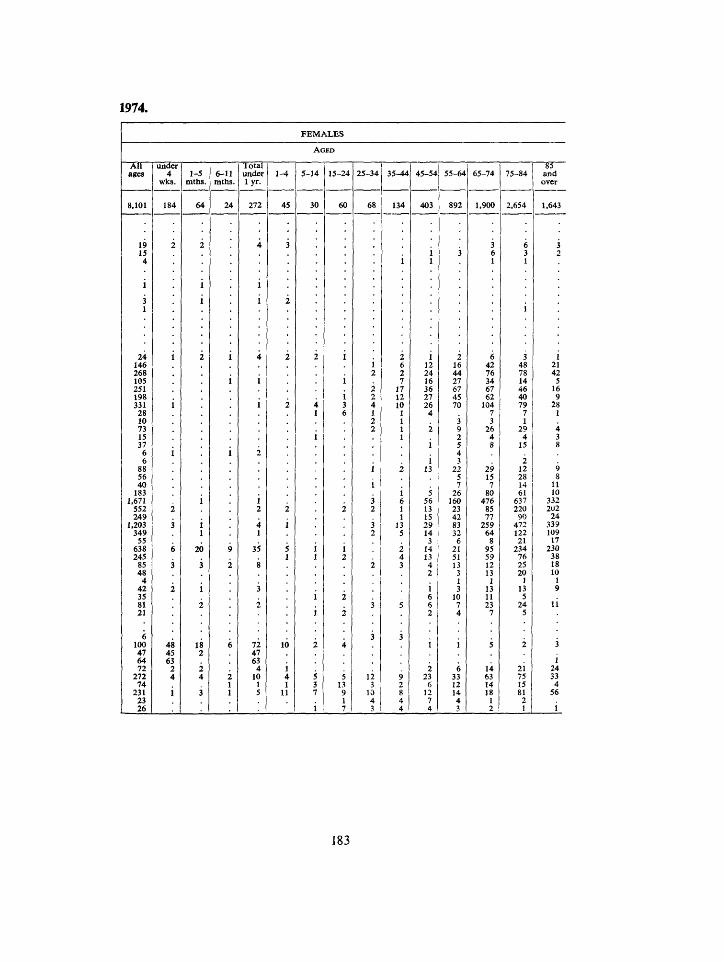
1974.
All ages
8,101
19 15 4
i 3 1
24 146 268 105 251 198 331
28 10 73 15 37
6 6
88 56 40
183 1.671
552 249
1,203 349
55 638 245
85 48
4 42 35 81 21
6 100 47 64 72
272 74
231 23 26
under 4
wks.
184
2
2
3
6
3
2
48 45 63
2 4
i
1-5 mths.
64
2
2
i
i 1
20
3
i 2
18 2
2 4
3
6-11 mths.
24
9
2
6
2 1 1
Total under l y r .
272
4
4
2
i 2
4 1
35
8
3
2
72 47 63
4 10
1 5
1 ^
45
3
2
2
2
2
i 5 1
10
i 4 1
11
FEMALES
A G E D
5-14
30
;
4 1
t
i 1
; ,
5 3 7
i
15-2
6(
: <
A
' V
s 1
4 25-3
) 6
'
: 1 ^ > J
]
:
.
; ^
12 3
K 4 3
4 35-44
8 134
2 6
J 2 7
J 17 > 12 I 10
1 > 1
1 1
2
! 1 6 1 1
13 5
2 4 3
5
3
9 2 8 4 4
45- .
40
1. 2-: 1( 3( 2" 2(
4
1
1 13
< 5f 13 If 25 l-fl 3
14 13 A 2
1 €
( 2
I
2 23
6 i : 7 4
54 55-<
J 89-
. I
: u i 4A
) 2" ; 6-
45 i 7C I
2 c 2
< 4 3
22 5
i 2i 16C 23 42
> 83 ^ 32
f 21 51 13 3 1 3
10 7 A
i 6
33 12 14 4 3
A 65-7')
I 1,90(
5 i
< ) 42 1 It
34 6-62
104
' 3 2(
4 S
25 15 7
8C 476
85 77
255 64
8 95 55 12 13
1 13 11 23
7
5
14 63 14 18
1 2
\ 75-84
) 2.654
1 6 > 3
1
3 48
) 78 \- 14
46 40 79
7 1
29 4
15
2 12 28 14 61
637 220
90 472 122 21
234 76 25 20
1 13 5
24 5
2
21 75 15 81
2 1
85 and over
1,64 5
3 2
1 21 42
5 16 9
28 1
4 3 8
9 8
11 10
332 202
24 339 109
17 230
38 18 10
1 9
li
3
1 24 33 4
56
i
183
ABSTRACT 17. Ards District: Causes of death at different age-periods
Abbreviated List
Total deaths
A L L CAUSES
Bl B2 B3 B4 B5 B6 B7 B8 B9 BIO B U B12 B13 B14 B15 E16 B17 B18 B19A B19a B19c B19D BI9E B 1 9 F B19G B20 B21 B22 B23 B24 B2S B26 B 2 7 A B 2 7 B B 2 8 A B28B B29 B30A B30B B46A B31 B32 B33 B 4 6 B B34 B35 B36 B37 B46C B38 B39 B40 B41 B42 B43 B44 B45 B46D
BE47 BE48 BE49 BE50
596
4 3
20 138 51 21 65 32
3 27 31 2 7
MALES
All ages
304
under 4
wks. 1-5
mths. 6-11 mths.
Total under l y r .
10
5-14 15-24 35-44 45-54
23
55-64
56
65-74 75-84
84 90
* Corresponding detailed list niuubers and causes of death appear on page 132.
184
by sex 1974.
FEMALES
All ages
under 4
•wks. 1-5
mths. 6-11 mths.
Total under lyr .
25-34 35-44 45-54 55-64 65-74 85 and over
55
185
ABSTRACT 17. Belfast District: Causes of death at different age-periods
Abbreviated
List 'B'*
Total deaths
MALES
All ages
under 4
wks. 1-5
mths. 6-11 mtlis.
Total under l y r .
5-14 15-24 25-34 35-44 45-54 55-64 65-74 75-84
A L L CAUSES 4,958 2.516
Bl B2 B3 B4 BS B6 B7 B8 B9 BIO B U B12 B13 B14 B15 B16 B17 B18 B 1 9 A B19B B19c B 1 9 D BI9E B19F B19o B20 B21 B22 B23 B24 B25 B26 B 2 7 A B 2 7 B B 2 8 A B 2 8 B B29 B 3 0 A B30B B46A B31 B32 B33 B46B B34 B35 B36 B37 B46C B38 B39 B40 n41 B42 B43 B44 B45 B 4 6 D
BE47 BE48 BE49 BE50
15 87
147 228
82 116 191 24 13 28
7 15 7 3
45 17 25
128 1.230
177 80
575 161
17 382 293 48 38 13 24 51 15
3 2
45 19 41 26
123 86
145 25
126
47 68
190 1
60 103
18 10 9 1 6 4 1
10 7
15 79
690 66 32
210 69
4 142 189 25 22
5 12 25 10 3
18 10 23 11 45 59 61 15
112
83 52 69 226 462
10
1 14 17 44
3 26
2 3 2
2 1 1
2 1
20 167
3 11 26
8 1
10 38
2 7
i 5 7 3
793
4 3 4
32 233
18 10 84 34
26 82 10
1 3
11 153 33
6 53 17 1
58 45
•Corresponding detailed list numbers and causes of death appear on page 132.
186
by sex 1974.
FEMALES
AU ages
2,442
7 40 79 38 81 56 88
6 3
19 6 9 3 2
35 10 10 49
540 111 48
365 92 13
240 104 23 16
under 4
wks. 1-5
mths.
18
6-11 mths.
Total under l y r .
5-14 15-24
23
25-34
19
35-44 45-54
122
55-64
284
5 19 13 23 14 17
2 2
2 5
56 5 7
17 15
1 5
26 4 2
65-74
579
16 13 22 17 32
3
4 2 2
3 16
152 17 19 87 19
4 35 22
2 3
75-84
816
2 22 26
3 18 13 20
2
10 2 2
i 4 6 2
24 214
43 13
149 32
5 83 30
8 8 2 2 8
85 and over
477
3 4 3 3
97 42
2 97 21
3 99 11 4 2
2 27
9 18 15 78 27 84 10 14
2 26
6 7
7 14 7
27 2 1
1 3
10 3
18
13 187
ABSTRACT 17. Castlereagh District: Causes of death at different »ge-P€rtoj
Abbie-viated
List Total
deaths
MALES
All ages
under 4
wks. 1-5
mths. 6-11 mths.
Total under l y r .
1-4 5-14 15-24 25-34 35--M 45-54 55-64 65-74 75-84
A L L CAUSES 458 259
Bl B2 B3 B4 B5 B6 B7 B8 B9 BIO B l l B12 B13 B14 BIS B16 B17 B18 B19A B19B B19C B19D B19E B19F B190 B20 B21 B22 B23 B24 B25 B26 B27A B27B B28A B 2 8 B B29 B30A B 3 0 B B46A B31 B32 B33 B46B B34 B35 B36 B37 B46C B38 B39 B40 B41 B42 B43 B44 B45 B46o
BE47 BE48 BE49 BE50
4 2 2 11 114 17 9 51 19
25 22 7 4 2 3 5 1 2
i 2 4 3 6 16 10 13 1 3 Corresponding detailed list numbers and causes of death appear on page 132.
188
by sex, 1974.
FEMALES
All ages
199
4 2 1 4
37 8 6
30 9.
13 9 2
under 4
wJcs. 1-5
mths. 6-11 mths.
Total under 1-4 5-14 15-24 25-34 35-44 45-54
13
55-64
21
65-74
44
75-84 85 and
over
10 4 1
11 2 5 1
189
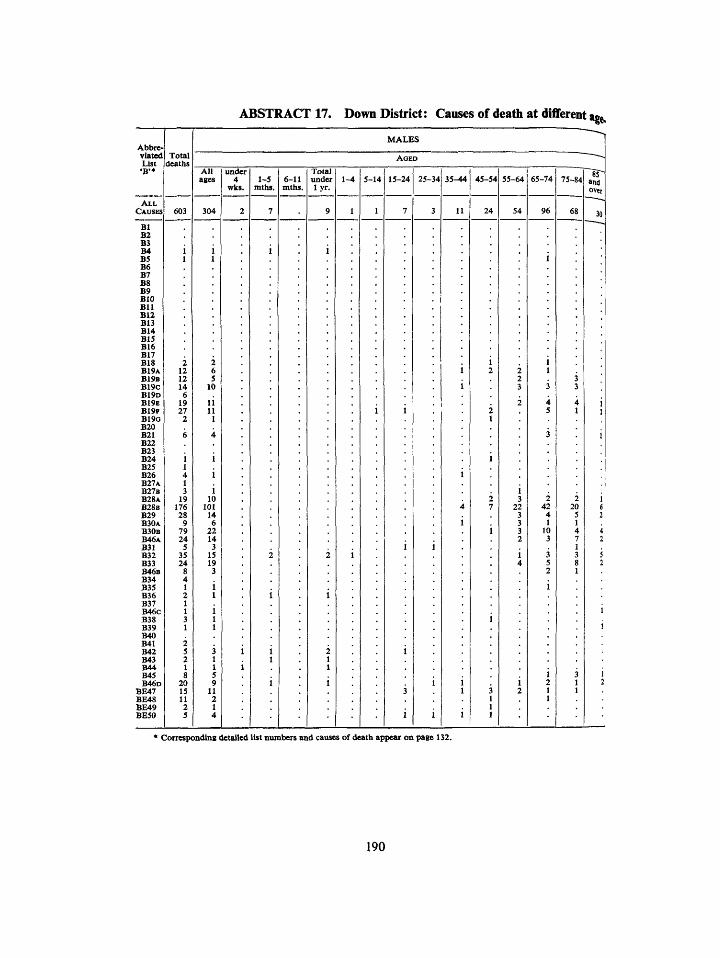
ABSTRACT 17. Down District: Causes of death at different age.
Abbre' viated List •B'»
Total deaths
MALES
All ages
under 4
wks. 1-5
mths. 6-11 mths.
Total under l y r .
15-24 25-34 35-44 45-54 55-64 75-84
A L L CAUSES 603 24 96 68
Bl B2 B3 B4 B5 B6 B7 B8 B9 BIO B U B12 B13 B14 B15 B16 BIT B18 B19A B19B B19C B19D B19E B19F B190 B20 B21 B22 B23 B24 B25 B26 B27A B 2 7 B B28A B 2 8 B B29 B30A B 3 0 B B46A B31 B32 B33 B46B B34 B35 B36 B37 B46C B38 B39 B40 B41 B42 B43 B44 B45 B 4 6 D
BE47 BE48 BE49 BE50
1 1 4 1 3
19 176 28
9 79 24
5 35 24
8 4 1 2 1 1 3 1 2 5 2 1 8
20 15 11 2 5
1 10
101 14 6
22 14 3
15 19 3
i 1
i 1 1
Corresponding detailed list nimibers and causes of death appear on page 132.
190
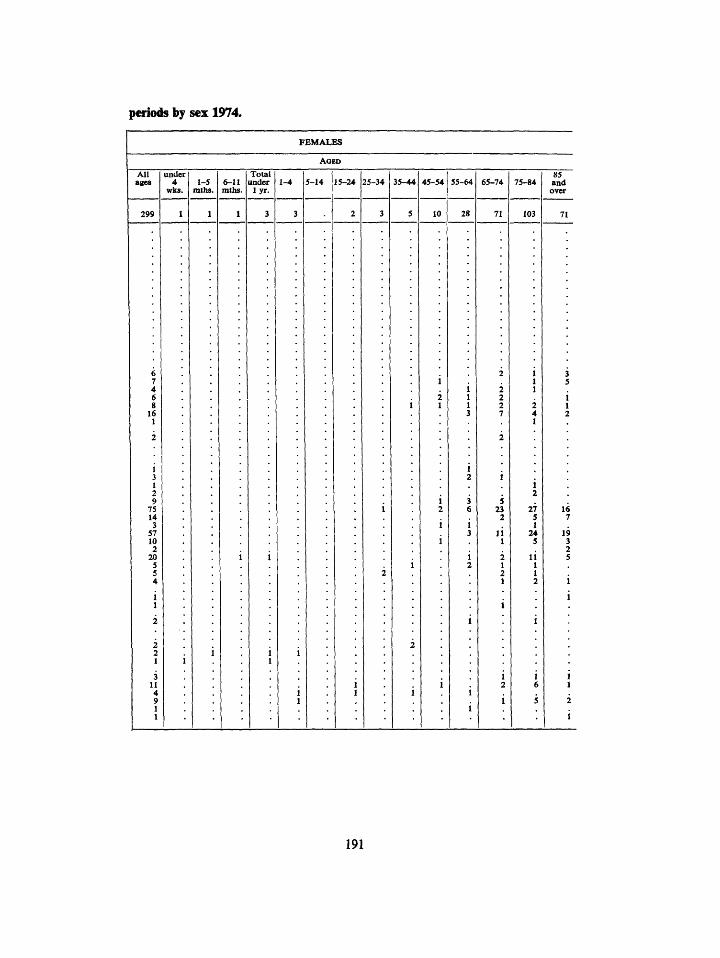
periods by sex 1974.
FEMALES
AOED
All ages
299
1 3 1 2 9
75 14 3
57 10 2
20 5 5 4
under 4
wks. 1-5
mths. 6-11 mths.
Total under
l y r . 1-4 5-14 15-24 25-34 35-44 45-54
10
55-64
28
65-74
5 23
2
li 1
2 1 2 1
85 and
over
1 2
27 5 1
24 5
li 1 1 2
191
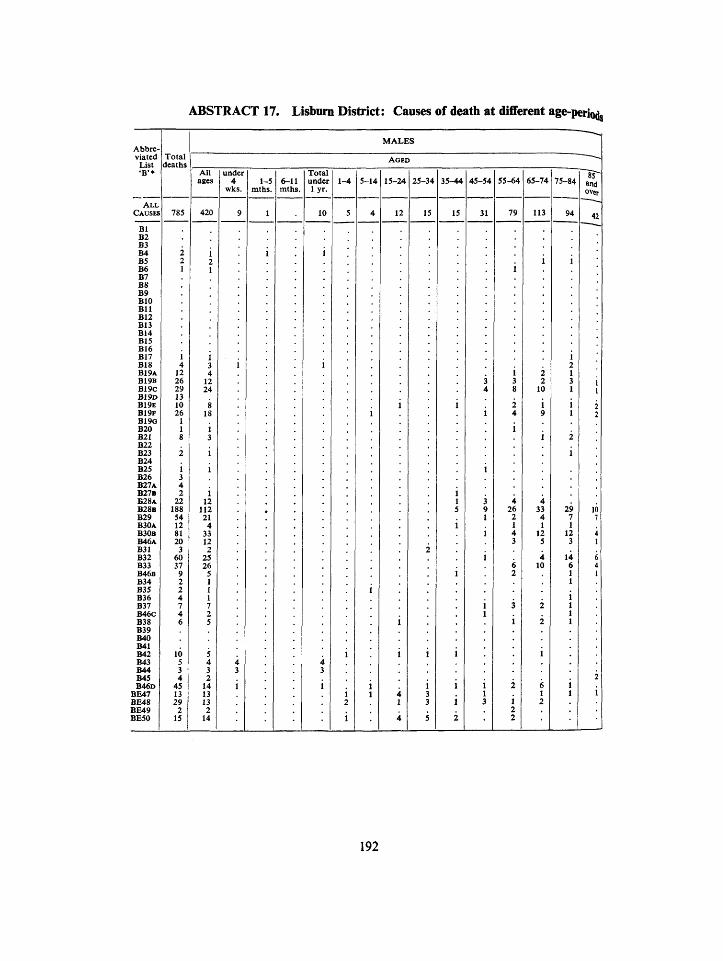
ABSTRACT 17. Lisburn District: Causes of death at dilBferent age-perio^
Abbreviated
List •B'*
A L L CAUSES
Bl B2 B3 B4 BS B6 B7 B8 B9 BIO B U B12 B13 B14 B15 B16 B17 B18 B19A B19B B19C B19D B19E B19F B190 B20 B21 B22 B23 B24 B25 B26 B27A B27B B28A B 2 8 B B29 B30A B30B B46A B31 B32 B33 B 4 6 B B34 B35 B36 B37 B46C B38 B39 B40 B41 B42 B43 B44 B45 B46D
BE47 BE48 BE49 BE50
Total deaths
785
1 3 4 2
22 188
54 12 81 20
3 60 37
9 2 2 4 7 4 6
All ages
1 3 4
12 24
1 12
112 21
4 33 12 2
25 26
5 1 1 1 7 2 5
MALES
under 4
wks. 1-5
mths. 6-11 mths.
Total under l y r .
10
1-4 5-14 15-24 25-34 35-44 45-54
31
55-64
79
65-74
113
75-84
94
192
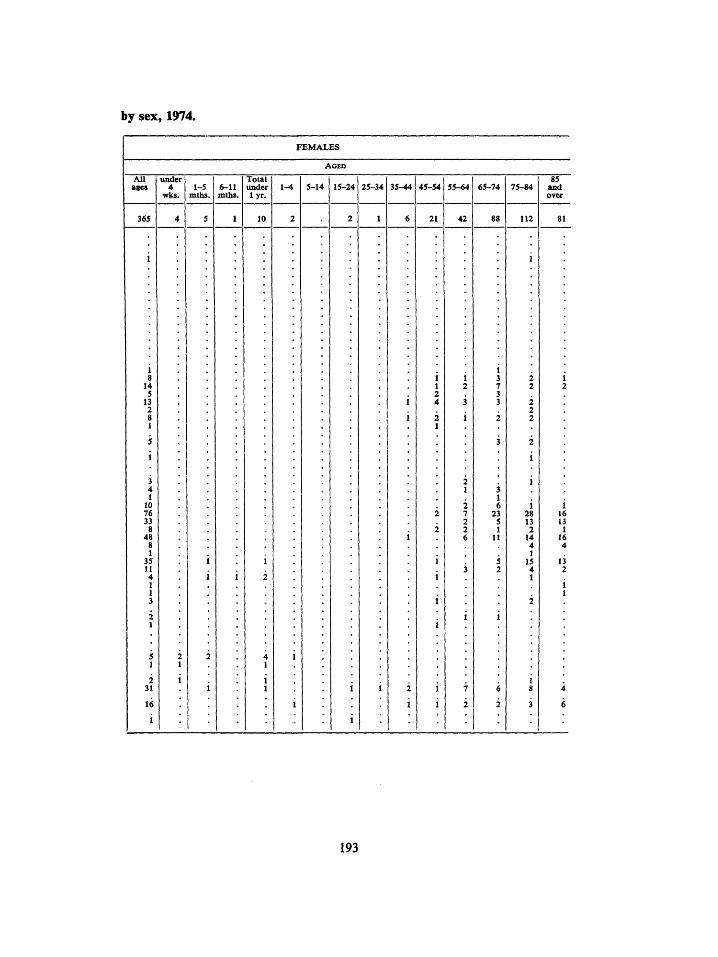
by sex, 1974.
FEMALES
All ages
365
3 4 1
10 76 33 8
48 8 1
35 II 4 1 1 3 2 1
under 4
wks. 1-5
mths. 6-11 mths.
Total under lyr.
1-4 15-24 25-34 35-44 45-54
21
55-64
42
65-74
88
75-84
112
3 1 6
23 5 1
II
85 and over
81
1 28 13 2
14 4 1
15 4 I
193
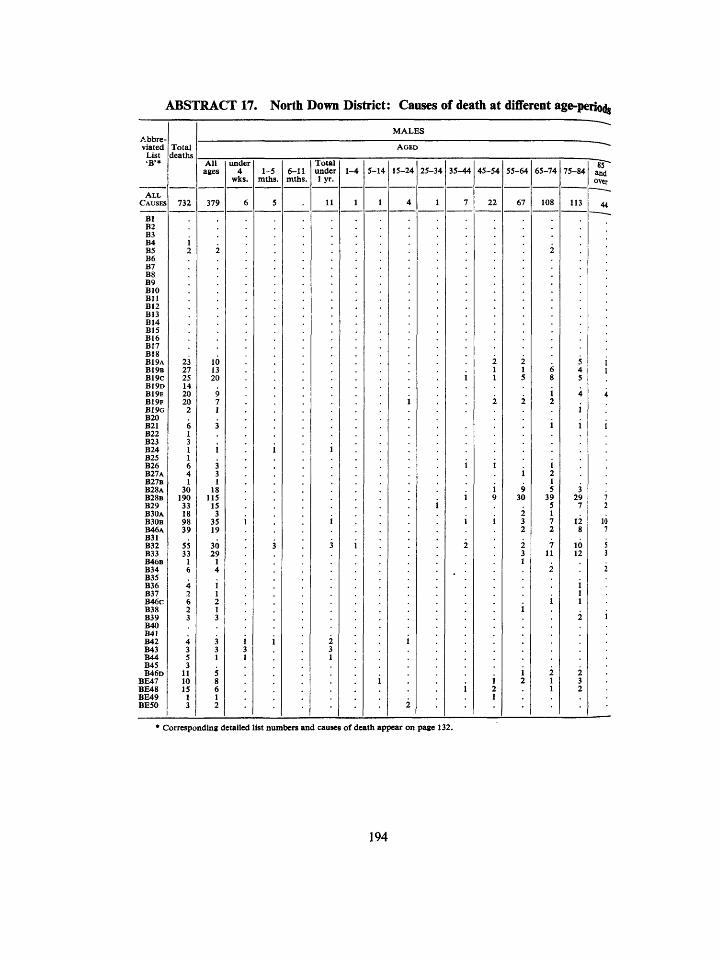
ABSTRACT 17. North Down District: Causes of death at different age-periods
Abbreviated
List 'B'*
A L L CAUSES
Total deaths
MALES
All ages
379
under 4
wks. 1-5
mths. 6-11 mths.
Total under l y r .
1-4 5-14 15-24 25-34 35-44 45-54
67
65-74 75-84 and over
Bl B2 B3 B4 B5 B6 B7 B8 B9 BIO B l l B12 B13 B14 B15 B16 B17 B18 B19A B19B B19c BI9D B19E B 1 9 F B19o B20 B21 B22 B23 B24 B25 B26 B27A B27B B 2 8 A B28B B 2 9 B30A B30B B 4 6 A B31 B32 B33 B 4 6 B B34 B35 B36 B37 B46c B38 B39 B40 B41 B42 B43 B44 B45 B 4 6 D
BE47 BE48 BE49 BE50
23 27 25 14 20 20
2
6 1 3 1 1 6 4 1
30 190 33 18 98 39 55 33
1 6
3 3 1
18 115
15 3
35 19
30 29
1 4
i 1 2 1 3
Corresponding detailed list numbers and causes of death appear on page 132.
194
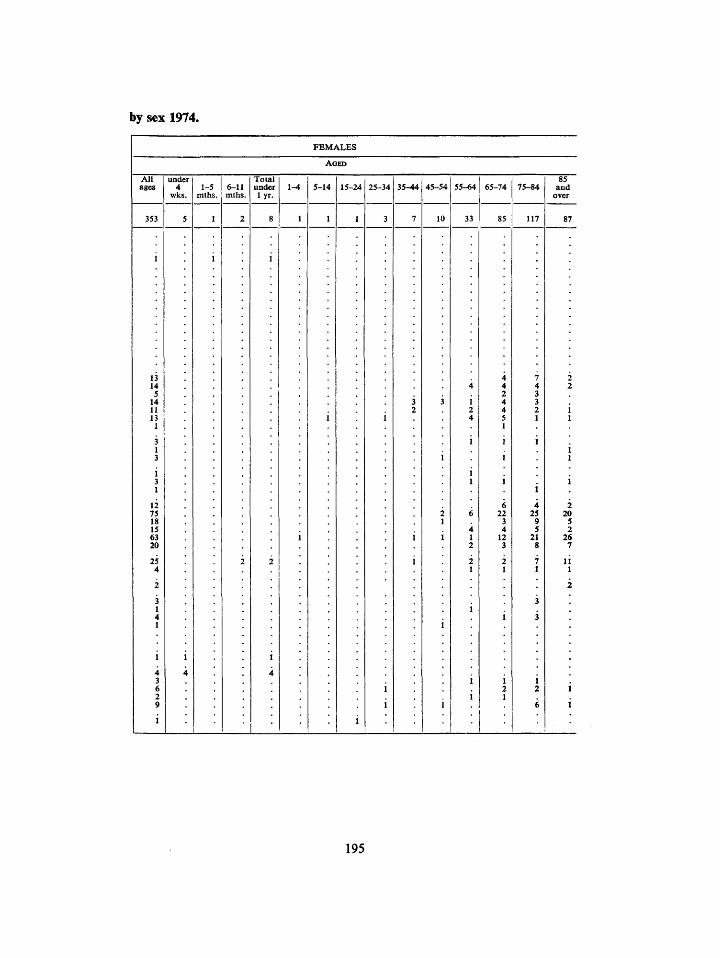
by sex 1974.
FEMALES
A G E D
All ages
353
under 4
wks. 1-5
mths. 6-11 mths.
Total under l y r .
15-24 25-34 35-44 45-54
10 33
65-74
85 117
4 25
9 5
21 8
7 1
85 and
over
87
2 20
5 2
26 7
li 1
195
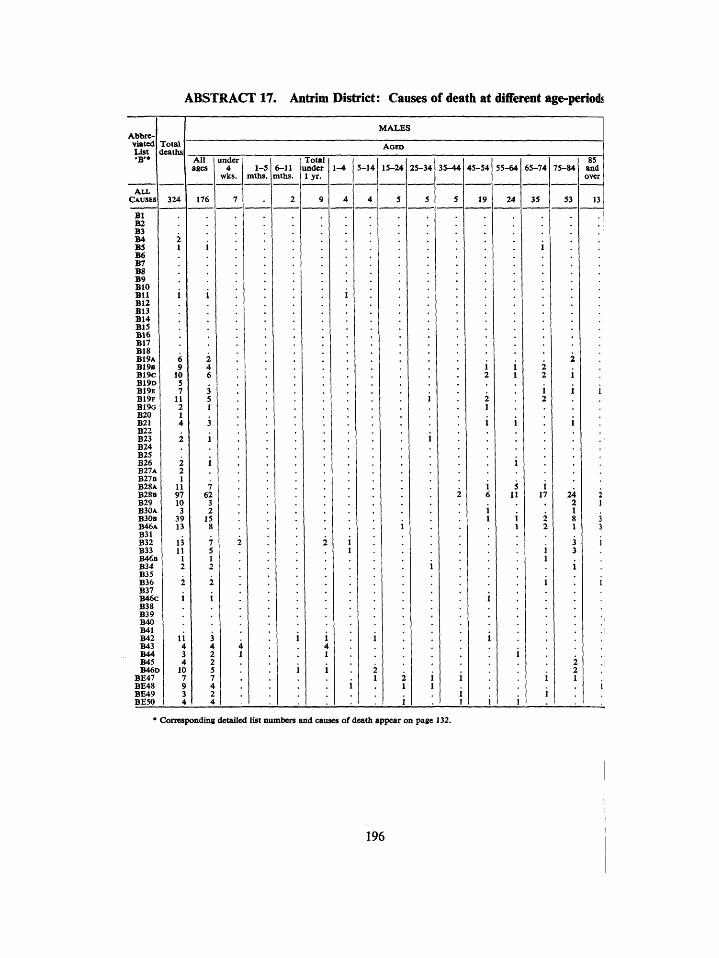
ABSTRACT 17. Antrim District: Causes of death at different age-periods
Abbreviated List •B'*
A L L CAUSES
Bl B2 B3 B4 BS B6 B7 B8 B9 BIO B l l B12 B13 B14 BIS B16 B17 B18 B 1 9 A B 1 9 B B19c B19D B 1 9 E B 1 9 F B19o B20 B21 B22 B23 B24 B2S B26 B27A B27B B28A B28B B29 B30A B30B B46A B31 B32 B33 B4eB B34 B35 B36 B37 B46C B38 B39 B40 B41 B42 B43 B44 B45 B46o
BE47 BE48 BE49 BESO
Total deaths
324
2 1
6 9
10 5 7
11 2 1 4
2
2 2 1
11 97 10
3 39 13
13 11
1 2
2
i
li 4 3 4
10 7 9 3 4
MALES
A G E D
All ages
176
2 4 6
3 5 1
3
i 7
62 3 2
15 8
7 5 1 2
2
1
3 4 2 2 5 7 4 2 4
under 4
wks.
7
2
4 1
1-5 mths.
6-11 mths.
2
i
i
Total under l y r .
9
2
i 4 1
i
1-4
4
i 1
5-14
4
2 1
15-24
5
2 1
i
25-34
5
i 1
35-44
5
i i '. 1
45-54 55-64 65-74
19
i 7
2 1
1
(
24
1 1
]
1 5 1
1 I
i
35
2 2
i 2
; i I 17
i 2 1 2
! i 1
'. i
i
75-84
53
24 2 1 8 1
3 3
i
2 2 1
85 and over
13
.
2 1
3 3
i
* Corresponding detailed list numbers and causes of death appear on page 132.
196
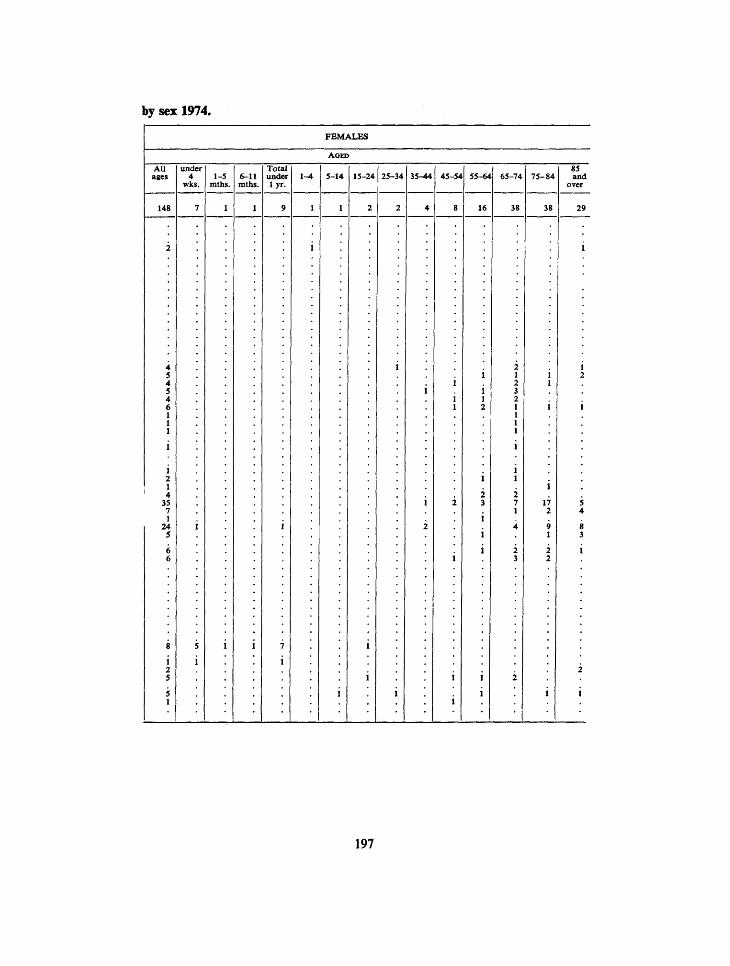
by sex 1974.
FEMALES
All ages
148
under 4
wks. 1-5
mths. 6-11 mths.
Total under lyr .
5-14 25-34 35-44 45-54 55-64
38
75-84
38
85 and
over
197
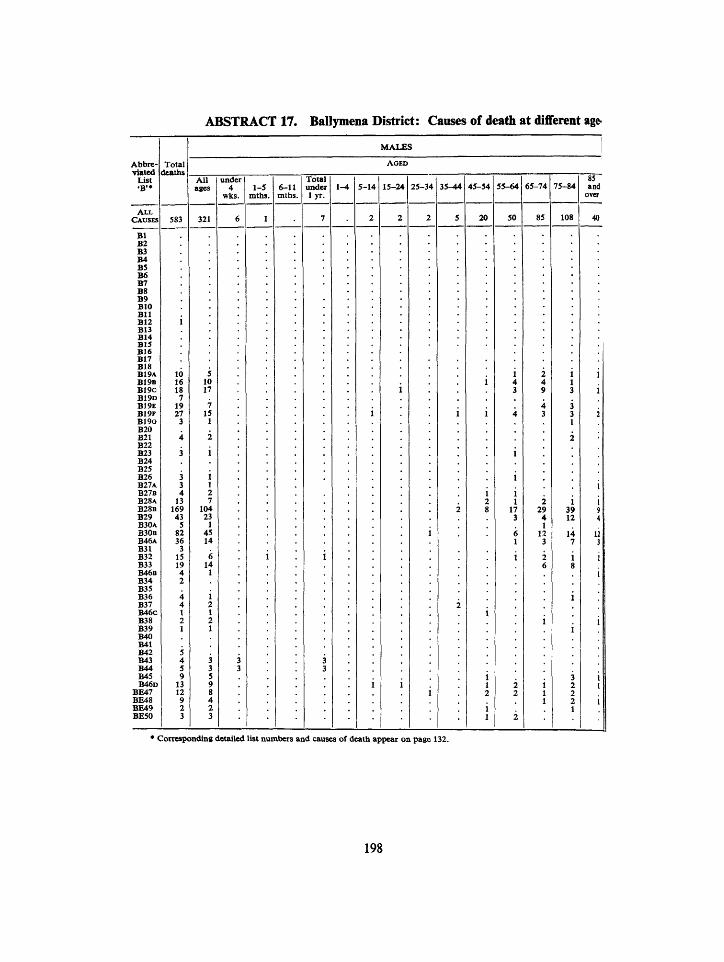
ABSTRACT 17. Ballymena District: Causes of death at different age-
Abbreviated
List 'B'*
Total deaths
ALL CAUSES
Bl B2 B3 B4 B5 B6 B7 B8 B9 BIO B l l B12 B13 B14 B15 B16 B17 B18 B19A B19B B19C B19D B19E B19F B190 B20 B21 B22 B23 B24 B25 B26 B27A B27B B28A B28B B29 B30A B30B B46A B31 B32 B33 B46B B34 B35 B36 B37 B46C B38 B39 B40 B41 B42 B43 B44 B45 B 4 6 D
BE47 BE48 BE49 BE50
583
3 3 4
13 169 43
5 82 36
3 15 19 4 2 4 4 1 2 1
All ages
321
1 1 2 7
104 23
1 45 14
6 14
1
MALES
under 4
wks. 1-5
mths. 6-11 mths.
Total under lyr -
5-14 15-24 25-34 35-44 45-54 55-64 65-74 75-84 85 and
over
85 108
* Corresponding detailed list numbers and causes of death appear on page 132.
198
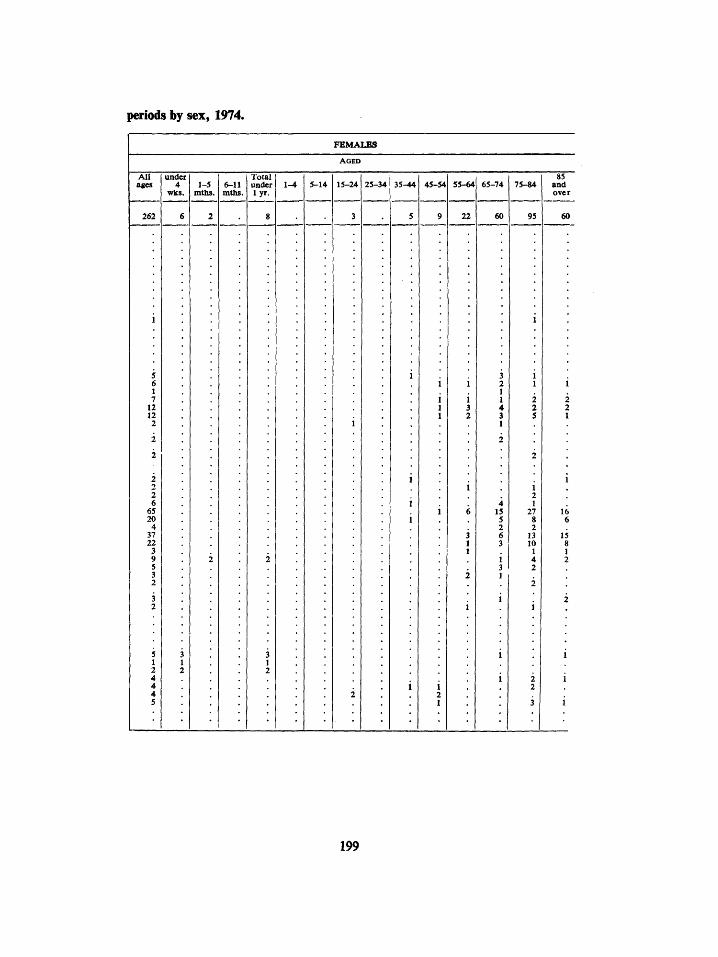
periods by sex, 1974.
FEMALES
All ages
262
under 4
wks. 1-5
mths. 6-11 mths.
Total under lyr.
1-4 35-44 45-54
22
75-84
95
85 and over
60
1 2 1
27 8 2
13 10
1 4 2
199
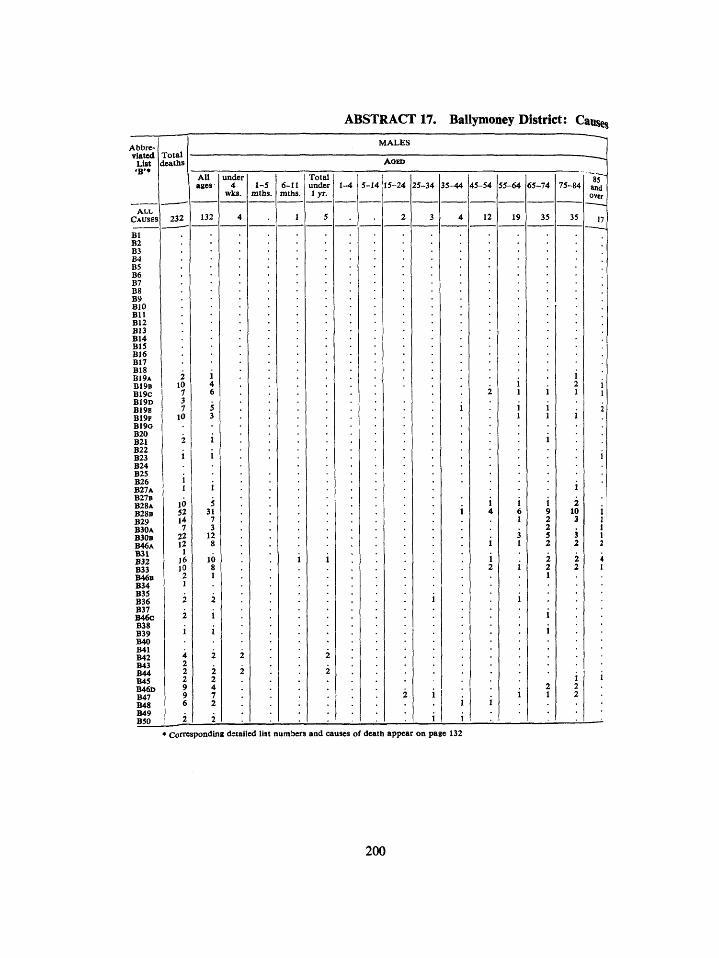
Abbreviated
List Total deaths
ALL CAUSES
Bl B2 B3 B4 B5 B6 B7 B8 B9 BIO B l l B12 B13 B14 B15 B16 B17 B18 B 1 9 A B19B B19c B 1 9 D B19E B 1 9 F B 1 9 O B20 B21 B22 B23 B24 B25 B26 B27A B27B B28A B28B B29 B30A B30B B46A B31 B32 B33 B46B B34 B35 B36 B37 B46c B38 B39 B40 B41 B42 B43 B44 B45 B46D B47 B48 B49 B50
232
ABSTRACT 17. Ballymoney District: Causes
MALES
AOED
All ages
132
under 4
wks. 1-5
mths. 6-11 mths.
Total under l y r .
5-14 15-24 25-34 35-44 45-54 55-64 65-74
19 35
75-84
35
85 and over
* Corresponding detailed list numbers and causes of death appear on page 132
200
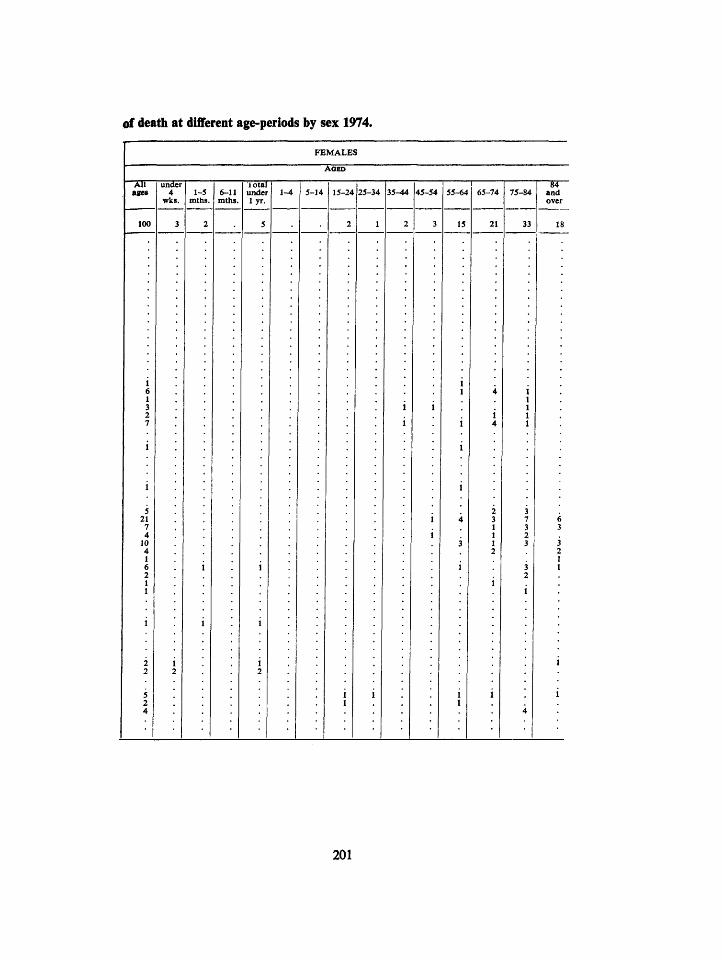
of death at different age-periods by sex 1974.
FEMALES
AOED
-5ir Bges
100
iotal under lyr.
under 4
wks. 1-5
mths. 6-11 mths.
5-14 25-34 35^14 45-54 55-64 65-74
15 21
75-84
33
^ 4 ^ and over
201
ABSTRACT 17. Carrickfergus District: Cause
Abbreviated
List •B'»
ALL CAUSES
Total deaths
Bl B2 B3 B4 B5 B6 B7 B8 B9 BIO B U B12 B13 B14 B15 B16 B17 B18 B19A B19B B l 9 c B19D B19E B 1 9 F B19o B20 B21 B22 B23 B24 B25 B26 B27A B27B B 2 8 A B 2 8 B B 2 9 B 3 0 A B 3 0 B B 4 6 A B31 B32 B33 B 4 6 B B34 B35 B36 B37 B46c B38 B39 B40 B41 B42 B43 B44 B4S B46o B47 B48 B49 B50
261
MALES
All ages
under | 4
wks. 1-5
mths. 6-11 mths.
Total under l y r .
1-4 5-14 15-24 25-34 35-44 45-54
17
55-64
24
65-74 75-84
* Corresponding detailed list numbers and causes of death appear on page 132.
202
of death at different age-pmods by sex, 1974.
FEMALES
under 4
wks.
Total under lyr.
ages
129
1-5 mths.
6-11 mths.
5-14 15-24 25-34 35-44 45-54
17 27
75-84
42
" ^ 5 ~ and over
25
14 203
ABSTRACT 17. Coleraine District: Cause
Abbreviated
List B ' *
Total deaths
MALES
AOED
ages under
4 wks.
1-5 mths.
6-11 mths.
i o t a l under l y r .
1-4 5-14 15-24 25-34 35-44 45-54 55-64 65-74 75-84 T-gr and
over AU.
CAUSES 459 225 12 39
B l B2 B3 B4 B5 B6 B7 B8 B9 BIO B l l B12 B13 B14 B15 B16 B17 B18 B19A B19B B19C B19D B19E B19F B190 B20 B21 B22 B23 B24 B25 B26 B27A B27B B28A B28B B29 B30A B30B B46A B31 B32 B33 B46B B34 B35 B36 B37 B46C B38 B39 B40 B41 B42 B43 B44 B45 B46P B47 B48 B49 B50
* Corresponding detailed list numbers and causes of death appear on page 132.
204
of death at different age-periods by sex 1974.
FEMALES
Total under l y r .
All ages
234
under 5
wks.
2 6 1 6
37 32
5 23
7 26
8 1 1
1-5 mths.
6-11 mths.
1 ^ 5-14 15-24 25-34 35-44 45-54 55-64
29
65-74
46
75-84
91
and over
45
2 18 15 2
14 4
8 4
12
205
ABSTRACT 17. Cookstown District: Cause*
Abbreviated
List 'B'»
Total deaths
MALES
AOED
"Sir ages
under 4
wks. 1-5
mths. 6-11 mths.
Total under l y r .
1-4 5-14 15-24 35-44 55-64 65-74 75-84 sri and over
ALL CAUSES 260 151 19 39 42
Bl B2 B3 B4 B5 B6 B7 B8 B9 BIO B l l B12 B13 B14 B15 B16 B17 B18 B19A B19B B19C B 1 9 D B19E B 1 9 F B190 B20 B21 B22 B23 B24 B25 B26 B27A. B27B B28A B 2 8 B B29 B30A B 3 0 B B46A B31 B32 B33 B46B B34 B35 B36 B37 B46C B38 B39 B40 B41 B42 B43 B44 B45 B46 B47 B48 B49 B50
* Corresponding detailed list numbers and causes of death appear on page 132.
206
of death at different age-periods by sex, 1974.
FEMALES
under 4
wks.
Total under lyr.
- 5 5 ^ and
over
29
ages
109
1-5 mths.
6-11 mths.
5-14 15-24 25-34 35-44 45-54 55-64 65-74 75-84
207
ABSTRACT 17. Lame District: Causes
Abbreviated
List 'B'*
Total deaths
MALES
AU ages
under 4
wks. 1-5
mttis. 6 - U mths.
Total under l y r .
1-4 5-14 15-24 25-34' ;35-44 45-54 155-64 65-74 75-84
A L L CAUSES
B l , B2 B3 B4 B5 B6 B7 B8 B9 BIO B l l B12 B13 B14 B15 B16 B17 B18 B19A B 1 9 B B19c B19D B19E B19F B19o B20 B21 B22 B23 B24 B25 B26 B 2 7 A B27B B 2 8 A B 2 8 B B 2 9 B 3 0 A B 3 0 B B46A B 3 1 B 3 2 B 3 3 B46B B34 B35 B36 B37 B46C B38 B39 B40 B41 B42 B43 B44 B45 B 4 6 D B47 B48 B49 B50
316 172
3 5 2 6
86 15 2
44 14 2
10 16 2 3
4 1 5
1 2
2 60
9
15 7 1 4
10 1
1 1 2
21 32 48 35
208
of death at different age-periods by sex, 1974.
FEMALES
Total under lyr.
All ages
under 4
wks. 1-5
mths. 6-11 mths.
5-14 15-24 25-34 35-44 45-54 55-64 65-74 75-84
42
^85 and over
24
209
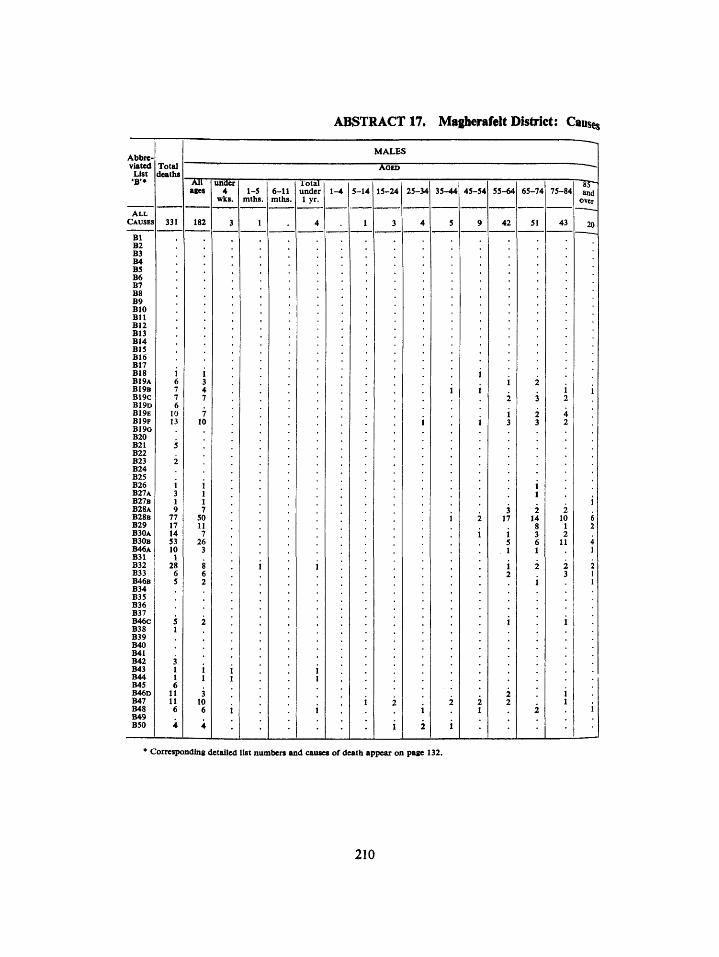
Abbreviated
Ust •B'»
Total deaths
ABSTRACT 17, Magherafelt District: Causes
MALES
TOT ages
uiider 4
wlcs. 1-5
mths. 6-11 mths.
lo ta l under l y r .
15-24 25-34 35-44 45-54 55-64 65-74 75-84 and over
A L L CAUSES 331 182 51 43
Bl B2 B3 B4 B5 B6 B7 B8 B9 BIO B l l B12 B13 B14 BIS B16 B17 B18 B19A B19B B19C B19D B 1 9 E B 1 9 F B19o B20 B21 B22 B23 B24 B25 B26 B 2 7 A B 2 7 B B 2 8 A B 2 8 B B29 B 3 0 A B 3 0 B B 4 6 A B31 B32 B33 B46B B34 B35 B36 B37 B 4 6 C B38 B39 B40 B41 B42 B43 B44 B45 B 4 6 D B47 B48 B49 B50
1 6 7 7 6 10 13
1 3 4 7
7 10
1 3 1 9 77 17 14 53 10 1 28 6 5
5 1
3 1 1 6 11 11 6
1 1 1 7 50 U 7 26 3
8 6 2
2
1 1
3 10 6
* Corresponding detailed list numbers and causes of death appear on page 132.
210
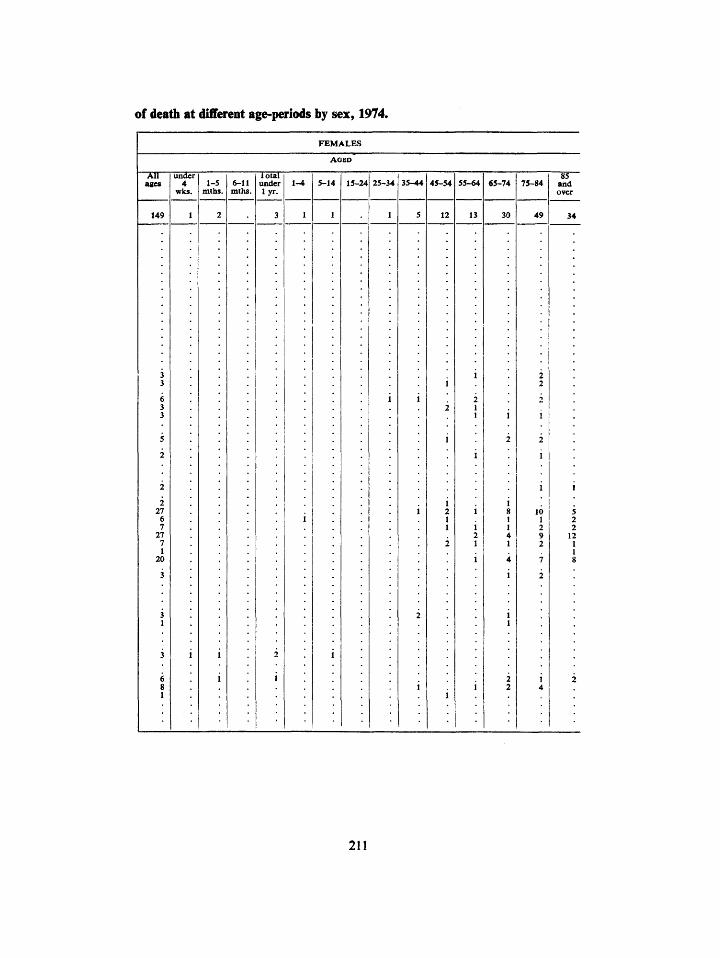
of death at different age-periods by sex, 1974.
FEMALES
ages
149
under 4
wks.
iotal under lyr .
X-5 mths.
6-U mths.
l--t 5-14 15-24 35-44 45-54
12
55-64
13
65-74 75-84 85
and over
34
211
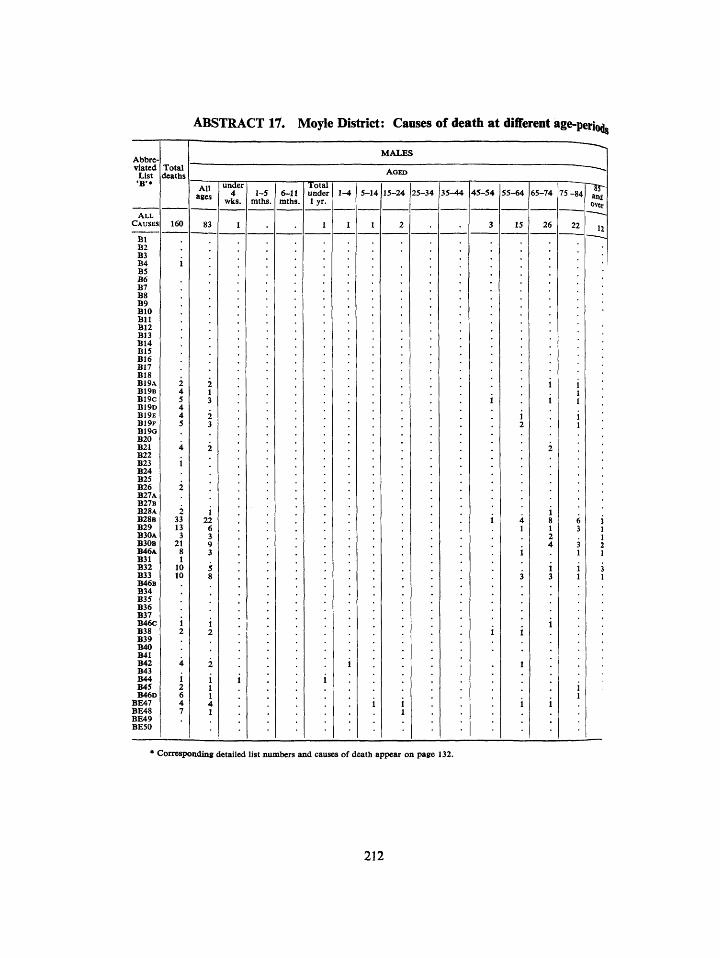
ABSTRACT 17. Moyle District: Causes of death at different age-perioj.
Abbreviated
List 'B'*
Total deaths
MALES
A G E D
All ages
undei 4
wks. 1-5
mths. 6-n mths.
Total under l y r .
1-4 5-14 15-24 25-34 35^M 45-54 55-64 65-74
A L L CAUSES 83
Bl B2 B3 B4 BS fi6 B7 B8 B9 BIO B l l B12 B13 B14 B15 B16 B17 B18 B19A B19B B19c B 1 9 D B19E B19F B19o B20 B21 B22 B23 B24 B25 B26 B27A B27B B28A B 2 8 B B29 B30A B30B B46A B31 B32 B33 B46B B34 B35 B36 B37 B46C B38 B39 B40 B41 B42 B43 B44 B45 B46D
BE47 BE48 BE49 BE50
2 4 5 4 4 5
2 1 3
2 3
2 33 13
3 21
8 1
10 10
i 2
1 22
6 3 9 3
5 8
i 2
* Corresponding detailed list numbers and causes of death appear on page 132.
212
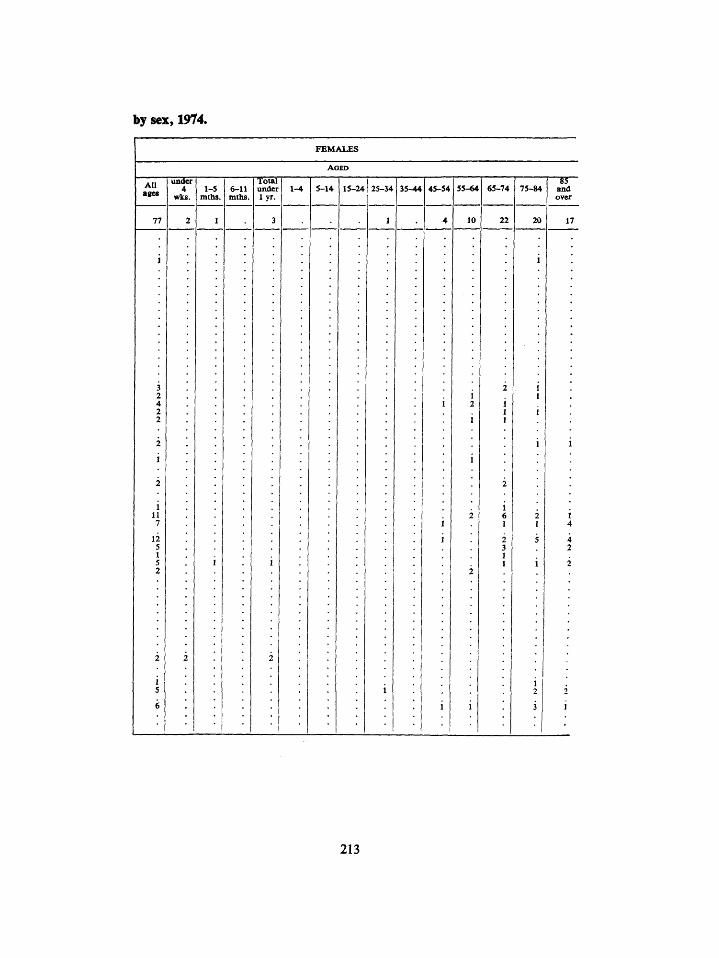
by sex, 1974.
FEMALES
Total under lyr .
and over
17
All ages
77
under 4
wks. 1-5
mths. 6-11 mths.
1-4 5-14 15-24 25-34 35-44 45-54 55-64 65-74 75-84
20
213
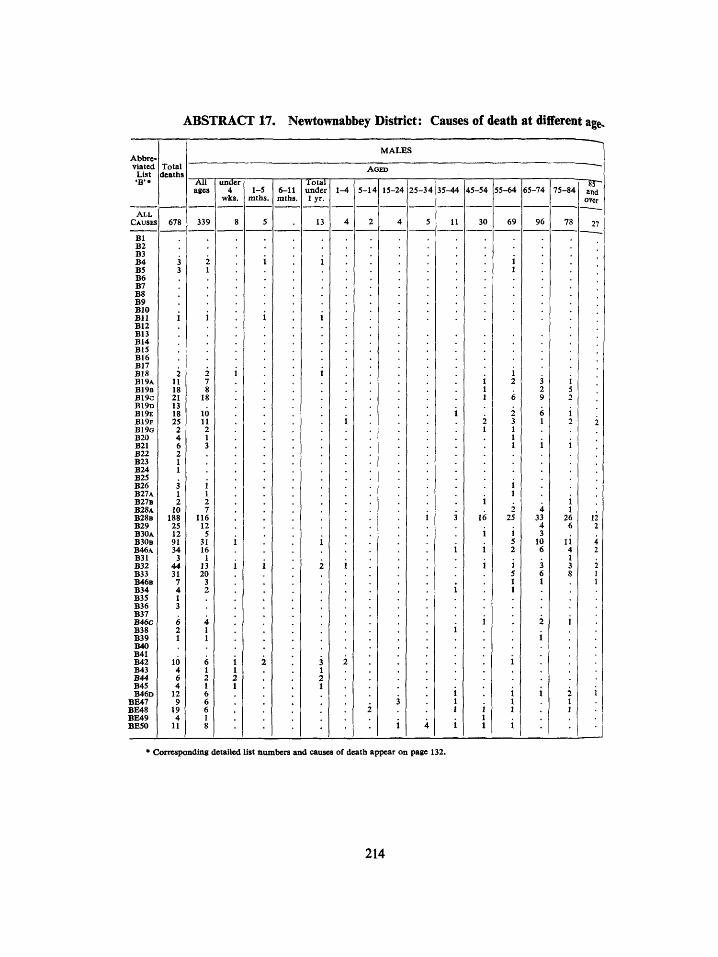
ABSTRACT 17. Ne^ownabbey District: Causes of death at different age.
Abbreviated
List •B'*
A L L CAUSES
Total deaths
678
MALES
- S I T ages
under 4
wks. 1-5
mths. 6-11 mths.
Total under 1-4 5 -14 15-24 25 -34 35-44 45-54
30
55-64
69
65-74
96
75-84
78
g r and
over
Bl B2 B3 B4 B5 B6 B7 B8 B9 BIO B l l B12 B13 B14 B15 B16 B17 B18 B19A B 1 9 B B19c B 1 9 D B 1 9 E B 1 9 F B I 9 G B20 B21 B22 B23 B24 B25 B26 B27A B 2 7 B B 2 8 A B 2 8 B B29 B 3 0 A B 3 0 B B 4 6 A B31 B32 B33 B 4 6 B B34 B35 B36 B37 B46c B38 B39 B40 B41 B42 B43 B44 B45 B 4 6 D
BE47 BE48 BE49 BE50
2 11 18 21 13 18 25
2 4 6 2 1 1 3 1 2
10 188
25 12 91 34
3 44 31
7 4 1 3 6 2 1
1 1 2 7
116 12
5 31 16
1 13 20
3 2
16
* Corresponding detailed list numbers and causes of death appear on page 132.
214

p^ods by, sex 1974.
FEMALES
ACED ~ 5 J -
and over
60
All ages
339
under 4
wks. 1-5
mths. 6-11 mtbs.
lotal under lyr-
14
1-4 5-14 15-24 25-34 35-44 45-54 55-64
20 40
65-74
89
75-84
101
1 28
1 2
14 7 4 3
1 29 4 3
28 4 1
10 3
215
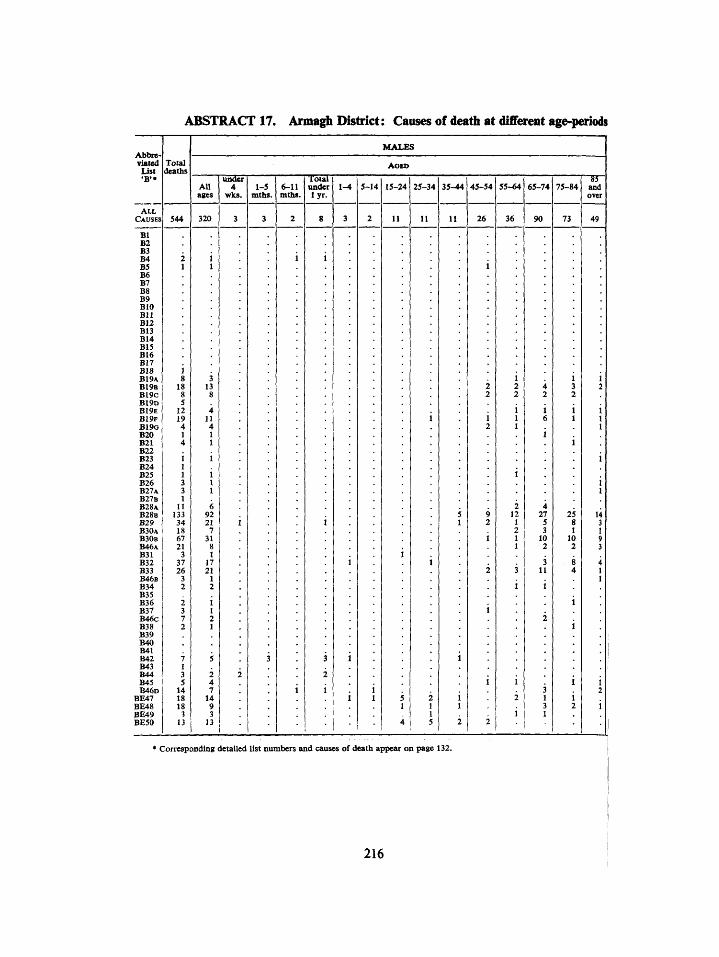
ABSTRACT 17. Armagh District: Causes of death at different age-periods
Abbreviated
List
ALL CAUSES
Total deaths
MALES
AOED
All ages
under 4
wks. 1-5
mths. 6-11 mtha.
Total under l y r .
5-14 15-24 25-34 35-44 45-54 55-64 65-74 75-84 and over
544 320 26 36 73
Bl B2 B3 B4 B5 B6 B7 B8 B9 BIO B l l B12 B13 B14 B15 B16 B17 B18 B19A B19B B19C B19D B19E B19P B19o B20 B21 B22 B23 B24 B25 B26 B27A B 2 7 B B 2 8 A B28B B29 B 3 0 A B30B B46A B31 B32 B33 B46B B34 B35 B36 B37 B46c B38 B39 B40 B41 B42 B43 B44 B45 B46D
BE47 BE48 BE49 BE50
18 8 5
12 19 4 1 4
i 1 1 3 3 1
n 133 34 18 67 21
3 37 26
3 2 2 3 7 2
Corresponding detailed list numbers and causes of death appear on page 132.
216
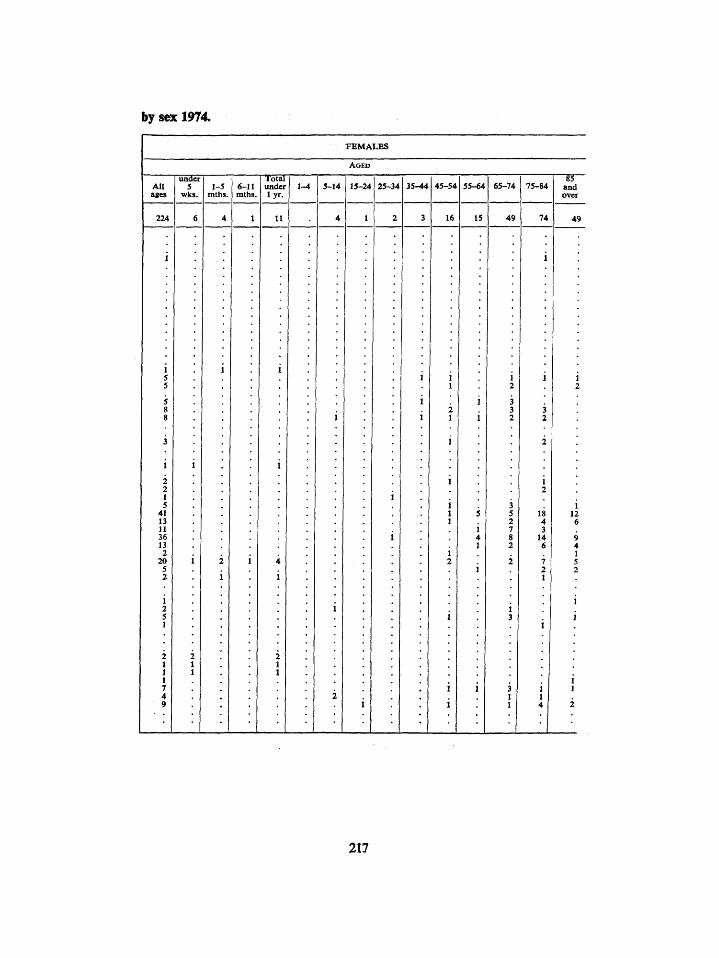
by sex 1974.
nEMALES
and over
49
All ages
224
under 5
wks. 1-5
mths. 6-11 mths.
Total under lyr.
1-4 5-14 15-24 25-34 35-44 45-54 55-64
15
65-74
49
75-84
74
2 2 1 5
41 13 11 36 13 2
20 5 2
217
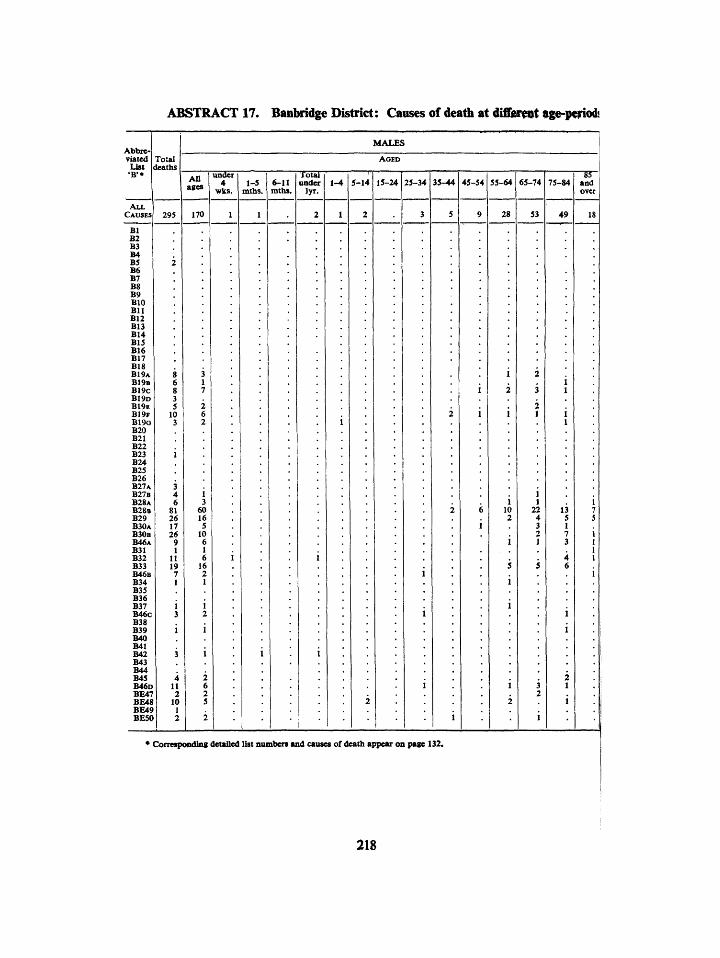
ABSTRACT 17. Banbridge District: Causes of death at difiier^t age-p^odi
Abbreviated
U s t •B'«
Total deaths
MALES
A G E D
All ages
under | 4 1-5
wks. mths. 6-11 mths.
Total under
lyr. 1-4 5-14 15-24 35-44 45-54 55-64 65-74 75-84 and
over
A L L CAUSES 295 170 28 53 49
Bl B2 B3 B4 B5 B6 B7 B8 B9 BIO B U B12 B13 B14 B15 B16 B17 B18 B 1 9 A B19B B 1 9 C B19D B 1 9 E B 1 9 F B190 B20 B21 B22 B23 B24 B25 B26 B27A B 2 7 B B 2 8 A B 2 8 B B29 B 3 0 A B30B B46A B31 B32 B33 B46B B34 B35 B36 B37 B46C B38 B39 B40 B41 B42 B43 B44 B45 B 4 6 D BE47 BE48 BE49 BE50
4 11 2
10
2
2 6 2 5
2
* Corresponding detailed list niuibers and causes of death appear on page 132.
218
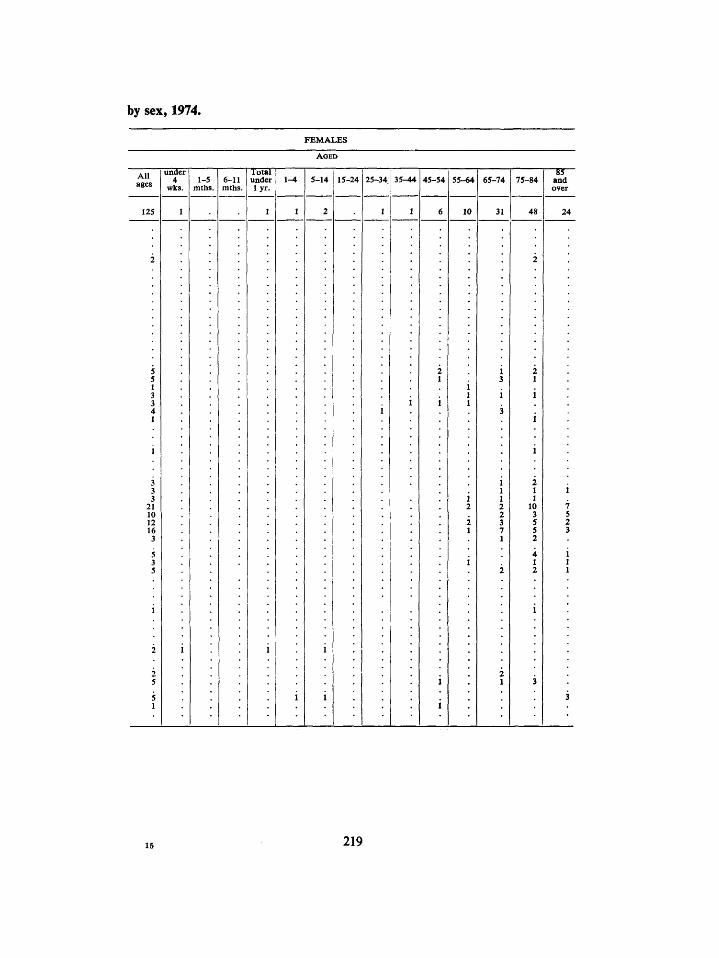
by sex, 1974.
FEMALES
under 4
wks.
Total under l y r .
and over
24
All ages
125
1-5 mths.
6-11 mths.
1-4 5-14 15-24 25-34 35-44
10
65-74
31
75-84
15 219
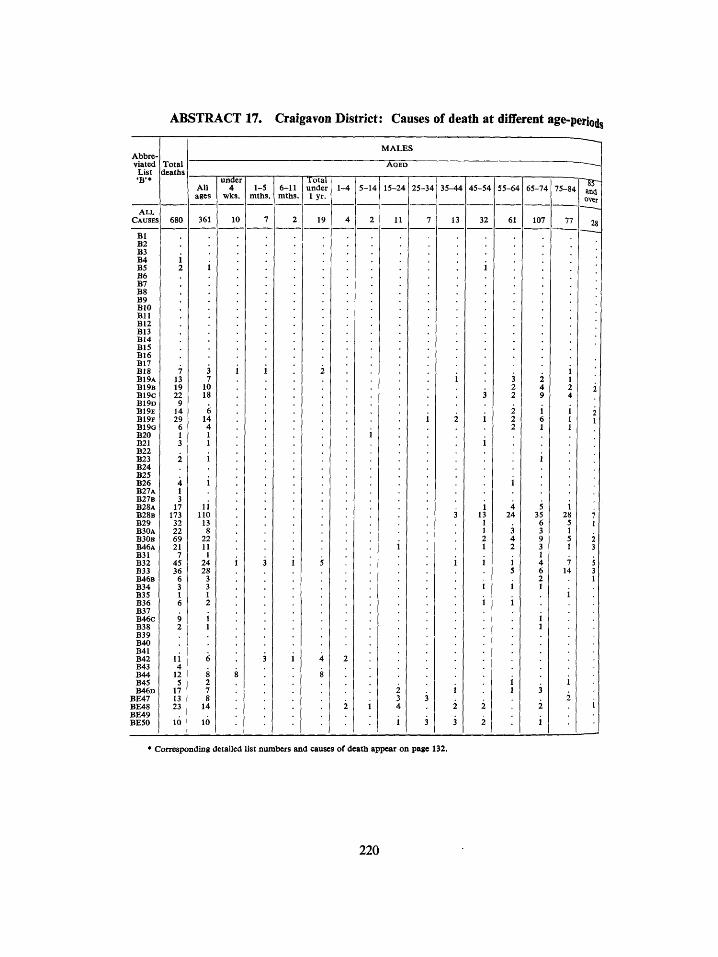
ABSTRACT 17. Craigaron District: Causes of death at different age-periods
Abbreviated
List Total
deaths
MALES
AOED
All ages
under 4
wks. 1-5
mths. 6-11 mths.
Total under l y r .
5-14 25-34 45-54 55-64 75-84
A L L CAUSES 32
Bl B2 B3 B4 B5 B6 B7 B8 B9 BIO B l l B12 B13 fil4 B15 B16 B17 B18 B19A B 1 9 B B19c B 1 9 D B 1 9 E B 1 9 F B19G B20 B21 B22 B23 B24 B25 B26 B27A B 2 7 B B28A B 2 8 B B29 B30A B 3 0 B B46A B31 B32 B33 B46B B34 B35 B36 B37 B46c B38 B39 B40 B41 B42 B43 B44 B45 B46D
BE47 BE48 BE49 BE50
4 1 3
17 173 32 22 69 21
7 45 36
6 3 1 6
11 110
13 8
22 11
1 24 28
3 3 1 2 i 1
14
* Corresponding detailed list niunbers and causes of death appear on page 132.
220
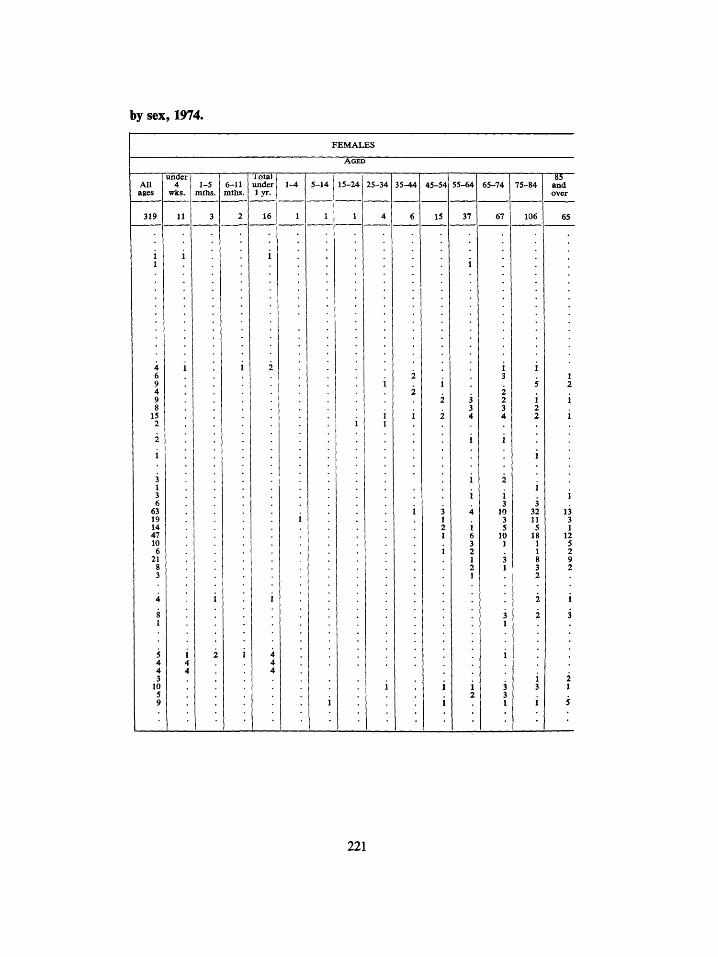
by sex, 1974.
FEMALES
Ibtal under l y r .
"gr and over
All
319
under 4
wks. 1-5
mths. 6-11 mths.
15-24 25-34 35^t4 45-54 55-64
37
65-74 75-84
106
3 1 3 6
63 19 14 47 10
6 21
3 32 11 5
18 1 1 8 3 2
221
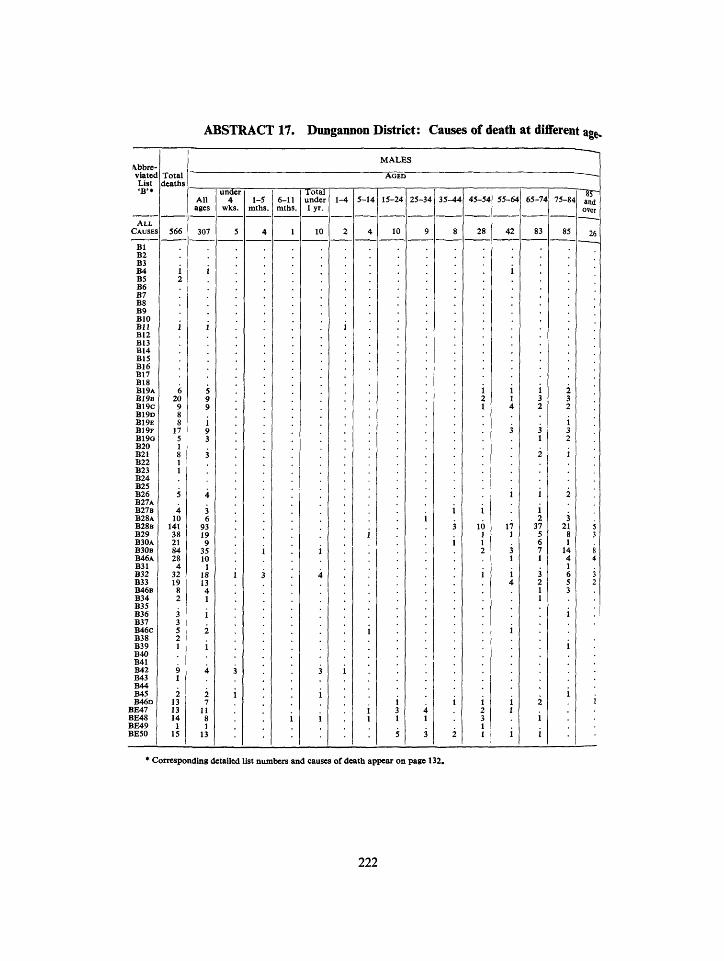
ABSTRACT 17. Dungannon District: Causes of death at different age.
\bbre viated List •B'»
Total deaths
MALES
AGED
All ages
under 4
wks. 1-5
mths. 6-11 mths.
TotaT under l y r .
1-4 5-14 45-54 55-641 65-74 75-84, and over
A L L CAUSES 566 307 28 42 83 85
Bl B2 B3 B4 B5 B6 B7 B8 B9 BIO B U B12 B13 B14 B15 B16 B17 B18 B19A B 1 9 B B19C B19D B19E B 1 9 F B190 B20 B21 B22 B23 B24 B25 B26 B 2 7 A B 2 7 B B 2 8 A B28B B29 B30A B30B B46A B31 B32 B33 B46B B34 B35 B36 B37 B46C B38 B39 B40 B41 B42 B43 B44 B45 B46D
BE47 BE48 BE49 BE50
1 I 1
4 10
141 38 21 84 28
4 32 19
1 2 3 1 1
1 I
i
* Corresponding detailed list numbers and causes of death appear on page 132.
222
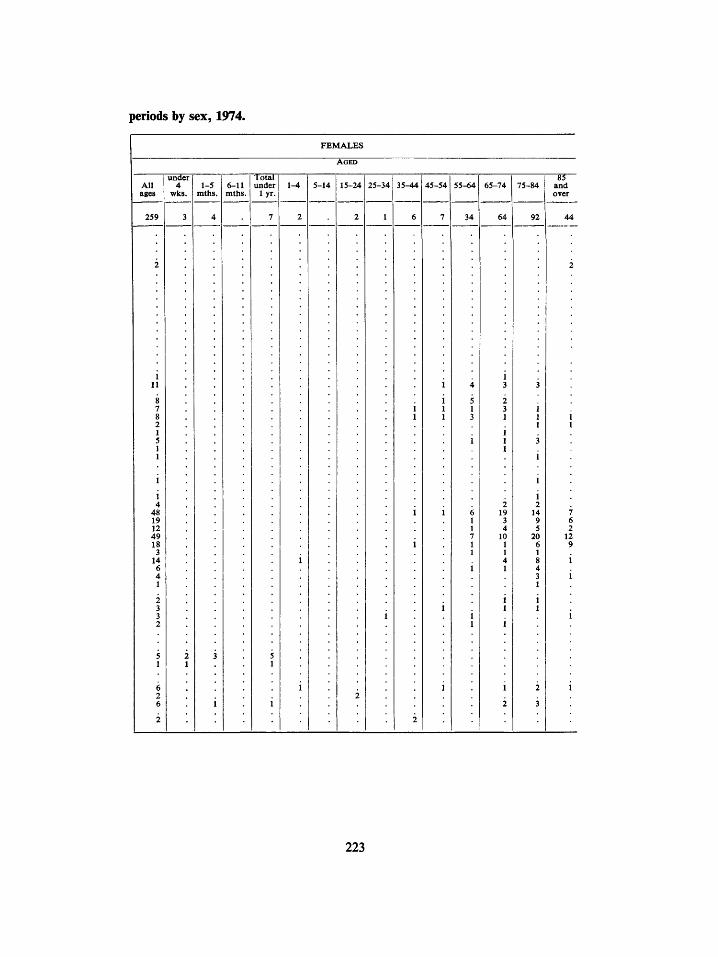
periods by sex, 1974.
under 4
wks.
Total under
lyr .
~ g 5 ~ and over
All ages
1-5 mths.
6-11 mths.
5-14 15-24 25-34 35-44 45-54 65-74
92
1 2
14 9 5
20 6 1 8 4 3 1
i 1
223
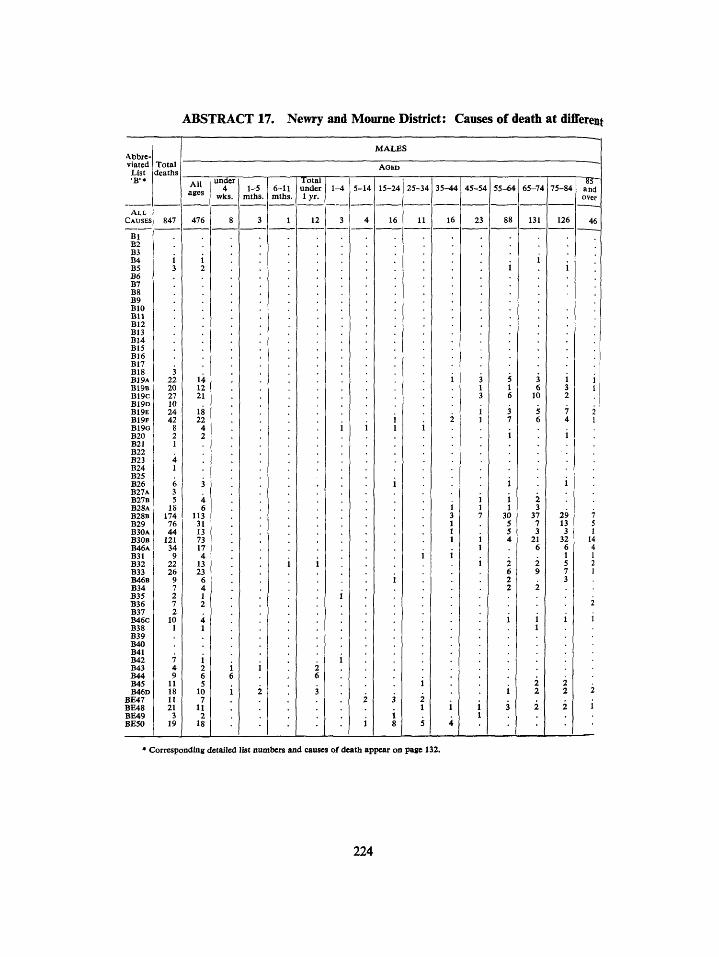
ABSTRACT 17. Newry and Mourne District: Causes of death at different
Abbreviated
List Total deaths
A L L CAUSES
Bl B2 B3 B4 B5 B6 B7 B8 B9 BIO B U B12 B13 B14 B15 B16 B17 B18 B19A B19B B19C BI9D B19E B19F B190 B20 B21 B22 B23 B24 B25 B26 B27A B27B B28A B28B B29 B30A B30B B46A B31 B32 B33 B46B B34 B35 B36 B37 B46C B38 B39 B40 B41 B42 B43 B44 B45 B46D
BE47 BE48 BE49 BE50
3 22 20 27 10 24 42
8 2 1 4 1
6 3 5
18 174 76 44
121 34
9 22 26
9 7 2 7 2
10 1
MALES
AU ages
476
4 6
113 31 13 73 17 4
13 23
6 4 1 2 4 1
under 4
wks. 1-5
mths. 6-11 mths.
Total under l y r .
12
15-24
16
25-34 35-44
16
45-54 55-64 65-74
23
75-84 " " g r
and over
46
* Corresponding detailed list numbers and causes of death appear on page 132.
224
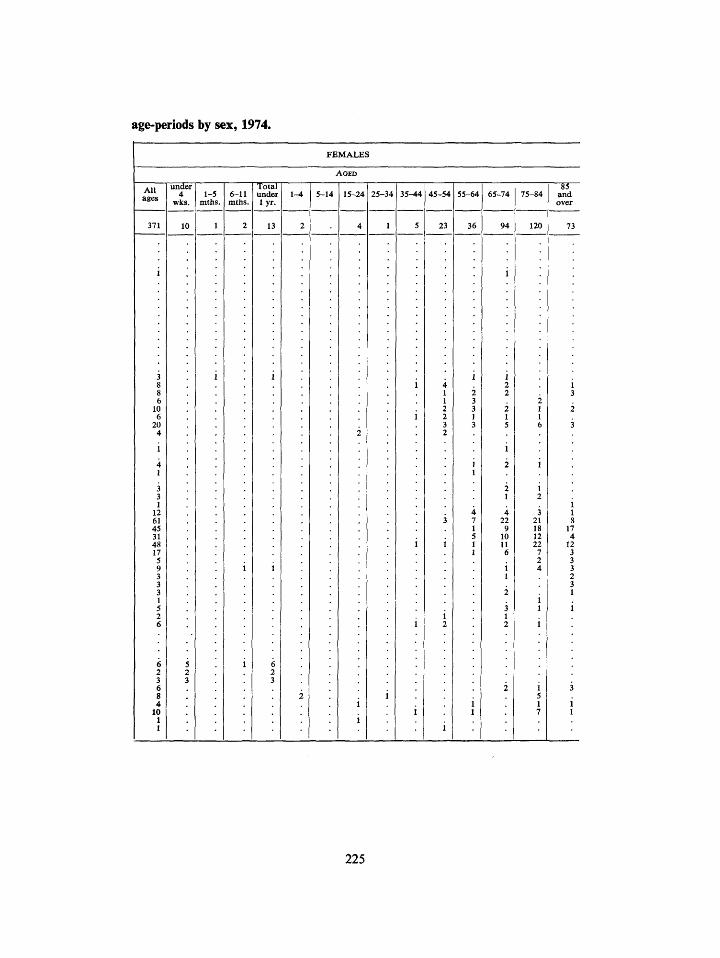
age-periods by sex, 1974.
FEMALES
under 4
wks.
Total under l y r .
All ages 1-5
mths. 6-11 mths.
5-14 15-24 25-34 35-44 45-54 55-64 65-74 75-84 and over
10 23 36
6 2 3 6 8 4
10 1 1
5 2 3
120 73
225
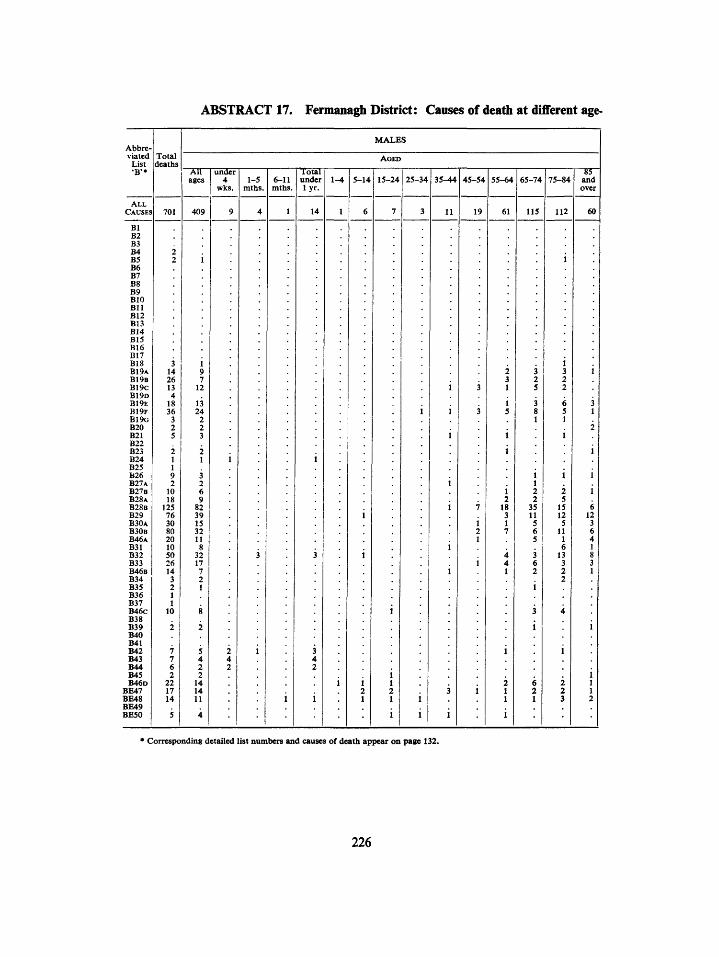
ABSTRACT 17. Fermanagh District: Causes of death at different age-
Abbreviated
List ' B ' *
Total deaths
MALES
" A i r ages
under 4
wks. 1-5
mths. 6-11 mths.
Total under l y r .
1-4 35-44 45-54 55-64 65-74 75-84 and over
A L L CAUSES 701 14 19 115 112 60
Bl B2 B3 B4 B5 B6 B7 B8 B9 BIO B l l B12 B13 B14 B15 B16 BI7 B18 B19A B19B B19c B19D B19E B19F B 1 9 G B20 B21 B22 B23 B24 B25 B26 B27A B27B B 2 8 A B28B B29 B30A B30B B46A B31 B32 B33 B46B B34 B35 B36 B37 B46c B38 B39 B40 B41 B42 B43 B44 B45 B46D
BE47 BE48 BE49 BE50
3 14 26 13 4
18 36
3 2 5
2 1 1 9 2
10 18
125 76 30 80 20 10 50 26 14 3 2 1 1
10
* Corresponding detailed list numbers and causes of death appear on page 132.
226
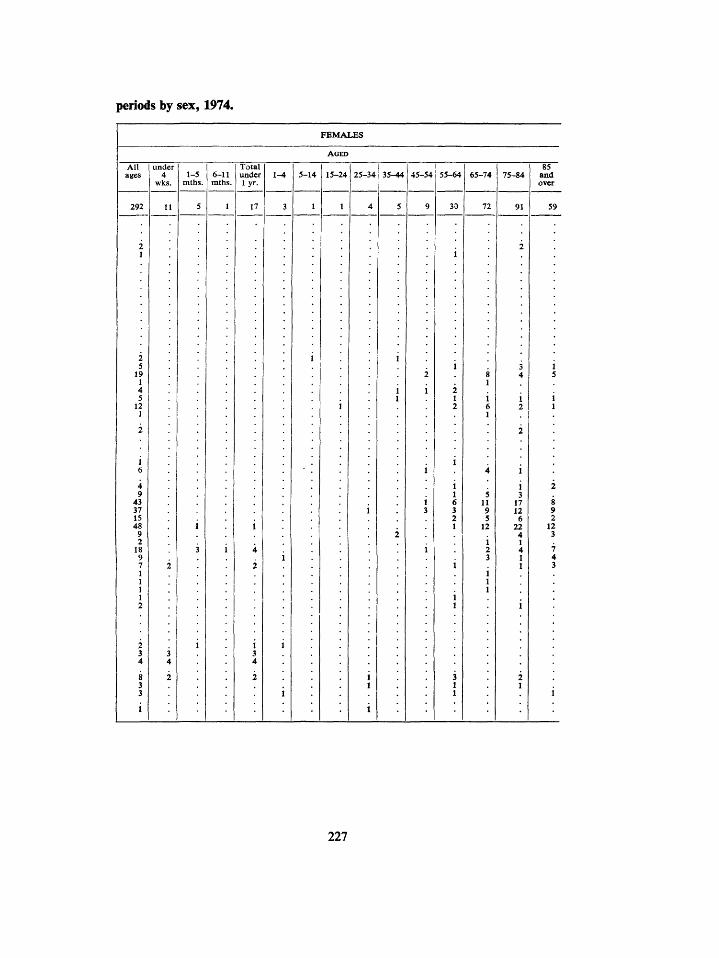
periods by sex, 1974.
All ages
under 4
wks. 1-5
mths. 6-11 mths.
Total under l y r .
1-4 15-24 25-34 35-44 45-54 55-64 65-74 85
and over
72 91
1 3
17 12
6 22
4 1 4 1 1
9 2
12 3
7 4 3
227
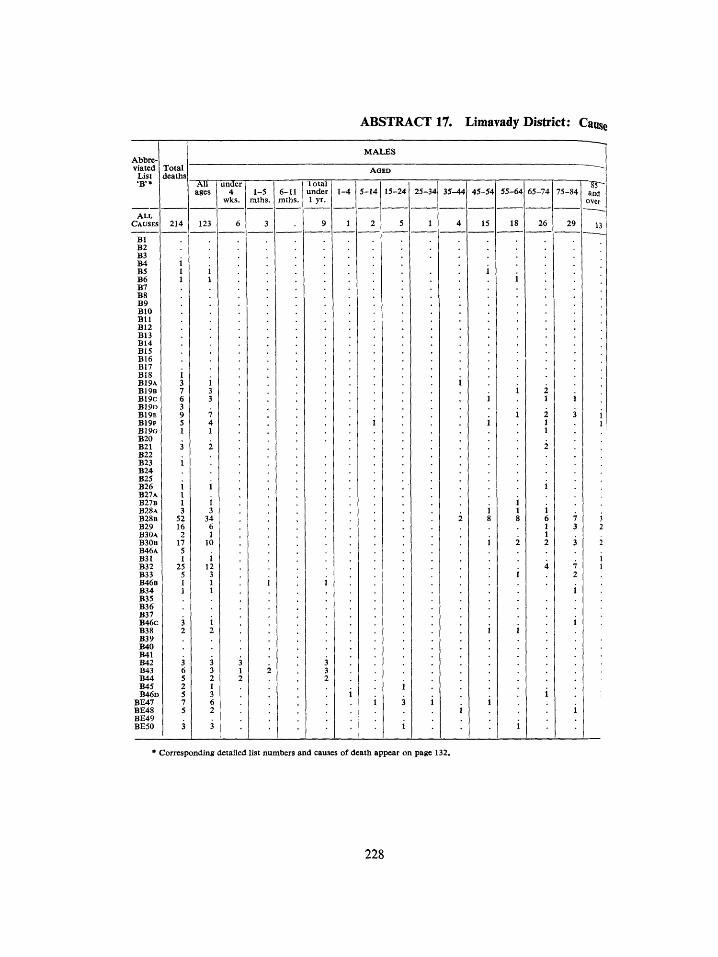
ABSTRACT 17. Limavady District: Cause
Abbreviated
List
ALL CAUSES
Total deaths
Bl B2 B3 B4 B5 B6 B7 Bg B9 BIO BI l B12 B13 B14 B15 B16 B17 BiS B19A B19B B19C B19D B19E B19F B190 B20 B21 B22 B23 B24 B25 B26 B27A B27B B28A B 2 8 B B29 B 3 0 A B30B B46A B31 B32 B33 B 4 6 B B34 B35 B36 B37 B46c B38 B39 B40 B41 B42 B43 B44 B45 B46D
BE47 BE48 BE49 BE50
214
MALES
All ages
123
under 4
wks. 1-5
raths. 6-11 mths.
lo ta l under l y r .
5-14 15-24 25-34 35-44 45-54
15 18
65-74 75-84 and over
* Corresponding detailed list numbers and causes of death appear on page 132.
228
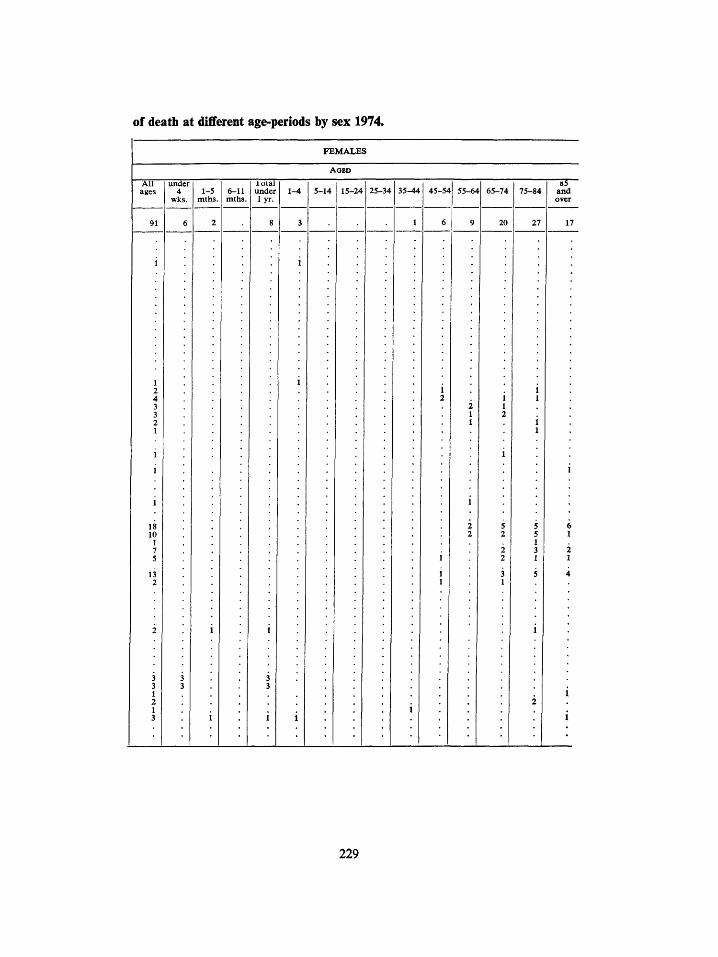
of death at different age-periods by sex 1974.
FEMALES
- « 5 ~ and over
17
All ages
91
under 4
wks. 1-5
mths. 6-11 mths.
xotal under l y r .
1-4 15-24 25-34 35^M 45-54 55-64 75-84
27
229
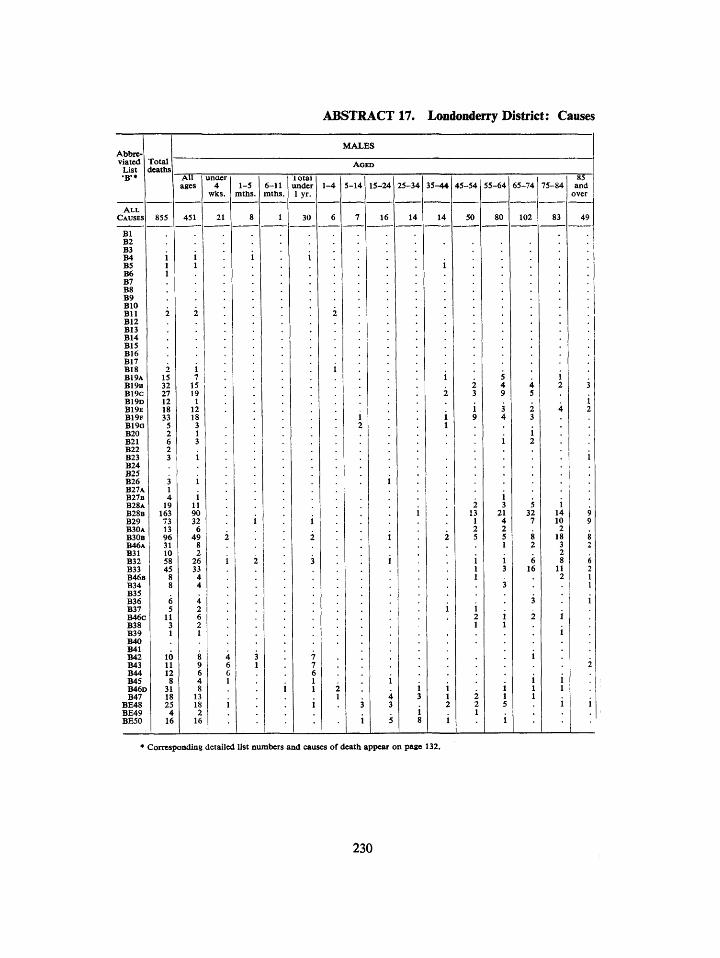
ABSTRACT 17. Londonderry District: Causes
Abbreviated
List •B'»
A L L CAUSES
Bl B2 B3 B4 B5 B6 B7 B8 B9 BIO B l l B12 B13 B14 B15 B16 B17 B18 B19A B19B B19C B 1 9 D B19E B19F B190 B20 B21 B22 B23 B24 B25 B26 B27A B27B B 2 8 A B 2 8 B B29 B30A B30B B46A B31 B32 B33 B46B B34 B35 B36 B37 B46C B38 B39 B40 B41 B42 B43 B44 B4S B46D B47
BE48 BE49 BE50
Total deaths
855
i 1 1
2
2 15 32 27 12 18 33
5 2 6 2 3
3 1 4
19 163 73 13 96 31 10 58 45
8 8
6 5
11 3 1
10 11 12 8
31 18 25
4 16
All ages
451
i 1
2
i 7 15 19
1 12 18
3 1 3
i
i i 11
90 32
6 49
8 2
26 33
4 4
4 2 6 2 1
8 9 6 4 8
13 18 2
unaei 4
wks.
21
16 1
MALES
A G E D
1-5 mtbs.
8
i
'.
i
i 2
4 3 6 1 6 1
i
• •
6-11 mths.
1
i
lotai under l y r .
30
7 7 6 1 1
i
1-4
6
2
1
2 1
5-14
7
1 2
3
i
15-241 25-34
16
i
14
i '. 1 4 3 3
35-44
14
2
i 1
2
i 1 2
1 5 ^ 1
45-54 55-64
50
J
.
(
1
80
5 > 4 1 9
L 3 ) 4
i
'. i 2 3 3 21 1 4 2 2 5 5
1
i i 1 3 1
3
i '. 2 1 1 1
'. i 2 1 2 5 1
1
85 65-74 75-84 and
102 83
'.
over
49
'. 4 2 3 5
i 2 4 2 3
i 2
5 32 1
7 1
. 8 1 2
. 6 16 1
.
3
2
i
i 1 1
i
i 4 9 J 9 2 8 8 3 2 2 8 6 1 2 2 1
1
'. i i i
'. 2
i 1
i i
* Corresponding detailed list numbers and causes of death appear on page 132.
230
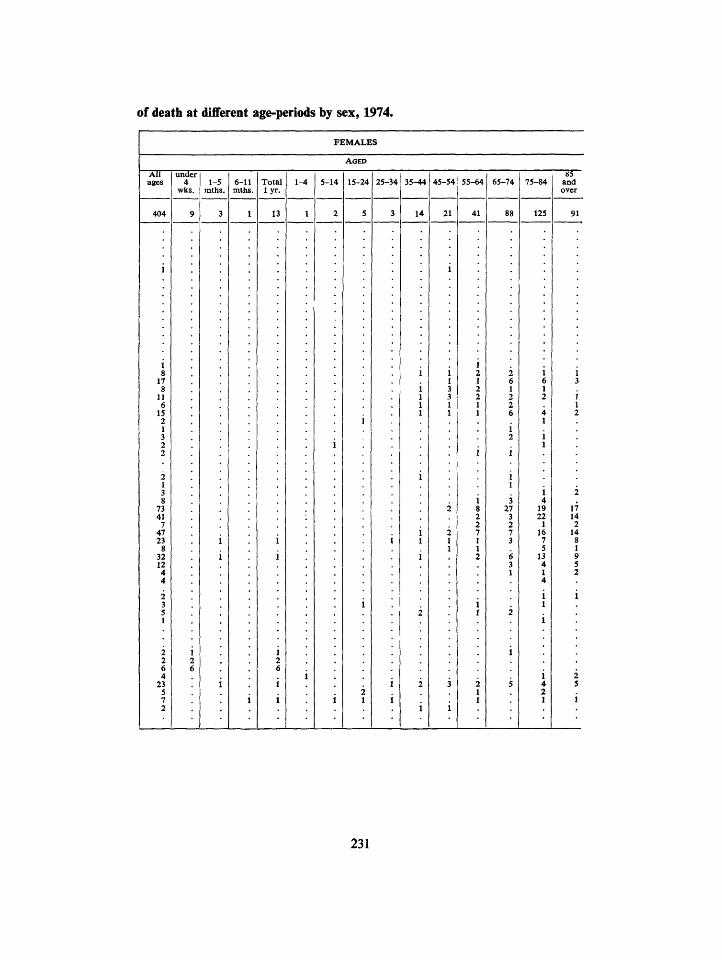
of deatli at different age-periods by sex, 1974.
FEMALES
A G E D
and over
91
Air ages
undet 4
wks. 1-5
mths. 6-11 mlhs.
Total l y r .
13
5-14 15-24 25-34 35-44
14
45-54
21
55-64 65-74
1 1
3 27
3 2 7 3
6 3 1
75-84
125
1 4
19 22
1 16 7 5
13 4 1 4 i 1
231
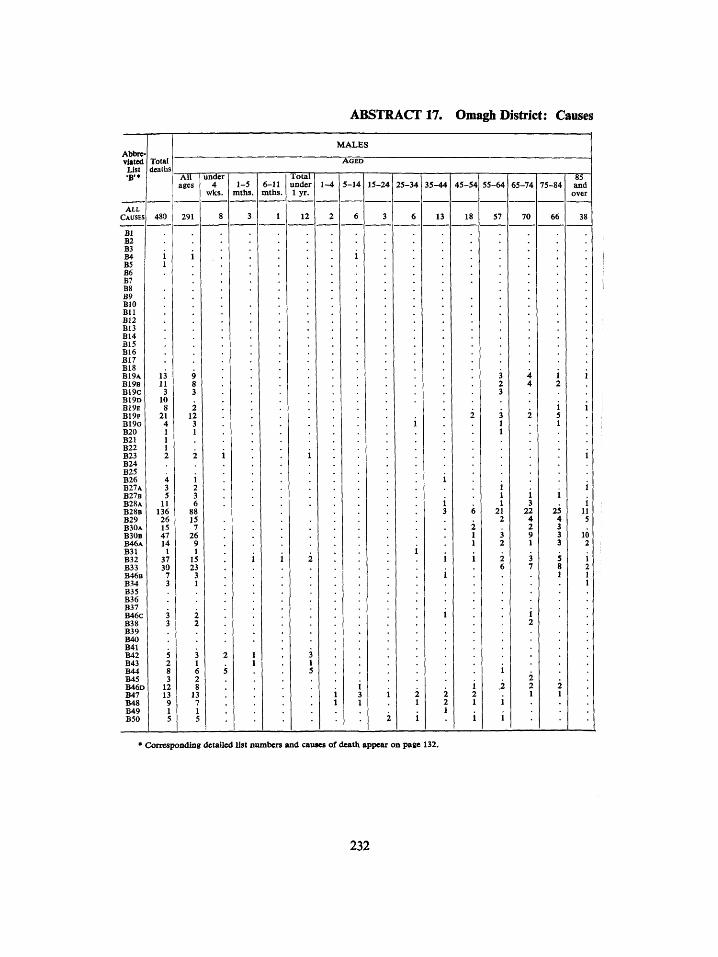
ABSTRACT 17. Omagh District: Causes
Abbreviated
List •B'»
Total deaths
MALES
All ages
under 4
wks. 1-5
mths . 6-11 mths.
Total under l y r .
5-14 15-24 25-34 35-44 45-54 55-64 65-74 85~ and
over
ALL CAUSES 480 291 12 18 66 38
Bl B2 B3 B4 B5 B6 B7 B8 B9 BIO Bl l B12 B13 B14 B15 B16 BI7 B18 B19A B19B B19C B19D B19E B19F B19G B20 B21 B22 B23 B24 B25 B26 B 2 7 A B27B B 2 8 A B 2 8 B B29 B30A B30B B46A B31 B32 B33 B46B B34 B35 B36 B37 B46C B38 B39 B40 B41 B42 B43 B44 B45 B46D B47 B48 B49 B50
4 3 5
11 136 26 15 47 14
1 37 30
7 3
* Corresponding detailed list niunbers and causes of death appear on page 132.
232
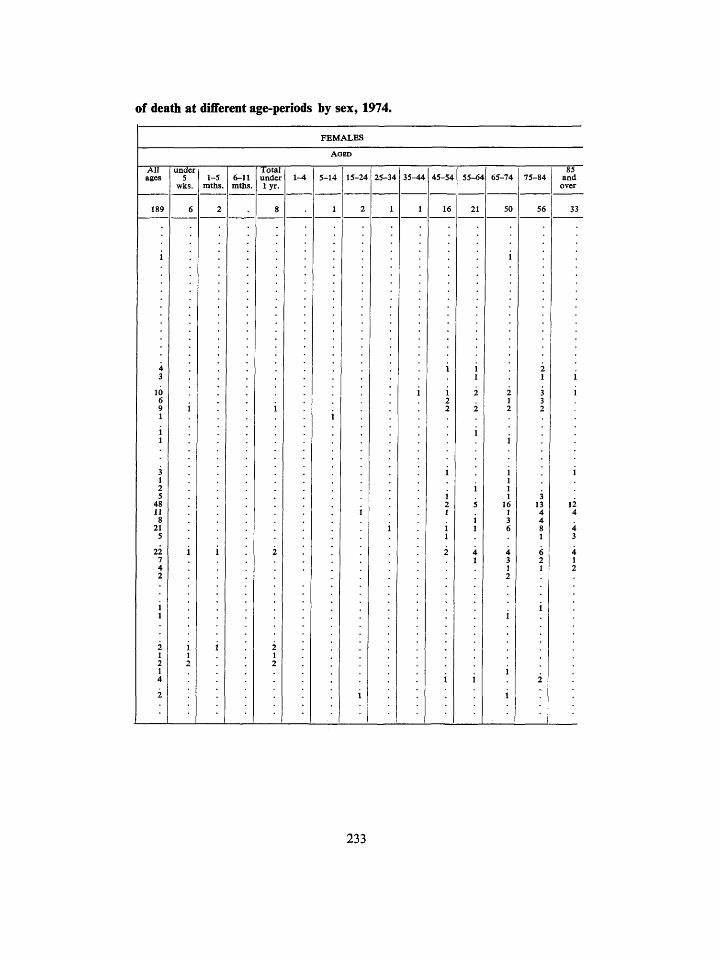
of death at different age-periods by sex, 1974.
FEMALES
Total under l y r .
3 1 2 5
48 11 8
21 5
22 7 4 2
under 5
wks. 1-5
mths. 6-11 mths.
15-24 25-34 35-44 45-54 55-64 65-74
50
75-84 85
and over
33
233
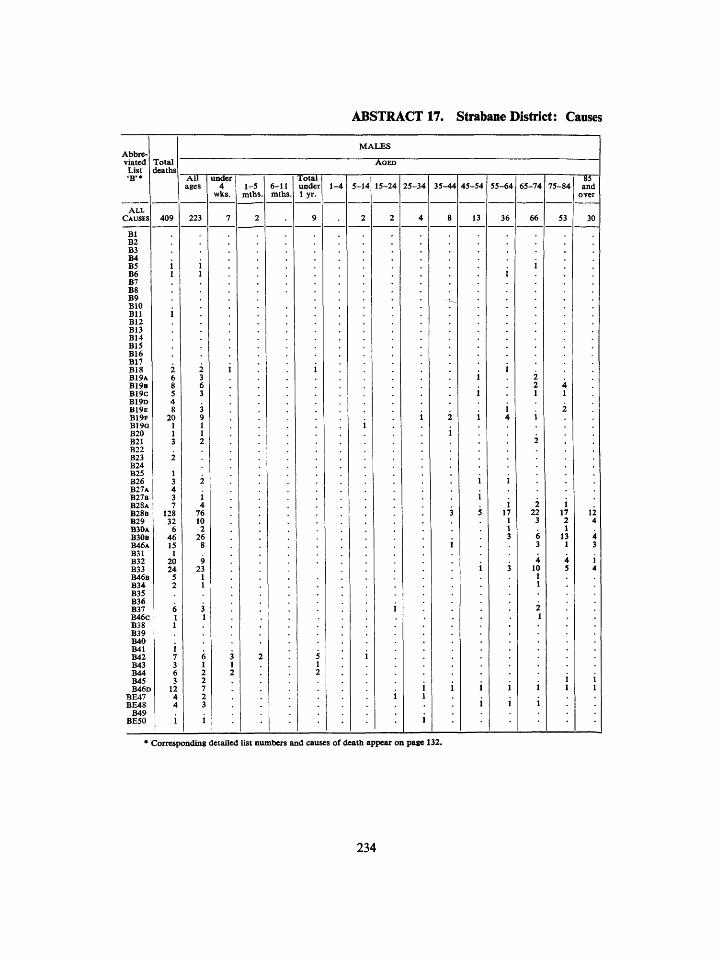
ABSTRACT 17. Strabane District: Causes
Abbreviated
List ' B ' *
A L L CAUSES
Total deaths
MALES
A G E D
All ages
under I i | Total 4 1-5 6-11 under
wks. mths . mths. 1 yr. 1-4 25-34 65-74 and
over
Bl B2 B3 B4 B5 B6 B7 B8 B9 BIO B U B12 B13 B14 B15 B16 B17 B18 B 1 9 A B 1 9 B B19c B 1 9 D B19E B19F B19Q B20 B21 B22 B23 B24 B25 B26 B 2 7 A B 2 7 B B 2 8 A B 2 8 B B29 B 3 0 A B30B B 4 6 A B31 B32 B33 B 4 6 B B34 B35 B36 B37 B46c B38 B39 B40 B41 B42 B43 B44 B45 B 4 6 D
BE47 BE48
B49 BE50
1 3 4 3 7
128 32
6 46 15
1 20 24
5 2
223 36 66 53 30
* Corresponding detailed list numbers and causes of death appear on page 132.
234
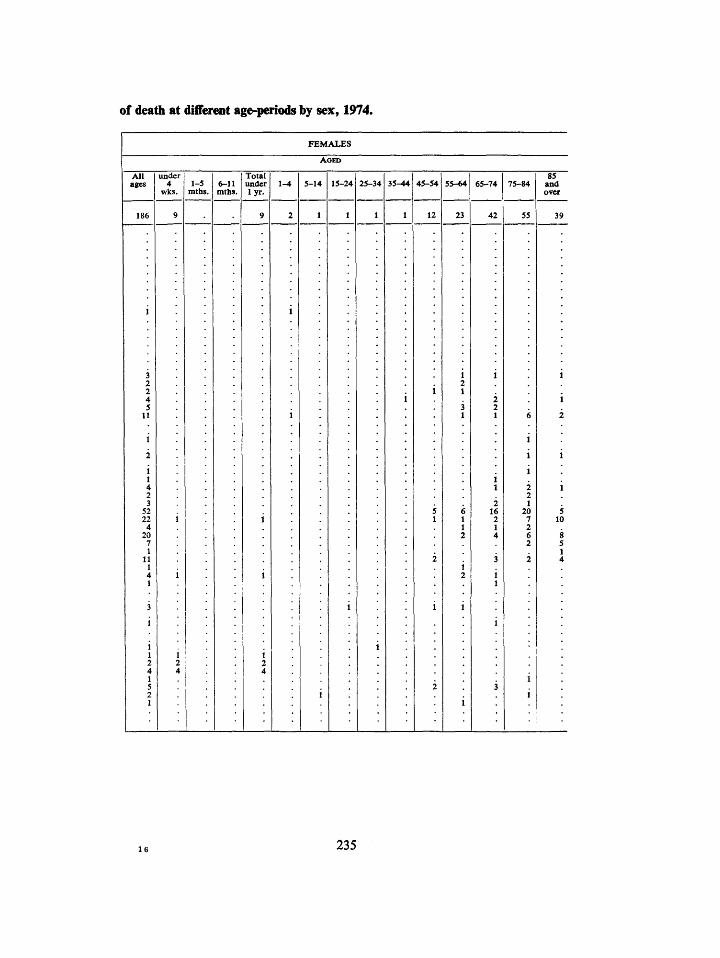
of death at differ it age^riods by sex, 1974.
FEMALES
All ages
under 4
wks. 1-5
mths. 6-11 mtbs.
Total under l y r .
1-4 5-14 35-44 45-54 55-64
23
65-74
42
75-84
55
85 and over
2 2 1
20 7 2 6 2
16 235
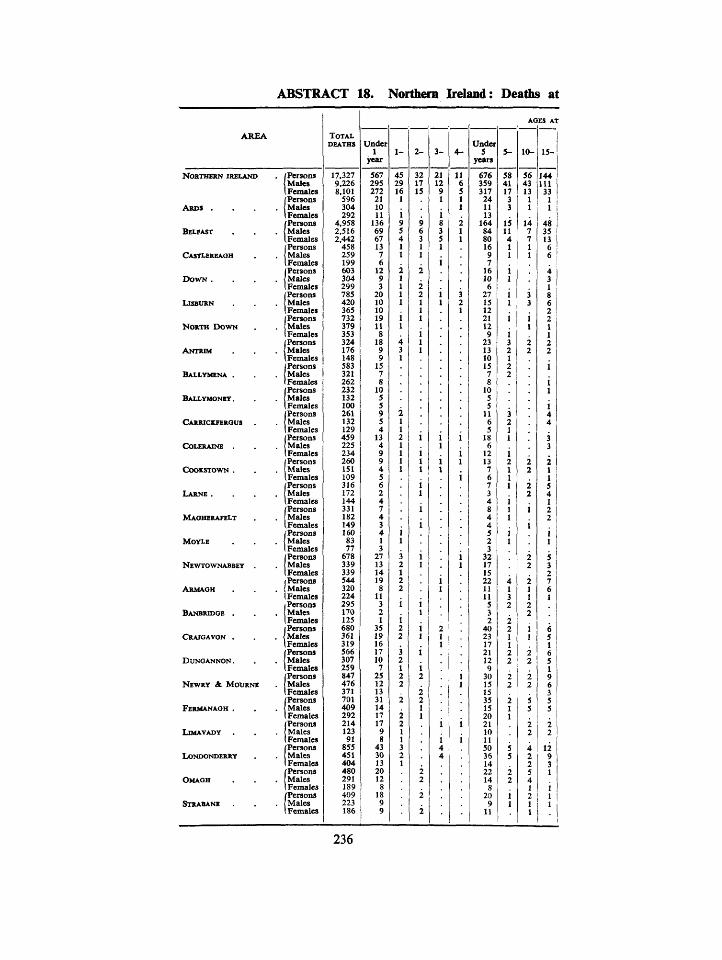
ABSTRACT 18. Northern Ireland: Deaths at
AREA
NORTHERN IRELAND
A R D S .
BELFAST
CASTLEREAOH
D O W N .
LISBURN
NORTH D O W N
ANTRIM
BALLYMENA .
BALLYMONEY.
CARRICXFEROUS
COLERAINE
COOKSTOWN .
LARNE .
MAOHERAFELT
MOYLE
NEWTOWNABBEY .
ARMAGH
BANBRIDOG .
CRAIOAVON .
D U N O A N N O N .
NEWRY & MOURNE
FERMANAOH .
LiMAVADY .
LONDONDERRY
OMAGH
STRABANE
. [Persons 1 Males [Females (Persons
. {Males I Females [Persons
. I Males (Females (Persons
. < Males [Females [Persons
. {Males (Females [Persons
. I Males (Females [Persons
. (Males 1 Females [Persons
. (Males [Females [Persons
. I Males 1 Females [Persons
. 1 Males [Females (Persons
. (Males [Females [Persons
. (Males (Females (Persons
. '.Males [Females [Persons
. (Males [Females [Persons
. J Males [Females • Persons
. Males 1 Females [Persons
. 1 Males [Females (Persons
. (Males [Females (Persons
. Males [Females [Persons
. (Males [Females [Persons
. (Males [Females [Persons
. Males [Females [Persons
. (Males [Females (Persons
. (Males [Females [Persons
. 1 Males [ Females [Persons
. {Males [Females [Persons
. j Males [Females
TOTAL DEATHS
17,327 9.226 8.101
596 304 292
4,958 2.516 2.442
458 259 199 603 304 299 785 420 365 732 379 353 324 176 148 583 321 262 232 132 100 261 132 129 459 225 234 260 151 109 316 172 144 331 182 149 160 83 77
678 339 339 544 320 224 295 170 125 680 361 319 566 307 259 847 476 371 701 409 292 214 123 91
855 451 404 480 291 189 409 223 186
Under 1
year
567 295 272
21 10 11
136 69 67 13 7 6
12 9 3
20 10 10 19 11 8
18 9 9
15 7 8
10 5 5 9 5 4
13 4 9 9 4 5 6 2 4 7 4 3 4 1 3
27 13 14 19 8
11 3 2 1
35 19 16 17 10 7
25 12 13 31 14 17 17
9 8
43 30 13 20 12 8
18 9 9
1 - 2-
45 3: 29 1' 16 1.
1
i
I
r 5
9 9 5 < 4 1 1
2 2 1 1 : 1 : 1 1
] 1 1 1
4 1 3 1 1
2 1 1 2 1 1 1 1 1 1 1 1
'. 1
• 1
]
1
3 ] 2 1 1 2 2
i 1 1
1 2 ] 2
3 1 2 1 1 2 : 2
2 :
. 2 2 1 1 3 2 1
. : '
. •
'
I
; I
I I
I
I
3 -
21 12 9 1
i 8 3 5 1
i
i 1
i 1
i 1
i 1
2 1 I
1
i 4 4
4 -
11 6 5 1 1
2 1 1
3 2 1
i i 1
i
i 1
_
i 1
Under 5
years
676 359 317
24 11 13
164 84 80 16 9 7
16 10 6
27 15 12 21 12 9
23 13 10 15 7 8
10 5 5
11 6 5
18 6
12 13 7 6 7 3 4 8 4 4 5 2 3
32 17 15 22 U U 5 3 2
40 23 17 21 12 9
30 15 15 35 15 20 21 10 11 50 36 14 22 14 8
20 9
U
5 -
58 41 17 3 3
15 11 4 1 1
i 1
i 1
i i 3 2 1 2 2
3 2
4 1 3 2
2 2 1 1 2 2
2 2
2 1 1
5 5
2 2
i 1
AGES AT
10-
56 43 13
1 1
14 7 7 1 1
3 3
i 1
2 2
2 2
2 2
i i
2 2
2 1 1 2 2
1 1
2 2
2 2
5 5
2 2
4 2 2 5 4 1 2
15-
144 111
33 1 1 i
48 1 35 ! 13 1 ^ 6
* i 3 1 8 6 2 2 1 1 2 2
i i 1
i 4 4
3 3
2 1 1 5 4 1 2 2
i 1
5 3 2 7 6 1
6 5 1 6 5 1 9 6 3 5 5
2 2
12 9 3 1
i 1 !
1 1 1 1 - I
1 1
236
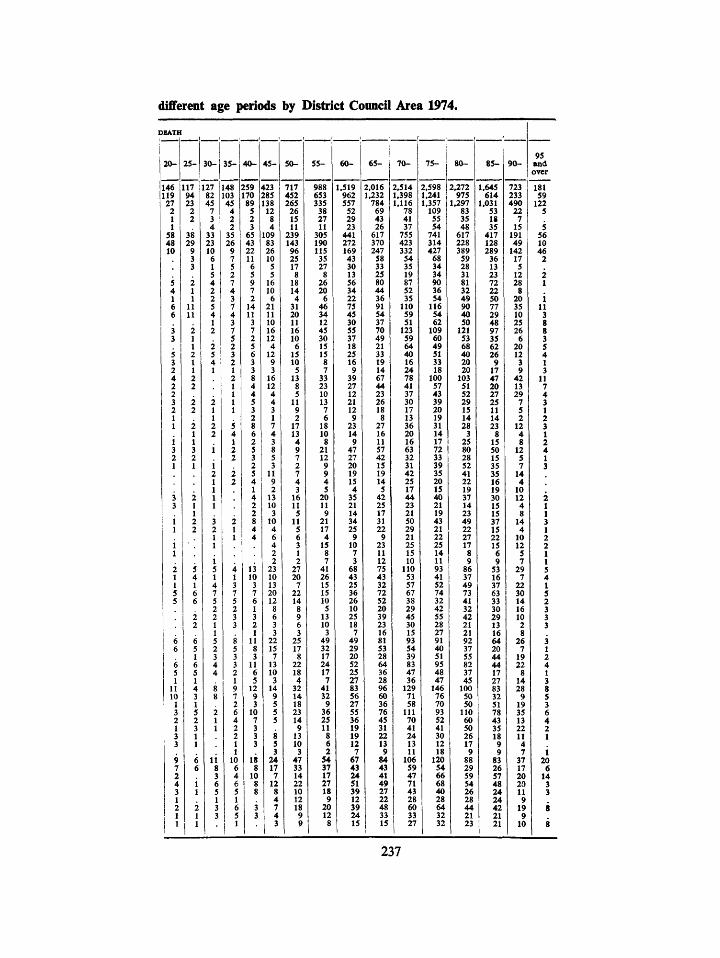
different age periods by District Council Area 1974.
i EATH
20-
146 119 27 2 1 1 58 48 10
5 4 1 6 6
3 3
5 3 2 4 2 2 3 2 1 1
i 3 2 1
3 3
i 1
i 1 2 1 1 5 5
1 6 6
6 5 1 11 10 1 3 2 1 3 3
9 7 2 4 3 1 2 1 1
1
25-
117 94 23 2 2
38 29 9 3 3
2 1 1 11 11
2 1 1 2 1 1 2 2
2 2
2 1 1 3 2 1
2 1 1 2 2
5 4 1 6 6
2 2
6 5 1 6 5 1 4 3 1 5 2 3 1 1
6 6
i 1 2 1
'
30-
127 82 45 7 3 4 33 23 10 6 1 5 4 2 2 5 4 1 2
2 5 4 1
2 1 1 2 2
i i 2 1 1 1 1
3 2 1 1
i 5 1 4 7 5 2 2 1 1 5 2 3 4 4
8 8
2 1 1
li 8 3 6 5 1 3 3
35-
148 103 45 4 2 2 35 26 9 7 5 2 7 4 3 7 4 3 7 5 2 3 2 1 2 1 1 1 1
5 4 1 2 2
2 2
2 1 1
4 1 3 7 5 2 3 3
8 5 3 3 2 1 9 7 2 6 4 2 2 1 1 10 6 4 6 5 1 6 5
'
40-
Z59 170 89 5 2 3 65 43 22 11 6 5 9 7 2 14 11 3 7 2 5 6 3 3 8 4 4 5 3 2 8 6 2 5 3 2 5 4 1 4 2 2 8 4 4
13 10 3 7 6 1 3 2 1 11 8 3 11 6 5 12 9 3 10 7 3 3 3
18 8 10 8 8
3 3
45-
423 285 138 12 8 4
109 83 26 10 5 5 16 10 6 21 11 10 16 12 4 12 9 3 16 12 4 4 3 1 7 4 3 8 5 3 11 9 2 13 10 3 10 4 6 4 2 2 23 10 13 20 12 8 6 3 3 22 15 7 13 10 3 14 9 5 5 5
8 5 3 24 17 7 12 8 4 7 4 3
50-
717 452 265 26 15 11 239 143 96 25 17 8 18 14 4 31 20 11 16 10 6 15 10 5 13 8 5 11 9 2 17 13 4 9 7 2 7 4 3 16 11 5 11 5 6 3 1 2 27 20 7 22 14 8 9 6 3 25 17 8 22 18 4 32 14 18 23 14 9 13 10 3 47 33 14 22 10 12 18 9 9
55-
988 653 335 38 27 11 305 190 115 35 27 8 26 20 6 46 34 12 45 30 15 15 8 7 33 23 10 13 7 6 18 10 8 21 12 9 9 4 5 20 11 9 21 17 4 15 8 7 41 26 15 15 10 5 13 10 3 49 32 17 24 17 7 41 32 9 36 25 11 8 6 2 54 37 17 27 18 9 20 12 8
60-
1,519 962 557 52 29 23 441 272 169 43 30 13 56 34 22 75 45 30 55 37 18 25 16 9 39 27 12 21 12 9 23 14 9 47 27 20 19 15 4 35 21 14 34 25 9 10 7 3 68 43 25 36 26 10 25 18 7 49 29 20 52 25 27 83 56 27 55 36 19 19 12 7 67 43 24 51 39 12 39 24 15
65-
2,016 1.232 784 69 43 26 617 370 247 58 33 25 80 44 36 91 54 37 70 49 21 33 19 14 67 44 23 26 18 8 27 16 11 57 42 15 19 14 5 42 25 17 31 22 9 23 11 12 75 43 32 72 52 20 39 23 16 81 53 28 64 36 28 96 60 36 76 45 31 22 13 9 84 43 41 49 27 22 48 33 15
f
70-
2,514 1,398 1,116 78 41 37 755 423 332 54 35 19 87 52 35 110 59 51 123 59 64 40 16 24 78 41 37 30 17 13 36 20 16 63 32 31 42 25 17 44 23 21 50 29 21 25 15 10 110 53 57 67 38 29 45 30 15 93 54 39 83 47 36 129 71 58 111 70 41 24 13 11 106 59 47 71 43 28 60 33 27
75-
2,598 1,241 1,357 109 55 54 741 314 427 68 34 34 90 36 54 116 54 62 109 60 49 51 33 18 100 57 43 39 20 19 31 14 17 72 33 39 35 20 15 40 21 19 43 21 22 25 14 11 93 41 52 74 32 42 55 28 27 91 40 51 95 48 47 146 76 70 93 52 41 30 12 18 120 54 66 68 40 28 64 32 32
80-
2,272 975
1,297 83 35 48 617 228 389 59 28 31 81 32 49 90 40 50 121 53 68 40 20 20 103 51 52 29 15 14 28 3 25 80 28 52 41 22 19 37 14 23 49 22 27 17 8 9 86 37 49 73 41 32 42 21 21 92 37 55 82 37 45 100 50 50 110 60 50 26 17 9 88 29 59 54 26 28 44 21 23
85-
1,645 614
1,031 53 18 35 417 128 289 36 13 23 72 22 50 77 29 48 97 35 62 26 9 17 47 20 27 25 11 14 23 8 15 50 15 35 35 16 19 30 15 15 37 15 22 15 6 9 53 16 37 63 33 30 29 13 16 64 20 44 44 17 27 83 32 51 78 43 35 18 9 9 83 26 57 48 24 24 42 21 21
90-
723 233 490 22 7 15 191 49 142 17 5 12 28 8 20 35 10 25 26 6 20 12 3 9 42 13 29 7 5 2 12 4 8 12 5 7 14 4 10 12 4 8 14 4 10 12 5 7 29 7 22 30 14 16 10 2 8 26 7 19 22 8 14 28 9 19 35 13 22 11 4 7 37 17 20 20 11 9 19 9 10
95 and over
181 59 122 5
5 56 10 46 2
2 1
i 11 3 8 8 3 5 4 1 3 11 7 4 3 1 2 3 1 2 4 1 3
2 1 1 3 1 2 2 1 1 5 4 1 5 2 3 3 3
3 1 2 4 1 3 8 5 3 6 4 2 1
i 20 6 14 3 3
8
8
237
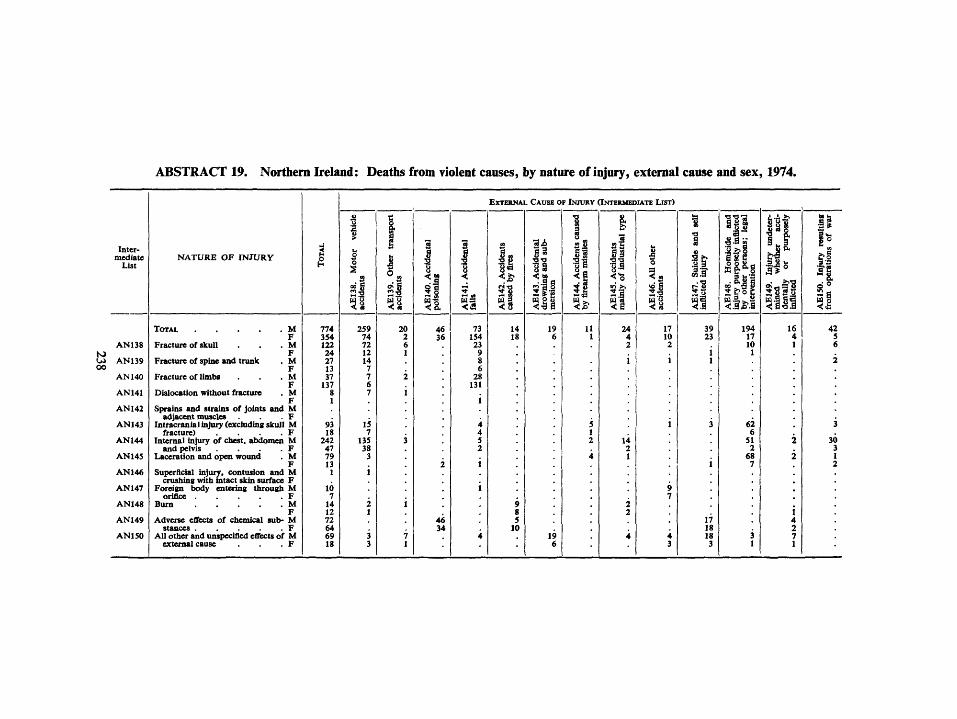
ABSTRACT 19. Northern Ireland: Deaths from violent causes, by nature of injury, external cause and sex, 1974.
Intermediate
List
AN138 N> U> ANI39 OO
AN140
AN141
AN142
AN143
AN144
ANUS
AN146
AN147
AN148
AN149
AN150
NATURE OF INJURY
TOTAL
Fracture of skull
Fracture of spine and trunk
Fracture of limbs
Dislocation without fracture
Sprains and strains of joints and adjacent muscles
Intracranial injury (excluding skull fracture) . . . .
Internal injury of chest, abdomen and pelvis . . . .
Laceration and open wound
Superficial injury, contusion and crushing with intact skin surface
Foreign body entering through orifice
Burn
Adverse effects of chemical substances . . . . .
All other and unspecified effects of external cause
774 354 122 24 27 13 37 137 8 1
93 18
242 47 79 13 1
10 7 14 12 72 64 69 18
EXTERNAL CAUSE OF INJURY (INTERMEDIATE LIST)
259 74 72 12 14 7 7 6 7
15 7
135 38
3
2:8
8
Is 1 1
73 154 23 9 8 6
28 131
< ] ?
^i
-3i>
II %
"1^
194 17 10 1
!l si
42 5 6

ABSTRACT 20. Northern Ireland: Deaths from (a) by place of occurrence
Age-groups TOTAL
M F
Home
M 1 F Fann
M F
Industrial place and premises
M F
Other specified
places
M F
Place unspecified
M j F
While worldng
M F
E8SO-869: Accidental poisoning by solid and liquid substances
All ages 0— . 5—
15— . 45— 65— 75 and over
23
1 12
8 2
27 1
14 8 1 3
14
E870-877: Accidental poisoning by gases and vapours
All ages 0— 5— .
15— 45— 65— . 75 and over
23 2 2 3 8 7 1
9 2
2 1
4
20 2 2 2 7 6 1
9 2
2 1
4
1 1 . . 1
.
. •1
2
i 1
1
1
E880-887: Accidental falls
All ages 0— 5—
15— . 45— . 65— . 75 and over
73 2
15 16 11 29
154 2 3 2
13 10
124
39 2
6 8 6
17
105 2 1 1 7 8
86
4
1 3
6
3 2 1
•
17
3 3 4 7
30
2 1 4 2
21
7
2
5
19
2
17
13
E890-899: Accidents caused by fire and flames
All ages 0— . 5— .
15— . 45— 65— 75 and over
14 3 1 2 2 1 5
18 3 I 4 1 5 4
14 3 1 2 2 1 5
18 3 1 4 1 5 4
!
. 1
E910: Accidental drowning and submersion
All ages 0— . 5—
15— . 45— . 65— 75 and over
19 2 2 3 7 2 3
6 8 1
2 3 1 1
5 1 1
2 1
11 1 2 1 4 1 2
1
1
1
i
E911-912: Inhalation and ingestion of food and other objects causing obstruction and suffocation
All ages 0— . 5— .
15— . 45— . 65— 75 and over •
9 2
3 4
6 5
240
non-transport accidents (£850-929) by age and sex, (b) while working, 1974.
E913: Accidental mechanical suffocation in bed and cradle and other circumstances
All ages 0— 5— .
15— . 4 5 — 65— 75 and over
2 1
i
3 2
. i 1
1 1
2 2
1
i . 1
1
i
1
1
E916: Blow from falling object
All ages 0— 5—
15— 45— 65— 75 and over
E922: Accident caused by firearm
All ages 0— 5—
15— . 45— 65— 75 and over
11 1 1 7 2
1
i
6 1 1 3 1
E925, 927. 928: Accident caused by machinery and electric current
All ages 0— 5— .
15— 45— . 65— 75 and over
5
3 2
1
i
Remainder E850-929: Other and unspecified accidents
All ages 0— . 5— .
15— 45— 65— . 75 and over
23 3 1
14 3 2
3
2
1
13 2 1 9
i
3
2
i
3
2 1
4
4
1
1
2 1
•
1 { . 1 • 1
5
2 2 1
E850-929: Total non-transport accidents
All ages 0— . 5— .
15— . 45— . 65— . 75 and over .
204 16
8 63 54 25 38
228 16 6
26 26 17
137
129 14 6
38 30 17 24
176 16 4
23 19 15 99
8
2 5 1
16
10 5 1
39 1 2 9
12 6 9
33
2 3 5 2
21
1 12
1
. 4 2 1 . ]
5
19
2
17
30
16 12 2
241
ABSTRACT 21. Northern Ireland: Deaths from cancer
Detailed List
Numbers
140 141 142 143 144 145 146 147 148 149
150 151 152 153 154 155
156 157 158 159
160
161 162 163
170 171 172 173 174
180 181 182 183
184
185 186 187
188 189
190 191 192 193 194 195 196
197
198 199
200
202 203 208 209
SITES
Buccal cavity and pharynx
Other and unspecified parts of mouth
Nasopharynx . . . .
Pharynx, unspecified
Digestive organs and peritoneum Oesphagus . . . . •
Small intestine, including duodenum . Large intestine, except rectum . Rectum and rectosigmoid junction Liver and intrahepatic bile ducts,
Gallbladder and bile ducts Pancreas . . . . . Peritoneum and retroperitoneal tissue Unspecified digestive organs
Respiratory system Nose, nasal cavities, middle ear and
Larynx . . . . . . Trachea, bronchus and lung Other and unspecified respiratory
Bone, connective tissue, skin and breast
Connective and other soft tissue
Skin (other than melanoma)
Genito-urinary organs Cervix uteri
Other parts of uterus Ovary, fallopian tube, and broad
ligament . . . . . Other and unspecified female genital
Testis Other and unspecified male genital
organs . . . . .
Other and unspecified urinary organs
Other and unspecified sites
Other parts of nervous system .
Ill-defined sites . . . . Lymph nodes (secondary and un-
Respiratory and digestive systems (secondary) . . . .
Lymphatic and haematopoietic tissue Lymphosarcoma and reticulumcell
Multiple myeloma . . . . Polycythaemia vera
TOTAL
•s <
M
1
1
1 6 1 b 4
i
1 14
3 2
1
3 1
2
1
1
51
F
•
4 i
9 4
i
b
2
5
4
4
i 1
2
1
2
1
1 1
54
^
1 m
M
1
F
1
1 i 1
IJ 47
36 32
3 5
25
i
4 190
5
4
2 2 1
36 1
14 9
5 1 1
1
7 1 b
2 1 4
469
i 1
10 40
61 18
5 17 5 2
i 38
3
2 2
81
8
11
19
9 3
4 3 4
4
3 1
10
4 2 1
382
•a S
1 u M
1 9
4 3
1
3
19
4
3
1
1
2
52
F
1 2
5 1
2 1
2
9
3
1
2
1 1
1
2
1
36
) Q
M
1
6
2 3
3
10
1
4
3 4
1 1
1
1
1
1
43
F
1
1 6
5 2
5
4
1 1
1 6
1
1
4
2
1
3
1
47
a 3
3 M
2 4
9 3
1 3 1
24
i
3 1
1 1 2
2
2
1
1
2 1
66
F
8
12 2
1
1 5
i li
1
1
1
1
1
1
1
50
Q
o ?
M
10
9 4
S
20
2
7
1 1
59
F
13
11 3
2 3 1
5
14
2
I
5
1
2
1
i 2 1
1
1
70
* Excluding Hodgkin's disease and leukaemia (201,203-207). Deaths from these diseases will be found in Abstract 17.
242
in each of the District Council Areas by sex and te 1974.
E •c
c <
M j F
1
1
<
i <
i
I
2
4
3 2
2
1
1
28
0
1
P
M
2
i
1
5
7 3
1 1
i
17
6
i i 1
2
3
54
1
i
F
1
2 3
A 2
1 3 1
1
1
4
1
I
(
5
» t c c £
0
M
1 1
2 2
(
1
1
1
1
> 3 )
F
1
1
i 5 1
1
i
3
1
1
\
3
i
43 1 19 1 20
1
s
1 B
c M
i
i
3
1
8
2
2
2
1
1
22
! 1
i
i ) F
2 3
3
1
3
1 1 5
1
2
1
•
1 1
i
1
27
<
1
M
1 2
1 1
1
I 17
1
3
1 1
i
1 1
33
i i >
F
1
3
6 3
1
5
4
i 6
1
1
1
i 1
1
i
i
38
e 2 tA
o U
M F
1
9
2 2
• 2
3
2
2
1
1
2
2
4
i
2
3
i
< 1 e
M
4
1 6
3
li
1
1
2
2
1
, ;
28 1 13 ! 33
1
i
F
1
1 2
2 1
1
4 1
i
<
1
1
1
]
1
_
27
1 M F
2 3
3 1
i
• r
5
I
I
I
i
I
31
3
3
1
J e
1
18
Detailed list
Numbers
140 141 142 143 144 145 146 147 148 149
150 151 152 153 154
155 156 157 158 159
160 161 162
163
170 171 172 173 174
180 181 182
183
184 185 186
187 188 189
190 191 192 193 194 195
196
197 198 199
200 202 203 208 209
243
Detailed List
Numbers
140 141 142 143 144 145 146 147 148 149
150 151 152 153 154 155
156 157 158 159
160
161 162 163
170 171 172 173 174
180 181 182 183
184
185 186 187
188 189
190 191 192 193 194 195 196
197
198 199
200
202 203 208 209
A B S T R A C T 2 1 (continued)
SITES
Buccal cavity and pharynx
Other and unspecified parts of mouth
Digestive organs and peritoneum
Small intestine, including duodenum . Large intestine, except rectum . Rectum and rectosigmoid junction . Liver and intrahepatic bUe ducts.
Peritoneum and retroperitoneal tissue Unspecified digestive organs
Respiratory system Nose, nasal cavities, middle ear and
Trachea, bronchus and lung Other and unspecified respiratory
Bone, connective tissue, skin and breast
Coimective and other soft tissue
Breast . . . . . .
Genito-urinary organs Cervix uteri . .
Other parts of uterus Ovary, fallopian tube, and broad
Other and unspecified female genital
Prostate . . . . .
Other and unspecified male genital
Other and unspecified urinary organs
Other and unspecified sites
Other parts of nervous system .
Ill-defined sites . . . . Lymph nodes (secondary and unspecified . . . . Respiratory and digestive system*
(secondary) . . . .
Lymphatic and haematopoietic tissue Lymphosarcoma and reticulumcell
Lymphoid tissue (other) .
« •> c
M
2
i
3
1
1
2
. Northern Ireland: Deatiis from cancer
F
3
1
2
4
1
1
1
o
•§
0
% o Z
M 1 F
1
1 7
6 2
1
18
7
2 1
1 1 1
2
2 1
3 4
8 2
2 2
1 3
13
2
2
3
i
i
1
1
2
i TOTAL . 1 11 1 13 1 54 1 52
i c
-< M
3 3
7 6
1 3
8
3
i
2
1
F
1
2 5
3 2
1 2
5
1
4
1 1
39 1 31
c e
•z J t
a M
3
1
1 2
7
1 1
1
1
1
> [
i 1
F
5
3 2
1
1
3
2
1
1
1
19 ' 21
c c
» _j *! u
M
1
7
6 4
6
18
1
4
1 1
1
1
2
1
i
! ) !
5 F
1
1
6
7 2
3 1
4
1
1
9
1
3
1 3
2
3
1 1
a 0
§ Q
M ! F
1
2 5
5 4
3
9
I
1
1
1
55 i 51 1 33
1 1
8 3
i
'\ 4 i 1
1
•
1
1
1
1
1
i
35
"Excluding Hodgkin's disease and leakaemia (201,203-207). Deaths from these diseases will be found in Abstract 17.
244
in each of the District Council Areas by sex and site 1974.
•a
li Is
M j F
1 •
1
1
3 14
7 5
1
i i 21
1
1
1 » i i 1 . i •
i • 14
3 1
1
1 1 1
1 * 3
1
: 1 1
1
4 8
5 3
1 2
2 6
10
3
3
1 1
2
1
2
2
1
•a § c &
M
1
3 9
5 2
2 2 5
1 12
1
9
3 1
i
2
2
3
1
1 87 1 58 1 65
1
4
r '
4<
>> at
> § 1^
~ M 1
1
1
5 i : 2
I 1 :
. I 1
L 3
2
* 1
1
1
L 3
2 2
i
1
i
I
• 1 5 1 18 1 1
fc e o •o
3 •a s o
' M 1 F M 1
i
2 7 1 8
( 6
1 4 2
J 19
i
1
} 1
10
2 I
1 3
1
1
i
1
1.
' i
1
5 1 72 1 6
1
•
2 1 9
5 5 : I 3 1
I i 2 <
i 3
I [ I 1(
z . : I . :
1
I 1
1 1
2
2 4
2
2 1 1
i 5 34 1 3
1
F
o
•2
M
1
_
t
3
5 1
2
3
1
) ) >
2
I
2
i
3
i
1
3
E 11 £« Zi;
F M 1 F
1 6 4 1
2 1 1 2 6 4
! 39 3 179
2 146 99
7 13 77 3 2
1 10
2 476
i
24 1 2
6
15 1 7
I 5 t 2
I
I
2
I 139 5
2 46 27
3 I 27 1 6 2 2
3 I 14
2
1 31 2
27
11 6
1 16 1 4
7 1491
1 4 1
i 3 1 4
32 146
206 62
2 20 65 9 3
2 8
105
3
4 4 7 6
251
35
38
68
18
19 20
2 18 8 14 2 14
2
22 1
35
11 5 13 1 2
1299
Detailed List
Numbers
140 141 142 143 144 145 146 147 148 149
150 151 152 153 154
155 156 157 158 159
160 161 162
163
170 171 172 173 174
180 181 182
183
184 185 186
187 188 189
190 191 192 193 194 195
196
197 198 199
200 202 203 208 209
245
ABSTRACT 22. Northern Irdand: Deaths of all diildren under one year in each District Coimcil area 1974.
AREA
Northern Ireland
Ards .
Belfast
Castlereagh
Down
Lisburn
North Down
Antrim
Ballymena .
Ballymoney
Carrickfergus
Coleraine
Cookstown .
Lame
Magherafelt
Moyle
Newtownabbcy
Armagh
Banbridge .
Craigavon
Dungannon
Newry & Moume
Fermanagh .
Limavady .
Londonderry
Omagh
Strabane
[Persons (Males (.Females j Persons (Males I Females [Persons (Males (Females (Persons (Males (Females [Persons {Males (Females [Persons (Males (Females [Pa-sons (Males (Females [Persons (Males (Females (Persons (Males (Females [Persons (Males (Females [Persons (Males (Females [Persons (Males (Females [Persons (Males (Females (Persons Males
(Females [Persons (Males (Females [Persons Males
(Females [Persons < Males (Females [Persons j Males (Females [Persons (Males (Females [Persons (Males (Females (Persons (Males (Females (Persons Males
1 Females (Persons j Males (Females (Persons (Males (Females [Persons (Males (Females [Persons (Males (Females [Persons 1 Males (Females
Total
567 295 272
21 10
n 136 69 67 13 7 6
12 9 3
20 10 10 19 11 8
18 9 9
15 7 8
10 5 5 9 5 4
13 4 9 9 4 5 6 2 4 7 4 3 4 1 3
27 13 14 19 8
11 3 2 1
35 19 16 17 10 7
25 12 13 31 14 17 17 9 8
43 30 13 20 12
8 18 9 9
under f day
167 89 78
5 2 3
43 24 19 6 3 3 2 1 1 4 2 2 6 3 3 4 2 2 5 3 2 4 3 1
6 1 5 3 1 2
2 1 1
8 4 4 2
2 1
i 12
7 5 3 2 1 5 4 1 8 5 3 7 4 3
16 10
6 5 3 2
10 4 6
1-6 days
155 74 81
7 5 2
35 16 19 4 1 3 1 1
6 5 1 3 2 1 8 4 4 5 2 3 2
2 4 2 2 5 2 3 2 1 1 3 1 2 2 2
i 1
8 3 5 5 2 3
5 2 3 3 2 1
10 3 7
10 3 7 4 1 3
11 8 3 6 3 3 5 2 3
1-3 wks.
53 28 25
2
2 10 6 4 2 2
4
4 wki
4" 2f 15
' c i A
' ] 1
'
' i
<
2 i. mths
1 35 J 21 > 14 I 2
1 1
) 9 1 6 i 3
1 1
1 2 2
2
2 3 3
i
1
i
I '.
'. '. .
i i
) i I 1
1
2 '.
.
. 2 1 1
> 1
( i 1 J I
2
2 I 2 t 1
1 I 4
4
i t 1
3 mths
31 14 17
7 3 4
2 1 1 2
2
i
i 1
i i
i 1
i i
6 5 1 1 1
i i 2 1 1
3 1 2 2
2
4 mths
18 9 9
4 1 3
i i
i 1
i 1
i i 1
i 1
i
i 1
i 1
3 2 1 1 1
i 1
5 mtl
r i:
4
( ;
1 ]
1 ]
] 1
]
] 1
1
1
]
] ]
6 IS mtl
' i:
< > ( 1
]
> : :
i
1 1
]
1
1
]
I
i
7 IS mtl
>. 1
> ( > ; 1
: .
I I
I
'
8 lis mths
7 > 4 i 3
.
. 3
i 2 1
]
1
i 1
1 1
I I
8
]
1
9 mths
4 1 3
3 1 2
10 mths
5 1 4 1 1
i i
i i
11 mths
5 2 3
i 1
i i 1 1
246
ABSTRACT 23. N(»rthern Ireland: Deaths of Illegitimate children under one year in each District Council area 1974.
Total under 1 day
1-6 days
1-3 wks.
4 wks.
2 mths
3 mths
4 mths
5 mths
6 mths
7 mths mths
9 mths
10 mths
11 mtlu
247
ABSTRACT 24. Northern Ireland: Infant
Detailed List
CAUSES OF DEATH
All causes /M IF
Diarrhoeal disease /M IF
Tuberculosis of meninges and central nervous/M system \ F
Tuberculosis of intestines, peritoneum andrM mesenteric glands iF
Other tuberculous diseases . . . . /M \F
Diphtheria /M IF
Whooping cough /M IF
Scarlet fever /M IF
Meningococcal infection . ./M IF
Acute poliomyelitis /M IF
Measles /M IF
Syphilis /M IF
Mental retardation . . . . /M IF
Meningitis /M IF
Bronchitis /M IF
Influenza /M IF
Pneumonia /M IF
Anencephalus /M IF
Spina bifida with hydrocephalus . /M IF
Spina bifida without hydrocephalus. . ./M IF
Congenital hydrocephalus . . ./M IF
Other congenital anomalies of nervous system . /M IF
Congenital anomalies of eye . . ./M IF
Congenital anomalies of ear, face and neck . /M IF
Congenital anomalies of heart . . /M IF
Other congenital anomalies of circulatory /M system '•F
Total deaths
295 272
DAYS
under 1
day
Total under
1 week
009
013
014
010-012. 015-019
032
033
034.1
036
040-043
055
090-097
310-315
320
466.0. 490-491
470-474
480-486
740
741.0
741.9
742
743
744
745
746
747
248
mortality by cause, age and sex, 1974. CC >M \uV H\
WEEKS
2-
Total under
4 weeks
191 184
MONTHS
7-
Mortak^ rate per 10.000 live
births
^ '
Deaths of illegitimate infants
No.
Rate per 10,000
illegitimate live births
153 121
Mx 010-012. F / 015-019
14
Detailed List
009
013
014
032
033
034.1
036
U\ 040-043 F.
055
M\ 090-097 F
M\ 310-315 F
M\ 466.0. F / 490-491
Ml 470-474 F
M\ 480-486 F.
M\ F /
M\ F /
M\ F /
M^ F /
740
741.0
741.9
742
743
744
745
746
747
249
ABSTRACT 24 (continued). Northern Ireland:
Detailed List
748
749
750
751
752
753
754
755
756
757
758
759
760
761
762
763
764
765
766
767
768
769
770
771
772
773
CAUSES OF DEATH
Congenital anomalies of respiratory system ./M IF
Cleft palate and cleft Up ./M IF
Other congenital anomalies of upper alimentaty rM tract IF
Other congoiital anomalies of digestive system /M IF
Congenital anomalies of genital organs
Congenital anomalies of urinary system
./M IF
Clubfoot (congenital) rM IF
Other congenital anomalies of limbs . rM IF
Other congenital anomalies of musculoskeletal/M system
Congenital anomalies of sUn, hair and nails ./M
Other and unspecified congenital anomalies . rM i r
fM IF
rM IF
Congenital syndromes affecting multiple systems rM IF
Chronic circulatory and genito-urinary diseases/M in mother IF
Other maternal conditions unrelated to preg-rM nancy IF
Toxaemia of pregnancy ./M IF
Maternal ante- and intrapartum infection . rM IF
i.f] organs or tissues . . . .IF
Difficult labour with abnormality of bones,rM
•{I Difficult labour with disproportion, but no men-/M tion of abnormality of pelvis
Difficult labour with malposition of foetus
Total deaths
Difficult labour with abnormality of forces of rM labour IF j
Difficult labour with other and unspecified com-/M | plications IF
Other complications of pregnancy and childbirth rM IF
Conditions of placenta rM IF
Conditions of umbilical cord
Birth injury without mention of cause . . rM IF
Termination of pregnancy . . . . rM IF
./M IF
DAYS
under 1
day
Total under
1 week
250
Infant mortality by cause, age and sex, 1974.
WEEKS
1-
i
1
1 1
2 -
1
3 -
1
1
Total under
4 weeks
1 1
2 1
1 1
2
1
.
2 3
4 1
3 2
1
1
3
2 1
2 3
5 5
3
1 -
1
2
2
2 -
1
1
3 - 4 -
Mo
5 -
NTHS
6 - 7 - 8 - 9 - 10-
1
11-
Mortality rate per 10,000
live births
1 1
1 1
2 1
3
i
i
1 2
3 1
2 1
i 1
2
1 1
1 2
5 3
2
Deaths of ' illegitimate infants
No .
Rate per 10.000
illegitimate live births
13
\
Detailed List
M \ 748 F /
M\ 749 F /
Ml 750 F /
Ml 751 F J
M \ 752 F /
M l 753 F /
M \ 754 F /
M\ 755 F /
M \ 756 F /
M-> 757 F ; M \ 758 F /
M l 759 F ; M» 760 F /
M \ 761 F /
M» 762 F /
Ml 763 F /
M \ 764 F /
M \ 765 F /
M \ 766 F /
M l 767 F /
Ml 768 F ; M \ 769 F /
M \ 770 F >
Mx 771 F ; M-i 772 F ; M \ 773
17 251
ABSTRACT 24 (con/iffue^. Norflieni Ireland:
Detailed List
774
775
776
777
778
Ron. 000-796
E904
E911-912
E913
Rem. E80O-999
CAUSES OF DEATH
Haemolytic disease of newborn with kemictenu/M IF
Haemolytic disease of newborn without lcemic-/M
Anoxic and hypoxic conditions not elsewhererM
Immaturity, unqualified . /M IF
Other conditions of foetus or newborn . /M \F
IF
Hunger, thirst, exposure and neglect . /M IF
Inhalation and ingestion of food, etc. causins/M obstruction or suffocation . . . .IF
Accidental mechanical suffocation . ./M IF
IF
Total deaths
2 2
48 42
63 45
1 3
41 40
1
2 2
1 2
1 2
DAYS
imder 1
day
1
18 16
44 27
1
4 5
1
1
1-
2
14 9
13 13
2
3 7
2-
1
7 9
1 1
1
4 2
3 -
1 1
2 1
3 2
4 -
1 1
i
2
5- 6-
1 1
1
1
Toul under
1 week
2 2
42 37
61 43
1 3
17 16
1
1
252
Infant mortality by cau^, age and sex, 1974.
WEEKS
1-
1 1
1 1
1 1
1
2 -
i 1 1
1
3 -
3 1
Total under
4 weeks
2 2
43 40
63 45
1 3
22 18
1
I
1
1-
4 2
4 4
^
5 2
3 -
7
4 -
1 2
MONTHS
5 -
2 1
6-
2 3
1
7 - 8 -
3 1
9 -
1
10-
2
n-
1
1 1
Mortality rate per 10.000
live births
1 1
34 31
45 34
1 2
32 33
1
1 1
1 1
1 1
Deaths of Ulegitintttc infanu
No .
2 2
5 2
2
1
Rate per 10,000
illegitimate live births
27 34
69 34
34
13
Detailed List
M» 774 F /
M-> 775 F ) M-i 776 F ;
Ml 777 F / M-, 778 F ;
M \ Rem. F / 000-796
M l E904 F ;
MxE911-912 F /
M . E913 F /
M \ Rem. F / E800-999
'253
ABSTRACT 25. Northern Ireland: Infant mortality by cause, sex and month of registration, 1974.
Detailed List CAUSES OF DEATH
009
013
014
010-012. 015-019
032
033
034.1
036
040-043
055
090-097
310-315
320
466.0, 490-491 470-474
480-486
740
741.0
741.9
742
743
744
745
746
747
748
749
750
751
752
753
754
755
756
757
758
759
Diatrhoeal disease
Tuberculosis of meninges and central nervous system
Tuberculosis of intestines, peritoneum and mesenteric glands . . . .
Other tuberculous diseases
Diphtheria . . . .
Whooping cough .
Scarlet fever
Meningoccocal infection
Acute poliomyelitis
Measles . . . .
Syphilis . . . .
Mental retardation
Meningitis . . . .
Bronchitis . . . .
Influenza . . . .
Pneumonia . . . .
Anencephalus
Spina bifida with hydrocephalus . . . .
Spina bifida without hydrocephalus . . . .
Congenital hydrocephalus
Other congenital anomalies of nervous system
Congenital anomalies of eye
Congenital anomalies of ear, face and neck
Congenital anomalies of heart . . . .
Other congenital anomalies of circulatory system .
Congenital anomalies of respiratory system
Cleft palate and cleft lip
Other congenital anomalies of upper alimentary tract
Other congenital anomalies of digestive system
Congenital anomalies of genital organs
Congenital anomalies of urinary system .
Clubfoot (congenital)
Other congenital anomalies of Ihnbs . . . .
Other congenital anomalies of musculoskeletal system .
Congenital anomalies of skin, hair and nails
Other and unspecified congenital anomalies
Congenital syndromes affecting multiple systnns
254
ABSTRACT 25 (continued). Northern Ireland: Infant mortality by cause, sex and month of registration, 1974.
Detailed List CAUSES OF DEATH
760
761
762
763
764
76S
766
767
768
769
770
771
772
773
774
775
776
777
778
Rem. 000-796
E904
E911-912
E913
Rem. E800-999
Chronic circulatory and M genito-urinary diseases in F mother . . . .
Other maternal conditions M imrelated to pregnancy . F
Toxaemia of pregnancy . M F
Maternal ante- and intra- M partum infection . F
Difficult labour with abnormality of bones, organs or M tissues of pelvis . . F
Difhcult labour with disproportion, but no mention of M abnormality of pelvis . F
Difficult labour with mal- M position of foetus . F
Difficult labour with abnor- M mality of forces of labour . F
Difficult labour with other and unspecified complica- M tions . F
Other complications of preg- M nancy and childbirth . . F
Conditions of placenta . . M F
Conditions of umbilical cord M F
Birth injury without mention M of cause . F
Termination of pregnancy . M F
Haemolytic disease of new- M bom with ketnicterus . F
Haemolytic disease of new- M bom without kemicterus . F
Anoxic and hypoxic condi- M tioos not elsewhere classified F
Immaturity, unqualified . M F
Other conditions of foetus or M newborn
Other natural causes F M F
Hunger, thirst, exposure or M neglect . F
Inhalation and ingestion of food causing obstruction or M suffocation . F
Accidental mechanical suffo- M cation . . . . F
Other violent deaths . M F
TOTAL M 295 F 272
255
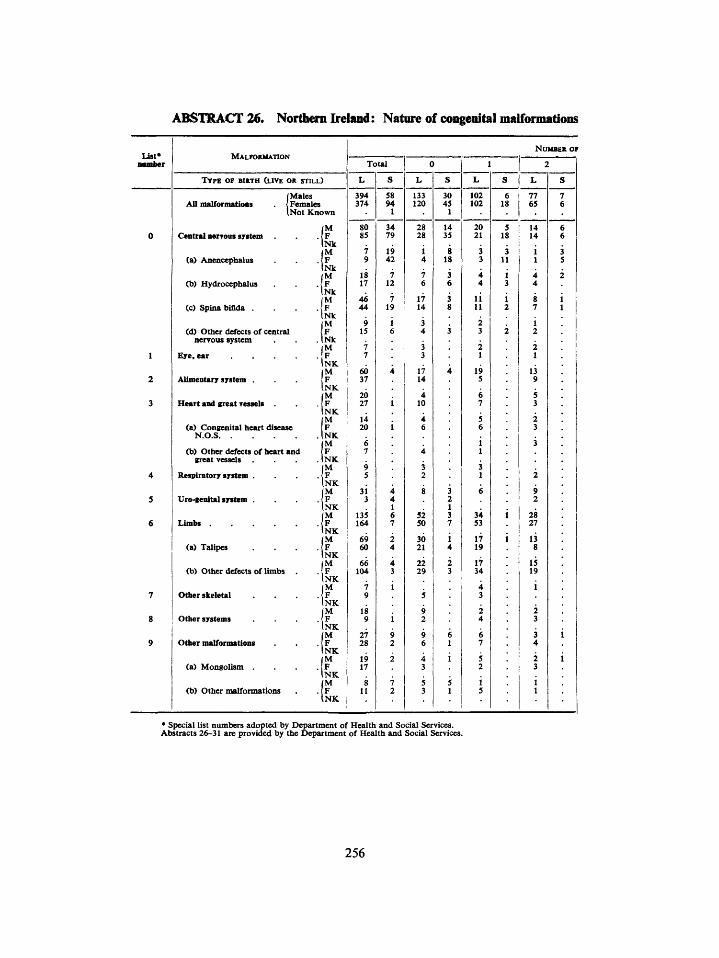
ABSTRACT 26. Northern Ireland: Nature of congenital malformations
List* number
0
1
2
3
4
5
6
7
8
9
MALFOKMATION
TYPE OF BIKTH (LIVE OR STILL)
(Males All malformatious j Females
INot Known
(M Central nervous S7item . {F
iNk (M
(a) Anencephalus . {F (Nk fM
(b) Hydrocephalus . I F iNk (M
(c) Spina bifida . . F iNk (M
(d) Other dtfects of central IF nervous system . . iNk
|M Eye. ear F
INK |M
AUmentarr system . {F INK (M
Heart and great vessels . {F INK (M
(a) Congenital heart disease 1F N.o.s INK
(M (b) Other defects of heart and IF
great vessels . . . . I N K M Bespiratorrsystem . . {F
INK (M
Uro-genitalsystem . . {F INK (M
Limbs F INK (M
(a) Talipes . . . F INK |M
Cb) Other defects of limbs . . { F INK |M
Other skeletal . {F INK (M
Other systems . {F INK |M
other malformations . { F INK |M
(a) Mongolism . . IF INK (M
(b) Other malformations . ( F INK
Total
L
394 374
80 85
7 9
18 17
46 44
9 15
7 7
60 37
20 27
14 20
6 7
9 5
31 3
135 164
69 60
66 104
7 9
18 9
27 28
19 17
8 11
S
58 94
1
34 79
19 42
7 12
7 19
i 6
4
4 4 1 6 7
2 4
4 3
i
i 9 2
2
7 2
0
L
133 120
28 28
i 4
7 6
17 14
3 4
3 3
17 14
4 10
4 6
4
3 2
8
52 50
30 21
22 29
5
9 2
9 6
4 3
5 3
s 3( 4.
1' 3.
1 1
< ; J
;
i
'
i
(
"
1
L
) 102 i 102 1
1 20 S 21
i 3 i 3
1 4 > 4
li i 11
2 3
2 1
I 19 5
6 7
5 6
i 1
3 1
) 6
1 34 r 53
17 i 19
i 17 i 34
4 3
2 4
5 6 7
5 2
5 i 5
s (
l i
li
i"
1 3
:
2
NUMBER OF
2
L !
5 77 ) 65 (
> 14 ( i 14 (
» i : 1
4 : 4
8 1 7 1
i 2
2 1
13 9
5 3
2 3
3
2
9 2
28 27
13 8
IS 19
i 2 3
3 4
2 3
i 1
; r
* special list numbers adopted by Department of Health and Social Services. Abstracts 26-31 are provided by the Department of Health and Social Services.
256
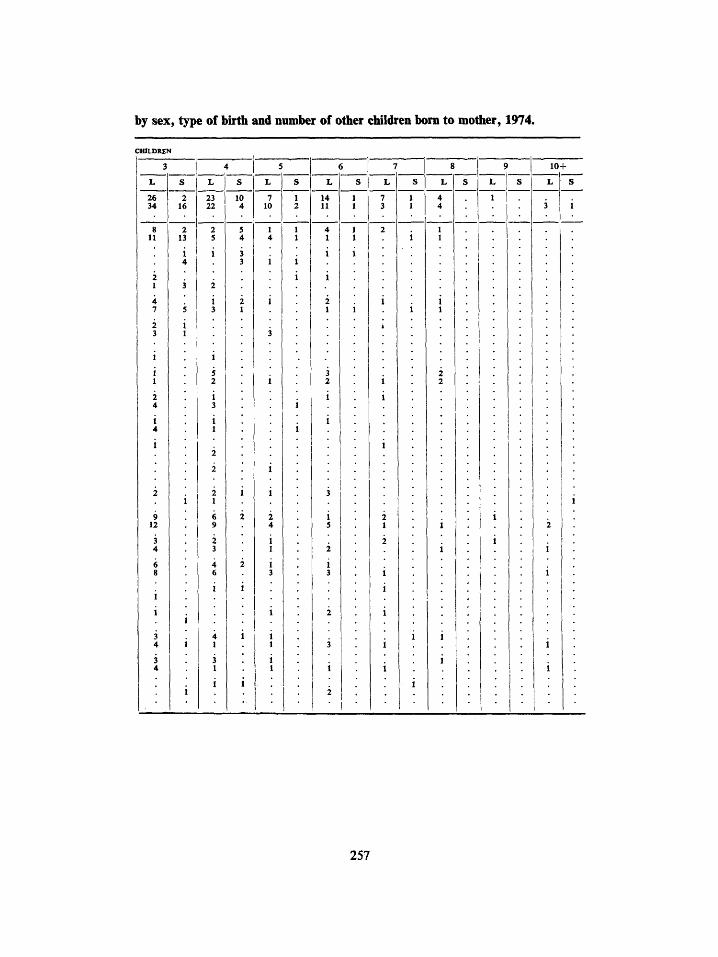
by sex, type of birth and number of other children bom to mother, 1974.
10+
26 34
257
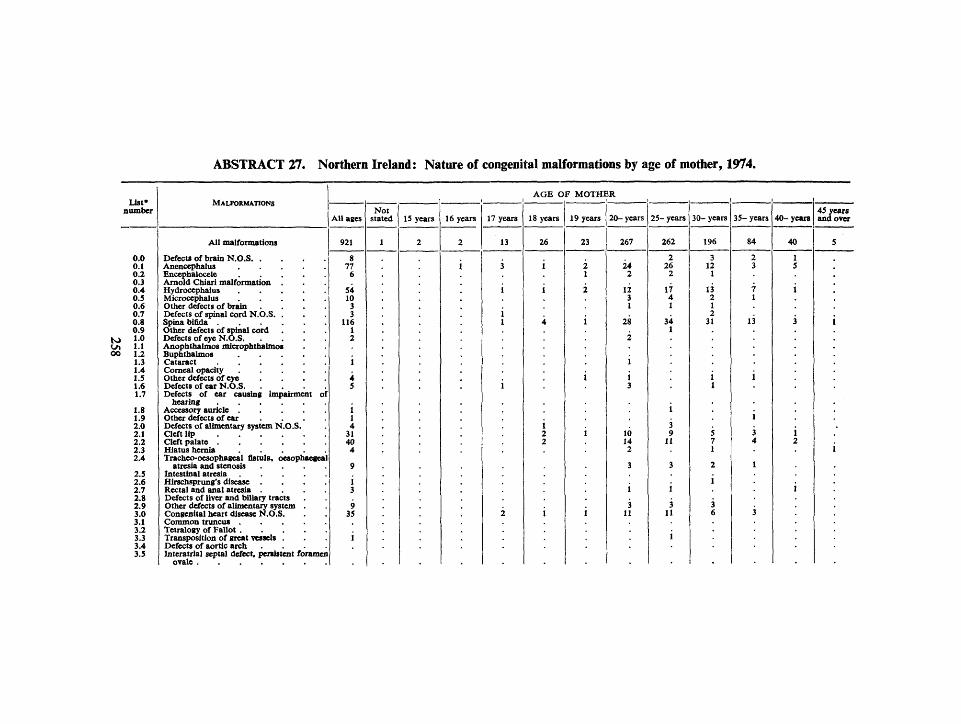
ABSTRACT 27. Northern Ireland: Nature of congenital malformations by age of mother, 1974.
List* number
to 00
0.0 0.1 0.2 0.3 0.4 0.5 0.6 0.7 0.8 0.9 1.0 1.1 1.2 1.3 1.4 1.5 1.6 1.7
1.8 1.9 2.0 2.1 2.2 2.3 2.4
2.5 2.6 2.7 2.8 2.9 3.0 3.1 3.2 3.3 3.4 3.5
MALFORMATIONS
All malformations
Defects of brain N.O.S. . Anencephalus . . . . Encephalocele . . . . Arnold Chiari malformation Hydrocephalus . . . . Microcephalus . . . . Other defects of brain Defects of spinal cord N.O.S. . Spina bifida Other defects of spinal cord Defects of eye N.O.S. Anophthalmos microphthalmos Buphthalmos . . . . Cataract Corneal opacity . . . . Other defects of eye Defects of ear N.O.S. Defects of ear causing impairment of
hearing Accessory auricle . . . . Other defects of ear Defects of alimentary system N.O.S. Cleft Up Cleft palate Hiatus hernia . . . . Tracheo-oesophageal fistula, oesophaegeal
atresia and stenosis Intestinal atresia . . . . Hirschsprung's disease Rectal and anal atresia Defects of liver and biliary tracts Other defects of alimentary system . Congenital heart disease N.O.S. Common truncus . . . . Tetralogy of Fallot . . . . Transposition of great ressels . Defects of aortic arch Interatrial septal defect, peralsteat foramen
ovale
AGE OF MOTHER
All ages
921
8 77
6
54 10 3 3
116 1 2
1 1 4
31 40 4
Not stated IS years 16 years 17 years 18 years
26
19 years 20- years
23
24 2
12 3 1
28
2
25-years
262
2 26
2
17 4 1
34 1
30- years
196
3 12 1
13 2 1 2
31
35- years 40- years 45 years and over
84
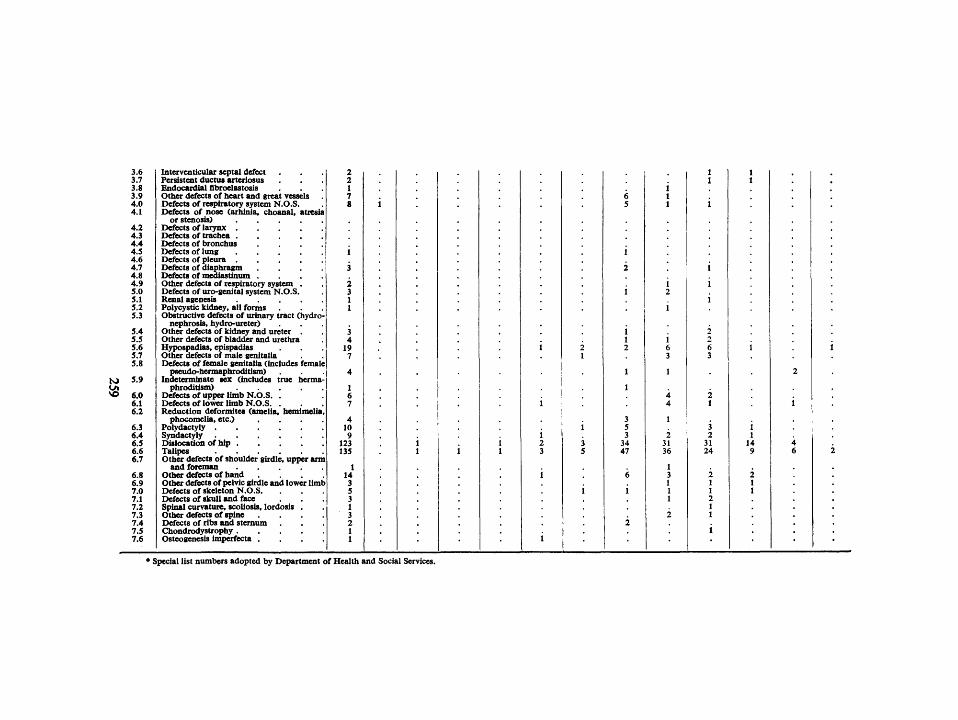
VO
3.6 3.7 3.8 3.9 4.0 4.1
4.2 4.3 4.4 4.5 4.6 4.7 4.8 4.9 5.0 5.1 5.2 5.3
5.4 5.5 5.6 5.7 5.8
5.9
6.0 6.1 6.2
6.3 6.4 6.5 6.6 6.7
6.8 6.9 7.0 7.1 7.2 7.3 7.4 7.5 7.6
Interventicular septal defect Persistent ductus arteriosus Endocardial fibroelastosis Other defects of heart and great vessels Defects of respiratory system H.O.S. Defects of nose (arhinia, choanal, aticsia
or stenosis) Defects of larynx . Defects of trachea . Defects of bronchus Defects of lung Defects of pleura Defects of diaphragm Defects of mediastinum Other defects of respiratory system Defects of uro-genital system N.O.S. Renal agenesis Polycystic kidney, all forms Obstructive defects of urinary tract (hydro'
nephrosis, hydro-ureter) Other defects of kidney and ureter Other defects of bladder and urethra Hypospadias, epispadias Other defects of male genitalia Defects of female genitalia (includes female
pseudo-hermaphroditism) Indeterminate sex (Includes true herma
phroditism) Defects of upper limb N.O.S. Defects of lower limb N.O.S. Reduction deformites (amelia, hemimelia,
phocomelia, etc.) Polydactyly . Syndactyly Dislocation of hip . Talipes Other defects of shoulder girdle, upper arm
and foreman Other defects of hand Other defects of pelvic girdle and lower limb Defects of skeleton N.O.S. Defects of skull and face Spinal curvature, scoliosis, lordosis Other defects of spine Defects of ribs and sternum C!hondrodystrophy . Osteogenesis imperfecta .
1 6 7
4 10 9
123 135
3 5 3
34 47
3 2
31 24
* Special list numbers adopted by Department of Health and Social Services.
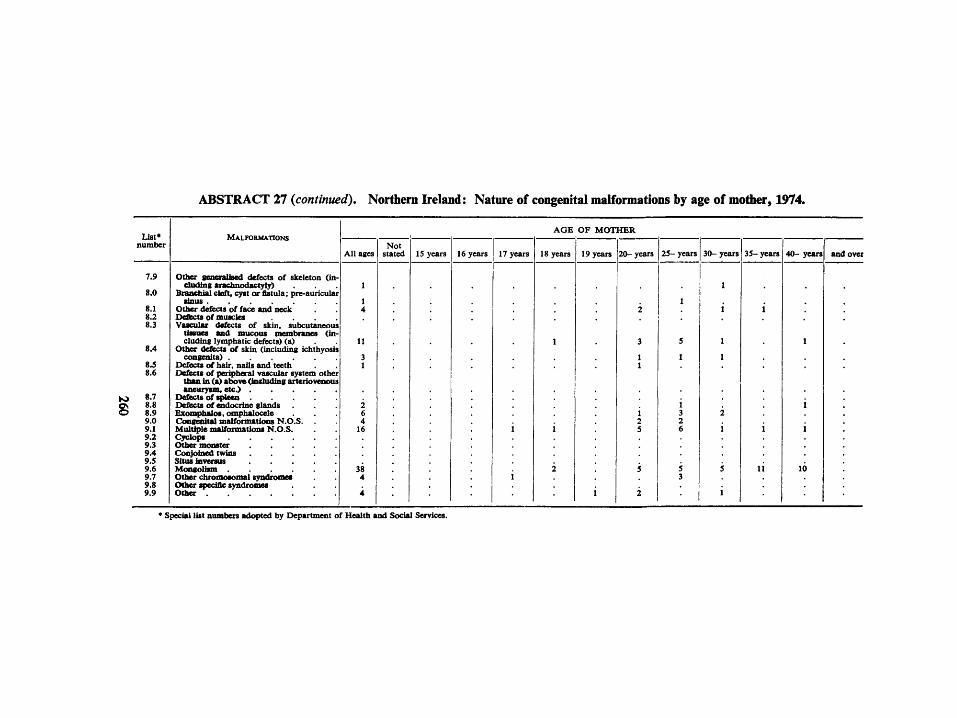
ABSTRACT 27 (continued). Northern Ireland: Nature of congenital malformations by age of motiier, 1974.
List* number
MALFORMATIONS AGE OF MOTHER
All ages Not
stated 15 years 16 years 17 years 18 years 19 years 20-years 25- years 30-years 35- years 40- years and over
s
13
8.0
8.1 8.2 8.3
8.4
8.5 8.6
8.7 8.8 8.9 9.0 9.1 9.2 9.3 9.4 9.5 9.6 9.7 9.8 9.9
Other generalised defects of skeleton (in-chiding araehnodactyty)
Branchial cleft, cyst or fistula; pre-auricular sinus
Other defeas of face and neck Dcftcts of muscles Vaaculaf defects of skin, subcutaneous
tiasues and mucous membranes (in' eluding lymphatic defects) (a)
Other defects of skin (including ichthyosis congenita)
Defects of hair, nails and teeth Defects of peripheral vascular sjvtem other
than in Ci) above (inaluding arteriovenous aneurysm, etc.) . . . .
Defects of ^iecn . . . . Defects of endocrine glands Exomptaalos, omphalocele CoBgenltal malformatiims N.O.S. . Multiple nuUfonnations N.O.S. C^lops Othet monster . . . . Conjoined twins . . . . Situs teverms . . . . Mongolism Other chromosomal syndrcmiea Other sptfdBc syndromes Other
10
' Special list numbers ad<^ed by Department of Health and Social Services.
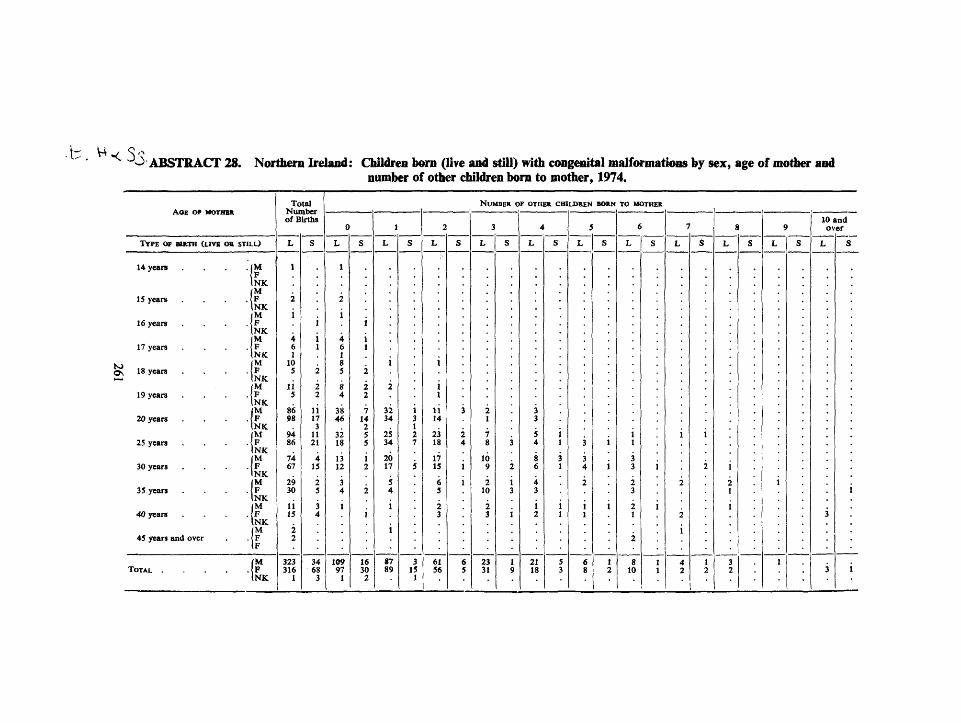
b . H < % ABSTRACT 28. Northern Ireland: Children born (liye and still) with congenital raalformatiiMBs by sex, age of modi^ and number of other children bom to mother, 1974.
TYPE (X B U T H (LIVE <» STILL)
14 years
15 years
16 years
17 years
Q^ 18 years
19 years
20 years
25 years
30 years
35 years
40 years
45 years and over
f INK
INK
|M INK
• 1 " INK
INK
INK
lU INK
•F INK (M
• P INK • ( "
INK (M INK (M
if TOTAL i F
INK
Total
of Births
L
1
2
i
4 6 1
10 5
li 5
86 98
94 86
74 67
29 30
li 15
2 2
323 316
1
S
i i 1
2
2 2
li 17 3
11 21
4 15
2 5
3 4
34 68
3
0
L
i
7
1
i ( 1 f -
A
3( 4<
32 \i
13 i :
109 97
1
s
i i 1
2
2 2
7 14 2 5 5
i
2
2
i
16 30
2
1
L
3 3'
2 3
2( 1
i
t
5
) 7
5
I
I
87 89
S
J
t 1
5
3 15
1
NUMBER OF OTHER CHILDREN BORN TO MOTHER
2
L
i 1
li 14
23 18
17 15
6 5
2 3
61 56
S
3
2 4
i i
6 5
3
L
2 1
7 8
10 9
2 10
2 3
23 31
S
3
2
i 3
i
1 9
4
L
3 3
5 4
8 6
4 3
i 2
21 18
S
J I
I
5 3
5
L
3
3 4
2
i 1
6 8
S
I 2
6
L
i 1
3 3
2 3
2 1
2
8 10
S
1 1
7
L
i
2
2
4 2
S
2
1 2
8
L
i 2
1
i
3 2
s 9
L 1 S
1
1
10 and over
L
;
3
S
1
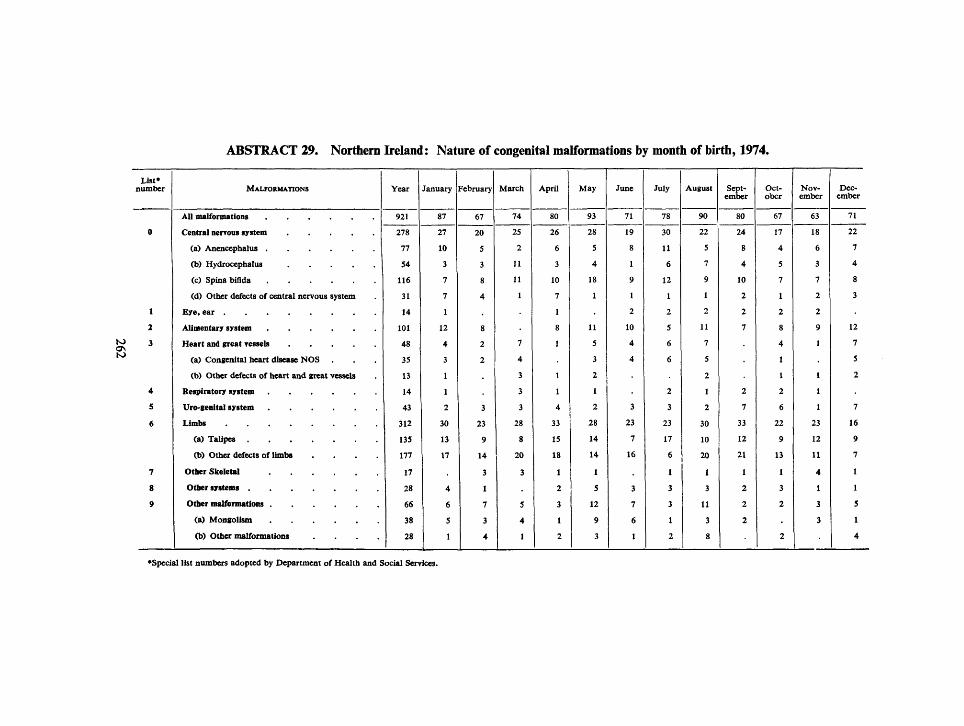
ABSTRACT 29. Northern Ireland: Nature of congenital malformations by month of birth, 1974.
ON KJ
List* number
0
1
2
3
4
5
6
7
8
9
MALFORMATIONS
(d) Other defects of central nervous system
(a) Congenital heart disease NOS
(b) Other defects of heart and great vessels
(b) Other defects of limbs . . . .
(b) Other malformations . . . .
Year
921
278
77
54
116
31
14
101
48
35
13
14
43
312
135
177
17
28
66
38
28
January
87
27
10
3
7
7
1
12
4
3
1
1
2
30
13
17
4
6
5
1
February
67
20
5
3
8
4
8
2
2
3
23
9
14
3
1
7
3
4
March
74
25
2
11
11
1
7
4
3
3
3
28
8
20
3
5
4
1
April
80
26
6
3
10
7
1
8
1
1
1
4
33
15
18
1
2
3
1
2
May
93
28
5
4
18
1
11
5
3
2
1
2
28
14
14
1
5
12
9
3
June
71
19
8
1
9
1
2
10
4
4
3
23
7
16
3
7
6
'
July
78
30
11
6
12
1
2
5
6
6
2
3
23
17
6
1
3
3
1
2
August
90
22
5
7
9
1
2
11
7
5
2
1
2
30
10
20
1
3
11
3
8
September
80
24
8
4
10
2
2
7
2
7
33
12
21
1
2
2
2
October
67
17
4
5
7
1
2
8
4
1
1
2
6
22
9
13
1
3
2
2
November
63
18
6
3
7
2
2
9
1
1
1
1
23
12
11
4
1
3
3
•
December
71
22
7
4
8
3
12
7
5
2
7
16
9
7
1
1
5
1
4
'Special list numbers adopted by Department of Health and Social Services.
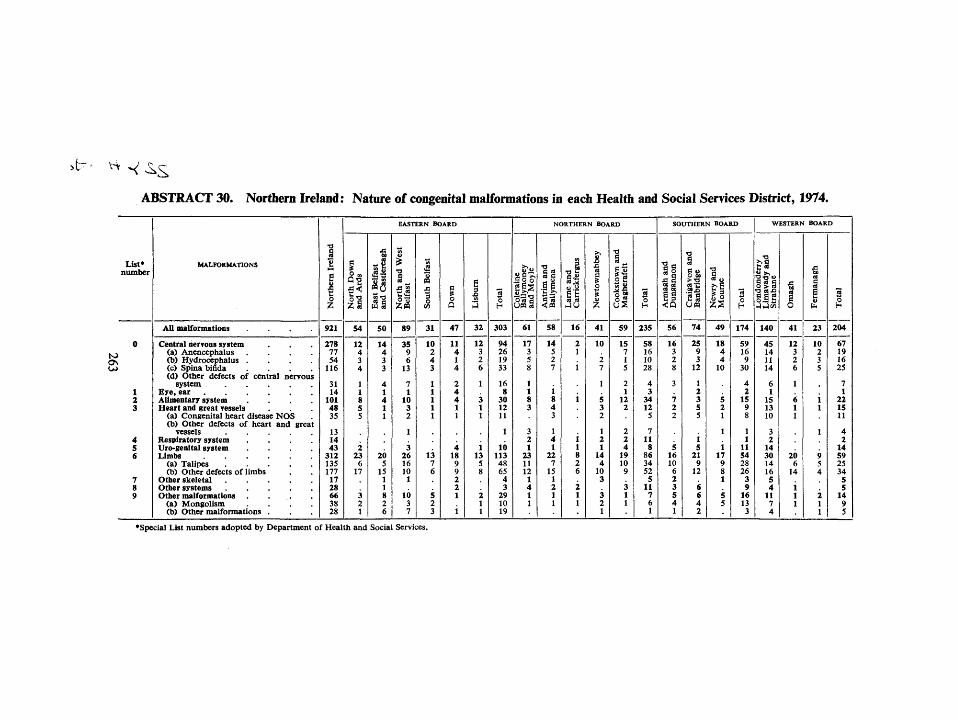
^•^^^s
ABSTRACT 30. Northern Ireland: Nature of congenital malformations in each Health and Social Services District, 1974.
List* mmtber
0
ON
u>
1 2 3
4 5 6
7 8 9
MALFORMJVTIONS
AU malformations . . . .
Central nervoas system (a) Anencephalus (b) Hydrocephalus . (c) Spina bifida (d) Other defects of central nervou,
system . . . . Ere , ear Alimentary system Heart and great vessels
(a) Congenital heart disease NOS (b) Other defects of heart and grea
vessels . . . . Respiratory system Uro-genital system Limbs . . . .
(a) Talipes (b) Other defects of limbs
Other skeletal Other systems Other malformations
(a) Mongolism (b) Other malformations .
s
t
1
o
921
278 77 54
116
31 14
101 48 35
13 14 43
312 135 177 17 28 66 38 28
54
12 4 3 4
1 1 8 5 5
2 23
6 17
3 2 1
•s
(2§
50
14 4 3 3
4 1 4 1 1
20 5
15 1 1 8 2 6
EASTERN BOARD
ti o-S
89
35 9 6
13
7 1
10 3 2
1
3 26 16 10
1
10 3 7
1
1 31
10
13 7 6
5 2 3
o 0
47
11 4 1 4
2 4 4 1 1
4 18 9 9 2 2 1
i
E
32
12 3 2 6
1
3 1 1
i 13 5 8
2 1 1
2 o H
303
94 26 19 33
16 8
30 12 11
1
10 113 48 65
4 3
29 10 19
> > . , .5 2 o
una
61
17 3 5 8
1 1 8 3
3 2 1
23 11 12
1 4 1 1
NORTHERN BOARD
•o a g
li 58
14 5 2 7
i 8 4 3
1 4 1
22 7
15 1 2 1 1
1
• J U
16
2 1
i
i
i 1 8 2 6
2 1 1
1 o
41
10
2 7
1
5 3 2
1 2 1
14 4
10 3
3 2 1
o 2
of uS
59
15 7 1 5
2 1
12 2
2 2 4
19 10 9
3 1 1
S o H
235
58 16 10 28
4 3
34 12
5
7 11
8 86 34 52
5 11
7 6 1
SOUTHERN BOARD
!l 56
16 3 2 8
3
7 2 2
. 5 16 10
6 2 3 5 4 1
1
i 74
25 9 3
12
1 2 3 5 5
i 5 21
9 12
6 6 4 2
zs
49
18 4 4
10
5 2 1
1
i 17 9 8 1
5 5
2 0 H
174
59 16 9
30
4 2
15 9 8
1 1
11 54 28 26
3 9
16 13 3
WESTER^
1
1 140
45 14 11 14
6 1
15 13 10
3 2
14 30 14 16 5 4
11 7 4
O
41
12 3 2 6
1
6 1 1
20 6
14
i 1 1
BOARD
C
U
23
10 2 3 5
i 1
1
9 5 4
2 1 1
204
67 19 16 25
7 1
22 15 11
4 2
14 59 25 34
5 5
14 9 5
* Special List numbers adopted by Department of Health and Social Services.
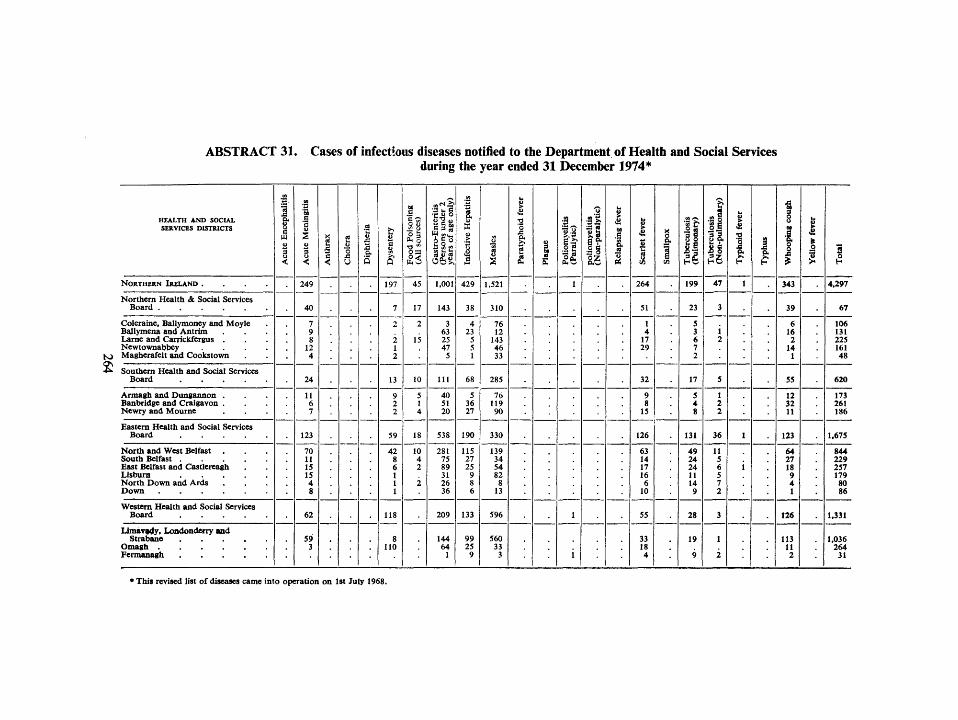
ABSTRACT 31. Cases of infectious diseases notified to the Department of Health and Social Services during the year ended 31 December 1974*
H E A L T H A N D S O C I A L
SERVICES D I S T R I C T S
NORTHERN IRELAND . . . .
Northern Health & Social Services
Coleraine, Ballymoney and Moyle Ballymena and Antrim Lame and Carriclj:fergus Newtownabbey . . . .
t o Magherafelt and Cookstown
• ^ Southern Health and Social Services
Armagh and Dungannon . Banbridge and Craigavon . Newry and Mourne
Eastern Health and Social Services
North and West Belfast .
East Belfast and Castlereagh
North Down and Ards
Western Health and Social Services
Limav^dy. Londonderry and
1 a M u 3 O <
.a g u 3 u <
249
40
7 9 8
12 4
24
11 6 7
123
70 11 15 15 4 8
62
59 3
X
1 S <
u>
"3 St
U
.9 'C 1 a 0 1
197
7
2
2 1 2
13
9 2 2
59
42 8 6 1 1 1
118
8 110
0 <i>
"3§ • o •"
OS (i<5
45
17
2
15
10
5 1 4
18
10 4 2
2
•3 w e • e g o
1,001
143
3 63 25 47
5
111
40 51 20
538
281 75 89 31 26 36
209
144 64
1
u X
1 1
429
38
4 23
5 5 1
68
5 36 27
190
115 27 25
9 8 6
133
99 25
9
1
1,521
310
76 12
143 46 33
285
76 119 90
330
139 34 54 82
8 13
596
560 33
3
•d 'o JB
.2 1 •S
o g
dlfc
1
1
1
•s'§
S i
as
—^-
1
1 —1-
s 1
264
51
1 4
17 29
32
9 8
15
126
63 14 17 16 6
10
55
33 18 4
i If H 199
23
5 3 6 7 2
17
5 4 8
131
49 24 24 11 14 9
28
19
9
. S o
l a
(2S
47
3
i 2
5
1 2 2
36
11 5 6 5 7 2
3
1
2
!
1 1
1
1
3
i M
f Xt
343
39
6 16 2
14 1
55
12 32 11
123
64 27 18 9 4 1
ne
113 11 2
1 1 3
o H
4.297
67
106 131 225 161 48
620
173 261 186
1.675
844 229 257 179
80 86
1.331
1.036 264
31
* This revised list of diseases came into operation on 1st July 1968.
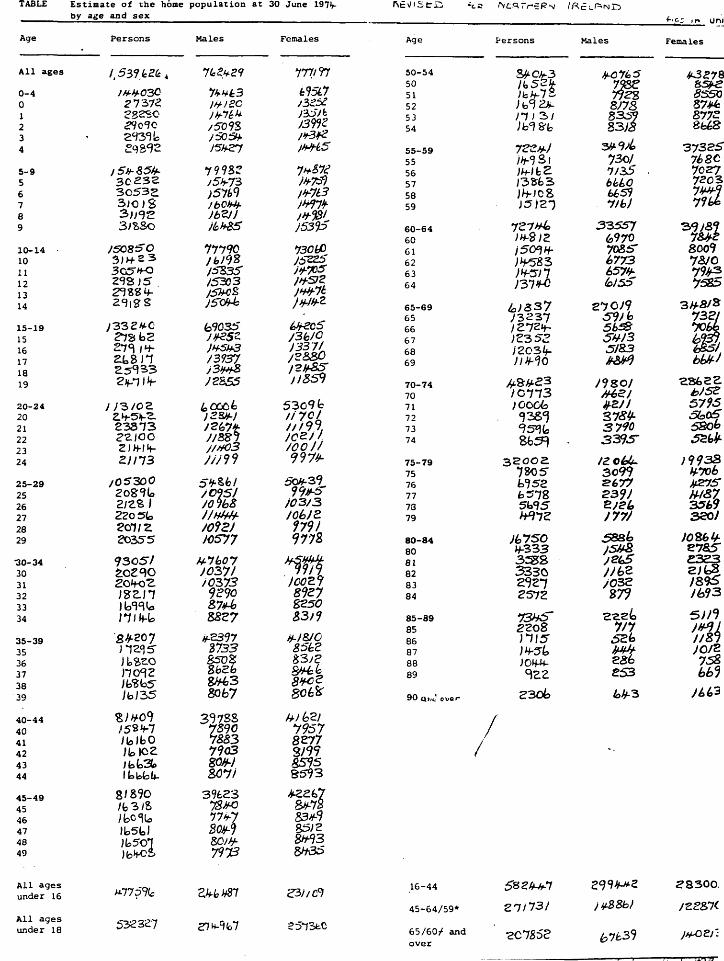
TABLE E s t i m a t e of t h e home p o p u l a t i o n a t 30 June I91>t-by age and s e x
f S t v i s t i : ! /NcRrr-^RN' //••<£Lr=iNr:>
Age Persons Males Females Age Males
All ages
0-4 0 1 2 3 4
5-9 5 6 7 8 9
10-14 10 11 12 13 14
15-19 15 16 17 18 19
20-24 20 21 22 23 24
25-29 25 26 27 28 29
•30-34 30 31 32 33 34
35-39 35 36 37 38 39
40-44 40 41 42 43 44
45-49 45 46 47 48 49
/, 539.626,
21'^1^
<?909O
30 2 3 2 3 0 5 3 S
3C5"'H3
; 3 3 2 Ate
2 3 S n 3
^z/oo
zins /0S3O0
2 / 2 S i 22o5t> 2cni2. 2 0 3 5 5
f 305 " /
2 0 ^ 2 . ISZ.il
5 ^ 2 0 7
)fcSb5
i b ; 3 5
;52i^7
/btbO
/bb3^ 8/S90 /fc3/S JbC ilo IbSbl ;b5oT
/^09S
y99S2 j5h-TS> )5%9
JfSJJ
77790
/SS3S / 5303 /SMS
)H-5U3 /393^ j3¥^
////03
JOISI
/0J2J
)oyji J 0^73
SBZ7
A<-2397 $733 BsoZ SbZb ZhhS 8067
3*5 78S 7590 7553 79<l3 SOJhl
39623 78MO 77h-7 Both")
7973
irrjTf
(:95L7
IhHS
7>*&7^ }¥7^ l¥7i3 /hTJ¥
/S33^
730yD / 5225
JH¥7t
/3h/0 J 337/ JZ&8J0 /2MSS
5309 fc /iyci
fCZ/l. /OOJJ 9 9 7 ^
5b*-39 39//-S'
J03/3 /Ob J a
97V 9775
^ ^
jcozf 8927
S3 J 9
t/.f&/0 85bZ &3y^
8¥Cf
UJb2/ 7957 8277 S/99 5595 8593
8M-72
S5J2 8M93 5H35
50-54 50 51 52 53 54
55-59 55 56 57 58 59
60-64 60 Gl 62 63 64
65-69 65 66 67 68 69
70-74 70 71 72 73 74
75-79 75 76 77 73 79
80-84 80 81 82 83 84
85-89 85 86 87 88 89
90 Que' ovsr
/
/ t 5 2 ¥
lli 3 /
72ZH-i
i 32r t3 ih-fOZ
)H-S)Z
i50^H-
IH-^n
; 3 2 3 7 fZlZh-)Z3S2 )2C3lj-
A&A^23 lonis )0OO(s
3 E o o a 7»05 fc?52
)(o7S0 H-333 3 S : S 3 3 5 0
2572
73hS 22o8 )1\5 ;»f '5t JOH-M-
Z3do
33557 6970 7055" 6773 657^ (ol5S
270^9 59/Js
S¥/3 SJ83
/9ZOI /M>S/
S781/-3790 3 3 9 ^
^(>77 239/ B/Si, J 777
,5SS4) /SM& j2(oS JJhZ /03Z 879
7/7 5Z^ M-eab es3 loh-3
*•<<:•: in U n i
Females
^ 2 7 8
8S50 8 7 ^ 877S 8U8
37325" 76 8C 7027 7203
8009 7S/0 7 9 ^ 75S5
3>fS/» 73Z/
bbh-i
h/se
3795
580b
; 9 9 3 S /^7o6 /fSTJS M&7 3569 3 2 0 /
^78S 2 3 2 3
/89S /693
3)n ///-'il //Zl
/6(o-^
All ages under 16
All ages under 18
ZklohSl
2573feC
16-44
45-64/59*
65/60/ and over
Szzf^n zin3i
•2C7S5e
29941^2
y-jtSSby
67^39
28300,
/ZZ&li
/H^Z)'~


