Embed Size (px)
Citation preview
1 Masan Group
Annual Report
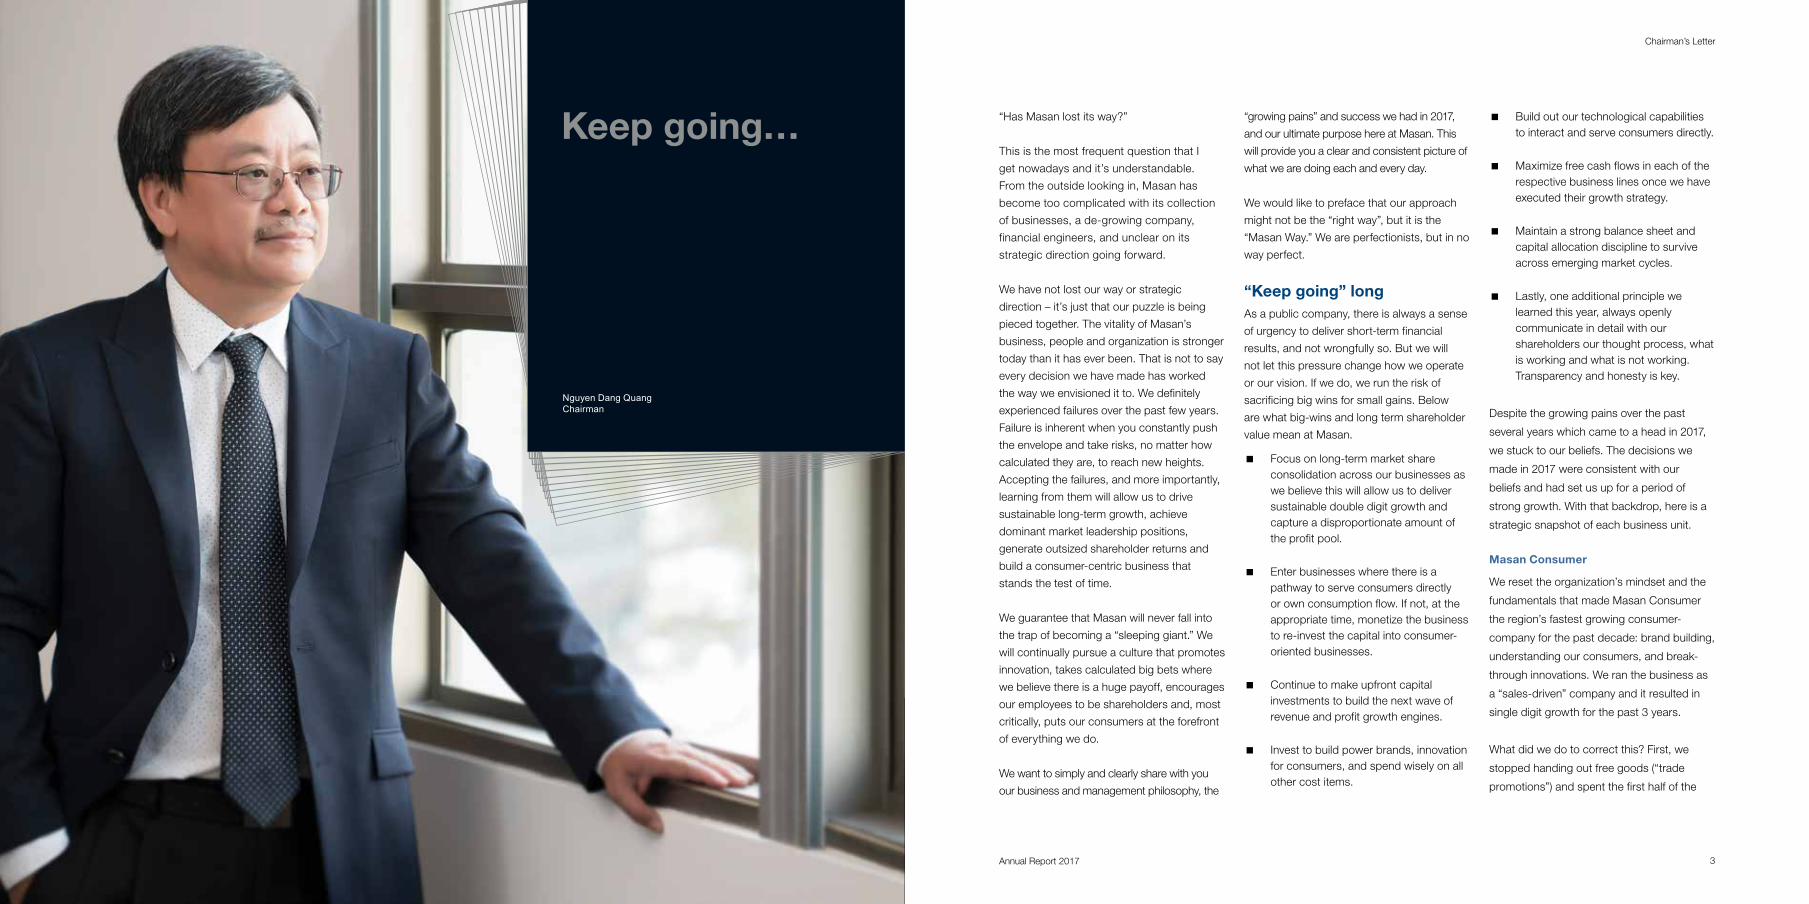
Keep going…
Annual Report 2017 1
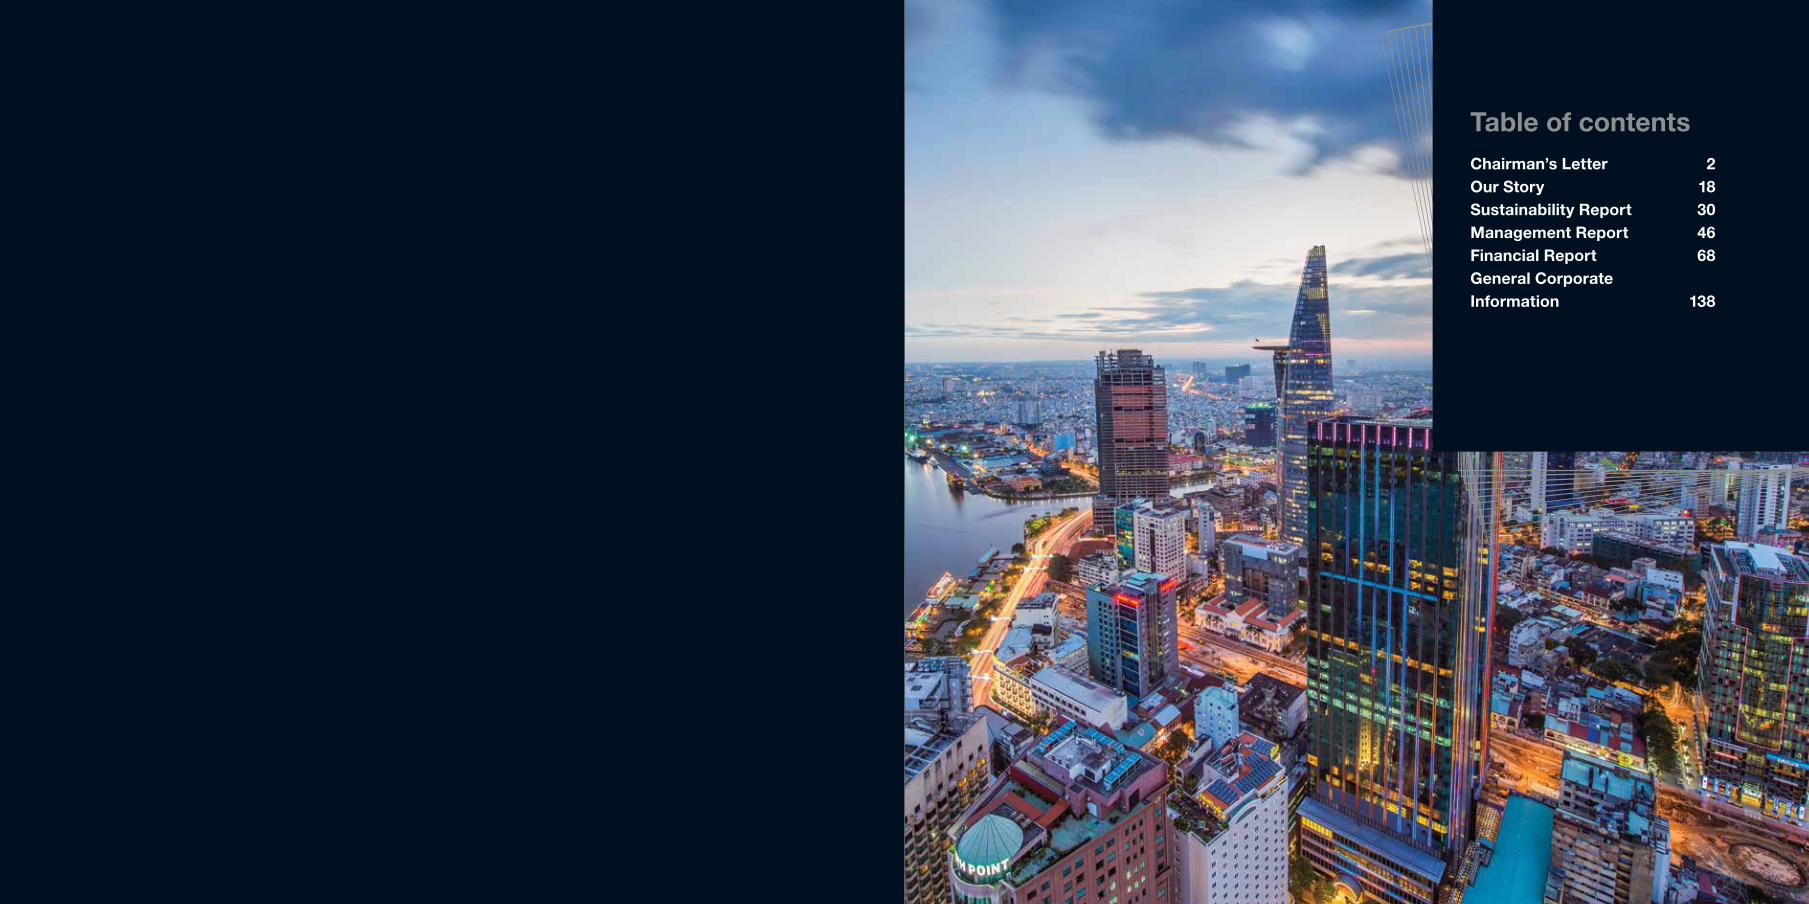
Table of contentsChairman’s Letter 2Our Story 18Sustainability Report 30 Management Report 46Financial Report 68 General Corporate Information 138
Annual Report 2017 3
Chairman’s Letter
“Has Masan lost its way?”
This is the most frequent question that I
get nowadays and it’s understandable.
From the outside looking in, Masan has
become too complicated with its collection
of businesses, a de-growing company,
financial engineers, and unclear on its
strategic direction going forward.
We have not lost our way or strategic
direction – it’s just that our puzzle is being
pieced together. The vitality of Masan’s
business, people and organization is stronger
today than it has ever been. That is not to say
every decision we have made has worked
the way we envisioned it to. We definitely
experienced failures over the past few years.
Failure is inherent when you constantly push
the envelope and take risks, no matter how
calculated they are, to reach new heights.
Accepting the failures, and more importantly,
learning from them will allow us to drive
sustainable long-term growth, achieve
dominant market leadership positions,
generate outsized shareholder returns and
build a consumer-centric business that
stands the test of time.
We guarantee that Masan will never fall into
the trap of becoming a “sleeping giant.” We
will continually pursue a culture that promotes
innovation, takes calculated big bets where
we believe there is a huge payoff, encourages
our employees to be shareholders and, most
critically, puts our consumers at the forefront
of everything we do.
We want to simply and clearly share with you
our business and management philosophy, the
“growing pains” and success we had in 2017,
and our ultimate purpose here at Masan. This
will provide you a clear and consistent picture of
what we are doing each and every day.
We would like to preface that our approach
might not be the “right way”, but it is the
“Masan Way.” We are perfectionists, but in no
way perfect.
“Keep going” longAs a public company, there is always a sense
of urgency to deliver short-term financial
results, and not wrongfully so. But we will
not let this pressure change how we operate
or our vision. If we do, we run the risk of
sacrificing big wins for small gains. Below
are what big-wins and long term shareholder
value mean at Masan.
� Focus on long-term market share consolidation across our businesses as we believe this will allow us to deliver sustainable double digit growth and capture a disproportionate amount of the profit pool.
� Enter businesses where there is a pathway to serve consumers directly or own consumption flow. If not, at the appropriate time, monetize the business to re-invest the capital into consumer-oriented businesses.
� Continue to make upfront capital investments to build the next wave of revenue and profit growth engines.
� Invest to build power brands, innovation for consumers, and spend wisely on all other cost items.
� Build out our technological capabilities to interact and serve consumers directly.
� Maximize free cash flows in each of the respective business lines once we have executed their growth strategy.
� Maintain a strong balance sheet and capital allocation discipline to survive across emerging market cycles.
� Lastly, one additional principle we learned this year, always openly communicate in detail with our shareholders our thought process, what is working and what is not working. Transparency and honesty is key.
Despite the growing pains over the past
several years which came to a head in 2017,
we stuck to our beliefs. The decisions we
made in 2017 were consistent with our
beliefs and had set us up for a period of
strong growth. With that backdrop, here is a
strategic snapshot of each business unit.
Masan Consumer
We reset the organization’s mindset and the
fundamentals that made Masan Consumer
the region’s fastest growing consumer-
company for the past decade: brand building,
understanding our consumers, and break-
through innovations. We ran the business as
a “sales-driven” company and it resulted in
single digit growth for the past 3 years.
What did we do to correct this? First, we
stopped handing out free goods (“trade
promotions”) and spent the first half of the
Nguyen Dang QuangChairman
Keep going…
Masan Group Annual Report 2017 54
Chairman’s Letter
year clearing out the stock at the distributor
and retailer level. Second, we started
communicating to our consumers again by
revitalizing our power brands through unique
and differentiated TV commercials. Third, we
launched 14 innovations into the market to
provide consumers with a new and enjoyable
experience across the portfolio. Fourth,
we scaled up our technological platform,
enabling us to track stock levels at our
distributors. More importantly, we stopped
wasting all of our time reading market
research and guessing what our consumers
want and need. Instead, we spent most of
our time in the field and market to understand
firsthand our consumers’ big unmet needs.
It was a painful process, but a rewarding and
necessary one. I truly admire and respect
the transformational job Mr. Truong Cong
Thang and our management did to revitalize
the company from top to bottom. Our
consumers are happier for it and as a result
our growth and profitability are healthier.
We will keep going with our beliefs: power
brands, innovation, and technology to better
serve our consumers.
Masan Nutri-Science
Conventional wisdom would have told us to
cut losses and stop investing through the
livestock crisis. We did the opposite as we
have strong conviction that this is the time to
solidify our market leadership position. What
we did will bring much more long-term value
compared to the short-term savings. Our pig
feed market share has increased from 30%
to 35% currently. The return metrics are not
overly impressive at this stage, but when the
livestock market rebounds, the returns will
justify our upfront investments. We are not
out of the woods yet. There will be more pain.
Luckily, we have great business managers
that will operate smartly and manage risk
appropriately, but at the same time not
compromise the end goal: a dominant feed
market position.
Conventional wisdom also would have told
us to put our meat plans on hold. But if we
stopped, someone else would be stepping
up and filling the void of providing our
consumers safe-for-health, affordable, fresh
meat products. The opportunity will not be
there forever. The future and vision of Masan
Nutri-Science is in meat. This is where we
can build a true and unique brand and serve
consumers directly. Meat will de-risk our
business from livestock cycles and transform
our financial model. Our meat journey will
truly kick start at the end of 2018 when we
launch our first branded fresh meat products.
A big thank you to Mr. Pham Trung Lam
and our management team for being bold.
The decisions they made were not easy, but
ultimately the right ones.
We will keep going with our beliefs: providing
Vietnamese people with quality and
affordable meat.
Techcombank and Masan Resources
Both of these businesses were
outperformers and delivered record financial
performance in 2017. Had we not maintained
our conviction during their respective
periods of growing pains, we would not be
realizing the big payoffs today.
Techcombank has emerged as a
differentiated and champion consumer
“financial life” platform. Despite our recent
success and transformation, the vision is
still not complete. There are over 60 million
citizens that do not have access to formal
financial services. Our strategic plan to
invest in technology starting today to offer
these services to everyone is much more
exciting and rewarding. This investment
will position us to grow efficiently for the
foreseeable future as we drive financial
inclusion. It is the right strategy, but it will
come down to superb execution.
Masan Resources is starting to generate
strong profitability and is expected to deliver
strong free cash flows over the medium-
term. Obviously, we have benefited from
the recent rebound in commodity prices,
mainly tungsten. We believe current price
levels will hold due to China’s environmental
policies forcing tungsten mines to shut down
production, resulting in a primary supply
deficit. Going forward, we will seek strategic
partnerships to accelerate our transformation
from a “miner” into a value-added, global
downstream tungsten industrial player. This will
de-risk the business and enable us to produce
stronger cash flows across commodity cycles.
We hope our shareholders are happy with the
strategic benefits of letting these platforms
develop. I am proud of and admire every
Masaner for demonstrating our “Keep Going
Long” philosophy each and every day, and it
is because of your dedication we are starting
to bear fruit.
2018 and future outlookWe are excited that each business is
starting to deliver on its underlying growth
potential simultaneously. We are also
excited to drive shareholder value: for
every one percent in topline growth, we
will deliver 2-3 percent profit growth. We
will do this by paying down our debt since
most of our major investments have been
made and by cutting out the fat to reduce
our operating costs. You will see this
reflected in our 2018 financial results.
There are always market and execution
risks for any business strategy. We will
monitor them carefully and navigate
them to the best of our abilities. We are
positioned to do so as we have learned a
lot through the “growing pains.” We do not
know everything, but we will keep learning
and applying them to win big.
“Keep going” as an entrepreneurOur top leaders often contemplate and
debate what is the right organizational model
for us going forward. Do we scale back our
entrepreneurial spirit and become more
professionalized?
I have given much thought to this critical
question and what it means for our future.
What we are ultimately debating is whether we
should stop doubling the bet and instead be
content with stable but not explosive growth.
We have concluded that we want Masan to
always live and breathe our entrepreneurial
spirit. Masan was founded on this spirit and
principle and this way of life has made us into
who we are today. From the day we change
our DNA, it will only be a matter of time
before we become irrelevant.
Exploring our potential, Vietnam’s growth
potential, is what excites us as people and
what drives us to constantly innovate and
reinvent ourselves. We will continue to
build a young and hungry talent pool that
possess this entrepreneurial spirit. We have
launched the “Masan Young Entrepreneurs
(MYE)” program to build and cultivate
the next generation of leaders, who will
determine our future.
We recognize that we need to combine this
spirit with professional expertise and superb
risk management. We are no longer the start-
up we were 22 years ago. We understand
the need for checks and balances across
the organization and to have a platform to
manage the downside as much as we believe
in the upside.
“Keep going” with our real purpose not just business rewards We have shared our long-term business
philosophy and how our entrepreneurial spirit
will make our vision a reality. However, we
believe it is fundamentally more important to
share why we started Masan in the first place
and why we want to keep it going.
The pioneers that started this journey wanted
to show that a group of Vietnamese people
could build something that symbolized the
true potential and value of Vietnam. We
wanted to create something our families
could be proud of, our future generations
could be proud of, and something long-
lasting and special that could always grow
alongside our country.
Our purpose has not changed, but it has
evolved into something larger. How can
we build a Vietnamese company alongside
Vietnam that is admired and respected
globally? This is a challenge that our MYEs
passionately want to tackle and it will be
interesting to see how it plays out. But as
long as we “keep going” for our 90 million
Vietnamese consumers, I am sure we can do
this for us and with our country.
Sincerely Yours,
Nguyen Dang Quang
Chairman of the Board
Masan Group6
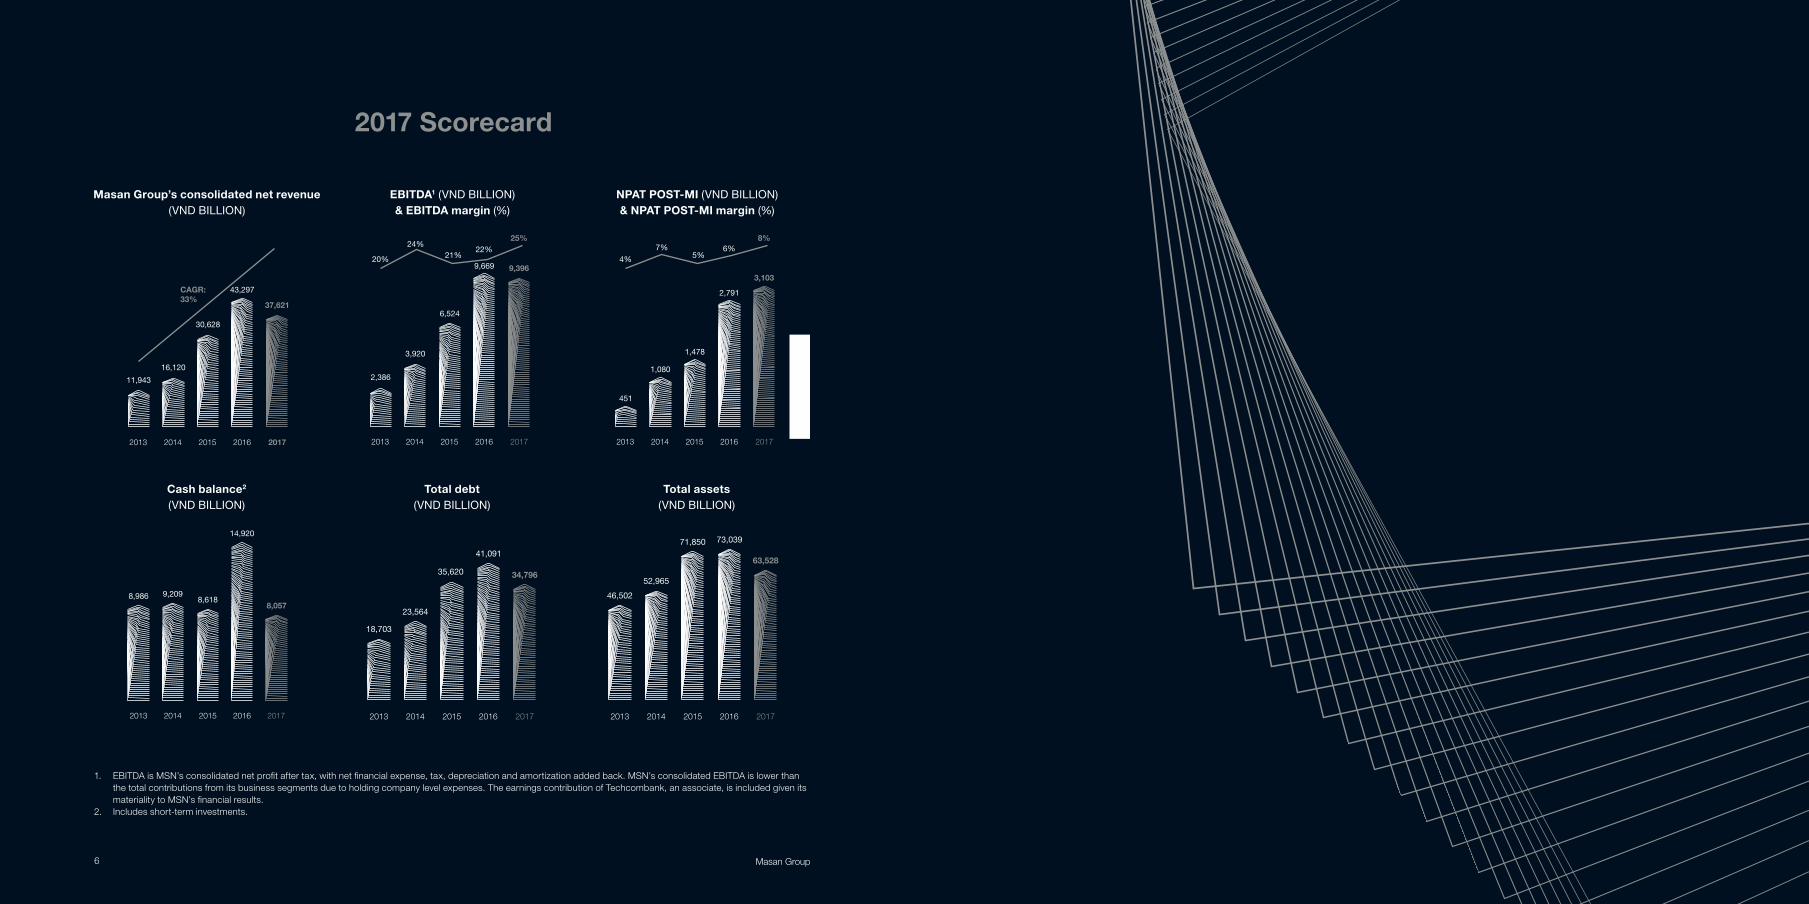
CAGR: 33%
20172016201520142013
37,621
43,297
30,628
16,120
11,943
20172016201520142013
9,3969,669
6,524
3,920
2,386
20%
24%21%
22%25%
20172016201520142013
3,103
2,791
1,478
1,080
451
4%
7%5%
6%8%
8,986
2013 2014 2015 2016 2017
9,209
14,920
8,0578,618
34,796
41,091
35,620
23,564
18,703
20172016201520142013
63,528
73,03971,850
52,96546,502
20172016201520142013
Masan Group’s consolidated net revenue (VND BILLION)
EBITDA1 (VND BILLION) & EBITDA margin (%)
NPAT POST-MI (VND BILLION) & NPAT POST-MI margin (%)
Cash balance2 (VND BILLION)
Total debt (VND BILLION)
Total assets (VND BILLION)
1. EBITDA is MSN’s consolidated net profit after tax, with net financial expense, tax, depreciation and amortization added back. MSN’s consolidated EBITDA is lower than the total contributions from its business segments due to holding company level expenses. The earnings contribution of Techcombank, an associate, is included given its materiality to MSN’s financial results.
2. Includes short-term investments.
2017 Scorecard
6 Masan Group

Keep going…with Vietnam
As an emerging economy, Vietnam can be a challenging and an uncertain place to build a sustainable business. Masan has experienced, to our benefit and also to our detriment, Vietnam’s volatility and economic cycles. But we are a Vietnamese company and we believe in our country’s potential. Vietnam is one of the world’s fastest growing economies with a compelling domestic consumption story supported by one of the worlds’ youngest and largest population (15th according to the United Nations). But at Masan, investing in and growing with Vietnam is not just the right business decision, but a matter of national pride, reflecting our deep commitment to our people. We want to create something our families could be proud of, our future generations could be proud of, and something long-lasting and special that could always grow alongside our country.
Keep going…with the Masan Way
The “Masan Way” is our consumer-centric execution model to build leading businesses in Vietnam. Across our organization, we believe in investing in innovation, distribution that reaches all corners of Vietnam, brands consumers trust and love, doing “fewer and bigger,” and an entrepreneurial team who puts consumers at the center of everything they do. In an ever-evolving market, it is often tempting to chase short-term gains. Our commitment to the Masan Way means that we have missed out on many easy opportunities to make money. But nothing sustainable is ever easy and many of our strategic mistakes were the results of us deviating from our principles and beliefs. This is why we will “keep going” with the Masan Way.
Keep going…for future leaders
With a young population and a market economy that is only a few decades old, Vietnam requires more professional talent than is available to maximize its potential. This is why Masan is proud of and grateful for the people we have. We are led by a team of professionals who exemplify our entrepreneurial spirit and commitment to the Masan Way. We have successfully recruited, developed and retained experienced talent from all over the world to accelerate our growth. However, looking ahead, we feel strongly that it is our responsibility to develop and nurture the next generation of Vietnamese leaders, not only to make Masan the destination of choice for young talent, but also to show the world that “Vietnam can do”. They will determine our future.
Keep going…with our consumers
Nearly 70% of Vietnam’s GDP is consumption-related. This opportunity, however, largely reflects how much more consumers must pay on a per capita basis for daily basic goods and services when compared to other economies in the region. Therefore, Masan believes we are “doing well by doing good” when we provide our consumers more value for their money by driving productivity and innovation. However, serving Vietnamese consumers will be increasingly more challenging as their needs and preferences change and evolve. As Vietnamese consumers achieve higher levels of disposable income and the country further urbanizes, Masan aims to keep going with our consumers and not stand still.
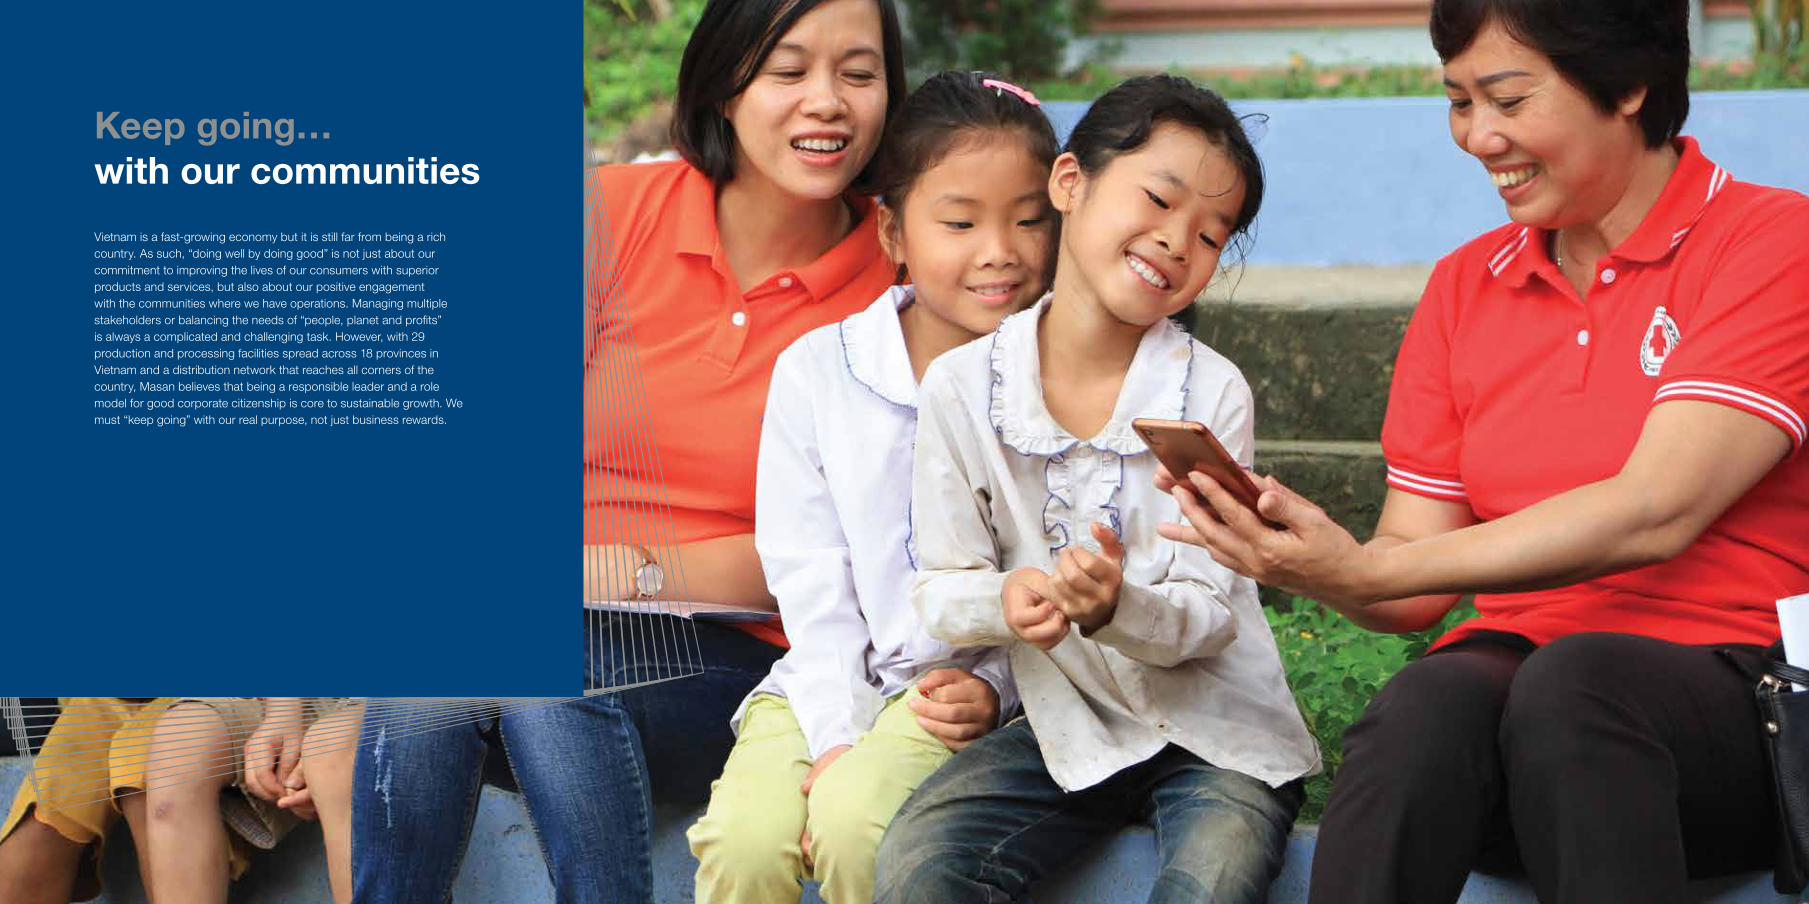
Keep going…with our communities
Vietnam is a fast-growing economy but it is still far from being a rich country. As such, “doing well by doing good” is not just about our commitment to improving the lives of our consumers with superior products and services, but also about our positive engagement with the communities where we have operations. Managing multiple stakeholders or balancing the needs of “people, planet and profits” is always a complicated and challenging task. However, with 29 production and processing facilities spread across 18 provinces in Vietnam and a distribution network that reaches all corners of the country, Masan believes that being a responsible leader and a role model for good corporate citizenship is core to sustainable growth. We must “keep going” with our real purpose, not just business rewards.
19Annual Report 2017Masan Group18
A diversified consumer platform servicing the needs of 90 million Vietnamese consumers Masan Group is one of Vietnam’s leading
private sector business groups and we believe
in “doing well by doing good.” Our mission is
to provide quality products and services for
Vietnam’s population of over 90 million people,
enabling them to get more value for their
money on their daily basic needs. Today, our
subsidiaries and associates operate in sectors
that include packaged food and beverage,
fresh food and protein, and financial services,
which all together represent approximately
50% of consumer wallet share.
These businesses are Masan Consumer
Holdings, a leader in some of Vietnam’s
largest consumer staple categories such
as seasonings and convenience foods,
with a fast-growing beverage business, and
Masan Nutri-Science, one of the leading
animal feed producers in Vietnam that has
developed a feed-farm-food (“3F”) model to
provide consumers with traceable, hygienic,
branded meat products, a US$9 billion market
opportunity.
Our other businesses include Masan
Resources, one of the world’s largest
producers of tungsten chemicals and
other strategic industrial minerals, and our
associate, Techcombank, a leading joint stock
commercial bank in Vietnam with a technology
driven retail strategy to capture the growth of
financial inclusion.
We believe in a “consumer-centric”
approach and deliver by building leading
power brands to win the trust and loyalty
of Vietnamese consumers, increasing
productivity through innovation and
technology as well as economies of scale, and
focusing on fewer but bigger opportunities
that can impact the most lives.
Our objective is to be and be recognized
worldwide as the pride of Vietnam by
creating a winning, unique business
model in Asia.
Doing fewer and bigger – Our beliefsIn a dynamic market with many opportunities,
we believe in being disciplined and have
recognized several important criteria of a
successful and sustainable business in
Vietnam. These include:
A passion to imagine and fulfill big unmet needs
Masan believes that value comes from scale
and leadership in large opportunities that are
underserved. We also believe that imagination
and creativity are critical to not only envision
such unmet needs, but to envision ways to
fulfill them with innovation or new insights. We
do not simply want to do what others do or
do what others do slightly better - we want to
change the rules of the game.
Throughout our history, we have focused
on large consumer categories, and have
constantly redefined them to expand our
addressable market, which today reaches
US$9 billion combined in Vietnam alone.
This does not include our recent entry into
Vietnam’s animal-based protein market,
where Vietnam spends approximately US$9
billion on meat products per year, or our
recently announced ambition to better serve
the 250 million consumers of In-land ASEAN.
Together with our associated company,
Techcombank, Masan operates in sectors
of the economy. Packaged food and
beverage, fresh food and protein, and
financial services represent approximately
13%, 14%, and 22% of Vietnamese
consumers’ wallet share, respectively.
An example of an “unmet need” is the
inefficient animal protein value chain
in Vietnam. We believe it is wrong that
Vietnamese consumers, who make on
average one tenth the income of Americans,
pay nearly double the price for meat
products. Starting with the commercial
animal feed business, we believe we can
transform the productivity of the animal
protein value chain to better serve consumers
with branded meat products that are more
Who we are
Our story
Our story
Masan Group 21Annual Report 201720
Our story
affordable, of higher quality, and safer. 2018
is expected to be a milestone year as we
expect to begin selling fresh chilled meat
products to consumers.
Vietnamese consumers also pay more
for financial services and products as low
financial inclusion means higher usage of
informal financial channels. Our associate
Techcombank is competing in a financial
sector that is undergoing restructuring, where
it is emerging as a leader in retail banking
with a healthy balance sheet and a scalable
technology platform.
In our tungsten mining and chemical
processing business, we are also
addressing a large market with
opportunities for transformation.
Globally, the industrial minerals we mine
and process represent a total size of
approximately US$4 to 5 billion per annum,
excluding copper. The unmet need in our
resource business is evidenced by a desire
from customers to buy large volumes from
a single supplier conflict- free minerals
and from an alternative source outside of
China. The European Union has stated that
tungsten and fluorspar are among the four
“critical raw materials” for Europe (Critical
Raw Materials for the E.U., July 2010)
due to concentration of supply sources
and importance to European industry.
As Masan Resources ventures further
downstream with industrial products, both
the addressable market size and margins
are expected to increase.
Building scale and leadership
To win, we need to be big. Being a market
leader of size allows us to compete
successfully in an economy with a
fragmented and small-scale local private
sector, and where competition from
multinational companies and state-owned
enterprises is intense.
As one of Vietnam’s largest private sector
companies, Masan has greater access to
capital and professional talent, and the scale
to invest in operating platforms, which leads
to increased productivity, allowing us to make
products more affordable for consumers. We
build scale through focus and consolidation,
growing our existing businesses organically
and accelerating growth with acquisitions
that fit within our sector focus. This enables
us to harness economies of scale, be cost-
competitive and earn high margins that
allows us to reinvest in brands and product
innovation.
As a result, today we have leading positions
in most of the markets and/or categories
where we compete. We are Vietnam’s
number one player in seasonings (where we
are the leader in fish sauce, soya sauce and
chili sauce) and instant coffee. In convenience
foods, we are the number one instant noodle
producer in the premium segment which
makes up most of the category’s profit pool.
Masan Nutri-Science was established with
the aim of transforming the meat market in
Vietnam by establishing a fully integrated
3F (Feed-Farm-Food) model. Today, we are
the largest local Vietnamese animal protein
company with leadership in external pig
feed sales (market share of approximately
35% at the end of 2017). We are on track
to develop an integrated 3F model with the
commissioning of our pig farm in Nghe An
(capacity of 230,000 to 250,000 porkers per
year) and the groundbreaking of a new meat
processing complex in Ha Nam (capacity
to slaughter and process 1.4 million pigs
per annum, equivalent to 140,000 tons
per annum). We believe that such scale
across our 3F model is critical in driving the
productivity within the animal protein value
chain and achieving sustainable margins.
Masan Resources is now a globally significant
player across several key industrial minerals,
namely tungsten, fluorspar and bismuth.
Our current market share is 36% of global
tungsten supply outside of China. Masan
Resources is exploring strategic opportunities
to become a more integrated downstream
tungsten processor.
Our associate Techcombank is one of
the largest joint stock commercial banks
in Vietnam with leadership position in
residential mortgages, bancassurance, Visa
and debit card transactions and wealth
management products. Techcombank
continues to invest to further enhance
its technology platform and has been
experiencing significant traction with its
mobile and digital channels. As a result of its
prudent approach to managing the banking
sector downturn over the past few years,
it is now on a path to market leadership as
sector fundamentals improve.
Cash flow generating businesses
Masan believes that sustainable growth in
an emerging market like Vietnam requires
building cash flow generating businesses.
We do not engage in asset trading, such as
purchasing land banks or participating in
short-term speculation. We compete only in
sectors with strong growth fundamentals, a
proven private sector regional business model
and the potential to build a business of scale.
Therefore, we have chosen to focus on the
consumption-related sectors.
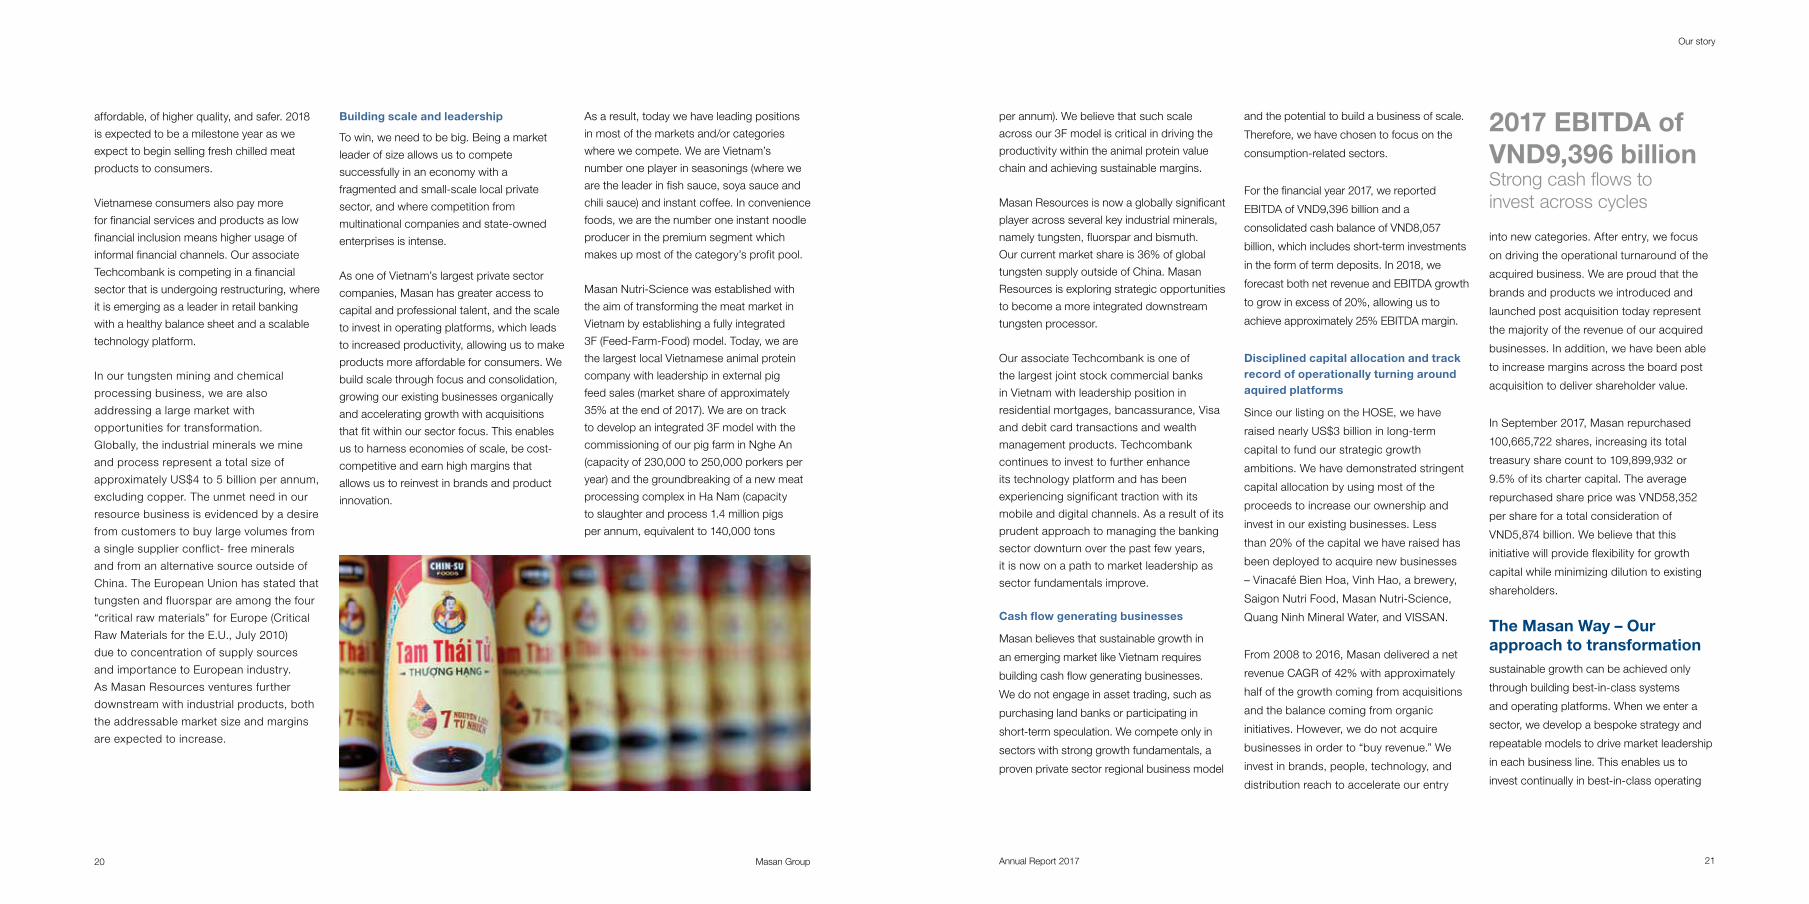
For the financial year 2017, we reported
EBITDA of VND9,396 billion and a
consolidated cash balance of VND8,057
billion, which includes short-term investments
in the form of term deposits. In 2018, we
forecast both net revenue and EBITDA growth
to grow in excess of 20%, allowing us to
achieve approximately 25% EBITDA margin.
Disciplined capital allocation and track record of operationally turning around aquired platforms
Since our listing on the HOSE, we have
raised nearly US$3 billion in long-term
capital to fund our strategic growth
ambitions. We have demonstrated stringent
capital allocation by using most of the
proceeds to increase our ownership and
invest in our existing businesses. Less
than 20% of the capital we have raised has
been deployed to acquire new businesses
– Vinacafé Bien Hoa, Vinh Hao, a brewery,
Saigon Nutri Food, Masan Nutri-Science,
Quang Ninh Mineral Water, and VISSAN.
From 2008 to 2016, Masan delivered a net
revenue CAGR of 42% with approximately
half of the growth coming from acquisitions
and the balance coming from organic
initiatives. However, we do not acquire
businesses in order to “buy revenue.” We
invest in brands, people, technology, and
distribution reach to accelerate our entry
into new categories. After entry, we focus
on driving the operational turnaround of the
acquired business. We are proud that the
brands and products we introduced and
launched post acquisition today represent
the majority of the revenue of our acquired
businesses. In addition, we have been able
to increase margins across the board post
acquisition to deliver shareholder value.
In September 2017, Masan repurchased
100,665,722 shares, increasing its total
treasury share count to 109,899,932 or
9.5% of its charter capital. The average
repurchased share price was VND58,352
per share for a total consideration of
VND5,874 billion. We believe that this
initiative will provide flexibility for growth
capital while minimizing dilution to existing
shareholders.
The Masan Way – Our approach to transformationsustainable growth can be achieved only
through building best-in-class systems
and operating platforms. When we enter a
sector, we develop a bespoke strategy and
repeatable models to drive market leadership
in each business line. This enables us to
invest continually in best-in-class operating
2017 EBITDA of VND9,396 billion Strong cash flows to invest across cycles
Masan Group 23Annual Report 201722
Our story
platforms. Over the past several years, we
have invested in power brands, innovation,
distribution networks, production facilities
and most importantly, talent.
Brands that consumers admire and trust
We have transformed our branded food
and beverage and consumer-agri platforms
to become market leaders across the
categories they operate in with strong brand
equity. Our approach to organically develop
or acquire power brands which are trusted by
consumers is in line with our belief of focusing
on the consumers’ daily basic needs.
Our seasoning products are market
leaders in their respective categories. In
instant noodles, we are number one in the
premium segment. We are also market
leader in the animal feed category based
on external sales.
We have grown our food and beverage
business to be what we believe is the market
leader in almost all of our segments. We
developed power brands by leveraging our
deep understanding of the Vietnamese
consumers and implementing best
practices, resulting in what we believe is
an unrivaled portfolio of distinct brands.
In a market where consumer behavior is
sensitive to price, we are proud to have
transformed products that were previously
considered commodities into power brands
that can command customer loyalty across
different price points while meeting the
diverse needs of Vietnamese consumers.
Our key brands include: Chin-su, Nam Ngu
and Tam Thai Tu for seasonings; Omachi,
Kokomi, Komi, Cao Boi and Heo Cao Boi for
convenience foods (which includes instant
noodles, congee, processed meat); and
Vinacafé, Wake-Up, Wake-Up 247, Kachi, Vinh
Hao, Quang Hanh and Faith for non-alcoholic
beverages. Our beer brand, Su Tu Trang is
on track to being a VND1,000 billion business
after only a few years since its launch.
Our associate, Cholimex Food Joint Stock
Company, in which we acquired a significant
stake at the end of 2014, also has well-known
sauces and condiments brands with a strong
presence in on-premise channels.
In 2017, our coffee business Vinacafé Bien
Hoa received the “Vietnam Top Quality
Product” award for 21st consecutive years
by Vietnam Top Quality Product Association
(formerly The Gioi Tiep Thi Newspaper).
In the same year, Vinacafé Bien Hoa was
recognized as “Vietnam’s Famous Brand”
by the Ministry of Science and Technology
and International Trademark Association
(INTA). Vinh Hao, our bottled mineral water
brand with a heritage beginning in 1928 also
received the “Vietnam’s Top Quality Product”
award for the 21st consecutive time by
Vietnam Top Quality Product Association.
We have also been able to apply our FMCG
brand building model to our consumer-agri
business. Three years after its launch, Bio-
zeem today comprises over 60% of our animal
feed sales. Bio-zeem is the brand for our feed
products that carry a proprietary enzyme to
strengthen a pig’s immune system and improve
the feed conversion ratio. Our innovation has
been supported by television advertising
campaigns and direct brand activation activities
with farmers. The strength of the brand was
validated by our ability to grow our market share
of the external pig feed market to 35% during a
period of historically low livestock pig prices.
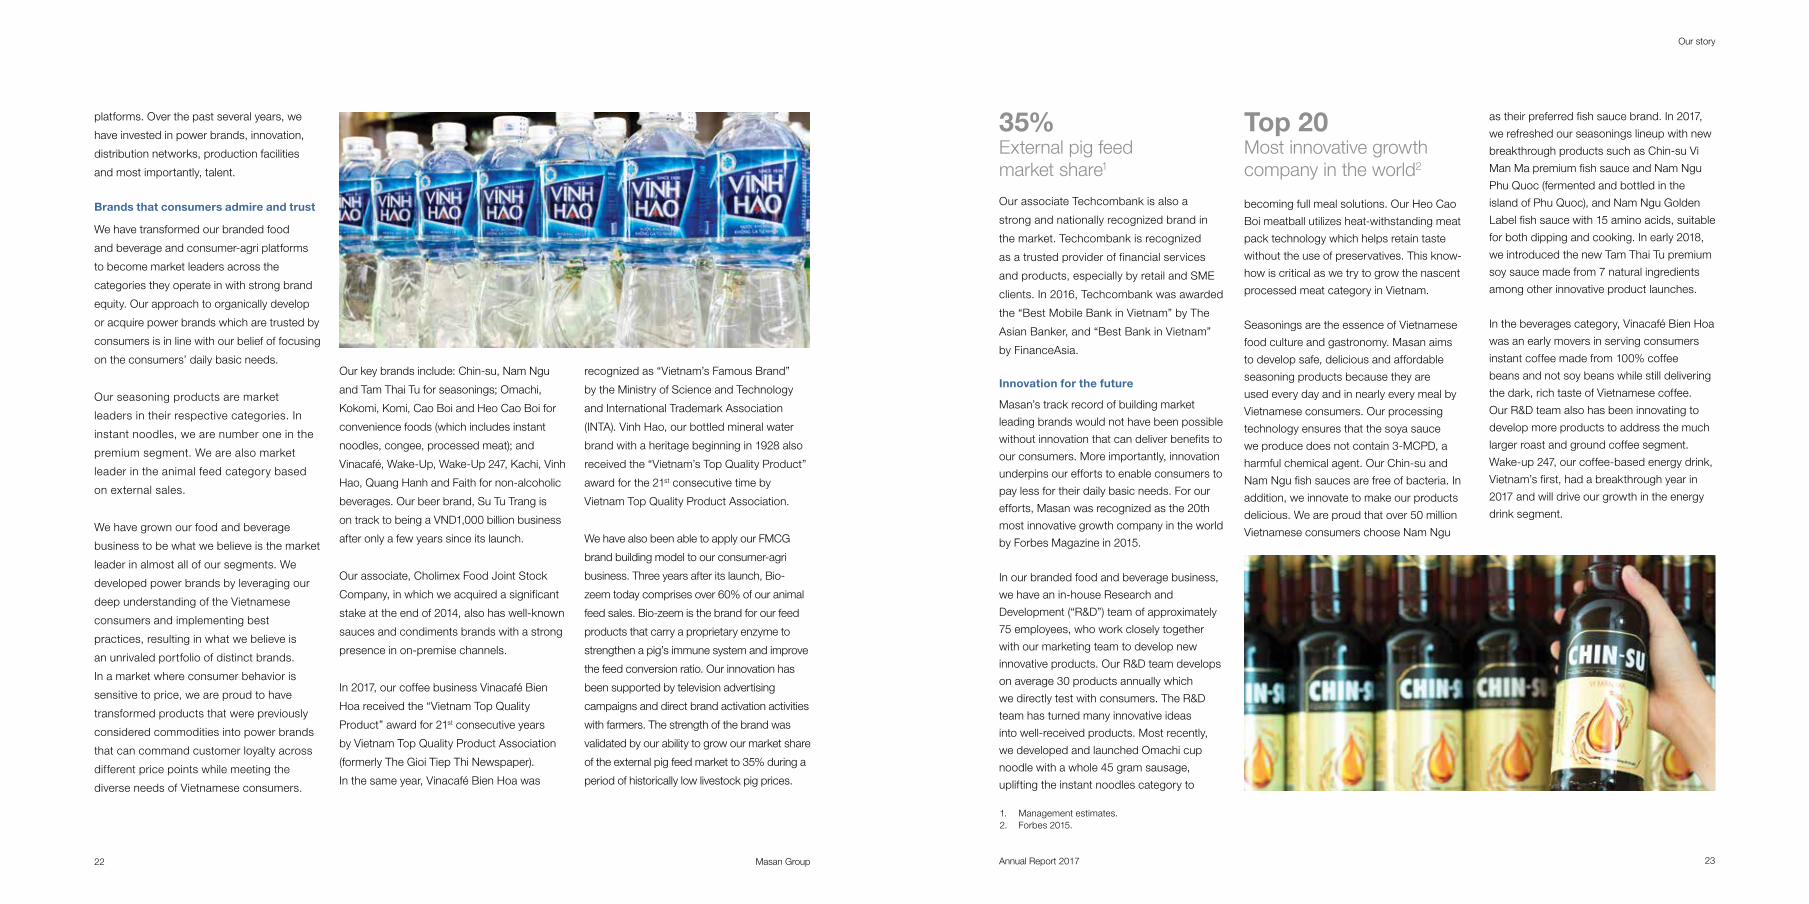
Our associate Techcombank is also a
strong and nationally recognized brand in
the market. Techcombank is recognized
as a trusted provider of financial services
and products, especially by retail and SME
clients. In 2016, Techcombank was awarded
the “Best Mobile Bank in Vietnam” by The
Asian Banker, and “Best Bank in Vietnam”
by FinanceAsia.
Innovation for the future
Masan’s track record of building market
leading brands would not have been possible
without innovation that can deliver benefits to
our consumers. More importantly, innovation
underpins our efforts to enable consumers to
pay less for their daily basic needs. For our
efforts, Masan was recognized as the 20th
most innovative growth company in the world
by Forbes Magazine in 2015.
In our branded food and beverage business,
we have an in-house Research and
Development (“R&D”) team of approximately
75 employees, who work closely together
with our marketing team to develop new
innovative products. Our R&D team develops
on average 30 products annually which
we directly test with consumers. The R&D
team has turned many innovative ideas
into well-received products. Most recently,
we developed and launched Omachi cup
noodle with a whole 45 gram sausage,
uplifting the instant noodles category to
becoming full meal solutions. Our Heo Cao
Boi meatball utilizes heat-withstanding meat
pack technology which helps retain taste
without the use of preservatives. This know-
how is critical as we try to grow the nascent
processed meat category in Vietnam.
Seasonings are the essence of Vietnamese
food culture and gastronomy. Masan aims
to develop safe, delicious and affordable
seasoning products because they are
used every day and in nearly every meal by
Vietnamese consumers. Our processing
technology ensures that the soya sauce
we produce does not contain 3-MCPD, a
harmful chemical agent. Our Chin-su and
Nam Ngu fish sauces are free of bacteria. In
addition, we innovate to make our products
delicious. We are proud that over 50 million
Vietnamese consumers choose Nam Ngu
as their preferred fish sauce brand. In 2017,
we refreshed our seasonings lineup with new
breakthrough products such as Chin-su Vi
Man Ma premium fish sauce and Nam Ngu
Phu Quoc (fermented and bottled in the
island of Phu Quoc), and Nam Ngu Golden
Label fish sauce with 15 amino acids, suitable
for both dipping and cooking. In early 2018,
we introduced the new Tam Thai Tu premium
soy sauce made from 7 natural ingredients
among other innovative product launches.
In the beverages category, Vinacafé Bien Hoa
was an early movers in serving consumers
instant coffee made from 100% coffee
beans and not soy beans while still delivering
the dark, rich taste of Vietnamese coffee.
Our R&D team also has been innovating to
develop more products to address the much
larger roast and ground coffee segment.
Wake-up 247, our coffee-based energy drink,
Vietnam’s first, had a breakthrough year in
2017 and will drive our growth in the energy
drink segment.
35%External pig feed market share1
1. Management estimates.2. Forbes 2015.
Top 20 Most innovative growth company in the world2
Masan Group 25Annual Report 201724
Our story
Masan Nutri-Science delivered innovation
in the meat value chain sector with
the introduction of Bio-zeem. Working
closely with global biotechnology firms,
we developed an enzyme additive which
improves intestinal health, enhances
absorption capacity, boosts resistance, and
reduces common diseases in pigs. As a
result, Bio-zeem improved feed conversion
ratios up to 6% according to internal studies,
enabling farmers to sell their pigs 12 days
sooner to market.
We have marketed Bio-zeem as a value-
added feature that can be found in our
range of animal feed products, giving us
an edge in a traditionally commoditized
market where farmers have been unable
to differentiate products. These innovative
efforts, along with our investment in brand
building, are the reasons 95% of pig
farmers switched to Bio-zeem after initial
trial. Going forward, we aim to continue
innovating across the entire meat value
chain (3F) to drive productivity and deliver
branded meat products to consumers.
In financial services, we believe that our
emphasis on innovation and being ahead
of the competition can also be seen at
Techcombank, which is developing a
“Consumer-Tech” model to better serve
retail clients.
Our resource mining and value-added
processing business has established itself
as a high-tech, low cost tungsten chemical
producer and has committed up to 1% of its
tungsten revenues to R&D.
Reaching consumers
We have the largest and deepest distribution
network in Vietnam with the ability to
reach Vietnamese consumers quickly and
effectively. This is critical as up to 70% of
Vietnam’s population is still rural and relies on
general trade. Modern trade penetration has
progressed slowly and the retail landscape
remains highly fragmented.
For our consumer products, we have
developed a nationwide distribution network
with 300 distributors, covering approximately
190,000 points of sale for food and 130,000
points of sale for beverage. This network is
one of the largest and deepest in Vietnam’s
FMCG sector. We have enhanced our
distribution capabilities over the past few
years with the addition of more distributors
for beverages and on-premise points of
sale. This achievement makes our business
one of the few in Vietnam with both a strong
on and off-premise presence for food and
beverage. Today, 98% of all Vietnamese
households have a Masan consumer
product in their homes.
We are also unique as a “one-stop” shop for
our distributors because our wide product
portfolio caters to the daily basic needs
of Vietnamese consumers, allowing us to
have loyal and close relationships with our
distributors. Further, our strategically located
distribution centers provide us with the ability
to distribute food and beverage products
within a single day to each distributor
nationwide. This also gives us the unique
capability to test new products efficiently and
be cost-effective across Vietnam. In 2017,
we implemented a destocking initiative at
the distributor level, which brings consumers
fresher products.
At Masan Nutri-Science, we have over
1,200 salesmen to serve over 4,500 dealers
nationwide. A large portion of the dealers are
exclusive. We believe that we have further
strengthened our nationwide distribution
network following our investment in VISSAN,
which has a nationwide network that reaches
130,000 points of sale and more than 1,000
supermarkets and convenience stores.
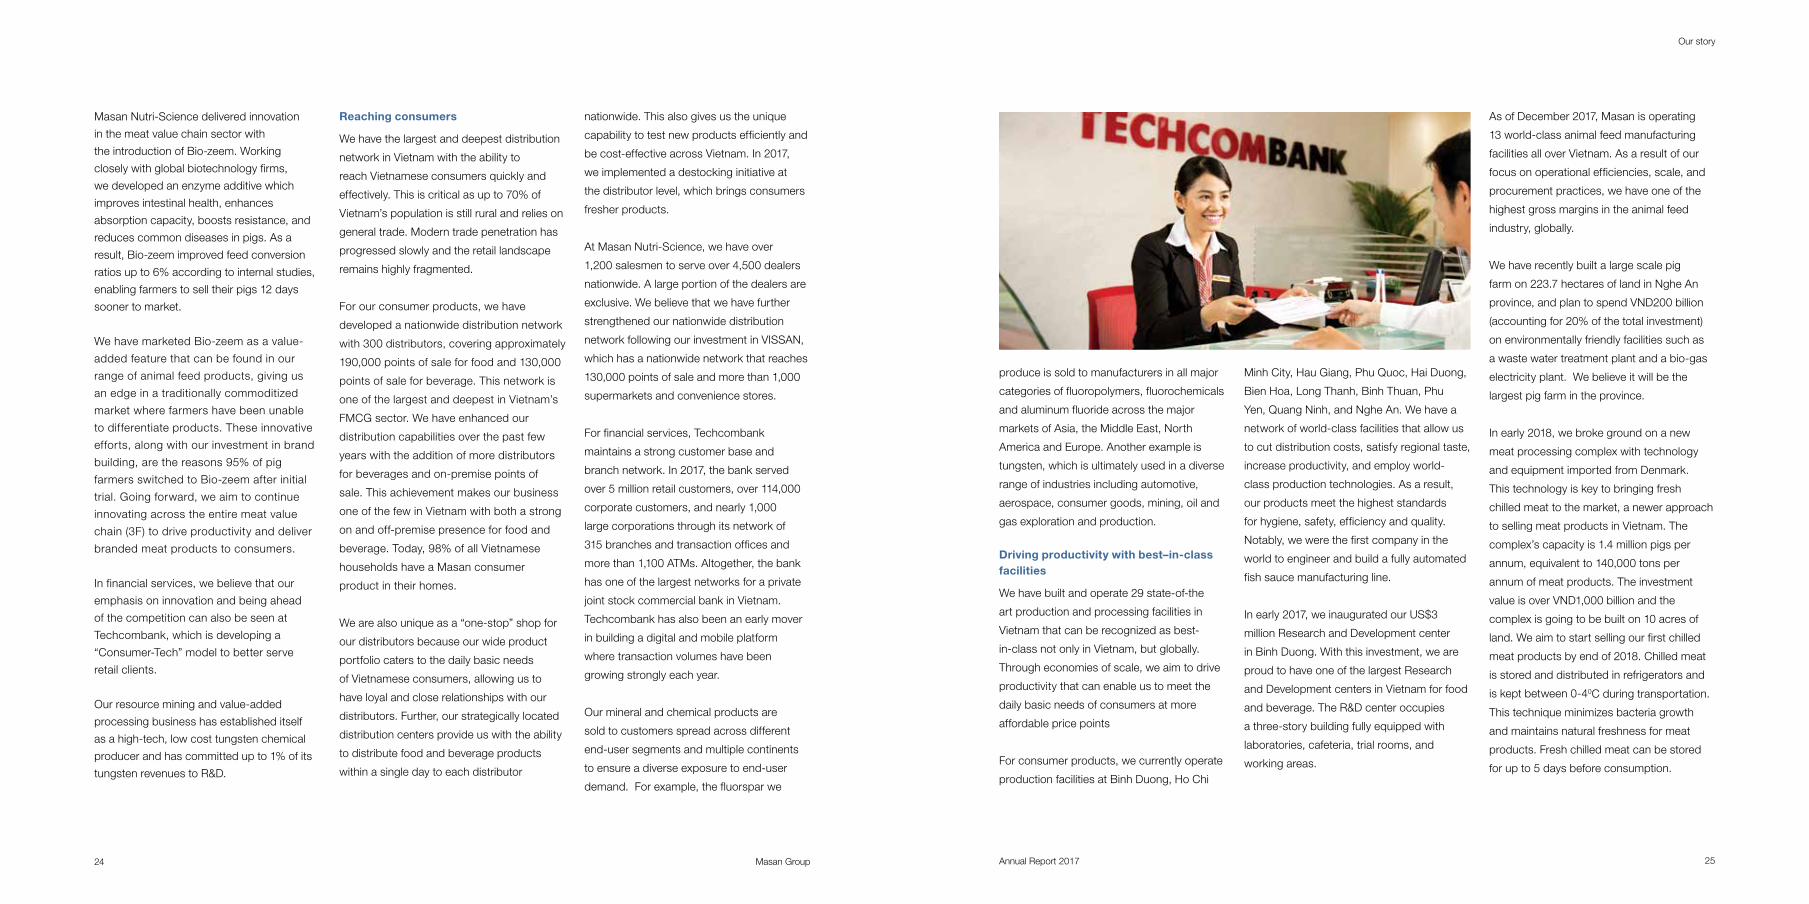
For financial services, Techcombank
maintains a strong customer base and
branch network. In 2017, the bank served
over 5 million retail customers, over 114,000
corporate customers, and nearly 1,000
large corporations through its network of
315 branches and transaction offices and
more than 1,100 ATMs. Altogether, the bank
has one of the largest networks for a private
joint stock commercial bank in Vietnam.
Techcombank has also been an early mover
in building a digital and mobile platform
where transaction volumes have been
growing strongly each year.
Our mineral and chemical products are
sold to customers spread across different
end-user segments and multiple continents
to ensure a diverse exposure to end-user
demand. For example, the fluorspar we
produce is sold to manufacturers in all major
categories of fluoropolymers, fluorochemicals
and aluminum fluoride across the major
markets of Asia, the Middle East, North
America and Europe. Another example is
tungsten, which is ultimately used in a diverse
range of industries including automotive,
aerospace, consumer goods, mining, oil and
gas exploration and production.
Driving productivity with best–in-class facilities
We have built and operate 29 state-of-the
art production and processing facilities in
Vietnam that can be recognized as best-
in-class not only in Vietnam, but globally.
Through economies of scale, we aim to drive
productivity that can enable us to meet the
daily basic needs of consumers at more
affordable price points
For consumer products, we currently operate
production facilities at Binh Duong, Ho Chi
Minh City, Hau Giang, Phu Quoc, Hai Duong,
Bien Hoa, Long Thanh, Binh Thuan, Phu
Yen, Quang Ninh, and Nghe An. We have a
network of world-class facilities that allow us
to cut distribution costs, satisfy regional taste,
increase productivity, and employ world-
class production technologies. As a result,
our products meet the highest standards
for hygiene, safety, efficiency and quality.
Notably, we were the first company in the
world to engineer and build a fully automated
fish sauce manufacturing line.
In early 2017, we inaugurated our US$3
million Research and Development center
in Binh Duong. With this investment, we are
proud to have one of the largest Research
and Development centers in Vietnam for food
and beverage. The R&D center occupies
a three-story building fully equipped with
laboratories, cafeteria, trial rooms, and
working areas.
As of December 2017, Masan is operating
13 world-class animal feed manufacturing
facilities all over Vietnam. As a result of our
focus on operational efficiencies, scale, and
procurement practices, we have one of the
highest gross margins in the animal feed
industry, globally.
We have recently built a large scale pig
farm on 223.7 hectares of land in Nghe An
province, and plan to spend VND200 billion
(accounting for 20% of the total investment)
on environmentally friendly facilities such as
a waste water treatment plant and a bio-gas
electricity plant. We believe it will be the
largest pig farm in the province.
In early 2018, we broke ground on a new
meat processing complex with technology
and equipment imported from Denmark.
This technology is key to bringing fresh
chilled meat to the market, a newer approach
to selling meat products in Vietnam. The
complex’s capacity is 1.4 million pigs per
annum, equivalent to 140,000 tons per
annum of meat products. The investment
value is over VND1,000 billion and the
complex is going to be built on 10 acres of
land. We aim to start selling our first chilled
meat products by end of 2018. Chilled meat
is stored and distributed in refrigerators and
is kept between 0-40C during transportation.
This technique minimizes bacteria growth
and maintains natural freshness for meat
products. Fresh chilled meat can be stored
for up to 5 days before consumption.
Masan Group 27Annual Report 201726
Vietnam’s growth story
Our story
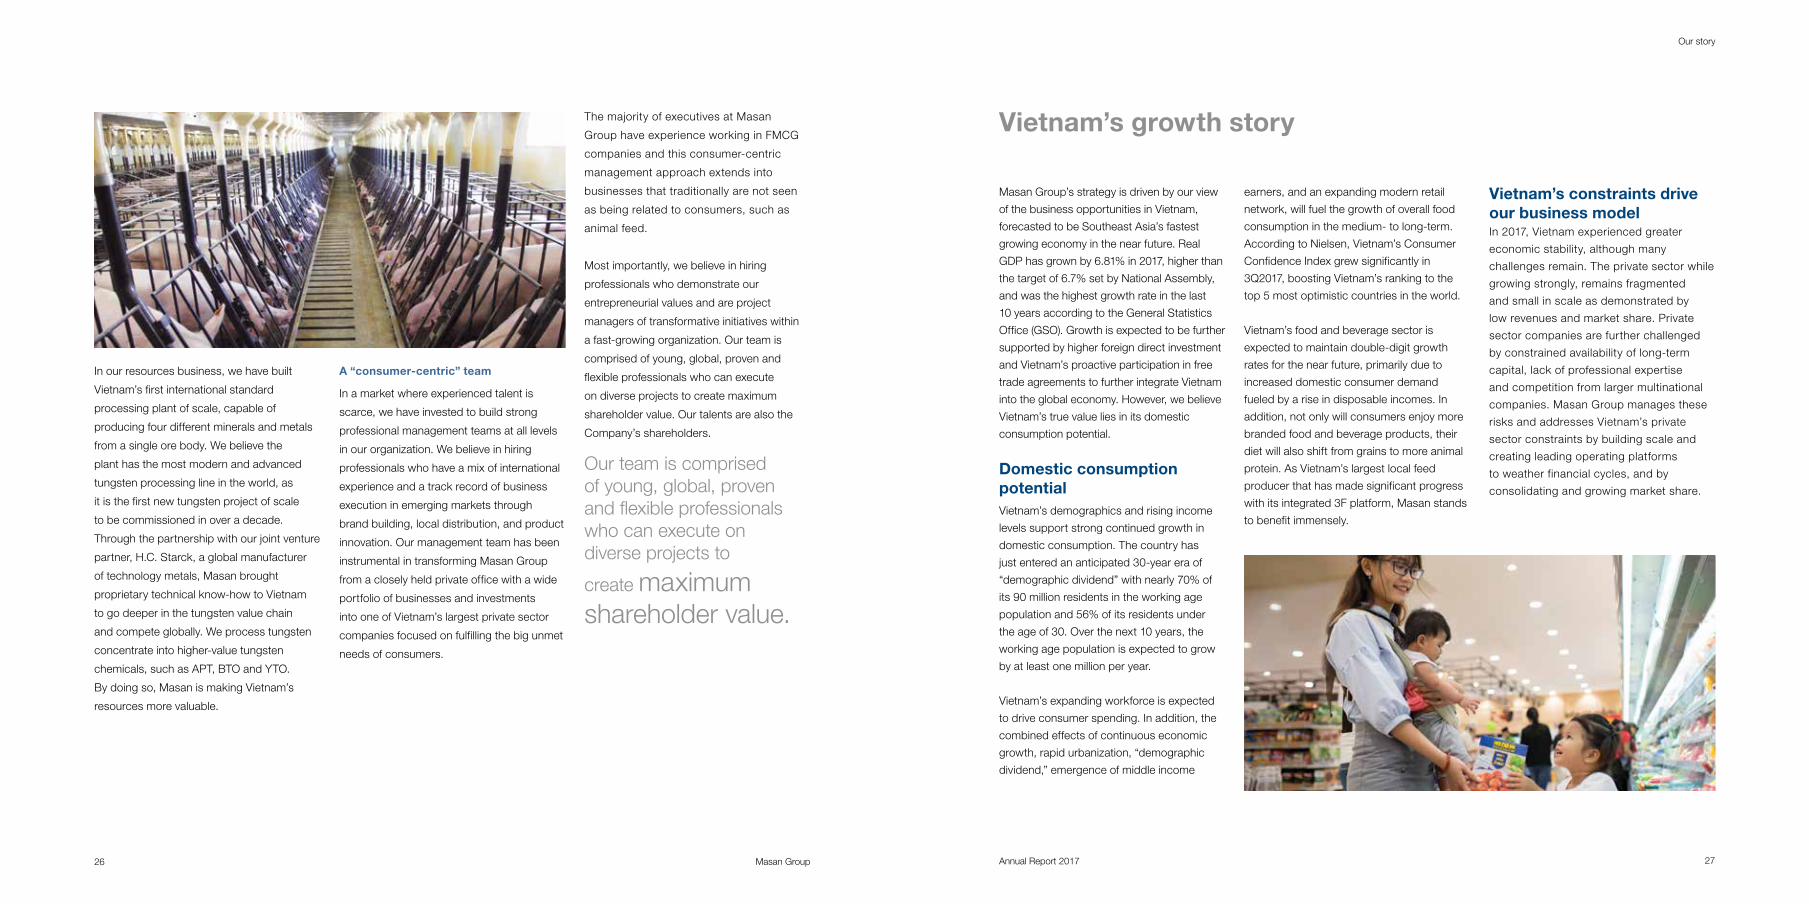
In our resources business, we have built
Vietnam’s first international standard
processing plant of scale, capable of
producing four different minerals and metals
from a single ore body. We believe the
plant has the most modern and advanced
tungsten processing line in the world, as
it is the first new tungsten project of scale
to be commissioned in over a decade.
Through the partnership with our joint venture
partner, H.C. Starck, a global manufacturer
of technology metals, Masan brought
proprietary technical know-how to Vietnam
to go deeper in the tungsten value chain
and compete globally. We process tungsten
concentrate into higher-value tungsten
chemicals, such as APT, BTO and YTO.
By doing so, Masan is making Vietnam’s
resources more valuable.
A “consumer-centric” team
In a market where experienced talent is
scarce, we have invested to build strong
professional management teams at all levels
in our organization. We believe in hiring
professionals who have a mix of international
experience and a track record of business
execution in emerging markets through
brand building, local distribution, and product
innovation. Our management team has been
instrumental in transforming Masan Group
from a closely held private office with a wide
portfolio of businesses and investments
into one of Vietnam’s largest private sector
companies focused on fulfilling the big unmet
needs of consumers.
The majority of executives at Masan
Group have experience working in FMCG
companies and this consumer-centric
management approach extends into
businesses that traditionally are not seen
as being related to consumers, such as
animal feed.
Most importantly, we believe in hiring
professionals who demonstrate our
entrepreneurial values and are project
managers of transformative initiatives within
a fast-growing organization. Our team is
comprised of young, global, proven and
flexible professionals who can execute
on diverse projects to create maximum
shareholder value. Our talents are also the
Company’s shareholders.
Masan Group’s strategy is driven by our view
of the business opportunities in Vietnam,
forecasted to be Southeast Asia’s fastest
growing economy in the near future. Real
GDP has grown by 6.81% in 2017, higher than
the target of 6.7% set by National Assembly,
and was the highest growth rate in the last
10 years according to the General Statistics
Office (GSO). Growth is expected to be further
supported by higher foreign direct investment
and Vietnam’s proactive participation in free
trade agreements to further integrate Vietnam
into the global economy. However, we believe
Vietnam’s true value lies in its domestic
consumption potential.
Domestic consumption potentialVietnam’s demographics and rising income
levels support strong continued growth in
domestic consumption. The country has
just entered an anticipated 30-year era of
“demographic dividend” with nearly 70% of
its 90 million residents in the working age
population and 56% of its residents under
the age of 30. Over the next 10 years, the
working age population is expected to grow
by at least one million per year.
Vietnam’s expanding workforce is expected
to drive consumer spending. In addition, the
combined effects of continuous economic
growth, rapid urbanization, “demographic
dividend,” emergence of middle income
earners, and an expanding modern retail
network, will fuel the growth of overall food
consumption in the medium- to long-term.
According to Nielsen, Vietnam’s Consumer
Confidence Index grew significantly in
3Q2017, boosting Vietnam’s ranking to the
top 5 most optimistic countries in the world.
Vietnam’s food and beverage sector is
expected to maintain double-digit growth
rates for the near future, primarily due to
increased domestic consumer demand
fueled by a rise in disposable incomes. In
addition, not only will consumers enjoy more
branded food and beverage products, their
diet will also shift from grains to more animal
protein. As Vietnam’s largest local feed
producer that has made significant progress
with its integrated 3F platform, Masan stands
to benefit immensely.
Vietnam’s constraints drive our business modelIn 2017, Vietnam experienced greater
economic stability, although many
challenges remain. The private sector while
growing strongly, remains fragmented
and small in scale as demonstrated by
low revenues and market share. Private
sector companies are further challenged
by constrained availability of long-term
capital, lack of professional expertise
and competition from larger multinational
companies. Masan Group manages these
risks and addresses Vietnam’s private
sector constraints by building scale and
creating leading operating platforms
to weather financial cycles, and by
consolidating and growing market share.
Our team is comprised of young, global, proven and flexible professionals who can execute on diverse projects to
create maximum shareholder value.
Masan Group 29Annual Report 201728
Our story
Our history – A track record of transformation
Masan Group’s first predecessor company
was established in 1996 with sales of
Asian foodstuff and other consumer goods
in Eastern Europe. In our early days, we
primarily focused on the Eastern European
markets and some of our more popular
products were sauces and instant noodles,
which we began to manufacture in Vietnam
when the export business grew. However,
by 2000, we shifted our focus towards the
domestic market and launched our premium
sauce brand, Chin-su in 2002. Chin-su’s
success was followed by more successful
brand launches such as Nam Ngu (Vietnam’s
most popular fish sauce) and Tam Thai Tu
(Vietnam’s most popular soy sauce).
In 2007, Masan entered the domestic
convenience foods category with the launch
of Omachi, a premium instant noodles brand.
We have expanded our convenience foods
portfolio with the introduction of Kokomi
(mass market instant noodles) and Komi
(instant congee), and today we are Vietnam’s
number two player in the overall category.
In 2008 the company was restructured and
formally named Masan Group Corporation,
comprising a fast growing food business
and a 20% stake in Techcombank, which
provided the company with greater scale
and exposure to Vietnam’s emerging middle
class story. Masan Group was subsequently
listed on Ho Chi Minh Stock Exchange on 5
November 2009 under the symbol “MSN,”
and immediately became the sixth largest
listed company in Vietnam based on market
capitalization. During 2009, several prominent
global investors such as TPG became
shareholders.
In 2010, the Group acquired a controlling
stake in the Nui Phao mine, one of the world’s
largest tungsten mines and established
Masan Resources. Masan Group also
increased its effective economic interest in
Techcombank the same year.
In 2011, Masan Group entered the beverage
segment by acquiring control of Vinacafé
Bien Hoa, Vietnam’s largest instant coffee
producer. The company has since grown its
beverage business where today it is not only
Vietnam’s largest instant coffee producer
with the Vinacafé and Wake-up brands, but
also the largest local mineral water company
with brands such as Vinh Hao and Quang
Hanh. In April 2011, KKR invested US$159
million into Masan Group’s branded food
and beverage business. KKR subsequently
increased its investment with an additional
US$200 million investment 2 years later.
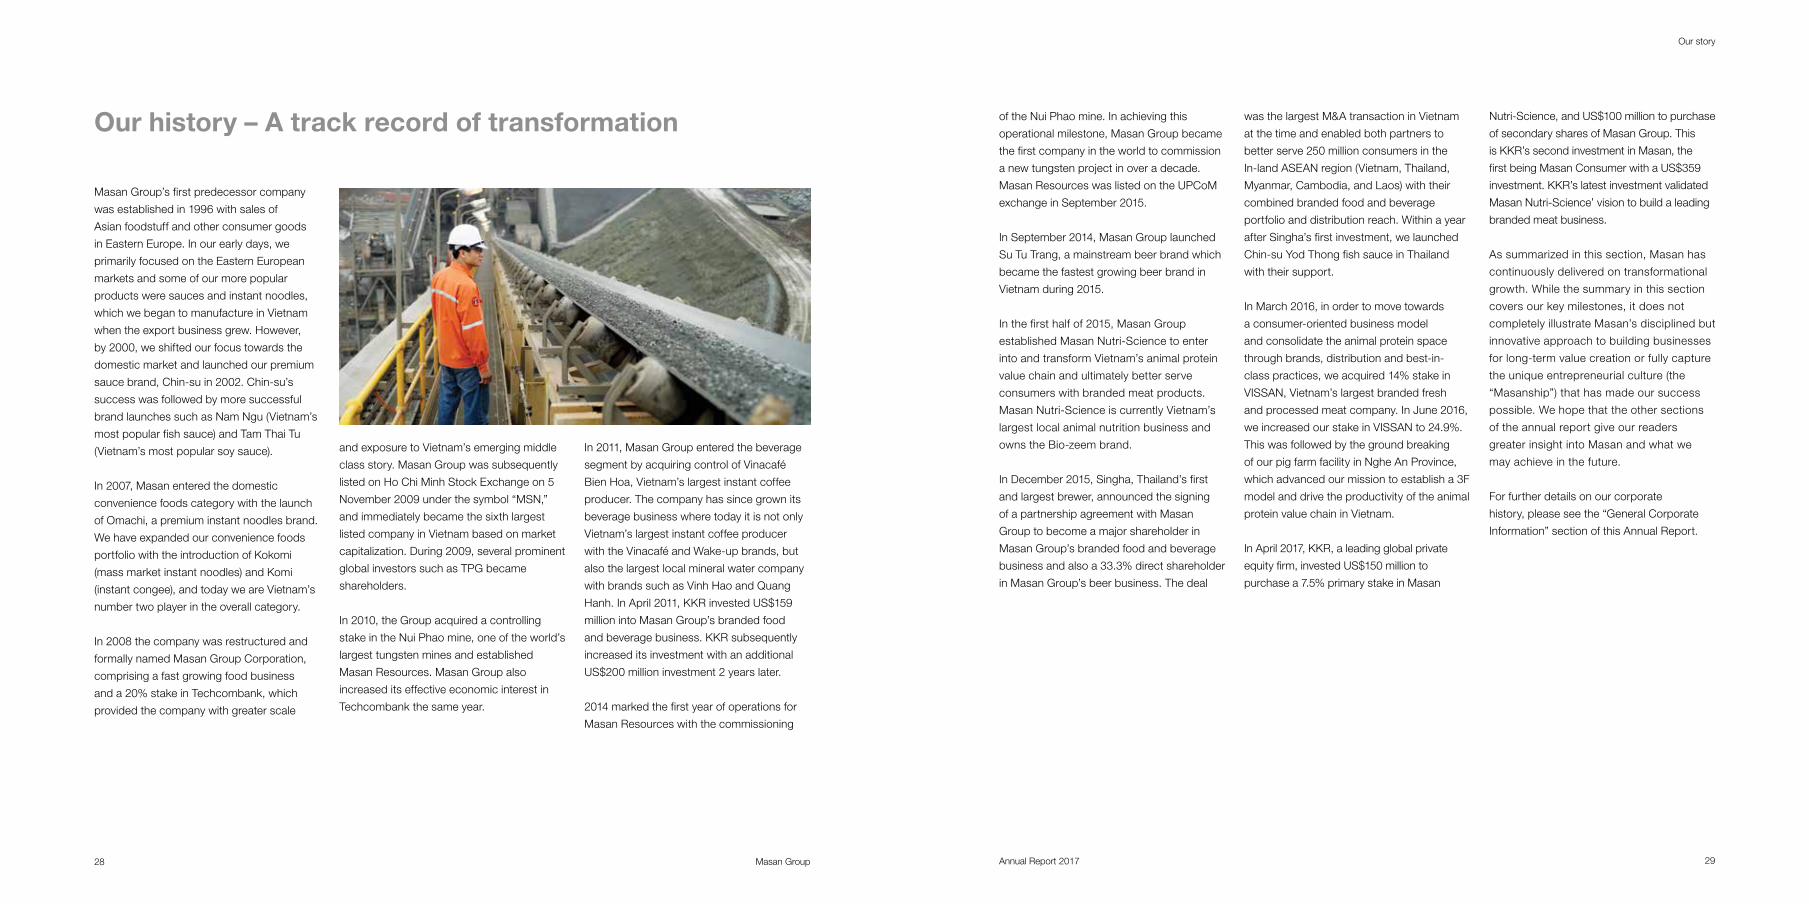
2014 marked the first year of operations for
Masan Resources with the commissioning
of the Nui Phao mine. In achieving this
operational milestone, Masan Group became
the first company in the world to commission
a new tungsten project in over a decade.
Masan Resources was listed on the UPCoM
exchange in September 2015.
In September 2014, Masan Group launched
Su Tu Trang, a mainstream beer brand which
became the fastest growing beer brand in
Vietnam during 2015.
In the first half of 2015, Masan Group
established Masan Nutri-Science to enter
into and transform Vietnam’s animal protein
value chain and ultimately better serve
consumers with branded meat products.
Masan Nutri-Science is currently Vietnam’s
largest local animal nutrition business and
owns the Bio-zeem brand.
In December 2015, Singha, Thailand’s first
and largest brewer, announced the signing
of a partnership agreement with Masan
Group to become a major shareholder in
Masan Group’s branded food and beverage
business and also a 33.3% direct shareholder
in Masan Group’s beer business. The deal
was the largest M&A transaction in Vietnam
at the time and enabled both partners to
better serve 250 million consumers in the
In-land ASEAN region (Vietnam, Thailand,
Myanmar, Cambodia, and Laos) with their
combined branded food and beverage
portfolio and distribution reach. Within a year
after Singha’s first investment, we launched
Chin-su Yod Thong fish sauce in Thailand
with their support.
In March 2016, in order to move towards
a consumer-oriented business model
and consolidate the animal protein space
through brands, distribution and best-in-
class practices, we acquired 14% stake in
VISSAN, Vietnam’s largest branded fresh
and processed meat company. In June 2016,
we increased our stake in VISSAN to 24.9%.
This was followed by the ground breaking
of our pig farm facility in Nghe An Province,
which advanced our mission to establish a 3F
model and drive the productivity of the animal
protein value chain in Vietnam.
In April 2017, KKR, a leading global private
equity firm, invested US$150 million to
purchase a 7.5% primary stake in Masan
Nutri-Science, and US$100 million to purchase
of secondary shares of Masan Group. This
is KKR’s second investment in Masan, the
first being Masan Consumer with a US$359
investment. KKR’s latest investment validated
Masan Nutri-Science’ vision to build a leading
branded meat business.
As summarized in this section, Masan has
continuously delivered on transformational
growth. While the summary in this section
covers our key milestones, it does not
completely illustrate Masan’s disciplined but
innovative approach to building businesses
for long-term value creation or fully capture
the unique entrepreneurial culture (the
“Masanship”) that has made our success
possible. We hope that the other sections
of the annual report give our readers
greater insight into Masan and what we
may achieve in the future.
For further details on our corporate
history, please see the “General Corporate
Information” section of this Annual Report.
SustainabilityReport
Masan Group 33Annual Report 201732
Sustainability Report
“Keep going” with our real purpose, not just business rewards
“Doing well by doing good”
Masan Group Corporation is one of Vietnam’s
largest private sector companies specializing
in branded foods and beverages, the meat
value chain, resources and financial services.
Our objective is to be and be recognized
worldwide as the pride of Vietnam by
creating a winning, unique business
model in Asia.
Our uniqueness is underpinned by our belief
in applying a consumer-centric business
model across all of our operating platforms
and across various industries. By doing so, we
can enable 90 million Vietnamese people to
pay less for their daily basic needs. However,
serving consumers with superior products is
not enough to become the “pride of Vietnam”.
We must “keep going with our real purpose,
not just business rewards”. To do so, we must
have a strategy on sustainbiliy.
To build a sustainable business, we
must act upon the four core values of
Win-win, Integrity, Leadership, and
most importantly, Driving Change
Sustainably. We must always act
in a manner that is environmentally,
economically, and socially sustainable,
adhering to the following principles:
� Environmental Stewardship: Encouraging a voluntary, progressive reduction in environmental impact throughout the lifecycle of our products by innovative solutions and
reduction in the amount of resources consumed, waste generated and emissions produced.
� Social Responsibility: Committing to a policy of proactive, voluntary and continual improvement over and above basic legal requirements so that we contribute in promoting and improving the health and quality of life of the community in which we operate, and our staff is recognized and encouraged by society and regulators.
� Economic Development: Contributing to economic growth through innovative delivery, based on sound science, up-to-date technologies and ethical standards for hygiene and specialty products for use across consumer, commercial and industrial applications.
Our corporate sustainability framework
revolves around the harmonious interactions
between people, planet and profit. We
believe a sustainable company’s goal is
the delivery of long-term shared value in
financial, environmental, social and ethical
terms. Corporate sustainability has become
our source for innovation and future growth
across all businesses. For that purpose, we
have established a Sustainability Committee
to spearhead all sustainable practices at
Masan and report its implementation across
our businesses to the Board of Directors.
At Masan, the Sustainability Committee
oversees, evaluates and advises on the
Company’s pursuit of best practices
that improve environmental and social
sustainability, enrich our customers’
experiences, increase shareholder value, and
lead to a better world.
Masan has taken on the responsibility in
creating value for consumers since our
establishment in 1996. Over the years, our
business strategy has evolved into creating
a sustainable business that combines
sustained financial growth with sustainable
operational practices. Sustainability has
also helped us improve efficiency, minimize
costs and wastes, optimize productivity and
stakeholders satisfaction.
With this Report, we wish to deliver a holistic
view of Masan’s consolidated efforts to
pursue sustainable business practices and
foster greater shared value as the nature
of our business dictates. We strongly
believe that Masan is at the intersection of
business goals and societal growth. With
our fundamental belief to improve the lives
of our consumers, we are on track to create
a better future for ourselves as well as the
society as a whole.
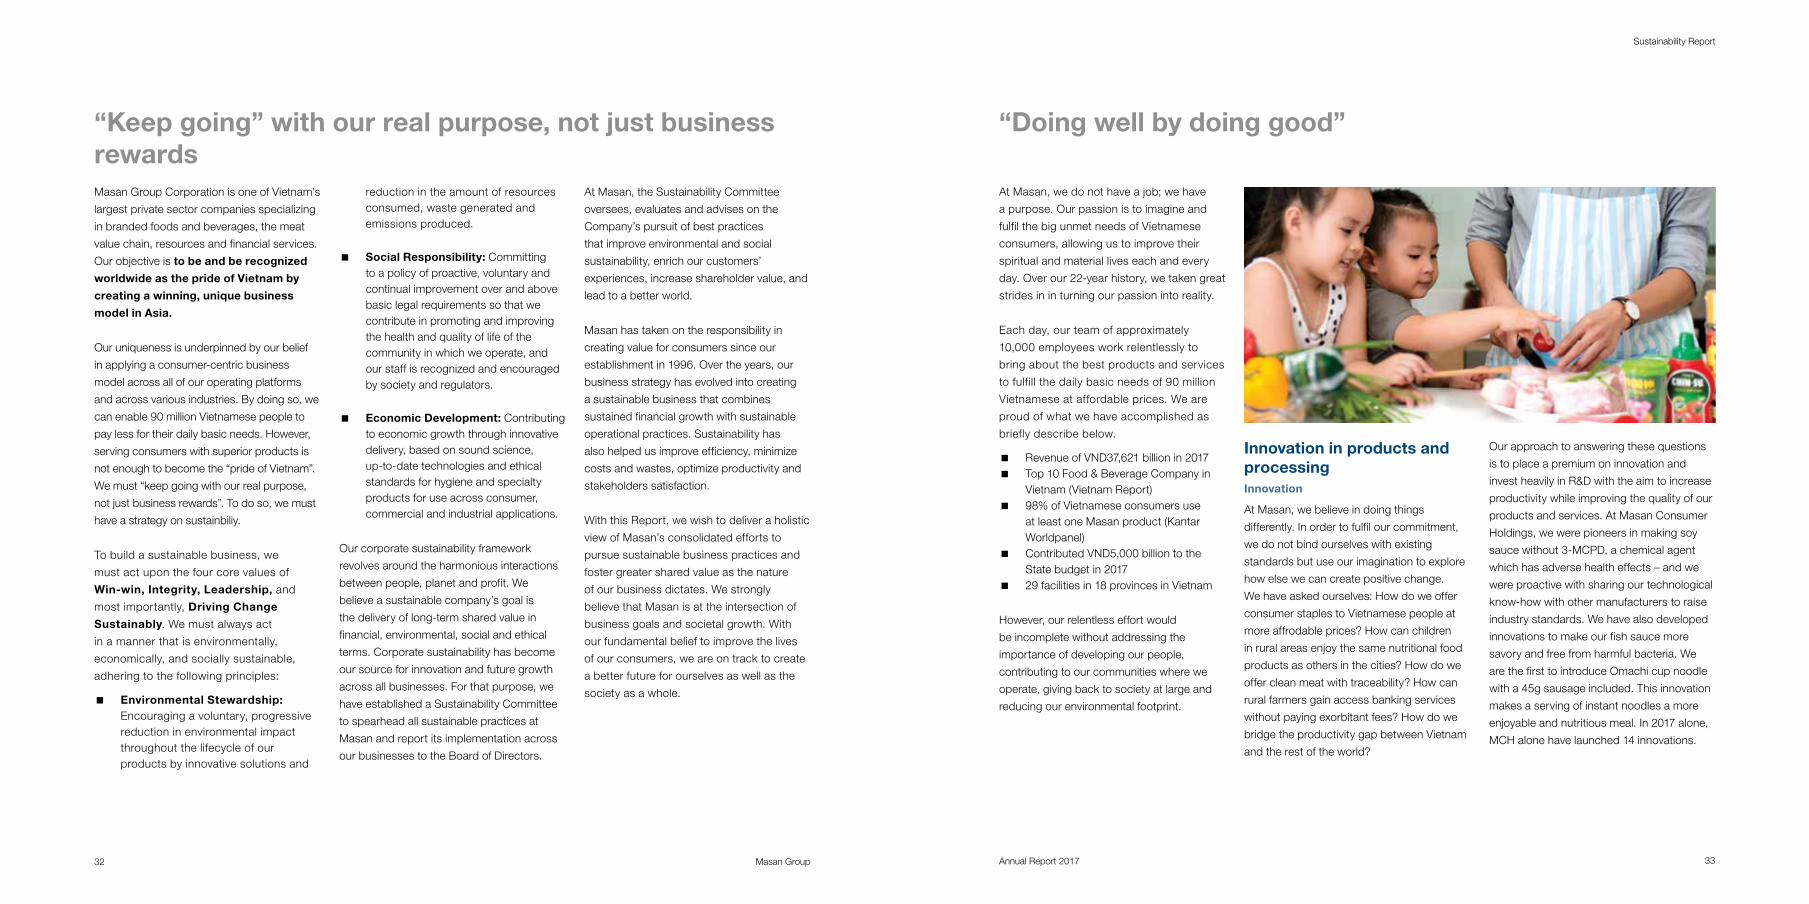
At Masan, we do not have a job; we have
a purpose. Our passion is to imagine and
fulfil the big unmet needs of Vietnamese
consumers, allowing us to improve their
spiritual and material lives each and every
day. Over our 22-year history, we taken great
strides in in turning our passion into reality.
Each day, our team of approximately
10,000 employees work relentlessly to
bring about the best products and services
to fulfill the daily basic needs of 90 million
Vietnamese at affordable prices. We are
proud of what we have accomplished as
briefly describe below.
� Revenue of VND37,621 billion in 2017 � Top 10 Food & Beverage Company in
Vietnam (Vietnam Report) � 98% of Vietnamese consumers use
at least one Masan product (Kantar Worldpanel)
� Contributed VND5,000 billion to the State budget in 2017
� 29 facilities in 18 provinces in Vietnam
However, our relentless effort would
be incomplete without addressing the
importance of developing our people,
contributing to our communities where we
operate, giving back to society at large and
reducing our environmental footprint.
Innovation in products and processingInnovation
At Masan, we believe in doing things
differently. In order to fulfil our commitment,
we do not bind ourselves with existing
standards but use our imagination to explore
how else we can create positive change.
We have asked ourselves: How do we offer
consumer staples to Vietnamese people at
more affrodable prices? How can children
in rural areas enjoy the same nutritional food
products as others in the cities? How do we
offer clean meat with traceability? How can
rural farmers gain access banking services
without paying exorbitant fees? How do we
bridge the productivity gap between Vietnam
and the rest of the world?
Our approach to answering these questions
is to place a premium on innovation and
invest heavily in R&D with the aim to increase
productivity while improving the quality of our
products and services. At Masan Consumer
Holdings, we were pioneers in making soy
sauce without 3-MCPD, a chemical agent
which has adverse health effects – and we
were proactive with sharing our technological
know-how with other manufacturers to raise
industry standards. We have also developed
innovations to make our fish sauce more
savory and free from harmful bacteria. We
are the first to introduce Omachi cup noodle
with a 45g sausage included. This innovation
makes a serving of instant noodles a more
enjoyable and nutritious meal. In 2017 alone,
MCH alone have launched 14 innovations.
Masan Group 35Annual Report 201734
Sustainability Report
With the same commitment to improving
our products to benefit our customers,
Masan Nutri-Science has developed Bio-
zeem animal feed which boosts immunity
to diseases and improves digestion for
pigs. As a result, farmers can deliver
their pigs to market 12 days earlier than
standard feed. We followed up on this
innovation with Bio-zeem Super, which is
free of antibiotics while preserving the same
feed conversation ratio, meat quality, and
tolerance to diseases with verified results. In
2017, we launched Bio-zeem Mama which
helps improve the number of piglets per sow
and efficiency. In the second half of the year,
we introduced Bio-zeem “Xanh”, our “value
for money” pig feed product to support
price sensitive farmers during a challenging
period and Bio-zeem for chicken.
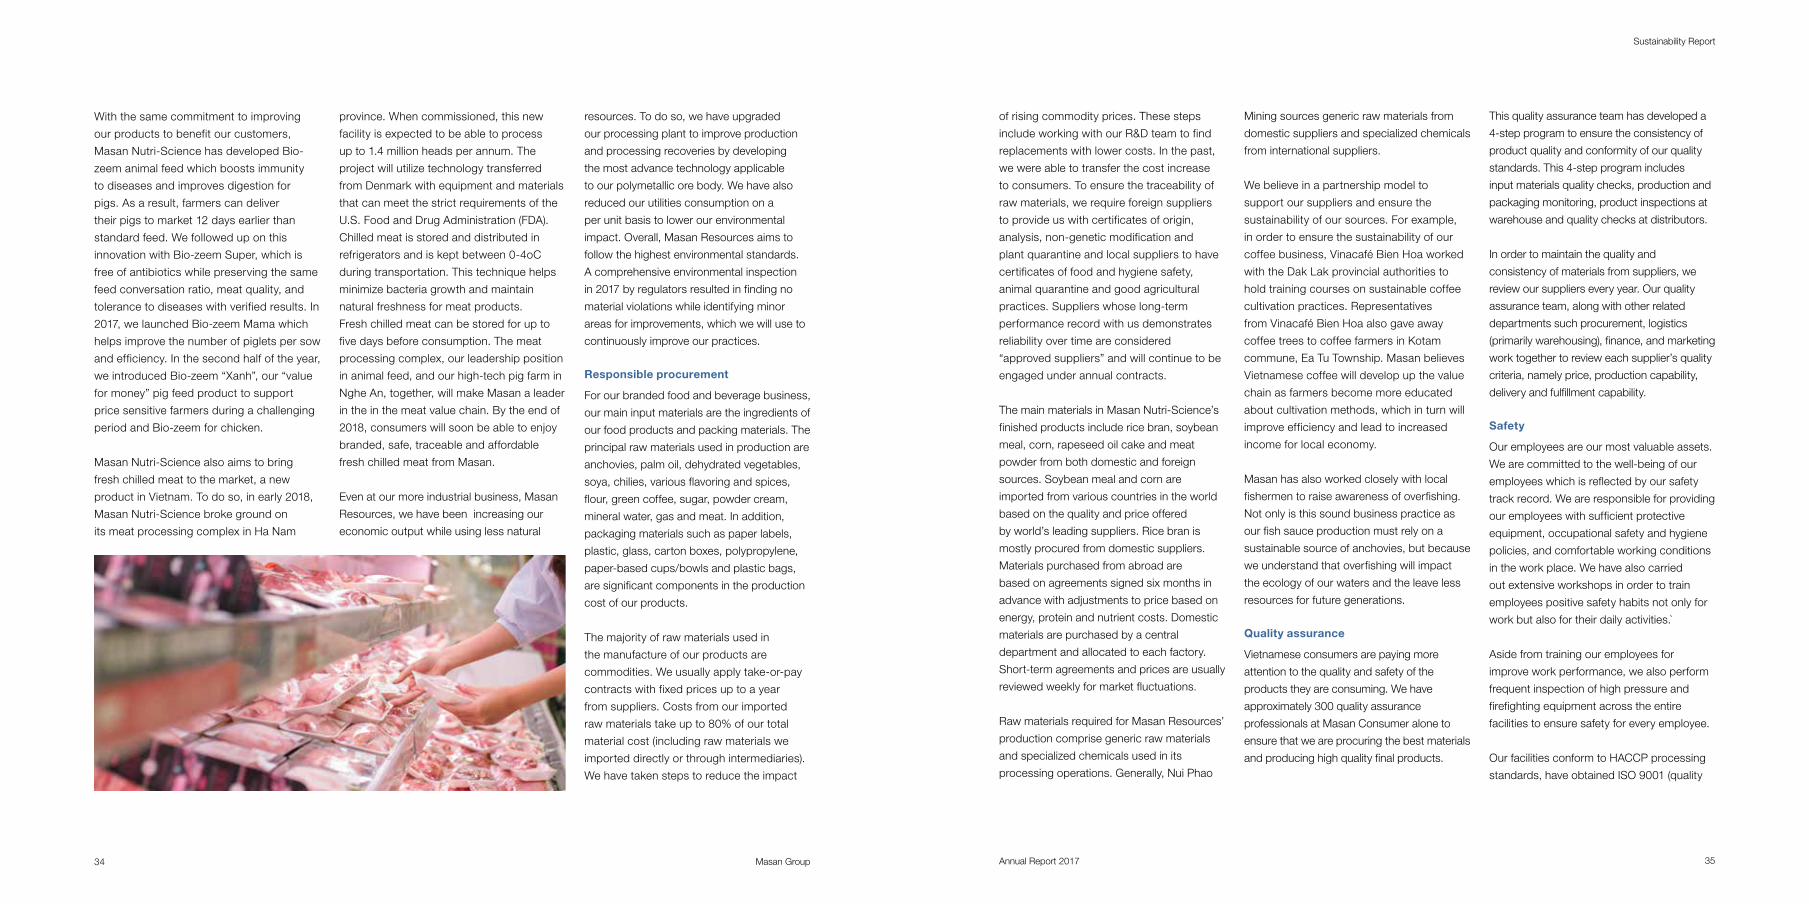
Masan Nutri-Science also aims to bring
fresh chilled meat to the market, a new
product in Vietnam. To do so, in early 2018,
Masan Nutri-Science broke ground on
its meat processing complex in Ha Nam
province. When commissioned, this new
facility is expected to be able to process
up to 1.4 million heads per annum. The
project will utilize technology transferred
from Denmark with equipment and materials
that can meet the strict requirements of the
U.S. Food and Drug Administration (FDA).
Chilled meat is stored and distributed in
refrigerators and is kept between 0-4oC
during transportation. This technique helps
minimize bacteria growth and maintain
natural freshness for meat products.
Fresh chilled meat can be stored for up to
five days before consumption. The meat
processing complex, our leadership position
in animal feed, and our high-tech pig farm in
Nghe An, together, will make Masan a leader
in the in the meat value chain. By the end of
2018, consumers will soon be able to enjoy
branded, safe, traceable and affordable
fresh chilled meat from Masan.
Even at our more industrial business, Masan
Resources, we have been increasing our
economic output while using less natural
resources. To do so, we have upgraded
our processing plant to improve production
and processing recoveries by developing
the most advance technology applicable
to our polymetallic ore body. We have also
reduced our utilities consumption on a
per unit basis to lower our environmental
impact. Overall, Masan Resources aims to
follow the highest environmental standards.
A comprehensive environmental inspection
in 2017 by regulators resulted in finding no
material violations while identifying minor
areas for improvements, which we will use to
continuously improve our practices.
Responsible procurement
For our branded food and beverage business,
our main input materials are the ingredients of
our food products and packing materials. The
principal raw materials used in production are
anchovies, palm oil, dehydrated vegetables,
soya, chilies, various flavoring and spices,
flour, green coffee, sugar, powder cream,
mineral water, gas and meat. In addition,
packaging materials such as paper labels,
plastic, glass, carton boxes, polypropylene,
paper-based cups/bowls and plastic bags,
are significant components in the production
cost of our products.
The majority of raw materials used in
the manufacture of our products are
commodities. We usually apply take-or-pay
contracts with fixed prices up to a year
from suppliers. Costs from our imported
raw materials take up to 80% of our total
material cost (including raw materials we
imported directly or through intermediaries).
We have taken steps to reduce the impact
of rising commodity prices. These steps
include working with our R&D team to find
replacements with lower costs. In the past,
we were able to transfer the cost increase
to consumers. To ensure the traceability of
raw materials, we require foreign suppliers
to provide us with certificates of origin,
analysis, non-genetic modification and
plant quarantine and local suppliers to have
certificates of food and hygiene safety,
animal quarantine and good agricultural
practices. Suppliers whose long-term
performance record with us demonstrates
reliability over time are considered
“approved suppliers” and will continue to be
engaged under annual contracts.
The main materials in Masan Nutri-Science’s
finished products include rice bran, soybean
meal, corn, rapeseed oil cake and meat
powder from both domestic and foreign
sources. Soybean meal and corn are
imported from various countries in the world
based on the quality and price offered
by world’s leading suppliers. Rice bran is
mostly procured from domestic suppliers.
Materials purchased from abroad are
based on agreements signed six months in
advance with adjustments to price based on
energy, protein and nutrient costs. Domestic
materials are purchased by a central
department and allocated to each factory.
Short-term agreements and prices are usually
reviewed weekly for market fluctuations.
Raw materials required for Masan Resources’
production comprise generic raw materials
and specialized chemicals used in its
processing operations. Generally, Nui Phao
Mining sources generic raw materials from
domestic suppliers and specialized chemicals
from international suppliers.
We believe in a partnership model to
support our suppliers and ensure the
sustainability of our sources. For example,
in order to ensure the sustainability of our
coffee business, Vinacafé Bien Hoa worked
with the Dak Lak provincial authorities to
hold training courses on sustainable coffee
cultivation practices. Representatives
from Vinacafé Bien Hoa also gave away
coffee trees to coffee farmers in Kotam
commune, Ea Tu Township. Masan believes
Vietnamese coffee will develop up the value
chain as farmers become more educated
about cultivation methods, which in turn will
improve efficiency and lead to increased
income for local economy.
Masan has also worked closely with local
fishermen to raise awareness of overfishing.
Not only is this sound business practice as
our fish sauce production must rely on a
sustainable source of anchovies, but because
we understand that overfishing will impact
the ecology of our waters and the leave less
resources for future generations.
Quality assurance
Vietnamese consumers are paying more
attention to the quality and safety of the
products they are consuming. We have
approximately 300 quality assurance
professionals at Masan Consumer alone to
ensure that we are procuring the best materials
and producing high quality final products.
This quality assurance team has developed a
4-step program to ensure the consistency of
product quality and conformity of our quality
standards. This 4-step program includes
input materials quality checks, production and
packaging monitoring, product inspections at
warehouse and quality checks at distributors.
In order to maintain the quality and
consistency of materials from suppliers, we
review our suppliers every year. Our quality
assurance team, along with other related
departments such procurement, logistics
(primarily warehousing), finance, and marketing
work together to review each supplier’s quality
criteria, namely price, production capability,
delivery and fulfillment capability.
Safety
Our employees are our most valuable assets.
We are committed to the well-being of our
employees which is reflected by our safety
track record. We are responsible for providing
our employees with sufficient protective
equipment, occupational safety and hygiene
policies, and comfortable working conditions
in the work place. We have also carried
out extensive workshops in order to train
employees positive safety habits not only for
work but also for their daily activities.̀
Aside from training our employees for
improve work performance, we also perform
frequent inspection of high pressure and
firefighting equipment across the entire
facilities to ensure safety for every employee.
Our facilities conform to HACCP processing
standards, have obtained ISO 9001 (quality
Masan Group 37Annual Report 201736
Sustainability Report
management system), ISO 22000 (food safety
management system) and OHSAS 18001
certifications (occupational health and safety
management systems certifications).
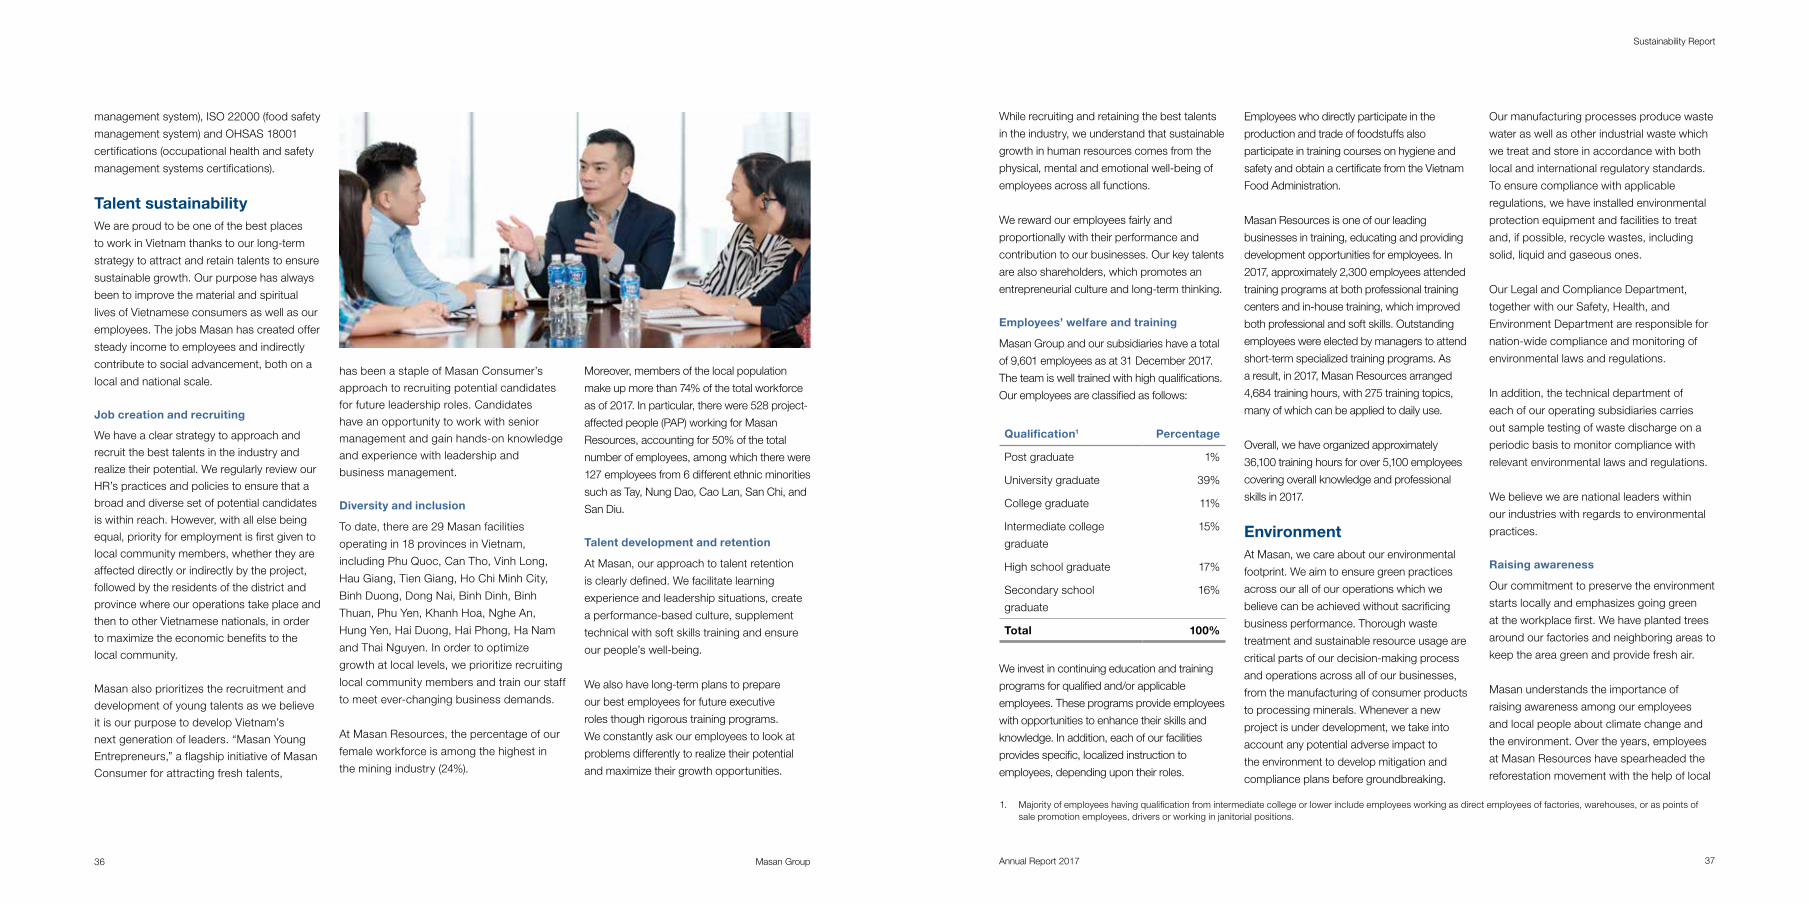
Talent sustainability We are proud to be one of the best places
to work in Vietnam thanks to our long-term
strategy to attract and retain talents to ensure
sustainable growth. Our purpose has always
been to improve the material and spiritual
lives of Vietnamese consumers as well as our
employees. The jobs Masan has created offer
steady income to employees and indirectly
contribute to social advancement, both on a
local and national scale.
Job creation and recruiting
We have a clear strategy to approach and
recruit the best talents in the industry and
realize their potential. We regularly review our
HR’s practices and policies to ensure that a
broad and diverse set of potential candidates
is within reach. However, with all else being
equal, priority for employment is first given to
local community members, whether they are
affected directly or indirectly by the project,
followed by the residents of the district and
province where our operations take place and
then to other Vietnamese nationals, in order
to maximize the economic benefits to the
local community.
Masan also prioritizes the recruitment and
development of young talents as we believe
it is our purpose to develop Vietnam’s
next generation of leaders. “Masan Young
Entrepreneurs,” a flagship initiative of Masan
Consumer for attracting fresh talents,
has been a staple of Masan Consumer’s
approach to recruiting potential candidates
for future leadership roles. Candidates
have an opportunity to work with senior
management and gain hands-on knowledge
and experience with leadership and
business management.
Diversity and inclusion
To date, there are 29 Masan facilities
operating in 18 provinces in Vietnam,
including Phu Quoc, Can Tho, Vinh Long,
Hau Giang, Tien Giang, Ho Chi Minh City,
Binh Duong, Dong Nai, Binh Dinh, Binh
Thuan, Phu Yen, Khanh Hoa, Nghe An,
Hung Yen, Hai Duong, Hai Phong, Ha Nam
and Thai Nguyen. In order to optimize
growth at local levels, we prioritize recruiting
local community members and train our staff
to meet ever-changing business demands.
At Masan Resources, the percentage of our
female workforce is among the highest in
the mining industry (24%).
Moreover, members of the local population
make up more than 74% of the total workforce
as of 2017. In particular, there were 528 project-
affected people (PAP) working for Masan
Resources, accounting for 50% of the total
number of employees, among which there were
127 employees from 6 different ethnic minorities
such as Tay, Nung Dao, Cao Lan, San Chi, and
San Diu.
Talent development and retention
At Masan, our approach to talent retention
is clearly defined. We facilitate learning
experience and leadership situations, create
a performance-based culture, supplement
technical with soft skills training and ensure
our people’s well-being.
We also have long-term plans to prepare
our best employees for future executive
roles though rigorous training programs.
We constantly ask our employees to look at
problems differently to realize their potential
and maximize their growth opportunities.
While recruiting and retaining the best talents
in the industry, we understand that sustainable
growth in human resources comes from the
physical, mental and emotional well-being of
employees across all functions.
We reward our employees fairly and
proportionally with their performance and
contribution to our businesses. Our key talents
are also shareholders, which promotes an
entrepreneurial culture and long-term thinking.
Employees’ welfare and training
Masan Group and our subsidiaries have a total
of 9,601 employees as at 31 December 2017.
The team is well trained with high qualifications.
Our employees are classified as follows:
Qualification1 Percentage
Post graduate 1%
University graduate 39%
College graduate 11%
Intermediate college
graduate
15%
High school graduate 17%
Secondary school
graduate
16%
Total 100%
We invest in continuing education and training
programs for qualified and/or applicable
employees. These programs provide employees
with opportunities to enhance their skills and
knowledge. In addition, each of our facilities
provides specific, localized instruction to
employees, depending upon their roles.
Employees who directly participate in the
production and trade of foodstuffs also
participate in training courses on hygiene and
safety and obtain a certificate from the Vietnam
Food Administration.
Masan Resources is one of our leading
businesses in training, educating and providing
development opportunities for employees. In
2017, approximately 2,300 employees attended
training programs at both professional training
centers and in-house training, which improved
both professional and soft skills. Outstanding
employees were elected by managers to attend
short-term specialized training programs. As
a result, in 2017, Masan Resources arranged
4,684 training hours, with 275 training topics,
many of which can be applied to daily use.
Overall, we have organized approximately
36,100 training hours for over 5,100 employees
covering overall knowledge and professional
skills in 2017.
EnvironmentAt Masan, we care about our environmental
footprint. We aim to ensure green practices
across our all of our operations which we
believe can be achieved without sacrificing
business performance. Thorough waste
treatment and sustainable resource usage are
critical parts of our decision-making process
and operations across all of our businesses,
from the manufacturing of consumer products
to processing minerals. Whenever a new
project is under development, we take into
account any potential adverse impact to
the environment to develop mitigation and
compliance plans before groundbreaking.
Our manufacturing processes produce waste
water as well as other industrial waste which
we treat and store in accordance with both
local and international regulatory standards.
To ensure compliance with applicable
regulations, we have installed environmental
protection equipment and facilities to treat
and, if possible, recycle wastes, including
solid, liquid and gaseous ones.
Our Legal and Compliance Department,
together with our Safety, Health, and
Environment Department are responsible for
nation-wide compliance and monitoring of
environmental laws and regulations.
In addition, the technical department of
each of our operating subsidiaries carries
out sample testing of waste discharge on a
periodic basis to monitor compliance with
relevant environmental laws and regulations.
We believe we are national leaders within
our industries with regards to environmental
practices.
Raising awareness
Our commitment to preserve the environment
starts locally and emphasizes going green
at the workplace first. We have planted trees
around our factories and neighboring areas to
keep the area green and provide fresh air.
Masan understands the importance of
raising awareness among our employees
and local people about climate change and
the environment. Over the years, employees
at Masan Resources have spearheaded the
reforestation movement with the help of local
1. Majority of employees having qualification from intermediate college or lower include employees working as direct employees of factories, warehouses, or as points of sale promotion employees, drivers or working in janitorial positions.
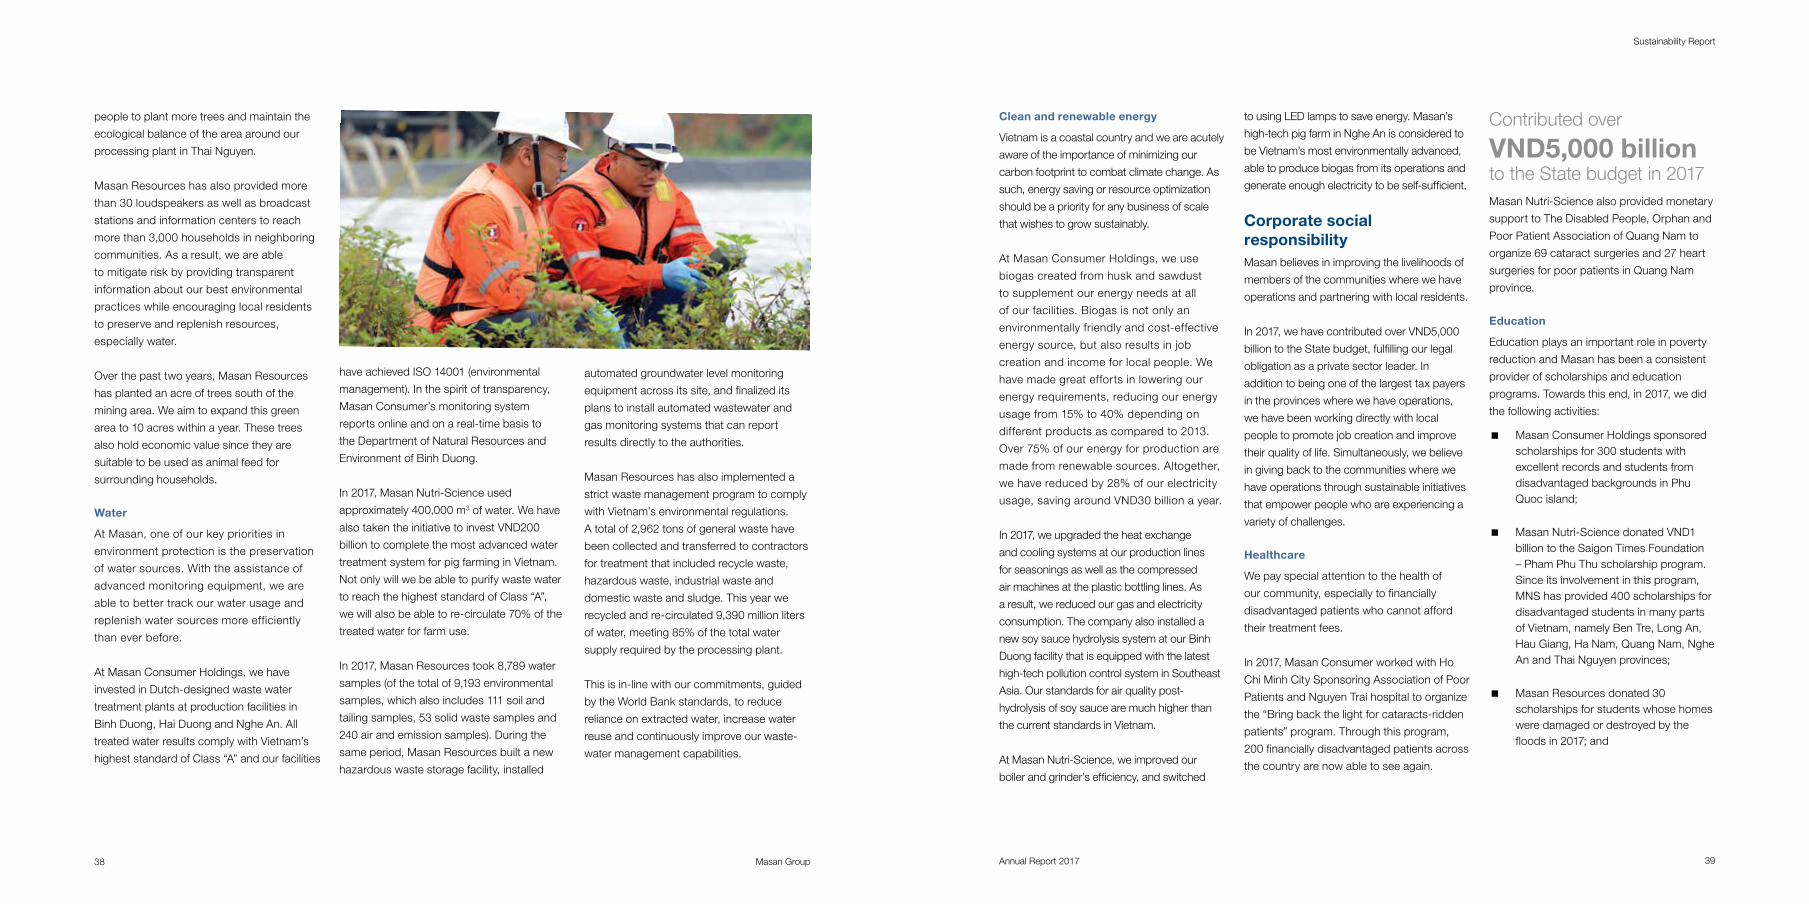
Masan Group 39Annual Report 201738
Sustainability Report
people to plant more trees and maintain the
ecological balance of the area around our
processing plant in Thai Nguyen.
Masan Resources has also provided more
than 30 loudspeakers as well as broadcast
stations and information centers to reach
more than 3,000 households in neighboring
communities. As a result, we are able
to mitigate risk by providing transparent
information about our best environmental
practices while encouraging local residents
to preserve and replenish resources,
especially water.
Over the past two years, Masan Resources
has planted an acre of trees south of the
mining area. We aim to expand this green
area to 10 acres within a year. These trees
also hold economic value since they are
suitable to be used as animal feed for
surrounding households.
Water
At Masan, one of our key priorities in
environment protection is the preservation
of water sources. With the assistance of
advanced monitoring equipment, we are
able to better track our water usage and
replenish water sources more efficiently
than ever before.
At Masan Consumer Holdings, we have
invested in Dutch-designed waste water
treatment plants at production facilities in
Binh Duong, Hai Duong and Nghe An. All
treated water results comply with Vietnam’s
highest standard of Class “A” and our facilities
have achieved ISO 14001 (environmental
management). In the spirit of transparency,
Masan Consumer’s monitoring system
reports online and on a real-time basis to
the Department of Natural Resources and
Environment of Binh Duong.
In 2017, Masan Nutri-Science used
approximately 400,000 m3 of water. We have
also taken the initiative to invest VND200
billion to complete the most advanced water
treatment system for pig farming in Vietnam.
Not only will we be able to purify waste water
to reach the highest standard of Class “A”,
we will also be able to re-circulate 70% of the
treated water for farm use.
In 2017, Masan Resources took 8,789 water
samples (of the total of 9,193 environmental
samples, which also includes 111 soil and
tailing samples, 53 solid waste samples and
240 air and emission samples). During the
same period, Masan Resources built a new
hazardous waste storage facility, installed
automated groundwater level monitoring
equipment across its site, and finalized its
plans to install automated wastewater and
gas monitoring systems that can report
results directly to the authorities.
Masan Resources has also implemented a
strict waste management program to comply
with Vietnam’s environmental regulations.
A total of 2,962 tons of general waste have
been collected and transferred to contractors
for treatment that included recycle waste,
hazardous waste, industrial waste and
domestic waste and sludge. This year we
recycled and re-circulated 9,390 million liters
of water, meeting 85% of the total water
supply required by the processing plant.
This is in-line with our commitments, guided
by the World Bank standards, to reduce
reliance on extracted water, increase water
reuse and continuously improve our waste-
water management capabilities.
Clean and renewable energy
Vietnam is a coastal country and we are acutely
aware of the importance of minimizing our
carbon footprint to combat climate change. As
such, energy saving or resource optimization
should be a priority for any business of scale
that wishes to grow sustainably.
At Masan Consumer Holdings, we use
biogas created from husk and sawdust
to supplement our energy needs at all
of our facilities. Biogas is not only an
environmentally friendly and cost-effective
energy source, but also results in job
creation and income for local people. We
have made great efforts in lowering our
energy requirements, reducing our energy
usage from 15% to 40% depending on
different products as compared to 2013.
Over 75% of our energy for production are
made from renewable sources. Altogether,
we have reduced by 28% of our electricity
usage, saving around VND30 billion a year.
In 2017, we upgraded the heat exchange
and cooling systems at our production lines
for seasonings as well as the compressed
air machines at the plastic bottling lines. As
a result, we reduced our gas and electricity
consumption. The company also installed a
new soy sauce hydrolysis system at our Binh
Duong facility that is equipped with the latest
high-tech pollution control system in Southeast
Asia. Our standards for air quality post-
hydrolysis of soy sauce are much higher than
the current standards in Vietnam.
At Masan Nutri-Science, we improved our
boiler and grinder’s efficiency, and switched
to using LED lamps to save energy. Masan’s
high-tech pig farm in Nghe An is considered to
be Vietnam’s most environmentally advanced,
able to produce biogas from its operations and
generate enough electricity to be self-sufficient.
Corporate social responsibilityMasan believes in improving the livelihoods of
members of the communities where we have
operations and partnering with local residents.
In 2017, we have contributed over VND5,000
billion to the State budget, fulfilling our legal
obligation as a private sector leader. In
addition to being one of the largest tax payers
in the provinces where we have operations,
we have been working directly with local
people to promote job creation and improve
their quality of life. Simultaneously, we believe
in giving back to the communities where we
have operations through sustainable initiatives
that empower people who are experiencing a
variety of challenges.
Healthcare
We pay special attention to the health of
our community, especially to financially
disadvantaged patients who cannot afford
their treatment fees.
In 2017, Masan Consumer worked with Ho
Chi Minh City Sponsoring Association of Poor
Patients and Nguyen Trai hospital to organize
the “Bring back the light for cataracts-ridden
patients” program. Through this program,
200 financially disadvantaged patients across
the country are now able to see again.
Masan Nutri-Science also provided monetary
support to The Disabled People, Orphan and
Poor Patient Association of Quang Nam to
organize 69 cataract surgeries and 27 heart
surgeries for poor patients in Quang Nam
province.
Education
Education plays an important role in poverty
reduction and Masan has been a consistent
provider of scholarships and education
programs. Towards this end, in 2017, we did
the following activities:
� Masan Consumer Holdings sponsored scholarships for 300 students with excellent records and students from disadvantaged backgrounds in Phu Quoc island;
� Masan Nutri-Science donated VND1 billion to the Saigon Times Foundation – Pham Phu Thu scholarship program. Since its involvement in this program, MNS has provided 400 scholarships for disadvantaged students in many parts of Vietnam, namely Ben Tre, Long An, Hau Giang, Ha Nam, Quang Nam, Nghe An and Thai Nguyen provinces;
� Masan Resources donated 30 scholarships for students whose homes were damaged or destroyed by the floods in 2017; and
Contributed over
VND5,000 billion to the State budget in 2017
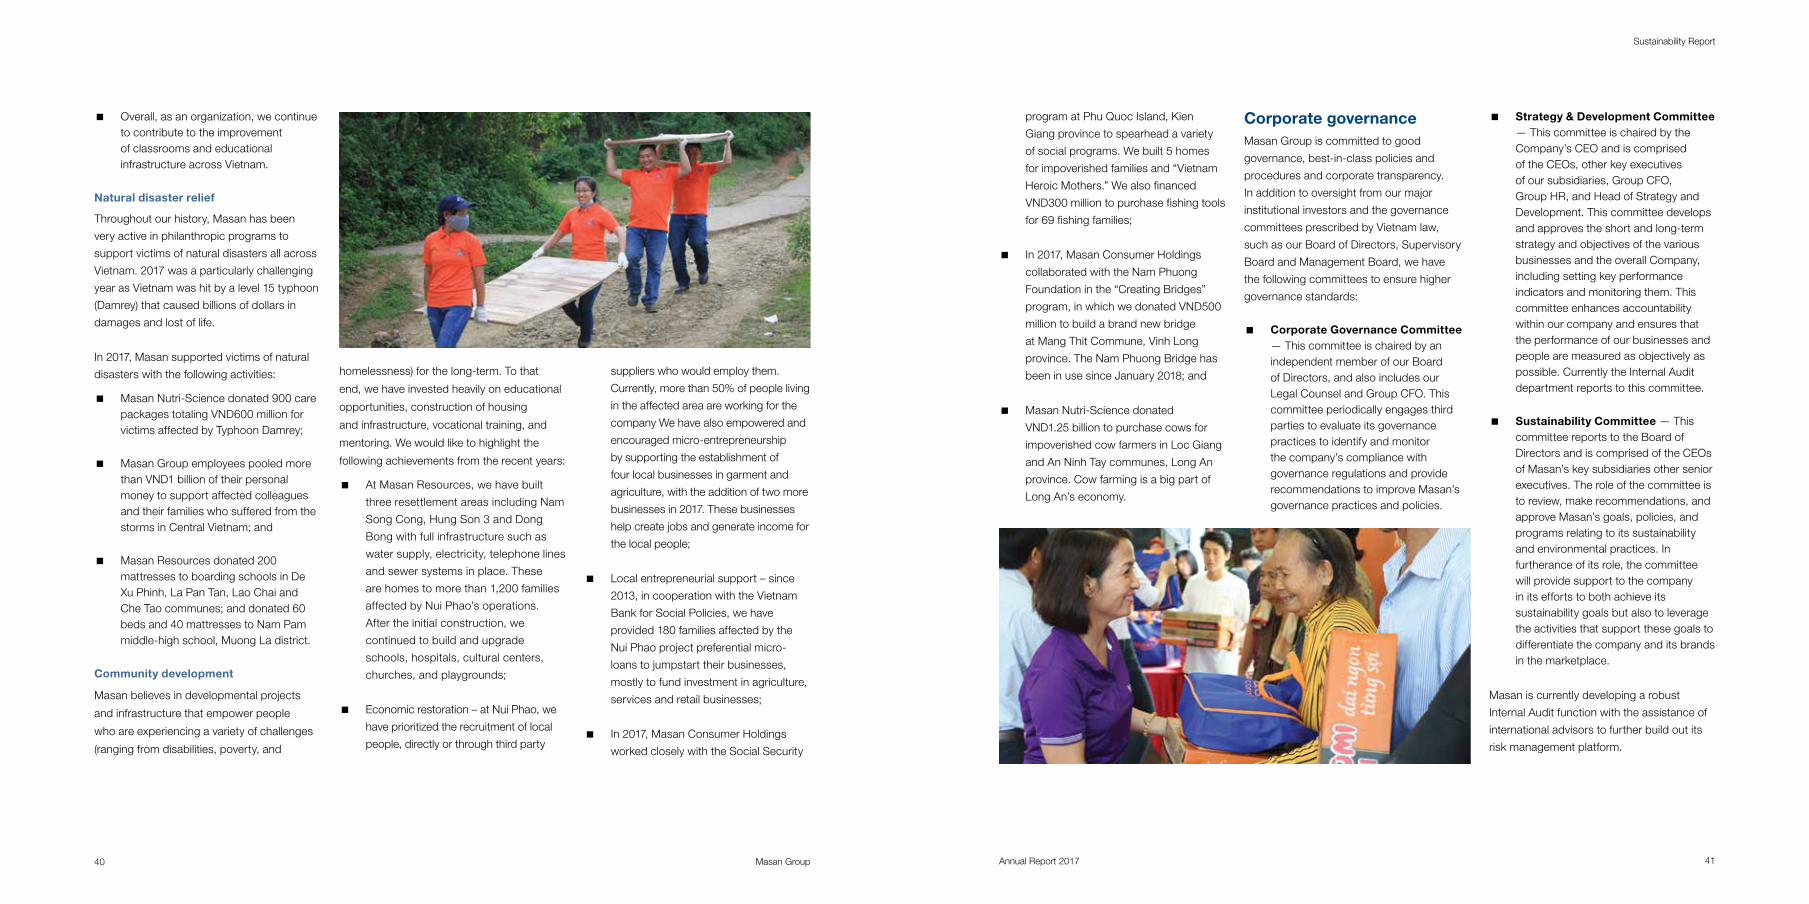
Masan Group 41Annual Report 201740
Sustainability Report
� Overall, as an organization, we continue to contribute to the improvement of classrooms and educational infrastructure across Vietnam.
Natural disaster relief
Throughout our history, Masan has been
very active in philanthropic programs to
support victims of natural disasters all across
Vietnam. 2017 was a particularly challenging
year as Vietnam was hit by a level 15 typhoon
(Damrey) that caused billions of dollars in
damages and lost of life.
In 2017, Masan supported victims of natural
disasters with the following activities:
� Masan Nutri-Science donated 900 care packages totaling VND600 million for victims affected by Typhoon Damrey;
� Masan Group employees pooled more than VND1 billion of their personal money to support affected colleagues and their families who suffered from the storms in Central Vietnam; and
� Masan Resources donated 200 mattresses to boarding schools in De Xu Phinh, La Pan Tan, Lao Chai and Che Tao communes; and donated 60 beds and 40 mattresses to Nam Pam middle-high school, Muong La district.
Community development
Masan believes in developmental projects
and infrastructure that empower people
who are experiencing a variety of challenges
(ranging from disabilities, poverty, and
homelessness) for the long-term. To that
end, we have invested heavily on educational
opportunities, construction of housing
and infrastructure, vocational training, and
mentoring. We would like to highlight the
following achievements from the recent years:
� At Masan Resources, we have built
three resettlement areas including Nam
Song Cong, Hung Son 3 and Dong
Bong with full infrastructure such as
water supply, electricity, telephone lines
and sewer systems in place. These
are homes to more than 1,200 families
affected by Nui Phao’s operations.
After the initial construction, we
continued to build and upgrade
schools, hospitals, cultural centers,
churches, and playgrounds;
� Economic restoration – at Nui Phao, we
have prioritized the recruitment of local
people, directly or through third party
suppliers who would employ them.
Currently, more than 50% of people living
in the affected area are working for the
company We have also empowered and
encouraged micro-entrepreneurship
by supporting the establishment of
four local businesses in garment and
agriculture, with the addition of two more
businesses in 2017. These businesses
help create jobs and generate income for
the local people;
� Local entrepreneurial support – since
2013, in cooperation with the Vietnam
Bank for Social Policies, we have
provided 180 families affected by the
Nui Phao project preferential micro-
loans to jumpstart their businesses,
mostly to fund investment in agriculture,
services and retail businesses;
� In 2017, Masan Consumer Holdings
worked closely with the Social Security
program at Phu Quoc Island, Kien
Giang province to spearhead a variety
of social programs. We built 5 homes
for impoverished families and “Vietnam
Heroic Mothers.” We also financed
VND300 million to purchase fishing tools
for 69 fishing families;
� In 2017, Masan Consumer Holdings
collaborated with the Nam Phuong
Foundation in the “Creating Bridges”
program, in which we donated VND500
million to build a brand new bridge
at Mang Thit Commune, Vinh Long
province. The Nam Phuong Bridge has
been in use since January 2018; and
� Masan Nutri-Science donated
VND1.25 billion to purchase cows for
impoverished cow farmers in Loc Giang
and An Ninh Tay communes, Long An
province. Cow farming is a big part of
Long An’s economy.
Corporate governance Masan Group is committed to good
governance, best-in-class policies and
procedures and corporate transparency.
In addition to oversight from our major
institutional investors and the governance
committees prescribed by Vietnam law,
such as our Board of Directors, Supervisory
Board and Management Board, we have
the following committees to ensure higher
governance standards:
� Corporate Governance Committee — This committee is chaired by an independent member of our Board of Directors, and also includes our Legal Counsel and Group CFO. This committee periodically engages third parties to evaluate its governance practices to identify and monitor the company’s compliance with governance regulations and provide recommendations to improve Masan’s governance practices and policies.
� Strategy & Development Committee — This committee is chaired by the Company’s CEO and is comprised of the CEOs, other key executives of our subsidiaries, Group CFO, Group HR, and Head of Strategy and Development. This committee develops and approves the short and long-term strategy and objectives of the various businesses and the overall Company, including setting key performance indicators and monitoring them. This committee enhances accountability within our company and ensures that the performance of our businesses and people are measured as objectively as possible. Currently the Internal Audit department reports to this committee.
� Sustainability Committee — This committee reports to the Board of Directors and is comprised of the CEOs of Masan’s key subsidiaries other senior executives. The role of the committee is to review, make recommendations, and approve Masan’s goals, policies, and programs relating to its sustainability and environmental practices. In furtherance of its role, the committee will provide support to the company in its efforts to both achieve its sustainability goals but also to leverage the activities that support these goals to differentiate the company and its brands in the marketplace.
Masan is currently developing a robust
Internal Audit function with the assistance of
international advisors to further build out its
risk management platform.
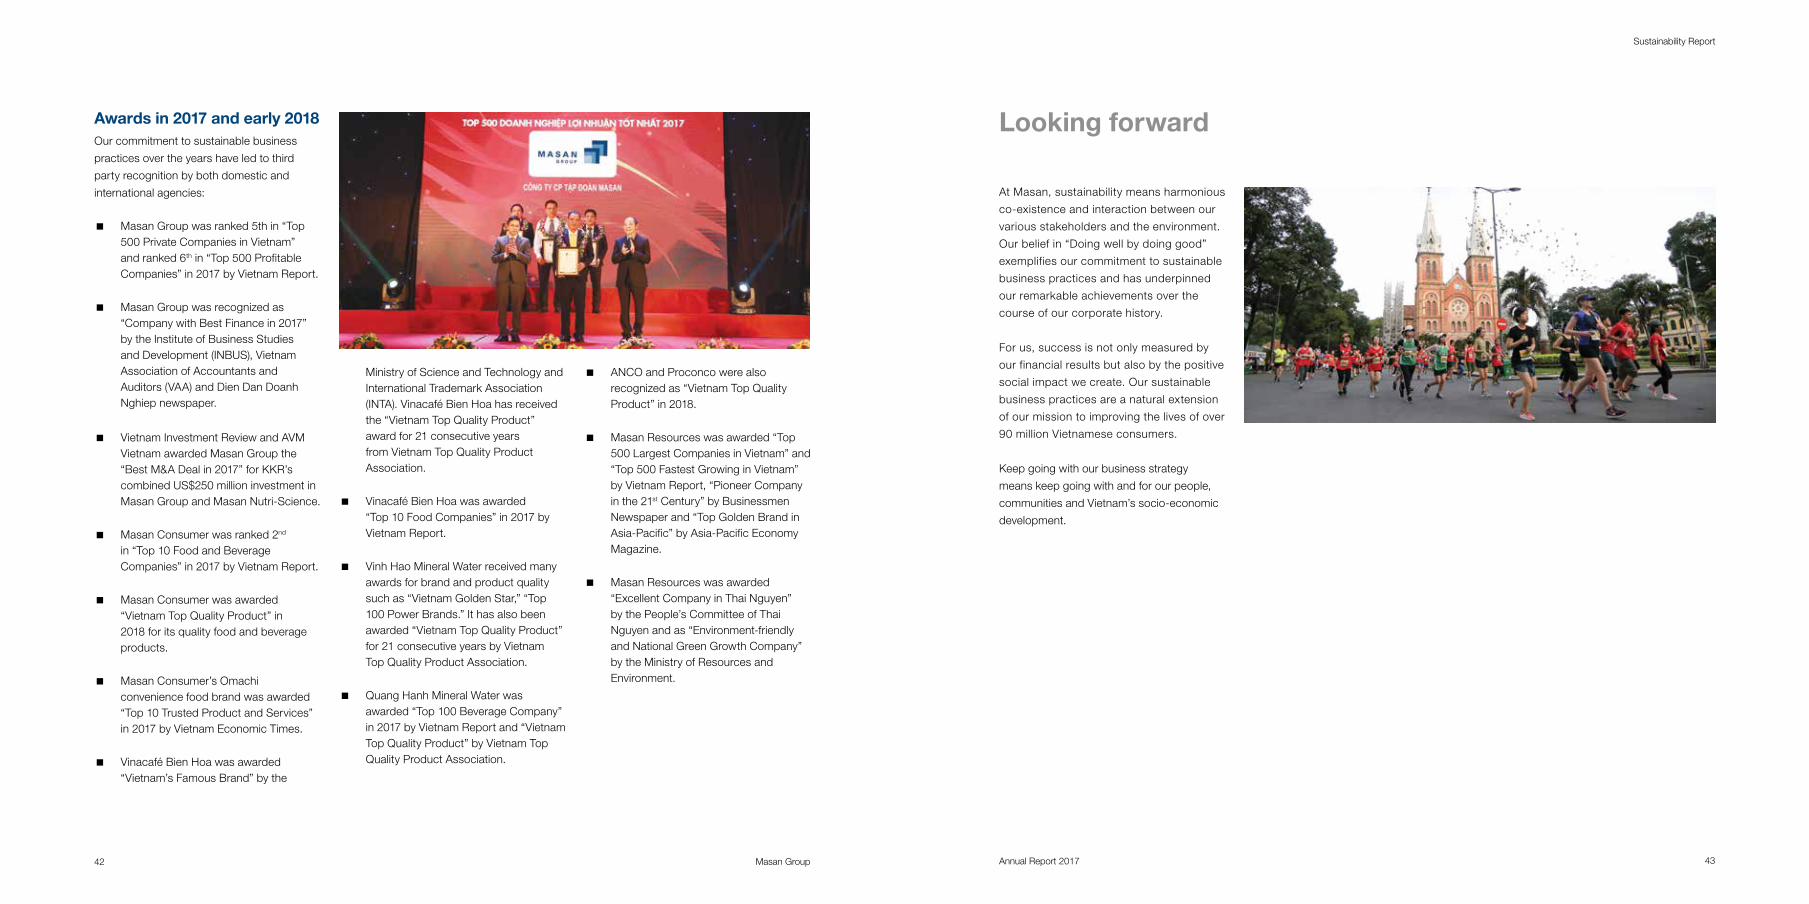
Masan Group 43Annual Report 201742
Sustainability Report
Awards in 2017 and early 2018Our commitment to sustainable business
practices over the years have led to third
party recognition by both domestic and
international agencies:
� Masan Group was ranked 5th in “Top 500 Private Companies in Vietnam” and ranked 6th in “Top 500 Profitable Companies” in 2017 by Vietnam Report.
� Masan Group was recognized as “Company with Best Finance in 2017” by the Institute of Business Studies and Development (INBUS), Vietnam Association of Accountants and Auditors (VAA) and Dien Dan Doanh Nghiep newspaper.
� Vietnam Investment Review and AVM Vietnam awarded Masan Group the “Best M&A Deal in 2017” for KKR’s combined US$250 million investment in Masan Group and Masan Nutri-Science.
� Masan Consumer was ranked 2nd
in “Top 10 Food and Beverage Companies” in 2017 by Vietnam Report.
� Masan Consumer was awarded “Vietnam Top Quality Product” in 2018 for its quality food and beverage products.
� Masan Consumer’s Omachi convenience food brand was awarded “Top 10 Trusted Product and Services” in 2017 by Vietnam Economic Times.
� Vinacafé Bien Hoa was awarded “Vietnam’s Famous Brand” by the
Ministry of Science and Technology and International Trademark Association (INTA). Vinacafé Bien Hoa has received the “Vietnam Top Quality Product” award for 21 consecutive years from Vietnam Top Quality Product Association.
� Vinacafé Bien Hoa was awarded “Top 10 Food Companies” in 2017 by Vietnam Report.
� Vinh Hao Mineral Water received many awards for brand and product quality such as “Vietnam Golden Star,” “Top 100 Power Brands.” It has also been awarded “Vietnam Top Quality Product” for 21 consecutive years by Vietnam Top Quality Product Association.
� Quang Hanh Mineral Water was awarded “Top 100 Beverage Company” in 2017 by Vietnam Report and “Vietnam Top Quality Product” by Vietnam Top Quality Product Association.
� ANCO and Proconco were also recognized as “Vietnam Top Quality Product” in 2018.
� Masan Resources was awarded “Top 500 Largest Companies in Vietnam” and “Top 500 Fastest Growing in Vietnam” by Vietnam Report, “Pioneer Company in the 21st Century” by Businessmen Newspaper and “Top Golden Brand in Asia-Pacific” by Asia-Pacific Economy Magazine.
� Masan Resources was awarded “Excellent Company in Thai Nguyen” by the People’s Committee of Thai Nguyen and as “Environment-friendly and National Green Growth Company” by the Ministry of Resources and Environment.
Looking forward
At Masan, sustainability means harmonious
co-existence and interaction between our
various stakeholders and the environment.
Our belief in “Doing well by doing good”
exemplifies our commitment to sustainable
business practices and has underpinned
our remarkable achievements over the
course of our corporate history.
For us, success is not only measured by
our financial results but also by the positive
social impact we create. Our sustainable
business practices are a natural extension
of our mission to improving the lives of over
90 million Vietnamese consumers.
Keep going with our business strategy
means keep going with and for our people,
communities and Vietnam’s socio-economic
development.
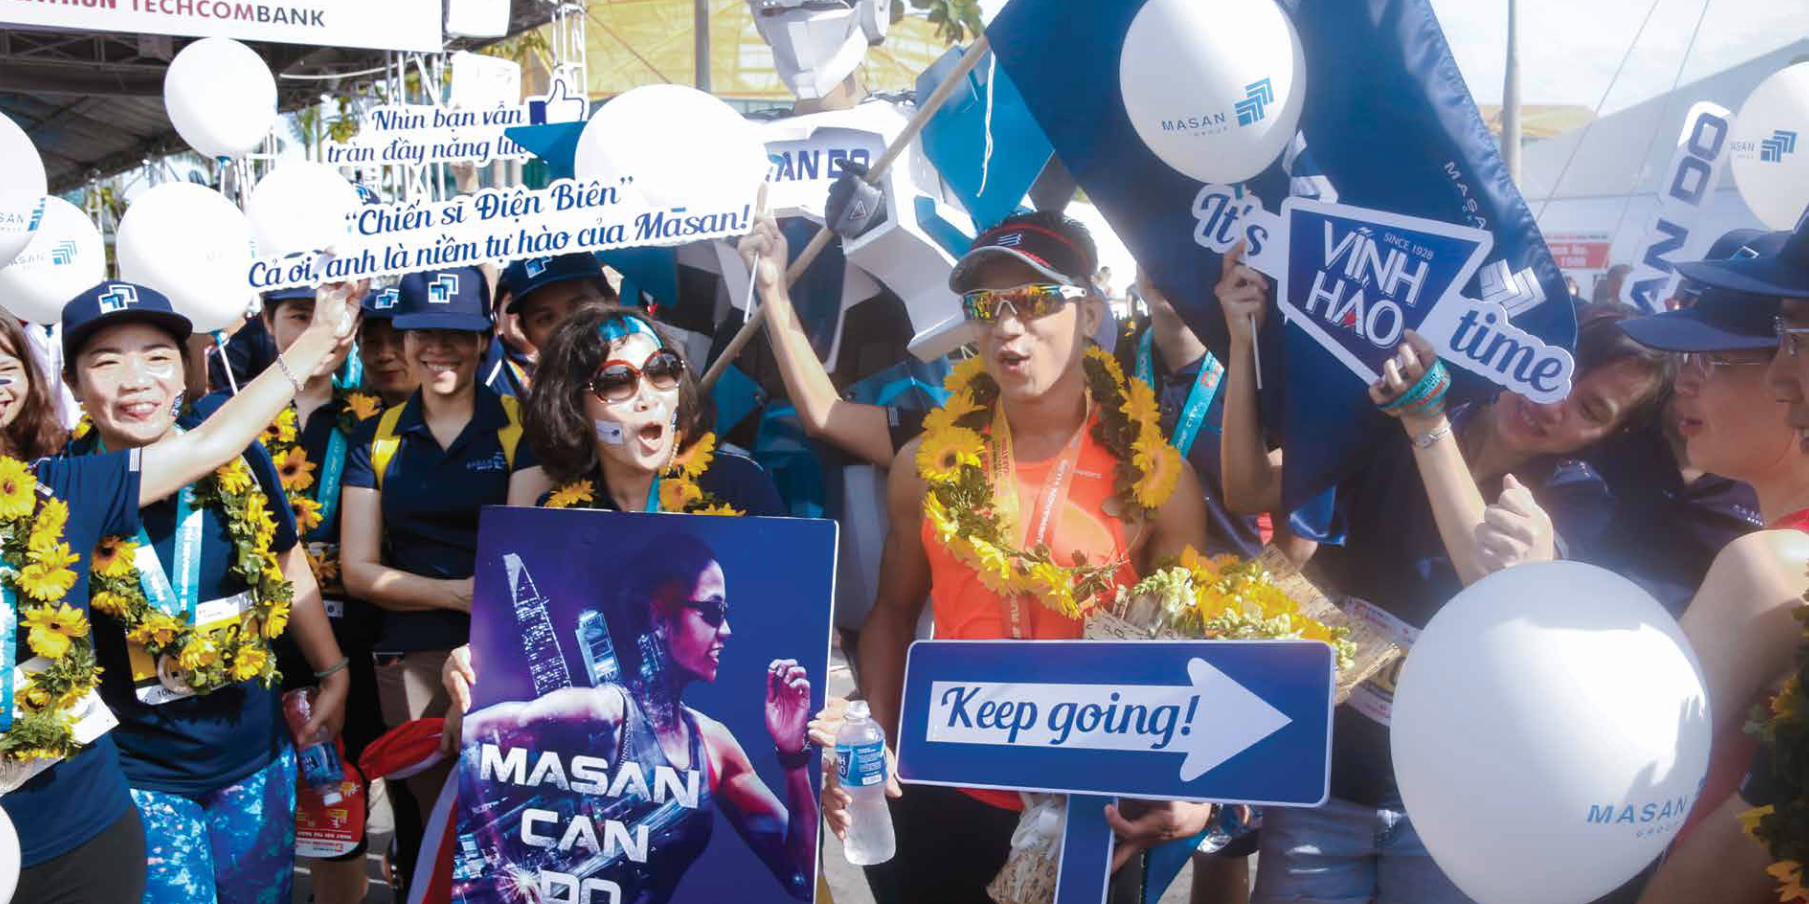
Masan Group 45Annual Report 201744
Sustainability Report
ManagementReport
Masan Group 49Annual Report 201748
Management Report
Macro overview Performance overview and outlook
Vietnam’s economy in 2017 continued to
be one of the best performers globally with
GDP growth of 6.81%, higher than the target
of 6.7% set by National Assembly and the
highest growth rate in the last 10 years
according to the General Statistics Office
(GSO). Growth is expected to be further
supported by higher foreign direct investment
and Vietnam’s proactive participation in free
trade agreements to further integrate Vietnam
into the global economy. However, we believe
Vietnam’s true value lies in its domestic
consumption potential.
Vietnam’s demographics and rising income
levels support strong continued growth in
domestic consumption. The country has
just entered an anticipated 30-year era of
“demographic dividend” with nearly 70% of
its 90 million residents in the working age
population and 56% of its residents under
the age of 30. Over the next 10 years, the
working age population is expected to grow
by at least one million per year.
Vietnam’s expanding workforce is expected
to drive consumer spending. In addition, the
combined effects of continuous economic
growth, rapid urbanization, “demographic
dividend,” emergence of middle income
earners, and an expanding modern retail
network, will fuel the growth of overall food
consumption in the medium- to long-term.
According to Nielsen, Vietnam’s Consumer
Confidence Index grew significantly in
3Q2017, boosting Vietnam’s ranking to the
top 5 most optimistic countries in the world.
Vietnam’s food and beverage sector is
expected to maintain double-digit growth
rates for the near future, primarily due to
increased domestic consumer demand
fueled by a rise in disposable incomes. In
addition, not only will consumers enjoy more
branded food and beverage products, their
diet will also shift from grains to more animal
protein. As Vietnam’s largest local feed
producer that has made significant progress
with its integrated 3F platform, Masan stands
to benefit immensely.
Concerns around Vietnam’s usual
macroeconomic risks were largely abated in
2017. With the strengthening economy and
recovery in the real estate sector, the banking
sector appears to be emerging from the
financial crisis, as evidenced by overall credit
growth of 18.2% in 2017 and the financial
system’s bad debt ratio declining from 11.9%
to 9.5% (National Financial Supervision
Commission). Inflation rate was controlled
at 3.5% (lower than the target of 4%) as
the Vietnamese dong continued to remain
stable against the US dollar. The VND/US$
exchange rate increased on average only
1.4% over the same period in 2016.
Overall, Masan is well positioned to benefit
from Vietnam’s improving macroeconomic
outlook, especially from growing consumer
confidence in Vietnam, as a market leader
with a portfolio of basic consumer staple
products including food, beverages, meat
and consumption finance (through its interest
in Techcombank).
We believe 2017 financial performance does not fully reflect business and growth fundamentals given one-time initiatives and historically low pig livestock prices. Masan Consumer Holdings (“MCH”) experienced a decline in net revenue and earnings as it reduced the inventory days at its distributors. Masan Nutri-Science (“MNS”) suffered a drop in sales due to the hog price crisis. These headwinds to our topline results were offset by significant growth in Masan Resources (“MSR”) due to higher volumes and prices. For the full year 2017, our consolidated net revenue declined to VND37,621 billion from VND43,297 billion in 2016, representing a 13% decrease, mainly due to the aforementioned reasons.
EBITDA declined by 2.8% from VND9,669 billion in 2016 to VND9,396 billion in 2017, driven by a decline in net revenue and higher SG&A in branded food and beverages and consumer-agri, but offset by higher contributions from mineral resources and financial services. Reported net profit after tax post minority interest increased from VND2,791 billion in 2016 to VND3,103 billion in 2017, representing an 11.1% growth. However, normalizing net profit after tax post minority interest by removing the one-time VND932 billion gain from the sale of convertible bonds of TCB, Masan earnings were down 22.3% to VND2,170 billion in 2017. MCH 2017 net revenue declined by 8.8% to VND13,526 billion, compared to VND14,826 billion in 2016, which takes into account over VND1,000 billion in distributor stock level reduction. By selling less to our distributors and allowing them to sell their existing stock
to consumers, MCH was able to cut back on promotion expenses and invest more into building brands. Objectives behind de-stocking distributor level inventory were to improve route to market efficiency and reduce reliance on trade promotions. Sales for the second half of 2017 stabilized while growth categories (bottled beverages, processed meat, and beer) demonstrated greater momentum. MCH saw a recovery in instant noodles sales (up 16.3% in 2H2017 versus down 18.7% in 1H2017) and significant improvement in beer sales as well, where sales in 2H2017 started to match the run-rate monthly sales to consumers in FY2016. Strong growth in energy drinks (up 54.9% YoY) and processed meat (up ~6x YoY) validated MCH’s entry into new growth categories. On the back of a more sustainable distribution model that allows for greater marketing to support its innovation pipeline, MCH is expected to achieve VND17,900 to VND19,500 billion in sales which would result in a annual growth of over 30% on the low end.
MNS was adversely impacted by historically low hog prices during FY2017, as hog prices traded below VND30,000, a decline of more than 30% compared to prices in December 2016. As a result, the pig feed market was estimated to have declined from 6.3 million tons to 3.4 million tons within 12 months, contributing to MNS’ net revenue declining by 23.5% in 2017 to VND18,690 billion. During this period, MNS made strategic investments to support farmers and dealers through loyalty programs and also launched a “value for money” product range called “Bio-zeem Xanh.” As a result of these initiatives, MNS
Vietnam – Top 5 most optimistic countries in the world1
1. Nielsen.
“2017 marks the end of Masan’s phase of experiencing major growing pains. But throughout this challenging period, we relentlessly executed on our bottom-up operational plans, strengthened our operating platforms and refocused on our medium to long-term growth strategy. The fundamentals of our businesses are not fully reflected in our 2017 financial results, but it is starting to converge. 2018 will be a key turning point as each of our businesses start to deliver on its underlying growth potential.”
Nguyen Dang Quang, Chairman and CEO.
Masan Group 51Annual Report 201750
Management Report
was able to grow its exit market share to 35% by the end of 2017, despite the challenging market. Masan expects the animal feed market to eventually recover in 2018 but does not expect to match the sales figures achieved in 2016. However, MNS aims to achieve a strategic milestone in 2018 with the sale of fresh chilled meat at the end of the year.
MSR delivered record results in 2017 on the back of higher commodity prices and increased operational efficiency. MSR delivered a 33.5% increase in net revenue from VND4,049 billion in 2016 to VND5,405 billion in 2017. Stricter production conditions globally and the return of broad based demand helped drive prices upwards. Average 2017 tungsten prices were up by nearly 31% as compared to average 2016 prices, helping net profit after tax post minority interest to grow 88.0% to VND206 billion in 2017. For FY2018, MSR forecasts net revenue to reach between VND7,300 to VND8,000 billion and earnings to reach between VND600 to VND1,000 billion. Strategically, the resources business continues to explore opportunities to become a further integrated downstream, industrial tungsten business of global scale.
In 2017, our associated company, Techcombank, delivered a substantial boost to our earnings, contributing VND2,044 billion to the Company’s consolidated earnings, as the bank more than doubled its net profit. The bank continues to implement its strategy of becoming a “Consumer-Tech Bank” by building out its retail franchise, underpinned by one of the strongest and cleanest balance sheets in Vietnam. Techcombank’s focus on fee income and its strong retail franchise helped the bank
deliver return on average equity of 30.7% ROE in 2017. In 2018, Masan expects the bank to continue to deliver earnings growth.
During 2017, our consolidated balance sheet was strengthened as our consolidated gross debt to EBITDA ratio improved from 4.2x at the end 2016 to 3.7x at the end of 2017. Gross financial debt declined by 15% to VND34,796 billion as at the end 2017, the lowest debt level in two years. Reducing debt is a strategic priority to enhance profitability margins to mid-teen levels and build a more sustainable balance sheet. Masan aims to achieve a debt to EBITDA ratio of 3x by the end of 2018 with a medium-term target of 2x. We believe these targets are achievable as the high capex phase of our businesses have largely passed and EBITDA is expected to grow by double digits for the foreseeable future.
Looking forward, Masan aims to deliver more than 20% growth in net revenues to reach between VND45,150 to VND47,000 billion for FY2018. Reported net profit post-minority interests is expected to reach between VND3,400 to VND4,000 billion during the same period. On a normalized basis, this would reflect a higher then 50% growth compared to 2017. Growth rates could be challenged by continued low pig prices affecting demand for our feed products and expected higher soft commodity prices which could put a downward pressure on margins. Within the branded food and beverage business, growth could be impacted by lower than expected success of new product launches and innovations. However, full year earnings may also improve as Masan pays down expensive debt and further increases its stake in subsidiaries to reduce minority interests.
With Vietnam’s macroeconomic outlook improving and the investments in our business platforms starting to show results, Masan is now well-positioned to benefit from Vietnam’s growing consumer potential and the larger In-land ASEAN opportunity. However, the way forward is not guaranteed and there will be plenty of challenges. Vietnam, as a frontier market, is expected to experience its fair share of economic volatility, and we also anticipate more competition, especially from foreign companies. However, after emerging from a period of “growing pains” and now starting to see the desired benefits from our multi-year efforts, we feel confident that the path that we have chosen has been validated and that we have developed the right platform to grow across cycles. While the road has not always been smooth, our commitment to the values and beliefs that have guided us throughout our 22-year history has proven to be successful and we will continue on with them. This is what we mean with “keep going…”
Business environment
Masan Group’s existing business operations
are focused primarily on Vietnam and its
performance and quality of assets depend
substantially on the Vietnamese economy.
During 2016, Masan introduced its first
seasoning brand “Chin-su Yod Thong”
in Thailand, as part of a broader strategy
to enter “In-land ASEAN”, comprising of
Vietnam, Thailand, Myanmar, Cambodia,
and Laos. Hence, going forward, economic
environment in Vietnam and In-land ASEAN
overall may significantly impact Masan’s
operations, in addition to a variety of external
factors, including economic developments
throughout Asia and the rest of the world.
In addition, various macroeconomic
factors including but not limited to personal
expenditure and consumption patterns,
inflation levels, interest rates, commodity
price levels, debt service burden of
consumers or businesses and general
availability of credit, as well as factors such
as the spread of disease, large-scale acts of
war, terrorism or any other adverse social,
geographic or political incidents may affect
Masan’s business operations adversely.
In 2018, Vietnam’s economy is expected to
continue expanding, supported by growing
domestic consumption on the back of higher
disposable incomes, expanding middle class,
higher rate of urbanization and a banking
system with stronger asset metrics.
Internationally, expected increase in soft
commodity prices during 2018 may adversely
impact margins for Masan’s consumer
focused businesses. Rising geo-political
concerns, especially in the South China
Sea, and possibility of trade wars and
protectionism may affect Vietnam’s export
growth leading to slower economic growth.
As occurred in 2017, natural disasters may
adversely impact Vietnam’s agricultural
sector, dampening consumers’ spending
power and affecting overall growth. Strong
demand-side pressure and any unexpected
depreciation of the Vietnamese Dong against
the U.S. Dollar could make it more expensive
to import goods, and push up overall prices
for goods and services.
Vietnam’s meat sectorTotal meat consumption in Vietnam is estimated at US$9 billion. Processed meat represents approximately 1% of total meat consumption, which is significantly lower than other Asian countries, such as China, where the proportion is approximately 14%. As income levels rise, protein consumption in Vietnam is expected to increase, and with greater focus on safety, health and branding, we expect to see a move towards packaged meat. The meat sector in Vietnam is fragmented, providing an opportunity for a leader to establish trends in this category.
Pig farming plays an integral part in Vietnam’s meat sector, as 70% of meat consumed in Vietnam is pork. Between 2013 and 2016, Vietnam’s local hog population grew at an annual pace of 11%, leading to a supply of 54 million pigs, according to International Livestock Research Institute. Domestic pork demand accounts for around 75% of Vietnam’s pork output, while the rest of the output is exported to neighboring markets.
China imports large numbers of Vietnam’s live hogs through documented and undocumented trade along the Vietnamese border with China’s Guangxi and Yunnan provinces. Vietnam’s hog exports to China nearly doubled from approximate daily sales of 17,000 hogs in 2013 to around 33,000 hogs by early 2016. The increase added up to 12 million live hogs in sales for the entire 2016.
Due to a dramatic increase in the Chinese hog imports, Vietnamese swine farms rushed to increase the sow herd and overlooked previous incidents when the borders were closed due to various reasons, though mainly for inferior meat quality. Vietnam’s sow population was 3.7 million sows in 2014, and peaked at 4 million animals within two years.
Masan Group’s targeted revenue in 2018
from VND45,150 to VND47,000 billion
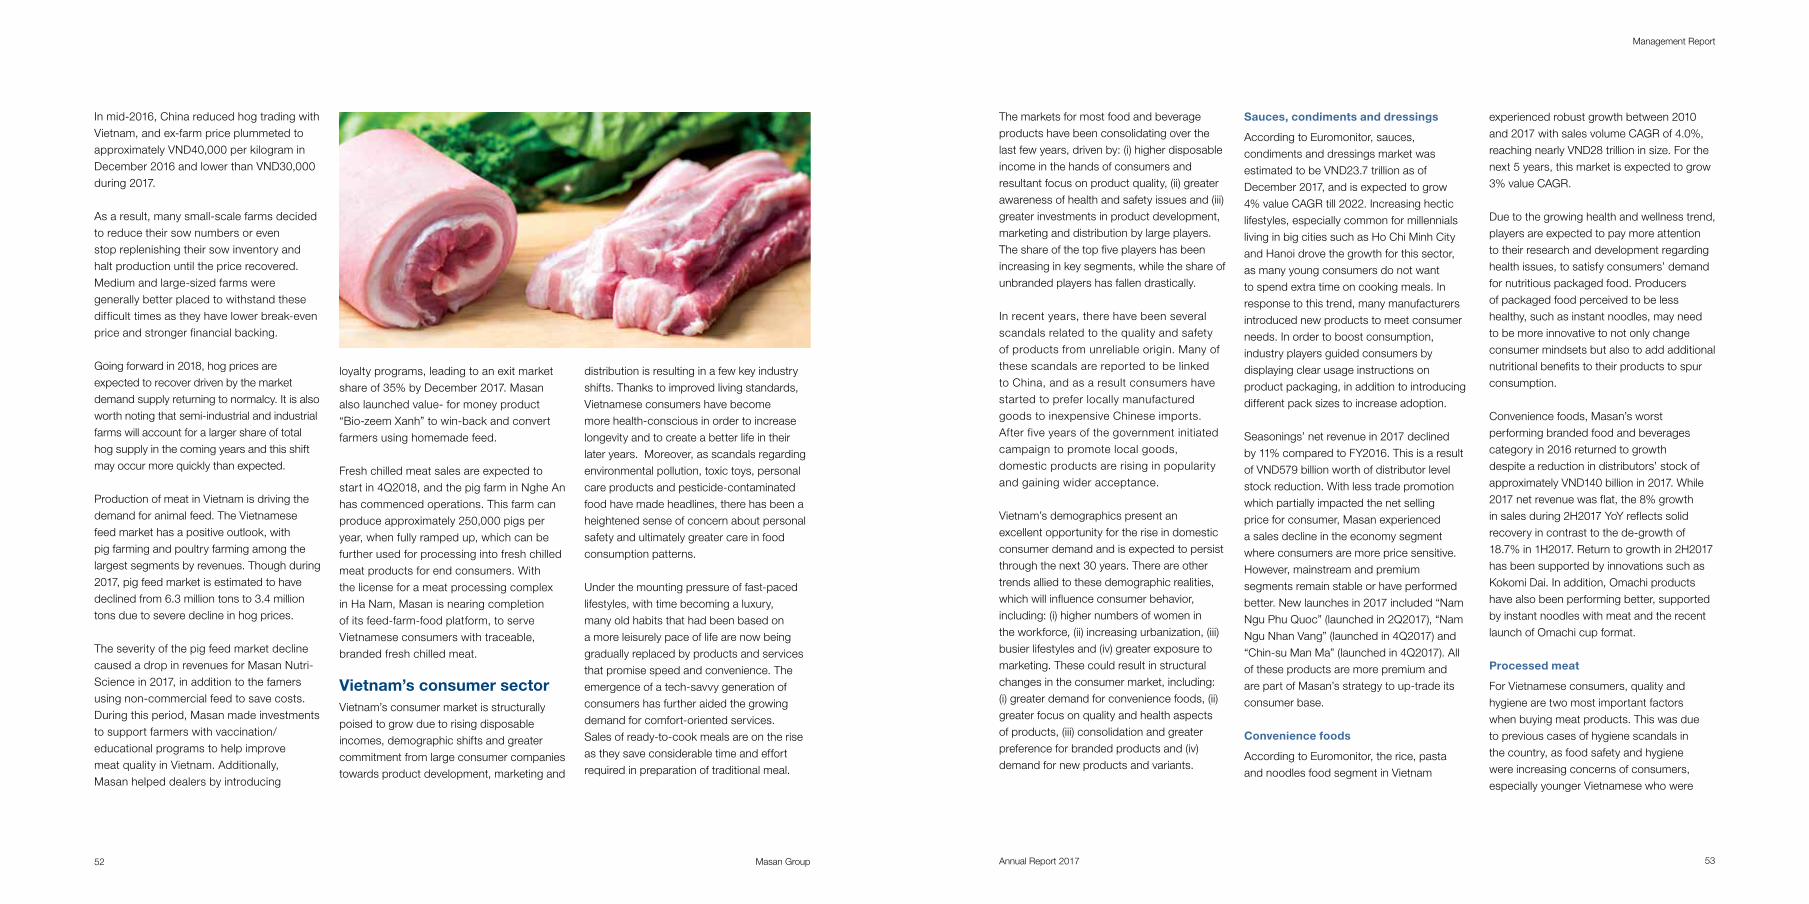
Masan Group 53Annual Report 201752
Management Report
In mid-2016, China reduced hog trading with Vietnam, and ex-farm price plummeted to approximately VND40,000 per kilogram in December 2016 and lower than VND30,000 during 2017.
As a result, many small-scale farms decided to reduce their sow numbers or even stop replenishing their sow inventory and halt production until the price recovered. Medium and large-sized farms were generally better placed to withstand these difficult times as they have lower break-even price and stronger financial backing.
Going forward in 2018, hog prices are expected to recover driven by the market demand supply returning to normalcy. It is also worth noting that semi-industrial and industrial farms will account for a larger share of total hog supply in the coming years and this shift may occur more quickly than expected.
Production of meat in Vietnam is driving the demand for animal feed. The Vietnamese feed market has a positive outlook, with pig farming and poultry farming among the largest segments by revenues. Though during 2017, pig feed market is estimated to have declined from 6.3 million tons to 3.4 million tons due to severe decline in hog prices.
The severity of the pig feed market decline caused a drop in revenues for Masan Nutri-Science in 2017, in addition to the famers using non-commercial feed to save costs. During this period, Masan made investments to support farmers with vaccination/educational programs to help improve meat quality in Vietnam. Additionally, Masan helped dealers by introducing
loyalty programs, leading to an exit market share of 35% by December 2017. Masan also launched value- for money product “Bio-zeem Xanh” to win-back and convert farmers using homemade feed.
Fresh chilled meat sales are expected to start in 4Q2018, and the pig farm in Nghe An has commenced operations. This farm can produce approximately 250,000 pigs per year, when fully ramped up, which can be further used for processing into fresh chilled meat products for end consumers. With the license for a meat processing complex in Ha Nam, Masan is nearing completion of its feed-farm-food platform, to serve Vietnamese consumers with traceable, branded fresh chilled meat. Vietnam’s consumer sectorVietnam’s consumer market is structurally poised to grow due to rising disposable incomes, demographic shifts and greater commitment from large consumer companies towards product development, marketing and
distribution is resulting in a few key industry shifts. Thanks to improved living standards, Vietnamese consumers have become more health-conscious in order to increase longevity and to create a better life in their later years. Moreover, as scandals regarding environmental pollution, toxic toys, personal care products and pesticide-contaminated food have made headlines, there has been a heightened sense of concern about personal safety and ultimately greater care in food consumption patterns.
Under the mounting pressure of fast-paced lifestyles, with time becoming a luxury, many old habits that had been based on a more leisurely pace of life are now being gradually replaced by products and services that promise speed and convenience. The emergence of a tech-savvy generation of consumers has further aided the growing demand for comfort-oriented services. Sales of ready-to-cook meals are on the rise as they save considerable time and effort required in preparation of traditional meal.
The markets for most food and beverage products have been consolidating over the last few years, driven by: (i) higher disposable income in the hands of consumers and resultant focus on product quality, (ii) greater awareness of health and safety issues and (iii) greater investments in product development, marketing and distribution by large players. The share of the top five players has been increasing in key segments, while the share of unbranded players has fallen drastically.
In recent years, there have been several scandals related to the quality and safety of products from unreliable origin. Many of these scandals are reported to be linked to China, and as a result consumers have started to prefer locally manufactured goods to inexpensive Chinese imports. After five years of the government initiated campaign to promote local goods, domestic products are rising in popularity and gaining wider acceptance.
Vietnam’s demographics present an excellent opportunity for the rise in domestic consumer demand and is expected to persist through the next 30 years. There are other trends allied to these demographic realities, which will influence consumer behavior, including: (i) higher numbers of women in the workforce, (ii) increasing urbanization, (iii) busier lifestyles and (iv) greater exposure to marketing. These could result in structural changes in the consumer market, including: (i) greater demand for convenience foods, (ii) greater focus on quality and health aspects of products, (iii) consolidation and greater preference for branded products and (iv) demand for new products and variants.
Sauces, condiments and dressings
According to Euromonitor, sauces, condiments and dressings market was estimated to be VND23.7 trillion as of December 2017, and is expected to grow 4% value CAGR till 2022. Increasing hectic lifestyles, especially common for millennials living in big cities such as Ho Chi Minh City and Hanoi drove the growth for this sector, as many young consumers do not want to spend extra time on cooking meals. In response to this trend, many manufacturers introduced new products to meet consumer needs. In order to boost consumption, industry players guided consumers by displaying clear usage instructions on product packaging, in addition to introducing different pack sizes to increase adoption.
Seasonings’ net revenue in 2017 declined by 11% compared to FY2016. This is a result of VND579 billion worth of distributor level stock reduction. With less trade promotion which partially impacted the net selling price for consumer, Masan experienced a sales decline in the economy segment where consumers are more price sensitive. However, mainstream and premium segments remain stable or have performed better. New launches in 2017 included “Nam Ngu Phu Quoc” (launched in 2Q2017), “Nam Ngu Nhan Vang” (launched in 4Q2017) and “Chin-su Man Ma” (launched in 4Q2017). All of these products are more premium and are part of Masan’s strategy to up-trade its consumer base.
Convenience foods
According to Euromonitor, the rice, pasta and noodles food segment in Vietnam
experienced robust growth between 2010 and 2017 with sales volume CAGR of 4.0%, reaching nearly VND28 trillion in size. For the next 5 years, this market is expected to grow 3% value CAGR.
Due to the growing health and wellness trend, players are expected to pay more attention to their research and development regarding health issues, to satisfy consumers’ demand for nutritious packaged food. Producers of packaged food perceived to be less healthy, such as instant noodles, may need to be more innovative to not only change consumer mindsets but also to add additional nutritional benefits to their products to spur consumption.
Convenience foods, Masan’s worst performing branded food and beverages category in 2016 returned to growth despite a reduction in distributors’ stock of approximately VND140 billion in 2017. While 2017 net revenue was flat, the 8% growth in sales during 2H2017 YoY reflects solid recovery in contrast to the de-growth of 18.7% in 1H2017. Return to growth in 2H2017 has been supported by innovations such as Kokomi Dai. In addition, Omachi products have also been performing better, supported by instant noodles with meat and the recent launch of Omachi cup format.
Processed meat
For Vietnamese consumers, quality and hygiene are two most important factors when buying meat products. This was due to previous cases of hygiene scandals in the country, as food safety and hygiene were increasing concerns of consumers, especially younger Vietnamese who were
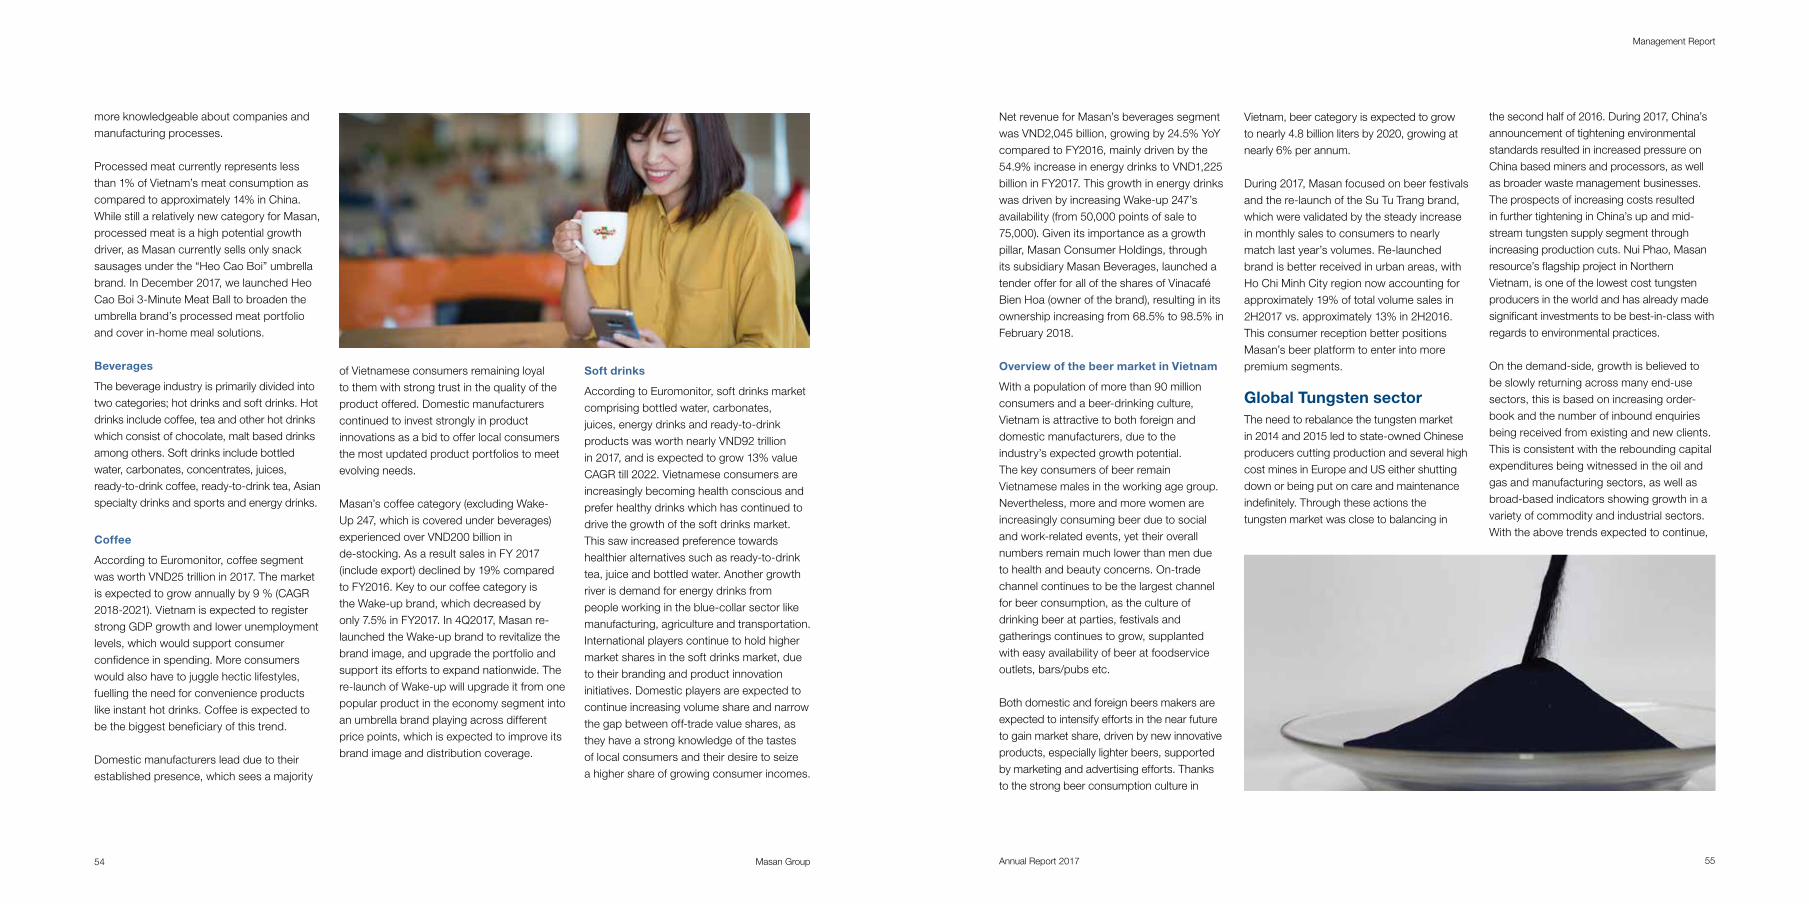
Masan Group 55Annual Report 201754
Management Report
more knowledgeable about companies and manufacturing processes.
Processed meat currently represents less than 1% of Vietnam’s meat consumption as compared to approximately 14% in China. While still a relatively new category for Masan, processed meat is a high potential growth driver, as Masan currently sells only snack sausages under the “Heo Cao Boi” umbrella brand. In December 2017, we launched Heo Cao Boi 3-Minute Meat Ball to broaden the umbrella brand’s processed meat portfolio and cover in-home meal solutions.
Beverages
The beverage industry is primarily divided into two categories; hot drinks and soft drinks. Hot drinks include coffee, tea and other hot drinks which consist of chocolate, malt based drinks among others. Soft drinks include bottled water, carbonates, concentrates, juices, ready-to-drink coffee, ready-to-drink tea, Asian specialty drinks and sports and energy drinks.
Coffee
According to Euromonitor, coffee segment was worth VND25 trillion in 2017. The market is expected to grow annually by 9 % (CAGR 2018-2021). Vietnam is expected to register strong GDP growth and lower unemployment levels, which would support consumer confidence in spending. More consumers would also have to juggle hectic lifestyles, fuelling the need for convenience products like instant hot drinks. Coffee is expected to be the biggest beneficiary of this trend.
Domestic manufacturers lead due to their established presence, which sees a majority
of Vietnamese consumers remaining loyal to them with strong trust in the quality of the product offered. Domestic manufacturers continued to invest strongly in product innovations as a bid to offer local consumers the most updated product portfolios to meet evolving needs.
Masan’s coffee category (excluding Wake-Up 247, which is covered under beverages) experienced over VND200 billion in de-stocking. As a result sales in FY 2017 (include export) declined by 19% compared to FY2016. Key to our coffee category is the Wake-up brand, which decreased by only 7.5% in FY2017. In 4Q2017, Masan re-launched the Wake-up brand to revitalize the brand image, and upgrade the portfolio and support its efforts to expand nationwide. The re-launch of Wake-up will upgrade it from one popular product in the economy segment into an umbrella brand playing across different price points, which is expected to improve its brand image and distribution coverage.
Soft drinks
According to Euromonitor, soft drinks market comprising bottled water, carbonates, juices, energy drinks and ready-to-drink products was worth nearly VND92 trillion in 2017, and is expected to grow 13% value CAGR till 2022. Vietnamese consumers are increasingly becoming health conscious and prefer healthy drinks which has continued to drive the growth of the soft drinks market. This saw increased preference towards healthier alternatives such as ready-to-drink tea, juice and bottled water. Another growth river is demand for energy drinks from people working in the blue-collar sector like manufacturing, agriculture and transportation. International players continue to hold higher market shares in the soft drinks market, due to their branding and product innovation initiatives. Domestic players are expected to continue increasing volume share and narrow the gap between off-trade value shares, as they have a strong knowledge of the tastes of local consumers and their desire to seize a higher share of growing consumer incomes.
Net revenue for Masan’s beverages segment was VND2,045 billion, growing by 24.5% YoY compared to FY2016, mainly driven by the 54.9% increase in energy drinks to VND1,225 billion in FY2017. This growth in energy drinks was driven by increasing Wake-up 247’s availability (from 50,000 points of sale to 75,000). Given its importance as a growth pillar, Masan Consumer Holdings, through its subsidiary Masan Beverages, launched a tender offer for all of the shares of Vinacafé Bien Hoa (owner of the brand), resulting in its ownership increasing from 68.5% to 98.5% in February 2018.
Overview of the beer market in Vietnam
With a population of more than 90 million consumers and a beer-drinking culture, Vietnam is attractive to both foreign and domestic manufacturers, due to the industry’s expected growth potential. The key consumers of beer remain Vietnamese males in the working age group. Nevertheless, more and more women are increasingly consuming beer due to social and work-related events, yet their overall numbers remain much lower than men due to health and beauty concerns. On-trade channel continues to be the largest channel for beer consumption, as the culture of drinking beer at parties, festivals and gatherings continues to grow, supplanted with easy availability of beer at foodservice outlets, bars/pubs etc.
Both domestic and foreign beers makers are expected to intensify efforts in the near future to gain market share, driven by new innovative products, especially lighter beers, supported by marketing and advertising efforts. Thanks to the strong beer consumption culture in
Vietnam, beer category is expected to grow to nearly 4.8 billion liters by 2020, growing at nearly 6% per annum.
During 2017, Masan focused on beer festivals and the re-launch of the Su Tu Trang brand, which were validated by the steady increase in monthly sales to consumers to nearly match last year’s volumes. Re-launched brand is better received in urban areas, with Ho Chi Minh City region now accounting for approximately 19% of total volume sales in 2H2017 vs. approximately 13% in 2H2016. This consumer reception better positions Masan’s beer platform to enter into more premium segments.
Global Tungsten sectorThe need to rebalance the tungsten market in 2014 and 2015 led to state-owned Chinese producers cutting production and several high cost mines in Europe and US either shutting down or being put on care and maintenance indefinitely. Through these actions the tungsten market was close to balancing in
the second half of 2016. During 2017, China’s announcement of tightening environmental standards resulted in increased pressure on China based miners and processors, as well as broader waste management businesses. The prospects of increasing costs resulted in further tightening in China’s up and mid-stream tungsten supply segment through increasing production cuts. Nui Phao, Masan resource’s flagship project in Northern Vietnam, is one of the lowest cost tungsten producers in the world and has already made significant investments to be best-in-class with regards to environmental practices.
On the demand-side, growth is believed to be slowly returning across many end-use sectors, this is based on increasing order-book and the number of inbound enquiries being received from existing and new clients. This is consistent with the rebounding capital expenditures being witnessed in the oil and gas and manufacturing sectors, as well as broad-based indicators showing growth in a variety of commodity and industrial sectors. With the above trends expected to continue,
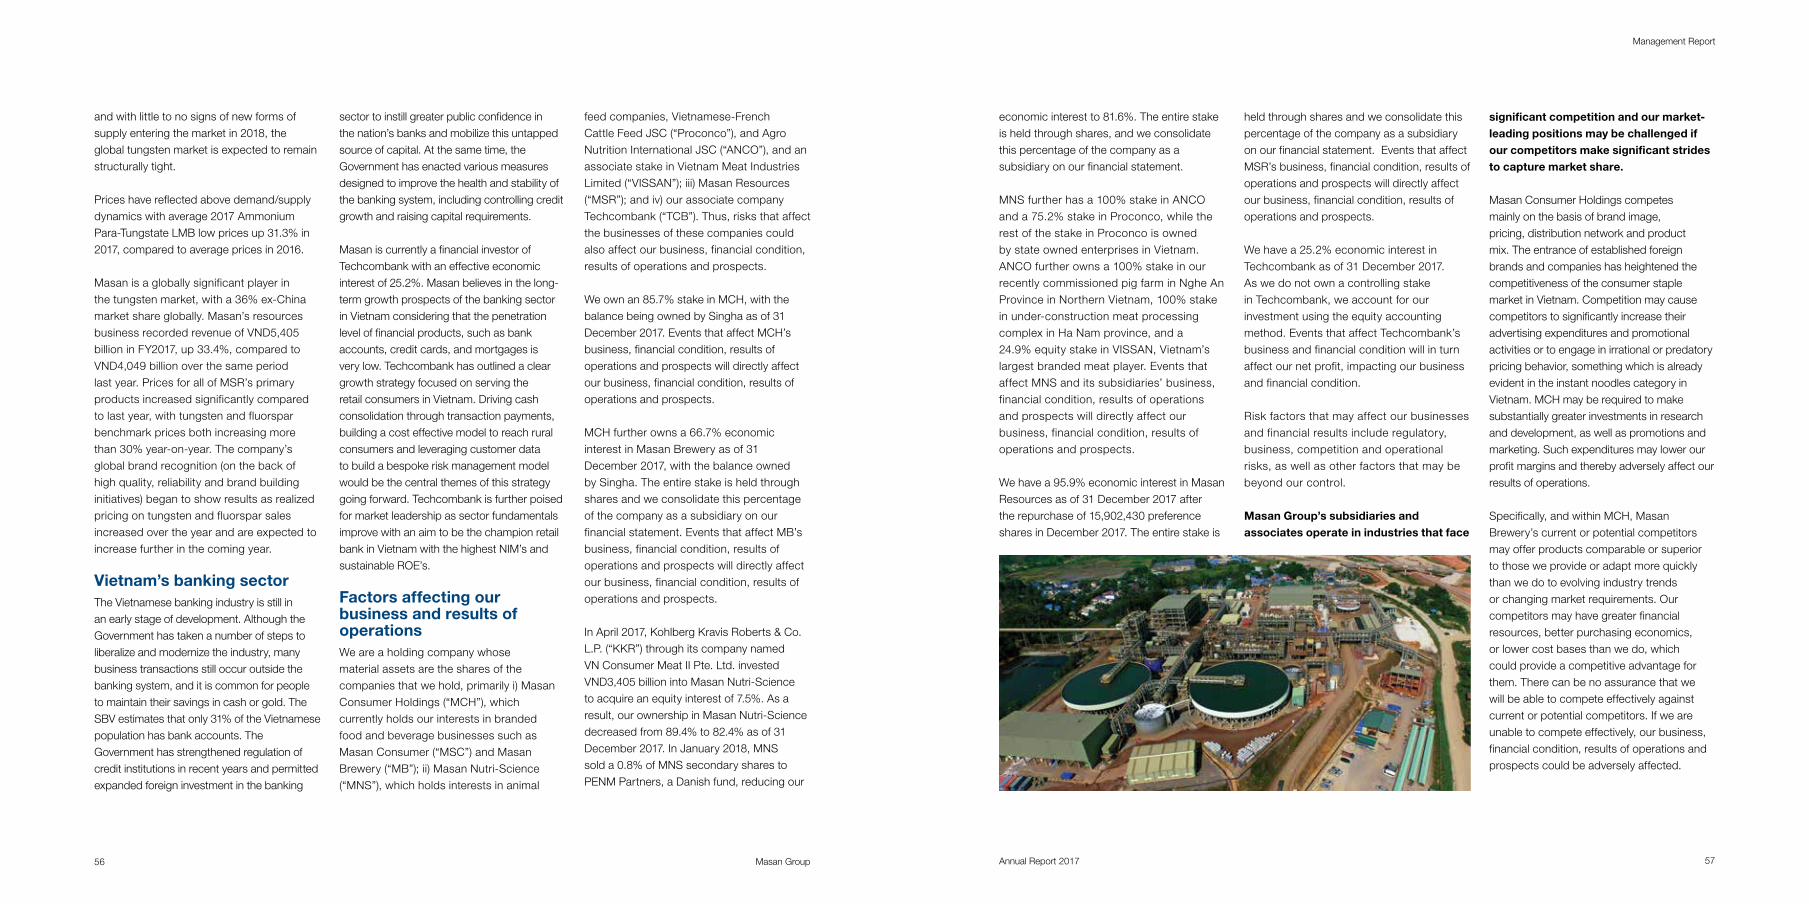
Masan Group 57Annual Report 201756
Management Report
and with little to no signs of new forms of supply entering the market in 2018, the global tungsten market is expected to remain structurally tight.
Prices have reflected above demand/supply dynamics with average 2017 Ammonium Para-Tungstate LMB low prices up 31.3% in 2017, compared to average prices in 2016.
Masan is a globally significant player in the tungsten market, with a 36% ex-China market share globally. Masan’s resources business recorded revenue of VND5,405 billion in FY2017, up 33.4%, compared to VND4,049 billion over the same period last year. Prices for all of MSR’s primary products increased significantly compared to last year, with tungsten and fluorspar benchmark prices both increasing more than 30% year-on-year. The company’s global brand recognition (on the back of high quality, reliability and brand building initiatives) began to show results as realized pricing on tungsten and fluorspar sales increased over the year and are expected to increase further in the coming year.
Vietnam’s banking sectorThe Vietnamese banking industry is still in an early stage of development. Although the Government has taken a number of steps to liberalize and modernize the industry, many business transactions still occur outside the banking system, and it is common for people to maintain their savings in cash or gold. The SBV estimates that only 31% of the Vietnamese population has bank accounts. The Government has strengthened regulation of credit institutions in recent years and permitted expanded foreign investment in the banking
sector to instill greater public confidence in the nation’s banks and mobilize this untapped source of capital. At the same time, the Government has enacted various measures designed to improve the health and stability of the banking system, including controlling credit growth and raising capital requirements.
Masan is currently a financial investor of Techcombank with an effective economic interest of 25.2%. Masan believes in the long-term growth prospects of the banking sector in Vietnam considering that the penetration level of financial products, such as bank accounts, credit cards, and mortgages is very low. Techcombank has outlined a clear growth strategy focused on serving the retail consumers in Vietnam. Driving cash consolidation through transaction payments, building a cost effective model to reach rural consumers and leveraging customer data to build a bespoke risk management model would be the central themes of this strategy going forward. Techcombank is further poised for market leadership as sector fundamentals improve with an aim to be the champion retail bank in Vietnam with the highest NIM’s and sustainable ROE’s. Factors affecting our business and results of operationsWe are a holding company whose material assets are the shares of the companies that we hold, primarily i) Masan Consumer Holdings (“MCH”), which currently holds our interests in branded food and beverage businesses such as Masan Consumer (“MSC”) and Masan Brewery (“MB”); ii) Masan Nutri-Science (“MNS”), which holds interests in animal
feed companies, Vietnamese-French Cattle Feed JSC (“Proconco”), and Agro Nutrition International JSC (“ANCO”), and an associate stake in Vietnam Meat Industries Limited (“VISSAN”); iii) Masan Resources (“MSR”); and iv) our associate company Techcombank (“TCB”). Thus, risks that affect the businesses of these companies could also affect our business, financial condition, results of operations and prospects.
We own an 85.7% stake in MCH, with the balance being owned by Singha as of 31 December 2017. Events that affect MCH’s business, financial condition, results of operations and prospects will directly affect our business, financial condition, results of operations and prospects.
MCH further owns a 66.7% economic interest in Masan Brewery as of 31 December 2017, with the balance owned by Singha. The entire stake is held through shares and we consolidate this percentage of the company as a subsidiary on our financial statement. Events that affect MB’s business, financial condition, results of operations and prospects will directly affect our business, financial condition, results of operations and prospects.
In April 2017, Kohlberg Kravis Roberts & Co. L.P. (“KKR”) through its company named VN Consumer Meat II Pte. Ltd. invested VND3,405 billion into Masan Nutri-Science to acquire an equity interest of 7.5%. As a result, our ownership in Masan Nutri-Science decreased from 89.4% to 82.4% as of 31 December 2017. In January 2018, MNS sold a 0.8% of MNS secondary shares to PENM Partners, a Danish fund, reducing our
economic interest to 81.6%. The entire stake is held through shares, and we consolidate this percentage of the company as a subsidiary on our financial statement.
MNS further has a 100% stake in ANCO and a 75.2% stake in Proconco, while the rest of the stake in Proconco is owned by state owned enterprises in Vietnam. ANCO further owns a 100% stake in our recently commissioned pig farm in Nghe An Province in Northern Vietnam, 100% stake in under-construction meat processing complex in Ha Nam province, and a 24.9% equity stake in VISSAN, Vietnam’s largest branded meat player. Events that affect MNS and its subsidiaries’ business, financial condition, results of operations and prospects will directly affect our business, financial condition, results of operations and prospects.
We have a 95.9% economic interest in Masan Resources as of 31 December 2017 after the repurchase of 15,902,430 preference shares in December 2017. The entire stake is
held through shares and we consolidate this percentage of the company as a subsidiary on our financial statement. Events that affect MSR’s business, financial condition, results of operations and prospects will directly affect our business, financial condition, results of operations and prospects.
We have a 25.2% economic interest in Techcombank as of 31 December 2017. As we do not own a controlling stake in Techcombank, we account for our investment using the equity accounting method. Events that affect Techcombank’s business and financial condition will in turn affect our net profit, impacting our business and financial condition.
Risk factors that may affect our businesses and financial results include regulatory, business, competition and operational risks, as well as other factors that may be beyond our control.
Masan Group’s subsidiaries and associates operate in industries that face
significant competition and our market-leading positions may be challenged if our competitors make significant strides to capture market share.
Masan Consumer Holdings competes mainly on the basis of brand image, pricing, distribution network and product mix. The entrance of established foreign brands and companies has heightened the competitiveness of the consumer staple market in Vietnam. Competition may cause competitors to significantly increase their advertising expenditures and promotional activities or to engage in irrational or predatory pricing behavior, something which is already evident in the instant noodles category in Vietnam. MCH may be required to make substantially greater investments in research and development, as well as promotions and marketing. Such expenditures may lower our profit margins and thereby adversely affect our results of operations.
Specifically, and within MCH, Masan Brewery’s current or potential competitors may offer products comparable or superior to those we provide or adapt more quickly than we do to evolving industry trends or changing market requirements. Our competitors may have greater financial resources, better purchasing economics, or lower cost bases than we do, which could provide a competitive advantage for them. There can be no assurance that we will be able to compete effectively against current or potential competitors. If we are unable to compete effectively, our business, financial condition, results of operations and prospects could be adversely affected.
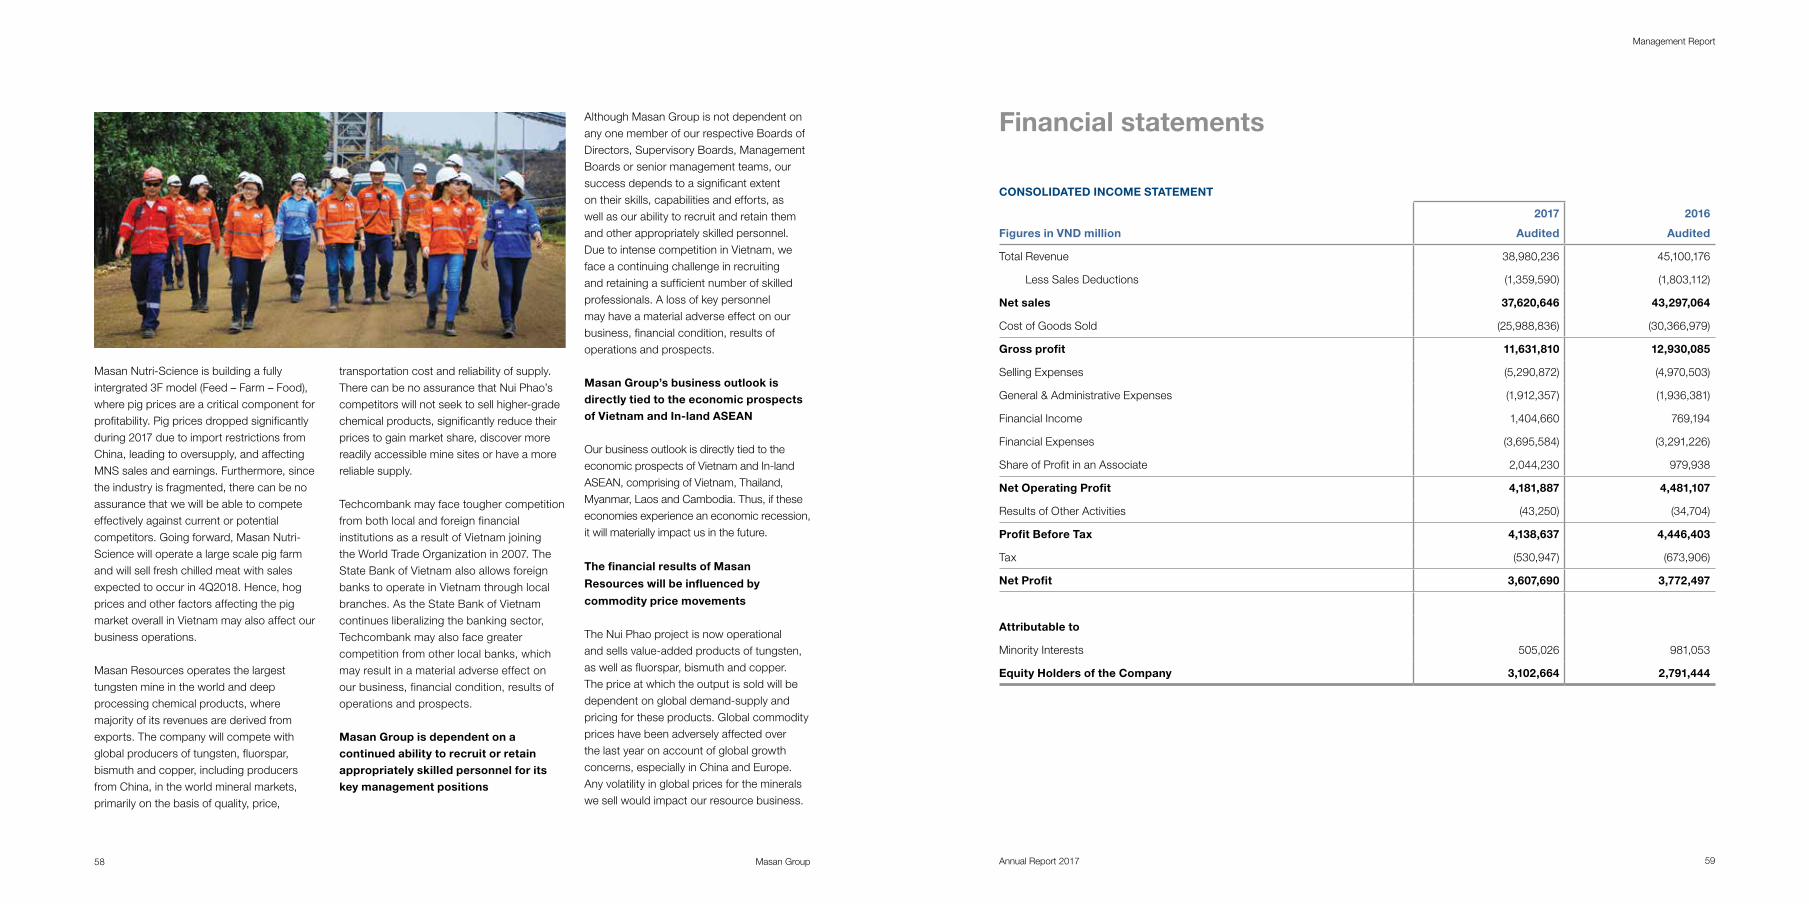
Masan Group 59Annual Report 201758
Management Report
Financial statements
CONSOLIDATED INCOME STATEMENT
Figures in VND million
2017
Audited
2016
Audited
Total Revenue 38,980,236 45,100,176
Less Sales Deductions (1,359,590) (1,803,112)
Net sales 37,620,646 43,297,064
Cost of Goods Sold (25,988,836) (30,366,979)
Gross profit 11,631,810 12,930,085
Selling Expenses (5,290,872) (4,970,503)
General & Administrative Expenses (1,912,357) (1,936,381)
Financial Income 1,404,660 769,194
Financial Expenses (3,695,584) (3,291,226)
Share of Profit in an Associate 2,044,230 979,938
Net Operating Profit 4,181,887 4,481,107
Results of Other Activities (43,250) (34,704)
Profit Before Tax 4,138,637 4,446,403
Tax (530,947) (673,906)
Net Profit 3,607,690 3,772,497
Attributable to
Minority Interests 505,026 981,053
Equity Holders of the Company 3,102,664 2,791,444
Masan Nutri-Science is building a fully intergrated 3F model (Feed – Farm – Food), where pig prices are a critical component for profitability. Pig prices dropped significantly during 2017 due to import restrictions from China, leading to oversupply, and affecting MNS sales and earnings. Furthermore, since the industry is fragmented, there can be no assurance that we will be able to compete effectively against current or potential competitors. Going forward, Masan Nutri-Science will operate a large scale pig farm and will sell fresh chilled meat with sales expected to occur in 4Q2018. Hence, hog prices and other factors affecting the pig market overall in Vietnam may also affect our business operations.
Masan Resources operates the largest tungsten mine in the world and deep processing chemical products, where majority of its revenues are derived from exports. The company will compete with global producers of tungsten, fluorspar, bismuth and copper, including producers from China, in the world mineral markets, primarily on the basis of quality, price,
transportation cost and reliability of supply. There can be no assurance that Nui Phao’s competitors will not seek to sell higher-grade chemical products, significantly reduce their prices to gain market share, discover more readily accessible mine sites or have a more reliable supply.
Techcombank may face tougher competition from both local and foreign financial institutions as a result of Vietnam joining the World Trade Organization in 2007. The State Bank of Vietnam also allows foreign banks to operate in Vietnam through local branches. As the State Bank of Vietnam continues liberalizing the banking sector, Techcombank may also face greater competition from other local banks, which may result in a material adverse effect on our business, financial condition, results of operations and prospects.
Masan Group is dependent on a continued ability to recruit or retain appropriately skilled personnel for its key management positions
Although Masan Group is not dependent on any one member of our respective Boards of Directors, Supervisory Boards, Management Boards or senior management teams, our success depends to a significant extent on their skills, capabilities and efforts, as well as our ability to recruit and retain them and other appropriately skilled personnel. Due to intense competition in Vietnam, we face a continuing challenge in recruiting and retaining a sufficient number of skilled professionals. A loss of key personnel may have a material adverse effect on our business, financial condition, results of operations and prospects.
Masan Group’s business outlook is directly tied to the economic prospects of Vietnam and In-land ASEAN
Our business outlook is directly tied to the economic prospects of Vietnam and In-land ASEAN, comprising of Vietnam, Thailand, Myanmar, Laos and Cambodia. Thus, if these economies experience an economic recession, it will materially impact us in the future.
The financial results of Masan
Resources will be influenced by
commodity price movements
The Nui Phao project is now operational and sells value-added products of tungsten, as well as fluorspar, bismuth and copper. The price at which the output is sold will be dependent on global demand-supply and pricing for these products. Global commodity prices have been adversely affected over the last year on account of global growth concerns, especially in China and Europe. Any volatility in global prices for the minerals we sell would impact our resource business.
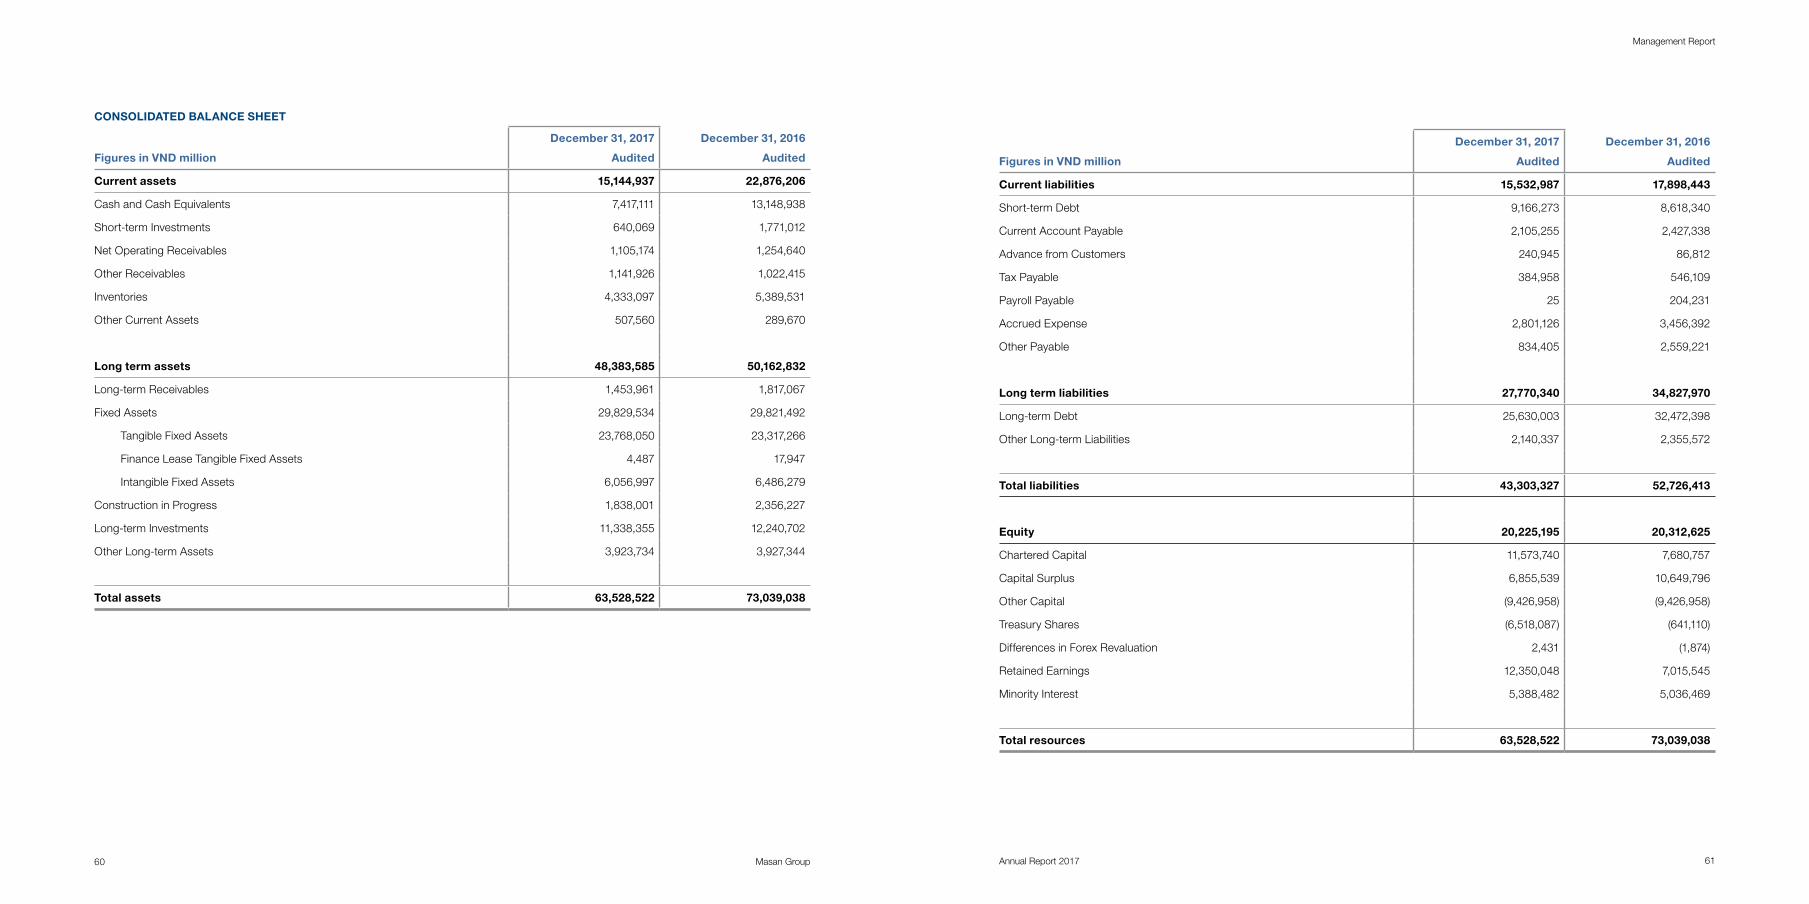
Masan Group 61Annual Report 201760
Management Report
CONSOLIDATED BALANCE SHEET
Figures in VND million
December 31, 2017
Audited
December 31, 2016
Audited
Current assets 15,144,937 22,876,206
Cash and Cash Equivalents 7,417,111 13,148,938
Short-term Investments 640,069 1,771,012
Net Operating Receivables 1,105,174 1,254,640
Other Receivables 1,141,926 1,022,415
Inventories 4,333,097 5,389,531
Other Current Assets 507,560 289,670
Long term assets 48,383,585 50,162,832
Long-term Receivables 1,453,961 1,817,067
Fixed Assets 29,829,534 29,821,492
Tangible Fixed Assets 23,768,050 23,317,266
Finance Lease Tangible Fixed Assets 4,487 17,947
Intangible Fixed Assets 6,056,997 6,486,279
Construction in Progress 1,838,001 2,356,227
Long-term Investments 11,338,355 12,240,702
Other Long-term Assets 3,923,734 3,927,344
Total assets 63,528,522 73,039,038
Figures in VND million
December 31, 2017
Audited
December 31, 2016
Audited
Current liabilities 15,532,987 17,898,443
Short-term Debt 9,166,273 8,618,340
Current Account Payable 2,105,255 2,427,338
Advance from Customers 240,945 86,812
Tax Payable 384,958 546,109
Payroll Payable 25 204,231
Accrued Expense 2,801,126 3,456,392
Other Payable 834,405 2,559,221
Long term liabilities 27,770,340 34,827,970
Long-term Debt 25,630,003 32,472,398
Other Long-term Liabilities 2,140,337 2,355,572
Total liabilities 43,303,327 52,726,413
Equity 20,225,195 20,312,625
Chartered Capital 11,573,740 7,680,757
Capital Surplus 6,855,539 10,649,796
Other Capital (9,426,958) (9,426,958)
Treasury Shares (6,518,087) (641,110)
Differences in Forex Revaluation 2,431 (1,874)
Retained Earnings 12,350,048 7,015,545
Minority Interest 5,388,482 5,036,469
Total resources 63,528,522 73,039,038
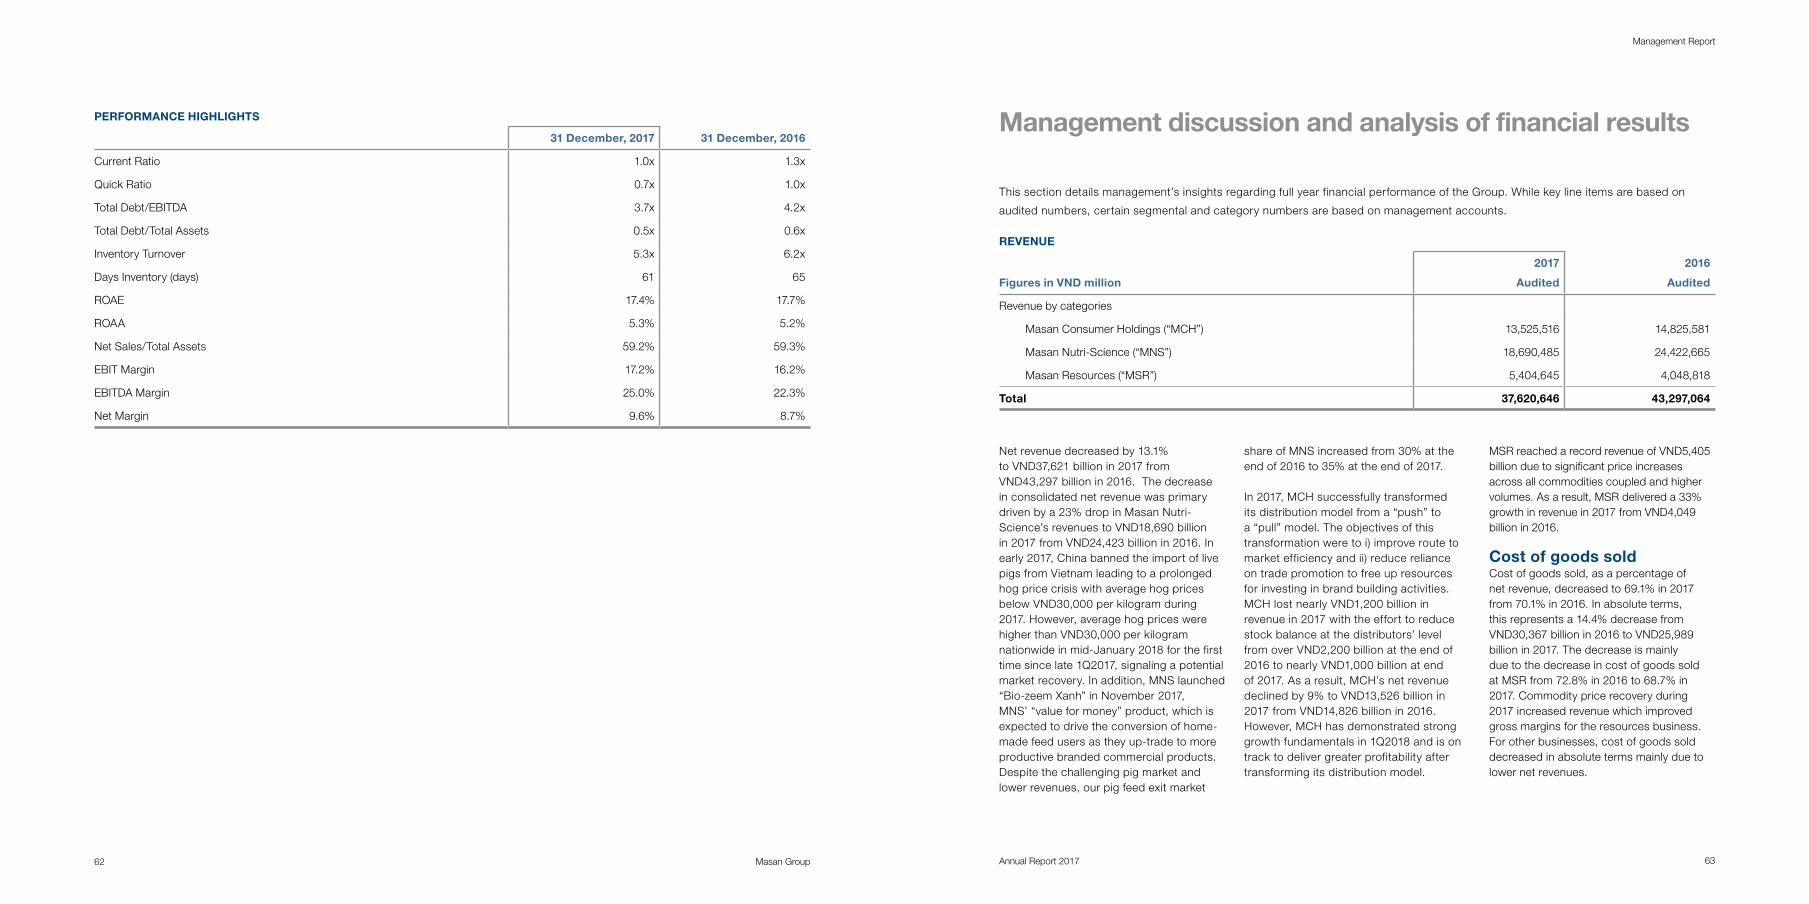
Masan Group 63Annual Report 201762
Management Report
This section details management’s insights regarding full year financial performance of the Group. While key line items are based on
audited numbers, certain segmental and category numbers are based on management accounts.
REVENUE
Figures in VND million
2017
Audited
2016
Audited
Revenue by categories
Masan Consumer Holdings (“MCH”) 13,525,516 14,825,581
Masan Nutri-Science (“MNS”) 18,690,485 24,422,665
Masan Resources (“MSR”) 5,404,645 4,048,818
Total 37,620,646 43,297,064
Net revenue decreased by 13.1% to VND37,621 billion in 2017 from VND43,297 billion in 2016. The decrease in consolidated net revenue was primary driven by a 23% drop in Masan Nutri-Science’s revenues to VND18,690 billion in 2017 from VND24,423 billion in 2016. In early 2017, China banned the import of live pigs from Vietnam leading to a prolonged hog price crisis with average hog prices below VND30,000 per kilogram during 2017. However, average hog prices were higher than VND30,000 per kilogram nationwide in mid-January 2018 for the first time since late 1Q2017, signaling a potential market recovery. In addition, MNS launched “Bio-zeem Xanh” in November 2017, MNS’ “value for money” product, which is expected to drive the conversion of home-made feed users as they up-trade to more productive branded commercial products. Despite the challenging pig market and lower revenues, our pig feed exit market
share of MNS increased from 30% at the end of 2016 to 35% at the end of 2017.
In 2017, MCH successfully transformed its distribution model from a “push” to a “pull” model. The objectives of this transformation were to i) improve route to market efficiency and ii) reduce reliance on trade promotion to free up resources for investing in brand building activities. MCH lost nearly VND1,200 billion in revenue in 2017 with the effort to reduce stock balance at the distributors’ level from over VND2,200 billion at the end of 2016 to nearly VND1,000 billion at end of 2017. As a result, MCH’s net revenue declined by 9% to VND13,526 billion in 2017 from VND14,826 billion in 2016. However, MCH has demonstrated strong growth fundamentals in 1Q2018 and is on track to deliver greater profitability after transforming its distribution model.
MSR reached a record revenue of VND5,405 billion due to significant price increases across all commodities coupled and higher volumes. As a result, MSR delivered a 33% growth in revenue in 2017 from VND4,049 billion in 2016. Cost of goods soldCost of goods sold, as a percentage of net revenue, decreased to 69.1% in 2017 from 70.1% in 2016. In absolute terms, this represents a 14.4% decrease from VND30,367 billion in 2016 to VND25,989 billion in 2017. The decrease is mainly due to the decrease in cost of goods sold at MSR from 72.8% in 2016 to 68.7% in 2017. Commodity price recovery during 2017 increased revenue which improved gross margins for the resources business. For other businesses, cost of goods sold decreased in absolute terms mainly due to lower net revenues.
Management discussion and analysis of financial resultsPERFORMANCE HIGHLIGHTS
31 December, 2017 31 December, 2016
Current Ratio 1.0x 1.3x
Quick Ratio 0.7x 1.0x
Total Debt/EBITDA 3.7x 4.2x
Total Debt/Total Assets 0.5x 0.6x
Inventory Turnover 5.3x 6.2x
Days Inventory (days) 61 65
ROAE 17.4% 17.7%
ROAA 5.3% 5.2%
Net Sales/Total Assets 59.2% 59.3%
EBIT Margin 17.2% 16.2%
EBITDA Margin 25.0% 22.3%
Net Margin 9.6% 8.7%
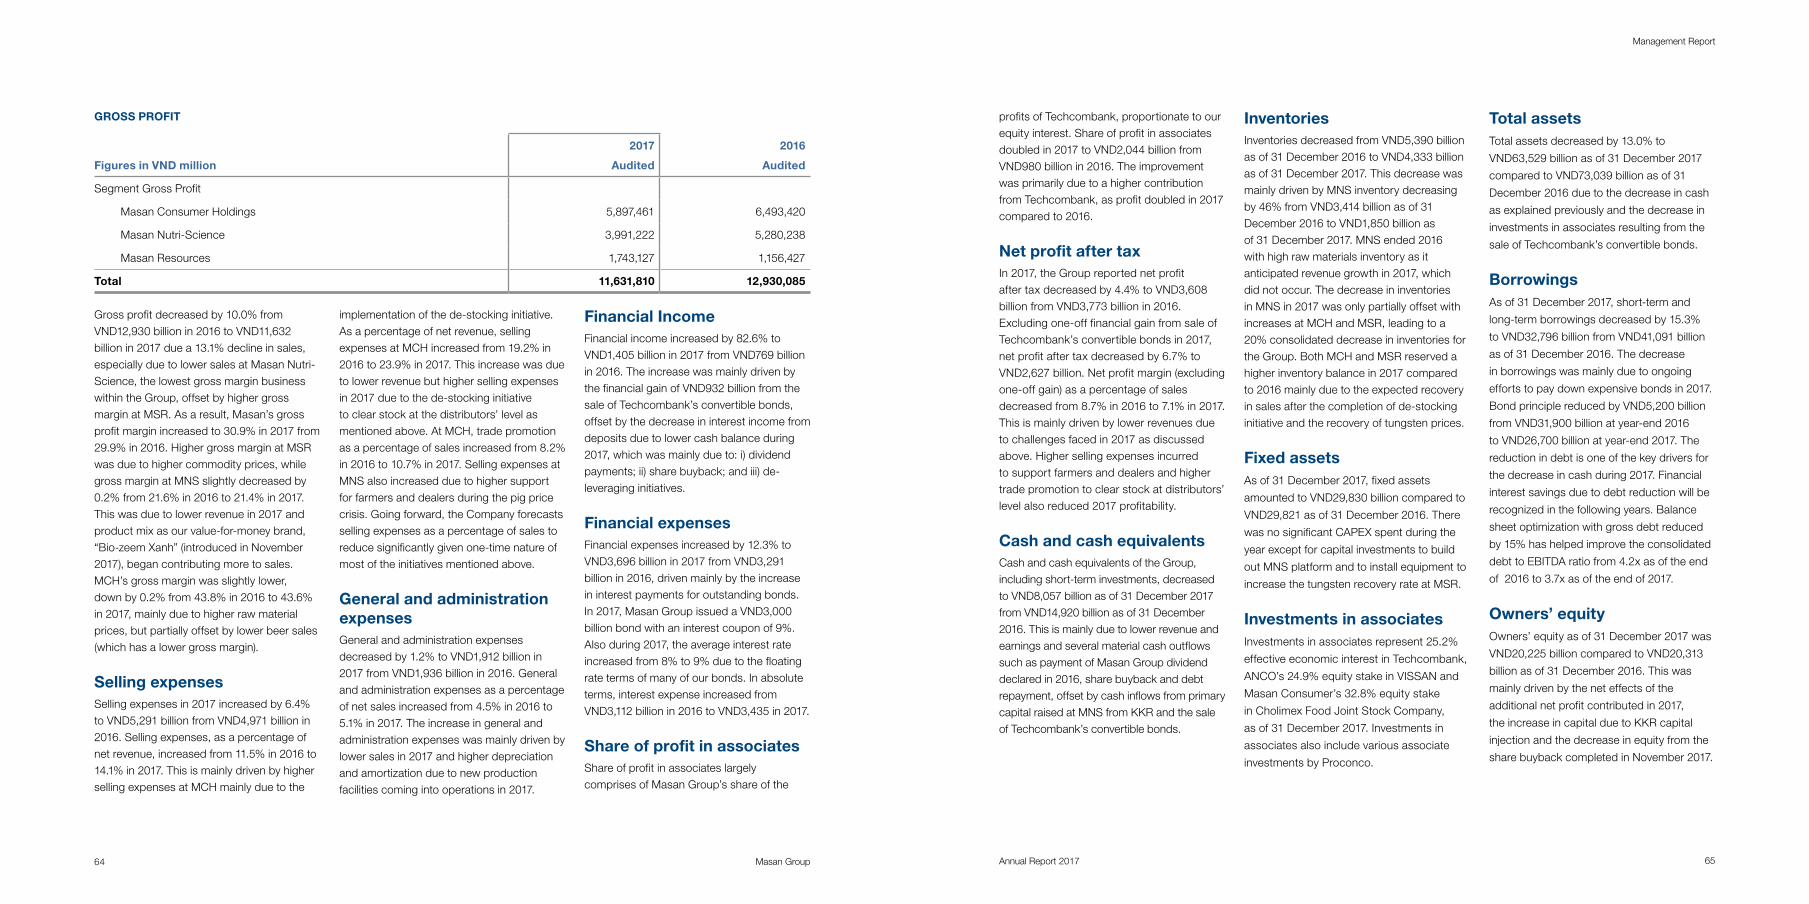
Masan Group 65Annual Report 201764
Management Report
GROSS PROFIT
Figures in VND million
2017
Audited
2016
Audited
Segment Gross Profit
Masan Consumer Holdings 5,897,461 6,493,420
Masan Nutri-Science 3,991,222 5,280,238
Masan Resources 1,743,127 1,156,427
Total 11,631,810 12,930,085
Gross profit decreased by 10.0% from VND12,930 billion in 2016 to VND11,632 billion in 2017 due a 13.1% decline in sales, especially due to lower sales at Masan Nutri-Science, the lowest gross margin business within the Group, offset by higher gross margin at MSR. As a result, Masan’s gross profit margin increased to 30.9% in 2017 from 29.9% in 2016. Higher gross margin at MSR was due to higher commodity prices, while gross margin at MNS slightly decreased by 0.2% from 21.6% in 2016 to 21.4% in 2017. This was due to lower revenue in 2017 and product mix as our value-for-money brand, “Bio-zeem Xanh” (introduced in November 2017), began contributing more to sales. MCH’s gross margin was slightly lower, down by 0.2% from 43.8% in 2016 to 43.6% in 2017, mainly due to higher raw material prices, but partially offset by lower beer sales (which has a lower gross margin).
Selling expensesSelling expenses in 2017 increased by 6.4% to VND5,291 billion from VND4,971 billion in 2016. Selling expenses, as a percentage of net revenue, increased from 11.5% in 2016 to 14.1% in 2017. This is mainly driven by higher selling expenses at MCH mainly due to the
implementation of the de-stocking initiative. As a percentage of net revenue, selling expenses at MCH increased from 19.2% in 2016 to 23.9% in 2017. This increase was due to lower revenue but higher selling expenses in 2017 due to the de-stocking initiative to clear stock at the distributors’ level as mentioned above. At MCH, trade promotion as a percentage of sales increased from 8.2% in 2016 to 10.7% in 2017. Selling expenses at MNS also increased due to higher support for farmers and dealers during the pig price crisis. Going forward, the Company forecasts selling expenses as a percentage of sales to reduce significantly given one-time nature of most of the initiatives mentioned above.
General and administration expensesGeneral and administration expenses decreased by 1.2% to VND1,912 billion in 2017 from VND1,936 billion in 2016. General and administration expenses as a percentage of net sales increased from 4.5% in 2016 to 5.1% in 2017. The increase in general and administration expenses was mainly driven by lower sales in 2017 and higher depreciation and amortization due to new production facilities coming into operations in 2017.
Financial IncomeFinancial income increased by 82.6% to VND1,405 billion in 2017 from VND769 billion in 2016. The increase was mainly driven by the financial gain of VND932 billion from the sale of Techcombank’s convertible bonds, offset by the decrease in interest income from deposits due to lower cash balance during 2017, which was mainly due to: i) dividend payments; ii) share buyback; and iii) de-leveraging initiatives.
Financial expensesFinancial expenses increased by 12.3% to VND3,696 billion in 2017 from VND3,291 billion in 2016, driven mainly by the increase in interest payments for outstanding bonds. In 2017, Masan Group issued a VND3,000 billion bond with an interest coupon of 9%. Also during 2017, the average interest rate increased from 8% to 9% due to the floating rate terms of many of our bonds. In absolute terms, interest expense increased from VND3,112 billion in 2016 to VND3,435 in 2017.
Share of profit in associatesShare of profit in associates largely comprises of Masan Group’s share of the
profits of Techcombank, proportionate to our equity interest. Share of profit in associates doubled in 2017 to VND2,044 billion from VND980 billion in 2016. The improvement was primarily due to a higher contribution from Techcombank, as profit doubled in 2017 compared to 2016.
Net profit after taxIn 2017, the Group reported net profit after tax decreased by 4.4% to VND3,608 billion from VND3,773 billion in 2016. Excluding one-off financial gain from sale of Techcombank’s convertible bonds in 2017, net profit after tax decreased by 6.7% to VND2,627 billion. Net profit margin (excluding one-off gain) as a percentage of sales decreased from 8.7% in 2016 to 7.1% in 2017. This is mainly driven by lower revenues due to challenges faced in 2017 as discussed above. Higher selling expenses incurred to support farmers and dealers and higher trade promotion to clear stock at distributors’ level also reduced 2017 profitability.
Cash and cash equivalentsCash and cash equivalents of the Group, including short-term investments, decreased to VND8,057 billion as of 31 December 2017 from VND14,920 billion as of 31 December 2016. This is mainly due to lower revenue and earnings and several material cash outflows such as payment of Masan Group dividend declared in 2016, share buyback and debt repayment, offset by cash inflows from primary capital raised at MNS from KKR and the sale of Techcombank’s convertible bonds.
InventoriesInventories decreased from VND5,390 billion as of 31 December 2016 to VND4,333 billion as of 31 December 2017. This decrease was mainly driven by MNS inventory decreasing by 46% from VND3,414 billion as of 31 December 2016 to VND1,850 billion as of 31 December 2017. MNS ended 2016 with high raw materials inventory as it anticipated revenue growth in 2017, which did not occur. The decrease in inventories in MNS in 2017 was only partially offset with increases at MCH and MSR, leading to a 20% consolidated decrease in inventories for the Group. Both MCH and MSR reserved a higher inventory balance in 2017 compared to 2016 mainly due to the expected recovery in sales after the completion of de-stocking initiative and the recovery of tungsten prices.
Fixed assetsAs of 31 December 2017, fixed assets
amounted to VND29,830 billion compared to
VND29,821 as of 31 December 2016. There
was no significant CAPEX spent during the
year except for capital investments to build
out MNS platform and to install equipment to
increase the tungsten recovery rate at MSR.
Investments in associatesInvestments in associates represent 25.2%
effective economic interest in Techcombank,
ANCO’s 24.9% equity stake in VISSAN and
Masan Consumer’s 32.8% equity stake
in Cholimex Food Joint Stock Company,
as of 31 December 2017. Investments in
associates also include various associate
investments by Proconco.
Total assetsTotal assets decreased by 13.0% to
VND63,529 billion as of 31 December 2017
compared to VND73,039 billion as of 31
December 2016 due to the decrease in cash
as explained previously and the decrease in
investments in associates resulting from the
sale of Techcombank’s convertible bonds.
BorrowingsAs of 31 December 2017, short-term and
long-term borrowings decreased by 15.3%
to VND32,796 billion from VND41,091 billion
as of 31 December 2016. The decrease
in borrowings was mainly due to ongoing
efforts to pay down expensive bonds in 2017.
Bond principle reduced by VND5,200 billion
from VND31,900 billion at year-end 2016
to VND26,700 billion at year-end 2017. The
reduction in debt is one of the key drivers for
the decrease in cash during 2017. Financial
interest savings due to debt reduction will be
recognized in the following years. Balance
sheet optimization with gross debt reduced
by 15% has helped improve the consolidated
debt to EBITDA ratio from 4.2x as of the end
of 2016 to 3.7x as of the end of 2017.
Owners’ equityOwners’ equity as of 31 December 2017 was
VND20,225 billion compared to VND20,313
billion as of 31 December 2016. This was
mainly driven by the net effects of the
additional net profit contributed in 2017,
the increase in capital due to KKR capital
injection and the decrease in equity from the
share buyback completed in November 2017.
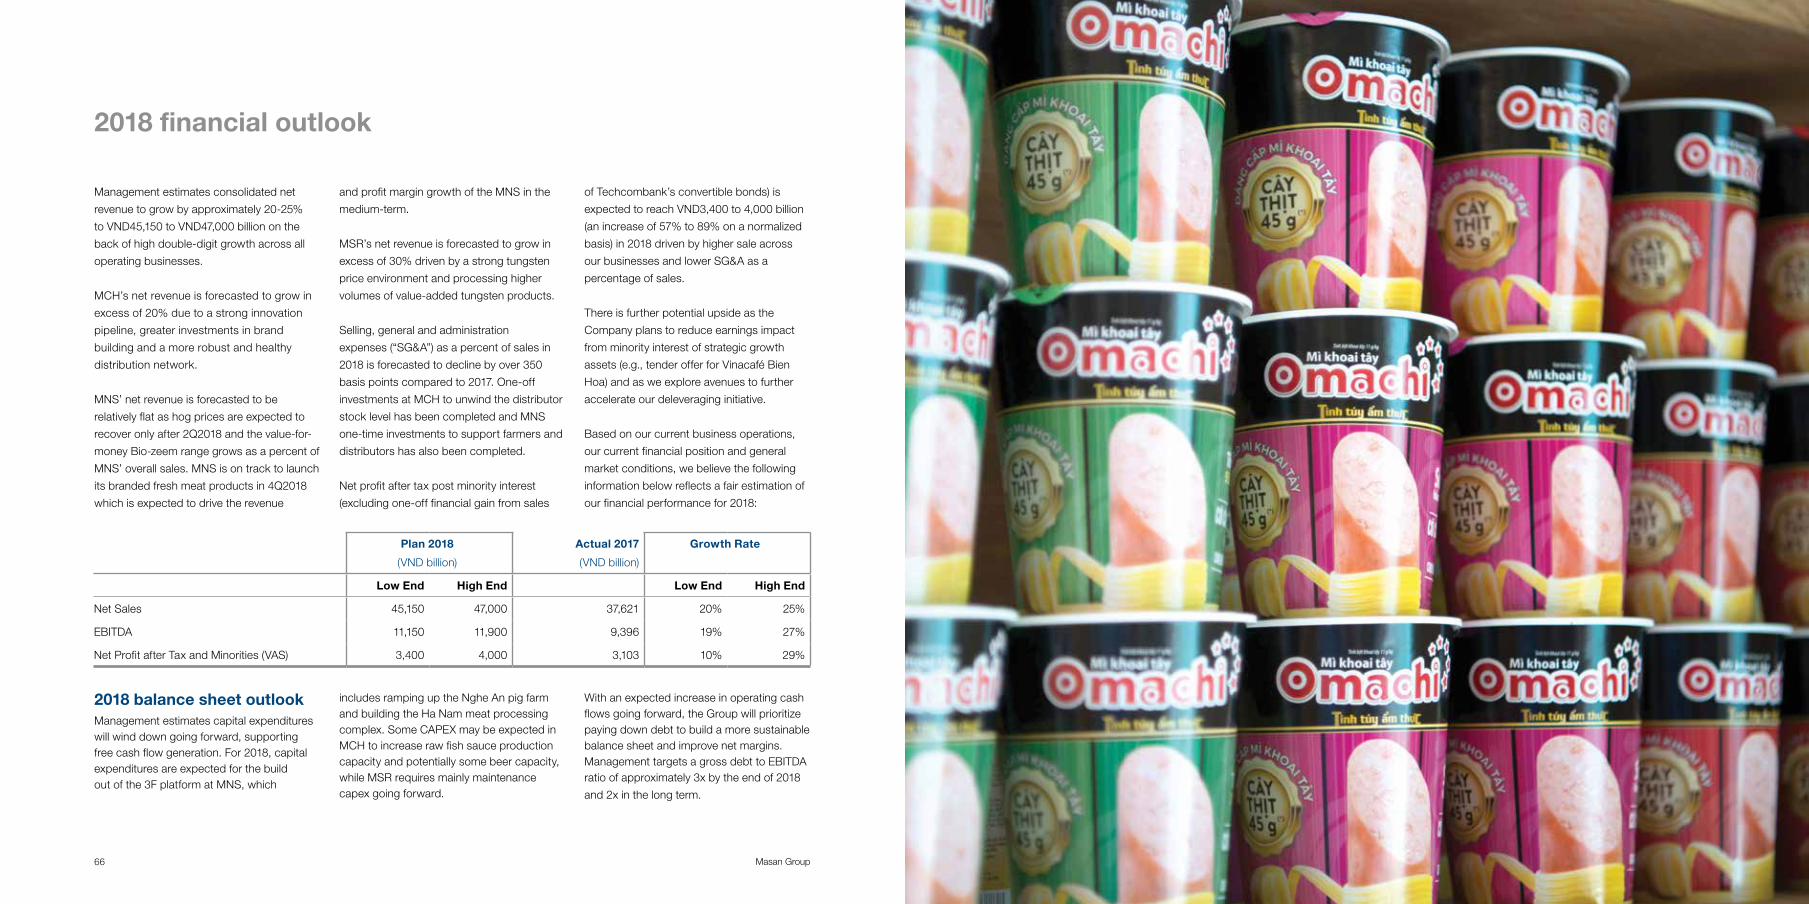
Masan Group 67Annual Report 201766
Management Report
2018 financial outlook
Management estimates consolidated net
revenue to grow by approximately 20-25%
to VND45,150 to VND47,000 billion on the
back of high double-digit growth across all
operating businesses.
MCH’s net revenue is forecasted to grow in
excess of 20% due to a strong innovation
pipeline, greater investments in brand
building and a more robust and healthy
distribution network.
MNS’ net revenue is forecasted to be
relatively flat as hog prices are expected to
recover only after 2Q2018 and the value-for-
money Bio-zeem range grows as a percent of
MNS’ overall sales. MNS is on track to launch
its branded fresh meat products in 4Q2018
which is expected to drive the revenue
and profit margin growth of the MNS in the
medium-term.
MSR’s net revenue is forecasted to grow in
excess of 30% driven by a strong tungsten
price environment and processing higher
volumes of value-added tungsten products.
Selling, general and administration
expenses (“SG&A”) as a percent of sales in
2018 is forecasted to decline by over 350
basis points compared to 2017. One-off
investments at MCH to unwind the distributor
stock level has been completed and MNS
one-time investments to support farmers and
distributors has also been completed.
Net profit after tax post minority interest
(excluding one-off financial gain from sales
of Techcombank’s convertible bonds) is
expected to reach VND3,400 to 4,000 billion
(an increase of 57% to 89% on a normalized
basis) in 2018 driven by higher sale across
our businesses and lower SG&A as a
percentage of sales.
There is further potential upside as the
Company plans to reduce earnings impact
from minority interest of strategic growth
assets (e.g., tender offer for Vinacafé Bien
Hoa) and as we explore avenues to further
accelerate our deleveraging initiative.
Based on our current business operations,
our current financial position and general
market conditions, we believe the following
information below reflects a fair estimation of
our financial performance for 2018:
2018 balance sheet outlookManagement estimates capital expenditures will wind down going forward, supporting free cash flow generation. For 2018, capital expenditures are expected for the build out of the 3F platform at MNS, which
includes ramping up the Nghe An pig farm and building the Ha Nam meat processing complex. Some CAPEX may be expected in MCH to increase raw fish sauce production capacity and potentially some beer capacity, while MSR requires mainly maintenance capex going forward.
With an expected increase in operating cash flows going forward, the Group will prioritize paying down debt to build a more sustainable balance sheet and improve net margins. Management targets a gross debt to EBITDA ratio of approximately 3x by the end of 2018
and 2x in the long term.
Plan 2018
(VND billion)
Actual 2017
(VND billion)
Growth Rate
Low End High End Low End High End
Net Sales 45,150 47,000 37,621 20% 25%
EBITDA 11,150 11,900 9,396 19% 27%
Net Profit after Tax and Minorities (VAS) 3,400 4,000 3,103 10% 29%

FinancialReport
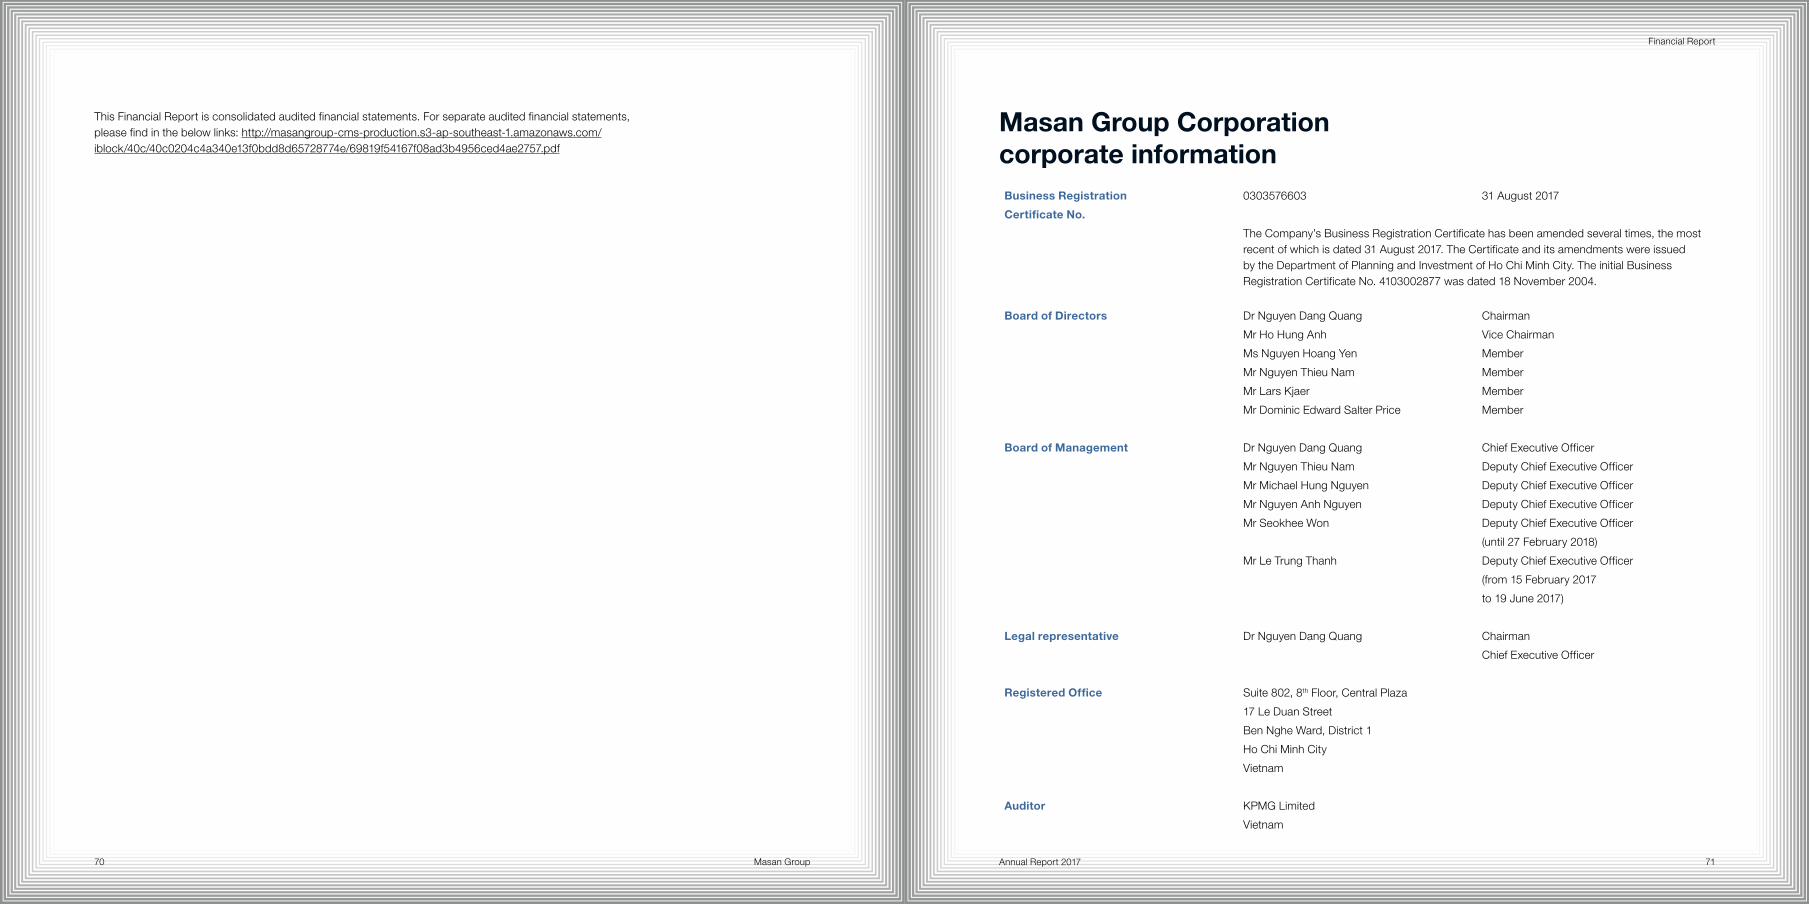
Masan Group70 71Annual Report 2017
Financial Report
Masan Group Corporationcorporate informationBusiness Registration 0303576603 31 August 2017
Certificate No.
The Company’s Business Registration Certificate has been amended several times, the most recent of which is dated 31 August 2017. The Certificate and its amendments were issued by the Department of Planning and Investment of Ho Chi Minh City. The initial Business Registration Certificate No. 4103002877 was dated 18 November 2004.
Board of Directors Dr Nguyen Dang Quang Chairman
Mr Ho Hung Anh Vice Chairman
Ms Nguyen Hoang Yen Member
Mr Nguyen Thieu Nam Member
Mr Lars Kjaer Member
Mr Dominic Edward Salter Price Member
Board of Management Dr Nguyen Dang Quang Chief Executive Officer
Mr Nguyen Thieu Nam Deputy Chief Executive Officer
Mr Michael Hung Nguyen Deputy Chief Executive Officer
Mr Nguyen Anh Nguyen Deputy Chief Executive Officer
Mr Seokhee Won Deputy Chief Executive Officer
(until 27 February 2018)
Mr Le Trung Thanh Deputy Chief Executive Officer
(from 15 February 2017
to 19 June 2017)
Legal representative Dr Nguyen Dang Quang Chairman
Chief Executive Officer
Registered Office Suite 802, 8th Floor, Central Plaza
17 Le Duan Street
Ben Nghe Ward, District 1
Ho Chi Minh City
Vietnam
Auditor KPMG Limited
Vietnam
This Financial Report is consolidated audited financial statements. For separate audited financial statements, please find in the below links: http://masangroup-cms-production.s3-ap-southeast-1.amazonaws.com/iblock/40c/40c0204c4a340e13f0bdd8d65728774e/69819f54167f08ad3b4956ced4ae2757.pdf
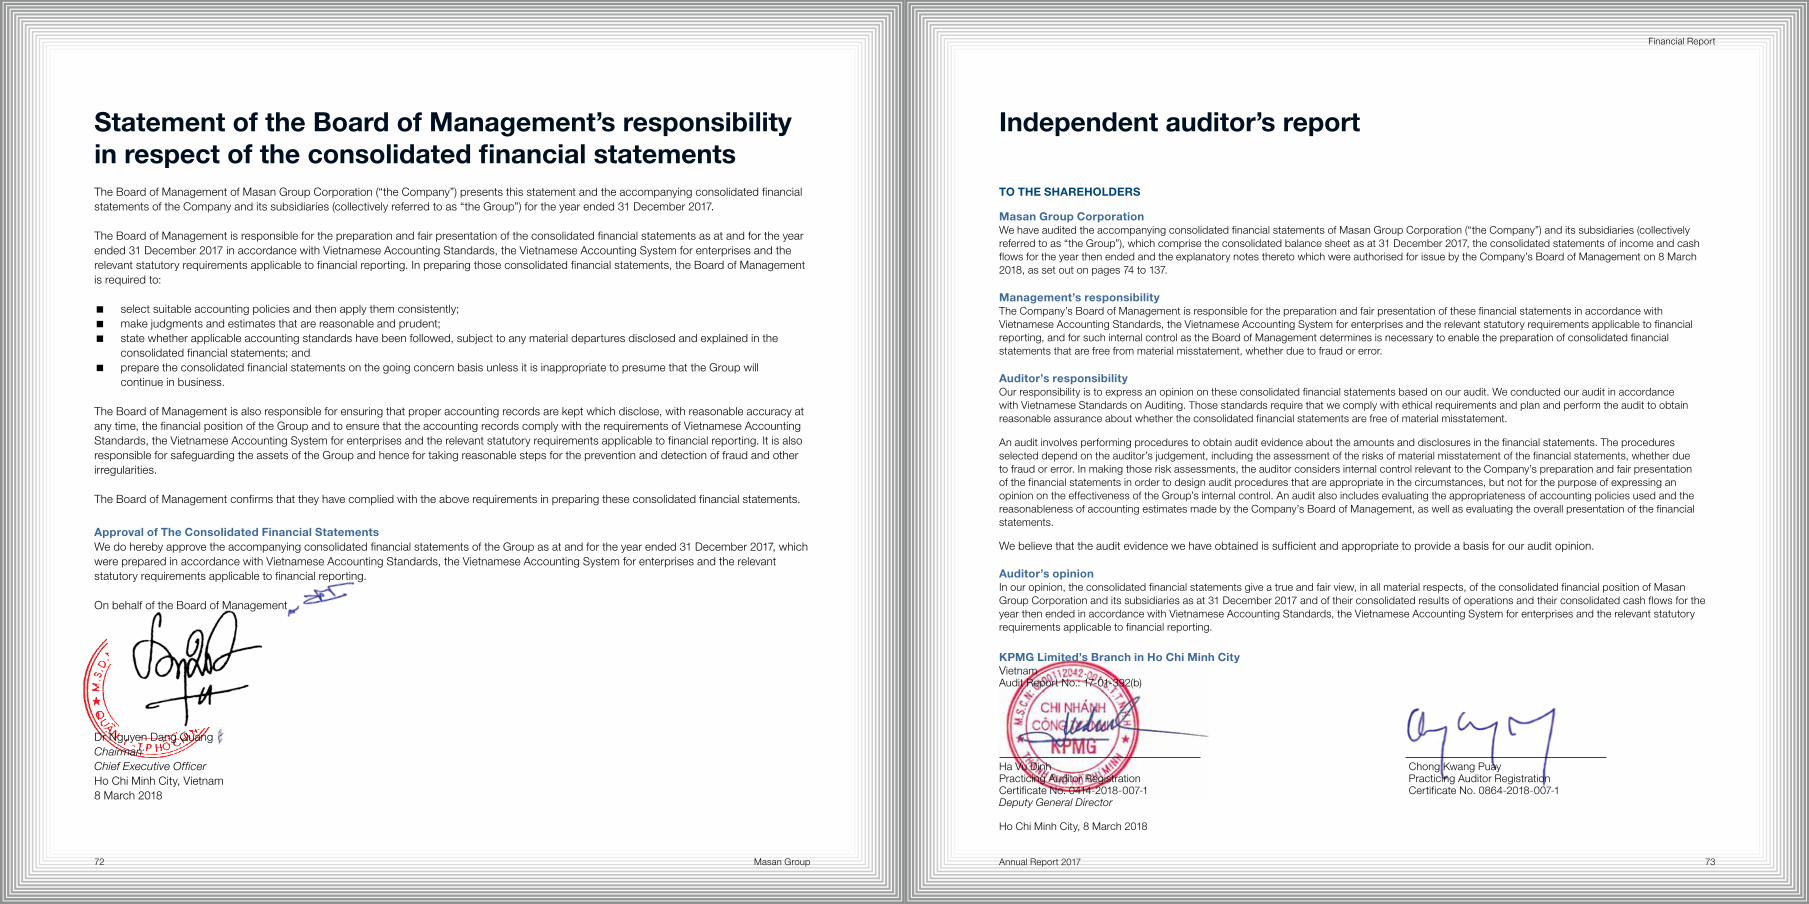
Masan Group72 73Annual Report 2017
Financial Report
The Board of Management of Masan Group Corporation (“the Company”) presents this statement and the accompanying consolidated financial statements of the Company and its subsidiaries (collectively referred to as “the Group”) for the year ended 31 December 2017.
The Board of Management is responsible for the preparation and fair presentation of the consolidated financial statements as at and for the year ended 31 December 2017 in accordance with Vietnamese Accounting Standards, the Vietnamese Accounting System for enterprises and the relevant statutory requirements applicable to financial reporting. In preparing those consolidated financial statements, the Board of Management is required to:
� select suitable accounting policies and then apply them consistently; � make judgments and estimates that are reasonable and prudent; � state whether applicable accounting standards have been followed, subject to any material departures disclosed and explained in the
consolidated financial statements; and � prepare the consolidated financial statements on the going concern basis unless it is inappropriate to presume that the Group will
continue in business.
The Board of Management is also responsible for ensuring that proper accounting records are kept which disclose, with reasonable accuracy at any time, the financial position of the Group and to ensure that the accounting records comply with the requirements of Vietnamese Accounting Standards, the Vietnamese Accounting System for enterprises and the relevant statutory requirements applicable to financial reporting. It is also responsible for safeguarding the assets of the Group and hence for taking reasonable steps for the prevention and detection of fraud and other irregularities.
The Board of Management confirms that they have complied with the above requirements in preparing these consolidated financial statements.
Approval of The Consolidated Financial StatementsWe do hereby approve the accompanying consolidated financial statements of the Group as at and for the year ended 31 December 2017, which were prepared in accordance with Vietnamese Accounting Standards, the Vietnamese Accounting System for enterprises and the relevant statutory requirements applicable to financial reporting.
On behalf of the Board of Management
Dr Nguyen Dang QuangChairmanChief Executive OfficerHo Chi Minh City, Vietnam8 March 2018
TO THE SHAREHOLDERS
Masan Group Corporation We have audited the accompanying consolidated financial statements of Masan Group Corporation (“the Company”) and its subsidiaries (collectively referred to as “the Group”), which comprise the consolidated balance sheet as at 31 December 2017, the consolidated statements of income and cash flows for the year then ended and the explanatory notes thereto which were authorised for issue by the Company’s Board of Management on 8 March 2018, as set out on pages 74 to 137.
Management’s responsibility The Company’s Board of Management is responsible for the preparation and fair presentation of these financial statements in accordance with Vietnamese Accounting Standards, the Vietnamese Accounting System for enterprises and the relevant statutory requirements applicable to financial reporting, and for such internal control as the Board of Management determines is necessary to enable the preparation of consolidated financial statements that are free from material misstatement, whether due to fraud or error.
Auditor’s responsibilityOur responsibility is to express an opinion on these consolidated financial statements based on our audit. We conducted our audit in accordance with Vietnamese Standards on Auditing. Those standards require that we comply with ethical requirements and plan and perform the audit to obtain reasonable assurance about whether the consolidated financial statements are free of material misstatement.
An audit involves performing procedures to obtain audit evidence about the amounts and disclosures in the financial statements. The procedures selected depend on the auditor’s judgement, including the assessment of the risks of material misstatement of the financial statements, whether due to fraud or error. In making those risk assessments, the auditor considers internal control relevant to the Company’s preparation and fair presentation of the financial statements in order to design audit procedures that are appropriate in the circumstances, but not for the purpose of expressing an opinion on the effectiveness of the Group’s internal control. An audit also includes evaluating the appropriateness of accounting policies used and the reasonableness of accounting estimates made by the Company’s Board of Management, as well as evaluating the overall presentation of the financial statements.
We believe that the audit evidence we have obtained is sufficient and appropriate to provide a basis for our audit opinion.
Auditor’s opinion In our opinion, the consolidated financial statements give a true and fair view, in all material respects, of the consolidated financial position of Masan Group Corporation and its subsidiaries as at 31 December 2017 and of their consolidated results of operations and their consolidated cash flows for the year then ended in accordance with Vietnamese Accounting Standards, the Vietnamese Accounting System for enterprises and the relevant statutory requirements applicable to financial reporting.
KPMG Limited’s Branch in Ho Chi Minh CityVietnamAudit Report No.: 17-01-392(b)
Ha Vu Dinh Chong Kwang Puay Practicing Auditor Registration Practicing Auditor Registration Certificate No. 0414-2018-007-1 Certificate No. 0864-2018-007-1 Deputy General Director
Ho Chi Minh City, 8 March 2018
Independent auditor’s report Statement of the Board of Management’s responsibility in respect of the consolidated financial statements
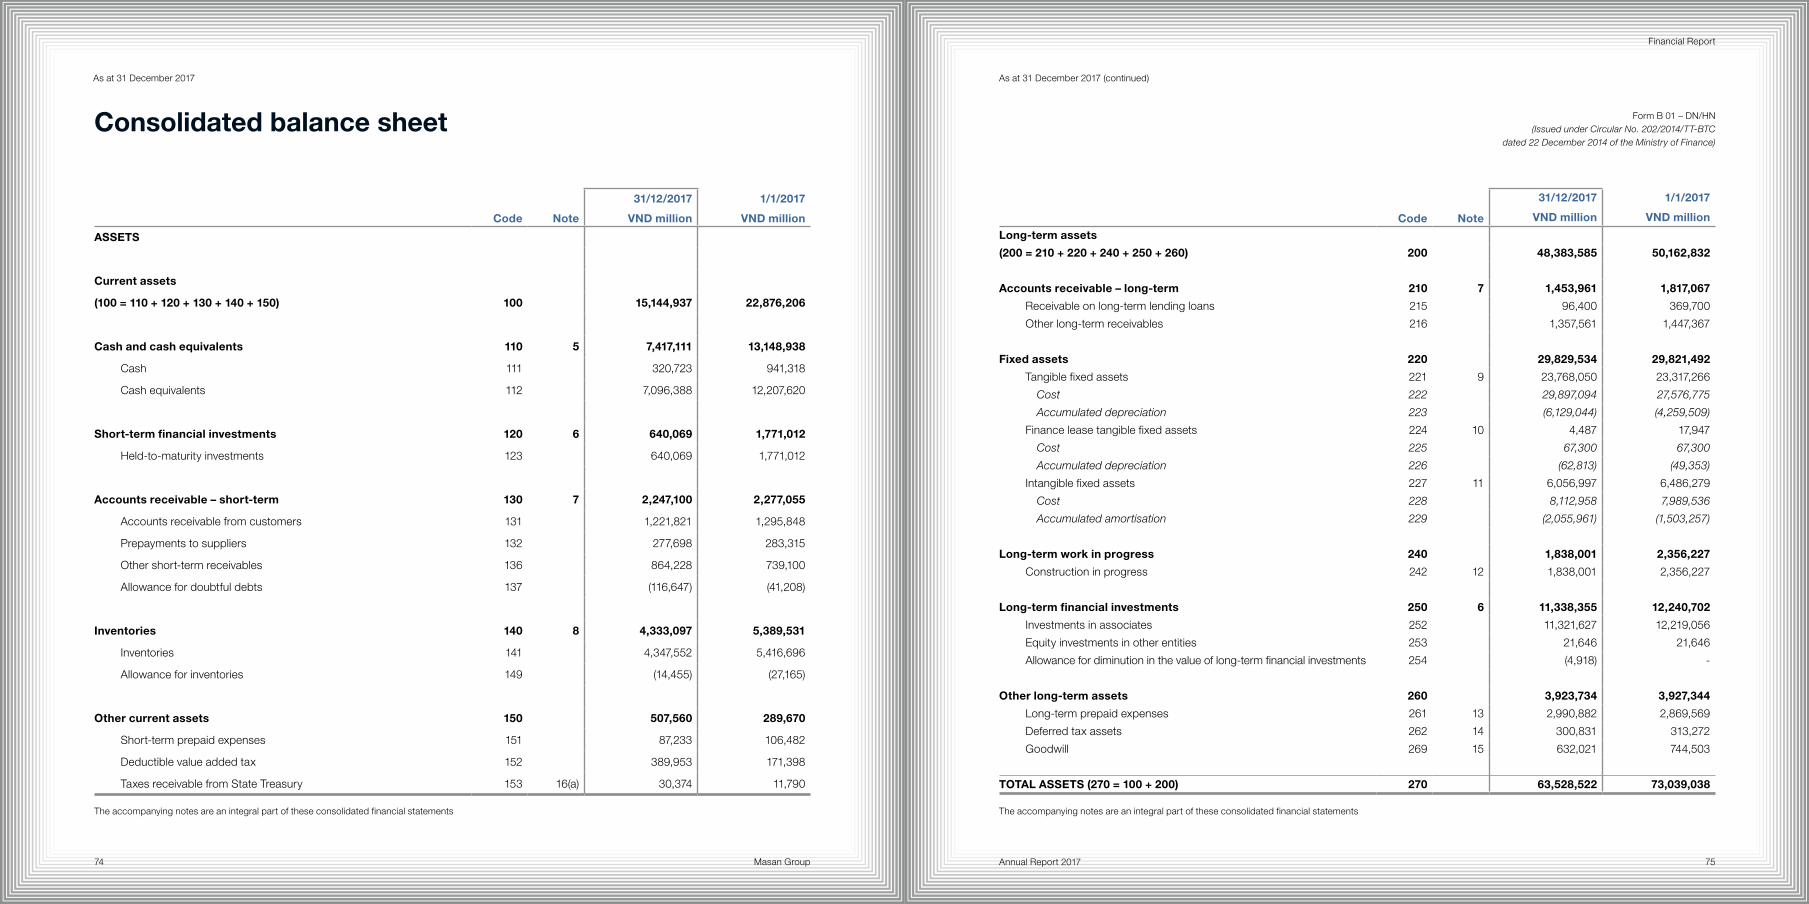
Masan Group74 75Annual Report 2017
Financial Report
As at 31 December 2017 As at 31 December 2017 (continued)
Form B 01 – DN/HN(Issued under Circular No. 202/2014/TT-BTC
dated 22 December 2014 of the Ministry of Finance)
Consolidated balance sheet
The accompanying notes are an integral part of these consolidated financial statements The accompanying notes are an integral part of these consolidated financial statements
Code Note
31/12/2017
VND million
1/1/2017
VND million
ASSETS
Current assets
(100 = 110 + 120 + 130 + 140 + 150) 100 15,144,937 22,876,206
Cash and cash equivalents 110 5 7,417,111 13,148,938
Cash 111 320,723 941,318
Cash equivalents 112 7,096,388 12,207,620
Short-term financial investments 120 6 640,069 1,771,012
Held-to-maturity investments 123 640,069 1,771,012
Accounts receivable – short-term 130 7 2,247,100 2,277,055
Accounts receivable from customers 131 1,221,821 1,295,848
Prepayments to suppliers 132 277,698 283,315
Other short-term receivables 136 864,228 739,100
Allowance for doubtful debts 137 (116,647) (41,208)
Inventories 140 8 4,333,097 5,389,531
Inventories 141 4,347,552 5,416,696
Allowance for inventories 149 (14,455) (27,165)
Other current assets 150 507,560 289,670
Short-term prepaid expenses 151 87,233 106,482
Deductible value added tax 152 389,953 171,398
Taxes receivable from State Treasury 153 16(a) 30,374 11,790
Code Note
31/12/2017
VND million
1/1/2017
VND million
Long-term assets
(200 = 210 + 220 + 240 + 250 + 260) 200 48,383,585 50,162,832
Accounts receivable – long-term 210 7 1,453,961 1,817,067
Receivable on long-term lending loans 215 96,400 369,700
Other long-term receivables 216 1,357,561 1,447,367
Fixed assets 220 29,829,534 29,821,492
Tangible fixed assets 221 9 23,768,050 23,317,266
Cost 222 29,897,094 27,576,775
Accumulated depreciation 223 (6,129,044) (4,259,509)
Finance lease tangible fixed assets 224 10 4,487 17,947
Cost 225 67,300 67,300
Accumulated depreciation 226 (62,813) (49,353)
Intangible fixed assets 227 11 6,056,997 6,486,279
Cost 228 8,112,958 7,989,536
Accumulated amortisation 229 (2,055,961) (1,503,257)
Long-term work in progress 240 1,838,001 2,356,227
Construction in progress 242 12 1,838,001 2,356,227
Long-term financial investments 250 6 11,338,355 12,240,702
Investments in associates 252 11,321,627 12,219,056
Equity investments in other entities 253 21,646 21,646
Allowance for diminution in the value of long-term financial investments 254 (4,918) -
Other long-term assets 260 3,923,734 3,927,344
Long-term prepaid expenses 261 13 2,990,882 2,869,569
Deferred tax assets 262 14 300,831 313,272
Goodwill 269 15 632,021 744,503
TOTAL ASSETS (270 = 100 + 200) 270 63,528,522 73,039,038
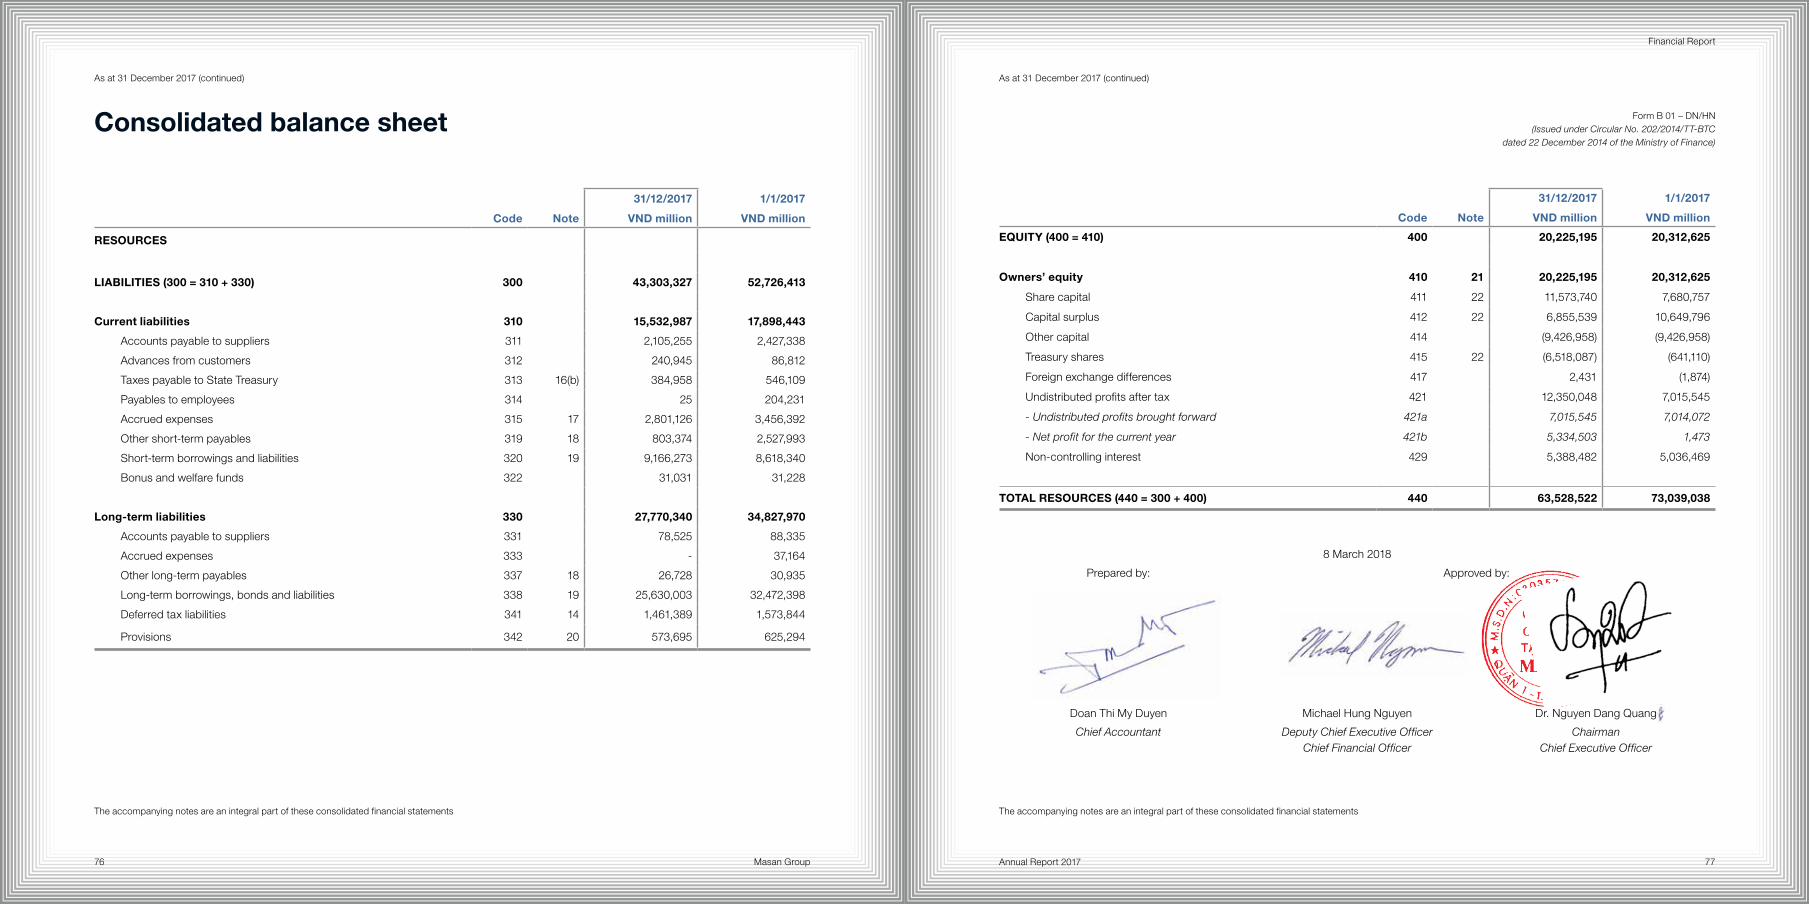
Masan Group76 77Annual Report 2017
Financial Report
As at 31 December 2017 (continued)As at 31 December 2017 (continued)
Form B 01 – DN/HN(Issued under Circular No. 202/2014/TT-BTC
dated 22 December 2014 of the Ministry of Finance)
The accompanying notes are an integral part of these consolidated financial statements
Code Note
31/12/2017
VND million
1/1/2017
VND million
EQUITY (400 = 410) 400 20,225,195 20,312,625
Owners’ equity 410 21 20,225,195 20,312,625
Share capital 411 22 11,573,740 7,680,757
Capital surplus 412 22 6,855,539 10,649,796
Other capital 414 (9,426,958) (9,426,958)
Treasury shares 415 22 (6,518,087) (641,110)
Foreign exchange differences 417 2,431 (1,874)
Undistributed profits after tax 421 12,350,048 7,015,545
- Undistributed profits brought forward 421a 7,015,545 7,014,072
- Net profit for the current year 421b 5,334,503 1,473
Non-controlling interest 429 5,388,482 5,036,469
TOTAL RESOURCES (440 = 300 + 400) 440 63,528,522 73,039,038
Code Note
31/12/2017
VND million
1/1/2017
VND million
RESOURCES
LIABILITIES (300 = 310 + 330) 300 43,303,327 52,726,413
Current liabilities 310 15,532,987 17,898,443
Accounts payable to suppliers 311 2,105,255 2,427,338
Advances from customers 312 240,945 86,812
Taxes payable to State Treasury 313 16(b) 384,958 546,109
Payables to employees 314 25 204,231
Accrued expenses 315 17 2,801,126 3,456,392
Other short-term payables 319 18 803,374 2,527,993
Short-term borrowings and liabilities 320 19 9,166,273 8,618,340
Bonus and welfare funds 322 31,031 31,228
Long-term liabilities 330 27,770,340 34,827,970
Accounts payable to suppliers 331 78,525 88,335
Accrued expenses 333 - 37,164
Other long-term payables 337 18 26,728 30,935
Long-term borrowings, bonds and liabilities 338 19 25,630,003 32,472,398
Deferred tax liabilities 341 14 1,461,389 1,573,844
Provisions 342 20 573,695 625,294
Consolidated balance sheet
The accompanying notes are an integral part of these consolidated financial statements
8 March 2018
Prepared by: Approved by:
Doan Thi My Duyen Michael Hung Nguyen Dr. Nguyen Dang Quang
Chief Accountant Deputy Chief Executive OfficerChief Financial Officer
ChairmanChief Executive Officer
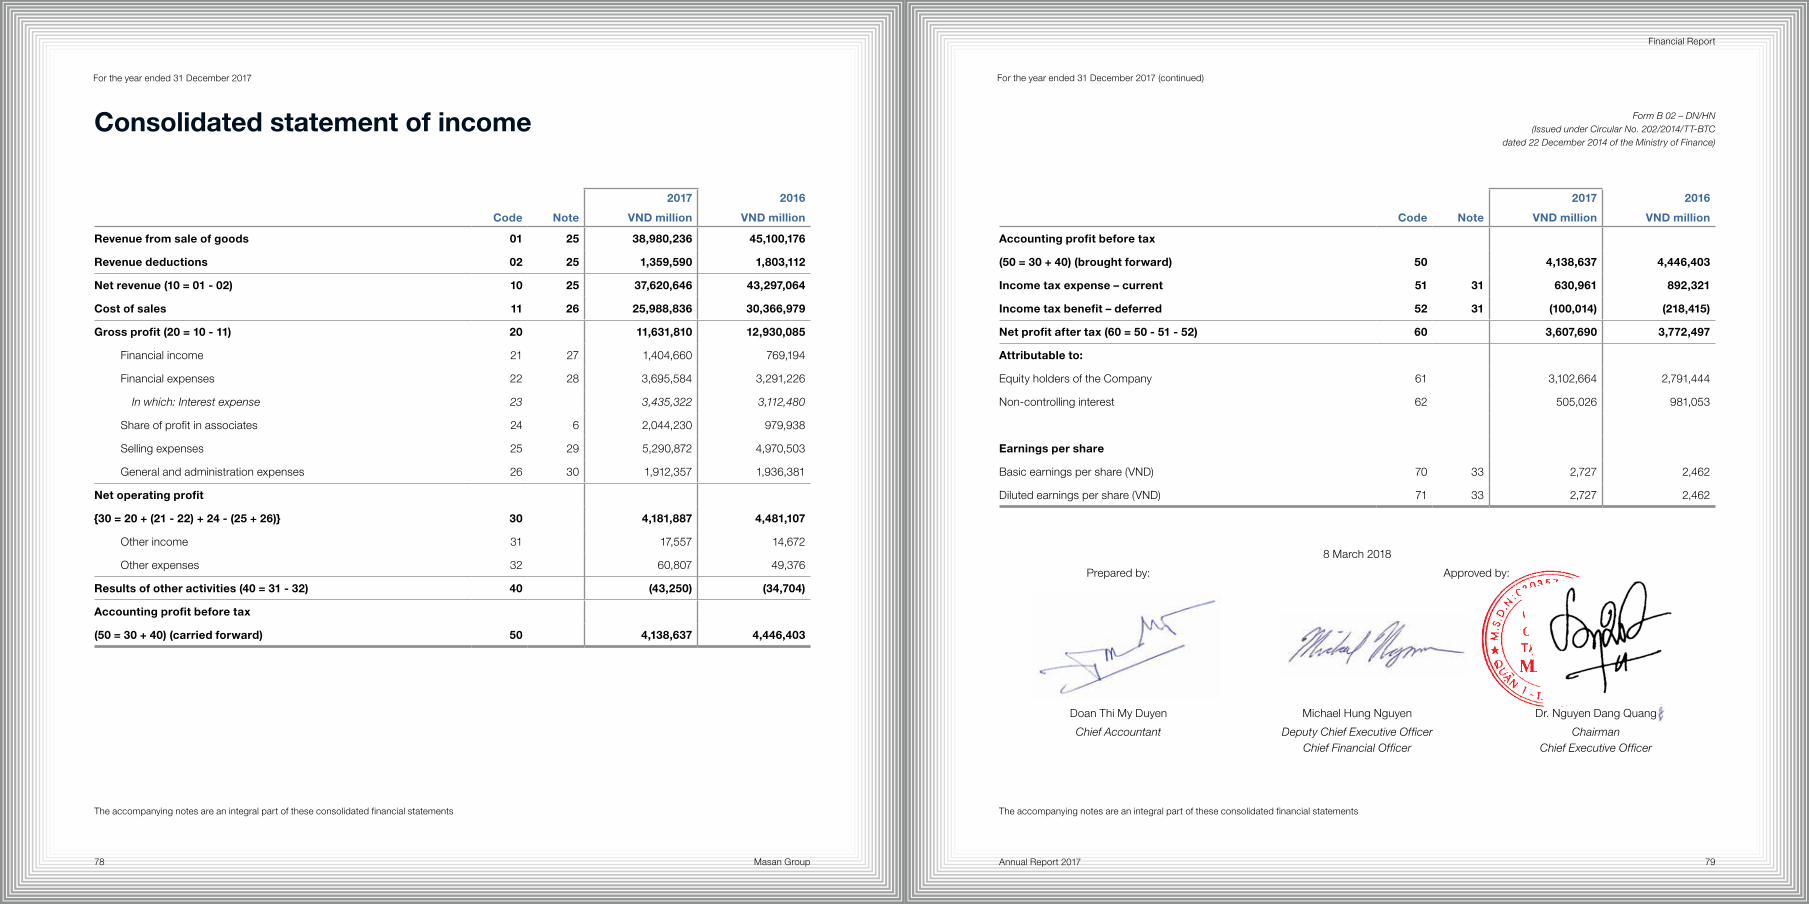
Masan Group78 79Annual Report 2017
Financial Report
For the year ended 31 December 2017
Consolidated statement of income
The accompanying notes are an integral part of these consolidated financial statements
For the year ended 31 December 2017 (continued)
Form B 02 – DN/HN(Issued under Circular No. 202/2014/TT-BTC
dated 22 December 2014 of the Ministry of Finance)
The accompanying notes are an integral part of these consolidated financial statements
Code Note
2017
VND million
2016
VND million
Accounting profit before tax
(50 = 30 + 40) (brought forward) 50 4,138,637 4,446,403
Income tax expense – current 51 31 630,961 892,321
Income tax benefit – deferred 52 31 (100,014) (218,415)
Net profit after tax (60 = 50 - 51 - 52) 60 3,607,690 3,772,497
Attributable to:
Equity holders of the Company 61 3,102,664 2,791,444
Non-controlling interest 62 505,026 981,053
Earnings per share
Basic earnings per share (VND) 70 33 2,727 2,462
Diluted earnings per share (VND) 71 33 2,727 2,462
Code Note
2017
VND million
2016
VND million
Revenue from sale of goods 01 25 38,980,236 45,100,176
Revenue deductions 02 25 1,359,590 1,803,112
Net revenue (10 = 01 - 02) 10 25 37,620,646 43,297,064
Cost of sales 11 26 25,988,836 30,366,979
Gross profit (20 = 10 - 11) 20 11,631,810 12,930,085
Financial income 21 27 1,404,660 769,194
Financial expenses 22 28 3,695,584 3,291,226
In which: Interest expense 23 3,435,322 3,112,480
Share of profit in associates 24 6 2,044,230 979,938
Selling expenses 25 29 5,290,872 4,970,503
General and administration expenses 26 30 1,912,357 1,936,381
Net operating profit
{30 = 20 + (21 - 22) + 24 - (25 + 26)} 30 4,181,887 4,481,107
Other income 31 17,557 14,672
Other expenses 32 60,807 49,376
Results of other activities (40 = 31 - 32) 40 (43,250) (34,704)
Accounting profit before tax
(50 = 30 + 40) (carried forward) 50 4,138,637 4,446,403
8 March 2018
Prepared by: Approved by:
Doan Thi My Duyen Michael Hung Nguyen Dr. Nguyen Dang Quang
Chief Accountant Deputy Chief Executive OfficerChief Financial Officer
ChairmanChief Executive Officer
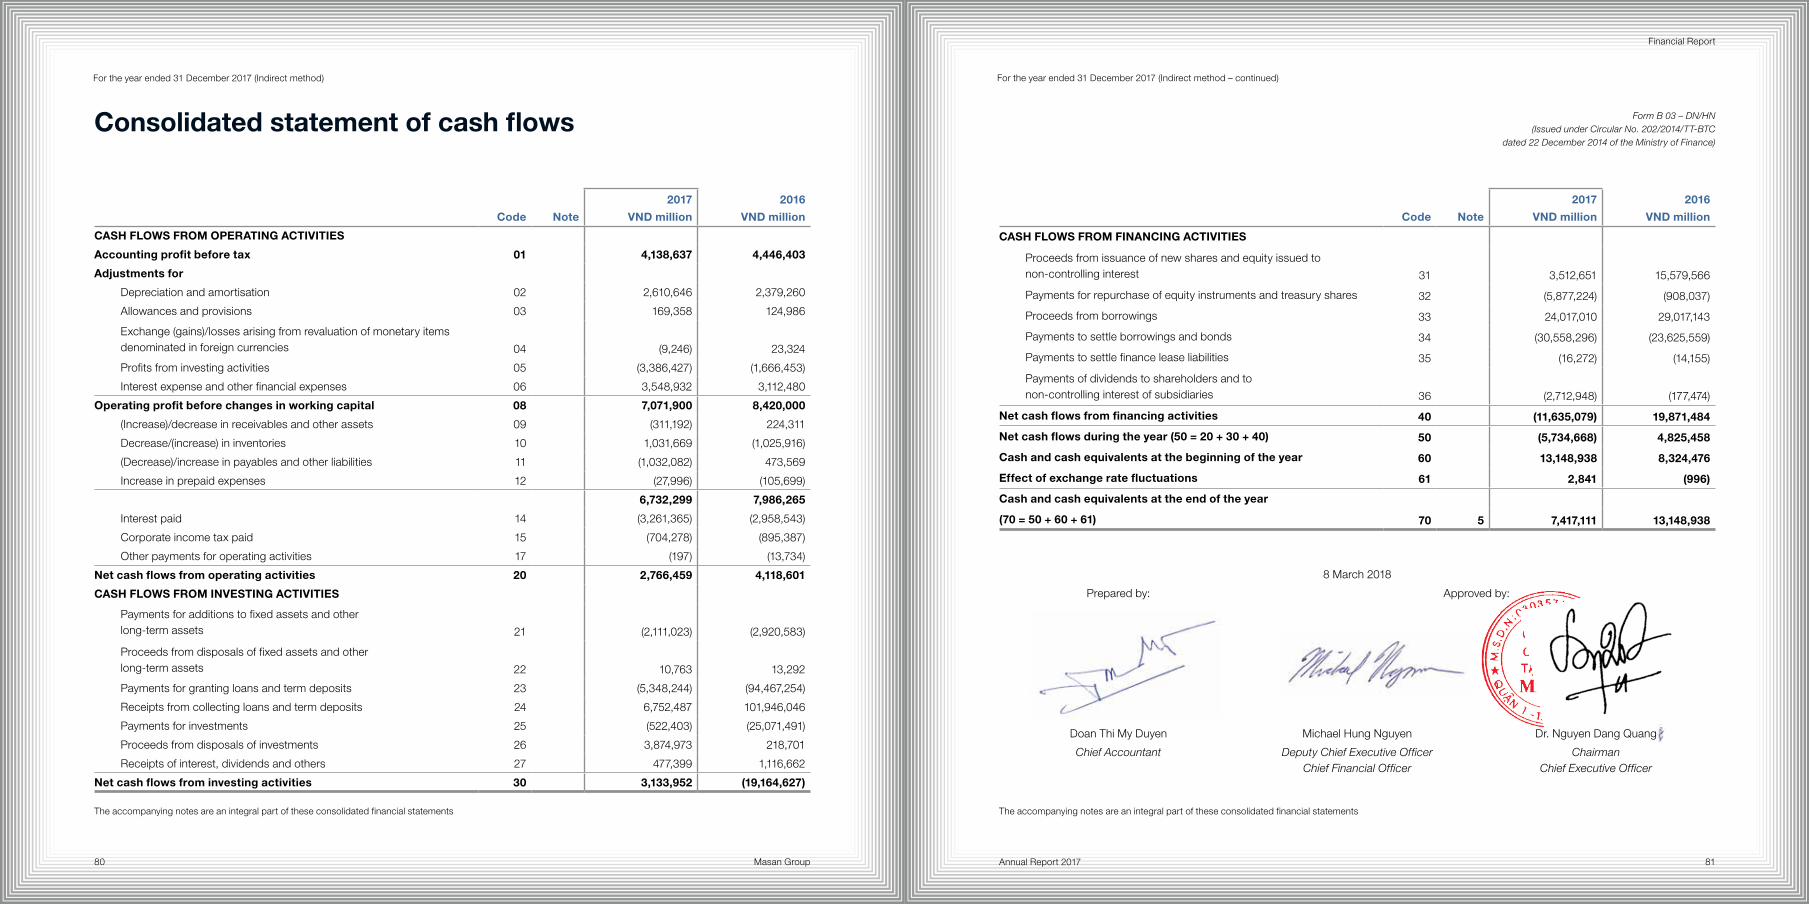
Masan Group80 81Annual Report 2017
Financial Report
For the year ended 31 December 2017 (Indirect method – continued)
Form B 03 – DN/HN(Issued under Circular No. 202/2014/TT-BTC
dated 22 December 2014 of the Ministry of Finance)
The accompanying notes are an integral part of these consolidated financial statements
For the year ended 31 December 2017 (Indirect method)
Consolidated statement of cash flows
The accompanying notes are an integral part of these consolidated financial statements
Code Note
2017
VND million
2016
VND million
CASH FLOWS FROM OPERATING ACTIVITIES
Accounting profit before tax 01 4,138,637 4,446,403
Adjustments for
Depreciation and amortisation 02 2,610,646 2,379,260
Allowances and provisions 03 169,358 124,986
Exchange (gains)/losses arising from revaluation of monetary items denominated in foreign currencies 04 (9,246) 23,324
Profits from investing activities 05 (3,386,427) (1,666,453)
Interest expense and other financial expenses 06 3,548,932 3,112,480
Operating profit before changes in working capital 08 7,071,900 8,420,000
(Increase)/decrease in receivables and other assets 09 (311,192) 224,311
Decrease/(increase) in inventories 10 1,031,669 (1,025,916)
(Decrease)/increase in payables and other liabilities 11 (1,032,082) 473,569
Increase in prepaid expenses 12 (27,996) (105,699)
6,732,299 7,986,265
Interest paid 14 (3,261,365) (2,958,543)
Corporate income tax paid 15 (704,278) (895,387)
Other payments for operating activities 17 (197) (13,734)
Net cash flows from operating activities 20 2,766,459 4,118,601
CASH FLOWS FROM INVESTING ACTIVITIES
Payments for additions to fixed assets and other long-term assets 21 (2,111,023) (2,920,583)
Proceeds from disposals of fixed assets and other long-term assets 22 10,763 13,292
Payments for granting loans and term deposits 23 (5,348,244) (94,467,254)
Receipts from collecting loans and term deposits 24 6,752,487 101,946,046
Payments for investments 25 (522,403) (25,071,491)
Proceeds from disposals of investments 26 3,874,973 218,701
Receipts of interest, dividends and others 27 477,399 1,116,662
Net cash flows from investing activities 30 3,133,952 (19,164,627)
Code Note
2017
VND million
2016
VND million
CASH FLOWS FROM FINANCING ACTIVITIES
Proceeds from issuance of new shares and equity issued to non-controlling interest 31 3,512,651 15,579,566
Payments for repurchase of equity instruments and treasury shares 32 (5,877,224) (908,037)
Proceeds from borrowings 33 24,017,010 29,017,143
Payments to settle borrowings and bonds 34 (30,558,296) (23,625,559)
Payments to settle finance lease liabilities 35 (16,272) (14,155)
Payments of dividends to shareholders and to non-controlling interest of subsidiaries 36 (2,712,948) (177,474)
Net cash flows from financing activities 40 (11,635,079) 19,871,484
Net cash flows during the year (50 = 20 + 30 + 40) 50 (5,734,668) 4,825,458
Cash and cash equivalents at the beginning of the year 60 13,148,938 8,324,476
Effect of exchange rate fluctuations 61 2,841 (996)
Cash and cash equivalents at the end of the year
(70 = 50 + 60 + 61) 70 5 7,417,111 13,148,938
8 March 2018
Prepared by: Approved by:
Doan Thi My Duyen Michael Hung Nguyen Dr. Nguyen Dang Quang
Chief Accountant Deputy Chief Executive OfficerChief Financial Officer
ChairmanChief Executive Officer
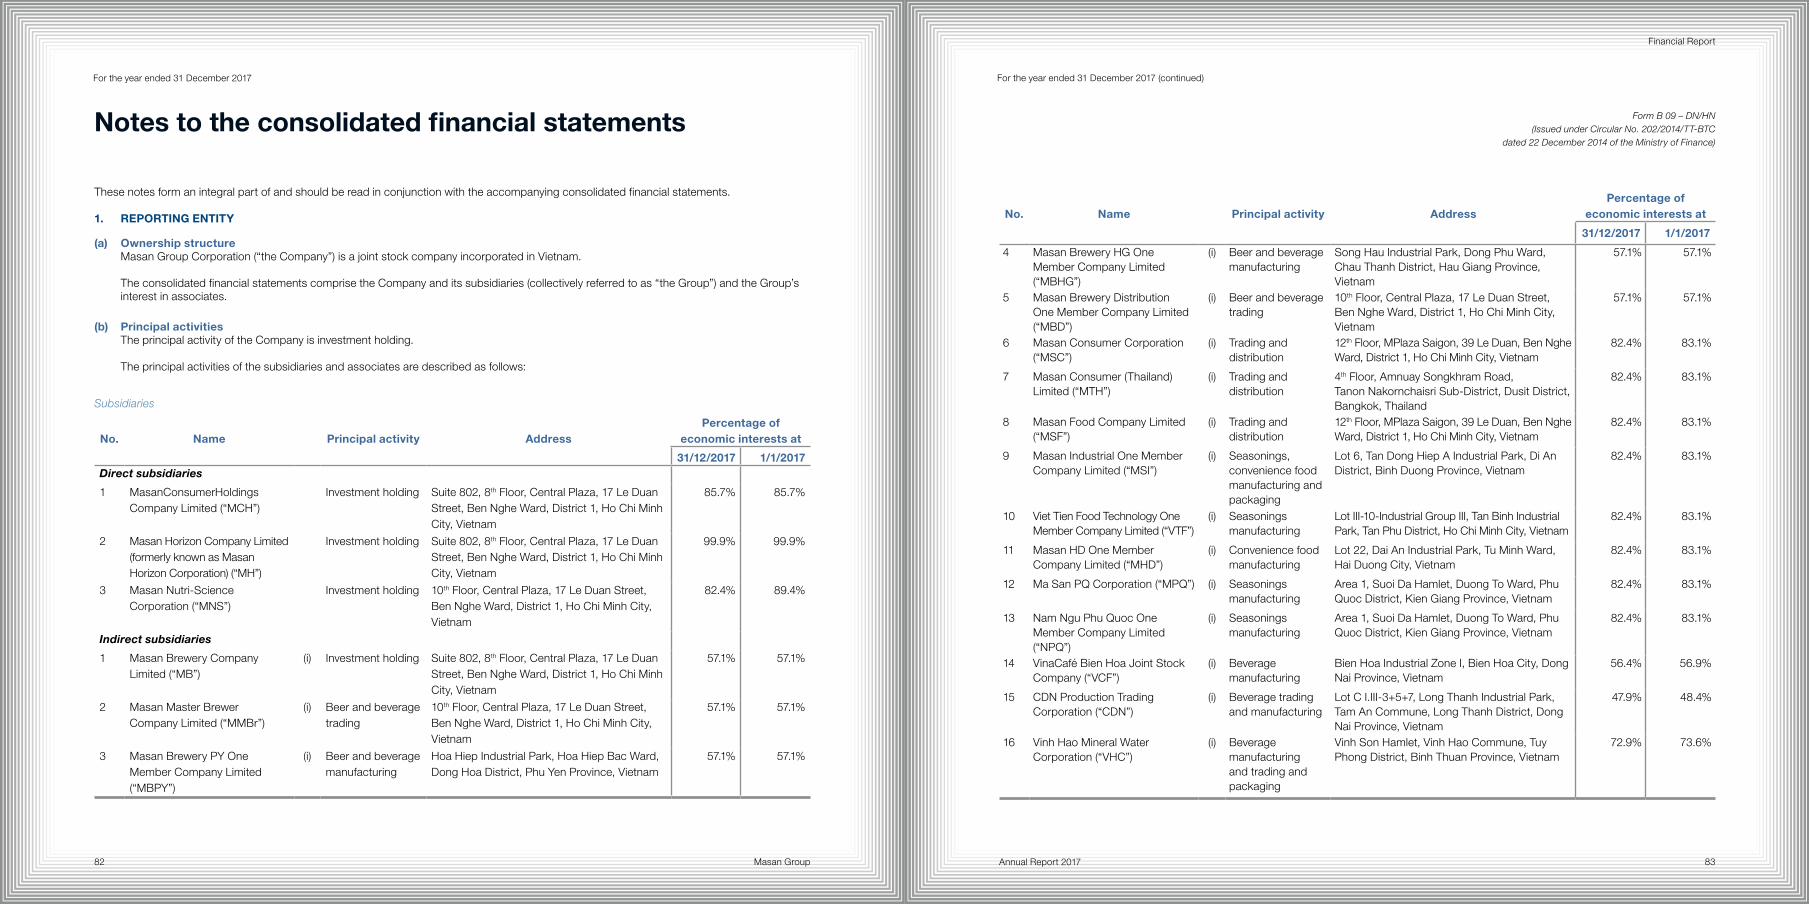
Masan Group82 83Annual Report 2017
Financial Report
For the year ended 31 December 2017
Notes to the consolidated financial statements
For the year ended 31 December 2017 (continued)
Form B 09 – DN/HN (Issued under Circular No. 202/2014/TT-BTC
dated 22 December 2014 of the Ministry of Finance)
These notes form an integral part of and should be read in conjunction with the accompanying consolidated financial statements.
1. REPORTING ENTITY
(a) Ownership structureMasan Group Corporation (“the Company”) is a joint stock company incorporated in Vietnam.
The consolidated financial statements comprise the Company and its subsidiaries (collectively referred to as “the Group”) and the Group’s interest in associates.
(b) Principal activitiesThe principal activity of the Company is investment holding.
The principal activities of the subsidiaries and associates are described as follows:
Subsidiaries
No. Name Principal activity AddressPercentage of
economic interests at
31/12/2017 1/1/2017Direct subsidiaries
1 MasanConsumerHoldings Company Limited (“MCH”)
Investment holding Suite 802, 8th Floor, Central Plaza, 17 Le Duan Street, Ben Nghe Ward, District 1, Ho Chi Minh City, Vietnam
85.7% 85.7%
2 Masan Horizon Company Limited (formerly known as Masan Horizon Corporation) (“MH”)
Investment holding Suite 802, 8th Floor, Central Plaza, 17 Le Duan Street, Ben Nghe Ward, District 1, Ho Chi Minh City, Vietnam
99.9% 99.9%
3 Masan Nutri-Science Corporation (“MNS”)
Investment holding 10th Floor, Central Plaza, 17 Le Duan Street, Ben Nghe Ward, District 1, Ho Chi Minh City, Vietnam
82.4% 89.4%
Indirect subsidiaries
1 Masan Brewery Company Limited (“MB”)
(i) Investment holding Suite 802, 8th Floor, Central Plaza, 17 Le Duan Street, Ben Nghe Ward, District 1, Ho Chi Minh City, Vietnam
57.1% 57.1%
2 Masan Master Brewer Company Limited (“MMBr”)
(i) Beer and beverage trading
10th Floor, Central Plaza, 17 Le Duan Street, Ben Nghe Ward, District 1, Ho Chi Minh City, Vietnam
57.1% 57.1%
3 Masan Brewery PY One Member Company Limited (“MBPY”)
(i) Beer and beverage manufacturing
Hoa Hiep Industrial Park, Hoa Hiep Bac Ward, Dong Hoa District, Phu Yen Province, Vietnam
57.1% 57.1%
No. Name Principal activity AddressPercentage of
economic interests at
31/12/2017 1/1/2017
4 Masan Brewery HG One Member Company Limited (“MBHG”)
(i) Beer and beverage manufacturing
Song Hau Industrial Park, Dong Phu Ward, Chau Thanh District, Hau Giang Province, Vietnam
57.1% 57.1%
5 Masan Brewery Distribution One Member Company Limited (“MBD”)
(i) Beer and beverage trading
10th Floor, Central Plaza, 17 Le Duan Street, Ben Nghe Ward, District 1, Ho Chi Minh City, Vietnam
57.1% 57.1%
6 Masan Consumer Corporation (“MSC”)
(i) Trading and distribution
12th Floor, MPlaza Saigon, 39 Le Duan, Ben Nghe Ward, District 1, Ho Chi Minh City, Vietnam
82.4% 83.1%
7 Masan Consumer (Thailand) Limited (“MTH”)
(i) Trading and distribution
4th Floor, Amnuay Songkhram Road, Tanon Nakornchaisri Sub-District, Dusit District, Bangkok, Thailand
82.4% 83.1%
8 Masan Food Company Limited (“MSF”)
(i) Trading and distribution
12th Floor, MPlaza Saigon, 39 Le Duan, Ben Nghe Ward, District 1, Ho Chi Minh City, Vietnam
82.4% 83.1%
9 Masan Industrial One Member Company Limited (“MSI”)
(i) Seasonings, convenience food manufacturing and packaging
Lot 6, Tan Dong Hiep A Industrial Park, Di An District, Binh Duong Province, Vietnam
82.4% 83.1%
10 Viet Tien Food Technology One Member Company Limited (“VTF”)
(i) Seasonings manufacturing
Lot III-10-Industrial Group III, Tan Binh Industrial Park, Tan Phu District, Ho Chi Minh City, Vietnam
82.4% 83.1%
11 Masan HD One Member Company Limited (“MHD”)
(i) Convenience food manufacturing
Lot 22, Dai An Industrial Park, Tu Minh Ward, Hai Duong City, Vietnam
82.4% 83.1%
12 Ma San PQ Corporation (“MPQ”) (i) Seasonings manufacturing
Area 1, Suoi Da Hamlet, Duong To Ward, Phu Quoc District, Kien Giang Province, Vietnam
82.4% 83.1%
13 Nam Ngu Phu Quoc One Member Company Limited (“NPQ”)
(i) Seasonings manufacturing
Area 1, Suoi Da Hamlet, Duong To Ward, Phu Quoc District, Kien Giang Province, Vietnam
82.4% 83.1%
14 VinaCafé Bien Hoa Joint Stock Company (“VCF”)
(i) Beverage manufacturing
Bien Hoa Industrial Zone I, Bien Hoa City, Dong Nai Province, Vietnam
56.4% 56.9%
15 CDN Production Trading Corporation (“CDN”)
(i) Beverage trading and manufacturing
Lot C I.III-3+5+7, Long Thanh Industrial Park, Tam An Commune, Long Thanh District, Dong Nai Province, Vietnam
47.9% 48.4%
16 Vinh Hao Mineral Water Corporation (“VHC”)
(i) Beverage manufacturing and trading and packaging
Vinh Son Hamlet, Vinh Hao Commune, Tuy Phong District, Binh Thuan Province, Vietnam
72.9% 73.6%
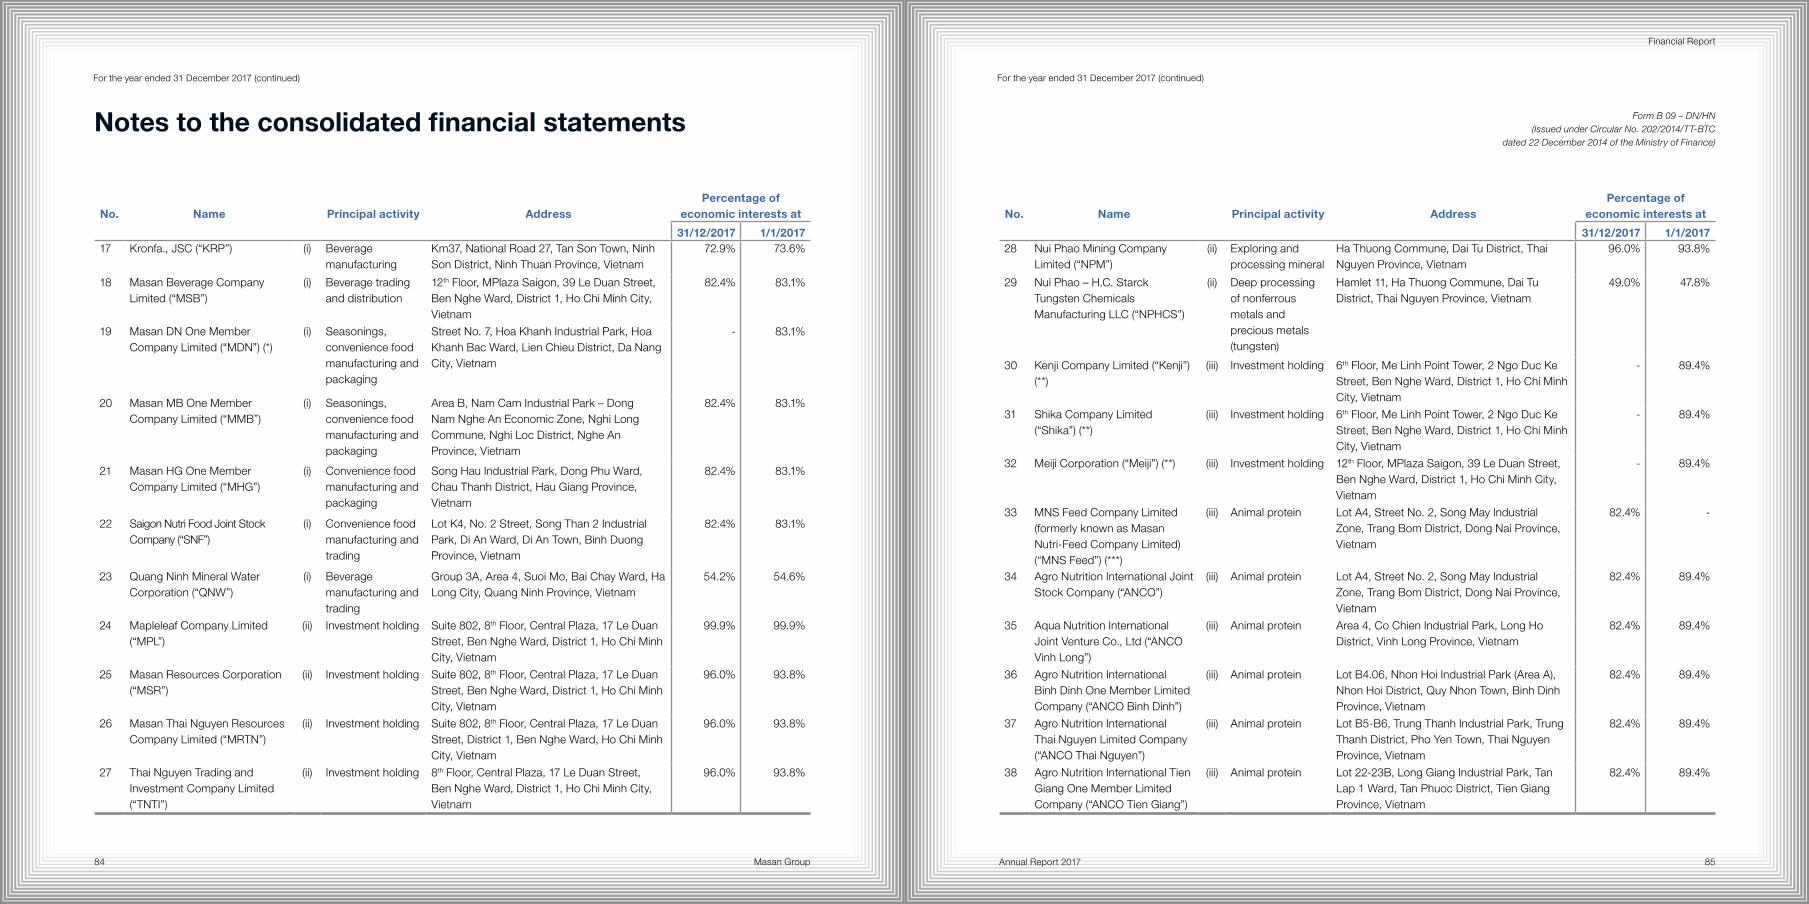
Masan Group84 85Annual Report 2017
Financial Report
No. Name Principal activity AddressPercentage of
economic interests at
31/12/2017 1/1/201717 Kronfa., JSC (“KRP”) (i) Beverage
manufacturingKm37, National Road 27, Tan Son Town, Ninh Son District, Ninh Thuan Province, Vietnam
72.9% 73.6%
18 Masan Beverage Company Limited (“MSB”)
(i) Beverage trading and distribution
12th Floor, MPlaza Saigon, 39 Le Duan Street, Ben Nghe Ward, District 1, Ho Chi Minh City, Vietnam
82.4% 83.1%
19 Masan DN One Member Company Limited (“MDN”) (*)
(i) Seasonings, convenience food manufacturing and packaging
Street No. 7, Hoa Khanh Industrial Park, Hoa Khanh Bac Ward, Lien Chieu District, Da Nang City, Vietnam
- 83.1%
20 Masan MB One Member Company Limited (“MMB”)
(i) Seasonings, convenience food manufacturing and packaging
Area B, Nam Cam Industrial Park – Dong Nam Nghe An Economic Zone, Nghi Long Commune, Nghi Loc District, Nghe An Province, Vietnam
82.4% 83.1%
21 Masan HG One Member Company Limited (“MHG”)
(i) Convenience food manufacturing and packaging
Song Hau Industrial Park, Dong Phu Ward, Chau Thanh District, Hau Giang Province, Vietnam
82.4% 83.1%
22 Saigon Nutri Food Joint Stock Company (“SNF”)
(i) Convenience food manufacturing and trading
Lot K4, No. 2 Street, Song Than 2 Industrial Park, Di An Ward, Di An Town, Binh Duong Province, Vietnam
82.4% 83.1%
23 Quang Ninh Mineral Water Corporation (“QNW”)
(i) Beverage manufacturing and trading
Group 3A, Area 4, Suoi Mo, Bai Chay Ward, Ha Long City, Quang Ninh Province, Vietnam
54.2% 54.6%
24 Mapleleaf Company Limited (“MPL”)
(ii) Investment holding Suite 802, 8th Floor, Central Plaza, 17 Le Duan Street, Ben Nghe Ward, District 1, Ho Chi Minh City, Vietnam
99.9% 99.9%
25 Masan Resources Corporation (“MSR”)
(ii) Investment holding Suite 802, 8th Floor, Central Plaza, 17 Le Duan Street, Ben Nghe Ward, District 1, Ho Chi Minh City, Vietnam
96.0% 93.8%
26 Masan Thai Nguyen Resources Company Limited (“MRTN”)
(ii) Investment holding Suite 802, 8th Floor, Central Plaza, 17 Le Duan Street, District 1, Ben Nghe Ward, Ho Chi Minh City, Vietnam
96.0% 93.8%
27 Thai Nguyen Trading and Investment Company Limited (“TNTI”)
(ii) Investment holding 8th Floor, Central Plaza, 17 Le Duan Street, Ben Nghe Ward, District 1, Ho Chi Minh City, Vietnam
96.0% 93.8%
No. Name Principal activity AddressPercentage of
economic interests at
31/12/2017 1/1/201728 Nui Phao Mining Company
Limited (“NPM”)(ii) Exploring and
processing mineralHa Thuong Commune, Dai Tu District, Thai Nguyen Province, Vietnam
96.0% 93.8%
29 Nui Phao – H.C. Starck Tungsten Chemicals Manufacturing LLC (“NPHCS”)
(ii) Deep processing of nonferrous metals and precious metals (tungsten)
Hamlet 11, Ha Thuong Commune, Dai Tu District, Thai Nguyen Province, Vietnam
49.0% 47.8%
30 Kenji Company Limited (“Kenji”) (**)
(iii) Investment holding 6th Floor, Me Linh Point Tower, 2 Ngo Duc Ke Street, Ben Nghe Ward, District 1, Ho Chi Minh City, Vietnam
- 89.4%
31 Shika Company Limited (“Shika”) (**)
(iii) Investment holding 6th Floor, Me Linh Point Tower, 2 Ngo Duc Ke Street, Ben Nghe Ward, District 1, Ho Chi Minh City, Vietnam
- 89.4%
32 Meiji Corporation (“Meiji”) (**) (iii) Investment holding 12th Floor, MPlaza Saigon, 39 Le Duan Street, Ben Nghe Ward, District 1, Ho Chi Minh City, Vietnam
- 89.4%
33 MNS Feed Company Limited (formerly known as Masan Nutri-Feed Company Limited) (“MNS Feed”) (***)
(iii) Animal protein Lot A4, Street No. 2, Song May Industrial Zone, Trang Bom District, Dong Nai Province, Vietnam
82.4% -
34 Agro Nutrition International Joint Stock Company (“ANCO”)
(iii) Animal protein Lot A4, Street No. 2, Song May Industrial Zone, Trang Bom District, Dong Nai Province, Vietnam
82.4% 89.4%
35 Aqua Nutrition International Joint Venture Co., Ltd (“ANCO Vinh Long”)
(iii) Animal protein Area 4, Co Chien Industrial Park, Long Ho District, Vinh Long Province, Vietnam
82.4% 89.4%
36 Agro Nutrition International Binh Dinh One Member Limited Company (“ANCO Binh Dinh”)
(iii) Animal protein Lot B4.06, Nhon Hoi Industrial Park (Area A), Nhon Hoi District, Quy Nhon Town, Binh Dinh Province, Vietnam
82.4% 89.4%
37 Agro Nutrition International Thai Nguyen Limited Company (“ANCO Thai Nguyen”)
(iii) Animal protein Lot B5-B6, Trung Thanh Industrial Park, Trung Thanh District, Pho Yen Town, Thai Nguyen Province, Vietnam
82.4% 89.4%
38 Agro Nutrition International Tien Giang One Member Limited Company (“ANCO Tien Giang”)
(iii) Animal protein Lot 22-23B, Long Giang Industrial Park, Tan Lap 1 Ward, Tan Phuoc District, Tien Giang Province, Vietnam
82.4% 89.4%
For the year ended 31 December 2017 (continued) For the year ended 31 December 2017 (continued)
Form B 09 – DN/HN (Issued under Circular No. 202/2014/TT-BTC
dated 22 December 2014 of the Ministry of Finance)
Notes to the consolidated financial statements
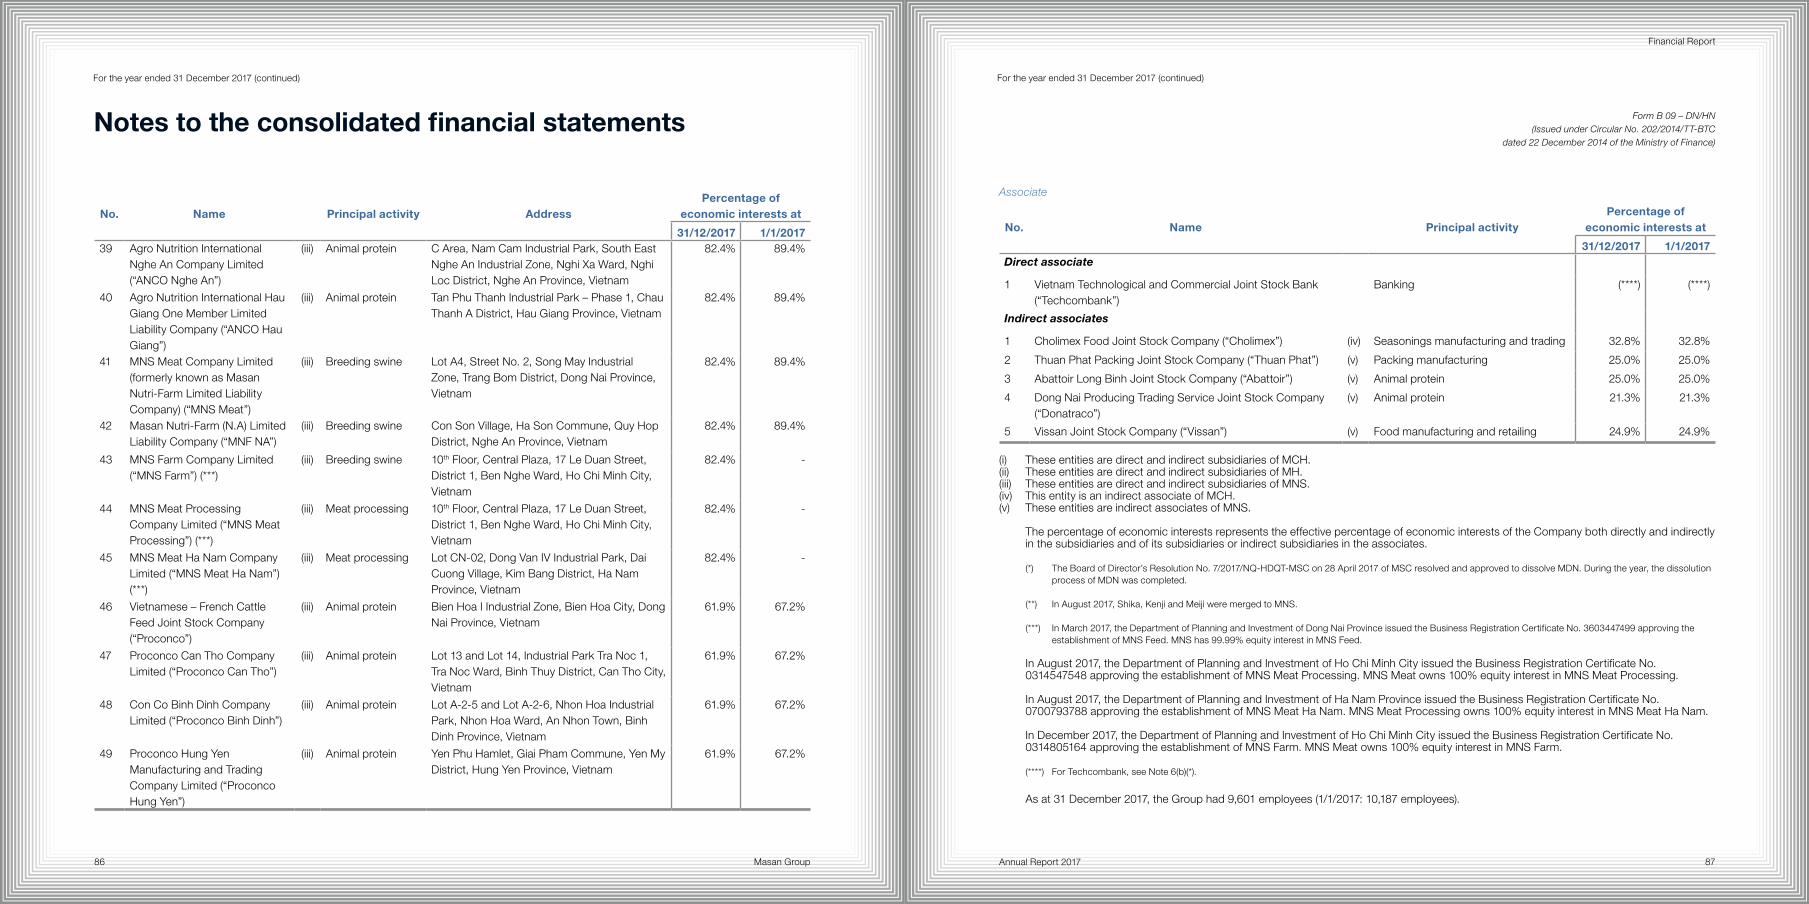
Masan Group86 87Annual Report 2017
Financial Report
No. Name Principal activity AddressPercentage of
economic interests at
31/12/2017 1/1/201739 Agro Nutrition International
Nghe An Company Limited (“ANCO Nghe An”)
(iii) Animal protein C Area, Nam Cam Industrial Park, South East Nghe An Industrial Zone, Nghi Xa Ward, Nghi Loc District, Nghe An Province, Vietnam
82.4% 89.4%
40 Agro Nutrition International Hau Giang One Member Limited Liability Company (“ANCO Hau Giang”)
(iii) Animal protein Tan Phu Thanh Industrial Park – Phase 1, Chau Thanh A District, Hau Giang Province, Vietnam
82.4% 89.4%
41 MNS Meat Company Limited (formerly known as Masan Nutri-Farm Limited Liability Company) (“MNS Meat”)
(iii) Breeding swine Lot A4, Street No. 2, Song May Industrial Zone, Trang Bom District, Dong Nai Province, Vietnam
82.4% 89.4%
42 Masan Nutri-Farm (N.A) Limited Liability Company (“MNF NA”)
(iii) Breeding swine Con Son Village, Ha Son Commune, Quy Hop District, Nghe An Province, Vietnam
82.4% 89.4%
43 MNS Farm Company Limited (“MNS Farm”) (***)
(iii) Breeding swine 10th Floor, Central Plaza, 17 Le Duan Street, District 1, Ben Nghe Ward, Ho Chi Minh City, Vietnam
82.4% -
44 MNS Meat Processing Company Limited (“MNS Meat Processing”) (***)
(iii) Meat processing 10th Floor, Central Plaza, 17 Le Duan Street, District 1, Ben Nghe Ward, Ho Chi Minh City, Vietnam
82.4% -
45 MNS Meat Ha Nam Company Limited (“MNS Meat Ha Nam”) (***)
(iii) Meat processing Lot CN-02, Dong Van IV Industrial Park, Dai Cuong Village, Kim Bang District, Ha Nam Province, Vietnam
82.4% -
46 Vietnamese – French Cattle Feed Joint Stock Company (“Proconco”)
(iii) Animal protein Bien Hoa I Industrial Zone, Bien Hoa City, Dong Nai Province, Vietnam
61.9% 67.2%
47 Proconco Can Tho Company Limited (“Proconco Can Tho”)
(iii) Animal protein Lot 13 and Lot 14, Industrial Park Tra Noc 1, Tra Noc Ward, Binh Thuy District, Can Tho City, Vietnam
61.9% 67.2%
48 Con Co Binh Dinh Company Limited (“Proconco Binh Dinh”)
(iii) Animal protein Lot A-2-5 and Lot A-2-6, Nhon Hoa Industrial Park, Nhon Hoa Ward, An Nhon Town, Binh Dinh Province, Vietnam
61.9% 67.2%
49 Proconco Hung Yen Manufacturing and Trading Company Limited (“Proconco Hung Yen”)
(iii) Animal protein Yen Phu Hamlet, Giai Pham Commune, Yen My District, Hung Yen Province, Vietnam
61.9% 67.2%
For the year ended 31 December 2017 (continued)
Notes to the consolidated financial statements
Associate
No. Name Principal activityPercentage of
economic interests at
31/12/2017 1/1/2017Direct associate
1 Vietnam Technological and Commercial Joint Stock Bank (“Techcombank”)
Banking (****) (****)
Indirect associates
1 Cholimex Food Joint Stock Company (“Cholimex”) (iv) Seasonings manufacturing and trading 32.8% 32.8%
2 Thuan Phat Packing Joint Stock Company (“Thuan Phat”) (v) Packing manufacturing 25.0% 25.0%
3 Abattoir Long Binh Joint Stock Company (“Abattoir”) (v) Animal protein 25.0% 25.0%
4 Dong Nai Producing Trading Service Joint Stock Company (“Donatraco”)
(v) Animal protein 21.3% 21.3%
5 Vissan Joint Stock Company (“Vissan”) (v) Food manufacturing and retailing 24.9% 24.9%
(i) These entities are direct and indirect subsidiaries of MCH.(ii) These entities are direct and indirect subsidiaries of MH.(iii) These entities are direct and indirect subsidiaries of MNS.(iv) This entity is an indirect associate of MCH.(v) These entities are indirect associates of MNS.
The percentage of economic interests represents the effective percentage of economic interests of the Company both directly and indirectly in the subsidiaries and of its subsidiaries or indirect subsidiaries in the associates.
(*) The Board of Director’s Resolution No. 7/2017/NQ-HDQT-MSC on 28 April 2017 of MSC resolved and approved to dissolve MDN. During the year, the dissolution process of MDN was completed.
(**) In August 2017, Shika, Kenji and Meiji were merged to MNS.
(***) In March 2017, the Department of Planning and Investment of Dong Nai Province issued the Business Registration Certificate No. 3603447499 approving the establishment of MNS Feed. MNS has 99.99% equity interest in MNS Feed.
In August 2017, the Department of Planning and Investment of Ho Chi Minh City issued the Business Registration Certificate No. 0314547548 approving the establishment of MNS Meat Processing. MNS Meat owns 100% equity interest in MNS Meat Processing.
In August 2017, the Department of Planning and Investment of Ha Nam Province issued the Business Registration Certificate No. 0700793788 approving the establishment of MNS Meat Ha Nam. MNS Meat Processing owns 100% equity interest in MNS Meat Ha Nam.
In December 2017, the Department of Planning and Investment of Ho Chi Minh City issued the Business Registration Certificate No. 0314805164 approving the establishment of MNS Farm. MNS Meat owns 100% equity interest in MNS Farm.
(****) For Techcombank, see Note 6(b)(*).
As at 31 December 2017, the Group had 9,601 employees (1/1/2017: 10,187 employees).
For the year ended 31 December 2017 (continued)
Form B 09 – DN/HN (Issued under Circular No. 202/2014/TT-BTC
dated 22 December 2014 of the Ministry of Finance)
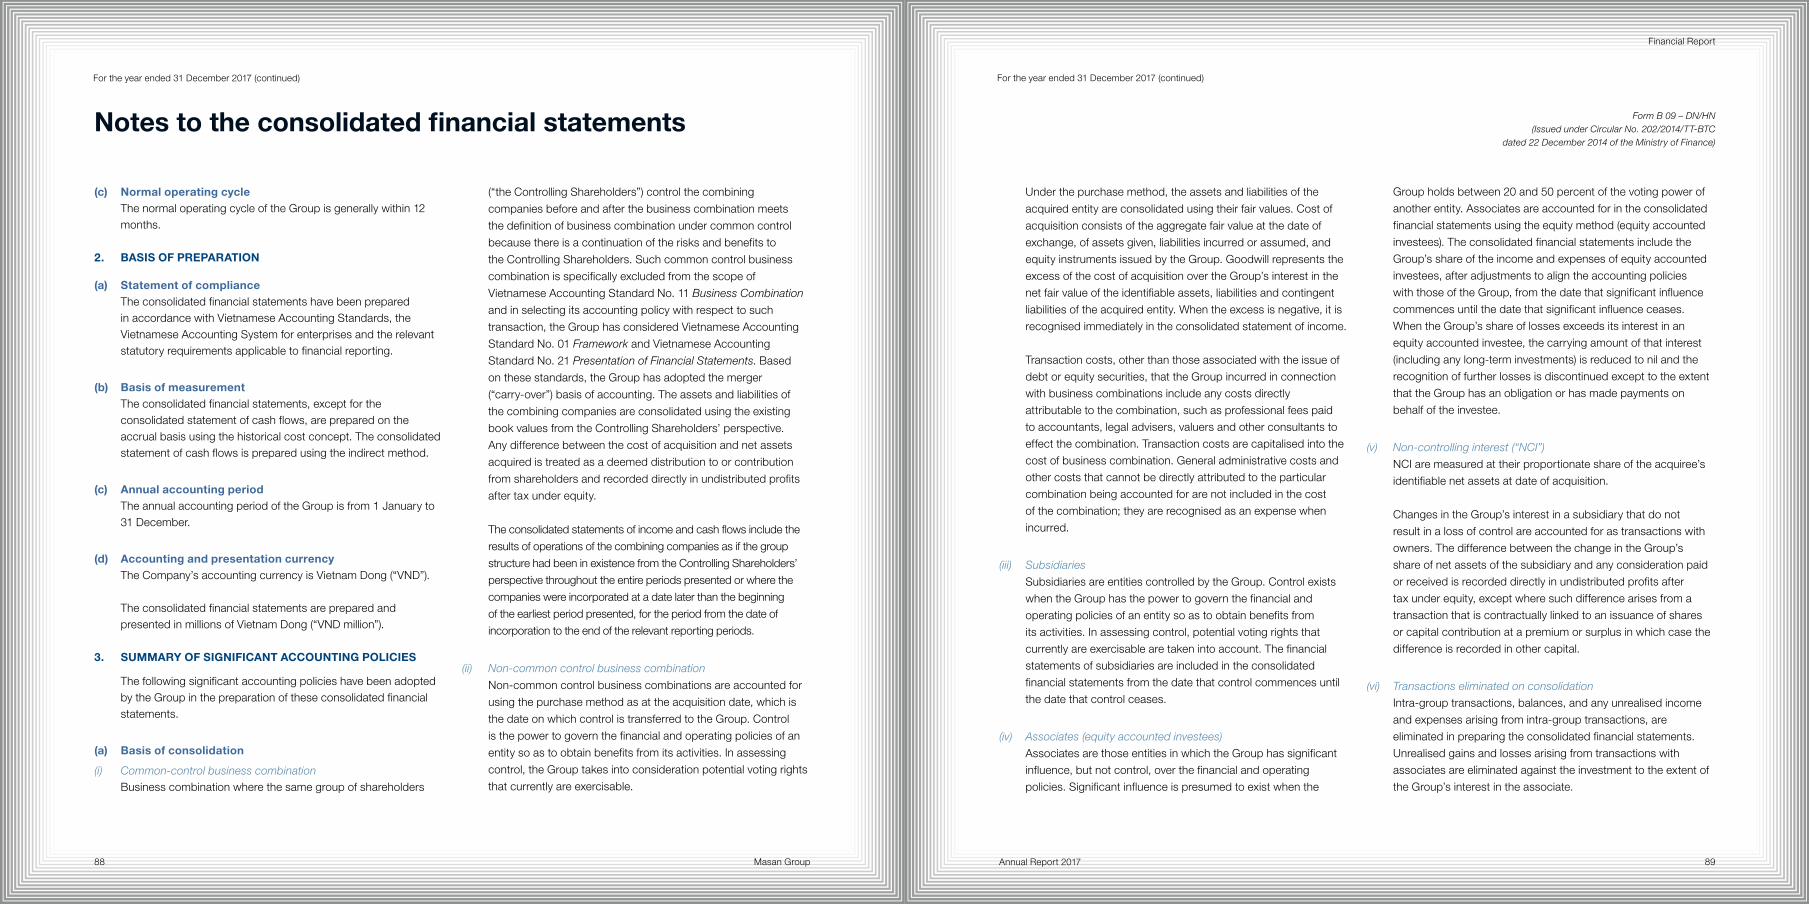
Masan Group88 89Annual Report 2017
Financial Report
For the year ended 31 December 2017 (continued)
Notes to the consolidated financial statements
For the year ended 31 December 2017 (continued)
Form B 09 – DN/HN (Issued under Circular No. 202/2014/TT-BTC
dated 22 December 2014 of the Ministry of Finance)
(c) Normal operating cycleThe normal operating cycle of the Group is generally within 12 months.
2. BASIS OF PREPARATION
(a) Statement of complianceThe consolidated financial statements have been prepared in accordance with Vietnamese Accounting Standards, the Vietnamese Accounting System for enterprises and the relevant statutory requirements applicable to financial reporting.
(b) Basis of measurementThe consolidated financial statements, except for the consolidated statement of cash flows, are prepared on the accrual basis using the historical cost concept. The consolidated statement of cash flows is prepared using the indirect method.
(c) Annual accounting periodThe annual accounting period of the Group is from 1 January to 31 December.
(d) Accounting and presentation currencyThe Company’s accounting currency is Vietnam Dong (“VND”).
The consolidated financial statements are prepared and presented in millions of Vietnam Dong (“VND million”).
3. SUMMARY OF SIGNIFICANT ACCOUNTING POLICIES
The following significant accounting policies have been adopted by the Group in the preparation of these consolidated financial statements.
(a) Basis of consolidation
(i) Common-control business combinationBusiness combination where the same group of shareholders
(“the Controlling Shareholders”) control the combining
companies before and after the business combination meets
the definition of business combination under common control
because there is a continuation of the risks and benefits to
the Controlling Shareholders. Such common control business
combination is specifically excluded from the scope of
Vietnamese Accounting Standard No. 11 Business Combination
and in selecting its accounting policy with respect to such
transaction, the Group has considered Vietnamese Accounting
Standard No. 01 Framework and Vietnamese Accounting
Standard No. 21 Presentation of Financial Statements. Based
on these standards, the Group has adopted the merger
(“carry-over”) basis of accounting. The assets and liabilities of
the combining companies are consolidated using the existing
book values from the Controlling Shareholders’ perspective.
Any difference between the cost of acquisition and net assets
acquired is treated as a deemed distribution to or contribution
from shareholders and recorded directly in undistributed profits
after tax under equity.
The consolidated statements of income and cash flows include the
results of operations of the combining companies as if the group
structure had been in existence from the Controlling Shareholders’
perspective throughout the entire periods presented or where the
companies were incorporated at a date later than the beginning
of the earliest period presented, for the period from the date of
incorporation to the end of the relevant reporting periods.
(ii) Non-common control business combination
Non-common control business combinations are accounted for
using the purchase method as at the acquisition date, which is
the date on which control is transferred to the Group. Control
is the power to govern the financial and operating policies of an
entity so as to obtain benefits from its activities. In assessing
control, the Group takes into consideration potential voting rights
that currently are exercisable.
Under the purchase method, the assets and liabilities of the
acquired entity are consolidated using their fair values. Cost of
acquisition consists of the aggregate fair value at the date of
exchange, of assets given, liabilities incurred or assumed, and
equity instruments issued by the Group. Goodwill represents the
excess of the cost of acquisition over the Group’s interest in the
net fair value of the identifiable assets, liabilities and contingent
liabilities of the acquired entity. When the excess is negative, it is
recognised immediately in the consolidated statement of income.
Transaction costs, other than those associated with the issue of
debt or equity securities, that the Group incurred in connection
with business combinations include any costs directly
attributable to the combination, such as professional fees paid
to accountants, legal advisers, valuers and other consultants to
effect the combination. Transaction costs are capitalised into the
cost of business combination. General administrative costs and
other costs that cannot be directly attributed to the particular
combination being accounted for are not included in the cost
of the combination; they are recognised as an expense when
incurred.
(iii) Subsidiaries
Subsidiaries are entities controlled by the Group. Control exists
when the Group has the power to govern the financial and
operating policies of an entity so as to obtain benefits from
its activities. In assessing control, potential voting rights that
currently are exercisable are taken into account. The financial
statements of subsidiaries are included in the consolidated
financial statements from the date that control commences until
the date that control ceases.
(iv) Associates (equity accounted investees)
Associates are those entities in which the Group has significant
influence, but not control, over the financial and operating
policies. Significant influence is presumed to exist when the
Group holds between 20 and 50 percent of the voting power of
another entity. Associates are accounted for in the consolidated
financial statements using the equity method (equity accounted
investees). The consolidated financial statements include the
Group’s share of the income and expenses of equity accounted
investees, after adjustments to align the accounting policies
with those of the Group, from the date that significant influence
commences until the date that significant influence ceases.
When the Group’s share of losses exceeds its interest in an
equity accounted investee, the carrying amount of that interest
(including any long-term investments) is reduced to nil and the
recognition of further losses is discontinued except to the extent
that the Group has an obligation or has made payments on
behalf of the investee.
(v) Non-controlling interest (“NCI”)
NCI are measured at their proportionate share of the acquiree’s
identifiable net assets at date of acquisition.
Changes in the Group’s interest in a subsidiary that do not
result in a loss of control are accounted for as transactions with
owners. The difference between the change in the Group’s
share of net assets of the subsidiary and any consideration paid
or received is recorded directly in undistributed profits after
tax under equity, except where such difference arises from a
transaction that is contractually linked to an issuance of shares
or capital contribution at a premium or surplus in which case the
difference is recorded in other capital.
(vi) Transactions eliminated on consolidation
Intra-group transactions, balances, and any unrealised income
and expenses arising from intra-group transactions, are
eliminated in preparing the consolidated financial statements.
Unrealised gains and losses arising from transactions with
associates are eliminated against the investment to the extent of
the Group’s interest in the associate.
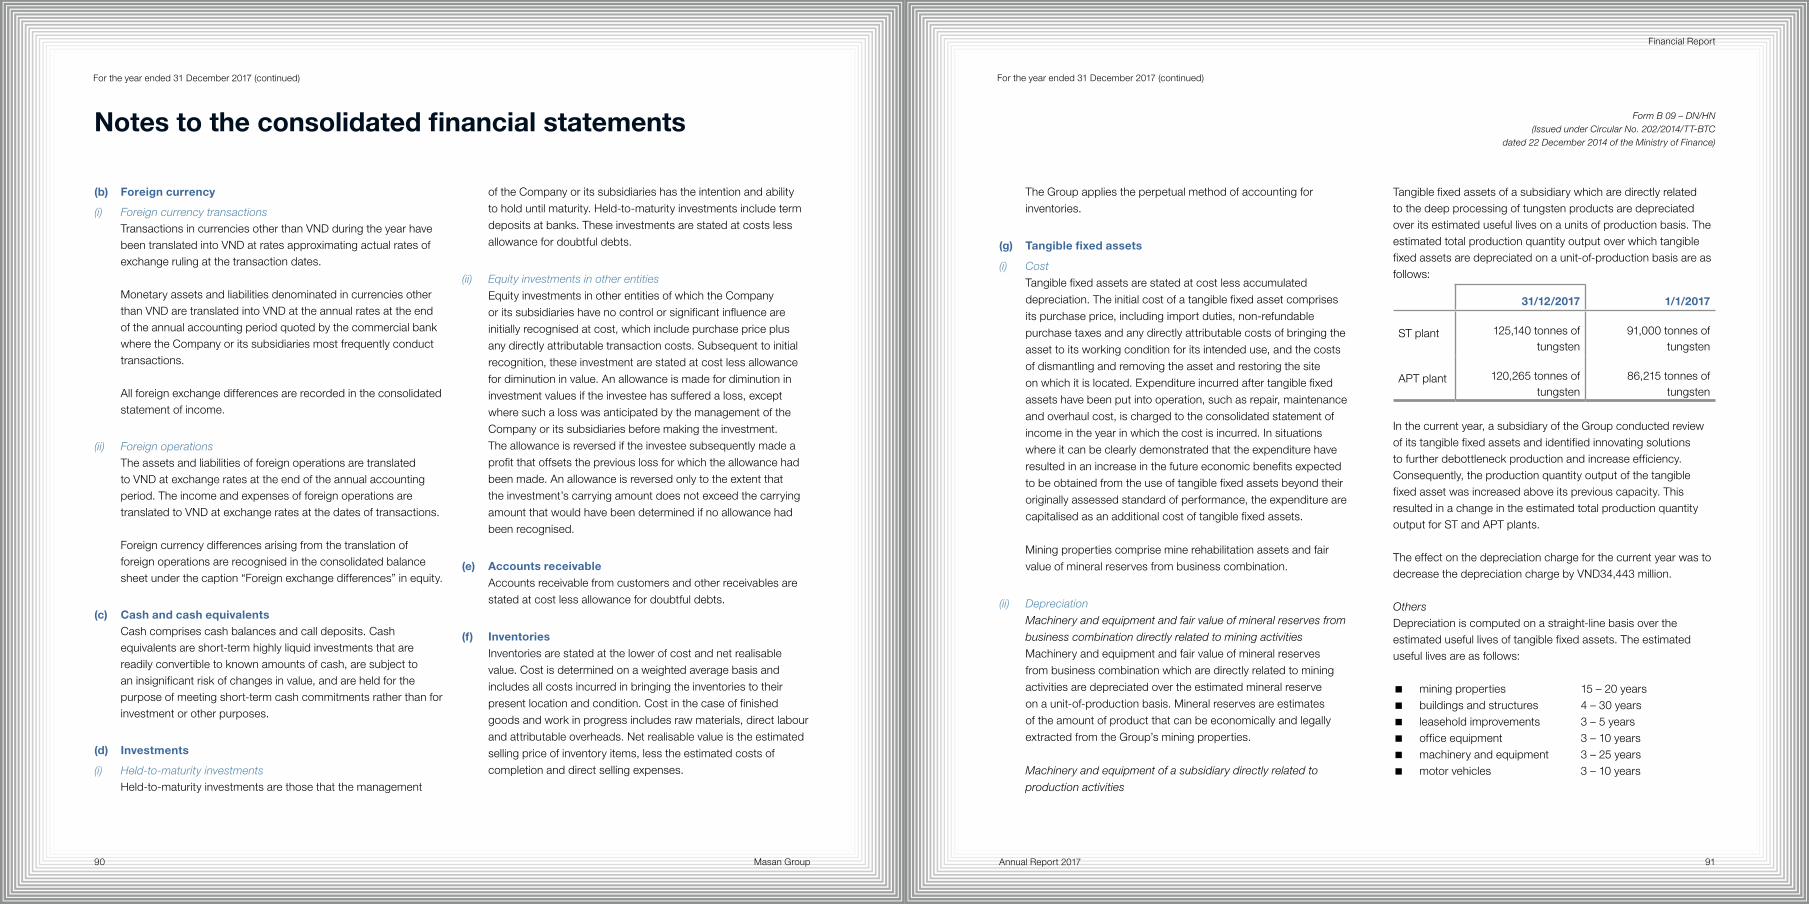
Masan Group90 91Annual Report 2017
Financial Report
(b) Foreign currency
(i) Foreign currency transactionsTransactions in currencies other than VND during the year have been translated into VND at rates approximating actual rates of exchange ruling at the transaction dates.
Monetary assets and liabilities denominated in currencies other than VND are translated into VND at the annual rates at the end of the annual accounting period quoted by the commercial bank where the Company or its subsidiaries most frequently conduct transactions.
All foreign exchange differences are recorded in the consolidated statement of income.
(ii) Foreign operationsThe assets and liabilities of foreign operations are translated to VND at exchange rates at the end of the annual accounting period. The income and expenses of foreign operations are translated to VND at exchange rates at the dates of transactions.
Foreign currency differences arising from the translation of foreign operations are recognised in the consolidated balance sheet under the caption “Foreign exchange differences” in equity.
(c) Cash and cash equivalentsCash comprises cash balances and call deposits. Cash equivalents are short-term highly liquid investments that are readily convertible to known amounts of cash, are subject to an insignificant risk of changes in value, and are held for the purpose of meeting short-term cash commitments rather than for investment or other purposes.
(d) Investments
(i) Held-to-maturity investmentsHeld-to-maturity investments are those that the management
of the Company or its subsidiaries has the intention and ability to hold until maturity. Held-to-maturity investments include term deposits at banks. These investments are stated at costs less allowance for doubtful debts.
(ii) Equity investments in other entities
Equity investments in other entities of which the Company or its subsidiaries have no control or significant influence are initially recognised at cost, which include purchase price plus any directly attributable transaction costs. Subsequent to initial recognition, these investment are stated at cost less allowance for diminution in value. An allowance is made for diminution in investment values if the investee has suffered a loss, except where such a loss was anticipated by the management of the Company or its subsidiaries before making the investment. The allowance is reversed if the investee subsequently made a profit that offsets the previous loss for which the allowance had been made. An allowance is reversed only to the extent that the investment’s carrying amount does not exceed the carrying amount that would have been determined if no allowance had been recognised.
(e) Accounts receivable Accounts receivable from customers and other receivables are stated at cost less allowance for doubtful debts.
(f) InventoriesInventories are stated at the lower of cost and net realisable value. Cost is determined on a weighted average basis and includes all costs incurred in bringing the inventories to their present location and condition. Cost in the case of finished goods and work in progress includes raw materials, direct labour and attributable overheads. Net realisable value is the estimated selling price of inventory items, less the estimated costs of completion and direct selling expenses.
The Group applies the perpetual method of accounting for inventories.
(g) Tangible fixed assets
(i) Cost
Tangible fixed assets are stated at cost less accumulated depreciation. The initial cost of a tangible fixed asset comprises its purchase price, including import duties, non-refundable purchase taxes and any directly attributable costs of bringing the asset to its working condition for its intended use, and the costs of dismantling and removing the asset and restoring the site on which it is located. Expenditure incurred after tangible fixed assets have been put into operation, such as repair, maintenance and overhaul cost, is charged to the consolidated statement of income in the year in which the cost is incurred. In situations where it can be clearly demonstrated that the expenditure have resulted in an increase in the future economic benefits expected to be obtained from the use of tangible fixed assets beyond their originally assessed standard of performance, the expenditure are capitalised as an additional cost of tangible fixed assets.
Mining properties comprise mine rehabilitation assets and fair value of mineral reserves from business combination.
(ii) Depreciation
Machinery and equipment and fair value of mineral reserves from
business combination directly related to mining activities
Machinery and equipment and fair value of mineral reserves from business combination which are directly related to mining activities are depreciated over the estimated mineral reserve on a unit-of-production basis. Mineral reserves are estimates of the amount of product that can be economically and legally extracted from the Group’s mining properties.
Machinery and equipment of a subsidiary directly related to
production activities
Tangible fixed assets of a subsidiary which are directly related to the deep processing of tungsten products are depreciated over its estimated useful lives on a units of production basis. The estimated total production quantity output over which tangible fixed assets are depreciated on a unit-of-production basis are as follows:
31/12/2017 1/1/2017
ST plant 125,140 tonnes of tungsten
91,000 tonnes of tungsten
APT plant 120,265 tonnes of tungsten
86,215 tonnes of tungsten
In the current year, a subsidiary of the Group conducted review of its tangible fixed assets and identified innovating solutions to further debottleneck production and increase efficiency. Consequently, the production quantity output of the tangible fixed asset was increased above its previous capacity. This resulted in a change in the estimated total production quantity output for ST and APT plants.
The effect on the depreciation charge for the current year was to decrease the depreciation charge by VND34,443 million.
OthersDepreciation is computed on a straight-line basis over the estimated useful lives of tangible fixed assets. The estimated useful lives are as follows:
� mining properties 15 – 20 years � buildings and structures 4 – 30 years � leasehold improvements 3 – 5 years � office equipment 3 – 10 years � machinery and equipment 3 – 25 years � motor vehicles 3 – 10 years
For the year ended 31 December 2017 (continued)For the year ended 31 December 2017 (continued)
Notes to the consolidated financial statements Form B 09 – DN/HN (Issued under Circular No. 202/2014/TT-BTC
dated 22 December 2014 of the Ministry of Finance)
Masan Group92 93Annual Report 2017
Financial Report
(h) Finance lease tangible fixed assetsLeases in terms of which the Group assumes substantially all the risks and rewards of ownership are classified as finance leases. Tangible fixed assets acquired by way of finance leases are stated at an amount equal to the lower of fair value and the present value of the minimum lease payments at inception of the lease, less accumulated depreciation.
Depreciation on finance leased assets is computed on a straight-line basis over the estimated useful lives of items of the leased assets. The estimated useful lives of finance leased assets are consistent with the useful lives of tangible fixed assets as described in accounting policy 3(g).
(i) Intangible fixed assets
(i) Land use rightsLand use rights comprise:
� those granted by the State for which land use payments are collected;
� those acquired in a legitimate transfer; and � rights to use leased land obtained before the effective date
of Land Law (2003) for which payments have been made in advance for more than 5 years and supported by land use right certificate issued by competent authority.
Land use rights are stated at cost less accumulated amortisation. The initial cost of land use rights comprises its purchase price and any directly attributable costs incurred in conjunction with securing the land use rights. Amortisation is computed on a straight-line basis over their useful lives ranging from 19 to 50 years.
(ii) Software
Cost of acquiring a new software, which is not an integral part of
the related hardware, is capitalised and treated as an intangible
fixed asset. Software cost is amortised on a straight-line basis
over 4 and 10 years.
(iii) Brand nameCost of acquiring a brand name is capitalised and treated as an intangible fixed asset.
The fair value of brand name acquired in a business combination is based on the discounted estimated royalty payments that have been avoided as a result of the brand name being owned. The fair value of brand name acquired in a business combination is recognised as an intangible asset and is amortised on a straight-line basis over a period ranging from 10 to 20 years.
(iv) Customer relationshipsCustomer relationships that are acquired by the Group in the acquisition of subsidiary are capitalised and presented as an intangible fixed asset.
The fair value of customer relationships acquired in a business combination is determined using the multi-period excess earnings method, whereby the subject assets are valued after deducting a fair return on all other assets that are part of creating the related cash flows. The fair value of customer relationships is amortised on a straight line basis over their useful lives ranging from 5 to 20 years.
(v) Mineral water resourcesMineral water resources that are acquired by the Group in the acquisition of subsidiary are capitalised and presented as an intangible fixed asset.
Fair values of mineral water resources acquired in a business combination are determined using either the direct comparison method or the multi-period excess earnings method. The direct comparison approach estimates the value of mineral resources by comparing recent asking/transacted price of similar interests located in a similar area. In the multi-period excess earnings method, subject assets are valued after deducting a fair return on
all other assets that are part of creating the related cash flows. The
fair value of mineral water resources are amortised on a straight line basis over their useful lives ranging from 10 to 37 years.
(vi) Mining rightsThe mining rights is calculated based on the remaining exploitable reserves multiplied with the price as announced by the provincial authorities in accordance with the Decree No. 203/2013/ND/CP dated 28 November 2013 which became effective from 20 January 2014. Cost of mining rights is stated at an amount equal to the present value of mining rights fee and is capitalised and treated as an intangible asset. Amortisation of mining rights fees is computed on a straight-line basis over the period of the economic life of the mine reserves.
In accordance with Decree No. 158/2016/ND-CP dated 29 November 2016 (“Decree 158/2016”) which became effective from 15 January 2017, mining rights is calculated based on the remaining exploitable reserves and the price to calculate the charge for granting mining rights which is defined under the prices to calculate the resource royalty in accordance with the law on resource royalty at the time of determining the charge for granting mining rights. The Ministry of Natural Resources and Environment (“MONRE”) shall provide guidelines for the conversion method to determine the charge for granting mining rights in accordance with Decree 158/2016. Up to date, MONRE has provided neither guidelines for the new calculation method for prospective changes in estimates to be made nor a basis for reliable estimates to be made.
(vii) TechnologyTechnology that are acquired by the Group in the acquisition of subsidiary are capitalised and presented as an intangible fixed asset.
The fair value of technology acquired in a business combination is determined using the multi-period excess earnings method, whereby the subject assets are valued after deducting a fair
return on all other assets that are part of creating the related cash flows. The fair value of technology is amortised on a straight line basis over their useful lives of 5 years.
(viii) Mineral water resources exploitation rightsExpenditure on obtaining exploitation rights for mineral water resources is capitalised and treated as an intangible fixed asset. Amortisation is computed on a straight-line basis over their useful lives ranging from 9 to 30 years.
(j) Construction in progressConstruction in progress represents the costs of construction and machinery which have not been fully completed or installed and mineral assets under development. No depreciation is provided for construction in progress during the period of construction, installation and commissioning stages.
Mineral assets under development comprise mineral reserve and related development costs acquired in a business combination and subsequent development expenditure. These assets are qualified for capitalisation when the mineral reserve to which they relate is proven to be commercially and technically viable. They are initially recognised at their fair value as part of business combination accounting and subsequent development expenditure are capitalised net of proceeds from the sale of ore extracted during the development phase. On completion of development, defined as the time when saleable materials begin to be extracted from the mine, all assets are reclassified to either “machinery or equipment” or “mining properties” in tangible fixed assets or in long-term prepaid expenses.
(k) Long-term prepaid expenses
(i) Other mining costsIn accordance with the Letter No. 12727/BTC-TCDN dated 14 September 2015 from the Ministry of Finance which provides guidance that mining related costs could be recognised as long-term prepaid expenses under non-current assets.
For the year ended 31 December 2017 (continued)For the year ended 31 December 2017 (continued)
Notes to the consolidated financial statements Form B 09 – DN/HN (Issued under Circular No. 202/2014/TT-BTC
dated 22 December 2014 of the Ministry of Finance)
Masan Group94 95Annual Report 2017
Financial Report
Other mining costs comprise of: � Exploration, evaluation and development expenditure
(including development stripping); and � Production stripping (as described below in “Deferred
stripping costs”).
Deferred stripping costsIn open pit mining operations, it is necessary to remove overburden and other waste materials to access ore body. Stripping costs incurred in the development phase of a mine (development stripping costs) are recorded as part of the cost of construction of the mine. All development stripping expenditure incurred during construction phase are transferred to other mining costs.
The costs of removal of the waste material during a mine’s production phase (production stripping costs) are deferred where they give rise to future benefits:a) It is probable that the future economic benefits will flow to the
Group;b) The component of the ore body for which access has been
improved can be identified; andc) The costs incurred can be measured reliably.
Production stripping costs are allocated between inventory and long-term prepaid expenses in accordance with the life of mine strip ratio.
The life of mine strip ratio represents the estimated total volume of waste, to the estimated total quantity of economically recoverable ore, over the life of the mine. These costs are recognised as long-term prepaid expenses where the current period actual stripping ratio is higher than the average life of mine strip ratio.
The development and production stripping costs are amortised over the life of the proven and probable reserves of the relevant components on a systematic basis.
(ii) Pre-operating expensesPre-operating expenses are recorded in the consolidated statement of income, except for establishment costs and expenditures on training, advertising and promotional activities incurred from the incorporation date to the commercial operation date. These expenses are recognised as long-term prepaid expenses, initially stated at cost, and are amortised on a straight line basis over 3 years starting from the date of commercial operation.
(iii) Prepaid land costsPrepaid land costs comprise prepaid land lease rentals, including those for which the Group obtained land use rights certificate but are not qualified as intangible fixed assets under Circular No. 45/2013/TT-BTC dated 25 April 2013 of the Ministry of Finance providing guidance on management, use and depreciation of fixed assets, and other costs incurred in conjunction with securing the use of leased land. These costs are recognised in the consolidated statement of income on a straight-line basis over the terms of the leases from 42 to 50 years.
(iv) Land compensation costsLand compensation costs comprise costs incurred in conjunction with securing the use of leased land. These costs are recognised in the consolidated statement of income on a straight-line basis over the term of the lease of 20 years.
(v) Printing axles and tools and suppliesPrinting axles and tools and supplies are initially stated at cost and amortised over their useful lives from 1 to 3 years.
Tools and supplies include assets held for use by the Group in the normal course of business whose costs of individual items are less than VND30 million and therefore not qualified for recognition as fixed assets under prevailing regulation. Cost of tools and supplies is amortised on a straight-line basis not more than 3 years.
(vi) Goodwill from equitisation
Goodwill generated from state-owned enterprise’s equitisation is
recognised as long-term prepaid expenses. Goodwill generated
from state-owned enterprise’s equitisation includes brand name
value and potential development value. Brand name value is
determined on the basis of actual costs incurred for creation
and protection of trademarks, trade name in the course of the
enterprise’s operation for the period of five years before the
valuation date (including establishment costs and expenditures
on training, advertising and promotional activities incurred to
promote and introduce the enterprise and its products and
website costs). Potential development value is evaluated on
the basis of profitability of the enterprise in the future taking
into account the enterprise’s profit ratio and interest rates of
5-year government bonds. Goodwill generated from the state-
owned enterprise equitisation is amortised on a straight-line
basis over ten years starting from the date of conversion from a
state-owned enterprise into a joint stock company (date of first
business registration certificate for a joint stock company).
(l) Goodwill
Goodwill arises on acquisition of subsidiaries and associates in
non-common control acquisition.
Goodwill is measured at cost less accumulated amortisation.
Cost of goodwill represents the excess of the cost of the
acquisition over the Group’s interest in the net fair value of
the identifiable assets, liabilities and contingent liabilities of
the acquiree. When the excess is negative (gain from bargain
purchase), it is recognised immediately in the consolidated
statement of income.
Goodwill arising on acquisition of a subsidiary is amortised on a straight-line basis over 10 years. Carrying value of goodwill arising on acquisition a subsidiary is written down to recoverable amount where management determines that it is not fully recoverable.
In respect of associates, the carrying amount of goodwill is included in the carrying amount of the investment and is not amortised.
(m) Trade and other payablesAccounts payable to suppliers and other payables are stated at their costs.
(n) ProvisionsA provision is recognised if, as a result of a past event, the Group has a present legal or constructive obligation that can be estimated reliably, and it is probable that an outflow of economic benefits will be required to settle the obligation. Provisions are determined by discounting the expected future cash flows at a pre-tax rate that reflects current market assessments of the time value of money and the risks specific to the liability.
Mining rightsIn accordance with the Law on Minerals No. 60/2010/QH12 dated 17 November 2010 (“Law on Minerals”) which became effective from 1 July 2011, a subsidiary of the Company has an obligation to pay the government fees for mining rights grant. The mining rights fees is calculated based on the remaining exploitable reserves and the price to calculate the charge for granting mining rights in accordance with Decree 158/2016 as described in Note 3(i)(vi).
Mine rehabilitationThe mining, extraction and processing activities of the Group give rise to obligations for site closure or rehabilitation. Closure and rehabilitation works can include facility decommissioning
For the year ended 31 December 2017 (continued)For the year ended 31 December 2017 (continued)
Notes to the consolidated financial statements Form B 09 – DN/HN (Issued under Circular No. 202/2014/TT-BTC
dated 22 December 2014 of the Ministry of Finance)
Masan Group96 97Annual Report 2017
Financial Report
and dismantling; removal or treatment of waste materials; site and land rehabilitation. The extent of work required and the associated costs are dependent on the requirements of the Ministry of Natural Resources and Environment (“MONRE”) and the Group’s environmental policies based on the Environment Impact Report. The timing of the actual closure and rehabilitation expenditure is dependent on the life and nature of the mine.
When provisions for closure and rehabilitation are initially recognised, the corresponding cost is capitalised as an asset, representing part of the cost of acquiring the future economic benefits of the operation. The capitalised cost of closure and rehabilitation activities is recognised in mining properties and depreciated accordingly. The value of the provision is progressively increased over time as the effect of the discounting unwinds, creating an expense recognised in financial expenses.
Closure and rehabilitation provisions are also adjusted for changes in estimates. These adjustments are accounted for as a change in the corresponding capitalised cost, except where a reduction in the provision is greater than the under-depreciated capitalised cost of the related assets, in which the capitalised cost is reduced to nil and the remaining adjustment is recognised in the consolidated statement of income.
Severance allowance
Under the Vietnamese Labour Code, when an employee who has worked for 12 months or more (“the eligible employees”) voluntarily terminates his/her labour contract, the employer is required to pay the eligible employee severance allowance calculated based on years of service and employee’s compensation at termination. Provision for severance allowance has been provided based on employees’ years of service and their average salary for the six-month period prior to the end of the annual accounting period. For the purpose of determining the number of years of service by an employee, the period for which the employee participated in and contributed to unemployment
insurance in accordance with prevailing laws and regulations and the period for which severance allowance has been paid by the Group are excluded.
(o) Bonds issuedStraight bonds
At initial recognition, straight bonds are measured at cost which comprises proceeds from the issuance net of issuance costs. Any discount, premium or issuance costs are amortised on a straight-line basis over the terms of the bonds.
(p) Derivative financial instrumentsThe Group holds derivative financial instruments to hedge its exposures to the risk of raw material price fluctuation. Derivative financial instruments are recorded in the consolidated balance sheet at cost on the date when the derivative contracts are entered into. Realised gains or losses from derivatives are recognised as financial income or financial expenses in the consolidated statement of income.
(q) TaxationIncome tax on the profit or loss for the year comprises current and deferred tax. Income tax is recognised in the consolidated statement of income except to the extent that it relates to items recognised directly in equity, in which case it is recognised in equity.
Current tax is the expected tax payable on the taxable income for the year, using tax rates enacted at the end of the annual accounting period and any adjustment to tax payable in respect of previous years.
Deferred tax is provided using the balance sheet method, providing for temporary differences between the carrying amounts of assets and liabilities for financial reporting purposes and the amounts used for taxation purposes. The amount of
For the year ended 31 December 2017 (continued)For the year ended 31 December 2017 (continued)
deferred tax provided is based on the expected manner of
realisation or settlement of the carrying amount of assets and
liabilities using tax rates enacted or substantively enacted at the
end of the annual accounting period.
A deferred tax asset is recognised only to the extent that it is
probable that future taxable profits will be available against which
the temporary difference can be utilised. Deferred tax assets are
reduced to the extent that it is no longer probable that the related
tax benefit will be realised.
(r) Equity
(i) Share capital and capital surplus
Ordinary shares are stated at par value. The difference between
proceeds from the issuance of shares over the par value is
recorded in capital surplus. Incremental costs directly attributable
to the issue of shares, net of tax effects, are recognised as a
deduction from capital surplus.
(ii) Other capital
Agreements to issue a fixed number of shares in the future
are recognised based on their fair values at the dates of the
agreements under other capital if there are no other settlement
alternatives.
(iii) Repurchase and reissue of ordinary shares (treasury shares)
When shares recognised as equity are repurchased, the amount
of the consideration paid, which includes directly attributable
costs, is recognised as a reduction from equity. Repurchased
shares are classified as treasury shares under equity. When
treasury shares are reissued subsequently, cost of the reissued
shares is determined on a weighted average basis. Any
difference between the amount received and the cost of the
shares reissued is presented within capital surplus.
s) RevenueGoods sold
Revenue from sale of goods is recognised in the consolidated
statement of income when the significant risks and rewards of ownership have been transferred to the buyer. For sales of minerals, the sales price is usually determined on a provisional basis at the date of revenue recognition. Adjustments to the sales price subsequently occurs based on movements in quoted market or contractual prices up to the date of final pricing. The period between provisional invoicing and final pricing is typically between 30 and 60 days, but in some cases can be as long as 90 days. Revenue on provisionally priced sales is recognised based on the estimated fair value of the total consideration receivable. In cases where the terms of the executed contractual sales agreement allow for an adjustment to the sales price based on a survey of the goods by the customer, assay results issued by a third party are preferable, unless customer’s survey is within executed contractual tolerance, then sales is based on the most recently determined product specifications.
No revenue is recognised if there are significant uncertainties regarding recovery of the consideration due or possible return of goods. Revenue from sale of goods is recognised at the net amount after deducting sales discounts stated on the invoice.
(t) Financial income and financial expenses
(i) Financial incomeFinancial income comprises interest income from deposits and loans, gains on disposals of investments, foreign exchange gains and realised gains from derivative financial instruments. Interest income is recognised on a time proportion basis with reference to the principal outstanding and the applicable interest rate.
(ii) Financial expensesFinancial expenses comprise interest expense on borrowings and bonds, interest costs, foreign exchange losses and realised losses from derivative financial instruments. Borrowing costs are
Notes to the consolidated financial statements Form B 09 – DN/HN (Issued under Circular No. 202/2014/TT-BTC
dated 22 December 2014 of the Ministry of Finance)
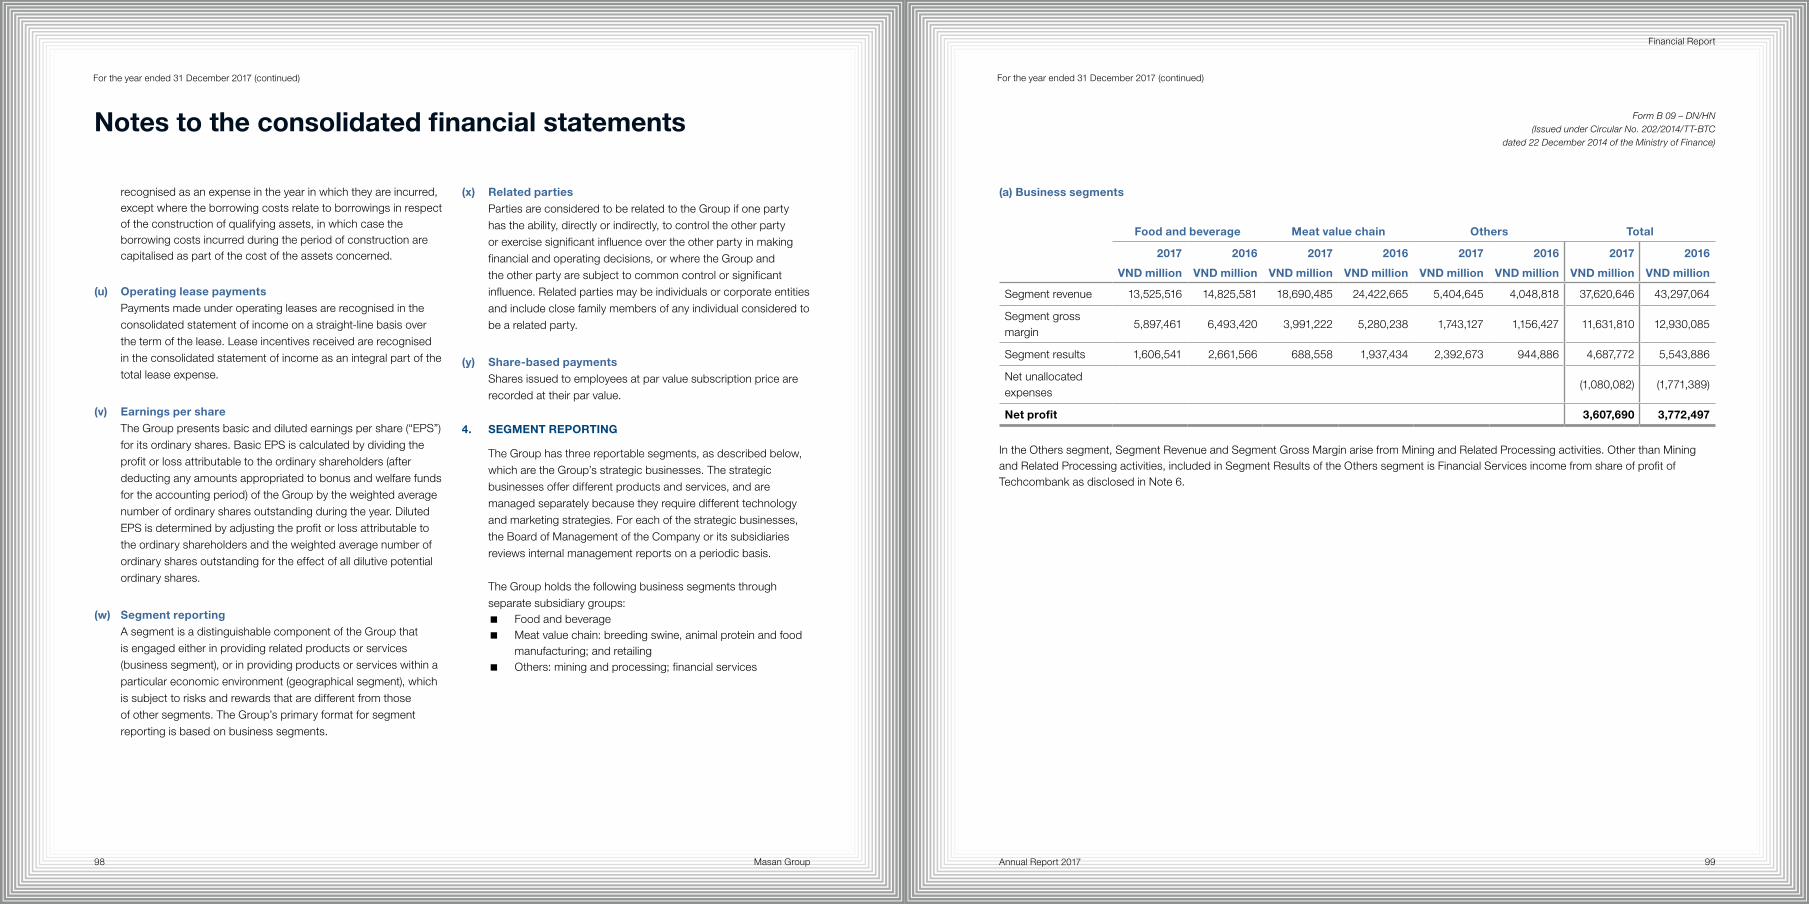
Masan Group98 99Annual Report 2017
Financial Report
For the year ended 31 December 2017 (continued)For the year ended 31 December 2017 (continued)
Notes to the consolidated financial statements Form B 09 – DN/HN (Issued under Circular No. 202/2014/TT-BTC
dated 22 December 2014 of the Ministry of Finance)
recognised as an expense in the year in which they are incurred, except where the borrowing costs relate to borrowings in respect of the construction of qualifying assets, in which case the borrowing costs incurred during the period of construction are capitalised as part of the cost of the assets concerned.
(u) Operating lease paymentsPayments made under operating leases are recognised in the consolidated statement of income on a straight-line basis over the term of the lease. Lease incentives received are recognised in the consolidated statement of income as an integral part of the total lease expense.
(v) Earnings per shareThe Group presents basic and diluted earnings per share (“EPS”) for its ordinary shares. Basic EPS is calculated by dividing the profit or loss attributable to the ordinary shareholders (after deducting any amounts appropriated to bonus and welfare funds for the accounting period) of the Group by the weighted average number of ordinary shares outstanding during the year. Diluted EPS is determined by adjusting the profit or loss attributable to the ordinary shareholders and the weighted average number of ordinary shares outstanding for the effect of all dilutive potential ordinary shares.
(w) Segment reportingA segment is a distinguishable component of the Group that is engaged either in providing related products or services (business segment), or in providing products or services within a particular economic environment (geographical segment), which is subject to risks and rewards that are different from those of other segments. The Group’s primary format for segment reporting is based on business segments.
(x) Related partiesParties are considered to be related to the Group if one party has the ability, directly or indirectly, to control the other party or exercise significant influence over the other party in making financial and operating decisions, or where the Group and the other party are subject to common control or significant influence. Related parties may be individuals or corporate entities and include close family members of any individual considered to be a related party.
(y) Share-based paymentsShares issued to employees at par value subscription price are recorded at their par value.
4. SEGMENT REPORTING
The Group has three reportable segments, as described below, which are the Group’s strategic businesses. The strategic businesses offer different products and services, and are managed separately because they require different technology and marketing strategies. For each of the strategic businesses, the Board of Management of the Company or its subsidiaries reviews internal management reports on a periodic basis.
The Group holds the following business segments through separate subsidiary groups:
� Food and beverage � Meat value chain: breeding swine, animal protein and food
manufacturing; and retailing � Others: mining and processing; financial services
(a) Business segments
Food and beverage Meat value chain Others Total
2017
VND million
2016
VND million
2017
VND million
2016
VND million
2017
VND million
2016
VND million
2017
VND million
2016
VND million
Segment revenue 13,525,516 14,825,581 18,690,485 24,422,665 5,404,645 4,048,818 37,620,646 43,297,064
Segment gross margin
5,897,461 6,493,420 3,991,222 5,280,238 1,743,127 1,156,427 11,631,810 12,930,085
Segment results 1,606,541 2,661,566 688,558 1,937,434 2,392,673 944,886 4,687,772 5,543,886
Net unallocated expenses
(1,080,082) (1,771,389)
Net profit 3,607,690 3,772,497
In the Others segment, Segment Revenue and Segment Gross Margin arise from Mining and Related Processing activities. Other than Mining and Related Processing activities, included in Segment Results of the Others segment is Financial Services income from share of profit of Techcombank as disclosed in Note 6.
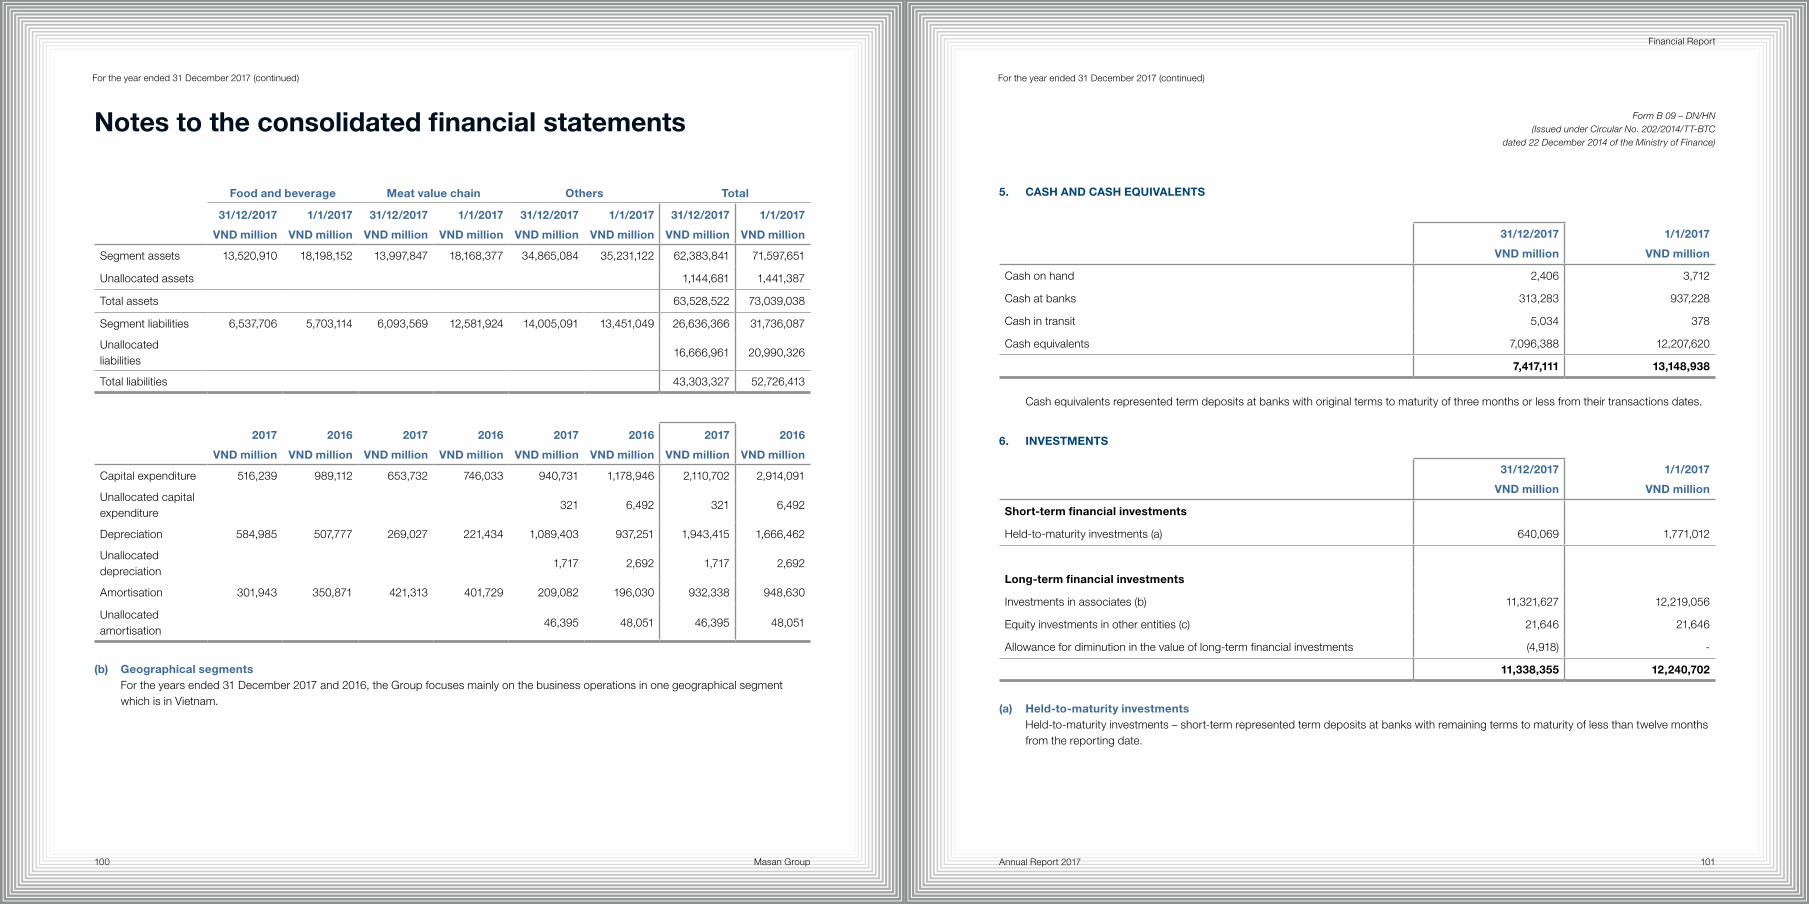
Masan Group100 101Annual Report 2017
Financial Report
For the year ended 31 December 2017 (continued)
Food and beverage Meat value chain Others Total
31/12/2017
VND million
1/1/2017
VND million
31/12/2017
VND million
1/1/2017
VND million
31/12/2017
VND million
1/1/2017
VND million
31/12/2017
VND million
1/1/2017
VND million
Segment assets 13,520,910 18,198,152 13,997,847 18,168,377 34,865,084 35,231,122 62,383,841 71,597,651
Unallocated assets 1,144,681 1,441,387
Total assets 63,528,522 73,039,038
Segment liabilities 6,537,706 5,703,114 6,093,569 12,581,924 14,005,091 13,451,049 26,636,366 31,736,087
Unallocated liabilities
16,666,961 20,990,326
Total liabilities 43,303,327 52,726,413
2017
VND million
2016
VND million
2017
VND million
2016
VND million
2017
VND million
2016
VND million
2017
VND million
2016
VND million
Capital expenditure 516,239 989,112 653,732 746,033 940,731 1,178,946 2,110,702 2,914,091
Unallocated capital expenditure
321 6,492 321 6,492
Depreciation 584,985 507,777 269,027 221,434 1,089,403 937,251 1,943,415 1,666,462
Unallocated depreciation
1,717 2,692 1,717 2,692
Amortisation 301,943 350,871 421,313 401,729 209,082 196,030 932,338 948,630
Unallocated amortisation
46,395 48,051 46,395 48,051
(b) Geographical segmentsFor the years ended 31 December 2017 and 2016, the Group focuses mainly on the business operations in one geographical segment which is in Vietnam.
For the year ended 31 December 2017 (continued)
5. CASH AND CASH EQUIVALENTS
31/12/2017
VND million
1/1/2017
VND million
Cash on hand 2,406 3,712
Cash at banks 313,283 937,228
Cash in transit 5,034 378
Cash equivalents 7,096,388 12,207,620
7,417,111 13,148,938
Cash equivalents represented term deposits at banks with original terms to maturity of three months or less from their transactions dates.
6. INVESTMENTS
31/12/2017
VND million
1/1/2017
VND million
Short-term financial investments
Held-to-maturity investments (a) 640,069 1,771,012
Long-term financial investments
Investments in associates (b) 11,321,627 12,219,056
Equity investments in other entities (c) 21,646 21,646
Allowance for diminution in the value of long-term financial investments (4,918) -
11,338,355 12,240,702
(a) Held-to-maturity investmentsHeld-to-maturity investments – short-term represented term deposits at banks with remaining terms to maturity of less than twelve months from the reporting date.
Notes to the consolidated financial statements Form B 09 – DN/HN (Issued under Circular No. 202/2014/TT-BTC
dated 22 December 2014 of the Ministry of Finance)
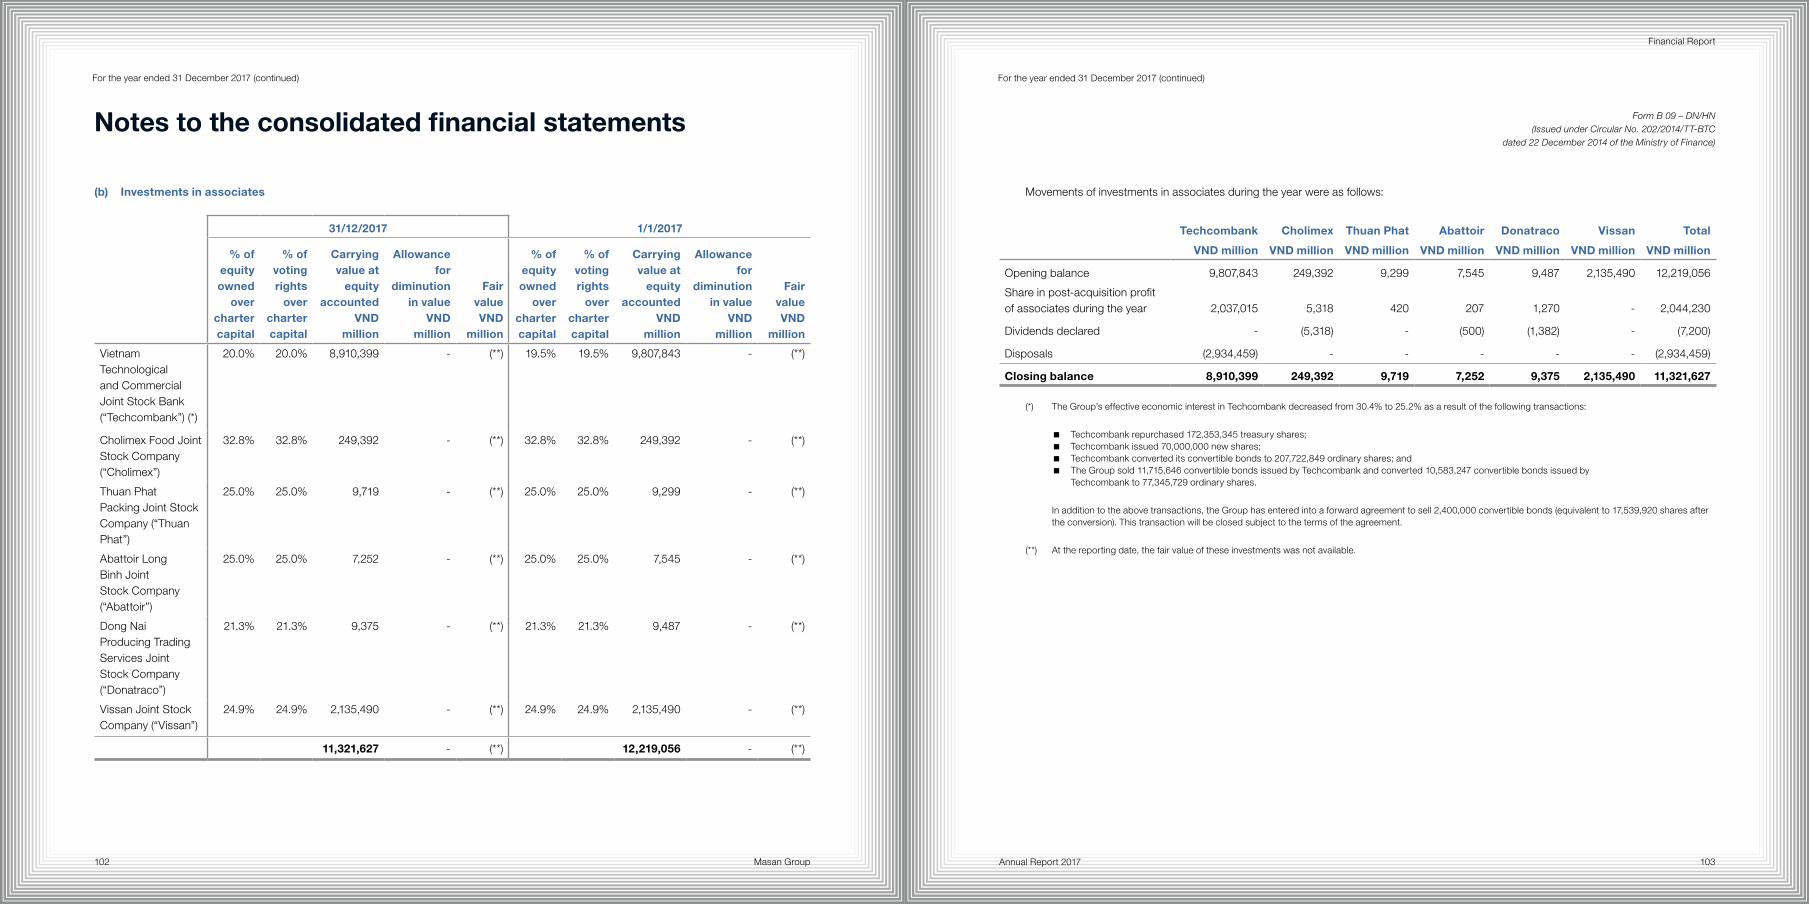
Masan Group102 103Annual Report 2017
Financial Report
For the year ended 31 December 2017 (continued)
(b) Investments in associates
31/12/2017 1/1/2017
% of equity owned
over charter capital
% of voting rights
over charter capital
Carrying value at
equity accounted
VND million
Allowance for
diminution in value
VND million
Fair valueVND
million
% of equity owned
over charter capital
% of voting rights
over charter capital
Carrying value at
equity accounted
VND million
Allowance for
diminution in value
VND million
Fair valueVND
million
Vietnam Technological and Commercial Joint Stock Bank (“Techcombank”) (*)
20.0% 20.0% 8,910,399 - (**) 19.5% 19.5% 9,807,843 - (**)
Cholimex Food Joint Stock Company (“Cholimex”)
32.8% 32.8% 249,392 - (**) 32.8% 32.8% 249,392 - (**)
Thuan Phat Packing Joint Stock Company (“Thuan Phat”)
25.0% 25.0% 9,719 - (**) 25.0% 25.0% 9,299 - (**)
Abattoir Long Binh Joint Stock Company (“Abattoir”)
25.0% 25.0% 7,252 - (**) 25.0% 25.0% 7,545 - (**)
Dong Nai Producing Trading Services Joint Stock Company (“Donatraco”)
21.3% 21.3% 9,375 - (**) 21.3% 21.3% 9,487 - (**)
Vissan Joint Stock Company (“Vissan”)
24.9% 24.9% 2,135,490 - (**) 24.9% 24.9% 2,135,490 - (**)
11,321,627 - (**) 12,219,056 - (**)
For the year ended 31 December 2017 (continued)
Movements of investments in associates during the year were as follows:
Techcombank
VND million
Cholimex
VND million
Thuan Phat
VND million
Abattoir
VND million
Donatraco
VND million
Vissan
VND million
Total
VND million
Opening balance 9,807,843 249,392 9,299 7,545 9,487 2,135,490 12,219,056
Share in post-acquisition profit of associates during the year 2,037,015 5,318 420 207 1,270 - 2,044,230
Dividends declared - (5,318) - (500) (1,382) - (7,200)
Disposals (2,934,459) - - - - - (2,934,459)
Closing balance 8,910,399 249,392 9,719 7,252 9,375 2,135,490 11,321,627
(*) The Group’s effective economic interest in Techcombank decreased from 30.4% to 25.2% as a result of the following transactions:
� Techcombank repurchased 172,353,345 treasury shares; � Techcombank issued 70,000,000 new shares; � Techcombank converted its convertible bonds to 207,722,849 ordinary shares; and � The Group sold 11,715,646 convertible bonds issued by Techcombank and converted 10,583,247 convertible bonds issued by
Techcombank to 77,345,729 ordinary shares.
In addition to the above transactions, the Group has entered into a forward agreement to sell 2,400,000 convertible bonds (equivalent to 17,539,920 shares after the conversion). This transaction will be closed subject to the terms of the agreement.
(**) At the reporting date, the fair value of these investments was not available.
Notes to the consolidated financial statements Form B 09 – DN/HN (Issued under Circular No. 202/2014/TT-BTC
dated 22 December 2014 of the Ministry of Finance)
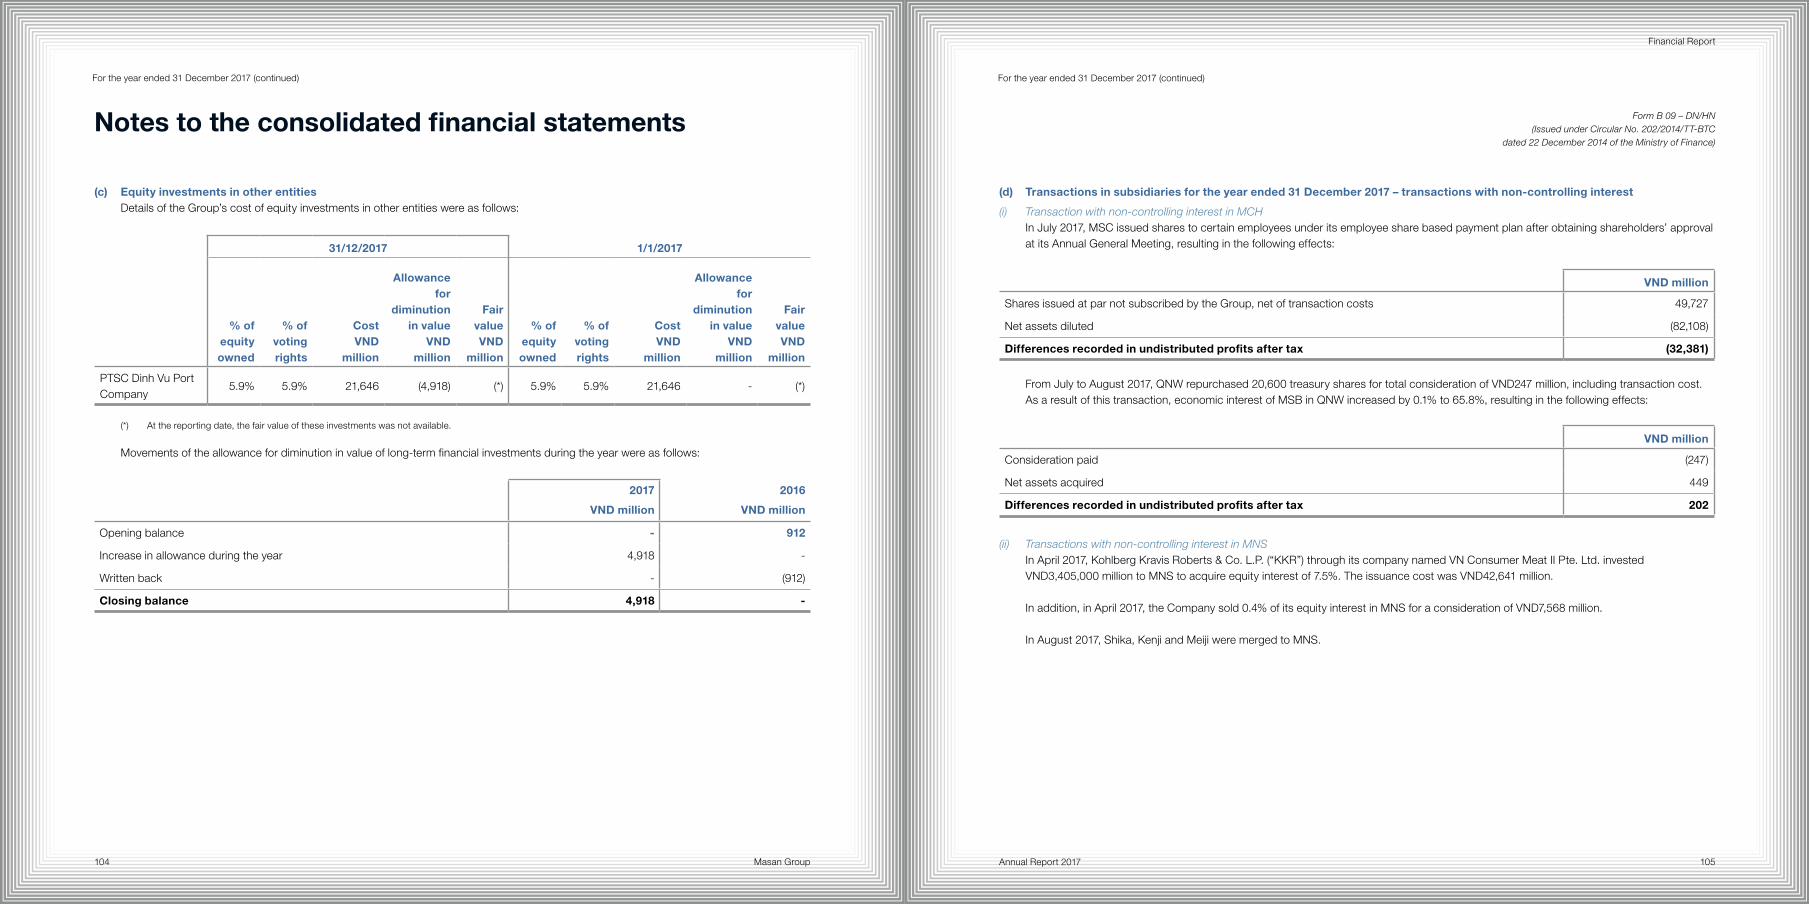
Masan Group104 105Annual Report 2017
Financial Report
For the year ended 31 December 2017 (continued)
(c) Equity investments in other entitiesDetails of the Group’s cost of equity investments in other entities were as follows:
31/12/2017 1/1/2017
% of equity owned
% of voting rights
CostVND
million
Allowance for
diminution in value
VND million
Fair valueVND
million
% of equity owned
% of voting rights
CostVND
million
Allowance for
diminution in value
VND million
Fair valueVND
million
PTSC Dinh Vu Port Company
5.9% 5.9% 21,646 (4,918) (*) 5.9% 5.9% 21,646 - (*)
(*) At the reporting date, the fair value of these investments was not available.
Movements of the allowance for diminution in value of long-term financial investments during the year were as follows:
2017
VND million
2016
VND million
Opening balance - 912
Increase in allowance during the year 4,918 -
Written back - (912)
Closing balance 4,918 -
For the year ended 31 December 2017 (continued)
(d) Transactions in subsidiaries for the year ended 31 December 2017 – transactions with non-controlling interest
(i) Transaction with non-controlling interest in MCHIn July 2017, MSC issued shares to certain employees under its employee share based payment plan after obtaining shareholders’ approval at its Annual General Meeting, resulting in the following effects:
VND million
Shares issued at par not subscribed by the Group, net of transaction costs 49,727
Net assets diluted (82,108)
Differences recorded in undistributed profits after tax (32,381)
From July to August 2017, QNW repurchased 20,600 treasury shares for total consideration of VND247 million, including transaction cost. As a result of this transaction, economic interest of MSB in QNW increased by 0.1% to 65.8%, resulting in the following effects:
VND million
Consideration paid (247)
Net assets acquired 449
Differences recorded in undistributed profits after tax 202
(ii) Transactions with non-controlling interest in MNSIn April 2017, Kohlberg Kravis Roberts & Co. L.P. (“KKR”) through its company named VN Consumer Meat II Pte. Ltd. invested VND3,405,000 million to MNS to acquire equity interest of 7.5%. The issuance cost was VND42,641 million.
In addition, in April 2017, the Company sold 0.4% of its equity interest in MNS for a consideration of VND7,568 million.
In August 2017, Shika, Kenji and Meiji were merged to MNS.
Notes to the consolidated financial statements Form B 09 – DN/HN (Issued under Circular No. 202/2014/TT-BTC
dated 22 December 2014 of the Ministry of Finance)
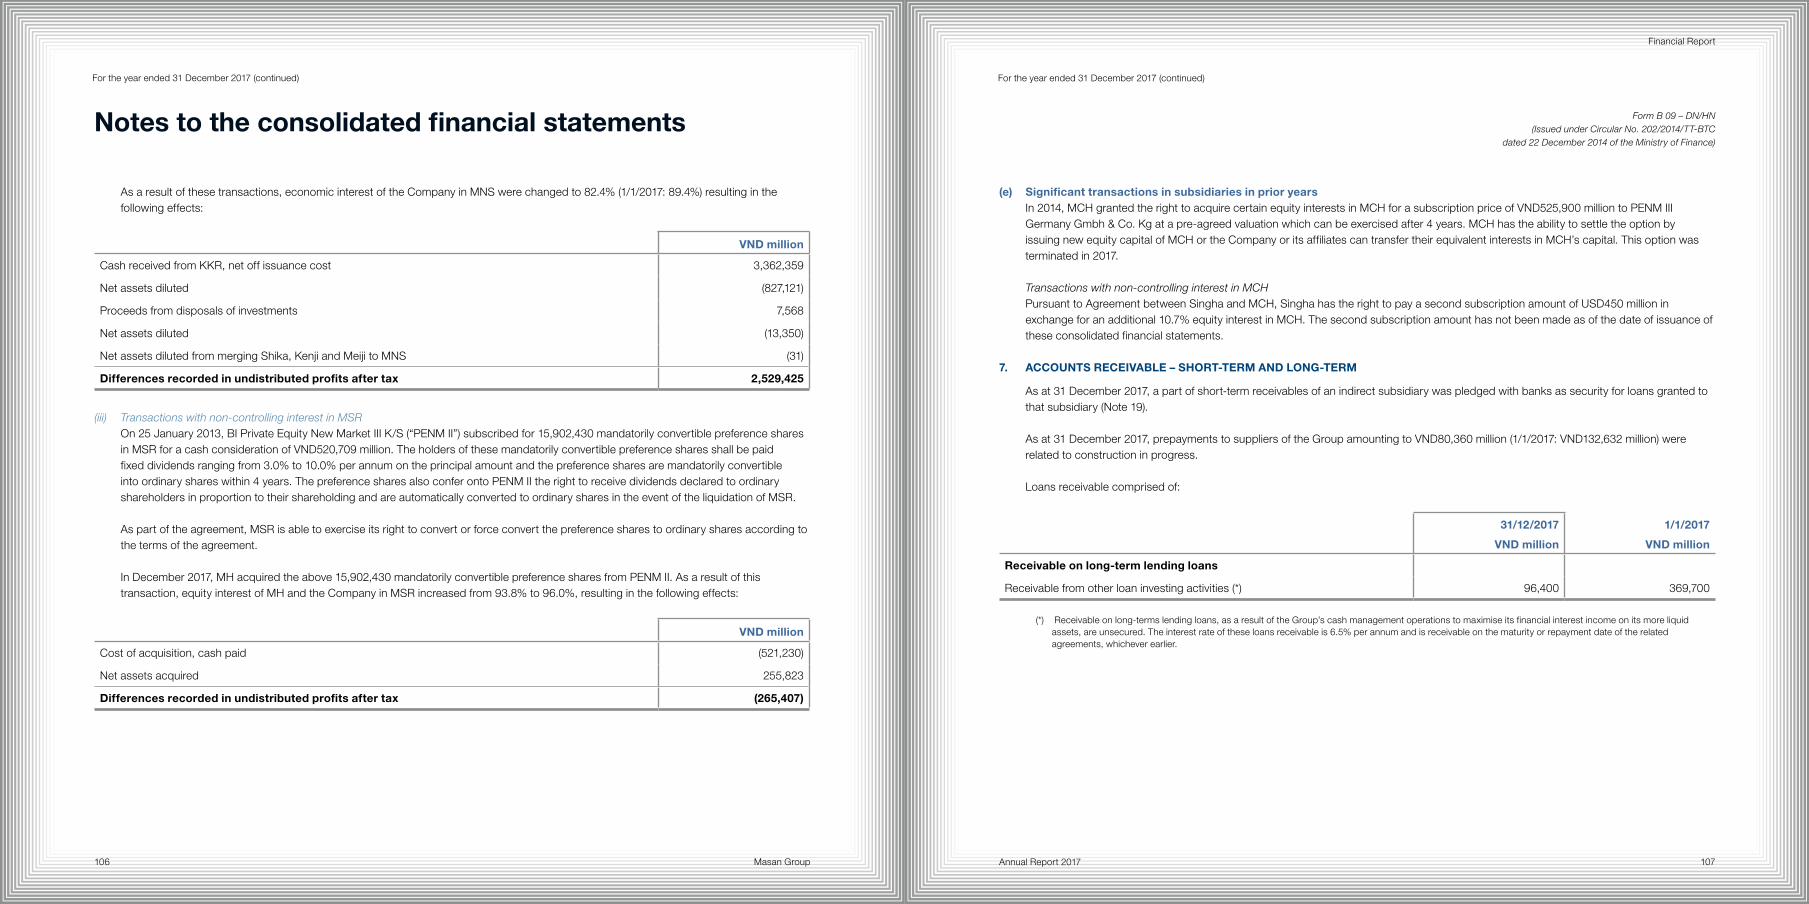
Masan Group106 107Annual Report 2017
Financial Report
For the year ended 31 December 2017 (continued)
As a result of these transactions, economic interest of the Company in MNS were changed to 82.4% (1/1/2017: 89.4%) resulting in the following effects:
VND million
Cash received from KKR, net off issuance cost 3,362,359
Net assets diluted (827,121)
Proceeds from disposals of investments 7,568
Net assets diluted (13,350)
Net assets diluted from merging Shika, Kenji and Meiji to MNS (31)
Differences recorded in undistributed profits after tax 2,529,425
(iii) Transactions with non-controlling interest in MSROn 25 January 2013, BI Private Equity New Market III K/S (“PENM II”) subscribed for 15,902,430 mandatorily convertible preference shares in MSR for a cash consideration of VND520,709 million. The holders of these mandatorily convertible preference shares shall be paid fixed dividends ranging from 3.0% to 10.0% per annum on the principal amount and the preference shares are mandatorily convertible into ordinary shares within 4 years. The preference shares also confer onto PENM II the right to receive dividends declared to ordinary shareholders in proportion to their shareholding and are automatically converted to ordinary shares in the event of the liquidation of MSR.
As part of the agreement, MSR is able to exercise its right to convert or force convert the preference shares to ordinary shares according to the terms of the agreement.
In December 2017, MH acquired the above 15,902,430 mandatorily convertible preference shares from PENM II. As a result of this transaction, equity interest of MH and the Company in MSR increased from 93.8% to 96.0%, resulting in the following effects:
VND million
Cost of acquisition, cash paid (521,230)
Net assets acquired 255,823
Differences recorded in undistributed profits after tax (265,407)
For the year ended 31 December 2017 (continued)
(e) Significant transactions in subsidiaries in prior yearsIn 2014, MCH granted the right to acquire certain equity interests in MCH for a subscription price of VND525,900 million to PENM III Germany Gmbh & Co. Kg at a pre-agreed valuation which can be exercised after 4 years. MCH has the ability to settle the option by issuing new equity capital of MCH or the Company or its affiliates can transfer their equivalent interests in MCH’s capital. This option was terminated in 2017.
Transactions with non-controlling interest in MCHPursuant to Agreement between Singha and MCH, Singha has the right to pay a second subscription amount of USD450 million in exchange for an additional 10.7% equity interest in MCH. The second subscription amount has not been made as of the date of issuance of these consolidated financial statements.
7. ACCOUNTS RECEIVABLE – SHORT-TERM AND LONG-TERM
As at 31 December 2017, a part of short-term receivables of an indirect subsidiary was pledged with banks as security for loans granted to that subsidiary (Note 19).
As at 31 December 2017, prepayments to suppliers of the Group amounting to VND80,360 million (1/1/2017: VND132,632 million) were related to construction in progress.
Loans receivable comprised of:
31/12/2017
VND million
1/1/2017
VND million
Receivable on long-term lending loans
Receivable from other loan investing activities (*) 96,400 369,700
(*) Receivable on long-terms lending loans, as a result of the Group’s cash management operations to maximise its financial interest income on its more liquid assets, are unsecured. The interest rate of these loans receivable is 6.5% per annum and is receivable on the maturity or repayment date of the related agreements, whichever earlier.
Notes to the consolidated financial statements Form B 09 – DN/HN (Issued under Circular No. 202/2014/TT-BTC
dated 22 December 2014 of the Ministry of Finance)
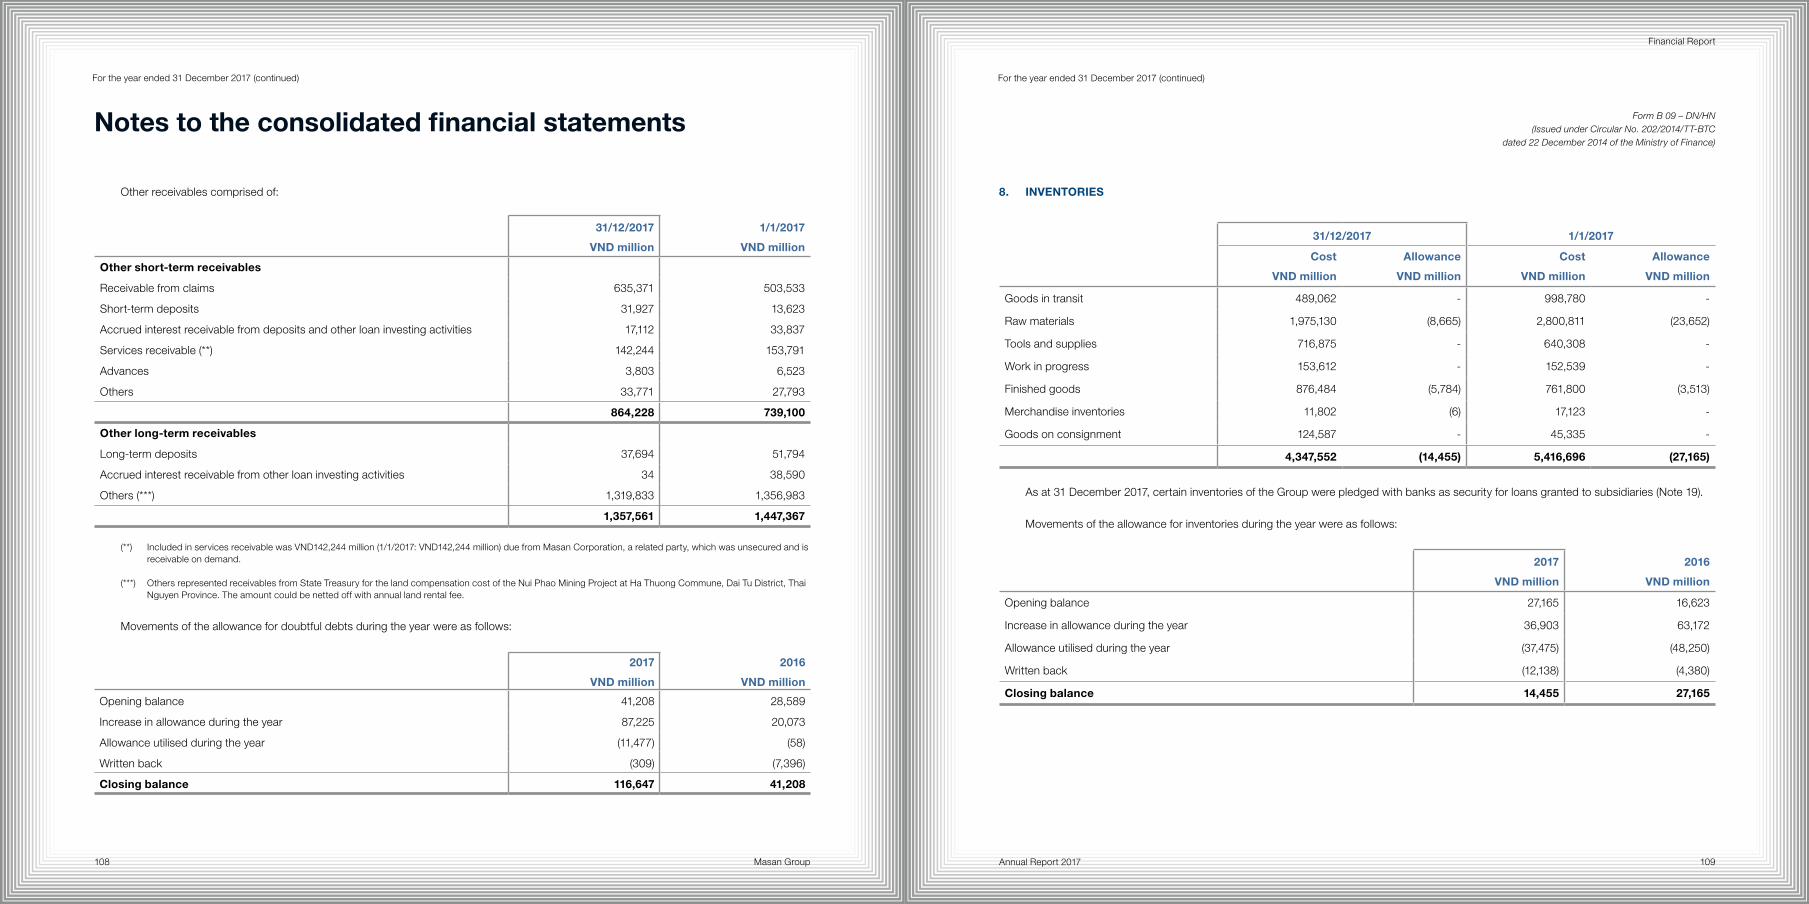
Masan Group108 109Annual Report 2017
Financial Report
For the year ended 31 December 2017 (continued)
Other receivables comprised of:
31/12/2017
VND million
1/1/2017
VND million
Other short-term receivables
Receivable from claims 635,371 503,533
Short-term deposits 31,927 13,623
Accrued interest receivable from deposits and other loan investing activities 17,112 33,837
Services receivable (**) 142,244 153,791
Advances 3,803 6,523
Others 33,771 27,793
864,228 739,100
Other long-term receivables
Long-term deposits 37,694 51,794
Accrued interest receivable from other loan investing activities 34 38,590
Others (***) 1,319,833 1,356,983
1,357,561 1,447,367
(**) Included in services receivable was VND142,244 million (1/1/2017: VND142,244 million) due from Masan Corporation, a related party, which was unsecured and is receivable on demand.
(***) Others represented receivables from State Treasury for the land compensation cost of the Nui Phao Mining Project at Ha Thuong Commune, Dai Tu District, Thai Nguyen Province. The amount could be netted off with annual land rental fee.
Movements of the allowance for doubtful debts during the year were as follows:
2017
VND million
2016
VND million
Opening balance 41,208 28,589
Increase in allowance during the year 87,225 20,073
Allowance utilised during the year (11,477) (58)
Written back (309) (7,396)
Closing balance 116,647 41,208
For the year ended 31 December 2017 (continued)
8. INVENTORIES
31/12/2017 1/1/2017
Cost
VND million
Allowance
VND million
Cost
VND million
Allowance
VND million
Goods in transit 489,062 - 998,780 -
Raw materials 1,975,130 (8,665) 2,800,811 (23,652)
Tools and supplies 716,875 - 640,308 -
Work in progress 153,612 - 152,539 -
Finished goods 876,484 (5,784) 761,800 (3,513)
Merchandise inventories 11,802 (6) 17,123 -
Goods on consignment 124,587 - 45,335 -
4,347,552 (14,455) 5,416,696 (27,165)
As at 31 December 2017, certain inventories of the Group were pledged with banks as security for loans granted to subsidiaries (Note 19).
Movements of the allowance for inventories during the year were as follows:
2017
VND million
2016
VND million
Opening balance 27,165 16,623
Increase in allowance during the year 36,903 63,172
Allowance utilised during the year (37,475) (48,250)
Written back (12,138) (4,380)
Closing balance 14,455 27,165
Notes to the consolidated financial statements Form B 09 – DN/HN (Issued under Circular No. 202/2014/TT-BTC
dated 22 December 2014 of the Ministry of Finance)
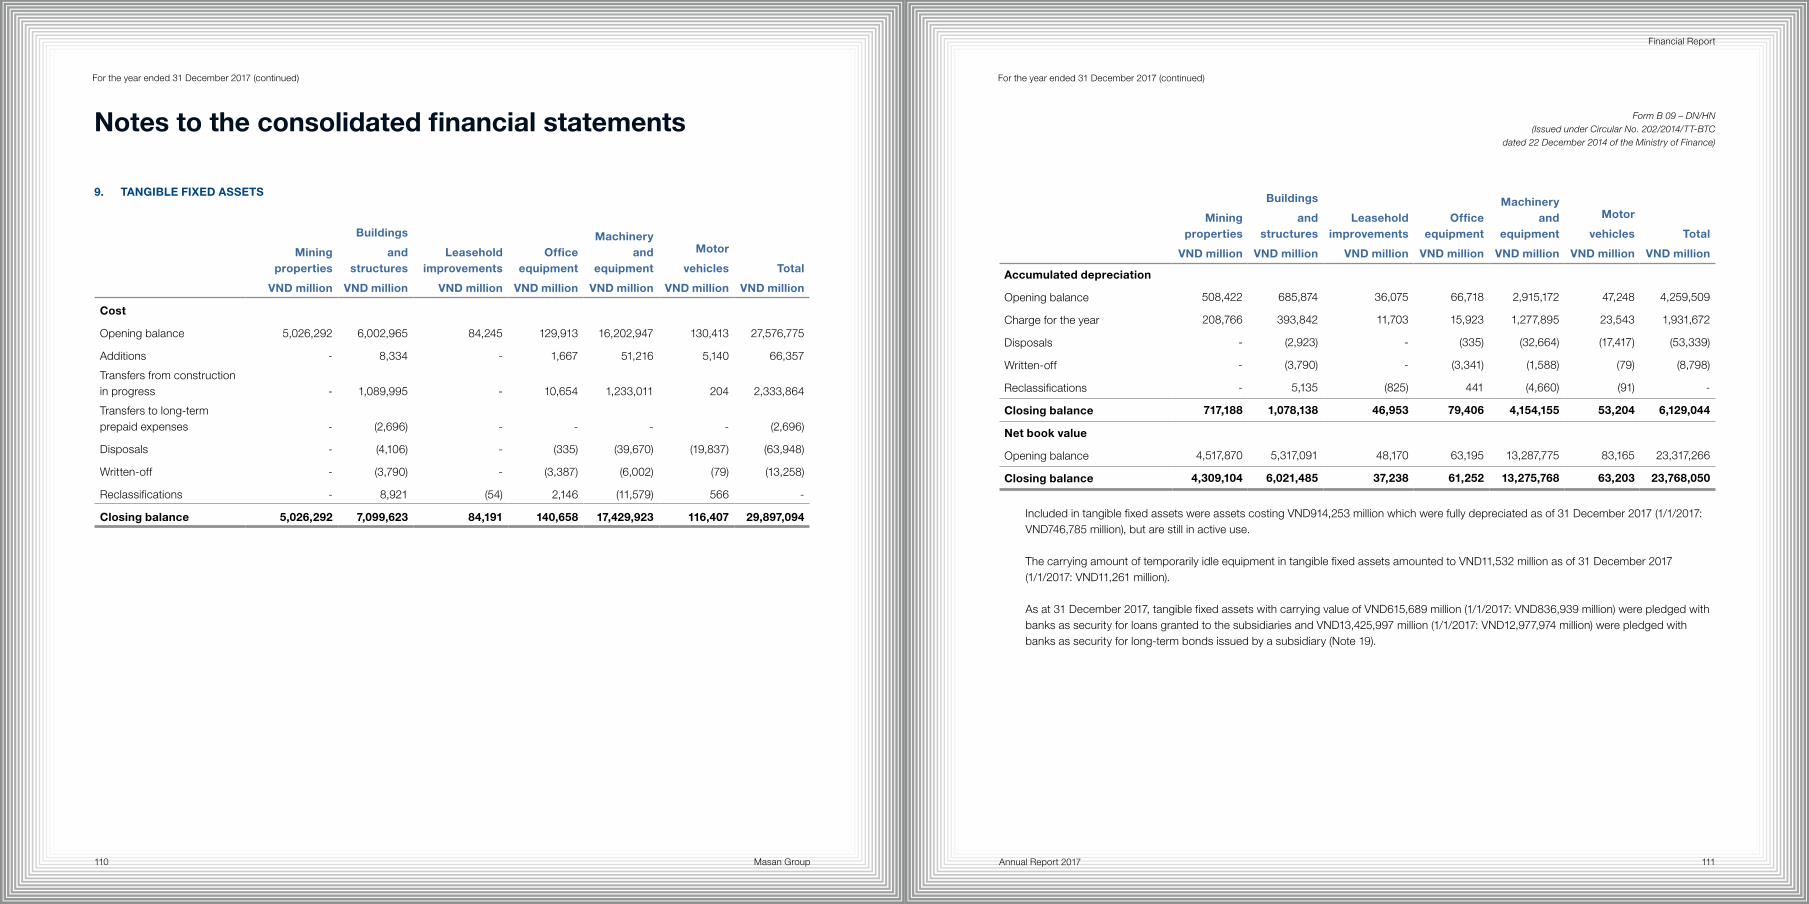
Masan Group110 111Annual Report 2017
Financial Report
For the year ended 31 December 2017 (continued)
9. TANGIBLE FIXED ASSETS
Mining properties
VND million
Buildings
and structures
VND million
Leasehold improvements
VND million
Office equipment
VND million
Machinery and
equipment
VND million
Motor
vehicles
VND million
Total
VND million
Cost
Opening balance 5,026,292 6,002,965 84,245 129,913 16,202,947 130,413 27,576,775
Additions - 8,334 - 1,667 51,216 5,140 66,357
Transfers from construction in progress - 1,089,995 - 10,654 1,233,011 204 2,333,864
Transfers to long-term prepaid expenses - (2,696) - - - - (2,696)
Disposals - (4,106) - (335) (39,670) (19,837) (63,948)
Written-off - (3,790) - (3,387) (6,002) (79) (13,258)
Reclassifications - 8,921 (54) 2,146 (11,579) 566 -
Closing balance 5,026,292 7,099,623 84,191 140,658 17,429,923 116,407 29,897,094
For the year ended 31 December 2017 (continued)
Mining properties
VND million
Buildings
and structures
VND million
Leasehold improvements
VND million
Office equipment
VND million
Machinery and
equipment
VND million
Motor
vehicles
VND million
Total
VND million
Accumulated depreciation
Opening balance 508,422 685,874 36,075 66,718 2,915,172 47,248 4,259,509
Charge for the year 208,766 393,842 11,703 15,923 1,277,895 23,543 1,931,672
Disposals - (2,923) - (335) (32,664) (17,417) (53,339)
Written-off - (3,790) - (3,341) (1,588) (79) (8,798)
Reclassifications - 5,135 (825) 441 (4,660) (91) -
Closing balance 717,188 1,078,138 46,953 79,406 4,154,155 53,204 6,129,044
Net book value
Opening balance 4,517,870 5,317,091 48,170 63,195 13,287,775 83,165 23,317,266
Closing balance 4,309,104 6,021,485 37,238 61,252 13,275,768 63,203 23,768,050
Included in tangible fixed assets were assets costing VND914,253 million which were fully depreciated as of 31 December 2017 (1/1/2017: VND746,785 million), but are still in active use.
The carrying amount of temporarily idle equipment in tangible fixed assets amounted to VND11,532 million as of 31 December 2017 (1/1/2017: VND11,261 million).
As at 31 December 2017, tangible fixed assets with carrying value of VND615,689 million (1/1/2017: VND836,939 million) were pledged with banks as security for loans granted to the subsidiaries and VND13,425,997 million (1/1/2017: VND12,977,974 million) were pledged with banks as security for long-term bonds issued by a subsidiary (Note 19).
Notes to the consolidated financial statements Form B 09 – DN/HN (Issued under Circular No. 202/2014/TT-BTC
dated 22 December 2014 of the Ministry of Finance)
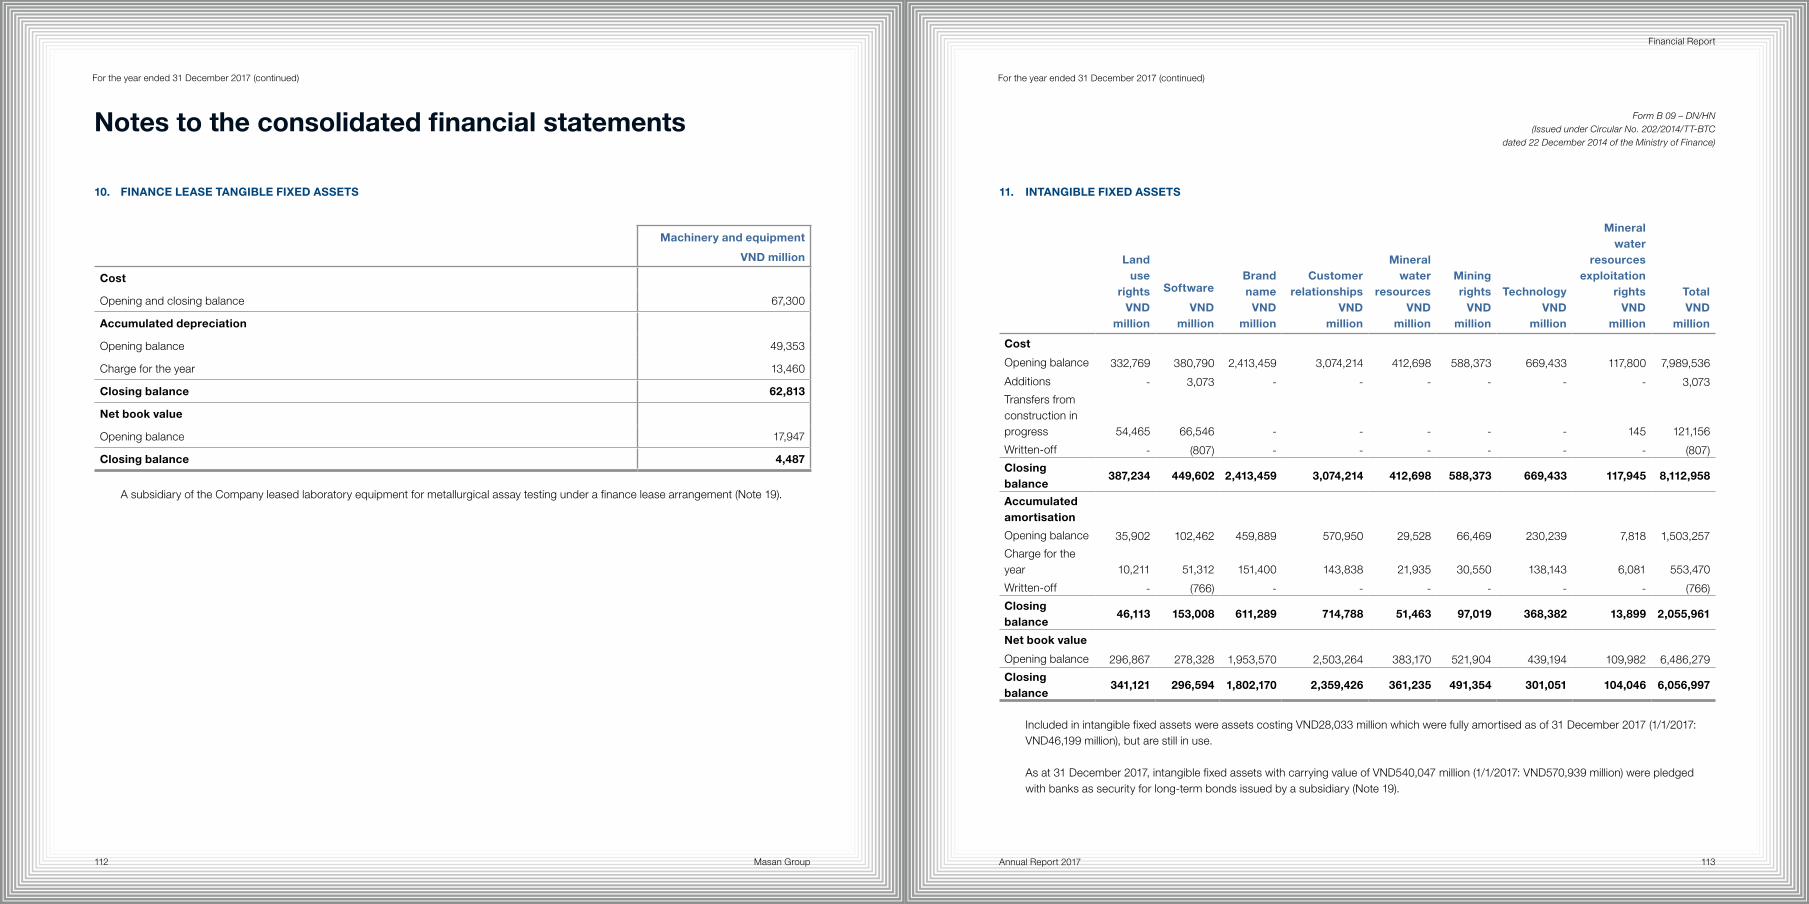
Masan Group112 113Annual Report 2017
Financial Report
For the year ended 31 December 2017 (continued)
10. FINANCE LEASE TANGIBLE FIXED ASSETS
Machinery and equipment
VND million
Cost
Opening and closing balance 67,300
Accumulated depreciation
Opening balance 49,353
Charge for the year 13,460
Closing balance 62,813
Net book value
Opening balance 17,947
Closing balance 4,487
A subsidiary of the Company leased laboratory equipment for metallurgical assay testing under a finance lease arrangement (Note 19).
11. INTANGIBLE FIXED ASSETS
Land use
rightsVND
million
Software
VND million
Brandname
VND million
Customer relationships
VND million
Mineral water
resourcesVND
million
Mining rights
VND million
TechnologyVND
million
Mineral water
resources exploitation
rightsVND
million
TotalVND
million
Cost
Opening balance 332,769 380,790 2,413,459 3,074,214 412,698 588,373 669,433 117,800 7,989,536
Additions - 3,073 - - - - - - 3,073
Transfers from construction in progress 54,465 66,546 - - - - - 145 121,156
Written-off - (807) - - - - - - (807)
Closing balance
387,234 449,602 2,413,459 3,074,214 412,698 588,373 669,433 117,945 8,112,958
Accumulated amortisation
Opening balance 35,902 102,462 459,889 570,950 29,528 66,469 230,239 7,818 1,503,257
Charge for the year 10,211 51,312 151,400 143,838 21,935 30,550 138,143 6,081 553,470
Written-off - (766) - - - - - - (766)
Closing balance
46,113 153,008 611,289 714,788 51,463 97,019 368,382 13,899 2,055,961
Net book value
Opening balance 296,867 278,328 1,953,570 2,503,264 383,170 521,904 439,194 109,982 6,486,279
Closing balance
341,121 296,594 1,802,170 2,359,426 361,235 491,354 301,051 104,046 6,056,997
Included in intangible fixed assets were assets costing VND28,033 million which were fully amortised as of 31 December 2017 (1/1/2017: VND46,199 million), but are still in use.
As at 31 December 2017, intangible fixed assets with carrying value of VND540,047 million (1/1/2017: VND570,939 million) were pledged with banks as security for long-term bonds issued by a subsidiary (Note 19).
For the year ended 31 December 2017 (continued)
Notes to the consolidated financial statements Form B 09 – DN/HN (Issued under Circular No. 202/2014/TT-BTC
dated 22 December 2014 of the Ministry of Finance)
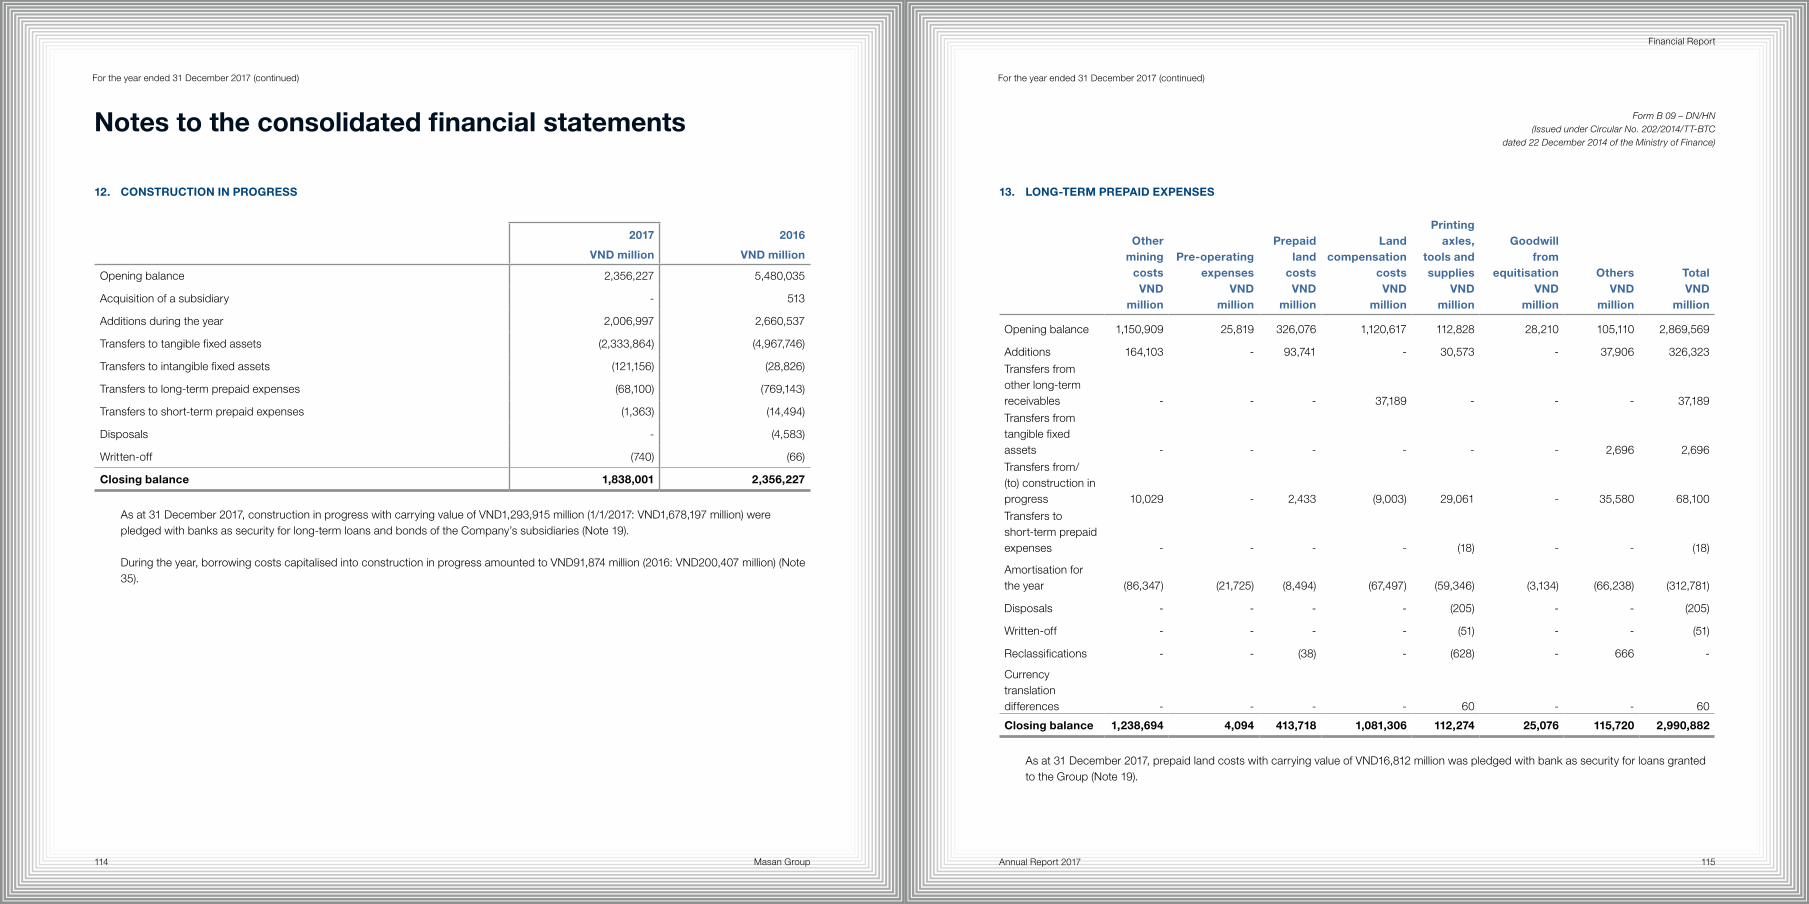
Masan Group114 115Annual Report 2017
Financial Report
For the year ended 31 December 2017 (continued)
12. CONSTRUCTION IN PROGRESS
2017
VND million
2016
VND million
Opening balance 2,356,227 5,480,035
Acquisition of a subsidiary - 513
Additions during the year 2,006,997 2,660,537
Transfers to tangible fixed assets (2,333,864) (4,967,746)
Transfers to intangible fixed assets (121,156) (28,826)
Transfers to long-term prepaid expenses (68,100) (769,143)
Transfers to short-term prepaid expenses (1,363) (14,494)
Disposals - (4,583)
Written-off (740) (66)
Closing balance 1,838,001 2,356,227
As at 31 December 2017, construction in progress with carrying value of VND1,293,915 million (1/1/2017: VND1,678,197 million) were pledged with banks as security for long-term loans and bonds of the Company’s subsidiaries (Note 19).
During the year, borrowing costs capitalised into construction in progress amounted to VND91,874 million (2016: VND200,407 million) (Note 35).
For the year ended 31 December 2017 (continued)
13. LONG-TERM PREPAID EXPENSES
Other mining
costsVND
million
Pre-operating expenses
VND million
Prepaid land
costsVND
million
Land compensation
costsVND
million
Printingaxles,
tools and supplies
VND million
Goodwill from
equitisationVND
million
OthersVND
million
TotalVND
million
Opening balance 1,150,909 25,819 326,076 1,120,617 112,828 28,210 105,110 2,869,569
Additions 164,103 - 93,741 - 30,573 - 37,906 326,323
Transfers from other long-term receivables - - - 37,189 - - - 37,189
Transfers from tangible fixed assets - - - - - - 2,696 2,696
Transfers from/(to) construction in progress 10,029 - 2,433 (9,003) 29,061 - 35,580 68,100
Transfers to short-term prepaid expenses - - - - (18) - - (18)
Amortisation for the year (86,347) (21,725) (8,494) (67,497) (59,346) (3,134) (66,238) (312,781)
Disposals - - - - (205) - - (205)
Written-off - - - - (51) - - (51)
Reclassifications - - (38) - (628) - 666 -
Currency translation differences - - - - 60 - - 60
Closing balance 1,238,694 4,094 413,718 1,081,306 112,274 25,076 115,720 2,990,882
As at 31 December 2017, prepaid land costs with carrying value of VND16,812 million was pledged with bank as security for loans granted to the Group (Note 19).
Notes to the consolidated financial statements Form B 09 – DN/HN (Issued under Circular No. 202/2014/TT-BTC
dated 22 December 2014 of the Ministry of Finance)
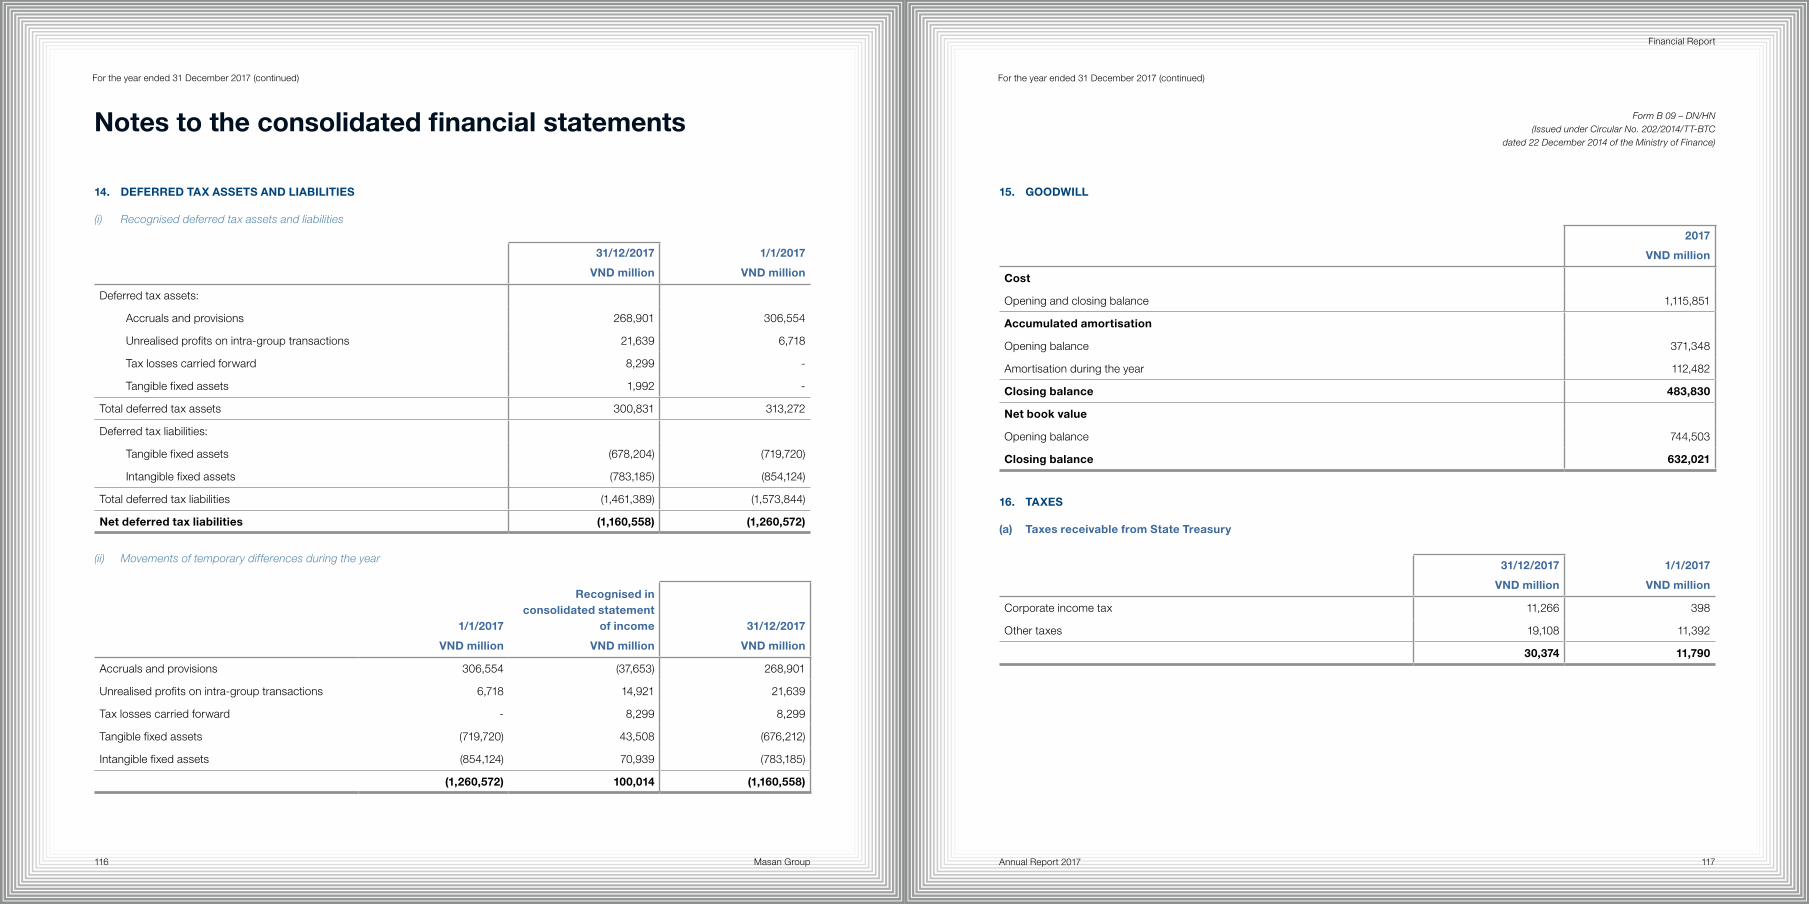
Masan Group116 117Annual Report 2017
Financial Report
For the year ended 31 December 2017 (continued)
14. DEFERRED TAX ASSETS AND LIABILITIES
(i) Recognised deferred tax assets and liabilities
31/12/2017
VND million
1/1/2017
VND million
Deferred tax assets:
Accruals and provisions 268,901 306,554
Unrealised profits on intra-group transactions 21,639 6,718
Tax losses carried forward 8,299 -
Tangible fixed assets 1,992 -
Total deferred tax assets 300,831 313,272
Deferred tax liabilities:
Tangible fixed assets (678,204) (719,720)
Intangible fixed assets (783,185) (854,124)
Total deferred tax liabilities (1,461,389) (1,573,844)
Net deferred tax liabilities (1,160,558) (1,260,572)
(ii) Movements of temporary differences during the year
1/1/2017
VND million
Recognised in consolidated statement
of income
VND million
31/12/2017
VND million
Accruals and provisions 306,554 (37,653) 268,901
Unrealised profits on intra-group transactions 6,718 14,921 21,639
Tax losses carried forward - 8,299 8,299
Tangible fixed assets (719,720) 43,508 (676,212)
Intangible fixed assets (854,124) 70,939 (783,185)
(1,260,572) 100,014 (1,160,558)
For the year ended 31 December 2017 (continued)
15. GOODWILL
2017
VND million
Cost
Opening and closing balance 1,115,851
Accumulated amortisation
Opening balance 371,348
Amortisation during the year 112,482
Closing balance 483,830
Net book value
Opening balance 744,503
Closing balance 632,021
16. TAXES
(a) Taxes receivable from State Treasury
31/12/2017
VND million
1/1/2017
VND million
Corporate income tax 11,266 398
Other taxes 19,108 11,392
30,374 11,790
Notes to the consolidated financial statements Form B 09 – DN/HN (Issued under Circular No. 202/2014/TT-BTC
dated 22 December 2014 of the Ministry of Finance)
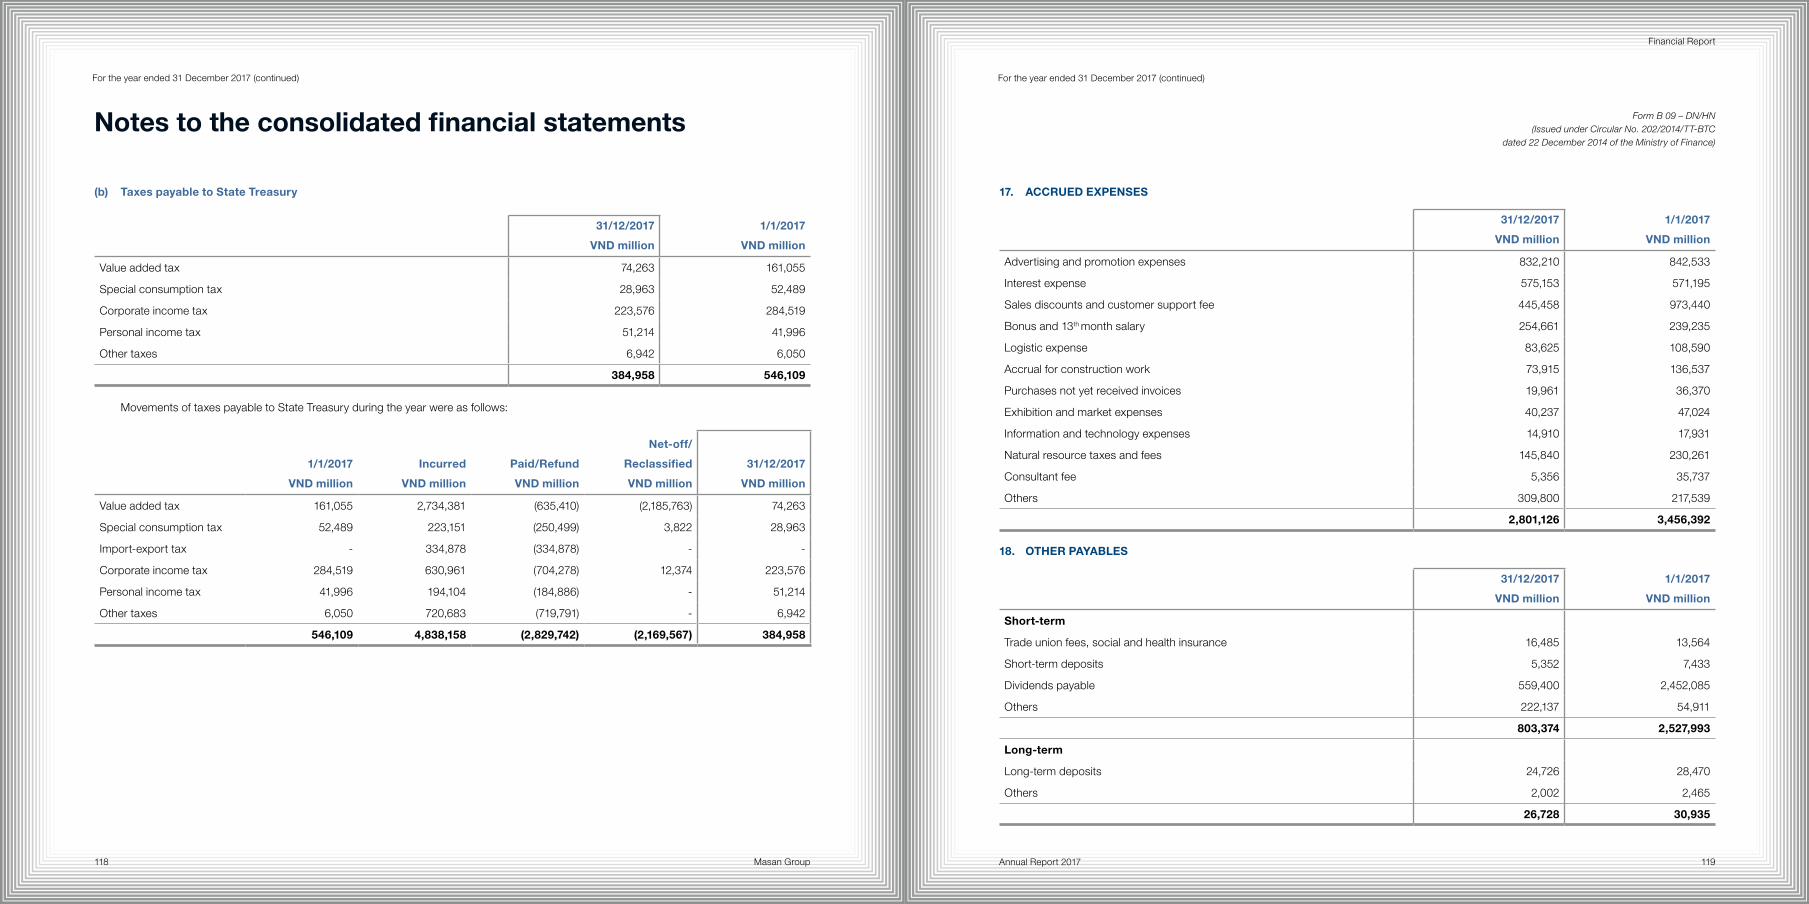
Masan Group118 119Annual Report 2017
Financial Report
For the year ended 31 December 2017 (continued)
(b) Taxes payable to State Treasury
31/12/2017
VND million
1/1/2017
VND million
Value added tax 74,263 161,055
Special consumption tax 28,963 52,489
Corporate income tax 223,576 284,519
Personal income tax 51,214 41,996
Other taxes 6,942 6,050
384,958 546,109
Movements of taxes payable to State Treasury during the year were as follows:
1/1/2017
VND million
Incurred
VND million
Paid/Refund
VND million
Net-off/
Reclassified
VND million
31/12/2017
VND million
Value added tax 161,055 2,734,381 (635,410) (2,185,763) 74,263
Special consumption tax 52,489 223,151 (250,499) 3,822 28,963
Import-export tax - 334,878 (334,878) - -
Corporate income tax 284,519 630,961 (704,278) 12,374 223,576
Personal income tax 41,996 194,104 (184,886) - 51,214
Other taxes 6,050 720,683 (719,791) - 6,942
546,109 4,838,158 (2,829,742) (2,169,567) 384,958
For the year ended 31 December 2017 (continued)
17. ACCRUED EXPENSES
31/12/2017
VND million
1/1/2017
VND million
Advertising and promotion expenses 832,210 842,533
Interest expense 575,153 571,195
Sales discounts and customer support fee 445,458 973,440
Bonus and 13th month salary 254,661 239,235
Logistic expense 83,625 108,590
Accrual for construction work 73,915 136,537
Purchases not yet received invoices 19,961 36,370
Exhibition and market expenses 40,237 47,024
Information and technology expenses 14,910 17,931
Natural resource taxes and fees 145,840 230,261
Consultant fee 5,356 35,737
Others 309,800 217,539
2,801,126 3,456,392
18. OTHER PAYABLES
31/12/2017
VND million
1/1/2017
VND million
Short-term
Trade union fees, social and health insurance 16,485 13,564
Short-term deposits 5,352 7,433
Dividends payable 559,400 2,452,085
Others 222,137 54,911
803,374 2,527,993
Long-term
Long-term deposits 24,726 28,470
Others 2,002 2,465
26,728 30,935
Notes to the consolidated financial statements Form B 09 – DN/HN (Issued under Circular No. 202/2014/TT-BTC
dated 22 December 2014 of the Ministry of Finance)
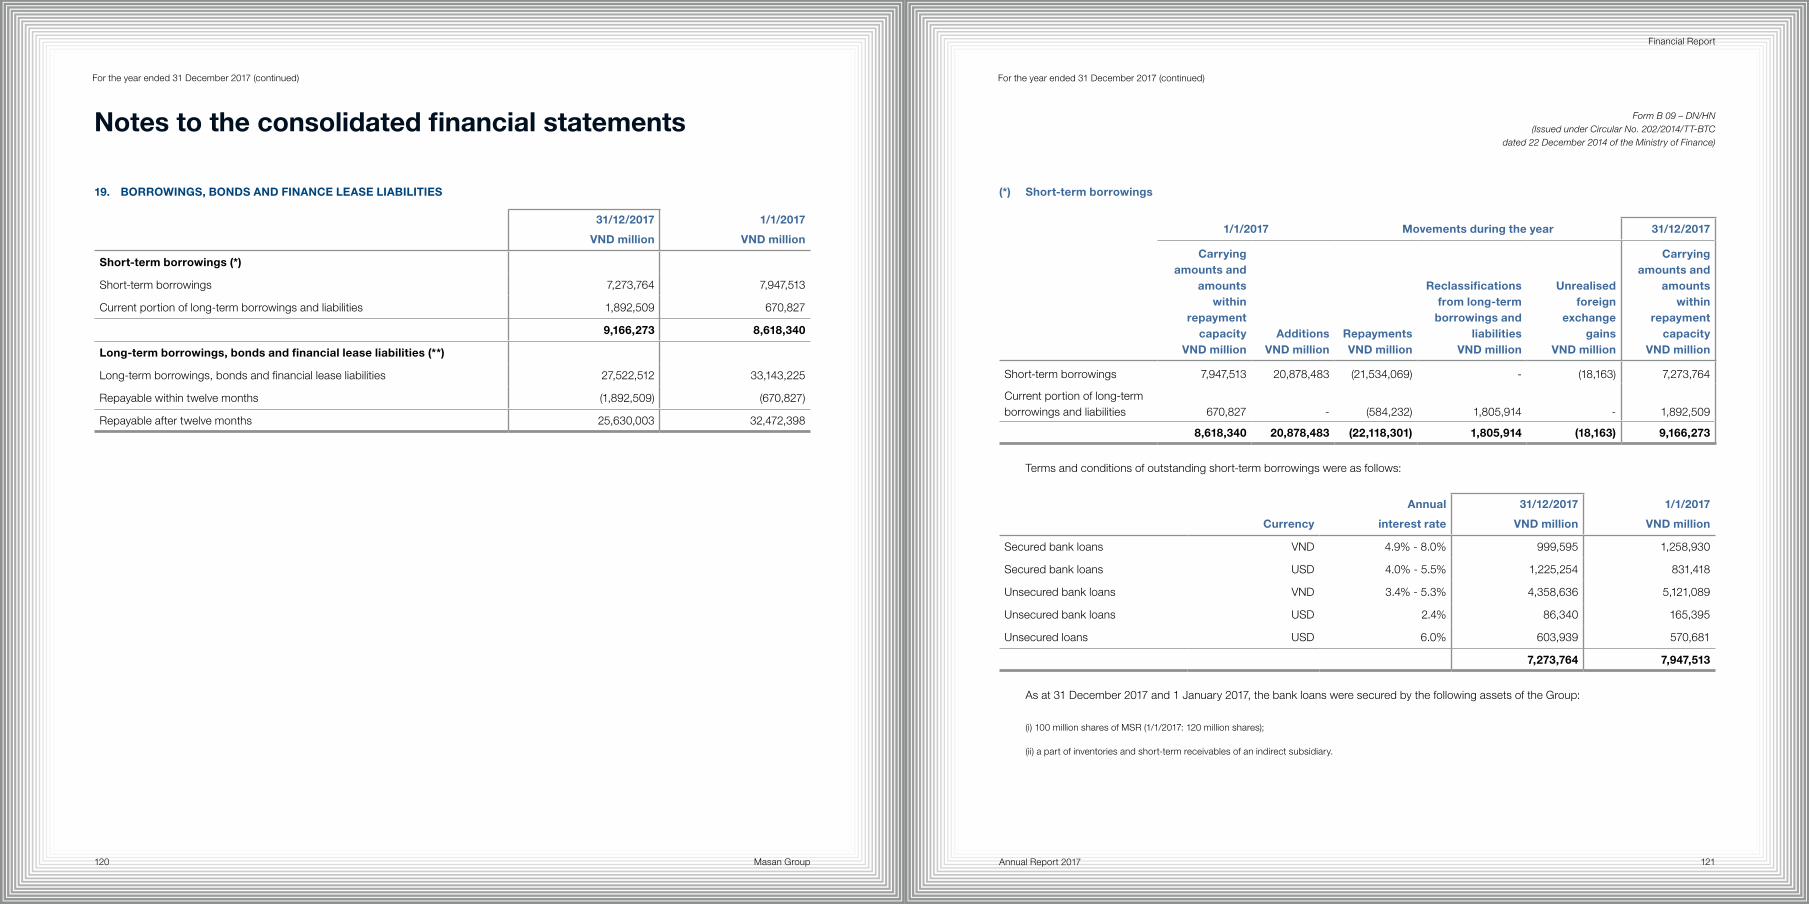
Masan Group120 121Annual Report 2017
Financial Report
For the year ended 31 December 2017 (continued)
19. BORROWINGS, BONDS AND FINANCE LEASE LIABILITIES
31/12/2017
VND million
1/1/2017
VND million
Short-term borrowings (*)
Short-term borrowings 7,273,764 7,947,513
Current portion of long-term borrowings and liabilities 1,892,509 670,827
9,166,273 8,618,340
Long-term borrowings, bonds and financial lease liabilities (**)
Long-term borrowings, bonds and financial lease liabilities 27,522,512 33,143,225
Repayable within twelve months (1,892,509) (670,827)
Repayable after twelve months 25,630,003 32,472,398
For the year ended 31 December 2017 (continued)
(*) Short-term borrowings
1/1/2017 Movements during the year 31/12/2017
Carrying amounts and
amounts within
repayment capacity
VND millionAdditions
VND millionRepaymentsVND million
Reclassifications from long-term
borrowings and liabilities
VND million
Unrealised foreign
exchange gains
VND million
Carrying amounts and
amounts within
repayment capacity
VND million
Short-term borrowings 7,947,513 20,878,483 (21,534,069) - (18,163) 7,273,764
Current portion of long-term borrowings and liabilities 670,827 - (584,232) 1,805,914 - 1,892,509
8,618,340 20,878,483 (22,118,301) 1,805,914 (18,163) 9,166,273
Terms and conditions of outstanding short-term borrowings were as follows:
Currency
Annual
interest rate
31/12/2017
VND million
1/1/2017
VND million
Secured bank loans VND 4.9% - 8.0% 999,595 1,258,930
Secured bank loans USD 4.0% - 5.5% 1,225,254 831,418
Unsecured bank loans VND 3.4% - 5.3% 4,358,636 5,121,089
Unsecured bank loans USD 2.4% 86,340 165,395
Unsecured loans USD 6.0% 603,939 570,681
7,273,764 7,947,513
As at 31 December 2017 and 1 January 2017, the bank loans were secured by the following assets of the Group:
(i) 100 million shares of MSR (1/1/2017: 120 million shares);
(ii) a part of inventories and short-term receivables of an indirect subsidiary.
Notes to the consolidated financial statements Form B 09 – DN/HN (Issued under Circular No. 202/2014/TT-BTC
dated 22 December 2014 of the Ministry of Finance)
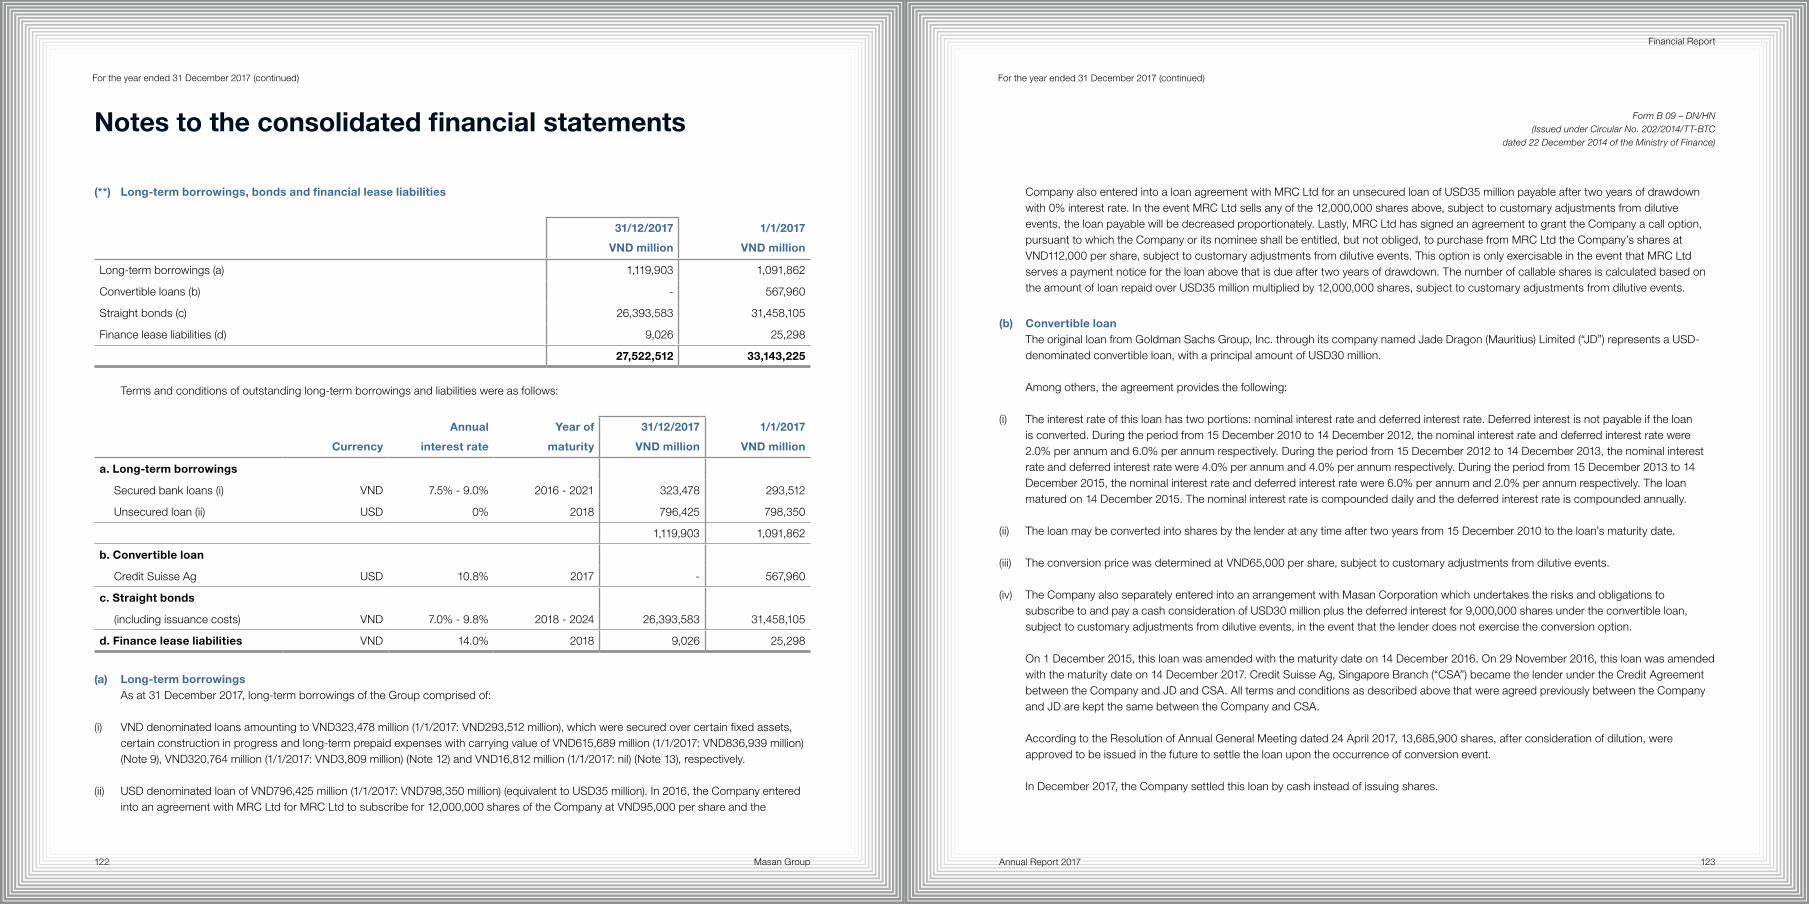
Masan Group122 123Annual Report 2017
Financial Report
For the year ended 31 December 2017 (continued)
(**) Long-term borrowings, bonds and financial lease liabilities
31/12/2017
VND million
1/1/2017
VND million
Long-term borrowings (a) 1,119,903 1,091,862
Convertible loans (b) - 567,960
Straight bonds (c) 26,393,583 31,458,105
Finance lease liabilities (d) 9,026 25,298
27,522,512 33,143,225
Terms and conditions of outstanding long-term borrowings and liabilities were as follows:
Currency
Annual
interest rate
Year of
maturity
31/12/2017
VND million
1/1/2017
VND million
a. Long-term borrowings
Secured bank loans (i) VND 7.5% - 9.0% 2016 - 2021 323,478 293,512
Unsecured loan (ii) USD 0% 2018 796,425 798,350
1,119,903 1,091,862
b. Convertible loan
Credit Suisse Ag USD 10.8% 2017 - 567,960
c. Straight bonds
(including issuance costs) VND 7.0% - 9.8% 2018 - 2024 26,393,583 31,458,105
d. Finance lease liabilities VND 14.0% 2018 9,026 25,298
(a) Long-term borrowingsAs at 31 December 2017, long-term borrowings of the Group comprised of:
(i) VND denominated loans amounting to VND323,478 million (1/1/2017: VND293,512 million), which were secured over certain fixed assets, certain construction in progress and long-term prepaid expenses with carrying value of VND615,689 million (1/1/2017: VND836,939 million) (Note 9), VND320,764 million (1/1/2017: VND3,809 million) (Note 12) and VND16,812 million (1/1/2017: nil) (Note 13), respectively.
(ii) USD denominated loan of VND796,425 million (1/1/2017: VND798,350 million) (equivalent to USD35 million). In 2016, the Company entered into an agreement with MRC Ltd for MRC Ltd to subscribe for 12,000,000 shares of the Company at VND95,000 per share and the
For the year ended 31 December 2017 (continued)
Company also entered into a loan agreement with MRC Ltd for an unsecured loan of USD35 million payable after two years of drawdown with 0% interest rate. In the event MRC Ltd sells any of the 12,000,000 shares above, subject to customary adjustments from dilutive events, the loan payable will be decreased proportionately. Lastly, MRC Ltd has signed an agreement to grant the Company a call option, pursuant to which the Company or its nominee shall be entitled, but not obliged, to purchase from MRC Ltd the Company’s shares at VND112,000 per share, subject to customary adjustments from dilutive events. This option is only exercisable in the event that MRC Ltd serves a payment notice for the loan above that is due after two years of drawdown. The number of callable shares is calculated based on the amount of loan repaid over USD35 million multiplied by 12,000,000 shares, subject to customary adjustments from dilutive events.
(b) Convertible loan The original loan from Goldman Sachs Group, Inc. through its company named Jade Dragon (Mauritius) Limited (“JD”) represents a USD-
denominated convertible loan, with a principal amount of USD30 million.
Among others, the agreement provides the following:
(i) The interest rate of this loan has two portions: nominal interest rate and deferred interest rate. Deferred interest is not payable if the loan is converted. During the period from 15 December 2010 to 14 December 2012, the nominal interest rate and deferred interest rate were 2.0% per annum and 6.0% per annum respectively. During the period from 15 December 2012 to 14 December 2013, the nominal interest rate and deferred interest rate were 4.0% per annum and 4.0% per annum respectively. During the period from 15 December 2013 to 14 December 2015, the nominal interest rate and deferred interest rate were 6.0% per annum and 2.0% per annum respectively. The loan matured on 14 December 2015. The nominal interest rate is compounded daily and the deferred interest rate is compounded annually.
(ii) The loan may be converted into shares by the lender at any time after two years from 15 December 2010 to the loan’s maturity date.
(iii) The conversion price was determined at VND65,000 per share, subject to customary adjustments from dilutive events.
(iv) The Company also separately entered into an arrangement with Masan Corporation which undertakes the risks and obligations to subscribe to and pay a cash consideration of USD30 million plus the deferred interest for 9,000,000 shares under the convertible loan, subject to customary adjustments from dilutive events, in the event that the lender does not exercise the conversion option.
On 1 December 2015, this loan was amended with the maturity date on 14 December 2016. On 29 November 2016, this loan was amended with the maturity date on 14 December 2017. Credit Suisse Ag, Singapore Branch (“CSA”) became the lender under the Credit Agreement between the Company and JD and CSA. All terms and conditions as described above that were agreed previously between the Company and JD are kept the same between the Company and CSA.
According to the Resolution of Annual General Meeting dated 24 April 2017, 13,685,900 shares, after consideration of dilution, were approved to be issued in the future to settle the loan upon the occurrence of conversion event.
In December 2017, the Company settled this loan by cash instead of issuing shares.
Notes to the consolidated financial statements Form B 09 – DN/HN (Issued under Circular No. 202/2014/TT-BTC
dated 22 December 2014 of the Ministry of Finance)
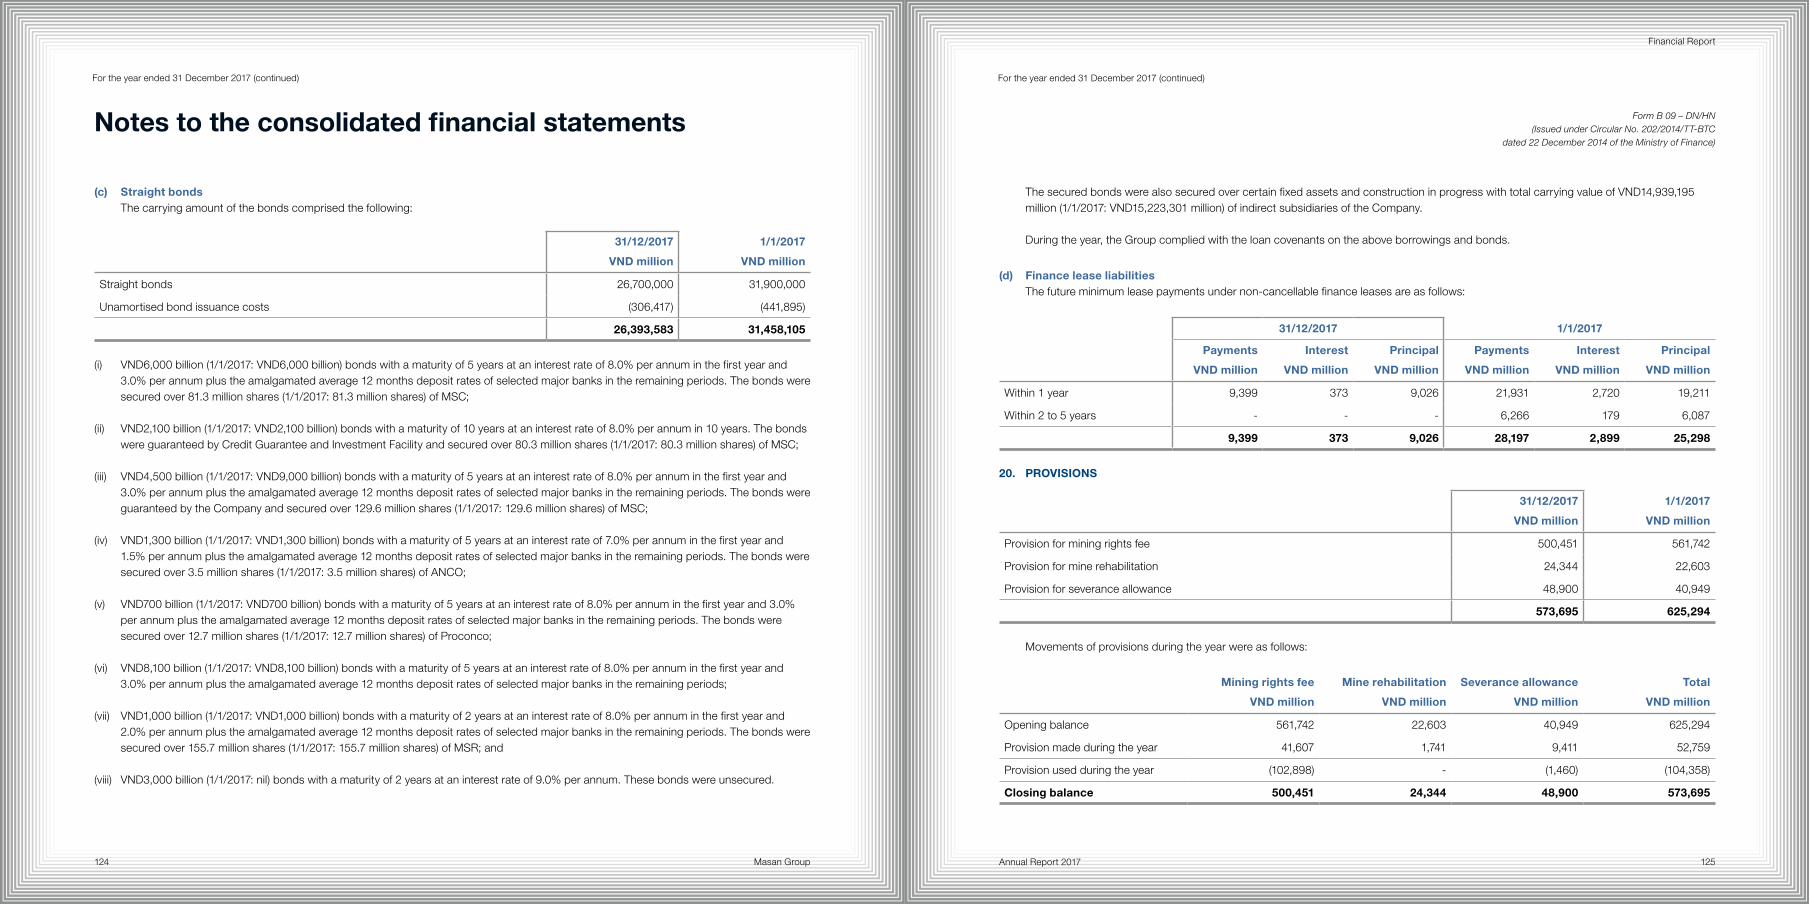
Masan Group124 125Annual Report 2017
Financial Report
For the year ended 31 December 2017 (continued)
(c) Straight bondsThe carrying amount of the bonds comprised the following:
31/12/2017
VND million
1/1/2017
VND million
Straight bonds 26,700,000 31,900,000
Unamortised bond issuance costs (306,417) (441,895)
26,393,583 31,458,105
(i) VND6,000 billion (1/1/2017: VND6,000 billion) bonds with a maturity of 5 years at an interest rate of 8.0% per annum in the first year and
3.0% per annum plus the amalgamated average 12 months deposit rates of selected major banks in the remaining periods. The bonds were secured over 81.3 million shares (1/1/2017: 81.3 million shares) of MSC;
(ii) VND2,100 billion (1/1/2017: VND2,100 billion) bonds with a maturity of 10 years at an interest rate of 8.0% per annum in 10 years. The bonds were guaranteed by Credit Guarantee and Investment Facility and secured over 80.3 million shares (1/1/2017: 80.3 million shares) of MSC;
(iii) VND4,500 billion (1/1/2017: VND9,000 billion) bonds with a maturity of 5 years at an interest rate of 8.0% per annum in the first year and 3.0% per annum plus the amalgamated average 12 months deposit rates of selected major banks in the remaining periods. The bonds were guaranteed by the Company and secured over 129.6 million shares (1/1/2017: 129.6 million shares) of MSC;
(iv) VND1,300 billion (1/1/2017: VND1,300 billion) bonds with a maturity of 5 years at an interest rate of 7.0% per annum in the first year and 1.5% per annum plus the amalgamated average 12 months deposit rates of selected major banks in the remaining periods. The bonds were secured over 3.5 million shares (1/1/2017: 3.5 million shares) of ANCO;
(v) VND700 billion (1/1/2017: VND700 billion) bonds with a maturity of 5 years at an interest rate of 8.0% per annum in the first year and 3.0% per annum plus the amalgamated average 12 months deposit rates of selected major banks in the remaining periods. The bonds were secured over 12.7 million shares (1/1/2017: 12.7 million shares) of Proconco;
(vi) VND8,100 billion (1/1/2017: VND8,100 billion) bonds with a maturity of 5 years at an interest rate of 8.0% per annum in the first year and 3.0% per annum plus the amalgamated average 12 months deposit rates of selected major banks in the remaining periods;
(vii) VND1,000 billion (1/1/2017: VND1,000 billion) bonds with a maturity of 2 years at an interest rate of 8.0% per annum in the first year and 2.0% per annum plus the amalgamated average 12 months deposit rates of selected major banks in the remaining periods. The bonds were secured over 155.7 million shares (1/1/2017: 155.7 million shares) of MSR; and
(viii) VND3,000 billion (1/1/2017: nil) bonds with a maturity of 2 years at an interest rate of 9.0% per annum. These bonds were unsecured.
For the year ended 31 December 2017 (continued)
The secured bonds were also secured over certain fixed assets and construction in progress with total carrying value of VND14,939,195 million (1/1/2017: VND15,223,301 million) of indirect subsidiaries of the Company.
During the year, the Group complied with the loan covenants on the above borrowings and bonds.
(d) Finance lease liabilitiesThe future minimum lease payments under non-cancellable finance leases are as follows:
31/12/2017 1/1/2017
Payments
VND million
Interest
VND million
Principal
VND million
Payments
VND million
Interest
VND million
Principal
VND million
Within 1 year 9,399 373 9,026 21,931 2,720 19,211
Within 2 to 5 years - - - 6,266 179 6,087
9,399 373 9,026 28,197 2,899 25,298
20. PROVISIONS
31/12/2017
VND million
1/1/2017
VND million
Provision for mining rights fee 500,451 561,742
Provision for mine rehabilitation 24,344 22,603
Provision for severance allowance 48,900 40,949
573,695 625,294
Movements of provisions during the year were as follows:
Mining rights fee
VND million
Mine rehabilitation
VND million
Severance allowance
VND million
Total
VND million
Opening balance 561,742 22,603 40,949 625,294
Provision made during the year 41,607 1,741 9,411 52,759
Provision used during the year (102,898) - (1,460) (104,358)
Closing balance 500,451 24,344 48,900 573,695
Notes to the consolidated financial statements Form B 09 – DN/HN (Issued under Circular No. 202/2014/TT-BTC
dated 22 December 2014 of the Ministry of Finance)
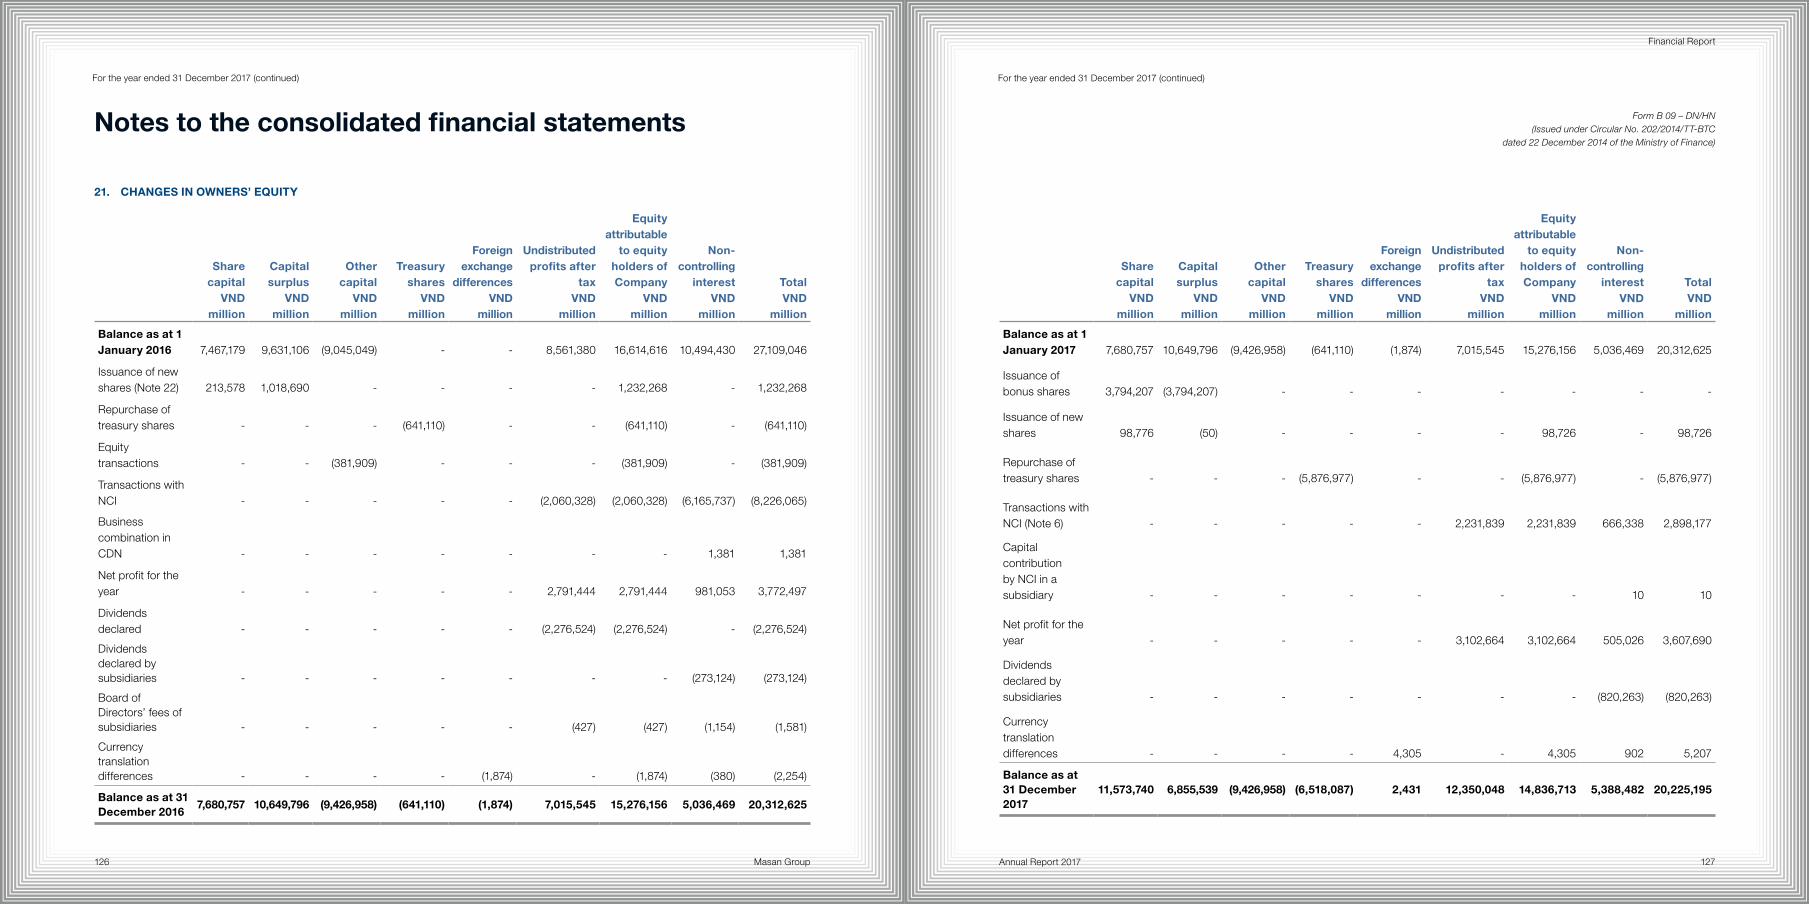
Masan Group126 127Annual Report 2017
Financial Report
For the year ended 31 December 2017 (continued)
21. CHANGES IN OWNERS’ EQUITY
Sharecapital
VND million
Capital surplus
VND million
Other capital
VND million
Treasury shares
VND million
Foreign exchange
differencesVND
million
Undistributed profits after
taxVND
million
Equity attributable
to equity holders of Company
VND million
Non-controlling
interestVND
million
TotalVND
million
Balance as at 1 January 2016 7,467,179 9,631,106 (9,045,049) - - 8,561,380 16,614,616 10,494,430 27,109,046
Issuance of new shares (Note 22) 213,578 1,018,690 - - - - 1,232,268 - 1,232,268
Repurchase of treasury shares - - - (641,110) - - (641,110) - (641,110)
Equity transactions - - (381,909) - - - (381,909) - (381,909)
Transactions with NCI - - - - - (2,060,328) (2,060,328) (6,165,737) (8,226,065)
Business combination in CDN - - - - - - - 1,381 1,381
Net profit for the year - - - - - 2,791,444 2,791,444 981,053 3,772,497
Dividends declared - - - - - (2,276,524) (2,276,524) - (2,276,524)
Dividends declared by subsidiaries - - - - - - - (273,124) (273,124)
Board of Directors’ fees of subsidiaries - - - - - (427) (427) (1,154) (1,581)
Currency translation differences - - - - (1,874) - (1,874) (380) (2,254)
Balance as at 31 December 2016
7,680,757 10,649,796 (9,426,958) (641,110) (1,874) 7,015,545 15,276,156 5,036,469 20,312,625
Sharecapital
VND million
Capital surplus
VND million
Other capital
VND million
Treasury shares
VND million
Foreign exchange
differencesVND
million
Undistributed profits after
taxVND
million
Equity attributable
to equity holders of Company
VND million
Non-controlling
interestVND
million
TotalVND
million
Balance as at 1 January 2017 7,680,757 10,649,796 (9,426,958) (641,110) (1,874) 7,015,545 15,276,156 5,036,469 20,312,625
Issuance of bonus shares 3,794,207 (3,794,207) - - - - - - -
Issuance of new shares 98,776 (50) - - - - 98,726 - 98,726
Repurchase of treasury shares - - - (5,876,977) - - (5,876,977) - (5,876,977)
Transactions with NCI (Note 6) - - - - - 2,231,839 2,231,839 666,338 2,898,177
Capital contribution by NCI in a subsidiary - - - - - - - 10 10
Net profit for the year - - - - - 3,102,664 3,102,664 505,026 3,607,690
Dividends declared by subsidiaries - - - - - - - (820,263) (820,263)
Currency translation differences - - - - 4,305 - 4,305 902 5,207
Balance as at 31 December 2017
11,573,740 6,855,539 (9,426,958) (6,518,087) 2,431 12,350,048 14,836,713 5,388,482 20,225,195
For the year ended 31 December 2017 (continued)
Notes to the consolidated financial statements Form B 09 – DN/HN (Issued under Circular No. 202/2014/TT-BTC
dated 22 December 2014 of the Ministry of Finance)
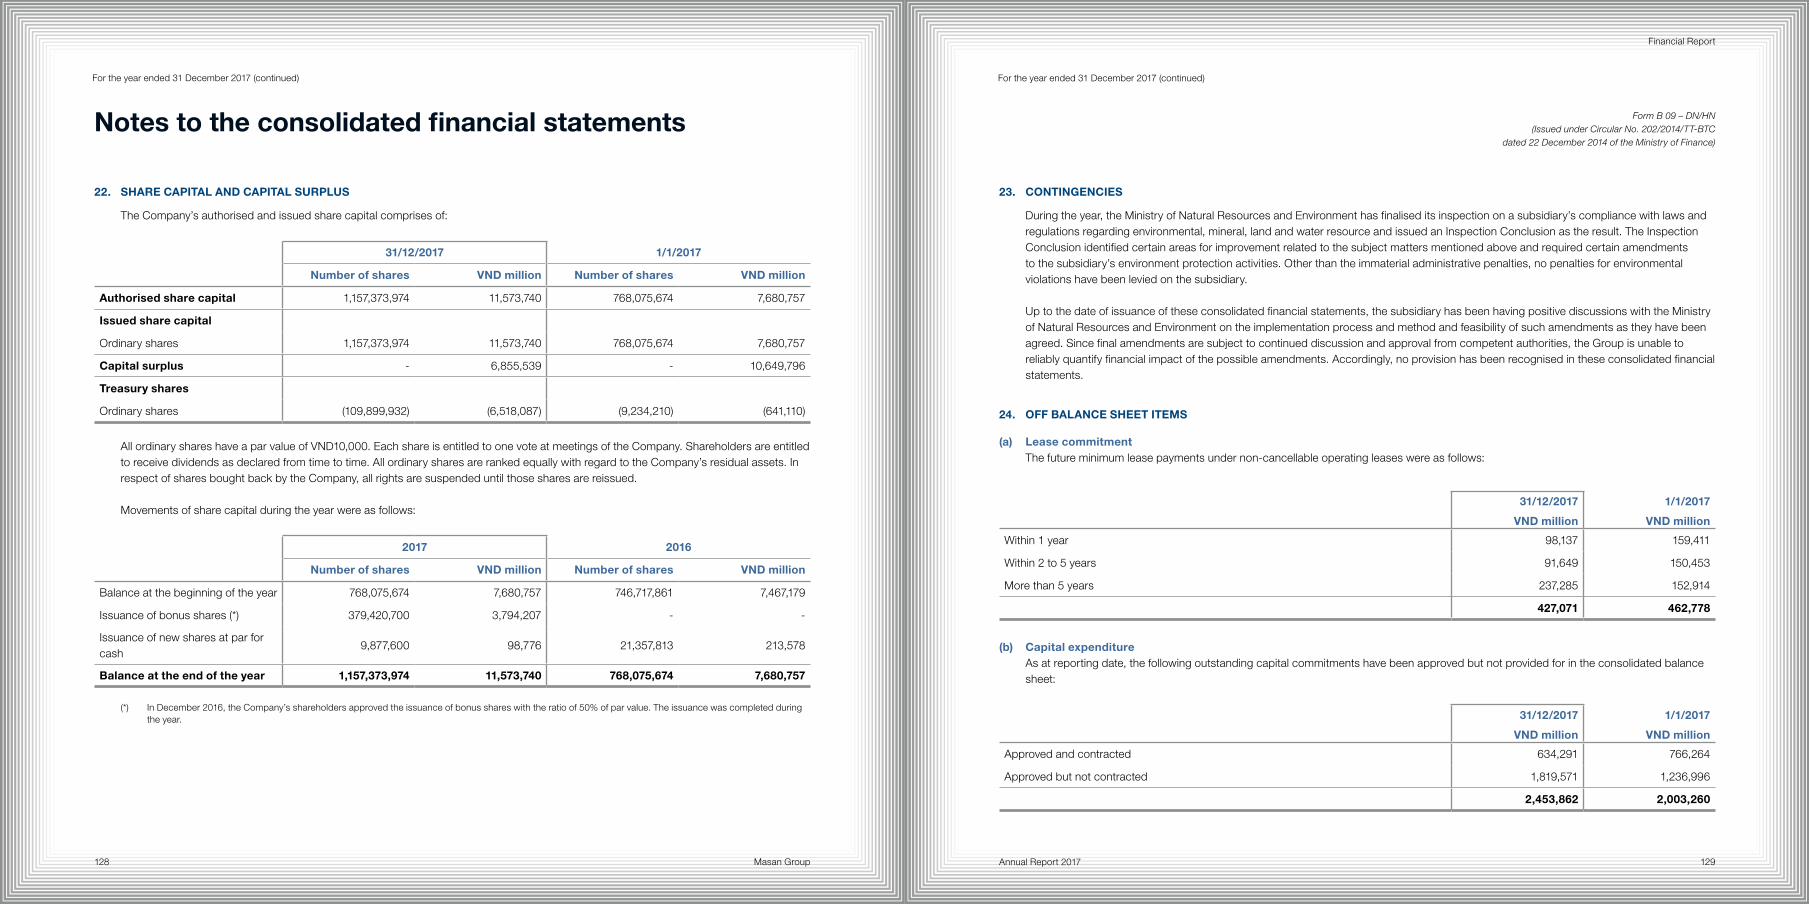
Masan Group128 129Annual Report 2017
Financial Report
For the year ended 31 December 2017 (continued)
22. SHARE CAPITAL AND CAPITAL SURPLUS
The Company’s authorised and issued share capital comprises of:
31/12/2017 1/1/2017
Number of shares VND million Number of shares VND million
Authorised share capital 1,157,373,974 11,573,740 768,075,674 7,680,757
Issued share capital
Ordinary shares 1,157,373,974 11,573,740 768,075,674 7,680,757
Capital surplus - 6,855,539 - 10,649,796
Treasury shares
Ordinary shares (109,899,932) (6,518,087) (9,234,210) (641,110)
All ordinary shares have a par value of VND10,000. Each share is entitled to one vote at meetings of the Company. Shareholders are entitled to receive dividends as declared from time to time. All ordinary shares are ranked equally with regard to the Company’s residual assets. In respect of shares bought back by the Company, all rights are suspended until those shares are reissued.
Movements of share capital during the year were as follows:
2017 2016
Number of shares VND million Number of shares VND million
Balance at the beginning of the year 768,075,674 7,680,757 746,717,861 7,467,179
Issuance of bonus shares (*) 379,420,700 3,794,207 - -
Issuance of new shares at par for cash
9,877,600 98,776 21,357,813 213,578
Balance at the end of the year 1,157,373,974 11,573,740 768,075,674 7,680,757
(*) In December 2016, the Company’s shareholders approved the issuance of bonus shares with the ratio of 50% of par value. The issuance was completed during the year.
For the year ended 31 December 2017 (continued)
23. CONTINGENCIES
During the year, the Ministry of Natural Resources and Environment has finalised its inspection on a subsidiary’s compliance with laws and regulations regarding environmental, mineral, land and water resource and issued an Inspection Conclusion as the result. The Inspection Conclusion identified certain areas for improvement related to the subject matters mentioned above and required certain amendments to the subsidiary’s environment protection activities. Other than the immaterial administrative penalties, no penalties for environmental violations have been levied on the subsidiary.
Up to the date of issuance of these consolidated financial statements, the subsidiary has been having positive discussions with the Ministry of Natural Resources and Environment on the implementation process and method and feasibility of such amendments as they have been agreed. Since final amendments are subject to continued discussion and approval from competent authorities, the Group is unable to reliably quantify financial impact of the possible amendments. Accordingly, no provision has been recognised in these consolidated financial statements.
24. OFF BALANCE SHEET ITEMS
(a) Lease commitmentThe future minimum lease payments under non-cancellable operating leases were as follows:
31/12/2017
VND million
1/1/2017
VND million
Within 1 year 98,137 159,411
Within 2 to 5 years 91,649 150,453
More than 5 years 237,285 152,914
427,071 462,778
(b) Capital expenditureAs at reporting date, the following outstanding capital commitments have been approved but not provided for in the consolidated balance sheet:
31/12/2017
VND million
1/1/2017
VND million
Approved and contracted 634,291 766,264
Approved but not contracted 1,819,571 1,236,996
2,453,862 2,003,260
Notes to the consolidated financial statements Form B 09 – DN/HN (Issued under Circular No. 202/2014/TT-BTC
dated 22 December 2014 of the Ministry of Finance)
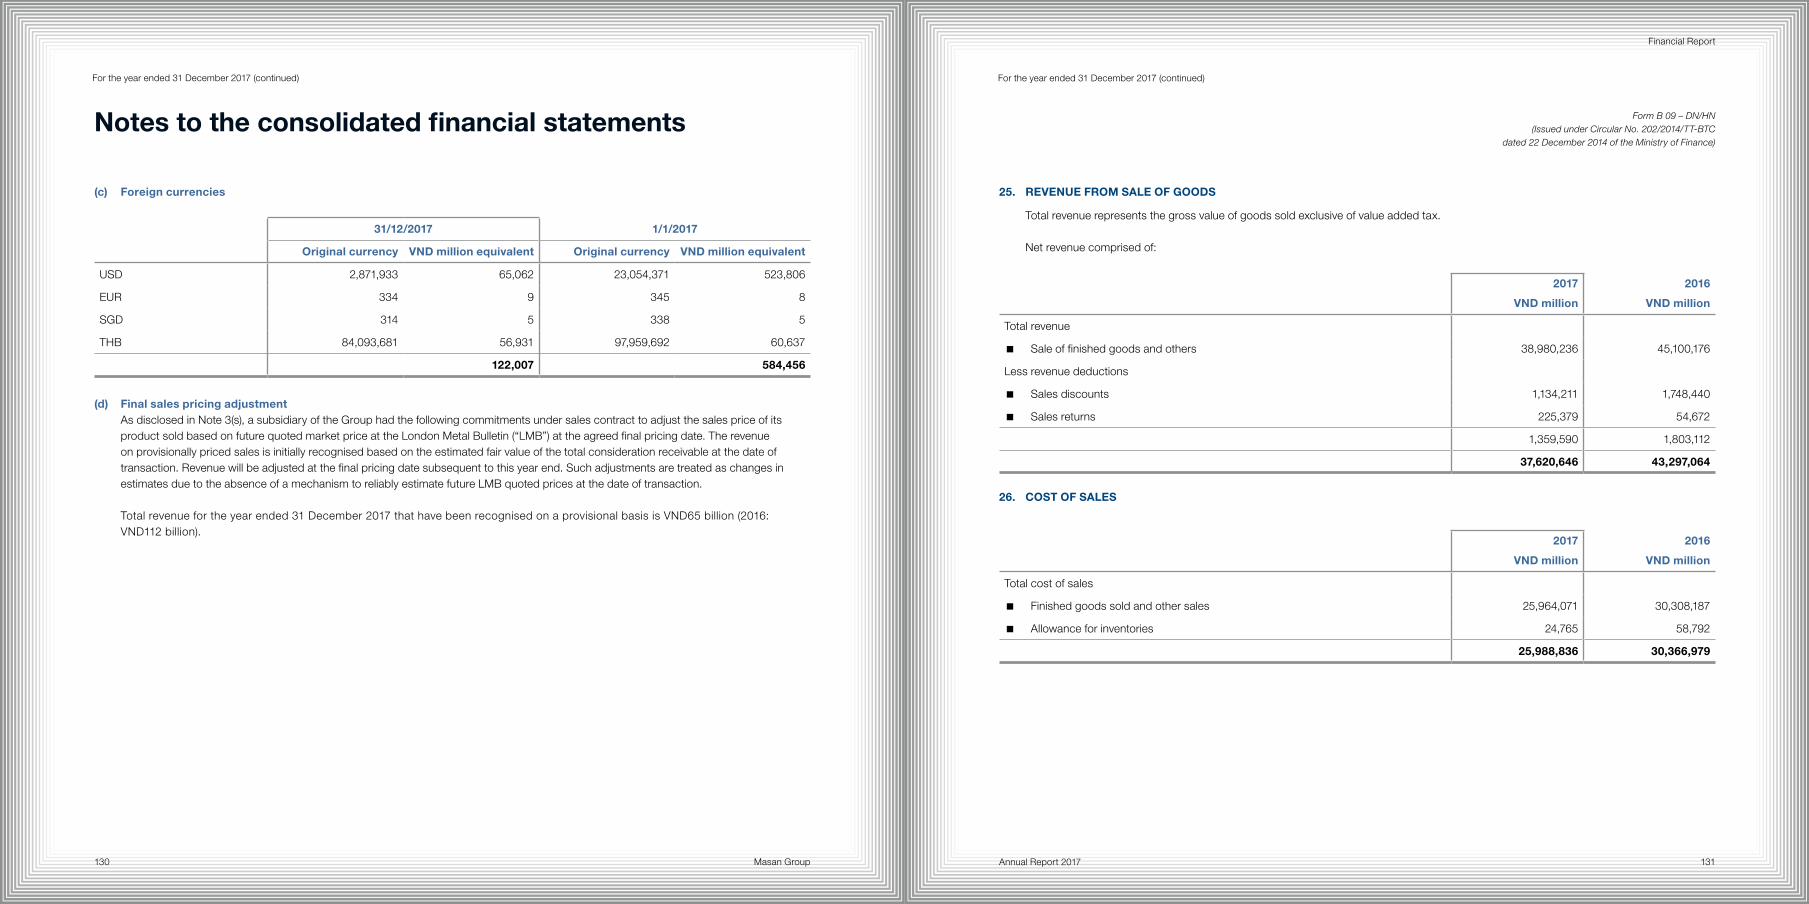
Masan Group130 131Annual Report 2017
Financial Report
For the year ended 31 December 2017 (continued)
(c) Foreign currencies
31/12/2017 1/1/2017
Original currency VND million equivalent Original currency VND million equivalent
USD 2,871,933 65,062 23,054,371 523,806
EUR 334 9 345 8
SGD 314 5 338 5
THB 84,093,681 56,931 97,959,692 60,637
122,007 584,456
(d) Final sales pricing adjustmentAs disclosed in Note 3(s), a subsidiary of the Group had the following commitments under sales contract to adjust the sales price of its product sold based on future quoted market price at the London Metal Bulletin (“LMB”) at the agreed final pricing date. The revenue on provisionally priced sales is initially recognised based on the estimated fair value of the total consideration receivable at the date of transaction. Revenue will be adjusted at the final pricing date subsequent to this year end. Such adjustments are treated as changes in estimates due to the absence of a mechanism to reliably estimate future LMB quoted prices at the date of transaction.
Total revenue for the year ended 31 December 2017 that have been recognised on a provisional basis is VND65 billion (2016: VND112 billion).
For the year ended 31 December 2017 (continued)
25. REVENUE FROM SALE OF GOODS
Total revenue represents the gross value of goods sold exclusive of value added tax.
Net revenue comprised of:
2017
VND million
2016
VND million
Total revenue
� Sale of finished goods and others 38,980,236 45,100,176
Less revenue deductions
� Sales discounts 1,134,211 1,748,440
� Sales returns 225,379 54,672
1,359,590 1,803,112
37,620,646 43,297,064
26. COST OF SALES
2017
VND million
2016
VND million
Total cost of sales
� Finished goods sold and other sales 25,964,071 30,308,187
� Allowance for inventories 24,765 58,792
25,988,836 30,366,979
Notes to the consolidated financial statements Form B 09 – DN/HN (Issued under Circular No. 202/2014/TT-BTC
dated 22 December 2014 of the Ministry of Finance)
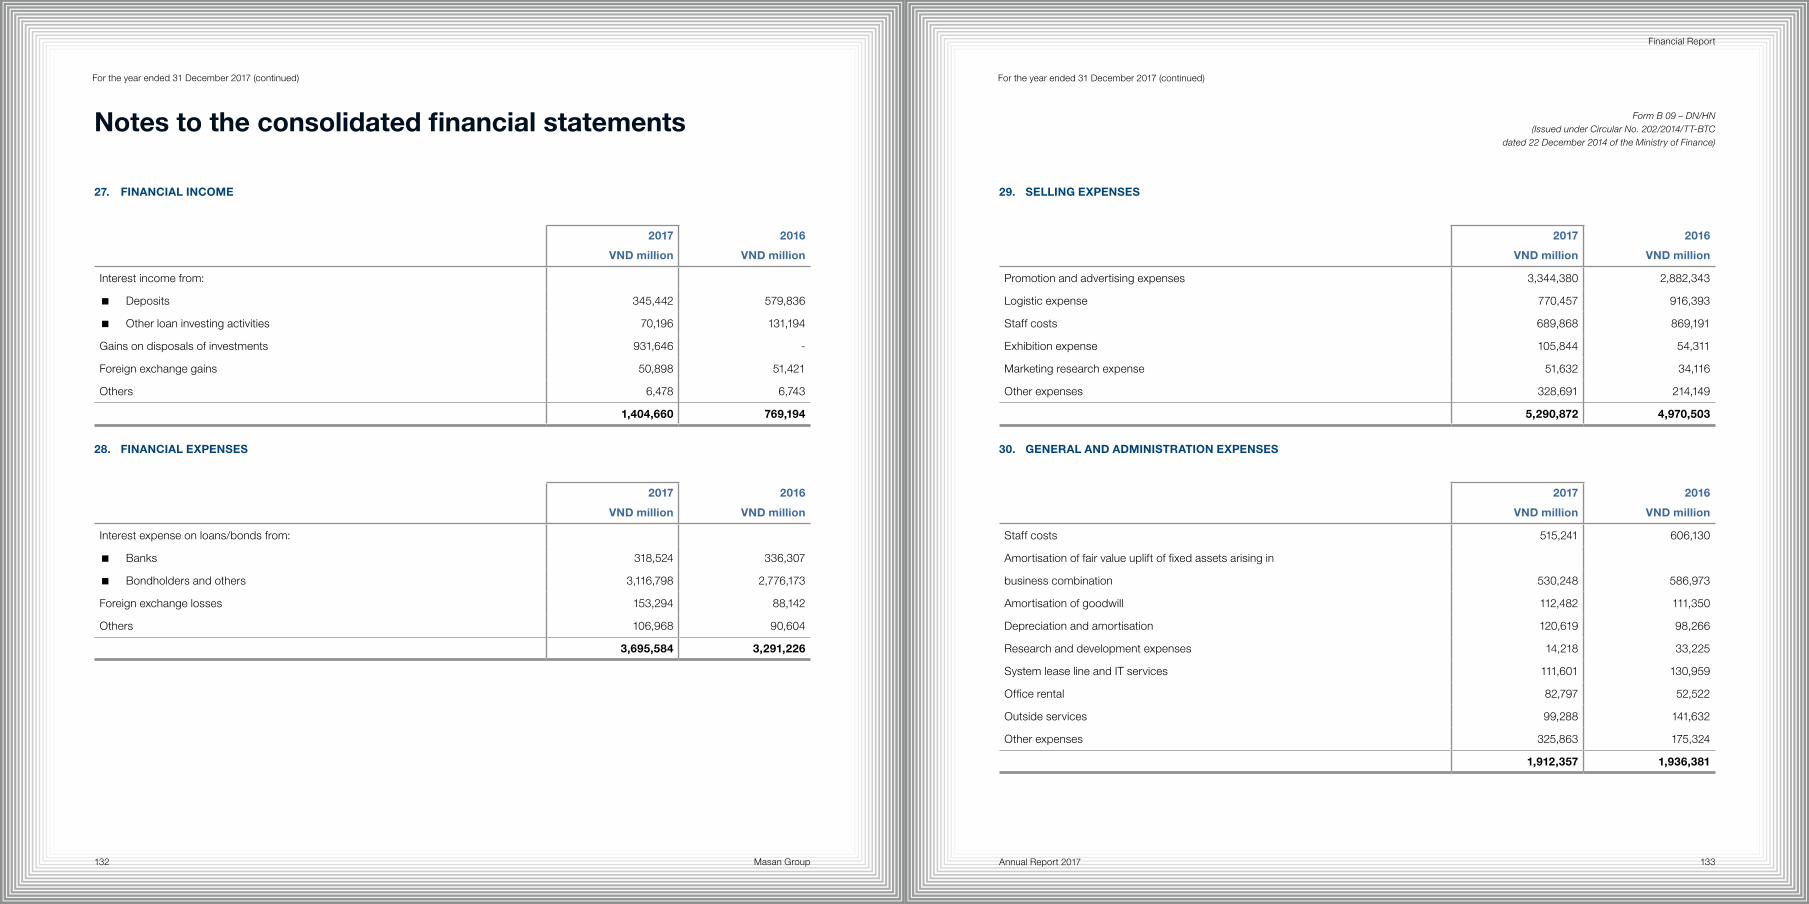
Masan Group132 133Annual Report 2017
Financial Report
For the year ended 31 December 2017 (continued)
27. FINANCIAL INCOME
2017
VND million
2016
VND million
Interest income from:
� Deposits 345,442 579,836
� Other loan investing activities 70,196 131,194
Gains on disposals of investments 931,646 -
Foreign exchange gains 50,898 51,421
Others 6,478 6,743
1,404,660 769,194
28. FINANCIAL EXPENSES
2017
VND million
2016
VND million
Interest expense on loans/bonds from:
� Banks 318,524 336,307
� Bondholders and others 3,116,798 2,776,173
Foreign exchange losses 153,294 88,142
Others 106,968 90,604
3,695,584 3,291,226
For the year ended 31 December 2017 (continued)
29. SELLING EXPENSES
2017
VND million
2016
VND million
Promotion and advertising expenses 3,344,380 2,882,343
Logistic expense 770,457 916,393
Staff costs 689,868 869,191
Exhibition expense 105,844 54,311
Marketing research expense 51,632 34,116
Other expenses 328,691 214,149
5,290,872 4,970,503
30. GENERAL AND ADMINISTRATION EXPENSES
2017
VND million
2016
VND million
Staff costs 515,241 606,130
Amortisation of fair value uplift of fixed assets arising in
business combination 530,248 586,973
Amortisation of goodwill 112,482 111,350
Depreciation and amortisation 120,619 98,266
Research and development expenses 14,218 33,225
System lease line and IT services 111,601 130,959
Office rental 82,797 52,522
Outside services 99,288 141,632
Other expenses 325,863 175,324
1,912,357 1,936,381
Notes to the consolidated financial statements Form B 09 – DN/HN (Issued under Circular No. 202/2014/TT-BTC
dated 22 December 2014 of the Ministry of Finance)
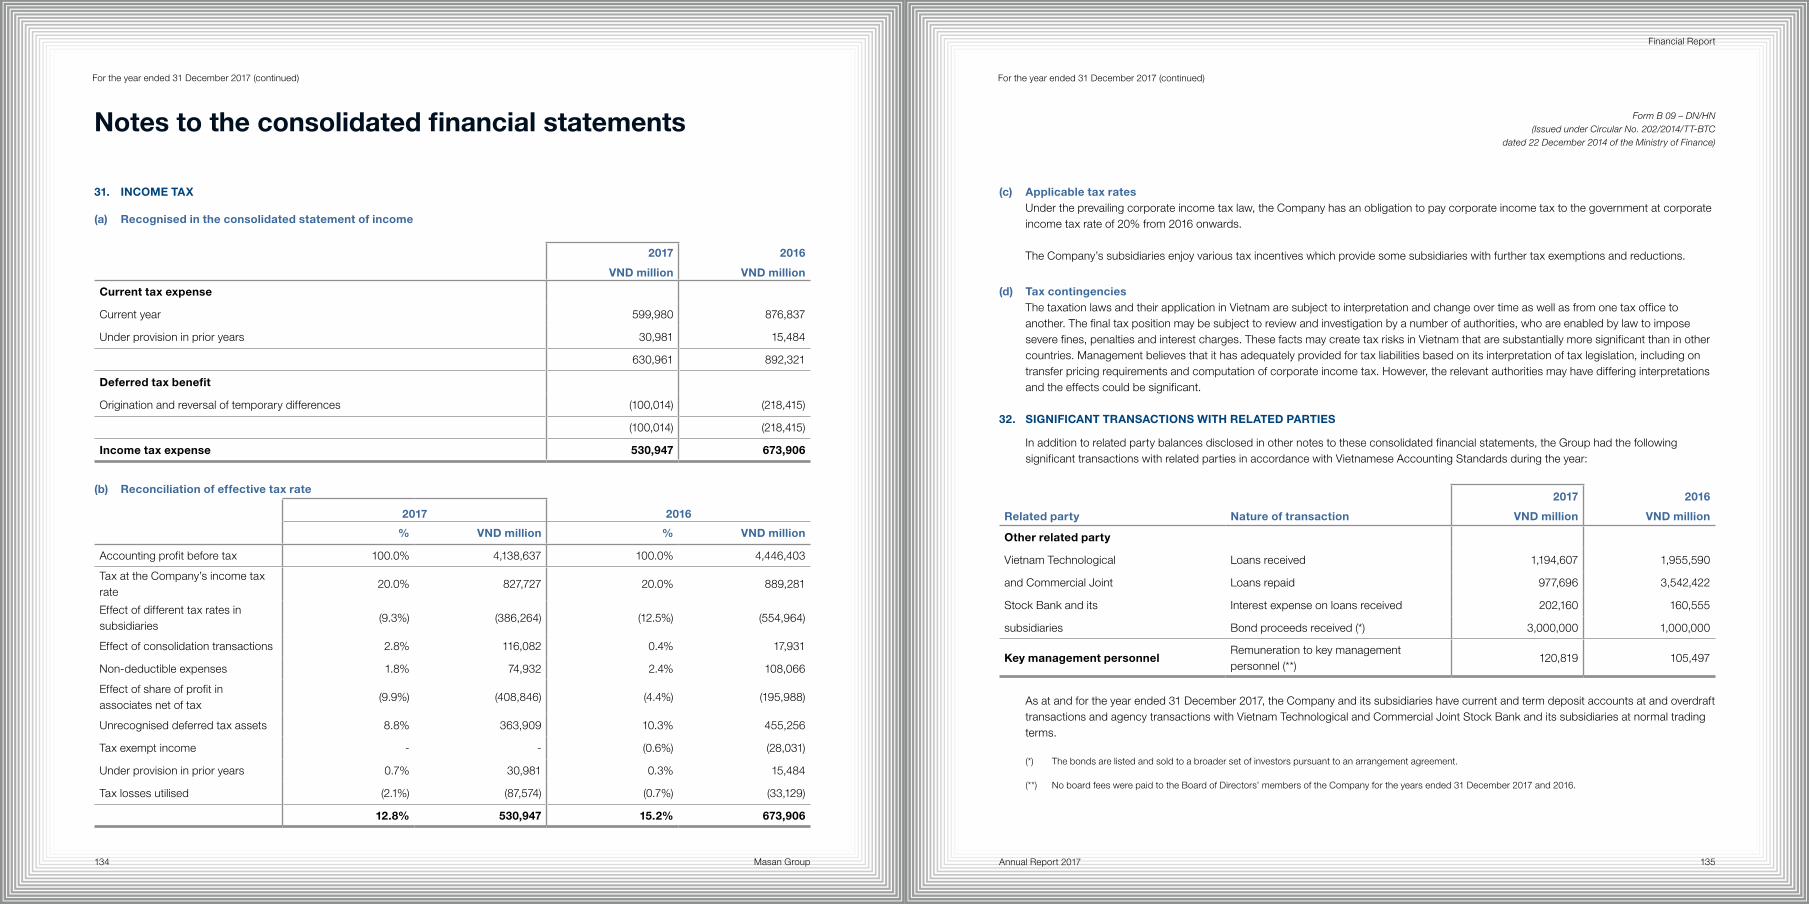
Masan Group134 135Annual Report 2017
Financial Report
For the year ended 31 December 2017 (continued)
31. INCOME TAX
(a) Recognised in the consolidated statement of income
2017
VND million
2016
VND million
Current tax expense
Current year 599,980 876,837
Under provision in prior years 30,981 15,484
630,961 892,321
Deferred tax benefit
Origination and reversal of temporary differences (100,014) (218,415)
(100,014) (218,415)
Income tax expense 530,947 673,906
(b) Reconciliation of effective tax rate
2017 2016
% VND million % VND million
Accounting profit before tax 100.0% 4,138,637 100.0% 4,446,403
Tax at the Company’s income tax rate
20.0% 827,727 20.0% 889,281
Effect of different tax rates in subsidiaries
(9.3%) (386,264) (12.5%) (554,964)
Effect of consolidation transactions 2.8% 116,082 0.4% 17,931
Non-deductible expenses 1.8% 74,932 2.4% 108,066
Effect of share of profit in associates net of tax
(9.9%) (408,846) (4.4%) (195,988)
Unrecognised deferred tax assets 8.8% 363,909 10.3% 455,256
Tax exempt income - - (0.6%) (28,031)
Under provision in prior years 0.7% 30,981 0.3% 15,484
Tax losses utilised (2.1%) (87,574) (0.7%) (33,129)
12.8% 530,947 15.2% 673,906
(c) Applicable tax ratesUnder the prevailing corporate income tax law, the Company has an obligation to pay corporate income tax to the government at corporate income tax rate of 20% from 2016 onwards.
The Company’s subsidiaries enjoy various tax incentives which provide some subsidiaries with further tax exemptions and reductions.
(d) Tax contingenciesThe taxation laws and their application in Vietnam are subject to interpretation and change over time as well as from one tax office to another. The final tax position may be subject to review and investigation by a number of authorities, who are enabled by law to impose severe fines, penalties and interest charges. These facts may create tax risks in Vietnam that are substantially more significant than in other countries. Management believes that it has adequately provided for tax liabilities based on its interpretation of tax legislation, including on transfer pricing requirements and computation of corporate income tax. However, the relevant authorities may have differing interpretations and the effects could be significant.
32. SIGNIFICANT TRANSACTIONS WITH RELATED PARTIES
In addition to related party balances disclosed in other notes to these consolidated financial statements, the Group had the following significant transactions with related parties in accordance with Vietnamese Accounting Standards during the year:
Related party Nature of transaction
2017
VND million
2016
VND million
Other related party
Vietnam Technological Loans received 1,194,607 1,955,590
and Commercial Joint Loans repaid 977,696 3,542,422
Stock Bank and its Interest expense on loans received 202,160 160,555
subsidiaries Bond proceeds received (*) 3,000,000 1,000,000
Key management personnelRemuneration to key management personnel (**)
120,819 105,497
As at and for the year ended 31 December 2017, the Company and its subsidiaries have current and term deposit accounts at and overdraft transactions and agency transactions with Vietnam Technological and Commercial Joint Stock Bank and its subsidiaries at normal trading terms.
(*) The bonds are listed and sold to a broader set of investors pursuant to an arrangement agreement.
(**) No board fees were paid to the Board of Directors’ members of the Company for the years ended 31 December 2017 and 2016.
For the year ended 31 December 2017 (continued)
Notes to the consolidated financial statements Form B 09 – DN/HN (Issued under Circular No. 202/2014/TT-BTC
dated 22 December 2014 of the Ministry of Finance)
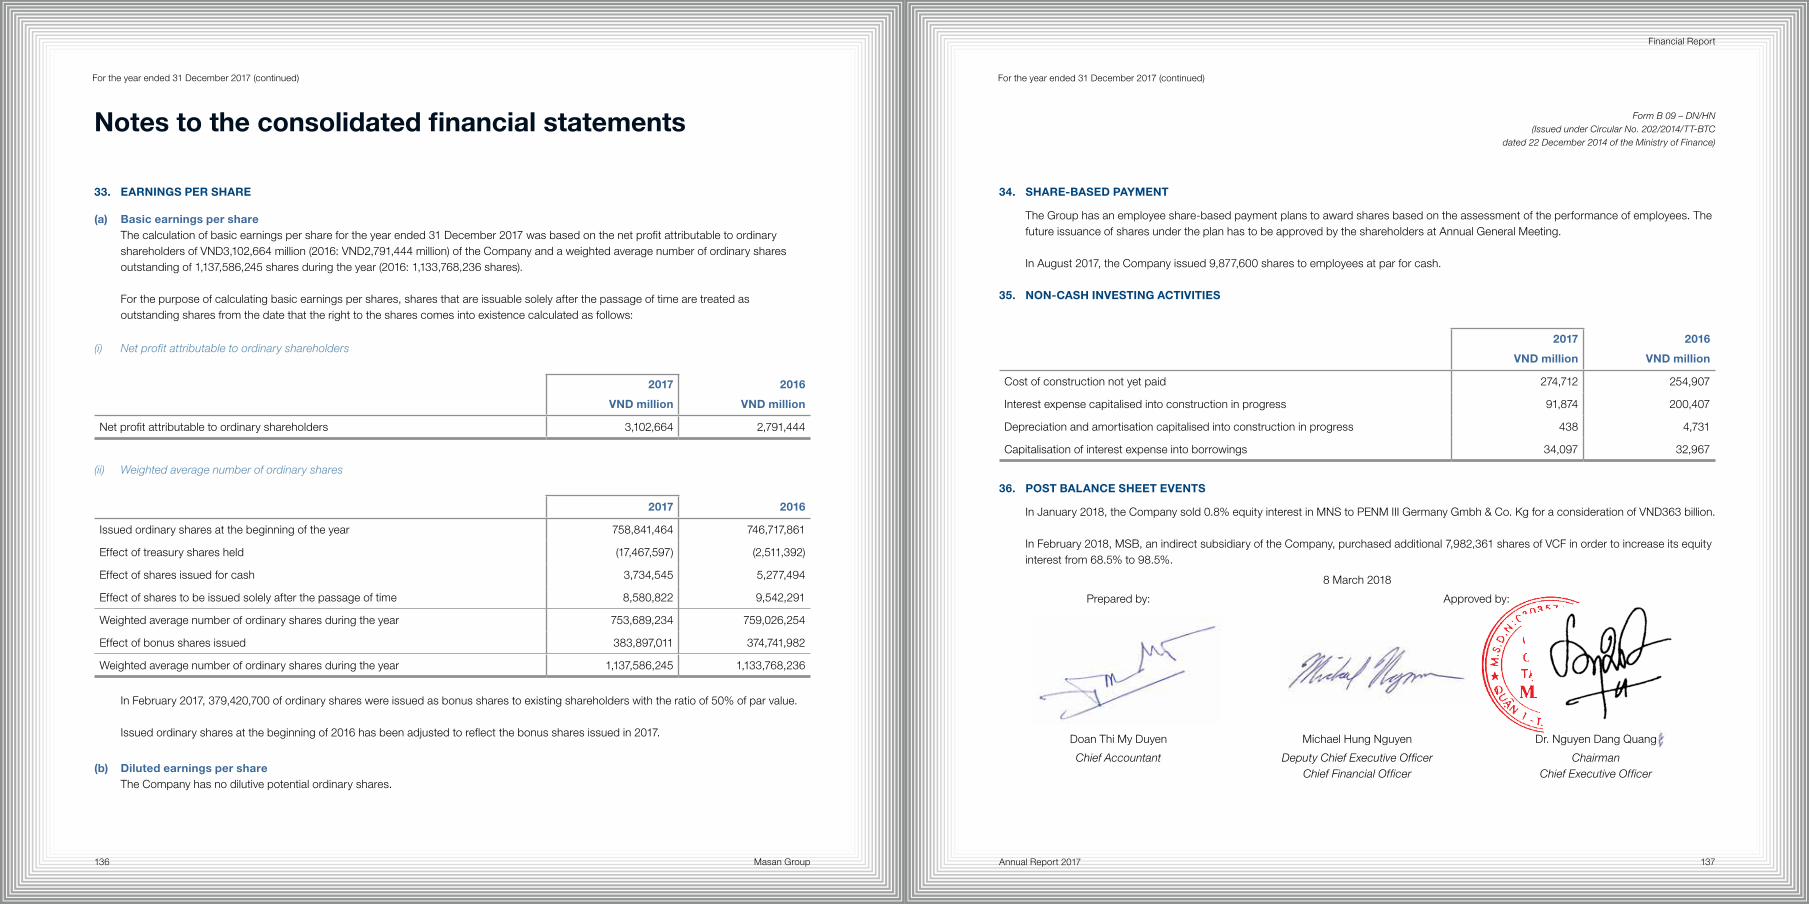
Masan Group136 137Annual Report 2017
Financial Report
For the year ended 31 December 2017 (continued)
33. EARNINGS PER SHARE
(a) Basic earnings per shareThe calculation of basic earnings per share for the year ended 31 December 2017 was based on the net profit attributable to ordinary shareholders of VND3,102,664 million (2016: VND2,791,444 million) of the Company and a weighted average number of ordinary shares outstanding of 1,137,586,245 shares during the year (2016: 1,133,768,236 shares).
For the purpose of calculating basic earnings per shares, shares that are issuable solely after the passage of time are treated as outstanding shares from the date that the right to the shares comes into existence calculated as follows:
(i) Net profit attributable to ordinary shareholders
2017
VND million
2016
VND million
Net profit attributable to ordinary shareholders 3,102,664 2,791,444
(ii) Weighted average number of ordinary shares
2017 2016
Issued ordinary shares at the beginning of the year 758,841,464 746,717,861
Effect of treasury shares held (17,467,597) (2,511,392)
Effect of shares issued for cash 3,734,545 5,277,494
Effect of shares to be issued solely after the passage of time 8,580,822 9,542,291
Weighted average number of ordinary shares during the year 753,689,234 759,026,254
Effect of bonus shares issued 383,897,011 374,741,982
Weighted average number of ordinary shares during the year 1,137,586,245 1,133,768,236
In February 2017, 379,420,700 of ordinary shares were issued as bonus shares to existing shareholders with the ratio of 50% of par value.
Issued ordinary shares at the beginning of 2016 has been adjusted to reflect the bonus shares issued in 2017.
(b) Diluted earnings per share The Company has no dilutive potential ordinary shares.
For the year ended 31 December 2017 (continued)
34. SHARE-BASED PAYMENT
The Group has an employee share-based payment plans to award shares based on the assessment of the performance of employees. The future issuance of shares under the plan has to be approved by the shareholders at Annual General Meeting.
In August 2017, the Company issued 9,877,600 shares to employees at par for cash.
35. NON-CASH INVESTING ACTIVITIES
2017
VND million
2016
VND million
Cost of construction not yet paid 274,712 254,907
Interest expense capitalised into construction in progress 91,874 200,407
Depreciation and amortisation capitalised into construction in progress 438 4,731
Capitalisation of interest expense into borrowings 34,097 32,967
36. POST BALANCE SHEET EVENTS
In January 2018, the Company sold 0.8% equity interest in MNS to PENM III Germany Gmbh & Co. Kg for a consideration of VND363 billion.
In February 2018, MSB, an indirect subsidiary of the Company, purchased additional 7,982,361 shares of VCF in order to increase its equity interest from 68.5% to 98.5%.
Notes to the consolidated financial statements Form B 09 – DN/HN (Issued under Circular No. 202/2014/TT-BTC
dated 22 December 2014 of the Ministry of Finance)
8 March 2018
Prepared by: Approved by:
Doan Thi My Duyen Michael Hung Nguyen Dr. Nguyen Dang Quang
Chief Accountant Deputy Chief Executive OfficerChief Financial Officer
ChairmanChief Executive Officer

GeneralCorporateInformation
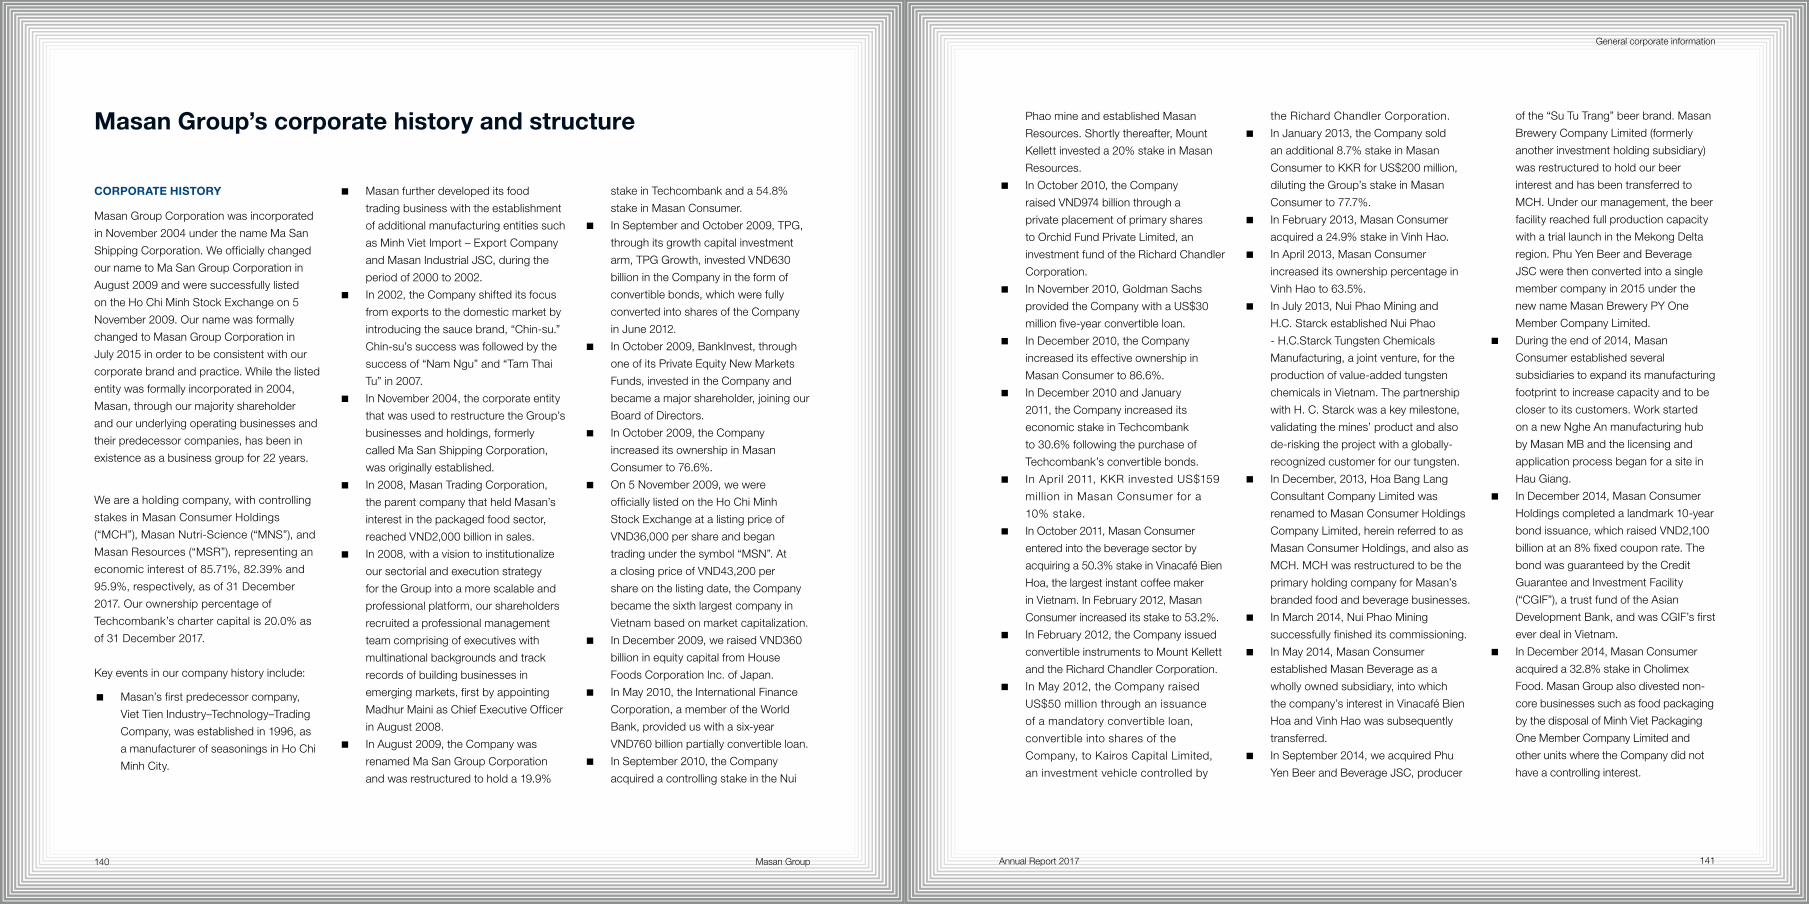
Masan Group Annual Report 2017 141140
General corporate information
Masan Group’s corporate history and structure
CORPORATE HISTORY
Masan Group Corporation was incorporated
in November 2004 under the name Ma San
Shipping Corporation. We officially changed
our name to Ma San Group Corporation in
August 2009 and were successfully listed
on the Ho Chi Minh Stock Exchange on 5
November 2009. Our name was formally
changed to Masan Group Corporation in
July 2015 in order to be consistent with our
corporate brand and practice. While the listed
entity was formally incorporated in 2004,
Masan, through our majority shareholder
and our underlying operating businesses and
their predecessor companies, has been in
existence as a business group for 22 years.
We are a holding company, with controlling
stakes in Masan Consumer Holdings
(“MCH”), Masan Nutri-Science (“MNS”), and
Masan Resources (“MSR”), representing an
economic interest of 85.71%, 82.39% and
95.9%, respectively, as of 31 December
2017. Our ownership percentage of
Techcombank’s charter capital is 20.0% as
of 31 December 2017.
Key events in our company history include:
� Masan’s first predecessor company,
Viet Tien Industry–Technology–Trading
Company, was established in 1996, as
a manufacturer of seasonings in Ho Chi
Minh City.
� Masan further developed its food
trading business with the establishment
of additional manufacturing entities such
as Minh Viet Import – Export Company
and Masan Industrial JSC, during the
period of 2000 to 2002.
� In 2002, the Company shifted its focus
from exports to the domestic market by
introducing the sauce brand, “Chin-su.”
Chin-su’s success was followed by the
success of “Nam Ngu” and “Tam Thai
Tu” in 2007.
� In November 2004, the corporate entity
that was used to restructure the Group’s
businesses and holdings, formerly
called Ma San Shipping Corporation,
was originally established.
� In 2008, Masan Trading Corporation,
the parent company that held Masan’s
interest in the packaged food sector,
reached VND2,000 billion in sales.
� In 2008, with a vision to institutionalize
our sectorial and execution strategy
for the Group into a more scalable and
professional platform, our shareholders
recruited a professional management
team comprising of executives with
multinational backgrounds and track
records of building businesses in
emerging markets, first by appointing
Madhur Maini as Chief Executive Officer
in August 2008.
� In August 2009, the Company was
renamed Ma San Group Corporation
and was restructured to hold a 19.9%
stake in Techcombank and a 54.8%
stake in Masan Consumer.
� In September and October 2009, TPG,
through its growth capital investment
arm, TPG Growth, invested VND630
billion in the Company in the form of
convertible bonds, which were fully
converted into shares of the Company
in June 2012.
� In October 2009, BankInvest, through
one of its Private Equity New Markets
Funds, invested in the Company and
became a major shareholder, joining our
Board of Directors.
� In October 2009, the Company
increased its ownership in Masan
Consumer to 76.6%.
� On 5 November 2009, we were
officially listed on the Ho Chi Minh
Stock Exchange at a listing price of
VND36,000 per share and began
trading under the symbol “MSN”. At
a closing price of VND43,200 per
share on the listing date, the Company
became the sixth largest company in
Vietnam based on market capitalization.
� In December 2009, we raised VND360
billion in equity capital from House
Foods Corporation Inc. of Japan.
� In May 2010, the International Finance
Corporation, a member of the World
Bank, provided us with a six-year
VND760 billion partially convertible loan.
� In September 2010, the Company
acquired a controlling stake in the Nui
Phao mine and established Masan
Resources. Shortly thereafter, Mount
Kellett invested a 20% stake in Masan
Resources.
� In October 2010, the Company
raised VND974 billion through a
private placement of primary shares
to Orchid Fund Private Limited, an
investment fund of the Richard Chandler
Corporation.
� In November 2010, Goldman Sachs
provided the Company with a US$30
million five-year convertible loan.
� In December 2010, the Company
increased its effective ownership in
Masan Consumer to 86.6%.
� In December 2010 and January
2011, the Company increased its
economic stake in Techcombank
to 30.6% following the purchase of
Techcombank’s convertible bonds.
� In April 2011, KKR invested US$159
million in Masan Consumer for a
10% stake.
� In October 2011, Masan Consumer
entered into the beverage sector by
acquiring a 50.3% stake in Vinacafé Bien
Hoa, the largest instant coffee maker
in Vietnam. In February 2012, Masan
Consumer increased its stake to 53.2%.
� In February 2012, the Company issued
convertible instruments to Mount Kellett
and the Richard Chandler Corporation.
� In May 2012, the Company raised
US$50 million through an issuance
of a mandatory convertible loan,
convertible into shares of the
Company, to Kairos Capital Limited,
an investment vehicle controlled by
the Richard Chandler Corporation.
� In January 2013, the Company sold
an additional 8.7% stake in Masan
Consumer to KKR for US$200 million,
diluting the Group’s stake in Masan
Consumer to 77.7%.
� In February 2013, Masan Consumer
acquired a 24.9% stake in Vinh Hao.
� In April 2013, Masan Consumer
increased its ownership percentage in
Vinh Hao to 63.5%.
� In July 2013, Nui Phao Mining and
H.C. Starck established Nui Phao
- H.C.Starck Tungsten Chemicals
Manufacturing, a joint venture, for the
production of value-added tungsten
chemicals in Vietnam. The partnership
with H. C. Starck was a key milestone,
validating the mines’ product and also
de-risking the project with a globally-
recognized customer for our tungsten.
� In December, 2013, Hoa Bang Lang
Consultant Company Limited was
renamed to Masan Consumer Holdings
Company Limited, herein referred to as
Masan Consumer Holdings, and also as
MCH. MCH was restructured to be the
primary holding company for Masan’s
branded food and beverage businesses.
� In March 2014, Nui Phao Mining
successfully finished its commissioning.
� In May 2014, Masan Consumer
established Masan Beverage as a
wholly owned subsidiary, into which
the company’s interest in Vinacafé Bien
Hoa and Vinh Hao was subsequently
transferred.
� In September 2014, we acquired Phu
Yen Beer and Beverage JSC, producer
of the “Su Tu Trang” beer brand. Masan
Brewery Company Limited (formerly
another investment holding subsidiary)
was restructured to hold our beer
interest and has been transferred to
MCH. Under our management, the beer
facility reached full production capacity
with a trial launch in the Mekong Delta
region. Phu Yen Beer and Beverage
JSC were then converted into a single
member company in 2015 under the
new name Masan Brewery PY One
Member Company Limited.
� During the end of 2014, Masan
Consumer established several
subsidiaries to expand its manufacturing
footprint to increase capacity and to be
closer to its customers. Work started
on a new Nghe An manufacturing hub
by Masan MB and the licensing and
application process began for a site in
Hau Giang.
� In December 2014, Masan Consumer
Holdings completed a landmark 10-year
bond issuance, which raised VND2,100
billion at an 8% fixed coupon rate. The
bond was guaranteed by the Credit
Guarantee and Investment Facility
(“CGIF”), a trust fund of the Asian
Development Bank, and was CGIF’s first
ever deal in Vietnam.
� In December 2014, Masan Consumer
acquired a 32.8% stake in Cholimex
Food. Masan Group also divested non-
core businesses such as food packaging
by the disposal of Minh Viet Packaging
One Member Company Limited and
other units where the Company did not
have a controlling interest.
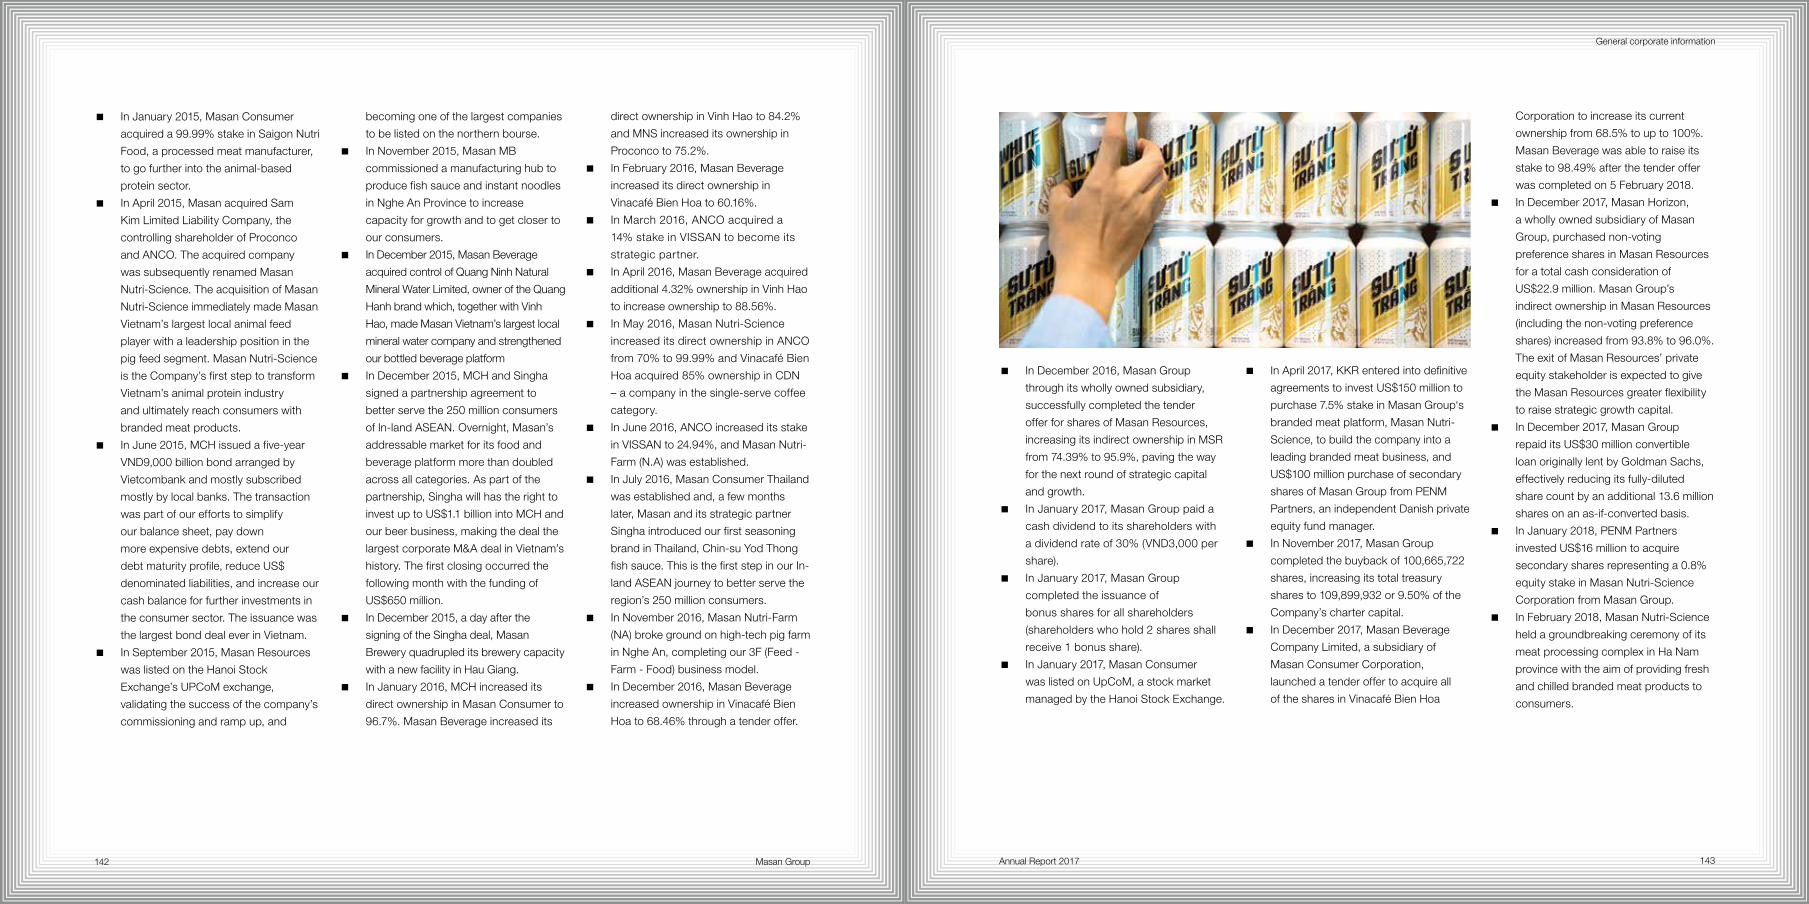
Masan Group Annual Report 2017 143142
General corporate information
� In January 2015, Masan Consumer
acquired a 99.99% stake in Saigon Nutri
Food, a processed meat manufacturer,
to go further into the animal-based
protein sector.
� In April 2015, Masan acquired Sam
Kim Limited Liability Company, the
controlling shareholder of Proconco
and ANCO. The acquired company
was subsequently renamed Masan
Nutri-Science. The acquisition of Masan
Nutri-Science immediately made Masan
Vietnam’s largest local animal feed
player with a leadership position in the
pig feed segment. Masan Nutri-Science
is the Company’s first step to transform
Vietnam’s animal protein industry
and ultimately reach consumers with
branded meat products.
� In June 2015, MCH issued a five-year
VND9,000 billion bond arranged by
Vietcombank and mostly subscribed
mostly by local banks. The transaction
was part of our efforts to simplify
our balance sheet, pay down
more expensive debts, extend our
debt maturity profile, reduce US$
denominated liabilities, and increase our
cash balance for further investments in
the consumer sector. The issuance was
the largest bond deal ever in Vietnam.
� In September 2015, Masan Resources
was listed on the Hanoi Stock
Exchange’s UPCoM exchange,
validating the success of the company’s
commissioning and ramp up, and
becoming one of the largest companies
to be listed on the northern bourse.
� In November 2015, Masan MB
commissioned a manufacturing hub to
produce fish sauce and instant noodles
in Nghe An Province to increase
capacity for growth and to get closer to
our consumers.
� In December 2015, Masan Beverage
acquired control of Quang Ninh Natural
Mineral Water Limited, owner of the Quang
Hanh brand which, together with Vinh
Hao, made Masan Vietnam’s largest local
mineral water company and strengthened
our bottled beverage platform
� In December 2015, MCH and Singha
signed a partnership agreement to
better serve the 250 million consumers
of In-land ASEAN. Overnight, Masan’s
addressable market for its food and
beverage platform more than doubled
across all categories. As part of the
partnership, Singha will has the right to
invest up to US$1.1 billion into MCH and
our beer business, making the deal the
largest corporate M&A deal in Vietnam’s
history. The first closing occurred the
following month with the funding of
US$650 million.
� In December 2015, a day after the
signing of the Singha deal, Masan
Brewery quadrupled its brewery capacity
with a new facility in Hau Giang.
� In January 2016, MCH increased its
direct ownership in Masan Consumer to
96.7%. Masan Beverage increased its
direct ownership in Vinh Hao to 84.2%
and MNS increased its ownership in
Proconco to 75.2%.
� In February 2016, Masan Beverage
increased its direct ownership in
Vinacafé Bien Hoa to 60.16%.
� In March 2016, ANCO acquired a
14% stake in VISSAN to become its
strategic partner.
� In April 2016, Masan Beverage acquired
additional 4.32% ownership in Vinh Hao
to increase ownership to 88.56%.
� In May 2016, Masan Nutri-Science
increased its direct ownership in ANCO
from 70% to 99.99% and Vinacafé Bien
Hoa acquired 85% ownership in CDN
– a company in the single-serve coffee
category.
� In June 2016, ANCO increased its stake
in VISSAN to 24.94%, and Masan Nutri-
Farm (N.A) was established.
� In July 2016, Masan Consumer Thailand
was established and, a few months
later, Masan and its strategic partner
Singha introduced our first seasoning
brand in Thailand, Chin-su Yod Thong
fish sauce. This is the first step in our In-
land ASEAN journey to better serve the
region’s 250 million consumers.
� In November 2016, Masan Nutri-Farm
(NA) broke ground on high-tech pig farm
in Nghe An, completing our 3F (Feed -
Farm - Food) business model.
� In December 2016, Masan Beverage
increased ownership in Vinacafé Bien
Hoa to 68.46% through a tender offer.
� In December 2016, Masan Group
through its wholly owned subsidiary,
successfully completed the tender
offer for shares of Masan Resources,
increasing its indirect ownership in MSR
from 74.39% to 95.9%, paving the way
for the next round of strategic capital
and growth.
� In January 2017, Masan Group paid a
cash dividend to its shareholders with
a dividend rate of 30% (VND3,000 per
share).
� In January 2017, Masan Group
completed the issuance of
bonus shares for all shareholders
(shareholders who hold 2 shares shall
receive 1 bonus share).
� In January 2017, Masan Consumer
was listed on UpCoM, a stock market
managed by the Hanoi Stock Exchange.
� In April 2017, KKR entered into definitive
agreements to invest US$150 million to
purchase 7.5% stake in Masan Group‘s
branded meat platform, Masan Nutri-
Science, to build the company into a
leading branded meat business, and
US$100 million purchase of secondary
shares of Masan Group from PENM
Partners, an independent Danish private
equity fund manager.
� In November 2017, Masan Group
completed the buyback of 100,665,722
shares, increasing its total treasury
shares to 109,899,932 or 9.50% of the
Company’s charter capital.
� In December 2017, Masan Beverage
Company Limited, a subsidiary of
Masan Consumer Corporation,
launched a tender offer to acquire all
of the shares in Vinacafé Bien Hoa
Corporation to increase its current
ownership from 68.5% to up to 100%.
Masan Beverage was able to raise its
stake to 98.49% after the tender offer
was completed on 5 February 2018.
� In December 2017, Masan Horizon,
a wholly owned subsidiary of Masan
Group, purchased non-voting
preference shares in Masan Resources
for a total cash consideration of
US$22.9 million. Masan Group’s
indirect ownership in Masan Resources
(including the non-voting preference
shares) increased from 93.8% to 96.0%.
The exit of Masan Resources’ private
equity stakeholder is expected to give
the Masan Resources greater flexibility
to raise strategic growth capital.
� In December 2017, Masan Group
repaid its US$30 million convertible
loan originally lent by Goldman Sachs,
effectively reducing its fully-diluted
share count by an additional 13.6 million
shares on an as-if-converted basis.
� In January 2018, PENM Partners
invested US$16 million to acquire
secondary shares representing a 0.8%
equity stake in Masan Nutri-Science
Corporation from Masan Group.
� In February 2018, Masan Nutri-Science
held a groundbreaking ceremony of its
meat processing complex in Ha Nam
province with the aim of providing fresh
and chilled branded meat products to
consumers.
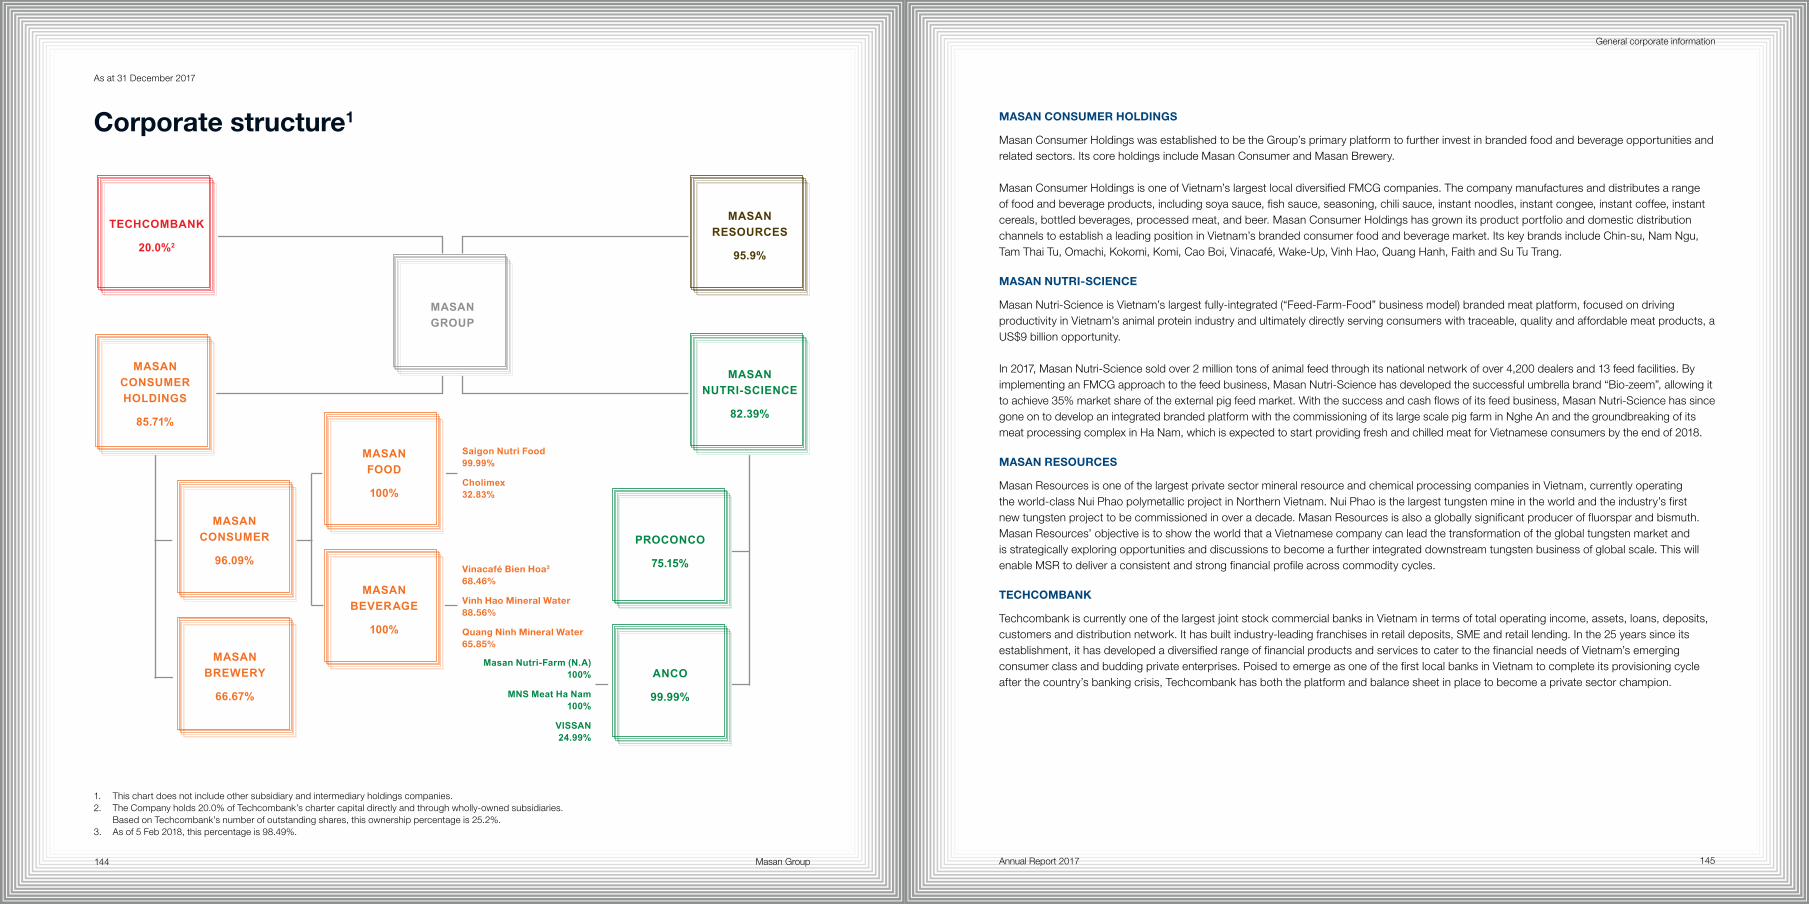
Masan Group Annual Report 2017 145144
General corporate information
MASAN CONSUMER HOLDINGS
Masan Consumer Holdings was established to be the Group’s primary platform to further invest in branded food and beverage opportunities and related sectors. Its core holdings include Masan Consumer and Masan Brewery.
Masan Consumer Holdings is one of Vietnam’s largest local diversified FMCG companies. The company manufactures and distributes a range of food and beverage products, including soya sauce, fish sauce, seasoning, chili sauce, instant noodles, instant congee, instant coffee, instant cereals, bottled beverages, processed meat, and beer. Masan Consumer Holdings has grown its product portfolio and domestic distribution channels to establish a leading position in Vietnam’s branded consumer food and beverage market. Its key brands include Chin-su, Nam Ngu, Tam Thai Tu, Omachi, Kokomi, Komi, Cao Boi, Vinacafé, Wake-Up, Vinh Hao, Quang Hanh, Faith and Su Tu Trang.
MASAN NUTRI-SCIENCE
Masan Nutri-Science is Vietnam’s largest fully-integrated (“Feed-Farm-Food” business model) branded meat platform, focused on driving productivity in Vietnam’s animal protein industry and ultimately directly serving consumers with traceable, quality and affordable meat products, a US$9 billion opportunity.
In 2017, Masan Nutri-Science sold over 2 million tons of animal feed through its national network of over 4,200 dealers and 13 feed facilities. By implementing an FMCG approach to the feed business, Masan Nutri-Science has developed the successful umbrella brand “Bio-zeem”, allowing it to achieve 35% market share of the external pig feed market. With the success and cash flows of its feed business, Masan Nutri-Science has since gone on to develop an integrated branded platform with the commissioning of its large scale pig farm in Nghe An and the groundbreaking of its meat processing complex in Ha Nam, which is expected to start providing fresh and chilled meat for Vietnamese consumers by the end of 2018.
MASAN RESOURCES
Masan Resources is one of the largest private sector mineral resource and chemical processing companies in Vietnam, currently operating the world-class Nui Phao polymetallic project in Northern Vietnam. Nui Phao is the largest tungsten mine in the world and the industry’s first new tungsten project to be commissioned in over a decade. Masan Resources is also a globally significant producer of fluorspar and bismuth. Masan Resources’ objective is to show the world that a Vietnamese company can lead the transformation of the global tungsten market and is strategically exploring opportunities and discussions to become a further integrated downstream tungsten business of global scale. This will enable MSR to deliver a consistent and strong financial profile across commodity cycles.
TECHCOMBANK
Techcombank is currently one of the largest joint stock commercial banks in Vietnam in terms of total operating income, assets, loans, deposits, customers and distribution network. It has built industry-leading franchises in retail deposits, SME and retail lending. In the 25 years since its establishment, it has developed a diversified range of financial products and services to cater to the financial needs of Vietnam’s emerging consumer class and budding private enterprises. Poised to emerge as one of the first local banks in Vietnam to complete its provisioning cycle after the country’s banking crisis, Techcombank has both the platform and balance sheet in place to become a private sector champion.
Vinacafé Bien Hoa3 68.46%
Vinh Hao Mineral Water 88.56%
Quang Ninh Mineral Water 65.85%
1. This chart does not include other subsidiary and intermediary holdings companies. 2. The Company holds 20.0% of Techcombank’s charter capital directly and through wholly-owned subsidiaries.
Based on Techcombank’s number of outstanding shares, this ownership percentage is 25.2%.3. As of 5 Feb 2018, this percentage is 98.49%.
As at 31 December 2017
Corporate structure1
PROCONCO
75.15%
ANCO
99.99%
Saigon Nutri Food 99.99%
Cholimex 32.83%
Masan Nutri-Farm (N.A) 100%
MNS Meat Ha Nam 100%
VISSAN 24.99%
MASAN CONSUMER HOLDINGS
85.71%
MASAN GROUP
MASAN RESOURCES
95.9%
MASAN NUTRI-SCIENCE
82.39%
MASAN CONSUMER
96.09%
MASAN BREWERY
66.67%
MASAN BEVERAGE
100%
MASAN FOOD
100%
TECHCOMBANK
20.0%2
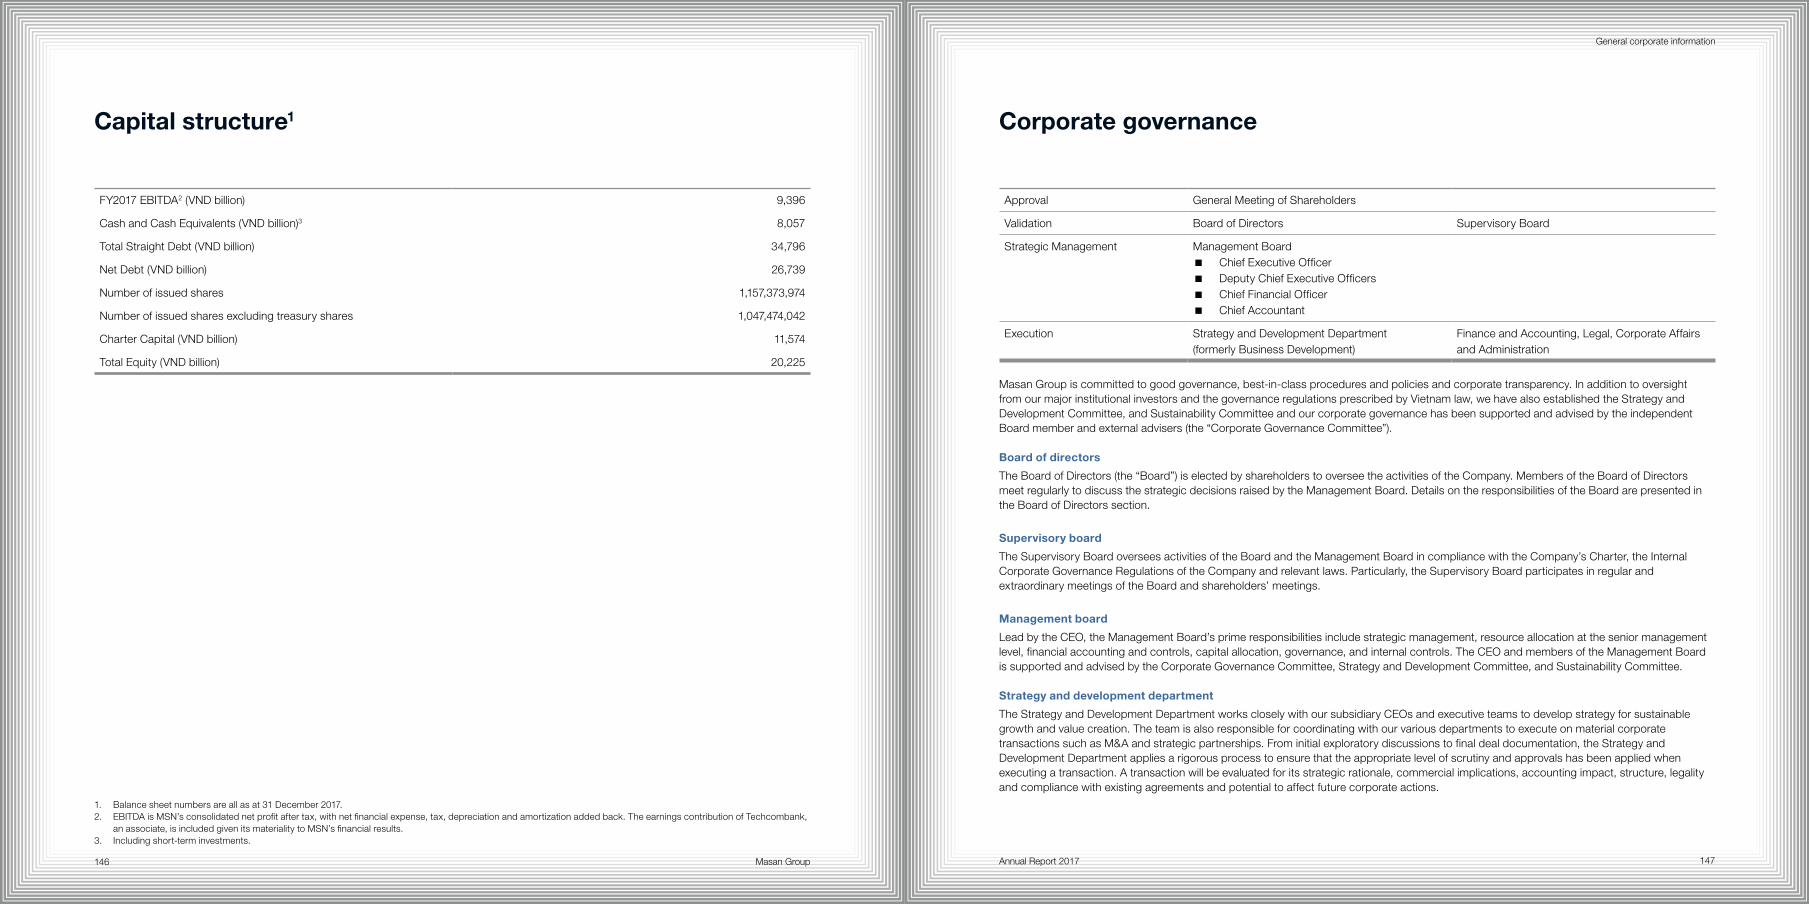
Masan Group Annual Report 2017 147146
General corporate information
FY2017 EBITDA2 (VND billion) 9,396
Cash and Cash Equivalents (VND billion)3 8,057
Total Straight Debt (VND billion) 34,796
Net Debt (VND billion) 26,739
Number of issued shares 1,157,373,974
Number of issued shares excluding treasury shares 1,047,474,042
Charter Capital (VND billion) 11,574
Total Equity (VND billion) 20,225
Approval General Meeting of Shareholders
Validation Board of Directors Supervisory Board
Strategic Management Management Board � Chief Executive Officer � Deputy Chief Executive Officers � Chief Financial Officer � Chief Accountant
Execution Strategy and Development Department (formerly Business Development)
Finance and Accounting, Legal, Corporate Affairs and Administration
Masan Group is committed to good governance, best-in-class procedures and policies and corporate transparency. In addition to oversight from our major institutional investors and the governance regulations prescribed by Vietnam law, we have also established the Strategy and Development Committee, and Sustainability Committee and our corporate governance has been supported and advised by the independent Board member and external advisers (the “Corporate Governance Committee”).
Board of directors
The Board of Directors (the “Board”) is elected by shareholders to oversee the activities of the Company. Members of the Board of Directors meet regularly to discuss the strategic decisions raised by the Management Board. Details on the responsibilities of the Board are presented in the Board of Directors section.
Supervisory board
The Supervisory Board oversees activities of the Board and the Management Board in compliance with the Company’s Charter, the Internal Corporate Governance Regulations of the Company and relevant laws. Particularly, the Supervisory Board participates in regular and extraordinary meetings of the Board and shareholders’ meetings.
Management board
Lead by the CEO, the Management Board’s prime responsibilities include strategic management, resource allocation at the senior management level, financial accounting and controls, capital allocation, governance, and internal controls. The CEO and members of the Management Board is supported and advised by the Corporate Governance Committee, Strategy and Development Committee, and Sustainability Committee.
Strategy and development department
The Strategy and Development Department works closely with our subsidiary CEOs and executive teams to develop strategy for sustainable growth and value creation. The team is also responsible for coordinating with our various departments to execute on material corporate transactions such as M&A and strategic partnerships. From initial exploratory discussions to final deal documentation, the Strategy and Development Department applies a rigorous process to ensure that the appropriate level of scrutiny and approvals has been applied when executing a transaction. A transaction will be evaluated for its strategic rationale, commercial implications, accounting impact, structure, legality and compliance with existing agreements and potential to affect future corporate actions.
1. Balance sheet numbers are all as at 31 December 2017.2. EBITDA is MSN’s consolidated net profit after tax, with net financial expense, tax, depreciation and amortization added back. The earnings contribution of Techcombank,
an associate, is included given its materiality to MSN’s financial results.3. Including short-term investments.
Capital structure1 Corporate governance
Masan Group Annual Report 2017 149148
General corporate information
Finance & accounting, legal, corporate affairs and administration
Finance & Accounting, Legal, Corporate Affairs and Administration are departments responsible for financial reporting, legal and regulatory compliance, corporate brand building and external relations and managing the administrative functions of the Company. Senior professionals from the Finance & Accounting, Legal and Coporate Affairs play pivotal roles in transaction execution and post-deal follow up.
BOARD OF DIRECTORS
Board responsibility and delegation of authority
The Board of Directors has two executive members and four non-executive members. The Board of Directors is chaired by the Chairman, who is also the Chief Executive Officer. The roles of the Chairman and Chief Executive Officer are separate.
Members of the Board of Directors include:
� Dr. Nguyen Dang Quang, Chairman
Dr. Nguyen Dang Quang is the Chairman and CEO of Masan Group. In addition, he is the Chairman of Masan Corporation, a board member of Masan Consumer and Masan Resources, Chairman of the Members’ Council of Nui Phao Mining Company and First Vice Chairman of the Board at Techcombank.
Dr. Quang has been highly instrumental in the establishment and development of many of our businesses and subsidiary companies. He is a visionary who has professionalized Masan Group at an early stage of development while still keeping our Vietnamese culture and values intact.
Dr. Quang has a Doctorate in Technical Sciences from the National Academy of Sciences of Belarus and a Master’s degree in Administration and Business Management from the Plekhanov Russian Economic University.
� Mr. Ho Hung Anh, Vice Chairman
Mr. Ho Hung Anh is Vice Chairman of Masan Group’s Board of Directors. He also serves as the Chairman of Techcombank and Techcom Capital’s Members’ Council, Vice Chairman of Masan Corporation, board member of Masan Consumer Corporation and is a member of the Members’ Council of Techcom Securities. Hung Anh has contributed to the early stages of Masan Group’s development and provides strategic guidance. He devotes his time to leading Techcombank, an associate of Masan Group, to become Vietnam’s leading private sector bank.
Mr. Ho Hung Anh holds a Bachelor’s degree in Electronics from the Kiev Polytechnic Institute.
� Mr. Nguyen Thieu Nam, Member
Mr. Nguyen Thieu Nam is Deputy CEO and member of the Board of Directors. He has previously held senior executive roles at our subsidiary and affiliated companies such as Masan Consumer and Techcombank. He also serves as Chairman of Masan Property Corporation, Quang Ninh Mineral Water, board member of Masan Corporation, Baltic Titan Corporation, Masan Resources and member of Masan Brewery’s Members’ Council.
At Masan Group, he manages the relationships with key partners and leads local execution. He was instrumental in accelerating the compensation and resettlement efforts of the Nui Phao project, advancing the land acquisition process to 91% of the land required immediately for the project by June 2011, as opposed to only 2% before acquisition. More recently, he has been critical in our entry into the beer category.
Mr. Nguyen Thieu Nam graduated from Vietnam University of Commerce, Hanoi, Vietnam, with a BA in Economics.
� Ms. Nguyen Hoang Yen, Member
Ms. Nguyen Hoang Yen is Deputy CEO of Masan Consumer, where she was a key executive in the company’s formative years when it was primarily a foodstuff trading company. She has contributed to its transformation into a domestic and branded food and beverage business.
She also serves as Chairwoman of Masan PQ Corporation, a member of the Board of Directors of Masan Corporation, Masan Consumer, Vinh Hao Mineral Water Corporation, and Vinacafé Bien Hoa Joint Stock Company. Ms. Nguyen Hoang Yen has a Bachelor’s degree in Russian from Ha Noi University of Foreign Languages.
� Mr. Lars Kjaer, Member
Mr. Lars Kjaer is a Deputy Managing Partner at PENM Partners. Lars was previously Managing Director at NOPEF (a developer of Nordic SME companies for establishment in emerging markets with a portfolio of more than 200 companies), Managing Director at InWear & IC Company (a fully integrated branded consumer good apparel company with sales of US$450 million) and Managing Director of Carlsberg Denmark. He was also a member of the Board of Directors at Coca-Cola Nordic Beverages and Vice President of Corporate Strategy and M&A at Carlsberg Breweries A/S. Through holding various positions in executive management, Lars has extensive experience in emerging markets, strategy formulation, corporate growth, operations development, restructuring and M&A. He also serves as board member of Asia Chemical Corporation, Asia Coconut Processing, Anco Family Food, GTNFoods, Taseco Air Services Joint Stock Company.
� Mr. Dominic Edward Salter Price, Mmember
Mr. Dominic Price has been a Senior Advisor to J.P. Morgan for Asian Frontier markets since leaving JPMorgan’s full-time employment at the end of 2012.
Dominic first joined J.P. Morgan in London in 1988 and during his time with the firm he worked in the United Kingdom, Singapore, India and Vietnam in a variety of trading and investment banking roles as well as serving as country head for J.P. Morgan in both India and Vietnam.
Dominic began his banking career with Standard Chartered in London working in technical services, strategic research and development and in their merchant banking arm. He worked as a fixed income trader at Credit Suisse First Boston in London and Tokyo and was also responsible for Asian debt origination and local currency trading in Singapore for Paribas Capital Markets.
The Chairman plays an important leadership role and is involved in:
� Chairing meetings of the Board and providing its effective leadership; � Maintaining dialogue with the Management Board and providing appropriate strategic input; � Monitoring the performance of the Board; and � Being a respected ambassador for the Group, including chairing shareholder meetings, managing community issues and interacting
with key stakeholders.
The Board is responsible for charting the direction, strategies and financial objectives of the Group and monitoring the progress in relation to such matters. It has not formed committees under itself.
Non-executive members regularly communicate with the management of the Group to understand the progress and performance of the operations.
As of 31 December 2017, Dr. Nguyen Dang Quang, Mr. Ho Hung Anh, Mr. Nguyen Thieu Nam, Ms. Nguyen Hoang Yen and Mr. Lars Kjaer held directorship members in four, three, five, five and five other companies, respectively.
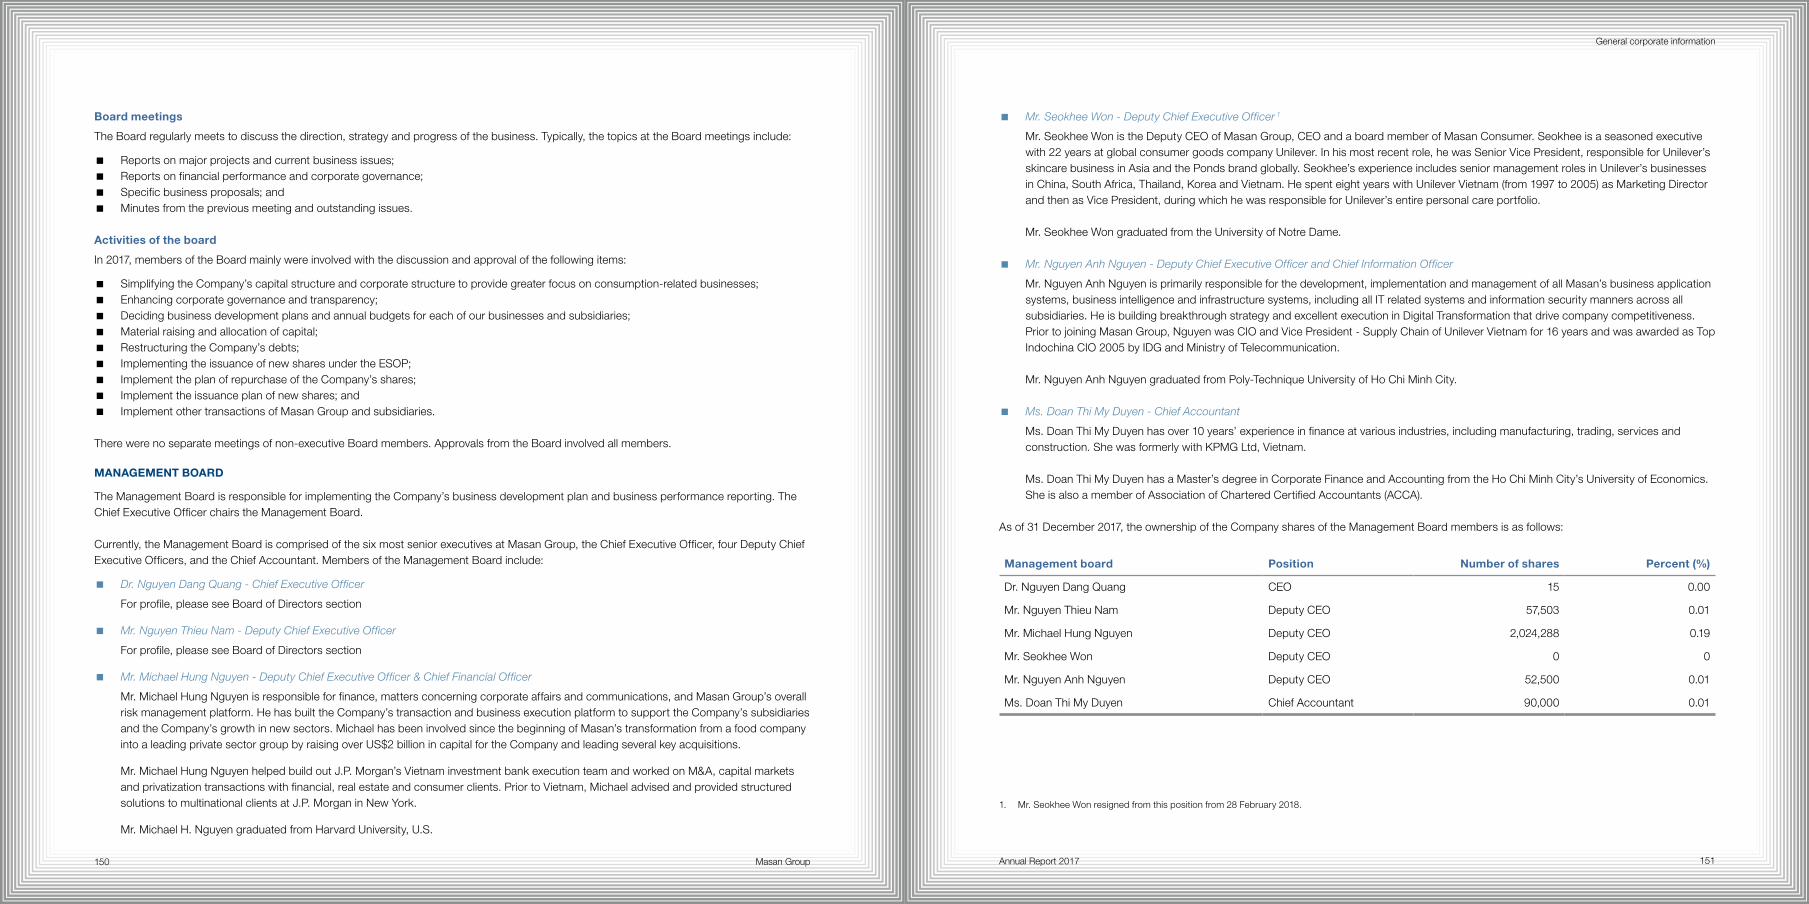
Masan Group Annual Report 2017 151150
General corporate information
Board meetings
The Board regularly meets to discuss the direction, strategy and progress of the business. Typically, the topics at the Board meetings include:
� Reports on major projects and current business issues; � Reports on financial performance and corporate governance; � Specific business proposals; and � Minutes from the previous meeting and outstanding issues.
Activities of the board
In 2017, members of the Board mainly were involved with the discussion and approval of the following items:
� Simplifying the Company’s capital structure and corporate structure to provide greater focus on consumption-related businesses; � Enhancing corporate governance and transparency; � Deciding business development plans and annual budgets for each of our businesses and subsidiaries; � Material raising and allocation of capital; � Restructuring the Company’s debts; � Implementing the issuance of new shares under the ESOP; � Implement the plan of repurchase of the Company’s shares; � Implement the issuance plan of new shares; and � Implement other transactions of Masan Group and subsidiaries.
There were no separate meetings of non-executive Board members. Approvals from the Board involved all members.
MANAGEMENT BOARD
The Management Board is responsible for implementing the Company’s business development plan and business performance reporting. The Chief Executive Officer chairs the Management Board.
Currently, the Management Board is comprised of the six most senior executives at Masan Group, the Chief Executive Officer, four Deputy Chief Executive Officers, and the Chief Accountant. Members of the Management Board include:
� Dr. Nguyen Dang Quang - Chief Executive Officer
For profile, please see Board of Directors section
� Mr. Nguyen Thieu Nam - Deputy Chief Executive Officer
For profile, please see Board of Directors section
� Mr. Michael Hung Nguyen - Deputy Chief Executive Officer & Chief Financial Officer
Mr. Michael Hung Nguyen is responsible for finance, matters concerning corporate affairs and communications, and Masan Group’s overall risk management platform. He has built the Company’s transaction and business execution platform to support the Company’s subsidiaries and the Company’s growth in new sectors. Michael has been involved since the beginning of Masan’s transformation from a food company into a leading private sector group by raising over US$2 billion in capital for the Company and leading several key acquisitions.
Mr. Michael Hung Nguyen helped build out J.P. Morgan’s Vietnam investment bank execution team and worked on M&A, capital markets and privatization transactions with financial, real estate and consumer clients. Prior to Vietnam, Michael advised and provided structured solutions to multinational clients at J.P. Morgan in New York.
Mr. Michael H. Nguyen graduated from Harvard University, U.S.
� Mr. Seokhee Won - Deputy Chief Executive Officer 1
Mr. Seokhee Won is the Deputy CEO of Masan Group, CEO and a board member of Masan Consumer. Seokhee is a seasoned executive with 22 years at global consumer goods company Unilever. In his most recent role, he was Senior Vice President, responsible for Unilever’s skincare business in Asia and the Ponds brand globally. Seokhee’s experience includes senior management roles in Unilever’s businesses in China, South Africa, Thailand, Korea and Vietnam. He spent eight years with Unilever Vietnam (from 1997 to 2005) as Marketing Director and then as Vice President, during which he was responsible for Unilever’s entire personal care portfolio.
Mr. Seokhee Won graduated from the University of Notre Dame.
� Mr. Nguyen Anh Nguyen - Deputy Chief Executive Officer and Chief Information Officer
Mr. Nguyen Anh Nguyen is primarily responsible for the development, implementation and management of all Masan’s business application systems, business intelligence and infrastructure systems, including all IT related systems and information security manners across all subsidiaries. He is building breakthrough strategy and excellent execution in Digital Transformation that drive company competitiveness. Prior to joining Masan Group, Nguyen was CIO and Vice President - Supply Chain of Unilever Vietnam for 16 years and was awarded as Top Indochina CIO 2005 by IDG and Ministry of Telecommunication.
Mr. Nguyen Anh Nguyen graduated from Poly-Technique University of Ho Chi Minh City.
� Ms. Doan Thi My Duyen - Chief Accountant
Ms. Doan Thi My Duyen has over 10 years’ experience in finance at various industries, including manufacturing, trading, services and construction. She was formerly with KPMG Ltd, Vietnam.
Ms. Doan Thi My Duyen has a Master’s degree in Corporate Finance and Accounting from the Ho Chi Minh City’s University of Economics. She is also a member of Association of Chartered Certified Accountants (ACCA).
As of 31 December 2017, the ownership of the Company shares of the Management Board members is as follows:
Management board Position Number of shares Percent (%)
Dr. Nguyen Dang Quang CEO 15 0.00
Mr. Nguyen Thieu Nam Deputy CEO 57,503 0.01
Mr. Michael Hung Nguyen Deputy CEO 2,024,288 0.19
Mr. Seokhee Won Deputy CEO 0 0
Mr. Nguyen Anh Nguyen Deputy CEO 52,500 0.01
Ms. Doan Thi My Duyen Chief Accountant 90,000 0.01
1. Mr. Seokhee Won resigned from this position from 28 February 2018.
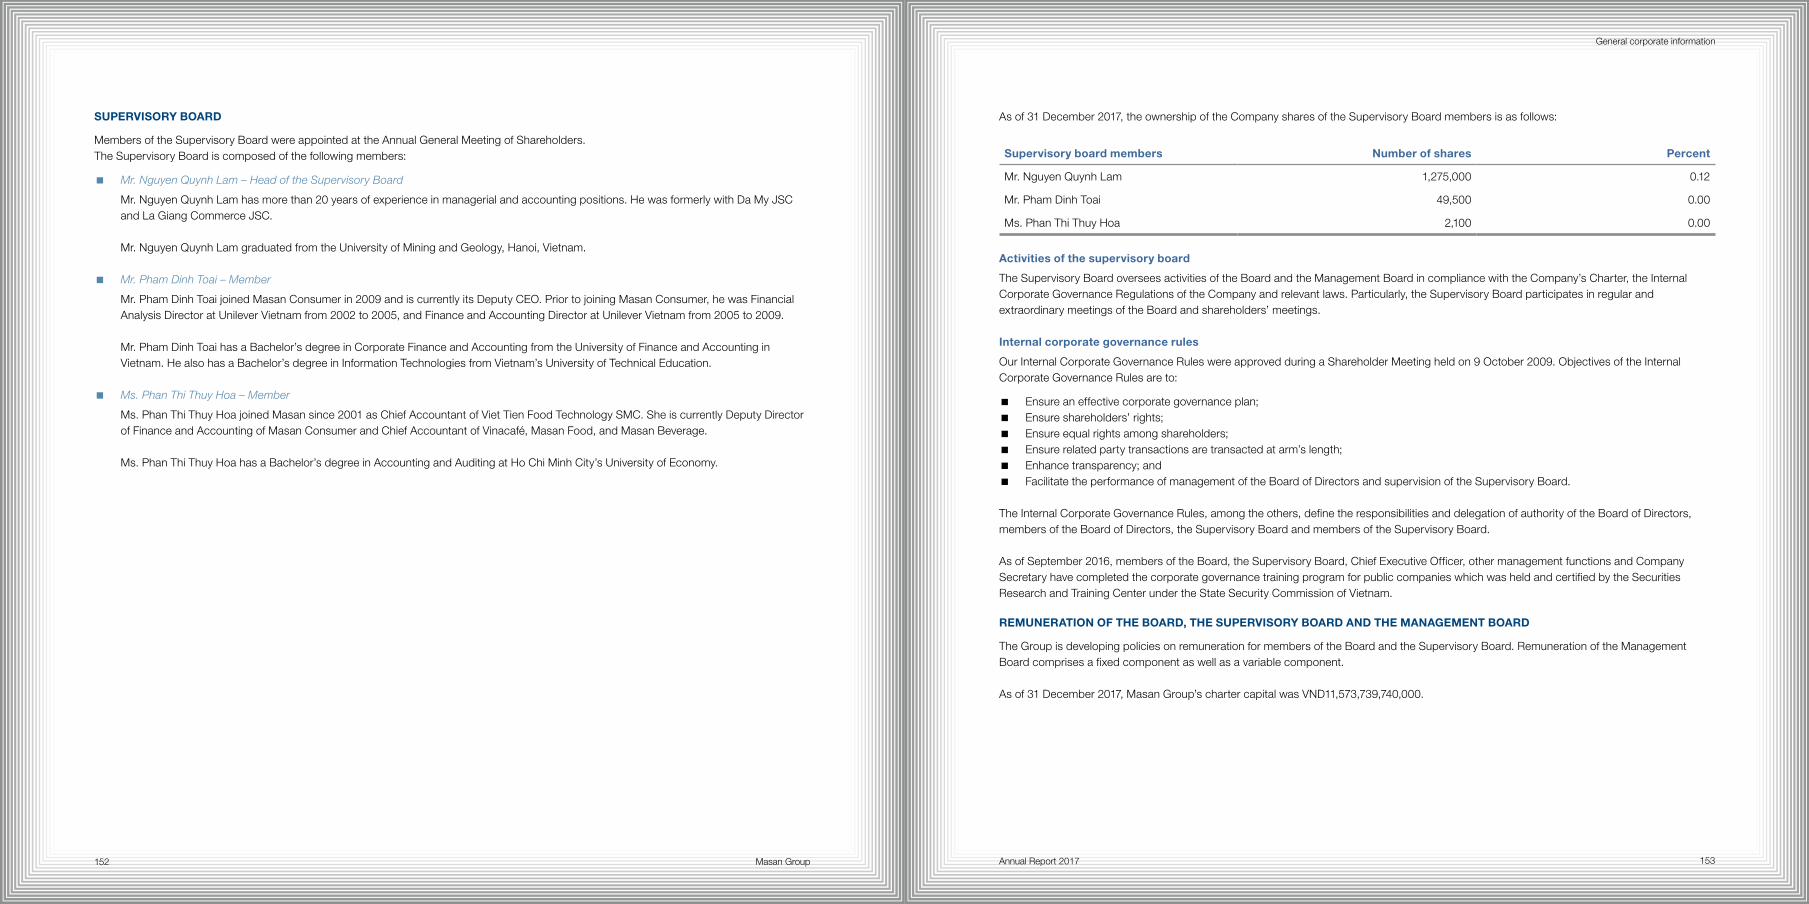
Masan Group Annual Report 2017 153152
General corporate information
SUPERVISORY BOARD
Members of the Supervisory Board were appointed at the Annual General Meeting of Shareholders. The Supervisory Board is composed of the following members:
� Mr. Nguyen Quynh Lam – Head of the Supervisory Board
Mr. Nguyen Quynh Lam has more than 20 years of experience in managerial and accounting positions. He was formerly with Da My JSC and La Giang Commerce JSC.
Mr. Nguyen Quynh Lam graduated from the University of Mining and Geology, Hanoi, Vietnam.
� Mr. Pham Dinh Toai – Member
Mr. Pham Dinh Toai joined Masan Consumer in 2009 and is currently its Deputy CEO. Prior to joining Masan Consumer, he was Financial Analysis Director at Unilever Vietnam from 2002 to 2005, and Finance and Accounting Director at Unilever Vietnam from 2005 to 2009.
Mr. Pham Dinh Toai has a Bachelor’s degree in Corporate Finance and Accounting from the University of Finance and Accounting in Vietnam. He also has a Bachelor’s degree in Information Technologies from Vietnam’s University of Technical Education.
� Ms. Phan Thi Thuy Hoa – Member
Ms. Phan Thi Thuy Hoa joined Masan since 2001 as Chief Accountant of Viet Tien Food Technology SMC. She is currently Deputy Director of Finance and Accounting of Masan Consumer and Chief Accountant of Vinacafé, Masan Food, and Masan Beverage.
Ms. Phan Thi Thuy Hoa has a Bachelor’s degree in Accounting and Auditing at Ho Chi Minh City’s University of Economy.
As of 31 December 2017, the ownership of the Company shares of the Supervisory Board members is as follows:
Supervisory board members Number of shares Percent
Mr. Nguyen Quynh Lam 1,275,000 0.12
Mr. Pham Dinh Toai 49,500 0.00
Ms. Phan Thi Thuy Hoa 2,100 0.00
Activities of the supervisory board
The Supervisory Board oversees activities of the Board and the Management Board in compliance with the Company’s Charter, the Internal Corporate Governance Regulations of the Company and relevant laws. Particularly, the Supervisory Board participates in regular and extraordinary meetings of the Board and shareholders’ meetings.
Internal corporate governance rules
Our Internal Corporate Governance Rules were approved during a Shareholder Meeting held on 9 October 2009. Objectives of the Internal Corporate Governance Rules are to:
� Ensure an effective corporate governance plan; � Ensure shareholders’ rights; � Ensure equal rights among shareholders; � Ensure related party transactions are transacted at arm’s length; � Enhance transparency; and � Facilitate the performance of management of the Board of Directors and supervision of the Supervisory Board.
The Internal Corporate Governance Rules, among the others, define the responsibilities and delegation of authority of the Board of Directors, members of the Board of Directors, the Supervisory Board and members of the Supervisory Board.
As of September 2016, members of the Board, the Supervisory Board, Chief Executive Officer, other management functions and Company Secretary have completed the corporate governance training program for public companies which was held and certified by the Securities Research and Training Center under the State Security Commission of Vietnam. REMUNERATION OF THE BOARD, THE SUPERVISORY BOARD AND THE MANAGEMENT BOARD
The Group is developing policies on remuneration for members of the Board and the Supervisory Board. Remuneration of the Management Board comprises a fixed component as well as a variable component.
As of 31 December 2017, Masan Group’s charter capital was VND11,573,739,740,000.
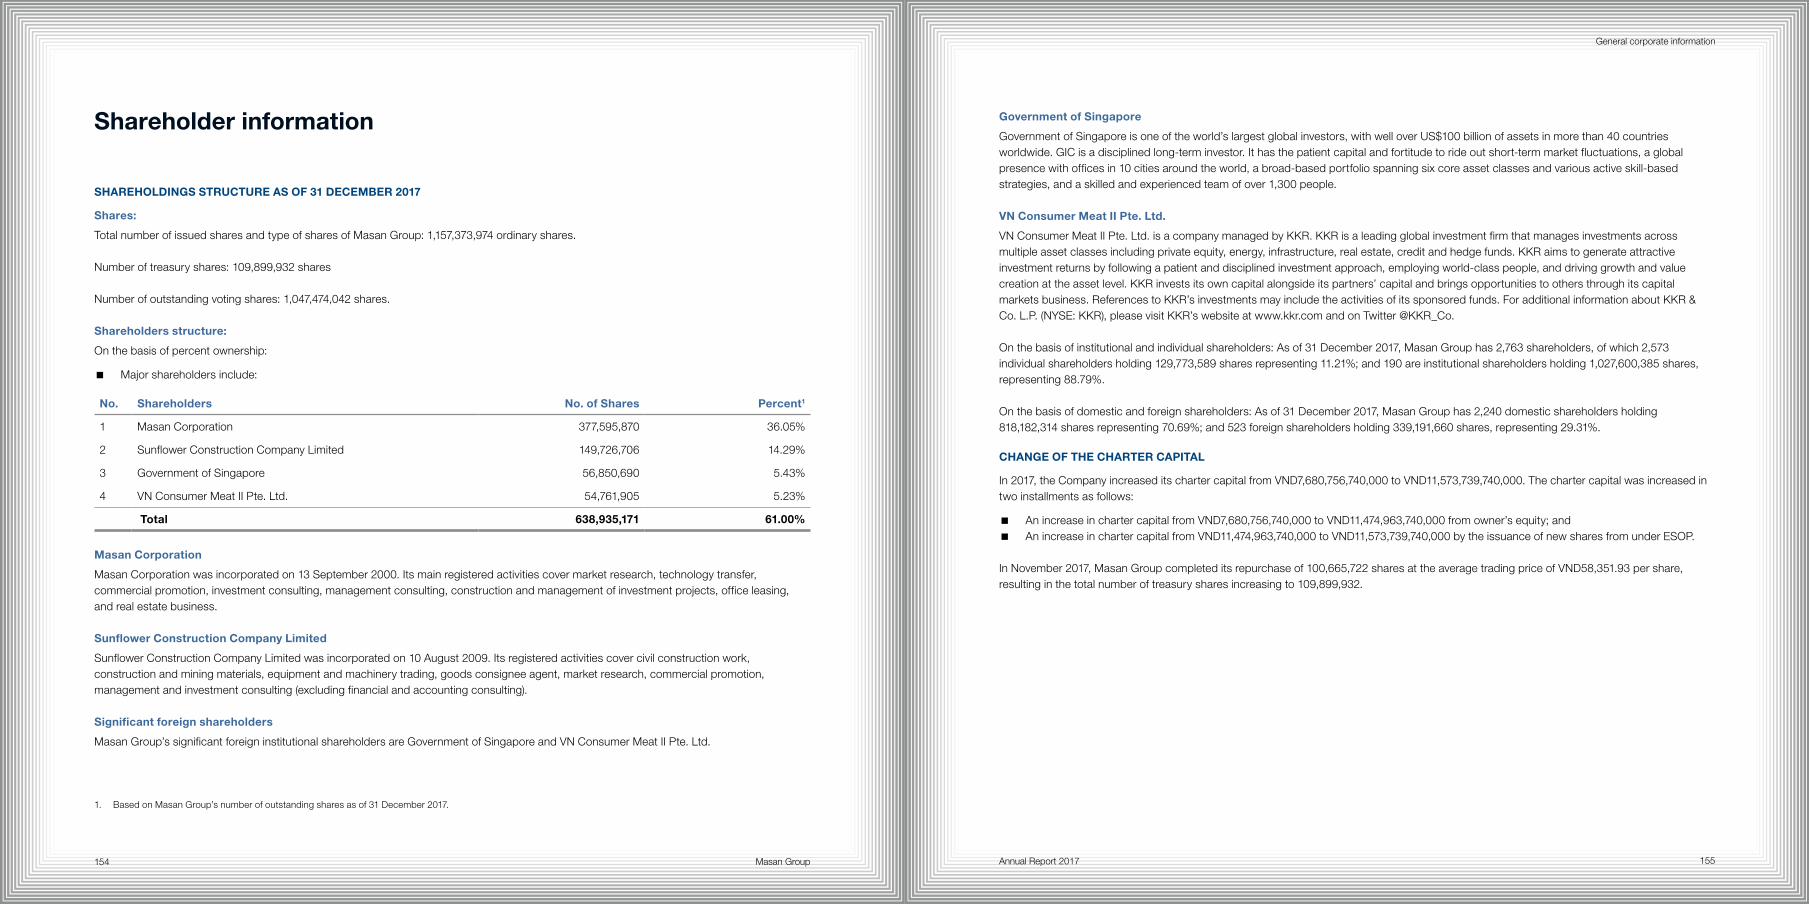
Masan Group Annual Report 2017 155154
General corporate information
SHAREHOLDINGS STRUCTURE AS OF 31 DECEMBER 2017
Shares:
Total number of issued shares and type of shares of Masan Group: 1,157,373,974 ordinary shares. Number of treasury shares: 109,899,932 shares
Number of outstanding voting shares: 1,047,474,042 shares.
Shareholders structure:
On the basis of percent ownership:
� Major shareholders include:
No. Shareholders No. of Shares Percent1
1 Masan Corporation 377,595,870 36.05%
2 Sunflower Construction Company Limited 149,726,706 14.29%
3 Government of Singapore 56,850,690 5.43%
4 VN Consumer Meat II Pte. Ltd. 54,761,905 5.23%
Total 638,935,171 61.00%
Masan Corporation
Masan Corporation was incorporated on 13 September 2000. Its main registered activities cover market research, technology transfer, commercial promotion, investment consulting, management consulting, construction and management of investment projects, office leasing, and real estate business.
Sunflower Construction Company Limited
Sunflower Construction Company Limited was incorporated on 10 August 2009. Its registered activities cover civil construction work, construction and mining materials, equipment and machinery trading, goods consignee agent, market research, commercial promotion, management and investment consulting (excluding financial and accounting consulting).
Significant foreign shareholders
Masan Group’s significant foreign institutional shareholders are Government of Singapore and VN Consumer Meat II Pte. Ltd.
Government of Singapore
Government of Singapore is one of the world’s largest global investors, with well over US$100 billion of assets in more than 40 countries worldwide. GIC is a disciplined long-term investor. It has the patient capital and fortitude to ride out short-term market fluctuations, a global presence with offices in 10 cities around the world, a broad-based portfolio spanning six core asset classes and various active skill-based strategies, and a skilled and experienced team of over 1,300 people.
VN Consumer Meat II Pte. Ltd.
VN Consumer Meat II Pte. Ltd. is a company managed by KKR. KKR is a leading global investment firm that manages investments across multiple asset classes including private equity, energy, infrastructure, real estate, credit and hedge funds. KKR aims to generate attractive investment returns by following a patient and disciplined investment approach, employing world-class people, and driving growth and value creation at the asset level. KKR invests its own capital alongside its partners’ capital and brings opportunities to others through its capital markets business. References to KKR’s investments may include the activities of its sponsored funds. For additional information about KKR & Co. L.P. (NYSE: KKR), please visit KKR’s website at www.kkr.com and on Twitter @KKR_Co.
On the basis of institutional and individual shareholders: As of 31 December 2017, Masan Group has 2,763 shareholders, of which 2,573 individual shareholders holding 129,773,589 shares representing 11.21%; and 190 are institutional shareholders holding 1,027,600,385 shares, representing 88.79%.
On the basis of domestic and foreign shareholders: As of 31 December 2017, Masan Group has 2,240 domestic shareholders holding 818,182,314 shares representing 70.69%; and 523 foreign shareholders holding 339,191,660 shares, representing 29.31%. CHANGE OF THE CHARTER CAPITAL
In 2017, the Company increased its charter capital from VND7,680,756,740,000 to VND11,573,739,740,000. The charter capital was increased in two installments as follows:
� An increase in charter capital from VND7,680,756,740,000 to VND11,474,963,740,000 from owner’s equity; and � An increase in charter capital from VND11,474,963,740,000 to VND11,573,739,740,000 by the issuance of new shares from under ESOP.
In November 2017, Masan Group completed its repurchase of 100,665,722 shares at the average trading price of VND58,351.93 per share, resulting in the total number of treasury shares increasing to 109,899,932.
1. Based on Masan Group’s number of outstanding shares as of 31 December 2017.
Shareholder information
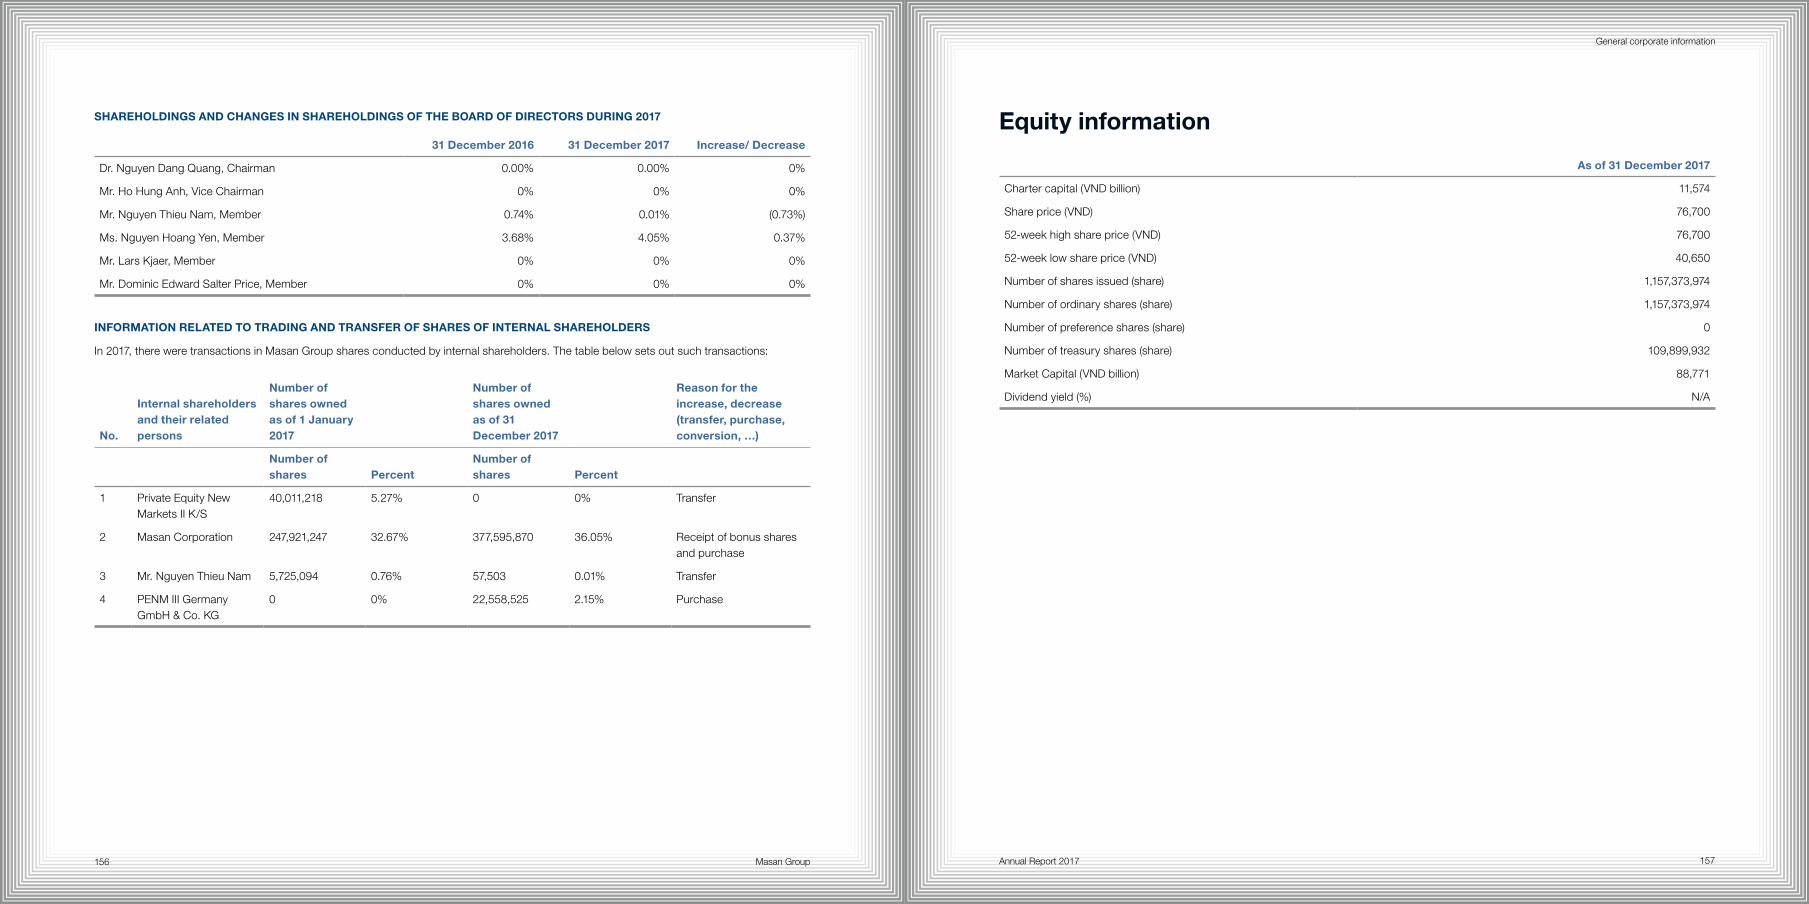
Masan Group Annual Report 2017 157156
General corporate information
SHAREHOLDINGS AND CHANGES IN SHAREHOLDINGS OF THE BOARD OF DIRECTORS DURING 2017
31 December 2016 31 December 2017 Increase/ Decrease
Dr. Nguyen Dang Quang, Chairman 0.00% 0.00% 0%
Mr. Ho Hung Anh, Vice Chairman 0% 0% 0%
Mr. Nguyen Thieu Nam, Member 0.74% 0.01% (0.73%)
Ms. Nguyen Hoang Yen, Member 3.68% 4.05% 0.37%
Mr. Lars Kjaer, Member 0% 0% 0%
Mr. Dominic Edward Salter Price, Member 0% 0% 0%
INFORMATION RELATED TO TRADING AND TRANSFER OF SHARES OF INTERNAL SHAREHOLDERS
In 2017, there were transactions in Masan Group shares conducted by internal shareholders. The table below sets out such transactions:
No.
Internal shareholders and their related persons
Number of shares owned as of 1 January 2017
Number of shares owned as of 31 December 2017
Reason for the increase, decrease (transfer, purchase, conversion, …)
Number of shares Percent
Number of shares Percent
1 Private Equity New Markets II K/S
40,011,218 5.27% 0 0% Transfer
2 Masan Corporation 247,921,247 32.67% 377,595,870 36.05% Receipt of bonus shares and purchase
3 Mr. Nguyen Thieu Nam 5,725,094 0.76% 57,503 0.01% Transfer
4 PENM III Germany GmbH & Co. KG
0 0% 22,558,525 2.15% Purchase
Equity information
As of 31 December 2017
Charter capital (VND billion) 11,574
Share price (VND) 76,700
52-week high share price (VND) 76,700
52-week low share price (VND) 40,650
Number of shares issued (share) 1,157,373,974
Number of ordinary shares (share) 1,157,373,974
Number of preference shares (share) 0
Number of treasury shares (share) 109,899,932
Market Capital (VND billion) 88,771
Dividend yield (%) N/A
Masan Group Annual Report 2017 159158
General corporate information
All statements contained in this report that are not statements of historical fact constitute “forward-looking statements”. Some of these statements can be identified by forward-looking terms, such as “anticipate”, “believe”, “can”, “could”, “estimate”, “anticipate”, “project”, “expect”, “intend”, “may”, “plan”, “aim”, “will” and “would” or similar words. However, these words are not the exclusive means of identifying forward-looking statements. All statements regarding our expected financial condition and results of operations, business, plans and prospects are forward-looking statements. These forward-looking statements include statements as to our business strategy, revenue and profitability (including, without limitation, any financial or operating projections or forecasts), planned projects and other matters discussed in this document regarding matters that are not historical fact. These forward-looking statements and any other projections contained in this report involve known and unknown risks, uncertainties and other factors that may cause our actual financial results, performance or achievements to be materially different from any future financial results, performance or achievements expressed or implied by such forward-looking statements or other projections.
Forward-looking statements are based on our beliefs and assumptions, which in turn are based on currently available information. We are in the business of acquiring, actively building, managing and investing in market-leading businesses in several of the fastest growing areas of the Vietnamese economy. Our outlook is predominantly based on our interpretation of what we consider to be the key economic factors affecting our business, the Vietnamese economy and the sectors we operate in. Although we believe the assumptions upon which these forward-looking statements are based are reasonable, any of these assumptions could prove to be inaccurate, and the forward-looking statements based on these assumptions could be incorrect. Actual results may differ materially from information contained in the forward-looking statements as a result of a number of factors, many of which are beyond our control. Accordingly, investors are cautioned not to place undue reliance on the forward-looking statements in this report. These statements speak only as of the date of this report or the respective dates indicated in this report, and we undertake no obligation to update or revise any of them, whether as a result of new information, future events or otherwise.
3F Feed – Farm - Food
ANCO Agro Nutrition Company JSC
APT Ammonium Paratungstate
ATM Automatic Teller Machine
BTO Blue Tungsten Oxide
CAGR Compound Annual Growth Rate
CEO Chief Executive Officer
CFO Chief Financial Officer
CSR Corporate Social Responsibility
Dr. Doctor
ESOP Employee Share Ownership Plan
FMCG Fast-moving Consumer Goods
GDP Gross Domestic Product
GSO Government Statistics Office (Vietnam)
HACCP Hazard Analysis and Critical Control Points
H.C. Starck H.C. Starck Group
IMF International Monetary Fund
In-land ASEAN A geographical region comprising Vietnam, Thailand, Myanmar, Cambodia, and Laos
JSC Joint Stock Company
KKR Kohlberg Kravis Roberts & Co. L.P., affiliates and/or investment funds it manages
M&A Mergers and Acquisitions
Masan A term referring to Masan Group, inclusive of subsidiaries and affiliates, as a whole
Masan Beverage or MSB Masan Beverage Company Limited
Masan Brewery or MB Masan Brewery Company Limited
Masan Consumer or MSC Masan Consumer Corporation
Masan Consumer Holdings or MCH MasanConsumerHoldings Company Limited
Masan Consumer Thailand Masan Consumer (Thailand) Limited.
Masan Group or the Group Masan Group Corporation
Masan Horizon or MH Masan Horizon Company Limited
Masan Nutri-Farm NA Masan Nutri-Farm (N.A) LLC.
Masan Nutri-Science or MNS Masan Nutri-Science JSC
Masan Resources or MSR Masan Resources Corporation
Cautionary note regarding forward-looking statements Glossary of terms
Masan Group160
Masan Thai Nguyen Resources Masan Thai Nguyen Resources Company Limited
MNC Multinational Company
NIM Net Interest Margin
Nui Phao Nui Phao Mining Limited Company
NPL Non-performing Loan
Phu Yen Beer or Pybeco Phu Yen Beer and Beverage JSC or Masan Brewery PY One Member Company Limited
Proconco Vietnamese-French Cattle Feed JSC.
Quang Hanh Quang Ninh Natural Mineral Water Limited Company (to refer to both the company and its main brand)
ROM Run-of-mine
Saigon NutriFood or SNF Saigon NutriFood Corporation
SBV State Bank of Vietnam
SG&A Selling, General and Administration expenses
Singha Singha Asia One Pte Ltd.
SME Small and Medium Sized Enterprises
SOE State-owned Enterprise
Techcombank, the Bank, or TCB Vietnamese Technological and Commercial Joint Stock Bank
The Board The Board of Directors
UPCoM Unlisted Public Company Market, part of the Hanoi Stock Exchange
US$ U.S. Dollar
Vinacafé Bien Hoa Vinacafé Bien Hoa Joint Stock Company
Vinacafé Coffee brand owned by Vinacafé Bien Hoa Joint Stock Company
Vinh Hao Vinh Hao Mineral Water Corporation
VISSAN Vietnam Meat Industries Limited Company
VND Vietnamese Dong
YTO Yellow Tungsten Oxide
2
Annual Report
Keep going…
MASAN GROUP CORPORATION8th Floor, Central Plaza17 Le Duan Street, District 1Ho Chi Minh City, VietnamTel: +84 8 6256 3862Fax: +84 8 38274115www.masangroup.com
MASAN G
ROUP
Annual Report 2017Back cover Cover
Folded size: 240mm x 240mm
Pantone 877C Rainbow foil stamping


