Embed Size (px)
Citation preview

Report
on
District Level Estimates
for the State of
Andhra Pradesh (2013-14)
GOVERNMENT OF INDIA
MINISTRY OF LABOUR & EMPLOYMENT
LABOUR BUREAU
CHANDIGARH

FOREWORD
Planning from the grass root level, i.e. down to top, helps to achieve optimum outcome in terms of development. Passing of 73rd and 74th
The development policies of Government and other agencies are now focused on the district level planning. The demands for district level estimates are increasing day by day. The National Statistical Commission has observed the importance of pooling the Central and State samples for regional level estimates. The 13th Finance Commission has also emphasized on the need for various parameters at district level.
Amendment Act attained considerable significance in the process of decentralized planning. In the planning process district occupies relevant position below the State level because of its location and administrative advantages. Moreover, the non-availability of data for planning and lack of adequate administrative setups below district level added the relevance of district level planning.
In order to materialize the concept of district level estimates by pooling Central and State sample, Labour Bureau approached a few States by offering technical and other support except data collection work for State sample. Directorate of Economics and Statistics, Andhra Pradesh State agreed and collected data under State sample of fourth Annual Employment Unemployment survey. Consequently the report on estimation of work force at district level for the State of Andhra Pradesh has been prepared. In the present report an initial step has been taken to assess and estimate the extent of unemployment, broad activities by educational level and kind of activities at district level. The report will be an important input for district level planners/policy makers in Andhra Pradesh.
While generating the district level estimates for the State of Andhra Pradesh, the State Government provided their consistent support for canvassing the schedules and also supervising the survey under Central sample on behalf of Labour Bureau as well as the execution of State sample in time. Without such support and co-operation from the DES, it would have been very difficult to undertake the exercise of pooling Central and State samples. I would like to express my deep appreciation for the constant support received from the State Government, especially their Directorates of Economics & Statistics (DES). I would also like to extend my gratitude for the constant efforts and dedication of staff and officers of Labour Bureau involved in the survey. I have no hesitation in admitting that the errors or inadequacies in the Report are however entirely due to the limitations of the Labour Bureau.
Chandigarh Daljeet Singh 3rd December, 2014 Director General

INDEX Employment-Unemployment Scenario
Foreword Executive Summary i-v Chapter-I Employment-Unemployment Scenario. 1-24 Annexure I Concepts and Definitions. 1-7 Annexure II Sampling Design & Estimation Procedure. 8-15 Annexure III Tables (1 to 19) 1-50
Table (1) Number of villages/UFS blocks allocated and actually surveyed for each district of Andhra Pradesh
1
Table (2) Number of households and persons surveyed for each district of Andhra Pradesh
1
Table (3) Per 1000 distribution of households (hhs) by members aged 15 years & above
2
Table (4) Per 1000 distribution of households (hhs) benefited from employment generating schemes for each district
2
Table (5) Per 1000 distribution of households (hhs) by number of employed persons aged 15 years & above for each district
3-4
Table (6) Per 1000 distribution of households (hhs) by number of wage/salaried persons aged 15 years & above for each district
4-5
Table (7) Labour Force Participation Rate (per 1000) for persons aged 15 years & above according to Usual Principal Status Approach (ps) for each district
6
Table (7.1) Worker Population Ratio (per 1000) for persons aged 15 years & above according to Usual Principal Status Approach (ps) for each district
6
Table (7.2) Unemployment Rate (per 1000) for persons aged 15 years & above according to Usual Principal Status Approach (ps) for each district
7
Table (7.3) Proportion Unemployed (per 1000) for persons aged 15 years & above according to Usual Principal Status Approach (ps) for each district
7
Table (8) Labour Force Participation Rate (per 1000) for persons aged 15 years & above according to Usual Principal & Subsidiary Status Approach (ps+ss) for each district
8
Table (8.1) Worker Population Ratio (per 1000) for persons aged 15 years & above according to Usual Principal & Subsidiary Status Approach (ps+ss) for each district
8
Table (8.2) Unemployment Rate (per 1000) for persons aged 15 years & above according to Usual Principal & Subsidiary Status Approach (ps+ss) for each district
9
Table (8.3) Proportion Unemployed (per 1000) for persons aged 15 years & above according to Usual Principal & Subsidiary Status Approach (ps+ss) for each district
9
Table (9) Per 1000 distribution of workers aged 15 years & above by broad activity according to Usual Principal Status Approach (ps) for each district
10-11
Table (10) Per 1000 distribution of workers aged 15 years & above by broad activity according to Usual Principal & Subsidiary Status Approach (ps+ss) for each district
11-12
Table (11) Percentage distribution of workers aged 15 years & above available for 12 months but actually worked according to Usual Principal & Subsidiary Status Approach (ps+ss) for each district
13-14
Table (12) Per 1000 distribution of persons aged 15 years & above by broad activity who received vocational training according to Usual Principal Status Approach
15-22
Table (13) Per 1000 distribution for persons aged 15 years & above by main activity & educational classification according to Usual Principal Status (ps) approach
23-36
Table (14) Per 1000 distribution of persons aged 15 years and above received/receiving vocational training in different fields and main activity pursued at State level
37-39
Table (15) Per 1000 distribution of persons aged 15 years & above who received/receiving vocational training pursuing different activities based on Usual Principal Status (ps) approach for each district
40-42
Table (16) Per 1000 distribution of persons aged 15 years and above who received/receiving vocational training in different fields and pursuing different economic activities based on Usual Principal Status (ps) approach at State level
43-45
Table (17) Labour Force Participation Rate (per 1000) for persons of different age groups according to Usual Principal Status Approach (ps) for each district
46
Table(17.1) Worker Population Ratio (per 1000) for persons of different age groups according to Usual Principal Status Approach (ps) for each district
46
Table(17.2) Unemployment Rate (per 1000) for persons of different age groups according to Usual Principal Status Approach (ps) for each district
47
Table(18) Labour Force Participation Rate (per 1000) for persons of different age groups according to Usual Principal & Subsidiary Status Approach (ps+ss) for each district
47
Table(18.1) Worker Population Ratio (per 1000) for persons of different age groups according to Usual Principal & Subsidiary Status Approach (ps+ss) for each district
48
Table(18.2) Unemployment Rate (per 1000) for persons of different age groups according to Usual Principal & Subsidiary Status Approach (ps+ss) for each district
48
Table(19) Per 1000 distribution of workers aged 15 years & above employed in different industries by NIC 2008 classification based on Usual Principal Status Approach (ps) for each district
49
Table(19.1) Per 1000 distribution of workers aged 15 years & above employed in different industries by NIC 2008 classification based on Usual Principal Status Approach (ps) for each district
49
Table(19.2) Per 1000 distribution of workers aged 15 years & above employed in different industries by NIC 2008 classification based on Usual Principal Status Approach (ps) for each district
50
i
EXECUTIVE SUMMARY
In the present report, District level/State level Estimates have
been generated for Labour Force and its derivatives by pooling
the Central and the State samples for the State of Andhra
Pradesh under 4th
Labour force parameters have been estimated at district level
for all the districts of Andhra Pradesh State.
Annual Employment-Unemployment Survey
2013-14.
The field work for both the Central and the State samples were
executed during the period January, 2014 to June, 2014.
A total of 11,058 households have been surveyed under both
Central and State samples in the State of Andhra Pradesh, out
of which 6,750 households are from rural areas and remaining
4,308 households from urban areas.
Number of persons surveyed under both Central and State
samples are 49,324 out of which 29,887 persons are from rural
areas and 19,437 persons from urban areas.
The labour force estimates are derived for the persons aged 15
years and above under two approaches namely Usual Principal
Status (UPS) approach and Usual Principal and Subsidiary
Status (UPSS) approach.
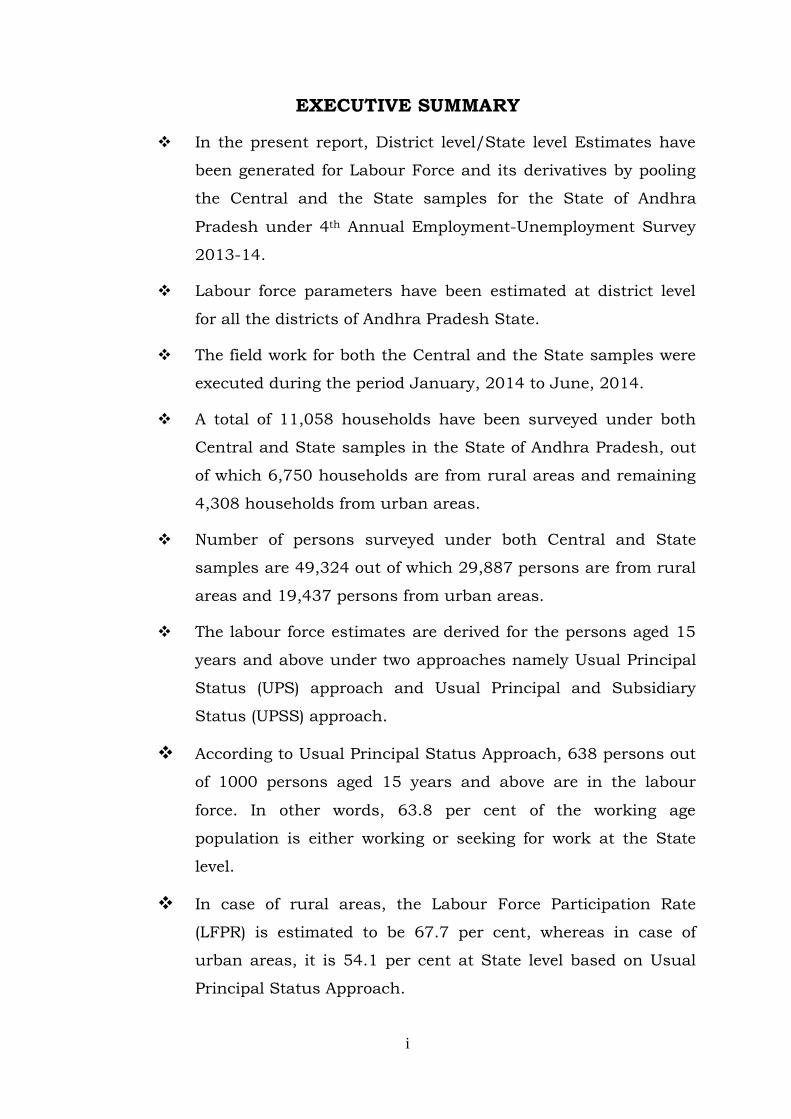
According to Usual Principal Status Approach, 638 persons out
of 1000 persons aged 15 years and above are in the labour
force. In other words, 63.8 per cent of the working age
population is either working or seeking for work at the State
level.
In case of rural areas, the Labour Force Participation Rate
(LFPR) is estimated to be 67.7 per cent, whereas in case of
urban areas, it is 54.1 per cent at State level based on Usual
Principal Status Approach.
ii
In case of females, the Labour Force Participation Rate is found
to be lower as compared to male counterparts. For male
category of persons, the LFPR is estimated to be 81.5 per cent
whereas for females, the same is 46.4 per cent at State level
based on Usual Principal Status Approach.
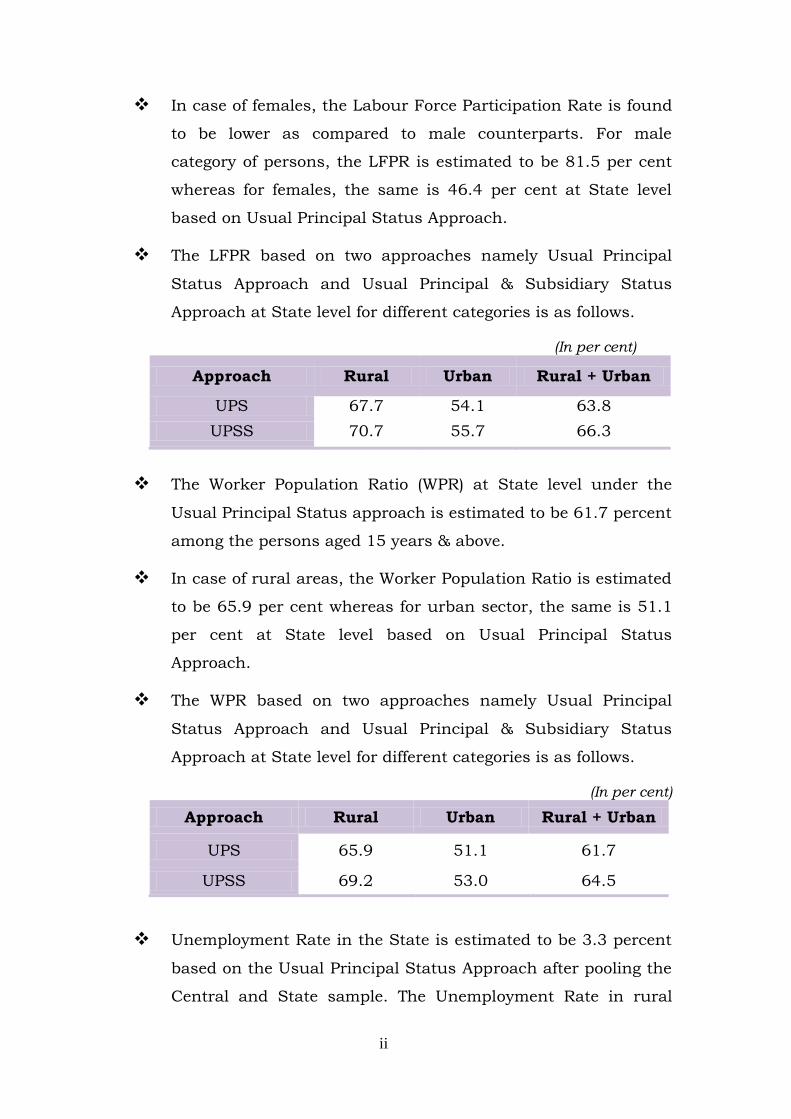
The LFPR based on two approaches namely Usual Principal
Status Approach and Usual Principal & Subsidiary Status
Approach at State level for different categories is as follows.
(In per cent)
Approach Rural Urban Rural + Urban
UPS 67.7 54.1 63.8 UPSS 70.7 55.7 66.3
The Worker Population Ratio (WPR) at State level under the
Usual Principal Status approach is estimated to be 61.7 percent
among the persons aged 15 years & above.
In case of rural areas, the Worker Population Ratio is estimated
to be 65.9 per cent whereas for urban sector, the same is 51.1
per cent at State level based on Usual Principal Status
Approach.
The WPR based on two approaches namely Usual Principal
Status Approach and Usual Principal & Subsidiary Status
Approach at State level for different categories is as follows.
(In per cent) Approach Rural Urban Rural + Urban
UPS 65.9 51.1 61.7
UPSS 69.2 53.0 64.5
Unemployment Rate in the State is estimated to be 3.3 percent
based on the Usual Principal Status Approach after pooling the
Central and State sample. The Unemployment Rate in rural
iii
areas and urban areas are estimated to be 2.6 percent and 5.5
percent respectively.
In case of male category of persons, the unemployment rate is
found to be 2.9 per cent whereas in case of females, the same is
4 per cent at State level based on Usual Principal Status
Approach.
In urban areas, the unemployment rate among females is
significantly higher i.e. 10.4 per cent at State level based on
Usual Principal Status Approach.
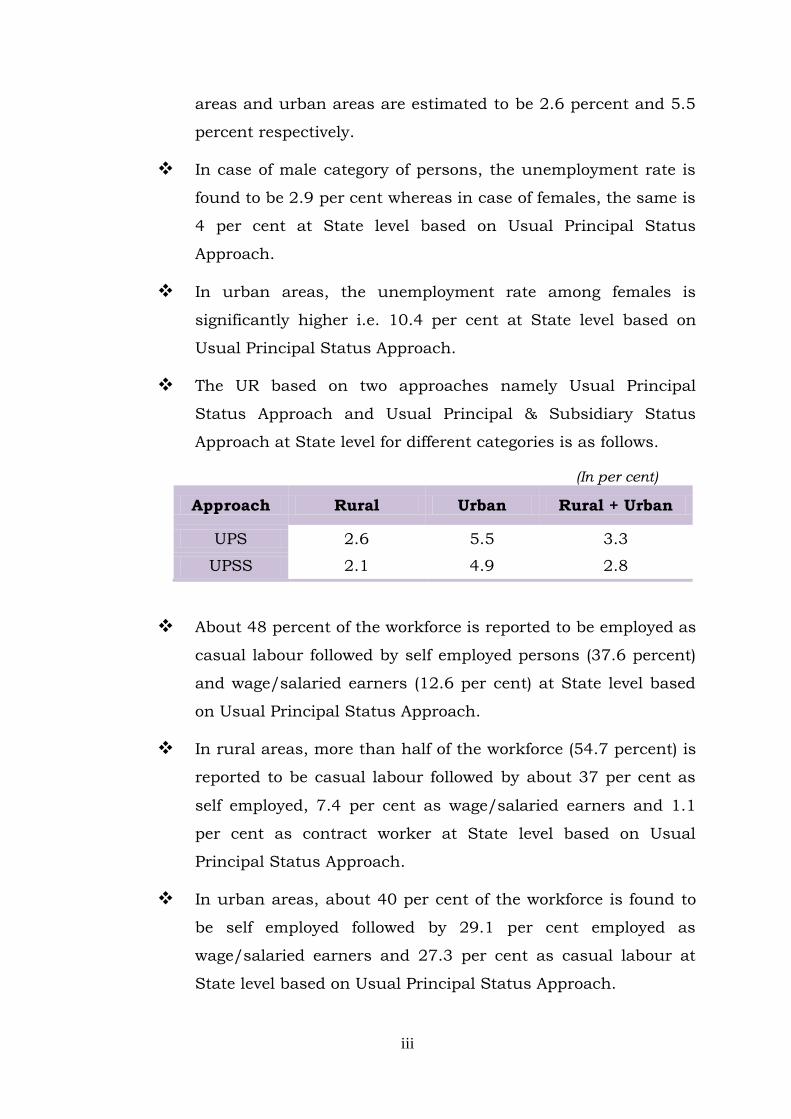
The UR based on two approaches namely Usual Principal
Status Approach and Usual Principal & Subsidiary Status
Approach at State level for different categories is as follows.
(In per cent)
Approach Rural Urban Rural + Urban
UPS 2.6 5.5 3.3
UPSS 2.1 4.9 2.8
About 48 percent of the workforce is reported to be employed as
casual labour followed by self employed persons (37.6 percent)
and wage/salaried earners (12.6 per cent) at State level based
on Usual Principal Status Approach.
In rural areas, more than half of the workforce (54.7 percent) is
reported to be casual labour followed by about 37 per cent as
self employed, 7.4 per cent as wage/salaried earners and 1.1
per cent as contract worker at State level based on Usual
Principal Status Approach.
In urban areas, about 40 per cent of the workforce is found to
be self employed followed by 29.1 per cent employed as
wage/salaried earners and 27.3 per cent as casual labour at
State level based on Usual Principal Status Approach.
iv
An attempt has been made to estimate the extent of
underemployment in the report. Special tables have been
generated for persons who were available for work throughout
the year i.e. 12 months.
The survey results reveal that around 59 percent of the labour
force who were available for 12 months is found to be fully
employed. On the other hand, 37.4 per cent of the labour force
who was available throughout the year has worked for 6-11
months during the reference period based on Usual Principal &
Subsidiary Status Approach.
Around 3 per cent of the persons who were available for 12
months during the reference period did not get any work even
for a month based on Usual Principal & Subsidiary Status
Approach.
In order to measure the employment-unemployment scenario
among youth population in the State, the Labour Force related
tables have been generated for persons aged 15-29 years in the
report.
Labour Force Participation rate is estimated to be 52 percent at
State level for the age group 15-29 years based on Usual
Principal Status Approach.
In case of rural sector, the LFPR for the age group 15-29 years
is found to be 55.7 per cent whereas for urban sector, the same
is 43.5 per cent at state level based on Usual Principal Status
Approach.
The ratio of employed persons or Worker Population Ratio for
the age group 15-29 years is estimated to be 46.6 percent at
state level under the Usual Principal Status Approach. In case
of rural sector, it is found to be 50.9 per cent whereas for urban
sector, the WPR is 36.7 per cent.
v
The Unemployment Rate (UR) among the age group 15-29 years
is estimated to be 10.4 percent under the Usual Principal
Status Approach at state level.
In rural sector, the unemployment rate is found to be 8.6 per
cent whereas for urban sector, it is 15.6 per cent for the age
group 15-29 years at State level based on Usual Principal
Status Approach.
About 7 percent of the persons aged 15 years and above is
estimated to be received/receiving vocational training in the
State of Andhra Pradesh. The proportion is significantly higher
in urban areas (9.7 percent) as compared to rural areas (5.9
percent).
Among the employed persons who received vocational training,
around 53 percent reported to be self employed followed by
wage/salaried earners (25.2 percent), casual workers (19.3
percent) and contract workers (2.3 percent).
Unemployment rate is found to be increasing as the education
level rises for the persons aged 15 years and above. In case of
post-graduation & above level, the unemployment rate is
significantly high at 18per cent at State level.
In case of persons with not literate, below primary, primary and
middle classifications, the unemployment rate is less than one
per cent at State level based on Usual Principal Status
Approach.
About 39 percent of the households are having two persons as
employed/earners followed by households with only one
employed person (36.1 percent).
About 82 percent of the households have reported to be having
no wage/salaried person in their households at State level.

1
CHAPTER-I
EMPLOYMENT-UNEMPLOYMENT SCENARIO
1. INTRODUCTION 1.1 In our country, the district
has always been the pivot of the
structure of administration.
District is the most suitable
administrative unit for
decentralized planning below the
state level as it possesses the
required heterogeneity and is
manageable enough to undertake
people in planning and
implementation and to improve
productivity. With the acceptance
of a Welfare State as the objective
the emphasis in district
administration has come to be
placed overwhelmingly on
development activities. But due
to non-availability of district-level
data on many important
indicators, the indicators at the
State/UT level are used as a
proxy for planning & policy
purposes at the district level. For
bigger states which have wide
diversity across districts in terms
of natural endowments, public
and private investment and other
employment opportunities, the
state-level indicators would not
be of much use for making state-
level policies.
1.2 The 73rd & 74th
Constitutional amendments
(1992) have also brought into
existence the democratically
elected grassroots institutions of
local self governance. This has
enhanced the demand for local
level statistics and necessitated
requirement of developing basic
capabilities at grass root levels to
organize such statistics in a
harmonious manner. In order to
meet this need of generating
estimates at more disaggregate
level particularly at district level,
Labour Bureau has offered to
many States/UT’s Directorate of
Economics & Statistics
Departments to generate district
level estimates on important
parameters relating to Labour
2
Force and its derivatives by
covering matching sample along
with Labour Bureau Annual
Employment Unemployment
Survey. This would help the
States to make State-level
inclusive development policies by
using statistics at local level.
1.3 District level estimates may
go a long way for effective district
level planning. Generation of
district level estimates viz.
Labour Force Participation Rate
which is also called as Labour
Supply, Worker Population Ratio
and Unemployment Rate will help
the Government to devise more
effective and targeted
employment and economic
policies. Local needs can be
taken care of more effectively and
efficiently at the lower levels.
Plans are expected to be more
effective because of the
homogeneity of the unit. Flow of
information/data will be quick
and reliable.
1.4 In the present Fourth
Annual Employment-
Unemployment Survey, Labour
Bureau agreed to assist the
States/UTs of Tamil Nadu,
Maharashtra, Telangana, Andhra
Pradesh and Puducherry for
generating district level estimates
on important parameters relating
to employment and
unemployment. This will no
doubt help the State
Governments to make state-level
inclusive development policies.
Moreover, District Level
Estimates will be helpful to aid
State and local policymakers,
program planners, and
community advocates to device
sound policies. The district level
estimates can also be used for
setting priorities, allocating
resources and targeting areas
where there are lack of
employment opportunities. The
present report relates to the
estimation workforce at district
level for the State of Andhra
Pradesh.
1.5 The district level estimates
have been generated by pooling
the central and state sample. In
order to generate the district level
estimates, the State Government
has covered a matching sample
3
along with Labour Bureau Survey
during the period January, 2014
to June, 2014 with their own
resources. On the other hand,
Labour Bureau has provided all
other assistance like selection of
sample, training to enumerators
and supervisors, supply of blank
schedules, scrutiny of data,
pooling of central and state
sample, generation of tables,
drafting of State report etc.
1.6 Andhra Pradesh is one of the
29 states of India, situated on the
country's south-eastern coast.
The state is the eighth largest
state in India covering an area of
160,205 km2
under both Central and State
samples in Andhra Pradesh, out
of which 6,750 households from
rural areas and remaining 4,308
households from urban areas.
Number of persons surveyed
under both Central and State
samples are 49,324, out of which
29,887 persons are from rural
areas and 19,437 persons are
from urban areas.
(61,855 sq mi). Acco
rding to 2011 census results, the
state is tenth largest by
population with 49,386,799
inhabitants. Andhra Pradesh has
a very diverse geography which
leads to a very diverse economy.
As many as 9 of the 13 districts
has sea coast along Bay of Bengal
which is conducive for promoting
manufacturing and export
oriented industries. Under fourth
employment-unemployment
survey, a total of 11,058
households have been surveyed
1.7 Estimates are generated for
various important Labour Force
parameters namely, Labour Force
Participation Rate, Worker
population Ratio and
Unemployment Rate by gender /
sector in proportion for the
persons aged 15 years and above.
The employed persons are further
classified based on the activity
pursued by them during the
reference period like self
employed, regular/wage salaried,
contract worker and casual
worker. Moreover, some specific
tables have been generated on
youth employment, vocational
training, etc. in order to give
some insights of the employment-
unemployment scenario in the
State of Andhra Pradesh.
4
2. HOUSEHOLD CHARACTERISTICS Members aged 15 years and above in a household 2.1 The second stage
stratification under the survey to
select the sample households is
based on number of members
aged 15 years and above in a
household. The households
studied under the survey have
been classified based on the
number of members aged 15
years and above in the
households. Accordingly, all the
households under study are put
in four categories as follows:
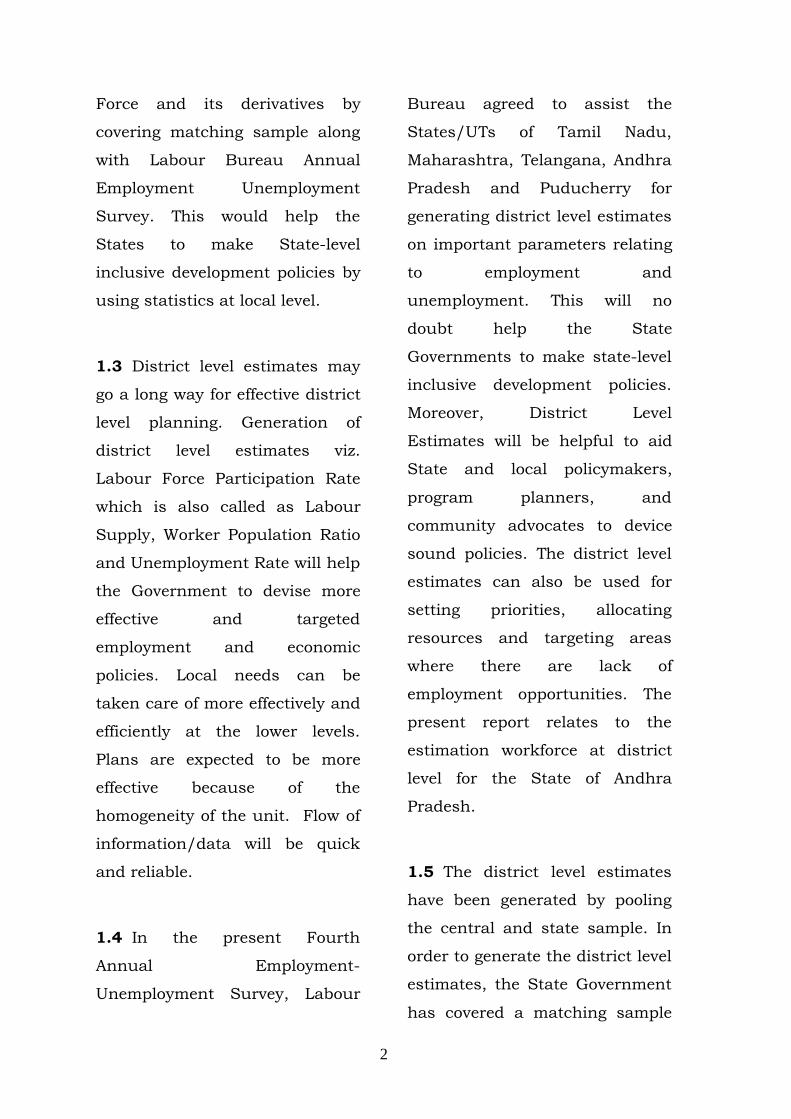
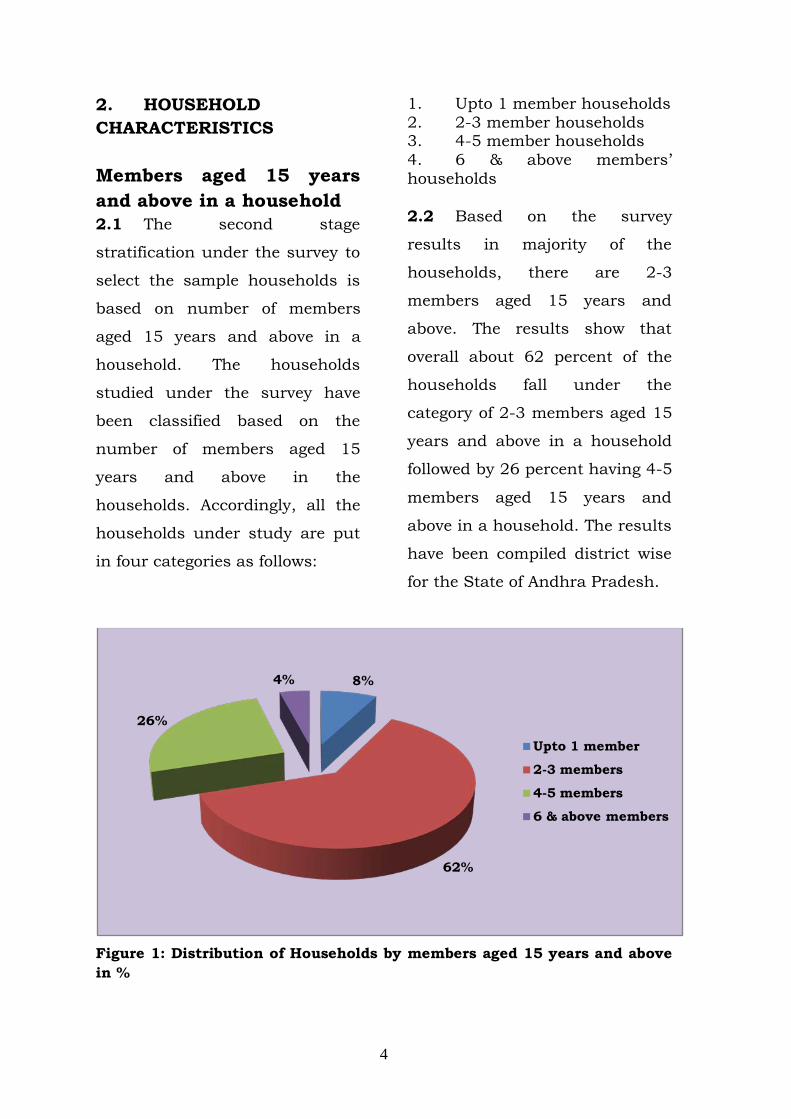
1. Upto 1 member households 2. 2-3 member households 3. 4-5 member households 4. 6 & above members’ households 2.2 Based on the survey
results in majority of the
households, there are 2-3
members aged 15 years and
above. The results show that
overall about 62 percent of the
households fall under the
category of 2-3 members aged 15
years and above in a household
followed by 26 percent having 4-5
members aged 15 years and
above in a household. The results
have been compiled district wise
for the State of Andhra Pradesh.
Figure 1: Distribution of Households by members aged 15 years and above in %
8%
62%
26%
4%
Upto 1 member
2-3 members
4-5 members
6 & above members
5
Households Benefitted from Employment Generating Schemes 2.3 In order to understand the
outreach of different Central and
State government schemes to the
targeted population in Andhra
Pradesh, information was also
collected from the households
regarding members of the
household benefitted from
different employment generating
schemes during the reference
period. Among the benefitted
households (34 percent), most of
them are benefitted from
MGNREGA scheme which is
implemented only in rural areas.
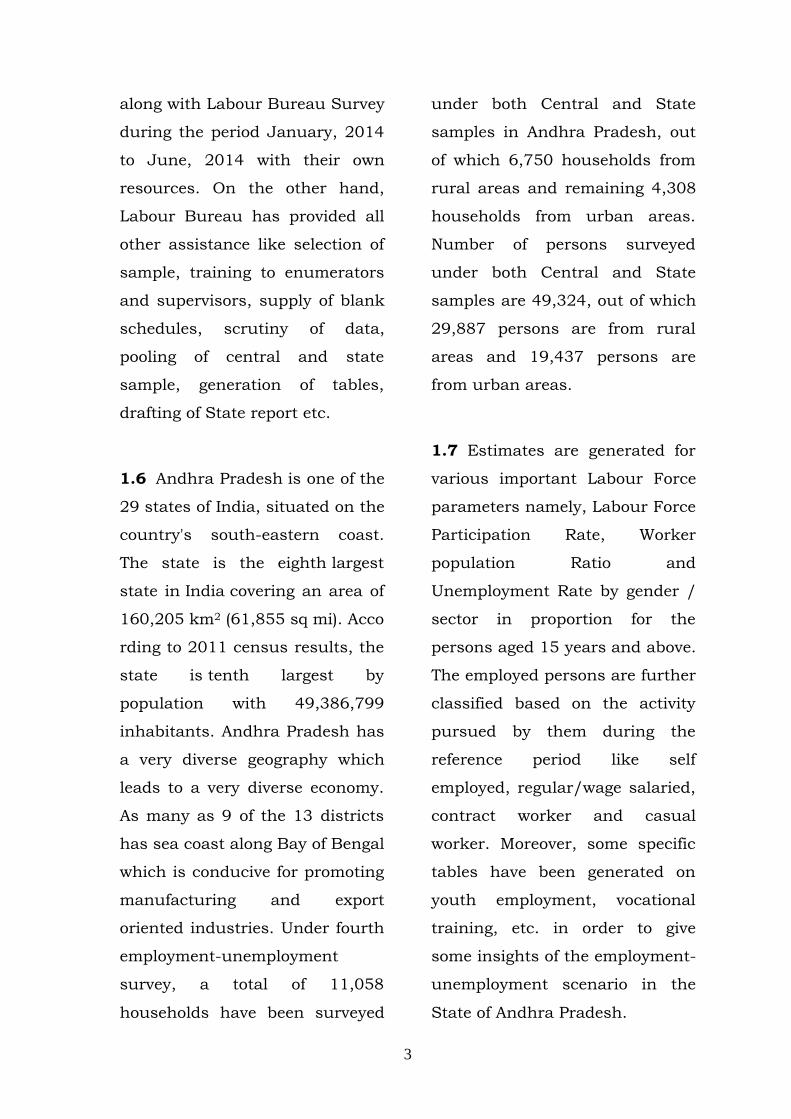
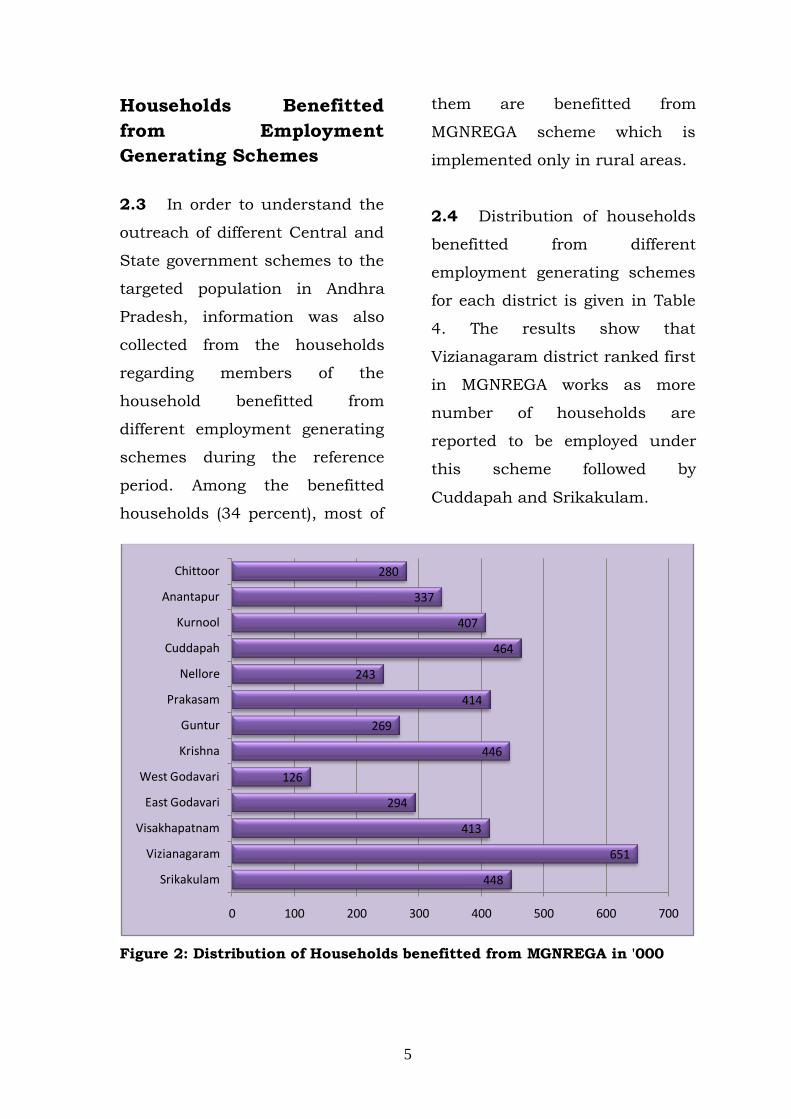
2.4 Distribution of households
benefitted from different
employment generating schemes
for each district is given in Table
4. The results show that
Vizianagaram district ranked first
in MGNREGA works as more
number of households are
reported to be employed under
this scheme followed by
Cuddapah and Srikakulam.
Figure 2: Distribution of Households benefitted from MGNREGA in '000
448
651
413
294
126
446
269
414
243
464
407
337
280
0 100 200 300 400 500 600 700
Srikakulam
Vizianagaram
Visakhapatnam
East Godavari
West Godavari
Krishna
Guntur
Prakasam
Nellore
Cuddapah
Kurnool
Anantapur
Chittoor
6
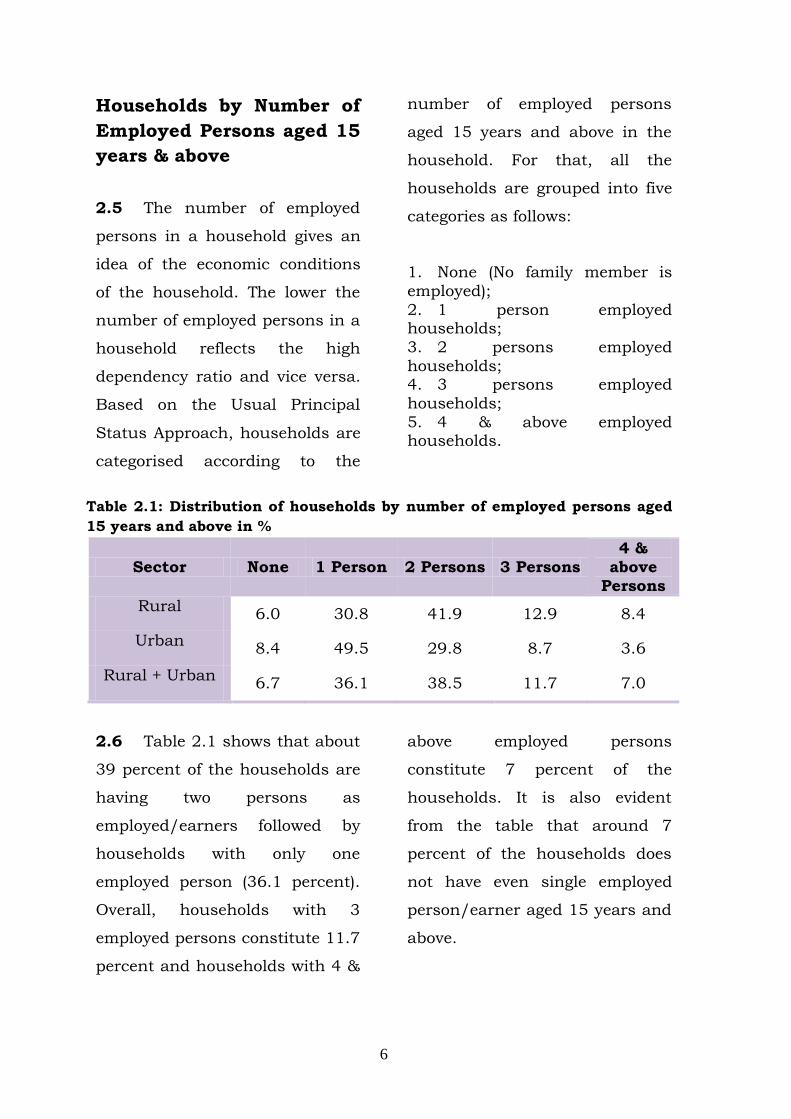
Households by Number of Employed Persons aged 15 years & above 2.5 The number of employed
persons in a household gives an
idea of the economic conditions
of the household. The lower the
number of employed persons in a
household reflects the high
dependency ratio and vice versa.
Based on the Usual Principal
Status Approach, households are
categorised according to the
number of employed persons
aged 15 years and above in the
household. For that, all the
households are grouped into five
categories as follows:
1. None (No family member is employed); 2. 1 person employed households; 3. 2 persons employed households; 4. 3 persons employed households; 5. 4 & above employed households.
Table 2.1: Distribution of households by number of employed persons aged 15 years and above in %
Sector None 1 Person 2 Persons 3 Persons 4 &
above Persons
Rural 6.0 30.8 41.9 12.9 8.4
Urban 8.4 49.5 29.8 8.7 3.6
Rural + Urban 6.7 36.1 38.5 11.7 7.0
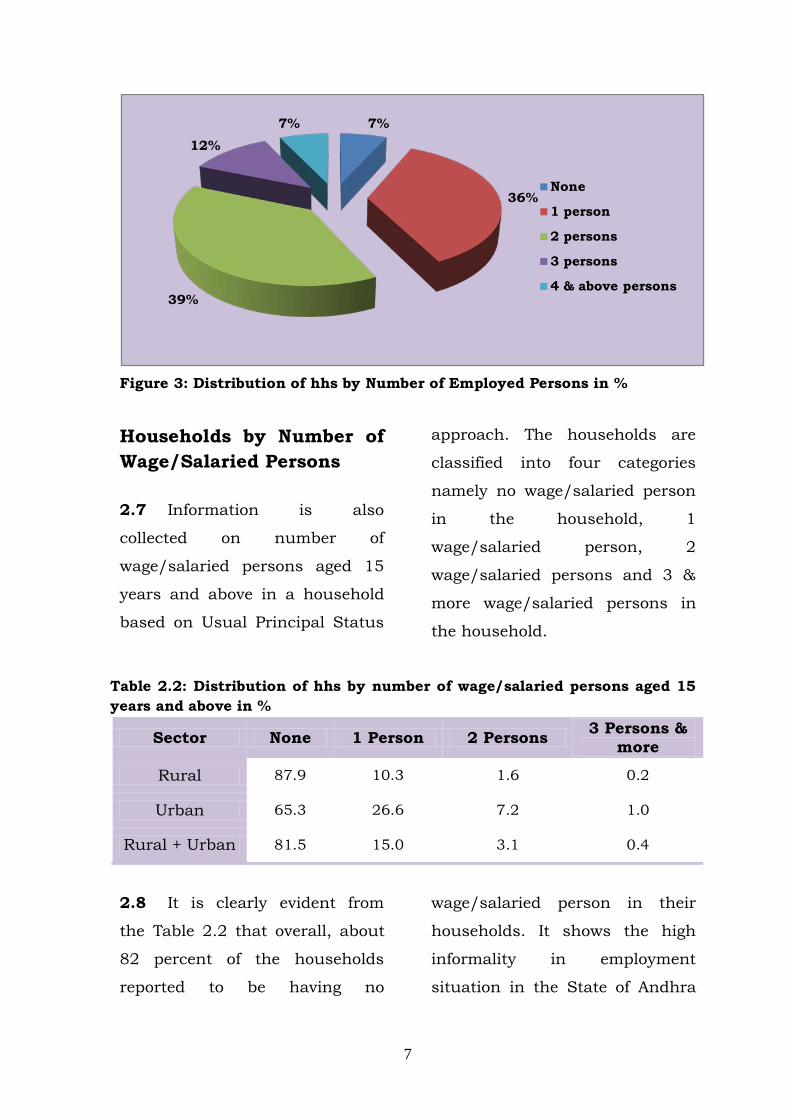
2.6 Table 2.1 shows that about
39 percent of the households are
having two persons as
employed/earners followed by
households with only one
employed person (36.1 percent).
Overall, households with 3
employed persons constitute 11.7
percent and households with 4 &
above employed persons
constitute 7 percent of the
households. It is also evident
from the table that around 7
percent of the households does
not have even single employed
person/earner aged 15 years and
above.
7
Figure 3: Distribution of hhs by Number of Employed Persons in %
Households by Number of Wage/Salaried Persons 2.7 Information is also
collected on number of
wage/salaried persons aged 15
years and above in a household
based on Usual Principal Status
approach. The households are
classified into four categories
namely no wage/salaried person
in the household, 1
wage/salaried person, 2
wage/salaried persons and 3 &
more wage/salaried persons in
the household.
Table 2.2: Distribution of hhs by number of wage/salaried persons aged 15 years and above in %
Sector None 1 Person 2 Persons 3 Persons & more
Rural 87.9 10.3 1.6 0.2
Urban 65.3 26.6 7.2 1.0
Rural + Urban 81.5 15.0 3.1 0.4
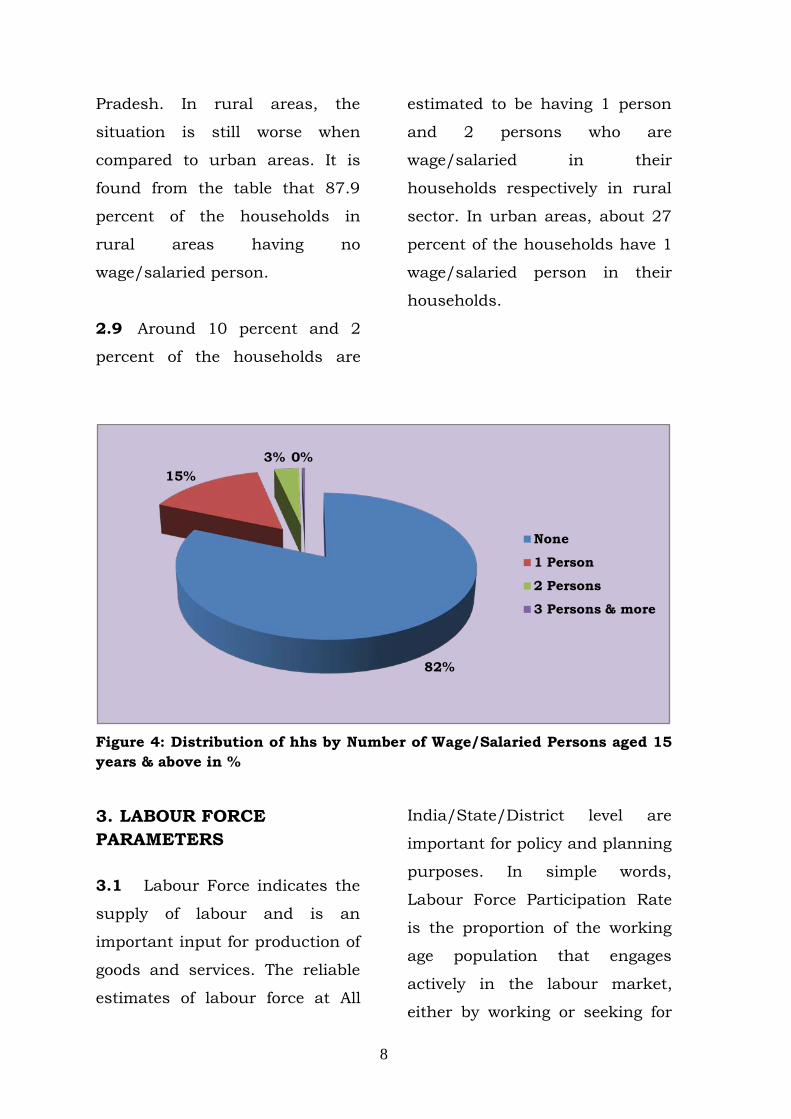
2.8 It is clearly evident from
the Table 2.2 that overall, about
82 percent of the households
reported to be having no
wage/salaried person in their
households. It shows the high
informality in employment
situation in the State of Andhra
7%
36%
39%
12%7%
None
1 person
2 persons
3 persons
4 & above persons
8
Pradesh. In rural areas, the
situation is still worse when
compared to urban areas. It is
found from the table that 87.9
percent of the households in
rural areas having no
wage/salaried person.
2.9 Around 10 percent and 2
percent of the households are
estimated to be having 1 person
and 2 persons who are
wage/salaried in their
households respectively in rural
sector. In urban areas, about 27
percent of the households have 1
wage/salaried person in their
households.
Figure 4: Distribution of hhs by Number of Wage/Salaried Persons aged 15 years & above in %
3. LABOUR FORCE PARAMETERS 3.1 Labour Force indicates the
supply of labour and is an
important input for production of
goods and services. The reliable
estimates of labour force at All
India/State/District level are
important for policy and planning
purposes. In simple words,
Labour Force Participation Rate
is the proportion of the working
age population that engages
actively in the labour market,
either by working or seeking for
82%
15%3% 0%
None
1 Person
2 Persons
3 Persons & more
9
work. It provides an indication of
the relative size of the supply of
labour available which can be
engaged in the production of
goods and services.
Important Concepts of Labour Force: The basic concepts of Labour
Force Parameters are given
below:
i) Labour Force
Participation Rate: - Labour
Force Participation Rate (LFPR) is
defined as the number of persons
in the labour force per 1000
persons.
𝑳𝑳𝑳𝑳𝑳𝑳𝑳𝑳 =
𝒏𝒏𝒏𝒏.𝒏𝒏𝒐𝒐 𝒆𝒆𝒆𝒆𝒆𝒆𝒆𝒆𝒏𝒏𝒆𝒆𝒆𝒆𝒆𝒆 𝒆𝒆𝒆𝒆𝒑𝒑𝒑𝒑𝒏𝒏𝒏𝒏𝒑𝒑 +𝒏𝒏𝒏𝒏. 𝒏𝒏𝒐𝒐 𝒖𝒖𝒏𝒏𝒆𝒆𝒆𝒆𝒆𝒆𝒆𝒆𝒆𝒆𝒆𝒆𝒆𝒆 𝒆𝒆𝒆𝒆𝒑𝒑𝒑𝒑𝒏𝒏𝒏𝒏𝒑𝒑
𝒕𝒕𝒏𝒏𝒕𝒕𝒕𝒕𝒆𝒆 𝒆𝒆𝒏𝒏𝒆𝒆𝒖𝒖𝒆𝒆𝒕𝒕𝒕𝒕𝒑𝒑𝒏𝒏𝒏𝒏 𝑿𝑿 𝟏𝟏𝟏𝟏𝟏𝟏𝟏𝟏
ii) Worker Population Ratio:
- Worker Population Ratio (WPR)
is defined as the number of
persons employed per 1000
persons.
𝑾𝑾𝑳𝑳𝑳𝑳 = 𝒏𝒏𝒏𝒏. 𝒏𝒏𝒐𝒐 𝒆𝒆𝒆𝒆𝒆𝒆𝒆𝒆𝒏𝒏𝒆𝒆𝒆𝒆𝒆𝒆 𝒆𝒆𝒆𝒆𝒑𝒑𝒑𝒑𝒏𝒏𝒏𝒏𝒑𝒑
𝒕𝒕𝒏𝒏𝒕𝒕𝒕𝒕𝒆𝒆 𝒆𝒆𝒏𝒏𝒆𝒆𝒖𝒖𝒆𝒆𝒕𝒕𝒕𝒕𝒑𝒑𝒏𝒏𝒏𝒏 𝑿𝑿 𝟏𝟏𝟏𝟏𝟏𝟏𝟏𝟏
iii) Proportion Unemployed: -
Proportion Unemployed (PU) is
defined as the number of persons
unemployed per 1000 persons.
𝑳𝑳𝑷𝑷 =𝒏𝒏𝒏𝒏. 𝒏𝒏𝒐𝒐 𝒖𝒖𝒏𝒏𝒆𝒆𝒆𝒆𝒆𝒆𝒆𝒆𝒏𝒏𝒆𝒆𝒆𝒆𝒆𝒆 𝒆𝒆𝒆𝒆𝒑𝒑𝒑𝒑𝒏𝒏𝒏𝒏𝒑𝒑
𝒕𝒕𝒏𝒏𝒕𝒕𝒕𝒕𝒆𝒆 𝒆𝒆𝒏𝒏𝒆𝒆𝒖𝒖𝒆𝒆𝒕𝒕𝒕𝒕𝒑𝒑𝒏𝒏𝒏𝒏 𝑿𝑿 𝟏𝟏𝟏𝟏𝟏𝟏𝟏𝟏
iv) Unemployment Rate: -
Unemployment Rate (UR) is
defined as the number of persons
unemployed per 1000 persons in
the Labour Force (Employed &
Unemployed).
𝑷𝑷𝑳𝑳 =𝒏𝒏𝒏𝒏.𝒏𝒏𝒐𝒐 𝒖𝒖𝒏𝒏𝒆𝒆𝒆𝒆𝒆𝒆𝒆𝒆𝒏𝒏𝒆𝒆𝒆𝒆𝒆𝒆 𝒆𝒆𝒆𝒆𝒑𝒑𝒑𝒑𝒏𝒏𝒏𝒏𝒑𝒑
𝒆𝒆𝒕𝒕𝒍𝒍𝒏𝒏𝒖𝒖𝒑𝒑 𝒐𝒐𝒏𝒏𝒑𝒑𝒇𝒇𝒆𝒆 𝑿𝑿 𝟏𝟏𝟏𝟏𝟏𝟏𝟏𝟏
Measurement of Labour Force
3.2 In a developing country like
India where majority of the
workers are employed in the
unorganized sector and pursuing
multiple activities, estimating
labour force and its derivatives is
a very complex job. In such cases
no single measure is appropriate
to estimate the labour force
parameters. Broadly, Labour
Force parameters may be derived
by the following two different
approaches.
i) Usual Principal Status (UPS)
Approach: The major time
criterion based on the last 365
days is used to determine the
activity pursued by a person
under the usual principal status
approach. Accordingly, the major
time spent by a person (183 days
or more) is used to determine
10
whether the person is in the
labour force or out of the labour
force. A person found
unemployed under this approach
reflects the chronic
unemployment. In the present
survey, the usual principal
activity status estimates are
derived based on a moving
reference period of last twelve
months. For example, if the
household is surveyed in
January 2014, then the reference
period will be January 2013 to
December 2013.
ii) Usual Principal & Subsidiary
Status (UPSS) Approach: The
second important approach to
measure the labour force
parameters is the usual principal
and subsidiary status approach.
This approach is a hybrid one
which takes into consideration
both the major time criterion and
the shorter time period (30 days
or more in any economic activity).
Thus a person who has worked
for even 30 days or more in any
economic activity during the
reference period during the last
12 months is considered as
employed under this hybrid
approach. In this approach also,
the same reference period as
taken in the usual principal
status approach is used. This
approach is also called as the
usual status approach.
3.3 The results of various
Labour Force related parameters
and its derivatives are compiled
based on all the two approaches
as mentioned above.
Labour Force Participation Rate (LFPR) 3.4 The results of all the
important parameters in the
report are presented in the form
of proportions only for the
persons aged 15 years & above.
According to Usual Principal
Status Approach, 638 persons
out of 1000 persons are in the
labour force at state level after
pooling the Central and State
sample. In other words, it implies
that 63.8 per cent of the working
age population i.e. persons aged
15 years and above is either
working or seeking for work at
the State level under UPS
approach. In the Rural and
Urban sectors of the State after
pooling the estimates, the LFPR
11
is estimated to be 67.7 per cent
and 54.1 per cent respectively.
The State level estimates based
on pooled sample are presented
in Table 2.3.
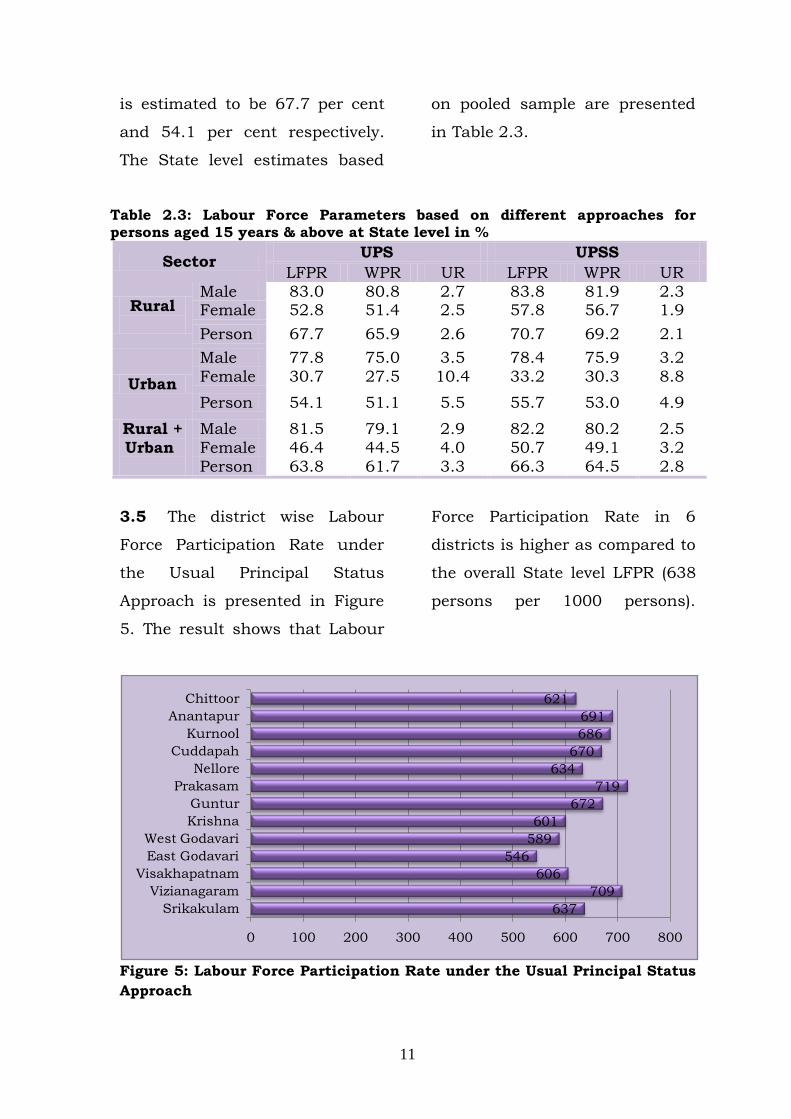
Table 2.3: Labour Force Parameters based on different approaches for persons aged 15 years & above at State level in %
Sector UPS UPSS LFPR WPR UR LFPR WPR UR
Rural
Male 83.0 80.8 2.7 83.8 81.9 2.3 Female 52.8 51.4 2.5 57.8 56.7 1.9 Person 67.7 65.9 2.6 70.7 69.2 2.1
Urban Male 77.8 75.0 3.5 78.4 75.9 3.2 Female 30.7 27.5 10.4 33.2 30.3 8.8
Person 54.1 51.1 5.5 55.7 53.0 4.9
Rural + Urban
Male 81.5 79.1 2.9 82.2 80.2 2.5 Female 46.4 44.5 4.0 50.7 49.1 3.2 Person 63.8 61.7 3.3 66.3 64.5 2.8
3.5 The district wise Labour
Force Participation Rate under
the Usual Principal Status
Approach is presented in Figure
5. The result shows that Labour
Force Participation Rate in 6
districts is higher as compared to
the overall State level LFPR (638
persons per 1000 persons).
Figure 5: Labour Force Participation Rate under the Usual Principal Status Approach
637709
606546
589601
672719
634670686691
621
0 100 200 300 400 500 600 700 800
SrikakulamVizianagaram
VisakhapatnamEast GodavariWest Godavari
KrishnaGuntur
PrakasamNellore
CuddapahKurnool
AnantapurChittoor
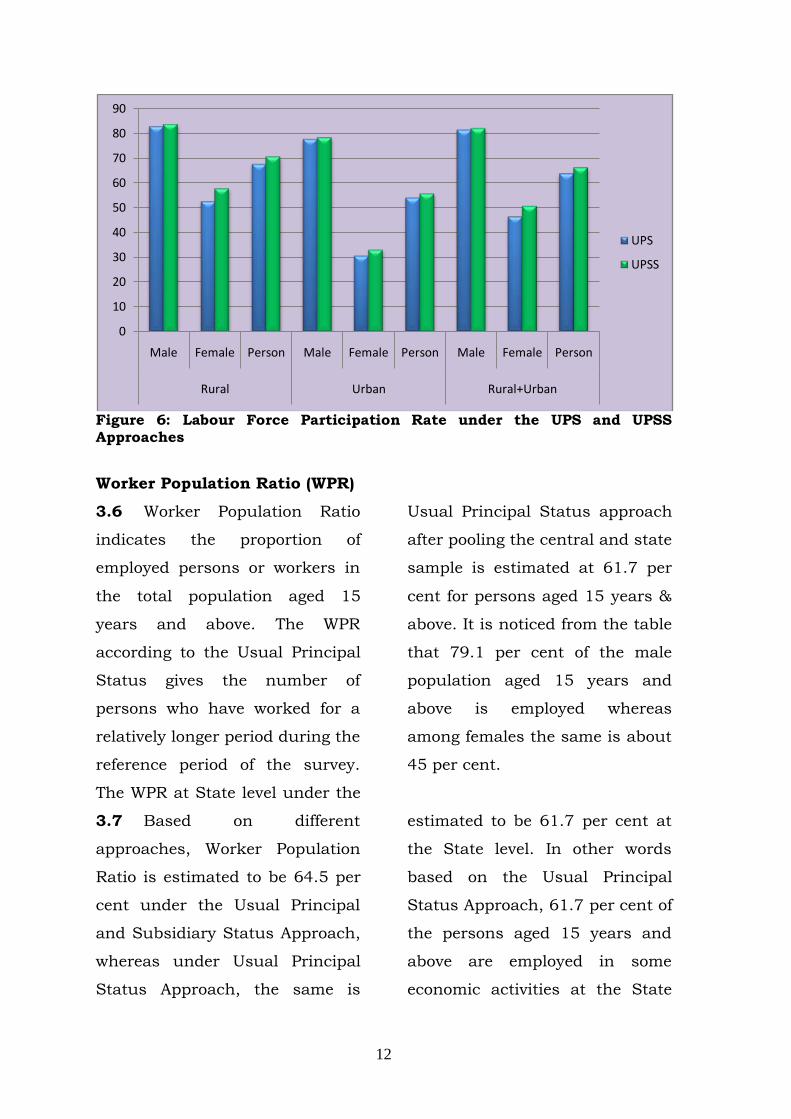
12
Figure 6: Labour Force Participation Rate under the UPS and UPSS Approaches
Worker Population Ratio (WPR)
3.6 Worker Population Ratio
indicates the proportion of
employed persons or workers in
the total population aged 15
years and above. The WPR
according to the Usual Principal
Status gives the number of
persons who have worked for a
relatively longer period during the
reference period of the survey.
The WPR at State level under the
Usual Principal Status approach
after pooling the central and state
sample is estimated at 61.7 per
cent for persons aged 15 years &
above. It is noticed from the table
that 79.1 per cent of the male
population aged 15 years and
above is employed whereas
among females the same is about
45 per cent.
3.7 Based on different
approaches, Worker Population
Ratio is estimated to be 64.5 per
cent under the Usual Principal
and Subsidiary Status Approach,
whereas under Usual Principal
Status Approach, the same is
estimated to be 61.7 per cent at
the State level. In other words
based on the Usual Principal
Status Approach, 61.7 per cent of
the persons aged 15 years and
above are employed in some
economic activities at the State
0
10
20
30
40
50
60
70
80
90
Male Female Person Male Female Person Male Female Person
Rural Urban Rural+Urban
UPS
UPSS

13
level. In case of rural and urban
areas, the corresponding figures
are 65.9 percent and 51.1 per
cent respectively at the State
level.
Figure 7: WPR based on UPS and UPSS approaches for persons aged 15 years & above at State level
Unemployment Rate (UR)
3.8 The Unemployment Rate or
ratio of unemployed person to the
labour force at the State level
after pooling the Central and
State sample by different
approaches to measure
unemployment is presented in
Table 2.3. Unemployment Rate at
State level is estimated to be 3.3
percent based on the Usual
Principal Status Approach after
pooling the Central and State
sample. The Unemployment Rate
in rural areas and urban areas
are estimated to be 2.6 percent
and 5.5 percent respectively.
Table 2.4: Unemployment Rate based on Usual Principal Status Approach in %
Sector Male Female Person
Rural 2.7 2.5 2.6
Urban 3.5 10.4 5.5
Rural + Urban 2.9 4 3.3
0
10
20
30
40
50
60
70
80
90
Male Female Person Male Female Person Male Female Person
Rural Urban Rural+Urban
UPS
UPSS
14
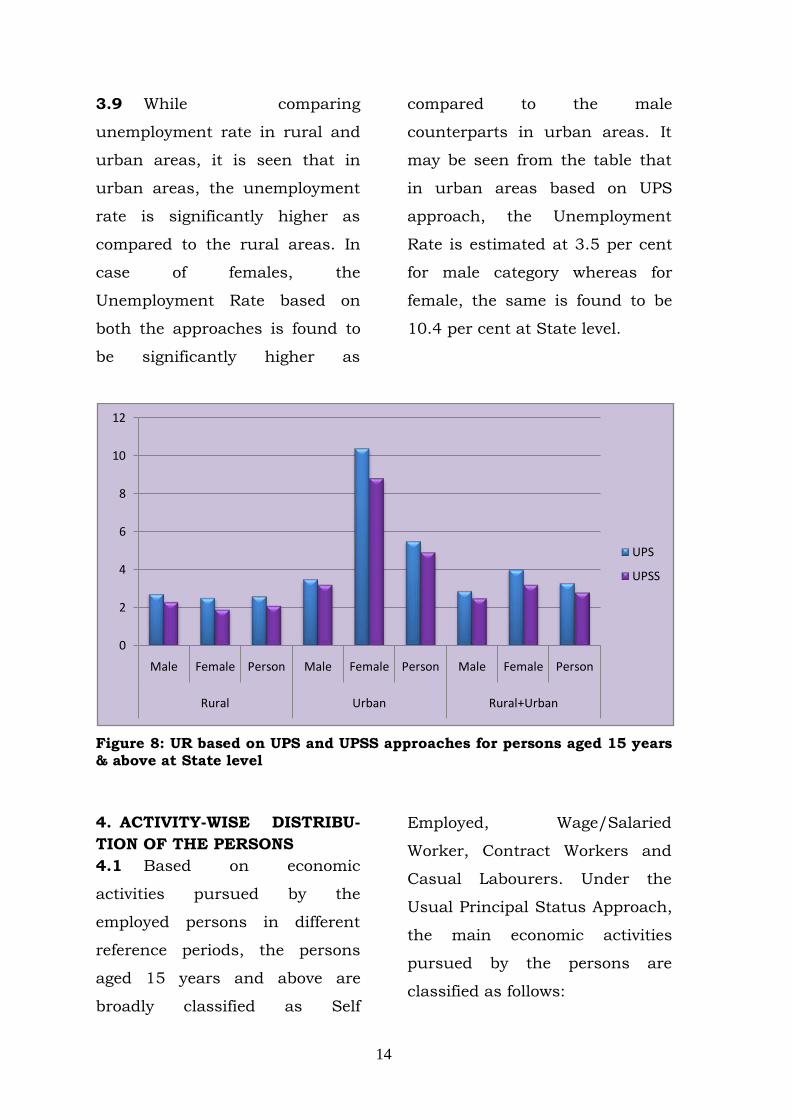
3.9 While comparing
unemployment rate in rural and
urban areas, it is seen that in
urban areas, the unemployment
rate is significantly higher as
compared to the rural areas. In
case of females, the
Unemployment Rate based on
both the approaches is found to
be significantly higher as
compared to the male
counterparts in urban areas. It
may be seen from the table that
in urban areas based on UPS
approach, the Unemployment
Rate is estimated at 3.5 per cent
for male category whereas for
female, the same is found to be
10.4 per cent at State level.
Figure 8: UR based on UPS and UPSS approaches for persons aged 15 years & above at State level
4. ACTIVITY-WISE DISTRIBU-TION OF THE PERSONS 4.1 Based on economic
activities pursued by the
employed persons in different
reference periods, the persons
aged 15 years and above are
broadly classified as Self
Employed, Wage/Salaried
Worker, Contract Workers and
Casual Labourers. Under the
Usual Principal Status Approach,
the main economic activities
pursued by the persons are
classified as follows:
0
2
4
6
8
10
12
Male Female Person Male Female Person Male Female Person
Rural Urban Rural+Urban
UPS
UPSS
15
i) worked in household
enterprise as an own account
worker;
ii) worked in household
enterprise as an employer;
iii) worked as helper in household
enterprise (unpaid family
worker);
iv) worked as regular salaried/
wage employee;
v) worked as contract worker;
vi) worked as casual wage labour
in public works;
vii) worked as casual wage labour
in other types of work;
4.2 Under the Usual Principal
Status approach, majority of the
work force aged 15 years and
above are employed as Casual
Workers. About 48 per cent of the
workers are reported to be
employed as casual labour
followed by 38 per cent found to
be self employed, and 13 per cent
as wage/salaried at State level.
4.3 In rural areas, about 55
per cent of the workforce is
reported as casual labour,
followed by self employed persons
(36.7 per cent) and wage/salaried
earners (7.4 per cent). The
distribution of employed persons
among different economic
activities under the UPSS is
found to be almost similar to the
UPS approach and is as shown in
Table 2.4.
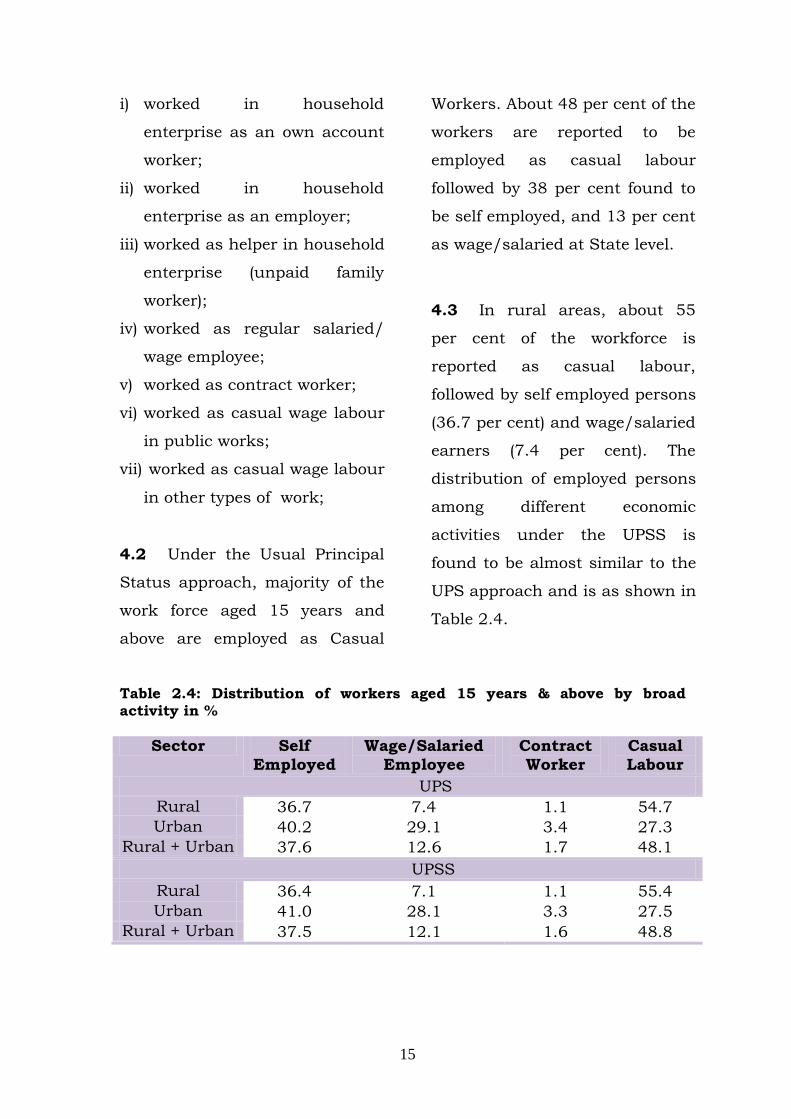
Table 2.4: Distribution of workers aged 15 years & above by broad activity in %
Sector Self Employed
Wage/Salaried Employee
Contract Worker
Casual Labour
UPS Rural 36.7 7.4 1.1 54.7 Urban 40.2 29.1 3.4 27.3
Rural + Urban 37.6 12.6 1.7 48.1 UPSS
Rural 36.4 7.1 1.1 55.4 Urban 41.0 28.1 3.3 27.5
Rural + Urban 37.5 12.1 1.6 48.8
16
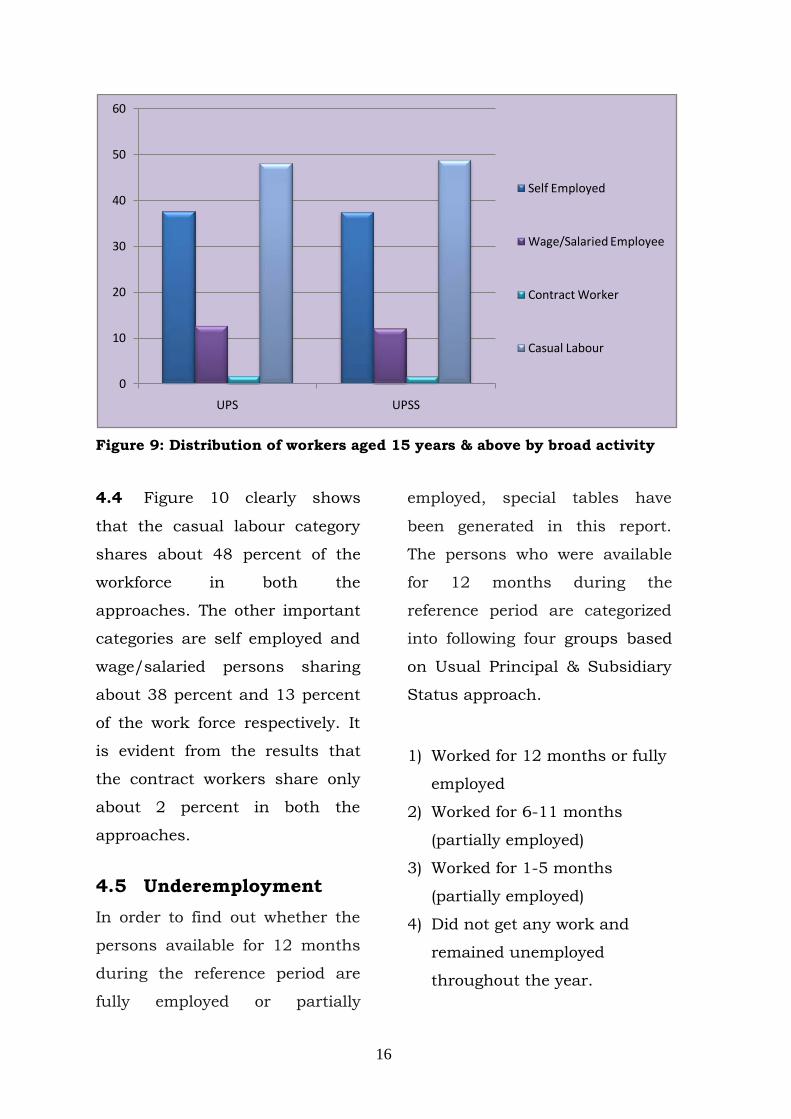
Figure 9: Distribution of workers aged 15 years & above by broad activity
4.4 Figure 10 clearly shows
that the casual labour category
shares about 48 percent of the
workforce in both the
approaches. The other important
categories are self employed and
wage/salaried persons sharing
about 38 percent and 13 percent
of the work force respectively. It
is evident from the results that
the contract workers share only
about 2 percent in both the
approaches.
4.5 Underemployment In order to find out whether the
persons available for 12 months
during the reference period are
fully employed or partially
employed, special tables have
been generated in this report.
The persons who were available
for 12 months during the
reference period are categorized
into following four groups based
on Usual Principal & Subsidiary
Status approach.
1) Worked for 12 months or fully
employed
2) Worked for 6-11 months
(partially employed)
3) Worked for 1-5 months
(partially employed)
4) Did not get any work and
remained unemployed
throughout the year.
0
10
20
30
40
50
60
UPS UPSS
Self Employed
Wage/Salaried Employee
Contract Worker
Casual Labour
17
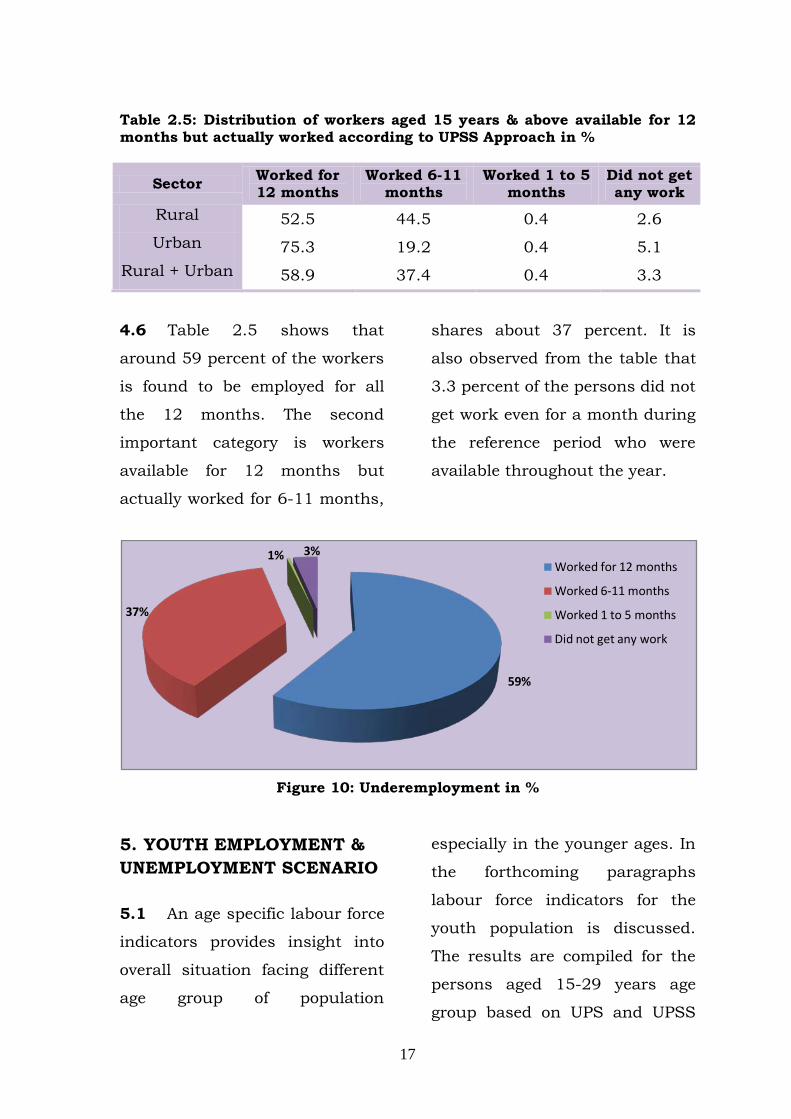
Table 2.5: Distribution of workers aged 15 years & above available for 12 months but actually worked according to UPSS Approach in %
Sector Worked for 12 months
Worked 6-11 months
Worked 1 to 5 months
Did not get any work
Rural 52.5 44.5 0.4 2.6 Urban 75.3 19.2 0.4 5.1
Rural + Urban 58.9 37.4 0.4 3.3
4.6 Table 2.5 shows that
around 59 percent of the workers
is found to be employed for all
the 12 months. The second
important category is workers
available for 12 months but
actually worked for 6-11 months,
shares about 37 percent. It is
also observed from the table that
3.3 percent of the persons did not
get work even for a month during
the reference period who were
available throughout the year.
Figure 10: Underemployment in %
5. YOUTH EMPLOYMENT & UNEMPLOYMENT SCENARIO 5.1 An age specific labour force
indicators provides insight into
overall situation facing different
age group of population
especially in the younger ages. In
the forthcoming paragraphs
labour force indicators for the
youth population is discussed.
The results are compiled for the
persons aged 15-29 years age
group based on UPS and UPSS
59%
37%
1% 3%Worked for 12 months
Worked 6-11 months
Worked 1 to 5 months
Did not get any work
18
approaches. The sector wise
labour force parameters for the
age group 15-29 years are
presented in Table 2.6.
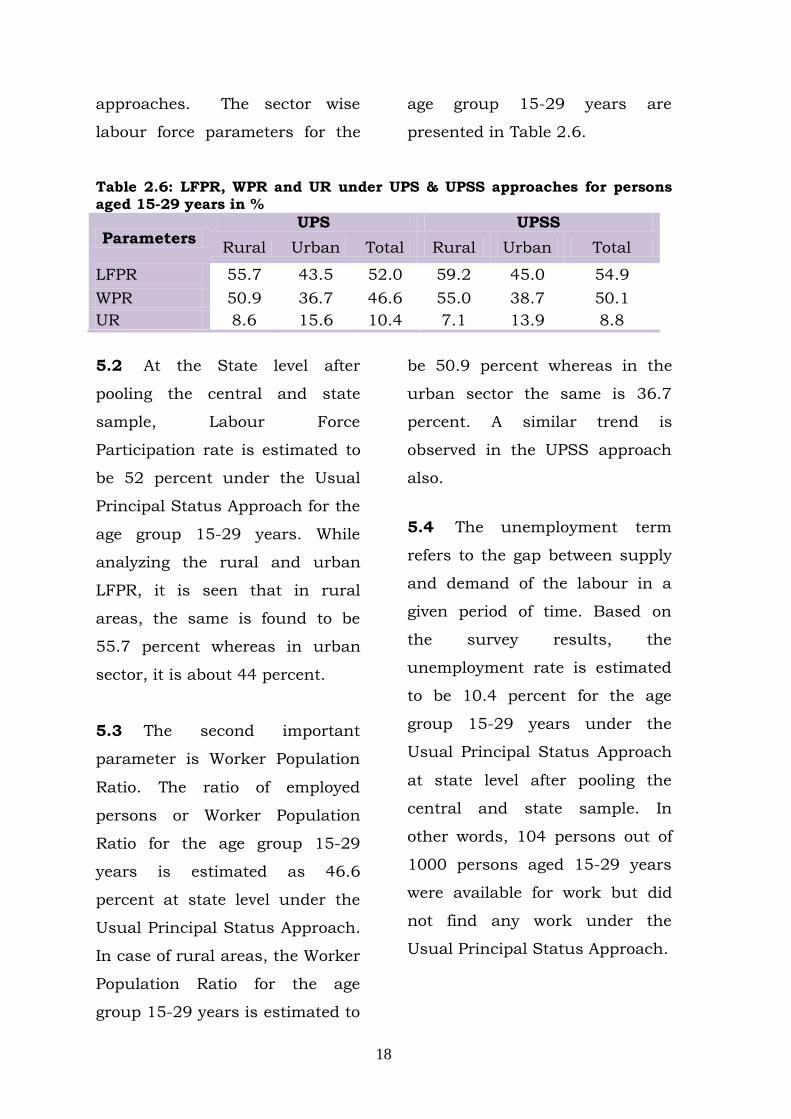
Table 2.6: LFPR, WPR and UR under UPS & UPSS approaches for persons aged 15-29 years in %
Parameters UPS UPSS
Rural Urban Total Rural Urban Total
LFPR 55.7 43.5 52.0 59.2 45.0 54.9 WPR 50.9 36.7 46.6 55.0 38.7 50.1 UR 8.6 15.6 10.4 7.1 13.9 8.8
5.2 At the State level after
pooling the central and state
sample, Labour Force
Participation rate is estimated to
be 52 percent under the Usual
Principal Status Approach for the
age group 15-29 years. While
analyzing the rural and urban
LFPR, it is seen that in rural
areas, the same is found to be
55.7 percent whereas in urban
sector, it is about 44 percent.
5.3 The second important
parameter is Worker Population
Ratio. The ratio of employed
persons or Worker Population
Ratio for the age group 15-29
years is estimated as 46.6
percent at state level under the
Usual Principal Status Approach.
In case of rural areas, the Worker
Population Ratio for the age
group 15-29 years is estimated to
be 50.9 percent whereas in the
urban sector the same is 36.7
percent. A similar trend is
observed in the UPSS approach
also.
5.4 The unemployment term
refers to the gap between supply
and demand of the labour in a
given period of time. Based on
the survey results, the
unemployment rate is estimated
to be 10.4 percent for the age
group 15-29 years under the
Usual Principal Status Approach
at state level after pooling the
central and state sample. In
other words, 104 persons out of
1000 persons aged 15-29 years
were available for work but did
not find any work under the
Usual Principal Status Approach.
19
5.5 While comparing the
results at sector level, it may be
seen from the above table, that
the unemployment rate in urban
areas is higher as compared to
the rural areas for the age group
15-29 years in both the
approaches. In rural sector, the
unemployment rate is found to
be 8.6 percent whereas in urban
sector, the same is found to be
15.6 percent under UPS
approach. District level estimates
for the age group 15-29 years are
given in Tables 17 to 18.2.
6. VOCATIONAL TRAINING 6.1. It is the general notion that
a person having vocational
training will get employment
easily. As vocational training
improves the employability of the
person through enhancing
his/her skill in particular work, it
is important to understand how
the vocational training helps
people in getting job and in which
sector. Keeping these things in
mind, information is collected on
vocational training and presented
in the ensuing paragraphs.
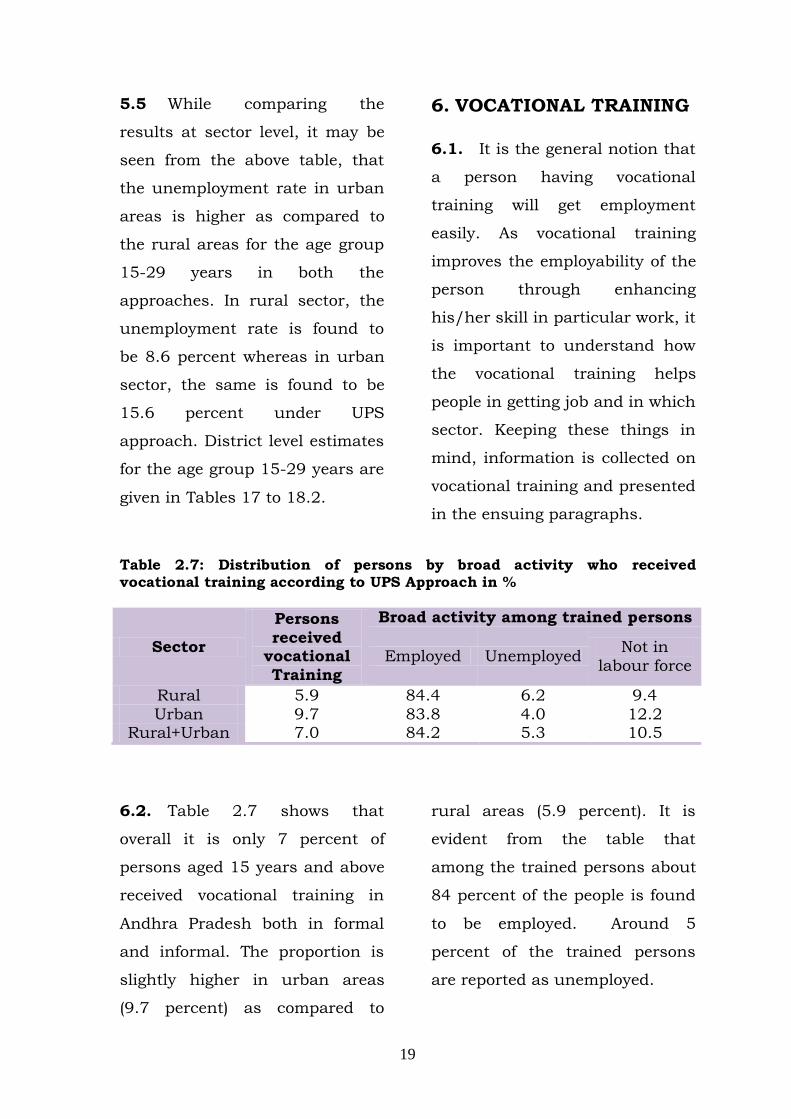
Table 2.7: Distribution of persons by broad activity who received vocational training according to UPS Approach in %
Sector
Persons received
vocational Training
Broad activity among trained persons
Employed Unemployed Not in labour force
Rural 5.9 84.4 6.2 9.4 Urban 9.7 83.8 4.0 12.2
Rural+Urban 7.0 84.2 5.3 10.5
6.2. Table 2.7 shows that
overall it is only 7 percent of
persons aged 15 years and above
received vocational training in
Andhra Pradesh both in formal
and informal. The proportion is
slightly higher in urban areas
(9.7 percent) as compared to
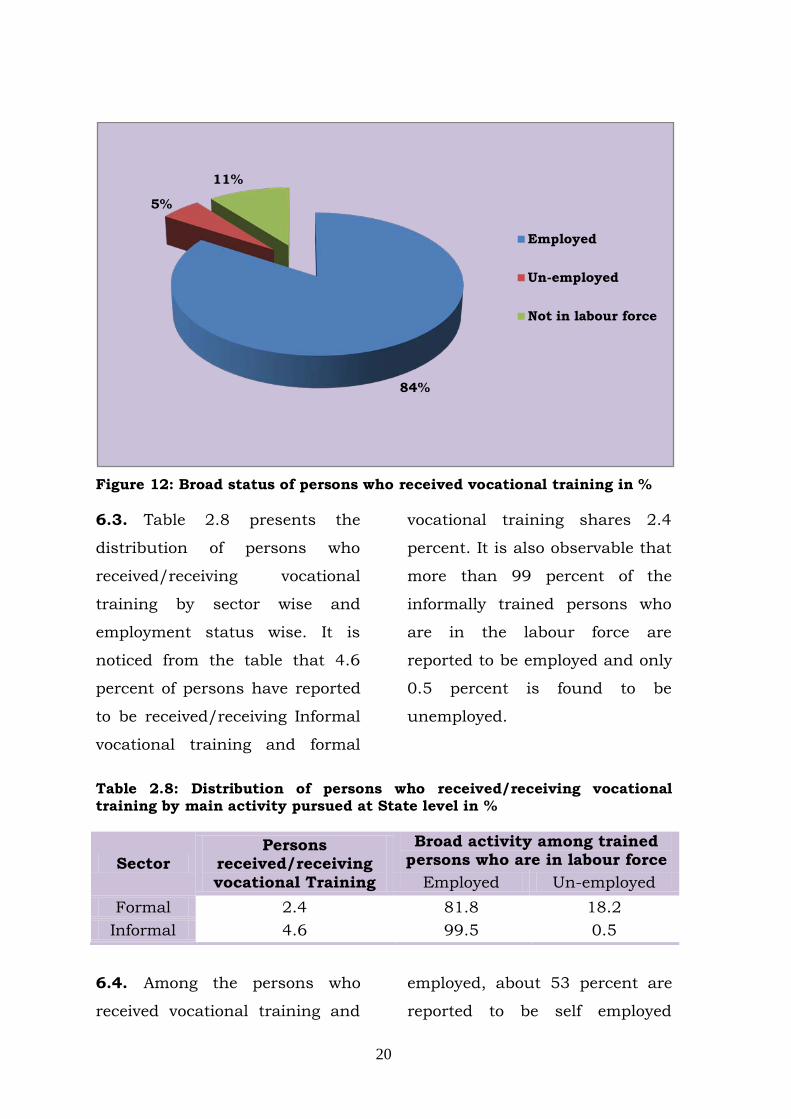
rural areas (5.9 percent). It is
evident from the table that
among the trained persons about
84 percent of the people is found
to be employed. Around 5
percent of the trained persons
are reported as unemployed.
20
Figure 12: Broad status of persons who received vocational training in %
6.3. Table 2.8 presents the
distribution of persons who
received/receiving vocational
training by sector wise and
employment status wise. It is
noticed from the table that 4.6
percent of persons have reported
to be received/receiving Informal
vocational training and formal
vocational training shares 2.4
percent. It is also observable that
more than 99 percent of the
informally trained persons who
are in the labour force are
reported to be employed and only
0.5 percent is found to be
unemployed.
Table 2.8: Distribution of persons who received/receiving vocational training by main activity pursued at State level in %
Sector Persons
received/receiving vocational Training
Broad activity among trained persons who are in labour force
Employed Un-employed Formal 2.4 81.8 18.2
Informal 4.6 99.5 0.5
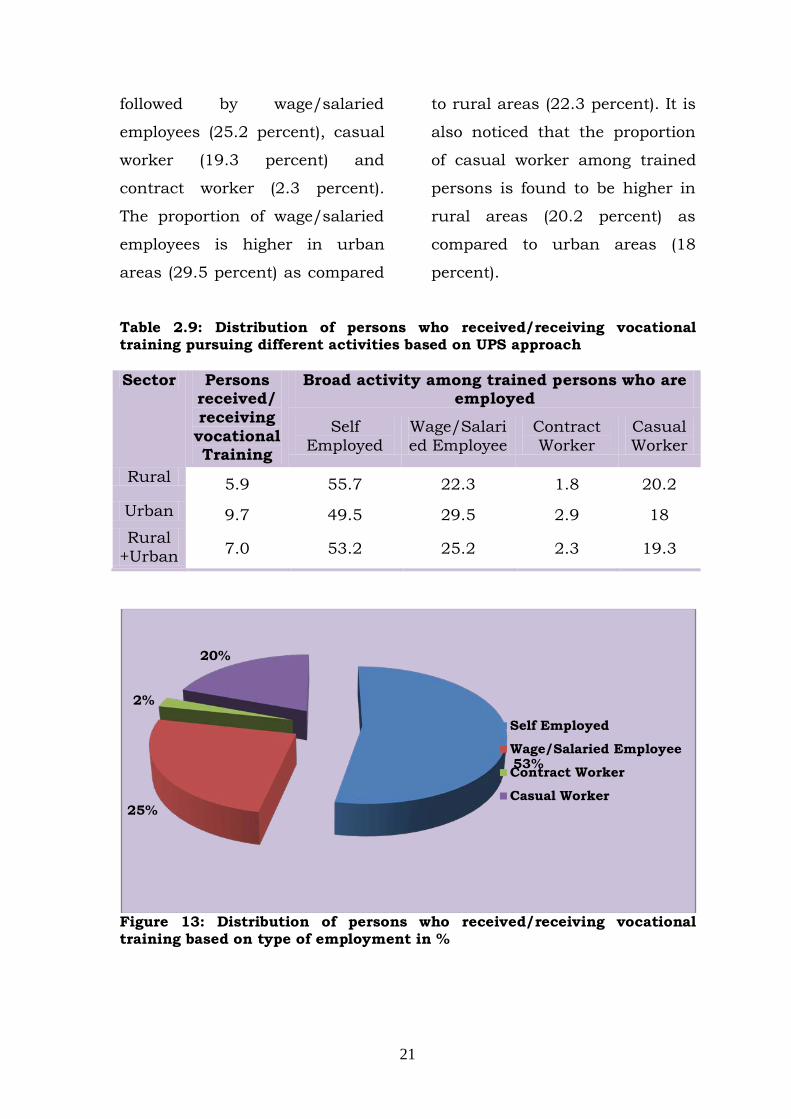
6.4. Among the persons who
received vocational training and
employed, about 53 percent are
reported to be self employed
84%
5%
11%
Employed
Un-employed
Not in labour force
21
followed by wage/salaried
employees (25.2 percent), casual
worker (19.3 percent) and
contract worker (2.3 percent).
The proportion of wage/salaried
employees is higher in urban
areas (29.5 percent) as compared
to rural areas (22.3 percent). It is
also noticed that the proportion
of casual worker among trained
persons is found to be higher in
rural areas (20.2 percent) as
compared to urban areas (18
percent).
Table 2.9: Distribution of persons who received/receiving vocational training pursuing different activities based on UPS approach Sector Persons
received/ receiving vocational Training
Broad activity among trained persons who are employed
Self Employed
Wage/Salaried Employee
Contract Worker
Casual Worker
Rural 5.9 55.7 22.3 1.8 20.2
Urban 9.7 49.5 29.5 2.9 18 Rural
+Urban 7.0 53.2 25.2 2.3 19.3
Figure 13: Distribution of persons who received/receiving vocational training based on type of employment in %
53%
25%
2%
20%
Self Employed
Wage/Salaried Employee
Contract Worker
Casual Worker

22
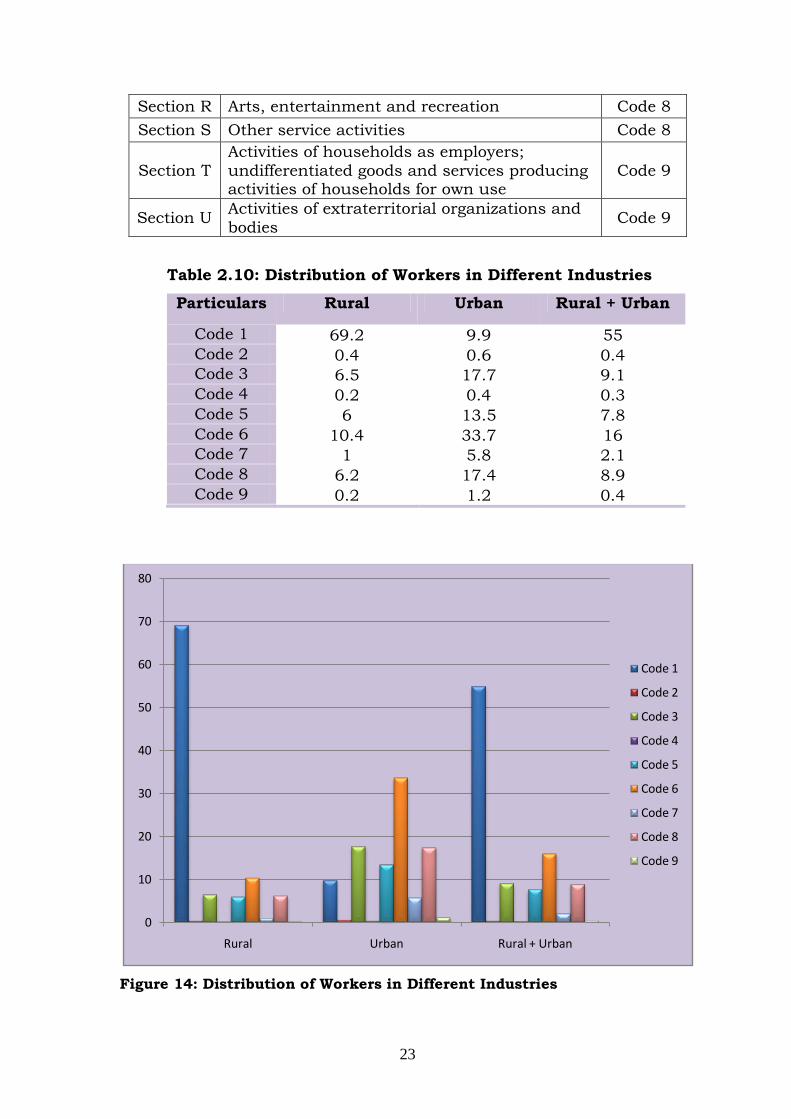
7. INDUSTRY WISE DISTRI-BUTION OF WORKERS 7.1. Employed persons are
further classified based on the
economic activity pursued by
them in different industry
sections. The results are
compiled based on National
Industrial Classification 2008.
The survey results reveal that
under UPS approach, majority of
the persons are employed in
primary sector i.e agriculture,
forestry & fishing and mining &
quarrying or Section A & Section
B of NIC 2008 classification.
7.2. The second important
industrial code which engages
more workers is code 6 which
comprises wholesale and retail
trade; repair of motor vehicles
and motorcycles, Transportation
and storage, etc shares around
16 percent of the employed
persons.
Section Wise details of NIC 2008
Section Details Code Section A Agriculture, forestry and fishing Code 1 Section B Mining and quarrying Code 2 Section C Manufacturing Code 3
Section D Electricity, gas, steam and air conditioning supply Code 4
Section E Water supply; sewerage, waste management and remediation activities Code 4
Section F Construction Code 5
Section G Wholesale and retail trade; repair of motor vehicles and motorcycles Code 6
Section H Transportation and storage Code 6 Section I Accommodation and Food service activities Code 6 Section J Information and communication Code 6 Section K Financial and insurance activities Code 7 Section L Real estate activities Code 7 Section M Professional, scientific and technical activities Code 7 Section N Administrative and support service activities Code 7
Section O Public administration and defence; compulsory social security Code 8
Section P Education Code 8 Section Q Human health and social work activities Code 8
23
Section R Arts, entertainment and recreation Code 8 Section S Other service activities Code 8
Section T Activities of households as employers; undifferentiated goods and services producing activities of households for own use
Code 9
Section U Activities of extraterritorial organizations and bodies Code 9
Table 2.10: Distribution of Workers in Different Industries
Particulars Rural Urban Rural + Urban
Code 1 69.2 9.9 55 Code 2 0.4 0.6 0.4 Code 3 6.5 17.7 9.1 Code 4 0.2 0.4 0.3 Code 5 6 13.5 7.8 Code 6 10.4 33.7 16 Code 7 1 5.8 2.1 Code 8 6.2 17.4 8.9 Code 9 0.2 1.2 0.4
Figure 14: Distribution of Workers in Different Industries
0
10
20
30
40
50
60
70
80
Rural Urban Rural + Urban
Code 1
Code 2
Code 3
Code 4
Code 5
Code 6
Code 7
Code 8
Code 9

24
8. EDUCATION WISE CLASS-IFICATION OF PERSONS 8.1. In the present report,
persons are also classified based
on their educational level with
main activity pursued by them
during the reference period viz.
employed, unemployed and not
in labour force. The results are
presented under nine heads
starting from non-literate to post
graduation and above level. Table 2.11: Distribution for persons by main activity & educational classification according to UPS approach in % Sl. No.
Education Classification
Employed Unemployed Not in Labour Force
1 Not literate 69.6 0.1 30.3 2 Below Primary 70.1 0.4 29.5 3 Primary 70.6 0.4 29 4 Middle 64.4 0.7 34.9 5 Secondary 49.9 1.8 48.3 6 Higher secondary 36.8 2.9 60.2 7 Diploma/ certificate 54.6 9.7 35.7 8 Graduate 56.2 12.4 31.4 9 Post graduate & above 65.1 14.3 20.6
Overall 61.7 2.1 36.2
8.2. It is clearly evident from
the table that the unemployment
rate is increasing as the
education level rises. In case of
graduation and above education
level, the unemployment rate is
significantly high at 18 per cent
at state level.
1
Annexure I CONCEPTS AND DEFINITIONS
Important concepts and definitions used in the survey and relevant to this report are explained below. 1.1 House: Every structure, tent or other place of shelter, etc. which is used primarily for residential use is considered as a house for the present survey. 1.2 Household: A group of persons normally living together and taking food from a common kitchen constitutes a household. It will include temporary stay-aways (those whose total period of absence from the household is expected to be less than 6 months) but exclude temporary visitors and guests (expected total period of stay less than 6 months). The members of a household may or may not be related by blood or marriage to one another. The following examples may be useful while determining the group of persons to be considered as households:
(a) In case a hostel is listed, it will constitute a single household.
(b) Inmates of hotel, lodging and boarding house etc. will also constitute a single household.
(c) In deciding the composition of a household, more emphasis is to be placed on ‘normally living together’ than on ordinarily taking food from a common kitchen. In case the place of residence of a person is different from the place of boarding, he or she will be treated as a member of the household in which he or she resides.
(d) A resident employee, or domestic servant or a paying guest will be considered as a member of the household in which he or she resides even though he or she is not a member of the same family if the period of stay is six month or above.
(e) In case a member of a family (say a son or a daughter of the head of family) stays elsewhere like in hostel for studies or for any other reason for major part of the year, he/she will not be considered as a member of his/her parents household.
2
1.3 Household size: The number of members normally residing in a household is its size.
1.4 Economic activity: The entire spectrum of human activity falls into two categories: i) economic activity and ii) non-economic activity. Any activity that results in production of goods and services which adds value to the national product is considered as an economic activity. Further the economic activities have two parts namely i) market activities and ii) non-market activities. Market activities are those that involve remuneration to those who perform it, i.e., activity performed for pay or profit. Such activities include production of all goods and services for market including those of government services, etc. On the other hand non-market activities are those involving the production of primary commodities for own consumption and own account production of fixed assets.
1.5 Thus the term 'economic activity' under the fourth Annual Employment and Unemployment survey includes:
i. All the market activities described above, i.e., the activities performed for pay or profit which result in production
of goods and services for exchange,
ii. Of the non-market activities, a) All the activities relating to
the primary sector which result in production (including free collection of uncultivated crops, forestry, firewood, hunting, fishing, mining, quarrying, etc.) of primary goods for own consumption.
b) The activities relating to the own-account production of fixed assets. Own account production of fixed assets include construction of own houses, roads, wells, etc., and of machinery, tools, etc., for household enterprise and also construction of any private or community facilities free of charge. A person may be engaged in own account construction in the capacity of either a labour or a supervisor.
1.6 Activity status: It is the activity in which a person is engaged during the reference period, which in turn decides the person's participation in economic and /or non-economic activities. According to this, a person will be in one or a combination of the
3
following three statuses during a reference period: i. Working or engaged in economic
activity (work); ii. Not engaged in economic activity
(work) but either making tangible efforts to seek 'work' or being available for 'work' in case the 'work’ is available and
iii. Neither engaged in any economic activity (work) nor available for 'work'.
1.7 Activity statuses mentioned against sl. no. (i) & (ii) above, are associated with 'being in labour force' and the last s1.no. (iii) is associated with 'not being in the labour force'. Being in labour force is further categorized into two parts (i) employed and unemployed. 1.8 The three broad activity statuses have been further sub-divided into the following categories as listed below:
i. working or being engaged in economic activity (employed): a) worked as an own-account
worker (self-employed); b) employer (self-employed); c) worked in household
enterprise as 'helper' (unpaid family worker);
d) worked as regular salaried/wage employee other than contract worker;
e) worked as contract worker; f) worked as casual wage
labour in public works; g) worked as casual wage
labour in other types of works;
ii. not working but seeking or available for work (unemployed);
iii. neither working nor available for work (not in labour force) i) attended educational
institution; ii) attended domestic duties; iii) recipients of rent, pension,
remittance, etc; iv) not able to work due to
disability; v) Others (prostitutes, beggars,
etc.);
1.9 The various concepts like, 'workers', 'unemployed', labour force, out of labour force are as explained below:
1.10 Workers (or employed): Persons who during the reference period are engaged in any economic activity or who, despite their attachment to their economic activity, have temporarily abstained from work, for reasons of illness, injury or other physical
4
disability, bad weather, festivals, social or religious functions or other contingencies necessitating temporary absence from work constitute workers. Unpaid helpers who assist in the operation of an economic activity in the household, farm or non-farm activities are also considered as workers. 1.11 Seeking or available for work (or unemployed): Persons, who owing to lack of work, had not worked but either sought work through employment exchanges, intermediaries, friends or relatives or by making applications to prospective employers or expressed their willingness or availability for work under the prevailing condition of work and remuneration are considered as those who are 'seeking or available for work' (or unemployed).
1.12 Labour force: Persons who are either 'working' (employed) or 'seeking or available for work' (unemployed) or both during a major part of the reference period, constitute the labour force.
1.13 Out of labour force: Persons who are neither 'working' and at the same time nor 'seeking or available for work' for various reasons during the major part of
the reference period are considered to be 'out of the labour force'. The persons under this category includes students, persons engaged in domestic duties, rentiers, pensioners, recipients of remittances, those living on alms, infirm or disabled persons, too young or too old persons, beggars, prostitutes, etc. 1.14 It may be noted that workers have been further categorized as self-employed, regular salaried/wage employee and casual wage labour. The details of these categories are defined in the following paragraphs.
1.15 Self-employed: Persons who operate their own farm or non-farm enterprises or are engaged independently in a profession or trade on own-account or with one or a few partners are considered as self-employed. The essential feature of the self-employed is that they have autonomy (i.e., regarding how, where and when to produce) and economic independence (i.e. regarding market, scale of operation and money) for carrying out operation. The fee or remuneration received by them consists of two parts - the share of their labour and profit of the enterprise. In other words, their
5
remuneration is determined wholly or mainly by sales or profits of the goods or services which are produced.
1.16 The self-employed persons may again be categorized into the following groups: i) Own-account workers: The
self-employed persons, who operate their enterprises on their own account or with one or a few partners and who during the reference period by and large, run their enterprises without hiring any labour are called as own account workers. They may, however, have unpaid helpers to assist them in the activity of the enterprise.
ii) Employers: The self-employed persons who work on their own account or with one or a few partners and by and large run their enterprises by hiring labour are considered as the employers.
iii) Helpers in household enterprise: The helpers are a category of self-employed persons, mostly family members, who keep themselves engaged in their household enterprises, working full or part time and do not receive
any regular salary or wages in return for the work performed. They do not run the household enterprise on their own but assist the related person living in the same household in running the household enterprise.
1.17 Regular salaried/wage employee other than contract workers: Persons working in others farm or non-farm enterprises (both household and non-household) and getting in return salary or wages on a regular basis (and not on the basis of daily or periodic renewal of work contract) are the regular salaried/wage employees. The category not only includes persons getting time-rate wage but also persons receiving piece-rate wage or salary and paid apprentices, both full time and part-time.
1.18 Worked on contract basis: As per the definition of contract worker, a worker is deemed to be employed as contract worker when he/she is hired in connection with the work of an establishment by or through a contractor. Contract workmen are indirect employees; persons who are hired, supervised and remunerated by a contractor who, in turn, is compensated by the establishment. For the purpose
6
of present survey, in addition to the above mentioned category of workers, the term contract workers includes workers whose work are governed by a contract agreement either in writing or oral directly by the establishment. More precisely, the workers hired by the establishment directly for a specific job and for a specified period will also be categorized under the contract category of workers. 1.19 Casual wage labour: A person casually engaged in others farm or non-farm enterprises (both household and non-household) and getting in return wage according to the terms of the daily or periodic work contract is a casual wage labour. Usually in the rural areas, a type of casual labourers can be seen who normally engage themselves in 'public works' activities. 'Public works' are those activities which are sponsored by the Government or local bodies for construction of roads, digging of ponds, etc. as relief measures (like flood relief, drought relief, famine relief, etc.) and also under various employment generation schemes under poverty alleviation programmes.
1.20 Different approaches for determining activity status: The persons surveyed can be classified into various activity categories on the basis of activities pursued by them during certain specified reference periods. There could be three reference periods viz. (i) one year, (ii) one week and (iii) each day of the reference week. Based on these three reference periods, three different measures of activity status are arrived at. These are termed respectively as usual principal status, current weekly status and current daily status. The activity status determined on the basis of a reference period of one year is known as the usual principal activity status of the person, that determined on the basis of a reference period of 1 week is known as the current weekly status (CWS) of the person and the activity status determined on the basis of a reference period of one day is known as the current daily status (CDS) of the person. In this report, the labour force related parameters are estimated for a reference period of one year.
1.21 Usual activity status: The usual activity status relates to the activity status of a person during the last completed twelve months from the date of survey. The
7
activity in which a person spent relatively longer time (major time criterion) during the reference period is considered as the usual principal activity of the person. To decide the usual principal activity of a person, he/she is first categorized as belonging to the labour force or not during the reference period on the basis of major time criterion. Persons, thus adjudged as not belonging to the labour force are assigned the broad activity status 'neither working nor available for work'. 1.22 For the persons belonging to the labour force, the broad activity status of either 'working' or 'not working but available for work and/or seeking work is then ascertained again on the basis of the relatively longer time spent during the period in the labour force. Within the broad activity
status so determined, the detailed activity status category of a person pursuing more than one such activity will be determined again on the basis of the relatively longer time spent.
1.23 Subsidiary economic activity status: A person whose usual principal status is determined on the basis of the major time criterion may have pursued some other economic activity for 30 days or more during the reference period. The status in which such economic activity is pursued during the reference period is the subsidiary economic activity status of the person. In case of multiple subsidiary economic activities, subsidiary activity will be determined on the basis of relatively longer time spent criterion.
8
Annexure II
SAMPLING DESIGN & ESTIMATION PROCEDURE Introduction Labour Bureau has been entrusted with the task of conducting Annual Employment-Unemployment Surveys in the country. The objective of this annual survey is to regularly make available the basic inputs on labour force related parameters to facilitate policy formulation/review. The first such Annual Household Employment-Unemployment survey for the period 2009-10 was conducted during the year 2010. Till so far three such surveys have been conducted and thereon reports released. The present one is the Fourth Annual Employment-Unemployment Survey in the series. 2.4 In the current survey, a moving reference period is used to determine the usual status activity of the persons. The survey has been conducted in all the States/UTs by covering all the districts in the country. The field work of the present survey was launched in January, 2014 and completed in majority of the States/UTs by June, 2014. A
sample of about 1.36 lakh household schedules has been covered during the survey in 36 States/UTs. 2.5 Sample Design: A stratified multi-stage sample design has been adopted for the Fourth Annual Household Employment-Unemployment Survey. The first stage units (FSU) for rural sector are the 2011 census villages in all the States/UTs, except Kerala State, where panchayat wards are the FSUs. In case of urban sector, the latest available Urban Frame Survey (UFS) blocks for the period 2007-12 prepared by National Sample Survey Office are the First stage units. 2.6 Stratification: Each district of a State/UT has been divided into two strata: i) rural stratum comprising of all the rural areas of the district and ii) urban stratum comprising of all the urban areas of the district. 2.7 Sample Size: In all 36 States/UTs, a total sample of
9
12598 First Stage Units (FSUs) is allocated at All India level keeping in view the resource availability and other logistics. Broadly considering the population proportion, a sample of 7270 FSUs is allocated to rural sector in all the 36 States/UTs, while rest 5328 FSUs are allocated in the urban sector. While allocating the sample, additional weight age is given to the urban sector as compared to rural sector; so that the urban areas are not under represented in the survey on the basis of proportional allocation, with the condition that in major states the total sample size in urban sector does not exceed that of the rural sector. 2.8 Allocation of Sample to States/UTs: Distribution of total number of sample FSUs in rural sector among the States/UTs is done in proportion to their respective rural population as per 2011 census, subject to a minimum sample allocation to each State/UT. For urban sector, the sample FSUs are allocated among the 36 States/UTs in proportion to the UFS blocks for the period 2007-12. A minimum sample size in a State/UT is allocated at 16 FSUs with a
minimum of 8 each in rural and urban areas. 2.9 Allocation of State/UT level rural and Urban Stratum sample to districts: The State/UT level rural/ urban sample is further distributed among its districts in proportion to rural/ urban population/urban frame survey blocks. A minimum of 16 FSUs are allocated to each State/UT for rural and urban areas combined. Stratum level sample is adjusted to multiple of 4 FSUs with a minimum sample size of 4 FSUs in a stratum. In case of some North Eastern States and UTs a marginal increase in sample size is done due to their under representation in overall sample because of their lower population. 2.10 Selection of FSUs: For the rural stratum, the village lists based on 2011 census frame are taken in the same order and the required sample is drawn by using circular systematic sampling technique with probability proportional to size (size being the population of the village as per Census 2011). In case of urban stratum, the UFS blocks are arranged in ascending order based on the town variable. After
10
arranging UFS blocks, sample is drawn by circular systematic sampling. This arrangement is done to ensure that most of the towns are represented in the sample. In both, the rural and the urban strata, samples are drawn in the form of two independent sub-samples.
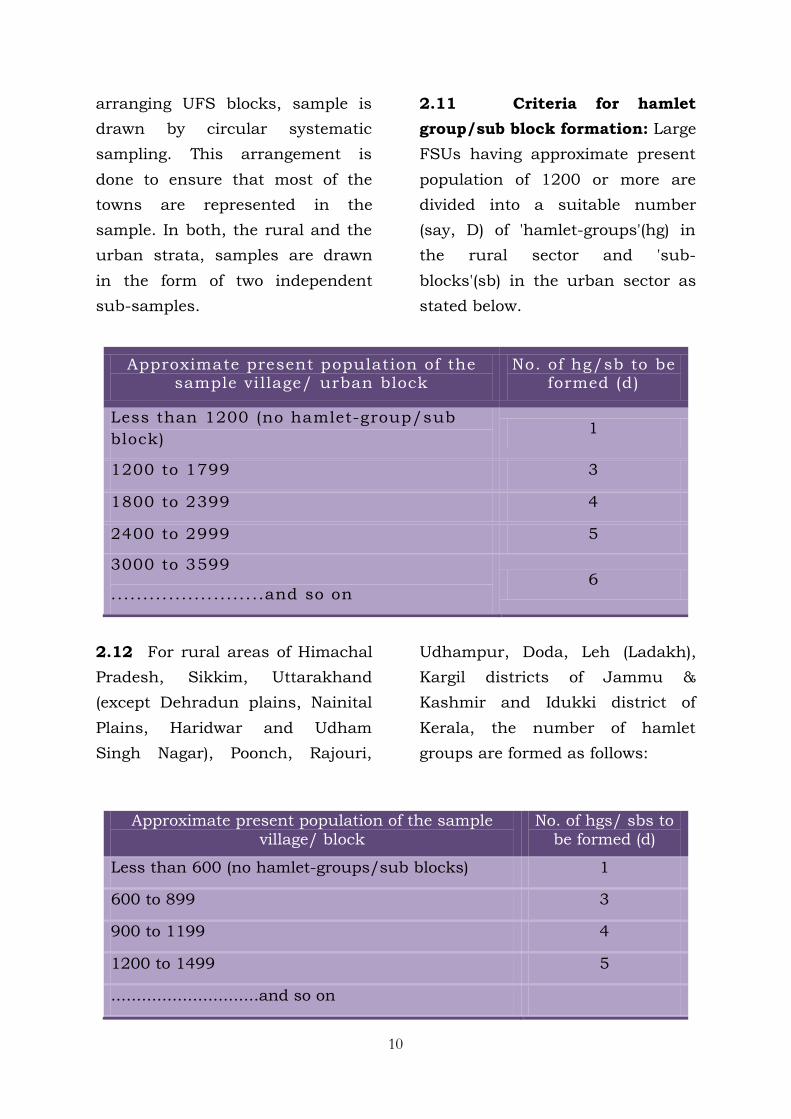
2.11 Criteria for hamlet group/sub block formation: Large FSUs having approximate present population of 1200 or more are divided into a suitable number (say, D) of 'hamlet-groups'(hg) in the rural sector and 'sub-blocks'(sb) in the urban sector as stated below.
Approximate present population of the sample village/ urban block
No. of hg/sb to be formed (d)
Less than 1200 (no hamlet-group/sub block)
1
1200 to 1799 3
1800 to 2399 4
2400 to 2999 5
3000 to 3599
......... ....... ...... ..and so on 6
2.12 For rural areas of Himachal Pradesh, Sikkim, Uttarakhand (except Dehradun plains, Nainital Plains, Haridwar and Udham Singh Nagar), Poonch, Rajouri,
Udhampur, Doda, Leh (Ladakh), Kargil districts of Jammu & Kashmir and Idukki district of Kerala, the number of hamlet groups are formed as follows:
Approximate present population of the sample village/ block
No. of hgs/ sbs to be formed (d)
Less than 600 (no hamlet-groups/sub blocks) 1
600 to 899 3
900 to 1199 4
1200 to 1499 5
.............................and so on
11
2.13 Selection of hamlet groups/sub blocks: In case of large village/UFS block wherever hamlet-groups/sub-blocks have been formed, two hamlet-groups /sub-blocks are selected. The procedure to select the hg/sb is as follows: i) The hg/sb with maximum
percentage share of population will always be selected and termed as hg/sb 1.
ii) Second hg/sb will be selected from the remaining hgs/sbs by simple random sampling and termed as hg/sb 2.
Listing and selection of the households will be done independently in the two selected hamlet-groups/sub-blocks. In case hamlet-groups/sub-blocks is formed in a sample FSU, it is ensured that the hamlet-groups/ sub-blocks formed are clearly identifiable in terms of physical landmarks. The FSU without hg/sb formation will be treated as sample hg/sb number 1.
2.14 Listing of households: After determining the hamlet-groups/sub-blocks i.e. areas to be considered for listing, all the
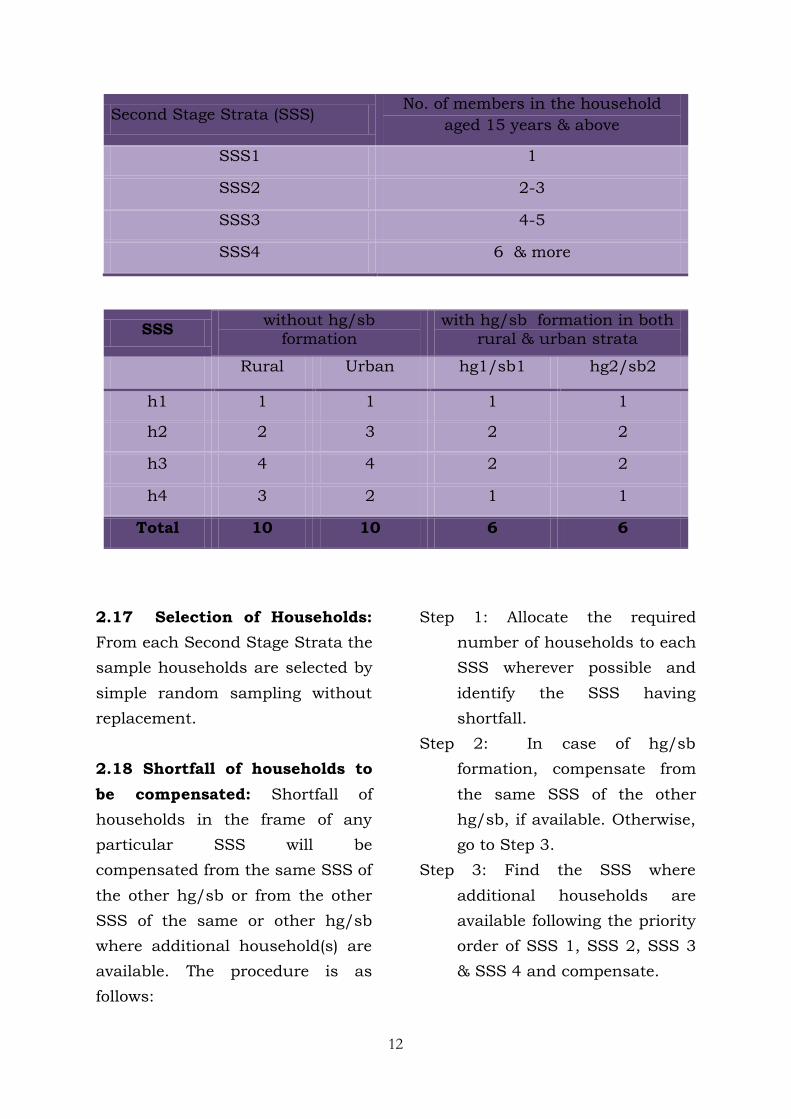
households in that area will be listed (including those found to be temporarily locked after ascertaining the temporariness of locking of households through local people). The hamlet-group/ sub-block with sample hg/sb number 1 will be listed first and that with sample hg/sb number 2 will be listed next. Formation of Second Stage Strata and allocation of households: 2.15 For canvassing the schedules, all the households listed in selected FSU/ hamlet-groups/ sub-blocks are to be stratified into four second stage strata (SSS) as given below: The second-stage-strata in the rural and urban stratum will be formed based on the number of persons in a household aged 15 years and above. The four second-stage-strata (SSS) in the rural and urban strata are formed in the following order: 2.16 Allocation of households: The number of households to be surveyed (h) in each second stage stratum in the sample FSUs is as follows:
12
Second Stage Strata (SSS) No. of members in the household
aged 15 years & above
SSS1 1
SSS2 2-3
SSS3 4-5
SSS4 6 & more
SSS without hg/sb formation
with hg/sb formation in both rural & urban strata
Rural Urban hg1/sb1 hg2/sb2
h1 1 1 1 1
h2 2 3 2 2
h3 4 4 2 2
h4 3 2 1 1
Total 10 10 6 6
2.17 Selection of Households: From each Second Stage Strata the sample households are selected by simple random sampling without replacement. 2.18 Shortfall of households to be compensated: Shortfall of households in the frame of any particular SSS will be compensated from the same SSS of the other hg/sb or from the other SSS of the same or other hg/sb where additional household(s) are available. The procedure is as follows:
Step 1: Allocate the required number of households to each SSS wherever possible and identify the SSS having shortfall.
Step 2: In case of hg/sb formation, compensate from the same SSS of the other hg/sb, if available. Otherwise, go to Step 3.
Step 3: Find the SSS where additional households are available following the priority order of SSS 1, SSS 2, SSS 3 & SSS 4 and compensate.
13
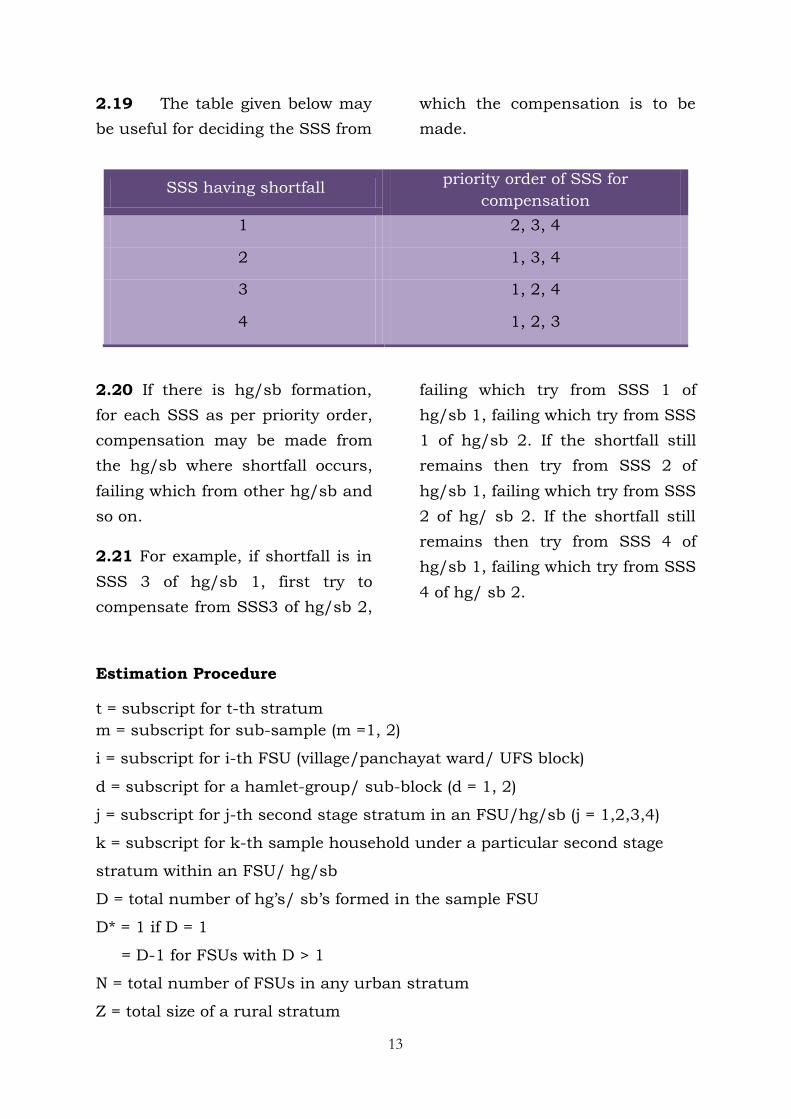
2.19 The table given below may be useful for deciding the SSS from
which the compensation is to be made.
SSS having shortfall priority order of SSS for compensation
1 2, 3, 4
2 1, 3, 4
3 1, 2, 4
4 1, 2, 3
2.20 If there is hg/sb formation, for each SSS as per priority order, compensation may be made from the hg/sb where shortfall occurs, failing which from other hg/sb and so on.
2.21 For example, if shortfall is in SSS 3 of hg/sb 1, first try to compensate from SSS3 of hg/sb 2,
failing which try from SSS 1 of hg/sb 1, failing which try from SSS 1 of hg/sb 2. If the shortfall still remains then try from SSS 2 of hg/sb 1, failing which try from SSS 2 of hg/ sb 2. If the shortfall still remains then try from SSS 4 of hg/sb 1, failing which try from SSS 4 of hg/ sb 2.
Estimation Procedure
t = subscript for t-th stratum m = subscript for sub-sample (m =1, 2)
i = subscript for i-th FSU (village/panchayat ward/ UFS block)
d = subscript for a hamlet-group/ sub-block (d = 1, 2)
j = subscript for j-th second stage stratum in an FSU/hg/sb (j = 1,2,3,4)
k = subscript for k-th sample household under a particular second stage
stratum within an FSU/ hg/sb
D = total number of hg’s/ sb’s formed in the sample FSU
D* = 1 if D = 1
= D-1 for FSUs with D > 1
N = total number of FSUs in any urban stratum
Z = total size of a rural stratum
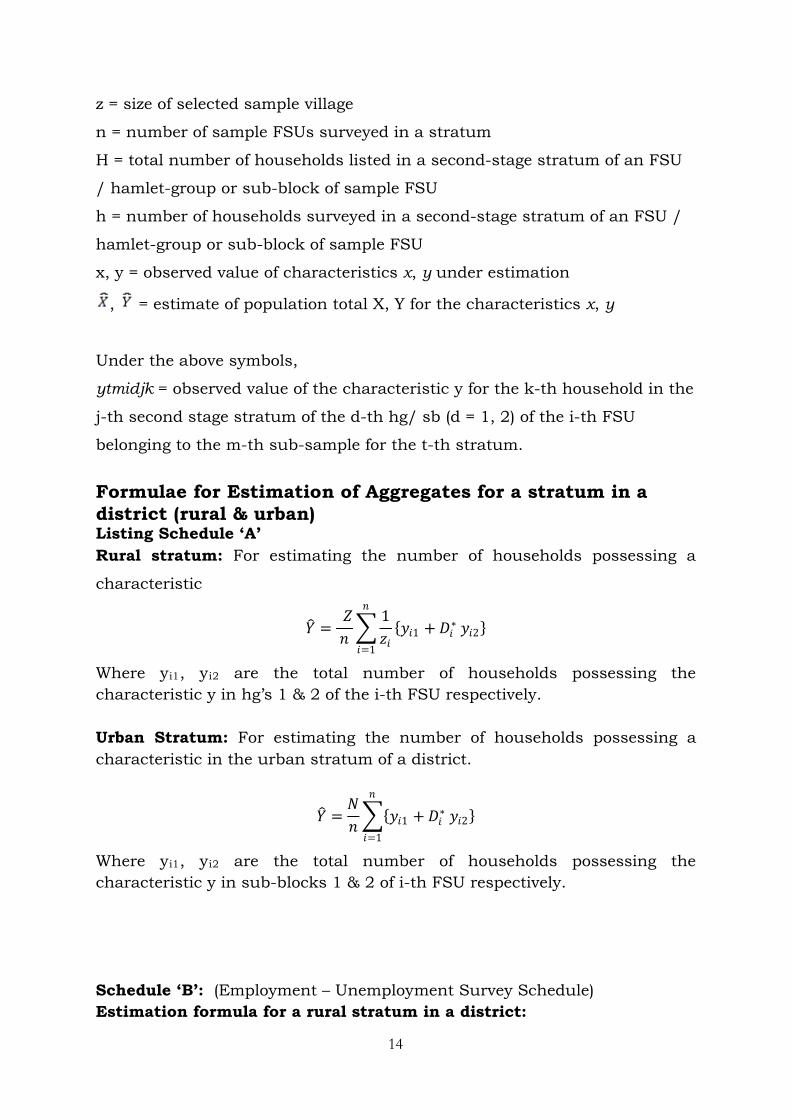
14
z = size of selected sample village
n = number of sample FSUs surveyed in a stratum
H = total number of households listed in a second-stage stratum of an FSU
/ hamlet-group or sub-block of sample FSU
h = number of households surveyed in a second-stage stratum of an FSU /
hamlet-group or sub-block of sample FSU
x, y = observed value of characteristics x, y under estimation
, = estimate of population total X, Y for the characteristics x, y
Under the above symbols,
ytmidjk = observed value of the characteristic y for the k-th household in the
j-th second stage stratum of the d-th hg/ sb (d = 1, 2) of the i-th FSU
belonging to the m-th sub-sample for the t-th stratum.
Formulae for Estimation of Aggregates for a stratum in a district (rural & urban) Listing Schedule ‘A’ Rural stratum: For estimating the number of households possessing a
characteristic
𝑌𝑌� = 𝑍𝑍𝑛𝑛 �
1𝑧𝑧𝑖𝑖
𝑛𝑛
𝑖𝑖=1
{𝑦𝑦𝑖𝑖1 + 𝐷𝐷𝑖𝑖∗ 𝑦𝑦𝑖𝑖2}
Where yi1, yi2
are the total number of households possessing the characteristic y in hg’s 1 & 2 of the i-th FSU respectively.
Urban Stratum: For estimating the number of households possessing a characteristic in the urban stratum of a district.
𝑌𝑌� =𝑁𝑁𝑛𝑛�
{𝑦𝑦𝑖𝑖1 + 𝐷𝐷𝑖𝑖∗ 𝑦𝑦𝑖𝑖2}𝑛𝑛
𝑖𝑖=1
Where yi1, yi2
are the total number of households possessing the characteristic y in sub-blocks 1 & 2 of i-th FSU respectively.
Schedule ‘B’: (Employment – Unemployment Survey Schedule) Estimation formula for a rural stratum in a district:
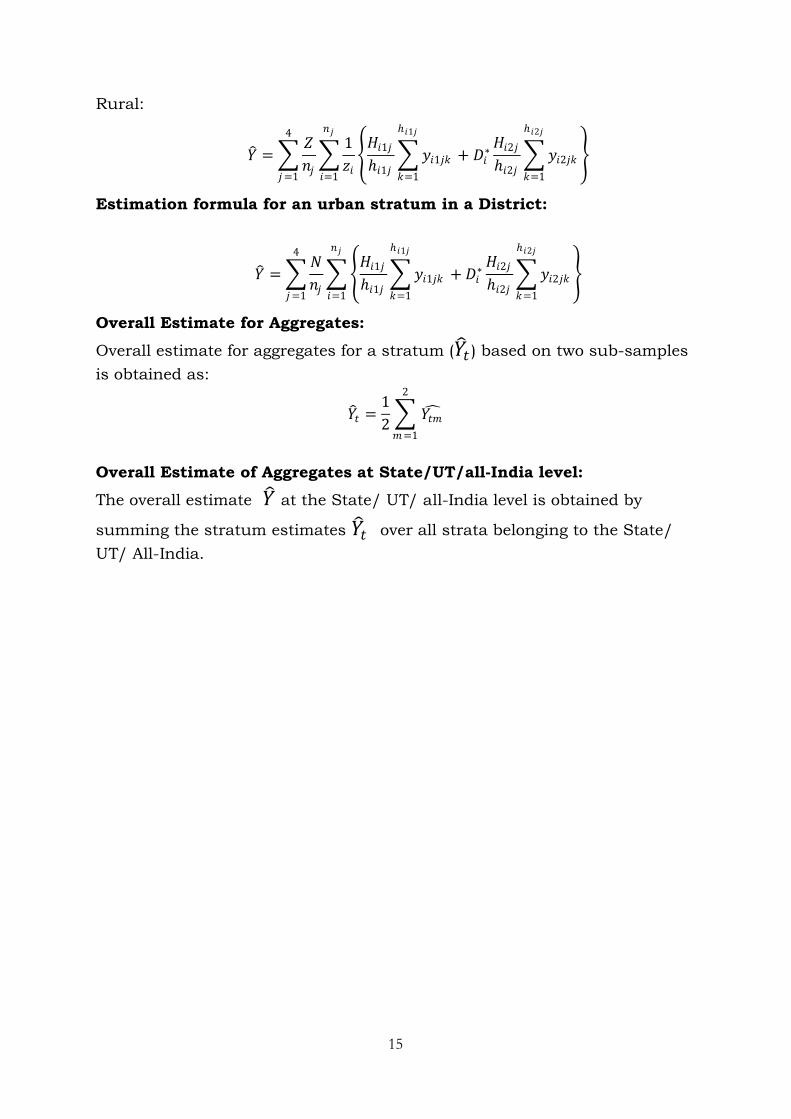
15
Rural:
𝑌𝑌� = �𝑍𝑍𝑛𝑛𝑗𝑗
4
𝑗𝑗=1
�1𝑧𝑧𝑖𝑖
𝑛𝑛𝑗𝑗
𝑖𝑖=1
�𝐻𝐻𝑖𝑖1𝑗𝑗ℎ𝑖𝑖1𝑗𝑗
�𝑦𝑦𝑖𝑖1𝑗𝑗𝑗𝑗 + 𝐷𝐷𝑖𝑖∗ℎ𝑖𝑖1𝑗𝑗
𝑗𝑗=1
𝐻𝐻𝑖𝑖2𝑗𝑗ℎ𝑖𝑖2𝑗𝑗
�𝑦𝑦𝑖𝑖2𝑗𝑗𝑗𝑗
ℎ𝑖𝑖2𝑗𝑗
𝑗𝑗=1
�
Estimation formula for an urban stratum in a District:
𝑌𝑌� = �𝑁𝑁𝑛𝑛𝑗𝑗
4
𝑗𝑗=1
��𝐻𝐻𝑖𝑖1𝑗𝑗ℎ𝑖𝑖1𝑗𝑗
�𝑦𝑦𝑖𝑖1𝑗𝑗𝑗𝑗 + 𝐷𝐷𝑖𝑖∗ℎ𝑖𝑖1𝑗𝑗
𝑗𝑗=1
𝐻𝐻𝑖𝑖2𝑗𝑗ℎ𝑖𝑖2𝑗𝑗
�𝑦𝑦𝑖𝑖2𝑗𝑗𝑗𝑗
ℎ𝑖𝑖2𝑗𝑗
𝑗𝑗=1
�
𝑛𝑛𝑗𝑗
𝑖𝑖=1
Overall Estimate for Aggregates:
Overall estimate for aggregates for a stratum (𝑌𝑌�𝑡𝑡 ) based on two sub-samples is obtained as:
𝑌𝑌�𝑡𝑡 =12 � 𝑌𝑌𝑡𝑡𝑡𝑡�
2
𝑡𝑡=1
Overall Estimate of Aggregates at State/UT/all-India level:
The overall estimate 𝑌𝑌� at the State/ UT/ all-India level is obtained by
summing the stratum estimates 𝑌𝑌�𝑡𝑡 over all strata belonging to the State/ UT/ All-India.

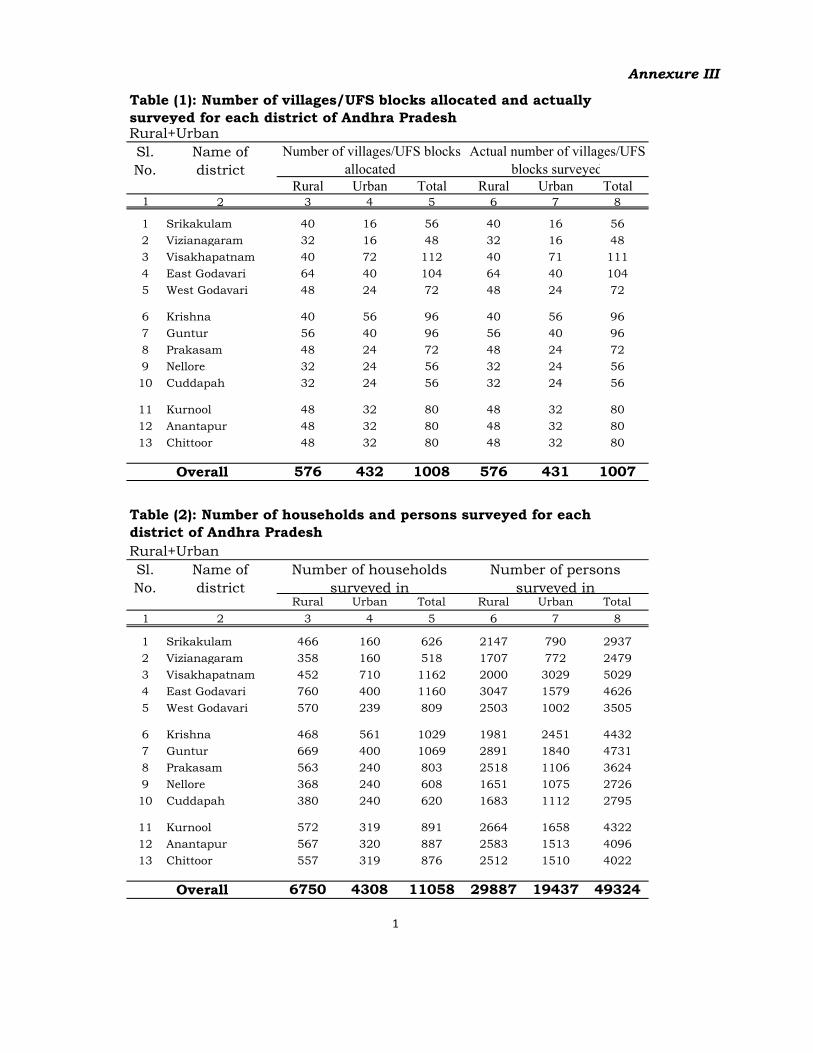
Annexure III
Rural Urban Total Rural Urban Total 1 2 3 4 5 6 7 8
1 Srikakulam 40 16 56 40 16 562 Vizianagaram 32 16 48 32 16 483 Visakhapatnam 40 72 112 40 71 1114 East Godavari 64 40 104 64 40 1045 West Godavari 48 24 72 48 24 72
6 Krishna 40 56 96 40 56 967 Guntur 56 40 96 56 40 968 Prakasam 48 24 72 48 24 729 Nellore 32 24 56 32 24 5610 Cuddapah 32 24 56 32 24 56
11 Kurnool 48 32 80 48 32 8012 Anantapur 48 32 80 48 32 8013 Chittoor 48 32 80 48 32 80
576 432 1008 576 431 1007
Rural Urban Total Rural Urban Total
1 2 3 4 5 6 7 8
1 Srikakulam 466 160 626 2147 790 29372 Vizianagaram 358 160 518 1707 772 24793 Visakhapatnam 452 710 1162 2000 3029 50294 East Godavari 760 400 1160 3047 1579 46265 West Godavari 570 239 809 2503 1002 3505
6 Krishna 468 561 1029 1981 2451 44327 Guntur 669 400 1069 2891 1840 47318 Prakasam 563 240 803 2518 1106 36249 Nellore 368 240 608 1651 1075 272610 Cuddapah 380 240 620 1683 1112 2795
11 Kurnool 572 319 891 2664 1658 432212 Anantapur 567 320 887 2583 1513 409613 Chittoor 557 319 876 2512 1510 4022
6750 4308 11058 29887 19437 49324
1
Overall
Overall
Table (2): Number of households and persons surveyed for each district of Andhra PradeshRural+UrbanSl.No.
Name of district
Number of households surveyed in
Number of persons surveyed in
Table (1): Number of villages/UFS blocks allocated and actually surveyed for each district of Andhra PradeshRural+UrbanSl.No.
Name of district
Number of villages/UFS blocks allocated
Actual number of villages/UFS blocks surveyed
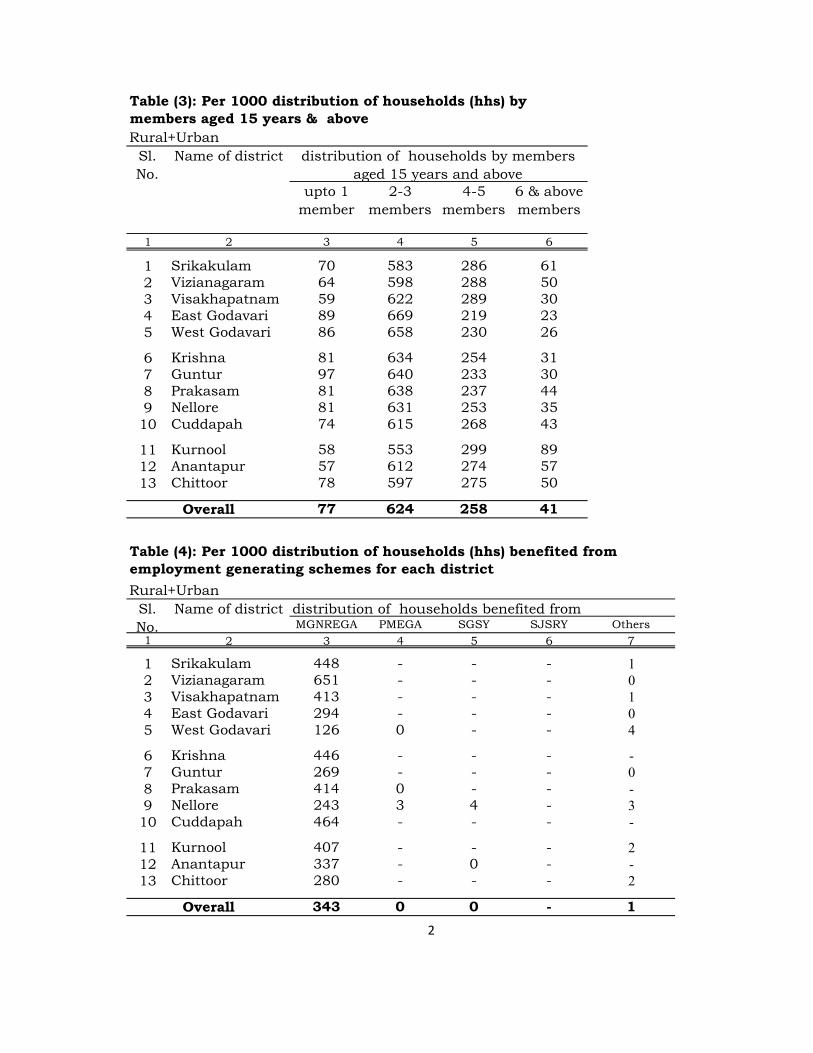
upto 1 member
2-3 members
4-5 members
6 & above members
1 2 3 4 5 6
1 Srikakulam 70 583 286 612 Vizianagaram 64 598 288 503 Visakhapatnam 59 622 289 304 East Godavari 89 669 219 235 West Godavari 86 658 230 26
6 Krishna 81 634 254 317 Guntur 97 640 233 308 Prakasam 81 638 237 449 Nellore 81 631 253 3510 Cuddapah 74 615 268 43
11 Kurnool 58 553 299 8912 Anantapur 57 612 274 5713 Chittoor 78 597 275 50
77 624 258 41
MGNREGA PMEGA SGSY SJSRY Others1 2 3 4 5 6 7
1 Srikakulam 448 - - - 12 Vizianagaram 651 - - - 03 Visakhapatnam 413 - - - 14 East Godavari 294 - - - 05 West Godavari 126 0 - - 4
6 Krishna 446 - - - -7 Guntur 269 - - - 08 Prakasam 414 0 - - -9 Nellore 243 3 4 - 310 Cuddapah 464 - - - -
11 Kurnool 407 - - - 212 Anantapur 337 - 0 - -13 Chittoor 280 - - - 2
343 0 0 - 1
2
Overall
Table (3): Per 1000 distribution of households (hhs) by members aged 15 years & above Rural+Urban
Sl.No.
Name of district distribution of households by members aged 15 years and above
Table (4): Per 1000 distribution of households (hhs) benefited from employment generating schemes for each district
Rural+UrbanSl.No.
Name of district distribution of households benefited from
Overall
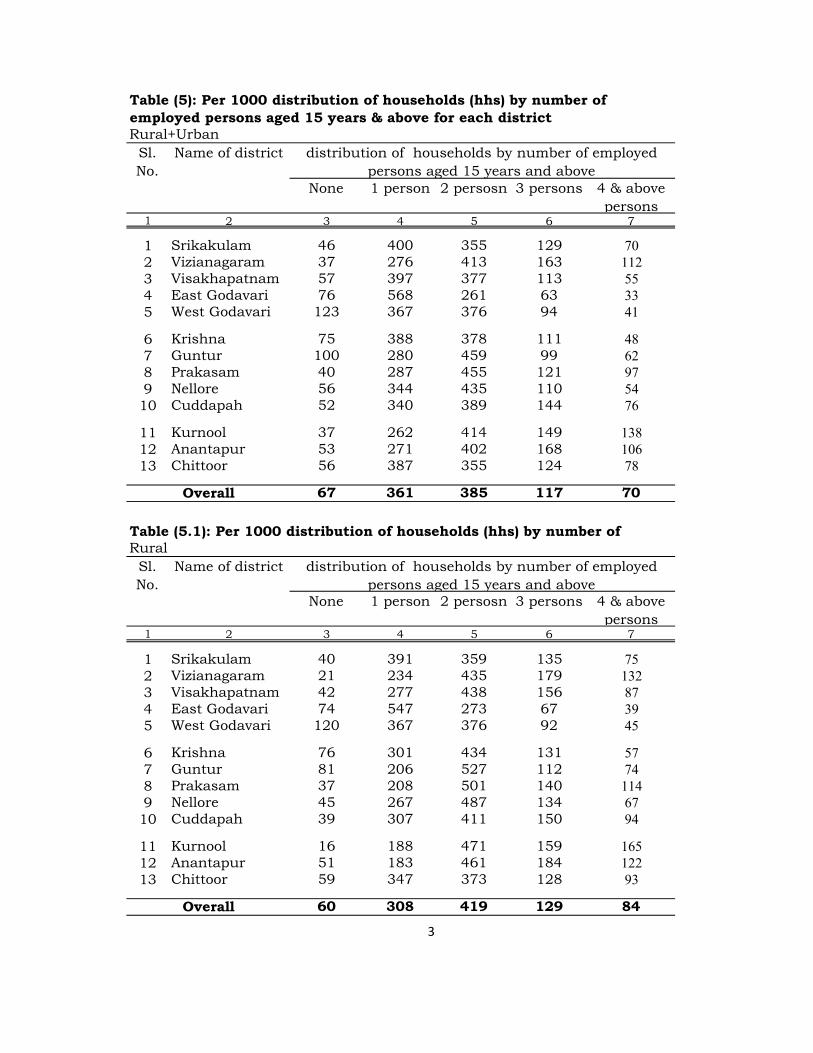
None 1 person 2 persosn 3 persons 4 & above persons
1 2 3 4 5 6 7
1 Srikakulam 46 400 355 129 702 Vizianagaram 37 276 413 163 1123 Visakhapatnam 57 397 377 113 554 East Godavari 76 568 261 63 335 West Godavari 123 367 376 94 41
6 Krishna 75 388 378 111 487 Guntur 100 280 459 99 628 Prakasam 40 287 455 121 979 Nellore 56 344 435 110 5410 Cuddapah 52 340 389 144 76
11 Kurnool 37 262 414 149 13812 Anantapur 53 271 402 168 10613 Chittoor 56 387 355 124 78
67 361 385 117 70
None 1 person 2 persosn 3 persons 4 & above persons
1 2 3 4 5 6 7
1 Srikakulam 40 391 359 135 752 Vizianagaram 21 234 435 179 1323 Visakhapatnam 42 277 438 156 874 East Godavari 74 547 273 67 395 West Godavari 120 367 376 92 45
6 Krishna 76 301 434 131 577 Guntur 81 206 527 112 748 Prakasam 37 208 501 140 1149 Nellore 45 267 487 134 6710 Cuddapah 39 307 411 150 94
11 Kurnool 16 188 471 159 16512 Anantapur 51 183 461 184 12213 Chittoor 59 347 373 128 93
60 308 419 129 84
3
Overall
Table (5): Per 1000 distribution of households (hhs) by number of employed persons aged 15 years & above for each districtRural+Urban
Sl.No.
Name of district distribution of households by number of employed persons aged 15 years and above
Table (5.1): Per 1000 distribution of households (hhs) by number of Rural
Sl.No.
Name of district distribution of households by number of employed persons aged 15 years and above
Overall
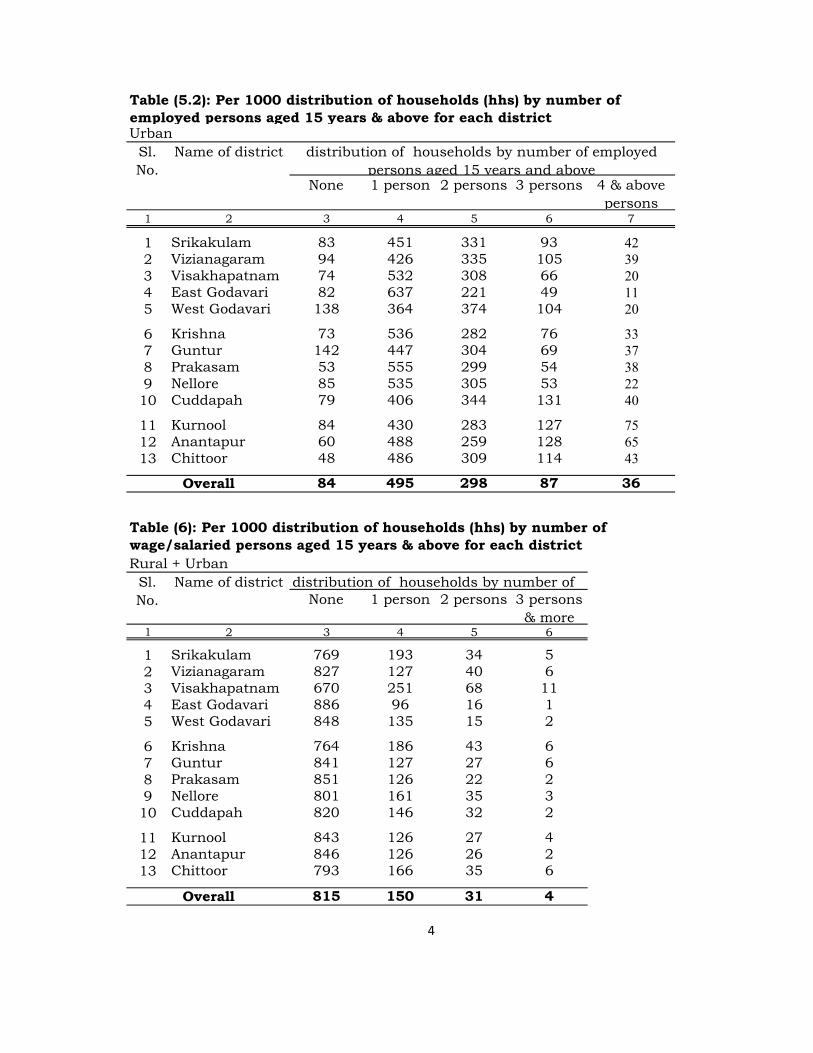
None 1 person 2 persons 3 persons 4 & above persons
1 2 3 4 5 6 7
1 Srikakulam 83 451 331 93 422 Vizianagaram 94 426 335 105 393 Visakhapatnam 74 532 308 66 204 East Godavari 82 637 221 49 115 West Godavari 138 364 374 104 20
6 Krishna 73 536 282 76 337 Guntur 142 447 304 69 378 Prakasam 53 555 299 54 389 Nellore 85 535 305 53 2210 Cuddapah 79 406 344 131 40
11 Kurnool 84 430 283 127 7512 Anantapur 60 488 259 128 6513 Chittoor 48 486 309 114 43
84 495 298 87 36
None 1 person 2 persons 3 persons & more
1 2 3 4 5 6
1 Srikakulam 769 193 34 52 Vizianagaram 827 127 40 63 Visakhapatnam 670 251 68 114 East Godavari 886 96 16 15 West Godavari 848 135 15 2
6 Krishna 764 186 43 67 Guntur 841 127 27 68 Prakasam 851 126 22 29 Nellore 801 161 35 310 Cuddapah 820 146 32 2
11 Kurnool 843 126 27 412 Anantapur 846 126 26 213 Chittoor 793 166 35 6
815 150 31 4
4
Overall
Table (5.2): Per 1000 distribution of households (hhs) by number of employed persons aged 15 years & above for each districtUrban
Sl.No.
Name of district distribution of households by number of employed persons aged 15 years and above
Table (6): Per 1000 distribution of households (hhs) by number of wage/salaried persons aged 15 years & above for each districtRural + Urban
Sl.No.
Name of district distribution of households by number of
Overall
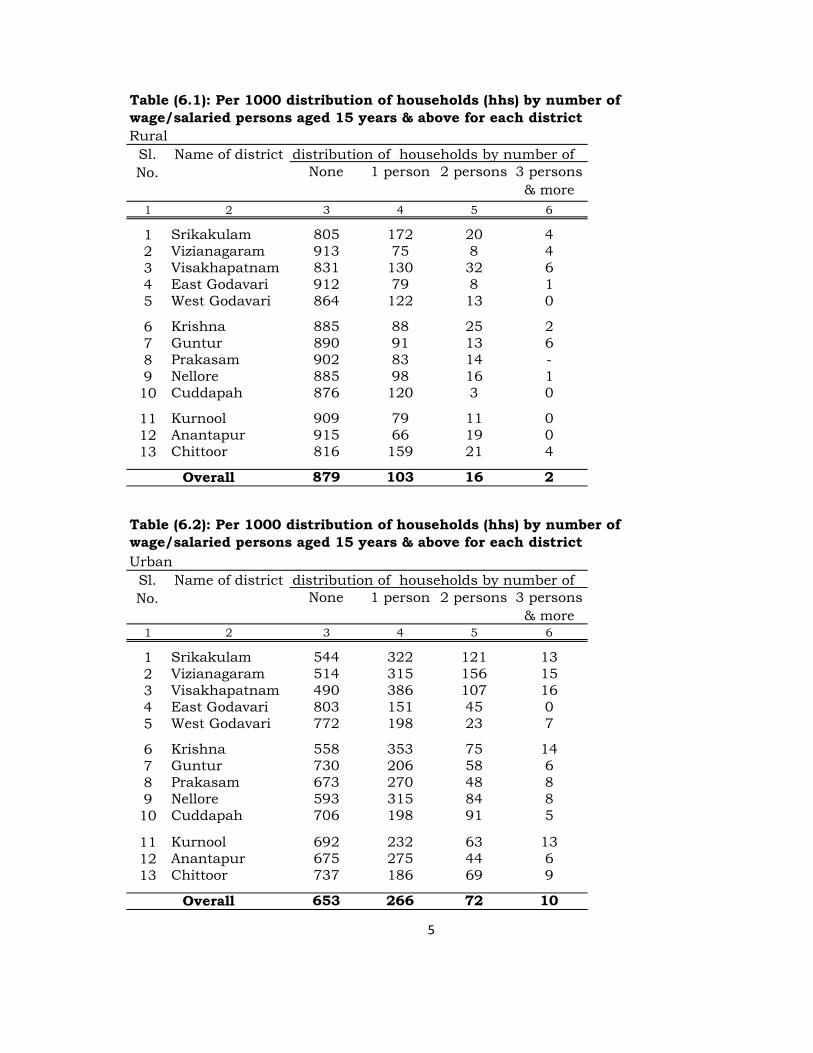
None 1 person 2 persons 3 persons & more
1 2 3 4 5 6
1 Srikakulam 805 172 20 42 Vizianagaram 913 75 8 43 Visakhapatnam 831 130 32 64 East Godavari 912 79 8 15 West Godavari 864 122 13 0
6 Krishna 885 88 25 27 Guntur 890 91 13 68 Prakasam 902 83 14 -9 Nellore 885 98 16 110 Cuddapah 876 120 3 0
11 Kurnool 909 79 11 012 Anantapur 915 66 19 013 Chittoor 816 159 21 4
879 103 16 2
None 1 person 2 persons 3 persons & more
1 2 3 4 5 6
1 Srikakulam 544 322 121 132 Vizianagaram 514 315 156 153 Visakhapatnam 490 386 107 164 East Godavari 803 151 45 05 West Godavari 772 198 23 7
6 Krishna 558 353 75 147 Guntur 730 206 58 68 Prakasam 673 270 48 89 Nellore 593 315 84 810 Cuddapah 706 198 91 5
11 Kurnool 692 232 63 1312 Anantapur 675 275 44 613 Chittoor 737 186 69 9
653 266 72 10
5
Table (6.1): Per 1000 distribution of households (hhs) by number of wage/salaried persons aged 15 years & above for each districtRural
Sl.No.
Name of district distribution of households by number of
Overall
Overall
Table (6.2): Per 1000 distribution of households (hhs) by number of wage/salaried persons aged 15 years & above for each districtUrban
Sl.No.
Name of district distribution of households by number of
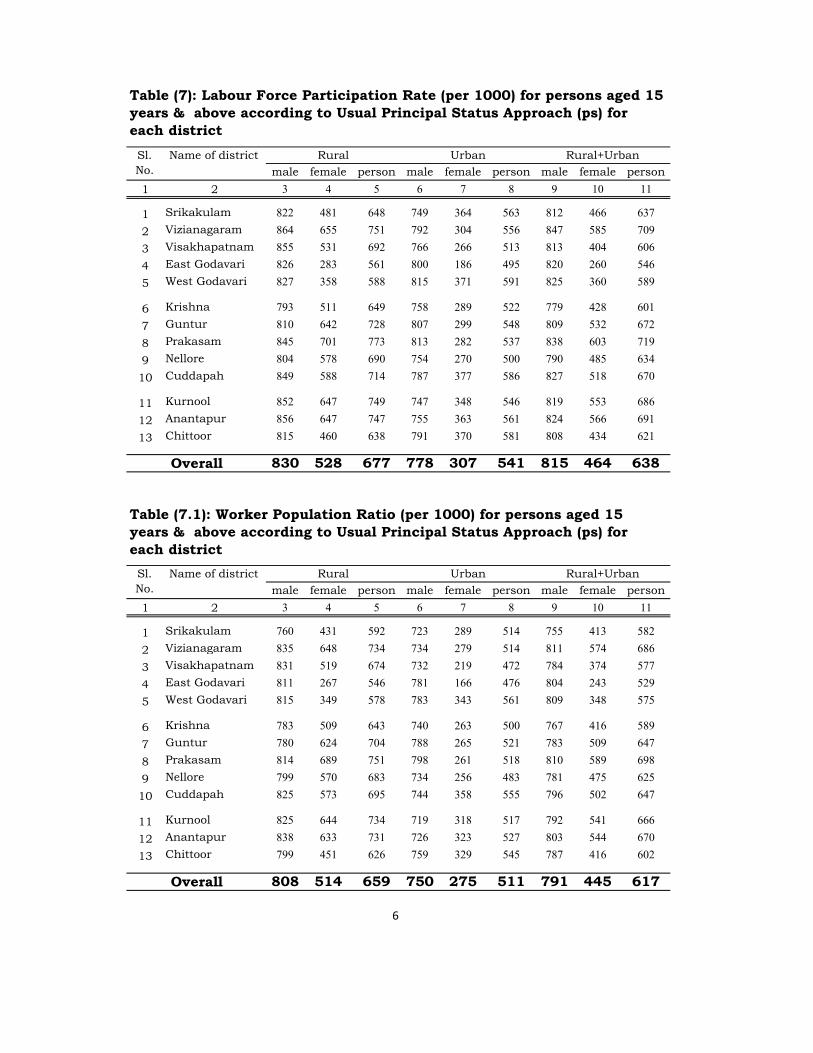
male female person male female person male female person
1 2 3 4 5 6 7 8 9 10 11
1 Srikakulam 822 481 648 749 364 563 812 466 637
2 Vizianagaram 864 655 751 792 304 556 847 585 709
3 Visakhapatnam 855 531 692 766 266 513 813 404 606
4 East Godavari 826 283 561 800 186 495 820 260 546
5 West Godavari 827 358 588 815 371 591 825 360 589
6 Krishna 793 511 649 758 289 522 779 428 601
7 Guntur 810 642 728 807 299 548 809 532 672
8 Prakasam 845 701 773 813 282 537 838 603 719
9 Nellore 804 578 690 754 270 500 790 485 634
10 Cuddapah 849 588 714 787 377 586 827 518 670
11 Kurnool 852 647 749 747 348 546 819 553 686
12 Anantapur 856 647 747 755 363 561 824 566 691
13 Chittoor 815 460 638 791 370 581 808 434 621
830 528 677 778 307 541 815 464 638
male female person male female person male female person
1 2 3 4 5 6 7 8 9 10 11
1 Srikakulam 760 431 592 723 289 514 755 413 582
2 Vizianagaram 835 648 734 734 279 514 811 574 686
3 Visakhapatnam 831 519 674 732 219 472 784 374 577
4 East Godavari 811 267 546 781 166 476 804 243 529
5 West Godavari 815 349 578 783 343 561 809 348 575
6 Krishna 783 509 643 740 263 500 767 416 589
7 Guntur 780 624 704 788 265 521 783 509 647
8 Prakasam 814 689 751 798 261 518 810 589 698
9 Nellore 799 570 683 734 256 483 781 475 625
10 Cuddapah 825 573 695 744 358 555 796 502 647
11 Kurnool 825 644 734 719 318 517 792 541 666
12 Anantapur 838 633 731 726 323 527 803 544 670
13 Chittoor 799 451 626 759 329 545 787 416 602
808 514 659 750 275 511 791 445 617
6
Overall
Overall
Table (7.1): Worker Population Ratio (per 1000) for persons aged 15 years & above according to Usual Principal Status Approach (ps) for each district
Sl.No.
Name of district Rural Urban Rural+Urban
Table (7): Labour Force Participation Rate (per 1000) for persons aged 15 years & above according to Usual Principal Status Approach (ps) for each district
Sl.No.
Name of district Rural Urban Rural+Urban
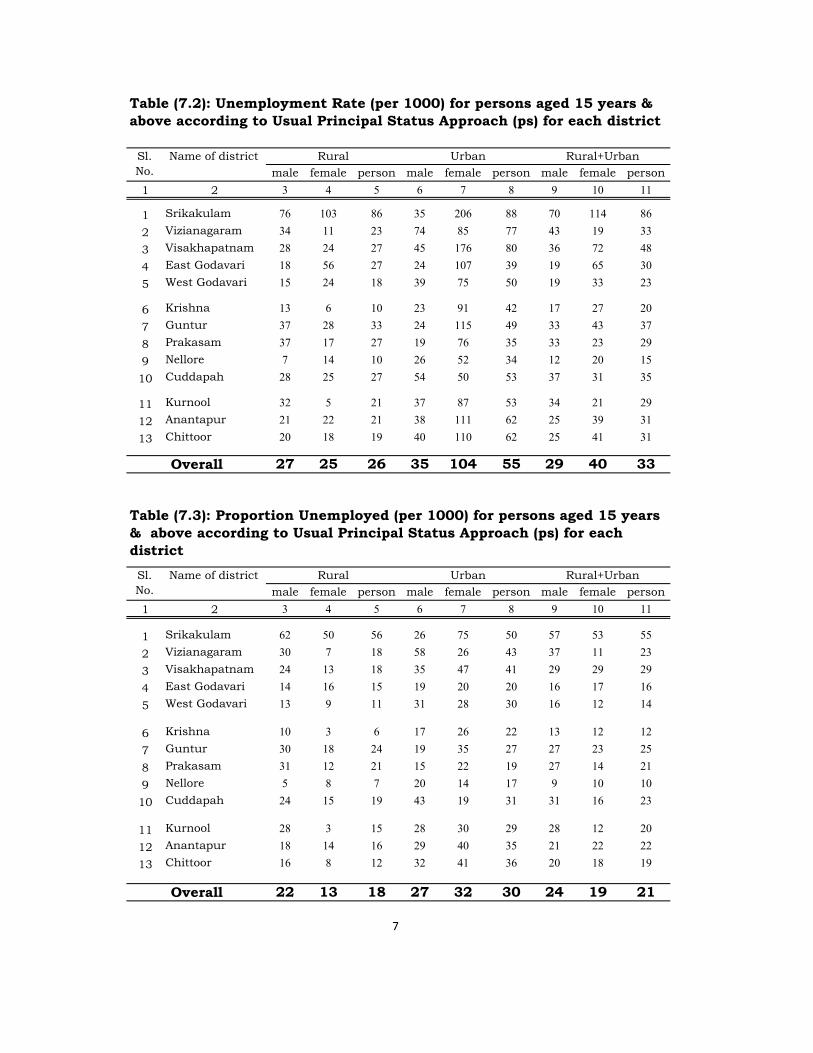
male female person male female person male female person
1 2 3 4 5 6 7 8 9 10 11
1 Srikakulam 76 103 86 35 206 88 70 114 86
2 Vizianagaram 34 11 23 74 85 77 43 19 33
3 Visakhapatnam 28 24 27 45 176 80 36 72 48
4 East Godavari 18 56 27 24 107 39 19 65 30
5 West Godavari 15 24 18 39 75 50 19 33 23
6 Krishna 13 6 10 23 91 42 17 27 20
7 Guntur 37 28 33 24 115 49 33 43 37
8 Prakasam 37 17 27 19 76 35 33 23 29
9 Nellore 7 14 10 26 52 34 12 20 15
10 Cuddapah 28 25 27 54 50 53 37 31 35
11 Kurnool 32 5 21 37 87 53 34 21 29
12 Anantapur 21 22 21 38 111 62 25 39 31
13 Chittoor 20 18 19 40 110 62 25 41 31
27 25 26 35 104 55 29 40 33
male female person male female person male female person
1 2 3 4 5 6 7 8 9 10 11
1 Srikakulam 62 50 56 26 75 50 57 53 55
2 Vizianagaram 30 7 18 58 26 43 37 11 23
3 Visakhapatnam 24 13 18 35 47 41 29 29 29
4 East Godavari 14 16 15 19 20 20 16 17 16
5 West Godavari 13 9 11 31 28 30 16 12 14
6 Krishna 10 3 6 17 26 22 13 12 12
7 Guntur 30 18 24 19 35 27 27 23 25
8 Prakasam 31 12 21 15 22 19 27 14 21
9 Nellore 5 8 7 20 14 17 9 10 10
10 Cuddapah 24 15 19 43 19 31 31 16 23
11 Kurnool 28 3 15 28 30 29 28 12 20
12 Anantapur 18 14 16 29 40 35 21 22 22
13 Chittoor 16 8 12 32 41 36 20 18 19
22 13 18 27 32 30 24 19 21
7
Overall
Overall
Table (7.3): Proportion Unemployed (per 1000) for persons aged 15 years & above according to Usual Principal Status Approach (ps) for each district
Sl.No.
Name of district Rural Urban Rural+Urban
Table (7.2): Unemployment Rate (per 1000) for persons aged 15 years & above according to Usual Principal Status Approach (ps) for each district
Sl.No.
Name of district Rural Urban Rural+Urban
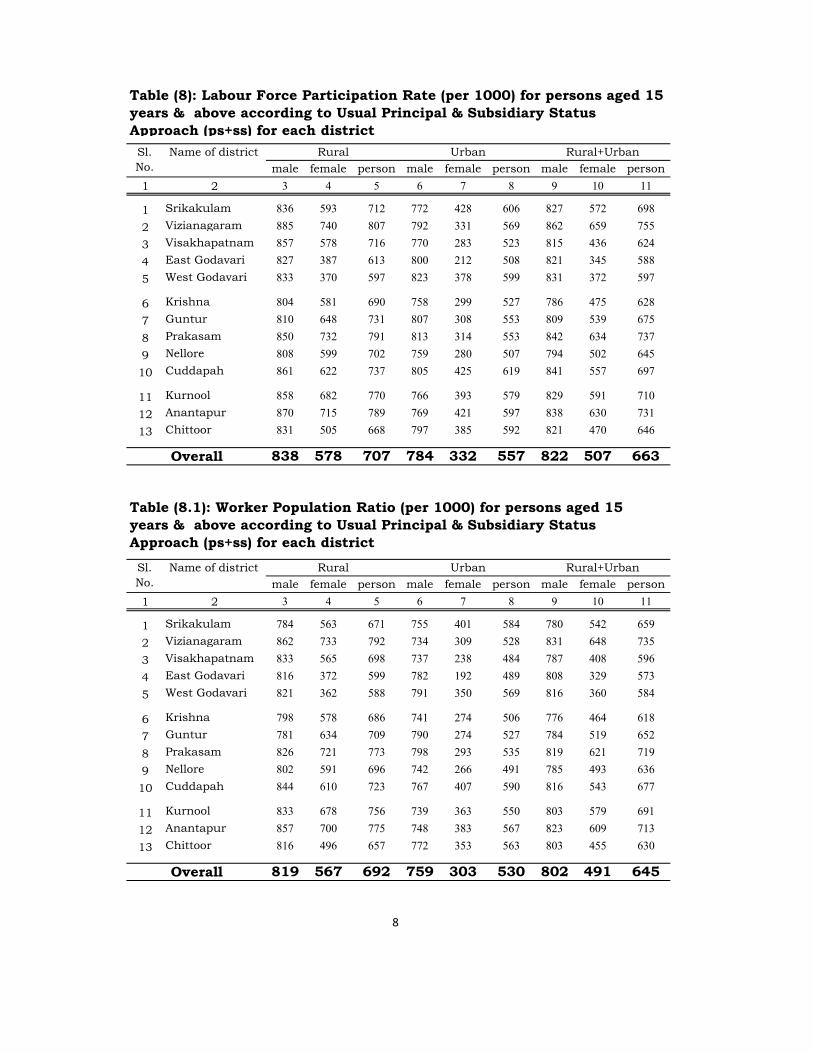
male female person male female person male female person
1 2 3 4 5 6 7 8 9 10 11
1 Srikakulam 836 593 712 772 428 606 827 572 698
2 Vizianagaram 885 740 807 792 331 569 862 659 755
3 Visakhapatnam 857 578 716 770 283 523 815 436 624
4 East Godavari 827 387 613 800 212 508 821 345 588
5 West Godavari 833 370 597 823 378 599 831 372 597
6 Krishna 804 581 690 758 299 527 786 475 628
7 Guntur 810 648 731 807 308 553 809 539 675
8 Prakasam 850 732 791 813 314 553 842 634 737
9 Nellore 808 599 702 759 280 507 794 502 645
10 Cuddapah 861 622 737 805 425 619 841 557 697
11 Kurnool 858 682 770 766 393 579 829 591 710
12 Anantapur 870 715 789 769 421 597 838 630 731
13 Chittoor 831 505 668 797 385 592 821 470 646
838 578 707 784 332 557 822 507 663
male female person male female person male female person
1 2 3 4 5 6 7 8 9 10 11
1 Srikakulam 784 563 671 755 401 584 780 542 659
2 Vizianagaram 862 733 792 734 309 528 831 648 735
3 Visakhapatnam 833 565 698 737 238 484 787 408 596
4 East Godavari 816 372 599 782 192 489 808 329 573
5 West Godavari 821 362 588 791 350 569 816 360 584
6 Krishna 798 578 686 741 274 506 776 464 618
7 Guntur 781 634 709 790 274 527 784 519 652
8 Prakasam 826 721 773 798 293 535 819 621 719
9 Nellore 802 591 696 742 266 491 785 493 636
10 Cuddapah 844 610 723 767 407 590 816 543 677
11 Kurnool 833 678 756 739 363 550 803 579 691
12 Anantapur 857 700 775 748 383 567 823 609 713
13 Chittoor 816 496 657 772 353 563 803 455 630
819 567 692 759 303 530 802 491 645
8
Overall
Overall
Table (8.1): Worker Population Ratio (per 1000) for persons aged 15 years & above according to Usual Principal & Subsidiary Status Approach (ps+ss) for each district
Sl.No.
Name of district Rural Urban Rural+Urban
Table (8): Labour Force Participation Rate (per 1000) for persons aged 15 years & above according to Usual Principal & Subsidiary Status Approach (ps+ss) for each district
Sl.No.
Name of district Rural Urban Rural+Urban
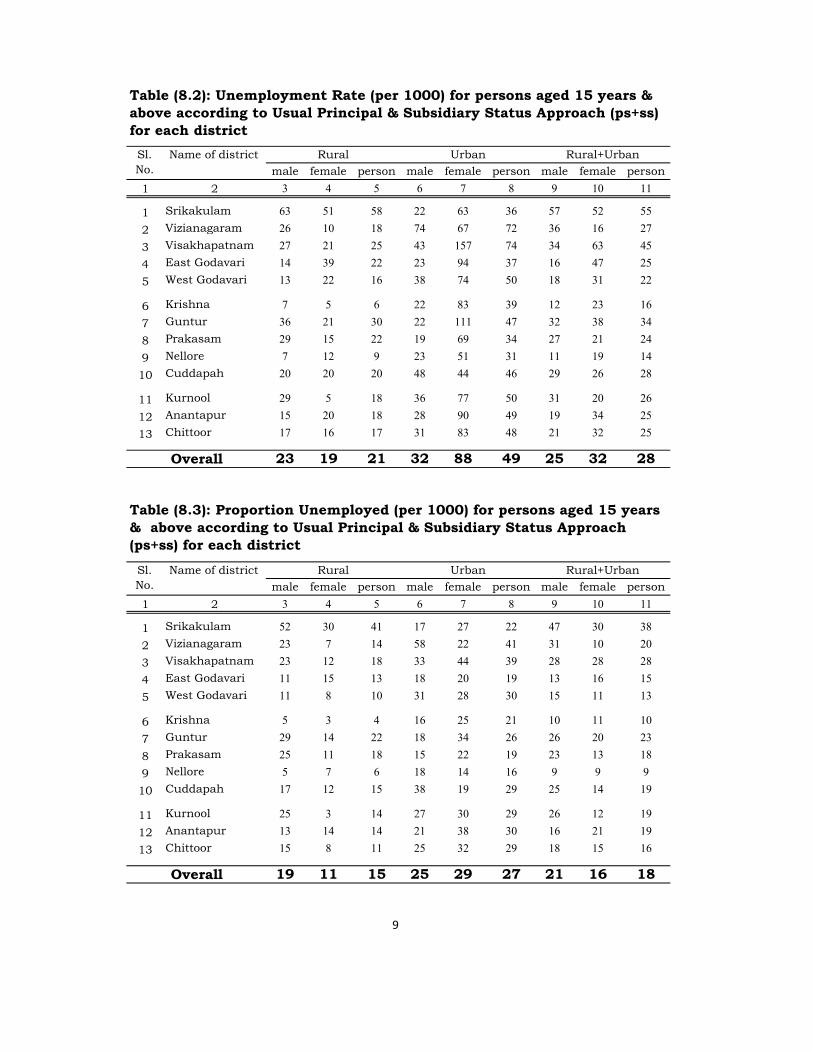
male female person male female person male female person
1 2 3 4 5 6 7 8 9 10 11
1 Srikakulam 63 51 58 22 63 36 57 52 55
2 Vizianagaram 26 10 18 74 67 72 36 16 27
3 Visakhapatnam 27 21 25 43 157 74 34 63 45
4 East Godavari 14 39 22 23 94 37 16 47 25
5 West Godavari 13 22 16 38 74 50 18 31 22
6 Krishna 7 5 6 22 83 39 12 23 16
7 Guntur 36 21 30 22 111 47 32 38 34
8 Prakasam 29 15 22 19 69 34 27 21 24
9 Nellore 7 12 9 23 51 31 11 19 14
10 Cuddapah 20 20 20 48 44 46 29 26 28
11 Kurnool 29 5 18 36 77 50 31 20 26
12 Anantapur 15 20 18 28 90 49 19 34 25
13 Chittoor 17 16 17 31 83 48 21 32 25
23 19 21 32 88 49 25 32 28
male female person male female person male female person
1 2 3 4 5 6 7 8 9 10 11
1 Srikakulam 52 30 41 17 27 22 47 30 38
2 Vizianagaram 23 7 14 58 22 41 31 10 20
3 Visakhapatnam 23 12 18 33 44 39 28 28 28
4 East Godavari 11 15 13 18 20 19 13 16 15
5 West Godavari 11 8 10 31 28 30 15 11 13
6 Krishna 5 3 4 16 25 21 10 11 10
7 Guntur 29 14 22 18 34 26 26 20 23
8 Prakasam 25 11 18 15 22 19 23 13 18
9 Nellore 5 7 6 18 14 16 9 9 9
10 Cuddapah 17 12 15 38 19 29 25 14 19
11 Kurnool 25 3 14 27 30 29 26 12 19
12 Anantapur 13 14 14 21 38 30 16 21 19
13 Chittoor 15 8 11 25 32 29 18 15 16
19 11 15 25 29 27 21 16 18
9
Overall
Overall
Table (8.3): Proportion Unemployed (per 1000) for persons aged 15 years & above according to Usual Principal & Subsidiary Status Approach (ps+ss) for each district
Sl.No.
Name of district Rural Urban Rural+Urban
Table (8.2): Unemployment Rate (per 1000) for persons aged 15 years & above according to Usual Principal & Subsidiary Status Approach (ps+ss) for each district
Sl.No.
Name of district Rural Urban Rural+Urban
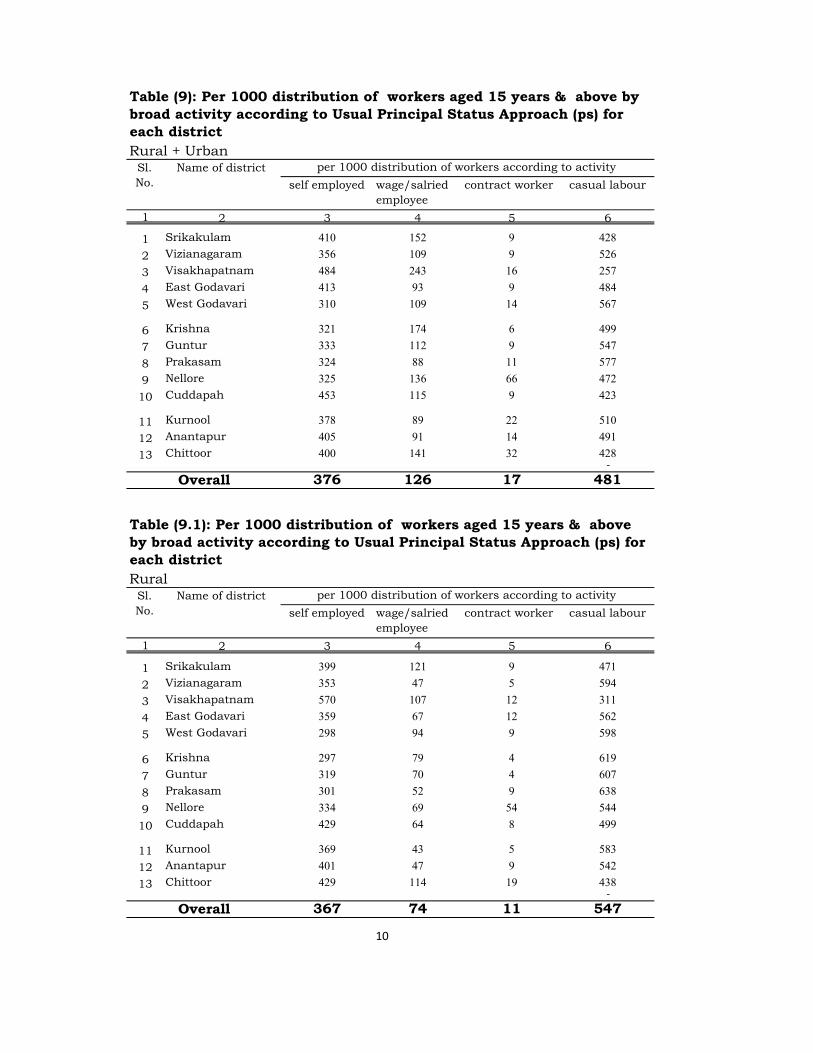
self employed wage/salried employee
contract worker casual labour
1 2 3 4 5 6
1 Srikakulam 410 152 9 428
2 Vizianagaram 356 109 9 526
3 Visakhapatnam 484 243 16 257
4 East Godavari 413 93 9 484
5 West Godavari 310 109 14 567
6 Krishna 321 174 6 499
7 Guntur 333 112 9 547
8 Prakasam 324 88 11 577
9 Nellore 325 136 66 472
10 Cuddapah 453 115 9 423
11 Kurnool 378 89 22 510
12 Anantapur 405 91 14 491
13 Chittoor 400 141 32 428-
376 126 17 481
self employed wage/salried employee
contract worker casual labour
1 2 3 4 5 6
1 Srikakulam 399 121 9 471
2 Vizianagaram 353 47 5 594
3 Visakhapatnam 570 107 12 311
4 East Godavari 359 67 12 562
5 West Godavari 298 94 9 598
6 Krishna 297 79 4 619
7 Guntur 319 70 4 607
8 Prakasam 301 52 9 638
9 Nellore 334 69 54 544
10 Cuddapah 429 64 8 499
11 Kurnool 369 43 5 583
12 Anantapur 401 47 9 542
13 Chittoor 429 114 19 438-
367 74 11 547
10
Overall
Table (9): Per 1000 distribution of workers aged 15 years & above by broad activity according to Usual Principal Status Approach (ps) for each districtRural + Urban
Sl.No.
Name of district per 1000 distribution of workers according to activity
Table (9.1): Per 1000 distribution of workers aged 15 years & above by broad activity according to Usual Principal Status Approach (ps) for each districtRural
Sl.No.
Name of district per 1000 distribution of workers according to activity
Overall
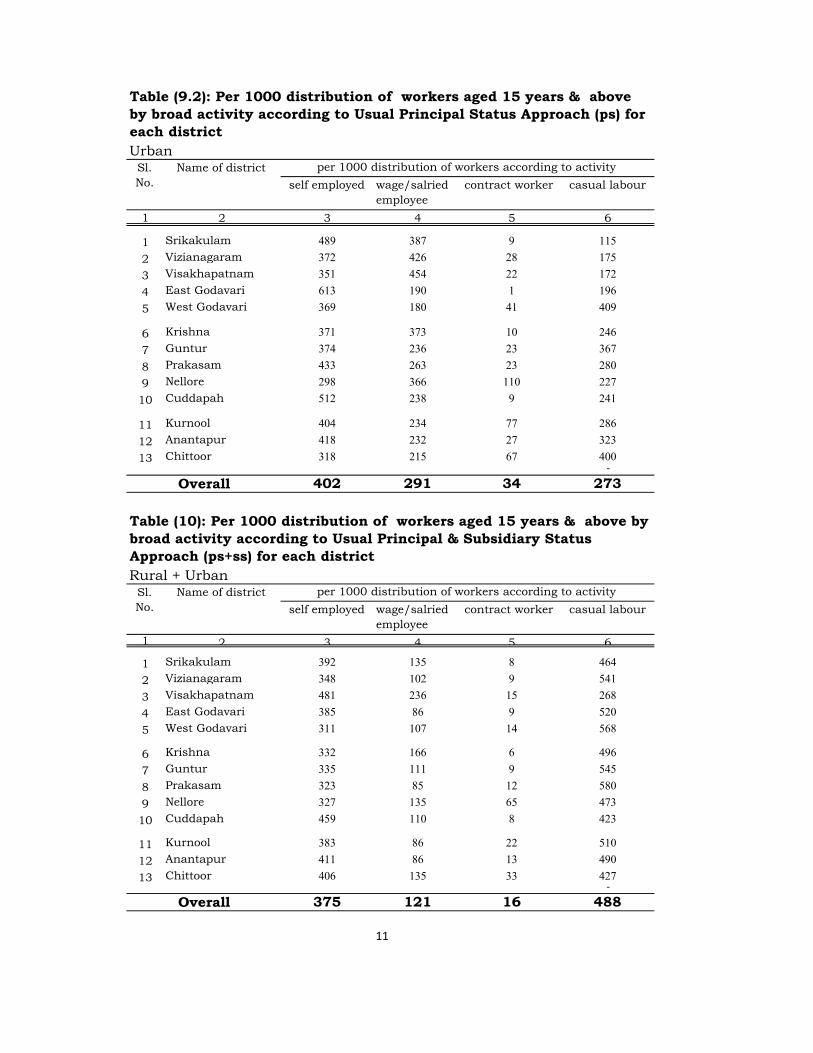
self employed wage/salried employee
contract worker casual labour
1 2 3 4 5 6
1 Srikakulam 489 387 9 115
2 Vizianagaram 372 426 28 175
3 Visakhapatnam 351 454 22 172
4 East Godavari 613 190 1 196
5 West Godavari 369 180 41 409
6 Krishna 371 373 10 246
7 Guntur 374 236 23 367
8 Prakasam 433 263 23 280
9 Nellore 298 366 110 227
10 Cuddapah 512 238 9 241
11 Kurnool 404 234 77 286
12 Anantapur 418 232 27 323
13 Chittoor 318 215 67 400-
402 291 34 273
self employed wage/salried employee
contract worker casual labour
1 2 3 4 5 6
1 Srikakulam 392 135 8 464
2 Vizianagaram 348 102 9 541
3 Visakhapatnam 481 236 15 268
4 East Godavari 385 86 9 520
5 West Godavari 311 107 14 568
6 Krishna 332 166 6 496
7 Guntur 335 111 9 545
8 Prakasam 323 85 12 580
9 Nellore 327 135 65 473
10 Cuddapah 459 110 8 423
11 Kurnool 383 86 22 510
12 Anantapur 411 86 13 490
13 Chittoor 406 135 33 427-
375 121 16 488
11
Overall
Table (9.2): Per 1000 distribution of workers aged 15 years & above by broad activity according to Usual Principal Status Approach (ps) for each districtUrban
Sl.No.
Name of district per 1000 distribution of workers according to activity
Table (10): Per 1000 distribution of workers aged 15 years & above by broad activity according to Usual Principal & Subsidiary Status Approach (ps+ss) for each districtRural + Urban
Sl.No.
Name of district per 1000 distribution of workers according to activity
Overall
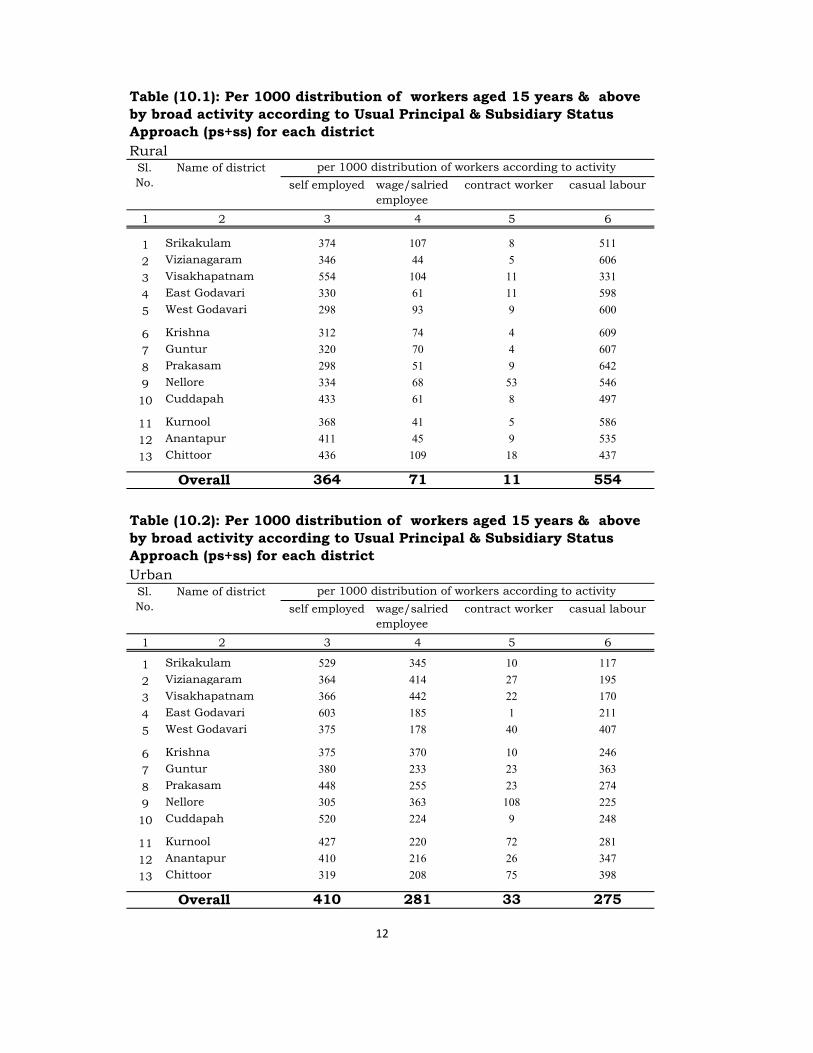
self employed wage/salried employee
contract worker casual labour
1 2 3 4 5 6
1 Srikakulam 374 107 8 511
2 Vizianagaram 346 44 5 606
3 Visakhapatnam 554 104 11 331
4 East Godavari 330 61 11 598
5 West Godavari 298 93 9 600
6 Krishna 312 74 4 609
7 Guntur 320 70 4 607
8 Prakasam 298 51 9 642
9 Nellore 334 68 53 546
10 Cuddapah 433 61 8 497
11 Kurnool 368 41 5 586
12 Anantapur 411 45 9 535
13 Chittoor 436 109 18 437
364 71 11 554
self employed wage/salried employee
contract worker casual labour
1 2 3 4 5 6
1 Srikakulam 529 345 10 117
2 Vizianagaram 364 414 27 195
3 Visakhapatnam 366 442 22 170
4 East Godavari 603 185 1 211
5 West Godavari 375 178 40 407
6 Krishna 375 370 10 246
7 Guntur 380 233 23 363
8 Prakasam 448 255 23 274
9 Nellore 305 363 108 225
10 Cuddapah 520 224 9 248
11 Kurnool 427 220 72 281
12 Anantapur 410 216 26 347
13 Chittoor 319 208 75 398
410 281 33 275
12
Overall
Table (10.1): Per 1000 distribution of workers aged 15 years & above by broad activity according to Usual Principal & Subsidiary Status Approach (ps+ss) for each districtRural
Sl.No.
Name of district per 1000 distribution of workers according to activity
Table (10.2): Per 1000 distribution of workers aged 15 years & above by broad activity according to Usual Principal & Subsidiary Status Approach (ps+ss) for each districtUrban
Sl.No.
Name of district per 1000 distribution of workers according to activity
Overall
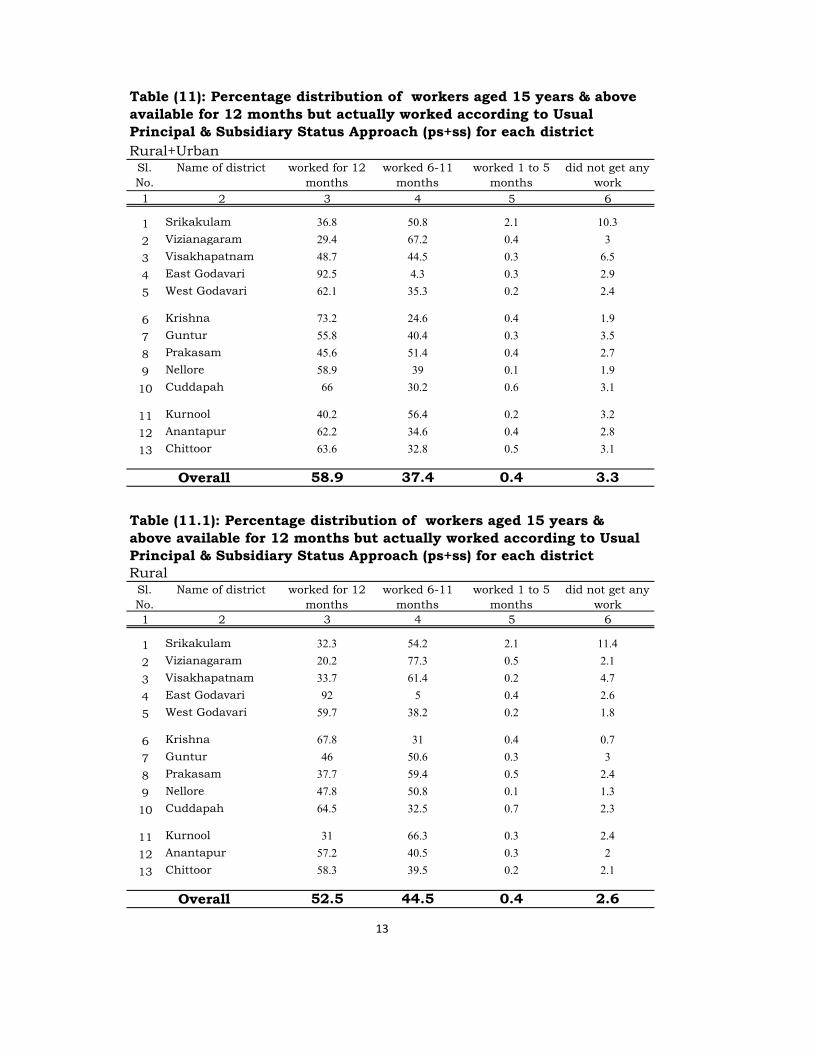
1 2 3 4 5 6
1 Srikakulam 36.8 50.8 2.1 10.3
2 Vizianagaram 29.4 67.2 0.4 3
3 Visakhapatnam 48.7 44.5 0.3 6.5
4 East Godavari 92.5 4.3 0.3 2.9
5 West Godavari 62.1 35.3 0.2 2.4
6 Krishna 73.2 24.6 0.4 1.9
7 Guntur 55.8 40.4 0.3 3.5
8 Prakasam 45.6 51.4 0.4 2.7
9 Nellore 58.9 39 0.1 1.9
10 Cuddapah 66 30.2 0.6 3.1
11 Kurnool 40.2 56.4 0.2 3.2
12 Anantapur 62.2 34.6 0.4 2.8
13 Chittoor 63.6 32.8 0.5 3.1
58.9 37.4 0.4 3.3
1 2 3 4 5 6
1 Srikakulam 32.3 54.2 2.1 11.4
2 Vizianagaram 20.2 77.3 0.5 2.1
3 Visakhapatnam 33.7 61.4 0.2 4.7
4 East Godavari 92 5 0.4 2.6
5 West Godavari 59.7 38.2 0.2 1.8
6 Krishna 67.8 31 0.4 0.7
7 Guntur 46 50.6 0.3 3
8 Prakasam 37.7 59.4 0.5 2.4
9 Nellore 47.8 50.8 0.1 1.3
10 Cuddapah 64.5 32.5 0.7 2.3
11 Kurnool 31 66.3 0.3 2.4
12 Anantapur 57.2 40.5 0.3 2
13 Chittoor 58.3 39.5 0.2 2.1
52.5 44.5 0.4 2.6
13
did not get any work
Overall
Table (11): Percentage distribution of workers aged 15 years & above available for 12 months but actually worked according to Usual Principal & Subsidiary Status Approach (ps+ss) for each districtRural+Urban
Sl.No.
Name of district worked for 12 months
worked 6-11 months
worked 1 to 5 months
Table (11.1): Percentage distribution of workers aged 15 years & above available for 12 months but actually worked according to Usual Principal & Subsidiary Status Approach (ps+ss) for each districtRural
Sl.No.
Name of district worked for 12 months
worked 6-11 months
worked 1 to 5 months
did not get any work
Overall
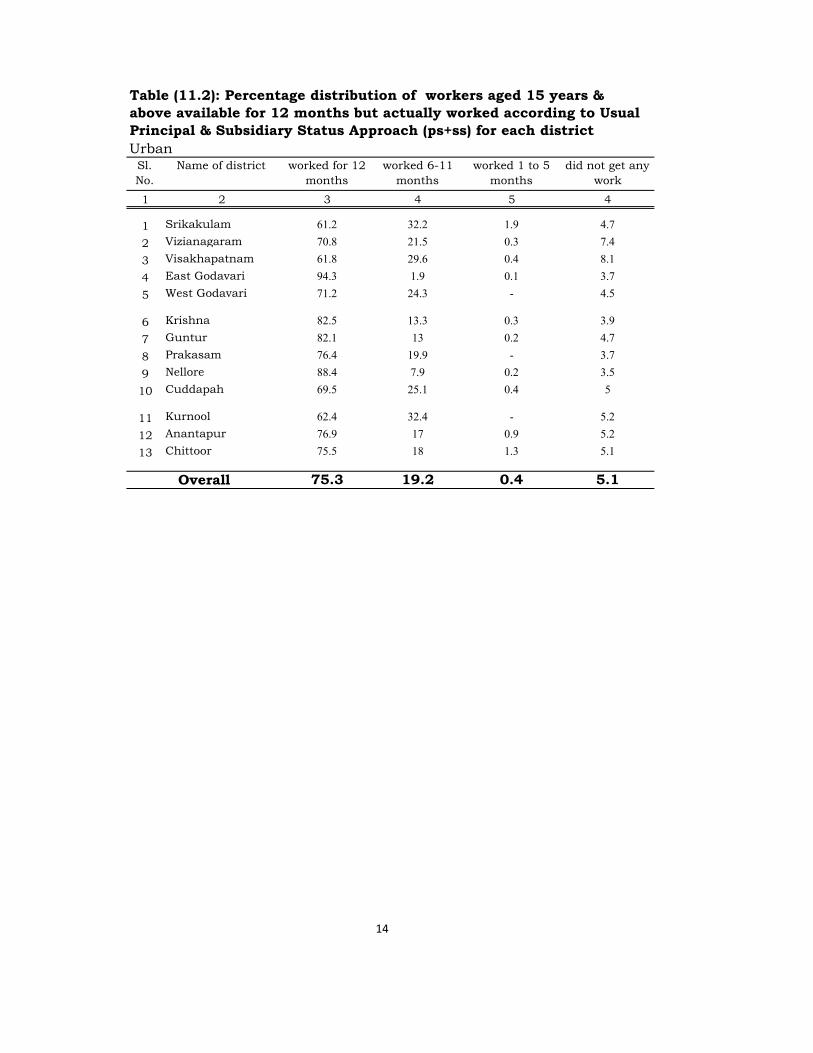
1 2 3 4 5 4
1 Srikakulam 61.2 32.2 1.9 4.7
2 Vizianagaram 70.8 21.5 0.3 7.4
3 Visakhapatnam 61.8 29.6 0.4 8.1
4 East Godavari 94.3 1.9 0.1 3.7
5 West Godavari 71.2 24.3 - 4.5
6 Krishna 82.5 13.3 0.3 3.9
7 Guntur 82.1 13 0.2 4.7
8 Prakasam 76.4 19.9 - 3.7
9 Nellore 88.4 7.9 0.2 3.5
10 Cuddapah 69.5 25.1 0.4 5
11 Kurnool 62.4 32.4 - 5.2
12 Anantapur 76.9 17 0.9 5.2
13 Chittoor 75.5 18 1.3 5.1
75.3 19.2 0.4 5.1
14
worked for 12 months
worked 6-11 months
worked 1 to 5 months
did not get any work
Overall
Table (11.2): Percentage distribution of workers aged 15 years & above available for 12 months but actually worked according to Usual Principal & Subsidiary Status Approach (ps+ss) for each districtUrban
Sl.No.
Name of district
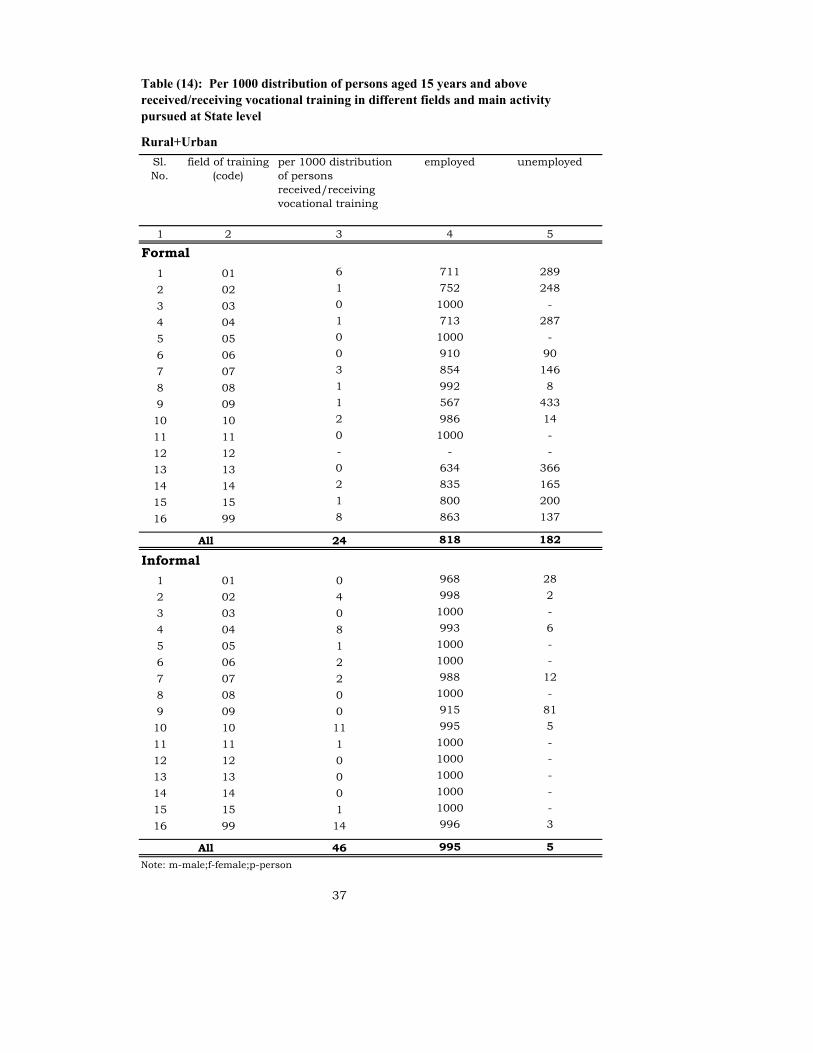
per 1000 distribution of persons received/receiving vocational training
employed unemployed
1 2 3 4 5
Formal
1 01 6 711 289
2 02 1 752 248
3 03 0 1000 -
4 04 1 713 287
5 05 0 1000 -
6 06 0 910 90
7 07 3 854 146
8 08 1 992 8
9 09 1 567 433
10 10 2 986 14
11 11 0 1000 -
12 12 - - -
13 13 0 634 366
14 14 2 835 165
15 15 1 800 200
16 99 8 863 137
24 818 182
Informal
1 01 0 968 28
2 02 4 998 2
3 03 0 1000 -
4 04 8 993 6
5 05 1 1000 -
6 06 2 1000 -
7 07 2 988 12
8 08 0 1000 -
9 09 0 915 81
10 10 11 995 5
11 11 1 1000 -
12 12 0 1000 -
13 13 0 1000 -
14 14 0 1000 -
15 15 1 1000 -
16 99 14 996 3
46 995 5
Note: m-male;f-female;p-person
37
Table (14): Per 1000 distribution of persons aged 15 years and above received/receiving vocational training in different fields and main activity pursued at State level
Rural+Urban
Sl.No.
field of training (code)
All
All
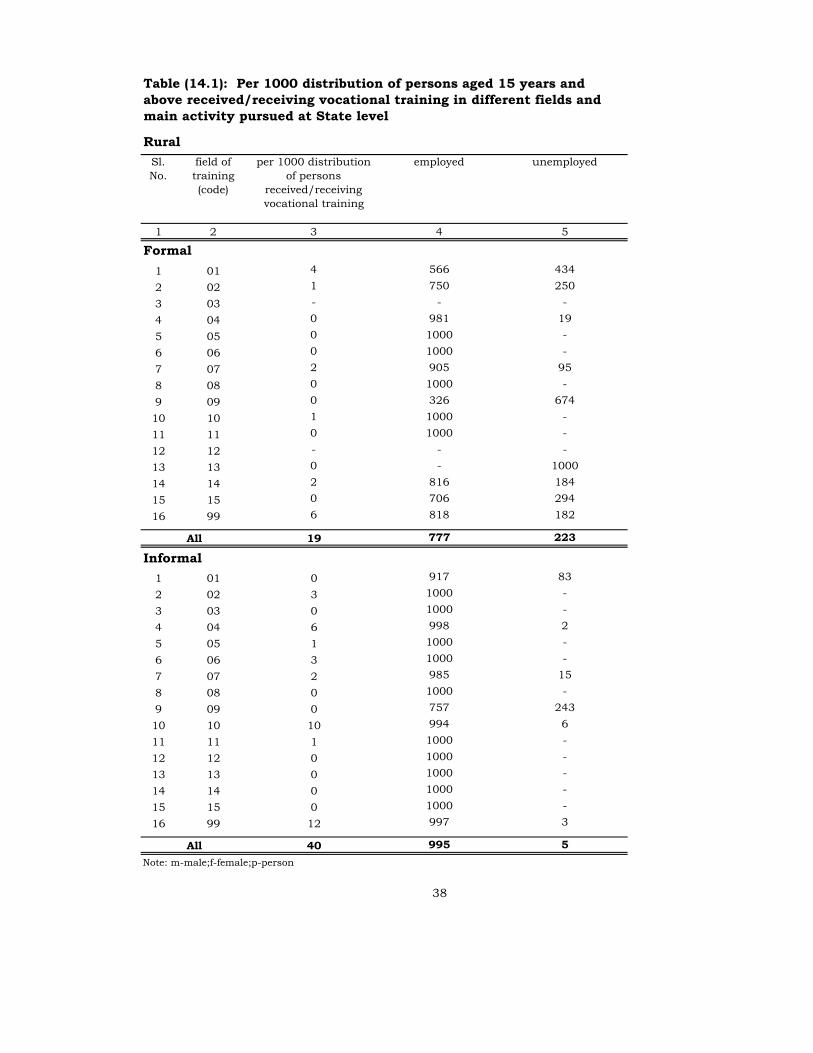
per 1000 distribution of persons
received/receiving vocational training
employed unemployed
1 2 3 4 5
Formal
1 01 4 566 434
2 02 1 750 250
3 03 - - -
4 04 0 981 19
5 05 0 1000 -
6 06 0 1000 -
7 07 2 905 95
8 08 0 1000 -
9 09 0 326 674
10 10 1 1000 -
11 11 0 1000 -
12 12 - - -
13 13 0 - 1000
14 14 2 816 184
15 15 0 706 294
16 99 6 818 182
19 777 223
Informal
1 01 0 917 83
2 02 3 1000 -
3 03 0 1000 -
4 04 6 998 2
5 05 1 1000 -
6 06 3 1000 -
7 07 2 985 15
8 08 0 1000 -
9 09 0 757 243
10 10 10 994 6
11 11 1 1000 -
12 12 0 1000 -
13 13 0 1000 -
14 14 0 1000 -
15 15 0 1000 -
16 99 12 997 3
40 995 5
Note: m-male;f-female;p-person
38
All
Table (14.1): Per 1000 distribution of persons aged 15 years and above received/receiving vocational training in different fields and main activity pursued at State level
Rural
Sl.No.
field of training (code)
All
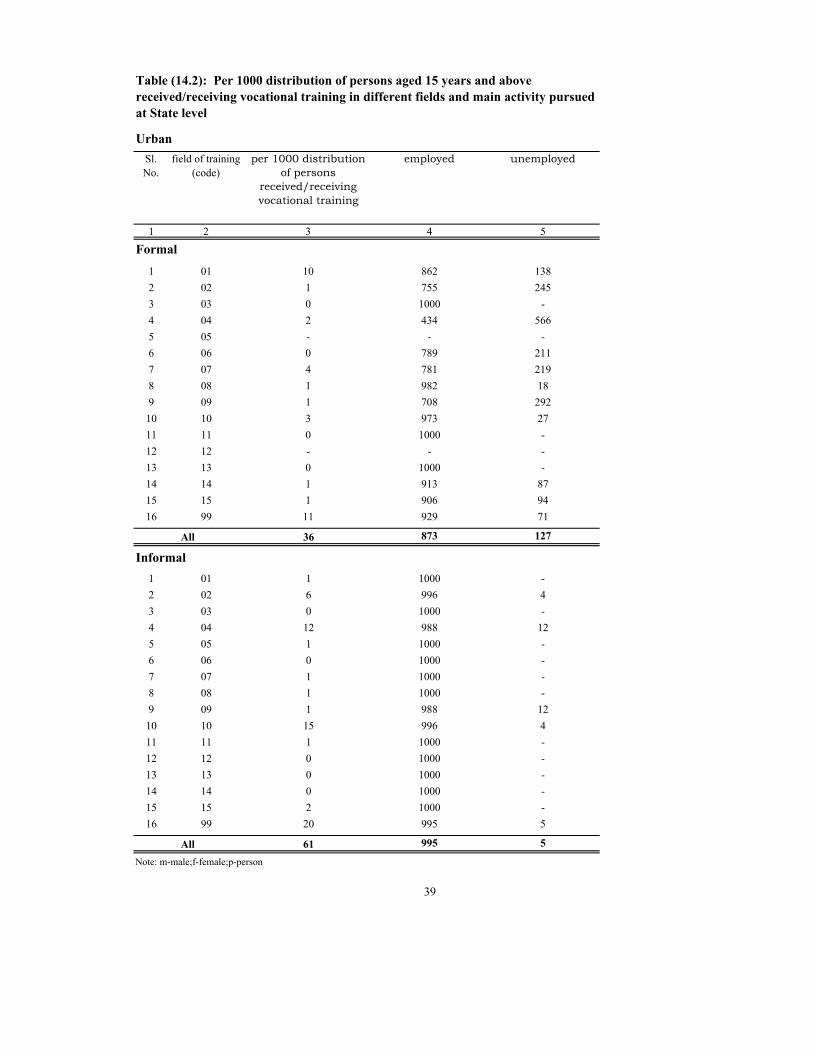
per 1000 distribution of persons
received/receiving vocational training
employed unemployed
1 2 3 4 5
Formal
1 01 10 862 138
2 02 1 755 245
3 03 0 1000 -
4 04 2 434 566
5 05 - - -
6 06 0 789 211
7 07 4 781 219
8 08 1 982 18
9 09 1 708 292
10 10 3 973 27
11 11 0 1000 -
12 12 - - -
13 13 0 1000 -
14 14 1 913 87
15 15 1 906 94
16 99 11 929 71
36 873 127
Informal
1 01 1 1000 -
2 02 6 996 4
3 03 0 1000 -
4 04 12 988 12
5 05 1 1000 -
6 06 0 1000 -
7 07 1 1000 -
8 08 1 1000 -
9 09 1 988 12
10 10 15 996 4
11 11 1 1000 -
12 12 0 1000 -
13 13 0 1000 -
14 14 0 1000 -
15 15 2 1000 -
16 99 20 995 5
61 995 5
Note: m-male;f-female;p-person
39
Table (14.2): Per 1000 distribution of persons aged 15 years and above received/receiving vocational training in different fields and main activity pursued at State level
Urban
Sl.No.
field of training (code)
All
All
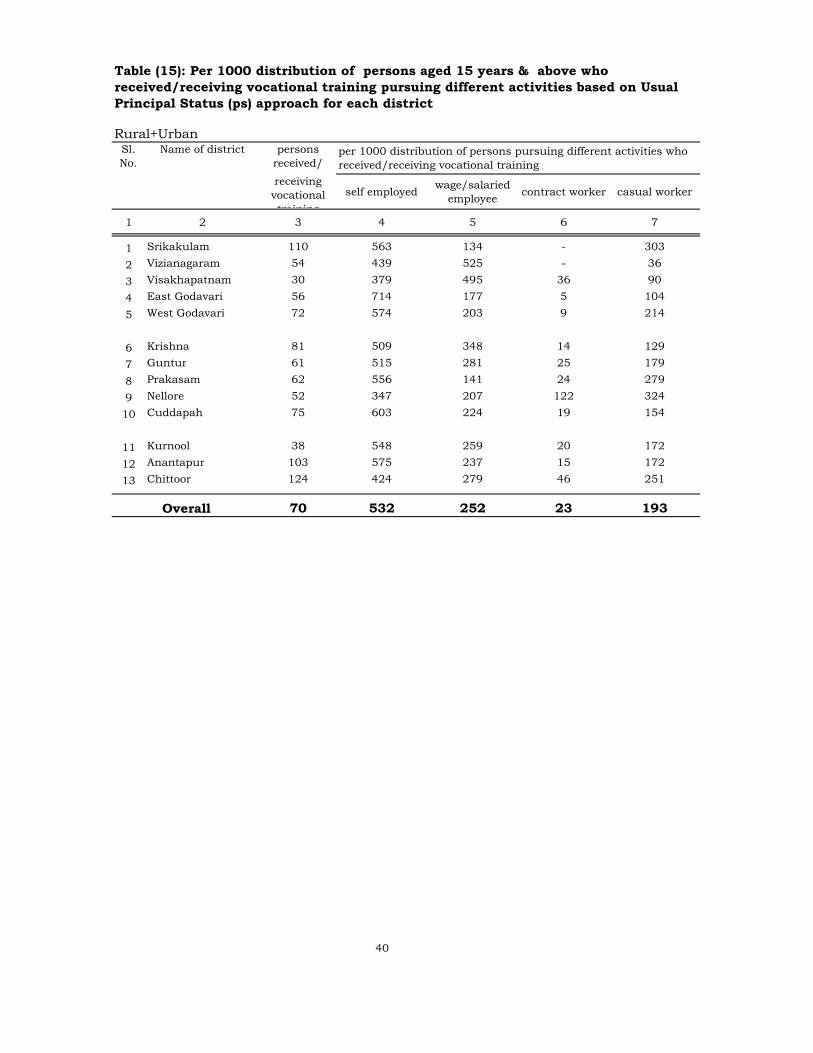
persons received/
receiving vocational training
self employedwage/salaried
employeecontract worker casual worker
1 2 3 4 5 6 7
1 Srikakulam 110 563 134 - 303
2 Vizianagaram 54 439 525 - 36
3 Visakhapatnam 30 379 495 36 90
4 East Godavari 56 714 177 5 104
5 West Godavari 72 574 203 9 214
6 Krishna 81 509 348 14 129
7 Guntur 61 515 281 25 179
8 Prakasam 62 556 141 24 279
9 Nellore 52 347 207 122 324
10 Cuddapah 75 603 224 19 154
11 Kurnool 38 548 259 20 172
12 Anantapur 103 575 237 15 172
13 Chittoor 124 424 279 46 251
70 532 252 23 193
40
Table (15): Per 1000 distribution of persons aged 15 years & above who received/receiving vocational training pursuing different activities based on Usual Principal Status (ps) approach for each district
Rural+UrbanSl.No.
Name of district per 1000 distribution of persons pursuing different activities who received/receiving vocational training
Overall
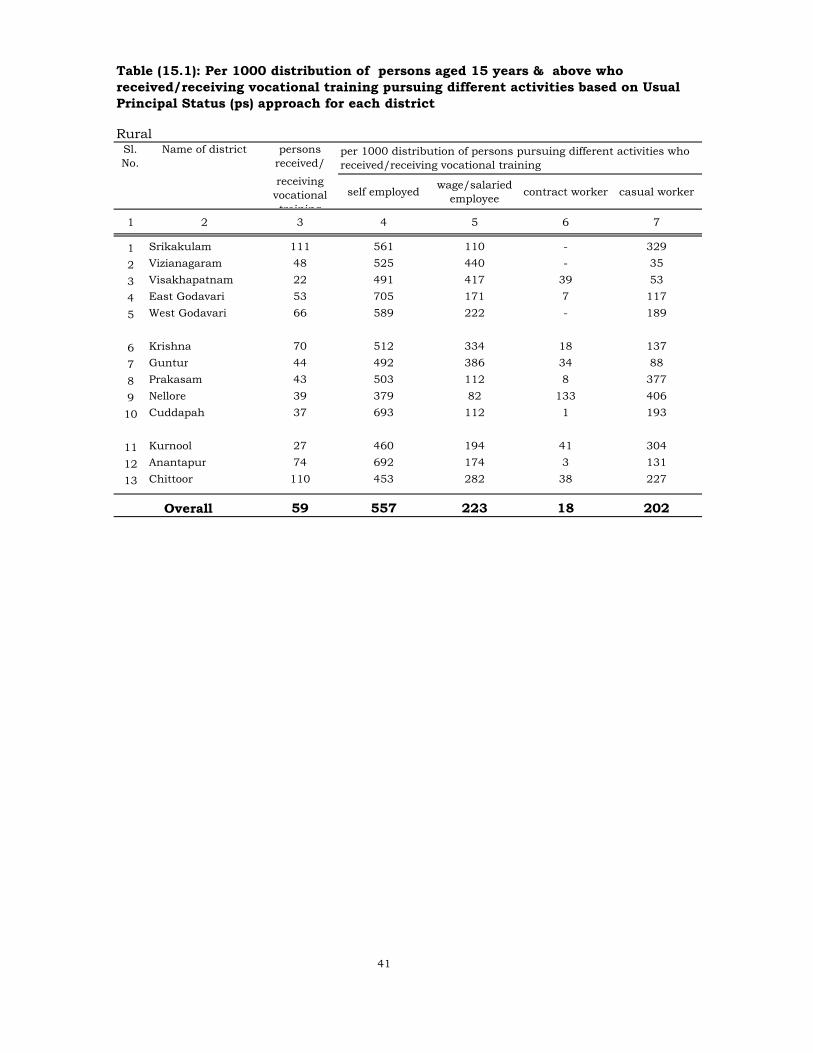
persons received/
receiving vocational training
self employedwage/salaried
employeecontract worker casual worker
1 2 3 4 5 6 7
1 Srikakulam 111 561 110 - 329
2 Vizianagaram 48 525 440 - 35
3 Visakhapatnam 22 491 417 39 53
4 East Godavari 53 705 171 7 117
5 West Godavari 66 589 222 - 189
6 Krishna 70 512 334 18 137
7 Guntur 44 492 386 34 88
8 Prakasam 43 503 112 8 377
9 Nellore 39 379 82 133 406
10 Cuddapah 37 693 112 1 193
11 Kurnool 27 460 194 41 304
12 Anantapur 74 692 174 3 131
13 Chittoor 110 453 282 38 227
59 557 223 18 202
41
Table (15.1): Per 1000 distribution of persons aged 15 years & above who received/receiving vocational training pursuing different activities based on Usual Principal Status (ps) approach for each district
Overall
per 1000 distribution of persons pursuing different activities who received/receiving vocational training
RuralSl.No.
Name of district

persons received/
receiving vocational training
self employedwage/salaried
employeecontract worker casual worker
1 2 3 4 5 6 7
1 Srikakulam 105 575 317 - 108
2 Vizianagaram 78 254 708 - 38
3 Visakhapatnam 37 293 554 34 119
4 East Godavari 62 738 193 - 69
5 West Godavari 99 523 140 39 298
6 Krishna 97 506 363 10 121
7 Guntur 97 534 196 18 253
8 Prakasam 126 611 172 41 176
9 Nellore 83 299 397 105 199
10 Cuddapah 147 548 292 31 130
11 Kurnool 63 632 321 - 47
12 Anantapur 171 458 301 28 214
13 Chittoor 159 374 274 60 292
97 495 295 29 180
42
Table (15.2): Per 1000 distribution of persons aged 15 years & above who received/receiving vocational training pursuing different activities based on Usual Principal Status (ps) approach for each district
UrbanSl.No.
Name of district per 1000 distribution of persons pursuing different activities who received/receiving vocational training
Overall
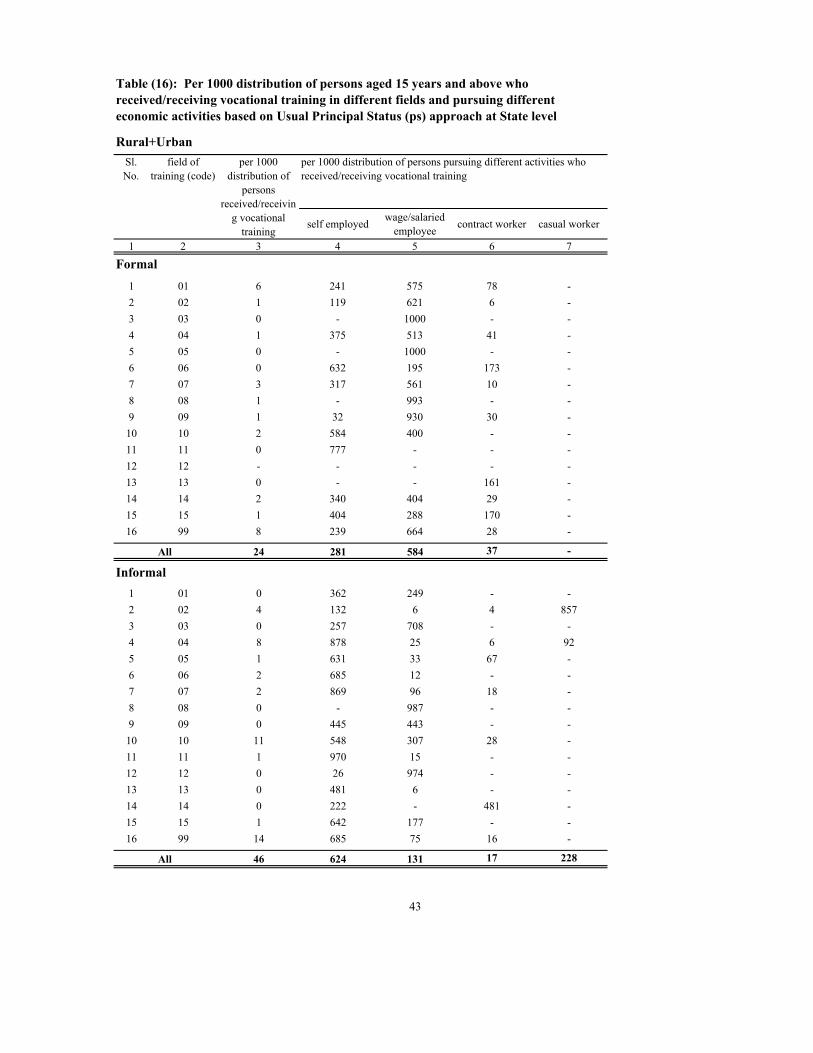
self employedwage/salaried
employeecontract worker casual worker
1 2 3 4 5 6 7
Formal
1 01 6 241 575 78 -
2 02 1 119 621 6 -
3 03 0 - 1000 - -
4 04 1 375 513 41 -
5 05 0 - 1000 - -
6 06 0 632 195 173 -
7 07 3 317 561 10 -
8 08 1 - 993 - -
9 09 1 32 930 30 -
10 10 2 584 400 - -
11 11 0 777 - - -
12 12 - - - - -
13 13 0 - - 161 -
14 14 2 340 404 29 -
15 15 1 404 288 170 -
16 99 8 239 664 28 -
24 281 584 37 -
Informal
1 01 0 362 249 - -
2 02 4 132 6 4 857
3 03 0 257 708 - -
4 04 8 878 25 6 92
5 05 1 631 33 67 -
6 06 2 685 12 - -
7 07 2 869 96 18 -
8 08 0 - 987 - -
9 09 0 445 443 - -
10 10 11 548 307 28 -
11 11 1 970 15 - -
12 12 0 26 974 - -
13 13 0 481 6 - -
14 14 0 222 - 481 -
15 15 1 642 177 - -
16 99 14 685 75 16 -
46 624 131 17 228
43
All
All
Table (16): Per 1000 distribution of persons aged 15 years and above who received/receiving vocational training in different fields and pursuing different economic activities based on Usual Principal Status (ps) approach at State level
Rural+Urban
Sl.No.
field of training (code)
per 1000 distribution of
persons received/receivin
g vocational training
per 1000 distribution of persons pursuing different activities who received/receiving vocational training
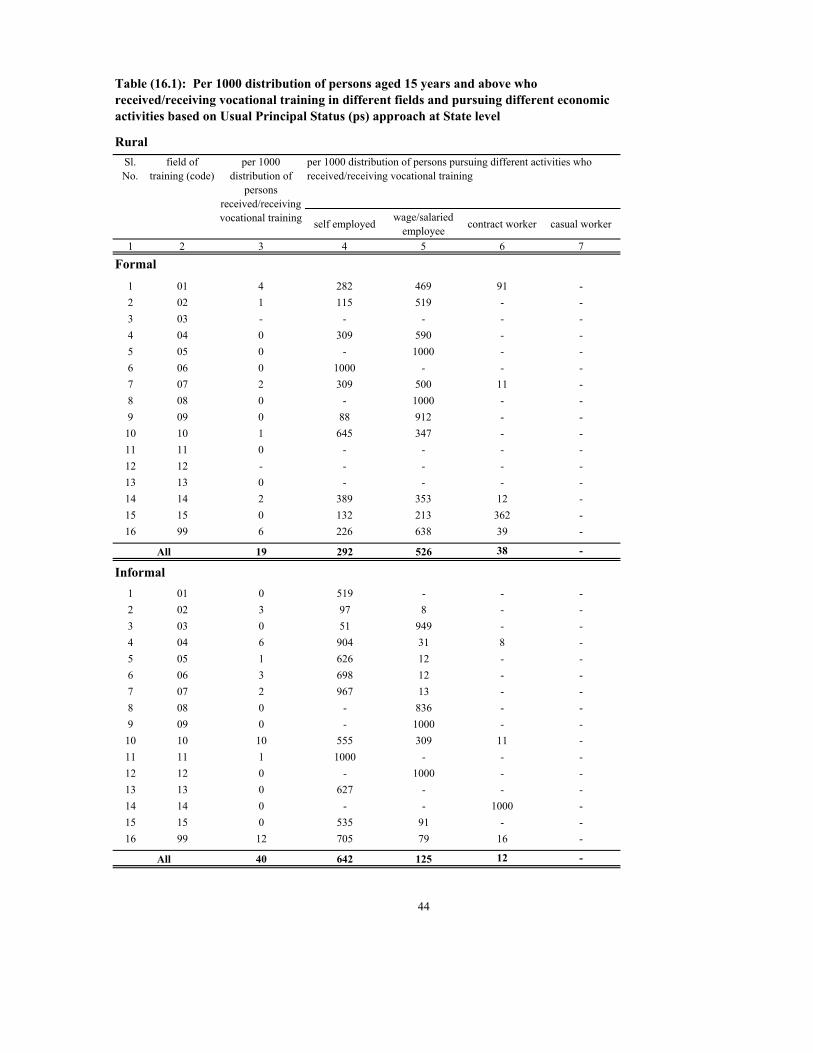
self employedwage/salaried
employeecontract worker casual worker
1 2 3 4 5 6 7
Formal
1 01 4 282 469 91 -
2 02 1 115 519 - -
3 03 - - - - -
4 04 0 309 590 - -
5 05 0 - 1000 - -
6 06 0 1000 - - -
7 07 2 309 500 11 -
8 08 0 - 1000 - -
9 09 0 88 912 - -
10 10 1 645 347 - -
11 11 0 - - - -
12 12 - - - - -
13 13 0 - - - -
14 14 2 389 353 12 -
15 15 0 132 213 362 -
16 99 6 226 638 39 -
19 292 526 38 -
Informal
1 01 0 519 - - -
2 02 3 97 8 - -
3 03 0 51 949 - -
4 04 6 904 31 8 -
5 05 1 626 12 - -
6 06 3 698 12 - -
7 07 2 967 13 - -
8 08 0 - 836 - -
9 09 0 - 1000 - -
10 10 10 555 309 11 -
11 11 1 1000 - - -
12 12 0 - 1000 - -
13 13 0 627 - - -
14 14 0 - - 1000 -
15 15 0 535 91 - -
16 99 12 705 79 16 -
40 642 125 12 -
44
Table (16.1): Per 1000 distribution of persons aged 15 years and above who received/receiving vocational training in different fields and pursuing different economic activities based on Usual Principal Status (ps) approach at State level
Rural
Sl.No.
field of training (code)
All
All
per 1000 distribution of
persons received/receiving vocational training
per 1000 distribution of persons pursuing different activities who received/receiving vocational training
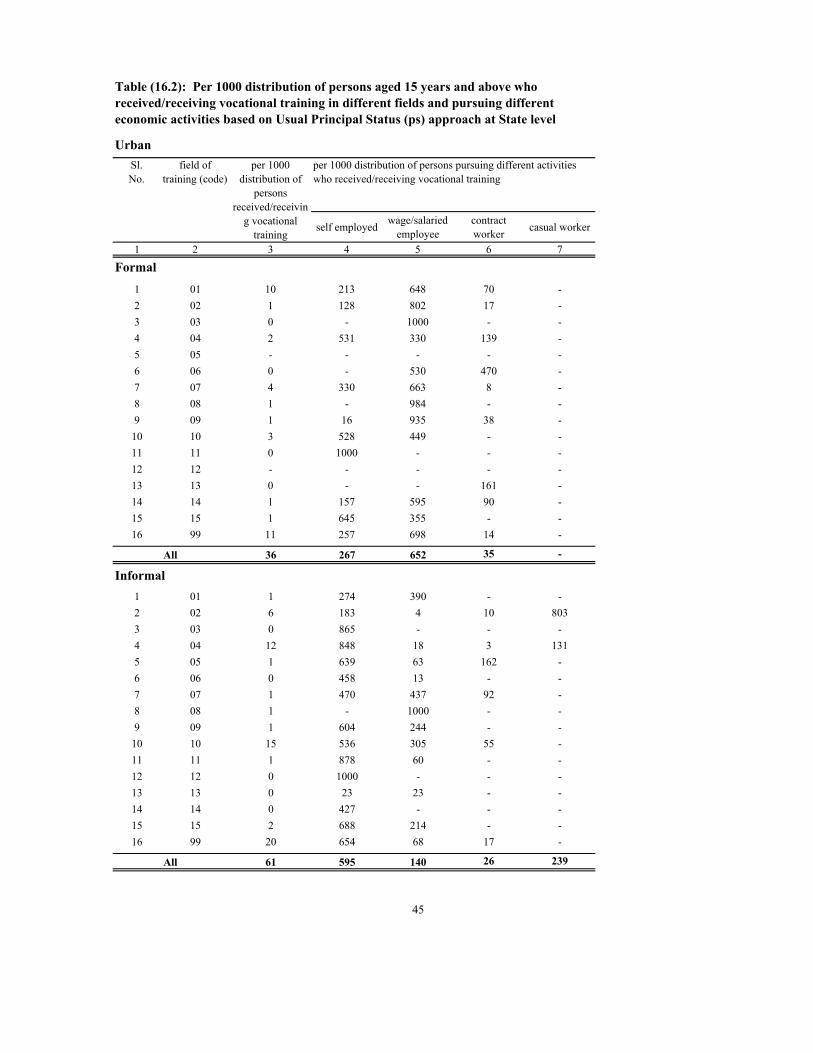
self employedwage/salaried
employeecontract worker
casual worker
1 2 3 4 5 6 7
Formal
1 01 10 213 648 70 -
2 02 1 128 802 17 -
3 03 0 - 1000 - -
4 04 2 531 330 139 -
5 05 - - - - -
6 06 0 - 530 470 -
7 07 4 330 663 8 -
8 08 1 - 984 - -
9 09 1 16 935 38 -
10 10 3 528 449 - -
11 11 0 1000 - - -
12 12 - - - - -
13 13 0 - - 161 -
14 14 1 157 595 90 -
15 15 1 645 355 - -
16 99 11 257 698 14 -
36 267 652 35 -
Informal
1 01 1 274 390 - -
2 02 6 183 4 10 803
3 03 0 865 - - -
4 04 12 848 18 3 131
5 05 1 639 63 162 -
6 06 0 458 13 - -
7 07 1 470 437 92 -
8 08 1 - 1000 - -
9 09 1 604 244 - -
10 10 15 536 305 55 -
11 11 1 878 60 - -
12 12 0 1000 - - -
13 13 0 23 23 - -
14 14 0 427 - - -
15 15 2 688 214 - -
16 99 20 654 68 17 -
61 595 140 26 239
45
All
All
Table (16.2): Per 1000 distribution of persons aged 15 years and above who received/receiving vocational training in different fields and pursuing different economic activities based on Usual Principal Status (ps) approach at State level
Urban
Sl.No.
field of training (code)
per 1000 distribution of
persons received/receivin
g vocational training
per 1000 distribution of persons pursuing different activities who received/receiving vocational training
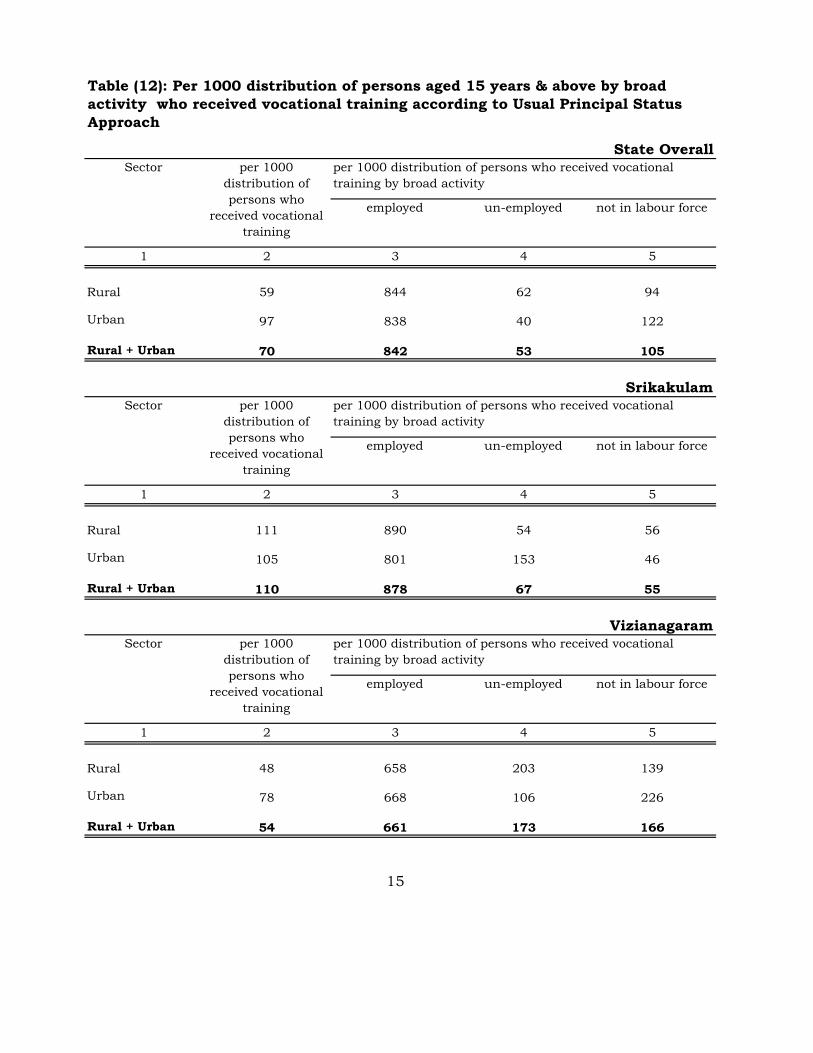
employed un-employed not in labour force
1 2 3 4 5
Rural 59 844 62 94
Urban 97 838 40 122
Rural + Urban 70 842 53 105
employed un-employed not in labour force
1 2 3 4 5
Rural 111 890 54 56
Urban 105 801 153 46
Rural + Urban 110 878 67 55
employed un-employed not in labour force
1 2 3 4 5
Rural 48 658 203 139
Urban 78 668 106 226
Rural + Urban 54 661 173 166
15
VizianagaramSector per 1000
distribution of persons who
received vocational training
per 1000 distribution of persons who received vocational training by broad activity
Sector per 1000 distribution of persons who
received vocational training
per 1000 distribution of persons who received vocational training by broad activity
Srikakulam
Sector
Table (12): Per 1000 distribution of persons aged 15 years & above by broad activity who received vocational training according to Usual Principal Status Approach
State Overallper 1000
distribution of persons who
received vocational training
per 1000 distribution of persons who received vocational training by broad activity

employed un-employed not in labour force
1 2 3 4 5
Rural 22 899 65 36
Urban 37 755 34 211
Rural + Urban 30 812 47 142
employed un-employed not in labour force
1 2 3 4 5
Rural 53 874 33 93
Urban 62 944 50 6
Rural + Urban 56 892 38 70
employed un-employed not in labour force
1 2 3 4 5
Rural 66 861 5 135
Urban 99 830 44 126
Rural + Urban 72 854 14 133
16
Table (12): Per 1000 distribution of persons aged 15 years & above by broad activity who received vocational training according to Usual Principal Status Approach
VisakhapatnamSector per 1000
distribution of persons who
received vocational training
per 1000 distribution of persons who received vocational training by broad activity
East GodavariSector per 1000
distribution of persons who
received vocational training
per 1000 distribution of persons who received vocational training by broad activity
West GodavariSector per 1000
distribution of persons who
received vocational training
per 1000 distribution of persons who received vocational training by broad activity

employed un-employed not in labour force
1 2 3 4 5
Rural 70 847 32 122
Urban 97 938 14 48
Rural + Urban 81 889 23 88
employed un-employed not in labour force
1 2 3 4 5
Rural 44 703 199 97
Urban 97 881 21 98
Rural + Urban 61 792 110 98
employed un-employed not in labour force
1 2 3 4 5
Rural 43 831 70 99
Urban 126 902 2 97
Rural + Urban 62 864 38 98
17
Table (12): Per 1000 distribution of persons aged 15 years & above by broad activity who received vocational training according to Usual Principal Status Approach
KrishnaSector per 1000
distribution of persons who
received vocational training
per 1000 distribution of persons who received vocational training by broad activity
GunturSector per 1000
distribution of persons who
received vocational training
per 1000 distribution of persons who received vocational training by broad activity
PrakasamSector per 1000
distribution of persons who
received vocational training
per 1000 distribution of persons who received vocational training by broad activity

employed un-employed not in labour force
1 2 3 4 5
Rural 39 812 28 161
Urban 83 606 14 380
Rural + Urban 52 716 21 263
employed un-employed not in labour force
1 2 3 4 5
Rural 37 982 - 18
Urban 147 788 62 150
Rural + Urban 75 852 42 106
employed un-employed not in labour force
1 2 3 4 5
Rural 27 763 122 115
Urban 63 750 128 122
Rural + Urban 38 756 125 119
18
Table (12): Per 1000 distribution of persons aged 15 years & above by broad activity who received vocational training according to Usual Principal Status Approach
NelloreSector per 1000
distribution of persons who
received vocational training
per 1000 distribution of persons who received vocational training by broad activity
CuddapahSector per 1000
distribution of persons who
received vocational training
per 1000 distribution of persons who received vocational training by broad activity
KurnoolSector per 1000
distribution of persons who
received vocational training
per 1000 distribution of persons who received vocational training by broad activity
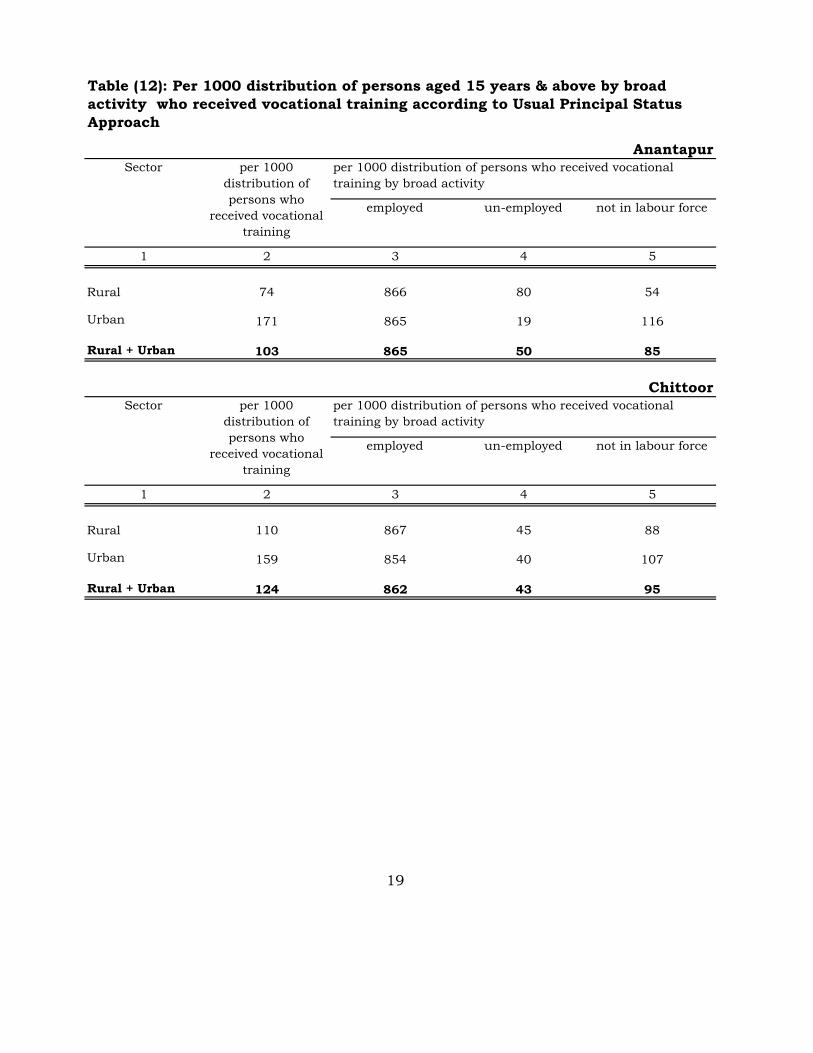
employed un-employed not in labour force
1 2 3 4 5
Rural 74 866 80 54
Urban 171 865 19 116
Rural + Urban 103 865 50 85
employed un-employed not in labour force
1 2 3 4 5
Rural 110 867 45 88
Urban 159 854 40 107
Rural + Urban 124 862 43 95
19
ChittoorSector per 1000
distribution of persons who
received vocational training
per 1000 distribution of persons who received vocational training by broad activity
Table (12): Per 1000 distribution of persons aged 15 years & above by broad activity who received vocational training according to Usual Principal Status Approach
AnantapurSector per 1000
distribution of persons who
received vocational training
per 1000 distribution of persons who received vocational training by broad activity

employed un-employed not in labour force
1 2 3 4 5
Rural 66 861 5 135
Urban 99 830 44 126
Rural + Urban 72 854 14 133
employed un-employed not in labour force
1 2 3 4 5
Rural 70 847 32 122
Urban 97 938 14 48
Rural + Urban 81 889 23 88
employed un-employed not in labour force
1 2 3 4 5
Rural 44 703 199 97
Urban 97 881 21 98
Rural + Urban 61 792 110 98
20
GunturSector per 1000
distribution of persons who
received vocational training
per 1000 distribution of persons who received vocational training by broad activity
KrishnaSector per 1000
distribution of persons who
received vocational training
per 1000 distribution of persons who received vocational training by broad activity
Table (12): Per 1000 distribution of persons aged 15 years & above by broad activity who received vocational training according to Usual Principal Status Approach
West GodavariSector per 1000
distribution of persons who
received vocational training
per 1000 distribution of persons who received vocational training by broad activity
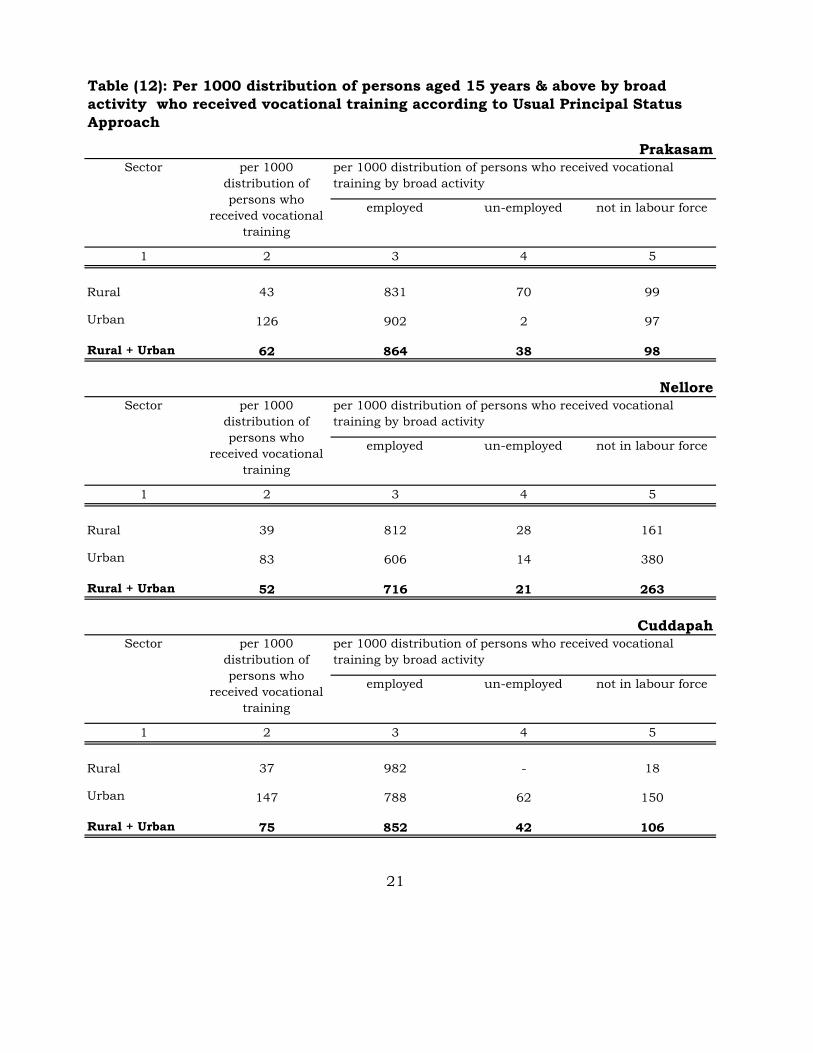
employed un-employed not in labour force
1 2 3 4 5
Rural 43 831 70 99
Urban 126 902 2 97
Rural + Urban 62 864 38 98
employed un-employed not in labour force
1 2 3 4 5
Rural 39 812 28 161
Urban 83 606 14 380
Rural + Urban 52 716 21 263
employed un-employed not in labour force
1 2 3 4 5
Rural 37 982 - 18
Urban 147 788 62 150
Rural + Urban 75 852 42 106
21
CuddapahSector per 1000
distribution of persons who
received vocational training
per 1000 distribution of persons who received vocational training by broad activity
NelloreSector per 1000
distribution of persons who
received vocational training
per 1000 distribution of persons who received vocational training by broad activity
Table (12): Per 1000 distribution of persons aged 15 years & above by broad activity who received vocational training according to Usual Principal Status Approach
PrakasamSector per 1000
distribution of persons who
received vocational training
per 1000 distribution of persons who received vocational training by broad activity
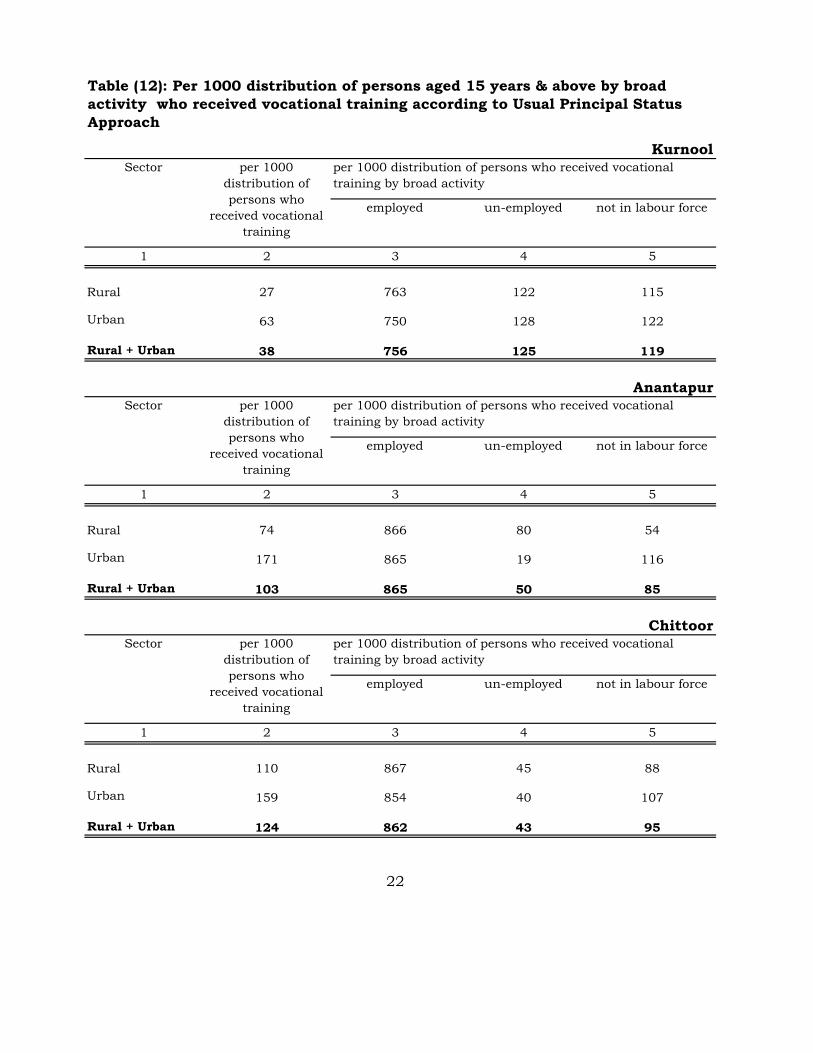
employed un-employed not in labour force
1 2 3 4 5
Rural 27 763 122 115
Urban 63 750 128 122
Rural + Urban 38 756 125 119
employed un-employed not in labour force
1 2 3 4 5
Rural 74 866 80 54
Urban 171 865 19 116
Rural + Urban 103 865 50 85
employed un-employed not in labour force
1 2 3 4 5
Rural 110 867 45 88
Urban 159 854 40 107
Rural + Urban 124 862 43 95
22
ChittoorSector per 1000
distribution of persons who
received vocational training
per 1000 distribution of persons who received vocational training by broad activity
AnantapurSector per 1000
distribution of persons who
received vocational training
per 1000 distribution of persons who received vocational training by broad activity
Table (12): Per 1000 distribution of persons aged 15 years & above by broad activity who received vocational training according to Usual Principal Status Approach
KurnoolSector per 1000
distribution of persons who
received vocational training
per 1000 distribution of persons who received vocational training by broad activity
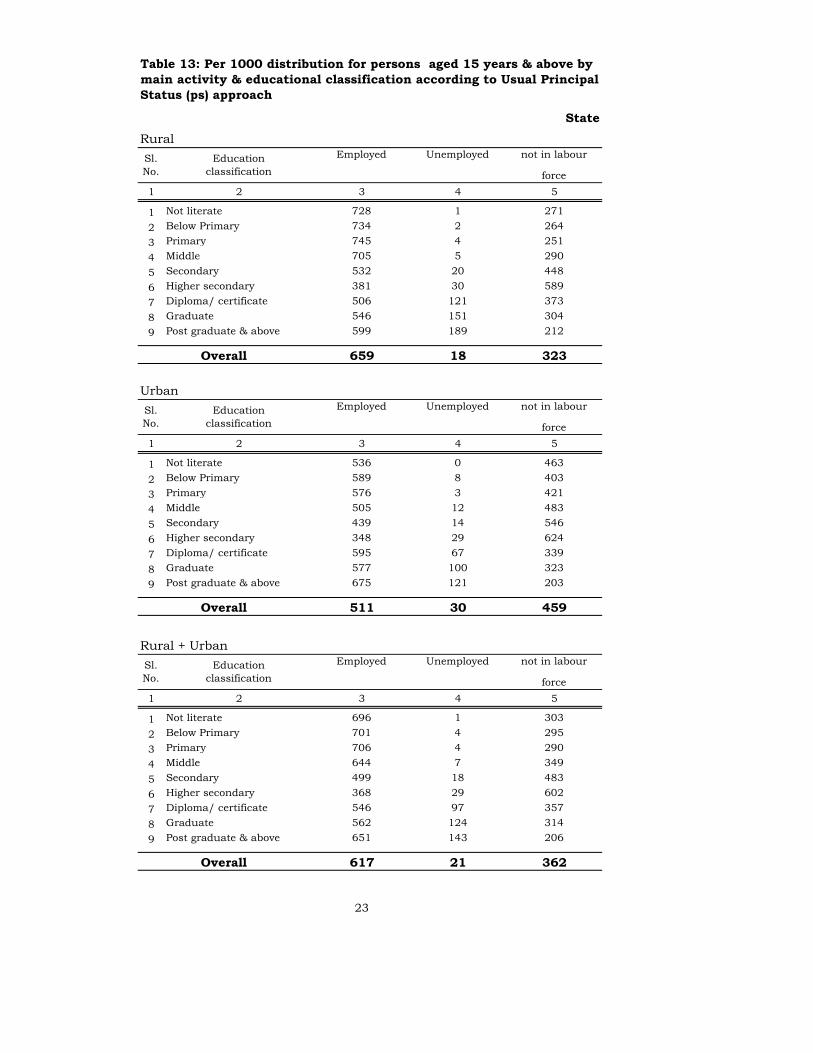
1 2 3 4 5
1 Not literate 728 1 271
2 Below Primary 734 2 264
3 Primary 745 4 251
4 Middle 705 5 290
5 Secondary 532 20 448
6 Higher secondary 381 30 589
7 Diploma/ certificate 506 121 373
8 Graduate 546 151 304
9 Post graduate & above 599 189 212
659 18 323
1 2 3 4 5
1 Not literate 536 0 463
2 Below Primary 589 8 403
3 Primary 576 3 421
4 Middle 505 12 483
5 Secondary 439 14 546
6 Higher secondary 348 29 624
7 Diploma/ certificate 595 67 339
8 Graduate 577 100 323
9 Post graduate & above 675 121 203
511 30 459
1 2 3 4 5
1 Not literate 696 1 303
2 Below Primary 701 4 295
3 Primary 706 4 290
4 Middle 644 7 349
5 Secondary 499 18 483
6 Higher secondary 368 29 602
7 Diploma/ certificate 546 97 357
8 Graduate 562 124 314
9 Post graduate & above 651 143 206
617 21 362
23
Urban
Rural + Urban
State
Overall
Employed Unemployed not in labour
force
Employed Unemployed not in labour
force
Employed Unemployed not in labour
force
Sl.No.
Education classification
Overall
Sl.No.
Education classification
Table 13: Per 1000 distribution for persons aged 15 years & above by main activity & educational classification according to Usual Principal Status (ps) approach
Overall
Sl.No.
Education classification
Rural

1 2 3 4 5
1 Not literate 632 5 363
2 Below Primary 671 33 296
3 Primary 736 23 241
4 Middle 644 42 315
5 Secondary 471 79 451
6 Higher secondary 413 116 472
7 Diploma/ certificate 508 214 278
8 Graduate 419 339 242
9 Post graduate & above 890 82 28
592 56 352
1 2 3 4 5
1 Not literate 567 14 419
2 Below Primary 708 66 225
3 Primary 469 30 502
4 Middle 594 30 376
5 Secondary 386 49 565
6 Higher secondary 379 2 618
7 Diploma/ certificate 436 355 208
8 Graduate 584 107 310
9 Post graduate & above 696 111 193
514 50 437
1 2 3 4 5
1 Not literate 628 6 367
2 Below Primary 675 37 288
3 Primary 691 24 285
4 Middle 634 39 326
5 Secondary 455 73 472
6 Higher secondary 409 102 490
7 Diploma/ certificate 497 236 267
8 Graduate 460 282 258
9 Post graduate & above 808 94 97
582 55 363
24
Overall
Sl.No.
Education classification
Employed Unemployed not in labour
force
Overall
Rural + Urban
Sl.No.
Education classification
Employed Unemployed not in labour
force
Overall
Urban
Sl.No.
Education classification
Employed Unemployed not in labour
force
Srikakulam
Rural
Table 13.1: Per 1000 distribution for persons aged 15 years & above by main activity & educational classification according to Usual Principal Status (ps) approach

1 2 3 4 5
1 Not literate 832 - 168
2 Below Primary 972 - 28
3 Primary 864 - 136
4 Middle 672 - 328
5 Secondary 553 24 423
6 Higher secondary 184 - 816
7 Diploma/ certificate 312 488 200
8 Graduate 421 223 357
9 Post graduate & above 1000 - -
734 18 249
1 2 3 4 5
1 Not literate 451 - 549
2 Below Primary 466 - 534
3 Primary 473 - 527
4 Middle 576 - 424
5 Secondary 455 9 536
6 Higher secondary 397 80 523
7 Diploma/ certificate 700 14 286
8 Graduate 626 104 271
9 Post graduate & above 679 321 -
514 43 444
1 2 3 4 5
1 Not literate 803 - 197
2 Below Primary 895 - 105
3 Primary 723 - 277
4 Middle 639 - 361
5 Secondary 515 18 467
6 Higher secondary 234 19 747
7 Diploma/ certificate 462 304 233
8 Graduate 508 172 320
9 Post graduate & above 703 297 -
686 23 291
25
Overall
Sl.No.
Education classification
Employed Unemployed not in labour
force
Overall
Rural + Urban
Sl.No.
Education classification
Employed Unemployed not in labour
force
Overall
Urban
Sl.No.
Education classification
Employed Unemployed not in labour
force
Vizianagaram
Rural
Table 13.2: Per 1000 distribution for persons aged 15 years & above by main activity & educational classification according to Usual Principal Status (ps) approach
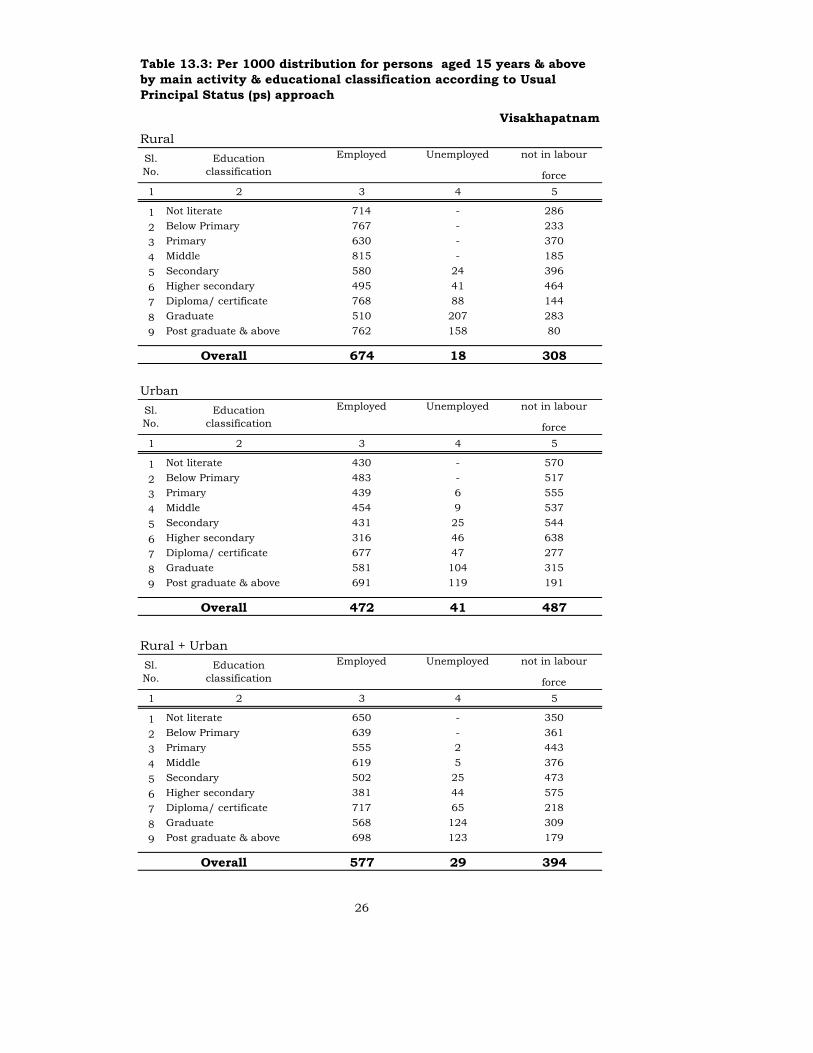
1 2 3 4 5
1 Not literate 714 - 286
2 Below Primary 767 - 233
3 Primary 630 - 370
4 Middle 815 - 185
5 Secondary 580 24 396
6 Higher secondary 495 41 464
7 Diploma/ certificate 768 88 144
8 Graduate 510 207 283
9 Post graduate & above 762 158 80
674 18 308
1 2 3 4 5
1 Not literate 430 - 570
2 Below Primary 483 - 517
3 Primary 439 6 555
4 Middle 454 9 537
5 Secondary 431 25 544
6 Higher secondary 316 46 638
7 Diploma/ certificate 677 47 277
8 Graduate 581 104 315
9 Post graduate & above 691 119 191
472 41 487
1 2 3 4 5
1 Not literate 650 - 350
2 Below Primary 639 - 361
3 Primary 555 2 443
4 Middle 619 5 376
5 Secondary 502 25 473
6 Higher secondary 381 44 575
7 Diploma/ certificate 717 65 218
8 Graduate 568 124 309
9 Post graduate & above 698 123 179
577 29 394
26
Overall
Sl.No.
Education classification
Employed Unemployed not in labour
force
Overall
Rural + Urban
Sl.No.
Education classification
Employed Unemployed not in labour
force
Overall
Urban
Sl.No.
Education classification
Employed Unemployed not in labour
force
Visakhapatnam
Rural
Table 13.3: Per 1000 distribution for persons aged 15 years & above by main activity & educational classification according to Usual Principal Status (ps) approach

1 2 3 4 5
1 Not literate 626 - 374
2 Below Primary 584 - 416
3 Primary 583 - 417
4 Middle 576 2 422
5 Secondary 449 34 517
6 Higher secondary 214 10 776
7 Diploma/ certificate 640 87 273
8 Graduate 545 130 325
9 Post graduate & above 637 198 165
546 15 439
1 2 3 4 5
1 Not literate 559 - 441
2 Below Primary 465 - 535
3 Primary 530 - 470
4 Middle 527 3 470
5 Secondary 320 3 677
6 Higher secondary 356 33 611
7 Diploma/ certificate 581 53 366
8 Graduate 563 97 341
9 Post graduate & above 699 64 237
476 20 505
1 2 3 4 5
1 Not literate 617 - 383
2 Below Primary 556 - 444
3 Primary 575 - 425
4 Middle 563 2 435
5 Secondary 412 25 563
6 Higher secondary 260 18 722
7 Diploma/ certificate 621 76 303
8 Graduate 552 116 331
9 Post graduate & above 677 112 211
529 16 454
27
Overall
Sl.No.
Education classification
Employed Unemployed not in labour
force
Overall
Rural + Urban
Sl.No.
Education classification
Employed Unemployed not in labour
force
Overall
Urban
Sl.No.
Education classification
Employed Unemployed not in labour
force
East Godavari
Rural
Table 13.4: Per 1000 distribution for persons aged 15 years & above by main activity & educational classification according to Usual Principal Status (ps) approach
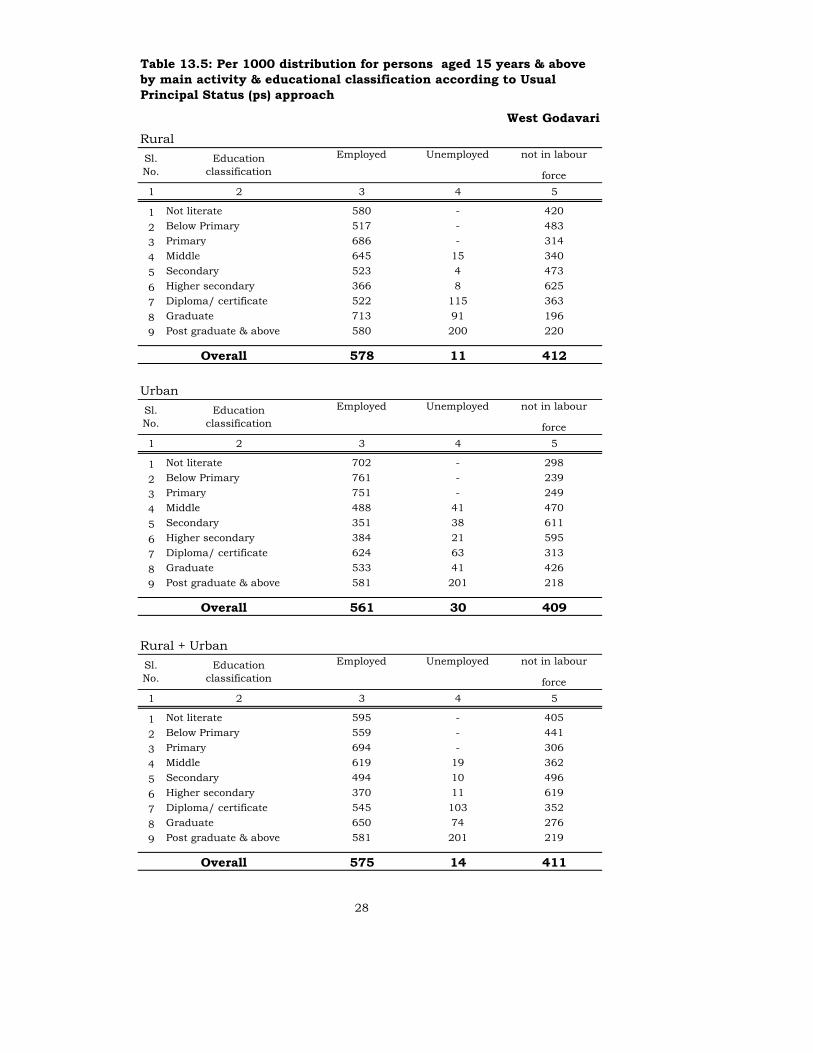
1 2 3 4 5
1 Not literate 580 - 420
2 Below Primary 517 - 483
3 Primary 686 - 314
4 Middle 645 15 340
5 Secondary 523 4 473
6 Higher secondary 366 8 625
7 Diploma/ certificate 522 115 363
8 Graduate 713 91 196
9 Post graduate & above 580 200 220
578 11 412
1 2 3 4 5
1 Not literate 702 - 298
2 Below Primary 761 - 239
3 Primary 751 - 249
4 Middle 488 41 470
5 Secondary 351 38 611
6 Higher secondary 384 21 595
7 Diploma/ certificate 624 63 313
8 Graduate 533 41 426
9 Post graduate & above 581 201 218
561 30 409
1 2 3 4 5
1 Not literate 595 - 405
2 Below Primary 559 - 441
3 Primary 694 - 306
4 Middle 619 19 362
5 Secondary 494 10 496
6 Higher secondary 370 11 619
7 Diploma/ certificate 545 103 352
8 Graduate 650 74 276
9 Post graduate & above 581 201 219
575 14 411
28
Overall
Sl.No.
Education classification
Employed Unemployed not in labour
force
Overall
Rural + Urban
Sl.No.
Education classification
Employed Unemployed not in labour
force
Overall
Urban
Sl.No.
Education classification
Employed Unemployed not in labour
force
West Godavari
Rural
Table 13.5: Per 1000 distribution for persons aged 15 years & above by main activity & educational classification according to Usual Principal Status (ps) approach

1 2 3 4 5
1 Not literate 727 - 273
2 Below Primary 794 - 206
3 Primary 762 - 238
4 Middle 691 - 309
5 Secondary 417 10 573
6 Higher secondary 312 13 675
7 Diploma/ certificate 464 - 536
8 Graduate 429 73 498
9 Post graduate & above 927 - 73
643 6 351
1 2 3 4 5
1 Not literate 558 - 442
2 Below Primary 655 16 328
3 Primary 472 - 528
4 Middle 462 6 532
5 Secondary 422 6 572
6 Higher secondary 360 28 612
7 Diploma/ certificate 423 105 472
8 Graduate 602 51 347
9 Post graduate & above 673 85 242
500 22 478
1 2 3 4 5
1 Not literate 688 - 312
2 Below Primary 763 4 233
3 Primary 680 - 320
4 Middle 596 2 401
5 Secondary 420 8 572
6 Higher secondary 336 21 643
7 Diploma/ certificate 442 57 501
8 Graduate 539 59 402
9 Post graduate & above 716 70 214
589 12 399
29
Overall
Sl.No.
Education classification
Employed Unemployed not in labour
force
Overall
Rural + Urban
Sl.No.
Education classification
Employed Unemployed not in labour
force
Overall
Urban
Sl.No.
Education classification
Employed Unemployed not in labour
force
Krishna
Rural
Table 13.6: Per 1000 distribution for persons aged 15 years & above by main activity & educational classification according to Usual Principal Status (ps) approach
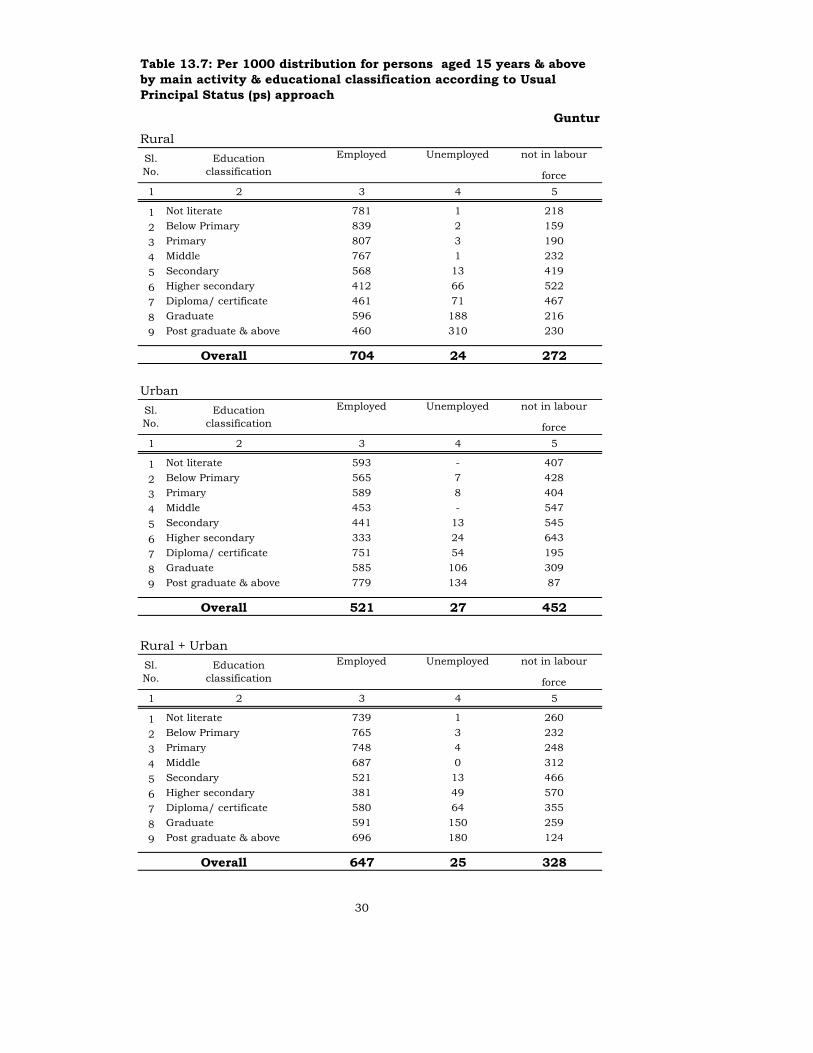
1 2 3 4 5
1 Not literate 781 1 218
2 Below Primary 839 2 159
3 Primary 807 3 190
4 Middle 767 1 232
5 Secondary 568 13 419
6 Higher secondary 412 66 522
7 Diploma/ certificate 461 71 467
8 Graduate 596 188 216
9 Post graduate & above 460 310 230
704 24 272
1 2 3 4 5
1 Not literate 593 - 407
2 Below Primary 565 7 428
3 Primary 589 8 404
4 Middle 453 - 547
5 Secondary 441 13 545
6 Higher secondary 333 24 643
7 Diploma/ certificate 751 54 195
8 Graduate 585 106 309
9 Post graduate & above 779 134 87
521 27 452
1 2 3 4 5
1 Not literate 739 1 260
2 Below Primary 765 3 232
3 Primary 748 4 248
4 Middle 687 0 312
5 Secondary 521 13 466
6 Higher secondary 381 49 570
7 Diploma/ certificate 580 64 355
8 Graduate 591 150 259
9 Post graduate & above 696 180 124
647 25 328
30
Overall
Sl.No.
Education classification
Employed Unemployed not in labour
force
Overall
Rural + Urban
Sl.No.
Education classification
Employed Unemployed not in labour
force
Overall
Urban
Sl.No.
Education classification
Employed Unemployed not in labour
force
Guntur
Rural
Table 13.7: Per 1000 distribution for persons aged 15 years & above by main activity & educational classification according to Usual Principal Status (ps) approach

1 2 3 4 5
1 Not literate 850 1 149
2 Below Primary 797 - 203
3 Primary 829 29 142
4 Middle 766 3 231
5 Secondary 522 41 438
6 Higher secondary 455 28 517
7 Diploma/ certificate 580 64 356
8 Graduate 569 153 278
9 Post graduate & above 408 287 305
751 21 227
1 2 3 4 5
1 Not literate 508 - 492
2 Below Primary 500 - 500
3 Primary 633 - 367
4 Middle 448 - 552
5 Secondary 466 - 534
6 Higher secondary 412 26 562
7 Diploma/ certificate 595 59 346
8 Graduate 605 85 309
9 Post graduate & above 712 68 220
518 19 463
1 2 3 4 5
1 Not literate 812 1 187
2 Below Primary 744 - 256
3 Primary 778 22 200
4 Middle 692 2 305
5 Secondary 504 28 468
6 Higher secondary 438 27 535
7 Diploma/ certificate 588 61 350
8 Graduate 584 125 291
9 Post graduate & above 577 165 258
698 21 281
31
Overall
Sl.No.
Education classification
Employed Unemployed not in labour
force
Overall
Rural + Urban
Sl.No.
Education classification
Employed Unemployed not in labour
force
Overall
Urban
Sl.No.
Education classification
Employed Unemployed not in labour
force
Prakasam
Rural
Table 13.8: Per 1000 distribution for persons aged 15 years & above by main activity & educational classification according to Usual Principal Status (ps) approach

1 2 3 4 5
1 Not literate 666 - 334
2 Below Primary 906 - 94
3 Primary 790 0 209
4 Middle 773 - 227
5 Secondary 525 3 472
6 Higher secondary 544 - 456
7 Diploma/ certificate 460 50 490
8 Graduate 513 47 440
9 Post graduate & above 613 133 255
683 7 310
1 2 3 4 5
1 Not literate 475 - 525
2 Below Primary 501 - 499
3 Primary 460 - 540
4 Middle 427 2 571
5 Secondary 463 - 537
6 Higher secondary 301 27 672
7 Diploma/ certificate 631 - 369
8 Graduate 567 84 349
9 Post graduate & above 623 15 362
483 17 500
1 2 3 4 5
1 Not literate 630 - 370
2 Below Primary 875 - 125
3 Primary 726 0 273
4 Middle 694 0 306
5 Secondary 498 2 500
6 Higher secondary 458 10 533
7 Diploma/ certificate 574 17 409
8 Graduate 540 66 394
9 Post graduate & above 619 63 318
625 10 366
32
Overall
Sl.No.
Education classification
Employed Unemployed not in labour
force
Overall
Rural + Urban
Sl.No.
Education classification
Employed Unemployed not in labour
force
Overall
Urban
Sl.No.
Education classification
Employed Unemployed not in labour
force
Nellore
Rural
Table 13.9: Per 1000 distribution for persons aged 15 years & above by main activity & educational classification according to Usual Principal Status (ps) approach
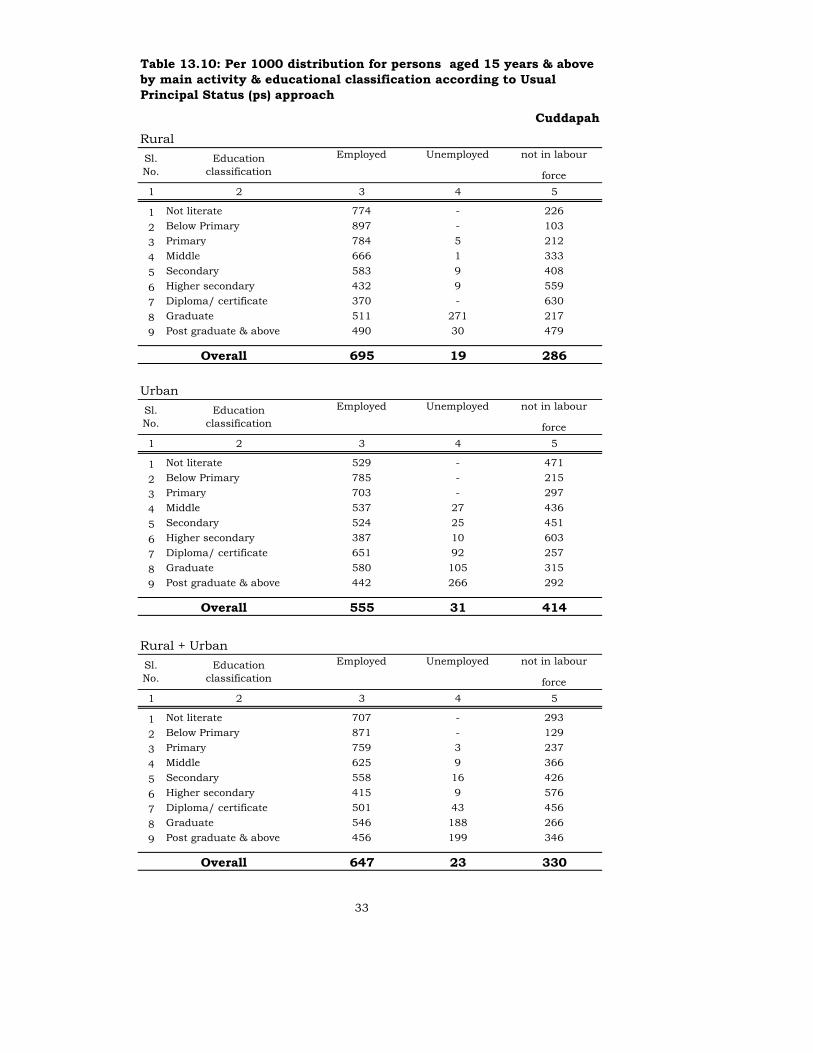
1 2 3 4 5
1 Not literate 774 - 226
2 Below Primary 897 - 103
3 Primary 784 5 212
4 Middle 666 1 333
5 Secondary 583 9 408
6 Higher secondary 432 9 559
7 Diploma/ certificate 370 - 630
8 Graduate 511 271 217
9 Post graduate & above 490 30 479
695 19 286
1 2 3 4 5
1 Not literate 529 - 471
2 Below Primary 785 - 215
3 Primary 703 - 297
4 Middle 537 27 436
5 Secondary 524 25 451
6 Higher secondary 387 10 603
7 Diploma/ certificate 651 92 257
8 Graduate 580 105 315
9 Post graduate & above 442 266 292
555 31 414
1 2 3 4 5
1 Not literate 707 - 293
2 Below Primary 871 - 129
3 Primary 759 3 237
4 Middle 625 9 366
5 Secondary 558 16 426
6 Higher secondary 415 9 576
7 Diploma/ certificate 501 43 456
8 Graduate 546 188 266
9 Post graduate & above 456 199 346
647 23 330
33
Overall
Sl.No.
Education classification
Employed Unemployed not in labour
force
Overall
Rural + Urban
Sl.No.
Education classification
Employed Unemployed not in labour
force
Overall
Urban
Sl.No.
Education classification
Employed Unemployed not in labour
force
Cuddapah
Rural
Table 13.10: Per 1000 distribution for persons aged 15 years & above by main activity & educational classification according to Usual Principal Status (ps) approach

1 2 3 4 5
1 Not literate 778 - 222
2 Below Primary 856 - 144
3 Primary 874 - 126
4 Middle 752 - 248
5 Secondary 612 18 370
6 Higher secondary 462 53 484
7 Diploma/ certificate 370 293 337
8 Graduate 520 109 370
9 Post graduate & above 388 448 164
734 15 251
1 2 3 4 5
1 Not literate 558 - 442
2 Below Primary 507 45 448
3 Primary 708 - 292
4 Middle 560 17 423
5 Secondary 446 - 554
6 Higher secondary 366 21 613
7 Diploma/ certificate 507 130 363
8 Graduate 518 111 372
9 Post graduate & above 724 146 130
517 29 454
1 2 3 4 5
1 Not literate 741 - 259
2 Below Primary 759 12 229
3 Primary 826 - 174
4 Middle 698 5 298
5 Secondary 538 10 451
6 Higher secondary 410 35 555
7 Diploma/ certificate 438 212 350
8 Graduate 519 110 371
9 Post graduate & above 618 242 141
666 20 314
34
Overall
Sl.No.
Education classification
Employed Unemployed not in labour
force
Overall
Rural + Urban
Sl.No.
Education classification
Employed Unemployed not in labour
force
Overall
Urban
Sl.No.
Education classification
Employed Unemployed not in labour
force
Kurnool
Rural
Table 13.11: Per 1000 distribution for persons aged 15 years & above by main activity & educational classification according to Usual Principal Status (ps) approach
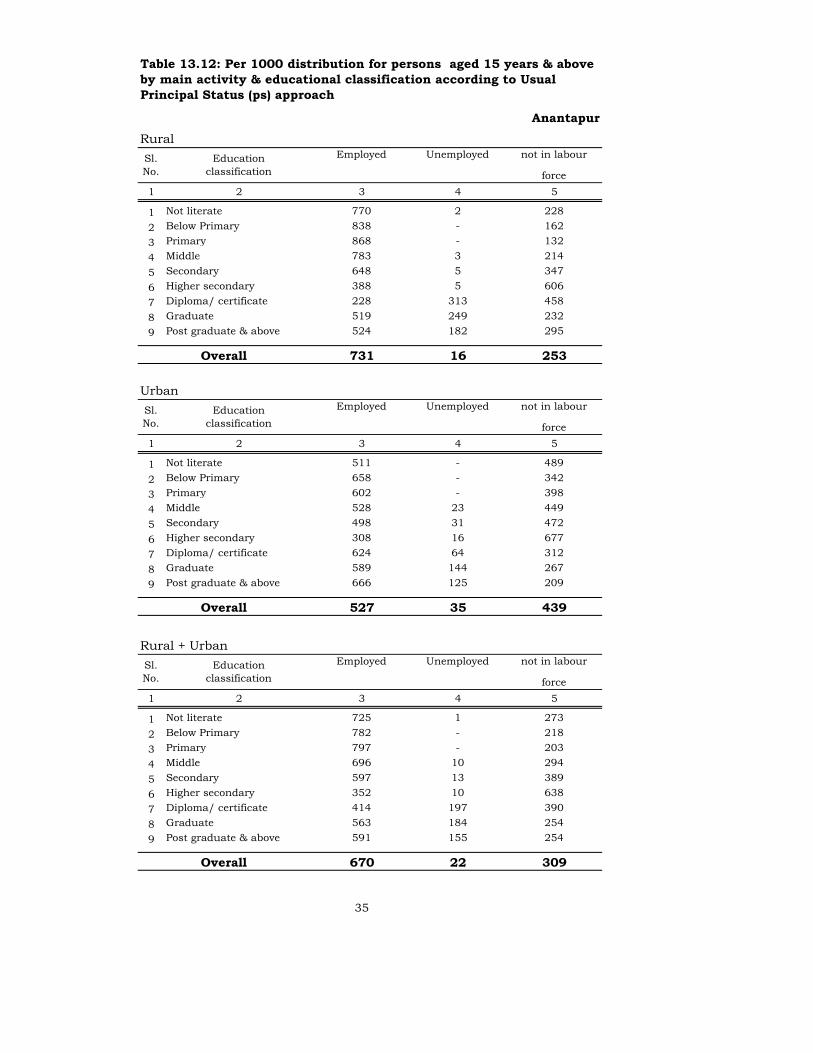
1 2 3 4 5
1 Not literate 770 2 228
2 Below Primary 838 - 162
3 Primary 868 - 132
4 Middle 783 3 214
5 Secondary 648 5 347
6 Higher secondary 388 5 606
7 Diploma/ certificate 228 313 458
8 Graduate 519 249 232
9 Post graduate & above 524 182 295
731 16 253
1 2 3 4 5
1 Not literate 511 - 489
2 Below Primary 658 - 342
3 Primary 602 - 398
4 Middle 528 23 449
5 Secondary 498 31 472
6 Higher secondary 308 16 677
7 Diploma/ certificate 624 64 312
8 Graduate 589 144 267
9 Post graduate & above 666 125 209
527 35 439
1 2 3 4 5
1 Not literate 725 1 273
2 Below Primary 782 - 218
3 Primary 797 - 203
4 Middle 696 10 294
5 Secondary 597 13 389
6 Higher secondary 352 10 638
7 Diploma/ certificate 414 197 390
8 Graduate 563 184 254
9 Post graduate & above 591 155 254
670 22 309
35
Overall
Sl.No.
Education classification
Employed Unemployed not in labour
force
Overall
Rural + Urban
Sl.No.
Education classification
Employed Unemployed not in labour
force
Overall
Urban
Sl.No.
Education classification
Employed Unemployed not in labour
force
Anantapur
Rural
Table 13.12: Per 1000 distribution for persons aged 15 years & above by main activity & educational classification according to Usual Principal Status (ps) approach

1 2 3 4 5
1 Not literate 620 0 380
2 Below Primary 734 - 266
3 Primary 760 6 234
4 Middle 677 5 318
5 Secondary 551 10 440
6 Higher secondary 398 18 584
7 Diploma/ certificate 468 102 430
8 Graduate 626 60 314
9 Post graduate & above 703 151 147
626 12 362
1 2 3 4 5
1 Not literate 565 - 435
2 Below Primary 571 17 412
3 Primary 649 - 351
4 Middle 610 21 369
5 Secondary 490 9 501
6 Higher secondary 329 30 641
7 Diploma/ certificate 625 32 343
8 Graduate 579 181 240
9 Post graduate & above 671 98 231
545 36 419
1 2 3 4 5
1 Not literate 608 0 392
2 Below Primary 694 4 302
3 Primary 739 5 256
4 Middle 659 9 332
5 Secondary 529 9 461
6 Higher secondary 376 22 602
7 Diploma/ certificate 532 74 395
8 Graduate 606 112 282
9 Post graduate & above 684 120 196
602 19 379
36
Overall
Sl.No.
Education classification
Employed Unemployed not in labour
force
Overall
Rural + Urban
Sl.No.
Education classification
Employed Unemployed not in labour
force
Overall
Urban
Sl.No.
Education classification
Employed Unemployed not in labour
force
Chittoor
Rural
Table 13.13: Per 1000 distribution for persons aged 15 years & above by main activity & educational classification according to Usual Principal Status (ps) approach
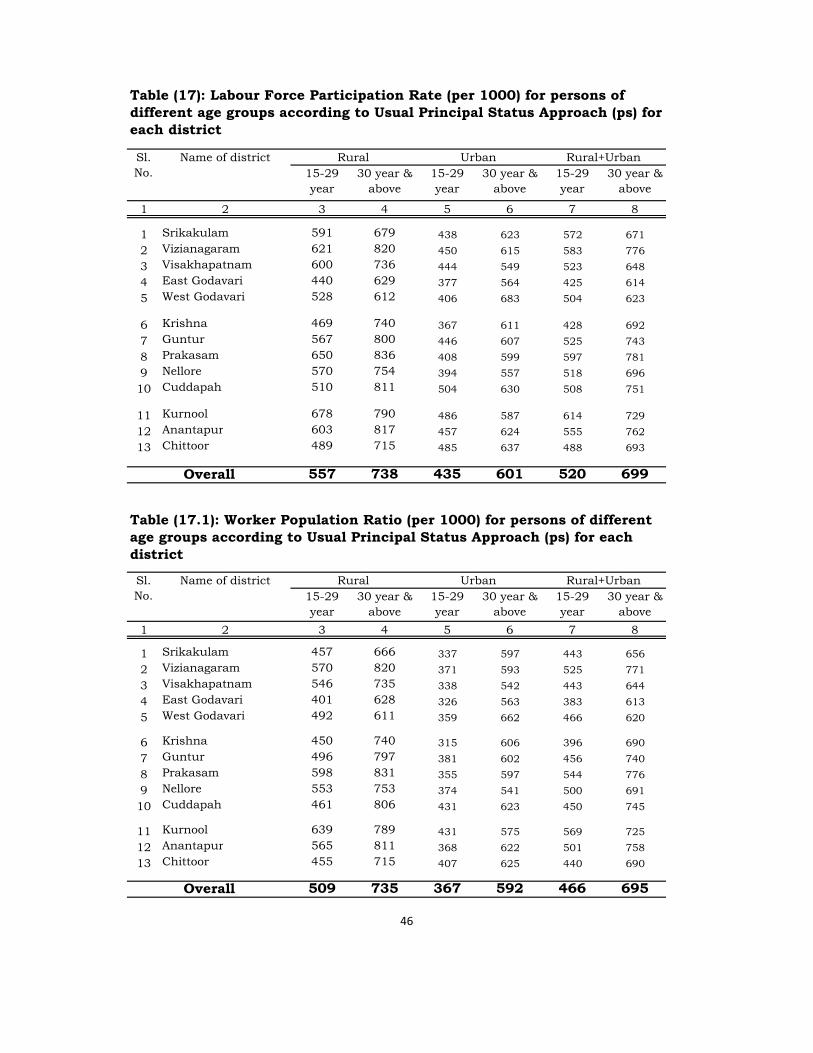
15-29 year
30 year & above
15-29 year
30 year & above
15-29 year
30 year & above
1 2 3 4 5 6 7 8
1 Srikakulam 591 679 438 623 572 671
2 Vizianagaram 621 820 450 615 583 776
3 Visakhapatnam 600 736 444 549 523 648
4 East Godavari 440 629 377 564 425 614
5 West Godavari 528 612 406 683 504 623
6 Krishna 469 740 367 611 428 692
7 Guntur 567 800 446 607 525 743
8 Prakasam 650 836 408 599 597 781
9 Nellore 570 754 394 557 518 696
10 Cuddapah 510 811 504 630 508 751
11 Kurnool 678 790 486 587 614 729
12 Anantapur 603 817 457 624 555 762
13 Chittoor 489 715 485 637 488 693
557 738 435 601 520 699
15-29 year
30 year & above
15-29 year
30 year & above
15-29 year
30 year & above
1 2 3 4 5 6 7 8
1 Srikakulam 457 666 337 597 443 656
2 Vizianagaram 570 820 371 593 525 771
3 Visakhapatnam 546 735 338 542 443 644
4 East Godavari 401 628 326 563 383 613
5 West Godavari 492 611 359 662 466 620
6 Krishna 450 740 315 606 396 690
7 Guntur 496 797 381 602 456 740
8 Prakasam 598 831 355 597 544 776
9 Nellore 553 753 374 541 500 691
10 Cuddapah 461 806 431 623 450 745
11 Kurnool 639 789 431 575 569 725
12 Anantapur 565 811 368 622 501 758
13 Chittoor 455 715 407 625 440 690
509 735 367 592 466 695
46
Overall
Table (17): Labour Force Participation Rate (per 1000) for persons of different age groups according to Usual Principal Status Approach (ps) for each district
Sl.No.
Name of district Rural Urban Rural+Urban
Overall
Table (17.1): Worker Population Ratio (per 1000) for persons of different age groups according to Usual Principal Status Approach (ps) for each district
Sl.No.
Name of district Rural Urban Rural+Urban
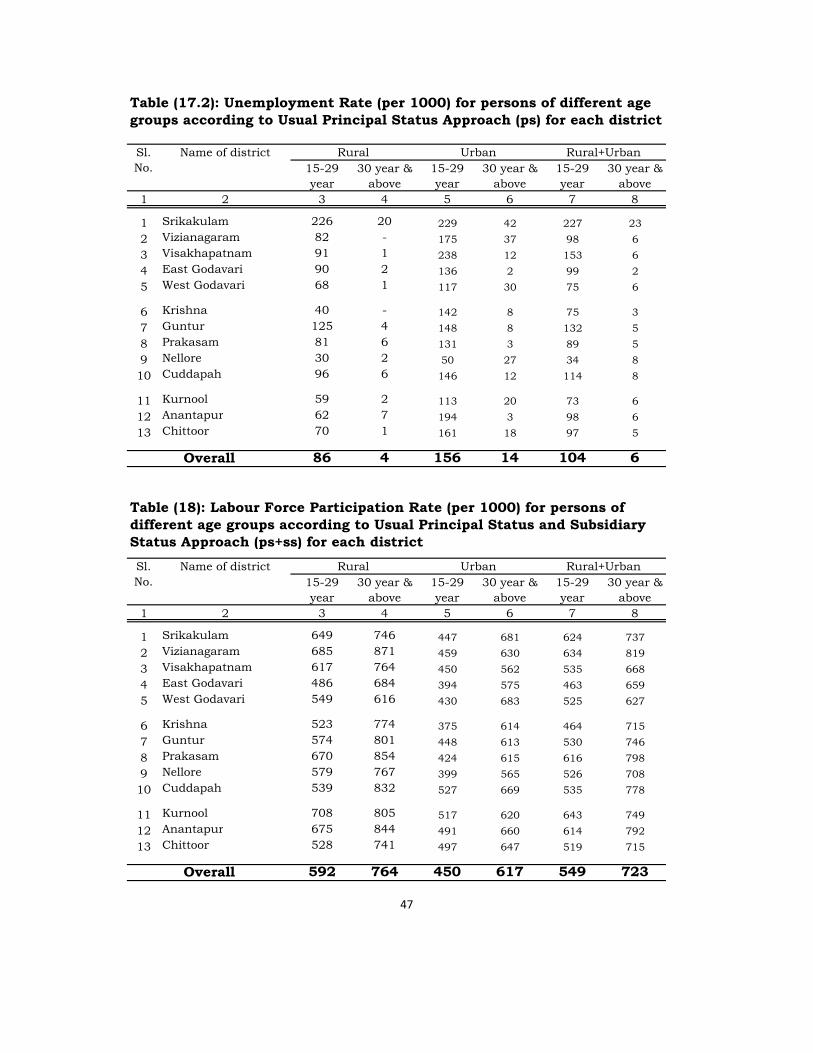
15-29 year
30 year & above
15-29 year
30 year & above
15-29 year
30 year & above
1 2 3 4 5 6 7 8
1 Srikakulam 226 20 229 42 227 23
2 Vizianagaram 82 - 175 37 98 6
3 Visakhapatnam 91 1 238 12 153 6
4 East Godavari 90 2 136 2 99 2
5 West Godavari 68 1 117 30 75 6
6 Krishna 40 - 142 8 75 3
7 Guntur 125 4 148 8 132 5
8 Prakasam 81 6 131 3 89 5
9 Nellore 30 2 50 27 34 8
10 Cuddapah 96 6 146 12 114 8
11 Kurnool 59 2 113 20 73 6
12 Anantapur 62 7 194 3 98 6
13 Chittoor 70 1 161 18 97 5
86 4 156 14 104 6
15-29 year
30 year & above
15-29 year
30 year & above
15-29 year
30 year & above
1 2 3 4 5 6 7 8
1 Srikakulam 649 746 447 681 624 737
2 Vizianagaram 685 871 459 630 634 819
3 Visakhapatnam 617 764 450 562 535 668
4 East Godavari 486 684 394 575 463 659
5 West Godavari 549 616 430 683 525 627
6 Krishna 523 774 375 614 464 715
7 Guntur 574 801 448 613 530 746
8 Prakasam 670 854 424 615 616 798
9 Nellore 579 767 399 565 526 708
10 Cuddapah 539 832 527 669 535 778
11 Kurnool 708 805 517 620 643 749
12 Anantapur 675 844 491 660 614 792
13 Chittoor 528 741 497 647 519 715
592 764 450 617 549 723
47
Overall
Table (17.2): Unemployment Rate (per 1000) for persons of different age groups according to Usual Principal Status Approach (ps) for each district
Sl.No.
Name of district Rural Urban Rural+Urban
Overall
Table (18): Labour Force Participation Rate (per 1000) for persons of different age groups according to Usual Principal Status and Subsidiary Status Approach (ps+ss) for each district
Sl.No.
Name of district Rural Urban Rural+Urban
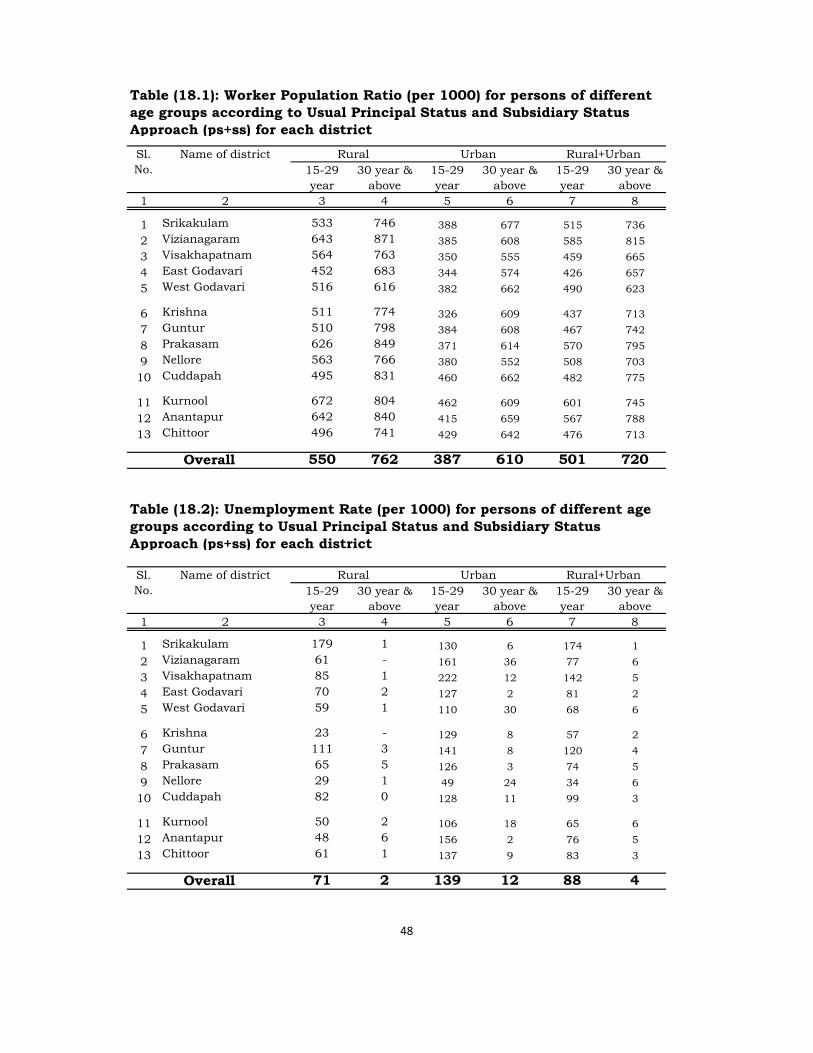
15-29 year
30 year & above
15-29 year
30 year & above
15-29 year
30 year & above
1 2 3 4 5 6 7 8
1 Srikakulam 533 746 388 677 515 736
2 Vizianagaram 643 871 385 608 585 815
3 Visakhapatnam 564 763 350 555 459 665
4 East Godavari 452 683 344 574 426 657
5 West Godavari 516 616 382 662 490 623
6 Krishna 511 774 326 609 437 713
7 Guntur 510 798 384 608 467 742
8 Prakasam 626 849 371 614 570 795
9 Nellore 563 766 380 552 508 703
10 Cuddapah 495 831 460 662 482 775
11 Kurnool 672 804 462 609 601 745
12 Anantapur 642 840 415 659 567 788
13 Chittoor 496 741 429 642 476 713
550 762 387 610 501 720
15-29 year
30 year & above
15-29 year
30 year & above
15-29 year
30 year & above
1 2 3 4 5 6 7 8
1 Srikakulam 179 1 130 6 174 1
2 Vizianagaram 61 - 161 36 77 6
3 Visakhapatnam 85 1 222 12 142 5
4 East Godavari 70 2 127 2 81 2
5 West Godavari 59 1 110 30 68 6
6 Krishna 23 - 129 8 57 2
7 Guntur 111 3 141 8 120 4
8 Prakasam 65 5 126 3 74 5
9 Nellore 29 1 49 24 34 6
10 Cuddapah 82 0 128 11 99 3
11 Kurnool 50 2 106 18 65 6
12 Anantapur 48 6 156 2 76 5
13 Chittoor 61 1 137 9 83 3
71 2 139 12 88 4
48
Overall
Table (18.1): Worker Population Ratio (per 1000) for persons of different age groups according to Usual Principal Status and Subsidiary Status Approach (ps+ss) for each district
Sl.No.
Name of district Rural Urban Rural+Urban
Overall
Table (18.2): Unemployment Rate (per 1000) for persons of different age groups according to Usual Principal Status and Subsidiary Status Approach (ps+ss) for each district
Sl.No.
Name of district Rural Urban Rural+Urban
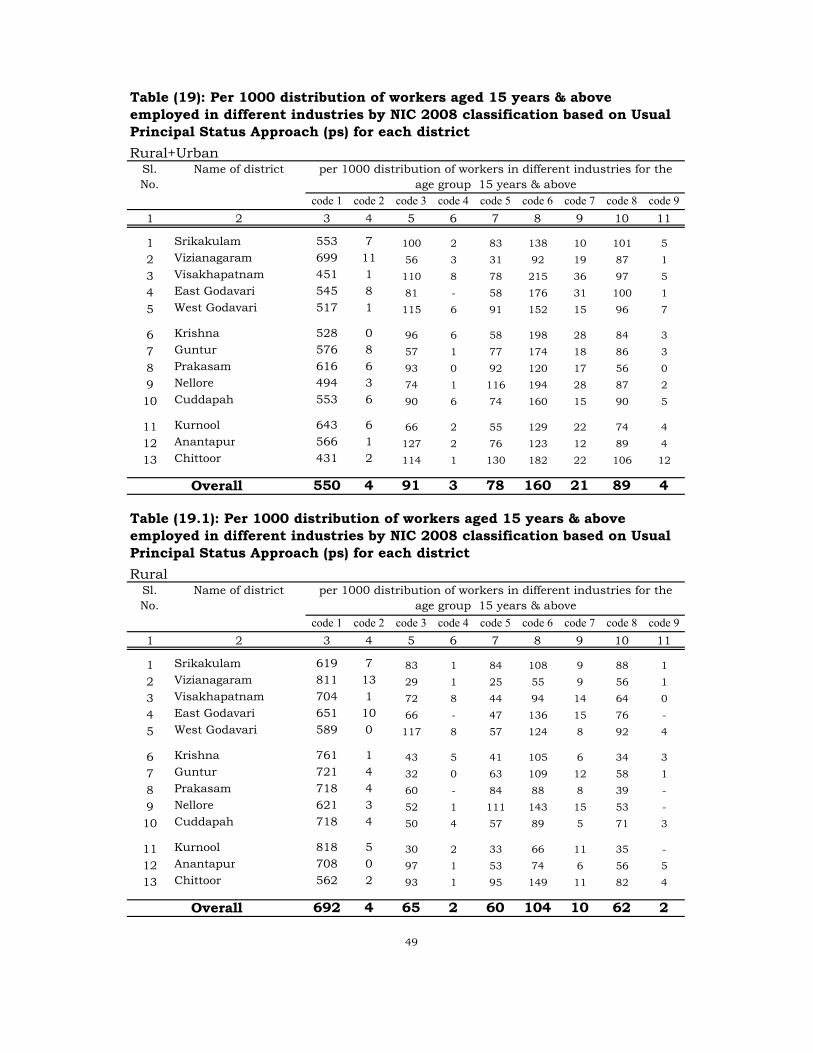
code 1 code 2 code 3 code 4 code 5 code 6 code 7 code 8 code 9
1 2 3 4 5 6 7 8 9 10 11
1 Srikakulam 553 7 100 2 83 138 10 101 5
2 Vizianagaram 699 11 56 3 31 92 19 87 1
3 Visakhapatnam 451 1 110 8 78 215 36 97 5
4 East Godavari 545 8 81 - 58 176 31 100 1
5 West Godavari 517 1 115 6 91 152 15 96 7
6 Krishna 528 0 96 6 58 198 28 84 3
7 Guntur 576 8 57 1 77 174 18 86 3
8 Prakasam 616 6 93 0 92 120 17 56 0
9 Nellore 494 3 74 1 116 194 28 87 2
10 Cuddapah 553 6 90 6 74 160 15 90 5
11 Kurnool 643 6 66 2 55 129 22 74 4
12 Anantapur 566 1 127 2 76 123 12 89 4
13 Chittoor 431 2 114 1 130 182 22 106 12
550 4 91 3 78 160 21 89 4
code 1 code 2 code 3 code 4 code 5 code 6 code 7 code 8 code 9
1 2 3 4 5 6 7 8 9 10 11
1 Srikakulam 619 7 83 1 84 108 9 88 1
2 Vizianagaram 811 13 29 1 25 55 9 56 1
3 Visakhapatnam 704 1 72 8 44 94 14 64 0
4 East Godavari 651 10 66 - 47 136 15 76 -
5 West Godavari 589 0 117 8 57 124 8 92 4
6 Krishna 761 1 43 5 41 105 6 34 3
7 Guntur 721 4 32 0 63 109 12 58 1
8 Prakasam 718 4 60 - 84 88 8 39 -
9 Nellore 621 3 52 1 111 143 15 53 -
10 Cuddapah 718 4 50 4 57 89 5 71 3
11 Kurnool 818 5 30 2 33 66 11 35 -
12 Anantapur 708 0 97 1 53 74 6 56 5
13 Chittoor 562 2 93 1 95 149 11 82 4
692 4 65 2 60 104 10 62 2
49
Table (19.1): Per 1000 distribution of workers aged 15 years & above employed in different industries by NIC 2008 classification based on Usual Principal Status Approach (ps) for each district
RuralSl.No.
Name of district per 1000 distribution of workers in different industries for the age group 15 years & above
Overall
Overall
Table (19): Per 1000 distribution of workers aged 15 years & above employed in different industries by NIC 2008 classification based on Usual Principal Status Approach (ps) for each district
Rural+UrbanSl.No.
Name of district per 1000 distribution of workers in different industries for the age group 15 years & above
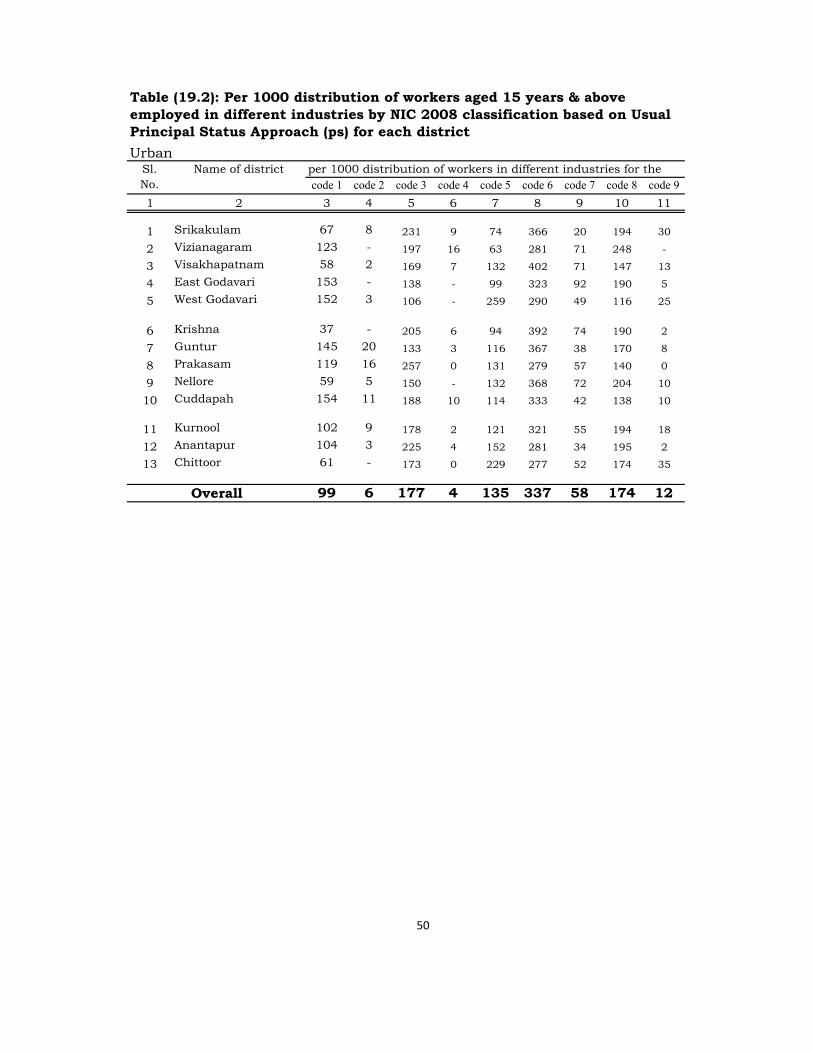
code 1 code 2 code 3 code 4 code 5 code 6 code 7 code 8 code 9
1 2 3 4 5 6 7 8 9 10 11
1 Srikakulam 67 8 231 9 74 366 20 194 30
2 Vizianagaram 123 - 197 16 63 281 71 248 -
3 Visakhapatnam 58 2 169 7 132 402 71 147 13
4 East Godavari 153 - 138 - 99 323 92 190 5
5 West Godavari 152 3 106 - 259 290 49 116 25
6 Krishna 37 - 205 6 94 392 74 190 2
7 Guntur 145 20 133 3 116 367 38 170 8
8 Prakasam 119 16 257 0 131 279 57 140 0
9 Nellore 59 5 150 - 132 368 72 204 10
10 Cuddapah 154 11 188 10 114 333 42 138 10
11 Kurnool 102 9 178 2 121 321 55 194 18
12 Anantapur 104 3 225 4 152 281 34 195 2
13 Chittoor 61 - 173 0 229 277 52 174 35
99 6 177 4 135 337 58 174 12
50
Overall
Table (19.2): Per 1000 distribution of workers aged 15 years & above employed in different industries by NIC 2008 classification based on Usual Principal Status Approach (ps) for each district
UrbanSl.No.
Name of district per 1000 distribution of workers in different industries for the