Embed Size (px)
Citation preview

[Wani,2(3): March 2015] ISSN 2348 – 8034
(C)Global Journal Of Engineering Science And Researches
67
GLOBAL JOURNAL OF ENGINEERING SCIENCE AND RESEARCHES
ANALYZING PHYSICO-CHEMICAL CHARACTERISTICS OF DAL LAKE WATERS
OF KASHMIR
Mudasir Ahmad Wani*1
, Ashit Dutta2, M. Ashraf Wani
3 &Umer Jan Wani
4
*1PhD Scholar, Department of Environmental Science, Bhagwant University Ajmir, Rajasthan
2Associate Profesor, Department of Environmental Science, Bhagwant University Ajmir, Rajasthan
3Senior Resident, Department of Hospital administration, Sher-i-Kashmir Institute of Medical Sciences
(SKIMS), `Srinagar, Kashmir. 4Lecturer, Department of Geography, Higher Education Jammu and Kashmir
ABSTRACT
Fresh water is essential for agriculture, industry and human existence. Fresh water resources get depleted at a very
faster rate. Water pollution is a global problem. The healthy aquatic ecosystem is depended on the biological
diversity and physicochemical characteristics of water. As water is scarce and its demand is likely to increase
further, preservation of water resources is a need of hour.
Keywords- Dal Lake, Water, Water body, Water quality, Water chemistry, Eutrophication, Anthropogenic activity,
Physicochemical characteristics, Organic pollutant, Inorganic pollutant, Jammu and Kashmir.
I. INTRODUCTION Fresh water is essential for agriculture, industry and human existence; it is a finite resource of earth. Without
adequate quantity and quality of fresh water sustainable development will not be possible. [1] Fresh water resource
are becoming deteriorate day-by-day at a very faster rate. Now water quality is a global problem. [2] The healthy
aquatic ecosystem is depended on the biological diversity and Physico-chemical characteristics. [3]
Almost 71% surface area of the earth is covered with water in the form of streams, lakes, rivers, Seas and oceans.
Water is most important geological agent that modifies the surface morphology of the planet on a very grand scale.
[4]
As far as the environment is concerned, its quality has deteriorated drastically. The air that we breathe, the water that we drink, and the land that we walk on, is polluted. As water is scarce and its demand is likely to increase further, it
needs more attention. After air pollution, water pollution is the most serious threat faced by the whole world. [5]
Domestic wastes, industrial effluents, agricultural wastes, etc are the major pollutants entering our water bodies.
Even ground water is polluted from the soakage pits, septic tanks, manure, garbage, etc. [6] Most of the problems
occur due to the lack of proper sanitation facilities and waste disposal system. [7] Loading and unloading of oil and
petroleum in the tankers along the sea shore results in oil spills that are a menace as they affect not only water but
aquatic life as well. [8] Agricultural wastes contain pesticides and chemicals, which add to water pollution as by
way of filling them up with nitrates and phosphates. These pollutants obviously create an ecological imbalance in
the water bodies. [9]
All the water pollutants are responsible for decreasing the self purifying ability of the water bodies and lose the
capacity to recycle the wastes. As a result, water clarity is affected and the water bodies become shallower. [10] Contaminants may include organic and inorganic substances. Organic water pollutants include detergents,
disinfection byproducts found in chemically disinfecteddrinking water, such as chloroform, Food processing waste,
which can include oxygen demanding substances, fats and grease, insecticides and herbicides, a huge range of
organohalides and other chemical compounds, Petroleum hydrocarbons, including fuels like gasoline, diesel and
lubricants, and fuel combustion byproducts, from storm waterrunoff.
Tree and bush debris from logging operations, volatile organic compounds such as industrial solvents, from
improper storage. Chlorinated solvents may fall to the bottom of reservoirs. Polychlorinated biphenyl,
trichloroethylene, perchlorate, various chemical compounds are found in personal hygiene and cosmetic products.
Inorganic water pollutants include sulfur dioxide from power plants, ammonia from food processing waste,
Chemical waste as industrial by products, fertilizers containing nutrients like nitrates and phosphates, which are
found in storm water runoff from agriculture as well as commercial and residential use, heavy metals from motor
vehicles and acid mine drainage, silt/sediment in runoff from construction sites, logging, slash and burn practices or land clearing sites. [11, 12]

[Wani,2(3): March 2015] ISSN 2348 – 8034
(C)Global Journal Of Engineering Science And Researches
68
Large visible items such as trash or garbage discarded by people on the ground and rubbish that are washed by
rainfall into storm drains and eventually discharged into surface waters.
A common cause of thermal pollution is the use of water as a coolant by power plants and industrial manufacturers.
Elevated water temperatures decreases oxygen levels which can kill fish and affects ecosystem composition, such as
invasion by new thermophilic species. Urban runoff may also elevate temperature in surface waters. [13]
Most water pollutants are eventually carried by rivers into the oceans. Many chemicals undergo reactive decay or chemically change especially over long periods of time in groundwater reservoirs. A noteworthy class of such
chemicals is the chlorinated hydrocarbons such as trichloroethylene and tetrachloroethylene used in the dry cleaning
industry. Both of these chemicals, which are carcinogens themselves, undergo partial decomposition reactions,
leading to new hazardous chemicals including dichloroethylene and vinyl chloride.
Physico-chemical characteristics of water may be analyzed through several broad categories of methods, physical,
chemical and biological. Most involve collection of samples, followed by specialized analytical tests. Some methods
may be conducted in situ, without sampling, such as temperature. Government agencies and research organizations
have published standardized, validated analytical test methods to facilitate the comparability of results from different
testing events. [14]
Water samples may be examined using the principles of analytical chemistry. Many published test methods are
available for both organic and inorganic compounds. Frequently used methods include pH, biochemical oxygen
demand (BOD), chemical oxygen demand (COD), nutrients (nitrate and phosphorus compounds), metals (including copper, zinc, cadmium, lead and mercury), oil and grease, total petroleum hydrocarbons (TPH), and pesticides. [15]
Dal Lake located at an altitude of 1587m above sea level and with an area of 1670 ha is one of a series of freshwater
lakes of Kashmir valley. Dal Lake is a multi-basined, ox bow type of lake, with shallow saucer-shaped basins
formed by the changing course of river Jhelum. The main source of water for the lake is Telbal Nalla in the
Dachigam area, numerous springs arising from the bottom of lake and outwash from surrounding mountains. The
outflow of lake occurs through a weir-n- lock system. The maximum depth is 6.5m, while the average depth is less
than 3m. Water levels which fluctuate during the course of a year are maximum in April and minimum in
November. The pH values of the lake fall within the alkaline range until recently. It is drained through Pir Panjal
mountainous range at Baramula to the plains of the Punjab. Climate of Kashmir is montane valley climate with a
pronounced cold season from October to March (Average temperature 7.5oC) and warm summers (Average
temperature 19.8oC). January is the coldest month (-2oC to 3 oC), and July the warmest (34 oC to 35 oC). The average annual rainfall is 551 mm. Most of the precipitation is in the form of snow (January–March). Summer monsoon
rainfall is scanty. [16]
Jammu & Kashmir is one of the beautiful parts of this planet with rich water resources. There are many water bodies
in Jammu & Kashmir and Dal Lake is a largest water body after Wular Lake situated in Srinagar, the capital of J &
K which lies more than 5000 ft. above the sea level. Dal Lake is world famous water body which needs to be
preserved. The Government of Jammu and Kashmir has commissioned an authority to preserve the pristine beauty
of the water body called Jammu & Kashmir Lakes and Waterways Development Authority. [17]
Recognizing the importance of this world famous water body the governments as well as the public have to be
conscious of preserving this water body from extinction besides maintaining its water quality.
II. MATERIALS & METHODS The study was undertaken on the Dal lake of Srinagar, Kashmir on ten randomly selected sampling sites by simple
random selection as under:
Sampling Site Name of Site
S1 Near Telbal Nallah
S2 Dhobi Ghat area
S3 Near Sona Lank
S4 Near Nishat pipe
line

[Wani,2(3): March 2015] ISSN 2348 – 8034
(C)Global Journal Of Engineering Science And Researches
69
S5 Near char chinari
S6 Near Kabootar
Khana
S7 Nigeen
S8 Saderabal area
S9 Pokhribal area
S10 Outlet site of (STP)
Hazratbal
A prospective study for a period of two years duration was conducted to study the physicochemical properties of Dal
Lake water with effect from May 2011-April 2013 after proper permission from concerned authorities.
The samples were collected from ten selected sites of Dal Lake as mentioned above. The sampling sites were
selected by simple random sampling. The samples were collected in prewashed sterile plastic bottles. After that
samples were immediately brought to analytical laboratory and further analysis started without any delay. These
samples were analyzed with respect to PH, EC,TDS, Free Co2, Alkalinity, Hardness, DO, Ca, Mg, Chloride, Nitrate,
Phosphate, Silicates, Sulphates, Iron, Na+, and K+ . The purpose of analysis was to monitor the changes in the
chemistry and physical properties of Dal lake water. Sample testing was conducted by fallowing methods to obtain the best results and the results were recorded on a predesigned, standardized proforma.
A Pearson’s (Chi-square) statistical test was used to ascertain the strength of correlation between different variables.
The arithmetic means (overall as well as seasonal) of each parameter were, therefore, calculated for each site to
obtain representative values for use in statistical analyses. The data was compared with other studies conducted
earlier which are available in published literature to investigate the trend of pollution of Dal Lake water.
The methodology adopted for analysis of physio-chemical characteristics of water is as under:
S.No. Parameter Method
1 PH PH meter
2
3
4
Electrical cond.
TDS
Free Co2
Electrometric method
APHA, 1998
APHA, 1998
5 DO Winkler’s Iodometric method
6
7
Alkalinity
Hardness
Titrimetric method
APHA, 1998
8 Calcium EDTA Titrimetric method
9 10
11
12
Magnesium Chloride
Nitrate
Phosphate
EDTA Titrimetric method Argentometric method
Spectrophotometric method
Spectrophotometric method
13 Silicates Spectrophotometric method
14 Sulphates Spectrophotometric method
15
16
17
Iron
Na+
K+
Spectrophotometric method
Flame Photometer
Flame Photometer

[Wani,2(3): March 2015] ISSN 2348 – 8034
(C)Global Journal Of Engineering Science And Researches
70
III. RESULTS Dal Lake is a Himalayan Urban Lake, located in the heart of Srinagar (Latitude 34o 18’N Longitude 74o 91’E) at an
average altitude of 1,583 M. Srinagar is summer capital of Jammu & Kashmir. Dal Lake is located at an altitude of
1730 mtrs. above sea level and with an area of 1670 ha. The findings of research are as under:
Table 1: Physical Dimensions of Dal Lake
Surface area 24 Sq Km
Volume 12.37mm3
Maximum depth 6 – 9 m
Water level Regulated (1.20 mm)
Catchment area 316 Sq Kms
Physiographic Features
Geographical: Name of main basins- Nagain Lake, Hazratbal, Bod Dal and Gagribal.
Name of main islands- Sona Lank and Rupa Lank.
Number of out flowing channels- Dal Gate and Nalla Mar
[Wani,2(3): March 2015] ISSN 2348 – 8034
(C)Global Journal Of Engineering Science And Researches
71
Figure 1: Site Map of Dal Lake
Table 2: Showing physico-chemical parameters (mean values) of ten selected sites (May, 2011- April, 2013)
Parameter Sampling Sites
S1 S2 S3 S4 S5 S6 S7 S8 S9 S10
PH 8.0 7.9 8.3 8.1 8.0 8.0 7.8 7.8 8.0 8.0
E.C 272.0
5
293.0
5
248.05 245.59 237.46 246.50 310.00 343.67 286.63 345.80
TDS 360 345 280 385 225 310 230 310 235 220
Free CO2 8.9 9.5 6.5 6.8 4.5 5.3 10.2 9.0 9.8 7.5
DO 7.78 5.94 7.18 6.58 7.47 6.50 7.55 6.2 5.93 5.80
Alkalinity 208.2
0
214.0
8
162.96 175.42 161.80 181.84 224.20 226.20 230.88 290.08
Hardness 213 165 103 117 105 147 140 144 137 141
Ca2+ 40.78 41.25 35.00 35.38 33.88 35.13 33.38 36.59 38.63 44.09
Mg2+ 4.72 4.60 3.73 4.02 3.50 3.78 3.57 4.19 4.39 5.80
Chloride 14.8 18.4 12.7 15.9 13.2 14.7 17.7 19.1 17.7 16.3
Nitrate 465.3 340.7 250.7 155.9 248.8 269.6 481.1 352.2 485.7 344.9
Phosphate 208.8 124.1 89.2 90.9 82.2 115.7 152.6 143.2 122.6 158.0
Iron 281.4
6
326.3
8
221.88 187.67 117.46 172.67 282.92 276.21 280.21 254.30
Silicates 2.59 2.00 1.06 1.53 1.34 1.57 1.29 1.95 2.36 2.56

[Wani,2(3): March 2015] ISSN 2348 – 8034
(C)Global Journal Of Engineering Science And Researches
72
Sulphates 9.27 10.83 7.13 8.05 6.67 7.98 7.63 8.30 9.67 14.08
Na+ 2.1 1.9 1.9 2.4 2.0 1.8 1.9 2.1 2.2 2.3
K+ 2.4 2.7 1.8 2.1 1.7 1.6 3.5 1.7 1.9 2.3
The lake is characterized by highly alkaline pH during summer as well as in the winter season. The central site
near Sona Lank (S3) shows high range of pH (8.3). The central site Nageen (S7) and Saderabal area (S8) show
low range of PH (7.8).The Lake shows high value of electrical conductivity of (345.80μS/cm) at outlet site of
(STP) Hazratbal (S10), and shows low value of EC (237.46μS/cm) at Central site near Char Chinari (S5).The
study reveals that there is high value of TDS (385mg/l) Near Nishat Pipe line (S4) and low values of TDS
near outlet site of STP Hazratbal (S10).
The Lake shows high value of free CO2 near Central site Nigeen (S7) 243 mg/land low value at Central site near Char Chinari (S5) 108 mg/l .The study reveals that site near Telbal Nallah (S1) shows high value of DO (7.78 mg/l)
and the Outlet site of (STP) Hazratbal (S10) shows low value of DO (5.80 mg/l). The outlet site of STP Hazratbal
(S10) shows high total alkalinity (290.08 mg/l) and the central site near Char Chinari (S5) shows low values for total
alkalinity (161.80 mg/l). The site inside lake near the entry of Telbal Nallah (S1) shows high values of hardness
(213mg/l) and Central site near Sonalank (S3) shows low values (103mg/l). High values of calcium are seen near the
outlet site of STP Hazratbal (S10) (44.09 mg/l) and the central site Nigeen (S7) shows low values of calcium
(33.38mg/l).
Magnesium is high in concentration near outlet site of STP Hazratbal (S10) (5.80mg/l) and low in concentration at central site near Char Chinari (S5) (3.50mg/l). High values of chloride (458 mg/l) are found near Saderabal Area
(S8) and low values at Central site near Sonalank (S3) (306 mg/l).
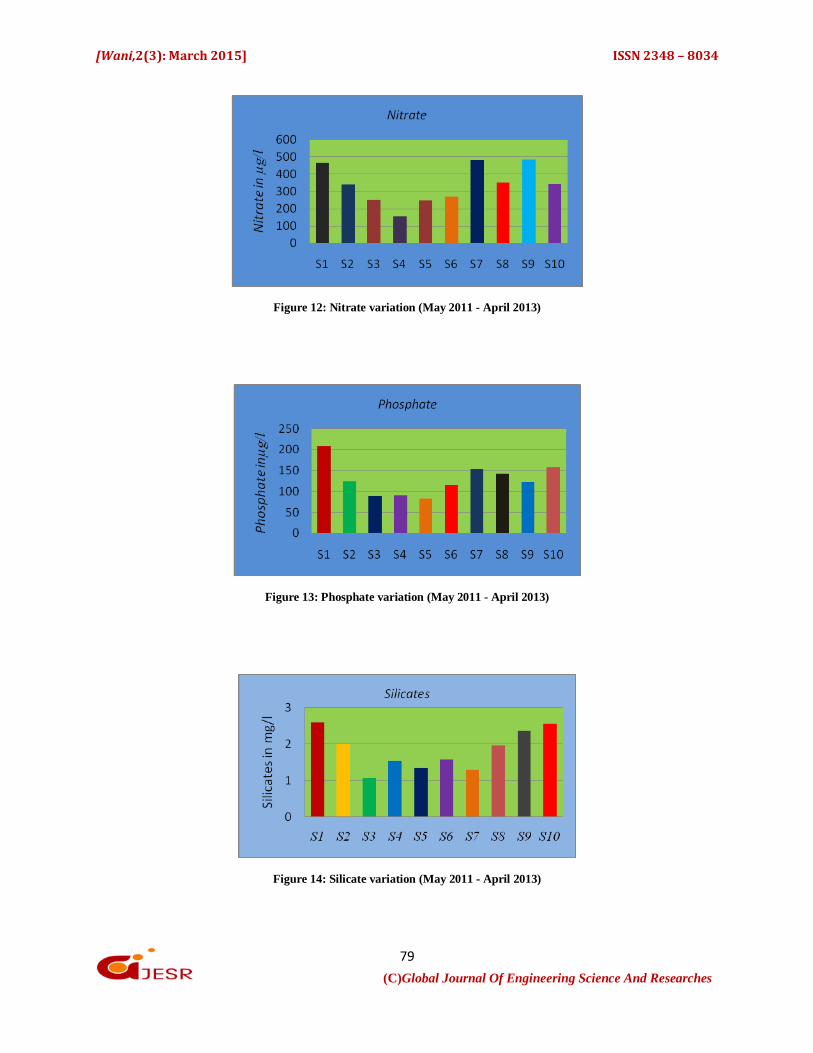
The site Pokhribal (S9) shows high value of nitrate 485.7µg/l and site Char Chainari (S5) shows low values of
nitrate 155.9µg/l. The site inside lake near the entry of Telbal Nallah (S1) shows high value of phosphate 208.8µg/l
and low value is found near Central site near Sonalank (S3) 82.2 µg/l. The site near Telbal Nallah (S1) shows high
values for the reactive silicate ions (2.59 mg/l) and central site near Sona Lank (S3) shows low values for silicate
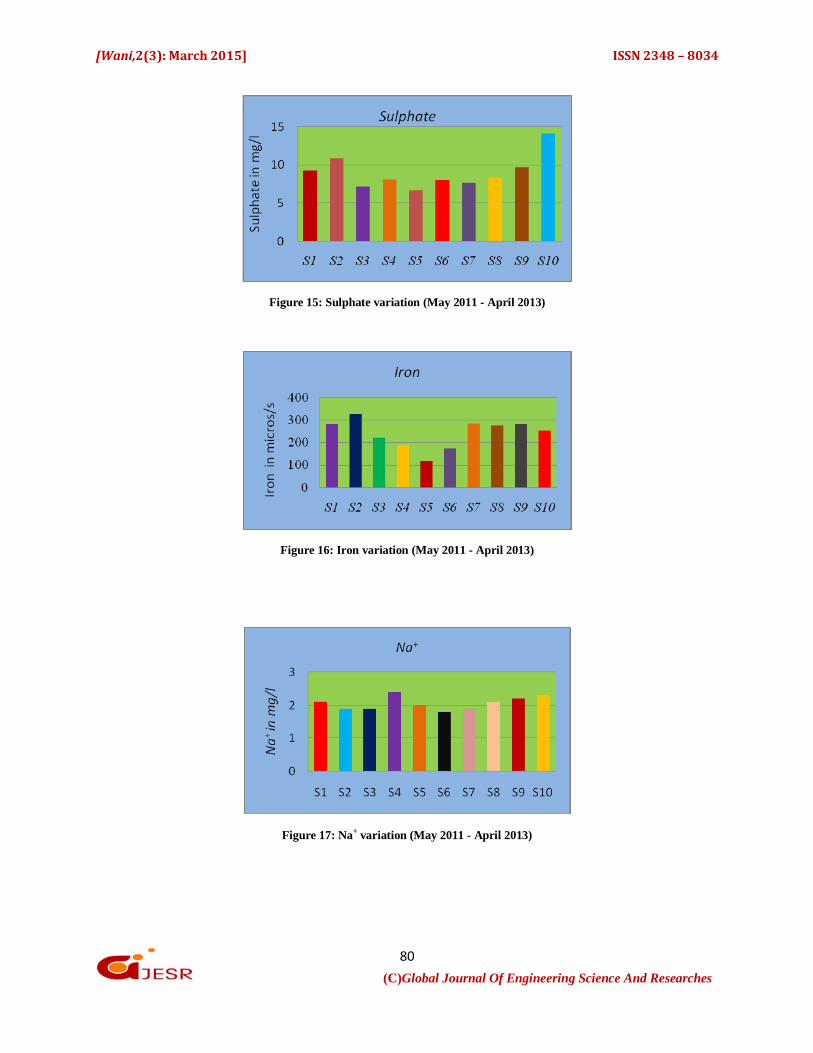
ions (1.06 mg/l). The outlet site of STP Hazratbal (S10) shows high value for Sulphate ions (14.08mg/l) and the
central site near Char Chinari (S5) shows low value for Sulphate ions (6.67 mg/l).
The site near Dhobi Ghat area (S2) shows high concentration of iron (326.38µg/l) and low concentration of iron
(117.46µg/l) is found at central site near Char Chinari (S5). The site near Nishat Pipe line bund (S4) shows high
value of Na+ 2.4 mg/l and site near Kabootar Khana (S6) shows low value 1.8 mg/l. The central site Nigeen (S7)
shows high value of K+ 3.5 mg/l and low value is found near Kabootar Khana (S6) 1.6 mg/l.
The results of various physico-chemical characteristics of Dal Lake water samples for the two seasons (summer and
winter) are presented in the (table 3 and 4). Natural water is usually alkaline due to presence of high concentration of
carbonates. Considerable fluctuations in pH can be observed in natural water during day, season to season and within years because of exposure to the air and biological activities. The lake is characterized by highly alkaline pH
during summer as well as in the winter season. The site near Nishat pipe line S4 shows high range of PH during
summer (8.2) and the site near Dhobi Ghat area S2 shows low range of PH (7.8). During winter there are not evident
changes in the PH. During the summer season Saderabal area S8 shows high values of E.C (321μS/cm) and low
value near kabootar khana S6 (178μS/cm). There is further decrease in the E.C. during the winter season because of
temperature variation in the winter season there might be sudden fall in the electrolytic conductivity. During winter
Saderabal area S8 shows high value (305μS/cm) and low value (201μS/cm) near Dhobi Ghat area S2. The site near
Nishat pipe line S4 shows high value during summer (16.1mg/l) and low value (9mg/l) near outlet site of STP
Hazratbal S10. During winter the site near Nishat pipe line S4 shows high value (16.6mg/l) and Nigeen S7 shows low
value (9.3mg/l). During summer Pokhribal area S8 shows high value of free Co2 (10.3mg/l) and low value near Char
Chinari S5 (4mg/l). During winter the site near Telbal Nallah S1 shows high value of free Co2 (11.1mg/l) and low value near Kabootar khana S6 (4mg/l). During summer Nigeen S7 shows high value of DO (7.4mg/l) and Dhobi Ghat
area S2 shows low value (5.7mg/l). High values of DO are seen near Telbal Nallah S1 (7.8mg/l) and low value near
Pokhribal area S9 (5.5mg/l). High values of alkalinity are seen during summer near STP Hazratbal S10 (247mg/l) and
low value near Sona Lank S3 (118mg/l), during winter outlet site of STP Hazratbal S10 shows high value (332mg/l)
and low value near Sona Lank S3 (192mg/l). During summer site near Telbal Nallah S1 shows high value of Total
[Wani,2(3): March 2015] ISSN 2348 – 8034
(C)Global Journal Of Engineering Science And Researches
73
Hardness (276mg/l) and site near Sona Lank S3 shows low value (111mg/l), high values of Total Hardness are seen
in winter near Telbal Nallah S1 (159mg/l) and low value near Sona Lank S3 (96mg/l). During summer high values of
Ca2+ are seen near outlet site of STP Hazratbal S10 (44.3mg/l) and low value near Sona Lank S3 (33.8mg/l), during
winter high values are seen near outlet site of STP Hazratbal S10 (43.8mg/l) and low near Char Chinari S5
(33.2mg/l). During summer high values of Mg2+ are seen near outlet site of STP Hazratbal S10 (6.2mg/l) and low value in
Nigeen S7 (3.3mg/l), during winter high values are seen near Char Chinari S5 (8.2mg/l) and low value in Nigeen
(3.5mg/l). High values of Chloride (20.5mg/l) are seen near pokhribal area S9 during summer and low values near
Sona Lank S3 (12.7mg/l), during winter site near Dhobi Ghat area S2 shows high value (19.7mg/l) and site near
Char Chinari S5 shows low value (13.3mg/l). During summer site near STP Hazratbal S10 shows high values of
Nitrate (897.6µg/l) and Nigeen S7 shows low value (118.8µg/l), during winter high value are seen near Nishat pipe
line S4 (827.4µg/l) and low values near Saderable area S8 (219µg/l). During summer site near Telbal Nallah S1
shows high values of Phosphate (219.7µg/l) and low value are seen near Char Chinari S5 (93.8µg/l), High values are
seen during winter near Telbal Nallah S1 (208.9µg/l) and low value near Sona Lank S3 (71.3µg/l).
During summer the outlet site of STP Hazratbal S10 shows high values of Iron (279.9mg/l) and low values are seen
near Sona Lank S3 (209.1mg/l), during winter high values are seen near Telbal Nallah S1 (251.1mg/l) and low values
are seen in Dhobi Ghat area S2 (30mg/l). High values of Silicate (2.4mg/l) are seen during summer near Telbal Nallah S1 and low values (1.0mg/l) near Sona Lank S3, during winter outlet site of STP Hazratbal S10 shows high
values (2.7mg/l) and low value (1.0mg/l) are seen near Sona Lank S3. During summer outlet site of STP Hazratbal
S10 shows high values of Sulphate (22.3mg/l) and low values (7.1mg/l) are seen near Char Chinari i.e. S5.
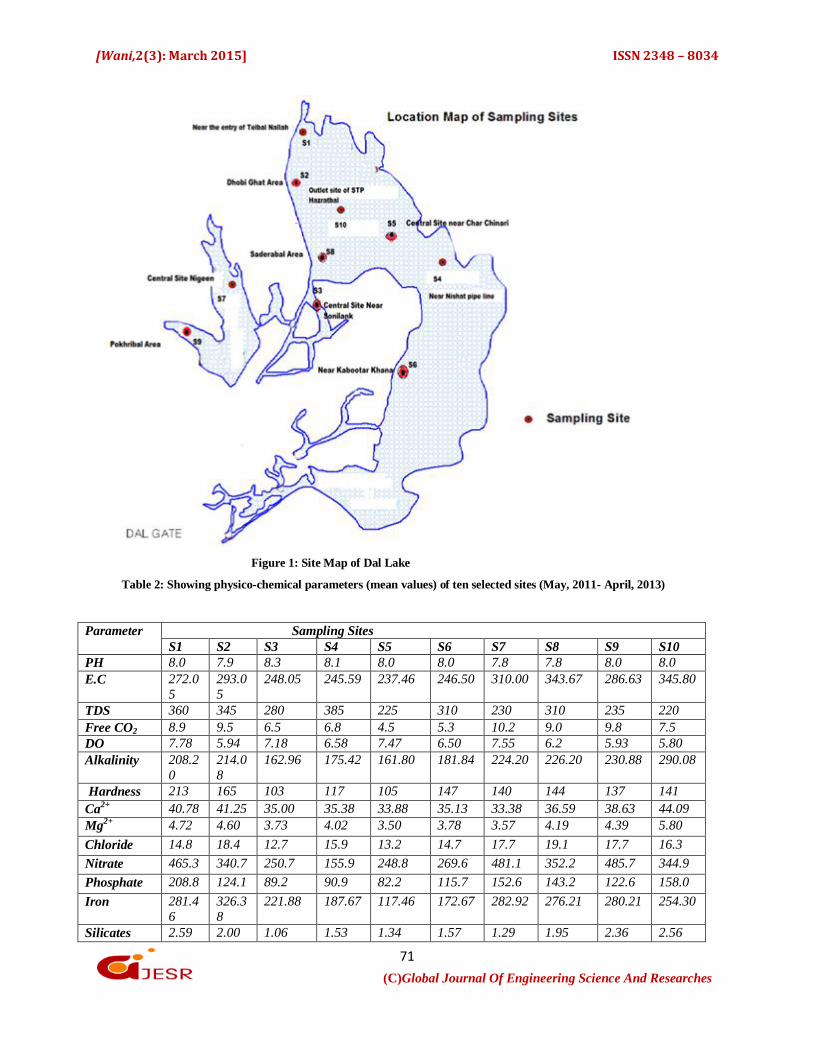
Table 3: Physico-chemical parameters (mean values) of different sites during summer
Sites S1 S2 S3 S4 S5 S6 S7 S8 S9 S10
Ph 8 7.8 8.1 8.2 8 8.1 8 8.1 7.9 7.9
E.C 220 245 198 181 199 178 278 321 258 310
TDS 15.4 13.5 10.5 16.1 9.1 13 9.5 13 9.8 9
CO2 6.6 8.8 5 7.8 4 6.5 9 10.3 102 9.8
DO 7.1 5.7 7 6.4 7.3 6.4 7.4 6 6.2 5.8
ALK 170 163 118 161 130 140 178 203 175 247
T.H 276 183 111 125 112 166 134 152 137 149
Ca2+ 41.3 41.1 33.8 36.6 34.5 35.8 33.1 36.5 38.2 44.3
Mg2+ 4.8 4.5 3.8 4.3 3.6 3.9 3.5 4.3 4.5 6.2
Cl 13 16.7 12.5 16.6 12.6 14 18.5 20.3 20.5 17.8
N 338.7 178.3 207 176.6 194.8 201.6 118.8 247.1 124.4 897.6
P 206.7 140 96.9 99.6 93.8 95 135 173.5 131 176.6
Fe 211.4 219.7 209.1 218 215 272 223.4 276.2 265.3 279.9
Si 2.4 2.2 1 1.4 1.2 1.4 1.1 2 2.1 2.3
Su 9.1 11.6 7.5 8.9 7.1 7.8 8 8.5 9.2 22.3
Na+ 1.8 1.9 2.1 2.2 1.8 1.7 1.9 1.8 2.1 2.1
K+ 2.4 2.6 1.4 1.7 1.7 1.4 3.5 1.7 1.9 2.2

[Wani,2(3): March 2015] ISSN 2348 – 8034
(C)Global Journal Of Engineering Science And Researches
74
Table 4: Physico-chemical parameters (mean values) of different sites during winter.
Sites S1 S2 S3 S4 S5 S6 S7 S8 S9 S10
Ph 7.9 7.9 7.8 8.1 7.9 7.8 7.8 7.9 7.8 7.9
E.C 224 201 297 209 275 289 278 305 301 304
TDS 14.5 15.2 12.5 16.6 9.6 12.5 9.3 12.3 9.8 9.6
CO2 11.1 10.3 5.3 5.5 4.8 4 9.9 8.6 9 5
DO 7.8 6.1 7.2 6.8 7.5 6.6 7.6 6.3 5.5 5.8
ALK 246 265 207 207 192 223 270 249 286 332
T.H 159 123 96 108 97 138 131 136 136 133
Ca2+ 40.2 41.3 33.3 34.1 33.2 34.4 33.5 36.6 39 43.8
Mg2+ 4.6 4.6 3.5 3.6 8.2 3.6 3.5 4 4.2 5.3
Cl 17.2 19.7 13.6 15 13.3 15.5 16.1 16.8 17.5 14.2
N 594.6 502 320.4 827.4 315 322.5 327.4 219 810 228.3
P 208.9 97.41 71.5 71.5 68.3 133.2 165.9 133 161.2 136.4
Fe 251.5 30 144.5 157.2 116.3 139.9 14.1 176 195 228.6
Si 2.6 1.7 1 1.5 1.3 1.6 1.4 1.7 2.5 2.7
Su 9.5 9.9 6.6 7.1 6.1 8 17 8 10 13.2
Na+ 2.3 1.7 1.7 2.2 1.7 1.7 1.9 2.2 2.1 2.1
K+ 2.2 2.6 2.1 2.3 1.3 1.2 3.4 1.4 1.8 2
During winter Nigeen S7 shows high values of Sulphate (17mg/l) and low values (6.1mg/l) near Char Chinari S5.
During summer high values of Na2+ (2.2mg/l) are seen near Nishat pipe line S4 and low values (1.7mg/l) near
Kabootar Khana S6, during winter high values of Na2+ (2.3mg/l) are seen near Telbal Nallah S1 and low values
(1.7mg/l) near Char Chinari S3. During summer Nigeen shows high values (3.5mg/l) of K+ and low values (1.4mg/l)
near Kabootar Khana, High values of K+ (3.4mg/l) are seen in Nigeen S7 and low values (1.2mg/l) near Kabootar
Khana.
Table 5: Pearson correlation matrix for measured variables of all ten sites of Dal Lake
PH E.C TD
S
Co2 DO Alk TH Ca2
+ Mg2
+ Cl- N Po4
Si So4 Fe Na+ K+
PH 1
E.C -
0.6
2
1
TD
S
0.1
1
-
0.2
7
1
Co2 -
0.5
3
0.6
3
0.0
4
1
DO 0.1
4
-
0.46
0.0
1
-
0.18
1
Alk -
0.4
7
0.8
9
-
0.3
4
0.5
7
-
0.5
3
1
TH -
0.3
9
0.2
8
0.4
1
0.5
1
0.0
7
0.3
6
1
Ca2
+ -
0.0
0.5
1
0.0
7
0.3
5
-
0.50.7
2
0.5
6
1

[Wani,2(3): March 2015] ISSN 2348 – 8034
(C)Global Journal Of Engineering Science And Researches
75
7 1
Mg2
+ -
0.0
7
0.6
0
-
0.0
1
0.3
0
-
0.5
4
0.8
1
0.4
6 0.9
6
1
Cl-
-
0.7
6
0.7
4
0.0
6 0.7
8
-
0.5
6
0.6
1
0.3
0
0.2
9
0.2
9
1
N -
0.5
2
0.5
1
-
0.3
2
0.7
8
0.0
7
0.5
6
0.5
9
0.3
1
0.2
5
0.4
7
1
Po4 -0.4
5
0.55
0.09
0.59
0.13
0.6
1
0.8
7
0.55
0.55
0.33
0.7
3
1
Si -
0.2
7
0.5
2
0.0
7
0.4
4
-
0.4
2
0.7
2
0.6
9
0.8
7
0.8
5
0.4
0
0.5
2 0.7
0
1
So4 -
0.1
5
0.6
3
-
0.1
2
0.3
2
-
0.6
4
0.8
5
0.3
6 0.9
2
0.9
6
0.3
8
0.2
6
0.4
5 0.7
7
1
Fe -
0.4
2
0.6
6
0.1
2 0.9
3
-
0.3
0
0.6
1
0.5
9
0.5
5
0.4
7 0.7
3
0.6
9
0.6
2
0.5
2
0.4
9
1
Na+ 0.1
0
0.2
3
0.1
1
0.1
0
-
0.3
2
0.3
7
-
0.4
1
0.3
7
0.5
1
0.1
8
-
0.1
0
0.0
9
0.4
7
0.4
1
0.0
1
1
K+ -
0.44
0.3
5
-
0.06
0.6
4
0.2
2
0.3
6
0.3
3
0.1
2
0.1
1
0.4
0
0.5
1
0.4
5
0.0
4
0.2
1
0.5
7
-0.09 1
Statistical analysis
Pearson Correlation coefficients were calculated to obtain relations between the variables (Table 5). The E.C
showed positively significant correlation with free Co2 (0.63), alkalinity (0.89), Mg2+ (0.60), Cl- (0.74) Sulphates (0.63) and with Fe (0.66). Free Co2 is found positively correlated with Chlorides (0.78), Nitrates (0.78), Fe (0.93)
and with K+ (0.64). Alkalinity is found positively correlated with Ca2+ (0.72), Mg2+ (0.81), Cl- (0.61), Po4 (0.61), Si
(0.72), Sulphates (0.85), and with Fe (0.61). Total Hardness is positively correlated with Po4 (0.87) and with Si
(0.69). Ca2+ is positively correlated with Mg2+ (0.96), Si (0.85) and with So4 (0.92). Mg2+ is positively correlated
with Si (0.85) and So4 (0.96). Cl- showed positive correlation with Fe (0.73). Nitrate is positively correlated with
Phosphate (0.73) and Fe (0.69). Phosphate showed positive correlation with Si (0.70) and Fe (0.69). Si showed
positive correlation with Sulphates (0.77)
7.4
7.6
7.8
8
8.2
8.4
S1 S2 S3 S4 S5 S6 S7 S8 S9 S10
PH
PH
Figure 2: pH variation (May 2011 - April 2013)

[Wani,2(3): March 2015] ISSN 2348 – 8034
(C)Global Journal Of Engineering Science And Researches
76
Figure 3: EC variation (May 2011 - April 2013)
Figure 4: TDS variation (May 2011-April 2013)
Figure 5: Free CO2 variation (May 2011 - April 2013)
[Wani,2(3): March 2015] ISSN 2348 – 8034
(C)Global Journal Of Engineering Science And Researches
77
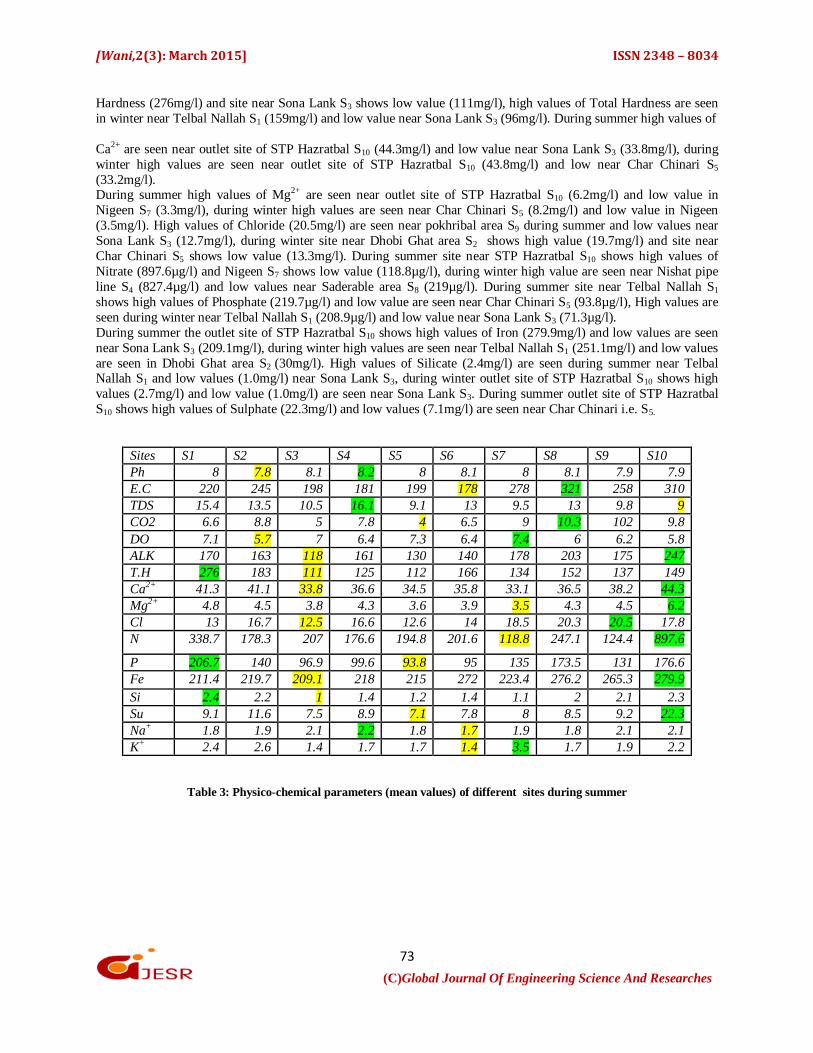
Figure 6: DO variation (May 2011 - April 2013)
Figure 7: Alkalinity variation (May 2011 - April 2013)
Figure 8: Total Hardness variation (May 2011 - April 2013)

[Wani,2(3): March 2015] ISSN 2348 – 8034
(C)Global Journal Of Engineering Science And Researches
78
Figure 9: Calcium variation (May 2011 - April 2013)
Figure10: Magnesium variation (May 2011 - April 2013)
Figure 11: Chloride variation (May 2011 - April 2013)
[Wani,2(3): March 2015] ISSN 2348 – 8034
(C)Global Journal Of Engineering Science And Researches
79
Figure 12: Nitrate variation (May 2011 - April 2013)
Figure 13: Phosphate variation (May 2011 - April 2013)
Figure 14: Silicate variation (May 2011 - April 2013)
[Wani,2(3): March 2015] ISSN 2348 – 8034
(C)Global Journal Of Engineering Science And Researches
80
Figure 15: Sulphate variation (May 2011 - April 2013)
Figure 16: Iron variation (May 2011 - April 2013)
Figure 17: Na+ variation (May 2011 - April 2013)

[Wani,2(3): March 2015] ISSN 2348 – 8034
(C)Global Journal Of Engineering Science And Researches
81
Figure 18: K+ variation (May 2011 - April 2013)
IV. DISCUSSION Due to discharge of large quantities of Wastes from human settlements, agricultural runoff and house boats
remarkable changes have occurred in the water chemistry of Dal Lake.
A prospective design was used to study the physicochemical characteristics of Dal Lake water. A wide spectrum of
physical and chemical changes have occurred in Dal Lake waters such as elevated temperature, pH, electric
conductivity, alkalinity etc. While many of the chemicals and substances that are regulated may be naturally
occurring (calcium, sodium, iron, manganese, etc.) the concentration is often the key in determining what is a
natural component of water, and what is a contaminant. High concentrations of naturally occurring substances can
have negative impacts on aquatic flora and fauna. [18]
The main indicators of pollution include the amount of total suspended solids, biochemical oxygen demand (BOD)
at 20 deg. C, concentration of chlorides, nitrogen and phosphorus and absence of dissolved oxygen. [19]
The pH recorded during the present study (mean 7.8-8.3) is indicative of alkaline nature of water which may be due
to high temperature that causes reduction in solubility of CO2. Our study shows increase in pH during summer
months. A Study conducted by Mahananda et al., (2010) also shows that temperature is one of the most significant
parameter which reduces the solubility of CO2 which increases the alkaline nature of water. [2]In our study average
electrical conductivity value recorded was (237.46µs/cm-345.80µs/cm) which is thus above eutrophic levels of
200µs/cm. Increased electrical conductivity is regarded as pollution indicator in shallow lakes. Das R. et al (2006) also support the similar findings in their study. [20]Site S4 (near Nishat pipeline) showed high values for TDS in our
study. In water, total dissolved solids (TDS) can be used to check the accuracy of analyses when dissolved solids are
composed mainly of carbonates, bicarbonates, chlorides, phosphates and nitrates of calcium, magnesium, sodium,
potassium and manganese, organic matter, salt and other particles. [2]
Alkalinity is generally associated with presence of carbonates and bicarbonates in natural waters. Our study revealed
that alkalinity is in the range between161.80 to 290.08 which is higher than acceptable range. Highly alkaline water
is unpotable as with alkalinity beyond 200mg/l, the taste of water becomes unpleasant. Goel et al (1985) reported
same results in Yelgaon Dam Maharashtra. [21] Hardness plays an important role in the distribution of aquatic biota
and many species are identified as indicators for hard and soft waters. Hardness of water is due to major cations
present in the water body. Calcium and magnesium are principle cations that impart the hardness to water. The mean
value of hardness was maximum at site S1, which may be due to the outflow of sewage treatment plant at this particular site. Hardness of water also depends on geological nature of drainage basin. [22] Free CO2 depicted well
marked fluctuations at all the sites, registering a minimum mean value (4.5 mg/L) and a maximum (11.1 mg/L).
High value of free CO2 content is an indication of high degree of pollution, a fact supported by Todda (1970) also.
[23]Among the various cations, Ca2+ and Mg2+ were found abundant almost at all sites in our study. Ca2+ and Mg2+
concentration of freshwater bodies of Kashmir Valley has been associated with thick population of plankton,
especially Cyanophyceae. [16] The concentration of nitrates and phosphates also showed great variations among
various sites in our study. Pandit et al (2002) argue in their study that increased concentration of nitrates and
phosphates in lakes resulted in enhanced productivity. Alteration of water's physical chemistry including acidity
(change in pH), electrical conductivity, temperature and eutrophication where eutrophication is an increase in the
concentration of chemical nutrients (nitrate, phosphate) in an ecosystem to an extent that increases in the primary
productivity of the ecosystem.

[Wani,2(3): March 2015] ISSN 2348 – 8034
(C)Global Journal Of Engineering Science And Researches
82
Silicate remains low in different months at different sites in the present study. This fact was also supported by
Sarwar (1986) who argue that the silicate content in the lake water gets depleted as it is taken up by the abundance
of diatoms. [24]
Our study revealed that the dissolved oxygen remains almost low at each site. It may be due to highly eutrophic
conditions of Dal Lake. The low level of DO is again indicative of polluted nature of water body. Such low level of
dissolved oxygen was also noted in other lakes by Iqbal et al (2006). [25] The maximum mean sulphate concentration was recorded as 14.08 mg/L at site S10 and minimum as 6.67 mg/L at
site S5. The high concentration of sulphate at site S10 may be due to drainage of untreated sewage from sewage
treatment plant into the lake. This agrees with Renn (1968) observation on the abundance of sulphate ions into the
freshwaters is due to untreated sewage. [22]The chloride content was observed higher in summer than in winter in
our study. The same results have been revealed by Jana (1973) and Govindan et al (1979). According to them higher
concentration of chloride in the summer period could be due to sewage mixing, increased temperature and
evaporation by water. [26, 27]
Iron in surface water is generally present in the form of ferric state. Surface waters in a normal pH range of 6 to 9
rarely carry more than 1 mg of dissolved iron per liter.S2 (near dhobi ghat) shows high concentration of iron
(3.2mg/l) and S5 (near Char Chinari) low concentration (1.1mg/l) which reveals that S2 is disturbed.
Remarkable changes have taken place in water chemistry of Dal lake over the past few decades which are revealed
by comparing the present water quality with that of the past (Table 6).
Table.6. Comparison of physico-chemical characteristics of Dal lake water (Present and Past)
Parameter Year(2011-13) Year(2007) Year (1977)
PH 7.8-8.3 7.6-8.6 7.5-9.7
E.C 237.46-345.80 122-317 115-283
TDS 220-385 78-201 183-289
Free CO2 4.5-10.2 4.9-14 7.7-19.3
DO 5.80-7.78 5.8-10 1.2-10.7
Alkalinity 161.80-290.08 46-372 17-269
Hardness 105-213 42-164 38-63
Ca2+ 33.38-44.09 14-46 1.7-61
Mg2+ 3.50-5.80 2-12 0.4-18.3
Chloride 12.7-19.1 6-18 8.11-15.89
Nitrate 155.9-485.7 - 26-135.7
Phosphate 82.2-208.8 - 121-418.2
Silicates 1.06-2.59 1.6-3.2 0.2-32.5
Sulphates 6.67-14.08 2-9 1.3-3.4
Iron 1.1-3.2 - 0.39-0.98
Na+ 1.8-2.4 2-8 0.4-3.8
K+ 1.6-3.5 0.2-4 0-2.2
The overall physicochemical parameters of Dal Lake water show an increasing trend when we compare it with previous data (Table 6). It is clear from the data that values of EC, TDS, TH, Chloride, Nitrate, Sulphate and K+
have significantly increased and value of DO has decreased over past few decades. It has been prophesized that
within next fifty years period the Dal Lake will disappear. [28] Scientific research also reveals that Telbal Nallah,
Botkal, and sewage drains are responsible for a substantial influx of nitrogen and phosphorus into the lake. A large
Quantity of phosphorus and inorganic nitrogen has been discharged into the lake. Non point sources, such as
seepage and diffused runoff, have been recorded as adding 4.5 tones of total phosphates and 18.14 tones of nitrogen
(NO3–N and NH4–N) to the lake. [29] Based on this, it has been inferred that the water quality of the lake has
deteriorated. The water quality has also deteriorated due to intense pollution caused by untreated sewage and solid
wastes that is fed into the lake from peripheral areas and from settlements and houseboats. Besides, some experts
believe that deforestation in the catchment of Dal Lake and Telbal stream may have led to more nitrogen and
phosphorus rich run off, further aiding eutrophication. Encroachments of water channels and consequent clogging
have diminished the circulation and inflows into the lake, so with the building up of phosphates and nitrogen, this has led to extensive weed growth and consequences on the biodiversity of lake. [30]

[Wani,2(3): March 2015] ISSN 2348 – 8034
(C)Global Journal Of Engineering Science And Researches
83
An assessment of physicochemical characteristics of Dal Lake water from time to time is important so far as
preventive and treatment measures are concerned. The knowledge of this will also guide us in assessing the
pollution load. Besides, this may also prove useful for providing data (both primary and secondary) for
environmental impact assessment.
V. CONCLUSION Drastic changes have taken place in the water chemistry of Dal Lake over the past few decades. Correlation with
available data shows an increasing trend of different physicochemical parameters which lead to deterioration in
water quality.
The lake water is characterized by highly alkaline pH and medium electrical conductivity and TDS. The overall
calcium and magnesium content of lake is high. It is clear from the study that values of EC, TDS, TH, Chloride, Nitrate, Sulphate and K+ have significantly increased and value of DO has decreased over past few decades.
Dal Lake is undergoing rapid eutrophication due to rapid anthropogenic disturbances. The addition of various
chemicals particularly nitrogen and phosphorus increases the pollution load. The organic and inorganic pollutant
load in the Dal has accelerated the macrophytic growth which in turn has reduced the water quality of the lake.
An assessment of physicochemical characteristics of Dal Lake water from time to time is important so far as
preventive and treatment measures are concerned. The knowledge of this will also guide us in assessing the
pollution load. Besides, this may also prove useful for providing data (both primary and secondary) for
environmental impact assessment.
REFERENCES 1. Kumar N (1997). “A View on Freshwater Environment”. Ecology, Environment & Conservation; 3: 3-4.
2. Mahananda HB, Mahananda MR, Mohanty BP (2005). “Studies on the Physico-Chemical and Biological
Parameters of a Fresh Water Pond Ecosystem as an Indicator of Water Pollution”. Ecology, Environment &
Conservation; 11 (3-4): 537-541.
3. Venkatesharaju K, Ravikumar P, Somashekar RK, Prakash KL (2010). “Physico-Chemical and Bacteriological
Investigation on the River Cauvery of Kollegal Stretch in Karnataka”. Journal of Science, Engineering and
Technology; 6(1): 50-59.
4. Singh P (2004). Geological Work of Water and Physiographic Features In: Parbin Singh’s Text Book of
Engineering and General Geology.7thed., M/S Sanjeev Kumar Kataria Publishers Nai sarak, Delhi, India.
Pp54-170. 5. Hamnera S, Anshuman T, Kumar R, et al. (2006). “The Role of Water Use Patterns and Sewage Pollution in
Incidence of Water Born/ Enteric Diseases along the Ganga River in Varanasi India”. Int. J Environmental
Health Research; 16(2): 113-132.
6. Evaluation of Operation and Maintenance of Sewage Treatment Plants in India (2007). Central Pollution
Board, Ministry of Environment and Forests. Available from http//: www.en.wikipedia.org/water pollution.
Retrieved on 15-09-2013.
7. WHO (2011). Guidelines for Drinking Water Quality.Vol. 1 & II recommendations, 4th ed. Available from
http//: www.who.int/../en/ Accessed on 28-11-2013.
8. Akpofure EA, Efere ML, Ayawei P (2000): The Adverse Effects of Crude Oil Spills in the Niger Delta.
Urhobo Historical Society journal; 10: 10-14.
9. Cook JL, Baumann P, Jackman JA, Stevenson D. “Pesticides Characteristics that Affect Water Quality”. Available From http://insects.tamu.edu/extension/bulletins/water/water_01.html. Retrieved on 20-12-2014.
10. Agrawal A, Pandey RS, Sharma B (2010). Water Pollution with Special Reference to Pesticide Contamination
in India. Journal of Water Resource and Protection; 2 (5): 1-17.
11. Burton GA, Pitt R (2001). “Stormwater Effects Handbook: A Toolbox for Watershed Managers, Scientists, and
Engineers”. New York: CRC/Lewis Publishers.
12. Schueler TR (2000) "Cars Are Leading Source of Metal Loads in California." (Reprint) In: The Practice of
Watershed Protection.Center for Watershed Protection. Ellicott City, MD. Available From
http://www.cwp.org/store/guidance.htm. Accessed on 09-03-2014.
13. Selna R (2009). "Power Plant has no Plans to Stop Killing Fish."San Francisco Chronicle. Available From
http://www.sfgate.com/cgi-bin/article.cgi? Accessed on 09-03-2014.
[Wani,2(3): March 2015] ISSN 2348 – 8034
(C)Global Journal Of Engineering Science And Researches
84
14. Clescerl LS, Greenberg AE, Eaton AD. “Standard Methods for the Examination of Water and Wastewater”
(20th Ed.) American Public Health Association, Washington, DC.
15. Newton D (2008). “Chemistry of the Environment”. Checkmark Books. Pp102-104.
16. "Dal Lake Kashmir". Jammu and Kashmir Tourism. Available Fromhttp//:www.kashmirtourism.com.
Retrieved On 18-12-2013.
17. Jammu and Kashmir Lakes and Waterways Development Authority.Available From http://www.jklda.org. Assessed on 20-12-2013.
18. Environment Protection Act (EPA) "Protecting Water Quality from Agricultural Runoff." Fact Sheet No.
EPA-841-F-05-001. March 2005. Available From http://www.epa.gov/owow/nps/. Accessed on 07- 07-2013.
19. Park K (2013). Environment and Health. In: Park’s Text Book of Preventive and Social Medicine. 22th ed.,
Vol. 6. M/S Banarasi Das Bhanot Publishers, Jabalpur, MP, India:pp 654-733.
20. Das R, Samal NR, Roy PK, Mitra D (2006). “Role of ElectricalConductivity as an Indicator of Pollution in
Shallow Lakes”. Asian J water Env Polln; 3(1): 143-146.
21. Goel PK, Trivedi RK (1986). “Studies on Limnology of the Freshwater Bodies in Southwestern Maharashtra”,
Indian Journal of Environmental Protection; 5(1) p19-25.
22. Renn CE (1968). “A study of water quality Lamotte chemicalProducts Company Chestertown, Maryland”.
pp46.
23. Todda BK (1970). Water Encyclopedia. Water Information Centre.Port Washington, New York. 24. Sarwar SG (1986). “Species Composition and Seasonal Variation of Periphyton on Cerratophyllum Demersum
Linn. In Wular Lake, Kashmir”, Geobios; 6:114-118.
25. Iqbal PJ, Pandit AK, Javeed JA (2006). “Impact of Sewage Waste from Human Settlements on Physico-
Chemical Characteristics of Dal Lake, Kashmir”. J. Res. Dev; 6:81-85.
26. Jana BB (1973). “Seasonal Periodicity of Plankton in Fresh Water Ponds”, West Bengal, India. J. Int. Rev.
Hydrobiol; 58:127-143.
27. Govindan VS, Sundaresan BB (1979). “Seasonal Succession of Algal Flora in Polluted Region of Adyar
River”. Indian J. Environ. Health; 21:131-142.
28. Water Pollution Prevention and Control Act (1974). Ministry of Environment and Forests. Available From
http:// www.envfor.nic.in.Retrieved on 9-08-2014.
29. The Alternate Hydro Energy Centre of the University of Rookee. "Data Collection and Analysis". House Boat Owners Association.. Available From http://www.houseboatowners.org/datacollection.html.Retrieved 212-
2013.
30. Okpokwasili GC, Akujobi TC (1996). “Bacteriological Indicators of Tropical Water Quality.” Environmental
Toxicology and Water Quality; 11: 77–81.