Embed Size (px)
Citation preview
Continental Shelf Research 124 (2016) 23–34
Contents lists available at ScienceDirect
Continental Shelf Research
http://d0278-43
n CorrE-m
lcalliari@
journal homepage: www.elsevier.com/locate/csr
Analytical model of sea level elevation during a storm: Supportfor coastal flood risk assessment associated with cyclone passage
Natan Zambroni Maia n, Lauro Julio Calliari, João Luiz NicolodiLaboratório de Oceanografia Geológica, Universidade Fereral do Rio Grande (FURG), CP 474, CEP 96201–900 Rio Grande, Brazil
a r t i c l e i n f o
Article history:Received 5 August 2015Received in revised form9 April 2016Accepted 19 April 2016Available online 3 May 2016
Keywords:Storm surgeWave run-upWind set-upBarometric set-up
x.doi.org/10.1016/j.csr.2016.04.01243/& 2016 Elsevier Ltd. All rights reserved.
esponding author.ail addresses: [email protected] (log.furg.br (L.J. Calliari), joaoluiznicolodi@gm
a b s t r a c t
Sea level oscillations are a result of continuous astronomic, oceanographic, and atmospheric interactionson different time and intensity scales. Thus, the collective action of forcing factors such as tide, wind,atmospheric pressure, and wave action may lead to elevated sea levels during cyclone events over thecontinental shelf, abruptly impacting adjacent coasts. The objective of this study is to evaluate the po-tential risks of sea level rise and coastal flooding associated with the passage of cyclones in southernBrazil. An analytical model was developed based on extreme storm events from 1997 to 2008. The modelidentifies the impact of each forcing factor during temporary sea level rise. Through the development of adigital terrain model, it was possible to identify the areas most vulnerable to flooding by superimposingthe terrain model onto calculated sea levels. During storm events, sea level elevations ranged from 2 to5 m and show wind as the major forcing factor, followed by swells waves, astronomical tide and finallyatmospheric pressure.
& 2016 Elsevier Ltd. All rights reserved.
1. Introduction
Sea level oscillations continuously respond to astronomical,oceanographic and atmospheric interactions, with a wide range ofperiodicity (Gill, 1982). Thus, all sea level records contain a com-plex signature spectrum that includes the tides with periods ofless than 1 day to the global eustatic secular changes that occurwith longer periods (Goring, 1995). In the intermediate range be-tween 3 and 15 days, atmospheric pressure and wind variationsaffect sea level. This meteorological influence produces low oscil-lating flows in the sea level, known as storm surges, which canpropagate along or towards the coastline (Truccolo et al., 2006).According to Pugh (1987), meteorological tides can be defined asthe difference between the observed and astronomical tides,which may be negative or positive (“storm surge”). The stormsurge is therefore responsible for the increase or decrease in sealevel in relation to the astronomical tide observed at a given lo-cation. This phenomenon is positive and generally more importantwhen the records exceed those provided by the astronomical tide,which implies seawater intrusion into places where this usuallydoes not happen, causing major flooding (Marone and Camargo,1994). However, when negative, the storm surge has considerableeffects on port activities.
N.Z. Maia),ail.com (J.L. Nicolodi).
The storm surge phenomenon consists of two major compo-nents: the wind friction on the sea surface allows momentumtransfer from the atmosphere to the ocean, and strong windsblowing along an oceanic track towards the mainland leads to the“pile up” of water in the coastal zone (“wind set-up”), while the lowbarometric pressure associated with the cyclonic rotation in-creases the level of the ocean (the inverted barometer effect -“barometric set-up”, Pugh, 1987; Benavente et al., 2006).
Additionally, a third factor, the increase in the wave height, alsoacts to increase the water level in the surf zone (“wave set-up”),allowing the waves to reach further in land than normal waves do,which transfers the surf zone towards the coast (Benavente et al.,2006). Thus, according to Marone and Camargo (1994), positivestorm surges may be intensified depending on the amplitude andperiod of the waves that often accompany these events when theyare most significant.
During high-energy conditions (storm cycles), the average levelof the sea water increases by a combination of the tide, wind, waveand pressure. Thus, the beach and dunes are strongly attacked bythe incident waves, which generally causes erosion. When stormwaves reach the beach, they break with great intensity, and as aresult, a large volume of water is released on to the beach (VanRijn, 2009).
It is understood then that besides the rise in sea level due to thepresence of a long wave on the platform (tide), there is water onthe shore resulting from the wave breaking process (Marone andCamargo, 1994), where the gradient of atmospheric pressurecauses the formation of winds, which in turn are responsible for
N.Z. Maia et al. / Continental Shelf Research 124 (2016) 23–3424
generating waves and increasing the sea level. When the airpressure gradient is very intense, there is the possibility that tro-pical cyclones will form, leading to the generation of tall wavesthat propagate as swells over long distances to the shore. Waterstacking by these waves associated with astronomical spring tidesaccentuates the erosive power active on the coast to cause superelevation above the tidal prism (Parise, 2007).
The combination of positive meteorological tides with wave set-up can result in extreme values of wave run-up (maximum verticalexcursion of swash on the beach face), which can result in theovertopping of dunes as well as structures of coastal protection,especially when these storms coincide with astronomical springtides. Thus, flooding and erosion can occur in areas where they donot normally occur (Benavente et al., 2006). According to Ferreiraet al. (2006), the storms associated with storm surges are the mostimportant factor controlling shoreline movement in the short term.
Thus, the effects of storm surges on the coast may result inmany losses for coastal communities, such as by depositing fluidmud on the beach (Calliari and Faria, 2003), the loss of land, thedestruction of property and natural habitats, estate depreciationand tourism, the reduction in tax collection and the loss of lives(Teixeira, 2007). However, the distribution of the effects of a stormon a coast depends on many variables, such as subaqueous mor-phology, refraction and diffraction patterns of waves, sedimentbudgets, morphodynamic behavior of beaches, dune developmentand also human interventions and coast line uses (Balsillie, 1986;Lawrence, 1994 apud Benavente et al., 2002; Toldo et al., 2010).
The potential consequences of these storm simply the need fortools that recognize vulnerable areas at risk of flooding. This factorhas been modeled, and the resulting information forms the basisfor mappings of coastal risk (Benavente et al., 2006), as noted inVan Cooten et al. (2011), that coupled hydrodynamic, hydrologicaland atmospheric models aiming to measure sea level rises during
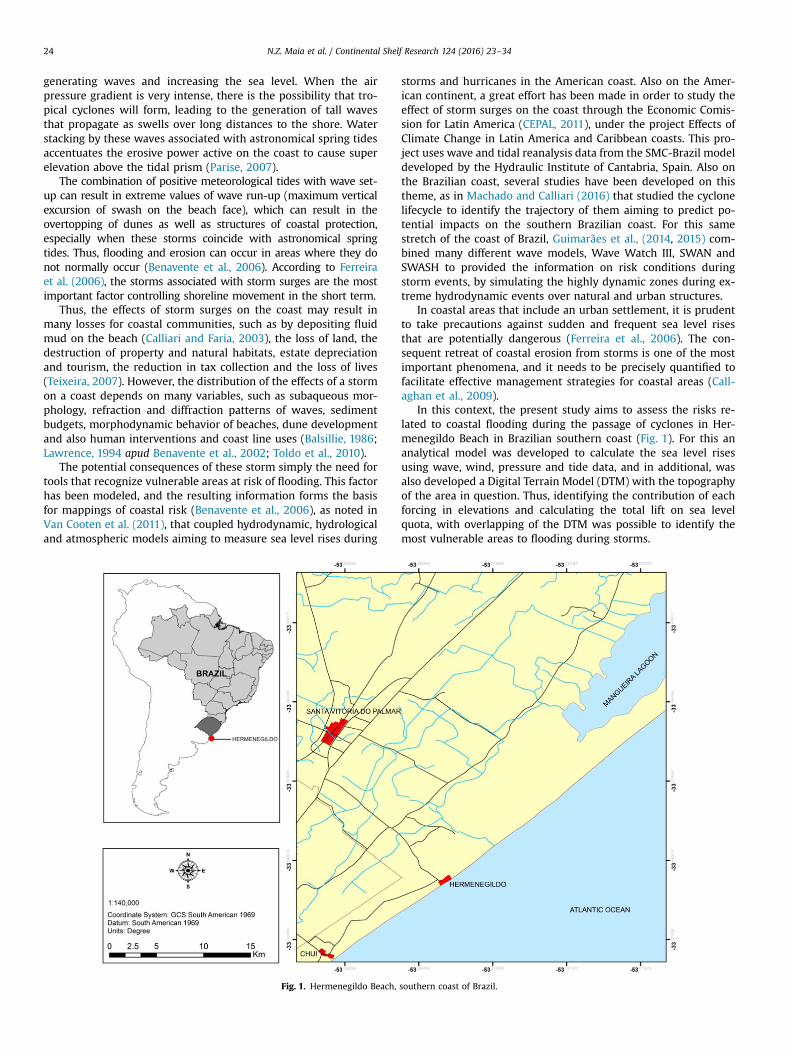
Fig. 1. Hermenegildo Beach,
storms and hurricanes in the American coast. Also on the Amer-ican continent, a great effort has been made in order to study theeffect of storm surges on the coast through the Economic Comis-sion for Latin America (CEPAL, 2011), under the project Effects ofClimate Change in Latin America and Caribbean coasts. This pro-ject uses wave and tidal reanalysis data from the SMC-Brazil modeldeveloped by the Hydraulic Institute of Cantabria, Spain. Also onthe Brazilian coast, several studies have been developed on thistheme, as in Machado and Calliari (2016) that studied the cyclonelifecycle to identify the trajectory of them aiming to predict po-tential impacts on the southern Brazilian coast. For this samestretch of the coast of Brazil, Guimarães et al., (2014, 2015) com-bined many different wave models, Wave Watch III, SWAN andSWASH to provided the information on risk conditions duringstorm events, by simulating the highly dynamic zones during ex-treme hydrodynamic events over natural and urban structures.
In coastal areas that include an urban settlement, it is prudentto take precautions against sudden and frequent sea level risesthat are potentially dangerous (Ferreira et al., 2006). The con-sequent retreat of coastal erosion from storms is one of the mostimportant phenomena, and it needs to be precisely quantified tofacilitate effective management strategies for coastal areas (Call-aghan et al., 2009).
In this context, the present study aims to assess the risks re-lated to coastal flooding during the passage of cyclones in Her-menegildo Beach in Brazilian southern coast (Fig. 1). For this ananalytical model was developed to calculate the sea level risesusing wave, wind, pressure and tide data, and in additional, wasalso developed a Digital Terrain Model (DTM) with the topographyof the area in question. Thus, identifying the contribution of eachforcing in elevations and calculating the total lift on sea levelquota, with overlapping of the DTM was possible to identify themost vulnerable areas to flooding during storms.
southern coast of Brazil.
N.Z. Maia et al. / Continental Shelf Research 124 (2016) 23–34 25
2. Methodology
The methodological sequence for the development of this workfollowed the following chronology: gathering and processing datarelated to the waves, wind, pressure and astronomical tide; de-velopment and validation of an analytical model to calculate sealevel elevations; implementation of the analytical model to cal-culate sea levels for the selected events; preparation of a digitalterrain model; and, finally, preparation of the illustrations relatedto the calculated flood levels from 1997 to 2008 in the regionwhere it was tested.
2.1. Data
2.1.1. WavesWave data were obtained from the outputs of the model Wave
Watch III NCEP/NOAA (version 2.22), available at ftp://polar. ncep.noaa. gov/pub/history/waves. Significant wave height and waveperiod were considered with a temporal resolution of 3 h. Themodel has a spatial resolution of 1°�1.25°, with the point definedby the coordinates 34°S and 52.5°W used to obtain the data.
This point was chosen because, according to the output of themodel, it is close to Hermenegildo Beach over the continental shelfand is situated approximately 80 km from the coast. The equationsthat govern the Wave Watch III model include wave refraction dueto temporal and spatial variations of the average water depth andcurrents. The parameterization of physical processes includes theaction of wind, nonlinear interactions, dissipation and frictionwith the bottom. WW3 solve the conservation equation of spectralenergy density in terms of the number and wave direction asfunctions that vary slowly in space and time. This equation im-plicitly admits that the spatial and temporal scales of the wavesthemselves are much smaller than the corresponding variationranges of the spectrum and the depths and currents. WW3 de-termines the directional spectrum evolution of field waves, whichshows how this sea surface energy is distributed in terms of fre-quency and direction of components, being height, period anddirection of waves (Tolman, 1997, 2002).
2.1.2. Wind and pressureData on wind and atmospheric pressure came from the Re-
analysis Project R-1NCEP/NCAR (National Centers for Environ-mental Prediction) database, which is available at http://www.esrl.noaa.gov/psd/data/gridded/data.ncep.reanalysis.html. Thus, it waspossible to monitor the weather conditions in the study areaduring the passage of cyclones. The reanalysis data have a tem-poral resolution of 6 h and spatial resolution of 2.5°�2.5°.
The NCEP/NCAR Reanalysis Project is a joint project betweenthe National Centers for Environmental Prediction (NCEP) and theNational Center for Atmospheric Research (NCAR). Reanalysis is ascientific method for developing a comprehensive record of howweather and climate are changing over time. In it, observationsand a numerical model that simulates one or more aspects of theEarth system are combined objectively to generate a synthesizedestimate of the state of the system. Reanalysis products are usedextensively in climate research and services, including for mon-itoring and comparing current climate conditions with those ofthe past, identifying the causes of climate variations and change,and preparing climate predictions A reanalysis typically extendsover several decades or longer, and covers the entire globe fromthe Earth's surface. The goal of this joint effort is to produce newatmospheric analyses using historical data (1948 onwards) and aswell to produce analyses of the current atmospheric. Reanalysisdatasets are created by assimilating climate observations using thesame climate model throughout the entire reanalysis period inorder to reduce the affects of modeling changes on climate
statistics. Observations are from many different sources includingships, satellites, ground stations, RAOBS, and radar. The dataset iskept current using near real-time observations (Available at http://www.cpc.ncep.noaa.gov/products/wesley/reanalysis.html#intro;http://www.esrl.noaa.gov/psd/data/gridded/reanalysis/).
For this study, the data at the point defined by the coordinates32.5°S and 52.5°W were used, and with respect to the wave data,this point was chosen based on the output of the template as beingthe closest to Hermenegildo Beach over the continental shelf. Tocalculate the resulting wind speed, we used the zonal (u) andmeridional (v) components at a height of 10 m (Bowden, 1983),and for the atmospheric pressure, the respective values at theaverage sea level. According to Oliveira et al. (2007), the Reanalysisdata are quite useful and satisfactory for cases in which the lack ofatmospheric data is substantial.
For visualization and analysis of wind and pressure data, aswell as waves, the Panoplys program (NASA/GISS) was used.
2.1.3. Astronomical tideAstronomical tide data are from the Directorate of Hydrography
and Navigation (DHN) from the Brazil Navy and are available atwww.mar.mil.br/dhn/chm. DHN forecast are generated from har-monic components obtained from observations made by variousinstitutions distributed along the Brazilian coast.
In the absence of specific data for Hermenegildo Beach, it wasdecided to use the tide predictions for harmonic analysis for thecoast adjacent to Rio Grande city, approximately 200 km from thestudy area. However, the two regions experience the same tidalpattern. For each event, to characterize the worst elevation sce-nario, the highest elevation value of the astronomical tide duringthe passage of cyclones along the coast was selected.
2.2. Methods
2.2.1. Development of the analytical modelAn analytical model (Equation 1) was developed for sea level
rise calculation during storms induced by the passage of a cyclone.The water surface elevation was calculated by taking into accounteach of the contributing factors described in this equation andcalculates the most extreme values of sea level rise during stormevents.
2.2.1.1. Level rise induced by wind (wind set-up). In the simplifiedmodel used in this article, it is normally a fundamental hypothesisthat the wind-induced rise in the landmark is dominated by localforcing. According to this hypothesis, level variations due to re-mote effects that propagate along the coast in the form of platformwaves are excluded.
To calculate the elevation in the wind-induced level, we usedthe equation proposed by Csanady (1982) for winds parallel to theshore (Equation 2).
The average of platform depth (H¼100 m) of Equation 4 wasdetermined by parametric analysis, where different values havebeen tested without significant variations in the results. In thisway it estimated the average value thereof.
The events analyzed were initially selected based on wind be-havior, requiring cyclones to be located over the continental shelfand requiring the wind to flow parallel to the coast from the SW.The wind speed value entered into the equation was the averagespeed for the duration of the event, which was also determinedfrom the displacement of the cyclone.
2.2.1.2. Level rise induced by wave (wave run-up). The increase inthe wave run-up on the coast caused by increased wave heightduring the storms was calculated by Equation 8 proposed byBattjes (1971), which evaluates the maximum vertical wave tour
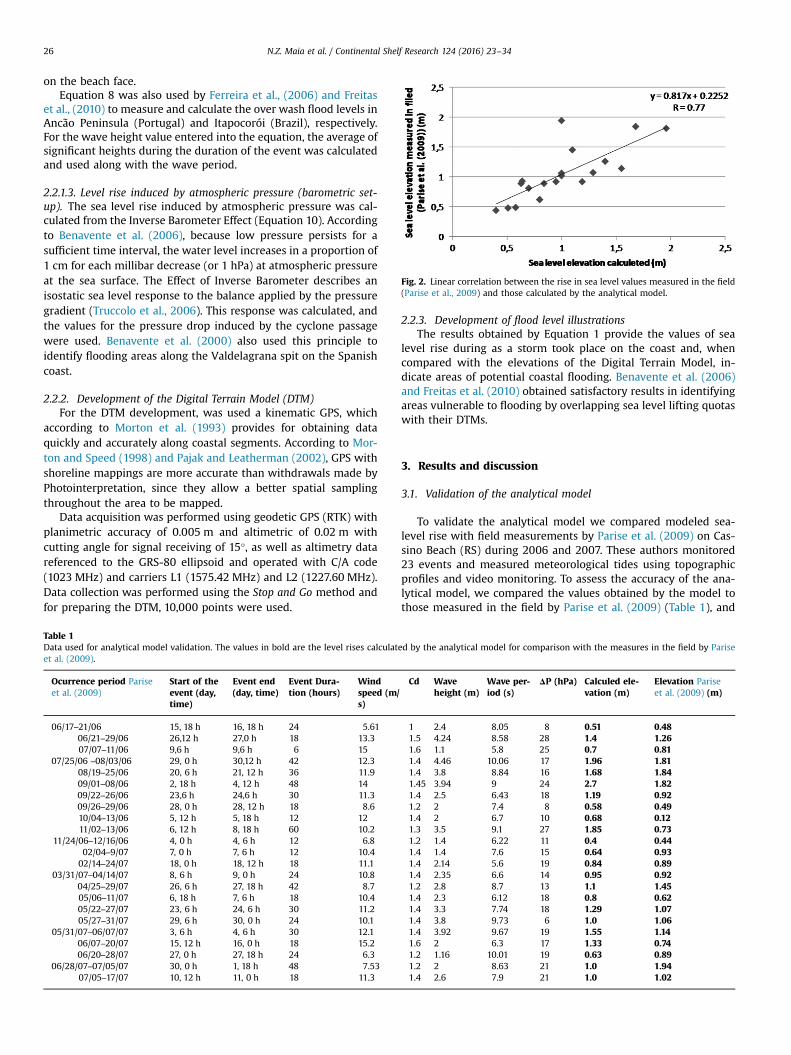
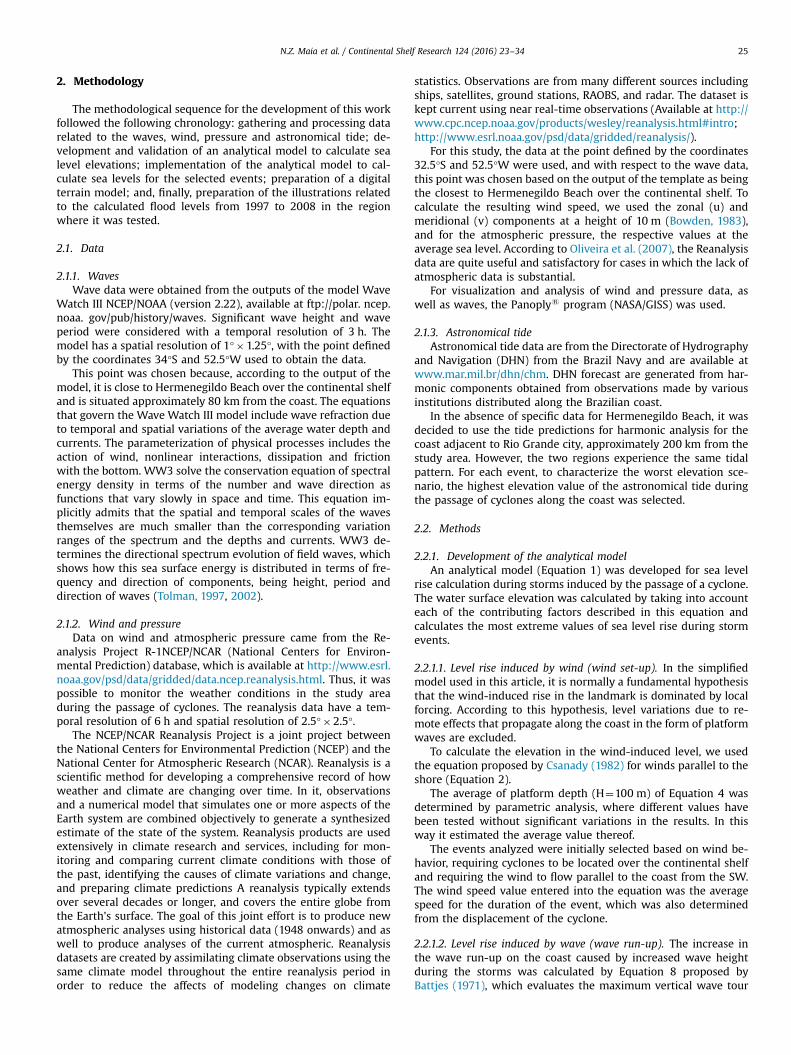
Fig. 2. Linear correlation between the rise in sea level values measured in the field(Parise et al., 2009) and those calculated by the analytical model.
N.Z. Maia et al. / Continental Shelf Research 124 (2016) 23–3426
on the beach face.Equation 8 was also used by Ferreira et al., (2006) and Freitas
et al., (2010) to measure and calculate the over wash flood levels inAncão Peninsula (Portugal) and Itapocorói (Brazil), respectively.For the wave height value entered into the equation, the average ofsignificant heights during the duration of the event was calculatedand used along with the wave period.
2.2.1.3. Level rise induced by atmospheric pressure (barometric set-up). The sea level rise induced by atmospheric pressure was cal-culated from the Inverse Barometer Effect (Equation 10). Accordingto Benavente et al. (2006), because low pressure persists for asufficient time interval, the water level increases in a proportion of1 cm for each millibar decrease (or 1 hPa) at atmospheric pressureat the sea surface. The Effect of Inverse Barometer describes anisostatic sea level response to the balance applied by the pressuregradient (Truccolo et al., 2006). This response was calculated, andthe values for the pressure drop induced by the cyclone passagewere used. Benavente et al. (2000) also used this principle toidentify flooding areas along the Valdelagrana spit on the Spanishcoast.
2.2.2. Development of the Digital Terrain Model (DTM)For the DTM development, was used a kinematic GPS, which
according to Morton et al. (1993) provides for obtaining dataquickly and accurately along coastal segments. According to Mor-ton and Speed (1998) and Pajak and Leatherman (2002), GPS withshoreline mappings are more accurate than withdrawals made byPhotointerpretation, since they allow a better spatial samplingthroughout the area to be mapped.
Data acquisition was performed using geodetic GPS (RTK) withplanimetric accuracy of 0.005 m and altimetric of 0.02 m withcutting angle for signal receiving of 15°, as well as altimetry datareferenced to the GRS-80 ellipsoid and operated with C/A code(1023 MHz) and carriers L1 (1575.42 MHz) and L2 (1227.60 MHz).Data collection was performed using the Stop and Go method andfor preparing the DTM, 10,000 points were used.
Table 1Data used for analytical model validation. The values in bold are the level rises calculatet al. (2009).
Ocurrence period Pariseet al. (2009)
Start of theevent (day,time)
Event end(day, time)
Event Dura-tion (hours)
Windspeed (m/s)
06/17–21/06 15, 18 h 16, 18 h 24 5.6106/21–29/06 26,12 h 27,0 h 18 13.307/07–11/06 9,6 h 9,6 h 6 15
07/25/06 –08/03/06 29, 0 h 30,12 h 42 12.308/19–25/06 20, 6 h 21, 12 h 36 11.909/01–08/06 2, 18 h 4, 12 h 48 1409/22–26/06 23,6 h 24,6 h 30 11.309/26–29/06 28, 0 h 28, 12 h 18 8.610/04–13/06 5, 12 h 5, 18 h 12 1211/02–13/06 6, 12 h 8, 18 h 60 10.2
11/24/06–12/16/06 4, 0 h 4, 6 h 12 6.802/04–9/07 7, 0 h 7, 6 h 12 10.402/14–24/07 18, 0 h 18, 12 h 18 11.1
03/31/07–04/14/07 8, 6 h 9, 0 h 24 10.804/25–29/07 26, 6 h 27, 18 h 42 8.705/06–11/07 6, 18 h 7, 6 h 18 10.405/22–27/07 23, 6 h 24, 6 h 30 11.205/27–31/07 29, 6 h 30, 0 h 24 10.1
05/31/07–06/07/07 3, 6 h 4, 6 h 30 12.106/07–20/07 15, 12 h 16, 0 h 18 15.206/20–28/07 27, 0 h 27, 18 h 24 6.3
06/28/07–07/05/07 30, 0 h 1, 18 h 48 7.5307/05–17/07 10, 12 h 11, 0 h 18 11.3
2.2.3. Development of flood level illustrationsThe results obtained by Equation 1 provide the values of sea
level rise during as a storm took place on the coast and, whencompared with the elevations of the Digital Terrain Model, in-dicate areas of potential coastal flooding. Benavente et al. (2006)and Freitas et al. (2010) obtained satisfactory results in identifyingareas vulnerable to flooding by overlapping sea level lifting quotaswith their DTMs.
3. Results and discussion
3.1. Validation of the analytical model
To validate the analytical model we compared modeled sea-level rise with field measurements by Parise et al. (2009) on Cas-sino Beach (RS) during 2006 and 2007. These authors monitored23 events and measured meteorological tides using topographicprofiles and video monitoring. To assess the accuracy of the ana-lytical model, we compared the values obtained by the model tothose measured in the field by Parise et al. (2009) (Table 1), and
ed by the analytical model for comparison with the measures in the field by Parise
Cd Waveheight (m)
Wave per-iod (s)
ΔP (hPa) Calculed ele-vation (m)
Elevation Pariseet al. (2009) (m)
1 2.4 8.05 8 0.51 0.481.5 4.24 8.58 28 1.4 1.261.6 1.1 5.8 25 0.7 0.811.4 4.46 10.06 17 1.96 1.811.4 3.8 8.84 16 1.68 1.841.45 3.94 9 24 2.7 1.821.4 2.5 6.43 18 1.19 0.921.2 2 7.4 8 0.58 0.491.4 2 6.7 10 0.68 0.121.3 3.5 9.1 27 1.85 0.731.2 1.4 6.22 11 0.4 0.441.4 1.4 7.6 15 0.64 0.931.4 2.14 5.6 19 0.84 0.891.4 2.35 6.6 14 0.95 0.921.2 2.8 8.7 13 1.1 1.451.4 2.3 6.12 18 0.8 0.621.4 3.3 7.74 18 1.29 1.071.4 3.8 9.73 6 1.0 1.061.4 3.92 9.67 19 1.55 1.141.6 2 6.3 17 1.33 0.741.2 1.16 10.01 19 0.63 0.891.2 2 8.63 21 1.0 1.941.4 2.6 7.9 21 1.0 1.02
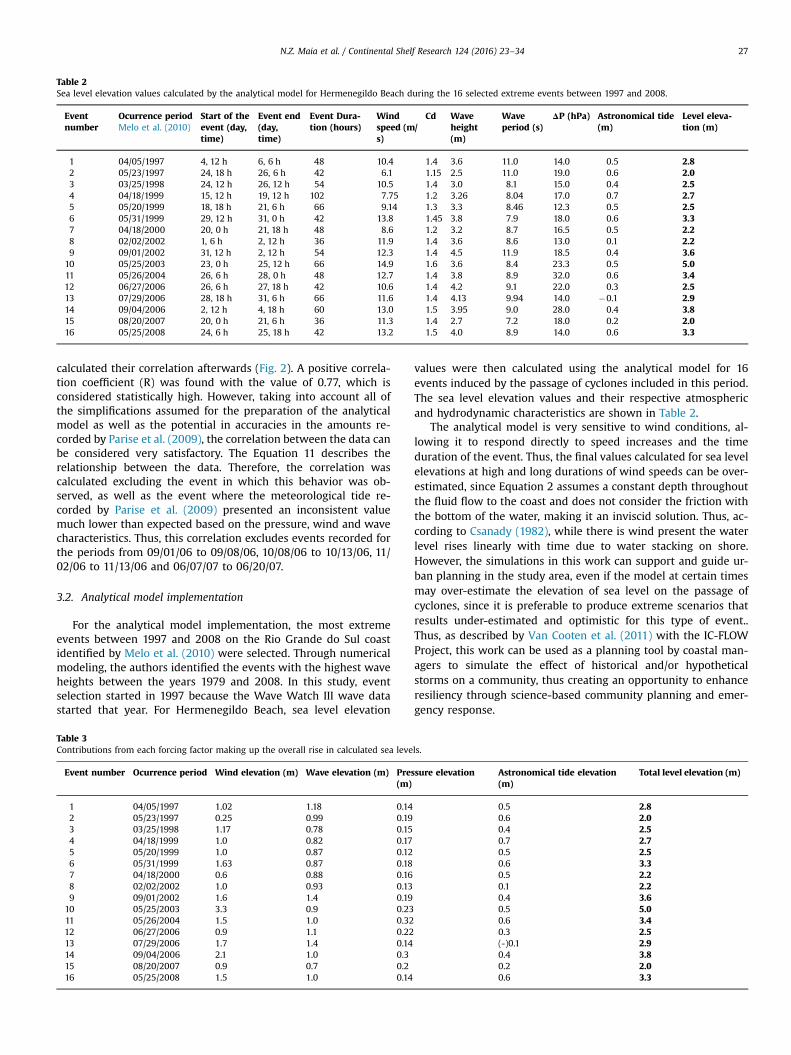
Table 2Sea level elevation values calculated by the analytical model for Hermenegildo Beach during the 16 selected extreme events between 1997 and 2008.
Eventnumber
Ocurrence periodMelo et al. (2010)
Start of theevent (day,time)
Event end(day,time)
Event Dura-tion (hours)
Windspeed (m/s)
Cd Waveheight(m)
Waveperiod (s)
ΔP (hPa) Astronomical tide(m)
Level eleva-tion (m)
1 04/05/1997 4, 12 h 6, 6 h 48 10.4 1.4 3.6 11.0 14.0 0.5 2.82 05/23/1997 24, 18 h 26, 6 h 42 6.1 1.15 2.5 11.0 19.0 0.6 2.03 03/25/1998 24, 12 h 26, 12 h 54 10.5 1.4 3.0 8.1 15.0 0.4 2.54 04/18/1999 15, 12 h 19, 12 h 102 7.75 1.2 3.26 8.04 17.0 0.7 2.75 05/20/1999 18, 18 h 21, 6 h 66 9.14 1.3 3.3 8.46 12.3 0.5 2.56 05/31/1999 29, 12 h 31, 0 h 42 13.8 1.45 3.8 7.9 18.0 0.6 3.37 04/18/2000 20, 0 h 21, 18 h 48 8.6 1.2 3.2 8.7 16.5 0.5 2.28 02/02/2002 1, 6 h 2, 12 h 36 11.9 1.4 3.6 8.6 13.0 0.1 2.29 09/01/2002 31, 12 h 2, 12 h 54 12.3 1.4 4.5 11.9 18.5 0.4 3.6
10 05/25/2003 23, 0 h 25, 12 h 66 14.9 1.6 3.6 8.4 23.3 0.5 5.011 05/26/2004 26, 6 h 28, 0 h 48 12.7 1.4 3.8 8.9 32.0 0.6 3.412 06/27/2006 26, 6 h 27, 18 h 42 10.6 1.4 4.2 9.1 22.0 0.3 2.513 07/29/2006 28, 18 h 31, 6 h 66 11.6 1.4 4.13 9.94 14.0 �0.1 2.914 09/04/2006 2, 12 h 4, 18 h 60 13.0 1.5 3.95 9.0 28.0 0.4 3.815 08/20/2007 20, 0 h 21, 6 h 36 11.3 1.4 2.7 7.2 18.0 0.2 2.016 05/25/2008 24, 6 h 25, 18 h 42 13.2 1.5 4.0 8.9 14.0 0.6 3.3
N.Z. Maia et al. / Continental Shelf Research 124 (2016) 23–34 27
calculated their correlation afterwards (Fig. 2). A positive correla-tion coefficient (R) was found with the value of 0.77, which isconsidered statistically high. However, taking into account all ofthe simplifications assumed for the preparation of the analyticalmodel as well as the potential in accuracies in the amounts re-corded by Parise et al. (2009), the correlation between the data canbe considered very satisfactory. The Equation 11 describes therelationship between the data. Therefore, the correlation wascalculated excluding the event in which this behavior was ob-served, as well as the event where the meteorological tide re-corded by Parise et al. (2009) presented an inconsistent valuemuch lower than expected based on the pressure, wind and wavecharacteristics. Thus, this correlation excludes events recorded forthe periods from 09/01/06 to 09/08/06, 10/08/06 to 10/13/06, 11/02/06 to 11/13/06 and 06/07/07 to 06/20/07.
3.2. Analytical model implementation
For the analytical model implementation, the most extremeevents between 1997 and 2008 on the Rio Grande do Sul coastidentified by Melo et al. (2010) were selected. Through numericalmodeling, the authors identified the events with the highest waveheights between the years 1979 and 2008. In this study, eventselection started in 1997 because the Wave Watch III wave datastarted that year. For Hermenegildo Beach, sea level elevation
Table 3Contributions from each forcing factor making up the overall rise in calculated sea leve
Event number Ocurrence period Wind elevation (m) Wave elevation (m) Pres(m)
1 04/05/1997 1.02 1.18 0.142 05/23/1997 0.25 0.99 0.193 03/25/1998 1.17 0.78 0.154 04/18/1999 1.0 0.82 0.175 05/20/1999 1.0 0.87 0.126 05/31/1999 1.63 0.87 0.187 04/18/2000 0.6 0.88 0.168 02/02/2002 1.0 0.93 0.139 09/01/2002 1.6 1.4 0.19
10 05/25/2003 3.3 0.9 0.2311 05/26/2004 1.5 1.0 0.3212 06/27/2006 0.9 1.1 0.2213 07/29/2006 1.7 1.4 0.1414 09/04/2006 2.1 1.0 0.315 08/20/2007 0.9 0.7 0.216 05/25/2008 1.5 1.0 0.14
values were then calculated using the analytical model for 16events induced by the passage of cyclones included in this period.The sea level elevation values and their respective atmosphericand hydrodynamic characteristics are shown in Table 2.
The analytical model is very sensitive to wind conditions, al-lowing it to respond directly to speed increases and the timeduration of the event. Thus, the final values calculated for sea levelelevations at high and long durations of wind speeds can be over-estimated, since Equation 2 assumes a constant depth throughoutthe fluid flow to the coast and does not consider the friction withthe bottom of the water, making it an inviscid solution. Thus, ac-cording to Csanady (1982), while there is wind present the waterlevel rises linearly with time due to water stacking on shore.However, the simulations in this work can support and guide ur-ban planning in the study area, even if the model at certain timesmay over-estimate the elevation of sea level on the passage ofcyclones, since it is preferable to produce extreme scenarios thatresults under-estimated and optimistic for this type of event..Thus, as described by Van Cooten et al. (2011) with the IC-FLOWProject, this work can be used as a planning tool by coastal man-agers to simulate the effect of historical and/or hypotheticalstorms on a community, thus creating an opportunity to enhanceresiliency through science-based community planning and emer-gency response.
ls.
sure elevation Astronomical tide elevation(m)
Total level elevation (m)
0.5 2.80.6 2.00.4 2.50.7 2.70.5 2.50.6 3.30.5 2.20.1 2.20.4 3.60.5 5.00.6 3.40.3 2.5(-)0.1 2.90.4 3.80.2 2.00.6 3.3
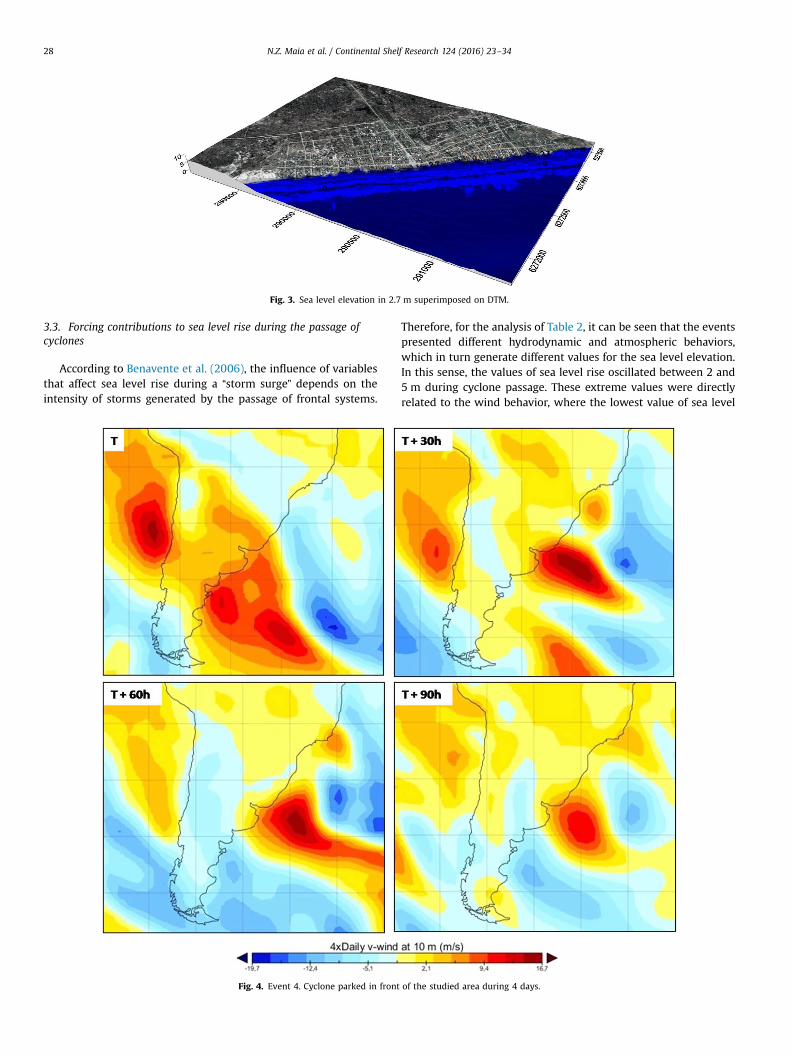
Fig. 3. Sea level elevation in 2.7 m superimposed on DTM.
N.Z. Maia et al. / Continental Shelf Research 124 (2016) 23–3428
3.3. Forcing contributions to sea level rise during the passage ofcyclones
According to Benavente et al. (2006), the influence of variablesthat affect sea level rise during a “storm surge” depends on theintensity of storms generated by the passage of frontal systems.
Fig. 4. Event 4. Cyclone parked in front
Therefore, for the analysis of Table 2, it can be seen that the eventspresented different hydrodynamic and atmospheric behaviors,which in turn generate different values for the sea level elevation.In this sense, the values of sea level rise oscillated between 2 and5 m during cyclone passage. These extreme values were directlyrelated to the wind behavior, where the lowest value of sea level
of the studied area during 4 days.
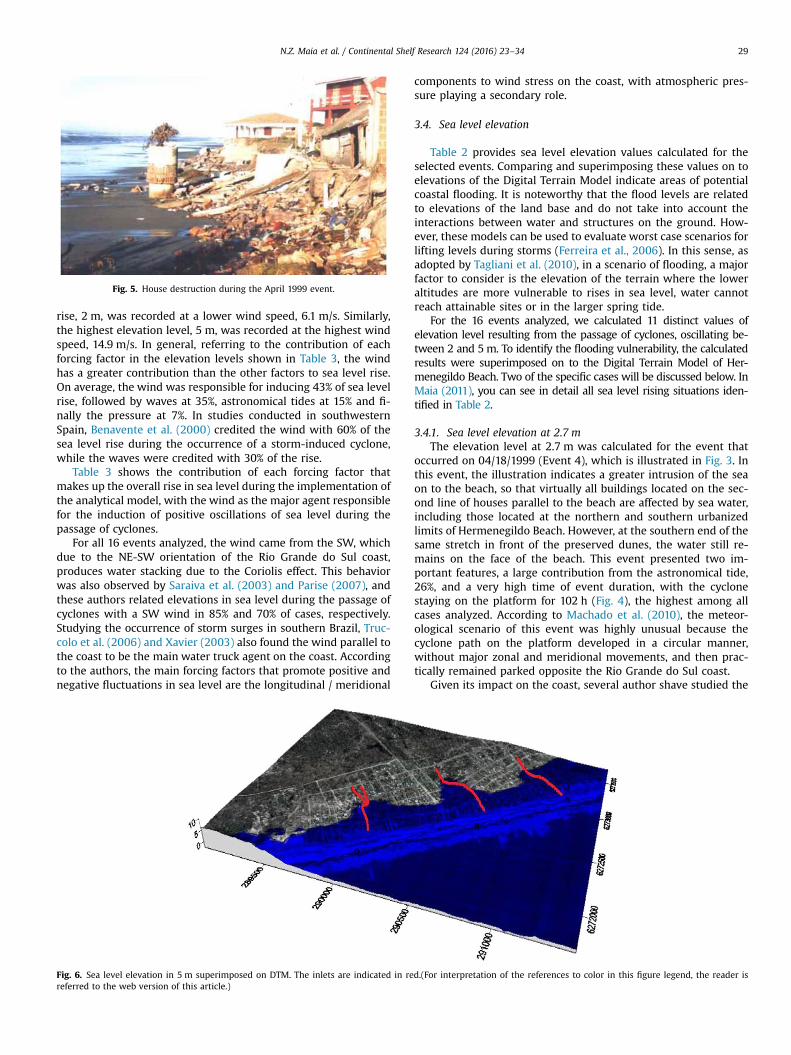
Fig. 5. House destruction during the April 1999 event.
N.Z. Maia et al. / Continental Shelf Research 124 (2016) 23–34 29
rise, 2 m, was recorded at a lower wind speed, 6.1 m/s. Similarly,the highest elevation level, 5 m, was recorded at the highest windspeed, 14.9 m/s. In general, referring to the contribution of eachforcing factor in the elevation levels shown in Table 3, the windhas a greater contribution than the other factors to sea level rise.On average, the wind was responsible for inducing 43% of sea levelrise, followed by waves at 35%, astronomical tides at 15% and fi-nally the pressure at 7%. In studies conducted in southwesternSpain, Benavente et al. (2000) credited the wind with 60% of thesea level rise during the occurrence of a storm-induced cyclone,while the waves were credited with 30% of the rise.
Table 3 shows the contribution of each forcing factor thatmakes up the overall rise in sea level during the implementation ofthe analytical model, with the wind as the major agent responsiblefor the induction of positive oscillations of sea level during thepassage of cyclones.
For all 16 events analyzed, the wind came from the SW, whichdue to the NE-SW orientation of the Rio Grande do Sul coast,produces water stacking due to the Coriolis effect. This behaviorwas also observed by Saraiva et al. (2003) and Parise (2007), andthese authors related elevations in sea level during the passage ofcyclones with a SW wind in 85% and 70% of cases, respectively.Studying the occurrence of storm surges in southern Brazil, Truc-colo et al. (2006) and Xavier (2003) also found the wind parallel tothe coast to be the main water truck agent on the coast. Accordingto the authors, the main forcing factors that promote positive andnegative fluctuations in sea level are the longitudinal / meridional
Fig. 6. Sea level elevation in 5 m superimposed on DTM. The inlets are indicated in rereferred to the web version of this article.)
components to wind stress on the coast, with atmospheric pres-sure playing a secondary role.
3.4. Sea level elevation
Table 2 provides sea level elevation values calculated for theselected events. Comparing and superimposing these values on toelevations of the Digital Terrain Model indicate areas of potentialcoastal flooding. It is noteworthy that the flood levels are relatedto elevations of the land base and do not take into account theinteractions between water and structures on the ground. How-ever, these models can be used to evaluate worst case scenarios forlifting levels during storms (Ferreira et al., 2006). In this sense, asadopted by Tagliani et al. (2010), in a scenario of flooding, a majorfactor to consider is the elevation of the terrain where the loweraltitudes are more vulnerable to rises in sea level, water cannotreach attainable sites or in the larger spring tide.
For the 16 events analyzed, we calculated 11 distinct values ofelevation level resulting from the passage of cyclones, oscillating be-tween 2 and 5m. To identify the flooding vulnerability, the calculatedresults were superimposed on to the Digital Terrain Model of Her-menegildo Beach. Two of the specific cases will be discussed below. InMaia (2011), you can see in detail all sea level rising situations iden-tified in Table 2.
3.4.1. Sea level elevation at 2.7 mThe elevation level at 2.7 m was calculated for the event that
occurred on 04/18/1999 (Event 4), which is illustrated in Fig. 3. Inthis event, the illustration indicates a greater intrusion of the seaon to the beach, so that virtually all buildings located on the sec-ond line of houses parallel to the beach are affected by sea water,including those located at the northern and southern urbanizedlimits of Hermenegildo Beach. However, at the southern end of thesame stretch in front of the preserved dunes, the water still re-mains on the face of the beach. This event presented two im-portant features, a large contribution from the astronomical tide,26%, and a very high time of event duration, with the cyclonestaying on the platform for 102 h (Fig. 4), the highest among allcases analyzed. According to Machado et al. (2010), the meteor-ological scenario of this event was highly unusual because thecyclone path on the platform developed in a circular manner,without major zonal and meridional movements, and then prac-tically remained parked opposite the Rio Grande do Sul coast.
Given its impact on the coast, several author shave studied the
d.(For interpretation of the references to color in this figure legend, the reader is
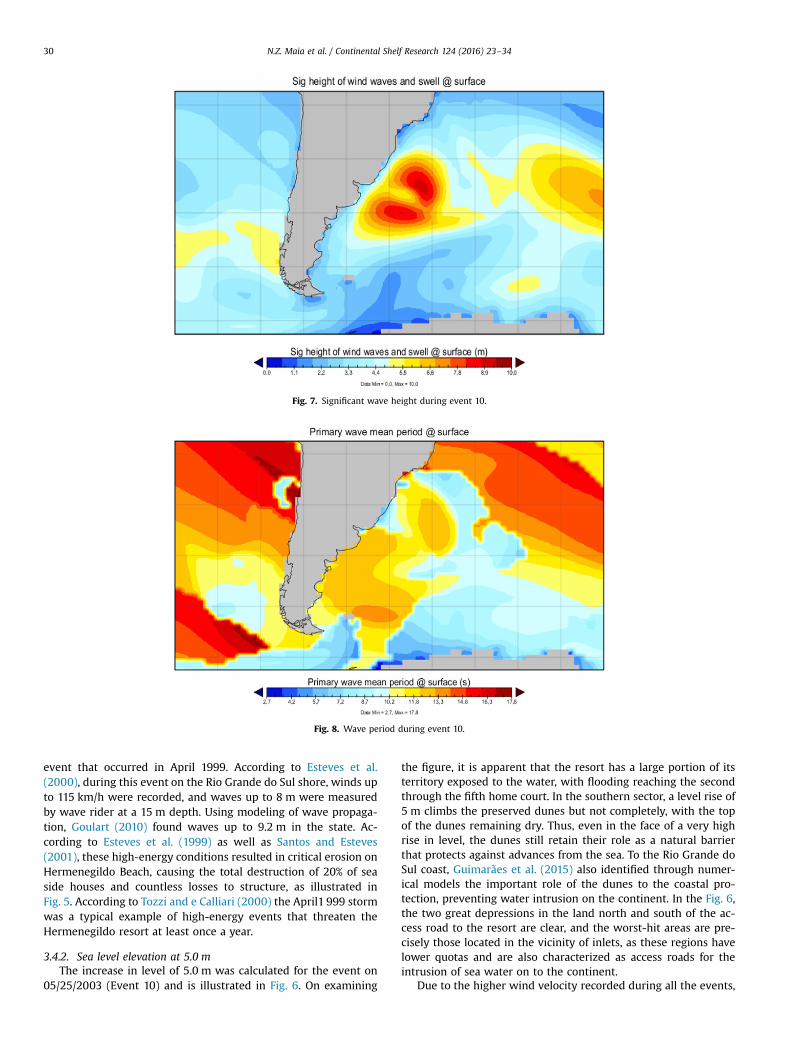
Fig. 7. Significant wave height during event 10.
Fig. 8. Wave period during event 10.
N.Z. Maia et al. / Continental Shelf Research 124 (2016) 23–3430
event that occurred in April 1999. According to Esteves et al.(2000), during this event on the Rio Grande do Sul shore, winds upto 115 km/h were recorded, and waves up to 8 m were measuredby wave rider at a 15 m depth. Using modeling of wave propaga-tion, Goulart (2010) found waves up to 9.2 m in the state. Ac-cording to Esteves et al. (1999) as well as Santos and Esteves(2001), these high-energy conditions resulted in critical erosion onHermenegildo Beach, causing the total destruction of 20% of seaside houses and countless losses to structure, as illustrated inFig. 5. According to Tozzi and e Calliari (2000) the April1 999 stormwas a typical example of high-energy events that threaten theHermenegildo resort at least once a year.
3.4.2. Sea level elevation at 5.0 mThe increase in level of 5.0 m was calculated for the event on
05/25/2003 (Event 10) and is illustrated in Fig. 6. On examining
the figure, it is apparent that the resort has a large portion of itsterritory exposed to the water, with flooding reaching the secondthrough the fifth home court. In the southern sector, a level rise of5 m climbs the preserved dunes but not completely, with the topof the dunes remaining dry. Thus, even in the face of a very highrise in level, the dunes still retain their role as a natural barrierthat protects against advances from the sea. To the Rio Grande doSul coast, Guimarães et al. (2015) also identified through numer-ical models the important role of the dunes to the coastal pro-tection, preventing water intrusion on the continent. In the Fig. 6,the two great depressions in the land north and south of the ac-cess road to the resort are clear, and the worst-hit areas are pre-cisely those located in the vicinity of inlets, as these regions havelower quotas and are also characterized as access roads for theintrusion of sea water on to the continent.
Due to the higher wind velocity recorded during all the events,
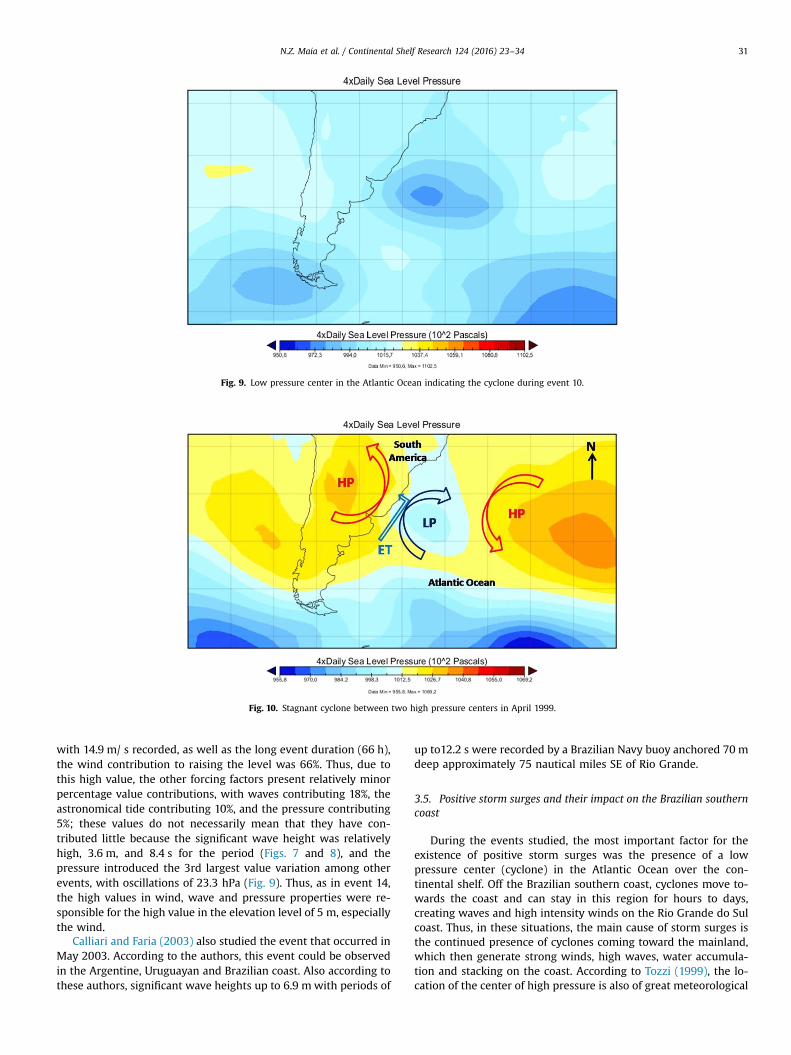
Fig. 9. Low pressure center in the Atlantic Ocean indicating the cyclone during event 10.
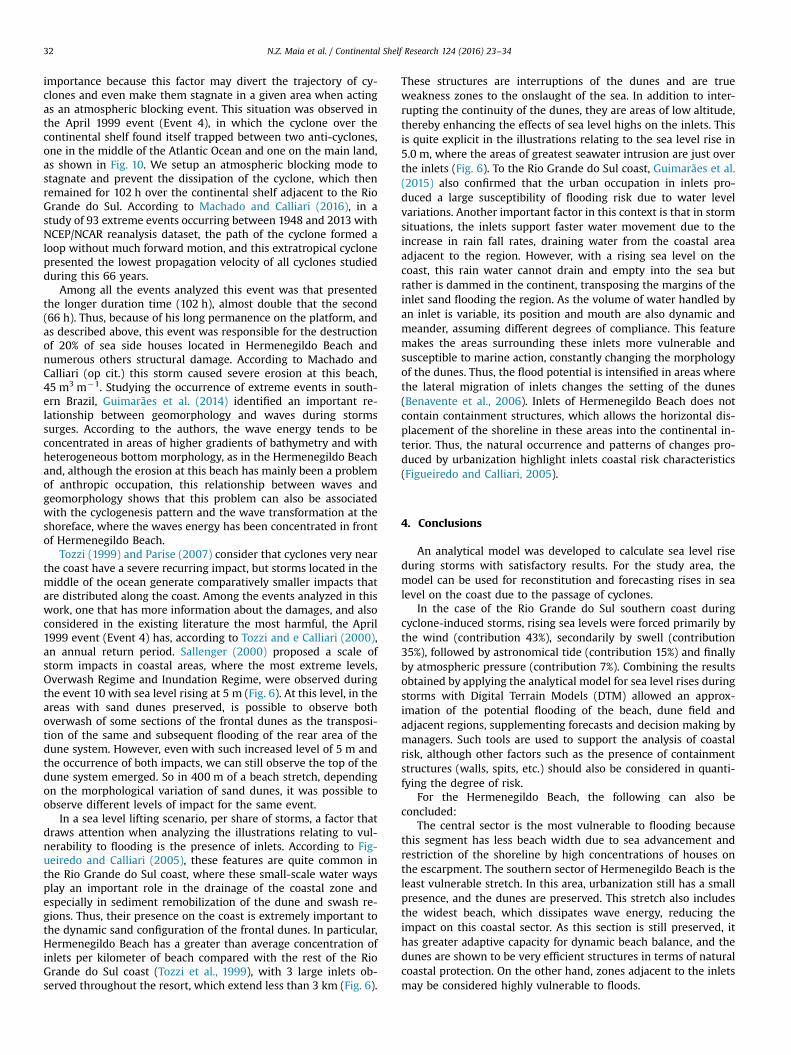
Fig. 10. Stagnant cyclone between two high pressure centers in April 1999.
N.Z. Maia et al. / Continental Shelf Research 124 (2016) 23–34 31
with 14.9 m/ s recorded, as well as the long event duration (66 h),the wind contribution to raising the level was 66%. Thus, due tothis high value, the other forcing factors present relatively minorpercentage value contributions, with waves contributing 18%, theastronomical tide contributing 10%, and the pressure contributing5%; these values do not necessarily mean that they have con-tributed little because the significant wave height was relativelyhigh, 3.6 m, and 8.4 s for the period (Figs. 7 and 8), and thepressure introduced the 3rd largest value variation among otherevents, with oscillations of 23.3 hPa (Fig. 9). Thus, as in event 14,the high values in wind, wave and pressure properties were re-sponsible for the high value in the elevation level of 5 m, especiallythe wind.
Calliari and Faria (2003) also studied the event that occurred inMay 2003. According to the authors, this event could be observedin the Argentine, Uruguayan and Brazilian coast. Also according tothese authors, significant wave heights up to 6.9 m with periods of
up to12.2 s were recorded by a Brazilian Navy buoy anchored 70 mdeep approximately 75 nautical miles SE of Rio Grande.
3.5. Positive storm surges and their impact on the Brazilian southerncoast
During the events studied, the most important factor for theexistence of positive storm surges was the presence of a lowpressure center (cyclone) in the Atlantic Ocean over the con-tinental shelf. Off the Brazilian southern coast, cyclones move to-wards the coast and can stay in this region for hours to days,creating waves and high intensity winds on the Rio Grande do Sulcoast. Thus, in these situations, the main cause of storm surges isthe continued presence of cyclones coming toward the mainland,which then generate strong winds, high waves, water accumula-tion and stacking on the coast. According to Tozzi (1999), the lo-cation of the center of high pressure is also of great meteorological
N.Z. Maia et al. / Continental Shelf Research 124 (2016) 23–3432
importance because this factor may divert the trajectory of cy-clones and even make them stagnate in a given area when actingas an atmospheric blocking event. This situation was observed inthe April 1999 event (Event 4), in which the cyclone over thecontinental shelf found itself trapped between two anti-cyclones,one in the middle of the Atlantic Ocean and one on the main land,as shown in Fig. 10. We setup an atmospheric blocking mode tostagnate and prevent the dissipation of the cyclone, which thenremained for 102 h over the continental shelf adjacent to the RioGrande do Sul. According to Machado and Calliari (2016), in astudy of 93 extreme events occurring between 1948 and 2013 withNCEP/NCAR reanalysis dataset, the path of the cyclone formed aloop without much forward motion, and this extratropical cyclonepresented the lowest propagation velocity of all cyclones studiedduring this 66 years.
Among all the events analyzed this event was that presentedthe longer duration time (102 h), almost double that the second(66 h). Thus, because of his long permanence on the platform, andas described above, this event was responsible for the destructionof 20% of sea side houses located in Hermenegildo Beach andnumerous others structural damage. According to Machado andCalliari (op cit.) this storm caused severe erosion at this beach,45 m3 m�1. Studying the occurrence of extreme events in south-ern Brazil, Guimarães et al. (2014) identified an important re-lationship between geomorphology and waves during stormssurges. According to the authors, the wave energy tends to beconcentrated in areas of higher gradients of bathymetry and withheterogeneous bottom morphology, as in the Hermenegildo Beachand, although the erosion at this beach has mainly been a problemof anthropic occupation, this relationship between waves andgeomorphology shows that this problem can also be associatedwith the cyclogenesis pattern and the wave transformation at theshoreface, where the waves energy has been concentrated in frontof Hermenegildo Beach.
Tozzi (1999) and Parise (2007) consider that cyclones very nearthe coast have a severe recurring impact, but storms located in themiddle of the ocean generate comparatively smaller impacts thatare distributed along the coast. Among the events analyzed in thiswork, one that has more information about the damages, and alsoconsidered in the existing literature the most harmful, the April1999 event (Event 4) has, according to Tozzi and e Calliari (2000),an annual return period. Sallenger (2000) proposed a scale ofstorm impacts in coastal areas, where the most extreme levels,Overwash Regime and Inundation Regime, were observed duringthe event 10 with sea level rising at 5 m (Fig. 6). At this level, in theareas with sand dunes preserved, is possible to observe bothoverwash of some sections of the frontal dunes as the transposi-tion of the same and subsequent flooding of the rear area of thedune system. However, even with such increased level of 5 m andthe occurrence of both impacts, we can still observe the top of thedune system emerged. So in 400 m of a beach stretch, dependingon the morphological variation of sand dunes, it was possible toobserve different levels of impact for the same event.
In a sea level lifting scenario, per share of storms, a factor thatdraws attention when analyzing the illustrations relating to vul-nerability to flooding is the presence of inlets. According to Fig-ueiredo and Calliari (2005), these features are quite common inthe Rio Grande do Sul coast, where these small-scale water waysplay an important role in the drainage of the coastal zone andespecially in sediment remobilization of the dune and swash re-gions. Thus, their presence on the coast is extremely important tothe dynamic sand configuration of the frontal dunes. In particular,Hermenegildo Beach has a greater than average concentration ofinlets per kilometer of beach compared with the rest of the RioGrande do Sul coast (Tozzi et al., 1999), with 3 large inlets ob-served throughout the resort, which extend less than 3 km (Fig. 6).
These structures are interruptions of the dunes and are trueweakness zones to the onslaught of the sea. In addition to inter-rupting the continuity of the dunes, they are areas of low altitude,thereby enhancing the effects of sea level highs on the inlets. Thisis quite explicit in the illustrations relating to the sea level rise in5.0 m, where the areas of greatest seawater intrusion are just overthe inlets (Fig. 6). To the Rio Grande do Sul coast, Guimarães et al.(2015) also confirmed that the urban occupation in inlets pro-duced a large susceptibility of flooding risk due to water levelvariations. Another important factor in this context is that in stormsituations, the inlets support faster water movement due to theincrease in rain fall rates, draining water from the coastal areaadjacent to the region. However, with a rising sea level on thecoast, this rain water cannot drain and empty into the sea butrather is dammed in the continent, transposing the margins of theinlet sand flooding the region. As the volume of water handled byan inlet is variable, its position and mouth are also dynamic andmeander, assuming different degrees of compliance. This featuremakes the areas surrounding these inlets more vulnerable andsusceptible to marine action, constantly changing the morphologyof the dunes. Thus, the flood potential is intensified in areas wherethe lateral migration of inlets changes the setting of the dunes(Benavente et al., 2006). Inlets of Hermenegildo Beach does notcontain containment structures, which allows the horizontal dis-placement of the shoreline in these areas into the continental in-terior. Thus, the natural occurrence and patterns of changes pro-duced by urbanization highlight inlets coastal risk characteristics(Figueiredo and Calliari, 2005).
4. Conclusions
An analytical model was developed to calculate sea level riseduring storms with satisfactory results. For the study area, themodel can be used for reconstitution and forecasting rises in sealevel on the coast due to the passage of cyclones.
In the case of the Rio Grande do Sul southern coast duringcyclone-induced storms, rising sea levels were forced primarily bythe wind (contribution 43%), secondarily by swell (contribution35%), followed by astronomical tide (contribution 15%) and finallyby atmospheric pressure (contribution 7%). Combining the resultsobtained by applying the analytical model for sea level rises duringstorms with Digital Terrain Models (DTM) allowed an approx-imation of the potential flooding of the beach, dune field andadjacent regions, supplementing forecasts and decision making bymanagers. Such tools are used to support the analysis of coastalrisk, although other factors such as the presence of containmentstructures (walls, spits, etc.) should also be considered in quanti-fying the degree of risk.
For the Hermenegildo Beach, the following can also beconcluded:
The central sector is the most vulnerable to flooding becausethis segment has less beach width due to sea advancement andrestriction of the shoreline by high concentrations of houses onthe escarpment. The southern sector of Hermenegildo Beach is theleast vulnerable stretch. In this area, urbanization still has a smallpresence, and the dunes are preserved. This stretch also includesthe widest beach, which dissipates wave energy, reducing theimpact on this coastal sector. As this section is still preserved, ithas greater adaptive capacity for dynamic beach balance, and thedunes are shown to be very efficient structures in terms of naturalcoastal protection. On the other hand, zones adjacent to the inletsmay be considered highly vulnerable to floods.
N.Z. Maia et al. / Continental Shelf Research 124 (2016) 23–34 33
Acknowledgements
We gratefully acknowledge CAPES for the financial supportoffered during this work.
Appendix
η η η η η= + + +t v w p a.Equation 1. Analytical model to calculate the rise in sea level
during storms induced by cyclones. Where,.ηt¼total level rise.ηv¼ level rise induced by wind (wind set-up).ηw¼ level rise induced by wave (wave run-up).ηp¼ level rise induced by pressure (barometric set-up).ηa¼ level rise induced by astronomical tide.
η = *ƒ
[(ƒ )е ]−vu
ct
2 xR
Equation 2. Wind-induced level elevation. Where,ηv¼ level rise induced by wind (wind set-up) (m).u*¼wind stress on the water surface (m/s).ƒ¼Coriolis parameter (1/s).c¼wave velocity in shallow water (m/s).t¼event duration (s).x¼distance from the point of desired elevation to the coast,
adopted here as 0 m (for wanting to achieve a level rise on thecoast).
R¼Rossby ray strain (m).Where,
Ω αƒ = ( )2 sin
Equation 3. Coriolis parameter.
=c gH
Equation 4. Wave propagation speed calculation in shallowwater.
=ƒ
Rc
Equation 5. Rossby ray strain. Where,Ω¼7.292�10�5.α¼�34°.g¼9.8 m/s.H¼ Average depth of the platform, adopted in this work as
100 m.And also,
τρ* =ua
2
Equation 6. Wind surface tension on water.Where,ρa¼water density (1024 kg/m3).τ¼wind shear stress.
τ ρ= CdVar2
Equation 7. Wind shear stress. Where,ρar¼air density (1.25 kg/m3).V¼wind speed parallel to the coast (m/s).Cd¼wind drag coefficient, which is dependent on the wind
speed and is derived from Bowden (1983).
η β= ( ′)o H L tans 00.5
Equation 8. Wave run-up. Where,Hs ¼significant wave height in deepwater.
L0¼wave length.β¼slope from the beach face in degrees, adopted here as 2.6°,
taken from Pereira et al. (2010).And also,
′ =L T1. 5602
Equation 9. Wave length. Where,T¼ peak period associated with the significant wave height.
ρη =ΔP
gp
a
Equation 10. Pressure-induced level elevation by Inverse Bar-ometer Effect. Where,
ηp¼ level rise induced by pressure (barometric set-up).ΔP¼atmospheric pressure variation (Pa).ρa¼water density (1024 kg/m3).g¼9.8 m/s.
= +Y x0.817 0.2252
Equation 11. Equation from linear correlation between sea le-vel elevation values measured in the field (Parise et al., 2009) andcalculated by the analytical model.
References
Balsillie, J.H., 1986. Beach and coast erosion due to extreme event impact. Shore andBeach 54 (4), 22–37.
Battjes, J., 1971. Run-up distributions of waves breaking on slopes. J. Waterw., Harb.Coast. Eng. Div. 97, 91–114.
Benavente, J., Garcia, F.J., López-Aguayo, F., 2000. Empirical model of morphody-namic beachface behaviour for low-energy mesotidal environments. Mar. Geol.167, pg375–390.
Benavente, J., Del Río, L., Anfuso, G., Gracia, F.J. e Reyes, J.L., 2002. Utility of Mor-phodynamic Characterisation in the Prediction of Beach Damage by Storms. J.Coast. Res. SI 36 56–64 (ICS 2002 Proceedings) Northern Ireland ISSN 0749–0208.
Benavente, J., Del Río, L., Gracia, F.J., Martínez-del-Pozo, J.A., 2006. Coastal floodinghazard related to storms and coastal evolution in Valdelagrana spit (Cadiz BayNatural Park, SW Spain). Cont. Shelf Res. 26 (2006), 1061–1076.
Bowden, K.F., 1983. Physical Oceanography of Coastal Waters. Ellis Horwood Ltd.,Chichester England, p. 301.
Callaghan, D.P., Ranasinghe, R., e Short, A., 2009. Quantifying the storm erosionhazard for coastal planning. Coast. Eng. 56, 90–93.
Calliari L.J., Faria, A.F.G., 2003. Bancos De Lama na Praia Do Cassino: Formação,Implicações geomorfológicas, ambientais e riscos costeiros, estudo De caso:maio De 2003. Anais Do IX Congresso da Associação Brasileira De Estudos DoQuaternário.
CEPAL-ONU –Efectos Del cambio climático En La Costa De América Latina y ELCaribe, 2011.
Csanady, G.T., 1982. Circulation in the Coastal Ocean. D.Reidel Publishing Company,Dordrecht, Holland/Boston, U.S.A/London, England, 279 p.
Esteves, L.S., Vranjac. M.P., Barletta, R.C., Pivel, M.A.G., Erthal, S., Vanz, A., Silva, A.R.P., Oliveira, U.R., 1999. Impacto de um evento de alta energia nas obras deproteção costeira no balneário do Hermenegildo, RS, Brasil. Anais Do VII Con-gresso da ABEQUA, Porto Seguro – BA.
Esteves, L.S., Pivel, M.A.G., Silva, B., Vranjac, M.P., Oliveira, U.R., R.C., A.R.P., Vanz, A.,2000. Beach owners perception of beach erosion along na armored shoreline insouthern Brasil. Pesqui. Em Geociênc. 27 (2), 93–109.
Ferreira, O., Garcia, T., Matias, A., Taborda, R., Alveirinho, J.D., 2006. An integratedmethod for the determination of set-back lines for coastal erosion hazards onsandy shores. Cont. Shelf Res.. 26, 1030–1044.
Figueiredo, S.A., Calliari, L.J., 2005. Sangradouros: Distribuição Espacial, VariaçãoSazonal, Padrões Morfológicos e Implicações no Gerenciamento Costeiro.GRAVEL, Porto Alegre, ISSN 1678–5975, no. 3, pp. 47–57.
Freitas, D., Araújp, R.S., Klein, A.H.F., e Menezes, J.T., 2010. Quantificação dos perigoscosteiros e projeção de linhas de costa futuras para a enseada de Itapocorói –SC. Braz. J. Aquat. Sci. Technol. 14 (1), 39–49.
Gill, A.E., 1982. Atmosfere-Ocean Dynamics. Academic Press, New York, p. 662.Goring, D.E., 1995. Short-term variations in sea level (2–15 days) in the New
Zealand region. N.Z. J. Mar. Freshw. Res., 1995 29, 69–82.Goulart, E.S., 2010. Morfodinâmica da antepraia adjacente ao Farol da Conceição:
litoral médio do RS. Dissertação de mestrado. Universidade Federal do RioGrande, Furg.
Guimarães, P.,V., Farina, L., Toldo Jr, E., 2014. Analysis of extreme wave events on thesouthern coast of Brazil. Nat. Hazards Earth Syst. Sci. 14, 3195–3205.
Guimarães, P.,V., Farina, L., Toldo Jr, E., Diaz-Hernandes, G., Akhmatskaya, E., 2015.
N.Z. Maia et al. / Continental Shelf Research 124 (2016) 23–3434
Numerical simulation of extreme wave runup during storm events in Tra-mandaí Beach, Rio Grande do Sul, Brazil. Coast. Eng. 95, 171–180.
Lawrence, P.L., 1994. Natural hazards of shoreline bluff erosion: a case study ofHorizon View, Lake Huron. In: Morisawa, M. (Ed.), Geomorphology and NaturalHazards vol. 10. Geomorphology, pp. 65–81.
Machado, A.A., Calliari, L.J., 2016. Synoptic systems generators of extremes wind insouthern Brazil: atmospheric conditions and consequences in the coastal zone.Proceedings of the 14th International Coastal Symposium, Sydney, Australia. J.Coast. Res., Special Issue, No. 75, pp. 1182–1186. Coconut Crrek, Florida, ISSN0749–0208.
Machado, A.A., Calliari, L.J., Melo, E., e Klein, A.H.F., 2010. Historical assessment ofextreme coastal sea state conditions in southern Brazil and their relation toerosion episodes. Pan-Am. J. Aquat. Sci. 5 (2), 277–286.
Maia, N.Z., 2011. Avaliação da elevação do nível do mar e riscos de inundaçãocosteira associados à passagem de ciclones no balneário Hermenegildo, RS.Dissertação de mestrado. Universidade Federal do Rio Grande, FURG. 118 p.
Marone, E. e, Camargo, R., 1994. Marés Meteorológicas no estado do Paraná: oevento de 18 de agosto de 1993. Nerítica, Curitiba 8 (1–2), 55–72 (Editora daUFPR).
Melo, E., Romeu, M.A.R., Hammes, G.R., 2010. Condições extremas de agitaçãomarítima ao largo de Rio Grande a partir do Modelo WW3. IV Seminário eWorkshop emEngenharia Oceânica – FURG(SEMENGO), Rio Grande Rio Grandedo Sul, Brasil, 20 p.
Morton, R.A., Leach, M.P., Paine, J.G., Cardoza, M.A., 1993. Monitoring beach changesusing GPS surveying techniques. J. Coast. Res. 9 (3), 884–908.
Morton, R.A., Speed, F.M., 1998. Evaluation of shorelines and legal boundariescontrolled by water levels on sandy beaches. J. Coast. Res. 14 (4), 1373–1384.
Oliveira, M.M.F., Ebecken, N.F.F., Santos, I.A., Neves, C.F., Caloba, L.P., Oliveira, J.L.F.,2007. Modelagem da maré meteorológica utilizando redes neurais artificiais:uma aplicação para a baía de Paranaguá – PR, parte 2: dados meteorológicos deREANÁLISE do NCEP/NCAR. Rev. Bras. De. Meteorol. 22 (1), 53–62.
Pajak, M.J., Leatherman, S., 2002. The high water line as shoreline indicator. J. Coast.Res. 18 (2), 329–337.
Parise, C.K., 2007. Padrões atmosféricos sinóticos geradores de mares meteor-ológicas intensas e a resposta morfodinâmica da praia do Cassino. Trabalho Deconclusão De curso De Oceanologia. Universidade Federal Do Rio Grande, FURG.
Parise, C.K., Calliari, L.J., Krusche, N., 2009. Extreme storm surges in the south ofBrazil: atmospheric conditions and shore erosion. Braz. J. Ocean. 57 (3),175–188.
Pereira, P.S., Calliari, L.J., Barletta, R.C., 2010. Heterogeneity and homogeneity ofSouthern Brazilian beaches: a morphodynamic and statistical approach. Cont.Shelf Res. 30, 270–280.
Pugh, D.T., 1987. Tides, Surges and Mean Sea Level. A Handbook for Engineers andScientists. John Wiley&Sons Ltd., New York, p. 472.
Santos, I.R., e Esteves, L.S., 2001. Evolução das obras de proteção costeira no Her-menegildo (RS) entre 1999–2001. Anais da XIV Semana Nacional de Oceano-grafia. Rio Grande, RS, Brasil.
Sallenger, A.H., Jr. 2000. Storm Impact Scale for Barrier Island. J. Coast. Res., vol. 16
(3), pp. 890–895. West Palm Beach, Florida, ISSN 0749–0208.Saraiva, J.M.B., Bedran, C. e, Carneiro, C., 2003. Monitoring of storm surges on
Cassino Beach. J. Coast. Res. Spec. Issue 35, 323–331.Tagliani, C.R., Calliari, L.J., Tagliani, P., e Antiqueira, J.A., 2010. Vulnerability to sea
level rise of an estuarine island in southern Brazil. Quat. Environ. Geosci. 01 (1),18–24.
Teixeira, P.S., 2007. Subsídios Para o gerenciamento costeiro por erosão da falésiaNo balneário Hermenegildo. Dissertação apresentada como requisito parcial àobtenção Do grau De Mestre Em Oceanografia Física, Química e Geológica.Universidade Federal Do Rio Grande, FURG.
Toldo Jr, E.E., Almeida, L.E.S.B., Martins, L.R.S., Gruber, N.L.S., Barros, C.E., Nicolodi, J.L., Farina, L. e Nunes, J.C., 2010. Hidrodinâmica e Sedimentologia das PraiasOceânicas do Rio Grande do Sul. Instituto de Geociências. Contribuições. 50anos de Geologia. Universidade Federal do Rio Grande do Sul.
Tolman, H.L., 1997. User manual and system documentation of WAVEWATCH- IIIversion 1.15 NOAA/NWS/NCEP/OMB Technical Note, 151, 97 pp.
Tolman, H.L., 2002. User manual and system documentation of WAVE-WATCH IIIversion 2.22. NOAA/NWS/NCEP/OMB Technical Note 222, 130 pp.
Tozzi, H.A.M., 1999. Influência das tempestades extratropicais sobre o estoquesubaéreo das praias entre Rio Grande e Chuí, RS. Campanha do outono e in-verno de 1996. Dissertação De mestrado. Universidade Federal Do Rio Grande,FURG.
Tozzi, H.A.M., e Calliari, L.J., 2000. Morfodinâmica da Praia do Cassino, RS. Pesqui.Em Geociênc. 27 (1), 29–42.
Tozzi, H.A.M., Pereira da Silva, R., Calliari, L.J. e Barletta, R.C., 1999. Variações decurto e longo período na morfologia das praias entre Cassino e Hermenegildo,Rio Grande do Sul. Anais Do VII Congresso da ABEQUA, Porto Seguro – BA.
Truccolo, E.C., Franco, D., e Schettini. C.A.F., 2006. The Low Frequency Sea LevelOscillations in the Northern Coast of Santa Catarina, Brazil. J. Coast. Res. SI 39,547�552 ICS 2004 (Proceedings) Brazil ISSN 0749–0208.
Van Cooten, S., Kelleher, K.E., Howard, K., Zhang, J., Gourley, J.J., Kain, J.S., Nemu-naitis-Monroe, K., Flamig, Z., Moser, H., Arthur, A., Langston, C., Kolar, R., Hong,Y., Dresback, K., Tromble, E., Vergara, H., Luettich Jr., R.A., Blanton, B., Lander, H.,Galluppi, K., Losego, J.P., Blain, C.A., Thigpen, J., Mosher, K., Figurskey, D.,Moneypenny, M., Blaes, J., Orrock, J., Bandy, R., Goodall, C., Kelley, J.G.W.,Greenlaw, J., Wengren, M., Eslinger, D., Payne, J., Olmi, G., Feldt, J., Schmidt, J.,Hamill, T., Bacon, R., Stickney, R., Spence, L., 2011. The CI-FLOW project: asystem for total water level prediction from the summit to the sea. Bull. Am.Meteorol. Soc. 92, 1427–1442.
Van Rijn, L.C., 2009. Prediction of dune erosion due to storms. Coast. Eng. 56 (2009),441–457.
Xavier, A.L.M., 2003. Influência do padrão atmosférico nas marés meteorológicas naPraia do Cassino, Rio Grande, RS. Trabalho De conclusão De curso De Oceano-logia. Universidade Federal Do Rio Grande, FURG.
⟨http://www.cpc.ncep.noaa.gov/products/wesley/reanalysis.html#intro⟩ (accessed26.03.16).
⟨http://www.esrl.noaa.gov/psd/data/gridded/reanalysis/⟩ (accessed 26.03.16).