Embed Size (px)
Citation preview
BioMed CentralProteome Science
ss
Open AcceMethodologyAnalytical model of peptide mass cluster centres with applicationsWitold E Wolski*1,2, Malcolm Farrow1, Anne-Katrin Emde2, Hans Lehrach4, Maciej Lalowski3 and Knut Reinert2Address: 1School of Mathematics and Statistics, Merz Court, University of Newcastle upon Tyne, NE1 7RU, UK, 2Institute for Computer Science, Free University Berlin, Takustr. 9, 14195 Berlin, Germany, 3Max Delbrück Center for Molecular Medicine, Robert-Roessle-Str. 10, D-13125 Berlin-Buch, Germany and 4Max Planck Institute for Molecular Genetics, Ihnestraße 63-73, D-14195 Berlin, Germany
Email: Witold E Wolski* - [email protected]; Malcolm Farrow - [email protected]; Anne-Katrin Emde - [email protected]; Hans Lehrach - [email protected]; Maciej Lalowski - [email protected]; Knut Reinert - [email protected]
* Corresponding author
AbstractBackground: The elemental composition of peptides results in formation of distinct, equidistantlyspaced clusters across the mass range. The property of peptide mass clustering is used to calibratepeptide mass lists, to identify and remove non-peptide peaks and for data reduction.
Results: We developed an analytical model of the peptide mass cluster centres. Inputs to themodel included, the amino acid frequencies in the sequence database, the average length of theproteins in the database, the cleavage specificity of the proteolytic enzyme used and the cleavageprobability. We examined the accuracy of our model by comparing it with the model based on anin silico sequence database digest. To identify the crucial parameters we analysed how the clustercentre location depends on the inputs. The distance to the nearest cluster was used to calibratemass spectrometric peptide peak-lists and to identify non-peptide peaks.
Conclusion: The model introduced here enables us to predict the location of the peptide masscluster centres. It explains how the location of the cluster centres depends on the inputparameters. Fast and efficient calibration and filtering of non-peptide peaks is achieved by a distancemeasure suggested by Wool and Smilansky.
BackgroundThe mass spectrometric (MS) technique is widely used toidentify proteins in biological samples [1-4]. The proteinsare cleaved into peptides by a residue specific protease, e.g.trypsin. The resulting cleavage products can then be ana-lysed by Peptide Mass Fingerprinting (PMF) [5] or sub-jected to MS/MS fragment ion analysis [6,7], which bothrely on the comparison of peptide or peptide fragment ionspectra with spectra simulated from protein sequencedatabases [8].
The sensitivity and specificity of the peptide identificationcan be increased by various post-processing methods, forexample calibration [9-12] and identification of non-pep-tide peaks [10,13,14]. The fact that peptide masses are notuniformly distributed across the mass range but formequidistantly spaced clusters [15] is employed by some ofthese methods. In dependence on the atomic composi-tion of the peptide, the monoisotopic mass would emergebelow (e.g. cystein rich peptides) or above (e.g. lysine richpeptides) the cluster centres. The deviation from the clus-ter centre is a result of the mass defect, which is the differ-
Published: 23 September 2006
Proteome Science 2006, 4:18 doi:10.1186/1477-5956-4-18
Received: 30 January 2006Accepted: 23 September 2006
This article is available from: http://www.proteomesci.com/content/4/1/18
© 2006 Wolski et al; licensee BioMed Central Ltd.This is an Open Access article distributed under the terms of the Creative Commons Attribution License (http://creativecommons.org/licenses/by/2.0), which permits unrestricted use, distribution, and reproduction in any medium, provided the original work is properly cited.
Page 1 of 19(page number not for citation purposes)
Proteome Science 2006, 4:18 http://www.proteomesci.com/content/4/1/18
ence between the nominal mass and the monoisotopicmass (Table 1). The mass defect is a result of atom fusion[16,17].
CalibrationMass spectrometric peptide peak-lists of peptide mass fin-ger print experiments [18] can be calibrated by comparingthe location of measured peptide masses with the locationof the peptide mass cluster centres. Gras et al. [19] sug-gested the use of maximum likelihood methods in orderto determine the calibration coefficients a and b. Theydefined the likelihood function by:
where mi is the i-th mass in the peak-list, and Δm is asearch window. P(m, Δm) is the probability to find a massin [m, m + Δm] given the theoretical distribution of pep-tide masses. The parameters a, b for argmax ∑i P(ami + b,Δm) can then be used to calibrate the peak-lists. Theauthors, however, do not provide information on whetherP(m, Δm) was determined from the exact distribution ofthe peptide masses or if a model approximating the distri-bution was used. They also do not mention which algo-rithm was used to maximise the likelihood. They reportedthat a mass measurement accuracy of 0.2Da and betterwas obtained after calibration.
Wool and Smilansky [10] have used Discrete FourierTransformation (DFT) to determine the frequency λ andphase ϕ of a peak-list or mass spectrum. By comparing theexperimental λ and ϕ with the theoretical λ = 1.000495and ϕ = 0, they determined the slope and intercept of thecalibration function. The authors reported a 40 – 60%reduction of the mass measurement error. Furthermore,they presented a scoring scheme for sequence databasesearches. This scoring scheme approximates the probabil-ity P(m, Δm) to observe a peptide peak of mass m withgiven measurement error Δm.
Matrix noise filtrationThe most widely used MALDI matrices for the analysis ofpeptides are 3,5-Dimethoxy-4-hydroxycinnamic acid (syn-apic acid), alpha-Cyano-4-hydroxycinnamic acid (alpha
cyano) [20] and 2,5-dihydroxybenzoic acid (DHB) [21].Unfortunately, clusters of matrix molecules can be ionisedand cause peaks in the same mass range where peptidepeaks are measured. Matrix aggregate formation can beminimised but not eliminated by adding ammonium ace-tate [21].
Some of the database search scoring schemes incorporatethe number of signals (peaks) not assigned to a proteinwhen computing the identification scores [22]. Therefore,the presence of matrix signals in MS spectra decreases thesensitivity of the MS spectra interpretation. Hence, theremoval of peaks strongly deviating from the cluster cen-tres is applied [21,23]. The measure of deviation fromcluster centres introduced here provides a simple tool tofilter non-peptide peaks.
Data reductionA further application which employs the property of pep-tide mass clustering is the binning of the mass measure-ment range. By applying this technique the amount ofdata is reduced, thus increasing the speed with which thepairwise comparison of spectra can be made [24,25].
All these applications require us to know the exact loca-tion of or the distance between the peptide mass clustercentres. The distance between the cluster centres, whichwe will henceforth call wavelength λ, is commonly com-puted by first generating an in silico digest of the database.Afterwards, the linear dependence between the decimalpoint and the integer part is determined by regressionanalysis, for a relatively small mass range of 500 to1000Da [23]. Various authors report different values ofthe distance between clusters: Wool and Smilanskyreported 1.000495 [10], Gay et al. 1.000455 [15], whileTabb et al. used a wavelength of 1.00057 [24].
In this work we present an analytical model allowing us topredict the mass of the peptide cluster centres. The param-eters of the model include: the frequencies of the aminoacids in the sequence database [26], the average proteinlength of the proteins in the database, the cleavage sites ofthe proteolytic enzyme and the cleavage probability.Based on this model we introduced a measure of devia-tion of peptide masses from the nearest cluster centre,which is a refinement of a measure proposed by Wool andSmilansky [10]. Using this distance measure, we devel-oped a calibration procedure which employs least squareslinear regression in order to determine the affine model ofthe mass measurement error and subsequently to calibratethe spectra. Using this method we reached higher calibra-tion accuracy as reported by Wool and Smilansky [10],and Gras et al [19]. We used the same distance measure toidentify and remove non-peptide peaks prior to databasesearches performed by the Mascot search engine [22].
P am b mii
( , ),+ Δ ( )∑ 1
Table 1: Masses of Atoms
Atom monoisotopic nominal mass defect
1 H 1.00782 1 0.007822 C 12.00000 12 0.000003 N 14.003074 14 0.0030744 0 15.99491 16 -0.000325 S 31.97207 32 -0.00087
Page 2 of 19(page number not for citation purposes)

Proteome Science 2006, 4:18 http://www.proteomesci.com/content/4/1/18
Results and discussionA simple way to predict the peptide mass cluster centres of a protein databaseFigure 1 shows the mass defect, the difference of themonoisotopic (m(M)) and nominal (m(N))masses of pep-tides of a sequence specific in silico protein sequence data-
base digest [27], as a function of m(N). The peptides wereproduced with the restriction that no missed cleavageswere allowed. A strong linear dependence of the massdefect on m(N) can be observed.
The peptide mass ruleFigure 1The peptide mass rule. Panel A: Scatterplot of m(M) - m(N) against the m(N) mass (m(M) - monoisotopic mass, m(N) - nominalmass). Red dashed line – the model determined by linear regression with intercept fixed at 0. The magenta line represents the cluster centres predicted by linear regression.
0 1000 2000 3000 4000 5000 6000
0.0
0.5
1.0
1.5
2.0
2.5
3.0
3.5
mnominal
mm
onoi
soto
pic
−−m
nom
inal
c1=4.99*10−−4
c1=4.85*10−−4 c0=2.9*10−−2
1500
100015002000
z ≥≥ 2500
Page 3 of 19(page number not for citation purposes)

Proteome Science 2006, 4:18 http://www.proteomesci.com/content/4/1/18
The first model of this dependence which we examinedwas m(M) - m(N) = c1·m(N). We fixed the intercept at 0,because a hypothetical peptide with a nominal mass of 0must have a monoisotopic mass equal to 0. The slopecoefficient c1, determined by linear regression (cf. Meth-ods) equalled 4.98·10-4(Figure 1, Panel A – red dashedline), which is a value similar to the values 4.95·10-4
reported by Wool and Smilansky [10].
We were interested in determining the dependencebetween monoisotopic and nominal mass analytically.
For example, the monoisotopic mass (m(M)) of hypothet-ical peptides built only of one amino acid i can be pre-
dicted, given their nominal mass (m(N)) by = λi
when λi = / . For peptides generated by
random cleavage of protein sequences from a proteindatabase this dependence is approximated by:
where fi is the frequency of the amino acid i in the data-base.
Now write = λDB + εi. Substituting this is (2),
it follows that ∑i∈AA fiεi = 0. Therefore, for an amino acid
randomly selected from the database, with frequencies fi,
the expectation of εi is zero. Now consider a peptide made
of a random selection of J amino acids, i(1),...,i(J). Theratio of monoisotopic to nominal mass for this peptidewould be:
If ∑i εi(j) were uncorrelated with for a ran-
dom selection of amino acids, then λp would have expec-
tation λDB. Of course, there may be a relationship between
εi and and we would wish to use any such relation-
ship to improve prediction of
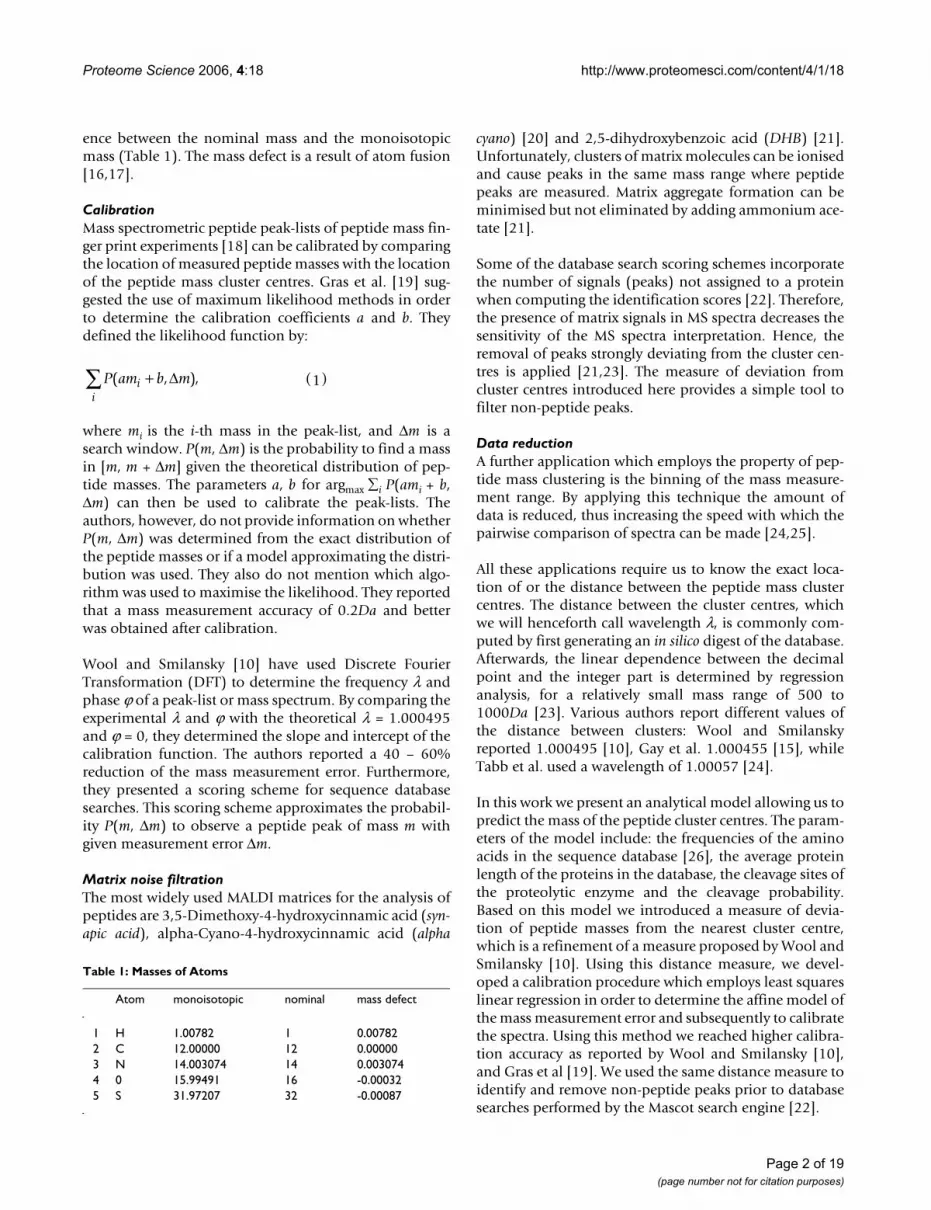
Figure 2 visualises the frequencies fi of all amino acids inthe Uniprot database [27] with their respective λi plotted
on the abscissa. The position of the red vertical line on theabscissa denotes λDB (Equation 2) and equals λDB =1.000511. The dotted, dashed and dot dashed lines indi-cate the wavelength λ of DHB, alpha-cyano and sinapicacid mass spectrometric matrix clusters, respectively.
When testing for the significance of the intercept coeffi-cient in the regression model mM ∝ λmN of a sequence spe-cific (Tryptic) in silico database digest, we found that theintercept coefficient must be included into the model.Therefore, the extended model of the monoisotopic pep-tide mass cluster centres was:
m(M) = c1·m(N) + c0. (3)
Subtracting mN from each side of Equation 3 we obtainedΔ = m(M) - m(N) = (c1 - 1)·m(N) + c0. The coefficients of theaffine linear model of the cluster centres, determinedusing regression analysis of Δ = m(M) - m(N) on m(N) were c
0 = 0.029 and (c1 - 1) = 4.85·10-4.
The maximal difference between the prediction of m(M)
using m(M) = 1.000499·m(N) and m(M) = 1.000485·m(N) +0.029 is 0.022 Dalton for m(N) ∈ [600, 2500] Dalton.
The influence of the digestion enzyme on the wavelength of peptide mass clustersIn case of a complete sequence specific cleavage of pro-teins, the number of generated peptides is CP + 1 peptides,given that CP is the number of cleavage sites per protein.The peptides generated from the terminus of the protein(further called terminal) will not bear a cleavage site resi-due RC at their end. All the other peptides, which we callinternal, will have such a residue at their end. The fractionof the internal peptides fc,n is given by
where n is the number of missed cleavages per protein. Weapproximate CP, for a sequence database, by:
where are the relative frequencies of the cleavage sites
and |P| is the average protein length in the database. Thefraction of the terminal peptides in case of n missed cleav-ages is given by 1 - fc,n. The fraction of cleavage site resi-
dues RC in a internal peptide of mass mpep, with n missed
cleavage sites is denoted fm,n and approximated by:
miM( )
miN( ) mi
M( ) miN( )
λDBi i
Mi AA
i iN
i AA
f m
f m= ( )
( )∈
( )∈
∑∑
, 2
miM( ) mi
N( )
λλ ε
pi jM
jJ
i jN
jJ
DB i jN
jJ
i jjJ
i jN
j
m
m
m
m= =
+( )=
( )=
( )= ( )=
( )
∑∑
∑ ∑1
1
1 1
==∑ 1J
.
mi jN
i ( )( ) −
∑( ) 1
miN( )
miM( )
fC n
C nc nP
P, ,= −
+ −( )
14
C P fP RC= ⋅( ) ( )∑| | , 5
fRC
Page 4 of 19(page number not for citation purposes)
Proteome Science 2006, 4:18 http://www.proteomesci.com/content/4/1/18
where is the average mass of an amino acid residue. Amore accurate model of fm,n is provided in the Appendix. In
the case of terminal peptides the fraction of cleavage siteresidues RC equals fm,n - 1. The fraction of all the other
amino acid residues R\RC equals 1 - fm,n or 1 - fm,n - 1 respec-
tively. Table 2 summarises these results.
In the case of internal peptides, the average contributionof the amino acid residues to the peptide mass is theweighted sum:
where
is the average mass of non cleavage residues, and:
is the average mass of the cleavage site residues RC. Finally,the wavelength of internal peptides is presented as:
The wavelength of terminal peptides was determined by:
.
f nm
mm n, ,= +( ) ( )1 6pep
m
m f m f m
m f m m
R n m n none m n R
none m n R none
C c
C
, , ,
,
∗( ) = −( ) ⋅ + ⋅ ( )
= + ⋅ −( )1 7
,, 8( )
m f mnone i ii R RC
= ⋅ ( )∈∑ ,
\9
m f mR i ii R
C
C
= ⋅ ( )⋅∈∑ 10
λR nm R n
M
R nNC
C
C
m
m,
,
,
= ( )( )
( ) 11
λR mn R n
M
R nNC
C
C
m
m,
,
,
−( ) −( )
−( )=1 1
1
Bar-plot of the Amino Acid frequenciesFigure 2
Bar-plot of the Amino Acid frequencies. The bars are drawn on the position of λi = / , for each amino acid i. The
red line indicates λDB computed using the Equation 2. Dotted blue line - λDHB 2,5-dihydroxybenzoic acid; dashed line - λalphacyano
alpha-Cyano-4-hydroxycinnamic acid; dot dashed line - λsinapica. 3,5-Dimethoxy-4-hydroxycinnamic acid.
miM( ) mi
N( )
Page 5 of 19(page number not for citation purposes)
Proteome Science 2006, 4:18 http://www.proteomesci.com/content/4/1/18
The wavelength λ of all peptides at a mass m withexactly n missed cleavages is given by:
where
is the weighted sum of the mass of the terminal peptides(with frequency 1 - fc,n) and the internal peptides (withfrequency fc,n).
Cleavage probability pc In practice, the cleavage probabil-ity will depend on various factors, for example on theincubation time and the efficiency of the protease used.The probability to generate a peptide with n ∈ 0...∞missed cleavage sites, given the cleavage probability pc canbe modelled using the geometric distribution:
P(n, pc) = (1 - pc)n·pc (17)
Furthermore,
holds. Hence, given the cleavage probability is pcandcleavage residues RC, we express the peptide mass by:
where
Sn = (fc,nfm,n + fm,(n-1) - fc,nfm,(n-1)). (20)
Therefore, the wavelength λ of peptides if the cleavageprobability is pc is given by:
The monoisotopic mass as a function of the nominalmass can be expressed by:
This equation represents our final model of the peptidemass cluster centres. To illustrate the accuracy of the pre-diction we computed the residuals Δ between the monoi-sotopic masses of the in silico database digest and thecluster centres predicted by Equation 24. Figure 3 showsthe relative residuals Δppm(m) = Δ(m)/m·106, in parts permillion. The grey line shows the moving average of theresiduals Δppm(m) computed for a window of 15Da.
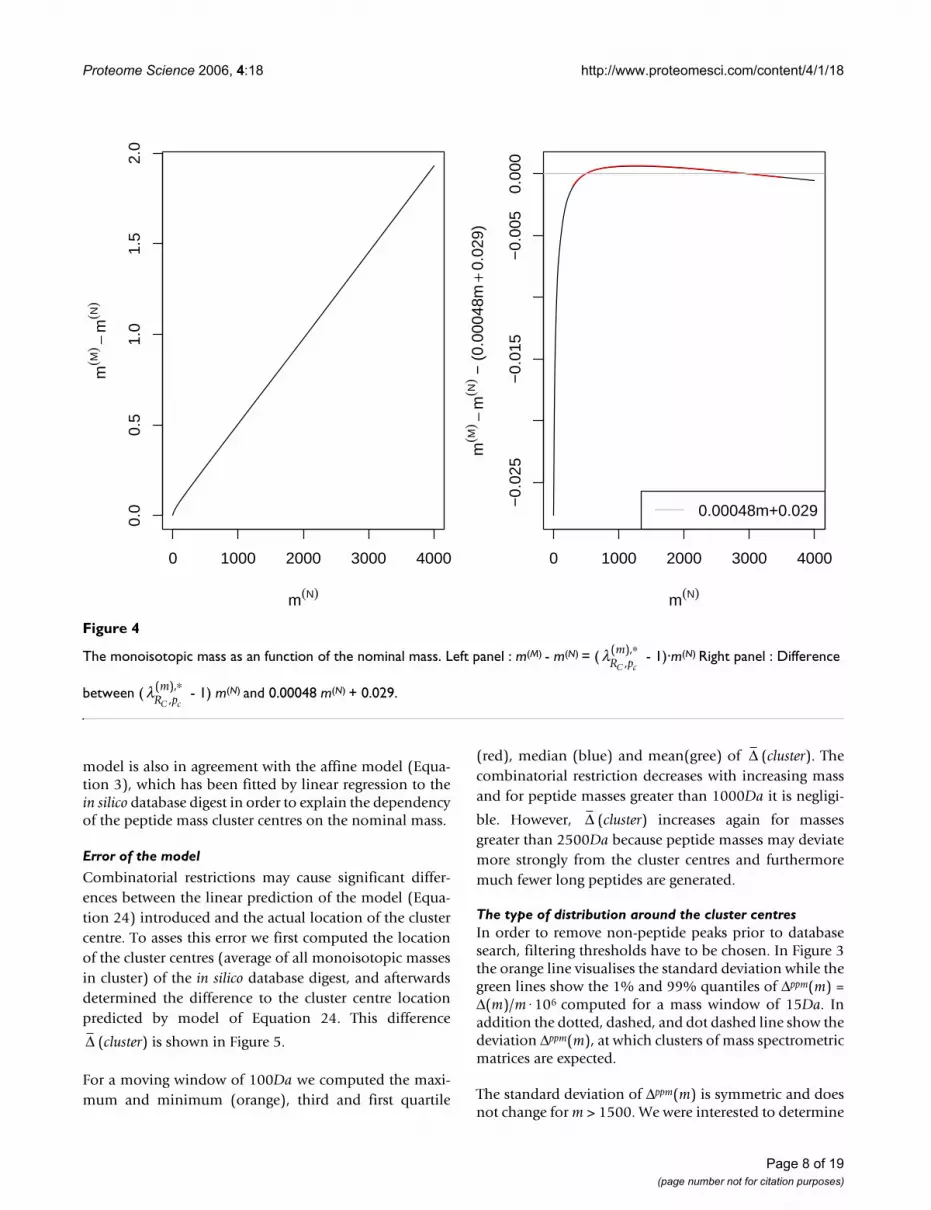
Figure 4, panel A, shows the difference between nominaland monoisotopic mass (m(M) - m(N)) where m(M) was pre-dicted using the model of Equation 24. We observed thatm(M) - m(N) ∝ m(N) is approximately a straight line for themass range greater than 500Da. By using the predictedmonoisotopic mass m(M) at m(N) = 500 and at m(N) = 3000we determined the slope:
and intercept coefficient
λR nm R n
M
R nNC
C
C
m
m,
, ,,
,,
∗( ) ∗
( ) ∗= ( )12
m f m f m
m
R nMN
c n R nMN
c n R nMN
none
C C C,[ ],
, ,[ ]
, ,[ ]( )∗
−= ⋅ + − ⋅ ( )
= +
1 131
mm m f f f f fR none c n m n m n c n m nC−( ) ⋅ + −( ) ( )
=
− −, , ,( ) , ,( )1 1 14
with Equaation 6
with Equation 4
mm
mf n m mnone c n R noneC
+ +( ) −( ) ( )
=
, 15
mnnonep
pR none
C n
C nn
m
mm m
C+
−
+ −+
⎛
⎝⎜⎜
⎞
⎠⎟⎟ ⋅ ⋅ −( ) ( )
116
1 1 180
−( ) ⋅ = ( )=
∞∑ p pc
n
nc
mR pC c, ,∗ = + ( ) ( ) ( )∑m p p m m Snone cn
nc R none nC
10
−− ⋅⋅ ⋅⋅ −− ⋅⋅==
∞∞19
λR pm R p
M
R pNC c
C c
C c
m
m,
, ,,
,,
∗( ) ∗
( ) ∗= ( )21
m m
m m
m
MR pm N
R pM N
R pN
C c
C c
C c
( ),
( ), ( )
,( ), ( )
,( ),
= ⋅ ( )
=⋅
( )
=
∗
∗
∗
λ 22
23
wwith Eq. 20 and 4
m m p p m mnoneM N
cn
c RM
noneM
C
( ) ( ) ( ) (⋅ + −( ) ⋅ ⋅ −1 ))=
∞
( ) ( ) ( )
( ) ⋅ +( )+ −( ) ⋅ ⋅ −( ) ⋅
∑ m f n
m p p m mm
c nn
noneN
cn
c RN
noneN
C
,0
1mm
f n
m m
m
N c nn
m m
noneM N
noneN
N
( )=∞ +( )
( )
≈⋅
+−
∑
( )
,
( ) ( )
( )
0
24
1
for
pp p m m m f n
m
cn
c RM
noneM
n c n
noneMC
( ) ⋅ ⋅ − ⋅ +( )( )=
∞∑ ( )( ) ( ),
( )0
25
cR p R pC c C c
1
3000 5003000 500
3000 5001 000482=
⋅ − ⋅
−=
( ) ∗ ( ) ∗λ λ,,
,,
. , 226( )
c cR pC c0500
1500 1 500 0 029 27= ⋅ −( ) − ⋅ = ( )( ) ∗λ ,, . .
Table 2: Frequencies of cleavage site residues, and all other residues, in peptides of mass m and of terminal, and internal, peptides.
Rnon-cleavage Rcleavage Peptide type
(1 - fm,n) fm,n fc,n internal(1 - fm,n - 1) fm,n - 1 1 - fc,n terminal
Rcleavage – frequencies of cleavage site residues; Rnon-cleavage – frequencies of non-cleavage site residues; fm,n – see Equation 6; fc,n – see Equation 4.
Page 6 of 19(page number not for citation purposes)

Proteome Science 2006, 4:18 http://www.proteomesci.com/content/4/1/18
These coefficients are in good agreement with the slopeand intercept determined by linear regression for the in sil-ico sequence database digest (Figure 1).
Furthermore, we observed that the intercept c0 will be pos-
itive if > mnone, zero or negative otherwise. The slope
c1 equals λnone = , for large m(N), because the fre-
quency of the cleavage site residues RC decreases with
increasing peptide length:
Figure 4, panel B, displays the difference between the line(c1 + 1)·m(M) + c0 and the prediction made using Equation3. For the mass range m ∈ (500, 4000) where peptidemasses for peptide mass fingerprinting are acquired thisdifference is minimal.
The coefficients c0 and c1 do not depend on the mass of thepeptides. Due to this feature, we are going to use the affinemodel c1m(N) + c0 to predict the peptide mass cluster cen-tres in the applications discussed later. This simplified
mRC
m
mnoneM
noneN
( )
( )
lim lim .| |
,Pep
m nm N
f n m
mpep→∞ →∞ ( )∝ +( ) =1 0
Deviation Δppm of peptide masses from mass cluster centres predicted using the Equation 24 in parts per million [ppm]Figure 3Deviation Δppm of peptide masses from mass cluster centres predicted using the Equation 24 in parts per million [ppm]. Gray line – moving average of Δppm. Orange lines – Standard deviation of Δppm, Green lines – 1% and 99% Quantile computed for mass windows having a size of 15Da and covering the mass range. Magenta dot dashed line – maximum possible deviation from cluster centre, which can be assigned to the true cluster centre using the Equation 30. Horizontal dotted blue line – distance of DHB (2,5-dihydroxybenzoic acid) matrix clusters from the peptide mass cluster centres; dashed line – distance of alphacyano (alpha-Cyano-4-hydroxycinnamic acid) clusters from the peptide mass cluster centres; distance of sinapicacid (3,5-Dimethoxy-4-hydroxycinnamic acid) clusters from peptide mass cluster centres.
0 1000 2000 3000 4000
−40
0−
200
020
040
0
mnominal
Δ[pp
m]
DHBsinapic.aalpha cyano
(0.5)106 mnominal
ΔSN(Δ)1% and 99% quantiles
Page 7 of 19(page number not for citation purposes)
Proteome Science 2006, 4:18 http://www.proteomesci.com/content/4/1/18
model is also in agreement with the affine model (Equa-tion 3), which has been fitted by linear regression to thein silico database digest in order to explain the dependencyof the peptide mass cluster centres on the nominal mass.
Error of the model
Combinatorial restrictions may cause significant differ-ences between the linear prediction of the model (Equa-tion 24) introduced and the actual location of the clustercentre. To asses this error we first computed the locationof the cluster centres (average of all monoisotopic massesin cluster) of the in silico database digest, and afterwardsdetermined the difference to the cluster centre locationpredicted by model of Equation 24. This difference
(cluster) is shown in Figure 5.
For a moving window of 100Da we computed the maxi-mum and minimum (orange), third and first quartile
(red), median (blue) and mean(gree) of (cluster). Thecombinatorial restriction decreases with increasing massand for peptide masses greater than 1000Da it is negligi-
ble. However, (cluster) increases again for massesgreater than 2500Da because peptide masses may deviatemore strongly from the cluster centres and furthermoremuch fewer long peptides are generated.
The type of distribution around the cluster centresIn order to remove non-peptide peaks prior to databasesearch, filtering thresholds have to be chosen. In Figure 3the orange line visualises the standard deviation while thegreen lines show the 1% and 99% quantiles of Δppm(m) =Δ(m)/m·106 computed for a mass window of 15Da. Inaddition the dotted, dashed, and dot dashed line show thedeviation Δppm(m), at which clusters of mass spectrometricmatrices are expected.
The standard deviation of Δppm(m) is symmetric and doesnot change for m > 1500. We were interested to determine
Δ
Δ
Δ
The monoisotopic mass as an function of the nominal massFigure 4
The monoisotopic mass as an function of the nominal mass. Left panel : m(M) - m(N) = ( - 1)·m(N) Right panel : Difference
between ( - 1) m(N) and 0.00048 m(N) + 0.029.
0 1000 2000 3000 4000
0.0
0.5
1.0
1.5
2.0
m(N)
m(M
) −m
(N)
0 1000 2000 3000 4000
−0.
025
−0.
015
−0.
005
0.00
0
m(N)
m(M
) −m
(N) −
(0.
0004
8m+
0.02
9)
0.00048m+0.029
λR pmC c,
( ),∗
λR pmC c,
( ),∗
Page 8 of 19(page number not for citation purposes)

Proteome Science 2006, 4:18 http://www.proteomesci.com/content/4/1/18
the distribution of Δppm around the peptide mass clustercentres. To determine the type of distribution we useqqplots [28] shown in Figure 6. We compared the distri-bution of the residues Δppm(m), observed for four differentmass windows (m ∈ (500 – 530), m ∈ (1000 – 1110), m∈ (2000 – 2200) and m ∈ (3400 – 3700)) with the normaldistribution and t-distributions with various degrees offreedom. The t-distribution with degrees of freedom μ ∈(15, 25) is a good approximation of the empirical distri-bution of Δppm for masses > 2000,.
Sensitivity analysisThe input parameters to the model of the peptide masscluster centres included:
• fi – frequencies of the amino acids.
• cleavage specificity of the protease RC
• |P| – Protein length
• pc – cleavage probability
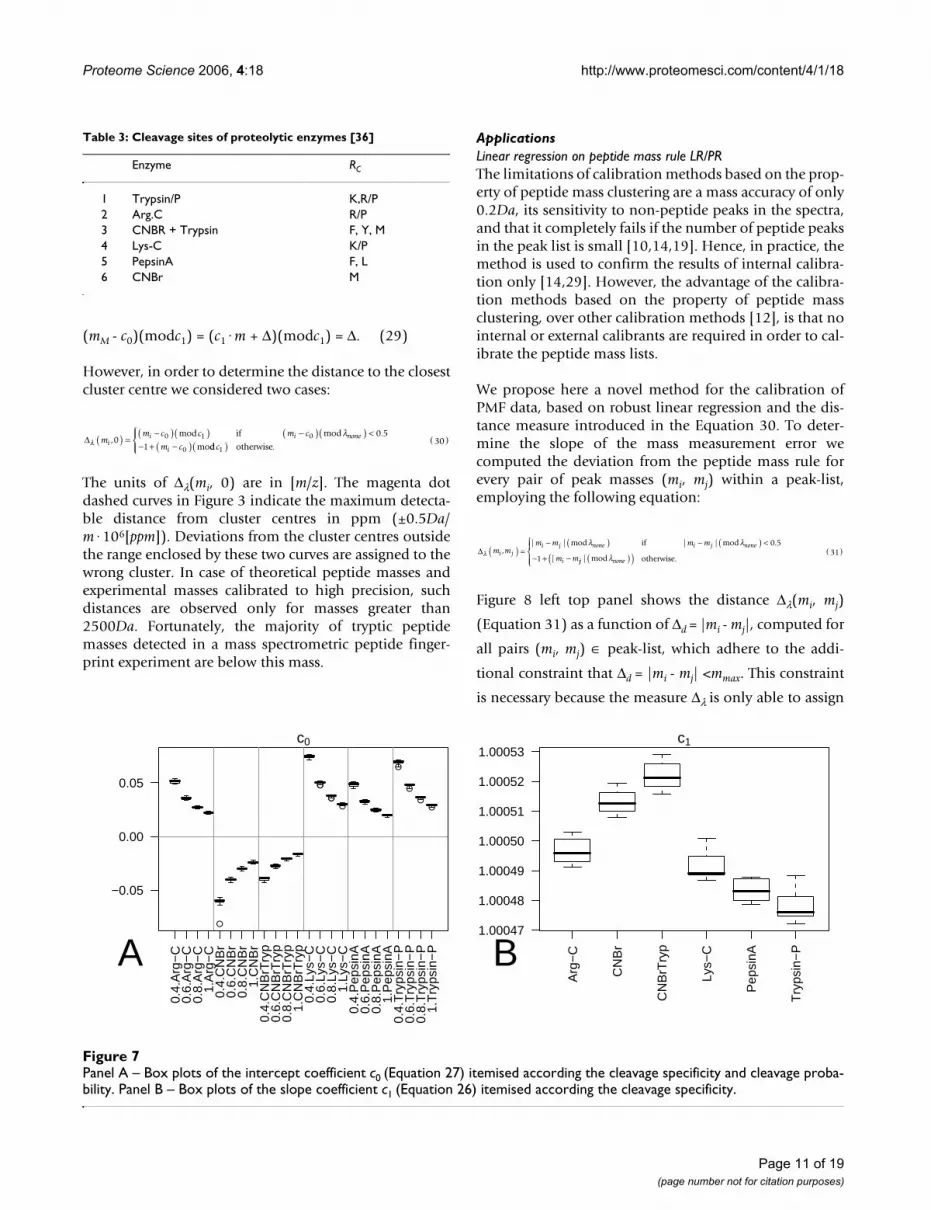
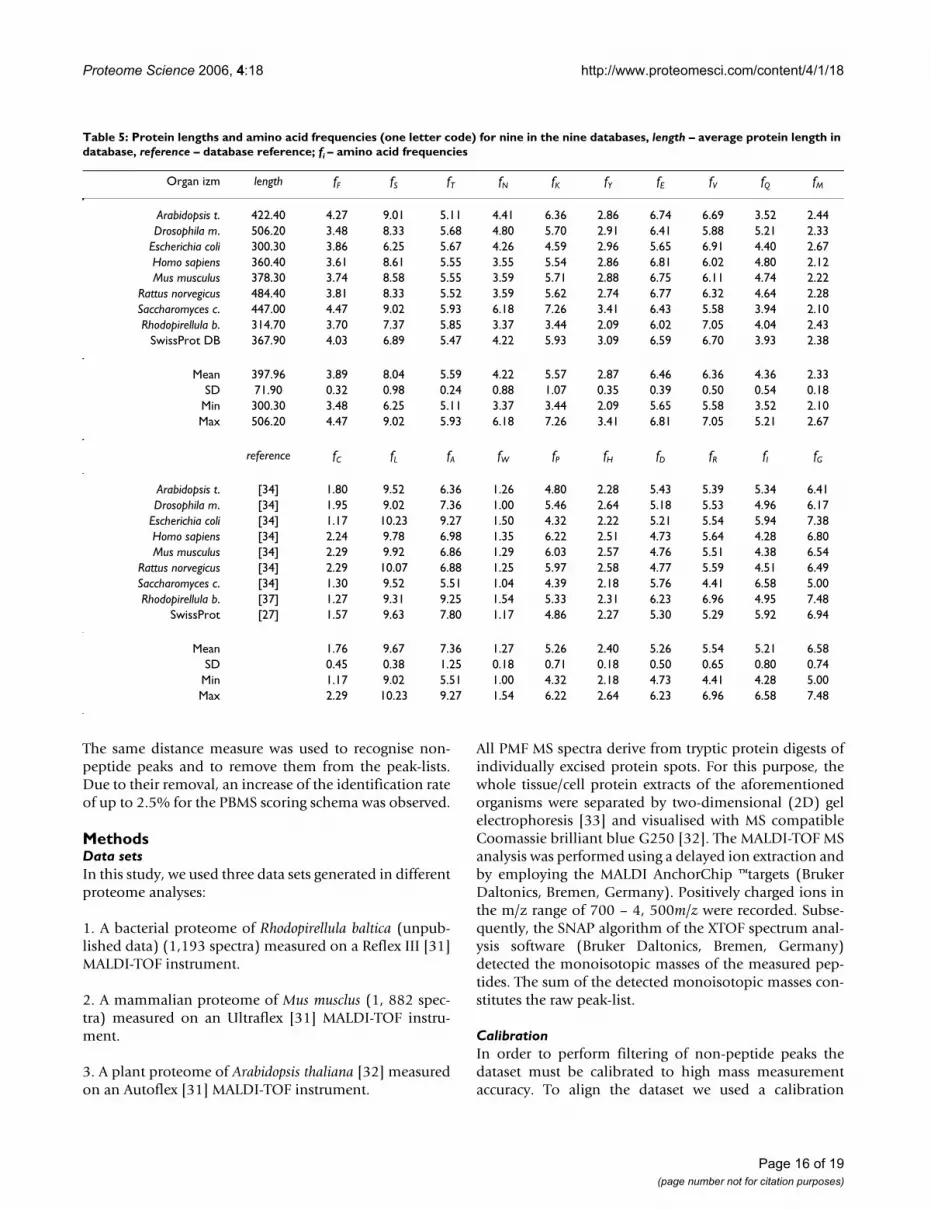
To examine how the output of the model is influenced bythese factors we varied the protein length |P| in steps of100 from 300 to 800 amino acids per protein. We deter-mined the amino acid frequencies fi for 9 sequence data-bases (cf. Methods) and used them as inputs to the model.Furthermore, six cleavage specificities (shown in Table 3)were examined and the cleavage probability pc waschanged from 0.4 to 1 in increments of 0.2.
The box-plots, of Figure 7, Panel A demonstrate that thevalues of the intercept coefficient c0 (Equation 27) mainlydepend on the cleavage probability pc and on the cleavagespecificity of the proteolytic enzyme. The relatively smallheight of the boxes indicates that the differences in aminoacid frequencies fi for the databases examined, and theaverage protein length |P| have a negligible effect on theintercept coefficient. The slope coefficient c1 (see Equation26) depends only on the cleavage site specificities of theproteolytic enzyme and the amino acid frequencies f. Thebox-plots 7 Panel B show that the model output is highlysensitive to the cleavage specificity of the proteolyticenzyme.
Difference between cluster centre computed for the in silico database digest and the cluster centre location predicted by the model (Equation 24)Figure 5Difference between cluster centre computed for the in silico database digest and the cluster centre location predicted by the model (Equation 24). Orange lines – minimum and maximum, red lines – first and third quartile, green – mean, blue – median of the differences computed for a moving window of 100Da.
0 500 1000 1500 2000 2500 3000 3500
−0.
06−
0.02
0.02
0.04
0.06
m/z
ΔΔ clu
ster
Page 9 of 19(page number not for citation purposes)

Proteome Science 2006, 4:18 http://www.proteomesci.com/content/4/1/18
A measure of distance to cluster centresGiven an experimentally determined mM we were inter-ested to estimate the deviation Δ from the closest pre-dicted cluster centre. The model of the monoisotopicmass is:
c0 + c1·mN + Δ = mM, (28)
where c0, c1 can be obtained using the Equations 27 and26, mN is the nominal mass (an integer).
Therefore, for a given mM, c0 and c1 we can determine thedeviation Δ from the closest cluster centre of smaller massby using the modulo operator as suggested by Wool andSmilansky [10]:
qqplot – of Δppm = mm - c1·mN - c0 versus the t-distribution with 19 degrees of freedom for four mass ranges m ∈ (500 – 530), m ∈ (1000 – 1110), m ∈ (2000 – 2200)and m ∈ (3400 – 3700)Figure 6qqplot – of Δppm = mm - c1·mN - c0 versus the t-distribution with 19 degrees of freedom for four mass ranges m ∈ (500 – 530), m ∈ (1000 – 1110), m ∈ (2000 – 2200)and m ∈ (3400 – 3700).
Theoretical Quantiles
Sam
ple
Qua
ntile
s
−6
−4
−2
0
2
4
−5 0 5
500−530 1000−1110
2000−2200
−5 0 5
−6
−4
−2
0
2
4
3400−3700
Page 10 of 19(page number not for citation purposes)
Proteome Science 2006, 4:18 http://www.proteomesci.com/content/4/1/18
(mM - c0)(modc1) = (c1·m + Δ)(modc1) = Δ. (29)
However, in order to determine the distance to the closestcluster centre we considered two cases:
The units of Δλ(mi, 0) are in [m/z]. The magenta dotdashed curves in Figure 3 indicate the maximum detecta-ble distance from cluster centres in ppm (±0.5Da/m·106[ppm]). Deviations from the cluster centres outsidethe range enclosed by these two curves are assigned to thewrong cluster. In case of theoretical peptide masses andexperimental masses calibrated to high precision, suchdistances are observed only for masses greater than2500Da. Fortunately, the majority of tryptic peptidemasses detected in a mass spectrometric peptide finger-print experiment are below this mass.
ApplicationsLinear regression on peptide mass rule LR/PRThe limitations of calibration methods based on the prop-erty of peptide mass clustering are a mass accuracy of only0.2Da, its sensitivity to non-peptide peaks in the spectra,and that it completely fails if the number of peptide peaksin the peak list is small [10,14,19]. Hence, in practice, themethod is used to confirm the results of internal calibra-tion only [14,29]. However, the advantage of the calibra-tion methods based on the property of peptide massclustering, over other calibration methods [12], is that nointernal or external calibrants are required in order to cal-ibrate the peptide mass lists.
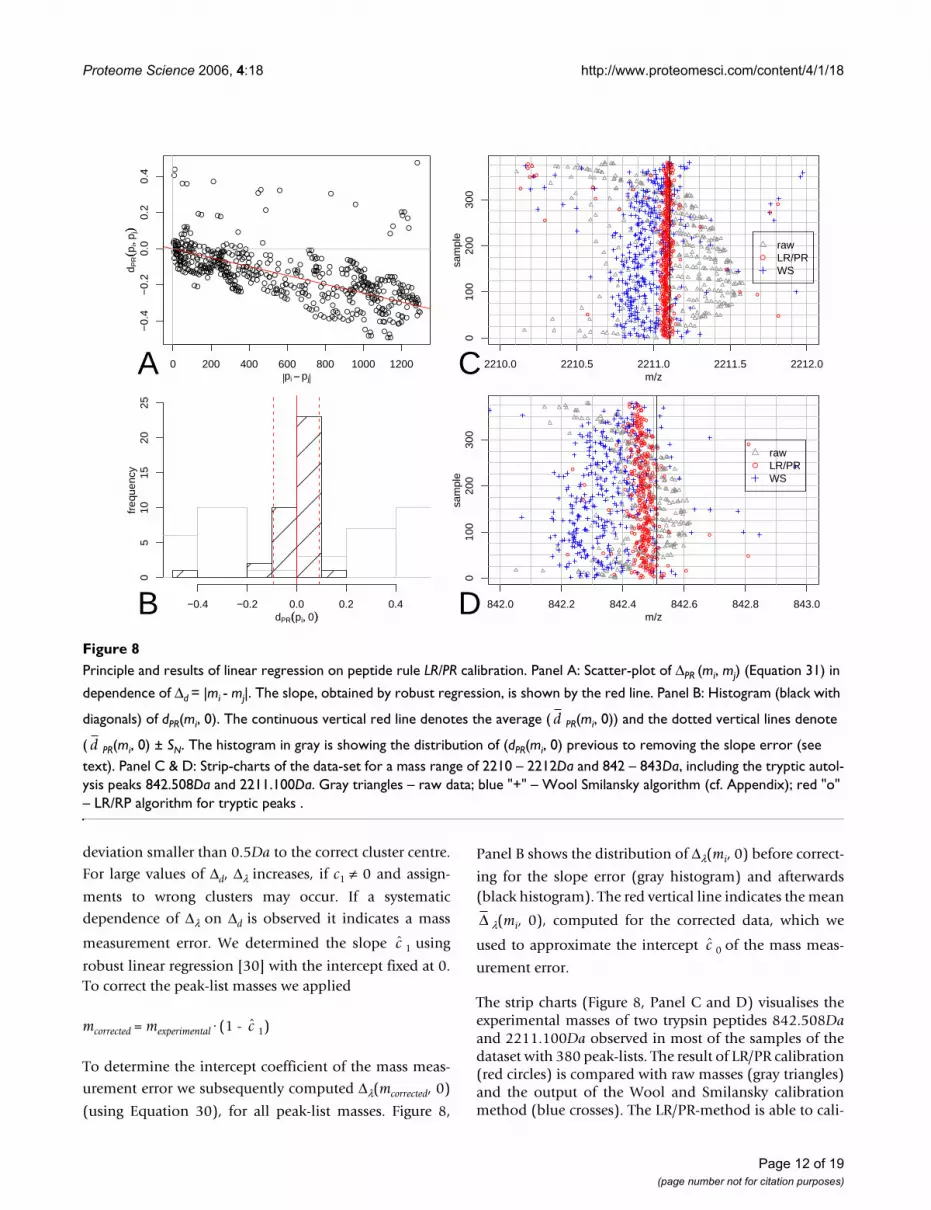
We propose here a novel method for the calibration ofPMF data, based on robust linear regression and the dis-tance measure introduced in the Equation 30. To deter-mine the slope of the mass measurement error wecomputed the deviation from the peptide mass rule forevery pair of peak masses (mi, mj) within a peak-list,employing the following equation:
Figure 8 left top panel shows the distance Δλ(mi, mj)
(Equation 31) as a function of Δd = |mi - mj|, computed for
all pairs (mi, mj) ∈ peak-list, which adhere to the addi-
tional constraint that Δd = |mi - mj| <mmax. This constraint
is necessary because the measure Δλ is only able to assign
Δ ( ) =−( )( ) −( )( ) <
− + −( )λλ
mm c c m c
m cii i none
i,
mod mod .
mo0
0 5
10 1 0
0
if
dd .c130( ) ( )
⎧⎨⎪
⎩⎪ otherwise
Δ ( ) =− ( ) − ( ) <
− + −λλ λ
m mm m m m
m mi j
i j none i j none
i
,| | mod | | mod .
|
if 0 5
1 jj none| mod λ( )( ) ( )⎧⎨⎪
⎩⎪ otherwise.31
Panel A – Box plots of the intercept coefficient c0 (Equation 27) itemised according the cleavage specificity and cleavage proba-bilityFigure 7Panel A – Box plots of the intercept coefficient c0 (Equation 27) itemised according the cleavage specificity and cleavage proba-bility. Panel B – Box plots of the slope coefficient c1 (Equation 26) itemised according the cleavage specificity.
●
●●
●●●
●
●
●●
0.4.
Arg
−C
0.6.
Arg
−C
0.8.
Arg
−C
1.A
rg−
C0.
4.C
NB
r0.
6.C
NB
r0.
8.C
NB
r1.
CN
Br
0.4.
CN
BrT
ryp
0.6.
CN
BrT
ryp
0.8.
CN
BrT
ryp
1.C
NB
rTry
p0.
4.Ly
s−C
0.6.
Lys−
C0.
8.Ly
s−C
1.Ly
s−C
0.4.
Pep
sinA
0.6.
Pep
sinA
0.8.
Pep
sinA
1.P
epsi
nA0.
4.T
ryps
in−
P0.
6.T
ryps
in−
P0.
8.T
ryps
in−
P1.
Try
psin
−P
−0.05
0.00
0.05
c0
A
Arg
−C
CN
Br
CN
BrT
ryp
Lys−
C
Pep
sinA
Try
psin
−P
1.00047
1.00048
1.00049
1.00050
1.00051
1.00052
1.00053c1
B
Table 3: Cleavage sites of proteolytic enzymes [36]
Enzyme RC
1 Trypsin/P K,R/P2 Arg.C R/P3 CNBR + Trypsin F, Y, M4 Lys-C K/P5 PepsinA F, L6 CNBr M
Page 11 of 19(page number not for citation purposes)
Proteome Science 2006, 4:18 http://www.proteomesci.com/content/4/1/18
deviation smaller than 0.5Da to the correct cluster centre.
For large values of Δd, Δλ increases, if c1 ≠ 0 and assign-
ments to wrong clusters may occur. If a systematic
dependence of Δλ on Δd is observed it indicates a mass
measurement error. We determined the slope 1 using
robust linear regression [30] with the intercept fixed at 0.To correct the peak-list masses we applied
mcorrected = mexperimental·(1 - 1)
To determine the intercept coefficient of the mass meas-
urement error we subsequently computed Δλ(mcorrected, 0)
(using Equation 30), for all peak-list masses. Figure 8,
Panel B shows the distribution of Δλ(mi, 0) before correct-
ing for the slope error (gray histogram) and afterwards(black histogram). The red vertical line indicates the mean
λ(mi, 0), computed for the corrected data, which we
used to approximate the intercept 0 of the mass meas-
urement error.
The strip charts (Figure 8, Panel C and D) visualises theexperimental masses of two trypsin peptides 842.508Daand 2211.100Da observed in most of the samples of thedataset with 380 peak-lists. The result of LR/PR calibration(red circles) is compared with raw masses (gray triangles)and the output of the Wool and Smilansky calibrationmethod (blue crosses). The LR/PR-method is able to cali-
c
c
Δc
Principle and results of linear regression on peptide rule LR/PR calibrationFigure 8Principle and results of linear regression on peptide rule LR/PR calibration. Panel A: Scatter-plot of ΔPR (mi, mj) (Equation 31) in
dependence of Δd = |mi - mj|. The slope, obtained by robust regression, is shown by the red line. Panel B: Histogram (black with
diagonals) of dPR(mi, 0). The continuous vertical red line denotes the average ( PR(mi, 0)) and the dotted vertical lines denote
( PR(mi, 0) ± SN. The histogram in gray is showing the distribution of (dPR(mi, 0) previous to removing the slope error (see text). Panel C & D: Strip-charts of the data-set for a mass range of 2210 – 2212Da and 842 – 843Da, including the tryptic autol-ysis peaks 842.508Da and 2211.100Da. Gray triangles – raw data; blue "+" – Wool Smilansky algorithm (cf. Appendix); red "o" – LR/RP algorithm for tryptic peaks .
●●
●
●
●●
●
●●
●
●
●●
●●
●
●●
●●●
●
●●
●●●
●
●
●●
●●●
●●
●
●●
●●●
●●
●
●
●●
●●●
●●
●
●
●
●●
●●●
●●
●
●●
●
●●
●●●
●●
●
●●
●
●
●●
●●●
●●
●
●●
●
●
●
●●
●●●
●●
●
●●
●
●●
●
●●
●●●
●●
●
●●
●
●●
●
●
●●
●●●
●●
●
●●
●
●●
●●
●
●●
●●●
●●
●
●●
●
●●
●●●
●
●●
●●●
●●
●
●●
●
●●
●●●
●
●
●●
●
●●
●
●●
●●●
●
●
●
●●
●
●●
●
●●
●●●
●
●●
●
●●
●
●●
●
●●
●●●
●
●●●
●
●●
●
●●
●
●●
●●●
●
●●●
●
●
●●
●
●●
●
●●
●●●
●
●●●
●●
●
●●
●
●●
●
●●
●●●
●
●●●
●●●
●
●●
●
●●
●
●●
●●●
●
●●●
●●●●
●
●●
●
●●
●
●●
●●●
●
●●●
●●●●●
●
●●
●
●●
●
●●
●●●
●
●●●
●●●●●●
●●
●
●●
●
●●
●●●
●
●●●
●●●●●●
●
●●
●
●●
●
●●
●●●
●
●●●
●●●●●●
●●
●●
●
●●
●
●●
●●●
●
●●●
●●●●●●
●●●
●●
●
●●
●
●●
●●●
●
●●●
●●●●●●
●●●●
●
●●
●●●
●
●●●
●●●●●●
●●●●●
●●
●●●
●
●●●
●●●●●●
●●●●●
●
●●●
●
●●●
●●●●●●
●●●●●
●●
●●●
●
●●●
●●●●●●
●●●●●
●●
●
●●●●●●
●●
●●●●●
●●
●●
0 200 400 600 800 1000 1200
−0.
4−
0.2
0.0
0.2
0.4
pi −− pj
d PR((p
i,, pj))
A
−0.4 −0.2 0.0 0.2 0.4
05
1015
2025
dPR((pi,, 0))
freq
uenc
y
B
2210.0 2210.5 2211.0 2211.5 2212.0
010
020
030
0
m/z
sam
ple
●●●●●●● ●●●●●● ●●●●●● ● ●● ●●●●●● ●●● ●●● ●● ●●●●● ●● ●●● ●●●● ● ●● ●●●●●●●●●● ●●● ●● ●●●● ●●●●●●●●● ●●●●●●● ●● ● ●● ●●●● ●●●●●●●●●●●●●●●●●●●● ●●●●●● ●●●●●●●●● ●●●●●●●● ●●●●● ●●●●●●●● ●●●● ●●● ●●●● ●● ●●●●● ●●●●●●●● ●●● ●●●●●● ●●●●●● ●●●● ●●● ●● ●● ● ●● ●●●● ●●●●●● ●●● ●●●●●●●●●●
●● ●● ●● ●●● ● ●●●●●●● ●●●● ●●●●●●●●●●●● ●●●● ●● ●●●●●● ● ●●●●● ●● ●● ●●● ●● ●●●● ●●●● ●● ●●●●● ●●●●●●●●● ●●●● ●● ●● ●●●●●●● ●●●● ●●●● ●●●●●●●
● ● ●●● ●●● ●●●●●● ●● ●●● ●● ●●● ●●●● ●●●
●
rawLR/PRWS
C
842.0 842.2 842.4 842.6 842.8 843.0
010
020
030
0
m/z
sam
ple
● ●● ● ●● ●● ●●●● ●● ● ●● ●●●●●● ●● ●●●●● ●●●●●●●● ●●● ●●● ●● ●● ●●● ● ●● ●● ●● ●● ● ●● ● ●●●● ●●●● ●● ● ●●● ●●●●● ●●● ●●● ●●● ●●● ●●● ●●●●●● ●●● ●● ●● ● ●●●●●●● ●●●● ●● ●● ●●● ●●● ●● ●●●● ●●● ●● ●●● ●●●●● ●●● ● ●●●●●● ●●● ●● ●● ●● ● ●●● ●●● ●●● ●● ●●● ●●● ●● ●● ●● ●●●●● ●●● ● ●● ● ●●● ●● ●● ●●●●● ●●● ●●●●● ● ●● ●● ●● ●●●●●●● ●●●● ●●● ●● ●●●●● ●●● ●●● ●●●● ●●●●●●● ●●●●●● ●● ●●● ● ●●●●●● ●●●● ● ●●● ●●● ●● ●● ●●● ●●●● ●●●● ●●
●●●● ●● ●● ●
●
rawLR/PRWS
D
d
d
Page 12 of 19(page number not for citation purposes)

Proteome Science 2006, 4:18 http://www.proteomesci.com/content/4/1/18
brate mass spectrometric peak-lists to an accuracy of0.1Da. This measurement accuracy surpasses the otherpublished calibration methods [10,19] at least two-fold.
Filtering of non-peptide peaks using the peptide mass ruleNon-peptide peaks can be recognised according to theirdeviation from the cluster centres. The amino acids that
Schema of non-peptide mass filteringFigure 9Schema of non-peptide mass filtering. Abscissae – peptide mass, ordinate – m mod 1, dashed region – non-peptide masses. Green line – decimal part of poly-(L(lys), I(ile)) peptide masses as a function of their mass. Red line – decimal part of poly-(C(cys)) peptide masses as function of their mass. Black line – Predicted cluster centres using the Equation 2.
0 500 1000 1500 2000
0.0
0.5
1.0
1.5
m[m/z]
mod
(m, 1
)
λL = 0.000744λC = 0.000098λDB = 0.000496
non−peptide region
Page 13 of 19(page number not for citation purposes)

Proteome Science 2006, 4:18 http://www.proteomesci.com/content/4/1/18
have the most extreme λ values are I, L and K (because oftheir large fraction of Hydrogen H (1.007825) atoms) andC (Cysteine – because of the heavy sulfur atom S(31.97207)). If we plot the position after the decimalpoint given by n·(λi - l)(modl) with n ∈ , for i = L and i =C, and connect the points for readability purposes by aline (the red and green lines in Figure 9 respectively), weobtain the range enclosing any possible decimal point atheoretical peptide mass can have. If a mass with a deci-mal point lying in the dashed region is detected it can notbe a peptide peak. For peptide peaks, the following ine-qualities hold:
-413[ppm] = (λC - λDB)·106 < ΔΔ(m, 0)·106/m = (m,
0) < (λL - λDB) = 241[ppm], (32)
where λDB = 1.000511 (Equation 2). We used the relativedeviation of Δppm from the cluster centre in parts per mil-lion instead of using absolute values.
Figure 3 shows that only very short peptides approach thelower bound of -413ppm. This is due to the low frequency
of Cysteine (C). The high frequencies of K, L, I (whose λ ≈1.00074) mean that the theoretical upper bound of241ppm can indeed be reached by some peptides with a
mass of ≈ l000Da. Peptides of higher mass never approachthe upper and lower theoretical bound due to the rapidlydecreasing probability to consist of K, L or I, or of C only.The lines for the standard deviation of SN (orange lines)
and of the 1% and 99% quantile (green lines) in Figure 3indicate that it is an exceedingly rare event to encounter a
peptide mass for which (m, 0) will deviate more
Δλppm
Δλppm
Scatter plot : abscissae – peptide mass mi, ordinate – mimodλ with λ = 1.000495Figure 10Scatter plot : abscissae – peptide mass mi, ordinate – mimodλ with λ = 1.000495. In red are highlighted peaks removed from the dataset because of their high frequencies. In green, peaks removed due to the strong deviation from the peptide mass cluster centres.
●●
●
●●●●
●
●
●●
●●●
●
●
●
●●●
●
●
●
●
●
●
●
●
●
●
●
●
●
●
●
●
●
●
●
●
●
●
●●
●
●●
●
●
●
●
●
●
●
●
●
●
●
●
●
●●
●
●
●
●
●
●
●
●
●●
●
●
●
●
●
●
●
●
●●
●
●●
●
●●
●
●
●●
●
●●●●
●
●
●
●
●
●
●●●●●
●
●
●
●
●
●
●
●●●●●
●
●●●
●●●
●
●
●
●●
●
●
●
●
●
●
●
●
●
●
●
●
●●●●●
●●
●●
●
●
●
●●●
●
●
●●
●●
●
●
●
●
●
●●
●
●
●●●●●●●●●●●●●●●●●●●
●●
●
●
●
●
●
●
●●●●
●
●
●
●
●
●●●●●●
●
●●
●
●●●●●
●●
●
●
●
●
●
●●●
●
●
●
●
●●●●●●
●
●
●●
●
●
●
●
●
●
●●
●
●●
●●
●
●
●
●●●●
●
●
●
●
●
●
●●
●●
●
●●
●
●●
●●
●
●
●●●●●●
●
●
●
●
●
●
●●
●
●
●
●
●
●●
●
●●●
●
●●
●
●
●
●
●
●
●
●
●●●●●●●●●
●
●
●●●
●
●●
●●●
●
●
●
●●●
●
●●●●●●
●
●
●●●
●
●
●●●
●
●
●
●
●
●
●●●
●●
●●
●
●
●●
●
●
●
●
●●
●
●
●●●●●●
●●●
●
●
●
●●
●
●
●●
●●●●●●●●●●
●
●
●●●
●●
●
●
●
●
●
●
●
●
●
●●
●●
●
●
●
●●
●●
●●
●
●
●
●
●
●●●●●●●
●
●
●●
●
●
●
●
●●●
●
●
●
●
●
●
●
●
●
●●●
●
●
●
●●●●●●●●●●●●
●
●
●
●
●●
●
●
●
●
●●
●
●●●
●
●●●●
●
●
●●●●●
●●●
●
●
●●●
●●
●
●
●
●
●
●
●
●
●
●●●
●
●
●●
●●
●
●
●
●
●
●
●
●●
●●
●●●●●
●
●
●
●
●●●●
●●●
●●
●●
●
●
●
●●●●
●
●
●
●
●●
●●
●
●
●
●
●●
●
●●
●
●●
●
●
●
●
●
●
●
●
●●●
●●
●
●●●●
●●●●●●●●●●●●●●●●●●
●
●
●
●
●
●
●
●●
●●
●
●
●
●
●
●
●●
●
●
●
●
●●
●●●●●●●
●
●
●
●
●●●●
●●●●●●●●●●●●●●●●●●
●
●
●●
●●
●
●
●
●●
●
●
●
●
●●
●
●●●
●●
●
●
●
●●●●●●●
●●●●
●●●
●
●●●
●
●
●
●
●●
●
●
●
●●
●
●
●
●
●
●
●●
●●
●
●
●●●●
●
●
●
●●●●●●●●
●
●●●
●
●
●
●●
●
●
●●
●●●●
●
●
●
●
●
●●●
●●
●
●
●●
●●
●
●
●
●
●●
●●
●
●●
●●
●
●
●
●●●
●
●
●
●●
●●●●●●●
●
●●
●
●●
●
●
●
●●●
●
●
●
●
●
●
●
●
●
●
●
●
●●●●●●●
●
●
●●
●
●
●
●
●
●
●
●●
●●
●●●
●
●
●
●●
●●
●●●
●●●
●
●
●
●
●
●
●●●
●
●
●
●●
●●
●
●●
●
●●●
●●
●
●●●
●●●
●●
●
●●
●
●
●
●
●●●
●
●
●
●
●
●●●
●
●
●
●
●
●
●●●●●●●●●●●●●
●
●●●
●
●
●
●●
●
●
●
●
●
●●
●●●●●●●●●●●●●●●●●●
●
●
●
●●●
●●
●
●
●●
●
●
●
●
●
●
●●
●
●●●●●●
●
●●
●●
●
●●
●
●
●●●
●●
●
●●
●
●
●
●
●●●
●●●●
●
●
●
●
●
●●
●●
●●●
●
●●
●●
●
●
●●
●
●
●
●
●
●●●
●
●
●
●
●●●●●●
●●●
●●
●
●●●
●●●
●
●
●
●
●
●●●●●
●●●●
●
●
●
●
●
●●●
●●
●
●
●
●
●
●
●
●
●
●●●
●●
●
●
●●
●●
●●
●
●
●
●●●●●●●●
●●
●●●●●●
●
●●●●●
●
●●●
●
●●●●●●●
●
●
●
●
●●
●
●●●
●
●
●
●
●●
●
●●
●
●
●
●●●●●●●●●●
●
●
●●
●●●●
●●
●●
●
●
●
●
●●
●
●
●●●●●●●●●
●
●
●
●
●●●
●
●●●●
●
●●
●●●
●
●●
●
●
●
●
●●●●
●●●●●●●●●●●●●●●●●
●
●●
●
●
●
●●
●●●●
●
●
●
●●
●
●
●
●
●
●●●●●●●●●●●
●
●●●●●●
●
●
●
●●
●●●●●●●
●
●●●
●
●
●
●
●●
●
●
●●
●
●
●●●●●●
●
●●
●●●●
●
●●
●
●
●
●
●●●●●●●●●
●●
●
●●
●●
●●
●
●
●●●●
●
●
●
●
●
●
●●
●
●●
●●
●
●
●
●●●
●
●
●
●
●
●
●
●●●●●●●●●●●●●●
●
●
●
●
●
●
●
●
●●●●●●
●
●
●
●
●
●
●●●
●
●
●
●
●
●
●
●●●●
●●
●
●
●●●●●●●
●●●●
●
●●
●●●
●
●
●●
●●
●
●●
●
●
●●
●●
●
●●●
●
●●
●
●
●
●
●
●
●
●
●
●
●
●
●●●●●●●
●●
●
●
●
●●●
●●
●
●●
●●
●●
●
●
●
●
●
●
●
●
●●●●
●
●
●●
●
●
●
●
●
●
●
●●●
●
●
●
●
●
●
●
●
●
●●●●●
●●
●
●●●●●
●
●
●●
●●
●●
●●
●
●
●
●●
●
●
●●●●●●●●●
●
●
●●
●
●●
●
●
●●
●
●
●
●●
●
●
●●●
●●
●
●●●●●●●●●●
●
●
●
●
●
●
●
●
●●
●
●
●
●
●●
●
●
●
●
●
●
●
●
●
●●●●●●●
●
●
●
●
●
●
●
●
●
●
●●●●
●●
●●
●
●
●
●
●●●●●●●●●●●●●●●●●●●●●●●●
●
●
●●●
●
●
●
●
●
●
●
●●
●
●
●
●
●●●
●
●
●
●
●●●
●
●
●●●●●●●●●●●
●
●
●
●
●
●
●
●
●
●
●●
●
●
●
●
●●
●
●●●
●●
●●●●
●●●
●
●
●
●●●●
●
●●
●
●
●
●
●
●
●
●
●●
●
●●
●
●
●
●●
●●●●
●
●●●●
●
●
●
●
●
●
●
●●
●●●●●●●●●●●●●
●
●
●
●
●
●
●
●●●●●
●●
●
●
●
●
●
●
●●●●●●
●
●●
●
●
●
●
●
●
●
●●
●●
●●
●
●●
●●●●●●●
●
●
●●
●●●
●
●
●●●●●●
●
●
●
●
●●
●●
●
●
●
●
●
●
●●●●●
●●
●
●
●
●
●
●●
●●
●●●
●●
●
●
●
●●●
●
●
●
●
●●●
●●●●
●
●
●●●●●●●●●●●
●
●●
●●●●●●●●●
●
●●
●
●
●●
●●
●●
●
●
●
●●●
●●●●
●●●●
●
●
●
●●●
●
●
●
●
●
●
●
●
●
●●●
●
●
●●
●●
●
●●
●●●
●
●●●
●●
●●●
●
●
●●●
●
●
●
●●●●
●●
●
●
●●●●
●●
●
●
●
●
●
●●●●
●
●
●●
●●
●
●
●
●
●●
●
●
●
●●●
●
●
●●
●
●
●
●
●●
●
●
●
●
●
●●●
●
●
●
●●
●
●●
●
●●●
●
●●
●●
●
●●●●
●●●
●●●
●
●
●●●
●
●
●
●
●●●●
●
●
●●
●
●
●●
●
●●●●●●●
●
●●
●
●
●
●
●
●
●
●●●●●
●
●
●
●●●
●
●●
●
●●●●
●
●
●
●
●
●
●
●
●
●
●
●
●
●●
●
●●
●●●
●
●
●●
●
●
●
●●●●●●●
●●●●●
●
●●
●●
●●●
●
●●
●●
●●●
●
●●
●
●
●●●●
●
●
●
●●●
●●
●
●
●●●●
●●●
●
●●
●
●
●
●●
●
●
●
●
●
●●
●●●
●
●
●
●●
●●●●
●●●
●●
●
●●
●●●
●
●
●
●
●●
●
●
●●
●
●
●
●●
●
●
●●●
●
●
●●
●●
●
●
●●
●●
●
●
●●
●
●
●
●
●
●●
●●
●
●
●
●●●
●
●
●
●●●●
●
●
●●
●●
●●
●●
●●
●
●
●●●
●
●●●●●●●●●●●●●●●
●
●
●●●
●●●●●●●
●
●●
●
●
●●●●
●●●
●●
●●
●
●
●
●●
●
●
●●
●
●
●
●
●●
●
●
●●
●
●●●
●
●●
●
●
●
●●●●●●●●
●●●
●
●
●●
●
●●
●
●
●●●●
●
●
●
●
●
●
●
●
●
●
●
●
●●●
●
●
●
●
●
●
●●
●
●
●
●●
●●
●
●●●●
●
●
●
●
●
●
●
●
●
●
●
●
●●
●
●
●
●
●
●
●
●
●
●
●
●
●
●●●●
●
●
●
●●
●
●
●
●
●
●●●
●
●
●
●●
●
●
●
●●
●
●
●
●
●●
●●
●
●
●●
●●
●
●●
●●●●●●●
●●
●●
●●●●●●●●●●
●●●●●●●
●
●
●
●
●
●
●
●
●
●
●●
●●●
●
●
●●
●
●●●●
●
●●●
●●●
●
●●
●
●
●
●●●
●
●●
●
●
●●●
●
●●
●
●
●●
●
●●
●
●●
●
●
●●
●
●
●
●●●●
●
●●
●
●●
●
●●
●
●
●
●
●
●
●
●●●●●●●●
●
●●
●●
●●●●●●●●●
●
●
●●●
●
●●●
●●●●●●●●●●●●●●
●●
●
●●●
●
●
●●
●●
●
●
●●●●●●●●●
●
●●●
●
●
●
●
●
●
●
●●●●●●●●●●●●●●●●
●
●
●
●●
●
●
●
●
●
●
●
●●●
●
●
●●
●
●
●
●
●
●●
●
●
●●
●
●
●●
●
●
●
●●●
●
●●●●
●
●
●●●●
●
●●
●
●●●●●
●
●●
●●●
●●●●●●●●●●●●●●●●●
●
●●
●
●●
●
●
●
●●●●●
●●●
●
●●
●
●●
●
●●●●●●
●●
●
●●●●
●●●
●
●●
●●●
●●●
●●●●●●
●
●
●●●●●
●●●●●●●●
●●●●●
●
●
●●
●
●●
●
●
●
●
●
●●
●
●●●●
●
●
●●●
●●●●●●
●
●
●
●●
●●●
●●●●●●
●
●
●
●
●
●
●
●
●●
●●●●●●●
●●
●●●
●
●●
●
●●
●●●●●●
●
●
●
●
●●
●●●
●●●●●●●●●●●
●
●
●
●
●
●
●
●
●
●●●
●
●
●
●
●●●●●●●●●●●
●
●
●
●
●
●
●
●
●
●●●●●●●●
●
●
●
●
●
●●●●●
●●●●●
●
●
●
●
●
●
●
●●●
●●●●
●●●●●
●
●●●●●●●●●●●●●●●●●
●●●●
●
●
●●
●●
●
●
●
●●
●
●
●●●●●
●
●
●
●
●●
●
●
●
●●
●
●
●
●
●
●●
●
●●
●
●●
●
●
●●
●
●●
●
●
●●
●
●
●
●●●
●
●
●●
●●●
●
●
●●●●
●●
●●
●●
●●●
●
●
●
●●
●
●
●
●●
●●●
●
●
●●●●●
●●●●
●
●
●
●
●●●
●
●
●
●●●
●
●
●
●
●
●
●●
●
●
●
●●●●●●●●
●
●
●
●
●
●
●
●
●
●●
●
●●
●
●
●
●●
●
●
●
●●●
●●
●
●
●
●
●
●
●
●
●
●
●●
●
●
●●●●●●●●●
●
●
●
●
●
●
●
●●
●
●●
●
●
●
●
●
●●●
●●●●
●
●
●
●
●●
●●●
●●●●
●
●
●
●●
●
●●●
●
●
●
●●
●
●●●●●●●●●●●●●●●●●●●●●●
●
●
●●●●●●●
●
●
●
●
●
●●●●●●●●●
●
●
●
●
●
●
●
●
●
●
●
●
●
●●●●
●●●
●
●
●
●
●●●
●●
●
●●●
●
●
●
●
●
●
●●
●
●
●
●
●
●
●
●
●
●
●
●●●●●
●
●
●
●
●●
●
●●
●
●●●
●
●●
●●●●●●●
●
●
●
●
●
●●
●
●
●
●
●
●
●
●●
●●
●
●
●●
●
●
●
●
●●
●
●
●
●
●
●
●
●
●
●
●
●
●
●
●
●●
●●●●●●●●●●●●●●●●●●
●●
●
●
●●
●
●
●
●
●
●
●●
●
●
●
●
●
●
●●
●
●
●
●●●
●
●
1000 1500 2000 2500 3000 3500
0.0
0.2
0.4
0.6
0.8
1.0
m [m/z]
mod
(m,1
) [m
/z]
●●●
●●●●●●●●●●●●●●●●●●●●●●●●●●●●●●●●●●●●●●●●●●●●●●●●●●●●●●●●●●●●●●●●●●●●●●●●●●●●●●●●●●●●●●●●●●●●●●●●●●●●●●●●●●●●●●●●●●●●●●●●
●●●●●●●●●●●●●●●●●●●●●●●●●●●●●●●●●●●●●●●●●●●●●●●●●●●●●●●●●●●●●●●●●●●●●●●●●●●●●●●●●●●●●●●●●●●●●●●●●●●●●●●●●●●●●●●●●●●●●●●●●●●●●●●●●●●●●●●●●●●●●●●●●●●●●●●●●●●●●●●●●●●●●●●●●●●●●●●●●●●●●●●●●●●●●●●●●●●●●●●●●●●●●●●●●●●●●●●●●●●●●●●●●●●●●●●●●●●●●●●●●●●●●●●●●●●●●●●●●●●●●●●●●●●●●●●●●●●●●●●●●●●●●●●●●●●●●●●●●●●●●●●●●●●●●●●●●●●●●●●●●●●●
●
●●●●●●●●●●●●●●●●●●●●●●●●●●●●●●●●●●●●●●●●●●●●●●●●●●●●●●●●●●●●●●●●●●
●●●●●●●●●●●●●●●●●●●●●●●●●●●●●●●●●●●●●●●●●●●●●●●●●●●●●●●●●●●●●●●●●●●●●●●●●●●●●●●●●●●●●●●●●●●●●●●●●●
●●●●●●●●●●●●●●●●●●●●●●●●●●●●●●●●●●●●●●●●●●●●●●●●●●●●●●●●●●●●●●●●●●●●●●●●●●●●●●●●●●●●●●●●●●●●●●●●●●●●●●●●●●●●●●●●●●●●●●●●●●●●●●●●●●●●●●●●●●●●●●●●●●●●●●●●●●●●●●●●●●●●●●●●●●●●●●●●
●
●●●●●●●●●●●●●●●●●●●●●●●●●●●●●●●●●●●●●●●●●●●●●●●●●●●●●●●●●●●●●●●
●●●●●●●●●●●●●●●●●●●●●●●●●●●●●●●●●●●●●●●●●●●●●●●●●●●●●●●●●●●●●●●●●●●●●●●●●●●●●●●●●●●●●●●●●●●●●●●●●●●●●●●●●●●●●●●●●●●●●●●●●●●●●●●●●●●●●●●●●●●●●●●●●●●●●●●●●●●●●●●●●●●●●●●●●●●●●●●●●●●●●●●●●●●●●●●●●●●●●●●●●●●●●●●●●●●●●●●●●●●●●●●●●●●●●●●●●●●●●●●●●●●●●●●●●●●●●●●●●●●●●●●●●●●●●●●●●●●●●●●●●●●●●●●●●●●●●●●●●●●●●●●●●●●●●●●●●●●●●●●●●●●●●●●●●●●●●●●●●●●●●●●●●
●
●
●●●●●●●●●●●●●●●●●●●●●●●●●
●●●●●●●●●●●●●●●●●●●●●●●●●●●●
●
●●●●●●●●●●●●●●●●●●●●●●●●●●●●●●●●●●●●●●●●●●●●●●●●●●●●●●●
●●
●●●●●●●●●●●●●●●●●●●●●●●●●●●●●●●●●●●●●●●●●●●●●●●●●●●●●●●●●●●●●●●●●●●●●●●●
●●
●●●●●●●●●●●●●●●●●●●●●●●●●●●●●●●●●●●●●●●●●●●●●●●●●●●●●●●●●●●●●●●●●●●●●●●●●●●●●●●●●●●●●●●●●●●●●●●●●●●●●●●●●●●●●●●●●●●●●●●●●●●●●●●●●●●●●●●●●●●●●●●●●●●●●●●●●●●●●●●●●●●●●●●●●●●●●●●●●●●●●●●●●●●●●●●●●●●●●●●●●●●●●●●●●●●●●●●●●●●●●●●●●●●●●●●●●●●●●●●●●●●●●●●●●●●●●●●●●●●●●●●●●●●●●●●●●●●●●●●●●●●●●●●●●●●●●●●●●●●●●●●●●●●●●●●●●●●●●●●●●●●●●●●●●●●●●●●●●●●●●●●●●●●●●●●●●●●●●●●●●●●●●●●●●●●●●
●
●●●●●●●●●●●●●●●●●●●●●●●●●●●●●●●●●●●●●●●●●●●●●●●●●●●●●●●●●●●●●●●●●●●●●●●●●●●●●●●●●●●●●●●●●●●●●●●●●●●●●●●●●●●●●●●●●●●●●●●●●●●●●●●●●●●●●●●●●●●●●●●●●●●●●●●●●●●●●●●●●●●●●●●●●●●●●●●●●●●●●●●●●●●●●●●●●●●●●●●●●●●●●●●●●●●●●●●●●●●●●●●●●●●●●●●●●●●●●●●●●●●●●●●●●●●●●●●●●●●●●●●●●●●●●●●●●●●●●●●●●●●●●●●●●●●●●●●●●●●●●●●●●●●●●●●●●●●●●●●●●●●●●●●●●●●●●●●
●●●●●●●●●●●●●●●●●●●●●●●●●●●●●●●●●●●●●●●●●●●●●●●●●●●●●●●●●●●●●●●●●●●●●●●●●●●●●●●●●●●●●●●●●●●●●●●●●●●●●●●●●●●●●●●●●●●●●●●●●●●●●●●●●●●●●●●●●●●●●●●●●●●●●●●●●●●●●●●●●●●●●●●●●●●●●●●●●●●●●●●●●●●●●●●●●●●●●●●●●●●●●●●●●●●●●●●●●●●●●●●●●●●●●●●●●●●●●●●●●●●●●●●●●●●●●●●●
●●●●●●●●●●●●●●●●●●●●●●●●●●●●●●●●●●●●●●●●●●●●●●●●●●●●●●●●●●●●●●●●●●●●●●●●●●●●●●●●●●●●●●●●●●●●●●●●●●●●●●●●●●●●●●●●●●●●●●●●●●●●●●●●●●●●●●●●●●●●●●●●●●●●●●●●●●●●●●●●●●●●●●●●●●●●●●●●●●●●●●●●●●●●●●●●●●●●●●●●●●●●●●●●●●●●●●●●●●●●●●●●●●●●●
●
●●●●●●●●●●●●●●●●●●●●●●●●●●●●●●●●●
●●●●
●●
●●●●●●●●●●●●●●●●●●●●●●●●●
●●
●●●●●●●●●●●●●●●●●●●●●●●●●●●●●●●●●●●●●●●●●●●●●●●●●●●●●●●●●●●●●●●●●●●●●●●●●●●●●●●●●●●●●●●●●●●●●●●●●●●●●●●●●●●●●●●●●●●●●●●●●●●●●●●●●●●●●●●●●●●●●●●●●●●●●●●●●●●●●●●●●●●●●●●●●●●●●●●●●●●●●●●●●●●●●●●●●●●●●●●●●●●●●●●●●●●●●●●●●●●●●●●●●●●●●●●●●●●●●●●●●●●●●●●●●●●●●●●●●●●●●●●●●●●●●●●●●●●●●●●●●●●●●●●●●●●●●●●●●●●●●●●●●●●●●●●●●●●●●●●●●●●●●●●●●●●●●●●●●●●●●●●●●●●●●●●●●●●●●●●●●●●●●●●●
●
●●
●●●●●●●●●●●●●●●●●●●●●●●●●●●●●●●●●●●●●●●●●●●●●●●●●●●●●●●●●●●●●●●●●●●●●●●●●●●●●●●●●●●●●●●●●●●●●●●●●●●●●●●●●●●●●●●●●●●●●●●●●●●●●●●●●●●●●●●●●●●●●●●●●●●●●●●●●●●●●●●●●●●●●●●●●●●●●●●●●●●●●●●●●●●●●●●●●●●●●●●●●●●●●●●●●●●●●●●●●●●●●●●●●●●●●●●●●●●●●●●●●●●●●●●●●●●●●●●●●●●●●●●●●●●●●●●●●●●●●●●●●●●●●●●●●●●●●●●●●●●●●●●●●●●●●●●●●●●●●●●●●●●●●●●●●●●●●●●●●●●●●●●●●●●●●●●●●●●●●●●●●●●●●●●●●●●●●●
●●●●●●●●●●●●●●●●●●●●●●●●●●●●●●●●●●●●●●●●●●●●●●●●●●●●●●●●●●●●●●●●●●●●●●●●●●●●●●●●●●●●●●●●●●●●●●●●●●●●●●●●●●●●●●●●●●
●
●●●●●●●●●●●●●●●●●●●●●●●●●●●●●●●●●●●●●●●●●●●●●●●●●●●●●●●●●●●●●●●●●●●●●●●●●●●●●●●●●●●●●●●●●●●●●●●●●●●●●●●●●●●●●●●●●●●●●●●●●●●●●●●●●●●●●●●●●●●●●●●●●●●●●●●●●●●●●●●●●●●●●●●●●●●●●●●●●●●●●●●●●●●●●●●●●●●●●●●●●●●●●●●●●●●●
●●●●●●●●●●●●●●●●●●●●●●●●●●●●●●●●●●●●●●●●●●●●●●●●●●●●●●●●●●●●●●●●●●●●●●●●●●●●●●●●●●●●●●●●●●●●●●●●●●●●●●●●●●●●●●●●●●●●●●●●●●●●●●●●●●●●●●
●
●●●●●●●●●●●●●●●●●●●●●●●●●●●●●●●●●●●●●●●●●●●●●●●●●●●●●●●
●●●●●●●●●●●●●●●●●●●●●●●●●●●●●●●●●●●●●●●●●●●●●●●●●●●●●●●●●●●●●●●●●●●●●●●●●●●●●●●
●
●●●●●●●●●●●●●●●●●●●●●●●●●●●●●●●●●●●●●●●●●●●●●●●●●●●●●●●●●●●●●●●●●●●●●●●●●●●●●●●●●●●●●●●●●●●●●●
●●●●●●●●●●●●●●●●●●●●●●●●●●●●●●●●●●●●●●●●●●●●●●●●●●●●●●●●●●●●●●●●●●●●●●●●●●●
●●●●●●●●●●●●●●●●●●●●●●●●●●●●●●●●●●●●●●●●●●●●●●●●●●●●●●●●●●
●●●●●●●●●●●●●●●●●●●●●●●●●●●●●●●●●●●●●●●●●●●●●●●●●●●●●●●●●●●●●●●●●●●●●●●●●●●●●●●●●●●●●●●●●●●
●●●●●●●●●●●●●●●●●●●●●●●●●●●●●●●●●●●●●●●●
●●●●●●●●●●●●●●●●●●●●●●●●●●●●●●●●●●●●●●●●●●●●●●●●●●●●●●●●●●●●●●●●●●●●●●●●●●
●
●●●●●●●●●●●●●●●●●●●●●●●●●●●●●●●●●●●●●●●●●●●●●●●●●●●●●●●●●●●●●●●●●●●●●●●●●●●●●●●●●●●●●●●●●●●
●●
●●
●●●●●●●●●
●
●
●●●●●
●
●●●●●●
●
●
●●
●
●
●
●●●●●
●
●
●●
●
●
●
●
●
●
●
●
●
●
●
●
●
●
●
●●
●
●
●
●
●
●●●●●●●●●●
●●●●
●
●
●
●
●
●●
●
●
●
●●
●●●●●●●●●●●●
●●●●
●
●●
●
●
●●
●●
●
●
●
●
●
●
●●●●●●●●
●●●●●●●●●●●●●●●
●
●●●●
●
●
●
●●
●
●●●
●
●●
●
●
●
●
●
●
●
●●●●●
●●●●●●●●●●●
●
●
●●●●●●
●
●
Page 14 of 19(page number not for citation purposes)

Proteome Science 2006, 4:18 http://www.proteomesci.com/content/4/1/18
than 200ppm from the peptide cluster centre predicted byour model. Therefore, we use 200ppm as a filtering thresh-old. An essential requirement, to apply this filteringmethod successfully is that peak-list must be calibrated tohigh precision [12].
Figure 10 visualizes the result of non-peptide peak filter-ing in case of a dataset of 380 calibrated peak-lists. Spots
removed by applying the filtering criterion (m, 0) >
200 are shown in green. Peptide masses removed due tofiltering of abundant masses [12] are shown in red.
We studied how the non-peptide peak filtering influencesthe Probability Based Mascot Score (PBMS) [22]. In the-ory, for example one cystein rich peptide strongly deviat-ing from the peptide mass rule and with a unique mass inthe database digest, if properly assigned is sufficient toidentify the protein unambiguously [10]. In case of PBMS,which requires multiple matches to peptide masses, a sin-gle match of a unique peptide mass, even if properlyassigned, will not give a score indicating reliable identifi-cation of the protein. Furthermore, this scoring schemetakes into account the number of non-matching peaks. Ifmany unassigned peaks are observed, the score isdecreased and the assignment is interpreted as insignifi-cant. Therefore, the removal of non-peptide peaks shouldincrease the identification sensitivity. Table 4 demon-strates that an increase of 2.5% in the number of identi-fied samples can be obtained by removing all peaks with
a distance (m, 0) > 200ppm from the peptide peak-
lists. Row 8 of Table 4 shows that non-peptide peak filter-
ing increases the PBMS score in 30 – 55% of cases.Removal of peptide peaks due to filtering caused adecrease of the PBMS score in less than 1% of samples.
We concluded that non-peptide peak filtering increasesthe sensitivity of protein identification if using the PBMSscoring schema. However, to which extend these resultscan be reproduced is dependent on the database searchalgorithm used.
ConclusionWe introduced here a simple model to predict the clustercentres of peptide masses. The input parameters of themodel can be easily determined for the sequence data-bases. We studied how these parameters influence thelocation of cluster centres, concluding that the cleavagespecificity of the enzyme used for peptide digestion andthe cleavage probability are the main factors. The changeof the cluster centre location due to changes in averageprotein length or due to variability of amino acid frequen-cies among the databases is relatively small. However, ouranalysis also illustrates that, due to combinatorial con-straints, the location of the cluster centres for massessmaller than l000Da can differ from the average location.Based on the model of the peptide mass cluster centres wederived a measure to determine the deviation of an exper-imental peptide mass from the nearest cluster centre. Weused this distance measure to calibrate the peptide peak-lists and to recognise non-peptide peaks. The calibrationmethod, linear regression on peptide rule, is a robust andaccurate method to calibrate single peak lists withoutresorting to internal calibrants. With this method highercalibration precision was obtained in comparison to othercalibration methods, which also employ the property ofpeptide mass clustering.
Δλppm
Δλppm
Table 4: Results for filtering of non-peptide masses.
Arabidopsis t. Rhodopirelulla b. Mus musculus
1 Identification no PR filtering 423 1009 8722 Identification with PR filtering 432 1017 8943 Change in identification (Percent) 2.13 0.79 2.52
4 Total nr. of samples* 818 1169 17095 Nr. samples with PBMS increase 240 622 7246 Nr. samples with no change of PBMS 571 542 9827 Nr. samples with PBMS decrease 7 5 38 Percent increase of PBMS score 29.34 53.21 42.369 Percent decrease of PBMS score 0.86 0.43 0.18
Columns: Arabidopsis t., Rhodopirelulla b., Mus musculus – peptide mass fingerprint datasets (cf. Methods). Row 1 – number of samples with a significant PBMS score prior to filtering of non-peptide peak masses. Row 2 – number of samples with a significant PBMS score for peak-lists with non-peptide removed. Row 3 – relative change of the identification rate (Row 2 – Row 1)/Row1 100. Row 4 – Total number of samples which produced a PBMS score. Row 5 -number of samples for which an increase of the PBMS score due to non peptide peak filtering was observed. Row 6 – number of samples for which no change of the PBMS score due to non-peptide peak filtering was observed. Row 7 – number of samples for which a decrease of the PBMS score due to non-peptide peak filtering was observed. Row 8–9 – relative increase and decrease of the PBMS score, respectively.
Page 15 of 19(page number not for citation purposes)
Proteome Science 2006, 4:18 http://www.proteomesci.com/content/4/1/18
The same distance measure was used to recognise non-peptide peaks and to remove them from the peak-lists.Due to their removal, an increase of the identification rateof up to 2.5% for the PBMS scoring schema was observed.
MethodsData setsIn this study, we used three data sets generated in differentproteome analyses:
1. A bacterial proteome of Rhodopirellula baltica (unpub-lished data) (1,193 spectra) measured on a Reflex III [31]MALDI-TOF instrument.
2. A mammalian proteome of Mus musclus (1, 882 spec-tra) measured on an Ultraflex [31] MALDI-TOF instru-ment.
3. A plant proteome of Arabidopsis thaliana [32] measuredon an Autoflex [31] MALDI-TOF instrument.
All PMF MS spectra derive from tryptic protein digests ofindividually excised protein spots. For this purpose, thewhole tissue/cell protein extracts of the aforementionedorganisms were separated by two-dimensional (2D) gelelectrophoresis [33] and visualised with MS compatibleCoomassie brilliant blue G250 [32]. The MALDI-TOF MSanalysis was performed using a delayed ion extraction andby employing the MALDI AnchorChip ™targets (BrukerDaltonics, Bremen, Germany). Positively charged ions inthe m/z range of 700 – 4, 500m/z were recorded. Subse-quently, the SNAP algorithm of the XTOF spectrum anal-ysis software (Bruker Daltonics, Bremen, Germany)detected the monoisotopic masses of the measured pep-tides. The sum of the detected monoisotopic masses con-stitutes the raw peak-list.
CalibrationIn order to perform filtering of non-peptide peaks thedataset must be calibrated to high mass measurementaccuracy. To align the dataset we used a calibration
Table 5: Protein lengths and amino acid frequencies (one letter code) for nine in the nine databases, length – average protein length in database, reference – database reference; fi – amino acid frequencies
Organ izm length fF fS fT fN fK fY fE fV fQ fM
Arabidopsis t. 422.40 4.27 9.01 5.11 4.41 6.36 2.86 6.74 6.69 3.52 2.44Drosophila m. 506.20 3.48 8.33 5.68 4.80 5.70 2.91 6.41 5.88 5.21 2.33
Escherichia coli 300.30 3.86 6.25 5.67 4.26 4.59 2.96 5.65 6.91 4.40 2.67Homo sapiens 360.40 3.61 8.61 5.55 3.55 5.54 2.86 6.81 6.02 4.80 2.12Mus musculus 378.30 3.74 8.58 5.55 3.59 5.71 2.88 6.75 6.11 4.74 2.22
Rattus norvegicus 484.40 3.81 8.33 5.52 3.59 5.62 2.74 6.77 6.32 4.64 2.28Saccharomyces c. 447.00 4.47 9.02 5.93 6.18 7.26 3.41 6.43 5.58 3.94 2.10Rhodopirellula b. 314.70 3.70 7.37 5.85 3.37 3.44 2.09 6.02 7.05 4.04 2.43
SwissProt DB 367.90 4.03 6.89 5.47 4.22 5.93 3.09 6.59 6.70 3.93 2.38
Mean 397.96 3.89 8.04 5.59 4.22 5.57 2.87 6.46 6.36 4.36 2.33SD 71.90 0.32 0.98 0.24 0.88 1.07 0.35 0.39 0.50 0.54 0.18
Min 300.30 3.48 6.25 5.11 3.37 3.44 2.09 5.65 5.58 3.52 2.10Max 506.20 4.47 9.02 5.93 6.18 7.26 3.41 6.81 7.05 5.21 2.67
reference fC fL fA fW fP fH fD fR fI fG
Arabidopsis t. [34] 1.80 9.52 6.36 1.26 4.80 2.28 5.43 5.39 5.34 6.41Drosophila m. [34] 1.95 9.02 7.36 1.00 5.46 2.64 5.18 5.53 4.96 6.17
Escherichia coli [34] 1.17 10.23 9.27 1.50 4.32 2.22 5.21 5.54 5.94 7.38Homo sapiens [34] 2.24 9.78 6.98 1.35 6.22 2.51 4.73 5.64 4.28 6.80Mus musculus [34] 2.29 9.92 6.86 1.29 6.03 2.57 4.76 5.51 4.38 6.54
Rattus norvegicus [34] 2.29 10.07 6.88 1.25 5.97 2.58 4.77 5.59 4.51 6.49Saccharomyces c. [34] 1.30 9.52 5.51 1.04 4.39 2.18 5.76 4.41 6.58 5.00Rhodopirellula b. [37] 1.27 9.31 9.25 1.54 5.33 2.31 6.23 6.96 4.95 7.48
SwissProt [27] 1.57 9.63 7.80 1.17 4.86 2.27 5.30 5.29 5.92 6.94
Mean 1.76 9.67 7.36 1.27 5.26 2.40 5.26 5.54 5.21 6.58SD 0.45 0.38 1.25 0.18 0.71 0.18 0.50 0.65 0.80 0.74
Min 1.17 9.02 5.51 1.00 4.32 2.18 4.73 4.41 4.28 5.00Max 2.29 10.23 9.27 1.54 6.22 2.64 6.23 6.96 6.58 7.48
Page 16 of 19(page number not for citation purposes)
Proteome Science 2006, 4:18 http://www.proteomesci.com/content/4/1/18
sequence [12] consisting of several calibration proce-dures.
First calibration using external calibration samples wasperformed in order to remove higher order terms of themass measurement error [11]. Next, the affine mass meas-urement error of all samples on the sample support wasdetermined by linear regression on the peptide mass ruleintroduced here. Subsequently, the thin plate splines wereused to model the mass measurement error in depend-ence of the sample support positions to calibrate the spec-tra. Finally, the spectra were aligned using a modifiedspanning tree algorithm [12].
Mascot database searchProcessed peak-lists were then used for the protein data-base searches with the Mascot search software (Version1.8.1) [22], employing a mass accuracy of ± 0.1Da.Methionine oxidation was set as a variable and carbamid-omethylation of cysteine residues as fixed modification.We allowed only one missed proteolytic cleavage site inthe analysis.
Sequence databasesWe determined the amino acid frequencies of the nineprotein sequence databases listed in Table 5. Seven ofthese databases are organism specific subsets of the NCBInon-redundant protein database [34].
In silico protein digestionThe theoretical digestion of the protein databases wasdone with ProtDigest [35], a command line program tak-ing a protein sequence database file in fasta format andcleavage specificities as input. Other optional inputparameters included fixed as well as variable modifica-tions and number of missed cleavages. The output filecontains all theoretically resulting peptides with their cor-responding masses.
Regression analysisThe complete tryptic insilico digest of the SwissProt [27]database generated more than 7 million peptides. In orderto compute the slope coefficient we were sampling 500times 10000 monoisotopic and corresponding nominalmasses. For each sample we fitted the affine linear modelwith and without fixed intercept using linear regression.The slope and intercept coefficients in Figure 1 are themedians of these 500 samples.
AppendixWool and Smilanskys algorithmWool and Smilansky [10] use a Discrete Fourier Trans-form (DFT) to determine the calibration coefficients. Thewavelength λ of a peptide peak-list can be determined byconvolution. The "time domain" is the peak-list X with
masses xi. We computed the amplitude A (Equation 36)for a small range of frequencies (ω ~ f = 1/λ around λtheo.We scanned the range λ ∈ λtheo ± 0.0005 in steps of 5·10-
7 computing, for each λ, the real part (Equation 35), theimaginary part (Equation 34) and the amplitude A(ω)(Equation 36):
f = 1/λ ω = 2πf, (33)
The wavelength of the masses in the peak-list is the λ atthe maximum of A(ω). The phase for this ω0 = ωmax A(ω)can be determined by:
The peak centres are at the line:
But they should be on the line:
M = λtheo * N. (39)
Solving Equation 38 for N and substituting N in the Equa-tion 39 yields the Equation:
mcorr = α(mexp - β) = αmexp - αβ, (42)
which can be used to correct the masses. This is an affinelinear model with two coefficients α and αβ.
ℑ ω ω( ) = ( ) ( )∑ sin xii
, 34
ℜ ω ω( ) = ( ) ( )∑ cos xii
, 35
A ω ω ω( ) = ℑ( ) + ℜ( ) ( )2 2 36.
ϕ ϕ ωω
ω0 ω= ( ) =
ℑ( )ℜ( )
⎛
⎝⎜⎜
⎞
⎠⎟⎟
⋅ ( )( )max arctanA0
2
02 37
M N N n′
= ⋅ ⋅ + = ( )21 2 38
0
0
0
πω
ϕω
where , ,..., .
M Mtheo=⋅
⋅− ( )λ ω
πϕω
0 0
0240( ),
′
α λ ωπ
β ϕω
α β α αβ
=⋅
⋅= ( )
= − = −
theo
corrm m m
0 0
0241
4
and and
( ) ,exp exp 22( )
Page 17 of 19(page number not for citation purposes)
Proteome Science 2006, 4:18 http://www.proteomesci.com/content/4/1/18
Abbreviation• PBMS – Probability based Mascot score
• DFT – Discrete Fourier Transformation
• m/z – mass over charge
Authors' contributionsWEW developed and implemented the methodsdescribed, carried out the analysis and visualised theresults.
WEW, MF, ML and AKE wrote the manuscript.
AKE implemented the sequence digester.
All authors contributed to the final version of the manu-script.
AcknowledgementsI would like to thank the members of Algorithmic Bioinformatics group of Prof. Knut Reinert at the FU-Berlin for valuable discussion, especially Andreas Döring and Dr. Clemens Gröpl. Many thanks also to Dr. Johan Gobom, Dr. Patrick Giavalisco for providing the PMF-MS data and for val-uable discussion. This project was partially funded by the National Genome Research Network (NGFN) of the German Ministry for Education and Research (BMBF).
References1. Fenyo D: Identifying the proteome: software tools. Current
Opinion in Biotechnology 2000, 11:391-395.2. Griffin TJ, Aebersold R: Advances in proteome analysis by mass
spectrometry. J Biol Chem 2001, 276:45497-500.3. Patterson SD: Data analysis – the Achilles heel of proteomics.
Nat Biotechnol 2003, 21(3):221-2.4. Aebersold R, Mann M: Mass spectrometry-based proteomics.
Nature 2003, 422(6928):198-207.5. Mann M, Hojrup P, Roepstorff P: Use of mass spectrometric
molecular weight information to identify proteins insequence databases. Biol Mass Spectrom 1993, 22(6):338-345.
6. Johnson R, Martin S, Biemann K, Stults J, Watson J: Novel Fragmen-tation Process of Peptides by Collision-Induced Decomposi-tion in a Tandem Mass Spectrometer: Differentiation ofLeucine and Isoleucine. Analytical Chemistry 1987, 59(21):2621-2625.
7. Smith RD, Loo JA, Edmonds CG, Barinaga CJ, Udseth HR: Newdevelopments in biochemical mass spectrometry: electro-spray ionization. Anal Chem 1990, 62(9):882-99.
8. Apweiler R, Bairoch A, Wu CH: Protein sequence databases.Curr Opin Chem Biol 2004, 8:76-80.
9. Gentzel M, Kocher T, Ponnusamy S, Wilm M: Preprocessing oftandem mass spectrometric data to support automatic pro-tein identification. Proteomics 2003, 3(8):1597-610.
10. Wool A, Smilansky Z: Precalibration of matrix-assisted laserdesorption/ionization-time of flight spectra for peptide massfingerprinting. Proteomics 2002, 2(10):1365-1373.
11. Gobom J, Mueller M, Egelhofer V, Theiss D, Lehrach H, Nordhoff E:A calibration method that simplifies and improves accuratedetermination of peptide molecular masses by MALDI-TOFMS. Anal Chem 2002, 74(15):3915-3923. [(eng)]
12. Wolski WE, Lalowski M, Jungblut P, Reinert K: Calibration of massspectrometric peptide mass fingerprint data without specificexternal or internal calibrants. BMC Bioinformatics 2005, 6:203[http://www.biomedcentral.com/1471-2105/6/203].
13. Levander F, Rognvaldsson T, Samuelsson J, James P: Automatedmethods for improved protein identification by peptidemass fingerprinting. Proteomics 2004, 4(9):2594-601.
14. Chamrad DC, Koerting G, Gobom J, Thiele H, Klose J, Meyer HE,Blueggel M: Interpretation of mass spectrometry data forhigh-throughput proteomics. Anal Bioanal Chem 2003, 376(7):1014-22.
15. Gay S, Binz PA, Hochstrasser DF, Appel RD: Modeling peptidemass fingerprinting data using the atomic composition ofpeptides. Electrophoresis 1999, 20(18):3527-3534. [(eng)]
16. Wikipedia is a Web-based, free-content encyclopedia 2004[http://www.wikipedia.org].
17. Giles J: Internet encyclopaedias go head to head. Nature 2005,438(7070):900-1.
18. Pappin DJC, Hojrup P, Bleasby AJ: Rapid identification of proteinsby peptide-mass fingerprinting. Curr Biol 1993, 3:327-332.
19. Gras R, Muller M, Gasteiger E, Gay S, Binz PA, Bienvenut W, Hoog-land C, Sanchez JC, Bairoch A, Hochstrasser DF, Appel RD: Improv-ing protein identification from peptide mass fingerprintingthrough a parameterized multi-level scoring algorithm andan optimized peak detection. Electrophoresis 1999, 20(18):3535-3550. [(eng)]
20. Gobom J, Schürenberg M, Mueller M, Theiss D, Lehrach H, NordhoffE: Alpha-cyano-4-hydroxycinnamic acid affinity sample prep-aration. A protocol for MALDI-MS peptide analysis in pro-teomics. Analytical Chemistry 2001, 73(3):434-438.
21. Zhen Y, Xu N, Richardson B, Becklin R, Savage JR, Blake K, Peltier JM:Development of an LC-MALDI method for the analysis ofprotein complexes. J Am Soc Mass Spectrom 2004, 15(6):803-22.
22. Perkins DN, Pappin DJ, Creasy DM, Cottrell JS: Probability-basedprotein identification by searching sequence databases usingmass spectrometry data. Electrophoresis 1999, 20(18):3551-3567.
23. Schmidt F, Schmid M, Jungblut PR, Mattow J, Facius A, Pleissner KP:Iterative data analysis is the key for exhaustive analysis ofpeptide mass fingerprints from proteins separated by two-dimensional electrophoresis. J Am Soc Mass Spectrom 2003, 14(9):943-56.
24. Tabb DL, MacCoss MJ, Wu CC, Anderson SD, Yates JRr: Similarityamong tandem mass spectra from proteomic experiments:detection, significance, and utility. Anal Chem 2003, 75(10):2470-7.
25. Wolski WE, Lalowski M, Martus P, Herwig R, Giavalisco P, Gobom J,Sickmann A, Lehrach H, Reinert K: Transformation and otherfactors of the peptide mass spectrometry pairwise peak-listcomparison process. BMC Bioinformatics 2005, 6:285.
26. Cagney G, Amiri S, Premawaradena T, Lindo M, Emili A: In silicoproteome analysis to facilitate proteomics experimentsusing mass spectrometry. Proteome Science 2003, 1:5 [http://www.Proteomesci.com/content/1/1/5].
27. Bairoch A, Apweiler R, Wu CH, Barker WC, Boeckmann B, Ferro S,Gasteiger E, Huang H, Lopez R, Magrane M, Martin MJ, Natale DA,O'Donovan C, Redaschi N, Yeh LSL: The Universal ProteinResource (UniProt). Nucleic Acids Res 2005:D154-9.
28. Becker RA, Chambers JM, Wilks AR: The New S Language London:Chapman & Hall; 1988.
29. Samuelsson J, Dalevi D, Levander F, Rognvaldsson T: Modular,Scriptable, and Automated Analysis Tools for High-Throughput Peptide Mass Fingerprinting. Bioinformatics 2004.
30. Venables WN, Ripley BD: Modern Applied Statistics with S Fourth 2002[http://www.stats.ox.ac.uk/pub/MASS4/]. Springer [ISBN 0-387-95457-0]
31. Bruker Daltonics – enabling life science tools based on massspectrometry 2004 [http://www.bdal.com].
32. Giavalisco P, Nordhoff E, Kreitler T, Kloeppel KD, Lehrach H, KloseJ, Gobom J: Proteome Analysis of Arabidopsis Thaliana by 2-D Electrophoresis and Matrix Assisted Laser Desorption/Ionization Time of Flight Mass Spectrometry. . [To appear inProteomics]
33. Klose J, Kobalz U: Two-dimensional electrophoresis of pro-teins: an updated protocol and implications for a functionalanalysis of the genome. Electrophoresis 1995, 16(6):1034-59.
34. Pruitt KD, Tatusova T, Maglott DR: NCBI Reference Sequenceproject: update and current status. Nucleic Acids Res 2003, 31:34-7.
35. Emde AK: Protein Sequence Digester. 2004 [http://www.inf.fu-berlin.de/~emde/].
36. Mascot 2005 [http://www.matrixscience.com].
Page 18 of 19(page number not for citation purposes)

Proteome Science 2006, 4:18 http://www.proteomesci.com/content/4/1/18
Publish with BioMed Central and every scientist can read your work free of charge
"BioMed Central will be the most significant development for disseminating the results of biomedical research in our lifetime."
Sir Paul Nurse, Cancer Research UK
Your research papers will be:
available free of charge to the entire biomedical community
peer reviewed and published immediately upon acceptance
cited in PubMed and archived on PubMed Central
yours — you keep the copyright
Submit your manuscript here:http://www.biomedcentral.com/info/publishing_adv.asp
BioMedcentral
37. Glockner FO, Kube M, Bauer M, Teeling H, Lombardot T, Ludwig W,Gade D, Beck A, Borzym K, Heitmann K, Rabus R, Schlesner H,Amann R, Reinhardt R: Complete genome sequence of themarine planctomycete Pirellula sp. strain 1. Proc Natl Acad SciUSA 2003, 100(14):8298-303.
Page 19 of 19(page number not for citation purposes)


