Embed Size (px)
Citation preview
ANALYSIS OF IPL MATCH RESULTS USING MACHINELEARNING ALGORITHMS
A Project report submitted in partial fulfillment of the requirements for the awardof the degree of
BACHELOR OF TECHNOLOGY
IN
COMPUTER SCIENCE ENGINEERING
Submitted by
KALYAN PAVAN LATCHIPATRUNI 317126510091
PAVAN SIMHADRI 317126510111
Under the Guidance of
Ms. N. Lokeswari, M.Tech, (Ph.D)
Assistant Professor
DEPARTMENT OF COMPUTER SCIENCE AND ENGINEERING
ANIL NEERUKONDA INSTITUTE OF TECHNOLOGY AND SCIENCES
(UGC AUTONOMOUS)
(Permanently Affiliated to AU, Approved by AICTE and Accredited by NBA & NAAC with ‘A’ Grade )
SANGIVALASA, Bheemili Mandal, VISAKHAPATNAM – 531162
2020-2021
R1
DEPARTMENT OF COMPUTER SCIENCE AND ENGINEERING
ANIL NEERUKONDA INSTITUTE OF TECHNOLOGY AND SCIENCES(UGC AUTONOMOUS)
(Affiliated to AU, Approved by AICTE and Accredited by NBA & NAAC with ‘A’ Grade )SANGIVALASA, Bheemili Mandal, VISAKHAPATNAM – 531162
BONAFIDE CERTIFICATE
This is to certify that the project report entitled “Analysis of IPL Match ResultsUsing Machine Learning Algorithms” submitted by Kalyan Pavan. L(317126510091), Pavan. S (317126510111), in partial fulfillment of the requirementsfor the award of the degree of Bachelor of Technology in Computer ScienceEngineering of Anil Neerukonda Institute of technology and sciences (A),Visakhapatnam is a record of bonafide work carried out under my guidance andsupervision.
Project Guide Head of the Department
Ms. N. Lokeswari, M.Tech, (Ph.D) Dr. R.Sivaranjani, Ph.D
Assistant Professor HoD & Professor
Department of CSE Department of CSE
ANITS ANITS
R2
DECLARATION
We, Kalyan Pavan. L (317126510091), Pavan. S (317126510111) of final
semester B.Tech., in the department of Computer Science and Engineering from
ANITS, Visakhapatnam, hereby declare that the project work entitled “Analysis Of
IPL Match Results Using Machine Learning Algorithms” is carried out by us and
submitted in partial fulfilment of the requirements for the award of Bachelor of
Technology in Computer Science Engineering , under Anil Neerukonda Institute of
Technology & Sciences (A) during the academic year 2017-2021 and has not been
submitted to any other university for the award of any kind of degree.
KALYAN PAVAN LATCHIPATRUNI 317126510091
PAVAN SIMHADRI 317126510111
R3

ACKNOWLEDGEMENT
We would like to express our deep gratitude to our project guide Ms.N.Lokeswari,
M.tech, (Ph.D), Assistant Professor, Department of Computer Science and
Engineering, ANITS, for her guidance with unsurpassed knowledge and immense
encouragement. We are grateful to Dr.R.Sivaranjani, Head of the Department,
Computer Science and Engineering, for providing us with the required facilities for the
completion of the project work.
We are very much thankful to the Principal and Management, ANITS, Sangivalasa,
for their encouragement and cooperation to carry out this work.
We express our thanks to Project Coordinator, Dr.K.S.Deepthi, Associate Professor,
Department of Computer Science for her Continuous support and encouragement. We
thank all the teaching faculty of the Department of CSE, whose suggestions during
reviews helped us in accomplishment of our project. We would like to thank the
non-teaching staff of the Department of CSE, ANITS, for providing great assistance in
the accomplishment of our project.
We would like to thank our parents, friends, and classmates for their encouragement
throughout our project period. At last but not the least, we thank everyone for
supporting us directly or indirectly in completing this project successfully.
KALYAN PAVAN LATCHIPATRUNI 317126510091
PAVAN SIMHADRI 317126510111
R4
ABSTRACT
Indian Premier League (IPL) is a famous Twenty-20 League conducted by The Boardof Control for Cricket in India (BCCI). It was started in 2008 and successfullycompleted its thirteen seasons till 2020. IPL is a popular sport where it has a large setof audience throughout the country. Every cricket fan would be eager to know andpredict the IPL match results.A solution using Machine Learning is provided for theanalysis of IPL Match results. This paper attempts to predict the match winner and theinnings score considering the past data of match by match and ball by ball. Matchwinner prediction is taken as classification problem and innings score prediction istaken as regression problem. Algorithms like Support Vector Machine(SVM),NaiveBayes, k-Nearest Neighbour(kNN) are used for classification of match winner andLinear Regression, Decision tree for prediction of innings score. The dataset containsmany features in which 7 features are identified in which that can be used for theprediction. Based on those features, models are built and evaluated by certainparameters. Based on the results SVM performed.
Keywords : IPL, Machine Learning, Match winner prediction, Score Prediction,SVM, kNN, Naive Bayes.
R5
CONTENTS
ABSTRACT R5
LIST OF SYMBOLS R8
LIST OF FIGURES R9
LIST OF TABLES R10
LIST OF ABBREVIATION R11
CHAPTER 1 INTRODUCTION 1
1.1 Introduction 2
1.1.1 Indian Premier League (IPL) 2
1.1.2 Machine Learning 2
1.1.3 Flask 5
1.2 Motivation of the work 6
1.3 Problem Statement 6
1.4 Organization of Thesis 6
CHAPTER 2 LITERATURE SURVEY 7
2.1 A Perspective on Analyzing IPL Match Results using Machine Learning 8
2.2 Predictive Analysis of IPL Match Winner using Machine Learning 10
Techniques.
2.3 Predicting Outcome of Indian Premier League(IPL) Matches Using 12
Machine Learning
CHAPTER 3 METHODOLOGY 15
3.1 Proposed System 163.1.1 Data Acquisition 163.1.2 Data Cleaning 193.1.3 Feature Selection 203.1.4 Training Classification Methods 213.1.5 Testing Data 24
3.2 User Interface 24
CHAPTER 4 EXPERIMENTAL ANALYSIS AND RESULTS 25
4.1 System Configuration 26
4.1.1 Software Requirements 26
R6
4.1.1.1 Introduction to Python 26
4.1.1.2 Introduction to Flask Framework 26
4.1.1.3 Python Libraries 27
4.1.2 Hardware Requirements 28
4.2 Code 29
4.3 Experimental analysis and Performance Measures 68
4.3.1 Performance Analysis and Models Comparison 68
4.3.1.1 Methods Comparison 69
4.4 Results 70
CHAPTER 5 CONCLUSION AND FUTURE WORK 73
5.1 Conclusion 74
5.2 Future Work 74
REFERENCES 75
R7
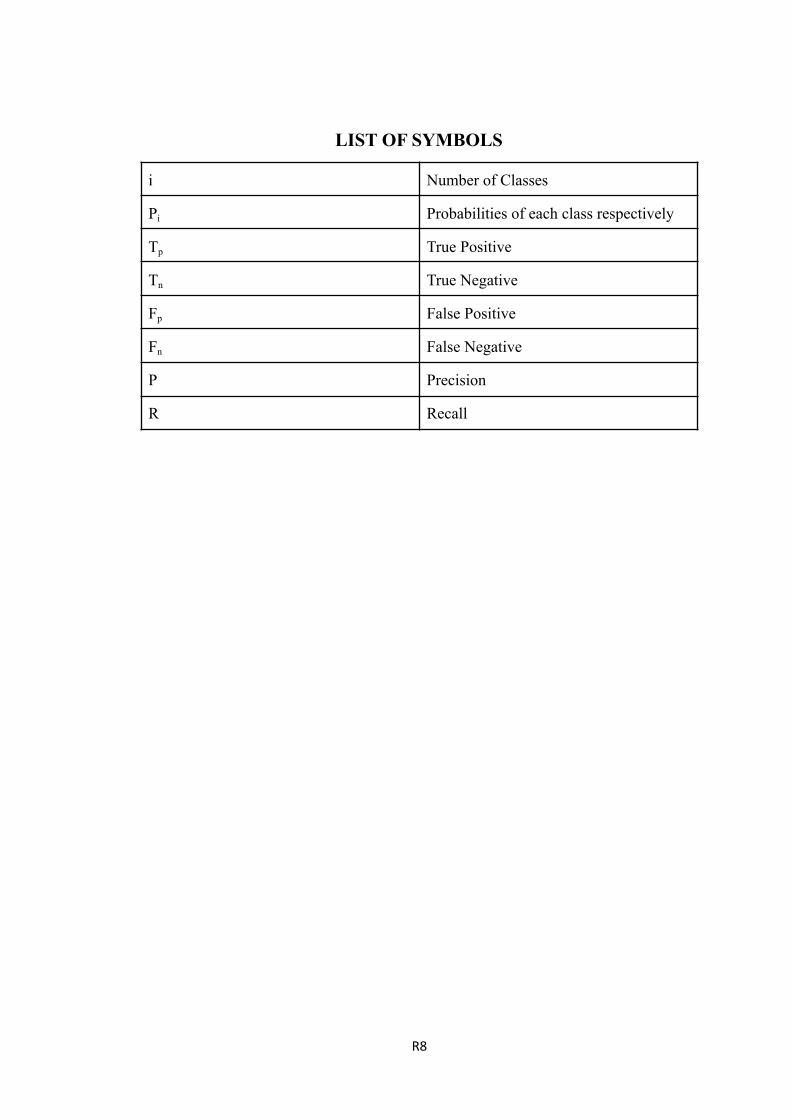
LIST OF SYMBOLS
i Number of Classes
Pi Probabilities of each class respectively
Tp True Positive
Tn True Negative
Fp False Positive
Fn False Negative
P Precision
R Recall
R8
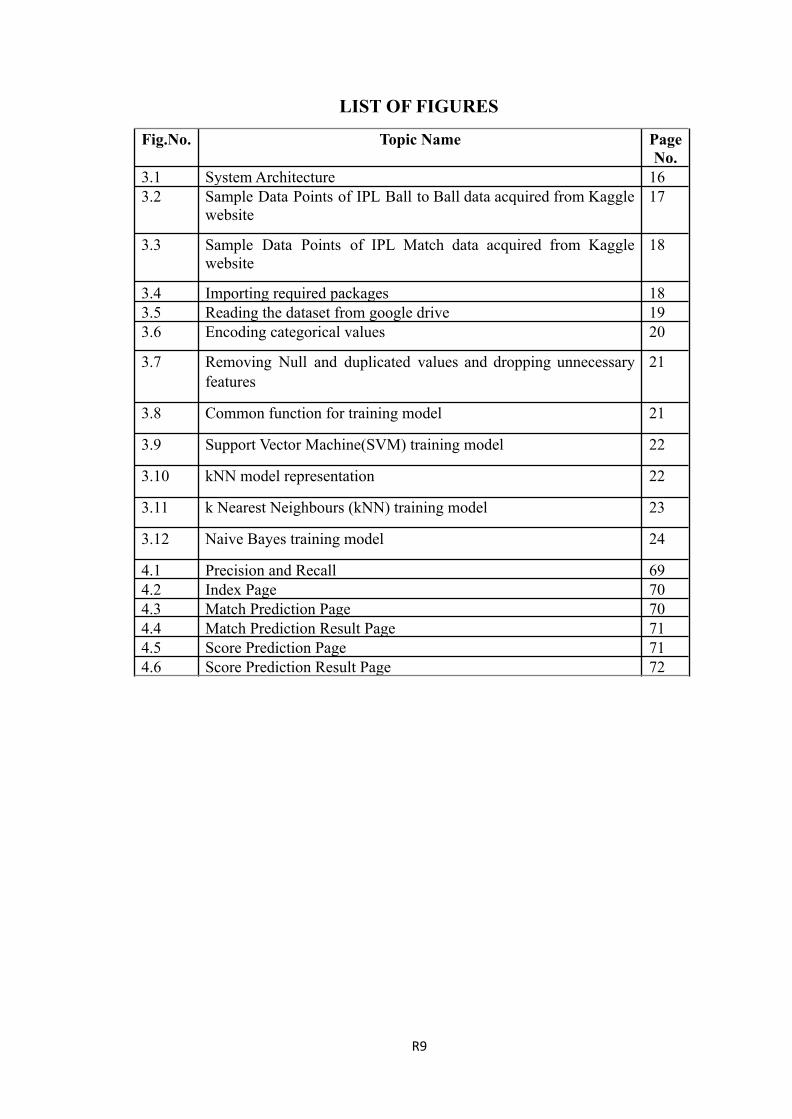
LIST OF FIGURES
Fig.No. Topic Name PageNo.
3.1 System Architecture 163.2 Sample Data Points of IPL Ball to Ball data acquired from Kaggle
website17
3.3 Sample Data Points of IPL Match data acquired from Kagglewebsite
18
3.4 Importing required packages 183.5 Reading the dataset from google drive 193.6 Encoding categorical values 20
3.7 Removing Null and duplicated values and dropping unnecessaryfeatures
21
3.8 Common function for training model 21
3.9 Support Vector Machine(SVM) training model 22
3.10 kNN model representation 22
3.11 k Nearest Neighbours (kNN) training model 23
3.12 Naive Bayes training model 24
4.1 Precision and Recall 694.2 Index Page 704.3 Match Prediction Page 704.4 Match Prediction Result Page 714.5 Score Prediction Page 714.6 Score Prediction Result Page 72
R9

LIST OF TABLESTableNo.
Topic Name PageNo.
4.1 Methods Comparison 69
R10
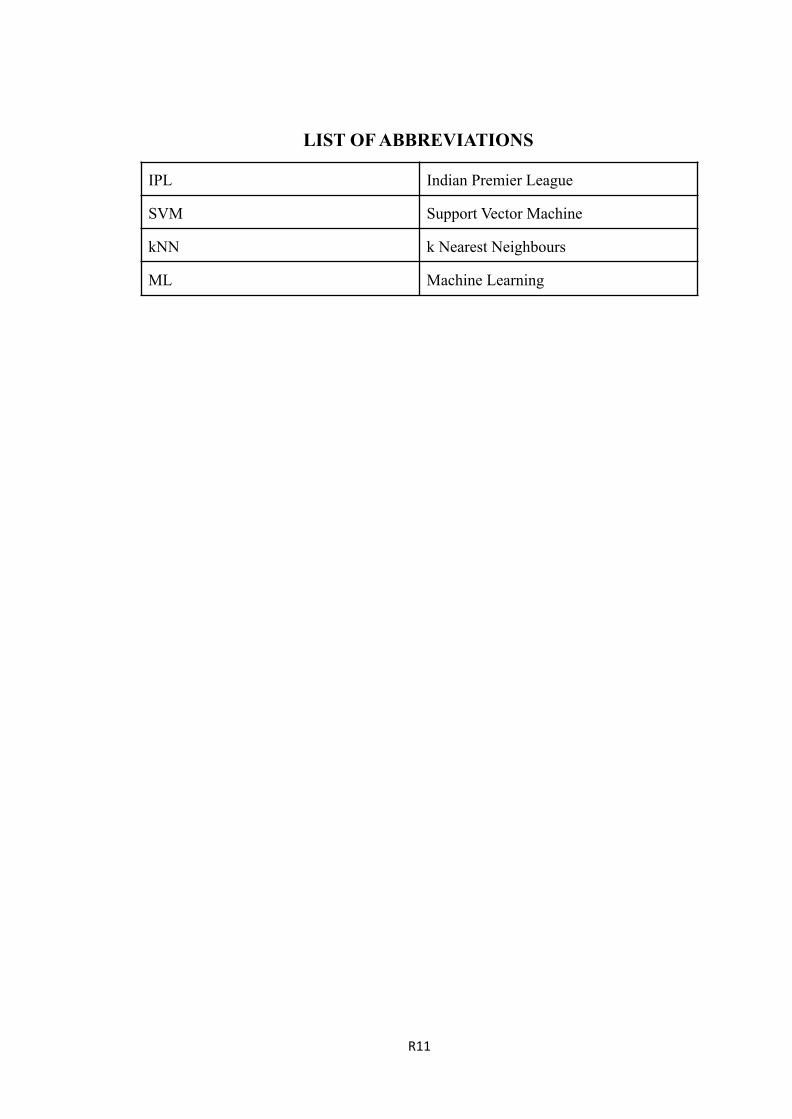
LIST OF ABBREVIATIONS
IPL Indian Premier League
SVM Support Vector Machine
kNN k Nearest Neighbours
ML Machine Learning
R11

CHAPTER 1
INTRODUCTION
1
1.1 Introduction
1.1.1 Indian Premier League (IPL)
Sports have gained much importance at both national and international level. Cricketis one such game, which is marked as the prominent sport in the world. T20 is oneamong the forms of cricket which is recognized by the International Cricket Council(ICC). Because of the short duration of time and the excitement generated, T20 hasbecome a huge success. The T20 format gave a productive platform to the IPL, whichis now pointed as the biggest revolution in the field of cricket. IPL is an annualtournament usually played in the months of April and May. Each team in IPLrepresents a state or a part of the nation in India. IPL has taken T20 cricket’spopularity to sparkling heights.
It is the most attended cricket league in the world and in the year 2010, IPL becamethe first sporting event to be broadcasted live. Till date, IPL has successfullycompleted 13 seasons from the year of its inauguration. Currently, there are 8 teamsthat compete with each other, organized in a round robin fashion during the stages ofthe league. After the completion of league stages, the top 4 teams in the points tableare eligible to the playoffs. In playoffs, the winner between 1st and 2nd team qualifiesfor the final and the loser gets another opportunity to qualify for the finals by playingagainst the winner between 3rd and 4th team. In the end, the 2 qualified teams playedagainst each other for the IPL title. The significance is that IPL employs televisiontimeouts and therefore there is no time constraint in which teams have to complete theinnings.
In this paper, we have examined various elements that may affect the outcome of anIPL match in determining the runs for each ball by considering the runs scored by thebatsman in the previous ball as the labeled data. The suggested prediction modelmakes use of SVM and KNN to fulfill the objective of the problem stated. Few workshave been carried out in this field of predicting the outcomes in IPL. In our survey, wefound that the work carried out so far is based on Data Mining for analyzing andpredicting the outcomes of the match. Our work novelty is to predict runs for each ballby keeping the runs scored by the batsman in the previous ball as the observed dataand to verify whether our prediction fits into the desired model.
1.1.2 Machine Learning
Machine Learning is the preferred technique of predicting or classifying informationto assist folks in creating necessary selections. Machine Learning algorithms aretrained over instances or examples through that they learn from past experiences andanalyse the historical knowledge. Simply building models isn't enough. you want toconjointly optimize and tune the model appropriately in order that it provides you with
2
correct results. Improvement techniques involve tuning the hyperparameters tosucceed in Associate in Nursing optimum results.
As it trains over the examples, once more and once more, it will determine patterns toform selections additionally accurately. Whenever any new input is introduced to thecubic centimetre model, it applies its learned patterns over the new knowledge to formfuture predictions. Based on the ultimate accuracy, one will optimize their models byexploiting numerous standardized approaches. During this manner, the MachineLearning model learns to adapt to new examples and produce higher results.
Types of Learnings
Machine Learning Algorithms can be classified into 3 types as follows:
1. Supervised learning
2. Unsupervised Learning
3. Reinforcement Learning
1.1.2.1 Supervised Learning
Supervised learning is the preferred paradigm for machine learning. It is the simplestto know and therefore the simplest to implement. It is the task of learning a functionthat maps an input to an output supported example input-output pairs. It infers afunction from labelled training data consisting of a group of coaching examples. Insupervised learning, each example may be a pair consisting of an input object(typically a vector) and a desired output value (also called the supervisory signal). Asupervised learning algorithm analyses the training data and produces an inferredfunction, which may be used for mapping new examples. Supervised Learning is verysimilar to teaching a child with the given data and that data is in the form of exampleswith labels, we can feed a learning algorithm with these example label pairs one byone, allowing the algorithm to predict the right answer or not. Over time, the algorithmwill learn to approximate the exact nature of the relationship between examples andtheir labels. When fully trained, the supervised learning algorithms are going to beready to observe a replacement , never-before-seen example and predict an honestlabel for it.
Most of the sensible machine learning uses supervised learning. Supervised learning iswhere you've got input variable (x) and an output variable (Y) and you employ analgorithm to find out the mapping function from the input to the output.
Y = f(x)
The goal is to approximate the mapping function so well that once you have a newinput file (x) that you simply can predict the output variables (Y) for the info . It'scalled supervised learning because the method of an algorithm learning from thetraining dataset is often thought of as an educator supervising the training process.Supervised learning is usually described as task oriented. It's highly focused on asingular task, feeding more and more examples to the algorithm until it can accurately
3
perform the on task. This is often the training type that you simply will presumablyencounter, because it is exhibited in many of the common applications likeAdvertisement Popularity, Spam Classification, and face recognition.
Two types of Supervised Learning are:
(i) Regression:
Regression models a target prediction value supported by independent variables. It'smostly used for locating out the connection between variables and forecasting.Regressions are often wont to estimate/ predict continuous values (Real valuedoutput). For instance , given an image of an individual then we've to predict the agebased on the idea of the given picture.
(ii) Classification:
Classification means to group the output into a category . If the info is discrete orcategorical then it's a classification problem. for instance , given data about the sizes ofhomes within the land market, making our output about whether the house “sells formore or but the asking price” i.e. Classifying houses into two discrete categories.
1.1.2.2 Unsupervised Learning
Unsupervised Learning may be a machine learning technique, where you are not got tosupervise the model. Instead, you would like to permit the model to figure on its ownto get information. It mainly deals with the unlabelled data and appears for previouslyundetected patterns during a data set with no pre-existing labels and with a minimumof human supervision. In contrast to supervised learning that sometimes makes use ofhuman-labelled data, unsupervised learning, also referred to as self-organization,allows for modelling of probability densities over inputs.
Unsupervised machine learning algorithms infer patterns from a dataset without regardto known, or labelled outcomes. It's the training of machines using information that'sneither classified nor labelled and allowing the algorithm to act on information withoutguidance. Here the task of the machine is to group unsorted information consistentwith similarities, patterns, and differences with no prior training of knowledge . Unlikesupervised learning, no teacher is as long as it means no training is going to be givento the machine. Therefore, machines are restricted to seek out the hidden structure inunlabelled data by our-self. For instance , if we offer some pictures of dogs and cats tothe machine to categorize, then initially the machine has no idea about the features ofdogs and cats so it categorizes them consistent with their similarities, patterns anddifferences. The Unsupervised Learning algorithms allow you to perform morecomplex processing tasks compared to supervised learning. Although, unsupervisedlearning is often more unpredictable compared with other natural learning methods.
4
Unsupervised learning problems are classified into two categories of algorithms:
(i) Clustering: A clustering problem is where you want to discover the inherent groupings in the data, such as grouping customers by purchasing behaviour.
(ii) Association: An association rule learning problem is where you want to discover rules that describe large portions of your data, such as people that buy X also tend tobuy Y.
1.1.2.3 Reinforcement Learning
Reinforcement Learning (RL) may be a sort of machine learning technique thatpermits an agent to find out in an interactive environment by trial and error usingfeedback from its own actions and experiences. Machine mainly learns from pastexperiences and tries to perform the absolute best solution to a particular problem. It'sthe training of machine learning models to form a sequence of selections . Thoughboth supervised and reinforcement learning use mapping between input and output,unlike supervised learning where the feedback provided to the agent is the correct setof actions for performing a task, reinforcement learning uses rewards and punishmentsas signals for positive and negative behaviour. Reinforcement learning is currently theforemost effective tool thanks to the machine’s creativity.
1.1.3 Flask
Flask is an API of Python that permits us to create web-applications. Flask was createdby Armin Ronacher of Pocoo, a world group of Python enthusiasts formed in 2004.Flask’s framework is more explicit than Django’s framework and is additionally easierto find out because it's less base code to implement an easy web-Application. AWeb-Application Framework or Web Framework is the collection of modules andlibraries that helps the developer to write down applications without writing thelow-level codes like protocols, thread management, etc. Flask is predicated onWSGI(Web Server Gateway Interface) toolkit and Jinja2 template engine. Python 2.6or higher is required for the installation of the Flask.
Flask supports extensions which will add application features as if they wereimplemented in Flask itself. Extensions exist for object-relational mappers, formvalidation, upload handling, various open authentication technologies and a number ofother common framework related tools. Flask is additionally easy to start with as abeginner because there's little boilerplate code for getting an easy app up and running.
5
1.2 Motivation of the Work
The history of machine learning and technology have always been intertwined. Artisticrevolutions which have happened in history were made possible by the tools to makethe work. We are entering an age where machine learning is becoming increasinglypresent in almost every field.
As the audience of IPL is increasing daily, people are looking at trending technologieslike data science, big data to deal with predictions. So we gathered the data from thepast seasons and made an analysis on the data. We focused on the factors that areaffecting the match winning and started to predict the match winner using thosefeatures.
1.3 Problem Statement
The main objective is to predict the IPL Match Result that would be beneficial for thefranchises and authorities who are at a position of decision making. IPL has a large setof audience. In cricket, particularly IPL is most watched and loved by the people,where no one can guess who will win the match until the last ball of the last over. Themain purpose of this research work is to find the best prediction model i.e. the bestmachine learning technique which will predict the match winner out of the two teams.The techniques used in this problem are k - Nearest Neighbour(kNN), Naïve Bayesand Support Vector Machine(SVM). The experimental study is performed on thedataset of the IPL’s patients which is downloaded from kaggle. The prediction isevaluated using evaluation metrics like confusion matrix, precision, recall accuracyand f1-score.
1.4 Organization of Thesis
The chapters of this document describe the following:
Chapter-1 is about the introduction of our project where we have given clear insightsabout our project domain and other related concepts.
Chapter-2 specifies a literature survey where all different existing methods andmodels are examined.
Chapter-3 specifies the proposed system with a system architecture along withdetailed explanations of each module.
Chapter-4 specifies the experimental analysis of our system along with performancemeasures and comparisons between different models. It also specifies aboutimplementation along with sample code.
Chapter-5 gives the conclusion to our work with an insight for the future scope.
6
CHAPTER 2
LITERATURE SURVEY
7
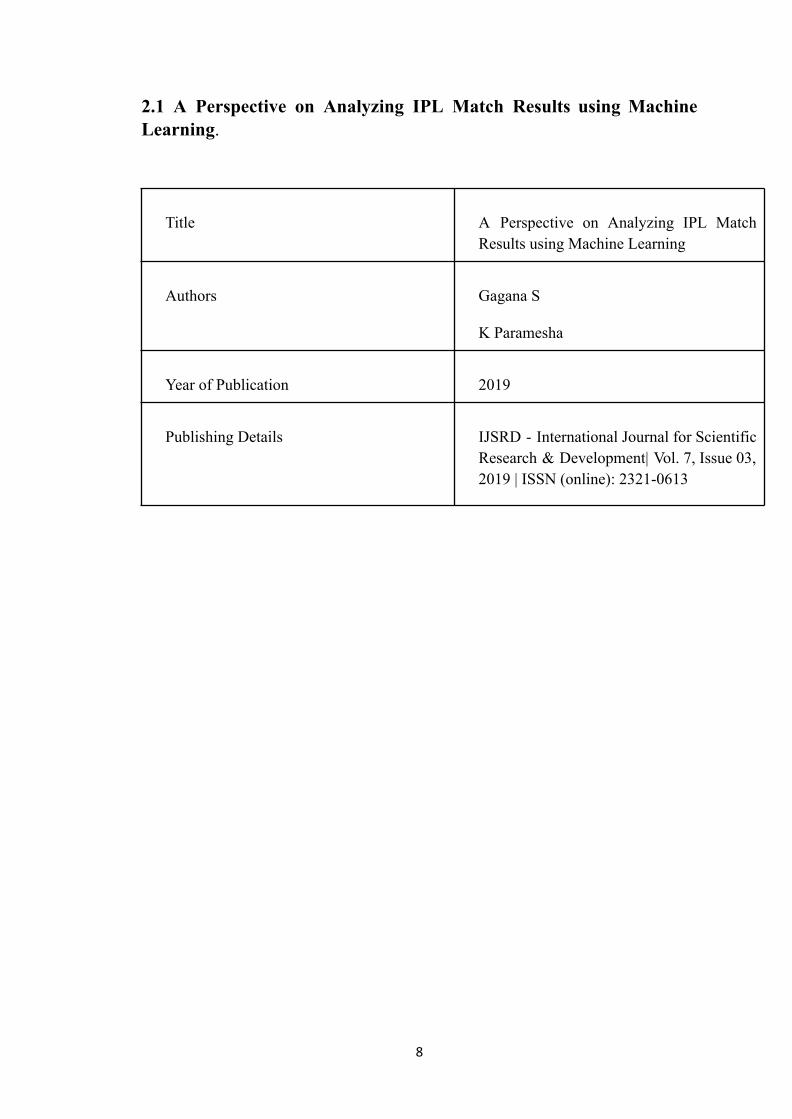
2.1 A Perspective on Analyzing IPL Match Results using MachineLearning.
Title A Perspective on Analyzing IPL MatchResults using Machine Learning
Authors Gagana S
K Paramesha
Year of Publication 2019
Publishing Details IJSRD - International Journal for ScientificResearch & Development| Vol. 7, Issue 03,2019 | ISSN (online): 2321-0613
8
Summary of Paper In this work, a new model is developed forpredicting runs by considering thepreviously scored runs by the batsman asthe observed data. In order to achieve thetask, a large dataset having details about577 IPL matches was taken intoconsideration with independent anddependent variables. Research in this paperconcludes that RNN and HMM gives thebest prediction accuracy for predicting runsin IPL. This model is distinct in its ownways, as Machine Learning techniques wasnot much used for prediction of IPL matchresults. The developed model helps inanalyzing and predicting IPL matchresults.
Similar work can be negotiated for otherformats of the game such as test cricket,ODI matches and T20 matches. The modelcan be further refined to reflect necessarycharacteristics of various other aspectssuch as weather conditions, injured playersetc. that contribute to the end result of thematch.
9
2.2 Predictive Analysis of IPL Match Winner using MachineLearning Techniques.
Title Predictive Analysis of IPL Match Winnerusing Machine Learning Techniques
Authors Ch Sai Abhishek
Ketaki V Patil
P Yuktha
Meghana K S
MV Sudhamani
Year of Publication Dec,2019
Publishing Details International Journal of InnovativeTechnology and Exploring Engineering(IJITEE) ISSN: 2278-3075, Volume-9Issue-2S, December 2019
10
Summary of Paper Predicting the winner in sports, cricket inparticular, is a challenge and very complex.But by incorporating machine learning,this can be made much simpler and easier.In this study, the various factors thatinfluence the outcome of an Indian PremierLeague match were identified. The factorswhich significantly influence the result ofan IPL match included the playing teams,match venue, city, the toss winner and thetoss decision.
A generic function for classifier model wasdesigned to measure the points earned byeach team based on their pastperformances, including team1, team2,venue of the match, toss winner, city andtoss decision. Different classification-basedmachine learning algorithms were trainedon the IPL dataset developed for this work.The methodologies used in our work tofind the final evaluation are Logisticregression, Decision trees, Random forestand K-nearest neighbours. Among thesetechniques, the Random forest classifierand Decision Tree provided the highestaccuracy of 89.151%.
11
2.3 Predicting Outcome of Indian Premier League(IPL) MatchesUsing Machine Learning
Title Predicting Outcome of Indian PremierLeague(IPL) Matches Using MachineLearning
Authors Rabindra Lamsal
Ayesha Choudhary
Year of Publication 21 Sept, 2020
Publishing Details arXiv:1809.09813v5 [stat.AP] 21 Sep 2020.
12
Summary of Paper In this study, the various factors thatinfluence the outcome of an Indian PremierLeague match were identified. The sevenfactors which significantly influence theresult of an IPL match include the hometeam, the away team, the toss winner, tossdecision, the stadium, and the respectiveteams’ weight. A multivariate regressionbased model was formulated to calculatethe points earned by each player based ontheir past performances which include
(i) Number ofwickets taken,
(ii) Number ofdot balls given,
(iii) Number offours hit,
(iv) Number ofsixes hit,
(v) Number ofcatches, and
(vi) Number ofstumpings.
The points awarded to each player wereused to compute the relative strength ofeach team. Various classification-basedmachine learning algorithms were trainedon the IPL dataset designed for this study.The Multilayer perceptron classifieroutperformed other classifiers by correctlypredicting 43 out of 60, 2018 IndianPremier League matches.
The accuracy of the MLP classifier wouldhave improved further if the team weightwas calculated immediately after the end ofeach match. Because this is the only way,the classifier gets fed with real-timeperformance of the participating teams.
The designing of a machine learning modelfor predicting the match outcome of an
13

auction-based Twenty20 format premierleague with an accuracy of 72.66% and F1score of
0.72 is highly satisfactory at this stage.
14
CHAPTER 3METHODOLOGY
15
3.1 PROPOSED SYSTEM
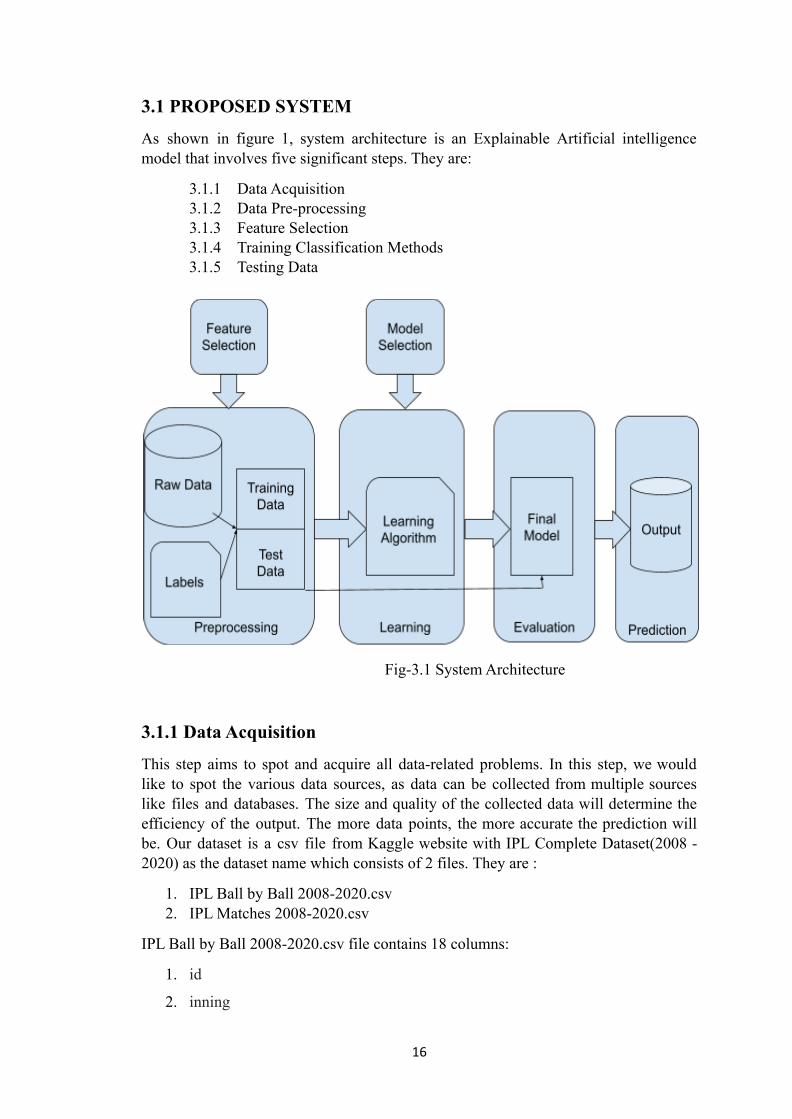
As shown in figure 1, system architecture is an Explainable Artificial intelligencemodel that involves five significant steps. They are:
3.1.1 Data Acquisition3.1.2 Data Pre-processing3.1.3 Feature Selection3.1.4 Training Classification Methods3.1.5 Testing Data
Fig-3.1 System Architecture
3.1.1 Data Acquisition
This step aims to spot and acquire all data-related problems. In this step, we wouldlike to spot the various data sources, as data can be collected from multiple sourceslike files and databases. The size and quality of the collected data will determine theefficiency of the output. The more data points, the more accurate the prediction willbe. Our dataset is a csv file from Kaggle website with IPL Complete Dataset(2008 -2020) as the dataset name which consists of 2 files. They are :
1. IPL Ball by Ball 2008-2020.csv2. IPL Matches 2008-2020.csv
IPL Ball by Ball 2008-2020.csv file contains 18 columns:
1. id
2. inning
16
3. over
4. ball
5. batsman
6. non_striker
7. bowler
8. batsman_runs
9. extra_runs
10. total_runs
11. non_boundary
12. is_wicket
13. dismissal_kind
14. player_dismissed
15. fielder
16. extras_type
17. batting_team
18.bowling_team
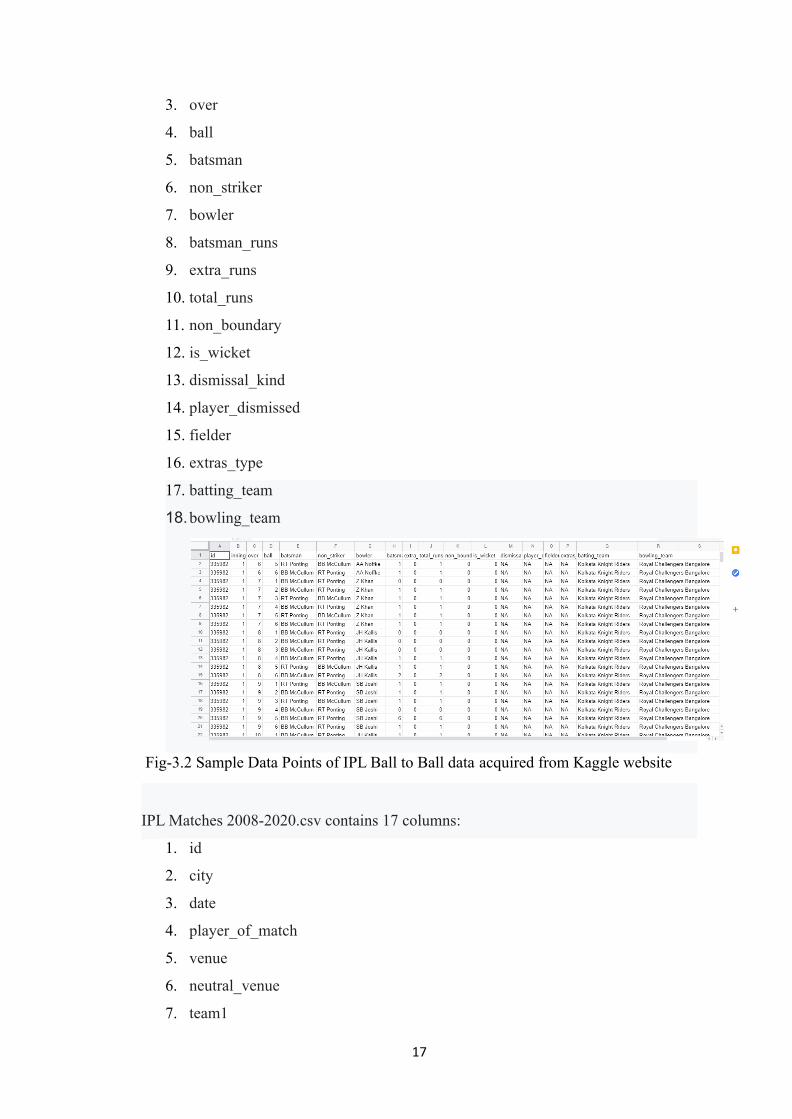
Fig-3.2 Sample Data Points of IPL Ball to Ball data acquired from Kaggle website
IPL Matches 2008-2020.csv contains 17 columns:
1. id
2. city
3. date
4. player_of_match
5. venue
6. neutral_venue
7. team1
17
8. team2
9. toss_winner
10. toss_decision
11. winner
12. result
13. result_margin
14. eliminator
15. method
16. umpire1
17. umpire2
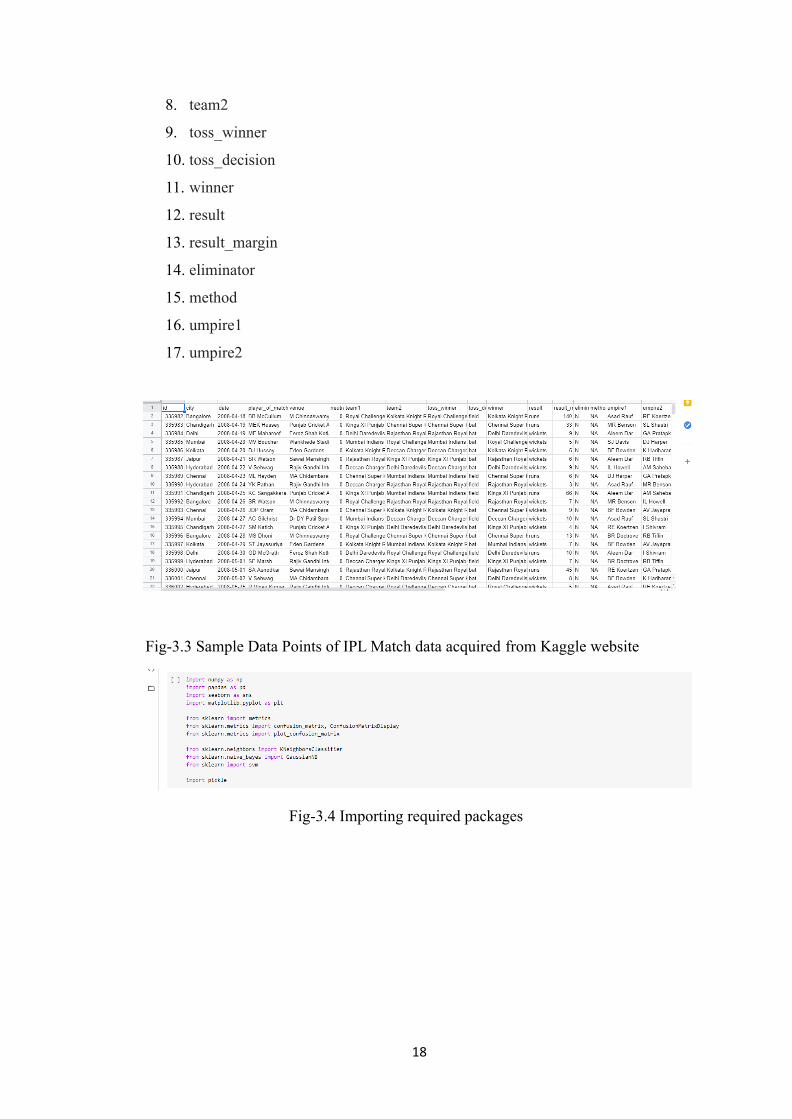
Fig-3.3 Sample Data Points of IPL Match data acquired from Kaggle website
Fig-3.4 Importing required packages
18
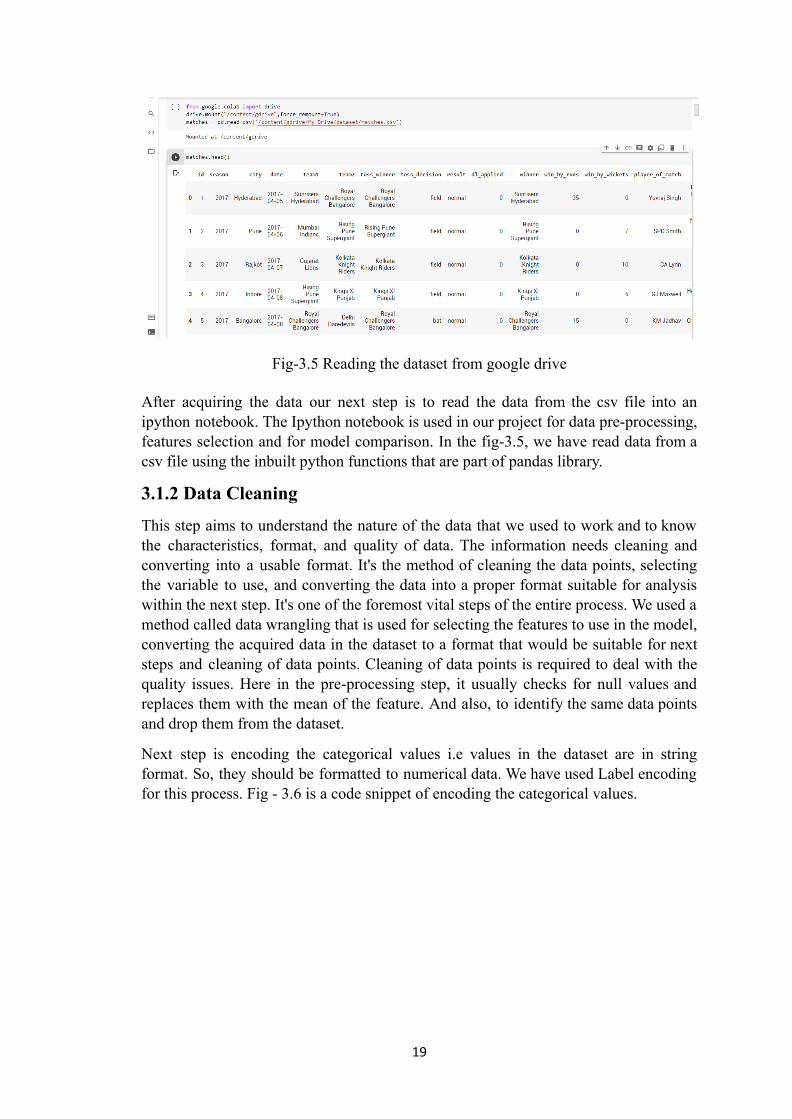
Fig-3.5 Reading the dataset from google drive
After acquiring the data our next step is to read the data from the csv file into anipython notebook. The Ipython notebook is used in our project for data pre-processing,features selection and for model comparison. In the fig-3.5, we have read data from acsv file using the inbuilt python functions that are part of pandas library.
3.1.2 Data Cleaning
This step aims to understand the nature of the data that we used to work and to knowthe characteristics, format, and quality of data. The information needs cleaning andconverting into a usable format. It's the method of cleaning the data points, selectingthe variable to use, and converting the data into a proper format suitable for analysiswithin the next step. It's one of the foremost vital steps of the entire process. We used amethod called data wrangling that is used for selecting the features to use in the model,converting the acquired data in the dataset to a format that would be suitable for nextsteps and cleaning of data points. Cleaning of data points is required to deal with thequality issues. Here in the pre-processing step, it usually checks for null values andreplaces them with the mean of the feature. And also, to identify the same data pointsand drop them from the dataset.
Next step is encoding the categorical values i.e values in the dataset are in stringformat. So, they should be formatted to numerical data. We have used Label encodingfor this process. Fig - 3.6 is a code snippet of encoding the categorical values.
19
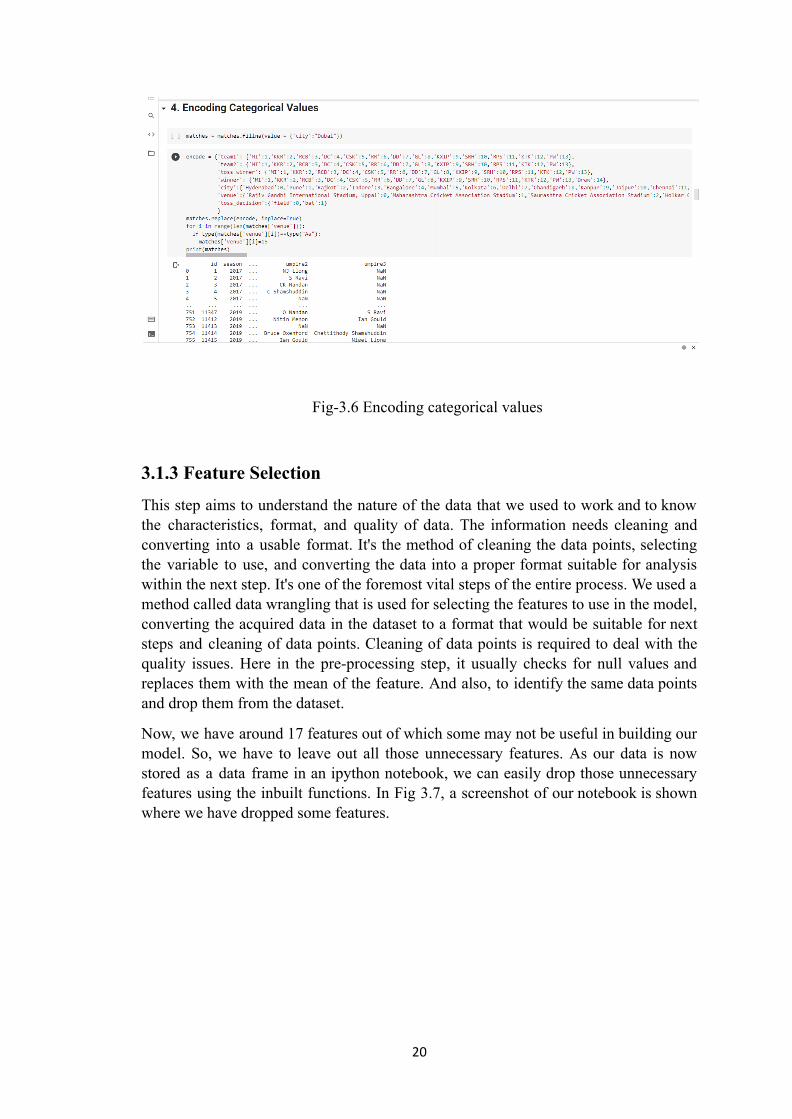
Fig-3.6 Encoding categorical values
3.1.3 Feature Selection
This step aims to understand the nature of the data that we used to work and to knowthe characteristics, format, and quality of data. The information needs cleaning andconverting into a usable format. It's the method of cleaning the data points, selectingthe variable to use, and converting the data into a proper format suitable for analysiswithin the next step. It's one of the foremost vital steps of the entire process. We used amethod called data wrangling that is used for selecting the features to use in the model,converting the acquired data in the dataset to a format that would be suitable for nextsteps and cleaning of data points. Cleaning of data points is required to deal with thequality issues. Here in the pre-processing step, it usually checks for null values andreplaces them with the mean of the feature. And also, to identify the same data pointsand drop them from the dataset.
Now, we have around 17 features out of which some may not be useful in building ourmodel. So, we have to leave out all those unnecessary features. As our data is nowstored as a data frame in an ipython notebook, we can easily drop those unnecessaryfeatures using the inbuilt functions. In Fig 3.7, a screenshot of our notebook is shownwhere we have dropped some features.
20
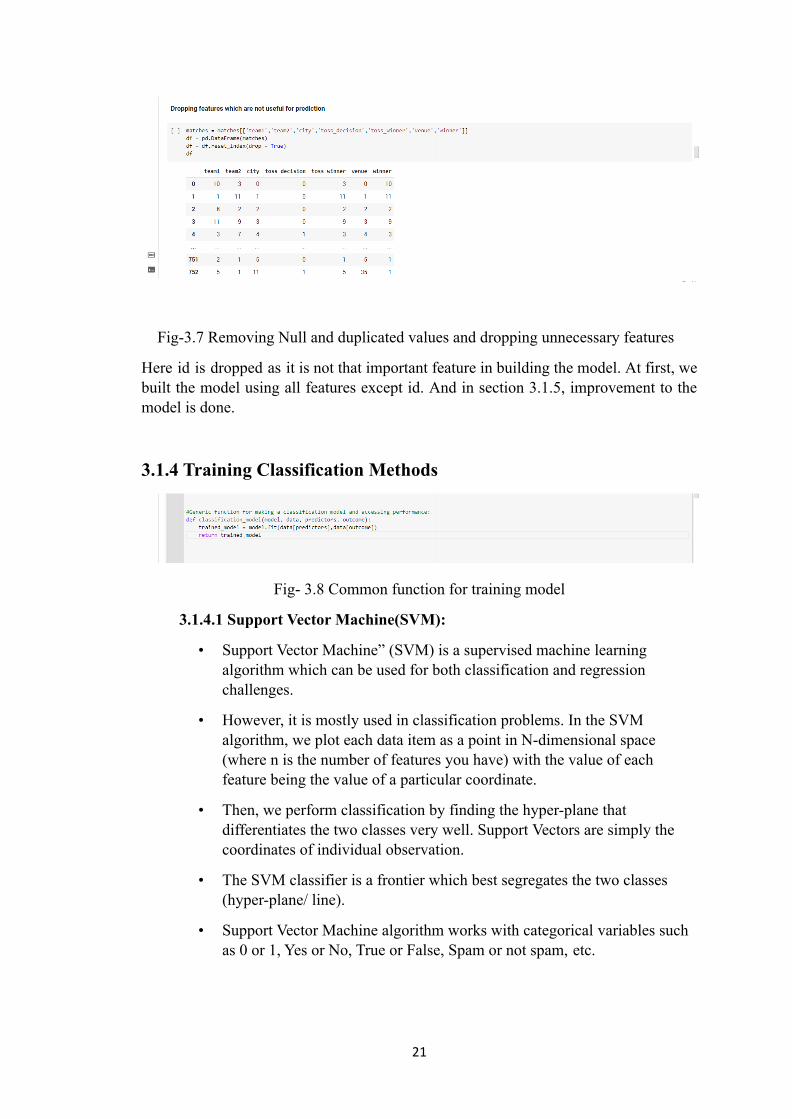
Fig-3.7 Removing Null and duplicated values and dropping unnecessary features
Here id is dropped as it is not that important feature in building the model. At first, webuilt the model using all features except id. And in section 3.1.5, improvement to themodel is done.
3.1.4 Training Classification Methods
Fig- 3.8 Common function for training model
3.1.4.1 Support Vector Machine(SVM):
• Support Vector Machine” (SVM) is a supervised machine learningalgorithm which can be used for both classification and regressionchallenges.
• However, it is mostly used in classification problems. In the SVMalgorithm, we plot each data item as a point in N-dimensional space(where n is the number of features you have) with the value of eachfeature being the value of a particular coordinate.
• Then, we perform classification by finding the hyper-plane thatdifferentiates the two classes very well. Support Vectors are simply thecoordinates of individual observation.
• The SVM classifier is a frontier which best segregates the two classes(hyper-plane/ line).
• Support Vector Machine algorithm works with categorical variables suchas 0 or 1, Yes or No, True or False, Spam or not spam, etc.
21
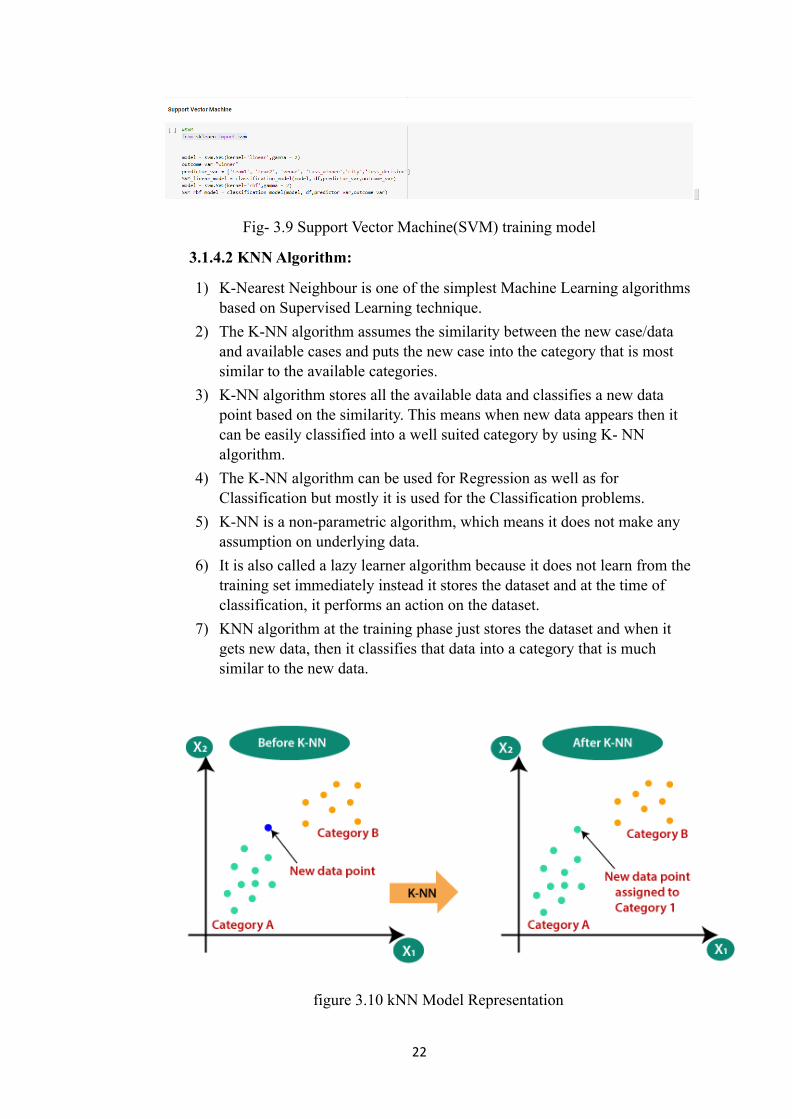
Fig- 3.9 Support Vector Machine(SVM) training model
3.1.4.2 KNN Algorithm:
1) K-Nearest Neighbour is one of the simplest Machine Learning algorithmsbased on Supervised Learning technique.
2) The K-NN algorithm assumes the similarity between the new case/dataand available cases and puts the new case into the category that is mostsimilar to the available categories.
3) K-NN algorithm stores all the available data and classifies a new datapoint based on the similarity. This means when new data appears then itcan be easily classified into a well suited category by using K- NNalgorithm.
4) The K-NN algorithm can be used for Regression as well as forClassification but mostly it is used for the Classification problems.
5) K-NN is a non-parametric algorithm, which means it does not make anyassumption on underlying data.
6) It is also called a lazy learner algorithm because it does not learn from thetraining set immediately instead it stores the dataset and at the time ofclassification, it performs an action on the dataset.
7) KNN algorithm at the training phase just stores the dataset and when itgets new data, then it classifies that data into a category that is muchsimilar to the new data.
figure 3.10 kNN Model Representation
22
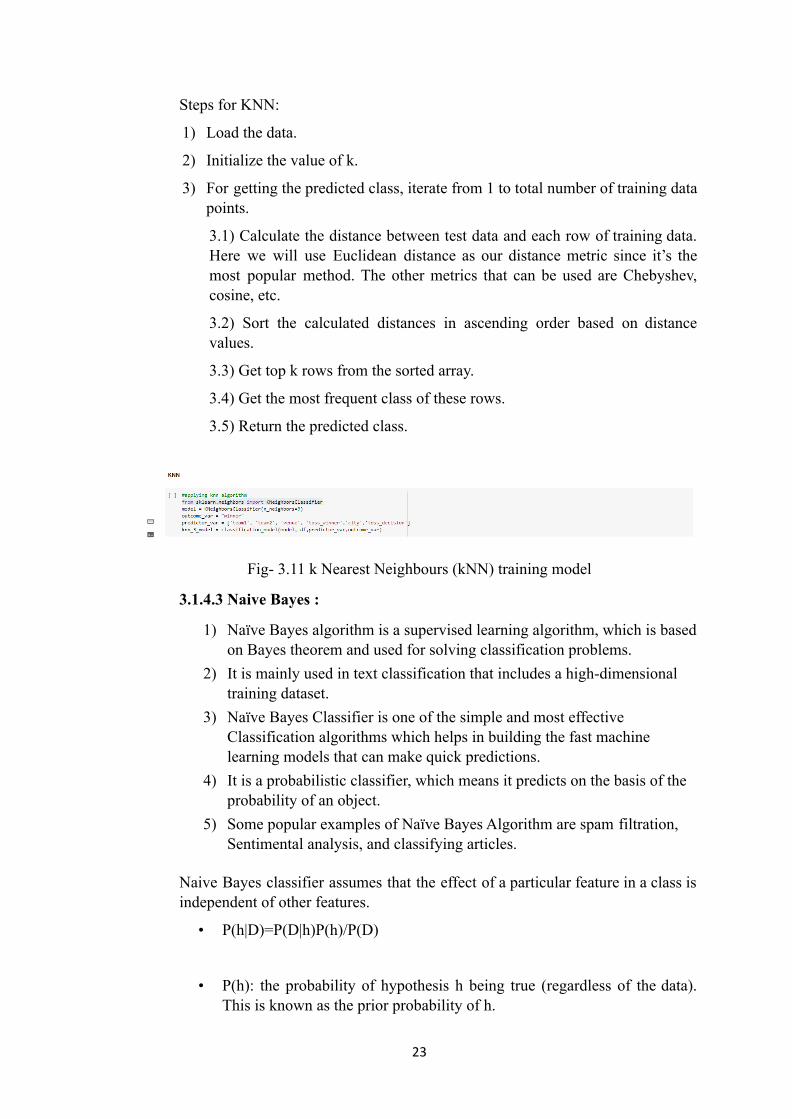
Steps for KNN:
1) Load the data.
2) Initialize the value of k.
3) For getting the predicted class, iterate from 1 to total number of training datapoints.
3.1) Calculate the distance between test data and each row of training data.Here we will use Euclidean distance as our distance metric since it’s themost popular method. The other metrics that can be used are Chebyshev,cosine, etc.
3.2) Sort the calculated distances in ascending order based on distancevalues.
3.3) Get top k rows from the sorted array.
3.4) Get the most frequent class of these rows.
3.5) Return the predicted class.
Fig- 3.11 k Nearest Neighbours (kNN) training model
3.1.4.3 Naive Bayes :
1) Naïve Bayes algorithm is a supervised learning algorithm, which is basedon Bayes theorem and used for solving classification problems.
2) It is mainly used in text classification that includes a high-dimensionaltraining dataset.
3) Naïve Bayes Classifier is one of the simple and most effectiveClassification algorithms which helps in building the fast machinelearning models that can make quick predictions.
4) It is a probabilistic classifier, which means it predicts on the basis of theprobability of an object.
5) Some popular examples of Naïve Bayes Algorithm are spam filtration,Sentimental analysis, and classifying articles.
Naive Bayes classifier assumes that the effect of a particular feature in a class isindependent of other features.
• P(h|D)=P(D|h)P(h)/P(D)
• P(h): the probability of hypothesis h being true (regardless of the data).This is known as the prior probability of h.
23
• P(D): the probability of the data (regardless of the hypothesis). This isknown as the prior probability.
• P(h|D): the probability of hypothesis h given the data D. This is known asposterior probability.
P(D|h): the probability of data d given that the hypothesis h was true. This isknown as posterior probability.
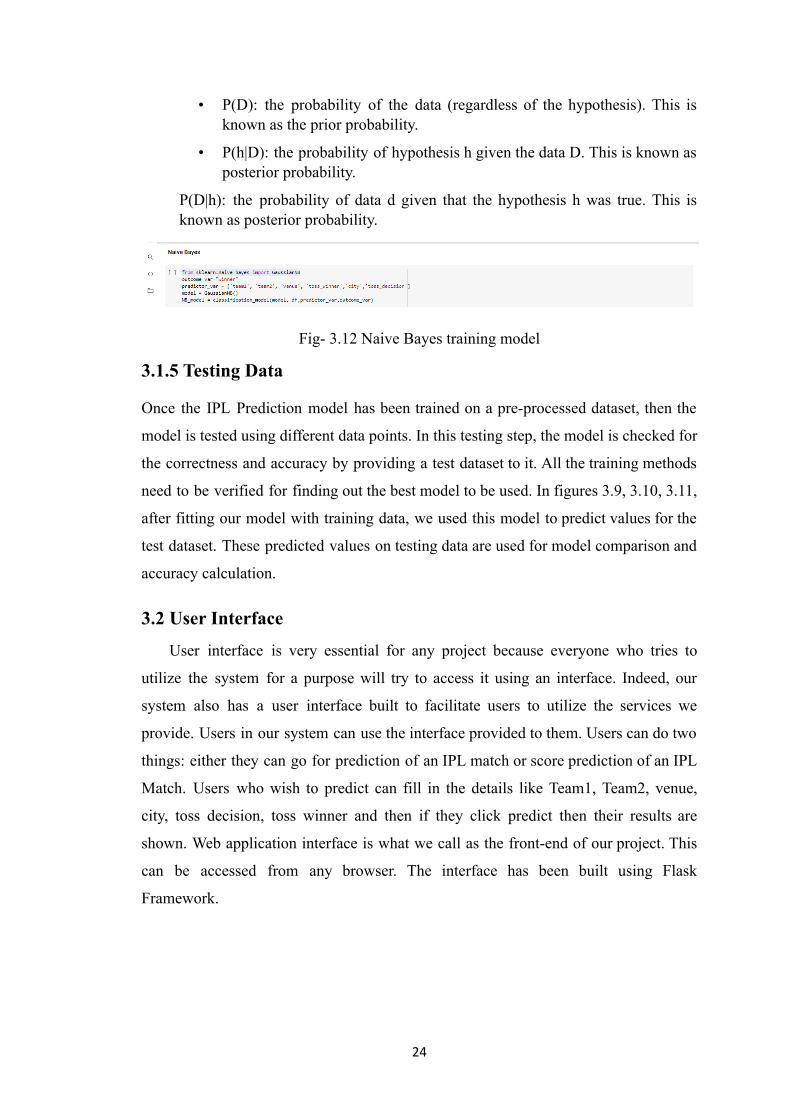
Fig- 3.12 Naive Bayes training model
3.1.5 Testing Data
Once the IPL Prediction model has been trained on a pre-processed dataset, then the
model is tested using different data points. In this testing step, the model is checked for
the correctness and accuracy by providing a test dataset to it. All the training methods
need to be verified for finding out the best model to be used. In figures 3.9, 3.10, 3.11,
after fitting our model with training data, we used this model to predict values for the
test dataset. These predicted values on testing data are used for model comparison and
accuracy calculation.
3.2 User Interface
User interface is very essential for any project because everyone who tries to
utilize the system for a purpose will try to access it using an interface. Indeed, our
system also has a user interface built to facilitate users to utilize the services we
provide. Users in our system can use the interface provided to them. Users can do two
things: either they can go for prediction of an IPL match or score prediction of an IPL
Match. Users who wish to predict can fill in the details like Team1, Team2, venue,
city, toss decision, toss winner and then if they click predict then their results are
shown. Web application interface is what we call as the front-end of our project. This
can be accessed from any browser. The interface has been built using Flask
Framework.
24
CHAPTER 4EXPERIMENTALANALYSIS ANDRESULTS
25
4.1 System Configuration
4.1.1 Software Requirements
1. Software:
� Python Version 3.0 or above
� Flask Framework
2. Operating System: Windows 10
3. Tools: Web Browser (Google Chrome or Firefox)
4. Python Libraries: Numpy, pandas, sklearn, matplotlib, pickle.
4.1.1.1 Introduction to Python
Python is an interpreted, high-level, general-purpose programming language. Python is
simple and easy to read syntax emphasizes readability and therefore reduces system
maintenance costs. Python supports modules and packages, which promote system
layout and code reuse. It saves space but it takes slightly higher time when its code is
compiled. Indentation needs to be taken care while coding.
Python does the following:
� Python can be used on a server to create web applications.
� It can connect to database systems. It can also read and modify files.
� It can be used to handle big data and perform complex mathematics.
� It can be used for production-ready software development.
Python has many inbuilt library functions that can be used easily for working with
machine learning algorithms. All the necessary python libraries must be pre-installed
using “pip” command.
4.1.1.2 Introduction to Flask Framework
Flask is a micro web framework written in Python. It is classified as a
microframework because it does not require particular tools or libraries. It has no
database abstraction layer, form validation, or any other components where
pre-existing third-party libraries provide common functions.
26
It has no database abstraction layer, form validation, or any other components where
pre-existing third-party libraries provide common functions. However, Flask supports
extensions that can add application features as if they were implemented in Flask
itself. Extensions exist for object-relational mappers, form validation, upload handling,
various open authentication technologies and several common framework related
tools.
4.1.1.3 Python Libraries
NumPy:
NumPy is a general-purpose array-processing package. It provides a high-performance
multidimensional array object, and tools for working with these arrays. It is the
fundamental package for scientific computing with Python. It contains various features
including these important ones:
● A powerful N-dimensional array object
● Sophisticated (broadcasting) functions
● Tools for integrating C/C++ and Fortran code
● Useful linear algebra, Fourier transform, and random number capabilities.
Besides its obvious scientific uses, NumPy can also be used as an efficient
multi-dimensional container of generic data.
Pandas:
Pandas is an open-source library that is built on top of NumPy library. It is a Python
package that offers various data structures and operations for manipulating numerical
data and time series. It is fast and it has high-performance & productivity for users. It
provides high-performance and is easy-to-use data structures and data analysis tools
for the Python language. Pandas is used in a wide range of fields including academic
and commercial domains including economics, Statistics, analytics, etc.
SKLearn:
Scikit-learn (Sklearn) is the most useful and robust library for machine learning in
Python. It is an open-source Python library that implements a range of machine
learning, pre-processing, cross-validation and visualization algorithms using a unified
interface. Sklearn provides a selection of efficient tools for machine learning and
statistical modeling including classification, regression, clustering and dimensionality
27
reduction via a consistence interface in Python. This library, which is largely written in
Python, is built upon NumPy, SciPy and Matplotlib.
Pickle:
Python pickle module is used for serializing and de-serializing a Python object
structure. Pickling is a way to convert a python object (list, dict, etc.) into a character
stream. The idea is that this character stream contains all the information necessary to
reconstruct the object in another python script. Pickling is useful for applications
where you need some degree of persistency in your data. Your program's state data can
be saved to disk, so you can continue working on it later on.
4.1.2 Hardware Requirements
1. RAM: 4 GB or above
2. Storage: 30 to 50 GB
3. Processor: Any Processor above 500MHz
28
4.2 Code
(a) match_prediction.py
import numpy as npimport pandas as pdimport seaborn as snsimport matplotlib.pyplot as pltimport pickle
# from google.colab import drive# drive.mount("/content/gdrive",force_remount=True)matches = pd.read_csv('./matches.csv')
matches.info()
matches.shape
matches.head()
"""# **2. Assess Missing Values**"""
# Checking the missing values in the datasetmatches.isnull().sum()
matches[pd.isnull(matches['winner'])]
matches['winner'].fillna('Draw', inplace=True)
#Find cities which are nullmatches[pd.isnull(matches['city'])]
matches['city'].fillna('Dubai',inplace=True)
matches.isnull().sum()
"""# Rename teams"""
matches.replace(['Mumbai Indians','Kolkata Knight Riders','RoyalChallengers Bangalore','Deccan Chargers','Chennai Super Kings',
29
'Rajasthan Royals','Delhi Daredevils',"Delhi Capitals",'GujaratLions','Kings XI Punjab',
'Sunrisers Hyderabad','Rising Pune Supergiants',"Rising PuneSupergiant",'Kochi Tuskers Kerala','Pune Warriors']
,['MI','KKR','RCB','DC','CSK','RR','DD','DD','GL','KXIP','SRH','RPS','RPS','KTK','PW'],inplace=True)
matches.head()
"""# **3. Exploratory Data Analysis**
# Venues"""
print(matches['city'].unique())len(matches['city'].unique())
"""# Teams"""
teams = matches['team1'].unique()teams
"""# Most Player Of the Match"""
matches['player_of_match'].value_counts()
"""## Toss Decision by teams season wise"""
sns.countplot(x='season',hue='toss_decision',data=matches)
"""# Most toss winner"""
matches['toss_winner'].value_counts().plot(kind='bar')
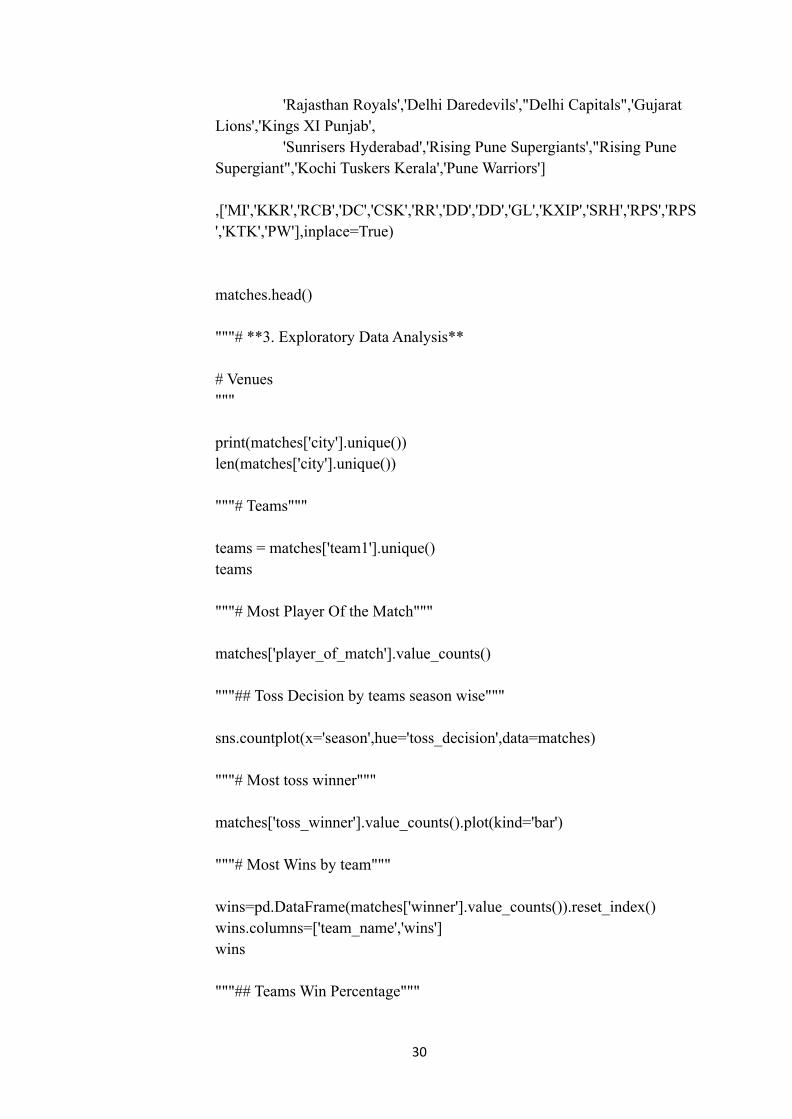
"""# Most Wins by team"""
wins=pd.DataFrame(matches['winner'].value_counts()).reset_index()wins.columns=['team_name','wins']wins
"""## Teams Win Percentage"""
30
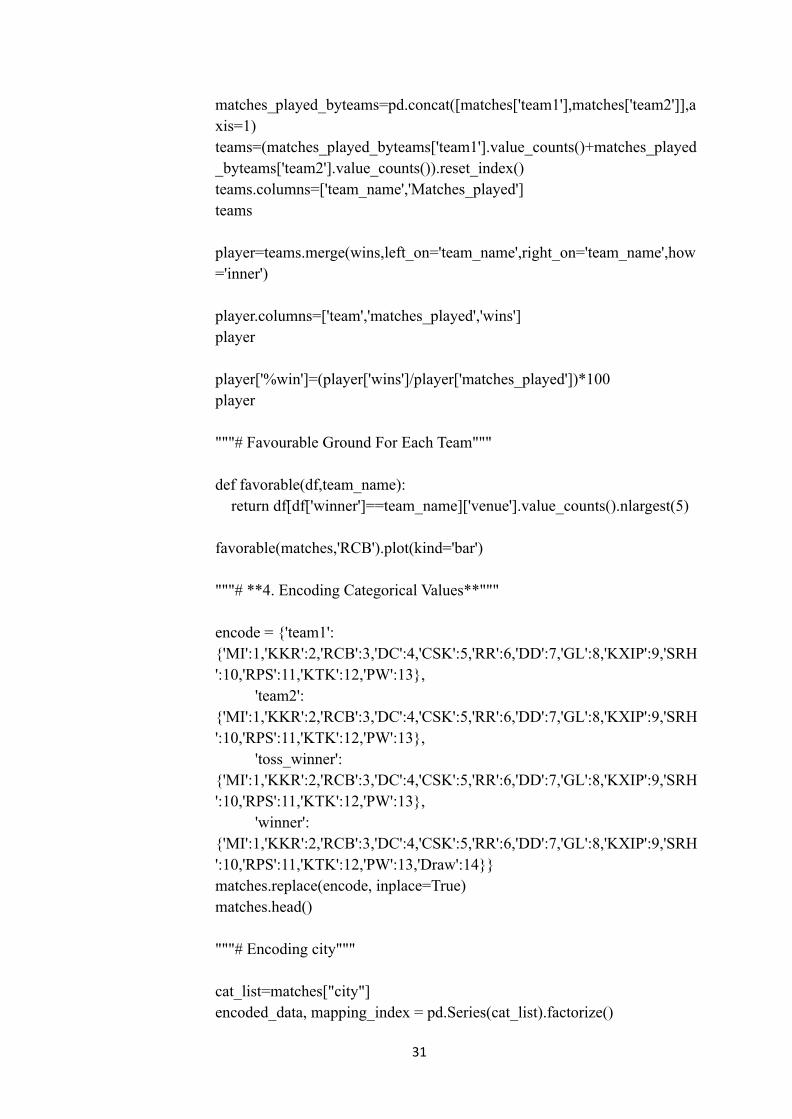
matches_played_byteams=pd.concat([matches['team1'],matches['team2']],axis=1)teams=(matches_played_byteams['team1'].value_counts()+matches_played_byteams['team2'].value_counts()).reset_index()teams.columns=['team_name','Matches_played']teams
player=teams.merge(wins,left_on='team_name',right_on='team_name',how='inner')
player.columns=['team','matches_played','wins']player
player['%win']=(player['wins']/player['matches_played'])*100player
"""# Favourable Ground For Each Team"""
def favorable(df,team_name):return df[df['winner']==team_name]['venue'].value_counts().nlargest(5)
favorable(matches,'RCB').plot(kind='bar')
"""# **4. Encoding Categorical Values**"""
encode = {'team1':{'MI':1,'KKR':2,'RCB':3,'DC':4,'CSK':5,'RR':6,'DD':7,'GL':8,'KXIP':9,'SRH':10,'RPS':11,'KTK':12,'PW':13},
'team2':{'MI':1,'KKR':2,'RCB':3,'DC':4,'CSK':5,'RR':6,'DD':7,'GL':8,'KXIP':9,'SRH':10,'RPS':11,'KTK':12,'PW':13},
'toss_winner':{'MI':1,'KKR':2,'RCB':3,'DC':4,'CSK':5,'RR':6,'DD':7,'GL':8,'KXIP':9,'SRH':10,'RPS':11,'KTK':12,'PW':13},
'winner':{'MI':1,'KKR':2,'RCB':3,'DC':4,'CSK':5,'RR':6,'DD':7,'GL':8,'KXIP':9,'SRH':10,'RPS':11,'KTK':12,'PW':13,'Draw':14}}matches.replace(encode, inplace=True)matches.head()
"""# Encoding city"""
cat_list=matches["city"]encoded_data, mapping_index = pd.Series(cat_list).factorize()
31
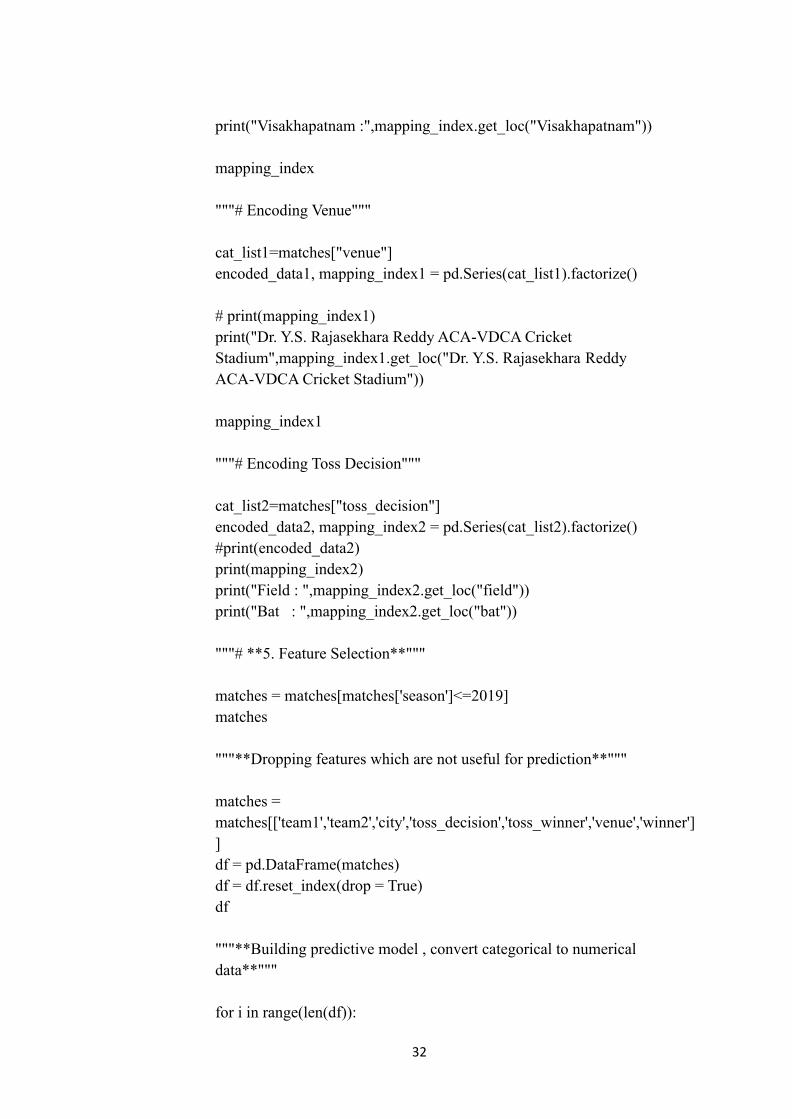
print("Visakhapatnam :",mapping_index.get_loc("Visakhapatnam"))
mapping_index
"""# Encoding Venue"""
cat_list1=matches["venue"]encoded_data1, mapping_index1 = pd.Series(cat_list1).factorize()
# print(mapping_index1)print("Dr. Y.S. Rajasekhara Reddy ACA-VDCA CricketStadium",mapping_index1.get_loc("Dr. Y.S. Rajasekhara ReddyACA-VDCA Cricket Stadium"))
mapping_index1
"""# Encoding Toss Decision"""
cat_list2=matches["toss_decision"]encoded_data2, mapping_index2 = pd.Series(cat_list2).factorize()#print(encoded_data2)print(mapping_index2)print("Field : ",mapping_index2.get_loc("field"))print("Bat : ",mapping_index2.get_loc("bat"))
"""# **5. Feature Selection**"""
matches = matches[matches['season']<=2019]matches
"""**Dropping features which are not useful for prediction**"""
matches =matches[['team1','team2','city','toss_decision','toss_winner','venue','winner']]df = pd.DataFrame(matches)df = df.reset_index(drop = True)df
"""**Building predictive model , convert categorical to numericaldata**"""
for i in range(len(df)):
32
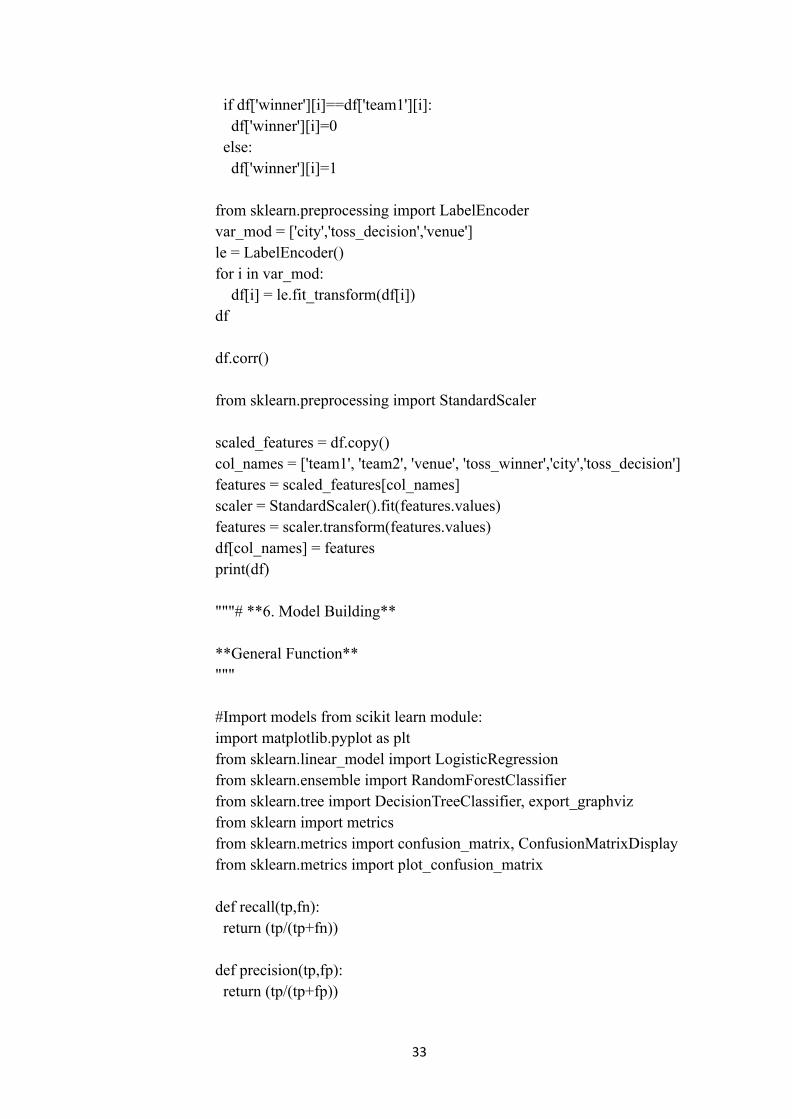
if df['winner'][i]==df['team1'][i]:df['winner'][i]=0
else:df['winner'][i]=1
from sklearn.preprocessing import LabelEncodervar_mod = ['city','toss_decision','venue']le = LabelEncoder()for i in var_mod:
df[i] = le.fit_transform(df[i])df
df.corr()
from sklearn.preprocessing import StandardScaler
scaled_features = df.copy()col_names = ['team1', 'team2', 'venue', 'toss_winner','city','toss_decision']features = scaled_features[col_names]scaler = StandardScaler().fit(features.values)features = scaler.transform(features.values)df[col_names] = featuresprint(df)
"""# **6. Model Building**
**General Function**"""
#Import models from scikit learn module:import matplotlib.pyplot as pltfrom sklearn.linear_model import LogisticRegressionfrom sklearn.ensemble import RandomForestClassifierfrom sklearn.tree import DecisionTreeClassifier, export_graphvizfrom sklearn import metricsfrom sklearn.metrics import confusion_matrix, ConfusionMatrixDisplayfrom sklearn.metrics import plot_confusion_matrix
def recall(tp,fn):return (tp/(tp+fn))
def precision(tp,fp):return (tp/(tp+fp))
33
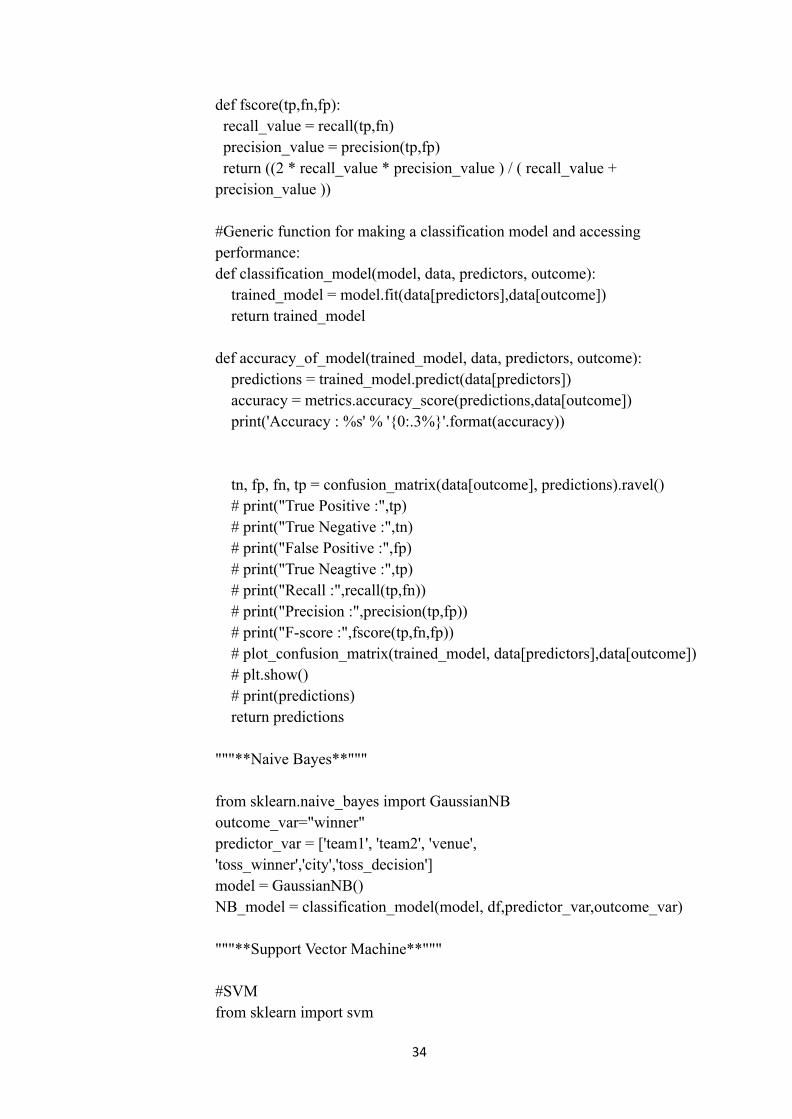
def fscore(tp,fn,fp):recall_value = recall(tp,fn)precision_value = precision(tp,fp)return ((2 * recall_value * precision_value ) / ( recall_value +
precision_value ))
#Generic function for making a classification model and accessingperformance:def classification_model(model, data, predictors, outcome):
trained_model = model.fit(data[predictors],data[outcome])return trained_model
def accuracy_of_model(trained_model, data, predictors, outcome):predictions = trained_model.predict(data[predictors])accuracy = metrics.accuracy_score(predictions,data[outcome])print('Accuracy : %s' % '{0:.3%}'.format(accuracy))
tn, fp, fn, tp = confusion_matrix(data[outcome], predictions).ravel()# print("True Positive :",tp)# print("True Negative :",tn)# print("False Positive :",fp)# print("True Neagtive :",tp)# print("Recall :",recall(tp,fn))# print("Precision :",precision(tp,fp))# print("F-score :",fscore(tp,fn,fp))# plot_confusion_matrix(trained_model, data[predictors],data[outcome])# plt.show()# print(predictions)return predictions
"""**Naive Bayes**"""
from sklearn.naive_bayes import GaussianNBoutcome_var="winner"predictor_var = ['team1', 'team2', 'venue','toss_winner','city','toss_decision']model = GaussianNB()NB_model = classification_model(model, df,predictor_var,outcome_var)
"""**Support Vector Machine**"""
#SVMfrom sklearn import svm
34
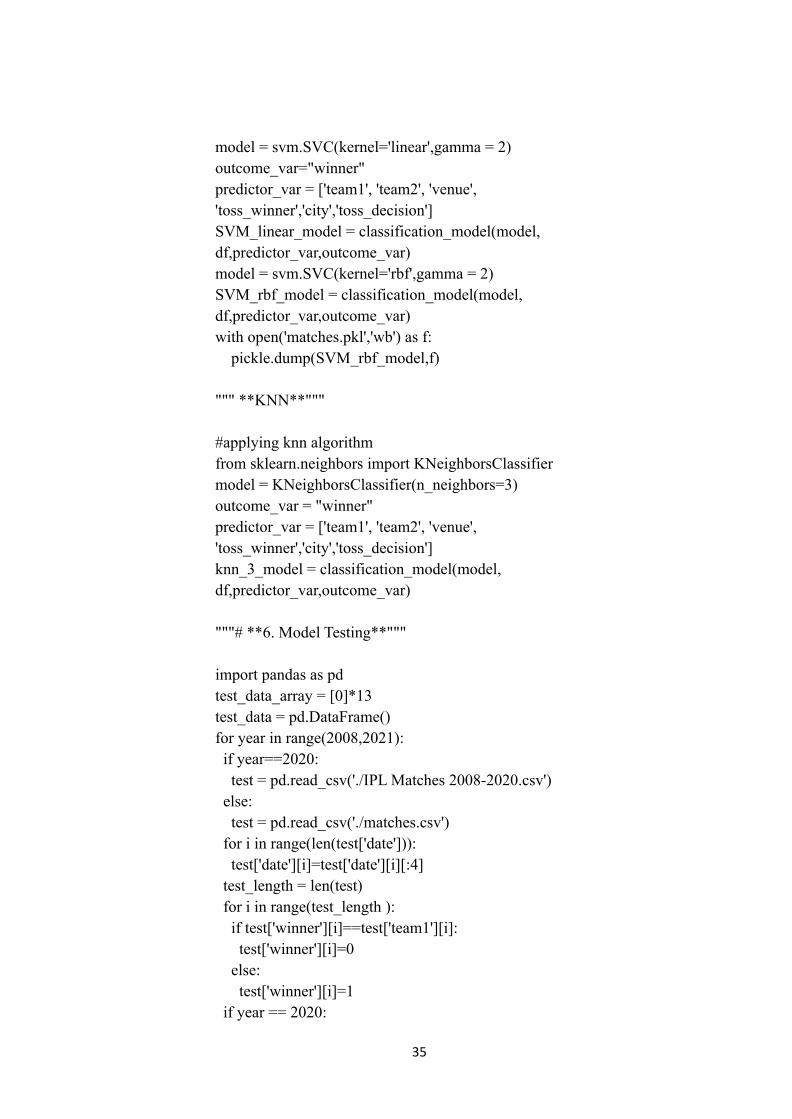
model = svm.SVC(kernel='linear',gamma = 2)outcome_var="winner"predictor_var = ['team1', 'team2', 'venue','toss_winner','city','toss_decision']SVM_linear_model = classification_model(model,df,predictor_var,outcome_var)model = svm.SVC(kernel='rbf',gamma = 2)SVM_rbf_model = classification_model(model,df,predictor_var,outcome_var)with open('matches.pkl','wb') as f:
pickle.dump(SVM_rbf_model,f)
""" **KNN**"""
#applying knn algorithmfrom sklearn.neighbors import KNeighborsClassifiermodel = KNeighborsClassifier(n_neighbors=3)outcome_var = "winner"predictor_var = ['team1', 'team2', 'venue','toss_winner','city','toss_decision']knn_3_model = classification_model(model,df,predictor_var,outcome_var)
"""# **6. Model Testing**"""
import pandas as pdtest_data_array = [0]*13test_data = pd.DataFrame()for year in range(2008,2021):if year==2020:test = pd.read_csv('./IPL Matches 2008-2020.csv')
else:test = pd.read_csv('./matches.csv')
for i in range(len(test['date'])):test['date'][i]=test['date'][i][:4]
test_length = len(test)for i in range(test_length ):if test['winner'][i]==test['team1'][i]:test['winner'][i]=0
else:test['winner'][i]=1
if year == 2020:
35
test = test.loc[test['date']==str(year)]else:test = test[test['season']==year]
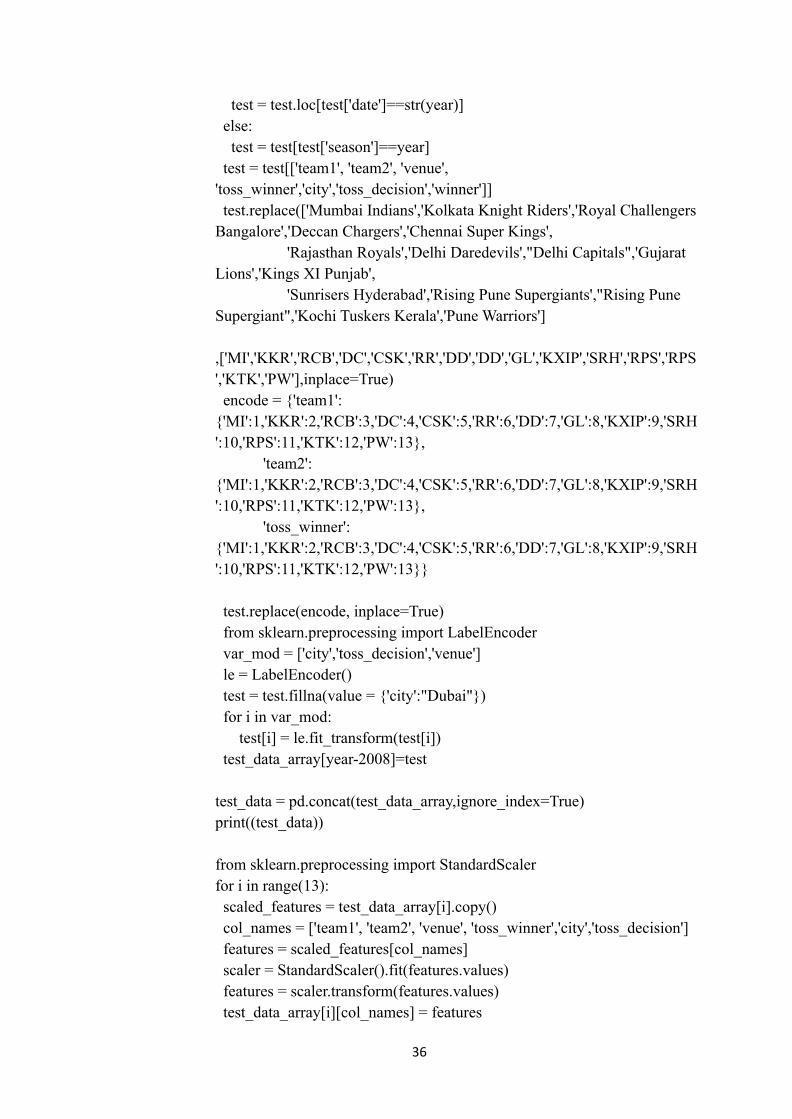
test = test[['team1', 'team2', 'venue','toss_winner','city','toss_decision','winner']]test.replace(['Mumbai Indians','Kolkata Knight Riders','Royal Challengers
Bangalore','Deccan Chargers','Chennai Super Kings','Rajasthan Royals','Delhi Daredevils',"Delhi Capitals",'Gujarat
Lions','Kings XI Punjab','Sunrisers Hyderabad','Rising Pune Supergiants',"Rising Pune
Supergiant",'Kochi Tuskers Kerala','Pune Warriors']
,['MI','KKR','RCB','DC','CSK','RR','DD','DD','GL','KXIP','SRH','RPS','RPS','KTK','PW'],inplace=True)encode = {'team1':
{'MI':1,'KKR':2,'RCB':3,'DC':4,'CSK':5,'RR':6,'DD':7,'GL':8,'KXIP':9,'SRH':10,'RPS':11,'KTK':12,'PW':13},
'team2':{'MI':1,'KKR':2,'RCB':3,'DC':4,'CSK':5,'RR':6,'DD':7,'GL':8,'KXIP':9,'SRH':10,'RPS':11,'KTK':12,'PW':13},
'toss_winner':{'MI':1,'KKR':2,'RCB':3,'DC':4,'CSK':5,'RR':6,'DD':7,'GL':8,'KXIP':9,'SRH':10,'RPS':11,'KTK':12,'PW':13}}
test.replace(encode, inplace=True)from sklearn.preprocessing import LabelEncodervar_mod = ['city','toss_decision','venue']le = LabelEncoder()test = test.fillna(value = {'city':"Dubai"})for i in var_mod:
test[i] = le.fit_transform(test[i])test_data_array[year-2008]=test
test_data = pd.concat(test_data_array,ignore_index=True)print((test_data))
from sklearn.preprocessing import StandardScalerfor i in range(13):scaled_features = test_data_array[i].copy()col_names = ['team1', 'team2', 'venue', 'toss_winner','city','toss_decision']features = scaled_features[col_names]scaler = StandardScaler().fit(features.values)features = scaler.transform(features.values)test_data_array[i][col_names] = features
36
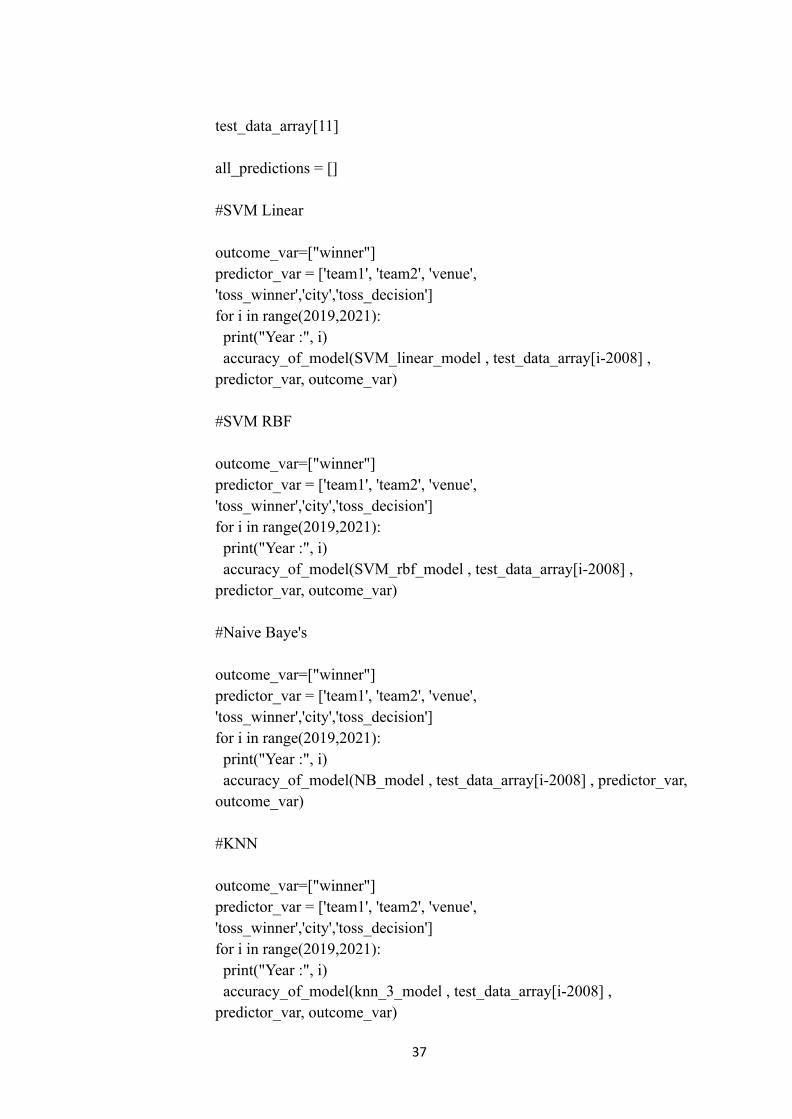
test_data_array[11]
all_predictions = []
#SVM Linear
outcome_var=["winner"]predictor_var = ['team1', 'team2', 'venue','toss_winner','city','toss_decision']for i in range(2019,2021):print("Year :", i)accuracy_of_model(SVM_linear_model , test_data_array[i-2008] ,
predictor_var, outcome_var)
#SVM RBF
outcome_var=["winner"]predictor_var = ['team1', 'team2', 'venue','toss_winner','city','toss_decision']for i in range(2019,2021):print("Year :", i)accuracy_of_model(SVM_rbf_model , test_data_array[i-2008] ,
predictor_var, outcome_var)
#Naive Baye's
outcome_var=["winner"]predictor_var = ['team1', 'team2', 'venue','toss_winner','city','toss_decision']for i in range(2019,2021):print("Year :", i)accuracy_of_model(NB_model , test_data_array[i-2008] , predictor_var,
outcome_var)
#KNN
outcome_var=["winner"]predictor_var = ['team1', 'team2', 'venue','toss_winner','city','toss_decision']for i in range(2019,2021):print("Year :", i)accuracy_of_model(knn_3_model , test_data_array[i-2008] ,
predictor_var, outcome_var)
37
(b) App.py
from flask import Flask, render_template, request, url_forimport picklefrom sklearn import svmimport numpy as np
app = Flask(__name__)
@app.route('/index')@app.route('/')def index():
return render_template('index.html')
@app.route('/match')def match():
return render_template('match.html')
@app.route('/score')def score():
return render_template('score.html')
@app.route('/predict_match', methods=['POST'])def predict_match():
if request.method == 'POST':team1 = int(request.form['team1'])team2 = int(request.form['team2'])venue = int(request.form['venue'])city = int(request.form['city'])toss_decision = int(request.form['toss_decision'])toss_winner = int(request.form['toss_winner'])
data =[[team1,team2,venue,toss_winner,city,toss_decision]]prediction = []svm_rbf = pickle.load(open('matches_svm_rbf.pkl', 'rb'))prediction.append(svm_rbf.predict(data)[0])svm_linear = pickle.load(open('matches_svm_linear.pkl', 'rb'))prediction.append(svm_linear.predict(data)[0])nb = pickle.load(open('matches_nb.pkl', 'rb'))prediction.append(nb.predict(data)[0])knn = pickle.load(open('matches_knn.pkl', 'rb'))
38
prediction.append(knn.predict(data)[0])
teams = ['Mumbai Indians','Kolkata Knight Riders','Royal ChallengersBangalore','Deccan Chargers','Chennai Super Kings','RajasthanRoyals','Delhi Daredevils',"Delhi Capitals",'Gujarat Lions','Kings XIPunjab','Sunrisers Hyderabad','Rising Pune Supergiants',"Rising PuneSupergiant",'Kochi Tuskers Kerala','Pune Warriors']
venues = ['Rajiv Gandhi International Stadium, Uppal','MaharashtraCricket Association Stadium','Saurashtra Cricket Association Stadium','Holkar Cricket Stadium','M Chinnaswamy Stadium', 'Wankhede Stadium','Eden Gardens',
'Feroz Shah Kotla','Punjab Cricket Association IS Bindra Stadium,Mohali', 'Green Park','Punjab Cricket Association Stadium, Mohali', 'SawaiMansingh Stadium','MA Chidambaram Stadium, Chepauk', 'Dr DY PatilSports Academy','Newlands', 'St Georges Park', 'Kingsmead', 'SuperSportPark','Buffalo Park', 'New Wanderers Stadium', 'De Beers Diamond Oval',
'OUTsurance Oval', 'Brabourne Stadium', 'Sardar Patel Stadium,Motera','Barabati Stadium', 'Vidarbha Cricket Association Stadium,Jamtha','Himachal Pradesh Cricket Association Stadium', 'NehruStadium','Dr. Y.S. Rajasekhara Reddy ACA-VDCA CricketStadium','Subrata Roy Sahara Stadium','Shaheed Veer Narayan SinghInternational Stadium','JSCA International Stadium Complex', 'SheikhZayed Stadium','Sharjah Cricket Stadium', 'Dubai International CricketStadium','M. A. Chidambaram Stadium', 'Feroz Shah Kotla Ground','M.Chinnaswamy Stadium', 'Rajiv Gandhi Intl. Cricket Stadium','IS BindraStadium', 'ACA-VDCA Stadium']
cities = ['Hyderabad', 'Pune', 'Rajkot', 'Indore', 'Bangalore','Mumbai','Kolkata', 'Delhi', 'Chandigarh', 'Kanpur', 'Jaipur', 'Chennai','CapeTown', 'Port Elizabeth', 'Durban', 'Centurion', 'East London','Johannesburg','Kimberley', 'Bloemfontein', 'Ahmedabad', 'Cuttack','Nagpur', 'Dharamsala','Kochi', 'Visakhapatnam', 'Raipur', 'Ranchi','Abu Dhabi', 'Sharjah', 'Dubai','Mohali', 'Bengaluru']
toss = ['Field','Bat']p = dict()p['Home Team'] = teams[team1-1]p['Away Team'] = teams[team2-1]p['Venue'] = venues[venue]p['City'] = cities[city]p['Toss Winner'] = teams[toss_winner-1]p['Toss Decision'] = toss[toss_decision]if prediction[0] == 0:
winner = teams[team1-1]else:
winner = teams[team2-1]
39
# print(p)return render_template('predict_match.html', prediction=p,winner =
winner)
@app.route('/predict_score', methods=['POST'])def predict_score():
if request.method == 'POST':temp_array = list()batting_team = int(request.form['team1'])bowling_team = int(request.form['team2'])
if batting_team == 5:temp_array = temp_array + [1,0,0,0,0,0,0,0]
elif batting_team == 8:temp_array = temp_array + [0,1,0,0,0,0,0,0]
elif batting_team == 10:temp_array = temp_array + [0,0,1,0,0,0,0,0]
elif batting_team == 2:temp_array = temp_array + [0,0,0,1,0,0,0,0]
elif batting_team == 1:temp_array = temp_array + [0,0,0,0,1,0,0,0]
elif batting_team == 6:temp_array = temp_array + [0,0,0,0,0,1,0,0]
elif batting_team == 3:temp_array = temp_array + [0,0,0,0,0,0,1,0]
elif batting_team == 11:temp_array = temp_array + [0,0,0,0,0,0,0,1]
if bowling_team == 5:temp_array = temp_array + [1,0,0,0,0,0,0,0]
elif bowling_team == 8:temp_array = temp_array + [0,1,0,0,0,0,0,0]
elif bowling_team == 10:temp_array = temp_array + [0,0,1,0,0,0,0,0]
elif bowling_team == 2:temp_array = temp_array + [0,0,0,1,0,0,0,0]
elif bowling_team == 1:temp_array = temp_array + [0,0,0,0,1,0,0,0]
elif bowling_team == 6:temp_array = temp_array + [0,0,0,0,0,1,0,0]
elif bowling_team == 3:temp_array = temp_array + [0,0,0,0,0,0,1,0]
elif bowling_team == 11:
40
temp_array = temp_array + [0,0,0,0,0,0,0,1]
# Overs, Runs, Wickets, Runs_in_prev_5, Wickets_in_prev_5overs = float(request.form['over'])runs = int(request.form['runs'])wickets = int(request.form['wickets'])runs_in_last_5 = int(request.form['runs_in_last_5'])wickets_in_last_5 = int(request.form['wickets_in_last_5'])temp_array = temp_array + [overs, runs,wickets, runs_in_last_5,
wickets_in_last_5]
# Converting into numpy arraytemp_array = np.array([temp_array])
linear_regressor = pickle.load(open('score_linear.pkl', 'rb'))final_score = int(linear_regressor.predict(temp_array)[0])teams = ['Mumbai Indians','Kolkata Knight Riders','Royal Challengers
Bangalore','Deccan Chargers','Chennai Super Kings','RajasthanRoyals','Delhi Daredevils',"Delhi Capitals",'Gujarat Lions','Kings XIPunjab','Sunrisers Hyderabad','Rising Pune Supergiants',"Rising PuneSupergiant",'Kochi Tuskers Kerala','Pune Warriors']
venues = ['Rajiv Gandhi International Stadium, Uppal','MaharashtraCricket Association Stadium','Saurashtra Cricket Association Stadium','Holkar Cricket Stadium','M Chinnaswamy Stadium', 'Wankhede Stadium','Eden Gardens',
'Feroz Shah Kotla','Punjab Cricket Association IS Bindra Stadium,Mohali', 'Green Park','Punjab Cricket Association Stadium, Mohali', 'SawaiMansingh Stadium','MA Chidambaram Stadium, Chepauk', 'Dr DY PatilSports Academy','Newlands', 'St Georges Park', 'Kingsmead', 'SuperSportPark','Buffalo Park', 'New Wanderers Stadium', 'De Beers Diamond Oval',
'OUTsurance Oval', 'Brabourne Stadium', 'Sardar Patel Stadium,Motera','Barabati Stadium', 'Vidarbha Cricket Association Stadium,Jamtha','Himachal Pradesh Cricket Association Stadium', 'NehruStadium','Dr. Y.S. Rajasekhara Reddy ACA-VDCA CricketStadium','Subrata Roy Sahara Stadium','Shaheed Veer Narayan SinghInternational Stadium','JSCA International Stadium Complex', 'SheikhZayed Stadium','Sharjah Cricket Stadium', 'Dubai International CricketStadium','M. A. Chidambaram Stadium', 'Feroz Shah Kotla Ground','M.Chinnaswamy Stadium', 'Rajiv Gandhi Intl. Cricket Stadium','IS BindraStadium', 'ACA-VDCA Stadium']
cities = ['Hyderabad', 'Pune', 'Rajkot', 'Indore', 'Bangalore','Mumbai','Kolkata', 'Delhi', 'Chandigarh', 'Kanpur', 'Jaipur', 'Chennai','CapeTown', 'Port Elizabeth', 'Durban', 'Centurion', 'East London','Johannesburg','Kimberley', 'Bloemfontein', 'Ahmedabad', 'Cuttack','Nagpur', 'Dharamsala',
41
'Kochi', 'Visakhapatnam', 'Raipur', 'Ranchi','Abu Dhabi', 'Sharjah', 'Dubai','Mohali', 'Bengaluru']
toss = ['Field','Bat']
return render_template('predict_score.html', low = final_score-6,high= final_score+6)if __name__ == '__main__':
app.run()
42
(c) index.html<!doctype html><html lang="en"><head><!-- Required meta tags --><meta charset="utf-8"><meta name="viewport" content="width=device-width, initial-scale=1,
shrink-to-fit=no">
<!-- Bootstrap CSS --><link rel="stylesheet"
href="https://stackpath.bootstrapcdn.com/bootstrap/4.3.1/css/bootstrap.min.css"integrity="sha384-ggOyR0iXCbMQv3Xipma34MD+dH/1fQ784/j6cY/iJTQUOhcWr7x9JvoRxT2MZw1T" crossorigin="anonymous">
<title>Home</title><style type="text/css">.button: hover{border: 2px solid blue;background-color : #0c21a8;width: 250px;height: 70px;color: white;font-weight: bold;
}.button{border: 2px solid blue;background-color: white;width: 250px;height: 70px;color: #0c21a8;font-weight: bold;
}</style>
</head><body><div class="text-center">
<img src="./static/images/ipl.jpg" height="350px" width="70%"></div><div class="row p-3"><div class="col-sm-6 text-center"><a href="{{ url_for('match') }}"><button class="btn btn-primary button">Match Prediction</button>
</a>
43
</div><div class="col-sm-6 text-center"><a href="{{ url_for('score') }}"><button class="button btn btn-primary">Score Pediction</button>
</a></div>
</div><!-- Optional JavaScript --><!-- jQuery first, then Popper.js, then Bootstrap JS --><script src="https://code.jquery.com/jquery-3.3.1.slim.min.js"
integrity="sha384-q8i/X+965DzO0rT7abK41JStQIAqVgRVzpbzo5smXKp4YfRvH+8abtTE1Pi6jizo" crossorigin="anonymous"></script>
<scriptsrc="https://cdnjs.cloudflare.com/ajax/libs/popper.js/1.14.7/umd/popper.min.js"integrity="sha384-UO2eT0CpHqdSJQ6hJty5KVphtPhzWj9WO1clHTMGa3JDZwrnQq4sF86dIHNDz0W1" crossorigin="anonymous"></script>
<scriptsrc="https://stackpath.bootstrapcdn.com/bootstrap/4.3.1/js/bootstrap.min.js"integrity="sha384-JjSmVgyd0p3pXB1rRibZUAYoIIy6OrQ6VrjIEaFf/nJGzIxFDsf4x0xIM+B07jRM" crossorigin="anonymous"></script></body>
</html>
44
(d) match.html
<!doctype html><html lang="en"><head><!-- Required meta tags --><meta charset="utf-8"><meta name="viewport" content="width=device-width, initial-scale=1,
shrink-to-fit=no">
<!-- Bootstrap CSS --><link rel="stylesheet"
href="https://stackpath.bootstrapcdn.com/bootstrap/4.4.1/css/bootstrap.min.css"integrity="sha384-Vkoo8x4CGsO3+Hhxv8T/Q5PaXtkKtu6ug5TOeNV6gBiFeWPGFN9MuhOf23Q9Ifjh" crossorigin="anonymous">
<title>Match Prediction</title></head><body><br><br><br><div class="container"><div class="row justify-content-center">
<div class="col-md-8"><div class="card">
<div class="card-header row"><div class="col-md-6">
<b>Match Prediction</b></div><div class="text-md-right col-md-6">
<a href="{{ url_for('index') }}"><button class="btn btn-primary">
Back</button>
</a></div>
</div>
<div class="card-body"><form method="POST" action="/predict_match">
<div class="form-group row">
45
<label for="name" class="col-md-4 col-form-labeltext-md-right">Team 1</label>
<div class="col-md-6"><select class="form-control" name="team1"
required="true"><option selected="true" disabled="true">Select Team
1</option><option value = 1>Mumbai Indians</option><option value = 2>Kolkata Knight Riders</option><option value = 3>Royal Challengers
Bangalore</option><option value = 5>Chennai Super Kings</option><option value = 6>Rajasthan Royals</option><option value = 8>Delhi Capitals</option><option value = 10>Punjab Kings</option><option value = 11>Sunrisers Hyderabad</option>
</select>
</div></div>
<div class="form-group row"><label for="desc" class="col-md-4 col-form-label
text-md-right">Team 2</label>
<div class="col-md-6"><select class="form-control" name="team2" required><option hidden>Select Team 2</option><option value = 1>Mumbai Indians</option><option value = 2>Kolkata Knight Riders</option><option value = 3>Royal Challengers
Bangalore</option><option value = 5>Chennai Super Kings</option><option value = 6>Rajasthan Royals</option><option value = 8>Delhi Capitals</option><option value = 10>Punjab Kings</option><option value = 11>Sunrisers Hyderabad</option>
</select>
</div></div>
46
<div class="form-group row"><label for="cost" class="col-md-4 col-form-label
text-md-right">Venue</label>
<div class="col-md-6"><select class="form-control" name="venue" required><option hidden>Select Venue</option><option value = 0>Rajiv Gandhi International
Stadium, Uppal</option><option value = 1>Maharashtra Cricket Association
Stadium</option><option value = 2>Saurashtra Cricket Association
Stadium</option><option value = 3>Holkar Cricket Stadium</option><option value = 4>M Chinnaswamy
Stadium</option><option value = 5>Wankhede Stadium</option><option value = 6>Eden Gardens</option><option value = 7>Feroz Shah Kotla</option><option value = 8>Punjab Cricket Association IS
Bindra Stadium, Mohali</option><option value = 9>Green Park</option><option value = 10>Punjab Cricket Association
Stadium, Mohali</option><option value = 11>Sawai Mansingh
Stadium</option><option value = 12>MA Chidambaram Stadium,
Chepauk</option><option value = 13>Dr DY Patil Sports
Academy</option><option value = 14>Newlands</option><option value = 15>St George's Park</option><option value = 16>Kingsmead</option><option value = 17>SuperSport Park</option><option value = 18>Buffalo Park</option><option value = 19>New Wanderers
Stadium</option><option value = 20>De Beers Diamond
Oval</option><option value = 21>OUTsurance Oval</option><option value = 22>Brabourne Stadium</option><option value = 23>Sardar Patel Stadium,
Motera</option>
47
<option value = 24>Barabati Stadium</option><option value = 25>Vidarbha Cricket Association
Stadium, Jamtha</option><option value = 26>Himachal Pradesh Cricket
Association Stadium</option><option value = 27>Nehru Stadium</option><option value = 28>Dr. Y.S. Rajasekhara Reddy
ACA-VDCA Cricket Stadium</option><option value = 29>Subrata Roy Sahara
Stadium</option><option value = 30>Shaheed Veer Narayan Singh
International Stadium</option><option value = 31>JSCA International Stadium
Complex</option><option value = 32>Sheikh Zayed Stadium</option><option value = 33>Sharjah Cricket
Stadium</option><option value = 34>Dubai International Cricket
Stadium</option><option value = 35>M. A. Chidambaram
Stadium</option><option value = 36>Feroz Shah Kotla
Ground</option><option value = 37>M. Chinnaswamy
Stadium</option><option value = 38>Rajiv Gandhi Intl. Cricket
Stadium</option><option value = 39>IS Bindra Stadium</option><option value = 40>ACA-VDCA Stadium</option>
</select></div>
</div>
<div class="form-group row"><label for="cost" class="col-md-4 col-form-label
text-md-right">City</label>
<div class="col-md-6"><select class="form-control" name="city" required>
<option hidden>Select City</option><option value = 0>Hyderabad</option><option value = 1>Pune</option><option value = 2>Rajkot</option><option value = 3>Indore</option>
48
<option value = 4>Bangalore</option><option value = 5>Mumbai</option><option value = 6>Kolkata</option><option value = 7>Delhi</option><option value = 8>Chandigarh</option><option value = 9>Kanpur</option><option value = 10>Jaipur</option><option value = 11>Chennai</option><option value = 12>Cape Town</option><option value = 13>Port Elizabeth</option><option value = 14>Durban</option><option value = 15>Centurion</option><option value = 16>East London</option><option value = 17>Johannesburg</option><option value = 18>Kimberley</option><option value = 19>Bloemfontein</option><option value = 20>Ahmedabad</option><option value = 21>Cuttack</option><option value = 22>Nagpur</option><option value = 23>Dharamsala</option><option value = 24>Kochi</option><option value = 25>Visakhapatnam</option><option value = 26>Raipur</option><option value = 27>Ranchi</option><option value = 28>Abu Dhabi</option><option value = 29>Sharjah</option><option value = 30>Dubai</option><option value = 31>Mohali</option><option value = 32>Bengaluru</option>
</select></div>
</div>
<div class="form-group row"><label for="start" class="col-md-4 col-form-label
text-md-right">Toss Winner</label>
<div class="col-md-6"><select class="form-control" name="toss_winner"
required="true"><option hidden>Select Toss Winner</option><option value = 1>Mumbai Indians</option><option value = 2>Kolkata Knight Riders</option>
49
<option value = 3>Royal ChallengersBangalore</option>
<option value = 5>Chennai Super Kings</option><option value = 6>Rajasthan Royals</option><option value = 8>Delhi Capitals</option><option value = 10>Punjab Kings</option><option value = 11>Sunrisers Hyderabad</option>
</select></div>
</div>
<div class="form-group row"><label for="end" class="col-md-4 col-form-label
text-md-right">Toss Decision</label>
<div class="col-md-6"><select class="form-control" name="toss_decision">
<option hidden>Select Toss Decision</option><option value = 0>Field</option><option value = 1>Bat</option>
</select></div>
</div>
<div class="form-group row mb-0"><div class="col-md-6 offset-md-4">
<button type="submit" class="btn btn-primary">Predict
</button>
</div></div>
</form></div>
</div></div>
</div></div>
<!-- Optional JavaScript --><!-- jQuery first, then Popper.js, then Bootstrap JS --><script src="https://code.jquery.com/jquery-3.4.1.slim.min.js"
integrity="sha384-J6qa4849blE2+poT4WnyKhv5vZF5SrPo0iEjwBvKU7imGFAV0wwj1yYfoRSJoZ+n" crossorigin="anonymous"></script>
50
<scriptsrc="https://cdn.jsdelivr.net/npm/[email protected]/dist/umd/popper.min.js"integrity="sha384-Q6E9RHvbIyZFJoft+2mJbHaEWldlvI9IOYy5n3zV9zzTtmI3UksdQRVvoxMfooAo" crossorigin="anonymous"></script>
<scriptsrc="https://stackpath.bootstrapcdn.com/bootstrap/4.4.1/js/bootstrap.min.js"integrity="sha384-wfSDF2E50Y2D1uUdj0O3uMBJnjuUD4Ih7YwaYd1iqfktj0Uod8GCExl3Og8ifwB6" crossorigin="anonymous"></script></body>
</html>
51

(e) score.html
<!doctype html><html lang="en"><head><!-- Required meta tags --><meta charset="utf-8"><meta name="viewport" content="width=device-width, initial-scale=1,
shrink-to-fit=no">
<!-- Bootstrap CSS --><link rel="stylesheet"
href="https://stackpath.bootstrapcdn.com/bootstrap/4.4.1/css/bootstrap.min.css"integrity="sha384-Vkoo8x4CGsO3+Hhxv8T/Q5PaXtkKtu6ug5TOeNV6gBiFeWPGFN9MuhOf23Q9Ifjh" crossorigin="anonymous">
<title>Score Prediction</title></head><body><br><br><br><div class="container"><div class="row justify-content-center">
<div class="col-md-8"><div class="card">
<div class="card-header row"><div class="col-md-6">
<b>Score Prediction</b></div><div class="text-md-right col-md-6">
<a href="{{ url_for('index') }}"><button class="btn btn-primary">
Back</button>
</a></div>
</div>
<div class="card-body"><form method="POST" action="/predict_score">
<div class="form-group row">
52
<label for="name" class="col-md-4 col-form-labeltext-md-right">Batting Team</label>
<div class="col-md-6"><select class="form-control" name="team1"
required="true"><option selected="true" disabled="true">Select Team
1</option><option value = 1>Mumbai Indians</option><option value = 2>Kolkata Knight Riders</option><option value = 3>Royal Challengers
Bangalore</option><option value = 5>Chennai Super Kings</option><option value = 6>Rajasthan Royals</option><option value = 8>Delhi Capitals</option><option value = 10>Punjab Kings</option><option value = 11>Sunrisers Hyderabad</option>
</select>
</div></div>
<div class="form-group row"><label for="desc" class="col-md-4 col-form-label
text-md-right">Bowling Team</label>
<div class="col-md-6"><select class="form-control" name="team2" required><option hidden>Select Team 2</option><option value = 1>Mumbai Indians</option><option value = 2>Kolkata Knight Riders</option><option value = 3>Royal Challengers
Bangalore</option><option value = 5>Chennai Super Kings</option><option value = 6>Rajasthan Royals</option><option value = 8>Delhi Capitals</option><option value = 10>Punjab Kings</option><option value = 11>Sunrisers Hyderabad</option>
</select>
</div></div>
53
<div class="form-group row"><label for="cost" class="col-md-4 col-form-label
text-md-right">Current Over</label>
<div class="col-md-6"><input class="form-control" type="number"
name="over" min="6" max="20" step="0.1"></div>
</div>
<div class="form-group row"><label for="cost" class="col-md-4 col-form-label
text-md-right">Current Runs</label>
<div class="col-md-6"><input class="form-control" type="number"
name="runs" min="0"></div>
</div>
<div class="form-group row"><label for="cost" class="col-md-4 col-form-label
text-md-right">Current Wickets</label>
<div class="col-md-6"><input class="form-control" type="number"
name="wickets" min="0" max="10"></div>
</div>
<div class="form-group row"><label for="cost" class="col-md-4 col-form-label
text-md-right">Runs in last 5 overs</label>
<div class="col-md-6"><input class="form-control" type="number"
name="runs_in_last_5" min="0"></div>
</div>
<div class="form-group row"><label for="cost" class="col-md-4 col-form-label
text-md-right">Wickets in last 5 overs</label>
54
<div class="col-md-6"><input class="form-control" type="number"
name="wickets_in_last_5" min="0" max="10"></div>
</div>
<div class="form-group row mb-0"><div class="col-md-6 offset-md-4">
<button type="submit" class="btn btn-primary">Predict
</button>
</div></div>
</form></div>
</div></div>
</div></div>
<!-- Optional JavaScript --><!-- jQuery first, then Popper.js, then Bootstrap JS --><script src="https://code.jquery.com/jquery-3.4.1.slim.min.js"
integrity="sha384-J6qa4849blE2+poT4WnyKhv5vZF5SrPo0iEjwBvKU7imGFAV0wwj1yYfoRSJoZ+n" crossorigin="anonymous"></script>
<scriptsrc="https://cdn.jsdelivr.net/npm/[email protected]/dist/umd/popper.min.js"integrity="sha384-Q6E9RHvbIyZFJoft+2mJbHaEWldlvI9IOYy5n3zV9zzTtmI3UksdQRVvoxMfooAo" crossorigin="anonymous"></script>
<scriptsrc="https://stackpath.bootstrapcdn.com/bootstrap/4.4.1/js/bootstrap.min.js"integrity="sha384-wfSDF2E50Y2D1uUdj0O3uMBJnjuUD4Ih7YwaYd1iqfktj0Uod8GCExl3Og8ifwB6" crossorigin="anonymous"></script></body>
</html>
55
(f) score_prediction.py
import pandas as pdimport pickle
# Loading the datasetdf = pd.read_csv('./ipl.csv')
df.head()
df.tail()
"""# **Data Cleaning**"""
# Removing unwanted columnscolumns_to_remove = ['mid', 'venue', 'batsman', 'bowler', 'striker','non-striker']df.drop(labels=columns_to_remove, axis =1, inplace=True)
df['bat_team'].unique()
df.head()
# Keeping the consistent teamsconsistent_teams = ['Kolkata Knight Riders', 'Chennai Super Kings','Rajasthan Royals',
'Mumbai Indians', 'Kings XI Punjab','Royal Challengers Bangalore', 'Delhi Daredevils','Sunrisers
Hyderabad']
## So the teams which we have considered, we shall filter it out from thebatting team and bowling teamdf=df[(df['bat_team'].isin(consistent_teams) &(df['bowl_team'].isin(consistent_teams)))]
# Removing the first 5 overs data in every matchdf = df[df['overs']>=5.0]
print(df['bat_team'].unique())print(df['bowl_team'].unique())
df.head()
56
# Converting the column 'date' from string into datetime objectfrom datetime import datetime
df['date'] = df['date'].apply(lambda x: datetime.strptime(x,'%Y-%m-%d'))
"""# **Data Preprocessing**"""
# Converting categorical features using OnehotEncoding methodencoded_df = pd.get_dummies(data = df, columns=['bat_team','bowl_team'])
encoded_df.head()
encoded_df.tail()
encoded_df.columns
# Rearranging the columnsencoded_df = encoded_df[['date', 'bat_team_Chennai Super Kings','bat_team_Delhi Daredevils', 'bat_team_Kings XI Punjab',
'bat_team_Kolkata Knight Riders', 'bat_team_Mumbai Indians','bat_team_Rajasthan Royals',
'bat_team_Royal Challengers Bangalore', 'bat_team_SunrisersHyderabad',
'bowl_team_Chennai Super Kings', 'bowl_team_DelhiDaredevils', 'bowl_team_Kings XI Punjab',
'bowl_team_Kolkata Knight Riders', 'bowl_team_MumbaiIndians', 'bowl_team_Rajasthan Royals',
'bowl_team_Royal Challengers Bangalore', 'bowl_team_SunrisersHyderabad',
'overs', 'runs', 'wickets', 'runs_last_5', 'wickets_last_5', 'total']]
# Splitting the data into train and test setX_train = encoded_df.drop(labels='total',axis=1)[encoded_df['date'].dt.year <= 2016]X_test = encoded_df.drop(labels='total', axis=1)[encoded_df['date'].dt.year>= 2017]
y_train = encoded_df[encoded_df['date'].dt.year <= 2016]['total'].valuesy_test = encoded_df[encoded_df['date'].dt.year >= 2017]['total'].values
# Removing the 'date' columnX_train.drop(labels='date', axis=True, inplace=True)X_test.drop(labels='date', axis=True, inplace=True)
57
print("Training set: {} and Test set: {}".format(X_train.shape,X_test.shape))
"""# **Model Building and Testing**
**Linear Regression Model**"""
# Linear Regression Modelfrom sklearn.linear_model import LinearRegressionregressor = LinearRegression()regressor.fit(X_train,y_train)
prediction_linear=regressor.predict(X_test)
import seaborn as snssns.distplot(y_test-prediction_linear)
with open('score_linear.pkl','wb') as f:pickle.dump(regressor,f)
from sklearn import metricsimport numpy as npprint('MAE:', metrics.mean_absolute_error(y_test, prediction_linear))print('MSE:', metrics.mean_squared_error(y_test, prediction_linear))print('RMSE:', np.sqrt(metrics.mean_squared_error(y_test,prediction_linear)))
"""## Decision Tree"""
# Decision Tree Regression Modelfrom sklearn.tree import DecisionTreeRegressordecision_regressor = DecisionTreeRegressor()decision_regressor.fit(X_train,y_train)
# Predicting resultsprediction_decision = decision_regressor.predict(X_test)
# Decision Tree Regression - Model Evaluationprint("---- Decision Tree Regression - Model Evaluation ----")print('MAE:', metrics.mean_absolute_error(y_test, prediction_decision))print('MSE:', metrics.mean_squared_error(y_test, prediction_decision))
58
print('RMSE:', np.sqrt(metrics.mean_squared_error(y_test,prediction_decision)))
"""# **Predictions**"""
def predict_score(batting_team='Chennai Super Kings',bowling_team='Mumbai Indians', overs=5.1, runs=50, wickets=0,runs_in_prev_5=50, wickets_in_prev_5=0):temp_array = list()
# Batting Teamif batting_team == 'Chennai Super Kings':temp_array = temp_array + [1,0,0,0,0,0,0,0]
elif batting_team == 'Delhi Daredevils':temp_array = temp_array + [0,1,0,0,0,0,0,0]
elif batting_team == 'Kings XI Punjab':temp_array = temp_array + [0,0,1,0,0,0,0,0]
elif batting_team == 'Kolkata Knight Riders':temp_array = temp_array + [0,0,0,1,0,0,0,0]
elif batting_team == 'Mumbai Indians':temp_array = temp_array + [0,0,0,0,1,0,0,0]
elif batting_team == 'Rajasthan Royals':temp_array = temp_array + [0,0,0,0,0,1,0,0]
elif batting_team == 'Royal Challengers Bangalore':temp_array = temp_array + [0,0,0,0,0,0,1,0]
elif batting_team == 'Sunrisers Hyderabad':temp_array = temp_array + [0,0,0,0,0,0,0,1]
# Bowling Teamif bowling_team == 'Chennai Super Kings':temp_array = temp_array + [1,0,0,0,0,0,0,0]
elif bowling_team == 'Delhi Daredevils':temp_array = temp_array + [0,1,0,0,0,0,0,0]
elif bowling_team == 'Kings XI Punjab':temp_array = temp_array + [0,0,1,0,0,0,0,0]
elif bowling_team == 'Kolkata Knight Riders':temp_array = temp_array + [0,0,0,1,0,0,0,0]
elif bowling_team == 'Mumbai Indians':temp_array = temp_array + [0,0,0,0,1,0,0,0]
elif bowling_team == 'Rajasthan Royals':temp_array = temp_array + [0,0,0,0,0,1,0,0]
elif bowling_team == 'Royal Challengers Bangalore':temp_array = temp_array + [0,0,0,0,0,0,1,0]
elif bowling_team == 'Sunrisers Hyderabad':
59
temp_array = temp_array + [0,0,0,0,0,0,0,1]
# Overs, Runs, Wickets, Runs_in_prev_5, Wickets_in_prev_5temp_array = temp_array + [overs, runs, wickets, runs_in_prev_5,
wickets_in_prev_5]
# Converting into numpy arraytemp_array = np.array([temp_array])
# Predictionreturn int(regressor.predict(temp_array)[0])
60
(g) predict_score.html
<!doctype html><html lang="en"><head><!-- Required meta tags --><meta charset="utf-8"><meta name="viewport" content="width=device-width, initial-scale=1,
shrink-to-fit=no">
<!-- Bootstrap CSS --><link rel="stylesheet"
href="https://stackpath.bootstrapcdn.com/bootstrap/4.3.1/css/bootstrap.min.css"integrity="sha384-ggOyR0iXCbMQv3Xipma34MD+dH/1fQ784/j6cY/iJTQUOhcWr7x9JvoRxT2MZw1T" crossorigin="anonymous">
<title>Prediction</title></head><body><div class="row p-3"><div class="col-sm-12 text-left p-2"><a href="{{ url_for('index') }}"><button style="width: 100px;" class="btn btn-primary
p-2">Home</button></a><a href="{{ url_for('match') }}"><button style="width: 100px;" class="btn btn-primary p-2
float-right">Back</button></a>
</div></div><h1 class="text-center">Predicted Score range is
{{low}}-{{high}}.</h1>
<!-- Optional JavaScript --><!-- jQuery first, then Popper.js, then Bootstrap JS --><script src="https://code.jquery.com/jquery-3.3.1.slim.min.js"
integrity="sha384-q8i/X+965DzO0rT7abK41JStQIAqVgRVzpbzo5smXKp4YfRvH+8abtTE1Pi6jizo" crossorigin="anonymous"></script>
<scriptsrc="https://cdnjs.cloudflare.com/ajax/libs/popper.js/1.14.7/umd/popper.min.js"
61

integrity="sha384-UO2eT0CpHqdSJQ6hJty5KVphtPhzWj9WO1clHTMGa3JDZwrnQq4sF86dIHNDz0W1" crossorigin="anonymous"></script>
<scriptsrc="https://stackpath.bootstrapcdn.com/bootstrap/4.3.1/js/bootstrap.min.js"integrity="sha384-JjSmVgyd0p3pXB1rRibZUAYoIIy6OrQ6VrjIEaFf/nJGzIxFDsf4x0xIM+B07jRM" crossorigin="anonymous"></script></body>
</html>
62
(h) predict_match.html
<!doctype html><html lang="en"><head><!-- Required meta tags --><meta charset="utf-8"><meta name="viewport" content="width=device-width, initial-scale=1,
shrink-to-fit=no">
<!-- Bootstrap CSS --><link rel="stylesheet"
href="https://stackpath.bootstrapcdn.com/bootstrap/4.3.1/css/bootstrap.min.css"integrity="sha384-ggOyR0iXCbMQv3Xipma34MD+dH/1fQ784/j6cY/iJTQUOhcWr7x9JvoRxT2MZw1T" crossorigin="anonymous">
<title>Prediction</title></head><body><div class="row p-3"><div class="col-sm-12 text-left p-2"><a href="{{ url_for('index') }}"><button style="width: 100px;" class="btn btn-primary
p-2">Home</button></a><a href="{{ url_for('match') }}"><button style="width: 100px;" class="btn btn-primary p-2
float-right">Back</button></a>
</div></div><h1 class="text-center">Predicted Winner is {{winner}}.</h1><div class="p-3"><h2>Match Details:</h2><table class="table table-dark">{% for key,value in prediction.items() %}<tr><th style="border: 1px solid white">{{key}}</th><td style="border: 1px solid white">{{value}}</td>
</tr>{% endfor %}
</table>
63
</div><!-- Optional JavaScript --><!-- jQuery first, then Popper.js, then Bootstrap JS --><script src="https://code.jquery.com/jquery-3.3.1.slim.min.js"
integrity="sha384-q8i/X+965DzO0rT7abK41JStQIAqVgRVzpbzo5smXKp4YfRvH+8abtTE1Pi6jizo" crossorigin="anonymous"></script>
<scriptsrc="https://cdnjs.cloudflare.com/ajax/libs/popper.js/1.14.7/umd/popper.min.js"integrity="sha384-UO2eT0CpHqdSJQ6hJty5KVphtPhzWj9WO1clHTMGa3JDZwrnQq4sF86dIHNDz0W1" crossorigin="anonymous"></script>
<scriptsrc="https://stackpath.bootstrapcdn.com/bootstrap/4.3.1/js/bootstrap.min.js"integrity="sha384-JjSmVgyd0p3pXB1rRibZUAYoIIy6OrQ6VrjIEaFf/nJGzIxFDsf4x0xIM+B07jRM" crossorigin="anonymous"></script></body>
</html>
64
(i) match2021.pydef accuracy_of_model(trained_model, data, predictors, outcome):
predictions = trained_model.predict(data[predictors])accuracy = metrics.accuracy_score(predictions,data[outcome])print('Accuracy : %s' % '{0:.3%}'.format(accuracy))
import pandas as pdimport numpy as npimport picklefrom sklearn import metricsfrom sklearn.metrics import confusion_matrix, ConfusionMatrixDisplayfrom sklearn.metrics import plot_confusion_matrixdata = pd.read_csv('./IPL Matches Dataset 2021.csv')columns = ['team1', 'team2', 'venue','toss_winner','city','toss_decision','winner']data = data[columns]data.replace(['Mumbai Indians','Kolkata Knight Riders','Royal ChallengersBangalore','Deccan Chargers','Chennai Super Kings',
'Rajasthan Royals','Delhi Daredevils',"Delhi Capitals",'GujaratLions','Punjab Kings',
'Sunrisers Hyderabad','Rising Pune Supergiants',"Rising PuneSupergiant",'Kochi Tuskers Kerala','Pune Warriors']
,['MI','KKR','RCB','DC','CSK','RR','DD','DD','GL','KXIP','SRH','RPS','RPS','KTK','PW'],inplace=True)encode = {'team1':{'MI':1,'KKR':2,'RCB':3,'DC':4,'CSK':5,'RR':6,'DD':7,'GL':8,'KXIP':9,'SRH':10,'RPS':11,'KTK':12,'PW':13},
'team2':{'MI':1,'KKR':2,'RCB':3,'DC':4,'CSK':5,'RR':6,'DD':7,'GL':8,'KXIP':9,'SRH':10,'RPS':11,'KTK':12,'PW':13},
'toss_winner':{'MI':1,'KKR':2,'RCB':3,'DC':4,'CSK':5,'RR':6,'DD':7,'GL':8,'KXIP':9,'SRH':10,'RPS':11,'KTK':12,'PW':13},
'winner':{'MI':1,'KKR':2,'RCB':3,'DC':4,'CSK':5,'RR':6,'DD':7,'GL':8,'KXIP':9,'SRH':10,'RPS':11,'KTK':12,'PW':13,'Draw':14},
'city':{'Hyderabad':0,'Pune':1,'Rajkot':2,'Indore':3,'Bangalore':4,'Mumbai':5,'Kolkata':6,'Delhi':7,'Chandigarh':8,'Kanpur':9,'Jaipur':10,'Chennai':11,'Cape Town':12,'Port Elizabeth':13,'Durban':14,'Centurion':15,'EastLondon':16,'Johannesburg':17,'Kimberley':18,'Bloemfontein':19,'Ahmedabad':20,'Cuttack':21,'Nagpur':22,'Dharamsala':23,'Kochi':24,'Visakhapatnam'
65
:25,'Raipur':26,'Ranchi':27,'AbuDhabi':28,'Sharjah':29,'Dubai':30,'Mohali':31,'Bengaluru':32},
'venue':{'Rajiv Gandhi International Stadium, Uppal':0,'MaharashtraCricket Association Stadium':1,'Saurashtra Cricket AssociationStadium':2,'Holkar Cricket Stadium':3,'M ChinnaswamyStadium':4,'Wankhede Stadium, Mumbai':5,'Eden Gardens':6,'Feroz ShahKotla':7,'Punjab Cricket Association IS Bindra Stadium, Mohali':8,'GreenPark':9,'Punjab Cricket Association Stadium, Mohali':10,'Sawai MansinghStadium':11,'MA Chidambaram Stadium, Chepauk, Chennai':12,'Dr DYPatil Sports Academy':13,'Newlands':14,'St GeorgesPark':15,'Kingsmead':16,'SuperSport Park':17,'Buffalo Park':18,'NewWanderers Stadium':19,'De Beers Diamond Oval':20,'OUTsuranceOval':21,'Brabourne Stadium':22,'Narendra Modi Stadium,Ahmedabad':23,'Barabati Stadium':24,'Vidarbha Cricket AssociationStadium, Jamtha':25,'Himachal Pradesh Cricket AssociationStadium':26,'Nehru Stadium':27,'Dr. Y.S. Rajasekhara Reddy ACA-VDCACricket Stadium':28,'Subrata Roy Sahara Stadium':29,'Shaheed VeerNarayan Singh International Stadium':30,'JSCA International StadiumComplex':31,'Sheikh Zayed Stadium':32,'Sharjah CricketStadium':33,'Dubai International Cricket Stadium':34,'M. A. ChidambaramStadium':35,'Feroz Shah Kotla Ground':36,'M. ChinnaswamyStadium':37,'Rajiv Gandhi Intl. Cricket Stadium':38,'IS BindraStadium':39,'ACA-VDCA Stadium':40},
'toss_decision':{'field':0,'bat':1}}
data.replace(encode, inplace=True)for i in range(len(data)):if data['winner'][i]==data['team1'][i]:data['winner'][i]=0
else:data['winner'][i]=1
svm_rbf = pickle.load(open('matches_svm_rbf.pkl', 'rb'))svm_linear = pickle.load(open('matches_svm_linear.pkl', 'rb'))nb = pickle.load(open('matches_nb.pkl', 'rb'))knn = pickle.load(open('matches_knn.pkl', 'rb'))
# #SVM Linear
outcome_var=["winner"]predictor_var = ['team1', 'team2', 'venue','toss_winner','city','toss_decision']print("\nSVM Linear")
66
accuracy_of_model(svm_linear , data , predictor_var, outcome_var)print("\nSVM RBF")accuracy_of_model(svm_rbf , data , predictor_var, outcome_var)print("\nNaive Bayes")accuracy_of_model(nb , data , predictor_var, outcome_var)print("\nKNN")accuracy_of_model(knn , data , predictor_var, outcome_var)
67
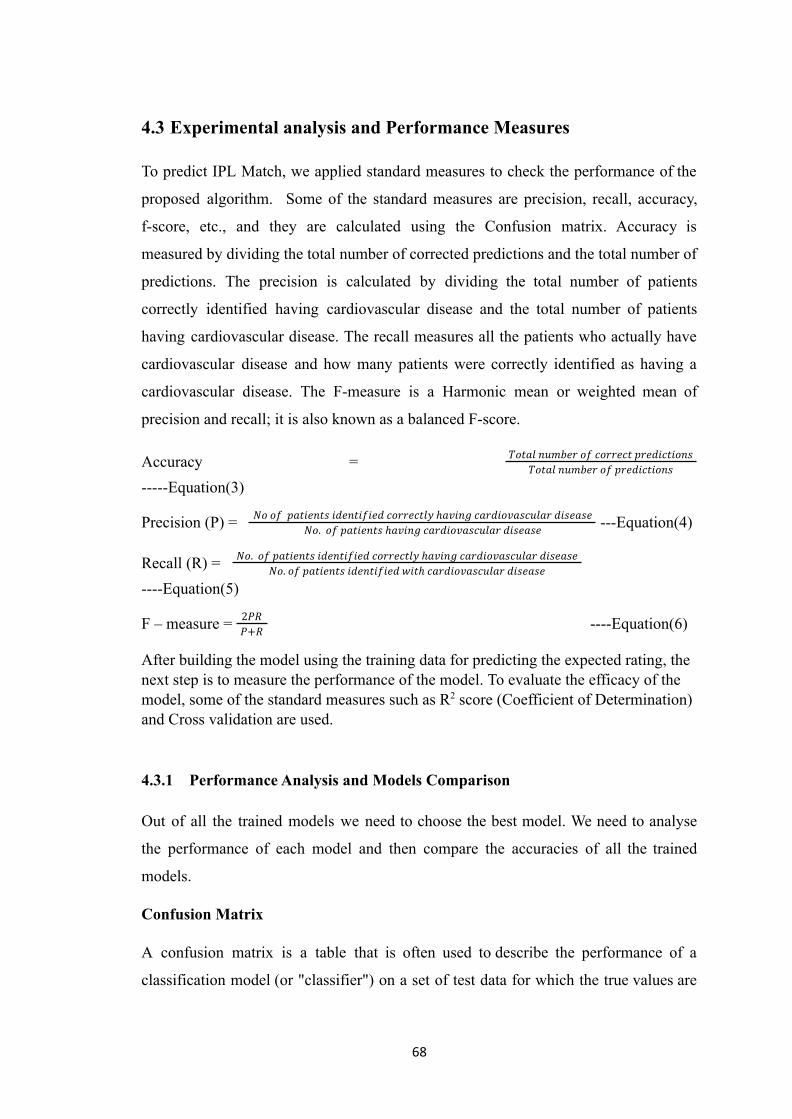
4.3 Experimental analysis and Performance Measures
To predict IPL Match, we applied standard measures to check the performance of the
proposed algorithm. Some of the standard measures are precision, recall, accuracy,
f-score, etc., and they are calculated using the Confusion matrix. Accuracy is
measured by dividing the total number of corrected predictions and the total number of
predictions. The precision is calculated by dividing the total number of patients
correctly identified having cardiovascular disease and the total number of patients
having cardiovascular disease. The recall measures all the patients who actually have
cardiovascular disease and how many patients were correctly identified as having a
cardiovascular disease. The F-measure is a Harmonic mean or weighted mean of
precision and recall; it is also known as a balanced F-score.
Accuracy = 𝑇𝑜𝑡𝑎𝑙 𝑛𝑢𝑚𝑏𝑒𝑟 𝑜𝑓 𝑐𝑜𝑟𝑟𝑒𝑐𝑡 𝑝𝑟𝑒𝑑𝑖𝑐𝑡𝑖𝑜𝑛𝑠𝑇𝑜𝑡𝑎𝑙 𝑛𝑢𝑚𝑏𝑒𝑟 𝑜𝑓 𝑝𝑟𝑒𝑑𝑖𝑐𝑡𝑖𝑜𝑛𝑠
-----Equation(3)
Precision (P) = ---Equation(4)𝑁𝑜 𝑜𝑓 𝑝𝑎𝑡𝑖𝑒𝑛𝑡𝑠 𝑖𝑑𝑒𝑛𝑡𝑖𝑓𝑖𝑒𝑑 𝑐𝑜𝑟𝑟𝑒𝑐𝑡𝑙𝑦 ℎ𝑎𝑣𝑖𝑛𝑔 𝑐𝑎𝑟𝑑𝑖𝑜𝑣𝑎𝑠𝑐𝑢𝑙𝑎𝑟 𝑑𝑖𝑠𝑒𝑎𝑠𝑒𝑁𝑜. 𝑜𝑓 𝑝𝑎𝑡𝑖𝑒𝑛𝑡𝑠 ℎ𝑎𝑣𝑖𝑛𝑔 𝑐𝑎𝑟𝑑𝑖𝑜𝑣𝑎𝑠𝑐𝑢𝑙𝑎𝑟 𝑑𝑖𝑠𝑒𝑎𝑠𝑒
Recall (R) = 𝑁𝑜. 𝑜𝑓 𝑝𝑎𝑡𝑖𝑒𝑛𝑡𝑠 𝑖𝑑𝑒𝑛𝑡𝑖𝑓𝑖𝑒𝑑 𝑐𝑜𝑟𝑟𝑒𝑐𝑡𝑙𝑦 ℎ𝑎𝑣𝑖𝑛𝑔 𝑐𝑎𝑟𝑑𝑖𝑜𝑣𝑎𝑠𝑐𝑢𝑙𝑎𝑟 𝑑𝑖𝑠𝑒𝑎𝑠𝑒𝑁𝑜. 𝑜𝑓 𝑝𝑎𝑡𝑖𝑒𝑛𝑡𝑠 𝑖𝑑𝑒𝑛𝑡𝑖𝑓𝑖𝑒𝑑 𝑤𝑖𝑡ℎ 𝑐𝑎𝑟𝑑𝑖𝑜𝑣𝑎𝑠𝑐𝑢𝑙𝑎𝑟 𝑑𝑖𝑠𝑒𝑎𝑠𝑒
----Equation(5)
F – measure = ----Equation(6)2𝑃𝑅𝑃+𝑅
After building the model using the training data for predicting the expected rating, thenext step is to measure the performance of the model. To evaluate the efficacy of themodel, some of the standard measures such as R2 score (Coefficient of Determination)and Cross validation are used.
4.3.1 Performance Analysis and Models Comparison
Out of all the trained models we need to choose the best model. We need to analyse
the performance of each model and then compare the accuracies of all the trained
models.
Confusion Matrix
A confusion matrix is a table that is often used to describe the performance of a
classification model (or "classifier") on a set of test data for which the true values are
68
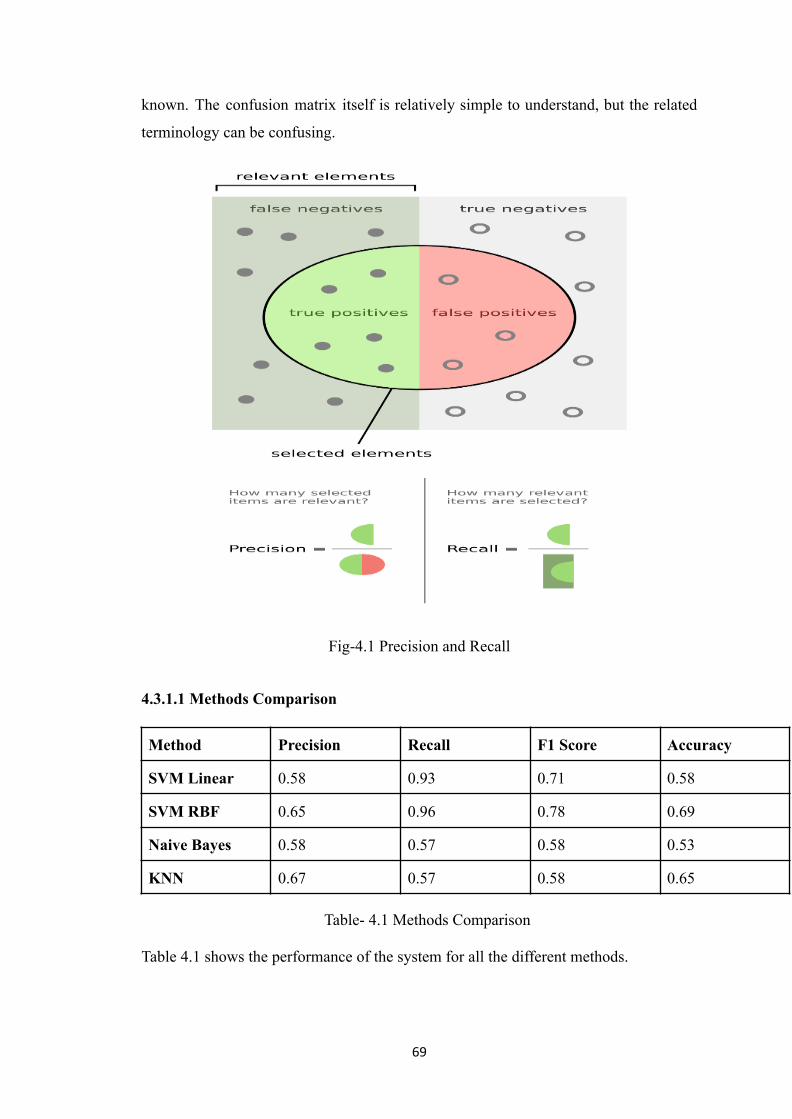
known. The confusion matrix itself is relatively simple to understand, but the related
terminology can be confusing.
Fig-4.1 Precision and Recall
4.3.1.1 Methods Comparison
Method Precision Recall F1 Score Accuracy
SVM Linear 0.58 0.93 0.71 0.58
SVM RBF 0.65 0.96 0.78 0.69
Naive Bayes 0.58 0.57 0.58 0.53
KNN 0.67 0.57 0.58 0.65
Table- 4.1 Methods Comparison
Table 4.1 shows the performance of the system for all the different methods.
69
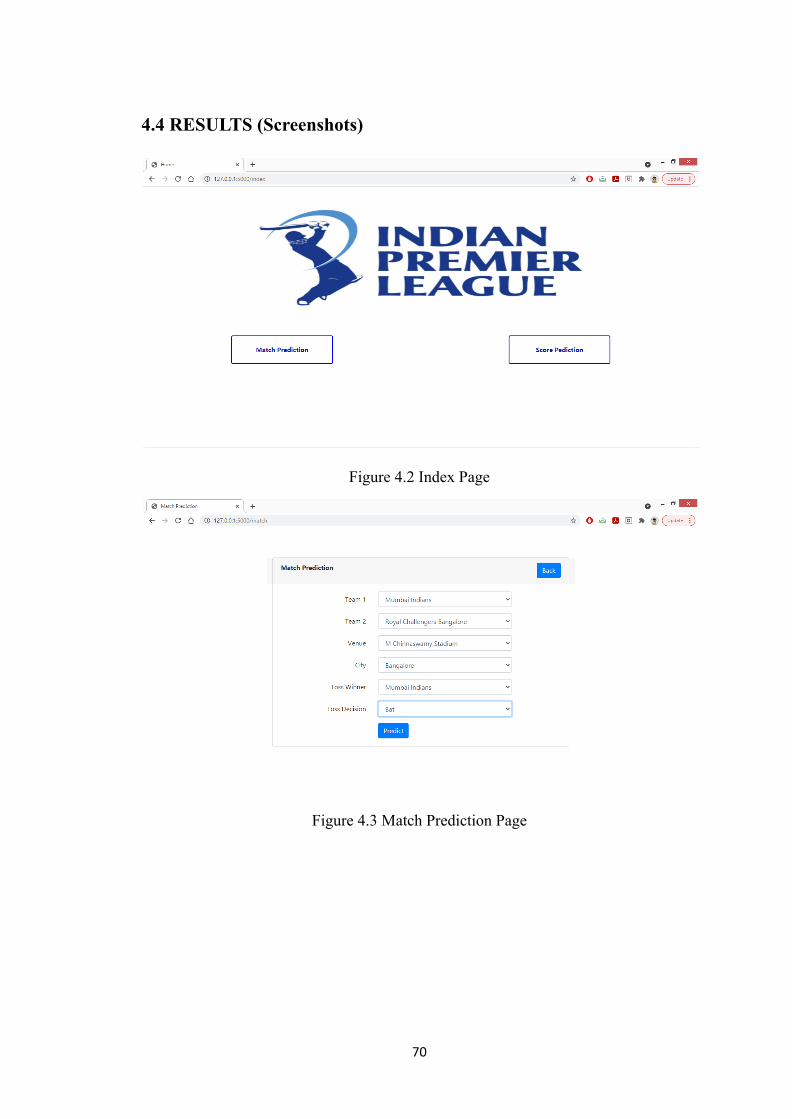
4.4 RESULTS (Screenshots)
Figure 4.2 Index Page
Figure 4.3 Match Prediction Page
70
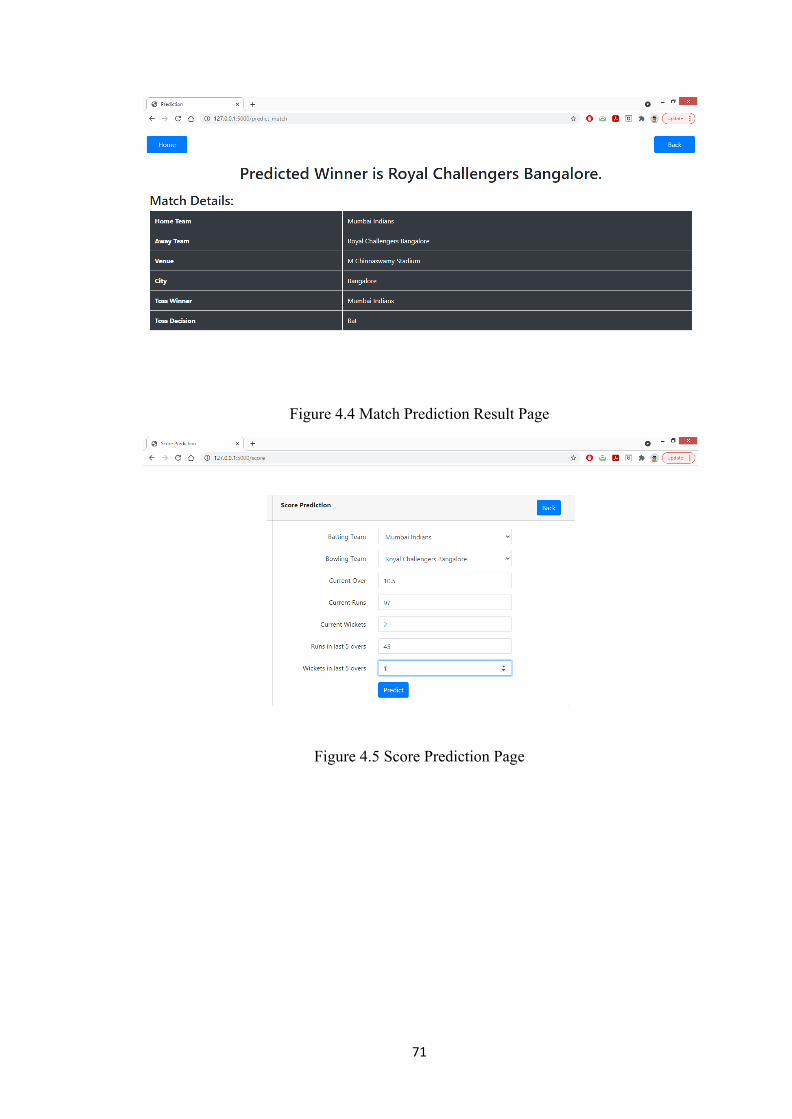
Figure 4.4 Match Prediction Result Page
Figure 4.5 Score Prediction Page
71
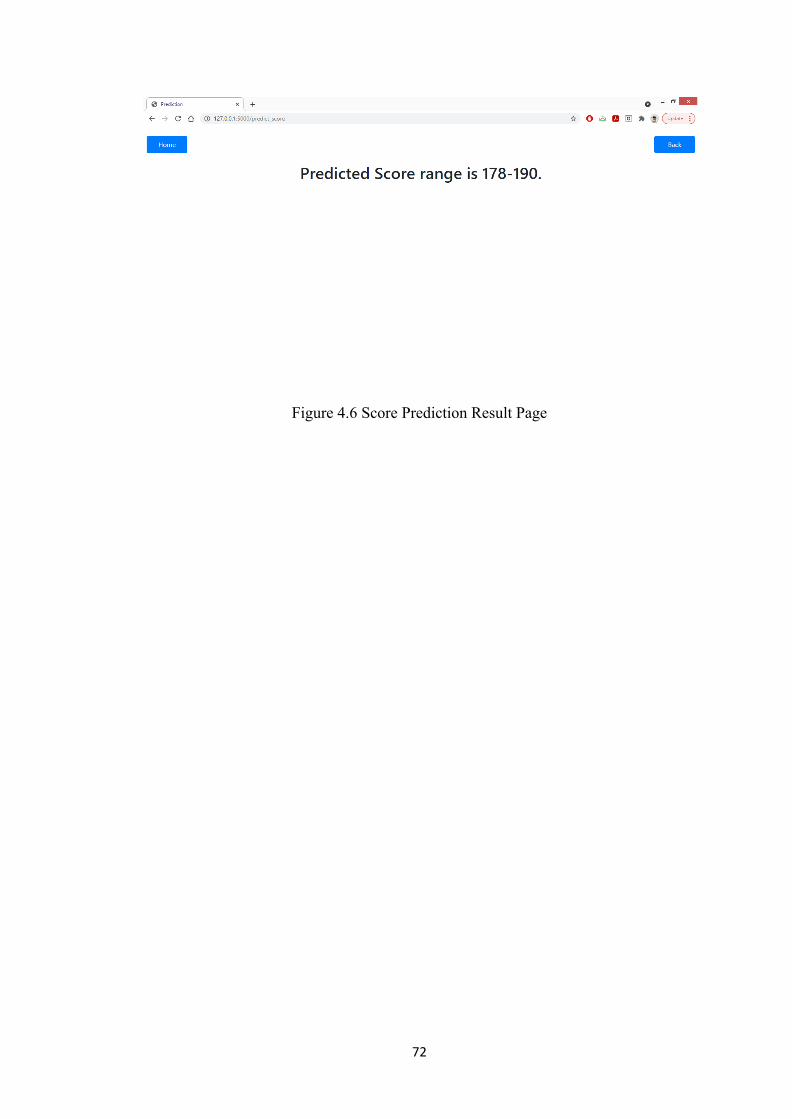
Figure 4.6 Score Prediction Result Page
72

CHAPTER 5CONCLUSION ANDFUTURE WORK
73
5.1 ConclusionSupport Vector Machine(SVM), Naive Bayes, k-Nearest Neighbour(kNN) algorithmsare implemented on the input data to assess the best performance. These methods arecompared using performance metrics. According to the analysis of metrics, SupportVector Machine(SVM) gives a better accuracy score on test data than the other twoalgorithms.
5.2 Future WorkAt present, the data is limited to match and score. It doesn't have details about theplayers and their stats. There is a great scope for applying this concept to the playersand their stats data and can find the batting order and bowling order of a particularmatch. It will be helpful to franchise people who are at decision making level.
74
REFERENCES[1] Gagana S, K Paramesha, “A Perspective on Analyzing IPL Match Results using
Machine Learning”, IJSRD - International Journal for Scientific Research &Development| Vol. 7, Issue 03, 2019 | ISSN (online): 2321-0613.
[2] Rabindra Lamsal and Ayesha Choudhary, “Predicting Outcome of Indian PremierLeague(IPL) Matches Using Machine Learning”, arXiv:1809.09813v5 [stat.AP] 21Sep 2020.
[3] Shubhra Singh, Parmeet Kaur, “IPL Visualization and Prediction Using HBase”,Procedia Computer Science 122 (2017) 910–915.
[4] Pallavi Tekade, Kunal Markad, Aniket Amage, Bhagwat Natekar, “Cricket MatchOutcome Prediction Using Machine Learning”, International Journal Of AdvanceScientific Research And Engineering Trends, Volume 5, Issue 7, July 2020, ISSN(Online) 2456-0774.
[5] Ch Sai Abhishek, Ketaki V Patil, P Yuktha, Meghana K S, MV Sudhamani,“Predictive Analysis of IPL Match Winner using Machine Learning Techniques”,International Journal of Innovative Technology and Exploring Engineering(IJITEE) ISSN: 2278-3075, Volume-9 Issue-2S, December 2019.
[6] https://www.kaggle.com/patrickb1912/ipl-complete-dataset-20082020
75
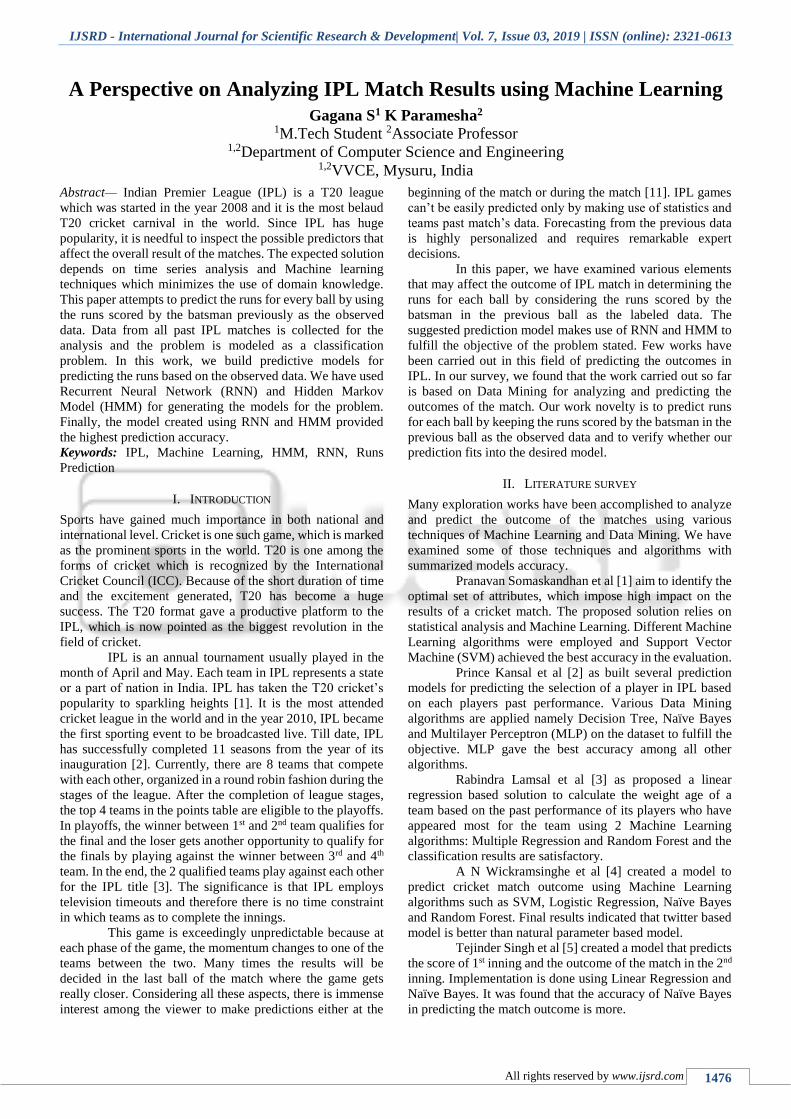
IJSRD - International Journal for Scientific Research & Development| Vol. 7, Issue 03, 2019 | ISSN (online): 2321-0613
All rights reserved by www.ijsrd.com 1476
A Perspective on Analyzing IPL Match Results using Machine Learning
Gagana S1 K Paramesha2 1M.Tech Student 2Associate Professor
1,2Department of Computer Science and Engineering 1,2VVCE, Mysuru, India
Abstract— Indian Premier League (IPL) is a T20 league
which was started in the year 2008 and it is the most belaud
T20 cricket carnival in the world. Since IPL has huge
popularity, it is needful to inspect the possible predictors that
affect the overall result of the matches. The expected solution
depends on time series analysis and Machine learning
techniques which minimizes the use of domain knowledge.
This paper attempts to predict the runs for every ball by using
the runs scored by the batsman previously as the observed
data. Data from all past IPL matches is collected for the
analysis and the problem is modeled as a classification
problem. In this work, we build predictive models for
predicting the runs based on the observed data. We have used
Recurrent Neural Network (RNN) and Hidden Markov
Model (HMM) for generating the models for the problem.
Finally, the model created using RNN and HMM provided
the highest prediction accuracy.
Keywords: IPL, Machine Learning, HMM, RNN, Runs
Prediction
I. INTRODUCTION
Sports have gained much importance in both national and
international level. Cricket is one such game, which is marked
as the prominent sports in the world. T20 is one among the
forms of cricket which is recognized by the International
Cricket Council (ICC). Because of the short duration of time
and the excitement generated, T20 has become a huge
success. The T20 format gave a productive platform to the
IPL, which is now pointed as the biggest revolution in the
field of cricket.
IPL is an annual tournament usually played in the
month of April and May. Each team in IPL represents a state
or a part of nation in India. IPL has taken the T20 cricket’s
popularity to sparkling heights [1]. It is the most attended
cricket league in the world and in the year 2010, IPL became
the first sporting event to be broadcasted live. Till date, IPL
has successfully completed 11 seasons from the year of its
inauguration [2]. Currently, there are 8 teams that compete
with each other, organized in a round robin fashion during the
stages of the league. After the completion of league stages,
the top 4 teams in the points table are eligible to the playoffs.
In playoffs, the winner between 1st and 2nd team qualifies for
the final and the loser gets another opportunity to qualify for
the finals by playing against the winner between 3rd and 4th
team. In the end, the 2 qualified teams play against each other
for the IPL title [3]. The significance is that IPL employs
television timeouts and therefore there is no time constraint
in which teams as to complete the innings.
This game is exceedingly unpredictable because at
each phase of the game, the momentum changes to one of the
teams between the two. Many times the results will be
decided in the last ball of the match where the game gets
really closer. Considering all these aspects, there is immense
interest among the viewer to make predictions either at the
beginning of the match or during the match [11]. IPL games
can’t be easily predicted only by making use of statistics and
teams past match’s data. Forecasting from the previous data
is highly personalized and requires remarkable expert
decisions.
In this paper, we have examined various elements
that may affect the outcome of IPL match in determining the
runs for each ball by considering the runs scored by the
batsman in the previous ball as the labeled data. The
suggested prediction model makes use of RNN and HMM to
fulfill the objective of the problem stated. Few works have
been carried out in this field of predicting the outcomes in
IPL. In our survey, we found that the work carried out so far
is based on Data Mining for analyzing and predicting the
outcomes of the match. Our work novelty is to predict runs
for each ball by keeping the runs scored by the batsman in the
previous ball as the observed data and to verify whether our
prediction fits into the desired model.
II. LITERATURE SURVEY
Many exploration works have been accomplished to analyze
and predict the outcome of the matches using various
techniques of Machine Learning and Data Mining. We have
examined some of those techniques and algorithms with
summarized models accuracy.
Pranavan Somaskandhan et al [1] aim to identify the
optimal set of attributes, which impose high impact on the
results of a cricket match. The proposed solution relies on
statistical analysis and Machine Learning. Different Machine
Learning algorithms were employed and Support Vector
Machine (SVM) achieved the best accuracy in the evaluation.
Prince Kansal et al [2] as built several prediction
models for predicting the selection of a player in IPL based
on each players past performance. Various Data Mining
algorithms are applied namely Decision Tree, Naïve Bayes
and Multilayer Perceptron (MLP) on the dataset to fulfill the
objective. MLP gave the best accuracy among all other
algorithms.
Rabindra Lamsal et al [3] as proposed a linear
regression based solution to calculate the weight age of a
team based on the past performance of its players who have
appeared most for the team using 2 Machine Learning
algorithms: Multiple Regression and Random Forest and the
classification results are satisfactory.
A N Wickramsinghe et al [4] created a model to
predict cricket match outcome using Machine Learning
algorithms such as SVM, Logistic Regression, Naïve Bayes
and Random Forest. Final results indicated that twitter based
model is better than natural parameter based model.
Tejinder Singh et al [5] created a model that predicts
the score of 1st inning and the outcome of the match in the 2nd
inning. Implementation is done using Linear Regression and
Naïve Bayes. It was found that the accuracy of Naïve Bayes
in predicting the match outcome is more.
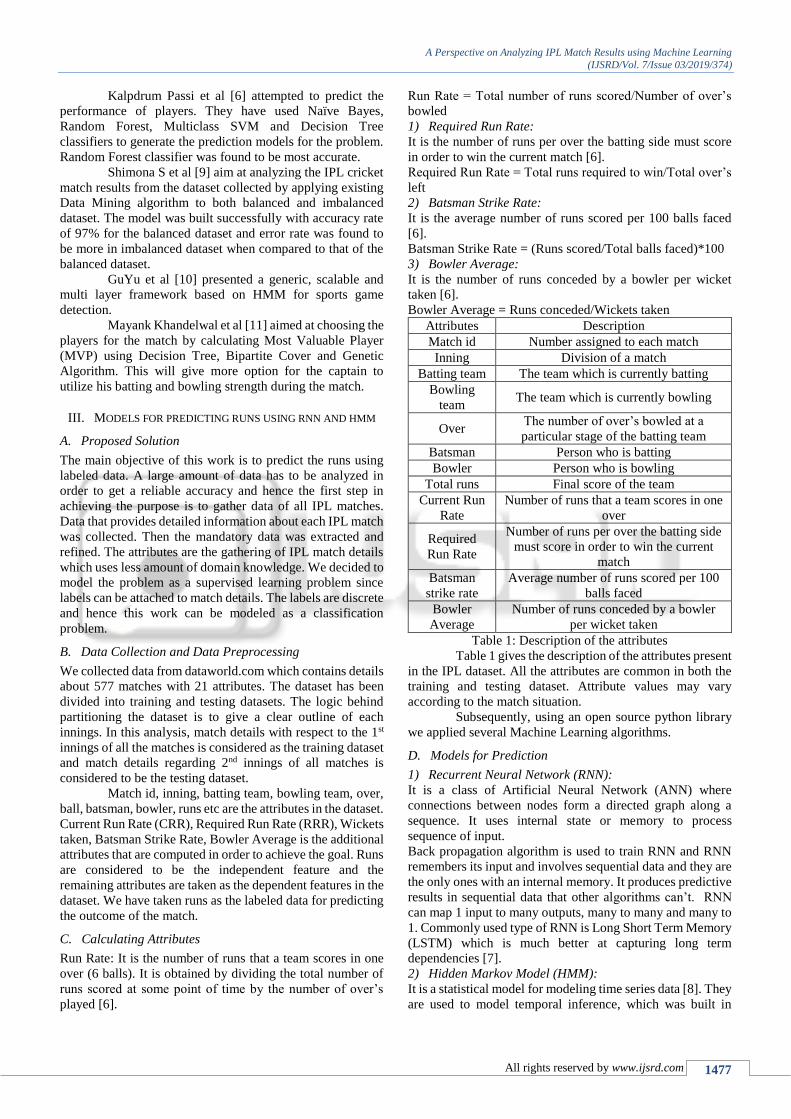
A Perspective on Analyzing IPL Match Results using Machine Learning
(IJSRD/Vol. 7/Issue 03/2019/374)
All rights reserved by www.ijsrd.com 1477
Kalpdrum Passi et al [6] attempted to predict the
performance of players. They have used Naïve Bayes,
Random Forest, Multiclass SVM and Decision Tree
classifiers to generate the prediction models for the problem.
Random Forest classifier was found to be most accurate.
Shimona S et al [9] aim at analyzing the IPL cricket
match results from the dataset collected by applying existing
Data Mining algorithm to both balanced and imbalanced
dataset. The model was built successfully with accuracy rate
of 97% for the balanced dataset and error rate was found to
be more in imbalanced dataset when compared to that of the
balanced dataset.
GuYu et al [10] presented a generic, scalable and
multi layer framework based on HMM for sports game
detection.
Mayank Khandelwal et al [11] aimed at choosing the
players for the match by calculating Most Valuable Player
(MVP) using Decision Tree, Bipartite Cover and Genetic
Algorithm. This will give more option for the captain to
utilize his batting and bowling strength during the match.
III. MODELS FOR PREDICTING RUNS USING RNN AND HMM
A. Proposed Solution
The main objective of this work is to predict the runs using
labeled data. A large amount of data has to be analyzed in
order to get a reliable accuracy and hence the first step in
achieving the purpose is to gather data of all IPL matches.
Data that provides detailed information about each IPL match
was collected. Then the mandatory data was extracted and
refined. The attributes are the gathering of IPL match details
which uses less amount of domain knowledge. We decided to
model the problem as a supervised learning problem since
labels can be attached to match details. The labels are discrete
and hence this work can be modeled as a classification
problem.
B. Data Collection and Data Preprocessing
We collected data from dataworld.com which contains details
about 577 matches with 21 attributes. The dataset has been
divided into training and testing datasets. The logic behind
partitioning the dataset is to give a clear outline of each
innings. In this analysis, match details with respect to the 1st
innings of all the matches is considered as the training dataset
and match details regarding 2nd innings of all matches is
considered to be the testing dataset.
Match id, inning, batting team, bowling team, over,
ball, batsman, bowler, runs etc are the attributes in the dataset.
Current Run Rate (CRR), Required Run Rate (RRR), Wickets
taken, Batsman Strike Rate, Bowler Average is the additional
attributes that are computed in order to achieve the goal. Runs
are considered to be the independent feature and the
remaining attributes are taken as the dependent features in the
dataset. We have taken runs as the labeled data for predicting
the outcome of the match.
C. Calculating Attributes
Run Rate: It is the number of runs that a team scores in one
over (6 balls). It is obtained by dividing the total number of
runs scored at some point of time by the number of over’s
played [6].
Run Rate = Total number of runs scored/Number of over’s
bowled
1) Required Run Rate:
It is the number of runs per over the batting side must score
in order to win the current match [6].
Required Run Rate = Total runs required to win/Total over’s
left
2) Batsman Strike Rate:
It is the average number of runs scored per 100 balls faced
[6].
Batsman Strike Rate = (Runs scored/Total balls faced)*100
3) Bowler Average:
It is the number of runs conceded by a bowler per wicket
taken [6].
Bowler Average = Runs conceded/Wickets taken
Attributes Description
Match id Number assigned to each match
Inning Division of a match
Batting team The team which is currently batting
Bowling
team The team which is currently bowling
Over The number of over’s bowled at a
particular stage of the batting team
Batsman Person who is batting
Bowler Person who is bowling
Total runs Final score of the team
Current Run
Rate
Number of runs that a team scores in one
over
Required
Run Rate
Number of runs per over the batting side
must score in order to win the current
match
Batsman
strike rate
Average number of runs scored per 100
balls faced
Bowler
Average
Number of runs conceded by a bowler
per wicket taken
Table 1: Description of the attributes
Table 1 gives the description of the attributes present
in the IPL dataset. All the attributes are common in both the
training and testing dataset. Attribute values may vary
according to the match situation.
Subsequently, using an open source python library
we applied several Machine Learning algorithms.
D. Models for Prediction
1) Recurrent Neural Network (RNN):
It is a class of Artificial Neural Network (ANN) where
connections between nodes form a directed graph along a
sequence. It uses internal state or memory to process
sequence of input.
Back propagation algorithm is used to train RNN and RNN
remembers its input and involves sequential data and they are
the only ones with an internal memory. It produces predictive
results in sequential data that other algorithms can’t. RNN
can map 1 input to many outputs, many to many and many to
1. Commonly used type of RNN is Long Short Term Memory
(LSTM) which is much better at capturing long term
dependencies [7].
2) Hidden Markov Model (HMM):
It is a statistical model for modeling time series data [8]. They
are used to model temporal inference, which was built in
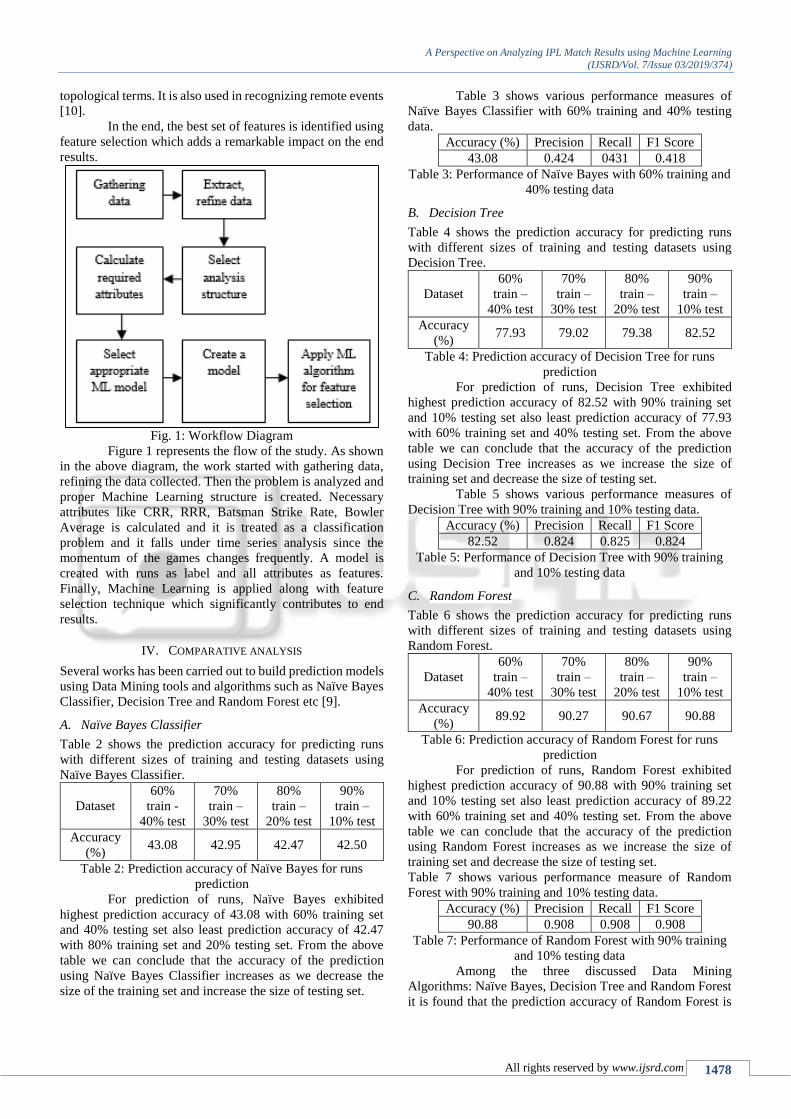
A Perspective on Analyzing IPL Match Results using Machine Learning
(IJSRD/Vol. 7/Issue 03/2019/374)
All rights reserved by www.ijsrd.com 1478
topological terms. It is also used in recognizing remote events
[10].
In the end, the best set of features is identified using
feature selection which adds a remarkable impact on the end
results.
Fig. 1: Workflow Diagram
Figure 1 represents the flow of the study. As shown
in the above diagram, the work started with gathering data,
refining the data collected. Then the problem is analyzed and
proper Machine Learning structure is created. Necessary
attributes like CRR, RRR, Batsman Strike Rate, Bowler
Average is calculated and it is treated as a classification
problem and it falls under time series analysis since the
momentum of the games changes frequently. A model is
created with runs as label and all attributes as features.
Finally, Machine Learning is applied along with feature
selection technique which significantly contributes to end
results.
IV. COMPARATIVE ANALYSIS
Several works has been carried out to build prediction models
using Data Mining tools and algorithms such as Naïve Bayes
Classifier, Decision Tree and Random Forest etc [9].
A. Naïve Bayes Classifier
Table 2 shows the prediction accuracy for predicting runs
with different sizes of training and testing datasets using
Naïve Bayes Classifier.
Dataset
60%
train -
40% test
70%
train –
30% test
80%
train –
20% test
90%
train –
10% test
Accuracy
(%) 43.08 42.95 42.47 42.50
Table 2: Prediction accuracy of Naïve Bayes for runs
prediction
For prediction of runs, Naïve Bayes exhibited
highest prediction accuracy of 43.08 with 60% training set
and 40% testing set also least prediction accuracy of 42.47
with 80% training set and 20% testing set. From the above
table we can conclude that the accuracy of the prediction
using Naïve Bayes Classifier increases as we decrease the
size of the training set and increase the size of testing set.
Table 3 shows various performance measures of
Naïve Bayes Classifier with 60% training and 40% testing
data.
Accuracy (%) Precision Recall F1 Score
43.08 0.424 0431 0.418
Table 3: Performance of Naïve Bayes with 60% training and
40% testing data
B. Decision Tree
Table 4 shows the prediction accuracy for predicting runs
with different sizes of training and testing datasets using
Decision Tree.
Dataset
60%
train –
40% test
70%
train –
30% test
80%
train –
20% test
90%
train –
10% test
Accuracy
(%) 77.93 79.02 79.38 82.52
Table 4: Prediction accuracy of Decision Tree for runs
prediction
For prediction of runs, Decision Tree exhibited
highest prediction accuracy of 82.52 with 90% training set
and 10% testing set also least prediction accuracy of 77.93
with 60% training set and 40% testing set. From the above
table we can conclude that the accuracy of the prediction
using Decision Tree increases as we increase the size of
training set and decrease the size of testing set.
Table 5 shows various performance measures of
Decision Tree with 90% training and 10% testing data.
Accuracy (%) Precision Recall F1 Score
82.52 0.824 0.825 0.824
Table 5: Performance of Decision Tree with 90% training
and 10% testing data
C. Random Forest
Table 6 shows the prediction accuracy for predicting runs
with different sizes of training and testing datasets using
Random Forest.
Dataset
60%
train –
40% test
70%
train –
30% test
80%
train –
20% test
90%
train –
10% test
Accuracy
(%) 89.92 90.27 90.67 90.88
Table 6: Prediction accuracy of Random Forest for runs
prediction
For prediction of runs, Random Forest exhibited
highest prediction accuracy of 90.88 with 90% training set
and 10% testing set also least prediction accuracy of 89.22
with 60% training set and 40% testing set. From the above
table we can conclude that the accuracy of the prediction
using Random Forest increases as we increase the size of
training set and decrease the size of testing set.
Table 7 shows various performance measure of Random
Forest with 90% training and 10% testing data.
Accuracy (%) Precision Recall F1 Score
90.88 0.908 0.908 0.908
Table 7: Performance of Random Forest with 90% training
and 10% testing data
Among the three discussed Data Mining
Algorithms: Naïve Bayes, Decision Tree and Random Forest
it is found that the prediction accuracy of Random Forest is
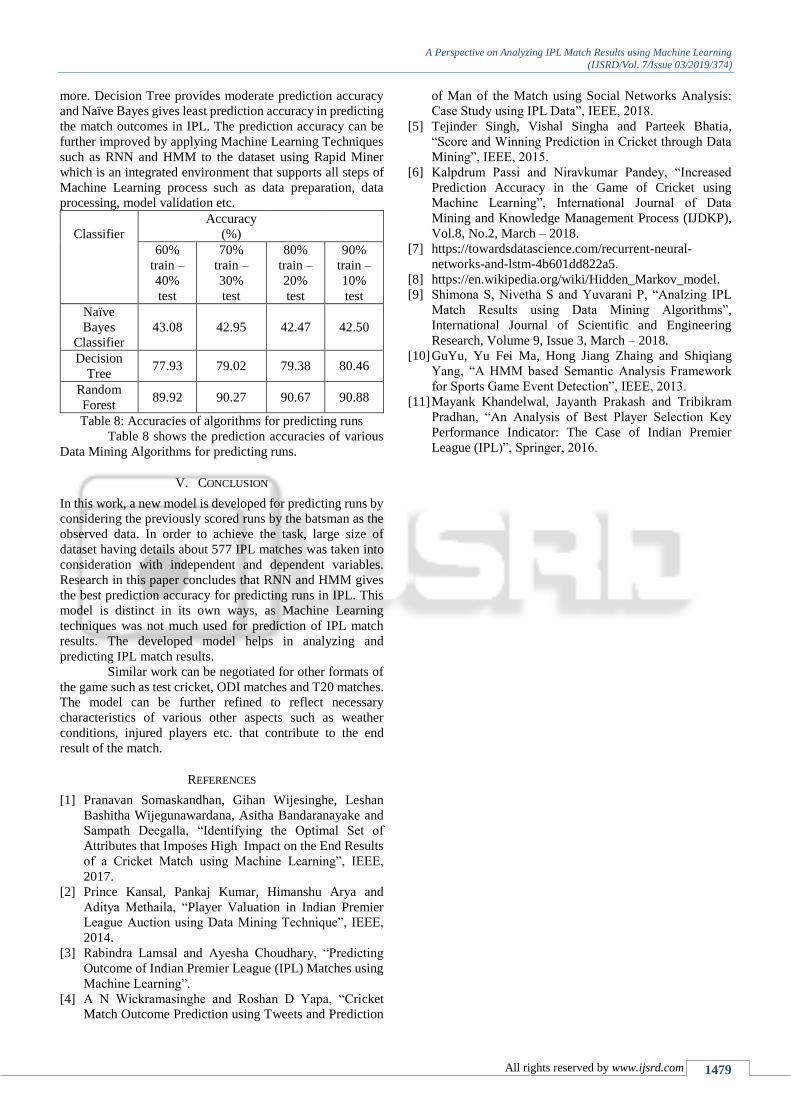
A Perspective on Analyzing IPL Match Results using Machine Learning
(IJSRD/Vol. 7/Issue 03/2019/374)
All rights reserved by www.ijsrd.com 1479
more. Decision Tree provides moderate prediction accuracy
and Naïve Bayes gives least prediction accuracy in predicting
the match outcomes in IPL. The prediction accuracy can be
further improved by applying Machine Learning Techniques
such as RNN and HMM to the dataset using Rapid Miner
which is an integrated environment that supports all steps of
Machine Learning process such as data preparation, data
processing, model validation etc.
Classifier
Accuracy
(%)
60%
train –
40%
test
70%
train –
30%
test
80%
train –
20%
test
90%
train –
10%
test
Naïve
Bayes
Classifier
43.08 42.95 42.47 42.50
Decision
Tree 77.93 79.02 79.38 80.46
Random
Forest 89.92 90.27 90.67 90.88
Table 8: Accuracies of algorithms for predicting runs
Table 8 shows the prediction accuracies of various
Data Mining Algorithms for predicting runs.
V. CONCLUSION
In this work, a new model is developed for predicting runs by
considering the previously scored runs by the batsman as the
observed data. In order to achieve the task, large size of
dataset having details about 577 IPL matches was taken into
consideration with independent and dependent variables.
Research in this paper concludes that RNN and HMM gives
the best prediction accuracy for predicting runs in IPL. This
model is distinct in its own ways, as Machine Learning
techniques was not much used for prediction of IPL match
results. The developed model helps in analyzing and
predicting IPL match results.
Similar work can be negotiated for other formats of
the game such as test cricket, ODI matches and T20 matches.
The model can be further refined to reflect necessary
characteristics of various other aspects such as weather
conditions, injured players etc. that contribute to the end
result of the match.
REFERENCES
[1] Pranavan Somaskandhan, Gihan Wijesinghe, Leshan
Bashitha Wijegunawardana, Asitha Bandaranayake and
Sampath Deegalla, “Identifying the Optimal Set of
Attributes that Imposes High Impact on the End Results
of a Cricket Match using Machine Learning”, IEEE,
2017.
[2] Prince Kansal, Pankaj Kumar, Himanshu Arya and
Aditya Methaila, “Player Valuation in Indian Premier
League Auction using Data Mining Technique”, IEEE,
2014.
[3] Rabindra Lamsal and Ayesha Choudhary, “Predicting
Outcome of Indian Premier League (IPL) Matches using
Machine Learning”.
[4] A N Wickramasinghe and Roshan D Yapa, “Cricket
Match Outcome Prediction using Tweets and Prediction
of Man of the Match using Social Networks Analysis:
Case Study using IPL Data”, IEEE, 2018.
[5] Tejinder Singh, Vishal Singha and Parteek Bhatia,
“Score and Winning Prediction in Cricket through Data
Mining”, IEEE, 2015.
[6] Kalpdrum Passi and Niravkumar Pandey, “Increased
Prediction Accuracy in the Game of Cricket using
Machine Learning”, International Journal of Data
Mining and Knowledge Management Process (IJDKP),
Vol.8, No.2, March – 2018.
[7] https://towardsdatascience.com/recurrent-neural-
networks-and-lstm-4b601dd822a5.
[8] https://en.wikipedia.org/wiki/Hidden_Markov_model.
[9] Shimona S, Nivetha S and Yuvarani P, “Analzing IPL
Match Results using Data Mining Algorithms”,
International Journal of Scientific and Engineering
Research, Volume 9, Issue 3, March – 2018.
[10] GuYu, Yu Fei Ma, Hong Jiang Zhaing and Shiqiang
Yang, “A HMM based Semantic Analysis Framework
for Sports Game Event Detection”, IEEE, 2013.
[11] Mayank Khandelwal, Jayanth Prakash and Tribikram
Pradhan, “An Analysis of Best Player Selection Key
Performance Indicator: The Case of Indian Premier
League (IPL)”, Springer, 2016.

9 VI June 2021
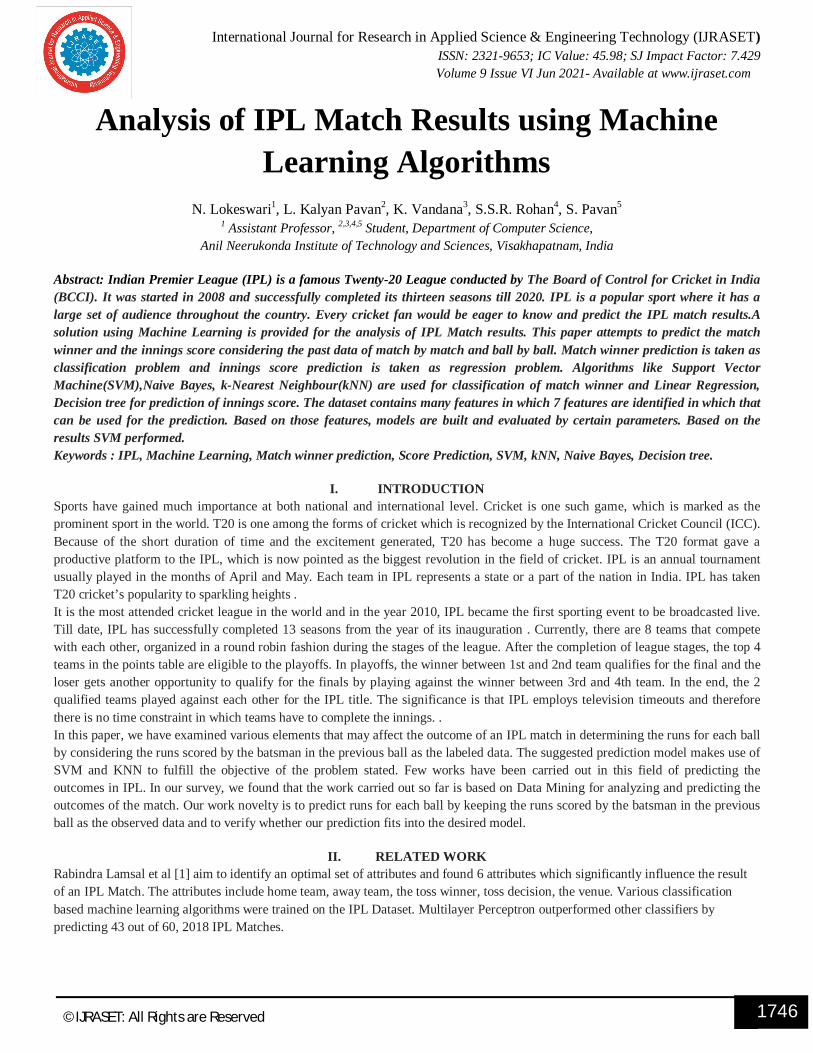
International Journal for Research in Applied Science & Engineering Technology (IJRASET) ISSN: 2321-9653; IC Value: 45.98; SJ Impact Factor: 7.429
Volume 9 Issue VI Jun 2021- Available at www.ijraset.com
1746 ©IJRASET: All Rights are Reserved
Analysis of IPL Match Results using Machine Learning Algorithms
N. Lokeswari1, L. Kalyan Pavan2, K. Vandana3, S.S.R. Rohan4, S. Pavan5 1 Assistant Professor, 2,3,4,5 Student, Department of Computer Science,
Anil Neerukonda Institute of Technology and Sciences, Visakhapatnam, India
Abstract: Indian Premier League (IPL) is a famous Twenty-20 League conducted by The Board of Control for Cricket in India (BCCI). It was started in 2008 and successfully completed its thirteen seasons till 2020. IPL is a popular sport where it has a large set of audience throughout the country. Every cricket fan would be eager to know and predict the IPL match results.A solution using Machine Learning is provided for the analysis of IPL Match results. This paper attempts to predict the match winner and the innings score considering the past data of match by match and ball by ball. Match winner prediction is taken as classification problem and innings score prediction is taken as regression problem. Algorithms like Support Vector Machine(SVM),Naive Bayes, k-Nearest Neighbour(kNN) are used for classification of match winner and Linear Regression, Decision tree for prediction of innings score. The dataset contains many features in which 7 features are identified in which that can be used for the prediction. Based on those features, models are built and evaluated by certain parameters. Based on the results SVM performed. Keywords : IPL, Machine Learning, Match winner prediction, Score Prediction, SVM, kNN, Naive Bayes, Decision tree.
I. INTRODUCTION Sports have gained much importance at both national and international level. Cricket is one such game, which is marked as the prominent sport in the world. T20 is one among the forms of cricket which is recognized by the International Cricket Council (ICC). Because of the short duration of time and the excitement generated, T20 has become a huge success. The T20 format gave a productive platform to the IPL, which is now pointed as the biggest revolution in the field of cricket. IPL is an annual tournament usually played in the months of April and May. Each team in IPL represents a state or a part of the nation in India. IPL has taken T20 cricket’s popularity to sparkling heights . It is the most attended cricket league in the world and in the year 2010, IPL became the first sporting event to be broadcasted live. Till date, IPL has successfully completed 13 seasons from the year of its inauguration . Currently, there are 8 teams that compete with each other, organized in a round robin fashion during the stages of the league. After the completion of league stages, the top 4 teams in the points table are eligible to the playoffs. In playoffs, the winner between 1st and 2nd team qualifies for the final and the loser gets another opportunity to qualify for the finals by playing against the winner between 3rd and 4th team. In the end, the 2 qualified teams played against each other for the IPL title. The significance is that IPL employs television timeouts and therefore there is no time constraint in which teams have to complete the innings. . In this paper, we have examined various elements that may affect the outcome of an IPL match in determining the runs for each ball by considering the runs scored by the batsman in the previous ball as the labeled data. The suggested prediction model makes use of SVM and KNN to fulfill the objective of the problem stated. Few works have been carried out in this field of predicting the outcomes in IPL. In our survey, we found that the work carried out so far is based on Data Mining for analyzing and predicting the outcomes of the match. Our work novelty is to predict runs for each ball by keeping the runs scored by the batsman in the previous ball as the observed data and to verify whether our prediction fits into the desired model.
II. RELATED WORK Rabindra Lamsal et al [1] aim to identify an optimal set of attributes and found 6 attributes which significantly influence the result of an IPL Match. The attributes include home team, away team, the toss winner, toss decision, the venue. Various classification based machine learning algorithms were trained on the IPL Dataset. Multilayer Perceptron outperformed other classifiers by predicting 43 out of 60, 2018 IPL Matches.
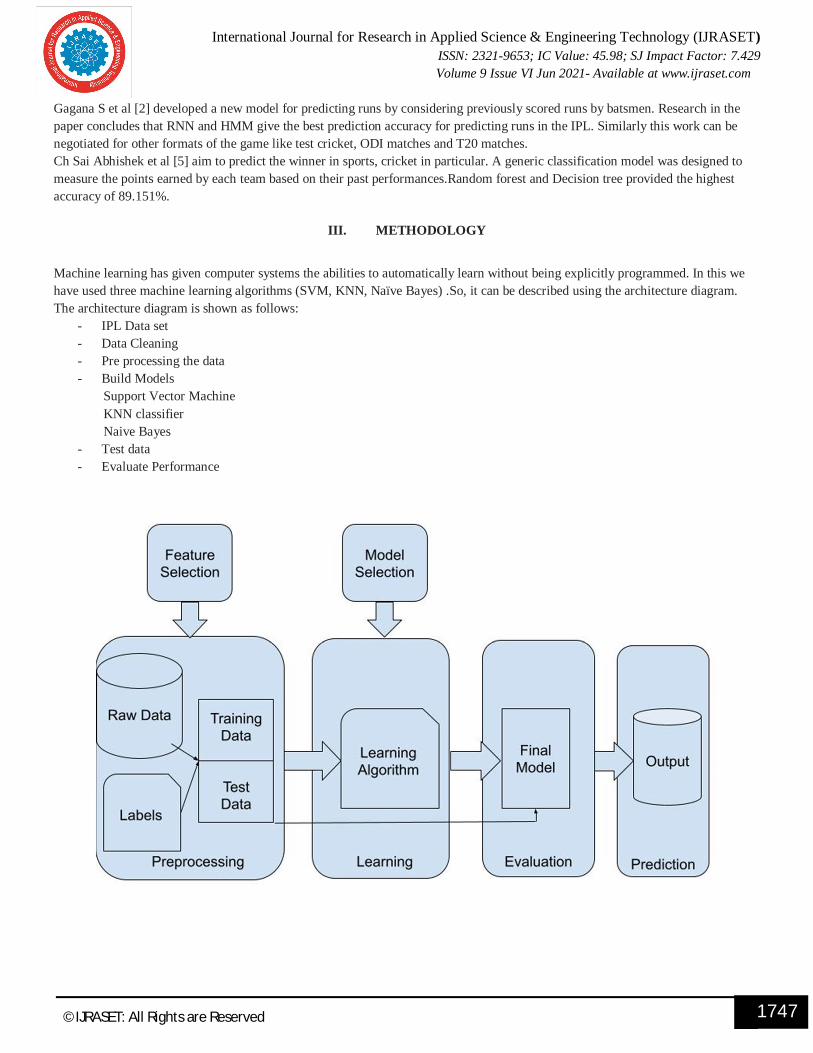
International Journal for Research in Applied Science & Engineering Technology (IJRASET) ISSN: 2321-9653; IC Value: 45.98; SJ Impact Factor: 7.429
Volume 9 Issue VI Jun 2021- Available at www.ijraset.com
1747 ©IJRASET: All Rights are Reserved
Gagana S et al [2] developed a new model for predicting runs by considering previously scored runs by batsmen. Research in the paper concludes that RNN and HMM give the best prediction accuracy for predicting runs in the IPL. Similarly this work can be negotiated for other formats of the game like test cricket, ODI matches and T20 matches. Ch Sai Abhishek et al [5] aim to predict the winner in sports, cricket in particular. A generic classification model was designed to measure the points earned by each team based on their past performances.Random forest and Decision tree provided the highest accuracy of 89.151%.
III. METHODOLOGY
Machine learning has given computer systems the abilities to automatically learn without being explicitly programmed. In this we have used three machine learning algorithms (SVM, KNN, Naïve Bayes) .So, it can be described using the architecture diagram. The architecture diagram is shown as follows:
- IPL Data set - Data Cleaning - Pre processing the data - Build Models
Support Vector Machine KNN classifier Naive Bayes
- Test data - Evaluate Performance
International Journal for Research in Applied Science & Engineering Technology (IJRASET) ISSN: 2321-9653; IC Value: 45.98; SJ Impact Factor: 7.429
Volume 9 Issue VI Jun 2021- Available at www.ijraset.com
1748 ©IJRASET: All Rights are Reserved
A. The architecture diagram is defined with the flow of process which is used to refine the raw data and used for predicting the IPL’s data.
B. The next step is preprocessing the collected raw data into understandable format.
C. Then we have to train the data by splitting the dataset into train data and test data.
D. The IPL’s data is evaluated with the application of a machine learning algorithm that is Support Vector Machine, KNN and Naïve Bayes algorithm and the classification accuracy of this model is found.
E. After training the data with these algorithms we have to test on the same algorithms.
F. Finally, the result of these three algorithms is compared on the basis of classification accuracy.
IV. MODULES We have divided the whole project into 2 modules:
● Score Prediction ● IPL Match Prediction
For each of the modules, the sub module division is as follows:
A. Data set Collection: The goal of this step is to identify and obtain all data-related problems. In this step, we need to identify the different data sources, as data can be collected from various sources such as files and database. The quantity and quality of the collected data will determine the efficiency of the output. The more data, the more accurate the prediction will be. We have collected our data from the Kaggle website. Data preparation is a step where we put our data into a suitable place and prepare it to use in our machine learning training. It is used to understand the nature of data that we have to work with. We need to understand the characteristics, format, and quality of data.
B. Data Pre-Processing: A real-world data generally contains noises, missing values, and maybe in an unusable format which cannot be directly used for machine learning models. Data preprocessing is required for cleaning the data and making it suitable for a machine learning model which also increases the accuracy and efficiency of a machine learning model. It also includes encoding the values to numerical form which are in different formats other than numerical( like string, date etc..). It also includes feature selection so that we consider the features in which the output feature will be depending. It also includes standardization for the data set. In machine learning data preprocessing, we divide our dataset into a training set and test set. This is one of the crucial steps of data pre-processing as by doing this, we can enhance the performance of our machine learning model. Suppose, if we have given training to our machine learning model by a dataset and we test it by a completely different dataset. Then, it will create difficulties for our model to understand the correlations between the models. If we train our model very well and its training accuracy is also very high, but we provide a new dataset to it, then it will decrease the performance. So we always try to make a machine learning model which performs well with the training set and also with the test dataset. Here, we can define these datasets as: training set and test set. 1) Train Model: Here, in this step we select the machine learning techniques such as Classification, Regression etc. then build the
model using prepared data, and evaluate the model. We use datasets to train the model using various machine learning algorithms. Training a model is required so that it can understand the various patterns, rules, and features.
2) Test Data: Once our machine learning model has been trained on a given dataset, then we test the model. In this step, we check for the accuracy of our model by providing a test dataset to it. Testing the model determines the percentage accuracy of the model as per the requirement of project or problem.
C. Model Building(SVM, KNN Algorithm, Naive Bayes) and Testing:
1) Support Vector Machine(SVM): a) Support Vector Machine” (SVM) is a supervised machine learning algorithm which can be used for both
classification and regression challenges.
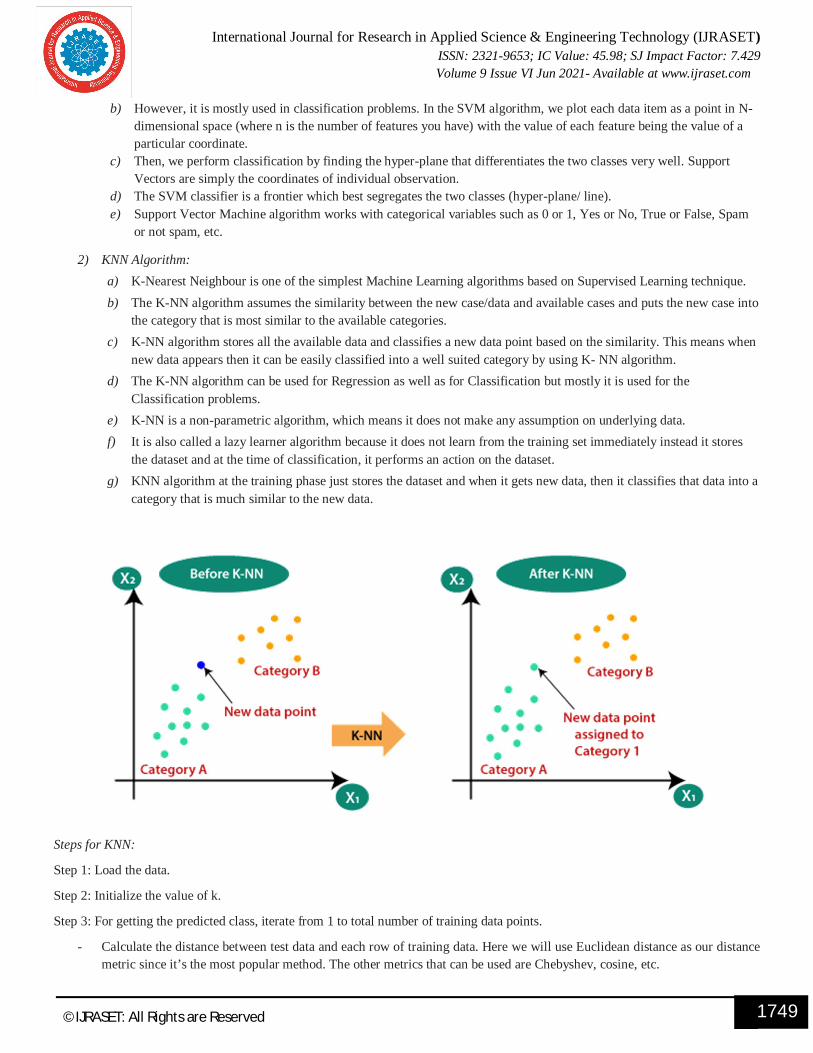
International Journal for Research in Applied Science & Engineering Technology (IJRASET) ISSN: 2321-9653; IC Value: 45.98; SJ Impact Factor: 7.429
Volume 9 Issue VI Jun 2021- Available at www.ijraset.com
1749 ©IJRASET: All Rights are Reserved
b) However, it is mostly used in classification problems. In the SVM algorithm, we plot each data item as a point in N-dimensional space (where n is the number of features you have) with the value of each feature being the value of a particular coordinate.
c) Then, we perform classification by finding the hyper-plane that differentiates the two classes very well. Support Vectors are simply the coordinates of individual observation.
d) The SVM classifier is a frontier which best segregates the two classes (hyper-plane/ line). e) Support Vector Machine algorithm works with categorical variables such as 0 or 1, Yes or No, True or False, Spam
or not spam, etc.
2) KNN Algorithm: a) K-Nearest Neighbour is one of the simplest Machine Learning algorithms based on Supervised Learning technique. b) The K-NN algorithm assumes the similarity between the new case/data and available cases and puts the new case into
the category that is most similar to the available categories. c) K-NN algorithm stores all the available data and classifies a new data point based on the similarity. This means when
new data appears then it can be easily classified into a well suited category by using K- NN algorithm. d) The K-NN algorithm can be used for Regression as well as for Classification but mostly it is used for the
Classification problems. e) K-NN is a non-parametric algorithm, which means it does not make any assumption on underlying data. f) It is also called a lazy learner algorithm because it does not learn from the training set immediately instead it stores
the dataset and at the time of classification, it performs an action on the dataset. g) KNN algorithm at the training phase just stores the dataset and when it gets new data, then it classifies that data into a
category that is much similar to the new data.
Steps for KNN:
Step 1: Load the data.
Step 2: Initialize the value of k.
Step 3: For getting the predicted class, iterate from 1 to total number of training data points.
- Calculate the distance between test data and each row of training data. Here we will use Euclidean distance as our distance metric since it’s the most popular method. The other metrics that can be used are Chebyshev, cosine, etc.
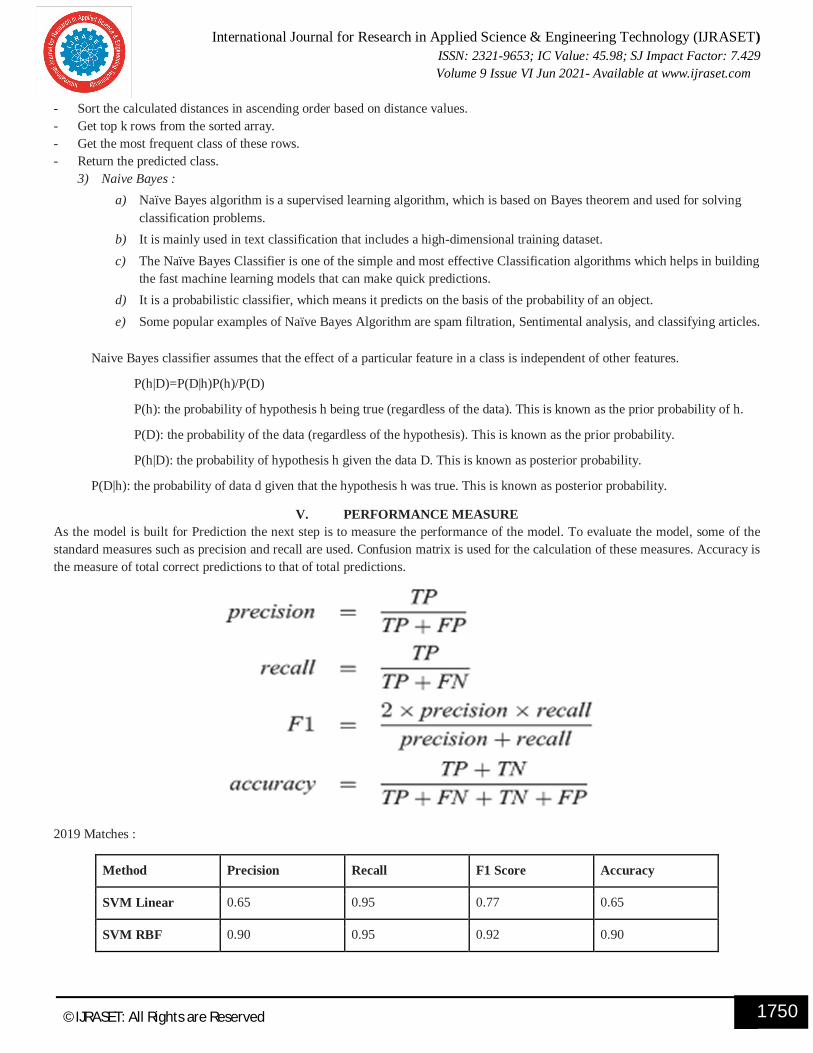
International Journal for Research in Applied Science & Engineering Technology (IJRASET) ISSN: 2321-9653; IC Value: 45.98; SJ Impact Factor: 7.429
Volume 9 Issue VI Jun 2021- Available at www.ijraset.com
1750 ©IJRASET: All Rights are Reserved
- Sort the calculated distances in ascending order based on distance values. - Get top k rows from the sorted array. - Get the most frequent class of these rows. - Return the predicted class.
3) Naive Bayes : a) Naïve Bayes algorithm is a supervised learning algorithm, which is based on Bayes theorem and used for solving
classification problems. b) It is mainly used in text classification that includes a high-dimensional training dataset. c) The Naïve Bayes Classifier is one of the simple and most effective Classification algorithms which helps in building
the fast machine learning models that can make quick predictions. d) It is a probabilistic classifier, which means it predicts on the basis of the probability of an object. e) Some popular examples of Naïve Bayes Algorithm are spam filtration, Sentimental analysis, and classifying articles.
Naive Bayes classifier assumes that the effect of a particular feature in a class is independent of other features.
P(h|D)=P(D|h)P(h)/P(D)
P(h): the probability of hypothesis h being true (regardless of the data). This is known as the prior probability of h.
P(D): the probability of the data (regardless of the hypothesis). This is known as the prior probability.
P(h|D): the probability of hypothesis h given the data D. This is known as posterior probability.
P(D|h): the probability of data d given that the hypothesis h was true. This is known as posterior probability.
V. PERFORMANCE MEASURE As the model is built for Prediction the next step is to measure the performance of the model. To evaluate the model, some of the standard measures such as precision and recall are used. Confusion matrix is used for the calculation of these measures. Accuracy is the measure of total correct predictions to that of total predictions.
2019 Matches :
Method Precision Recall F1 Score Accuracy
SVM Linear 0.65 0.95 0.77 0.65
SVM RBF 0.90 0.95 0.92 0.90
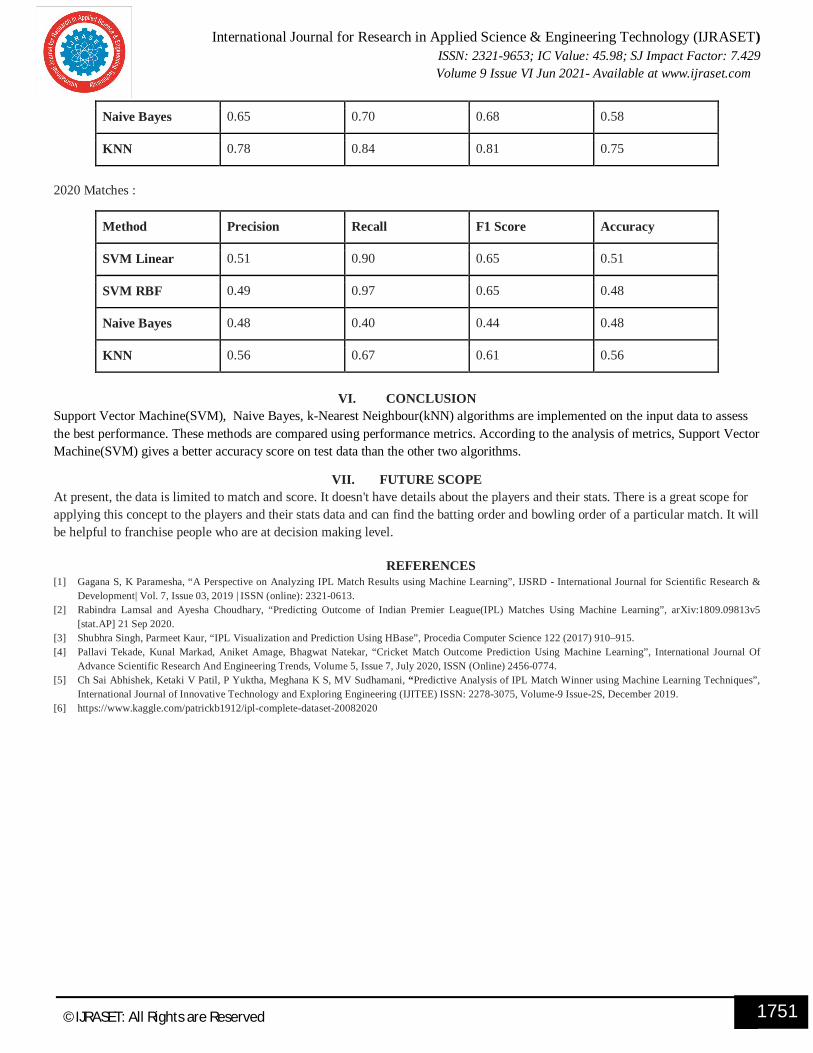
International Journal for Research in Applied Science & Engineering Technology (IJRASET) ISSN: 2321-9653; IC Value: 45.98; SJ Impact Factor: 7.429
Volume 9 Issue VI Jun 2021- Available at www.ijraset.com
1751 ©IJRASET: All Rights are Reserved
Naive Bayes 0.65 0.70 0.68 0.58
KNN 0.78 0.84 0.81 0.75
2020 Matches :
Method Precision Recall F1 Score Accuracy
SVM Linear 0.51 0.90 0.65 0.51
SVM RBF 0.49 0.97 0.65 0.48
Naive Bayes 0.48 0.40 0.44 0.48
KNN 0.56 0.67 0.61 0.56
VI. CONCLUSION
Support Vector Machine(SVM), Naive Bayes, k-Nearest Neighbour(kNN) algorithms are implemented on the input data to assess the best performance. These methods are compared using performance metrics. According to the analysis of metrics, Support Vector Machine(SVM) gives a better accuracy score on test data than the other two algorithms.
VII. FUTURE SCOPE At present, the data is limited to match and score. It doesn't have details about the players and their stats. There is a great scope for applying this concept to the players and their stats data and can find the batting order and bowling order of a particular match. It will be helpful to franchise people who are at decision making level.
REFERENCES [1] Gagana S, K Paramesha, “A Perspective on Analyzing IPL Match Results using Machine Learning”, IJSRD - International Journal for Scientific Research &
Development| Vol. 7, Issue 03, 2019 | ISSN (online): 2321-0613. [2] Rabindra Lamsal and Ayesha Choudhary, “Predicting Outcome of Indian Premier League(IPL) Matches Using Machine Learning”, arXiv:1809.09813v5
[stat.AP] 21 Sep 2020. [3] Shubhra Singh, Parmeet Kaur, “IPL Visualization and Prediction Using HBase”, Procedia Computer Science 122 (2017) 910–915. [4] Pallavi Tekade, Kunal Markad, Aniket Amage, Bhagwat Natekar, “Cricket Match Outcome Prediction Using Machine Learning”, International Journal Of
Advance Scientific Research And Engineering Trends, Volume 5, Issue 7, July 2020, ISSN (Online) 2456-0774. [5] Ch Sai Abhishek, Ketaki V Patil, P Yuktha, Meghana K S, MV Sudhamani, “Predictive Analysis of IPL Match Winner using Machine Learning Techniques”,
International Journal of Innovative Technology and Exploring Engineering (IJITEE) ISSN: 2278-3075, Volume-9 Issue-2S, December 2019. [6] https://www.kaggle.com/patrickb1912/ipl-complete-dataset-20082020