Embed Size (px)
Citation preview
Bachelor’s thesis
Industrial management and engineering
2019
Oscar Rudnäs
ANALYSIS AND REDESIGN OF A PRODUCT COSTING SYSTEM – A case study of Mirka Oy
BACHELOR’S THESIS | ABSTRACT
TURKU UNIVERSITY OF APPLIED SCIENCES
Industrial management and engineering
2019 | 49, 2
Oscar Rudnäs
ANALYSIS AND REDESIGN OF A PRODUCT COSTING SYSTEM
A case study of Mirka Oy
The objective of this thesis was to analyze the product costing system of a case company and suggest improvements to implement, to ensure that the product costs correlate better with the actual costs. The case company is a medium sized manufacturing company in Finland and was commissioned by Mirka Oy. The study researched the current product costing system, its cost allocation mechanism and analyzed its limitations, as well as discussed possible improvements and conclusions from the proposed solutions. The quantitative data used in the study was gathered within the company mainly from the ERPsystem.
The study consists of three major elements: Product costing theory, case study and finally conclusions. Product costing theory will examine the different methods available and explain different key terms. The case study includes problem background, examining the different needs and analysis of all the current cost elements in the product costing system. Lastly, the study concludes in a discussion regarding the different effects of a new product costing system.
A reliable product cost calculation in the ERP system, that matches the actual costs, is key for making correct and datadriven decisions in an increasingly more complex business environment. The study found many problem points that distorts the cost calculation and in turn leads to biased product costs. The result of this study is a new product calculation formula, which considers all the limitations discussed in the analysis.
KEYWORDS:
Cost accounting, allocation, costing, ERPsystems
OPINNÄYTETYÖ (AMK) | TIIVISTELMÄ
TURUN AMMATTIKORKEAKOULU
Tuotantotalous
2019 | 49, 2
Oscar Rudnäs
TUOTEKUSTANNUSLASKENNAN ANALYYSI JA UUDISTAMINEN
Tapaustutkimus Mirka Oy
Tämän opinnäytetyön tavoitteena oli tuotekustannuslaskennan analyysi tapausyrityksessä ja ehdota parannuksia saavuttaakseen parempi korrelaation tuotekustannuksien todelliseen kustannuksien verrattuna. Tapausyritys ja tilaaja on keskisuuri tuotantoyrityksen, Suomessa toimiva Mirka Oy. Työssä tutkittiin toiminnanohjausjärjestelmässä olemassa oleva tuotekustannuslaskentamenetelmän, kustannuksien kohdentamismekanismi ja analysoi sen rajoitukset ja ongelmankohteet. Tutkimuksessa on käytetty kvantitatiivista dataa, kerätty pääasiallisesti toiminnanohjausjärjestelmästä.
Työ koostuu kolmesta eri elementeistä: tuotekustannusteoriasta, tapaustutkimuksesta ja lopuksi keskustelu ja johtopäätöksestä. Tuotekustannusteoria selittää erilaisia menetelmiä ja termejä. Tapaustutkimus sisältää tausta, tarpeiden selvittämisen ja analyysi olemasta olevasta kustannuslaskentamenetelmästä ja sen komponentit. Lopuksi tutkimus päättyy johtopäätökseen koskien erilaiset vaikutukset uudesta kustannuslaskentamenetelmästä.
Luotettava tuotekustannuslaskentamenetelmä toiminnanohjausjärjestelmässä, joka kuvaa yrityksen todelliset kustannukset on avaintekijä täsmällisiin päätöksille yhä monimutkaisemmassa yritysympäristössä. Tutkimuksessa todettiin monta ongelmankohtia, jotka vääristävät tuotekustannuksien täsmällisyys. Työn tulos on uuden laskentamenetelmän, joka ottaa huomioon kaikki hetkellä olevat rajoitukset yrityksessä.
ASIASANAT:
Kustannuslaskenta, sisäinen laskentatoimi, kohdentaminen, toiminnanohjausjärjestelmät
CONTENT
LIST OF ABBREVIATIONS 7
INTRODUCTION 6
1.1 Problem statement 6
1.2 Objective 7
1.3 Methodology and data gathering 8
1.4 Disposition 8
COSTING TERMS AND OTHER METHODOLOGY 9
2.1 Costing key terms 9
2.2 Enterprise resource planning systems 11
COST ACCOUNTING SYSTEMS 12
3.1 Input measurement basis 12
3.2 Inventory valuation method 14
3.3 Cost accumulation method 15
3.4 Cost flow assumption 16
3.5 Recording inventory interval 16
3.6 Assessing and designing cost accounting systems 16
3.7 Determining which cost system to implement 18
CASE STUDY MIRKA LTD 19
4.1 Mirka Ltd, the company 19
4.2 Mirka Ltd, the products 20
4.3 Mirka Ltd, the production 20
4.4 Project background 22
4.5 Different needs in the company 23
4.6 Current product cost calculation explained 25
4.6.1 Raw material consumption and scrap 29
4.6.2 Raw material price 30
4.6.3 Structure time 31
4.6.4 Salary 35
4.6.5 Energy 37
4.6.6 Other variable costs 38
4.6.7 Batch level activities 39
4.6.8 Different cost drivers 41
DISCUSSION AND CONCLUSION 42
5.1 Result and summary of improvements 42
5.2 Limitations 45
5.3 Conclusion and implications 46
REFERENCES 48
APPENDICES
Appendix 1. Structure time calculation model Appendix 2. Product costing flowchart
FIGURES
Figure 1 Five parts of a cost accounting system inspired by Martin, J.R. 12 Figure 2 Measurements applied to inventory inspired by Martin, J.R. 13 Figure 3 Levels of product costing completeness according to Fisher et al (2015) 14 Figure 4 Costing continuums according to Fisher et al (2015) 17 Figure 5 Process of determining costing system 18 Figure 6 The Mirka Bulldog 19 Figure 7 Production value chain 21 Figure 8 Product costing needs 24 Figure 9 Product cost calculation 26 Figure 10 Variable product costs in financial statement 27 Figure 11 Variable product costs in product calculation 27 Figure 12 Case company product costing system 28 Figure 13 Variable and fixed components 34 Figure 14 Energy comparison 37 Figure 15 Form cost difference 39 Figure 16 Batch size and product cost simulation 40 Figure 17 New product costing components 44
EQUATIONS
Equation 1 Structure time calculation 31

TABLES
Table 1 Structure time analysis results ....................................................................... 33 Table 2 Machine hours vs. Personnel time costs ........................................................ 36
LIST OF ABBREVIATIONS
ERP Enterprise resource planning
PRM Product range management
R&D Research and development
EBIT Earnings Before Interests and Taxes
6
TURKU UNIVERSITY OF APPLIED SCIENCES THESIS | Rudnäs Oscar
INTRODUCTION
Making decisions is the task of the executive. In order to make effective and correct decisions,
correct data and information is needed. Gathering data to provide useful information is
therefore one important function of the manufacturing company. The information available
should serve the executive’s decision making and the task of the management accountant is to
serve the managers in reaching the organizational goals (Horngren et al, 2015, p. 3; Drury, 2012,
p. 16)
With management philosophies like LEAN, there’s a tendency today towards optimizing
manufacturing processes. The essence of LEAN is to reduce waste processes that does not add
value to the product from the customer’s perspective. Management accounting practices aims
to make valuable decisions based on accurate information to optimize the organization and
hence enhance value creation in the organization (Horngren et al 2015, p. 5).
The core of this thesis is to ease the decision making for executives by analyzing the needs of
the cost accounting system in a case company and suggest improvements in need of change.
The result of this study will
1.1 Problem statement
On a management and organizational level, the problem with an old and incorrect product cost
structure leads to difficulties in decision making. Management decisions should be based on
correct data in order to not be a risky decision for the business. Making decisions for investments
or product range management (PRM), for example, leads to bad decisions in case of having
inaccurate data. In worst case scenario, a decision will be made to end a highprofitable product
and start producing a lowprofitable as a cause of incorrect information. The correct information
would help in decision making, both in understanding the prime costs for price setting, and for
strategic decision making and PRM. Cost management is a central task of managers and correct
information is essential in order to accurately understand, analyze and implement any change
in a process.
“To make the important decisions is the specific executive task.”
– Peter F Drucker (Drucker, 1967).

7
TURKU UNIVERSITY OF APPLIED SCIENCES THESIS | Rudnäs Oscar
On a functional level, the problem viewed through process and production perspective involves
daytoday tasks of production planning and supply chain management. Understanding what
drives costs and the effect batch size has on product costs are essential in daytoday operation,
unfortunately the current cost structure does not support that function.
The biggest implication and most benefit from an updated product costing system would be in
decision making. Understanding the company’s product costing structure will lead to a better
position for optimizing the margins and ending low profitable products. The management needs
to have correct information to make accurate decisions.
Finally, the implications of a correct product calculation is invaluable and priceless for a company
to be competitive. The project is of high importance for both managerial decisionmaking and
daytoday operations.
1.2 Objective
The objective is to analyze the current product costing method and formulate an improved
version for more accurate presentation of variable costs in manufacturing. The main study
object in this study is the systematic flaws of the enterprise resource planning (ERP) system from
a product costing perspective. The ERP should reflect the business functions and manufacturing
processes in order to render correct data and such match the actual product costs. This thesis
will focus on researching the development needs and suggest a roadmap of key changes to be
made in order to implement a new product costing system to the existing ERP system.
The task of this thesis is not to implement the change itself but suggest improvements and find
the key actions to make the product cost structure more accurate. This thesis focuses on the
case company’s current costing system and how it’s current system could be developed to better
match the actual costs of manufacturing. However, other costing methods are examined and
discussed as probable for the case company. Furthermore, the result of the thesis will be a
thorough understanding of the current system as well as problems in need of change for the
case company.
8
TURKU UNIVERSITY OF APPLIED SCIENCES THESIS | Rudnäs Oscar
1.3 Methodology and data gathering
The study is of quantitative nature and aims to research the subject of product cost calculation
and present a more correct cost calculation method as well as the roadmap forward for a case
company. Existing data within the company’s ERPsystem will be used and analyzed in order to
present the current system’s problems and variances in accuracy.
1.4 Disposition
Chapter 2 and 3 will focus on the management accounting theories, terminologies and problems
solving in general. In chapter 4, the analysis of the current system will be presented in line with
all the problems explained in further detail. Chapter 4 will also explore the needs, requirements
and the updating process as well as suggest a roadmap for the implementation of the new
costing method. Finally, chapter 5 will include a discussion and conclusion based on the
performed analysis and suggested improvements.
9
TURKU UNIVERSITY OF APPLIED SCIENCES THESIS | Rudnäs Oscar
COSTING TERMS AND OTHER METHODOLOGY
There are several theories for cost accounting, and according to Drury (2012 p. 46), there are
two typical main methods for cost calculation: direct costing systems (or costing systems) and
absorption costing systems (or full costing systems). Absorption costing systems can be sub
divided into traditional costing systems and activity-based costing systems. (Drury, 2012, p. 46)
According to Drury (2012, p. 16), cost accounting systems should have the following
characteristics: “Allocate costs between cost of goods sold and inventories for internal and
external profit reporting; Provide relevant information to help managers make better decisions;
Provide information for planning, control and performance measurement.” It is clear, that all
three characteristics are valuable to the company and the function of decision making. These
characteristics are a base for this study. (Drury, 2012, p. 16)
Bhimani et al (2015, pp. 4445) states that different purposes need different product cost
calculations. For example, for pricing purposes a complete understanding of the total costs for
the company is needed, but on product portfolio management decisions, the more interesting
part is the actual cost of manufacturing.
In this chapter, theories are presented as a part of understanding the way cost calculations
works.
2.1 Costing key terms
There is a myriad of different terms for costs according to the behavior and function. It is
therefore of high importance to specify different key terms and vocabulary used for an accurate
understanding of the subject cost accounting and product costing. This subchapter will explain
key terms and definitions of cost accounting concepts.
A cost is usually defined by accountants as a sacrificed resource to achieve a specific object
(Bhimani, Horngren, Datar, & Foster, 2015, p. 31). A cost object is the specified activity or object
for which a separate cost is calculated (Drury, 2012, p. 37). The term product cost is often used
to explain the production costs of the product, which often is used for inventory valuation and
financial statements (Bhimani, Horngren, Datar, & Foster, 2015, p. 45). A Period cost is a cost
not specifically allocated to a product but occurs during a specific period. Period costs are often
10
TURKU UNIVERSITY OF APPLIED SCIENCES THESIS | Rudnäs Oscar
not allocated to product costs for inventory valuation and are only treated as expenses during
the specific period (Drury, 2012, p. 27)
Different types of costs are often separated in management accounting according to the
behavior. Variable costs are costs that increases proportionally to the number of units
produced, whereas fixed costs are not increasing even though units produced are increasing
and are usually triggered by a certain event. Semi-variable costs contain both fixed and variable
costs and semi-fixed costs are referring to costs that are fixed for specific activity levels but
changes at a critical activity level. (Drury, 2012, pp. 3738)
Another term used along these terms are incremental cost. In case of calculating an increase in
production from 1000 units to 1100 units over a period, the additional costs are the costs of
producing 100 units more. If the fixed costs are increasing due to the result of the decision, the
increase of cost is an incremental cost. If the fixed cost doesn’t change, the incremental cost is
zero. (Drury, 2012, p. 35)
Direct costs are costs that directly can be assigned to a specific cost object, whereas indirect
costs (or overhead) are simply the costs that cannot be allocated to a specific cost object, but
broadly specified to a specific group of tasks. (Drury, 2012, pp. 2426)
Standard cost is a target or predetermined cost of a specific object during normal operating
conditions (Drury, 2012, p. 449). A standard costing system, as discussed in chapter 3, is utilizing
standard costs rather than actual costs for determining the different product costs (Gurowka &
Lawson, 2007).
Cost assignment is the process of assigning different costs to a cost object and is often sub
divided to cost tracing and cost allocation. Cost tracing is the action for applying or deriving the
direct costs on a specific cost object. A common consensus in cost and management accounting
is that the more direct costs that can be traced, the more accurate the cost calculation will be.
Cost allocation is the process of assigning indirect costs or overhead to the cost object. Both
actions are needed to provide an accurate result. (Drury, 2012, p. 45)
In order to allocate costs to cost objects, cost drivers (or allocations bases) are used. A cost
driver is the action that results in cost at a specific level. Cause-and-effect allocations should be
used as often as possible and can be defined as “when x is used, causes y cost”. Indirect costs
are often first allocated to a cost center (or cost pool), which often is divided into departments
or machines. The cost drivers are then affecting the amount allocated to the specific product
11
TURKU UNIVERSITY OF APPLIED SCIENCES THESIS | Rudnäs Oscar
cost based on the cost center. The use of cost centers is often called a two-stage allocation and
is characterized of an activity-based costing system.
Prime costs are the sum of direct material costs and direct labor costs. Manufacturing overhead
is basically all the other manufacturing costs except prime costs. The sum of prime cost and
manufacturing overhead is often referred to as total manufacturing cost. (Drury, 2012, p. 26)
Cost accounting refers to the task of accounting for costs, such as for inventory valuation and
provides information for both management accounting and financial accounting. Management
accounting is the process of interpreting and calculating the information primarily for
management decision making (Bhimani, Horngren, Datar, & Foster, 2015, p. 3). Both terms are
referring to internal reporting. However, these terms are often mixed up and according to Drury
(2012, p. 17) the terms are often used synonymously. Financial accounting is the process of
providing information for external reporting and is guided by directed accounting principles, for
taxation and valuation purposes (Bhimani, Horngren, Datar, & Foster, 2015, p. 3).
2.2 Enterprise resource planning systems
The business environment is becoming more complex while the markets are growing more
competitive with a globalized world. As the demands increases, the companies utilize different
tools in order to deal with the competitive and complex nature. Enterprise resource planning
(ERP) system is a software that provides integration between all the information flowing through
a company, such as financial management, inventory, order and supply chain management
among many other areas. (Karsak & Özogul, 2009)
12
TURKU UNIVERSITY OF APPLIED SCIENCES THESIS | Rudnäs Oscar
COST ACCOUNTING SYSTEMS
There are many tools, systems and costing terms that are used to describe different costs and
methods. Because organizations often are so individual, different cost accounting systems are
designed the specific needs of the organization. Costing systems are often distinguished as
traditional costing systems (TCS) or activitybased costing (ABC).
Different parts of the cost accounting system are often mistakenly referred to as whole costing
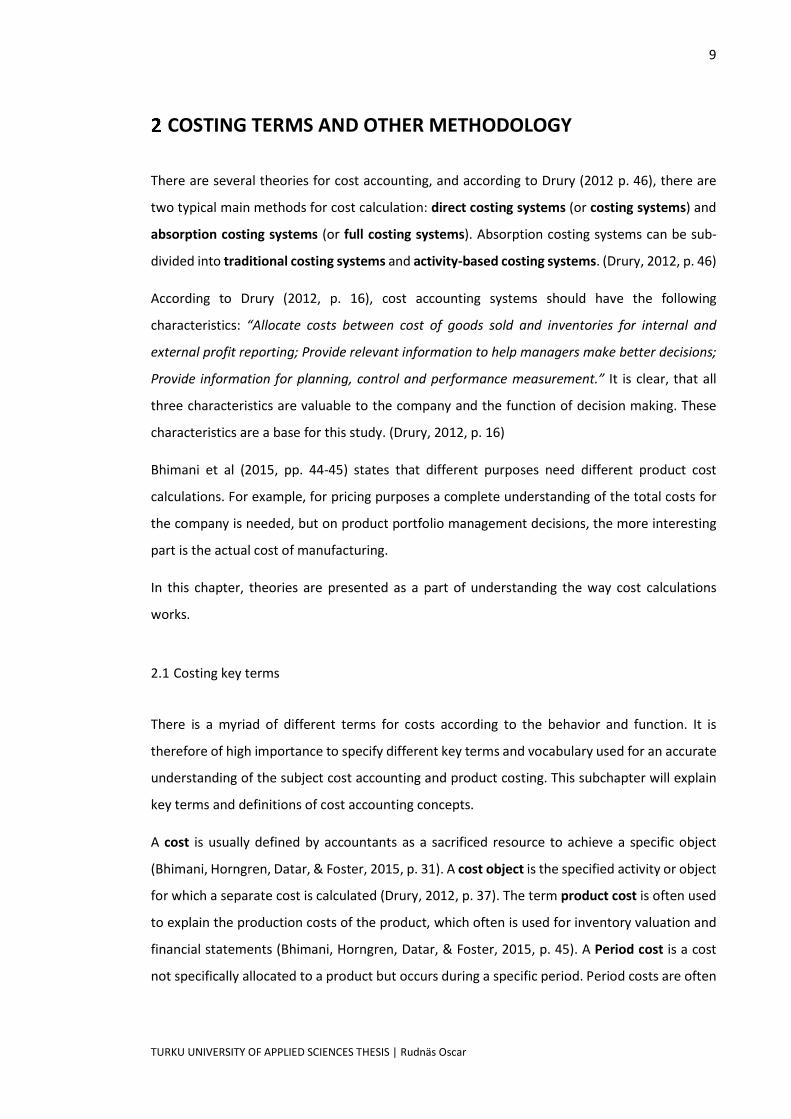
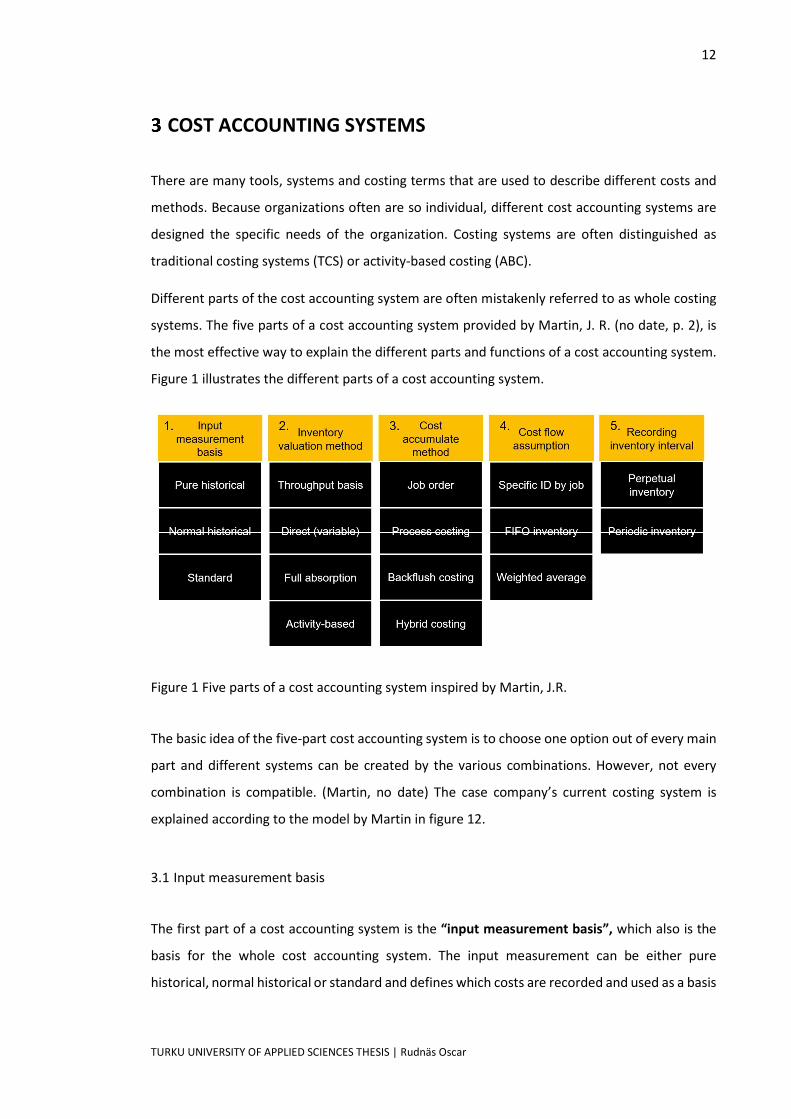
systems. The five parts of a cost accounting system provided by Martin, J. R. (no date, p. 2), is
the most effective way to explain the different parts and functions of a cost accounting system.
Figure 1 illustrates the different parts of a cost accounting system.
Figure 1 Five parts of a cost accounting system inspired by Martin, J.R.
The basic idea of the fivepart cost accounting system is to choose one option out of every main
part and different systems can be created by the various combinations. However, not every
combination is compatible. (Martin, no date) The case company’s current costing system is
explained according to the model by Martin in figure 12.
3.1 Input measurement basis
The first part of a cost accounting system is the “input measurement basis”, which also is the
basis for the whole cost accounting system. The input measurement can be either pure
historical, normal historical or standard and defines which costs are recorded and used as a basis
13
TURKU UNIVERSITY OF APPLIED SCIENCES THESIS | Rudnäs Oscar
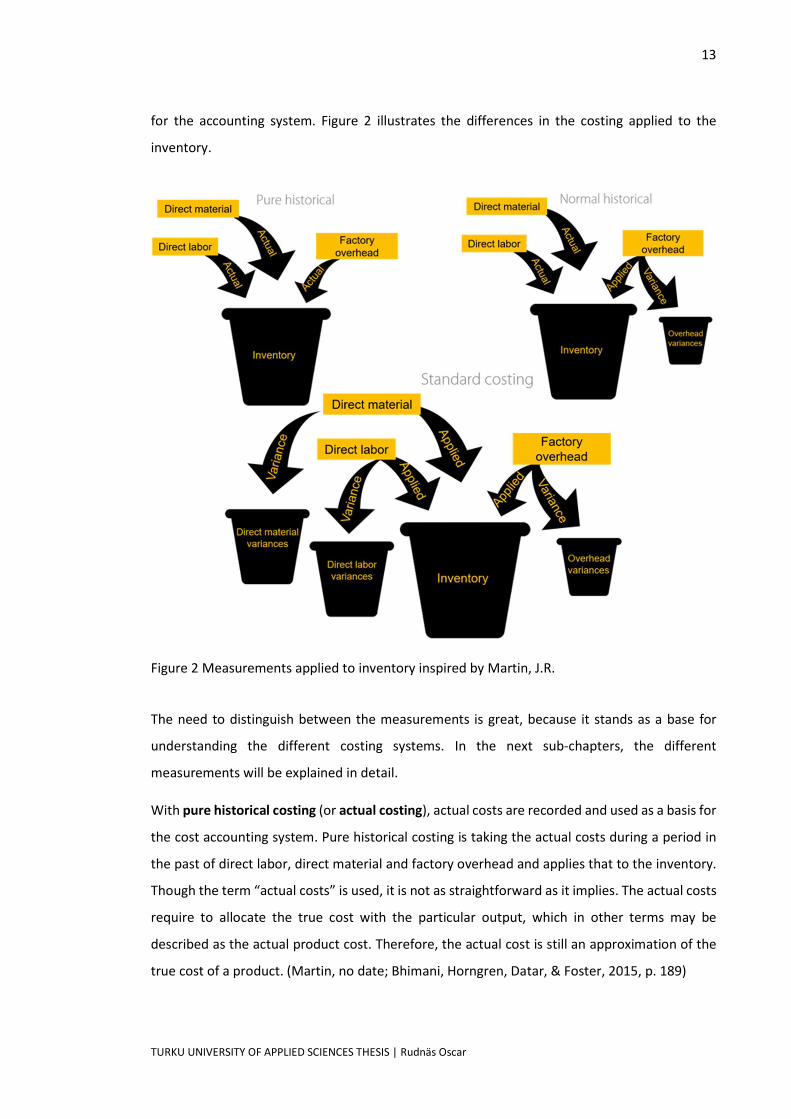
for the accounting system. Figure 2 illustrates the differences in the costing applied to the
inventory.
Figure 2 Measurements applied to inventory inspired by Martin, J.R.
The need to distinguish between the measurements is great, because it stands as a base for
understanding the different costing systems. In the next subchapters, the different
measurements will be explained in detail.
With pure historical costing (or actual costing), actual costs are recorded and used as a basis for
the cost accounting system. Pure historical costing is taking the actual costs during a period in
the past of direct labor, direct material and factory overhead and applies that to the inventory.
Though the term “actual costs” is used, it is not as straightforward as it implies. The actual costs
require to allocate the true cost with the particular output, which in other terms may be
described as the actual product cost. Therefore, the actual cost is still an approximation of the
true cost of a product. (Martin, no date; Bhimani, Horngren, Datar, & Foster, 2015, p. 189)
14
TURKU UNIVERSITY OF APPLIED SCIENCES THESIS | Rudnäs Oscar
Normal historical (or normal costing) is differentiated through instead of using actual costs for
factory overhead, it takes and applied rate to inventory valuation and removes the variance to
an account of overhead variances using a predetermined allocation per activity rate, such as per
machine hours. (Martin, no date; Bhimani, Horngren, Datar, & Foster, 2015, p. 189)
In a standard costing system, all manufacturing costs are applied to the inventory valuations
according to predetermined rates, percentages or time used and the variances between applied
and total amount from direct material, direct labor and factory overhead is applied to separate
variance accounts. (Martin, no date; Bhimani, Horngren, Datar, & Foster, 2015, p. 189)
3.2 Inventory valuation method
The next part of the cost accounting system is inventory valuation method (or stock-costing),
which determines which part of the costs are traced to inventory valuation and which are period
costs. Inventory valuation method is often used for product costing, but instances where
different methods are used does however occur. The method also determines the net income
statement and will differ in a few important matters. The following options are arranged
according to the amount of costs that are traced to the inventory valuation. (Martin, no date)
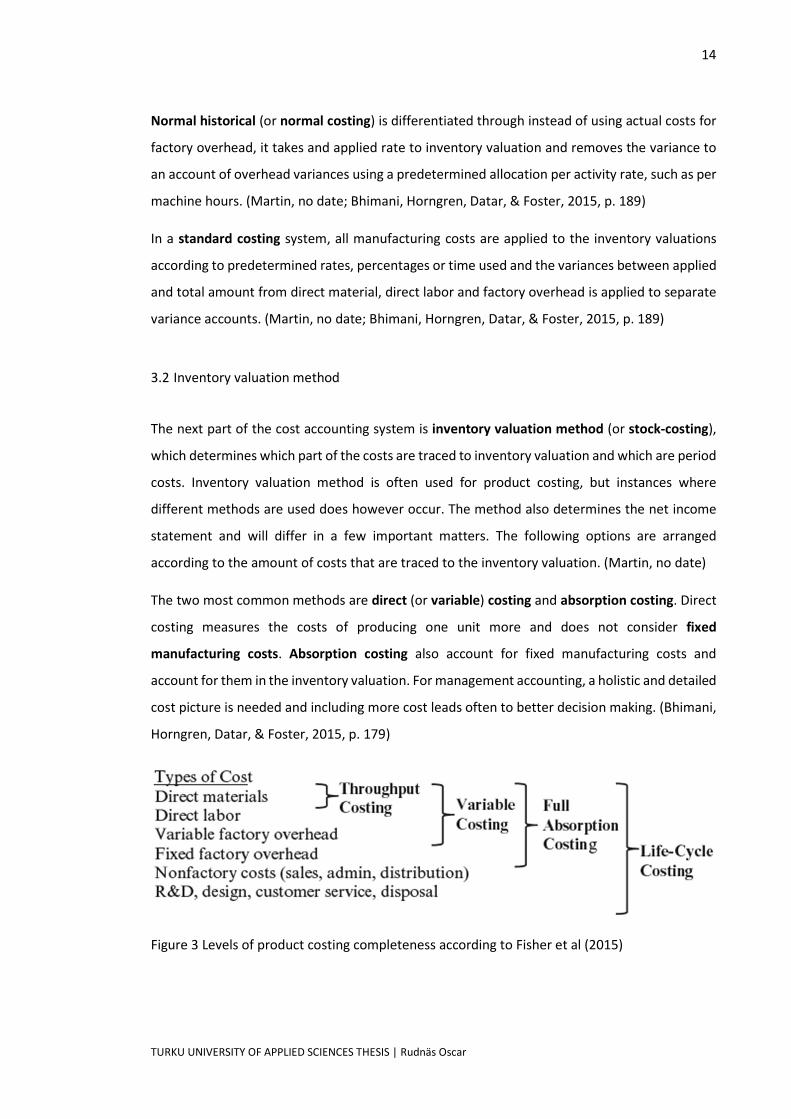
The two most common methods are direct (or variable) costing and absorption costing. Direct
costing measures the costs of producing one unit more and does not consider fixed
manufacturing costs. Absorption costing also account for fixed manufacturing costs and
account for them in the inventory valuation. For management accounting, a holistic and detailed
cost picture is needed and including more cost leads often to better decision making. (Bhimani,
Horngren, Datar, & Foster, 2015, p. 179)
Figure 3 Levels of product costing completeness according to Fisher et al (2015)
15
TURKU UNIVERSITY OF APPLIED SCIENCES THESIS | Rudnäs Oscar
Throughput costing is only applying direct material to inventory costs and the rest of the costs
are charged as a period expense (Martin, no date).
According to International Accounting Standard on Inventories (IAS2), it is required to adopt
absorption costing, since it states that inventory valuation should include fixed and variable
manufacturing overheads. However, the standards are only mandatory for publicly listed
companies in Finland.
The basic differences between the valuation methods should be clear and due to the highly
complex nature of the functionality, no attempt will be made to explain those in further detail
in this chapter. For more information on direct costing, see Bhimani (2015) chapter 2 and 5 and
for more information on activitybased costing see Drury (2012, pp. 251271) or Bhimani (2015,
pp. 312333).
3.3 Cost accumulation method
The main characteristic of a cost accumulation method is the way costs are collected. The
methods are identified according to process, jobs, batches, orders or departments. The four
main different accumulation methods are job-, process-, backflush- and hybrid costing. (Martin,
no date)
A job-costing system assigns costs to a unit or batch of a product or service. The product or
service is often custommade or specific, whereas a process-costing system cost objects are
masses of identical or similar units. However, the relationship between jobcosting and process
costing is often seen as a continuum and often products are neither pure jobcosting nor pure
processcosting. In that case a hybrid-costing method is used, which is using one system in one
process and another system for another process. This is sometimes necessary to achieve
accurate measurements. (Bhimani, Horngren, Datar, & Foster, 2015, pp. 5758)
Backflush systems is often used in Justintime manufacturing (JIT), where minimal stocks are
kept and makes FIFO or weighted average methods unimportant. Since a large part of the costs
in JITsystems are only occurring when manufacturing, the product cost is the same as direct
costs. This leads to few allocations. (Martin, no date; Bhimani, Horngren, Datar, & Foster, 2015,
p. 665)
16
TURKU UNIVERSITY OF APPLIED SCIENCES THESIS | Rudnäs Oscar
3.4 Cost flow assumption
The cost flow refers to how costs flow through inventory accounts. Cost flows like firstinfirst
out (FIFO), lastinfirstout (LIFO) or weighted average are widely used and must be determined
when designing a cost accounting system. (Martin, no date; Bhimani, Horngren, Datar, & Foster,
2015, p. 179)
3.5 Recording inventory interval
The recording inventory interval refers to which methods is used for recording the inventory
valuation and can be maintained on a periodic or perpetual basis. A perpetual inventory is
maintaining the actual balance of the inventory constantly, whereas the periodic inventory is
requiring to manually calculate the inventory and valuating the inventory based on the input.
Nowadays, these systems are more common in smaller companies. Large corporations often use
ERPsystems to calculate a perpetual inventory. (Martin, no date)
3.6 Assessing and designing cost accounting systems
To assess the current costing system, following dimensions can be used according to Fisher et.
al (2015): Convenience: ease of access to the cost information; Correctness: are the costs
accurate; Cost of implementation: are the costs of implementing reasonable.
For selection and design of a new product costing system, Fisher et. al suggest that the company
needs to answer four key questions: Which costs should be included in product cost? At what
level of detail should we track direct product costs? How do we organize indirect product costs?
How do we allocate indirect costs to products?
These questions will be evaluated and examined further in the analysis of the case company.
Figure 4 below examines the different questions and distinguishes between the different costing
systems, use of cost centers and cost drivers.

17
TURKU UNIVERSITY OF APPLIED SCIENCES THESIS | Rudnäs Oscar
Figure 4 Costing continuums according to Fisher et al (2015)
Product costs are the results from a product costing system, which is determined by the designer
of the costing system and therefore through different heuristic forms a bias for the actual
product costs. The research of Balakrishnan et. al provides a good base for the design of a new
product costing method. (Balakrishnan, Hansen, & Labro, 2011)
The research suggests that cost centers should be between 10 to 20. Furthermore, the research
shows that small resources should be grouped in to one miscellaneous overhead cost centers
rather than large cost centers. Finally, indexed or composite cost drivers represent the best
accuracycost relation. (Balakrishnan, Hansen, & Labro, 2011)
18
TURKU UNIVERSITY OF APPLIED SCIENCES THESIS | Rudnäs Oscar
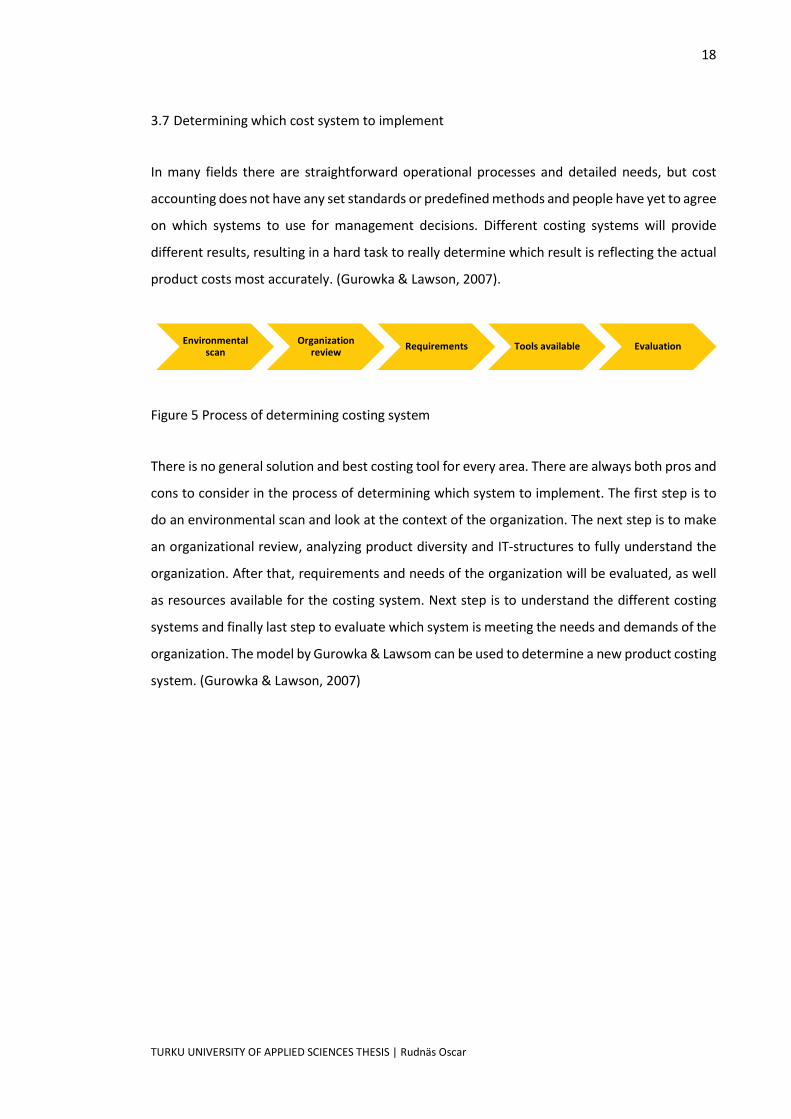
3.7 Determining which cost system to implement
In many fields there are straightforward operational processes and detailed needs, but cost
accounting does not have any set standards or predefined methods and people have yet to agree
on which systems to use for management decisions. Different costing systems will provide
different results, resulting in a hard task to really determine which result is reflecting the actual
product costs most accurately. (Gurowka & Lawson, 2007).
Figure 5 Process of determining costing system
There is no general solution and best costing tool for every area. There are always both pros and
cons to consider in the process of determining which system to implement. The first step is to
do an environmental scan and look at the context of the organization. The next step is to make
an organizational review, analyzing product diversity and ITstructures to fully understand the
organization. After that, requirements and needs of the organization will be evaluated, as well
as resources available for the costing system. Next step is to understand the different costing
systems and finally last step to evaluate which system is meeting the needs and demands of the
organization. The model by Gurowka & Lawsom can be used to determine a new product costing
system. (Gurowka & Lawson, 2007)
Environmental scan
Organization review Requirements Tools available Evaluation
19
TURKU UNIVERSITY OF APPLIED SCIENCES THESIS | Rudnäs Oscar
CASE STUDY MIRKA LTD
This chapter will present a case study of Mirka Ltd, explaining its current cost calculation system,
its restrictions and problems as well as a thorough walkthrough of the processes and cost drivers
in the company’s manufacturing process. This chapter will also examine the different functions
and suggest a roadmap for further improvements. Further, the future needs of the new cost
calculation will be reviewed, and opportunities of changes will be suggested.
4.1 Mirka Ltd, the company
Mirka Ltd is one of the larger surface finishing technology manufacturers in the world, with the
production plant based in Jepua, Finland. The company is a part of a Finnish family corporate
group, KWH Group, which now has grown to a turnover of 502 MEUR (2018). Mirka Ltd has a
large product portfolio of abrasives and sanding tools, offering comprehensive solutions for
precision and surface finishing. The company’s customers are automotive manufacturers, wood
and marine industries as well as customers from the precision industries (KWH Group, 2019).
The company was founded in 1943 in Helsinki and its production moved to Jepua, Ostrobothnia
in 1965. Around 97% of the company’s production is exported to over 100 different countries,
and with a turnover of close to 300MEUR (2018), the company is also internationally known. In
2018, Mirka received the Red Dot award for groundbreaking design and is a company of constant
development and innovation. The Mirka brand is known worldwide. (Mirka, 2019)
Figure 6 The Mirka Bulldog

20
TURKU UNIVERSITY OF APPLIED SCIENCES THESIS | Rudnäs Oscar
Mirka Ltd is a fastgrowing company with 1409 employees in 2018, compared to 1223 in 2017.
During 2018, the company made 20,9 MEUR investments, which suggests the company is
growing and is in a good financial position. (KWH Group, 2019)
4.2 Mirka Ltd, the products
Mirka Ltd is offering products to different industries and markets. The abrasives stand for the
largest part of the product portfolio, while the Mirka tools, accessories and polishing compounds
for the smaller quarter, in the mentioned order. (Mirka, 2019)
Abrasives are sold to several different industries. The abrasives are paper, net, film or foam
based, depending on its use. Different abrasives have different qualities and is used in different
industries. The automotive refinishing trade (ART) is one of the main markets for Mirka. Mirka’s
products are used by the major car manufacturers around the world. Mirka’s product range for
ART is 30 different abrasive product groups including grits between 80 and 2500 and more.
Products are everything from net dustfree to soft foambased products and polishing. The
marine industry product range includes abrasives from grinding glass fiberreinforced polyester
to sanding contoured surfaces and molds. (Mirka, 2019)
One of the most important innovation originating from Mirka is the dustfree sanding, which has
been around for decades now. The innovation has been a big competitive advantage for Mirka,
which is a whole product concept and selling proposition: dustfree solutions. The dustfree
solutions are important for both health and clean finishes. (Mirka, 2019)
Engineered surface finishing (ESF) demanding highprecision surfaces for consumer electronics,
powertrain applications and roller conditioning. Mirka is continuously innovating new products
and expanding their markets. (Mirka, 2019)
4.3 Mirka Ltd, the production
Understanding the value chain of the abrasives are important, because it stands as a base for
how costs are formed in the production. The value chain can be categorized to four major
processes: manufacturing, climatization, flexing and converting. Figure 7 below presents the
basic value chain of the production.

21
TURKU UNIVERSITY OF APPLIED SCIENCES THESIS | Rudnäs Oscar
Figure 7 Production value chain
During the production process glue coating is applied to the backing material, grains are applied
through an electrostatic coating technique and a second layer of glue coating is applied to better
attach the grain to the backing material. Paper has traditionally been used, but the net products
uses a knitted polyester material. The grains used are often aluminum oxide or silicon carbide,
which have slightly different qualities and traits. After the second glue coating, the products will
dry, hanging in a large room with high temperature.
After the product has dried, the next phase in production is climatization. The product is stiff
and not yet ready to be used. Moisture and heat is applied, which eventually softens the material
enough to not break as easily. The next phase is flexing. The glue applied in the first phase will
eventually harden and make the abrasive stiff. In the flexing phase, the products are going
through a vertical and diagonal strain in order to break the material in a controlled way.
The final step in the production is conversion and packaging. The process of converting the
jumbo rolls to small discs, sheets or triangles, with different hole patterns, is often a big task.
Traditionally, punching holes have been used for perforation. Hole combinations differ between
0 holes to up to 60 holes per 150mm diameter discs. That means one tool will have up to several
hundred bits that needs to be changed regularly.

22
TURKU UNIVERSITY OF APPLIED SCIENCES THESIS | Rudnäs Oscar
4.4 Project background
The background for this project is that Mirka has a built inhouse ERPsystem with a product
costing system that is not reliable and does not match the actual costs. The current cost
calculation system in their ERPsystem does not reflect the actual costs of manufacturing and
due to the high growth and new technology, the product costing system needs an update.
Disregarding the updating would eventually lead to biased management decision making and
could be a financial risk for the company. The goal of this case study is to analyze the product
costing, which eventually will result in a roadmap of improvements for the company to
implement. As previously stated, for an ERP system to be correct in the calculations, it should
reflect and meet the functions and operations of the company’s manufacturing. Therefore, the
analysis of this study will focus on the differences between the actual operation compared to
the ERP system.
There are many limitations of the current cost structure, but at the time this system was made
it was adequate and useful for its purpose. Today, when the company has grown significantly,
and the product portfolio has grown many times since, there are unfortunately limitations.
These need to be taken into consideration when calculating product profitability and making
management decisions. For example, the company is currently doing projects in product range
management (PRM) and product lifecycle management (PLM), consisting of decisions of
eliminating unprofitable products from the portfolio and accounting for the total cost of
production. The reasons for the limitations are both an outdated structure of not containing
batchlevel activities as well as an old allocation model for the different cost centers among
other reasons.
The basis for the calculation system in use is based on inventory valuation, which is by law
necessary for manufacturing companies to do. However, due to the external reporting’s
characteristics, the system didn’t need to consider every aspect of costs for the product.
Additionally, many organizations are using costing systems primarily designed for external use.
However, making decisions based solely on the external accounting requirements are not
necessary the most reliable and secure method. Therefore, I suggest an update of the current
costing system for the case company including more correct data than just the basic inventory
valuation criteria.
23
TURKU UNIVERSITY OF APPLIED SCIENCES THESIS | Rudnäs Oscar
The most critical factors in need of change are: Material consumption (waste and updating of
product recipes); Structure time divided to a fixed and variable time (add batchlevel activities);
Energy cost allocation (create a new way for allocating costs), Other costs allocation and
appropriate units (tools, cost driver machine hours and units produced). These are further
examined in detail in the following chapters.
4.5 Different needs in the company
According to Karzak & Özogul (2009) it is required to align the ERP system and the company
needs and characteristics. The company has different needs for the cost calculation, but
summarized, anything that really matters for everyone is a reliable system that reflects the
actual costs. During this study interviews were performed in management on different levels,
examining which functions are needed and what the implications of a correct cost calculation
would be.
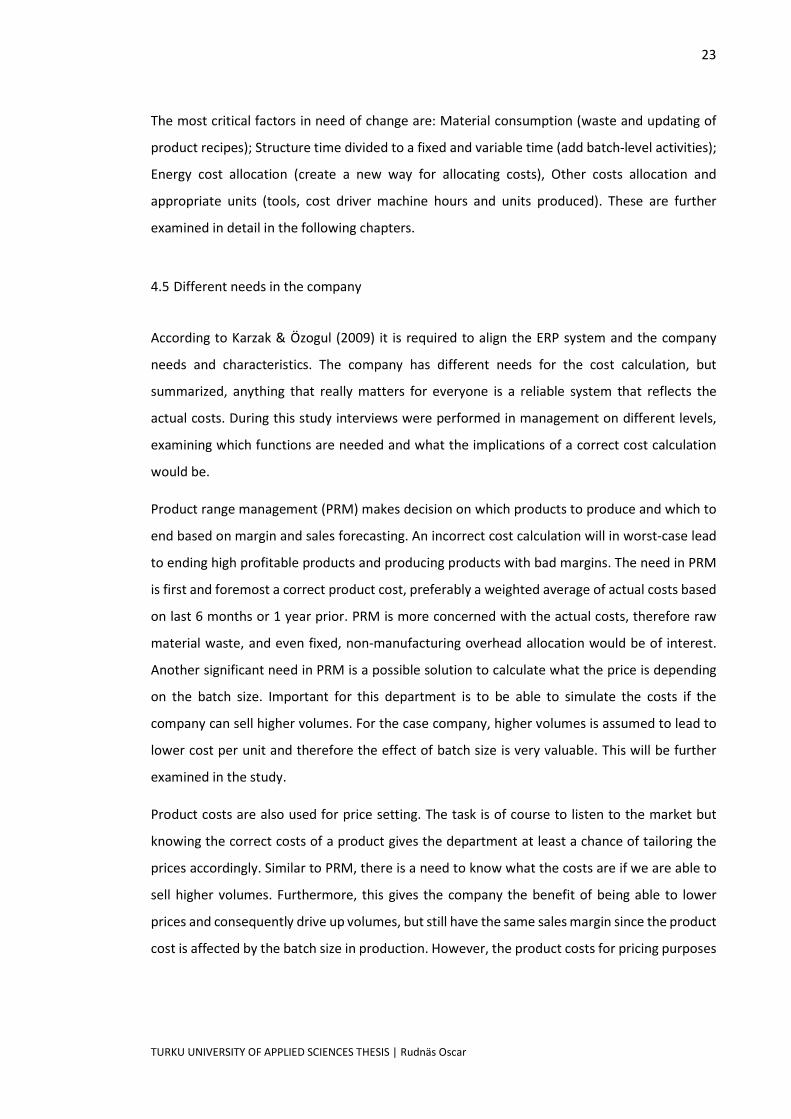
Product range management (PRM) makes decision on which products to produce and which to
end based on margin and sales forecasting. An incorrect cost calculation will in worstcase lead
to ending high profitable products and producing products with bad margins. The need in PRM
is first and foremost a correct product cost, preferably a weighted average of actual costs based
on last 6 months or 1 year prior. PRM is more concerned with the actual costs, therefore raw
material waste, and even fixed, nonmanufacturing overhead allocation would be of interest.
Another significant need in PRM is a possible solution to calculate what the price is depending
on the batch size. Important for this department is to be able to simulate the costs if the
company can sell higher volumes. For the case company, higher volumes is assumed to lead to
lower cost per unit and therefore the effect of batch size is very valuable. This will be further
examined in the study.
Product costs are also used for price setting. The task is of course to listen to the market but
knowing the correct costs of a product gives the department at least a chance of tailoring the
prices accordingly. Similar to PRM, there is a need to know what the costs are if we are able to
sell higher volumes. Furthermore, this gives the company the benefit of being able to lower
prices and consequently drive up volumes, but still have the same sales margin since the product
cost is affected by the batch size in production. However, the product costs for pricing purposes
24
TURKU UNIVERSITY OF APPLIED SCIENCES THESIS | Rudnäs Oscar
should not fluctuate too much based on the current situation in the company. Therefore, a
product cost that is based on the actual cost along with a trendline to be able to forecast prices.
Research and development (R&D) are often calculating costs of new products based on historical
costs of producing similar products. Again, an incorrect cost calculation will lead to development
of a nonprofitable product, leading to large development costs. The need for R&D is to have
correct data to base the estimated costs of producing a similar unit.
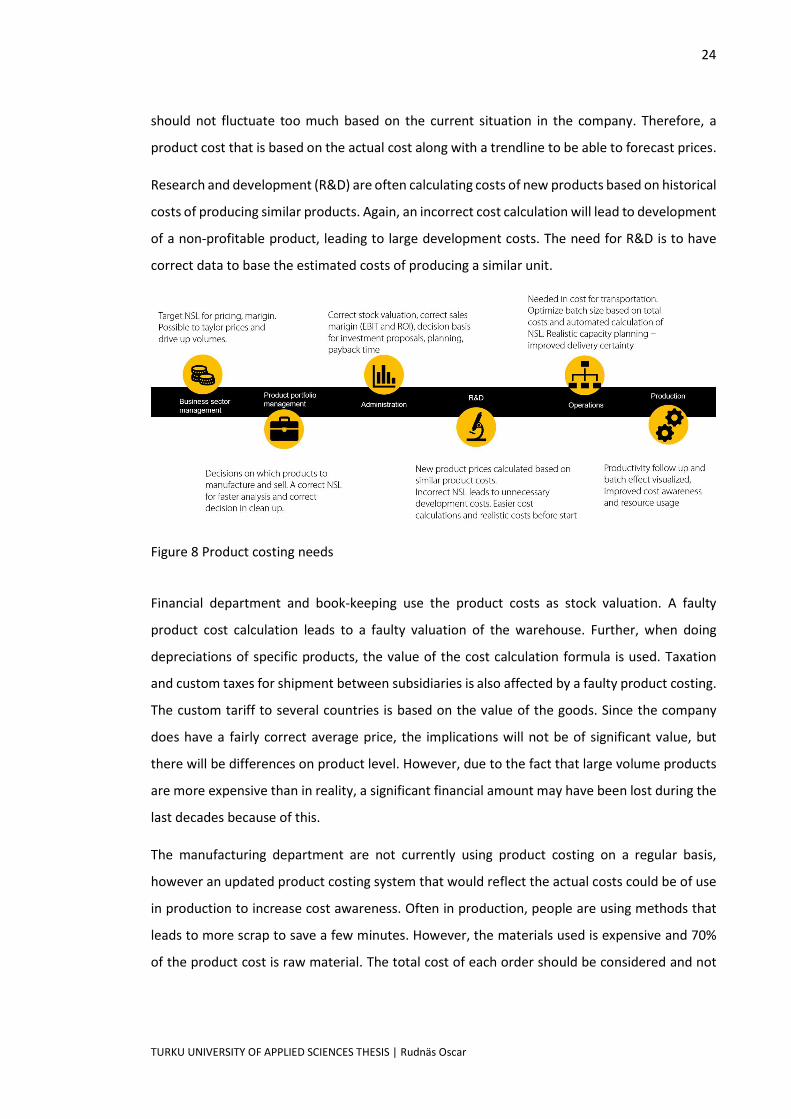
Figure 8 Product costing needs
Financial department and bookkeeping use the product costs as stock valuation. A faulty
product cost calculation leads to a faulty valuation of the warehouse. Further, when doing
depreciations of specific products, the value of the cost calculation formula is used. Taxation
and custom taxes for shipment between subsidiaries is also affected by a faulty product costing.
The custom tariff to several countries is based on the value of the goods. Since the company
does have a fairly correct average price, the implications will not be of significant value, but
there will be differences on product level. However, due to the fact that large volume products
are more expensive than in reality, a significant financial amount may have been lost during the
last decades because of this.
The manufacturing department are not currently using product costing on a regular basis,
however an updated product costing system that would reflect the actual costs could be of use
in production to increase cost awareness. Often in production, people are using methods that
leads to more scrap to save a few minutes. However, the materials used is expensive and 70%
of the product cost is raw material. The total cost of each order should be considered and not
25
TURKU UNIVERSITY OF APPLIED SCIENCES THESIS | Rudnäs Oscar
only the production time. Total order cost can also be motivated as environmentally more
sustainable when reducing material waste like glue and other harmful chemicals in the process.
The operations department is responsible for production planning and supplying the distribution
centers. For production planning, the need is mainly optimized batch size for production runs.
Another need is a correct structure time gives the production planning an indepth
understanding and correct results in capacity planning, which in turn increases delivery certainty
and customer satisfaction.
The management is responsible for investment decisions and basically for the success of the
company. If we are not able to correctly calculate product costs, cost management is virtually
impossible. It is a real frustration in the company that you cannot trust the numbers. If you knew
the costs of different processes and would be able to do them more effectively and even rethink
some of the more expensive processes, you could get prices down more easily. From a cost
management perspective, accurate product costs on different levels are very important. As it is
said what gets measured, gets managed.
4.6 Current product cost calculation explained
The product costing should contain all the variable costs for manufacturing a specific product.
The current cost calculation is in the ERPsystem and is based on a direct (variable) costing
method. It is built on the sum of raw material costs and an allocation of the cost centers: salaries,
energy and other variable costs. The raw material is directly added as a cost based on a standard
consumption and weighted average cost of material. The indirect costs are allocated by a cost
driver of standard machine hours, calculated as a weighted average based on the production
from the year prior. The cost centers are more than two hundred in total, all with a different
costs per machine hour. In this way, the company gets the standard cost for producing each
product. This product cost is used for stock valuation and pricing, even though within the
company employees know the product cost does not reflect the actual costs of production.
In manufacturing there are many different processes and in order to make it possible to
distinguish between each workinprogress product, new product codes are created. This leads
to different levels of product codes. Eventually, the end products have accumulated up to 9
different product levels. Each product level gets a different product cost per unit, consisting of
raw material, salary, energy and other costs. The unit can be in meter, kilograms, piece or
26
TURKU UNIVERSITY OF APPLIED SCIENCES THESIS | Rudnäs Oscar
according to the packaging between 10 to 100 pieces. To make it even more difficult, each unit
can have different widths of material, from 120mm to 1460mm and be in different shapes and
contain different amounts of holes.
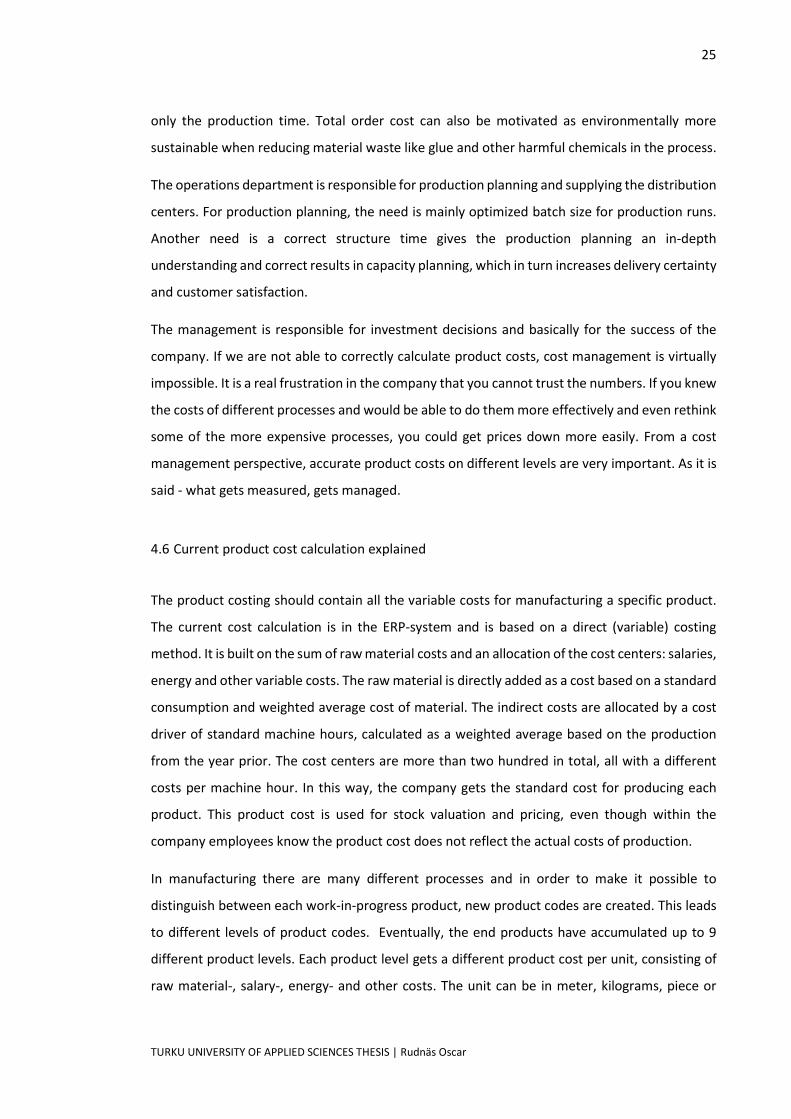
Figure 9 explains a simplified version of how the costs are formed on product level. A flowchart
in Appendix 2 is explaining the cost calculation method in more detail.
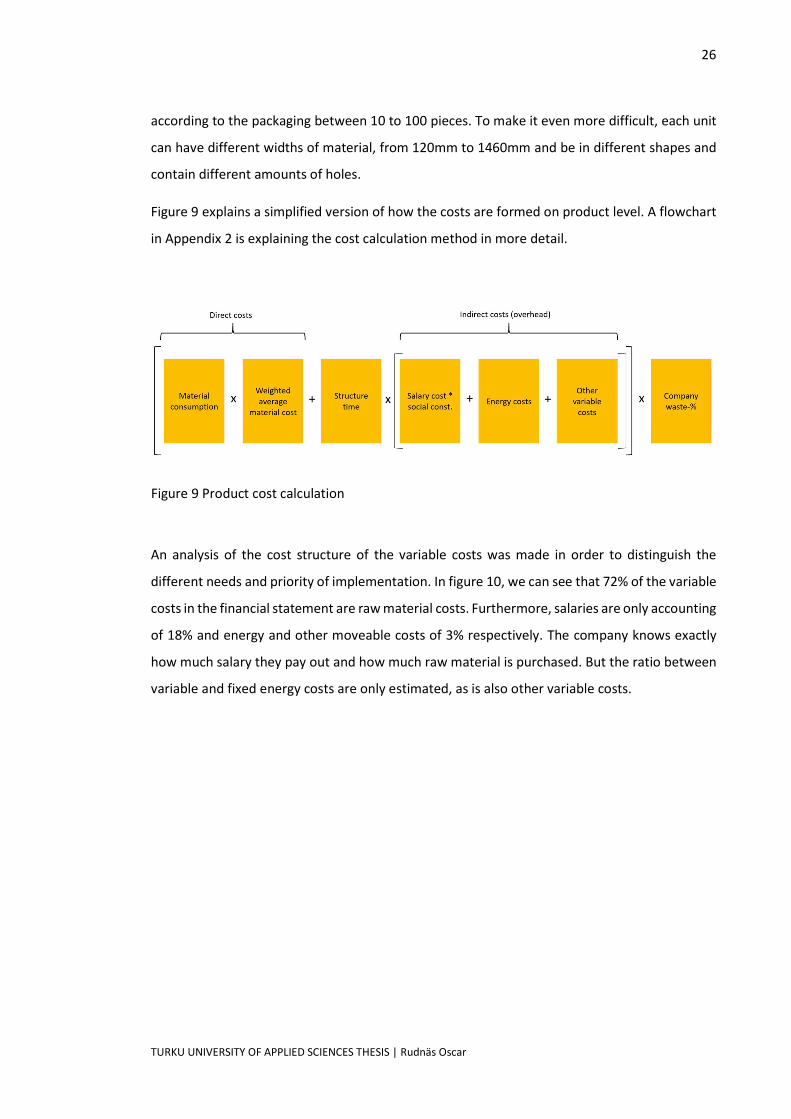
An analysis of the cost structure of the variable costs was made in order to distinguish the
different needs and priority of implementation. In figure 10, we can see that 72% of the variable
costs in the financial statement are raw material costs. Furthermore, salaries are only accounting
of 18% and energy and other moveable costs of 3% respectively. The company knows exactly
how much salary they pay out and how much raw material is purchased. But the ratio between
variable and fixed energy costs are only estimated, as is also other variable costs.
Figure 9 Product cost calculation
27
TURKU UNIVERSITY OF APPLIED SCIENCES THESIS | Rudnäs Oscar
Figure 10 Variable product costs in financial statement
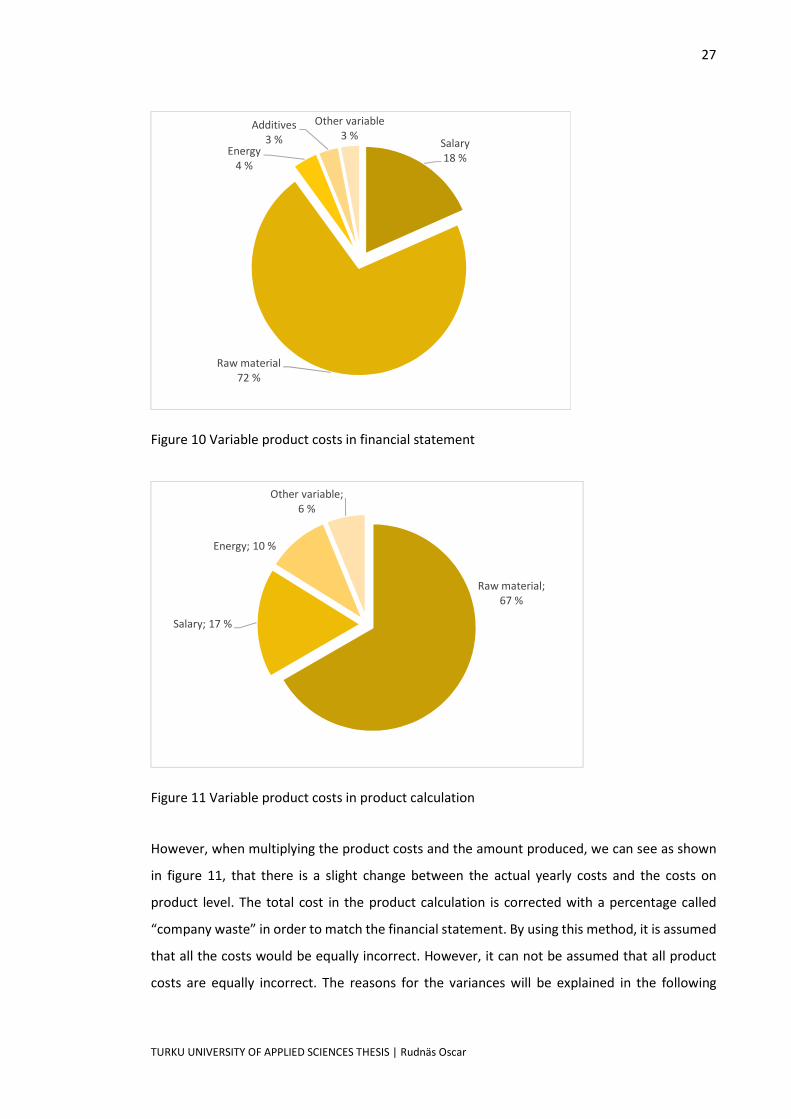
Figure 11 Variable product costs in product calculation
However, when multiplying the product costs and the amount produced, we can see as shown
in figure 11, that there is a slight change between the actual yearly costs and the costs on
product level. The total cost in the product calculation is corrected with a percentage called
“company waste” in order to match the financial statement. By using this method, it is assumed
that all the costs would be equally incorrect. However, it can not be assumed that all product
costs are equally incorrect. The reasons for the variances will be explained in the following
Salary18 %
Raw material72 %
Energy4 %
Additives3 %
Other variable3 %
Raw material; 67 %
Salary; 17 %
Energy; 10 %
Other variable; 6 %
28
TURKU UNIVERSITY OF APPLIED SCIENCES THESIS | Rudnäs Oscar
chapters. The direct “company waste%” is an estimated percentage between 014% on
different product families in order to get the costs more comparable to the financial statement.
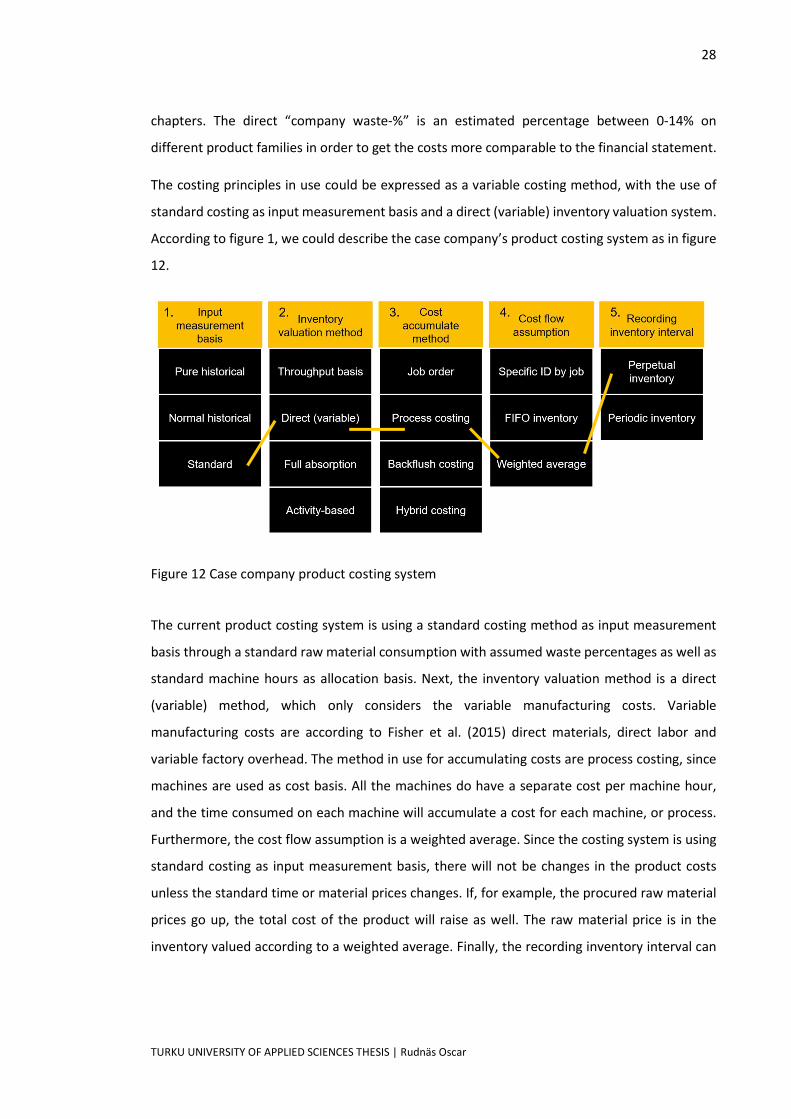
The costing principles in use could be expressed as a variable costing method, with the use of
standard costing as input measurement basis and a direct (variable) inventory valuation system.
According to figure 1, we could describe the case company’s product costing system as in figure
12.
Figure 12 Case company product costing system
The current product costing system is using a standard costing method as input measurement
basis through a standard raw material consumption with assumed waste percentages as well as
standard machine hours as allocation basis. Next, the inventory valuation method is a direct
(variable) method, which only considers the variable manufacturing costs. Variable
manufacturing costs are according to Fisher et al. (2015) direct materials, direct labor and
variable factory overhead. The method in use for accumulating costs are process costing, since
machines are used as cost basis. All the machines do have a separate cost per machine hour,
and the time consumed on each machine will accumulate a cost for each machine, or process.
Furthermore, the cost flow assumption is a weighted average. Since the costing system is using
standard costing as input measurement basis, there will not be changes in the product costs
unless the standard time or material prices changes. If, for example, the procured raw material
prices go up, the total cost of the product will raise as well. The raw material price is in the
inventory valued according to a weighted average. Finally, the recording inventory interval can
29
TURKU UNIVERSITY OF APPLIED SCIENCES THESIS | Rudnäs Oscar
be classified as a perpetual inventory. The ERPsystem is able to account the value of the
inventory at any time and records inventory transactions immediately as they leave the building.
Naturally, the following step is to analyze and address raw material costs as it is the most
significant cost. Following, a thorough walk through the limitations as well as improvements for
the new product cost calculation will be made.
4.6.1 Raw material consumption and scrap
Raw material cost is the biggest variable cost on product level. In the current product costing
structure raw material consumption is based on the values provided by the R&D department
but is not updated regularly and does not reflect the actual consumption of raw material. Raw
material consumption should be updated regularly to meet correct withdrawal of raw material.
The consumption is however recorded in the ERPsystem in order to keep the stock levels up to
date.
Secondly, wastes in production are monitored and reported as a part of the work routine but is
done inconsistently. Waste costs are also a big part of the total product costs, since the raw
material accounts for more than 6070% of the total product costs. However, the amount of
waste has not been updated or analyzed regularly, which results in incorrect waste percentage
and as a result, product costs. The actual consumed amount is reported in order to not get
enormous inventory differences. Inventory differences are due to either wrong structure data,
meaning that we are not monitoring the recipes of the product correctly, or due to unreported
waste. This should be taken into consideration when performing an update of the current cost
calculation. However, abnormal wastes can not be included in inventory valuation and therefore
separate product costs should be considered, one for inventory valuation and one for actual cost
of production.
For example, backing material production waste (paper, net or film) is set to be consuming 1024
meters per 1000 meters produced. However, backing material waste is an effect by tweaking
the parameters to get the right quality for the product. This means, once the right quality is
achieved, the production can start. A normal tweak is consuming between 150 – 300 meters,
meaning the minimal batch size would need to be 6200 meters in order for 150 meters to equal
2,4% (150/62000). However, the most common batch size on low volume products is 1700 m.
30
TURKU UNIVERSITY OF APPLIED SCIENCES THESIS | Rudnäs Oscar
While the total waste per year of 2,4% might be close to reality, the weight on low volume
products compared to high volume is totally wrong.
Typically, waste is separated to three different categories: Technical scrap; Changeover
difficulties and quality issues; Scrap during production. It is possible to consider technical scrap,
such as fixed scrap and the area between the discs in the cutting process. It is an average for the
last year’s production runs and the amount of material it takes to accomplish the desired quality.
Fixed scrap would always be accounted for as a normal scrap, meaning the ERP system would
be included in the estimated material need in the MRPsystem. Changeover quality issues arises
from different factors and is considered abnormal scrap during changeover. Finally, scrap during
production would be regarded as variable scrap. The amount of scrap is reported and would be
analyzed to be included as a %scrap on production. This would also be considered as normal
scrap in manufacturing. The total waste from each production run could be accounted in the
product costs and for inventory valuation abnormal scrap would be excluded.
This is important to distinguish between, because different accounting standards states which
material scrap can be regarded in inventory valuation. Even though the company is not
mandatory regulated by the standards, it is better to have foresight and not reactive in case of
changes.
First step to consider in raw material costs are to update raw material consumption on a regular
basis on product level and follow up the actual raw material consumption. This will lead to a
more correct product cost. Finally, scrap is by far the biggest cost difference on the raw material
level and should be included in the product costing system. Considering that the current method
is using fixed percentages of waste as a variable waste, the effect of changeover waste is not
visible. However, a fixed waste or event triggered waste should however be accounted for.
4.6.2 Raw material price
Raw material costs are based on the product of the amount of raw material used and the price
for the particular raw material. Raw material prices are set by the procurement department and
is updated to the product costing system each month. The new raw material cost is weighted to
the value in stock. When the update is done for product prices, the new cost of the product gets
balanced with the instock prices and volumes based on the weighted average.
31
TURKU UNIVERSITY OF APPLIED SCIENCES THESIS | Rudnäs Oscar
A suggested new method of use would be to use FIFO, meaning that the oldest product price in
inventory still left would be used and when updates are done in the system, the stock would be
based on that particular price. One problem that arises with this method is that you would have
different product prices for the same product depending on when it was produced. However,
this is the actual cost and is more similar to the actual cost of production, which is the objective
for the product costing. However, a weighted average is in many ways easy and correct to use
for product calculations. No drastic methods need to be made and there would be no significant
differences in the product costs.
4.6.3 Structure time
The cost driver in the current product costing method is machine hours (variable time), which is
calculated based on the sum of production time and set up times per 1000 meters produced.
The old method of calculating uses a weighted average or a standard time for whole production
families, whereas a new suggested method would have been to have a separate, fixed setup
times for every product.
This structure time update has been calculated manually every year and works as the cost driver
for the cost centers, such as salaries, energy and other variable costs. In order to compare the
old method with the new method, an analysis had to be made. A calculation document extracts
the data from the ERP system generated excel files and automatically sums up the different
structure times.
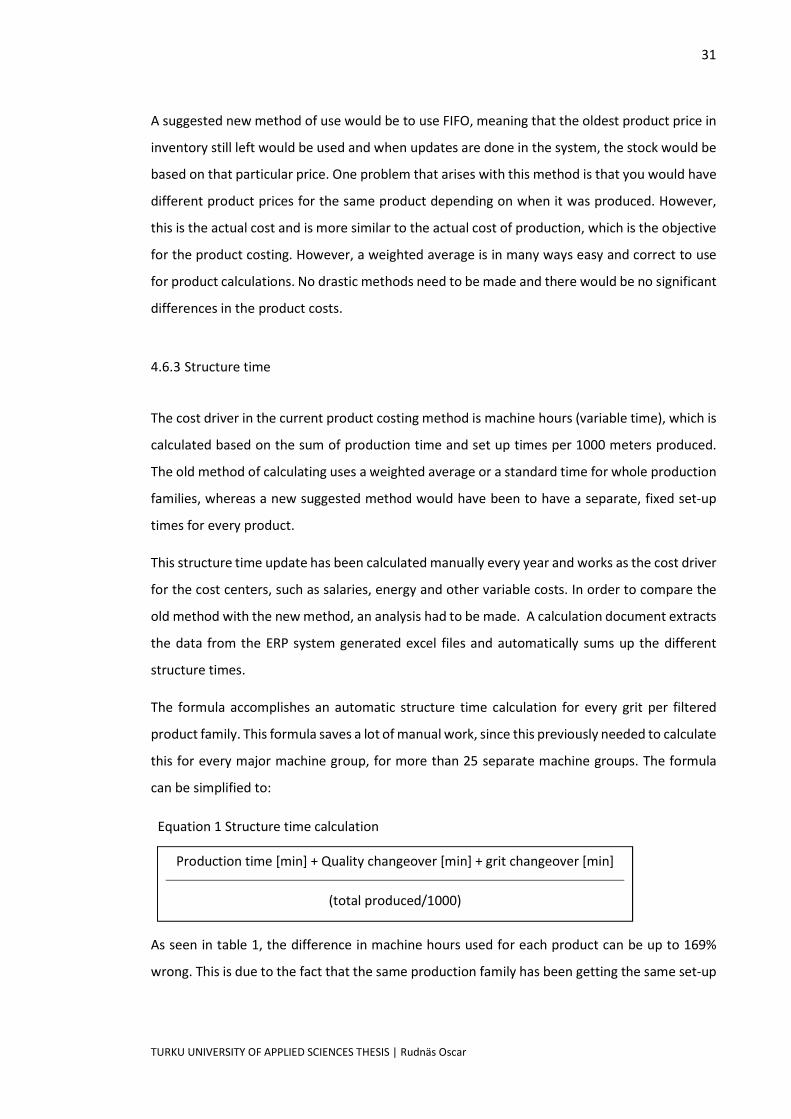
The formula accomplishes an automatic structure time calculation for every grit per filtered
product family. This formula saves a lot of manual work, since this previously needed to calculate
this for every major machine group, for more than 25 separate machine groups. The formula
can be simplified to:
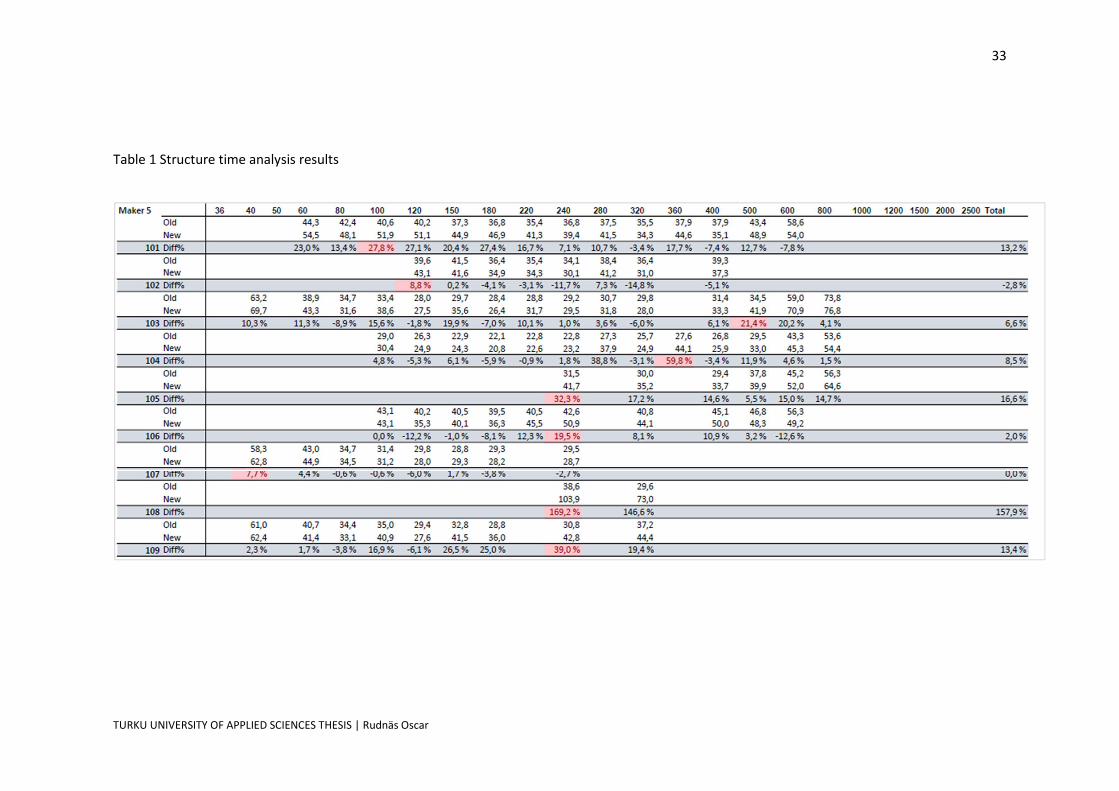
As seen in table 1, the difference in machine hours used for each product can be up to 169%
wrong. This is due to the fact that the same production family has been getting the same setup
Production time [min] + Quality changeover [min] + grit changeover [min]
(total produced/1000)
Structure time calculation equation Equation 1 Structure time calculation

32
TURKU UNIVERSITY OF APPLIED SCIENCES THESIS | Rudnäs Oscar
time for all product families inside the production family and that the time is fully variable. A
production family are similar products that require less setup time between changes and are
often produced in the same cycle. However, this data is calculating the exact amount of time
spend on each setup for every production run. The calculator is attached in appendix 1, where
the variation inside a production family is clearly visible. These variations should be eliminated
by using a setup time that is not same for the whole production family and is separated to a
fixed and variable component.
33
TURKU UNIVERSITY OF APPLIED SCIENCES THESIS | Rudnäs Oscar
Table 1 Structure time analysis results
34
TURKU UNIVERSITY OF APPLIED SCIENCES THESIS | Rudnäs Oscar
Based on the results, we can clearly see that the new method of calculating the setup time
based every product instead of production family will have a significant change in the product
structure time and consequently also on the product costs. The new method is sensitive to
production runs with lower volumes, which is why there is a difference in the methods. As the
case company also asked for a batchsensitive product costing, I suggest that the company would
use a different method than what is currently used.
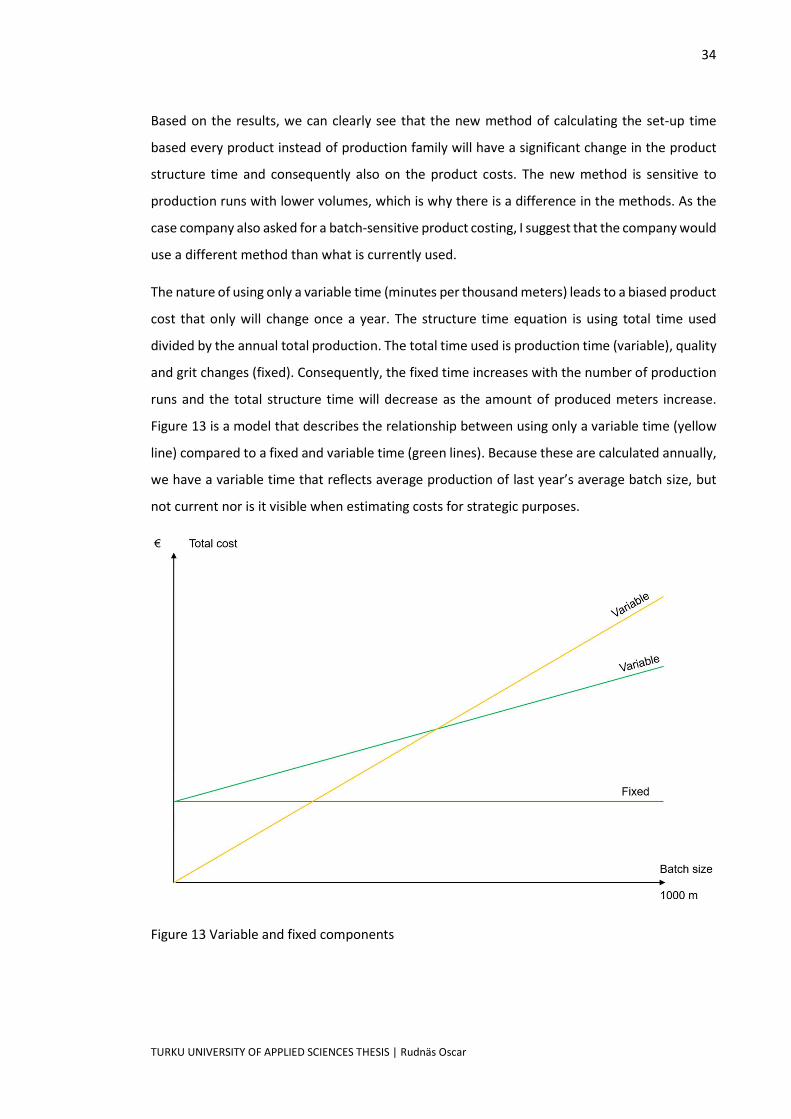
The nature of using only a variable time (minutes per thousand meters) leads to a biased product
cost that only will change once a year. The structure time equation is using total time used
divided by the annual total production. The total time used is production time (variable), quality
and grit changes (fixed). Consequently, the fixed time increases with the number of production
runs and the total structure time will decrease as the amount of produced meters increase.
Figure 13 is a model that describes the relationship between using only a variable time (yellow
line) compared to a fixed and variable time (green lines). Because these are calculated annually,
we have a variable time that reflects average production of last year’s average batch size, but
not current nor is it visible when estimating costs for strategic purposes.
Figure 13 Variable and fixed components
35
TURKU UNIVERSITY OF APPLIED SCIENCES THESIS | Rudnäs Oscar
However, increasing production volume would lead to lower cost per meter, which in turn would
lead to better sales margins. Currently, this is not visible in the current costing system. This
would reflect the actual costs and in turn affect the strategic decision making.
Consequently, since the product cost calculation uses the structure time as a cost driver, both
salaries, energy and other variable costs are all affected by the structure time and has a
significant impact on the product cost. However, the cost allocations have also incorrect data
that will be explained next.
4.6.4 Salary
Salaries are updated once every year and are allocated to the products by dividing the total
salary costs with machine hours per machine group. The cost (€/machine hour) is multiplied by
the structure time and 1.67 (2018), which is a social constant for covering different costs related
to the employees.
There are however limitations in this way of calculating. The number of workers per machine
group is not constant, which results in slightly different distribution between costs between
product groups and products. The number of workers per machine is recorded in the ERP
system, but the systematic of the product calculation does not consider variations in the number
of workers.
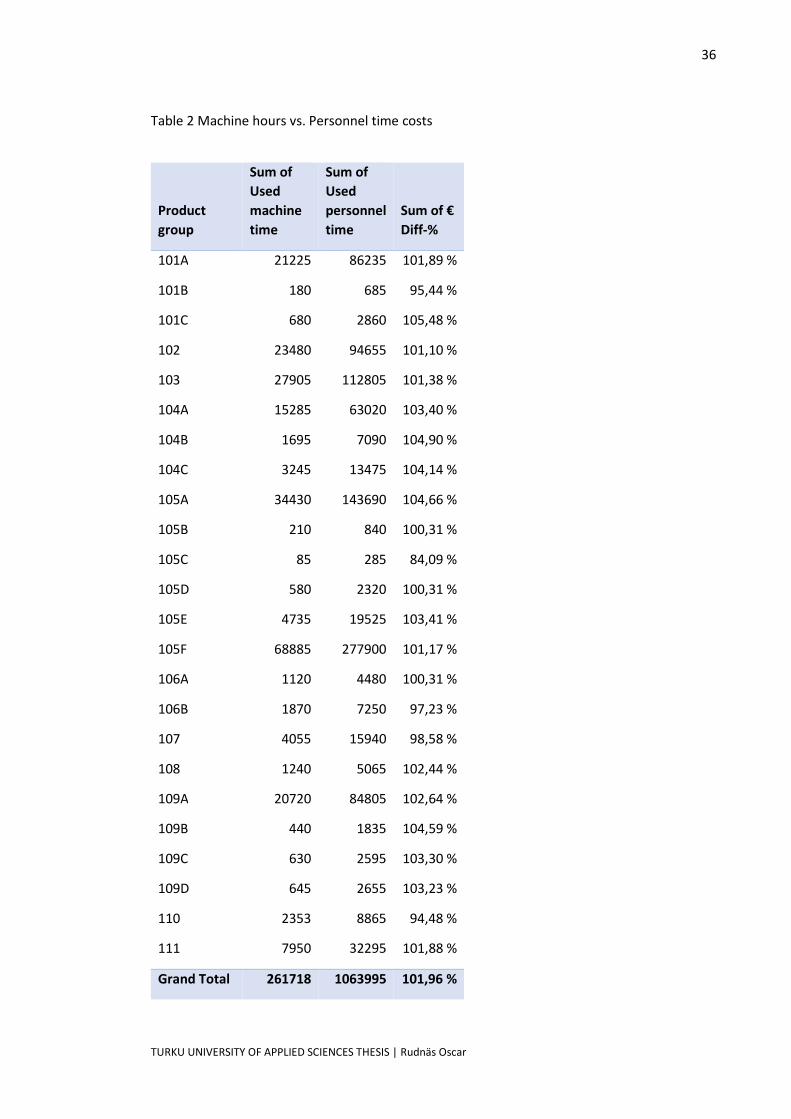
An analysis was made of one machine group and is based on calculating the cost when using
machine hours as cost driver and the cost when using personnel time as cost driver. As seen in
table 1, a variation between 84,09% to 112,85% on the product cost. However, there are
limitations to this method of calculating, since the personnel time needs to be divided to several
machines and might not be accurate enough.
36
TURKU UNIVERSITY OF APPLIED SCIENCES THESIS | Rudnäs Oscar
Table 2 Machine hours vs. Personnel time costs
Product group
Sum of Used machine time
Sum of Used personnel time
Sum of € Diff-%
101A 21225 86235 101,89 %
101B 180 685 95,44 %
101C 680 2860 105,48 %
102 23480 94655 101,10 %
103 27905 112805 101,38 %
104A 15285 63020 103,40 %
104B 1695 7090 104,90 %
104C 3245 13475 104,14 %
105A 34430 143690 104,66 %
105B 210 840 100,31 %
105C 85 285 84,09 %
105D 580 2320 100,31 %
105E 4735 19525 103,41 %
105F 68885 277900 101,17 %
106A 1120 4480 100,31 %
106B 1870 7250 97,23 %
107 4055 15940 98,58 %
108 1240 5065 102,44 %
109A 20720 84805 102,64 %
109B 440 1835 104,59 %
109C 630 2595 103,30 %
109D 645 2655 103,23 %
110 2353 8865 94,48 %
111 7950 32295 101,88 %
Grand Total 261718 1063995 101,96 %
37
TURKU UNIVERSITY OF APPLIED SCIENCES THESIS | Rudnäs Oscar
However, the implication of the change is rather small compared to the total amount and the
required effort is rather extensive. I do however recommend the company to further examine
the effect of choosing another cost driver for salary costs.
4.6.5 Energy
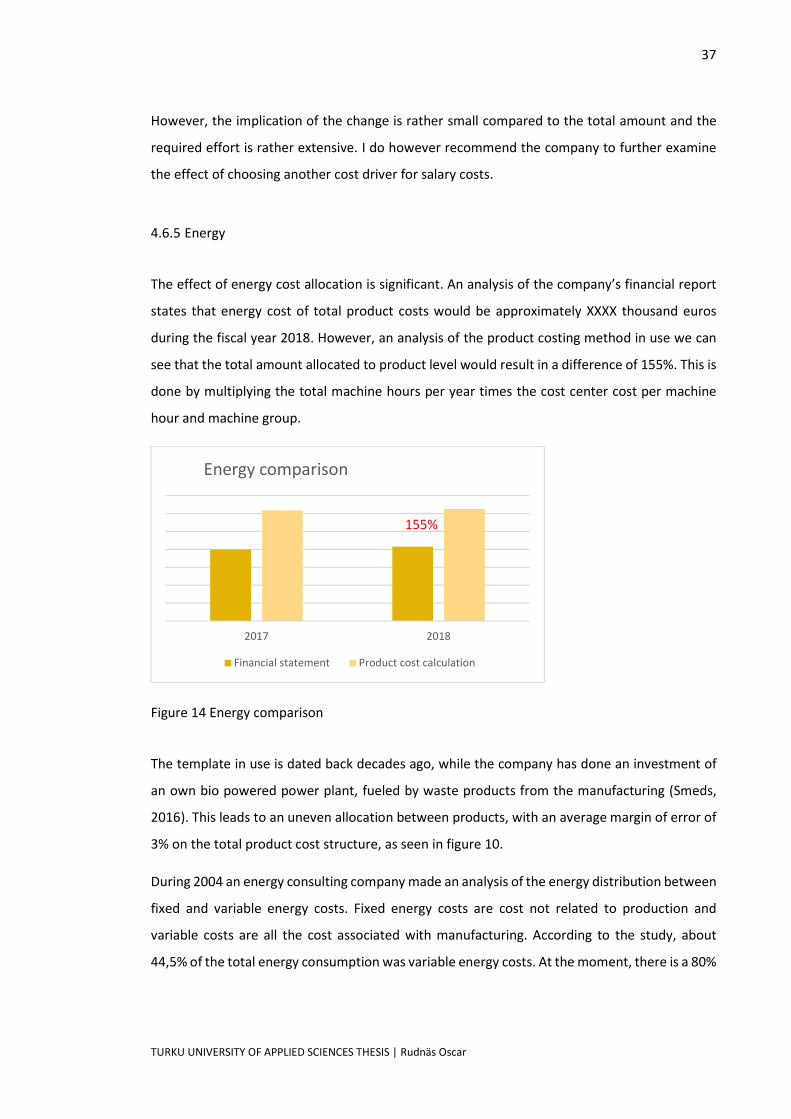
The effect of energy cost allocation is significant. An analysis of the company’s financial report
states that energy cost of total product costs would be approximately XXXX thousand euros
during the fiscal year 2018. However, an analysis of the product costing method in use we can
see that the total amount allocated to product level would result in a difference of 155%. This is
done by multiplying the total machine hours per year times the cost center cost per machine
hour and machine group.
Figure 14 Energy comparison
The template in use is dated back decades ago, while the company has done an investment of
an own bio powered power plant, fueled by waste products from the manufacturing (Smeds,
2016). This leads to an uneven allocation between products, with an average margin of error of
3% on the total product cost structure, as seen in figure 10.
During 2004 an energy consulting company made an analysis of the energy distribution between
fixed and variable energy costs. Fixed energy costs are cost not related to production and
variable costs are all the cost associated with manufacturing. According to the study, about
44,5% of the total energy consumption was variable energy costs. At the moment, there is a 80%
2017 2018
Energy comparison
Financial statement Product cost calculation
155%
38
TURKU UNIVERSITY OF APPLIED SCIENCES THESIS | Rudnäs Oscar
variable cost distribution which both distorts the energy costs on product level, but also the
contribution margin.
The suggested improvements on energy to be done is to measure the actual consumption of
energy and energyrelated costs (such as gas and oil), similarly to what was made in 2004. Due
to the fact that production volume has grown significantly since 2004, but fixed energy costs
such as lighting theoretically should have just a marginal increase, the variable proportion will
increase and will probably not be 44,5% anymore, but much higher.
Finally, the cost driver should be considered. Currently machine hours (structure time) is the
driver for energy costs. Cost driver change is further explained in chapter 4.2.8. Because there
is no correct data available, and the effort to get the proportions right is extensive, the energy
cost allocation will not be further discussed in this study. Energy cost allocation is a challenge
without a thorough analysis of all the fixed and variable energy costs and will therefore be left
out. However, there is a strong need to correct the energy cost allocation.
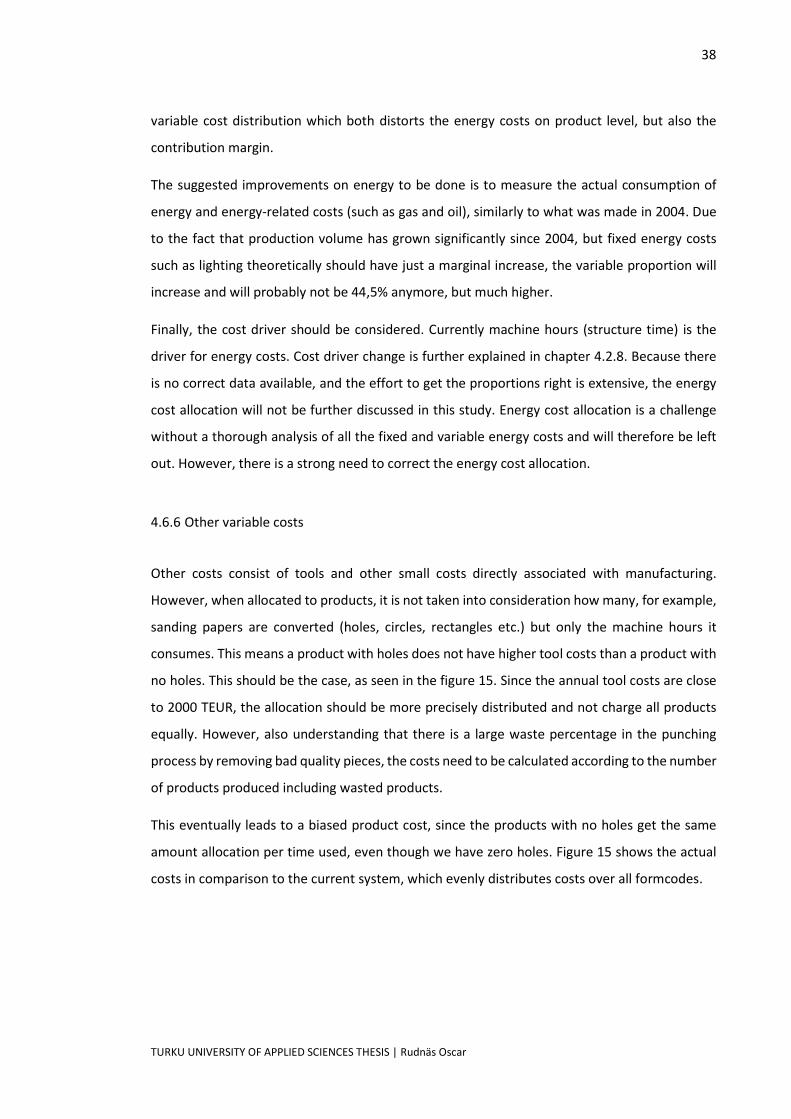
4.6.6 Other variable costs
Other costs consist of tools and other small costs directly associated with manufacturing.
However, when allocated to products, it is not taken into consideration how many, for example,
sanding papers are converted (holes, circles, rectangles etc.) but only the machine hours it
consumes. This means a product with holes does not have higher tool costs than a product with
no holes. This should be the case, as seen in the figure 15. Since the annual tool costs are close
to 2000 TEUR, the allocation should be more precisely distributed and not charge all products
equally. However, also understanding that there is a large waste percentage in the punching
process by removing bad quality pieces, the costs need to be calculated according to the number
of products produced including wasted products.
This eventually leads to a biased product cost, since the products with no holes get the same
amount allocation per time used, even though we have zero holes. Figure 15 shows the actual
costs in comparison to the current system, which evenly distributes costs over all formcodes.
39
TURKU UNIVERSITY OF APPLIED SCIENCES THESIS | Rudnäs Oscar
Figure 15 Form cost difference
I suggest the company to include the tool costs in the product recipe to be consumed, because
the consumption of cutbite tools are followed through well in the production unit. This would
require no actual coding in the ERP system, but only need to update the product recipes with
the corresponding tools. This would be done in Hproduct level, which contain only endproducts
which are converted. In that sense, variable costs such as the cost of cutbites would only be
added on endproducts. Another way to include cutbite costs in the product costing would be
to use production amount as cost driver and use a specific cost for every formcode. The cost
data is currently monitored in the ERPsystem and would need to be defined to consider the
cutbite costs according to a more correlative allocation.
4.6.7 Batch level activities
Furthermore, the present cost calculation does not take into consideration batchlevel activities,
meaning setup times and cleaning of machines every time a changeover between product
families and grit sizes are made, are not affecting the product cost. Currently some higher
volume products and low volume product have the same setup times. As seen in table 2, some
structure times would change up to 160%. This is due to the batchsize effect: the longer the
production run, the smaller amount is the setup time per 1000 meter.
121% 126% 211% 295%
709%964% 987%
869%
2524%
0%
500%
1000%
1500%
2000%
2500%
3000%
232 0hole
241 0hole
622 0hole
149 0hole
620 7hole
628 7hole
684 0hole
611 15hole
648 27hole
6CF 37hole
Costs compared to 232 0 hole
40
TURKU UNIVERSITY OF APPLIED SCIENCES THESIS | Rudnäs Oscar
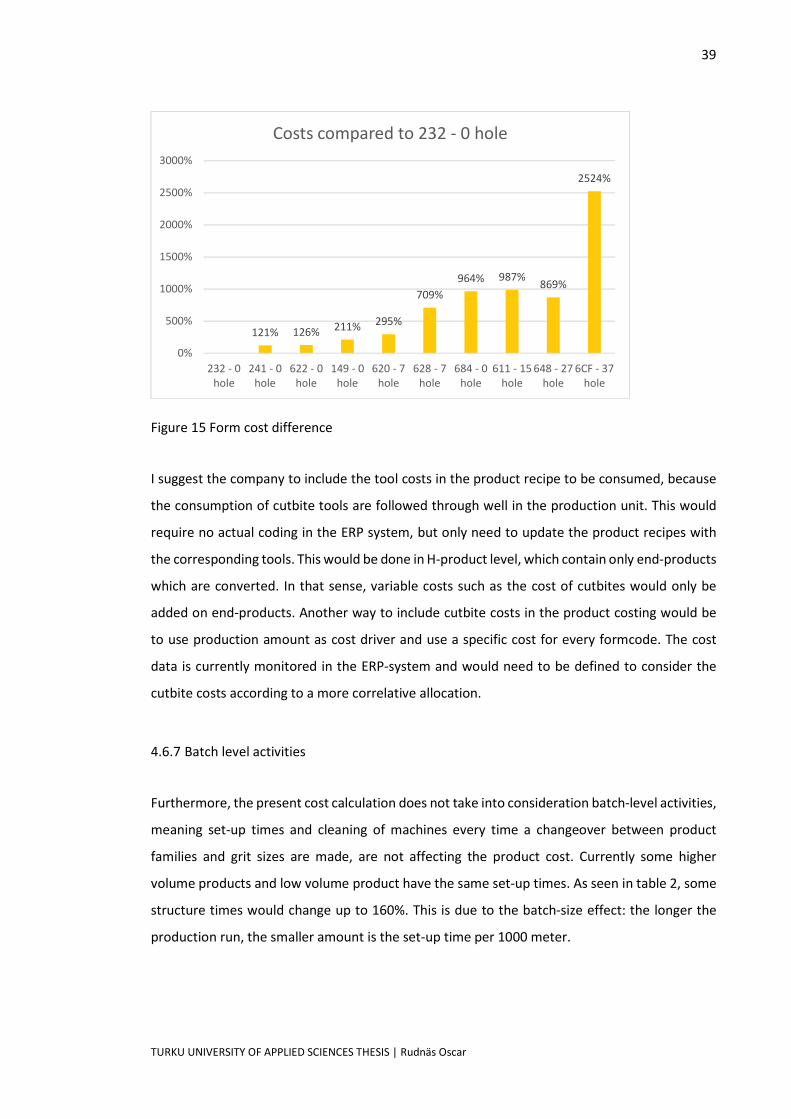
Smaller batch volumes are burdening the higher volumes unevenly, which is not taken into
consideration when producing and making decisions on prices. One batch equals a production
run of multiple grits and abrasive families that can be produced in same batch. Every grit change
consumes between 5 to 30 minutes, but product family changes can be up to 8 to 10 hours.
Today the batch setup and grit change time are allocated with the same amount of time for
every product in the same production family. The allocation is wrong, because even if you
produce only one piece, the setup time is the same. Therefore, a new method for allocation is
suggested that would allocate a fixed batch setup and a variable structure time per 1000
meters. Grit change time would be reported and added to the total set up time. In that sense,
the setup time is a fixedvariable cost. Setup times and cleaning are very long, approximately
even up to 15% of the total production time per batch but has been burdening higher volume
products’ costs.
Figure 16 Batch size and product cost simulation
Furthermore, to be even more accurate in product costing there is a need to distinguish between
what is consumed at each activity. The fixed setup time would not consume the same amount
of energy as production would. However, the significance of the required effort might be too
small to be considered. I suggest the case company to simulate the differences between the two
scenarios.
Finally, as described in chapter 4.6.1, raw material scrap is issued in the setup of new product
families in tweaking different parameters in order to get the targeted quality. The longer the
batch size the smaller scrap per thousand meters. This also adds up to the batch size effect.
0,000
100,000
200,000
300,000
400,000
500,000
600,000
0 5000 10000 15000 20000 25000 30000
Variable vs. Variable + Fixed
€/1000m fixed €/1000m variable + fixed

41
TURKU UNIVERSITY OF APPLIED SCIENCES THESIS | Rudnäs Oscar
4.6.8 Different cost drivers
Cost drivers are only used for allocation of indirect manufacturing costs. Cost drivers are the
drivers that is specified to drive a cost in the cost centers. In other words, a cost center is the
total amount of costs for a period in a specific machine group. The cost driver, in this case
machine hours, is determining how much of the cost center was used on a specific task. The
total amount of product costs allocated per machine hours is specified in the cost center. The
cost driver, structure time used on a specific task is then multiplied to get the cost for the specific
product.
The existing product costing mechanism does only use one cost driver, structure time with a unit
of machine hours. This is fair in those cases when there is a causal relationship between machine
hours and actual consumption. The machine hours can be assumed to correlate well, or even
better with some functions, but for example energy costs could correlate better with units
produced and for salary costs with personnel time. The faster you run a machine, the more it
will consume energy and the more people put in work, the more the cost. Therefore, a deeper
analysis of other cost drivers should be considered.
For example, in converting the jumbo rolls to final sandpaper pieces, the products go through a
process of punching. Depending on the products, different tools are used that have a significant
cost. In this case, it doesn’t depend on machine hours to produce a product, but more on the
number of times the tool was used. A suggestion was prior made to include cutbite costs in the
product recipe instead of changing another variable for easier calculation and more precise cost
calculation. Another suggestion is to simply use the total amount of meters used for producing
the specified endproducts. I suggest that the case company further analyses the best cost driver
that has the most correlation with actual tool wear.
42
TURKU UNIVERSITY OF APPLIED SCIENCES THESIS | Rudnäs Oscar
DISCUSSION AND CONCLUSION
First, we examined the background for the study. Next, product costing systems and cost
accounting theory was explained in further detail. Finally, an extensive analysis of the different
components and cost activities of the product costing system was made. This chapter will solely
focus on discussing the results and conclusions to make based on the study.
The objective and essence of this thesis was to make a thorough analysis of the case company’s
systematic faults of the product costing system in the ERP system and point to different
systematic problems and biased information. As stated in chapter 4.6, there is currently a large
gap between the real product costs and the outcome of the annual financial statement.
5.1 Result and summary of improvements
Through the analysis, several improvement changes have been suggested. Next, I will present
the results and expected benefits as well as suggest the roadmap forward in a prioritized order
of implementation.
First, raw material costs should not only include a predetermined waste percentage, but also
include an event triggered waste amount for every changeover. Even though it is necessary to
use a productwide average, it will still be much more accurate and reflect the actual waste
better. Furthermore, the actual raw material consumption should be regularly monitored and
defined to an employee’s work routine to be regularly analyzed and updated.
Second, structure time, or the cost driver, should be separated in to a variable and fixed driver.
The fixed driver is so call event dependent and will lead to a specific cost at the time of
changeover. The production time is in turn a variable driver and will drive costs according to the
amount of time. These costs are energy, salary and other variable costs. Furthermore, the fixed
part should include only the product specific grit and quality change, and not the whole
production family.
Salary costs are now precise enough and don’t need any significant changes. It would however
be good to further analyze the implication and possibilities of using personnel time instead of
machine hours.
43
TURKU UNIVERSITY OF APPLIED SCIENCES THESIS | Rudnäs Oscar
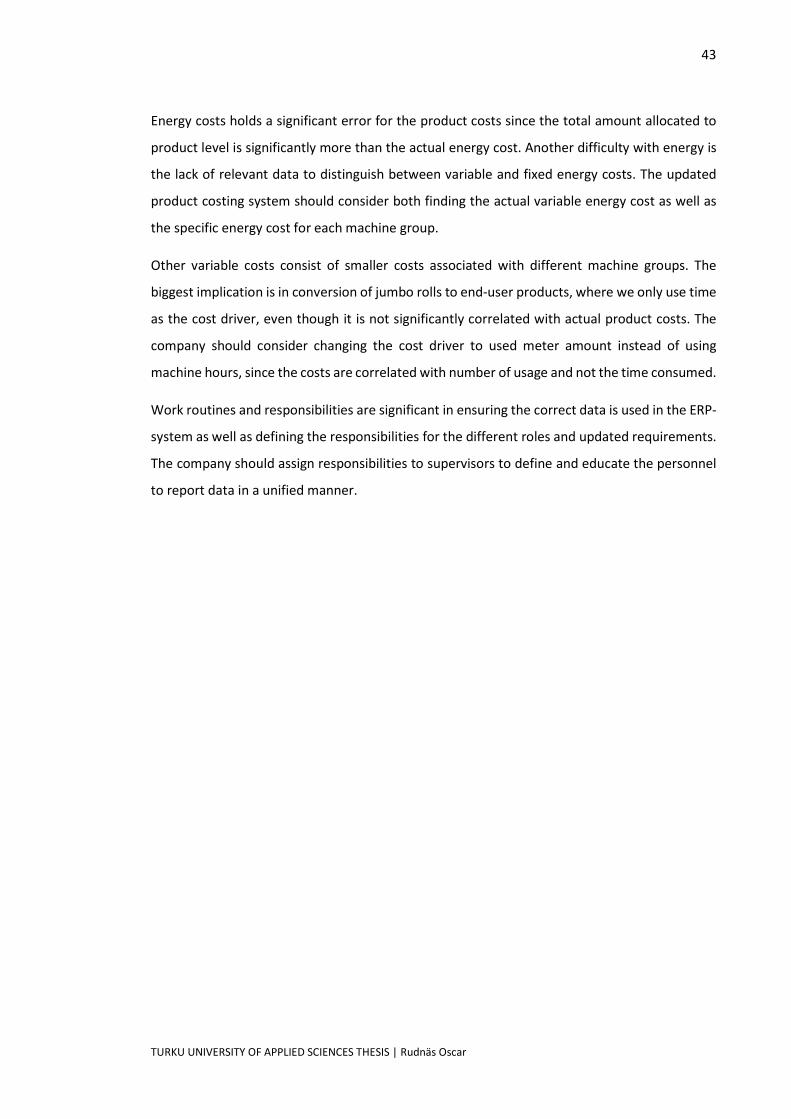
Energy costs holds a significant error for the product costs since the total amount allocated to
product level is significantly more than the actual energy cost. Another difficulty with energy is
the lack of relevant data to distinguish between variable and fixed energy costs. The updated
product costing system should consider both finding the actual variable energy cost as well as
the specific energy cost for each machine group.
Other variable costs consist of smaller costs associated with different machine groups. The
biggest implication is in conversion of jumbo rolls to enduser products, where we only use time
as the cost driver, even though it is not significantly correlated with actual product costs. The
company should consider changing the cost driver to used meter amount instead of using
machine hours, since the costs are correlated with number of usage and not the time consumed.
Work routines and responsibilities are significant in ensuring the correct data is used in the ERP
system as well as defining the responsibilities for the different roles and updated requirements.
The company should assign responsibilities to supervisors to define and educate the personnel
to report data in a unified manner.
44
TURKU UNIVERSITY OF APPLIED SCIENCES THESIS | Rudnäs Oscar
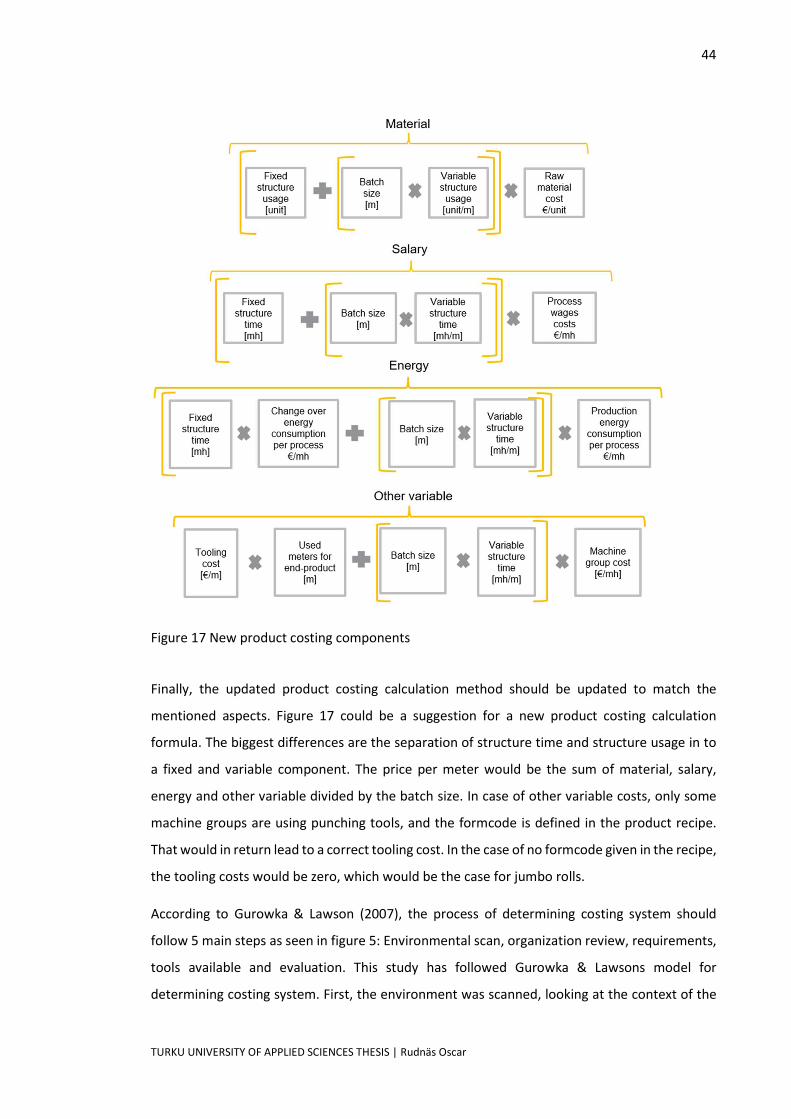
Figure 17 New product costing components
Finally, the updated product costing calculation method should be updated to match the
mentioned aspects. Figure 17 could be a suggestion for a new product costing calculation
formula. The biggest differences are the separation of structure time and structure usage in to
a fixed and variable component. The price per meter would be the sum of material, salary,
energy and other variable divided by the batch size. In case of other variable costs, only some
machine groups are using punching tools, and the formcode is defined in the product recipe.
That would in return lead to a correct tooling cost. In the case of no formcode given in the recipe,
the tooling costs would be zero, which would be the case for jumbo rolls.
According to Gurowka & Lawson (2007), the process of determining costing system should
follow 5 main steps as seen in figure 5: Environmental scan, organization review, requirements,
tools available and evaluation. This study has followed Gurowka & Lawsons model for
determining costing system. First, the environment was scanned, looking at the context of the
45
TURKU UNIVERSITY OF APPLIED SCIENCES THESIS | Rudnäs Oscar
organization. Next, the organization was reviewed, and requirements were listed by looking at
the requirements of different needs and resources available. The inhouse ERPsystem is both a
challenge and an opportunity to redesign the costing system, while people in the organization
were interviewed to find the different requirements as seen in figure 8. Furthermore, the tools
available were discussed in chapter 3 and explained in detail in the case. However, due to the
needs of the company the main objective was not to implement a new costing system, but to
analyze and point to different biases and incorrect product costs, which is also why the
evaluation phase was left out. The evaluation phase according to Gurowka & Lawson is to
evaluate different methods according to a matrix. However, since the inventory valuation
method was going to be the same, no effort was made to evaluate these in detail.
Lastly, a suggestion has been made to, in addition to this method, further develop a tool for
order cost calculation. Every production order is different, even though the same product is
produced – there are quality issues and different environmental conditions that leads to a
slightly different result. To be able to track the cost of each order would increase the cost
awareness in the factory, making it easier to spot activities that results in large costs.
Furthermore, a follow up on the order costs would encourage the workers to achieve better
results and could increase efficiency and cost effectiveness. The cost awareness would have an
effect on both production and production planning as well as planning for capacity.
Furthermore, an orderbased cost calculation would simplify the cost management as well as
the ability to track actual costs to different reasons. It would also provide a reliable method for
calculating the actual costs, since even same products may be produced on different products
than stated in the product structure (routing), leading to further incorrect costs mainly based on
decisions made the first time it was produced.
5.2 Limitations
The study has done a wide range of analyzes and several improvements have been suggested.
However, there are limitations to this study that needs to be discussed.
First, the study has only been focusing on the limitations of the current product costing system
and correcting the variable manufacturing costs. The variable costs are the basis of
understanding the product costs, but other costing methods such as absorption costing or
activitybased costing would include also fixed costs. Ignoring fixed costs and cost of capital,

46
TURKU UNIVERSITY OF APPLIED SCIENCES THESIS | Rudnäs Oscar
leads to a risk of not accounting for the total actual costs for a product. However, the case
company did state that the main objective was to improve the current product costing method
and not implement another costing method that requires more maintenance and resources.
Furthermore, the costs considered in the variable costing method is still relevant in case of an
implementation of another costing system, since all the variable costs are accounted for.
Second, we have not yet tested the new system due to reasons explained in the case. One reason
is a shortage of energy data at the moment, that would require manual measurements of
machines and all the different energy consumers in the production. Not having an accurate test
of the new product costs is a limitation of this study, however the structure time calculator in
Appendix 1 does however imply that the difference between the products will be affected
significantly by the batch size. Considering that the current product costs are mainly composed
of raw material plus the structure time as cost driver, the effect on product cost will be reflected
by the differences in structure time.
Third, the cost calculation is only as good as the information that is put in. The human interaction
with information systems should be standardized for the employees in order to match the actual
costs. Furthermore, the employees need to be educated in routines and rules for how to put in
the relevant data as well as informed on how their actions affect the information reliability.
5.3 Conclusion and implications
The implications of the product costing change are many. It will lead to significant shifts in the
employees’ daily work and will lead to a change of the costing structure. Several products will
have a higher cost and as many products will have a lower cost. This will eventually lead to
reactions within the organization’s different departments.
According to the data gathered, a conclusion can be made that lowvolume products will get an
increased cost and highvolume products will get a lower cost due to the fact that the structure
time has been fully variable and not divided to a fixed and variable time. The effect is explained
in figure 13. Another significant change is the nohole products will become cheaper, but the
multihole products will have a higher price, because tooling costs will be allocated to the
corresponding formcode and not whole machine groups. Furthermore, difficult products as seen
from the manufacturing will become more expensive. Quality issues and waste will be included
in the total cost per product, instead of using a fixed percentage as has been done previously.

47
TURKU UNIVERSITY OF APPLIED SCIENCES THESIS | Rudnäs Oscar
The most significant improvement is a reliable product cost, which in turn will lead to easier and
faster decision making in product range and a better knowledge on where the most significant
cost arise in the manufacturing process. Being able to make management decisions based on
correct data is essential for any organization using data for decision making. Consequently,
fewer products lead to less production runs and in turn lower proportion of fixed costs on
product level as seen in figure 16. Less products and production runs lead to more available
space in the inventory. Furthermore, product range management needs because of this consider
the effect of batch size and simulate the possible volume and corresponding costs. In other
words, because we have low sales volume, we have a higher cost, which in turn affects the sales
volume. Because the ERP system would reflect the actual function of the company, the product
costs would be more correct.
Furthermore, the update of a dynamic product costing system that reflects the actual costs of
production opens the possibility to simulate possible outcomes from decision scenarios. The
possibility to simulate different product costs based on different volumes and different hole
combinations for strategic purposes would be of high value for the product portfolio department
as well as from the product range management perspective. I highly encourage the case
company to further study and develop a product costing simulation tool that would enable this
possibility.
A correct product cost and product costing system will have a significant impact on the
organizational success through a variety of reasons. Not only does it hold a risk for the company,
but it affects the organization across the organization from manual workers to sales and in the
end even the financial statement. Because the current system favors lowvolume products, the
company will get a lower EBIT since the margin is not reflected by the actual costs. Consequently,
as the new product costing method is implemented, the longterm benefit will be not only be
cost effectiveness, but better EBIT margins as well as a more effective decisionmaking basis.
Drucker was quoted in the introduction, saying that important decision making is the specific
executive task. A reliable product costing system in the ERP that matches the actual costs is key
for making correct and datadriven decisions in an increasingly more complex business
environment.
48
TURKU UNIVERSITY OF APPLIED SCIENCES THESIS | Rudnäs Oscar
REFERENCES
Ax, C., Johansson, C., & Kullvén, H. (2015). Den nya ekonomistyrningen. Stockholm: Liber AB.
Balakrishnan, R., Hansen, S., & Labro, E. (2011). Evaluating Heuristics Used When Designing. Management science, 520541.
Bhimani, A., Horngren, C. T., Datar, S. M., & Foster, G. (2015). Management and cost accounting. New Jersey: PrenticeHall Inc.
Cooper, R., & Kaplan, R. S. (1988). How cost accounting distorts product costs. Management accounting, 2027.
Drucker, P. F. (1967). The effective decision. Harward business review.
Drury, C. (2003). Cost & management accounting. London: Thomson Learning.
Drury, C. (2012). Management and cost accounting. Hampshire: Cengage Learning EMEA.
Fisher, J. G., & Krumviede, K. (2015). Product costing systems: finding the right approach. The journal of corporate accounting and finance, 1321.
Gurowka, J., & Lawson, R. A. (2007, March 19). Selecting the right costing tool for your business needs. Wiley Periodicals, Inc., pp. 2127.
Horngren, C. T., Bhimani, A., Datar, S. M., & Foster, G. (2002). Management and cost accounting (2nd Edition ed.). PrenticeHall.
International accounting standards. (2019, February 22). Retrieved from IASplus: https://www.iasplus.com/en/standards/ias
Investopedia. (2018). Investopedia.com. Retrieved 12 30, 2018, from https://www.investopedia.com/terms/r/returnoninvestment.asp
Karsak, E. E., & Özogul, C. (2009). An integrated decision making approach for ERP system selection. Expert Systems with Applications, 660667.
KWH Group. (2019, May 2). KWH annual report. Retrieved from kwhgroup.com: https://www.kwhgroup.com/wpcontent/uploads/2019/04/KWH_annual_review_2018web2.pdf
Martin, J. R. (no date). Management Accounting: Concepts, Techniques & Controversial Issues. Retrieved February 2019, 20, from Management And Accounting Web: https://maaw.info/Chapter2.htm
Mirka. (2019, February 10). About. Retrieved from Mirka.com: https://www.mirka.com/top/about/
Smeds, J. (2016, August 31). Svenska.yle.fi. Retrieved from YLE: https://svenska.yle.fi/artikel/2016/08/31/mirkamindreberoendeavfossilabranslen
49
TURKU UNIVERSITY OF APPLIED SCIENCES THESIS | Rudnäs Oscar
Van der Merwe, A. a. (2002). The case for resource consumption accounting. Strategic Finance, 3136.
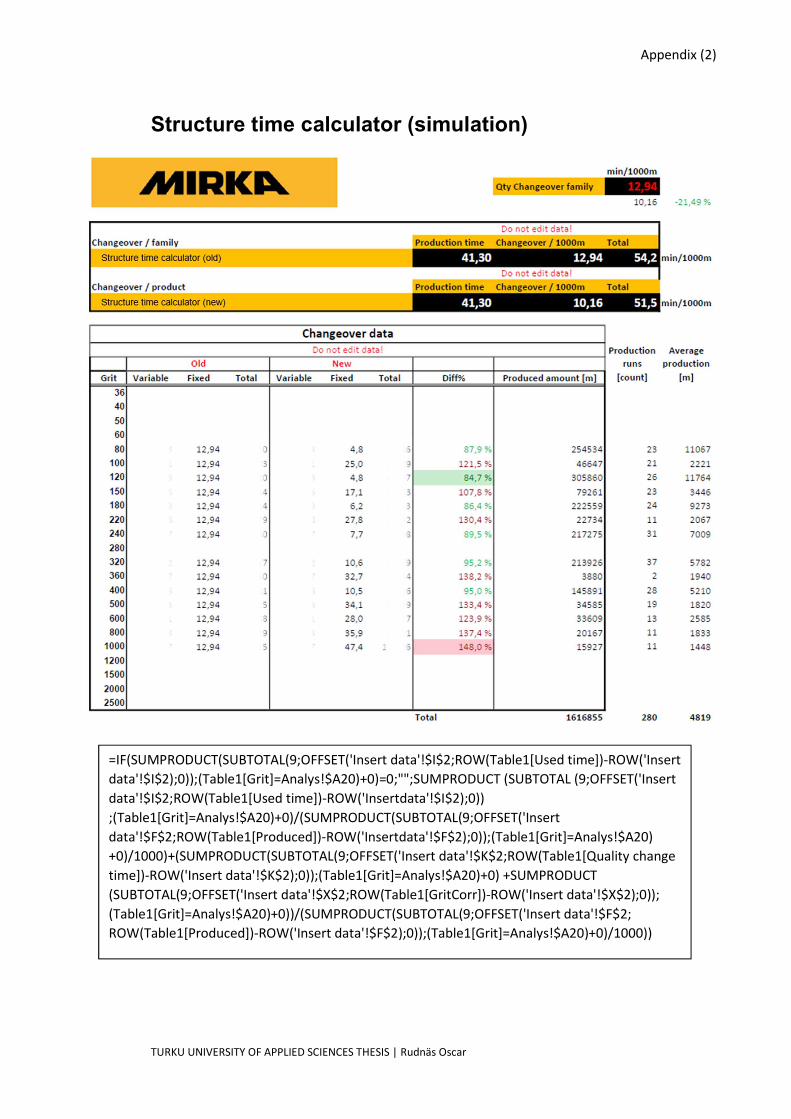
Appendix (2)
TURKU UNIVERSITY OF APPLIED SCIENCES THESIS | Rudnäs Oscar
Structure time calculator (simulation)
=IF(SUMPRODUCT(SUBTOTAL(9;OFFSET('Insert data'!$I$2;ROW(Table1[Used time])ROW('Insert data'!$I$2);0));(Table1[Grit]=Analys!$A20)+0)=0;"";SUMPRODUCT (SUBTOTAL (9;OFFSET('Insert data'!$I$2;ROW(Table1[Used time])ROW('Insertdata'!$I$2);0)) ;(Table1[Grit]=Analys!$A20)+0)/(SUMPRODUCT(SUBTOTAL(9;OFFSET('Insert data'!$F$2;ROW(Table1[Produced])ROW('Insertdata'!$F$2);0));(Table1[Grit]=Analys!$A20) +0)/1000)+(SUMPRODUCT(SUBTOTAL(9;OFFSET('Insert data'!$K$2;ROW(Table1[Quality change time])ROW('Insert data'!$K$2);0));(Table1[Grit]=Analys!$A20)+0) +SUMPRODUCT (SUBTOTAL(9;OFFSET('Insert data'!$X$2;ROW(Table1[GritCorr])ROW('Insert data'!$X$2);0)); (Table1[Grit]=Analys!$A20)+0))/(SUMPRODUCT(SUBTOTAL(9;OFFSET('Insert data'!$F$2; ROW(Table1[Produced])ROW('Insert data'!$F$2);0));(Table1[Grit]=Analys!$A20)+0)/1000))

Appendix (2)
TURKU UNIVERSITY OF APPLIED SCIENCES THESIS | Rudnäs Oscar
Product costing flowchart