Embed Size (px)
Citation preview
Ana Rita Pontes Pereira
OPTIMIZING THE SCALE UP BIOCHEMICAL
PLATFORM BIOREFINERY FOR LACTIC ACID
PRODUCTION FROM LIGNOCELLULOSIC
BIOMASS
Tese no âmbito do doutoramento em Biociências, especialização em
Biotecnologia orientada pelo Professor Doutor José António Couto
Teixeira, pelo Professor Doutor António Manuel Veríssimo Pires, e pelo
Doutor João Miguel dos Santos Almeida Nunes e apresentada ao
Departamento de Ciências da Vida da Faculdade de Ciências e
Tecnologia da Universidade de Coimbra.
Dezembro de 2020

Dezembro de 2020
ii
Rita Pontes | Universidade de Coimbra, 2020
AGRADECIMENTOS |
Pensei várias vezes nos agradecimentos e no momento que os estaria a escrever pois
significava que este capítulo estaria a terminar. Assim chegou o dia de agradecer a todos
aqueles que de alguma forma contribuíram para este trabalho e as palavras que se seguem
não vão ser suficientes para vos agradecer.
Em primeiro lugar, gostaria de agradecer ao meu orientador e amigo João Nunes por todos
os ensinamentos, pela partilha constante de conhecimento ao longo de todos estes anos,
quer académico quer pessoal, e principalmente pela motivação sempre na perspetiva do
“copo meio cheio”. Gostaria de expressar a minha admiração e agradecimento ao
Professor José Teixeira, por me acolher sempre tão bem nos laboratórios do Centro de
Engenharia Biológica, pela disponibilidade constante e partilha de conhecimento, foi uma
honra trabalhar consigo. Gostaria de congratular o Professor António Veríssimo pelas
palavras encorajadoras, pela confiança e disponibilidade ao longo destes anos de
investigação. À Professora Lucília Domingues, que foi um apoio constante ao longo de
todo o trabalho.
Às Doutoras Aloia Romaní e Michele Michelin, o meu mais sincero agradecimento, sem
a vossa ajuda não teria sido possível. Agradeço a dedicação, o apoio científico e acima de
tudo a incansável disponibilidade.
À BLC3, que é mais que uma instituição de acolhimento, pela oportunidade, por me ter
acolhido e permitido alcançar este objetivo. Como diz Antoine de Saint-Exupéry “foi o
tempo que dedicaste à tua rosa que a fez tão importante” e é o tempo que dedico a esta
“casa” que a faz tão importante para mim.
Às instituições de acolhimento, Centro de Engenharia Biológica da Universidade do
Minho e ao Centro de Neurociências e Biologia Celular da Universidade de Coimbra,
pela disponibilidade do espaço e equipamentos indispensáveis no decorrer do meu
trabalho científico e à Fundação para a Ciência e Tecnologia pela atribuição da bolsa de
doutoramento.
À equipa da BLC3 pela amizade durante estes anos, pela confiança e a acima de tudo
paciência perante as adversidades. Em especial à Lúcia Mota pela ajuda no trabalho
experimental.
iii
Rita Pontes | Universidade de Coimbra, 2020
A todos os meus colegas do Centro de Engenharia Biológica pelo apoio constante,
disponibilidade e partilha de conhecimento.
Obrigada Diogo por seres o pilar da minha vida, pelo amor, por me fazeres acreditar que
é sempre possível!
Obrigada Benedita por seres a minha força de vontade e por me ensinares sempre o que
é mais importante.
Agradeço aos meus pais Emília e Domingos, aos meus irmãos Pedro, Zara e Victor, aos
meus sobrinhos Petra, Margarida, Catarina, Nuno, Francisco, Miguel, Lourenço,
Carminho e Roberto, aos meus sogros Anabela e Tozé, aos meus cunhados Fernanda, Zé,
Francisca e Bruno, à minha tia Catarina, ao Manel, a dedicação, ajuda e o carinho.
Obrigada a todos os meus amigos, ao SPOT e aos de coimbra, pela amizade constante,
pela motivação e por acreditarem sempre em mim!
Dedico este trabalho aos meus pais.
Rita
A elaboração desta Tese de Doutoramento foi suportada por uma bolsa de doutoramento
financiada pela Fundação Ciência e Tecnologia (FCT) com a referência
SFRH/BDE/109316/2015, pelo projeto COMPETE 2020 [POCI-01-0246-FEDER-
026758] e pela BLC3 Evolution Lda.

iv
Rita Pontes | Universidade de Coimbra, 2020
STATEMENT OF INTEGRITY |
I hereby declare having conducted this entire work with integrity. I confirm that I have
not used plagiarism or any form of undue use of information or falsification of results
along the process leading to its elaboration.

vi
Rita Pontes | Universidade de Coimbra, 2020
ABSTRACT |
Optimizing the scale up biochemical platform biorefinery for
lactic acid production from lignocellulosic biomass
Lignocellulosic biomass, such as forest and agriculture residues or dedicated
energy crops, is a promising renewable feedstock for the production of advanced biofuels
and chemical building blocks. Lactic acid (LA) has been identified as one with high
potential, playing an essential role in industrial applications ranging from the food
industry to life-sciences. Moreover, LA is widely used for producing green,
biodegradable and biocompatible polylactic acid polymers (PLA).
In order to develop an efficient process for the production of LA from
lignocellulosic biomass, complementary to the selection of the biomass, process
optimization must be carried out. For this, three main operations have to be considered -
(1) biomass pretreatment, (2) enzymatic saccharification to obtain fermentable sugar by
cellulases and (3) the fermentation of sugars by suitable microorganisms to lactic acid.
The selection of the raw material as well as the development of the main process
operations are the focus of this work.
The selection of the raw material was focused on evaluating two mixtures of
lignocellulosic biomass (M1-4 and M2-3), forest ecosystems and biological resources
from marginal land, in order to co-produce oligosaccharides, solid fuel and glucose under
a biorefinery concept. The selection of mixtures was based on different criteria, namely,
territorial distribution, fire risk during summer months and total sugar content. The two
mixtures were submitted to autohydrolysis pretreatment under non-isothermal conditions
(in the range of 190 ºC - 240 ºC corresponding to severity of 3.71 to 4.82). Both mixtures
were compared in terms of fractionation (cellulose and lignin recoveries and
hemicellulose solubilization) and for enzymatic susceptibility of cellulose. The highest
xylan recoveries (62 and 69 %), as xylose and xylooligosaccharides, were achieved for
both mixtures in the liquid phase at 206 ºC. Moreover, enzymatic susceptibility of these
pretreated mixtures was also improved from 45 to 90 % of glucose yield by increasing
pretreatment severity and at 206 ºC glucose yield from enzymatic hydrolysis resulted in
60.1 % and 73.7 % for M1-4 and M2-3, respectively, these results led to the selection of
the mixture M2-3 for further processing.
vii
Rita Pontes | Universidade de Coimbra, 2020
The solid fraction of M2-3 resulted from autohydrolysis (AM2-3) at 206 ºC was
subsequently delignified by uncatalyzed ethanol-organosolv process to recover
hemicellulose, cellulose and lignin in separate streams. Three factors were evaluated in
the experimental design of organosolv process: ethanol concentration (30–80%),
temperature (160–200 ºC) and time (20–60 min). Organosolv process showed that the
best compromise between lignin removal and cellulose preservation was obtained at
highest temperature and ethanol concentration (p-value of 0.05). Maximal delignification
(49.40%) was obtained at the highest severity condition (200ºC, 60 min, 80 % EtOH).
Moreover, 35.32 g/L glucose, corresponding to a glucose yield of 49.65 %, was produced
from enzymatic hydrolysis of delignified biomass. FTIR analysis of the isolated lignins
(OL1–OL10) showed that the main lignin structure was not changed, while thermal
analysis revealed Tg values from 73 to 85 ºC. All OL presented radical scavenging activity
as high as the commercial antioxidant BHT.
Considering the glucose yield of solid fraction from AM2-3 and from organosolv,
the last one did not increase enzymatic susceptibility and for this reason the following
processes did not include this step. Whereas enzymatic susceptibility improved by
increasing pretreatment severity, M2-3 was presented to autohydrolysis pretreatment at
226 ºC. The solid fraction (AM2-3) obtained was submitted to separated hydrolysis and
fermentation (SHF) and simultaneous saccharification and fermentation (SSF) for LA
production. LA yield on glucose obtained for both assays was 1 g/g, although the
volumetric productivity of SSF (2.5 g/Lh) was higher than SHF (0.8 g/Lh). Therefore, the
SSF process was optimized through a factorial design to evaluate the effect of
independent variables, solids load and enzyme-substrate ratio (ESR), on LA production.
The maximum concentration of LA was obtained using the highest solids load (16 %) and
with the highest ESR (54 FPU/g). Finally, scale up of LA was performed in a bioreactor
under the optimized conditions in Erlenmeyer flasks, being obtained 61.74 g/L of LA at
44 h which corresponds to LA yield of 0.97 g/g.
In order to present a quantitative evaluation of the environmental loads associated
with LA production from M2-3, it was compared with the lactic acid production from
non-renewable resources and modeled using the Life Cycle Assessment method through
SimaPro®. The life cycle approach took into account the raw material, transport,
viii
Rita Pontes | Universidade de Coimbra, 2020
pretreatment, saccharification and fermentation and LA recovery considering 1 tonne of
LA as the functional unit. The major environmental savings obtained by replacing one
tonne of fossil-based LA by biobased LA are : 4056.60 kg CO2 eq. of global warming
potential; 193.03 kBq U235 eq. of ionizing radiation potential; 3.78 kg C2H4 eq of
photochemical oxidation potential; 0.73 kg PO4 3- eq freshwater eutrophication potential;
9569.40 kg 1,4-DB eq. of terrestrial ecotoxicity potential; 99.32 kg 1,4-DB eq. of fresh
water aquatic ecotoxicity potential; 137.69 kg 1,4-DB eq. of marine aquatic ecotoxicity
potential; 94.89 human toxicity potential and 126.63 m2 of land use. Auxiliary chemicals,
electricity and enzyme used in the biobased LA production are most relevant to the total
environmental impacts. Biobased LA production significantly reduces the impact on the
environment, giving 60 % environmental savings compared to fossil-derived LA.
The results obtained in this work demonstrate the potential of lignocellulosic
biomass as an unexploited raw material for an economical and environmental viable
solution to produce lactic acid by fermentation.
ix
Rita Pontes | Universidade de Coimbra, 2020
SUMÁRIO |
Otimização do scale up da biorrefinaria da plataforma
bioquímica para a produção de ácido láctico a partir de
biomassa lenhocelulósica
A biomassa lenhocelulósica, como resíduos florestais e agrícolas ou culturas
energéticas dedicadas, é uma matéria-prima renovável promissora para a produção de
biocombustíveis avançados e químicos de plataforma. O ácido láctico (LA) foi
identificado como um de elevado potencial, desempenhando um papel essencial em
aplicações industriais, que vão desde a indústria alimentar até às ciências da vida. Além
disso, o ácido láctico é amplamente utilizado na produção de polímeros de ácido
poliláctico (PLA) verdes, biodegradáveis e biocompatíveis.
A fim de desenvolver um processo eficiente de produção de LA a partir de
biomassa lenhocelulósica, complementar à seleção da biomassa, a otimização do processo
deve ser realizada. Assim, três operações principais devem ser consideradas: (1) pré-
tratamento da biomassa, (2) sacarificação enzimática para obter açúcares fermentáveis
através de celulases e (3) fermentação de açúcares por microrganismos adequados ao
ácido láctico. A seleção da matéria-prima, bem como o desenvolvimento das principais
operações do processo são o foco deste trabalho.
A seleção da matéria-prima centrou-se na avaliação de duas misturas de biomassa
lenhocelulósica (M1-4 e M2-3), ecossistemas florestais e vegetação natural, com o
objetivo de coproduzir oligossacarídeos, combustível sólido e glucose sob um conceito
de biorrefinaria. A seleção das misturas foi baseada em diferentes critérios,
nomeadamente a distribuição territorial, risco de incêndio durante os meses de Verão e
teor total de açúcar. As duas misturas foram submetidas a um pré-tratamento de
autohidrólise em condições não isotérmicas (na gama de 190 ºC - 240 ºC correspondente
a uma severidade de 3.71 a 4.82). Ambas as misturas foram comparadas em termos de
fracionamento (recuperações de celulose e lenhina e solubilização de hemicelulose) e de
suscetibilidade enzimática da celulose. As maiores recuperações de xilanos (62 e 69 %),
como xilose e xilooligossacarídeos, foram obtidas para ambas as misturas na fase líquida
a 206 ºC. Além disso, a suscetibilidade enzimática destas misturas pré-tratadas foi
x
Rita Pontes | Universidade de Coimbra, 2020
também melhorada de 45 a 90 % em rendimento da glucose, com o aumento da severidade
do pré-tratamento e, a 206 ºC, o rendimento de glucose da hidrólise enzimática resultou
em 60.1 % e 73.7 % para M1-4 e M2-3, respetivamente, esses resultados levaram à
seleção da mistura M2-3 para os processos posteriores.
A fração sólida resultante da auto-hidrólise (AM2-3) a 206 ºC foi
subsequentemente delignificada pelo processo de etanol-organosolv não catalisado para
recuperar hemicelulose, celulose e lenhina em fluxos separados. Foram avaliados três
fatores no desenho experimental do processo organosolv: concentração de etanol (30-80
%), temperatura (160-200 ºC) e tempo (20-60 min). O processo organosolv mostrou que
o melhor compromisso entre a remoção da lignina e a preservação da celulose foi obtido
nas condições extremas de temperatura e concentração de etanol (p-value de 0.05). A
delignificação máxima (49.40%) foi obtida na condição de maior severidade (200 ºC, 60
min, 80 % EtOH). Além disso, 35.32 g/L de glucose, correspondendo a um rendimento
de glucose de 49.65 %, foi produzida a partir da hidrólise enzimática da biomassa
delignificada. A análise FTIR das lenhinas isoladas (OL1-OL10) mostrou que a estrutura
principal da lenhina não foi alterada, enquanto que a análise térmica revelou valores de
Tg de 73 a 85 ºC. Todas as lenhinas (OL1-OL10) apresentavam atividade antioxidante tão
elevada quanto o antioxidante comercial BHT.
Considerando o rendimento de glucose da fração sólida do AM2-3 e do
organosolv, este último não aumentou a suscetibilidade enzimática e por esse motivo os
processos a seguir não incluíram esta etapa. Considerando que a suscetibilidade
enzimática melhorou com o aumento da severidade do pré-tratamento, M2-3 foi
submetido ao pré-tratamento de auto-hidrólise a 226 ºC. A fração sólida (AM2-3) obtida
foi submetida a hidrólise e fermentação em separado (SHF) e sacarificação e fermentação
em simultâneo (SSF) para produção de LA. O rendimento de LA em glucose obtido para
ambos os ensaios foi de 1 g/g, embora a produtividade volumétrica de SSF (2.5 g/Lh)
tenha sido superior a SHF (0.8 g/Lh). Portanto, o processo SSF foi otimizado através de
um desenho fatorial para avaliar o efeito das variáveis independentes, carga de sólidos e
relação enzima-substrato (ESR), na produção de LA. A concentração máxima de LA foi
obtida com a maior carga de sólidos (16 %) e com a maior ESR (54 FPU/g). Por fim, o
aumento de escala do LA foi realizado em biorreator nas condições otimizadas nos frascos
xi
Rita Pontes | Universidade de Coimbra, 2020
Erlenmeyer, sendo obtido 61.74 g/L de LA às 44 h que corresponde a rendimento de LA
de 0.97 g/g.
Para apresentar uma avaliação quantitativa das cargas ambientais associadas à
produção de LA a partir de M2-3, esta foi comparada com a produção de ácido láctico a
partir de recursos não renováveis e foi modelada utilizando o método de Avaliação do
Ciclo de Vida através do SimaPro®. A abordagem do ciclo de vida teve em conta a
matéria-prima, transporte, pré-tratamento, sacarificação e fermentação e recuperação de
LA, considerando 1 tonelada de LA como a unidade funcional. As maiores poupanças
ambientais obtidas através da substituição de uma tonelada de LA de base fóssil por LA
de base biológica são : 4056.60 kg CO2 eq. de potencial de aquecimento global; 193.03
kBq U235 eq. de potencial de radiação ionizante; 3.78 kg C2H4 eq de potencial de
oxidação fotoquímica; 0.73 kg PO43- eq de potencial de eutrofização de água doce;
9569.40 kg 1,4-DB eq. de potencial de ecotoxicidade terrestre; 99.32 kg 1,4-DB eq. de
potencial de ecotoxicidade aquática de água doce; 137.69 kg 1,4-DB eq. de potencial de
ecotoxicidade aquática marinha; 94.89 potencial de toxicidade humana e 126.63 m2 de
uso da terra. Os produtos químicos auxiliares, eletricidade e enzimas utilizados na
produção de LA de base biológica são os mais relevantes para os impactos ambientais
totais. A produção de LA de base biológica reduz significativamente o impacto sobre o
ambiente, proporcionando 60 % de poupança ambiental em comparação com o LA de
origem fóssil.
Os resultados obtidos neste trabalho demonstram o potencial da biomassa
lignocelulósica como matéria-prima inexplorada para uma solução económica e
ambientalmente viável para a produção de ácido lático por fermentação.
xii
Rita Pontes | Universidade de Coimbra, 2020
OUTPUTS |
Role:
Chief Research Officer of Association BLC3 - Technology and Innovation Campus
Board Member of Association BLC3 - Technology and Innovation Campus
Papers:
Pontes, R.; Michelin, M.; Romaní, A.; Teixeira, J.; Nunes, J. (2021). Assessment of the
organosolv process in a mixture of autohydrolyzed unexploited lignocellulosic biomasses
for an effective recovery and valorization of lignin. International journal of biological
macromolecules (under review to International Journal of Biological Macromolecules).
Pontes, R., Romaní, A., Michelin, M., Domingues, L. Teixeira, J., Nunes, J. 2021. L-
lactic acid production from multi-supply autohydrolyzed economically unexploited
lignocellulosic biomass. Industrial Crops and Products 170.
Pontes, R., Romaní, Aloia, Michelin, M., Domingues, L., Teixeira, J., Nunes, J. (2018).
Comparative autohydrolysis study of two mixtures of forest and marginal land resources
for co-production of biofuels and value-added compounds. Renewable Energy 128, 20-
29
Book chapter:
Pontes, R., Romaní, Aloia, Michelin, M., Domingues, L., Nunes, J., Teixeira, J. (2020).
Biobased fuel and chemicals from lignocellulosic biomass- Prospects & Challenges. In:
Mondal, S., Singh, S., Lahir, Y. (eds.), Emerging Trends in Environmental Biotechnology
(submitted).
xiii
Rita Pontes | Universidade de Coimbra, 2020
Conferences:
Pontes, R.; Michelin, M.; Romaní, A.; Domingues, L.; Teixeira, J.; Nunes, J. (2019).
Biomass fractionation of forest and marginal land resources using autohydrolysis and
organosolv processes for the lignin valorization (EUBCE 2019), Lisbon, 27-30 May,
Portugal.
Pontes, R.; Ribeiro, S.; Alves, N.; Cancela, E.; Figo, S.; Nunes, J. (2019). Assessing the
main lignocelluosic biomass resources in Portugal for biobased industries market
(EUBCE 2019), Lisbon 27-30 May, Portugal.
Nunes, C.; Pontes, R.; Nunes, J. (2019). PinusResina- Evaluation of Higher Heating
Value of Pine Resin Waste from Portugal for Energy application valorization (EUBCE
2019), Lisbon, 27-30 May, Portugal.
Pontes, R.; Romaní, A.; Michelin, M.; Domingues, L.; Teixeira, J.; Nunes, J. (2018).
Multi-feedstock biorefinery for valorization of forest and marginal land resources:
comparative autohydrolysis study (4-CIAB), Jaén, 24-26 October, Spain.
Projects Involved:
Project Biomass4Synthon: Straightening training, research and innovation capacities in
the valorisation of bio-renewable resources (H2020-EU: 900 000, 00 Euros-2021 to
2023).
BioVino Project: Development of a cross-border strategy for the eco-sustainable
recovery of waste biomass from the wine sector into integral biorefineries for biofuels
and bioproducts production. (INTERREG Spain – Portugal; FEDER –European Regional
Development Fund: 626 642, 00 Euros – 2018 to 2021).
ValorMais Project: Creation value in agri-food and forestry by-products (PDR2020:
18 500, 00 Euros - 2018 to 2020).
PinusResina Project: Identify / establish new value chains for the competitive and safe
transformation and enhancement of Pinus resin in products with high added value
(PDR2020: 163 839, 03 Euros - 2017 to 2021).
3iBioeconomia Project: Support System for Collective Actions - Transfer of Scientific
and Technological Knowledge- New 2nd and 3rd generation integrated Biorefinery
xiv
Rita Pontes | Universidade de Coimbra, 2020
system as a multi-input conversion system into three main outputs: bioenergy, biofuels
and bioproducts with high levels of energy efficiency and zero waste (PT2020:
532 216,91 Euros - 2017 to 2020)
Presentations:
Discussing meeting, International Conference of Agricultural, agrifood and forestry by-
products valorization- ValorMais Project, Polytechnic Institute of Castelo Branco
(November, 2019).
New models of multifunctional forests and ecosystem services – PinusResina Project,
RAIZ (October, 2019).
Efficient use of resources and sustainability through innovation - 3iBioeconomia Project,
Tagus Valley (May, 2018).
PinusResina Project, Competence Center of Pinheiro-Bravo, Coimbra Agricultural
School (May, 2018).
Application of new technologies, Smartagrifor Norte, School of Biotechnology
(November, 2017).
xv
Rita Pontes | Universidade de Coimbra, 2020
TABLE OF CONTENTS |
CHAPTER 0 | General Introduction……………………………………………. 1
CHAPTER 1 | Introduction……………………………………………………... 13
CHAPTER 2 | Fractionation of multi-lignocellulosic resources: Autohydrolysis
pretreatment…………………………………………............................................
43
CHAPTER 3 | Organosolv process of a mixture of autohydrolyzed biomass….. 73
CHAPTER 4 | Scale-up of lactic acid production……………………………… 103
CHAPTER 5 | Life cycle assessment of lactic acid production………………… 129
CHAPTER 6 | General conclusions and future perspectives…………………… 153
xvi
Rita Pontes | Universidade de Coimbra, 2020
LIST OF FIGURES |
Chapter 0.
Figure 1- Illustrative map of the BLC3 Association locations 1
Figure 2- BLC3 Association Main Structure 3
Figure 3- R&D Strategic areas. 4
Figure 4- Global lactic acid revenue by application (%) of 2018(“Global Lactic Acid
Market Size & Share Report, 2019-2025,” n.d.).
5
Figure 5- U.S. lactic acid market revenue, by raw material, from 2014 to 2025 (USD
Million) (“Global Lactic Acid Market Size & Share Report, 2019-2025,” n.d.)
6
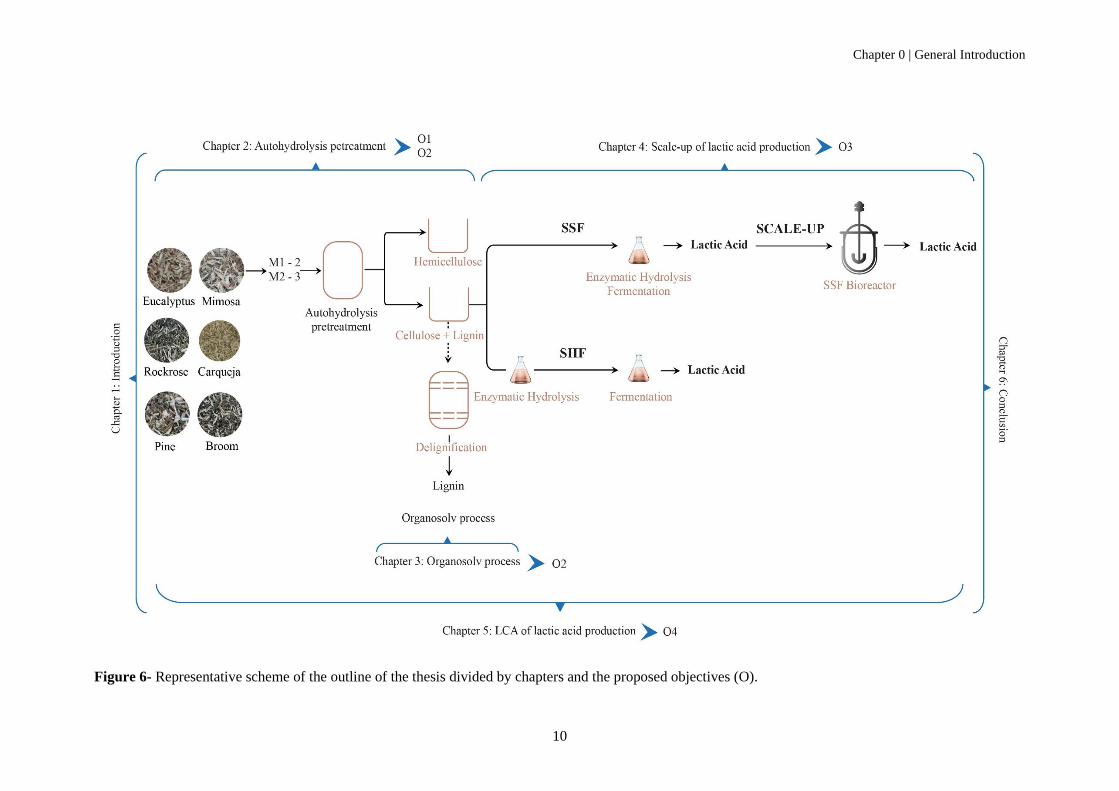
Figure 6- Representative scheme of the outline of the thesis divided by chapters and the
proposed objectives (O).
10
Chapter 1.
Figure 7- The fully integrated forest-biofuel-biomaterial-energy cycle for sustainable
technologies-Biorefinery.
16
Figure 8- Generalized scheme for the fermentation of glucose to lactic acid bacteria. 31
Figure 9- Synthesis routes of PLA. 33
Chapter 2.
Figure 10- Flow chart of whole process and analytical methods used in this work. 49
Figure 11-Figure 2- Heating and cooling temperature profiles of autohydrolysis assay
carried out at S0 = 3.71 and 4.82. TREF: temperature of reference, 100 ºC.
51
Figure 12- Evaluation of calorific value (MJ/kg) in different TMAX for M1-4 and M2-3. 61
Figure 13- Yield of glucose YG (%) at autohydrolysis conditions (TMAX) in the range 190
ºC to 240 ºC for M 1-4 (a) and M 2-3 (b).
64
Figure 14- Overall balance of M1-4 (a) and M2-3 (b) for autohydrolysis and
saccharification processing at TMAX = 206 ºC (results expressed in kg/100kg raw
material) oven dry basis.
66
Chapter 3.
Figure 15-Scheme of the organosolv delignification process. 79
Figure 16- Pareto diagrams of the responses from the cubic experimental design. (1)
EtOH (%) denotes the ethanol concentration, (2) T (ºC) the temperature, and (3) t (min)
87
xvii
Rita Pontes | Universidade de Coimbra, 2020
the time, 1by2 the interation between EtOH and T, 1by3 interation between EtOH and t,
2by3 interation between T and t.
Figure 17- Glucose yield (GY %) during enzymatic hydrolysis of the solid fraction from
organosolv treatment for the 10 % solids load (the standard desviation is presented on
the graph).
88
Figure 18- FTIR spectra of the different ethanol organosolv lignins (OL1-OL10) in a
wavenumber from 3000-700 cm-1.
90
Figure 19- Radical scavenging activities of OL samples (OL4 and OL9) compared with
commercial antioxidants (BHT and Trolox) for DPPH assay.
96
Chapter 4.
Figure 20- Comparison of the SHF and SSF processes during LA fermentation using L.
rhamnosus.
113
Figure 21- Response surface for L(24) with variable solids loads and ESR.. 116
Figure 22- Response surface YL/G (24) with variable solids loads and ESR. 118
Figure 23- Time course of glucose, xylose, lactic acid and acetic acid for the bioreactor
experiment.
120
Figure 24- Mass balance of the optimized process for L-LA production. 122
Chapter 5.
Figure 25- Schematic block flow diagram of scenario 1. 134
Figure 26- Environmental impacts for the production of 1kg of biobased LA production
according to each process.
141
Figure 27- Environmental savings in different impact categories upon replacing one kg
of LA produced from fossil resources with equivalent biobased LA.
146
xviii
Rita Pontes | Universidade de Coimbra, 2020
LIST OF TABLES |
Chapter 1.
Table 1- The contents of cellulose, hemicellulose, and lignin in different types of
lignocellulosic biomass (LCB) (% dry weight).
18-19
Table 2- Pretreatments physical, chemicals, biological or a combination of these. 21-23
Table 3- Comparison of lignocellulosic feedstocks used for the production of lactic
acid by lactic acid bacteria.
28-29
Chapter 2.
Table 4- Proportion of the two mixtures from lignocellulosic resources stablished by
quarter.
48
Table 5- Chemical composition of feedstock mixtures (M1-4 and M2-3) (expressed
in g/100g of raw material in oven-dry basis ± standard deviation on three replicate
determinations).
54
Table 6- Solid yield and chemical composition of pretreated solids and liquid fraction
of mixtures M1-4 and M2-3 after autohydrolysis pretreatment.
59
Table 7- Glucose concentration, G72, and glucose yield, YG72, at reaction time of 72
h, maximal glucose yield, YGMAX, time needed to achieve ½ of YGMAX, t1/2 and
coefficient of determination R2.
63
Chapter 3.
Table 8- Chemical composition of solid fractions after organosolv delignification
process of AM2-3.
84
Table 9- Chemical composition of precipited lignin after organosolv process of
AM2-3.
85
Table 10- ANOVA table for the studied responses. 88
Table 11- Assignments of FTIR bands of lignin (Faix, 1991). 91
Table 12- Thermal analysis of lignins. 92
Table 13- Summary of IC50 values of lignin samples. 95
Chapter 4.
Table 14- Value (real and coded) of experimental variables used in the experimental
design.
110
Table 15- ANOVA for L(24) produced response from the optimizing design. 115
Table 16- ANOVA for YL/G (24) produced response from the optimizing design. 117
Table 17- Main experimental data from 0.05 L in Erlenmeyer flask and 2 L in
bioreactor of batch process of L.rhamnosus. The fermentations conditions were 16 %
121
xix
Rita Pontes | Universidade de Coimbra, 2020
solids load and 54 FPU/g of ESR. The values correspond to the end of fermentation,
24 h and 44h respectively.
Table 18- Comparative analysis of lignocellulosic biomass conversion into lactic
acid. 123
Chapter 5.
Table 19- Input and output of LA production from lignocellulosic biomass, based on
1 tonne of biomass per batch process.
135
Table 20- Environmental impact categories considered for comparison of biobased
LA and fossil based LA production.
139
xx
Rita Pontes | Universidade de Coimbra, 2020
LIST OF SYMBOLS |
Symbols
TMAX Final temperature ºC
S0 Severity
SY Solid yield g/g
YG Glucose yield %
YG (t) Glucose yield at time t %
t1/2 Time needed to reach 50% of glucose yield h
Gt Glucose concentration at time t g/L
YL Lignin yield %
EE Lignin extraction efficiency %
DE Delignification Extend %
T Temperature ºC E Ethanol Concentration v/v t Time h GPOT Glucose potential g/L
Tg Glass transition ºC
RSA Radical Scavenging Activity %
Tonset Temperature of degradation ºC
YL/G (t) Glucose to lactic acid yield at time t g/g
L(t) Lactic acid concentration at time t g/L
YL/RM (t) Raw material to lactic acid yield at time t g/g
Qp(t) volumetric productivity at time t g/L h
xxi
Rita Pontes | Universidade de Coimbra, 2020
Abbreviations
ADP Abiotic Depletion Potential
AM Autohydrolyzed Mixture
AP Acidification Potential
ArOS Arabinooligosaccharides
AcGOS Acetyl groups
CBM Carbohydrate Binding Module
CFCs Chlorofluorocarbons
DSC Differential Scanning Calorimetry
EH Enzymatic Hydrolysis
EMP Embden-Meyerhof-Parnas
EP Eutrophication Potential
ETLA Volatile Ethyl Ester
ESR Enzyme-Substrate Ratio
F Furfural
FPU Filter Paper Units
FTIR Fourier Transform Infrared spectroscopy
FWAETP Freshwater Aquatic Ecotoxicity Potential
GOS Glucooligosaccharides
GWP Global Warming Potential
HCFCs Halons and Hydrochlorofluorocarbons
HHVs Higher Heating Values
HMF hydroxymethylfurfural HTP Human Toxicity Potential
HVLV High-Value Low-Volume
IRP Ionizing Radiation Potential
KL Klason Lignin
LA Lactic Acid
LAB LA Bacteria
LCB Lignocellulosic biomass
LCM Lignocellulosic Materials
LDA Linear Discriminant Analysis
LU Land Use
LVHV Low-Value High-Volume
MAETP Marine Aquatic Ecotoxicology Potential
ODP Ozone Layer Depletion Potential
OL Organosolv Lignin Fractions
OS Oligosaccharides
PLA Polylactic Acid
PM Particulate Matter
POCP Photochemical Oxidation Potential
PP Pentose Phosphate
PK Phosphoketolase
RSA Radical Scavenging Activity
SHF Separate Hydrolysis and Fermentation
SSCF Saccharification and Co-Fermentation
SSF Simultaneous Saccharification and Fermentation
SSR Sum of squares of residuals
TETP Terrestrial Ecotoxicity Potential
TGA Thermogravimetric Analysis
WDP Water Depletion Potential
XOS Xylooligosaccharides
1
CHAPTER 0 |
General Introduction
| Context and motivation
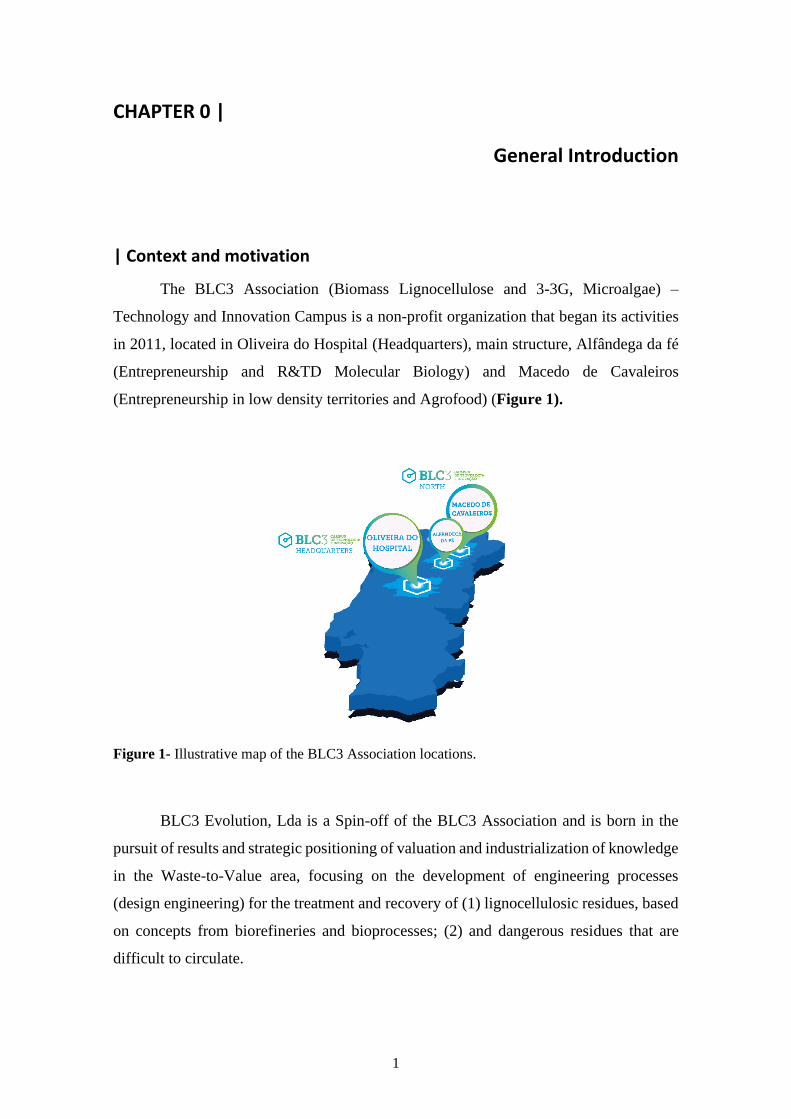
The BLC3 Association (Biomass Lignocellulose and 3-3G, Microalgae) –
Technology and Innovation Campus is a non-profit organization that began its activities
in 2011, located in Oliveira do Hospital (Headquarters), main structure, Alfândega da fé
(Entrepreneurship and R&TD Molecular Biology) and Macedo de Cavaleiros
(Entrepreneurship in low density territories and Agrofood) (Figure 1).
Figure 1- Illustrative map of the BLC3 Association locations.
BLC3 Evolution, Lda is a Spin-off of the BLC3 Association and is born in the
pursuit of results and strategic positioning of valuation and industrialization of knowledge
in the Waste-to-Value area, focusing on the development of engineering processes
(design engineering) for the treatment and recovery of (1) lignocellulosic residues, based
on concepts from biorefineries and bioprocesses; (2) and dangerous residues that are
difficult to circulate.
Chapter 0 | General Introduction
2
The Centre Bio R&D Unit is a new and unique Unit within the BLC3 Association,
recently rated “very good”.
The members of the BLC3 Association are mainly of a technical-scientific
background: Oliveira do Hospital School of Management and Technology, University of
Coimbra, National Laboratory of Energy and Geology (LNEG), University of Minho,
Porto Catholic University, Oliveira do Hospital Municipality, Institute of Catalysis and
Petrochemistry of the Higher Council of Scientific Research of Spain. João Nunes,
coordinator of the Centre Bio R&D Unit, is the founder of BLC3 Association and CEO
of BLC3 Evolution where he merged the capacities of the Academic and Industrial
partners to promote unique synergies for project development.
The BLC3 Association has been extremely engaged in collaborating with several
entities and working groups in order to expand its network (55 entities from 9 European
Countries). In 2013, BLC3 Association became the first Portuguese representative in the
European Commission's Biobased Industries Consortium (BIC), and a member of the
National Horizon 2020 Task Force and Analysis in the Societal Challenge 2 area: "Food
Security, Sustainable Agriculture, Marine and Maritime Research and Bioeconomy”. In
2014, the BLC3 Association integrated the Network of Business Incubators of the Central
Region (RIERC) and in 2015 the National Network of Business Incubators (RNIE). It is
also part of the RIS3 working group (Strategy of Intelligent Specialization: Center
Region) and the network "Mentor" North and Center of Portugal, for entrepreneurship
projects.
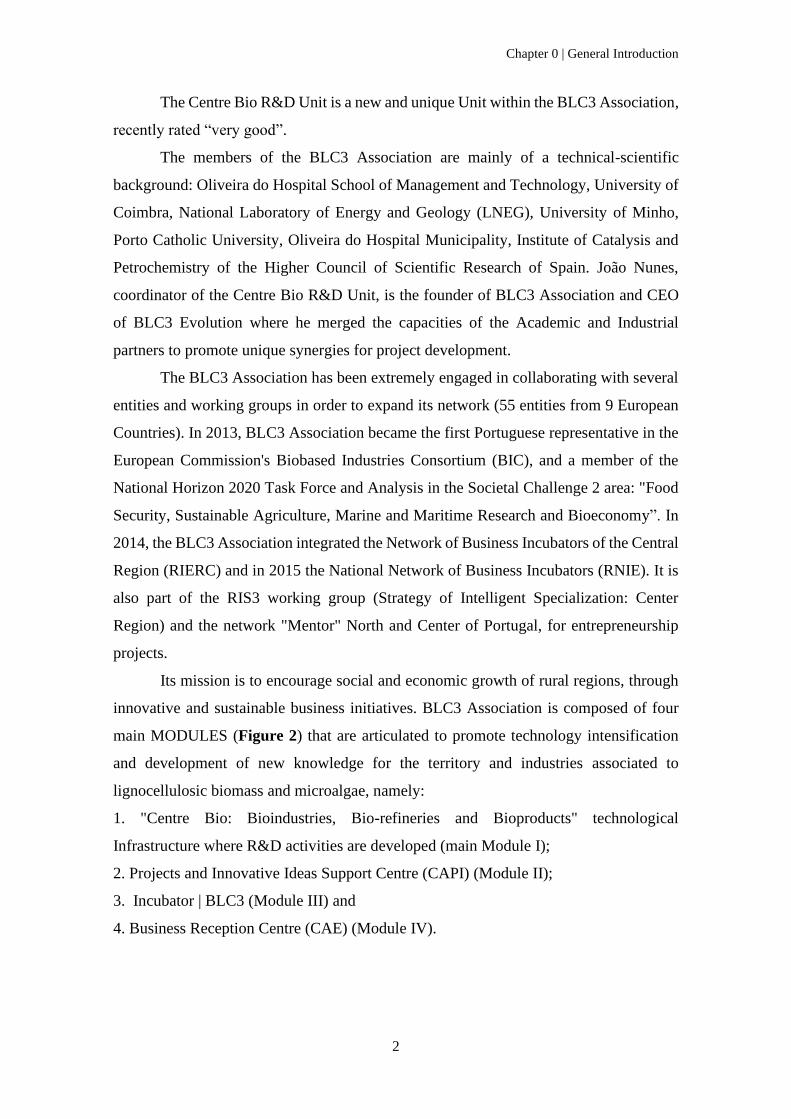
Its mission is to encourage social and economic growth of rural regions, through
innovative and sustainable business initiatives. BLC3 Association is composed of four
main MODULES (Figure 2) that are articulated to promote technology intensification
and development of new knowledge for the territory and industries associated to
lignocellulosic biomass and microalgae, namely:
1. "Centre Bio: Bioindustries, Bio-refineries and Bioproducts" technological
Infrastructure where R&D activities are developed (main Module I);
2. Projects and Innovative Ideas Support Centre (CAPI) (Module II);
3. Incubator | BLC3 (Module III) and
4. Business Reception Centre (CAE) (Module IV).
Chapter 0 | General Introduction
3
The BLC3 Awards:
- 2018 (Finalist of the Green Award Project in the category "Efficient Resource
Management";
- 2017 (Finalist at the European Commission Best Public Administration For Start Up in
the category of Green Entrepreneurship);
- 2016 (most innovative European project winner of the Regiostars prize, European
Commission, Sustainable Growth: Circular Economy category);
- 2015 (World Top 25 University Business Incubator and European Top 10 University
Business Incubator, in a group of more than 370 incubators from 76 countries;
- 2014 (2nd place in the European Enterprise Promotion Awards (EEPA) in the area of
"Supporting the development of ecological markets and resource efficiency".
With the creation of a Centre Bio R&D Unit (with the participation of the
ESTGOH/IPC - School of Technology and Management of Oliveira do Hospital of the
Polytechnic Institute of Coimbra), the BLC3 Association aims to bring Academia and
industry closer together (Academia ↔ Interface (BLC3) ↔ Industry) and to support the
transfer of knowledge and technology between higher education institutions and the
industry in a targeted and results-oriented manner.
Figure 2- BLC3 Association Main Structure
Chapter 0 | General Introduction
4
Centre Bio R&D Unit is composed of 29 integrated researchers (12 PhDs) and 11
other collaborators.
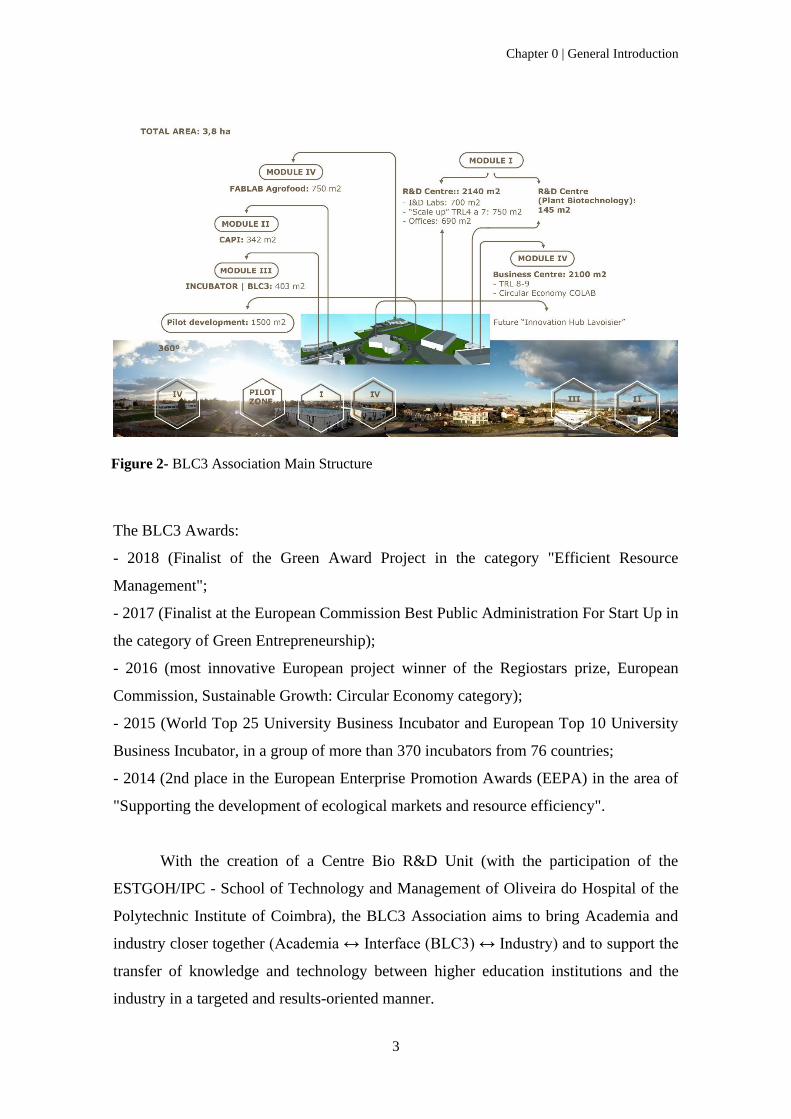
The Centre Bio R&D Unit has four main core strategic areas of action (Figure 3):
1. Citizenship: General education (including training, pedagogy and didactics for
different age students – 3 to 16 years conducted under the Lab-I-DUCA project focused
on the Bioeconomy and Circular Economy).
Support the creation of the ESTGOH/IPC Bioindustry Management course. The practical
component of the course is lectured within the BLC3 premisses.
2. Energy and Territory: Biorefineries (expanding the sustainable use of the bioresources
or biowastes, integrating to the well-known lignocellulosic biomass resources, other mass
fluxes such as, agro-industrial, fabric industries, construction and urban effluents),
industrial biotechnology, bio-processing technologies (industrial processes that rely on
biological agents to promote the process), bioproducts (products manufactured using
biological materials as raw material) biomaterials, bioplastics, biofuels, new bio-derived
materials, bio-derived chemicals;
3. Agriculture and Food Technology: food engineering and technology; plant
biotechnology; mycology; food biotechnology; biomass production technologies;
development of high value products (food and pharmaceutical) and
4. Environment and Quality of life: Turnkey solutions for effluent treatment systems,
recovery of degraded soils.
Figure 3- R&D Strategic areas.
Within the areas of action of BLC3 Association, the main motivation of this thesis
was the development of advanced technologies for biomass conversion and valorisation
Chapter 0 | General Introduction
5
in cascade of value through biochemical biorefineries for the production of bioproducts,
namely intermediate chemical building blocks, as succinic acid, lactic acid (LA), citric
acid 2,3-butanediol, ethanol, n- butanol among others (Kumar and Longhurst, 2018),
while simultaneously creating problem-solving solutions (creation of opportunities) in
the areas of the energy and environmental sector related to forest residues and innovation
strategies to sustainable use of territory (“Bioeconomy solutions”), considering the
Circular Economy concepts.
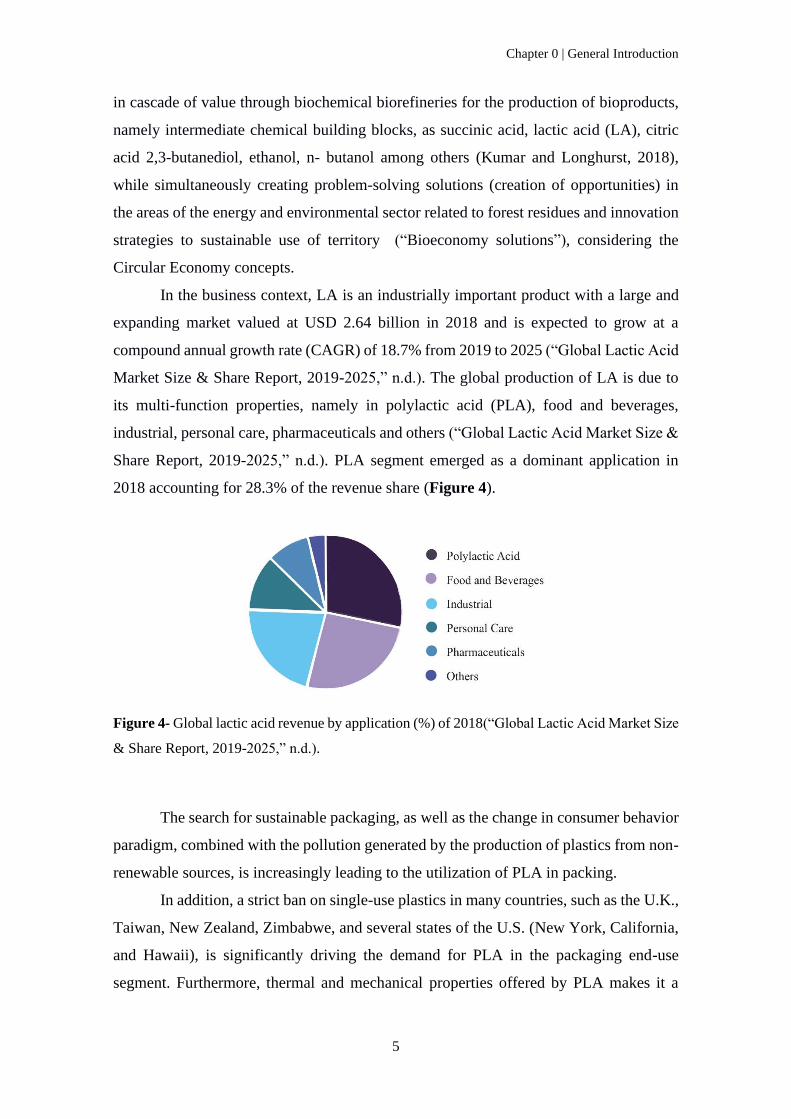
In the business context, LA is an industrially important product with a large and
expanding market valued at USD 2.64 billion in 2018 and is expected to grow at a
compound annual growth rate (CAGR) of 18.7% from 2019 to 2025 (“Global Lactic Acid
Market Size & Share Report, 2019-2025,” n.d.). The global production of LA is due to
its multi-function properties, namely in polylactic acid (PLA), food and beverages,
industrial, personal care, pharmaceuticals and others (“Global Lactic Acid Market Size &
Share Report, 2019-2025,” n.d.). PLA segment emerged as a dominant application in
2018 accounting for 28.3% of the revenue share (Figure 4).
Figure 4- Global lactic acid revenue by application (%) of 2018(“Global Lactic Acid Market Size
& Share Report, 2019-2025,” n.d.).
The search for sustainable packaging, as well as the change in consumer behavior
paradigm, combined with the pollution generated by the production of plastics from non-
renewable sources, is increasingly leading to the utilization of PLA in packing.
In addition, a strict ban on single-use plastics in many countries, such as the U.K.,
Taiwan, New Zealand, Zimbabwe, and several states of the U.S. (New York, California,
and Hawaii), is significantly driving the demand for PLA in the packaging end-use
segment. Furthermore, thermal and mechanical properties offered by PLA makes it a
Chapter 0 | General Introduction
6
suitable packaging material (“Global Lactic Acid Market Size & Share Report, 2019-
2025,” n.d.).
Another large application of LA is in the food industry as it is recognized as safe
(GRAS) food substance. LA is found in beverages, candy, meat, sauces, etc. for their
mildly acidic taste (Dusselier et al., 2013). Traditional non-food uses of LA can be found
in leather tanning, and industrial textile treatments is the third market with greater
importance.
Pharmaceutical and personal care were the fastest-growing segment, taking into
account PLA properties such as its effectiveness as a natural body constituent and chiral
intermediate in pharmaceutical products, along with pH regulation and metal
sequestration are likely to be the key factors that will contribute to its increasing use in
the pharmaceutical industry ( e.g., the use of Na-lactate in dialysis, Ca-lactate in calcium
deficiency therapy, anti-acne treatments) (Dusselier et al., 2013).
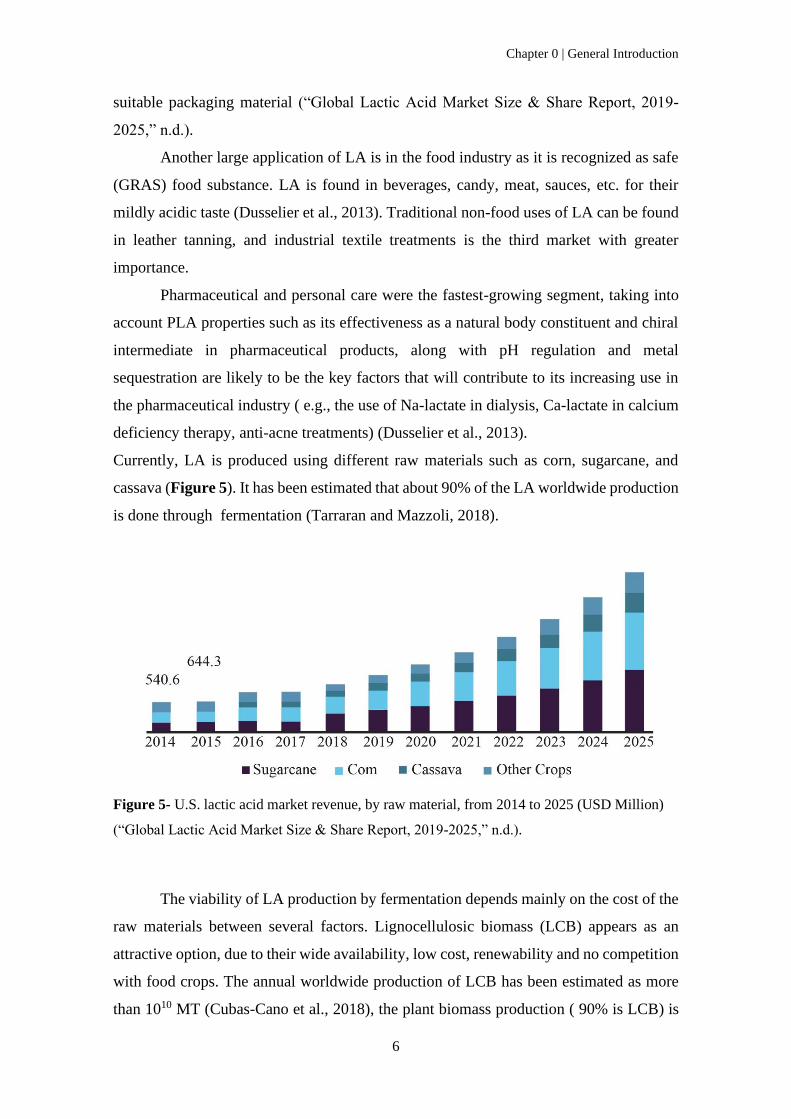
Currently, LA is produced using different raw materials such as corn, sugarcane, and
cassava (Figure 5). It has been estimated that about 90% of the LA worldwide production
is done through fermentation (Tarraran and Mazzoli, 2018).
Figure 5- U.S. lactic acid market revenue, by raw material, from 2014 to 2025 (USD Million)
(“Global Lactic Acid Market Size & Share Report, 2019-2025,” n.d.).
The viability of LA production by fermentation depends mainly on the cost of the
raw materials between several factors. Lignocellulosic biomass (LCB) appears as an
attractive option, due to their wide availability, low cost, renewability and no competition
with food crops. The annual worldwide production of LCB has been estimated as more
than 1010 MT (Cubas-Cano et al., 2018), the plant biomass production ( 90% is LCB) is
Chapter 0 | General Introduction
7
approximately 200 x 109 tons per year, where 8-20 x 109 tons of the primary biomass
remains potentially accessible (Abdel-Rahman et al., 2011). Several studies suggest the
use of LCB as feedstock for lactic acid production. There is a recent trend of using forestry
waste, agricultural waste, and industrial waste as feedstock, owing to their cost-
effectiveness for large-scale fermentation (“Global Lactic Acid Market Size & Share
Report, 2019-2025,” n.d.).
Some of the prominent players in the lactic acid are located on North America.
Corbion attained the top market position in 2018, followed by NatureWorks LLC,
Galactic, Henan Jindan Lactic Acid Technology Co., Ltd., and Synbra Technology BV
(“Global Lactic Acid Market Size & Share Report, 2019-2025,” n.d.).
| Research aims
The main aim of this thesis was the optimization of key processes for the scaling up of a
biochemical platform to produce lactic acid using forest residues as raw material. More
specifically, the objectives of this proposal were:
O1) To study the influence of raw material in the downstream processes. For this purpose,
the following different lignocellulosic residues, from natural vegetation and forest
ecosystems, were used: Broom (Cytisus sp.), Carqueja (Genista tridentate), Mimosa
(Acacia dealbata), Rockrose (Cistus ladanifer), Eucalyptus (Eucalyptus globulus) and
Pine (Pinus pinaster). These species are the source of most forest residues in Portugal,
which are also responsible for the majority of forest fires.
O1.1) To define different criteria to the use of different biomass mixtures,
according to the residual forest biomass mentioned before;
O1.2) To determine the composition of the feedstock in terms of cellulose
(as glucan), xylan, arabinan, acetyl groups, klason lignin, extractives and ashes, and to
evaluate the fractionation of biomass;
O2) To develop a pretreatment for fractionation of LCB in order to solubilize
hemicellulose fraction and reduce the lignin content to improve saccharification taking
into account the industrial scale up;
Chapter 0 | General Introduction
8
O2.1) To evaluate and optimize operational conditions of autohydrolysis
pretreatment;
O2.2) To recover lignin from the autohydrolysis solid fraction by
organosolv process, characterize it and evaluate its revalorization;
O3) To optimize Saccharification and Fermentation process of autohydrolysis solid
fraction.
O3.1) Optimize different conditions of enzymatic saccharification in order
to obtain fermentable sugars of autohydrolysis solid fraction;
O3.2) Optimize SHF and SSF processes;
O3.3) Produce lactic acid in a bioreactor by batch fermentation;
O4) To evaluate the viability of scaling up processes for further pilot and/or industrial
applications (considering the technological performance, environmental impact and cost
of a biochemical biorefinery over the whole life cycle).
| Outline of the thesis
This thesis is organized in 6 chapters, beyond the chapter 0 general introduction, which
covers the research aims stated above, as follows and outlined on Figure 6:
- Chapter 1 provides an overview of different lignocellulosic biomass,
pretreatments methods, saccharification and fermentation processes to produce
lactic acid for further polymerization to polylactic acid.
- Chapter 2 describes the selection of two mixtures (M1-2 and M2-3) of different
lignocellulosic biomass, namely, broom (Cytisus sp.), carqueja (Genista
tridentata), mimosa (Acacia dealbata), rockrose (Cistus ladanifer), eucalyptus
(Eucalyptus globulus) and pine (Pinus pinaster) residues. Biomass were collected
in the Center Inner Region and milled, including branches and twigs with bark
and leaves, for further use. Analytical assays for characterization were performed.
The two mixtures suffered a pretreatment (hydrothermal treatment or
autohydrolysis) to alter LCM recalcitrant structure and to improve enzymatic
accessibility towards cellulose. Different conditions of maximum temperature
Chapter 0 | General Introduction
9
(190 ºC, 196 ºC, 206 ºC, 216 ºC, 226 ºC and 240 ºC) were evaluated. Different
approaches were employed for the interpretation of autohydrolysis data, including
severity analysis.
- In Chapter 3, the solid fraction (enriched in cellulose and lignin) resulted from
autohydrolysis, was submitted to an organosolv process to separate lignin from
cellulose (“delignification”). Organosolv process was performed by different
ethanol concentration (v/v), temperature and time. The precipitated lignin was
recovered for further valorization. Different organosolv lignin fractions (OL1-
OL10) were chemically and thermally characterized by Fourier Transform
Infrared spectroscopy (FTIR), differential scanning calorimetry (DSC) and
thermogravimetric analysis (TGA). Moreover, lignin fractions were analyzed for
their antioxidant activity.
- Chapter 4 describes the optimization of SHF and SSF using the solid fraction
resulting from autohydrolysis at TMAX226 ºC. SHF and SSF were performed on
Erlenmeyer flasks, with the enzyme (Cellic CTec2) and the microorganism
Lactobacillus rhamnosus. Lactic acid, acetic acid, glucose and xylose were
monitored during 48 hours. The parameters (percentage of solids and enzyme
solid ratio) were optimized by a factorial design. After the conditions were
optimized, experiments were carried out in an automated bioreactor in batch
mode, with approximately 5 L of working volume.
- Chapter 5, defines the environmental impacts evaluated using Life Cycle
Assessment method using SimaPro of biobased and fossil based LA production.
The ecoinvent database of SimaPro was used for fossil based LA production while
the inventory of biobased LA was performed using the results of the lab-scale
experiments. The total environmental savings of the impact categories obtained
upon replacing a ton of fossil-based LA with biobased LA were assessed and
compared.
- In Chapter 6 the main conclusions are summarized and future perspectives from
the current work are addressed.
Chapter 0 | General Introduction
10
Figure 6- Representative scheme of the outline of the thesis divided by chapters and the proposed objectives (O).
Chapter 0 | General Introduction
11
| References
Abdel-Rahman, M.A., Tashiro, Y., Sonomoto, K., 2011. Lactic acid production from
lignocellulose-derived sugars using lactic acid bacteria: Overview and limits.
Journal of Biotechnology. https://doi.org/10.1016/j.jbiotec.2011.06.017
Cubas-Cano, E., González-Fernández, C., Ballesteros, M., Tomás-Pejó, E., 2018.
Biotechnological advances in lactic acid production by lactic acid bacteria:
lignocellulose as novel substrate. Biofuels, Bioproducts and Biorefining 12, 290–
303. https://doi.org/10.1002/bbb.1852
Dusselier, M., Van Wouwe, P., Dewaele, A., Makshina, E., Sels, B.F., 2013. Lactic acid
as a platform chemical in the biobased economy: The role of chemocatalysis. Energy
and Environmental Science 6, 1415–1442. https://doi.org/10.1039/c3ee00069a
Global Lactic Acid Market Size & Share Report, 2019-2025 [WWW Document], n.d.
URL https://www.grandviewresearch.com/industry-analysis/lactic-acid-and-poly-
lactic-acid-market (accessed 11.28.20).
Kumar, V., Longhurst, P., 2018. Recycling of food waste into chemical building blocks.
Current Opinion in Green and Sustainable Chemistry.
https://doi.org/10.1016/j.cogsc.2018.05.012
Tarraran, L., Mazzoli, R., 2018. Alternative strategies for lignocellulose fermentation
through lactic acid bacteria: The state of the art and perspectives. FEMS
Microbiology Letters. https://doi.org/10.1093/femsle/fny126
CHAPTER 1 |
Introduction
Abstract
Lignocellulosic biomass, such as forest and agriculture residues or dedicated energy
crops, is a promising renewable feedstock for the production of advanced biofuels and
chemical building blocks. Lactic acid has been identified as one with high potential,
playing an essential role in industrial applications ranging from the food industry to life-
sciences. Moreover, LA is widely used for producing green, biodegradable and
biocompatible polylactic acid polymers (PLA).
Its biochemical production includes three main operations: (1) biomass pretreatment, (2)
enzymatic saccharification to obtain fermentable sugar by cellulases and (3) the
fermentation of sugars by suitable microorganisms to lactic acid. Special emphasis has
been given to the recovery and recycling of cellulases because high enzyme costs are still
a hurdle for large competitive lignocellulosic lactic acid production. The present chapter
reviews the viability and industrial potential of the most recent advances in lactic acid
production.
Keywords: Biochemical biorefinery, lignocellulosic biomass, pretreatment, lactic acid,
lactic acid bacteria, polylactic acid
This chapter is based on the following book chapter:
Pontes, R., Romaní, Aloia, Michelin, M., Domingues, L., Nunes, J., Teixeira, J. 2020.
Biobased fuel and chemicals from lignocellulosic biomass- Prospects & Challenges. In:
Mondal, S., Singh, S., Lahir, Y. (eds.), Emerging Trends in Environmental Biotechnology
(submitted).
Chapter I | Introduction
14
Contents
1. Brief introduction: Current status ............................................................................... 15
2. Lignocellulosic biomass ............................................................................................. 17
3. Pretreatment methods ................................................................................................. 19
4. Lactic acid production by saccharification and fermentation process ........................ 24
5. Polylactic Acid ........................................................................................................... 32
6. Conclusions ................................................................................................................ 34
7. References .................................................................................................................. 35
Chapter I | Introduction
15
1.1. Brief introduction: Current status
Nowadays, the world energy requirements are largely met by fossil resources.
These non-renewable sources are used for the manufacturing of fuels, fine chemicals,
pharmaceuticals, detergents, synthetic fiber, plastics, pesticides, fertilizers, lubricants,
solvents, waxes, coke, asphalt, among others, to meet the growing demand of the
population (Yu et al., 2011). Moreover, the use of fossil resources contributes to the
emission of greenhouse gases, increasing the level of carbon dioxide in the atmosphere,
consequently contributing to global warming (Naik et al., 2010). During the last three
decades, greenhouse gas emissions have already made the global temperature rise 0.6 °C,
according to the intergovernmental panel on climate change (Bessou et al., 2011).
The economic development around the globe and the increasing shortage of
petroleum reserves, coupled with these environmental problems, greenhouse gas
emission and global warming, have boosted demand of sustainable resources for the
production of renewable energy (John et al., 2009). Currently, only 10 % of the total
energy is supplied by renewable energy including solar, wind and other renewable energy
sources (Bessou et al., 2011).
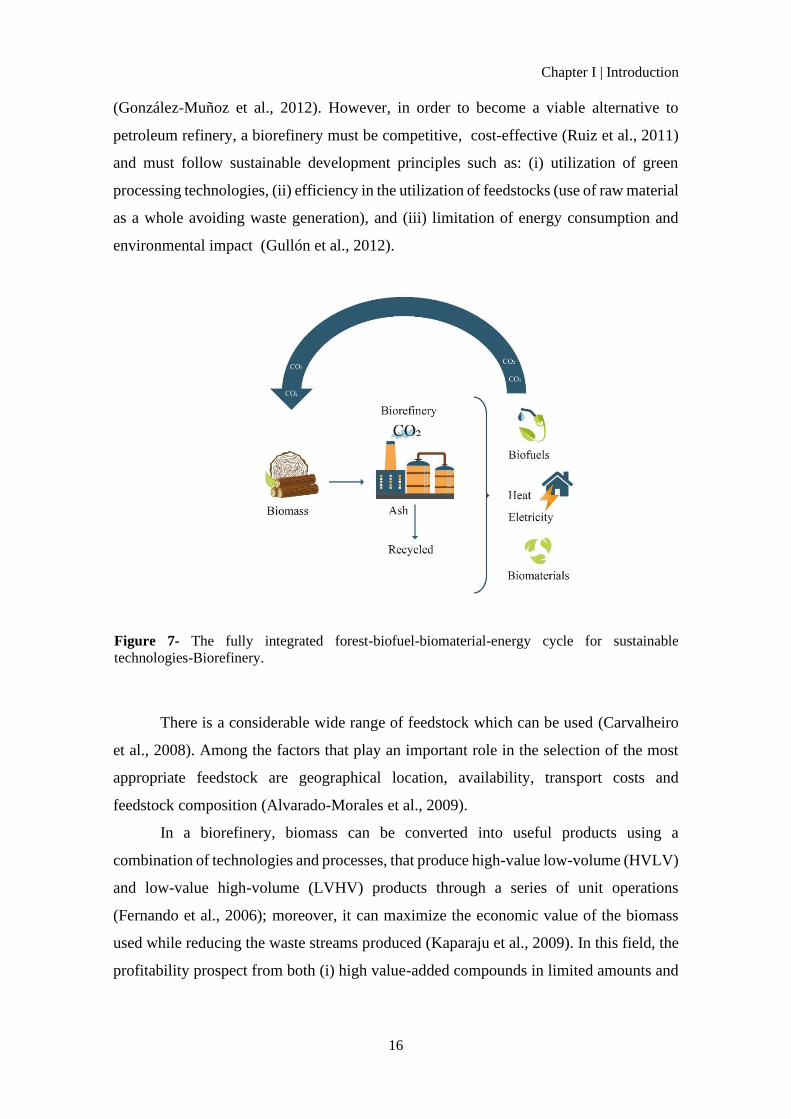
The integrated biorefinery can provide a strong, self-dependent and sustainable
alternative for the production of energy and high value-added products that could fulfill
the demand for energy and chemicals, as shown in Figure 7 (Alvarado-Morales et al.,
2009).
Generally, a biorefinery includes several processes from biological, enzymatic to
chemical technologies, where biomass feedstock is fractionated into main constituting
components (cellulose, hemicellulose and lignin) for the conversion of a wide range of
valuable products with applications in many industrial sectors, likewise to petroleum
refineries (Carvalheiro et al., 2008; Yánez et al., 2014). Nevertheless, in contrast to
petroleum refinery, a biorefinery uses renewable resources to produces fuels and
chemicals that have lower impact on the environment (Fernando et al., 2006).
Biorefineries work as a carbon “catch and release” method: as plants consume CO2
through photosynthesis, the amount of CO2 released from the Biorefinery is equal to the
amount CO2 caught by the plant. The development of new manufacturing concepts
enables the management of environmental challenges, namely, the decrease in
greenhouse gas emissions and the mitigation of global warming, as shown in Figure 7.
Chapter I | Introduction
16
(González-Muñoz et al., 2012). However, in order to become a viable alternative to
petroleum refinery, a biorefinery must be competitive, cost-effective (Ruiz et al., 2011)
and must follow sustainable development principles such as: (i) utilization of green
processing technologies, (ii) efficiency in the utilization of feedstocks (use of raw material
as a whole avoiding waste generation), and (iii) limitation of energy consumption and
environmental impact (Gullón et al., 2012).
There is a considerable wide range of feedstock which can be used (Carvalheiro
et al., 2008). Among the factors that play an important role in the selection of the most
appropriate feedstock are geographical location, availability, transport costs and
feedstock composition (Alvarado-Morales et al., 2009).
In a biorefinery, biomass can be converted into useful products using a
combination of technologies and processes, that produce high-value low-volume (HVLV)
and low-value high-volume (LVHV) products through a series of unit operations
(Fernando et al., 2006); moreover, it can maximize the economic value of the biomass
used while reducing the waste streams produced (Kaparaju et al., 2009). In this field, the
profitability prospect from both (i) high value-added compounds in limited amounts and
Figure 7- The fully integrated forest-biofuel-biomaterial-energy cycle for sustainable
technologies-Biorefinery.
Chapter I | Introduction
17
(ii) lower added-value compounds at large scale fits in the scope of biorefineries (Gullón
et al., 2012).
Consequently, a wide range of products can be made with different values and
markets. To date, most emphasis has been on fuel production but is clear that there are
many opportunities for chemical production, which will become increasingly significant
in near future (Alvarado-Morales et al., 2009). Concerning the biobased products,
building block chemicals as lactic acid can be used as monomers for the synthesis of
biodegradable polymers, including polylactic acid (PLA)(Gross and Kalra, 2002; Lee et
al., 2011). Other biobased products include: adhesives, cleaning compounds, detergents,
dielectric fluid, dyes, hydraulic fluids, inks, lubricants, packaging materials, paints and
coatings, paper and box board, plastic fillers, polymers, solvents and sorbents (Cherubini,
2010).
In this chapter we will introduce the lignocellulosic biomass structure followed by
biomass pretreatment and saccharification and then we will discuss the fermentation of
lactic acid from microorganisms.
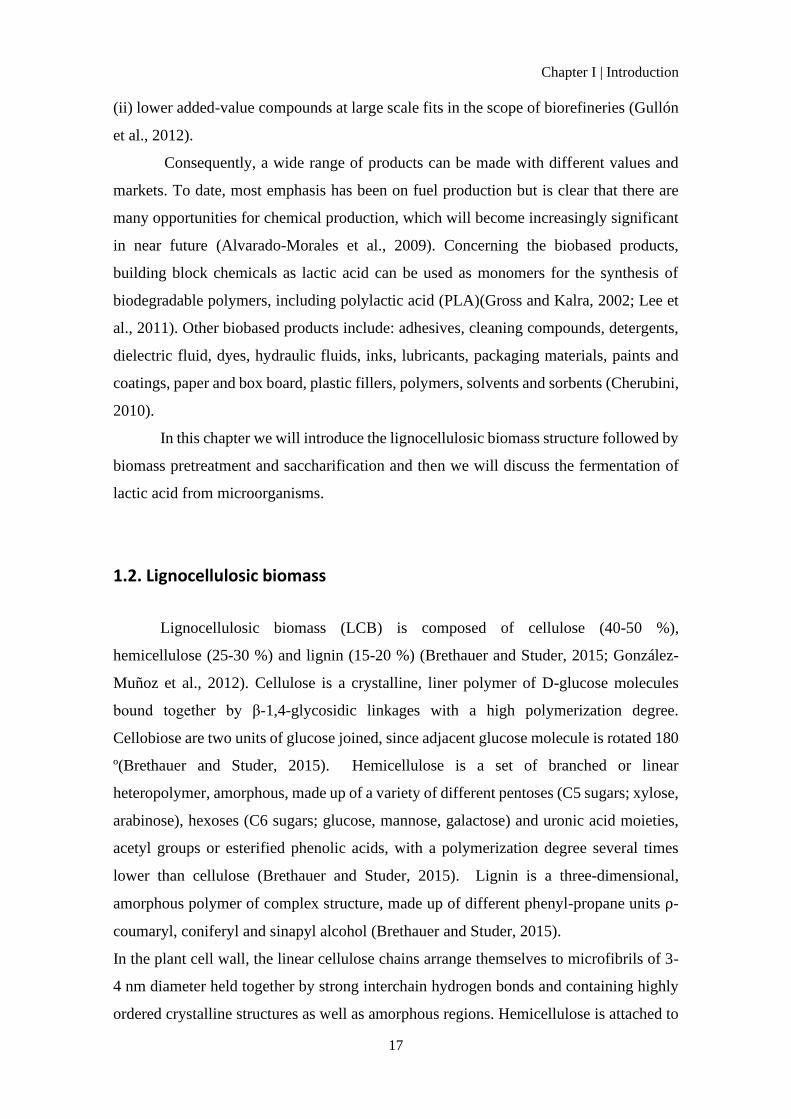
1.2. Lignocellulosic biomass
Lignocellulosic biomass (LCB) is composed of cellulose (40-50 %),
hemicellulose (25-30 %) and lignin (15-20 %) (Brethauer and Studer, 2015; González-
Muñoz et al., 2012). Cellulose is a crystalline, liner polymer of D-glucose molecules
bound together by β-1,4-glycosidic linkages with a high polymerization degree.
Cellobiose are two units of glucose joined, since adjacent glucose molecule is rotated 180
º(Brethauer and Studer, 2015). Hemicellulose is a set of branched or linear
heteropolymer, amorphous, made up of a variety of different pentoses (C5 sugars; xylose,
arabinose), hexoses (C6 sugars; glucose, mannose, galactose) and uronic acid moieties,
acetyl groups or esterified phenolic acids, with a polymerization degree several times
lower than cellulose (Brethauer and Studer, 2015). Lignin is a three-dimensional,
amorphous polymer of complex structure, made up of different phenyl-propane units ⍴-
coumaryl, coniferyl and sinapyl alcohol (Brethauer and Studer, 2015).
In the plant cell wall, the linear cellulose chains arrange themselves to microfibrils of 3-
4 nm diameter held together by strong interchain hydrogen bonds and containing highly
ordered crystalline structures as well as amorphous regions. Hemicellulose is attached to
Chapter I | Introduction
18
the outside of the microfibrils by hydrogen bonding and is covalently linked to lignin by
ester bonds (Brethauer and Studer, 2015).
Additionally, LCB contains non-structural components (including ashes, extractives,
pectins and proteins) in lower proportions (Ares-Peón et al., 2013; Romaní et al., 2010).
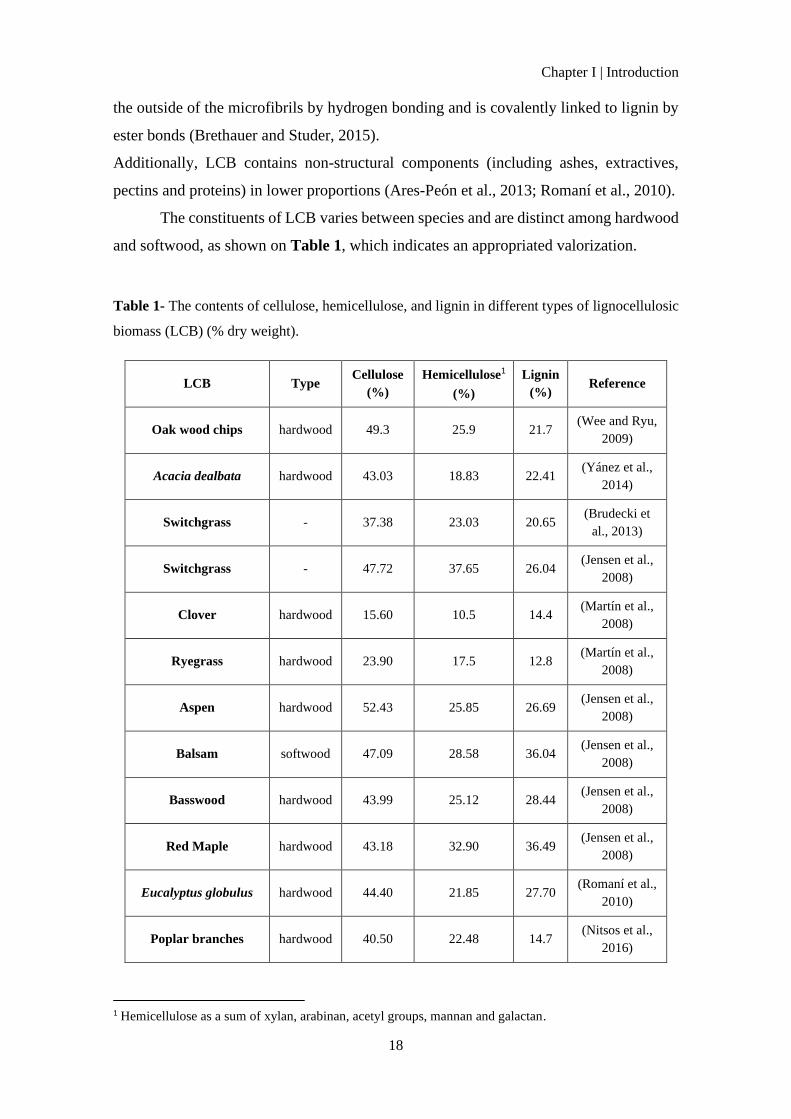
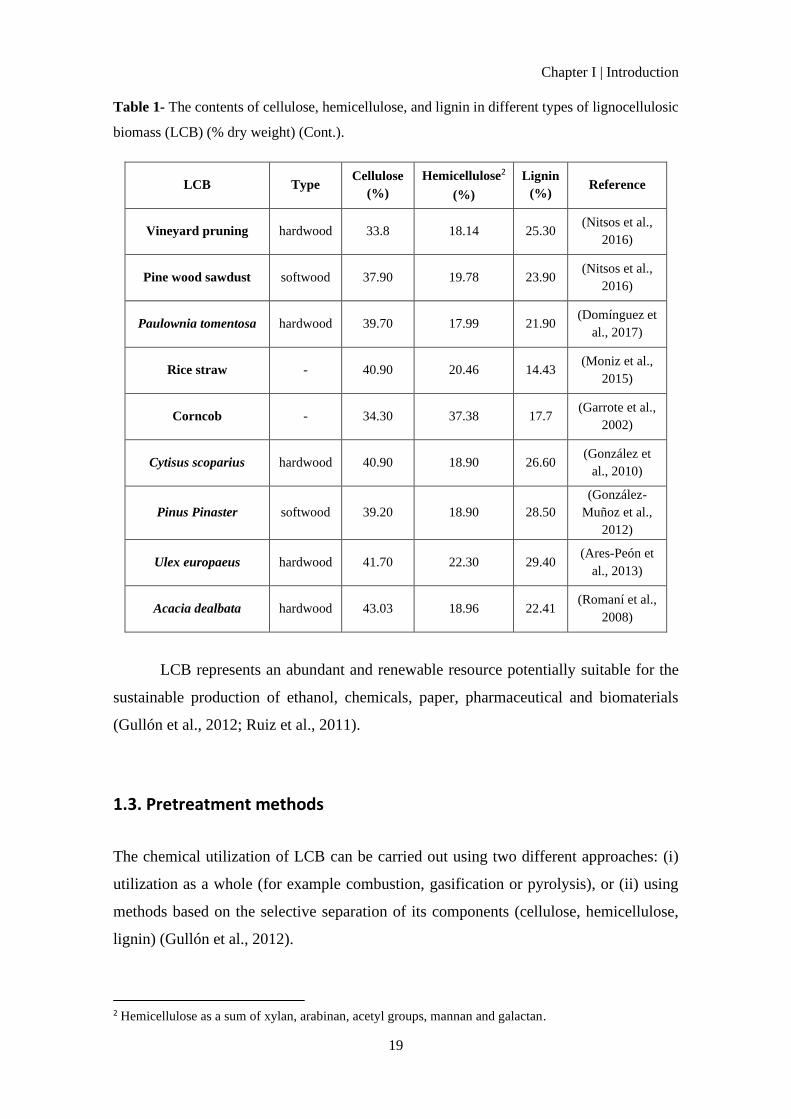
The constituents of LCB varies between species and are distinct among hardwood
and softwood, as shown on Table 1, which indicates an appropriated valorization.
Table 1- The contents of cellulose, hemicellulose, and lignin in different types of lignocellulosic
biomass (LCB) (% dry weight).
LCB Type Cellulose
(%)
Hemicellulose1
(%)
Lignin
(%) Reference
Oak wood chips hardwood 49.3 25.9 21.7 (Wee and Ryu,
2009)
Acacia dealbata hardwood 43.03 18.83 22.41 (Yánez et al.,
2014)
Switchgrass - 37.38 23.03 20.65 (Brudecki et
al., 2013)
Switchgrass - 47.72 37.65 26.04 (Jensen et al.,
2008)
Clover hardwood 15.60 10.5 14.4 (Martín et al.,
2008)
Ryegrass hardwood 23.90 17.5 12.8 (Martín et al.,
2008)
Aspen hardwood 52.43 25.85 26.69 (Jensen et al.,
2008)
Balsam softwood 47.09 28.58 36.04 (Jensen et al.,
2008)
Basswood hardwood 43.99 25.12 28.44 (Jensen et al.,
2008)
Red Maple hardwood 43.18 32.90 36.49 (Jensen et al.,
2008)
Eucalyptus globulus hardwood 44.40 21.85 27.70 (Romaní et al.,
2010)
Poplar branches hardwood 40.50 22.48 14.7 (Nitsos et al.,
2016)
1 Hemicellulose as a sum of xylan, arabinan, acetyl groups, mannan and galactan.
Chapter I | Introduction
19
Table 1- The contents of cellulose, hemicellulose, and lignin in different types of lignocellulosic
biomass (LCB) (% dry weight) (Cont.).
LCB Type Cellulose
(%)
Hemicellulose2
(%)
Lignin
(%) Reference
Vineyard pruning hardwood 33.8 18.14 25.30 (Nitsos et al.,
2016)
Pine wood sawdust softwood 37.90 19.78 23.90 (Nitsos et al.,
2016)
Paulownia tomentosa hardwood 39.70 17.99 21.90 (Domínguez et
al., 2017)
Rice straw - 40.90 20.46 14.43 (Moniz et al.,
2015)
Corncob - 34.30 37.38 17.7 (Garrote et al.,
2002)
Cytisus scoparius hardwood 40.90 18.90 26.60 (González et
al., 2010)
Pinus Pinaster softwood 39.20 18.90 28.50
(González-
Muñoz et al.,
2012)
Ulex europaeus hardwood 41.70 22.30 29.40 (Ares-Peón et
al., 2013)
Acacia dealbata hardwood 43.03 18.96 22.41 (Romaní et al.,
2008)
LCB represents an abundant and renewable resource potentially suitable for the
sustainable production of ethanol, chemicals, paper, pharmaceutical and biomaterials
(Gullón et al., 2012; Ruiz et al., 2011).
1.3. Pretreatment methods
The chemical utilization of LCB can be carried out using two different approaches: (i)
utilization as a whole (for example combustion, gasification or pyrolysis), or (ii) using
methods based on the selective separation of its components (cellulose, hemicellulose,
lignin) (Gullón et al., 2012).
2 Hemicellulose as a sum of xylan, arabinan, acetyl groups, mannan and galactan.
Chapter I | Introduction
20
For the development of lignocellulosic biorefineries, suitable fractionation
making use of environmentally friendly pretreatments is necessary. One of the main
objectives of almost all pretreatments is the removal of lignin/hemicellulose to increase
the cellulose accessibility for enzymatic hydrolysis or microorganisms (Karimi and
Taherzadeh, 2016).
LCB have external and internal surfaces, where the total accessible surface area is
the sum of both. External surface could be increased by size reduction, according to a
typical physical pretreatment, since it depends on the size and shape. Internal surface
depends on the pore size and distributions, and it decreases especially after drying. Thus,
a suitable pretreatment should significantly increase the internal surfaces (Karimi and
Taherzadeh, 2016) .
Therefore, the pretreatment is considered the first step in a biorefinery since it
allows for the disruption of LCB complex structure and facilitates the enzymatic access
to polysaccharides. Enzymatic saccharification of polysaccharides produces fermentable
sugars able to be used for bioconversion to fuels and chemicals. Hence, two steps should
be optimized, namely pretreatment and enzymatic hydrolysis (González-Muñoz et al.,
2012).
A suitable pretreatment should fulfill the following requirements: (1) allow high
carbohydrate recovery; (2) produce substrates with high digestibility towards the
subsequent enzymatic hydrolysis; (3) avoid the formation of byproducts (phenolic acids,
furfural or 5-hydroxymethylfurfural) that cause inhibition in the subsequent hydrolysis
and/or fermentation, reducing or suppressing detoxification steps; (4) suitable for
operation at high solid concentration, enabling the production of hydrolysates with high
concentration of sugars; (5) to be cost effective, (6) limited energy consumption, (7)
employ green solvents and (8) limited generation of wastes (Gregg and Saddler, 1996;
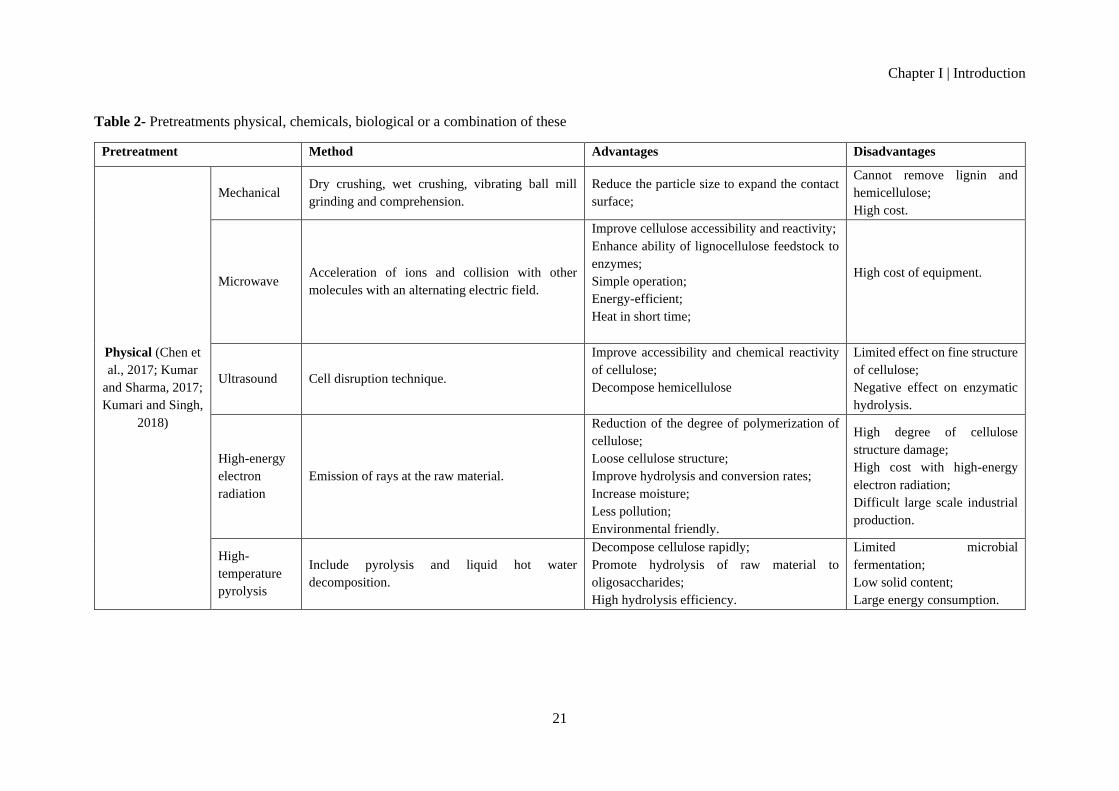
Hama et al., 2015). The multiple methods proposed for LCB pretreatment can be grouped
in different categories: physical, chemical, biological or a combination of all (Table 2).
During the pretreatment, some sugars are converted into toxic inhibitors of microbial
growth or enzymes, such as furan derivatives (mostly furfural and 5-
hydroxymethylfurfural) and several phenolic compounds (namely vanillin) and from
heavily acetylated polymers, as well as acetic acid are also formed, which is the frequent
inhibitor present in plant-biomass hydrolysates (Duarte et al., 2013).
Chapter I | Introduction
21
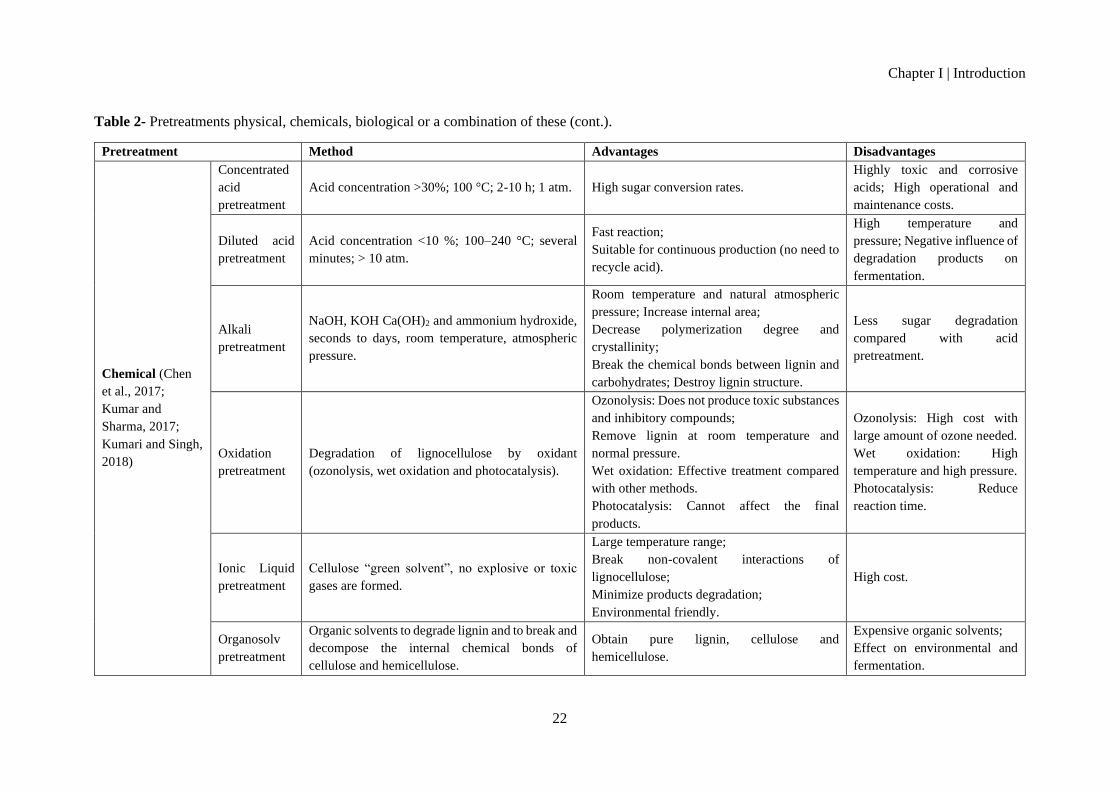
Table 2- Pretreatments physical, chemicals, biological or a combination of these
Pretreatment Method Advantages Disadvantages
Physical (Chen et
al., 2017; Kumar
and Sharma, 2017;
Kumari and Singh,
2018)
Mechanical Dry crushing, wet crushing, vibrating ball mill
grinding and comprehension.
Reduce the particle size to expand the contact
surface;
Cannot remove lignin and
hemicellulose;
High cost.
Microwave Acceleration of ions and collision with other
molecules with an alternating electric field.
Improve cellulose accessibility and reactivity;
Enhance ability of lignocellulose feedstock to
enzymes;
Simple operation;
Energy-efficient;
Heat in short time;
High cost of equipment.
Ultrasound Cell disruption technique.
Improve accessibility and chemical reactivity
of cellulose;
Decompose hemicellulose
Limited effect on fine structure
of cellulose;
Negative effect on enzymatic
hydrolysis.
High-energy
electron
radiation
Emission of rays at the raw material.
Reduction of the degree of polymerization of
cellulose;
Loose cellulose structure;
Improve hydrolysis and conversion rates;
Increase moisture;
Less pollution;
Environmental friendly.
High degree of cellulose
structure damage;
High cost with high-energy
electron radiation;
Difficult large scale industrial
production.
High-
temperature
pyrolysis
Include pyrolysis and liquid hot water
decomposition.
Decompose cellulose rapidly;
Promote hydrolysis of raw material to
oligosaccharides;
High hydrolysis efficiency.
Limited microbial
fermentation;
Low solid content;
Large energy consumption.
Chapter I | Introduction
22
Table 2- Pretreatments physical, chemicals, biological or a combination of these (cont.).
Pretreatment Method Advantages Disadvantages
Chemical (Chen
et al., 2017;
Kumar and
Sharma, 2017;
Kumari and Singh,
2018)
Concentrated
acid
pretreatment
Acid concentration >30%; 100 °C; 2-10 h; 1 atm. High sugar conversion rates.
Highly toxic and corrosive
acids; High operational and
maintenance costs.
Diluted acid
pretreatment
Acid concentration <10 %; 100–240 °C; several
minutes; > 10 atm.
Fast reaction;
Suitable for continuous production (no need to
recycle acid).
High temperature and
pressure; Negative influence of
degradation products on
fermentation.
Alkali
pretreatment
NaOH, KOH Ca(OH)2 and ammonium hydroxide,
seconds to days, room temperature, atmospheric
pressure.
Room temperature and natural atmospheric
pressure; Increase internal area;
Decrease polymerization degree and
crystallinity;
Break the chemical bonds between lignin and
carbohydrates; Destroy lignin structure.
Less sugar degradation
compared with acid
pretreatment.
Oxidation
pretreatment
Degradation of lignocellulose by oxidant
(ozonolysis, wet oxidation and photocatalysis).
Ozonolysis: Does not produce toxic substances
and inhibitory compounds;
Remove lignin at room temperature and
normal pressure.
Wet oxidation: Effective treatment compared
with other methods.
Photocatalysis: Cannot affect the final
products.
Ozonolysis: High cost with
large amount of ozone needed.
Wet oxidation: High
temperature and high pressure.
Photocatalysis: Reduce
reaction time.
Ionic Liquid
pretreatment
Cellulose “green solvent”, no explosive or toxic
gases are formed.
Large temperature range;
Break non-covalent interactions of
lignocellulose;
Minimize products degradation;
Environmental friendly.
High cost.
Organosolv
pretreatment
Organic solvents to degrade lignin and to break and
decompose the internal chemical bonds of
cellulose and hemicellulose.
Obtain pure lignin, cellulose and
hemicellulose.
Expensive organic solvents;
Effect on environmental and
fermentation.
Chapter I | Introduction
23
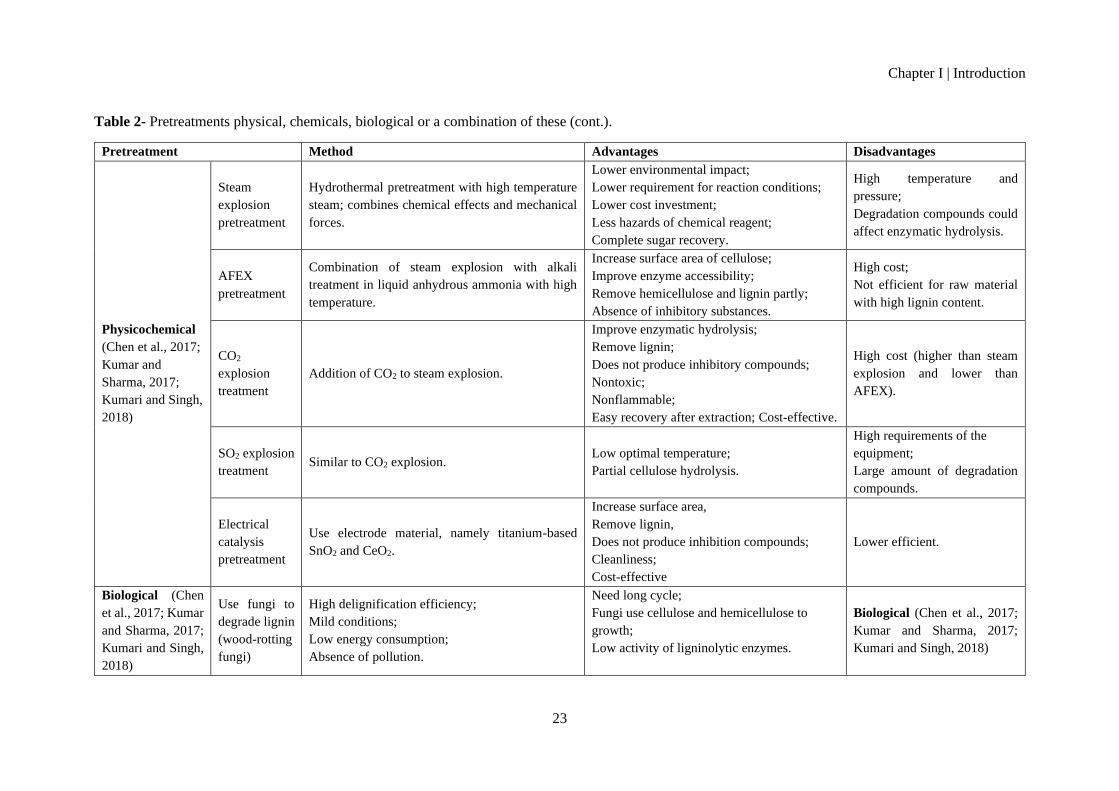
Table 2- Pretreatments physical, chemicals, biological or a combination of these (cont.).
Pretreatment Method Advantages Disadvantages
Physicochemical
(Chen et al., 2017;
Kumar and
Sharma, 2017;
Kumari and Singh,
2018)
Steam
explosion
pretreatment
Hydrothermal pretreatment with high temperature
steam; combines chemical effects and mechanical
forces.
Lower environmental impact;
Lower requirement for reaction conditions;
Lower cost investment;
Less hazards of chemical reagent;
Complete sugar recovery.
High temperature and
pressure;
Degradation compounds could
affect enzymatic hydrolysis.
AFEX
pretreatment
Combination of steam explosion with alkali
treatment in liquid anhydrous ammonia with high
temperature.
Increase surface area of cellulose;
Improve enzyme accessibility;
Remove hemicellulose and lignin partly;
Absence of inhibitory substances.
High cost;
Not efficient for raw material
with high lignin content.
CO2
explosion
treatment
Addition of CO2 to steam explosion.
Improve enzymatic hydrolysis;
Remove lignin;
Does not produce inhibitory compounds;
Nontoxic;
Nonflammable;
Easy recovery after extraction; Cost-effective.
High cost (higher than steam
explosion and lower than
AFEX).
SO2 explosion
treatment Similar to CO2 explosion.
Low optimal temperature;
Partial cellulose hydrolysis.
High requirements of the
equipment;
Large amount of degradation
compounds.
Electrical
catalysis
pretreatment
Use electrode material, namely titanium-based
SnO2 and CeO2.
Increase surface area,
Remove lignin,
Does not produce inhibition compounds;
Cleanliness;
Cost-effective
Lower efficient.
Biological (Chen
et al., 2017; Kumar
and Sharma, 2017;
Kumari and Singh,
2018)
Use fungi to
degrade lignin
(wood-rotting
fungi)
High delignification efficiency;
Mild conditions;
Low energy consumption;
Absence of pollution.
Need long cycle;
Fungi use cellulose and hemicellulose to
growth;
Low activity of ligninolytic enzymes.
Biological (Chen et al., 2017;
Kumar and Sharma, 2017;
Kumari and Singh, 2018)
Chapter I | Introduction
24
To overcome some drawbacks of the aforementioned pretreatment methods, a
combination of two or more treatments for improving the process are also reported. An
increased efficiency of sugar production, shortened process time and decreased formation
of inhibitors is observed when a combination of pretreatment methods has been tried.
These combinations of pretreatment would result in more commercial processes and
higher yields (Kumari and Singh, 2018)
Considering LCB biorefineries, the key instrument is the efficient utilization of
the major feedstock components and the development of viable technologies that allow
efficient and clean fractionation to produce multiple commercially products to develop
the so-called Bioeconomy (Menon and Rao, 2012; Nunes et al., 2012)
1.4. Lactic acid production by saccharification and fermentation process
There are four stages in production of lignocellulose-based lactic acid:
pretreatment, saccharification, fermentation and product purification (Limayem and
Ricke, 2012).
After pretreatment, enzymatic hydrolysis is used to convert cellulose and
hemicellulose into monomeric sugars. When enzymatic hydrolysis and fermentation are
performed sequentially, it is referred to as separate hydrolysis and fermentation (SHF).
However, the two processes can be performed simultaneously, i.e. simultaneous
saccharification and fermentation (SSF) (Öhgren et al., 2007). The latter is usually
described as simultaneous saccharification and co-fermentation (SSCF) when the
consumption of different sugars take place (Cubas-Cano et al., 2018).
SHF is the conventional method that allows hydrolysis process to work first to
produce monosaccharide sugar, so this is available when the fermentation begins.
Through this method, each process should operate at optimum conditions (Dahnum et al.,
2015).SSF improves enzymatic hydrolysis because glucose is continuously removed by
fermentation as soon is produced, thus preventing the sugars accumulation and enzyme
end-product inhibition. Besides the reducing of end-product inhibition, reduces
equipment cost, as saccharification and fermentation are performed in the same step and
in the same reactor and have lower enzyme requirements (Gregg and Saddler, 1996;
Wyman et al., 1992).
Chapter I | Introduction
25
In recent years, cellulolytic enzymes have increasingly gained attention for
lignocellulose hydrolysis. The main drawback is that the cost of enzymes significantly
contributes to the total process cost (Cavka et al., 2014). According to the National
Renewable Energy Laboratory’s (NREL) 2011 report, the enzyme cost accounts for
15,7% of the total cost considering enzyme loading of 20 mg per gram glucan (Jin et al.,
2012).
Enzymatic hydrolysis generally consists of three steps: adsorption of cellulase
enzymes onto the surface of cellulose, the subsequent breakdown of cellulose to
fermentable sugars and the desorption of the cellulase enzymes into de supernatant
(Gregg and Saddler, 1996).The susceptibility of cellulosic substrates to enzymatic
hydrolysis depends on (1) cellulose crystallinity, (2) degree of cellulose polymerization,
(3) lignin content, and (4) surface area accessible to cellulases (Gregg and Saddler, 1996).
There is adsorption of cellulases onto lignin due to hydrophobic interaction lignin-
enzyme. Lignin is one of the major barriers in enzymatic hydrolysis, and thus,
delignification improves cellulose saccharification, being greater than 90% of theoretical
maximum and decreasing enzyme losses, as the solid fiber remaining with the residual
lignin is highly susceptible to cellulose hydrolysis (Ruiz et al., 2011).
Although several factors affect hydrolysis rate, such as enzyme inhibition or
recalcitrant substrate, complete hydrolysis could be obtained and the majority of cellulose
added will be free on the solution (Gregg and Saddler, 1996).
Recovery and recycling of enzymes are the strategies that have been adopted to
decrease the cost of overall enzymatic processes (John et al., 2009). An efficient cellulase
recycling process should meet the following requirements: (1) high stable cellulase, (2)
high hydrolysis efficiency, and (3) good control over the substrate adsorption/desorption
processes (Gomes et al., 2015). A vast number of methods have been extensively
investigated to recycle enzymes, such as: immobilization (Verardi et al., 2012);
membrane separation; chromatography or affinity purification (Rashid et al., 2013); and
re-adsorption with fresh substrate (Rodrigues et al., 2014).
Consequently, there are two complementary strategies to recover cellulases, one
regarding the fraction of enzymes present in the liquid phase and the other one relating to
the solid bound fraction (Gregg and Saddler, 1996; Rodrigues et al., 2014).
Free cellulases in bulk solution may be recovered by promoting its re-adsorption
on fresh substrate. It is a simple and low-cost method of enzyme recovery after
Chapter I | Introduction
26
lignocellulose bioconversion (Gregg and Saddler, 1996; Guo et al., 2015). Cellulases can
be recovered through the exposure to fresh substrate, relying on their high capacity to
adsorb the solid residue. Fresh substrate (usually the same amount of the first cycle) is
added to the free cellulase suspension and the adsorption occurs (under optimal
conditions). Afterwards, the overall suspension is filtered or centrifuged to separate the
fresh substrate with bound cellulases from the product of hydrolysis. The solid is
resuspended in buffer and supplemented with fresh β-glucosidase, allowing the next
round of hydrolysis. The addition of fresh β-glucosidase is mandatory since it lacks the
carbohydrate binding module (CBM) and cannot bind to cellulose substrate (Gomes et
al., 2015). However, the process cost will increase due to supplementation of β-
glucosidase (Guo et al., 2015).
Most cellulases are found free on liquid fraction, however the solid-bound
cellulases may also be recovered, almost all desorption methods involve pH shift or
addition of chemicals (alcohols or surfactants). The control of pH allows a substantial
control over the cellulase adsorption/desorption onto the substrate. Alkaline environment
increases the cellulases desorption. The amount of desorbed cellulase increased from 20%
with an acidic neutral pH to 80% with alkaline pH (Gomes et al., 2015).
The addition of chemicals also showed influence on binding of cellulases to both
lignin and cellulose, with the consequent improvement of hydrolysis and cellulase
recovery. Among several detergents, Tween 80 led to enzyme desorption increase.
However, polyhydric alcohols (ethylene glycol and glycerol) were efficient in cellulase
desorption compared to surfactants (e.g. Tweens, Triton X-100) (Gomes et al., 2015; Guo
et al., 2015).
Temperature is the major influence on cellulase recycling efficiency. Cellulase
desorption increased when temperature raised from 24 to 45 ◦C but dropped rapidly in
the range of 50 to 75 ◦C. Higher temperatures may favor a faster reaction rate but also
lead to a faster denaturation (Gomes et al., 2015).
A significant reduction in the cost of cellulases is an urgent requirement to enable
an economically sustainable utilization of lignocellulosic biomasses. Enzyme recycling
depends on the amounts of lignin and cellulose, the affinity of cellulases for the substrate,
the pH, the presence of additives and the temperature and, enzymes recycling is possible
only as long as they are stable through several cycles (Gomes et al., 2015; Rodrigues et
al., 2014).
Chapter I | Introduction
27
LCB is a potential feedstock for the production of organic acids, such as lactic
acid. Both cellulose and hemicellulose can be hydrolyzed into fermentable
monosaccharides such as glucose and xylose and converted to lactic acid (Maas et al.,
2006). Some successful examples of LA production from lignocellulosic biomasses are
displayed on Table 3. Lactic acid production from renewable biomass is economic and
environmental friendly, comparing with the lactic acid production from fossil resources,
which is now widely accepted as unsustainable due to resources depletion and the
accumulation of environmentally hazardous chemicals (John et al., 2009).
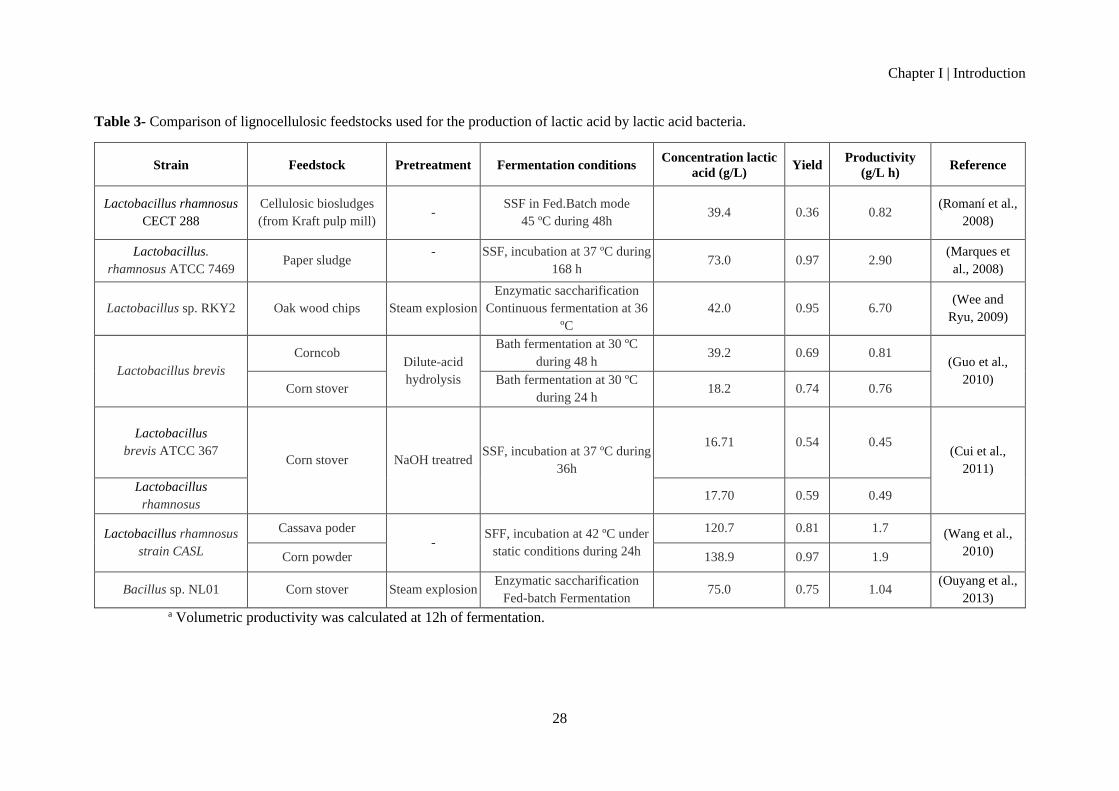
Chapter I | Introduction
28
Table 3- Comparison of lignocellulosic feedstocks used for the production of lactic acid by lactic acid bacteria.
Strain Feedstock Pretreatment Fermentation conditions Concentration lactic
acid (g/L) Yield
Productivity
(g/L h) Reference
Lactobacillus rhamnosus
CECT 288
Cellulosic biosludges
(from Kraft pulp mill) -
SSF in Fed.Batch mode
45 ºC during 48h 39.4
0.36
0.82 (Romaní et al.,
2008)
Lactobacillus.
rhamnosus ATCC 7469 Paper sludge
-
SSF, incubation at 37 ºC during
168 h 73.0 0.97 2.90
(Marques et
al., 2008)
Lactobacillus sp. RKY2 Oak wood chips Steam explosion
Enzymatic saccharification
Continuous fermentation at 36
ºC
42.0 0.95 6.70 (Wee and
Ryu, 2009)
Lactobacillus brevis
Corncob Dilute-acid
hydrolysis
Bath fermentation at 30 ºC
during 48 h 39.2 0.69 0.81
(Guo et al.,
2010) Corn stover
Bath fermentation at 30 ºC
during 24 h 18.2 0.74 0.76
Lactobacillus
brevis ATCC 367
Corn stover NaOH treatred
SSF, incubation at 37 ºC during
36h
16.71 0.54 0.45 (Cui et al.,
2011)
Lactobacillus
rhamnosus 17.70 0.59 0.49
Lactobacillus rhamnosus
strain CASL
Cassava poder -
SFF, incubation at 42 ºC under
static conditions during 24h
120.7 0.81 1.7 (Wang et al.,
2010) Corn powder 138.9 0.97 1.9
Bacillus sp. NL01 Corn stover Steam explosion Enzymatic saccharification
Fed-batch Fermentation 75.0 0.75 1.04
(Ouyang et al.,
2013)
a Volumetric productivity was calculated at 12h of fermentation.
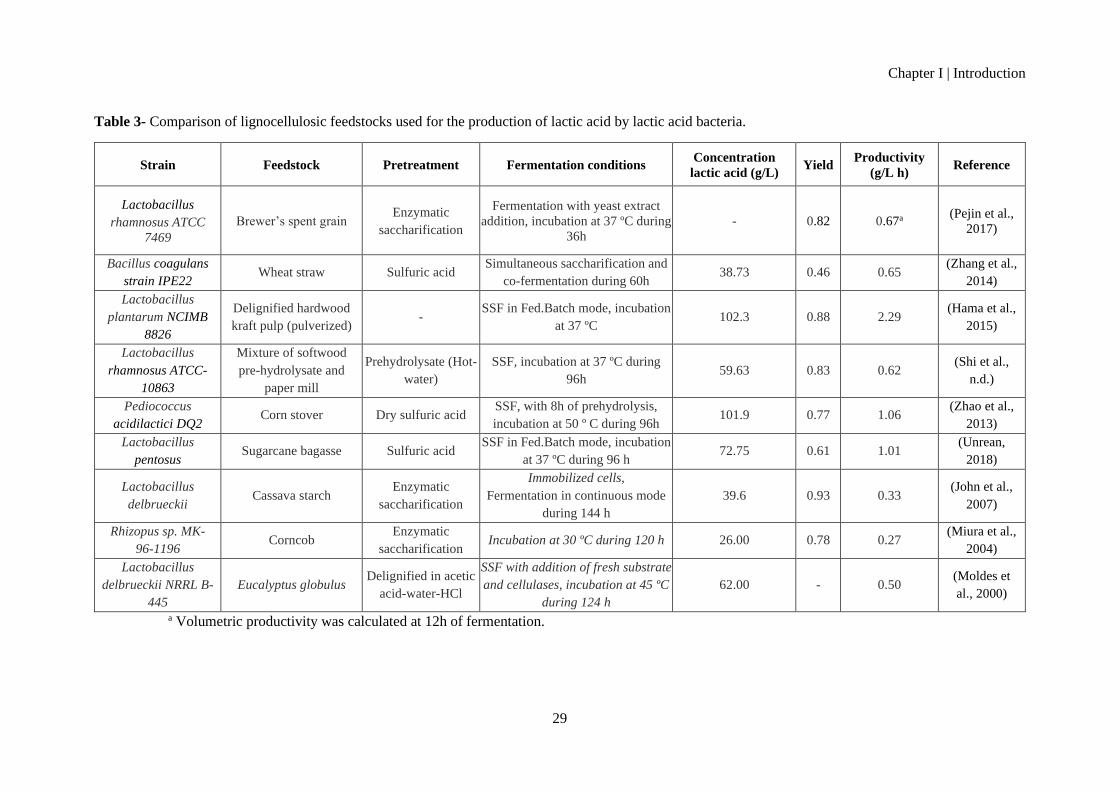
Chapter I | Introduction
29
Table 3- Comparison of lignocellulosic feedstocks used for the production of lactic acid by lactic acid bacteria.
Strain Feedstock Pretreatment Fermentation conditions Concentration
lactic acid (g/L) Yield
Productivity
(g/L h) Reference
Lactobacillus
rhamnosus ATCC
7469
Brewer’s spent grain
Enzymatic
saccharification
Fermentation with yeast extract
addition, incubation at 37 ºC during
36h
- 0.82 0.67a (Pejin et al.,
2017)
Bacillus coagulans
strain IPE22 Wheat straw Sulfuric acid
Simultaneous saccharification and
co-fermentation during 60h 38.73 0.46 0.65
(Zhang et al.,
2014)
Lactobacillus
plantarum NCIMB
8826
Delignified hardwood
kraft pulp (pulverized) -
SSF in Fed.Batch mode, incubation
at 37 ºC 102.3 0.88 2.29
(Hama et al.,
2015)
Lactobacillus
rhamnosus ATCC-
10863
Mixture of softwood
pre-hydrolysate and
paper mill
Prehydrolysate (Hot-
water)
SSF, incubation at 37 ºC during
96h 59.63 0.83 0.62
(Shi et al.,
n.d.)
Pediococcus
acidilactici DQ2 Corn stover Dry sulfuric acid
SSF, with 8h of prehydrolysis,
incubation at 50 º C during 96h 101.9 0.77 1.06
(Zhao et al.,
2013)
Lactobacillus
pentosus Sugarcane bagasse Sulfuric acid
SSF in Fed.Batch mode, incubation
at 37 ºC during 96 h 72.75 0.61 1.01
(Unrean,
2018)
Lactobacillus
delbrueckii Cassava starch
Enzymatic
saccharification
Immobilized cells,
Fermentation in continuous mode
during 144 h
39.6 0.93 0.33 (John et al.,
2007)
Rhizopus sp. MK-
96-1196 Corncob
Enzymatic
saccharification Incubation at 30 ºC during 120 h 26.00 0.78 0.27
(Miura et al.,
2004)
Lactobacillus
delbrueckii NRRL B-
445
Eucalyptus globulus Delignified in acetic
acid-water-HCl
SSF with addition of fresh substrate
and cellulases, incubation at 45 ºC
during 124 h
62.00 - 0.50 (Moldes et
al., 2000)
a Volumetric productivity was calculated at 12h of fermentation.
Chapter 1 | Introduction
30
Lactic acid (LA) is the simplest hydroxyl acid and presents a hydroxyl group
adjacent to the carboxyl group (2-hydroxypropanoic acid, CH3-CH(OH)-COH)) (Cubas-
Cano et al., 2018). Due to the chirality of LA, there are two optical forms L(+) and D(-):
the first is produced in humans, other mammals and bacterial systems, the other is only
produced in bacterial systems (Garlotta, 2002). Pure isomers are more valuable than the
racemic mixture, since each one has a specific industrial role. Considering food and
pharmaceutical industries, L-LA have a preference as it can be metabolized by the human
body due to the presence of L-lactate dehydrogenase. In view of green chemistry, both
isomers can be used in the production of acetaldehyde, propylene glycol, propionic acid,
acrylic acid, 2,3-pentadione and mainly polylactic acid (PLA) (Cubas-Cano et al., 2018).
LA is industrially produced either by chemical synthesis or by microbial
fermentation, 90% of LA produced commercially is made by bacterial fermentation,
while only 10% is produced synthetically by the hydrolysis of lactonitrile (Schmidt and
Padukone, 1997; Hofvendahl and Hahn-Hägerdal, 2000; John, Madhavan Nampoothiri
and Pandey, 2007).
LA bacteria (LAB) are included in the order Lactobacillales by 16S rRNA
sequencing (Cubas-Cano et al., 2018). They are a group of Gram-positive bacteria, non-
respiring, non-spore forming, cocci or rods, which produce lactic acid as the major
metabolic end product from fermentation of sugars. LAB contains six families with 38
genera and the main species cover Lactococcus (Lc), Lactobacillus (Lb), Leuconostoc
(Leu), Pediococcus (Ped), Enterococcus and Streptococcus (Str). There are also some
non-LAB that produce LA with significant yields, namely, Escherichia coli,
Corynebacterium glutamicum and, among them, several Bacillus strains (Cubas-Cano et
al., 2018). Even as the filamentous fungus Rhizopus oryzae is another natural producer,
that has the advantage of growing on mineral medium and carbon sources such as starch
or xylose (Sauer et al., 2008).
LAB have high acid tolerance and survive pH 5 and lower. Their acid tolerance
gives them competitive advantage over other bacteria. The optimal temperature for
growth varies between the genera from 20 ºC to 45 º. Most of them are considered GRAS
(generally regarded as safe) (Hofvendahl and Hahn–Hägerdal, 2000).
LAB have complex nutrients requirements, due to their limited ability to
synthetize B-vitamins and amino acids. Therefore, they are naturally found in nutrient-
rich environments such as in plants, milk and inside the human and animal bodies. A
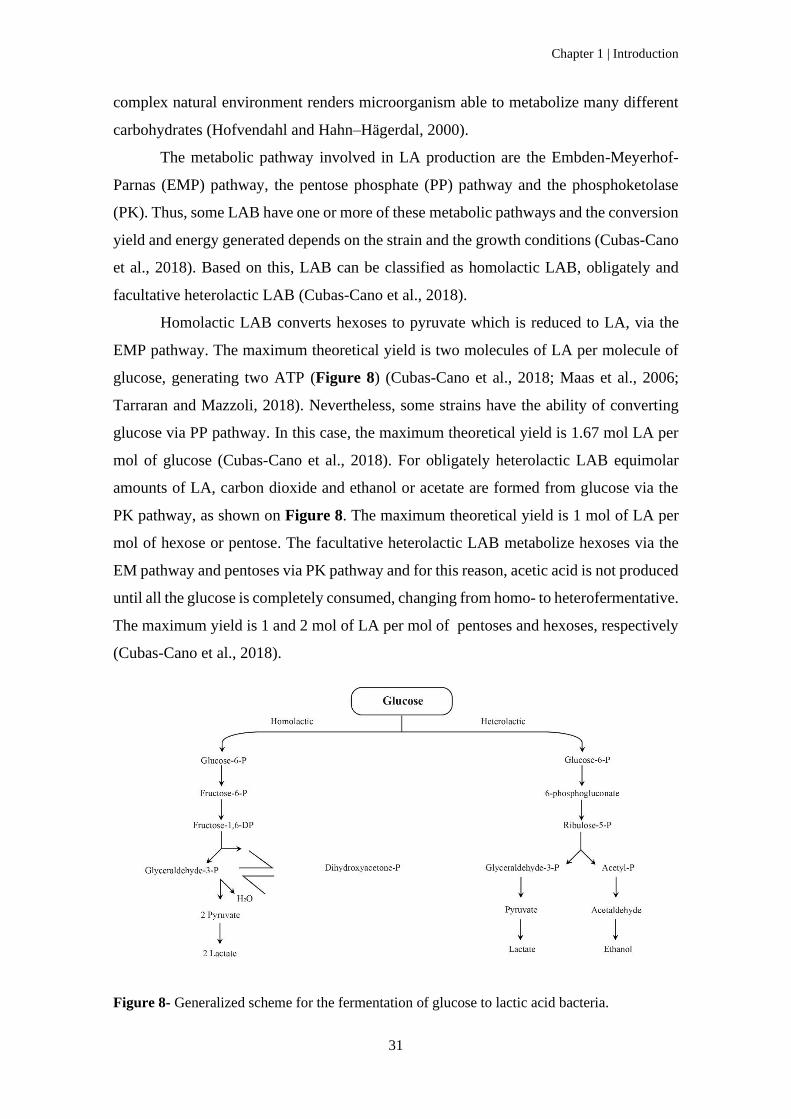
Chapter 1 | Introduction
31
complex natural environment renders microorganism able to metabolize many different
carbohydrates (Hofvendahl and Hahn–Hägerdal, 2000).
The metabolic pathway involved in LA production are the Embden-Meyerhof-
Parnas (EMP) pathway, the pentose phosphate (PP) pathway and the phosphoketolase
(PK). Thus, some LAB have one or more of these metabolic pathways and the conversion
yield and energy generated depends on the strain and the growth conditions (Cubas-Cano
et al., 2018). Based on this, LAB can be classified as homolactic LAB, obligately and
facultative heterolactic LAB (Cubas-Cano et al., 2018).
Homolactic LAB converts hexoses to pyruvate which is reduced to LA, via the
EMP pathway. The maximum theoretical yield is two molecules of LA per molecule of
glucose, generating two ATP (Figure 8) (Cubas-Cano et al., 2018; Maas et al., 2006;
Tarraran and Mazzoli, 2018). Nevertheless, some strains have the ability of converting
glucose via PP pathway. In this case, the maximum theoretical yield is 1.67 mol LA per
mol of glucose (Cubas-Cano et al., 2018). For obligately heterolactic LAB equimolar
amounts of LA, carbon dioxide and ethanol or acetate are formed from glucose via the
PK pathway, as shown on Figure 8. The maximum theoretical yield is 1 mol of LA per
mol of hexose or pentose. The facultative heterolactic LAB metabolize hexoses via the
EM pathway and pentoses via PK pathway and for this reason, acetic acid is not produced
until all the glucose is completely consumed, changing from homo- to heterofermentative.
The maximum yield is 1 and 2 mol of LA per mol of pentoses and hexoses, respectively
(Cubas-Cano et al., 2018).
Figure 8- Generalized scheme for the fermentation of glucose to lactic acid bacteria.
Chapter 1 | Introduction
32
The conventional method to produce lactic acid is an anaerobic fermentation in
batch reactors, and, in order to keep the fermentation, the acid produced is neutralized
with alkali or removed from the fermentation system (John, 2011).
LA is an interesting end-product due to its (i) high market price, (ii) growing
demand, (iii) high fermentation yield (theoretical product yield in homolactic
fermentations) and (iv) wide range of applications (Moldes, Alonso and Parajó, 2000).
The most important application of LA may yet be as a raw material for producing
the polymer polylactic acid (PLA). However, the use of LA has a wide range of
applications, such as acidulant, flavoring and preservative in the food, pharmaceutical,
leather and textile industries, and for the production of other base chemicals (Schmidt and
Padukone, 1997; Hofvendahl and Hahn–Hägerdal, 2000; John, Madhavan Nampoothiri
and Pandey, 2007)
1.5. Polylactic Acid
PLA is one of the most important commercial biodegradable thermoplastic
polymer. Not only does it has a favorable melting point (around 160–180 °C, below the
temperatures at which natural fibers start to degrade), but it is also versatile (many
applications in several areas), suitable for melt processing (injection molding),
biodegradable, thermoplastic and very strong (González et al., 2010; John et al., 2009).
This polymer is an appropriate material for the manufacture of fibers, nonwoven fabrics
and films and its use for packing is also starting to gain interest (Cubas-Cano et al., 2018).
Recently, Naturworks LLC, the major producer of PLA, has doubled the
production capacity of its PLA plant in Blair (Nebraska, USA) reaching 140.000 metric
tons/year. Environmental concerns and legislatives incentives, particularly in the
European Union (EU) and the United States (US), tend to promote the use of
biodegradable plastics (González et al., 2010).
The mixtures of both isomers (L-LA and D-LA) are used in polymerization of
PLA. However, the resulting polymer is amorphous and unstable. Nevertheless, using
optically pure L-LA and D-LA, highly crystalline poly-D-(-)-lactic acid (PDLA) or poly-
L-(+)-lactic acid (PLLA) is formed (Cubas-Cano et al., 2018).
The synthesis of lactic acid into PLA can follow two different routes of
polymerization (Figure 9). Lactic acid can be polymerized to yield a low-molecular
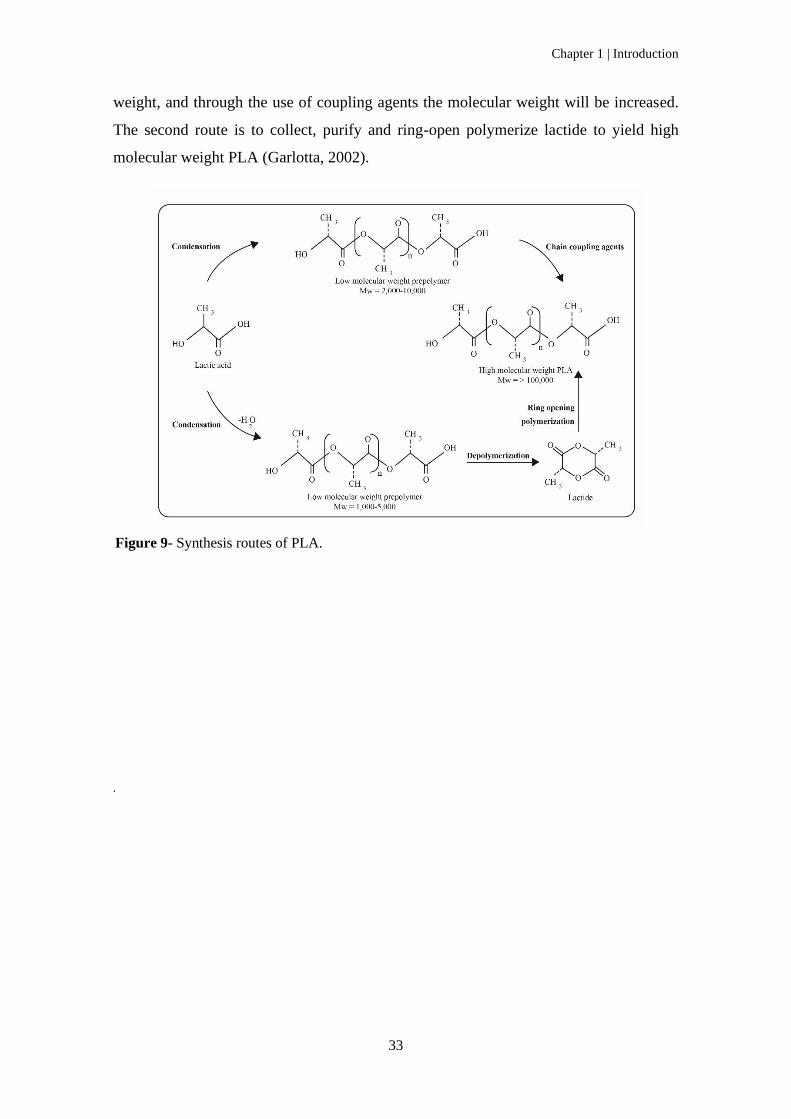
Chapter 1 | Introduction
33
weight, and through the use of coupling agents the molecular weight will be increased.
The second route is to collect, purify and ring-open polymerize lactide to yield high
molecular weight PLA (Garlotta, 2002).
.
Figure 9- Synthesis routes of PLA.
Chapter 1 | Introduction
34
1.6. Conclusions
Lactic acid production from lignocellulosic biomass has received a lot of attention
in recent years. The cost of the raw material is one of the most significant factors affecting
the viability of LA production, making the selecting of the appropriate raw material a key
factor for the profitability of the process. From process point of view, choosing the right
configuration will increase the yield and productivity. Considering the microorganism,
the ability to produce optically pure LA remains one of the major obstacles to reach cost-
effective LA production.
Thus, a chemical platform for the valorization of lignocellulosic biomass, aiming
at the production of biobased chemicals, with high value, can contribute to reduce the
world’s dependence on fossil fuels while also increasing the viability of the biorefining
industry.
Chapter 1 | Introduction
35
1.7. References
Alvarado-Morales, M., Terra, J., Gernaey, K. V., Woodley, J.M., Gani, R., 2009.
Biorefining: Computer aided tools for sustainable design and analysis of bioethanol
production. Chemical Engineering Research and Design 87, 1171–1183.
https://doi.org/10.1016/j.cherd.2009.07.006
Ares-Peón, I.A., Romaní, A., Garrote, G., Parajó, J.C., 2013. Invasive biomass
valorization: Environmentally friendly processes for obtaining second generation
bioethanol and saccharides from Ulex europ??us. Journal of Chemical Technology
and Biotechnology 88, 999–1006. https://doi.org/10.1002/jctb.3963
Brethauer, S., Studer, M.H., 2015. Biochemical conversion processes of lignocellulosic
biomass to fuels and chemicals - A review. Chimia 69, 572–581.
https://doi.org/10.2533/chimia.2015.572
Brudecki, G., Cybulska, I., Technology, K.R.-B., 2013, U., 2013. Optimization of clean
fractionation process applied to switchgrass to produce pulp for enzymatic
hydrolysis. Elsevier.
Carvalheiro, F., Duarte, L.C., Gírio, F.M., 2008. Hemicellulose biorefineries: A review
on biomass pretreatments. Journal of Scientific and Industrial Research 67, 849–
864.
Cavka, A., Alriksson, B., Rose, S.H., Van Zyl, W.H., Jönsson, L.J., 2014. Production of
cellulosic ethanol and enzyme from waste fiber sludge using SSF, recycling of
hydrolytic enzymes and yeast, and recombinant cellulase-producing Aspergillus
niger. Journal of Industrial Microbiology and Biotechnology 41, 1191–1200.
https://doi.org/10.1007/s10295-014-1457-9
Chen, H., Liu, J., Chang, X., Chen, D., Xue, Y., Liu, P., Lin, H., Han, S., 2017. A review
on the pretreatment of lignocellulose for high-value chemicals. Fuel Processing
Technology. https://doi.org/10.1016/j.fuproc.2016.12.007
Cherubini, F., 2010. The biorefinery concept: Using biomass instead of oil for producing
energy and chemicals. Energy Conversion and Management 51, 1412–1421.
https://doi.org/10.1016/j.enconman.2010.01.015
Cubas-Cano, E., González-Fernández, C., Ballesteros, M., Tomás-Pejó, E., 2018.
Chapter 1 | Introduction
36
Biotechnological advances in lactic acid production by lactic acid bacteria:
lignocellulose as novel substrate. Biofuels, Bioproducts and Biorefining 12, 290–
303. https://doi.org/10.1002/bbb.1852
Cui, F., Li, Y., Wan, C., 2011. Lactic acid production from corn stover using mixed
cultures of Lactobacillus rhamnosus and Lactobacillus brevis. Bioresource
Technology 102, 1831–1836. https://doi.org/10.1016/j.biortech.2010.09.063
Dahnum, D., Tasum, S.O., Triwahyuni, E., Nurdin, M., Abimanyu, H., 2015. Comparison
of SHF and SSF processes using enzyme and dry yeast for optimization of bioethanol
production from empty fruit bunch. Energy Procedia 68, 107–116.
https://doi.org/10.1016/j.egypro.2015.03.238
Domínguez, E., Romaní, A., Domingues, L., Garrote, G., 2017. Evaluation of strategies
for second generation bioethanol production from fast growing biomass Paulownia
within a biorefinery scheme. Applied Energy 187, 777–789.
https://doi.org/10.1016/j.apenergy.2016.11.114
Duarte, G. V., Moura, A.I., Moreira, R., Nunes, J., Figueiredo, M.M., Carvalho, M.G.,
2013. Evaluation of Several Forest Residues as Potential Raw Material for
Bioethanol Production in Portugal. Journal of Bioprocess Engineering and
Biorefinery 2, 73–78. https://doi.org/10.1166/jbeb.2013.1035
Fernando, S., Adhikari, S., Chandrapal, C., Murali, N., 2006. Biorefineries: Current
Status, Challenges, and Future Direction. Energy Fuels 20, 1727–1737.
https://doi.org/10.1021/ef060097w
Garlotta, D., 2002. A Literature Review of Poly ( Lactic Acid ). Journal of Polymers and
the Environment 9, 63–84. https://doi.org/10.1023/A:1020200822435
Garrote, G., Domínguez, H., Parajó, J.C., 2002. Autohydrolysis of corncob: Study of non-
isothermal operation for xylooligosaccharide production. Journal of Food
Engineering 52, 211–218. https://doi.org/10.1016/S0260-8774(01)00108-X
Gomes, D., Rodrigues, A.C., Domingues, L., Gama, M., 2015. Cellulase recycling in
biorefineries-is it possible? Applied Microbiology and Biotechnology 99, 4131–
4143. https://doi.org/10.1007/s00253-015-6535-z
González-Muñoz, M.J., Alvarez, R., Santos, V., Parajó, J.C., 2012. Production of
Chapter 1 | Introduction
37
hemicellulosic sugars from Pinus pinaster wood by sequential steps of aqueous
extraction and acid hydrolysis. Wood Science and Technology 46, 271–285.
https://doi.org/10.1007/s00226-011-0408-0
González, D., Campos, A.R., Cunha, A.M., Santos, V., Parajó, J.C., 2010. Utilization of
fibers obtained by peroxyformic acid processing of broom as reinforcing agents for
biocomposites. BioResources 5, 2591–2610.
Gregg, D.J., Saddler, J.N., 1996. Factors affecting cellulose hydrolysis and the potential
of enzyme recycle to enhance the efficiency of an integrated wood to ethanol
process. Biotechnology and Bioengineering 51, 375–383.
https://doi.org/10.1002/(SICI)1097-0290(19960820)51:4<375::AID-
BIT1>3.0.CO;2-F
Gross, R. a, Kalra, B., 2002. Biodegradable polymers for the environment. Science (New
York, N.Y.) 297, 803–807. https://doi.org/10.1126/science.297.5582.803
Gullón, P., Romaní, A., Vila, C., Garrote, G., Parajó, J.C., 2012. Potential of
hydrothermal treatments in lignocellulose biorefineries. Biofuels, Bioproducts and
Biorefining 6, 219–232. https://doi.org/10.1002/bbb.339
Guo, H., Zou, S., Liu, B., Su, R., Huang, R., Qi, W., Zhang, M., He, Z., 2015. Reducing
β-glucosidase supplementation during cellulase recovery using engineered strain for
successive lignocellulose bioconversion. Bioresource Technology 187, 362–368.
https://doi.org/10.1016/j.biortech.2015.03.105
Guo, W., Jia, W., Li, Y., Chen, S., 2010. Performances of Lactobacillus brevis for
producing lactic acid from hydrolysate of lignocellulosics. Applied Biochemistry
and Biotechnology 161, 124–136. https://doi.org/10.1007/s12010-009-8857-8
Hama, S., Mizuno, S., Kihara, M., Tanaka, T., Ogino, C., Noda, H., Kondo, A., 2015.
Production of d-lactic acid from hardwood pulp by mechanical milling followed by
simultaneous saccharification and fermentation using metabolically engineered
Lactobacillus plantarum. Bioresource Technology 187, 167–172.
https://doi.org/10.1016/j.biortech.2015.03.106
Hofvendahl, K., Hahn–Hägerdal, B., 2000. Factors affecting the fermentative lactic acid
production from renewable resources1. Enzyme and Microbial Technology 26, 87–
107. https://doi.org/10.1016/S0141-0229(99)00155-6
Chapter 1 | Introduction
38
Jensen, J., Morinelly, J., Aglan, A., Mix, A., Shonnard, D.R., 2008. Kinetic
characterization of biomass dilute sulfuric acid hydrolysis: Mixtures of hardwoods,
softwood, and switchgrass. AIChE Journal 54, 1637–1645.
https://doi.org/10.1002/aic.11467
Jin, M., Gunawan, C., Uppugundla, N., Balan, V., Dale, B.E., 2012. A novel integrated
biological process for cellulosic ethanol production featuring high ethanol
productivity, enzyme recycling and yeast cells reuse. Energy & Environmental
Science 5, 7168–7175. https://doi.org/10.1039/C2EE03058F
John, R.P., G.S., A., Nampoothiri, K.M., Pandey, A., 2009. Direct lactic acid
fermentation: Focus on simultaneous saccharification and lactic acid production.
Biotechnology Advances 27, 145–152.
https://doi.org/10.1016/j.biotechadv.2008.10.004
John, R.P., Madhavan Nampoothiri, K., Pandey, A., 2007. Production of L(+) lactic acid
from cassava starch hydrolyzate by immobilized Lactobacillus delbrueckii. Journal
of Basic Microbiology 47, 25–30. https://doi.org/10.1002/jobm.200610208
Kaparaju, P., Serrano, M., Thomsen, A.B., Kongjan, P., Angelidaki, I., 2009. Bioethanol,
biohydrogen and biogas production from wheat straw in a biorefinery concept.
Bioresource Technology 100, 2562–2568.
https://doi.org/10.1016/j.biortech.2008.11.011
Karimi, K., Taherzadeh, M.J., 2016. A critical review on analysis in pretreatment of
lignocelluloses: Degree of polymerization, adsorption/desorption, and accessibility.
Bioresource Technology 203, 348–356.
https://doi.org/10.1016/J.BIORTECH.2015.12.035
Kumar, A.K., Sharma, S., 2017. Recent updates on different methods of pretreatment of
lignocellulosic feedstocks: a review. Bioresources and Bioprocessing.
https://doi.org/10.1186/s40643-017-0137-9
Kumari, D., Singh, R., 2018. Pretreatment of lignocellulosic wastes for biofuel
production: A critical review. Renewable and Sustainable Energy Reviews 90, 877–
891. https://doi.org/10.1016/J.RSER.2018.03.111
Lee, J.W., Kim, H.U., Choi, S., Yi, J., Lee, S.Y., 2011. Microbial production of building
block chemicals and polymers. Current Opinion in Biotechnology 22, 758–767.
Chapter 1 | Introduction
39
https://doi.org/10.1016/j.copbio.2011.02.011
Limayem, A., Ricke, S.C., 2012. Lignocellulosic biomass for bioethanol production:
Current perspectives, potential issues and future prospects. Progress in Energy and
Combustion Science 38, 449–467. https://doi.org/10.1016/j.pecs.2012.03.002
Maas, R.H.W., Bakker, R.R., Eggink, G., Weusthuis, R.A., 2006. Lactic acid production
from xylose by the fungus Rhizopus oryzae. Applied Microbiology and
Biotechnology 72, 861–868. https://doi.org/10.1007/s00253-006-0379-5
Marques, S., Santos, J.A.L., Gírio, F.M., Roseiro, J.C., 2008. Lactic acid production from
recycled paper sludge by simultaneous saccharification and fermentation.
Biochemical Engineering Journal 41, 210–216.
https://doi.org/10.1016/j.bej.2008.04.018
Martín, C., Thomsen, M.H., Hauggaard-Nielsen, H., BelindaThomsen, A., 2008. Wet
oxidation pretreatment, enzymatic hydrolysis and simultaneous saccharification and
fermentation of clover-ryegrass mixtures. Bioresource Technology 99, 8777–8782.
https://doi.org/10.1016/j.biortech.2008.04.039
Menon, V., Rao, M., 2012. Trends in bioconversion of lignocellulose: Biofuels, platform
chemicals & biorefinery concept. Progress in Energy and Combustion Science 38,
522–550. https://doi.org/10.1016/j.pecs.2012.02.002
Miura, S., Arimura, T., Itoda, N., Dwiarti, L., Feng, J.B., Bin, C.H., Okabe, M., 2004.
Production of l-lactic acid from corncob. Journal of Bioscience and Bioengineering
97, 153–157. https://doi.org/http://dx.doi.org/10.1016/S1389-1723(04)70184-X
Moldes, A.B., Alonso, J.L., Parajó, J.C., 2000. Multi-step feeding systems for lactic acid
production by simultaneous saccharification and fermentation of processed wood.
Bioprocess Engineering 22, 175–180.
Moniz, P., João, L., Duarte, L.C., Roseiro, L.B., Boeriu, C.G., Pereira, H., Carvalheiro,
F., 2015. Fractionation of Hemicelluloses and Lignin from Rice Straw by Combining
Autohydrolysis and Optimised Mild Organosolv Delignification. BioResources 10,
2626–2641. https://doi.org/10.15376/biores.10.2.2626-2641
Nitsos, C.K., Choli-Papadopoulou, T., Matis, K.A., Triantafyllidis, K.S., 2016.
Optimization of hydrothermal pretreatment of hardwood and softwood
Chapter 1 | Introduction
40
lignocellulosic residues for selective hemicellulose recovery and improved cellulose
enzymatic hydrolysis. ACS Sustainable Chemistry and Engineering 4, 4529–4544.
https://doi.org/10.1021/acssuschemeng.6b00535
Nunes, J., Fierro, J., Freitas, H., 2012. Sustainable management of forest ecosystems and
lignocellulosic biomass use: A case study from Portugal. 20th European Biomass
Conference and Exhibition.
Öhgren, K., Bura, R., Lesnicki, G., Saddler, J., Zacchi, G., 2007. A comparison between
simultaneous saccharification and fermentation and separate hydrolysis and
fermentation using steam-pretreated corn stover. Process Biochemistry 42, 834–839.
https://doi.org/10.1016/j.procbio.2007.02.003
Ouyang, J., Ma, R., Zheng, Z., Cai, C., Zhang, M., Jiang, T., 2013. Open fermentative
production of l-lactic acid by Bacillus sp. strain NL01 using lignocellulosic
hydrolyzates as low-cost raw material. Bioresource Technology 135, 475–480.
https://doi.org/10.1016/j.biortech.2012.09.096
Pejin, J., Radosavljević, M., Kocić-Tanackov, S., Djukić-Vuković, A., Mojović, L., 2017.
Lactic acid fermentation of brewer’s spent grain hydrolysate by Lactobacillus
rhamnosus with yeast extract addition and pH control. Journal of the Institute of
Brewing 123, 98–104. https://doi.org/10.1002/jib.403
Rashid, S.S., Alam, M.Z., Fazli, M.B.F.A., 2013. Separation of Cellulase Enzyme from
Fermentation Broth of Palm Oil Mill Effluent by Ultrafiltration Process 1, 501–506.
Rodrigues, A.C., Felby, C., Gama, M., 2014. Cellulase stability, adsorption/desorption
profiles and recycling during successive cycles of hydrolysis and fermentation of
wheat straw. Bioresource Technology 156, 163–169.
https://doi.org/10.1016/j.biortech.2014.01.019
Romaní, A., Garrote, G., Alonso, J.L., Parajó, J.C., 2010. Bioethanol production from
hydrothermally pretreated Eucalyptus globulus wood. Bioresource Technology 101,
8706–8712. https://doi.org/10.1016/j.biortech.2010.06.093
Romaní, A., Yáñez, R., Garrote, G., Alonso, J.L., 2008. SSF production of lactic acid
from cellulosic biosludges. Bioresource Technology 99, 4247–4254.
https://doi.org/10.1016/j.biortech.2007.08.051
Chapter 1 | Introduction
41
Ruiz, H.A., Ruzene, D.S., Silva, D.P., Da Silva, F.F.M., Vicente, A.A., Teixeira, J.A.,
2011. Development and characterization of an environmentally friendly process
sequence (autohydrolysis and organosolv) for wheat straw delignification. Applied
Biochemistry and Biotechnology 164, 629–641. https://doi.org/10.1007/s12010-
011-9163-9
Sauer, M., Porro, D., Mattanovich, D., Branduardi, P., 2008. Microbial production of
organic acids: expanding the markets. Trends in Biotechnology 26, 100–108.
https://doi.org/10.1016/j.tibtech.2007.11.006
Shi, S., Kang, L., Lee, Y.Y., n.d. Production of Lactic Acid from the Mixture of Softwood
Pre-hydrolysate and Paper Mill Sludge by Simultaneous Saccharification and
Fermentation. https://doi.org/10.1007/s12010-014-1451-8
Tarraran, L., Mazzoli, R., 2018. Alternative strategies for lignocellulose fermentation
through lactic acid bacteria: The state of the art and perspectives. FEMS
Microbiology Letters. https://doi.org/10.1093/femsle/fny126
Unrean, P., 2018. Optimized feeding schemes of simultaneous saccharification and
fermentation process for high lactic acid titer from sugarcane bagasse. Industrial
Crops and Products 111, 660–666. https://doi.org/10.1016/j.indcrop.2017.11.043
Verardi, A., Bari, I. De, Ricca, E., Calabrò, V., 2012. Hydrolysis of Lignocellulosic
Biomass : Current Status of Processes and Technologies and Future Perspectives.
Bioethanol 290. https://doi.org/10.5772/23987
Wang, L., Zhao, B., Liu, B., Yang, C., Yu, B., Li, Q., Ma, C., Xu, P., Ma, Y., 2010.
Efficient production of l-lactic acid from cassava powder by Lactobacillus
rhamnosus. Bioresource Technology 101, 7895–7901.
https://doi.org/10.1016/j.biortech.2010.05.018
Wee, Y.J., Ryu, H.W., 2009. Lactic acid production by Lactobacillus sp. RKY2 in a cell-
recycle continuous fermentation using lignocellulosic hydrolyzates as inexpensive
raw materials. Bioresource Technology 100, 4262–4270.
https://doi.org/10.1016/j.biortech.2009.03.074
Wyman, C.E., Spindler, D.D., Grohmann, K., 1992. Simultaneous saccharification and
fermentation of several lignocellulosic feedstocks to fuel ethanol. Biomass and
Bioenergy 3, 301–307. https://doi.org/10.1016/0961-9534(92)90001-7
Chapter 1 | Introduction
42
Yánez, R., Gómez, B., Martínez, M., Gullón, B., Alonso, J.L., 2014. Valorization of an
invasive woody species, Acacia dealbata, by means of Ionic liquid pretreatment and
enzymatic hydrolysis. Journal of Chemical Technology and Biotechnology 89,
1337–1343. https://doi.org/10.1002/jctb.4207
Zhang, Y., Chen, X., Luo, J., Qi, B., Wan, Y., 2014. An efficient process for lactic acid
production from wheat straw by a newly isolated Bacillus coagulans strain IPE22.
Bioresource Technology 158, 396–399.
https://doi.org/10.1016/j.biortech.2014.02.128
Zhao, K., Qiao, Q., Chu, D., Gu, H., Dao, T.H., Zhang, J., Bao, J., 2013. Simultaneous
saccharification and high titer lactic acid fermentation of corn stover using a newly
isolated lactic acid bacterium Pediococcus acidilactici DQ2. Bioresource
Technology 135, 481–489. https://doi.org/10.1016/j.biortech.2012.09.063
CHAPTER 2 |
Fractionation of multi-lignocellulosic resources: Autohydrolysis
pretreatment
Abstract
This chapter was focused on evaluating two mixtures (M1-4 and M2-3) of
lignocellulosic biomass, forest ecosystems and biological resources from marginal land,
in order to co-produce oligosaccharides, solid fuel and glucose under a biorefinery
concept. The selection of mixtures was based on different criteria, namely, territorial
distribution, fire risk during summer months and total sugar content. The two mixtures
were submitted to autohydrolysis pretreatment under non-isothermal conditions (in the
range of 190 ºC - 240 ºC corresponding to severity of 3.71 to 4.82). Both mixtures (AM1-
4 and AM2-3) were compared in terms of fractionation (cellulose and lignin recoveries
and hemicellulose solubilization), analyzed for thermal properties (high heating values)
and for enzymatic susceptibility of cellulose. The highest xylan recoveries (62 and 69 %),
as xylose and xylooligosaccharides, were achieved for both mixtures in the liquid phase
at 206 ºC. Autohydrolysis pretreatment increased the high heating values of the two
mixtures presenting an alternative use of solid fraction as solid fuel. Moreover, enzymatic
susceptibility of these pretreated mixtures was also improved from 45 to 90 % of glucose
yield by increasing pretreatment severity.
Keywords: Multi-feedstock, lignocellulosic resource, autohydrolysis, enzymatic
hydrolysis, biorefinery, solid fuel
This chapter is based on the following paper:
Pontes, R., Romaní, A., Michelin, M., Domingues, L., Teixeira, J., Nunes, J. 2018.
Comparative autohydrolysis study of two mixtures of forest and marginal land resources
for co-production of biofuels and value-added compounds. Renewable Energy 128, 20-
29
Chapter 2 | Fractionation of multi-lignocellulosic resources: Autohydrolysis pretreatment
44
Contents
2.1. Introduction ............................................................................................................. 45
2.2. Materials and methods ............................................................................................. 46
2.2.1. Raw materials and criteria of feedstocks mixture ............................................. 46
2.2.2. Analysis of raw material ................................................................................... 48
2.2.3. Non-isothermal autohydrolysis pretreatment of the lignocellulosic mixtures (M1-
4 and M2-3): solid and liquid phases composition ..................................................... 50
2.2.4. Enzymatic hydrolysis of solid fraction from autohydrolysis pretreatment ....... 51
2.2.5. Determination of higher heating values of autohydrolyzed mixture ................ 52
2.2.6. Statistical analysis ............................................................................................. 52
2.3. Results and Discussion ............................................................................................ 53
2.3.1. Raw material mixture criteria ........................................................................... 53
2.3.2. Chemical characterization of M1-4 and M2-3 mixtures ................................... 54
2.3.3. Effect of autohydrolysis pretreatment on fractionation of M1-4 and M2-3
mixtures ...................................................................................................................... 55
2.3.4. Energy production of pretreated M1-4 and M2-3 mixtures .............................. 60
2.3.5. Enzymatic saccharification of pretreated M1-4 and M2-3 mixtures ................ 61
2.3.6. Overall balance of M1-4 and M2-3 .................................................................. 65
2.4. Conclusions ............................................................................................................. 67
2.5. References ............................................................................................................... 68
Chapter 2: Fractionation of multi-lignocellulosic resources: Autohydrolysis pretreatment
45
2.1. Introduction
In Portugal, the territory is divided in wood and uncultivated land (22 %); forest
of pure and mixed stands of Pinus pinaster and Eucalyptus globulus (21 %); and farm
land (33 %), mainly composed by olive groves, vineyards and orchards, that generate
significant amount of lignocellulosic residues (Duarte et al., 2013). Approximately half
of the national territory (40 % to 50 %) consists of poor soils with no potential for
profitable agricultural use. On average, 60 % to 70 % of the total fires take place in
forested and uncultivated areas, resulting in a loss of roughly 800 million Euros annually
(Nunes et al., 2012) . So far, there is no sustainable alternative for the use of this territory
and no viable solution for forest residues valorization (Nunes et al., 2012) . Social and
economic benefits could be achieved from the utilization of these raw materials in order
to develop the so-called bioeconomy, which would boost the creation of new rural jobs
(Gullón et al., 2012).
Forest and agricultural residues are the most important sources of lignocellulosic
materials (LCM) (Cherubini, 2010) . LCM are the most abundant renewable resource in
the world, generated at high rate (González-Muñoz et al., 2012) and suitable for
production of energy, biofuels, chemicals, paper, pharmaceuticals and biomaterials
(Gullón et al., 2012; Ruiz et al., 2011). LCM are composed by 50 % to 60 %
carbohydrates, namely, cellulose and hemicellulose and 10 % to 30% of lignin, together
with non-structural components (including ashes, extractives, pectin and proteins) in
lower proportions (Ares-Peón et al., 2013; Romaní et al., 2010a, 2013). Nevertheless, the
conversion of LCM into chemicals is one of the main challenges for biomass processing
due to their complex three-dimensional structure, requiring multidisciplinary approaches
to achieve their integrated benefit (González-Muñoz et al., 2012).
The chemical utilization of LCM can be carried out using two different
approaches: (i) utilization as a whole (for example combustion, gasification or pyrolysis),
or (ii) using methods based on the selective separation of its components (cellulose,
hemicellulose, lignin) (Gullón et al., 2012). The latter process can be based on multistep
processing, starting with separation of easily recovered fractions (extractives and
hemicellulose) from the more resistant ones (cellulose and lignin), which could be further
fractioned by means of more aggressive treatments (González-Muñoz et al., 2012).
Hydrothermal pretreatment has been successfully applied to LCM. This eco-
Chapter 2: Fractionation of multi-lignocellulosic resources: Autohydrolysis pretreatment
46
friendly process, also known as autohydrolysis, requires no other reagents than water and
high temperature, which enables a wide variety of reactions without the need of a catalyst
(Domínguez et al., 2017; Xu et al., 2017). The autohydrolysis reaction solubilizes
selectively hemicellulose into oligosaccharides and promotes lower liberation of
compounds derived from lignin and cellulose, as well as hemicellulose degradation
products (Silva-Fernandes et al., 2015). The main compounds found in the remaining
solid fraction are cellulose and sulfur-free lignin. Cellulose can be subjected to enzymatic
hydrolysis to produce glucose, an important input for biofuels and biochemicals (Patel et
al., 2017; Silva-Fernandes et al., 2015).
The use of feedstock mixtures rather than a single raw material can minimize the
problems related to biomass availability, seasonality, price volatility and storage. In this
work, broom (Cytisus sp.), carqueja (Genista tridentate), mimosa (Acacia dealbata),
rockrose (Cistus ladanifer), eucalyptus (Eucalyptus globulus) and pine (Pinus pinaster)
were identified as the most important sources of forest fire cases in Portugal. Since the
security supply for biorefineries and the sustainability of exploration are key factors to
ensure the industrialization of these systems, the aim of this chapter was to evaluate
feedstock mixtures fractionation to supply a biorefinery throughout the year. Two
feedstock mixtures were selected and subjected to autohydrolysis treatment in the range
of 190 ºC – 240 ºC, in order to evaluate and compare the pretreatment effect on
fractionation of feedstock mixtures by hemicellulose solubilization. Besides
oligosaccharides, two other alternatives were evaluated for valorization of pretreated
feedstock mixtures: solid fuel production and enzymatic saccharification of cellulose into
glucose.
2.2. Materials and methods
2.2.1. Raw materials and criteria of feedstocks mixture
Lignocellulosic biomass collecting through the year was divided into four
quarters, considering the biomass from 1st and 4th quarters (winter months) as mixture 1-
4 (M1-4) and from 2nd and 3rd quarters (summer months) as mixture 2-3 (M2-3). The M1-
4 and M2-3 were set with different lignocellulosic biomasses from forest ecosystems (A)
(namely, eucalyptus and pine) and from marginal land (B) (namely, broom, carqueja,
Chapter 2: Fractionation of multi-lignocellulosic resources: Autohydrolysis pretreatment
47
mimosa and rockrose). The criteria for the formulation of (A) and (B) were taking into
account their proportion of territorial occupation, based on the National Portuguese Forest
Inventory (ICNF, 2013). These percentages were considered to establish the proportion
of biomass for M2-3. The collection of biological resources from marginal land (B)
during winter months (1st and 4th quarters) provide reduction of fire risks in the summer
months (2nd and 3rd quarters) therefore, a preference factor of 2:1 of biomass from
marginal land (B) to forest ecosystem (A) was considered in order to establish the M1-4
(Table 4). The percentage of eucalyptus and pine present in M1-4 and M2-3 was also
based on area in the Portuguese territory for these species (Lavoie et al., 2010). For the
percentages of biomass from marginal land, the weight ratio among broom, mimosa,
carqueja and rockrose was calculated as a function of total sugars content (Duarte et al.,
2013), since there is no information available regarding territorial distribution of
biological resources from marginal land.
The mixtures M1-4 and M2-3 were prepared, homogenized and then characterized
as described below. The raw material resulting from forest management practices,
namely, broom, carqueja, mimosa, rockrose, eucalyptus and pine, were collected in the
Center Region of Portugal, from a location with the same type of soil. The lignocellulosic
materials included branches and twigs with barks and leaves. The raw materials were air-
dried, milled and sieved between 0.25 to 0.40 mm using a vibratory sieve shaker (40 and
60 mesh). After that, the samples were homogenized in a single lot to avoid compositional
differences among aliquots and were stored in polypropylene bags at room temperature.
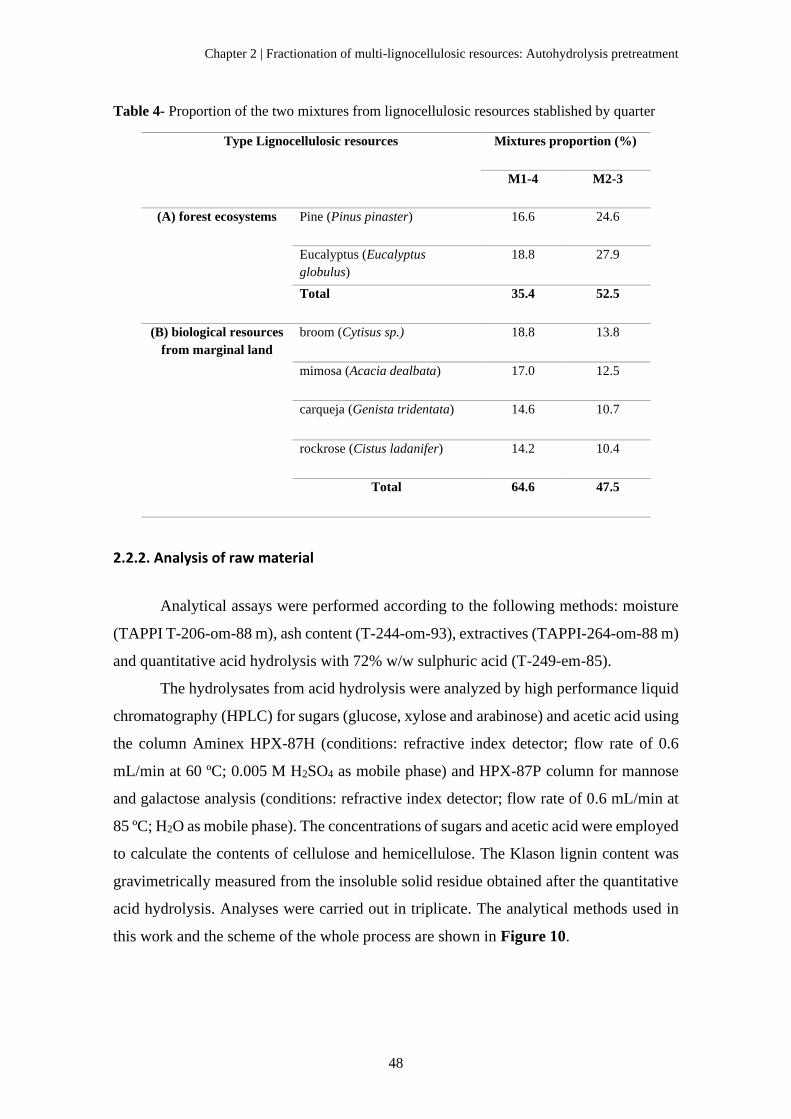
Chapter 2 | Fractionation of multi-lignocellulosic resources: Autohydrolysis pretreatment
48
Table 4- Proportion of the two mixtures from lignocellulosic resources stablished by quarter
Type Lignocellulosic resources Mixtures proportion (%)
M1-4 M2-3
(A) forest ecosystems Pine (Pinus pinaster) 16.6 24.6
Eucalyptus (Eucalyptus
globulus)
18.8 27.9
Total 35.4 52.5
(B) biological resources
from marginal land
broom (Cytisus sp.) 18.8 13.8
mimosa (Acacia dealbata) 17.0 12.5
carqueja (Genista tridentata) 14.6 10.7
rockrose (Cistus ladanifer) 14.2 10.4
Total 64.6 47.5
2.2.2. Analysis of raw material
Analytical assays were performed according to the following methods: moisture
(TAPPI T-206-om-88 m), ash content (T-244-om-93), extractives (TAPPI-264-om-88 m)
and quantitative acid hydrolysis with 72% w/w sulphuric acid (T-249-em-85).
The hydrolysates from acid hydrolysis were analyzed by high performance liquid
chromatography (HPLC) for sugars (glucose, xylose and arabinose) and acetic acid using
the column Aminex HPX-87H (conditions: refractive index detector; flow rate of 0.6
mL/min at 60 ºC; 0.005 M H2SO4 as mobile phase) and HPX-87P column for mannose
and galactose analysis (conditions: refractive index detector; flow rate of 0.6 mL/min at
85 ºC; H2O as mobile phase). The concentrations of sugars and acetic acid were employed
to calculate the contents of cellulose and hemicellulose. The Klason lignin content was
gravimetrically measured from the insoluble solid residue obtained after the quantitative
acid hydrolysis. Analyses were carried out in triplicate. The analytical methods used in
this work and the scheme of the whole process are shown in Figure 10.
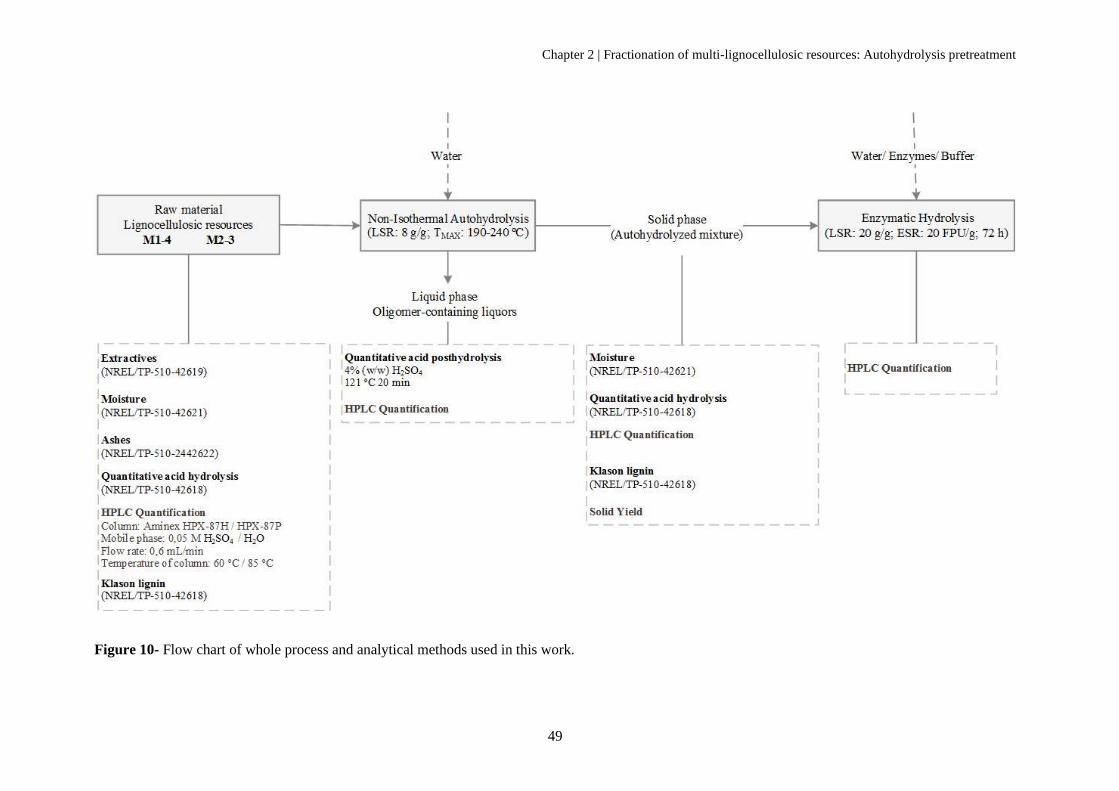
Chapter 2 | Fractionation of multi-lignocellulosic resources: Autohydrolysis pretreatment
49
Figure 10- Flow chart of whole process and analytical methods used in this work.
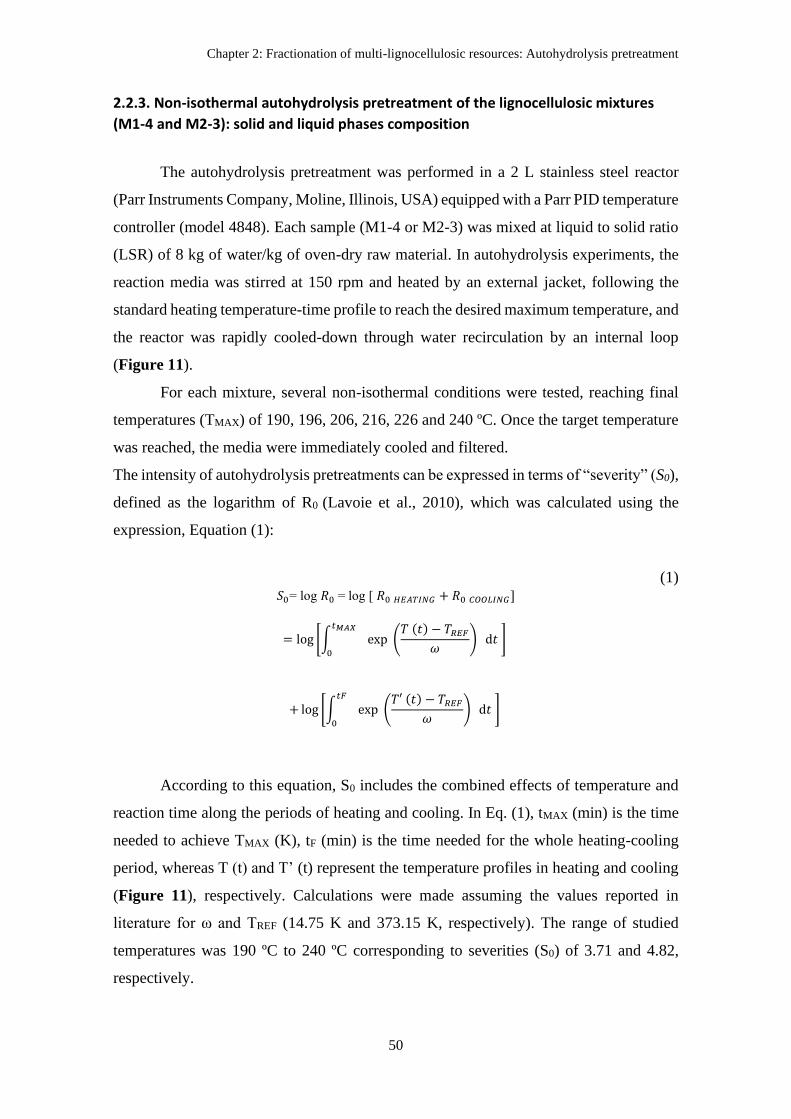
Chapter 2: Fractionation of multi-lignocellulosic resources: Autohydrolysis pretreatment
50
2.2.3. Non-isothermal autohydrolysis pretreatment of the lignocellulosic mixtures
(M1-4 and M2-3): solid and liquid phases composition
The autohydrolysis pretreatment was performed in a 2 L stainless steel reactor
(Parr Instruments Company, Moline, Illinois, USA) equipped with a Parr PID temperature
controller (model 4848). Each sample (M1-4 or M2-3) was mixed at liquid to solid ratio
(LSR) of 8 kg of water/kg of oven-dry raw material. In autohydrolysis experiments, the
reaction media was stirred at 150 rpm and heated by an external jacket, following the
standard heating temperature-time profile to reach the desired maximum temperature, and
the reactor was rapidly cooled-down through water recirculation by an internal loop
(Figure 11).
For each mixture, several non-isothermal conditions were tested, reaching final
temperatures (TMAX) of 190, 196, 206, 216, 226 and 240 ºC. Once the target temperature
was reached, the media were immediately cooled and filtered.
The intensity of autohydrolysis pretreatments can be expressed in terms of “severity” (S0),
defined as the logarithm of R0 (Lavoie et al., 2010), which was calculated using the
expression, Equation (1):
(1) 𝑆0= log 𝑅0 = log [ 𝑅0 𝐻𝐸𝐴𝑇𝐼𝑁𝐺 + 𝑅0 𝐶𝑂𝑂𝐿𝐼𝑁𝐺]
= log [∫ exp (𝑇 (𝑡) − 𝑇𝑅𝐸𝐹
𝜔) d𝑡
𝑡𝑀𝐴𝑋
0
]
+ log [∫ exp (𝑇′ (𝑡) − 𝑇𝑅𝐸𝐹
𝜔) d𝑡
𝑡𝐹
0
]
According to this equation, S0 includes the combined effects of temperature and
reaction time along the periods of heating and cooling. In Eq. (1), tMAX (min) is the time
needed to achieve TMAX (K), tF (min) is the time needed for the whole heating-cooling
period, whereas T (t) and T’ (t) represent the temperature profiles in heating and cooling
(Figure 11), respectively. Calculations were made assuming the values reported in
literature for ω and TREF (14.75 K and 373.15 K, respectively). The range of studied
temperatures was 190 ºC to 240 ºC corresponding to severities (S0) of 3.71 and 4.82,
respectively.
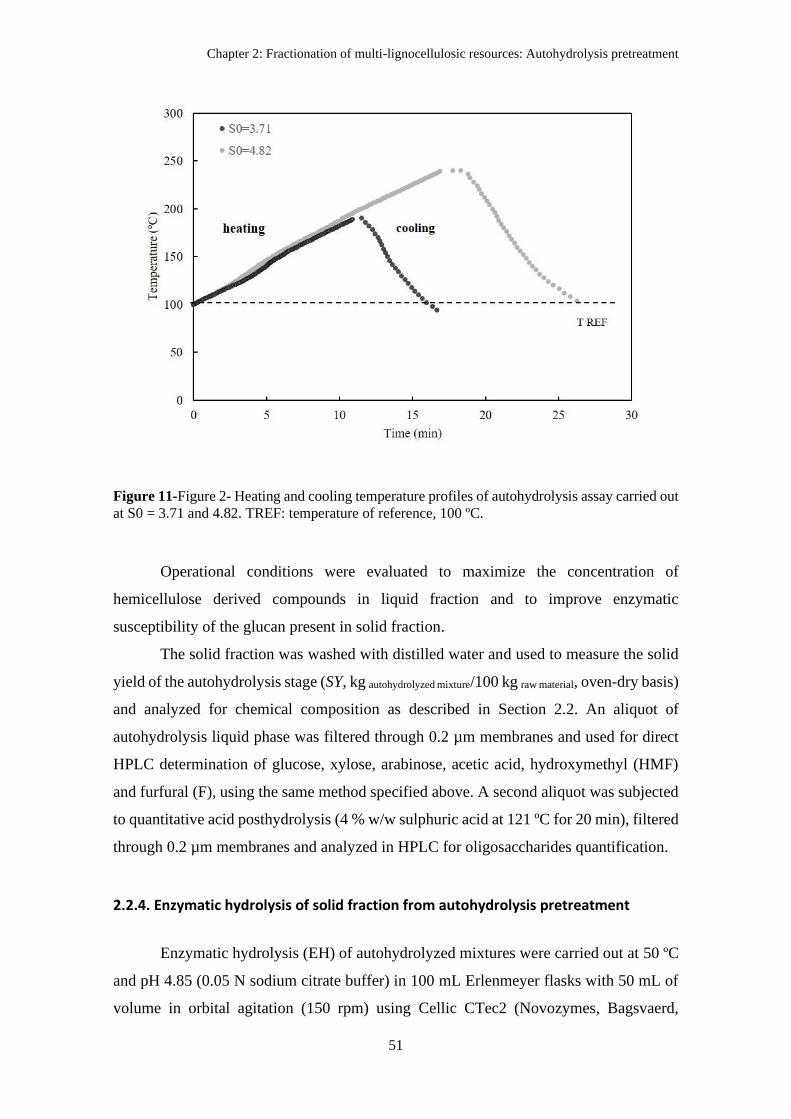
Chapter 2: Fractionation of multi-lignocellulosic resources: Autohydrolysis pretreatment
51
Figure 11-Figure 2- Heating and cooling temperature profiles of autohydrolysis assay carried out
at S0 = 3.71 and 4.82. TREF: temperature of reference, 100 ºC.
Operational conditions were evaluated to maximize the concentration of
hemicellulose derived compounds in liquid fraction and to improve enzymatic
susceptibility of the glucan present in solid fraction.
The solid fraction was washed with distilled water and used to measure the solid
yield of the autohydrolysis stage (SY, kg autohydrolyzed mixture/100 kg raw material, oven-dry basis)
and analyzed for chemical composition as described in Section 2.2. An aliquot of
autohydrolysis liquid phase was filtered through 0.2 µm membranes and used for direct
HPLC determination of glucose, xylose, arabinose, acetic acid, hydroxymethyl (HMF)
and furfural (F), using the same method specified above. A second aliquot was subjected
to quantitative acid posthydrolysis (4 % w/w sulphuric acid at 121 ºC for 20 min), filtered
through 0.2 µm membranes and analyzed in HPLC for oligosaccharides quantification.
2.2.4. Enzymatic hydrolysis of solid fraction from autohydrolysis pretreatment
Enzymatic hydrolysis (EH) of autohydrolyzed mixtures were carried out at 50 ºC
and pH 4.85 (0.05 N sodium citrate buffer) in 100 mL Erlenmeyer flasks with 50 mL of
volume in orbital agitation (150 rpm) using Cellic CTec2 (Novozymes, Bagsvaerd,
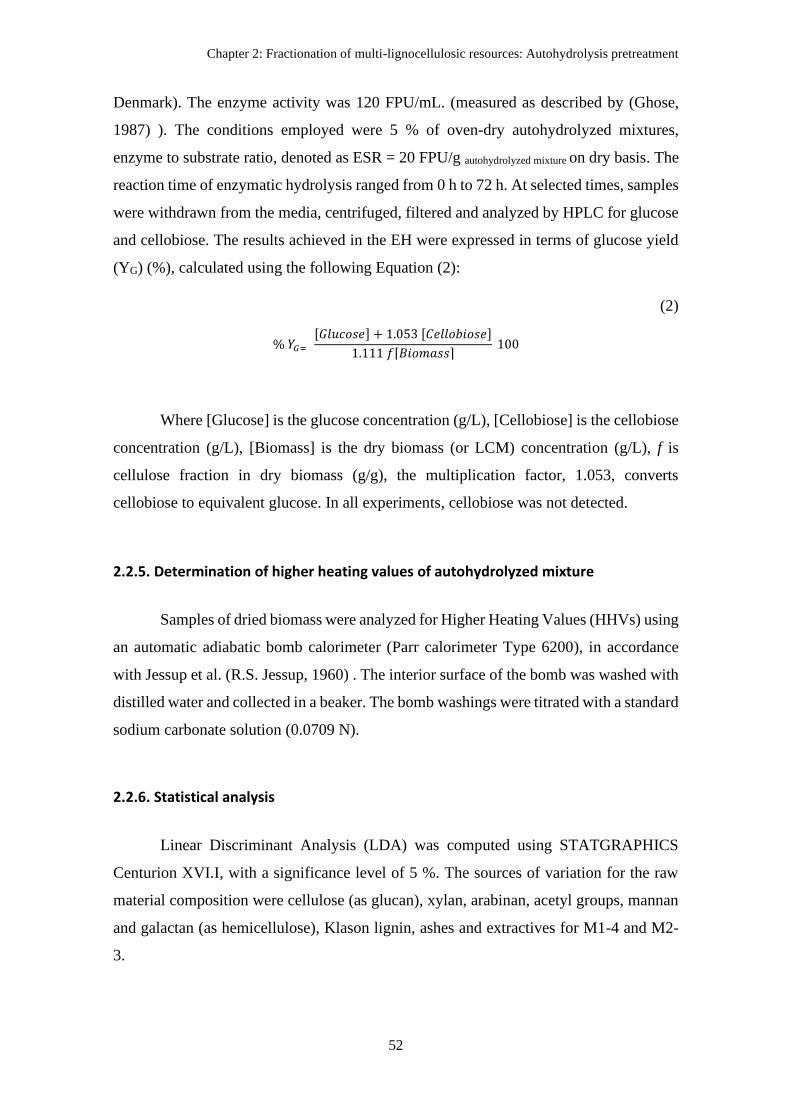
Chapter 2: Fractionation of multi-lignocellulosic resources: Autohydrolysis pretreatment
52
Denmark). The enzyme activity was 120 FPU/mL. (measured as described by (Ghose,
1987) ). The conditions employed were 5 % of oven-dry autohydrolyzed mixtures,
enzyme to substrate ratio, denoted as ESR = 20 FPU/g autohydrolyzed mixture on dry basis. The
reaction time of enzymatic hydrolysis ranged from 0 h to 72 h. At selected times, samples
were withdrawn from the media, centrifuged, filtered and analyzed by HPLC for glucose
and cellobiose. The results achieved in the EH were expressed in terms of glucose yield
(YG) (%), calculated using the following Equation (2):
(2)
% 𝑌𝐺= [𝐺𝑙𝑢𝑐𝑜𝑠𝑒] + 1.053 [𝐶𝑒𝑙𝑙𝑜𝑏𝑖𝑜𝑠𝑒]
1.111 𝑓⌈𝐵𝑖𝑜𝑚𝑎𝑠𝑠⌉ 100
Where [Glucose] is the glucose concentration (g/L), [Cellobiose] is the cellobiose
concentration (g/L), [Biomass] is the dry biomass (or LCM) concentration (g/L), f is
cellulose fraction in dry biomass (g/g), the multiplication factor, 1.053, converts
cellobiose to equivalent glucose. In all experiments, cellobiose was not detected.
2.2.5. Determination of higher heating values of autohydrolyzed mixture
Samples of dried biomass were analyzed for Higher Heating Values (HHVs) using
an automatic adiabatic bomb calorimeter (Parr calorimeter Type 6200), in accordance
with Jessup et al. (R.S. Jessup, 1960) . The interior surface of the bomb was washed with
distilled water and collected in a beaker. The bomb washings were titrated with a standard
sodium carbonate solution (0.0709 N).
2.2.6. Statistical analysis
Linear Discriminant Analysis (LDA) was computed using STATGRAPHICS
Centurion XVI.I, with a significance level of 5 %. The sources of variation for the raw
material composition were cellulose (as glucan), xylan, arabinan, acetyl groups, mannan
and galactan (as hemicellulose), Klason lignin, ashes and extractives for M1-4 and M2-
3.
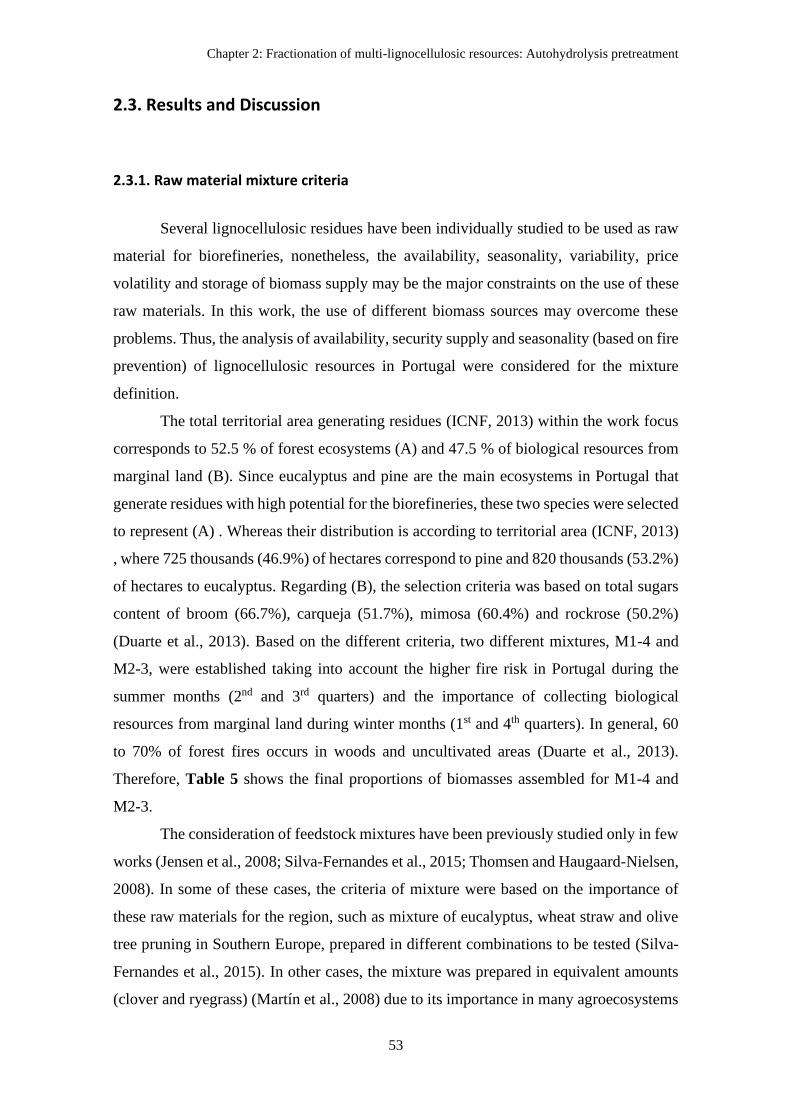
Chapter 2: Fractionation of multi-lignocellulosic resources: Autohydrolysis pretreatment
53
2.3. Results and Discussion
2.3.1. Raw material mixture criteria
Several lignocellulosic residues have been individually studied to be used as raw
material for biorefineries, nonetheless, the availability, seasonality, variability, price
volatility and storage of biomass supply may be the major constraints on the use of these
raw materials. In this work, the use of different biomass sources may overcome these
problems. Thus, the analysis of availability, security supply and seasonality (based on fire
prevention) of lignocellulosic resources in Portugal were considered for the mixture
definition.
The total territorial area generating residues (ICNF, 2013) within the work focus
corresponds to 52.5 % of forest ecosystems (A) and 47.5 % of biological resources from
marginal land (B). Since eucalyptus and pine are the main ecosystems in Portugal that
generate residues with high potential for the biorefineries, these two species were selected
to represent (A) . Whereas their distribution is according to territorial area (ICNF, 2013)
, where 725 thousands (46.9%) of hectares correspond to pine and 820 thousands (53.2%)
of hectares to eucalyptus. Regarding (B), the selection criteria was based on total sugars
content of broom (66.7%), carqueja (51.7%), mimosa (60.4%) and rockrose (50.2%)
(Duarte et al., 2013). Based on the different criteria, two different mixtures, M1-4 and
M2-3, were established taking into account the higher fire risk in Portugal during the
summer months (2nd and 3rd quarters) and the importance of collecting biological
resources from marginal land during winter months (1st and 4th quarters). In general, 60
to 70% of forest fires occurs in woods and uncultivated areas (Duarte et al., 2013).
Therefore, Table 5 shows the final proportions of biomasses assembled for M1-4 and
M2-3.
The consideration of feedstock mixtures have been previously studied only in few
works (Jensen et al., 2008; Silva-Fernandes et al., 2015; Thomsen and Haugaard-Nielsen,
2008). In some of these cases, the criteria of mixture were based on the importance of
these raw materials for the region, such as mixture of eucalyptus, wheat straw and olive
tree pruning in Southern Europe, prepared in different combinations to be tested (Silva-
Fernandes et al., 2015). In other cases, the mixture was prepared in equivalent amounts
(clover and ryegrass) (Martín et al., 2008) due to its importance in many agroecosystems
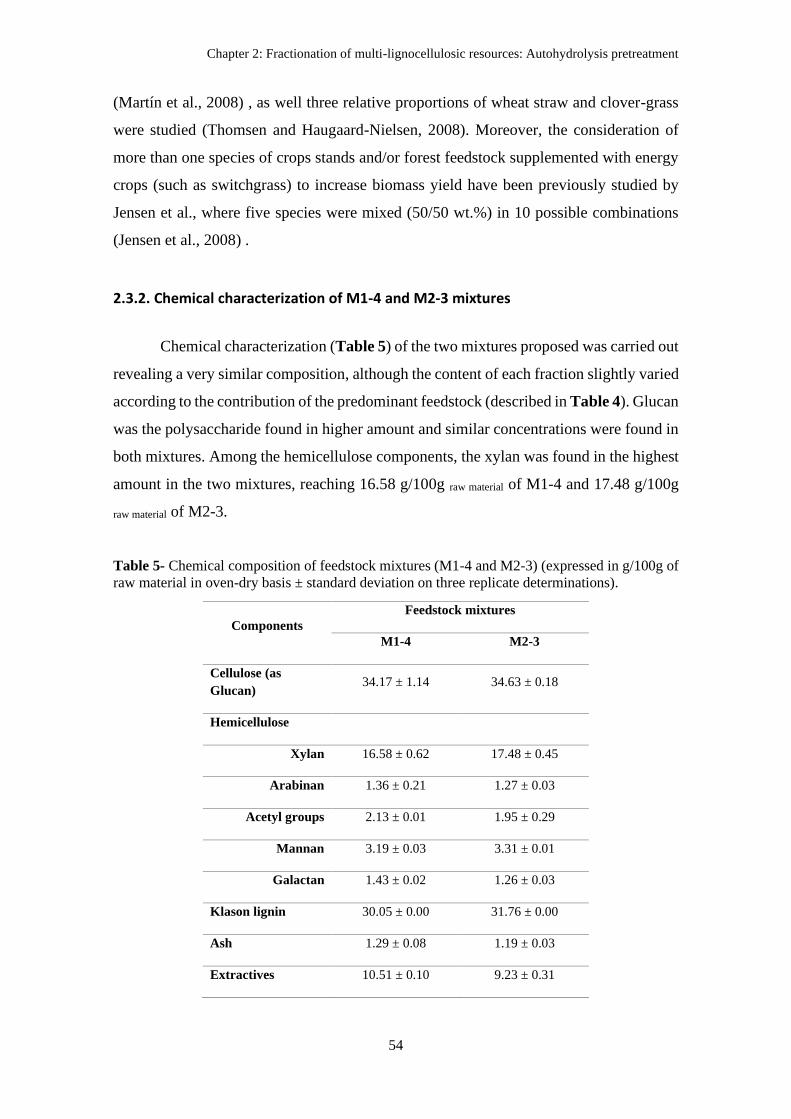
Chapter 2: Fractionation of multi-lignocellulosic resources: Autohydrolysis pretreatment
54
(Martín et al., 2008) , as well three relative proportions of wheat straw and clover-grass
were studied (Thomsen and Haugaard-Nielsen, 2008). Moreover, the consideration of
more than one species of crops stands and/or forest feedstock supplemented with energy
crops (such as switchgrass) to increase biomass yield have been previously studied by
Jensen et al., where five species were mixed (50/50 wt.%) in 10 possible combinations
(Jensen et al., 2008) .
2.3.2. Chemical characterization of M1-4 and M2-3 mixtures
Chemical characterization (Table 5) of the two mixtures proposed was carried out
revealing a very similar composition, although the content of each fraction slightly varied
according to the contribution of the predominant feedstock (described in Table 4). Glucan
was the polysaccharide found in higher amount and similar concentrations were found in
both mixtures. Among the hemicellulose components, the xylan was found in the highest
amount in the two mixtures, reaching 16.58 g/100g raw material of M1-4 and 17.48 g/100g
raw material of M2-3.
Table 5- Chemical composition of feedstock mixtures (M1-4 and M2-3) (expressed in g/100g of
raw material in oven-dry basis ± standard deviation on three replicate determinations).
Components
Feedstock mixtures
M1-4 M2-3
Cellulose (as
Glucan) 34.17 ± 1.14 34.63 ± 0.18
Hemicellulose
Xylan 16.58 ± 0.62 17.48 ± 0.45
Arabinan 1.36 ± 0.21 1.27 ± 0.03
Acetyl groups 2.13 ± 0.01 1.95 ± 0.29
Mannan 3.19 ± 0.03 3.31 ± 0.01
Galactan 1.43 ± 0.02 1.26 ± 0.03
Klason lignin 30.05 ± 0.00 31.76 ± 0.00
Ash 1.29 ± 0.08 1.19 ± 0.03
Extractives 10.51 ± 0.10 9.23 ± 0.31
Chapter 2: Fractionation of multi-lignocellulosic resources: Autohydrolysis pretreatment
55
Arabinan and acetyl groups were identified, although in lower proportions in both
mixtures, approximately 2 g/100g raw material. Mannan showed concentration around 3
g/100g raw material for both mixtures and galactan was detected in low concentrations
approximately 1 g/100g raw material. Klason lignin was the second highest fraction in the
mixtures, namely 30 % for M1-4 and 32 % for M2-3. Ashes were quantified and
correspond to about 1 % for both mixtures. Extractives correspond approximately to 10
% in both mixtures. As seen in Table 5, there were no significant differences regarding
chemical composition between M1-4 and M2-3 (p-value > 0.05).
Nevertheless, the study of mixture of different species is still scarce. Previous reports
already studied the species that compose M1-4 and M2-3 individually, namely, Acacia
dealbata (Yánez et al., 2014), Cytisus sp (Dusselier et al., 2013) , Pinus pinaster
(González-Muñoz et al., 2012) and Eucalyptus globulus (Romaní et al., 2014). In these
studies, the cellulose content (as glucan) was higher than 40 %, while M1-4 and M2-3
presented lower content of cellulose, around 35 %. This fact can be explained due to
extractives content, as the mixtures comprised branches and twigs with bark and leaves
(which contain high ash content) (Dibdiakova et al., 2015), since the aim of this work was
the integral valorization of these lignocellulosic resources.
Despite the similar composition of M1-4 and M2-3, the outcome of pretreatment could
be different due to their diverse origin (hardwood, softwood and bush), making it
necessary to analyze the pretreatment effect on both mixtures.
2.3.3. Effect of autohydrolysis pretreatment on fractionation of M1-4 and M2-3
mixtures
The conditions of pretreatment (190 ºC to 240 ºC) were chosen based on reported
data by Romaní et al. (Romaní et al., 2010a) and Silva-Fernandes et al. (Silva-Fernandes
et al., 2015). For integral valorization of biomass, all fractions should be considered
(Gullón et al., 2012). Thus, in this work, fractionation of two mixtures was evaluated in
order to recover the hemicellulose as oligosaccharides and to improve the enzymatic
saccharification of cellulose and/or use the solid fraction as solid fuel.
Chapter 2: Fractionation of multi-lignocellulosic resources: Autohydrolysis pretreatment
56
2.3.3.1. Solid phase composition after autohydrolysis pretreatment
Chemical composition of solid phase after autohydrolysis pretreatment is shown
in Table 6. The solid yield (SY) decreased with severity increase and varied from 62.37
- 75.25 g /100 g raw material for M1-4 and 62.33 - 76.70 g/100 g raw material for M2-3, which
is in agreement with previous works under similar conditions for other hardwoods
(Domínguez et al., 2017; Romaní et al., 2014).
The glucan content varied in the range of 40.96 – 47.00 g glucan/100 g autohydrolyzed mixture (on
dry basis) for pretreated M1-4 and 41.07 - 48.47 g glucan/100 g autohydrolyzed mixture (on dry
basis) for pretreated M2-3. Thus, the percentage of glucan that remained in the solid
fraction was very similar after pretreatment for both mixtures, presenting an average of
glucan recovery about 84.86 % and 88.68 % (expressed as g of glucan per 100 g of
autohydrolyzed mixture) for M1-4 and M2-3, respectively, which reveals the selectivity
of this pretreatment.
In addition, the content of lignin after pretreatment varied in the range of 35.76 -
47.82 and 37.04 - 44.56 g lignin/ 100 g autohydrolyzed mixture of M1-4 and M2-3, respectively.
The average recovery was high for the two mixtures, 96.36% and 90.36% (expressed as
g of lignin per 100 g of autohydrolyzed mixture) for M1-4 and M2-3, respectively.
However, lignin content followed a typical pattern for both mixtures, up to a
temperature of 206 ºC the remaining lignin in the solid fraction increased, from this
temperature forward, lignin content decreased and it increased again under the most
severe condition (240 ºC). This behavior was also studied by Moniz et al. with
autohydrolyzed rice straw where until 210 ºC the remaining lignin was close to 100 % of
the initial amount, from 210 ºC onwards showed a decreased around 30 % and it increased
again for the most severe conditions (Moniz et al., 2015). The lignin increase is common
of autohydrolysis pretreatment due to condensation reactions between lignin, sugars and
degradation products (HMF and F) leading to the formation of insoluble compounds that
are quantified as Klason lignin (Pereira Ramos, 2003; Romaní et al., 2010a)
Under most severe conditions (S0=4.15) glucan and lignin represent more than
84% of the solid fraction, and the combined amounts of these fractions matched the one
contained in the raw material. These results are comparable with the results obtained by
Silva-Fernandes et al. in which at the same conditions glucan and lignin contain 85% of
the solid fraction (Silva-Fernandes et al., 2015).
Chapter 2: Fractionation of multi-lignocellulosic resources: Autohydrolysis pretreatment
57
The hemicellulose in the pretreated mixtures, namely, xylan showed a steadily
decrease with the severity of pretreatment and it was the most solubilized fraction, since
it was totally solubilized for both mixtures at temperatures higher than 226 ºC. The same
was reported by Silva-Fernandes et al. in which under most severe conditions 93-95% of
xylan was solubilized in liquid phase (Silva-Fernandes et al., 2015). Patel et al. studied a
different pretreatment (dilute acid pretreatment) to solubilize the hemicellulose fraction
in which revealed that almost, all the hemicellulose content was hydrolyzed, obtained
only 0.4 % in the solid fraction. However, this pretreatment is not ecofriendly, since it
requires an additional detoxification step, increasing the process cost (Patel et al., 2017).
The data described above indicate that autohydrolysis pretreatment in an appropriate
process for the selective fractionation of both mixtures in which showed high
hemicellulose solubilization, directly proportional to autohydrolysis severity, while
cellulose and lignin were usually retained in the solid fraction.
2.3.3.1. Composition of liquid phase resulting from autohydrolysis pretreatment
Autohydrolysis process allows substantial fractionation of components, namely
oligosaccharides, monosaccharides, acetyl groups from hemicellulose, and degradation
products of released sugars as furfural and hydroxymethylfurfural.
The liquid phase composition of the two mixtures (M1-4 and M2-3) is presented
in Table 6, in which the products recovered were represented in three groups:
oligosaccharides (OS), including glucooligosaccharides (GOS), xylooligosaccharides
(XOS), arabinooligosaccharides (ArOS) and acetyl groups (AcGOS); monosaccharides,
as well as glucose, xylose and arabinose; and other by-products such as organic acids
(acetic acid) and furans (HMF and F).
Based on the previous reports (Romaní et al., 2010a), the concentrations (in g/L)
of the liquid phase derived principally from hemicellulose fractions. Hence, the main
compounds were XOS and xylose. The maximal XOS concentrations (10.8 g/L and 14.3
g/L) were obtained at 190 ºC and 206 ºC for M1-4 and M2-3, respectively, representing
47.7 % and 58.1 % of the total compounds presented in the liquid phase. Therefore, at
these conditions of autohydrolysis pretreatment, 47.4 % and 59.8 % of xylan
solubilization was recovered as XOS for M1-4 and M2-3, respectively. These results can
be compared with reported data in literature in which 60 % of the compounds identified
Chapter 2: Fractionation of multi-lignocellulosic resources: Autohydrolysis pretreatment
58
in the liquid phase were XOS, achieved at maximal concentration, at S0 of 3.99
(Domínguez et al., 2017).
At more severe conditions S0> 4.15 the concentration of XOS decreased until
reached 0.33 g/L and 0.49 g/L for M1-4 and M2-3, respectively. XOS started to degrade
into xylose, in which M1-4 achieved 7.9 g/L of maximal xylose concentration at 226 ºC
(S0=4.60) and M2-3 obtained 3.5 g/L at S0= 4.38.
The highest xylan solubilization as a sum of xylose and XOS (62.2 % and 68.6 % for M1-
4 and M2-3, respectively) was obtained at TMAX = 206 ºC for both mixtures. This result
is consistent with Romaní et al. (Romaní et al., 2010a) in which, at mild conditions
(TMAX=210 ºC) 76 % of xylan can be recovered as xylose and XOS.
Consequently, the highest furfural concentration was 2.4 g/L for M1-4 and 2.9 for
M2-3 g/L at S0= 4.82. The highest HMF concentration was also found at the same
severity, in which 1.1 g/L was obtained for both mixtures. Acetic acid raised the
maximum at S0> 4.38 of 4.9 g/L and 4.7 g/L for M1-4 and M2-3, respectively. The harsher
conditions of pretreatment led to an increase of inhibitor compounds, as F, HMF, and
acetic acid.
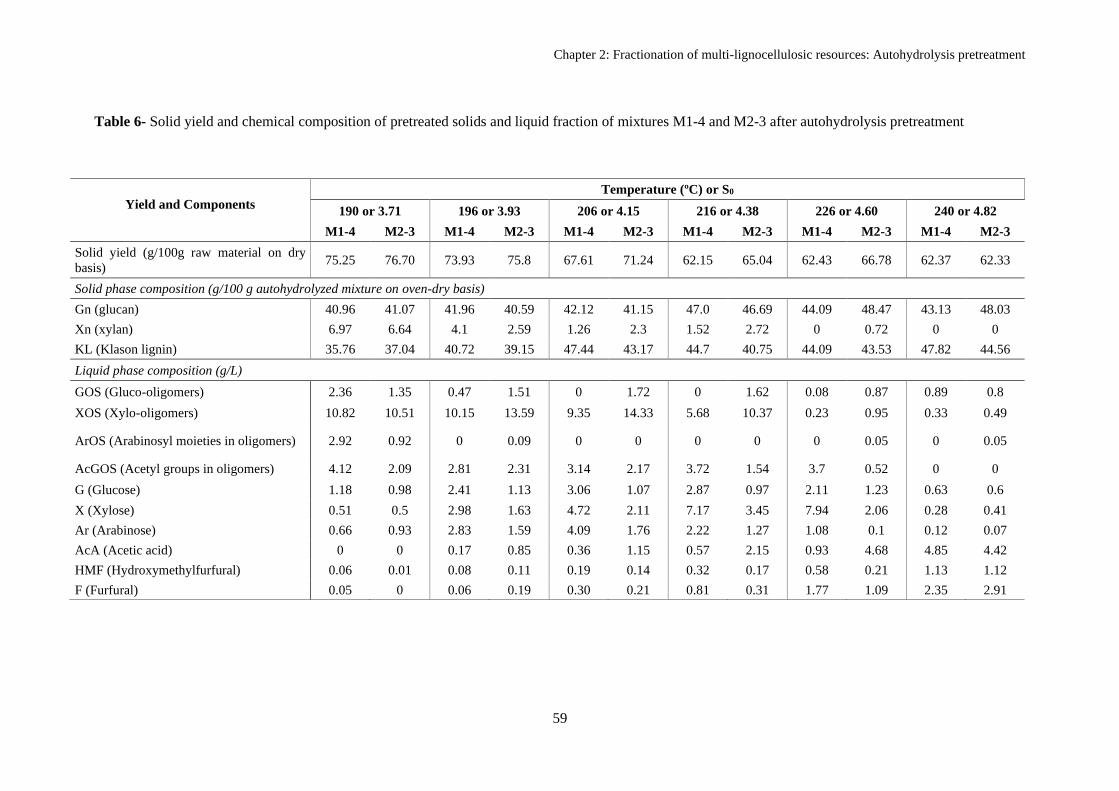
Chapter 2: Fractionation of multi-lignocellulosic resources: Autohydrolysis pretreatment
59
Table 6- Solid yield and chemical composition of pretreated solids and liquid fraction of mixtures M1-4 and M2-3 after autohydrolysis pretreatment
Yield and Components
Temperature (ºC) or S0
190 or 3.71 196 or 3.93 206 or 4.15 216 or 4.38 226 or 4.60 240 or 4.82
M1-4 M2-3 M1-4 M2-3 M1-4 M2-3 M1-4 M2-3 M1-4 M2-3 M1-4 M2-3
Solid yield (g/100g raw material on dry
basis) 75.25 76.70 73.93 75.8 67.61 71.24 62.15 65.04 62.43 66.78 62.37 62.33
Solid phase composition (g/100 g autohydrolyzed mixture on oven-dry basis)
Gn (glucan) 40.96 41.07 41.96 40.59 42.12 41.15 47.0 46.69 44.09 48.47 43.13 48.03
Xn (xylan) 6.97 6.64 4.1 2.59 1.26 2.3 1.52 2.72 0 0.72 0 0
KL (Klason lignin) 35.76 37.04 40.72 39.15 47.44 43.17 44.7 40.75 44.09 43.53 47.82 44.56
Liquid phase composition (g/L)
GOS (Gluco-oligomers) 2.36 1.35 0.47 1.51 0 1.72 0 1.62 0.08 0.87 0.89 0.8
XOS (Xylo-oligomers) 10.82 10.51 10.15 13.59 9.35 14.33 5.68 10.37 0.23 0.95 0.33 0.49
ArOS (Arabinosyl moieties in oligomers) 2.92 0.92 0 0.09 0 0 0 0 0 0.05 0 0.05
AcGOS (Acetyl groups in oligomers) 4.12 2.09 2.81 2.31 3.14 2.17 3.72 1.54 3.7 0.52 0 0
G (Glucose) 1.18 0.98 2.41 1.13 3.06 1.07 2.87 0.97 2.11 1.23 0.63 0.6
X (Xylose) 0.51 0.5 2.98 1.63 4.72 2.11 7.17 3.45 7.94 2.06 0.28 0.41
Ar (Arabinose) 0.66 0.93 2.83 1.59 4.09 1.76 2.22 1.27 1.08 0.1 0.12 0.07
AcA (Acetic acid) 0 0 0.17 0.85 0.36 1.15 0.57 2.15 0.93 4.68 4.85 4.42
HMF (Hydroxymethylfurfural) 0.06 0.01 0.08 0.11 0.19 0.14 0.32 0.17 0.58 0.21 1.13 1.12
F (Furfural) 0.05 0 0.06 0.19 0.30 0.21 0.81 0.31 1.77 1.09 2.35 2.91
Chapter 2: Fractionation of multi-lignocellulosic resources: Autohydrolysis pretreatment
60
The concentration of F is higher than HMF, because the first is attributed to the
degradation of xylose while HMF is obtained through C6 degradation, namely glucose.
As mentioned before, glucose was also present in low amounts varying between 0.6 to
3.1 g/L for M1-4 and 0.6 to 1.2 g/L for M2-3, which represented on average 3.6 % of
glucan solubilization for M1-4 and 1.7 % for M2-3. The results obtained in this work re
in agreement with reported data using Paulownia tomentosa wood in which <4 % of
glucan was recovered in liquid phase (Domínguez et al., 2017). As seen in Table 6, M1-
4 and M2-3 showed differences in XOS and xylose concentration. This fact was probably
influenced by the intrinsic features of lignocellulosic material, since M1-4 is composed
by a higher percentage of residues from bush (as broom, mimosa, carqueja and rockrose)
than M2-3. The main fractions recovered in the liquid phase, xylose and XOS, can be
used for value-added compounds production as xylitol, lactic acid and ethanol obtained
by fermentation and/or directly as prebiotic (Costa et al., 2017; Gullón et al., 2014; Ma et
al., 2016).
As previously reported, at TMAX = 206 ºC, high percentages of hemicellulose were
removed but also primary degradation products (F and HMF) were kept at relatively low
levels, which could be achieved by applying pretreatment conditions of moderate
severity. Although pretreatment improves enzymatic access to cellulose for further
fermentation, it generates byproducts decomposition which may affect negatively
fermentation (Siqueira and Reginatto, 2015).
2.3.4. Energy production of pretreated M1-4 and M2-3 mixtures
HHVs of pretreated mixtures were analyzed in order to evaluate the influence of
pretreatment and compare their behavior as solid fuel. These results are displayed in
Figure 12. The untreated mixtures were analyzed and showed HHVs of 17.23 MJ/kg and
17.26 MJ/kg for M1-4 and M2-3, respectively. HHV of pretreated samples increased with
severity, achieving maximal values of 20.4 MJ/kg and 20.5 MJ/kg, for M1-4 and M2-3,
respectively. The results obtained in this work are in agreement with reported data using
softwood chips in which the HHV of the original wood was 17.9 MJ/kg and with
temperature increase (autohydrolysis pretreatment) reached 20.5 MJ/kg (Pu et al., 2013).
Leaching processes with water and acetic acid were also used to increase the HHVs of
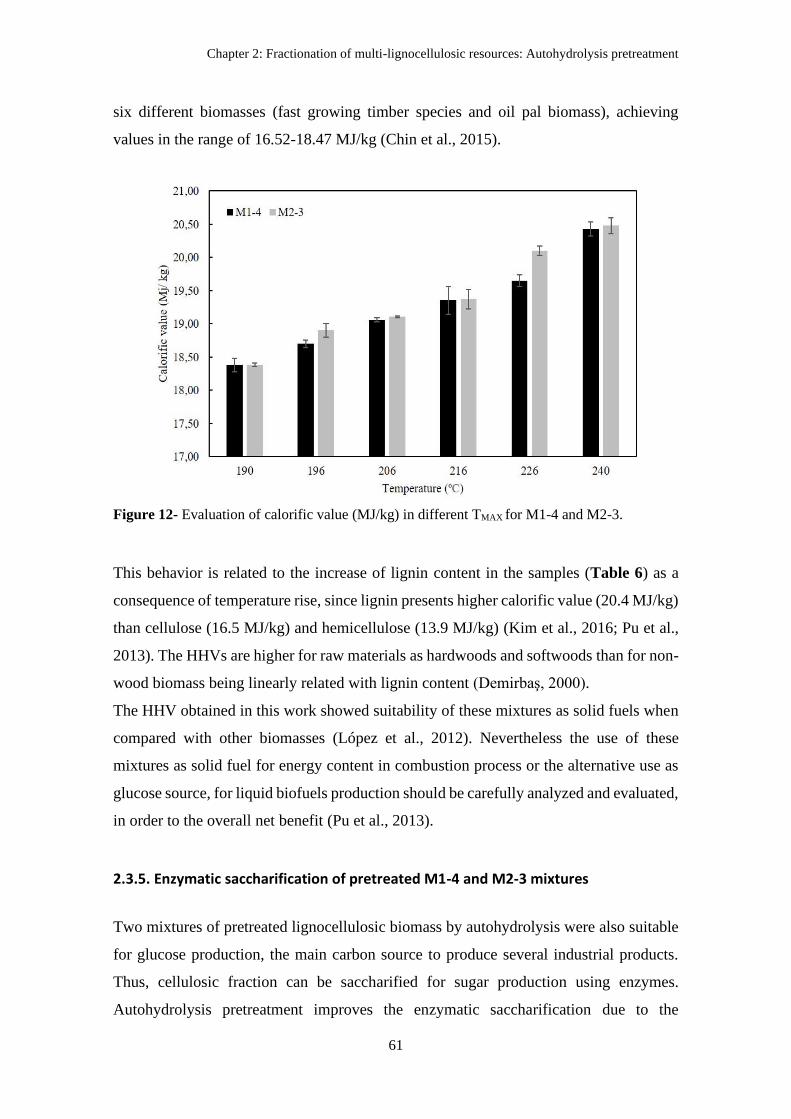
Chapter 2: Fractionation of multi-lignocellulosic resources: Autohydrolysis pretreatment
61
six different biomasses (fast growing timber species and oil pal biomass), achieving
values in the range of 16.52-18.47 MJ/kg (Chin et al., 2015).
Figure 12- Evaluation of calorific value (MJ/kg) in different TMAX for M1-4 and M2-3.
This behavior is related to the increase of lignin content in the samples (Table 6) as a
consequence of temperature rise, since lignin presents higher calorific value (20.4 MJ/kg)
than cellulose (16.5 MJ/kg) and hemicellulose (13.9 MJ/kg) (Kim et al., 2016; Pu et al.,
2013). The HHVs are higher for raw materials as hardwoods and softwoods than for non-
wood biomass being linearly related with lignin content (Demirbaş, 2000).
The HHV obtained in this work showed suitability of these mixtures as solid fuels when
compared with other biomasses (López et al., 2012). Nevertheless the use of these
mixtures as solid fuel for energy content in combustion process or the alternative use as
glucose source, for liquid biofuels production should be carefully analyzed and evaluated,
in order to the overall net benefit (Pu et al., 2013).
2.3.5. Enzymatic saccharification of pretreated M1-4 and M2-3 mixtures
Two mixtures of pretreated lignocellulosic biomass by autohydrolysis were also suitable
for glucose production, the main carbon source to produce several industrial products.
Thus, cellulosic fraction can be saccharified for sugar production using enzymes.
Autohydrolysis pretreatment improves the enzymatic saccharification due to the
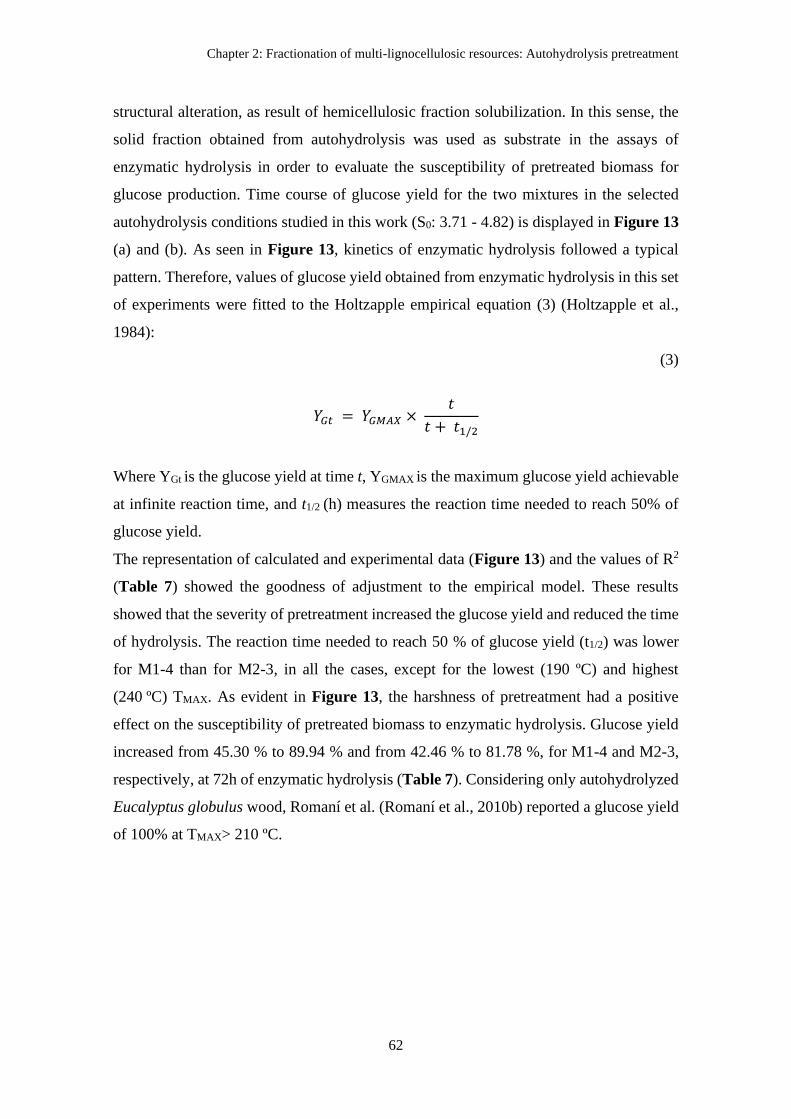
Chapter 2: Fractionation of multi-lignocellulosic resources: Autohydrolysis pretreatment
62
structural alteration, as result of hemicellulosic fraction solubilization. In this sense, the
solid fraction obtained from autohydrolysis was used as substrate in the assays of
enzymatic hydrolysis in order to evaluate the susceptibility of pretreated biomass for
glucose production. Time course of glucose yield for the two mixtures in the selected
autohydrolysis conditions studied in this work (S0: 3.71 - 4.82) is displayed in Figure 13
(a) and (b). As seen in Figure 13, kinetics of enzymatic hydrolysis followed a typical
pattern. Therefore, values of glucose yield obtained from enzymatic hydrolysis in this set
of experiments were fitted to the Holtzapple empirical equation (3) (Holtzapple et al.,
1984):
(3)
𝑌𝐺𝑡 = 𝑌𝐺𝑀𝐴𝑋 × 𝑡
𝑡 + 𝑡1/2
Where YGt is the glucose yield at time t, YGMAX is the maximum glucose yield achievable
at infinite reaction time, and t1/2 (h) measures the reaction time needed to reach 50% of
glucose yield.
The representation of calculated and experimental data (Figure 13) and the values of R2
(Table 7) showed the goodness of adjustment to the empirical model. These results
showed that the severity of pretreatment increased the glucose yield and reduced the time
of hydrolysis. The reaction time needed to reach 50 % of glucose yield (t1/2) was lower
for M1-4 than for M2-3, in all the cases, except for the lowest (190 ºC) and highest
(240 ºC) TMAX. As evident in Figure 13, the harshness of pretreatment had a positive
effect on the susceptibility of pretreated biomass to enzymatic hydrolysis. Glucose yield
increased from 45.30 % to 89.94 % and from 42.46 % to 81.78 %, for M1-4 and M2-3,
respectively, at 72h of enzymatic hydrolysis (Table 7). Considering only autohydrolyzed
Eucalyptus globulus wood, Romaní et al. (Romaní et al., 2010b) reported a glucose yield
of 100% at TMAX> 210 ºC.
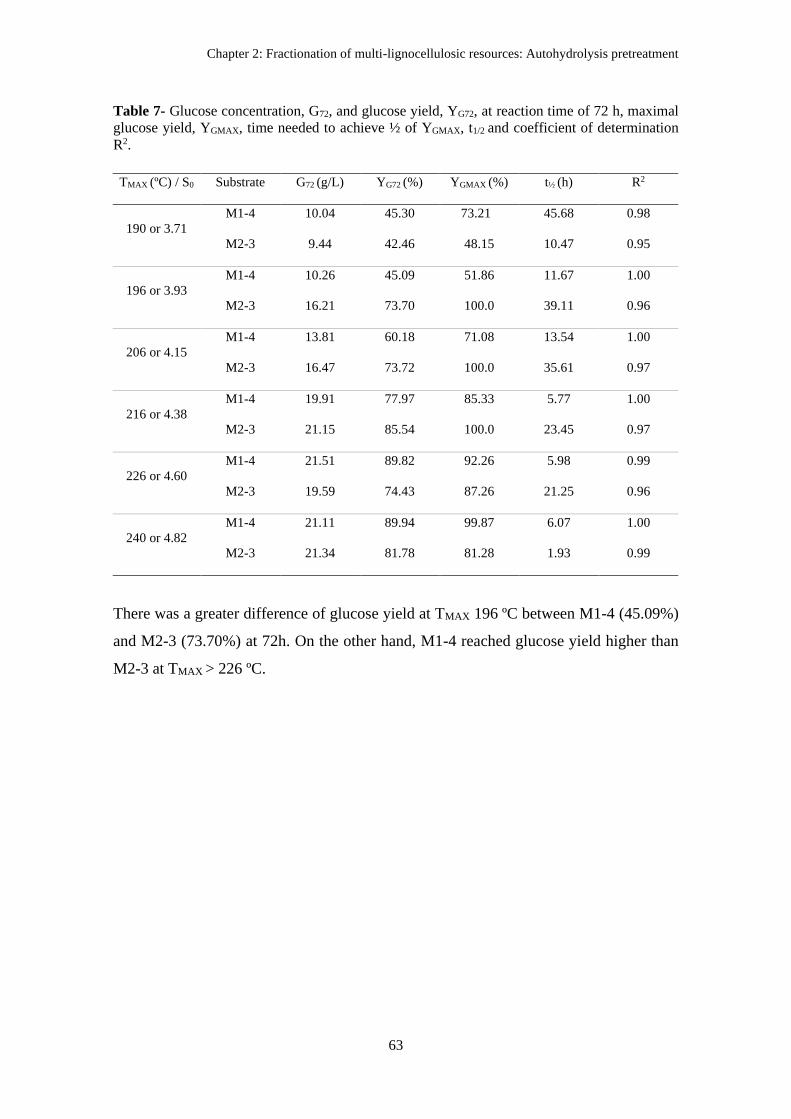
Chapter 2: Fractionation of multi-lignocellulosic resources: Autohydrolysis pretreatment
63
Table 7- Glucose concentration, G72, and glucose yield, YG72, at reaction time of 72 h, maximal
glucose yield, YGMAX, time needed to achieve ½ of YGMAX, t1/2 and coefficient of determination
R2.
There was a greater difference of glucose yield at TMAX 196 ºC between M1-4 (45.09%)
and M2-3 (73.70%) at 72h. On the other hand, M1-4 reached glucose yield higher than
M2-3 at TMAX > 226 ºC.
TMAX (ºC) / S0 Substrate G72 (g/L) YG72 (%) YGMAX (%) t½ (h) R2
190 or 3.71
M1-4 10.04 45.30 73.21 45.68 0.98
M2-3 9.44 42.46 48.15 10.47 0.95
196 or 3.93
M1-4 10.26 45.09 51.86 11.67 1.00
M2-3 16.21 73.70 100.0 39.11 0.96
206 or 4.15
M1-4 13.81 60.18 71.08 13.54 1.00
M2-3 16.47 73.72 100.0 35.61 0.97
216 or 4.38
M1-4 19.91 77.97 85.33 5.77 1.00
M2-3 21.15 85.54 100.0 23.45 0.97
226 or 4.60
M1-4 21.51 89.82 92.26 5.98 0.99
M2-3 19.59 74.43 87.26 21.25 0.96
240 or 4.82
M1-4 21.11 89.94 99.87 6.07 1.00
M2-3 21.34 81.78 81.28 1.93 0.99
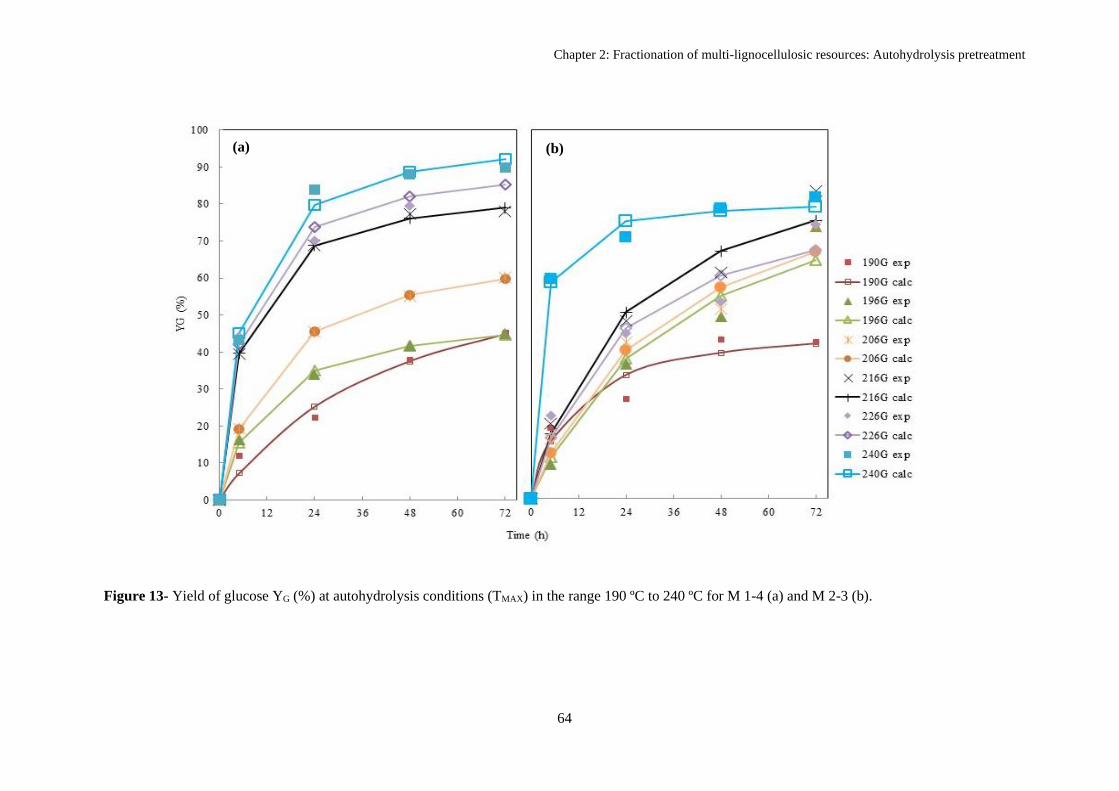
Chapter 2: Fractionation of multi-lignocellulosic resources: Autohydrolysis pretreatment
64
Figure 13- Yield of glucose YG (%) at autohydrolysis conditions (TMAX) in the range 190 ºC to 240 ºC for M 1-4 (a) and M 2-3 (b).
(a) (b)
Chapter 2 | Fractionation of multi-lignocellulosic resources: Autohydrolysis pretreatment
65
An increase in the autohydrolysis severity (S0) from 3.71 to 4.82 allowed glucose
concentration to increase from 10 g/L to 21 g/L, approximately, at 72 h of hydrolysis for
the two mixtures (Table 7). The similar behavior was reported by Domínguez et al.
(Domínguez et al., 2017), using Paulownia tomentosa as biomass, where an increase in
the autohydrolysis severity from S0 3.31 to 4.82 allowed a five-fold increment in glucose
concentration to 27.5 g/L at 120 h.
In general, enzymatic hydrolysis is an efficient process without generation of any
toxic waste and does not contain fermentation inhibitors, which reveals a promising
strategy to obtain higher glucose yield (Singh et al., 2013).
2.3.6. Overall balance of M1-4 and M2-3
Considering the results obtained in this chapter, Figure 14 compares the
fractionation effect of autohydrolysis pretreatment on the two feedstock mixtures. The
highest hemicellulose solubilization (as XOS and xylose) was observed at TMAX = 206 ºC,
as glucose yield of enzymatic hydrolysis higher than 60% for both mixtures (Table 7).
As seen in Figure 14, the value-added compound obtained in separated streams was of
19.1 kg of glucose for M1-4 and 24.1 kg of glucose for M2-3. Overall yield of glucose
for M1-4 and M2-3 was 50% and 63%, respectively. These results can be compared with
reported data in literature using the same pretreatment, in which 76% and 63% of glucose
yield at S0 = 4.13 were achieved from brewers’s spent grain and corn husk, respectively
(Michelin and Teixeira, 2016). At the same condition, overall yield of xylose was 62%
and 69% for M1-4 and M2-3, respectively. The results obtained for xylose yield can be
favorably compared with data reported by Nitsos et al., that obtained around 60% yield
(S0 3.8 - 4.01) for poplar and grapevine, respectively (Nitsos et al., 2016). The data
described above indicate that autohydrolysis at 206 ºC is an appropriate process for the
selective fractionation of mixtures obtaining a solid fraction composed mainly by glucan
and lignin, and high solubilization of hemicellulose into the liquid phase with minimum
formation of degradation products. Cellulose was subjected to enzymatic hydrolysis and
could be further processed for biological conversion into biofuels, biochemical or
biomaterials as single or in combination with sugars obtained from liquid phase. The
remaining lignin can simply be used for co-generation of energy in a biorefinery context
or exploited for other high value applications.
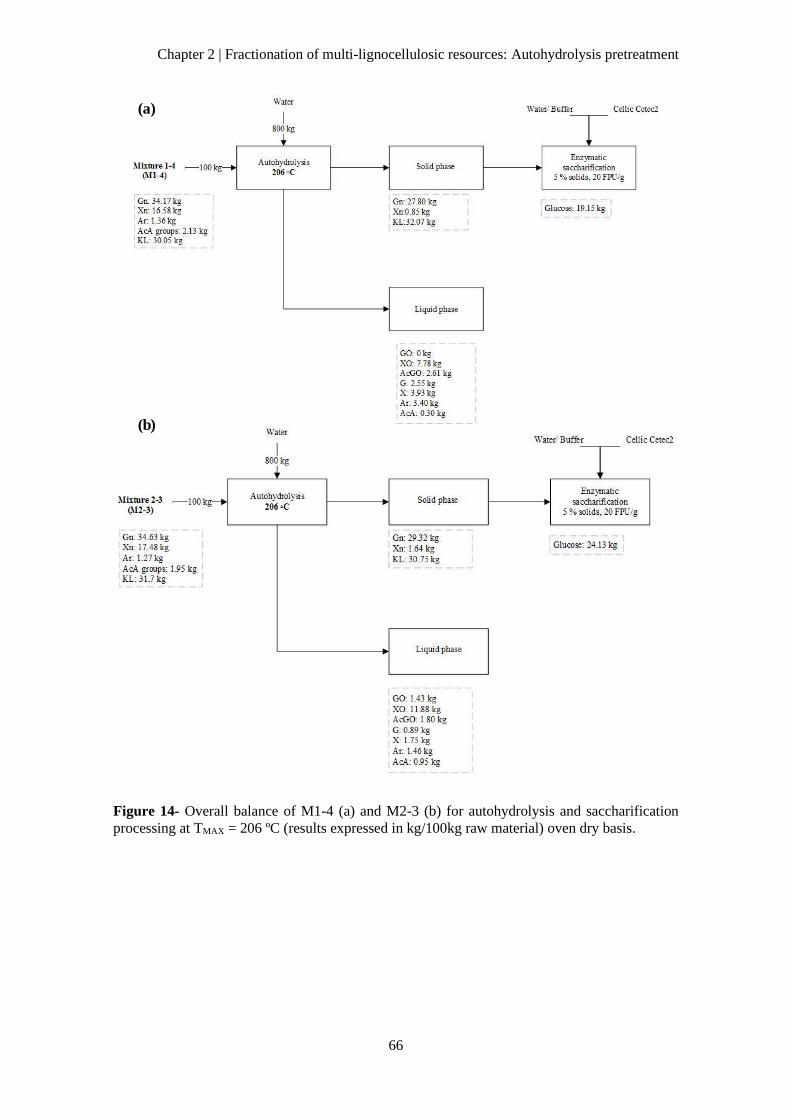
Chapter 2 | Fractionation of multi-lignocellulosic resources: Autohydrolysis pretreatment
66
Figure 14- Overall balance of M1-4 (a) and M2-3 (b) for autohydrolysis and saccharification
processing at TMAX = 206 ºC (results expressed in kg/100kg raw material) oven dry basis.
(a)
(b)
Chapter 2 | Fractionation of multi-lignocellulosic resources: Autohydrolysis pretreatment
67
2.4. Conclusions
This chapter proved an efficient fractionation of the selected mixtures (M1-4 and
M2-3) by autohydrolysis, demonstrating that the criteria selected, besides representing an
actual scenario of lignocellulosic biomass selection, results in valuable outcomes. Mixed
feedstocks evaluated in this work showed a similar behavior to autohydrolysis treatment,
however different yields of value-added compounds were co-produced. One condition
(TMAX = 206 ºC or S0 = 4.15) could be selected for the treatment of both biomass mixtures.
Since under this condition, recoveries of 62.2% and 68.8% of hemicellulose-derived
compounds (as XOS and xylose) were obtained for M1-4 and M2-3, respectively.
Likewise, glucose yield from enzymatic hydrolysis resulted in 60.1% for M1-4 and 73.7%
for M2-3. Alternatively, autohydrolyzed pretreated biomass may be used for solid fuel as
high heating values of 20.5 MJ/kg were attained.
Chapter 2 | Fractionation of multi-lignocellulosic resources: Autohydrolysis pretreatment
68
2.5. References
Ares-Peón, I.A., Romaní, A., Garrote, G., Parajó, J.C., 2013. Invasive biomass
valorization: Environmentally friendly processes for obtaining second generation
bioethanol and saccharides from Ulex europ??us. Journal of Chemical Technology
and Biotechnology 88, 999–1006. https://doi.org/10.1002/jctb.3963
Cherubini, F., 2010. The biorefinery concept: Using biomass instead of oil for producing
energy and chemicals. Energy Conversion and Management 51, 1412–1421.
https://doi.org/10.1016/j.enconman.2010.01.015
Chin, K.L., H’ng, P.S., Paridah, M.T., Szymona, K., Maminski, M., Lee, S.H., Lum,
W.C., Nurliyana, M.Y., Chow, M.J., Go, W.Z., 2015. Reducing ash related operation
problems of fast growing timber species and oil palm biomass for combustion
applications using leaching techniques. Energy 90, 622–630.
https://doi.org/10.1016/j.energy.2015.07.094
Costa, C.E., Romaní, A., Cunha, J.T., Johansson, B., Domingues, L., 2017. Integrated
approach for selecting efficient Saccharomyces cerevisiae for industrial
lignocellulosic fermentations: Importance of yeast chassis linked to process
conditions. Bioresource Technology 227, 24–34.
https://doi.org/10.1016/j.biortech.2016.12.016
Demirbaş, A., 2000. Mechanisms of liquefaction and pyrolysis reactions of biomass.
Energy Conversion and Management 41, 633–646. https://doi.org/10.1016/S0196-
8904(99)00130-2
Dibdiakova, J., Wang, L., Li, H., 2015. Characterization of Ashes from Pinus Sylvestris
forest Biomass, in: Energy Procedia. Elsevier Ltd, pp. 186–191.
https://doi.org/10.1016/j.egypro.2015.07.289
Domínguez, E., Romaní, A., Domingues, L., Garrote, G., 2017. Evaluation of strategies
for second generation bioethanol production from fast growing biomass Paulownia
within a biorefinery scheme. Applied Energy 187, 777–789.
https://doi.org/10.1016/j.apenergy.2016.11.114
Duarte, G. V., Moura, A.I., Moreira, R., Nunes, J., Figueiredo, M.M., Carvalho, M.G.,
2013. Evaluation of Several Forest Residues as Potential Raw Material for
Chapter 2 | Fractionation of multi-lignocellulosic resources: Autohydrolysis pretreatment
69
Bioethanol Production in Portugal. Journal of Bioprocess Engineering and
Biorefinery 2, 73–78. https://doi.org/10.1166/jbeb.2013.1035
Dusselier, M., Van Wouwe, P., Dewaele, A., Makshina, E., Sels, B.F., 2013. Lactic acid
as a platform chemical in the biobased economy: The role of chemocatalysis. Energy
and Environmental Science 6, 1415–1442. https://doi.org/10.1039/c3ee00069a
Ghose, T.K., 1987. Measurement of cellulase activities. Pure and Applied Chemistry 59,
257–268. https://doi.org/10.1351/pac198759020257
González-Muñoz, M.J., Alvarez, R., Santos, V., Parajó, J.C., 2012. Production of
hemicellulosic sugars from Pinus pinaster wood by sequential steps of aqueous
extraction and acid hydrolysis. Wood Science and Technology 46, 271–285.
https://doi.org/10.1007/s00226-011-0408-0
Gullón, P., Gullón, B., Cardelle-Cobas, A., Alonso, J.L., Pintado, M., Gomes, A.M.,
2014. Effects of hemicellulose-derived saccharides on behavior of Lactobacilli
under simulated gastrointestinal conditions. Food Research International 64, 880–
888. https://doi.org/10.1016/j.foodres.2014.08.043
Gullón, P., Romaní, A., Vila, C., Garrote, G., Parajó, J.C., 2012. Potential of
hydrothermal treatments in lignocellulose biorefineries. Biofuels, Bioproducts and
Biorefining 6, 219–232. https://doi.org/10.1002/bbb.339
Holtzapple, M.T., Caram, H.S., Humphrey, A.E., 1984. A comparison of two empirical
models for the enzymatic hydrolysis of pretreated poplar wood. Biotechnology and
Bioengineering 26, 936–941. https://doi.org/10.1002/bit.260260818
ICNF, 2013. IFN6- Áreas dos usos do solo e das espécies florestais de Portugal
Continental. Resultados preliminares. Lisboa.
Jensen, J., Morinelly, J., Aglan, A., Mix, A., Shonnard, D.R., 2008. Kinetic
characterization of biomass dilute sulfuric acid hydrolysis: Mixtures of hardwoods,
softwood, and switchgrass. AIChE Journal 54, 1637–1645.
https://doi.org/10.1002/aic.11467
Kim, D., Lee, K., Park, K.Y., 2016. Upgrading the characteristics of biochar from
cellulose, lignin, and xylan for solid biofuel production from biomass by
hydrothermal carbonization. Journal of Industrial and Engineering Chemistry 42,
Chapter 2 | Fractionation of multi-lignocellulosic resources: Autohydrolysis pretreatment
70
95–100. https://doi.org/10.1016/j.jiec.2016.07.037
Lavoie, J.M., Capek-Menard, E., Gauvin, H., Chornet, E., 2010. Production of pulp from
Salix viminalis energy crops using the FIRSST process. Bioresource Technology
101, 4940–4946. https://doi.org/10.1016/j.biortech.2009.09.021
López, F., Pérez, A., Zamudio, M.A.M., De Alva, H.E., García, J.C., 2012. Paulownia as
raw material for solid biofuel and cellulose pulp. Biomass and Bioenergy 45, 77–86.
https://doi.org/10.1016/j.biombioe.2012.05.010
Ma, K., Hu, G., Pan, L., Wang, Z., Zhou, Y., Wang, Y., Ruan, Z., He, M., 2016. Highly
efficient production of optically pure L-lactic acid from corn stover hydrolysate by
thermophilic Bacillus coagulans. Bioresource Technology 219, 114–122.
https://doi.org/10.1016/j.biortech.2016.07.100
Martín, C., Thomsen, M.H., Hauggaard-Nielsen, H., BelindaThomsen, A., 2008. Wet
oxidation pretreatment, enzymatic hydrolysis and simultaneous saccharification and
fermentation of clover-ryegrass mixtures. Bioresource Technology 99, 8777–8782.
https://doi.org/10.1016/j.biortech.2008.04.039
Michelin, M., Teixeira, J.A., 2016. Liquid hot water pretreatment of multi feedstocks and
enzymatic hydrolysis of solids obtained thereof. Bioresource Technology 216, 862–
869. https://doi.org/10.1016/j.biortech.2016.06.018
Moniz, P., João, L., Duarte, L.C., Roseiro, L.B., Boeriu, C.G., Pereira, H., Carvalheiro,
F., 2015. Fractionation of Hemicelluloses and Lignin from Rice Straw by Combining
Autohydrolysis and Optimised Mild Organosolv Delignification. BioResources 10,
2626–2641. https://doi.org/10.15376/biores.10.2.2626-2641
Nitsos, C.K., Choli-Papadopoulou, T., Matis, K.A., Triantafyllidis, K.S., 2016.
Optimization of hydrothermal pretreatment of hardwood and softwood
lignocellulosic residues for selective hemicellulose recovery and improved cellulose
enzymatic hydrolysis. ACS Sustainable Chemistry and Engineering 4, 4529–4544.
https://doi.org/10.1021/acssuschemeng.6b00535
Nunes, J., Fierro, J., Freitas, H., 2012. Sustainable management of forest ecosystems and
lignocellulosic biomass use: A case study from Portugal. 20th European Biomass
Conference and Exhibition.
Chapter 2 | Fractionation of multi-lignocellulosic resources: Autohydrolysis pretreatment
71
Patel, H., Chapla, D., Shah, A., 2017. Bioconversion of pretreated sugarcane bagasse
using enzymatic and acid followed by enzymatic hydrolysis approaches for
bioethanol production. Renewable Energy 109, 323–331.
https://doi.org/10.1016/j.renene.2017.03.057
Pereira Ramos, L., 2003. The chemistry involved in the steam treatment of lignocellulosic
materials. Quimica Nova. https://doi.org/10.1590/s0100-40422003000600015
Pu, Y., Treasure, T., Gonzalez, R., Venditti, R.A., Jameel, H., 2013. Autohydrolysis
Pretreatment of Mixed Softwood to Produce Value Prior to Combustion. Bioenergy
Research 6, 1094–1103. https://doi.org/10.1007/s12155-013-9343-2
R.S. Jessup, 1960. Precise Measurement of Heat of Combustion With a Bomb
Calorimeter.
Romaní, A., Garrote, G., Alonso, J.L., Parajó, J.C., 2010a. Bioethanol production from
hydrothermally pretreated Eucalyptus globulus wood. Bioresource Technology 101,
8706–8712. https://doi.org/10.1016/j.biortech.2010.06.093
Romaní, A., Garrote, G., Alonso, J.L., Parajó, J.C., 2010b. Experimental assessment on
the enzymatic hydrolysis of hydrothermally pretreated eucalyptus globulus wood.
Industrial and Engineering Chemistry Research 49, 4653–4663.
https://doi.org/10.1021/ie100154m
Romaní, A., Hector, H., Ruiz, A., Pereira, F.B., Domingues, L., Teixeira, J.J., 2013.
Fractionation of Eucalyptus globulus Wood by Glycerol−Water Pretreatment:
Optimization and Modeling. https://doi.org/10.1021/ie402177f
Romaní, Aloia, Ruiz, Héctor A, Pereira, Francisco B, Domingues, L., Teixeira, José A,
Romaní, A, Ruiz, H A, Pereira, F B, Domingues, : L, Teixeira, J A, 2014. Effect of
hemicellulose liquid phase on the enzymatic hydrolysis of autohydrolyzed
Eucalyptus globulus wood Time needed to reach CGC max /2 (h). Biomass Conv.
Bioref 4, 77–86. https://doi.org/10.1007/s13399-013-0093-3
Ruiz, H.A., Ruzene, D.S., Silva, D.P., Da Silva, F.F.M., Vicente, A.A., Teixeira, J.A.,
2011. Development and characterization of an environmentally friendly process
sequence (autohydrolysis and organosolv) for wheat straw delignification. Applied
Biochemistry and Biotechnology 164, 629–641. https://doi.org/10.1007/s12010-
011-9163-9
Chapter 2 | Fractionation of multi-lignocellulosic resources: Autohydrolysis pretreatment
72
Silva-Fernandes, T., Duarte, L.C., Carvalheiro, F., Loureiro-Dias, M.C., Fonseca, C.,
Gírio, F., 2015. Hydrothermal pretreatment of several lignocellulosic mixtures
containing wheat straw and two hardwood residues available in Southern Europe.
Bioresource Technology 183, 213–220.
https://doi.org/10.1016/j.biortech.2015.01.059
Singh, A., Sharma, P., Saran, A.K., Singh, N., Bishnoi, N.R., 2013. Comparative study
on ethanol production from pretreated sugarcane bagasse using immobilized
Saccharomyces cerevisiae on various matrices. Renewable Energy 50, 488–493.
https://doi.org/10.1016/j.renene.2012.07.003
Siqueira, M.R., Reginatto, V., 2015. Inhibition of fermentative H2 production by
hydrolysis byproducts oflignocellulosic substrates. Renewable Energy 80, 109–116.
https://doi.org/10.1016/j.renene.2015.01.070
Thomsen, M.H., Haugaard-Nielsen, H., 2008. Sustainable bioethanol production
combining biorefinery principles using combined raw materials from wheat
undersown with clover-grass. Journal of Industrial Microbiology and Biotechnology
35, 303–311. https://doi.org/10.1007/s10295-008-0334-9
Xu, Y., Zhang, K., Wang, D., 2017. High gravity enzymatic hydrolysis of hydrothermal
and ultrasonic pretreated big bluestem with recycling prehydrolysate water.
Renewable Energy 114, 351–356. https://doi.org/10.1016/j.renene.2017.07.045
Yánez, R., Gómez, B., Martínez, M., Gullón, B., Alonso, J.L., 2014. Valorization of an
invasive woody species, Acacia dealbata, by means of Ionic liquid pretreatment and
enzymatic hydrolysis. Journal of Chemical Technology and Biotechnology 89,
1337–1343. https://doi.org/10.1002/jctb.4207
CHAPTER 3 |
Organosolv process of a mixture of autohydrolyzed biomass
Abstract
Mixture of autohydrolyzed unexploited lignocellulosic biomass (AM2-3) was
delignified by uncatalyzed ethanol-organosolv process to recover hemicellulose,
cellulose and lignin in separate streams. Three factors were evaluated in the experimental
design of organosolv process: ethanol concentration (30–80%), temperature (160–200ºC)
and time (20–60 min). Organosolv process showed that the best compromise between
lignin removal and cellulose preservation was obtained at high temperature and ethanol
concentration (p-value of 0.05). Maximal delignification (49.40%) was obtained at the
highest severity condition (200ºC, 60 min, 80% EtOH). Moreover, 35.32 g/L glucose,
correspondig to a glucose yield of 49.65%, was produced from enzymatic hydrolysis of
delignified biomass. FTIR analysis of the isolated lignins (OL1–OL10) showed that the
main lignin structure was not changed, while thermal analysis revealed Tg values from 73
to 85 ºC. All OL presented radical scavenging activity as high as the commercial
antioxidant BHT.
Keywords: Lignocellulosic feedstock, organosolv delignification process, lignin.
This chapter is based on the following paper:
Pontes, R., Michelin, M., Romaní, A., Teixeira, J., Nunes, J. 2018. Assessment of the
organosolv process in a mixture of autohydrolyzed unexploited lignocellulosic biomasses
for an effective recovery and valorization of lignin (submitted to International Journal of
Biological Macromolecules)
Chapter 3 | Organosolv process of a mixture of autohydrolyzed biomass
74
Contents
3.1. Introduction ............................................................................................................. 75
3.2. Materials and methods ............................................................................................. 77
3.2.1. Lignocellulosic biomass ................................................................................... 77
3.2.2. Organosolv delignification process................................................................... 77
3.2.3. Enzymatic hydrolysis of delignified biomass ................................................... 80
3.2.4. Chemical analysis of biomass composition ...................................................... 81
3.2.5. Lignin characterization ..................................................................................... 81
3.3. Results and discussion ............................................................................................. 83
3.3.1. Organosolv lignin extraction ................................................................................ 83
3.3.2. Enzymatic Hydrolysis (EH) of delignified biomass mixture ............................... 88
3.3.3. Organosolv lignin characterization ....................................................................... 90
3.4. Conclusion ............................................................................................................... 96
3.5. References ............................................................................................................... 97
Chapter 3 | Organosolv process of a mixture of autohydrolyzed biomass
75
3.1. Introduction
Lignocellulosic biomass (LCB) has proven to be a promising resource for
sustainable development towards a biobased society, and is a key option for biorefinery
concepts. Nevertheless, some factors such as feedstock type and availability, time of
harvest, transportation costs, and storage have been identified as main drawbacks for the
feasibility of biorefineries. Thus, the combination of mixtures of unexploited biomasses
from marginal land could be a solution for the sustainable biorefinery supply when
compared to single feedstock (Astner et al., 2015). Furthermore, the economic viability
of the future lignocellulosic biorefinery depends on the conversion of all fractions,
namely, cellulose, hemicellulose and lignin to value-added compounds, based on a
cascade use concept (Azadi et al., 2013). Thus, the selective separation of these
components enables their efficient utilization (Romaní et al., 2011).
One potential strategy proposed as a first step is the hemicellulose solubilization
by hydrothermal processing (or autohydrolysis), with hot and compressed water
(Cybulska et al., 2017). This technology, under optimized conditions, enables a high
production of soluble hemicellulosic oligosaccharides without causing significant
dissolution of cellulose and lignin, while remaining in the solid fraction (Moniz et al.,
2015; Romaní et al., 2011).
For further fractionation, the removal of lignin before hydrolysis of cellulose in
glucose and subsequent fermentation of fermentable sugars avoids problems related to
the non-specific binding of cellulolytic enzymes to lignin and reprecipitation of soluble
lignin, which could make cellulose fibers more recalcitrant to enzyme digestion reducing
fermentation yield (Brudecki et al., 2013; Romaní et al., 2011).
Among the different processes able to break lignin bonds from cellulose, chemical
treatments are particularly effective for lignin extraction/recovery, in particular the
organosolv delignification process, which is highly optimized for this purpose (Cybulska
et al., 2017; Maniet et al., 2017). The Organosolv process is based on organic solvents
that break bonds such as β-aryl ether and aryl glycerol-β-aryl ether in the lignin
macromolecule, causing lignin alteration (Vargas et al., 2016). To date, different
combinations of solvents (e.g. methanol, ethanol, acetone, and/or organic acids) and many
treatment conditions have been studied for autohydrolyzed biomass (Amiri and Karimi,
2016; Michelin et al., 2018; Moniz et al., 2015; Romaní et al., 2011; Vargas et al., 2016;
Chapter 3 | Organosolv process of a mixture of autohydrolyzed biomass
76
Zhu et al., 2015). Nevertheless, ethanol is the most used due to its low cost and easy
recovery, with promising results (Brudecki et al., 2013; Moniz et al., 2015). In the studied
cases, and considering our knowledge and the available literature, it is the first time the
organosolv process was used to pretreat complex mixtures of autohydrolyzed
lignocellulosic biomass, especially in the scope of the raw material from marginal lands
without economic activity and relevant uses.
The products commonly obtained by this process include sulphur-free lignin
fragments, which are useful for the production of lignin-based high value products due to
their purity and low molecular weight (Moniz et al., 2015). Therefore, aside from its
current use as solid fuel, potential applications for lignin , such as copolymers and
polymers blends (Doherty et al., 2011), cosmetic (Vinardell et al., 2011), resins (Stewart,
2008), adhesives (Reddy and Yang, 2005), carbon fibers, fillers, encapsulants,
pharmaceutical intermediates and oxygenated aromatic compounds could be developed
(Astner et al., 2015).
Furthermore, lignin separation could reduce problems in wastewater treatment
from the environmental point of view and improve the economic value of the process
(Amiri and Karimi, 2016). In order to find new lignin valorization routes, it is essential
to perform an extensively characterization of this fraction, since lignin demonstrates
different properties according to lignocellulosic biomass, pretreatment and isolation
process (Martín-Sampedro et al., 2019).
In this context, the present original study aimed to extract lignin from mixtures of
autohydrolyzed forest and marginal lands lignocellulosic biomasses resources by
organosolv delignification process, using ethanol/water mixture. The purpose of using a
mixture of biomasses is to have sufficient resources available to supply a biorefinery
throughout the year, since the security supply and the sustainability of exploration are key
factors to ensure the industrialization of these systems (Pontes et al., 2018). The criteria
for the mixture of biomasses was based on territory distribution, fire risk during summer
months and total sugar content (Pontes et al., 2018).
For organosolv evaluation, the effects of operational conditions (temperature, time
and ethanol concentration) were evaluated by experimental design. This chapter has
extended to the study of the physicochemical and antioxidant properties of isolated lignins
for further valorization and follow up of the enzymatic hydrolysis of the recovered
cellulosic fraction.
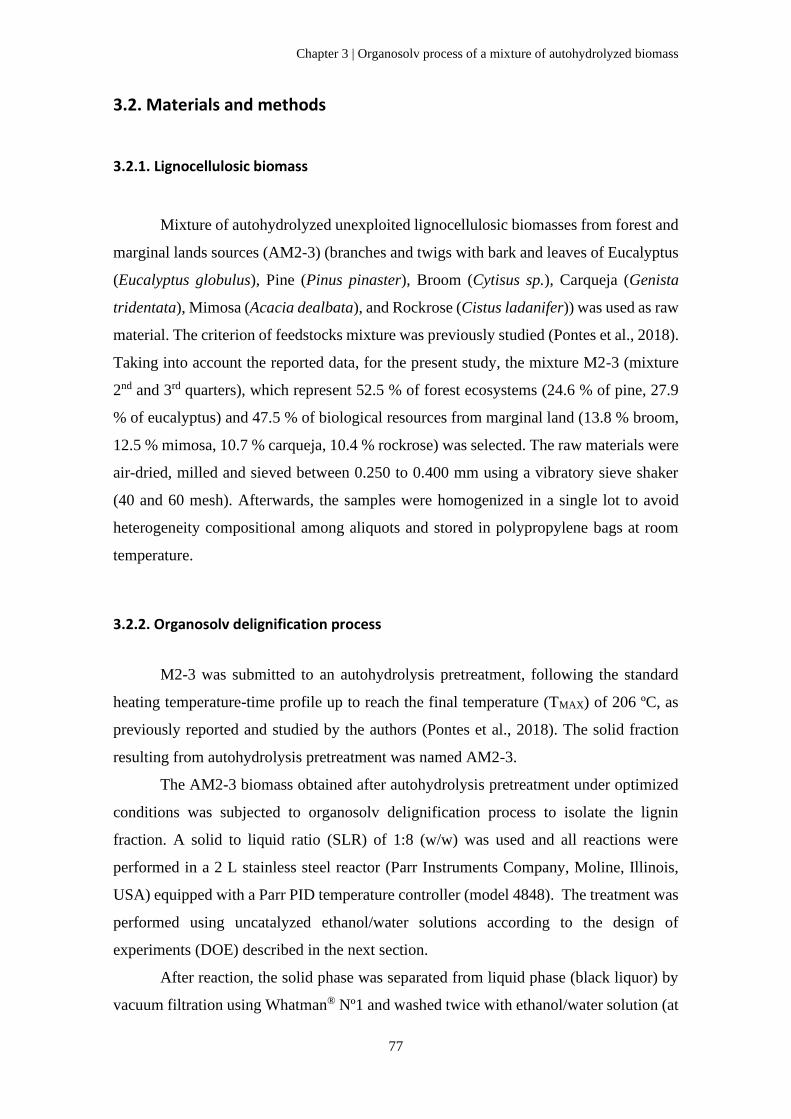
Chapter 3 | Organosolv process of a mixture of autohydrolyzed biomass
77
3.2. Materials and methods
3.2.1. Lignocellulosic biomass
Mixture of autohydrolyzed unexploited lignocellulosic biomasses from forest and
marginal lands sources (AM2-3) (branches and twigs with bark and leaves of Eucalyptus
(Eucalyptus globulus), Pine (Pinus pinaster), Broom (Cytisus sp.), Carqueja (Genista
tridentata), Mimosa (Acacia dealbata), and Rockrose (Cistus ladanifer)) was used as raw
material. The criterion of feedstocks mixture was previously studied (Pontes et al., 2018).
Taking into account the reported data, for the present study, the mixture M2-3 (mixture
2nd and 3rd quarters), which represent 52.5 % of forest ecosystems (24.6 % of pine, 27.9
% of eucalyptus) and 47.5 % of biological resources from marginal land (13.8 % broom,
12.5 % mimosa, 10.7 % carqueja, 10.4 % rockrose) was selected. The raw materials were
air-dried, milled and sieved between 0.250 to 0.400 mm using a vibratory sieve shaker
(40 and 60 mesh). Afterwards, the samples were homogenized in a single lot to avoid
heterogeneity compositional among aliquots and stored in polypropylene bags at room
temperature.
3.2.2. Organosolv delignification process
M2-3 was submitted to an autohydrolysis pretreatment, following the standard
heating temperature-time profile up to reach the final temperature (TMAX) of 206 ºC, as
previously reported and studied by the authors (Pontes et al., 2018). The solid fraction
resulting from autohydrolysis pretreatment was named AM2-3.
The AM2-3 biomass obtained after autohydrolysis pretreatment under optimized
conditions was subjected to organosolv delignification process to isolate the lignin
fraction. A solid to liquid ratio (SLR) of 1:8 (w/w) was used and all reactions were
performed in a 2 L stainless steel reactor (Parr Instruments Company, Moline, Illinois,
USA) equipped with a Parr PID temperature controller (model 4848). The treatment was
performed using uncatalyzed ethanol/water solutions according to the design of
experiments (DOE) described in the next section.
After reaction, the solid phase was separated from liquid phase (black liquor) by
vacuum filtration using Whatman® Nº1 and washed twice with ethanol/water solution (at
Chapter 3 | Organosolv process of a mixture of autohydrolyzed biomass
78
the same concentration of the treatment). The washing ethanol/water solution and black
liquor were combined to recover the lignin. The organosolv lignin fractions were
recovered by precipitation after addition of three volumes of water acidified with acetic
acid to pH 2.0. The precipitated lignins were centrifuged, washed, and freeze-dried.
On the other hand, the delignified solids were washed with 10 g of NaOH (1%,
w/w)/g of solids at room temperature plus washes until pH 7 (approximately 1 L of
distilled water/g of solids), in order to remove adsorbed lignin from the pretreated solids
as described at (Romaní et al., 2016). Washed delignified solids were air-dried at 45 ºC.
The yield of lignin or solid residue (YL) was determined according to Eq (1).
(1)
𝑌𝐿(%) =𝑚𝑟𝑒𝑐𝑜𝑣𝑒𝑟𝑒𝑑
𝑚𝐴𝑀2−3× 100
Where mrecovered is the mass of lignin or solid residue recovered after the organosolv
process (g), mAM2-3 is the mass of the AM2-3 biomass used for the treatment (g).
The lignin extraction efficiency (EE) was determined according to Eq. (2).
(2)
𝐸𝐸 (%) =𝑌
𝐾𝐿𝐴𝑀2−3× 100
Where Y is the yield of lignin extracted in the organosolv process (%), KLAM2-3 is
the quantity of the Klason lignin of the AM2-3 biomass (%).
The delignification extent (DE) was determined by Eq. (3).
(3)
𝐷𝐸 (%) = {𝐾𝐿𝐴𝑀2−3 − [𝐾𝐿𝑑𝑒𝑙𝑖𝑔𝑛𝑖𝑓𝑖𝑒𝑑 𝐴𝑀2−3(𝑌𝑑𝑒𝑙𝑖𝑔𝑛𝑖𝑓𝑖𝑒𝑑 𝐴𝑀2−3/100)]
𝐾𝐿𝐴𝑀2−3} × 100
Where KLAM2-3 is the quantity of Klason lignin in the AM2-3 biomass (%),
KLdelignified AM2-3 is the quantity of the Klason lignin in the solids after organosolv process
(%) and Ydelignified AM2-3 is the yield of solid residue (%).
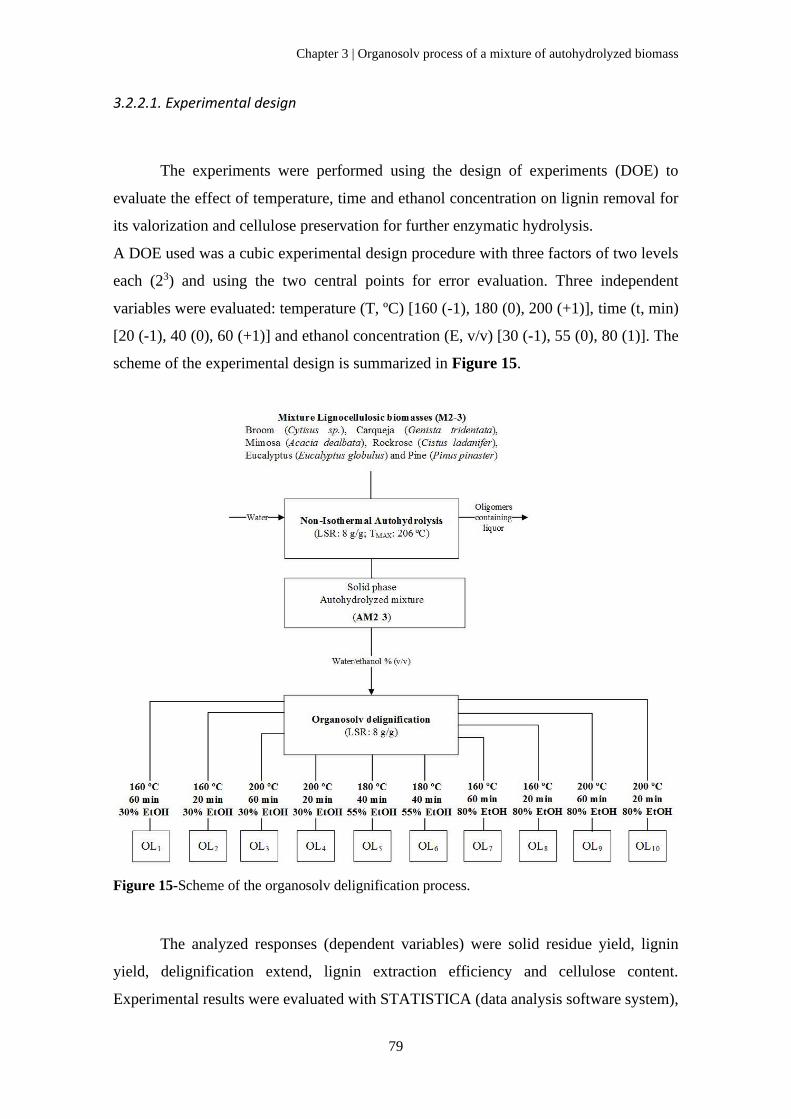
Chapter 3 | Organosolv process of a mixture of autohydrolyzed biomass
79
3.2.2.1. Experimental design
The experiments were performed using the design of experiments (DOE) to
evaluate the effect of temperature, time and ethanol concentration on lignin removal for
its valorization and cellulose preservation for further enzymatic hydrolysis.
A DOE used was a cubic experimental design procedure with three factors of two levels
each (23) and using the two central points for error evaluation. Three independent
variables were evaluated: temperature (T, ºC) [160 (-1), 180 (0), 200 (+1)], time (t, min)
[20 (-1), 40 (0), 60 (+1)] and ethanol concentration (E, v/v) [30 (-1), 55 (0), 80 (1)]. The
scheme of the experimental design is summarized in Figure 15.
Figure 15-Scheme of the organosolv delignification process.
The analyzed responses (dependent variables) were solid residue yield, lignin
yield, delignification extend, lignin extraction efficiency and cellulose content.
Experimental results were evaluated with STATISTICA (data analysis software system),
Chapter 3 | Organosolv process of a mixture of autohydrolyzed biomass
80
version 12 from StatSoft, Inc. (2014) (www.statsoft.com) for analysis of variance
(ANOVA), modeling the responses, regression coefficients and graphical analysis. Sum
of squares of residuals (SSR) was chosen for statistical significance and computation of
standard error. Statistical analyses were performed with a 95% significance level.
3.2.3. Enzymatic hydrolysis of delignified biomass
The delignified solid recovered after the organosolv process at the highest severity
condition (200 ºC, 60 min and 80 % of ethanol concentration) was subjected to enzymatic
hydrolysis (EH). Hydrolysis was conducted in a 100 ml Erlenmeyer flasks with the Cellic
CTec2 enzyme (Novozymes, Bagsvaerd, Denmark) at 50 ºC and pH 4.8 (0.05 N sodium
citrate buffer), in orbital agitation at 150 rpm. The enzyme activity was 120 FPU/mL
(measured as described by Ghose) (Ghose, 1987). The percentage of solids in the
enzymatic hydrolysis assays was 10 %, with an enzyme to substrate ratio (ESR) of 20
FPU/g of substrate (or delignified solid). The reaction time of enzymatic hydrolysis
varied in the range 0–72h. The samples were withdrawn from the media at desired times
(0 h, 5 h, 25 h, 48 h and 72 h). The samples were centrifugated and analyzed by HPLC as
described in 2.4 section – Chemical composition of material. In order to determine the
enzymatic susceptibility of delignified biomass, glucose yield (YG) was calculated as
follows (Romaní et al., 2011):
(4)
𝑌𝐺 = 100 ×𝐺𝑡−𝐺𝑡−0
𝐺𝑃𝑂𝑇
Where Gt is the glucose concentration (g/L) achieved at time t, Gt-0 is the glucose
concentration at the beginning of the experiments, and GPOT means the potential glucose
concentration (calculated assuming total cellulose conversion into glucose). GPOT was
calculated by equation 5 (Romaní et al., 2011):
(5)
𝐺𝑃𝑂𝑇 =𝐺𝑛
100×
180
162×
⍴
𝐿𝑆𝑅 + 1 −𝐾𝐿100
Chapter 3 | Organosolv process of a mixture of autohydrolyzed biomass
81
Whereas Gn is the glucan content of solid residue recovered after organosolv
process (kg glucan/ 100 kg solid residue, on dry basis), 180/162 is a stoichiometric factor,
⍴ is the density of the reaction medium (average value, 1005 g/L), LSR is the liquid-to-
solid ratio, in this case for 10 % of solids is 10, and KL is the Klason lignin content of
solid residue.
3.2.4. Chemical analysis of biomass composition
The aliquots of lignin and delignified solids were chemically analyzed. Analytical
assays were performed according to the following National Renewable Energy
Laboratory (NREL) methods: moisture (NREL/TP-510-42621)) and quantitative acid
hydrolysis with 72% w/w sulphuric acid (NREL/TP-510-42618).
The hydrolysates from acid hydrolysis were analyzed by high performance liquid
chromatography (HPLC) for sugars (glucose, xylose, arabinose), acetic acid,
hydroxymethylfurfural (HMF) and furfural (F) using the columns Aminex HPX-87H
(conditions: refractive index detector; flow rate of 0.6 mL/min at 60 ºC; 0.005 M H2SO4
as mobile phase). The concentrations of sugars and acetic acid were employed to calculate
the contents of cellulose and hemicellulose. The solid phase from the quantitative acid
hydrolysis was considered as Klason lignin. Analyses were carried out in triplicate.
3.2.5. Lignin characterization
3.2.5.1. Fourier-transform infrared spectroscopy (FT-IR)
The organosolv lignins were analyzed by a FTIR spectrometer (IRAffinity -1S
Shimadzu) operating in the range of 4000–400 cm-1 with a resolution of 4 cm-1 recorded
over 20 scans according to Hansen et al. 2016 (Hansen et al., 2016).
3.2.5.2. Thermal analysis: thermo gravimetric analysis (TGA) and differential scanning
calorimetric (DSC)
Thermo gravimetric analysis (TGA) and differential scanning calorimetric (DSC)
of organosolv lignins were carried out in Perkin Elmer TGA 4000 and DSC 6000
Chapter 3 | Organosolv process of a mixture of autohydrolyzed biomass
82
equipment, respectively, in order to evaluate their thermal behaviors. TGA was performed
with about 10 mg of lignin, with a heating rate of 10 ºC/min under nitrogen atmosphere,
and temperature ranging from 20 ºC to 800 ºC. DSC analysis was carried out according
to a standard heat-cool-heat experiment at a constant heating rate of 20 ºC/min. Lignin
samples were heated from 0 ºC to 120 ºC and then, cooled until 0 ºC for a new heating up
to 200 ºC, under a nitrogen atmosphere. The measurements were made in triplicate using
4 mg of lignin samples placed in a hermetically sealed DSC pan, the top of each sealed
pan was punctured to allow volatiles to escape. Glass transition (Tg) was calculated by
using the half-height technique in the transition region.
3.2.5.3. Antioxidant activities
3.2.5.3. DPPH free radical scavenging
The DPPH scavenging activity of lignins was determined according to the slightly
modified method of Blois (Blois, 1958) that is based on its ability to act as free radical
scavenger. Commercial antioxidants like 6-hydroxy-2,5,7,8-tetramethylchroman-2-
carboxylic acid (trolox) and butylated hydroxytoluene (BHT) were used as reference.
Briefly, 150 M solution of DPPH was prepared and diluted in ethanol to get an absorbance
of 0.700 at 517 nm. A volume of 200 μL of this solution was added to 25 μL of lignin
samples dispersed in 80 % ethanol at different concentrations (0.05–1 mg/mL). These
solutions were incubated in the dark for 30 min at room temperature. The decrease of the
solution absorbance, due to proton donating activity, was measured using a UV–Vis
spectrophotometer against a control sample (200 μL of DPPH mixed with 25 μL of
ethanol 80 %). The percentage of radical scavenging activity (RSA) was calculated using
the Eq. (6) (Michelin et al., 2018):
(6)
𝑅𝑆𝐴 (%) = [(𝐴𝑐𝑜𝑛𝑡𝑟𝑜𝑙 − 𝐴𝑠𝑎𝑚𝑝𝑙𝑒)
𝐴𝑐𝑜𝑛𝑡𝑟𝑜𝑙] × 100
where Acontrol is the absorbance of the control sample and Asample is the absorbance
of the lignin sample. The IC50 (half maximal inhibitory concentration) value was
Chapter 3 | Organosolv process of a mixture of autohydrolyzed biomass
83
calculated as the concentration of the compounds that causes 50% reduction in the DPPH
color (also referred as inhibition). All experiments were carried out in triplicate.
3.2.5.3.2. ABTS radical scavenging activity
The ABTS radical scavenging activity of lignins was determined according to the
slightly modified method of Magalhães et al. (Magalhães et al., 2014), that is based on
the ability of antioxidants to interact with the ABTS radical, descreasing its absorbance.
Commercial antioxidants like trolox and BHT were used as reference at the same
concentrations as the samples. ABTS was dissolved in water to a 7 mM concentration,
and ABTS radical cation (ABTS*+) was produced by reacting ABTS stock solution with
2.45 mM potassium persulfate in the dark, at room temperature for 12–16 h before use.
ABTS*+ solution was diluted with water to get an absorbance of 0.700 at 734 nm. For
each sample, six concentrations were analyzed, in duplicate, to establish a relationship
between the radical scavenging activity (RSA) and the antioxidant concentration
(mg/mL). Blanks were run in each assay. The absorbance was read after 6 min of reaction
in a 96-well microplate format using Synergy HT spectrophotometer. The percentage of
radical scavenging activity (RSA) was calculated using the previous Eq. (4).
3.3. Results and discussion
3.3.1. Organosolv lignin extraction
AM2-3 solid fraction used in this study was chemically analyzed and its
composition was as follow: (41.87 ± 2.36) % cellulose, (6.30 ± 0.35) % xylan, (50.62 ±
1.07) % Klason lignin and the remaining minor compounds were ashes and soluble lignin.
In the liquid fraction, 68.80 % of hemicellulose was recovered (mainly composed by XOS
and xylose). This condition was selected taking into account the high hemicellulose
solubilization and higher preservation of cellulose and lignin in the solid fraction, as
described in the previous work (Pontes et al., 2018). Thus, an organosolv process after an
autohydrolysis pretreatment may provide an efficient fractionation of autohydrolyzed
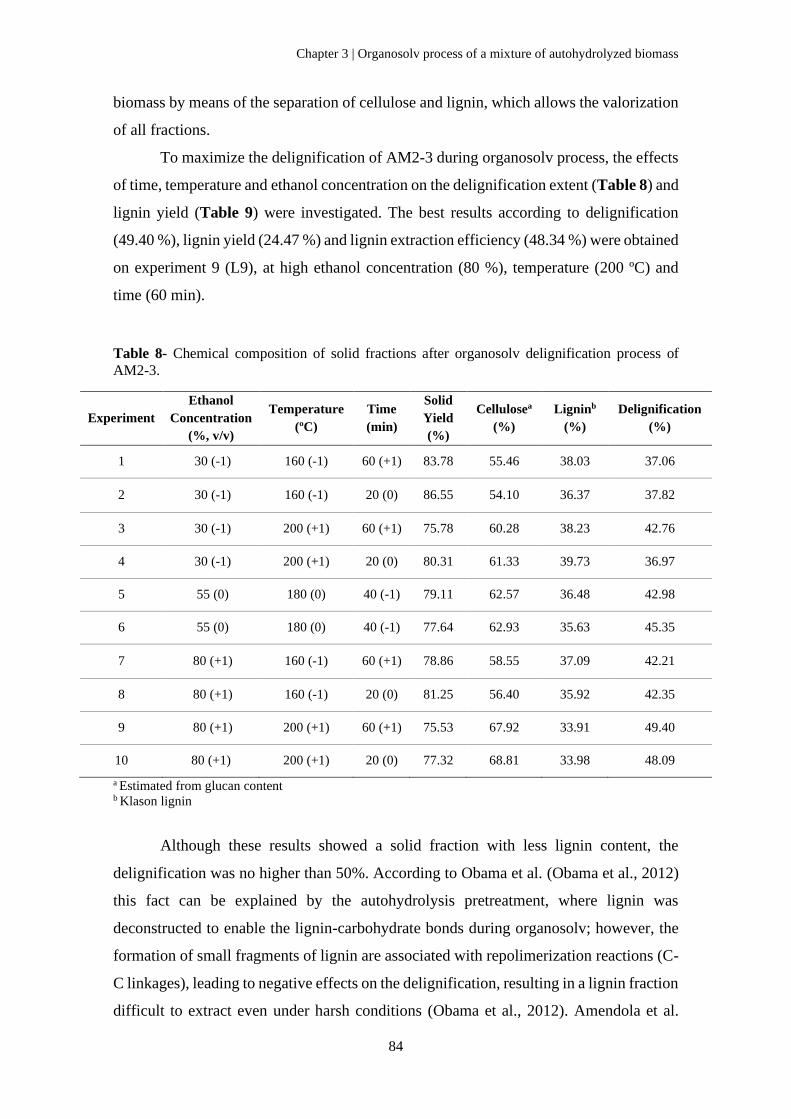
Chapter 3 | Organosolv process of a mixture of autohydrolyzed biomass
84
biomass by means of the separation of cellulose and lignin, which allows the valorization
of all fractions.
To maximize the delignification of AM2-3 during organosolv process, the effects
of time, temperature and ethanol concentration on the delignification extent (Table 8) and
lignin yield (Table 9) were investigated. The best results according to delignification
(49.40 %), lignin yield (24.47 %) and lignin extraction efficiency (48.34 %) were obtained
on experiment 9 (L9), at high ethanol concentration (80 %), temperature (200 ºC) and
time (60 min).
Table 8- Chemical composition of solid fractions after organosolv delignification process of
AM2-3.
Experiment
Ethanol
Concentration
(%, v/v)
Temperature
(ºC)
Time
(min)
Solid
Yield
(%)
Cellulosea
(%)
Ligninb
(%)
Delignification
(%)
1 30 (-1) 160 (-1) 60 (+1) 83.78 55.46 38.03 37.06
2 30 (-1) 160 (-1) 20 (0) 86.55 54.10 36.37 37.82
3 30 (-1) 200 (+1) 60 (+1) 75.78 60.28 38.23 42.76
4 30 (-1) 200 (+1) 20 (0) 80.31 61.33 39.73 36.97
5 55 (0) 180 (0) 40 (-1) 79.11 62.57 36.48 42.98
6 55 (0) 180 (0) 40 (-1) 77.64 62.93 35.63 45.35
7 80 (+1) 160 (-1) 60 (+1) 78.86 58.55 37.09 42.21
8 80 (+1) 160 (-1) 20 (0) 81.25 56.40 35.92 42.35
9 80 (+1) 200 (+1) 60 (+1) 75.53 67.92 33.91 49.40
10 80 (+1) 200 (+1) 20 (0) 77.32 68.81 33.98 48.09
a Estimated from glucan content b Klason lignin
Although these results showed a solid fraction with less lignin content, the
delignification was no higher than 50%. According to Obama et al. (Obama et al., 2012)
this fact can be explained by the autohydrolysis pretreatment, where lignin was
deconstructed to enable the lignin-carbohydrate bonds during organosolv; however, the
formation of small fragments of lignin are associated with repolimerization reactions (C-
C linkages), leading to negative effects on the delignification, resulting in a lignin fraction
difficult to extract even under harsh conditions (Obama et al., 2012). Amendola et al.
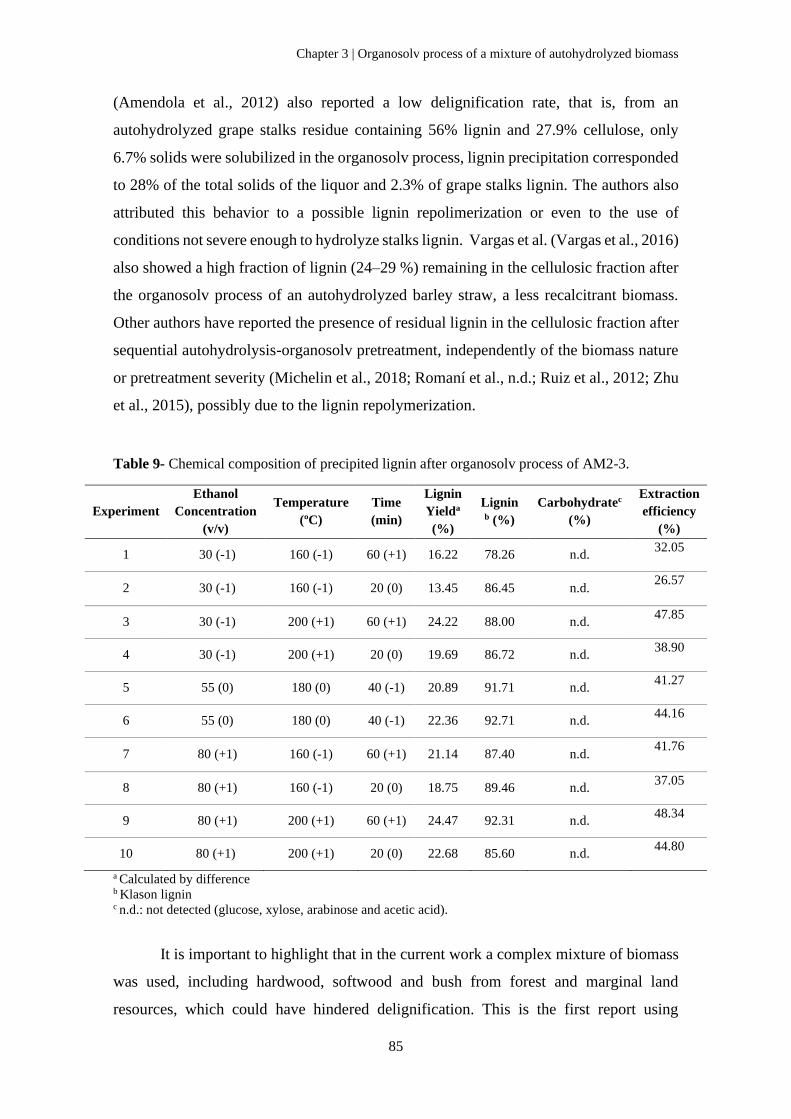
Chapter 3 | Organosolv process of a mixture of autohydrolyzed biomass
85
(Amendola et al., 2012) also reported a low delignification rate, that is, from an
autohydrolyzed grape stalks residue containing 56% lignin and 27.9% cellulose, only
6.7% solids were solubilized in the organosolv process, lignin precipitation corresponded
to 28% of the total solids of the liquor and 2.3% of grape stalks lignin. The authors also
attributed this behavior to a possible lignin repolimerization or even to the use of
conditions not severe enough to hydrolyze stalks lignin. Vargas et al. (Vargas et al., 2016)
also showed a high fraction of lignin (24–29 %) remaining in the cellulosic fraction after
the organosolv process of an autohydrolyzed barley straw, a less recalcitrant biomass.
Other authors have reported the presence of residual lignin in the cellulosic fraction after
sequential autohydrolysis-organosolv pretreatment, independently of the biomass nature
or pretreatment severity (Michelin et al., 2018; Romaní et al., n.d.; Ruiz et al., 2012; Zhu
et al., 2015), possibly due to the lignin repolymerization.
Table 9- Chemical composition of precipited lignin after organosolv process of AM2-3.
Experiment
Ethanol
Concentration
(v/v)
Temperature
(ºC)
Time
(min)
Lignin
Yielda
(%)
Ligninb (%)
Carbohydratec
(%)
Extraction
efficiency
(%)
1 30 (-1) 160 (-1) 60 (+1) 16.22 78.26 n.d. 32.05
2 30 (-1) 160 (-1) 20 (0) 13.45 86.45 n.d. 26.57
3 30 (-1) 200 (+1) 60 (+1) 24.22 88.00 n.d. 47.85
4 30 (-1) 200 (+1) 20 (0) 19.69 86.72 n.d. 38.90
5 55 (0) 180 (0) 40 (-1) 20.89 91.71 n.d. 41.27
6 55 (0) 180 (0) 40 (-1) 22.36 92.71 n.d. 44.16
7 80 (+1) 160 (-1) 60 (+1) 21.14 87.40 n.d. 41.76
8 80 (+1) 160 (-1) 20 (0) 18.75 89.46 n.d. 37.05
9 80 (+1) 200 (+1) 60 (+1) 24.47 92.31 n.d. 48.34
10 80 (+1) 200 (+1) 20 (0) 22.68 85.60 n.d. 44.80
a Calculated by difference b Klason lignin c n.d.: not detected (glucose, xylose, arabinose and acetic acid).
It is important to highlight that in the current work a complex mixture of biomass
was used, including hardwood, softwood and bush from forest and marginal land
resources, which could have hindered delignification. This is the first report using
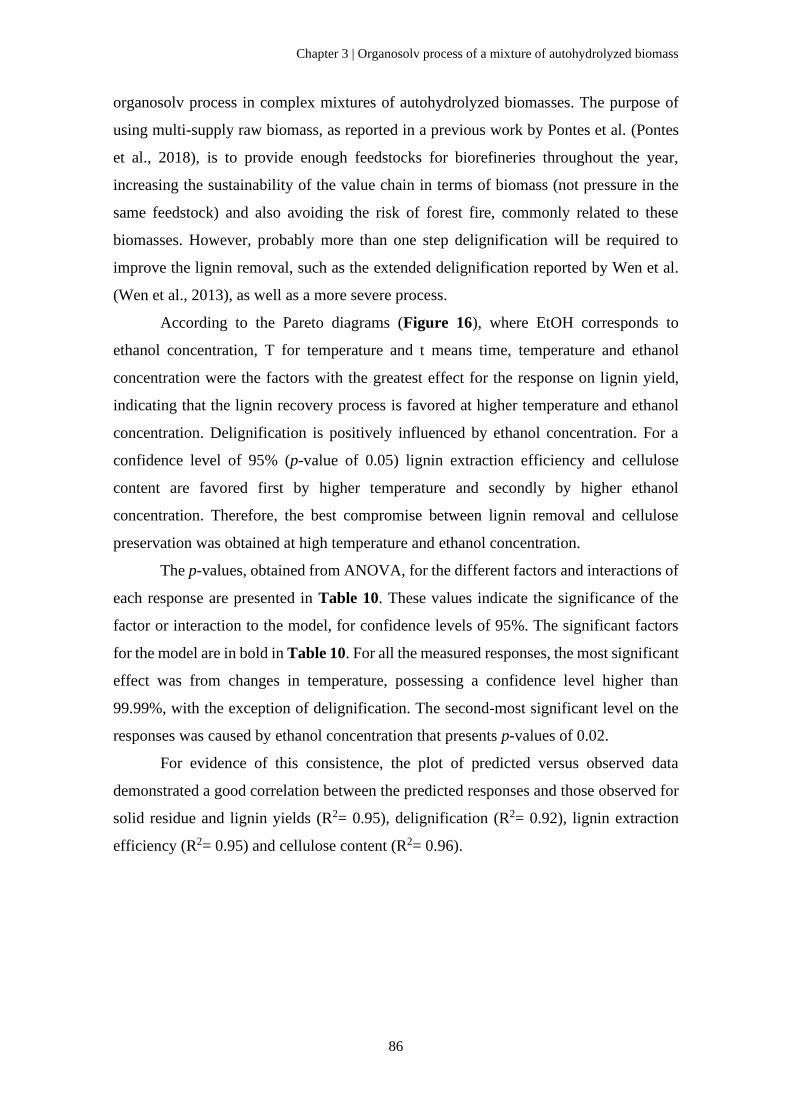
Chapter 3 | Organosolv process of a mixture of autohydrolyzed biomass
86
organosolv process in complex mixtures of autohydrolyzed biomasses. The purpose of
using multi-supply raw biomass, as reported in a previous work by Pontes et al. (Pontes
et al., 2018), is to provide enough feedstocks for biorefineries throughout the year,
increasing the sustainability of the value chain in terms of biomass (not pressure in the
same feedstock) and also avoiding the risk of forest fire, commonly related to these
biomasses. However, probably more than one step delignification will be required to
improve the lignin removal, such as the extended delignification reported by Wen et al.
(Wen et al., 2013), as well as a more severe process.
According to the Pareto diagrams (Figure 16), where EtOH corresponds to
ethanol concentration, T for temperature and t means time, temperature and ethanol
concentration were the factors with the greatest effect for the response on lignin yield,
indicating that the lignin recovery process is favored at higher temperature and ethanol
concentration. Delignification is positively influenced by ethanol concentration. For a
confidence level of 95% (p-value of 0.05) lignin extraction efficiency and cellulose
content are favored first by higher temperature and secondly by higher ethanol
concentration. Therefore, the best compromise between lignin removal and cellulose
preservation was obtained at high temperature and ethanol concentration.
The p-values, obtained from ANOVA, for the different factors and interactions of
each response are presented in Table 10. These values indicate the significance of the
factor or interaction to the model, for confidence levels of 95%. The significant factors
for the model are in bold in Table 10. For all the measured responses, the most significant
effect was from changes in temperature, possessing a confidence level higher than
99.99%, with the exception of delignification. The second-most significant level on the
responses was caused by ethanol concentration that presents p-values of 0.02.
For evidence of this consistence, the plot of predicted versus observed data
demonstrated a good correlation between the predicted responses and those observed for
solid residue and lignin yields (R2= 0.95), delignification (R2= 0.92), lignin extraction
efficiency (R2= 0.95) and cellulose content (R2= 0.96).
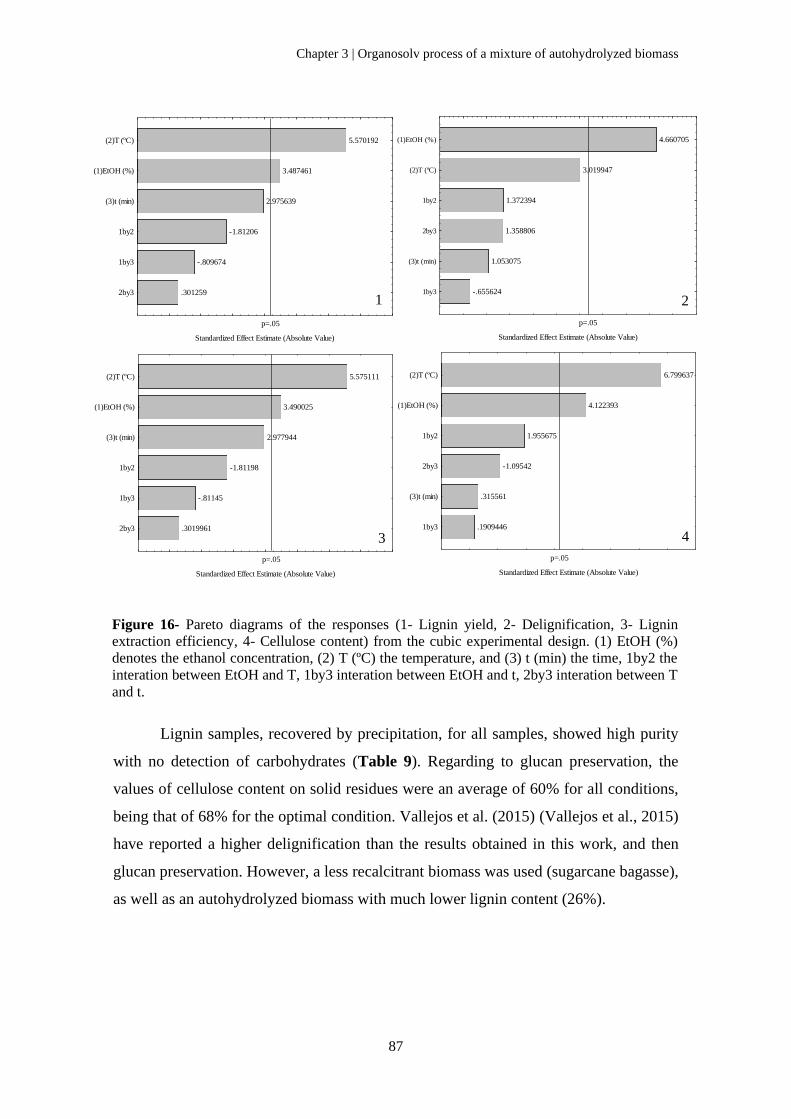
Chapter 3 | Organosolv process of a mixture of autohydrolyzed biomass
87
-.655624
1.053075
1.358806
1.372394
3.019947
4.660705
p=.05
Standardized Effect Estimate (Absolute Value)
1by3
(3)t (min)
2by3
1by2
(2)T (ºC)
(1)EtOH (%)
.3019961
-.81145
-1.81198
2.977944
3.490025
5.575111
p=.05
Standardized Effect Estimate (Absolute Value)
2by3
1by3
1by2
(3)t (min)
(1)EtOH (%)
(2)T (ºC)
.1909446
.315561
-1.09542
1.955675
4.122393
6.799637
p=.05
Standardized Effect Estimate (Absolute Value)
1by3
(3)t (min)
2by3
1by2
(1)EtOH (%)
(2)T (ºC)
.301259
-.809674
-1.81206
2.975639
3.487461
5.570192
p=.05
Standardized Effect Estimate (Absolute Value)
2by3
1by3
1by2
(3)t (min)
(1)EtOH (%)
(2)T (ºC)
Figure 16- Pareto diagrams of the responses (1- Lignin yield, 2- Delignification, 3- Lignin
extraction efficiency, 4- Cellulose content) from the cubic experimental design. (1) EtOH (%)
denotes the ethanol concentration, (2) T (ºC) the temperature, and (3) t (min) the time, 1by2 the
interation between EtOH and T, 1by3 interation between EtOH and t, 2by3 interation between T
and t.
Lignin samples, recovered by precipitation, for all samples, showed high purity
with no detection of carbohydrates (Table 9). Regarding to glucan preservation, the
values of cellulose content on solid residues were an average of 60% for all conditions,
being that of 68% for the optimal condition. Vallejos et al. (2015) (Vallejos et al., 2015)
have reported a higher delignification than the results obtained in this work, and then
glucan preservation. However, a less recalcitrant biomass was used (sugarcane bagasse),
as well as an autohydrolyzed biomass with much lower lignin content (26%).
1 2
3 4
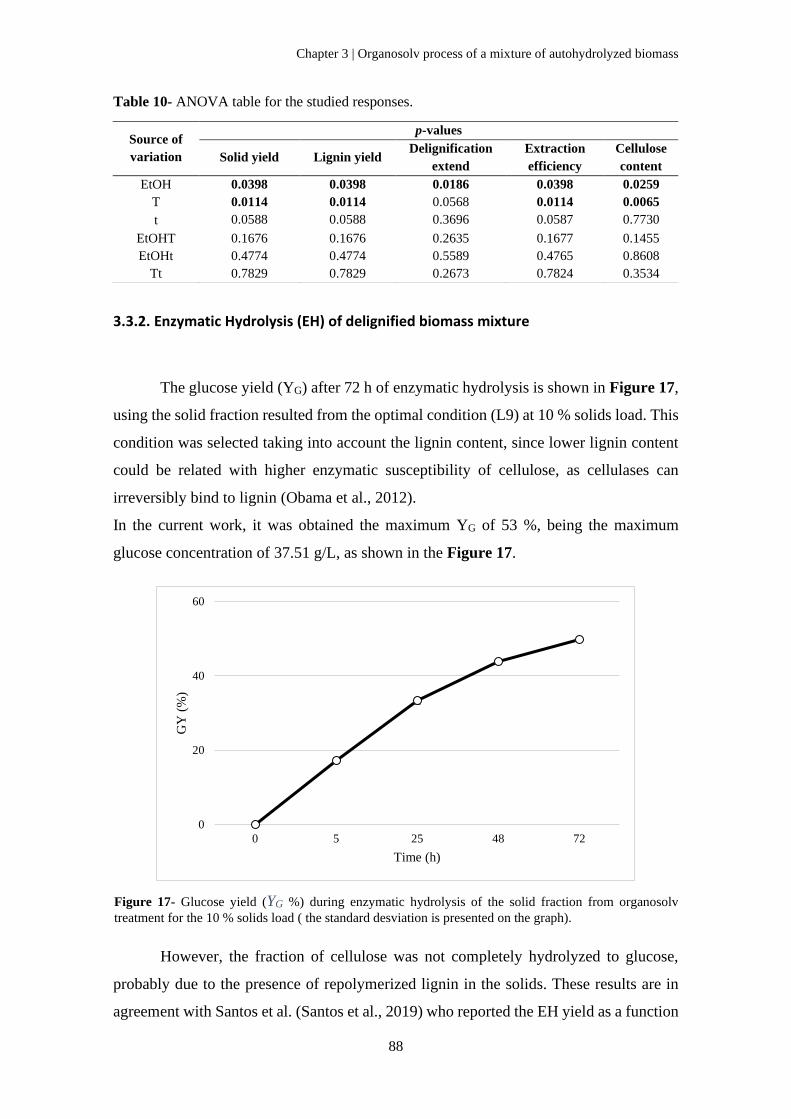
Chapter 3 | Organosolv process of a mixture of autohydrolyzed biomass
88
Table 10- ANOVA table for the studied responses.
3.3.2. Enzymatic Hydrolysis (EH) of delignified biomass mixture
The glucose yield (YG) after 72 h of enzymatic hydrolysis is shown in Figure 17,
using the solid fraction resulted from the optimal condition (L9) at 10 % solids load. This
condition was selected taking into account the lignin content, since lower lignin content
could be related with higher enzymatic susceptibility of cellulose, as cellulases can
irreversibly bind to lignin (Obama et al., 2012).
In the current work, it was obtained the maximum YG of 53 %, being the maximum
glucose concentration of 37.51 g/L, as shown in the Figure 17.
However, the fraction of cellulose was not completely hydrolyzed to glucose,
probably due to the presence of repolymerized lignin in the solids. These results are in
agreement with Santos et al. (Santos et al., 2019) who reported the EH yield as a function
Source of
variation
p-values
Solid yield Lignin yield Delignification
extend
Extraction
efficiency
Cellulose
content
EtOH 0.0398 0.0398 0.0186 0.0398 0.0259
T 0.0114 0.0114 0.0568 0.0114 0.0065
t 0.0588 0.0588 0.3696 0.0587 0.7730
EtOHT 0.1676 0.1676 0.2635 0.1677 0.1455
EtOHt 0.4774 0.4774 0.5589 0.4765 0.8608
Tt 0.7829 0.7829 0.2673 0.7824 0.3534
0
20
40
60
0 5 25 48 72
GY
(%
)
Time (h)
Figure 17- Glucose yield (YG %) during enzymatic hydrolysis of the solid fraction from organosolv
treatment for the 10 % solids load ( the standard desviation is presented on the graph).
Chapter 3 | Organosolv process of a mixture of autohydrolyzed biomass
89
of the insoluble lignin content of the pretreated solids, showing that the higher the lignin
content, the lower the EH yield. On the other hand, Obama et al. (Obama et al., 2012)
used a Miscanthus biomass in two combined treatments of autohydrolysis + organosolv
(AO), and enzymatic hydrolysis + organosolv (EO). The authors obtained a maximum of
CGC (cellulose-to-glucose conversion) of approximately 40 % , in conditions similar to
those of this work (AO2), and this conversion increased to approximately 60 % with
enzymatic prehydrolysis step instead of autohydrolysis (EO2) (Obama et al., 2012). As
previously mentioned, autohydrolysis promotes the repolymerization of small lignin
fragments that are formed during pretreatment, resulting in a fraction of lignin that is more
difficult to remove from cellulose (Obama et al., 2012).
Nonetheless, other authors also used different pretreatments and obtained low
yields, as reported by Mesa el at. (Mesa et al., 2011), who submitted sugarcane bagasse
to acid pretreated before organosolv process, under different operational conditions,
obtaining the maximum glucose yield of 29 %, at the most severe condition of 195 ºC, 60
minutes and 60 % of ethanol concentration. However, Hallac et al. (Hallac et al., 2010)
using ethanol organosolv treatment of Buddleja davidii, obtained around 60 % of CGC
with a material with 21 % of lignin content. They also tested other condition with less
lignin, and a higher yield was obtained, but the relationship between lignin content and
enzymatic hydrolysis was not proportional. For this reason, they have shown that there
are other factors beyond lignin content influencing enzymatic hydrolysis. Wang et al.
(Wang et al., 2017) studied the use of organosolv on Eucalyptus wood and reported from
54.65 % to 88. 59 % YG for organosolv pretreated solids, and verified that the
saccharification ratio increased with the increment of the time (60–120 min) and
temperature (200–220 ºC), which was related to the hemicellulose degradation and
cleavage of LCC (lignin carbohydrate complex) bonds, with partial depolymerization and
removal of lignin, improving the cellulase accessibility to cellulose and consequently the
enzymatic hydrolysis. Furthermore, Huijgen et al. (Huijgen et al., 2012) found that
increasing the temperature of organosolv treatment from 200 ºC to 210 ºC for
prehydrolyzed wheat straw biomass, under the same conditions as in the current work,
increased the enzymatic glucose yield from 67 % to 90 %.
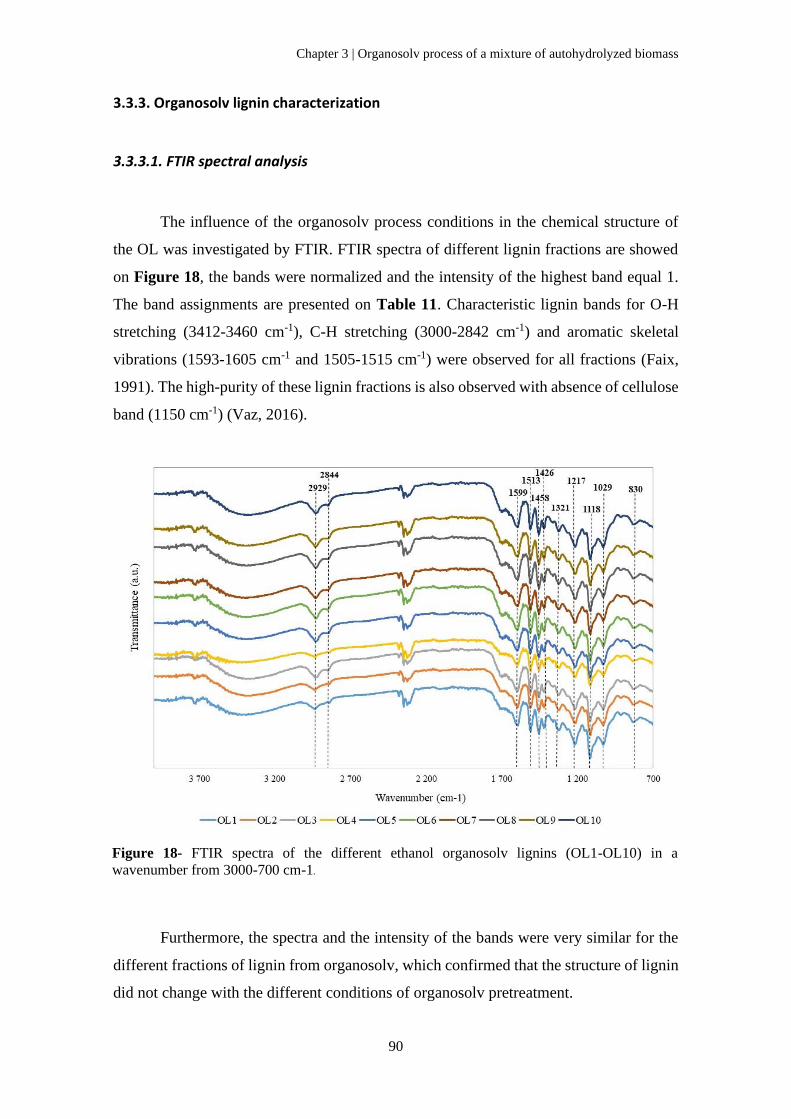
Chapter 3 | Organosolv process of a mixture of autohydrolyzed biomass
90
3.3.3. Organosolv lignin characterization
3.3.3.1. FTIR spectral analysis
The influence of the organosolv process conditions in the chemical structure of
the OL was investigated by FTIR. FTIR spectra of different lignin fractions are showed
on Figure 18, the bands were normalized and the intensity of the highest band equal 1.
The band assignments are presented on Table 11. Characteristic lignin bands for O-H
stretching (3412-3460 cm-1), C-H stretching (3000-2842 cm-1) and aromatic skeletal
vibrations (1593-1605 cm-1 and 1505-1515 cm-1) were observed for all fractions (Faix,
1991). The high-purity of these lignin fractions is also observed with absence of cellulose
band (1150 cm-1) (Vaz, 2016).
Furthermore, the spectra and the intensity of the bands were very similar for the
different fractions of lignin from organosolv, which confirmed that the structure of lignin
did not change with the different conditions of organosolv pretreatment.
Figure 18- FTIR spectra of the different ethanol organosolv lignins (OL1-OL10) in a
wavenumber from 3000-700 cm-1.
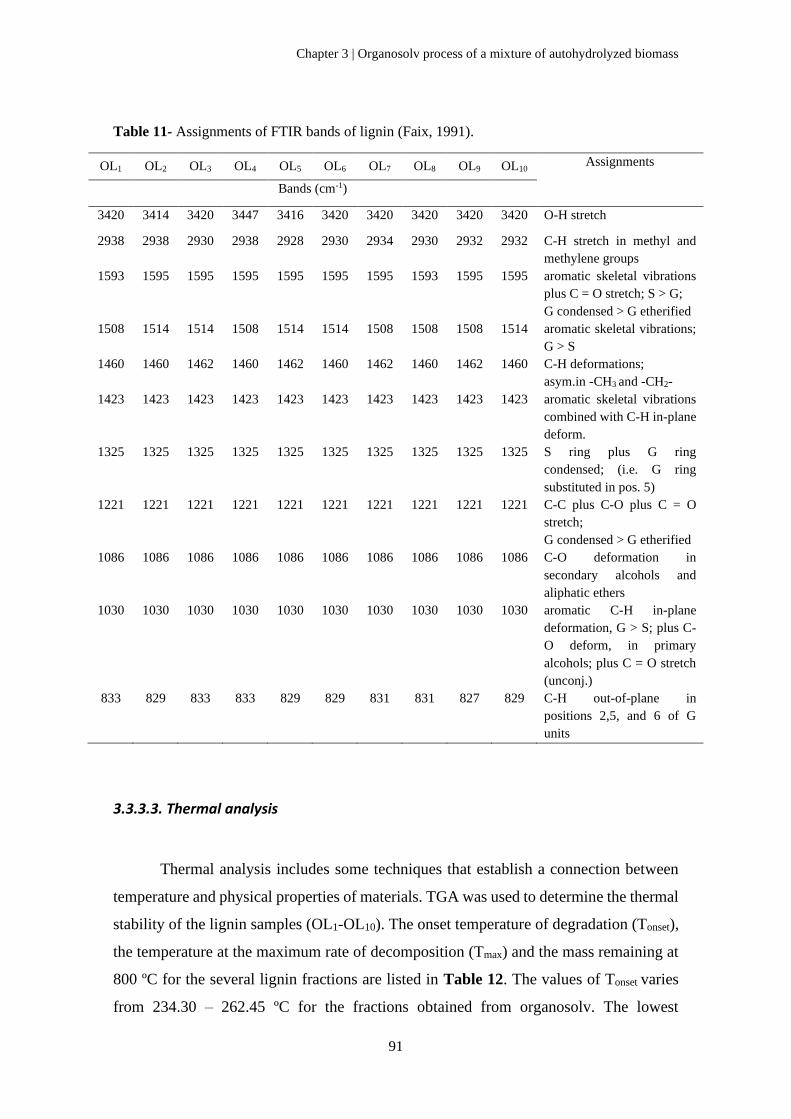
Chapter 3 | Organosolv process of a mixture of autohydrolyzed biomass
91
Table 11- Assignments of FTIR bands of lignin (Faix, 1991).
OL1 OL2 OL3 OL4 OL5 OL6 OL7 OL8 OL9 OL10 Assignments
Bands (cm-1)
3420 3414 3420 3447 3416 3420 3420 3420 3420 3420 O-H stretch
2938 2938 2930 2938 2928 2930 2934 2930 2932 2932 C-H stretch in methyl and
methylene groups
1593 1595 1595 1595 1595 1595 1595 1593 1595 1595 aromatic skeletal vibrations
plus C = O stretch; S > G;
G condensed > G etherified
1508 1514 1514 1508 1514 1514 1508 1508 1508 1514 aromatic skeletal vibrations;
G > S
1460 1460 1462 1460 1462 1460 1462 1460 1462 1460 C-H deformations;
asym.in -CH3 and -CH2-
1423 1423 1423 1423 1423 1423 1423 1423 1423 1423 aromatic skeletal vibrations
combined with C-H in-plane
deform.
1325 1325 1325 1325 1325 1325 1325 1325 1325 1325 S ring plus G ring
condensed; (i.e. G ring
substituted in pos. 5)
1221 1221 1221 1221 1221 1221 1221 1221 1221 1221 C-C plus C-O plus C = O
stretch;
G condensed > G etherified
1086 1086 1086 1086 1086 1086 1086 1086 1086 1086 C-O deformation in
secondary alcohols and
aliphatic ethers
1030 1030 1030 1030 1030 1030 1030 1030 1030 1030 aromatic C-H in-plane
deformation, G > S; plus C-
O deform, in primary
alcohols; plus C = O stretch
(unconj.)
833 829 833 833 829 829 831 831 827 829 C-H out-of-plane in
positions 2,5, and 6 of G
units
3.3.3.3. Thermal analysis
Thermal analysis includes some techniques that establish a connection between
temperature and physical properties of materials. TGA was used to determine the thermal
stability of the lignin samples (OL1-OL10). The onset temperature of degradation (Tonset),
the temperature at the maximum rate of decomposition (Tmax) and the mass remaining at
800 ºC for the several lignin fractions are listed in Table 12. The values of Tonset varies
from 234.30 – 262.45 ºC for the fractions obtained from organosolv. The lowest
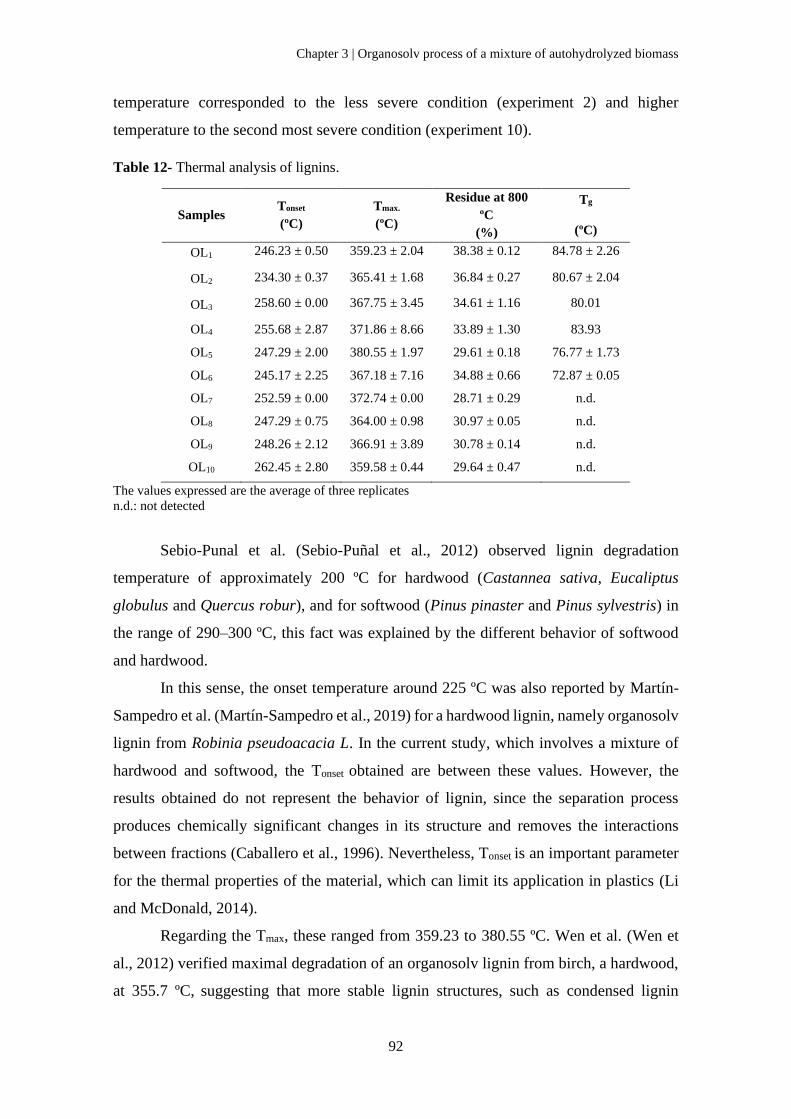
Chapter 3 | Organosolv process of a mixture of autohydrolyzed biomass
92
temperature corresponded to the less severe condition (experiment 2) and higher
temperature to the second most severe condition (experiment 10).
Table 12- Thermal analysis of lignins.
Samples Tonset
(ºC)
Tmax.
(ºC)
Residue at 800
ºC
(%)
Tg
(ºC)
OL1 246.23 ± 0.50 359.23 ± 2.04 38.38 ± 0.12 84.78 ± 2.26
OL2 234.30 ± 0.37 365.41 ± 1.68 36.84 ± 0.27 80.67 ± 2.04
OL3 258.60 ± 0.00 367.75 ± 3.45 34.61 ± 1.16 80.01
OL4 255.68 ± 2.87 371.86 ± 8.66 33.89 ± 1.30 83.93
OL5 247.29 ± 2.00 380.55 ± 1.97 29.61 ± 0.18 76.77 ± 1.73
OL6 245.17 ± 2.25 367.18 ± 7.16 34.88 ± 0.66 72.87 ± 0.05
OL7 252.59 ± 0.00 372.74 ± 0.00 28.71 ± 0.29 n.d.
OL8 247.29 ± 0.75 364.00 ± 0.98 30.97 ± 0.05 n.d.
OL9 248.26 ± 2.12 366.91 ± 3.89 30.78 ± 0.14 n.d.
OL10 262.45 ± 2.80 359.58 ± 0.44 29.64 ± 0.47 n.d.
The values expressed are the average of three replicates
n.d.: not detected
Sebio-Punal et al. (Sebio-Puñal et al., 2012) observed lignin degradation
temperature of approximately 200 ºC for hardwood (Castannea sativa, Eucaliptus
globulus and Quercus robur), and for softwood (Pinus pinaster and Pinus sylvestris) in
the range of 290–300 ºC, this fact was explained by the different behavior of softwood
and hardwood.
In this sense, the onset temperature around 225 ºC was also reported by Martín-
Sampedro et al. (Martín-Sampedro et al., 2019) for a hardwood lignin, namely organosolv
lignin from Robinia pseudoacacia L. In the current study, which involves a mixture of
hardwood and softwood, the Tonset obtained are between these values. However, the
results obtained do not represent the behavior of lignin, since the separation process
produces chemically significant changes in its structure and removes the interactions
between fractions (Caballero et al., 1996). Nevertheless, Tonset is an important parameter
for the thermal properties of the material, which can limit its application in plastics (Li
and McDonald, 2014).
Regarding the Tmax, these ranged from 359.23 to 380.55 ºC. Wen et al. (Wen et
al., 2012) verified maximal degradation of an organosolv lignin from birch, a hardwood,
at 355.7 ºC, suggesting that more stable lignin structures, such as condensed lignin
Chapter 3 | Organosolv process of a mixture of autohydrolyzed biomass
93
structures, were formed after the organosolv process, as also reported by the authors.
Nonetheless, Martín-Sampedro et al. (Martín-Sampedro et al., 2019) reported the
maximal lignin degradation at 475 ºC for hardwood. As mentioned before the Tmax from
OL of the current work, which involves a mixture of hardwood and softwood, are among
these values.
For all the samples the mass loss increased until the temperature of 800 ºC where
the mass loss curves became relatively flat. The mass remaining at 800 ºC varies from
28.71 % to 38.38 %. This is in agreement with the work of Ross et al. (Ross et al., 2012)
which reported at 800 ºC the mass remaining between 34.7 % and 36.9 % for lignin
extracted from wheat straw, triticale straw and flax shives with ionic liquid. This amount
of residue is also comparable to that reported by Elshafie et al. (Elshafie et al., 2020) for
lignin extracted from the black liquor.
In general, as reported by Prime et al.(Prime et al., 2009), if the polymeric portion
of a material is relatively stable, up to 300 ºC, only a low molecular mass will be lost;
between 300 ºC and 600 ºC, most polymers will degrade and volatilize; and above 600
ºC, some polymers based on aromatic structures will not be converted into gaseous
products and will form a char residue, as was verified in OL samples of the current work.
The glass transition temperature (Tg) is an important property to use lignin as a
polymer for industrial application and limits its usability in the glassy state (for example,
polystyrene and epoxy) or in the rubbery state (for example, polysoprene or
polybutadiene). At Tg (on heating), the glassy state changes to the rubbery or melt state.
Nonetheless, the glass transition does not take place at a precise temperature, but in a
temperature range, thus being a kinetic transition (Menczel et al., 2009). For this reason,
Tg is defined as the midpoint of the linear variation of the polymer heat capacity and,
taking into account this inflexion point, is the maximum of the first derivative curve.
In this study, to determine the Tg for the different lignin fractions from organosolv
process, it was applied a first heating to remove the thermal history in all lignin fractions.
Values of Tg obtained from DSC are given in Table 12. The studied lignins had a glass
transition temperature between 73–85 ºC, and it was not possible to detect Tg in treatment
with the highest ethanol concentration (80%). The results showed that, in general, the
increase in treatment severity led to a decrease in Tg values.
The low values of Tg are related to the decline in the rigid aromatic backbone of
macromolecules due to the replacement of hydroxyl groups (namely phenolic hydoxyl
groups) by ester, which lead to a reduction in the number of hydrogen bonds in the lignin
Chapter 3 | Organosolv process of a mixture of autohydrolyzed biomass
94
molecule, implying an increase of the free volume and thus the mobility of the chains
(Gordobil et al., 2017; Li and McDonald, 2014).
In general Tg of lignin has been reported to be between 90 and 180 ºC (Lora, 2008;
Lora and Glasser, 2002), but lower Tg has been reported for organosolv lignin (Hansen et
al., 2016; Huijgen et al., 2014; Hussin et al., 2013; Michelin et al., 2018). For example,
Hussin et al. (2013) reported Tg value for soda lignin of 81.79 ºC, while for kraft and
organosolv lignins were 64.62 ºC and 51.65 ºC, respectively, suggesting that the relation
between the molecular weight of lignin samples and the free volume can affect the Tg
values (Hussin et al., 2013) . Li and McDonald (2014) studied the fractionation of
commercial lignin with methanol and reported a lower Tg for the methanol soluble lignin
fractions, 117 ºC for Indulin AT lignin (softwood kraft) and 132 ºC for Protobind 1000
lignin (agricultural fiber soda pulp), than the original lignin, which was related to the
fewer condensed structures of the methanol soluble lignin fractions (Li and McDonald,
2014). On the other hand, Martín-Sampedro (Martín-Sampedro et al., 2019) showed a Tg
at 138 ºC for lignin obtained from organosolv treatment. Low Tg temperatures, as those
of the current work, may be related to more thermoplastic lignins. Thus, these OL are
more susceptible to be mixed with synthetic and bio-based polymers (Martín-Sampedro
et al., 2019).
3.3.3.5. Radical scavenging activities
In the present study the antioxidant properties of the different lignin fractions were
characterized using two different tests. The results of the DPPH and ABTS radical-
scavenging activity are presented in Table 13 in terms of IC50. IC50 measured the
concentration of the tested antioxidant sample required for a 50% inhibition of radical
species. The lower is this value the higher is the radical scavenging activity of the
compounds tested.
Radical scavenging activity of DPPH of all OL fractions did not strongly differ
between samples (IC50 from 0.14 to 0.21 mg/mL). Although their antioxidant potential
was lower than that of Trolox (0.06 mg/mL), they were comparable to BHT (0.16
mg/mL), commercial antioxidants often used as standards. Figure 19 compares the RSA
of L9 (the optimal condition for OL extraction), L4 (OL with the lowest IC50) and the
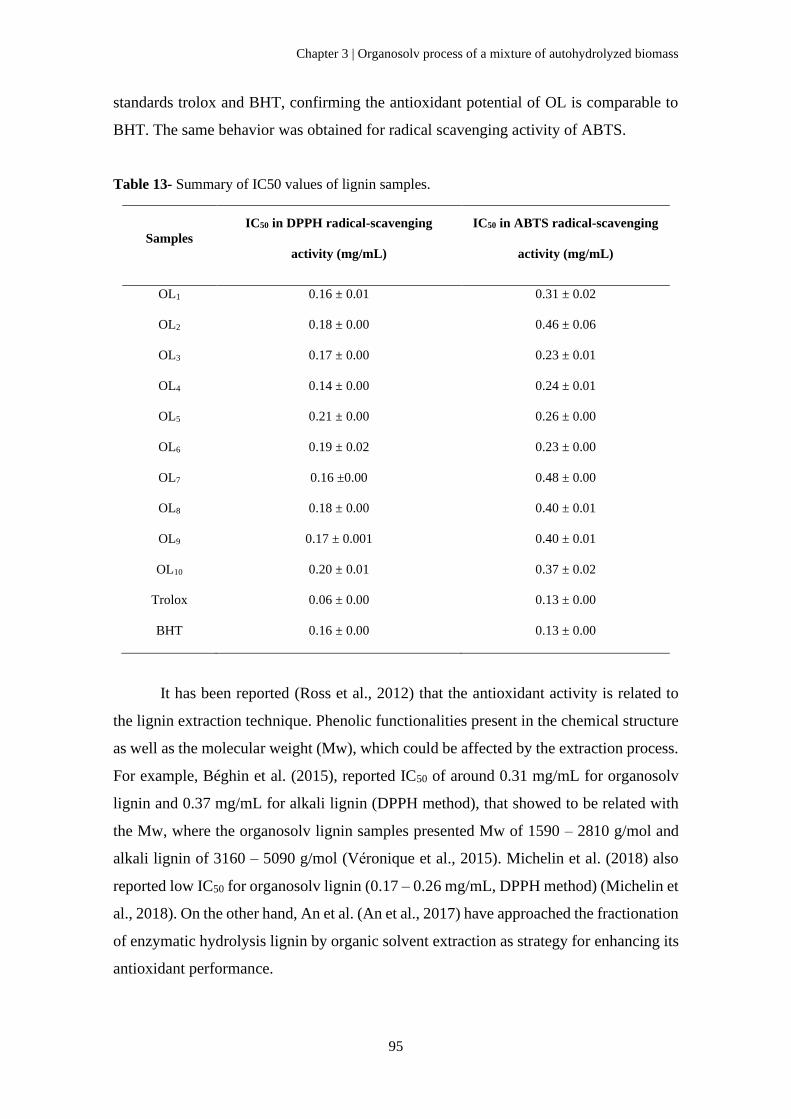
Chapter 3 | Organosolv process of a mixture of autohydrolyzed biomass
95
standards trolox and BHT, confirming the antioxidant potential of OL is comparable to
BHT. The same behavior was obtained for radical scavenging activity of ABTS.
Table 13- Summary of IC50 values of lignin samples.
Samples
IC50 in DPPH radical-scavenging
activity (mg/mL)
IC50 in ABTS radical-scavenging
activity (mg/mL)
OL1 0.16 ± 0.01 0.31 ± 0.02
OL2 0.18 ± 0.00 0.46 ± 0.06
OL3 0.17 ± 0.00 0.23 ± 0.01
OL4 0.14 ± 0.00 0.24 ± 0.01
OL5 0.21 ± 0.00 0.26 ± 0.00
OL6 0.19 ± 0.02 0.23 ± 0.00
OL7 0.16 ±0.00 0.48 ± 0.00
OL8 0.18 ± 0.00 0.40 ± 0.01
OL9 0.17 ± 0.001 0.40 ± 0.01
OL10 0.20 ± 0.01 0.37 ± 0.02
Trolox 0.06 ± 0.00 0.13 ± 0.00
BHT 0.16 ± 0.00 0.13 ± 0.00
It has been reported (Ross et al., 2012) that the antioxidant activity is related to
the lignin extraction technique. Phenolic functionalities present in the chemical structure
as well as the molecular weight (Mw), which could be affected by the extraction process.
For example, Béghin et al. (2015), reported IC50 of around 0.31 mg/mL for organosolv
lignin and 0.37 mg/mL for alkali lignin (DPPH method), that showed to be related with
the Mw, where the organosolv lignin samples presented Mw of 1590 – 2810 g/mol and
alkali lignin of 3160 – 5090 g/mol (Veronique et al., 2015). Michelin et al. (2018) also
reported low IC50 for organosolv lignin (0.17 – 0.26 mg/mL, DPPH method) (Michelin et
al., 2018). On the other hand, An et al. (An et al., 2017) have approached the fractionation
of enzymatic hydrolysis lignin by organic solvent extraction as strategy for enhancing its
antioxidant performance.
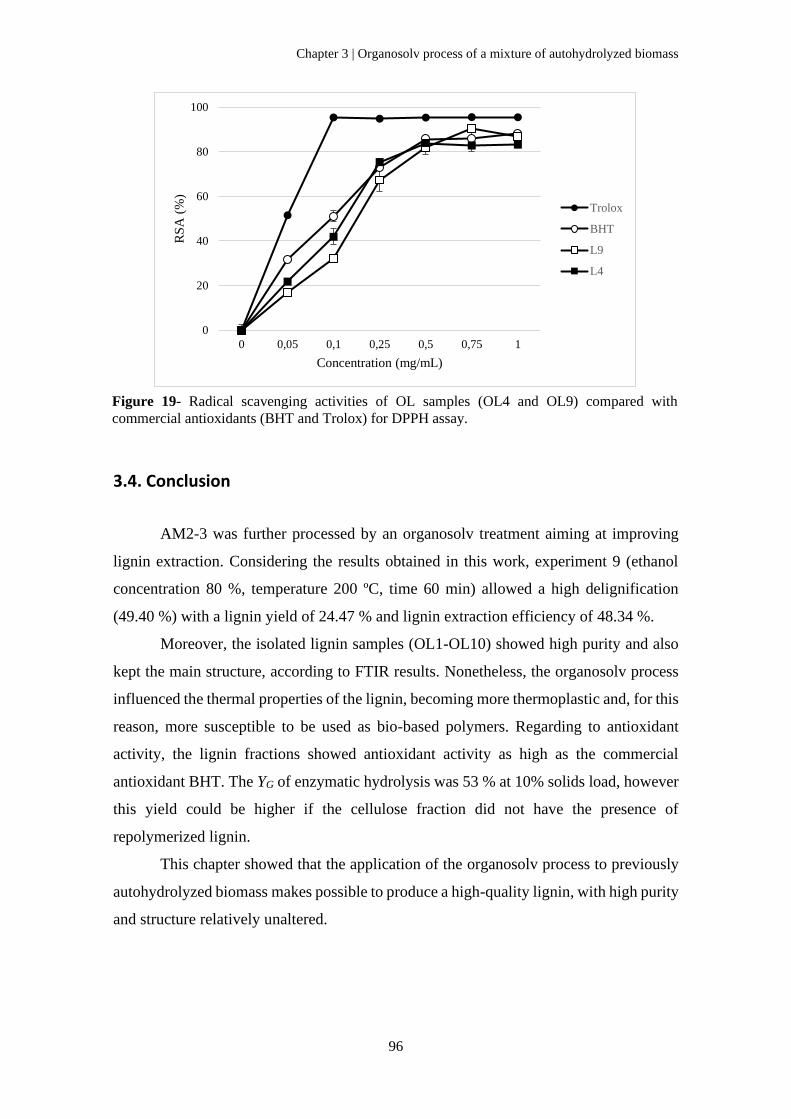
Chapter 3 | Organosolv process of a mixture of autohydrolyzed biomass
96
3.4. Conclusion
AM2-3 was further processed by an organosolv treatment aiming at improving
lignin extraction. Considering the results obtained in this work, experiment 9 (ethanol
concentration 80 %, temperature 200 ºC, time 60 min) allowed a high delignification
(49.40 %) with a lignin yield of 24.47 % and lignin extraction efficiency of 48.34 %.
Moreover, the isolated lignin samples (OL1-OL10) showed high purity and also
kept the main structure, according to FTIR results. Nonetheless, the organosolv process
influenced the thermal properties of the lignin, becoming more thermoplastic and, for this
reason, more susceptible to be used as bio-based polymers. Regarding to antioxidant
activity, the lignin fractions showed antioxidant activity as high as the commercial
antioxidant BHT. The YG of enzymatic hydrolysis was 53 % at 10% solids load, however
this yield could be higher if the cellulose fraction did not have the presence of
repolymerized lignin.
This chapter showed that the application of the organosolv process to previously
autohydrolyzed biomass makes possible to produce a high-quality lignin, with high purity
and structure relatively unaltered.
0
20
40
60
80
100
0 0,05 0,1 0,25 0,5 0,75 1
RS
A (
%)
Concentration (mg/mL)
Trolox
BHT
L9
L4
Figure 19- Radical scavenging activities of OL samples (OL4 and OL9) compared with
commercial antioxidants (BHT and Trolox) for DPPH assay.
Chapter 3 | Organosolv process of a mixture of autohydrolyzed biomass
97
3.5. References
Amendola, D., De Faveri, D.M., Egües, I., Serrano, L., Labidi, J., Spigno, G., 2012.
Autohydrolysis and organosolv process for recovery of hemicelluloses, phenolic
compounds and lignin from grape stalks. Bioresource Technology 107, 267–274.
https://doi.org/10.1016/j.biortech.2011.12.108
Amiri, H., Karimi, K., 2016. Integration of Autohydrolysis and Organosolv
Delignification for Efficient Acetone, Butanol, and Ethanol Production and Lignin
Recovery. Industrial & Engineering Chemistry Research 55, 4836–4845.
https://doi.org/10.1021/acs.iecr.6b00110
An, L., Wang, G., Jia, H., Liu, C., Sui, W., Si, C., 2017. Fractionation of enzymatic
hydrolysis lignin by sequential extraction for enhancing antioxidant performance.
International Journal of Biological Macromolecules 99, 674–681.
https://doi.org/10.1016/j.ijbiomac.2017.03.015
Astner, A., Young, T., Bioenergy, J.B. and, 2015, U., 2015. Lignin yield maximization
of mixed biorefinery feedstocks by organosolv fractionation using Taguchi Robust
Product Design. Elsevier.
Azadi, P., Inderwildi, O.R., Farnood, R., King, D.A., 2013. Liquid fuels, hydrogen and
chemicals from lignin: A critical review. Renewable and Sustainable Energy
Reviews 21, 506–523. https://doi.org/10.1016/J.RSER.2012.12.022
Blois, M.S., 1958. Antioxidant determinations by the use of a stable free radical [10].
Nature. https://doi.org/10.1038/1811199a0
Brudecki, G., Cybulska, I., Technology, K.R.-B., 2013, U., 2013. Optimization of clean
fractionation process applied to switchgrass to produce pulp for enzymatic
hydrolysis. Elsevier.
Caballero, J.., Font, R., Marcilla, A., 1996. Comparative study of the pyrolysis of almond
shells and their fractions, holocellulose and lignin. Product yields and kinetics.
Thermochimica Acta 276, 57–77. https://doi.org/10.1016/0040-6031(95)02794-7
Cybulska, I., Brudecki, G.P., Zembrzuska, J., Schmidt, J.E., Lopez, C.G.-B., Thomsen,
M.H., 2017. Organosolv delignification of agricultural residues (date palm fronds,
Chapter 3 | Organosolv process of a mixture of autohydrolyzed biomass
98
Phoenix dactylifera L.) of the United Arab Emirates. Applied Energy 185, 1040–
1050. https://doi.org/10.1016/J.APENERGY.2016.01.094
Doherty, W.O.S., Mousavioun, P., Fellows, C.M., 2011. Value-adding to cellulosic
ethanol: Lignin polymers. Industrial Crops and Products 33, 259–276.
https://doi.org/10.1016/J.INDCROP.2010.10.022
Elshafie, M., Taha, M.G., Elhamamsy, S.M., Moustafa, Y., Elazab, W.I.M., 2020.
Thermal analysis of the prepared lignin/graphene oxide/polyurethane composite.
Egyptian Journal of Petroleum. https://doi.org/10.1016/J.EJPE.2020.04.001
Faix, O., 1991. Classification of Lignins from Different Botanical Origins by FT-IR
Spectroscopy. Holzforschung 45, 21–28. https://doi.org/10.1515/hfsg.1991.45.s1.21
Ghose, T.K., 1987. Measurement of cellulase activities. Pure and Applied Chemistry 59,
257–268. https://doi.org/10.1351/pac198759020257
Gordobil, O., Herrera, R., Llano-Ponte, R., Labidi, J., 2017. Esterified organosolv lignin
as hydrophobic agent for use on wood products. Progress in Organic Coatings 103,
143–151. https://doi.org/10.1016/J.PORGCOAT.2016.10.030
Hallac, B.B., Sannigrahi, P., Pu, Y., Ray, M., Murphy, R.J., Ragauskas, A.J., 2010. Effect
of ethanol organosolv pretreatment on enzymatic hydrolysis of Buddleja davidii
stem biomass. Industrial and Engineering Chemistry Research 49, 1467–1472.
https://doi.org/10.1021/ie900683q
Hansen, B., Kusch, P., Schulze, M., Kamm, B., 2016. Qualitative and Quantitative
Analysis of Lignin Produced from Beech Wood by Different Conditions of the
Organosolv Process. Journal of Polymers and the Environment 24, 85–97.
https://doi.org/10.1007/s10924-015-0746-3
Huijgen, W.J.J., Smit, A.T., de Wild, P.J., den Uil, H., 2012. Fractionation of wheat straw
by prehydrolysis, organosolv delignification and enzymatic hydrolysis for
production of sugars and lignin. Bioresource Technology.
https://doi.org/10.1016/j.biortech.2012.02.143
Huijgen, W.J.J., Telysheva, G., Arshanitsa, A., Gosselink, R.J.A., de Wild, P.J., 2014.
Characteristics of wheat straw lignins from ethanol-based organosolv treatment.
Industrial Crops and Products 59, 85–95.
Chapter 3 | Organosolv process of a mixture of autohydrolyzed biomass
99
https://doi.org/10.1016/j.indcrop.2014.05.003
Hussin, M.H., Rahim, A.A., Mohamad Ibrahim, M.N., Brosse, N., 2013. Physicochemical
characterization of alkaline and ethanol organosolv lignins from oil palm (Elaeis
guineensis) fronds as phenol substitutes for green material applications. Industrial
Crops and Products 49, 23–32. https://doi.org/10.1016/j.indcrop.2013.04.030
Li, H., McDonald, A.G., 2014. Fractionation and characterization of industrial lignins.
Industrial Crops and Products 62, 67–76.
https://doi.org/10.1016/J.INDCROP.2014.08.013
Lora, J.H., 2008. Industrial commercial lignins: Sources, properties and applications, in:
Monomers, Polymers and Composites from Renewable Resources. Elsevier Ltd, pp.
225–241. https://doi.org/10.1016/B978-0-08-045316-3.00010-7
Lora, J.H., Glasser, W.G., 2002. Recent Industrial Applications of Lignin: A Sustainable
Alternative to Nonrenewable Materials, Journal of Polymers and the Environment.
Magalhães, L.M., Barreiros, L., Reis, S., Segundo, M.A., 2014. Kinetic matching
approach applied to ABTS assay for high-throughput determination of total
antioxidant capacity of food products. Journal of Food Composition and Analysis
33, 187–194. https://doi.org/10.1016/J.JFCA.2014.01.003
Maniet, G., Schmetz, Q., Jacquet, N., … M.T.-I. crops and, 2017, U., 2017. Effect of
steam explosion treatment on chemical composition and characteristic of organosolv
fescue lignin. Elsevier.
Martín-Sampedro, R., Santos, J.I., Eugenio, M.E., Wicklein, B., Jiménez-López, L.,
Ibarra, D., 2019. Chemical and thermal analysis of lignin streams from Robinia
pseudoacacia L. generated during organosolv and acid hydrolysis pre-treatments and
subsequent enzymatic hydrolysis. International Journal of Biological
Macromolecules 140, 311–322. https://doi.org/10.1016/J.IJBIOMAC.2019.08.029
Menczel, J.D., Judovits, L., Prime, R.B., Bair, H.E., Reading, M., Swier, S., Prime, R.B.,
Bair, H.E., Vyazovkin, S., Gallagher, P.K., Riga, A., 2009. Differential Scanning
Calorimetry (DSC). Thermal Analysis of Polymers, Wiley Online Books.
https://doi.org/doi:10.1002/9780470423837.ch2
Mesa, L., González, E., Cara, C., González, M., Castro, E., Mussatto, S.I., 2011. The
Chapter 3 | Organosolv process of a mixture of autohydrolyzed biomass
100
effect of organosolv pretreatment variables on enzymatic hydrolysis of sugarcane
bagasse. Chemical Engineering Journal 168, 1157–1162.
https://doi.org/10.1016/j.cej.2011.02.003
Michelin, M., Liebentritt, S., Vicente, A.A., Teixeira, J.A., 2018. Lignin from an
integrated process consisting of liquid hot water and ethanol organosolv:
Physicochemical and antioxidant properties. International Journal of Biological
Macromolecules 120, 159–169. https://doi.org/10.1016/j.ijbiomac.2018.08.046
Moniz, P., João, L., Duarte, L.C., Roseiro, L.B., Boeriu, C.G., Pereira, H., Carvalheiro,
F., 2015. Fractionation of Hemicelluloses and Lignin from Rice Straw by Combining
Autohydrolysis and Optimised Mild Organosolv Delignification. BioResources 10,
2626–2641. https://doi.org/10.15376/biores.10.2.2626-2641
Obama, P., Ricochon, G., Muniglia, L., Brosse, N., 2012. Combination of enzymatic
hydrolysis and ethanol organosolv pretreatments: Effect on lignin structures,
delignification yields and cellulose-to-glucose conversion. Bioresource Technology.
https://doi.org/10.1016/j.biortech.2012.02.080
Pontes, R., Romaní, A., Michelin, M., Domingues, L., Teixeira, J., Nunes, J., 2018.
Comparative autohydrolysis study of two mixtures of forest and marginal land
resources for co-production of biofuels and value-added compounds. Renewable
Energy 128, 20–29. https://doi.org/10.1016/j.renene.2018.05.055
Prime, R.B., Bair, H.E., Vyazovkin, S., Gallagher, P.K., Riga, A., 2009.
Thermogravimetric Analysis (TGA). Thermal Analysis of Polymers, Wiley Online
Books. https://doi.org/doi:10.1002/9780470423837.ch3
Reddy, N., Yang, Y., 2005. Biofibers from agricultural byproducts for industrial
applications. Trends in Biotechnology 23, 22–27.
https://doi.org/10.1016/J.TIBTECH.2004.11.002
Romaní, A., Garrote, G., López, F., Technology, J.P.-B., 2011, undefined, n.d.
Eucalyptus globulus wood fractionation by autohydrolysis and organosolv
delignification. Elsevier.
Romaní, A., Garrote, G., López, F., Technology, J.P.-B., 2011, U., 2011. Eucalyptus
globulus wood fractionation by autohydrolysis and organosolv delignification.
Elsevier.
Chapter 3 | Organosolv process of a mixture of autohydrolyzed biomass
101
Romaní, A., Ruiz, H.A., Teixeira, J.A., Domingues, L., 2016. Valorization of Eucalyptus
wood by glycerol-organosolv pretreatment within the biorefinery concept: An
integrated and intensified approach. Renewable Energy 95, 1–9.
https://doi.org/10.1016/J.RENENE.2016.03.106
Ross, K., Leung, A., Godfrey, D., Mazza, G., 2012. Evaluation of Thermal
Decomposition and Antioxidant Activity of Crop Residues and Ionic Liquid
Extracted Lignin. World Applied Sciences Journal 16, 160–178.
Ruiz, H.A., Vicente, A.A., Teixeira, J.A., 2012. Kinetic modeling of enzymatic
saccharification using wheat straw pretreated under autohydrolysis and organosolv
process. Industrial Crops and Products 36, 100–107.
https://doi.org/10.1016/j.indcrop.2011.08.014
Santos, T.M., Rigual, V., Oliet, M., Alonso, M.V., Domínguez, J.C., Rodriguez, F., 2019.
Two‐step fractionation of Pinus radiata by autohydrolysis and organosolv
delignification for enzymatic hydrolysis. Journal of Chemical Technology &
Biotechnology 94, 3951–3959. https://doi.org/10.1002/jctb.6197
Sebio-Puñal, T., Naya, S., López-Beceiro, J., Tarrío-Saavedra, J., Artiaga, R., 2012.
Thermogravimetric analysis of wood, holocellulose, and lignin from five wood
species. Journal of Thermal Analysis and Calorimetry 109, 1163–1167.
https://doi.org/10.1007/s10973-011-2133-1
Stewart, D., 2008. Lignin as a base material for materials applications: Chemistry,
application and economics. Industrial Crops and Products 27, 202–207.
https://doi.org/10.1016/J.INDCROP.2007.07.008
Vallejos, M.E., Zambon, M.D., Area, M.C., Curvelo, A.A. da S., 2015. Low liquid-solid
ratio fractionation of sugarcane bagasse by hot water autohydrolysis and organosolv
delignification. Industrial Crops and Products.
https://doi.org/10.1016/j.indcrop.2014.11.018
Vargas, F., Domínguez, E., Vila, C., Rodríguez, A., Garrote, G., 2016. Biorefinery
Scheme for Residual Biomass Using Autohydrolysis and Organosolv Stages for
Oligomers and Bioethanol Production. Energy & Fuels 30, 8236–8245.
https://doi.org/10.1021/acs.energyfuels.6b00277
Vaz, S. (Ed.), 2016. Analytical Techniques and Methods for Biomass. Springer
Chapter 3 | Organosolv process of a mixture of autohydrolyzed biomass
102
International Publishing, Cham. https://doi.org/10.1007/978-3-319-41414-0
Veronique, V., Aguie-, A.-, Beghin, B., Foulon, L., Soto, P., Cro, D., Corti, E., Frede, F.,
Legeé, F., Laurent, #, Cezard, C., Chabbert, B., Maillard, M.-N.L., Wouter, ∥,
Huijgen, J.J., Stephanie Baumberger, S., 2015. Use of Food and Packaging Model
Matrices to Investigate the Antioxidant Properties of Biorefinery Grass Lignins.
https://doi.org/10.1021/acs.jafc.5b03686
Vinardell, M., Ugartondo, V., Products, M.M.-I. crops and, 2008, U., 2011. Potential
applications of antioxidant lignins from different sources. Elsevier.
Wang, B., Shen, X.-J., Wen, J.-L., Xiao, L., Sun, R.-C., 2017. Evaluation of organosolv
pretreatment on the structural characteristics of lignin polymers and follow-up
enzymatic hydrolysis of the substrates from Eucalyptus wood. International journal
of biological macromolecules 97, 447–459.
https://doi.org/10.1016/j.ijbiomac.2017.01.069
Wen, J.-L., Sun, S.-L., Xue, B.-L., Sun, R.-C., 2012. Quantitative Structures and Thermal
Properties of Birch Lignins after Ionic Liquid Pretreatment.
https://doi.org/10.1021/jf3051939
Wen, J.L., Sun, S.N., Yuan, T.Q., Xu, F., Sun, R.C., 2013. Fractionation of bamboo culms
by autohydrolysis, organosolv delignification and extended delignification:
Understanding the fundamental chemistry of the lignin during the integrated process.
Bioresource Technology 150, 278–286.
https://doi.org/10.1016/j.biortech.2013.10.015
Zhu, M.-Q., Wen, J.-L., Su, Y.-Q., Wei, Q., Sun, R.-C., 2015. Effect of structural changes
of lignin during the autohydrolysis and organosolv pretreatment on Eucommia
ulmoides Oliver for an effective enzymatic hydrolysis. Bioresource Technology 185,
378–385. https://doi.org/10.1016/J.BIORTECH.2015.02.061
CHAPTER 4 |
Scale-up of lactic acid production
Abstract
This chapter was focused on evaluating a mixture of lignocellulosic biomass in
order to produce lactic acid (LA) by Lactobacillus rhamnosus within a multi-supply
biorefinery scheme. The mixture of lignocellulosic biomass was submitted to
autohydrolysis pretreatment under non-isothermal regime at 226 ºC (corresponding to a
severity of 4.15) yielding a glucan recovery of 93 % in the solid phase.
Two different strategies were assayed for LA production, namely separated hydrolysis
and fermentation (SHF) and simultaneous saccharification and fermentation (SSF). The
glucose to LA yield obtained for both assays was 1 g/g, although the volumetric
productivity of SSF (2.5 g/Lh) was higher than SHF (0.8 g/Lh). Therefore, the SSF
process was optimized through a factorial design to evaluate the effect of the independent
variables, solids load and enzyme-substrate ratio (ESR), on LA production. The
maximum concentration of LA was obtained using the highest solids load (16 %) and
with the highest ESR (54 FPU/g). Finally, scale up of LA was performed in a bioreactor
under the optimized conditions of Erlenmeyer, obtaining 61.74 g/L of LA at 44 h which
corresponds to LA yield of 0.97 g/g.
Keywords: Lignocellulosic biomass mixture, autohydrolysis, simultaneous saccharification
and fermentation, biorefinery, Lactobacillus rhamnosus, lactic acid
This chapter is based on the following paper:
Pontes, R., Romaní, A., Michelin, M., Domingues, L. Teixeira, J., Nunes, J. 2021. Scale-
up of lactic acid production from multi-supply autohydrolyzed economically unexploited
lignocellulosic biomass (submitted to Industrial Crops and Products).
Chapter 4 | Scale-up of lactic acid production
104
Contents
4.1. Introduction ........................................................................................................... 105
4.2. Materials and methods ........................................................................................... 107
4.2.1. Lignocellulosic biomass and pretreatment ......................................................... 107
4.2.2. Microorganism, culture media and inoculum preparation.................................. 108
4.2.3. Simultaneous and separated hydrolysis and fermentation in shake flask ........... 108
4.2.4. Experimental design and statistical analysis ...................................................... 110
4.2.5. Data fitting .......................................................................................................... 111
4.2.6. Simultaneous saccharification and fermentation in bioreactor .......................... 111
4.2.7. Chemical composition of materials .................................................................... 111
4.3. Results and discussion ........................................................................................... 112
4.3.1. Effect of autohydrolysis pretreatment on M2-3 lignocellulosic biomass mixture
...................................................................................................................................... 112
4.3.2. Simultaneous and separated hydrolysis and fermentation of AM2-3: preliminary
assays ............................................................................................................................ 112
4.3.3. Optimization of simultaneous saccharification and fermentation: Experimental
design ............................................................................................................................ 114
4.3.4. Lactic acid production in bioreactor ................................................................... 119
4.3.5. Mass balance and process comparison ............................................................... 122
4.4. Conclusion ............................................................................................................. 124
4.5. References ............................................................................................................. 125
Chapter 4 | Scale-up of lactic acid production
105
4.1. Introduction
The demand for lactic acid (LA) is expected to increase due to new processing
technologies and further fields of application, namely biodegradable polymers, green
solvent and oxygenated, fine and commodity chemicals (Ziadi et al., 2020). Traditionally
LA is used in food industry as a preservative, acidulant, flavoring agent or pH buffer
(Jawad et al., 2013; Pejin et al., 2017). LA (2-hydroxypropanoic acid) is a chiral molecule
with two optical enantiomers, L-(+)-LA and D-(-)-LA, produced via either chemical
synthesis or microbial fermentation (Choi et al., 2019; Mora‐Villalobos et al., 2020)
Through microbial fermentation an optically pure LA can be obtained by choosing an
appropriate strain of lactic acid bacteria (LAB).
LAB are non-sporuling, non-motile, acid-tolerant, non-respiring but aerotolerant,
catalase-negative, Gram-positive cocci or rods and recognized as safe (GRAS). They are
characterized to produce LA as the major end product of sugars derived from
carbohydrate (Mora-Villalobos et al., 2020).Some LAB species are capable of
synthetizing only one of the two enantiomers, most of them produce the L-(+) enantiomer,
partly because the D-(-) cannot be metabolized by animal cells. As an example, L.
rhamnosus produces L-(+)-LA (Cubas-Cano et al., 2018; Mora-Villalobos et al., 2020).
Furthermore, pure isomers are more valuable than the racemic mixture due to each
isomer’s specific industrial application (Pejin et al., 2017).
Lignocellulosic biomass (LCB) has gained a lot of interest for LA production.
Currently, corn and cassava were commercially used as raw material, however, the cost
of feedstock is more than 50% of the overall production cost (Unrean, 2018). Other LCB
also have been studied and reviewed, namely from sorghum, corncob, bagasse and wheat
straw (Alexandri et al., 2019; Tarraran and Mazzoli, 2018). Therefore, is crucial to select
a low-cost feedstock, obtained in large quantities, unexploited or exploited inefficiently
and renewable to make LA production cost-effective (Unrean, 2018).
In the present chapter we explore unexploited LCB sources, namely forest
ecosystems and biological resources from marginal land, in a mixture regime, not studied
so far. LCB is primarily composed of the two carbohydrate polymers, cellulose and
hemicellulose, and the non-carbohydrate phenolic polymer (lignin). Thus, the
microorganism should be selected for the corresponding fermentation, for example,
glucose is widespread metabolized, but most microorganisms lack the ability to utilize
Chapter 4 | Scale-up of lactic acid production
106
xylose. In this regard, mixed-culture fermentation systems have been studied using LAB
to produce LA. In a typical mixed-culture system, microorganisms that are suitable for
each sugar are involved (Zhang et al., 2018).
Still, there are several technical barriers to use lignocellulosic biomass, namely
pretreatment to cleave the complex structure (Zhang et al., 2018; Zhou et al., 2016). An
effective and ecofriendly pretreatment of LCB is required to overcome its intrinsic
recalcitrant nature prior to the production of LA. In this case, a hydrothermal pretreatment
was selected for being an ecofriendly process (only requires high temperature and water).
This pretreatment promotes hemicellulose solubilization, cellulose decrystallization,
reduces the lignin-recalcitrant behavior, while increases the surface accessibility for
hydrolysis, in this work for enzymatic hydrolysis (Romaní et al., 2010; Sarip et al., 2016).
Enzymatic hydrolysis is the most promising process to obtain a high yield of
fermentable sugars from pretreated lignocellulosic biomass allowing LAB to use them as
a carbon source (Abdel-Rahman et al., 2011; Siqueira et al., 2020).
Fermentation technology is another important factor that affects the production
and scalability of LA production. Both Separate hydrolysis and fermentation (SHF) and
simultaneous saccharification and fermentation (SSF) are process configurations used for
the biochemical process. In SHF, saccharification and fermentation are carried out in two
steps, while in SSF they are combined in one (Müller et al., 2017). The first one allows
for optimum temperature for cellulases and producer cells, although the duration of the
process is longer (Maslova et al., 2019). High solid load should also be favorable, as it
can yield high titer of LA (Unrean, 2018). SSF reduces reactor volume, processing time,
and feedback inhibition and consequently increases productivity (Marulanda et al., 2019).
Microorganisms in the SSF system can readily consume the sugars, maintaining the sugar
concentrations at a low level reducing the osmotic pressure of cells, while significantly
reducing the feedback inhibition of the enzymes (Chen et al., 2019a). The disadvantage
of SSF lies in the difference of optimum temperature and pH required for saccharification
and fermentation, as well as LA inhibition of the enzymes (Zhang et al., 2018).
Despite attracting a lot of attention, the large-scale production of LA from
lignocellulosic biomass has not yet been commercialized. The scalability limitations of
LA depend on the type of lignocellulosic biomass, pretreatment, saccharification, strains
and fermentation process. For any pretreatment process to be commercially feasible,
energy costs and solvent requirements for the separation, depolymerization, and
conversion of lignocellulose must be taken into account (Grewal and Khare, 2018). In the
Chapter 4 | Scale-up of lactic acid production
107
present chapter, the performance of SSF and SHF of autohydrolysis pretreated
lignocellulosic biomass for LA production was evaluated. SSF process, according to an
enzyme-substrate ratio (ESR) and solids load, was assessed by experimental design and
a predictive model was developed. Finally, the SSF process to maximize LA production
efficiency was performed in 5L stirred tank bioreactor. This work aims to fulfil the
knowledge gap regarding to the production of LA from multi-supply lignocellulosic
biomass for flagship and industrial projects. One of the most important challenge for
industrialization of LA production from lignocellulosic biomass is the security supply of
the raw material. Take into account this challenge and necessity of the market and to
increase the private investment in this field, the work was focused:
1. Sustainable raw material, with different lignocellulosic biomasses from
forest ecosystems namely, eucalyptus (Eucalyptus globulus) and pine (Pinus pinaster)
and from biological resources from marginal land, namely broom (Cytisus sp.), carqueja
(Genista tridentate), mimosa (Acacia dealbata) and rockrose (Cistus ladanifer), without
competitive with feed and food sectors and without commercial exploitation. Marginal
lands in Portugal, representing 22% of the total territory without economic activity use,
are associated with the paradigm of the rural fires, as they increase the fuel available in
the land resulting in a loss of roughly 800 million Euros annually (Pontes et al., 2018);
2. Security supply: a mixture of raw materials was used in this work, which
represents possible scenarios for a multi-supply biorefinery concept from residues and
biological resources without commercial exploitation. The mixture defined in this work
is a result of previous work (Pontes et al., 2018). This type of multi-supply concept is
aligned with the principles of circular and sustainable bio economy European action plan,
defined by European Commission (European Commission, 2018).
4.2. Materials and methods
4.2.1. Lignocellulosic biomass and pretreatment
Mixture of autohydrolyzed forest and marginal lands lignocellulosic biomass
residues, namely M2-3 (mixture 2nd and 3rd quarters) was used as raw material. The
mixture M2-3 represents 52.5 % of forest ecosystems (24.6 % of pine (Pinus pinaster)
and 27.9 % of eucalyptus (Eucalyptus globulus)), and 47.5 % of biological resources from
Chapter 4 | Scale-up of lactic acid production
108
marginal land (13.8 % broom (Cytisus sp.), 12.5 % mimosa (Acacia dealbata), 10.7 %
carqueja (Genista tridentata) and 10.4 % rockrose (Cistus ladanifer)). The criterion of
feedstocks mixture was previously reported in the study by Pontes and co-authors (Pontes
et al., 2018). The raw materials were air-dried, milled and sieved between 0.250 to 0.400
mm using a vibratory sieve shaker (40 and 60 mesh). Afterwards, the samples were mixed
in order to obtain a homogeneous lot and avoid compositional heterogeneity between the
aliquots, and stored in polypropylene bags at room temperature.
M2-3 was submitted to an autohydrolysis pretreatment, following the standard
heating temperature-time profile up to reach the final temperature (TMAX) of 226 ºC, as
reported by Pontes and co-authors (Pontes et al., 2018). The solid fraction obtained from
the autohydrolysis pretreatment was named AM2-3.
4.2.2. Microorganism, culture media and inoculum preparation
Lactobacillus rhamnosus (ATCC American Collection 7469) was the organism
used in this study. Stock cultures were maintained at -80 ºC in the pre-culture MRS broth
media with 20 % (v/v) glycerol. The inoculum for SSF and SHF assays was prepared by
transfering the cells to 150 mL of MRS broth media placed in 250 mL erlenmeyer flasks.
After 7 h of shaking at 37 ºC and 150 rpm, a volume of 15 mL of this was transferred to
the same amount of MRS medium, which was incubated again for 12 h under the same
conditions. MRS broth media contained 20 g/L glucose, 5 g/L yeast extract, 10 g/L meat
extract, 10 g/L enzymatic digest of casein, 5 g/L sodium acetate, 2 g/L diamonium citrate,
2 g/L K2HPO4, 0.2 g/L MgSO4.
4.2.3. Simultaneous and separated hydrolysis and fermentation in shake flask
The solid fraction AM2-3 was subjected to batch SSF and SHF. Both assays were
carried out in 100 mL Erlenmeyer flasks with a final volume of 50 mL, 10 % of solids
load and with approximately 50 g/L of potential glucose of AM2-3, taking into account
the glucan content in the pretreated biomass, and nutrients (according to MRS broth
without glucose), previously sterilized at 121 ºC for 15 min. Commercial enzyme Cellic
CTec2 (Novozymes, Bagsvaerd, Denmark) presented an enzymatic activity of 120
FPU/mL (measured as described by Ghose, 1987) (Ghose, 1987) and was employed with
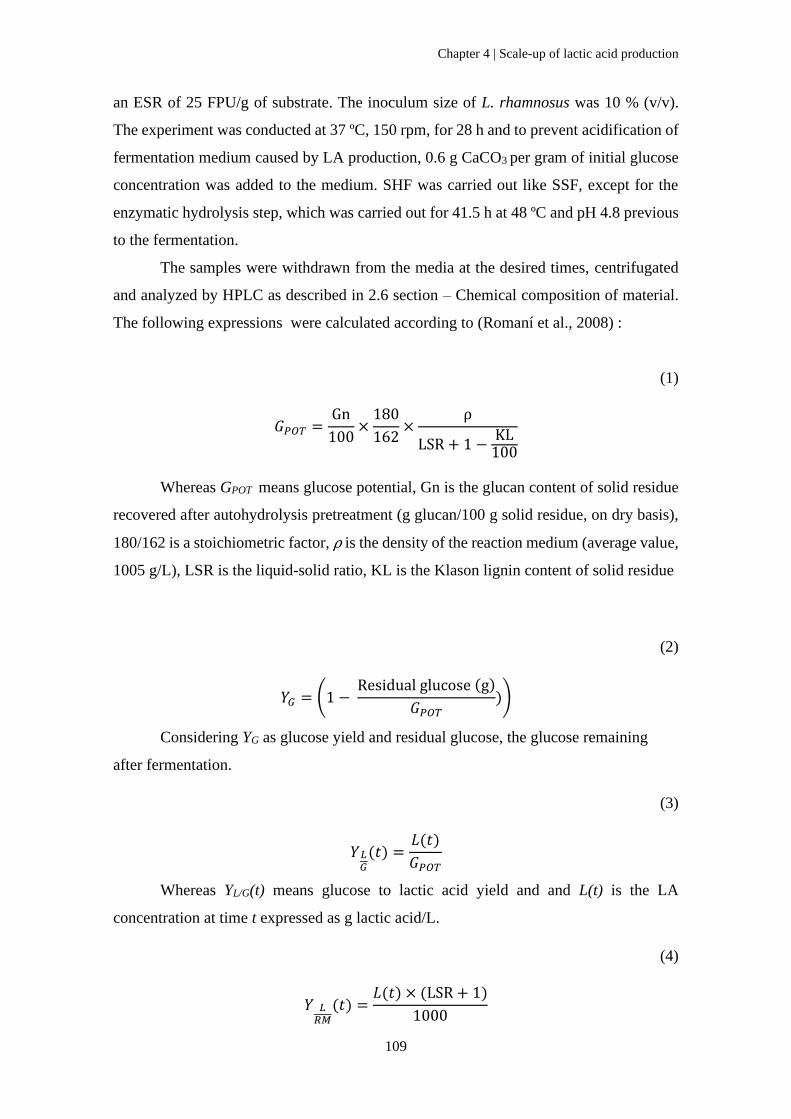
Chapter 4 | Scale-up of lactic acid production
109
an ESR of 25 FPU/g of substrate. The inoculum size of L. rhamnosus was 10 % (v/v).
The experiment was conducted at 37 ºC, 150 rpm, for 28 h and to prevent acidification of
fermentation medium caused by LA production, 0.6 g CaCO3 per gram of initial glucose
concentration was added to the medium. SHF was carried out like SSF, except for the
enzymatic hydrolysis step, which was carried out for 41.5 h at 48 ºC and pH 4.8 previous
to the fermentation.
The samples were withdrawn from the media at the desired times, centrifugated
and analyzed by HPLC as described in 2.6 section – Chemical composition of material.
The following expressions were calculated according to (Romaní et al., 2008) :
(1)
𝐺𝑃𝑂𝑇 =Gn
100×
180
162×
⍴
LSR + 1 −KL
100
Whereas GPOT means glucose potential, Gn is the glucan content of solid residue
recovered after autohydrolysis pretreatment (g glucan/100 g solid residue, on dry basis),
180/162 is a stoichiometric factor, ⍴ is the density of the reaction medium (average value,
1005 g/L), LSR is the liquid-solid ratio, KL is the Klason lignin content of solid residue
(2)
𝑌𝐺 = (1 − Residual glucose (g)
𝐺𝑃𝑂𝑇))
Considering YG as glucose yield and residual glucose, the glucose remaining
after fermentation.
(3)
𝑌𝐿𝐺
(𝑡) =𝐿(𝑡)
𝐺𝑃𝑂𝑇
Whereas YL/G(t) means glucose to lactic acid yield and and L(t) is the LA
concentration at time t expressed as g lactic acid/L.
(4)
𝑌 𝐿𝑅𝑀
(𝑡) =𝐿(𝑡) × (LSR + 1)
1000
Chapter 4 | Scale-up of lactic acid production
110
Considering YL/RM (t) as raw material to lactic acid yield.
(5)
𝑄𝑝(𝑡) =𝐿(𝑡)
𝑡
Whereas Qp(t) is lactic acid volumetric productivity.
4.2.4. Experimental design and statistical analysis
Experiments were carried out according to the design generated by the software
to study the effect of two factors (independent variables): solids load and ESR on LA
concentration and glucose to LA yield (dependent variables or responses). This
experimental design resulted in 11 with two factors at three levels, with three center
points. The real and coded experimental variables are presented in Table 14.
Table 14. Value (real and coded) of experimental variables used in the experimental design.
Independent variables Levels
-1 0 1
Solids load (%) (x1) 8 12 16
ESR (FPU/g) (x2) 18 36 54
The process behavior can be explained by a quadratic equation form, between
independent variables and responses:
𝑦 = 𝑏0 + ∑ 𝑏𝑖𝑥𝑖
𝑘
𝑖=1
+ ∑ 𝑏𝑖𝑖
𝑘
𝑖=1
𝑥𝑖2 + ∑ ∑ 𝑏𝑖𝑗
𝑘
𝑗=𝑖
𝑥𝑖𝑥𝑗 + ɛ
𝑘
𝑖=1
Where y represents the predicted responses, namely yLA(24) represents LA
concentration and yYL/G(24) glucose to LA yield. Whereas b0, bi ,bii, and bij means
offset term, linear effect, quadratic effect and interaction effect respectively. The
independents variables xi and xj represent solids load (SL) and enzyme to solid ratio
(ESR). The factor ɛ is random error or allows for discrepancies or uncertainties between
predicted and measured values.
Chapter 4 | Scale-up of lactic acid production
111
4.2.5. Data fitting
Experimental results were evaluated with STATISTICA (data analysis software
system), version 12 from StatSoft, Inc. (2014) (www.statsoft.com) for analysis of
variance (ANOVA), regression coefficients, modeling the responses and graphical
analysis. Sum of squares of residuals (SSR) was chosen for statistical significance and
computation of standard error. Statistical analyses were performed with a 95%
significance level.
4.2.6. Simultaneous saccharification and fermentation in bioreactor
The condition selected for scaling up was based on the experimental design assay
(condition 11). Batch SSF was conducted in 2 L of a 5 L Bioreator BioFlo/CelliGen115
for 48 h. SSF was carried out with a LSR of 6 g/g, ESR of 54 FPU/g and 10 % (v/v)
inoculum size, and conducted at 37 ºC, 150 rpm, and pH 4.8 controlled with 5 M NaOH.
At given fermentation times, samples were withdrawn from the media and centrifuged.
The concentrations of glucose, xylose, lactic acid and acetic acid were measured by HPLC
in the supernatants (see Section 2.6 for details). The parameters were calculated according
to the expressions described in Section 2.3).
4.2.7. Chemical composition of materials
Analytical assays were performed according to the following methods: moisture
(NREL/TP-510-42621) T-206-om-88 m) and quantitative acid hydrolysis with 72 % w/w
sulphuric acid (NREL/TP-510-42618). The solid phase from the quantitative acid
hydrolysis was considered as Klason lignin. The hydrolysates from acid hydrolysis were
analyzed by high performance liquid chromatography (HPLC) for sugars (glucose,
xylose), lactic acid and acetic acid using the columns Aminex HPX-87H (conditions:
refractive index detector; flow rate of 0.6 mL/min at 60 ºC; 0.005 M H2SO4 as mobile
phase). Analyses were carried out in duplicate.
Chapter 4 | Scale-up of lactic acid production
112
4.3. Results and discussion
4.3.1. Effect of autohydrolysis pretreatment on M2-3 lignocellulosic biomass mixture
To evaluate the potential of pretreatment biomass for LA production, M2-3 was
submitted to autohydrolysis treatment to obtain an enriched solid phase (or AM2-3)
composed by 48.47 ± 0.34 % of cellulose (measured as glucan), 0.72 ± 0.10 % of xylan
and 43.53 ± 0.45 % of Klason lignin. The liquid phase enriched in hemicellulose-derived
compounds was composed mainly by oligosaccharides (OS), including 0.87 g/L
glucooligosaccharides (GOS), 0.95 g/L xylooligosaccharides (XOS), 0.05 g/L
arabinooligosaccharides (ArOS) and 0.52 g/L acetyl groups (AcGOS). The content of
monosaccharides in autohydrolysis liquor was 2.23 g/L of glucose, 2.06 g/L of xylose
and 0.1 g/L of arabinose; and other by-products such as organic acids, 4.68 g/L of acetic
acid, and furans (0.21 g/L of hydroxymethlyfurfural and 1.09 g/L of furfural).
Therefore, at these conditions the recovery of glucan and lignin in the solid phase
was 93.47 % and 91.53 %, respectively. The xylan solubilization as a sum of xylose and
XOS was 12.63 %.
4.3.2. Simultaneous and separated hydrolysis and fermentation of AM2-3: preliminary
assays
The solid fraction obtained from the autohydrolysis pretreatment (AM2.3), enriched with
cellulose content was submitted to enzymatic hydrolysis and fermentation. SSF and SHF
were conducted with 10 % of solids load (w/v) with the same enzyme loading in batch
mode at 37 ºC for 52 h (except for the saccharification step in SHF which was performed
at 48 ºC) as presented in the Figure 20. The non-detection of residual sugar showed that
glucose was consumed rapidly and suggests that all of it was converted to LA.
Additionally, the slower rate of glucose released during SSF implies a slower LA
production, in the first 7 h, compared to SHF. Nonetheless, there was a lag phase
(approximately 2 h) on the onset of glucose assimilation and LA production for both
assays.
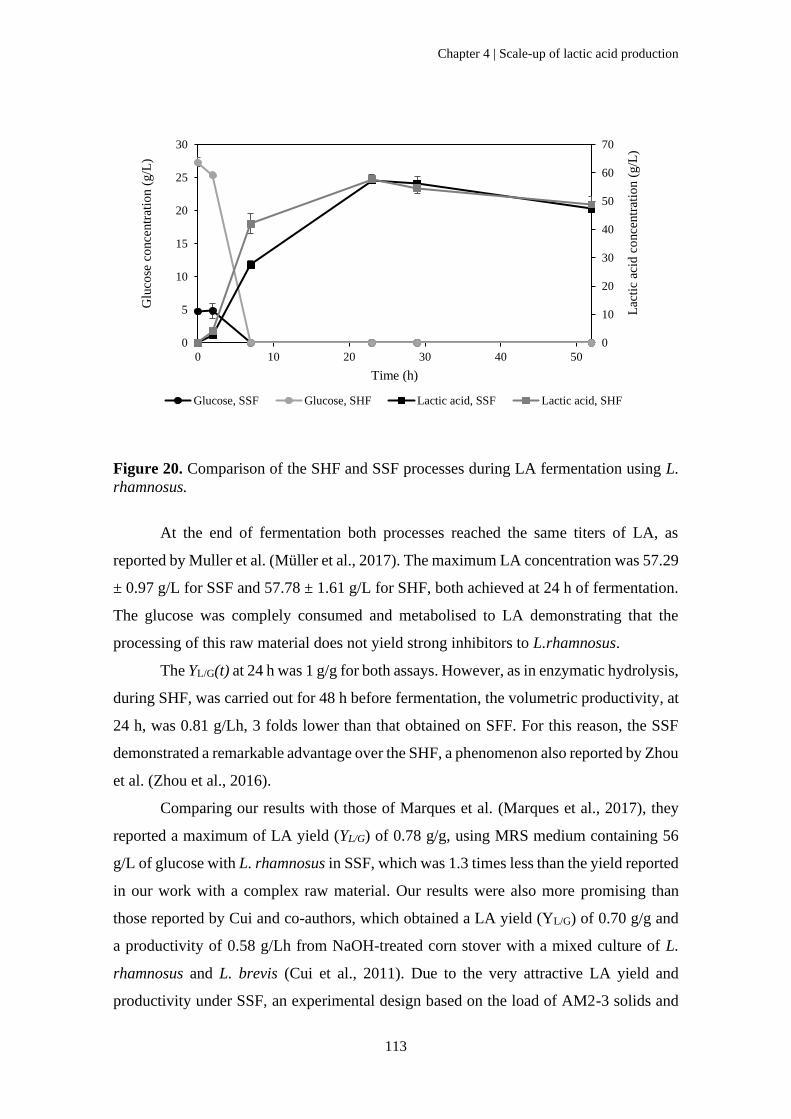
Chapter 4 | Scale-up of lactic acid production
113
Figure 20. Comparison of the SHF and SSF processes during LA fermentation using L.
rhamnosus.
At the end of fermentation both processes reached the same titers of LA, as
reported by Muller et al. (Müller et al., 2017). The maximum LA concentration was 57.29
± 0.97 g/L for SSF and 57.78 ± 1.61 g/L for SHF, both achieved at 24 h of fermentation.
The glucose was complely consumed and metabolised to LA demonstrating that the
processing of this raw material does not yield strong inhibitors to L.rhamnosus.
The YL/G(t) at 24 h was 1 g/g for both assays. However, as in enzymatic hydrolysis,
during SHF, was carried out for 48 h before fermentation, the volumetric productivity, at
24 h, was 0.81 g/Lh, 3 folds lower than that obtained on SFF. For this reason, the SSF
demonstrated a remarkable advantage over the SHF, a phenomenon also reported by Zhou
et al. (Zhou et al., 2016).
Comparing our results with those of Marques et al. (Marques et al., 2017), they
reported a maximum of LA yield (YL/G) of 0.78 g/g, using MRS medium containing 56
g/L of glucose with L. rhamnosus in SSF, which was 1.3 times less than the yield reported
in our work with a complex raw material. Our results were also more promising than
those reported by Cui and co-authors, which obtained a LA yield (YL/G) of 0.70 g/g and
a productivity of 0.58 g/Lh from NaOH-treated corn stover with a mixed culture of L.
rhamnosus and L. brevis (Cui et al., 2011). Due to the very attractive LA yield and
productivity under SSF, an experimental design based on the load of AM2-3 solids and
0
10
20
30
40
50
60
70
0
5
10
15
20
25
30
0 10 20 30 40 50
Lac
tic
acid
co
nce
ntr
atio
n (
g/L
)
Glu
cose
co
nce
ntr
atio
n (
g/L
)
Time (h)
Glucose, SSF Glucose, SHF Lactic acid, SSF Lactic acid, SHF
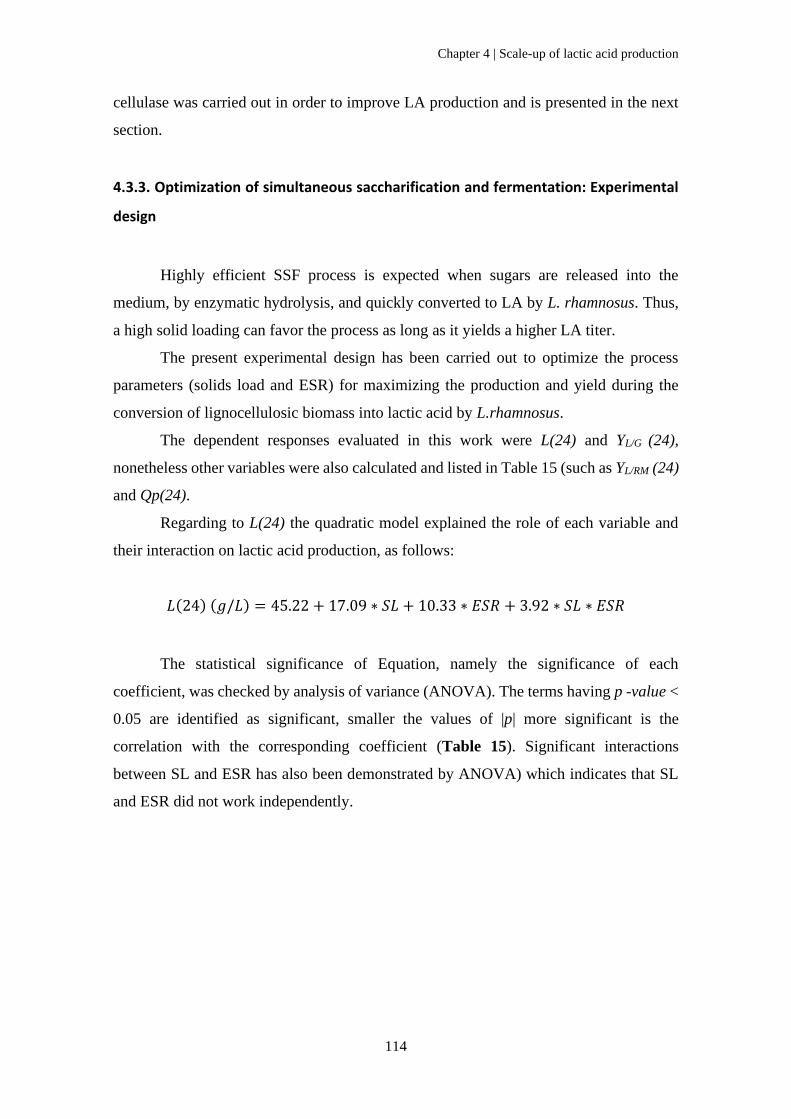
Chapter 4 | Scale-up of lactic acid production
114
cellulase was carried out in order to improve LA production and is presented in the next
section.
4.3.3. Optimization of simultaneous saccharification and fermentation: Experimental
design
Highly efficient SSF process is expected when sugars are released into the
medium, by enzymatic hydrolysis, and quickly converted to LA by L. rhamnosus. Thus,
a high solid loading can favor the process as long as it yields a higher LA titer.
The present experimental design has been carried out to optimize the process
parameters (solids load and ESR) for maximizing the production and yield during the
conversion of lignocellulosic biomass into lactic acid by L.rhamnosus.
The dependent responses evaluated in this work were L(24) and YL/G (24),
nonetheless other variables were also calculated and listed in Table 15 (such as YL/RM (24)
and Qp(24).
Regarding to L(24) the quadratic model explained the role of each variable and
their interaction on lactic acid production, as follows:
𝐿(24) (𝑔/𝐿) = 45.22 + 17.09 ∗ 𝑆𝐿 + 10.33 ∗ 𝐸𝑆𝑅 + 3.92 ∗ 𝑆𝐿 ∗ 𝐸𝑆𝑅
The statistical significance of Equation, namely the significance of each
coefficient, was checked by analysis of variance (ANOVA). The terms having p -value <
0.05 are identified as significant, smaller the values of |p| more significant is the
correlation with the corresponding coefficient (Table 15). Significant interactions
between SL and ESR has also been demonstrated by ANOVA) which indicates that SL
and ESR did not work independently.
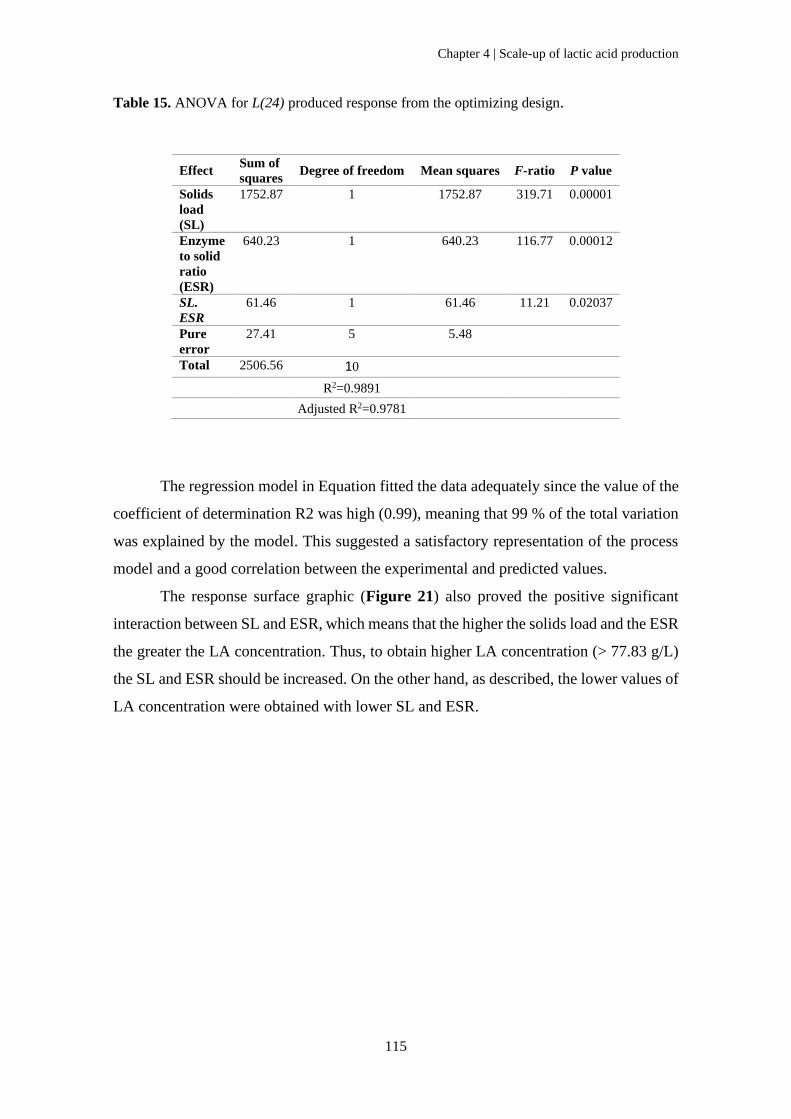
Chapter 4 | Scale-up of lactic acid production
115
Table 15. ANOVA for L(24) produced response from the optimizing design.
Effect Sum of
squares Degree of freedom Mean squares F-ratio P value
Solids
load
(SL)
1752.87 1 1752.87 319.71 0.00001
Enzyme
to solid
ratio
(ESR)
640.23 1 640.23 116.77 0.00012
SL.
ESR
61.46 1 61.46 11.21 0.02037
Pure
error
27.41 5 5.48
Total 2506.56 10
R2=0.9891
Adjusted R2=0.9781
The regression model in Equation fitted the data adequately since the value of the
coefficient of determination R2 was high (0.99), meaning that 99 % of the total variation
was explained by the model. This suggested a satisfactory representation of the process
model and a good correlation between the experimental and predicted values.
The response surface graphic (Figure 21) also proved the positive significant
interaction between SL and ESR, which means that the higher the solids load and the ESR
the greater the LA concentration. Thus, to obtain higher LA concentration (> 77.83 g/L)
the SL and ESR should be increased. On the other hand, as described, the lower values of
LA concentration were obtained with lower SL and ESR.
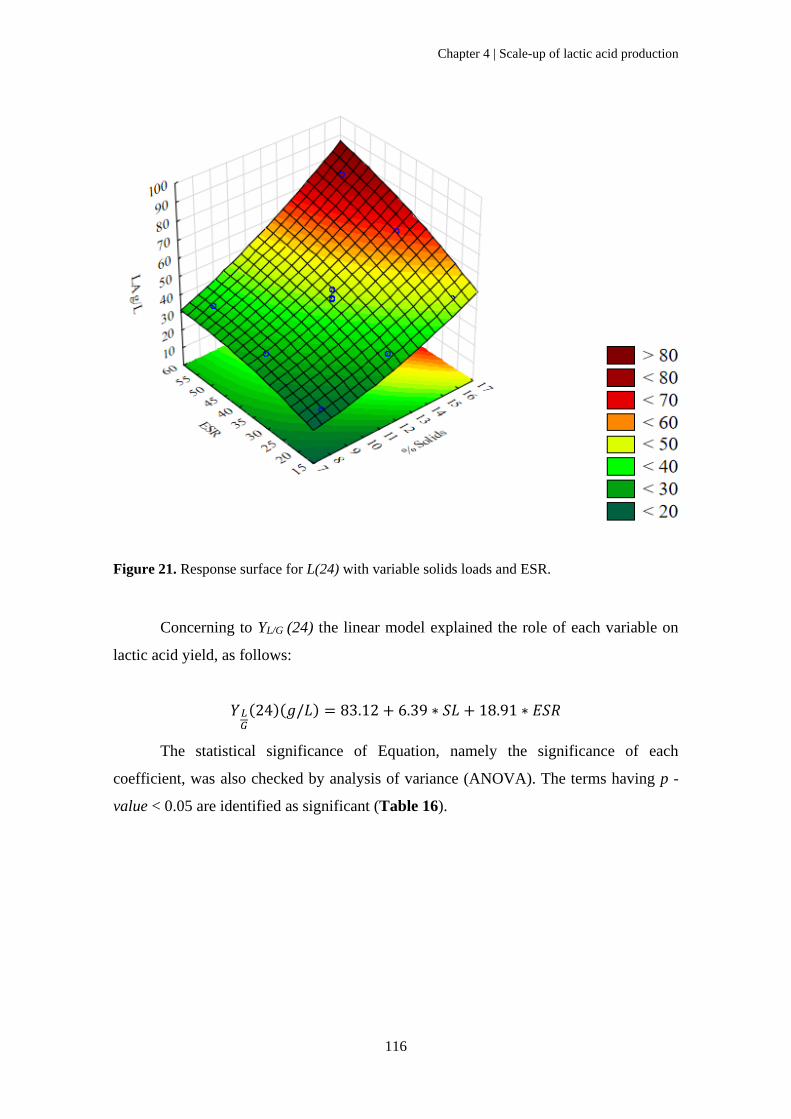
Chapter 4 | Scale-up of lactic acid production
116
Concerning to YL/G (24) the linear model explained the role of each variable on
lactic acid yield, as follows:
𝑌𝐿𝐺
(24)(𝑔/𝐿) = 83.12 + 6.39 ∗ 𝑆𝐿 + 18.91 ∗ 𝐸𝑆𝑅
The statistical significance of Equation, namely the significance of each
coefficient, was also checked by analysis of variance (ANOVA). The terms having p -
value < 0.05 are identified as significant (Table 16).
Figure 21. Response surface for L(24) with variable solids loads and ESR.
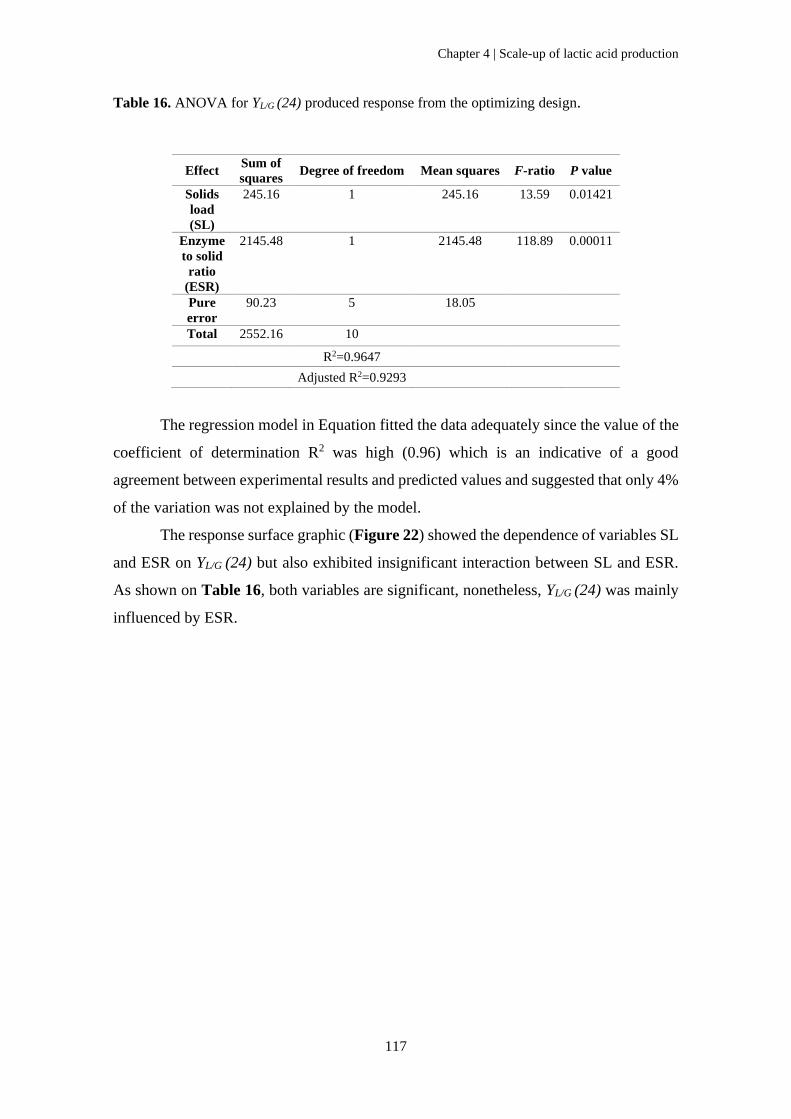
Chapter 4 | Scale-up of lactic acid production
117
Table 16. ANOVA for YL/G (24) produced response from the optimizing design.
Effect Sum of
squares Degree of freedom Mean squares F-ratio P value
Solids
load
(SL)
245.16 1 245.16 13.59 0.01421
Enzyme
to solid
ratio
(ESR)
2145.48 1 2145.48 118.89 0.00011
Pure
error
90.23 5 18.05
Total 2552.16 10
R2=0.9647
Adjusted R2=0.9293
The regression model in Equation fitted the data adequately since the value of the
coefficient of determination R2 was high (0.96) which is an indicative of a good
agreement between experimental results and predicted values and suggested that only 4%
of the variation was not explained by the model.
The response surface graphic (Figure 22) showed the dependence of variables SL
and ESR on YL/G (24) but also exhibited insignificant interaction between SL and ESR.
As shown on Table 16, both variables are significant, nonetheless, YL/G (24) was mainly
influenced by ESR.
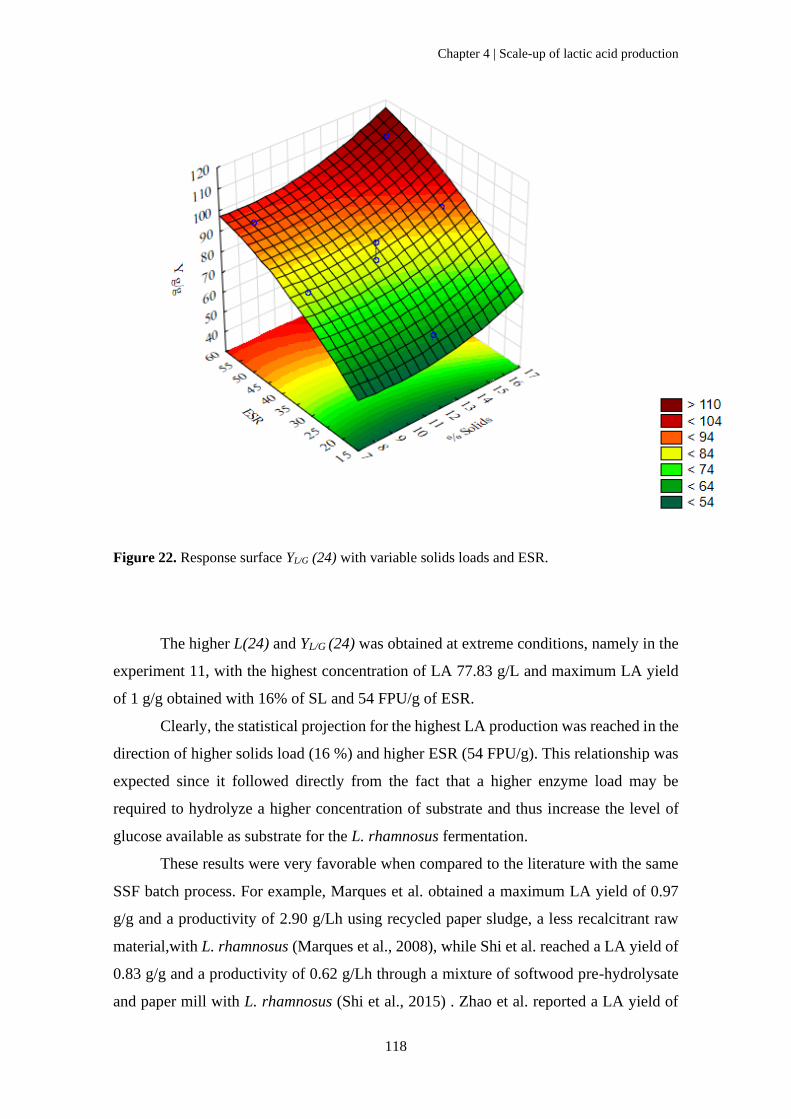
Chapter 4 | Scale-up of lactic acid production
118
The higher L(24) and YL/G (24) was obtained at extreme conditions, namely in the
experiment 11, with the highest concentration of LA 77.83 g/L and maximum LA yield
of 1 g/g obtained with 16% of SL and 54 FPU/g of ESR.
Clearly, the statistical projection for the highest LA production was reached in the
direction of higher solids load (16 %) and higher ESR (54 FPU/g). This relationship was
expected since it followed directly from the fact that a higher enzyme load may be
required to hydrolyze a higher concentration of substrate and thus increase the level of
glucose available as substrate for the L. rhamnosus fermentation.
These results were very favorable when compared to the literature with the same
SSF batch process. For example, Marques et al. obtained a maximum LA yield of 0.97
g/g and a productivity of 2.90 g/Lh using recycled paper sludge, a less recalcitrant raw
material,with L. rhamnosus (Marques et al., 2008), while Shi et al. reached a LA yield of
0.83 g/g and a productivity of 0.62 g/Lh through a mixture of softwood pre-hydrolysate
and paper mill with L. rhamnosus (Shi et al., 2015) . Zhao et al. reported a LA yield of
Figure 22. Response surface YL/G (24) with variable solids loads and ESR.
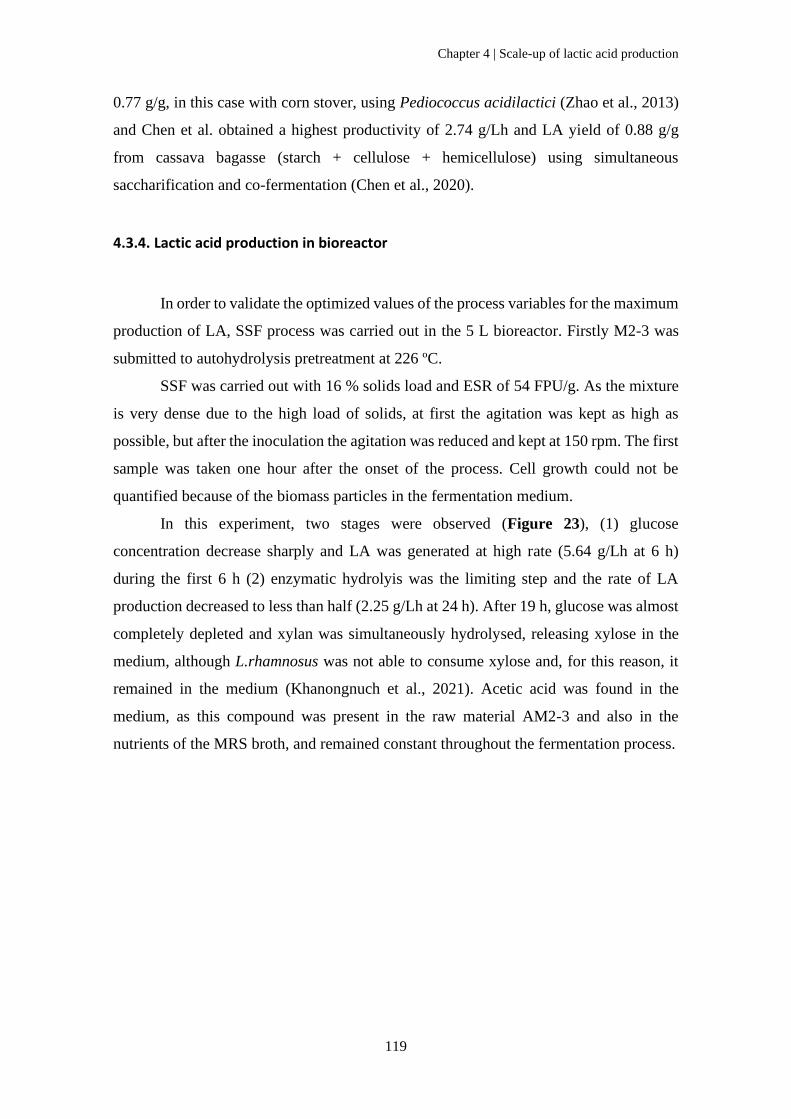
Chapter 4 | Scale-up of lactic acid production
119
0.77 g/g, in this case with corn stover, using Pediococcus acidilactici (Zhao et al., 2013)
and Chen et al. obtained a highest productivity of 2.74 g/Lh and LA yield of 0.88 g/g
from cassava bagasse (starch + cellulose + hemicellulose) using simultaneous
saccharification and co-fermentation (Chen et al., 2020).
4.3.4. Lactic acid production in bioreactor
In order to validate the optimized values of the process variables for the maximum
production of LA, SSF process was carried out in the 5 L bioreactor. Firstly M2-3 was
submitted to autohydrolysis pretreatment at 226 ºC.
SSF was carried out with 16 % solids load and ESR of 54 FPU/g. As the mixture
is very dense due to the high load of solids, at first the agitation was kept as high as
possible, but after the inoculation the agitation was reduced and kept at 150 rpm. The first
sample was taken one hour after the onset of the process. Cell growth could not be
quantified because of the biomass particles in the fermentation medium.
In this experiment, two stages were observed (Figure 23), (1) glucose
concentration decrease sharply and LA was generated at high rate (5.64 g/Lh at 6 h)
during the first 6 h (2) enzymatic hydrolyis was the limiting step and the rate of LA
production decreased to less than half (2.25 g/Lh at 24 h). After 19 h, glucose was almost
completely depleted and xylan was simultaneously hydrolysed, releasing xylose in the
medium, although L.rhamnosus was not able to consume xylose and, for this reason, it
remained in the medium (Khanongnuch et al., 2021). Acetic acid was found in the
medium, as this compound was present in the raw material AM2-3 and also in the
nutrients of the MRS broth, and remained constant throughout the fermentation process.
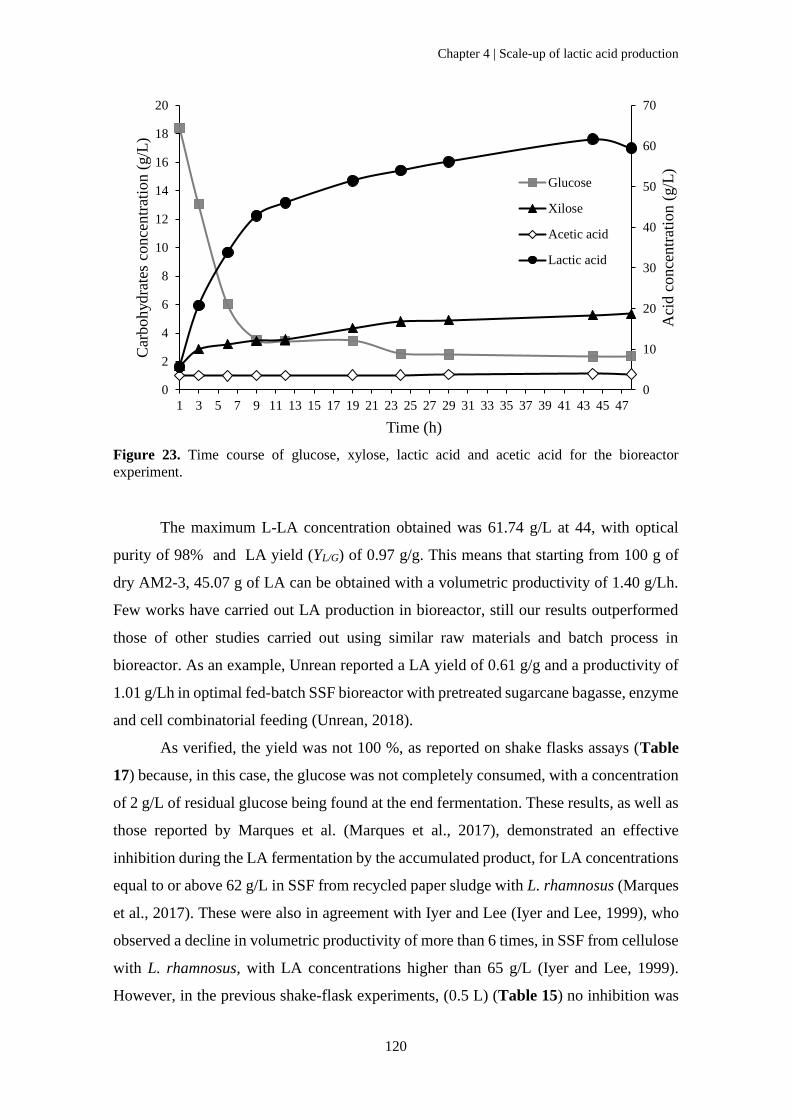
Chapter 4 | Scale-up of lactic acid production
120
Figure 23. Time course of glucose, xylose, lactic acid and acetic acid for the bioreactor
experiment.
The maximum L-LA concentration obtained was 61.74 g/L at 44, with optical
purity of 98% and LA yield (YL/G) of 0.97 g/g. This means that starting from 100 g of
dry AM2-3, 45.07 g of LA can be obtained with a volumetric productivity of 1.40 g/Lh.
Few works have carried out LA production in bioreactor, still our results outperformed
those of other studies carried out using similar raw materials and batch process in
bioreactor. As an example, Unrean reported a LA yield of 0.61 g/g and a productivity of
1.01 g/Lh in optimal fed-batch SSF bioreactor with pretreated sugarcane bagasse, enzyme
and cell combinatorial feeding (Unrean, 2018).
As verified, the yield was not 100 %, as reported on shake flasks assays (Table
17) because, in this case, the glucose was not completely consumed, with a concentration
of 2 g/L of residual glucose being found at the end fermentation. These results, as well as
those reported by Marques et al. (Marques et al., 2017), demonstrated an effective
inhibition during the LA fermentation by the accumulated product, for LA concentrations
equal to or above 62 g/L in SSF from recycled paper sludge with L. rhamnosus (Marques
et al., 2017). These were also in agreement with Iyer and Lee (Iyer and Lee, 1999), who
observed a decline in volumetric productivity of more than 6 times, in SSF from cellulose
with L. rhamnosus, with LA concentrations higher than 65 g/L (Iyer and Lee, 1999).
However, in the previous shake-flask experiments, (0.5 L) (Table 15) no inhibition was
0
10
20
30
40
50
60
70
0
2
4
6
8
10
12
14
16
18
20
1 3 5 7 9 11 13 15 17 19 21 23 25 27 29 31 33 35 37 39 41 43 45 47
Aci
d c
once
ntr
atio
n (
g/L
)
Car
bo
hyd
rate
s co
nce
ntr
atio
n (
g/L
)
Time (h)
Glucose
Xilose
Acetic acid
Lactic acid
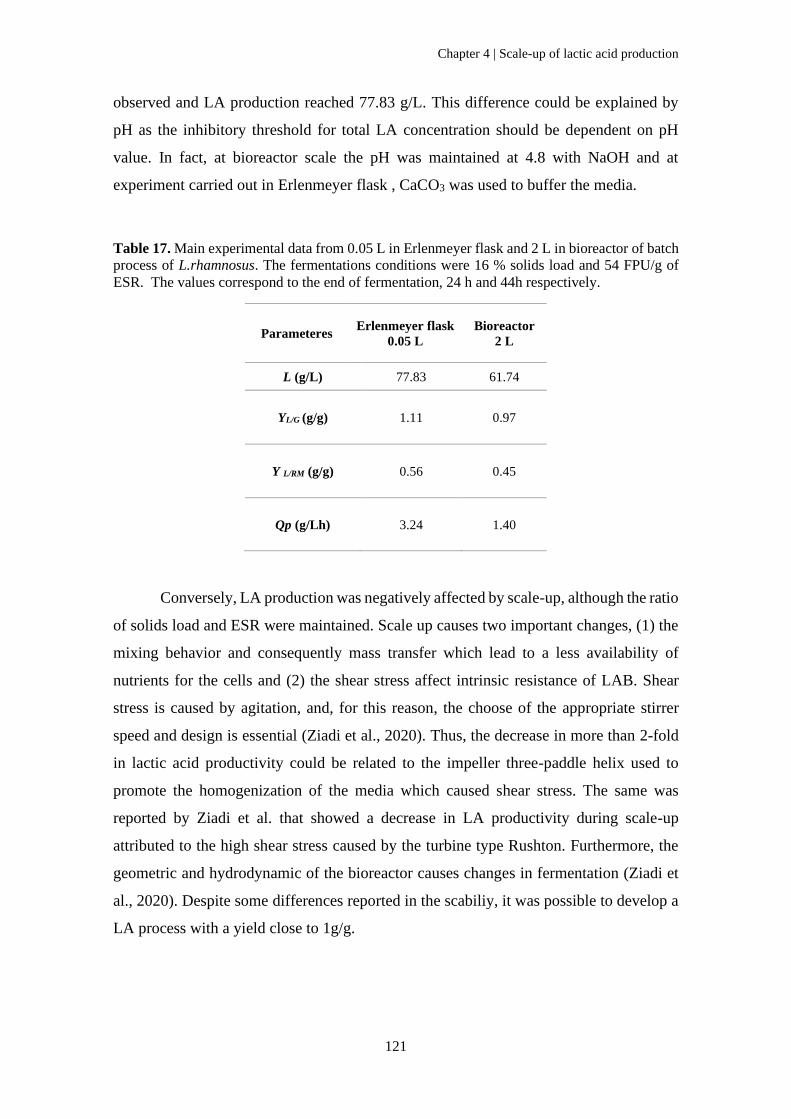
Chapter 4 | Scale-up of lactic acid production
121
observed and LA production reached 77.83 g/L. This difference could be explained by
pH as the inhibitory threshold for total LA concentration should be dependent on pH
value. In fact, at bioreactor scale the pH was maintained at 4.8 with NaOH and at
experiment carried out in Erlenmeyer flask , CaCO3 was used to buffer the media.
Table 17. Main experimental data from 0.05 L in Erlenmeyer flask and 2 L in bioreactor of batch
process of L.rhamnosus. The fermentations conditions were 16 % solids load and 54 FPU/g of
ESR. The values correspond to the end of fermentation, 24 h and 44h respectively.
Parameteres Erlenmeyer flask
0.05 L
Bioreactor
2 L
L (g/L) 77.83 61.74
YL/G (g/g) 1.11 0.97
Y L/RM (g/g) 0.56 0.45
Qp (g/Lh) 3.24 1.40
Conversely, LA production was negatively affected by scale-up, although the ratio
of solids load and ESR were maintained. Scale up causes two important changes, (1) the
mixing behavior and consequently mass transfer which lead to a less availability of
nutrients for the cells and (2) the shear stress affect intrinsic resistance of LAB. Shear
stress is caused by agitation, and, for this reason, the choose of the appropriate stirrer
speed and design is essential (Ziadi et al., 2020). Thus, the decrease in more than 2-fold
in lactic acid productivity could be related to the impeller three-paddle helix used to
promote the homogenization of the media which caused shear stress. The same was
reported by Ziadi et al. that showed a decrease in LA productivity during scale-up
attributed to the high shear stress caused by the turbine type Rushton. Furthermore, the
geometric and hydrodynamic of the bioreactor causes changes in fermentation (Ziadi et
al., 2020). Despite some differences reported in the scabiliy, it was possible to develop a
LA process with a yield close to 1g/g.
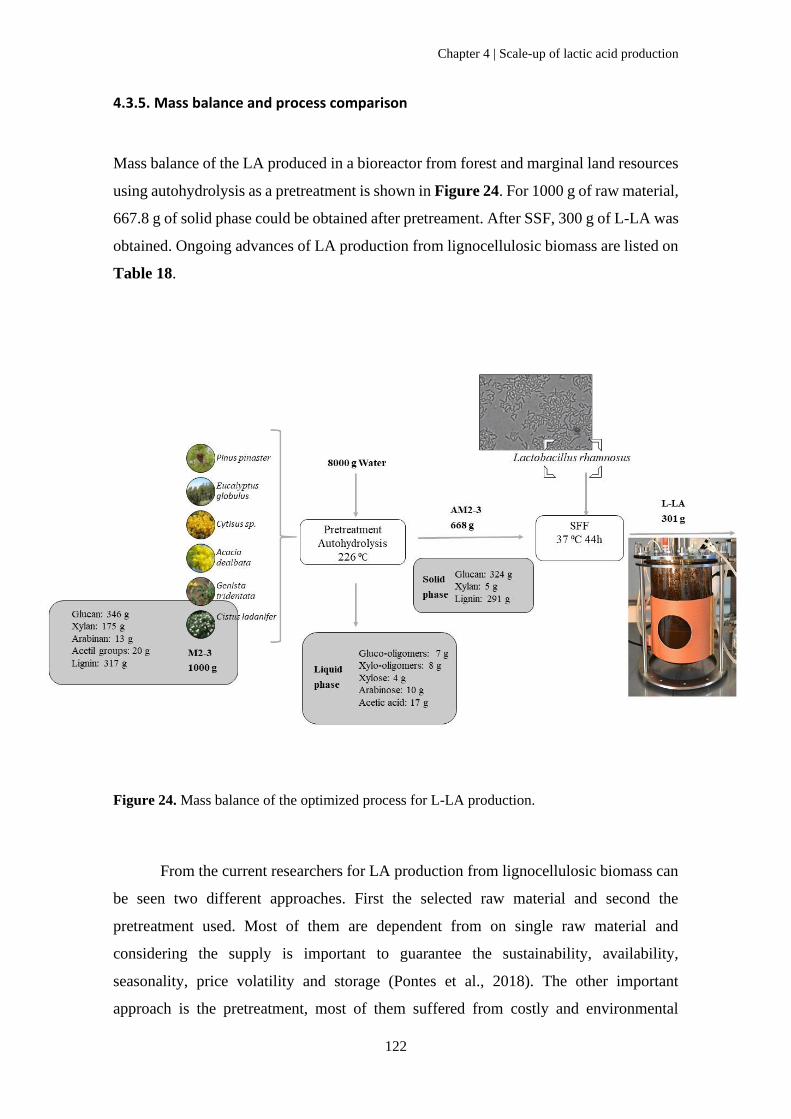
Chapter 4 | Scale-up of lactic acid production
122
4.3.5. Mass balance and process comparison
Mass balance of the LA produced in a bioreactor from forest and marginal land resources
using autohydrolysis as a pretreatment is shown in Figure 24. For 1000 g of raw material,
667.8 g of solid phase could be obtained after pretreament. After SSF, 300 g of L-LA was
obtained. Ongoing advances of LA production from lignocellulosic biomass are listed on
Table 18.
From the current researchers for LA production from lignocellulosic biomass can
be seen two different approaches. First the selected raw material and second the
pretreatment used. Most of them are dependent from on single raw material and
considering the supply is important to guarantee the sustainability, availability,
seasonality, price volatility and storage (Pontes et al., 2018). The other important
approach is the pretreatment, most of them suffered from costly and environmental
Figure 24. Mass balance of the optimized process for L-LA production.
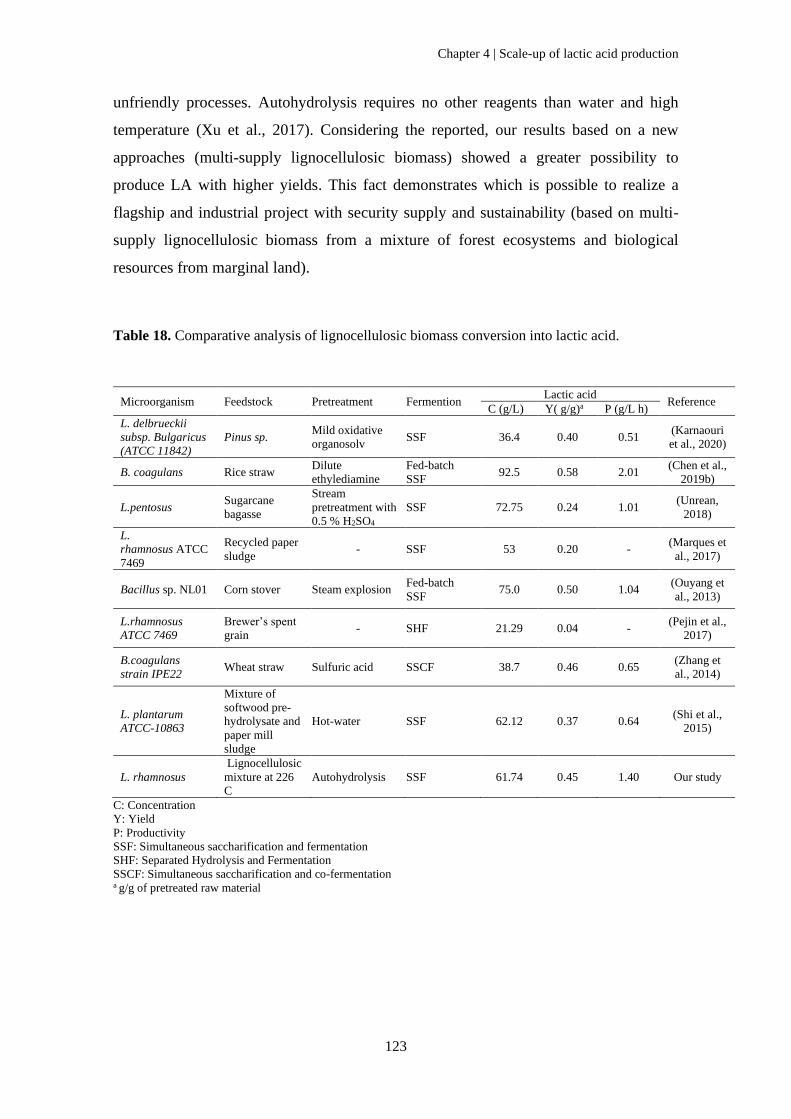
Chapter 4 | Scale-up of lactic acid production
123
unfriendly processes. Autohydrolysis requires no other reagents than water and high
temperature (Xu et al., 2017). Considering the reported, our results based on a new
approaches (multi-supply lignocellulosic biomass) showed a greater possibility to
produce LA with higher yields. This fact demonstrates which is possible to realize a
flagship and industrial project with security supply and sustainability (based on multi-
supply lignocellulosic biomass from a mixture of forest ecosystems and biological
resources from marginal land).
Table 18. Comparative analysis of lignocellulosic biomass conversion into lactic acid.
Microorganism Feedstock Pretreatment Fermention Lactic acid
Reference C (g/L) Y( g/g)a P (g/L h)
L. delbrueckii
subsp. Bulgaricus
(ATCC 11842)
Pinus sp. Mild oxidative
organosolv SSF 36.4 0.40 0.51
(Karnaouri
et al., 2020)
B. coagulans Rice straw Dilute
ethylediamine
Fed-batch
SSF 92.5 0.58 2.01
(Chen et al.,
2019b)
L.pentosus Sugarcane
bagasse
Stream
pretreatment with
0.5 % H2SO4
SSF 72.75 0.24 1.01 (Unrean,
2018)
L.
rhamnosus ATCC
7469
Recycled paper
sludge - SSF 53 0.20 -
(Marques et
al., 2017)
Bacillus sp. NL01 Corn stover Steam explosion Fed-batch
SSF 75.0 0.50 1.04
(Ouyang et
al., 2013)
L.rhamnosus
ATCC 7469 Brewer’s spent
grain - SHF 21.29 0.04 -
(Pejin et al.,
2017)
B.coagulans
strain IPE22 Wheat straw Sulfuric acid SSCF 38.7 0.46 0.65
(Zhang et
al., 2014)
L. plantarum
ATCC-10863
Mixture of
softwood pre-
hydrolysate and
paper mill
sludge
Hot-water SSF 62.12 0.37 0.64 (Shi et al.,
2015)
L. rhamnosus Lignocellulosic
mixture at 226
C
Autohydrolysis SSF 61.74 0.45 1.40 Our study
C: Concentration
Y: Yield
P: Productivity
SSF: Simultaneous saccharification and fermentation
SHF: Separated Hydrolysis and Fermentation
SSCF: Simultaneous saccharification and co-fermentation a g/g of pretreated raw material
Chapter 4 | Scale-up of lactic acid production
124
4.4. Conclusion
The present chapter demonstrated an optimized batch SSF for the production of
LA from an autohydrolyzed mixture of lignocellulosic biomass, from forest ecosystems
and biological resources from marginal land not studied so far, by L. rhamnosus. SHF
and SSF were successfully conducted on Erlenmeyer flasks and the glucose to LA yield
obtained was 1 g/g for both assays, although the volumetric productivity was 3-fold
higher for SSF. We demonstrated, through a factorial design with 11 experiments, with
SFF process, there was a significant influence of the solids load and the ESR on the final
LA concentration. This means that the higher the solids load and the ESR, the greater the
LA concentration. The optimized condition was validated in a bioreactor. The achieved
LA concentration (61.74 g/L), glucose to LA yield (0.97 g/g) and volumetric productivity
(1.40 g/Lh) offers a process strategy to explore unexploited lignocellulosic biomass based
LA production process for the industrialization of multi-supply biorefinery concept,
contributing to the circular and sustainable bioeconomy development.
Chapter 4 | Scale-up of lactic acid production
125
4.5. References
Abdel-Rahman, M.A., Tashiro, Y., Sonomoto, K., 2011. Lactic acid production from
lignocellulose-derived sugars using lactic acid bacteria: Overview and limits. J.
Biotechnol. https://doi.org/10.1016/j.jbiotec.2011.06.017
Alexandri, M., Schneider, R., Mehlmann, K., Venus, J., 2019. Recent Advances in D-
Lactic Acid Production from RenewableResources: Case Studies on Agro-Industrial
Waste Streams. Food Technol. Biotechnol. 57, 293–304.
https://doi.org/10.17113/FTB.57.03.19.6023
Chen, H., Huo, W., Wang, B., Wang, Y., Wen, H., Cai, D., Zhang, C., Wu, Y., Qin, P.,
2019a. L-lactic acid production by simultaneous saccharification and fermentation
of dilute ethylediamine pre-treated rice straw. Ind. Crops Prod. 141.
https://doi.org/10.1016/j.indcrop.2019.111749
Chen, H., Huo, W., Wang, B., Wang, Y., Wen, H., Cai, D., Zhang, C., Wu, Y., Qin, P.,
2019b. L-lactic acid production by simultaneous saccharification and fermentation
of dilute ethylediamine pre-treated rice straw. Ind. Crops Prod. 141, 111749.
https://doi.org/10.1016/j.indcrop.2019.111749
Choi, S.Y., Cho, I.J., Lee, Y., Park, S., Lee, S.Y., 2019. Biocatalytic synthesis of
polylactate and its copolymers by engineered microorganisms, in: Methods in
Enzymology. Academic Press Inc., pp. 125–162.
https://doi.org/10.1016/bs.mie.2019.04.032
Cubas-Cano, E., González-Fernández, C., Ballesteros, M., Tomás-Pejó, E., 2018.
Biotechnological advances in lactic acid production by lactic acid bacteria:
lignocellulose as novel substrate. Biofuels, Bioprod. Biorefining 12, 290–303.
https://doi.org/10.1002/bbb.1852
Cui, F., Li, Y., Wan, C., 2011. Lactic acid production from corn stover using mixed
cultures of Lactobacillus rhamnosus and Lactobacillus brevis. Bioresour. Technol.
102, 1831–1836. https://doi.org/10.1016/j.biortech.2010.09.063
Ghose, T.K., 1987. Measurement of cellulase activities. Pure Appl. Chem. 59, 257–268.
https://doi.org/10.1351/pac198759020257
Grewal, J., Khare, S.K., 2018. One-pot bioprocess for lactic acid production from
lignocellulosic agro-wastes by using ionic liquid stable Lactobacillus brevis.
Bioresour. Technol. 251, 268–273. https://doi.org/10.1016/j.biortech.2017.12.056
Iyer, P. V., Lee, Y.Y., 1999. Product inhibition in simultaneous saccharification and
Chapter 4 | Scale-up of lactic acid production
126
fermentation of cellulose into lactic acid. Biotechnol. Lett. 21, 371–373.
https://doi.org/10.1023/A:1005435120978
Jawad, A.H., Alkarkhi, A.F.M., Jason, O.C., Easa, A.M., Nik Norulaini, N.A., 2013.
Production of the lactic acid from mango peel waste - Factorial experiment. J. King
Saud Univ. - Sci. 25, 39–45. https://doi.org/10.1016/j.jksus.2012.04.001
Karnaouri, A., Asimakopoulou, G., Kalogiannis, K.G., Lappas, A., Topakas, E., 2020.
Efficient D-lactic acid production by Lactobacillus delbrueckii subsp. bulgaricus
through conversion of organosolv pretreated lignocellulosic biomass. Biomass and
Bioenergy 140, 105672. https://doi.org/10.1016/j.biombioe.2020.105672
Khanongnuch, C., Klongklaew, A., Unban, K., Kanpiengjai, A., Wongputtisin, P.,
Pamuangmul, P., Shetty, K., 2021. Improvement of Enantiomeric L-Lactic Acid
Production from Mixed Hexose-Pentose Sugars by Co-Culture of Enterococcus
mundtii WX1 and Lactobacillus rhamnosus SCJ9.
https://doi.org/10.5281/ZENODO.4748389
Marques, S., Matos, C.T., Gírio, F.M., Roseiro, J.C., Santos, J.A.L., 2017. Lactic acid
production from recycled paper sludge: Process intensification by running fed-batch
into a membrane-recycle bioreactor. Biochem. Eng. J. 120, 63–72.
https://doi.org/10.1016/j.bej.2016.12.021
Marulanda, V.A., Gutierrez, C.D.B., Alzate, C.A.C., 2019. Thermochemical, biological,
biochemical, and hybrid conversion methods of bio-derived molecules into
renewable fuels, in: Advanced Bioprocessing for Alternative Fuels, Biobased
Chemicals, and Bioproducts: Technologies and Approaches for Scale-Up and
Commercialization. Elsevier, pp. 59–81. https://doi.org/10.1016/B978-0-12-
817941-3.00004-8
Maslova, O., Stepanov, N., Senko, O., Efremenko, E., 2019. Production of various
organic acids from different renewable sources by immobilized cells in the regimes
of separate hydrolysis and fermentation (SHF) and simultaneous saccharification
and fermentation (SFF). Bioresour. Technol. 272, 1–9.
https://doi.org/10.1016/j.biortech.2018.09.143
Mora-Villalobos, Montero-Zamora, Barboza, Rojas-Garbanzo, Usaga, Redondo-Solano,
Schroedter, Olszewska-Widdrat, López-Gómez, 2020. Multi-Product Lactic Acid
Bacteria Fermentations: A Review. Fermentation 6, 23.
https://doi.org/10.3390/fermentation6010023
Mora‐Villalobos, J.A., Montero‐Zamora, J., Barboza, N., Rojas‐Garbanzo, C., Usaga, J.,
Chapter 4 | Scale-up of lactic acid production
127
Redondo‐Solano, M., Schroedter, L., Olszewska‐Widdrat, A., López‐Gómez, J.P.,
2020. Multi‐product lactic acid bacteria fermentations: A review. Fermentation.
https://doi.org/10.3390/fermentation6010023
Müller, G., Kalyani, D.C., Horn, S.J., 2017. LPMOs in cellulase mixtures affect
fermentation strategies for lactic acid production from lignocellulosic biomass.
Biotechnol. Bioeng. 114, 552–559. https://doi.org/10.1002/bit.26091
Ouyang, J., Ma, R., Zheng, Z., Cai, C., Zhang, M., Jiang, T., 2013. Open fermentative
production of l-lactic acid by Bacillus sp. strain NL01 using lignocellulosic
hydrolyzates as low-cost raw material. Bioresour. Technol. 135, 475–480.
https://doi.org/10.1016/j.biortech.2012.09.096
Pejin, J., Radosavljević, M., Kocić-Tanackov, S., Djukić-Vuković, A., Mojović, L., 2017.
Lactic acid fermentation of brewer’s spent grain hydrolysate by Lactobacillus
rhamnosus with yeast extract addition and pH control. J. Inst. Brew. 123, 98–104.
https://doi.org/10.1002/jib.403
Pontes, R., Romaní, A., Michelin, M., Domingues, L., Teixeira, J., Nunes, J., 2018.
Comparative autohydrolysis study of two mixtures of forest and marginal land
resources for co-production of biofuels and value-added compounds. Renew. Energy
128, 20–29. https://doi.org/10.1016/j.renene.2018.05.055
Romaní, A., Garrote, G., Alonso, J.L., Parajó, J.C., 2010. Bioethanol production from
hydrothermally pretreated Eucalyptus globulus wood. Bioresour. Technol. 101,
8706–8712. https://doi.org/10.1016/j.biortech.2010.06.093
Romaní, A., Yáñez, R., Garrote, G., Alonso, J.L., 2008. SSF production of lactic acid
from cellulosic biosludges. Bioresour. Technol. 99, 4247–4254.
https://doi.org/10.1016/j.biortech.2007.08.051
Sarip, H., Hossain, M.S., Mohamad Azemi, M.N., Allaf, K., 2016. A review of the
thermal pretreatment of lignocellulosic biomass towards glucose production:
Autohydrolysis with DIC technology. BioResources 11, 10625–10653.
https://doi.org/10.15376/biores.11.4
Shi, S., Kang, L., Lee, Y.Y., 2015. Production of Lactic Acid from the Mixture of
Softwood Pre-hydrolysate and Paper Mill Sludge by Simultaneous Saccharification
and Fermentation. Appl. Biochem. Biotechnol. 175, 2741–2754.
https://doi.org/10.1007/s12010-014-1451-8
Siqueira, J.G.W., Rodrigues, C., Vandenberghe, L.P. de S., Woiciechowski, A.L., Soccol,
C.R., 2020. Current advances in on-site cellulase production and application on
Chapter 4 | Scale-up of lactic acid production
128
lignocellulosic biomass conversion to biofuels: A review. Biomass and Bioenergy.
https://doi.org/10.1016/j.biombioe.2019.105419
Tarraran, L., Mazzoli, R., 2018. Alternative strategies for lignocellulose fermentation
through lactic acid bacteria: The state of the art and perspectives. FEMS Microbiol.
Lett. https://doi.org/10.1093/femsle/fny126
Unrean, P., 2018. Optimized feeding schemes of simultaneous saccharification and
fermentation process for high lactic acid titer from sugarcane bagasse. Ind. Crops
Prod. 111, 660–666. https://doi.org/10.1016/j.indcrop.2017.11.043
Zhang, Y., Chen, X., Luo, J., Qi, B., Wan, Y., 2014. An efficient process for lactic acid
production from wheat straw by a newly isolated Bacillus coagulans strain IPE22.
Bioresour. Technol. 158, 396–399. https://doi.org/10.1016/j.biortech.2014.02.128
Zhang, Y., Yoshida, M., Vadlani, P. V., 2018. Biosynthesis of d-lactic acid from
lignocellulosic biomass. Biotechnol. Lett. https://doi.org/10.1007/s10529-018-
2588-2
Zhou, J., Ouyang, J., Xu, Q., Zheng, Z., 2016. Cost-effective simultaneous
saccharification and fermentation of L-lactic acid from bagasse sulfite pulp by
Bacillus coagulans CC17. Bioresour. Technol. 222, 431–438.
https://doi.org/10.1016/j.biortech.2016.09.119
Ziadi, M., M’Hir, S., Aydi, A., Hamdi, M., Al Loman, A., 2020. Bioreactor Scale-Up and
Kinetic Modeling of Lactic Acid and Biomass Production by Enterococcus faecalis
SLT13 during Batch Culture on Hydrolyzed Cheese Whey. J. Chem. 2020.
https://doi.org/10.1155/2020/1236784
CHAPTER 5 |
Life cycle assessment of lactic acid production
Abstract
Lactic acid (LA) demand is expected to increase due to new processing technologies and
further several fields of application. The lactic acid production from unexploited
lignocellulosic biomass was compared with the lactic acid production from non-
renewable resources and it was modeled using the Life Cycle Assessment method through
SimaPro®. The life cycle approach took into account the raw material, transport,
pretreatment, saccharification and fermentation and LA recovery considering 1 tonne of
LA as the functional unit. The life cycle inventory of the biobased LA was obtained from
lab-scale experiments while the fossil-based LA was obtained from the ecoinvent
database of SimaPro®. The major environmental savings obtained by replacing one tonne
of fossil-based LA by biobased LA are : 4056.60 kg CO2 eq. of global warming potential;
193.03 kBq U235 eq. of ionizing radiation potential; 3.78 kg C2H4 eq. of photochemical
oxidation potential; 0.73 kg PO4 3- eq. freshwater eutrophication potential; 9569.40 kg
1,4-DB eq. of terrestrial ecotoxicity potential; 99.32 kg 1,4-DB eq. of fresh water aquatic
ecotoxicity potential; 137.69 kg 1,4-DB eq. of marine aquatic ecotoxicity potential; 94.89
human toxicity potential and 126.63 m2 of land use. Auxiliary chemicals, electricity and
enzyme used in the biobased LA production are most relevant to the total environmental
impacts. Thus, biobased LA production significantly reduces the impact on the
environment of LA production, giving 60 % environmental savings compared to fossil-
derived LA.
Keywords: Life cycle assessment, environmental impacts, lignocellulosic biomass,
lactic acid
This chapter is based on the following paper:
Pontes, R., Romaní, Michelin, M., Aloia, Domingues, L., Teixeira, J., Veríssimo, A.,
Nunes, J. Life cycle assessment of lactic acid production: Comparison between from
unexploited lignocellulosic biomass and non-renewable resources (manuscript in
preparation to submit to Renewable & Sustainable Energy Reviews ).
Chapter 5 | Life cycle assessment of lactic acid production
130
Contents
5.1. Introduction ........................................................................................................... 131
5.2. Materials and methods ........................................................................................... 133
5.3. Goal and scope definition ...................................................................................... 133
5.4. Life Cycle Inventory Analysis (LCI) .................................................................... 135
5.4.1. Scenario 1 ....................................................................................................... 135
5.4.2. Scenario 2 ....................................................................................................... 138
5.5. Life Cycle Impact Assessment (LCIA) ................................................................. 139
5.6. Results and discussion ........................................................................................... 140
5.6.1. Global warming potential (GWP) ................................................................... 140
5.6.2. Ozone layer depletion potential (ODP)........................................................... 142
5.6.3. Ionizing radiation potential (IRP) ................................................................... 142
5.6.4. Photochemical oxidation potential (POCP) .................................................... 142
5.6.5. Particle Matter Formation (PM) ..................................................................... 143
5.6.6. Acidification potential (AP) ............................................................................ 143
5.6.7. Eutrophication potential (EP) ......................................................................... 144
5.6.8. Terrestrial ecotoxicity potential (TETP), Freshwater aquatic ecotoxicity
potential (FWAETP), Marine aquatic ecotoxicology potential (MAETP) and Human
toxicity potential (HTP) ............................................................................................ 144
5.6.9. Abiotic depletion potential (ADP) .................................................................. 144
5.6.10. Water depletion potential (WDP) ................................................................. 145
5.6.11. Land Use (LU) .............................................................................................. 145
5.6.12. Life Cycle Interpretation ............................................................................... 145
5.7. Conclusion ............................................................................................................. 147
5.8. References ............................................................................................................. 148
Chapter 5 | Life cycle assessment of lactic acid production
131
5.1. Introduction
The concerns about global warming and the depletion of fossil reserves, associated
with environmental impacts, are driving researchers to investigate the potential
substitution of the current petrochemically derived building blocks with equivalent
molecules obtained from renewable resources (Corma et al., 2007). Nonetheless, the
environmental impacts of the growing demand for petroleum-derived chemicals and fuels
can be mitigated by the use of lignocellulosic based biochemicals and biofuels, while
also meeting the societal needs for greener products (Mandegari et al., 2017).
Lignocellulose biomass conversion should follow a biorefinery concept for
carbohydrate conversion into fuels, chemicals, and energy, where a production of value-
added compounds addressed to market demand, can impart robustness to the production
facility business model, and exploit the full value presented by all fractions of
lignocellulose, in a sustainable and environmentally favorable way (Mandegari et al.,
2017).
The conversion of biomass to chemicals and other value-added products may create
higher economic and environmental benefits compared to their conversion by synthetic
route. More specifically, some recent investigations have shown that upgrading sugars
and biomass into chemicals and polymers could lead to two-four fold more added value,
when compared to the production of biofuels using a constant quantity of a given
feedstock (Khoshnevisan et al., 2020).
Ethanol, lactic acid (LA), propionic acid, and succinic acid, among others, are some
examples of the most important building blocks which can be produced from
lignocellulosic biomass via biotechnological routes (Khoshnevisan et al., 2020).
In this context, LA is a key example of a platform molecule in biochemical production
which has recently gained significant interest (Päivi et al., 2014). LA, the simplest
hydroxy carboxylic acid is a bulk chemical with two optically active enantiomers D-(−)
and L-(+). LA is a platform chemical with wide industrial applications demonstrating
strong market growth, namely (i) in the food and beverage sector as a preservative
acidulant, flavoring agent, pH buffer or for packing; (ii) generated multiple commodity
and intermediate chemicals, for example pyruvic acid, acetaldehyde; (iii) biodegradable
polymers such as poly lactic acid (PLA); (iv) exploited in pharmaceutical industry, for
example internal drug dosing; (v) manufactured of hygiene products for cosmetic industry
Chapter 5 | Life cycle assessment of lactic acid production
132
(Daful et al., 2016; Jawad et al., 2013; Pejin et al., 2017). Global LA production is
estimated to be in excess of 500 000 tonne per year (t/year) (Mandegari et al., 2017).
Current fermentation-based processes for LA production from lignocellulosic
biomass are characterized by several technology barriers, namely (i) efficient separation
of lignocellulosic components (cellulose, hemicellulose and lignin)(Ruiz et al., 2011); (ii)
convention LA purification methods generate large quantities of gypsum as a by–product,
with obvious environmental burdens since up to 1 kg gypsum per 1 kg LA produced was
reported (Dusselier et al., 2013; Morales et al., 2015) and (iii) expensive purification
requirements. In order to overcome these constraints, the selected pretreatment should
start with separation of easily recovered fractions through a hydrothermal treatment as
autohydrolysis(Yánez et al., 2014). Regarding the purification process, gypsum-free
reactive distillation is a promising alternative and an environmentally friendly
technology, whereby LA can be recovered at high purity (Mandegari et al., 2017).
Technologies to produce LA from lignocellulosic derived sugars are the least
advanced, while the use of sugars from starch, sugar crops and whey are more
commercially available (Daful et al., 2016).
In this study, as the first attempt, we considered a lactic acid production from
lignocellulosic biomass whose concept was previously proved and tested at lab scale.
Overall, the production routes of biobased and fossil based LA were thoroughly analyzed
and compared -following a systematic approach- to support decisions towards the
establishment of bioeconomy. Mass flow modeling and life cycle assessment (LCA) were
performed in order to assess the feasibility of developing a biorefinery valorizing
unexploited lignocellulosic biomass as a useful resource.
LCA has been widely used as a tool for the assessment of environmental performance
of different products and services. According to ISO 14040-44 (2006), the main phases
of an LCA are (i) goal & scope definition: where the product or service to be assessed is
defined and a functional basis for comparison is chosen, (ii) inventory analysis: where the
details on the data used for the assessment are discussed, (iii) impact assessment: where
the effects of the resource use and the generated emissions are quantified into a limited
number of impact categories, and (iv) interpretation of the results: where results are
reported in the most informative way, along with the opportunities to reduce the impact
of the product(s) or service(s) (Parajuli et al., 2017).
To the best knowledge of the authors, LCA of lactic acid production has only been
investigated in a limited number of instances where studies focused predominantly on the
Chapter 5 | Life cycle assessment of lactic acid production
133
environmental performance of PLA, and specific consequences on GHG emissions and
energy utilization of PLA production from corn and sugarcane.
The aim of this study is to present a quantitative evaluation of the environmental loads
associated with (i) LA production from unexploited lignocellulosic biomass and (ii) LA
produced from non-renewable resources. Two scenarios were identified and rigorous
process models were developed using SimaPro Version 8 software (Aspen Technology
Inc., Burlington, MA, USA).
5.2. Materials and methods
This LCA study was based on ISO 14040 (ISO 2006) (“ISO - ISO 14040:2006 -
Environmental management — Life cycle assessment — Principles and framework,”
n.d.) and ISO 14044 (ISO 2006) (“ISO - ISO 14044:2006 - Environmental management
— Life cycle assessment — Requirements and guidelines,” n.d.), which is expressed by
four steps: (1) goal and scope definition of LCA, (2) life cycle inventory analysis (LCI),
(3) life cycle impact assessment (LCIA) and (4) life cycle interpretation.
5.3. Goal and scope definition
The goal of this life cycle assessment was to compare and quantify the
environmental impacts caused by LA production. The scope, the full system boundary
and process flow diagram of scenario 1, is schematized in Figure 25. It includes two
scenarios of LA production from lignocellulosic biomass and from non-renewable
resources. Then the following two scenarios are presented:
Sc1- (A-SSF-LA): Lactic acid production through autohydrolysis pretreatment (A)
followed by simultaneous saccharification and fermentation process (SSF). SSF was
carried out with a percentage of solids (S) of 16 % and enzyme to substrate ratio (ESR)
of 54 FPU/g (E). LA was separated and purified from the media and the solid fraction
(waste) was subsequently valued.
Sc2- (Ace-LA): Lactic acid was produced from acetaldehyde (Ace),
A time scope from 2018 to 2035 was considered as temporal boundary and Portugal was
selected as the geographical scope.
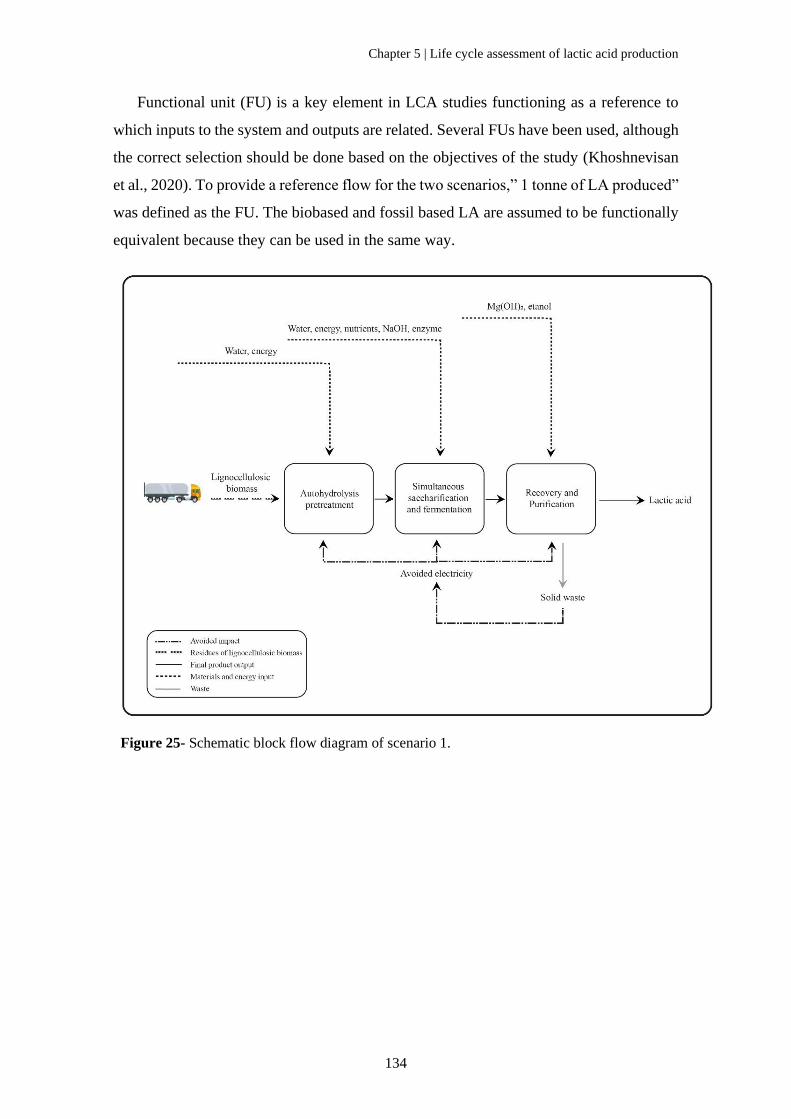
Chapter 5 | Life cycle assessment of lactic acid production
134
Functional unit (FU) is a key element in LCA studies functioning as a reference to
which inputs to the system and outputs are related. Several FUs have been used, although
the correct selection should be done based on the objectives of the study (Khoshnevisan
et al., 2020). To provide a reference flow for the two scenarios,” 1 tonne of LA produced”
was defined as the FU. The biobased and fossil based LA are assumed to be functionally
equivalent because they can be used in the same way.
Figure 25- Schematic block flow diagram of scenario 1.
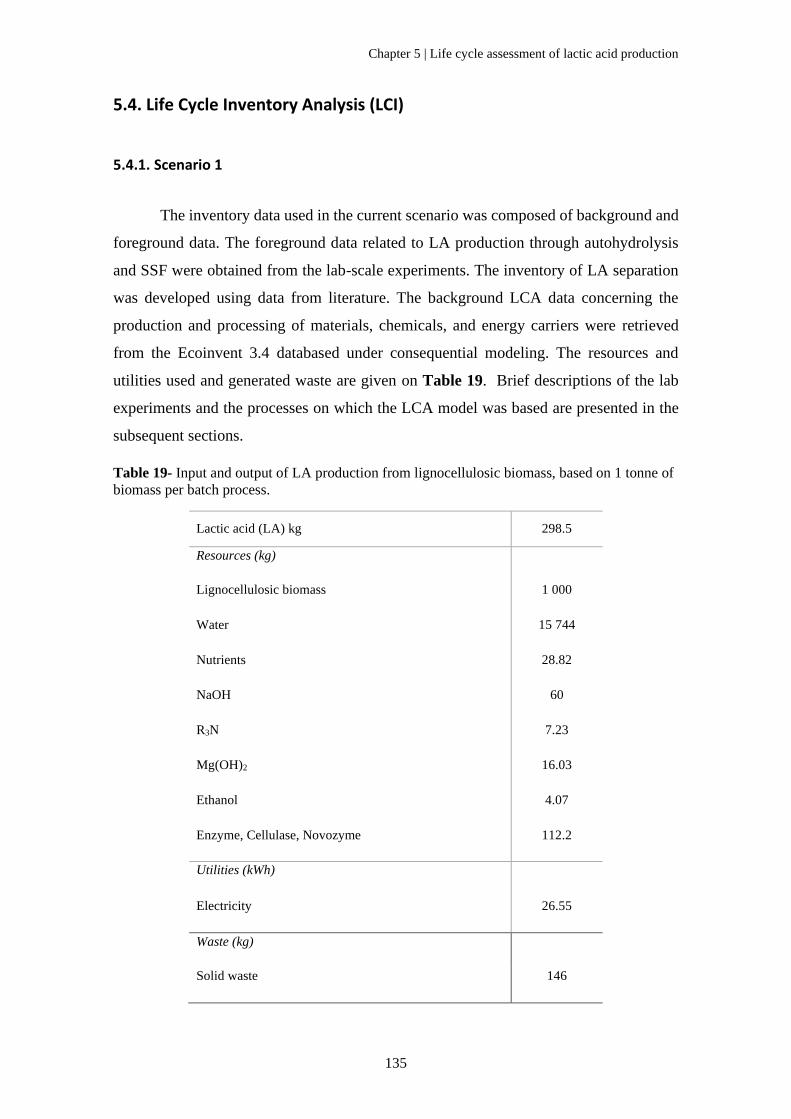
Chapter 5 | Life cycle assessment of lactic acid production
135
5.4. Life Cycle Inventory Analysis (LCI)
5.4.1. Scenario 1
The inventory data used in the current scenario was composed of background and
foreground data. The foreground data related to LA production through autohydrolysis
and SSF were obtained from the lab-scale experiments. The inventory of LA separation
was developed using data from literature. The background LCA data concerning the
production and processing of materials, chemicals, and energy carriers were retrieved
from the Ecoinvent 3.4 databased under consequential modeling. The resources and
utilities used and generated waste are given on Table 19. Brief descriptions of the lab
experiments and the processes on which the LCA model was based are presented in the
subsequent sections.
Table 19- Input and output of LA production from lignocellulosic biomass, based on 1 tonne of
biomass per batch process.
Lactic acid (LA) kg 298.5
Resources (kg)
Lignocellulosic biomass 1 000
Water 15 744
Nutrients 28.82
NaOH 60
R3N 7.23
Mg(OH)2 16.03
Ethanol 4.07
Enzyme, Cellulase, Novozyme 112.2
Utilities (kWh)
Electricity 26.55
Waste (kg)
Solid waste 146
Chapter 5 | Life cycle assessment of lactic acid production
136
5.4.1.1. Raw material process
A mixture of autohydrolyzed unexploited lignocellulosic biomasses from forest and
marginal lands resources (branches and twigs with bark and leaves of Eucalyptus
(Eucalyptus globulus), Pine (Pinus pinaster), Broom (Cytisus sp.), Carqueja (Genista
tridentata), Mimosa (Acacia dealbata), and Rockrose (Cistus ladanifer)) was used as raw
material. The criterion of feedstocks mixture was previously studied (Pontes et al., 2018).
Taking into account the reported data, for the present study, the mixture M2-3 (mixture
2nd and 3rd quarters), which represent 52.5 % of forest ecosystems (24.6 % of pine, 27.9
% of eucalyptus) and 47.5 % of biological resources from marginal land (13.8 % broom,
12.5 % mimosa, 10.7 % carqueja, 10.4 % rockrose) was selected. The raw materials were
air-dried, milled and sieved between 0.250 to 0.400 mm using a vibratory sieve shaker
(40 and 60 mesh). Afterwards, the samples were homogenized in a single lot to avoid
composition heterogeneity among aliquots and stored in polypropylene bags at room
temperature.
5.4.1.2. Transport process
The transport process was selected according to two different paths, namely, from the
forest to the collection point (10 km) by a 10 tonnes truck capacity and the collection
point to the industrial unit (30 km) by a 24 tonnes truck capacity, taking into account the
tortuosity coefficient of 1.2.
On these routes the truck was considered full on the outward journey and empty on
the return.
5.4.1.3. Autohydrolysis pretreatment
The autohydrolysis pretreatment was performed in a reactor equipped with a
temperature controller (model 4848). The mixture was mixed at liquid to solid ratio (LSR)
of 8 kg of water/kg of oven-dry raw material. In autohydrolysis experiments, the reaction
media was stirred at 150 rpm and heated by an external jacket, following the standard
heating temperature-time profile to reach the desired maximum temperature (226 ºC),
through non-isothermal conditions. Once the target temperature was reached, the media
Chapter 5 | Life cycle assessment of lactic acid production
137
were immediately cooled and filtered. The solid fraction was washed and used in the
followed process.
5.4.1.4. Simultaneous saccharification and fermentation (SSF)
Batch simultaneous saccharification and fermentation was conducted in a bioreactor
for 44 h. SSF was carried out with a LSR of 6 g/g, ESR (enzyme to substrate ratio) of 54
FPU/g and 10 % (v/v) inoculum size and it was conducted at 37 ºC, agitation rate at 150
rpm, and pH 4.8 controlled with 5M of NaOH.
5.4.1.5. Downstream process for LA recovery
One of the most important and challenging steps at the biorefining of the biopulp is
the downstream strategy implemented to recover the produced LA from the fermentation
broth. This step plays an important role because the fermentation broth includes both
organic and inorganic components, considering that a successful purification and
acidification step would increase the profitability of the whole process. Several processes
for LA recovery have been studied and reported, such as, direct distillation, nanofiltration,
adsorption, membrane separation, ion-exchange resins, solvent electrodialysis and
reactive distillation (Daful et al., 2016; Khoshnevisan et al., 2020).
Reactive distillation was the process modeled in the present work, since it has shown
promising results at the industrial scale. As reported by Daful et al. and Mandegari et al.
LA recovery involved the reaction with Mg(OH)2 , as neutralizer, which formed Mg-
lactate. The latter reacted with trimethylamine (R3N) to form Mg(OH)2 and R3N-lactate.
Thus Mg(OH)2 could be recycled back to the reactor. So reactive distillation was applied
for LA purification, which involved two catalyzed reversible reactions, esterification and
hydrolysis. In the esterification column LA liberated from the R3N-lactate was converted
to the more volatile ethyl ester (ETLA) using ethanol and this ethyl ester was then
removed from the column by distillation. Pure LA was subsequently recovered by
hydrolysis of the ester with water, in a hydrolysis reactive distillation column. In further
consideration, the ethanol from the top of hydrolysis reactive distillation could be purified
by normal distillation and recycled back to the esterification section (Daful et al., 2016;
Mandegari et al., 2017).
Chapter 5 | Life cycle assessment of lactic acid production
138
Accordingly, an acid recovery of 99.5% was assumed (Mandegari et al., 2017).
5.4.1.6. Electricity
The valorization of the solid fraction, obtained from LA recovery, was converted to
energy resulting in 117 kWh, according to Khoshvenevisan et al. (Khoshnevisan et al.,
2020). This electricity generated was described as avoided impact (negative values),
which means could be subtracted from the induced impacts.
5.4.2. Scenario 2
The inventory data used in the current scenario were taken from the Ecoinvent
database of SimaPro software. The process was modelled for the production
of lactic acid from acetaldehyde in Europe. Raw material preparation involved extraction
of crude oil and refining to produce ethane. Ethane was then used to make ethylene and
then converted to acetaldehyde (CH3CHO). Acetaldehyde was then used as a raw material
to produce lactonitrile (acetaldehyde cyanohydrin) by a catalytic reaction of acetaldehyde
with hydrogen cyanide (HCN) in the presence of a base catalyst under high pressure.
Crude lactonitrile was then purified by distillation and subsequently hydrolyzed to LA by
H2SO4 (Narayanan et al., 2004; Pal et al., 2009). LA was then esterified using methanol
to produce methyl lactate, which was removed and purified by distillation and hydrolyzed
by water under acid catalyst to produce LA and the methanol, which is recycled. The
chemical synthesis route produced a racemic mixture of dl-lactic acid (Daful et al., 2016).
Raw materials were modelled with a stoichiometric calculation. Emissions were
estimated. Energy consumptions, infrastructure and transports were calculated with
standard values.
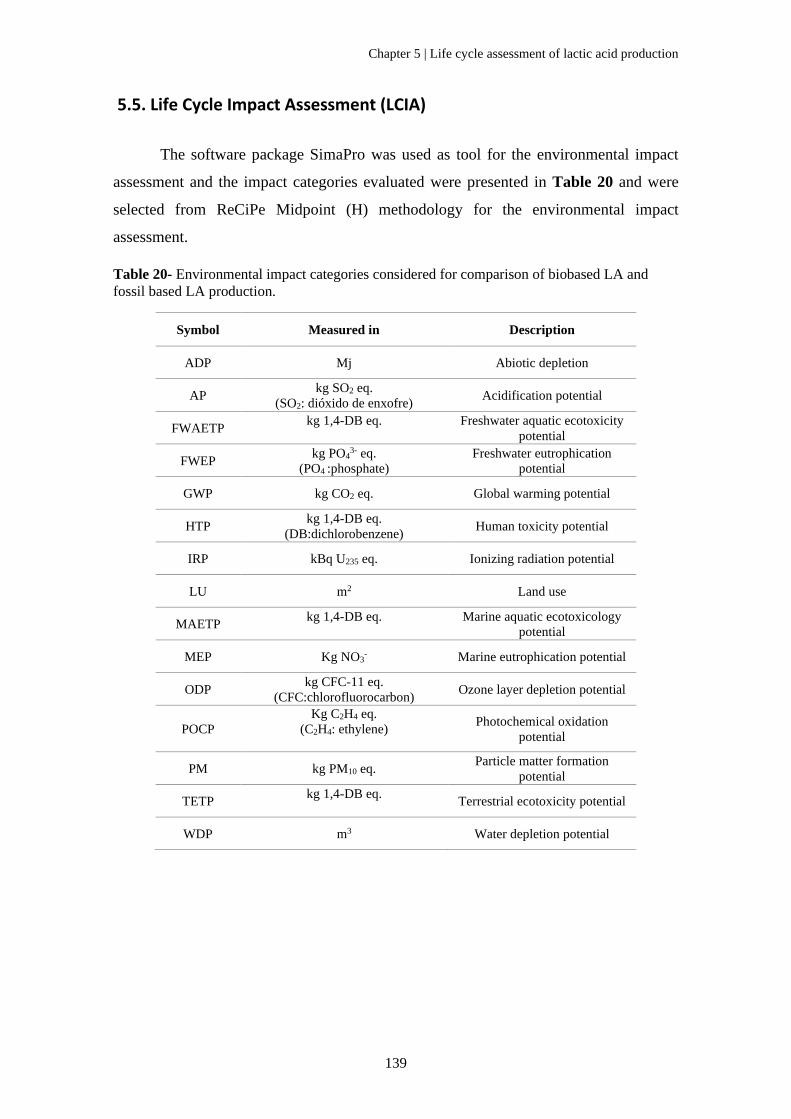
Chapter 5 | Life cycle assessment of lactic acid production
139
5.5. Life Cycle Impact Assessment (LCIA)
The software package SimaPro was used as tool for the environmental impact
assessment and the impact categories evaluated were presented in Table 20 and were
selected from ReCiPe Midpoint (H) methodology for the environmental impact
assessment.
Table 20- Environmental impact categories considered for comparison of biobased LA and
fossil based LA production.
Symbol Measured in Description
ADP Mj Abiotic depletion
AP kg SO2 eq.
(SO2: dióxido de enxofre) Acidification potential
FWAETP kg 1,4-DB eq.
Freshwater aquatic ecotoxicity
potential
FWEP kg PO4
3- eq.
(PO4 :phosphate)
Freshwater eutrophication
potential
GWP kg CO2 eq. Global warming potential
HTP kg 1,4-DB eq.
(DB:dichlorobenzene) Human toxicity potential
IRP kBq U235 eq. Ionizing radiation potential
LU m2 Land use
MAETP kg 1,4-DB eq.
Marine aquatic ecotoxicology
potential
MEP Kg NO3- Marine eutrophication potential
ODP kg CFC-11 eq.
(CFC:chlorofluorocarbon) Ozone layer depletion potential
POCP
Kg C2H4 eq.
(C2H4: ethylene)
Photochemical oxidation
potential
PM kg PM10 eq. Particle matter formation
potential
TETP kg 1,4-DB eq.
Terrestrial ecotoxicity potential
WDP m3 Water depletion potential
Chapter 5 | Life cycle assessment of lactic acid production
140
5.6. Results and discussion
The fifteen environmental impact categories, depicted in Table 20, have been
assessed and evaluated for both biobased LA and fossil based LA and discussed in the
following sections.
5.6.1. Global warming potential (GWP)
The characterization model as established by the Intergovernmental Panel on
Climate Change (IPCC) was selected for the development of characterization factors.
Factors were expressed as Global Warming Potential for time horizon 100 years
(GWP100), in kg carbon dioxide equivalent/kg emission.
GWP is the ability of greenhouse gases to trap heat in the atmosphere relative to
carbon dioxide, which serves as the reference gas. The global warming potential of
biobased and fossil-based LA are 1131.92 and 5188.52 kg CO2 eq./tonne of LA
respectively, giving total environmental saving of 4056.60 kg CO2 eq./tonne of LA, i.e.,
reducing the environmental burden by 78 %. On the other hand, the main GWP
contribution for the biobased LA comes from the SSF process, as depicted in Figure 26,
due to the enzymes and nutrients required for the saccharification. Furthermore, it was
considered that the selected raw material promoted a biogenic dioxide carbon storage of
6.03 kg CO2eq. /tonne of LA resulting the photosynthesis process (the lignocellulosic
biomass mixture used in the work represent a biogenic dioxide carbon storage of -1.870
kgCO2eq. /tonne). These results were generally consistent with Mandegari et al which
obtained 3800 kg CO2 eq./tonne of LA of GWP100 and the difference was allocated to the
sugarcane cultivation and processing (Mandegari et al., 2017). In the same manner,
Parajuli et al. for the production of 1 tonne of biobased lactic acid from alfalfa obtained
3080 kg CO2 eq. using attributional life cycle assessment approach (Parajuli et al., 2017).
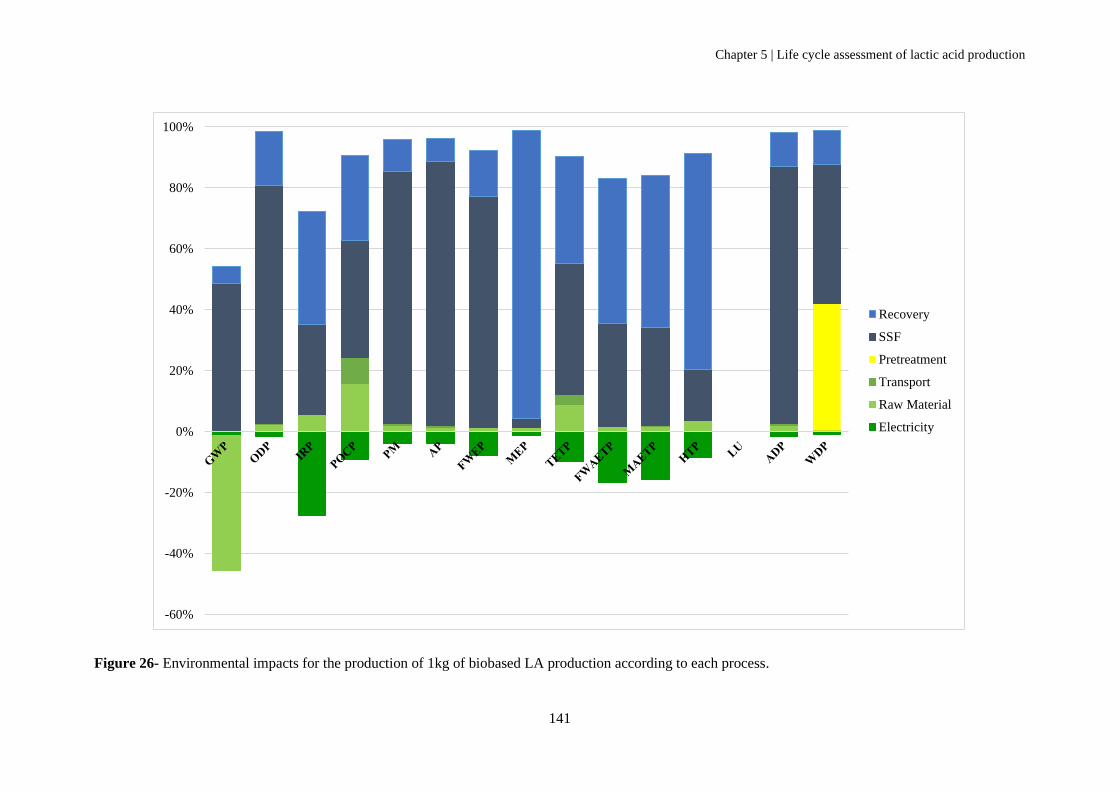
Chapter 5 | Life cycle assessment of lactic acid production
141
Figure 26- Environmental impacts for the production of 1kg of biobased LA production according to each process.
-60%
-40%
-20%
0%
20%
40%
60%
80%
100%
Recovery
SSF
Pretreatment
Transport
Raw Material
Electricity
Chapter 5 | Life cycle assessment of lactic acid production
142
5.6.2. Ozone layer depletion potential (ODP)
The characterization model was developed by the World Meteorological Organization
(WMO) and defines ozone depletion potential of different gases (kg CFC-11 equivalent/
kg emission).
Ozone-depleting gases damage the stratospheric ozone or the ‘ozone layer’. There are
no certainties as to the combined effects of different gases on the stratosphere, and all
chlorinated and brominated compounds that are stable enough to reach the stratosphere
can have an effect. Chlorofluorocarbons (CFCs), halons and hydrochlorofluorocarbons
(HCFCs) are the major causes of ozone depletion. The ozone layer depletion potential for
biobased and fossil based LA production are 3.78 x 10⁻³ and 1.34 x 10⁻³ kg CFC-11 eq.
per tonne of LA produced respectively, which means there was no environmental saving
on the production of biobased LA. As shown in Figure 26, SSF process was the major
contributor for ODP, due to the enzyme and nutrients used. However, the recovery
process also contributes through Mg (OH)2 and trimethylamine.
5.6.3. Ionizing radiation potential (IRP)
Ionizing radiation is an impact category in LCA relating to the damage to human
health and ecosystems that is linked to the emissions of radionuclides throughout a
process. The ionizing radiation potentials of biobased and fossil based LA productions
are 21.94 and 214.98 kBq U235 eq. per tonne of LA, respectively, the biobased LA
process reducing the environmental burden by 90 %. As shown in Figure 26, SSF and
recovery process were the major contributor for IRP.
5.6.4. Photochemical oxidation potential (POCP)
The model is developed by Jenkin & Hayman and Derwent and defines
photochemical oxidation expressed in kg ethylene equivalents per kg emission.
Ozone is protective in the stratosphere, but on the ground-level it is toxic to humans
in high concentrations. Also known as photochemical ozone, it is formed by the reaction
of volatile organic compounds and nitrogen oxides in the presence of heat and sunlight.
The photochemical oxidant creation potential measures the potential for the creation of
photo-chemical (summer) smog due to the reaction of relevant chemical compounds
Chapter 5 | Life cycle assessment of lactic acid production
143
when exposed to sunlight. The POCP for biobased and fossil based LA productions were
3.61 and 7.38 kg C2H4 eq. per tonne of LA produced respectively, giving a net
environmental saving potential of 3.78 kg C2H4 eq. per tonne of biobased LA produced.
All the processes contributed to POCP with exception of pretreatment as shown on Figure
26.
5.6.5. Particulate Matter Formation (PM)
Particulate matter (PM) is a complex mixture of extremely small particles. Particle
pollution can be made up of a number of components, including acids (such as nitrates
and sulfates), organic chemicals, metals, and soil or dust particles. A multitude of health
problems, especially of the respiratory tract, are linked to particulate pollution. PM is
measured in PM10 equivalents, i.e. particles with a size of 10 μm. The potential
particulate matter formation for the biobased LA production was 7.89 and that of fossil
based LA 4.83 kg PM10 eq. per tonne of LA produced. In this case there was no total
environmental saving on replacing the fossil-based LA with biobased LA.
5.6.6. Acidification potential (AP)
Acidification potential (AP) is expressed in kg SO2 equivalents per kg emission
and the applied model was developed by Huijbregts (Huijbregts et al., 2003). Acidic gases
such as sulfur dioxide (SO2) react with water in the atmosphere to form ‘acid rain’,
causing ecosystem damage of varying degrees, depending on the nature of the landscape
ecosystems.
The AP for the biobased LA production was 25.62 and for the fossil based LA 10.27
kg SO2 eq. per tonne of LA produced. As shown in Figure 26, SSF process was the major
contributor for AP because the enzyme production with contributed about 20 % to
acidification, considering the waterborne emissions such as phosphate, caused by the
consumption of phosphate fertilizers and di-ammonium phosphate used for enzyme
production (Mandegari et al., 2017).
Chapter 5 | Life cycle assessment of lactic acid production
144
5.6.7. Eutrophication potential (EP)
Eutrophication potential was developed by Heijungs et al and is expressed in kg PO4
equivalents per kg emission (de Bruijn et al., 2002). Eutrophication was the accumulation
of chemical nutrients in an ecosystem which led to abnormal productivity. In this study,
EP was considered in two categories, namely, Freshwater eutrophication (FWEP) and
Marine eutrophication (MEP). The FWEP of biobased and fossil based LA productions
are 0.64 and 1.37 kg P eq. per tonne of LA respectively, the biobased LA reducing the
environmental burden by 53 %. The MEP for biobased and fossil based LA productions
were 0.33 and 0.19 kg N eq. per tonne of LA produced respectively. As described in
Figure 26, recovery process was the major contributor for EP, mainly due to the presence
of Mg(OH)2 and trimethylamine.
5.6.8. Terrestrial ecotoxicity potential (TETP), Freshwater aquatic ecotoxicity potential
(FWAETP), Marine aquatic ecotoxicology potential (MAETP) and Human toxicity
potential (HTP)
Characterization factors, expressed as Human Toxicity Potentials (HTP), are
calculated with USES-LCA, describing fate, exposure and effects of toxic substances for
an infinite time horizon. For each toxic substance HTP's are expressed as 1,4-
dichlorobenzene equivalents/ kg emission. Regarding to TETP, FWAETP, MAETP and
HTP, the production of biobased LA reduces the environmental burden by 77%, 66 %,
67 % and 62 % respectively.
5.6.9. Abiotic depletion potential (ADP)
This impact category is concerned with protection of human welfare, human health
and ecosystem health. This impact category indicator is related to extraction of minerals
and fossil fuels due to inputs in the system. The Abiotic Depletion Factor (ADF) is
determined for each extraction of minerals (kg antimony equivalents/kg extraction) based
on concentration reserves and rate of deaccumulation. Abiotic depletion of fossil fuels is
related to the Lower Heating Value (LHV) expressed in MJ per kg of m3 fossil fuel. The
reason for taking the LHV is that fossil fuels are considered to be fully substitutable. The
Chapter 5 | Life cycle assessment of lactic acid production
145
ADP of biobased and fossil based LA productions are 2043.05 and 1820.02 kg fossil fuel
eq. per tonne of LA. As shown in Figure 26, SSF process was the major contributor for
AP.
5.6.10. Water depletion potential (WDP)
The water depletion potential is higher for the biobased LA production, 183.97 m3,
than its equivalent from fossil based LA 69.67 m3. This is due to the impact associated
with the lignocellulosic pretreatment, namely autohydrolysis. This process only required
water and temperature to solubilize hemicellulose fraction.
5.6.11. Land Use (LU)
The LU impact was not considered in the results because there was no land use
potential for agricultural land occupation (ALO) and urban land occupation (ULO). The
raw material selected originated from wastes generated from forest and marginal land, in
other words, the life cycle of the process, begins only at the waste collection stage. Taking
into account the use of waste, environmental impacts up to the generation of the waste
are not considered and they are part of the production process, e.g. roundwood.
Land use for biobased chemicals was generally expected to be higher than that for
equivalent fossil based products (Hermann et al., 2007; Lammens et al., 2011) , although
this was not verified in this study.
5.6.12. Life Cycle Interpretation
Considering the environmental impacts in 15 categories, the biobased-LA showed
to reduce the environmental burden in 9, described in Figure 27.
Regarding to the raw material, as the feedstock was an unexploited lignocellulosic
biomass resulted from forest residues and marginal land, the impact LU was not verified.
However, in vast majority of the studies, the main contributor of the selected impact
categories was the biomass production (Parajuli et al., 2017). This result highlights the
importance of the strategy presented in this work for the selection of the biomass.
The processes that demonstrated to be more relevant for the total environmental
impacts were SFF and LA recovery. This can be explained by the auxiliary chemicals
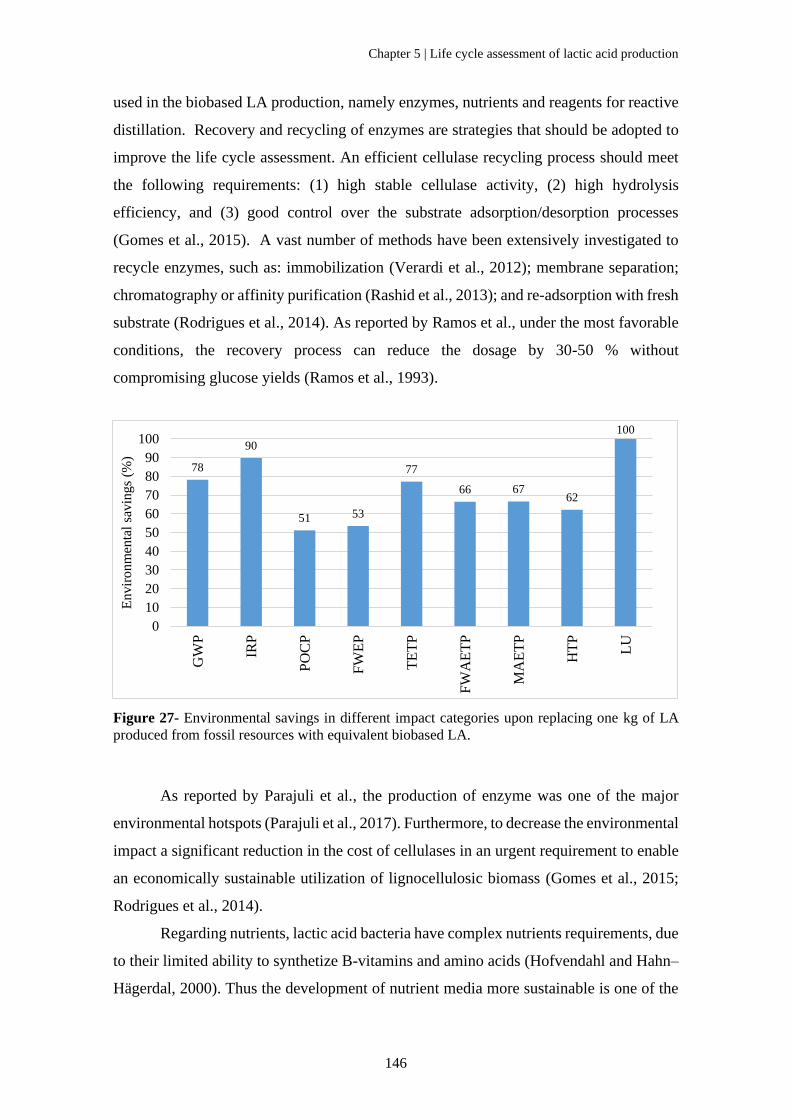
Chapter 5 | Life cycle assessment of lactic acid production
146
used in the biobased LA production, namely enzymes, nutrients and reagents for reactive
distillation. Recovery and recycling of enzymes are strategies that should be adopted to
improve the life cycle assessment. An efficient cellulase recycling process should meet
the following requirements: (1) high stable cellulase activity, (2) high hydrolysis
efficiency, and (3) good control over the substrate adsorption/desorption processes
(Gomes et al., 2015). A vast number of methods have been extensively investigated to
recycle enzymes, such as: immobilization (Verardi et al., 2012); membrane separation;
chromatography or affinity purification (Rashid et al., 2013); and re-adsorption with fresh
substrate (Rodrigues et al., 2014). As reported by Ramos et al., under the most favorable
conditions, the recovery process can reduce the dosage by 30-50 % without
compromising glucose yields (Ramos et al., 1993).
Figure 27- Environmental savings in different impact categories upon replacing one kg of LA
produced from fossil resources with equivalent biobased LA.
As reported by Parajuli et al., the production of enzyme was one of the major
environmental hotspots (Parajuli et al., 2017). Furthermore, to decrease the environmental
impact a significant reduction in the cost of cellulases in an urgent requirement to enable
an economically sustainable utilization of lignocellulosic biomass (Gomes et al., 2015;
Rodrigues et al., 2014).
Regarding nutrients, lactic acid bacteria have complex nutrients requirements, due
to their limited ability to synthetize B-vitamins and amino acids (Hofvendahl and Hahn–
Hägerdal, 2000). Thus the development of nutrient media more sustainable is one of the
78
90
51 53
77
66 6762
100
0
10
20
30
40
50
60
70
80
90
100
GW
P
IRP
PO
CP
FW
EP
TE
TP
FW
AE
TP
MA
ET
P
HT
P
LU
Envir
onm
enta
l sa
vin
gs
(%)
Chapter 5 | Life cycle assessment of lactic acid production
147
main objectives. As an example, fishery wastes have been studied as a nutrient source for
lactic acid production (Gao et al., 2006).
5.7. Conclusion
This study evaluated the environmental performance of LA produced from
lignocellulosic biomass and from non-renewable resources. From this analysis it has been
found that biobased LA has a positive effect in nine environmental impact categories
among the fifteen considered. The dominant environmental impacts of the analyzed
categories from which large environmental savings obtained per tonne of LA produced
are global warming potential (4056.60 kg CO2 eq.), ionizing radiation potential (193.03
kBq U235 eq.), Terrestrial ecotoxicity (9569.40 kg 1,4-DB eq.) and land use (126.63 m2).
About 60 % of the environmental burdens of most of the environmental impact categories
of the fossil based LA can be reduced upon replacing with its biobased equivalent. SSF
and recovery process were the major contributors to the environmental impacts. Thus,
enzyme recovery as well the use of sustainable nutrient supplementation could be an
opportunity to lower the environmental footprint of biobased LA production. Briefly, the
biobased LA is environmentally friendlier than the fossil based LA.
Chapter 5 | Life cycle assessment of lactic acid production
148
5.8. References
Corma, A., Iborra, S., Velty, A., 2007. Chemical Routes for the Transformation of
Biomass into Chemicals. https://doi.org/10.1021/cr050989d
Daful, A.G., Haigh, K., Vaskan, P., Görgens, J.F., 2016. Environmental impact
assessment of lignocellulosic lactic acid production: Integrated with existing sugar
mills. Food and Bioproducts Processing 99, 58–70.
https://doi.org/10.1016/j.fbp.2016.04.005
de Bruijn, H., van Duin, R., Huijbregts, M.A.J., 2002. Handbook on Life Cycle
Assessment, Eco-Efficiency in Industry and Science. Springer Netherlands,
Dordrecht. https://doi.org/10.1007/0-306-48055-7
Dusselier, M., Van Wouwe, P., Dewaele, A., Makshina, E., Sels, B.F., 2013. Lactic acid
as a platform chemical in the biobased economy: The role of chemocatalysis. Energy
and Environmental Science 6, 1415–1442. https://doi.org/10.1039/c3ee00069a
Gao, M.T., Hirata, M., Toorisaka, E., Hano, T., 2006. Acid-hydrolysis of fish wastes for
lactic acid fermentation. Bioresource Technology 97, 2414–2420.
https://doi.org/10.1016/j.biortech.2005.10.002
Gomes, D., Rodrigues, A.C., Domingues, L., Gama, M., 2015. Cellulase recycling in
biorefineries-is it possible? Applied Microbiology and Biotechnology 99, 4131–
4143. https://doi.org/10.1007/s00253-015-6535-z
Hermann, B.G., Blok, K., Patel, M.K., 2007. Producing bio-based bulk chemicals using
industrial biotechnology saves energy and combats climate change. Environmental
Science and Technology 41, 7915–7921. https://doi.org/10.1021/es062559q
Hofvendahl, K., Hahn–Hägerdal, B., 2000. Factors affecting the fermentative lactic acid
production from renewable resources1. Enzyme and Microbial Technology 26, 87–
107. https://doi.org/10.1016/S0141-0229(99)00155-6
Huijbregts, M.A.J., Breedveld, L., Huppes, G., De Koning, A., Van Oers, L., Suh, S.,
2003. Normalisation figures for environmental life-cycle assessment: The
Netherlands (1997/1998), Western Europe (1995) and the world (1990 and 1995).
Journal of Cleaner Production 11, 737–748. https://doi.org/10.1016/S0959-
6526(02)00132-4
ISO - ISO 14040:2006 - Environmental management — Life cycle assessment —
Principles and framework [WWW Document], n.d. URL
https://www.iso.org/standard/37456.html (accessed 12.14.20).
Chapter 5 | Life cycle assessment of lactic acid production
149
ISO - ISO 14044:2006 - Environmental management — Life cycle assessment —
Requirements and guidelines [WWW Document], n.d. URL
https://www.iso.org/standard/38498.html (accessed 12.14.20).
Jawad, A.H., Alkarkhi, A.F.M., Jason, O.C., Easa, A.M., Nik Norulaini, N.A., 2013.
Production of the lactic acid from mango peel waste - Factorial experiment. Journal
of King Saud University - Science 25, 39–45.
https://doi.org/10.1016/j.jksus.2012.04.001
Khoshnevisan, B., Tabatabaei, M., Tsapekos, P., Rafiee, S., Aghbashlo, M., Lindeneg,
S., Angelidaki, I., 2020. Environmental life cycle assessment of different biorefinery
platforms valorizing municipal solid waste to bioenergy, microbial protein, lactic
and succinic acid. Renewable and Sustainable Energy Reviews 117, 109493.
https://doi.org/10.1016/j.rser.2019.109493
Lammens, T.M., Potting, J., M Sanders, J.P., M De Boer, I.J., 2011. Environmental
Comparison of Biobased Chemicals from Glutamic Acid with Their Petrochemical
Equivalents. Environ. Sci. Technol 45, 8521–8528.
https://doi.org/10.1021/es201869e
Mandegari, M.A., Farzad, S., van Rensburg, E., Görgens, J.F., 2017. Multi‐criteria
analysis of a biorefinery for co‐production of lactic acid and ethanol from sugarcane
lignocellulose. Biofuels, Bioproducts and Biorefining 11, 971–990.
https://doi.org/10.1002/bbb.1801
Morales, M., Dapsens, P.Y., Giovinazzo, I., Witte, J., Mondelli, C., Papadokonstantakis,
S., Hungerbühler, K., Pérez-Ramírez, J., 2015. Environmental and economic
assessment of lactic acid production from glycerol using cascade bio- and
chemocatalysis. Energy and Environmental Science 8, 558–567.
https://doi.org/10.1039/c4ee03352c
Narayanan, N., Roychoudhury, P.K., Srivastava, A., 2004. L (+) lactic acid fermentation
and its product polymerization (a) Addition of Hydrogen Cyanide CH 3 CHO +
HCN catalyst CH 3 CHOHCN acetaldehyde hydrogen cyanide lactonitrile (b)
Hydrolysis by H 2 SO 4 CH 3 CHOHCN + H2O +1/2H 2 SO 4 CH 3 CHOHCOOH
+ 1/2(NH 4 ) 2 SO 4 Lactonitrile sulphuric acid lactic acid ammonium salt,
Electronic Journal of Biotechnology.
Pal, P., Sikder, J., Roy, S., Giorno, L., 2009. Process intensification in lactic acid
production: A review of membrane based processes. Chemical Engineering and
Processing: Process Intensification 48, 1549–1559.
Chapter 5 | Life cycle assessment of lactic acid production
150
https://doi.org/10.1016/j.cep.2009.09.003
Parajuli, R., Knudsen, M.T., Birkved, M., Djomo, S.N., Corona, A., Dalgaard, T., 2017.
Environmental impacts of producing bioethanol and biobased lactic acid from
standalone and integrated biorefineries using a consequential and an attributional life
cycle assessment approach. Science of the Total Environment 598, 497–512.
https://doi.org/10.1016/j.scitotenv.2017.04.087
Pejin, J., Radosavljević, M., Kocić-Tanackov, S., Djukić-Vuković, A., Mojović, L., 2017.
Lactic acid fermentation of brewer’s spent grain hydrolysate by Lactobacillus
rhamnosus with yeast extract addition and pH control. Journal of the Institute of
Brewing 123, 98–104. https://doi.org/10.1002/jib.403
Pontes, R., Romaní, A., Michelin, M., Domingues, L., Teixeira, J., Nunes, J., 2018.
Comparative autohydrolysis study of two mixtures of forest and marginal land
resources for co-production of biofuels and value-added compounds. Renewable
Energy 128, 20–29. https://doi.org/10.1016/j.renene.2018.05.055
Ramos, L.P., Breuil, C., Saddler, J.N., 1993. The use of enzyme recycling and the
influence of sugar accumulation on cellulose hydrolysis by Trichoderma cellulases.
Enzyme and Microbial Technology 15, 19–25. https://doi.org/10.1016/0141-
0229(93)90111-E
Rashid, S.S., Alam, M.Z., Fazli, M.B.F.A., 2013. Separation of Cellulase Enzyme from
Fermentation Broth of Palm Oil Mill Effluent by Ultrafiltration Process 1, 501–506.
Rodrigues, A.C., Felby, C., Gama, M., 2014. Cellulase stability, adsorption/desorption
profiles and recycling during successive cycles of hydrolysis and fermentation of
wheat straw. Bioresource Technology 156, 163–169.
https://doi.org/10.1016/j.biortech.2014.01.019
Ruiz, H.A., Ruzene, D.S., Silva, D.P., Da Silva, F.F.M., Vicente, A.A., Teixeira, J.A.,
2011. Development and characterization of an environmentally friendly process
sequence (autohydrolysis and organosolv) for wheat straw delignification. Applied
Biochemistry and Biotechnology 164, 629–641. https://doi.org/10.1007/s12010-
011-9163-9
Verardi, A., Bari, I. De, Ricca, E., Calabrò, V., 2012. Hydrolysis of Lignocellulosic
Biomass : Current Status of Processes and Technologies and Future Perspectives.
Bioethanol 290. https://doi.org/10.5772/23987
Yánez, R., Gómez, B., Martínez, M., Gullón, B., Alonso, J.L., 2014. Valorization of an
invasive woody species, Acacia dealbata, by means of Ionic liquid pretreatment and
Chapter 5 | Life cycle assessment of lactic acid production
151
enzymatic hydrolysis. Journal of Chemical Technology and Biotechnology 89,
1337–1343. https://doi.org/10.1002/jctb.4207

CHAPTER 6 |
General conclusions and future perspectives
Chapter 6 | General conclusions and future perspectives
154
6.1. General conclusions
This chapter contains the main conclusions from the present thesis. Nonetheless,
the detailed conclusions can be found at the end of each individual chapter.
The main outcome of the developed work was the demonstration of the feasibility
of the production of lactic acid from multi supply lignocellulosic biomass, namely natural
vegetation and forest residues, with high yield of conversion. A 40 folds scale up of the
process was also done.
The highlights on the results obtained on this thesis are summarized below:
- Mixtures of lignocellulosic biomass were selected that allow for a positive
outcome of its use on the production of lactic acid. The selected mixtures M1-4
and M2-3 from natural vegetation and forest ecosystems, namely, broom (Cytisus
sp.), carqueja (Genista tridentate), mimosa (Acacia dealbata), rockrose (Cistus
ladanifer), eucalyptus (Eucalyptus globulus) and pine (Pinus pinaster), represent
an effective scenario to be used on the development of lignocellulosic biomass
biorefineries in Portugal;
- When pretreated by autohydrolysis, both mixtures showed similar behavior and
at TMAX = 206 ºC recoveries of 62.2 % and 68.8 % of hemicellulose-derived
compounds (as XOS and xylose) were obtained for M1-4 and M2-3;
- Under this condition glucose yield from enzymatic hydrolysis resulted in 60.1 %
and 73.7 % for M1-4 and M2-3, respectively; these results led to the selection of
the mixture M2-3 for further processing;
- Autohydrolyzed M2-3 (AM2-3), solid fraction, was subsequently pretreated by
organosolv process, through a factorial design, ethanol concentration 80 %,
temperature 200 ºC and time 60 min allowed a high delignification (49.40 %) with
a lignin yield of 24.47 % and lignin extraction efficiency of 48.34 %;
Chapter 6 | General conclusions and future perspectives
155
- The delignified biomass was submitted to enzymatic hydrolysis and a glucose
yield of 49.65 % was obtained;
- The isolated lignin samples obtained (OL1-OL10) showed the potential to be used
as bio-based polymers because presented low Tg temperatures which was related
with more thermoplastic properties;
- Comparing the glucose yield of solid fraction resulted from autohydrolysis and
from organosolv, delignified biomass, the last one did not increased enzymatic
susceptibility and for this reason the following processes did not include
organosolv treatment;
- SSF and SHF was conducted on the solid fraction resulted from the autohydrolysis
of M2-3 for the production of LA by L. rhamnosus. For both conditions, the yield
of glucose into LA was s 1 g/g, but the volumetric productivity was 3 fold higher
for SSF;
- Optimal conditions for LA production by SSF were obtained with 16 % solids
load and ESR 54 FPU/g, allowing for a concentration of LA of 77.83 g/L, with
an yield of 1 g/g and productivity of 3.24 g/Lh;
- The optimized condition was scaled up to a 5 L bioreactor and the achieved LA
concentration was 61.74 g/L, glucose to LA yield 0.97 g/g and volumetric
productivity 1.40 g/Lh;
- The environmental performance of LA produced from M2-3 when compared with
LA obtained from non-renewable resources demonstrated large environmental
savings per tonne of LA produced in several parameters – 78 % savings in global
warming potential, 90 % savings in ionizing radiation potential, 77 % savings in
Terrestrial ecotoxicity and 100 % savings in land use.
Overall, it was demonstrated that the use of mixture M2-3, processed by
autohydrolysis followed by simultaneous saccharification and fermentation, offers a
strategy to produce LA from lignocellulosic biomass with high conversion. Furthermore,
Chapter 6 | General conclusions and future perspectives
156
biobased LA production significantly reduces 60 % the environmental impact of the
production process as compared to fossil-derived LA.
6.2. Future perspectives
This chapter presents recommendations/ suggestion for future work, taking into
account the many questions that have emerged during the development of the thesis.
Future perspectives on lactic acid production from lignocellulosic biomass resources are
listed below:
- LAB are extremely fastidious and require one or more amino acids to grow. The
rich nutrients supplements required for LA fermentation not only increase the raw
materials costs, but also make the final product recovery and purification difficult
and costly. Thus, the nutrient supplementation with residues should be developed
and optimized;
- More research and studies should be done to decrease the enzyme loading, while
maintaining the high solids, which could improve the economic and
environmental viability of the process. Thus, this work could be integrated with
other PhD research, in BLC3, in cooperation with University of Coimbra (the
same research group present in this thesis), which intends to develop a bacterial
consortium to produce enzymes, isolated from the digestive tract of a ruminant,
that has the ability to degrade the different fractions of lignocellulosic biomass to
increase the performance in pretreatment and fermentation processes;
- For a future work, fed-batch or a continuous fermentation of LA should also be
investigated in order to improve the productivity, reduce the substrate inhibition
and also offer a process more economically viable;
- Work to develop a tolerance strain of L. rhamnosus through metabolic engineering
to tolerate higher LA concentrations and enhance the LA production should also
be done.


