Embed Size (px)
Citation preview
An Open Environment CT-US Fusion for TissueSegmentation during Interventional GuidanceCharles F. Caskey1*, Mario Hlawitschka2, Shengping Qin1, Lisa M. Mahakian1, Robert D. Cardiff3, John M.
Boone4, Katherine W. Ferrara1
1 Department of Biomedical Engineering, University of California Davis, Davis, California, United States of America, 2 Department of Computer Science, University of
California Davis, Davis, California, United States of America, 3 Department of Pathology and Laboratory Medicine, School of Medicine, University of California Davis, Davis,
California, United States of America, 4 Department of Radiology, University of California Davis, Davis, California, United States of America
Abstract
Therapeutic ultrasound (US) can be noninvasively focused to activate drugs, ablate tumors and deliver drugs beyond theblood brain barrier. However, well-controlled guidance of US therapy requires fusion with a navigational modality, such asmagnetic resonance imaging (MRI) or X-ray computed tomography (CT). Here, we developed and validated tissuecharacterization using a fusion between US and CT. The performance of the CT/US fusion was quantified by the calibrationerror, target registration error and fiducial registration error. Met-1 tumors in the fat pads of 12 female FVB mice provided amodel of developing breast cancer with which to evaluate CT-based tissue segmentation. Hounsfield units (HU) within thetumor and surrounding fat pad were quantified, validated with histology and segmented for parametric analysis (fat: 2300to 0 HU, protein-rich: 1 to 300 HU, and bone: HU.300). Our open source CT/US fusion system differentiated soft tissue,bone and fat with a spatial accuracy of ,1 mm. Region of interest (ROI) analysis of the tumor and surrounding fat pad usinga 1 mm2 ROI resulted in mean HU of 68644 within the tumor and 297652 within the fat pad adjacent to the tumor(p,0.005). The tumor area measured by CT and histology was correlated (r2 = 0.92), while the area designated as fatdecreased with increasing tumor size (r2 = 0.51). Analysis of CT and histology images of the tumor and surrounding fat padrevealed an average percentage of fat of 65.3% vs. 75.2%, 36.5% vs. 48.4%, and 31.6% vs. 38.5% for tumors ,75 mm3, 75–150 mm3 and .150 mm3, respectively. Further, CT mapped bone-soft tissue interfaces near the acoustic beam during real-time imaging. Combined CT/US is a feasible method for guiding interventions by tracking the acoustic focus within a pre-acquired CT image volume and characterizing tissues proximal to and surrounding the acoustic focus.
Citation: Caskey CF, Hlawitschka M, Qin S, Mahakian LM, Cardiff RD, et al. (2011) An Open Environment CT-US Fusion for Tissue Segmentation duringInterventional Guidance. PLoS ONE 6(11): e27372. doi:10.1371/journal.pone.0027372
Editor: Martin W. Brechbiel, National Institute of Health, United States of America
Received May 9, 2011; Accepted October 15, 2011; Published November 23, 2011
Copyright: � 2011 Caskey et al. This is an open-access article distributed under the terms of the Creative Commons Attribution License, which permitsunrestricted use, distribution, and reproduction in any medium, provided the original author and source are credited.
Funding: This work was supported by the National Institutes of Health under grant NIH R01CA103828. The funders had no role in study design, data collectionand analysis, decision to publish, or preparation of the manuscript.
Competing Interests: The authors have declared that no competing interests exist.
* E-mail: [email protected]
Introduction
CT has long been applied for the characterization of tissues,
such as fat and bone, in diagnostic imaging [1]. More recently, the
use of CT in the interventional and intra-operative setting is
expanding, due to advantages in speed and convenience as
compared to MRI. C-arm cone-beam CT scanners with flat-panel
detectors are increasingly used in interventional radiology suites
for mapping and navigational applications [2]. Fusions between
CT and US have been developed for the purposes of guiding
biopsy and radio-frequency ablation [3,4]. However, CT has not
yet been applied to guide ultrasound therapy planning and US-
based thermometry for mild hyperthermia or ultrasonic ablation.
Mild hyperthermia is an emerging technique for image-guided
interventions since tumor oxygenation, vascular permeability and
blood flow can be enhanced, potentially increasing the efficacy of
radiotherapy and chemotherapeutic drugs [5,6,7,8,9] and activat-
ing temperature-sensitive drugs [10,11,12,13]. Ultrasound is an
ideal method for noninvasively generating hyperthermia due to
the low cost, flexibility and potential to image and detect
temperature changes in real time [14]. While MR-guided focused
ultrasound can similarly monitor treatment and temperature [15],
US guidance of interventions remains widespread.
In the guidance of mild hyperthermia, tissue characterization is
important since the reflection of sound waves by bone can create
unanticipated regions of thermal damage. Also, during thermal
therapy, changes in the speed of sound produce an apparent shift in
the position of tissue within and distal to the acoustic focus over
successive image acquisitions, providing a basis for ultrasonic
thermometry [13]. While sound speed increases with increasing
temperature in non-fatty soft tissues over a temperature range of 30-
50uC, sound speed decreases as temperature increases over this
range in fatty tissue [16]. Therefore, ultrasound thermometry
requires accurate estimation of fat content. The local temperature
change is then estimated from the product of the apparent echo time
shift and the tissue-dependent coefficient for thermal expansion. By
estimating the percentage of fat and other tissue components and
incorporating the relevant thermal expansion coefficients within
each small region prior to thermal therapy, temperature changes
can be mapped from shifts in ultrasound echoes [14].
Open source software environments are emerging as an
important component of multi-modality imaging; for example,
PLoS ONE | www.plosone.org 1 November 2011 | Volume 6 | Issue 11 | e27372
3D Slicer facilitates image segmentation and OpenIGTLink is an
open-source protocol for rapid transfer of generic data between
software and devices used in image-guided procedures [17]
[18,19]. We set out to leverage these platforms to develop an
open source fused CT/US system by interfacing a clinical US
scanner and generic clinical CT scanner, and to demonstrate the
utility of such a fused system by characterizing tissues relevant to
ultrasound therapy (soft tissue, bone, and fat) in a mouse breast
cancer tumor model [17,19,20].
Study DesignImage registration between CT and US was first quantified.
Next, we characterized HU-based segmentation of fat and soft
tissue by comparing fat content and tumor size (n = 12) in histology
and comparable CT and US slices. We tested the feasibility of
using CT to identify tissue within the acoustic beam by
retrospectively fusing images from US and CT clinical scanners
(n = 4). These data were supplemented by tissue characterization
performed on living animals using a small animal CT scanner.
Results
OpenIGTLink has been applied to interface a Siemens Sequoia
US scanner with a cone-beam breast CT via electromagnetic (EM)
positioning. The resulting open source software acquires US images
in real-time, computes the 2D image slice location and transmits the
image and location via OpenIGTLink within 0.1 seconds (http://
code.google.com/p/ct-us-openigtlink/). By using the IGSTK driver
to interface with hardware and standard NTSC video capture, the
fused CT/US plug-in can easily be extended to function with
optically-tracked systems and other CT and US scanners. Our
combined platform includes a physical interface for small animal
research, in which the animal is either imaged with both modalities
within the same study or moved between imaging platforms.
Millimeter-scale Accuracy Possible with Fused CT/USBy bridging EM tracking hardware and image acquisition with
3D slicer, US images were acquired for real-time combined CT/
US with mm-scale accuracy. The target registration error was
indicated by the quality of the transformations between the
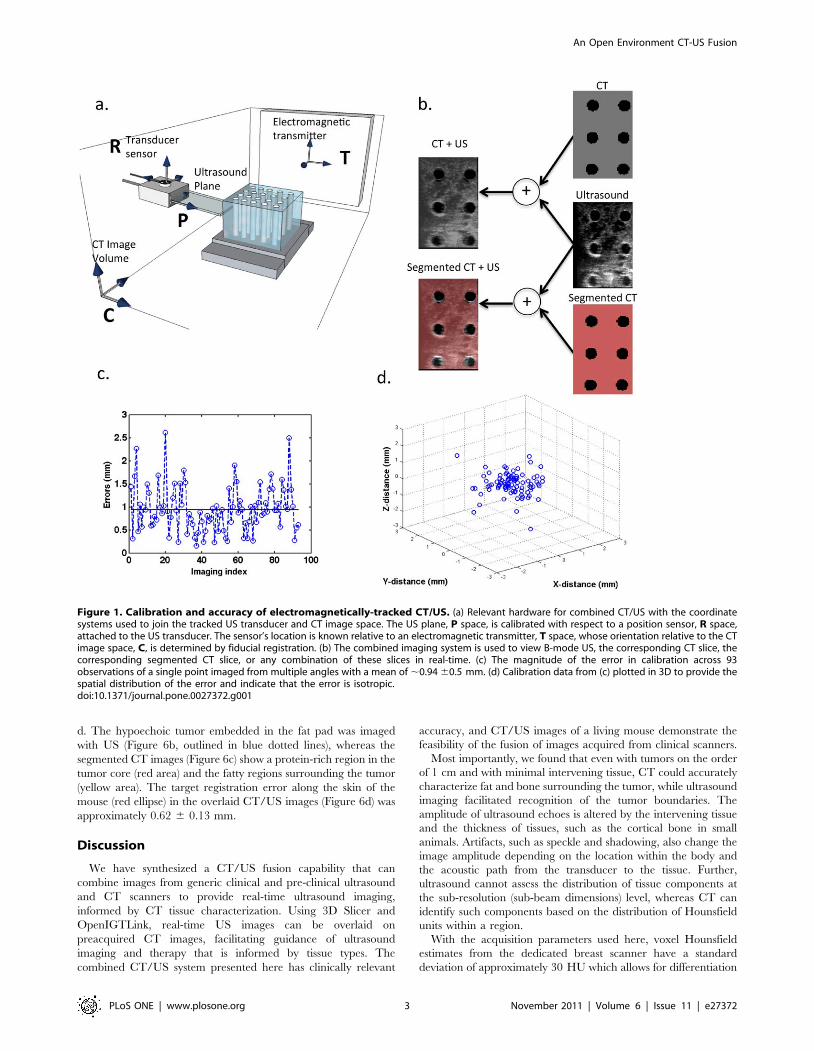
coordinate systems described in Figure 1a. The mean error in
calibration between the US plane (P space) and transducer sensor
(R space) was 0.9 6 0.5 mm. With 93 observations of a single
point acquired from different angles, the maximum and minimum
residual errors were 2.6 and 0.2 mm, respectively (Figure 1c, d).
Registration between the CT image space, C, and the tracked
space, T, was also achieved with mm-scale accuracy. The mean
residual error in the transformation of twelve mutual fiducial
points between C and T was 1.0 ± 0.2 mm.
The propagation of these errors was indicated by the target
registration error between the US image and comparable CT slice
after co-registration of the images. Slices through the cylinders in
the phantom were easily visualized in both modalities and accurate
co-registration was evident by the consistent shape and alignment
between the targets (Figure 1b). Circular targets in the dual
modality phantom appeared as a grid of circles during combined
CT/US imaging. A mean target registration error of 1.0 6
0.3 mm was measured across 50 corresponding targets on CT and
US in fused 2D images.
Syngeneic Met-1 tumor provides model system forimaging-based tissue characterization
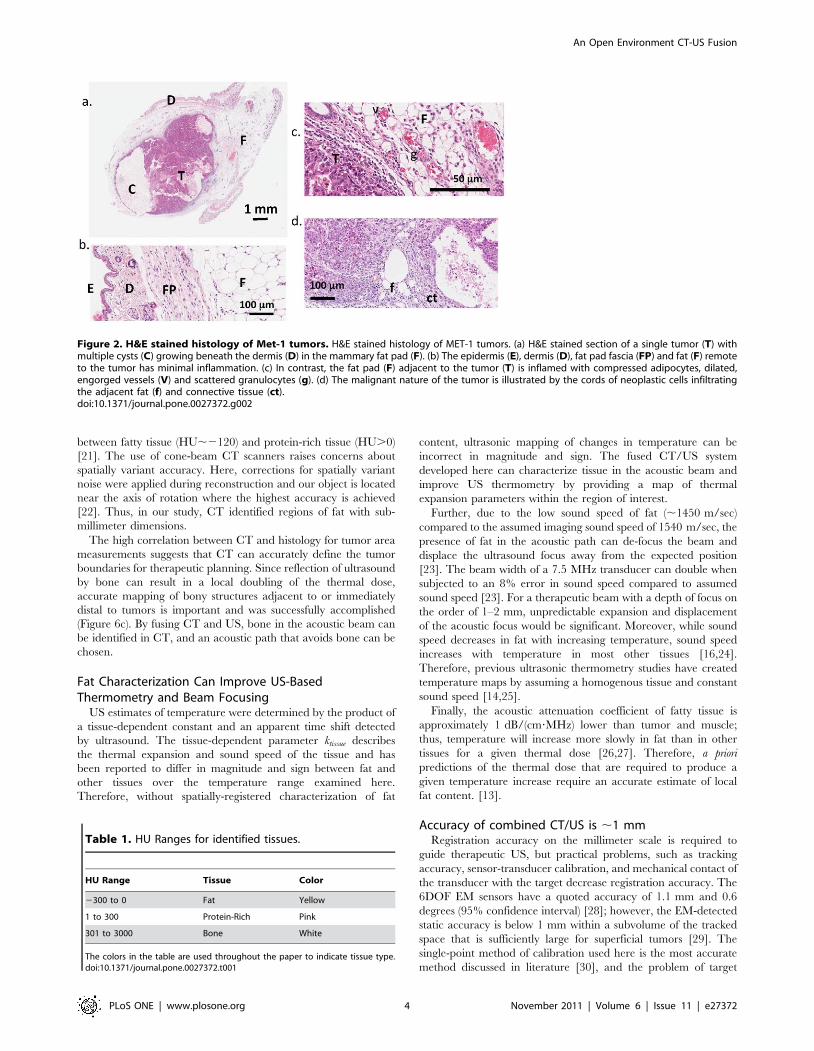
The transplanted tumor cells formed a mass that expands within
the mammary fat pad (Figure 2a). In the absence of inflammation
and tumor expansion, the fat pad thickness ranged from 1 to
3 mm and extended laterally over more than 10 mm, separated
from the dermal layers by the fascia (see Figure 2b). As the tumor
grew within the fat pad, scattered fat cells and connective tissue
were evident, while the fat cells surrounding the tumor were
compressed, aspherical and disorganized (Figure 2d). Granular
lymphocytes and vasodilation within the fat pad provided evidence
of inflammation during tumor growth (Figure 2c).
Tissue characterization based on echogenicity could notdifferentiate tumor and fat
In this study, the grayscale B-mode image amplitude was 111.0
6 9.6, 76.8 6 5.7, 107.8 6 8.5, and 63.3 6 7.9 for fat, muscle,
bone and tumor, respectively. Fat and bone were differentiated
from the less echogenic muscle and tumor tissue (p,0.05, multiple
comparison ANOVA); however, fat and bone or muscle and
tumor could not be differentiated from one another using US.
CT successfully characterizes fat and tumorSegmentation of CT images according to the HU in Table 1
indicated the location of the murine fat pads. Isosurfaces generated
from segmented CT images identified bone, fat and protein-rich
regions (Figure 3a–c). A fat pad on the left hind limb and a
unilateral Met-1 tumor that disrupts the fat pad on the right hind
limb were visible in segmented images. The fatty regions detected
by CT were distributed throughout the abdomen and along the
back (Figure 3d). In transverse CT images, fat pads appeared as a
contiguous layer with HU in the range expected for adipose tissue
(Figures 3e–h).
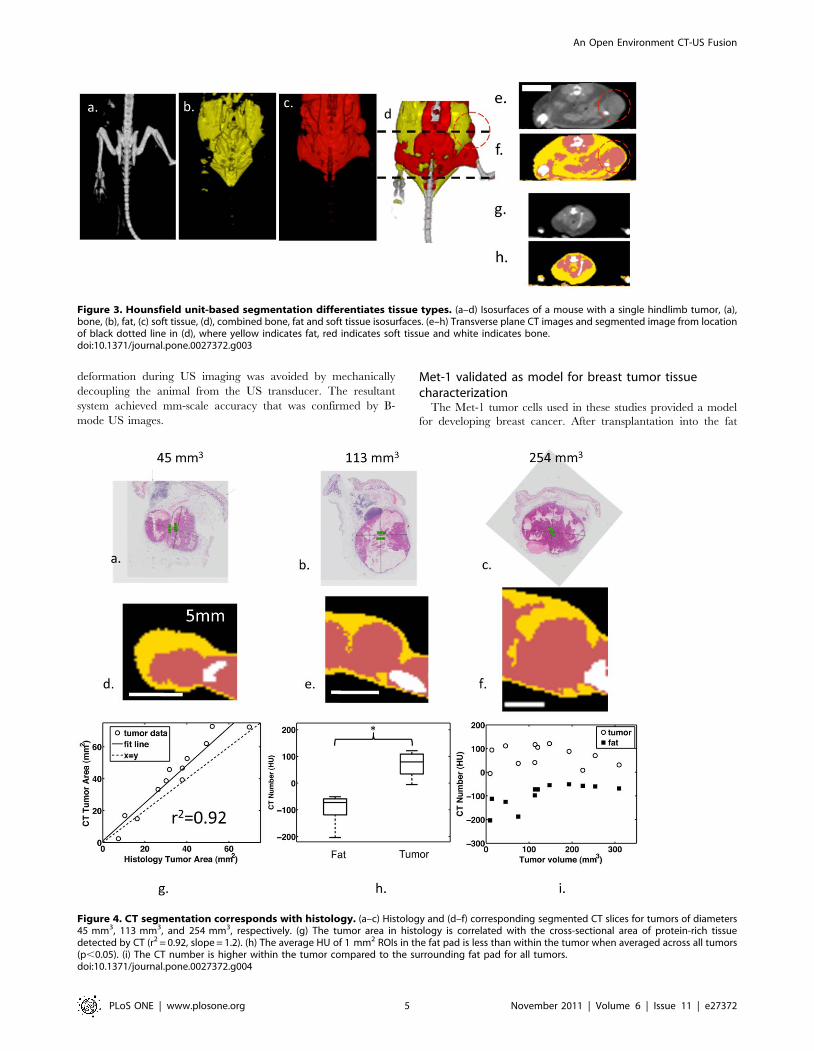
H&E-stained histology slides and comparable CT slices had
similar morphology. Representative histology images (Figure 4a–c)
and comparable CT slices (Figure 4d–f) showed a core tumor
embedded in a surrounding fat pad with a thickness of 1 to 3 mm.
The computed area of the protein-rich region in the CT slice of
the tumor was similar to the histological slice (Figure 4g,
slope = 1.2, r2 = 0.92), and the mean CT number was -
97652 HU for a ,1 mm2 circular ROI in the fat pad
surrounding the tumor, compared to 68644 HU for an ROI of
the same area within the tumor (Figure 4h) (p,0.05). In all
tumors, the CT number within the tumor was greater than in the
surrounding fat pad (Figure 4i).
CT Provides a Basis for Automated Tissue SegmentationThe area of fat in histology slices decreased with increasing
tumor size (Figure 5a slope = -0.33, r2 = 0.51). Tumors with
volumes less than 75 mm3 had a negative-shifted radiodensity on
average, compared to tumors larger than 75 mm3, which had a
higher probability of positively-shifted histograms (Figure 5b). The
average percentage of fat measured from histology (%fat = Afat/
(Afat+Atumor)) for tumors ,75 mm3, 75–150 mm3 and .150 mm3
was 75.2 611.8%, 48.4% 63.3%, and 38.5 6 8.2%, respectively,
while CT quantitation yielded 65.3 6 24.6%, 36.5 69.3%, and
31.6 6 7.2%. Based on CT and histology, tumors with volumes
less than 75 mm3 had a higher percentage of surrounding fat than
larger tumors (p,0.05 for both measurement methods, t-test).
Average histograms for the smallest tumors showed a greater
count in the HU range below zero compared to larger tumors
(Figure 5c–e).
Fused CT/US imaging and tissue characterization isfeasible in vivo
A real-time tissue-type overlay from CT was acquired in vivo,
with a representative image from these studies shown in Figure 6a–
An Open Environment CT-US Fusion
PLoS ONE | www.plosone.org 2 November 2011 | Volume 6 | Issue 11 | e27372
d. The hypoechoic tumor embedded in the fat pad was imaged
with US (Figure 6b, outlined in blue dotted lines), whereas the
segmented CT images (Figure 6c) show a protein-rich region in the
tumor core (red area) and the fatty regions surrounding the tumor
(yellow area). The target registration error along the skin of the
mouse (red ellipse) in the overlaid CT/US images (Figure 6d) was
approximately 0.62 6 0.13 mm.
Discussion
We have synthesized a CT/US fusion capability that can
combine images from generic clinical and pre-clinical ultrasound
and CT scanners to provide real-time ultrasound imaging,
informed by CT tissue characterization. Using 3D Slicer and
OpenIGTLink, real-time US images can be overlaid on
preacquired CT images, facilitating guidance of ultrasound
imaging and therapy that is informed by tissue types. The
combined CT/US system presented here has clinically relevant
accuracy, and CT/US images of a living mouse demonstrate the
feasibility of the fusion of images acquired from clinical scanners.
Most importantly, we found that even with tumors on the order
of 1 cm and with minimal intervening tissue, CT could accurately
characterize fat and bone surrounding the tumor, while ultrasound
imaging facilitated recognition of the tumor boundaries. The
amplitude of ultrasound echoes is altered by the intervening tissue
and the thickness of tissues, such as the cortical bone in small
animals. Artifacts, such as speckle and shadowing, also change the
image amplitude depending on the location within the body and
the acoustic path from the transducer to the tissue. Further,
ultrasound cannot assess the distribution of tissue components at
the sub-resolution (sub-beam dimensions) level, whereas CT can
identify such components based on the distribution of Hounsfield
units within a region.
With the acquisition parameters used here, voxel Hounsfield
estimates from the dedicated breast scanner have a standard
deviation of approximately 30 HU which allows for differentiation
Figure 1. Calibration and accuracy of electromagnetically-tracked CT/US. (a) Relevant hardware for combined CT/US with the coordinatesystems used to join the tracked US transducer and CT image space. The US plane, P space, is calibrated with respect to a position sensor, R space,attached to the US transducer. The sensor’s location is known relative to an electromagnetic transmitter, T space, whose orientation relative to the CTimage space, C, is determined by fiducial registration. (b) The combined imaging system is used to view B-mode US, the corresponding CT slice, thecorresponding segmented CT slice, or any combination of these slices in real-time. (c) The magnitude of the error in calibration across 93observations of a single point imaged from multiple angles with a mean of ,0.94 60.5 mm. (d) Calibration data from (c) plotted in 3D to provide thespatial distribution of the error and indicate that the error is isotropic.doi:10.1371/journal.pone.0027372.g001
An Open Environment CT-US Fusion
PLoS ONE | www.plosone.org 3 November 2011 | Volume 6 | Issue 11 | e27372
between fatty tissue (HU,2120) and protein-rich tissue (HU.0)
[21]. The use of cone-beam CT scanners raises concerns about
spatially variant accuracy. Here, corrections for spatially variant
noise were applied during reconstruction and our object is located
near the axis of rotation where the highest accuracy is achieved
[22]. Thus, in our study, CT identified regions of fat with sub-
millimeter dimensions.
The high correlation between CT and histology for tumor area
measurements suggests that CT can accurately define the tumor
boundaries for therapeutic planning. Since reflection of ultrasound
by bone can result in a local doubling of the thermal dose,
accurate mapping of bony structures adjacent to or immediately
distal to tumors is important and was successfully accomplished
(Figure 6c). By fusing CT and US, bone in the acoustic beam can
be identified in CT, and an acoustic path that avoids bone can be
chosen.
Fat Characterization Can Improve US-BasedThermometry and Beam Focusing
US estimates of temperature were determined by the product of
a tissue-dependent constant and an apparent time shift detected
by ultrasound. The tissue-dependent parameter ktissue describes
the thermal expansion and sound speed of the tissue and has
been reported to differ in magnitude and sign between fat and
other tissues over the temperature range examined here.
Therefore, without spatially-registered characterization of fat
content, ultrasonic mapping of changes in temperature can be
incorrect in magnitude and sign. The fused CT/US system
developed here can characterize tissue in the acoustic beam and
improve US thermometry by providing a map of thermal
expansion parameters within the region of interest.
Further, due to the low sound speed of fat (,1450 m/sec)
compared to the assumed imaging sound speed of 1540 m/sec, the
presence of fat in the acoustic path can de-focus the beam and
displace the ultrasound focus away from the expected position
[23]. The beam width of a 7.5 MHz transducer can double when
subjected to an 8% error in sound speed compared to assumed
sound speed [23]. For a therapeutic beam with a depth of focus on
the order of 1–2 mm, unpredictable expansion and displacement
of the acoustic focus would be significant. Moreover, while sound
speed decreases in fat with increasing temperature, sound speed
increases with temperature in most other tissues [16,24].
Therefore, previous ultrasonic thermometry studies have created
temperature maps by assuming a homogenous tissue and constant
sound speed [14,25].
Finally, the acoustic attenuation coefficient of fatty tissue is
approximately 1 dB/(cm?MHz) lower than tumor and muscle;
thus, temperature will increase more slowly in fat than in other
tissues for a given thermal dose [26,27]. Therefore, a priori
predictions of the thermal dose that are required to produce a
given temperature increase require an accurate estimate of local
fat content. [13].
Accuracy of combined CT/US is ,1 mmRegistration accuracy on the millimeter scale is required to
guide therapeutic US, but practical problems, such as tracking
accuracy, sensor-transducer calibration, and mechanical contact of
the transducer with the target decrease registration accuracy. The
6DOF EM sensors have a quoted accuracy of 1.1 mm and 0.6
degrees (95% confidence interval) [28]; however, the EM-detected
static accuracy is below 1 mm within a subvolume of the tracked
space that is sufficiently large for superficial tumors [29]. The
single-point method of calibration used here is the most accurate
method discussed in literature [30], and the problem of target
Table 1. HU Ranges for identified tissues.
HU Range Tissue Color
2300 to 0 Fat Yellow
1 to 300 Protein-Rich Pink
301 to 3000 Bone White
The colors in the table are used throughout the paper to indicate tissue type.doi:10.1371/journal.pone.0027372.t001
Figure 2. H&E stained histology of Met-1 tumors. H&E stained histology of MET-1 tumors. (a) H&E stained section of a single tumor (T) withmultiple cysts (C) growing beneath the dermis (D) in the mammary fat pad (F). (b) The epidermis (E), dermis (D), fat pad fascia (FP) and fat (F) remoteto the tumor has minimal inflammation. (c) In contrast, the fat pad (F) adjacent to the tumor (T) is inflamed with compressed adipocytes, dilated,engorged vessels (V) and scattered granulocytes (g). (d) The malignant nature of the tumor is illustrated by the cords of neoplastic cells infiltratingthe adjacent fat (f) and connective tissue (ct).doi:10.1371/journal.pone.0027372.g002
An Open Environment CT-US Fusion
PLoS ONE | www.plosone.org 4 November 2011 | Volume 6 | Issue 11 | e27372
deformation during US imaging was avoided by mechanically
decoupling the animal from the US transducer. The resultant
system achieved mm-scale accuracy that was confirmed by B-
mode US images.
Met-1 validated as model for breast tumor tissuecharacterization
The Met-1 tumor cells used in these studies provided a model
for developing breast cancer. After transplantation into the fat
Figure 4. CT segmentation corresponds with histology. (a–c) Histology and (d–f) corresponding segmented CT slices for tumors of diameters45 mm3, 113 mm3, and 254 mm3, respectively. (g) The tumor area in histology is correlated with the cross-sectional area of protein-rich tissuedetected by CT (r2 = 0.92, slope = 1.2). (h) The average HU of 1 mm2 ROIs in the fat pad is less than within the tumor when averaged across all tumors(p,0.05). (i) The CT number is higher within the tumor compared to the surrounding fat pad for all tumors.doi:10.1371/journal.pone.0027372.g004
Figure 3. Hounsfield unit-based segmentation differentiates tissue types. (a–d) Isosurfaces of a mouse with a single hindlimb tumor, (a),bone, (b), fat, (c) soft tissue, (d), combined bone, fat and soft tissue isosurfaces. (e–h) Transverse plane CT images and segmented image from locationof black dotted line in (d), where yellow indicates fat, red indicates soft tissue and white indicates bone.doi:10.1371/journal.pone.0027372.g003
An Open Environment CT-US Fusion
PLoS ONE | www.plosone.org 5 November 2011 | Volume 6 | Issue 11 | e27372
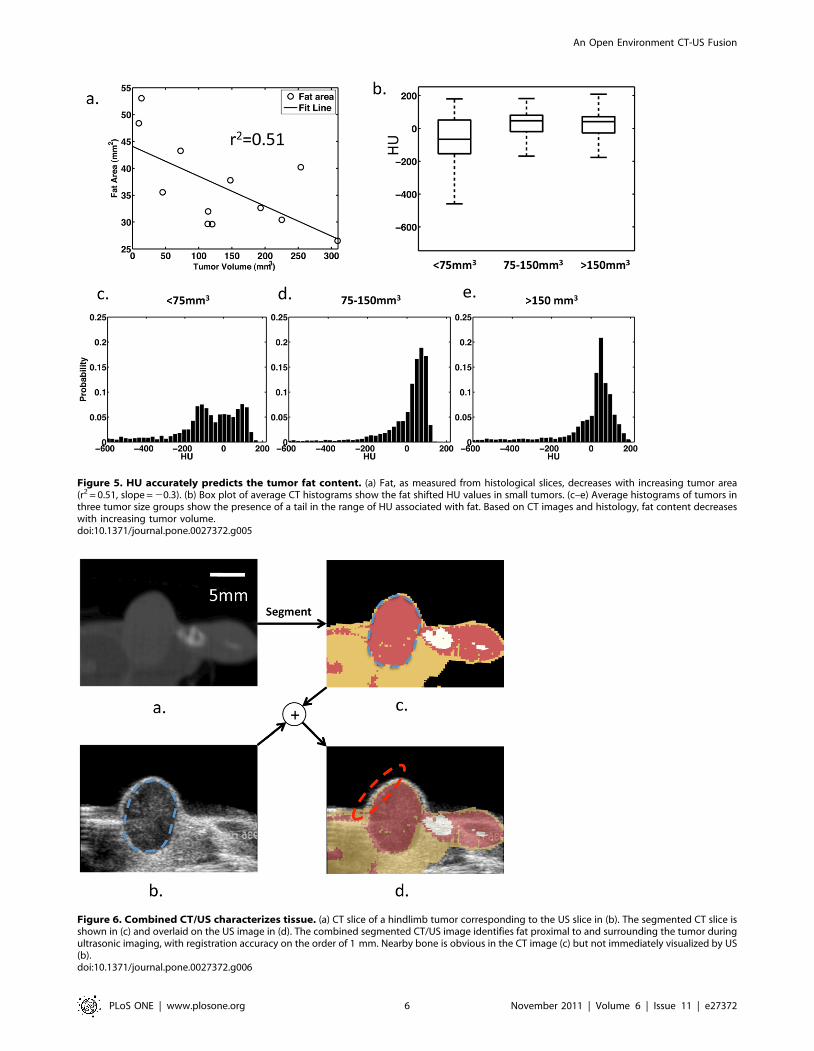
Figure 5. HU accurately predicts the tumor fat content. (a) Fat, as measured from histological slices, decreases with increasing tumor area(r2 = 0.51, slope = 20.3). (b) Box plot of average CT histograms show the fat shifted HU values in small tumors. (c–e) Average histograms of tumors inthree tumor size groups show the presence of a tail in the range of HU associated with fat. Based on CT images and histology, fat content decreaseswith increasing tumor volume.doi:10.1371/journal.pone.0027372.g005
Figure 6. Combined CT/US characterizes tissue. (a) CT slice of a hindlimb tumor corresponding to the US slice in (b). The segmented CT slice isshown in (c) and overlaid on the US image in (d). The combined segmented CT/US image identifies fat proximal to and surrounding the tumor duringultrasonic imaging, with registration accuracy on the order of 1 mm. Nearby bone is obvious in the CT image (c) but not immediately visualized by US(b).doi:10.1371/journal.pone.0027372.g006
An Open Environment CT-US Fusion
PLoS ONE | www.plosone.org 6 November 2011 | Volume 6 | Issue 11 | e27372
pads, a growing tumor displaced the surrounding fat and
infiltrated the tissue, increasing the mean HU values as compared
to fat pads without a tumor. The protein-rich tumor embedded in
the fat pad is a heterogeneous tissue with decreasing fat content as
the tumor grows and provided a model to test the capabilities of
CT tissue characterization.
Study LimitationsFor the first time, tissue characterization has been performed
using fused, clinically-relevant CT and US images; however, there
are some limitations that should be acknowledged. Temporal
resolution of the image update is currently limited by the 30 Hz
maximum frame rate output from our commercial US system.
While the physical limitations of US allow for higher frame rates, a
30 Hz update rate is likely to be adequate for interventional
applications. An alternative approach is to acquire raw radio
frequency signals from a research-based ultrasonic system which
operates at a higher frame rate [31]. Further, while phantom
studies used a real-time overlay of CT and US, our in vivo study
used a retrospective overlay due to logistics of the vivarium and
US and CT scanners. However, in vivo tissue characterization is
feasible (see Figure S1).
In addition, optimization of the HU values used in segmentation
has not been pursued. While the HU limits we applied for
segmentation have a physical basis and are similar to those found
elsewhere in literature, methods to leverage a priori information
and 3D morphological and region growth operations have been
reported [32], and would likely increase the accuracy of
segmentation. Finally, while the clinical CT scanners used here
have a resolution of approximately 0.3 mm, which was sufficient
to detect fat pads with thicknesses of 1–3 mm, the Siemens Inveon
scanner, with a resolution of ,0.1 mm, further improved fat pad
tissue characterization and has been applied to characterize
tumors based on in vivo imaging (see Figure S1).
The overall goal of this research was to create an imaging
method that can accurately identify tissues in the acoustic beam
path. Quantification of the sensitivity, specificity, and accuracy of
such a system are important questions that are not fully addressed
here. Future work will focus on quantifying the specificity,
sensitivity, and accuracy of tissue characterization using fused
CT/US.
Summary and practical applicationsIn summary, we developed an open environment fused
CT/US system with 1 mm resolution and applied this system
to characterize bone, fat and tumor in a mouse model of
developing cancer. Practical applications for this technology
include acoustic therapy planning and enhancing US-based
thermometry in heterogeneous tissue. In the future, the
combined CT/US system will be integrated with ultrasound
thermometry as described in [33], facilitating real-time control of
hyperthermia as required for image-guided drug delivery and
image-guided hyperthermia.
Methods
Animal Model and Imaging ProceduresThe University of California at Davis Institutional Animal Care
and Use Committee approved our study (protocol # 15864).
Syngeneic Met-1 tumors grown within the mammary fat pad
provided the model used here for tissue characterization and
validation. Female FVB mice underwent bilateral transplantation
of Met-1 tumor cells into the fourth fat pad. After tumor growth to
a diameter of approximately 0.5 cm, seven mice with 12 tumors
(two tumors did not develop) were imaged with CT after
euthanasia using a dedicated breast CT [21]. All tumors were
excised for H&E stained histology along the midline sagittal
direction of the tumor.
Four female mice with Met-1 tumors within the mammary fat
pad were imaged to test in vivo feasibility of fused CT/US. In these
studies, the mice were imaged with tracked US prior to euthanasia
and subsequently underwent CT imaging. The tracked US images
were localized in the CT volume retrospectively using the tracking
information and fiducial locations acquired during the US scan.
The feasibility of CT segmentation using in vivo images was
demonstrated using a small animal Siemens Inveon CT (Erlangen,
Germany) with a pixel dimension of 48.9 mm. Two mice with
three tumors were imaged before euthanasia (Inveon: Bin 2, low
magnification, Current/Voltage: 80 kVp/425 uA, 750 ms/pro-
jection, 180 projections). CT images and tissue-segmented images
along with comparable histology are shown in Figure S1.
Localization of Histological Slice in CT ImagesTumors were localized in the CT image stack by generating
circular ROIs in multiple transverse images in the region of the
hind limb using custom MATLAB software (MATLAB, Natwick,
MA). The resultant ROI was sliced in the midline sagittal plane
coincident with the histology slice, and the CT slice was cropped
so only the tumor region was visible for comparison with histology,
yielding a 2D CT image containing only the tumor and
surrounding fat pad.
CT Segmentation, Percentage Calculation, and ROISelection
CT images were characterized as fat, protein-rich, or bone
according to the values shown in Table 1 using 3D Slicer. The
ranges were chosen based on observation of HU histograms of
axial slices of tumors and are similar to those used by Borkan et al
[34]. The area fat percentage within a 2D CT slice comparable to
the histology slice was determined by computing the 2D area of fat
after segmentation using HU in Table 1 normalized by the area of
the tumor and surrounding fat (all measurements reported in
Table 2). To measure the difference in radiodensity between the
tumor and surrounding fat pad, we computed the mean HU of a
circular ROI with an area of ,1 mm2 from the 2D CT slice
within the tumor and another ROI in the surrounding fat pad.
Probability density functions of small (,75 mm3), medium (75–
150 mm3), and large (.150 mm3) tumor groups were created
from a HU histogram (128 bins) containing all pixels from the
midline sagittal images of tumors from each group (MATLAB,
Mathworks, Natick, MA). The resultant histogram was converted
to a probability density function by dividing by the total area in the
histogram.
ROI Selection and Volume Estimation from HistologyHistological images were used to validate the percentage of fat
in the region surrounding the tumors and tumor volume. Two
researchers blinded to tumor size selected ROIs containing either
fat or tumor cells on histological images. Linear regression
indicated similarity between the two measurement sets (fat area:
r2 = 0.61, tumor area: r2 = 0.96). The mean of these two sets of
measurements was used to minimize selection bias. The area of the
fatty region was divided by the area of the combined tumor and fat
regions. Tumor volume was estimated from histology by assuming
an ellipsoidal shape and overlaying two radii of the tumor in the
2D slice (r1, r2), while the third radius (r3) was estimated by
calculating the mean of the first two radii. Tumor volume was
An Open Environment CT-US Fusion
PLoS ONE | www.plosone.org 7 November 2011 | Volume 6 | Issue 11 | e27372
estimated by taking the volume of the ellipsoid with radii r1, r2,
and r3 (measurements reported in Table 2).
Statistical MethodsThe area of tumors in the histological slice (as described in the
methods) was compared to the tumor area computed from CT
slices by linear regression with r2.0.5 considered significant. One-
way ANOVA was used to test the ability for US to differentiate
tissue types based on US image amplitude in tumor, fat pads, bone
and muscle of 4 mice. Assuming a standard deviation of 10%, a
change of 30% image amplitude can be detected between 4 tissues
with a power of 80% and n = 4. Linear regression was performed
to characterize general trends between tumor size and the area
designated as fat by histology (r2.0.5 considered significant).
Tumors were divided into small (n = 4, ,75 mm3), medium (n = 4,
75–150 mm3), and large (n = 4, .150 mm3) size groups. With this
sample size and assuming a standard deviation of 15%, the
Student’s t-test can detect differences of 35% in the regional
percentage of fat with a power of 80%. We evaluated residuals of
all measurements for normality and did not detect a substantial
deviation from a normal distribution.
Fused CT/US Imaging HardwareAn EM tracking system (NDI Aurora, Ontario, Canada) was
used to detect the spatial location and orientation of sensors affixed
to the US probe (as shown in Figure 1a). Within the complete cube
volume (500 cm3), the tracking system’s static position and
orientation accuracy are 1.1 mm and 0.6 degrees, respectively,
with a 95% confidence interval [28]. The 6 Degree of freedom
(6DOF) sensors have improved static accuracy (less than 1 mm)
when located within a 300 mm radial distance from the
transmitter’s origin [29]. Imaging and calibration were performed
within this high performance subvolume. The video output of a
clinical Sequoia ultrasound scanner (Siemens, Issaquah, WA,
15L8 transducer, 14 MHz) transmitted US images to a video
capture card at 10 fps. The US scan plane was localized in the
tracked volume and then mapped via fiducial registration to the
CT volume. All images in the results section were acquired with a
clinical dedicated breast CT [21] with a pixel dimension of
0.3 mm (breast CT scanner: X-ray Tube Current/Voltage:
7 mA/80 kVp, 530 projections).
Tracked Imaging SoftwareThe software component of our fused CT/US system is a plug-
in created for 3D Slicer that imports the transducer position and
corresponding US image and performs transformations for
registration between CT and US, as described in the subsequent
sections (plug-in source code, test data, and tutorial are available
online: http://code.google.com/p/ct-us-openigtlink/) [35]. 3D
Slicer provides the visualization interface for the combined image
data. This software platform is open source, available on multiple
operating systems, and has a modular architecture that allows for
custom plug-ins to be created [35,36,37,38]. The OpenIGTLink
protocol is used to transfer US images and sensor position data to
Slicer 3D [17]. Aurora tracking information is read using a device
driver included in the Image Guided Surgery Toolkit (IGSTK),
while images are captured with the Unicap library [18,19].
Image RegistrationFollowing notation used in Prager et al., we use MTN to indicate
a coordinate transform from an arbitrary coordinate system, N,
into another system M and Nx to represent a location in a
coordinate system N (see coordinate systems in Figure 1a and
Glossary of symbols, Table S1) [30]. Points in the scan plane
(coordinate system P) must be transformed into the volume C,
which is a 3D matrix of volume elements acquired by the CT
scanner. The transformation of a pixel within the ultrasound
image plane, Px, to the corresponding location within the CT
volume, Cx, can be described by:
Cx~(CTTT TR
RTP)Px ð1Þ
Each transformation consists of a translation and three Euler angle
rotations. All transformations assume fixed axes and column
vectors with rotations acting on objects and a rotation order of z-y-x. A general affine transformation between two coordinate
systems can be achieved by:
T~
cosbcosa cosbsina {sinb dx
sincsinbcosa sincsinbsinazcosccosa sinccosb dy
coscsinbcosazsincsina coscsinbsinazcosccosa sinccosb dz
0 0 0 1
0BBB@
1CCCAð2Þ
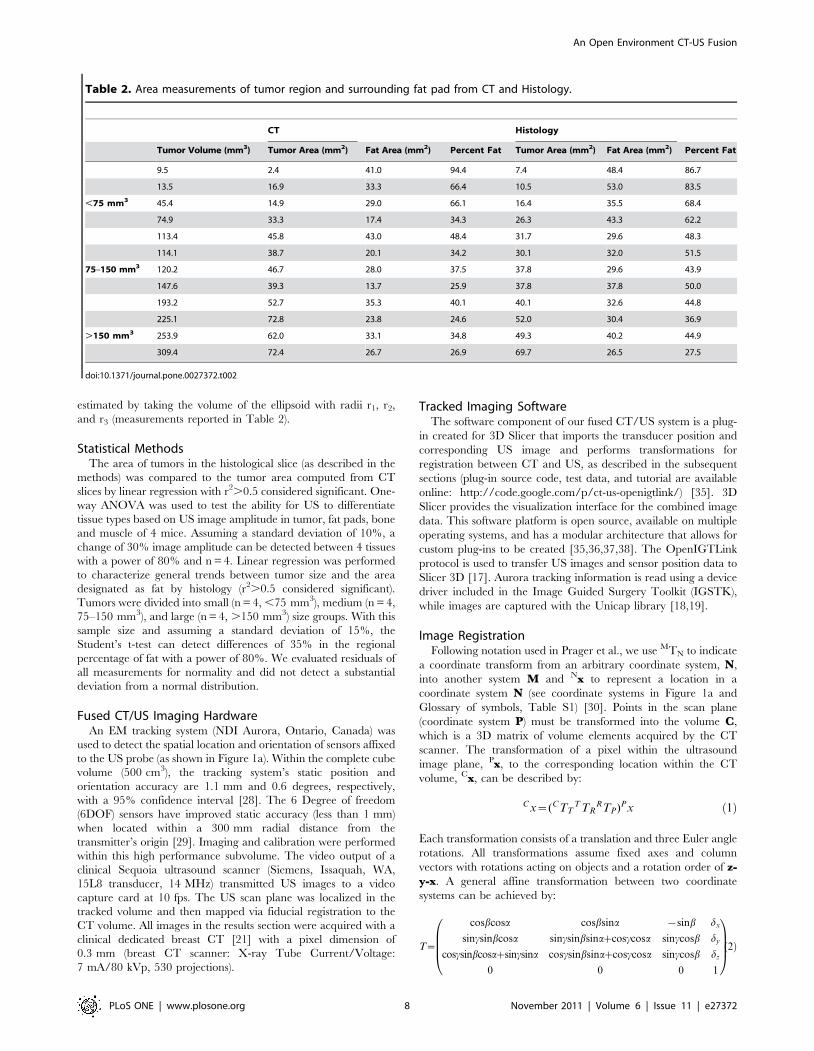
Table 2. Area measurements of tumor region and surrounding fat pad from CT and Histology.
CT Histology
Tumor Volume (mm3) Tumor Area (mm2) Fat Area (mm2) Percent Fat Tumor Area (mm2) Fat Area (mm2) Percent Fat
9.5 2.4 41.0 94.4 7.4 48.4 86.7
13.5 16.9 33.3 66.4 10.5 53.0 83.5
,75 mm3 45.4 14.9 29.0 66.1 16.4 35.5 68.4
74.9 33.3 17.4 34.3 26.3 43.3 62.2
113.4 45.8 43.0 48.4 31.7 29.6 48.3
114.1 38.7 20.1 34.2 30.1 32.0 51.5
75–150 mm3 120.2 46.7 28.0 37.5 37.8 29.6 43.9
147.6 39.3 13.7 25.9 37.8 37.8 50.0
193.2 52.7 35.3 40.1 40.1 32.6 44.8
225.1 72.8 23.8 24.6 52.0 30.4 36.9
.150 mm3 253.9 62.0 33.1 34.8 49.3 40.2 44.9
309.4 72.4 26.7 26.9 69.7 26.5 27.5
doi:10.1371/journal.pone.0027372.t002
An Open Environment CT-US Fusion
PLoS ONE | www.plosone.org 8 November 2011 | Volume 6 | Issue 11 | e27372
with three rotations (a,b,c) with respect to z, y, x and translations
(dx,dy,dz) corresponding to x, y, and z respectively.
Calibration ProceduresAccurate calculation of the orientation and translation between
the transducer sensor and US image plane has been discussed
previously, and many methods are outlined in [39]. Briefly, we
used a single-point target method, where US acquired images of a
fixed point from multiple angles while the tracking system returned
position and orientation information for the attached sensor. In
our calibration method, a cross-wire phantom was created with
two pieces of 100-micron thread. The cross between the thread
was assumed to be located at the origin of an arbitrary coordinate
system, A, such that each image generated the following equation:
0
0
0
1
0BBB@
1CCCA~(ATT
T TRRTP)Px ð3Þ
where ATT represents the transformation from the EM transmitter
into an arbitrary space centered at the line’s midpoint. The point
relative to the ultrasound image (Px) was calculated from manual
measurements where the threads cross in the image (Figure S2a,b).
The EM tracking system reported the associated sensor position
and orientation (TTR). The resultant system of equations was
solved for RTP using the Levenberg-Marquardt algorithm [40]. In
solving Eq. 3, TTR is also optimized, but these values are discarded
since TTR is measured from the tracking device during normal
operation. An ensemble of observations was transformed accord-
ing to Eq. 3 using measured values for TTR, and the average
magnitude of the resultant vector indicated the residual error in
the tracked ultrasound calibration.
Registration Between Tracked Space and CT Image SpaceThe tracked volume and CT imaging stack were registered by
selecting pairs of locations in the CT stack and the corresponding
location in the tracked volume. Measurements in the tracked
volume were made with a second EM sensor that was not attached
to the ultrasound transducer. Given these paired measurements,
the affine transformation between the CT stack and the tracked
volume (TTC) was determined using Horn’s method, as imple-
mented in 3D Slicer [41]. Fiducial registration error is the average
magnitude of the absolute difference between points transformed
from the CT stack to the tracked volume. Target registration error
in the cylindrical phantom was quantified by measuring the
distance between circular ROIs centered on circular targets in
fused images, and registration error in tumor images was
quantified by measuring the mean difference in the skin boundary
detected by CT versus US (ImageJ, NIH).
Temporal CalibrationThe 3D position, orientation, and image must be stored with the
correct time-stamp to achieve accurate registration and recon-
struction. In order to verify the accuracy of the timestamps, images
of the base of a water bath were acquired along with the sensor
location during the scans. The ultrasound technician moved the
transducer in an oscillatory motion during the acquisition. The
distance from the center of the transducer to the base of the water
bath was measured from the US images by applying a threshold to
generate binary images and counting the number of pixels from
the center row of the image to the point on the line along the
image row. The time lag between the sensor location and the
distance to the bottom of the water bath measured from the US
image was determined by taking the cross-correlation of both of
the signals.
Supporting Information
Figure S1 Each row (a-c) shows histology, the compa-rable CT slice, and tissue segmented CT slice of threesyngeneic mouse tumors imaged in vivo with theSiemens Inveon small animal scanner. Images underwent
a median filter with radius of 5 pixels prior to segmentation to
reduce star artifacts from the CT scan.
(TIF)
Figure S2 (a) The crosswire phantom is imaged atmultiple angles by the transducer with attached 6DOFsensor. (b) The spatial location of the sensor andcoordinates of the cross in the resultant image providexp and TTR for Eq. 3.
(TIF)
Table S1 Glossary of symbols.
(DOCX)
Acknowledgments
The authors would like to acknowledge Dr. Sandra Taylor for discussions
about statistics, Jason Peters for technical assistance with CT imaging,
members of Kevin Cleary’s lab group for discussions about real-time
visualization of fused imaging, and Julien Bec for mechanical design
assistance.
Author Contributions
Conceived and designed the experiments: KWF CFC. Performed the
experiments: CFC LMM. Analyzed the data: CFC KWF LMM RDC JMB
SQ MH. Contributed reagents/materials/analysis tools: KWF JMB RDC.
Wrote the paper: CFC KWF MH. During experiments and data analysis,
provided input on data analysis and experimental procedures: CFC MH
SQ LMM RDC JMB KWF.
References
1. Yoshizumi T, Nakamura T, Yamane M, Islam AH, Menju M, et al. (1999)
Abdominal fat: standardized technique for measurement at CT. Radiology 211:
283–286.
2. Wallace MJ, Kuo MD, Glaiberman C, Binkert CA, Orth RC, et al. (2009)Three-dimensional C-arm cone-beam CT: applications in the interventional
suite. J Vasc Interv Radiol 20: S523–537.
3. Ukimura O, Mitterberger M, Okihara K, Miki T, Pinggera GM, et al. (2008)
Real-time virtual ultrasonographic radiofrequency ablation of renal cell
carcinoma. BJU International 101: 707–711.
4. Kitada T, Murakami T, Kuzushita N, Minamitani K, Nakajo K, et al. (2008)Effectiveness of real-time virtual sonography-guided radiofrequency ablation
treatment for patients with hepatocellular carcinomas. Hepatology Research 38:
565–571.
5. Kong G, Braun RD, Dewhirst MW (2000) Hyperthermia Enables Tumor-
specific Nanoparticle Delivery: Effect of Particle Size. Cancer Res 60:4440–4445.
6. Lefor AT, Makohon S, Ackerman NB (1985) The effects of hyperthermia on
vascular permeability in experimental liver metastasis. Journal of SurgicalOncology 28: 297–300.
7. Brizel DM, Scully SP, Harrelson JM, Layfield LJ, Dodge RK, et al. (1996)
Radiation Therapy and Hyperthermia Improve the Oxygenation of Human
Soft Tissue Sarcomas. Cancer Research 56: 5347–5350.
8. Song CW (1984) Effect of Local Hyperthermia on Blood Flow and
Microenvironment: A Review. Cancer Research 44: 4721s–4730s.
9. Dewey WC, Hopwood LE, Sapareto SA, Gerweck LE (1977) Cellular Responses
to Combinations of Hyperthermia and Radiation. Radiology 123: 463–474.
An Open Environment CT-US Fusion
PLoS ONE | www.plosone.org 9 November 2011 | Volume 6 | Issue 11 | e27372
10. Hynynen K, Roemer R, Anhalt D, Johnson C, Xu ZX, et al. (1987) A scanned,
focused, multiple transducer ultrasonic system for localized hyperthermia
treatments. International Journal of Hyperthermia 3: 21–35.
11. Dromi S, Frenkel V, Luk A, Traughber B, Angstadt M, et al. (2007) Pulsed-High
Intensity Focused Ultrasound and Low Temperature, Sensitive Liposomes for
Enhanced Targeted Drug Delivery and Antitumor Effect. Clinical Cancer
Research 13: 2722–2727.
12. Needham D, Anyarambhatla G, Kong G, Dewhirst MW (2000) A New
Temperature-sensitive Liposome for Use with Mild Hyperthermia: Character-
ization and Testing in a Human Tumor Xenograft Model. Cancer Res 60:
1197–1201.
13. Simon C, VanBaren P, Ebbini ES (1998) Two-dimensional temperature
estimation using diagnostic ultrasound. Ultrasonics, Ferroelectrics and Frequen-
cy Control, IEEE Transactions on 45: 1088–1099.
14. Seip R, VanBaren P, Cain CA, Ebbini ES (1996) Noninvasive real-time
multipoint temperature control for ultrasound phased array treatments.
Ultrasonics, Ferroelectrics and Frequency Control, IEEE Transactions on 43:
1063–1073.
15. Rieke V, Butts Pauly K (2008) MR thermometry. Journal of Magnetic
Resonance Imaging 27: 376–390.
16. Hill C, Bamber J, Haar G (2004) Physical principles of medical ultrasonics: John
Wiley & Sons Inc. 497 p.
17. Image Guided Therapy in Slicer3: Introduction to Navigation using Open-
IGTLink. Available: http://www.slicer.org/slicerWiki/index.php/Modules:O-
penIGTLinkIF-Documentation-3.6. Acccessed 2011 Nov, 2.
18. unicap - The uniform API for image acquisition devices. Available: http://
unicap-imaging.org/. Accessed 2011 Nov 2.
19. Cleary K, Ibanez L, Ranjan S, Blake B (2004) IGSTK: a software toolkit for
image-guided surgery applications. International Congress Series 1268:
473–479.
20. Fitzpatrick JM, West JB (2001) The distribution of target registration error in
rigid-body point-based registration. Medical Imaging, IEEE Transactions on 20:
917–927.
21. Boone JM, Nelson TR, Lindfors KK, Seibert JA (2001) Dedicated Breast CT:
Radiation Dose and Image Quality Evaluation. Radiology 221: 657–667.
22. Yang K, Kwan AL, Huang SY, Packard NJ, Boone JM (2008) Noise power
properties of a cone-beam CT system for breast cancer detection. Med Phys 35:
5317–5327.
23. Goss SA, Johnston RL, Dunn F (1978) Comprehensive compilation of empirical
ultrasonic properties of mammalian tissues. The Journal of the Acoustical
Society of America 64: 423–457.
24. Abolhassani MD, Norouzy A, Takavar A, Ghanaati H (2007) Noninvasive
Temperature Estimation Using Sonographic Digital Images. J Ultrasound Med
26: 215–222.
25. Lai C, Kruse DE, Caskey CF, Stephens DN, Sutcliffe PL, et al. (2010)
Noninvasive Thermometry Assisted by a Dual Function Ultrasound Transducerfor Mild Hyperthermia. IEEE Trans Ultrason Ferroelectr Freq Control 57:
2671–2684.
26. D’Astous FT, Foster FS (1986) Frequency dependence of ultrasound attenuationand backscatter in breast tissue. Ultrasound in medicine & biology 12: 795–808.
27. Chivers RC, Hill CR (1975) Ultrasonic attenuation in human tissue. Ultrasoundin medicine & biology 2: 25–29.
28. Egorov V, Tsyuryupa S, Kanilo S, Kogit M, Sarvazyan A (2008) Soft tissue
elastometer. Med Eng Phys 30: 206–212.29. Nafis C, Jensen V, Beauregard L, Anderson P (2006) Method for estimating
dynamic EM tracking accuracy of surgical navigation tools. SPIE. 61410K.30. Prager R, Rohling R, Gee A, Berman L (1998) Rapid calibration for 3-D
freehand ultrasound. Ultrasound in medicine & biology 24: 855–869.31. Pace DF, Gobbi DG, Wedlake C, Gumprecht J, Boisvert J, et al. (2009) An
open-source real-time ultrasound reconstruction system for four-dimensional
imaging of moving organs. The MIDAS Journal.32. Nelson TR, Cervino LI, Boone JM, Lindfors KK (2008) Classification of breast
computed tomography data. Medical Physics 35: 1078–1086.33. Kruse DE, Chun-Yen L, Stephens DN, Sutcliffe P, Paoli EE, et al. (2010) Spatial
and Temporal-Controlled Tissue Heating on a Modified Clinical Ultrasound
Scanner for Generating Mild Hyperthermia in Tumors. Biomedical Engineer-ing, IEEE Transactions on 57: 155–166.
34. Borkan G, Gerzof S, Robbins A, Hults D, Silbert C, et al. (1982) Assessment ofabdominal fat content by computed tomography. The American Journal of
Clinical Nutrition 36: 172–177.35. Pieper S, Lorensen B, Schroeder W, Kikinis R (2006) The NA-MIC Kit: ITK,
VTK, Pipelines, Grids and 3D Slicer as an Open Platform for the Medical
Image Computing Community. Proceedings of the 3rd IEEE InternationalSymposium on Biomedical Imaging: From Nano to Macro 1: 698–701.
36. Pieper S, Halle M, Kikinis R (2004) 3D Slicer. Proceedings of the 1st IEEEInternational Symposium on Biomedical Imaging: From Nano to Macro 2004 1:
632–635.
37. Gering D, Nabavi A, Kikinis R, Grimson W, Hata N, et al. (1999) An IntegratedVisualization System for Surgical Planning and Guidance using Image Fusion
and Interventional Imaging. Int Conf Med Image Comput Comput Assist Interv2: 809–819.
38. SlicerWeb. Available: http://www.slicer.org. Accessed 2011 Oct, 19.39. Mercier L, Lang T, Lindseth F, Collins D (2005) A review of calibration
techniques for freehand 3-D ultrasound systems. Ultrasound in medicine &
biology 31: 449–471.40. More JJ (1977) Levenberg--Marquardt algorithm: implementation and theory.
Medium: ED; Size: Pages. 13 p.41. Horn BKP (1987) Closed-form solution of absolute orientation using unit
quaternions. J Opt Soc Am A 4: 629–642.
An Open Environment CT-US Fusion
PLoS ONE | www.plosone.org 10 November 2011 | Volume 6 | Issue 11 | e27372