Embed Size (px)
Citation preview
An Integrated High-density Linkage Map of Soybean with RFLP, SSR,
STS, and AFLP Markers Using A Single F2 Population
Zhengjun XIA1,2, Yasutaka TSUBOKURA1,2, Masako HOSHI1, Masayoshi HANAWA1,†, Chizuru YANO1, Kayo OKAMURA1,‡,Talaat A. AHMED1,3, Toyoaki ANAI4, Satoshi WATANABE5, Masaki HAYASHI1,2, Takashi KAWAI1,}, Khwaja G. HOSSAIN1,6,Hirokazu MASAKI1,§, Kazumi ASAI1,k, Naoki YAMANAKA7, Nakao KUBO1,#, Koh-ichi KADOWAKI2,**, Yoshiaki NAGAMURA2,Masahiro YANO2, Takuji SASAKI2, and Kyuya HARADA,1,2,*
Faculty of Horticulture, Chiba University, 648 Matsudo, Chiba 271-8510, Japan1; National Institute of AgrobiologicalSciences, 2-1-2 Kannondai, Tsukuba, Ibaraki 305-8602, Japan2; Faculty of Agriculture, Agronomy Department, AssiutUniversity, Assiut 71515, Egypt3; Faculty of Agriculture, Saga University, Honjo-machi 1, Saga 840-8502, Japan4;Research Faculty of Agriculture, Hokkaido University, Sapporo, Hokkaido 060-8589, Japan5; Division of Science andMathematics, Mayville State University, 330 3rd Street NE, Mayville, ND 58257, USA6 and Japan InternationalResearch Center for Agricultural Sciences, 1-1 Ohwashi, Tsukuba, Ibaraki 305-8686, Japan7
(Received 25 September 2007; accepted 29 November 2007; published online 11 January 2008)
Abstract
Soybean [Glycine max (L.) Merrill] is the most important leguminous crop in the world due to its high contents ofhigh-quality protein and oil for human and animal consumption as well as for industrial uses. An accurate and satu-rated genetic linkage map of soybean is an essential tool for studies on modern soybean genomics. In order to updatethe linkage map of a F2 population derived from a cross between Misuzudaizu and Moshidou Gong 503 and to make itmore informative and useful to the soybean genome research community, a total of 318 AFLP, 121 SSR, 108 RFLP,and 126 STS markers were newly developed and integrated into the framework of the previously described linkage map.The updated genetic map is composed of 509 RFLP, 318 SSR, 318 AFLP, 97 AFLP-derived STS, 29 BAC-end or EST-derived STS, 1 RAPD, and five morphological markers, covering a map distance of 3080 cM (Kosambi function) in 20linkage groups (LGs). To our knowledge, this is presently the densest linkage map developed from a single F2 popu-lation in soybean. The average intermarker distance was reduced to 2.41 from 5.78 cM in the earlier version of thelinkage map. Most SSR and RFLP markers were relatively evenly distributed among different LGs in contrast tothe moderately clustered AFLP markers. The number of gaps of more than 25 cM was reduced to 6 from 19 in theearlier version of the linkage map. The coverage of the linkage map was extended since 17 markers were mappedbeyond the distal ends of the previous linkage map. In particular, 17 markers were tagged in a 5.7 cM intervalbetween CE47M5a and Satt100 on LG C2, where several important QTLs were clustered. This newly updatedsoybean linkage map will enable to streamline positional cloning of agronomically important trait locus genes, andpromote the development of physical maps, genome sequencing, and other genomic research activities.Key words: soybean; linkage map; SSR; RFLP; AFLP; STS
† Present address: Sinary Company, Ltd, 2-11-13 Kamiosahi, Sinagawa-ku, Tokyo 141-0021, Japan‡ Present address: Colorado State Department of Agriculture, 2331 West 31st Avenue, Denver, CO 80211, USA} Present address: GE Heathcare Bio-Sciences KK, 3-25-1 Hyakunincho, Shinjuku-ku, Tokyo 169-0073, Japan§ Present address: Metropolitan Police Department, 1-15-15 Kitaohtsuku, Toshima-ku, Tokyo 170-0004, Japank Present address: Institute for Environmental Science, University of Shizuoka, 52-1 Yada, Suruga, Shizuoka 422-8526, Japan# Present address: Graduate School of Agriculture, Kyoto Prefectural University, 74 Oji, Kitainayazuma, Seika, Soraku, Kyoto 619-0244, Japan** Present address: Ministry of Agriculture, Forestry and Fisheries, 1-2-1 Kasumigaseki, Chiyoda-ku, Tokyo 100-8950, Japan
# The Author 2008. Kazusa DNA Research Institute.
The online version of this article has been published under an open access model. Users are entitled to use, reproduce, disseminate, or display theopen access version of this article for non-commercial purposes provided that: the original authorship is properly and fully attributed; the Journaland Oxford University Press are attributed as the original place of publication with the correct citation details given; if an article is subsequentlyreproduced or disseminated not in its entirety but only in part or as a derivative work this must be clearly indicated. For commercial re-use,please contact [email protected]
Edited by Kazuo Shinozaki* To whom correspondence should be addressed. Tel/Fax. þ81 29-838-7452. E-mail: [email protected]
DNA RESEARCH 14, 257–269, (2007) doi:10.1093/dnares/dsm027
by guest on Decem
ber 17, 2015http://dnaresearch.oxfordjournals.org/
Dow
nloaded from
1. Introduction
Soybean, Glycine max (L.) Merr., supplies a largeamount of high-quality protein and oil for food productsand industrial materials. Recently, researchers havereported that various biochemical constituents ofsoybean seeds exert physiological functions beneficial tohuman health.1–3 The availability of numerous character-istics in soybean, such as symbiosis with root bacteroids,has set the stage for international efforts to exploresoybean at the whole genome level.4,5 In modern geno-mics, the size of soybean genome (1.12–1.81 � 109 bp)has been considered to be moderate.6 Evolutionally,soybean is referred to as a recently diploidized tetraploid,and generally more than two copies are present for over90% of the non-repetitive sequences in the soybeangenome.7 In addition, 40–60% of the soybean sequencesare repetitive.8,9 In the crop legumes, most crops belongto either the Hologalegina or the Phaseoloid lineage.10
Although two model legumes, Lotus and Medicago,belong to the Hologalegina lineage, it has been recentlyproposed that soybean genome could be used as a modelfor the Phaseoloid legumes due to the economic and bio-logical importance of soybean, the moderate genome size,as well as the existing infrastructure for soybean researchand commercial production.5,11
An accurate and saturated genetic linkage map ofsoybean is essential for studies on modern soybean geno-mics, i.e. identification of subtle or new trait loci includingquantitative trait loci (QTLs), map-based cloning, andphysical map construction or even whole-genome sequen-cing. The first soybean genetic map was constructed with57 classical markers.12 Thereafter, molecular maps havebeen gradually integrated using restriction-fragmentlength polymorphism (RFLP) markers,13–16 randomamplified polymorphic DNA (RAPD) markers,17 simplesequence repeat (SSR)18,19 and amplified-fragmentlength polymorphism (AFLP) markers.20,21 In recentyears, integrated maps have been reported, each ofwhich was merged from several maps derived from dif-ferent mapping populations using JoinMap.22,23 Morerecently, an integrated map with sequence-based genicmarkers has also been constructed.24
Moshidou Gong503 (Glycine gracilis), which originatedin Northeast China, is morphologically intermediatebetween the cultivated G. max and the wild form,G. soja.25 However, these three forms which are fullycross-compatible, effectively constitute a single species,G. max.25,26 Crosses between the cultivar (Misuzudaizu)and the intermediate form (Moshidou Gong503) wouldprovide good genetic resources for linkage map construc-tion and for the isolation of agronomically and biologi-cally important genes. A framework of genetic linkagemap had been previously constructed mainly withRFLP and SSR markers using a single F2 population ofthis combination.27–29 In addition, several agronomically
and biologically important trait loci such as floweringtime, growth habit, and seed quality were identifiedusing this mapping population27,28 and its progenies(RILs).30,31 Further integration of this linkage map witha large number of SSR or RFLP markers and withother types of markers, i.e. AFLP or AFLP-derivedsequence-tagged site (STS) markers, may enable tomake this linkage map more informative and moreuseful for soybean genomics studies and particularly forthe isolation of agronomically and biologically importantQTL genes harbored by the parents, Misuzudaizu andMoshidou Gong503. Therefore, the objectives of thepresent study were threefold; (i) to develop AFLP andAFLP-derived STS markers; (ii) to develop a largernumber of SSR and RFLP markers; and (iii) to integratethe newly developed markers into the framework of thepreviously described linkage map.28
2. Materials and methods
2.1. Plant materials and DNA extractionA framework of the genetic linkage map had been pre-
viously constructed using an F2 population that wasderived from a cross between the cultivar Misuzudaizuand a weedy form, Moshidou Gong 503, as ovule andpollen parents, respectively. This mapping populationconsisting of 190 F2 plants was used in the presentstudy.27,28 However, the DNA was newly extracted forthe present study from the leaves that had been preservedat 2808C, using the CTAB method32 with a slightmodification.
2.2. AFLP marker developmentThe AFLP procedure was performed essentially as
described by Vos et al.33 A total of 100–150 ng ofgenomic DNA was completely digested with EcoRI andMseI. Digested DNA was subjected to ligation withadapters that were compatible with the restriction sites(AFLP Core Reagent Kit, Life Technology, USA). Afterligation, the reaction mixtures were diluted 10 timeswith TE. For the amplification of the restricted andligated fragments, a two-step protocol was adopted. Thefirst step included the selective pre-amplification ofadapter-ligated DNA with primers with one additionalselective nucleotide (þ1/þ1). In the second step, selec-tive amplification of pre-amplified DNA was performedwith adapter primers with two more additional selectivenucleotides (þ3/þ3). All the amplification reactionswere performed with TaKaRa EXTaq (TaKaRa,Japan). Electrophoresis was conducted by high-efficiencygenome scanning (HEGS)34,35 with non-denaturing 11–13% polyacrylamide separating gels and 5% stackinggels. Gels were stained by Vistra Green (AmershamPharmacia Biotech, UK) and were detected withFluorImager 585 (Amersham Pharmacia Biotech).
258 An Integrated High-density Linkage Map of Soybean [Vol. 14,
by guest on Decem
ber 17, 2015http://dnaresearch.oxfordjournals.org/
Dow
nloaded from
Only clearly distinguishable polymorphic AFLP bandswere scored for mapping in the present study.
Nomenclature for the AFLP markers includes the letterE for the EcoRI primer and the letter M for the MseIprimer, each of which being followed by a number repre-senting combinations of three selective nucleotides. Theletter C was added as the prefix referring to the markerdeveloped at Chiba University.
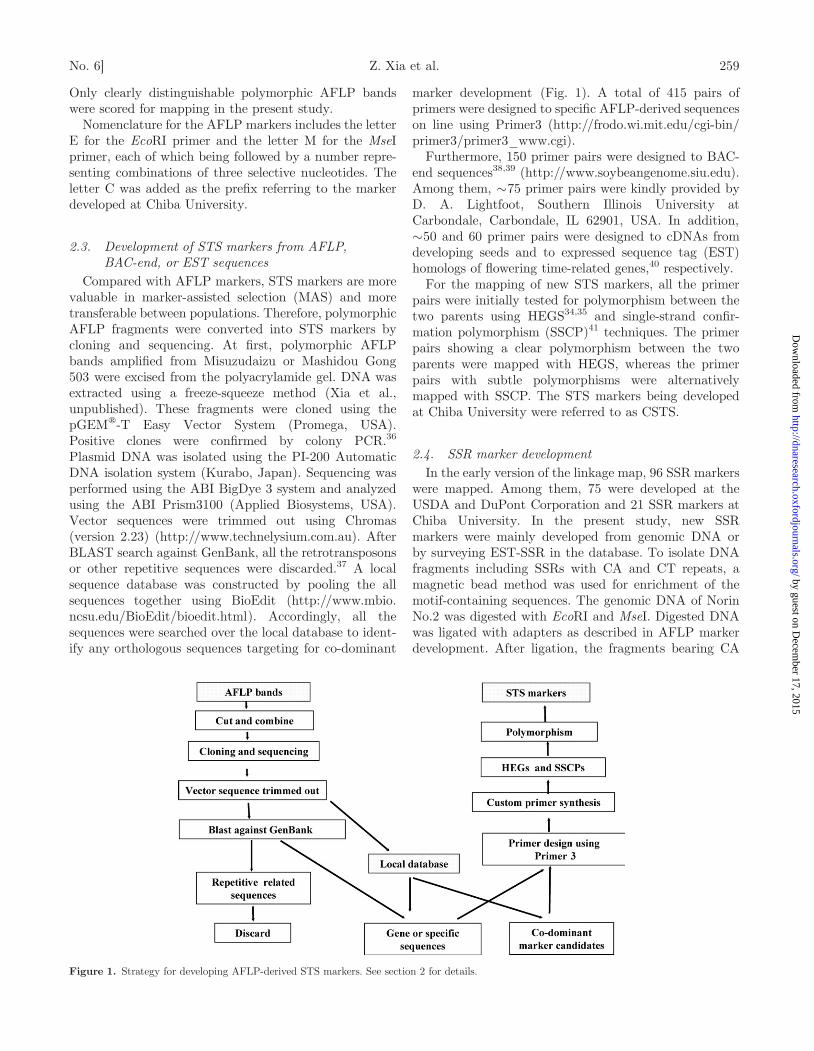
2.3. Development of STS markers from AFLP,BAC-end, or EST sequences
Compared with AFLP markers, STS markers are morevaluable in marker-assisted selection (MAS) and moretransferable between populations. Therefore, polymorphicAFLP fragments were converted into STS markers bycloning and sequencing. At first, polymorphic AFLPbands amplified from Misuzudaizu or Mashidou Gong503 were excised from the polyacrylamide gel. DNA wasextracted using a freeze-squeeze method (Xia et al.,unpublished). These fragments were cloned using thepGEMw-T Easy Vector System (Promega, USA).Positive clones were confirmed by colony PCR.36
Plasmid DNA was isolated using the PI-200 AutomaticDNA isolation system (Kurabo, Japan). Sequencing wasperformed using the ABI BigDye 3 system and analyzedusing the ABI Prism3100 (Applied Biosystems, USA).Vector sequences were trimmed out using Chromas(version 2.23) (http://www.technelysium.com.au). AfterBLAST search against GenBank, all the retrotransposonsor other repetitive sequences were discarded.37 A localsequence database was constructed by pooling the allsequences together using BioEdit (http://www.mbio.ncsu.edu/BioEdit/bioedit.html). Accordingly, all thesequences were searched over the local database to ident-ify any orthologous sequences targeting for co-dominant
marker development (Fig. 1). A total of 415 pairs ofprimers were designed to specific AFLP-derived sequenceson line using Primer3 (http://frodo.wi.mit.edu/cgi-bin/primer3/primer3_www.cgi).
Furthermore, 150 primer pairs were designed to BAC-end sequences38,39 (http://www.soybeangenome.siu.edu).Among them, �75 primer pairs were kindly provided byD. A. Lightfoot, Southern Illinois University atCarbondale, Carbondale, IL 62901, USA. In addition,�50 and 60 primer pairs were designed to cDNAs fromdeveloping seeds and to expressed sequence tag (EST)homologs of flowering time-related genes,40 respectively.
For the mapping of new STS markers, all the primerpairs were initially tested for polymorphism between thetwo parents using HEGS34,35 and single-strand confir-mation polymorphism (SSCP)41 techniques. The primerpairs showing a clear polymorphism between the twoparents were mapped with HEGS, whereas the primerpairs with subtle polymorphisms were alternativelymapped with SSCP. The STS markers being developedat Chiba University were referred to as CSTS.
2.4. SSR marker developmentIn the early version of the linkage map, 96 SSR markers
were mapped. Among them, 75 were developed at theUSDA and DuPont Corporation and 21 SSR markers atChiba University. In the present study, new SSRmarkers were mainly developed from genomic DNA orby surveying EST-SSR in the database. To isolate DNAfragments including SSRs with CA and CT repeats, amagnetic bead method was used for enrichment of themotif-containing sequences. The genomic DNA of NorinNo.2 was digested with EcoRI and MseI. Digested DNAwas ligated with adapters as described in AFLP markerdevelopment. After ligation, the fragments bearing CA
Figure 1. Strategy for developing AFLP-derived STS markers. See section 2 for details.
No. 6] Z. Xia et al. 259
by guest on Decem
ber 17, 2015http://dnaresearch.oxfordjournals.org/
Dow
nloaded from
and CT repeats were enriched with streptavidin-coatedparamagnetic particles (Promega) probed with 30-biotinylated (TG)8 and (AG)8 oligonucleotides, respect-ively. The enriched fraction was refined usingSUPRECw-02 (TaKaRa), amplified by MseI and EcoRIprimers and ligated to pGEMw-T Easy Vector System(Promega), and then transformed into Escherichia coliDH5a (Toyobo, Japan). The transformants were screenedby blue–white selection. The positive clones were ident-ified by colony hybridization using a DIG LuminescentDetection kit (Roche Diagnostics, USA) with DIG-labeled (TG)8 or (AG)8 probes. The PCR products ofthe positive clones were sequenced and the primers weredesigned using Primer 3 on line. In some cases, a dual-step method42,43 was used to isolate CA and CT-motifSSRs. The procedure was performed as previouslydescribed by Tamura et al.44 (AT)n(AC)n-motif SSRswere isolated using the streptavidin-coated magneticbeads described earlier, since this type of repeat is abun-dant in the soybean genome and AT repeats are difficultto screen directly due to the self-complementarity of theprobe sequence. The SSR markers including AC, AG,AT, AAC, AAG, AAT, ACG, AGT, ATG, GGA, GGC,and GCT core-motifs were developed from motif-containing EST sequences. These sequences were ident-ified by homology search of motif repeats against theEST data in DNA Data Bank of Japan (DDBJ) byFASTA. The minimum number of repeats for dinucleo-tide motif and trinucleotide motif SSRs was set to 10and 7, respectively. The SSR markers developed atChiba University were referred to as CSSRs in thepresent study.
2.5. RFLP analysisOn the basis of the earlier version of the linkage map,28
additional soybean cDNA clones derived from greenleaves and clones of up-regulated genes in the nodules ofLotus japonicus45 were employed as probes to generateRFLP markers. The DNA was digested with eight restric-tion enzymes, ApaI, BamHI, BglII, DraI, EcoRI, EcoRV,HindIII, and KpnI. Electrophoresis, Southern blottingand hybridization procedures were performed as pre-viously described.27
2.6. Linkage map constructionMost of the markers were mapped with F2 population
consisting of 192 individuals. However, �200 markers,including newly developed RFLP and AFLP-derivedSTS markers, were mapped with 94 randomly selectedF2 individuals. All the markers were checked against theexpected 3:1 segregation by the x2 test at a 5% signifi-cance level. The new marker data set was added to theoriginal data set to produce the combined data set.Linkage analyses were performed using MAPMAKER(version 3) software.46 The commands ‘try’, ‘order’, and
‘build’ in MAPMAKER were used independently or incombination to insert new marker(s) into the frame-work of the previously described linkage map.28
Recombination frequencies were converted into mapdistance in centimorgans using the Kosambi mappingfunction.47 A LOD score of 3.0 and a maximum distanceof 37.2 cM were used as linkage criteria for new markerinsertion. The error detection function was set ‘on’ todetect any possible scoring errors. The linkage map wasgraphically visualized with MapChart.48
3. Results
3.1. AFLP marker developmentOut of �800 primer pairs tested, 135 primer pairs that
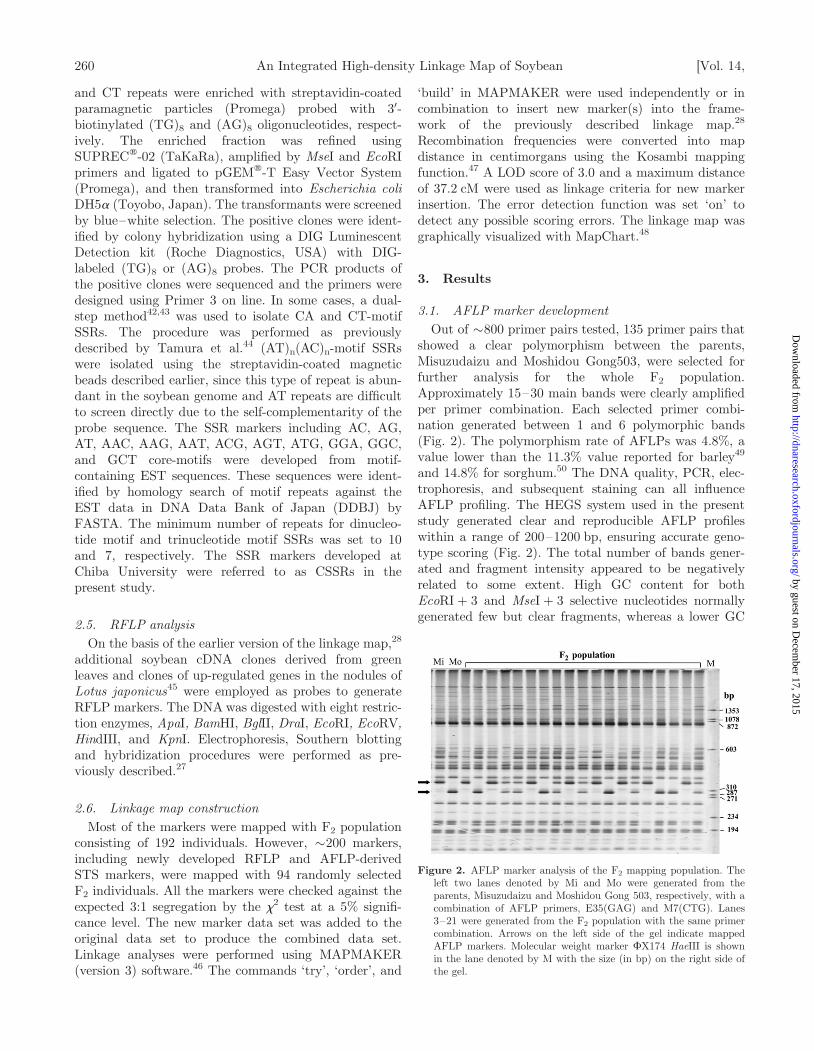
showed a clear polymorphism between the parents,Misuzudaizu and Moshidou Gong503, were selected forfurther analysis for the whole F2 population.Approximately 15–30 main bands were clearly amplifiedper primer combination. Each selected primer combi-nation generated between 1 and 6 polymorphic bands(Fig. 2). The polymorphism rate of AFLPs was 4.8%, avalue lower than the 11.3% value reported for barley49
and 14.8% for sorghum.50 The DNA quality, PCR, elec-trophoresis, and subsequent staining can all influenceAFLP profiling. The HEGS system used in the presentstudy generated clear and reproducible AFLP profileswithin a range of 200–1200 bp, ensuring accurate geno-type scoring (Fig. 2). The total number of bands gener-ated and fragment intensity appeared to be negativelyrelated to some extent. High GC content for bothEcoRI þ 3 and MseI þ 3 selective nucleotides normallygenerated few but clear fragments, whereas a lower GC
Figure 2. AFLP marker analysis of the F2 mapping population. Theleft two lanes denoted by Mi and Mo were generated from theparents, Misuzudaizu and Moshidou Gong 503, respectively, with acombination of AFLP primers, E35(GAG) and M7(CTG). Lanes3–21 were generated from the F2 population with the same primercombination. Arrows on the left side of the gel indicate mappedAFLP markers. Molecular weight marker FX174 HaeIII is shownin the lane denoted by M with the size (in bp) on the right side ofthe gel.
260 An Integrated High-density Linkage Map of Soybean [Vol. 14,
by guest on Decem
ber 17, 2015http://dnaresearch.oxfordjournals.org/
Dow
nloaded from
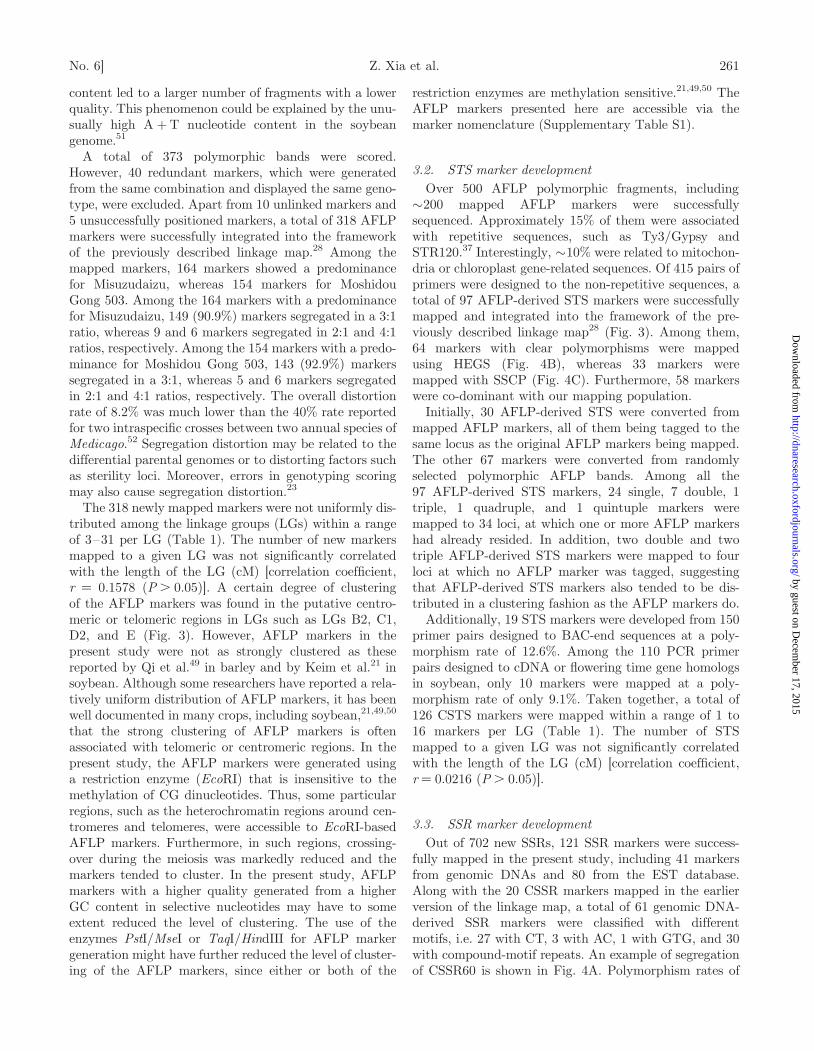
content led to a larger number of fragments with a lowerquality. This phenomenon could be explained by the unu-sually high A þT nucleotide content in the soybeangenome.51
A total of 373 polymorphic bands were scored.However, 40 redundant markers, which were generatedfrom the same combination and displayed the same geno-type, were excluded. Apart from 10 unlinked markers and5 unsuccessfully positioned markers, a total of 318 AFLPmarkers were successfully integrated into the frameworkof the previously described linkage map.28 Among themapped markers, 164 markers showed a predominancefor Misuzudaizu, whereas 154 markers for MoshidouGong 503. Among the 164 markers with a predominancefor Misuzudaizu, 149 (90.9%) markers segregated in a 3:1ratio, whereas 9 and 6 markers segregated in 2:1 and 4:1ratios, respectively. Among the 154 markers with a predo-minance for Moshidou Gong 503, 143 (92.9%) markerssegregated in a 3:1, whereas 5 and 6 markers segregatedin 2:1 and 4:1 ratios, respectively. The overall distortionrate of 8.2% was much lower than the 40% rate reportedfor two intraspecific crosses between two annual species ofMedicago.52 Segregation distortion may be related to thedifferential parental genomes or to distorting factors suchas sterility loci. Moreover, errors in genotyping scoringmay also cause segregation distortion.23
The 318 newly mapped markers were not uniformly dis-tributed among the linkage groups (LGs) within a rangeof 3–31 per LG (Table 1). The number of new markersmapped to a given LG was not significantly correlatedwith the length of the LG (cM) [correlation coefficient,r ¼ 0.1578 (P . 0.05)]. A certain degree of clusteringof the AFLP markers was found in the putative centro-meric or telomeric regions in LGs such as LGs B2, C1,D2, and E (Fig. 3). However, AFLP markers in thepresent study were not as strongly clustered as thesereported by Qi et al.49 in barley and by Keim et al.21 insoybean. Although some researchers have reported a rela-tively uniform distribution of AFLP markers, it has beenwell documented in many crops, including soybean,21,49,50
that the strong clustering of AFLP markers is oftenassociated with telomeric or centromeric regions. In thepresent study, the AFLP markers were generated usinga restriction enzyme (EcoRI) that is insensitive to themethylation of CG dinucleotides. Thus, some particularregions, such as the heterochromatin regions around cen-tromeres and telomeres, were accessible to EcoRI-basedAFLP markers. Furthermore, in such regions, crossing-over during the meiosis was markedly reduced and themarkers tended to cluster. In the present study, AFLPmarkers with a higher quality generated from a higherGC content in selective nucleotides may have to someextent reduced the level of clustering. The use of theenzymes PstI/MseI or TaqI/HindIII for AFLP markergeneration might have further reduced the level of cluster-ing of the AFLP markers, since either or both of the
restriction enzymes are methylation sensitive.21,49,50 TheAFLP markers presented here are accessible via themarker nomenclature (Supplementary Table S1).
3.2. STS marker developmentOver 500 AFLP polymorphic fragments, including�200 mapped AFLP markers were successfullysequenced. Approximately 15% of them were associatedwith repetitive sequences, such as Ty3/Gypsy andSTR120.37 Interestingly, �10% were related to mitochon-dria or chloroplast gene-related sequences. Of 415 pairs ofprimers were designed to the non-repetitive sequences, atotal of 97 AFLP-derived STS markers were successfullymapped and integrated into the framework of the pre-viously described linkage map28 (Fig. 3). Among them,64 markers with clear polymorphisms were mappedusing HEGS (Fig. 4B), whereas 33 markers weremapped with SSCP (Fig. 4C). Furthermore, 58 markerswere co-dominant with our mapping population.
Initially, 30 AFLP-derived STS were converted frommapped AFLP markers, all of them being tagged to thesame locus as the original AFLP markers being mapped.The other 67 markers were converted from randomlyselected polymorphic AFLP bands. Among all the97 AFLP-derived STS markers, 24 single, 7 double, 1triple, 1 quadruple, and 1 quintuple markers weremapped to 34 loci, at which one or more AFLP markershad already resided. In addition, two double and twotriple AFLP-derived STS markers were mapped to fourloci at which no AFLP marker was tagged, suggestingthat AFLP-derived STS markers also tended to be dis-tributed in a clustering fashion as the AFLP markers do.
Additionally, 19 STS markers were developed from 150primer pairs designed to BAC-end sequences at a poly-morphism rate of 12.6%. Among the 110 PCR primerpairs designed to cDNA or flowering time gene homologsin soybean, only 10 markers were mapped at a poly-morphism rate of only 9.1%. Taken together, a total of126 CSTS markers were mapped within a range of 1 to16 markers per LG (Table 1). The number of STSmapped to a given LG was not significantly correlatedwith the length of the LG (cM) [correlation coefficient,r ¼ 0.0216 (P . 0.05)].
3.3. SSR marker developmentOut of 702 new SSRs, 121 SSR markers were success-
fully mapped in the present study, including 41 markersfrom genomic DNAs and 80 from the EST database.Along with the 20 CSSR markers mapped in the earlierversion of the linkage map, a total of 61 genomic DNA-derived SSR markers were classified with differentmotifs, i.e. 27 with CT, 3 with AC, 1 with GTG, and 30with compound-motif repeats. An example of segregationof CSSR60 is shown in Fig. 4A. Polymorphism rates of
No. 6] Z. Xia et al. 261
by guest on Decem
ber 17, 2015http://dnaresearch.oxfordjournals.org/
Dow
nloaded from
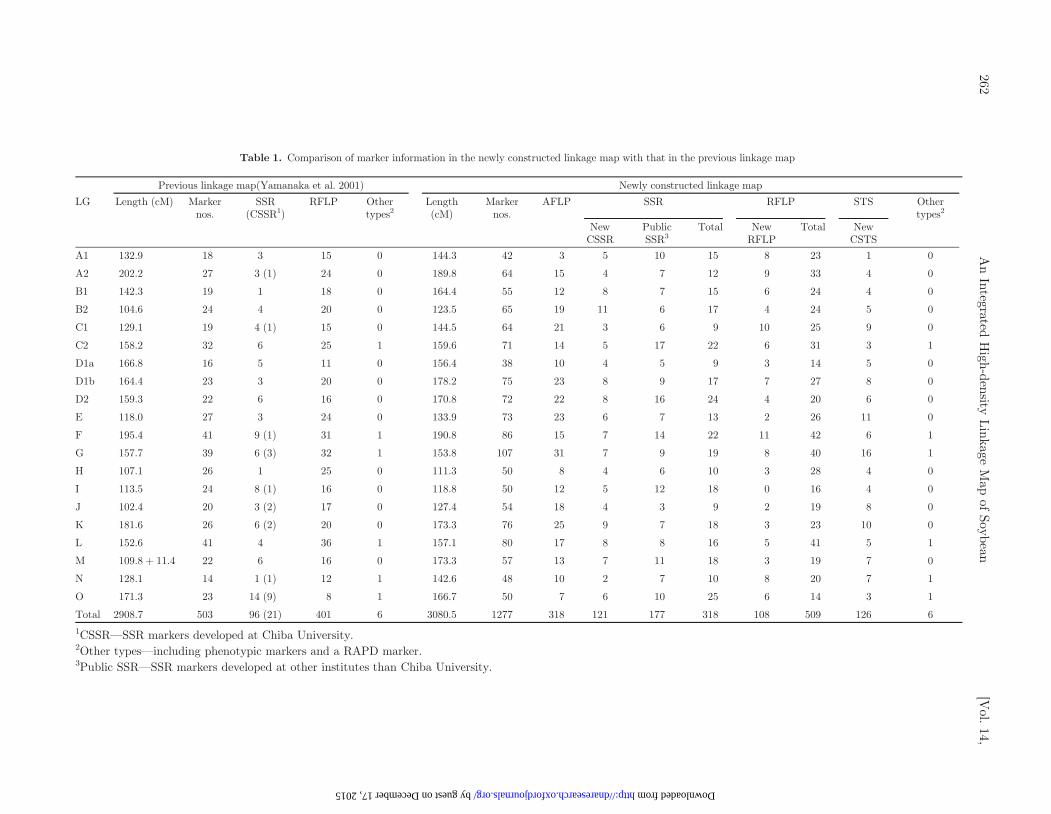
Table 1. Comparison of marker information in the newly constructed linkage map with that in the previous linkage map
Previous linkage map(Yamanaka et al. 2001) Newly constructed linkage map
LG Length (cM) Markernos.
SSR(CSSR1)
RFLP Othertypes2
Length(cM)
Markernos.
AFLP SSR RFLP STS Othertypes2
NewCSSR
PublicSSR3
Total NewRFLP
Total NewCSTS
A1 132.9 18 3 15 0 144.3 42 3 5 10 15 8 23 1 0
A2 202.2 27 3 (1) 24 0 189.8 64 15 4 7 12 9 33 4 0
B1 142.3 19 1 18 0 164.4 55 12 8 7 15 6 24 4 0
B2 104.6 24 4 20 0 123.5 65 19 11 6 17 4 24 5 0
C1 129.1 19 4 (1) 15 0 144.5 64 21 3 6 9 10 25 9 0
C2 158.2 32 6 25 1 159.6 71 14 5 17 22 6 31 3 1
D1a 166.8 16 5 11 0 156.4 38 10 4 5 9 3 14 5 0
D1b 164.4 23 3 20 0 178.2 75 23 8 9 17 7 27 8 0
D2 159.3 22 6 16 0 170.8 72 22 8 16 24 4 20 6 0
E 118.0 27 3 24 0 133.9 73 23 6 7 13 2 26 11 0
F 195.4 41 9 (1) 31 1 190.8 86 15 7 14 22 11 42 6 1
G 157.7 39 6 (3) 32 1 153.8 107 31 7 9 19 8 40 16 1
H 107.1 26 1 25 0 111.3 50 8 4 6 10 3 28 4 0
I 113.5 24 8 (1) 16 0 118.8 50 12 5 12 18 0 16 4 0
J 102.4 20 3 (2) 17 0 127.4 54 18 4 3 9 2 19 8 0
K 181.6 26 6 (2) 20 0 173.3 76 25 9 7 18 3 23 10 0
L 152.6 41 4 36 1 157.1 80 17 8 8 16 5 41 5 1
M 109.8 þ 11.4 22 6 16 0 173.3 57 13 7 11 18 3 19 7 0
N 128.1 14 1 (1) 12 1 142.6 48 10 2 7 10 8 20 7 1
O 171.3 23 14 (9) 8 1 166.7 50 7 6 10 25 6 14 3 1
Total 2908.7 503 96 (21) 401 6 3080.5 1277 318 121 177 318 108 509 126 6
1CSSR—SSR markers developed at Chiba University.2Other types—including phenotypic markers and a RAPD marker.3Public SSR—SSR markers developed at other institutes than Chiba University.
262A
nIntegrated
High-density
Linkage
Map
ofSoybean
[Vol.
14,
by guest on December 17, 2015 http://dnaresearch.oxfordjournals.org/ Downloaded from
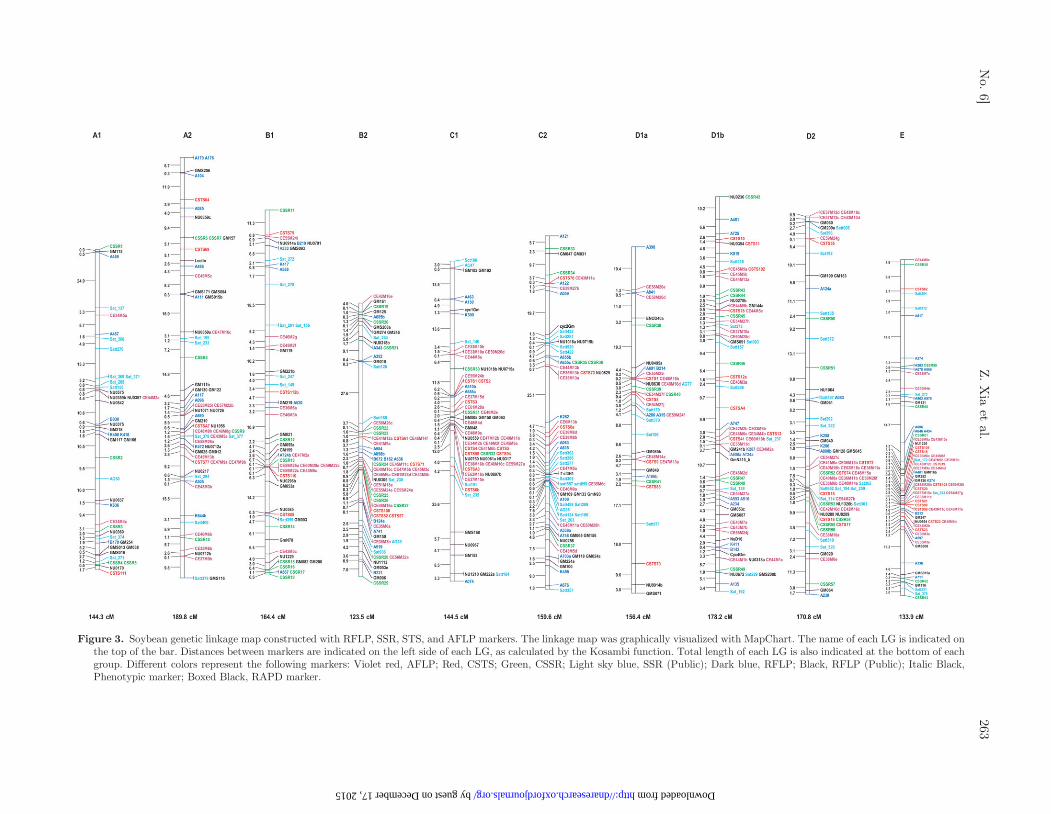
Figure 3. Soybean genetic linkage map constructed with RFLP, SSR, STS, and AFLP markers. The linkage map was graphically visualized with MapChart. The name of each LG is indicated onthe top of the bar. Distances between markers are indicated on the left side of each LG, as calculated by the Kosambi function. Total length of each LG is also indicated at the bottom of eachgroup. Different colors represent the following markers: Violet red, AFLP; Red, CSTS; Green, CSSR; Light sky blue, SSR (Public); Dark blue, RFLP; Black, RFLP (Public); Italic Black,Phenotypic marker; Boxed Black, RAPD marker.
No.
6]Z.X
iaet
al.263
by guest on December 17, 2015 http://dnaresearch.oxfordjournals.org/ Downloaded from
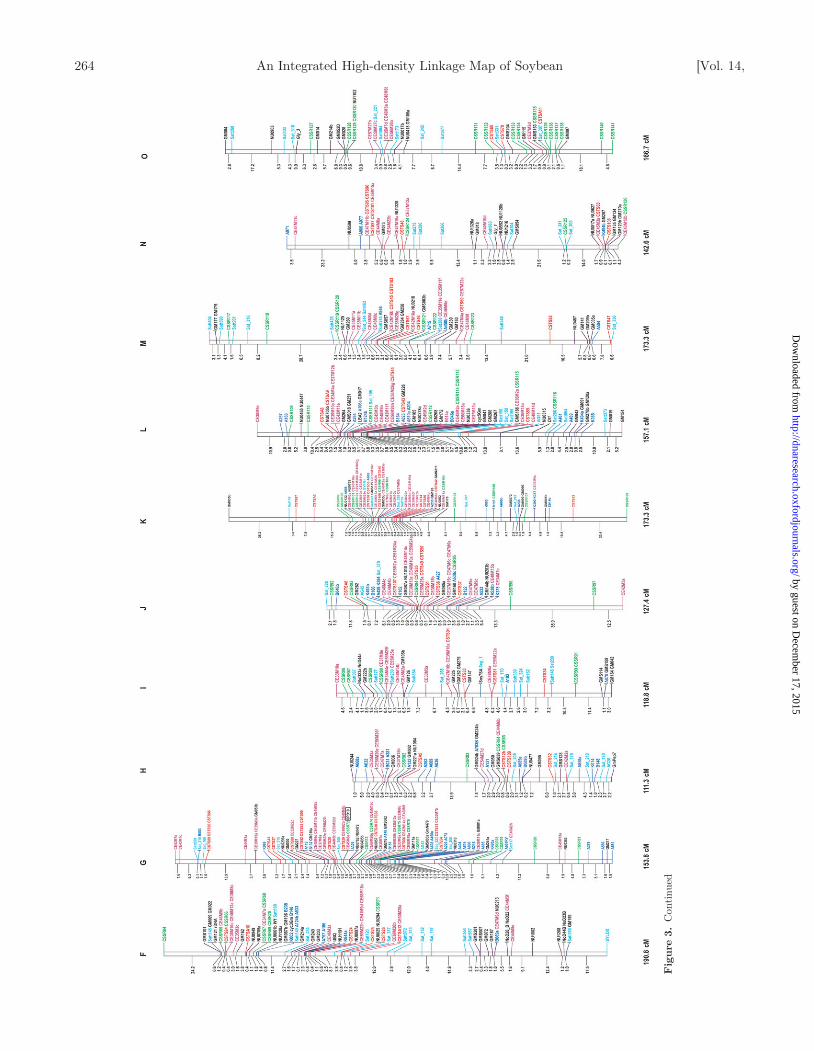
Fig
ure
3.
Con
tinu
ed
264 An Integrated High-density Linkage Map of Soybean [Vol. 14,
by guest on Decem
ber 17, 2015http://dnaresearch.oxfordjournals.org/
Dow
nloaded from
genomic SSRs were 8, 18, and 53% for AC repeats, CTrepeats, and (AT)n(AC)n motif, respectively.
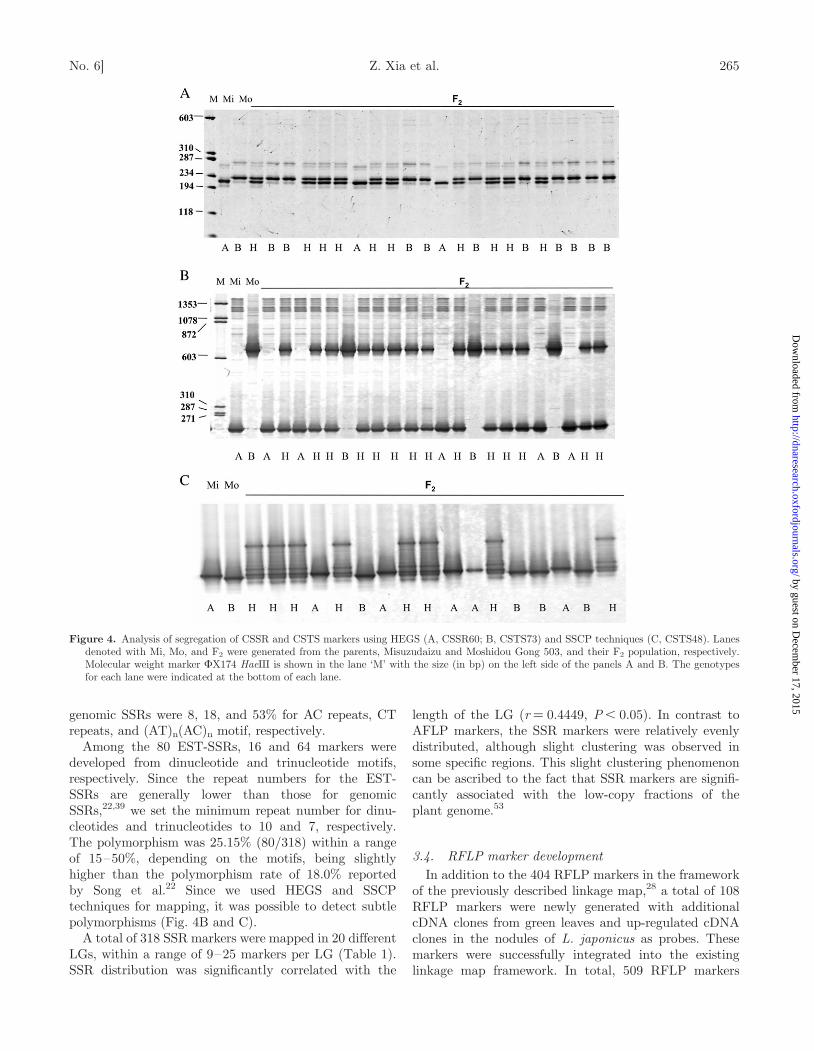
Among the 80 EST-SSRs, 16 and 64 markers weredeveloped from dinucleotide and trinucleotide motifs,respectively. Since the repeat numbers for the EST-SSRs are generally lower than those for genomicSSRs,22,39 we set the minimum repeat number for dinu-cleotides and trinucleotides to 10 and 7, respectively.The polymorphism was 25.15% (80/318) within a rangeof 15–50%, depending on the motifs, being slightlyhigher than the polymorphism rate of 18.0% reportedby Song et al.22 Since we used HEGS and SSCPtechniques for mapping, it was possible to detect subtlepolymorphisms (Fig. 4B and C).
A total of 318 SSR markers were mapped in 20 differentLGs, within a range of 9–25 markers per LG (Table 1).SSR distribution was significantly correlated with the
length of the LG (r ¼ 0.4449, P , 0.05). In contrast toAFLP markers, the SSR markers were relatively evenlydistributed, although slight clustering was observed insome specific regions. This slight clustering phenomenoncan be ascribed to the fact that SSR markers are signifi-cantly associated with the low-copy fractions of theplant genome.53
3.4. RFLP marker developmentIn addition to the 404 RFLP markers in the framework
of the previously described linkage map,28 a total of 108RFLP markers were newly generated with additionalcDNA clones from green leaves and up-regulated cDNAclones in the nodules of L. japonicus as probes. Thesemarkers were successfully integrated into the existinglinkage map framework. In total, 509 RFLP markers
Figure 4. Analysis of segregation of CSSR and CSTS markers using HEGS (A, CSSR60; B, CSTS73) and SSCP techniques (C, CSTS48). Lanesdenoted with Mi, Mo, and F2 were generated from the parents, Misuzudaizu and Moshidou Gong 503, and their F2 population, respectively.Molecular weight marker FX174 HaeIII is shown in the lane ‘M’ with the size (in bp) on the left side of the panels A and B. The genotypesfor each lane were indicated at the bottom of each lane.
No. 6] Z. Xia et al. 265
by guest on Decem
ber 17, 2015http://dnaresearch.oxfordjournals.org/
Dow
nloaded from
ware distributed among the LGs within a range of 13–44markers per LG (Table 1). However, RFLP distributionwas not significantly correlated with the length of theLG (r ¼ 0.2905, P . 0.05).
3.5. The characteristics of the current linkage mapOn the basis of the earlier version of the linkage map, a
total of 318 AFLP, 121 SSR, 108 RFLP, and 126 STSmarkers were newly developed and integrated (Table 1,Fig. 3). The current genetic map is composed of 1277loci at 2.41 cM intervals, covering a map distance of3080 cM (Kosambi function) in 20 LGs. Most SSR andRFLP markers were relatively evenly distributed amongthe different LGs, although the AFLP markers were mod-erately clustered and several relatively large gaps stillremained (Fig. 3). The coverage of the linkage map wasextended since 17 markers were mapped beyond distalends of the previous linkage map (Fig. 3). This is pre-sently the densest linkage map developed from a singleF2 population in soybean, although integrated maps,each of which was merged from several maps derivedfrom different mapping populations, have beenreported.23,24
3.6. Information about the developed markersThe information about the mapped markers regarding
LG, map position, gene/accession numbers, and primersequences and marker type is available in the onlineversion of this article (Supplementary Table S1). Inaddition, primer information for about the STS andSSR markers, which were developed but not presentedin Supplementary Table S1, is also accessible online-only (Supplementary Table S2).
4. Discussion
4.1. Marker order and position among differentmapping populations
In our updated linkage map, 139 SSR markers wereshared with the LGs described by Song et al.22 Mostmarkers were in consensus order in both LGs, indicatinga significant correlation (r ¼ 0.6064, P , 0.01) betweenthe length of the LGs in both maps.22 However, reversionsoccurred in some regions in LGs A1, D2, and G. In the LGG, the order of Sat_223 and Sat_260 was 0.2 cM apart inthe present map, whereas 0.22 cM apart with a reversedorder in the linkage map constructed by Song et al.22
Comparison of different linkage maps constructed fromdifferent populations with a different genetic backgroundusing different marker sets indicated that most markersshowed the consensus order, although some intervals orregions always displayed some discrepancy in the markerorder or positions. This phenomenon may be due to inver-sion, insertion, deletion, or transition of genomic regionsas well as meiotic drive and gametic or zygotic selection.23
Also, possible errors in genotyping scoring may distortmarker orders and segregation ratios.23 In soybean,some markers, especially RFLP markers, could bemapped on more than one LG. Because soybean is anallotetraploid, it has been shown that for over 90% ofthe non-repetitive sequences in the soybean genome,there were two closely related copies at different loci.7
As reported earlier, there was some inconsistency existedbetween physical map and genetic map regarding themarker order and positions.54–56 With the new progressmade in genome sequencing and comparative mapping,it is likely that these discrepancies or inconsistencies willbe reduced or eventually clarified.
4.2. AFLP-derived STS markersConversion of AFLP fragments into polymorphic STS
markers would enable to achieve a high throughputscoring of genotypes in fine mapping and MAS in breed-ing.57 Development of AFLP-derived STS markers tendto be laborious and time-consuming due to the lower con-version efficiency. The lower polymorphism rate for STSor other markers22 may be due to the low sequence vari-ation in soybean and its wild ancestor G. soja.24 Zhuet al.58 reported values of 0.5 and 4.7 SNPs/Kb incoding and non-coding perigenic DNA, respectively. Asa result, the polymorphism rate was 10 times lower thanthat reported in maize.59,60 AFLP-derived STS markersdeveloped in the present study displayed a high degreeof transferability since most of them showed polymorph-ism in the RIL populations, Jack � Fukuyataka andPeking � Akita (Hwang et al., personal communication).Although 97 AFLP-derived STSs and 29 BAC and EST-derived STSs have been developed, the number is notnecessarily large enough for a saturated map.
4.3. Comparison with the earlier versionof the linkage map
As a total of 673 newly developed AFLP, SSR, RFLP,and STS markers in addition to 101 new public SSRmarkers were integrated, the average intermarker distancewas reduced by more than twofold to 2.41 from 5.78 cM inthe earlier version of the linkage map.28 In addition, theproportion of PCR-based markers was 34.8%, a muchhigher value than the 19.2% reported in the earlierversion of the linkage map. A large gap of more than37.5 cM in LG C1 was filled and two unlinked LGs forLG M were joined. The number of gaps of more than25 cM was reduced to 6 from 19 in the earlier version ofthe linkage map.28 Similar large gaps were also presenton the same or similar positions in a linkage map con-structed from a RIL population derived from thecurrent mapping population, using an other set ofmarkers (Hayashi et al., unpublished result), indicatingthat some of these gaps may be partially associatedwith the nature of the genome structure of the parents.
266 An Integrated High-density Linkage Map of Soybean [Vol. 14,
by guest on Decem
ber 17, 2015http://dnaresearch.oxfordjournals.org/
Dow
nloaded from
Some hot-spots of recombination may lead to enlargedgaps in the genetic linkage map, in spite of short physicaldistances. In addition, the degree of coverage of the newlyconstructed linkage map was improved, as 17 markerswere mapped beyond the distal ends of the LGs in theprevious linkage map.
4.4. Usefulness of the linkage mapMap-based cloning requires very fine resolution
mapping in the target interval, since the highest markerdensity can shorten chromosome walking. MAS is mosteffective when the markers are tightly linked to the geneof interest since crossing-over between the gene andmarkers dramatically decreases. In general, accurate andconsistent integrated genetic and physical maps55,56 ofthe soybean genome should enable to distinguish new orsubtle QTL(s) from any of the more than a thousandidentified QTLs, and thereafter to clone and functionallyconfirm cloned QTL genes. Several agronomically andbiologically important trait loci such as flowering time,growth habit, and seed quality have been identified withthis mapping population28 and its progeny.31 In particu-lar, 17 markers were tagged in the 5.7 cM intervalbetween CE47M5a and Satt100 on LG C2, wherevarious important QTLs were clustered. The currentsoybean linkage map became more informative anduseful for positional cloning of agronomically importantgenes for traits including QTLs that are harbored bythe parents. On the basis of this linkage map, severalresidual heterozygous lines (RHLs) have been developedfrom the progeny of this mapping population for fine-mapping of several QTLs.61 More than 30 primer pairstargeting SSR motifs have been specifically developedfrom physical contigs of the flowering time QTLs (FT1,FT2, and FT3), 70% of which displaying polymorphismbetween the parents. These markers should enable tofurther narrow the QTL gene regions toward the cloningof candidate QTL(s) (Xia et al. and Watanabe et al.,unpublished results).
Soybean originated in East Asia and the vast collectionof wild species and landraces should provide useful geneticresources for studies on soybean genomics. Recent studieshave revealed that a large number of wild species ofsoybean contain a wide range of secondary metabolitecompounds, which have preliminarily been found to bebeneficial to human health.1–3 Genetic differences in thesecondary metabolite compounds between the cultivarMisuzudaizu and the intermediate weedy formMoshidou Gong 503 were also observed.
4.5. Future perspectivesOwing to the presence of relatively large gaps or marker-
sparse regions, targeted marker development via BACsequencing62 is a powerful tool. An accurate and consistentintegrated genetic map is useful for physical map
development and whole genome sequencing. Conversely,a large number of targeted SSR and STS markers can begenerated from genome sequencing for saturation of thelinkage map in soybean. Furthermore, due to the lowerpolymorphism rate in the soybean genome, new types ofmarkers such as SNP-based markers need to be graduallyincorporated due to their abundance in the soybeangenome and technical applicability.24 Ideally, near orover 10 000 evenly distributed PCR-based markers couldsatisfy most applications including QTL gene isolation,evolution studies, and other field of genomics.
Supplementary Data: Supplementary data areavailable online at www.dnaresearch.oxfordjournals.org
Acknowledgments: We wish to thank ProfessorJ. Rees, University of Western Cape, South Africa, forthe critical reading of the manuscript and ProfessorD. A. Lightfoot, Southern Illinois University, forproviding the primer pairs.
Funding: Ministry of Agriculture, Forestry andFisheries (Rice Genome Project DM-2109, GreenTechnology Project DM-1213); Japan InternationalResearch Center for Agricultural Sciences(Comprehensive Studies on Soybean Improvement,Production and Utilization in South America); Programfor the Promotion of Basic Research Activities forInnovative Biosciences; Ministry of Education, Science,Sports, and Culture of Japan (935600).
References
1. Liu, K. 2004, Soy Isoflavones, In: Liu, K. (ed.), Chemistry,Processing Effects, Health Benefits, and Functional Foodsand Ingredients, Champaign, IL: AOCS Press, pp. 52–72.
2. Lin, J. and Wang, C. 2004, Soybean Saponins, In: Liu, K.(ed.), Chemistry, Processing Effects, Health Benefits, andFunctional Foods and Ingredients, Champaign, IL: AOCSPress, pp. 73–100.
3. Messina, M. J. 2005, Potential public health implications ofthe hypocholesterolemic effects of soy protein, Nutrition, 19,280–281.
4. Stacey, G., Vodkin, L., Parrott, W. A. and Shoemaker, R. C.2004, National Science Foundation-sponsored workshopreport. Draft plan for soybean genomics, Plant Physiol.,135, 59–70.
5. Jackson, S. A., Rokhsar, D., Stacey, G., Shoemaker, R. C.,Schmutz, J. and Grimwood, J. 2006, Toward a referencesequence of the soybean genome: a multiagency effort,Crop. Sci., 46, 55–61.
6. Arumaganthan, K. and Earle, E. 1991, Nuclear DNAcontent of some important plant species, Plant Mol. Biol.Rep., 9, 208–218.
7. Shoemaker, R. C., Polzin, K., Labate, J., et al. 1996,Genome duplication in soybean (Glycine subgenus soja).Genetics, 144, 329–338.
8. Goldberg, R. B. 1978, DNA sequence organization in thesoybean plant, Biochem. Genet., 16, 45–68.
No. 6] Z. Xia et al. 267
by guest on Decem
ber 17, 2015http://dnaresearch.oxfordjournals.org/
Dow
nloaded from
9. Danesh, D., Penuela, S., Mudge, J., et al. 1998, A bacterialartificial chromosome library for soybean and identificationof clones near a major cyst nematode resistance gene, Theor.Appl. Genet., 96, 196–202.
10. Lavin, M., Herendeen, P. S. and Wojciechowski, M. F. 2005,Evolutionary rates analysis of Leguminosae implicates arapid diversification of lineages during the tertiary, Syst.Biol., 54, 575–594.
11. Gepts, P., Beavis, W. D., Brummer, E. C., et al. 2005,Legumes as a model plant family. Genomics for food andfeed report of the cross-legume advances through genomicsconference, Plant Physiol., 137, 1228–1235.
12. Palmer, R. G. and Kilen, T. C. 1987, Qualitative geneticsand cytogenetics, Agronomy, 16, 135–209.
13. Keim, P., Diers, B. W., Olson, T. C. and Shoemaker, R. C.1990, RFLP mapping in soybean: association betweenmarker loci and variation in quantitative traits, Genetics,126, 735–742.
14. Lark, K. G., Weisemann, J. M., Mathews, B. F., Palmer, R.,Chase, K. and Macalma, T. 1993, A genetic map of soybean(Glycine max L.) using an intraspecific cross of two culti-vars: ‘Minsoy’ and ‘Noir 1’, Theor. Appl. Genet., 86,901–906.
15. Shoemaker, R. C. and Specht, J. E. 1995, Integration of thesoybean molecular and classical genetic linkage groups,Crop. Sci., 35, 436–446.
16. Mansur, L. M., Orf, J. H., Chase, K., Jarvik, T.,Cregan, P. B. and Lark, K. G. 1996, Genetic mapping ofagronomic traits using recombinant inbred lines ofsoybean, Crop. Sci., 36, 1327–1336.
17. Ferreira, A. R., Foutz, K. R. and Keim, P. 2000, Soybeangenetic map of RAPD markers assigned to an existing scaf-fold RFLP map, J. Hered., 91, 392–396.
18. Akkaya, M. S., Shoemaker, R. C., Specht, J. E.,Bhagwat, A. A. and Cregan, P. B. 1995, Integration ofsimple sequence repeat DNA markers into a soybeanlinkage map, Crop. Sci., 35, 1439–1445.
19. Cregan, P. B., Jarvik, T., Bush, A. L., et al. 1999, An inte-grated genetic linkage map of the soybean, Crop. Sci., 39,1464–1490.
20. Maughan, P. J., Marouf, M. A. S., Buss, G. R. andHuestis, G. M. 1996, Amplified fragment length polymorph-ism (AFLP) in soybean: species diversity, inheritance, andnear-isogenic line analysis, Theor. Appl. Genet., 93,392–401.
21. Keim, P., Schupp, J. M., Travis, S. E., et al. 1997, A high-density soybean genetic map based on AFLP markers,Crop. Sci., 37, 537–543.
22. Song, Q. J., Marek, L. F., Shoemaker, R. C., et al. 2004, Anew integrated genetic linkage map of the soybean, Theor.Appl. Genet., 109, 122–128.
23. Kassem, M. A., Shultz, J., Meksem, K., et al. 2006, Anupdated ‘Essex’ by ‘Forrest’ linkage map and first compositeinterval map of QTL underlying six soybean traits, Theor.Appl. Genet., 113, 1015–1026.
24. Choi, I. Y., Hyten, D. L., Matukumalli, L. K., et al. 2007, Asoybean transcript map: gene distribution, haplotype andsingle-nucleotide polymorphism analysis, Genetics, 176,685–696.
25. Hymowitz, T. 2004, Speciation and cytogenetics, In:Boerma, H. R. and Specht, J. E. (eds.), Soybeans:
Improvement, Production and Uses, 3rd Ed., AgronomyMonograph No. 16, Madison, WI: American Society ofAgronomy-Crop Science Society of America-Soil ScienceSociety of America, 97–136.
26. Smartt, J. 1990, Grain Legumes-Evolution and GeneticResources, Cambridge: Cambridge University Press,246–257.
27. Yamanaka, N., Nagamura, Y., Tsubokura, Y., et al. 2000,Quantitative trait locus analysis of flowering time insoybean using a RFLP linkage map, Breed. Sci., 50,109–115.
28. Yamanaka, N., Ninomiya, S., Hoshi, M., et al. 2001, Aninformative linkage map of soybean reveals QTLs for flower-ing time, leaflet morphology and regions of segregationdistortion, DNA Res., 8, 61–72.
29. Hossain, K., Kawai, G., Hayashi, H., Hoshi, M.,Yamanaka, N. and Harada, K. 2000, Characterization andidentification of (CT)n microsatellites in soybean usingsheared genomic libraries, DNA Res., 7, 103–110.
30. Tajuddin, T., Watanabe, S., Yamanaka, N. and Harada, K.2003, Analysis of quantitative trait loci for protein and lipidcontents in soybean seeds using recombinant inbred lines,Breed. Sci., 53, 133–140.
31. Watanabe, S., Tadjuddin, T., Yamanaka, N., Hayashi, M.and Harada, K. 2004, Analysis of QTLs for reproductivedevelopment and seed quality traits in soybean using recom-binant inbred lines, Breed. Sci., 54, 399–407.
32. Murray, M. G. and Thompson, W. F. 1980, Rapid isolationof high molecular weight plant DNA, Nucleic Acids Res., 8,4321–4325.
33. Vos, P., Hogers, R., Bleeker, M., et al. 1995, AFLP: a newtechnique for DNA fingerprinting, Nucleic Acids Res., 23,4407–4414.
34. Kawasaki, S. and Murakami, Y. 2000, Genome analysis ofLotus japonicus, J. Plant Res., 113, 497–506.
35. Hayashi, M., Miyahara, A., Sato, S., et al. 2001,Construction of a genetic linkage map of the modellegume Lotus japonicus using an intraspecific F2 population,DNA Res., 8, 301–310.
36. Sambrook, J., Frietsch, E. F. and Maniatis, T. 1989,Molecular Cloning: A Laboratory Manual, 2nd Ed., ColdSpring Harbor, NY: Cold Spring Harbor Laboratory.
37. Laten, H. M., Havecker, E. R., Farmer, L. M. andVoytas, D. F. 2003, SIRE1, an endogenous retrovirusfamily from Glycine max, is highly homogeneous and evolu-tionarily young, Mol. Biol. Evol., 20, 1222–1230.
38. Xia, Z., Sato, H., Watanabe, S., Kawasaki, S. andHarada, K. 2005, Construction and characterization of aBAC library of soybean, Euphytica, 141, 129–137.
39. Shultz, J. L., Kazi, S., Bashir, R., Afzal, J. A. andLightfoot, D. A. 2007, The development of BAC-endsequence-based microsatellite markers and placement inthe physical and genetic maps of soybean, Theor. Appl.Genet., 114, 1081–1090.
40. Hecht, V., Foucher, F., Ferrandiz, C., et al. 2005,Conservation of Arabidopsis flowering genes in modellegumes, Plant Physiol., 137, 1420–1434.
41. Shirasawa, K., Monna, L., Kishitani, S. and Nishio, T. 2004,Single nucleotide polymorphisms in randomly selected genesamong japonica rice (Oryza sativa L.) varieties identified byPCR-RF-SSCP, DNA Res., 11, 275–283.
268 An Integrated High-density Linkage Map of Soybean [Vol. 14,
by guest on Decem
ber 17, 2015http://dnaresearch.oxfordjournals.org/
Dow
nloaded from
42. Lian, C., Zhou, Z. and Hougetsu, T. 2001, A simple methodfor developing microsatellite markers using amplified frag-ments of inter-simple sequence repeat (ISSR), J. PlantRes., 114, 381–385.
43. Lian, C., Hougetsu, T., Matsushit, N. G., Alexis, L.,Suzuki, K. and Yamada, A. 2003, Development of micro-satellite markers from an ectomycorrhizal fungus,Tricholoma matsutake, by an ISSR-suppression-PCRmethod, Mycorrhiza, 13, 27–31.
44. Tamura, K., Nishioka, M., Hayashi, M., et al. 2005,Development of microsatellite markers by ISSR-suppres-sion-PCR method in Brassica rapa, Breed. Sci., 55,247–252.
45. Kouchi, H., Shimomura, K., Hata, S., et al. 2004, Largescale analysis of gene expression profiles during earlystages of root nodule formation in a model legume, Lotusjaponicus, DNA Res., 11, 263–274.
46. Lander, E. S., Green, P., Abrahamson, J., et al. 1987,MAPMAKER: an interactive computer package for con-structing primary linkage maps of experimental andnatural populations, Genomics, 1, 174–181.
47. Kosambi, D. D. 1944, The estimation of map distances fromrecombination values, Ann. Eugen., 12, 172–175.
48. Voorrips, R. E. 2002, MapChart: Software for the graphicalpresentation of linkage maps and QTLs, J. Heredity, 93,77–78.
49. Qi, X., Stam, P. and Lindhout, P. 1998, Use of locus-specificAFLP markers to construct a high-density molecular map inbarley, Theor. Appl. Genet., 96, 376–384.
50. Klein, P. E., Klein, R. R., Cartinhour, S. W., et al. 2000, Ahigh-throughput AFLP-based method for constructingintegrated genetic and physical maps: progress toward asorghum genome map, Genome Res., 10, 789–807.
51. Zhu, T., Oliphant, A., Schupp, J. M. and Keim, P. 1994,Hypomethylated DNA sequences: characterization of theduplicated soybean genome, Mol. Gen. Genet., 244,638–645.
52. Jenczewski, E., Ghererdi, M., Bonnin, I., Prosperi, J. M.,Olivieri, I. and Huguet, T. 1997, Insight on segregation dis-tortion in two intraspecific crosses between annual species of
Medicago (Leguminosae), Theor. Appl. Genet., 94,682–691.
53. Morgante, M., Hanafey, M. and Powell, W. 2002,Microsatellites are preferentially associated with nonrepeti-tive DNA in plant genomes, Nat. Genet., 30, 194–200.
54. Shultz, J. L, Meksem, K. and Lightfoot, D. A. 2003,Evaluating physical maps by clone location comparison,Genome Lett., 2, 99–107.
55. Shultz, J. L., Kurunam, D. J., Shopinski, K. L., et al. 2006,The soybean genome database (SoyGD): a browser fordisplay of duplicated, polyploid, regions and sequencetagged sites on the integrated physical and genetic mapsof Glycine max, Nucleic Acids Res., 34, D758–D765.
56. Wu, C. S., Sun, P., Nimmakayala, P., et al. 2004, A BAC-and BIBAC-based physical map of the soybean genome,Genome Res., 14, 319–326.
57. Meksem, K., Ruben, E., Hyten, D., Triwitayakorn, K. andLightfoot, D. A. 2001, Conversion of AFLP bands intohigh-throughput DNA markers, Mol. Genet. Genomics,265, 207–214.
58. Zhu, Y. L., Song, Q. J., Hyten, D. L., et al. 2003, Single-nucleotide polymorphisms in soybean, Genetics, 163,1123–1134.
59. Tenaillon, M. I., Sawkins, M. C., Long, A. D., Gaut, R. L.,Doebley, J. F. and Gaut, B. S. 2001, Patterns of DNAsequence polymorphism along chromosome 1 of maize(Zea mays ssp. mays L.), Proc. Natl. Acad. Sci. USA, 98,9161–9166.
60. Ching, A., Caldwell, K. S., Jung, M., et al. 2002, SNP, fre-quency, haplotype structure and linkage disequilibrium inelite maize inbred lines, BMC Genetics, 3, 19.
61. Yamanaka, N., Watanabe, S., Toda, K., et al. 2005, Finemapping of the FT1 locus for soybean flowering timeusing a residual heterozygous line derived from arecombinant inbred line, Theor. Appl. Genet., 110,634–639.
62. Cregan, P. B., Mudge, J., Fickus, E. W., et al. 1999,Targeted isolation of simple sequence repeat markersthrough the use of bacterial artificial chromosomes, Theor.Appl. Genet., 98, 919–928.
No. 6] Z. Xia et al. 269
by guest on Decem
ber 17, 2015http://dnaresearch.oxfordjournals.org/
Dow
nloaded from


