Embed Size (px)
Citation preview
Journal Articles Donald and Barbara Zucker School of MedicineAcademic Works
2018
An eQTL Landscape of Kidney Tissue in HumanNephrotic SyndromeC. E. Gillies
R. Putler
R. Menon
E. Otto
K. Yasutake
See next page for additional authors
Follow this and additional works at: https://academicworks.medicine.hofstra.edu/articlesPart of the Pediatrics Commons
This Article is brought to you for free and open access by Donald and Barbara Zucker School of Medicine Academic Works. It has been accepted forinclusion in Journal Articles by an authorized administrator of Donald and Barbara Zucker School of Medicine Academic Works. For moreinformation, please contact [email protected].
Recommended CitationGillies CE, Putler R, Menon R, Otto E, Yasutake K, Nair V, Hoover P, Lieb D, Sethna C, Abbott K, . An eQTL Landscape of KidneyTissue in Human Nephrotic Syndrome. . 2018 Jan 01; 103(2):Article 4754 [ p.]. Available from:https://academicworks.medicine.hofstra.edu/articles/4754. Free full text article.
brought to you by COREView metadata, citation and similar papers at core.ac.uk
provided by Hofstra Northwell Academic Works (Hofstra Northwell School of Medicine)
AuthorsC. E. Gillies, R. Putler, R. Menon, E. Otto, K. Yasutake, V. Nair, P. Hoover, D. Lieb, C. Sethna, K. Abbott, and+89 additional authors
This article is available at Donald and Barbara Zucker School of Medicine Academic Works:https://academicworks.medicine.hofstra.edu/articles/4754
ARTICLE
An eQTL Landscape of Kidney Tissuein Human Nephrotic Syndrome
Christopher E. Gillies,1,8 Rosemary Putler,1,8 Rajasree Menon,2,8 Edgar Otto,3 Kalyn Yasutake,1
Viji Nair,3 Paul Hoover,4,5 David Lieb,5 Shuqiang Li,5 Sean Eddy,3 Damian Fermin,1
Michelle T. McNulty,1 Nephrotic Syndrome Study Network (NEPTUNE), Nir Hacohen,4,5
Krzysztof Kiryluk,6 Matthias Kretzler,2,3,9 Xiaoquan Wen,7,9 and Matthew G. Sampson1,9,10,*
Expression quantitative trait loci (eQTL) studies illuminate the genetics of gene expression and, in disease research, can be particularly
illuminating when using the tissues directly impacted by the condition. In nephrology, there is a paucity of eQTL studies of human
kidney. Here, we used whole-genome sequencing (WGS) and microdissected glomerular (GLOM) and tubulointerstitial (TI) transcrip-
tomes from 187 individuals with nephrotic syndrome (NS) to describe the eQTL landscape in these functionally distinct kidney
structures. Using MatrixEQTL, we performed cis-eQTL analysis on GLOM (n ¼ 136) and TI (n ¼ 166). We used the Bayesian ‘‘Determin-
istic Approximation of Posteriors’’ (DAP) to fine-map these signals, eQTLBMA to discover GLOM- or TI-specific eQTLs, and single-cell
RNA-seq data of control kidney tissue to identify the cell type specificity of significant eQTLs. We integrated eQTL data with an IgA
Nephropathy (IgAN) GWAS to perform a transcriptome-wide association study (TWAS). We discovered 894 GLOM eQTLs and
1,767 TI eQTLs at FDR< 0.05. 14% and 19% of GLOM and TI eQTLs, respectively, had>1 independent signal associated with its expres-
sion. 12% and 26% of eQTLs were GLOM specific and TI specific, respectively. GLOM eQTLs were most significantly enriched in
podocyte transcripts and TI eQTLs in proximal tubules. The IgAN TWAS identified significant GLOM and TI genes, primarily at the
HLA region. In this study, we discovered GLOM and TI eQTLs, identified those that were tissue specific, deconvoluted them into
cell-specific signals, and used them to characterize known GWAS alleles. These data are available for browsing and download via our
eQTL browser, ‘‘nephQTL.’’
Introduction
Nephrotic syndrome (NS) is a rare disease of glomerular
filtration barrier failure,1,2 causing massive urinary excre-
tion of protein, that can progress to chronic kidney disease
(CKD) and end-stage renal disease (ESRD).3,4 NS is a hetero-
geneous disease, so we use the histologic descriptions of
glomeruli on kidney biopsy to diagnose individuals with
‘‘minimal change disease (MCD)’’ and ‘‘focal segmental
glomerulosclerosis (FSGS).’’ Additionally, we use an indi-
vidual’s response to these treatments to give them a post
hoc diagnosis of steroid-sensitive NS (SSNS) or steroid-
resistant NS (SRNS).
Understanding how human genetic variation contrib-
utes to the development and progression of NS has been
a fruitful strategy in gaining a more precise understanding
of the molecular underpinnings of NS.5 More than 50
genes have been discovered that harbor rare variants
sufficient to cause SRNS (‘‘Mendelian’’ NS).6 Through
genome-wide association studies (GWASs) and exome-
chip studies,7–10 common genetic variants have been
discovered that contribute to the pathogenesis of FSGS,
pediatric SSNS, and membranous nephropathy (MN).
Rare variant association studies in FSGS have implicated
a small set of genes harboring an increased burden of
rare, deleterious variants.8 We are challenged to discover
additional forms of NS-associated genetic variation to
gain biological and clinical insights.
Expression quantitative trait loci (eQTL) studies, which
use mRNA expression as a proximal (and continuous)
cellular endophenotype, have increased power for the
discovery of statistically significant genetic effects as
compared to GWASs and provides inherent biological
meaning in the associations between a regulatory variant
and its associated gene.11–14 The GTEx project has gener-
ated eQTL data which is publicly available and has been
used extensively to help interpret GWAS signals emerging
from other complex traits.15 Meaningful eQTL discoveries
using the affected tissues in other human diseases suggest
their potential for NS genomic discovery as well. This is
appealing given that we often obtain kidney tissue via
biopsy from affected individuals.
With regards to kidney eQTLs, the final release of GTEx
will have only 73 kidney cortex samples. There is also an
1Department of Pediatrics-Nephrology, University of Michigan School of Medicine, Ann Arbor, MI 48109, USA; 2Department of Computational Medicine
and Bioinformatics, University of Michigan School of Medicine, Ann Arbor, MI 48109, USA; 3Department of Medicine-Nephrology, University of Michigan
School of Medicine, Ann Arbor, MI 48109, USA; 4Department of Medicine, Massachusetts General Hospital Cancer Center, Boston, MA 02114, USA; 5Broad
Institute of the Massachusetts Institute of Technology (MIT) and Harvard, Cambridge, MA 02142, USA; 6Department of Medicine, Division of Nephrology,
College of Physicians & Surgeons, Columbia University, New York, NY, USA; 7Department of Biostatistics, University of Michigan School of Public Health,
Ann Arbor, MI 48109, USA8These authors contributed equally to this work9These authors contributed equally to this work10Twitter: @kidneyomicsamps
*Correspondence: [email protected]
https://doi.org/10.1016/j.ajhg.2018.07.004.
232 The American Journal of Human Genetics 103, 232–244, August 2, 2018
� 2018 American Society of Human Genetics.
absence of any other major public kidney eQTL datasets.
This represents a significant barrier for genomic discovery
in nephrology.
The most comprehensive kidney eQTL study thus far
discovered them using unaffected portions of 96 nephrec-
tomy samples from The Cancer Genome Atlas.16 The
investigators integrated these eQTLs with risk loci for
CKD to establish links between these risk alleles and
molecular mechansims.16 A limitation of this study was
that bulk renal cortex was used for association, which is
known to be 80% proximal tubule cells. The preponder-
ance of this cell type may obscure eQTL signals emerging
from the structurally and cellularly heterogeneous kidney.
This study also exclusively used healthy tissue, which
prevents an opportunity to potentially discover disease-
context-specific eQTL effects.
Microdissecting bulk renal cortex tissue into its two
main functional structures, the glomerulus (GLOM) and
tubulointerstitium (TI), allows increased specificity for kid-
ney transcriptomics studies. For instance, targeted GLOM
and TI eQTL studies have led to discoveries of the tran-
scriptomic impact of diabetic kidney disease GWAS alleles
in individuals with diabetic nephropathy.17–19 In an NS
GLOM eQTL study of apolipoprotein L1 (APOL1), ubiqui-
tin D (UBD) was significantly upregulated in individuals
with a high-risk (HR) APOL1 genotype.20 These findings
were subsequently followed up in an admixture mapping
study that identified enriched African ancestry at the
UBD locus in people with a HR genotype and FSGS versus
no FSGS and protective effects of UBD expression on the
viability of cells overexpressing APOL1 risk variants,21
providing additional support for UBD’s involvement in
APOL1-attributed NS.
The success of previous tissue-specific eQTL studies in
affected populations motivated us to use this strategy for
NS genomic discovery. Here, we report the results of a
genome-wide GLOM and TI cis-eQTL study from 187 bio-
psied NS participants enrolled in the Nephrotic Syndrome
Study Network (NEPTUNE).22 In addition to this report, we
have created ‘‘nephQTL,’’ a publicly available eQTL
browser to share these data with the wider community
(Web Resources).
Material and Methods
Data Sources and Participant InclusionThe Nephrotic Syndrome Study Network (NEPTUNE) is a prospec-
tive, longitudinal cohort recruiting participants with substantial
proteinuria at the time of first kidney biopsy for clinical suspicion
of minimal change disease (MCD), focal segmental glomeruloscle-
rosis (FSGS), or membanous nephropathy (MN).22 Phenotypic
data, urine, and blood samples are collected at baseline and over
time. DNA is collected for a variety of genotyping studies, and a
research renal biopsy core is collected for transcriptomic anal-
ysis.20,22–24 All procedures were done in accordance with the
ethical standards of the IRBs overseeing the NEPTUNE study,
and proper informed consent was obtained from each participant.
Whole-Genome SequencingWe used Illumina Hi-Seq to perform low-depth WGS on 322
NEPTUNE participants, allowingus to take advantage of sharedhap-
lotypes andmake accurate genotype calls.25We used GotCloud26 as
our standard pipeline for alignment and variant calling (including
insertion-deletions [indels]). A subset of participants also underwent
IlluminaExomeChip SNPgenotyping.UsingExomechipgenotypes
as our gold standard, we calculated their concordance with non-
monomorphic sitesonWGSat77,769 shared sites.Amongheterozy-
gous sites present in both the exome chip and WGS with minor
allele frequency (MAF) > 0.05 and MAF between 0.03 and 0.05,
there was 98.7% and 97.8% concordance, respectively. Site-level
genotype data from WGS and the Exome Chip, summarized across
this cohort, are available at our NephVS browser (Web Resources).
Gene ExpressionGene expression data from microdissected GLOM and TI were
generated using Affymetrix 2.1 ST chips27 and quantified with a
Custom CDF file from BrainArray for EntrezG, v.19.28 Expression
was normalized across genes using robust multi-array average
(RMA).29 PEER factors were computed as previously described.30
Participant InclusionThere were 187 NEPTUNE participants eligible for this study
because they had WGS data, transcriptomic data for at least
GLOM or TI, and clinical and demographic information. There
were 136 and 166 available for GLOM and TI eQTL discovery,
respectively. Of these, 115 participants were part of both the
GLOM and TI eQTL analyses (Figure S1).
eQTL AnalysisWe used MatrixEQTL31 for the initial step in the eQTL study. We
focused solely on cis-eQTLs because we lacked substantial power
for trans studies. Eligible variants were those with a MAF > 0.03
in our cohort and within 500 kb of qualifying genes’ transcription
start or end sites (and within the gene itself). We adjusted for age,
sex, principal components of genetic ancestry, and PEER factors.
Principal components of genetic ancestry were calculated using
EPACTS (Web Resources) on LD-pruned WGS data across all 187
individuals from whom we had expression information
(Figure S2).We adjusted for thefirst four PCsbasedonvisual inspec-
tionof theeigenvalueplot (FigureS3). PEER factorswere createduti-
lizing the PEER framework as previously described,30,32 adjusting
for age, sex, andmicroarray batch.We adjusted for 31 PEER factors
in GLOM and 25 in TI, the number which, at an empirical p value
threshold (p< 13 10�4), maximized the number of eQTLs discov-
ered on chromosome 21 for that tissue. We examined the correla-
tion of our MatrixEQTL results with and without the inclusion of
a metric of NS severity, choosing baseline estimated glomerular
filtration rate (eGFR). To control the FDR at gene level from the
MatrixEQTL output, we used TORUS, a computationally efficient
method that uses an EM (expectation maximization) algorithm
to compute the prior enrichment parameters for variants.33 The
enrichment parameters computed from this procedure define a
prior distribution per gene (Figure S4). The estimated priors from
the GLOM and TI data can be summarized across all genes in rela-
tion to distance from the transcription start site (TSS).
Fine Mapping with DAPWe utilized the estimated priors from TORUS, accounting for
variant distances to the TSS of the target genes, to perform variant
The American Journal of Human Genetics 103, 232–244, August 2, 2018 233
fine-mapping of eQTLs for each gene, using the Deterministic
Approximation of Posteriors (DAP) algorithm.34 Rather than
solely calling eGenes (genes with significant eQTLs), DAP iden-
tifies independent eQTLs contributing significantly to changes
in expression and assigns a posterior inclusion probability (PIP)
to them. DAP incorporates functional genomic annotations and
accounts for patterns of linkage disequilibrium (LD) among
single-nucleotide polymorphisms (SNPs). Compared to calling
eGenes, implicating independent eQTLs using DAP requires
higher statistical stringency.
Independent association signals were either single SNPs or
indels (or groups of them in LD [r2 > 0.25]). The significance of
each signal was characterized by local FDR. Those with local
FDR < 0.05 were considered significant association signals in
which we could predict the driving variants. Due to high LD and
similar effect, the exact variant that drives the association signal
was not always easily determined. DAP provides within-signal pos-
terior inclusion probabilities (PIP) for each variant to help identify
the most likely driver. The member SNPs for each signal group
naturally form a 95% Bayesian credible set.
Tissue-Specific Mapping with eQTLBMATo assess the extent of tissue specificity, we used eQTLBMA (eQTL
by BayesianModel Averaging) to estimate the proportion of eQTLs
shared across GLOM and TI,35 using summary statistics generated
by MatrixEQTL. Partial overlapping of samples is explicitly
modeled in eQTLBMA. In comparing between GLOM and TI,
genes were filtered prior to running eQTLBMA to make sure that
they were expressed in both tissues. This filtering process ensured
that the effect sizes for each SNP/transcript pair were reliably
measured in both compartments. This framework also has the
benefit of maximizing power over tissue-by-tissue analysis by
jointly analyzing the tissues, allowing for differences in eQTLs
by tissue, and improving power for detection of shared eQTLs.
Gene Set Enrichment AnalysisTo better understand the biologic context of the gene sets
emerging from our DAP and eQTLBMA analyses, we used the
Genomatix Software Suite (Genomatix) and Ingenuity Pathway
Analysis (IPA; QIAGEN)36 for functional annotation. In the IPA
analysis, a complex network was constructed among the pathways
that shared three or more genes to highlight ‘‘clusters’’ and path-
ways that crosstalk between the clusters.
Generation of Single-Cell RNA-Seq DataWe combined and analyzed three single-cell RNA-seq (scRNA-seq)
datasets generated from healthy portions of tumor-nephrectomy
samples specifically harvested for single-cell analysis using
103 Genomics methodology. Single-cell dissociations were done
as reported.37 Individual cells were labeled with barcodes, and
transcripts within each cell were tagged with distinct UMIs
(unique molecular identifiers) in order to determine absolute tran-
script abundance. The library quality was assessed with ‘‘high
sensitivity cDNA arrays’’ on an Agilent Bioanalyzer (Thermo
Fischer) platform. Sequencing was done on Illumina HiSeq2500
with 2 3 75 paired-end kits using the following read lengths:
26 bp Read1 and 110 bp Read2.
The sequencing data were first analyzed using the Cell Ranger
software (103 Genomics Inc.) in order to extract the gene expres-
sion data matrix. Each element of the matrix is the number of
UMIs associated with a gene and a barcoded cell. Next, we filtered
out cells with fewer than 500 genes per cell and with more than
25% mitochondrial read content. Further downstream analysis
steps used the Seurat R package include normalization, identifica-
tion of highly variable genes across the single cells, scaling based
on the number of UMI and batch effect, dimensionality reduction
(PCA and t-SNE), standard unsupervised clustering, and the
discovery of differentially expressed cell type-specific markers.
Differential gene expression to identify cell type-specific genes
was performed using the non-parametric Wilcoxon rank sum test.
Cell-Type Deconvolution using Kidney Single-Cell
RNA-SeqWe wanted to discover whether our significant GLOM and TI
eQTLs were enriched in specific kidney cell types. We began by
analyzing our adult kidney scRNA-seq data to identify genes
whose expression were enriched in a particular cell type. We
then computed the enrichment of GLOM and TI eGenes in these
cell type-enriched gene sets using a Fisher’s exact test.
Enrichment of eQTLs for Roadmap Fetal Kidney
AnnotationsWedownloaded the full dataset of epigenomic annotations of fetal
kidney from the NIH Roadmap project (Web Resources) to
examine whether our eQTL variants were enriched in these anno-
tations. As input, we used all variants within all clusters identified
by DAP, and we stored the variants’ PIP and their corresponding
Roadmap fetal kidney annotation.
logitðPIPiÞ� Annotationi
In the above equation, ‘‘PIPi’’ corresponds to the posterior inclu-
sion probability of variant i, and Annotationi is the state of the
ChromHMM model that intersects with variant i. Annotationiwas coded as indicator variables for each state of the 15-state
ChromHMM model, with state number 15 (‘‘quiescent/low’’) as
the baseline state. The result of this is a logistic regression model
with 1 intercept term and 14 indicator variables, where each
variant was assigned to one annotation. Significance was deter-
mined using a Wald-test of each annotation level while control-
ling for all other levels.
Comparison with GTEx eGenes and eQTLsWe performed three analyses to compare DAP-derived eQTLs and
eGenes found in GLOM and TI with those fromGTEx v.6. First, we
looked up the GTEx v.6 tissue with the smallest p value for each
significant SNP-eGene pair found in GLOM and TI. We then
compared the difference in the –log10 p values of GLOM and TI
SNP-eGene pairs with the minimum GTEx tissue. These analyses
were limited to autosomes.
Second, to gain insight about eGenes unique to GLOM and TI as
compared to other tissues, we used the following approach. If a
significant GLOMor TI eGenewas also present in theGTEx dataset
and classified as an eGene in 1 of the 44 GTEx v6 tissues (per their
previously described procedure38), we labeled the corresponding
tissue an ‘‘eGene-tissue.’’ We then summarized the distribution
of the number of eGene-tissues across GTEx for all significant
eGenes discovered in GLOM and TI. We also plotted GTEx liver
(which has a similar number of eGenes identified as in TI) as a
comparator.
Finally, to identify the magnitude of overlap between our eQTLs
and those from whole blood in GTEx, we first selected GLOM and
TI eQTLs with a p value< 13 10�5. We chose the most significant
234 The American Journal of Human Genetics 103, 232–244, August 2, 2018
eSNP in this eQTL to take forward (a ‘‘SNP-eGene’’ pair). We then
identified overlapping SNP-eGene pairs in whole blood fromGTEx
v6. Whole blood SNP-eGene pairs with p value < 1 3 10�3 were
empirically defined as nominally significant and classified as over-
lapping with GLOM or TI eQTLs.
Comparison to Renal Cortex eGenes and eQTLsKo et al. have previously reported kidney cortex eQTLs16 and pub-
lished 1,886 eGenes and 124,612 SNP-eGene pairs that passed a
statistical threshold of q-value < 0.05. We compared these with
our GLOM and TI data in two separate analyses, recognizing
that biological heterogeneity, technical andmethodological differ-
ences, and availability of only a subset of cortex eQTL datamust be
taken into account when interpreting the data.
First, using the SNP-eGene pairs from cortex, we compared the
magnitude and direction of effect of the same SNP-eGene pairs
found in GLOM and TI. We then assessed the z-scores computed
from cortex, GLOM, and TI via visualization and Pearson correla-
tion. Second, we compared our significant eGene lists to those
1,886 significant cortical eGenes to identify eGenes uniquely
found significant in GLOM and TI.
Transcriptome-wide Association Study with IgA
Nephropathy GWASsPrevious studies have shown that risk alleles from GWASs are
enriched for eQTLs,39 and others have used eQTL data to pinpoint
genes whose expression was regulated by GWAS alleles.16 Here,
we integrated our DAP-derived GLOM and TI eQTL data
with summary statistics from the largest published GWAS of
glomerular disease, in IgA Nephropathy40 (IgAN), and performed
a transcriptome-wide association study (TWAS) using an approach
adapted from the PrediXcan and MetaXcan methods.41,42 See
Appendix A for details.
Results
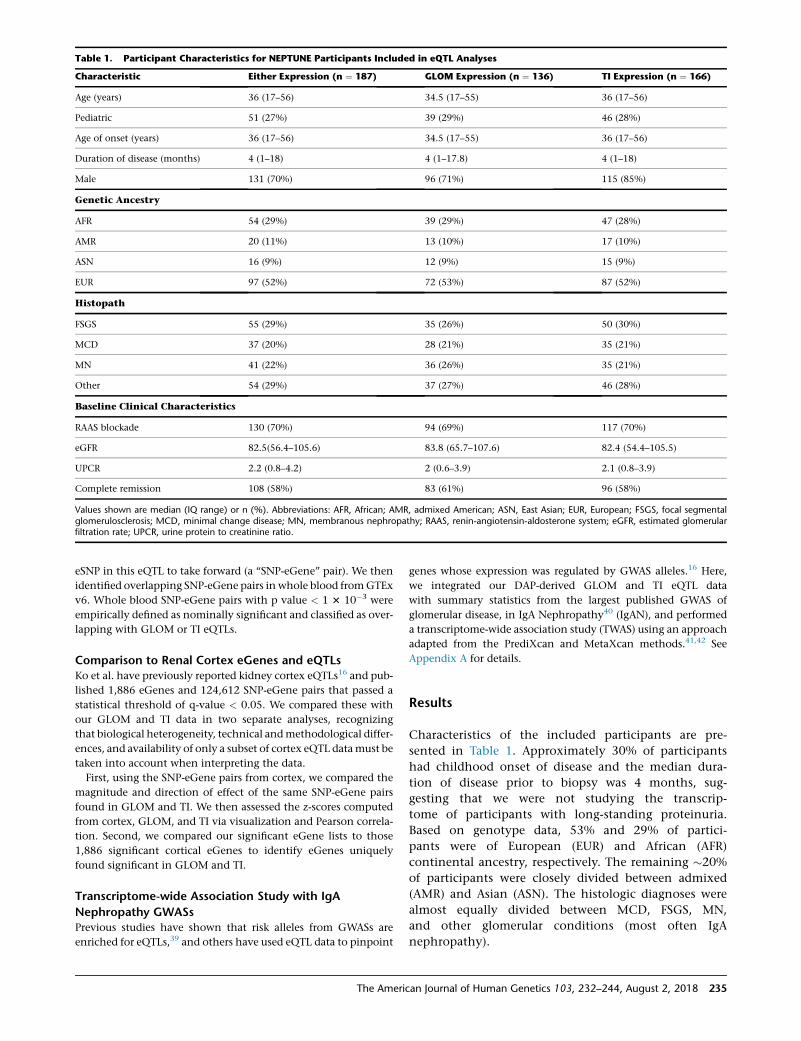
Characteristics of the included participants are pre-
sented in Table 1. Approximately 30% of participants
had childhood onset of disease and the median dura-
tion of disease prior to biopsy was 4 months, sug-
gesting that we were not studying the transcrip-
tome of participants with long-standing proteinuria.
Based on genotype data, 53% and 29% of partici-
pants were of European (EUR) and African (AFR)
continental ancestry, respectively. The remaining �20%
of participants were closely divided between admixed
(AMR) and Asian (ASN). The histologic diagnoses were
almost equally divided between MCD, FSGS, MN,
and other glomerular conditions (most often IgA
nephropathy).
Table 1. Participant Characteristics for NEPTUNE Participants Included in eQTL Analyses
Characteristic Either Expression (n ¼ 187) GLOM Expression (n ¼ 136) TI Expression (n ¼ 166)
Age (years) 36 (17–56) 34.5 (17–55) 36 (17–56)
Pediatric 51 (27%) 39 (29%) 46 (28%)
Age of onset (years) 36 (17–56) 34.5 (17–55) 36 (17–56)
Duration of disease (months) 4 (1–18) 4 (1–17.8) 4 (1–18)
Male 131 (70%) 96 (71%) 115 (85%)
Genetic Ancestry
AFR 54 (29%) 39 (29%) 47 (28%)
AMR 20 (11%) 13 (10%) 17 (10%)
ASN 16 (9%) 12 (9%) 15 (9%)
EUR 97 (52%) 72 (53%) 87 (52%)
Histopath
FSGS 55 (29%) 35 (26%) 50 (30%)
MCD 37 (20%) 28 (21%) 35 (21%)
MN 41 (22%) 36 (26%) 35 (21%)
Other 54 (29%) 37 (27%) 46 (28%)
Baseline Clinical Characteristics
RAAS blockade 130 (70%) 94 (69%) 117 (70%)
eGFR 82.5(56.4–105.6) 83.8 (65.7–107.6) 82.4 (54.4–105.5)
UPCR 2.2 (0.8–4.2) 2 (0.6–3.9) 2.1 (0.8–3.9)
Complete remission 108 (58%) 83 (61%) 96 (58%)
Values shown are median (IQ range) or n (%). Abbreviations: AFR, African; AMR, admixed American; ASN, East Asian; EUR, European; FSGS, focal segmentalglomerulosclerosis; MCD, minimal change disease; MN, membranous nephropathy; RAAS, renin-angiotensin-aldosterone system; eGFR, estimated glomerularfiltration rate; UPCR, urine protein to creatinine ratio.
The American Journal of Human Genetics 103, 232–244, August 2, 2018 235
Single SNP Analysis
Using Matrix eQTL, we analyzed 76,979,158 cis-pairs
across 9,114,417 SNPs and expression from 22,893 genes.
Based on the minimum FDR values across all eQTLs, there
were 1,055 eGenes in GLOM and 3,217 eGenes in TI, at
FDR< 0.05.We found a strong correlation betweenmodels
that included and did not include a measure of disease
severity (in this case, baseline eGFR). We used FDR of the
eQTL as our metric of comparison. The overall correlation
was 0.99 in both GLOM and TI. For eQTLs in which at least
one model resulted in an FDR < 0.05, the correlation was
0.83 in GLOM and 0.89 in TI. Given these results, we
used a model without a metric of disease severity.
Multi-SNP and Multi-tissue Analyses
The output from MatrixEQTL plus the local FDR from
TORUS (Figure S4) were ‘‘fine-mapped’’ using DAP. Rather
than solely identifying that an eQTL exists, DAP identifies
eQTLs in which the specific variants or ‘‘clusters’’ of vari-
ants predicted to be driving the association can be confi-
dently identified. In addition, DAP can discover eQTLs in
which multiple independent SNPs or clusters of SNPs are
associated with the gene’s expression.
Using DAP, we discovered 894 GLOM eQTLs and 1,767
TI eQTLs at <5% FDR level (Table S1). The majority of
eQTLs had one independent signal responsible for the
association. Multiple independent signals associated with
expression were found in 112 GLOM eQTL (14%) and in
337 in TI (19%) (Figure S5).
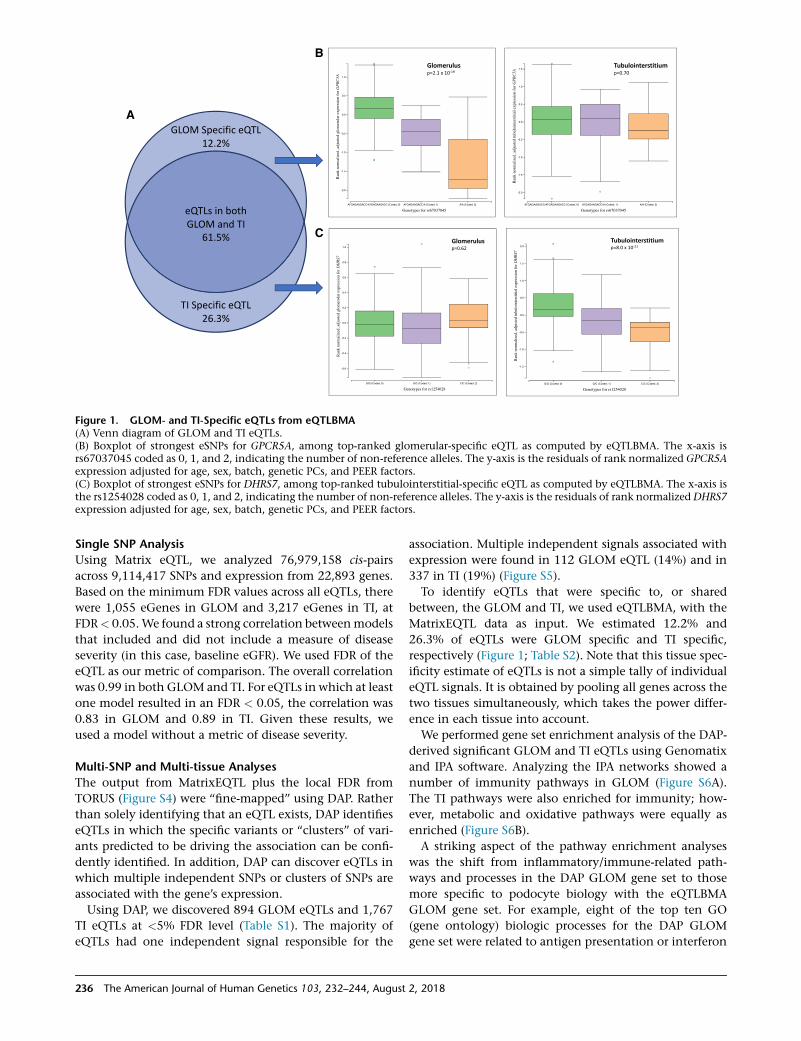
To identify eQTLs that were specific to, or shared
between, the GLOM and TI, we used eQTLBMA, with the
MatrixEQTL data as input. We estimated 12.2% and
26.3% of eQTLs were GLOM specific and TI specific,
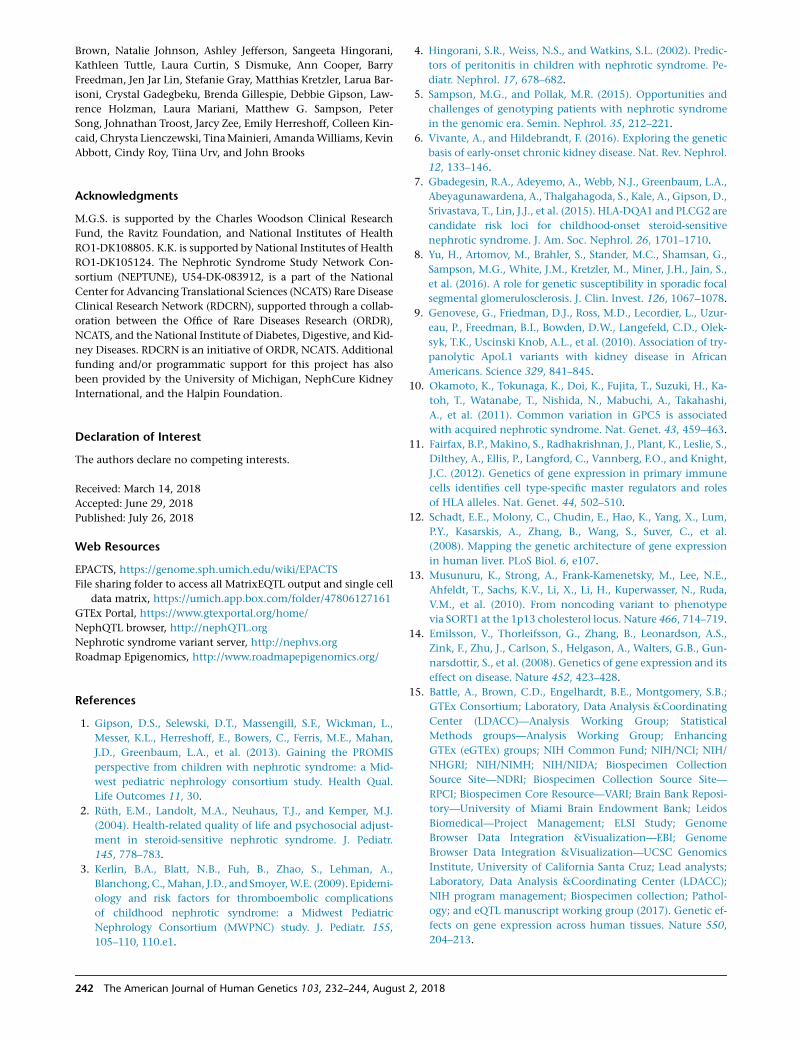
respectively (Figure 1; Table S2). Note that this tissue spec-
ificity estimate of eQTLs is not a simple tally of individual
eQTL signals. It is obtained by pooling all genes across the
two tissues simultaneously, which takes the power differ-
ence in each tissue into account.
We performed gene set enrichment analysis of the DAP-
derived significant GLOM and TI eQTLs using Genomatix
and IPA software. Analyzing the IPA networks showed a
number of immunity pathways in GLOM (Figure S6A).
The TI pathways were also enriched for immunity; how-
ever, metabolic and oxidative pathways were equally as
enriched (Figure S6B).
A striking aspect of the pathway enrichment analyses
was the shift from inflammatory/immune-related path-
ways and processes in the DAP GLOM gene set to those
more specific to podocyte biology with the eQTLBMA
GLOM gene set. For example, eight of the top ten GO
(gene ontology) biologic processes for the DAP GLOM
gene set were related to antigen presentation or interferon
B
A
C
Figure 1. GLOM- and TI-Specific eQTLs from eQTLBMA(A) Venn diagram of GLOM and TI eQTLs.(B) Boxplot of strongest eSNPs for GPCR5A, among top-ranked glomerular-specific eQTL as computed by eQTLBMA. The x-axis isrs67037045 coded as 0, 1, and 2, indicating the number of non-reference alleles. The y-axis is the residuals of rank normalized GPCR5Aexpression adjusted for age, sex, batch, genetic PCs, and PEER factors.(C) Boxplot of strongest eSNPs for DHRS7, among top-ranked tubulointerstitial-specific eQTL as computed by eQTLBMA. The x-axis isthe rs1254028 coded as 0, 1, and 2, indicating the number of non-reference alleles. The y-axis is the residuals of rank normalized DHRS7expression adjusted for age, sex, batch, genetic PCs, and PEER factors.
236 The American Journal of Human Genetics 103, 232–244, August 2, 2018
gamma signaling. By contrast, the top ten GO biologic
processes for GLOM-specific eQTLs via eQTLBMA included
actin cytoskeleton rearrangement, calcium signaling, and
cell and biologic adhesion (Table 2). A StringDB
network43 created from the eQTLBMA GLOM-specific
genes showed a network significantly enriched for interac-
tions, with the twomost interconnected genes being trans-
forming growth factor beta 1 (TGFB1) and integrin alpha V
(ITGAV) (Figure S7). TGFB1 has been implicated in renal
disease pathways,44,45 including pathology of NS glomer-
ular proteinuria.46 ITGAV is a podocyte-specific essential
gene candidate47 and shows increased expression in
nephritic mice.48
Among the most significant GLOM-specific eQTLs as
computed by eQTLBMA were those of notable relevance
to NS, particularly with phospholipase C gamma 2
(PLCG2) and vacuolar protein sorting 33b (VPS33B).
PLCG2 has been implicated in pediatric SSNS via
genome-wide rare-variant association study.7 VPS33B is a
vacuolar protein and functions in vesicle-mediated protein
sorting, predominantly in the late endosome/lysosome.49
Importantly, mutations in VPS33B cause arthrogryposis,
renal dysfunction, and cholestasis (ARC) syndrome, in
which the renal phenotype includes NS.50–52
Cell Type Specificity of Significant GLOM and TI eQTLs
There is substantial cellular heterogeneity within the
GLOM and TI which could potentially limit us from recog-
nizing eQTLs that are cell specific or restricted to a subset of
cells. We hypothesized that we could deconvolute the
GLOM and TI eQTLs into specific cell types through use
of independent scRNA-seq data of human kidney. Because
scRNA-seq on NEPTUNE research biopsy cores is not
feasible due to a lack of sufficient starting material, we
integrated our eQTL data with scRNA-seq data derived
from healthy portions of adult tumor nephrectomy tissue.
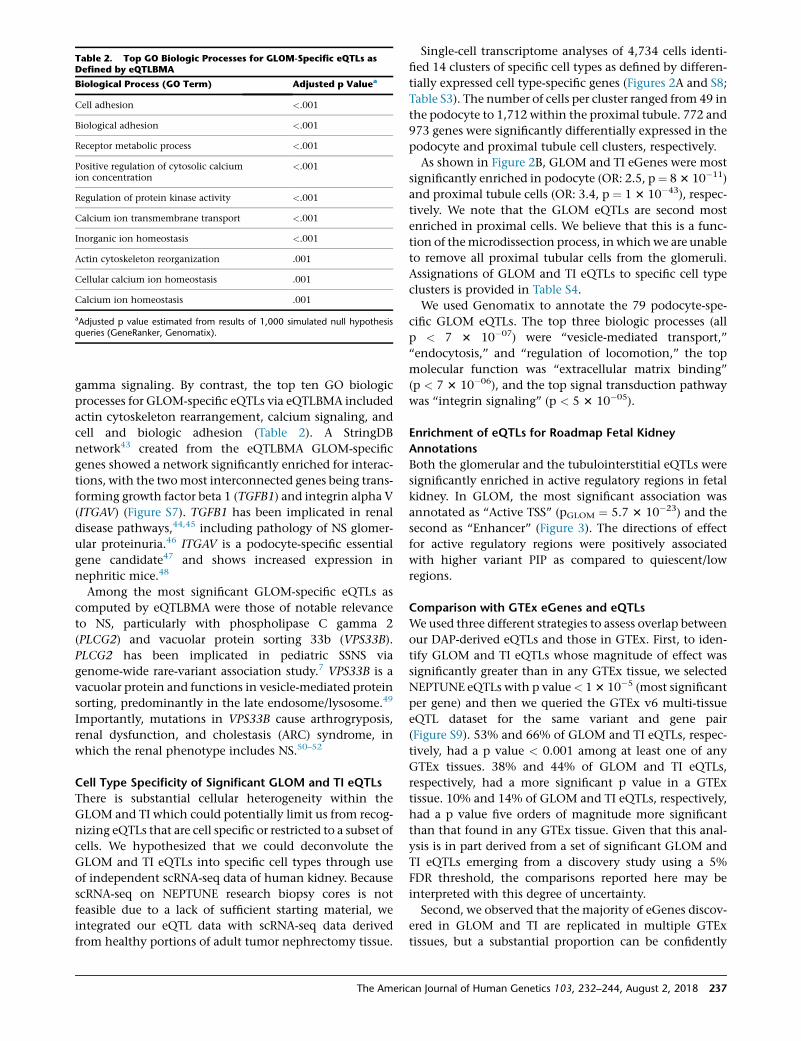
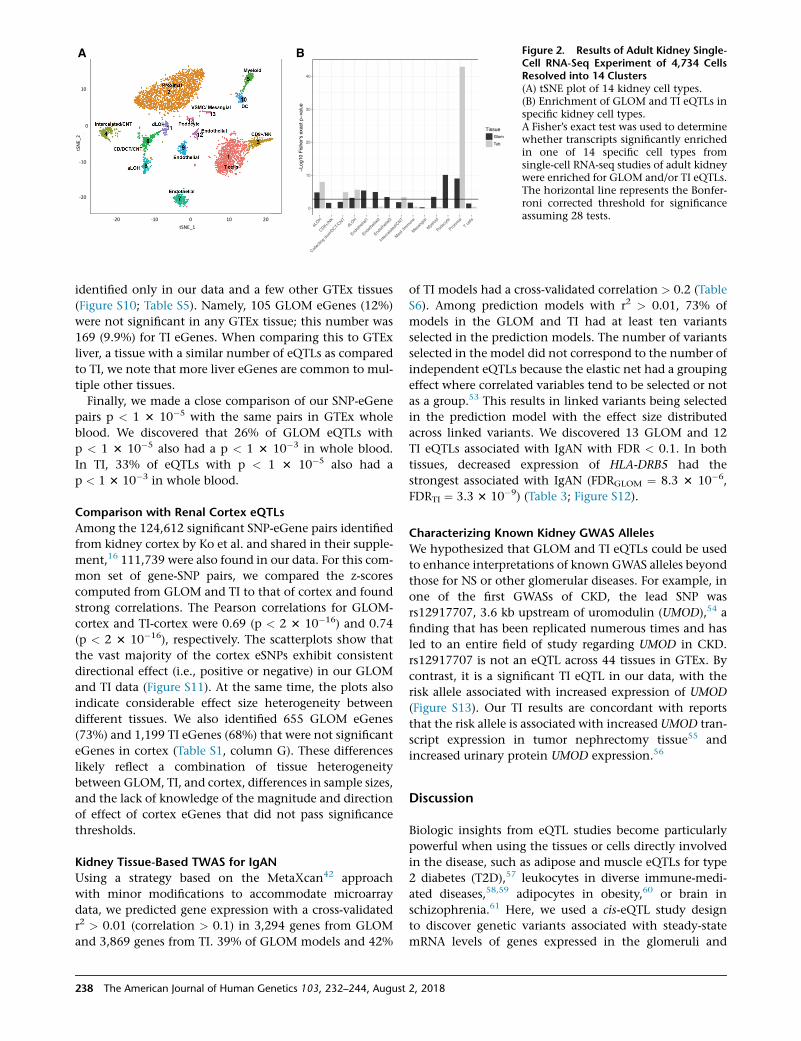
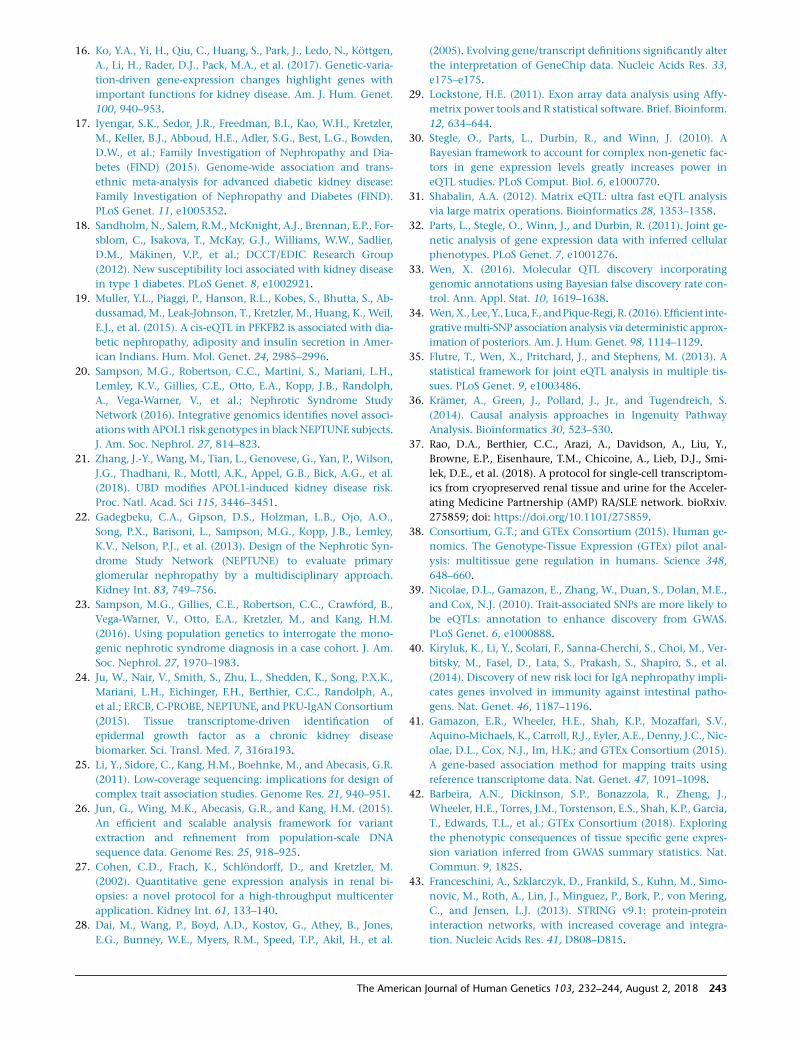
Single-cell transcriptome analyses of 4,734 cells identi-
fied 14 clusters of specific cell types as defined by differen-
tially expressed cell type-specific genes (Figures 2A and S8;
Table S3). The number of cells per cluster ranged from 49 in
the podocyte to 1,712 within the proximal tubule. 772 and
973 genes were significantly differentially expressed in the
podocyte and proximal tubule cell clusters, respectively.
As shown in Figure 2B, GLOM and TI eGenes were most
significantly enriched in podocyte (OR: 2.5, p ¼ 83 10�11)
and proximal tubule cells (OR: 3.4, p ¼ 1 3 10�43), respec-
tively. We note that the GLOM eQTLs are second most
enriched in proximal cells. We believe that this is a func-
tion of themicrodissection process, in whichwe are unable
to remove all proximal tubular cells from the glomeruli.
Assignations of GLOM and TI eQTLs to specific cell type
clusters is provided in Table S4.
We used Genomatix to annotate the 79 podocyte-spe-
cific GLOM eQTLs. The top three biologic processes (all
p < 7 3 10�07) were ‘‘vesicle-mediated transport,’’
‘‘endocytosis,’’ and ‘‘regulation of locomotion,’’ the top
molecular function was ‘‘extracellular matrix binding’’
(p < 7 3 10�06), and the top signal transduction pathway
was ‘‘integrin signaling’’ (p < 5 3 10�05).
Enrichment of eQTLs for Roadmap Fetal Kidney
Annotations
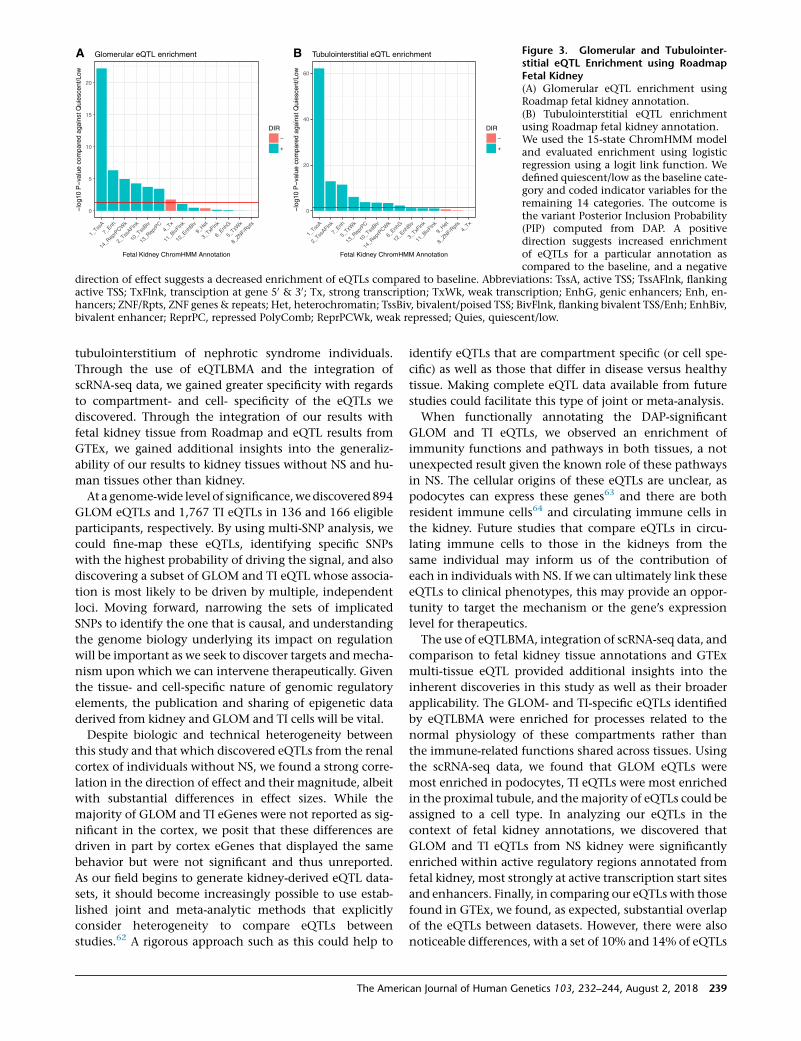
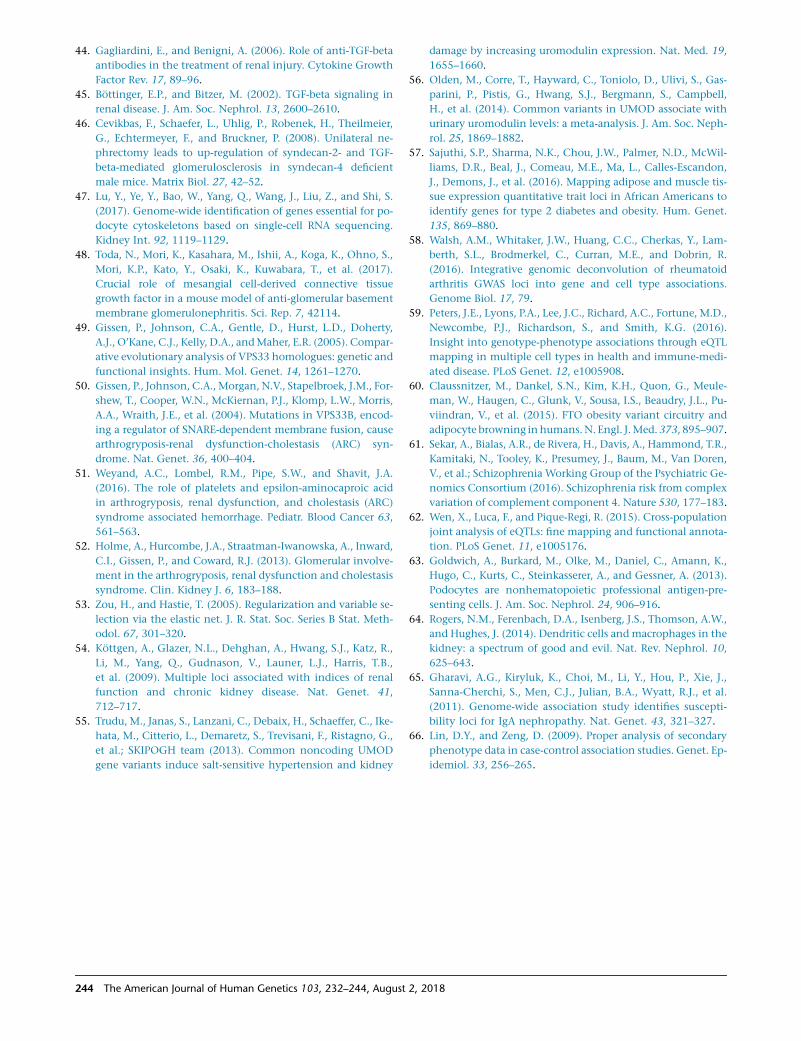
Both the glomerular and the tubulointerstitial eQTLs were
significantly enriched in active regulatory regions in fetal
kidney. In GLOM, the most significant association was
annotated as ‘‘Active TSS’’ (pGLOM ¼ 5.7 3 10�23) and the
second as ‘‘Enhancer’’ (Figure 3). The directions of effect
for active regulatory regions were positively associated
with higher variant PIP as compared to quiescent/low
regions.
Comparison with GTEx eGenes and eQTLs
We used three different strategies to assess overlap between
our DAP-derived eQTLs and those in GTEx. First, to iden-
tify GLOM and TI eQTLs whose magnitude of effect was
significantly greater than in any GTEx tissue, we selected
NEPTUNE eQTLs with p value< 13 10�5 (most significant
per gene) and then we queried the GTEx v6 multi-tissue
eQTL dataset for the same variant and gene pair
(Figure S9). 53% and 66% of GLOM and TI eQTLs, respec-
tively, had a p value < 0.001 among at least one of any
GTEx tissues. 38% and 44% of GLOM and TI eQTLs,
respectively, had a more significant p value in a GTEx
tissue. 10% and 14% of GLOM and TI eQTLs, respectively,
had a p value five orders of magnitude more significant
than that found in any GTEx tissue. Given that this anal-
ysis is in part derived from a set of significant GLOM and
TI eQTLs emerging from a discovery study using a 5%
FDR threshold, the comparisons reported here may be
interpreted with this degree of uncertainty.
Second, we observed that the majority of eGenes discov-
ered in GLOM and TI are replicated in multiple GTEx
tissues, but a substantial proportion can be confidently
Table 2. Top GO Biologic Processes for GLOM-Specific eQTLs asDefined by eQTLBMA
Biological Process (GO Term) Adjusted p Valuea
Cell adhesion <.001
Biological adhesion <.001
Receptor metabolic process <.001
Positive regulation of cytosolic calciumion concentration
<.001
Regulation of protein kinase activity <.001
Calcium ion transmembrane transport <.001
Inorganic ion homeostasis <.001
Actin cytoskeleton reorganization .001
Cellular calcium ion homeostasis .001
Calcium ion homeostasis .001
aAdjusted p value estimated from results of 1,000 simulated null hypothesisqueries (GeneRanker, Genomatix).
The American Journal of Human Genetics 103, 232–244, August 2, 2018 237
identified only in our data and a few other GTEx tissues
(Figure S10; Table S5). Namely, 105 GLOM eGenes (12%)
were not significant in any GTEx tissue; this number was
169 (9.9%) for TI eGenes. When comparing this to GTEx
liver, a tissue with a similar number of eQTLs as compared
to TI, we note that more liver eGenes are common to mul-
tiple other tissues.
Finally, we made a close comparison of our SNP-eGene
pairs p < 1 3 10�5 with the same pairs in GTEx whole
blood. We discovered that 26% of GLOM eQTLs with
p < 1 3 10�5 also had a p < 1 3 10�3 in whole blood.
In TI, 33% of eQTLs with p < 1 3 10�5 also had a
p < 1 3 10�3 in whole blood.
Comparison with Renal Cortex eQTLs
Among the 124,612 significant SNP-eGene pairs identified
from kidney cortex by Ko et al. and shared in their supple-
ment,16 111,739 were also found in our data. For this com-
mon set of gene-SNP pairs, we compared the z-scores
computed from GLOM and TI to that of cortex and found
strong correlations. The Pearson correlations for GLOM-
cortex and TI-cortex were 0.69 (p < 2 3 10�16) and 0.74
(p < 2 3 10�16), respectively. The scatterplots show that
the vast majority of the cortex eSNPs exhibit consistent
directional effect (i.e., positive or negative) in our GLOM
and TI data (Figure S11). At the same time, the plots also
indicate considerable effect size heterogeneity between
different tissues. We also identified 655 GLOM eGenes
(73%) and 1,199 TI eGenes (68%) that were not significant
eGenes in cortex (Table S1, column G). These differences
likely reflect a combination of tissue heterogeneity
between GLOM, TI, and cortex, differences in sample sizes,
and the lack of knowledge of the magnitude and direction
of effect of cortex eGenes that did not pass significance
thresholds.
Kidney Tissue-Based TWAS for IgAN
Using a strategy based on the MetaXcan42 approach
with minor modifications to accommodate microarray
data, we predicted gene expression with a cross-validated
r2 > 0.01 (correlation > 0.1) in 3,294 genes from GLOM
and 3,869 genes from TI. 39% of GLOM models and 42%
of TI models had a cross-validated correlation > 0.2 (Table
S6). Among prediction models with r2 > 0.01, 73% of
models in the GLOM and TI had at least ten variants
selected in the prediction models. The number of variants
selected in the model did not correspond to the number of
independent eQTLs because the elastic net had a grouping
effect where correlated variables tend to be selected or not
as a group.53 This results in linked variants being selected
in the prediction model with the effect size distributed
across linked variants. We discovered 13 GLOM and 12
TI eQTLs associated with IgAN with FDR < 0.1. In both
tissues, decreased expression of HLA-DRB5 had the
strongest associated with IgAN (FDRGLOM ¼ 8.3 3 10�6,
FDRTI ¼ 3.3 3 10�9) (Table 3; Figure S12).
Characterizing Known Kidney GWAS Alleles
We hypothesized that GLOM and TI eQTLs could be used
to enhance interpretations of known GWAS alleles beyond
those for NS or other glomerular diseases. For example, in
one of the first GWASs of CKD, the lead SNP was
rs12917707, 3.6 kb upstream of uromodulin (UMOD),54 a
finding that has been replicated numerous times and has
led to an entire field of study regarding UMOD in CKD.
rs12917707 is not an eQTL across 44 tissues in GTEx. By
contrast, it is a significant TI eQTL in our data, with the
risk allele associated with increased expression of UMOD
(Figure S13). Our TI results are concordant with reports
that the risk allele is associated with increased UMOD tran-
script expression in tumor nephrectomy tissue55 and
increased urinary protein UMOD expression.56
Discussion
Biologic insights from eQTL studies become particularly
powerful when using the tissues or cells directly involved
in the disease, such as adipose and muscle eQTLs for type
2 diabetes (T2D),57 leukocytes in diverse immune-medi-
ated diseases,58,59 adipocytes in obesity,60 or brain in
schizophrenia.61 Here, we used a cis-eQTL study design
to discover genetic variants associated with steady-state
mRNA levels of genes expressed in the glomeruli and
A B Figure 2. Results of Adult Kidney Single-Cell RNA-Seq Experiment of 4,734 CellsResolved into 14 Clusters(A) tSNE plot of 14 kidney cell types.(B) Enrichment of GLOM and TI eQTLs inspecific kidney cell types.A Fisher’s exact test was used to determinewhether transcripts significantly enrichedin one of 14 specific cell types fromsingle-cell RNA-seq studies of adult kidneywere enriched for GLOM and/or TI eQTLs.The horizontal line represents the Bonfer-roni corrected threshold for significanceassuming 28 tests.
238 The American Journal of Human Genetics 103, 232–244, August 2, 2018
tubulointerstitium of nephrotic syndrome individuals.
Through the use of eQTLBMA and the integration of
scRNA-seq data, we gained greater specificity with regards
to compartment- and cell- specificity of the eQTLs we
discovered. Through the integration of our results with
fetal kidney tissue from Roadmap and eQTL results from
GTEx, we gained additional insights into the generaliz-
ability of our results to kidney tissues without NS and hu-
man tissues other than kidney.
At a genome-wide level of significance,wediscovered 894
GLOM eQTLs and 1,767 TI eQTLs in 136 and 166 eligible
participants, respectively. By using multi-SNP analysis, we
could fine-map these eQTLs, identifying specific SNPs
with the highest probability of driving the signal, and also
discovering a subset of GLOM and TI eQTL whose associa-
tion is most likely to be driven by multiple, independent
loci. Moving forward, narrowing the sets of implicated
SNPs to identify the one that is causal, and understanding
the genome biology underlying its impact on regulation
will be important as we seek to discover targets andmecha-
nism upon which we can intervene therapeutically. Given
the tissue- and cell-specific nature of genomic regulatory
elements, the publication and sharing of epigenetic data
derived from kidney and GLOM and TI cells will be vital.
Despite biologic and technical heterogeneity between
this study and that which discovered eQTLs from the renal
cortex of individuals without NS, we found a strong corre-
lation in the direction of effect and their magnitude, albeit
with substantial differences in effect sizes. While the
majority of GLOM and TI eGenes were not reported as sig-
nificant in the cortex, we posit that these differences are
driven in part by cortex eGenes that displayed the same
behavior but were not significant and thus unreported.
As our field begins to generate kidney-derived eQTL data-
sets, it should become increasingly possible to use estab-
lished joint and meta-analytic methods that explicitly
consider heterogeneity to compare eQTLs between
studies.62 A rigorous approach such as this could help to
identify eQTLs that are compartment specific (or cell spe-
cific) as well as those that differ in disease versus healthy
tissue. Making complete eQTL data available from future
studies could facilitate this type of joint or meta-analysis.
When functionally annotating the DAP-significant
GLOM and TI eQTLs, we observed an enrichment of
immunity functions and pathways in both tissues, a not
unexpected result given the known role of these pathways
in NS. The cellular origins of these eQTLs are unclear, as
podocytes can express these genes63 and there are both
resident immune cells64 and circulating immune cells in
the kidney. Future studies that compare eQTLs in circu-
lating immune cells to those in the kidneys from the
same individual may inform us of the contribution of
each in individuals with NS. If we can ultimately link these
eQTLs to clinical phenotypes, this may provide an oppor-
tunity to target the mechanism or the gene’s expression
level for therapeutics.
The use of eQTLBMA, integration of scRNA-seq data, and
comparison to fetal kidney tissue annotations and GTEx
multi-tissue eQTL provided additional insights into the
inherent discoveries in this study as well as their broader
applicability. The GLOM- and TI-specific eQTLs identified
by eQTLBMA were enriched for processes related to the
normal physiology of these compartments rather than
the immune-related functions shared across tissues. Using
the scRNA-seq data, we found that GLOM eQTLs were
most enriched in podocytes, TI eQTLs were most enriched
in the proximal tubule, and themajority of eQTLs could be
assigned to a cell type. In analyzing our eQTLs in the
context of fetal kidney annotations, we discovered that
GLOM and TI eQTLs from NS kidney were significantly
enriched within active regulatory regions annotated from
fetal kidney, most strongly at active transcription start sites
and enhancers. Finally, in comparing our eQTLs with those
found in GTEx, we found, as expected, substantial overlap
of the eQTLs between datasets. However, there were also
noticeable differences, with a set of 10% and 14% of eQTLs
0
5
10
15
20
1_Tss
A
7_Enh
14_R
eprP
CWk
2_Tss
AFlnk
10_T
ssBiv
13_R
eprP
C4_
Tx
11_B
ivFlnk
12_E
nhBiv
9_Het
3_TxF
lnk
6_Enh
G
5_TxW
k
8_ZNF/R
pts
Fetal Kidney ChromHMM Annotation
log1
0 P
valu
e co
mpa
red
agai
nst Q
uies
cent
/Low
DIR
+
Glomerular eQTL enrichmentA
0
20
40
60
1_Tss
A
2_Tss
AFlnk
7_Enh
5_TxW
k
13_R
eprP
C
10_T
ssBiv
14_R
eprP
CWk
6_Enh
G
12_E
nhBiv
3_TxF
lnk
11_B
ivFlnk
9_Het
8_ZNF/R
pts
4_Tx
Fetal Kidney ChromHMM Annotation
log1
0 P
valu
e co
mpa
red
agai
nst Q
uies
cent
/Low
DIR
+
Tubulointerstitial eQTL enrichmentB Figure 3. Glomerular and Tubulointer-stitial eQTL Enrichment using RoadmapFetal Kidney(A) Glomerular eQTL enrichment usingRoadmap fetal kidney annotation.(B) Tubulointerstitial eQTL enrichmentusing Roadmap fetal kidney annotation.We used the 15-state ChromHMM modeland evaluated enrichment using logisticregression using a logit link function. Wedefined quiescent/low as the baseline cate-gory and coded indicator variables for theremaining 14 categories. The outcome isthe variant Posterior Inclusion Probability(PIP) computed from DAP. A positivedirection suggests increased enrichmentof eQTLs for a particular annotation ascompared to the baseline, and a negative
direction of effect suggests a decreased enrichment of eQTLs compared to baseline. Abbreviations: TssA, active TSS; TssAFlnk, flankingactive TSS; TxFlnk, transciption at gene 50 & 30; Tx, strong transcription; TxWk, weak transcription; EnhG, genic enhancers; Enh, en-hancers; ZNF/Rpts, ZNF genes & repeats; Het, heterochromatin; TssBiv, bivalent/poised TSS; BivFlnk, flanking bivalent TSS/Enh; EnhBiv,bivalent enhancer; ReprPC, repressed PolyComb; ReprPCWk, weak repressed; Quies, quiescent/low.
The American Journal of Human Genetics 103, 232–244, August 2, 2018 239
seemingly specific to GLOM or TI, respectively. The degree
to which this heterogeneity is attributed to differences in
technologies or sample size is unclear. Nevertheless, this
provides an eQTL set that can be further examined for sup-
port of biologic differences driving this heterogeneity.
Together, these findings should provide confidence that
the data and discoveries emerging from this study may
be useful beyond NS discovery.
Through a TWAS of IgAN and a single SNP lookup of the
lead SNP at the CKD-associated UMOD locus, we demon-
strated the utility of these eQTL data to gain further in-
sights from existing GWASs of kidney disease. We focused
on IgAN because, among glomerular disorders, it has the
largest GWAS readily available. The ancestral composition
of NEPTUNE participants (63% European or East Asian)
differed from that of IgAN GWAS (exclusively Europeans
and East Asians). Previous work has shown that most
eQTL effect sizes are consistent across populations,62 and
this is the assumption we made in this TWAS. Substantial
heterogeneity across ancestries in this particular analysis
would diminish power. However, this would not increase
type 1 error.
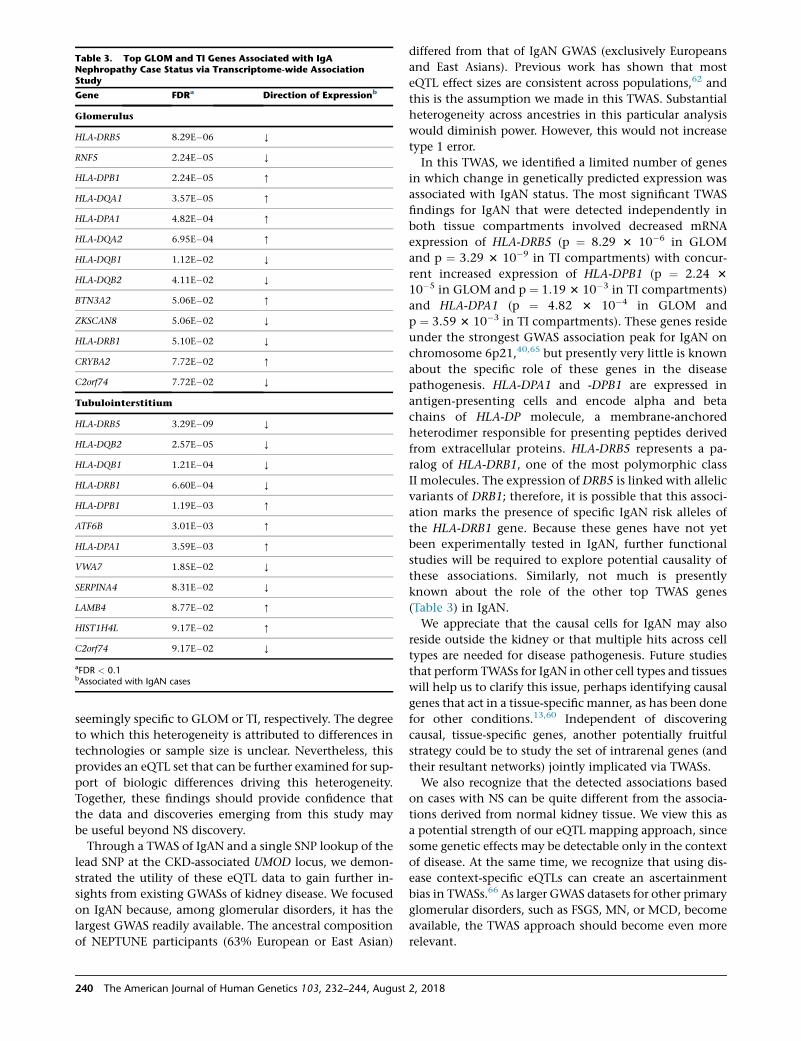
In this TWAS, we identified a limited number of genes
in which change in genetically predicted expression was
associated with IgAN status. The most significant TWAS
findings for IgAN that were detected independently in
both tissue compartments involved decreased mRNA
expression of HLA-DRB5 (p ¼ 8.29 3 10�6 in GLOM
and p ¼ 3.29 3 10�9 in TI compartments) with concur-
rent increased expression of HLA-DPB1 (p ¼ 2.24 3
10�5 in GLOM and p ¼ 1.19 3 10�3 in TI compartments)
and HLA-DPA1 (p ¼ 4.82 3 10�4 in GLOM and
p ¼ 3.59 3 10�3 in TI compartments). These genes reside
under the strongest GWAS association peak for IgAN on
chromosome 6p21,40,65 but presently very little is known
about the specific role of these genes in the disease
pathogenesis. HLA-DPA1 and -DPB1 are expressed in
antigen-presenting cells and encode alpha and beta
chains of HLA-DP molecule, a membrane-anchored
heterodimer responsible for presenting peptides derived
from extracellular proteins. HLA-DRB5 represents a pa-
ralog of HLA-DRB1, one of the most polymorphic class
II molecules. The expression of DRB5 is linked with allelic
variants of DRB1; therefore, it is possible that this associ-
ation marks the presence of specific IgAN risk alleles of
the HLA-DRB1 gene. Because these genes have not yet
been experimentally tested in IgAN, further functional
studies will be required to explore potential causality of
these associations. Similarly, not much is presently
known about the role of the other top TWAS genes
(Table 3) in IgAN.
We appreciate that the causal cells for IgAN may also
reside outside the kidney or that multiple hits across cell
types are needed for disease pathogenesis. Future studies
that perform TWASs for IgAN in other cell types and tissues
will help us to clarify this issue, perhaps identifying causal
genes that act in a tissue-specific manner, as has been done
for other conditions.13,60 Independent of discovering
causal, tissue-specific genes, another potentially fruitful
strategy could be to study the set of intrarenal genes (and
their resultant networks) jointly implicated via TWASs.
We also recognize that the detected associations based
on cases with NS can be quite different from the associa-
tions derived from normal kidney tissue. We view this as
a potential strength of our eQTL mapping approach, since
some genetic effects may be detectable only in the context
of disease. At the same time, we recognize that using dis-
ease context-specific eQTLs can create an ascertainment
bias in TWASs.66 As larger GWAS datasets for other primary
glomerular disorders, such as FSGS, MN, or MCD, become
available, the TWAS approach should become even more
relevant.
Table 3. Top GLOM and TI Genes Associated with IgANephropathy Case Status via Transcriptome-wide AssociationStudy
Gene FDRa Direction of Expressionb
Glomerulus
HLA-DRB5 8.29E�06 Y
RNF5 2.24E�05 Y
HLA-DPB1 2.24E�05 [
HLA-DQA1 3.57E�05 [
HLA-DPA1 4.82E�04 [
HLA-DQA2 6.95E�04 [
HLA-DQB1 1.12E�02 Y
HLA-DQB2 4.11E�02 Y
BTN3A2 5.06E�02 [
ZKSCAN8 5.06E�02 Y
HLA-DRB1 5.10E�02 Y
CRYBA2 7.72E�02 [
C2orf74 7.72E�02 Y
Tubulointerstitium
HLA-DRB5 3.29E�09 Y
HLA-DQB2 2.57E�05 Y
HLA-DQB1 1.21E�04 Y
HLA-DRB1 6.60E�04 Y
HLA-DPB1 1.19E�03 [
ATF6B 3.01E�03 [
HLA-DPA1 3.59E�03 [
VWA7 1.85E�02 Y
SERPINA4 8.31E�02 Y
LAMB4 8.77E�02 [
HIST1H4L 9.17E�02 [
C2orf74 9.17E�02 Y
aFDR < 0.1bAssociated with IgAN cases
240 The American Journal of Human Genetics 103, 232–244, August 2, 2018
In interpreting this study overall and trying to place it in
the context of similarly designed eQTL studies, there are a
couple of unique characteristics to explicitly point out.
First, the inclusion criteria for participants enrolled in
NEPTUNE was a need for a kidney biopsy for suspicion of
primary NS. There was no limitation to self-reported race,
specific histologic diagnoses, eGFR, or response to immu-
nosuppression. As such, this study should be interpreted
in this light; namely that we are identifying eQTLs that
are observed in the kidneys of individuals of diverse races
with proteinuric glomerular filtration barrier failure.
Second, the recruitment of participants of diverse ances-
tries created a risk of population stratification confounding
the results of this study. By following community standards,
weworked tomitigate this risk through the inclusionof four
PCs of genetic ancestry in the matrix eQTL model. In addi-
tion, the inclusion of PEER factors in the model should
also help to account for gene expression variation attribut-
able to population differences.Nonetheless, the transethnic
design of this study should be taken into account when in-
terpreting results. Our understanding of the potential
impact of population stratification will be aided by future
kidney eQTL studies from diverse ancestral populations.
With regards to heterogeneity in the causes of proteinu-
ric kidney disease in this cohort, we found computational
and experimental strategies that can be applied to GLOM
and TI eQTL data to derive insights that are broadly rele-
vant to underlying biology of these structures and specific
to particular cell types. Future GLOM and TI eQTL studies
in normal kidneys and those with a specific histologic or
molecular diagnosis (and of similar sample sizes) would
complement this study with insights about similarities
and differences in the genetics of gene expression as a
function of disease state.
In our opinion, sharing these eQTL and single-cell data in
an easily accessiblemanner is just as important as anyof the
specific discoveries thatwe report here. To this end,wehave
added a stand-alone eQTLbrowser ‘‘nephQTL,’’ to our exist-
ingNephVS software. nephQTL has a searchable browser of
the summary-level MatrixEQTL andDAP output for GLOM
and TI, with both summary statistics and visualizations of
the eQTLs. The full MatrixEQTL output is also available
for download and secondary use. For the single-cell RNA-
seq data, we have also uploaded to our file sharing folder a
single data matrix files with the read counts from all three
tumor nephrectomy databases (see Web Resources for
link). Our hope is that unrestricted access to this unique
data will be useful to the wider community, catalyzing
and accelerating discoveries that will ultimately lead to
improved health for individuals with NS and beyond.
Appendix A: Transcriptome-wide Association
Study
Using the same genotype and expression data from the
eQTL analysis, we first adjusted each gene’s expression by
age, sex, 4 genetic PCs, and 31 PEER factors in TI and 25
in GLOM. Using the residuals for each gene, we used the
R package ‘‘glmnet’’ to fit a regression equation penalized
using an elastic net with a ¼ 0.5, which is a mixture of
an L1 and L2 penalty. For each gene we allowed non-
ambiguous biallelic variants within 500 kb of the start
and end positions of each gene that were also present in
the IgAN GWAS and eQTL dataset (MAF > 0.03 in the
eQTL dataset). To select an appropriate hyperparameter,
we used 30-fold cross-validation and selected the param-
eter that maximized the prediction R2 of the validation
set. We selected genes with a cross-validated prediction
R2 > 0.01.Using a reference panel comprising East Asian and Euro-
pean samples from the 1000 Genomes data (n ¼ 1,007
samples), for each gene g, we computed the variance of
SNP l (0o2
l ) and variance of predicted expression0o2
g . The
variance0o2
g was defined in the MetaXcan paper as:0o2
g ¼ w0g~Awg ;
where w0g is a vector of weights for gene g and
~A is a covari-
ance matrix of the SNPs included for gene g computed
across the samples selected above.Finally, we computed the Zg statistic for gene g as:
ZgzP
l˛Modelg
wlg
0o
l0o
g
blse blð Þ
where Modelg is the set of SNPs for gene g, wlg is the weight
learned for gene g and SNP l from the elastic net, bl is the
effect size from the GWAS result for SNP l, and se blð is
the standard error for the effect size. We performed gene-
level association using only the genes for which we could
predict expression with a cross-validated r2 > 0.01.
Supplemental Data
Supplemental Data include 13 figures, consortium information,
and 6 tables and can be found with this article online at https://
doi.org/10.1016/j.ajhg.2018.07.004.
Consortia
Members of the Nephrotic Syndrome Study Network (NEPTUNE)
are as follows: John Sedor, Katherine Dell, Marleen Schachere, Ke-
vin Lemley, Lauren Whitted, Tarak Srivastava, Connie Haney,
Christine Sethna, Kalliopi Grammatikopoulos, Gerald Appel,
Michael Toledo, Laurence Greenbaum, Chia-shi Wang, Brian
Lee, Sharon Adler, Cynthia Nast, Janine LaPage, Ambarish Atha-
vale, Alicia Neu, Sara Boynton, Fernando Fervenza, Marie Hogan,
John C. Lieske, Vladimir Chernitskiy, Frederick Kaskel, Neelja Ku-
mar, Patricia Flynn, Jeffrey Kopp, Eveleyn Castro-Rubio, Jodi
Blake, Howard Trachtman, Olga Zhdanova, Frank Modersitzki, Su-
zanne Vento, Richard Lafayette, Kshama Mehta, Crystal Gadeg-
beku, Duncan Johnstone, Daniel Cattran, Michelle Hladunewich,
Heather Reich, Paul Ling, Martin Romano, Alessia Fornoni, Laura
Barisoni, Carlos Bidot, Matthias Kretzler, Debbie Gipson, Amanda
Williams, Renee Pitter, Patrick Nachman, Keisha Gibson, Sandra
Grubbs, Anne Froment, Lawrence Holzman, Kevin Meyers,
Krishna Kallem, Fumei Cerecino, Kamal Sambandam, Elizabeth
The American Journal of Human Genetics 103, 232–244, August 2, 2018 241
Brown, Natalie Johnson, Ashley Jefferson, Sangeeta Hingorani,
Kathleen Tuttle, Laura Curtin, S Dismuke, Ann Cooper, Barry
Freedman, Jen Jar Lin, Stefanie Gray, Matthias Kretzler, Larua Bar-
isoni, Crystal Gadegbeku, Brenda Gillespie, Debbie Gipson, Law-
rence Holzman, Laura Mariani, Matthew G. Sampson, Peter
Song, Johnathan Troost, Jarcy Zee, Emily Herreshoff, Colleen Kin-
caid, Chrysta Lienczewski, TinaMainieri, AmandaWilliams, Kevin
Abbott, Cindy Roy, Tiina Urv, and John Brooks
Acknowledgments
M.G.S. is supported by the Charles Woodson Clinical Research
Fund, the Ravitz Foundation, and National Institutes of Health
RO1-DK108805. K.K. is supported by National Institutes of Health
RO1-DK105124. The Nephrotic Syndrome Study Network Con-
sortium (NEPTUNE), U54-DK-083912, is a part of the National
Center for Advancing Translational Sciences (NCATS) Rare Disease
Clinical Research Network (RDCRN), supported through a collab-
oration between the Office of Rare Diseases Research (ORDR),
NCATS, and the National Institute of Diabetes, Digestive, and Kid-
ney Diseases. RDCRN is an initiative of ORDR, NCATS. Additional
funding and/or programmatic support for this project has also
been provided by the University of Michigan, NephCure Kidney
International, and the Halpin Foundation.
Declaration of Interest
The authors declare no competing interests.
Received: March 14, 2018
Accepted: June 29, 2018
Published: July 26, 2018
Web Resources
EPACTS, https://genome.sph.umich.edu/wiki/EPACTS
File sharing folder to access all MatrixEQTL output and single cell
data matrix, https://umich.app.box.com/folder/47806127161
GTEx Portal, https://www.gtexportal.org/home/
NephQTL browser, http://nephQTL.org
Nephrotic syndrome variant server, http://nephvs.org
Roadmap Epigenomics, http://www.roadmapepigenomics.org/
References
1. Gipson, D.S., Selewski, D.T., Massengill, S.F., Wickman, L.,
Messer, K.L., Herreshoff, E., Bowers, C., Ferris, M.E., Mahan,
J.D., Greenbaum, L.A., et al. (2013). Gaining the PROMIS
perspective from children with nephrotic syndrome: a Mid-
west pediatric nephrology consortium study. Health Qual.
Life Outcomes 11, 30.
2. Ruth, E.M., Landolt, M.A., Neuhaus, T.J., and Kemper, M.J.
(2004). Health-related quality of life and psychosocial adjust-
ment in steroid-sensitive nephrotic syndrome. J. Pediatr.
145, 778–783.
3. Kerlin, B.A., Blatt, N.B., Fuh, B., Zhao, S., Lehman, A.,
Blanchong,C.,Mahan, J.D., and Smoyer,W.E. (2009). Epidemi-
ology and risk factors for thromboembolic complications
of childhood nephrotic syndrome: a Midwest Pediatric
Nephrology Consortium (MWPNC) study. J. Pediatr. 155,
105–110, 110.e1.
4. Hingorani, S.R., Weiss, N.S., and Watkins, S.L. (2002). Predic-
tors of peritonitis in children with nephrotic syndrome. Pe-
diatr. Nephrol. 17, 678–682.
5. Sampson, M.G., and Pollak, M.R. (2015). Opportunities and
challenges of genotyping patients with nephrotic syndrome
in the genomic era. Semin. Nephrol. 35, 212–221.
6. Vivante, A., and Hildebrandt, F. (2016). Exploring the genetic
basis of early-onset chronic kidney disease. Nat. Rev. Nephrol.
12, 133–146.
7. Gbadegesin, R.A., Adeyemo, A., Webb, N.J., Greenbaum, L.A.,
Abeyagunawardena, A., Thalgahagoda, S., Kale, A., Gipson, D.,
Srivastava, T., Lin, J.J., et al. (2015). HLA-DQA1 and PLCG2 are
candidate risk loci for childhood-onset steroid-sensitive
nephrotic syndrome. J. Am. Soc. Nephrol. 26, 1701–1710.
8. Yu, H., Artomov, M., Brahler, S., Stander, M.C., Shamsan, G.,
Sampson, M.G., White, J.M., Kretzler, M., Miner, J.H., Jain, S.,
et al. (2016). A role for genetic susceptibility in sporadic focal
segmental glomerulosclerosis. J. Clin. Invest. 126, 1067–1078.
9. Genovese, G., Friedman, D.J., Ross, M.D., Lecordier, L., Uzur-
eau, P., Freedman, B.I., Bowden, D.W., Langefeld, C.D., Olek-
syk, T.K., Uscinski Knob, A.L., et al. (2010). Association of try-
panolytic ApoL1 variants with kidney disease in African
Americans. Science 329, 841–845.
10. Okamoto, K., Tokunaga, K., Doi, K., Fujita, T., Suzuki, H., Ka-
toh, T., Watanabe, T., Nishida, N., Mabuchi, A., Takahashi,
A., et al. (2011). Common variation in GPC5 is associated
with acquired nephrotic syndrome. Nat. Genet. 43, 459–463.
11. Fairfax, B.P., Makino, S., Radhakrishnan, J., Plant, K., Leslie, S.,
Dilthey, A., Ellis, P., Langford, C., Vannberg, F.O., and Knight,
J.C. (2012). Genetics of gene expression in primary immune
cells identifies cell type-specific master regulators and roles
of HLA alleles. Nat. Genet. 44, 502–510.
12. Schadt, E.E., Molony, C., Chudin, E., Hao, K., Yang, X., Lum,
P.Y., Kasarskis, A., Zhang, B., Wang, S., Suver, C., et al.
(2008). Mapping the genetic architecture of gene expression
in human liver. PLoS Biol. 6, e107.
13. Musunuru, K., Strong, A., Frank-Kamenetsky, M., Lee, N.E.,
Ahfeldt, T., Sachs, K.V., Li, X., Li, H., Kuperwasser, N., Ruda,
V.M., et al. (2010). From noncoding variant to phenotype
via SORT1 at the 1p13 cholesterol locus. Nature 466, 714–719.
14. Emilsson, V., Thorleifsson, G., Zhang, B., Leonardson, A.S.,
Zink, F., Zhu, J., Carlson, S., Helgason, A., Walters, G.B., Gun-
narsdottir, S., et al. (2008). Genetics of gene expression and its
effect on disease. Nature 452, 423–428.
15. Battle, A., Brown, C.D., Engelhardt, B.E., Montgomery, S.B.;
GTEx Consortium; Laboratory, Data Analysis &Coordinating
Center (LDACC)—Analysis Working Group; Statistical
Methods groups—Analysis Working Group; Enhancing
GTEx (eGTEx) groups; NIH Common Fund; NIH/NCI; NIH/
NHGRI; NIH/NIMH; NIH/NIDA; Biospecimen Collection
Source Site—NDRI; Biospecimen Collection Source Site—
RPCI; Biospecimen Core Resource—VARI; Brain Bank Reposi-
tory—University of Miami Brain Endowment Bank; Leidos
Biomedical—Project Management; ELSI Study; Genome
Browser Data Integration &Visualization—EBI; Genome
Browser Data Integration &Visualization—UCSC Genomics
Institute, University of California Santa Cruz; Lead analysts;
Laboratory, Data Analysis &Coordinating Center (LDACC);
NIH program management; Biospecimen collection; Pathol-
ogy; and eQTL manuscript working group (2017). Genetic ef-
fects on gene expression across human tissues. Nature 550,
204–213.
242 The American Journal of Human Genetics 103, 232–244, August 2, 2018
16. Ko, Y.A., Yi, H., Qiu, C., Huang, S., Park, J., Ledo, N., Kottgen,
A., Li, H., Rader, D.J., Pack, M.A., et al. (2017). Genetic-varia-
tion-driven gene-expression changes highlight genes with
important functions for kidney disease. Am. J. Hum. Genet.
100, 940–953.
17. Iyengar, S.K., Sedor, J.R., Freedman, B.I., Kao, W.H., Kretzler,
M., Keller, B.J., Abboud, H.E., Adler, S.G., Best, L.G., Bowden,
D.W., et al.; Family Investigation of Nephropathy and Dia-
betes (FIND) (2015). Genome-wide association and trans-
ethnic meta-analysis for advanced diabetic kidney disease:
Family Investigation of Nephropathy and Diabetes (FIND).
PLoS Genet. 11, e1005352.
18. Sandholm, N., Salem, R.M., McKnight, A.J., Brennan, E.P., For-
sblom, C., Isakova, T., McKay, G.J., Williams, W.W., Sadlier,
D.M., Makinen, V.P., et al.; DCCT/EDIC Research Group
(2012). New susceptibility loci associated with kidney disease
in type 1 diabetes. PLoS Genet. 8, e1002921.
19. Muller, Y.L., Piaggi, P., Hanson, R.L., Kobes, S., Bhutta, S., Ab-
dussamad, M., Leak-Johnson, T., Kretzler, M., Huang, K., Weil,
E.J., et al. (2015). A cis-eQTL in PFKFB2 is associated with dia-
betic nephropathy, adiposity and insulin secretion in Amer-
ican Indians. Hum. Mol. Genet. 24, 2985–2996.
20. Sampson, M.G., Robertson, C.C., Martini, S., Mariani, L.H.,
Lemley, K.V., Gillies, C.E., Otto, E.A., Kopp, J.B., Randolph,
A., Vega-Warner, V., et al.; Nephrotic Syndrome Study
Network (2016). Integrative genomics identifies novel associ-
ations with APOL1 risk genotypes in black NEPTUNE subjects.
J. Am. Soc. Nephrol. 27, 814–823.
21. Zhang, J.-Y., Wang, M., Tian, L., Genovese, G., Yan, P., Wilson,
J.G., Thadhani, R., Mottl, A.K., Appel, G.B., Bick, A.G., et al.
(2018). UBD modifies APOL1-induced kidney disease risk.
Proc. Natl. Acad. Sci 115, 3446–3451.
22. Gadegbeku, C.A., Gipson, D.S., Holzman, L.B., Ojo, A.O.,
Song, P.X., Barisoni, L., Sampson, M.G., Kopp, J.B., Lemley,
K.V., Nelson, P.J., et al. (2013). Design of the Nephrotic Syn-
drome Study Network (NEPTUNE) to evaluate primary
glomerular nephropathy by a multidisciplinary approach.
Kidney Int. 83, 749–756.
23. Sampson, M.G., Gillies, C.E., Robertson, C.C., Crawford, B.,
Vega-Warner, V., Otto, E.A., Kretzler, M., and Kang, H.M.
(2016). Using population genetics to interrogate the mono-
genic nephrotic syndrome diagnosis in a case cohort. J. Am.
Soc. Nephrol. 27, 1970–1983.
24. Ju, W., Nair, V., Smith, S., Zhu, L., Shedden, K., Song, P.X.K.,
Mariani, L.H., Eichinger, F.H., Berthier, C.C., Randolph, A.,
et al.; ERCB, C-PROBE, NEPTUNE, and PKU-IgAN Consortium
(2015). Tissue transcriptome-driven identification of
epidermal growth factor as a chronic kidney disease
biomarker. Sci. Transl. Med. 7, 316ra193.
25. Li, Y., Sidore, C., Kang, H.M., Boehnke, M., and Abecasis, G.R.
(2011). Low-coverage sequencing: implications for design of
complex trait association studies. Genome Res. 21, 940–951.
26. Jun, G., Wing, M.K., Abecasis, G.R., and Kang, H.M. (2015).
An efficient and scalable analysis framework for variant
extraction and refinement from population-scale DNA
sequence data. Genome Res. 25, 918–925.
27. Cohen, C.D., Frach, K., Schlondorff, D., and Kretzler, M.
(2002). Quantitative gene expression analysis in renal bi-
opsies: a novel protocol for a high-throughput multicenter
application. Kidney Int. 61, 133–140.
28. Dai, M., Wang, P., Boyd, A.D., Kostov, G., Athey, B., Jones,
E.G., Bunney, W.E., Myers, R.M., Speed, T.P., Akil, H., et al.
(2005). Evolving gene/transcript definitions significantly alter
the interpretation of GeneChip data. Nucleic Acids Res. 33,
e175–e175.
29. Lockstone, H.E. (2011). Exon array data analysis using Affy-
metrix power tools and R statistical software. Brief. Bioinform.
12, 634–644.
30. Stegle, O., Parts, L., Durbin, R., and Winn, J. (2010). A
Bayesian framework to account for complex non-genetic fac-
tors in gene expression levels greatly increases power in
eQTL studies. PLoS Comput. Biol. 6, e1000770.
31. Shabalin, A.A. (2012). Matrix eQTL: ultra fast eQTL analysis
via large matrix operations. Bioinformatics 28, 1353–1358.
32. Parts, L., Stegle, O., Winn, J., and Durbin, R. (2011). Joint ge-
netic analysis of gene expression data with inferred cellular
phenotypes. PLoS Genet. 7, e1001276.
33. Wen, X. (2016). Molecular QTL discovery incorporating
genomic annotations using Bayesian false discovery rate con-
trol. Ann. Appl. Stat. 10, 1619–1638.
34. Wen,X.,Lee,Y.,Luca, F., andPique-Regi,R. (2016).Efficient inte-
grativemulti-SNP association analysis via deterministic approx-
imation of posteriors. Am. J. Hum. Genet. 98, 1114–1129.
35. Flutre, T., Wen, X., Pritchard, J., and Stephens, M. (2013). A
statistical framework for joint eQTL analysis in multiple tis-
sues. PLoS Genet. 9, e1003486.
36. Kramer, A., Green, J., Pollard, J., Jr., and Tugendreich, S.
(2014). Causal analysis approaches in Ingenuity Pathway
Analysis. Bioinformatics 30, 523–530.
37. Rao, D.A., Berthier, C.C., Arazi, A., Davidson, A., Liu, Y.,
Browne, E.P., Eisenhaure, T.M., Chicoine, A., Lieb, D.J., Smi-
lek, D.E., et al. (2018). A protocol for single-cell transcriptom-
ics from cryopreserved renal tissue and urine for the Acceler-
ating Medicine Partnership (AMP) RA/SLE network. bioRxiv.
275859; doi: https://doi.org/10.1101/275859.
38. Consortium, G.T.; and GTEx Consortium (2015). Human ge-
nomics. The Genotype-Tissue Expression (GTEx) pilot anal-
ysis: multitissue gene regulation in humans. Science 348,
648–660.
39. Nicolae, D.L., Gamazon, E., Zhang, W., Duan, S., Dolan, M.E.,
and Cox, N.J. (2010). Trait-associated SNPs are more likely to
be eQTLs: annotation to enhance discovery from GWAS.
PLoS Genet. 6, e1000888.
40. Kiryluk, K., Li, Y., Scolari, F., Sanna-Cherchi, S., Choi, M., Ver-
bitsky, M., Fasel, D., Lata, S., Prakash, S., Shapiro, S., et al.
(2014). Discovery of new risk loci for IgA nephropathy impli-
cates genes involved in immunity against intestinal patho-
gens. Nat. Genet. 46, 1187–1196.
41. Gamazon, E.R., Wheeler, H.E., Shah, K.P., Mozaffari, S.V.,
Aquino-Michaels, K., Carroll, R.J., Eyler, A.E., Denny, J.C., Nic-
olae, D.L., Cox, N.J., Im, H.K.; and GTEx Consortium (2015).
A gene-based association method for mapping traits using
reference transcriptome data. Nat. Genet. 47, 1091–1098.
42. Barbeira, A.N., Dickinson, S.P., Bonazzola, R., Zheng, J.,
Wheeler, H.E., Torres, J.M., Torstenson, E.S., Shah, K.P., Garcia,
T., Edwards, T.L., et al.; GTEx Consortium (2018). Exploring
the phenotypic consequences of tissue specific gene expres-
sion variation inferred from GWAS summary statistics. Nat.
Commun. 9, 1825.
43. Franceschini, A., Szklarczyk, D., Frankild, S., Kuhn, M., Simo-
novic, M., Roth, A., Lin, J., Minguez, P., Bork, P., von Mering,
C., and Jensen, L.J. (2013). STRING v9.1: protein-protein
interaction networks, with increased coverage and integra-
tion. Nucleic Acids Res. 41, D808–D815.
The American Journal of Human Genetics 103, 232–244, August 2, 2018 243
44. Gagliardini, E., and Benigni, A. (2006). Role of anti-TGF-beta
antibodies in the treatment of renal injury. Cytokine Growth
Factor Rev. 17, 89–96.
45. Bottinger, E.P., and Bitzer, M. (2002). TGF-beta signaling in
renal disease. J. Am. Soc. Nephrol. 13, 2600–2610.
46. Cevikbas, F., Schaefer, L., Uhlig, P., Robenek, H., Theilmeier,
G., Echtermeyer, F., and Bruckner, P. (2008). Unilateral ne-
phrectomy leads to up-regulation of syndecan-2- and TGF-
beta-mediated glomerulosclerosis in syndecan-4 deficient
male mice. Matrix Biol. 27, 42–52.
47. Lu, Y., Ye, Y., Bao, W., Yang, Q., Wang, J., Liu, Z., and Shi, S.
(2017). Genome-wide identification of genes essential for po-
docyte cytoskeletons based on single-cell RNA sequencing.
Kidney Int. 92, 1119–1129.
48. Toda, N., Mori, K., Kasahara, M., Ishii, A., Koga, K., Ohno, S.,
Mori, K.P., Kato, Y., Osaki, K., Kuwabara, T., et al. (2017).
Crucial role of mesangial cell-derived connective tissue
growth factor in a mouse model of anti-glomerular basement
membrane glomerulonephritis. Sci. Rep. 7, 42114.
49. Gissen, P., Johnson, C.A., Gentle, D., Hurst, L.D., Doherty,
A.J., O’Kane, C.J., Kelly, D.A., andMaher, E.R. (2005). Compar-
ative evolutionary analysis of VPS33 homologues: genetic and
functional insights. Hum. Mol. Genet. 14, 1261–1270.
50. Gissen, P., Johnson, C.A., Morgan, N.V., Stapelbroek, J.M., For-
shew, T., Cooper, W.N., McKiernan, P.J., Klomp, L.W., Morris,
A.A., Wraith, J.E., et al. (2004). Mutations in VPS33B, encod-
ing a regulator of SNARE-dependent membrane fusion, cause
arthrogryposis-renal dysfunction-cholestasis (ARC) syn-
drome. Nat. Genet. 36, 400–404.
51. Weyand, A.C., Lombel, R.M., Pipe, S.W., and Shavit, J.A.
(2016). The role of platelets and epsilon-aminocaproic acid
in arthrogryposis, renal dysfunction, and cholestasis (ARC)
syndrome associated hemorrhage. Pediatr. Blood Cancer 63,
561–563.
52. Holme, A., Hurcombe, J.A., Straatman-Iwanowska, A., Inward,
C.I., Gissen, P., and Coward, R.J. (2013). Glomerular involve-
ment in the arthrogryposis, renal dysfunction and cholestasis
syndrome. Clin. Kidney J. 6, 183–188.
53. Zou, H., and Hastie, T. (2005). Regularization and variable se-
lection via the elastic net. J. R. Stat. Soc. Series B Stat. Meth-
odol. 67, 301–320.
54. Kottgen, A., Glazer, N.L., Dehghan, A., Hwang, S.J., Katz, R.,
Li, M., Yang, Q., Gudnason, V., Launer, L.J., Harris, T.B.,
et al. (2009). Multiple loci associated with indices of renal
function and chronic kidney disease. Nat. Genet. 41,
712–717.
55. Trudu, M., Janas, S., Lanzani, C., Debaix, H., Schaeffer, C., Ike-
hata, M., Citterio, L., Demaretz, S., Trevisani, F., Ristagno, G.,
et al.; SKIPOGH team (2013). Common noncoding UMOD
gene variants induce salt-sensitive hypertension and kidney
damage by increasing uromodulin expression. Nat. Med. 19,
1655–1660.
56. Olden, M., Corre, T., Hayward, C., Toniolo, D., Ulivi, S., Gas-
parini, P., Pistis, G., Hwang, S.J., Bergmann, S., Campbell,
H., et al. (2014). Common variants in UMOD associate with
urinary uromodulin levels: a meta-analysis. J. Am. Soc. Neph-
rol. 25, 1869–1882.
57. Sajuthi, S.P., Sharma, N.K., Chou, J.W., Palmer, N.D., McWil-
liams, D.R., Beal, J., Comeau, M.E., Ma, L., Calles-Escandon,
J., Demons, J., et al. (2016). Mapping adipose and muscle tis-
sue expression quantitative trait loci in African Americans to
identify genes for type 2 diabetes and obesity. Hum. Genet.
135, 869–880.
58. Walsh, A.M., Whitaker, J.W., Huang, C.C., Cherkas, Y., Lam-
berth, S.L., Brodmerkel, C., Curran, M.E., and Dobrin, R.
(2016). Integrative genomic deconvolution of rheumatoid
arthritis GWAS loci into gene and cell type associations.
Genome Biol. 17, 79.
59. Peters, J.E., Lyons, P.A., Lee, J.C., Richard, A.C., Fortune, M.D.,
Newcombe, P.J., Richardson, S., and Smith, K.G. (2016).
Insight into genotype-phenotype associations through eQTL
mapping in multiple cell types in health and immune-medi-
ated disease. PLoS Genet. 12, e1005908.
60. Claussnitzer, M., Dankel, S.N., Kim, K.H., Quon, G., Meule-
man, W., Haugen, C., Glunk, V., Sousa, I.S., Beaudry, J.L., Pu-
viindran, V., et al. (2015). FTO obesity variant circuitry and
adipocyte browning inhumans.N. Engl. J.Med. 373, 895–907.
61. Sekar, A., Bialas, A.R., de Rivera, H., Davis, A., Hammond, T.R.,
Kamitaki, N., Tooley, K., Presumey, J., Baum, M., Van Doren,
V., et al.; Schizophrenia Working Group of the Psychiatric Ge-
nomics Consortium (2016). Schizophrenia risk from complex
variation of complement component 4. Nature 530, 177–183.
62. Wen, X., Luca, F., and Pique-Regi, R. (2015). Cross-population
joint analysis of eQTLs: fine mapping and functional annota-
tion. PLoS Genet. 11, e1005176.
63. Goldwich, A., Burkard, M., Olke, M., Daniel, C., Amann, K.,
Hugo, C., Kurts, C., Steinkasserer, A., and Gessner, A. (2013).
Podocytes are nonhematopoietic professional antigen-pre-
senting cells. J. Am. Soc. Nephrol. 24, 906–916.
64. Rogers, N.M., Ferenbach, D.A., Isenberg, J.S., Thomson, A.W.,
and Hughes, J. (2014). Dendritic cells and macrophages in the
kidney: a spectrum of good and evil. Nat. Rev. Nephrol. 10,
625–643.
65. Gharavi, A.G., Kiryluk, K., Choi, M., Li, Y., Hou, P., Xie, J.,
Sanna-Cherchi, S., Men, C.J., Julian, B.A., Wyatt, R.J., et al.
(2011). Genome-wide association study identifies suscepti-
bility loci for IgA nephropathy. Nat. Genet. 43, 321–327.
66. Lin, D.Y., and Zeng, D. (2009). Proper analysis of secondary
phenotype data in case-control association studies. Genet. Ep-
idemiol. 33, 256–265.
244 The American Journal of Human Genetics 103, 232–244, August 2, 2018


