Embed Size (px)
Citation preview

In: Biochemical Engineering ISBN 978-1-60741-257-1
Editors: F. E. Dumont and J. A. Sacco, pp. © 2009 Nova Science Publishers, Inc.
Chapter 7
AMYLASE PRODUCTION BY ASPERGILLUS ORYZAE IN
SUBMERGED AND SOLID STATE FERMENTATIONS
Nelson Pérez-Guerra 1,*
, Lorenzo Pastrana-Castro1,†
,
Renato Pérez-Rosés2,‡
1Nutrition and Bromatology Group, Department of Analytical and Food Chemistry, Food
Science and Technology Faculty, Ourense Campus, University of Vigo, Ourense, Spain 2Department of Pharmacy, Natural Science Faculty, University of Oriente, Patricio
Lumumba Ave., E-90500, Santiago de Cuba, Cuba
ABSTRACT
Synthesis of amylase by Aspergillus oryzae strain FQB-01 was followed in
submerged liquid and solid state fermentations. The submerged cultures were carried out
in media prepared with brewery (BW) and meat processing (MPW) wastewaters
supplemented with different starch concentrations (10, 20 30 and 40 g/L).
Amylase productions (116 and 111 EU/mL) in the BW and MPW media
supplemented with 40 g of starch/L of medium were slightly higher than those obtained
in the same media supplemented with 30 g of starch/L (113 and 107 EU/mL) after 84 h of
fermentation. In addition, the initial chemical oxygen demand in both wastes was reduced
by at least 95%. Optimal pH and temperature for amylase activity were estimated at 5.8
and 46.4ºC, respectively. In the optimal conditions, the enzyme showed a high stability at
40 or 50ºC (pH = 5.8) or at pH values of 5.0 and 6.0 (T = 46.4ºC) in the absence of
starch.
* Author whom correspondence should be addressed: Nelson Pérez Guerra, Nutrition and Bromatology Group,
Department of Analytical and Food Chemistry, Food Science and Technology Faculty, Ourense Campus,
University of Vigo, E-32004 Ourense, SPAIN. Tel: 34-988-387-062; Fax: 34-988-387-001. E-mail:
[email protected] † E-mail: [email protected]

Amylase Production in Submerged and Solid state Fermentations 2
The optimum conditions for high amylase production (539 EU/g of dry bagasse)
under solid stated fermentation were particle size of bagasse in the range of 5-10 mm,
incubation temperature of 32.5ºC, pH of 5.9, moisture content of bagasse of 75%, starch
concentration of 70.5 mg/g of dry bagasse and inoculum size of 1.4 × 10⁷ spores/g of dry
bagasse.
Keywords: amylase, brewery wastes, meat processing wastes, solid state fermentation,
starch, submerged liquid fermentation, sugar cane bagasse
INTRODUCTION
The meat and brewery industries produce large quantities of wastewaters with high
chemical oxygen demand (COD) and biochemical oxygen demand (BOD), thus representing
a serious environmental problem in Santiago de Cuba. Therefore, these effluents must be
treated by using clean technologies for reducing their initial COD, as reported before for these
wastes (Salas et al., 2006) and for other wastes from food industry (Murado et al., 1993;
Roukas, 1999; Guerra & Pastrana, 2003).
In this way, different food wastes (e.g. mussel processing wastes, brewery wastes, whey)
have been used as culture media in submerged cultures to produce different metabolites
including amylases (Murado et al., 1993; 1997), pullulan (Roukas, 1999) and bacteriocins
(Guerra & Pastrana, 2003; Guerra et al., 2005), among others. However, comparative studies
between submerged liquid fermentation (SLF) and solid state fermentation (SSF) claim
higher yields and other advantages for products produced by SSF, such as low energy
requirements, lower availability of water that reduces the possibilities of contamination by
bacteria and yeast, small volumes of polluting effluents and low downstream processing cost
(Hesseltine, 1972; Cannel and Moo-Young, 1980; Aidoo et al., 1981; Steinkraus, 1984;
Kumar & Lonsane, 1990; Kumaran et al., 1997; Raimbault, 1998; Guerra et al., 2003). Some
agro-industrial products (e.g. sugar cane bagasse, spent brewing grains, cassava starch, sweet
potato residue and peanut meal residue, palm fiber, banana waste) have been used for
metabolite production in SSF (Krishna & Chandrasekaran, 1996; Yang and Wang, 1999;
Francis et al., 2002; Milagres et al., 2004; John et al., 2006; Spier et al., 2006; Mazutti et al.,
2006; 2007; Balkan & Ertan, 2007; Laxmi et al., 2008).
Amylases production by Aspergillus species in both submerged and solid state
cultivations using different food wastes or agricultural residues has been thoroughly studied
(Gigras et al., 2002; Ellaiah et al., 2002; Francis et al., 2002; 2003; Salas et al., 2006). These
enzymes have not only been used in fermentation processes, but also in processed food
industry and in the textile and paper industries (Pandey et al., 2000; Ellaiah et al., 2002;
Gigras et al., 2002). The production of amylases in SLF and SSF is affected by a variety of
physicochemical factors, including the composition of the growth medium, incubation
temperature, pH, aeration, concentration and type of the carbon, phosphate and nitrogen
sources, size and age of the inoculum, particle size and moisture level of the substrate (Gigras
et al., 2002; Salas et al., 2006; Balkan & Ertan, 2007). Therefore, after selecting a culture
medium for amylase production, it is necessary to determine the optimal culture conditions to
improve enzyme production at a low production cost (Salas et al., 2006; Spier et al., 2006;
Balkan & Ertan, 2007).

Amylase Production in Submerged and solid State Fermentations 3
Considering the substantial availability of highly rich wastewaters and sugar cane
bagasse at very low prices by local brewery, meat and sugar processing plants of Santiago de
Cuba, their use as culture media or support material for different bioproductions could
provide profitable substrates for a low cost production. This approach allows the protection of
the environment by recycling these residues in production of amylases by Aspergillus oryzae
strain FQB-01.
In the present study, both brewery and meat processing wastes of Santiago de Cuba were
evaluated as culture media for amylase production by A. oryzae strain FQB-01 under
submerged culture conditions. The reduction in COD in both wastes after biological treatment
and the effects of pH and temperature on the stability of amylase produced by A. oryzae strain
FQB-01were also investigated. Because A. oryzae strains are also capable of growing on solid
substrates (Murado et al., 1997; Francis et al., 2002), the feasibility of sugar cane bagasse as a
support material for the production of amylase by A. oryzae FQB-01 was also studied in SSF.
To optimize the enzyme production in SSF, the effects of particle size, pH, incubation
temperature, moisture content, inoculum size and initial starch levels on the production of
amylase were studied.
MATERIALS AND METHODS
Microorganism
Aspergillus oryzae strain FQB-01, was acquired from the Biotechnology Center of the
University of Oriente (Santiago de Cuba, Cuba) and it was maintained on potato dextrose
agar slants at 4ºC (Ellaiah et al., 2002; Salas et al., 2006).
Inoculum Preparation
Inocula were prepared by transferring 2-mL of 60-h old slant culture in 50 mL of medium
(250 mL Erlenmeyer) composed by (g/L): glucose, 20; (NH4)2SO4, 6.6; KH2PO4, 3.5;
FeSO4·7H2O, 0.15; MgSO4·7H2O, 0.10; MnCl2·2H2O, 0.45 and mycological peptone, 3.0; at
pH 6.8. The culture was incubated at 30ºC/48 h in an orbital shaker at 200 rpm (Salas et al.,
2006).
Submerged Fermentations
Brewery (BW) and meat processing (MPW) wastewaters, which were used as a base of
the culture media, were obtained from a local brewery and a local meat processing plant. Both
wastes were centrifuged at 15000 rpm/15 min to remove the solids in suspension. The
supernatant obtained from BW contained (g/L): COD, 3.40; total sugars, 1.98; reducing
sugars, 1.46; total nitrogen, 0.095; total phosphorous, 0.034. The composition of the
supernatant obtained from MPW (g/L) was: COD, 3.00; total sugars, 1.82; reducing sugars,
0.99; total nitrogen, 0.172; total phosphorous, 0.028 (Salas et al., 2006).

Amylase Production in Submerged and Solid state Fermentations 4
After being used as culture media, both supernatants were supplemented with the
following nutrients (g/L): mycological peptone, 3.0; (NH4)2SO4, 6.6; CaCO3, 8.0; NaCl, 5;
KH2PO4, 3.5; FeSO4·7H2O, 0.15; MgSO4·7H2O, 0.10. To study the influence of the initial
concentration of starch on amylase production, the media were supplemented with soluble
potato starch to obtain initial starch concentrations of 10, 20, 30 and 40 g/L. Media without
starch were used as controls. The media were adjusted at pH 6.0, sterilized (121ºC/15 min),
inoculated with a 2% inoculum level (3 × 10⁷ spores/mL) and incubated at 30ºC/96 h. All
submerged cultures were carried out in 250-mL Erlenmeyer flasks with 50 mL of production
media in an orbital shaker (200 rpm), using eight flasks in each fermentation serie (Salas et
al., 2006).
The culture samples, as whole flasks in duplicate, were collected each 12 h. Mycelial
mass was harvested by paper filtration using a pre-dried and pre-weighted Whatman filter
paper No. 1, washed with distilled water and dried to constant weight at 105ºC. The growth of
the organism was determined as dry weight. Paper-filtered media were used to perform
analytical determinations (pH, enzyme concentration, total sugars and COD).
Method for determination of total sugars was described in a previous work (Guerra &
Pastrana, 2003). COD analyses were carried out in both the MPW and BW media before the
fermentations and in the paper-filtered media at the end of each fermentation using the closed
reflux colorimetric method as described previously (Greenberg et al., 1980). All
determinations were carried out in triplicate.
Assay of Amylase Activity
Total amylase activity (TAA) in the submerged and solid state cultures was determined as
described by Murado et al., (1993). Then, 80 µL of suitably diluted paper-filtered medium (in
case of submerged cultures) or crude enzyme extract (in case of solid state cultures) were
mixed with 400 µL of 0.15 M citrate-phosphate buffer, pH 5.0 (1 volume) and 4% soluble
starch (1.5 volumes) previously maintained at 40ºC/15 min. The reaction mixture was
incubated at 40ºC for 10 min. The reaction was stopped by addition of 480 µL of
dinitrosalicylic acid, and the released glucose was determined by 3,5-dinitrosalicylic acid
reaction (Bernfeld, 1951). One unit of amylase activity (enzymatic units (EU)/mL) was
defined as the amount of enzyme that releases 1 mg/mL of reducing sugars (glucose
equivalents) under the assay conditions. In case of SSF in sugar cane bagasse, the amylase
activity units were expressed as EU/g of dry support (gds).
Table 1. Experimental domain and codification of the variables used in the factorial
design to test the effect of temperature (T) and pH on amylase activity
Natural values Coded values
T (ºC) pH
- 1.267 26 3.6
-1 30 4.0
0 45 5.5
+ 1 60 7.0
+ 1.267 64 7.4
Amylase Production in Submerged and solid State Fermentations 5
Effect of Temperature and pH on Amylase Activity
A second-order orthogonal design (Box et al., 1989) based on five levels and two
variables was used to study the combined influence of pH and temperature on amylase
activity. The design consisted of 13 experiments with four (22) factorial points, four axial
points to form a central composite design with α = 1.267 and five center points for
replication.
Samples of cell-free medium containing the enzymes were buffered at different pHs with
the appropriate buffer (potassium hydrogen phthalate-HCl buffer for pH 3.6, 4.0 and 5.5;
sodium phosphate buffer for pH 7.0 and 7.4). The buffering agents were prepared as
concentrated stock solutions. Then, appropriate volumes of them were mixed with the
samples of cell-free medium to obtain a final buffer concentration of 0.1 M. The samples
containing the amylase were incubated for 5 min at the corresponding temperature according
to the experimental matrix defined by the design used (Table 1). The enzyme activities
obtained were corrected with the corresponding dilution factor.
Results were analyzed by Experimental Design Module of the Statistica software package
(Statistica 5.1 for Windows computer program manual; StatSoft Inc. Tulsa, OK, USA). The
response surfaces were plotted using the DeltaGraph software, version 4.0 (SPSS, Inc.,
Chicago, IL, USA).
Solid State Fermentation (SSF)
Sugar cane bagasse was treated with NaOH (0.12 g of NaOH per gram of dry bagasse)
and autoclaved at 121ºC for 20 min (Gutiérrez-Correa & Tengerdy, 1997) to remove the core
and noncore lignin fractions (Doran et al., 1994). Then, the samples of sugar cane bagasse
were thoroughly washed with tap water, subsequently with distilled water until neutrality and
dried at 80ºC (Gutiérrez-Correa & Tengerdy, 1997).
Fermentations were conducted in 250-mL Erlenmeyer flasks containing 5 g of dried
bagasse supplemented with the basal salt solution, previously adjusted at the appropriated pH
value, and distilled water until reaching the desired moisture level. The salt solution contained
(%, g/g of dry support), NH4NO3, 1; KH2PO4, 1; NaCl, 0.2; MgSO47H2O, 0.2 (Francis et al.,
2003). The contents of the flasks were thoroughly mixed and autoclaved at 121ºC for 15 min.
After cooling, the flasks were inoculated with 1.25 mL of inoculum containing the
appropriate cell suspension. The contents were thoroughly mixed and incubated at the
appropriate temperature for 96 h in a chamber with temperature and humidity control.
Samples as whole flasks in triplicate were withdrawn after 96 h of fermentation (Francis et
al., 2002).
Optimization of Process Parameters in SSF
In a first step, the bagasse was milled to different particle sizes (<1.0, 1.0-2.0, 2.0-5.0,
5.0-10.0 and 10.0-15.0 mm) and used as support materials to determine the appropriate
particle size for maximal enzyme production in SSF. The initial moisture content of the
growth media was adjusted to 80% (Milagres et al., 2004) with a mixture of 2.5 mL of the

Amylase Production in Submerged and Solid state Fermentations 6
basal salt solution (initial pH of 6.0) and 16.25 mL of distilled water previously supplemented
with soluble potato starch to obtain the desire level of starch in the solid support (26 mg of
TS/g of dry sugar cane bagasse). The media were autoclaved (121ºC for 15 min), cooled and
inoculated with 1.25 mL of the spores suspension (1 × 10⁷ spores/g of dry sugar cane
bagasse) previously prepared and then incubated at 30ºC for 96 h.
Secondly, a second-order orthogonal design (Box et al., 1989) was performed to asses the
effect of pH of the liquid medium (salt solution plus distilled water) and incubation
temperature on amylase production. The design consisted of 13 experiments with four (22)
factorial points, four axial points to form a central composite design with α = 1.267 and five
center points for replication. The range and coding values selected for all independent
variables in this experimental design are listed in Table 2.
After this previous optimization, a new second-order orthogonal design was used to study
the effect of three factors (total sugars concentration, inoculum size and moisture content) on
amylase production in the optimal conditions calculated before (particle size, pH and
incubation temperature). In this case, the design consisted of 20 experiments with eight (23)
factorial points, six axial points to form a central composite design with α = 1.525 and six
center points for replication.
The medium was supplemented with 2.5 mL of the basal salt solution and an appropriate
volume of distilled water containing different amounts of soluble potato starch to give both
the different moisture contents and total sugars concentration in the medium (mg of total
sugars per g of dry support) defined by the experimental design (Table 3). The media were
autoclaved (121ºC for 15 min), cooled and inoculated with 1.25 mL of a cell suspension
containing the appropriate amount of spores to obtain the inoculum rate (spores/g of dry sugar
cane bagasse) defined by the experimental design (Table 3). The media were then incubated
at 32.5ºC for 96 h.
All the solid state fermentations were done in triplicates and the data presented are mean
values of each experiment. Results were analyzed by Experimental Design Module of the
Statistica software package (Statistica 5.1 for Windows computer program manual; StatSoft
Inc. Tulsa, OK, USA). The response surfaces were plotted using the DeltaGraph software,
version 4.0 (SPSS, Inc., Chicago, IL, USA).
Table 2. Experimental domain and codification of the variables used in the factorial
design to test the effect of temperature (T) and pH on amylase production by A. oryzae
FQB-01 in SSF
Natural values Coded values
T (ºC) pH
- 1.267 23.4 3.7
-1 25.0 4.0
0 31.0 5.3
+ 1 37.0 6.5
+ 1.267 38.6 6.8

Amylase Production in Submerged and solid State Fermentations 7
Table 3. Experimental domain and codification of the variables used in the factorial
design to test the effect of total sugars (TS in mg/g of dry support (gds)), moisture
content (M in %) and inoculum size (IS in log (number of spores/gds)) on amylase
production by A. oryzae FQB-01 in SSF
Natural values Coded values
TS M IS
- 1.525 9.5 58.5 4.2
-1 20.0 63.0 5.0
0 40.0 71.5 6.5
+ 1 65.0 80.0 8.0
+ 1.525 70.5 84.5 8.8
Extraction of the Enzyme
After fermentations the whole sample of each flask was extracted by the addition of
distilled water containing 0.1% Tween-80, to a total extract volume of 100 mL. Contents
were mixed thoroughly (150 rpm, at room temperature for 1 h) in a rotary shaker and
subsequently, the suspension was centrifuged (7000 rpm for 10 min) and the supernatants
were used as the crude enzyme extract for further analysis (Francis et al., 2003).
RESULTS AND DISCUSSION
Amylases Production in Food Wastes Supplemented with Starch
Amylase production by Aspergillus oryzae strain FQB-01 was followed in media
prepared with brewery and meat processing wastewaters supplemented with varying
concentrations of starch. Figures 1 and 2 show the time course of growth, pH, total sugars
(TS) and enzyme (TAA) production. As it can be observed, the increase in the initial TS
concentration led to an increase in biomass (as cell dry weight) and amylase synthesis when
compared to the control cultures (BW and MPW media without starch). This indicates that
the supplements with starch in both media favoured both biomass and enzyme production.
Thus, the maximum TAA levels obtained in the media supplemented with 10, 20, 30 and 40 of
g of starch/L of medium were 81, 102, 113 and 116 EU/mL in BW medium and 78, 98, 107
and 111 EU/mL in MPW medium. As it can be noted, increasing the TS concentration from
30 to 40 g/L did not produce a significant increase in TAA concentrations in both MPW and
BW media (Figures 1 and 2).

Amylase Production in Submerged and Solid state Fermentations 8
Figure 1. Time course of growth and enzyme synthesis by A. oryzae strain FQB-01 grown in media
prepared with meat processing wastewaters (MPW) supplemented with different initial concentrations
of soluble starch (2: 0, □: 10, Ο: 20; ∆: 30; ◊: 40 g/L). TS: total sugars; TAA: total amylolytic activity.
The cultures were carried out at 30ºC/96 h in an orbital shaker at 200 rpm.
Figure 2. Time course of growth and enzyme synthesis by A. oryzae strain FQB-01 grown in media
prepared with brewery wastewaters (BW) supplemented with different initial concentrations of soluble
starch (2: 0, □: 10, Ο: 20; ∆: 30; ◊: 40 g/L). TS: total sugars; TAA: total amylolytic activity. The
cultures were carried out at 30ºC/96 h in an orbital shaker at 200 rpm.

Amylase Production in Submerged and solid State Fermentations 9
From the comparison of the results obtained in both media, it can be noted that the
maximum TAA obtained in BW medium (116 EU/mL) was slightly higher than in MPW (111
EU/mL). In contrast, biomass concentration in MPW medium (3.47 g/L) was slightly higher
than that in BW medium (3.32 g/L). Taking into account these results, it can be concluded
that the biomass produced in BW was more productive than that in MPW, being the yields of
enzyme production (EU on g of cell dry weight) calculated as 34939.76 and 31988.47 EU/g
of cell dry weight, respectively.
During fermentation in both the starch-supplemented MPW and BW media, the pH
initially dropped from 6.0 to 4.0 after 24 h followed by its increase to 7.0 approximately (60
h), and remained constant thereafter. The TS concentration decreased during fermentation in
parallel with the increase in biomass and enzyme production. Final COD values of
approximately 0.16 g/L or lower were obtained in the media supplemented with 40 g of
starch/L of medium and in the media containing lower initial starch concentrations,
respectively. This indicates that at least 95% of the initial COD were removed from BW and
MPW media.
Table 4. Comparison of the observed and the predicted responses (remaining amylase
activity) after pH and temperature treatment and significance analysis of the model
coefficients
Natural values Remaining TAA (%)
T pH Observed response Predicted value
60 7.0 58.94 59.04
60 4.0 39.14 37.92
30 7.0 43.16 48.49
30 4.0 28.04 27.37
64 5.5 53.85 55.03
26 5.5 45.06 41.67
45 7.4 75.65 71.66
45 3.6 43.12 44.90
45 5.5 89.63 94.44
45 5.5 92.34 94.44
45 5.5 100.00 94.44
45 5.5 94.00 94.44
45 5.5 95.36 94.44
Significance analysis of coefficients
Factor Coefficient t-value
Constant 94.4 55.34*
T 5.3 3.67*
pH 10.6 7.36*
T·pH 1.2 0.61
T2 -28.7 16.92*
pH2 -22.5 13.28*
* Significant at t (α < 0.05; υ = 4) > 2.78.

Amylase Production in Submerged and Solid state Fermentations 10
From a comparative point of view, it can be noted that the TAA concentrations produced
by A. oryzae FQB-01 were considerably higher than those produced by Aspergillus niger UO-
01 in both BW (70 EU/mL) and MPW (60 EU/mL) media (Salas et al., 2006).
Effect of pH and Temperature on the Stability of Enzymes
Samples of amylase previously produced in BW medium supplemented with 40 g of
starch/L, were used to test the effect of temperature and pH on the enzyme activity using a
second order orthogonal design. Table 4 summarizes the responses for each individual
experiment along with the predicted responses.
The model equation fitted by regression analysis is given by:
TAA (%) = 94.4 + 5.3T + 10.6pH – 28.7T2 – 22.5pH
2 (1)
where TAA is the remaining total amylolytic activity and T is the temperature. The model
terms T, pH, T2 and pH
2 were found to be significant according to the Student t-test (α <
0.05), meanwhile the interaction term between T and pH variables (T·pH) was found to be
non significant (Table 4).
The equation (1) was significant in Fisher`s F-tests (α < 0.05) applied to both quotients
total error/experimental error and lack of fitting/experimental error (Table 5). In addition, the
value of the adjusted determination coefficient (adj. r2) was calculated to be 0.977 (Table 5).
These results indicate that there is a statistically significant relationship between the variables
at the 95% confidence level as well as an excellent adequacy of the quadratic models to the
experimental data.
The response surface obtained from the empirical model (1) is depicted in Figure 3.
Optimal residual amylase activity (95 %) was at pH 5.8 (coded value of 0.23) and 46.4ºC
(coded value of 0.09), with visible decrease toward low or high values of both variables
(Figure 3).
Table 5. Significance analysis of the model (1) obtained for remaining amylase activity
after treatment of pH and temperature
SS fd QM
Model 7869.7 4 1967.4
Error 121.8 8 15.2
Exp. error 59.4 4 14.8
Lack of fitting 62.5 4 15.6
Total 7991.5 12 1982.6
QME/QMEe = 1.03 F84 (α = 0.05) = 6.04
QMLF/QMEe = 1.05 F44 (α = 0.05) = 6.39
r2 = 0.985 adj r
2 = 0.977
SS: Sum of Squares; df: degrees of freedom; QM: Quadratic Means; E: total error; Ee: Experimental
error; LF: Lack of Fitting.

Amylase Production in Submerged and solid State Fermentations 11
-1,30
1,3
-1,30
1,3
120
90
60
30
120
90
60
30
TpHT
AA
(%
)
Figure 3. Response surface showing the influence of pH and temperature on the total amylolytic
activity (TAA) produced by A. oryzae FQB-01 in BW medium. T and pH are in coded values.
Figure 4. Stability of the total amylolytic activity (TAA) produced by A. oryzae FQB-01 in BW medium
in absence of substrate (starch). A: The amylase samples were buffered at pH 5.8 with 0.1 M potassium
hydrogen phthalate-HCl buffer and incubated at 40ºC (□), 50ºC (O), 60ºC (∆) and 70ºC (◊). B: The
enzyme preparation was buffered with 0.1 M potassium hydrogen phthalate-HCl buffer (at pH values of
4 (□), 5 (O) and 6 (∆)) and with 0.1 M sodium phosphate buffer (at pH value of 7 (◊)) and incubated at
46.4ºC.
On the other hand, when amylase samples were adjusted at optimum pH value of 5.8 and
incubated at 40, 50, 60 and 70ºC in absence of substrate (starch), the enzyme retained
approximately 85% of its initial activity after 1 h of incubation at 40 and 50ºC (left part of
Figure 4). However, at 60 and 70ºC the initial amylase activity was completely lost after 50
and 30 min of incubation, respectively.
In the same way, when amylase samples were adjusted at pH values of 4.0, 5.0, 6.0 and
7.0 and incubated at 46.4ºC for 1h in absence of starch, the highest stabilities were observed
at pH values of 5.0 and 6.0 (right part of Figure 4). In these cases, the enzyme retained 96 and
99% of its initial activity, respectively. In contrast, the enzyme lost about 42% and 39% of its
initial activity when it was incubated at pH values of 4.0 and 7.0, respectively (right part of
Figure 4).

Amylase Production in Submerged and Solid state Fermentations 12
Optimization of TAA Production in Solid State Fermentation (SSF)
Particle size, temperature, pH, initial moisture content of support material, inoculum size
and starch concentration are important factors that influence amylase production by A. oryzae
strains in SSF (Gigras et al., 2002; Murado et al., 1997; Francis et al., 2003).
However, the effects of these variables on enzyme production depend on the strain and
the solid substrate or the support material used. For example, the use of a large particle size
(14 mm) support increased penicillin production by 37% in SSF using bagasse as an inert
support (Barrios-González et al., 1993). On the contrary, optimal particle size, moisture level
and inoculum concentration for α-amylase production in SSF by a strain of Penicillium
chrysogenum were >1 mm, 75% and 20% for corncob leaf, >1 mm, 65% and 20% for wheat
straw, 1 mm, 65% and 20% for wheat bran and >1 mm, 55% and 30% for rye straw (Balkan
& Ertan, 2007). However, an initial moisture content (70%), inoculum rate (1 × 10⁷
spores/gds) and an incubation temperature in the range of 25-30ºC were necessary to achieved
the maximum α-amylase production by A. oryzae NRRL 6270 on spent brewing grains
(Francis et al., 2002). The optimal moisture level for glucoamylase production by Aspergillus
sp. A3 in wheat bran was 80% (Ellaiah et al., 2002), while for α-amylase and glucoamylase
production by A. niger LPB 28 (Spier et al., 2006) in cassava starch and sugar cane bagasse
was 90%.
Taking into account these observations, TAA production by A. oryzae FQB-01 under SSF
using sugar cane bagasse as a support material was optimized by determining the optimal
particle size, temperature, pH, inoculum size, initial moisture content and starch concentration
in the solid support.
The first optimization experiment was performed to determine the influence of different
sugar cane particle sizes (<1.0, 1.0-2.0, 2.0-5.0, 5.0-10.0 and 10.0-15.0 mm) on amylase
production by A. oryzae FQB-01 in SSF. The results obtained are shown in Figure 5.
Maximum enzyme production (191 EU/g of dry support) was observed when the particle size
of bagasse was in the range of 5.0-10.0 mm, decreasing for low of high particle sizes. Thus,
this particle size probably provides the most effective support material for attachment of the
fungal strain (Laxmi et al., 2008), or facilitates the mass transfer performance (gas and
nutrient diffusion) greatly. This provides better respiration/aeration efficiency (Pandey et al.,
1999; Balkan & Ertan, 2007) and an increased availability of nutrients (Mazutti et al., 2007).
These facts favour growth and enzyme production (Pandey et al., 1999; Balkan & Ertan,
2007). In subsequent experiments, therefore, a particle size between 5.0-10.0 mm was used
for the production of amylase by A. oryzae FQB-01.
After optimizing the particle size of bagasse, the following experiment was focused on
the determination of the optimal pH and incubation temperature for high amylase production.
Table 6 summarizes the response for each individual experiment along with the calculated
response and the significance analysis of the model terms. Table 7 shows the significance
analysis of the empirical model (2), which gives the level of TAA as a function of pH and
temperature. The value of the determination coefficient (0.940) suggested that the fitted
model could explain 94% of the total variation. Thus, it can be concluded that the quadratic
model was appropriate to fit satisfactorily the experimental data.
The TAA production could be therefore predicted by the model:
TAA (EU/gds) = 185.5 + 16.8T + 32.9pH –34.4T2 – 29.8pH
2 (2)

Amylase Production in Submerged and solid State Fermentations 13
Figure 5. Effect of particle size of the sugar cane bagasse on the production of total amylolytic activity
(TAA) by A. oryzae FQB-01 in solid state fermentation.
Table 6. Results of the experimental design showing both the experimental and the
calculated values of TAA production levels in response to pH and temperature of
incubation and significance analysis of the model coefficients
Natural values TAA (EU/gds)
T pH Observed response Predicted value
37.0 6.5 157.90 170.95
37.0 4.0 99.09 105.15
25.0 6.5 129.01 137.41
25.0 4.0 59.64 71.61
38.6 5.3 163.25 151.46
23.4 5.3 121.76 108.96
31.0 6.8 193.02 179.37
31.0 3.7 106.94 96.00
31.0 5.3 176.59 185.47
31.0 5.3 181.94 185.47
31.0 5.3 197.03 185.47
31.0 5.3 183.01 185.47
31.0 5.3 179.09 185.47
Significance analysis of coefficients
Factor Coefficient t-value
Constant 185.5 52.66*
T 16.8 5.66*
pH 32.9 11.11*
T·pH -2.6 0.66
T2 -34.4 9.83*
pH2 -29.8 8.50*
* Significant at t (α < 0.05; υ = 4) > 2.78.

Amylase Production in Submerged and Solid state Fermentations 14
-1,30
1,3
-1,30
1,3
200
150
100
50
200
150
100
50
TpH
TA
A (
EU
/g)
Figure 6. Response surface showing the combined effect of temperature (T) and pH on the production
of total amylolytic activity (TAA) by A. oryzae FQB-01 in solid state fermentation. T and pH are in
coded values.
The three-dimensional response surface (Figure 6) shows that the maximum TAA (197
EU/gds) was obtained at pH 5.9 (coded value of 0.55) and 32.5ºC (coded value of 0.24).
Thus, A. oryzae exhibited its best performance for enzyme production in the mesophilic range
(Figure 6), as it was reported before for A. oryzae NRRL 6270, which produce the highest α-
amylase level in the range from 25 to 30ºC (Francis et al., 2003).
High temperature values may lead to enzymatic inactivation (Mazutti et al., 2006) or
suppression of cell viability and death (Pandey et al., 2001; Francis et al., 2002), meanwhile
low temperature values may reduce the metabolism of the microorganism (Mazutti et al.,
2006) and consequently, the enzyme production.
Table 7. Significance analysis of the model (2) obtained for TAA production under
different initial pH and temperature conditions
SS fd QM
Model 20511.9 4 5128.0
Error 1301.2 8 162.6
Exp. error 252.8 4 63.2
Lack of fitting 1048.4 4 262.1
Total 21813.1 12 1817.7
QME/QMEe = 2.57 F84 (α = 0.05) = 6.04
QMLF/QMEe = 4.15 F44 (α = 0.05) = 6.39
r2 = 0.940 adj r
2 = 0.911
SS: Sum of Squares; df: degrees of freedom; QM: Quadratic Means; E: total error; Ee: Experimental
error; LF: Lack of Fitting.

Amylase Production in Submerged and solid State Fermentations 15
In this study, it was verified that A. oryzae FQB-01 has a preference to pH around 6.0 for
TAA production. However, its production capacity decreased for pH levels higher and lower
than the optimum pH probably as a consequence of a reduction in the metabolic activity of
the amylase-producing strain at these pH values (Ellaiah et al., 2002).
Table 8. Results of the experimental design showing both the experimental and the
calculated values of TAA levels in function of the total sugars (TS in mg/gds), moisture
content (M in %) and inoculum size (IS) as log (number of spores/gds) and significance
analysis of the model coefficients
Natural values TAA (EU/gds)
M IS TS Observed
response
Predicted value
80 8.0 60.0 470.3 461.0
80 8.0 20.0 347.1 328.1
80 5.0 60.0 400.2 373.1
80 5.0 20.0 218.6 240.2
63 8.0 60.0 342.6 333.2
63 8.0 20.0 228.6 265.7
63 5.0 60.0 243.4 245.3
63 5.0 20.0 183.3 177.8
59 6.5 40.0 189.8 173.0
84 6.5 40.0 296.9 318.0
72 4.3 40.0 245.0 249.8
72 8.8 40.0 384.4 383.8
72 6.5 9.5 386.1 361.0
72 6.5 70.5 487.8 513.8
72 6.5 40.0 451.1 437.4
72 6.5 40.0 428.7 437.4
72 6.5 40.0 455.6 437.4
72 6.5 40.0 437.6 437.4
72 6.5 40.0 424.2 437.4
72 6.5 40.0 426.8 437.4
Significance analysis of coefficients
Factor Coefficient t-value
Constant 437.0 81.83*
M 47.5 12.71*
IS 43.9 11.74*
TS 50.1 13.39*
M·IS 6.8 1.44
M·TS 16.3 3.47*
IS·TS -0.6 0.12
M2 -82.5 20.39*
IS2 -51.9 12.81*
TS2 0.7 0.18
* Significant at t (α < 0.05; υ = 5) > 2.57.

Amylase Production in Submerged and Solid state Fermentations 16
Taking into account the results obtained in this second optimization experiment, a pH
value of 5.9 and a temperature of 32.5ºC were used for further optimization studies.
The following study was focused on the determination of the effects of three factors (total
sugars concentration, inoculum size and moisture content) on amylase production in the
optimal conditions calculated before (particle size, pH and temperature) by using a new
second-order orthogonal design. Table 8 summarizes the experimental and predicted
responses along with significance of the model terms.
Table 9. Significance analysis of the model (3) obtained for production of TAA in
function of the variables M, IS and TS
SS fd QM
Model 189619.7 6 31603.3
Error 6087.2 13 468.2
Exp. error 885.6 5 177.1
Lack of fitting 5201.6 8 650.2
Total 195707.4 19 32071.5
QME/QMEe = 2.64 F13
5 (α = 0.05) = 4.66
QMLF/QMEe = 3.67 F85 (α = 0.05) = 4.82
r2 = 0.969 adj r
2 = 0.955
SS: Sum of Squares; df: degrees of freedom; QM: Quadratic Means; E: total error; Ee: Experimental
error; LF: Lack of Fitting.
With the model coefficients acceptable according to the Student t test (α < 0.05), the
equation obtained is significant in Fisher´s F tests (α = 0.05) applied to the quotients total
error/experimental error and lack of fitting/experimental error (Table 9). The value of the
coefficient of determination (0.969) ensures that the model fits satisfactorily the data and
indicates that 96.9% of the variability in TAA production could be explained by the empirical
model (3):
TAA (EU/gds) = 437.0 + 47.5M + 43.9IS + 50.1TS + 16.3M·TS – 82.5M2 – 51.9IS
2 (3)
where TAA is the total amylolytic activity, M is the moisture content, IS is the inoculum size
and TS is the total sugars concentration. Among the most notable characteristics of the system
studied, it should be stated that for enzyme production, all the independent variables (M, IS
and TS) and the binary interaction between M and TS had positive coefficients. In contrast,
the coefficients of the quadratic terms M2 and IS
2 had negative sign and the quadratic term
TS2 as well as the binary interactions M·IS and IS·TS were found to be non significant (Table
8). The significant coefficients for the quadratic terms (M2 and IS
2) implied the existence of
optimum values of M and IS inside the experimental domain. Since the quadratic term TS
2 was
found to be non-significant and the linear term T had a positive coefficient, the optimum
value for this variable corresponds to its highest value.
The response surfaces curves generated according to model (3) show the relative effect of
two variables on TAA production, when the coded value of the third variable is kept at a
constant level of +1 or –1 (Figures 7A, B and C). For example, Figure 7A illustrates the effect
of inoculum size and moisture content on TAA production at constant starch levels. As it can
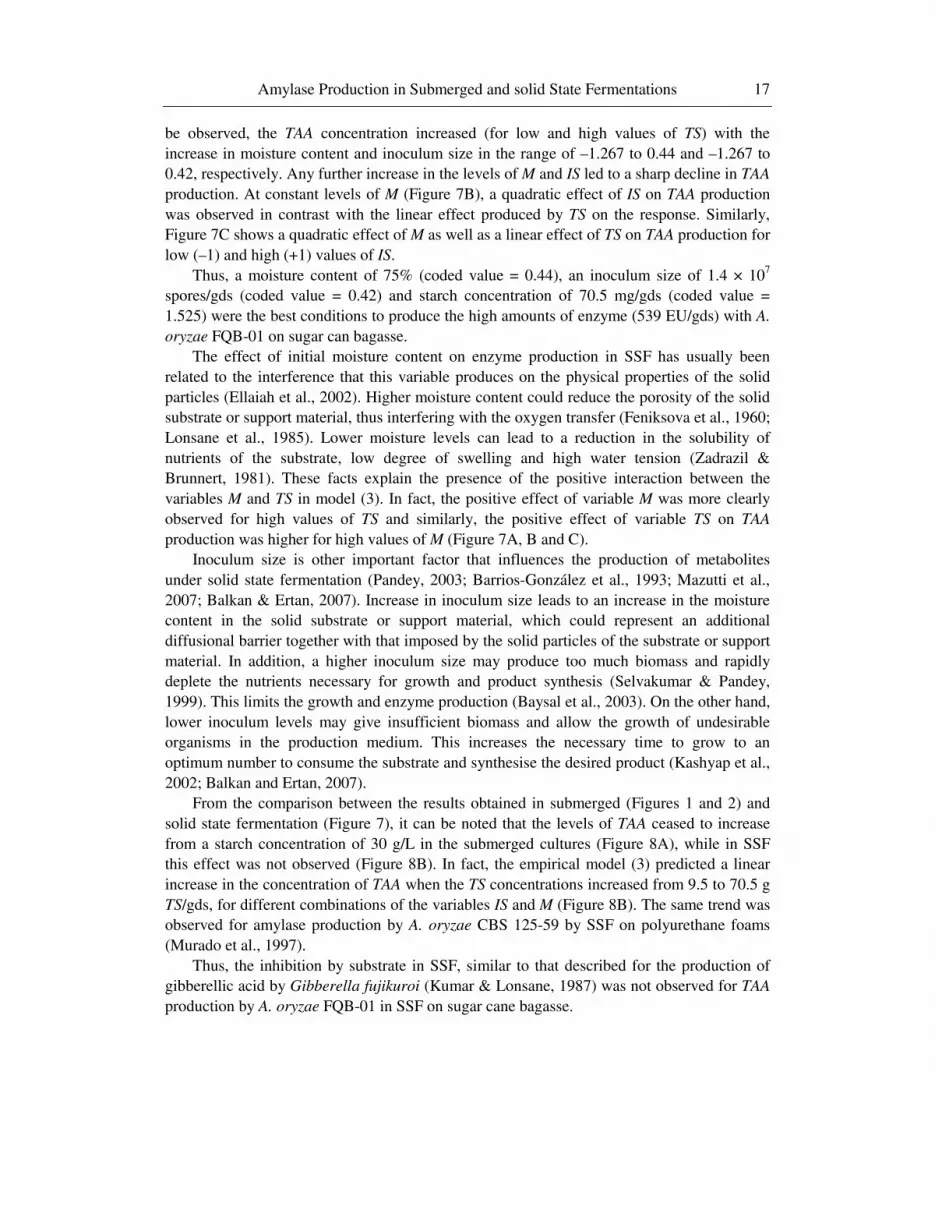
Amylase Production in Submerged and solid State Fermentations 17
be observed, the TAA concentration increased (for low and high values of TS) with the
increase in moisture content and inoculum size in the range of –1.267 to 0.44 and –1.267 to
0.42, respectively. Any further increase in the levels of M and IS led to a sharp decline in TAA
production. At constant levels of M (Figure 7B), a quadratic effect of IS on TAA production
was observed in contrast with the linear effect produced by TS on the response. Similarly,
Figure 7C shows a quadratic effect of M as well as a linear effect of TS on TAA production for
low (–1) and high (+1) values of IS.
Thus, a moisture content of 75% (coded value = 0.44), an inoculum size of 1.4 × 10⁷
spores/gds (coded value = 0.42) and starch concentration of 70.5 mg/gds (coded value =
1.525) were the best conditions to produce the high amounts of enzyme (539 EU/gds) with A.
oryzae FQB-01 on sugar can bagasse.
The effect of initial moisture content on enzyme production in SSF has usually been
related to the interference that this variable produces on the physical properties of the solid
particles (Ellaiah et al., 2002). Higher moisture content could reduce the porosity of the solid
substrate or support material, thus interfering with the oxygen transfer (Feniksova et al., 1960;
Lonsane et al., 1985). Lower moisture levels can lead to a reduction in the solubility of
nutrients of the substrate, low degree of swelling and high water tension (Zadrazil &
Brunnert, 1981). These facts explain the presence of the positive interaction between the
variables M and TS in model (3). In fact, the positive effect of variable M was more clearly
observed for high values of TS and similarly, the positive effect of variable TS on TAA
production was higher for high values of M (Figure 7A, B and C).
Inoculum size is other important factor that influences the production of metabolites
under solid state fermentation (Pandey, 2003; Barrios-González et al., 1993; Mazutti et al.,
2007; Balkan & Ertan, 2007). Increase in inoculum size leads to an increase in the moisture
content in the solid substrate or support material, which could represent an additional
diffusional barrier together with that imposed by the solid particles of the substrate or support
material. In addition, a higher inoculum size may produce too much biomass and rapidly
deplete the nutrients necessary for growth and product synthesis (Selvakumar & Pandey,
1999). This limits the growth and enzyme production (Baysal et al., 2003). On the other hand,
lower inoculum levels may give insufficient biomass and allow the growth of undesirable
organisms in the production medium. This increases the necessary time to grow to an
optimum number to consume the substrate and synthesise the desired product (Kashyap et al.,
2002; Balkan and Ertan, 2007).
From the comparison between the results obtained in submerged (Figures 1 and 2) and
solid state fermentation (Figure 7), it can be noted that the levels of TAA ceased to increase
from a starch concentration of 30 g/L in the submerged cultures (Figure 8A), while in SSF
this effect was not observed (Figure 8B). In fact, the empirical model (3) predicted a linear
increase in the concentration of TAA when the TS concentrations increased from 9.5 to 70.5 g
TS/gds, for different combinations of the variables IS and M (Figure 8B). The same trend was
observed for amylase production by A. oryzae CBS 125-59 by SSF on polyurethane foams
(Murado et al., 1997).
Thus, the inhibition by substrate in SSF, similar to that described for the production of
gibberellic acid by Gibberella fujikuroi (Kumar & Lonsane, 1987) was not observed for TAA
production by A. oryzae FQB-01 in SSF on sugar cane bagasse.

Amylase Production in Submerged and Solid state Fermentations 18
A
B
C
-1,50
1,5
-1,50
1,5
500
400
300
200
100
500
400
300
200
100
-1,50
1,5
-1,50
1,5
500
400
300
200
100
500
400
300
200
100
-1,50
1,5
-1,50
1,5
500
400
300
200
100
500
400
300
200
100
TS = -1 TS = 1
-1,50
1,5
-1,50
1,5
500
400
300
200
100
500
400
300
200
100
M = -1 M = 1
TA
A (
EU
/g)
TA
A (
EU
/g)
-1,50
1,5
-1,50
1,5
500
400
300
200
100
500
400
300
200
100TA
A (
EU
/g)
TA
A (
EU
/g)
MTSMTS-1,5
0
1,5
-1,50
1,5
500
400
300
200
100
500
400
300
200
100
IS = -1 IS = 1
MIS
TA
A (
EU
/g)
TA
A (
EU
/g)
MIS
TSISTSIS
Figure 7. Response surfaces showing the effect of moisture content (M), inoculum size (IS) and total
sugars (TS) on the production of total amylolytic activity (TAA) by A. oryzae FQB-01 in solid state
fermentation. Values of TS, M and IS are in coded values.

Amylase Production in Submerged and solid State Fermentations 19
40
60
80
100
120
0 10 20 30 40
TA
A (
EU
/mL)
TS (g/L)
100
200
300
400
500
600
0 20 40 60 80
TA
A (
EU
/gds)
TS (mg TS/gds)
A B
Figure 8. Effect of TS concentration on the production of total amylolytic activity (TAA) in submerged
fermentation (A) on BW (□) and MPW (Ο) and in solid state fermentation (B) when the levels of the
other independent variables are: M = 0.44, IS = 0.42 (□); M = +1.0, IS = +1.0 (Ο); M = +1.0, IS = -1.0
(◊); M = -1.0, IS = +1.0 (∆) and M = -1.0, IS = -1.0 (2).
CONCLUSIONS
Two industrial wastes (brewery and meat processing wastes) and an agro-industrial
residue (sugar cane bagasse) showed a great potential as substrates and support material,
respectively for TAA production by A. oryzae FQB-01 at low production costs. In addition,
the organic load of the two wastes is substantially reduced at the end of the fermentations.
Increased TAA productions (107 and 113 EU/mL) were respectively obtained in the
MPW and BW media supplemented with 30 g of starch/L of medium. A further increase in
the initial starch concentration in the medium (40 g of starch/L) did not improve significantly
TAA production in both media (111 and 116 EU/mL, respectively).
The maximum TAA concentration (539 EU/gds) in SSF was achieved with optimized
process parameters such as particle size of bagasse (in the range of 5-10 mm), fermentation
temperature (32.5ºC), pH (5.9), moisture content of bagasse (75%), starch concentration (70.5
mg/gds) and inoculum size (1.4 × 10⁷ spores/gds).
However, other studies based on the use of carbon sources from agro-industrial residues
(wheat bran, rice bran, rice husk, maize bran, etc) for TAA production are necessary to
continue optimizing the production of the enzyme in submerged and solid state fermentations.
REFERENCES
Aidoo, K. E.; Hendry, R. & Wood, B. J. B. (1981). Estimation of fungal growth in a solid
state fermentation system Eur. J. Appl. Microbiol. Biotechnol., 12, 6-9.
Balkan, B. & Ertan, F. (2007). Production of α-amylase from P. chrysogenum. Food Technol.
Biotechnol., 45, 439–442.

Amylase Production in Submerged and Solid state Fermentations 20
Barrios-González, J.; González, H. & Mejía, A. (1993). Effect of size particle, packing
density and agitation on penicillin production in solid state fermentation. Biotechnol.
Adv., 11, 539–547.
Baysal, Z.; Uyar, F. & Aytekin, C. (2003). Solid state fermentation for production of α-
amylase by a thermotolerant Bacillus subtilis from hot-spring water, Process Biochem.,
38, 1665–1668.
Bernfeld, P. (1951). Enzymes of starch degradation and synthesis. Adv. Enzymol., 12, 397-
427.
Box, G. E. P.; Hunter, W. G. & Hunter, J. S. (1989). In Reverte, S.A. (Publ.), Estadística
para investigadores (pp. 317-361), Barcelona, España.
Cannel, E. & M. Moo-Young. (1980). Solid state fermentation system. Process Biochem., 15,
2-7.
Doran, J. B.; Aldrich, H. C. & Ingram, L. O. (1994). Saccharification and fermentation of
sugarcane bagasse. Biotechnol. Bioeng., 44, 240–247.
Ellaiah, P.; Adinarayana, K.; Bhavani, Y.; Padmaja, P. & Srinivasulu, B. (2002).
Optimization of process parameters for glucoamylase production under solid state
fermentation by a new isolated Aspergillus species. Process Biochem., 38, 615-620.
Feniksova, R. V.; Tikhomirova, A. S. & Rakhleeva, E. E. (1960). Conditions for forming
amylase and proteinase in surface cultures of Bacillus subtilis. Microbiol., 29, 745–748.
Francis, F.; Sabu, A.; Nampoothiri, K. M.; Ramachandran, S.; Ghosh, S.; Szakacs, G. &
Pandey, A. (2003). Use of response surface methodology for optimizing process
parameters for the production of α-amylase by Aspergillus oryzae. Biochem. Eng. J., 15,
107-115.
Francis, F.; Sabu, A.; Nampoothiri, K. M.; Szakacs, G. & Pandey, A. (2002). Synthesis of α-
amylase by Aspergillus oryzae in solid-state fermentation. J. Basic Microbiol., 5, 320-
326.
Gigras, P.; Sahai, V. & Gupta, R. (2002). Statistical media optimization and production of
ITS α-amylase from Aspergillus oryzae in a bioreactor. Curr. Microbiol., 45, 203-208.
Greenberg, A. E.; Connors, J. J. & Jenkins, D. (1980). Standard methods for the examination
of water and wastewater. 15th ed. American Public Health Association, Washington, D.C.
Guerra, N. P. & Pastrana, L. (2003). Enhancement of nisin production by Lactococcus lactis
in periodically re-alkalized cultures. Biotechnol. Appl. Biochem., 38, 157-167.
Guerra, N. P.; Torrado A.; López, C. & Pastrana, L. (2005). Modelling the fed-batch
production of pediocin using mussel-processing wastes. Process Biochem., 40, 1071-
1083.
Guerra, N. P.; Torrado-Agrasar, A.; López-Macías, C. & Pastrana, L. (2003). Main
characteristics and applications of solid substrate fermentation. Electron. J. Environ.
Agricult. Food Chem., 2, 343-350.
Gutiérrez-Correa, M. & Tengerdy, R. P. (1997). Production of cellulase on sugar cane
bagasse by fungal mixed culture solid substrate fermentation. Biotechnol. Lett., 19, 665–
667.
Hesseltine, C. W. (1972). Solid state fermentations. Biotechnol. Bioeng., 14, 517-532.
Kashyap, P.; Sabu, A.; Pandey, A. & Szakacs, G. (2002). Extra-cellular l-glutaminase
production by Zygosaccharomyces rouxii under solid-state fermentation. Process
Biochem., 38, 307–312.

Amylase Production in Submerged and solid State Fermentations 21
Krishna, C. & Chandrasekaran, M. (1996). Banana waste as substrate for α-amylase
production by Bacillus subtilis (CBTK 106) under solid-state fermentation. Appl.
Microbiol. Biotechnol., 46, 106-111.
Kumar, P. K. R. & Lonsane, B. K. (1987). Potential of fed-batch culture in solid state
fermentation for production of gibberellic acid. Biotechnol. Lett., 9, 179-182.
Kumar, P. R. K. & Lonsane, B. K. (1990). Solid state fermentation: physical and nutritional
factors influencing gibberellic acid production Appl. Microbiol. Biotechnol., 34, 145-148.
Kumaran, S.; Sastuy, C. A. & Vikineswary, S. (1997). Laccase, cellulose, xylanase activities
during growth of Pleurotus sojor-caju on sago hampas. World. J. Microb. Biotechnol.,
13, 43-49.
Laxmi, G. S.; Sathish, T.; Rao, Ch. S., Brahmaiah, P.; Hymavathi, M. & Prakasham, R. S.
(2008). Palm fiber as novel substrate for enhanced xylanase production by isolated
Aspergillus sp. RSP-6. Curr.Trends Biotechnol. Pharm., 2, 447-455.
Lonsane, B. K.; Ghildyal, N. P.; Budiatman, S. & Ramakrishna, S. V. (1985). Engineering
aspects of solid state fermentation. Enzyme Microb. Technol., 7, 258–265.
Mazutti, M.; Ceni, G.; Di Luccio, M. & Treichel, H. (2007). Production of inulinase by solid-
state fermentation: effect of process parameters on production and preliminary
characterization of enzyme preparations. Bioprocess Biosyst. Eng., 30, 297-304.
Mazutti, M.; Bender, J. P.; Treichel, Helen & Di Luccio, M. (2006). Optimization of inulinase
production by solid-state fermentation using sugarcane bagasse as substrate. Enzyme
Microb. Technol., 39, 56-59.
Milagres, A. M. F.; Santos, E.; Piovan, T. & Roberto, I. C. (2004). Production of xylanase by
Thermoascus aurantiacus from sugar cane bagasse in an aerated growth fermentor.
Process Biochem., 39, 1387-1391.
Murado, M. A.; González, M. P.; Torrado, A. & Pastrana, L. M. (1997). Amylase production
by solid state culture of Aspergillus oryzae on polyurethane foams. Some mechanistic
approaches from an empirical model. Process Biochem., 32, 35-42.
Murado, M. A.; Siso, M. I. G.; González, M. P.; Montemayor, M. I.; Pastrana, L. & Mirón, J.
(1993). Characterization of microbial biomasses and amylolytic preparations obtained
from mussel-processing waste treatment. Biores. Technol., 43, 117-125.
Pandey, A. (2003). Solid state fermentation. Biochem. Eng. J., 13, 81–84.
Pandey, A.; Nigam, P.; Soccol, C. R.; Soccol, V.T.; Singh, D. & Mohan, R. (2000). Advances
in microbial amylases. Biotechnol. Appl. Biochem., 31, 135-152.
Pandey, A.; Selvakumar, P.; Soccol, R. C. & Nigam, P. (1999). Solid state fermentation for
the production of industrial enzyme. Bioresour. Technol., 77, 149-162.
Pandey, A.; Soccol, C. R.; Rodriguez-Leon, J. A. & Nigam, P. (2001). Solid State
Fermentation in Biotechnology: Fundamentals and Applications. Asiatech Publishers,
Inc., New Delhi.
Raimbault, M. (1998). General and microbiological aspects of solid substrate fermentation.
Electron. J. Biotechnol., 1, 1-22. Available from http://www.ejb.org/content/
vol1/issue3/full/9/index.html.
John, R. P.; Nampoothiri, K. M. & Pandey, A. (2006). Solid-state fermentation for L-lactic
acid production from agro wastes using Lactobacillus delbrueckii. Process Biochem.,
41, 759-763.
Roukas, T. (1999). Pullulan production from brewery wastes by Aureobasidium pullulans.
World J. Biotechnol., 15, 447-450.

Amylase Production in Submerged and Solid state Fermentations 22
Salas, M.; Rodríguez, M.; Guerra, N. P. & Pérez R. (2006). Amylase production by
Aspergillus niger in submerged cultivation on two wastes from food industries. J. Food
Eng., 73, 93-100.
Selvakumar, P. & Pandey, A. (1999). Solid state fermentation for the synthesis of inulinase
from Staphylococcus sp. and Kluyveromyces marxianus. Process Biochem., 34, 851–858.
Spier, M. R.; Woiciechowski, A. L.; Vandenberghe, L. P. S. & Zoclo, C. R. (2006).
Production and characterization of amylases by Aspergillus niger under solid state
fermentation using agro industrials products. Int. J. Food Eng., 2. Available at:
http://www.bepress.com/ijfe/vol2/iss3/art6.
Steinkraus, K. H. (1984). Solid-state (solid-substrate) food/beverage fermentations involving
fungi. Acta Biotechnol., 4, 83-88.
Yang, S. S. & Wang, J. Y. (1999). Protease and amylase production of Streptomyces rimosus
in submerged and solid state cultivations. Bot. Bull. Acad. Sin, 40, 259-265.
Zadrazil, F. & Brunnert, H. (1981). Investigation of physical parameters important for the
SSF of straw by white rot fungi. Eur. J. Appl. Microbiol. Biotechnol., 11, 183–188.