Embed Size (px)
Citation preview
NeuroImage 59 (2012) 2196–2207
Contents lists available at SciVerse ScienceDirect
NeuroImage
j ourna l homepage: www.e lsev ie r .com/ locate /yn img
Altered resting state complexity in schizophrenia
Danielle S. Bassett a,⁎, Brent G. Nelson b, Bryon A. Mueller b, Jazmin Camchong b, Kelvin O. Lim b
a Complex Systems Group, Department of Physics, University of California, Santa Barbara, CA 93106, United Statesb Laboratory of NeuroPsychiatric Imaging, Department of Psychiatry, University of Minnesota, Minneapolis, MN 55455, United States
⁎ Corresponding author.E-mail address: [email protected] (D.S. Bas
1053-8119/$ – see front matter © 2011 Elsevier Inc. Alldoi:10.1016/j.neuroimage.2011.10.002
a b s t r a c t
a r t i c l e i n f oArticle history:Received 2 June 2011Revised 21 September 2011Accepted 3 October 2011Available online 8 October 2011
Keywords:SchizophreniaFunctional connectivityNetwork analysisGraph theoryResting state
The complexity of the human brain's activity and connectivity varies over temporal scales and is altered indisease states such as schizophrenia. Using a multi-level analysis of spontaneous low-frequency fMRI datastretching from the activity of individual brain regions to the coordinated connectivity pattern of thewhole brain, we investigate the role of brain signal complexity in schizophrenia. Specifically, we quantitative-ly characterize the univariate wavelet entropy of regional activity, the bivariate pairwise functional connec-tivity between regions, and the multivariate network organization of connectivity patterns. Our resultsindicate that univariate measures of complexity are less sensitive to disease state than higher level bivariateand multivariate measures. While wavelet entropy is unaffected by disease state, the magnitude of pairwisefunctional connectivity is significantly decreased in schizophrenia and the variance is increased. Furthermore,by considering the network structure as a function of correlation strength, we find that network organizationspecifically of weak connections is strongly correlated with attention, memory, and negative symptom scoresand displays potential as a clinical biomarker, providing up to 75% classification accuracy and 85% sensitivity.We also develop a general statistical framework for the testing of group differences in network properties,which is broadly applicable to studies where changes in network organization are crucial to the understand-ing of brain function.
© 2011 Elsevier Inc. All rights reserved.
Introduction
Recent evidence suggests that resting-state brain function measuredby functional magnetic resonance imaging (fMRI) (Raichle and Snyder,2007) is a sensitive marker of disease (Auer, 2008; Broyd et al., 2009)and a potentially important tool for the discovery of quantitative geneticphenotypes (Biswal et al., 2010). Resting-state functional connectivity,measured by correlations between blood oxygen level dependent(BOLD) time series, is profoundly disturbed in schizophrenia (Lynallet al., 2010; Skudlarski et al., 2010), supporting the dysconnectivity hy-pothesis (Friston, 1998) of the disease. Dysconnectivity refers to achange in the complex pattern of healthy functional interactions be-tween brain regions, likely driven by alterations in underlying neuro-physiological processes (Valli et al., 2011) such as synaptic plasticity ordevelopmental wiring (Stephan et al., 2006).
Resting state brain function in both health and disease can becharacterized at multiple levels, from the activity of single brain re-gions (univariate), to the functional interactions between a pair of re-gions (bivariate), to the coordinated pattern of connectivity betweenmany brain regions (multivariate). Each provides a window into aunique dimension of brain function complexity that can be linked tocognitive function and its alteration in disease. At the lowest level,
sett).
rights reserved.
the predictability of a single brain signal can be examined using Lya-punov exponents, Hurst exponents, dimensional complexity, andmulti-scale entropy (Subha et al., 2010), which vary with age and de-velopment (McIntosh et al., 2010; Meyer-Lindenberg and Bassett,2008), task (Barnes et al., 2009; Meyer-Lindenberg and Bassett,2008; Misic et al., 2010), and disease (Bosl et al., 2011; Breakspear,2006). In schizophrenia, studies have reported both increases (Bobet al., 2009) and decreases (Meyer-Lindenberg and Bassett, 2008) inEEG signal complexity relative to healthy controls, and modulationby antipsychotics (Takahashi et al., 2010). At intermediate levels,pairwise functional connectivity can be measured by simple linearcorrelations or more complex synchronization or causal properties.Mounting evidence suggests that pairwise functional connectivity isparticularly critical for the understanding of schizophrenia as it repre-sents a neurogenetic risk mechanism for psychosis (Esslinger et al.,2009; Esslinger et al., 2011). At higher levels, complex network theo-ry provides a framework in which to examine the multivariate pat-tern of functional interactions between brain signals, where thehuman brain is represented as a network whose nodes are brain re-gions and whose edges are their functional connections (Bassett andBullmore, 2006; Bassett and Bullmore, 2009; Bullmore and Bassett,2011; Bullmore and Sporns, 2009). In schizophrenia, network organi-zation extracted from multiple imaging modalities (EEG, fMRI, andMEG) appears to be both randomized (Bassett et al., 2008; Lynallet al., 2010; Rubinov and Sporns, 2009) and less cost-efficient (Bassettet al., 2009) compared to controls.
2197D.S. Bassett et al. / NeuroImage 59 (2012) 2196–2207
Herewe examine the advantages of and relationships between uni-,bi-, and multi-variate properties in identifying abnormalities in restingstate function in schizophrenia. We hypothesize that regional activitydirectly constrains higher-order connectivity properties, and suggestthat understanding this link is critical for the development of a neuro-physiological interpretation of altered functional connectivity in schizo-phrenia. We further hypothesize that the added power of multivariatenetwork measures will provide enhanced sensitivity to detecting dis-ease effects on brain function, and that the patterns of both strong andweak connections will be differentially sensitive to disease state. Inthe context of our analysis, we introduce a statistical framework forthe examination of group differences in functional connectivity basedon functional data analysis (FDA) (Ramsay and Silverman, 2005) thathas significant advantages over previously used methods of networkcomparison.
Methods
Data acquisition and preprocessing
Data from 29 participants with chronic schizophrenia (11 females;age 41.3±9.3 (SD); 5 left-handed) and 29 healthy participants (11females; age 41.1±10.6 (SD); 2 left-handed) were included in thisanalysis (see (Camchong et al., 2011) for detailed characteristics ofparticipants and imaging data). Out of the 29 chronic schizophreniapatients: 16 were taking 1 atypical antipsychotic, 8 were taking 2atypical antipsychotics, 1 was taking 1 typical antipsychotic, 1 wastaking 1 atypical and 1 typical antipsychotic, 1 was taking 2 atypicaland 1 atypical antipsychotics, and 2 were not taking any antipsychotic(Camchong et al., 2011).
A Siemens Trio 3T scanner was used to collect imaging data, includ-ing a 6-min (TR=2 s; 180 volumes) resting-state fMRI scan, in whichparticipants were asked to remain awake with their eyes closed, afield map scan, and a T1 MPRAGE whole brain volumetric scan. ThefMRI data was preprocessed using FEAT (FMRI Expert Analysis Tool)from FMRIB's Software Library (FSL; Smith et al., 2004) with the follow-ing pipeline: deletion of the first 3 volumes to account for magnetiza-tion stabilization; motion correction using MCFLIRT (MotionCorrection using FMRIB's Linear Image Registration Tool; Jenkinsonet al., 2002); B0 fieldmap unwarping to correct for geometric distortionusing acquired field maps using PRELUDE (Phase Region ExpandingLabeller for Unwrapping Discrete Estimates) and FUGUE52 (FMRIB'sUtility for Geometrically Unwarping EPIs); slice-timing correctionusing Fourier-space time-series phase-shifting; non-brain removalusing BET (Brain Extraction Tool; Smith, 2002); regression against the6 motion parameter time courses; registration of fMRI to standardspace (Montreal Neurological Institute-152 brain); registration offMRI to high resolution anatomical MRI; registration of high resolutionanatomical MRI to standard space. Importantly, the two groups hadsimilar mean root mean square (RMS) motion parameters: two-sample t-tests of mean RMS translational and angular movementwere not significant (p=0.14 and p=0.12, respectively).
Each individual in the study completed a cognitive battery includ-ing tests that measured two domains of general cognitive abilitiesknown to be altered in schizophrenia (Aleman et al., 1999; Carroll,1993; Fuller et al., 2006; Heinrichs and Zakzanis, 1998; Potts et al.,2002): (1) the Weschler Adult Intelligence Scale-III (digit symbol,digit span, symbol search, letter-number sequence) and the Delis–Kaplan Executive Function System (trails numbers-letters test,tower test) to assess attention and concentration and (2) the Califor-niaVerbal Learning Test II and the Weschler Memory Scales to assessmemory. The symptomatology of participants in the schizophreniacohort (diagnosed using the DSM-IV criteria First et al., 1995) wasassessed using the scale for the assessment of negative symptoms(SANS) and the scale for the assessment of positive symptoms(SAPS) (Andreasen, 1982; Andreasen and Olsen, 1982).
Multi-level complexity in brain signals
Univariate activityWe began by studying the complexity of resting state fMRI data
using a univariate approach, that is, estimating the complexity ofdata extracted from individual brain regions. Average time serieswere extracted for each participant from 90 of the 116 anatomical re-gions of interest (ROIs) defined by the AAL atlas (Tzourio-Mazoyeret al., 2002) covering the whole brain and including cortical and sub-cortical regions but excluding the cerebellar regions and vermis. Wefocused our investigation on low frequency (0.06–0.125 Hz) oscilla-tions in the BOLD signal which have previously been shown to be par-ticularly sensitive to disease-related alterations in schizophrenia(Lynall et al., 2010). Consistent with Lynall et al. (2010), our datarevealed that this frequency band was most sensitive to group differ-ences in average connectivity as measured by correlation and mutualinformation. The frequency band of interest was isolated by applyingthe maximal overlap discrete wavelet transform to each time series(Percival and Walden, 2000) and selecting wavelet scale 2 (whichcorresponds approximately to the frequency range of interest andhas center frequency 0.7143 Hz as determined by the MATLAB func-tion centfrq for the Daubechies 4 wavelet used in this study).
While many measures exist to study the univariate complexity ofthese 90 regions, we chose to examine signal variation by employingthe simple, temporally-independent measure of the Shannon waveletentropy. We estimated the wavelet scale 2 entropy using methodsdeveloped in Coifman and Wickerhauser (1992) and Donoho andJohnstone (1994) and implemented in the MATLAB Wavelet Toolbox(function wentropy.m). The Shannon entropy of the wavelet coeffi-cients is defined as:
E sð Þ ¼ −∑i
s2i log s2i� �
; ð1Þ
where s is the signal of a single region in a given individual, si are thecoefficients of s in the orthonormal wavelet basis, and i indexes thewavelet coefficients of the scale 2 time series. As the wavelet entropyestimates were found to be non-normally distributed, we report me-dian rather than mean values over subjects or ROIs, however, consis-tent results are found when using the mean.
Bivariate pairwise correlationWe next studied the complexity of the resting state fMRI data
using a bivariate approach, by estimating the functional interactionsbetween brain regions. We estimated the functional connectivity bycomputing the absolute value of the Pearson's correlation betweenall possible pairs of time series, creating a 90×90 (N×N) connectivitymatrix (Lynall et al., 2010). We then computed two simple measuresof bivariate connectivity: strength and diversity (Lynall et al., 2010).The strength of node i is defined as the mean value of the ith columnof the connectivity matrix and indicates the average connectivity for asingle brain region to all others (Bassett et al., 2010; Lynall et al.,2010). The diversity of node i is defined as the variance of the ith col-umn of the connectivity matrix andmeasures the variation in connec-tivity strength of a single brain region to all others. The averageconnectivity is defined as the average nodal strength over all brain re-gions. We note that while fine-grained analyses of voxel-wise con-nectivity have also been reported (Ferrarini et al., 2011; Hayasakaand Laurienti, 2010), here we focused our examination on averageconnectivity properties of resting state function derived from largeanatomically-specified regions.
Multivariate network organizationWhile the mean and variance of the pairwise correlation matrix
are useful measures of gross functional properties, neither character-izes the pattern of correlation values within the matrix. We
2198 D.S. Bassett et al. / NeuroImage 59 (2012) 2196–2207
quantitatively examine these patterns using complex network theoryafter converting the correlation matrix to a binary graph as describedin the next section. Each graph can be characterized by a variety of di-agnostic measures, although many of these measures are stronglycorrelated with one another (see for example Lynall et al., 2010).Mathematically, many graph metric values are dependent on thenumber of nodes (brain regions) present in the graph. While the orig-inal connectivity matrix contains information from all brain regions, athreshold exists for all graphs such that nodes become disconnectedfrom the graph, i.e., when no correlations for a node in the graph ex-ceed the threshold applied during the graph construction process, sono edges connect that node to any other node in the graph. Therefore,a useful explanatory variable of interest is the size of the largest con-nected component (e.g., Achard et al., 2006), defined as the largestnumber of nodes that form a connected group in the graph. In lightof the dysconnectivity hypothesis of schizophrenia (Friston, 1998),this measure is particularly appropriate in the current context be-cause it provides direct information regarding the global connectivityof the subject's brain network. In addition, more complex graph met-rics can be computed, including measures of global connectivity be-tween all nodes (global efficiency (Latora and Marchiori, 2001) andbetweenness (Freeman, 1977)), local connectivity betweensubsetsof nodes (clustering coefficient (Watts and Strogatz, 1998) and localefficiency (Latora and Marchiori, 2001)), and relationships betweenglobal and local connectivity (modularity Leicht and Newman, 2008and small-worldness Watts and Strogatz, 1998). See Bullmore andBassett (2011) for detailed descriptions and applications, andRubinov and Sporns (2009) for mathematical definitions of these 6graph metrics.
Graph construction
In order to perform the multivariate network analysis describedabove, it is necessary to convert the correlation matrices to binarygraphs through the application of a threshold or set of thresholds(Bullmore and Bassett, 2011). The set of networks from a particularclinical group can be thresholded to create either equi-sparse graphs(different thresholds for each individual in order to ensure that allnetworks in the group have the same number of edges or ‘sparsity’;see for example Achard et al., 2006 and Bassett et al., 2006) or equi-threshold graphs (the same threshold for each individual such thatthe networks usually have a different number of edges; see for exam-ple Hayasaka and Laurienti, 2010; van den Heuvel et al., 2008, andvan den Heuvel et al., 2009). In both cases, network organization ismost often examined over a wide range of sparsity values (Bassettand Bullmore, 2009; Bullmore and Bassett, 2011; Bullmore andSporns, 2009). We chose to construct equi-sparse graphs in order toensure the most direct mathematical comparability of graph metricvalues (Bullmore and Bassett, 2011).
Traditional cumulative thresholdingFor each threshold over the full range of sparsity values from 0 (no
node pairs connected) to 1 (all node pairs connected), we generate abinary matrix by setting all elements of the correlation matrix abovethat threshold to 1 and all elements below to 0. We choose thresholdvalues that produce binary matrices with densities ranging from 0 to1: for example, a density of 0.1 is obtained by using a threshold abovewhich lie 10% of the elements of the correlation matrix. This “cumula-tive” thresholding procedure has been used extensively in previousfunctional brain network studies because it facilitates an investigationof a network composed of the x% statistically most significant connec-tions (Bullmore and Bassett, 2011).
Alternative windowed thresholdingGraphs constructed by cumulative thresholding provide the most
insight into the pattern of strong connections (for high thresholds).
However, they provide less information regarding the pattern ofweak connections. To address this weakness, we employed a win-dowed thresholding procedure in which graphs were constructedby retaining connections that fell in a threshold range rather thanabove a threshold (Schwarz and McGonigle, 2011). For example, agraph could be constructed from the 1% strongest connections, a sec-ond graph from the 1% next strongest connections, etc. In this way,100 separate graphs can be constructed that facilitate the assessmentof the pattern of different connection strengths: for example, we caninvestigate the topological organization of the 40 strongest connec-tions separately from that of the 40 weakest connections. Windowedthresholding allows for an examination of independent sets of con-nections while the more traditional cumulative thresholding allowsfor an examination of additive, non-independent sets of connections.
Network organization
Graph curvesBoth the windowed and cumulative thresholding procedures re-
duce full connectivity matrices (weighted graphs) into sets of binarymatrices (single graphs or ‘graphlets’). As discussed in an earlier sec-tion, each graphlet may then be characterized using a variety of net-work measures (Costa et al., 2007; Rubinov and Sporns, 2009) toobtain unique graph metric values. The set of graph metric values de-rived from a given set of graphlets (and therefore a single full connec-tivity matrix or weighted graph) can be treated mathematically as afunctional curve: the y-axis represents the graph metric value andthe x-axis represents either connectivity density (in the case of cumu-lative thresholding) or window number (in the case of windowedthresholding). The complete network organization of each individualsubject can then be characterized by one of the two curves (the cu-mulative curve or the windowed curve) depending on whether addi-tive or independent network structure, respectively, are to beexamined. Importantly, by transforming a correlation matrix into acomplete set of binary graphs (also referred to as adjacency matri-ces), we are leveraging the inherent continuous structure of the cor-relation matrix. That is, in such a complex system, differentneurophysiological drivers may be responsible for different portionsof the network curves, and therefore a characterization of the entirecurve is preferable to a characterization of a single point or portionof the curve.
Statistical testingTo determine the existence of group differences in these curves,
we utilized Functional Data Analysis (FDA), a statistical method thattreats a curve as a function. FDA is a swiftly evolving branch of statis-tics used to characterize and compare curves (Ramsay and Silverman,2005) and has been predominantly employed using MATLAB and R(Ramsay et al., 2009). Within FDA, there are several methods to com-pare sets of curves between groups. The simplest method is the non-parametric permutation test, which we employ here since the form ofthe graph-value-vs-density curves and their variance in the humanpopulation are currently unknown. Although beyond the scope ofthis paper, it is also possible to use parametric and semi-parametrictests based on complex statistical estimates of model parameters(for more information, see Ramsay and Silverman, 2005).
To perform the non-parametric test, we first treat each curve as afunction (y= f(x)). For each graph metric, we compute the averagecurve for the healthy control group, �yhc and the average curve forthe schizophrenia group, �ysz separately. We then compute the area,A, between the two curves �yhc and �ysz by summing the differences be-tween y-values (graph metric values) of the two groups at each valueof x (corresponding to windows for windowed curves and connectiondensities for cumulative curves): A ¼ ∑i yhc xið Þ−ysz xið Þ�� ��. The differ-ence between the two groups was tested for significance using non-parametric permutation testing, whereby the group identity of each
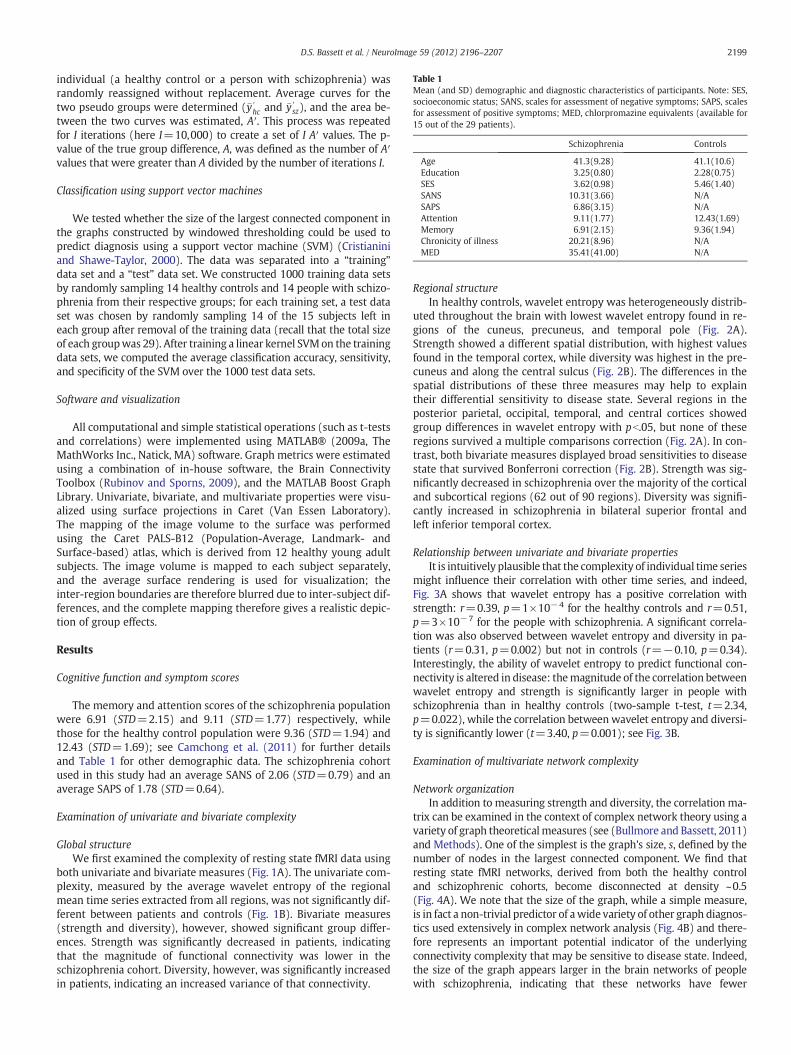
Table 1Mean (and SD) demographic and diagnostic characteristics of participants. Note: SES,socioeconomic status; SANS, scales for assessment of negative symptoms; SAPS, scalesfor assessment of positive symptoms; MED, chlorpromazine equivalents (available for15 out of the 29 patients).
Schizophrenia Controls
Age 41.3(9.28) 41.1(10.6)Education 3.25(0.80) 2.28(0.75)SES 3.62(0.98) 5.46(1.40)SANS 10.31(3.66) N/ASAPS 6.86(3.15) N/AAttention 9.11(1.77) 12.43(1.69)Memory 6.91(2.15) 9.36(1.94)Chronicity of illness 20.21(8.96) N/AMED 35.41(41.00) N/A
2199D.S. Bassett et al. / NeuroImage 59 (2012) 2196–2207
individual (a healthy control or a person with schizophrenia) wasrandomly reassigned without replacement. Average curves for thetwo pseudo groups were determined (�y′
hc and �y′sz), and the area be-
tween the two curves was estimated, A′. This process was repeatedfor I iterations (here I=10,000) to create a set of I A′ values. The p-value of the true group difference, A, was defined as the number of A′values that were greater than A divided by the number of iterations I.
Classification using support vector machines
We tested whether the size of the largest connected component inthe graphs constructed by windowed thresholding could be used topredict diagnosis using a support vector machine (SVM) (Cristianiniand Shawe-Taylor, 2000). The data was separated into a “training”data set and a “test” data set. We constructed 1000 training data setsby randomly sampling 14 healthy controls and 14 people with schizo-phrenia from their respective groups; for each training set, a test dataset was chosen by randomly sampling 14 of the 15 subjects left ineach group after removal of the training data (recall that the total sizeof each groupwas 29). After training a linear kernel SVMon the trainingdata sets, we computed the average classification accuracy, sensitivity,and specificity of the SVM over the 1000 test data sets.
Software and visualization
All computational and simple statistical operations (such as t-testsand correlations) were implemented using MATLAB® (2009a, TheMathWorks Inc., Natick, MA) software. Graph metrics were estimatedusing a combination of in-house software, the Brain ConnectivityToolbox (Rubinov and Sporns, 2009), and the MATLAB Boost GraphLibrary. Univariate, bivariate, and multivariate properties were visu-alized using surface projections in Caret (Van Essen Laboratory).The mapping of the image volume to the surface was performedusing the Caret PALS-B12 (Population-Average, Landmark- andSurface-based) atlas, which is derived from 12 healthy young adultsubjects. The image volume is mapped to each subject separately,and the average surface rendering is used for visualization; theinter-region boundaries are therefore blurred due to inter-subject dif-ferences, and the complete mapping therefore gives a realistic depic-tion of group effects.
Results
Cognitive function and symptom scores
The memory and attention scores of the schizophrenia populationwere 6.91 (STD=2.15) and 9.11 (STD=1.77) respectively, whilethose for the healthy control population were 9.36 (STD=1.94) and12.43 (STD=1.69); see Camchong et al. (2011) for further detailsand Table 1 for other demographic data. The schizophrenia cohortused in this study had an average SANS of 2.06 (STD=0.79) and anaverage SAPS of 1.78 (STD=0.64).
Examination of univariate and bivariate complexity
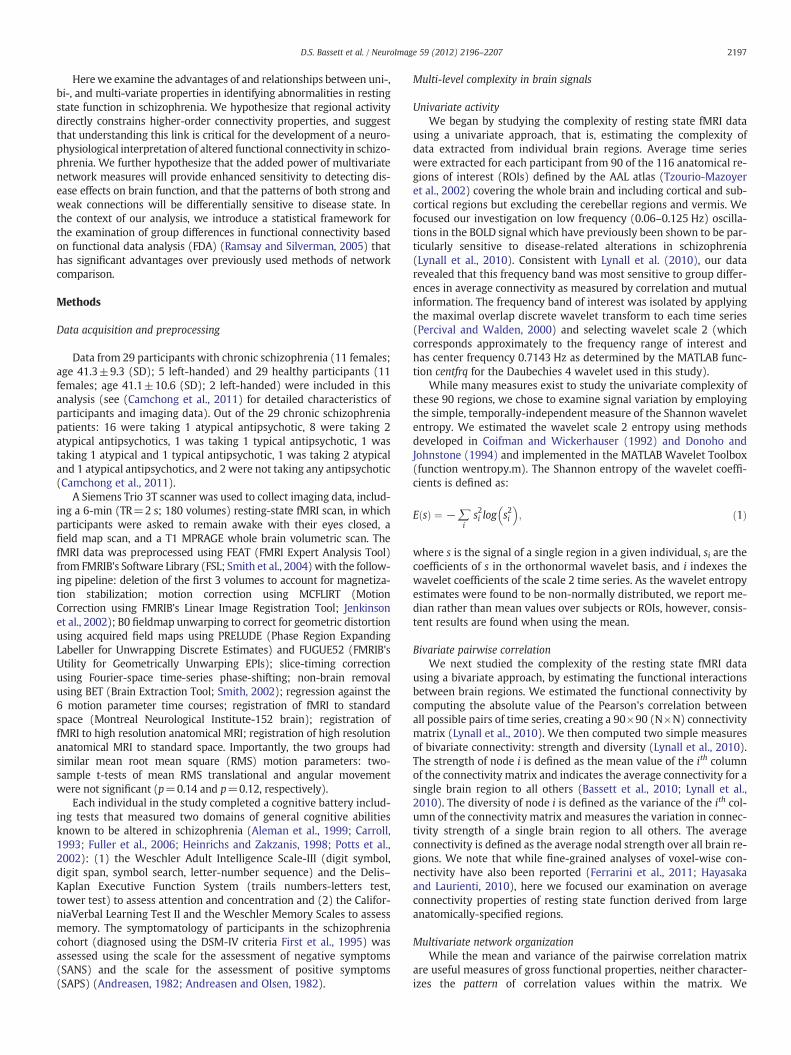
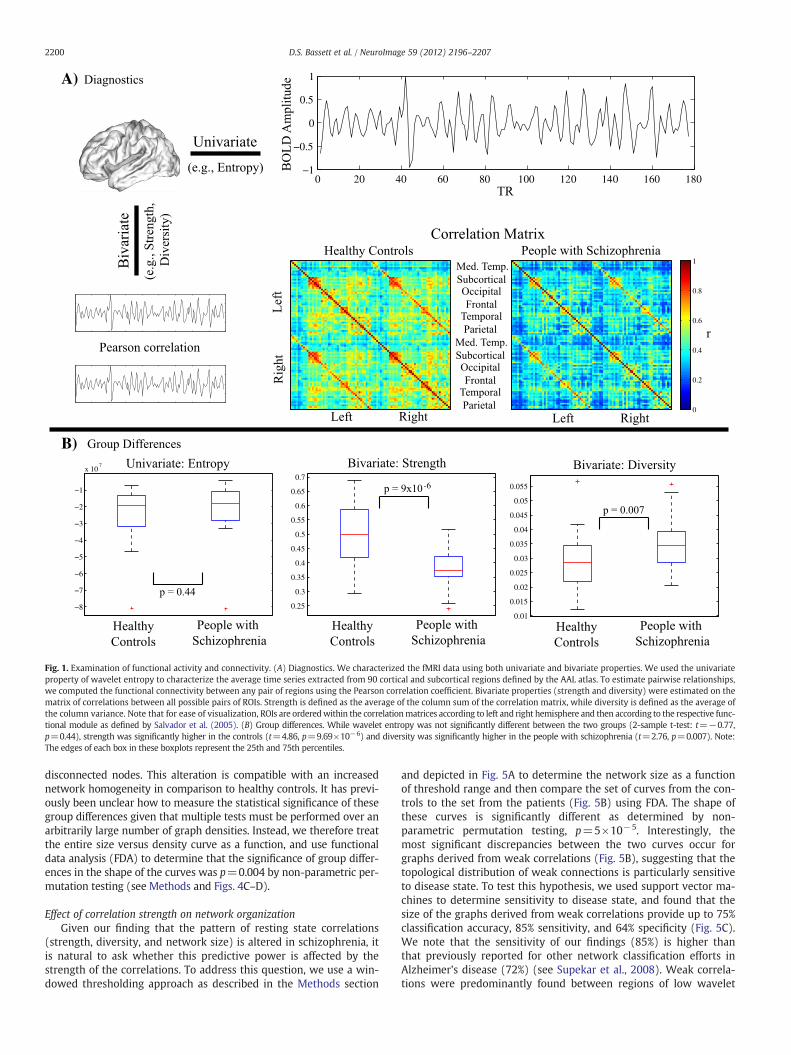
Global structureWe first examined the complexity of resting state fMRI data using
both univariate and bivariate measures (Fig. 1A). The univariate com-plexity, measured by the average wavelet entropy of the regionalmean time series extracted from all regions, was not significantly dif-ferent between patients and controls (Fig. 1B). Bivariate measures(strength and diversity), however, showed significant group differ-ences. Strength was significantly decreased in patients, indicatingthat the magnitude of functional connectivity was lower in theschizophrenia cohort. Diversity, however, was significantly increasedin patients, indicating an increased variance of that connectivity.
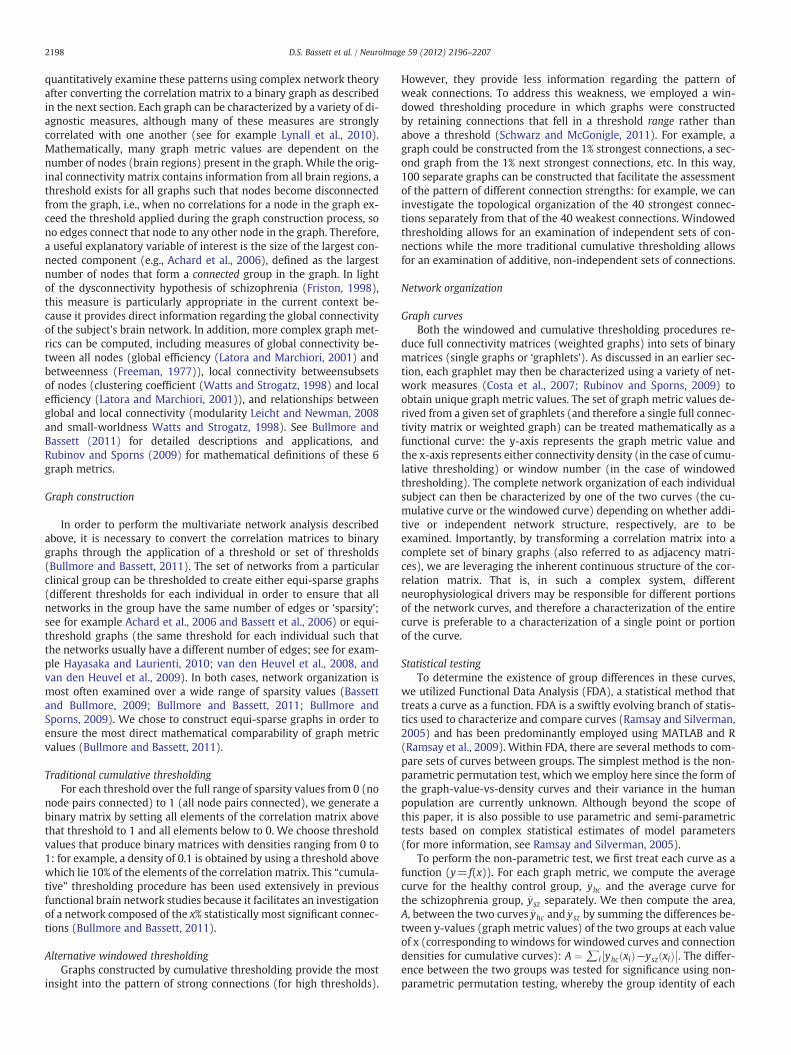
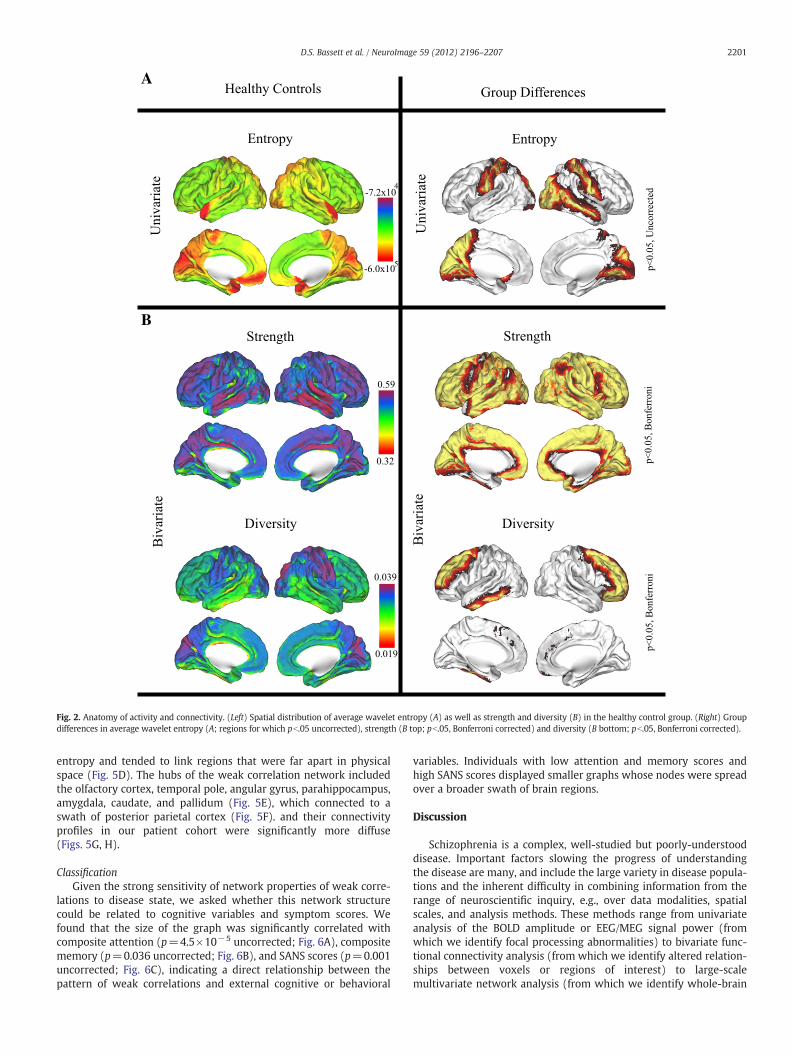
Regional structureIn healthy controls, wavelet entropy was heterogeneously distrib-
uted throughout the brain with lowest wavelet entropy found in re-gions of the cuneus, precuneus, and temporal pole (Fig. 2A).Strength showed a different spatial distribution, with highest valuesfound in the temporal cortex, while diversity was highest in the pre-cuneus and along the central sulcus (Fig. 2B). The differences in thespatial distributions of these three measures may help to explaintheir differential sensitivity to disease state. Several regions in theposterior parietal, occipital, temporal, and central cortices showedgroup differences in wavelet entropy with pb.05, but none of theseregions survived a multiple comparisons correction (Fig. 2A). In con-trast, both bivariate measures displayed broad sensitivities to diseasestate that survived Bonferroni correction (Fig. 2B). Strength was sig-nificantly decreased in schizophrenia over the majority of the corticaland subcortical regions (62 out of 90 regions). Diversity was signifi-cantly increased in schizophrenia in bilateral superior frontal andleft inferior temporal cortex.
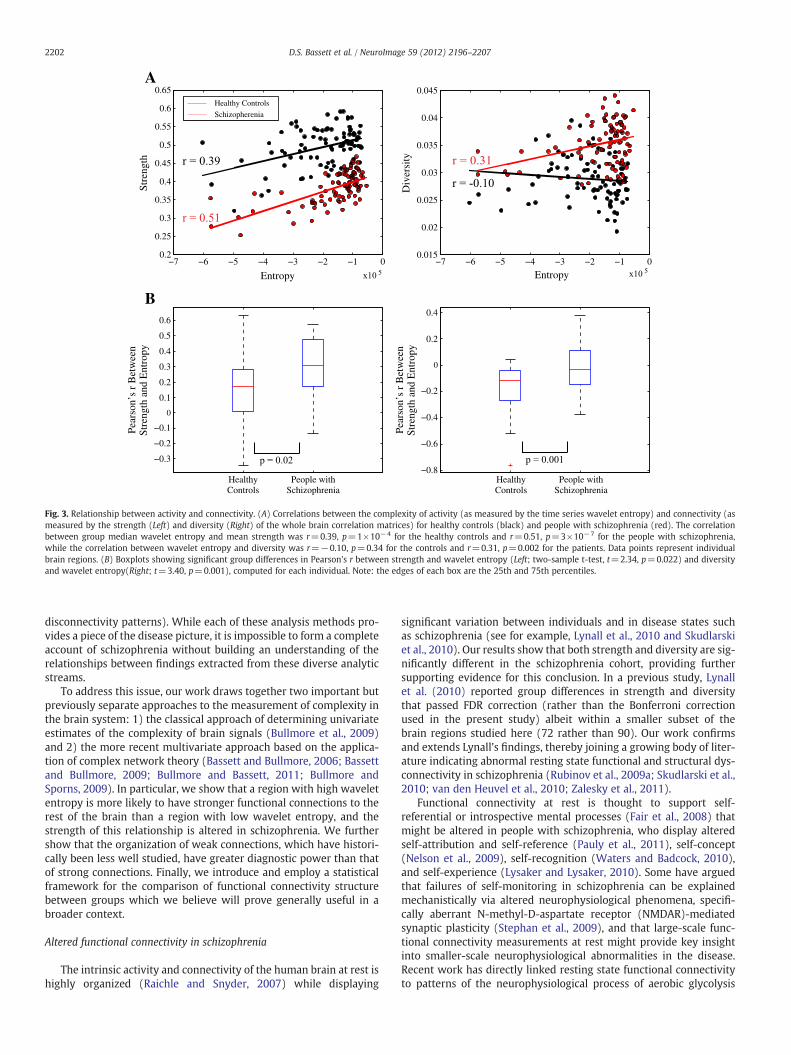
Relationship between univariate and bivariate propertiesIt is intuitively plausible that the complexity of individual time series
might influence their correlation with other time series, and indeed,Fig. 3A shows that wavelet entropy has a positive correlation withstrength: r=0.39, p=1×10⁻⁴ for the healthy controls and r=0.51,p=3×10⁻⁷ for the people with schizophrenia. A significant correla-tion was also observed between wavelet entropy and diversity in pa-tients (r=0.31, p=0.002) but not in controls (r=−0.10, p=0.34).Interestingly, the ability of wavelet entropy to predict functional con-nectivity is altered in disease: themagnitude of the correlation betweenwavelet entropy and strength is significantly larger in people withschizophrenia than in healthy controls (two-sample t-test, t=2.34,p=0.022), while the correlation betweenwavelet entropy and diversi-ty is significantly lower (t=3.40, p=0.001); see Fig. 3B.
Examination of multivariate network complexity
Network organizationIn addition to measuring strength and diversity, the correlation ma-
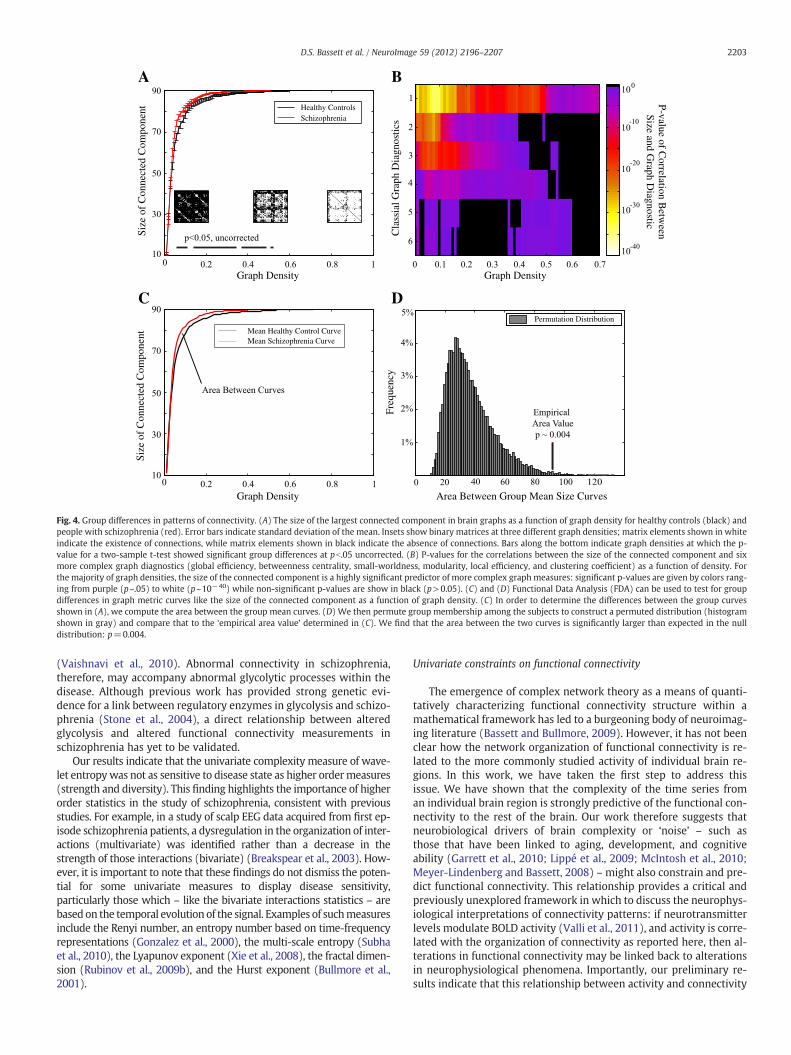
trix can be examined in the context of complex network theory using avariety of graph theoreticalmeasures (see (Bullmore and Bassett, 2011)and Methods). One of the simplest is the graph's size, s, defined by thenumber of nodes in the largest connected component. We find thatresting state fMRI networks, derived from both the healthy controland schizophrenic cohorts, become disconnected at density ~0.5(Fig. 4A). We note that the size of the graph, while a simple measure,is in fact a non-trivial predictor of awide variety of other graph diagnos-tics used extensively in complex network analysis (Fig. 4B) and there-fore represents an important potential indicator of the underlyingconnectivity complexity that may be sensitive to disease state. Indeed,the size of the graph appears larger in the brain networks of peoplewith schizophrenia, indicating that these networks have fewer
0 20 40 60 80 100 120 140 160 180−1
−0.5
0
0.5
1
0
0.2
0.4
0.6
0.8
1
−8
−7
−6
−5
−4
−3
−2
−1
x 107
0.25
0.3
0.35
0.4
0.45
0.5
0.55
0.6
0.65
0.7
0.01
0.015
0.02
0.025
0.03
0.035
0.04
0.045
0.05
0.055
-6
B)
A)
Fig. 1. Examination of functional activity and connectivity. (A) Diagnostics. We characterized the fMRI data using both univariate and bivariate properties. We used the univariateproperty of wavelet entropy to characterize the average time series extracted from 90 cortical and subcortical regions defined by the AAL atlas. To estimate pairwise relationships,we computed the functional connectivity between any pair of regions using the Pearson correlation coefficient. Bivariate properties (strength and diversity) were estimated on thematrix of correlations between all possible pairs of ROIs. Strength is defined as the average of the column sum of the correlation matrix, while diversity is defined as the average ofthe column variance. Note that for ease of visualization, ROIs are orderedwithin the correlationmatrices according to left and right hemisphere and then according to the respective func-tional module as defined by Salvador et al. (2005). (B) Group differences. While wavelet entropy was not significantly different between the two groups (2-sample t-test: t=−0.77,p=0.44), strength was significantly higher in the controls (t=4.86, p=9.69×10⁻⁶) and diversity was significantly higher in the people with schizophrenia (t=2.76, p=0.007). Note:The edges of each box in these boxplots represent the 25th and 75th percentiles.
2200 D.S. Bassett et al. / NeuroImage 59 (2012) 2196–2207
disconnected nodes. This alteration is compatible with an increasednetwork homogeneity in comparison to healthy controls. It has previ-ously been unclear how to measure the statistical significance of thesegroup differences given that multiple tests must be performed over anarbitrarily large number of graph densities. Instead, we therefore treatthe entire size versus density curve as a function, and use functionaldata analysis (FDA) to determine that the significance of group differ-ences in the shape of the curves was p=0.004 by non-parametric per-mutation testing (see Methods and Figs. 4C–D).
Effect of correlation strength on network organizationGiven our finding that the pattern of resting state correlations
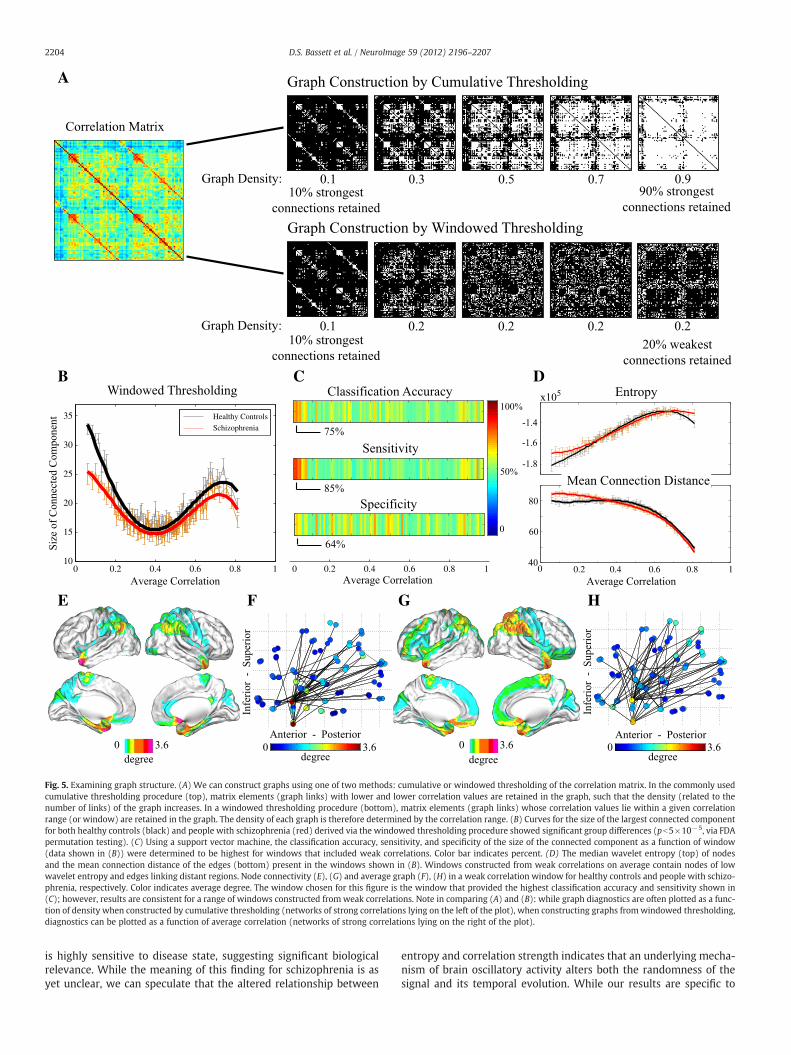
(strength, diversity, and network size) is altered in schizophrenia, itis natural to ask whether this predictive power is affected by thestrength of the correlations. To address this question, we use a win-dowed thresholding approach as described in the Methods section
and depicted in Fig. 5A to determine the network size as a functionof threshold range and then compare the set of curves from the con-trols to the set from the patients (Fig. 5B) using FDA. The shape ofthese curves is significantly different as determined by non-parametric permutation testing, p=5×10⁻⁵. Interestingly, themost significant discrepancies between the two curves occur forgraphs derived from weak correlations (Fig. 5B), suggesting that thetopological distribution of weak connections is particularly sensitiveto disease state. To test this hypothesis, we used support vector ma-chines to determine sensitivity to disease state, and found that thesize of the graphs derived from weak correlations provide up to 75%classification accuracy, 85% sensitivity, and 64% specificity (Fig. 5C).We note that the sensitivity of our findings (85%) is higher thanthat previously reported for other network classification efforts inAlzheimer's disease (72%) (see Supekar et al., 2008). Weak correla-tions were predominantly found between regions of low wavelet
A
B
Fig. 2. Anatomy of activity and connectivity. (Left) Spatial distribution of average wavelet entropy (A) as well as strength and diversity (B) in the healthy control group. (Right) Groupdifferences in average wavelet entropy (A; regions for which pb.05 uncorrected), strength (B top; pb.05, Bonferroni corrected) and diversity (B bottom; pb.05, Bonferroni corrected).
2201D.S. Bassett et al. / NeuroImage 59 (2012) 2196–2207
entropy and tended to link regions that were far apart in physicalspace (Fig. 5D). The hubs of the weak correlation network includedthe olfactory cortex, temporal pole, angular gyrus, parahippocampus,amygdala, caudate, and pallidum (Fig. 5E), which connected to aswath of posterior parietal cortex (Fig. 5F). and their connectivityprofiles in our patient cohort were significantly more diffuse(Figs. 5G, H).
ClassificationGiven the strong sensitivity of network properties of weak corre-
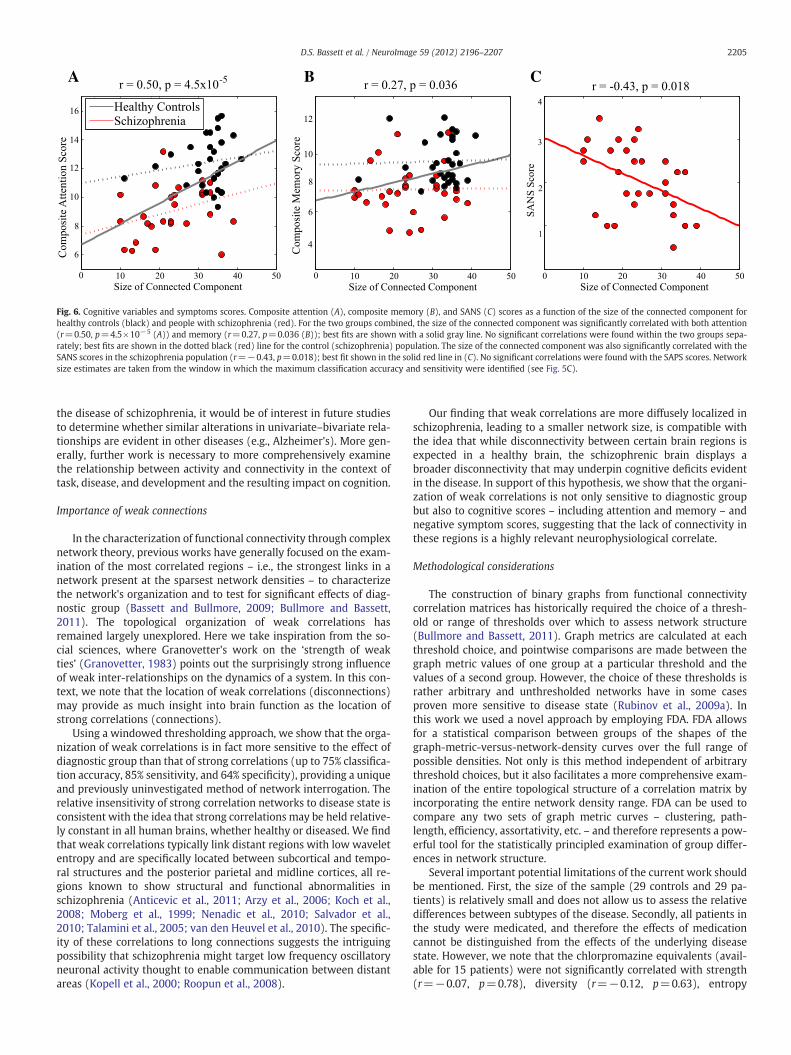
lations to disease state, we asked whether this network structurecould be related to cognitive variables and symptom scores. Wefound that the size of the graph was significantly correlated withcomposite attention (p=4.5×10⁻⁵ uncorrected; Fig. 6A), compositememory (p=0.036 uncorrected; Fig. 6B), and SANS scores (p=0.001uncorrected; Fig. 6C), indicating a direct relationship between thepattern of weak correlations and external cognitive or behavioral
variables. Individuals with low attention and memory scores andhigh SANS scores displayed smaller graphs whose nodes were spreadover a broader swath of brain regions.
Discussion
Schizophrenia is a complex, well-studied but poorly-understooddisease. Important factors slowing the progress of understandingthe disease are many, and include the large variety in disease popula-tions and the inherent difficulty in combining information from therange of neuroscientific inquiry, e.g., over data modalities, spatialscales, and analysis methods. These methods range from univariateanalysis of the BOLD amplitude or EEG/MEG signal power (fromwhich we identify focal processing abnormalities) to bivariate func-tional connectivity analysis (from which we identify altered relation-ships between voxels or regions of interest) to large-scalemultivariate network analysis (from which we identify whole-brain
−7 −6 −5 −4 −3 −2 −1 00.015
0.02
0.025
0.03
0.035
0.04
0.045
−7 −6 −5 −4 −3 −2 −1 00.2
0.25
0.3
0.35
0.4
0.45
0.5
0.55
0.6
0.65
−0.8
−0.6
−0.4
−0.2
0
0.2
0.4
−0.3
−0.2
−0.1
0
0.1
0.2
0.3
0.4
0.5
0.6
Entropy
Stre
ngth
Pear
son’
s r
Bet
wee
nSt
reng
th a
nd E
ntro
py
Pear
son’
s r
Bet
wee
nSt
reng
th a
nd E
ntro
pyD
iver
sity
Entropy
Schizopherenia
Healthy Controls
HealthyControls
People withSchizophrenia
HealthyControls
People withSchizophrenia
A
B
Fig. 3. Relationship between activity and connectivity. (A) Correlations between the complexity of activity (as measured by the time series wavelet entropy) and connectivity (asmeasured by the strength (Left) and diversity (Right) of the whole brain correlation matrices) for healthy controls (black) and people with schizophrenia (red). The correlationbetween group median wavelet entropy and mean strength was r=0.39, p=1×10⁻⁴ for the healthy controls and r=0.51, p=3×10⁻⁷ for the people with schizophrenia,while the correlation between wavelet entropy and diversity was r=−0.10, p=0.34 for the controls and r=0.31, p=0.002 for the patients. Data points represent individualbrain regions. (B) Boxplots showing significant group differences in Pearson's r between strength and wavelet entropy (Left; two-sample t-test, t=2.34, p=0.022) and diversityand wavelet entropy(Right; t=3.40, p=0.001), computed for each individual. Note: the edges of each box are the 25th and 75th percentiles.
2202 D.S. Bassett et al. / NeuroImage 59 (2012) 2196–2207
disconnectivity patterns). While each of these analysis methods pro-vides a piece of the disease picture, it is impossible to form a completeaccount of schizophrenia without building an understanding of therelationships between findings extracted from these diverse analyticstreams.
To address this issue, our work draws together two important butpreviously separate approaches to the measurement of complexity inthe brain system: 1) the classical approach of determining univariateestimates of the complexity of brain signals (Bullmore et al., 2009)and 2) the more recent multivariate approach based on the applica-tion of complex network theory (Bassett and Bullmore, 2006; Bassettand Bullmore, 2009; Bullmore and Bassett, 2011; Bullmore andSporns, 2009). In particular, we show that a region with high waveletentropy is more likely to have stronger functional connections to therest of the brain than a region with low wavelet entropy, and thestrength of this relationship is altered in schizophrenia. We furthershow that the organization of weak connections, which have histori-cally been less well studied, have greater diagnostic power than thatof strong connections. Finally, we introduce and employ a statisticalframework for the comparison of functional connectivity structurebetween groups which we believe will prove generally useful in abroader context.
Altered functional connectivity in schizophrenia
The intrinsic activity and connectivity of the human brain at rest ishighly organized (Raichle and Snyder, 2007) while displaying
significant variation between individuals and in disease states suchas schizophrenia (see for example, Lynall et al., 2010 and Skudlarskiet al., 2010). Our results show that both strength and diversity are sig-nificantly different in the schizophrenia cohort, providing furthersupporting evidence for this conclusion. In a previous study, Lynallet al. (2010) reported group differences in strength and diversitythat passed FDR correction (rather than the Bonferroni correctionused in the present study) albeit within a smaller subset of thebrain regions studied here (72 rather than 90). Our work confirmsand extends Lynall's findings, thereby joining a growing body of liter-ature indicating abnormal resting state functional and structural dys-connectivity in schizophrenia (Rubinov et al., 2009a; Skudlarski et al.,2010; van den Heuvel et al., 2010; Zalesky et al., 2011).
Functional connectivity at rest is thought to support self-referential or introspective mental processes (Fair et al., 2008) thatmight be altered in people with schizophrenia, who display alteredself-attribution and self-reference (Pauly et al., 2011), self-concept(Nelson et al., 2009), self-recognition (Waters and Badcock, 2010),and self-experience (Lysaker and Lysaker, 2010). Some have arguedthat failures of self-monitoring in schizophrenia can be explainedmechanistically via altered neurophysiological phenomena, specifi-cally aberrant N-methyl-D-aspartate receptor (NMDAR)-mediatedsynaptic plasticity (Stephan et al., 2009), and that large-scale func-tional connectivity measurements at rest might provide key insightinto smaller-scale neurophysiological abnormalities in the disease.Recent work has directly linked resting state functional connectivityto patterns of the neurophysiological process of aerobic glycolysis
Graph Density
Graph Density Graph Density
Area Between Group Mean Size Curves
Size
of
Con
nect
ed C
ompo
nent
Freq
uenc
y
Mean Healthy Control Curve
Healthy ControlsSchizophrenia
Mean Schizophrenia Curve
Permutation Distribution
Cla
ssia
l Gra
ph D
iagn
ostic
s
Size
of
Con
nect
ed C
ompo
nent
P-value of Correlation B
etween
Size and Graph D
iagnostic
A B
C D
Fig. 4. Group differences in patterns of connectivity. (A) The size of the largest connected component in brain graphs as a function of graph density for healthy controls (black) andpeople with schizophrenia (red). Error bars indicate standard deviation of the mean. Insets show binary matrices at three different graph densities; matrix elements shown in whiteindicate the existence of connections, while matrix elements shown in black indicate the absence of connections. Bars along the bottom indicate graph densities at which the p-value for a two-sample t-test showed significant group differences at pb.05 uncorrected. (B) P-values for the correlations between the size of the connected component and sixmore complex graph diagnostics (global efficiency, betweenness centrality, small-worldness, modularity, local efficiency, and clustering coefficient) as a function of density. Forthe majority of graph densities, the size of the connected component is a highly significant predictor of more complex graph measures: significant p-values are given by colors rang-ing from purple (p~.05) to white (p~10−40) while non-significant p-values are show in black (p>0.05). (C) and (D) Functional Data Analysis (FDA) can be used to test for groupdifferences in graph metric curves like the size of the connected component as a function of graph density. (C) In order to determine the differences between the group curvesshown in (A), we compute the area between the group mean curves. (D) We then permute group membership among the subjects to construct a permuted distribution (histogramshown in gray) and compare that to the ‘empirical area value’ determined in (C). We find that the area between the two curves is significantly larger than expected in the nulldistribution: p=0.004.
2203D.S. Bassett et al. / NeuroImage 59 (2012) 2196–2207
(Vaishnavi et al., 2010). Abnormal connectivity in schizophrenia,therefore, may accompany abnormal glycolytic processes within thedisease. Although previous work has provided strong genetic evi-dence for a link between regulatory enzymes in glycolysis and schizo-phrenia (Stone et al., 2004), a direct relationship between alteredglycolysis and altered functional connectivity measurements inschizophrenia has yet to be validated.
Our results indicate that the univariate complexity measure of wave-let entropywas not as sensitive to disease state as higher ordermeasures(strength and diversity). This finding highlights the importance of higherorder statistics in the study of schizophrenia, consistent with previousstudies. For example, in a study of scalp EEG data acquired from first ep-isode schizophrenia patients, a dysregulation in the organization of inter-actions (multivariate) was identified rather than a decrease in thestrength of those interactions (bivariate) (Breakspear et al., 2003). How-ever, it is important to note that these findings do not dismiss the poten-tial for some univariate measures to display disease sensitivity,particularly those which – like the bivariate interactions statistics – arebased on the temporal evolution of the signal. Examples of suchmeasuresinclude the Renyi number, an entropy number based on time-frequencyrepresentations (Gonzalez et al., 2000), the multi-scale entropy (Subhaet al., 2010), the Lyapunov exponent (Xie et al., 2008), the fractal dimen-sion (Rubinov et al., 2009b), and the Hurst exponent (Bullmore et al.,2001).
Univariate constraints on functional connectivity
The emergence of complex network theory as a means of quanti-tatively characterizing functional connectivity structure within amathematical framework has led to a burgeoning body of neuroimag-ing literature (Bassett and Bullmore, 2009). However, it has not beenclear how the network organization of functional connectivity is re-lated to the more commonly studied activity of individual brain re-gions. In this work, we have taken the first step to address thisissue. We have shown that the complexity of the time series froman individual brain region is strongly predictive of the functional con-nectivity to the rest of the brain. Our work therefore suggests thatneurobiological drivers of brain complexity or ‘noise’ – such asthose that have been linked to aging, development, and cognitiveability (Garrett et al., 2010; Lippé et al., 2009; McIntosh et al., 2010;Meyer-Lindenberg and Bassett, 2008) –might also constrain and pre-dict functional connectivity. This relationship provides a critical andpreviously unexplored framework in which to discuss the neurophys-iological interpretations of connectivity patterns: if neurotransmitterlevels modulate BOLD activity (Valli et al., 2011), and activity is corre-lated with the organization of connectivity as reported here, then al-terations in functional connectivity may be linked back to alterationsin neurophysiological phenomena. Importantly, our preliminary re-sults indicate that this relationship between activity and connectivity
0 0.2 0.4 0.6 0.8 10 0.2 0.4 0.6 0.8 10 0.2 0.4 0.6 0.8 110
15
20
25
30
35
A
B C D
E F HG
Healthy Controls
Schizophrenia
Fig. 5. Examining graph structure. (A) We can construct graphs using one of two methods: cumulative or windowed thresholding of the correlation matrix. In the commonly usedcumulative thresholding procedure (top), matrix elements (graph links) with lower and lower correlation values are retained in the graph, such that the density (related to thenumber of links) of the graph increases. In a windowed thresholding procedure (bottom), matrix elements (graph links) whose correlation values lie within a given correlationrange (or window) are retained in the graph. The density of each graph is therefore determined by the correlation range. (B) Curves for the size of the largest connected componentfor both healthy controls (black) and people with schizophrenia (red) derived via the windowed thresholding procedure showed significant group differences (pb5×10−5, via FDApermutation testing). (C) Using a support vector machine, the classification accuracy, sensitivity, and specificity of the size of the connected component as a function of window(data shown in (B)) were determined to be highest for windows that included weak correlations. Color bar indicates percent. (D) The median wavelet entropy (top) of nodesand the mean connection distance of the edges (bottom) present in the windows shown in (B). Windows constructed from weak correlations on average contain nodes of lowwavelet entropy and edges linking distant regions. Node connectivity (E), (G) and average graph (F), (H) in a weak correlation window for healthy controls and people with schizo-phrenia, respectively. Color indicates average degree. The window chosen for this figure is the window that provided the highest classification accuracy and sensitivity shown in(C); however, results are consistent for a range of windows constructed from weak correlations. Note in comparing (A) and (B): while graph diagnostics are often plotted as a func-tion of density when constructed by cumulative thresholding (networks of strong correlations lying on the left of the plot), when constructing graphs fromwindowed thresholding,diagnostics can be plotted as a function of average correlation (networks of strong correlations lying on the right of the plot).
2204 D.S. Bassett et al. / NeuroImage 59 (2012) 2196–2207
is highly sensitive to disease state, suggesting significant biologicalrelevance. While the meaning of this finding for schizophrenia is asyet unclear, we can speculate that the altered relationship between
entropy and correlation strength indicates that an underlying mecha-nism of brain oscillatory activity alters both the randomness of thesignal and its temporal evolution. While our results are specific to
Healthy ControlsSchizophrenia
A B C
Fig. 6. Cognitive variables and symptoms scores. Composite attention (A), composite memory (B), and SANS (C) scores as a function of the size of the connected component forhealthy controls (black) and people with schizophrenia (red). For the two groups combined, the size of the connected component was significantly correlated with both attention(r=0.50, p=4.5×10⁻⁵ (A)) and memory (r=0.27, p=0.036 (B)); best fits are shown with a solid gray line. No significant correlations were found within the two groups sepa-rately; best fits are shown in the dotted black (red) line for the control (schizophrenia) population. The size of the connected component was also significantly correlated with theSANS scores in the schizophrenia population (r=−0.43, p=0.018); best fit shown in the solid red line in (C). No significant correlations were found with the SAPS scores. Networksize estimates are taken from the window in which the maximum classification accuracy and sensitivity were identified (see Fig. 5C).
2205D.S. Bassett et al. / NeuroImage 59 (2012) 2196–2207
the disease of schizophrenia, it would be of interest in future studiesto determine whether similar alterations in univariate–bivariate rela-tionships are evident in other diseases (e.g., Alzheimer's). More gen-erally, further work is necessary to more comprehensively examinethe relationship between activity and connectivity in the context oftask, disease, and development and the resulting impact on cognition.
Importance of weak connections
In the characterization of functional connectivity through complexnetwork theory, previous works have generally focused on the exam-ination of the most correlated regions – i.e., the strongest links in anetwork present at the sparsest network densities – to characterizethe network's organization and to test for significant effects of diag-nostic group (Bassett and Bullmore, 2009; Bullmore and Bassett,2011). The topological organization of weak correlations hasremained largely unexplored. Here we take inspiration from the so-cial sciences, where Granovetter's work on the ‘strength of weakties’ (Granovetter, 1983) points out the surprisingly strong influenceof weak inter-relationships on the dynamics of a system. In this con-text, we note that the location of weak correlations (disconnections)may provide as much insight into brain function as the location ofstrong correlations (connections).
Using a windowed thresholding approach, we show that the orga-nization of weak correlations is in fact more sensitive to the effect ofdiagnostic group than that of strong correlations (up to 75% classifica-tion accuracy, 85% sensitivity, and 64% specificity), providing a uniqueand previously uninvestigated method of network interrogation. Therelative insensitivity of strong correlation networks to disease state isconsistent with the idea that strong correlations may be held relative-ly constant in all human brains, whether healthy or diseased. We findthat weak correlations typically link distant regions with low waveletentropy and are specifically located between subcortical and tempo-ral structures and the posterior parietal and midline cortices, all re-gions known to show structural and functional abnormalities inschizophrenia (Anticevic et al., 2011; Arzy et al., 2006; Koch et al.,2008; Moberg et al., 1999; Nenadic et al., 2010; Salvador et al.,2010; Talamini et al., 2005; van den Heuvel et al., 2010). The specific-ity of these correlations to long connections suggests the intriguingpossibility that schizophrenia might target low frequency oscillatoryneuronal activity thought to enable communication between distantareas (Kopell et al., 2000; Roopun et al., 2008).
Our finding that weak correlations are more diffusely localized inschizophrenia, leading to a smaller network size, is compatible withthe idea that while disconnectivity between certain brain regions isexpected in a healthy brain, the schizophrenic brain displays abroader disconnectivity that may underpin cognitive deficits evidentin the disease. In support of this hypothesis, we show that the organi-zation of weak correlations is not only sensitive to diagnostic groupbut also to cognitive scores – including attention and memory – andnegative symptom scores, suggesting that the lack of connectivity inthese regions is a highly relevant neurophysiological correlate.
Methodological considerations
The construction of binary graphs from functional connectivitycorrelation matrices has historically required the choice of a thresh-old or range of thresholds over which to assess network structure(Bullmore and Bassett, 2011). Graph metrics are calculated at eachthreshold choice, and pointwise comparisons are made between thegraph metric values of one group at a particular threshold and thevalues of a second group. However, the choice of these thresholds israther arbitrary and unthresholded networks have in some casesproven more sensitive to disease state (Rubinov et al., 2009a). Inthis work we used a novel approach by employing FDA. FDA allowsfor a statistical comparison between groups of the shapes of thegraph-metric-versus-network-density curves over the full range ofpossible densities. Not only is this method independent of arbitrarythreshold choices, but it also facilitates a more comprehensive exam-ination of the entire topological structure of a correlation matrix byincorporating the entire network density range. FDA can be used tocompare any two sets of graph metric curves – clustering, path-length, efficiency, assortativity, etc. – and therefore represents a pow-erful tool for the statistically principled examination of group differ-ences in network structure.
Several important potential limitations of the current work shouldbe mentioned. First, the size of the sample (29 controls and 29 pa-tients) is relatively small and does not allow us to assess the relativedifferences between subtypes of the disease. Secondly, all patients inthe study were medicated, and therefore the effects of medicationcannot be distinguished from the effects of the underlying diseasestate. However, we note that the chlorpromazine equivalents (avail-able for 15 patients) were not significantly correlated with strength(r=−0.07, p=0.78), diversity (r=−0.12, p=0.63), entropy
2206 D.S. Bassett et al. / NeuroImage 59 (2012) 2196–2207
(r=0.09, p=0.71), or the size of the connected component over thecorrelation windows (rb0.51, p>0.05 FDR corrected). Thirdly, wenote that while network size was significantly correlated with cogni-tive variables of attention and memory in the two groups combined(Figs. 6A–B), no significant correlations were observed with thesetwo variables for the two groups separately. Two potential explana-tions for this finding are that 1) no correlation exists between net-work size and attention/memory in the control or schizophrenicgroups or 2) the size or cognitive range of our sample was not largeenough to sensitively measure a correlation between these variables.From the current study, we cannot determine which of these twopossibilities is the case. And finally, we have noted that the classifica-tion results we have obtained are higher than those previouslyreported in Alzheimer's disease (Supekar et al., 2008). However,from the current study we cannot determine whether our increasedsensitivity is due to our alternative methods employing weak correla-tions, a difference in schizophrenia versus Alzheimer's disease, or ourparticular schizophrenia cohort.
Conceptually, it is also important to note that the approach pre-sented in this study, consistent with other similar studies (e.g., Lynallet al., 2010 and Skudlarski et al., 2010), considers a single static net-work structure as an average representation of the overall restingstate functional connectivity over the experimental duration. Howev-er, evidence suggests that resting state functional connectivity archi-tecture evolves in time (Park et al., 2011) and displays spatiallydistinct and temporally coherent subnetworks (Damoiseaux et al.,2006). One potential method for examining the dynamics of restingstate function is the construction of dynamic network models, ashave recently been extracted from task data during a simple motorlearning paradigm (Bassett et al., 2011). Alternatively, multiple net-work models can be extracted from resting state time series using ap-proaches based on independent components analysis (ICA), whichwhen applied to schizophrenia (Calhoun et al., 2009) have identifiedseveral independent networks whose intra- and inter-network connec-tivity is altered in the disease (Jafri et al., 2008;Woodward et al., 2011).
Conclusion
Here we develop a novel multi-level framework for the analysis ofunivariate, bivariate, and multivariate estimates of complexity inbrain signals. We identify a strong relationship between the univari-ate and bivariate measures, and find that this relationship is signifi-cantly altered in disease. Our results underscore the critical role ofconnectivity patterns in understanding brain function in schizophre-nia and specifically highlight the as-yet-unexplored networks ofweak correlations, which appear to be sensitive to diagnosis, cogni-tion, and symtomatology. Furthermore, we develop and report a gen-eral framework for statistical testing of group differences in graphcurves based on FDA, which is generalizable to the study of group dif-ferences in any network property.
Competing interests
The authors declare that they have no competing financial interests.
Acknowledgment
D.S.B. was supported by the David and Lucile Packard Foundation,PHS Grant NS44393 and the Institute for Collaborative Biotechnol-ogies through contract no. W911NF-09-D-0001 from the U.S. ArmyResearch Office. Additional support for this research was providedby the National Institute of Mental Health (R01MH060662), TrainingGrant T32DA007097 for J.C., and the Center for Magnetic ResonanceResearch (BTRR P41 RR008079 and NCC grant P30 NS057091).
References
Achard, S., Salvador, R., Whitcher, B., Suckling, J., Bullmore, E., 2006. A resilient, low-frequency, small-world human brain functional network with highly connectedassociation cortical hubs. J. Neurosci. 26 (1), 63–72.
Aleman, A., Hijman, R., deHaan, E.H., Kahn, R.S., 1999.Memory impairment in schizophrenia:a meta-analysis. Am. J. Psychiatry 156 (9), 1358–1366.
Andreasen, N.C., 1982. Negative symptoms in schizophrenia definition and reliability.Arch. Gen. Psychiatry 39 (7), 784–788.
Andreasen, N.C., Olsen, S., 1982. Negative v positive schizophrenia definition and validation.Arch. Gen. Psychiatry 39 (7), 789–794.
Anticevic, A., Repovs, G., Barch, D.M., 2011. Emotion effects on attention, amygdala ac-tivation, and functional connectivity in schizophrenia. Schizophr. Bull. (March 17,Electronic publication ahead of print).
Arzy, S., Seeck, M., Ortigue, S., Spinelli, L., Blanke, O., 2006. Induction of an illusoryshadow person. Nature 443 (7109), 287.
Auer, D.P., 2008. Spontaneous low-frequency blood oxygenation level-dependent fluctu-ations and functional connectivity analysis of the ‘resting’ brain.Magn. Reson. Imaging26 (7), 1055–1064.
Barnes, A., Bullmore, E.T., Suckling, J., 2009. Endogenous human brain dynamics recoverslowly following cognitive effort. PLoS One 4 (8), e6626.
Bassett, D.S., Bullmore, E.T., 2006. Small-world brain networks. Neuroscientist 12,512–523.
Bassett, D.S., Bullmore, E.T., 2009. Human brain networks in health and disease. Curr.Opin. Neurol. 22 (4), 340–347.
Bassett, D.S., Meyer-Lindenberg, A., Achard, S., Duke, T., Bullmore, E., 2006. Adaptivereconfiguration of fractal small-world human brain functional networks. Proc.Natl. Acad. Sci. U. S. A. 103, 19518–19523.
Bassett, D.S., Bullmore, E.T., Verchinski, B.A., Mattay, V.S., Weinberger, D.R., Meyer-Lindenberg, A., 2008. Hierarchical organization of human cortical networks inhealth and schizophrenia. J. Neurosci. 28 (37), 9239–9248.
Bassett, D.S., Meyer-Lindenberg, A., Weinberger, D.R., Coppola, R., Bullmore, E., 2009.Cognitive fitness of cost-efficient brain functional networks. Proc. Natl. Acad. Sci.U. S. A. 106 (28), 11747–11752.
Bassett, D.S., Brown, J.A., Deshpande, V., Carlson, J.M., Grafton, S.T., 2010. Conservedand variable architecture of human white matter connectivity. NeuroImage.doi:10.1016/j.neuroimage.2010.09.006.
Bassett, D.S.,Wymbs,N.F., Porter,M.A.,Mucha, P.J., Carlson, J.M.,Grafton, S.T., 2011. Dynamicreconfiguration of human brain networks during learning. Proc. Natl. Acad. Sci. U. S. A.108 (18), 7641–7646.
Biswal, B.B., Mennes, M., Zuo, X.N., Gohel, S., Kelly, C., Smith, S.M., Beckmann, C.F.,Adelstein, J.S., Buckner, R.L., Colcombe, S., Dogonowski, A.M., Ernst, M., Fair, D.,Hampson, M., Hoptman, M.J., Hyde, J.S., Kiviniemi, V.J., Kötter, R., Li, S.J., Lin,C.P., Lowe, M.J., Mackay, C., Madden, D.J., Madsen, K.H., Margulies, D.S., Mayberg,H.S., McMahon, K., Monk, C.S., Mostofsky, S.H., Nagel, B.J., Pekar, J.J., Peltier, S.J.,Petersen, S.E., Riedl, V., Rombouts, S.A., Rypma, B., Schlaggar, B.L., Schmidt, S.,Seidler, R.D., Siegle, G.J., Sorg, C., Teng, G.J., Veijola, J., Villringer, A., Walter, M.,Wang, L., Weng, X.C., Whitfield-Gabrieli, S., Williamson, P., Windischberger, C.,Zang, Y.F., Zhang, H.Y., Castellanos, F.X., Milham,M.P., 2010. Toward discovery scienceof human brain function. Proc. Natl. Acad. Sci. U. S. A. 107 (10), 4734–4739.
Bob, P., Susta, M., Chladek, J., Glaslova, K., Palus, M., 2009. Chaos in schizophrenia asso-ciations, reality or metaphor? Int. J. Psychophysiol. 73 (3), 179–185.
Bosl, W., Tierney, A., Tager-Flusberg, H., Nelson, C., 2011. EEG complexity as a biomarkerfor autism spectrum disorder risk. BMC Med. 9, 18.
Breakspear, M., 2006. The nonlinear theory of schizophrenia. Aust. N. Z. J. Psychiatry 40(1), 20–35.
Breakspear, M., Terry, J.R., Friston, K.J., Harris, A.W., Williams, L.M., Brown, K., Brennan,J., Gordon, E., 2003. A disturbance of nonlinear interdependence in scalp eeg ofsubjects with first episode schizophrenia. NeuroImage 20 (1), 466–478.
Broyd, S.J., Demanuele, C., Debener, S., Helps, S.K., James, C.J., Sonuga-Barke, E.J., 2009. Default-mode brain dysfunction in mental disorders: a systematic review. Neurosci. Biobehav.Rev. 33 (3), 279–296.
Bullmore, E., Bassett, D.S., 2011. Brain graph models: graphical models of the humanbrain connectome. Annu. Rev. Clin. Psychol. 7, 113–140.
Bullmore, E., Sporns, O., 2009. Complex brain networks: graph theoretical analysis ofstructural and functional systems. Nat. Rev. Neurosci. 10 (3), 186–198.
Bullmore, E., Long, C., Suckling, J., Fadili, J., Calvert, G., Zelaya, F., Carpenter, T.A., Brammer,M., 2001. Colored noise and computational inference in neurophysiological (fMRI)time series analysis: resampling methods in time and wavelet domains. Hum. BrainMapp. 12 (2), 61–78.
Bullmore, E., Barnes, A., Bassett, D.S., Fornito, A., Kitzbichler, M., Meunier, D., Suckling,J., 2009. Generic aspects of complexity in brain imaging data and other biologicalsystems. NeuroImage 47 (3), 1125–1134.
Calhoun, V.D., Eichele, T., Pearlson, G., 2009. Functional brain networks in schizophrenia: areview. Front. Hum. Neurosci. 3 (17).
Camchong, J., Macdonald, A.W.r., Bell, C., Mueller, B.A., Lim, K.O., 2011. Altered func-tional and anatomical connectivity in schizophrenia. Schizophr. Bull. 37 (3),640–650.
Carroll, J.B., 1993. Human cognitive abilities. A survey of factor-analytic studies. CambridgeUniversity Press.
Coifman, R. R., Wickerhauser, M. V., 1992. Entropy-based algorithms for best basis selection38 (2), 713–718.
Costa, L.D.F., Rodrigues, F.A., Travieso, G., Villas Boas, P.R., 2007. Characterization ofcomplex networks: a survey of measurements. Adv. Phys. 56 (1), 167–242.
Cristianini, N., Shawe-Taylor, J., 2000. An Introduction to Support Vector Machines andOther Kernel-based Learning Methods. Cambridge University Press.
2207D.S. Bassett et al. / NeuroImage 59 (2012) 2196–2207
Damoiseaux,J.S.,Rombouts,S.A.,Barkhof,F.,Scheltens,P.,Stam,C.J.,Smith,S.M.,Beckmann,C.F.,2006.Consistentresting-statenetworksacrosshealthysubjects.Proc.Natl.Acad.Sci.U.S.A.103(37),13848–13853.
Donoho, D.L., Johnstone, I.M., 1994. Ideal de-noising in an orthonormal basis chosenfrom a library of bases. C. R. Acad. Sci. Paris Sér. I 319, 1317–1322.
Esslinger, C., Walter, H., Kirsch, P., Erk, S., Schnell, K., Arnold, C., Haddad, L., Mier, D., Opitzvon Boberfeld, C., Raab, K., Witt, S.H., Rietschel, M., Cichon, S., Meyer-Lindenberg, A.,2009. Neural mechanisms of a genome-wide supported psychosis variant. Science324 (5927), 605.
Esslinger, C., Kirsch, P., Haddad, L., Mier, D., Sauer, C., Erk, S., Schnell, K., Arnold, C., Witt,S.H., Rietschel, M., Cichon, S., Walter, H., Meyer-Lindenberg, A., 2011. Cognitivestate and connectivity effects of the genome-wide significant psychosis variant inznf804a. NeuroImage 54 (3), 2514–2523.
Fair, D.A., Cohen, A.L., Dosenbach, N.U., Church, J.A., Miezin, F.M., Barch, D.M., Raichle,M.E., Petersen, S.E., Schlaggar, B.L., 2008. The maturing architecture of the brain'sdefault network. Proc. Natl. Acad. Sci. U. S. A. 105 (10), 4028–4032.
Ferrarini, L., Veer, I.M., van Lew, B., Oei, N.Y., van Buchem,M.A., Reiber, J.H., Rombouts, S.A.,Milles, J., 2011. Non-parametric model selection for subject-specific topological orga-nization of resting-state functional connectivity. Neuroimage 56 (3), 1453–1462.
First, M., Spitzer, R., Gibbon, M., Williams, J., 1995. Structured clinical interview forDSM-IV axis i disorderspatient edition (scid-i/p).
Freeman, L.C., 1977. A set of measures of centrality based on betweenness. Sociometry40, 35–41.
Friston, K.J., 1998. The disconnection hypothesis. Schizophr. Res. 30 (2), 115–125.Fuller, R.L., Luck, S.J., Braun, E.L., Robinson, B.M., McMahon, R.P., Gold, J.M., 2006. Im-
paired control of visual attention in schizophrenia. J. Abnorm. Psychol. 115 (2),266–275.
Garrett, D.D., Kovacevic, N., McIntosh, A.R., Grady, C.L., 2010. Blood oxygen level-dependent signal variability is more than just noise. J. Neurosci. 30 (14),4914–4921.
Gonzalez, A.S.L., de Peralta, Grave,Menendez, R., Thut, G., Spinelli, L., Blanke, O.,Michel, C.M.,Seeck, M., Landis, T., 2000. Measuring the complexity of time series: an application toneurophysiological signals. Hum. Brain Mapp. 11 (1), 46–57.
Granovetter, M., 1983. The strength of weak ties: a network theory revisited. SociologicalTheory, 1, pp. 201–233.
Hayasaka, S., Laurienti, P.J., 2010. Comparison of characteristics between region-and voxel-based network analyses in resting-state fMRI data. NeuroImage 50 (2), 499–508.
Heinrichs, R.W., Zakzanis, K.K., 1998. Neurocognitive deficit in schizophrenia: a quantitativereview of the evidence. Neuropsychology 12, 426–445.
Jafri, M.J., Pearlson, G.D., Stevens, M., Calhoun, V.D., 2008. A method for functional networkconnectivity among spatially independent resting-state components in schizophrenia.NeuroImage 39 (4), 1666–1681.
Jenkinson, M., Bannister, P., Brady, M., Smith, S., 2002. Improved optimization for therobust and accurate linear registration andmotion correction of brain images. Neu-roimage 17 (2), 825–841.
Koch, G., Ribolsi, M., Mori, F., Sacchetti, L., Codecà, C., Rubino, I.A., Siracusano, A., Bernardi,G., Centonze, D., 2008. Connectivity between posterior parietal cortex and ipsilateralmotor cortex is altered in schizophrenia. Biol. Psychiatry 64 (9), 815–819.
Kopell, N., Ermentrout, G.B., Whittington, M.A., Traub, R.D., 2000. Gamma rhythmsand beta rhythms have different synchronization properties. Proc. Natl. Acad. Sci.U. S. A. 97, 1867–1872.
Latora, V., Marchiori, M., 2001. Efficient behavior of small-world networks. Phys. Rev.Lett. 87, 198701.
Leicht, E.A., Newman, M.E.J., 2008. Community structure in directed networks. Phys.Rev. Lett. 100 (11), 118703.
Lippé, S., Kovacevic, N., McIntosh, A.R., 2009. Differential maturation of brain signalcomplexity in the human auditory and visual system. Front. Hum. Neurosci. 3, 48.
Lynall, M.E., Bassett, D.S., Kerwin, R.,McKenna, P., Muller, U., Bullmore, E.T., 2010. Functionalconnectivity and brain networks in schizophrenia. J. Neurosci. 30 (28), 9477–9487.
Lysaker, P.H., Lysaker, J.T., 2010. Schizophrenia and alterations in self-experience: acomparison of 6 perspectives. Schizophr. Bull. 36 (2), 331–340.
McIntosh, A.R., Kovacevic, N., Lippe, S., Garrett, D., Grady, C., Jirsa, V., 2010. The developmentof a noisy brain. Arch. Ital. Biol. 148 (3), 323–337.
Meyer-Lindenberg, A., Bassett, D.S., 2008. Nonlinear and cooperative dynamics in the humanbrain: evidence frommultimodal neuroimaging. In: Fuchs, A., Jirsa, V. (Eds.), Coordina-tion: neural, behavioral and social dynamics. Vol. 17 of understanding complex systems.Springer, Berlin/Heidelberg, pp. 161–181.
Misic, B., Mills, T., Taylor, M.J., McIntosh, A.R., 2010. Brain noise is task dependent andregion specific. J. Neurophysiol. 104 (5), 2667–2676.
Moberg, P.J., Agrin, R., Gur, R.E., Gur, R.C., Turetsky, B.I., Doty, R.L., 1999. Olfactory dysfunctionin schizophrenia: a qualitative and quantitative review. Neuropsychopharmacology 21(3), 325–340.
Nelson, B., Fornito, A., Harrison, B.J., Yücel, M., Sass, L.A., Yung, A.R., Thompson, A.,Wood, S.J., Pantelis, C., McGorry, P.D., 2009. A disturbed sense of self in the psycho-sis prodrome: linking phenomenology and neurobiology. Neurosci. Biobehav. Rev.33 (6), 807–817.
Nenadic, I., Smesny, S., Schlösser, R.G., Sauer, H., Gaser, C., 2010. Auditory hallucinations andbrain structure in schizophrenia: voxel-basedmorphometric study. Br. J. Psychiatry 196(5), 412–413.
Park, B., Kim, J.I., Lee, D., Jeong, S.O., Lee, J.D., Park, H.J., 2011. Are brain networks stable dur-ing a 24-hour period? Neuroimage ( Jul 23, Electronic publication ahead of print).
Pauly, K., Kircher, T., Weber, J., Schneider, F., Habel, U., 2011. Self-concept, emotion andmemory performance in schizophrenia. Psychiatry Res. 186 (1), 11–17.
Percival, D.B., Walden, A.T., 2000. Wavelet Methods for Time Series Analysis. CambridgeUniversity Press.
Potts, G.F., O'Donnell, B.F., Hirayasu, Y., McCarley, R.W., 2002. Disruption of neural sys-tems of visual attention in schizophrenia. Arch. Gen. Psychiatry 59 (5), 418–424.
Raichle, M.E., Snyder, A.Z., 2007. A default mode of brain function: a brief history of anevolving idea. NeuroImage 37 (4), 1083–1090.
Ramsay, J.O., Silverman, B.W., 2005. Functional Data Analysis. Springer.Ramsay, J.O., Hooker, G., Graves, S., 2009. Functional Data Analysis with R and MATLAB
(Use R).Roopun, A.K., Kramer, M.A., Carracedo, L.M., Kaiser, M., Davies, C.H., Traub, R.D., Kopell,
N.J., Whittington, M.A., 2008. Period concatenation underlies interactions betweengamma and beta rhythms in neocortex. Front. Cell. Neurosci. 2, 1.
Rubinov, M., Sporns, O., 2009. Complex network measures of brain connectivity: usesand interpretations. NeuroImage 52 (3), 1059–1069.
Rubinov,M., Knock, S.A., Stam, C.J., Micheloyannis, S., Harris, A.W.,Williams, L.M., Breakspear,M., 2009a. Small-world properties of nonlinear brain activity in schizophrenia. Hum.Brain Mapp. 30 (2), 403–416.
Rubinov, M., Sporns, O., van Leeuwen, C., Breakspear, M., 2009b. Symbiotic Relationshipbetween Brain Structure and Dynamics.
Salvador, R., Suckling, J., Coleman, M.R., Pickard, J.D., Menon, D., Bullmore, E., 2005.Neurophysiological architecture of functional magnetic resonance images ofhuman brain. Cereb. Cortex 15, 1332–1342.
Salvador, R., Sarró, S., Gomar, J.J., Ortiz-Gil, J., Vila, F., Capdevila, A., Bullmore, E., McKenna,P.J., Pomarol-Clotet, E., 2010. Overall brain connectivity maps show cortico-subcortical abnormalities in schizophrenia. Hum. Brain Mapp. 31 (12), 2003–2014.
Schwarz, A.J., McGonigle, J., 2011. Negative edges and soft thresholding in complex networkanalysis of resting state functional connectivity data. NeuroImage 55 (3), 1132–1146.
Skudlarski, P., Jagannathan, K., Anderson, K., Stevens, M.C., Calhoun, V.D., Skudlarska, B.A.,Pearlson, G., 2010. Brain connectivity is not only lower but different in schizophrenia:a combined anatomical and functional approach. Biol. Psychiatry 68 (1), 61–69.
Smith, S.M., 2002. Fast robust automated brain extraction. Hum. Brain Mapp. 17 (3),143–155.
Smith, S.M., Jenkinson, M., Woolrich, M.W., Beckmann, C.F., Behrens, T.E.J., Johansen-Berg,H., Bannister, P.R., De Luca,M., Drobnjak, I., Flitney, D.E., Niazy, R., Saunders, J., Vickers,J., Zhang, Y., De Stefano, N., Brady, J.M., Matthews, P.M., 2004. Advances in functionaland structural MR image analysis and implementation as FSL. NeuroImage 23 (S1),208–219.
Stephan, K.E., Baldeweg, T., Friston, K.J., 2006. Synaptic plasticity and dysconnection inschizophrenia. Biol. Psychiat. 59 (10), 929–939.
Stephan, K.E., Friston, K.J., Frith, C.D., 2009. Dysconnection in schizophrenia: from abnormalsynaptic plasticity to failures of self-monitoring. Schizophr. Bull. 35 (3), 509–527.
Stone,W.S., Faraone, S.V., Su, J., Tarbox, S.I., Van Eerdewegh, P., Tsuang, M.T., 2004. Evidencefor linkage between regulatory enzymes in glycolysis and schizophrenia in a multiplexsample. Am. J. Med. Genet. B. Neuropsychiatr. Genet. 127B (1), 5–10.
Subha, D.P., Joseph, P.K., Acharya, U.R., Lim, C.M., 2010. Eeg signal analysis: a survey. J.Med. Syst. 34 (2), 195–212.
Supekar, K., Menon, V., Rubin, D., Musen, M., Greicius, M.D., 2008. Network analysis ofintrinsic functional brain connectivity in Alzheimer's disease. PLoS Comput. Biol. 4(6), e1000100.
Takahashi, T., Cho, R.Y., Mizuno, T., Kikuchi, M., Murata, T., Takahashi, K., Wada, Y., 2010.Antipsychotics reverse abnormal eeg complexity in drug-naive schizophrenia: a mul-tiscale entropy analysis. NeuroImage 51 (1), 173–182.
Talamini, L.M., Meeter, M., Elvevåg, B., Murre, J.M., Goldberg, T.E., 2005. Reduced parahip-pocampal connectivity produces schizophrenia-like memory deficits in simulatedneural circuits with reduced parahippocampal connectivity. Arch. Gen. Psychiatry62 (5), 485–493.
Tzourio-Mazoyer, B., Landeau, D., Papathanassiou, F., Crivello, O., Etard, N., Delcroix, B.,Joliot, M., 2002. Automated anatomical labeling of activations in SPM using a mac-roscopic anatomical parcellation of the MNI MRI single-subject brain. NeuroImage15, 273–289.
Vaishnavi, S.N., Vlassenko, A.G., Rundle, M.M., Snyder, A.Z., Mintun, M.A., Raichle, M.E.,2010. Regional aerobic glycolysis in the human brain. Proc. Natl. Acad. Sci. U. S. A.107 (41), 17757–17762.
Valli, I.J.S., Mechelli, A., Bhattacharyya, S., Raffin, M., Allen, P., Fusar-Poli, P., Lythgoe, D.,O'Gorman, R., Seal, M., McGuire, P., 2011. Altered medial temporal activation relatedto local glutamate levels in subjects with prodromal signs of psychosis. Biol. Psychia-try 69 (1), 97–99.
van den Heuvel, M.P., Stam, C.J., Boersma, M., Hulshoff Pol, H.E., 2008. Small-world andscale-free organization of voxel-based resting-state functional connectivity in thehuman brain. NeuroImage 43 (3), 528–539.
van den Heuvel, M.P., Stam, C.J., Kahn, R.S., Hulshoff Pol, H.E., 2009. Efficiency of func-tional brain networks and intellectual performance. J. Neurosci. 29 (23),7619–7624.
van den Heuvel, M.P., Mandl, R.C., Stam, C.J., Kahn, R.S., Hulshoff Pol, H.E., 2010. Aberrantfrontal and temporal complex network structure in schizophrenia: a graph theoreticalanalysis. J. Neurosci. 30 (47), 15915–15926.
Waters, F.A., Badcock, J.C., 2010. First-rank symptoms in schizophrenia: reexaminingmechanisms of self-recognition. Schizophr. Bull. 36 (3), 510–517.
Watts, D.J., Strogatz, S.H., 1998. Collective dynamics of ‘small-world’ networks. Nature393 (6684), 440–442.
Woodward, N.D., Rogers, B., Heckers, S., 2011. Functional resting-state networks aredifferentially affected in schizophrenia. Schizophr. Res. 130 (1–3), 86–93.
Xie, X., Cao, Z., Weng, X., 2008. Spatiotemporal nonlinearity in resting-state fmri of thehuman brain. NeuroImage 40 (4), 1672–1685.
Zalesky, A., Fornito, A., Seal, M.L., Cocchi, L., Westin, C.F., Bullmore, E.T., Egan, G.F., Pantelis,C., 2011. Disrupted axonal fiber connectivity in schizophrenia. Biol. Psychiatry 69 (1),80–89.


