Embed Size (px)
Citation preview

Seediscussions,stats,andauthorprofilesforthispublicationat:https://www.researchgate.net/publication/221778797
AllergenArraysforAntibodyScreeningandImmuneCellActivationProfilingGeneratedbyParallelLipidDip-PenNanolithography
ARTICLEinSMALL·FEBRUARY2012
ImpactFactor:8.37·DOI:10.1002/smll.201101694·Source:PubMed
CITATIONS
14
READS
34
6AUTHORS,INCLUDING:
SylwiaSekula-Neuner
KarlsruheInstituteofTechnology
13PUBLICATIONS253CITATIONS
SEEPROFILE
EmmanuelOppong
InstitutdeGénétiqueetdeBiologieMolécu…
8PUBLICATIONS73CITATIONS
SEEPROFILE
MichaelHirtz
KarlsruheInstituteofTechnology
76PUBLICATIONS724CITATIONS
SEEPROFILE
FuchsHarald
UniversityofMünster
510PUBLICATIONS11,097CITATIONS
SEEPROFILE
Availablefrom:SylwiaSekula-Neuner
Retrievedon:04February2016

Allergen Arrays
Allergen Arrays for Antibody Screening and Immune Cell Activation Profi ling Generated by Parallel Lipid Dip-Pen Nanolithography
Sylwia Sekula-Neuner ,* Jana Maier , Emmanuel Oppong , Andrew C. B. Cato , Michael Hirtz , and Harald Fuchs
Multiple-allergen testing for high throughput and high sensitivity requires the development of miniaturized immunoassays that allow for a large test area and require only a small volume of the test analyte, which is often available only in limited amounts. Developing such miniaturized biochips containing arrays of test allergens needs application of a technique able to deposit molecules at high resolution and speed while preserving its functionality. Lipid dip-pen nanolithography (L-DPN) is an ideal technique to create such biologically active surfaces, and it has already been successfully applied for the direct, nanoscale deposition of functional proteins, as well as for the fabrication of biochemical templates for selective adsorption. The work presented here shows the application of L-DPN for the generation of arrays of the ligand 2,4-dinitrophenyl[1,2-dipalmitoyl- sn -glycero-3-phosphoethanolamine- N -[6-[(2,4-dinitrophenyl)amino]hexanoyl] (DNP)] onto glass surfaces as a model system for detection of allergen-specifi c Immunoglobin E (IgE) antibodies and for mast cell activation profi ling.
1. Introduction
Hundreds of common allergens that exert hazardous effects
in allergic disorders remain to be identifi ed. To achieve this, an
assay that provides multiple-allergen testing in a timely and
cost-effective manner is required. Miniaturized immunoassays
© 2012 Wiley-VCH Verlag Gm
DOI: 10.1002/smll.201101694
Dr. S. Sekula-Neuner , Dr. M. Hirtz , Prof. H. Fuchs Karlsruher Institut für Technologie (KIT)Institut für Nanotechnologie (INT)Karlsruhe Nano Micro Facility (KNMF)76021 Karlsruhe GermanyE-mail: [email protected]
Dr. J. Maier , E. Oppong , Prof. A. C. B. Cato Karlsruher Institut für TechnologieInstitut für Toxikologie und Genetik76021 Karlsruhe, Germany
Prof. H. Fuchs Physikalisches InstitutUniversität Münsterand Center for Nanotechnology (CeNTech)48149 Münster, Germany
small 2012, DOI: 10.1002/smll.201101694
that utilize protein microarray technology now offer the pos-
sibility of circumventing most of the current limitations of this
technology in the serodiagnosis of allergic disease; these limi-
tations include processing time and large quantities of both
sample and reagents, which have, to date, limited their appli-
cation for mass screening. In this context, the heterogeneous
nature of allergens presents many challenges in all aspects
of developing such miniaturized arrays, from immobilization
of the allergen, to detection of the bound ligand. However,
allergen biochips are a promising new technology for the in
vitro measurement of allergen-specifi c antibodies in allergic
patients. With recombinant and purifi ed allergens and small
haptens currently available for determining specifi c anti-
bodies targeted at different allergenic components, [ 1 ] the uti-
lization of microarrays for diagnostics becomes possible with
the advantage to determine the detailed sensitization profi le
of each individual patient. Technological advancements have
improved molecule deposition over the past ten years, [ 2–4 ] but
the patterning of multiple compounds still relies on spotting
techniques. [ 5,6 ]
The aim of this work is to design a platform towards com-
binatorial allergen arrays generated with L-DPN [ 7 ] that can
1bH & Co. KGaA, Weinheim wileyonlinelibrary.com

S. Sekula-Neuner et al.full papers
Figure 1 . DPN of phospholipids with allergenic headgroups. a) An optical image of M-type pen array over microfl uidic-inkwell channels. b) Fluorescence image of an array of 10 mol% DNP patterned on a glass substrate.
be used as biochips for detection of allergen-specifi c immu-
noglobulin E (IgE) antibodies in allergic patients and for live
mast cell sensitization tests. In order to generate arrays of
biologically active molecules, we have applied L-DPN using
headgroup-modifi ed phospholipids as ink. DPN is a direct pat-
terning method that uses the tip of an atomic force microscope
as an ultrasharp pen to locally deliver molecular inks onto sur-
faces. Also, as it allows high-throughput and high-resolution
generation of arrays on the millimeter scale, DPN is a perfect
technique to create biologically active chips. It has so far been
successfully used for the direct deposition of functional pro-
teins, [ 8–12 ] as well as for the fabrication of biochemical tem-
plates for selective adsorption. [ 13–15 ] The work presented here
applies the DNP ligand admixed with 1,2-dioleoyl- sn -glycero-
3-phosphocholine (DOPC) phospholipid for the chemical
control of the generated patterns under humidity-controlled
lithography conditions. This set-up can be extended to multi-
plexing various lipids with modifi ed headgroups in order to
simultaneously pattern multiple allergens for large-scale
screening. DNP–allergen arrays are used as a model system
for binding DNP-specifi c IgE antibodies and IgE-driven mast
cell activation. Mast cells are present in almost every organ of
the body, particularly in tissues interacting with the environ-
ment, and their role in allergy and IgE-mediated atopic disor-
ders has been well established. [ 16,17 ] They bind IgE antibodies
that are produced after the exposure to an allergen (antigen)
through Fc ε RI, which is the receptor for IgE that is expressed
on their surface. The Fc ε RI receptor is cross-linked upon
contact with an allergen, leading to the recruitment of intra-
cellular signaling molecules at the site of the clustered recep-
tors. Finally multiple cellular responses are initiated to release
pro-infl ammatory mediators. [ 17,18 ] In in-vitro studies, mast cells
serve as a robust read-out system in allergen activity screens;
hence, they are used to test the biological activity of DNP–
allergen chips and show potential in receptor-mediated mast
cell activation profi ling.
2. Results and Discussion
In order to generate arrays of allergen microfl uidic inkwells
capable of simultaneously delivering different lipid mixtures
to tips were used ( Figure 1 a). Tip arrays were coated with ink
mixtures containing increasing amounts of DNP headgroups
(2.5 to 10 mol%) admixed to the carrier lipid DOPC with
1 mol% content of rhodamine-labeled lipid (for the chemical
structure of lipids, see the Supporting Information). Using
an M-type 12-tip array (DPN 5000 system, NanoInk Inc.)
for the lithography process presented in Figure 1 , one tip
from the array can generate dot structures within a 60 μ m ×
80 μ m area in one lithography step. This area allows for 6 dots ×
8 dots with 10 μ m spacing. If the lithography is repeated
ten times, one tip in the array can cover an area of 60 μ m ×
800 μ m making 480 dots. Tips with 66 μ m spacing in one
array can cover an area of 780 μ m × 800 μ m, giving 5760 dots
in total, in less than 5 min of the lithography process. This
number of features in the array is suffi cient to gain statistical
information on antibody-recognition of the allergen on the
surface or cell response to the allergen pattern.
2 www.small-journal.com © 2012 Wiley-VCH Ve
To evaluate the infl uence of DNP admixing with the
DOPC carrier lipid, we performed measurements of the
pressure–area ( p – A ) isotherms of pure DOPC, DNP, and a
10 mol% DNP admixture in DOPC in a Langmuir–Blodgett
(LB) trough. Solutions of the pure compounds in chloro-
form were prepared (concentration ∼ 1 mg mL − 1 ) and mixed
appropriately to gain a ratio of 10 mol% DNP in DOPC
chloroform solution. These solutions were then spread at the
air–water interface in a LB trough, and the surface pressure
versus molecular area was recorded ( Figure 2 ). In large areas,
the molecules are widely spaced, similar to gas molecules in
3D space. Upon compression, a point is reached where the
surface pressure begins to rise. At this point, the molecules—
or domains of molecules—are pressed against each other, and
they start to experience restrictions in their freedom of move-
ment. The area per molecule can be calculated by dividing the
confi nement area by the number of molecules deposited. The
overall appearance of the DOPC isotherm, as expected, [ 19 ]
shows a rise in lateral pressure from when the area is about
110 Å 2 and reaches a plateau at about 47 mN m − 1 of lateral
rlag GmbH & Co. KGaA, Weinheim small 2012, DOI: 10.1002/smll.201101694

Allergen Arrays for Antibody Screening and Immune Cell Activation Profi ling
Figure 2 . Surface p – A isotherms for pure DOPC, pure DNP, and DOPC with 10 mol% DNP lipid mixture recorded at 25 ° C.
Figure 3 . IgE reactivity profi le on DNP-gradient allergen arrays. a) Fluorescence image of an allergen array containing 0, 10, 5, and 2.5 mol% DNP. The decrease in red channel fl uorescence at high DNP concentration is due to the DNP molecule affecting the rhodamine fl uorescence. [ 20 ] b) Binding of anti-DNP IgE to the DNP arrays was detected with anti-IgE FITC antibody. c) Quantifi cation of an antibody binding from (b), based on changes in mean fl uorescence intensity after background extraction, is presented on the graph. Red bars correspond to the rhodamine-dye signal from the lipid pattern; green bars correspond to the anti-IgE FITC antibody signal detected on the DNP pattern.
pressure. The rise in lateral pressure sets in at a signifi cantly
higher molecular area for pure DNP ( ∼ 155 Å 2 ), with the
isotherm showing a phase transition at a lateral pressure of
32 mN m − 1 . The earlier rise in lateral pressure for DNP comes
from the bulky headgroup of this phospholipid, which takes
up more space at the air–water interface. The isotherm of the
mixed solution (DOPC with 10 mol% DNP) is almost iden-
tical to pure DOPC, showing a good compatibility of these
two compounds. The DNP does not seem to signifi cantly dis-
turb the organization of the DOPC monolayer, indicating
that DNP is well integrated into the DOPC monolayer.
Assuming small quantities of DNP in DOPC membranes
are homogeneously mixed, we can estimate the number
of accessible DNP molecules (i.e., molecules that are posi-
tioned in the outermost membrane layer) in one dot of the
patterned array. This is done by considering the dot area A
(in μ m 2 ) and the molecular area a (in Å 2 ) of a DOPC molecule
within a fl oating monolayer. Admixing of 10 mol% DNP yields
180 000 molecules (i.e., 0.30 amol) of DNP potentially acces-
sible in the outermost surface membrane layer of one dot in a
typical array (see the Supporting Information for calculation).
This presupposes that cells contacting the pattern will encounter
only DNP molecules available in the top layer of the patterned
membranes, and in each dot 180 000 molecules (i.e., 0.30 amol)
of DNP have the potential to trigger IgE–Fc ε RI clustering.
Allergen detection was assessed by the binding of DNP-
specifi c IgE antibodies onto the patterned ligand. An array of
dots with DNP admixtures ranging from 10 to 2.5 mol% DNP
was prepared. Dots were spaced 10 μ m apart and, overall,
4000 dot features of each DNP concentration covered an area
of 50 μ m × 800 μ m. Arrays were incubated with anti-DNP
IgE antibody solution, washed, and incubated with anti-IgE
fl uorescein isothiocyanate (FITC) antibody. Figure 3 a,b show
DNP gradient arrays before and after binding of anti-DNP
IgE. The chart presented in Figure 3 c shows quantifi cation
of the anti-IgE FITC binding to the DNP gradient based on
fl uorescence signal intensity measurements. Binding of anti-
DNP IgE detected with anti-IgE FITC was highest on the
10 mol% DNP arrays and was still detectable with wide-fi eld
fl uorescence on 2.5 mol% DNP dots (Figure 3 c).
© 2012 Wiley-VCH Verlag Gmsmall 2012, DOI: 10.1002/smll.201101694
The number of molecules calculated from p – A isotherms
(Figure 2 ) in 10 mol% DNP content was estimated to be
180 000 (0.30 amol) of DNP in each dot, and the concentra-
tion of IgE antibody used for DNP detection allows visible
identifi cation of DNP headgroups present in the dots written
with the 2.5 mol% DNP admixtures at concentrations as low
as 0.075 amol (Figure 3 c).
The biological activity of the allergen arrays was assessed
by applying and analyzing the response of sensitized, fl uores-
cently labelled mast cells used as sensors on the DNP arrays.
Application of live cells as sensors is an emerging fi eld, with
3www.small-journal.combH & Co. KGaA, Weinheim
S. Sekula-Neuner et al.full papers
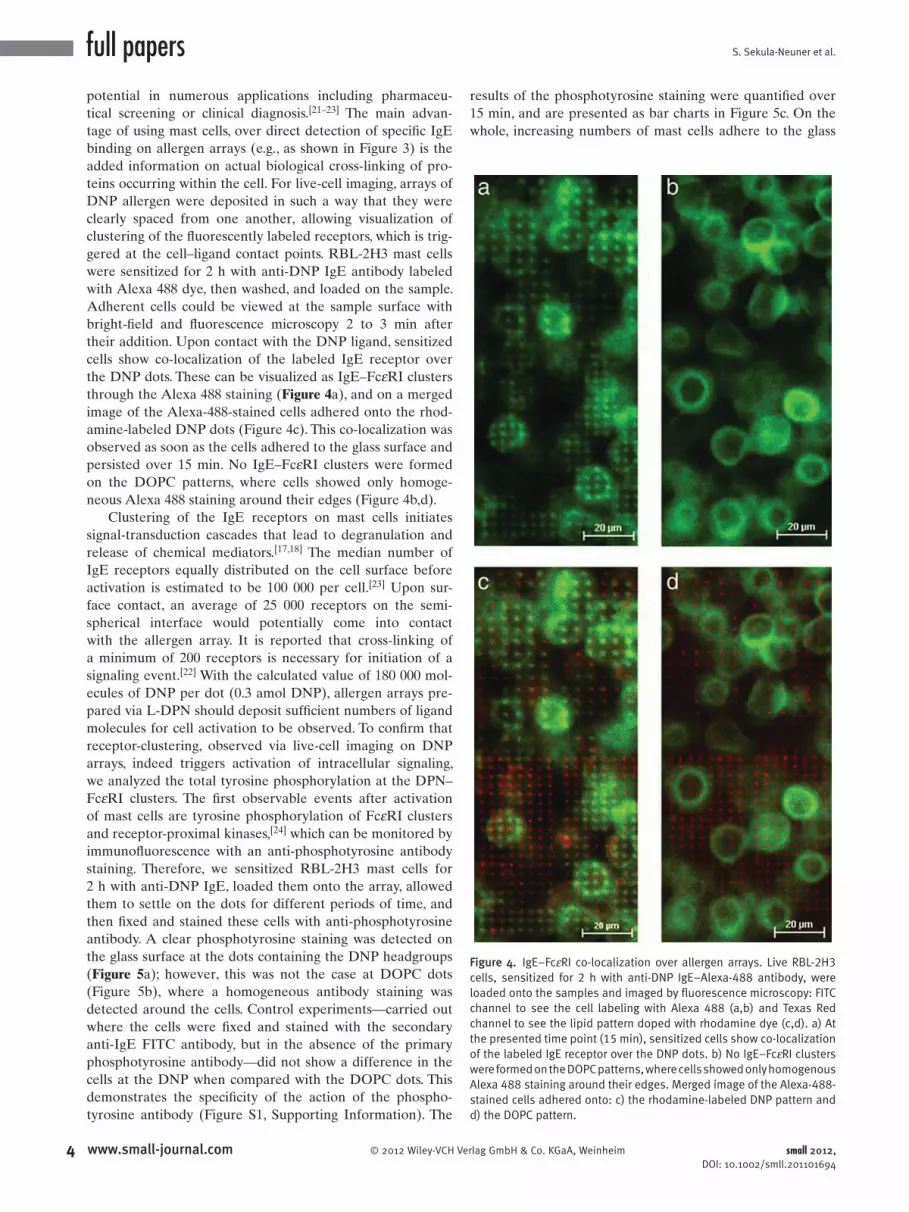
Figure 4 . IgE–Fc ε RI co-localization over allergen arrays. Live RBL-2H3 cells, sensitized for 2 h with anti-DNP IgE–Alexa-488 antibody, were loaded onto the samples and imaged by fl uorescence microscopy: FITC channel to see the cell labeling with Alexa 488 (a,b) and Texas Red channel to see the lipid pattern doped with rhodamine dye (c,d). a) At the presented time point (15 min), sensitized cells show co-localization of the labeled IgE receptor over the DNP dots. b) No IgE–Fc ε RI clusters were formed on the DOPC patterns, where cells showed only homogenous Alexa 488 staining around their edges. Merged image of the Alexa-488-stained cells adhered onto: c) the rhodamine-labeled DNP pattern and d) the DOPC pattern.
potential in numerous applications including pharmaceu-
tical screening or clinical diagnosis. [ 21–23 ] The main advan-
tage of using mast cells, over direct detection of specifi c IgE
binding on allergen arrays (e.g., as shown in Figure 3 ) is the
added information on actual biological cross-linking of pro-
teins occurring within the cell. For live-cell imaging, arrays of
DNP allergen were deposited in such a way that they were
clearly spaced from one another, allowing visualization of
clustering of the fl uorescently labeled receptors, which is trig-
gered at the cell–ligand contact points. RBL-2H3 mast cells
were sensitized for 2 h with anti-DNP IgE antibody labeled
with Alexa 488 dye, then washed, and loaded on the sample.
Adherent cells could be viewed at the sample surface with
bright-fi eld and fl uorescence microscopy 2 to 3 min after
their addition. Upon contact with the DNP ligand, sensitized
cells show co-localization of the labeled IgE receptor over
the DNP dots. These can be visualized as IgE–Fc ε RI clusters
through the Alexa 488 staining ( Figure 4 a), and on a merged
image of the Alexa-488-stained cells adhered onto the rhod-
amine-labeled DNP dots (Figure 4 c). This co-localization was
observed as soon as the cells adhered to the glass surface and
persisted over 15 min. No IgE–Fc ε RI clusters were formed
on the DOPC patterns, where cells showed only homoge-
neous Alexa 488 staining around their edges (Figure 4 b,d).
Clustering of the IgE receptors on mast cells initiates
signal-transduction cascades that lead to degranulation and
release of chemical mediators. [ 17,18 ] The median number of
IgE receptors equally distributed on the cell surface before
activation is estimated to be 100 000 per cell. [ 23 ] Upon sur-
face contact, an average of 25 000 receptors on the semi-
spherical interface would potentially come into contact
with the allergen array. It is reported that cross-linking of
a minimum of 200 receptors is necessary for initiation of a
signaling event. [ 22 ] With the calculated value of 180 000 mol-
ecules of DNP per dot (0.3 amol DNP), allergen arrays pre-
pared via L-DPN should deposit suffi cient numbers of ligand
molecules for cell activation to be observed. To confi rm that
receptor-clustering, observed via live-cell imaging on DNP
arrays, indeed triggers activation of intracellular signaling,
we analyzed the total tyrosine phosphorylation at the DPN–
Fc ε RI clusters. The fi rst observable events after activation
of mast cells are tyrosine phosphorylation of Fc ε RI clusters
and receptor-proximal kinases, [ 24 ] which can be monitored by
immunofl uorescence with an anti-phosphotyrosine antibody
staining. Therefore, we sensitized RBL-2H3 mast cells for
2 h with anti-DNP IgE, loaded them onto the array, allowed
them to settle on the dots for different periods of time, and
then fi xed and stained these cells with anti-phosphotyrosine
antibody. A clear phosphotyrosine staining was detected on
the glass surface at the dots containing the DNP headgroups
( Figure 5 a); however, this was not the case at DOPC dots
(Figure 5 b), where a homogeneous antibody staining was
detected around the cells. Control experiments—carried out
where the cells were fi xed and stained with the secondary
anti-IgE FITC antibody, but in the absence of the primary
phosphotyrosine antibody—did not show a difference in the
cells at the DNP when compared with the DOPC dots. This
demonstrates the specifi city of the action of the phospho-
tyrosine antibody (Figure S1, Supporting Information). The
4 www.small-journal.com © 2012 Wiley-VCH Ve
results of the phosphotyrosine staining were quantifi ed over
15 min, and are presented as bar charts in Figure 5 c. On the
whole, increasing numbers of mast cells adhere to the glass
rlag GmbH & Co. KGaA, Weinheim small 2012, DOI: 10.1002/smll.201101694

Allergen Arrays for Antibody Screening and Immune Cell Activation Profi ling
Figure 5 . Activation of mast cells on DNP arrays. RBL-2H3 mast cells, sensitized for 2 h with anti-DNP IgE antibody, were loaded onto the samples, allowed to adhere, then fi xed and stained with anti-phosphotyrosine antibody. a) Concentration of phosphorylated tyrosine signal is visible on cells exposed to DNP allergen. b) No phosphorylated tyrosine signal is visible in cells adhered onto DOPC array; only homogeneous antibody staining around the cells is detected after 15min. c) Quantifi cation of the number of activated cells on 10 mol% DNP and DOPC arrays followed over 15 min. Empty bars show the number of cells scored on the DOPC and DNP samples at the indicated time point. Filled bars show the number of activated cells where co-localization of the phosphorylated tyrosine signal over the DNP dot was detected.
surface with time (from 2 to 15 min), independent of whether
the surfaces were patterned with DNP ligand or DOPC
alone. The kinetics of adherence was faster for the cells on
the DNP dots than for those on the DOPC dots (Figure 5 c,
empty bars). It should be noted; however, that at 15 min,
although almost equal numbers of cells adhere to both sur-
faces containing DNP and DOPC patterns, co-localization
of the phosphorylated tyrosine signal over the dots was only
© 2012 Wiley-VCH Verlag Gmsmall 2012, DOI: 10.1002/smll.201101694
observed in the case of the DNP pattern. The tyrosine phos-
phorylation at the dot was monitored over time from 2 to
15 min (Figure 5 c, fi lled bars). These results confi rm that con-
tact of the mast cells with the allergenic ligand triggers a bio-
logical response evidenced by the tyrosine phosphorylation
of intracellular molecules. Thus, other allergens that bind to
mast cell surfaces could be similarly analyzed by L-DPN in
multi-allergen testing, and the strengths of the activation of
5www.small-journal.combH & Co. KGaA, Weinheim

S. Sekula-Neuner et al.full papers
the individual allergens could be quantifi ed and comparedwith one another.
3. Conclusion
The aim of this work was to apply L-DPN to create a plat-
form towards the generation of combinatorial allergen
arrays, which could be used as biochips in antibody detection
and as tools for live mast cell sensitization tests. L-DPN is a
suitable technique to create biologically active allergen chips
because it allows high-throughput and high-resolution gen-
eration of arrays on the millimeter scale. We have success-
fully patterned an allergenic hapten linked to a phospholipid
showing the potential of L-DPN as a lithography technique
in bio-research. Specifi c and sensitive recognition of the var-
ious doses of allergen by dedicated IgE molecules, as well
as the quick response of living mast cells, shows the poten-
tial of allergen arrays in diagnostic research. These technical
developments demonstrate the feasibility of chip-based
approaches for allergen screening. Additionally, complex and
dynamic studies on the co-operation between membrane
receptors and partner proteins involved in allergic responses,
which are impossible to reveal using other techniques such
as enzyme-linked immunosorbent assays (ELISA) or fl ow
cytometry, could be studied using microscopy techniques via
this approach. [ 25–27 ]
Moreover, keeping in mind previous applications of
the DPN technique [ 7–15 , 28 , 20 ] the proposed application could
be extended to manufacture microarrays containing var-
ious antigens, such as proteins, peptides, DNA, and enzy-
matic complexes with novel inks such as hydrogels. [ 29 ] Such
allergen chips can be used to perform simple, low-sample-
volume, fl uorescent-based characterization of antibody
responses. In contrast to conventional in vitro tools, chips
consisting of multiple-allergen components patterned on
subcellular scales would allow multiple analyses to be per-
formed in a single measurement. In the present application
of L-DPN, the spots were placed close enough for the round
mast cells, with a diameter of up to 25 μ m, [ 29 ] to make con-
tact with several spots, each of which contains more than
200 DNP molecules for activation. Future studies where the
spacing of the spots is altered to exhibit only one dot per cell
would allow comparison of the response of the individual
cells in a multiple-allergen array. Alternatively the spacing
could be manipulated so that different allergens are allowed
to interact with one cell, demonstrating the combinatorial
action of the allergens. The possibility of combinatorial and
multiple direct deposition of allergens on subcellular levels,
when using L-DPN, shows the advantage of this method
over other techniques such as spotting or micro-contact
printing.
The application of fl uorescently labeled secondary anti-
bodies to detect specifi c auto-antibody binding to micro-
arrays has been shown to be sensitive at nanogram per
milliliter concentrations, and its sensitivity has been shown
to be greater (four- to eight-fold) than conventional ELISA
assays. [ 5 ] In future studies a wider range of different allergens
should be tested for use in microarrays. By addressing issues
6 www.small-journal.com © 2012 Wiley-VCH
such as preservation of 3D structures, steric interferences,
and electrostatic repulsion, and by analyzing the strength of
the cellular activation in response to pattern dimensions and
spacing, the method described here provides great potential
for upcoming work in allergology.
4. Experimental Section
Materials : The phospholipids DOPC, 1,2-dipalmitoyl- sn -glycero-3-phosphoethanolamine- N -[6-[(2,4-dinitrophenyl) amino] hexanoyl] (DNP-cap-DPPE), and fl uorophore-labeled lipids 1,2-dio-leoyl- sn -glycero-3-phosphoethanolamine- N -(lissamine rhodamine B sulfonyl) (18:1 lissamine rhodamine/PE) were purchased from Avanti Polar Lipids, Alabaster, AL, USA.
Glass cover slips (18 mm × 18 mm) were purchased from VWR Scientifi c.
Antibodies : Mouse monoclonal anti-2,4-dinitrophenyl (DNP) IgE (clone7) was purchased from Sigma Aldrich and fl uorescently modifi ed with Alexa Fluor 488 antibody labelling kit according to the manufacturer’s instructions (Molecular Probes); anti-phospho-tyrosine, clone 4G10 was purchased from Millipore.
Cell Culture : Cell-culture medium and supplements were pur-chased from Invitrogen Gibco, Germany. RBL-2H3 cell line was cultured in RPMI 1640 medium supplemented with 10% fetal calf serum, 2 m M glutamine, 100 U/mL Penicillin, and 100 mg/mL Streptomycin under standard cell-culture conditions: 37 ° C and 5% CO 2 .
For sensitization, RBL-2H3 cells treated for 2 h with anti-dini-trophenyl (DNP) IgE (Sigma-Aldrich, Germany), harvested, washed, and suspended in Tyrode’s buffer with 0.1% bovine serum albumin (BSA) 10 7 cells/mL were added onto the samples in each experiment.
For immunofl uorescence, cells suspended in pre-warmed Tyrode’s buffer with 0.1% BSA, were loaded onto and allowed to settle on the samples, fi xed after indicated time points with 3.7% pareformaldehyde, washed, blocked with 10% BSA, and stained with anti-phosphotyrosine 4G10 antibody (1 h, 1:100 dilution phosphate buffered saline (PBS)) The signal was detected with goat anti-mouse-FITC-conjugated secondary antibody (45 min, 1:10 dilution in PBS). Control experiments were carried out with the secondary antibody goat anti-mouse-FITC without prior anti-phosphotyrosine 4G10 antibody incubation.
DPN Patterning : Tip coating and lithography was performed with commercially available instrumentation (DPN 5000/ NLP 2000, NanoInk Inc., Chicago, IL, USA) and the following accesso-ries: 1D tip arrays of the M-type (M-12) and M-12MW inkwells. The inkwells were fi lled with a chloroform solution of the phospholipid ink (1 mL, 1 μ M , doped with 1 mol% of the dye-labeled lipid). The solvent was allowed to evaporate for 1 h before coating the tips. Tips were inked by placing them in contact with the inkwell and increasing the humidity to 70% for 30 min. Excess ink was removed from freshly coated tips by writing at high humidity ( > 55%) on a sacrifi cial substrate for 10 min.
Fluorescence Microscopy and Quantifi cation of Signal : Fluo-rescence microscopy was carried out on an inverted TE 2000 microscope (Nikon Instruments Inc.). Fluorescence images were taken using 20 × or 63 × (oil immersion) objectives. Images were recorded with a digital charge coupled device (CCD) camera Orca
Verlag GmbH & Co. KGaA, Weinheim small 2012, DOI: 10.1002/smll.201101694

Allergen Arrays for Antibody Screening and Immune Cell Activation Profi ling
(Hamamatsu Photonics). Patterns were aligned for imaging using alignment markers scratched onto the glass surface. Bleaching of fl uorophores was minimized (especially for quantitative measure-ments) by fi rst focusing on the alignment mark before exposing the patterned area to light, and the lamp intensity was kept at a minimum.
Fluorescence intensity quantifi cation of IgE reactivity profi le experiment was performed with NIS-Elements AR software installed on the microscope PC (Nikon Instruments Inc.). For measurements, patterned areas of interest was marked, and fl uorescence inten-sity was automatically recorded. Mean fl uorescence intensity after background extraction was automatically calculated.
Quantifi cation of the phosphotyrosine positive cells in immun-ofl uorescence experiments was performed manually. Samples from each time point were imaged in bright-fi eld channel to see the cells: a Texas Red channel to see the DNP pattern and an FITC channel to see the anti-phosphotyrosine antibody staining of the cells (Figure 5). The graph shows the number of all cells scored at indicated time points (empty bars), and the number of phos-photyrosine positive cells at indicated time points (fi lled bars). Cells that showed co-localization of the anti-phosphotyrosine antibody signal over the DNP dot pattern are considered activated and phosphotyrosine positive. Cells that did not show the co-localization of the two fl uorescent signals were not considered as activated.
Supporting Information
Supporting Information is available from the Wiley Online Library or from the author.
Acknowledgements
S.S.-N. thanks the DFG Center for Functional Nanomaterials (CFN E3.2). H.F. acknowledges the DFG (TRR 61), and the World Class University program of the Korean Ministry of Education, Science, and Technology at Gwangju Institute of Science and Technology. This work was supported in part by funds from the DFG (SPP 1394) to A.C.B.C. This work was partly carried out with the support of the Karlsruhe Nano Micro Facility (KNMF, www.knmf.kit.edu), a Helm-holtz Research Infrastructure at Karlsruhe Institute of Technology (KIT, www.kit.edu).
This Full Paper part of the Special Issue on Multilevel Molecular Assemblies: Structure, Dynamics, and Functions, featuring contribu-tions from the Transregional Collaborative Research Center (TRR 61).
© 2012 Wiley-VCH Verlag Gmsmall 2012, DOI: 10.1002/smll.201101694
[ 1 ] M. Ferrer , M. L. Sanz , J. Sastre , J. Bartra , A. del Cuvillo , J. Montoro , I. Jáuregui , I. Dávila , J. Mullol , A. Valero , J. Invest. Allerg. Clin. 2009 , 19 , Suppl. 1: 19 .
[ 2 ] B. Pignataro , J. Mater. Chem. 2009 , 19 , 3338 . [ 3 ] X. N. Xie , H. J. Chung , C. H. Sow , A. T. S. Wee , Mater. Sci. Eng. R
2006 , 54 , 1 . [ 4 ] M. Geissler , Y. Xia , Adv. Mater. 2004 , 16 , 1249 . [ 5 ] W. H. Robinson , C. DiGennaro , W. Hueber , B. B. Haab , M. Kamachi ,
E. J. Dean , S. Fournel , D. Fong , M. C. Genovese , H. E. Neuman de Vegvar , K. Skriner , D. Hirschberg , R. I. Morris , S. Muller , G. J. Pruijn , W. J. van Venrooij , J. S. Smolen , P. O. Brown , L. Steinman , P. J. Utz , Nat. Med. 2002 , 8 , 295 .
[ 6 ] B. B. Haab , M. J. Dunham , P. O. Brown , Genome Biol. 2001 , 2 , 2 . [ 7 ] S. Lenhert , P. Sun , Y. Wang , H. Fuchs , C. A. Mirkin , Small 2007 , 3 , 71 . [ 8 ] J. H. Lim , D. S. Ginger , K. B. Lee , J. Heo , J. M. Nam , C. A. Mirkin ,
Angew. Chem. Int. Ed. Engl. 2003 , 42 , 2309 . [ 9 ] M. Lee , D.-K. Kang , H.-K. Yang , K.-H. Park , S. Y. Choe , C. Kang ,
S.-I. Chang , M. H. Han , I.-C. Kang , Proteomics 2006 , 6 , 1094 . [ 10 ] K. B. Lee , S. J. Park , C. A. Mirkin , J. C. Smith , M. Mrksich , Science
2002 , 295 , 1702 . [ 11 ] K. B. Lee , J. H. Lim , C. A. Mirkin , J. Am. Chem. Soc. 2003 , 125 , 5588 . [ 12 ] D. L. Wilson , R. Martin , S. Hong , M. Cronin-Golomb , C. A. Mirkin ,
D. L. Kaplanet , Proc. Natl. Acad. Sci. USA 2001 , 98 , 13660 . [ 13 ] R. Vega , C. K.-F. Shen , D. Maspoch , J. G. Robach , R. A. Lamb ,
C. A. Mirkin , Small 2007 , 3 , 1482 . [ 14 ] R. Valiokas , S. Vaitekonis , G. Klenkar , G. Trinkunas , B. Liedberg ,
Langmuir 2006 , 22 , 3456 . [ 15 ] G. Agarwal , R. R. Naik , M. O Stone , J. Am. Chem. Soc. 2003 , 125 , 7408 . [ 16 ] S. J. Galli , S. Nakae , M. Tsai , Nat. Immunol. 2005 , 6 , 135 . [ 17 ] J. Rivera , A. M. Gilfi llan , J. Allergy Clin. Immun. 2006 , 117 , 1214 . [ 18 ] P. Valent , J. Allergy Clin. Immun. 1994 , 94 , 1177 . [ 19 ] V. Rosilio , M.-M. Boissonnadea , L. C. B. B. Coelhoet ,
N. S. Santos-Magalhaes , C. Andrade , A. Baszkin , Coll. Surf A: Physicochem. Eng. Aspects 2004 , 250 , 491 .
[ 20 ] M. Hirtz , R. Corso , S. Sekula-Neuner , H. Fuchs , Langmuir 2011 , 27 , 11605 .
[ 21 ] T. Curtis , R. M. Naalb , C. Batt , J. Tabba , D. Holowka , Biosens. Bio-electron. 2008 , 23 , 1024 .
[ 22 ] F. H. Falcone , J. Lin , N. Renault , H. Haas , G. Schramm , B. F. Gibbs , M. J. C. Alcoceret , Clin. Appl. Immun. 2009 , 2 , 153 .
[ 23 ] J. Kleine-Tebbe , S. Erdmann , E. F. Knol , D. W. MacGlashan Jr. , L. K. Poulsen , B. F. Gibbs , Intl. Archives Allergy Immunol. 2006 , 141 , 79 .
[ 24 ] U. Blank , J. Rivera , Trends Immunol. 2004 , 25 , 266 . [ 25 ] S. Hammond , A. Wagenknecht-Wiesner , S. L. Veatch , D. Holowka ,
B. Baird , J. Struct. Biol. 2009 , 168 , 161 . [ 26 ] M. Wu , D. Holowka , H. G. Craighead , B. Baird , Proc. Natl. Acad.
Sci. USA 2004 , 21 , 13798 . [ 27 ] M. Wu , T. Baumgartet , S. Hammond , D. Holowka , B. Baird , J. Cell
Sci. 2007 , 120 , 3147 . [ 28 ] R. A. Vega , D. Maspoch , K. Salaita , C. A. Mirkin , Angew. Chem. Int.
Ed. 2005 , 44 , 6013 . [ 29 ] F. E. Mahjoub , F. Farahmand , Z. Pourpak , H. Asefi , Z. Amini , Diagn.
Pathol. 2009 , 3 , 34 .
Received: August 19, 2011 Revised: September 21, 2011Published online:
7www.small-journal.combH & Co. KGaA, Weinheim


