Embed Size (px)
Citation preview
Alkem Laboratories Ltd. BUY
- 1 - Thursday, 25th April, 2019
This document is for private circulation, and must be read in conjunction with the disclaimer on the last page.
ST
OC
K P
OIN
TE
R
Target Price ₹ 2,306 CMP ₹ 1,698 FY22E PE 20X
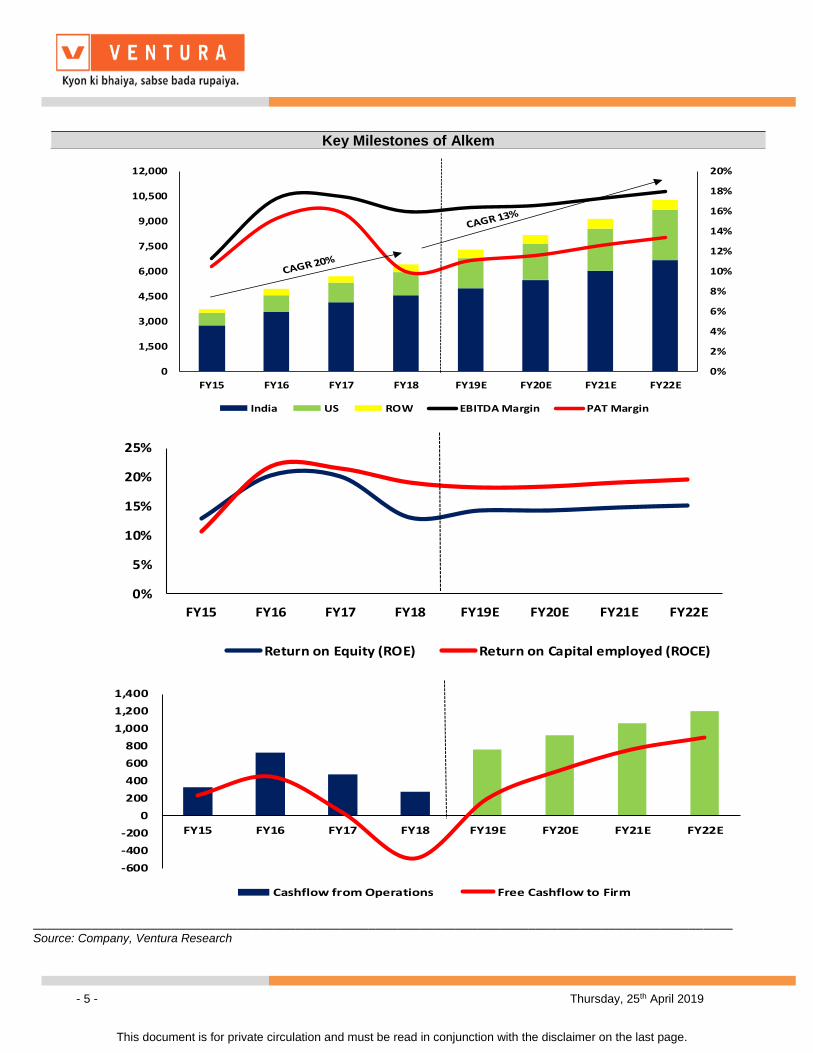
Index Details The acute therapy segment, in which Alkem is a market leader, is seeing a significant slowdown. In order to fortify its growth and maintain market leadership Alkem has strategized to diversify its revenue stream by foraying into the fast-growing chronic therapy segment for the domestic markets and developing generic solutions for the world’s largest pharma market namely the US. Over the last four years Alkem has been working on building capabilities in the direction of its intended strategy. Till date the company has invested ~ Rs. 900 crores in building manufacturing facilities and R&D activities for filing 120 ANDAs for the US geography. Going ahead we expect revenues to grow at 13% CAGR to Rs 10,309 crores by FY22. EBIDTA and net earnings are expected to grow to Rs. 1,856 crores and Rs. 1,398 crores respectively over the same period. We expect the company to become virtually net debt free by FY22. As a result, return ratios ROE & ROCE are also expected to improve by 220 bps and 60 bps to 15.3% & 19.7% respectively by FY22. We initiate with a BUY for a price target of Rs. 2,306 representing an upside of 36% over 36 months from the CMP of Rs. 1,698 Our optimism stems from the following
1. The company’s India revenue is expected to grow at 10% CAGR to Rs. 6,685 crores by FY22 driven by
• Robust growth of 21% CAGR from the chronic segment on the back of new product launches
• Maintaining the market leadership in the acute segment with a stable growth of 6% CAGR
2. US geography to demonstrate a healthy growth of 21% CAGR to Rs. 2,993 crores by FY22 on back of approval pipeline.
3. Other International market to grow at 7% CAGR to Rs. 630 crores on account of strong product base and more than 800 approvals across various markets.
Sensex 38,730
Nifty 11,641
Industry Pharma
Scrip Details
MktCap (`cr) 20,302.0
BVPS (`) 416.9
O/s Shares (Cr) 12.0
AvVol (Lacs) 10.7
52 Week H/L 2,265/1,693
Div Yield (%) 0.7
FVPS (`) 2.0
Shareholding Pattern
Shareholders %
Promoters 66.0
Public 34.0
Total 100.0
Alkem vs. Sensex
1000
1200
1400
1600
1800
2000
2200
2400
2600
20000
24000
28000
32000
36000
40000
44000
SENSEX Alkem Lab
Key Financials (Rs in cr)
Y/E March Sales EBITDA PATEBITDA
Margin (%)
PAT
Margin(%)EPS BV
RoE
(%)
RoCE
(%)
P/E
(x)
P/BV
(x)
EV/EBITDA
(x)
FY18 6,432 1,028 638 16.0 9.9 52.8 406.8 13.1 19.1 32.7 4.3 21.4
FY19E 7,290 1,193 802 16.4 11.0 66.2 471.5 14.2 18.1 25.7 3.6 16.9
FY20E 8,169 1,360 938 16.6 11.5 77.4 548.9 14.2 18.4 21.9 3.1 14.4
FY21E 9,172 1,587 1,154 17.3 12.6 95.2 644.1 14.9 19.1 17.8 2.6 11.8
FY22E 10,309 1,856 1,398 18.0 13.6 115.3 759.4 15.3 19.7 14.7 2.2 9.6
- 2 - Thursday, 25th April 2019
This document is for private circulation and must be read in conjunction with the disclaimer on the last page.
❖ Company Background
Established in 1973, Alkem is ranked amongst the top ten domestic pharmaceutical
companies in terms of sales. It has also been ranked the #1 anti-infective company
for the past 10 years and features amongst the leading pharmaceutical companies in
the therapeutic segments of gastro-intestinal, pain management and vitamins /
minerals / nutrients.
Alkem has a comprehensive portfolio of over 800 brands covering all the major
therapeutic segments and a robust pan-India sales and distribution network. It has a
strong and extensive Pan-India distribution network of 11 warehouses, 40+ sales
depots, 7000+ Stockists and 9,000 people in the field force covering all states
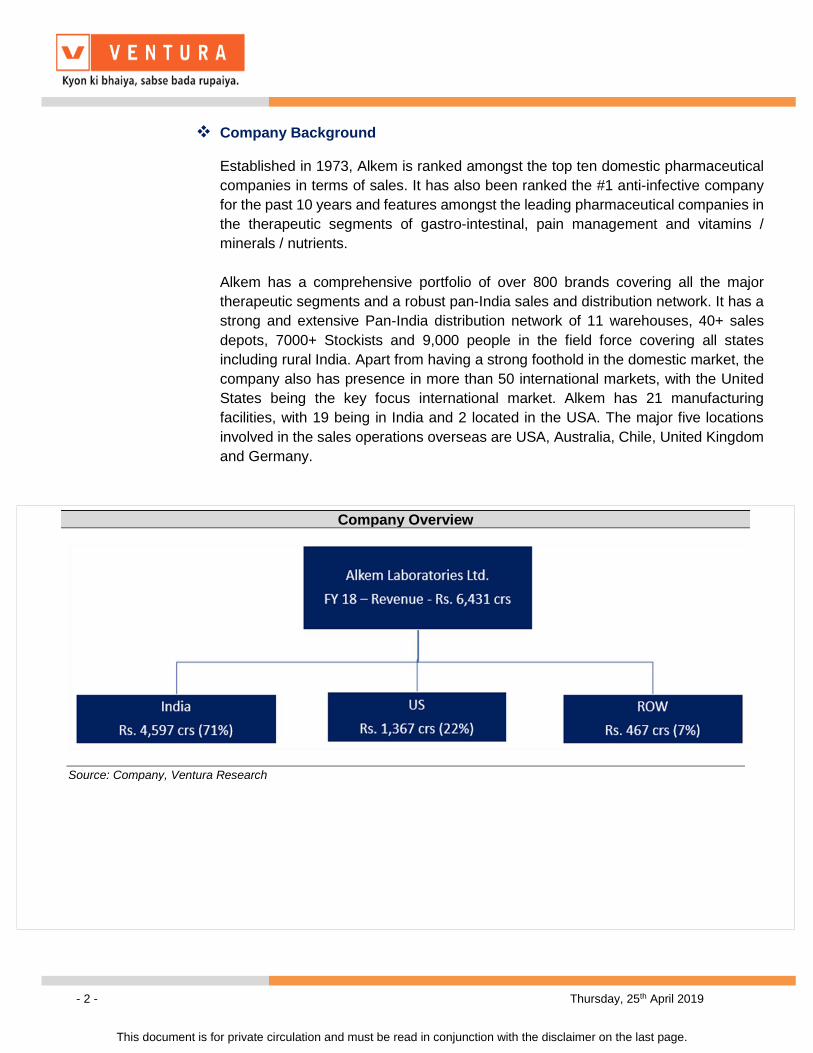
including rural India. Apart from having a strong foothold in the domestic market, the
company also has presence in more than 50 international markets, with the United
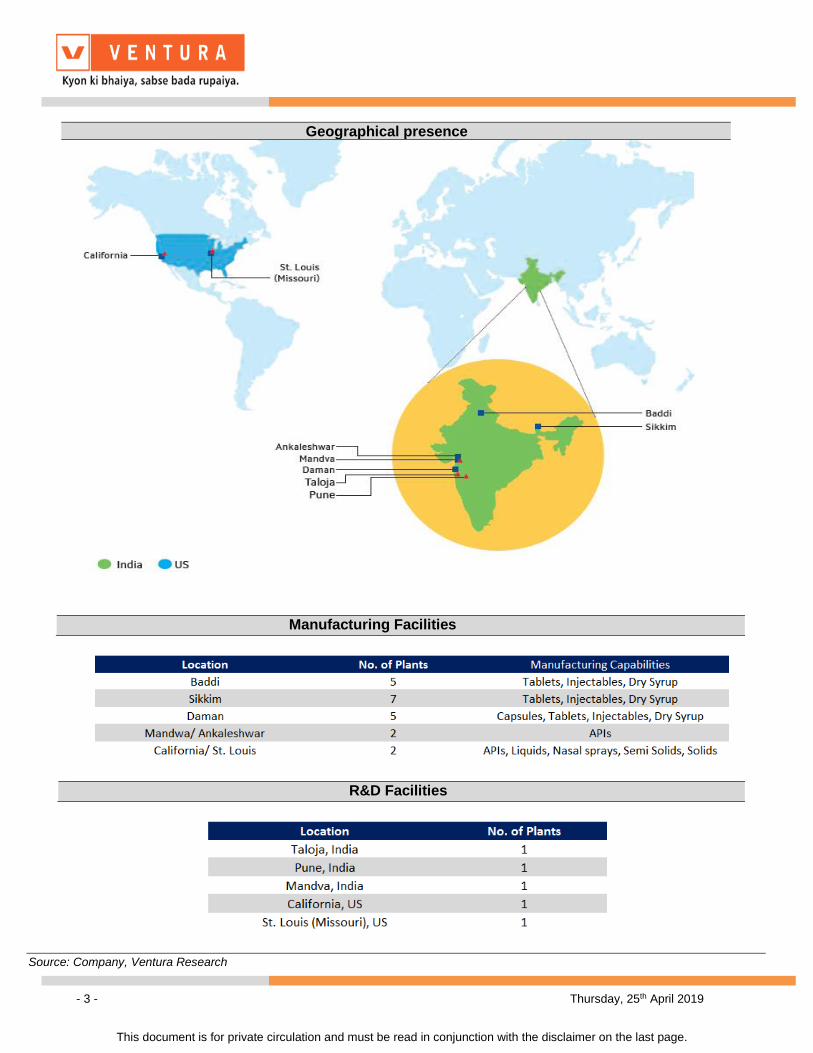
States being the key focus international market. Alkem has 21 manufacturing
facilities, with 19 being in India and 2 located in the USA. The major five locations
involved in the sales operations overseas are USA, Australia, Chile, United Kingdom
and Germany.
Company Overview
Source: Company, Ventura Research
- 3 - Thursday, 25th April 2019
This document is for private circulation and must be read in conjunction with the disclaimer on the last page.
Geographical presence
ManMana Manufacturing Facilities
R&D Facilities
Source: Company, Ventura Research
- 4 - Thursday, 25th April 2019
This document is for private circulation and must be read in conjunction with the disclaimer on the last page.
❖ Key Investment Highlights
➢ FY15-FY18:
Over the period FY15-18, revenues grew at a scorching 20% CAGR to reach Rs.
6,431 crores in FY18 from Rs. 3,743 crores recorded in FY15. The growth was
mainly driven by: -
1. Aggressive expansion of its MR force improving the doctor coverage
2. Acquisition of a multi-dosage formulation facility acquired at St. Louis, US, which
is near to its new market.
3. An exclusive in-licensing agreement with Haw Par India Private Limited to
distribute Tiger Balm range of products in India. This has aided in the building out
its OTC business.
4. New product launches and in-licensed product opportunities and improving
market share in key emerging therapies like neuro, CNS, cardiac and anti-
diabetic over the period FY15-18.
5. Strong underlying demand in nouveau markets of Australia, Chile and
Kazakhstan.
Over the same period, EBITDA witnessed 35% CAGR to Rs. 1,028 crores in FY18
from Rs. 422 crores in FY15 with margins expanding 475 bps to 16% from 11.3% in
FY18.
Despite higher taxation, PAT grew by a CAGR of 18% to Rs.638 crores in FY18 from
Rs. 392 crores in FY15, which is attributable to lower interest expense. PAT margin
witnessed a decline 510 bps to 9.9% from 10.5% as a result of the one-off higher
tax outlay.
- 5 - Thursday, 25th April 2019
This document is for private circulation and must be read in conjunction with the disclaimer on the last page.
0%
2%
4%
6%
8%
10%
12%
14%
16%
18%
20%
0
1,500
3,000
4,500
6,000
7,500
9,000
10,500
12,000
FY15 FY16 FY17 FY18 FY19E FY20E FY21E FY22E
India US ROW EBITDA Margin PAT Margin
0%
5%
10%
15%
20%
25%
FY15 FY16 FY17 FY18 FY19E FY20E FY21E FY22E
Return on Equity (ROE) Return on Capital employed (ROCE)
-600
-400
-200
0
200
400
600
800
1,000
1,200
1,400
FY15 FY16 FY17 FY18 FY19E FY20E FY21E FY22E
Cashflow from Operations Free Cashflow to Firm
________________________________________________________________________________________________ Source: Company, Ventura Research
Key Milestones of Alkem
- 6 - Thursday, 25th April 2019
This document is for private circulation and must be read in conjunction with the disclaimer on the last page.
➢ FY18-FY21
➢ Domestic business
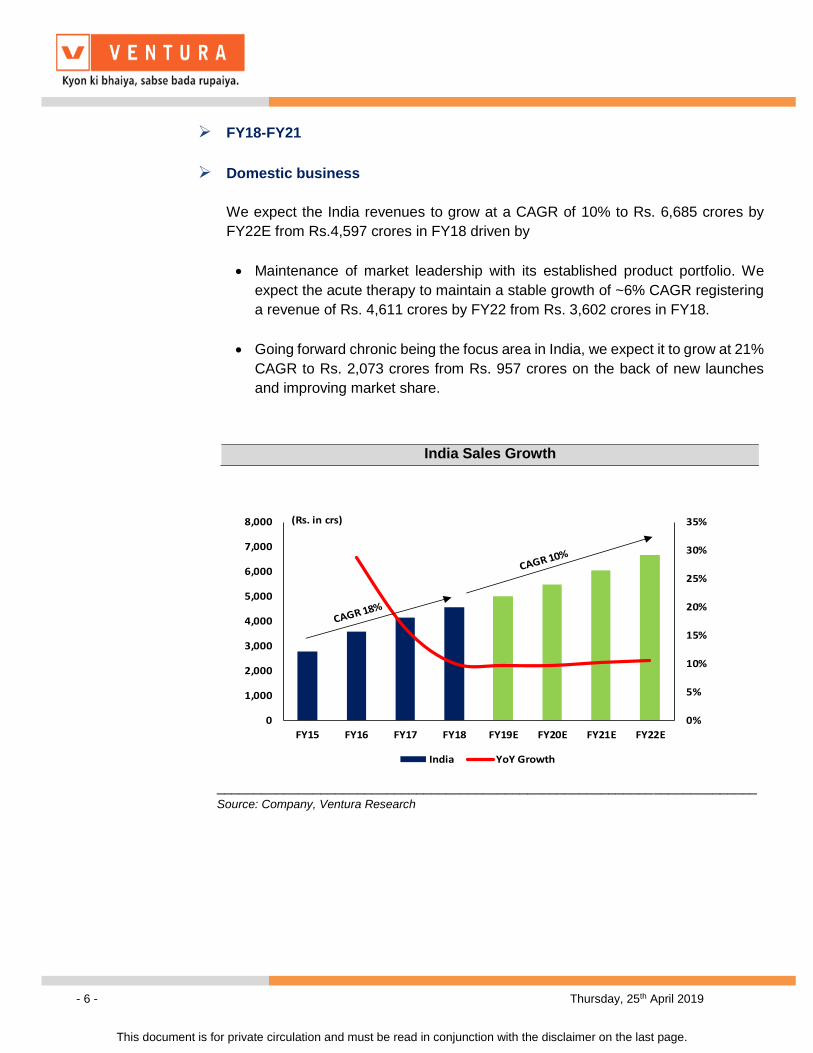
We expect the India revenues to grow at a CAGR of 10% to Rs. 6,685 crores by
FY22E from Rs.4,597 crores in FY18 driven by
• Maintenance of market leadership with its established product portfolio. We
expect the acute therapy to maintain a stable growth of ~6% CAGR registering
a revenue of Rs. 4,611 crores by FY22 from Rs. 3,602 crores in FY18.
• Going forward chronic being the focus area in India, we expect it to grow at 21%
CAGR to Rs. 2,073 crores from Rs. 957 crores on the back of new launches
and improving market share.
0%
5%
10%
15%
20%
25%
30%
35%
0
1,000
2,000
3,000
4,000
5,000
6,000
7,000
8,000
FY15 FY16 FY17 FY18 FY19E FY20E FY21E FY22E
India YoY Growth
(Rs. in crs)
_________________________________________________________________________
Source: Company, Ventura Research
India Sales Growth
- 7 - Thursday, 25th April 2019
This document is for private circulation and must be read in conjunction with the disclaimer on the last page.
___________________________________________________________________
Source: Company, Ventura Research
________________________________________________________________________________
Source: Company, Ventura Research
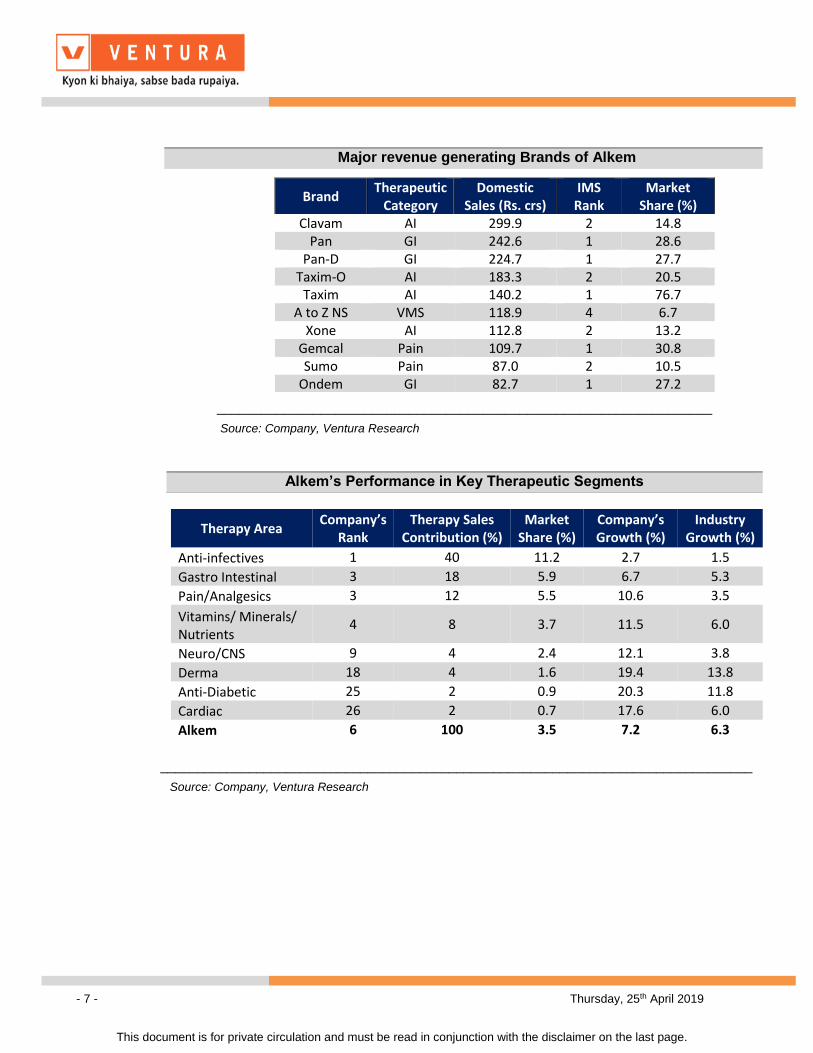
Major revenue generating Brands of Alkem
Brand Therapeutic
Category Domestic
Sales (Rs. crs) IMS
Rank Market
Share (%) Clavam AI 299.9 2 14.8
Pan GI 242.6 1 28.6 Pan-D GI 224.7 1 27.7
Taxim-O AI 183.3 2 20.5 Taxim AI 140.2 1 76.7
A to Z NS VMS 118.9 4 6.7 Xone AI 112.8 2 13.2
Gemcal Pain 109.7 1 30.8 Sumo Pain 87.0 2 10.5
Ondem GI 82.7 1 27.2
Alkem’s Performance in Key Therapeutic Segments
Therapy Area Company’s
Rank Therapy Sales
Contribution (%) Market
Share (%) Company’s Growth (%)
Industry Growth (%)
Anti-infectives 1 40 11.2 2.7 1.5
Gastro Intestinal 3 18 5.9 6.7 5.3
Pain/Analgesics 3 12 5.5 10.6 3.5
Vitamins/ Minerals/ Nutrients
4 8 3.7 11.5 6.0
Neuro/CNS 9 4 2.4 12.1 3.8
Derma 18 4 1.6 19.4 13.8
Anti-Diabetic 25 2 0.9 20.3 11.8
Cardiac 26 2 0.7 17.6 6.0
Alkem 6 100 3.5 7.2 6.3
- 8 - Thursday, 25th April 2019
This document is for private circulation and must be read in conjunction with the disclaimer on the last page.
80% 80% 79% 77% 75% 72% 69%
20% 20% 21% 23% 25% 28% 31%
0%
20%
40%
60%
80%
100%
FY16 FY17 FY18 FY19E FY20E FY21E FY22E
Acute Chronic
___________________________________________________________________________
Source: Company, Ventura Research
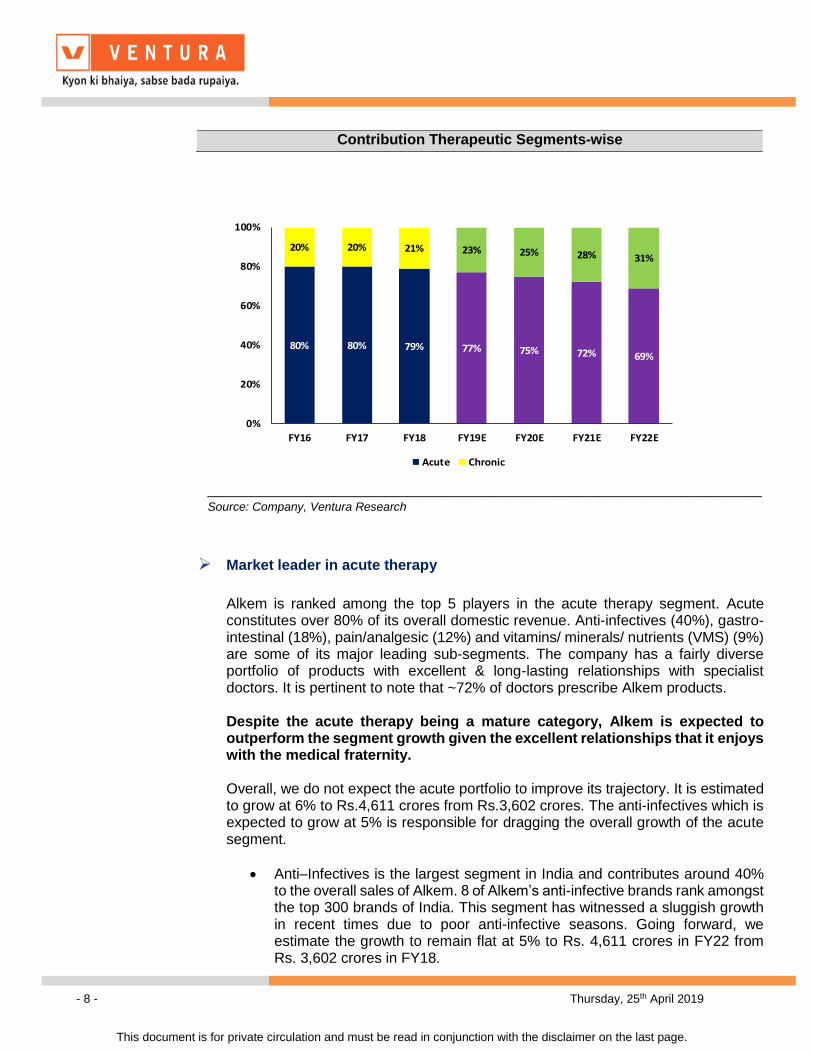
➢ Market leader in acute therapy
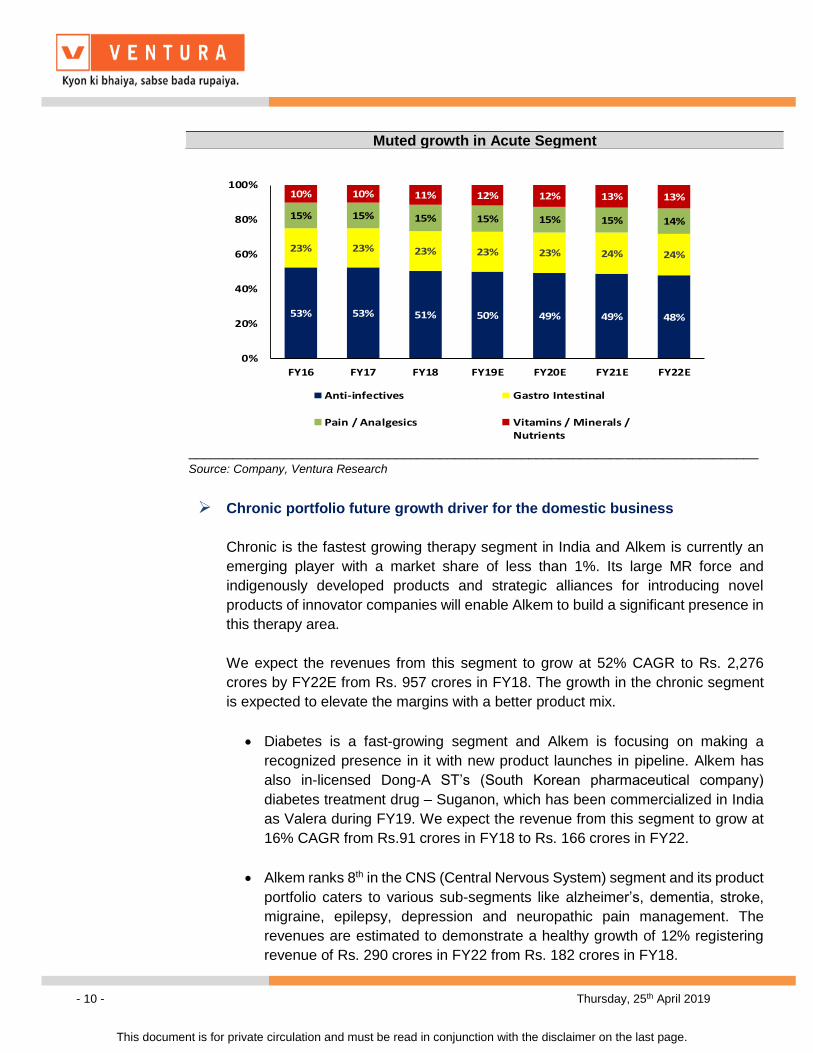
Alkem is ranked among the top 5 players in the acute therapy segment. Acute constitutes over 80% of its overall domestic revenue. Anti-infectives (40%), gastro-intestinal (18%), pain/analgesic (12%) and vitamins/ minerals/ nutrients (VMS) (9%) are some of its major leading sub-segments. The company has a fairly diverse portfolio of products with excellent & long-lasting relationships with specialist doctors. It is pertinent to note that ~72% of doctors prescribe Alkem products. Despite the acute therapy being a mature category, Alkem is expected to outperform the segment growth given the excellent relationships that it enjoys with the medical fraternity. Overall, we do not expect the acute portfolio to improve its trajectory. It is estimated to grow at 6% to Rs.4,611 crores from Rs.3,602 crores. The anti-infectives which is expected to grow at 5% is responsible for dragging the overall growth of the acute segment.
• Anti–Infectives is the largest segment in India and contributes around 40% to the overall sales of Alkem. 8 of Alkem’s anti-infective brands rank amongst the top 300 brands of India. This segment has witnessed a sluggish growth in recent times due to poor anti-infective seasons. Going forward, we estimate the growth to remain flat at 5% to Rs. 4,611 crores in FY22 from Rs. 3,602 crores in FY18.
Contribution Therapeutic Segments-wise
- 9 - Thursday, 25th April 2019
This document is for private circulation and must be read in conjunction with the disclaimer on the last page.
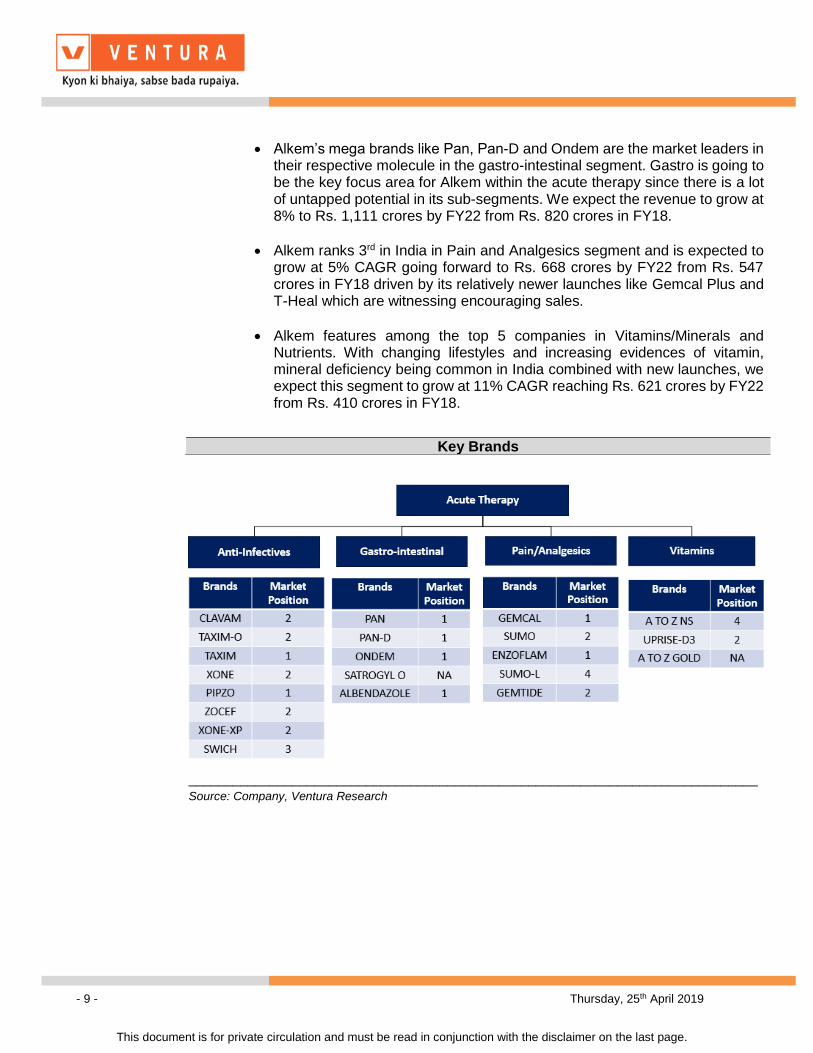
• Alkem’s mega brands like Pan, Pan-D and Ondem are the market leaders in their respective molecule in the gastro-intestinal segment. Gastro is going to be the key focus area for Alkem within the acute therapy since there is a lot of untapped potential in its sub-segments. We expect the revenue to grow at 8% to Rs. 1,111 crores by FY22 from Rs. 820 crores in FY18.
• Alkem ranks 3rd in India in Pain and Analgesics segment and is expected to grow at 5% CAGR going forward to Rs. 668 crores by FY22 from Rs. 547 crores in FY18 driven by its relatively newer launches like Gemcal Plus and T-Heal which are witnessing encouraging sales.
• Alkem features among the top 5 companies in Vitamins/Minerals and Nutrients. With changing lifestyles and increasing evidences of vitamin, mineral deficiency being common in India combined with new launches, we expect this segment to grow at 11% CAGR reaching Rs. 621 crores by FY22 from Rs. 410 crores in FY18.
_____________________________________________________________________________
Source: Company, Ventura Research
Key Brands
- 10 - Thursday, 25th April 2019
This document is for private circulation and must be read in conjunction with the disclaimer on the last page.
53% 53% 51% 50% 49% 49% 48%
23% 23% 23% 23% 23% 24% 24%
15% 15% 15% 15% 15% 15% 14%
10% 10% 11% 12% 12% 13% 13%
0%
20%
40%
60%
80%
100%
FY16 FY17 FY18 FY19E FY20E FY21E FY22E
Anti-infectives Gastro Intestinal
Pain / Analgesics Vitamins / Minerals /Nutrients
_____________________________________________________________________________
Source: Company, Ventura Research
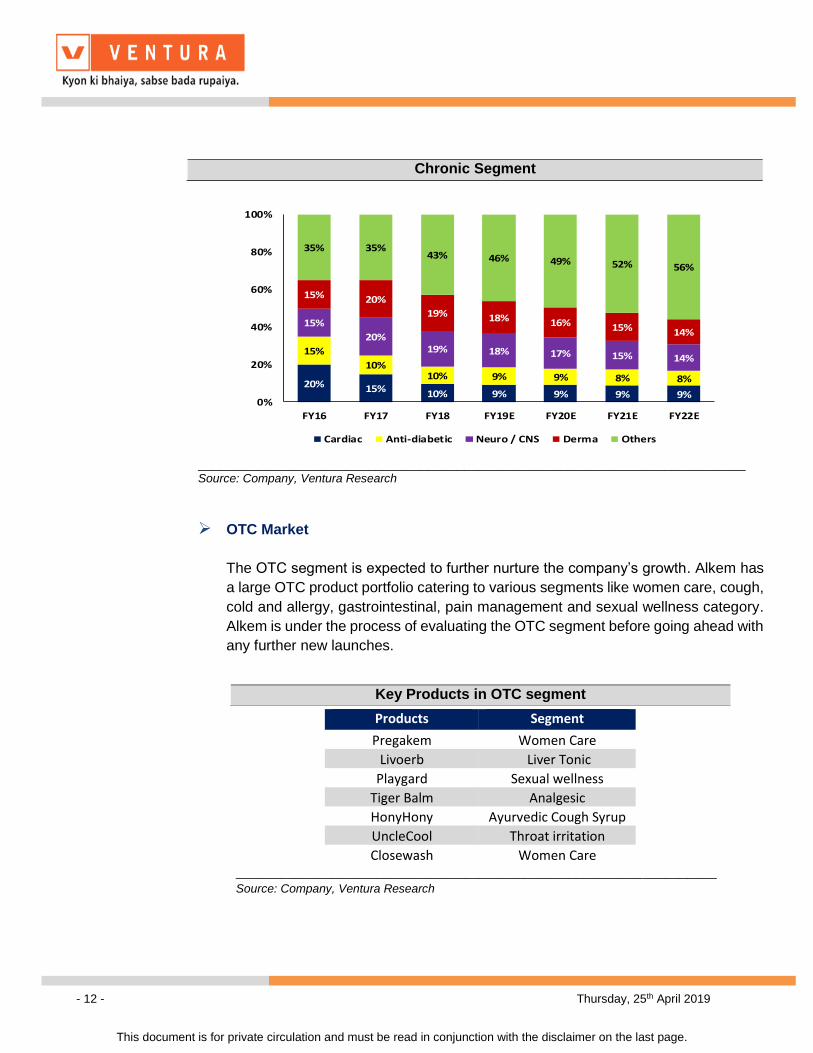
➢ Chronic portfolio future growth driver for the domestic business
Chronic is the fastest growing therapy segment in India and Alkem is currently an
emerging player with a market share of less than 1%. Its large MR force and
indigenously developed products and strategic alliances for introducing novel
products of innovator companies will enable Alkem to build a significant presence in
this therapy area.
We expect the revenues from this segment to grow at 52% CAGR to Rs. 2,276
crores by FY22E from Rs. 957 crores in FY18. The growth in the chronic segment
is expected to elevate the margins with a better product mix.
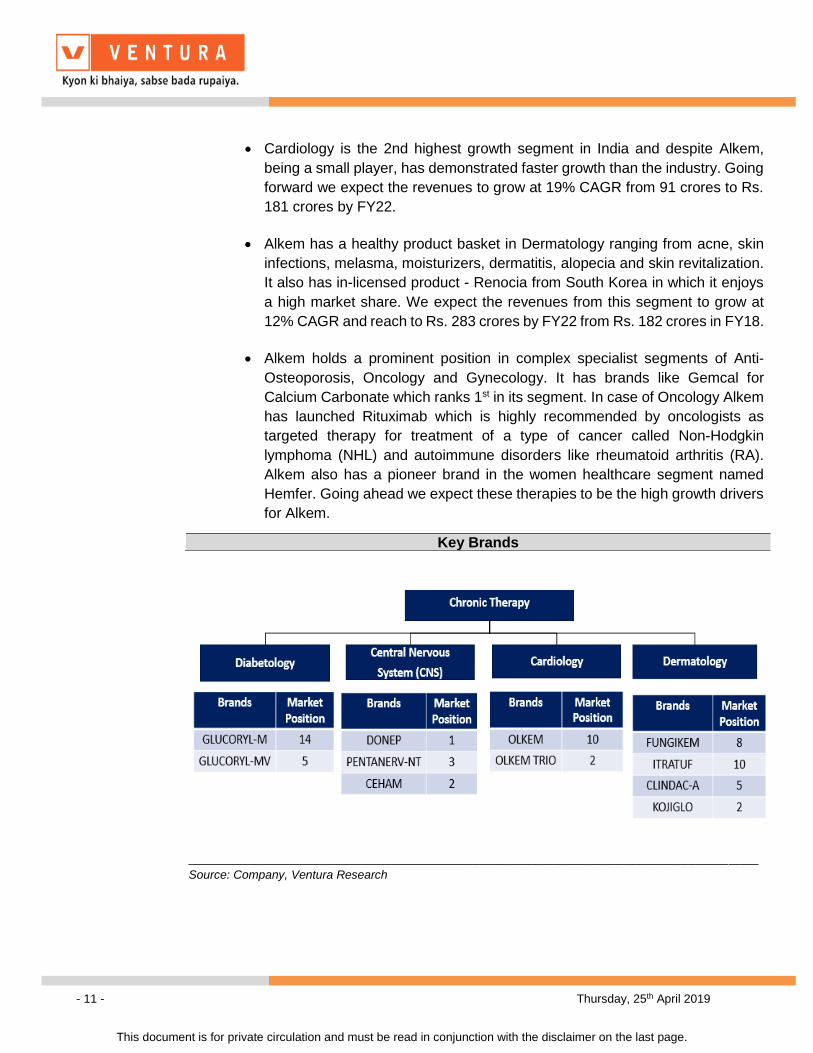
• Diabetes is a fast-growing segment and Alkem is focusing on making a
recognized presence in it with new product launches in pipeline. Alkem has
also in-licensed Dong-A ST’s (South Korean pharmaceutical company)
diabetes treatment drug – Suganon, which has been commercialized in India
as Valera during FY19. We expect the revenue from this segment to grow at
16% CAGR from Rs.91 crores in FY18 to Rs. 166 crores in FY22.
• Alkem ranks 8th in the CNS (Central Nervous System) segment and its product
portfolio caters to various sub-segments like alzheimer’s, dementia, stroke,
migraine, epilepsy, depression and neuropathic pain management. The
revenues are estimated to demonstrate a healthy growth of 12% registering
revenue of Rs. 290 crores in FY22 from Rs. 182 crores in FY18.
Muted growth in Acute Segment
- 11 - Thursday, 25th April 2019
This document is for private circulation and must be read in conjunction with the disclaimer on the last page.
• Cardiology is the 2nd highest growth segment in India and despite Alkem,
being a small player, has demonstrated faster growth than the industry. Going
forward we expect the revenues to grow at 19% CAGR from 91 crores to Rs.
181 crores by FY22.
• Alkem has a healthy product basket in Dermatology ranging from acne, skin
infections, melasma, moisturizers, dermatitis, alopecia and skin revitalization.
It also has in-licensed product - Renocia from South Korea in which it enjoys
a high market share. We expect the revenues from this segment to grow at
12% CAGR and reach to Rs. 283 crores by FY22 from Rs. 182 crores in FY18.
• Alkem holds a prominent position in complex specialist segments of Anti-
Osteoporosis, Oncology and Gynecology. It has brands like Gemcal for
Calcium Carbonate which ranks 1st in its segment. In case of Oncology Alkem
has launched Rituximab which is highly recommended by oncologists as
targeted therapy for treatment of a type of cancer called Non-Hodgkin
lymphoma (NHL) and autoimmune disorders like rheumatoid arthritis (RA).
Alkem also has a pioneer brand in the women healthcare segment named
Hemfer. Going ahead we expect these therapies to be the high growth drivers
for Alkem.
_____________________________________________________________________________
Source: Company, Ventura Research
Key Brands
- 12 - Thursday, 25th April 2019
This document is for private circulation and must be read in conjunction with the disclaimer on the last page.
20% 15% 10% 9% 9% 9% 9%
15%
10%10% 9% 9% 8% 8%
15%
20%19% 18% 17% 15% 14%
15% 20%
19% 18% 16% 15% 14%
35% 35%43% 46% 49% 52% 56%
0%
20%
40%
60%
80%
100%
FY16 FY17 FY18 FY19E FY20E FY21E FY22E
Cardiac Anti-diabetic Neuro / CNS Derma Others
__________________________________________________________________________ Source: Company, Ventura Research
➢ OTC Market
The OTC segment is expected to further nurture the company’s growth. Alkem has
a large OTC product portfolio catering to various segments like women care, cough,
cold and allergy, gastrointestinal, pain management and sexual wellness category.
Alkem is under the process of evaluating the OTC segment before going ahead with
any further new launches.
_________________________________________________________________
Source: Company, Ventura Research
Chronic Segment
Key Products in OTC segment
Products Segment
Pregakem Women Care
Livoerb Liver Tonic
Playgard Sexual wellness
Tiger Balm Analgesic
HonyHony Ayurvedic Cough Syrup
UncleCool Throat irritation
Closewash Women Care
- 13 - Thursday, 25th April 2019
This document is for private circulation and must be read in conjunction with the disclaimer on the last page.
➢ Biosimilars – future promising growth segment
The company has also made investments in the biosimilar markets through its
subsidiary Enzene Biosciences. This will cater to recombinant proteins and
monoclonal antibodies. Alkem has biosimilar products in pre-clinical and clinical
development stages which is expected to be commercialized by FY20 in markets of
India, US and other emerging countries supporting the growth further
➢ Large basket of ANDA filings and 8-10 annual commercialization expected to
boost revenues from the USA geography
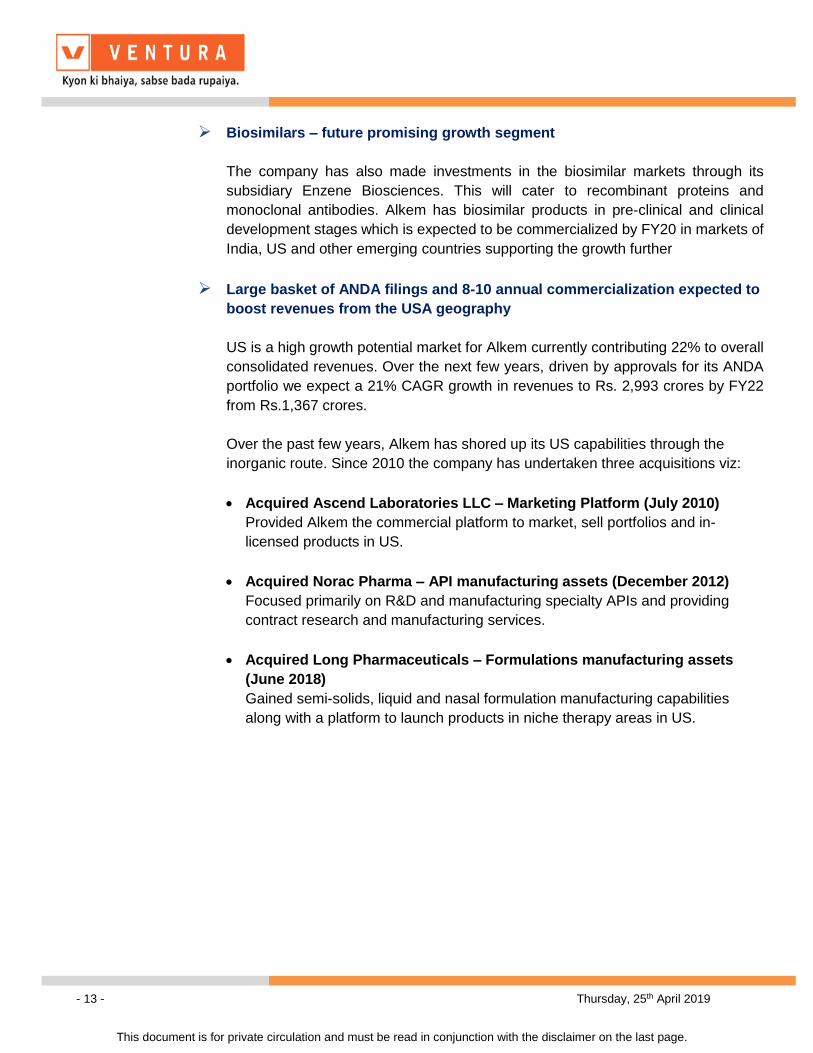
US is a high growth potential market for Alkem currently contributing 22% to overall
consolidated revenues. Over the next few years, driven by approvals for its ANDA
portfolio we expect a 21% CAGR growth in revenues to Rs. 2,993 crores by FY22
from Rs.1,367 crores.
Over the past few years, Alkem has shored up its US capabilities through the
inorganic route. Since 2010 the company has undertaken three acquisitions viz:
• Acquired Ascend Laboratories LLC – Marketing Platform (July 2010)
Provided Alkem the commercial platform to market, sell portfolios and in-
licensed products in US.
• Acquired Norac Pharma – API manufacturing assets (December 2012)
Focused primarily on R&D and manufacturing specialty APIs and providing
contract research and manufacturing services.
• Acquired Long Pharmaceuticals – Formulations manufacturing assets
(June 2018)
Gained semi-solids, liquid and nasal formulation manufacturing capabilities
along with a platform to launch products in niche therapy areas in US.
- 14 - Thursday, 25th April 2019
This document is for private circulation and must be read in conjunction with the disclaimer on the last page.
0%
5%
10%
15%
20%
25%
30%
35%
40%
0
500
1,000
1,500
2,000
2,500
3,000
3,500
FY15 FY16 FY17 FY18 FY19E FY20E FY21E FY22E
US YoY Growth
(Rs. in crs)
______________________________________________________________
Source: Company, Ventura Research
_______________________________________________________________
Source: Company, Ventura Research
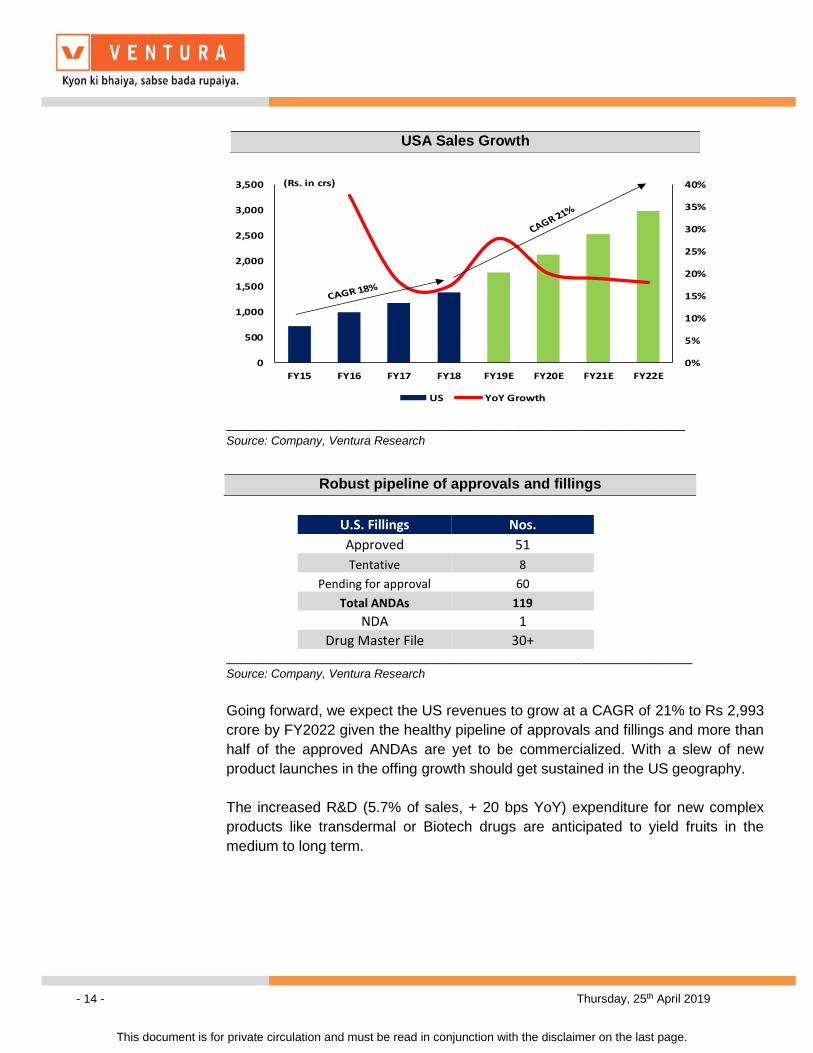
Going forward, we expect the US revenues to grow at a CAGR of 21% to Rs 2,993
crore by FY2022 given the healthy pipeline of approvals and fillings and more than
half of the approved ANDAs are yet to be commercialized. With a slew of new
product launches in the offing growth should get sustained in the US geography.
The increased R&D (5.7% of sales, + 20 bps YoY) expenditure for new complex
products like transdermal or Biotech drugs are anticipated to yield fruits in the
medium to long term.
USA Sales Growth
Robust pipeline of approvals and fillings
U.S. Fillings Nos.
Approved 51
Tentative 8
Pending for approval 60
Total ANDAs 119
NDA 1
Drug Master File 30+
- 15 - Thursday, 25th April 2019
This document is for private circulation and must be read in conjunction with the disclaimer on the last page.
11 13 15 1931
3950
2026
34
44
46
52
58
0
20
40
60
80
100
120
FY12 FY13 FY14 FY15 FY16 FY17 FY18
Approved Pending
___________________________________________________________
Source: Company, Ventura Research
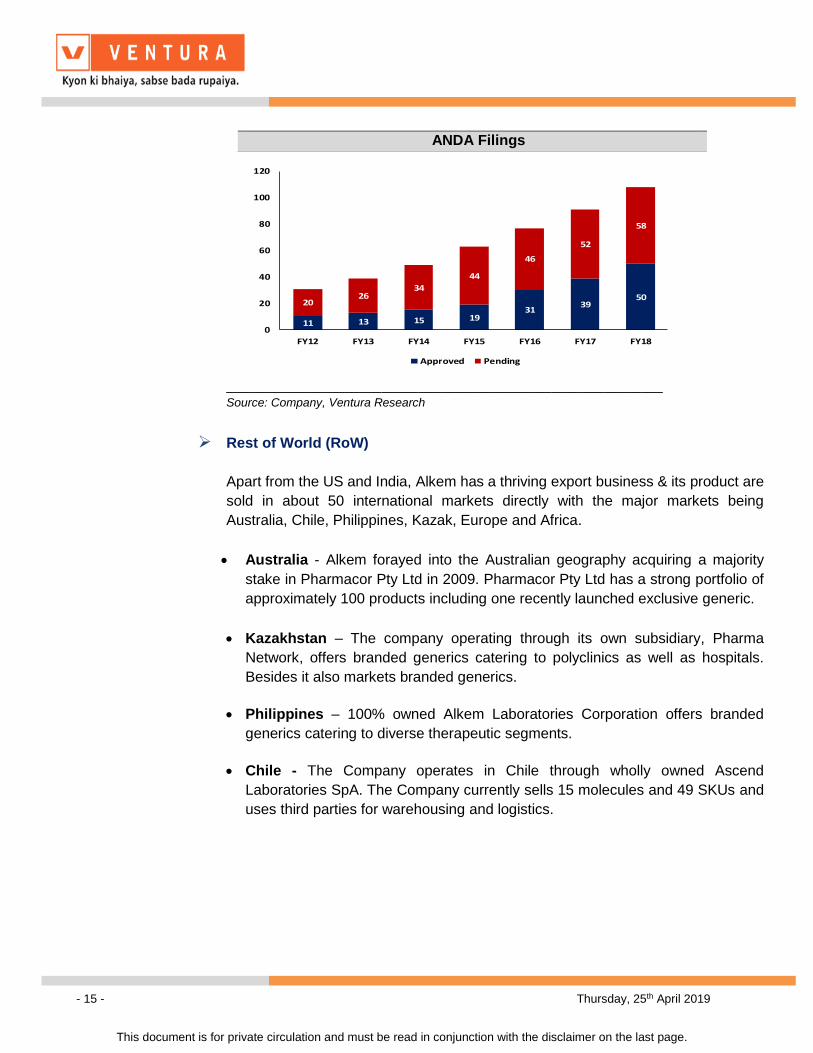
➢ Rest of World (RoW)
Apart from the US and India, Alkem has a thriving export business & its product are
sold in about 50 international markets directly with the major markets being
Australia, Chile, Philippines, Kazak, Europe and Africa.
• Australia - Alkem forayed into the Australian geography acquiring a majority
stake in Pharmacor Pty Ltd in 2009. Pharmacor Pty Ltd has a strong portfolio of
approximately 100 products including one recently launched exclusive generic.
• Kazakhstan – The company operating through its own subsidiary, Pharma
Network, offers branded generics catering to polyclinics as well as hospitals.
Besides it also markets branded generics.
• Philippines – 100% owned Alkem Laboratories Corporation offers branded
generics catering to diverse therapeutic segments.
• Chile - The Company operates in Chile through wholly owned Ascend
Laboratories SpA. The Company currently sells 15 molecules and 49 SKUs and
uses third parties for warehousing and logistics.
ANDA Filings
- 16 - Thursday, 25th April 2019
This document is for private circulation and must be read in conjunction with the disclaimer on the last page.
0%
5%
10%
15%
20%
25%
30%
35%
40%
45%
50%
0
100
200
300
400
500
600
700
FY15 FY16 FY17 FY18 FY19E FY20E FY21E FY22E
Rest of World (ROW) YoY Growth
____________________________________________________________
Source: Company, Ventura Research
______________________________________________________________________
Source: Company, Ventura Research
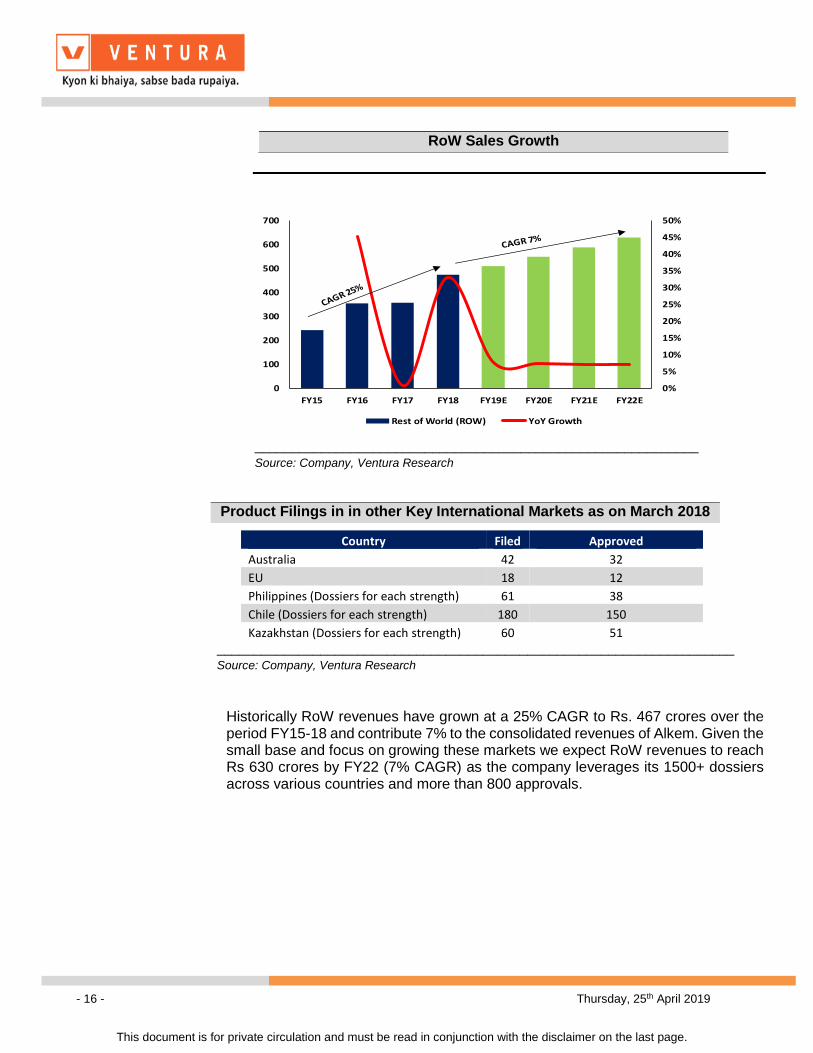
Historically RoW revenues have grown at a 25% CAGR to Rs. 467 crores over the period FY15-18 and contribute 7% to the consolidated revenues of Alkem. Given the small base and focus on growing these markets we expect RoW revenues to reach Rs 630 crores by FY22 (7% CAGR) as the company leverages its 1500+ dossiers across various countries and more than 800 approvals.
RoW Sales Growth
Product Filings in in other Key International Markets as on March 2018
Country Filed Approved
Australia 42 32
EU 18 12
Philippines (Dossiers for each strength) 61 38
Chile (Dossiers for each strength) 180 150
Kazakhstan (Dossiers for each strength) 60 51
- 17 - Thursday, 25th April 2019
This document is for private circulation and must be read in conjunction with the disclaimer on the last page.
❖ Peak in capex cycle to lead to debt being pared as cash flow generation
improves
We expect a recurring capex of Rs. 300-400 crore pa over the period FY18-22 to
cater to the upgradation of the Sikkim facility and ramp up of the Indore R&D facility.
Earlier, Alkem has raised debt to cater to the high capex requirement. Going
forward, with the reduction in capex we expect Alkem to become virtually debt free.
Also, since the US market was in the investment stage Alkem’s margins were under
marginal pressure. However, with US operations achieving scale and the domestic
chronic business ramping up, we believe the trajectory to historical company levels
margins should play out.
The reduction in debt and improvement in margins will therefore yield higher cash
from operations, which in tend improve Free cash flow.
As a result, we expect margins to improve gradually by 200 bps to 18% by FY22. It
is expected that ROE will improve from 13.1% to 15.2% by FY22.
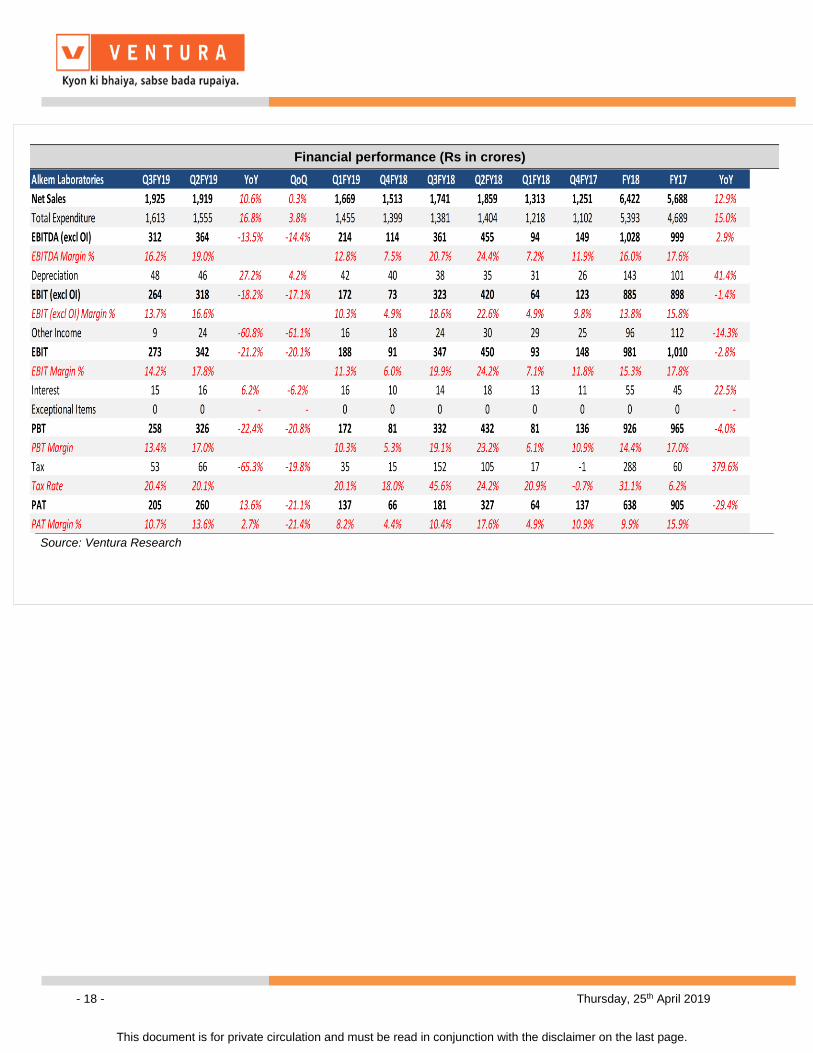
❖ Financial Performance
In Q3FY19, Alkem reported a healthy growth of 10.6% in topline to Rs.1,925 crores
from Rs 1,741 crores reported in the same quarter of the previous year. EBITDA
witnessed a decline of 13.5% YoY to Rs. 312 crores mainly on account of high API
prices and higher sales from international business where the margins are relatively
lower. PAT stood at Rs. 205 crores an increase of 13.6% YoY from Rs.181 crores.
During FY18, Alkem’s net sales stood at Rs. 6,432 crores, registering a growth of
13% YoY. EBIDTA margin declined by 160 bps YoY to 16% due to higher investment
in R&D and MRs. The consolidated PAT in FY18 stood at Rs. 638 crores as a
consequence of higher tax outgo due to some of the manufacturing facilities losing
their fiscal benefits and also one-off charges related to significant changes in the US
corporate income tax system.
- 18 - Thursday, 25th April 2019
This document is for private circulation and must be read in conjunction with the disclaimer on the last page.
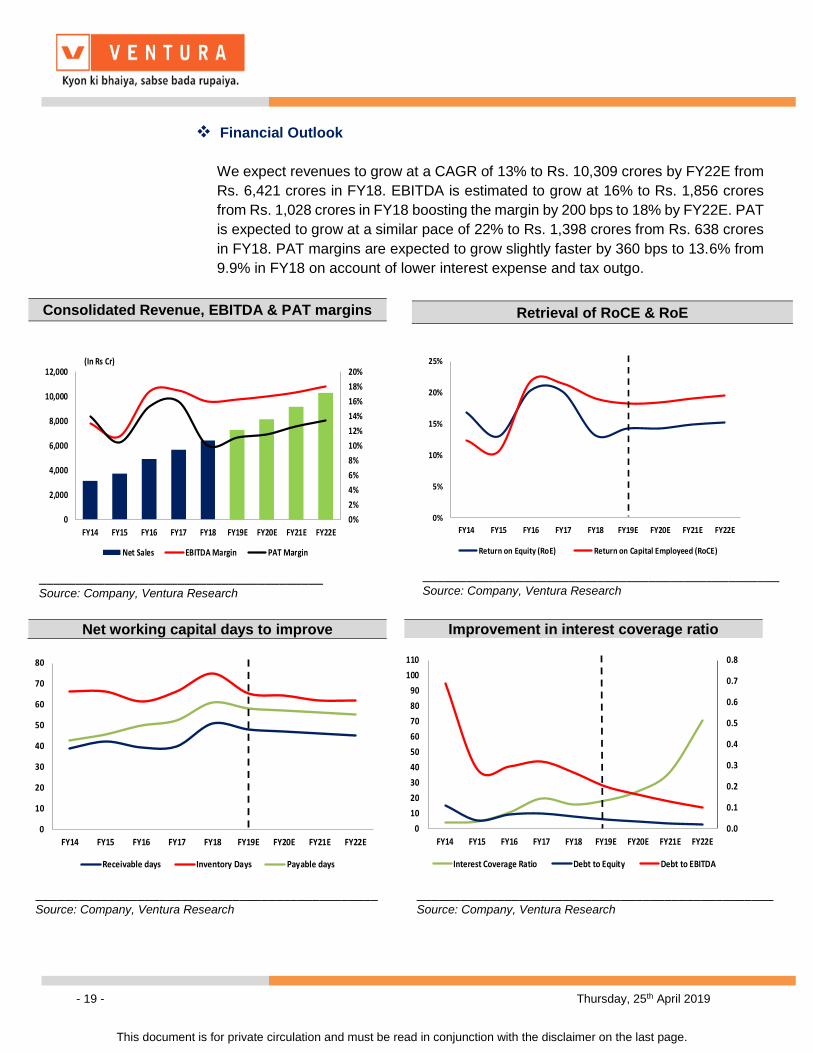
❖ Financial Outlook
Financial performance (Rs in crores)
Source: Ventura Research
- 19 - Thursday, 25th April 2019
This document is for private circulation and must be read in conjunction with the disclaimer on the last page.
❖ Financial Outlook
We expect revenues to grow at a CAGR of 13% to Rs. 10,309 crores by FY22E from
Rs. 6,421 crores in FY18. EBITDA is estimated to grow at 16% to Rs. 1,856 crores
from Rs. 1,028 crores in FY18 boosting the margin by 200 bps to 18% by FY22E. PAT
is expected to grow at a similar pace of 22% to Rs. 1,398 crores from Rs. 638 crores
in FY18. PAT margins are expected to grow slightly faster by 360 bps to 13.6% from
9.9% in FY18 on account of lower interest expense and tax outgo.
0
10
20
30
40
50
60
70
80
FY14 FY15 FY16 FY17 FY18 FY19E FY20E FY21E FY22E
Receivable days Inventory Days Payable days
0.0
0.1
0.2
0.3
0.4
0.5
0.6
0.7
0.8
0
10
20
30
40
50
60
70
80
90
100
110
FY14 FY15 FY16 FY17 FY18 FY19E FY20E FY21E FY22E
Interest Coverage Ratio Debt to Equity Debt to EBITDA
Consolidated Revenue, EBITDA & PAT margins
0%
2%
4%
6%
8%
10%
12%
14%
16%
18%
20%
0
2,000
4,000
6,000
8,000
10,000
12,000
FY14 FY15 FY16 FY17 FY18 FY19E FY20E FY21E FY22E
Net Sales EBITDA Margin PAT Margin
(In Rs Cr)
_______________________________________ Source: Company, Ventura Research
Retrieval of RoCE & RoE
0%
5%
10%
15%
20%
25%
FY14 FY15 FY16 FY17 FY18 FY19E FY20E FY21E FY22E
Return on Equity (RoE) Return on Capital Employeed (RoCE)
_________________________________________________ Source: Company, Ventura Research
Net working capital days to improve Improvement in interest coverage ratio
_______________________________________________ _________________________________________________ Source: Company, Ventura Research
Source: Company, Ventura Research
- 20 - Thursday, 25th April 2019
This document is for private circulation and must be read in conjunction with the disclaimer on the last page.
❖ Risk Factors
1. The Health Ministry included 376 drugs in the new National List of Essential
Medicines (NLEM list) in 2015. It is likely that the Government may bring more
drugs and formulations under price control or change the mechanism of calculating
the ceiling price of the drugs, which are under the ambit of the revised policy. This
might impact the pricing and profitability of India business for Alkem as 20% of its
product portfolio is under the coverage of DPCO.
2. Any negative observation by USFDA on manufacturing facilities of Alkem can
affect the operations of the company.
3. Currency fluctuation can impact the revenue.
4. Jan Aushadhi and traction in unbranded generics can impact growth volumes of
the industry leaders.
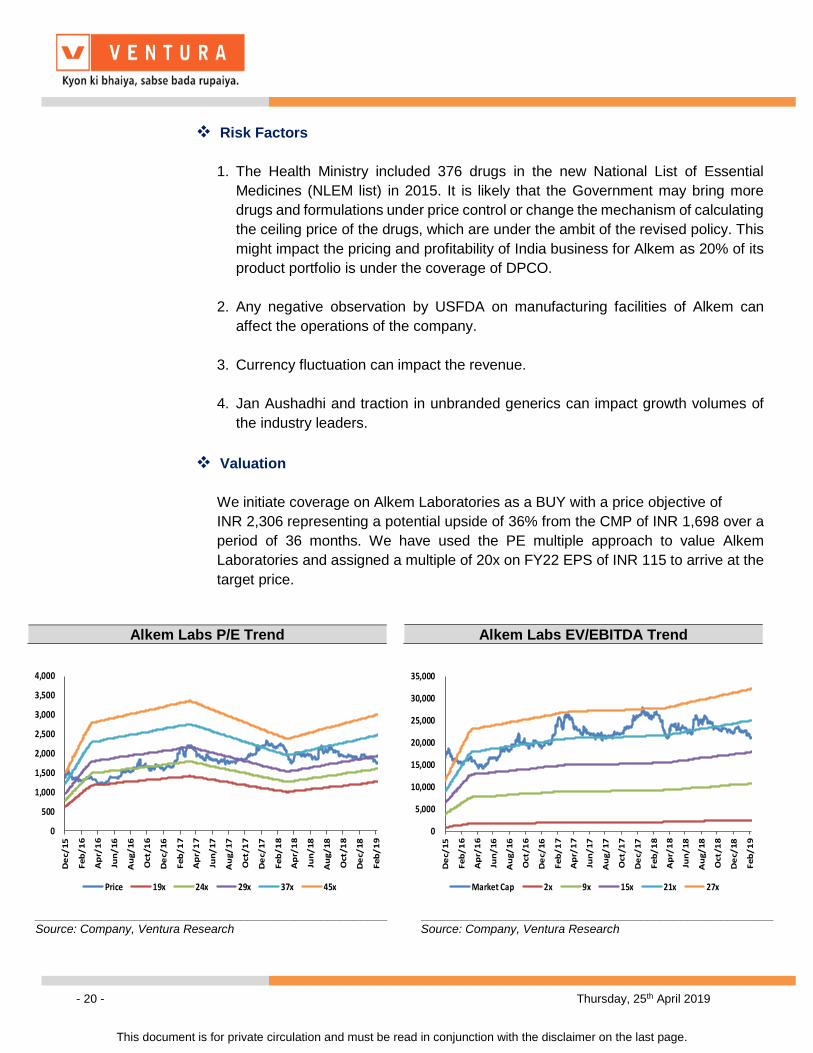
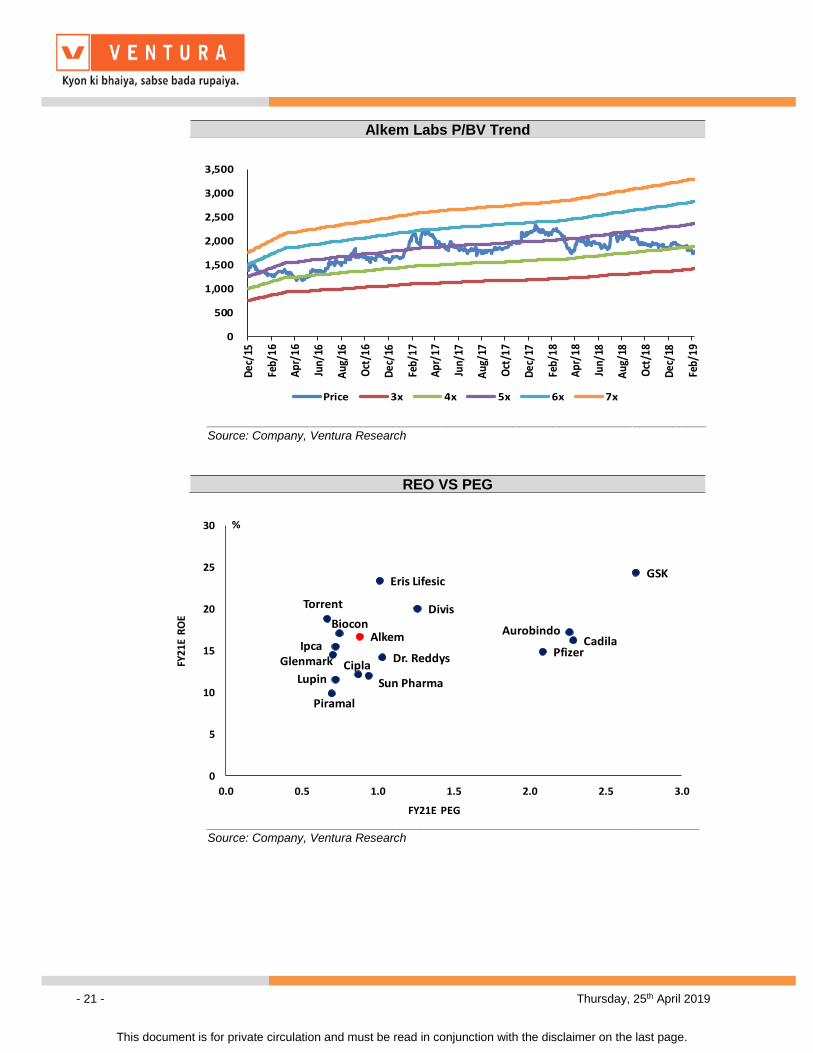
❖ Valuation
We initiate coverage on Alkem Laboratories as a BUY with a price objective of
INR 2,306 representing a potential upside of 36% from the CMP of INR 1,698 over a
period of 36 months. We have used the PE multiple approach to value Alkem
Laboratories and assigned a multiple of 20x on FY22 EPS of INR 115 to arrive at the
target price.
0
500
1,000
1,500
2,000
2,500
3,000
3,500
4,000
De
c/1
5
Fe
b/
16
Ap
r/1
6
Jun
/1
6
Au
g/
16
Oct
/16
De
c/1
6
Fe
b/
17
Ap
r/1
7
Jun
/1
7
Au
g/
17
Oct
/17
De
c/1
7
Fe
b/
18
Ap
r/1
8
Jun
/1
8
Au
g/
18
Oct
/18
De
c/1
8
Fe
b/
19
Price 19x 24x 29x 37x 45x
0
5,000
10,000
15,000
20,000
25,000
30,000
35,000
De
c/1
5
Fe
b/
16
Ap
r/1
6
Jun
/1
6
Au
g/
16
Oct
/16
De
c/1
6
Fe
b/
17
Ap
r/1
7
Jun
/1
7
Au
g/
17
Oct
/17
De
c/1
7
Fe
b/
18
Ap
r/1
8
Jun
/1
8
Au
g/
18
Oct
/18
De
c/1
8
Fe
b/
19
Market Cap 2x 9x 15x 21x 27x
Alkem Labs EV/EBITDA Trend Alkem Labs P/E Trend
_____________________________________________________ _____________________________________________________ Source: Company, Ventura Research Source: Company, Ventura Research
- 21 - Thursday, 25th April 2019
This document is for private circulation and must be read in conjunction with the disclaimer on the last page.
Alkem Labs P/BV Trend
0
500
1,000
1,500
2,000
2,500
3,000
3,500
Dec
/15
Feb/
16
Apr
/16
Jun/
16
Aug
/16
Oct
/16
Dec
/16
Feb/
17
Apr
/17
Jun/
17
Aug
/17
Oct
/17
Dec
/17
Feb/
18
Apr
/18
Jun/
18
Aug
/18
Oct
/18
Dec
/18
Feb/
19
Price 3x 4x 5x 6x 7x
___________________________________________________________________________ Source: Company, Ventura Research
REO VS PEG
Sun Pharma
Cipla Dr. Reddys
Aurobindo
Piramal
Divis Biocon
Lupin
Cadila
Torrent
GSK
Alkem
Glenmark Pfizer
Ipca
Eris Lifesic
0
5
10
15
20
25
30
0.0 0.5 1.0 1.5 2.0 2.5 3.0
FY21E PEG
FY21
E R
OE
%
__________________________________________________________________________ Source: Company, Ventura Research
- 22 - Thursday, 25th April 2019
This document is for private circulation and must be read in conjunction with the disclaimer on the last page.
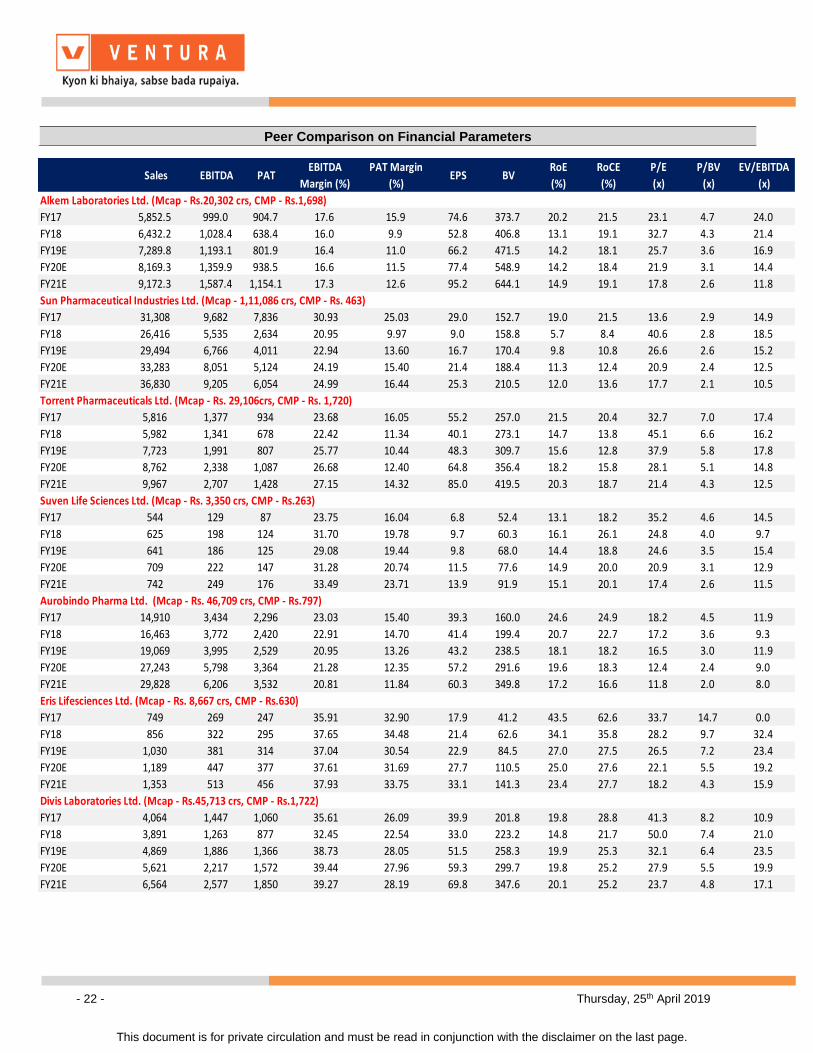
Peer Comparison on Financial Parameters
Sales EBITDA PATEBITDA
Margin (%)
PAT Margin
(%)EPS BV
RoE
(%)
RoCE
(%)
P/E
(x)
P/BV
(x)
EV/EBITDA
(x)
Alkem Laboratories Ltd. (Mcap - Rs.20,302 crs, CMP - Rs.1,698)
FY17 5,852.5 999.0 904.7 17.6 15.9 74.6 373.7 20.2 21.5 23.1 4.7 24.0
FY18 6,432.2 1,028.4 638.4 16.0 9.9 52.8 406.8 13.1 19.1 32.7 4.3 21.4
FY19E 7,289.8 1,193.1 801.9 16.4 11.0 66.2 471.5 14.2 18.1 25.7 3.6 16.9
FY20E 8,169.3 1,359.9 938.5 16.6 11.5 77.4 548.9 14.2 18.4 21.9 3.1 14.4
FY21E 9,172.3 1,587.4 1,154.1 17.3 12.6 95.2 644.1 14.9 19.1 17.8 2.6 11.8
Sun Pharmaceutical Industries Ltd. (Mcap - 1,11,086 crs, CMP - Rs. 463)
FY17 31,308 9,682 7,836 30.93 25.03 29.0 152.7 19.0 21.5 13.6 2.9 14.9
FY18 26,416 5,535 2,634 20.95 9.97 9.0 158.8 5.7 8.4 40.6 2.8 18.5
FY19E 29,494 6,766 4,011 22.94 13.60 16.7 170.4 9.8 10.8 26.6 2.6 15.2
FY20E 33,283 8,051 5,124 24.19 15.40 21.4 188.4 11.3 12.4 20.9 2.4 12.5
FY21E 36,830 9,205 6,054 24.99 16.44 25.3 210.5 12.0 13.6 17.7 2.1 10.5
Torrent Pharmaceuticals Ltd. (Mcap - Rs. 29,106crs, CMP - Rs. 1,720)
FY17 5,816 1,377 934 23.68 16.05 55.2 257.0 21.5 20.4 32.7 7.0 17.4
FY18 5,982 1,341 678 22.42 11.34 40.1 273.1 14.7 13.8 45.1 6.6 16.2
FY19E 7,723 1,991 807 25.77 10.44 48.3 309.7 15.6 12.8 37.9 5.8 17.8
FY20E 8,762 2,338 1,087 26.68 12.40 64.8 356.4 18.2 15.8 28.1 5.1 14.8
FY21E 9,967 2,707 1,428 27.15 14.32 85.0 419.5 20.3 18.7 21.4 4.3 12.5
Suven Life Sciences Ltd. (Mcap - Rs. 3,350 crs, CMP - Rs.263)
FY17 544 129 87 23.75 16.04 6.8 52.4 13.1 18.2 35.2 4.6 14.5
FY18 625 198 124 31.70 19.78 9.7 60.3 16.1 26.1 24.8 4.0 9.7
FY19E 641 186 125 29.08 19.44 9.8 68.0 14.4 18.8 24.6 3.5 15.4
FY20E 709 222 147 31.28 20.74 11.5 77.6 14.9 20.0 20.9 3.1 12.9
FY21E 742 249 176 33.49 23.71 13.9 91.9 15.1 20.1 17.4 2.6 11.5
Aurobindo Pharma Ltd. (Mcap - Rs. 46,709 crs, CMP - Rs.797)
FY17 14,910 3,434 2,296 23.03 15.40 39.3 160.0 24.6 24.9 18.2 4.5 11.9
FY18 16,463 3,772 2,420 22.91 14.70 41.4 199.4 20.7 22.7 17.2 3.6 9.3
FY19E 19,069 3,995 2,529 20.95 13.26 43.2 238.5 18.1 18.2 16.5 3.0 11.9
FY20E 27,243 5,798 3,364 21.28 12.35 57.2 291.6 19.6 18.3 12.4 2.4 9.0
FY21E 29,828 6,206 3,532 20.81 11.84 60.3 349.8 17.2 16.6 11.8 2.0 8.0
Eris Lifesciences Ltd. (Mcap - Rs. 8,667 crs, CMP - Rs.630)
FY17 749 269 247 35.91 32.90 17.9 41.2 43.5 62.6 33.7 14.7 0.0
FY18 856 322 295 37.65 34.48 21.4 62.6 34.1 35.8 28.2 9.7 32.4
FY19E 1,030 381 314 37.04 30.54 22.9 84.5 27.0 27.5 26.5 7.2 23.4
FY20E 1,189 447 377 37.61 31.69 27.7 110.5 25.0 27.6 22.1 5.5 19.2
FY21E 1,353 513 456 37.93 33.75 33.1 141.3 23.4 27.7 18.2 4.3 15.9
Divis Laboratories Ltd. (Mcap - Rs.45,713 crs, CMP - Rs.1,722)
FY17 4,064 1,447 1,060 35.61 26.09 39.9 201.8 19.8 28.8 41.3 8.2 10.9
FY18 3,891 1,263 877 32.45 22.54 33.0 223.2 14.8 21.7 50.0 7.4 21.0
FY19E 4,869 1,886 1,366 38.73 28.05 51.5 258.3 19.9 25.3 32.1 6.4 23.5
FY20E 5,621 2,217 1,572 39.44 27.96 59.3 299.7 19.8 25.2 27.9 5.5 19.9
FY21E 6,564 2,577 1,850 39.27 28.19 69.8 347.6 20.1 25.2 23.7 4.8 17.1
- 23 - Thursday, 25th April 2019
This document is for private circulation and must be read in conjunction with the disclaimer on the last page.
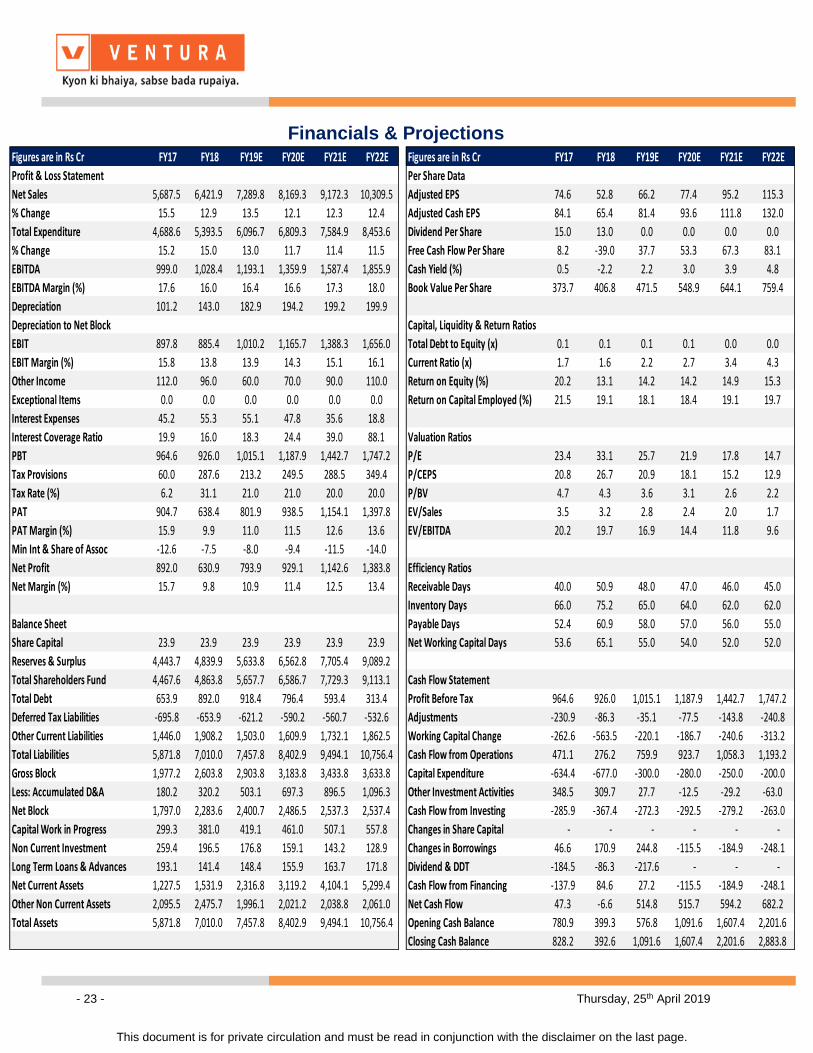
Financials & Projections
Figures are in Rs Cr FY17 FY18 FY19E FY20E FY21E FY22E Figures are in Rs Cr FY17 FY18 FY19E FY20E FY21E FY22E
Profit & Loss Statement Per Share Data
Net Sales 5,687.5 6,421.9 7,289.8 8,169.3 9,172.3 10,309.5 Adjusted EPS 74.6 52.8 66.2 77.4 95.2 115.3
% Change 15.5 12.9 13.5 12.1 12.3 12.4 Adjusted Cash EPS 84.1 65.4 81.4 93.6 111.8 132.0
Total Expenditure 4,688.6 5,393.5 6,096.7 6,809.3 7,584.9 8,453.6 Dividend Per Share 15.0 13.0 0.0 0.0 0.0 0.0
% Change 15.2 15.0 13.0 11.7 11.4 11.5 Free Cash Flow Per Share 8.2 -39.0 37.7 53.3 67.3 83.1
EBITDA 999.0 1,028.4 1,193.1 1,359.9 1,587.4 1,855.9 Cash Yield (%) 0.5 -2.2 2.2 3.0 3.9 4.8
EBITDA Margin (%) 17.6 16.0 16.4 16.6 17.3 18.0 Book Value Per Share 373.7 406.8 471.5 548.9 644.1 759.4
Depreciation 101.2 143.0 182.9 194.2 199.2 199.9
Depreciation to Net Block Capital, Liquidity & Return Ratios
EBIT 897.8 885.4 1,010.2 1,165.7 1,388.3 1,656.0 Total Debt to Equity (x) 0.1 0.1 0.1 0.1 0.0 0.0
EBIT Margin (%) 15.8 13.8 13.9 14.3 15.1 16.1 Current Ratio (x) 1.7 1.6 2.2 2.7 3.4 4.3
Other Income 112.0 96.0 60.0 70.0 90.0 110.0 Return on Equity (%) 20.2 13.1 14.2 14.2 14.9 15.3
Exceptional Items 0.0 0.0 0.0 0.0 0.0 0.0 Return on Capital Employed (%) 21.5 19.1 18.1 18.4 19.1 19.7
Interest Expenses 45.2 55.3 55.1 47.8 35.6 18.8
Interest Coverage Ratio 19.9 16.0 18.3 24.4 39.0 88.1 Valuation Ratios
PBT 964.6 926.0 1,015.1 1,187.9 1,442.7 1,747.2 P/E 23.4 33.1 25.7 21.9 17.8 14.7
Tax Provisions 60.0 287.6 213.2 249.5 288.5 349.4 P/CEPS 20.8 26.7 20.9 18.1 15.2 12.9
Tax Rate (%) 6.2 31.1 21.0 21.0 20.0 20.0 P/BV 4.7 4.3 3.6 3.1 2.6 2.2
PAT 904.7 638.4 801.9 938.5 1,154.1 1,397.8 EV/Sales 3.5 3.2 2.8 2.4 2.0 1.7
PAT Margin (%) 15.9 9.9 11.0 11.5 12.6 13.6 EV/EBITDA 20.2 19.7 16.9 14.4 11.8 9.6
Min Int & Share of Assoc -12.6 -7.5 -8.0 -9.4 -11.5 -14.0
Net Profit 892.0 630.9 793.9 929.1 1,142.6 1,383.8 Efficiency Ratios
Net Margin (%) 15.7 9.8 10.9 11.4 12.5 13.4 Receivable Days 40.0 50.9 48.0 47.0 46.0 45.0
Inventory Days 66.0 75.2 65.0 64.0 62.0 62.0
Balance Sheet Payable Days 52.4 60.9 58.0 57.0 56.0 55.0
Share Capital 23.9 23.9 23.9 23.9 23.9 23.9 Net Working Capital Days 53.6 65.1 55.0 54.0 52.0 52.0
Reserves & Surplus 4,443.7 4,839.9 5,633.8 6,562.8 7,705.4 9,089.2
Total Shareholders Fund 4,467.6 4,863.8 5,657.7 6,586.7 7,729.3 9,113.1 Cash Flow Statement
Total Debt 653.9 892.0 918.4 796.4 593.4 313.4 Profit Before Tax 964.6 926.0 1,015.1 1,187.9 1,442.7 1,747.2
Deferred Tax Liabilities -695.8 -653.9 -621.2 -590.2 -560.7 -532.6 Adjustments -230.9 -86.3 -35.1 -77.5 -143.8 -240.8
Other Current Liabilities 1,446.0 1,908.2 1,503.0 1,609.9 1,732.1 1,862.5 Working Capital Change -262.6 -563.5 -220.1 -186.7 -240.6 -313.2
Total Liabilities 5,871.8 7,010.0 7,457.8 8,402.9 9,494.1 10,756.4 Cash Flow from Operations 471.1 276.2 759.9 923.7 1,058.3 1,193.2
Gross Block 1,977.2 2,603.8 2,903.8 3,183.8 3,433.8 3,633.8 Capital Expenditure -634.4 -677.0 -300.0 -280.0 -250.0 -200.0
Less: Accumulated D&A 180.2 320.2 503.1 697.3 896.5 1,096.3 Other Investment Activities 348.5 309.7 27.7 -12.5 -29.2 -63.0
Net Block 1,797.0 2,283.6 2,400.7 2,486.5 2,537.3 2,537.4 Cash Flow from Investing -285.9 -367.4 -272.3 -292.5 -279.2 -263.0
Capital Work in Progress 299.3 381.0 419.1 461.0 507.1 557.8 Changes in Share Capital - - - - - -
Non Current Investment 259.4 196.5 176.8 159.1 143.2 128.9 Changes in Borrowings 46.6 170.9 244.8 -115.5 -184.9 -248.1
Long Term Loans & Advances 193.1 141.4 148.4 155.9 163.7 171.8 Dividend & DDT -184.5 -86.3 -217.6 - - -
Net Current Assets 1,227.5 1,531.9 2,316.8 3,119.2 4,104.1 5,299.4 Cash Flow from Financing -137.9 84.6 27.2 -115.5 -184.9 -248.1
Other Non Current Assets 2,095.5 2,475.7 1,996.1 2,021.2 2,038.8 2,061.0 Net Cash Flow 47.3 -6.6 514.8 515.7 594.2 682.2
Total Assets 5,871.8 7,010.0 7,457.8 8,402.9 9,494.1 10,756.4 Opening Cash Balance 780.9 399.3 576.8 1,091.6 1,607.4 2,201.6
Closing Cash Balance 828.2 392.6 1,091.6 1,607.4 2,201.6 2,883.8
- 24 - Thursday, 25th April 2019
This document is for private circulation and must be read in conjunction with the disclaimer on the last page.
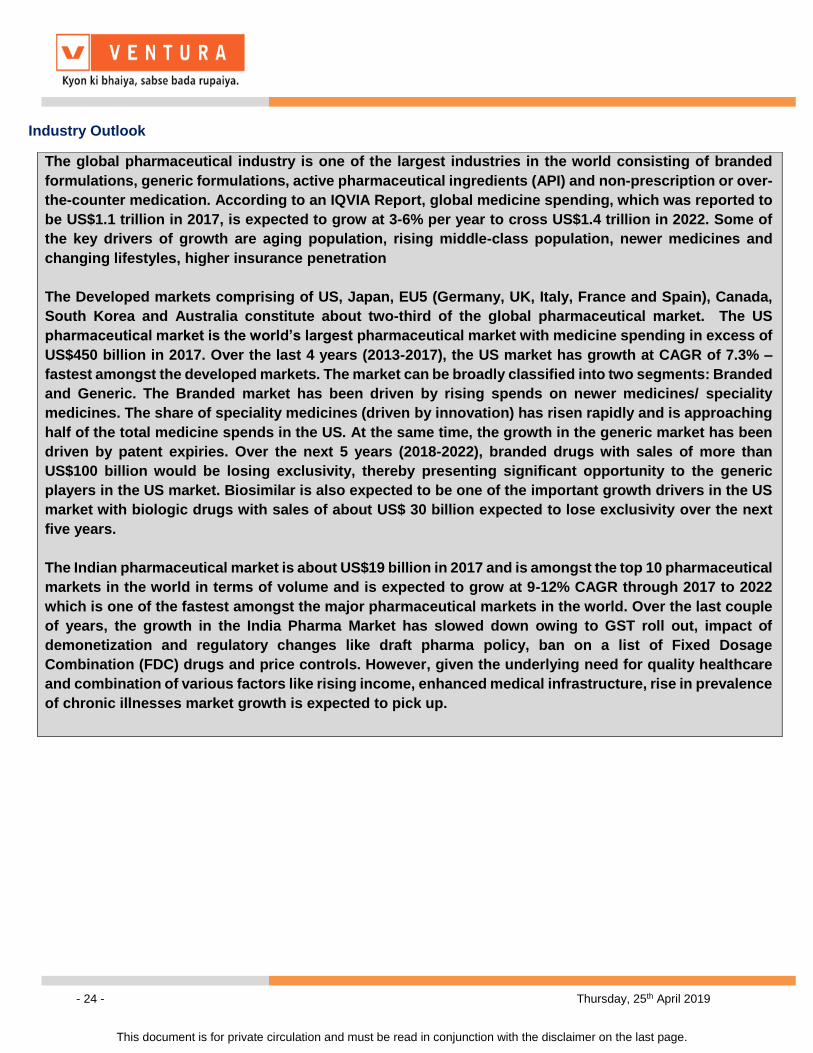
Industry Outlook
The global pharmaceutical industry is one of the largest industries in the world consisting of branded
formulations, generic formulations, active pharmaceutical ingredients (API) and non-prescription or over-
the-counter medication. According to an IQVIA Report, global medicine spending, which was reported to
be US$1.1 trillion in 2017, is expected to grow at 3-6% per year to cross US$1.4 trillion in 2022. Some of
the key drivers of growth are aging population, rising middle-class population, newer medicines and
changing lifestyles, higher insurance penetration
The Developed markets comprising of US, Japan, EU5 (Germany, UK, Italy, France and Spain), Canada,
South Korea and Australia constitute about two-third of the global pharmaceutical market. The US
pharmaceutical market is the world’s largest pharmaceutical market with medicine spending in excess of
US$450 billion in 2017. Over the last 4 years (2013-2017), the US market has growth at CAGR of 7.3% –
fastest amongst the developed markets. The market can be broadly classified into two segments: Branded
and Generic. The Branded market has been driven by rising spends on newer medicines/ speciality
medicines. The share of speciality medicines (driven by innovation) has risen rapidly and is approaching
half of the total medicine spends in the US. At the same time, the growth in the generic market has been
driven by patent expiries. Over the next 5 years (2018-2022), branded drugs with sales of more than
US$100 billion would be losing exclusivity, thereby presenting significant opportunity to the generic
players in the US market. Biosimilar is also expected to be one of the important growth drivers in the US
market with biologic drugs with sales of about US$ 30 billion expected to lose exclusivity over the next
five years.
The Indian pharmaceutical market is about US$19 billion in 2017 and is amongst the top 10 pharmaceutical
markets in the world in terms of volume and is expected to grow at 9-12% CAGR through 2017 to 2022
which is one of the fastest amongst the major pharmaceutical markets in the world. Over the last couple
of years, the growth in the India Pharma Market has slowed down owing to GST roll out, impact of
demonetization and regulatory changes like draft pharma policy, ban on a list of Fixed Dosage
Combination (FDC) drugs and price controls. However, given the underlying need for quality healthcare
and combination of various factors like rising income, enhanced medical infrastructure, rise in prevalence
of chronic illnesses market growth is expected to pick up.
- 25 - Thursday, 25th April 2019
This document is for private circulation and must be read in conjunction with the disclaimer on the last page.
Disclosures and Disclaimer
Ventura Securities Limited (VSL) is a SEBI registered intermediary offering broking, depository and portfolio management services to clients. VSL is member of BSE, NSE and MCX-SX. VSL is a depository participant of NSDL. VSL states that no disciplinary action whatsoever has been taken by SEBI against it in last five years except administrative warning issued in connection with technical and venial lapses observed while inspection of books of accounts and records. Ventura Commodities Limited, Ventura Guaranty Limited, Ventura Insurance Brokers Limited and Ventura Allied Services Private Limited are associates of VSL. Research Analyst (RA) involved in the preparation of this research report and VSL disclose that neither RA nor VSL nor its associates (i) have any financial interest in the company which is the subject matter of this research report (ii) holds ownership of one percent or more in the securities of subject company (iii) have any material conflict of interest at the time of publication of this research report (iv) have received any compensation from the subject company in the past twelve months (v) have managed or co-managed public offering of securities for the subject company in past twelve months (vi) have received any compensation for investment banking merchant banking or brokerage services from the subject company in the past twelve months (vii) have received any compensation for product or services from the subject company in the past twelve months (viii) have received any compensation or other benefits from the subject company or third party in connection with the research report. RA involved in the preparation of this research report discloses that he / she has not served as an officer, director or employee of the subject company. RA involved in the preparation of this research report and VSL discloses that they have not been engaged in the market making activity for the subject company. Our sales people, dealers, traders and other professionals may provide oral or written market commentary or trading strategies to our clients that reflect opinions that are contrary to the opinions expressed herein. We may have earlier issued or may issue in future reports on the companies covered herein with recommendations/ information inconsistent or different those made in this report. In reviewing this document, you should be aware that any or all of the foregoing, among other things, may give rise to or potential conflicts of interest. We may rely on information barriers, such as "Chinese Walls" to control the flow of information contained in one or more areas within us, or other areas, units, groups or affiliates of VSL. This report is for information purposes only and this document/material should not be construed as an offer to sell or the solicitation of an offer to buy, purchase or subscribe to any securities, and neither this document nor anything contained herein shall form the basis of or be relied upon in connection with any contract or commitment whatsoever. This document does not solicit any action based on the material contained herein. It is for the general information of the clients / prospective clients of VSL. VSL will not treat recipients as clients by virtue of their receiving this report. It does not constitute a personal recommendation or take into account the particular investment objectives, financial situations, or needs of clients / prospective clients. Similarly, this document does not have regard to the specific investment objectives, financial situation/circumstances and the particular needs of any specific person who may receive this document. The securities discussed in this report may not be suitable for all investors. The appropriateness of a particular investment or strategy will depend on an investor's individual circumstances and objectives. Persons who may receive this document should consider and independently evaluate whether it is suitable for his/ her/their particular circumstances and, if necessary, seek professional/financial advice. And such person shall be responsible for conducting his/her/their own investigation and analysis of the information contained or referred to in this document and of evaluating the merits and risks involved in the securities forming the subject matter of this document. The projections and forecasts described in this report were based upon a number of estimates and assumptions and are inherently subject to significant uncertainties and contingencies. Projections and forecasts are necessarily speculative in nature, and it can be expected that one or more of the estimates on which the projections and forecasts were based will not materialize or will vary significantly from actual results, and such variances will likely increase over time. All projections and forecasts described in this report have been prepared solely by the authors of this report independently of the Company. These projections and forecasts were not prepared with a view toward compliance with published guidelines or generally accepted accounting principles. No independent accountants have expressed an opinion or any other form of assurance on these projections or forecasts. You should not regard the inclusion of the projections and forecasts described herein as a representation or warranty by VSL, its associates, the authors of this report or any other person that these projections or forecasts or their underlying assumptions will be achieved. For these reasons, you should only consider the projections and forecasts described in this report after carefully evaluating all of the information in this report, including the assumptions underlying such projections and forecasts. The price and value of the investments referred to in this document/material and the income from them may go down as well as up, and investors may realize losses on any investments. Past performance is not a guide for future performance. Future returns are not guaranteed and a loss of original capital may occur. Actual results may differ materially from those set forth in projections. Forward-looking statements are not predictions and may be subject to change without notice. We do not provide tax advice to our clients, and all investors are strongly advised to consult regarding any potential investment. VSL, the RA involved in the preparation of this research report and its associates accept no liabilities for any loss or damage of any kind arising out of the use of this report. This report/document has been prepared by VSL, based upon information available to the public and sources, believed to be reliable. No representation or warranty, express or implied is made that it is accurate or complete. VSL has reviewed the report and, in so far as it includes current or historical information, it is believed to be reliable, although its accuracy and completeness cannot be guaranteed. The opinions expressed in this document/material are subject to change without notice and have no obligation to tell you when opinions or information in this report change. This report or recommendations or information contained herein do/does not constitute or purport to constitute investment advice in publicly accessible media and should not be reproduced, transmitted or published by the recipient. The report is for the use and consumption of the recipient only. This publication may not be distributed to the public used by the public media without the express written consent of VSL. This report or any portion hereof may not be printed, sold or distributed without the written consent of VSL. This document does not constitute an offer or invitation to subscribe for or purchase or deal in any securities and neither this document nor anything contained herein shall form the basis of any contract or commitment whatsoever. This document is strictly confidential and is being furnished to you solely for your information, may not be distributed to the press or other media and may not be reproduced or redistributed to any other person. The opinions and projections expressed herein are entirely those of the author and are given as part of the normal research activity of VSL and are given as of this date and are subject to change without notice. Any opinion estimate or projection herein constitutes a view as of the date of this report and there can be no assurance that future results or events will be consistent with any such opinions, estimate or projection. This document has not been prepared by or in conjunction with or on behalf of or at the instigation of, or by arrangement with the company or any of its directors or any other person. Information in this document must not be relied upon as having been authorized or approved by the company or its directors or any other person. Any opinions and projections contained herein are entirely those of the authors. None of the company or its directors or any other person accepts any liability whatsoever for any loss arising from any use of this document or its contents or otherwise arising in connection therewith. The information contained herein is not intended for publication or distribution or circulation in any manner whatsoever and any unauthorized reading, dissemination, distribution or copying of this communication is prohibited unless otherwise expressly authorized. Please ensure that you have read “Risk Disclosure Document for Capital Market and Derivatives Segments” as prescribed by Securities and Exchange Board of India before investing in Securities Market. Ventura Securities Limited Corporate Office: 8th Floor, ‘B’ Wing, I Think Techno Campus, Pokhran Road no. 02, Off Eastern Express Highway, Thane (West) 400 607. SEBI Registration No.: INH000001634


