Embed Size (px)
Citation preview

IEEE TRANSACTIONS ON MEDICAL IMAGING, VOL. 31, NO. 7, JULY 2012 1337
Alignment of 3-D Optical Coherence TomographyScans to Correct Eye Movement
Using a Particle FilteringJuan Xu*, Member, IEEE, Hiroshi Ishikawa, Gadi Wollstein, Larry Kagemann, and Joel S. Schuman
Abstract—Eye movement artifacts occurring during 3-D op-tical coherence tomography (OCT) scanning is a well-recognizedproblem that may adversely affect image analysis and interpre-tation. A particle filtering algorithm is presented in this paperto correct motion in a 3-D dataset by considering eye movementas a target tracking problem in a dynamic system. The proposedparticle filtering algorithm is an independent 3-D alignmentapproach, which does not rely on any reference image. 3-D OCTdata is considered as a dynamic system, while the location of eachA-scan is represented by the state space. A particle set is used toapproximate the probability density of the state in the dynamicsystem. The state of the system is updated frame by frame todetect A-scan movement. The proposed method was applied onboth simulated data for objective evaluation and experimentaldata for subjective evaluation. The sensitivity and specificity ofthe x-movement detection were 98.85% and 99.43%, respectively,in the simulated data. For the experimental data (74 3-D OCTimages), all the images were improved after z-alignment, while81.1% images were improved after x-alignment. The proposedalgorithm is an efficient way to align 3-D OCT volume data andcorrect the eye movement without using references.
Index Terms—Eye movement correction, particle filtering,retinal image processing, three-dimensional optical coherencetomography (3-D OCT).
I. INTRODUCTION
S PECTRAL domain optical coherence tomography(SD-OCT) is a high-speed, high-resolution imaging
technology that has gained a significant clinical impact in oph-thalmology [1]. Eye movement during 3-D SD-OCT imaging
Manuscript received November 10, 2011; revised December 22, 2011; ac-cepted December 22, 2011. Date of publication January 04, 2012; date of currentversion June 26, 2012. This work was supported in part by the National Institutesof Health (NIH) under Grant NIH R01-EY013178 and Grant P30-EY008098,in part by the Eye and Ear Foundation (Pittsburgh, PA), and in part by Researchto Prevent Blindness. Asterisk indicates corresponding author.*J. Xu is with the Department of Ophthalmology, UPMC Eye Center, Uni-
versity of Pittsburgh School of Medicine, Pittsburgh, PA 15213 USA (e-mail:[email protected]).G. Wollstein is with the Department of Ophthalmology, UPMC Eye Center,
University of Pittsburgh School of Medicine, Pittsburgh, PA 15213 USA(e-mail: [email protected]).H. Ishikawa, L. Kagemann, and J. S. Schuman are with the Department
of Ophthalmology, UPMC Eye Center, University of Pittsburgh Schoolof Medicine, Pittsburgh, PA 15213 USA, and the Department of Bioengi-neering, Swanson School of Engineering, University of Pittsburgh, Pittsburgh,PA 15213 USA (e-mail: [email protected]; [email protected];[email protected]).Color versions of one or more of the figures in this paper are available online
at http://ieeexplore.ieee.org.Digital Object Identifier 10.1109/TMI.2011.2182618
has been recognized as an important problem in OCT structuralassessment of various eye diseases. An ideal 3-D OCT volumedata is illustrated in Fig. 1(a), which is composed of a series ofcross-sectional scans (B-scan) from top to bottom (in the x-yplane) of the scanning region on retina [Fig. 1(b)]. Each B-scanconsists of multiple high-resolution 1-D scans in the z direction(A-scan). A typical scan protocol has a fast scan axis in thex direction [Fig. 1(a)]. Eye movement during 3-D SD-OCTscanning, however, creates significant spatial distortions in the3-D data that may adversely affect qualitative image interpre-tation and quantitative analysis [Fig. 1(c)]. Obtaining spatialintegrity restored (nondistorted) 3-D OCT data is the essentialfoundation of reliable and reproducible quantitative OCT mea-surements, which is particularly important in assessing diseaselongitudinally.Movement during scanning is a common problem in 3-D
medical imaging, e.g., eye movement in OCT imaging or headmovement in brain magnetic resonance imaging (MRI) orpositron emission tomography (PET) imaging. Strategies forcorrecting movement can be grouped into two main categories:device-based method (hardware solution) and image-basedmethod (software solution). The device-based method is usu-ally involves real-time processing, which uses a device tomonitor the subject movement during data acquisition. Themovement information, such as orientation and displacement,detected by the device is used to align the frame image usingcorresponding software [2]–[4]. The image-based method issolely based on the image data. The typical method involvesregistering one or multiple misaligned frame images to areference position, such as the first frame image or additionalreference image/scan [5], [6]. The kernel of image registrationis to optimize a cost-function generated from a transforma-tion model (movement model) and similarity measurementsbetween two images [7], [8]. The two registered images aregenerally assumed as static images globally or locally, whilethe transformation models commonly used are the rigid model,affine model, piecewise affine model, and nonrigid model[9]. An important step in the transformation model includesextracting common features from two images to compute thecost-function in image registration method.Compared to subject movement problems in other 3-D
imaging devices, 3-D OCT eye movement correction is achallenging problem due to the following.• The complicated nature of eye movement makes it difficultto design a uniform transformation model for the entire3-D dataset. For example, micro-saccades cause local
0278-0062/$31.00 © 2012 IEEE

1338 IEEE TRANSACTIONS ON MEDICAL IMAGING, VOL. 31, NO. 7, JULY 2012
Fig. 1. Example of a 3-D OCT image. (a) 3-D OCT image composed of consecutive B-scans, each B-scan consists of a certain number of A-scans. (b) Corre-sponding scanning region on fundus photograph. (c) 3-D OCT image with eye movement. (d) OCT fundus image, generated by averaging intensity values of eachA-scan. The blood vessel discontinuity and optic disc distortion are illustrated. (e) 3-D OCT volume data with z-movement (arrows).
discontinuities likely generating inter-B-scan movement[x-axis movement, Fig. 1(d)]. Drifts are slow and con-tinuous movements causing stretching/shrinking in 3-Dvolume data in all directions likely generating intra-B-scanmovement. The fore–aft eye movement generates z-axismovement [Fig. 1(e)].
• Due to the fore–aft eye movement, a B-scan cannot be con-sidered as a static image. There is a variable amount ofz-axis movement for each A-scan within a B-scan.
• Common 2-D features in the frame image are not reliabledue to intra-B-scan movement and these features are fun-damental to image registration.
Some hardware solutions were made by the OCT man-ufactures to resolve some of the eye movement problems.Spectralis HRA-OCT (Heidelberg Engineering, Heidelberg,Germany) uses a real time eye motion tracking system to trackeye movement, guide OCT to the proper location, and repeatthe B-scan if there was eye movement detected during scanning[10]. The tracking system is an effective solution for x- andy-axis movements, while z-alignment still requires a softwarecorrection. Another hardware solution approach employed byCirrus HD-OCT (Carl Zeiss Meditec, Dublin, CA) acquirestwo diagonal B-scans in addition to the 3-D raster scans thatare mainly used for z-offset correction [11].A few publications addressed image-based correction
methods in 3-D OCT volume data. Ricco et al. [7] proposeda local image registration algorithm to correct x- and y-axiseye movement. A 2-D OCT fundus image [generated by aver-aging each A-scan, Fig. 1(d)] was locally registered on a staticreference image using an affine transformation model. Xu et
al. [8] introduced another global image registration approachbased on the shape context algorithm [12] in order to correctx- and y-axis movements. Retinal blood vessels were detectedon the 3-D OCT image [13] and static reference image [14].A vessel map was then globally registered between the twoimages using a 2-D deformable model computed by the vesselshape context. However, since the reference image is a 2-Dimage in the x- and y-plane, fore–aft eye movement in thez direction is not accounted for by these two methods. Kraus etal. [15] introduced another method, which combined multiple3-D OCT scans into one 3-D OCT volume data to compensatefor motion in all three dimensions. A global cost-function wasoptimized to estimate two dense displacement fields that wereused for modeling the object motion during the scans. At leasttwo consecutive 3-D OCT scans with orthogonal fast scanaxes are required in this method. Antony et al. [16] proposed asegmentation-based method for the correction of axial artifacts.The retinal layer segmentation result was used to generatea reference plane based on thin-plate spline technique. The3-D OCT data was aligned with the reference plane to correctthe distortions. All the previous studies either relied on otherprocessing, such as retinal layer segmentation, or used addi-tional reference images or scans to correct the 3-D OCT image.However, not all OCT devices provide additional B-scans ora 2-D reference image to be used by the software correction.Therefore, eye movements occurring during OCT scanningremains a fundamental problem that needs to be solved.We introduce herein a new method to present a static 3-D
dataset using a dynamic system, where the eye movement cor-rection problem is handled as an object tracking problem in the

XU et al.: ALIGNMENT OF 3-D OPTICAL COHERENCE TOMOGRAPHY SCANS TO CORRECT EYE MOVEMENT USING A PARTICLE FILTERING 1339
Fig. 2. Target tracking based on particle filtering.
dynamic system. A particle filtering algorithm is proposed to au-tomatically align A-scans and correct x- and z-axis eye move-ment artifacts in 3-D SD-OCT images. The current 3-D OCTscan pattern acquires fast scans in the x-axis and slow scan inthe y-axis, where y-axis movement artifacts are mostly gener-ated from minor fixational eye movements such as drift, whichare difficult to detect. Therefore, y-movement correction is notstudied in this manuscript. A statistical model is used to estimatethe misalignment of A-scans, instead of a transformation modelbetween 2-D images. Independent A-scan features are extractedas common features for tracking. The approach is independentand does not rely on any reference images and overcomes mostof the eye movement difficulties stated above.
II. METHOD
Particle filtering has been recognized as an effective targettracking algorithm due to its accuracy, robustness and flexi-bility in nonlinear and non-Gaussian systems [17]–[19]. Thebasic idea of particle filtering is to present the target by a statespace model and convert the target tracking into a state estima-tion problem. The state at a given time in the dynamic system isestimated by its simulated probability density generated from aset of weighted samples, called particles (Fig. 2).The spatial distortion in the 3-D OCT volume data is the com-
bined effect of several eye movement factors. Moreover, thespatial variation between A-scans comes from natural anatomyas well. Particle filtering is a promising approach for statis-tical solution of a nonlinear alignment problem. Because of theintra-B-scan z-movement, each A-scan (1024 1 voxels) in the3-D OCT image voxels is considered as aprocessing unit instead of the 2-D patch in the B-scan. The pro-posed method is to track A-scan movement in the 3-D dataset.It is actually object tracking in one dimension, which causesmore difficulties due to the lack of robust features for similaritymeasurements compared to 2-D object tracking in the generalcases. Based on our results, the algorithm is more stable whencorrecting x- and z-axis movements separately rather than a onestep xz-movement correction. Therefore, an x-movement cor-rection is first performed by an implementation of a particle fil-tering algorithm, followed by z-movement correction. The ker-nels of particle filtering include state space, system dynamics,observations, and state estimation.
A. State Space
The 3-D OCT volume data generated from consecutiveB-scans is considered as a dynamic system that is changingover time, represented by , where the first B-scan is set to be
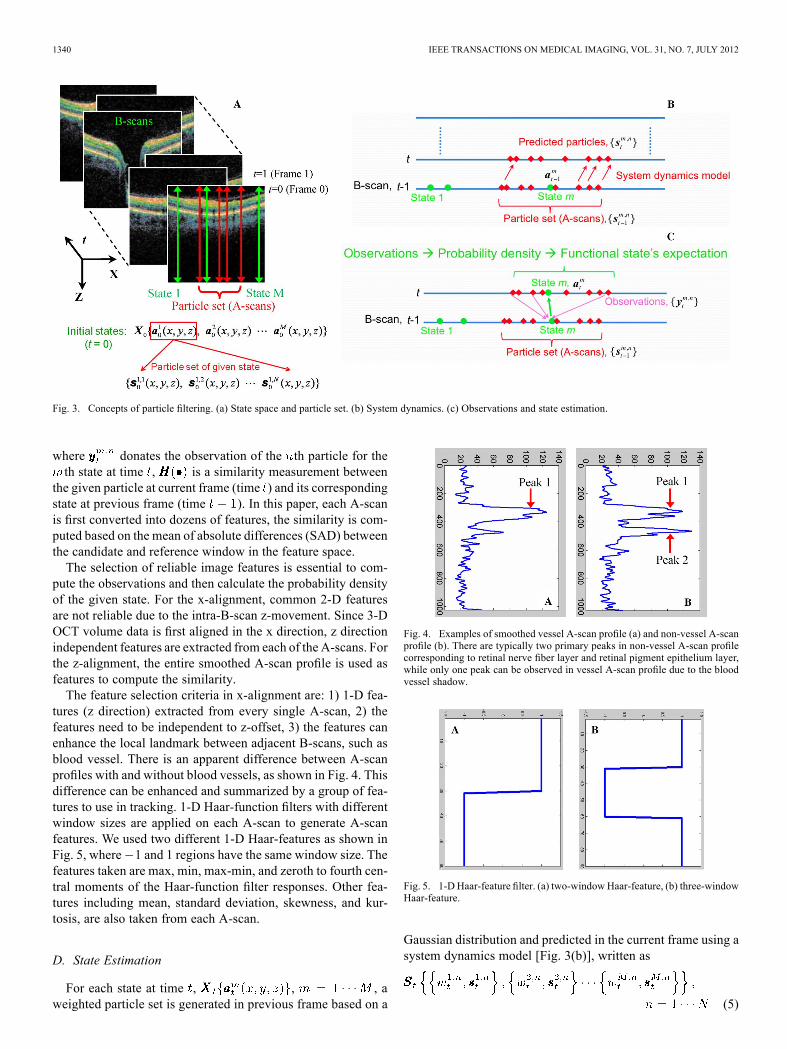
time . The state space is represented in the spatial domainas the 3-D location of an A-scan, donated by .A number of A-scans are selected on the first B-scanas the initial states, denoted by
(1)
where is the number of states in state space [Fig. 3(a)]. Theinitial states can be selected randomly or using a predefined dis-tribution pattern. In this study, considering the computationalefficiency in the 3-D OCT data, we attempted to use the ma-jority of the B-scan without redundancy. Therefore, the spatiallocations of a few equally spaced A-scans were used as the ini-tial states. The state of the system (the locations of the selectedA-scans) is updated frame by frame using particle filtering, inorder to detect the eye movement.A particle set is used to represent the state in a statistical
model (i.e., probability density). For each state , aset of weighted samples is generated as particles in the previousframe, denoted as
(2)
where is the th particle of the th state at time, and is the particle weight. Each sample consists of a par-ticle that represents the hypothetical state and a correspondingdiscrete sampling probability , where . Todeal with the abrupt x-axis movement, we use a Gaussian distri-bution to generate the particle set for each state in x-alignment.Uniform distribution is used to obtain particle set in z-align-ment. Particles are predicted by a system dynamics model inthe current frame [Fig. 3(b)]. An observation model is designedto compute the likelihood between each particle and the statein the previous frame, which is used to approximate the proba-bility density of the state. The displacement of the state in thecurrent frame is obtained by taking the expectation [Fig. 3(c)].
B. System Dynamics
System dynamics is used to predict the tendency of the objectmovement, which is computed by the previous states. A linearregressive model is chosen for the system dynamics betweenadjacent B-scans, written as
(3)
where matrix is initially set to an identity matrix and matrixis set to a zero matrix. Two matrices are updated from two
previous sequences and .
C. Observation Model
The observation is defined as the similarity between the cur-rent particle and the state in the previous frame. To preprocessthe image, a median filter is applied on each A-scan to smooththe A-scan profile and reduce the effect of speckle noise. Awindow-based similarity measurement is used to compute theobservations of particle set at time , written as
(4)
1340 IEEE TRANSACTIONS ON MEDICAL IMAGING, VOL. 31, NO. 7, JULY 2012
Fig. 3. Concepts of particle filtering. (a) State space and particle set. (b) System dynamics. (c) Observations and state estimation.
where donates the observation of the th particle for theth state at time , is a similarity measurement between
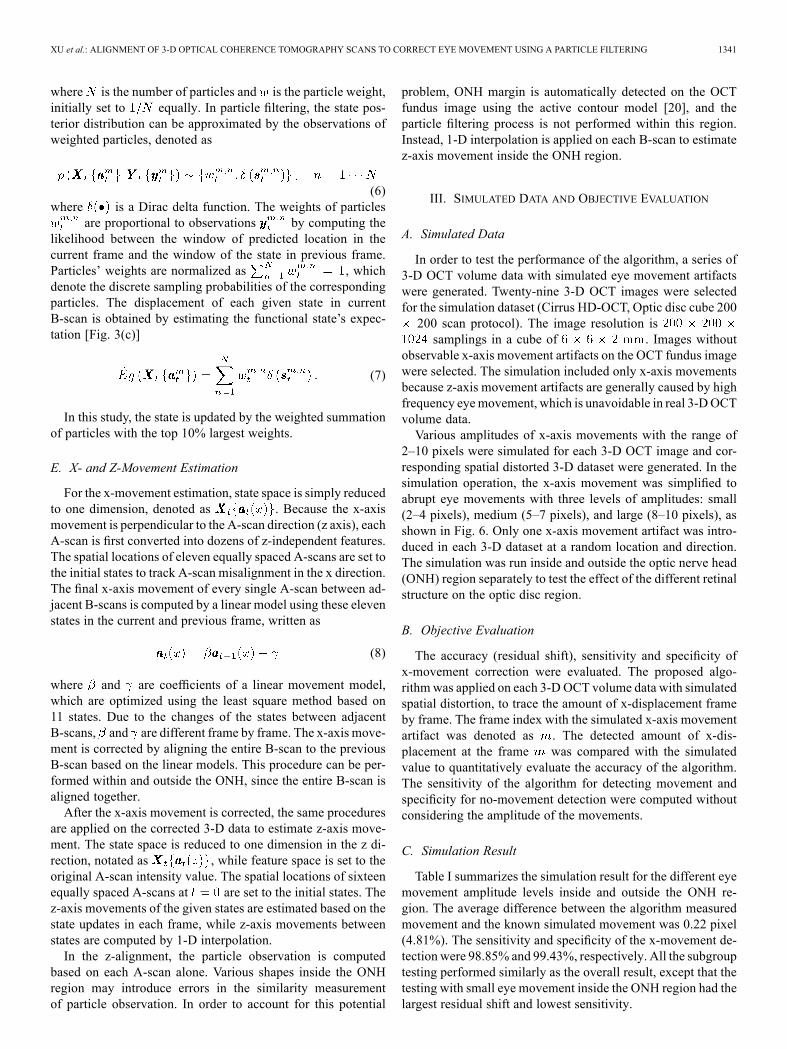
the given particle at current frame (time ) and its correspondingstate at previous frame (time ). In this paper, each A-scanis first converted into dozens of features, the similarity is com-puted based on the mean of absolute differences (SAD) betweenthe candidate and reference window in the feature space.The selection of reliable image features is essential to com-
pute the observations and then calculate the probability densityof the given state. For the x-alignment, common 2-D featuresare not reliable due to the intra-B-scan z-movement. Since 3-DOCT volume data is first aligned in the x direction, z directionindependent features are extracted from each of the A-scans. Forthe z-alignment, the entire smoothed A-scan profile is used asfeatures to compute the similarity.The feature selection criteria in x-alignment are: 1) 1-D fea-
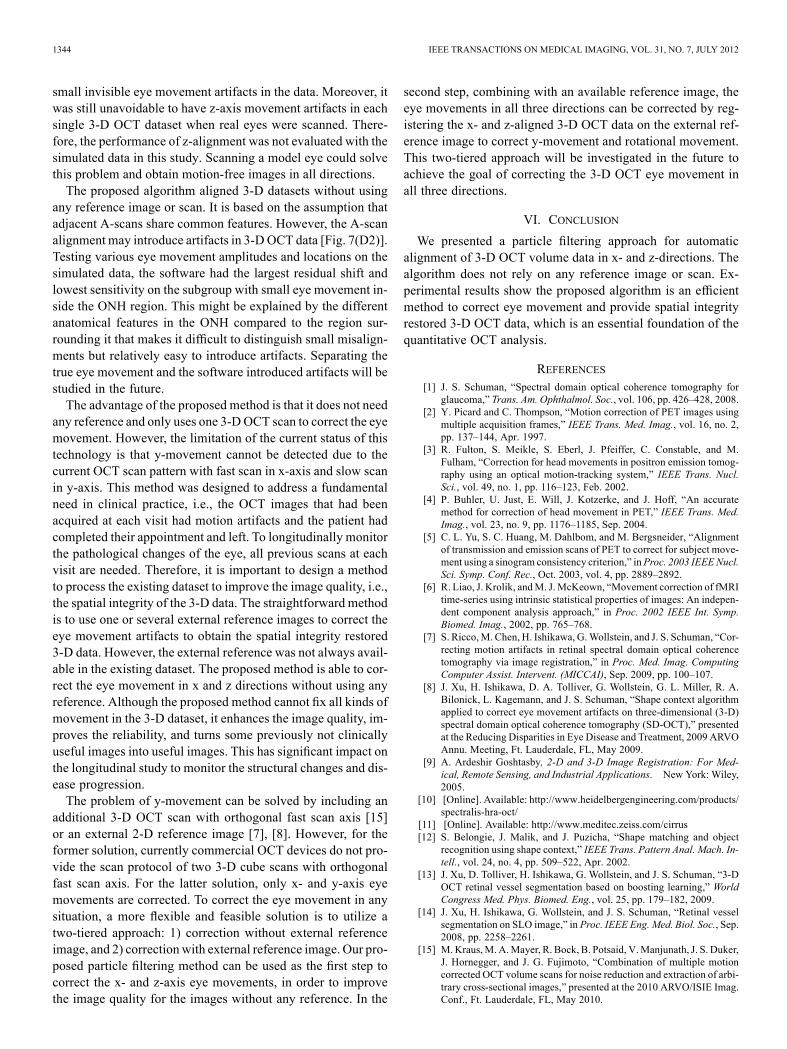
tures (z direction) extracted from every single A-scan, 2) thefeatures need to be independent to z-offset, 3) the features canenhance the local landmark between adjacent B-scans, such asblood vessel. There is an apparent difference between A-scanprofiles with and without blood vessels, as shown in Fig. 4. Thisdifference can be enhanced and summarized by a group of fea-tures to use in tracking. 1-D Haar-function filters with differentwindow sizes are applied on each A-scan to generate A-scanfeatures. We used two different 1-D Haar-features as shown inFig. 5, where 1 and 1 regions have the same window size. Thefeatures taken are max, min, max-min, and zeroth to fourth cen-tral moments of the Haar-function filter responses. Other fea-tures including mean, standard deviation, skewness, and kur-tosis, are also taken from each A-scan.
D. State Estimation
For each state at time , , , aweighted particle set is generated in previous frame based on a
Fig. 4. Examples of smoothed vessel A-scan profile (a) and non-vessel A-scanprofile (b). There are typically two primary peaks in non-vessel A-scan profilecorresponding to retinal nerve fiber layer and retinal pigment epithelium layer,while only one peak can be observed in vessel A-scan profile due to the bloodvessel shadow.
Fig. 5. 1-D Haar-feature filter. (a) two-windowHaar-feature, (b) three-windowHaar-feature.
Gaussian distribution and predicted in the current frame using asystem dynamics model [Fig. 3(b)], written as
(5)
XU et al.: ALIGNMENT OF 3-D OPTICAL COHERENCE TOMOGRAPHY SCANS TO CORRECT EYE MOVEMENT USING A PARTICLE FILTERING 1341
where is the number of particles and is the particle weight,initially set to equally. In particle filtering, the state pos-terior distribution can be approximated by the observations ofweighted particles, denoted as
(6)where is a Dirac delta function. The weights of particles
are proportional to observations by computing thelikelihood between the window of predicted location in thecurrent frame and the window of the state in previous frame.Particles’ weights are normalized as , whichdenote the discrete sampling probabilities of the correspondingparticles. The displacement of each given state in currentB-scan is obtained by estimating the functional state’s expec-tation [Fig. 3(c)]
(7)
In this study, the state is updated by the weighted summationof particles with the top 10% largest weights.
E. X- and Z-Movement Estimation
For the x-movement estimation, state space is simply reducedto one dimension, denoted as . Because the x-axismovement is perpendicular to the A-scan direction (z axis), eachA-scan is first converted into dozens of z-independent features.The spatial locations of eleven equally spaced A-scans are set tothe initial states to track A-scan misalignment in the x direction.The final x-axis movement of every single A-scan between ad-jacent B-scans is computed by a linear model using these elevenstates in the current and previous frame, written as
(8)
where and are coefficients of a linear movement model,which are optimized using the least square method based on11 states. Due to the changes of the states between adjacentB-scans, and are different frame by frame. The x-axis move-ment is corrected by aligning the entire B-scan to the previousB-scan based on the linear models. This procedure can be per-formed within and outside the ONH, since the entire B-scan isaligned together.After the x-axis movement is corrected, the same procedures
are applied on the corrected 3-D data to estimate z-axis move-ment. The state space is reduced to one dimension in the z di-rection, notated as , while feature space is set to theoriginal A-scan intensity value. The spatial locations of sixteenequally spaced A-scans at are set to the initial states. Thez-axis movements of the given states are estimated based on thestate updates in each frame, while z-axis movements betweenstates are computed by 1-D interpolation.In the z-alignment, the particle observation is computed
based on each A-scan alone. Various shapes inside the ONHregion may introduce errors in the similarity measurementof particle observation. In order to account for this potential
problem, ONH margin is automatically detected on the OCTfundus image using the active contour model [20], and theparticle filtering process is not performed within this region.Instead, 1-D interpolation is applied on each B-scan to estimatez-axis movement inside the ONH region.
III. SIMULATED DATA AND OBJECTIVE EVALUATION
A. Simulated Data
In order to test the performance of the algorithm, a series of3-D OCT volume data with simulated eye movement artifactswere generated. Twenty-nine 3-D OCT images were selectedfor the simulation dataset (Cirrus HD-OCT, Optic disc cube 200200 scan protocol). The image resolution issamplings in a cube of . Images without
observable x-axis movement artifacts on the OCT fundus imagewere selected. The simulation included only x-axis movementsbecause z-axis movement artifacts are generally caused by highfrequency eyemovement, which is unavoidable in real 3-DOCTvolume data.Various amplitudes of x-axis movements with the range of
2–10 pixels were simulated for each 3-D OCT image and cor-responding spatial distorted 3-D dataset were generated. In thesimulation operation, the x-axis movement was simplified toabrupt eye movements with three levels of amplitudes: small(2–4 pixels), medium (5–7 pixels), and large (8–10 pixels), asshown in Fig. 6. Only one x-axis movement artifact was intro-duced in each 3-D dataset at a random location and direction.The simulation was run inside and outside the optic nerve head(ONH) region separately to test the effect of the different retinalstructure on the optic disc region.
B. Objective Evaluation
The accuracy (residual shift), sensitivity and specificity ofx-movement correction were evaluated. The proposed algo-rithmwas applied on each 3-DOCT volume data with simulatedspatial distortion, to trace the amount of x-displacement frameby frame. The frame index with the simulated x-axis movementartifact was denoted as . The detected amount of x-dis-placement at the frame was compared with the simulatedvalue to quantitatively evaluate the accuracy of the algorithm.The sensitivity of the algorithm for detecting movement andspecificity for no-movement detection were computed withoutconsidering the amplitude of the movements.
C. Simulation Result
Table I summarizes the simulation result for the different eyemovement amplitude levels inside and outside the ONH re-gion. The average difference between the algorithm measuredmovement and the known simulated movement was 0.22 pixel(4.81%). The sensitivity and specificity of the x-movement de-tection were 98.85% and 99.43%, respectively. All the subgrouptesting performed similarly as the overall result, except that thetesting with small eye movement inside the ONH region had thelargest residual shift and lowest sensitivity.

1342 IEEE TRANSACTIONS ON MEDICAL IMAGING, VOL. 31, NO. 7, JULY 2012
Fig. 6. Simulated eye movement artifacts. (a) Abrupt eye movement in x direction, with eight pixel amplitude in the right direction. (b) OCT fundus image withoutany x-movement. (c) Three pixel x-movement (small) at the 140th frame moving to left. (d) Five pixel x-movement (medium) at the 102nd frame inside ONHregion moving to right. (e) Eight pixel x-movement (large) at the 21st frame moving to right.
TABLE IQUANTITATIVE EVALUATION OF THE PROPOSED EYE MOVEMENT
CORRECTION ALGORITHM USING SIMULATED DATA
ONH—optic nerve head, overall—2–10 pixels including both insideand outside ONH region, small—2–4 pixels, medium—5–7 pixels,large—8–10 pixels.
IV. EXPERIMENTAL DATA AND RESULT
A. Experimental Data
The algorithm was also tested on an independent dataset of74 3-D OCT images centred on the optic disc, taken from 25healthy and 49 glaucomatous eyes, using the same scanning pro-tocol as described above. The inclusion criteria for this datasetrequire the presence of clearly observable z-axis movement,blood vessel discontinuities, and/or optic disc distortions. Thisdataset represents the real-life clinical situation where acquiredimages often contain eye movement artifacts. Particle filteringwas applied on each 3-DOCT image. The entire processing withMATLAB, including generation of the corrected 3-D data, andsaving the results on a hard disk, lasted approximately 7 min.
B. Subjective Evaluation
The algorithm was subjectively evaluated by comparing theprocessed and original 3-D OCT images side by side. Each pro-
cessed image was evaluated with respect to overall x-movementcorrection and z-movement correction. Assessment of x-axiscorrection was based on the global blood vessel continuity onthe OCT fundus image. The retinal pigment epithelium [RPE,Fig. 7(a) and (b)] layer of the retina is typically flat within 66 mm OCT scan region. Therefore, overall z-correction consid-ered whether RPE layer was flat or not on the horizontal andvertical center B-scans generated from 3-D OCT volume data.The results were labeled as improved, equivalent, and degraded.
C. Experimental Result
Particle filtering was applied on the 3-D OCT volume dataframe by frame to correct x-axis movement and then z-axismovement. The overall 3-D OCT correction took 7 min usingMATLAB (Mac OS X 10.6.8, 2.4-GHz Intel Core 2 Duo, and2-GB 667-MHz DDR2 SDRAM). Examples of the results ofparticle filtering based 3-D OCT alignment is given in Fig. 7.Two original 3-D OCT volume data with spatial distortions areillustrated in Fig. 7(a). Blood vessel discontinuity generated bymicro-saccades could be observed on their OCT fundus images[Fig. 7(c)]. The z-axis movements generated from fore–afteye movements are shown in their vertical OCT B-scans[Fig. 7(e)]. The particle filtering approach efficiently correctedmicro-saccades and z-axis movements by aligning B-scans andA-scans. The corrected 3-D OCT volume data and their corre-sponding OCT fundus images and vertical B-scans are shownin Fig. 7(b), (d), (f). Table II gives the subjective evaluationof the processed images with respect to x- and z-movementcorrections. All the images were improved after z-alignment,while 81.1% images were improved after x-alignment.
V. DISCUSSION
The main difficulties of 3-D OCT eye movement correctionare the complicate nature of eye movement and the lack of ref-erence. The proposed algorithm used intrinsic features to align

XU et al.: ALIGNMENT OF 3-D OPTICAL COHERENCE TOMOGRAPHY SCANS TO CORRECT EYE MOVEMENT USING A PARTICLE FILTERING 1343
Fig. 7. Two examples of 3-D OCT eye movement correction using particle filtering. (A1, 2) 3-D OCT volume data with eye movements. (B1, 2) Corrected 3-DOCT volume data. (C1, 2) OCT fundus images with blood discontinuity caused by eye movements. (D1, 2) Corrected OCT fundus images. Note the appearanceof algorithm generated artifact in ONH region labeled with red arrow (D2). (E1, 2) Vertical OCT B-scans with z-axis eye movement artifacts. (F1, 2) Correctedvertical B-scans.
TABLE IISUBJECTIVE EVALUATION OF 74 PROCESSED 3-D OCT IMAGES
A-scans in the 3-D dataset. It did not rely on any reference imageor additional scan. A-scan alignment only used 1-D A-scan fea-tures but not 2-D B-scan features. Therefore, z-axis movementswithin a B-scan did not affect the alignment processing. Anotheradvantage of this method is the use of a statistical model to es-timate the A-scan movement, which could handle various typesof eye movements and their combinations. Therefore, it was notnecessary to design a particular movement model for each typeof eye movement.To reduce the redundancy and have a more efficient computa-
tion, the proposed A-scan tracking algorithm is initiated from a
few A-scans with equal interval in the first B-scan in the image.The overall 3-D OCT image alignment took approximately7 min using MATLAB, which is an acceptable processingtime in real-time clinical utility. Dedicated programming maysubstantially shorten this duration. For x-movement correction,some particular A-scans, such as A-scans with blood vessels,may provide more robust tracking results due to their differ-ences from neighboring samplings. However, the blood vesselapproach is only suitable for locations with apparent vesselnetwork, but will be of limited use in locations deprived ofmajor blood vessels such as the macular region. Further studiesare warranted to explore this method.In Table I, we computed “residual shift,” “sensitivity,” and
“specificity” to objectively evaluate the algorithm performancewith the simulated data. “Residual shift” measures the absolutedifference of the movement amplitude compared with thereference, thus quantitatively evaluating the accuracy of thealgorithm. “Sensitivity” and “specificity” measure the abilityof identifying movement and no-movement regardless ofamplitude.Although good quality OCT images were carefully selected
as ideal images for the simulated data, it is possible to have some
1344 IEEE TRANSACTIONS ON MEDICAL IMAGING, VOL. 31, NO. 7, JULY 2012
small invisible eye movement artifacts in the data. Moreover, itwas still unavoidable to have z-axis movement artifacts in eachsingle 3-D OCT dataset when real eyes were scanned. There-fore, the performance of z-alignment was not evaluated with thesimulated data in this study. Scanning a model eye could solvethis problem and obtain motion-free images in all directions.The proposed algorithm aligned 3-D datasets without using
any reference image or scan. It is based on the assumption thatadjacent A-scans share common features. However, the A-scanalignment may introduce artifacts in 3-DOCT data [Fig. 7(D2)].Testing various eye movement amplitudes and locations on thesimulated data, the software had the largest residual shift andlowest sensitivity on the subgroup with small eye movement in-side the ONH region. This might be explained by the differentanatomical features in the ONH compared to the region sur-rounding it that makes it difficult to distinguish small misalign-ments but relatively easy to introduce artifacts. Separating thetrue eye movement and the software introduced artifacts will bestudied in the future.The advantage of the proposed method is that it does not need
any reference and only uses one 3-DOCT scan to correct the eyemovement. However, the limitation of the current status of thistechnology is that y-movement cannot be detected due to thecurrent OCT scan pattern with fast scan in x-axis and slow scanin y-axis. This method was designed to address a fundamentalneed in clinical practice, i.e., the OCT images that had beenacquired at each visit had motion artifacts and the patient hadcompleted their appointment and left. To longitudinally monitorthe pathological changes of the eye, all previous scans at eachvisit are needed. Therefore, it is important to design a methodto process the existing dataset to improve the image quality, i.e.,the spatial integrity of the 3-D data. The straightforward methodis to use one or several external reference images to correct theeye movement artifacts to obtain the spatial integrity restored3-D data. However, the external reference was not always avail-able in the existing dataset. The proposed method is able to cor-rect the eye movement in x and z directions without using anyreference. Although the proposed method cannot fix all kinds ofmovement in the 3-D dataset, it enhances the image quality, im-proves the reliability, and turns some previously not clinicallyuseful images into useful images. This has significant impact onthe longitudinal study to monitor the structural changes and dis-ease progression.The problem of y-movement can be solved by including an
additional 3-D OCT scan with orthogonal fast scan axis [15]or an external 2-D reference image [7], [8]. However, for theformer solution, currently commercial OCT devices do not pro-vide the scan protocol of two 3-D cube scans with orthogonalfast scan axis. For the latter solution, only x- and y-axis eyemovements are corrected. To correct the eye movement in anysituation, a more flexible and feasible solution is to utilize atwo-tiered approach: 1) correction without external referenceimage, and 2) correction with external reference image. Our pro-posed particle filtering method can be used as the first step tocorrect the x- and z-axis eye movements, in order to improvethe image quality for the images without any reference. In the
second step, combining with an available reference image, theeye movements in all three directions can be corrected by reg-istering the x- and z-aligned 3-D OCT data on the external ref-erence image to correct y-movement and rotational movement.This two-tiered approach will be investigated in the future toachieve the goal of correcting the 3-D OCT eye movement inall three directions.
VI. CONCLUSION
We presented a particle filtering approach for automaticalignment of 3-D OCT volume data in x- and z-directions. Thealgorithm does not rely on any reference image or scan. Ex-perimental results show the proposed algorithm is an efficientmethod to correct eye movement and provide spatial integrityrestored 3-D OCT data, which is an essential foundation of thequantitative OCT analysis.
REFERENCES[1] J. S. Schuman, “Spectral domain optical coherence tomography for
glaucoma,” Trans. Am. Ophthalmol. Soc., vol. 106, pp. 426–428, 2008.[2] Y. Picard and C. Thompson, “Motion correction of PET images using
multiple acquisition frames,” IEEE Trans. Med. Imag., vol. 16, no. 2,pp. 137–144, Apr. 1997.
[3] R. Fulton, S. Meikle, S. Eberl, J. Pfeiffer, C. Constable, and M.Fulham, “Correction for head movements in positron emission tomog-raphy using an optical motion-tracking system,” IEEE Trans. Nucl.Sci., vol. 49, no. 1, pp. 116–123, Feb. 2002.
[4] P. Buhler, U. Just, E. Will, J. Kotzerke, and J. Hoff, “An accuratemethod for correction of head movement in PET,” IEEE Trans. Med.Imag., vol. 23, no. 9, pp. 1176–1185, Sep. 2004.
[5] C. L. Yu, S. C. Huang, M. Dahlbom, and M. Bergsneider, “Alignmentof transmission and emission scans of PET to correct for subject move-ment using a sinogram consistency criterion,” inProc. 2003 IEEENucl.Sci. Symp. Conf. Rec., Oct. 2003, vol. 4, pp. 2889–2892.
[6] R. Liao, J. Krolik, andM. J.McKeown, “Movement correction of fMRItime-series using intrinsic statistical properties of images: An indepen-dent component analysis approach,” in Proc. 2002 IEEE Int. Symp.Biomed. Imag., 2002, pp. 765–768.
[7] S. Ricco,M. Chen, H. Ishikawa, G.Wollstein, and J. S. Schuman, “Cor-recting motion artifacts in retinal spectral domain optical coherencetomography via image registration,” in Proc. Med. Imag. ComputingComputer Assist. Intervent. (MICCAI), Sep. 2009, pp. 100–107.
[8] J. Xu, H. Ishikawa, D. A. Tolliver, G. Wollstein, G. L. Miller, R. A.Bilonick, L. Kagemann, and J. S. Schuman, “Shape context algorithmapplied to correct eye movement artifacts on three-dimensional (3-D)spectral domain optical coherence tomography (SD-OCT),” presentedat the Reducing Disparities in Eye Disease and Treatment, 2009 ARVOAnnu. Meeting, Ft. Lauderdale, FL, May 2009.
[9] A. Ardeshir Goshtasby, 2-D and 3-D Image Registration: For Med-ical, Remote Sensing, and Industrial Applications. New York: Wiley,2005.
[10] [Online]. Available: http://www.heidelbergengineering.com/products/spectralis-hra-oct/
[11] [Online]. Available: http://www.meditec.zeiss.com/cirrus[12] S. Belongie, J. Malik, and J. Puzicha, “Shape matching and object
recognition using shape context,” IEEE Trans. Pattern Anal. Mach. In-tell., vol. 24, no. 4, pp. 509–522, Apr. 2002.
[13] J. Xu, D. Tolliver, H. Ishikawa, G. Wollstein, and J. S. Schuman, “3-DOCT retinal vessel segmentation based on boosting learning,” WorldCongress Med. Phys. Biomed. Eng., vol. 25, pp. 179–182, 2009.
[14] J. Xu, H. Ishikawa, G. Wollstein, and J. S. Schuman, “Retinal vesselsegmentation on SLO image,” in Proc. IEEE Eng. Med. Biol. Soc., Sep.2008, pp. 2258–2261.
[15] M.Kraus,M. A.Mayer, R. Bock, B. Potsaid, V.Manjunath, J. S. Duker,J. Hornegger, and J. G. Fujimoto, “Combination of multiple motioncorrected OCT volume scans for noise reduction and extraction of arbi-trary cross-sectional images,” presented at the 2010 ARVO/ISIE Imag.Conf., Ft. Lauderdale, FL, May 2010.

XU et al.: ALIGNMENT OF 3-D OPTICAL COHERENCE TOMOGRAPHY SCANS TO CORRECT EYE MOVEMENT USING A PARTICLE FILTERING 1345
[16] B. Antony, M. D. Abràmoff, L. Tang, W. D. Ramdas, J. R. Vingerling,N. M. Jansonius, K. Lee, Y. H. Kwon, M. Sonka, and M. K. Garvin,“Automated 3-Dmethod for the correction of axial artifacts in spectral-domain optical coherence tomography images,” Biomed. Opt. Express,vol. 2, no. 8, pp. 2403–2416, Aug. 1, 2011.
[17] Z. Yan, M. B. Yeary, S. Cheng, and N. Kehtarnavaz, “An ob-ject-tracking algorithm based on multiple-model particle filtering withstate partitioning,” IEEE Trans. Instrum. Meas., vol. 58, no. 5, pp.1797–1809, Apr. 2009.
[18] A. Doucet and A. M. Johansen, A tutorial on particle filtering andsmoothing: Fifteen years later Dept. Stat., Univ. British Columbia,Vancouver, BC, Canada, Tech. Rep..
[19] J. Xu, H. Ishikawa, G. Wollstein, and J. S. Schuman, “3-D OCT eyemovement correction based on particle filtering,” in Proc. IEEE Eng.Med. Biol. Soc., Sep. 2010, pp. 53–56.
[20] J. Xu, H. Ishikawa, G. Wollstein, R. A. Bilonick, K. R. Sung, L. Kage-mann, and J. S. Schuman, “Automated assessment of optic nerve headon stereo disc photographs,” Invest. Ophthalmol. Vis. Sci., vol. 49, pp.2512–2517, 2008.


