Embed Size (px)
Citation preview

CPD10, 4277–4363, 2014
Twelve thousandyears of dust
S. Albani et al.
Title Page
Abstract Introduction
Conclusions References
Tables Figures
J I
J I
Back Close
Full Screen / Esc
Printer-friendly Version
Interactive Discussion
Discussion
Paper
|D
iscussionP
aper|
Discussion
Paper
|D
iscussionP
aper|
Clim. Past Discuss., 10, 4277–4363, 2014www.clim-past-discuss.net/10/4277/2014/doi:10.5194/cpd-10-4277-2014© Author(s) 2014. CC Attribution 3.0 License.
This discussion paper is/has been under review for the journal Climate of the Past (CP).Please refer to the corresponding final paper in CP if available.
Twelve thousand years of dust: theHolocene global dust cycle constrainedby natural archives
S. Albani1,2, N. M. Mahowald1, G. Winckler3,4, R. F. Anderson3,4,L. I. Bradtmiller5, B. Delmonte2, R. François6, M. Goman7, N. G. Heavens8,P. P. Hesse9, S. A. Hovan10, K. E. Kohfeld11, H. Lu12, V. Maggi2, J. A. Mason13,P. A. Mayewski14, D. McGee15, X. Miao16, B. L. Otto-Bliesner17, A. T. Perry1,A. Pourmand18, H. M. Roberts19, N. Rosenbloom17, T. Stevens20, and J. Sun21
1Department of Earth and Atmospheric Science, Cornell University, Ithaca, NY, USA2Department of Environmental Sciences, University of Milano-Bicocca, Milano, Italy3Lamont-Doherty Earth Observatory, Columbia University, Palisades, NY, USA4Department of Earth and Environmental Sciences, Columbia University, New York, NY, USA5Department of Environmental Studies, Macalester College, Saint Paul, MN, USA6Department of Earth and Ocean Sciences, University of British Columbia, Vancouver,BC, Canada7Department of Geography and Global Studies, Sonoma State University, Rohnert Park,CA, USA8Department of Atmospheric and Planetary Sciences, Hampton University, Hampton, VA, USA
4277
CPD10, 4277–4363, 2014
Twelve thousandyears of dust
S. Albani et al.
Title Page
Abstract Introduction
Conclusions References
Tables Figures
J I
J I
Back Close
Full Screen / Esc
Printer-friendly Version
Interactive Discussion
Discussion
Paper
|D
iscussionP
aper|
Discussion
Paper
|D
iscussionP
aper|
9Department of Environment and Geography, Macquarie University, Sydney, Australia10Department of Geoscience, Indiana University of Pennsylvania, Indiana, PA, USA11School of Resource and Environmental Management, Simon Fraser University, Burnaby,BC, Canada12School of Geographic and Oceanographic Sciences, Nanjing University, Nanjing, China13Department of Geography, University of Wisconsin, Madison, WI, USA14Climate Change Institute, University of Maine, Orono, ME, USA15Department of Earth, Atmospheric and Planetary Sciences, Massachusetts Institute ofTechnology, Cambridge, MA, USA16Illinois State Geological Survey, Champaign, IL, USA17National Center for Atmospheric Research, Boulder, CO, USA18Department of Marine Geosciences, Rosenstiel School of Marine and Atmospheric Science,University of Miami, Miami, FL, USA19Institute of Geography and Earth Sciences, Aberystwyth University, Aberystwyth, Wales, UK20Department of Earth Sciences, Uppsala University, Uppsala, Sweden21Key laboratory of Cenozoic Geology and Environment, Institute of Geology and Geophysics,Chinese Academy of Science, Beijing, China
Received: 30 September 2014 – Accepted: 24 October 2014 – Published: 13 November 2014
Correspondence to: S. Albani ([email protected])
Published by Copernicus Publications on behalf of the European Geosciences Union.
4278
CPD10, 4277–4363, 2014
Twelve thousandyears of dust
S. Albani et al.
Title Page
Abstract Introduction
Conclusions References
Tables Figures
J I
J I
Back Close
Full Screen / Esc
Printer-friendly Version
Interactive Discussion
Discussion
Paper
|D
iscussionP
aper|
Discussion
Paper
|D
iscussionP
aper|
Abstract
Mineral dust plays an important role in the climate system by interacting with radia-tion, clouds, and biogeochemical cycles. In addition, natural archives show that thedust cycle experienced variability in the past in response to global and local climatechange. The compilation of the DIRTMAP paleodust datasets in the last two decades5
provided a target for paleoclimate models that include the dust cycle, following a timeslice approach. We propose an innovative framework to organize a paleodust datasetthat moves on from the positive experience of DIRTMAP and takes into account newscientific challenges, by providing a concise and accessible dataset of temporally re-solved records of dust mass accumulation rates and particle grain-size distributions.10
We consider data from ice cores, marine sediments, loess/paleosol sequences, lakesediments, and peat bogs for this compilation, with a temporal focus on the Holoceneperiod. This global compilation allows investigation of the potential, uncertainties andconfidence level of dust mass accumulation rates reconstructions, and highlights theimportance of dust particle size information for accurate and quantitative reconstruc-15
tions of the dust cycle. After applying criteria that help to establish that the data consid-ered represent changes in dust deposition, 43 paleodust records have been identified,with the highest density of dust deposition data occurring in the North Atlantic region.Although the temporal evolution of dust in the North Atlantic appears consistent acrossseveral cores and suggest that minimum dust fluxes are likely observed during the20
Early to mid-Holocene period (6000–8000 years ago), the magnitude of dust fluxes inthese observations is not fully consistent, suggesting that more work needs to be doneto synthesize datasets for the Holocene. Based on the data compilation, we used theCommunity Earth System Model to estimate the mass balance and variability of theglobal dust cycle during the Holocene, with dust load ranging from 17.1 to 20.5 Tg25
between 2000 and 10 000 years ago, and a minimum in the Early to Mid-Holocene(6000–8000 years ago).
4279

CPD10, 4277–4363, 2014
Twelve thousandyears of dust
S. Albani et al.
Title Page
Abstract Introduction
Conclusions References
Tables Figures
J I
J I
Back Close
Full Screen / Esc
Printer-friendly Version
Interactive Discussion
Discussion
Paper
|D
iscussionP
aper|
Discussion
Paper
|D
iscussionP
aper|
1 Introduction
Paleoclimate records from natural archives have laid foundations for understandingthe variability of the Earth’s climate system over different time scales. Paleoclimateproxies shed light on past environmental conditions such as the composition of theatmosphere, global ice volume, sea level, and surface temperatures (Bradley, 1999).5
Paleodust reconstructions paired with other proxies showed the response of the climatesystem to orbitally induced forcing, including feedback mechanisms. Dust feedbackson the climate system include scattering and absorption of solar radiation and indirecteffects on clouds and the global carbon cycle (e.g. Boucher et al., 2013; Martin, 1990).
The story told by paleodust archives suggests that increased aridity (An et al., 1991;10
Liu, 1985; Liu et al., 1998) and wind gustiness (McGee et al., 2010; Muhs et al., 2013)enhanced the dust cycle during cold periods over glacial-interglacial time scales, withadditional mechanisms introducing characteristic geographic patterns and/or imprint-ing the archives with characteristic signals in different geographical settings. Thesemechanisms include increased sediment availability by glacial erosion (Delmonte et al.,15
2010a; Petit et al., 1999), reorganization of the atmospheric circulation between midand high latitudes (Fuhrer et al., 1999; Lambert et al., 2008; Mayewski et al., 1997,2014), shifts in the Inter-Tropical Convergence Zone (ITCZ) (McGee et al., 2007; Rea,1994), changes in the monsoonal variability (Clemens and Prell, 1990; Hovan et al.,1991; Tiedemann et al., 1994), and regional drying (Lu et al., 2010).20
The growing number of paleodust archives and the inclusion of the dust cycle in cli-mate models has promoted synthesis efforts in the compilation of global dust datasets(Mahowald et al., 1999). The Dust Indicators and Records from Terrestrial and MArinePalaeoenvironments (DIRTMAP) Project (Kohfeld and Harrison, 2001) formalized thecompilation of Dust Mass Accumulation Rates (dust MAR, or DMAR) from marine and25
ice cores, later complemented by terrestrial sedimentary records (Derbyshire, 2003).This project followed a time slice approach, providing reference values of DMARs forthe Last Glacial Maximum (LGM) and Late Holocene/modern data, including sediment
4280

CPD10, 4277–4363, 2014
Twelve thousandyears of dust
S. Albani et al.
Title Page
Abstract Introduction
Conclusions References
Tables Figures
J I
J I
Back Close
Full Screen / Esc
Printer-friendly Version
Interactive Discussion
Discussion
Paper
|D
iscussionP
aper|
Discussion
Paper
|D
iscussionP
aper|
traps. DMAR is the fundamental measurement necessary to cross-correlate variabilityamong dust archives and sites. Without it, only the relative timing and amplitude ofindividual records can be studied. In combination with global climate models, DMARdatasets enable quantitative reconstructions of the global dust cycle. The DIRTMAPcompilation showed a globally averaged glacial/interglacial ratio of ∼ 2.5 in dust de-5
position. Subsequent work expanded upon the initial compilation (DIRTMAP2: Tegenet al., 2002), and the most recent version of the database (DIRTMAP3: Maher et al.,2010) also contains an extensive repository of additional metadata from the originalpublications. The DIRTMAP datasets have proven to be an invaluable tool for paleocli-mate research and model-data inter-comparison.10
The full definition of the global dust cycle in terms of DMAR is unavoidably linkedto the dust grain size distributions that characterize the mass balance and its spatialevolution. The more advanced dust models define a model particle size range and dis-tribution, which would require (although this has been often neglected) explicitly con-sidering the size range of dust found in the dust deposition data in model-observation15
inter-comparisons. This aspect was initially taken into account for terrestrial sedimentsin Mahowald et al. (2006) to match the specific model size range (0.1–10 µm), and re-cently extended by Albani et al. (2014). Still the necessity of more extensive grain sizeinformation from dust data has been emphasized by Maher et al. (2010), as well as byother review papers on dust (e.g. Formenti et al., 2011; Mahowald et al., 2014). Coher-20
ent information on grain size is missing in DIRTMAP3 (Maher et al., 2010), becauseof the difficulty of making a synthesis from measurements produced by a variety ofparticle-size measurement techniques often yielding quite different results (Mahowaldet al., 2014; Reid, 2003).
A time slice approach is often used by the paleoclimate modelling community to25
target key periods in climate history, such as the Last Glacial Maximum ∼ 21 000 yearsBefore Present (LGM: 21 ka BP), or the Mid-Holocene (MH: 6 ka BP), in the frameworkof the Paleoclimate Modelling Inter-comparison Project (PMIP: Joussaume and Taylor,2000). Continuing improvement in the performance of large-scale supercomputers is
4281

CPD10, 4277–4363, 2014
Twelve thousandyears of dust
S. Albani et al.
Title Page
Abstract Introduction
Conclusions References
Tables Figures
J I
J I
Back Close
Full Screen / Esc
Printer-friendly Version
Interactive Discussion
Discussion
Paper
|D
iscussionP
aper|
Discussion
Paper
|D
iscussionP
aper|
opening up doors to performing transient simulations on paleoclimate time scales, bothto intermediate complexity (Bauer and Ganopolski, 2014) and more complex EarthSystem Models (ESMs) (Liu et al., 2009). PMIP3 called for additional key transientexperiments to study abrupt climate change, with the implication that at the same timetarget observational datasets with the necessary temporal continuity and resolution are5
needed (Otto-Bliesner et al., 2009).We propose an innovative framework to organize a paleodust dataset that moves on
from the positive experience of DIRTMAP and takes into account new scientific chal-lenges outlined above, by providing a synthesized and accessible dataset of temporallyresolved records of dust MARs and size distributions. We aim to provide a database10
that is a concise and accessible compilation of time series, including age (with uncer-tainty), dust MAR (with uncertainty), and dust particle size distribution (where avail-able), standardized by the use of a common binning scheme, and complemented bya categorical attribution of confidence based on general consensus. Besides the ba-sic information mentioned above, we also report the ancillary information necessary15
to re-derive the dust MARs time series, i.e. the detailed depths and the relevant dustvariables.
We focus on dust variability during the Holocene, with emphasis on the MH as a keyPMIP scenario and also in relation to the large variability that affected the presentlargest dust source in the world, North Africa, with the termination of the African Humid20
Period (AHP) (deMenocal et al., 2000; McGee et al., 2013). For this reason we onlyselected paleodust records encompassing the MH with some degree of temporal res-olution (see Sect. 3), although we show in the paper the time series from the LGM toprovide reference to other key climate conditions and to place in a fuller context withrespect to the DIRTMAP compilation. The developed framework is suitable for a more25
extensive compilation.We acknowledge that there is a richness of information intrinsic in each sedimen-
tary record (i.e. as in the original studies) that is not necessarily fully captured by thesynthesized information we report, despite our efforts to be as complete as possible:
4282

CPD10, 4277–4363, 2014
Twelve thousandyears of dust
S. Albani et al.
Title Page
Abstract Introduction
Conclusions References
Tables Figures
J I
J I
Back Close
Full Screen / Esc
Printer-friendly Version
Interactive Discussion
Discussion
Paper
|D
iscussionP
aper|
Discussion
Paper
|D
iscussionP
aper|
simplification is inherent in a synthesis. For the sake of accessibility we refrain fromreporting extensive information that cannot be coherently organized. We therefore pro-vide a brief summary, and refer to the relevant literature for detailed description ofspecific records (Supplement). In addition, because our purpose is to provide a quanti-tative constraint on the dust cycle, we only considered sedimentary records that allow5
the derivation of meaningful dust MARs with the information we could access. Manymore studies focused on dust and provide important, good quality information, but didnot allow a time-resolved estimate of dust MAR. We refer to these studies when appro-priate, as they provide further context to ensure our interpretations.
Finally, we use the Community Earth System Model (CESM) in combination with the10
DMAR and size data (Albani et al., 2014; Mahowald et al., 2006) from the compilationto estimate the mass balance of the global dust cycle and its variability during theHolocene.
Section 2 gives an overview of the kind of natural archives initially considered forthis compilation, while in Sect. 3 we explain our methodological approach to select and15
organize the records. In Sect. 4 we present the database and model-based reconstruc-tions, and discuss its emerging properties in relation to the climate features in differentspatial domains. We summarize our work in Sect. 5.
2 Paleodust archives
Natural archives that preserve dust sediments have different characteristics in terms20
of: geographical settings and spatial distributions around the globe; the accuracy ofthe age models and temporal resolution; the ability to isolate eolian dust from otherdepositional contributions. Each type of paleodust archive has its own strengths andlimitations, and it is only by considering high quality records of all types (from land, ice,and ocean archives) that we can hope to build a consistent reconstruction of the global25
dust cycle. We only include paleodust records that allow estimation of dust MARs withrelevance for medium/large scale dust export.
4283

CPD10, 4277–4363, 2014
Twelve thousandyears of dust
S. Albani et al.
Title Page
Abstract Introduction
Conclusions References
Tables Figures
J I
J I
Back Close
Full Screen / Esc
Printer-friendly Version
Interactive Discussion
Discussion
Paper
|D
iscussionP
aper|
Discussion
Paper
|D
iscussionP
aper|
Natural archives preserve eolian dust within a sedimentary matrix. The essentialelements for a paleodust record are the possibility of establishing a reliable chronology,the estimation of the sedimentation rates, and the isolation of the eolian component(Fig. 1).
One of the key elements in the production of a paleodust record is the possibility of5
establishing a depth-age relation. Typically the starting point for this procedure is theattribution of age to a series of specific depth layers along the profile, based on numer-ical dating or stratigraphic correlations. Numerical dating can be based on counting ofannual layers, radionuclide decays (e.g. 14C), or exposure to radiation (e.g. Thermo-Luminescence (TL)/Optically Stimulated Luminescence (OSL)) (Brauer et al., 2014).10
Stratigraphic correlations either exploit stratigraphic markers such as known volcaniceruptions and spikes in tracers of the atmospheric thermonuclear test explosions, orare attributed by wiggle-matching an age-carrier profile from the study site (e.g. δ18O offoraminifera in marine sediment cores, methane concentration in ice cores) with a ref-erence record of global signatures such as global ice volume (e.g. Martinson et al.,15
1987), or the variations in atmospheric methane concentrations (e.g. Loulergue et al.,2008).
Sediment chronologies can be established based on the initial age-depth relationsidentified along a profile. With “chronology” we identify a continuous function that pro-vides a unique attribution of the depth-age relation along the entire profile, based on20
some kind of age model. Age models can vary from simple linear sedimentation mod-els, to complex Bayesian models (Brauer et al., 2014).
A general expression for dust (or eolian – the two terms will be used equivalentlythroughout the text) MARs is the following: DMAR=SBMAR ·EC, where SBMAR is theSediment Bulk Mass Accumulation Rate and EC is Eolian Contribution.25
The estimation of SBMAR relies on a couple of main approaches. The first one isbased on estimating SBMARs between dated horizons as the product of sedimen-tation rates and dry bulk densities: SBMAR=SR ·DBD. Either a Linear Sedimenta-tion Rate (LSR) is derived between dated layers, or more complex age models are
4284

CPD10, 4277–4363, 2014
Twelve thousandyears of dust
S. Albani et al.
Title Page
Abstract Introduction
Conclusions References
Tables Figures
J I
J I
Back Close
Full Screen / Esc
Printer-friendly Version
Interactive Discussion
Discussion
Paper
|D
iscussionP
aper|
Discussion
Paper
|D
iscussionP
aper|
appliedfformed by the accumulation of, resulting in diverse SR profiles. The other ap-proach is specific for the marine sediments realm, and it is largely (other than for decay-correction) independent from the underlying age model: it is based on the assumptionthat the rapid scavenging of 230Th produced in the water column by decay of dissolveduranium results in its flux to the seafloor being equal/close to its known rate of pro-5
duction. Measurements of 230Th in marine sediments therefore allow us to estimateinstantaneous SBMARs that are independent from LSRs (François et al., 2004).
Because eolian DMAR is the product of at least two factors (SBMAR and EC), thesampling (depth) resolution at which the two of them are available will determine theDMAR resolution, and in some cores the resolutions may coincide. Sometimes a con-10
stant LSR is assumed between dated depth layers whereas stratigraphic samples areanalysed at higher resolution and an estimated age is assigned based on the agemodel (Fig. 2). At the time scale of interest, it should be noted that deviations from theideal pairing of EC and SBMAR measurements along a profile might be consideredacceptable if the resolutions are not too different. On the other hand, if one variable15
(typically EC) has a much higher resolution than the other, then its high resolutionis not informative with respect to their product (DMAR), and misinterpretations couldarise. In those cases the lower resolution variable should be used to provide the paceof the record’s resolution.
An additional aspect to consider when dealing with dust MARs is the relationship20
between the dust Deposition Flux (DF) and the dust MAR i.e. to what extent the mea-sured DMAR is representative (in a quantitative way) of the dust deposition, which isof primary interest: ideally DMAR=DF. Deviations from this ideal relation occur, forinstance, when sediment redistribution disturbs the ocean sediments (François et al.,2004), or when erosion leaves hiatuses in loess/paleosol sequences (Stevens et al.,25
2007).The other fundamental piece of information is the size distribution of dust, which is
tightly coupled to the DMAR in determining the magnitude (or mass balance) of the dustcycle (Albani et al., 2014; Mahowald et al., 2014; Schulz et al., 1998; Lu et al., 1999). In
4285

CPD10, 4277–4363, 2014
Twelve thousandyears of dust
S. Albani et al.
Title Page
Abstract Introduction
Conclusions References
Tables Figures
J I
J I
Back Close
Full Screen / Esc
Printer-friendly Version
Interactive Discussion
Discussion
Paper
|D
iscussionP
aper|
Discussion
Paper
|D
iscussionP
aper|
addition, size data is a necessary piece of information to determine the provenance ofdust. In remote accumulation sites, size distribution allows (together with geochemicaland mineralogical data) the identification of local vs. remote inputs (Albani et al., 2012a;Delmonte et al., 2010b). In terrestrial sites proximal to the source areas it is necessaryto evaluate the amount of dust actually available for long-range transport (Mahowald5
et al., 2006; Muhs et al., 2013; Roberts et al., 2003).We next analyse the main characteristics of the different kinds of paleodust records
considered for this compilation: ice cores, marine sediments, loess/paleosol se-quences, lake sediments and peat bogs.
2.1 Ice cores10
Ice cores constitute a natural sampler of past atmospheric composition, includinggreenhouse gases and aerosols. Isolation of the eolian component from the ice matrixis rather straightforward – it is usually obtained by melting the ice at room temperature(Delmonte et al., 2004), although sublimation of the ice is another option (Iizuka et al.,2013) – so that the ice allows the most pristine preservation of the locally deposited15
atmospheric aerosol.The presence of perennial ice limits the geographical coverage of ice core records
worldwide, and the recovery of long dust stratigraphies is limited to the high latitudesand a few alpine glaciers in the low and mid latitudes. Often the EC is a direct mea-sure of the insoluble dust concentration and size distribution in the ice samples, using20
either a Coulter Counter (Delmonte et al., 2004) or a laser diffraction particle counter(Lambert et al., 2008). Alternatively a geochemical dust proxy can be used (e.g. Mc-Connell et al., 2007), and the most common approach considers non-sea salt calcium(Fischer et al., 2007). Despite the fact that the dust-calcium relation should be takenwith caution under certain circumstances (Ruth et al., 2002, 2008), this approach has25
successfully been used to produce dust records in Greenland (e.g. Fuhrer et al., 1999;Mayewski et al., 1997) and Antarctica (Lambert et al., 2012; Schüpbach et al., 2013).
4286

CPD10, 4277–4363, 2014
Twelve thousandyears of dust
S. Albani et al.
Title Page
Abstract Introduction
Conclusions References
Tables Figures
J I
J I
Back Close
Full Screen / Esc
Printer-friendly Version
Interactive Discussion
Discussion
Paper
|D
iscussionP
aper|
Discussion
Paper
|D
iscussionP
aper|
Since in most cases both dust (insoluble) and calcium records were produced atthe same location, we focus on insoluble particle records, which also include dust sizedistributions. Possible non-dust contributions include volcanic tephra, which are usuallyidentifiable and excluded from the records (e.g. Narcisi et al., 2012). For Greenlandthere is only one record spanning the Holocene, GISP2, for which we consider calcium5
as a proxy for dust (Mayewski et al., 1997).For the estimation of SBMAR, post-depositional changes may potentially affect
snow/ice accumulation rates through surface redistribution or sublimation. In the po-lar ice sheets plateaus these effects are probably negligible on domes where ice coresare usually drilled (Frezzotti et al., 2007), so that dust DMAR=DF.10
Polar ice cores’ age models are in continuous evolution and they benefit from thegrowing number of deep ice cores. The striking feature is the absolute counting of an-nual layers in Greenland ice cores (Vinther et al., 2006), which in combination withseveral ice and stratigraphic markers (e.g. methane spikes, volcanic signals) allowsestablishing consistent chronologies for both Greenland and Antarctic ice cores. In this15
work we use the most recent AICC2012 chronology for Antarctic ice cores (Veres et al.,2013). Because of the high sediment accumulation rates compared to other naturalarchives, polar ice cores usually provide the highest resolution dust records. Dust con-centration records are also available from alpine glaciers (e.g. Thompson et al., 1995,1997). While it is possible to derive estimates of dust MARs on the glacial/interglacial20
time scale (Kohfeld and Harrison, 2001), it is problematic to calculate DMAR time se-ries. This is because there are no reliable age models due to the difficulty in establishingadequate accumulation stratigraphies in such environments.
With a few exceptions from sites on the edges of the ice sheets both in Greenland(Renland: Hansson, 1994) and Antarctica (e.g. TALDICE: Albani et al., 2012a; Del-25
monte et al., 2013), polar ice cores are thought to archive almost exclusively dust fromremote source areas (Bory et al., 2003; Delmonte et al., 2010b), and to be representa-tive of the magnitude and variability of the dust cycle at least over the high latitudes onboth hemispheres (Mahowald et al., 2011).
4287

CPD10, 4277–4363, 2014
Twelve thousandyears of dust
S. Albani et al.
Title Page
Abstract Introduction
Conclusions References
Tables Figures
J I
J I
Back Close
Full Screen / Esc
Printer-friendly Version
Interactive Discussion
Discussion
Paper
|D
iscussionP
aper|
Discussion
Paper
|D
iscussionP
aper|
2.2 Marine sediments
With the oceans covering two thirds of the Earth’s surface marine sediment cores rep-resent key paleoclimate archives, recording among other things global land ice vol-umes, ocean productivity linked to the carbon cycle and the main characteristics of theocean deep circulation. Dust particles deposited to the ocean’s surface attach to other5
suspended particles and get scavenged throughout the water column, determining theaccumulation of eolian material in pelagic sediments. Despite the complexity and un-certainties in the dynamics of particle sedimentation throughout the water column (e.g.Bory and Newton, 2000; De La Rocha et al., 2008) and well as their potential advectiondownstream (Siegel and Deuser, 1997; Han et al., 2008), we can reasonably make10
the approximation that dust DF(surface)=DF(benthic). This is valid in most regions(Siegel and Armstrong, 2002; Kohfeld and Tegen, 2007), with the notable exception ofthe Southern Ocean.
The pelagic environment is characterized by low deposition rates, so that most ma-rine records naturally have a lower temporal resolution than ice cores. Chronologies for15
marine sediment cores are often derived by stratigraphic correlation of δ18O recordsof benthic or pelagic foraminifera (representative of a combination of global ice vol-ume and temperature) with reference stacks such as SPECMAP (Imbrie et al., 1984;Martinson et al., 1987) or LR04 (Lisiecki and Raymo, 2005).
In many studies, which is especially relevant for the Holocene, additional constraints20
for the age models are given by radiocarbon-dating foraminifera (e.g. Anderson et al.,2006; McGee et al., 2013) or tephras (Nagashima et al., 2007). The age-depth rela-tion is usually assigned by linear interpolation between dated layers. Chronologies onlybased on stratigraphic correlation of δ18O records are inherently affected by a signifi-cant degree of uncertainty for the Holocene, because the youngest tie-points in δ18O25
stacks can be considered the last glacial maximum (18 ka BP) and the Marine Iso-topic Stage (MIS) boundary MIS1/2 (14 ka BP) (Lisiecki and Raymo, 2005). Often, inthe absence of absolute ages, the assumption is made that the surface sediment age
4288

CPD10, 4277–4363, 2014
Twelve thousandyears of dust
S. Albani et al.
Title Page
Abstract Introduction
Conclusions References
Tables Figures
J I
J I
Back Close
Full Screen / Esc
Printer-friendly Version
Interactive Discussion
Discussion
Paper
|D
iscussionP
aper|
Discussion
Paper
|D
iscussionP
aper|
is 0 ka BP, although the surface sediments may be disturbed or partially lost during thecore recovery.
Two main strategies are used to derive dust records from marine cores. In the first,more traditional “operational” approach SBMAR=LSR ·DBD, with LSR calculated fromthe age model and DBD measured or estimated. EC is determined by isolating the5
lithogenic fraction from the sediment matrix by subsequent removal of the organiccomponent, carbonates, and biogenic opal by thermal/chemical treatments (Rea andJanecek, 1981). In this approach the basic assumption is that the entire lithogenicfraction is eolian in origin. Corrections for volcanic contributions were attempted byvisual inspection (Hovan et al., 1991) or by the use of geochemical tracers (Olivarez10
et al., 1991), which could also help to distinguish fluvial vs. eolian inputs (Box et al.,2011). Other spurious lithogenic inputs may include material from turbidite currents,hemipelagic sediments, or ice-rafted debris (e.g. Rea and Hovan, 1995). Additionally,sediment redistribution may alter the depositional stratigraphy biasing the true sed-imentation rates (François et al., 2004), which is usually not accounted for in studies15
following this kind of approach. Here we exclude sites known (or very likely) to be signif-icantly affected by sediment redistribution (e.g. nepheloid layers: Kohfeld and Harrison,2001), ice-rafted debris (Kohfeld and Harrison, 2001), and those close to the continen-tal margins (e.g. Serno et al., 2014).
The other strategy consists in deriving SBMAR from 230Th profiling (François et al.,20
2004). Briefly, 230Th (half-life=75 690 years) is produced uniformly throughout theocean by radioactive decay of dissolved 234U. Due to its high particle reactivity, 230Th isefficiently scavenged by particulate matter and has a short residence time in the ocean(< 30 years) (Bacon and Anderson, 1982). The rain rate of scavenged 230Th to thesediments is therefore equal to its known rate of production in the overlying water col-25
umn (Henderson et al., 1999). SBMARs are calculated by dividing the production rateof 230Th in the water column by concentrations of scavenged 230Th in the sediment(Bacon, 1984; François et al., 2004).
4289

CPD10, 4277–4363, 2014
Twelve thousandyears of dust
S. Albani et al.
Title Page
Abstract Introduction
Conclusions References
Tables Figures
J I
J I
Back Close
Full Screen / Esc
Printer-friendly Version
Interactive Discussion
Discussion
Paper
|D
iscussionP
aper|
Discussion
Paper
|D
iscussionP
aper|
At sites potentially influenced by sediment redistribution, the 230Th profiling methodis probably the more reliable approach for the determination of SBMAR, as it accountsfor sediment focusing (Anderson et al., 2008; François et al., 2004). If it can be as-sumed that the lithogenic fraction is of eolian origin, EC can be derived from the 232Thconcentration in the sediment of a dust proxy (232Th). As 232Th concentrations in dust5
are generally more than an order of magnitude higher than in most volcanic materials,232Th levels closely track continental inputs and are insensitive to volcanic inputs. Inaddition, 232Th offers the advantage compared to other dust proxies, that its concen-tration in global dust sources is relatively invariable and close to the upper continentalcrust concentration (McGee et al., 2007). If non-eolian contributions (such as volcanic)10
are present, multi-proxy approaches (using REE, 4He) can provide a means to isolatethe eolian fraction (Serno et al., 2014). On continental margin settings high sedimen-tation rates are related to the presence of fluvial inputs, which can be isolated from theeolian component by use of grain size end-member modelling (McGee et al., 2013).
Bioturbation i.e. surface sediment mixing by the benthic fauna is a common uncon-15
strained feature of marine sediments, that acts as a smoothing filter on the sedimentarystratigraphy, including ages and other profiles interest, with a typical vertical smoothingscale of 8–10 cm. A few studies evaluated the potential effects of bioturbation of theirrecords, although they do not correct their profiles (François et al., 1990; McGee et al.,2013), based on a simple de-convolution linear model (Bard et al., 1987).20
2.3 Loess/paleosol sequences
The possibility of reconstructing the global dust cycle requires observations distributedgeographically to constrain different regions, but also encompassing the evolution ofdust spread from the source areas to the areas downwind and to remote regions. Ter-restrial sediment records are therefore necessary to constrain the location and magni-25
tude of past source of dust. Loess can be defined as terrestrial eolian sediments, com-posed predominantly of silt-size particles, formed by the accumulation of wind-blown
4290
CPD10, 4277–4363, 2014
Twelve thousandyears of dust
S. Albani et al.
Title Page
Abstract Introduction
Conclusions References
Tables Figures
J I
J I
Back Close
Full Screen / Esc
Printer-friendly Version
Interactive Discussion
Discussion
Paper
|D
iscussionP
aper|
Discussion
Paper
|D
iscussionP
aper|
dust (Pye, 1995; Liu, 1985), covering vast regions (∼ 10 %) of the land masses (e.g.Derbyshire et al., 1995; Rousseau et al., 2011). The formation of loess deposits is of-ten associated with the proximity of major dust sources, the availability of fine-grainederodible sediments and adequate winds, and a suitable accumulation site (Pye, 1995;Liu, 1985). This requires that a complex deposition-erosion balance determines the5
actual rate of accumulation at a site and the alternation of accumulation/weatheringphases depending on the dominant environmental conditions (Kemp, 2001; Muhs et al.,2003a). Loess/paleosol records (or soil profiles) spanning the Late Quaternary haveshown to be important proxies and dust archives, both on glacial-interglacial (e.g. Ko-hfeld and Harrison, 2003; Muhs et al., 2008; Lu and Sun, 2000; Liu et al., 1999) and10
millennial time scales (e.g. Mason et al., 2003).Because of their nature, loess records are more challenging to interpret than ma-
rine or ice dust stratigraphies in quantitative terms, but they hold great potential underopportune circumstances. In the case of loess/paleosol sequences, the assumption isoften made that EC=1, because the other soil component i.e. the organic matter con-15
tent is usually very low i.e. < 1 % (e.g. Miao et al., 2007). Nonetheless in carbon richsoils where the organic matter can be ∼ 10 %, this should be taken into account (Muhset al., 2013). Therefore, the implication is that the dust MAR is entirely determinedby SBMAR=LSR ·DBD. Depending on the study DBD is either measured or assumedbased on literature surveys, which adds significant uncertainty to calculations. The LSR20
is determined based on the age-depth relation. For this compilation, focused on theHolocene, we only consider profiles were absolute ages (or more correctly, numericalages) have been measured, rather than relying on stratigraphic correlations.
Depending on the availability of suitable material at loess sites, radiocarbon dating iscarried out on different organic components such as plant material (e.g. charcoal, plant25
and wood fragments) and/or, or Succineidae (land snails). Humic acid is also utilized,however, this medium provides less reliable dates. Scarcity of organic samples couldbe a limitation for chronologies relying on radiocarbon dating. An alternative categoryof methods for numerical dating of loess deposits is the luminescence-dating group of
4291

CPD10, 4277–4363, 2014
Twelve thousandyears of dust
S. Albani et al.
Title Page
Abstract Introduction
Conclusions References
Tables Figures
J I
J I
Back Close
Full Screen / Esc
Printer-friendly Version
Interactive Discussion
Discussion
Paper
|D
iscussionP
aper|
Discussion
Paper
|D
iscussionP
aper|
techniques (Roberts, 2008). In particular OSL dating of quartz grains with the SingleAliquot Regenerative (SAR) dose protocol (Wintle and Murray, 2006) is considered tobe quite robust (Roberts, 2008).
Bioturbation by faunal burrowing is an active process complicating the interpretationsof soil profiles, as indicated by stratigraphic age inversions. In addition human activities5
such as agriculture may cause significant perturbations to the upper sections of soilprofiles (Roberts et al., 2001). Additional problems in the interpretation of soil profilesmay arise in cases where the origin of the loess is not primarily eolian, but rather theproduct or reworking of local deposits (Kemp, 2001). We therefore, did not considersections from areas where such occurrence was identified.10
Even when reworked origin can be excluded, it should not be taken for granted thatthe DMAR=DF relation necessarily holds in the case of loess deposits. Conceptually,we can imagine the process of dust emission and deposition in a regional setting asfollows: dust emanates from a source and starts to be deposited downwind at ratesdecreasing with distance from the source (Fig. 3). A clear example of this is evident15
in the maps showing the spatial variability of the thickness of last glacial Peoria loessdeposits in North America (Bettis et al., 2003), or the loess deposition in the ChineseLoess Plateau (CLP) (Liu, 1985; Lu and Sun, 2000). Understanding the spatial scaleof this process is essential.
Grain size data from sampling transects at various locations suggest that a sharp20
decrease in DMAR immediately downwind of source areas is associated with a de-crease in the size distribution within 20–50 km, before a slower decline in DMAR andsize takes place (Chewings et al., 2014; Mason et al., 2003; Muhs et al., 2004; Wintonet al., 2014), and then slowly keeps on the same trajectory on broader spatial scales(Ding et al., 2005; Lawrence and Neff, 2009; Porter, 2001; Prins et al., 2007; Sun et al.,25
2003). It is evident then that bulk (i.e. over the entire size range) DMARs from profileslocated within a very short distance (i.e. 20–50 km) from the sources are not suited toprovide a representative estimate of DF over a broad spatial domain, unless the spatialscale of interest is very fine (Cook et al., 2013). This has substantial implications for
4292

CPD10, 4277–4363, 2014
Twelve thousandyears of dust
S. Albani et al.
Title Page
Abstract Introduction
Conclusions References
Tables Figures
J I
J I
Back Close
Full Screen / Esc
Printer-friendly Version
Interactive Discussion
Discussion
Paper
|D
iscussionP
aper|
Discussion
Paper
|D
iscussionP
aper|
climate models and reconstructions of the mass balance of global dust cycle in gen-eral, because a misinterpretation of the significance of bulk DMARs can drive largeoverestimation of DF (Albani et al., 2014).
On the other hand it happens that sites located in close proximity to the sources havethe highest accumulation rates, allowing for better chances of obtaining high resolution5
profiles that are of great utility in paleoclimate reconstructions. Thus, often some ofthe better-resolved sites, especially those having an adequate time resolution to showvariability during the Holocene, tend to be close to the sources.
After the steep decline in bulk DMAR close to the source areas, we can imagine theDF blanketing over the surface of the Earth, slowly decreasing as the distance from10
the source increases, but approximately homogeneous over a broad area at a coarseenough spatial resolution (Fig. 3). In reality the DMAR is highly dependent on the lo-cal landforms, both for accumulation and preservation of the deposited dust (Stevensand Lu, 2009). Thus loess deposited on escarpments facing the wind direction may befavourable for an enhanced dust deposition (Bowen and Lindley, 1977; Mason et al.,15
2003). More often erosion is a major player, so that DMAR<DF. Upland sites are gen-erally considered more suitable geomorphological settings to recover well-preservedprofiles of DF (Derbyshire, 2003; Kohfeld and Harrison, 2003; Mason et al., 2003; Muhset al., 2003a). Field examination of the broad area where a profile was studied may pro-vide evidence of erosion (Lu et al., 2006), i.e. if the horizon’s stratigraphy is not widely20
reproduced regionally, but in some cases evidence for erosion is only available via de-tailed independent age models (Buylaert et al., 2008; Stevens et al., 2008). In addition,supporting data from other proxies in the profile, i.e. bio- or chemo-stratigraphy, canprovide grounds to establish the degree of coherence of specific sections (Markovićet al., 2011).25
2.4 Other paleodust archives: lake sediments and peat bogs
Beside loess/paleosol sequences other land archives carry the potential to preservedust stratigraphies: lakes and ombrotrophic peat bogs. Both can be located at an
4293

CPD10, 4277–4363, 2014
Twelve thousandyears of dust
S. Albani et al.
Title Page
Abstract Introduction
Conclusions References
Tables Figures
J I
J I
Back Close
Full Screen / Esc
Printer-friendly Version
Interactive Discussion
Discussion
Paper
|D
iscussionP
aper|
Discussion
Paper
|D
iscussionP
aper|
opportune medium range distance between the source areas and the more remoteoceanic and polar sites. In addition, the preservation of large amounts of organic mat-ter involve the possibility of high-resolution radiocarbon dating, which is of great valueespecially for a period such as the Holocene (Muhs et al., 2003b; Marx et al., 2009; LeRoux et al., 2012).5
While diverse in nature, lakes and peat bogs also share some common issues thatgenerally need to be addressed in order to provide reliable paleodust profiles: the pos-sibility of quantitatively isolating remote from local dust deposition, and the basin-scalerepresentativeness of eolian DMARs compared to DF.
In some circumstances (when fluvial inputs and rain outwash can be excluded)10
lake deposits can preserve reliable dust stratigraphies, with little or no unconformi-ties and relatively abundant organic matter for radiocarbon dating (e.g. Muhs et al.,2003b). Maar lakes developed in craters formed by explosive excavations associatedwith phreatomagmatic eruptions, are often an ideal setting, when the mafic compositionof the basin is substantially different than the mineralogical and geochemical charac-15
teristics of the remotely originated dust. However, a major problem with lakes is thepossibility of sediment focusing in the deeper parts of the basin, which may substan-tially affect SBMAR. With one exception, we were not able to retrieve adequate DMARsfrom lakes for this compilation, mostly because of problems with the age model, or a re-liable estimation of EC (Supplement).20
In recent years substantial progress was made in recovering dust profiles from om-brotrophic peats. Estimation of SBMAR depends on the radiocarbon dating of the or-ganic matter. The EC is determined by the elemental composition of the residual ashafter combustion of the organic matter. The identification of an adequate proxy fordust can be challenging (Kylander et al., 2013), so that several approaches including25
multi-proxy based approaches have been suggested (Marx et al., 2009). Even morechallenging is a quantitative isolation of the local vs. remote dust input, also becauseof the lack of size distribution data in most cases, although a few studies have providedgood approaches (Marx et al., 2009; Le Roux et al., 2012). At this stage, substantial
4294

CPD10, 4277–4363, 2014
Twelve thousandyears of dust
S. Albani et al.
Title Page
Abstract Introduction
Conclusions References
Tables Figures
J I
J I
Back Close
Full Screen / Esc
Printer-friendly Version
Interactive Discussion
Discussion
Paper
|D
iscussionP
aper|
Discussion
Paper
|D
iscussionP
aper|
uncertainties still exist in general in peat bog dust records for one or more of the vari-ables necessary to determine a reliable quantitative estimate of dust MARs relevant formedium/long range transport. Nonetheless we expect that in the near future this goalwill be achieved, because of the fast progress of the research in this field (e.g. Ferratet al., 2011; Kylander et al., 2013; Marx et al., 2009; McGowan et al., 2010; Le Roux5
et al., 2012; Sapkota et al., 2007; De Vleeschouwer et al., 2012).
3 Methodology
The goal of this compilation is to provide a quality-controlled dataset with specific ref-erence to the possibility of deriving reliable quantitative time series of eolian DMARrelevant to broad spatial scales. According to this principle and considering the specific10
characteristics of the different paleodust archives, we performed an extensive literaturereview to identify records suitable for the study of dust variability within the Holocene,encompassing the MH period ∼ 6 ka BP.
There is a spectrum of possible approaches for the compilation of this kind ofdatabase, comprised between two extremes: a minimal collection of DMARs (e.g. sim-15
ilar to DIRTMAP, Kohfeld and Harrison, 2001), and an extensive compilation includinga wide variety of metadata (e.g. DIRTMAP3, Maher et al., 2013). For this work, welean towards the first approach, although we include uncertainties and some additionalinformation, but stick to the age models from the original studies (Appendix A).
The concise operational product of the database is a set of dust MAR time series,20
with quantitative estimates of the uncertainties associated to both the age and DMAR.Dust MAR uncertainty quantified here is only associated with the calculations, henceit includes the analytical errors and the uncertainty associated with assumptions orapproximations in the magnitude of specific variables. We express all quantitative un-certainties as 1σ deviation, assuming a Gaussian distribution of the error. It will be25
expressed either in absolute terms or as a relative error, as specified in each case.
4295

CPD10, 4277–4363, 2014
Twelve thousandyears of dust
S. Albani et al.
Title Page
Abstract Introduction
Conclusions References
Tables Figures
J I
J I
Back Close
Full Screen / Esc
Printer-friendly Version
Interactive Discussion
Discussion
Paper
|D
iscussionP
aper|
Discussion
Paper
|D
iscussionP
aper|
This approach does not convey the overall uncertainty related for instance to a spe-cific technique or to a specific physical setting, which is difficult to express quantitatively.For this reason we complement the dataset with a categorical attribution of the overallconfidence on the reliability of the records for the purposes of this work.
In the following paragraphs we report the criteria followed for site selection and at-5
tribution of a confidence level (Sect. 3.1), and we provide a general description of theapproach used to report or calculate the age profiles of eolian DMAR, with relativeuncertainties (Sects. 3.2 and 3.3), and the information on the size distributions whereavailable (Sect. 3.4). More specific information for each record is reported in the Sup-plement. In Sect. 3.5 we describe the approach to estimate the mass balance of the10
global dust cycle throughout the Holocene with the CESM.
3.1 Site selection and attribution of confidence level
In an initial phase of scrutiny of the existing literature we identified paleodust recordsof interest to our project, based on the requirements that they:
a. have potential for calculating DMAR (i.e., the dust fraction must be identified and15
quantified in some way; no records with only size information)
b. have sufficient material within the Holocene to quantify DMAR (i.e., at least threedata points occur between 0 and 11.7 ka BP, with at least 1 data point between 4.5and 7.5 ka BP; three data points means three ages for loess/paleosol sequenceswhere EC=1, and three values of dust MAR for all other cases)20
c. have absolute (i.e., numerical) ages (only for terrestrial sediments)
d. include size information (only for the loess/paleosol records)
We identified 122 sites meeting these criteria. We then labelled each of those sites witha categorical attribution of the overall confidence we have that each record providesa quantitative profile of eolian DMAR with respect to the age, and that it is relevant to25
broad spatial scales, based on general consensus.4296

CPD10, 4277–4363, 2014
Twelve thousandyears of dust
S. Albani et al.
Title Page
Abstract Introduction
Conclusions References
Tables Figures
J I
J I
Back Close
Full Screen / Esc
Printer-friendly Version
Interactive Discussion
Discussion
Paper
|D
iscussionP
aper|
Discussion
Paper
|D
iscussionP
aper|
The attribution of the confidence level is based on whether or not there are substan-tial or critical uncertainties with respect to three aspects: (1) SBMAR (and confidencethat DMAR=DF); (2) EC; (3) quantitative distinction between remote and local EC(See Supplement Table 1).
The first criterion (1) is related to the chronology itself, and/or linking the chronology5
to SBMAR. We consider some types of dates more reliable than others in this context,depending on the kind of natural archive. Among the less reliable, some we consideracceptable per se (“substantial uncertainty”), while others we associate with a “criticaluncertainty”.
For marine sediments, we consider both absolute ages, and stratigraphic correlation10
with oxygen stacks, with the consideration that they are both acceptable in the caseof records based on thorium profiling, but only absolute ages are acceptable whenisolation of the terrigenous fraction is the method of determination of EC.
For ice cores, we regard age models based on a combination of absolute counting,stratigraphic correlations, and ice thinning modelling (e.g. Veres et al., 2013) with high15
confidence. These models apply to most of the polar ice cores. On the other hand,records from smaller ice caps and glaciers suffer from the lack of reliable age models,hence ice accumulation profiles, which cannot be resolved on Holocene time scales atpresent (L. Thompson, P. Gabrielli, C. Zdanowicz, personal communication, 2014.).
For terrestrial sediments, we only considered numerical ages (OSL, 14C), in the ini-20
tial scrutiny phase. This is important as in the case of loess/paleosol sequences, dis-turbances such as erosion and reworking (and agricultural practices, when they arenot limited to depths attributed to the last ∼ 2.5 ka) can disrupt the ideal correspon-dence between dust MAR and DF (Sect. 2.3). We consider evidence of such an occur-rence as a critical uncertainty. In addition, we have attempted to identify sites whose25
stratigraphies are consistent regionally and therefore demonstrate that they are morelikely to represent large-scale patterns. Sites with stratigraphies that diverge substan-tially from standard regional profiles suggest that these records are not likely to repre-sent large scale patterns in dust deposition, and this represents a critical uncertainty.
4297

CPD10, 4277–4363, 2014
Twelve thousandyears of dust
S. Albani et al.
Title Page
Abstract Introduction
Conclusions References
Tables Figures
J I
J I
Back Close
Full Screen / Esc
Printer-friendly Version
Interactive Discussion
Discussion
Paper
|D
iscussionP
aper|
Discussion
Paper
|D
iscussionP
aper|
When no critical uncertainties are identified, we still consider that SBMAR estimatesfrom loess/paleosol sequences contain substantial uncertainty, according to this crite-rion (1).
The second criterion (2) relates to the ability of a quantitative determination of theEC.5
For marine cores, we rely on the original and subsequent authors’ evaluation ofcontamination, e.g., the possibility of non-eolian inputs such as from sediment focus-ing, volcanic, fluvial, hemipelagic, and ice-rafted materials. Marine records that aredefinitely or very likely to be affected by unaccounted for non-eolian inputs are ratedas having critical uncertainty. These include sites in regions that have been identi-10
fied as being affected by non-eolian inputs such as the volcanic materials and ice-rafted detritus in the North Pacific (Serno et al., 2014), volcanic inputs in the Easternequatorial Pacific (Olivarez et al., 1991), possible non-eolian detritus in the WesternPacific/Ontong-Java plataeu (Kawahata, 199), or sediment focusing and Ice RaftedDebris (IRD) in the Southern Ocean (Kohfeld and Harrison, 2001). When the possi-15
ble presence of non-eolian components is more speculative, we attribute a substantiallevel of uncertainty. In addition, estimates of EC made using quartz concentrationsor elemental (e.g. Al) proxies were rated as having substantial uncertainty. Recordsbased on 232Th, experimental isolation of eolian component, or a differencing method(EC=1−CaCO3 −opal−Corganic) to determine EC were preferred.20
For ice cores, primary non-eolian inputs to the insoluble particle material are volcanicin origin, and can usually be singled-out and selectively removed from the records (Nar-cisi et al., 2010). In some cases though, they may be a widespread presence in a record(Gabrielli et al., 2014), which we consider cause for attribution of substantial uncer-tainty. We consider particle counters the more robust methods for the determination25
of EC. Un-calibrated laser counters give unreliable results though, which we considera critical uncertainty. Among the 122 records initially selected, a few ice core recordsrely on calcium as proxy for dust. Subtleties include that total calcium is a worse proxythan non-sea salt calcium, and that calcium in general is a better proxy in Greenland
4298

CPD10, 4277–4363, 2014
Twelve thousandyears of dust
S. Albani et al.
Title Page
Abstract Introduction
Conclusions References
Tables Figures
J I
J I
Back Close
Full Screen / Esc
Printer-friendly Version
Interactive Discussion
Discussion
Paper
|D
iscussionP
aper|
Discussion
Paper
|D
iscussionP
aper|
than in Antarctica (Ruth et al., 2002, 2008). We plainly assume a substantial uncer-tainty for all records based on calcium.
For terrestrial records, we attribute significant uncertainty to the presence of non-eolian inputs, as identified by authors. We attribute substantial uncertainty when anelemental proxy was used for the determination of EC, rather than relying on the sedi-5
mentation rate of the eolian sediment, or the residual fraction after elimination of non-eolian inputs. A critical uncertainty is attributed to the use of quartz as a quantitativeproxy for EC.
The third criterion (3) focuses on the quantitative and size-resolved separation oflocal vs. remote dust.10
This criterion in fact does not apply to loess/paleosol sequences, where instead wehad applied constraints on the necessity of size information. For the other types ofnatural archives, all the other records that we found to be most likely affected by unac-counted for local dust inputs, are rated as having critical uncertainty. When the possiblepresence of local dust inputs is likely, but more speculative, we attribute a substantial15
level of uncertainty.Records that meet all criteria are labelled with “high confidence”, whereas failing to
meet one criterion results in a record receiving the attribution of “medium confidence”level. A record is given a low level of confidence when either (a) two or more aspectsare considered affected by substantial uncertainty, or (b) even one aspect is considered20
a critical uncertainty. We included in the compilation only records (43 out of 122) withhigh and medium confidence levels (Table 1; Supplement).
3.2 Ages and chronologies
All the ages reported in this compilation are expressed in thousands of years before1950 AD (ka BP). We do not re-derive the age models for the records in this compila-25
tion, but use the original chronologies reported in the relevant publications. This is thecase for all records included in this compilation. The only exceptions are the case of
4299

CPD10, 4277–4363, 2014
Twelve thousandyears of dust
S. Albani et al.
Title Page
Abstract Introduction
Conclusions References
Tables Figures
J I
J I
Back Close
Full Screen / Esc
Printer-friendly Version
Interactive Discussion
Discussion
Paper
|D
iscussionP
aper|
Discussion
Paper
|D
iscussionP
aper|
the Antarctic ice cores, which have been reported to the AICC2012 chronology (Vereset al., 2013), and a specific approach for loess/paleosol sequences described below.
In the previous Sect. 3.1 we explained how loess/paleosol sequences with a mediumconfidence level satisfy the condition of being representative of large scale patterns.This is based on the possibility of grouping them within sub-regional settings where5
sequences exhibit a common stratigraphy. These groups should also account for spa-tial variability in the timing of the onset of climatic conditions that are linked to spe-cific loess/paleosol sub-units, e.g. on the CLP. When possible (i.e., for the records inthe Western CLP: Duowa and Jiuzhoutai), we constructed SBMAR records for thosesites, based on selecting (or interpolating, in the case of Duowa: see Supplement) only10
the dates at the interface between two consecutive sub-units, in fact reflecting the al-ternation of soil and loess sub-units (S0.S1 – S0.L1 – S0.S2 – S0.L2 – S0.S3). Weconsider this as a slightly conservative approach, which has the advantage of (a) lim-iting potential abrupt fluctuations in DMARs, which may just be reflecting dating errors(e.g., related to bioturbation), and (b) pairing to some extent the records, consistently15
with the criteria mentioned earlier. Note that a similar approach was used for the twoloess/paleosol sequences from Nebraska included in this compilation (Wauneta, LoganRoadcut). For the central CLP (Beiguoyuan, Xifeng, Luochuan), no such distinction ofsub-units within the Holocene paleosol (S0) is visible, thus the time series are basedon all the available dates. The same holds for the one single site in Alaska (Chitina).20
In the previous Section we discussed how either a linear or a more sophisticatedage model is used to determine a profile’s chronology. Each numeric age or tie-point ischaracterized by some uncertainty. The nature and magnitude of the error depend onthe specific technique, and include the analytical error, and the calibration or wiggle-matching error when applicable. We try to estimate quantitatively this type of uncer-25
tainty. Unquantifiable uncertainties include the effects of bioturbation, sample contami-nation, etc.
Age uncertainties that can be estimated arise from 3 different processes: (1) exper-imental error in a measurement (e.g. 14C, OSL, etc.); (2) calibration errors (e.g. 14C
4300
CPD10, 4277–4363, 2014
Twelve thousandyears of dust
S. Albani et al.
Title Page
Abstract Introduction
Conclusions References
Tables Figures
J I
J I
Back Close
Full Screen / Esc
Printer-friendly Version
Interactive Discussion
Discussion
Paper
|D
iscussionP
aper|
Discussion
Paper
|D
iscussionP
aper|
calibration software; OSL measurement in water content); (3) other age model uncer-tainties. For instance radiocarbon dating requires corrections to account for the carbonreservoir effect (Brauer et al., 2014). Calibration software has been developed to per-form this task (e.g. Bronk Ramsey, 1995; Reimer et al., 2009). All radiocarbon agesreported in this paper are calibrated, according to the original references.5
In the case of age models more complicated than the simple linear relation used toderive a LSR, errors associated with ages are usually reported in the publications. Anexample of this are the new ice core chronologies, such as AICC2012, which reportthe associated age uncertainties (Veres et al., 2013).
For a linear sedimentation model, the age of a given depth horizon is calculated10
by linear interpolation between two dated horizons. In this case the age error of thesamples is bound to the uncertainties associated with the bracketing ages. The age-model error of the sample can then be derived through the error propagation formula:
εsample =√ε2a +ε
2b (1)
where εa and εb are the age errors of the two adjacent dated points between which15
the linearly interpolated sample age was calculated.The other usual possibility is that the age model of a site was determined without
the help of any absolute age marker, but just using stratigraphic correlation. A typicalexample of such an age model is one based on stratigraphic correlation of a marinesediment core site’s δ18O profile with the SPECMAP stack (Imbrie et al., 1984). In this20
case and in all other circumstances where the age error is not reported, we arbitrarilyassume an uncertainty of 6.8 % (1σ, corresponding to an overall 10 %).
3.3 Eolian dust MARs
Dust MARs constitute the key element of this compilation. We previously discussed(Fig. 2) the non-parallel depth resolution of the age samples and the EC samples.25
Unless stated otherwise, we always use a chronology targeted on the final DMAR4301
CPD10, 4277–4363, 2014
Twelve thousandyears of dust
S. Albani et al.
Title Page
Abstract Introduction
Conclusions References
Tables Figures
J I
J I
Back Close
Full Screen / Esc
Printer-friendly Version
Interactive Discussion
Discussion
Paper
|D
iscussionP
aper|
Discussion
Paper
|D
iscussionP
aper|
resolution, which is determined ultimately by the EC resolution (see also Fig. 1). Thetypical exceptions are loess/paleosol sequences, where SR alone (hence the resolutionof the age samples) determines the dust MAR.
We report both the SBMAR (or SR and DBD) and EC for each point in the records,with relative uncertainties. The uncertainties are taken from the original sources when5
available, and assigned otherwise. The dust MAR uncertainty is determined from therelative uncertainties in the factors SBMAR and EC, combined through the error prop-agation formula:
εMAR =
√(εSBMAR
µSBMAR
)2
+(εEC
µEC
)2
(2)
with εSBMAR/EC and µSBMAR/EC representing the absolute errors and the average, re-10
spectively.In this compilation, there are two cases when SBMAR is provided directly instead
of being the combination of SR ·DBD: ice cores and marine sediment records derivedusing the thorium profiling method. In the case of ice cores SBMAR corresponds to theice accumulation rate, expressed in m (water equivalent) per year, which incorporates15
information about ice density and thinning with depth (Alley, 2000; Veres et al., 2013).When not reported, we assume that the relative uncertainty is the same as that of theage uncertainty. For marine cores, we consider the relative uncertainty in the thoriumexcess (xs-Th) parameter. When not reported we assumed a relative uncertainty of5 %.20
In all other cases, for SR we consider that the relative uncertainty is the same asthe age uncertainty, which again is combined through the error propagation formulato the other uncertainties. DBD is sometimes measured, often just assumed based onthe literature from the broad region. When no information was reported in the originalworks, we assumed a dry bulk density of 1.48 gcm−3 for the CLP (Kohfeld and Harrison,25
2003), and 1.45 gcm−3 for North America (Bettis et al., 2003). When not measured, weassumed 15 % relative uncertainty for DBD (Kohfeld and Harrison, 2003).
4302

CPD10, 4277–4363, 2014
Twelve thousandyears of dust
S. Albani et al.
Title Page
Abstract Introduction
Conclusions References
Tables Figures
J I
J I
Back Close
Full Screen / Esc
Printer-friendly Version
Interactive Discussion
Discussion
Paper
|D
iscussionP
aper|
Discussion
Paper
|D
iscussionP
aper|
With the exception of loess, for which we assume EC=1 unless otherwise stated,EC is either expressed in terms of fraction or concentration of dust or a proxy in thebulk sediment. For the Antarctic ice cores considered in this compilation the EC is de-termined after the volume dust concentrations determined by a Coulter Counter; themass concentration is calculated by multiplying that per the assumed dust density of5
2.5 gcm−3 (Delmonte et al., 2004). The uncertainty in this case is taken from the stan-dard deviation of the ∼ 3 replicate measurements. When a dust proxy is used insteadto determine the EC, its concentration is divided by the element’s typical abundancein dust (or crustal abundance). In this case the analytical uncertainty (if not reported,we assume 5 %) is combined with the uncertainty of the dust proxy i.e. the variability10
of its amount in dust. We keep the proxy-dust relation from the original studies whenavailable.
Several records in this compilation use 232Th as a dust proxy, for which we assume10.7 ppm in dust (McGee et al., 2007) if not specified otherwise in the original papers.We always assumed 9.3 % uncertainty for 232Th as a dust proxy (McGee et al., 2007),15
or a combined uncertainty of 15 % when the analytical uncertainty was not available.In one case (GISP2) we used calcium as a dust proxy (Mayewski et al., 1997), assum-ing a variable calcium-dust relation in Greenland with climate conditions, resulting in26 % calcium in dust (Ruth et al., 2002; Steffensen, 1997), with an arbitrarily assigneduncertainty of 20 %.20
When isolation of the detrital component from the sediment matrix is done by removalof carbonates, opal, and organic matter, then the EC can be estimated from the bulkterrigenous component. We assume 5 % uncertainty in this procedure.
We stress once again that the quantitative uncertainties estimated here do not fullyrepresent the overall uncertainty of a record, which should be pondered in combination25
with the confidence level (Table 1).
4303

CPD10, 4277–4363, 2014
Twelve thousandyears of dust
S. Albani et al.
Title Page
Abstract Introduction
Conclusions References
Tables Figures
J I
J I
Back Close
Full Screen / Esc
Printer-friendly Version
Interactive Discussion
Discussion
Paper
|D
iscussionP
aper|
Discussion
Paper
|D
iscussionP
aper|
3.4 Dust grain size distributions
Here we focus on the importance of the grain size information and its intimate link tothe DMAR. When possible, we retrieved the size distributions associated to the recordsin this compilation. Depending on the technique used, the size data was collected inthe form of size distributions (e.g. particle counters and laser particle analysers) or size5
classes (sieve and pipette method), e.g. the percentages of sand, silt, and clay (Muhset al., 2013; Lu et al., 1999).
Despite the differences and uncertainties associated with specific methods (Ma-howald et al., 2014; Reid, 2003), we include the available information according to theoriginal sources. In the case of size classes, we report the information as provided in10
the original papers. In addition, we take an innovative approach to organizing the sizedistribution data. First of all, we carry the original size distributions to a new, commonbinning, in order to enhance the accessibility of the data and to facilitate the inter-comparison among records. Second, we associate the size distributions to the DMARtime series sample-to-sample where possible, so that DMAR time series for different15
size ranges can be easily determined.The re-binning procedure to adapt the original size distributions from observations
is organized in a series of steps: (1) definition of a new binning model; (2) building thecumulative distribution from the normalized observations; (3) fitting a spline curve tothe observation cumulative distribution; (4) integration of the fitted spline curve into the20
new bins; (5) evaluation and summary of the fit of the new binned data to the originalobservations. The fitting spline in (3) is bounded to have values between 0 and 1, andto be monotonically non-decreasing.
One challenge in finding a new binning model is to avoid significant distortion to theoriginal size distribution, given that observations have both a different resolution and25
a different size range. A compromise is necessary to preserve both the actual dust flux(i.e. a size range wide enough to embrace most observations) and the shape of thedistributions. Preservation of the size distribution properties, i.e. the mass partitioning
4304

CPD10, 4277–4363, 2014
Twelve thousandyears of dust
S. Albani et al.
Title Page
Abstract Introduction
Conclusions References
Tables Figures
J I
J I
Back Close
Full Screen / Esc
Printer-friendly Version
Interactive Discussion
Discussion
Paper
|D
iscussionP
aper|
Discussion
Paper
|D
iscussionP
aper|
across the size spectrum, requires an adequate number of bins and adequate spac-ing. We adopted a new bin model with n = 76 bins, spanning the interval of particlediameters between 0.28 and 208.34 µm. The bin spacing is defined by a monotoni-cally increasing function: y = 0.089 ·x+0.002, where x is the nth bin centre, y is the(n+1)th bin centre, and x0 = 0.35 µm (first bin centre). Bin edges are calculated by5
linear interpolation, halfway between two consecutive bin centres. This binning modelis very similar to the instrumental size binning of e.g. Mulitza et al. (2010) or McGeeet al. (2013) in the same size range. For all samples subject to re-binning, visual in-spection of the original and new distributions was performed, as well production ofobjective metrics (Supplement).10
All references to the size in this work refer to the particle’s diameter.
3.5 Modelling the global dust cycle
Paleodust records not only represent excellent climate proxies, but they also offer thepossibility to quantitatively constrain the mass balance (or magnitude) of the globaldust cycle. Here we use a dust model to extrapolate the available data to allow15
global coverage for the deposition, as well as estimates of sources, concentrationsand aerosol optical depth using the Community Earth System Model (Albani et al.,2014; Mahowald et al., 2011, 2006). To represent the impact of climate variability dur-ing the Holocene onto the dust cycle, we chose two reference periods for our sim-ulations with the CESM: the MH (6 ka BP) and the pre-industrial (1850 AD), which20
we assume representative for the Early and Mid-Holocene (5–11 ka BP) and the LateHolocene (1–5 ka BP) respectively, based on the first-order differences in orbital forc-ing and climate in the two periods (e.g. Wanner et al., 2008). The initial conditionsfor the MH simulations are taken from a fully-coupled climate equilibrium simulationfor 6 ka BP (http://www.cesm.ucar.edu/experiments/cesm1.0/#paleo), which follows the25
PMIP3 prescriptions for greenhouse gases concentrations and orbital forcing, withpre-industrial prescribed vegetation (Otto-Bliesner et al., 2009), and was part of thePMIP3/CMIP5 model experiments for the IPCC AR5 (Masson-Delmotte et al., 2013;
4305

CPD10, 4277–4363, 2014
Twelve thousandyears of dust
S. Albani et al.
Title Page
Abstract Introduction
Conclusions References
Tables Figures
J I
J I
Back Close
Full Screen / Esc
Printer-friendly Version
Interactive Discussion
Discussion
Paper
|D
iscussionP
aper|
Discussion
Paper
|D
iscussionP
aper|
Flato et al., 2013). For the pre-industrial simulation we take the initial conditions froman equilibrium reference simulation described in Brady et al. (2013).
The dust model integrated in the CESM used for this study uses the Community At-mosphere Model version 4 with a Bulk Aerosol Model (CAM4-BAM), and is describedin detail in Albani et al. (2014). The dust model simulates dust emission, transport, dry5
and wet deposition, and direct interactions with radiation in the long and shortwavespectrum. The dust mass is partitioned in four size classes spanning the 0.1–10 µm di-ameter range. Modelled dust emissions are primarily a function of surface wind speed,vegetation (and snow) cover, and soil erodibility, which is a spatially-varying parametersummarizing the differences in susceptibility to erosion related to e.g. soil textures and10
geomorphology (Zender et al., 2003).Although the physical model does not include changes in vegetation, following the
PMIP protocols (Otto-Bliesner et al., 2009), we accounted for different vegetation coverin the MH by removing the online dependence of dust mobilization on preindustrialvegetation. For the 6 ka BP equilibrium climate instead we simulated new vegetation15
cover with BIOME4 (Kaplan et al., 2003), following the methodology of Mahowaldet al. (2006). The effects of vegetation were incorporated in the soil erodibility mapby applying a scale factor at each grid cell, proportional to the fraction of the grid cellavailable for dust emission in arid areas (same as for the LGM in Albani et al., 2014).We also accounted for glaciogenic sources in Alaska, which are not explicitly simulated20
by the model, by prescribing them according to Albani et al. (2014) and Mahowaldet al. (2006).
In addition, we relaxed the dampening effect of vegetation cover on dust mobiliza-tion in the model in one specific region, i.e. the Nebraska Sand Dunes, to account fora known dust source relevant for the Holocene (Miao et al., 2007). In that region, too25
much vegetation cover from the prescribed input datasets would otherwise inhibit dustmobilization for both for the pre-industrial and MH simulations.
We provided observational constraints on the model dust deposition flux by consid-ering the dust MAR from the data compilation, limited to the model’s size range i.e.
4306

CPD10, 4277–4363, 2014
Twelve thousandyears of dust
S. Albani et al.
Title Page
Abstract Introduction
Conclusions References
Tables Figures
J I
J I
Back Close
Full Screen / Esc
Printer-friendly Version
Interactive Discussion
Discussion
Paper
|D
iscussionP
aper|
Discussion
Paper
|D
iscussionP
aper|
< 10 µm. For each record we calculated MAR time series during 2 ka-long time inter-vals centred on 2, 4, 6, 8, and 10 ka BP, by averaging the original data across each ofthe macro-regions (Fig. 4). Linear interpolation was then used to fill-in the gaps.
The model’s fit to the observations was improved through a spatial optimization ofthe soil erodibility, by applying a set of scale factors specific to macro-areas, which is5
reflected on dust mobilization from those macro-areas (Albani et al., 2012b, 2014; Ma-howald et al., 2011, 2010, 2006). We applied this procedure to pre-industrial and MHsimulations constrained by the data in the 4 ka BP and 6 ka BP time slices, respectively.In order to account for dust variability in the other time periods (2, 8, and 10 ka BP)we linked them to the respective reference case for the Late (4 ka BP) and Mid/Late10
Holocene (6 ka BP), by prescribing an additional set of scale factors for dust emissionsin the same model macro-areas. Those scale factors are expressed as anomalies tothe reference period, and are determined based on the observations: each time seriesin the compilation at the 2 ka pace was reduced to an anomaly with respect to its valueat 6 ka BP (and 4 ka BP in parallel), then a regional average anomaly was calculated15
within specific regions determined based on the geographical distributions of the ob-servations (Fig. 4). We assume that emissions in each of the model macro-areas arerelated to observations from specific geographic regions, which act as sinks for dustoriginated from each dust source macro-area (Mahowald et al., 2010). The anomaly indust emissions was then calculated as the average of the anomalies from the group of20
forcing regions (Table 2). We acknowledge that this simple procedure implies possiblediscontinuity at the 4 to 6 ka BP transition.
4 Holocene dust variability
4.1 Global overview
A total of 43 high- and medium-confidence paleodust records (out of 122) from ice,25
terrestrial and marine archives distributed worldwide comprise the data compilation
4307

CPD10, 4277–4363, 2014
Twelve thousandyears of dust
S. Albani et al.
Title Page
Abstract Introduction
Conclusions References
Tables Figures
J I
J I
Back Close
Full Screen / Esc
Printer-friendly Version
Interactive Discussion
Discussion
Paper
|D
iscussionP
aper|
Discussion
Paper
|D
iscussionP
aper|
(Fig. 5). It is noteworthy that while in a few regions there is a relative abundance ofobservations (North Atlantic, Equatorial Pacific) there are few data from other parts ofthe world (North Pacific, Southern Hemisphere), after the application of filtering criteria.
The amplitude of bulk dust variability recorded from natural archives during the last22 ka relative to their Holocene average allows a comparison with the DIRTMAP3 (Ma-5
her et al., 2010) data with regard to the glacial/interglacial variability within severalregions around the globe (Fig. 5).
Different regions show different patterns of variability during the Holocene (e.g. theapparent little variability in the Equatorial Pacific vs. the Mid-Holocene minimum inthe North African margin), and even within certain regions there may be significantly10
diverse trends, which will be discussed in more detail in the following Sections.
4.2 North Africa and North Atlantic
The most striking display of variability during the Holocene is shown by the coresin North-western African Margin (13 records), with an amplitude comparable toglacial/interglacial variability (Fig. 5) (Adkins et al., 2006; McGee et al., 2013). As first15
suggested by deMenocal et al. (2000), this would be a clear mark of the significantchanges in the climatic conditions in North Africa between the wetter Early to Mid-Holocene compared to the drier late glacial and Late Holocene. During the so called“African Humid Period” in the Early to Mid-Holocene, greening of the Sahara occurredi.e. changes in vegetation in response to increased humidity and precipitation, as seen20
in pollen records and lake level changes (e.g. Hoelzmann et al., 1998; Jolly et al., 1998;Street-Perrott and Perrott, 1993). The cause of these changes has been identified asan enhanced summer monsoon, driven by changes in orbital forcing, sea surface tem-perature and vegetation changes (e.g. Braconnot et al., 2007; Claussen et al., 1999;Kutzbach and Liu, 1997).25
Figure 6 shows the large range of values (spanning two orders of magnitude) en-compassed by the DMAR estimates from marine sediment cores to the west of theAfrican coast. Records from the Equatorial Atlantic (lower temporal resolution) tend to
4308

CPD10, 4277–4363, 2014
Twelve thousandyears of dust
S. Albani et al.
Title Page
Abstract Introduction
Conclusions References
Tables Figures
J I
J I
Back Close
Full Screen / Esc
Printer-friendly Version
Interactive Discussion
Discussion
Paper
|D
iscussionP
aper|
Discussion
Paper
|D
iscussionP
aper|
show decreasing trends from the Early to Mid-Holocene, with little or no variability af-terwards (Bradtmiller et al., 2007; François et al., 1990), compared to the sites on theNW African margin (higher temporal resolution) that show a minimum in DMAR in the∼ 5–9 ka BP period (McGee et al., 2013).
The absolute values of bulk DMARs (dotted lines) are higher for the sites close to5
the coast of NW Africa (bluish colours) compared to the sites in the Equatorial Atlantic(reddish and greenish tones). When considering only the fine fraction (< 10 µm: solidlines), 3 (out of 5) records from the NW African margin are comparable in magnitudeto those in the equatorial Atlantic, at least for the Early to Mid-Holocene, but tend tobe larger in the Late Holocene. On the other hand, 2 of the records display very low10
values of DMARs, lower than the records from the equatorial Atlantic, and comparableto the Equatorial Pacific.
Core-top bulk dust MARs from NW African margin cores match very well with mod-ern sediment trap data (Ratmeyer et al., 1999). On the other hand there is substantialuncertainty in the attribution of the fine fractions, with records in the Equatorial At-15
lantic loosely constrained by present-day sediment trap data from the Cape Verde area(Ratmeyer et al., 1999), and size data for the NW African margin based on actualmeasurements from sediment samples, but relying on end-member modelling for theseparation between riverine and eolian inputs (McGee et al., 2013).
This compilation and comparison suggests that there is still a substantial knowledge20
gap in the area, and ample space to debate the causes of the differences in magni-tude and trends between the records form the NW African margin and the EquatorialAtlantic. For instance, there could be differences, related to shifts in the position ofthe ITCZ with relation to the dust plume, or to differences in the interpretation of thedata, in particular with reference to the grain size distributions and potential non-eolian25
components, with implications for the spatial representativeness of the records.
4309

CPD10, 4277–4363, 2014
Twelve thousandyears of dust
S. Albani et al.
Title Page
Abstract Introduction
Conclusions References
Tables Figures
J I
J I
Back Close
Full Screen / Esc
Printer-friendly Version
Interactive Discussion
Discussion
Paper
|D
iscussionP
aper|
Discussion
Paper
|D
iscussionP
aper|
4.3 Arabian sea
Marine sediments from the Arabian Sea are of great value, as they provide a rareopportunity to gather information about past dust variability from the Middle East andCentral Asia, from which little is known despite this arid belt being one of the majordust sources worldwide (Prospero et al., 2002). The most relevant climatic feature in5
the region is the seasonality related to the onset of the SW Indian monsoon. The largestdust activity in the region is from summer dust emissions from Mesopotamia and theArabian Peninsula, which are thought to constitute the major dust sources at presentfor the Arabian Sea, although contributions from Somalia and Iran/Pakistan may beimportant (Prospero et al., 2002).10
We report data from the cores RC-27–42 and 93KL, recovered from the centralArabian Sea (Pourmand et al., 2007) and the Little Murray ridge in the northeast(Pourmand et al., 2004), respectively. There are no clear common trends betweenthe two records, which indeed show very different DMARs, one order of magnitudeapart (Fig. 7). There is little information to explain the difference in magnitude, which15
is perhaps related to different sources, although possible fluvial inputs to 93KL cannotbe conclusively ruled out. There is clear evidence that dust grains larger than 10 µmare present in the Arabian Sea sediments (Clemens and Prell, 1990; Clemens, 1998;Sirocko et al., 1991). The fine fraction ratio for the two records is a rough approximationcommon to both records (Table 1).20
4.4 North America
Evidence of dust deposition and accumulation during the Holocene in North Amer-ica is widespread, mainly linked to loess deposits in the mid-continent (Bignell loess),particularly in Nebraska (Mason et al., 2003; Miao et al., 2007), Kansas (Feng et al.,1994), North Dakota (Mason et al., 2008), and Eastern Colorado (Muhs et al., 1999;25
Pigati et al., 2013). Most areas are characterized by relatively low thickness, so that low
4310

CPD10, 4277–4363, 2014
Twelve thousandyears of dust
S. Albani et al.
Title Page
Abstract Introduction
Conclusions References
Tables Figures
J I
J I
Back Close
Full Screen / Esc
Printer-friendly Version
Interactive Discussion
Discussion
Paper
|D
iscussionP
aper|
Discussion
Paper
|D
iscussionP
aper|
temporal resolution does not allow assessing Holocene variability, with the exceptionof a few sites in Nebraska (Miao et al., 2007).
Unlike the other areas where loess origin is related to local river systems, loessdeposits in Nebraska have their immediate sources in the extensive dune fields tothe Northwest. Changes in the climatic conditions affecting vegetation cover have the5
potential to loosen or stabilize the dunes, altering their potential as dust sources (Miaoet al., 2007).
Well-studied sites at Wauneta have very high temporal resolution due to the highDMARs, and allowed the identification of different phases of dust accumulation andpedogenesis during the Holocene. The high accumulation rates are related to the loca-10
tion, on the edge of tableland escarpments facing the immediate source areas of thedust. The accumulation rate drops off drastically in the downwind direction from thesesites, for example, the ∼ 6 m of Holocene loess in the Old Wauneta section thins toa little over a meter within a few hundred meters downwind, where a rather uniformloess mantle covers the upland sites (Jacobs and Mason, 2007; Mason et al., 2003).15
Another site to the NE (Logan Roadcut) shows lower bulk DMAR but similar phasing,associated to the sequence of pedostratigraphic horizons (Miao et al., 2007). Whenaccounting for the size information i.e. when focusing on the fine fraction DMARs, boththe absolute values of DMAR drastically decrease, and become comparable in mag-nitude (Fig. 8). This suggests that the fine fraction DMARs can be considered more20
representative (rather than bulk DMAR) of accumulation rates over large areas.
4.5 Alaska
Dust activity in Alaska has been reported for both the present day (Crusius et al., 2011)and the past, in glacial and interglacial times (Muhs et al., 2003a). Dust in Alaskais of glaciogenic origin i.e. results from the formation of loose sediments character-25
ized by fine particles, produced by the abrasion of the ice over the surface sedimentsor bedrock, and released on river/streams outwash plains during the melting season(Bullard, 2013).
4311

CPD10, 4277–4363, 2014
Twelve thousandyears of dust
S. Albani et al.
Title Page
Abstract Introduction
Conclusions References
Tables Figures
J I
J I
Back Close
Full Screen / Esc
Printer-friendly Version
Interactive Discussion
Discussion
Paper
|D
iscussionP
aper|
Discussion
Paper
|D
iscussionP
aper|
Loess deposits of Holocene origin have been identified in central (Begét, 1990) andsouthern Alaska (Muhs et al., 2004, 2013; Pigati et al., 2013). The only site with hightemporal resolution and numerical dating is the Chitina section in the Wrangnell-St.Elias National Park (Muhs et al., 2013; Pigati et al., 2013). The high bulk DMAR (Fig. 9)suggests that the dust sources (attributed to the Copper River basin) lay very close.5
This notion is supported by the coarseness of grain size data, comparable to analo-gous data from sites in the Matanuska Valley, which are located within 10 km from theputative source (Muhs et al., 2004).
Another record with Holocene temporal resolution is from a maar lake (ZagoskinLake, on St. Michel Island) in Western Alaska, which is thought to be representative of10
proximal but not strictly local sources (Yukon River Valley), as also shown by the grainsize (Muhs et al., 2003b). When the fine fraction of DMAR is considered, the Chitinasection and Zagoskin Lake show comparable magnitude (Fig. 9), which we observe israther large in a global perspective. While this indicates that dust deposition into theAlaskan Gulf and other surrounding seas is probably relatively large (Crusius et al.,15
2011), it is difficult to assess if the spatial extent of Alaskan dust sources is such thatthe region is a quantitatively relevant source for dust in the high latitudes (Bullard, 2013;Muhs et al., 2013). Geochemical tracer studies in the North Pacific may provide someclue (Serno et al., 2014).
4.6 East Asia and North Pacific20
The deserts in Western and Northern China are major global dust sources with rele-vance for the mid and high latitudes of the Northern Hemisphere (e.g. An et al., 1991;Lu and Sun, 2000; Bory et al., 2003; Prospero et al., 2002). The most stunning evi-dence of East Asian dust history in the Quaternary and beyond in response to orbitalforcing lies in the thick deposits of the Chinese Loess Plateau (CLP), which covers ex-25
tremely vast areas of the upper and middle reaches of the Yellow River to the Southeastof the Badain Juran, Tengger and Ordos deserts (e.g. Ding et al., 2005; Kohfeld andHarrison, 2003; Porter, 2001). In relation to the vastness of the CLP, different climatic
4312

CPD10, 4277–4363, 2014
Twelve thousandyears of dust
S. Albani et al.
Title Page
Abstract Introduction
Conclusions References
Tables Figures
J I
J I
Back Close
Full Screen / Esc
Printer-friendly Version
Interactive Discussion
Discussion
Paper
|D
iscussionP
aper|
Discussion
Paper
|D
iscussionP
aper|
forcing mechanisms may have inter-played in a varying fashion in different regions,in response to changes related to the monsoon system (Cosford et al., 2008, Donget al., 2010), including in the extent or activity of the source areas (e.g. Lu et al., 2013,2010), in transport, i.e. wind strength and/or seasonality (e.g. An et al., 1991; Dinget al., 2005), and climatic conditions controlling the balance of pedogenesis and loess5
accumulation (e.g. Jiang et al., 2014).Despite several studies conducted on the CLP, a few absolutely dated records exist
that have Holocene temporal resolution (Kohfeld and Harrison, 2003; Roberts et al.,2001), with some additions in more recent years (Stevens et al., 2006, 2008, 2010;Lu et al., 2006, 2013). In many areas agricultural practices carried out for at least the10
last ∼ 2.5 ka complicate the interpretations of the upper parts of several loess/paleosolsequences (e.g. Roberts et al., 2001). We selected two sites with loess/paleosol se-quences from the Western CLP, from Duowa (Maher et al., 2003; Roberts et al., 2001)and Jiuzhoutai (Kohfeld and Harrison, 2003; Sun et al., 2000). The two sites show thesame sequence of pedostratigraphic succession of loess and paleosol sub-units (Ko-15
hfeld and Harrison, 2003; Roberts et al., 2001; Sun et al., 2000), and the bulk DMARcorresponding to the alternation of those sub-units show similar trends (Fig. 10). Whenthe fine component alone is considered, the DMARs from the two sites are very similar.For those reasons, the two sites seem to be representative of large-scale patterns inthe Western CLP. We also report DMAR from three sites located in the central CLP:20
Xifeng and Beiguoyuan (Stevens and Lu, 2009), and Luochuan (Lu et al., 2000, 2013).Those sequences have similar soil unit stratigraphy for the Holocene (Sect. 3.2), butthe DMARs relative trends are not consistent (Fig. 10), possibly indicating that localeffects may have some more diffuse influence on DMARs in the central CLP sites. Thecentral sites show a more uniform stratigraphy during the Holocene (prevalence of pe-25
dogenesis) with respect to the sites in the Western CLP, possibly indicating a strongerinfluence of the summer monsoon.
Dust plumes emanating from Asian deserts provide dust inputs to the NorthernPacific Ocean (Rea, 1994), but because of low sedimentation rates and the lack
4313

CPD10, 4277–4363, 2014
Twelve thousandyears of dust
S. Albani et al.
Title Page
Abstract Introduction
Conclusions References
Tables Figures
J I
J I
Back Close
Full Screen / Esc
Printer-friendly Version
Interactive Discussion
Discussion
Paper
|D
iscussionP
aper|
Discussion
Paper
|D
iscussionP
aper|
of carbonate-rich sediments the information from records with temporally resolvedHolocene is very limited. We show one record from core V21-146 (Hovan et al., 1991),which exhibits relatively little variability during the Holocene.
4.7 Greenland
Ice core records from Greenland are among the best temporally resolved paleoclimate5
proxies. They show the sharpest and largest amplitude oscillations observed in paleo-dust records worldwide, following the trends exhibited by the other proxies such as e.g.δ18O in the alternation of stadial and interstadial phases during the last glacial periodand the deglaciation (Fuhrer et al., 1999; Mayewski et al., 1997; Ruth, 2003; Steffensenet al., 2008).10
Among the ice cores drilled in Greenland, only one has a full Holocene dust record:GISP2 (Mayewski et al., 1997; Zdanowicz et al., 2000; Zielinski and Mershon, 1997),for which we considered the calcium record as a proxy for dust (Mayewski et al., 1997).Compared to the large variability of the glacial period, the Holocene dust MAR israther flat, but a closer inspection shows an increasing trend from the Early to the15
Mid-Holocene, followed by a declining trend in the Late Holocene and a rise during thelast millennium (Fig. 11).
It is not clear whether dust variability during the Holocene at GISP2 is related to (1)changes in the dust sources, which are thought to be in central and East Asia (e.g. Boryet al., 2003), (2) the atmospheric circulation, which indeed played a major role during20
the sharp glacial climate transitions (Mayewski et al., 2014; Meeker and Mayewski,2002; Steffensen et al., 2008), or (3) changes in deposition mechanisms. New studiesspanning the Holocene perhaps using dust MARs from particle counters at other sitesmay help understanding if this is a consistent feature of dust deposition in Greenland.
4314

CPD10, 4277–4363, 2014
Twelve thousandyears of dust
S. Albani et al.
Title Page
Abstract Introduction
Conclusions References
Tables Figures
J I
J I
Back Close
Full Screen / Esc
Printer-friendly Version
Interactive Discussion
Discussion
Paper
|D
iscussionP
aper|
Discussion
Paper
|D
iscussionP
aper|
4.8 Equatorial Pacific
The Equatorial Pacific Ocean is one of the most remote regions in the world. It is char-acterized by low dust deposition, correlated with global ice volume and dust in Antarcticice cores over glacial/interglacial cycles (Winckler et al., 2008). The spatial coverage inthe region is relatively good, in that there are north–south and east–west transects of5
cores with temporally-resolved Holocene to Last Glacial dust records (Anderson et al.,2006; Bradtmiller et al., 2006; McGee et al., 2007).
The sites consistently show larger DMARs during the Early Holocene compared tothe MH and Late Holocene (Fig. 12), with the two northernmost records from 110W (green tones) showing the highest DMARs in then region. Due to the low sedi-10
mentation rates of equatorial Pacific sediments (typically 1–2 cm ka−1), it is uncertainwhether these Holocene trends are real or simply reflect bioturbative mixing of glacialsediments characterized by high dust MARs with lowermost Holocene sediments. Therecords generally show decreasing DMAR from north to south, and from east to west.Geochemical fingerprinting of dust in the Equatorial Pacific sediments indicates a com-15
plex situation, with a mixture of potential dust sources including Asia, North and Cen-tral/South America, Sahara, and Australia (Xie and Marcantonio, 2012; Ziegler et al.,2007).
4.9 Australia
Australia’s drylands are among the largest dust sources in the Southern Hemisphere in20
the present day (Prospero et al., 2002), and dust deposits on land and in the surround-ing seas archive evidence of the continent’s dust history during glacial and interglacialcycles (De Deckker et al., 2012; Hesse and McTainsh, 2003; Lamy et al., 2014). Thepaucity of data for the Holocene in the Australian region was stated at the time of theDIRTMAP compilation (Kohfeld and Harrison, 2001), and since then more research25
was carried out (Fitzsimmons et al., 2013; Marx et al., 2009; McGowan et al., 2010).
4315

CPD10, 4277–4363, 2014
Twelve thousandyears of dust
S. Albani et al.
Title Page
Abstract Introduction
Conclusions References
Tables Figures
J I
J I
Back Close
Full Screen / Esc
Printer-friendly Version
Interactive Discussion
Discussion
Paper
|D
iscussionP
aper|
Discussion
Paper
|D
iscussionP
aper|
We report (Fig. 13) two marine sediment records sampling the two main dust cor-ridors emanating from Australia: the Tasman Sea (Fitzsimmons et al., 2013; Hesse,1994), and the East Indian Ocean (Fitzsimmons et al., 2013; Hesse and McTainsh,2003). The NW core from the monsoon-influenced zone shows relatively high dustMAR during the Early Holocene and a declining trend toward the Mid- and Late5
Holocene (Fitzsimmons et al., 2013). On the other hand the core from the TasmanSea shows a minimum dust MAR during the Early Holocene compared to the MH, inline with trends reported from a peat bog in New Zealand (Fitzsimmons et al., 2013;Marx et al., 2009).
4.10 South Atlantic Ocean10
There is some information about lithogenic DMAR in the southern oceans in the liter-ature, but a quantitative estimation of eolian DMAR directly related to the atmosphericDF can be problematic, because of low dust DF coupled with strong sediment redis-tribution by currents and input of non-eolian material carried by floating icebergs i.e.ice-rafted debris (e.g. Kohfeld et al., 2013). Nonetheless a few studies exploiting the15
thorium profiling method attempted to correct SBMAR for sediment redistribution, pro-viding new data (Anderson et al., 2014; Lamy et al., 2014).
In particular the dust record from core PS2498-1 recovered from the Mid-AtlanticRidge in the sub-Antarctic South Atlantic Ocean (Anderson et al., 2014) is character-ized by high temporal resolution during the Holocene (Fig. 14). The dust, whose source20
is hypothesized to be from South America, shows a marked declining trend during theHolocene, with late Holocene values a factor of ∼ 2 lower than those found in the EarlyHolocene.
4.11 Antarctica
Ice core records from the East Antarctic plateau (Delmonte et al., 2004; Lambert et al.,25
2008) represent high quality dust records in terms of temporal resolution, reliability of
4316

CPD10, 4277–4363, 2014
Twelve thousandyears of dust
S. Albani et al.
Title Page
Abstract Introduction
Conclusions References
Tables Figures
J I
J I
Back Close
Full Screen / Esc
Printer-friendly Version
Interactive Discussion
Discussion
Paper
|D
iscussionP
aper|
Discussion
Paper
|D
iscussionP
aper|
the age model (Veres et al., 2013), isolation of the eolian component and measure ofits size distribution (Delmonte et al., 2004, 2013), identification of remote sources (Al-bani et al., 2012b; Delmonte et al., 2010b) and broad scale spatial representativeness(Mahowald et al., 2011). Similar to Greenland, the Holocene dust MAR in the EastAntarctic Plateau shows little variability compared to the large glacial/interglacial and5
stadial/interstadial variations.Both records considered in this study, EPICA Dome C (EDC) and Vostok-BH7 (Del-
monte et al., 2004; Lambert et al., 2008), show a slightly declining trend in dust MARthroughout the Holocene, superimposed on large variability (Lambert et al., 2012)(Fig. 15). Some deglaciated areas and nunataks at the edges of the ice sheets are10
prone to act as dust sources (Bory et al., 2010; Bullard, 2013; Chewings et al., 2014;Delmonte et al., 2010b, 2013). In such a remote environment, even small amounts oflocal dust can give a relevant contribution to the dust budget of ice cores e.g. TALDICE(Albani et al., 2012a; Delmonte et al., 2010b). Because dust from Antarctic sourcesdoes not travel in significant amounts to the interior of the East Antarctic Plateau (Del-15
monte et al., 2013), it is unlikely that the declining Holocene DMARs at Vostok andDome C are related to the large variations seen in the TALDICE record (Albani et al.,2012a).
Possible explanations may be related to the interplay of the contributions from dif-ferent dust source from South America and Australia (Albani et al., 2012b; Delmonte20
et al., 2010b), and atmospheric circulation changes.
4.12 Mass balance of the global dust cycle throughout the Holocene
A detailed comparison of modelled and observed dust deposition (< 10 µm) for 6 ka BP(5–7 ka BP interval) is shown in Fig. 16 (see Supplement for the other time periodsand the dominant sources). The modelled deposition is generally consistent with the25
observations of dust MAR spanning 6 orders of magnitude, within a factor of 10, similarto previous studies (Albani et al., 2014; Mahowald et al., 2006). Nonetheless, there area few notable outliers.
4317

CPD10, 4277–4363, 2014
Twelve thousandyears of dust
S. Albani et al.
Title Page
Abstract Introduction
Conclusions References
Tables Figures
J I
J I
Back Close
Full Screen / Esc
Printer-friendly Version
Interactive Discussion
Discussion
Paper
|D
iscussionP
aper|
Discussion
Paper
|D
iscussionP
aper|
While modelled deposition in the Equatorial Atlantic is very well reproduced, obser-vations of DMAR in the NW African margin appear to suggest overestimation by themodel for some sites in that region. There are several possible (perhaps concurrent)explanations worth considering. First of all, the model may not be able to representadequately the spatial distribution of dust sources within North Africa, resulting in a dif-5
ferent localization of the dust plume hence a different north–south gradient in the dustdeposition. On the other hand, it is possible that some inconsistencies exist amongobservations, due to different methodological approaches, as discussed in Sect. 4.2.From a global perspective, there is an interesting aspect emerging from Fig. 16, whichmay support this argument. The observational DMARs in some of the North African10
margin cores are comparable to or smaller in magnitude than some of the cores in theEquatorial Pacific, which was unexpected, and became evident once the size informa-tion was taken into account and coupled to the dust MARs.
In addition to the possible methodological inconsistencies outlined above, two otherpotential explanations for comparable fine (< 10 µm) DMARs on the NW African margin15
and the equatorial Pacific could be: (a) a lack of wet deposition on the NW Africanmargin, possibly leading to low deposition of fine dust particles there, despite highatmospheric dust loads; (b) possible substantial overestimation of dust deposition in theHolocene in the equatorial Pacific, due to bioturbative mixing of glacial and Holocenesediments in this regions with very low sedimentation rates (1–2 cm ka−1).20
We also note how South Atlantic DMARs are almost as large as the largest depo-sition rates observed downwind of North Africa for the fine fraction, in a region wheresatellite images show little dust loading today (Prospero et al., 2002), possibly indicat-ing that either sediment redistribution or non-eolian inputs may not be fully constrainedin that region (Anderson et al., 2014).25
Significant underestimation of dust deposition by the model in Alaska is also sug-gested by the observations. Note that dust sources in Alaska are glaciogenic, and inthe model for the MH we prescribed them; we allowed particular grid cells to emit dustwith no constraints provided by vegetation cover or geomorphic soil erodibility. The
4318

CPD10, 4277–4363, 2014
Twelve thousandyears of dust
S. Albani et al.
Title Page
Abstract Introduction
Conclusions References
Tables Figures
J I
J I
Back Close
Full Screen / Esc
Printer-friendly Version
Interactive Discussion
Discussion
Paper
|D
iscussionP
aper|
Discussion
Paper
|D
iscussionP
aper|
prescribed sources are the Matanuska Valley, the Copper River Valley, and the belt inCentral Alaska from Fairbanks to the West coast, including the Yukon Valley. The totalamount of dust that we allowed to be emitted from Alaska as a whole is constrained bythe fact that larger emissions would result in a prevalence of Alaskan dust in Greenlandin the model, which would not be consistent with observations (e.g. Bory et al., 2003).5
Satellite imagery clearly shows that even in large dust source areas, at a small spatialscale dust emanates from a constellation of localized hotspots, and then gets mixeddownwind (e.g. Knippertz and Todd, 2012). Global scale ESMs such as the CESM havea spatial resolution good enough to capture the process of large spatial extent, but maybe more sensitive to the exact localization of small dust hotspots when they are scat-10
tered over disparate valley settings, as in the case of Alaska. An insight from a slightlydifferent angle could be that it is still unclear to what extent the very large DMARs fromlocalized sources in low hotspot density regions such as Alaska are representative forlarge scale dust emissions, as discussed in Sect. 4.5.
The temporal evolution of the global dust cycle (Fig. 17) shows a decreasing trend15
in dustiness from the Early to Mid-Holocene, with a minimum between 6 and 8 ka BP,and an increasing tendency in the Late Holocene, with the global dust load varyingbetween 17.1 and 20.5 Tg, which corresponds to a difference of ∼ 17 %. For reference,dust load estimates with the same model are 23.8 Tg for current climate, and 37.4 Tgfor the LGM (Albani et al., 2014). Similarly, global dust deposition estimates during20
the Holocene vary by ∼ 15 %, between ∼ 2800 Tga−1 (10 ka BP) and ∼ 2400 Tga−1
(8 ka BP) (Fig. 17).Two distinct features characterize the spatial distribution of dust during the Holocene.
First, the Early to Mid-Holocene is characterized by enhanced dustiness in the South-ern Hemisphere compared to the Late Holocene. Second, there are shifts between25
the relative importance of Asian vs. North African sources. Even in the Late Holocenethough, there seems to be an imbalance towards Asian sources, compared to presentday. This may be related to the difficulties of constraining the model to the observa-tions in general and for the North African regions in particular, although the relative
4319

CPD10, 4277–4363, 2014
Twelve thousandyears of dust
S. Albani et al.
Title Page
Abstract Introduction
Conclusions References
Tables Figures
J I
J I
Back Close
Full Screen / Esc
Printer-friendly Version
Interactive Discussion
Discussion
Paper
|D
iscussionP
aper|
Discussion
Paper
|D
iscussionP
aper|
role of North Africa as a dust source may have actually increased significantly sincethe pre-industrial period due to much increased dustiness (Mulitza et al., 2010).
5 Conclusions
Here we present the first study using an innovative approach to organize a paleodustcompilation for the Holocene from different sedimentary archives, by collecting and5
evaluating dust records that allow the reconstruction of time series of eolian mass ac-cumulation rates with size information, with relevance for medium to long range trans-port.
The resulting database has the following characteristics.
– It is concise and accessible. The main information for each site included in the10
compilation is a time series including age (with uncertainty), dust MAR (withuncertainty), and size distribution (where available) standardized by the use ofa common binning scheme. The data are organized in ASCII tables with a coher-ent formatting, easily accessible by scripting or for importing into spreadsheets.The data will be publicly accessible on the web and released with this paper.15
We also provide a graphical overview that synthesizes “at-a-glance” the intrinsiccharacteristics and uncertainties for all the different records included in the com-pilation. Complementary to the data is a categorical attribution of the confidencelevel of each record, in terms of providing a reliable quantitative DMAR time seriesof eolian dust relevant for medium to long-range transport. Finally, we report de-20
tailed information of the dust size distributions when available. In particular whenfull size distributions were available (rather than mineralogical size classes), westandardized them to a common binning scheme, to facilitate comparability.
– It is detailed and flexible. On-going research often provides the opportunity ofrefined age models for sedimentary records, so we left the compilation open for25
easy future updates. In addition to the basic information mentioned above, we4320

CPD10, 4277–4363, 2014
Twelve thousandyears of dust
S. Albani et al.
Title Page
Abstract Introduction
Conclusions References
Tables Figures
J I
J I
Back Close
Full Screen / Esc
Printer-friendly Version
Interactive Discussion
Discussion
Paper
|D
iscussionP
aper|
Discussion
Paper
|D
iscussionP
aper|
report the ancillary information necessary to re-derive the dust MARs time series:the detailed depths and the relevant dust variables, i.e. dust concentration or dustproxy concentration or dust fraction and bulk density if applicable.
– Its compilation was highly participatory. It results from an extensive collabora-tion among scientists from the observational and modelling communities, which5
allowed more in depth analysis beyond the original studies.
We focused on dust variability during the Holocene, with emphasis on the MH as a keyPMIP scenario, and also in relation to the large amount of variability that affected thepresent world’s largest dust source, North Africa, with the termination of the AfricanHumid Period (deMenocal et al., 2000; McGee et al., 2013).10
An integrated approach of merging data and modelling with the CESM allowed a spa-tially consistent reconstruction of the global dust cycle and its variability throughoutthe Holocene. Our simulations indicate that the global dust load showed significantvariability ranging between 17.1 and 20.5 Tg, with a minimum during the Early to Mid-Holocene. The model/data compilation is likely to be useful to both dust and ocean15
biogeochemical modellers, who may use iron and mineral dust as a ballast input totheir model (e.g. Moore et al., 2006), or for observational studies to allow them to puttheir cores into the context of existing estimates of depositional fluxes (e.g. Winckleret al., 2008).
In addition we report on two relevant aspects that emerged from this work.20
First, we showed how the dust size distribution of dust is intrinsically related to theDMAR: ignoring this tight coupling would cause a misleading interpretation of the dustcycle, not only for modelling studies but also in a broader sense.
Second, comparing DMARs within a consistent size range allows for a consistentanalysis of the spatial features of the global dust cycle, which are not deducible by25
the simple analysis of relative timing and amplitude of the variations among differentpaleodust reconstructions.
4321

CPD10, 4277–4363, 2014
Twelve thousandyears of dust
S. Albani et al.
Title Page
Abstract Introduction
Conclusions References
Tables Figures
J I
J I
Back Close
Full Screen / Esc
Printer-friendly Version
Interactive Discussion
Discussion
Paper
|D
iscussionP
aper|
Discussion
Paper
|D
iscussionP
aper|
Our analysis shows that a knowledge gap in understanding relevant features of theglobal dust cycle still exists, in particular for key regions such as North African andAsian dust sources, where quantitative information on the dust cycle is limited or notfully consistent.
In our representation of the loess/paleosol data, we depict them as DMAR time se-5
ries, which is a rather innovative approach introduced in previous compilation efforts(Kohfeld and Harrison, 2003), as well as in a few observational studies (e.g., Muhset al., 2013a; Stevens and Lu, 2009), but which is not widespread in the loess commu-nity at large. We tentatively used an approach that privileges pairing of the time serieswith the soil sub-units stratigraphy. Future work will be needed to better asses this, as10
well as alternative approaches.We present a framework for future work on dust compilations, and although here we
focused on the Holocene, future updates using this framework over the current timeperiod are intending to improve the compilation. In addition, the framework providedfor this compilation can be extended to wider time periods in the future, for example,15
the full span of the last glacial cycle and the deglaciation, and the Late Holocene topresent day, which would allow linking the past and the present dust cycle.
Appendix A: Description of the template database tables and site sheets
All records in this compilation include a basic piece of information: a time series ofeolian DMAR, with 1σ uncertainty on both ages and DMARs (Supplement), and a cat-20
egorical attribution of the confidence level (Table 1).Because each record is characterized by a different number of age points, a separate
table is associated to each record. In addition, a descriptive sheet is provided for eachrecord, with a graphical overview of the sampling of the profile and the time-dependentdust MAR with uncertainties, as well as metadata. For sites where size information is25
available, an additional integrative table is provided, as well as a document with detailsabout the re-binning procedure.
4322

CPD10, 4277–4363, 2014
Twelve thousandyears of dust
S. Albani et al.
Title Page
Abstract Introduction
Conclusions References
Tables Figures
J I
J I
Back Close
Full Screen / Esc
Printer-friendly Version
Interactive Discussion
Discussion
Paper
|D
iscussionP
aper|
Discussion
Paper
|D
iscussionP
aper|
Each table in the database is a TAB-separated ASCII document, named after thesite, as reported in Table 1. The first four columns contain the basic information: Age(ka BP), Dust MAR (gm−2 a−1), Age error (ka), and Dust MAR error (gm−2 a−1). A sec-ond set of columns includes data relative to the depth of the samples and their age:Depth top (cm), Depth bottom (cm), Depth center (cm), Age top (ka BP), Age bottom5
(ka BP), Age center (ka BP). Finally, a third set of columns contains information rel-evant for the dust MAR calculation: Sediment Bulk MAR (gm−2 a−1), SBMAR relativeerror, Sediment Dry Bulk Density (g cm−3), SDBD relative error, SR (cm ka−1), SR rel-ative error, Eolian Contribution (fraction), EC (ppm), and EC relative error. All entriesare filled either with data or “NA”s.10
The tables with size information are also TAB-separated ASCII documents. There aretwo types of them, one with size classes, and one with the re-binned size distributions.The first four columns again contain the basic information: Age (ka BP), Dust MAR(gm−2 a−1), Age error (ka), and Dust MAR error (gm−2 a−1). The other columns containeither the size classes as reported in the original work, or the binned data, with upper15
and lower limits indicated in the first two rows of the table.The descriptive sheet is composed of three panels. The upper one shows the dust
MAR in function of depth, and highlights (grey shading) the sampling stratigraphy. Thecentral panel shows the dust MAR time series, with relative uncertainties. The bottompanel contains a concise summary about the sampling, and methods used to determine20
the ages, age model, SBMAR and EC (with relative uncertainties), and size.For the records with size distributions associated, an additional PDF document is
provided, showing the fitting procedure for each site: original cumulative distribution,fitting spline, original and new mass-size distribution (scaled). In addition, several per-centiles across the size spectrum are compared for the original and re-binned distribu-25
tions. For the overall record from one site, two summary metrics are produced, whichsynthesize the overall fit to the original data: the Pearson’s correlation coefficient of the
4323

CPD10, 4277–4363, 2014
Twelve thousandyears of dust
S. Albani et al.
Title Page
Abstract Introduction
Conclusions References
Tables Figures
J I
J I
Back Close
Full Screen / Esc
Printer-friendly Version
Interactive Discussion
Discussion
Paper
|D
iscussionP
aper|
Discussion
Paper
|D
iscussionP
aper|
5th, 25th, 50th, 90th, and 95th percentiles, and the mean normalized bias (MNB):
MNB =1
nobs ·ni
∑obs
∑i
(xobs,i
)−(yobs,i
)xobs,i
(A1)
where nobs is the number of samples for a site, ni is the number of percentiles includedin the calculation (here five of them), xobs,i is the original i th percentile for a givensample, and yobs,i is the corresponding new binning percentile.5
The Supplement related to this article is available online atdoi:10.5194/cpd-10-4277-2014-supplement.
Acknowledgements. We acknowledge assistance from NSF grants 0932946, 1003509, andDOE-SC00006735. S. Albani acknowledges funding from “Dote ricercatori”: FSE, RegioneLombardia. G. Winckler acknowledges funding from NSF grant AGS-1003505. We gratefully10
acknowledge Dan Muhs for sharing his data, and for thorough discussions on the interpreta-tion of terrestrial sediment records. We also would like to thank the following colleagues forconstructive discussions: L. Thompson, P. Gabrielli, C. Zdanowicz, S. Marx, M. Kylander, G. LeRoux, F. De Vleeschouwer, P. DeDeckker, D. Rea.
References15
Adkins, J., deMenocal, P., and Eshel, G.: The “African humid period” and the record of marineupwelling from excess 230Th in Ocean Drilling Program Hole 658C, Paleoceanography, 21,PA4203, doi:10.1029/2005PA001200, 2006.
Albani, S., Delmonte, B., Maggi, V., Baroni, C., Petit, J.-R., Stenni, B., Mazzola, C., and Frez-zotti, M.: Interpreting last glacial to Holocene dust changes at Talos Dome (East Antarctica):20
implications for atmospheric variations from regional to hemispheric scales, Clim. Past, 8,741–750, doi:10.5194/cp-8-741-2012, 2012a.
Albani, S., Mahowald, N. M., Delmonte, B., Maggi, V., and Winckler, G.: Comparing mod-eled and observed changes in mineral dust transport and deposition to Antarctica be-tween the Last Glacial Maximum and current climates, Clim. Dynam., 38, 1731–1755,25
doi:10.1007/s00382-011-1139-5, 2012b.4324

CPD10, 4277–4363, 2014
Twelve thousandyears of dust
S. Albani et al.
Title Page
Abstract Introduction
Conclusions References
Tables Figures
J I
J I
Back Close
Full Screen / Esc
Printer-friendly Version
Interactive Discussion
Discussion
Paper
|D
iscussionP
aper|
Discussion
Paper
|D
iscussionP
aper|
Albani, S., Mahowald, N. M., Perry, A. T., Scanza, R. A., Zender, C. S., Heavens, N. G.,Maggi, V., Kok, J. F., and Otto-Bliesner, B. L.: Improved dust representation in the CommunityAtmosphere Model, J. Adv. Model. Earth Syst., 6, 541–570, doi:10.1002/2013MS000279,2014.
Alley, R. B.: The Younger Dryas cold interval as viewed from central Greenland, Quaternary5
Sci. Rev., 19, 213–226, doi:10.1016/S0277-3791(99)00062-1, 2000.An, Z., Kukla, G., Porter, S. C., and Xiao, J.: Late quaternary dust flow on the chinese Loess
Plateau, Catena, 18, 125–132, doi:10.1016/0341-8162(91)90012-M, 1991.Anderson, R. F., Fleisher, M. Q., and Lao, Y.: Glacial–interglacial variability in the delivery
of dust to the central equatorial Pacific Ocean, Earth Planet. Sc. Lett., 242, 406–414,10
doi:10.1016/j.epsl.2005.11.061, 2006.Anderson, R. F., Fleisher, M. Q., Lao, Y., and Winckler, G.: Modern CaCO3 preservation in
equatorial Pacific sediments in the context of late-Pleistocene glacial cycles, Mar. Chem.,111, 30–46, doi:10.1016/j.marchem.2007.11.011, 2008.
Anderson, R. F., Barker, S., Fleisher, M., Gersonde, R., Goldstein, S. L., Kuhn, G., Mortyn, P. G.,15
Pahnke, K., and Sachs, J. P.: Biological response to millennial variability of dust and nutri-ent supply in the Subantarctic South Atlantic Ocean., Philos. T. R. Soc A., 372, 20130054,doi:10.1098/rsta.2013.0054, 2014.
Bacon, M. P.: Glacial to interglacial changes in carbonate and clay sedimentation in the AtlanticOcean estimated from 230Th measurements, Isot.Geosci., 2, 97–111, 1984.20
Bacon, M. P. and Anderson, R. F.: Distribution of thorium isotopes between dissolved and par-ticulate forms in the deep sea, J. Geophys. Res., 87, 2045, doi:10.1029/JC087iC03p02045,1982.
Bard, E., Arnold, M., Duprat, J., Moyes, J., and Duplessy, J.-C.: Reconstruction ofthe last deglaciation: deconvolved records of δ18O profiles, micropaleontological vari-25
ations and accelerator mass spectrometric 14C dating, Clim. Dynam., 1, 101–112,doi:10.1007/BF01054479, 1987.
Bauer, E. and Ganopolski, A.: Sensitivity simulations with direct shortwave radiative forcing byaeolian dust during glacial cycles, Clim. Past, 10, 1333–1348, doi:10.5194/cp-10-1333-2014,2014.30
Begét, J.: Middle Wisconsinan climate fluctuations recorded in central Alaskan loess, Geogr.Phys. Quatern, 44, 3, doi:10.7202/032793ar, 1990.
4325

CPD10, 4277–4363, 2014
Twelve thousandyears of dust
S. Albani et al.
Title Page
Abstract Introduction
Conclusions References
Tables Figures
J I
J I
Back Close
Full Screen / Esc
Printer-friendly Version
Interactive Discussion
Discussion
Paper
|D
iscussionP
aper|
Discussion
Paper
|D
iscussionP
aper|
Bettis III, E. A., Muhs, D. R., Roberts, H. M., and Wintle, A. G.: Last glacial loess in the conter-minous USA, Quaternary Sci. Rev., 22, 1907–1946, doi:10.1016/S0277-3791(03)00169-0,2003.
Bory, A. J.-M. and Newton, P. P.: Transport of airborne lithogenic material down through thewater column in two contrasting regions of the eastern subtropical North Atlantic Ocean,5
Global Biogeochem. Cy., 14, 297–315, doi:10.1029/1999GB900098, 2000.Bory, A. J.-M., Biscaye, P., and Grousset, F. E.: Two distinct seasonal Asian source re-
gions for mineral dust deposited in Greenland (NorthGRIP), Geophys. Res. Lett., 30, 1167,doi:10.1029/2002GL016446, 2003.
Bory, A., Wolff, E., Mulvaney, R., Jagoutz, E., Wegner, A., Ruth, U., and Elderfield, H.: Multiple10
sources supply eolian mineral dust to the Atlantic sector of coastal Antarctica: Evidencefrom recent snow layers at the top of Berkner Island ice sheet, Earth Planet. Sc. Lett., 291,138–148, doi:10.1016/j.epsl.2010.01.006, 2010.
Boucher, O., Randall, D., Artaxo, P., Bretherton, C., Feingold, G., Forster, P., Kerminen, V.-M.,Kondo, Y., Liao, H., Lohmann, U., Rasch, P., Satheesh, S. K., Sherwood, S., Stevens, B.,15
and Zhang, X. Y.: Clouds and aerosols, in: Climate Change 2013: The Physical ScienceBasis. Contribution of Working Group I to the Fifth Assessment Report of the Intergovern-mental Panel on Climate Change, edited by: Stocker, T. F., Qin, D., Plattner, G.-K., Tignor, M.,Allen, S. K., Boschung, J., Nauels, A., Xia, Y., Bex, V., and Midgley, P. M., Cambridge Univer-sity Press, Cambridge, United Kingdom and New York, NY, USA, 2013.20
Bowen, A. J. and Lindley, D.: A wind-tunnel investigation of the wind speed and turbulencecharacteristics close to the ground over various escarpment shapes, Bound.-Lay. Meteorol.,12, 259–271, doi:10.1007/BF00121466, 1977.
Box, M. R., Krom, M. D., Cliff, R. A., Bar-Matthews, M., Almogi-Labin, A., Ayalon, A., and Pa-terne, M.: Response of the Nile and its catchment to millennial-scale climatic change since25
the LGM from Sr isotopes and major elements of East Mediterranean sediments, QuaternarySci. Rev., 30, 431–442, doi:10.1016/j.quascirev.2010.12.005, 2011.
Braconnot, P., Otto-Bliesner, B., Harrison, S., Joussaume, S., Peterchmitt, J.-Y., Abe-Ouchi, A.,Crucifix, M., Driesschaert, E., Fichefet, Th., Hewitt, C. D., Kageyama, M., Kitoh, A., Laîné, A.,Loutre, M.-F., Marti, O., Merkel, U., Ramstein, G., Valdes, P., Weber, S. L., Yu, Y., and30
Zhao, Y.: Results of PMIP2 coupled simulations of the Mid-Holocene and Last Glacial Maxi-mum – Part 1: experiments and large-scale features, Clim. Past, 3, 261–277, doi:10.5194/cp-3-261-2007, 2007.
4326

CPD10, 4277–4363, 2014
Twelve thousandyears of dust
S. Albani et al.
Title Page
Abstract Introduction
Conclusions References
Tables Figures
J I
J I
Back Close
Full Screen / Esc
Printer-friendly Version
Interactive Discussion
Discussion
Paper
|D
iscussionP
aper|
Discussion
Paper
|D
iscussionP
aper|
Bradley, R. S.: Paleoclimatology: Reconstructing Climates of the Quaternary, 2nd edn., Aca-demic, San Diego, Calif., 610 pp., 1999.
Bradtmiller, L. I., Anderson, R. F., Fleisher, M. Q., and Burckle, L. H.: Diatom productivity in theequatorial Pacific Ocean from the last glacial period to the present: a test of the silicic acidleakage hypothesis, Paleoceanography, 21, PA4201, doi:10.1029/2006PA001282, 2006.5
Bradtmiller, L. I., Anderson, R. F., Fleisher, M. Q., and Burckle, L. H.: Opal burial in the equatorialAtlantic Ocean over the last 30 ka: implications for glacial-interglacial changes in the oceansilicon cycle, Paleoceanography, 22, PA4216, doi:10.1029/2007PA001443, 2007.
Bradtmiller, L. I., Anderson, R. F., Fleisher, M. Q., and Burckle, L. H.: Comparing glacial andHolocene opal fluxes in the Pacific sector of the Southern Ocean, Paleoceanography, 24,10
PA2214, doi:10.1029/2008PA001693, 2009.Brauer, A., Hajdas, I., Blockley, S. P. E., Bronk Ramsey, Christopher Christl, M., Ivy-Ochs, S.,
Moseley, G. E., Nowaczyk, N. N., Rasmussen, S. O., Roberts, H. M., Spötl, C., Staff, R. A.,and Svensson, A.: The importance of independent chronology in integrating records of pastclimate change for the 60–8 ka INTIMATE time interval, Quaternary Sci. Rev., in press,15
doi:10.1016/j.quascirev.2011.12.010, 2014.Bronk Ramsey, C.: Radiocarbon calibration and analysis of stratigraphy: the OxCal program,
Radiocarbon, 37, 425–430, available at: http://ci.nii.ac.jp/naid/80008936407/en/ (last ac-cess: 25 July 2014), 1995.
Bullard, J. E.: Contemporary glacigenic inputs to the dust cycle, Earth Surf. Proc. Land., 38,20
71–89, doi:10.1002/esp.3315, 2013.Buylaert, J-P., Murray, A. S., Vandenberghe, D., Vriend, M., De Corte, F., and Van den haute, P.:
Optical dating of Chinese loess using sand-sized quartz: establishing a time frame for LatePleistocene climate changes in the western part of the Chinese Loess Plateau, QuaternaryGeochronology, 3, 99–113, doi:10.1016/j.quageo.2007.05.003, 2008.25
Chewings, J. M., Atkins, C. B., Dunbar, G. B., and Golledge, N. R.: Aeolian sediment transportand deposition in a modern high-latitude glacial marine environment, Sedimentology, 61,1535–1557, doi:10.1111/sed.12108, 2014.
Claussen, M., Kubatzki, C., Brovkin, V., Ganopolski, A., Hoelzmann, P., and Pachur, H.-J.: Sim-ulation of an abrupt change in Saharan vegetation in the Mid-Holocene, Geophys. Res. Lett.,30
26, 2037–2040, doi:10.1029/1999GL900494, 1999.Clemens, S. C.: Dust response to seasonal atmospheric forcing: Proxy evaluation and calibra-
tion, Paleoceanography, 13, 471–490, doi:10.1029/98PA02131, 1998.
4327

CPD10, 4277–4363, 2014
Twelve thousandyears of dust
S. Albani et al.
Title Page
Abstract Introduction
Conclusions References
Tables Figures
J I
J I
Back Close
Full Screen / Esc
Printer-friendly Version
Interactive Discussion
Discussion
Paper
|D
iscussionP
aper|
Discussion
Paper
|D
iscussionP
aper|
Clemens, S. C. and Prell, W. L.: Late Pleistocene variability of Arabian Sea summer monsoonwinds and continental aridity: Eolian records from the lithogenic component of deep-seasediments, Paleoceanography, 5, 109–145, doi:10.1029/PA005i002p00109, 1990.
Cook, B. I., Seager, R., Miller, R. L., and Mason, J. A.: Intensification of North Ameri-can megadroughts through surface and dust aerosol forcing, J. Climate, 26, 4414–4430,5
doi:10.1175/JCLI-D-12-00022.1, 2013.Cosford, J., Qing, H. R., Eglington, B., Mattey, D., Yuan, D. X., Zhang, M. L., and Cheng, H.: East
Asian monsoon variability since the Mid-Holocene recorded in a high-resolution, absolute-dated aragonite speleothem from eastern China, Earth Planet. Sc. Lett., 275, 296–307,2008.10
Crusius, J., Schroth, A. W., Gassó, S., Moy, C. M., Levy, R. C., and Gatica, M.: Glacial flour duststorms in the Gulf of Alaska: Hydrologic and meteorological controls and their importance asa source of bioavailable iron, Geophys. Res. Lett., 38, L06602, doi:10.1029/2010GL046573,2011.
De Deckker, P., Moros, M., Perner, K., and Jansen, E.: Influence of the tropics and15
southern westerlies on glacial interhemispheric asymmetry, Nat. Geosci., 5, 266–269,doi:10.1038/ngeo1431, 2012.
De La Rocha, C. L., Nowald, N., and Passow, U.: Interactions between diatom aggregates,minerals, particulate organic carbon, and dissolved organic matter: further implications forthe ballast hypothesis, Global Biogeochem. Cy., 22, GB4005, doi:10.1029/2007GB003156,20
2008.Delmonte, B., Petit, J. R., Andersen, K. K., Basile-Doelsch, I., Maggi, V., and Ya Lipenkov, V.:
Dust size evidence for opposite regional atmospheric circulation changes over east Antarc-tica during the last climatic transition, Clim. Dynam., 23, 427–438, doi:10.1007/s00382-004-0450-9, 2004.25
Delmonte, B., Andersson, P., Schöberg, H., Hansson, M., Petit, J. R., Delmas, R., Gaiero, D. M.,Maggi, V., and Frezzotti, M.: Geographic provenance of aeolian dust in East Antarc-tica during Pleistocene glaciations: preliminary results from Talos Dome and comparisonwith East Antarctic and new Andean ice core data, Quaternary Sci. Rev., 29, 256–264,doi:10.1016/j.quascirev.2009.05.010, 2010a.30
Delmonte, B., Baroni, C., Andersson, P. S., Schoberg, H., Hansson, M., Aciego, S., Petit, J.-R.,Albani, S., Mazzola, C., Maggi, V., and Frezzotti, M.: Aeolian dust in the Talos Dome ice core
4328

CPD10, 4277–4363, 2014
Twelve thousandyears of dust
S. Albani et al.
Title Page
Abstract Introduction
Conclusions References
Tables Figures
J I
J I
Back Close
Full Screen / Esc
Printer-friendly Version
Interactive Discussion
Discussion
Paper
|D
iscussionP
aper|
Discussion
Paper
|D
iscussionP
aper|
(East Antarctica, Pacific/Ross Sea sector): victoria Land versus remote sources over the lasttwo climate cycles, J. Quaternary Sci., 25, 1327–1337, doi:10.1002/jqs.1418, 2010b.
Delmonte, B., Baroni, C., Andersson, P. S., Narcisi, B., Salvatore, M. C., Petit, J. R.,Scarchilli, C., Frezzotti, M., Albani, S., and Maggi, V.: Modern and Holocene aeolian dustvariability from Talos Dome (Northern Victoria Land) to the interior of the Antarctic ice sheet,5
Quaternary Sci. Rev., 64, 76–89, doi:10.1016/j.quascirev.2012.11.033, 2013.deMenocal, P., Ortiz, J., Guilderson, T., Adkins, J., Sarnthein, M., Baker, L., and Yarusin-
sky, M.: Abrupt onset and termination of the African Humid Period, Quaternary Sci. Rev.,19, 347–361, doi:10.1016/S0277-3791(99)00081-5, 2000.
Derbyshire, E.: Loess, and the dust indicators and records of terrestrial and marine palaeoenvi-10
ronments (DIRTMAP) database, Quaternary Sci. Rev., 22, 1813–1819, doi:10.1016/S0277-3791(03)00209-9, 2003.
Derbyshire, E., Kemp, R., and Meng, X.: Variations in loess and palaeosol properties as indi-cators of palaeoclimatic gradients across the Loess Plateau of North China, Quaternary Sci.Rev., 14, 681–697, doi:10.1016/0277-3791(95)00077-1, 1995.15
De Vleeschouwer, F., Pazdur, A., Luthers, C., Streel, M., Mauquoy, D., Wastiaux, C., LeRoux, G., Moschen, R., Blaauw, M., Pawlyta, J., Sikorski, J., and Piotrowska, N.: A mil-lennial record of environmental change in peat deposits from the Misten bog (East Belgium),Quatern. Int., 268, 44–57, doi:10.1016/j.quaint.2011.12.010, 2012.
Ding, Z. L., Derbyshire, E., Yang, S. L., Sun, J. M., and Liu, T. S.: Stepwise expansion of20
desert environment across northern China in the past 3.5 Ma and implications for monsoonevolution, Earth Planet. Sc. Lett., 237, 45–55, doi:10.1016/j.epsl.2005.06.036, 2005.
Dong, J., Wang, Y., Cheng, H., Hardt, B., Edwards, R. L., Xinggong, K., Jiangying, W., Shi-tao, C., Dianbing, L., Xiuyang, J., and Kan, Z.: A high-resolution stalagmite record of theHolocene East Asian monsoon from Mt Shennongjia, central China, Holocene, 20, 257–264,25
2010.Feng, Z.-D., Johnson, W. C., Sprowl, D. R., and Lu, Y.: Loess accumulation and soil formation
in central kansas, United States, during the past 400 000 years, Earth Surf. Proc. Land., 19,55–67, doi:10.1002/esp.3290190105, 1994.
Ferrat, M., Weiss, D. J., Strekopytov, S., Dong, S., Chen, H., Najorka, J., Sun, Y., Gupta, S.,30
Tada, R., and Sinha, R.: Improved provenance tracing of Asian dust sources using rare earthelements and selected trace elements for palaeomonsoon studies on the eastern TibetanPlateau, Geochim. Cosmochim. Ac., 75, 6374–6399, doi:10.1016/j.gca.2011.08.025, 2011.
4329

CPD10, 4277–4363, 2014
Twelve thousandyears of dust
S. Albani et al.
Title Page
Abstract Introduction
Conclusions References
Tables Figures
J I
J I
Back Close
Full Screen / Esc
Printer-friendly Version
Interactive Discussion
Discussion
Paper
|D
iscussionP
aper|
Discussion
Paper
|D
iscussionP
aper|
Fischer, H., Fundel, F., Ruth, U., Twarloh, B., Wegner, A., Udisti, R., Becagli, S., Castel-lano, E., Morganti, A., Severi, M., Wolff, E., Littot, G., Röthlisberger, R., Mulvaney, R., Hut-terli, M. A., Kaufmann, P., Federer, U., Lambert, F., Bigler, M., Hansson, M., Jonsell, U., deAngelis, M., Boutron, C., Siggaard-Andersen, M.-L., Steffensen, J. P., Barbante, C., Gas-pari, V., Gabrielli, P., and Wagenbach, D.: Reconstruction of millennial changes in dust5
emission, transport and regional sea ice coverage using the deep EPICA ice cores fromthe Atlantic and Indian Ocean sector of Antarctica, Earth Planet. Sc. Lett., 260, 340–354,doi:10.1016/j.epsl.2007.06.014, 2007.
Fitzsimmons, K. E., Cohen, T. J., Hesse, P. P., Jansen, J., Nanson, G. C., May, J.-H., Bar-rows, T. T., Haberlah, D., Hilgers, A., Kelly, T., Larsen, J., Lomax, J., and Treble, P.: Late10
quaternary palaeoenvironmental change in the Australian drylands, Quaternary Sci. Rev.,74, 78–96, doi:10.1016/j.quascirev.2012.09.007, 2013.
Flato, G., Marotzke, J., Abiodun, B., Braconnot, P., Chou, S. C., Collins, W., Cox, P., Driouech, F.,Emori, S., Eyring, V., Forest, C., Gleckler, P., Guilyardi, E., Jakob, C., Kattsov, V., Reason, C.,and Rummukainen, M.: Evaluation of climate models, in: Climate Change 2013: The Phys-15
ical Science Basis. Contribution of Working Group I to the Fifth Assessment Report of theIntergovernmental Panel on Climate Change, edited by: Stocker, T. F., Qin, D., Plattner, G.-K., Tignor, M., Allen, S. K., Boschung, J., Nauels, A., Xia, Y., Bex, V., and Midgley, P. M.,Cambridge University Press, Cambridge, United Kingdom and New York, NY, USA, 2013.
Formenti, P., Schütz, L., Balkanski, Y., Desboeufs, K., Ebert, M., Kandler, K., Petzold, A.,20
Scheuvens, D., Weinbruch, S., and Zhang, D.: Recent progress in understanding physi-cal and chemical properties of African and Asian mineral dust, Atmos. Chem. Phys., 11,8231–8256, doi:10.5194/acp-11-8231-2011, 2011.
François, R., Bacon, M. P., and Suman, D. O.: Thorium 230 profiling in deep-sea sediments:high-resolution records of flux and dissolution of carbonate in the equatorial Atlantic during25
the last 24 000 years, Paleoceanography, 5, 761–787, doi:10.1029/PA005i005p00761, 1990.François, R., Frank, M., Rutgers van der Loeff, M. M., and Bacon, M. P.: 230 Th normalization:
an essential tool for interpreting sedimentary fluxes during the late quaternary, Paleoceanog-raphy, 19, PA1018, doi:10.1029/2003PA000939, 2004.
Frezzotti, M., Urbini, S., Proposito, M., Scarchilli, C., and Gandolfi, S.: Spatial and temporal30
variability of surface mass balance near Talos Dome, East Antarctica, J. Geophys. Res.,112, F02032, doi:10.1029/2006JF000638, 2007.
4330

CPD10, 4277–4363, 2014
Twelve thousandyears of dust
S. Albani et al.
Title Page
Abstract Introduction
Conclusions References
Tables Figures
J I
J I
Back Close
Full Screen / Esc
Printer-friendly Version
Interactive Discussion
Discussion
Paper
|D
iscussionP
aper|
Discussion
Paper
|D
iscussionP
aper|
Fuhrer, K., Wolff, E. W., and Johnsen, S. J.: Timescales for dust variability in the GreenlandIce Core Project (GRIP) ice core in the last 100 000 years, J. Geophys. Res., 104, 31043,doi:10.1029/1999JD900929, 1999.
Han, Q., Moore, J. K., Zender, C., Measures, C., and Hydes, D.: Constraining oceanicdust depostion using surface ocean dissolved Al, Global Biogeochem. Cy., 22, GB2003,5
doi:10.1029/2007GB002975, 2008.Hansson, M. E.: The Renland ice core. A Northern Hemisphere record of aerosol composi-
tion over 120 000 years, Tellus B, 46, 390–418, doi:10.1034/j.1600-0889.1994.t01-4-00005.x,1994.
Henderson, G. M., Heinze, C., Anderson, R. F., and Winguth, A. M. E.: Global distribution of10
the 230Th flux to ocean sediments constrained by GCM modeling, Deep-Sea Res. Pt. I, 46,1861–1893, 1999.
Hesse, P. P.: The record of continental dust from Australia in Tasman Sea Sediments, Quater-nary Sci. Rev., 13, 257–272, doi:10.1016/0277-3791(94)90029-9, 1994.
Hesse, P. P. and McTainsh, G. H.: Australian dust deposits: modern processes and the Qua-15
ternary record, Quaternary Sci. Rev., 22, 2007–2035, doi:10.1016/S0277-3791(03)00164-1,2003.
Hoelzmann, P., Jolly, D., Harrison, S. P., Laarif, F., Bonnefille, R., and Pachur, H.-J.: Mid-Holocene land-surface conditions in northern Africa and the Arabian Peninsula: a data setfor the analysis of biogeophysical feedbacks in the climate system, Global Biogeochem. Cy.,20
12, 35–51, doi:10.1029/97GB02733, 1998.Hovan, S. A., Rea, D. K., and Pisias, N. G.: Late pleistocene continental climate and
oceanic variability recorded in Northwest Pacific sediments, Paleoceanography, 6, 349–370,doi:10.1029/91PA00559, 1991.
Iizuka, Y., Delmonte, B., Oyabu, I., Karlin, T., Maggi, V., Albani, S., Fukui, M., Hondoh, T.,25
and Hansson, M.: Sulphate and chloride aerosols during Holocene and last glacial periodspreserved in the Talos Dome Ice Core, a peripheral region of Antarctica, Tellus B, 65, 20197,doi:10.3402/tellusb.v65i0.20197, 2013.
Imbrie, J., Hays, J. D., Martinson, D. G., McIntyre, A., Mix, A. C., Morley, J. J., Pisias, N. G.,Prell, W. L., and Shackleton, N. J.: The orbital theory of Pleistocene climate: support from30
a revised chronology of the marine δ18O record, Milankovitch Clim. Underst. Response to As-tron. Forcing, 269 pp., available at: http://adsabs.harvard.edu/abs/1984mcur.conf..269I (lastaccess: 9 May 2014), 1984.
4331

CPD10, 4277–4363, 2014
Twelve thousandyears of dust
S. Albani et al.
Title Page
Abstract Introduction
Conclusions References
Tables Figures
J I
J I
Back Close
Full Screen / Esc
Printer-friendly Version
Interactive Discussion
Discussion
Paper
|D
iscussionP
aper|
Discussion
Paper
|D
iscussionP
aper|
Jacobs, P. M. and Mason, J. A.: Late quaternary climate change, loess sedimentation, and soilprofile development in the central Great Plains: a pedosedimentary model, Geol. Soc. Am.Bull., 119, 462–475, doi:10.1130/B25868.1, 2007.
Jiang, W., Yang, X., and Cheng, Y.: Spatial patterns of vegetation and climate on the Chi-nese Loess Plateau since the Last Glacial Maximum, Quatern. Int., 334–335, 52–60,5
doi:10.1016/j.quaint.2013.10.039, 2014.Jolly, D., Harrison, S., Damnati, B., and Bonnefille, R.: Simulated climate and biomes of Africa
during the late quaternary, Quaternary Sci. Rev., 17, D17hoel, 629–657, doi:10.1016/S0277-3791(98)00015-8, 1998.
Joussaume, S. and Taylor, K. E.: The paleoclimate modeling intercomparison project, in: PMIP,10
Paleoclimate Modeling Intercomparison Project (PMIP): Proceedings of the Third PMIPWorkshop, , edited by: Braconnot, P., 4–8 October 1999, Canada, WCRP-111, WMO/TD-1007, 271 pp., 2000.
Kaplan, J. O., Bigelow, N. H., Prentice, I. C., Harrison, S. P., Bartlein, P. J., Christensen, T. R.,Cramer, W., Matveyeva, N. V., McGuire, A. D., Murray, D. F., Razzhivin, V. Y., Smith, B.,15
Walker, D. A., Anderson, P. M., Andreev, A. A., Brubaker, L. B., Edwards, M. E., andLozhkin, A. V.: Climate change and Arctic ecosystems: 2. Modeling, paleodata-model com-parisons, and future projections, J. Geophys. Res., 108, 8171, doi:10.1029/2002JD002559,2003.
Kawahata, H.: Fluctuations in the ocean environment within the Western Pacific Warm Pool dur-20
ing Late Pleistocene, Paleoceanography, 14, 639–652, doi:10.1029/1999PA900023, 1999.Kemp, R. A.: Pedogenic modification of loess: significance for palaeoclimatic reconstructions,
Earth-Sci. Rev., 54, 145–156, doi:10.1016/S0012-8252(01)00045-9, 2001.Knippertz, P. and Todd, M. C.: Mineral dust aerosols over the Sahara: Meteorological con-
trols on emission and transport and implications for modeling, Rev. Geophys., 50, RG1007,25
doi:10.1029/2011RG000362, 2012.Kohfeld, K. E. and Harrison, S. P.: DIRTMAP: the geological record of dust, Earth-Sci. Rev., 54,
81–114, doi:10.1016/S0012-8252(01)00042-3, 2001.Kohfeld, K. and Harrison, S. P.: Glacial-interglacial changes in dust deposition on the Chinese
Loess Plateau, Quaternary Sci. Rev., 22, 1859–1878, doi:10.1016/S0277-3791(03)00166-5,30
2003.Kohfeld, K. and Tegen, I.: Record of mineral aerosols and their role in the Earth system, Treatise
Geochem., 4, 1–26, 2007.
4332

CPD10, 4277–4363, 2014
Twelve thousandyears of dust
S. Albani et al.
Title Page
Abstract Introduction
Conclusions References
Tables Figures
J I
J I
Back Close
Full Screen / Esc
Printer-friendly Version
Interactive Discussion
Discussion
Paper
|D
iscussionP
aper|
Discussion
Paper
|D
iscussionP
aper|
Kohfeld, K. E., Graham, R. M., de Boer, A. M., Sime, L. C., Wolff, E. W., Le Quéré, C., andBopp, L.: Southern Hemisphere westerly wind changes during the Last Glacial Maximum:paleo-data synthesis, Quaternary Sci. Rev., 68, 76–95, doi:10.1016/j.quascirev.2013.01.017,2013.
Kutzbach, J. E. and Liu, Z.: Response of the African Monsoon to orbital forcing and ocean feed-5
backs in the middle Holocene, Science, 278, 40–443, doi:10.1126/science.278.5337.440,1997.
Kylander, M. E., Bindler, R., Cortizas, A. M., Gallagher, K., Mörth, C.-M., and Rauch, S.: A novelgeochemical approach to paleorecords of dust deposition and effective humidity: 8500 yearsof peat accumulation at Store Mosse (the “Great Bog”), Sweden, Quaternary Sci. Rev., 69,10
69–82, doi:10.1016/j.quascirev.2013.02.010, 2013.Lambert, F., Delmonte, B., Petit, J. R., Bigler, M., Kaufmann, P. R., Hutterli, M. A., Stocker, T. F.,
Ruth, U., Steffensen, J. P., and Maggi, V.: Dust-climate couplings over the past 800 000 yearsfrom the EPICA Dome C ice core., Nature, 452, 616–619, doi:10.1038/nature06763, 2008.
Lambert, F., Bigler, M., Steffensen, J. P., Hutterli, M., and Fischer, H.: Centennial mineral dust15
variability in high-resolution ice core data from Dome C, Antarctica, Clim. Past, 8, 609–623,doi:10.5194/cp-8-609-2012, 2012.
Lamy, F., Gersonde, R., Winckler, G., Esper, O., Jaeschke, A., Kuhn, G., Uller-mann, J., Martinez-Garcia, A., Lambert, F., and Kilian, R.: Increased dust deposi-tion in the Pacific Southern Ocean during glacial periods, Science, 343, 403–407,20
doi:10.1126/science.1245424, 2014.Lawrence, C. R. and Neff, J. C.: The contemporary physical and chemical flux of aeolian
dust: a synthesis of direct measurements of dust deposition, Chem. Geol., 267, 46–63,doi:10.1016/j.chemgeo.2009.02.005, 2009.
Lisiecki, L. E. and Raymo, M. E.: A Pliocene-Pleistocene stack of 57 globally distributed benthic25
δ18O records, Paleoceanography, 20, PA1003, doi:10.1029/2004PA001071, 2005.Liu, T. S.: Loess and Environment, China Ocean Press, Beijing, 31–67, 1985.Liu, T. S. and Ding, Z. L.: Chinese loess and the palaeomonsoon, Annu. Rev. Earth Pl. Sci., 26,
111–145, 1998.Liu, Z., Otto-Bliesner, B. L., He, F., Brady, E. C., Tomas, R., Clark, P. U., Carlson, A. E., Lynch-30
Stieglitz, J., Curry, W., Brook, E., Erickson, D., Jacob, R., Kutzbach, J., and Cheng, J.: Tran-sient simulation of last deglaciation with a new mechanism for Bolling-Allerod warming, Sci-ence, 325, 310–314, doi:10.1126/science.1171041, 2009.
4333

CPD10, 4277–4363, 2014
Twelve thousandyears of dust
S. Albani et al.
Title Page
Abstract Introduction
Conclusions References
Tables Figures
J I
J I
Back Close
Full Screen / Esc
Printer-friendly Version
Interactive Discussion
Discussion
Paper
|D
iscussionP
aper|
Discussion
Paper
|D
iscussionP
aper|
Loulergue, L., Schilt, A., Spahni, R., Masson-Delmotte, V., Blunier, T., Lemieux, B.,Barnola, J.-M., Raynaud, D., Stocker, T. F., and Chappellaz, J.: Orbital and millennial-scale features of atmospheric CH4 over the past 800 000 years, Nature, 453, 383–386,doi:10.1038/nature06950, 2008.
Lu, H. and Sun, D.: Pathways of dust input to the Chinese Loess Plateau during the last glacial5
and interglacial periods, Catena, 40, 251–261, 2000.Lu, H., Van Huissteden, J., An, Z. S., Nugteren, G., and Vandenberghe, J.: East Asia winter
monsoon changes on millennial time scale before the Last Glacial-interglacial cycle, J. Qua-ternary Sci., 14, 101–111, 1999.
Lu, H., Stevens, T., Yi, S., and Sun, X.: An erosional hiatus in Chinese loess se-10
quences revealed by closely spaced optical dating, Chinese Sci. Bull., 51, 2253–2259,doi:10.1007/s11434-006-2097-x, 2006.
Lu, H., Wang, X. Y., and Li, L. P.: Aeolian sediment evidence that global cooling has drivenlate Cenozoic stepwise aridification in central Asia, in: Monsoon Evolution and Tectonics –Climate Linkage in Asia, edited by: Clift, P. D., Tada, R., and Zheng, H., Geological Society,15
London, Special Publications, 342, 29–44, 2010.Lu, H., Yi, S., Liu, Z., Mason, J. A., Jiang, D., Cheng, J., Stevens, T., Xu, Z., Zhang, E.,
Jin, L., Zhang, Z., Guo, Z., Wang, Y., and Otto-Bliesner, B.: Variation of East Asian monsoonprecipitation during the past 21 k.y., and potential CO2 forcing, Geology, 41, 1023–1026,doi:10.1130/G34488.1, 2013.20
Maher, B. A., MengYu, H., Roberts, H. M., and Wintle, A. G.: Holocene loess accumulationand soil development at the western edge of the Chinese Loess Plateau: implications formagnetic proxies of palaeorainfall, Quaternary Sci. Rev., 22, 445–451, doi:10.1016/S0277-3791(02)00188-9, 2003.
Maher, B. A., Prospero, J. M., Mackie, D., Gaiero, D., Hesse, P. P., and Balkanski, Y.: Global con-25
nections between aeolian dust, climate and ocean biogeochemistry at the present day andat the last glacial maximum, Earth-Sci. Rev., 99, 61–97, doi:10.1016/j.earscirev.2009.12.001,2010.
Mahowald, N., Kohfeld, K., Hansson, M., Balkanski, Y., Harrison, S. P., Prentice, I. C.,Schulz, M., and Rodhe, H.: Dust sources and deposition during the last glacial maximum30
and current climate: a comparison of model results with paleodata from ice cores and ma-rine sediments, J. Geophys. Res., 104, 15895, doi:10.1029/1999JD900084, 1999.
4334
CPD10, 4277–4363, 2014
Twelve thousandyears of dust
S. Albani et al.
Title Page
Abstract Introduction
Conclusions References
Tables Figures
J I
J I
Back Close
Full Screen / Esc
Printer-friendly Version
Interactive Discussion
Discussion
Paper
|D
iscussionP
aper|
Discussion
Paper
|D
iscussionP
aper|
Mahowald, N. M., Muhs, D. R., Levis, S., Rasch, P. J., Yoshioka, M., Zender, C. S., and Luo, C.:Change in atmospheric mineral aerosols in response to climate: Last glacial period, prein-dustrial, modern, and doubled carbon dioxide climates, J. Geophys. Res., 111, D10202,doi:10.1029/2005JD006653, 2006.
Mahowald, N. M., Kloster, S., Engelstaedter, S., Moore, J. K., Mukhopadhyay, S., Mc-5
Connell, J. R., Albani, S., Doney, S. C., Bhattacharya, A., Curran, M. A. J., Flanner, M. G.,Hoffman, F. M., Lawrence, D. M., Lindsay, K., Mayewski, P. A., Neff, J., Rothenberg, D.,Thomas, E., Thornton, P. E., and Zender, C. S.: Observed 20th century desert dust vari-ability: impact on climate and biogeochemistry, Atmos. Chem. Phys., 10, 10875–10893,doi:10.5194/acp-10-10875-2010, 2010.10
Mahowald, N., Albani, S., Engelstaedter, S., Winckler, G., and Goman, M.: Model insight intoglacial-interglacial paleodust records, Quaternary Sci. Rev., 30, 832–854, 2011.
Mahowald, N., Albani, S., Kok, J. F., Engelstaeder, S., Scanza, R., Ward, D. S., and Flan-ner, M. G.: The size distribution of desert dust aerosols and its impact on the Earth system,Aeolian Res., 15, 53–71, 2014.15
Marković, S. B., Hambach, U., Stevens, T., Kukla, G. J., Heller, F., McCoy, W. D., Oches, E. A.,Buggle, B., and Zöller, L.: The last million years recorded at the Stari Slankamen (NorthernSerbia) loess-palaeosol sequence: revised chronostratigraphy and long-term environmentaltrends, Quaternary Sci. Rev., 30, 1142–1154, doi:10.1016/j.quascirev.2011.02.003, 2011.
Martin, J. H.: Glacial-interglacial CO2 change: the iron hypothesis, Paleoceanography, 5, 1–13,20
doi:10.1029/PA005i001p00001, 1990.Martinson, D. G., Pisias, N. G., Hays, J. D., Imbrie, J., Moore, T. C., and Shackleton, N. J.: Age
dating and the orbital theory of the ice ages: Development of a high-resolution 0 to 300 000-year chronostratigraphy, Quaternary Res., 27, 1–29, doi:10.1016/0033-5894(87)90046-9,1987.25
Marx, S. K., McGowan, H. A., and Kamber, B. S.: Long-range dust transport from easternAustralia: a proxy for Holocene aridity and ENSO-type climate variability, Earth Planet. Sc.Lett., 282, 167–177, doi:10.1016/j.epsl.2009.03.013, 2009.
Mason, J. A., Jacobs, P. M., Hanson, P. R., Miao, X., and Goble, R. J.: Sources and paleoclimaticsignificance of Holocene Bignell Loess, central Great Plains, USA, Quaternary Res., 60,30
330–339, doi:10.1016/j.yqres.2003.07.005, 2003.
4335
CPD10, 4277–4363, 2014
Twelve thousandyears of dust
S. Albani et al.
Title Page
Abstract Introduction
Conclusions References
Tables Figures
J I
J I
Back Close
Full Screen / Esc
Printer-friendly Version
Interactive Discussion
Discussion
Paper
|D
iscussionP
aper|
Discussion
Paper
|D
iscussionP
aper|
Mason, J. A., Miao, X., Hanson, P. R., Johnson, W. C., Jacobs, P. M., and Goble, R. J.: Loessrecord of the Pleistocene–Holocene transition on the northern and central Great Plains, USA,Quaternary Sci. Rev., 27, 1772–1783, doi:10.1016/j.quascirev.2008.07.004, 2008.
Masson-Delmotte, V., Schulz, M., Abe-Ouchi, A., Beer, J., Ganopolski, A., GonzálezRouco, J. F., Jansen, E., Lambeck, K., Luterbacher, J., Naish, T., Osborn, T., Otto-5
Bliesner, B., Quinn, T., Ramesh, R., Rojas, M., Shao, X., and Timmermann, A.: Informationfrom paleoclimate archives, in: Climate Change 2013: The Physical Science Basis. Contri-bution of Working Group I to the Fifth Assessment Report of the Intergovernmental Panel onClimate Change, edited by: Stocker, T. F., Qin, D., Plattner, G.-K., Tignor, M., Allen, S. K.,Boschung, J., Nauels, A., Xia, Y., Bex, V., and Midgley, P. M., Cambridge University Press,10
Cambridge, United Kingdom and New York, NY, USA, 2013.Mayewski, P. A., Meeker, L. D., Twickler, M. S., Whitlow, S., Yang, Q., Lyons, W. B., and Pren-
tice, M.: Major features and forcing of high-latitude Northern Hemisphere atmospheric cir-culation using a 110 000-year-long glaciochemical series, J. Geophys. Res., 102, 26345,doi:10.1029/96JC03365, 1997.15
Mayewski, P. A., Maasch, K. A., Dixon, D., Sneed, S. B., Oglesby, R., Korotkikh, E., Po-tocki, M., Grigholm, B., Kreutz, K., Kurbatov, A. V., Spaulding, N., Stager, J. C., Taylor, K. C.,Steig, E. J., White, J., Bertler, N. A. N., Goodwin, I., Simões, J. C., Jaña, R., Kraus, S., andFastook, J.: West Antarctica’s sensitivity to natural and human-forced climate change overthe Holocene, J. Quaternary Sci., 28, 40–48, doi:10.1002/jqs.2593, 2013.20
Mayewski, P. A., Sneed, S. B., Birkel, S. D., Kurbatov, A. V., and Maasch, K. A.: Holocenewarming marked by abrupt onset of longer summers and reduced storm frequency aroundGreenland, J. Quaternary Sci., 29, 99–104, doi:10.1002/jqs.2684, 2014.
McConnell, J. R., Aristarain, A. J., Banta, J. R., Edwards, P. R., and Simões, J. C.: 20th-Century doubling in dust archived in an Antarctic Peninsula ice core parallels climate25
change and desertification in South America, P. Natl. Acad. Sci. USA, 104, 5743–5748,doi:10.1073/pnas.0607657104, 2007.
McGee, D., Broecker, W. S., and Winckler, G.: Gustiness: the driver of glacial dustiness?, Qua-ternary Sci. Rev., 29, 2340–2350, doi:10.1016/j.quascirev.2010.06.009, 2010.
McGee, D., deMenocal, P. B., Winckler, G., Stuut, J. B. W., and Bradtmiller, L. I.: The magnitude,30
timing and abruptness of changes in North African dust deposition over the last 20 000 yr,Earth Planet. Sc. Lett., 371–372, 163–176, doi:10.1016/j.epsl.2013.03.054, 2013.
4336

CPD10, 4277–4363, 2014
Twelve thousandyears of dust
S. Albani et al.
Title Page
Abstract Introduction
Conclusions References
Tables Figures
J I
J I
Back Close
Full Screen / Esc
Printer-friendly Version
Interactive Discussion
Discussion
Paper
|D
iscussionP
aper|
Discussion
Paper
|D
iscussionP
aper|
McGee, D., Marcantonio, F., and Lynch-Stieglitz, J.: Deglacial changes in dust flux in the east-ern equatorial Pacific, Earth Planet. Sc. Lett., 257, 215–230, doi:10.1016/j.epsl.2007.02.033,2007.
McGowan, H. A., Marx, S. K., Soderholm, J., and Denholm, J.: Evidence of solar and tropical-ocean forcing of hydroclimate cycles in southeastern Australia for the past 6500 years, Geo-5
phys. Res. Lett., 37, L10705, doi:10.1029/2010GL042918, 2010.Meeker, L. D. and Mayewski, P. A.: A 1400-year high-resolution record of atmospheric circula-
tion over the North Atlantic and Asia, Holocene, 12, 257–266, 2002.Miao, X., Mason, J. A., Johnson, W. C., and Wang, H.: High-resolution proxy record of Holocene
climate from a loess section in Southwestern Nebraska, USA, Palaeogeogr. Palaeocl., 245,10
368–381, doi:10.1016/j.palaeo.2006.09.004, 2007.Moore, J. K., Doney, S., Lindsay, K., Mahowald, N., and Michaels, A.: Nitrogen fixation am-
plifies the ocean biogeochemical response to decadal timesclae variations in mineral dustdeposition, Tellus B, 58, 560–572, 2006.
Muhs, D. R., Aleinikoff, J. N., Stafford, T. W. J., Kihl, R., Been, J., Mahan, S. A., and Cowherd, S.:15
Late quaternary loess in northeastern Colorado: Part I – Age and paleoclimatic significance,Geol. Soc. Am. Bull., 111, 1861–1875, doi:10.1130/0016-7606(1999)111, 1999.
Muhs, D., Agera, T., Bettis III, E. A., McGeehinc, J., Beena, J. M., Begét, J. E., Pavichc, M. J.,Stafford, T. W., and Stevens, D. A. S. P.: Stratigraphy and palaeoclimatic significance ofLate Quaternary loess–palaeosol sequences of the Last Interglacial–Glacial cycle in central20
Alaska, Quaternary Sci. Rev., 22, 1947–1986, doi:10.1016/S0277-3791(03)00167-7, 2003a.Muhs, D. R., Ager, T. A., Been, J., Bradbury, J. P., and Dean, W. E.: A late quaternary record
of eolian silt deposition in a maar lake, St. Michael Island, western Alaska, Quaternary Res.,60, 110–122, doi:10.1016/S0033-5894(03)00062-0, 2003b.
Muhs, D. R., McGeehin, J. P., Beann, J., and Fisher, E.: Holocene loess deposition and soil25
formation as competing processes, Matanuska Valley, southern Alaska, Quaternary Res.,61, 265–276, doi:10.1016/j.yqres.2004.02.003, 2004.
Muhs, D. R., Bettis, E. A., Aleinikoff, J. N., McGeehin, J. P., Beann, J., Skipp, G., Marshall, B. D.,Roberts, H. M., Johnson, W. C., and Benton, R.: Origin and paleoclimatic significance of latequaternary loess in Nebraska: evidence from stratigraphy, chronology, sedimentology, and30
geochemistry, Geol. Soc. Am. Bull., 120, 1378–1407, doi:10.1130/B26221.1, 2008.
4337
CPD10, 4277–4363, 2014
Twelve thousandyears of dust
S. Albani et al.
Title Page
Abstract Introduction
Conclusions References
Tables Figures
J I
J I
Back Close
Full Screen / Esc
Printer-friendly Version
Interactive Discussion
Discussion
Paper
|D
iscussionP
aper|
Discussion
Paper
|D
iscussionP
aper|
Muhs, D. R., Bettis, E. A., Roberts, H. M., Harlan, S. S., Paces, J. B., and Reynolds, R. L.:Chronology and provenance of last-glacial (Peoria) loess in western Iowa and paleoclimaticimplications, Quaternary Res., 80, 468–481, doi:10.1016/j.yqres.2013.06.006, 2013a.
Muhs, D. R., Budahn, J. R., McGeehin, J. P., Bettis, E. A., Skipp, G., Paces, J. B., andWheeler, E. A.: Loess origin, transport, and deposition over the past 10 000 years, Wrangell-5
St. Elias National Park, Alaska, Aeolian Res., 11, 85–99, doi:10.1016/j.aeolia.2013.06.001,2013b.
Mulitza, S., Heslop, D., Pittauerova, D., Fischer, H. W., Meyer, I., Stuut, J.-B., Zabel, M., Mollen-hauer, G., Collins, J. A., Kuhnert, H., and Schulz, M.: Increase in African dust flux at the onsetof commercial agriculture in the Sahel region, Nature, 466, 226–8, doi:10.1038/nature09213,10
2010.Nagashima, K., Tada, R., Matsui, H., Irino, T., Tani, A., and Toyoda, S.: Orbital- and millennial-
scale variations in Asian dust transport path to the Japan Sea, Palaeogeogr. Palaeocl., 247,144–161, doi:10.1016/j.palaeo.2006.11.027, 2007.
Olivarez, A. M., Owen, R. M., and Rea, D. K.: Geochemistry of eolian dust in Pacific pelagic15
sediments: Implications for paleoclimatic interpretations, Geochim. Cosmochim. Ac., 55,2147–2158, doi:10.1016/0016-7037(91)90093-K, 1991.
Otto-Bliesner, B. L., Joussaume, S., Braconnot, P., Harrison, S. P., and Abe-Ouchi, A.: Modelingand data syntheses of past climates: paleoclimate modelling intercomparison project phaseII workshop; Estes Park, Colorado, 15–19 September 2008, EOS T. Am. Geophys. Un., 90,20
93, doi:10.1029/2009EO110013, 2009.Petit, J. R., Jouzel, J., Raynaud, D., Barkov, N. I., Barnola, J. M., Basile, I., Bender, M., Chappel-
laz, J., Davis, M., Delaygue, G., Delmotte, M., Kotlyakov, V. M., Legrand, M., Lipenkov, V. Y.,Lorius, C., Pepin, L., Ritz, C., Saltzman, E., and Stievenard, M.: Climate and atmospherichistory of the past 420 000 years from the Vostok ice core, Antarctica, Nature, 399, 429–436,25
doi:10.1038/20859, 1999.Pigati, J. S., McGeehin, J. P., Muhs, D. R., and Bettis, E. A.: Radiocarbon dating late Quaternary
loess deposits using small terrestrial gastropod shells, Quaternary Sci. Rev., 76, 114–128,doi:10.1016/j.quascirev.2013.05.013, 2013.
Porter, S. C.: Chinese loess record of monsoon climate during the last glacial–interglacial cycle,30
Earth-Sci. Rev., 54, 115–128, doi:10.1016/S0012-8252(01)00043-5, 2001.Pourmand, A., Marcantonio, F., Bianchi, T. S., Canuel, E. A., and Waterson, E. J.: A 28-ka
history of sea surface temperature, primary productivity and planktonic community variability
4338

CPD10, 4277–4363, 2014
Twelve thousandyears of dust
S. Albani et al.
Title Page
Abstract Introduction
Conclusions References
Tables Figures
J I
J I
Back Close
Full Screen / Esc
Printer-friendly Version
Interactive Discussion
Discussion
Paper
|D
iscussionP
aper|
Discussion
Paper
|D
iscussionP
aper|
in the western Arabian Sea, Paleoceanography, 22, PA4208, doi:10.1029/2007PA001502,2007.
Pourmand, A., Marcantonio, F., and Schulz, H.: Variations in productivity and eolian fluxes inthe northeastern Arabian Sea during the past 110 ka, Earth Planet. Sc. Lett., 221, 39–54,doi:10.1016/S0012-821X(04)00109-8, 2004.5
Prins, M. A., Vriend, M., Nugteren, G., Vandenberghe, J., Lu, H., Zheng, H., and JanWeltje, G.: Late quaternary aeolian dust input variability on the Chinese Loess Plateau:inferences from unmixing of loess grain-size records, Quaternary Sci. Rev., 26, 230–242,doi:10.1016/j.quascirev.2006.07.002, 2007.
Prospero, J. M., Ginoux, P., Torres, O., Nicholson, S. E., and Gill, T. E.: Environmental char-10
acterization of global sources of atmospheric soil dust identified with the NIMBUS 7 TotalOzone Mapping Spectrometer (TOMS) absorbing aerosol product, Rev. Geophys., 40, 1002,doi:10.1029/2000RG000095, 2002.
Pye, K.: The nature, origin and accumulation of loess, Quaternary Sci. Rev., 14, 653–667,doi:10.1016/0277-3791(95)00047-X, 1995.15
Ratmeyer, V., Fischer, G., and Wefer, G.: Lithogenic particle fluxes and grain size distributionsin the deep ocean off NW Africa: implications for seasonal changes of aeolian dust input anddownward transport, Deep-Sea Res. Pt. I, 46, 1289–1337, 1999.
Rea, D. K.: The paleoclimatic record provided by eolian deposition in the deep sea: The geo-logic history of wind, Rev. Geophys., 32, 159, doi:10.1029/93RG03257, 1994.20
Rea, D. K. and Hovan, S. A.: Grain size distribution and depositional processes of the mineralcomponent of abyssal sediments: lessons from the North Pacific, Paleoceanography, 10,251–258, doi:10.1029/94PA03355, 1995.
Rea, D. K. and Janecek, T. R.: Late cretaceous history of eolian deposition in themid-pacific mountains, central North Pacific Ocean, Palaeogeogr. Palaeocl., 36, 55–67,25
doi:10.1016/0031-0182(81)90048-1, 1981.Reid, J. S.: Comparison of size and morphological measurements of coarse mode dust parti-
cles from Africa, J. Geophys. Res., 108, 8593, doi:10.1029/2002JD002485, 2003.Reimer, P. J., Baillie, M. G. L., Bard, E., Bayliss, A., Beck, J. W., Blackwell, P. G., Ramsey, C. B.,
Buck, C. E., Burr, G. S., Edwards, R. L., Friedrich, M., Grootes, P. M., Guilderson, T. P., Haj-30
das, I., Heaton, T. J., Hogg, A. G., Hughen, K. A., Kaiser, K. F., Kromer, B., McCormac, F. G.,Manning, S. W., Reimer, R. W., Richards, D. A., Southon, J. R., Talamo, S., Turney, C. S. M.,van der Plicht, J., and Weyhenmeyer, C. E.: IntCal09 and Marine09 radiocarbon age cal-
4339

CPD10, 4277–4363, 2014
Twelve thousandyears of dust
S. Albani et al.
Title Page
Abstract Introduction
Conclusions References
Tables Figures
J I
J I
Back Close
Full Screen / Esc
Printer-friendly Version
Interactive Discussion
Discussion
Paper
|D
iscussionP
aper|
Discussion
Paper
|D
iscussionP
aper|
ibration curves, 0–50 000yeats cal BP, available at: http://researchcommons.waikato.ac.nz/handle/10289/3622 (last access: 25 July 2014), 2009.
Roberts, H. M.: The development and application of luminescence dating to loess deposits:a perspective on the past, present and future, Boreas, 37, 483–507, doi:10.1111/j.1502-3885.2008.00057.x, 2008.5
Roberts, H. M., Wintle, A. G., Maher, B. A., and Hu, M.: Holocene sediment-accumulation ratesin the western Loess Plateau, China, and a 2500-year record of agricultural activity, revealedby OSL dating, Holocene, 11, 477–483, doi:10.1191/095968301678302913, 2001.
Roberts, H. M., Muhs, D. R., Wintle, A. G., Duller, G. A. T., and Bettis, E. A.: Unprecedented last-glacial mass accumulation rates determined by luminescence dating of loess from western10
Nebraska, Quaternary Res., 59, 411–419, doi:10.1016/S0033-5894(03)00040-1, 2003.Rousseau, D.-D., Antoine, P., Gerasimenko, N., Sima, A., Fuchs, M., Hatté, C., Moine, O.,
and Zoeller, L.: North Atlantic abrupt climatic events of the last glacial period recorded inUkrainian loess deposits, Clim. Past, 7, 221–234, doi:10.5194/cp-7-221-2011, 2011.
Le Roux, G., Fagel, N., De Vleeschouwer, F., Krachler, M., Debaille, V., Stille, P., Mattielli, N.,15
van der Knaap, W. O., van Leeuwen, J. F. N., and Shotyk, W.: Volcano- and climate-drivenchanges in atmospheric dust sources and fluxes since the Late Glacial in Central Europe,Geology, 40, 335–338, doi:10.1130/G32586.1, 2012.
Ruth, U.: Continuous record of microparticle concentration and size distribution in the cen-tral Greenland NGRIP ice core during the last glacial period, J. Geophys. Res., 108, 4098,20
doi:10.1029/2002JD002376, 2003.Ruth, U., Wagenbach, D., Bigler, M., Steffensen, J. P., Röthlisberger, R., and Miller, H.: High-
resolution microparticle profiles at NorthGRIP, Greenland: case studies of the calcium-dustrelationship, Ann. Glaciol., 35, 237–242, doi:10.3189/172756402781817347, 2002.
Ruth, U., Barbante, C., Bigler, M., Delmonte, B., Fischer, H., Gabrielli, P., Gaspari, V., Kauf-25
mann, P., Lambert, F., Maggi, V., Marino, F., Petit, J.-R., Udisti, R., Wagenbach, D., Weg-ner, A., and Wolff, E. W.: Proxies and Measurement Techniques for Mineral Dust in AntarcticIce Cores, Environ. Sci. Technol., 42, 5675–5681, doi:10.1021/es703078z, 2008.
Sapkota, A., Cheburkin, A. K., Bonani, G., and Shotyk, W.: Six millennia of atmosphericdust deposition in southern South America (Isla Navarino, Chile), Holocene, 17, 561–572,30
doi:10.1177/0959683607078981, 2007.Schulz, M., Balkanski, Y. J., Guelle, W., and Dulac, F.: Role of aerosol size distribution and
source location in a three-dimensional simulation of a Saharan dust episode tested against
4340

CPD10, 4277–4363, 2014
Twelve thousandyears of dust
S. Albani et al.
Title Page
Abstract Introduction
Conclusions References
Tables Figures
J I
J I
Back Close
Full Screen / Esc
Printer-friendly Version
Interactive Discussion
Discussion
Paper
|D
iscussionP
aper|
Discussion
Paper
|D
iscussionP
aper|
satellite-derived optical thickness, J. Geophys. Res., 103, 10579, doi:10.1029/97JD02779,1998.
Schüpbach, S., Federer, U., Kaufmann, P. R., Albani, S., Barbante, C., Stocker, T. F., and Fis-cher, H.: High-resolution mineral dust and sea ice proxy records from the Talos Dome icecore, Clim. Past, 9, 2789–2807, doi:10.5194/cp-9-2789-2013, 2013.5
Serno, S., Winckler, G., Anderson, R. F., Hayes, C. T., McGee, D., Machalett, B., Ren, H.,Straub, S. M., Gersonde, R., and Haug, G. H.: Eolian dust input to the Subarctic NorthPacific, Earth Planet. Sc. Lett., 387, 252–263, doi:10.1016/j.epsl.2013.11.008, 2014.
Siegel, D. A. and Armstrong, R. A.: Corrigendum to “Trajectories of sinking particles in theSargasso Sea: modeling of statistical funnels above deep-ocean sediment traps” [Deep-Sea10
Res. 44, 1519–1541], Deep-Sea Res., 49, 1115–1116, 2002.Siegel, D. A. and Deuser, W. G.: Trajectories of sinking particles in the Sargasso Sea: modeling
of statistical funnels above deep-ocean sediment traps, Deep-Sea Res., 44, 1519–1541,1997.
Sirocko, F., Sarnthein, M., Lange, H., and Erlenkeuser, H.: Atmospheric summer circulation and15
coastal upwelling in the Arabian Sea during the Holocene and the last glaciation, QuaternaryRes., 36, 72–93, doi:10.1016/0033-5894(91)90018-Z, 1991.
Steffensen, J. P.: The size distribution of microparticles from selected segments of the Green-land Ice Core Project ice core representing different climatic periods, J. Geophys. Res., 102,26755, doi:10.1029/97JC01490, 1997.20
Steffensen, J. P., Andersen, K. K., Bigler, M., Clausen, H. B., Dahl-Jensen, D., Fischer, H.,Goto-Azuma, K., Hansson, M., Johnsen, S. J., Jouzel, J., Masson-Delmotte, V., Popp, T.,Rasmussen, S. O., Röthlisberger, R., Ruth, U., Stauffer, B., Siggaard-Andersen, M.-L.,Sveinbjörnsdóttir, A. E., Svensson, A., and White, J. W. C.: High-resolution Greenlandice core data show abrupt climate change happens in few years, Science, 321, 680–684,25
doi:10.1126/science.1157707, 2008.Stevens, T. and Lu, H.: Optically stimulated luminescence dating as a tool for calculating sed-
imentation rates in Chinese loess: comparisons with grain-size records, Sedimentology, 56,911–934, doi:10.1111/j.1365-3091.2008.01004.x, 2009.
Stevens, T., Thomas, D. S. G., Armitage, S. J., Lunn, H. R., and Lu, H. Y.: Reinterpreting climate30
proxy records from late Quaternary Chinese loess: a detailed OSL investigation, Earth-Sci.Rev., 80, 111–136, 2007.
4341

CPD10, 4277–4363, 2014
Twelve thousandyears of dust
S. Albani et al.
Title Page
Abstract Introduction
Conclusions References
Tables Figures
J I
J I
Back Close
Full Screen / Esc
Printer-friendly Version
Interactive Discussion
Discussion
Paper
|D
iscussionP
aper|
Discussion
Paper
|D
iscussionP
aper|
Stevens, T., Lu, H., Thomas, D. S. G., and Armitage, S. J.: Optical dating of abrupt shifts inthe late Pleistocene East Asian Monsoon, Geology, 36, 415–418, doi:10.1130/G24524A.1,2008.
Street-Perrott, F. A. and Perrott, R. A.: Holocene vegetation, lake levels and climate of Africa, in:Global Climates Since the Last Glacial Maximum, University of Minnesota Press, Minnesota,5
318–356, 1993.Sun, J. M., Kohfeld, K. E., and Harrison, S. P.: Records of aeolian dust deposition on the Chi-
nese Loess Plateau during the Late Quaternary, Technical Reports – Max-Planck-Institutefür Biogeochemie 1, 318 pp., 2000.
Sun, D., Chen, F., Bloemendal, J., and Su, R.: Seasonal variability of modern dust over the10
Loess Plateau of China, J. Geophys. Res., 108, 4665, doi:10.1029/2003JD003382, 2003.Tegen, I., Harrison, S. P., Kohfeld, K. E., Prentice, I. C., Coe, M., and Heimann, M.: The impact
of vegetation and preferential source areas on the dust aerosol cycle, J. Geophys. Res., 107,4576, doi:10.1029/2001JD000963, 2002.
Thompson, L. G., Mosley-Thompson, E., Davis, M. E., Lin, P. N., Henderson, K. A., Cole-Dai, J.,15
Bolzan, J. F., and Liu, K. B.: Late glacial stage and holocene tropical ice core records fromHuascaran, Peru, Science, 80, 269, 46–50, doi:10.1126/science.269.5220.46, 1995.
Thompson, L. G., Yao, T., Davis, M. E., Henderson, K. A., Mosley-Thompson, E., Lin, P.-N., Beer, J., Synal, H.-A., Cole-Dai, J., and Bolzan, J. F.: Tropical climate instability:the last glacial cycle from a Qinghai-Tibetan ice core, Science, 80, 276, 1821–1825,20
doi:10.1126/science.276.5320.1821, 1997.Tiedemann, R., Sarnthein, M., and Shackleton, N. J.: Astronomic timescale for the Pliocene
Atlantic δ18O and dust flux records of Ocean Drilling Program Site 659, Paleoceanography,9, 619–638, doi:10.1029/94PA00208, 1994.
Veres, D., Bazin, L., Landais, A., Toyé Veres, D., Bazin, L., Landais, A., Toyé Ma-25
hamadou Kele, H., Lemieux-Dudon, B., Parrenin, F., Martinerie, P., Blayo, E., Blunier, T.,Capron, E., Chappellaz, J., Rasmussen, S. O., Severi, M., Svensson, A., Vinther, B., andWolff, E. W.: The Antarctic ice core chronology (AICC2012): an optimized multi-parameterand multi-site dating approach for the last 120 thousand years, Clim. Past, 9, 1733–1748,doi:10.5194/cp-9-1733-2013, 2013.30
Vinther, B. M., Clausen, H. B., Johnsen, S. J., Rasmussen, S. O., Andersen, K. K.,Buchardt, S. L., Dahl-Jensen, D., Seierstad, I. K., Siggaard-Andersen, M.-L., Stef-fensen, J. P., Svensson, A., Olsen, J., and Heinemeier, J.: A synchronized dating of
4342

CPD10, 4277–4363, 2014
Twelve thousandyears of dust
S. Albani et al.
Title Page
Abstract Introduction
Conclusions References
Tables Figures
J I
J I
Back Close
Full Screen / Esc
Printer-friendly Version
Interactive Discussion
Discussion
Paper
|D
iscussionP
aper|
Discussion
Paper
|D
iscussionP
aper|
three Greenland ice cores throughout the Holocene, J. Geophys. Res., 111, D13102,doi:10.1029/2005JD006921, 2006.
Wanner, H., Beer, J., Butikofer, J., Crowley, T. J., Cubasch, U., Fluckiger, J., Goosse, H., Gros-jean, M., Joos, F., Kaplan, J. O., Kuttel, M., Muller, S. A., Prentice, I. C., Solomina, O., Stocker,T. F., Tarasov, P., Wagner, M., and Widmann, M.: Mid- to Late Holocene climate change: an5
overview, Quaternary Sci. Rev., 27, 1791–1828, 2008.Winckler, G., Anderson, R. F., Fleisher, M. Q., McGee, D., and Mahowald, N.: Covariant
glacial-interglacial dust fluxes in the equatorial Pacific and Antarctica, Science, 320, 93–96,doi:10.1126/science.1150595, 2008.
Wintle, A. G. and Murray, A. S.: A review of quartz optically stimulated luminescence character-10
istics and their relevance in single-aliquot regeneration dating protocols, Radiat. Meas., 41,369–391, doi:10.1016/j.radmeas.2005.11.001, 2006.
Winton, V. H. L., Dunbar, G. B., Bertler, N. A. N., Millet, M.-A., Delmonte, B., Atkins, C. B.,Chewings, J. M., and Andersson, P.: The contribution of aeolian sand and dust to iron fertil-ization of phytoplankton blooms in southwestern Ross Sea, Antarctica, Global Biogeochem.15
Cy., 28, 423–436, doi:10.1002/2013GB004574, 2014.Xie, R. C. and Marcantonio, F.: Deglacial dust provenance changes in the Eastern Equatorial
Pacific and implications for ITCZ movement, Earth Planet. Sc. Lett., 317–318, 386–395,doi:10.1016/j.epsl.2011.11.014, 2012.
Zdanowicz, C. M., Zielinski, G. A., Wake, C. P., Fisher, D. A., and Koerner, R. M.: A holocene20
record of atmospheric dust deposition on the Penny Ice Cap, Baffin Island, Canada, Quater-nary Res., 53, 62–69, doi:10.1006/qres.1999.2091, 2000.
Zender, C. S., Newman, D., and Torres, O.: Spatial heterogeneity in aeolian erodibility: Uni-form, topographic, geomorphic, and hydrologic hypotheses, J. Geophys. Res., 108, 4543,doi:10.1029/2002JD003039, 2003.25
Ziegler, C. L., Murray, R. W., Hovan, S. A., and Rea, D. K.: Resolving eolian, volcanogenic, andauthigenic components in pelagic sediment from the Pacific Ocean, Earth Planet. Sc. Lett.,254, 3–4, 416–432, 2007.
Zielinski, G. A. and Mershon, G. R.: Paleoenvironmental implications of the insoluble micropar-ticle record in the GISP2 (Greenland) ice core during the rapidly changing climate of the30
Pleistocene-Holocene transition, Geol. Soc. Am. Bull., 109, 547–559, doi:10.1130/0016-7606(1997)109<0547:PIOTIM>2.3.CO;2, 1997.
4343
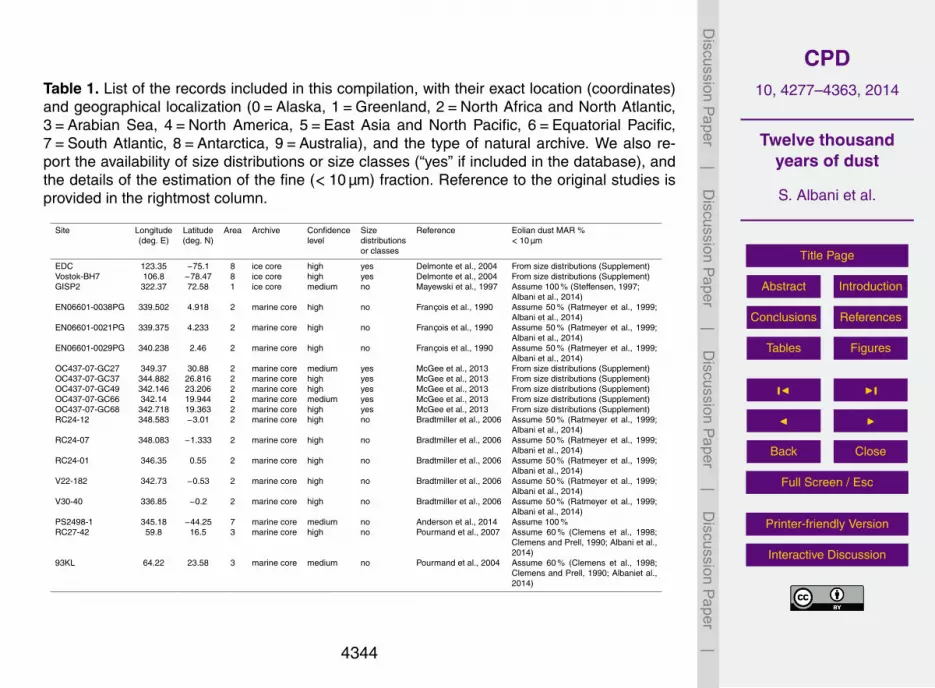
CPD10, 4277–4363, 2014
Twelve thousandyears of dust
S. Albani et al.
Title Page
Abstract Introduction
Conclusions References
Tables Figures
J I
J I
Back Close
Full Screen / Esc
Printer-friendly Version
Interactive Discussion
Discussion
Paper
|D
iscussionP
aper|
Discussion
Paper
|D
iscussionP
aper|
Table 1. List of the records included in this compilation, with their exact location (coordinates)and geographical localization (0=Alaska, 1=Greenland, 2=North Africa and North Atlantic,3=Arabian Sea, 4=North America, 5=East Asia and North Pacific, 6=Equatorial Pacific,7=South Atlantic, 8=Antarctica, 9=Australia), and the type of natural archive. We also re-port the availability of size distributions or size classes (“yes” if included in the database), andthe details of the estimation of the fine (< 10 µm) fraction. Reference to the original studies isprovided in the rightmost column.
Site Longitude Latitude Area Archive Confidence Size Reference Eolian dust MAR %(deg. E) (deg. N) level distributions < 10 µm
or classes
EDC 123.35 −75.1 8 ice core high yes Delmonte et al., 2004 From size distributions (Supplement)Vostok-BH7 106.8 −78.47 8 ice core high yes Delmonte et al., 2004 From size distributions (Supplement)GISP2 322.37 72.58 1 ice core medium no Mayewski et al., 1997 Assume 100 % (Steffensen, 1997;
Albani et al., 2014)EN06601-0038PG 339.502 4.918 2 marine core high no François et al., 1990 Assume 50 % (Ratmeyer et al., 1999;
Albani et al., 2014)EN06601-0021PG 339.375 4.233 2 marine core high no François et al., 1990 Assume 50 % (Ratmeyer et al., 1999;
Albani et al., 2014)EN06601-0029PG 340.238 2.46 2 marine core high no François et al., 1990 Assume 50 % (Ratmeyer et al., 1999;
Albani et al., 2014)OC437-07-GC27 349.37 30.88 2 marine core medium yes McGee et al., 2013 From size distributions (Supplement)OC437-07-GC37 344.882 26.816 2 marine core high yes McGee et al., 2013 From size distributions (Supplement)OC437-07-GC49 342.146 23.206 2 marine core high yes McGee et al., 2013 From size distributions (Supplement)OC437-07-GC66 342.14 19.944 2 marine core medium yes McGee et al., 2013 From size distributions (Supplement)OC437-07-GC68 342.718 19.363 2 marine core high yes McGee et al., 2013 From size distributions (Supplement)RC24-12 348.583 −3.01 2 marine core high no Bradtmiller et al., 2006 Assume 50 % (Ratmeyer et al., 1999;
Albani et al., 2014)RC24-07 348.083 −1.333 2 marine core high no Bradtmiller et al., 2006 Assume 50 % (Ratmeyer et al., 1999;
Albani et al., 2014)RC24-01 346.35 0.55 2 marine core high no Bradtmiller et al., 2006 Assume 50 % (Ratmeyer et al., 1999;
Albani et al., 2014)V22-182 342.73 −0.53 2 marine core high no Bradtmiller et al., 2006 Assume 50 % (Ratmeyer et al., 1999;
Albani et al., 2014)V30-40 336.85 −0.2 2 marine core high no Bradtmiller et al., 2006 Assume 50 % (Ratmeyer et al., 1999;
Albani et al., 2014)PS2498-1 345.18 −44.25 7 marine core medium no Anderson et al., 2014 Assume 100 %RC27-42 59.8 16.5 3 marine core high no Pourmand et al., 2007 Assume 60 % (Clemens et al., 1998;
Clemens and Prell, 1990; Albani et al.,2014)
93KL 64.22 23.58 3 marine core medium no Pourmand et al., 2004 Assume 60 % (Clemens et al., 1998;Clemens and Prell, 1990; Albaniet al.,2014)
4344

CPD10, 4277–4363, 2014
Twelve thousandyears of dust
S. Albani et al.
Title Page
Abstract Introduction
Conclusions References
Tables Figures
J I
J I
Back Close
Full Screen / Esc
Printer-friendly Version
Interactive Discussion
Discussion
Paper
|D
iscussionP
aper|
Discussion
Paper
|D
iscussionP
aper|
Table 1. Continued.
Site Longitude Latitude Area Archive Confidence Size Reference Eolian dust MAR %(deg. E) (deg. N) level distributions < 10 µm
or classes
ODP138-848B-1H-1 249 −3 6 marine core medium no McGee et al., 2007 Assume 100 %ODP138-849A-1H-1 249 0 6 marine core medium no McGee et al., 2007 Assume 100 %ODP138-850A-1H-1 249 1 6 marine core medium no McGee et al., 2007 Assume 100 %ODP138-851E-1H-1 249 3 6 marine core medium no McGee et al., 2007 Assume 100 %ODP138-852A-1H-1 250 5 6 marine core medium no McGee et al., 2007 Assume 100 %ODP138-853B-1H-1 250 7 6 marine core medium no McGee et al., 2007 Assume 100 %TT013-PC72 220 0 6 marine core high no Anderson et al., 2006 Assume 100 %TT013-MC27 220 −3 6 marine core high no Anderson et al., 2006 Assume 100 %TT013-MC69 220 2 6 marine core high no Anderson et al., 2006 Assume 100 %TT013-MC97 220 0 6 marine core high no Anderson et al., 2006 Assume 100 %TT013-MC19 220 −1.8 6 marine core high no Anderson et al., 2006 Assume 100 %V28-203 180.58 0.95 6 marine core high no Bradtmiller et al., 2007 Assume 100 %V21-146 163 38 5 marine core medium yes Hovan et al., 1991 From size distributions
(Supplement)SO-14-08-05 118.38 −16.35 9 marine core medium no Hesse and McTainsh, 2003;
Fitzsimmons et al., 2013Assume 100 %
E26.1 168.33 −40.28 9 marine core medium yes Hesse, 1994;Fitzsimmons et al., 2013
From size distributions(Supplement)
Zagoskin_Lake 197.9 63 0 lake medium yes Muhs et al., 2003b From size classes (Supple-ment): clay% +1/4 silt%
Chitina 215.62 61.54 0 loess/paleosol medium yes Muhs et al., 2013 From size classes (Supple-ment): clay% +1/4 silt%
Luochuan 109.42 35.75 5 loess/paleosol medium yes Lu et al.,2013 From size distributions(H. Lu, personal communica-tion, 2014)
Jiuzhoutai 103.75 36.07 5 loess/paleosol medium no Kohfeld and Harrison, 2003 Assume 23 %(Maher et al., 2010)
Duowa 102.63 35.65 5 loess/paleosol medium no Roberts et al., 2001 Assume 42 %:clay% +1/4 silt%
Beiguoyuan 107.28 36.62 5 loess/paleosol medium yes Stevens and Lu, 2009 From size distributions(Supplement)
Xifeng 107.72 35.53 5 loess/paleosol medium yes Stevens and Lu, 2009 From size distributions(Supplement)
OWR 258.58 40.5 4 loess/paleosol medium yes Miao et al., 2007 From size classes (Supple-ment): clay% +1/4 silt%
LRC 259.81 41.48 4 loess/paleosol medium yes Miao et al., 2007 From size classes (Supple-ment): clay% +1/4 silt%
4345

CPD10, 4277–4363, 2014
Twelve thousandyears of dust
S. Albani et al.
Title Page
Abstract Introduction
Conclusions References
Tables Figures
J I
J I
Back Close
Full Screen / Esc
Printer-friendly Version
Interactive Discussion
Discussion
Paper
|D
iscussionP
aper|
Discussion
Paper
|D
iscussionP
aper|
Table 2. Dust source areas in the CESM model, and scale factors expressed as anomalieswith respect to a reference period, derived from the observations. The first column lists themodel dust source areas. In the second column are listed the geographical regions whereobservations are clustered, which are used to scale the dust from the corresponding modelmacro-areas. The reference periods are 4 ka BP for 2 ka BP, and 6 ka BP for 8 and 10 ka BP.
Source area Anomaly forcing regions 2 ka BP 4 ka BP 6 ka BP 8 ka BP 10 ka BP
Alaska 0 0.6224 1 1 1.0800 1.3381North America (Southwest) 4, 6 0.8961 1 1 0.8810 0.9452North America (Midwest) 4 1.0081 1 1 0.9929 0.9481North Africa 2 1.3350 1 1 1.0030 1.5563Central Asia 3, 1 0.9628 1 1 1.1448 1.1448East Asia 5, 1 1.0030 1 1 1.0862 1.1429South America (Northern regions) 7, 8, 6 0.7396 1 1 1.1093 1.3482South America (Patagonia) 7, 8 0.9995 1 1 1.1358 1.2313South Africa 7, 8, 9 0.9777 1 1 1.1898 1.2764Australia 9, 8 0.9723 1 1 0.5183 1.4452
4346

CPD10, 4277–4363, 2014
Twelve thousandyears of dust
S. Albani et al.
Title Page
Abstract Introduction
Conclusions References
Tables Figures
J I
J I
Back Close
Full Screen / Esc
Printer-friendly Version
Interactive Discussion
Discussion
Paper
|D
iscussionP
aper|
Discussion
Paper
|D
iscussionP
aper|
Figure 1. Schematic representation of the process of calculation of eolian DMAR (Dust MassAccumulation Rate), and its relation to the SR (Sedimentation Rate), DBD (Dry Bulk Density),SBMAR (Sediment Bulk MAR), and EC (Eolian Content). DMAR (on age scale) is the typicalpath for loess/paleosol records, whereas DMAR (chronology) indicates the final step of theworkflow when EC is also measured.
4347

CPD10, 4277–4363, 2014
Twelve thousandyears of dust
S. Albani et al.
Title Page
Abstract Introduction
Conclusions References
Tables Figures
J I
J I
Back Close
Full Screen / Esc
Printer-friendly Version
Interactive Discussion
Discussion
Paper
|D
iscussionP
aper|
Discussion
Paper
|D
iscussionP
aper|
Figure 2. Example of different resolution of SBMAR and EC (Clemens and Prell, 1990).
4348

CPD10, 4277–4363, 2014
Twelve thousandyears of dust
S. Albani et al.
Title Page
Abstract Introduction
Conclusions References
Tables Figures
J I
J I
Back Close
Full Screen / Esc
Printer-friendly Version
Interactive Discussion
Discussion
Paper
|D
iscussionP
aper|
Discussion
Paper
|D
iscussionP
aper|
Figure 3. Conceptual plot of the evolution of dust deposition flux (DF) and size distribution(% sand) as a function of distance from the source.
4349
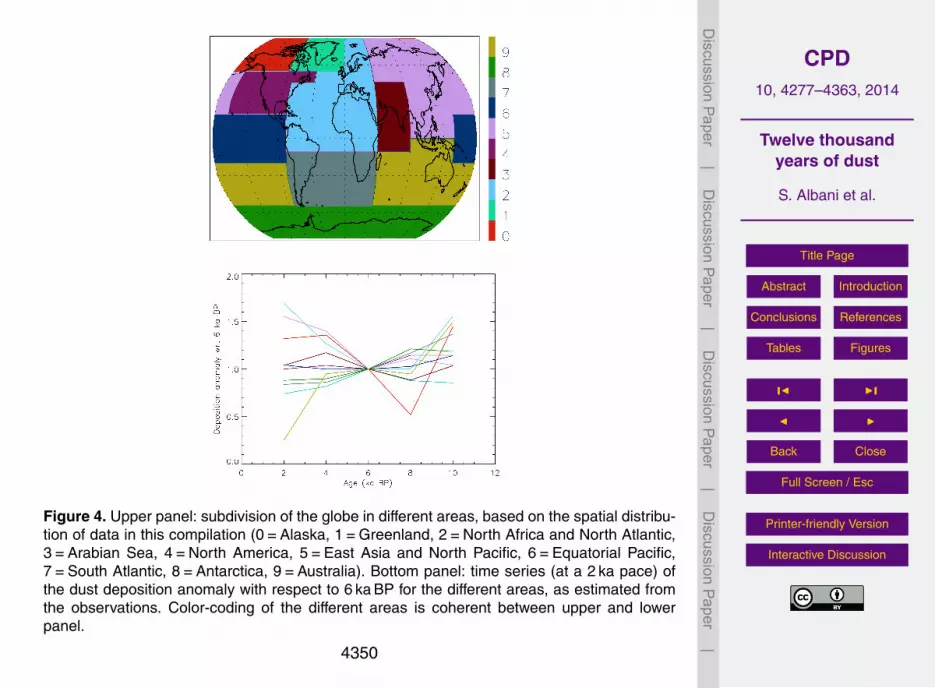
CPD10, 4277–4363, 2014
Twelve thousandyears of dust
S. Albani et al.
Title Page
Abstract Introduction
Conclusions References
Tables Figures
J I
J I
Back Close
Full Screen / Esc
Printer-friendly Version
Interactive Discussion
Discussion
Paper
|D
iscussionP
aper|
Discussion
Paper
|D
iscussionP
aper|
Figure 4. Upper panel: subdivision of the globe in different areas, based on the spatial distribu-tion of data in this compilation (0=Alaska, 1=Greenland, 2=North Africa and North Atlantic,3=Arabian Sea, 4=North America, 5=East Asia and North Pacific, 6=Equatorial Pacific,7=South Atlantic, 8=Antarctica, 9=Australia). Bottom panel: time series (at a 2 ka pace) ofthe dust deposition anomaly with respect to 6 ka BP for the different areas, as estimated fromthe observations. Color-coding of the different areas is coherent between upper and lowerpanel.
4350

CPD10, 4277–4363, 2014
Twelve thousandyears of dust
S. Albani et al.
Title Page
Abstract Introduction
Conclusions References
Tables Figures
J I
J I
Back Close
Full Screen / Esc
Printer-friendly Version
Interactive Discussion
Discussion
Paper
|D
iscussionP
aper|
Discussion
Paper
|D
iscussionP
aper|
Figure 5. Overview of the data compilation. Central plot: global overview of the location of thepalodust records. Color indicates the confidence level (red=high confidence, orange=mediumconfidence). Marker’s shape indicates if size distributions/classes are available (filled cir-cles= yes, empty diamonds=no). Framing plots: time series of bulk dust MAR in the differentareas, normalized to their Holocene (0–12 ka BP) average (red solid line for reference, whichrepresents the time span over which DMARs were averaged in the original DIRTMAP: Kohfeldand Harrison, 2001). Black solid lines represent high confidence records; gray lines identifymedium confidence records. Records are plotted in the 0–22 ka BP interval, to allow a compar-ison with DIRTMAP3 (Maher et al., 2010) data (as reported in Albani et al., 2014), representedby their glacial/interglacial ratio (green solid circles). Vertical color shading bands highlight thelast millennium (pink), the MH (5–7 ka BP, salmon), and Last Glacial Maximum (18–22 ka BP,light blue).
4351

CPD10, 4277–4363, 2014
Twelve thousandyears of dust
S. Albani et al.
Title Page
Abstract Introduction
Conclusions References
Tables Figures
J I
J I
Back Close
Full Screen / Esc
Printer-friendly Version
Interactive Discussion
Discussion
Paper
|D
iscussionP
aper|
Discussion
Paper
|D
iscussionP
aper|
Figure 6. Detailed view of the dust records in the North Africa/North Atlantic region. Upperpanel: geographical location of the paleodust records. Bottom panel: time series of the bulk(dotted lines) and “fine” i.e. < 10 µm (solid lines) dust MARs. Color-coding is consistent betweenupper and lower panel. Vertical grey solid lined mark the sub-periods within the Holocene asdescribed in Sect. 3.4 with a pace of 2 ka.
4352

CPD10, 4277–4363, 2014
Twelve thousandyears of dust
S. Albani et al.
Title Page
Abstract Introduction
Conclusions References
Tables Figures
J I
J I
Back Close
Full Screen / Esc
Printer-friendly Version
Interactive Discussion
Discussion
Paper
|D
iscussionP
aper|
Discussion
Paper
|D
iscussionP
aper|
Figure 7. Same as Fig. 6, for the Arabian Sea region.
4353

CPD10, 4277–4363, 2014
Twelve thousandyears of dust
S. Albani et al.
Title Page
Abstract Introduction
Conclusions References
Tables Figures
J I
J I
Back Close
Full Screen / Esc
Printer-friendly Version
Interactive Discussion
Discussion
Paper
|D
iscussionP
aper|
Discussion
Paper
|D
iscussionP
aper|
Figure 8. Same as Fig. 6, for the North American region.
4354

CPD10, 4277–4363, 2014
Twelve thousandyears of dust
S. Albani et al.
Title Page
Abstract Introduction
Conclusions References
Tables Figures
J I
J I
Back Close
Full Screen / Esc
Printer-friendly Version
Interactive Discussion
Discussion
Paper
|D
iscussionP
aper|
Discussion
Paper
|D
iscussionP
aper|
Figure 9. Same as Fig. 6, for Alaska.
4355

CPD10, 4277–4363, 2014
Twelve thousandyears of dust
S. Albani et al.
Title Page
Abstract Introduction
Conclusions References
Tables Figures
J I
J I
Back Close
Full Screen / Esc
Printer-friendly Version
Interactive Discussion
Discussion
Paper
|D
iscussionP
aper|
Discussion
Paper
|D
iscussionP
aper|
Figure 10. Same as Fig. 6, for East Asia and the North Pacific Ocean.
4356
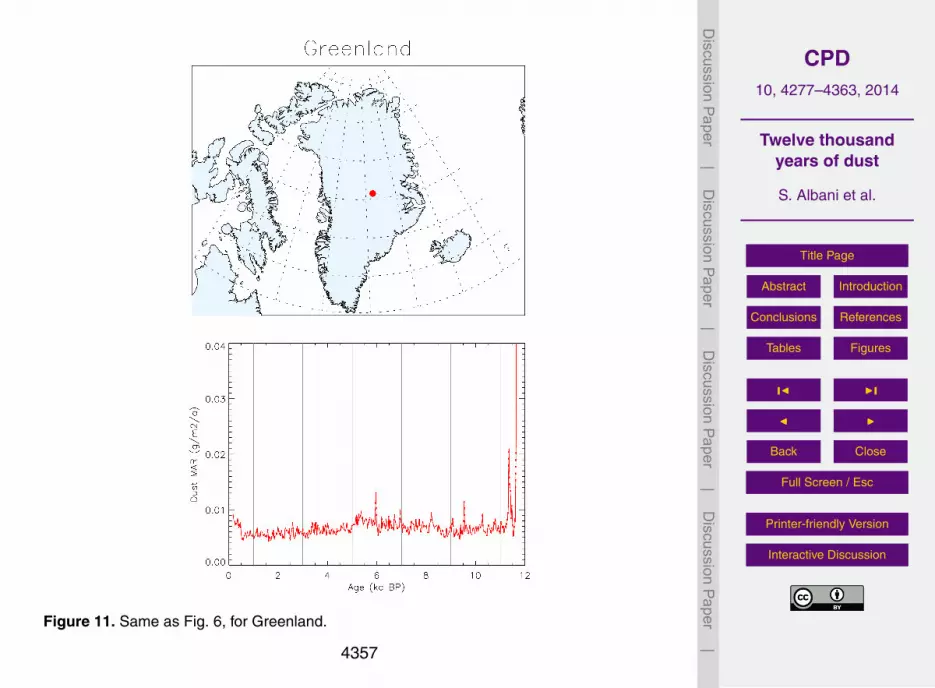
CPD10, 4277–4363, 2014
Twelve thousandyears of dust
S. Albani et al.
Title Page
Abstract Introduction
Conclusions References
Tables Figures
J I
J I
Back Close
Full Screen / Esc
Printer-friendly Version
Interactive Discussion
Discussion
Paper
|D
iscussionP
aper|
Discussion
Paper
|D
iscussionP
aper|
Figure 11. Same as Fig. 6, for Greenland.
4357

CPD10, 4277–4363, 2014
Twelve thousandyears of dust
S. Albani et al.
Title Page
Abstract Introduction
Conclusions References
Tables Figures
J I
J I
Back Close
Full Screen / Esc
Printer-friendly Version
Interactive Discussion
Discussion
Paper
|D
iscussionP
aper|
Discussion
Paper
|D
iscussionP
aper|
Figure 12. Same as Fig. 6, for the Equatorial Pacific.
4358

CPD10, 4277–4363, 2014
Twelve thousandyears of dust
S. Albani et al.
Title Page
Abstract Introduction
Conclusions References
Tables Figures
J I
J I
Back Close
Full Screen / Esc
Printer-friendly Version
Interactive Discussion
Discussion
Paper
|D
iscussionP
aper|
Discussion
Paper
|D
iscussionP
aper|
Figure 13. Same as Fig. 6, the Australian region.
4359

CPD10, 4277–4363, 2014
Twelve thousandyears of dust
S. Albani et al.
Title Page
Abstract Introduction
Conclusions References
Tables Figures
J I
J I
Back Close
Full Screen / Esc
Printer-friendly Version
Interactive Discussion
Discussion
Paper
|D
iscussionP
aper|
Discussion
Paper
|D
iscussionP
aper|
Figure 14. Same as Fig. 6, for the South Atlantic Ocean.
4360

CPD10, 4277–4363, 2014
Twelve thousandyears of dust
S. Albani et al.
Title Page
Abstract Introduction
Conclusions References
Tables Figures
J I
J I
Back Close
Full Screen / Esc
Printer-friendly Version
Interactive Discussion
Discussion
Paper
|D
iscussionP
aper|
Discussion
Paper
|D
iscussionP
aper|
Figure 15. Same as Fig. 6, for Antarctica.
4361

CPD10, 4277–4363, 2014
Twelve thousandyears of dust
S. Albani et al.
Title Page
Abstract Introduction
Conclusions References
Tables Figures
J I
J I
Back Close
Full Screen / Esc
Printer-friendly Version
Interactive Discussion
Discussion
Paper
|D
iscussionP
aper|
Discussion
Paper
|D
iscussionP
aper|
Figure 16. Comparison of simulated dust deposition (gm−2 a−1) for the 6 ka BP case, comparedto observational estimates of the fine (< 10 µm) eolian Mass Accumulation Rate for the period5–7 ka BP. (top) Observations; (middle) model; (bottom) model vs. observations scatterplot.Horizontal bars represent the variability of observational data averaged within the 5–7 ka BPtime lapse (1 sigma). Locations of observational sites are clustered in the scatterplots based ontheir geographical location, as indicated by the color-coding. In the bottom scatterplot, squaresindicate high confidence level, diamonds represent medium confidence level.
4362

CPD10, 4277–4363, 2014
Twelve thousandyears of dust
S. Albani et al.
Title Page
Abstract Introduction
Conclusions References
Tables Figures
J I
J I
Back Close
Full Screen / Esc
Printer-friendly Version
Interactive Discussion
Discussion
Paper
|D
iscussionP
aper|
Discussion
Paper
|D
iscussionP
aper|
Figure 17. Dust deposition flux (gm−2 a−1) from the CESM during the Holocene snapshots at2, 4, 6, 8, and 10 ka BP, based on spatially variable emissions constrained by the observationalMass Accumulation Rates. Black circles mark the locations of the observational records in thiscompilation.
4363