Embed Size (px)
Citation preview
/-- ------------------------- _. -- --------- --------- -------
(N~SA-~E-14~459) .. AIBE021H b1;L1OTE SENSORS lJ77"1642}k.PiLIEli IC1:.i;liIbil:.b,HNGG:L;CICGY £NL CIVIL
, ~01KS.DESIGN INVESTiGATICNS (A~my Engineeri ~~~tr.lc~, San francisco, Cali1:.) 59 p He UllclasvJd_f±/ l"Ji ... bU ~ c. ~CIJ)8 (;_G.JL4 3__15 417 /
SAN FRANCISCO DISTRICTU.S. ARMY CORPS OF ENGINEERS
AIRBORNE REMOTE SENSORSAPPLIED TO
ENGINEERING GEOLOGY AND,
CIVIL WORKS DESIGN INVESTIGATIONS
BYRONALD H. GELNETTPrincipal Investigator
UNDER
NATIONAL AERONAUTICS AND SPACE ADMINISTRATIONContract No. 160-75-89-03-10, SRT PROJECT 122
DECEMBER 1975
https://ntrs.nasa.gov/search.jsp?R=19770009484 2020-03-22T10:53:20+00:00Z

SAN FRANCISCO DISTRICTU.S. ARMY CORPS OF ENGINEERS
AIRBORNE REMOTE SENSORSAPPLIED TO
ENGINEERING GEOLOGY ANDCIVIL WORKS DESIGN INVESTIGATIONS
BYRONALD H. GELNETTPrincipal Investigator
UNDER
NATIONAL AERONAUTICS AND SPACE ADMINISTRATIONContract No. 160-75-89-03-10, SRT PROJECT 122
DECEMBER 1975

I.
II.
I I I.
IV.
V.
VI.
VII.
VIII.
IX.
CONTENTS
INTRODUCTION
STUDY AREA
OBJECTIVES
GEOLOGIC SETTING
SEISMICITY . .
REMOTE SENSORS USED.
A. General. .B. LandSat ..C. Photography.D. Thermal InfraredE. Side-Looking Airborne Radar.
DISCUSSION OF RESULTS.
A. General .B. Lineaments .C. Project Geology ..
1. Formation boundaries2. Landslide area ...3. Mapped and unmapped faults4. Freshwater fault ...
D. Regional Lineament Pattern
CONCLUSIONS.
SELECTED REFERENCES.
i
1
2
4
7
9
13
1314141516
19
192021
22252933
38
41
44
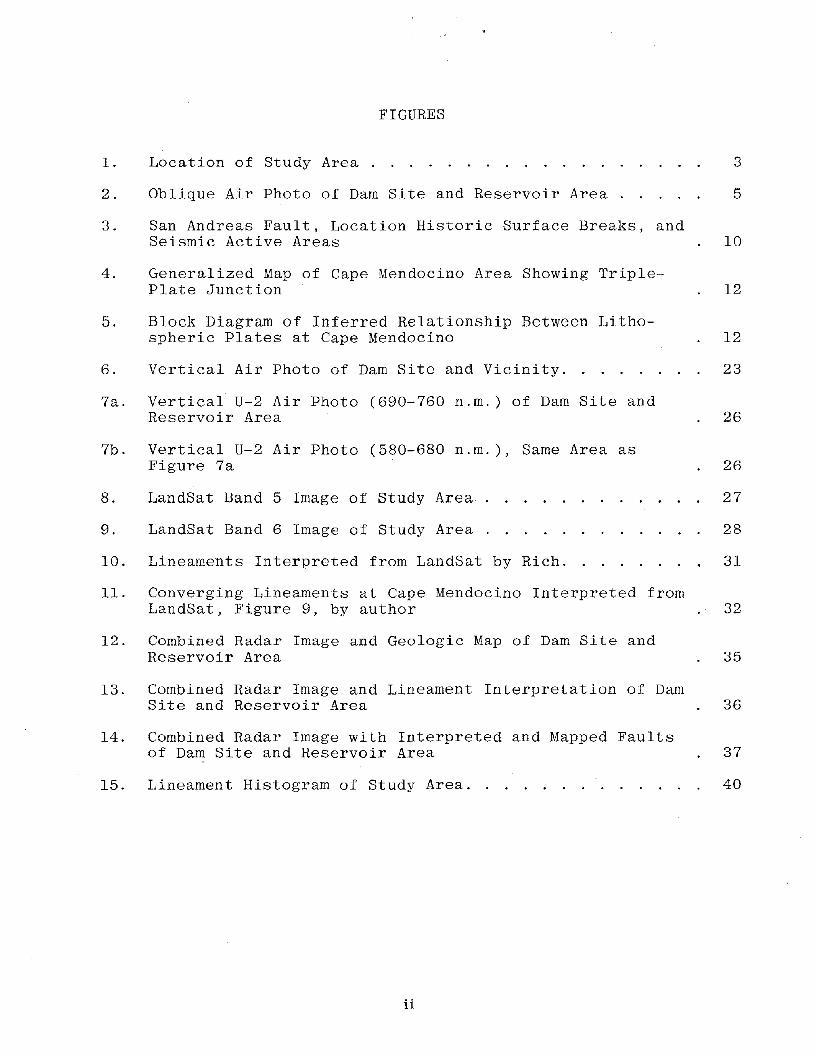
1. Location of Study Area .
FIGURES
3
2. Oblique Air Photo of Dam Site and Reservoir Area 5
3. San Andreas Fault, Location Historic Surface Breaks, andSeismic Active Areas 10
4. Generalized Map of Cape Mendocino Area Showing Triple-Plate Junction 12
5. Block Diagram of Inferred Relationship Between Litho-spheric Plates at Cape Mendocino 12
6. Vertical Air Photo of Dam Site and Vicinity. 23
7a. Vertical U-2 Air Photo (690-760 n.m.) of Dam Site andReservoir Area 26
7b. Vertical U-2 Air Photo (580-680 n.m.), Same Area asFigure 7a 26
8. LandSat Band 5 Image of Study Area 27
9. LandSat Band 6 Image of Study Area 28
10. Lineaments Interpreted from LandSat by Rich. 31
11. Converging Lineaments at Cape Mendocino Interpreted fromLandSat, Figure 9, by author 32
12. Combined Radar Image and Geologic Map of Dam Site andReservoir Area 35
13. Combined Radar Image and Lineament Interpretation of DamSite and Reservoir Area 36
14. Combined Radar Image with Interpreted and Mapped Faultsof Dam Site and Reservoir Area 37
15. Lineament Histogram of Study Area.
ii
40

PLATES
1. Geologic Map of Study Area
2. Historic Earthquake Epicenters in Study Area
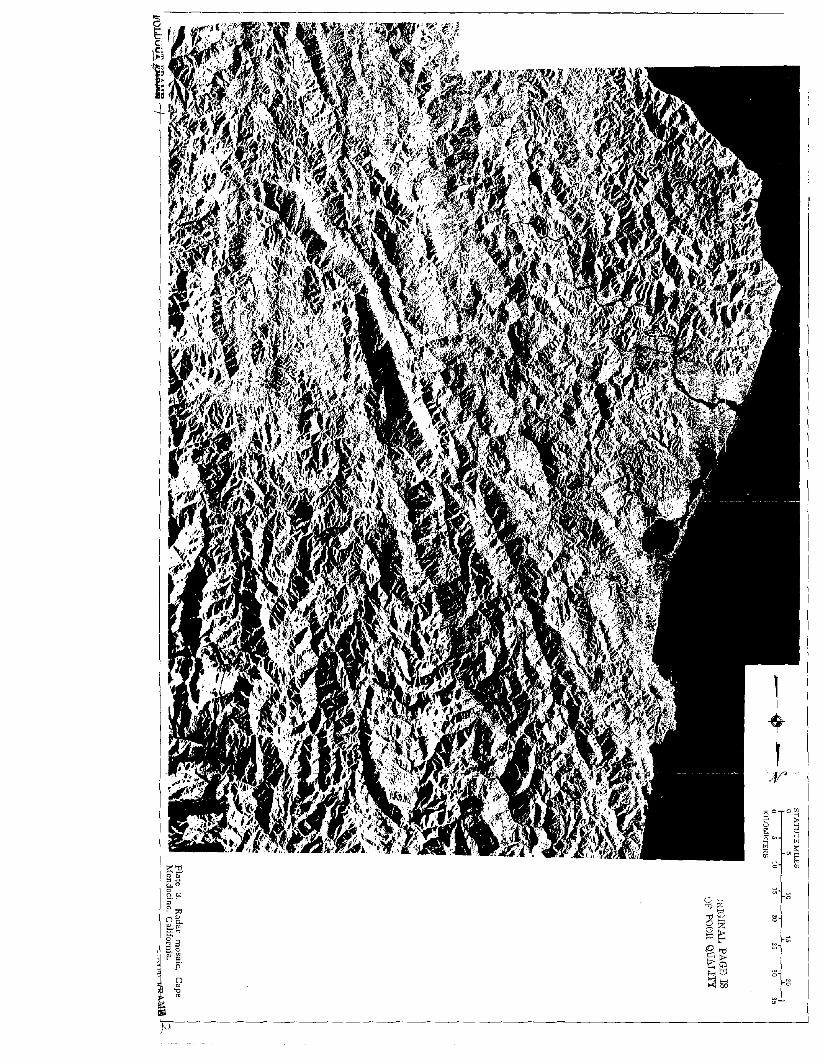
3. Radar Mosaic of Study Area
4. Lineaments Interpreted from Radar Imagery in Study Area
iii
ACKNOWLEDGMENTS
This work was authorized by the U.S. Army Corps of Engineers,Office of the Chief of Engineers (OCE), and partially funded bythe National Aeronautics and Space Administration under ContractNo. 160-75-89-03-10, SRT Project 122. In addition to the Satelliteimagery, NASA also flew and provided several types of photographyand thermal infrared imagery. The author is indebted to Messrs.J. Jarman and D. Penick of OCE, and O. Smistad and F. Neuman ofNASA, as well as others in both agencies.
Special thanks are due Major George Baena, Commanding Officer ofthe l84th Military Intelligence Company (Aerial Surveillance),Fort Lewis, Washington, and the many officers and enlisted men whoflew and provided the side-looking airborne radar imagery of thestudy area under contract to the District.
Further appreciation is extended to Colonels James L. Lammie andCharles R. Roberts, District Engineers of the San FranciscoDistrict, U.S. Army Corps of Engineers, for their constant encouragement in this as well as many other remote sensing projects, andto Mr. H.E. Pape, Jr., Chief of the Engineering Division, and Mr.N. Shimizu, Chief of the Foundations and Materials Branch, fortheir support. Gratitude is expressed to a number of Corps geologists who assisted in the geologic mapping and groundtruthinvestigations of the study area, and in particular Mr. Ted Coffman,Project Geologist on the Butler Valley Dam and R€servoir Project.
Credit is also due Motorola Aerial Remote Sensing, Inc., Phoenix,Arizona, for providing the time and funds to complete and printthis report.
iv
I. INTRODUCTION
This study was authorized and approved by NASA in June, 1972. Its
purpose is to assist the Corps of Engineers in determining the use
fulness of various airborne remote sensing systems in the detection
and identification of regional and specific geologic structural
features that may affect the design and location of engineering
structures on major civil works projects.
Careful consideration of both regional and local geologic features
are important to the designer of major engineering structures, such
as dams, nuclear power plants, tunnels, underground installations,
highways and railroads, etc.; because they can have a significant
effect on the stability and economics of the project. In some
cases, geologic factors are instrumental in determining the
location and type of structure to be constructed. The identifica
tion and evaluation of these factors are the responsibility of the
engineering geologist.
Geologic factors of fundamental importance to the design engineer
and engineering geologist on dam and reservoir projects are:
(1) Physical properties and characteristics of the geologic forma
tions in the foundation, abutments, spillway and outlet works,
reservoir area, and along routes of relocated roads and transmission
lines;
(2) Orientation, pattern and condition of faults, fractures, joints
bedding planes, cleveage and schistocity in foundation areas, cut
slopes and tunnel routes;
(3) Stability of reservoir wall rocks;
(4) Proximity of regional faults and shear zones;
(5) Regional seismicity; and
(6) Availability of suitability of construction materials.
1
The Butler Valley Dam and Blue Lake Project was selected as a
demonstration site because:
(1) It is located in a remote mountainous region of northern
California that is covered by dense evergreen forests;
(2) The regional geology is extremely complex and largely unknown,
except for local areas of interest;
(3) The difficulty in deciphering and extrapolating geologic
features due to the paucity of exposures; and
(4) It is located in a seismically active region.
This report is an account of the findings derived from the inter
pretation of various kinds of imagery used in the study area and
is supported by considerable groundtruth data in the project area.
It is not a concluding thesis on the regional geology, nor are the
findings necessarily complete. Future users of the imagery
interested in the same or other aspects of the geology in the study
area may modify or add to the data reported herein.
Work on the study was initiated and partially completed by the
author while employed as Chief Geologist for the San Francisco
District, U.S. Army Corps of Engineers, San Francisco, California.
Completion was accomplished while an employee of Motorola Aerial
Remote Sensing, Inc., Phoenix, Arizona.
II. STUDY AREA
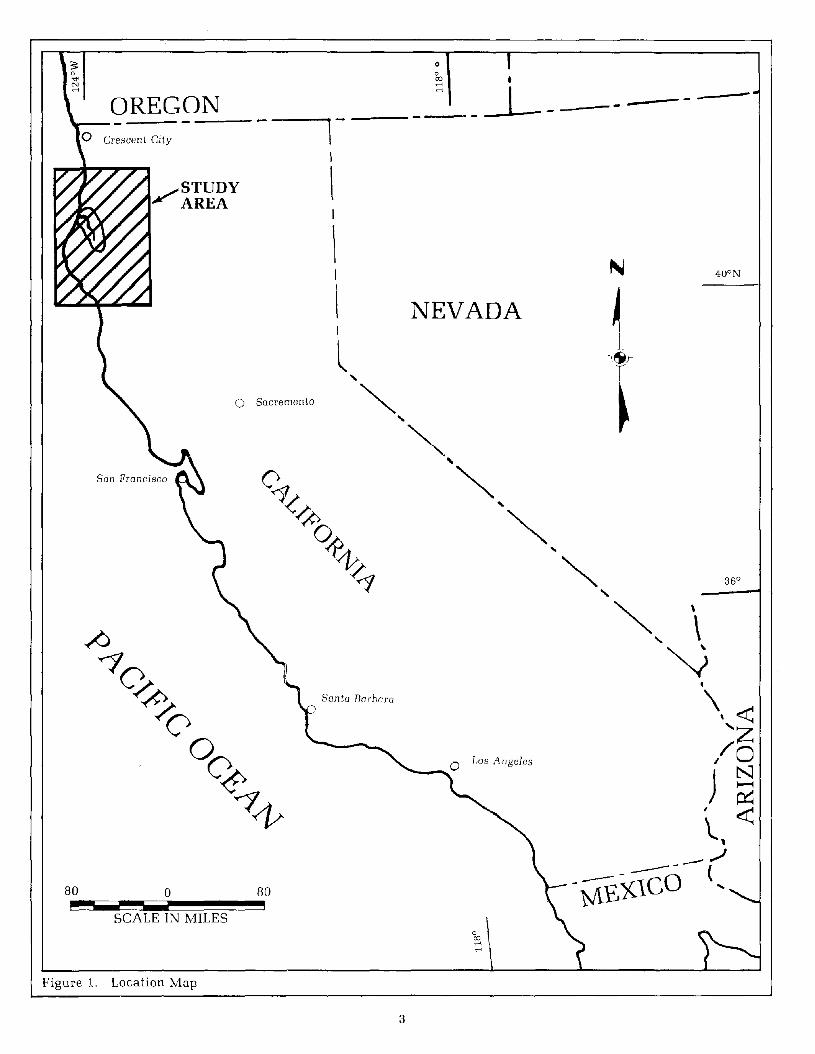
The study area, encompassing about 5,900 square miles (15,280 sq.
km.), is located in northern California, approximately 225 miles
(363 km.) north-northwest of San Francisco and includes the geo
logically unique Cape Mendocino area as shown in Fig. 1.
2
,
NEVADA
Santa Barbara
oo
--1---- ~ .-~--------I
\I
\I
\I
l"
'""~,
~ ,
""
o Sacremento
OREGON
80 a 80i I
SCALE IN MILES0co~
~
Figure 1. Location Map
3
Portions of two markedly different geologic provinces are repre
sented within the study area: The Klamath Mountains to the east,
and the northern Coast Ranges on the west.
Allor parts of five principal drainage basins are within its
boundaries; namely, Trinity River, Redwood Creek, Mad River,
Van Duzen River and Eel River. The proposed Butler Valley Dam and
Blue Lake project is in the northern Coast Ranges province located
at river mile 26 on the Mad River, which is near the lower end of
an SO-mile long and six-mile wide drainage basin trending north
westward. Consequently, most of the discussions in this report
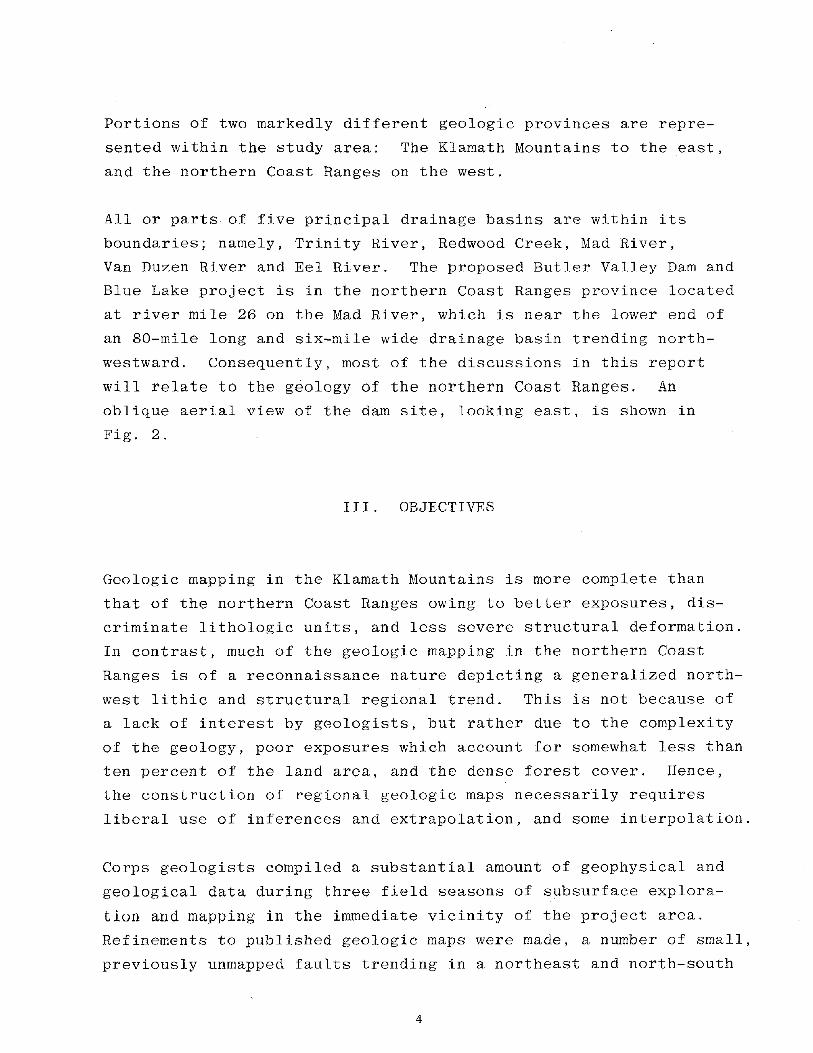
will relate to the geology of the northern Coast Ranges. An
oblique aerial view of the dam site, looking east, is shown in
Fig. 2.
III. OBJECTIVES
Geologic mapping in the Klamath Mountains is more complete than
that of the northern Coast Ranges owing to better exposures, dis
criminate lithologic units, and less severe structural deformation.
In contrast, much of the geologic mapping in the northern Coast
Ranges is of a reconnaissance nature depicting a generalized north
west lithic and structural regional trend. This is not because of
a lack of interest by geologists, but rather due to the complexity
of the geology, poor exposures which account for somewhat less than
ten percent of the land area, and the dense forest cover. Hence,
the construction of regional geologic maps necessarily requires
liberal use of inferences and extrapolation, and some interpolation.
Corps geologists compiled a substantial amount of geophysical and
geological data during three field seasons of subsurface explora
tion and mapping in the immediate vicinity of the project area.
Refinements to published geologic maps were made, a number of small,
previously unmapped faults trending in a northeast and north-south
4
Figure 2. Oblique air photo of dam site andreservoir, looking east.
5
direction were discovered, and many of the geologic factors
affecting the foundation design of the dam, spillway and outlet
works were ascertained. Yet little improvement was made in deter
mining the regional structural fabric due to the difficulty in
tracing rock units and faults from one stream course to another.
Since the region is known to be seismically active, a number of
questions needed to be answered, such as: (1) Were the faults in
the project area local or part of a regional pattern? (2) Were
the inferred major faults traversing the region continuous, active
or inactive? and (3) Were there as yet undiscovered major faults
in the region that may affect the design of the structures?
Secondly, numerous landslides were mapped along the northeast side
of the reservoir area where the relocated road is planned. However,
their upper limits and boundaries are indistinct due to the amount
of overburden materials, tree cover and erosion. Accordingly, the
dense tree cover made it difficult at best to define the above
features from the interpretation and use of multiple-scale (1:9,000
to 1:33,600) color air photos acquired for the project. To perform
detailed regional geologic mapping, or to drill every area of
uncertainty, would be economically impracticable.
In an attempt to help resolve some of the above problems in a cost
effective and time-efficient manner, the District sought the support
of the U.S. Army and NASA to conduct a comprehensive remote sensing
survey using side-looking airborne radar, thermal infrared line
scanning, and h~gh-altitude multiband photography. Specific
objectives were fourfold:
(1) To identify and refine the location of major regional faults
and possibly detect previously unknown faults;
(2) To ascertain the presence or absence of a regional fault and
fracture pattern that may be related to that found locally in the
vicinity of the project;
6
(3) To assist in defining the landslides along the proposed
relocated road; and
(4) To evaluate the applicability of the various sensor systems
for future use by other engineers and geologists.
IV. GEOLOGIC SETTING
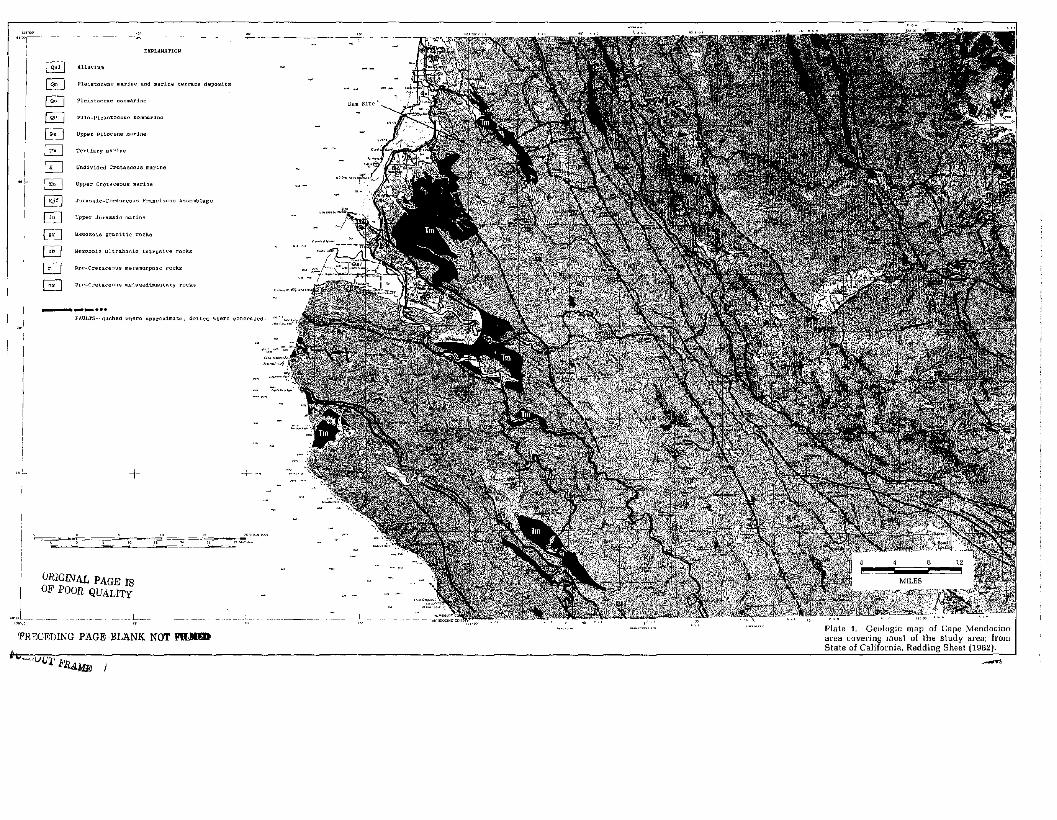
Plate 1 presents the regional geology over most of the study area
as published by the California Division of Mines and Geology in
the 1:250,000 scale Redding Sheet, 1962 edition, Geologic Map of
California. It is a compilation of all published and unpublished
geological work in this area. As previously stated, portions of
two geologic provinces are represented in the study area: the
Klamath Mountains to the east and the northern Coast Ranges to the
west. A prominent reverse fault dipping NE (Irwin, 1960) separates
the two provinces and traverses the study area diagonally from NW
to SE along a narrow belt of the pre-Cretaceous schist (ms).This
fault over much of its length is parallel to the faults of the
San Andreas system. The basis for defining the two provinces is a
natural grouping of principal rock units that differ markedly from
the standpoint of topography and geologic history.
The principal rock units of the Klamath Mountains range in age from
early Paleozoic to late Jurassic and are intruded by batholithic
granites. The rock units form general arcuate belts that are
concave to the east. Topographically, theprovinc~ is a rugged
mass of mountains with peaks standing from 6,000 to more than 9,000
feet in elevation, side slopes are steep, and the drainage is
, generally from east to west cutting across the lithic and struc
tural grain of the province.
In contrast, principal rock units in the northern Coast Ranges are
chiefly eugeosynclinal rocks, known as the Franciscan Assemblage,
7
ranging in age from late Jurassic to Cretaceous. There are no
granites and no known basement rocks. Both provinces, however, are
intruded by abundant ultrabasic rocks. Present evidence (Bailey
et. al. 1964) suggests that the entire assemblage may rest directly
on a basaltic substratum or peridotite. Topographically, the
mountains of the northern Coast Ranges are lower in elevation,
generally less than 5,000 feet decreasing toward the coast, and are
comprised of a series of ridges separated by V-shaped valleys.
Both the lithic and structural grain of the province are conspic
uously northwest controlling the drainage which is also north
westward. Slopes are moderate to steep and landsliding is
prevalent.
Marine sedimentary rocks of probable late Cretaceous age overlie
the Franciscan Assemblage in the Eel River Valley area and near
Eureka. Tertiary rocks of Eocene to Pliocene age occur in both
provinces. They are chiefly of marine origin in the northern Coast
Ranges, whereas they are mainly continental in the Klamath
Mountains.
The geologic structure in the study area is highly complex and
poorly known particularly in the northern Coast Ranges. The degree
of deformation in the rocks in the northern Coast Ranges is much
more severe than that of the Klamath Mountains. The arcuate
arrangement of lithic belts in the Klamath Mountains is interpreted
as resulting from compressive forces from the east, and the bound
aries between the lithic belts are chiefly eastward-dipping reverse
faults. In contrast, structural features in the northern Coast
Ranges appear to have been subjected to changing principal stress
directions through east-west to north-south. Major faulting is
chiefly normal and reverse, trending to the northwest. An
anomalous west-northwest structural trend occurs in the Eel River r
Valley area near Cape Mendocino as mapped by Ogle, 1953. Smaller
faults and shear zones are abundant throughout and trend in a
variety of directions.
8
Recent ideas based upon plate tectonics, or seafloor spreading,
attribute the structural complexity of the northern Coast Ranges
(melange-style deformation) to the piling-up of oceanic-plate
material along a subduction zone associated with a late Mesozoic
trench (Ernst, 1970). Looking at the structural trends and the
increasing degree of deformation to the east in the northern Coast
Ranges, there is a striking appearance of the older rocks having
been pressed against the more rigid mass of the Klamath Mountains.
v. SEISMICITY
After Alaska, the Cape Mendocino area, and particularly the area
off the coast, is the most seismically active in North America.
More than 20 percent of the major historical earthquakes listed for
California and Nevada occurred in this area. An important contri
buting factor to this activity is the San Andreas Fault which is a
right-lateral strike-slip fault having from 50 to as much as 350
miles (80 to 564 km.) of relative displacement (Crowell and Walker,
1962, and Hill and Dibblee, 1953). Its age is also not precisely
known; some saying as old as late Jurassic and others saying no
older than early Miocene. In any event, the San Andreas has long
been a prominent feature of the California landscape and has had
an unparalleled history of activity extending to this day. See
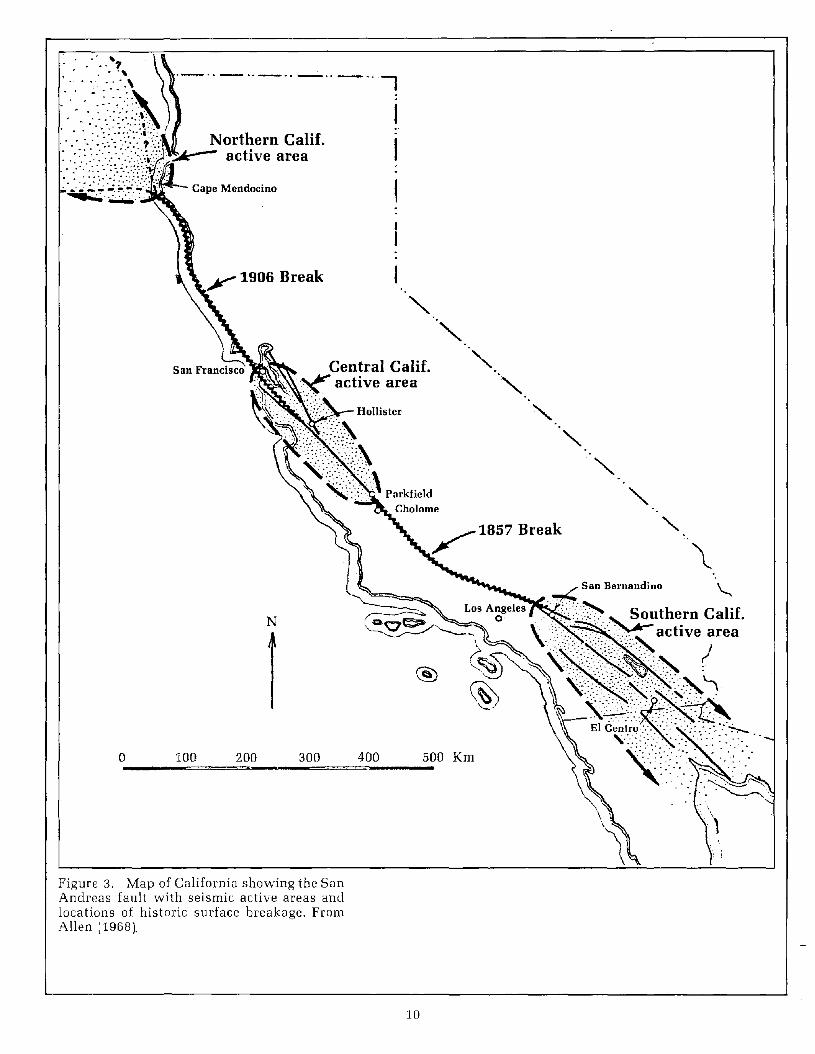
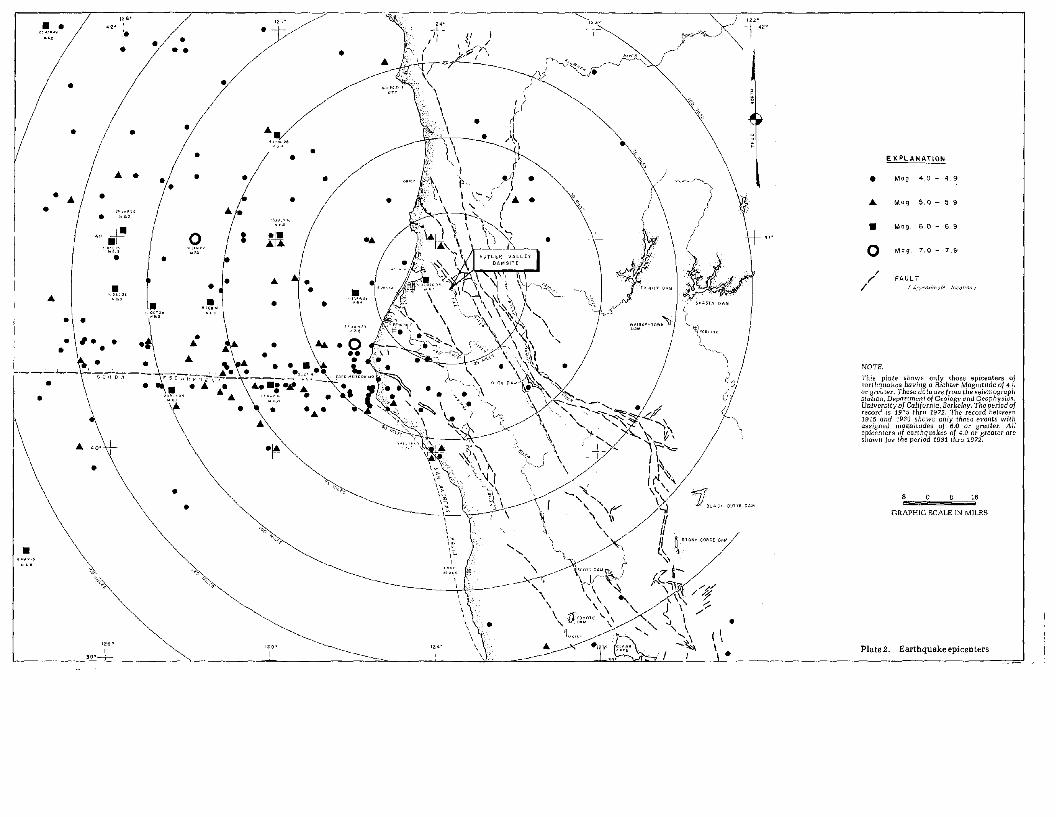
Figure 3 showing the fault and the active area off Cape Mendocino,
and Plate 2 showing epicenters of significant historical earth
quakes.
More recent studies of the faulting and seismicity in the Cape
Mendocino region have revealed additional contributing factors
that are of fundamental importance, at least in the late 2 to 5
m.y. (Seeber, 1970; Silver, 1971, et. al.). Figure 4 is a
generalized map schematically showing the relationship of the
triple junction of three lithospheric plates meeting at Cape
Mendocino. They are: the Pacific Plate, the North American Plate,
9
o 100 200
N
1300 400
'",
'.
".-1857 Break
500 Km
\
Figure 3. Map of California showing the SanAndreas fault with seismic active areas andlocations of historic surface breakage. FromAllen [1968).
10
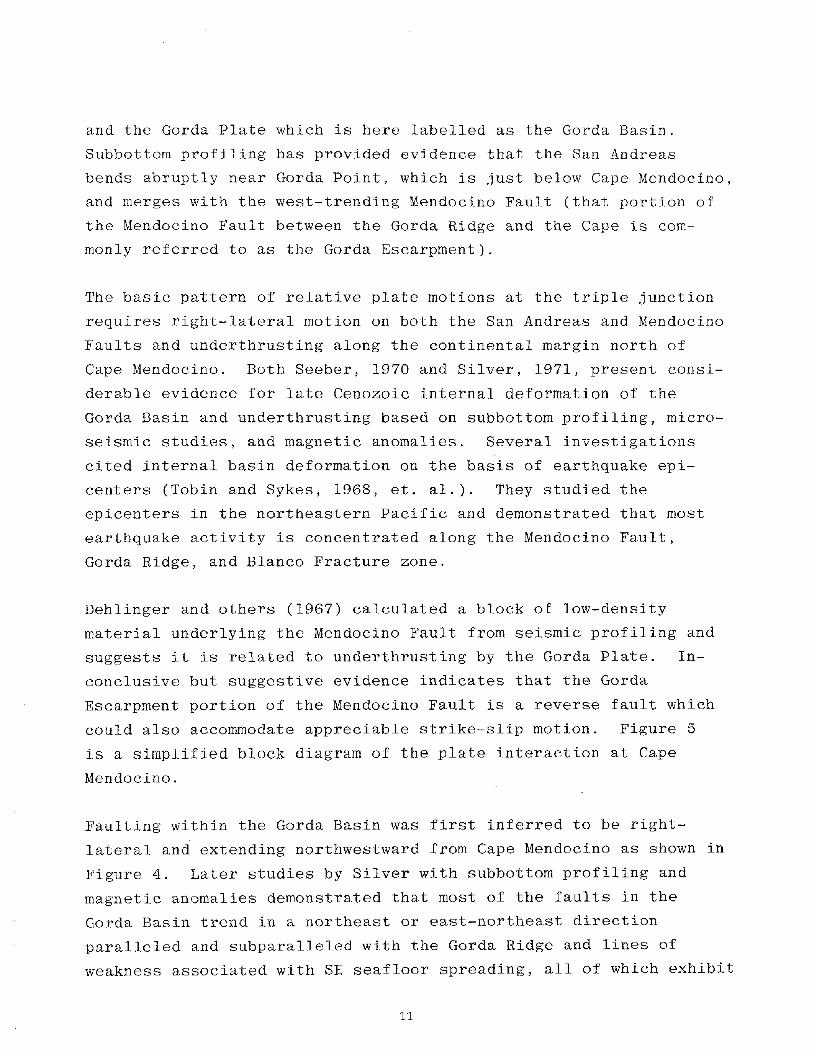
and the Gorda Plate which is here labelled as the Gorda Basin.
Subbottom profiling has provided evidence that the San Andreas
bends abruptly near Gorda Point, which is just below Cape Mendocino,
and merges with the west-trending Mendocino Fault (that portion of
the Mendocino Fault between the Gorda Ridge and the Cape is com
monly referred to as the Gorda Escarpment).
The basic pattern of relative plate motions at the triple junction
requires right-lateral motion on both the San Andreas and Mendocino
Faults and underthrusting along the continental margin north of
Cape Mendocino. Both Seeber, 1970 and Silver, 1971, present consi
derable evidence for late Cenozoic internal deformation of the
Gorda Basin and underthrusting based on subbottom profiling, micro
seismic studies,and magnetic anomalies. Several investigations
cited internal basin deformation on the basis of earthquake epi
centers (Tobin and Sykes, 1968, et. al.). They studied the
epicenters in the northeastern Pacific and demonstrated that most
earthquake activity is concentrated along the Mendocino Fault,
Gorda Ridge, and Blanco Fracture zone.
Dehlinger and others (1967) calculated a block of low-density
material underlying the Mendocino Fault from seismic profiling and
suggests it is related to underthrusting by the Gorda Plate. In
conclusive but suggestive evidence indicates that the Gorda
Escarpment portion of the Mendocino Fault is a reverse fault which
could also accommodate appreciable strike-slip motion. Figure 5
is a simplified block diagram of the plate interaction at Cape
Mendocino.
Faulting within the Gorda Basin was first inferred to be right
lateral and extending northwestward from Cape Mendocino as shown in
Figure 4. Later studies by Silver with subbottom profiling and
magnetic anomalies demonstrated that most of the faults in the
Gorda Basin trend in a northeast or east-northeast direction
paralleled and subparalleled with the Gorda Ridge and lines of
weakness associated with SE seafloor spreading, all of which exhibit
11
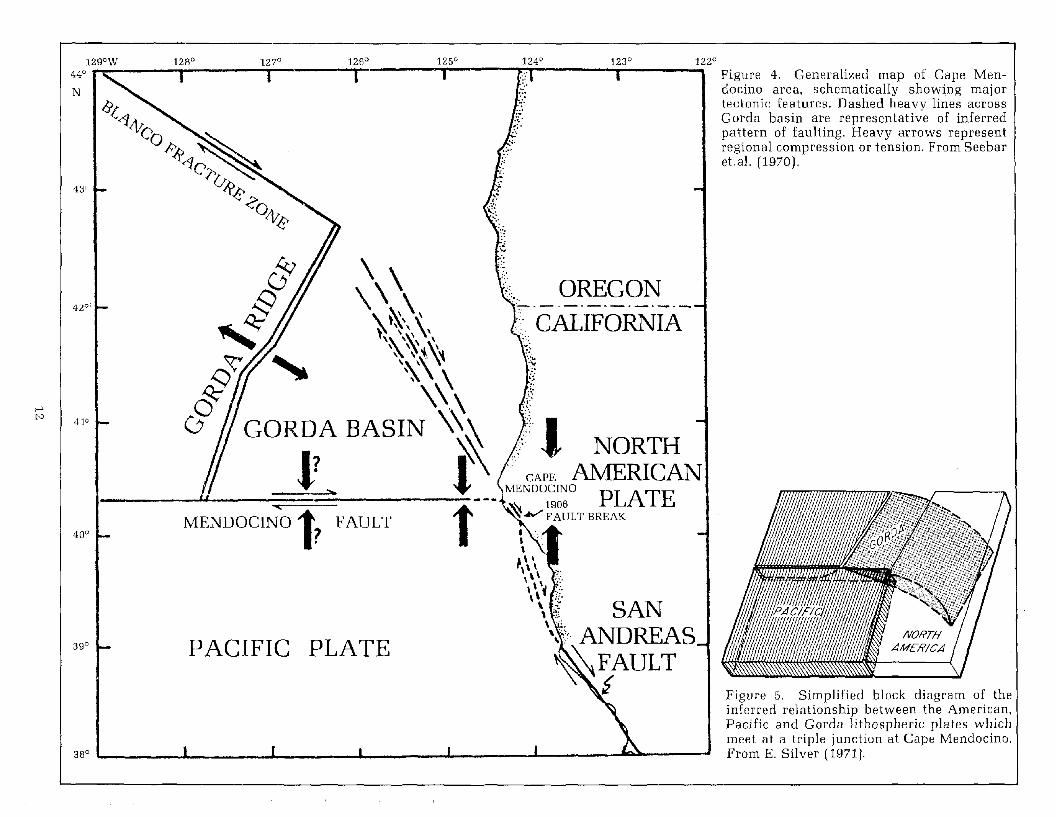
Figure 5. Simplified block diagram of theinferred relationship between the American,Pacific and Gorda lithospheric plates whichmeet at a triple junction at Cape Mendocino.From E. Silver (1971).
OREGON'.::. 'CALIFORNIA-
PLATEPACIFIC
& \\~ \ \~\\\~ \~~\\\~ \'~~~\1~~, '~\\~ \\.\.
() GORDA BASIN \~ ~.t I NORTH
} ? 1'\ . CAPE AMERICAN>. '" MEND01~~~O PLATE
Ii t ~""""'FAULT BREAKMENDOCINO t, FAULT ~ •.
. \
~ \ \\ \ \ .,;.\ \ \ ,..•.
\ ..\ \ ~ .:'\ \1 if' N\.' SA
\ '~~
\.\. ANDREAS
~~ULT
38° I:=====~I=====~I__----.L.-----L-----l-----~~---JI I I 40)" I
41°
43°
39°
40°
42°
N
129°W 128° 127° 126° 125° 124° 123° 122°44° i .... I I I I f.' I i Figure 4. Generalized map of Cape Men-
docino area, schematically showtng majortectonic features. Dashed heavy lines acrossGorda basin are representative of inferredpattern of faulting. Heavy arrows representregional compression or tension. From SeebareLal. (1970).
>-'N
left-lateral movements. The above investigators made three
important discoveries: (1) The dextral strike-slip motion along
the San Andreas Fault is at present being taken up by similar
motion on the Mendocino Fault accompanied by northward thrusting;
(2) Right-lateral, left-lateral, and thrusting predominate in the
focal mechanism of faulting both on and offshore of Cape Mendocino
radiating in east-west, northwest and northeast trends; and (3)
earthquake hypocenters are anomalously deeper in the Cape Mendocino
area (15 to 35 km.) than anywhere along the San Andreas system to
the south.
They suggest the evidence is indicative of a new tectonic regime
developing probably in the last 2-5 m.y. in which internal deforma
tion of the Gorda Basin and north-south compression along the
Mendocino Fault are important features. This is consistent with
historic epicentral locations as they die out rapidly to the north,
south and east.
VI. REMOTE SENSORS USED
A. General
Advanced planning and preconstruct ion exploration and design
studies began on the Butler Valley Dam and Blue Lake project in
1966. Imagery from a variety of remote sensing systems were
employed on the project, but not all at the same time. Black
and white air photos acquired in 1956 and 1966 after the de
vastating floods in the north coastal region, and multiple-scale
color photography acquired in 1970 for topo-map construction in
the project and reservoir areas were used extensively throughout
the studies.
In 1971, side-looking airborne radar coverage of the study area
was flown by the U.S. Army. It was acquired during 1-2
13
September 1971 and subsequently mosaicked. LandSat-l (formerly
ERTS) satellite imagery of the study became available in the
fall of 1972. NASA's P-3 aircraft under the sUbject SRT con
tract provided thermal infrared imagery, color infrared and
black and white photography in the spring of 1973. High
altitude U-2 aircraft multiband imagery of the project area was
also flown by NASA in September 1973.
Since the literature contains abundant data on the LandSat
system, thermal infrared line scanning, and certainly metric
and multiband photography, only brief descriptions of these
sensors are presented herein. Side-looking airborne radar, on
the other hand, will be described in more detail because there
are a variety of systems in use which are substantially dif
ferent. Secondly, Radar is unique in that it is an "active"
sensor system, whereas all others are "paSSive."
B. LandSat
NASA's LandSat-l satellite, launched in a polar orbit at an
altitude of 570 miles (918 km.) in JUly 1972, provided for the
first time small scale synoptic views of the earth's surface
that stirred universal renew~d interest in remote sensing. A
single frame scans a 115-mile square (185 km. square) area of
the earth's surface at a scale of 1;1,000,000. Each frame is
presented in four wavelengths, or bands, covering most of the
visible spectrum and a portion of the near infrared--Band 4,
0.5 to 0.6; Band 5, 0.6 to 0.7; Band 6, 0.7 to 0.8; and Band 7,
0.8 to 1.1 micrometers. Reported resolution (groundspot size)
of LandSat-l imagery is 100 meters square.
C. Photography
As stated earlier, multiple-scale aerial photography (B&W,
color, color infrared and multiband) was acquired by the Corps
and NASA using standard metric and multiband cameras. They
are as follows:
14
1. The District, under contract to private firms, acquired
B&W and color metric aerial photos in scales of 1:9,000,
1:12,000, 1:20,000 and 1:33,600;
2. The NASA P-3 aircraft provided 1:24,000 and 1:50,000 scale
color infrared and B&W aerial photos; and
3. The NASA U-2 aircraft, in its Vinten-A arrangement, pro
vided multiband aerial photos at a scale of approximately
1: 440,000.
Groundspot-size resolution on air photos vary from a few inches
to a few feet square (0.1 to 2.0 meters) depending on their
scale.
D. Thermal Infrared
The infrared system as configured on NASA's P-3 aircraft is an
RS-14 line-scanner manufactured by Texas Instruments. It is
also a passive system that detects and measures emitted infra
red radiation, but does not depend on reflected solar lighting
to obtain the image as with LandSat or aerial photography.
Since the amount of infrared energy emitted from any material
is affected by its temperature to the forth power, line
scanners are commonly referred to as "thermal infrared" sensors.
The RS-14 measures infrared energy in two atmospheric windows;
generally referred to as 3 to 5 and 8 to 14 micrometers.
Resolution depends on the aircraft altitude and the optical
system itself. Groundspot sizes at commonly flown altitudes
vary from two to ten feet square (0.7 to 3.0 meters).
A daytime and nighttime flight was planned consisting of two
overlapping strips covering the landslide area on the NE side
of the reservoir and the saddle dike area just north of the
dam site. The objective was to detect soil moisture differences
and small seeps to assist geologists in defining landslide
15

boundaries and fracture traces. However, this mission was
unsuccessful due to: (1) Too much tree cover, (2) Extreme
relief in the target area; and (3) Aircraft scheduling pre
cluded the nighttime flight. Therefore, no examples are
included in this report. Normally, thermal infrared is an
excellent sensor for these applications in spite of the fact
that it is very time and weather dependent. Experience with
the infrared line-scanner in other areas show that the most
advantageous time to fly this sensor is between the hours of
midnight and sun up.
E. Side-looking Airborne Radar
The Radar imagery of the study area was acquired by the l84th
Military Intelligence Company (Aerial Surveillance) under con
tract to and the direction of the San Francisco District. The
system is an APSj94(D) real-aperture (brute force) Radar
operating in the 3 em wavelength (X-Band) region of the electro
magnetic spectrum. Radar is called "active" because it
generates its own energy to illuminate the earth's surface and
operates entirely independent of solar lighting. This fact,
coupled with the long wavelength used, means that the Radar
antenna can illuminate terrain from any azimuth, day or night,
and through cloud cover with controlled illumination (depres
sion) angles. It was designed by Motorola Inc. specifically
for the U.S. Army and is mounted on the sophisticated OV-lD
Mohawk aircraft.
Unique features of the system are:
1. Near real-time display_of the imagery on-board the aircraft.
2. The original film negatives are available for on-the-spot
viewing immediately after each flight;
3. The imagery produced is in conventional map scales of
16
1:250,000, 1:500,000, 1:1,000,000, and 1:2,000,000 while
imaging out of the right, left or both sides of the antenna
simultaneously; and
4. Changes in aircraft altitude do not alter the mapping
scale.
Radar operates on two basic principles: (1) that all materials
reflect a portion of the microwave energy transmitted as a
pulse from the antenna; and (2) that microwave energy travels
in straight lines and at the speed of light. The specialized
Radar antenna is fixed to the belly of the aircraft. It trans
mits a narrow beam of pulsed energy in a perpendicular plane
and at an oblique angle to the line of flight. As the aircraft
moves forward, the beam scans the terrain in a series of rapid
sequential pulses. Energy reflected from the ground to the
receiving antenna is transformed into optical energy and is
exposed on photographic film. The film records at a rate pro
portional to the ground speed of the aircraft to maintain the
proper map scale.
Thus, the imagery strip is comprised of thousands of data lines
per inch, each line recording discrete variations in high and
low intensity returns differentiated as various shades of gray:
light grays for high reflected Radar energy returns and darker
grays for low reflected Radar energy returns. The amount of
reflected energy is primarily a function of: (1) topography,
(2) angle of incidence between the radiated beam and the
reflecting surface, (3) surface roughness (angular vs. specular),
(4) moisture content, and (5) dielectric constant of the re
flecting material.
The resulting Radar image looks much like a small scale low
sun-angle aerial photograph because of the shadows, but the two
are entirely different. With Radar you are viewing the terrain
as the reflected microwave energy portrays it and not as the
17
eye would see it in the visible spectrum. It is essential
that the interpreter understands these differences.
Unlike other Radar systems and aerial sensors having fixed
focal lengths or fields of view, the map scale of the imagery
in this Radar system remains constant at all aircraft altitudes
because it is a time-distance function of the microwave pulse.
However, the elevation of the Radar illumination (pseudo sun
angle) does vary with changing aircraft altitudes and,
accordingly, so does the amount of shadow (no return areas) on
the imagery.
The look direction and proper amount of shadowing are probably
the two most important factors in geological applications of
Radar. Too much or too little shadow results in significant
loss of data. Since the investigator can control the look
direction, or azimuth, and vertical angle of illumination,
judicious use of them provides him with the ability to accen
tuate geological features in any type of terrain, flat lying or
mountainous. Radar is particularly effective in areas of heavy
forest cover as will be demonstrated in the examples of this
report.
Resolution of Radar imagery is a commonly misunderstood term
and is not related to the conventional minimum ground-spot size
as in photographic resolution. Radar resolution is defined as
the !'minimum separation" between two targets (artillery, trucks,
tanks, etc.) that will appear individually on the imagery as
measured in the "range direction" (perpendicular to the air
craft) and in the !!azimuth direction!! (parallel with the line
of flight). In unclassified Radar systems, these dimensions
vary from 15 to 200 meters. That does not mean that an object
or feature has to be that big before you can see it on Radar.
Linear features for example, such as, roads, railroads, power
lines, etc., and geological features, such as, dikes, faults,
ridges, creeks, etc., of substantially smaller dimensions are
18
clearly visible and routinely identified on Radar because of
sequential pulse recording. Thus, if high reflective (hard)
targets are excluded, conventional ground-spot size resolution
for Radar imagery could be generally stated as less than ten
meters.
VII. DISCUSSION OF RESULTS
A. General
Imagery from the various remote sensor systems used, inter
pretive results, and discussions herein pertain to geological
applications only. Use of the same imagery for other applica
tions could diverge substantially from these findings. Use of
remote sensor imagery on this project, or any other project,
must not be considered as a final, definitive answer to geolo
gical exploration and related problems. Similarly, there is
no one sensor system that will provide all the answers. No.such all-encompassing method currently exists or is likely to
be developed. However, remote sensing methods are valid and
can be economically important in that: (1) some geological
features can be readily identified which cannot be detected in
any other way, or that are often overlooked in the field, and
(2) knowing where to concentrate groundtruth efforts can save
substantial man-months or man-years of field work. Their use
on this project added materially to and improved significantly
upon existing knowledge of the regional and project area
geology.
All of the imagery examples contained herein are of high quality
and represent the best samples obtained with the various remote
sensors used. Understandably, due to the printing process, all
are now fourth-generation lithographic prints, except for
Plate 3 (Radar mosaic) which is a 1.9X reduction and sixth
generation print.
19
The objectives of this study relate primarily to identifying
fault and fracture patterns, which the imagery interpreter must
necessarily regard as lineaments until groundtruth examinations
are made. Thus, it is important to describe them and their
occurrence.
B. Lineaments
Lineaments and their closely related synonyms (fracture traces,
microfractures, mesofractures, megajoints, photolinears, etc.)
have been noted on air photos and topographic maps for almost
a century (Hobbs, 1911, Lattman, 1958, and Blanchet, 1957).
Most of the investigators of lineaments relate their definitions
to the length of the feature, which necessarily is governed by
the scale of the imagery or map used. The term "lineament" is
preferred by this author because the exact cause is unknown.
A lineament can be a fault, joint, fracture, shear zone, or
zones of increased frequency of any of them as observed in the
rock unit itself, or the trace of these features propagated to
the surface through substantial thicknesses of younger rocks
or overburden materials. Once it has been specifically
identified in the field as a joint, fault or shear zone, then
it is, of course, no longer a lineament.
Lineaments identified on airborne imagery appear as naturally
occurring, comparatively straight or slightly curved features
usually accentuated by erosion. The most common are topo
graphic alignments, drainage alignments, and tonal variations
in soils or vegetation, or combinations of the three. Since
lineaments are approximately straight alignments that transect
a variety of local geologic features, the majority of them
must extend nearly vertically with depth.
Consistent, worldwide, roughly orthogonal fracture and joint
patterns have been recognized in the Precambrian Shield areas
and basement rock bodies of most continents. The basic shear
20
set consists of components oriented in the NW, NE, NS and EW
directions. The causative mechanism is not well understood,
but most agree their origin is related to global tectonics.
Similar patterns have been observed in the overlying sedi
mentary rocks and alluvium, which were apparently inherited
from the basement rocks as the surface pattern is consistent
with their basic shear set (Hodgson, 1961). Again, the pro
pagating mechansim is not agreed upon, but the repeated diurnal
stresses caused by earth tides is believed to be an important
contributing factor because they have been observed in uncon
solidated sediments and glacial till (Rumsey, 1971).
C. Project Geology
Rocks underlying the project area are portions of two principal
formations; the Franciscan Assemblage of late Jurassic to
Cretaceous age, and the Falor Formation (named by Manning and
Ogle, 1950) of mid-Pliocene age shown as Kjf and Tm, respec
tively, on Plate 1 and in Figure 12b. Franciscan rocks are
comprised of a heterogenous assemblage of indurated sandstones
(graywackes), shales, altered volcanics (greenstones), and
lesser amounts of serpentinite, chert, schist and conglomerate.
The Falor Formation consists of unconsolidated marine sediments
that were deposited in a shallow arm of the sea in mid-Pliocene
time. These sediments are chiefly poorly cemented sands, clays
and siltstones containing lenses of pebble conglomerates.
The Franciscan rocks were intensely faulted and tightly folded
in late Cretaceous time and subsequent periods of uplift and
faulting. The Falor sediments are only mildly deformed by
comparison and a portion of them have been down faulted into
the Franciscan along NW-trending normal faults of late Pliocene
age and thereby preserved from erosion. Estimated displacement
along the western boundary fault is about 1,000 feet (308 meters).
Manning and Olge, 1950, mapped a number of NE-trending faults
which transect and offset the NW-trending boundary faults.
Their age is thought to be related to the Plio-Pleistocene
21
faulting in the northern Coast Ranges. There is no evidence
of recent activity on any of the faults.
1. Formation boundaries
Foundations for the dam, spillway, and outlet works are
entirely within the more resistent Franciscan rocks, con
sisting of thick-bedded graywackes and thinly interbedded
shales and graywackes which strike N 700 _800 Wand dip 500
to 650 NE. Figure 6 is a medium-scale air photo of ther(l~~
dam site, north being toward the bot am. The conspicuous
hairpin bends in the river can be used as a reference in
the other sample imagery. The Mad River flows from left
to right in this view. Also note the contrasting topo
graphy on either side of the river, better illustrated in
Figures 7 and 12a.
Previous investigators in this area mapped the late
Jurassic and Cretaceous rock units as simply Franciscan,
Kjf on Plate 1 and in Figure 12b. In the Eel River Valley
area and Coast Ranges to the south, however, Bailey, et.
al., 1964, recognized that the younger Franciscan gray
wackes (Coastal Belt) contained an appreciable amount of
K-feldspar and consequently had lower specific gravities,
whereas the older Franciscan graywackes (Central and
Eastern Belts) rarely contained more than a trace of K
feldspar, had higher specific gravities, and in places
were mildly metamorphosed. In the study area the younger
and older Franciscan rocks are mapped as Kand Kjf,
respectively.
Diamond core drilling, sampling and laboratory testing of
the graywackes at the dam site revealed a high K-feldspar
content, ranging from 16 to 22 percent, and specific
gravities averaging about 2.54--10wer than the 2.65 to
2.70 for the older Franciscan graywackes. Suggesting that
22
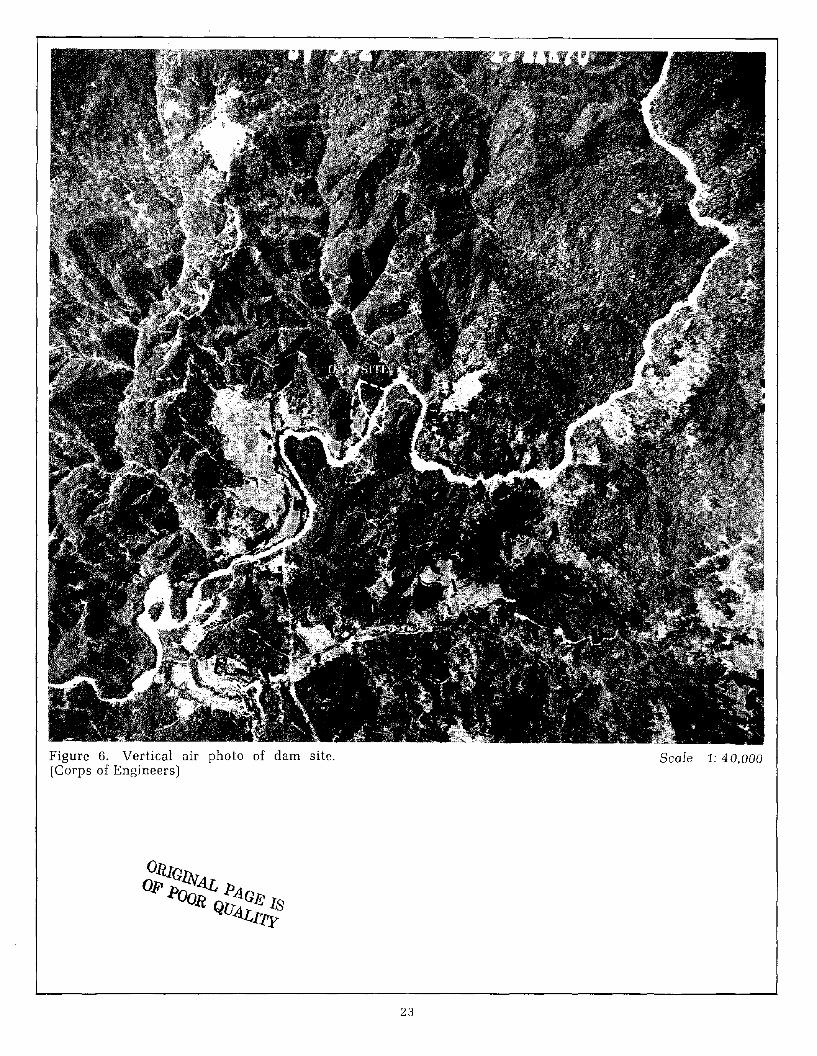
Figure 6. Vertical air photo of dam site.(Corps of Engineers)
23
Scale 1: 40,000
these rocks may be in fact younger Franciscan (K) rocks.
In outcrops, which are almos~entirely limited to the banks
of the river, these graywackes could be traced for several
miles upstream along the west side of the reservoir. The
exact boundary of this rock unit was not mapped by Corps
geologists and probably could not map it because of the
dense tree cover and lack of exposures at higher elevations.
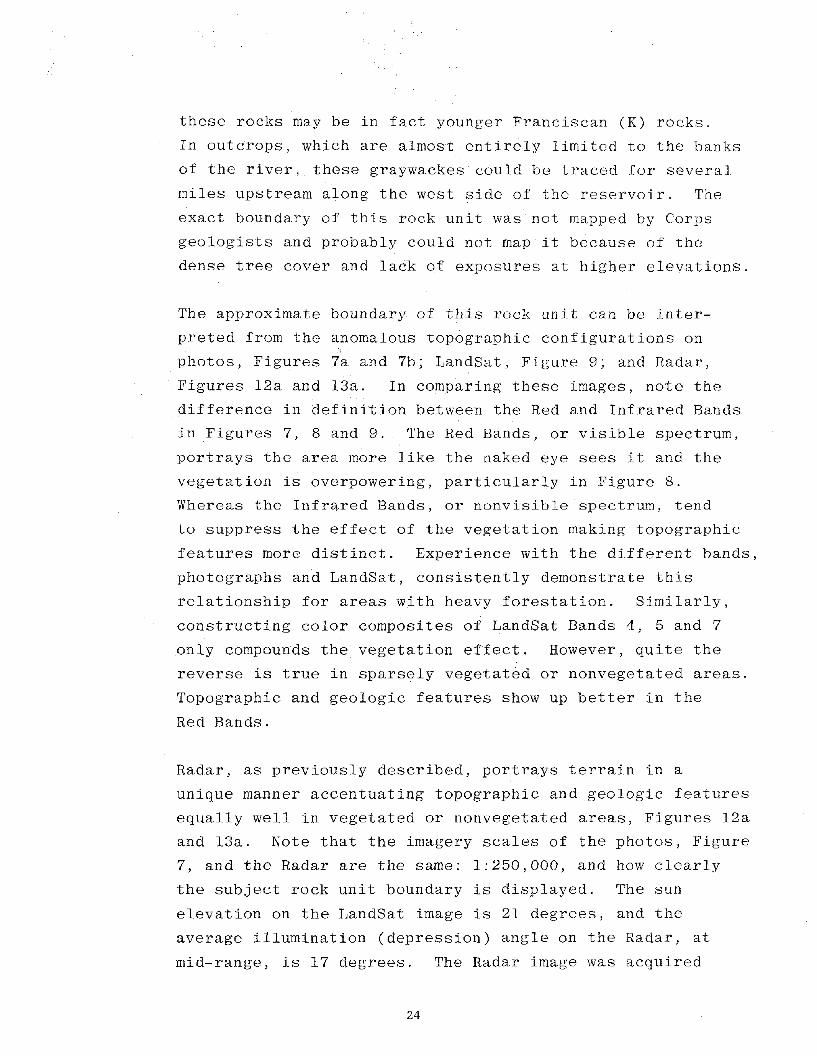
The approximate boundary of this rock unit can be inter
preted from the anomalous topographic configurations on
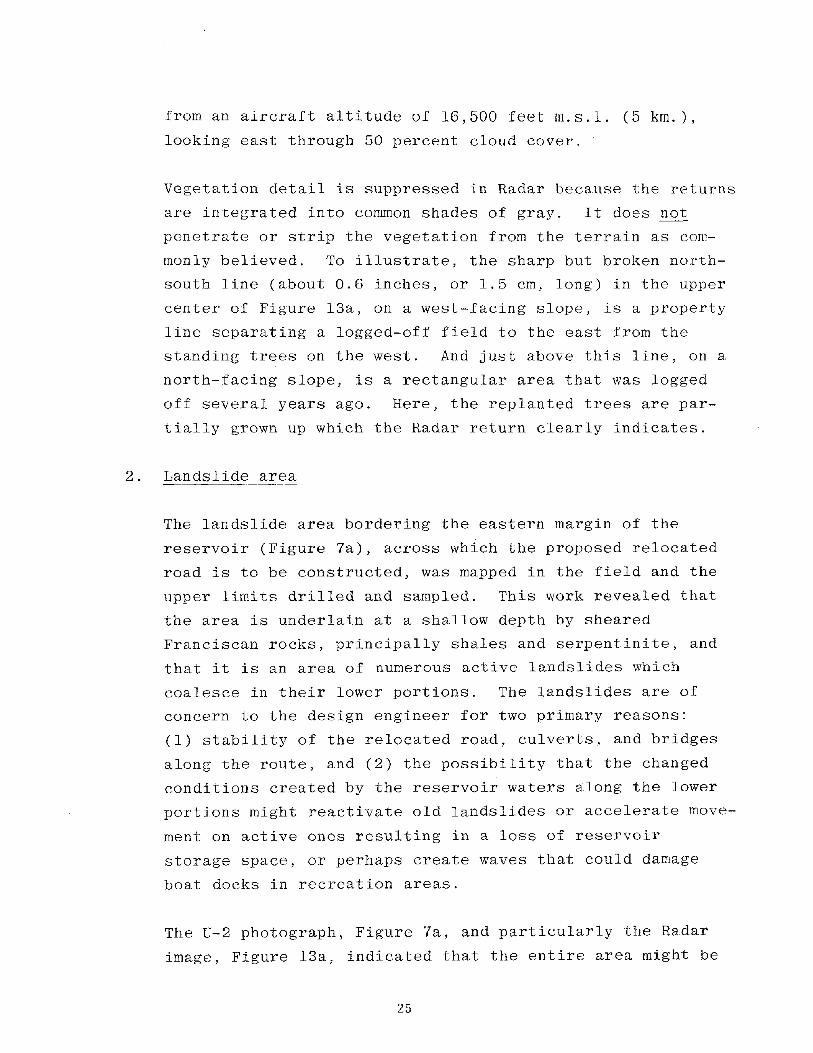
photos, Figures 7a and 7b; LandSat, Figure 9; and Radar,
Figures l2a and 13a. In comparing these images, note the
difference in defini~ion between the Red and Infrared Bands
in Figures 7, 8 and 9. The Red Bands, or visible spectrum,
portrays the area more like the naked eye sees it and the
vegetation is overpowering, particularly in Figure 8.
Whereas the Infrared Bands, or nonvisible spectrum, tend
to suppress the effect of the vegetation making topographic
features more distinct. Experience with the different bands,
photographs and LandSat, consistently demonstrate this
relationship for areas with heavy forestation. Similarly,
constructing color composites of LandSat Bands 4, 5 and 7
only compounds the vegetation effect. However, quite the
reverse is true in sparsely vegetated or nonvegetated areas.
Topographic and geologic features show up better in the
Red Bands.
Radar, as previously described, portrays terrain in a
unique manner accentuating topographic and geologic features
equally well in vegetated or nonvegetated areas, Figures l2a
and l3a. Note that the imagery scales of the photos, Figure
7, and the Radar are the same: 1:250,000, and how clearly
the subject rock unit boundary is displayed. The sun
elevation on the LandSat image is 21 degrees, and the
average illumination (depression) angle on the Radar, at
mid-range, is 17 degrees. The Radar image was acquired
24
from an aircraft altitude of 16,500 feet m.s.l. (5 km.),
looking east through 50 percent cloud cover.
Vegetation detail is suppressed in Radar because the returns
are integrated into common shades of gray. It does not
penetrate or strip the vegetation from the terrain as com
monly believed. To illustrate, the sharp but broken north
south line (about 0.6 inches, or 1.5 em, long) in the upper
center of Figure l3a, on a west-facing slope, is a property
line separating a logged-off field to the east from the
standing trees on the west. And just above this line, on a
north-facing slope, is a rectangular area that was logged
off several years ago. Here, the replanted trees are par
tially grown up which the Radar return clearly indicates.
2. Landslide area
The landslide area bordering the eastern margin of the
reservoir (Figure 7a), across which the proposed relocated
road is to be constructed, was mapped in the field and the
upper limits drilled and sampled. This work revealed that
the area is underlain at a shallow depth by sheared
Franciscan rocks, principally shales and serpentinite, and
that it is an area of numerous active landslides which
coalesce in their lower portions. The landslides are of
concern to the design engineer for two primary reasons:
(1) stability of the relocated road, culverts, and bridges
along the route, and (2) the possibility that the changed
conditions created by the reservoir waters along the lower
portions might reactivate old landslides or accelerate move
ment on active ones resulting in a loss of reservoir
storage space, or perhaps create waves that could damage
boat docks in recreation areas.
The U-2 photograph, Figure 7a, and particularly the Radar
image, Figure l3a, indicated that the entire area might be
25
26
Scale 1:250,000
Figure 7a. NASA U-2 vertical air photo; nearIR Band (690-760 nm) taken 27 Sept. 1973.
Figure 7b. NASA U-2 vertical air photo; RedBand (580-680 nm) taken simultaneously withfigure 7a on 27 Sept. 1973.
Scale 1:250,000
Figure 8. NASA, Landsat-1 Band 5 image ofCape Mendocino area with sun elevation of 21degrees, 1 January 1974.
27
Scale 1: 1,000,000
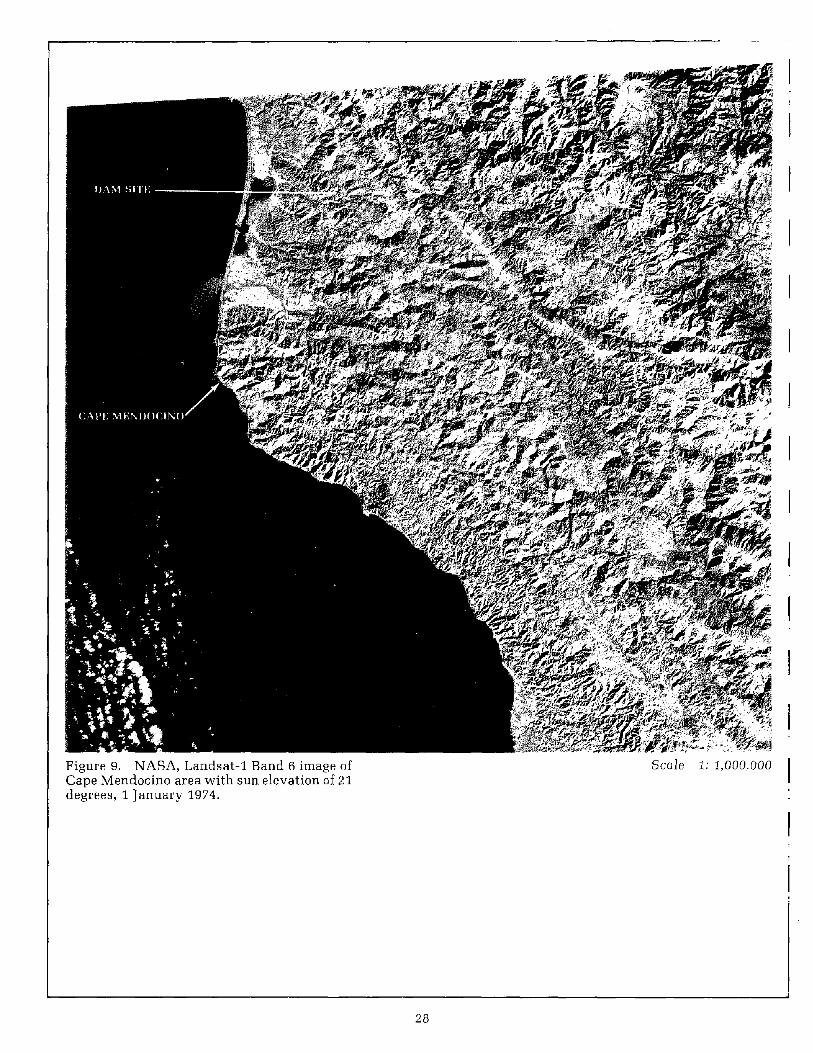
Figure 9. NASA, Landsat-1 Band 6 image ofCape Mendocino area with sun elevation of 21degrees, 1 January 1974.
28
Scale 1: 1,000,000
an integrated mass of landslides instead of a number of
individual slides. Substantial tree covered areas separate
the active slide areas which supported only grass and
sparse vegetation. Subsequent and on-going field work
suggested that this was probably a correct interpretation.
Most of the tree covered areas exhibited diagnostic
features of ancient, presently stable, slides, and the
obvious active portions were grass covered.
3. Mapped and unmapped faults
Manning and Ogle, 1950, in the course of their Master's
thesis field work during the summer of 1947 on the Blue
Lake Quadrange, were the first to recognize and map NE
trending faults in this region, right hand one quarter of
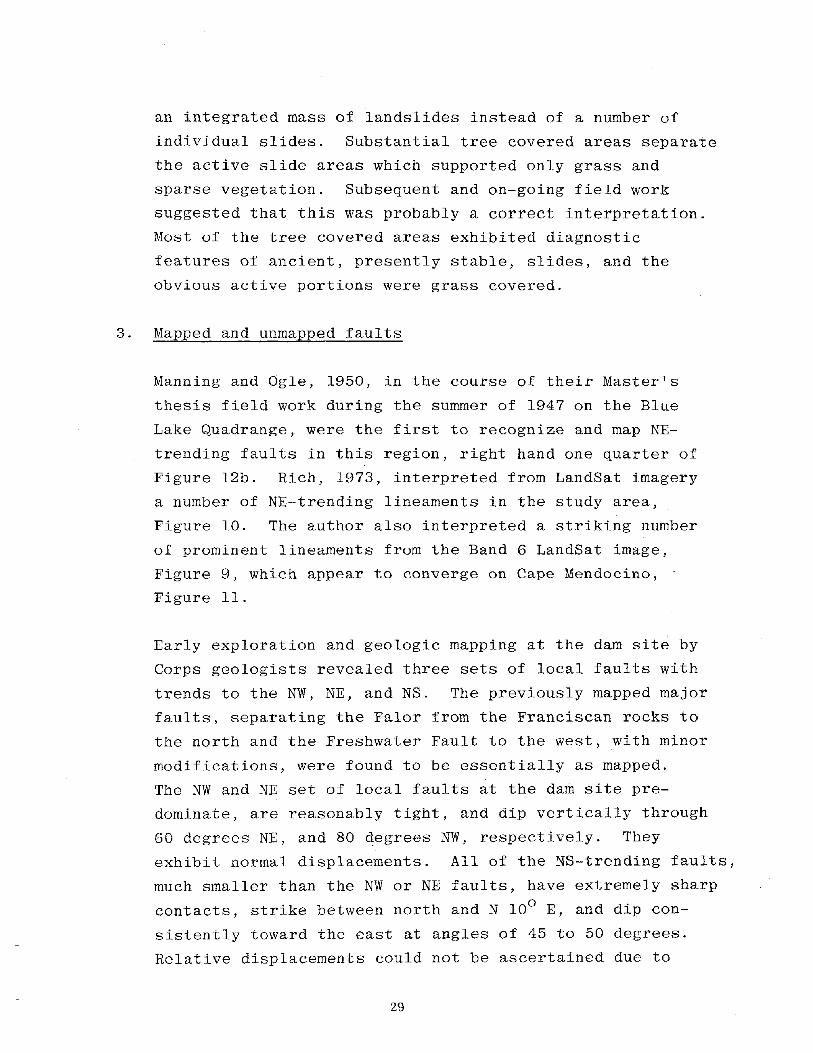
Figure l2b. Rich, 1973, interpreted from LandSat imagery
a number of NE-trending lineaments in the study area,
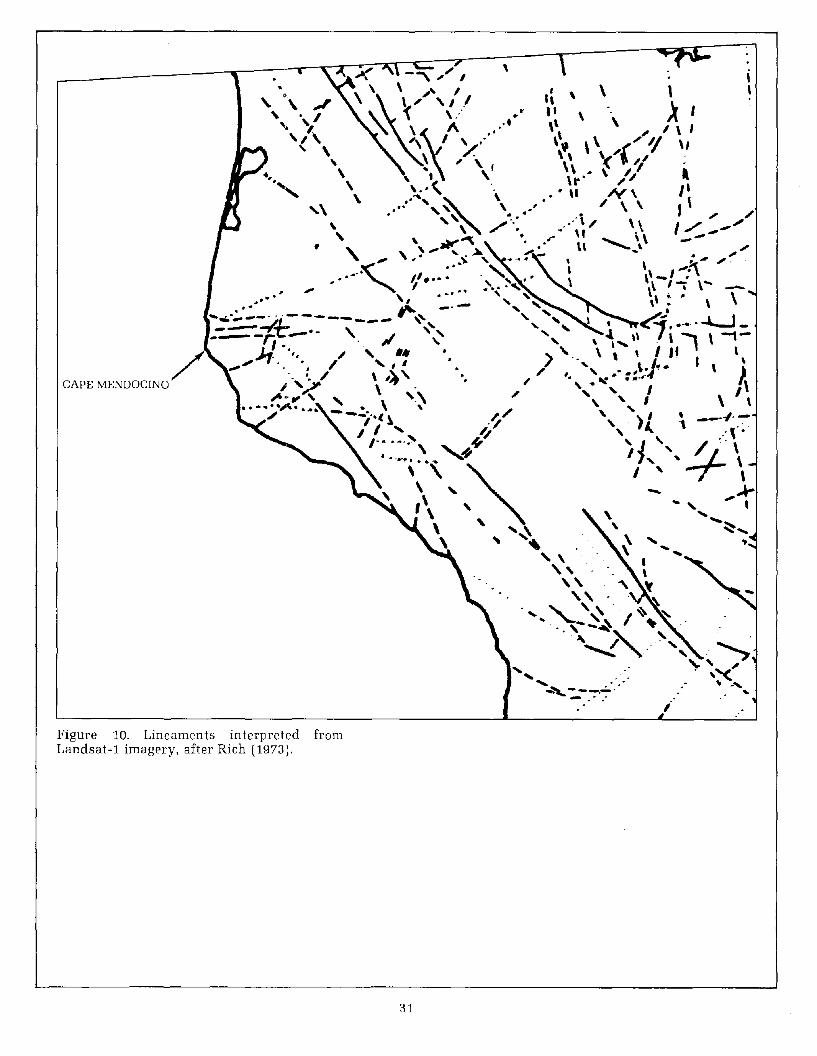
Figure 10. The author also interpreted a striking number
of prominent lineaments from the Band 6 LandSat image,
Figure 9, which appear to converge on Cape Mendocino,
Figure 11.
Early exploration and geologic mapping at the dam site by
Corps geologists revealed three sets of local faults with
trends to the NW, NE, and NS. The previously mapped major
faults, separating the Falor from the Franciscan rocks to
the north and the Freshwater Fault to the west, with minor
modifications, were found to be essentially as mapped.
The NW and NE set of local faults at the dam site pre
dominate, are reasonably tight, and dip vertically through
60 degrees NE, and 80 degrees NW, respectively. They
exhibit normal displacements. All of the NS-trending faults,
much smaller than the NW or NE faults, have extremely sharp
contacts, strike between north and N 100 E, and dip con
sistently toward the east at angles of 45 to 50 degrees.
Relative displacements could not be ascertained due to
29

overburden cover. Although the trends of the mapped local
faults clearly transect the narrow ridges in the project
area, they could not be conclusively traced from one side
to the other due to the lack of exposures and tree cover.
Interpretation of the subsequent imagery revealed a striking
number and persistent set of NE-trending lineaments in the
project area and the entire study area as well. This dis
covery could be of fundamental importance to both the
project and the understanding of the regional structural
geology, which will be discussed later. Viewing the project
area and entire study area in light of the information
interpreted from the imagery, substantially changed the
perspective of the regional structural geology. Faults
mapped during prior field work were reinvestigated, pro
minent lineaments examined for the possibility of faulting,
and the age relationship of NE vs. NW faulting evaluated.
The reader is again invited to closely study Figures 6, 7,
8, 9, 13 and 14 for a comparison of the various kinds of
imagery from the standpoint of identifying geologic struc
tural features. A capsulated summary is as follows: (1)
the high resolution of the conventional air photo shows
too much detail and has a limited field of view to ade
quately detect the trends of these features; (2) the small
scale of the U-2 multiband photos with their larger field
of view and choice of Bands provides sUbstantially more
information, but vegetation is a hindrance; (3) the LandSat
images are of too small a scale and low spatial resolution
to yield local definition, yet gross lineaments of consi
derable length are clearly evident by the integration of
topographic, drainage, and tonal features; and (4) it is
obvious that Radar provides far more definition on both
local and regional geologic structural features.
Lineaments of three kilometers or greater are plotted in
Figure 13b. Note that four principal trends are present
30
,,
i
\)(' -, ,'" ,. ",.. , '\ \" \" f \,~,~' '\(/ ...... \'. \\ A I
'- " ~,\ 1\ .,' \' \, , \ I
'\<\ '\~' '..,,' \'. \\ -*(' '/ "\ \" \ , \,.. ,, , '\ f \\ ~ ~
\ .. '., \ ." \ // ,'\ \ ~. r / I''\ ...<~ '\ .. '" IN ""\ ."", \.' , \ I '
\ . '\ " /".:' ~""\\, / \ \ I ./ ",-,,'"'\ ,,~ '". \ \ ---., \ -~ ~ :,.., \\ ............_, ", '\", ~ \ .'" ,,'~
•• ' " '\ I -1\ ." •• A'· /'.',.., ... ' '\_,-; \ .... _
, I •• ••,•. ~ " • _ \.. ,.a. ~ r ~..,,- ~ -' - ',,, \, \.........;...-...... ';--- ..__ -- .• -" " " ./.1 I I
_-:'::::-_~'t:'-'- , .~ \', ',," ~ < ~1' ..... --.....-... -- r; . ,r" " ~ ..... \\ . \ -, \ -',-/
J1. '" " .••• ) '\" \, ' '"_II' '.' " ,I' ... \. J,. I \ 1
, ~ '\ • ", f ',,' .' ~~ IiCAPE MENDOCINO \ " • " • \ .. ~, ••' I 1\
, '.\ ., ", I \ \- . \ .. '\ ,--'.•( ~ // \) I • __,,,,~
" -. I' '/ '\ I 1 ' .J"'/ ,\'" 0" •
1.:::~>\"'V~4- )/,:-'!j. \\ " -..r" , .. '\ .... ,
\ '-\ '\" \ ~ .....\ ,,,~ " ~
" '
"'\'\ ~
" ~, "'" '\\' ~" ~_ ' ... I .... ~ .. ',,\ _~ T
.~ "" "~ ,.", ",.'" ,. ,'<
~ -"...
Figure 10. Lineaments interpreted fromLandsat-l imagery, after Rich (1973).
31
/CAPE MENDOCINO
Figure 11. Converging trend of majorlineaments in the Cape Mendocino area.Complementary lineament sets purposelyomitted.
//
//
32
\.
"'\\
"\'\
"Scale 1: 1,000,000
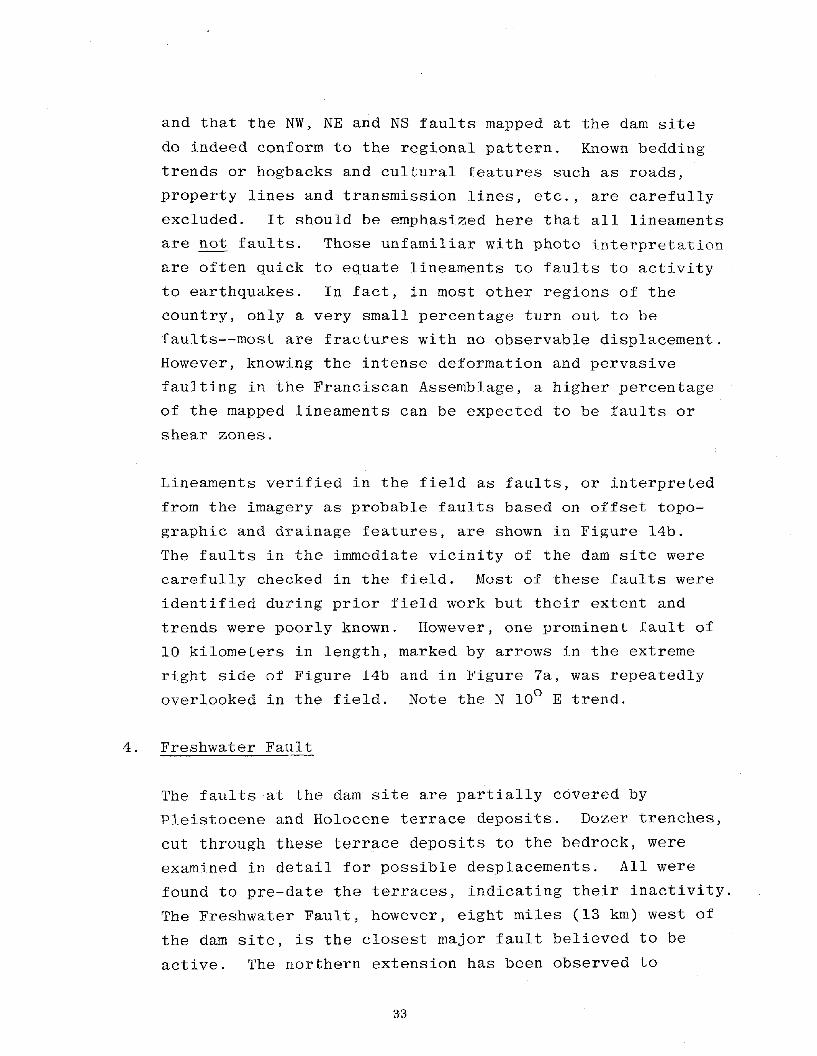
and that the NW, NE and NS faults mapped at the dam site
do indeed conform to the regional pattern. Known bedding
trends or hogbacks and cultural features such as roads,
property lines and transmission lines, etc., are carefully
excluded. It should be emphasized here that all lineaments
are not faults. Those unfamiliar with photo interpretation
are often qUick to equate lineaments to faults to activity
to earthquakes. In fact, in most other regions of the
country, only a very small percentage turn out to be
faults--most are fractures with no observable displacement.
However, knowing the intense deformation and pervasive
faulting in the Franciscan Assemblage, a higher percentage
of the mapped lineaments can be expected to be faults or
shear zones.
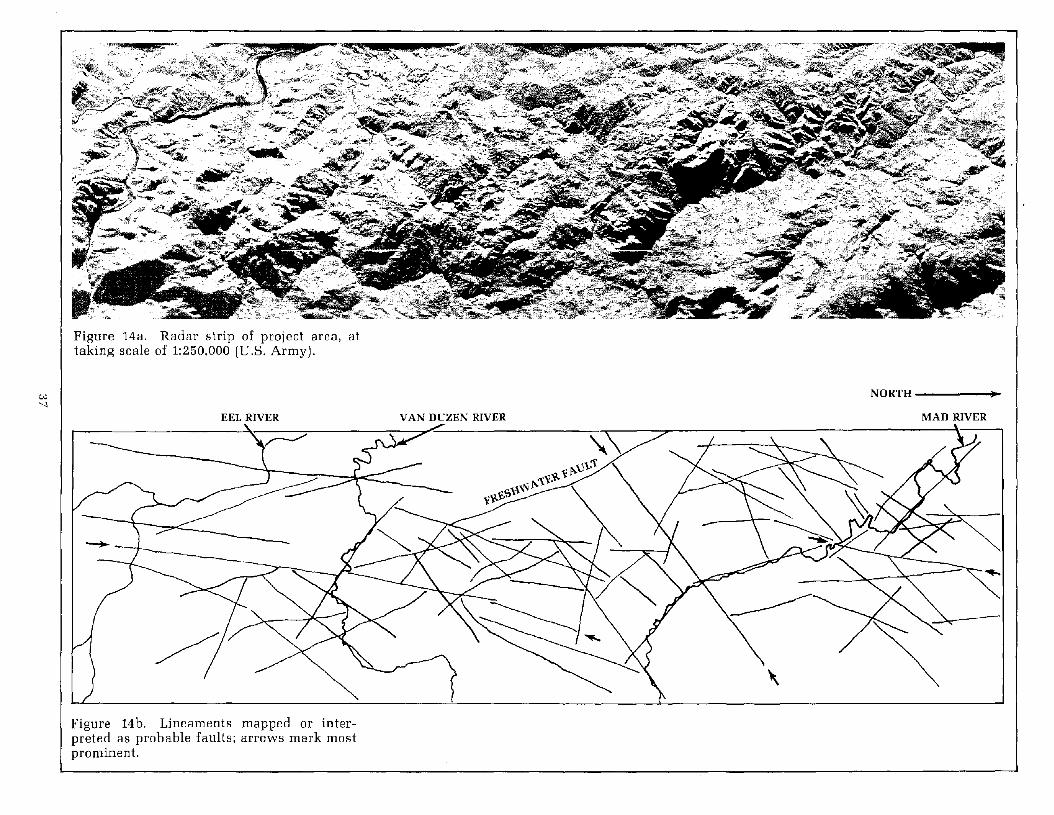
Lineaments verified in the field as faults, or interpreted
from the imagery as probable faults based on offset topo
graphic and drainage features, are shown in Figure l4b.
The faults in the immediate vicinity of the dam site were
carefully checked in the field. Most of these faults were
identified during prior field work but their extent and
trends were poorly known. However, one prominent fault of
10 kilometers in length, marked by arrows in the extreme
right side of Figure 14b and in Figure 7a, was repeatedly
overlooked in the field. Note the N 100 E trend.
4. Freshwater Fault
The faults at the dam site are partially covered by
Pleistocene and Holocene terrace deposits. Dozer trenches,
cut through these terrace deposits to the bedrock, were
examined in detail for possible desplacements. All were
found to pre-date the terraces, indicating their inactivity.
The Freshwater Fault, however, eight miles (13 km) west of
the dam site, is the closest major fault believed to be
active. The northern extension has been observed to
33
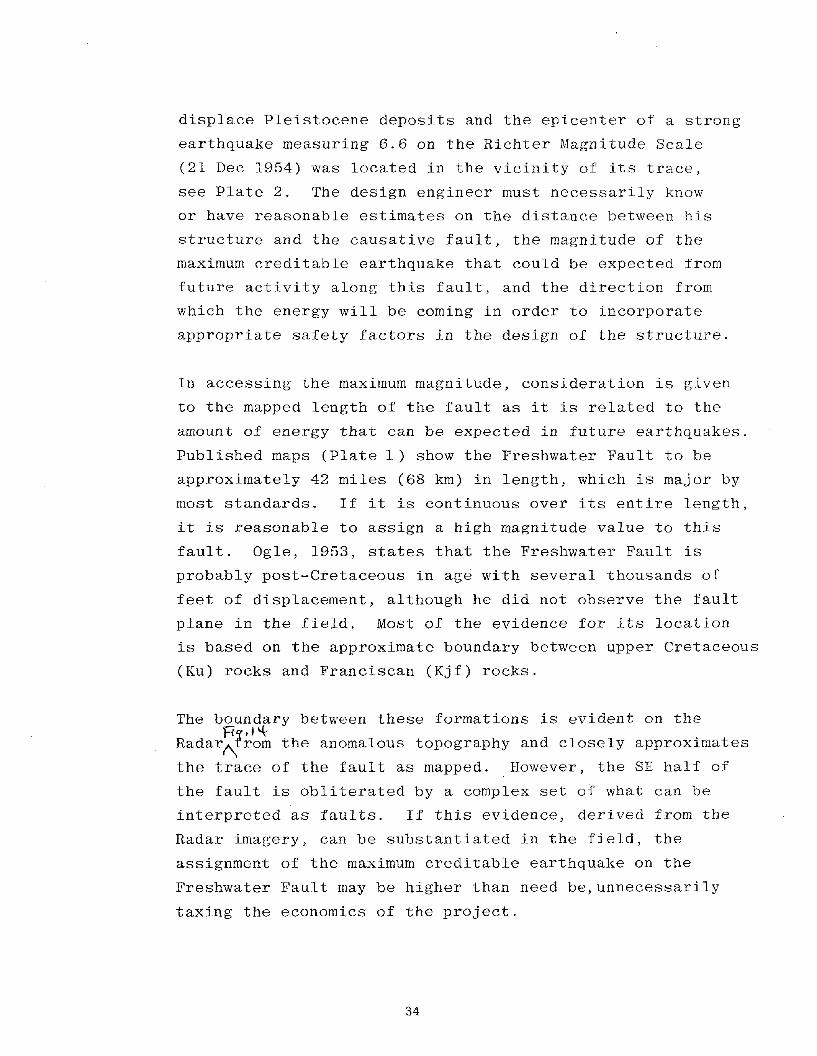
displace Pleistocene deposits and the epicenter of a strong
earthquake measuring 6.6 on the Richter Magnitude Scale
(21 Dec 1954) was located in the vicinity of its trace,
see Plate 2. The design engineer must necessarily know
or have reasonable estimates on the distance between his
structure and the causative fault, the magnitude of the
maximum creditable earthquake that could be expected from
future activity along this fault, and the direction from
which the energy will be coming in order to incorporate
appropriate safety factors in the design of the structure.
In accessing the maximum magnitude, consideration is given
to the mapped length of the fault as it is related to the
amount of energy that can be expected in future earthquakes.
Published maps (Plate 1) show the Freshwater Fault to be
approximately 42 miles (68 km) in length, which is major by
most standards. If it is continuous over its entire length,
it is reasonable to assign a high magnitude value to this
fault. Ogle, 1953, states that the Freshwater Fault is
probably post-Cretaceous in age with several thousands of
feet of displacement, although he did not observe the fault
plane in the field. Most of the evidence for its location
is based on the approximate boundary between upper Cretaceous
(Ku) rocks and Franciscan (Kjf) rocks.
The boundary between these formations is evident on theR ,1,*
Radar~from the anomalous topography and closely approximates
the trace of the fault as mapped. However, the SE half of
the fault is obliterated by a complex set of what can be
interpreted as faults. If this evidence, derived from the
Radar imagery, can be substantiated in the field, the
assignment of the maximum creditable earthquake on the
Freshwater Fault may be higher than need be, unnecessarily
taxing the economics of the project.
34
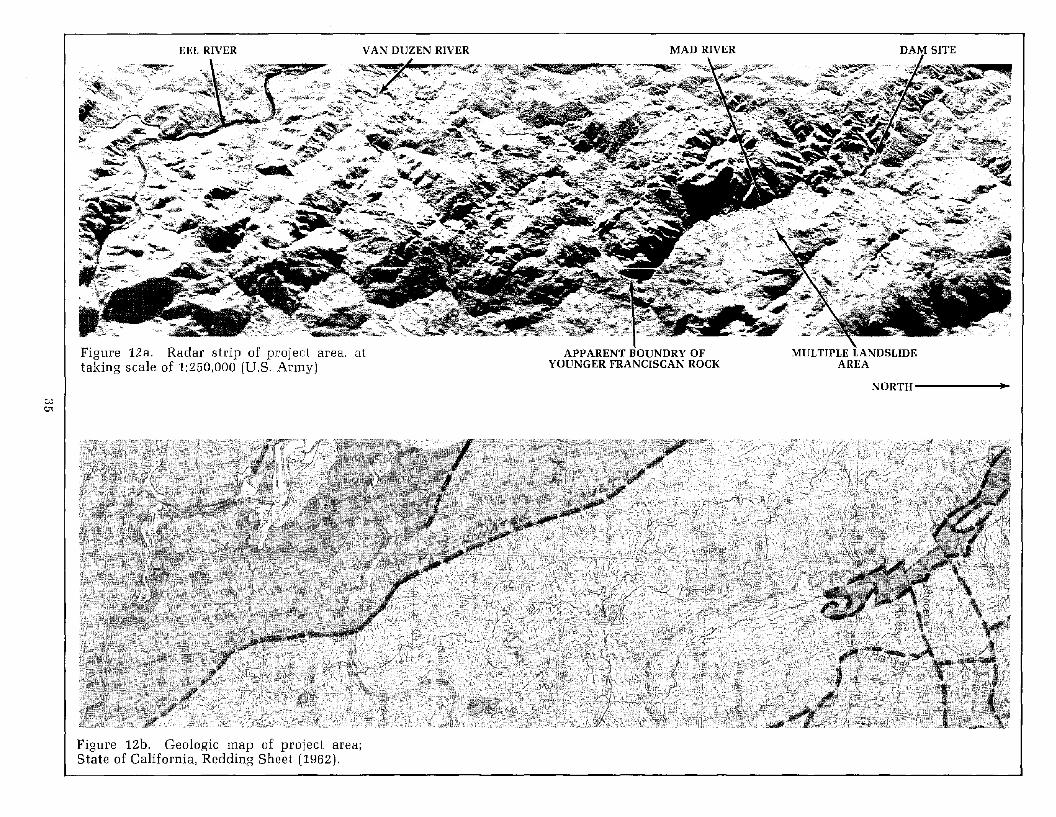
EEL RIVER VAN DUZEN RIVER MAD RIVER DAM SITE
WQ1
Figure 12a. Radar strip of project area, attaking scale of 1:250,000 (U.S. Army)
APPARENT BOUNDRY OFYOUNGER FRANCISCAN ROCK
MULTIPLE LANDSLIDEAREA
NORTH ..
Figure 12b. Geologic map of project area;State of California, Redding Sheet (1962).
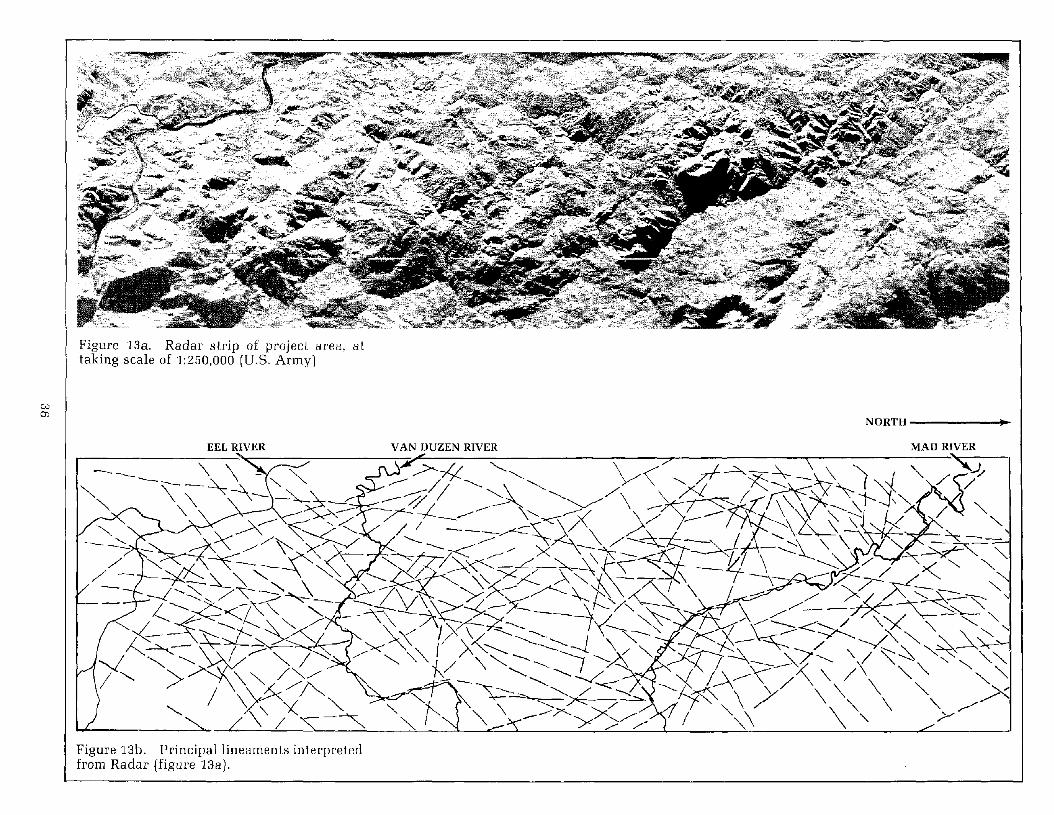
wQ)
Figure 13a. Radar strip of project area, attaking scale of 1:250,000 (U.S. Army)
NORTH •
EEL RIVER
Figure 13b. Principal lineaments interpretedfrom Radar (figure 13a).
MAD RIVER
W'1
Figure 14a. Radar strip of project area, attaking scale of 1:250,000 (U.S. Army).
NORTH •
EEL RIVER
Figure 14b. Lineaments mapped or interpreted as probable faults; arrows mark mostprominent.
V AN DUZEN RIVER MAD RIVER
.....
~
D. Regional lineament pattern
In the process of determining the regional lineament
pattern in the study area, the author interpreted U-2
photographs, Radar, and a number of different LandSat
images. As previously mentioned, the near infrared region
was found to provide the best structural detail. In spite
of the repetative coverage by the satellite, a surprisingly
few frames were cloud free. It was also apparent that the
winter scenes, having the lowest sun elevation, provided
more structural information. However, due to the small
scale and comparatively low resolution of LandSat images,
lineaments of less than about eight miles (13 km) in length
were questionable, whereas lineaments of 30 or more miles
(48 km) were readily apparent due to the gross integration
of aligned ridges and drainage courses. Although some of
these are obvious structural features, caution must be
exercised, because upon closer inspection of larger scale
imagery there is no apparent reason or suggestive evidence
of a structural discontinuity. Ironically, the excellent
quality and high resolution of the U-2 photographs por
trayed too much detail. Tree cover was particularly
distracting. In contrast, lineaments portrayed on Radar,
as has been demonstrated, are clearly evident and in better
detail.
Plate 3 is a Radar mosaic constructed from 12 north-south
strips of 1:250,000 scale imagery. A constant aircraft
altitude of 16,500 feet m.s.l. (5 km) was maintained and
the look direction is to the east. Side lap between strips
averaged 55 percent. The mosaic herein is a sixth
generation print of about 1.9X reduction. Lineaments were
interpreted from positive transparancies of individual
Radar strips and the mosaic at the original scale. Since
the primary objective was to determine the regional struc
tural fabric, only lineaments of five kilometers or greater
38
in length were mapped. Cultural features and known bedding
trends or hogbacks were carefully excluded. ~oordinates of
the end points of each lineament are determined on the
digitizer and put on magnetic tape for computer plotting.
To avoid erroneous azimuths on those lineaments that have
curved traces, they were broken into straight line segments.
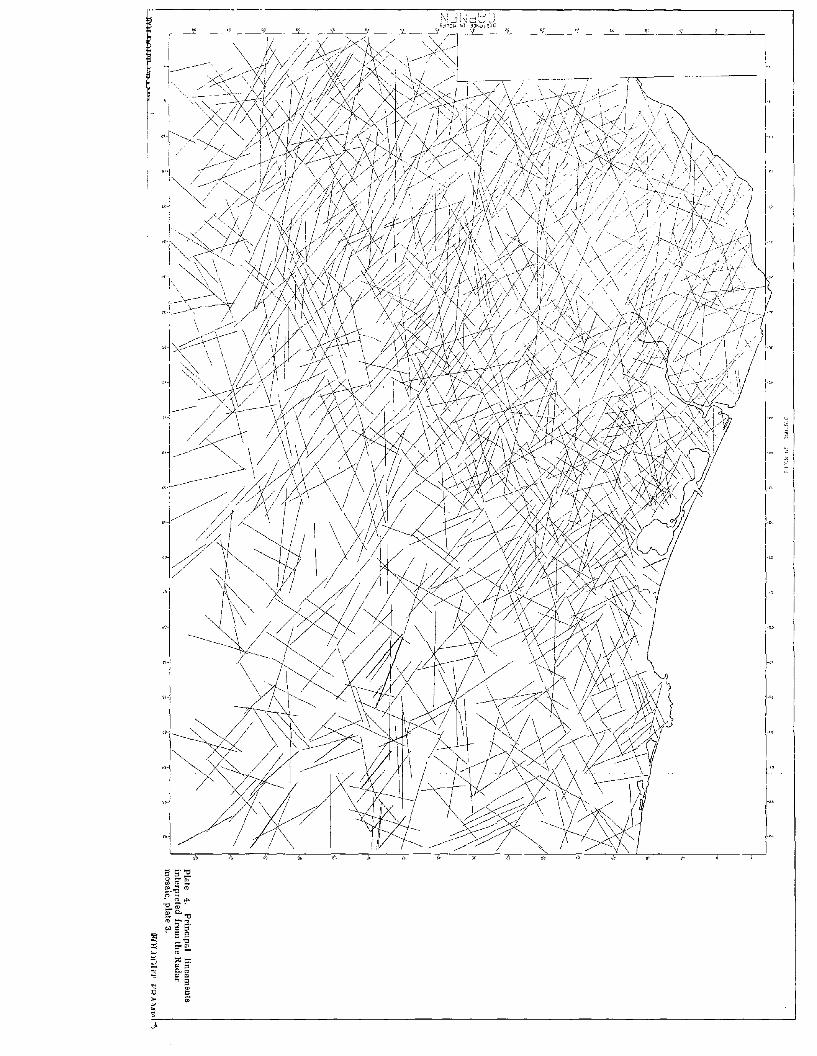
Plate 4 is a reduced computer plot of the resulting linea
ments. The study area includes 1242 lineaments of 5 to 45
kilometers in length. Note the contrasting lineament
density between the northern Coast Ranges and Klamath
Mountains provinces.
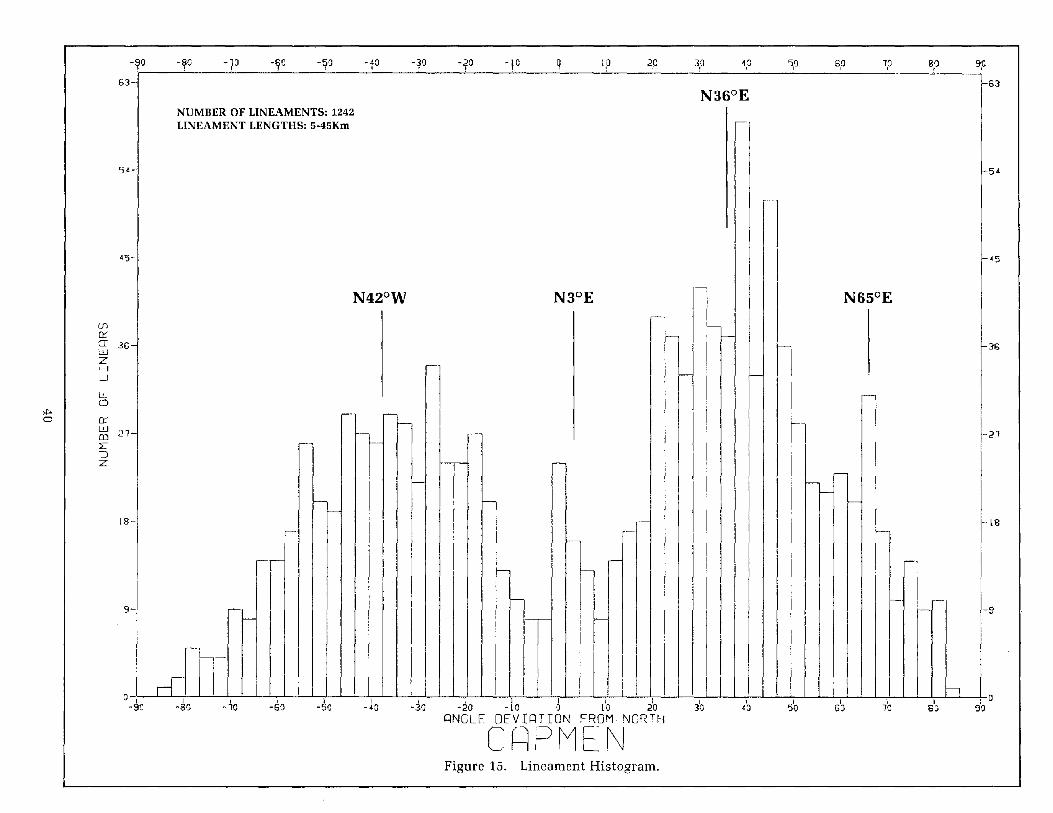
Reducing this information to a useful form in which mean
ingful evaluations can be made is accomplished by construc
ting rose diagrams or histograms. Histograms are parti
cularly useful for plotting lineaments because the unit cell
(azimuth interval) can be readily varied to refine the data.
The histogram plot of the lineaments in the study area is
shown in Figure 15. Azimuths in degrees occur along the
bottom (north is 0, west is -90, and east is 90) and-the
number of lineaments in each azimuth cell is recorded along
the right and left. A 3-degree azimuth cell is shown here.
The bisector of the various groupings is called the "point
of central tendency" which represents the average trend for
that group of lineaments. Here they are: N 420 W, N 30 E,o 0 0N 36 E, and N 65 E. They form two sets of N 42 Wando 00. 0N 36 E, and N 3 E and N 65 E WhlCh are separated by 78
and 62 0, respectively. In other areas where the rocks have
not undergone such severe deformation or that are under
lain by basement rocks, these peaks are substantially more
well defined.
The surprising result of this analysis--or not so surprising
considering the complex compressive stresses that have
affected this area--is that 59 percent of the lineaments are
in the northeast quadrant and most prominent in the N 360
E
group. The amount of east-west crustal shortening in the
39
-~o -~o -10, -~o -90 -fa -30I
-201
-\0 q 1.0 2,0 3,0 4.G 5,0 6,0 1,0 80I
9,0
45
l8
9
54
21
36
63
\- 090
,8'0
I106'05'0
I40
I30
, I I I , I-30 -20 -10 0 10 20
QNCLE DEVlqTION FROM NCRTH
CHPMENI
- 40I
-50I
-60,
-10I
-80
-N36°E
NUMBER OF LINEAMENTS: 1242LINEAMENT LENGTHS: 5-45Km r-
-
-
-
r-
N42°W N3°E N65°Er-
r-I- I--
- I--
r-r- 1-
-
r- -- r-
- r- r- -- '--
r-r- r--
r- I--
I r-- r- I---
r- -~ ,.-' -
r-
-- r- -r- r-
I-- - -- '--' r- -
r- ,-r- r-
Ir~rl h
l8-
a ,-90
9-
4")-
54
21-
36-
63
())(Y.
aLuzH-1
li.0
*" I (1':awmL::lZ
Figure 15. Lineament Histogram.
northern Coast Ranges with associated northwest faulting
and, more recently, the interaction of the previously
mentioned triple-junction of the lithospheric plates at
Cape Mendocino, logically requires a conjugate set of
shears or fractures. Secondly, the lineament trends
closely approximated the trends of local faults mapped in
the project area.
VIII. CONCLUSIONS
The purpose of this study is to assist engineering geologists and
engineers in determining the applicability of airborne remote
sensing systems in the detection and identification of geological
features that may affect the design of the Butler Valley Dam and
Blue Lake Project. Primary objectives are:
(1) To refine the location of known regional faults and possibly
detect previously unknown faUlts;
(2) To determine the presence or absence of a regional fault and
fracture pattern that may be related to that found locally in the
vicinity of the project;
(3) To assist in defining landslides existing along the proposed
relocated road; and
(4) To evaluate the applicability of individual sensors for future
use by other engineers and geologists.
These objectives were satisfactorily achieved, exceeding all
expectations. The information obtained from the remote sensor
imagery added materially to and improved significantly upon existing
knowledge of the geology in the project area as well as the entire
41
study area. Their use on other engineering projects should be
equally rewarding.
Remote sensing methods in themselves must not be considered as a
final, definitive answer to geological exploration and related
problems. Groundtruth investigations of the interpretive results
are imperative, particularly in engineering geological applica
tions. However, use of appropriate sensor systems and proper
interpretation of the imagery reveal important geological features
that may not be identified in any other way. Secondly, prudent
use of remote sensing methods can be a significant economic advan
tage. Knowing where to concentrate groundtruth investigations in
advance can save several man-years of field work and/or exploration
dollars.
Airborne remote sensor coverage in this study is unusually complete;
they include (1) multiple scale metric, mUltiband and infrared
photography, (2) thermal infrared imagery, (3) side-looking air
borne radar imagery, and (4) LandSat-1 imagery. The application,
interpretive results, and concluding remarks herein on the utility
of the various kinds of imagery pertain almost exclusively to the
detection of geologic structural features in a tree-covered environ
ment. As expected, there is no one sensor system that will provide
all of the answers. No such all-encompassing system currently
exists or is likely to be developed. Indeed, in the interpretation
process, imagery from all of the sensor systems complemented each
other nicely.
Relative to the stated objectives, Radar revealed substantially
more regional and local geologic structural detail than any of the
other systems. Radar's ability to perceive minute topographic and
geologic features lies primarily in its unique format which tends
to supress vegetative detail, and its low oblique-illumination
angle which accentuates these features. Additionally, the small
scale synoptic view of Radar imagery allows the investigator to
42
recognize discontinuous or intermittent fault traces for what they
really are. On large-scale imagery, these features are often
misinterpreted or overlooked entirely.
In applying remote sensing methods on future engineering projects,
it is doubtful that budgetary limitations would allow the luxury
of acquiring all of the above kinds of imagery. In fact, all are
not required. Because of the amount of geological detail required
in engineering geological applications, the Radar-air photo combi
nation was found to provide the most accurate and complete
information. Although most of the subject geologic structural
features could not be recognized directly from air photos in this
study, they were used extensively to field check the existance and
location of features identified on Radar.
43
IX. SELECTED REFERENCES
Atwater, T., 1970, Implications of plate tectonics for the Cenozoictectonics of western North America: Geol. Soc. America Bull.,v. 80.
Bailey, E.H., Irwin, W.P., and Jones, D.L., 1964, Franciscan andrelated rocks, and their significance 'in the geology of westernCalifornia: California Division of Mines and Geology Bull. 183.
Bailey, E.H., Editor, 1966, Geology of northern California:California Division of Mines and Geology Bull. 190.
Blanchet, P.H., 1957, Development of fracture analysis as exploration method: AAPG Bull., v. 41.
Bolt, B.A., Lomnitz, C., and McEvilly, T.V., 1968, Seismologicalevidence on the tectonics of central northern California andMendocino Escarpment: Bull. Seis. Soc. America, v. 58.
Crowell, J.C., and Walker, W.R., 1962, Anorthosite and relatedrocks along the San Andreas fault, southern California:California Univ. Pubs. Geol. Sei., v. 40.
Curray, J.R., and Nason, R.D., 1967, San Andreas fault north-ofPoint Arena, California: Geol. Soc. America Bull. v. 78.
Dehlinger, P., Couch, R.W., and Gemperle, M., (1967), Gravity andstructure of eastern part of the Mendocino Escarpment: Jour.Geophys. Research, v. 72.
Dellwig, L.F., MacDonald, H.C., and Kirk, J.N., 1968, Potentialof radar in geological exploration, Proc. 5th Sym. on RemoteSensing of Environment: Univ. of Michigan.
Ernst, W.G., 1970, Tectonic contact between the Franciscan melangeand the Great Valley sequence, crustal expression of a lateMesozoic Benioff zone: Jour. Geophys. Research, v. 75.
Hill, M.C., and Dibblee, T.W., Jr., 1953, San Andreas, Garlock,and Big Pine faults, California--a study of the character,history, and tectonic significance of their displacements:Geol. Soc. America Bull., v. 64.
'44
Hobbs, W.H., 1911, Repeating patterns in the relief and in thestructure of the land: Geol. Soc. America Bull., v. 22.
Hodgson, R.A., 1961, Regional study of jointing in Comb RidgeNavajo Mountain area, Arizona and Utah: AAPG Bull., v. 45.
Hodgson, R.A. 1961, Reconnaissance of jointing in Bright Angelarea, Grand Canyon, Arizona: AAPG Bull., v. 45.
Irwin, W.P., 1960, Geologic reconnaissance of the northern CoastRanges and Klamath Mountains, California: California Divisionof Mines and Geology Bull. 179.
Khain, V.E. ,and Murator, M.V., 1969, Crustal movements andtectonic structures of continents, in P.J. Hart, ed., Theearth's crust and upper mantle: Am. Geophy. Union, Wash., D.C.
Lattman, L.H., and Nickelsen, R.P., 1958, Photogeologic fracturetrace mapping in Appalachian Plateau: AAPG Bull., v. 42.
Manning, G.A., and Ogle, B.A., 1950, The geology of the Blue Lakequadrangle, California: California Division of Mines andGeology Bull. 148.
Moore, G.W., 1970, Sea-Floor spreading at the junction betweenGorda Rise and Mendocino Ridge: Geol. Soc. America Bull. v. 81.
Ogle, B.A., 1953, Geology of Eel River Valley area, HumboldtCounty, California: California Division of Mines and GeologyBull. 164.
Podwysocki, M.H., 1974, An analysis of fracture trace patterns inareas of flat-lying sedimentary rocks for the detection ofburied geologic structure: NASA-Goddard Space Flight CenterDoc. X-923-74-200.
Reeves, R.G., 1969, Structural geologic interpretations from radarimagery: Geol. Soc. America Bull., v. 80.
45
Rich, E.I., 1973, Relation of ERTS-l detected geologic structureto known economic ore deposits: Stanford University,unpublished.
Rumsey, I.A.P., 1971, Relationship of fractures in unconsolidatedsuperficial deposits to those in the underlying bedrock:Modern Geol., v. 3.
Seeber, L., Barazangi, M., and Nowroozi, A., 1970, Microearthquateseismicity and tectonics of coastal northern California: Bull.Seis. Soc. America, v. 60.
Silver, E.A., Jan 1971, Transitional tectonics and late Cenozoicstructure of the continental margin off northernmost California:Geol. Soc. America Bull., v. 82.
Silver, E.A., Nov. 1971, Tectonics of the Mendocino triple junction:Geol. Soc. America BUll., v. 82.
Tobin, D.G., and Sykes, L.R., 1968, Seismicity and tectonics of thenortheast Pacific Ocean: Jour. Geophys. Research, v. 73.
46
k,
'PR1~CP'DING PAGE BLANK NOT mJOlD
•"'-"--QTh'F~ --Plate 1. Geologic map of Cape Mendocinoarea covering most of the study area; fromState of California, Redding Sheet (1962).
+-"-+-
EXPLANATION
~y '0 '~.'o _,_do'd'.•.,,,,,
B Alluvium
~ Pleistocene marine and marine terrace depos! ts
~ Pleistocene nonmarine
EJ Plio_Pleistocene nonmarine
El Upper Pliocene marine
~ Tertiary marine
~ Undivided Cretaceous marine
EJ Upper Cretaceous marine
~ Jurassic_Cretaceous Franciscan Assemblage
o Upper Jurassic marine
o Mesozoic granitic rocks
B Mesozoic ultrabaslc intrusive rocks
c::J Prc-Cretaceous metamorphic rocks
o Pre-Cretaceous metasedimentary rocks
--_...FAULTS--dashed where approximate, dot ted where concealed.
ORIGINAL PAGE ISOF POOR QUALITY

16
GRAPHIC SCALE IN MILES
NOTE:
This plate shows only those epicenters ofearthquakes having a Richter Magnitude of 4.0or greater. These data are from the seismograph
U~~~~~?t~poafg:;hf~~Ji~.eB~~f~l~~~T~~O$;rr~~C~jrecord is 1915 thru 1972. The record between1915 and 1930 shows only those events withassigned magnitudes of 6.0 or greater. All
;h~c~~tf~; flee~~~?dJ~~~~~hr~ol~~lreateraTe
Plate 2. Earthquake epicenters
EXPLAN~
• Mag 4.0 - 4.9
• Mag. 5.0 - 5.9
• Mag . 6.0 - 6 9
""0 Mog . 7.0 - 7.9
// FAU L T
I (A."p.-oxirr;7!1J locolion)
122 Q
-l'"
•
•
~fjLAC~ BlIT1EOAM
:~"',J"
'°0
~STONY GORGE GAM
~
-'t';
124"
s~\
.t!!,:"
•
;Os ~;it.fs'
•
125 0
-
¥
1°0'
125 0
•
•'J~~••
./ - / ,.". I!iA .~ .... 1/1 •• / • Itr '-\ \.-~ ;; .I. •
'~JU" Y IS
'" 6,~
m••••
••
/"'§
o~I JAN 22
.. ~,3
•
•-
•
•
26JAH<l
><6.0
• •
•
,,!t.
.,. .J.!I.1~I OE C I~
'-;:~"
126·
•
"'S~'"
39'
•
-.19 f ~O 4'
• "'60" oe'~;,
- \'" - ~-• & -' - . . ...- ..... -,." ."W_. __ ""_• - --- ,.- -Iii- -11 •' -'---- ESc"" " " E'. •• _ __-" D A • • • '"n.
0, _. _. "" _ •
'" .. -..'~
.. 40·
••-
•
•
•
•
-
126 Q
• -/ .,. i-
-/ ---2~".RW
"&.2.
-
-
•

;tr
0 oU>...,:>...,c...,'",,,ist"'
" '"U>:i::::':!'" "
~" -
"0..'"
Si) ~-
0
" '"5"
'"00 N
9 ::<:l
Oz 0n"
§a~,,0..
~
::;:,E;
N0'
g~ '".., S
I =.~
~§?' F'~
~tij N0
n"
~
'g
'"