Embed Size (px)
Citation preview
This article appeared in a journal published by Elsevier. The attachedcopy is furnished to the author for internal non-commercial researchand education use, including for instruction at the authors institution
and sharing with colleagues.
Other uses, including reproduction and distribution, or selling orlicensing copies, or posting to personal, institutional or third party
websites are prohibited.
In most cases authors are permitted to post their version of thearticle (e.g. in Word or Tex form) to their personal website orinstitutional repository. Authors requiring further information
regarding Elsevier’s archiving and manuscript policies areencouraged to visit:
http://www.elsevier.com/copyright
Author's personal copy
Available online at www.sciencedirect.com
Europ. J. Agronomy 28 (2008) 526–540
Agrophysiological characterisation and parametrisation ofAndean tubers: Potato (Solanum sp.), oca (Oxalis tuberosa),
isano (Tropaeolum tuberosum) and papalisa(Ullucus tuberosus)
Bruno Condori a,1, Pablo Mamani a,1, Ruben Botello a,1, Fernando Patino a,1,Andre Devaux b,2, Jean Francois Ledent c,∗
a Fundacion Para la Promocion e Investigacion de Productos Andinos, Casilla 1079, La Paz, Boliviab Centro Internacional de la Papa, P.O. Box 1558, Lima 12, Peru
c Unite d’Ecophysiologie et d’Amelioration Vegetale, Universite Catholique de Louvain,Croix du Sud, 2 bte 11, 1348 Louvain-la-Neuve, Belgium
Received 28 June 2007; received in revised form 8 December 2007; accepted 10 December 2007
Abstract
Bolivia is part of the eight most important centres of biodiversity and domestication of plants in the world, including a broad diversity ofAndean grains, roots and tubers. A study was implemented to obtain the quantitative information to develop and validate, a simple growth potentialmodel of Andean tubers in production areas located above 3000 m altitude, and to analyze the difference between species in growth attributesand the resulting tuber production. Three potato species and sub-species (Solanum tuberosum ssp. andigenum and ssp. tuberosum, and Solanumjuzepczukii) as well as Oca (Oxalis tuberosa), Isano (Tropaeolum tuberosum) and Papalisa (Ullucus tuberosus) were studied. Trials were conductedunder normal field conditions prevailing in Bolivia but with the best cropping techniques available locally to obtain optimal growing conditions.Data on dry weight (of leaves, stems, tubers and roots) and leaf area were taken at several dates in five trials conducted between 1993 and 2003.The percentage of ground cover was also measured. Beta functions were fitted to data of dry weight and leaf area to establish growth curves.The potato groups have a smaller cycle duration than other Andean tubers. The Crop Growth Analysis indicated three important characteristicsdifferentiating Andean tubers: the S. juzepczukii potato has a high Relative Growth Rate (RGR) and a higher leaf mass ratio but a smaller tuberyield, due to a smaller harvest index (HI) and a very low Net Assimilation Rate (NAR). S. tuberosum ssp. tuberosum potatoes have smaller LeafArea Index (LAI), and RGR than juzepczukii, but their NAR and HI are higher. S. tuberosum potatoes are quite productive for the size of theirLAI. The Tropaeolum tuberosum or Isano has a great capacity of Ground Cover (GC) or a great LAI that is not translated into a greater tubersyield. It has low RGR, NAR and HI compared to all the other species studied. The crop growth was interpreted in Light Use Efficiency (LUE) andevolution of light interception through a linear model. The LUE of potato group is more elevated than the LUE of the other Andean tubers. Withineach group there is no statistical difference for the LUE value. The relationship of LAI with GC or fraction of light interception was determinedwith both linear and exponential relations. The low slope value for the relationship between LAI and GC characterises all Andean tubers studiedcompared to results reported for potato under other latitudes.© 2007 Elsevier B.V. All rights reserved.
Keywords: Native potato; Andean tuber; Growth analysis; Light use efficiency
∗ Corresponding author. Tel.: +32 10 47 34 58; fax: +32 10 47 20 21.E-mail addresses: [email protected] (B. Condori),
[email protected] (P. Mamani), [email protected] (R. Botello),[email protected] (F. Patino), [email protected] (A. Devaux),[email protected] (J.F. Ledent).
1 Tel.: +591 22 141209.2 Tel.: +511 349 6017.
1. Introduction
Bolivia is part of the eight most important centres of biodiver-sity and domestication of plants in the world, including a broaddiversity of Andean grains, roots and tubers. Amongst the tubers,the most widespread through the Andes since pre-Hispanic timesare oca (Oxalis tuberosa Molina), isano (Tropaeolum tubero-sum Ruiz and Pavon), papalisa (Ullucus tuberosus Caldas) and
1161-0301/$ – see front matter © 2007 Elsevier B.V. All rights reserved.doi:10.1016/j.eja.2007.12.002
Author's personal copy
B. Condori et al. / Europ. J. Agronomy 28 (2008) 526–540 527
potato (Solanum ssp. L.) (Contreras, 2001; Rea, 1998). Of thesetubers, potato is the most known and grown over the world,followed by oca, even though oca is produced only in Mex-ico and New Zealand (CIED, 2002) outside the Andes. Theother tubers are specific to the Andean highlands. Superficiesof Andean tubers other than potatoes are not known with preci-sion but in the regions where potatoes are in rotation with otherAndean tubers the superficies should be approximately equal(potatoes and other Andean tubers).
The composition and the number of varieties which consti-tute the Andean tubers germplasm is very heterogeneous andthe quantities of seed material in collections is limited hencea risk of loss of biodiversity. The banks of germplasm kept inToralapa (Bolivia) contain 1200 accesions of potato, 500 de oca,200 de papalisa, and 80 de isano (Garcia and Cadima, 2003).Except for isano which is mainly used for feeding pigs Andeantubers are grown chiefly for human consumption under differ-ent forms (fresh, boiled, fried, oven cooked, stewed, as soups,meal obtained after dehydration, etc.). There is also some use asmedicinal plants.
Some studies on the nutritional value and rusticity of Andeantubers confirm them as alternatives to cover increasing demandsin human and animal food and in industry, however, thereis still little knowledge of the growth dynamics and poten-tial production characteristics of such tubers (CIED, 2002). Itis a known fact that Andean tubers played a multiplicity ofroles in human activities since pre-Hispanic times; however, atpresent such tubers are almost forgotten and therefore under-used, with the exception of potato (NRC, 1989; Tapia, 1994;Rea, 1998).
Bolivia has a broad diversity of cultivated and wild potatoes,7 and 31 species, respectively, as noted by Ochoa (1990). But ofthe seven species cultivated, three can be cited as more impor-tant. In order of importance and market presence, the sub-specieSolanum tuberosum ssp. andigenum with the Waycha cultivarshould be cited as one of the variety most appreciated by theconsumers, both rural and urban. It is followed by Solanumjuzepczukii with the bitter cultivar Luki and Solanum tuberosumssp. tuberosum with the cultivars Alpha and Desiree (Irigoyen,2002). Due to its high concentration of glycoalkaloids, Luki hasa bitter taste when consumed fresh without processing (Ochoa,1990). For this reason it is processed into a frozen and dehy-drated product called chuno or tunta before consumption, usinga traditional processing method. One of its favourable attributesis that it can be grown in the highest areas (at elevations over3000 m) due to its tolerance to frost (Rea, 1992). Alpha is acultivar introduced from Europe, it is better adapted to milderareas, with the advantage of a shorter cycle, it becomes a winterproduction alternative in semi-tropical regions of Bolivia, eventhough its presence in the market is relatively recent and stillsmall (Irigoyen, 2002).
It is noteworthy that in Bolivia compared to other Andeancountries, the yield of tuber crops, potato included, is low inspite of the rusticity of the species and varieties used and eventhough they are genetic resources from this region (OEA, 1996).This could be due to several factors, such as the technological,socioeconomic and cultural factors. Another factor is the poor
knowledge about the growth and production processes of theAndean tubers (Tapia, 1994; Zeballos, 2006).
Most national statistics or authors mention potato as the tuberof reference and only in very specific occasions oca and papal-isa are mentioned. Official reports indicate that mean domesticyields of fresh tubers are about 6 t/ha for potato, 3 t/ha for oca and4 t/ha for papalisa (Montes de Oca, 1992; Tapia, 1994; Zeballos,1997, 2006; INE, 1999). No official reports on isano yields areavailable, though some studies indicate that isano yields canbe quite higher than potato yields (CIED, 2002). However, inother research reports, values higher than the national mean canbe found: Gonzales et al. (1997) indicate means of 25 t/ha oftubers for potato and oca, and 30 t/ha for isano in farmers plotsof the Candelaria area, a agrobiodiversity zone in Cochabamba.Other researchers, such as Iriarte (2003, personal communica-tion), indicate that in communities close to the area surroundingLake Titicaca yields of 27–31 t/ha of oca, and 38–41 t/ha of isanocan be found. Quispe et al. (1997) reports yields of 30 t/ha ofpotato, 22 t/ha of oca and 33 t/ha of isano. Reports on isanoyields are noteworthy, since yields ranging from 9 to 74 t/hacan be found (Grau et al., 2003). Research reports on papalisaindicated that its yield could reach 33 t/ha (Garcia and Cadima,2003).
This gap between maximum yields and average yields showsthe necessity to consolidate a clear and accurate knowledgebased on the characterisation of Andean tubers, describingthe main agrophysiological indices to determine their growthunder average and optimal conditions, and thus understand theirfunctioning. This could serve to establish criteria of geneticimprovement for the development of cultivars, criteria of cropmanagement and parameters to be used in simulation systemsfor improving the crop management and thus achieving betteryields.
One way in which development and growth dynamics in plantspecies can be studied and explained is through Crop GrowthAnalysis, an explanatory, holistic and comprehensive approachto interpret plant form and function (Clawson et al., 1986; Hunt,1982; Hunt et al., 2002). Growth analysis techniques are basedon a description of the physiological performance of a species,considering that the accumulation of carbon is determined bythe amount of foliage and their daily photosynthetic efficiency.Some studies on the growth and production of Andean tubershave addressed specific aspects according to the objective ofeach study, such as phenology, fertilization, and hydroponics,both in Bolivia (Quispe et al., 1997; Valdivia et al., 1998)and Peru (Valladolid et al., 1984; Gomez et al., 2001) usinggrowth analysis techniques. The above studies used differentmethodologies, such as “classic” growth analysis (Hunt, 2003)or “functional” analysis of growth according to Hunt (1979,1982) and Hunt et al. (2002), where polynomial equations arefitted to values of the coordinates of points measured throughtime to obtaine trend values. The coefficients of these equa-tions cannot be biologically explained; moreover, Poorter (1989)indicates that such growth curves may exhibit erratic behaviours.
A relatively recent alternative to plot growth curves is the Betafunction proposed by Yin et al. (2003). It is presented as one ofthe most versatile functions to describe growth curves and to
Author's personal copy
528 B. Condori et al. / Europ. J. Agronomy 28 (2008) 526–540
use for agronomic interpretation and characterisation purposes,because plotting of such curves requires three parameters clearlyexplainable and easily measurable in the field. This functionmakes an easier description and interpretation of a crop growthanalysis (CGA).
Considering the above, this study is intended to characteriseand analyze different Andean tubers through the comparisonof their agrophysiological attributes and their growth dynamicsunder their natural agroecological conditions. In another paperthe growth model for native potato species will be analyzed.
2. Materials and methods
2.1. Genetic material
For this study, three genotypes of potato, one of oca, one ofisano and one of papalisa were used. For potato, the species andsub-species studied were: S. juzepczukii (JUZ) with the bittercultivar Luki; Solanum tuberosum ssp. andigenum (AND) withthe cultivar Waycha; Solanum tuberosum ssp. tuberosum (TUB)with the cultivar Alpha. In oca or O. tuberosa (OXA) the cultivarPukanawi was used. In Isano or T. tuberosum (TRO) the cultivarAnaranjado was used. In papalisa or U. tuberosus (ULL) thecultivar Manzana was used; these potato, oca, isano and papalisacultivars are the most widespread amongst farmers of the studiedarea.
2.2. Trials
For the growth and development study of Andean tubersseveral trials were conducted in Toralapa, Candelaria and Pat-acamaya, in Bolivia (Table 1). The trials were conducted inexperimental stations (Toralapa and Patacamaya) and in farm-ers fields (Candelaria) but in all cases there was a cooperationbetween researchers and local farmers for the cultivation andcrop management. The crops were managed according to thebest local cropping techniques. Toralapa is located at an ele-vation of 3430 m, at 17◦30′ SL and 65◦40′ WL. The averagetemperature in this location is 11 ◦C, relative moisture 55%, andannual rainfall 500 mm. Candelaria is located at an elevation of3265 m, 17◦16′ SL and 65◦66′ WL. The average temperaturein this location is 11 ◦C, relative moisture is 80%, and rainfall
950 mm (CIDETI, 1994). Patacamaya is located at an elevationof 3800 m, at 17◦14′ SL and 67◦55′ WL. The average temper-ature in this zone is 11.2 ◦C, with relative moisture 50%, andrainfall 385 mm (Montes de Oca, 1992). The station of Pataca-maya closed in 2000 but it was still in activity at the time ofthese trials.
In these areas the potato is usually the first crop of the rota-tion system. In Patacamaya and Toralapa potatoes are plantedafter a rest period (fallow) of 2–3 years, but in Candelaria,because the cropping system is more intensive there is no fal-low period. In the three locations, the Andean tubers comealways as third or fourth crop in the rotation after potato, quinoa,and faba bean. During the trial implementation, cropping tech-niques included fertilization, weeding, ridging and preventivephytosanitary treatments to ensure plant health and obtain themaximum yield under these conditions.
Planting density was 47,600 plants per hectare, with distancesof 0.7 m between furrows and 0.30 m between plants. For fer-tilization, 80–160–0 to 80–160–60 kg/ha of N, P2O5 and K2Owere applied, based on soil requirements, and additional irriga-tion was also used as required and as available (e.g., additionalirrigation was performed in Patacamaya). The planting dateswere the same for the different Andean tubers but the harvestdate was established according to maturity and developmentcycle of the Andean tubers tested (Table 1).
Pests and diseases treatments against late blight (Phytoph-thora infestans (Mont. de Bary) were applied using Man-cozeb + metalaxil (Ridomil MZ) and Clorotalonil (Bravo 500),Andean weevil (Premnotrypes latithorax Pierce, Premnotrypessolaniperda Kuschel, and Rigopsidius tucumanus Heller) andmoth (Phthorimaea operculella Zeller, Symetrischema tango-lias Gyen, Paraschema detectendum Povolny) by syntheticcipermetrine-based pyrethroids (Karate) and clorpirifos (Lors-ban).
Experimental plots for each trial were arranged in completerandomised blocks with three or four repetitions, the surface areaof each experimental plot ranged from 21 to 29.4 m2 (Table 1).
2.3. Data collection
Daily measurements of maximum and minimum tempera-tures, global solar radiation and rainfall were recorded using
Table 1Description of the trials conducted to study the growth curves of Andean tubers
Trial Elevation(m)
Meantemperaturea (◦C)
Species studied Planting date Harvest date Cycle(days)
Number ofharvests
Plot × repetition Soil typeb
Toralapa 3430 11.4 TUB, AND, JUZc 22/10/1993 13/04/1994 174 6 29.4 m2 × 4 SLPatacamaya 3800 11.1 TUB, AND, JUZ 19/10/1998 20/04/1999 184 5 21.0 m2 × 4 SLToralapad 3430 11.5 OXA, TRO 18/10/1995 08/05/1996 204 9 26.3 m2 × 4 SLCandelaria 3265 11.0 OXA, TRO, ULL 16/10/1998 30/05/1999 227 5 24.0 m2 × 3 LCandelaria 3260 11.4 OXA, TRO, ULL 19/09/2003 27/04/2004 221 5 21.0 m2 × 3 SL
a Air temperature data are mean data from emergence to harvest.b SL, silty loam. L, loamy. SL, sandy loam.c Species and sub-species of potato: JUZ is Solanum juzepczukii; AND is Solanum tuberosum ssp. andigenum; TUB is Solanum tuberosum ssp. tuberosum. Other
Andean tubers: OXA is Oxalis tuberosa, TRO is Tropaeolum tuberosum and ULL is Ullucus tuberosus.d Part of the data of this trial were published by Quispe et al. (1997).
Author's personal copy
B. Condori et al. / Europ. J. Agronomy 28 (2008) 526–540 529
automatic or manual weather climate measurement equip-ment located on experimentation sites. Periodical sampling ofbiomass was performed five to nine times from emergenceto final harvest, according to the availability of plants to bedestroyed (Table 1). Harvests or samplings were determinedbased on four phenological macro-stages. Thus, the first harvestwas determined at the onset of foliage formation upon com-pletion of plant emergence; the second harvest was made atthe onset of tuberisation and flowering whereas the third oneoccurred at the maximum development of foliage and physio-logical maturity. The last harvest took place when plants had atleast half of their foliage in senescence and their tuber skin fullyset.
In each experimental unit and in each sampling, the fresh anddry weights of four plants fractioned in leaves (L), stems (S) andtubers (T) were measured. The sum of L plus S gives foliageweight (Sh). The sum of Sh plus T is the total biomass (W).Leaf Area Index (LAI) was measured using an area meter (LI-COR, model LI-3000A, Lincoln, USA). The LAI is the ratioof the foliar surface per unit of soil surface. Root (R) weightwas measured but not included in the total plant weight, due toits variability caused by the difficulty of separating roots fromthe soil. Root growth is only taken into account to calculate itsproportion in the total biomass. The ideal size of potato sam-ples has been reported to be of six to nine plants for studieson nitrogen concentration (Goffart et al., 2000), a coefficientof variation (CV) from 4 to 8% being obtained in that case. Inthis study, the plant samples were only used to determine the drymatter concentration. The ground cover (GC) of leaf canopy wasalso measured. This corresponds to the portion of soil surfacehidden by the canopy when seen from above. These readingswere made periodically, every 15 days, from emergence to ashort time before the harvest, using a mesh grid of 100 rectan-gles of 7 cm × 9 cm, obtained from the multiple of the distancebetween furrows and the distance between plants, respectively.The ground cover data was taken to estimate directly the cropcapacity to intercept light during the vegetative cycle (Haverkortet al., 1991).
2.4. Data analysis
2.4.1. Final yield of total biomass and tubersThe last harvests of each cropping cycle were used to cal-
culate the fresh tuber yields (FTY in t/ha). The dry tuber yield(DTY in kg/ha) was determined from the fresh yield using thepercentage of dry matter in tubers (DMT in %). The HarvestIndex (HI) was determined by the ratio of DTY to total drymatter (TDM in kg/ha).
2.4.2. Crop growth analysisIn Crop Growth Analysis, three main aspects will be pre-
sented: the accumulation of biomass in the different plant organs;the distribution of assimilates generated by each part of the plant(stems and leaves versus tubers); the estimates of the differentabsolute and relative rates and indices of the CGA itself. A sum-mary of the parameters and variables of this study is describedin Table 2.
Table 2Abreviations, list of variables and parameters used in the growth analysis
Abbreviation Description Units
A Leaf area m2/m2
AGR Absolute growth rate g/day, Eq. (3)CGA Crop growth analysis –Cm Maximum value of the absolute
growth rateg/m2, Eq. (2)
DMT Dry matter concentration in tubers %DTY Dry tuber yield kg/haFTY Fresh tuber yields t/haGC Ground cover FractionHI Harvest index %L Leaf weight g/m2
LAI Leaf area index m2/m2
LAR Leaf area ratio m2/g, Eq. (6) × Eq. (7)LMR Leaf mass rate g/g, Eq. (7)LUE Light use efficiency g/MJNAR Net assimilation rate g m−2 day−1, Eq. (5)PAR Photosynthetically active radiation MJ/m2
R Root weight g/m2
RGR Relative growth rate g g−1 day−1, Eq. (4)S Stem weight g/m2
Sh Shoot weight g/m2
SLA Specific leaf area m2/g, Eq. (6)T Tuber weight g/m2
TDM Total dry matter kg/haW Total plant weight (with out roots) g/m2
Y Any growth parameter (W, T, Sh, R) g/m2, Eq. (1)
Inside parenthesis is the number of reference attributed in the text to the equationused for calculating the parameter or variable.
To construct the Beta-curves of accumulated biomass, westarted with primary yield data (W, T, Sh, R) measured over timein several intermediate harvests, as described in data collection.Every data set (W, T, Sh, R) was subjected to a non-linear regres-sion analysis to obtain the growth curves over time expressed indays on a surface area of 1 m2 of soil. The regression was basedon the Beta function (Yin et al., 1995, 2003), a more versatileand explanatory equation than a polynomial equation commonlyused for CGA. The Beta function is of a sigmoid type with threeclearly explanatory parameters, and based on two fundamentalequations (Eqs. (1) and (2)):
Y = Ymax ×(
1 + te − t
te − tm
)×
(t
te
)te/(te−tm)
,
with 0 ≤ tm < te (1)
Cm = Ymax ×(
2te − tm
te × (te − tm)
)×
(tm
te
)tm/(te−tm)
(2)
Y is any growth parameter; t is the time in days after emergence;tm is the time when the maximum growth rate of Y is reached; teis the time when the growth period ends. Ymax is the maximumvalue of Y reached at te time (Eq. (1)). Cm is the maximum valueof the absolute growth rate reached at tm time (Eq. (2)).
The Beta regression was calculated with the Sigma Plotsoftware (Evaluation Version 8.02) that calculates non-linearregression through iterations, and requires an initial approximatevalue for each parameter of the function.
Author's personal copy
530 B. Condori et al. / Europ. J. Agronomy 28 (2008) 526–540
Assimilates distribution, was characterised by the proportionof dry matter allocated in the different organs, leaves, stems andtubers, and its evolution through time was determined using theBeta-curves.
The CGA (crop growth analysis) was based on the curvesfitted to the Beta function: with total plant weight (W in g/m2),leaf area (A in m2/m2), or leaf weight (L in g/m2) as dependentvariable. Using these curves the following growth parameterswere determined: the Absolute Growth Rate (AGR) based onEq. (3): the Relative Growth Rate (RGR) based on Eq. (4); theNet Assimilation Rate (TAN) by Eq. (5); the Specific Leaf Area(SLA) by Eq. (6); the Leaf Mass Rate (LMR) by Eq. (7). TheLeaf Area Ratio (LAR) can also be determined by the productof Eqs. (6) and (7). These parameters have been discussed inseveral research works conducted since the turn of the centuryand are still used nowadays. Hunt (1982), Clawson et al. (1986)and Hunt et al. (2002) discuss their limitations and scope indetail.
AGR = dW
dt(g/day) (3)
RGR =(
1
W
)×
(dW
dt
)(g g−1 day−1) (4)
NAR =(
1
A
)×
(dW
dt
)(g m−2 day−1) (5)
SLA = A
L(m2/g) (6)
LMR = L
W(g/g) (7)
2.4.3. Measurement of the photosynthetic mechanisms andlight use efficiency of the plant
Evident relationships between LAI and GC exist for potatocrop, and these range from a linear relationship to an exponen-tial relationship (Haverkort et al., 1991; Tourneux et al., 2003;Jefferies and Mackerron, 1989; Kooman, 1995). To determinewhether or not the different species of Andean tubers show arelation to LAI, which is consistent with the models determinedfor potato, we conducted regression analyses on LAI and GC,pairing the data observed throughout the whole growth cycle ofthe crops.
On the other hand, we determined light use efficiency (LUE)for each species of Andean tubers. This was performed by alinear regression analysis of the amount of intercepted photo-synthetically active radiation (PAR) and the total dry biomassproduced over time. The PAR was calculated from global radia-tion data. The light interception fraction is measured directly byGC and can serve to estimate the accumulated value of the inter-cepted PAR, as explained by Haverkort et al. (1991). Studiesconducted on potato all over the world demonstrate an averagevalue of 2.8 g of dry matter for each MJ of intercepted light (Stolet al., 1991). The LUE value for the other Andean tubers remainsunknown to this day. The program used for these analyses wasalso Sigma Plot (Evaluation Version 8.02).
3. Results and discussion
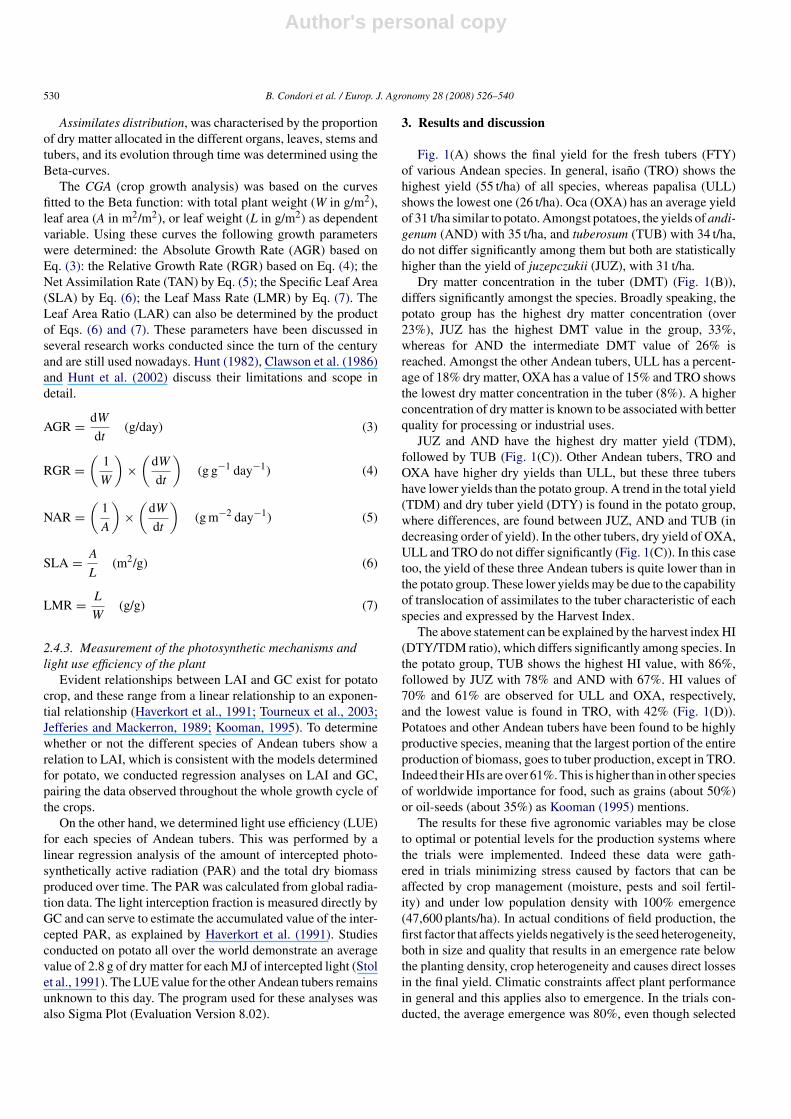
Fig. 1(A) shows the final yield for the fresh tubers (FTY)of various Andean species. In general, isano (TRO) shows thehighest yield (55 t/ha) of all species, whereas papalisa (ULL)shows the lowest one (26 t/ha). Oca (OXA) has an average yieldof 31 t/ha similar to potato. Amongst potatoes, the yields of andi-genum (AND) with 35 t/ha, and tuberosum (TUB) with 34 t/ha,do not differ significantly among them but both are statisticallyhigher than the yield of juzepczukii (JUZ), with 31 t/ha.
Dry matter concentration in the tuber (DMT) (Fig. 1(B)),differs significantly amongst the species. Broadly speaking, thepotato group has the highest dry matter concentration (over23%), JUZ has the highest DMT value in the group, 33%,whereas for AND the intermediate DMT value of 26% isreached. Amongst the other Andean tubers, ULL has a percent-age of 18% dry matter, OXA has a value of 15% and TRO showsthe lowest dry matter concentration in the tuber (8%). A higherconcentration of dry matter is known to be associated with betterquality for processing or industrial uses.
JUZ and AND have the highest dry matter yield (TDM),followed by TUB (Fig. 1(C)). Other Andean tubers, TRO andOXA have higher dry yields than ULL, but these three tubershave lower yields than the potato group. A trend in the total yield(TDM) and dry tuber yield (DTY) is found in the potato group,where differences, are found between JUZ, AND and TUB (indecreasing order of yield). In the other tubers, dry yield of OXA,ULL and TRO do not differ significantly (Fig. 1(C)). In this casetoo, the yield of these three Andean tubers is quite lower than inthe potato group. These lower yields may be due to the capabilityof translocation of assimilates to the tuber characteristic of eachspecies and expressed by the Harvest Index.
The above statement can be explained by the harvest index HI(DTY/TDM ratio), which differs significantly among species. Inthe potato group, TUB shows the highest HI value, with 86%,followed by JUZ with 78% and AND with 67%. HI values of70% and 61% are observed for ULL and OXA, respectively,and the lowest value is found in TRO, with 42% (Fig. 1(D)).Potatoes and other Andean tubers have been found to be highlyproductive species, meaning that the largest portion of the entireproduction of biomass, goes to tuber production, except in TRO.Indeed their HIs are over 61%. This is higher than in other speciesof worldwide importance for food, such as grains (about 50%)or oil-seeds (about 35%) as Kooman (1995) mentions.
The results for these five agronomic variables may be closeto optimal or potential levels for the production systems wherethe trials were implemented. Indeed these data were gath-ered in trials minimizing stress caused by factors that can beaffected by crop management (moisture, pests and soil fertil-ity) and under low population density with 100% emergence(47,600 plants/ha). In actual conditions of field production, thefirst factor that affects yields negatively is the seed heterogeneity,both in size and quality that results in an emergence rate belowthe planting density, crop heterogeneity and causes direct lossesin the final yield. Climatic constraints affect plant performancein general and this applies also to emergence. In the trials con-ducted, the average emergence was 80%, even though selected
Author's personal copy
B. Condori et al. / Europ. J. Agronomy 28 (2008) 526–540 531
Fig. 1. Agronomic behaviour of Andean potatoes: S. t. ssp. tuberosum (TUB), S. juzepckzukii (JUZ) and S. t. ssp. andigenum (AND); other Andean tubers: Oxalistuberosa (OXA), Tropaeolum tuberosum (TRO) and U. tuberosus (ULL); in (A) fresh tuber yield in t/ha (FTY); (B) percentage of dry matter in tubers (DMT); (C)total dry matter and dry tuber yield in kg/ha (TDM and DTY); (D) harvest yield (HI). Mean of the values observed in the final harvest, error bars were determinedby all trials for each species. S. t. is Solanum tuberosum.
seed of certified quality had been used. Our plots appeared morehomogeneous (compared to some farmers plots) but we areaware that in field plots of homogenous appearance the samplescorresponding to small surface areas can generate an overestima-tion up to 30% (Ledent, 2005 personal communication). Despitethis possible overestimation our results show that a more rigor-ous management allows achieving yields several times higherthan the yields reported in statistics and bibliography (Table 3).Relative yield was obtained by dividing the value of these poten-tial yields (Fig. 1(A)) by the domestic mean (Montes de Oca,1992; Tapia, 1994; Zeballos, 1997; INE, 1999) or by the meanof local data or trials conducted for research purposes (Garciaand Cadima, 2003).
Our results allowed deducing some relations or ratiosbetween total dry biomass (TDM) and dry tuber yield (DTY)
and between dry tuber yield (DTY) and fresh tuber yield. Theseratios were obtained across environments and cultivars. Theseratios although approximate may be useful to estimate biomassor dry tuber yield when only fresh tuber yield is available.
3.1. Dry biomass accumulation
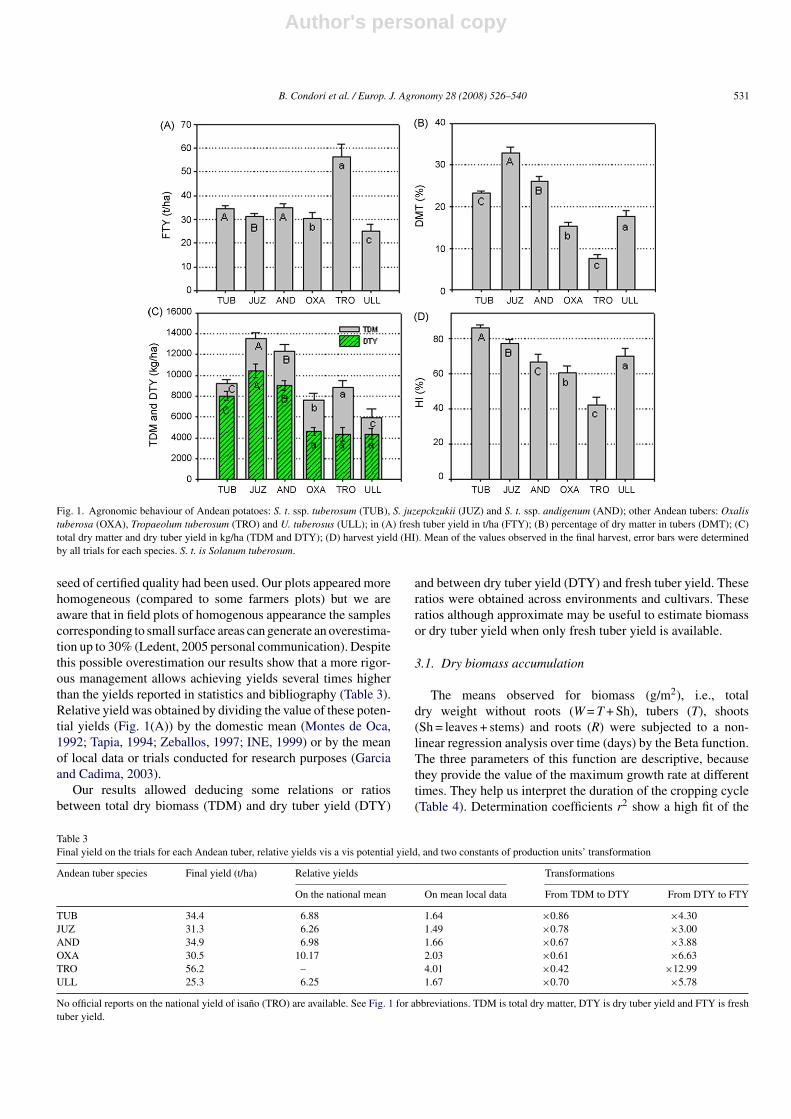
The means observed for biomass (g/m2), i.e., totaldry weight without roots (W = T + Sh), tubers (T), shoots(Sh = leaves + stems) and roots (R) were subjected to a non-linear regression analysis over time (days) by the Beta function.The three parameters of this function are descriptive, becausethey provide the value of the maximum growth rate at differenttimes. They help us interpret the duration of the cropping cycle(Table 4). Determination coefficients r2 show a high fit of the
Table 3Final yield on the trials for each Andean tuber, relative yields vis a vis potential yield, and two constants of production units’ transformation
Andean tuber species Final yield (t/ha) Relative yields Transformations
On the national mean On mean local data From TDM to DTY From DTY to FTY
TUB 34.4 6.88 1.64 ×0.86 ×4.30JUZ 31.3 6.26 1.49 ×0.78 ×3.00AND 34.9 6.98 1.66 ×0.67 ×3.88OXA 30.5 10.17 2.03 ×0.61 ×6.63TRO 56.2 – 4.01 ×0.42 ×12.99ULL 25.3 6.25 1.67 ×0.70 ×5.78
No official reports on the national yield of isano (TRO) are available. See Fig. 1 for abbreviations. TDM is total dry matter, DTY is dry tuber yield and FTY is freshtuber yield.
Author's personal copy
532 B. Condori et al. / Europ. J. Agronomy 28 (2008) 526–540
Table 4Beta parameters and coefficients of determination for biomass accumulation in diverse organs of Andean tubers fitted by the Beta function
TUB S.E. JUZ S.E. AND S.E. OXA S.E. TRO S.E. ULL S.E.
Total weight (W = T + Sh)Cm 17.70 1.3 17.41 0.9 18.48 2.3 9.00 0.7 10.81 0.3 8.43 0.5Wm 1071.00 11.6 1007.82 8.02 1102.76 26.5 662.27 73.2 873.64 32.0 557.55 51.6tm 67 0.6 70 1.2 68 1.6 95 5.9 100 2.6 75 9.0te 104 0.9 104 1.9 104 2.3 137 17.0 147 1.5 115 15.9r2 0.96 ** 0.94 ** 0.90 ** 0.88 ** 0.86 ** 0.94 **
Tubers (T)Cm 19.67 0.4 23.33 0.1 18.53 0.2 10.38 0.2 7.81 0.2 9.74 0.1Tm 951.34 3.8 659.01 14.9 792.83 21.6 460.86 18.9 401.77 16.3 431.27 15.3tm 74 0.2 90 0.6 78 1.4 118 1.9 115 2.1 95 1.5te 104 0.3 104 1.2 104 2.3 137 4.9 147 2.8 115 3.8r2 0.94 ** 0.90 ** 0.86 ** 0.88 ** 0.86 ** 0.83 **
Shoots (Sh = L + S)Cm 4.16 0.3 8.24 0.8 7.16 0.5 3.88 0.2 8.81 0.2 3.64 0.1Shm 211.24 19.4 435.85 52.4 385.25 33.8 259.12 17.4 573.96 17.6 206.13 5.9tm 35 7.4 45 20.1 45 6.5 70 19.7 85 4.6 55 3.4te 75 2.9 82 13.9 83 2.6 112 11.9 122 2.1 92 1.4r2 0.79 ** 0.77 ** 0.79 ** 0.72 ** 0.69 ** 0.71 **
Roots (R)Cm 0.16 – 0.53 – 0.53 – 0.18 – 0.70 – 0.21 –Rm 10.12 – 29.48 – 30.76 – 11.44 – 39.56 – 11.10 –tm 40 – 45 – 40 – 70 – 90 – 55 –te 90 – 85 – 85 – 110 – 120 – 89 –r2 0.42 ns 0.40 ns 0.35 ns 0.30 ns 0.38 ns 0.23 ns
Where S.E. is the Standard Error; ns is r2 not significant. W is the total weight of the plant, T is the weight of the tubers, Sh is foliage weight, and R is root weight;all expressed in dry weight and g/m2. t is the time in days after emergence; tm is the time when the maximum growth rate of W (T, Sh or R) is reached; te is the timewhen the growth period ends. Wmax is the maximum value of W (T, Sh or R) reached at te time. Cm is the maximum growth rate reached at time tm expressed ing m−2 day−1.** r2 highly significant.
Beta function for the different parts of the plants, except theroots.
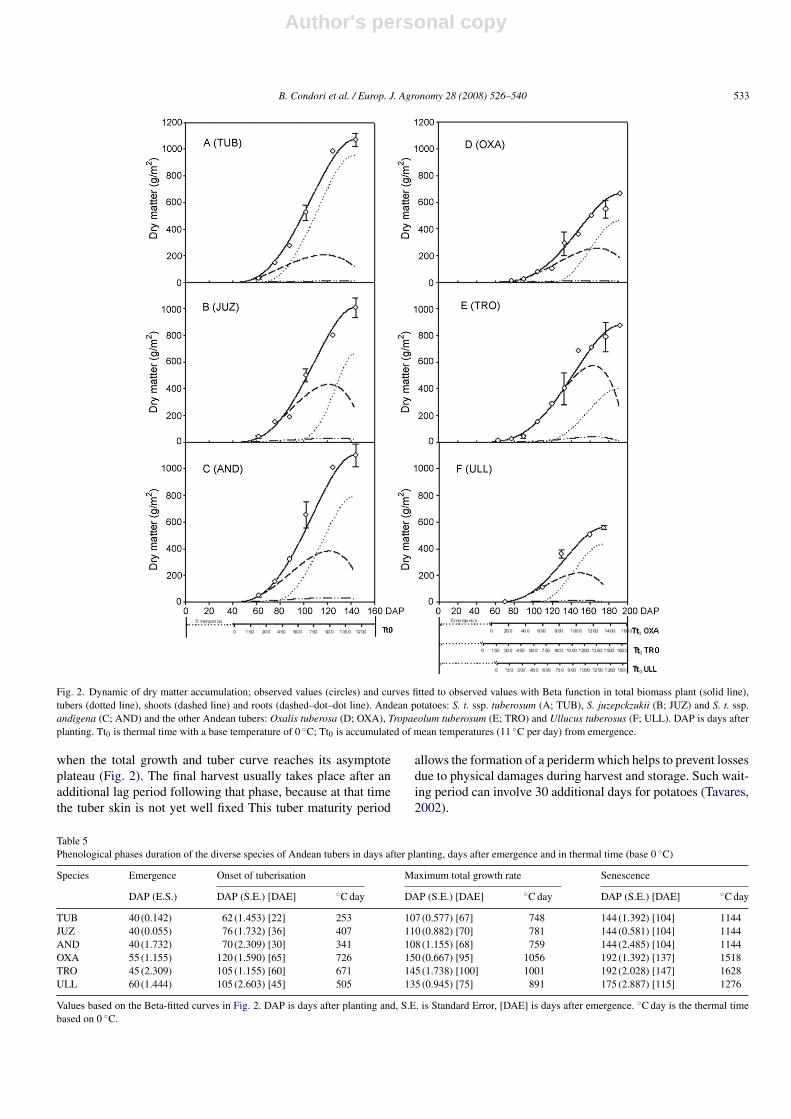
Fig. 2 provides the growth curves for each Andean tuber organand species. By way of example, we show the points observedfor the total dry matter (W), where we have a high r2 (over 0.86in all species). This analysis allows a more accurate descrip-tion of the cropping cycle duration, both in days and in thermaltime (base 0 ◦C, Squire, 1995), considering a daily mean tem-perature of 11 ◦C, accumulated as from emergence. This figureshows root growth, which is very reduced relative to the growthof other parts of the plant. Total root extraction was limited ineach sampling due to: sample extraction depth, involuntary cutsor breaking of roots due to the presence of gravel in the soil,losses during sample washings; for that reason R data was notconsidered in the total biomass sum.
Fig. 2 shows the bars of Standard Error (S.E.) that comparethe sampling of the species inside potato group and the otherAndean tubers. To avoid filling the figure, and to make a simplepresentation we showed the S.E. at three stages, at the begin-ning of the accumulation of biomass, at the maximal velocity ofgrowth and in the final phase of accumulation of biomass. Thesestages are reached at 62, 102 and 144 DAP for the potato groupand at 90, 133 and 177 DAP for the other Andean tubers (withslight variations of days). The S.E. bars are are given for thesedates in the figures presenting CGA (Figs. 4 and 5).
Four macro-stages or phenological phases (Kooman andHaverkort, 1995) were identified by the values of the parametersof the Beta function and the fitted curves (Table 5).
Phase 0 of emergence, covers the period of time from plant-ing to emergence, determined by direct periodical counts ofthe population emerged over the total plants planted. Thisphase is considered reached when half of the population hasemerged and takes 40–60 days, depending on the species(Table 5).
Phase 1, of onset of tuberisation goes from emergence to theonset of tuberisation when the biomass of tubers reaches 1 g/m2
as calculated by the Beta function. Leaf development occursmainly in this phase, that lasts 22–65 days depending on thespecies and includes the onset of tuberisation, which requires253–726 ◦C days (base temperature of 0 ◦C) depending on thespecies (Table 5).
Phase 2, of maximum total growth rate goes from the onsetof tuberisation to the maximum growth rate of total biomass,which coincides with the maximum accumulation of dry matterin foliage, which phase is reached from 748 to 1056 ◦C days orfrom 107 to 150 days after planting (Table 5).
Phase 3, of senescence goes from the maximum growth rateof foliage to the end of the cropping cycle or to senescence,and corresponds to 1144–1628 ◦C days (Table 5). This phaseis reached when at least half of the foliage is senescent and
Author's personal copy
B. Condori et al. / Europ. J. Agronomy 28 (2008) 526–540 533
Fig. 2. Dynamic of dry matter accumulation; observed values (circles) and curves fitted to observed values with Beta function in total biomass plant (solid line),tubers (dotted line), shoots (dashed line) and roots (dashed–dot–dot line). Andean potatoes: S. t. ssp. tuberosum (A; TUB), S. juzepckzukii (B; JUZ) and S. t. ssp.andigena (C; AND) and the other Andean tubers: Oxalis tuberosa (D; OXA), Tropaeolum tuberosum (E; TRO) and Ullucus tuberosus (F; ULL). DAP is days afterplanting. Tt0 is thermal time with a base temperature of 0 ◦C; Tt0 is accumulated of mean temperatures (11 ◦C per day) from emergence.
when the total growth and tuber curve reaches its asymptoteplateau (Fig. 2). The final harvest usually takes place after anadditional lag period following that phase, because at that timethe tuber skin is not yet well fixed This tuber maturity period
allows the formation of a periderm which helps to prevent lossesdue to physical damages during harvest and storage. Such wait-ing period can involve 30 additional days for potatoes (Tavares,2002).
Table 5Phenological phases duration of the diverse species of Andean tubers in days after planting, days after emergence and in thermal time (base 0 ◦C)
Species Emergence Onset of tuberisation Maximum total growth rate Senescence
DAP (E.S.) DAP (S.E.) [DAE] ◦C day DAP (S.E.) [DAE] ◦C day DAP (S.E.) [DAE] ◦C day
TUB 40 (0.142) 62 (1.453) [22] 253 107 (0.577) [67] 748 144 (1.392) [104] 1144JUZ 40 (0.055) 76 (1.732) [36] 407 110 (0.882) [70] 781 144 (0.581) [104] 1144AND 40 (1.732) 70 (2.309) [30] 341 108 (1.155) [68] 759 144 (2.485) [104] 1144OXA 55 (1.155) 120 (1.590) [65] 726 150 (0.667) [95] 1056 192 (1.392) [137] 1518TRO 45 (2.309) 105 (1.155) [60] 671 145 (1.738) [100] 1001 192 (2.028) [147] 1628ULL 60 (1.444) 105 (2.603) [45] 505 135 (0.945) [75] 891 175 (2.887) [115] 1276
Values based on the Beta-fitted curves in Fig. 2. DAP is days after planting and, S.E. is Standard Error, [DAE] is days after emergence. ◦C day is the thermal timebased on 0 ◦C.
Author's personal copy
534 B. Condori et al. / Europ. J. Agronomy 28 (2008) 526–540
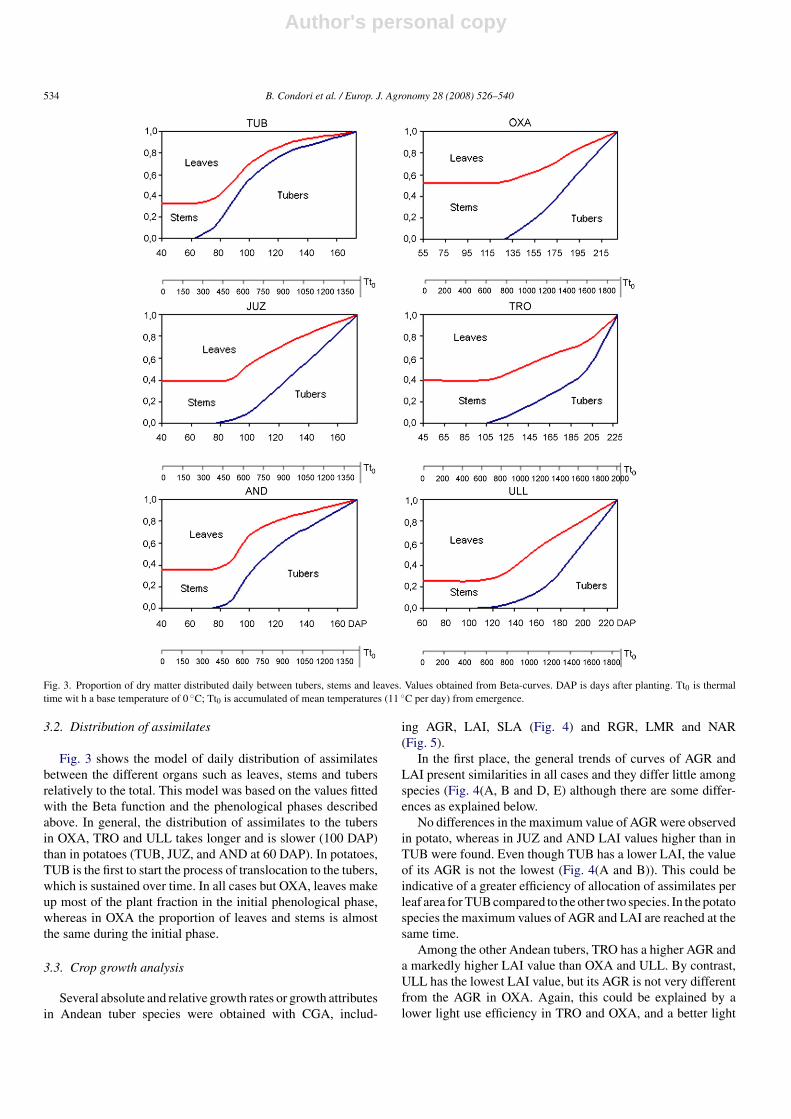
Fig. 3. Proportion of dry matter distributed daily between tubers, stems and leaves. Values obtained from Beta-curves. DAP is days after planting. Tt0 is thermaltime wit h a base temperature of 0 ◦C; Tt0 is accumulated of mean temperatures (11 ◦C per day) from emergence.
3.2. Distribution of assimilates
Fig. 3 shows the model of daily distribution of assimilatesbetween the different organs such as leaves, stems and tubersrelatively to the total. This model was based on the values fittedwith the Beta function and the phenological phases describedabove. In general, the distribution of assimilates to the tubersin OXA, TRO and ULL takes longer and is slower (100 DAP)than in potatoes (TUB, JUZ, and AND at 60 DAP). In potatoes,TUB is the first to start the process of translocation to the tubers,which is sustained over time. In all cases but OXA, leaves makeup most of the plant fraction in the initial phenological phase,whereas in OXA the proportion of leaves and stems is almostthe same during the initial phase.
3.3. Crop growth analysis
Several absolute and relative growth rates or growth attributesin Andean tuber species were obtained with CGA, includ-
ing AGR, LAI, SLA (Fig. 4) and RGR, LMR and NAR(Fig. 5).
In the first place, the general trends of curves of AGR andLAI present similarities in all cases and they differ little amongspecies (Fig. 4(A, B and D, E) although there are some differ-ences as explained below.
No differences in the maximum value of AGR were observedin potato, whereas in JUZ and AND LAI values higher than inTUB were found. Even though TUB has a lower LAI, the valueof its AGR is not the lowest (Fig. 4(A and B)). This could beindicative of a greater efficiency of allocation of assimilates perleaf area for TUB compared to the other two species. In the potatospecies the maximum values of AGR and LAI are reached at thesame time.
Among the other Andean tubers, TRO has a higher AGR anda markedly higher LAI value than OXA and ULL. By contrast,ULL has the lowest LAI value, but its AGR is not very differentfrom the AGR in OXA. Again, this could be explained by alower light use efficiency in TRO and OXA, and a better light
Author's personal copy
B. Condori et al. / Europ. J. Agronomy 28 (2008) 526–540 535
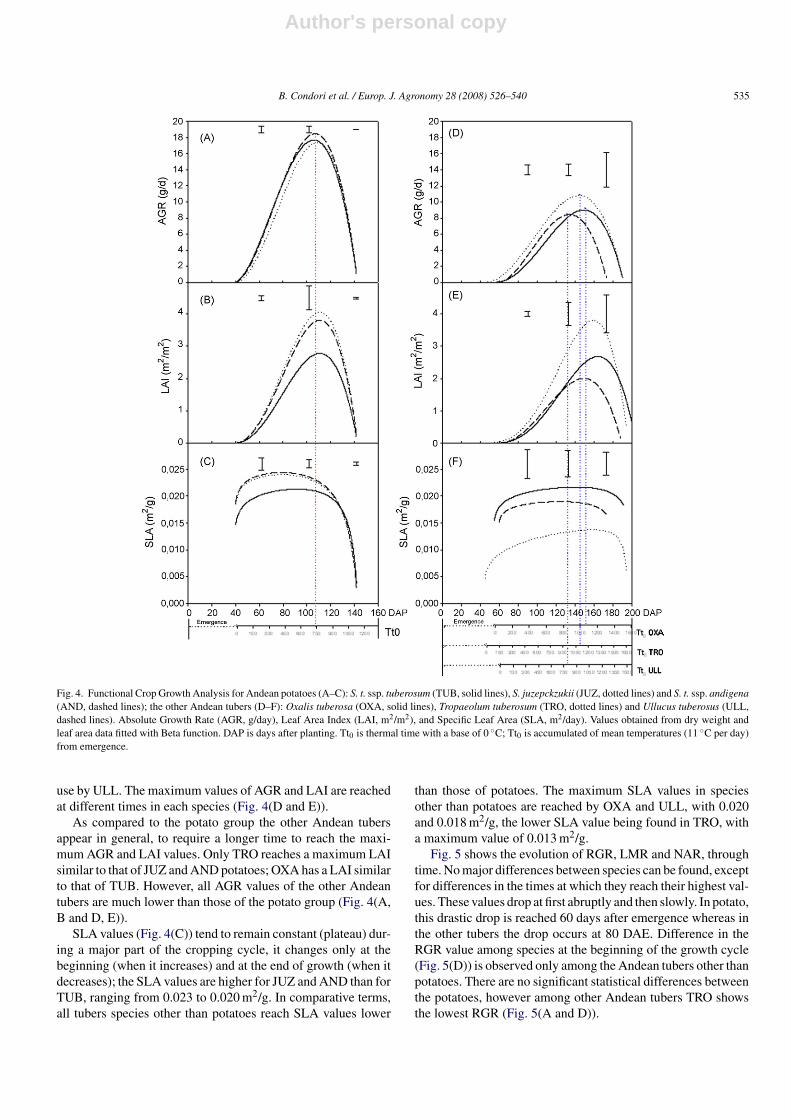
Fig. 4. Functional Crop Growth Analysis for Andean potatoes (A–C): S. t. ssp. tuberosum (TUB, solid lines), S. juzepckzukii (JUZ, dotted lines) and S. t. ssp. andigena(AND, dashed lines); the other Andean tubers (D–F): Oxalis tuberosa (OXA, solid lines), Tropaeolum tuberosum (TRO, dotted lines) and Ullucus tuberosus (ULL,dashed lines). Absolute Growth Rate (AGR, g/day), Leaf Area Index (LAI, m2/m2), and Specific Leaf Area (SLA, m2/day). Values obtained from dry weight andleaf area data fitted with Beta function. DAP is days after planting. Tt0 is thermal time with a base of 0 ◦C; Tt0 is accumulated of mean temperatures (11 ◦C per day)from emergence.
use by ULL. The maximum values of AGR and LAI are reachedat different times in each species (Fig. 4(D and E)).
As compared to the potato group the other Andean tubersappear in general, to require a longer time to reach the maxi-mum AGR and LAI values. Only TRO reaches a maximum LAIsimilar to that of JUZ and AND potatoes; OXA has a LAI similarto that of TUB. However, all AGR values of the other Andeantubers are much lower than those of the potato group (Fig. 4(A,B and D, E)).
SLA values (Fig. 4(C)) tend to remain constant (plateau) dur-ing a major part of the cropping cycle, it changes only at thebeginning (when it increases) and at the end of growth (when itdecreases); the SLA values are higher for JUZ and AND than forTUB, ranging from 0.023 to 0.020 m2/g. In comparative terms,all tubers species other than potatoes reach SLA values lower
than those of potatoes. The maximum SLA values in speciesother than potatoes are reached by OXA and ULL, with 0.020and 0.018 m2/g, the lower SLA value being found in TRO, witha maximum value of 0.013 m2/g.
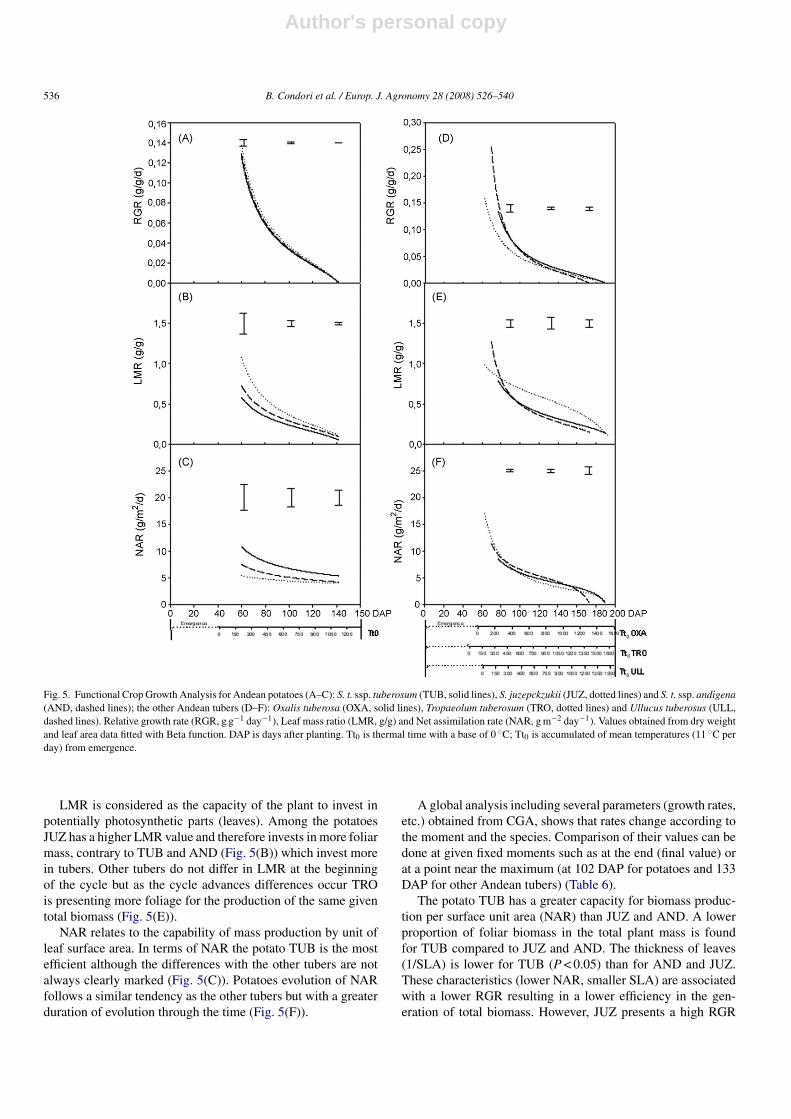
Fig. 5 shows the evolution of RGR, LMR and NAR, throughtime. No major differences between species can be found, exceptfor differences in the times at which they reach their highest val-ues. These values drop at first abruptly and then slowly. In potato,this drastic drop is reached 60 days after emergence whereas inthe other tubers the drop occurs at 80 DAE. Difference in theRGR value among species at the beginning of the growth cycle(Fig. 5(D)) is observed only among the Andean tubers other thanpotatoes. There are no significant statistical differences betweenthe potatoes, however among other Andean tubers TRO showsthe lowest RGR (Fig. 5(A and D)).
Author's personal copy
536 B. Condori et al. / Europ. J. Agronomy 28 (2008) 526–540
Fig. 5. Functional Crop Growth Analysis for Andean potatoes (A–C): S. t. ssp. tuberosum (TUB, solid lines), S. juzepckzukii (JUZ, dotted lines) and S. t. ssp. andigena(AND, dashed lines); the other Andean tubers (D–F): Oxalis tuberosa (OXA, solid lines), Tropaeolum tuberosum (TRO, dotted lines) and Ullucus tuberosus (ULL,dashed lines). Relative growth rate (RGR, g g−1 day−1), Leaf mass ratio (LMR, g/g) and Net assimilation rate (NAR, g m−2 day−1). Values obtained from dry weightand leaf area data fitted with Beta function. DAP is days after planting. Tt0 is thermal time with a base of 0 ◦C; Tt0 is accumulated of mean temperatures (11 ◦C perday) from emergence.
LMR is considered as the capacity of the plant to invest inpotentially photosynthetic parts (leaves). Among the potatoesJUZ has a higher LMR value and therefore invests in more foliarmass, contrary to TUB and AND (Fig. 5(B)) which invest morein tubers. Other tubers do not differ in LMR at the beginningof the cycle but as the cycle advances differences occur TROis presenting more foliage for the production of the same giventotal biomass (Fig. 5(E)).
NAR relates to the capability of mass production by unit ofleaf surface area. In terms of NAR the potato TUB is the mostefficient although the differences with the other tubers are notalways clearly marked (Fig. 5(C)). Potatoes evolution of NARfollows a similar tendency as the other tubers but with a greaterduration of evolution through the time (Fig. 5(F)).
A global analysis including several parameters (growth rates,etc.) obtained from CGA, shows that rates change according tothe moment and the species. Comparison of their values can bedone at given fixed moments such as at the end (final value) orat a point near the maximum (at 102 DAP for potatoes and 133DAP for other Andean tubers) (Table 6).
The potato TUB has a greater capacity for biomass produc-tion per surface unit area (NAR) than JUZ and AND. A lowerproportion of foliar biomass in the total plant mass is foundfor TUB compared to JUZ and AND. The thickness of leaves(1/SLA) is lower for TUB (P < 0.05) than for AND and JUZ.These characteristics (lower NAR, smaller SLA) are associatedwith a lower RGR resulting in a lower efficiency in the gen-eration of total biomass. However, JUZ presents a high RGR
Author's personal copy
B. Condori et al. / Europ. J. Agronomy 28 (2008) 526–540 537
Table 6Comparison of the values of the Relative Growth Rate (RGR), Net AssimilationRate (NAR), Leaf Mass Ratio (LMR) and Specific Leaf Area (SLA), for the 102DAP in potatoes and 133 DAP for other Andean tubers
Species RGR (g/g) = NAR (g/m2) × LMR (g/g) × SLA (m2/g)
TUB 0.032 6.65 0.23 0.021JUZ 0.035 4.39 0.35 0.023AND 0.033 5.04 0.28 0.024E.S. (0.0010) (1.67) (0.03) (0.0007)
OXA 0.031 4.27 0.34 0.022TRO 0.026 3.57 0.54 0.013ULL 0.027 4.67 0.30 0.019S.E. (0.0018) (0.32) (0.07) (0.0024)
The data come from the curves of Figs. 4 and 5. S.E. is the Standard Errorbetween the species of potato and other Andean tubers, respectively.
but with a greater allocation of assimilates to the leaves (LMR),which could affect negatively the tuber yields. TRO presents asmaller NAR than the others (OXA and ULL) but with a veryhigh LMR, a low SLA and a low RGR similar to ULL. In spiteof having a high LAI, TRO allocates more assimilates to thefoliage that to the tubers (Table 6).
4. Measurements of the photosynthetic mechanisms ofthe plant and light use efficiency
4.1. Relationship between LAI and GC
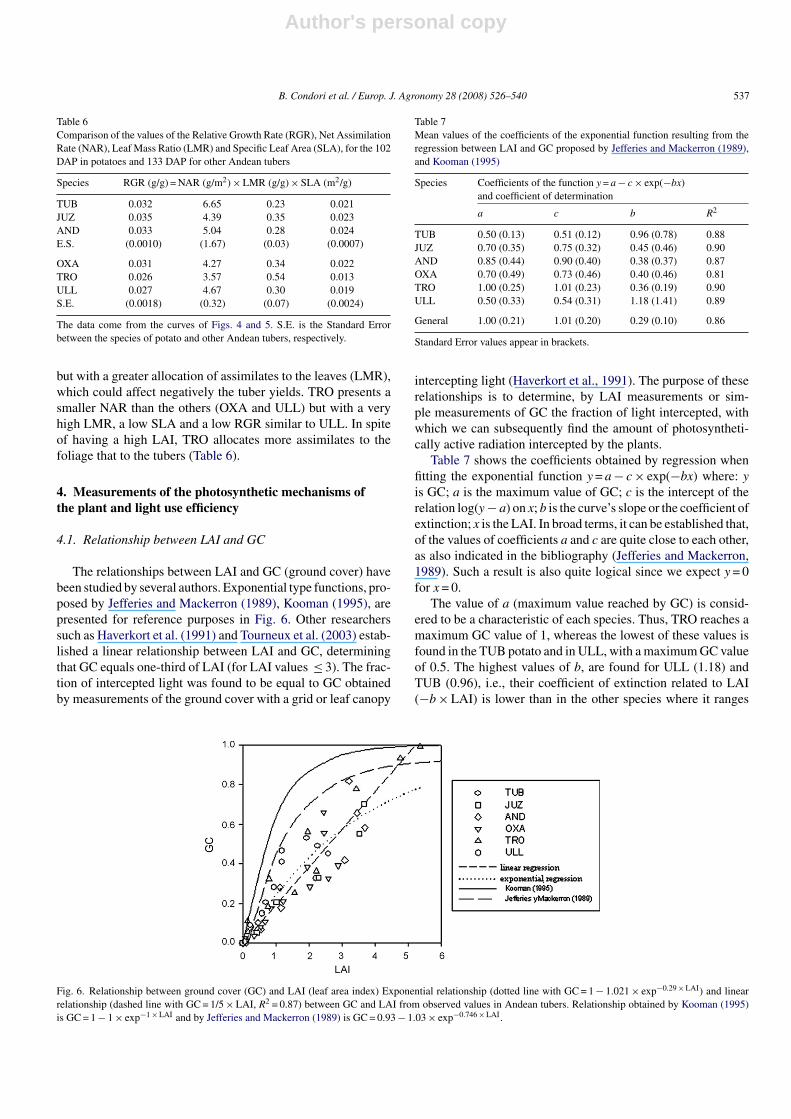
The relationships between LAI and GC (ground cover) havebeen studied by several authors. Exponential type functions, pro-posed by Jefferies and Mackerron (1989), Kooman (1995), arepresented for reference purposes in Fig. 6. Other researcherssuch as Haverkort et al. (1991) and Tourneux et al. (2003) estab-lished a linear relationship between LAI and GC, determiningthat GC equals one-third of LAI (for LAI values ≤ 3). The frac-tion of intercepted light was found to be equal to GC obtainedby measurements of the ground cover with a grid or leaf canopy
Table 7Mean values of the coefficients of the exponential function resulting from theregression between LAI and GC proposed by Jefferies and Mackerron (1989),and Kooman (1995)
Species Coefficients of the function y = a − c × exp(−bx)and coefficient of determination
a c b R2
TUB 0.50 (0.13) 0.51 (0.12) 0.96 (0.78) 0.88JUZ 0.70 (0.35) 0.75 (0.32) 0.45 (0.46) 0.90AND 0.85 (0.44) 0.90 (0.40) 0.38 (0.37) 0.87OXA 0.70 (0.49) 0.73 (0.46) 0.40 (0.46) 0.81TRO 1.00 (0.25) 1.01 (0.23) 0.36 (0.19) 0.90ULL 0.50 (0.33) 0.54 (0.31) 1.18 (1.41) 0.89
General 1.00 (0.21) 1.01 (0.20) 0.29 (0.10) 0.86
Standard Error values appear in brackets.
intercepting light (Haverkort et al., 1991). The purpose of theserelationships is to determine, by LAI measurements or sim-ple measurements of GC the fraction of light intercepted, withwhich we can subsequently find the amount of photosyntheti-cally active radiation intercepted by the plants.
Table 7 shows the coefficients obtained by regression whenfitting the exponential function y = a − c × exp(−bx) where: yis GC; a is the maximum value of GC; c is the intercept of therelation log(y − a) on x; b is the curve’s slope or the coefficient ofextinction; x is the LAI. In broad terms, it can be established that,of the values of coefficients a and c are quite close to each other,as also indicated in the bibliography (Jefferies and Mackerron,1989). Such a result is also quite logical since we expect y = 0for x = 0.
The value of a (maximum value reached by GC) is consid-ered to be a characteristic of each species. Thus, TRO reaches amaximum GC value of 1, whereas the lowest of these values isfound in the TUB potato and in ULL, with a maximum GC valueof 0.5. The highest values of b, are found for ULL (1.18) andTUB (0.96), i.e., their coefficient of extinction related to LAI(−b × LAI) is lower than in the other species where it ranges
Fig. 6. Relationship between ground cover (GC) and LAI (leaf area index) Exponential relationship (dotted line with GC = 1 − 1.021 × exp−0.29 × LAI) and linearrelationship (dashed line with GC = 1/5 × LAI, R2 = 0.87) between GC and LAI from observed values in Andean tubers. Relationship obtained by Kooman (1995)is GC = 1 − 1 × exp−1 × LAI and by Jefferies and Mackerron (1989) is GC = 0.93 − 1.03 × exp−0.746 × LAI.
Author's personal copy
538 B. Condori et al. / Europ. J. Agronomy 28 (2008) 526–540
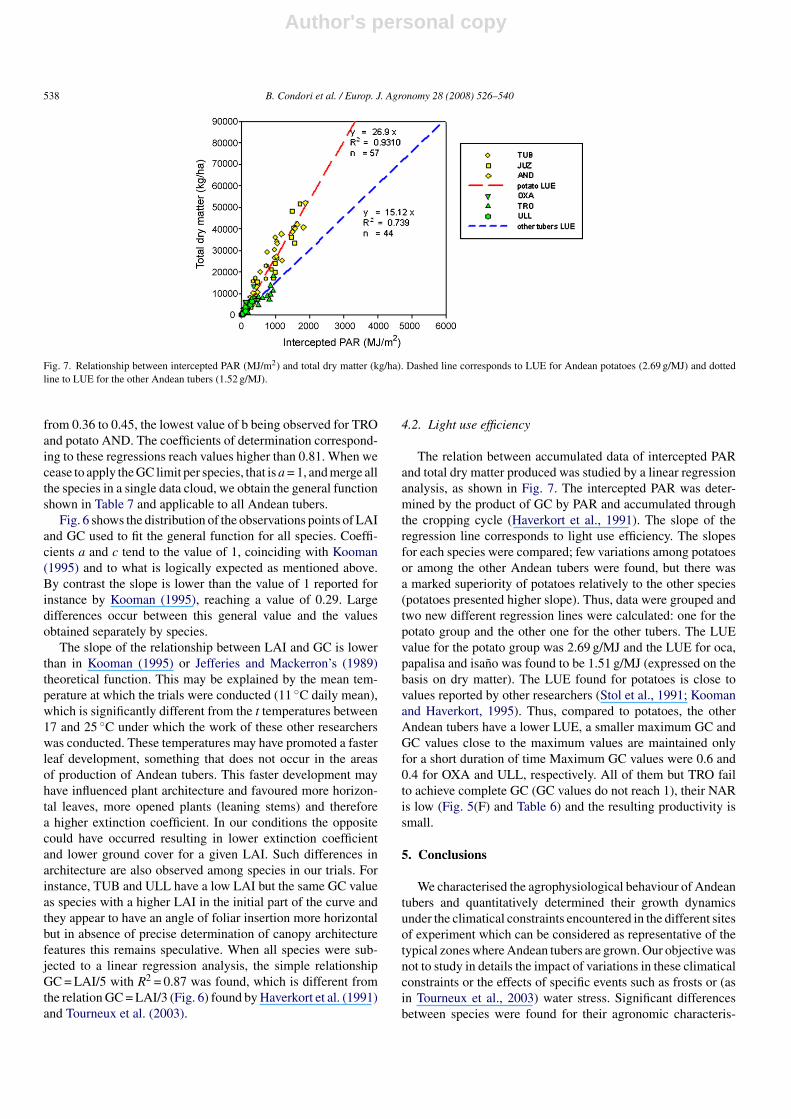
Fig. 7. Relationship between intercepted PAR (MJ/m2) and total dry matter (kg/ha). Dashed line corresponds to LUE for Andean potatoes (2.69 g/MJ) and dottedline to LUE for the other Andean tubers (1.52 g/MJ).
from 0.36 to 0.45, the lowest value of b being observed for TROand potato AND. The coefficients of determination correspond-ing to these regressions reach values higher than 0.81. When wecease to apply the GC limit per species, that is a = 1, and merge allthe species in a single data cloud, we obtain the general functionshown in Table 7 and applicable to all Andean tubers.
Fig. 6 shows the distribution of the observations points of LAIand GC used to fit the general function for all species. Coeffi-cients a and c tend to the value of 1, coinciding with Kooman(1995) and to what is logically expected as mentioned above.By contrast the slope is lower than the value of 1 reported forinstance by Kooman (1995), reaching a value of 0.29. Largedifferences occur between this general value and the valuesobtained separately by species.
The slope of the relationship between LAI and GC is lowerthan in Kooman (1995) or Jefferies and Mackerron’s (1989)theoretical function. This may be explained by the mean tem-perature at which the trials were conducted (11 ◦C daily mean),which is significantly different from the t temperatures between17 and 25 ◦C under which the work of these other researcherswas conducted. These temperatures may have promoted a fasterleaf development, something that does not occur in the areasof production of Andean tubers. This faster development mayhave influenced plant architecture and favoured more horizon-tal leaves, more opened plants (leaning stems) and thereforea higher extinction coefficient. In our conditions the oppositecould have occurred resulting in lower extinction coefficientand lower ground cover for a given LAI. Such differences inarchitecture are also observed among species in our trials. Forinstance, TUB and ULL have a low LAI but the same GC valueas species with a higher LAI in the initial part of the curve andthey appear to have an angle of foliar insertion more horizontalbut in absence of precise determination of canopy architecturefeatures this remains speculative. When all species were sub-jected to a linear regression analysis, the simple relationshipGC = LAI/5 with R2 = 0.87 was found, which is different fromthe relation GC = LAI/3 (Fig. 6) found by Haverkort et al. (1991)and Tourneux et al. (2003).
4.2. Light use efficiency
The relation between accumulated data of intercepted PARand total dry matter produced was studied by a linear regressionanalysis, as shown in Fig. 7. The intercepted PAR was deter-mined by the product of GC by PAR and accumulated throughthe cropping cycle (Haverkort et al., 1991). The slope of theregression line corresponds to light use efficiency. The slopesfor each species were compared; few variations among potatoesor among the other Andean tubers were found, but there wasa marked superiority of potatoes relatively to the other species(potatoes presented higher slope). Thus, data were grouped andtwo new different regression lines were calculated: one for thepotato group and the other one for the other tubers. The LUEvalue for the potato group was 2.69 g/MJ and the LUE for oca,papalisa and isano was found to be 1.51 g/MJ (expressed on thebasis on dry matter). The LUE found for potatoes is close tovalues reported by other researchers (Stol et al., 1991; Koomanand Haverkort, 1995). Thus, compared to potatoes, the otherAndean tubers have a lower LUE, a smaller maximum GC andGC values close to the maximum values are maintained onlyfor a short duration of time Maximum GC values were 0.6 and0.4 for OXA and ULL, respectively. All of them but TRO failto achieve complete GC (GC values do not reach 1), their NARis low (Fig. 5(F) and Table 6) and the resulting productivity issmall.
5. Conclusions
We characterised the agrophysiological behaviour of Andeantubers and quantitatively determined their growth dynamicsunder the climatical constraints encountered in the different sitesof experiment which can be considered as representative of thetypical zones where Andean tubers are grown. Our objective wasnot to study in details the impact of variations in these climaticalconstraints or the effects of specific events such as frosts or (asin Tourneux et al., 2003) water stress. Significant differencesbetween species were found for their agronomic characteris-
Author's personal copy
B. Condori et al. / Europ. J. Agronomy 28 (2008) 526–540 539
tics such as yield, harvest index and dry matter concentrationin tubers. Tuber yields were clearly above the national figurescommonly reported; this is due to the optimum managementconditions of the trials. Isano has a higher fresh tuber yield thanthe other Andean tubers, including potato, however, it shouldbe mentioned that this apparent advantage results from the largeamount of water that isano accumulates in its tubers with only8% of dry matter. When the tuber dry yields of isano and of otherAndean tuber species such as oca and papalisa, are comparedthey do not differ despite the lower harvest index of isano. Thetuber dry yield of isano is lower than in the potato species ana-lyzed. Isano has presented the lowest harvest index. The potatogroup has the highest harvest index; the S. juzepczukii potato isthe highest in terms of total dry matter yield. The Beta functionproved to be useful for fitting and analyzing growth curves. Ingeneral, the growth of potatoes and other Andean tubers presentsimilar trends; the specific difference is the longer time taken bythe other Andean tubers in each phenological phase.
The Crop Growth Analysis indicated three important char-acteristics differentiating the Andean tubers: the S. juzepczukiipotato compared to other tubers species has a higher relativegrowth rate but a smaller tuber yield, due to a smaller har-vest index associated to a high leaf mass ratio and a very lownet assimilation rate (NAR). The S. tuberosum sp. tuberosumpotato has a smaller leaf area index (LAI), an higher tuber yieldalthough their RGR is lower, and their NAR is very high. Witha smaller utilisation of assimilates in foliage and a high harvestindex S. tuberosum sp. tuberosum is the most productive sub-specie in relation to its relatively low LAI. Differences amongthese species may be related to their origin; the tuberosum used inthis study is an improved variety selected for its yield capacity inhigher latitudes and temperate conditions while the juzepczukiiis a native crop that adapted itself over the years to the adverseclimatic conditions of the Andes (frost and drought). T. tubero-sum or Isano has a great capacity of ground cover by foliageand a great LAI that is not translated in a greater tubers yield,it has low RGR, NAR and harvest index as compared to all theother species studied. In addition its allocation of biomass to theleaves is high as indicated by its leaf mass ratio.
A linear and exponencial relationship were determinated; thecoefficients of the fitted equations vary especially on the slopesamong the species of Andean tubers. The slopes of the equationdescribing the relationship between LAI and GC (light inter-ception fraction) values are lower in the tubers grown in theAndes as compared to the values reported for potato elsewheredue to lower local temperatures (11 ◦C average), and probablyto the architecture of the Andean tuber plants (high stems andhorizontal dispositions of leaves).
The value of light use efficiency, found for the potato varietyused in this study was similar to those reported in the bibliog-raphy for potatoes. The other Andean tubers have lower LUEvalues. A high tuber yield is not only determined by a high LUE.The lower HI values found for Andean tubers contributed also totheir lower yield. Duration of light interception or maintenanceof maximum LAI values tended to be lesser in our conditions,characters of the foliar system such as high LAI, low SLA andLMR). also played a role in some cases to explain the differences
of yield obtained but not systematically (higher LAI were notnecessarily associated with higher yields and vice versa).
This characterisation of agrophysiological parameters and thedevelopment of growth of Andean tubers will be useful for abetter knowledge, to improve their management and to build asimple model of these traditional crops for the region. Testingthe behaviour of the different tubers under the stress conditionscommonly found in the regions of cultivation remains to beconducted.
Acknowledgements
The field experiments in Bolivia were conducted with theteam of researchers of Foundation Proinpa. ‘The Universitecatholique de Louvain, UCL, Belgium’ attributed a fellowshipto B. Condori. The International Potato Centre CIP contributedthrough the projects Papa Andina y ALTAGRO to the finalisa-tion and revision of this paper. The authors thank all those whomade this work possible.
References
CIDETI, 1994. Diagnostico socioeconomico de la Microregion de Tiraque. Vol-umen 1. Poblacion, Historia social y organizacion. Comite Interinstitucionalpara el desarrollo de Tiraque, Cochabamba-Bolivia.
CIED (Centro de investigacion educacion y desarrollo), 2002. Productos Andi-nos potenciales. Online at: http://www.ciedperu.org/productos/fraprod.htm.
Clawson, K.L., Spetch, J.L., Blad, B.L., 1986. Growth analysis of soybeanisolines differing in pubescence density. Agron. J. 78, 164–172.
Contreras, A., 2001. Ecofisiologia del rendimiento de la planta de papa. Fac-uldad de Ciencias Agrarias de la Un iversidad Austral de Chile. Online at:http://www.agrarias.uach.cl/webpapa/pag04.html.
Garcia, W., Cadima, X. (Eds.), 2003. Manejo sostenible de la agrobiodiversidadde tuberculos andinos: Sıntesis de investigaciones y experiencias en Bolivia.Conservacion y uso de la biodiversidad de raıces y tuberculos andinos: Unadecada de investigacion para el desarrollo (1993–2003). Fundacion parala Promocion e Investigacion de Productos Andinos (PROINPA). Alcaldıade Colomi, Centro Internacional de la Papa (CIP). Agencia Suiza para elDesarrollo y Cooperacion (COSUDE), Cochabamba, Bolivia, 208 pp.
Goffart, J.P., Olivier, M., MacKerron, D.K.L., Postma, R., Johnson, P., 2000.Spatial and temporal aspects of sampling of potato crops for nitrogen analy-sis. In: Haverkort, A.J., MacKerron, D.K.L. (Eds.), Management of Nitrogenand Water in Potato Production. Wageningen Pers, Wageningen, pp. 83–102.
Gomez, D., Rodriguez-Delfin, A., Fernandez, E., 2001. Analisis de crecimientode plantas de Mashua (Tropaeolum tuberosum) sometidas a condicionesnutricionales marginales. Anales cientıficos de la UNALM. Lima, Peru 47,280–296.
Gonzales, S., Almanza, J., Devaux, A., Condori, P., 1997. Zonas productoras detuberculos andinos, identificacion e investigacion de factores limitantes deproduccion y conservacion en Cochabamba. In: Universidad Nacional de SanAntonio Abad del Cusco (UNSAAC), Centro de Investigacion en cultivosAndinos (CICA), Asociacion Arariwa (Eds.), IX Congreso Internacional deCultivos Andinos. Cochabamba, Bolivia, p. 21.
Grau, A., Ortega Duenas, R., Nieto Cabrera, C., Hermann, M., 2003. Mashua(Tropaeolum tuberosum Ruiz & Pav.). Promoting the Conservation andUse of Under-utilized and Neglected Crops, vol. 25. International PotatoCenter/International Plant Genetic Resources Institute, Lima, Peru/Rome,Italy.
Haverkort, A.J., Uenk, D., Veroude, H., Van de Waart, M., 1991. Radiationinterception by potato canopy: relations between ground cover, interceptedsolar radiation, leaf area index and infrared reflectance of potato crops. PotatoRes. 34, 113–121.
Author's personal copy
540 B. Condori et al. / Europ. J. Agronomy 28 (2008) 526–540
Hunt, R., 1979. Plant growth analysis: the rationale behind the use of the fittedmathematical function. Ann. Bot. 43, 245–249.
Hunt, R., 1982. Plant Growth Curves: The Functional Approach to Plant GrowthAnalysis. E. Arnold, London.
Hunt, R., 2003. Growth analysis, individual plants. In: Thomas, B., Murphy,D.J., Murray, D. (Eds.), Encyclopaedia of Applied Plant Sciences. AcademicPress, London, pp. 579–588.
Hunt, R., Causton, D.R., Shipley, B., Askew, P., 2002. A modern tool for classicalplant growth analysis. Ann. Bot. 90, 485–488.
INE (Instituto Nacional de Estadıstica), 1999. Estadısticas agropecuarias. LaPaz, Bolivia.
Irigoyen, X., 2002. Estudio de mercado de papas nativas en dos ciudadesde Bolivia. Cochabamba y La Paz. Reporte de Consultoria. Cochabamba,Bolivia.
Jefferies, R.A., Mackerron, D.K.L., 1989. Radiation interception and growth ofirrigated and droughted potato (Solanum tuberosum). Field Crop Res. 22,101–112.
Kooman, P.L., 1995. Yielding ability of potato crops as influenced by tem-perature and daylength. Ph.D. Thesis. Wageningen Agricultural University,Wageningen.
Kooman, P.L., Haverkort, A.J., 1995. Modelling development and growth of thepotato crop influenced by temperature and daylength: LINTUL-POTATO. In:Haverkort, A.J., Mackerron, D.K.L. (Eds.), Potato Ecology and Modellingof Crops Under Conditions Limiting Growth. Kluwer Academic Publishers,Dordrecht, pp. 41–60.
Montes de Oca, I., 1992. Sistemas de riego y agricultura en Bolivia. Taller deanalisis del Riego. Ministerio de Asuntos Campesinos y Agropecuarios, LaPaz.
NRC (National Research Council), 1989. Lost Crops of the Incas: Little-knownPlants of the Andes with Promise for Worldwide Cultivation. NationalAcademy Press, Washington, DC, pp. 82–113, Online at: http://www.nap.edu/books/030904264X/html/R1.html.
Ochoa, C.M., 1990. Las papas de Sudamerica. Bolivia, Plural Editores/CID, LaPaz.
OEA, 1996. Diagnostico ambiental del sistema Titicaca- esaguadero-Poopo-Salar Coipasa (Sistema TDPS), Bolivia-Peru. Organizacion de los EstadosAmericanos. Washington DC, USA.
Poorter, H., 1989. Plant growth analysis: towards a synthesis of the classical andthe functional approach. Physiol. Plant. 75, 237–244.
Quispe, C., Devaux, A., Gonzales, S., Tourneux, C., Hijmans, R., 1997. Eval-uacion comparativa del desarrollo y crecimiento de Papa, Oca e Isano enCochabamba, Bolivia. Revista Latinoamericana de la Papa 9/10, 140–155.
Rea, J., 1992. Vigencia de las papas nativas en Bolivia. In: Rea, J., Vacher, J.J.(Eds.), La Papa Amarga. Primera mesa redonda: Peru, Bolivia. ORSTOM,La Paz, pp. 15–23.
Rea, J., 1998. Manejo y conservacion comunitaria de recursos geneticosagrıcolas en Bolivia. Online at: http://www.grain.org/sp/publications/biodiv175-sp.cfm.
Squire, G.R., 1995. Linkages between plant and weather in models of crop pro-duction. In: Kabat, P., Marshall, B., Broek, B.J., van den, Vos, J., Keulen, H.,van. (Eds.), Modelling and Parameterization of the Soil–Plant–AtmosphereSystem. Wageningen Pers, Wageningen, pp. 57–76.
Stol, W., De Koning, G.H.J., Kooman, P.L., Haverkort, A.J., Van Keulen,H., Penning de Vries, F.W.T., 1991. Agro-ecological characterisation forpotato production. A simulation study at the request of the InternationalPotato Center (CIP), Lima, Peru. CABO-DLO, Report 155. CABO-DLO,Wageningen.
Tapia, G., 1994. La agricultura en Bolivia. Quimera del Desarrollo. Editorial losAmigos del Libro, La Paz.
Tavares, S., 2002. Tuberizacion. Asociacion Brasilera de la Papa, ABBA.Revue Batata Show, Ano 2, No. 5. Brasil. Online at: http://www.abbabatatabrasileira.com.br/revista05 015.htm.
Tourneux, Ch., Devaux, A., Camacho, M.R., Mamani, P., Ledent, J.F., 2003.Effects of water shortage on six potato genotypes in the highlands of Bolivia(I): morphological parameters, growth and yield. Agronomie 23, 169–179.
Valdivia, G., Devaux, A., Gonzales, S., Herbas, J., Hijmans, R., 1998. Desarrolloy produccion de Oca (Oxalis tuberosa) e Isano (Tropaeolum tuberosum) bajodos niveles de fertilizacion. Revista Latinoamericana de la Papa 11, 121–135.
Valladolid, J., Barrantes, F., Prado, A., Zambrano, L., Villantoy, A., 1984.Analisis de crecimiento de tres especies de plantas tuberosas andinas bajocondiciones de cultivo de secano en Allpachaca (3600 msnm) Ayacucho.Centro de Investigaciones Universidad Nacional de San Cristobal de Hua-manga, Ayacucho. Peru 2 (2), 37–48.
Yin, X., Kropff, M.J., McLaren, G., Visperas, R.M., 1995. A nonlinear modelfor crop development as a function of temparature. Agri. Forest Meteorol.77, 1–16.
Yin, X., Goudrian, J., Lantinga, E.A., Vos, J., Spiertz, H.J., 2003. A flexiblesigmoid function to determinate growth. Ann. Bot. 91, 361–371.
Zeballos, H., 1997. Aspectos Economicos de la Produccion de Papa en Bolivia.Centro Internacional de la Papa (CIP), Lima.
Zeballos, H., 2006. Agricultura y desarrollo sostenible. SIRENARE, COSUDEand PLURAL. La Paz, 226–230.


![Sawicka B., Bienia B., Krochmal-Marczak B. 2013. Prozdrowotne znaczenie słonecznika bulwiastego (Helianthus tuberosus L.). [w:] Ziołolecznictwo, biokosmetyki i żywność funkcjonalna](https://img.dokumen.tips/doc/110x75/631c2cbf93f371de19015053/sawicka-b-bienia-b-krochmal-marczak-b-2013-prozdrowotne-znaczenie-slonecznika.jpg)


