Embed Size (px)
Citation preview
Agriculture and Future Climate Dynamics in Africa: Impacts and Adaptation
Options
by
Nhemachena Charles
Submitted in partial fulfilment of the requirements for the degree of
PhD Environmental Economics
Centre for Environmental Economics and Policy in Africa (CEEPA)
Department of Agricultural Economics, Extension and Rural Development
Faculty of Natural and Agricultural Sciences
University of Pretoria
South Africa
January 2009
©© UUnniivveerrssiittyy ooff PPrreettoorriiaa
i
Dedication
To my wife Charity and son Blessings

ii
Declaration
I declare that this thesis I hereby submit for the degree of PhD in Environmental
Economics at the University of Pretoria is entirely my own work and has not been
submitted anywhere else for the award of a degree or otherwise.
Parts of the thesis have been published and submitted for publication in journals.
Any errors in thinking and omissions are entirely my own responsibility.
Signed: ………………………
Name: Charles Nhemachena
January 2009

iii
Acknowledgements
I am very grateful to many people and institutions that have supported me throughout my
PhD studies. This thesis would not have become a reality without the strong support from
my supervisor, Professor Rashid Hassan, who demonstrated a lot of patience, high
intellectual guidance, and untiring support throughout the writing process of the thesis. I
am grateful for his enormous contribution that has shaped this work.
Financial support from the CEEPA-SIDA PhD programme is highly appreciated. I am
also very grateful for the opportunity to use data from the GEF/WB/CEEPA funded
Africa Climate study. Further acknowledgement is due to the International START
Secretariat for providing a START/PACOM Doctoral Research Fellowship for research
support. The author also gratefully acknowledges the dissertation award supported by the
W.K. Kellogg Foundation. I am also very grateful to Dr Reneth Mano for all the financial
support during the initial stages of my PhD programme, without which I could not have
managed. I would also like to thank Dr Claudia Ringler for her support and for including
me as part of the IFPRI/CEEPA funded project: Food and Water Security under Global
Change − Developing Adaptive Capacity with a focus on Rural Africa. I also thank the
CSIR Built Environment, especially the Rural Infrastructure & Services unit for the
support during the final stages of my studies.
I am also deeply indebted to Drs James Benhin, Siwa Msangi and Wisdom Akpalu for
their invaluable comments and encouragement at various stages of this work. I am
thankful to Dalene du Plessis and Lynette Burger for their contributions and help. To my
friends and fellow students at the University of Pretoria: Benjamin, Jethro, Wellington,
Patrick, Davison, Abebe, Temesgen, Glwadyes, Yemane and all the members of the PhD
room − your support and encouragement are highly appreciated.
l would like to thank my parents, Mr and Mrs Nhemachena, and Mr and Mrs Mudombi
for patiently enduring the long wait for this study to be completed. I greatly appreciate
your invaluable support throughout my PhD studies. I am also greatly thankful to Mr and

iv
Mrs Matsekete, and Mr and Mrs Mukaratirwa for your prayers and support throughout
my studies. To my dear brothers Casnos and Givemore, unfortunately you were taken
before you could witness the end of my PhD programme − may your souls rest in peace.
I would not have accomplished this work without the unprecedented support, love and
care of my wife, Charity and son, Blessings, who have been patient and extraordinarily
supportive of my efforts throughout the last few years. Thank you for standing by my
side even in extremely trying moments of the entire study period. I am very grateful to
many people who contributed in various ways to the completion of this thesis, whom I
have not mentioned by name − your support is highly appreciated.
Finally, I thank my Lord, Jesus, for providing me with wisdom, patience and strength
throughout my studies.
Charles Nhemachena
University of Pretoria, South Africa
January 2009

v
Agriculture and future climate dynamics in Africa:
Impacts and adaptation options
by
Charles Nhemachena
Degree: PhD Environmental Economics
Supervisor: Professor Rashid M. Hassan
Department: Agricultural Economics, Extension and Rural Development
Abstract
This study had two main objectives. One objective was to measure the aggregate impact
of climate change on income from all agricultural production systems (crop, livestock
and mixed) in Africa and to predict future impacts under various climate scenarios. In
addition to measuring economic impacts, the study analysed determinants of farmers’
choices between alternative adaptation measures available to African farmers. The study
is based on a cross-section survey of over 8000 farming households from 11 countries in
east, west, north and southern Africa.
To achieve the first objective, the cross-section (Ricardian) approach was used to
measure the impact of climate change attributes (rainfall and temperature levels) on
income from all agricultural production systems (crop, livestock and mixed) in Africa,
controlling for other production factors. Based on empirical estimates from the Ricardian
model, the study predicts future impacts under various climate scenarios. In addition to
estimating impacts on mixed crop−livestock farms, the study also measures and compares
impacts on specialised crop and livestock farms. Responses of different production
systems are analysed under irrigation and dryland conditions. The response of net
revenue from crop and livestock agriculture across various farm types and systems in

vi
Africa, to changes in climate variables (i.e. mean rainfall and temperature) is analysed.
The analysis controlled for effects of key socio-economic, technology, soil and
hydrological factors influencing agricultural production. In addition to measuring impacts
on aggregate revenue, the study examined variations in the response of three distinct
production systems characterising African agriculture: specialised crop; specialised
livestock and mixed crop and livestock systems. Differential impacts of climate change
on the studied systems were measured under irrigation and dryland conditions.
Results show that net farm revenues are in general negatively affected by warmer and
dryer climates. The mixed crop and livestock system predominant in Africa is the most
tolerant, whereas specialised crop production is the most vulnerable to warming and
lower rainfall. These results have important policy implications, especially in terms of the
suitability of the increasing tendency toward mono-cropping strategies for agricultural
development in Africa and other parts of the developing world, in the light of expected
climate changes. Mixed crop and livestock farming and irrigation offered better
adaptation options for farmers against further warming and drying predicted under
various future climate scenarios.
For the second objective, the study employed a multinomial choice model to analyse
determinants of farm-level climate adaptation measures in Africa. Results indicate that
specialised crop cultivation (mono-cropping) is the most vulnerable agricultural practice
in Africa in the face of climate change. Warming, especially in summer, poses the highest
climate risk which tends to indicate switching away from mono-cropping towards the use
of irrigation, multiple cropping and integration of livestock activities. Increased
precipitation reduces the need for irrigation and will be beneficial to most African
farming systems, especially in drier areas. Better access to markets, agricultural extension
and credit services, technology and farm assets (such as labour, land and capital) are
critical enabling factors to enhance the capacity of African farmers to adapt to climate
change. Government policies and investment strategies that support the provision of and
access to education, markets, credit, and information on climate and adaptation measures,
including suitable technological and institutional mechanisms that facilitate climate

vii
adaptation, are therefore required for coping with climate change, particularly among
poor resource farmers in the dry areas of Africa.
Key words: climate change, impacts, adaptation, agriculture, Africa, Ricardian
approach, multinomial choice models
viii
Table of Contents
DEDICATION............................................................................................................................................... I
DECLARATION......................................................................................................................................... II
ACKNOWLEDGEMENTS ....................................................................................................................... III
ABSTRACT ..................................................................................................................................................V
TABLE OF CONTENTS ........................................................................................................................VIII
LIST OF TABLES........................................................................................................................................X
LIST OF FIGURES.................................................................................................................................... XI
ACRONYMS AND ABBREVIATIONS................................................................................................. XII
CHAPTER 1 ................................................................................................................................................. 1
INTRODUCTION ........................................................................................................................................ 1
1.0 BACKGROUND AND STATEMENT OF THE PROBLEM....................................................................... 1 1.2 OBJECTIVES OF THE STUDY .......................................................................................................... 3 1.3 HYPOTHESES OF THE STUDY......................................................................................................... 4 1.4 APPROACH AND METHODS OF THE STUDY ................................................................................... 5 1.5 ORGANISATION OF THE THESIS.................................................................................................... 5
CHAPTER 2 ................................................................................................................................................. 7
AFRICAN CLIMATE, FARMING SYSTEMS AND AGRICULTURAL PRODUCTION ................. 7
2.0 INTRODUCTION............................................................................................................................. 7 2.1 AFRICAN CLIMATE AND AGRICULTURAL POTENTIAL .................................................................... 8 2.2 AGRO-CLIMATES AND FARMING SYSTEMS IN SUB-SAHARAN AFRICA......................................... 11 2.3 CHARACTERISATION OF SELECTED PRIORITY FARMING SYSTEMS............................................... 16 2.4 IMPORTANCE OF LIVESTOCK IN AFRICAN FARMING SYSTEMS..................................................... 21 2.5 ENVIRONMENTAL CONSTRAINTS IN MAJOR FARMING SYSTEMS.................................................. 22 2.6 SUMMARY .................................................................................................................................. 24
CHAPTER 3 ............................................................................................................................................... 26
REVIEW OF LITERATURE ON MEASURING THE ECONOMIC IMPACTS OF CLIMATE CHANGE ON AGRICULTURE............................................................................................................... 26
3.0 INTRODUCTION........................................................................................................................... 26 3.1 APPROACHES TO MEASURING ECONOMIC IMPACTS OF CLIMATE CHANGE................................... 26
3.1.1 Structural approaches .......................................................................................................... 26 3.1.2 The Spatial analogue approach............................................................................................ 29
3.1.2.1 The Future Agricultural Resources Model (FARM) ......................................................................30 3.1.2.2 Ricardian cross-sectional approach..................................................................................................31
3.1.3 Integrated assessment models............................................................................................... 35 3.1.4 Agro-ecological zone (AEZ) method..................................................................................... 36
3.2 EMPIRICAL STUDIES ASSESSING IMPACTS OF CLIMATE CHANGE ON AGRICULTURE..................... 37 3.2.1 Empirical studies based on structural approaches............................................................... 37 3.2.2 Empirical studies based on the cross-sectional (Ricardian) approach ................................ 43
3.3 SUMMARY .................................................................................................................................. 46
CHAPTER 4 ............................................................................................................................................... 50
MEASURING THE ECONOMIC IMPACT OF CLIMATE CHANGE ON AFRICAN AGRICULTURAL PRODUCTION SYSTEMS...................................................................................... 50
4.0 INTRODUCTION........................................................................................................................... 50

ix
4.1 SPECIFICATION OF THE EMPIRICAL RICARDIAN MODEL FOR MEASURING ECONOMIC IMPACTS OF
CLIMATE CHANGE..................................................................................................................................... 50 4.2 THE DATA AND MODEL VARIABLES ............................................................................................ 52 4.3 RESULTS AND DISCUSSION......................................................................................................... 62 4.4 FORECASTING IMPACTS OF CLIMATE CHANGE ON NET REVENUE................................................ 76
4.4.1 Climate sensitivity scenarios ............................................................................................... 76 4.4.2 AOGCM climate scenarios .................................................................................................. 79
4.5 SUMMARY AND POLICY IMPLICATIONS ....................................................................................... 81
CHAPTER 5 ............................................................................................................................................... 85
THEORETICAL AND EMPIRICAL STUDIES RELATING TO THE ECONOMICS OF CLIMATE CHANGE ADAPTATION IN AGRICULTURE................................................................. 85
5.0 INTRODUCTION........................................................................................................................... 85 5.1 ADAPTATION TO CLIMATE CHANGE IN AGRICULTURE................................................................ 85 5.2 APPROACHES FOR ASSESSING ADAPTATION TO CLIMATE CHANGE IN AGRICULTURE.................. 87
5.2.1 Agronomic-economic models................................................................................................ 88 5.2.2 Cross-sectional methods....................................................................................................... 89 5.2.3 Discrete multinomial choice models..................................................................................... 90
5.3 SUMMARY .................................................................................................................................. 92
CHAPTER 6 ............................................................................................................................................... 94
DETERMINANTS OF CLIMATE ADAPTATION STRATEGIES OF AFRICAN FARMERS: MULTINOMIAL CHOICE ANALYSIS ................................................................................................. 94
6.0 INTRODUCTION........................................................................................................................... 94 6.1 PERCEIVED ADAPTATION STRATEGIES OF AFRICAN FARMERS.................................................... 94 6.2 CLASSIFICATION OF ACTUAL FARMERS’ ADAPTATION DECISIONS.............................................. 97 6.3 THE ANALYTICAL FRAMEWORK ................................................................................................. 99 6.4 THE DATA AND EMPIRICAL SPECIFICATIONS OF THE MODEL VARIABLES.................................. 102 6.5 RESULTS AND DISCUSSIONS...................................................................................................... 110 6.6 SUMMARY AND POLICY IMPLICATIONS ..................................................................................... 115
CHAPTER 7 ............................................................................................................................................. 118
SUMMARY, CONCLUSIONS AND IMPLICATIONS FOR POLICY AND RESEARCH............. 118
7.1 LIMITATIONS OF THE STUDY AND AREAS FOR FURTHER RESEARCH.......................................... 123
REFERENCES ......................................................................................................................................... 126
APPENDIX 1A: REGRESSION RESULTS FOR DRYLAND FARMS............................................. 146
APPENDIX 1B: REGRESSION RESULTS FOR IRRIGATED FARMS.......................................... 147
APPENDIX 2: CORRELATION ANALYSIS OF CONTINUOUS EXPLANATORY VARIABLES.................................................................................................................................................................... 148
APPENDIX 3: VARIANCE INFLATION FACTOR (VIF) TEST FOR MULTICOLLINEARITY149
APPENDIX 4: PARAMETER ESTIMATES FROM THE MULTINOMIAL LOGIT ADAPTATION MODEL..................................................................................................................................................... 150

x
List of Tables
TABLE 2.1: MAJOR FARMING SYSTEMS IN SUB-SAHARAN AFRICA-------------------------------------------------- 13
TABLE 2.2: MAJOR CHARACTERISTICS OF SELECTED PRIORITY FARMING SYSTEMS------------------------------ 17
TABLE 2.3: PRODUCTIVITY TRENDS FOR VARIOUS COMMODITIES IN THE PRIORITY FARMING SYSTEMS------ 18
TABLE 2.4: IRRIGATED LAND WITHIN THE MAIN FARMING SYSTEMS IN AFRICA IN 2000 ------------------------ 19
TABLE 2.5: PROPORTIONS OF RAIN-FED AREAS AND PRODUCTION TOTALS IN 1995 AND PROJECTED TO 2021-
25 IN AFRICA FOR SELECTED CROPS------------------------------------------------------------------------------ 20
TABLE 2.6: MAJOR ANIMAL PRODUCTION SYSTEMS IN AFRICAN AGRO-ECOLOGICAL ZONES------------------- 22
TABLE 4.1: SUMMARY STATISTICS OF THE SURVEY SAMPLE--------------------------------------------------------- 57
TABLE 4.2: CHARACTERISATION OF FARM TYPES---------------------------------------------------------------------- 58
TABLE 4.3: VARIABLES USED IN THE EMPIRICAL ANALYSIS AND THEIR EXPECTED EFFECTS-------------------- 61
TABLE 4.4: RICARDIAN REGRESSION RESULTS------------------------------------------------------------------------- 64
TABLE 4.5: MARGINAL IMPACTS AND ELASTICITIES OF CLIMATE VARIABLES ON NET REVENUE ($/FARM) --- 70
TABLE 4.6: PREDICTED IMPACTS OF CLIMATE CHANGE ON NET REVENUE FROM SIMPLE SCENARIOS---------- 78
TABLE 4.7: CLIMATE PREDICTIONS OF AOGCM MODELS FOR 2100------------------------------------------------ 79
TABLE 4.8: PREDICTED IMPACTS FROM AOGM CLIMATE SCENARIOS (PCM AND CCC) FOR THE YEAR 210081
TABLE 6.1: FARMER PERCEPTIONS ON LONG TERM TEMPERATURE AND PRECIPITATION CHANGES (% OF
RESPONDENTS) ------------------------------------------------------------------------------------------------------- 95
TABLE 6.2: PERCEIVED FARM-LEVEL ADAPTATION STRATEGIES IN AFRICA (% OF RESPONDENTS)------------ 96
TABLE 6.3: CATEGORISED ADAPTATION MEASURES USED BY FARMERS------------------------------------------- 98
TABLE 6.4: DEFINITION OF VARIABLES USED IN THE EMPIRICAL ANALYSIS--------------------------------------103
TABLE 6.5: MARGINAL EFFECTS OF EXPLANATORY VARIABLES FROM THE MULTINOMIAL LOGIT ADAPTATION
MODEL----------------------------------------------------------------------------------------------------------------111

xi
List of Figures
FIGURE 2.1 (A): VARIATIONS OF THE EARTH’S SURFACE TEMPERATURE FOR THE PAST 100 YEARS IN AFRICA
------------------------------------------------------------------------------------------------------------------------- 10
FIGURE 2.1 (C): FOOD PRODUCTION INDEX IN AFRICA ---------------------------------------------------------------- 11
FIGURE 2.2: MAJOR FARMING SYSTEMS IN AFRICA ------------------------------------------------------------------- 12
FIGURE 2.3(A): AVERAGE ANNUAL PRECIPITATION IN MAJOR FARMING SYSTEMS------------------------------- 15
FIGURE 2.3(B): AVERAGE ANNUAL TEMPERATURES IN MAJOR FARMING SYSTEMS------------------------------- 15
FIGURE 2.4: ENVIRONMENTAL CONSTRAINTS IN MAJOR FARMING SYSTEMS-------------------------------------- 23
FIGURE 4.1: MAP OF STUDY COUNTRIES--------------------------------------------------------------------------------- 53
FIGURE 4.2: TEMPERATURE RESPONSE FUNCTION –ALL FARMS ----------------------------------------------------- 71
FIGURE 4.3: PRECIPITATION RESPONSE FUNCTION-ALL FARMS ----------------------------------------------------- 71
FIGURE 4.4: TEMPERATURE RESPONSE FUNCTION –MIXED CROP−LIVESTOCK FARMS --------------------------- 72
FIGURE 4.5: PRECIPITATION RESPONSE FUNCTION − MIXED CROP−LIVESTOCK FARMS-------------------------- 72
FIGURE 4.6: TEMPERATURE RESPONSE FUNCTION – SPECIALISED CROP FARMS----------------------------------- 73
FIGURE 4.7: PRECIPITATION RESPONSE FUNCTION – SPECIALISED CROP FARMS---------------------------------- 73
FIGURE 4.8: TEMPERATURE RESPONSE FUNCTION – SPECIALISED LIVESTOCK FARMS--------------------------- 74
FIGURE 4.9: PRECIPITATION RESPONSE FUNCTION – SPECIALISED LIVESTOCK FARMS--------------------------- 74
xii
ACRONYMS AND ABBREVIATIONS
AEZ Agro Ecological Zone
AGRIM Agriculture, Growth and Redistribution of Income Model
AOGCMs Atmospheric-Oceanic Global Circulation Models
APN Asia-Pacific Network for Global Change Research
ARTES Africa Rainfall and Temperature Evaluation System
CCC Canadian Climate Centre
CEEPA Centre for Environmental Economics and Policy in Africa
CERES Crop Estimation through Resources and Environmental Synthesis
CGE Computable General Equilibrium
CO2 Carbon Dioxide
CROPWAT Crop Water
DES Dietary Needs Supply
EASM Egyptian Agricultural Sector Model
EPIC Erosion Productivity Impact Calculator
FAO Food and Agriculture Organization
FARM Future Agricultural Resources Model
GEF Global Environmental Facility
GCM Global Circulation Model
GDP Gross Domestic Product
GIS Geographic Information System
LUT Land Utilisation Types
IAC InterAcademy Council
IPCC Intergovernmental Panel on Climate Change
MINK Missouri-Iowa-Nebraska-Kansas
MLCRDRY Multiple crops under dryland
MLCRIRRG Multiple crops under irrigation
MLCRLSIR Multiple crop-livestock under irrigation
MLCRLSDR Multiple crop-livestock under dryland

xiii
MOCRLSDR Mono crop-livestock under dryland
MOCRLSIR Mono crop-livestock under irrigation
MNL Multinomial Logit
MNP Multinomial Probit
PCM Parallel Climate Model
SNM Standard National Model
SRES Special Report on Emissions Scenarios
SSA Sub-Saharan Africa
SSMI Special Sensor Microwave Imager
TAR Third Assessment Report
UNEP United Nations Environmental Programme
US United States of America
VIF Variance Inflation Factor
WB World Bank
1
Chapter 1
Introduction
1.0 Background and statement of the problem
Higher temperatures and declining rainfall patterns, as well as increasing frequency of
extreme climate events (such as droughts and floods), are the expected future climate in
the tropics (IPCC, 2007; Mitchell & Tanner, 2006; IPCC, 2001). In southern Africa, for
example, rainfall patterns show a declining trend of summer rainfall (about 20%) from
1950-1999 and a high frequency of droughts, predicted to intensify in the 21st century
(Mitchell & Tanner, 2006). Predictions for 2050 by the US National Center for
Atmospheric Research show that the declining trend in rainfall is set to continue and the
region is expected to be 10−20 percent drier than the previous 50 years (Mitchell &
Tanner, 2006). These predicted changes in climate are expected to have differential
impacts on agricultural productivity, food security and other sectors, across spatial and
temporal scales. In the tropics and Africa in particular, changes in climate are expected to
be detrimental to agricultural livelihood (IPCC, 2007; IAC, 2004; Dixon, Gulliver &
Gibbon, 2001; IPCC, 2001). Recent studies suggest that agricultural crop productivity in
Africa will be adversely affected by any warming above current levels (Kurukulasuriya et
al., 2006; Kurukulasuriya & Mendelsohn, 2007a; Seo & Mendelsohn, 2007a).
Local ecosystems provide the main source of livelihood for many of the world’s poor.
Most of the rural poor in sub-Saharan Africa rely for their livelihood and food security on
highly climate-sensitive rain-fed subsistence or small-scale farming, pastoral herding and
direct harvesting of natural services of ecosystems such as forests and wetlands (Mitchell
& Tanner, 2006; Leary et al., 2005; Roach, 2005; IPCC, 2001; Kandlinkar & Risbey,
2000). The productivity of this livelihood base is highly vulnerable to climate-related
stresses, such as changes in temperature, precipitation (both amount and variability), and
increased frequency of droughts and floods. The vulnerability of the majority of the poor
in Africa to climate-related stresses is worsened by widespread poverty, HIV/AIDS, lack
of access to resources (e.g. land and water) and management capabilities, wealth,

2
technology, education, ineffective institutional arrangements, and lack of social safety
nets (Leary et al., 2005; Nyong, 2005; APN, 2002; IPCC, 2001).
Studies based on the Global Environmental Facility (GEF) African Climate Project
estimated the economic impacts of climate change on African agriculture (Dinar, Hassan,
Mendelsohn & Benhin, 2008). These studies however, analysed impacts on dryland crops,
irrigated crops and livestock separately. This is a significant limitation, since factors
affecting the choice between crop and livestock production or their combination (mixed
systems), cannot be separated. The selection must be an endogenous decision made by
agricultural producers in response to varying climates and other circumstances. The
decision of what to produce and how to produce it is accordingly an important adaptation
mechanism in the face of changing climate and other ecological and economic
circumstances. This is of special importance to Africa, where the majority of poor small-
scale farmers practice mixed crop−livestock agriculture and few depend on crops or
livestock alone.
One main objective of this study is therefore to measure the aggregate impact of climate
change on income from all agricultural production systems (crop, livestock and mixed) in
Africa, and to predict future impacts under various climate scenarios. In addition, the
study also measures and compares impacts on specialised crop and livestock farms. The
results are contrasted with findings of other regional studies using the same data but
generating different climate response functions for crop and livestock farming separately
(Kurukulasuriya et al., 2006; Kurukulasuriya & Mendelsohn, 2007a; Seo & Mendelsohn,
2007a).
Climate is changing and mitigation efforts to reduce the sources or enhance the sinks of
greenhouse gases will take time and may also be very expensive (Stern, 2006). Empirical
studies measuring the economic impacts of climate change on agriculture in Africa
(Kurukulasuriya & Mendelsohn, 2007a; Seo & Mendelsohn, 2007a; Mano &
Nhemachena, 2007; Benhin, 2006; Kabubo-Mariara & Karanja, 2007) showed that such
impacts can be significantly reduced through adaptation. Adaptation is therefore critical
3
and of major concern in developing countries which are most vulnerable, particularly
Africa. While African farmers have low capacity to adapt to such risks, they have
survived and have coped with climate change in various ways over time and under
changing circumstances (Kurukulasuriya & Rosenthal, 2003). The second objective of
this study is to analyse adaptation measures used by African farmers and determinants of
their choices.
Better understanding of how farmers have coped with and adapted to climate change is
essential for designing incentives to enhance private adaptation. This is also true for
public adaptation as better understanding will help governments to design programmes to
help farmers adapt. Supporting the coping strategies of local farmers through appropriate
public policy, investment and collective actions has the potential to facilitate increased
adoption of adaptation measures. Such adoption will reduce the negative consequences of
predicted future climate changes, with great benefits to vulnerable rural communities in
Africa. Our analysis is different from other adaptation studies in that we consider actual
adaptation measures being taken by farmers, compared to the analysis conducted by
Maddison (2007) on the same sample of African farmers, which is based on farmers’
perceived adaptations. We also consider the choice between many adaptation measures
simultaneously, compared to studies that analysed such joint endogenous decisions in
separate analyses for crop selection (Kurukulasuriya & Mendelsohn, 2007b), irrigation
modelling (Kurukulasuriya & Mendelsohn, 2007c) and livestock choice analysis (Seo &
Mendelsohn, 2007b).
1.2 Objectives of the Study
The first main objective of this study is to measure the aggregate impact of climate
change on income from all agricultural production systems (crop, livestock and mixed) in
Africa, and to predict future impacts under various climate scenarios. The study analyses
the impacts of global warming on African agriculture in terms of long-term changes in
climate variables (temperature and precipitation). In addition to measuring economic
4
impacts, the second main objective of the study is to analyse determinants of farmers’
choices between alternative adaptation measures available to African farmers. Adaptation
measures1 refer to adjustments in management strategies to reduce risks or realise
opportunities from actual or expected changes in climatic conditions.
Under these main objectives the following specific objectives were pursued:
1. Apply a cross-sectional model to measure the impacts of changes in seasonal
climate attributes (rainfall and temperature levels) on net revenue from crop and
livestock farming, while controlling for the effect of other factors.
2. Use estimated model parameters to predict impacts of future climate changes on
net revenue from crop and livestock farming under various climate scenarios.
3. Estimate climatic response functions of different production systems under
irrigation and dryland conditions.
4. Analyse the significance of seasonal climate, household and other socio-economic
factors in influencing the use of adaptation measures at the farm level.
5. Suggest policy options that can reduce negative impacts of climate change and
help improve regional food security in the face of anticipated changes in climate.
1.3 Hypotheses of the study
1. In regions in Africa that are already hot and dry, increases in warming and
declining precipitation are expected to have negative effects on net revenue from
crop and livestock farming, controlling for the effects of other factors.
2. In regions in Africa experiencing dry and average wet conditions, increases in
seasonal rainfall are expected to increase net farm revenues, controlling for the
effects of other factors.
1 See Chapter 5 section for more details on adaptation.
5
3. The adverse impacts of increases in warming and declining precipitation in Africa
are expected to be higher for dryland, single-cropping and pastoralist systems than
for irrigated and mixed crop−livestock farms.
4. Improved access of African farmers to resources such as credit, extension,
information etc., enhances farm-level use of adaptation measures.
1.4 Approach and Methods of the Study
This study employs two main analytical techniques to attain the above objectives. It
firstly adopts the cross-section (Ricardian) approach to measure the impacts of climate
change attributes (rainfall and temperature levels) on income from all agricultural
production systems (crop, livestock and mixed) in Africa, controlling for other
production factors. Based on empirical estimates from the Ricardian model, future
impacts under various climate scenarios are predicted. In addition to estimating impacts
on mixed crop−livestock farms, impacts on specialised crop and livestock farms are also
measured and compared. Responses of different production systems are analysed under
irrigation and dryland conditions. Secondly, the study employs the multinomial logit
approach to analyse determinants of farm-level adaptation measures of African farmers.
The empirical estimations are based primarily on existing survey and other data collected
by the Global Environmental Facility/ World Bank/ Centre for Environmental Economics
and Policy in Africa (GEF/WB/CEEPA) study on climate change and agriculture (Dinar
et al., 2008). This data covers eleven countries: Burkina Faso, Cameroon, Egypt, Ethiopia,
Ghana, Kenya, Niger, Senegal, South Africa, Zambia and Zimbabwe.
1.5 Organisation of the Thesis
Chapter 2 provides background information on the climate, farming systems and
agricultural production in Africa. Chapter 3 presents a review of approaches for
measuring the economic impacts of climate change and empirical studies that have
6
estimated climate change impacts on agriculture. Specification of the Ricardian analytical
model and results of the empirical analyses of climate change impacts on agriculture are
presented and discussed in Chapter 4. Chapter 5 briefly reviews selected theoretical and
empirical studies relating to the economics of climate change adaptation in agriculture.
The empirical specification and estimation of the multinomial discrete choice model of
determinants of farm strategies is presented in Chapter 6. A summary, conclusions and
implications for policy and research are presented in Chapter 7.

7
Chapter 2
African climate, farming systems and agricultural production
2.0 Introduction
Agricultural production remains the main source of livelihood for most rural
communities in developing countries. In sub-Saharan Africa in particular, agriculture
provides a source of employment for more than 60% of the population and contributes
about 30% of the Gross Domestic Product (GDP) (Kandlinkar & Risbey, 2000). In
addition, agriculture provides an important source of export earnings, accounting for 16%
of the total exports in sub-Saharan Africa (47% of total exports in East Africa, 14% in
southern Africa and 10% in West Africa) (IAC, 2004; Dixon et al., 2001).
Agricultural production in Africa is vulnerable to climatic conditions due to a number of
reasons: (i) most parts of the continent are already experiencing very high temperatures;
(ii) most farmers depend on the quality of rain and production is mainly subsistence; and
(iii) most parts of the continent are already water stressed2 (IPCC, 2001). African farmers
and systems have adapted in many ways to climate change through, for example, growing
multiple crops, mixing crops and livestock, and using irrigation (Kurukulasuriya &
Rosenthal, 2003). With respect to the main goals of the study, this chapter presents an
overview assessment of the African climate and how it influences agricultural production
in major farming systems.
2 Many parts of Africa are vulnerable to lack of access to safe water arising from multiple factors, with the
situation exacerbated by climate change. For example, some assessments show severe increased water
stress and possible increased drought risk for parts of northern and southern Africa, and increases in
runoff in East Africa (IPCC, 2007). Further, Africa has the lowest conversion factor of precipitation to
runoff, averaging 15%. Also, although the equatorial region and coastal areas of eastern and southern
Africa are humid, the rest of the continent is dry sub-humid to arid (IPCC, 2001).

8
2.1 African climate and agricultural potential
According to the IPCC (2001), most parts of Africa are mainly tropical and experience
hot and dry conditions. Temperate climatic conditions are found in the extreme south and
north, and at high altitudes in between. Humid conditions are experienced in parts of
West Africa, including the western part of Central Africa, throughout the year. The sub-
humid region covers a large area north and south of the humid central region, and
experiences substantial rainfall during the wet season and almost no rain during the dry
season. Semi-arid climates are located from the sub-humid region further to the poles,
and are characterised by extreme unreliability of rainfall. Most of the human population
is located in the sub-humid and semi-arid zones (IPCC, 2001).
Scientific evidence on global warming shows that further increases in average
temperatures of 1.4-5.8°C are expected in the 21st century (Wilson, 2001). These
increases are expected to be more harmful in tropical areas such as Africa that are already
experiencing very high temperatures. Most climate models predict more frequent and
severe extreme weather events in the tropics generally, including both localised drought
and flooding. Agricultural productivity in Africa is considered to be vulnerable to such
extreme weather events.
An important example is the increased frequency of drought episodes over the last
several decades particularly in southeast Africa that are associated with the El Niño-
Southern Oscillation (ENSO3) phenomenon. In addition, arid and semi-arid sub-regions
and the grassland areas of eastern and southern Africa, as well as areas currently under
threat from land degradation and desertification, are particularly vulnerable to global
3 “The El Niño-Southern Oscillation (ENSO) is the atmosphere-ocean phenomenon responsible for
interannual climate variability” (IPCC, 2007; Nicholson & Entekhapi, 1986). “The ENSO events have
great impact on the wind, sea surface temperature, and precipitation patterns” (IPCC, 2007). “The
typical rainfall anomaly associated with ENSO is a dipole rainfall pattern: some regions will experience
warm ENSO episodes, whereas others will be negatively correlated with these events” (Nicholson &
Kim, 1997).

9
warming, indicating reduced potential for agricultural activities in these regions. A
reduction in rainfall projected by some climate models for the Sahel and southern Africa,
if accompanied by high inter-annual variability, could be detrimental to the hydrological
balance of the continent and disrupt various water-dependent socio-economic activities
that include agricultural production systems (IAC, 2004).
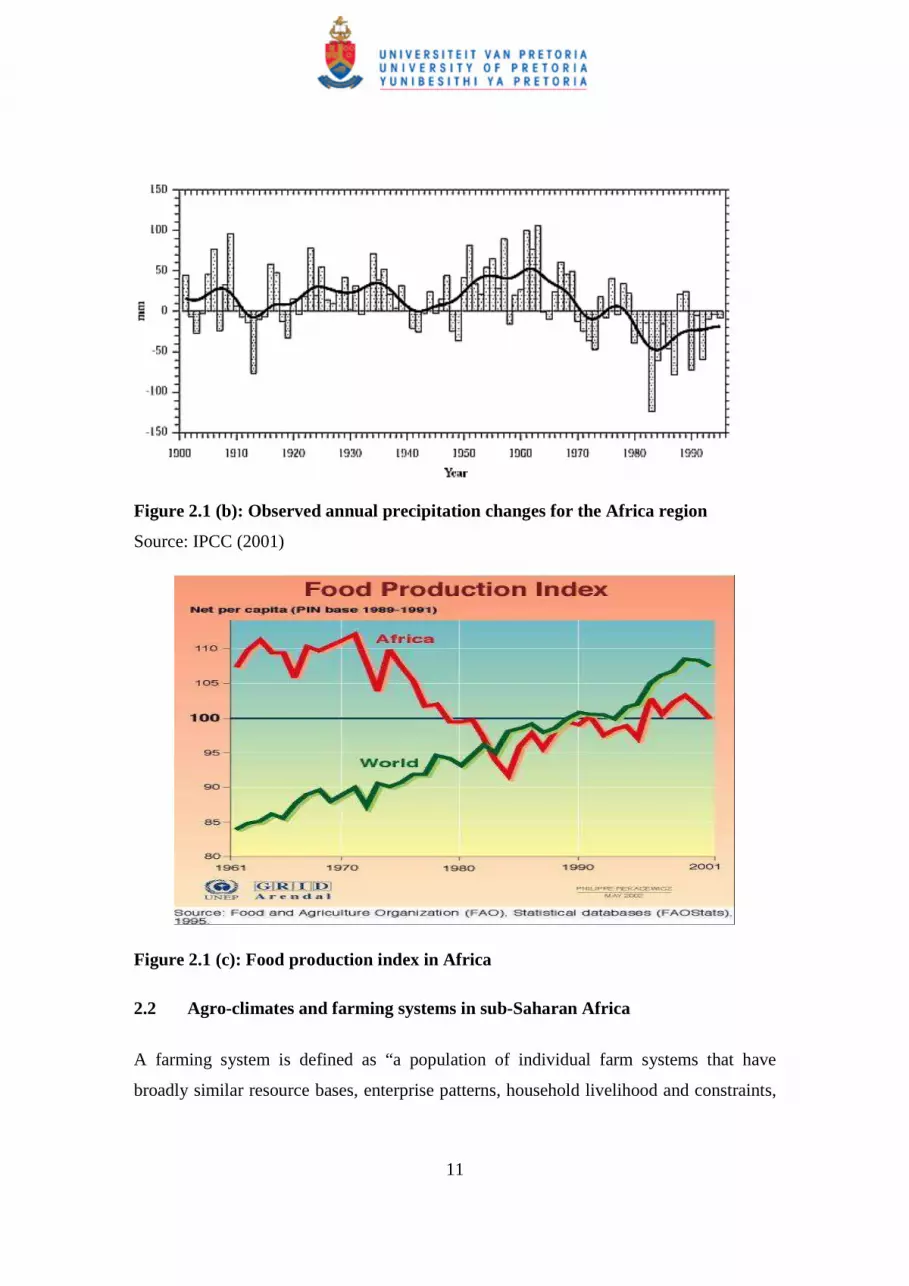
Figures 2.1(a), (b) and (c) below show trends in temperature, precipitation and food
production in Africa respectively. Trends in precipitation and temperature for the African
region indicate that the region is warming and getting drier. Trends in variability of
temperature in Africa over the 20th century show a rising trend in observational records at
a rate of about 0.05°C per decade. Much of the warming has been recorded in the June-
November seasons compared to the December-May seasons (Hulme, Doherty, Ngara,
New & Lister, 2001). According to the IPCC (2001), temperatures are expected to
increase most in southern and northwest Africa at a rate of about 0.6°C to 1°C per decade
and around 0.4°C in East Africa. Precipitation trends show that Africa is going to
experience drier conditions, with precipitation decreasing at a rate of between 10 and
20% in southern Africa and 10 to 50% in eastern and northern parts of Africa (IPCC,
2001). These trends are expected to negatively affect agricultural productivity and food
security in the region, unless precautionary adaptive measures are taken. These adaptive
measures, both at the local farm level and national levels are necessary to help reduce the
potential negative effects associated with these changes in temperature and precipitation.
It is difficult to establish causality between climate variability and rain-fed crop and
livestock production. It is however, true that for some countries and certain years, food
production has been declining in the face of increasing temperature and decreasing
precipitation regimes. The impact of these changes, in addition to other factors, is that
food production in most of sub-Saharan Africa (SSA) has not kept pace with population
growth over the past three decades. For example, in Africa as a whole, food consumption
exceeded domestic production by 50% in drought-prone areas in the mid-1980s and by
more than 30% in the mid-1990s (WRI, 1998). This has left many countries in Africa
being net food importers, with food aid constituting a major proportion of net food trade

10
in the region. For instance, food aid constituted two-thirds of food imports during the
1990s in Kenya and Tanzania (IPCC, 2001).
In addition, per capita dietary needs supply (DES) remains relatively low (Hulme, 1996).
About one-third of the countries in Africa had per capita DES of less than 2000 kcal per
day in the 1990s, which is lower than the minimum recommended intake of 2100 (Todd,
2004; Naiken, 2002). The results from the three graphs suggest a direct correlation
between increasing temperatures, decreasing precipitation and declining food production.
The implication of predicted further warming in Africa is that food production is going to
be adversely affected, unless farmers use adaptation strategies such as irrigation. It is
therefore important to find ways and strategies of reducing the vulnerability and
improving the adaptive capacity of African agriculture in the face of the adversities of
predicted climate changes.
Figure 2.1 (a): Variations of the earth’s surface temperature for the past 100 years
in Africa
Source: UNEP Grid Arendal (2002).
11
Figure 2.1 (b): Observed annual precipitation changes for the Africa region
Source: IPCC (2001)
Figure 2.1 (c): Food production index in Africa
2.2 Agro-climates and farming systems in sub-Saharan Africa
A farming system is defined as “a population of individual farm systems that have
broadly similar resource bases, enterprise patterns, household livelihood and constraints,
12
Sub-Saharan Africa Regional Boundary
Country Boundary
Farming Systems
1. Irrigated
2. Tree crop
3. Forest based
4. Rice-tree crop
5. Highland perennial
6. Highland temperate mixed
7. Root crop
8. Cereal-root crop mixed
9. Maize mixed
10. Large commercial & smallholder
11. Agro-pastoral millet/sorghum
12. Pastoral
13. Sparse (arid)
14. Coastal artisanal fishing
Irrigated area in rainfed farming system
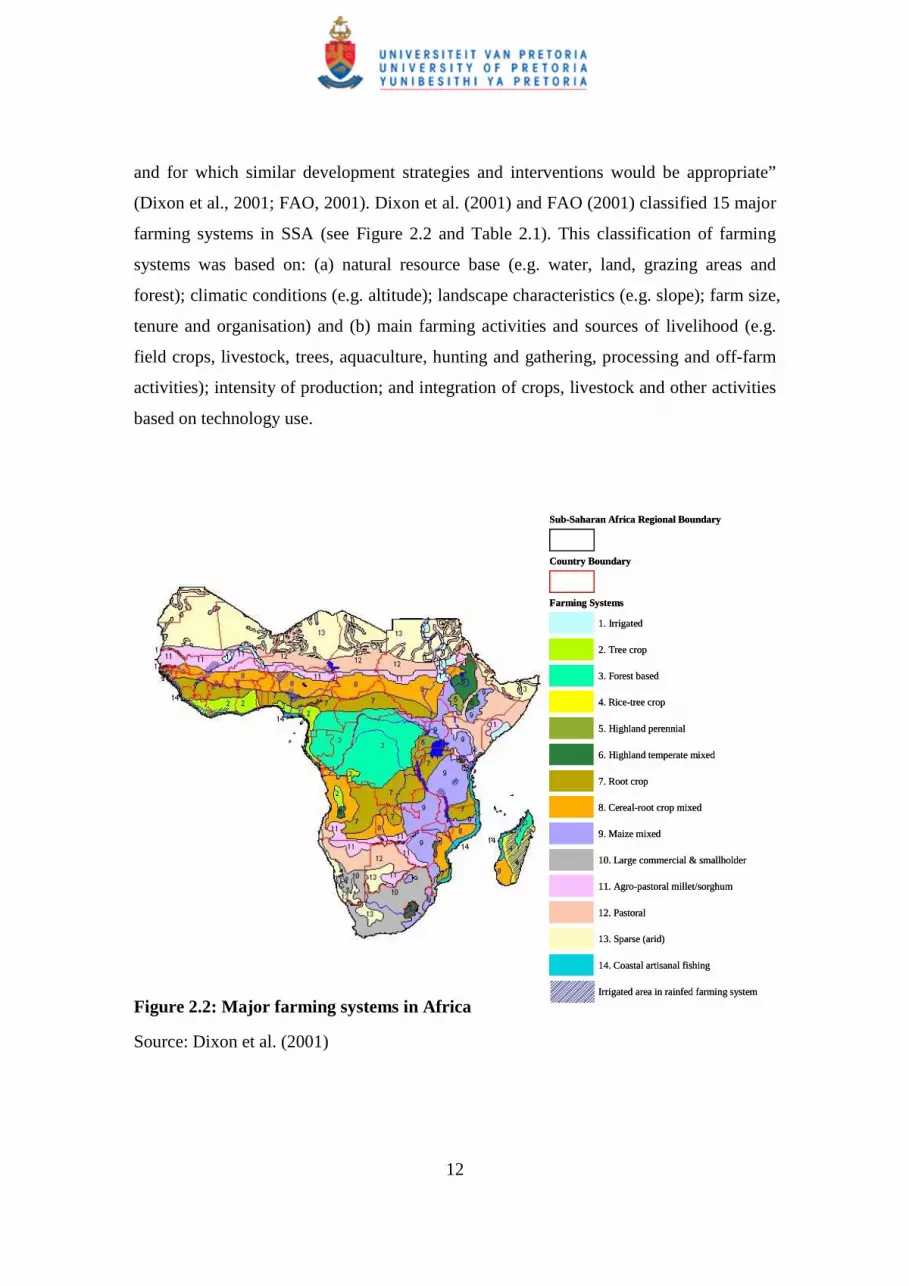
and for which similar development strategies and interventions would be appropriate”
(Dixon et al., 2001; FAO, 2001). Dixon et al. (2001) and FAO (2001) classified 15 major
farming systems in SSA (see Figure 2.2 and Table 2.1). This classification of farming
systems was based on: (a) natural resource base (e.g. water, land, grazing areas and
forest); climatic conditions (e.g. altitude); landscape characteristics (e.g. slope); farm size,
tenure and organisation) and (b) main farming activities and sources of livelihood (e.g.
field crops, livestock, trees, aquaculture, hunting and gathering, processing and off-farm
activities); intensity of production; and integration of crops, livestock and other activities
based on technology use.
Figure 2.2: Major farming systems in Africa
Source: Dixon et al. (2001)
13
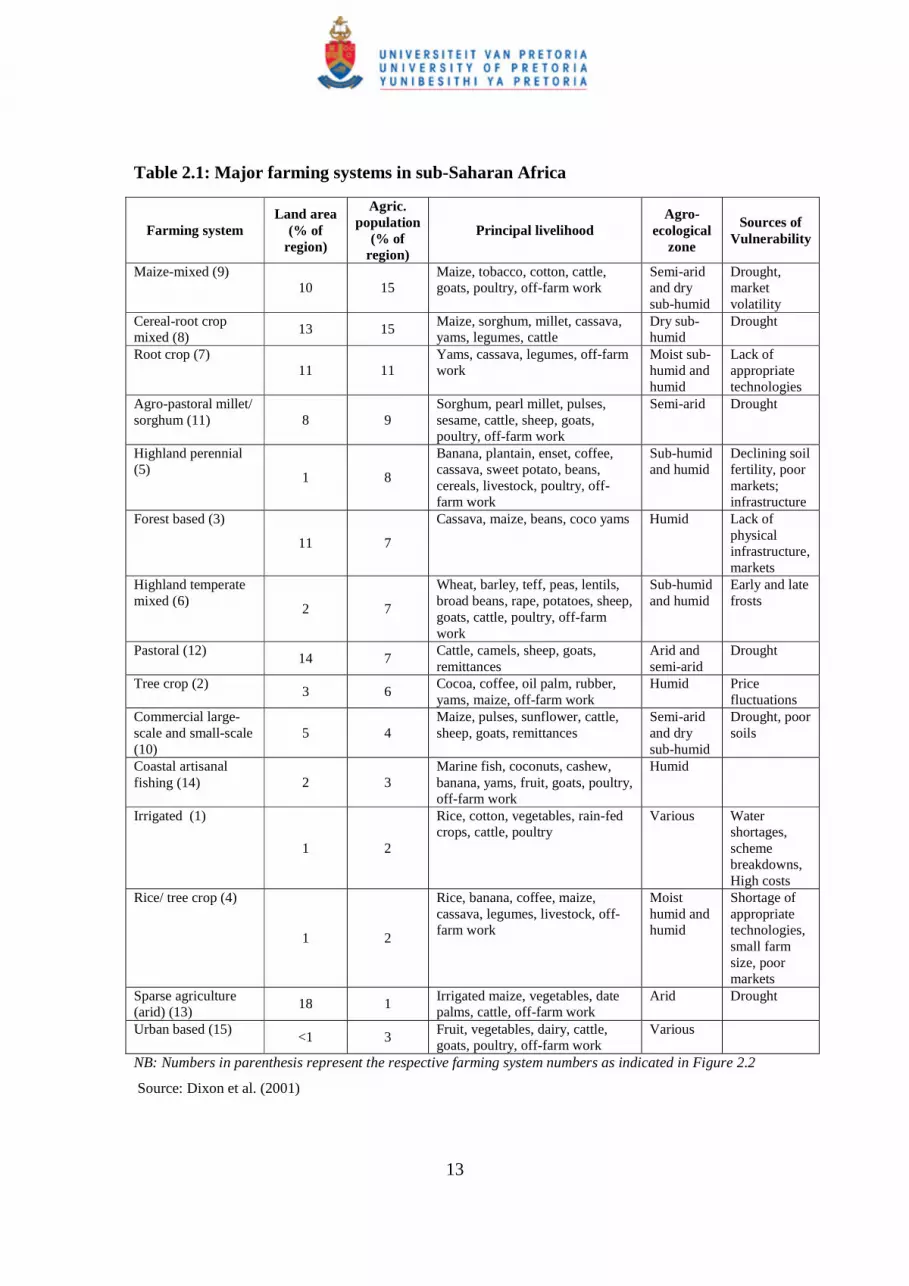
Table 2.1: Major farming systems in sub-Saharan Africa
Farming system Land area
(% of region)
Agric. population
(% of region)
Principal livelihood Agro-
ecological zone
Sources of Vulnerability
Maize-mixed (9) 10 15
Maize, tobacco, cotton, cattle, goats, poultry, off-farm work
Semi-arid and dry sub-humid
Drought, market volatility
Cereal-root crop mixed (8)
13 15 Maize, sorghum, millet, cassava, yams, legumes, cattle
Dry sub-humid
Drought
Root crop (7) 11 11
Yams, cassava, legumes, off-farm work
Moist sub-humid and humid
Lack of appropriate technologies
Agro-pastoral millet/ sorghum (11) 8 9
Sorghum, pearl millet, pulses, sesame, cattle, sheep, goats, poultry, off-farm work
Semi-arid Drought
Highland perennial (5)
1 8
Banana, plantain, enset, coffee, cassava, sweet potato, beans, cereals, livestock, poultry, off-farm work
Sub-humid and humid
Declining soil fertility, poor markets; infrastructure
Forest based (3)
11 7
Cassava, maize, beans, coco yams Humid Lack of physical infrastructure, markets
Highland temperate mixed (6)
2 7
Wheat, barley, teff, peas, lentils, broad beans, rape, potatoes, sheep, goats, cattle, poultry, off-farm work
Sub-humid and humid
Early and late frosts
Pastoral (12) 14 7
Cattle, camels, sheep, goats, remittances
Arid and semi-arid
Drought
Tree crop (2) 3 6
Cocoa, coffee, oil palm, rubber, yams, maize, off-farm work
Humid Price fluctuations
Commercial large-scale and small-scale (10)
5 4 Maize, pulses, sunflower, cattle, sheep, goats, remittances
Semi-arid and dry sub-humid
Drought, poor soils
Coastal artisanal fishing (14) 2 3
Marine fish, coconuts, cashew, banana, yams, fruit, goats, poultry, off-farm work
Humid
Irrigated (1)
1 2
Rice, cotton, vegetables, rain-fed crops, cattle, poultry
Various Water shortages, scheme breakdowns, High costs
Rice/ tree crop (4)
1 2
Rice, banana, coffee, maize, cassava, legumes, livestock, off-farm work
Moist humid and humid
Shortage of appropriate technologies, small farm size, poor markets
Sparse agriculture (arid) (13)
18 1 Irrigated maize, vegetables, date palms, cattle, off-farm work
Arid Drought
Urban based (15) <1 3
Fruit, vegetables, dairy, cattle, goats, poultry, off-farm work
Various
NB: Numbers in parenthesis represent the respective farming system numbers as indicated in Figure 2.2
Source: Dixon et al. (2001)

14
Despite the central role that agriculture plays in the region, most of the region has
marginal conditions for productive agriculture. Forty-three percent of sub-Saharan Africa
is located in the arid and semi-arid agro-ecological zones, thirteen percent is in the dry
sub-humid zones and thirty-eight percent is covered jointly by the sub-humid and humid
zones (IAC, 2004; Dixon et al., 2001; FAO, 2001). The arid, semi-arid and dry sub-
humid areas are characterised by large marginal areas, which experience very high
temperatures and very low and highly variable rainfall, all of which limit agricultural
productivity. Farming systems in the arid, semi-arid and dry sub-humid zones are
expected to suffer most from the adverse effects of climate change, such as increased
frequency and severity of droughts, high temperatures and rainfall variability (IAC, 2004).
The major farming systems that support most of the agricultural population in Africa and
in southern Africa in particular, are located in the dry sub-humid zone (cereal-root mixed,
maize mixed, large commercial and smallholder systems), semi-arid zone (agro-pastoral,
millet) and arid zone (pastoral). About half of the population in southern and eastern
Africa lives in the sub-humid and humid zones, compared to about seventy percent living
in the same areas in West Africa. The former areas are already experiencing very high
temperatures with a significant proportion of the region receiving mean annual rainfall of
less than 1000mm and having mean annual temperatures between 20 and 30 degrees
Celsius and (Figure 2.3(a) and 2.3(b) below).
Changes in climate in terms of increasing frequency and severity of droughts are
expected to have significant impacts on the arid, semi-arid and dry sub-humid agro-
ecological zones. The impacts would translate into widespread crop failure, high and
rising cereal prices, low and falling livestock prices, distress sales of animals,
decapitalisation, impoverishment, hunger and eventually famine (Dixon et al., 2001; FAO,
2001). Mixed cropping systems are better able to cope with changes in climate and other
stresses. They can reduce risk of crop failure, reduce incidence and losses from pests and
diseases, and can make efficient use of labour (IAC, 2004).

15
Farming Systems
Precipitation Ave mm/year
0 - 24
25 - 74
75 - 124
125 - 224
225 - 274
275 - 374
375 - 474
475 - 724
725 - 974
975 - 1474
1475 - 2474
2475 - 4974
4975 - 7474
7475 - 10004
> 10005
Farming Systems
Precipitation Ave mm/year
0 - 24
25 - 74
75 - 124
125 - 224
225 - 274
275 - 374
375 - 474
475 - 724
725 - 974
975 - 1474
1475 - 2474
2475 - 4974
4975 - 7474
7475 - 10004
> 10005
Farming Systems
Precipitation Ave mm/year
0 - 24
25 - 74
75 - 124
125 - 224
225 - 274
275 - 374
375 - 474
475 - 724
725 - 974
975 - 1474
1475 - 2474
2475 - 4974
4975 - 7474
7475 - 10004
> 10005
Farming Systems
Temperature (Ave Annual ºC)
< - 29.5
-29.5 to -25
-24.5 to -15.0
-14.5 to -10.0
-9.5 to -5.0
-4.5 to 0.0
0.5 to 5.0
5.5 to 10.0
10.5 to 15.0
15.5 to 20.0
20.5 to 30.0
30.5 to 35.0
35.5 to 40.0
> 40.0
Farming Systems
Temperature (Ave Annual ºC)
< - 29.5
-29.5 to -25
-24.5 to -15.0
-14.5 to -10.0
-9.5 to -5.0
-4.5 to 0.0
0.5 to 5.0
5.5 to 10.0
10.5 to 15.0
15.5 to 20.0
20.5 to 30.0
30.5 to 35.0
35.5 to 40.0
> 40.0
Farming Systems
Temperature (Ave Annual ºC)
< - 29.5
-29.5 to -25
-24.5 to -15.0
-14.5 to -10.0
-9.5 to -5.0
-4.5 to 0.0
0.5 to 5.0
5.5 to 10.0
10.5 to 15.0
15.5 to 20.0
20.5 to 30.0
30.5 to 35.0
35.5 to 40.0
> 40.0
Figure 2.3(a): Average annual precipitation in major farming systems
Figure 2.3(b): Average annual temperatures in major farming systems
Source: Dixon et al. (2001)

16
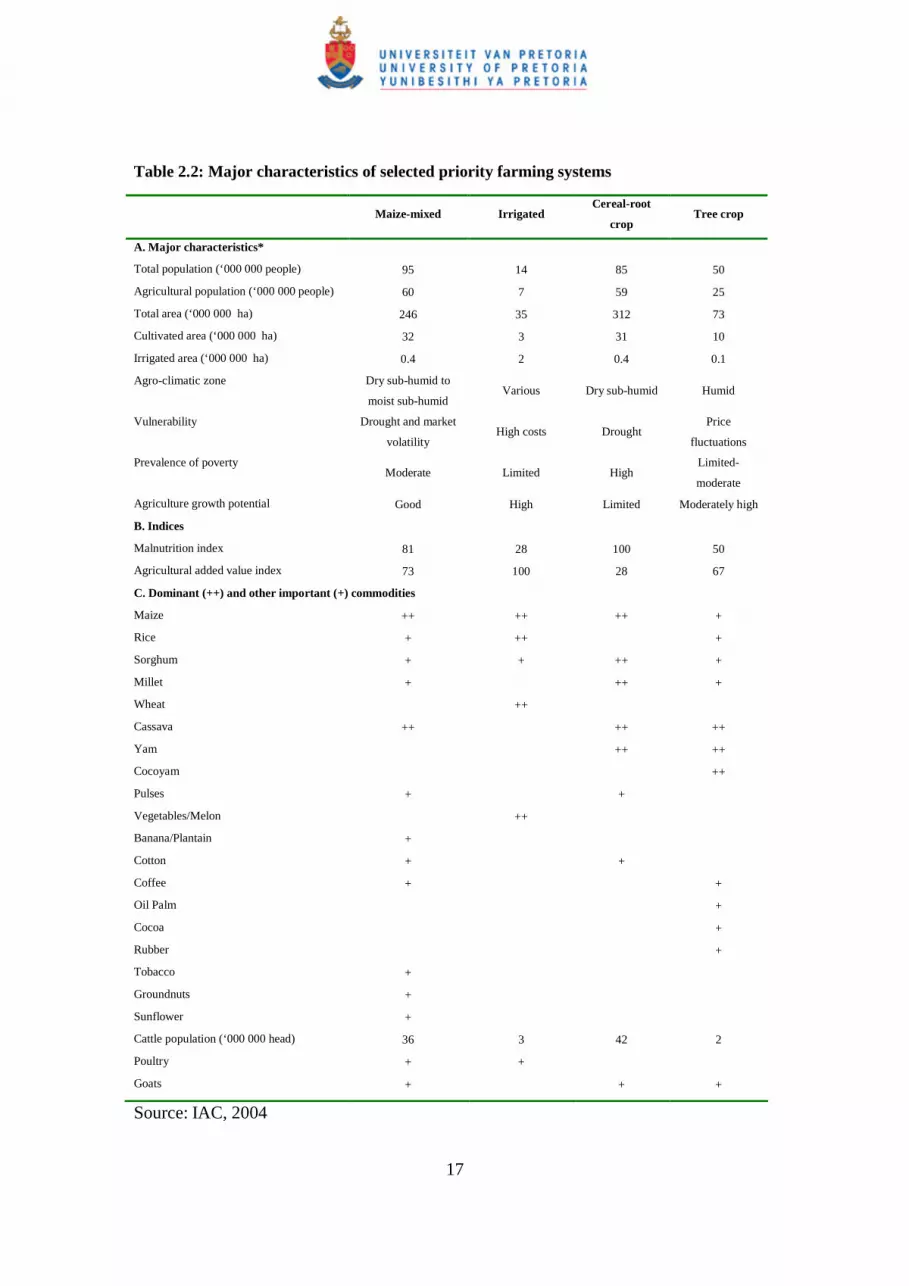
2.3 Characterisation of selected priority farming systems
Table 2.2 presents further information characterising the four priority farming systems:
maize-mixed; cereal-root crop mixed; irrigated and root crops, which support about 41%
of the agricultural population (IAC, 2004). Table 2.3 shows annual productivity growth
for the major commodities over the last two decades (1980-2000) and the two preceding
decades (1960-1980). Productivity trends for six of the major crops in the maize-mixed
farming system have been declining since 1981. On the other hand, crops in the irrigated
and tree crop systems that involve more commercial crops show increasing productivity
trends from 1981. In the main systems examined, productivity was relatively higher for
food crops (e.g. maize, wheat and cassava) than for other crops (e.g. coffee, palm oil and
cocoa).
17
Table 2.2: Major characteristics of selected priority farming systems
Maize-mixed Irrigated
Cereal-root
crop Tree crop
A. Major characteristics*
Total population (‘000 000 people) 95 14 85 50
Agricultural population (‘000 000 people) 60 7 59 25
Total area (‘000 000 ha) 246 35 312 73
Cultivated area (‘000 000 ha) 32 3 31 10
Irrigated area (‘000 000 ha) 0.4 2 0.4 0.1
Agro-climatic zone Dry sub-humid to
moist sub-humid Various Dry sub-humid Humid
Vulnerability Drought and market
volatility High costs Drought
Price
fluctuations
Prevalence of poverty Moderate Limited High
Limited-
moderate
Agriculture growth potential Good High Limited Moderately high
B. Indices
Malnutrition index 81 28 100 50
Agricultural added value index 73 100 28 67
C. Dominant (++) and other important (+) commodities
Maize ++ ++ ++ +
Rice + ++ +
Sorghum + + ++ +
Millet + ++ +
Wheat ++
Cassava ++ ++ ++
Yam ++ ++
Cocoyam ++
Pulses + +
Vegetables/Melon ++
Banana/Plantain +
Cotton + +
Coffee + +
Oil Palm +
Cocoa +
Rubber +
Tobacco +
Groundnuts +
Sunflower +
Cattle population (‘000 000 head) 36 3 42 2
Poultry + +
Goats + + +
Source: IAC, 2004

18
Table 2.3: Productivity trends for various commodities in the priority farming
systems
Annual % yield increase over two periods of two decades Crop
Decades
Maize-mixed Irrigated Cereal-root
crop Tree crop
Maize 1961-1980 2.63 1.97 -0.36 0.27
1981-2002 -0.04 3.3 3.83 2.56
Rice 1961-1980 0.98 0.2 -0.94 1.28
1981-2002 0.69 2.71 1.35 2.98
Sorghum 1961-1980 0.16 0.32 0.72 0.58
1981-2002 0.64 2 1.68 2.28
Millet 1961-1980 1.22 0.04 -1.07
1981-2002 0.54 1.92 0.11
Wheat 1961-1980 6.92 1.92
1981-2002 -0.08 3.19
Cassava 1961-1980 2.8 1.37 -0.06
1981-2002 0.03 2.09 1.75
Yam 1961-1980 1.29
1981-2002 0.92
Pulses 1961-1980 0.9
1981-2002 4.48
Vegetables/Melon 1961-1980 0.21
1981-2002 1.13
Banana 1961-1980 -0.4
1981-2002 1.4
Cotton 1961-1980 2.69
1981-2002 0.77
Coffee 1961-1980 -0.34
1981-2002 0.86
Oil Palm 1961-1980 0.44
1981-2002 0.48
Cocoa 1961-1980 -0.15
1981-2002 1.94
Source: IAC (2004). Indicator countries: Maize-mixed (Malawi and Zimbabwe: 70%; and Tanzania,
Uganda and Zambia: 50%); Irrigated (Egypt); Cereal-root crop mixed (Gambia, Guinea-Bissau and
Mozambique: 70%; and Benin and Burkina Faso: 50%) and tree crop based (Guinea and Liberia: 70%; and
Ghana: 50%). The percentages refer to minimum proportions of the countries that are covered by the
indicated systems.
19
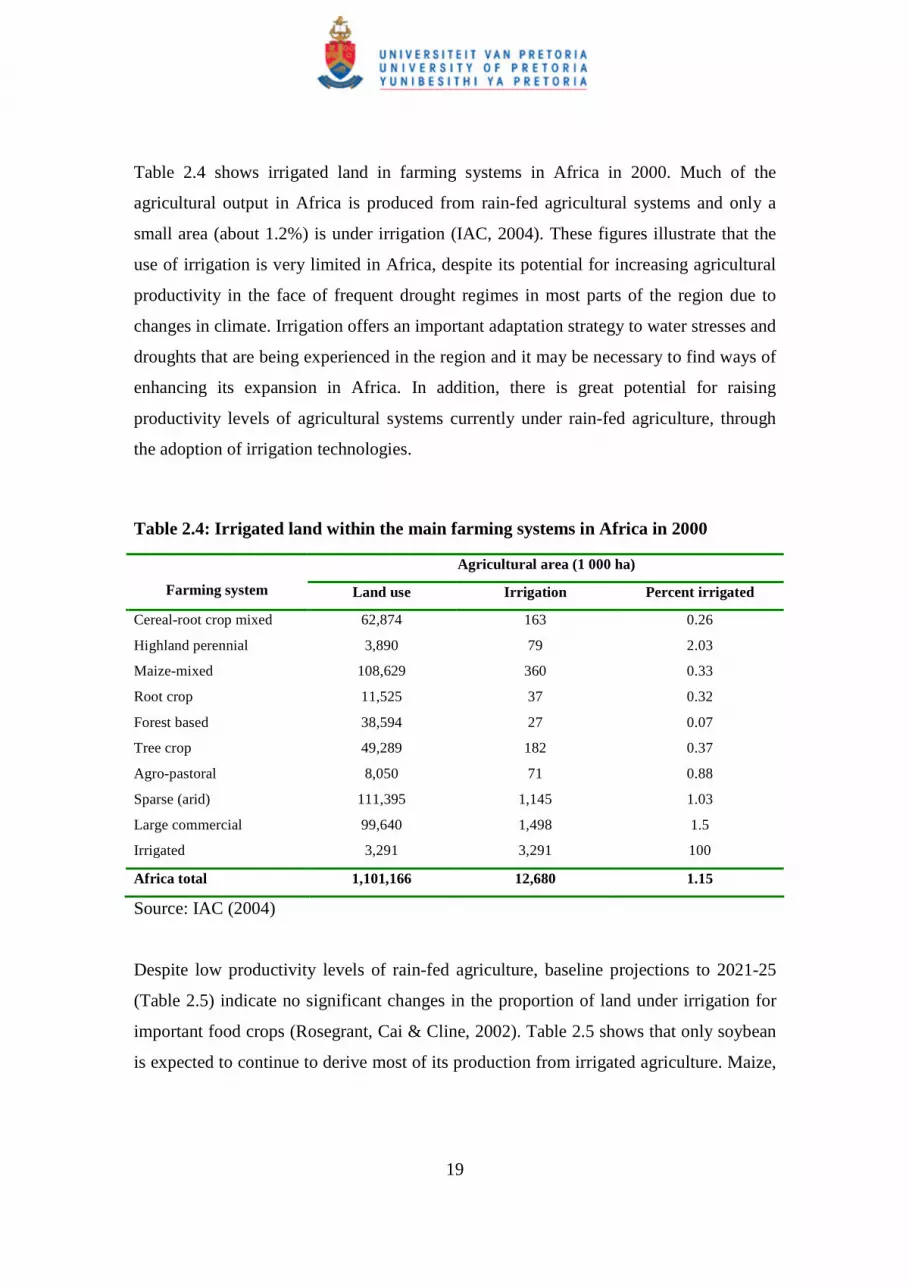
Table 2.4 shows irrigated land in farming systems in Africa in 2000. Much of the
agricultural output in Africa is produced from rain-fed agricultural systems and only a
small area (about 1.2%) is under irrigation (IAC, 2004). These figures illustrate that the
use of irrigation is very limited in Africa, despite its potential for increasing agricultural
productivity in the face of frequent drought regimes in most parts of the region due to
changes in climate. Irrigation offers an important adaptation strategy to water stresses and
droughts that are being experienced in the region and it may be necessary to find ways of
enhancing its expansion in Africa. In addition, there is great potential for raising
productivity levels of agricultural systems currently under rain-fed agriculture, through
the adoption of irrigation technologies.
Table 2.4: Irrigated land within the main farming systems in Africa in 2000
Agricultural area (1 000 ha)
Farming system Land use Irrigation Percent irrigated
Cereal-root crop mixed 62,874 163 0.26
Highland perennial 3,890 79 2.03
Maize-mixed 108,629 360 0.33
Root crop 11,525 37 0.32
Forest based 38,594 27 0.07
Tree crop 49,289 182 0.37
Agro-pastoral 8,050 71 0.88
Sparse (arid) 111,395 1,145 1.03
Large commercial 99,640 1,498 1.5
Irrigated 3,291 3,291 100
Africa total 1,101,166 12,680 1.15
Source: IAC (2004)
Despite low productivity levels of rain-fed agriculture, baseline projections to 2021-25
(Table 2.5) indicate no significant changes in the proportion of land under irrigation for
important food crops (Rosegrant, Cai & Cline, 2002). Table 2.5 shows that only soybean
is expected to continue to derive most of its production from irrigated agriculture. Maize,

20
which constitutes the main cereal in Africa, continues to derive most of its production
from rain-fed agricultural systems.
Table 2.5: Proportions of rain-fed areas and production totals in 1995 and projected
to 2021-25 in Africa for selected crops
Percentage rain-fed
Area (%) Production (%)
Region/commodity
1995 actual
2021-25
baseline
projection
1995 actual
2021-25
baseline
projection
Sub-Saharan Africa
Total cereals 96 95 89 89
Rice 81 77 68 64
Wheat 78 75 73 71
Maize 96 96 90 90
Soybean 25 27 49 52
Source: Rosegrant et al. (2002)
According to the IAC (2004), sustainable yield increases (e.g. through innovations in
integrated water, soil and nutrient management) should be the driving force in future rain-
fed agricultural strategies, rather than the former strategy of increasing production
through area expansion. The limitations of this former strategy are that with population
increases in the region and limited available agricultural land, further agricultural land
expansion will extend into marginal areas, leading to further land degradation, erosion
and loss of biodiversity.
The implication of expected dry and warm conditions in the future is that rain-fed
agricultural systems need more water-efficient farm management systems, combined with
drought-tolerant crops and varieties with higher water use efficiency. Recommended
practices include water harvesting, supplementary irrigation, run-off management,
conservation tillage and integration of more leguminous species into rotation systems.
Improved soil surface management practices, small water harvesting systems and small
21
irrigation systems have been shown to offer great potential for making maximum use of
rainwater. In addition, such practices allow farmers to intensify their production activities
and encourage increased diversity in production of high value crops (IAC, 2004).
2.4 Importance of livestock in African farming systems
Livestock provides an important source of livelihood for most of the rural poor.
Livestock are important as a source of cash; a coping strategy against climate change and
other stresses; and they provide a good source of social security capital and social
networking instruments (IAC, 2004). Other important benefits of livestock include: draft
power for land operations and post harvesting operations; soil fertility improvement from
manure; source of transport to markets; source of diversifying income sources; and an
important source of high quality proteins and energy (IAC, 2004).
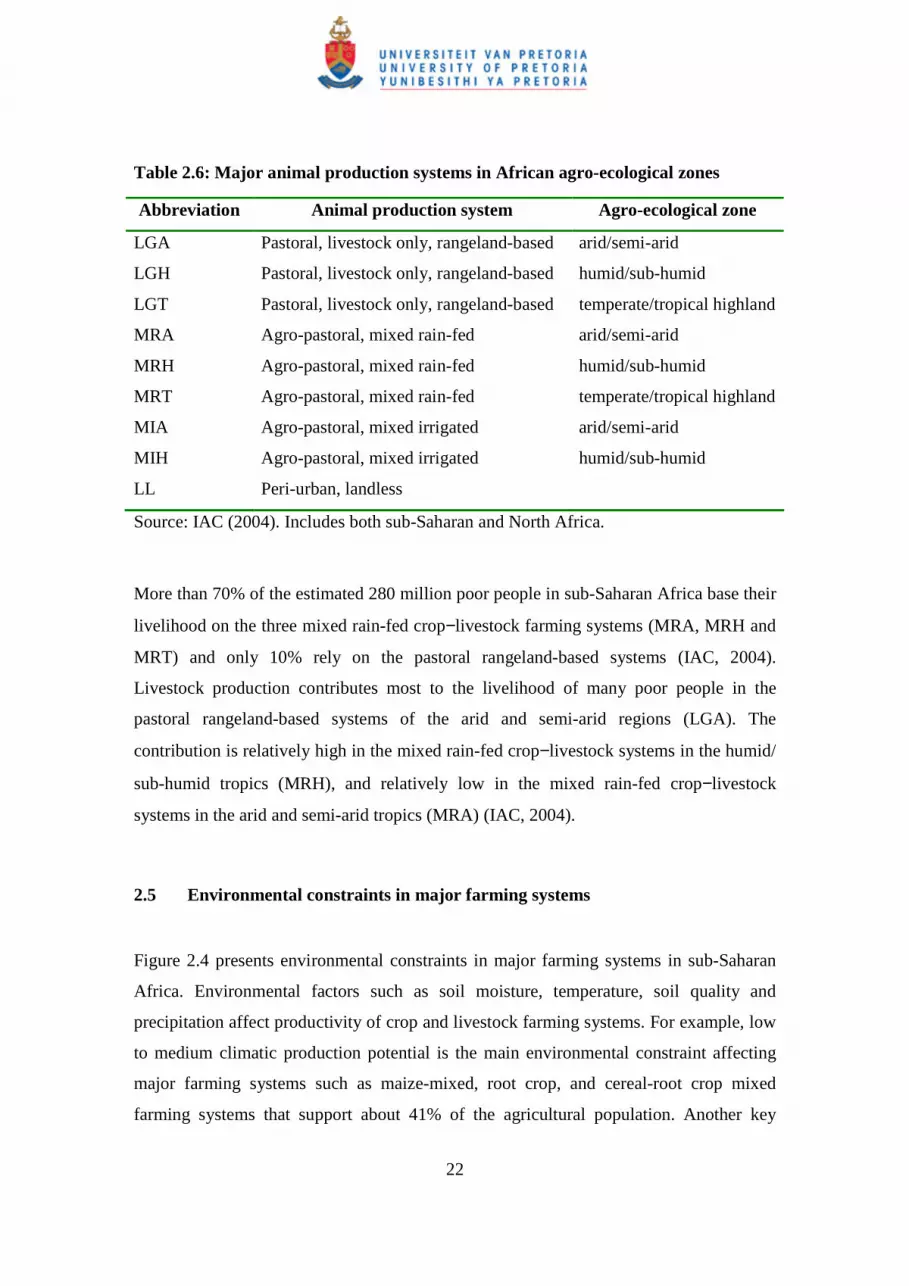
Major animal production systems are presented in Table 2.6. Cattle are a major breed for
most poor people in mixed crop−livestock systems in arid and semi-arid regions (MRA),
humid/sub-humid regions (MRH) and the tropical highlands (MRT) of eastern, central
and southern Africa. Other livestock in these farming systems are: sheep, goats, poultry,
horses, donkeys, mules and pigs. In West Africa, sheep and goats are the most important,
followed by poultry and cattle, horses, donkeys, mules and pigs. Sheep and goats are also
of great importance for the poor in pastoral rangeland-based systems, as are cattle, camels,
donkeys and mules (IAC, 2004).
22
Table 2.6: Major animal production systems in African agro-ecological zones
Abbreviation Animal production system Agro-ecological zone
LGA Pastoral, livestock only, rangeland-based arid/semi-arid
LGH Pastoral, livestock only, rangeland-based humid/sub-humid
LGT Pastoral, livestock only, rangeland-based temperate/tropical highland
MRA Agro-pastoral, mixed rain-fed arid/semi-arid
MRH Agro-pastoral, mixed rain-fed humid/sub-humid
MRT Agro-pastoral, mixed rain-fed temperate/tropical highland
MIA Agro-pastoral, mixed irrigated arid/semi-arid
MIH Agro-pastoral, mixed irrigated humid/sub-humid
LL Peri-urban, landless
Source: IAC (2004). Includes both sub-Saharan and North Africa.
More than 70% of the estimated 280 million poor people in sub-Saharan Africa base their
livelihood on the three mixed rain-fed crop−livestock farming systems (MRA, MRH and
MRT) and only 10% rely on the pastoral rangeland-based systems (IAC, 2004).
Livestock production contributes most to the livelihood of many poor people in the
pastoral rangeland-based systems of the arid and semi-arid regions (LGA). The
contribution is relatively high in the mixed rain-fed crop−livestock systems in the humid/
sub-humid tropics (MRH), and relatively low in the mixed rain-fed crop−livestock
systems in the arid and semi-arid tropics (MRA) (IAC, 2004).
2.5 Environmental constraints in major farming systems
Figure 2.4 presents environmental constraints in major farming systems in sub-Saharan
Africa. Environmental factors such as soil moisture, temperature, soil quality and
precipitation affect productivity of crop and livestock farming systems. For example, low
to medium climatic production potential is the main environmental constraint affecting
major farming systems such as maize-mixed, root crop, and cereal-root crop mixed
farming systems that support about 41% of the agricultural population. Another key

23
Farming Systems
Environmental Constraints
Dry and/or cold areas with low production potential
Low soil suitability
Erratic rainfall and cold stress risk
Steep slopes and mountains
Severe and very severe land degradation
Low to medium climatic production potential
High climatic production potential
Farming Systems
Environmental Constraints
Dry and/or cold areas with low production potential
Low soil suitability
Erratic rainfall and cold stress risk
Steep slopes and mountains
Severe and very severe land degradation
Low to medium climatic production potential
High climatic production potential
environmental constraint is erratic rainfall and cold stress risk, which is prevalent in the
pastoral, agro-pastoral millet/sorghum, cereal-root crop mixed, large commercial and
smallholder farming systems. The sparse arid farming system is located in dry and/or
cold areas with low production potential.
Figure 2.4: Environmental constraints in major farming systems
Source: Dixon et al. (2001)
Climate related factors (erratic rainfall and cold stress, climatic production potential and
dry and/or cold areas) are the main limiting environmental factors for agricultural
productivity in Africa. Farming systems, crop and livestock production and hydrological
balances are expected to be greatly influenced by changes in climatic variables
(temperature, precipitation) and the frequency and severity of extreme climate events
(droughts and floods).

24
The relatively large extent of areas already experiencing climate related constraints
implies that climatic factors have significant effects on performance of agricultural
systems in Africa. Figures 2.3(a) and 2.3(b) showing rainfall and temperature maps
indicate that these areas experience climate related constraints such as low to medium
rainfall and very high temperatures. The combination of these factors and other economic
factors such as low technology use, lack of inputs, and market access will negatively
affect productivity of farming systems in major farming systems in Africa.
2.6 Summary
This chapter described the various agro-ecological regions and the location of major
farming systems in Africa. Major farming systems in Africa are located in subtropical
and tropical regions which have marginal conditions for productive agricultural
production, with about 43% of the total land area being arid and semi-arid agro-
ecological zones. These regions are characterised by large marginal areas, very high
temperatures and very low and highly variable rainfall, all of which limit agricultural
productivity. The implication is that changes in climate attributes will have significant
impacts on agricultural production.
The maize-mixed, cereal-root crop mixed and root crop farming systems support about
41% of the agricultural population. Agro-pastoral millet/sorghum, highland perennial,
pastoral, forest based and highland temperate mixed are also important systems. The
mixed farming system is very important in Africa, which justifies the empirical analysis
in this study for estimating the impacts of climate change on mixed crop−livestock
systems.
It is difficult to establish causality between climate variability and rain-fed crop and
livestock production. However, it is true that for some countries and years, food
production has been declining in the face of increasing temperature and decreasing
precipitation regimes. Generally, long term temperature and precipitation patterns show
25
increasing and decreasing trends respectively, and food production trends show some
direct correlation with trends in climate attributes (temperature and precipitation).
Furthermore, maps of major farming systems and temperature and precipitation maps
show that most of the region experiences warm and dry climatic conditions. The
implication may be that climate change attributes have significant effects on agricultural
productivity and food security in the region.
This chapter also presented the environmental constraints in major farming systems.
Environmental factors such as soil moisture, temperature, soil quality and precipitation
affect productivity of crop and livestock farming systems. Climate related factors (erratic
rainfall and cold stress, climatic production potential, and dry and/or cold areas) affect
most parts of the sub-Saharan region. This evidence further justifies the hypothesis that
climate attributes (temperature and precipitation) have significant effects on agricultural
performance in Africa.

26
Chapter 3
Review of literature on measuring the economic impacts of climate change on
agriculture
3.0 Introduction
This chapter discusses the various approaches and methods that have been used to
measure economic impacts of climate change on agriculture. Particular empirical studies
that have measured economic impacts of climate change on agriculture are reviewed. The
chapter concludes with a discussion of the approach chosen to implement the empirical
economic analyses of this study and to yield its expected contributions.
3.1 Approaches to measuring economic impacts of climate change
Impacts of climate change on agriculture have been estimated using two main approaches:
(a) structural modelling of crop and farmer response − this approach combines crop
agronomic response with economic/farmer management decisions and practices; and (b)
spatial analogue models that measure observed spatial differences in agricultural
production (Adams, Hurd, Lenhart & Leary, 1998a; Schimmelpfenning, Lewandrowski,
Reilly, Tsigas & Parry, 1996). Other impact assessment methods that have been used are
the integrated impact assessment method and the agro-ecological zone (AEZ) method
(Mendelsohn, 2000). All these approaches are discussed in more detail in the following
sub-sections.
3.1.1 Structural approaches
Structural approaches (agronomic-economic models) start by using crop simulation
models such as the CERES family of models (see Ritchie, Singh, Goodwin & Hunt, 1989
27
for a description of the CERES models), CROPWAT (FAO, 1993) or EPIC models (see
Schneider, Easterling & Mearns, 2000). These models are based on detailed experiments
to determine the response of specific crops and crop varieties to different climatic and
other conditions. Farm management practices can be included in structural models, for
example, modelling the impacts of changing timing of field operations, crop choices,
adding irrigation etc. (Adams, 1999; Adams et al., 1998a; Schimmelpfenning et al., 1996).
Economic impacts (e.g. changes in acreage, supply by crop and region, as well as
resulting changes in prices) are then estimated by incorporating yield estimation results
from crop simulation models e.g. from General Circulation Model (GCM) forecasts into
economic models of the agricultural sector (Adams, 1999; Adams et al., 1998a). The
objective of the economic model component is to optimise consumer and producer
welfare, subject to climatic and other factors imposed in the model (Adams, 1999; Adams
et al., 1998a). Examples of studies that have applied this approach include: Kaiser, Riha,
Wilks, Rossier & Sampath (1993) at the farm-level; Adams and others (1998b; 1995;
1990) at the national level, and Easterling et al. (1993) at the regional level.
The types of economic models that have been used with agronomic models include: (a)
computable general equilibrium (CGE) models that simulate economic wide impacts of
climate change taking into account interactions between many economic agents and
activities (e.g. Yates & Strzepek, 1996, 1998; Darwin, Lewandrowski, McDonald &
Tsigas, 1994); (b) partial equilibrium models that include mathematical programming
(e.g. Chang, 2002; Kumar & Parikh, 2001) and spatial equilibrium models of the
agricultural sector (e.g. Adams et al., 1998b; Iglesias, Rosenzweig & Pereira, 1999); and
(c) the basic linked system approach − an applied general equilibrium model for
analysing global impacts of agricultural policies and food systems (e.g. Rosenzweig &
Parry, 1994; Parry, Rosenzweig, Iglesias, Fischer & Livermore, 1999).
The strength of using structural approaches is that they allow for detailed understanding
of the biophysical responses, as well as adjustments that farmers can make in response to
changing climatic and other conditions (Adams, 1999; Adams et al., 1998a;
Schimmelpfenning et al., 1996). In addition, economic models can estimate changes in

28
clearing prices that can be translated into aggregate changes in well-being for consumers
and producers (Adams, 1999; Adams et al., 1998a). This enables identification of the
gainers and losers from changing climate conditions, as well as the distribution of the
impacts. Such information might be important for focused policy and adaptation planning
in identifying which group of people to target and in which ways they should be
supported. Another strength of structural models compared to reduced form statistical
(cross-sectional) models, is that they indicate the various technological and adaptation
options that would offset the negative effects of climate change and positively increase
yields.
One of the disadvantages of structural approaches is that adaptations included in
agronomic models fail to account for economic considerations and limitations in human
capital and other resources that affect actual farm-level decisions (Mendelsohn, 2000). In
addition, if the economist fails to correctly anticipate the potential farmer adjustments
and adaptations, the estimates might be biased (either overestimating the damages or
underestimating the potential benefits of climate change) (Adams, 1999).
Furthermore, the problem of using such approaches is that in aggregate studies,
inferences need to be made based on results from very few laboratory and experimental
sites and crops analyses, to large areas and diverse agricultural production systems
(Schimmelpfenning et al., 1996). Crop simulations models fail to account for the
diversity of factors that affect production in the field (Adams et al., 1998a). Furthermore,
structural models are usually associated with very high cost implications (Mendelsohn,
2000; Adams, 1999). This makes it difficult to implement them in poor and developing
countries, implying that such countries need to rely on experiments conducted in
developed countries.
Another disadvantage of agronomic models is that they have historically ignored the
adoption of new technologies and most of them impose climate change scenarios on
current agricultural systems (Mendelsohn, 2000). The problem with this is that the
impact of climate change does not materialise for decades and by the time the climate

29
actually changes, the farming systems could have changed from their current form.
Including technical change in farming systems is important in assessing the damages that
will be caused by climate change when it occurs (Mendelsohn, 2000). Adams et al. (1998)
cited by Mendelsohn (2000), made attempts to capture technical change in the farming
system by explicitly forecasting how farming would change in the United States by 2060.
Modelling the adoption of new technologies and the transition from low input labour-
intensive agriculture to high input modern farming is particularly important for
developing countries. The sensitivity of climate change results to assumptions about
baseline scenarios can be assessed through examining a range of assumptions concerning
the speed of this transition.
The other disadvantages of structural approaches are the same as those for the cross-
sectional approach. For instance, uncertainties surrounding economic development and
political stability affect predictions of the nature of the future agricultural sector.
Technical progress is often difficult to predict and very few agronomic efforts have
considered the implications of projecting impacts into the future (Mendelsohn, 2000).
Generally as discussed above, the literature review reveals that agronomic models are
associated with high cost implications (for data collection) and historical non-use of new
technologies. However, more recent agronomic approaches make use of new global
databases, do not have to rely on farm-level experiments, and have no problem with using
advanced technologies. Furthermore, structural models, when combined with agricultural
sector models, can present some types of autonomous adaptation triggered by price
changes.
3.1.2 The Spatial analogue approach
The spatial analogue approach uses cross-sectional evidence to undertake statistical
(econometric) estimations of how changes in climate would affect agricultural production
across different climatic zones. Statistical and programming analyses across different
geographic areas make it possible to make a comparative assessment of factors affecting
30
production across different regions. In addition, this approach gives evidence of changes
in farmer management practices and decisions in response to changing climatic
conditions. Another advantage of the spatial analogue approach is that other factors that
affect crop production, such as soil type and quality, are taken into account in statistical
estimation. This cannot be done using the structural approach, since it depends on the
quality of the data and how representative it is, as well as on the ability of the statistical
analysis to separate the confounding effects (Adams et al., 1998a; Schimmelpfenning et
al., 1996).
Two main spatial analogue methods have been developed to account for adaptation in
response to changes in climate: (a) the Future Agricultural Resources Model (FARM) by
Darwin et al. (1994, 1995); and (b) the Ricardian approach by Mendelsohn, Nordhaus
and Shaw (1994). The basic underlying assumption for both the FARM and Ricardian
methods is that similar climates mean similar production practices. This allows the two
approaches to implicitly capture changes in crop or livestock outputs, production inputs
or management practices that farmers are likely to take in response to changing climatic
and other conditions (Darwin, 1999). Each of these approaches is discussed in more
detail below.
3.1.2.1 The Future Agricultural Resources Model (FARM)
The FARM was developed by Darwin et al. (1994, 1995) to estimate the potential
impacts of climate change on US agriculture, considering at the same time interactions
with non-agricultural sectors and other global regions. The estimates in the FARM fully
account for all responses by economic agents under global climate change, including
estimates of Ricardian rents4.
4 Ricardian rent refers to the estimates of land values from the ‘Ricardian’ approach named after David
Ricardo (1772–1823), which relies upon the standard theory of land rent, as a way of identifying the
impacts of changes on net economic welfare (Mendelsohn & Nordhaus, 1996).
31
The FARM makes use of geographic information systems (GIS) to link climatically
derived land classes with other inputs and agricultural outputs in a computable general
equilibrium (CGE) model of the world. The GIS component characterises regional
differences in land, climate, water and agricultural suitability. Changes in climate are
assumed to alter agricultural potentials of a given area by shifting regional land class and
water characteristics. The resulting economic changes and effects on regional and global
production and prices are then estimated in the CGE model (Adams et al., 1998a). The
FARM’s GIS is a spatial analogue model and the FARM’s CGE is structural model
(Darwin, 1999). Simulations using the FARM’s CGE model capture further interactions
that are likely to occur under climate change between farmers and downstream
consumers (both domestic and foreign) of agricultural products (Darwin, 1999).
One of the limitations of the FARM is that the sensitivity of the Ricardian rents to
changes in climate variables at grid levels is affected by the aggregation of climatic
information into six land classes. In addition, it may be difficult to downscale the analysis
to country level as some countries may be only one or two grids. Another limitation of
the FARM is that it fails to capture some seasonal variations in climatic variables such as
temperature, precipitation and coldness. Failure to include these variations might lead to
biased estimates (Darwin, 1999).
3.1.2.2 Ricardian cross-sectional approach
Cross-sectional models measure farm performances across climatic zones (Dinar et al.,
2008; Mendelsohn et al., 1994; 1996; Sanghi, Mendelsohn & Dinar, 1998; Mendelsohn,
2000, Mendelsohn & Dinar, 1999, 2003). The Ricardian approach is the cross-sectional
method commonly used to measure the impact of climate change on agriculture. The
Ricardian approach measures the performance of farmers, households and firms across
spatial scales with different climates. Measured changes in farm performance are used to
estimate long-run sensitivity of farm performance to climate (Dinar et al., 2008;
Mendelsohn & Dinar, 1999, 2003, 2005; Mendelsohn et al., 1994, 1996). The technique
32
draws heavily on the underlying observation by Ricardo that under competition, land
values reflect the productivity of the land. The Ricardian approach has been applied in
the United States (Mendelsohn et al., 1994, 1996) and in some developing countries:
India (Sanghi et al., 1998; Kumar & Parikh, 1998) (using district level data), South Africa,
(Gbetibouo & Hassan, 2005; Deressa et al., 2005) and eleven African countries5 under
the GEF/WB/CEEPA project (Dinar et al., 2008) using district level data to examine the
economic impacts of climate change on agriculture.
The Ricardian approach regresses farmland values against climate, economic and other
factors to estimate the economic impacts of climate change and other factors on farm
performance (Mendelsohn & Dinar, 1999, 2003; Mendelsohn, 2000; Mendelsohn et al.,
1994, 1996; Adams et al., 1998a). In a well-functioning market system, the value of a
parcel of land should reflect its potential profitability, implying that spatial variations in
climate derive spatial variations in land use, which in turn affects land values (Polsky,
2004). With this background, it should be possible to estimate a meaningful climate−land
value relationship by specifying a multivariate regression model. The estimated
coefficients for the climate variables would reflect the economic value of climate in
agriculture, holding other factors constant.
The Ricardian cross-sectional approach automatically incorporates farmer adaptation by
including decision making changes that farmers would make to tailor their operations to a
changing climate. An important example of farmer adaptation strategies is crop choice,
where a particular crop will become the optimal choice depending on the effects of a
warmer climate. Optimal crop switching is therefore an important component of
measuring the agricultural impact of climate change (Mendelsohn et al., 1994, 1996;
Mendelsohn & Dinar, 1999). The Ricardian approach provides a framework to make
comparative assessments of with and without adaptation scenarios, giving a valuable
view of how adaptation measures may help to reduce the impact of climate change on
agriculture.
5 Burkina Faso; Cameroon; Egypt; Ethiopia; Ghana; Kenya; Niger; Senegal; South Africa; Zambia and
Zimbabwe.
33
Farmer adaptations that are implicit in the Ricardian model results are projected to
largely offset the economic costs associated with climate change (Polsky, 2004). Farmers
use available information to their maximum economic benefit in adapting to climatic
shocks in any economy at equilibrium. For instance, a standard Ricardian model would
imply that if growing citrus crops is more profitable than growing wheat, and if the
climate becomes more suitable for citrus than for wheat, then farmers will adapt to the
changed climate by drawing on the experiences of citrus farmers elsewhere and switching
from wheat to citrus (Polsky, 2004).
The advantage of the cross-sectional approach is that it fully incorporates farmer
adaptations. The first round adaptations by farmers are captured in the estimates of
climate-induced changes that represent the economic value of climate change on
agriculture (Mendelsohn et al., 1994, 1996). Measurement of long-term impacts of
climate change considers the costs and benefits associated with changes in management
decisions and practices taken by farmers in response to changes in local climate, as well
as the effect of other explanatory variables such as soils, infrastructure, agricultural
services and other socio-economic variables (Mendelsohn & Dinar, 2005; Mendelsohn et
al., 1994, 1996). The underlying assumption is that farmers will automatically make
adjustments in their management practices and respond to changes in climate
(Mendelsohn & Dinar, 2003; Mendelsohn et al., 1994, 1996; Adams, 1999; Adams et al.,
1998a). The assumption of implicit structural changes and farmer adaptations frees one
from the burden of estimating the impacts of climate change on region-specific crops and
farmer adaptations (Adams, 1999; Adams et al., 1998).
One limitation of the cross-sectional approach is the scarcity of good and reliable data,
particularly in developing countries (Mendelsohn & Dinar, 2005; Adams, 1999). It is
difficult to control for all variables that might affect the estimated relationship between
climate and agricultural production using evidence from cross section data. For example,
some variables might be included in the model but poorly measured, or might be
excluded for lack of data (Reilly, 1999). The GEF/WB/CEEPA African climate and

34
agriculture project provided a dataset that is very useful in addressing data limitation in
developing countries (see Dinar et al., 2008). The empirical estimation for this study is
based on this rich dataset that has not been fully utilised in country and regional studies
for the GEF/WB/CEEPA African climate and agriculture project. The dataset contains
detailed farm information across agro-climatic zones and farming systems in eleven
Africa countries and provides an important source of information for assessing the effects
of climate change on farm performance. In addition, the data contains useful information
on farmer perceptions on changes in climate, and various farm-level adaptations they
have made in response to changes in climate (e.g. planting different crops, changing
planting and harvesting dates, changing livestock practices and using irrigation
technologies).
Another limiting factor of the cross-sectional approach is trying to control for spatial
variations in other physical (e.g. variations in soils across landscape), economic (e.g.
proximity to markets, labour and technology) and policy variables (e.g. trade restrictions,
subsidies and taxes) (Mendelsohn & Dinar, 2005). Making policy recommendations from
estimations that fail to take these factors into account will produce biased estimates of
impacts of and adaptation to climate change. Policy recommendations made based on
such results will be inaccurate and might lead to misdirection and mismanagement of
limited resources (Mendelsohn & Dinar, 2005). This study does control for these other
factors, in order to ensure improved accuracy of estimation results and policy
recommendations based on the results. A detailed description is provided in the section
that discusses the independent variables used in the estimation.
A further limiting factor of the cross-sectional approach is that estimations of climate
change impacts on farm performance are based on incremental changes in crop prices.
Estimates would be inaccurate if large and widespread changes in climate result in long-
term sustained changes in crop prices. Changes in prices would determine the magnitude
and direction of error (Schimmelpfenning et al., 1996).

35
The statistical and programming methods used in the spatial analogue approach assume
that farmers and other agents make costless structural adjustments and adaptations.
Adaptation is however associated with costs, for example, research and development
costs associated with changes in technologies, as well as costs of farm-level adoption and
possible physical and human capital investments (Adams, 1999; Adams et al., 1998a).
Another limitation of using cross-sectional evidence is that it represents at best a long-
run equilibrium response. Reilly (1999) argues that the cross-sectional Ricardian method
and other similar reduced form approaches fail to explicitly define/describe how one gets
from point A (current climate and current production activities) to point B (new climate
and new production activities). Darwin et al. (1995), as cited by Reilly (1999), attempted
to provide more information on possible ways of adaptation by dividing the response to
climate change into three options: (a) on farm changes, (b) in the market changes and (c)
land use changes. Despite being artificial, these categories provide more insight on the
ways farmers respond to changes in climate and adapt. Using these categories, Darwin et
al. were able to show that farmers can adjust their decisions even without much market
response and without moving agricultural production to completely new areas (Reilly,
1999).
3.1.3 Integrated assessment models
Integrated assessment models of climate change impacts predict a range of impacts and
climate sensitivity, starting with greenhouse gas emissions to final impacts. Using
projections of economic development over the next century, global warming integrated
assessment models can make predictions of future greenhouse gas concentrations.
Changes in greenhouse gas concentrations are expected to lead to increasing global
temperatures and hence global warming. Changing global temperatures will have
differential effects on patterns of climate change and climate sensitivity across climatic
regions (Mendelsohn, 2000).

36
Future agricultural impacts are predicted based on projected changes in climate and
climate sensitivity. Impacts from global warming are expected to be evident as the
climate changes. Changes in temperature, precipitation and carbon dioxide concentrations
are all expected to affect agricultural production (Mendelsohn, 2000). Studies that have
used integrated assessment methods in estimating climate change impacts on agriculture
include: the Egyptian study (Yates & Strzepek, 1998); the MINK study on Minnesota,
Iowa, Nebraska and Kansas (Crosson & Rosenburg, 1993); the US agriculture study
(Adams et al., 1990, 1995); and the world food trade study (Rosenweig & Parry, 1993).
3.1.4 Agro-ecological zone (AEZ) method
The agro-ecological zone (AEZ) model uses detailed information about climate and soil
conditions, crops and technologies to measure climate sensitivity of simulated crop yields.
The AEZ model relies heavily on natural science relationships and develops a detailed
eco-physiological process model. The model predicts Land Utilisation Types (LUT)
based on combinations of existing technology, soil and climate to determine which crops
are suitable for each cell. The AEZ model can simulate the impacts of changes in
temperature and precipitation on potential agricultural output and cropping patterns on a
global scale (Güther, van Velthuizen, Shah & Naehtergaele, 2002; Mendelsohn, 2000).
The AEZ model can be used to assess the impact of various aspects of climate change on
potential crop production over wide geographic areas, although it was not created to
model climate change. An important strength of the AEZ model is the widespread
coverage of developing countries, where little climate research has been done, and where
data constraints may make the use of other methods difficult. The AEZ model can
simulate the impacts of changing precipitation and cloud cover on potential crop
production and to a lesser extent, the impacts of temperature changes. Another advantage
of the AEZ model is that with full knowledge of the potential impacts of future
technology and genetic strains on specific parameters, modelling of future climate
sensitivities can be done based on detailed eco-physiological relationships (Güther et al.,
2002; Mendelsohn, 2000).

37
The main disadvantage of this method is that it is not possible to predict final outcomes
without explicitly modelling all relevant components. It is also difficult to build a general
model that will predict actual yields across locations, even with relatively simple
agronomic systems. To address this problem the AEZ method compares simulated yields
against reported yields and substitutes field data where there are major differences
(Güther et al., 2002; Mendelsohn, 2000).
3.2 Empirical studies assessing impacts of climate change on agriculture
3.2.1 Empirical studies based on structural approaches
Chang (2002) adapted the structural approach to incorporate the yield effects of climate
change directly into a sector-wide economic model with various levels of farm adaptation
possibilities. He used a two-step procedure to estimate the impacts of climate change on
the agricultural sector of Taiwan: (a) yield regression models were used to investigate the
impact of climate change on sixty crops; and (b) an agricultural sector model was used to
evaluate the impacts of crop yield changes (based on estimates from the regression
models) on agricultural production, land use, welfare distribution, as well as the potential
of agricultural adaptation in response to climate change.
The regression models for crop yields integrated the physical and social determinants of
yield. Welfare results showed that an increase in temperature is not stressful for Taiwan’s
farmers, and may even be beneficial when adaptation is taken into account. However, the
upward shift in rainfall intensity was found to have potentially devastating impacts on
farmers’ welfare. The welfare effects were shown to be different for producers and
consumers, with producers expected to benefit from changes in climate. Variations in
climate were shown to be significant in influencing crop yields and Chang (2002)
highlighted the importance of incorporating these variations in impact assessment studies
in sub-tropical and tropical regions.

38
In another study, the impact of climate change was estimated using an integrated
modelling approach that included a crop simulation model and an applied general
equilibrium model (Kumar & Parikh, 2001). The crop simulation model was used to
estimate the impacts of changing climatic conditions on crop yields of wheat and rice. To
estimate the economic and welfare implications of climate change, the authors integrated
the predicted yield changes from the crop simulation model as supply shocks into an
applied general equilibrium model (Agriculture, Growth and Redistribution of Income
Model - AGRIM). Results from the study show that predicted changes in climate are
expected to adversely affect crop yields and agricultural production. In addition, climate
change will negatively affect welfare and the poor will be most affected.
Schneider et al. (2000) used an Erosion Productivity Impact Calculator (EPIC) crop
model to examine the effects of natural variability on how farmers in the US Great Plains
respond to changes in climate. The EPIC model, driven by a 2×CO2 regional climate
model scenario, was used to calculate changes in crop yields for three groups of farmers
in terms of their adaptation practices: no adaptation; perfect adaptation; and 20-year
lagged adaptation. The latter group was included to mimic the masking effects of natural
variability on the ability of farmers to notice changes in climate. Adaptation options
tested in the EPIC crop model included: varying planting dates, changing crop varieties,
and regulating crop growth period. The results show that warmer temperatures enabled
farmers to plant early in the spring so that critical reproductive periods avoided the risk of
damage from high heat levels in mid-summer. In addition, with a longer growing period,
farmers were able to grow long maturity varieties with longer grain filling periods and
hence higher yields. The results from the EPIC crop model show that adaptation
improves crop yields relative to the no adaptation case. These results support findings
from other studies that adaptation serves to reduce potential negative effects from
changes in climate.
Iglesias et al. (1999) estimated the impacts of climate change across spatial scales (seven
sites) in major wheat growing regions in Spain, using CERES-Wheat, a dynamic process
crop growth model. Using results from the crop model, the authors examined response of

39
yield to changes in irrigation water, temperature, precipitation and CO2 concentration.
Results from the spatial analysis showed similar results to the CERES-Wheat crop
growth model. An important finding from the empirical results is that crop water (both
precipitation and irrigation) and temperature during the growing season significantly
affect variability in simulated crop yields.
Yates and Strzepek (1998) assessed the integrated impacts of climate change on the
Egyptian agricultural sector using a quadratic programming sector model. These authors
used a forward-linkage sector approach to impact assessment that applied two economic
models: (a) an Egyptian specific CGE sub-model (the Standard National Model-SNM) of
the Basic Linked System to estimate impacts of climate change on crop yields, crop water
use, water supply and land resources; and (b) results from the SNM were entered as
inputs into the Egyptian Agricultural Sector Model (EASM) for assessing climate change
impacts.
Simulations of the partial equilibrium, quadratic programming EASM model capture
changes in water, land, crop, livestock, labour and other components at the sub-national
scale. The results show that consumers and producers will be affected differently by
changes in climate, with producers likely to experience more losses. Another important
finding is that climate change impacts, coupled with changes in world markets as well as
local and regional biophysical factors, would be more harmful to smaller food importing
countries. Based on these findings, agricultural production will be vulnerable to changes
in climate in African countries, most of which are net small food importers. This will
impact negatively on national and regional food security efforts to support the fast
growing populations.
The findings by Yates and Strzepek (1998) on climate change impacts on Egyptian
farmers differ from those of Chang (2002) in terms of Taiwanese farmers. Although both
studies used the structural approach and different methods, the latter study showed that
farmers in Taiwan are likely to benefit from increases in temperature, while in Egypt (the
former study), farmers will suffer from further warming. A possible explanation for this

40
difference is the fact that Taiwan is already wetter and has cooler conditions compared to
Egypt. Furthermore, Egypt is entirely dependent on irrigated crops because the climate is
too dry to support crops without irrigation (Kurukulasuriya et al., 2006).
Kaiser et al. (1993) examined the potential economic and agronomic impacts of climate
change and farm-level adaptation using three models of the relevant climatic, agronomic
and economic processes based on a case study of a grain farm in southern Minnesota in
the United States. The study simulated the sensitivity of crop yields, crop mix and farm
revenue to climate change, based on a number of scenarios with different severity. The
study simulated climate change in a dynamic way rather than the comparative static way
of comparing a ‘doubled CO2’ induced climate change with the current climate, which is
important for analysing farm-level adaptations. The empirical estimation of climate
change impacts included variability in climate variables as a way of capturing impact on
agriculture performance.
The results by Kaiser et al (1993) show that climate change will affect growth and yield
of agricultural crops, as well as length and timing of growing periods, all of which will
contribute to reduction in the productivity of the agricultural sector of the southern
Minnesota of the United States. The study also shows that farmers will adjust their
management practices to reflect changes in the agricultural ecosystem due to climate
change and other factors. The ‘tactical’ farm-level adaptation decisions included:
changing crop varieties, changing planting and harvesting dates (to take advantage of a
longer growing season due to climate change) and crop mix. These adaptation measures,
even if they lag behind the evolution of climate change, were shown to be effective in
helping reduce the negative effects of climate change on agriculture. Adaptation is
therefore important in helping farmers to reduce the potential impacts of climate change,
while at the same time achieving their farming goals (e.g. food security and higher
incomes).
Empirical agronomic studies in Zimbabwe have revealed that climate change has a
negative effect on the agricultural performance of major crops. Muchena (1994) and
41
Magadza (1994) showed that a 2º C rise in ambient temperature and a 4º C rise in mean
temperature significantly lowered yields. In another study, Makadho (1996) assessed the
potential effects of climate change on corn, using a Global Circulation Model (GCM) and
the dynamic crop growth model CERES-Maize. The results indicated that maize
production is expected to decrease significantly by approximately 11–17%, under
conditions of both irrigation and non-irrigation. The above studies found that a reduced
crop growth period due to increases in temperature, particularly during the grain filling
and ripening stages, is the main factor contributing to decreased yields.
Schulze, Kiker and Kunz (1993), and Du Toit, Prinsloo, Durand and Kiker (2002) applied
a CERES-Maize simulation model to estimate the impacts of climate change on maize
production in South Africa. The former study considered the effects of increasing carbon
dioxide concentrations and subsequent increases in temperature and did not consider
changes in precipitation due to uncertainty of predicted changes. The results show that
potential maize production increased with varied intensity across geographic areas.
Increases in temperature and carbon dioxide strongly increased yields in low yielding
areas (below 4 tonnes per hectare), and had less impact in high yielding areas (at least 8
tonnes per hectare). The latter study showed that seasonal changes in precipitation
strongly affected maize yields. Simulation results showed that under current management
practices, some parts of South Africa, such as the marginal western region, may become
unsuitable for maize production, whereas the eastern region may remain unchanged or
increase production.
New research and knowledge since the Third Assessment Report (TAR) show that many
studies have estimated climate change impacts on agriculture (e.g. agricultural
productivity, food security etc) at regional and global scales (IPCC, 2007). Examples
include: Fischer and others (2002; 2005); Parry (2004); Parry et al., (2005); and Tubiello
& Fischer (2006). The methodologies applied were based on agro-ecological zone data
and/or dynamic crop models and socio-economic models. These studies first estimate
climate change impacts on agronomic production potentials, followed by estimations of

42
the effects on food supply, demand and consumption at regional to global levels that take
into account different socio-economic future scenarios (typically SRES) (IPCC, 2007).
Further highlights of new research and knowledge since the TAR confirm that developing
countries will suffer from potentially large negative impacts, while developed regions
will experience small changes (IPCC, 2007). The studies cited in the IPCC (2007) report
show that the aggregate impacts on world food production would be small based on the
projected impacts of climate change in developing and developed countries (Fisher et al.
2002, 2005; Parry, 2004; Parry et al., 2005). However, contrasting findings from
regional studies (e.g. Reilly et al. 2003; Olesen & Bindi, 2002) cited by the IPCC report
show that the impacts of climate change could be significantly negative in key production
regions even in developed countries.
Furthermore, the IPPC (2007) reports that climate change (especially increased frequency
of extreme events) is projected to have adverse impacts on long-term agricultural yields
(e.g. Antle, Capalbo, Elliott & Paustian, 2004; Porter & Semenov, 2005). These losses
are expected crop damages at specific developmental stages (e.g. temperature thresholds
during flowering) and reduced efficiency of farm inputs as timing of field applications
becomes more difficult.
Despite some limitations and uncertainties associated with these studies, they are reported
to provide fairly robust findings for policy formulation. The projections from the studies
show that the number of people at risk of hunger is likely to increase with climate change,
compared to reference scenarios with no climate change. For example, climate change is
projected to increase the number of undernourished people in 2080 by 5-26% relative to
the no climate change case, or by between 5 and 10 million people (SRES B1) and 120-
170 million people (SRES A2) (Fischer et al. 2002, 2005).

43
3.2.2 Empirical studies based on the cross-sectional (Ricardian) approach
Polsky (2004) explored the variations in human-environment relationships associated
with climate change in the US Great Plains from 1969 to 1992 using spatial Ricardian
econometric models. The study included effects of spatial and temporal scales in the
estimation of variations in human-environment interactions. The estimation results show
that climate sensitivities are significantly influenced by spatial effects such as extra-local
communication processes and proximity to and regulation of irrigation water. These
results indicate the importance of accounting for spatial and temporal scales in estimating
the impacts of climate change on agriculture.
Mendelsohn and Dinar (2003) explored the interaction between climate, water and
agriculture. The study tested the impacts of surface water withdrawal on the variation of
farm values across the United States, as well as the impact of adding these variables to
the standard Ricardian model on climate sensitivity of agriculture. The results of the
study show that the value of irrigated cropland is not sensitive to precipitation, but
increases in value with temperature. A key recommendation from the study is that
irrigation is an important potential adaptation measure for agriculture.
Mendelsohn et al. (1996) measured the economic impact of climate change on land prices.
An important contribution of the study is that it developed the Ricardian approach for
measuring the economic impacts of climate change on agriculture. The study was based
on cross-sectional data on climate, farmland prices and other economic and geographical
data, for almost 3000 counties in the United States. The results show that seasonal
temperatures in all seasons except autumn reduced average farm values, while more
precipitation outside autumn increased farm values. Another key result from the study
was that estimated impacts of global warming on US agriculture were significantly lower
than estimates from the traditional production-function approach.
Polsky and Easterling (2001) modelled the influences of factors from multiple spatial
scales on climate sensitivity of the Ricardian estimates in the US Great Plains. The study

44
extended the Ricardian approach to take into account social factors at large scales that
condition farm-level responses to changes in climate. An important contribution of the
study is that it included the large-scale social context missing from most impact
assessment studies. The Ricardian climate sensitivity results show that social factors
associated with large scale agro-climatic zones significantly affect local level climate
sensitivity. The study also showed that farmers and institutions in highly variable
climates have adapted and are more resistant, compared to those in relatively stable
climates. An important recommendation from this study is the necessity to investigate the
precise forms of local and other adaptations and their effects on sustainability of the
agricultural system.
Gbetibouo and Hassan (2005) applied the Ricardian approach to measure the impact of
climate change on South Africa’s field crops. The study regressed farm net revenue on
climate, soil and other socio-economic variables based on agricultural data for seven field
crops (maize, wheat, sorghum, sugarcane, groundnuts, sunflowers and soy beans), across
300 districts in South Africa. The results of the study show that production of field crops
is sensitive to marginal changes in temperature compared to changes in precipitation.
Increases in temperature were shown to be beneficial as they increased net farm revenues,
while reductions in precipitation were shown to be detrimental to crop production as they
led to reductions in net farm revenues. Potential adaptation options identified in the study
to respond to further changes in climate include: shifts in crop calendars and growing
seasons, and switching between crops to the extent of the possible complete
disappearance of some field crops in some regions.
In another study, Deressa, Hassan and Poonyth (2005) used a Ricardian model to
estimate climate change impacts on sugarcane production in South Africa. The study was
based on a time series data set for the period 1977-1998. The results show that predicted
changes in temperature strongly affected net revenue from sugarcane production
compared to changes in precipitation.

45
Kurukulasuriya et al. (2006) used a Ricardian method to estimate the likely impacts of
climate change on net farm revenues in African agriculture using farm-level data
collected for the GEF/WB African climate project coordinated by CEEPA. The study
measured total net farm revenue as the sum of three main activities: (a) dryland crops that
rely on natural rainfall; (b) irrigated crops that depend at least on some irrigated water;
and (c) livestock. Net farm revenues for both dryland and irrigated crops were measured
per hectare as the area planted could be accurately measured. This was difficult for the
livestock which is based largely on common grazing lands and had to be measured on a
per farm basis. The study estimated separately the impacts on dryland crops, irrigated
crops and livestock. The results show that dryland crops and livestock will experience
more adverse impacts from increases in temperature and decreases in precipitation,
compared to irrigated crops which will benefit from warming in terms of irrigation. Using
the same approach and dataset, Kurukulasuriya and Mendelsohn (2007a) also found that
dryland crops suffered more from increased warming compared to irrigated crops. In both
studies irrigation offered an important adaptation option for buffering the negative
impacts associated with warming.
Seo and Mendelsohn (2007a) used the cross-sectional Ricardian approach to estimate the
impacts of climate change on large and small livestock farms. The results show that large
specialised farms were more vulnerable to changes in temperature and precipitation,
compared to small farms. The reason for this is that large farms tend to rely on
commercial beef and other species that are not tolerant to high temperatures, compared to
small farms that have more traditional livestock species such as goats and sheep that can
do well in dry and warm environments.
Studies using the Ricardian approach in southern African countries also found that
dryland crops will be more affected by changes in temperature and precipitation (Mano &
Nhemachena (2007) in Zimbabwe; Benhin (2006) in South Africa). Jain (2007) found
that crop production is adversely affected by increases in temperature in November and
December and reduction of rainfall in January and February, which coincide with the
crop maturing stage. The above studies identified the following important adaptation
46
measures in the region: use of different crop varieties, crop diversification, different
planting dates (given the high perception that the timing of rains is changing),
diversifying from farming to non–farming activities, increased use of irrigation, increased
use of water and soil conservation techniques.
A study by Molua and Lambi (2007) in West Africa found that agriculture in Cameroon
is adversely affected by decreases in precipitation and increases in temperature. Future
climate scenarios predicted declines in farm net revenues due to increased warming and
decreased precipitation. In Senegal, small rain-fed farms were found to be highly
vulnerable to changes in climate variables (temperature and precipitation) (Sene, Diop &
Dieng, 2006). The study also identified some adaptation strategies being used by farmers,
such as crop diversification and growing short season crops.
In East Africa, Kabubo-Mariara and Karanga (2007) applied the Ricardian approach to
measure the economic impacts of climate change in Kenya. The results show that
changes in temperature are harmful to agricultural productivity. Predicted future impacts
indicate that agriculture production will be adversely affected by expected warming in
temperatures. The study also identified some important adaptation strategies being used
by farmers to help reduce the negative impacts of climate change: crop diversification,
water conservation, irrigation and shading. Poverty and lack of information were
identified as the major limiting factors in using different adaptation measures. Other East
African studies by Deressa (2007) in Ethiopia, and Eid, El-Marsafawy and Ouda (2007)
in Egypt, show that increases in temperature and decreases in precipitation are generally
detrimental to agricultural production in Ethiopia. Net farm revenues were reported to fall
due to increases in temperatures and decreases in precipitation.
3.3 Summary
The various approaches and methods that have been used to measure economic impacts
of climate change on agriculture were discussed in this chapter, as well as empirical

47
studies that applied the reviewed approaches. Two main approaches have been used in
the literature to measure climate change impacts on agriculture: (a) structural modelling
of crop and farmer response, which combines crop agronomic response with economic/
farmer management decisions and practices; and (b) spatial analogue models that
measure observed spatial differences in agricultural production. Other impact assessment
methods that have been used are the integrated impact assessment method and the agro-
ecological zone method.
The review of empirical studies shows that the various approaches have been applied at
different levels (district, national and regional). For example, the structural approach has
been applied at the farm-level (e.g. Kaiser et al., 1993; Muchena, 1994; Magadza, 1994);
the national level (e.g. Adams et al., 1990, 1995, 1998b) and the regional level (e.g.
Easterling et al., 1993). Similarly the Ricardian approach has been applied at different
levels: regional (e.g. Kurukulasuriya et al., 2006; Kurukulasuriya & Mendelsohn, 2007a;
Seo & Mendelsohn, 2007a), and national and farm level (e.g. Dinar et al., 2008;
Gbetibouo & Hassan, 2005).
The results of the various studies exhibit similar findings on the general impacts of
temperature and precipitation. For example, studies based on structural approaches in
Zimbabwe (e.g. Muchena, 1994; Magadza, 1994) show that warming and drying will
result in significantly low yields for maize. Similarly, Mano and Nhemachena (2007),
using a cross-sectional Ricardian approach, found that net farm revenues will be
adversely affected by further warming and decreases in precipitation. However, the
magnitude of the estimated impacts from studies using different approaches varies,
possibly due to the underlying assumptions of the studies. For example, structural
approaches tend to overestimate the impacts of climate change, as they do not include
adaptation mechanisms, as opposed to the cross-sectional Ricardian approach which does.
This study applies the Ricardian approach to measure the impact of changes in climate
attributes (rainfall and temperature levels) on net revenue from crop and livestock
farming, controlling for other production factors. The justification of this choice over

48
other models is that it helps to achieve the stated objectives of this study, and has several
advantages over other models (as discussed above), such as the incorporation of farmer
adaptations. Furthermore, measuring economic impacts of climate change in African
agriculture is limited by the scarcity of reliable data. The available data from the
GEF/WB/CEEPA African Climate and Agriculture Project provided a very useful cross-
sectional dataset that addresses typical limitations in developing countries, for estimation
of the Ricardian model (see Dinar et al., 2008).
Recent efforts have measured the impacts of climate change in Africa. Other studies
based on the Global Environmental Facility (GEF) African Climate Project estimated the
economic impacts of climate change on African agriculture (Dinar et al., 2008), using
district level data. Before the GEF/WB/CEEPA African climate study, other studies
applied the same approach: Gbetibouo and Hassan (2005) on South African field crops
and Deressa et al. (2005) on sugarcane production in South Africa.
However, these studies analysed impacts on dryland crops, irrigated crops and livestock
separately. This represents an important limitation of the cited studies, since the choice
between crop and livestock production, or the combination of both (mixed systems), is an
endogenous decision made by agricultural producers in response to varying climates and
other circumstances. The decision as to what to produce is motivated by climate and
other determinants and is accordingly an important adaptation mechanism of farmers. It
is therefore considered appropriate not to separate choices and responses of crop and
livestock farmers, but to analyse them jointly and to compare adaptive capacities of such
choices (the degree of vulnerability to climate change). This is of special importance for
Africa, where the majority of poor small-scale farmers practise mixed crop−livestock
agriculture and few depend on livestock only.
This study therefore measures the aggregate impact of climate change on income from all
agricultural production systems (crop, livestock and mixed) in Africa and predicts future
impacts under various climate scenarios. In addition to estimating impacts on mixed
crop−livestock farms, the study also measures and compares impacts on specialised crop

49
and livestock farms. The results are contrasted with findings of other regional studies
using the same data but generating different climate response functions for crop and
livestock farming separately (Kurukulasuriya et al., 2007; Kurukulasuriya & Mendelsohn,
2007a; Seo & Mendelsohn, 2007a). In this study, the responses of different production
systems are analysed under irrigation and dryland conditions.
50
Chapter 4
Measuring the economic impact of climate change on African agricultural
production systems
4.0 Introduction
This chapter reports on how this study measured the economic impacts of climate change
on agriculture in Africa. The specification of the empirical model, the model variables,
data sources and econometric procedures are presented in the following sections.
4.1 Specification of the empirical Ricardian model for measuring economic
impacts of climate change
This study applied the Ricardian approach to assist in measuring the economic impacts of
climate variables (temperature and precipitation) on African agricultural production
systems (see section 3.3 for justification in choosing the Ricardian model). In the
Ricardian model, net revenue or capitalised net revenue (land value (V)) and not yield,
accounts for the costs and benefits of adaptation. Direct measurement of farm prices or
revenues allows the Ricardian approach to account for the direct impacts of climate on
yields of different crops, as well as the indirect substitution of different activities and
other potential adaptations to different climates (Mendelsohn et al., 1994). As in other
Ricardian studies applied elsewhere, a number of variables – climatic, soil, socio-
economic and hydrological – were examined to determine the effects of climate on
farmland. Following Mendelsohn and Dinar (2003), the farmland value (V) reflects the
present value of future net productivity, captured by the following equation:
( )[ ] dteRXGHZFXQPdtePV tii
tLE
δδ∫ ∑ ∑∫ −== ,,,, (4.1)

51
where LEP is the net revenue per hectare, iP is the market price of crop i, iQ is output of
crop i, F is a vector of climate variables, Z is a set of soil variables, H is a set of
hydrological variables,G is a set of economic variables, X is a vector of purchased input
prices, t is time, and δ is the discount rate. The Ricardian approach assumes that the
farmer maximises net revenue by choosing inputs (X) given the characteristics of the
farm and market prices. The resulting net revenue function observes the loci of maximum
profits subject to a set of climate, soil and economic factors, and the Ricardian model is a
reduced form hedonic price model of the observed loci of profits (Kurukulasuriya &
Mendelsohn 2007a; Kurukulasuriya et al., 2006).
The standard Ricardian model relies on a quadratic formulation of climatic variables:
uHGZFFV ++++++= )log(5432
210 ββββββ (4.2)
where u is the error term.
To capture the non-linear relationship between net farm revenues and climate variables,
the estimation includes both the linear and quadratic terms for the climate variables, F
(temperature and precipitation) (Mendelsohn & Dinar, 2003; Mendelsohn et al., 1994,
1996). A negative quadratic term reflects an inverted U-shaped relationship between net
farm revenue and the climate variable and a positive quadratic term means a U-shaped
relationship (Mendelsohn & Dinar, 2003; Mendelsohn et al., 1994, 1996). Net farm
revenue is expected to have an inverted U-shaped relationship with temperature based on
agronomic research and previous cross-sectional studies. Following Kurukulasuriya et al.
(2006), water flow is introduced in a log form because the benefits from flow diminish as
flow increases. Based on other Ricardian studies (see Dinar et al., 2008; Kurukulasuriya
et al., 2006), water flow is used as a proxy for the hydrological variable (H). Water flow
is included because it is particularly important for irrigation (Mendelsohn & Dinar 2003).

52
Following Kurukulasuriya et al. (2006) and Mendelsohn and Dinar (2003), the marginal
impact of a climate variable (if ) on net farm revenue evaluated at the mean of that
variable is:
[ ]iiii
fEdf
dVE **2 ,2,1 ββ +=
(4.3)
and because flow is expressed in logarithmic terms, the marginal impact of flow (H) on
net farm revenue is given by:
HdH
dVE 5β
=
(4.4)
Again following Kurukulasuriya et al. (2006), the above marginal effects can be
evaluated at any level of climate or flow, but the focus is on showing effects at mean
climate levels for Africa. Furthermore, the linear formulation of the model assumes that
these marginal effects (equations (4.3) and (4.4)) are independent of future technological
change. Despite this assumption, future technological change could make crops (or other
farming activities) more susceptible to temperature or precipitation changes — or less so
(Kurukulasuriya et al., 2006).
4.2 The data and model variables
This study is based on the cross-section data obtained from the Global Environment
Facility/World Bank (GEF/WB)-CEEPA funded Climate Change and African
Agriculture Project: Climate, Water and Agriculture: Impacts on and Adaptations of
Agro-ecological Systems in Africa. The study involved eleven African countries: Burkina
Faso; Cameroon; Egypt; Ethiopia; Ghana; Kenya; Niger; Senegal; South Africa; Zambia
and Zimbabwe (Figure 4.1).
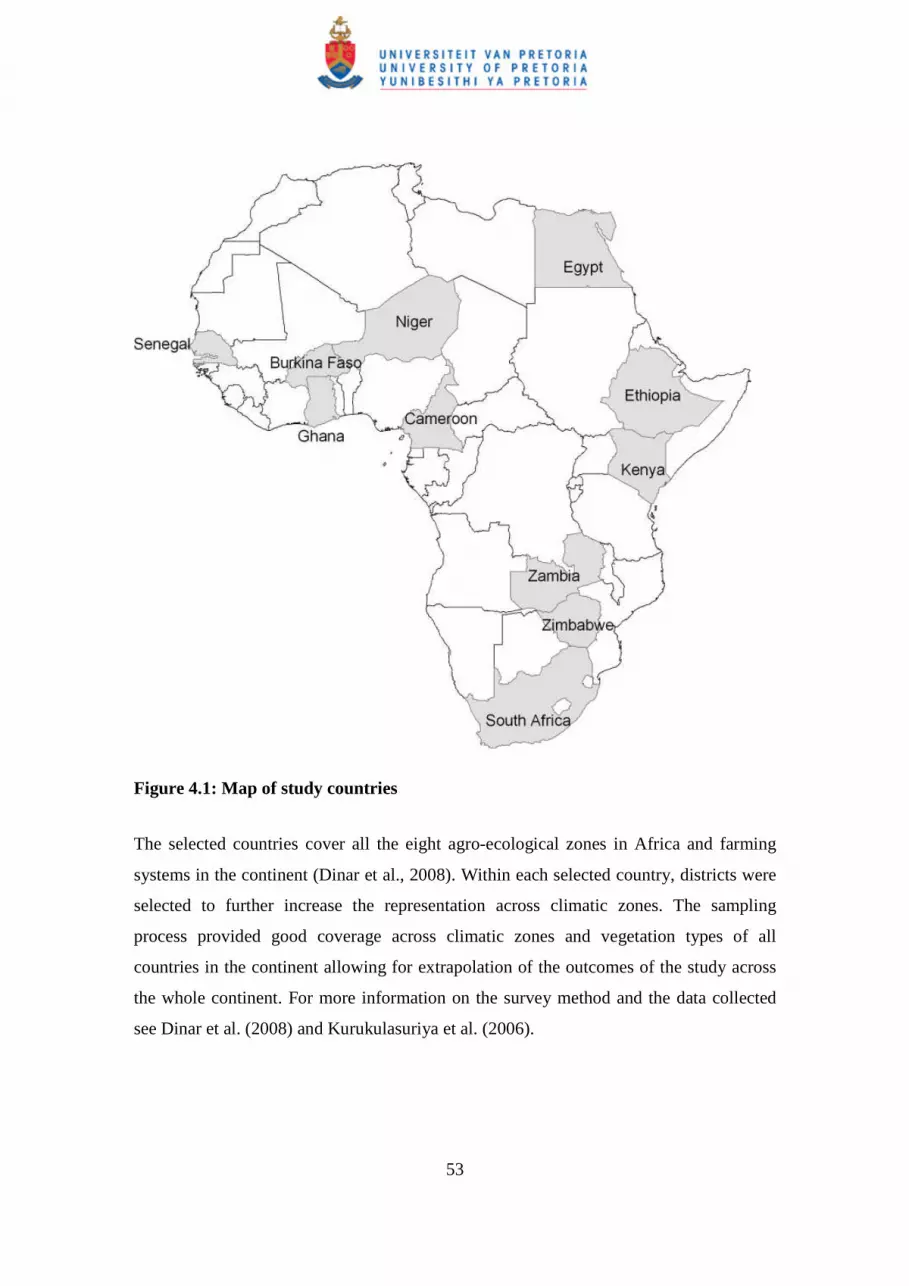
53
Figure 4.1: Map of study countries
The selected countries cover all the eight agro-ecological zones in Africa and farming
systems in the continent (Dinar et al., 2008). Within each selected country, districts were
selected to further increase the representation across climatic zones. The sampling
process provided good coverage across climatic zones and vegetation types of all
countries in the continent allowing for extrapolation of the outcomes of the study across
the whole continent. For more information on the survey method and the data collected
see Dinar et al. (2008) and Kurukulasuriya et al. (2006).

54
The surveys were conducted in 2002–04 of randomly selected farms (seven countries
were surveyed in the 2002–03 season and four countries were added in 2003–04).
Between 30 and 50 districts were sampled in each country. Sampling was clustered in
villages to reduce the cost of administering the survey (see Kurukulasuriya et al., 2006).
Over 9000 household surveys were conducted in the study and after data cleaning, about
8000 surveys were found to be useable. It is important to note that none of the farmers
interviewed kept livestock only. However, we attempted to separate those specialising in
livestock production from those practising mixed crop−livestock farming, as discussed
below (see categorisation of farm types in the entire sample (Table 4.2) and the
accompanying discussion).
Due to lack of African data on land rents, the study used total net farm revenue as the
measure of farm performance (similar to the approach used by Kurukulasuriya et al.,
2006). Total net farm revenue is defined as the sum of net revenues from three main
farming activities: (a) dryland crops, (b) irrigated crops, and (c) livestock6. Farm net
revenue (R) is assumed to reflect the present value of future net productivity and costs of
individual crops and livestock. For this study, crop net revenue is defined as gross
revenue less costs of fertilizer and pesticide, hired labour (valued at the median market
wage rate), transport, packaging and marketing, storage and post harvest losses.
Livestock net revenue is defined as gross revenue from livestock sales less costs of
livestock production.
Dryland crops rely only on rainfall that falls on the farm, while irrigated crops rely on at
least some irrigated water (from surface flows or ground water). Livestock in Africa
depend largely on grazing on natural lands or pasture. The amount of land that was
planted could be accurately measured for the crop revenues to estimate net revenue per
hectare. However, the same could not be done for livestock revenues, since most African
6 We considered impacts of climate change on two main datasets, one including negative net revenues up
to -US$200 and another set with only positive net revenues. The results of the two samples were not all
that different and the analyses in this study are based on the sample with positive net revenues.
55
farmers rely on common land for livestock grazing, making it difficult to determine how
much land was used (Kurukulasuriya et al., 2006).
Studies based on the Global Environmental Facility (GEF) African Climate Project
estimated the economic impacts of climate change on African agriculture (e.g. Dinar et
al., 2008). These studies however, analysed impacts on dryland crops, irrigated crops and
livestock separately. This is a significant limitation since the choice between crop and
livestock production, or their combination (mixed systems), must be considered an
endogenous decision made by agricultural producers in response to varying climates and
other circumstances. The decision as to what to produce and how to produce it is
accordingly an important adaptation mechanism in the face of changing climate and other
ecological and economic circumstances. This is of special importance for Africa, where
the majority of poor small-scale farmers practise mixed crop−livestock agriculture and
few depend on crops or livestock only.
This study therefore measures the aggregate impact of climate change on income from all
agricultural production systems (crop, livestock and mixed) in Africa and predicts future
impacts under various climate scenarios. The results are contrasted with findings of other
regional studies using the same data but generating different climate response functions
for crop and livestock farming separately (Kurukulasuriya et al., 2006; Kurukulasuriya &
Mendelsohn, 2007a; Seo & Mendelsohn, 2007a).
The Ricardian approach is traditionally based on analysing net revenue or land value per
hectare. As most farmers in Africa graze livestock on open access communal land it is
very difficult to measure the amount of land farmers allocate to livestock production.
Therefore, since this study combined net revenue for both crop and livestock production,
we could not use net revenue per hectare and instead used net revenue per farm, thus
making the unit of analysis in this study the farm.
The study relied on long-term average climate (normals) for districts in Africa gathered
from two sources (see Dinar et al., 2008; Kurukulasuriya et al., 2006 for details). Satellite
data on temperature was measured by a Special Sensor Microwave Imager (SSMI) on
56
U.S. Department of Defence satellites (Basist et al., 2001) for 1988 to 2003. The SSMI
detects microwaves through clouds and estimates surface temperature (Weng & Grody,
1998). The satellites conduct daily overpasses at 6 a.m. and 6 p.m. across the globe. The
precipitation data come from the Africa Rainfall and Temperature Evaluation System
(World Bank, 2003). The data was created by the Climate Prediction Centre of the U.S.
National Oceanic and Atmospheric Administration based on ground station
measurements of precipitation for 1977 to 2000. Thus, the temperature and precipitation
data cover slightly different periods. This discrepancy might be a problem for measuring
variance or higher moments of the climate distribution, but it should not affect the use of
the mean of the distribution (Kurukulasuriya et al., 2006).
Soil data from the Food and Agriculture Organization (FAO, 2003) containing
information about the major and minor soils in each location, as well as slope and texture,
were utilised in this study. Data on hydrological variables (e.g. flow and runoff for each
district) were obtained from Strzepek and McCluskey (2007).
Table 4.1 shows the distribution of useable surveys, net revenues and climate variables
by country. Table 4.2 presents the categorisation of farm types in the entire sample. The
tables also present the distribution of dryland and irrigated farms in each country and
farm type. The analyses in this study distinguish between the impacts of climate change
on these two main farm types. This helps us assess the importance of irrigation in
responding to changes in climate.
The study considered farms with only crops and livestock as specialised. None of the
farmers interviewed kept livestock only. However, the study attempted to separate those
specialising in livestock production from those practising mixed crop−livestock farming.
Specialised livestock farmers were identified as those with a very small share of their
total land area under crops and with relatively large numbers of head of cattle, goats or
sheep. The share of income from livestock production in the total income was also
considered, with a very high share implying that the farm specialised in livestock
production. Based on this classification, only 1% of the farms were classified as

57
specialised livestock production. All of these specialised livestock farms were under
dryland farming and none had irrigation.
Specialised crop production was defined as farms with crops only and no livestock, as
well as those with small livestock numbers such as two sheep or a few chickens. Mixed
crop−livestock farms were defined as farms were neither of the two production types
clearly dominated enough to be identified as specialised.
Table 4.1: Summary statistics of the survey sample
Useable surveys Temperature and Precipitation Normals (sample means)
Winter Spring Summer Fall Country Dryland Irrigated Total
Temp Precip Temp Precip Temp Precip Temp Precip
Burkina
Faso 765 94 859 26.1 2.4 30 14.9 29.9 110.8 28.3 129.1
Cameroon 583 91 674 24.2 57.4 25.9 97.4 24.2 180.5 24.3 221.9
Egypt 0 495 495 16.6 12.5 19.1 7.2 27.8 3.7 26.7 4.8
Ethiopia 170 491 661 20.9 19.4 22.1 48.4 22.7 127.5 19.4 120.3
Ghana 713 41 754 25.5 31.3 27.5 60.4 25.8 112.4 25.1 111.2
Kenya 547 78 625 22.1 86.8 22.8 104.8 20 89.5 21 65.4
Niger 560 125 685 24.5 0.7 29 3.1 31.8 64.8 29.6 71.5
Senegal 812 70 882 26.4 2.2 29.1 1.1 30.8 49.6 29.3 112.4
South
Africa
73 48 121 13.9 35.2 17.8 62.9 22.2 96.7 20.9 76.2
Zambia 813 20 833 22.1 48.1 23.5 58 24.3 108.3 24.9 100.3
Zimbabwe 318 59 377 16.5 7.3 20.6 15.4 23.5 137.9 22 88.9
Total
5354
1612
6966
22.7
25.4
25.2
39.5
26.4
95.9
25.6
103.6
NB: Precipitation = (mm/mo) Normals (Sample Mean) and Temperature = (°C) Normals (Sample Mean)
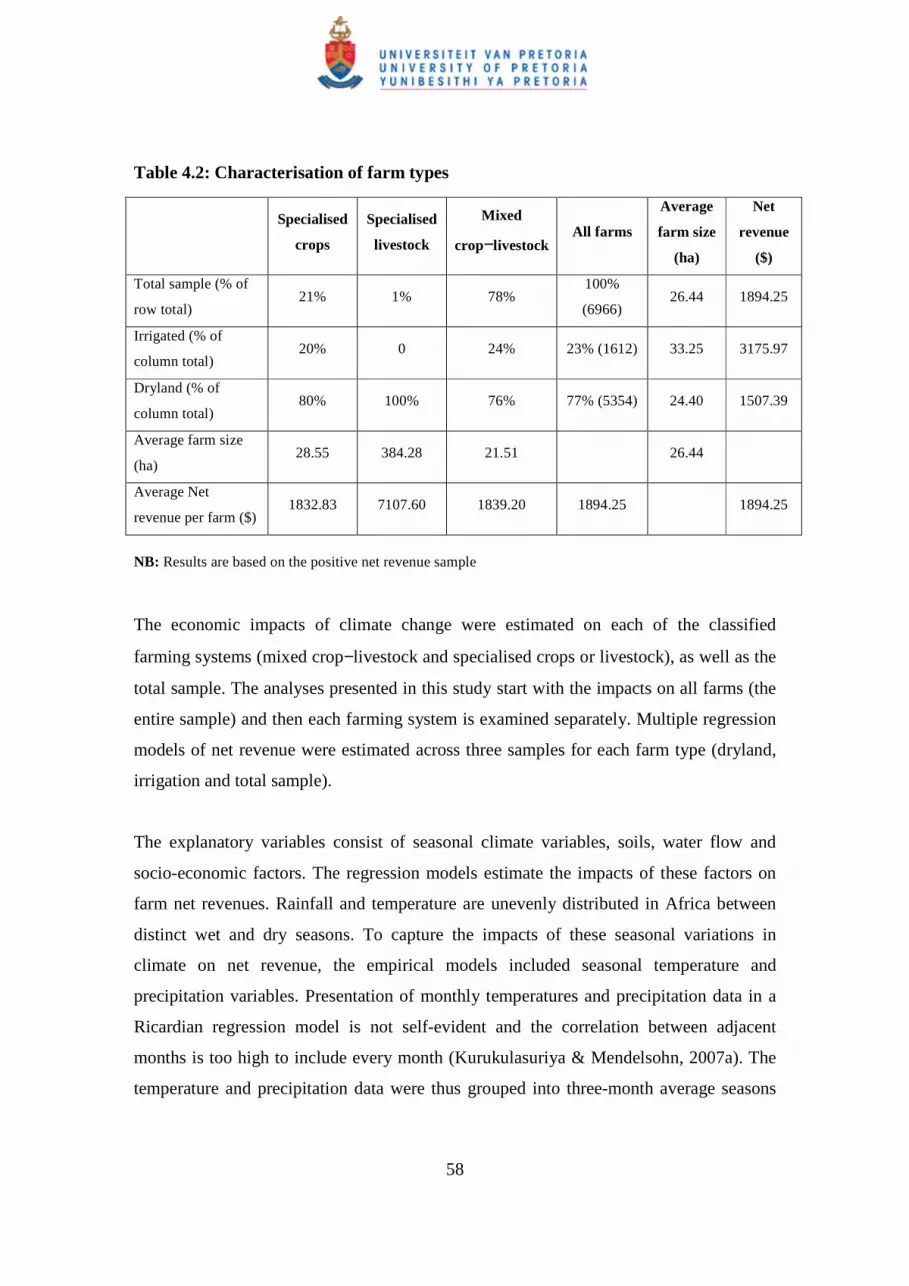
58
Table 4.2: Characterisation of farm types
Specialised
crops
Specialised
livestock
Mixed
crop−livestock All farms
Average
farm size
(ha)
Net
revenue
($)
Total sample (% of
row total) 21% 1% 78%
100%
(6966) 26.44 1894.25
Irrigated (% of
column total) 20% 0 24% 23% (1612) 33.25 3175.97
Dryland (% of
column total) 80% 100% 76% 77% (5354) 24.40 1507.39
Average farm size
(ha) 28.55 384.28 21.51 26.44
Average Net
revenue per farm ($) 1832.83 7107.60 1839.20 1894.25 1894.25
NB: Results are based on the positive net revenue sample
The economic impacts of climate change were estimated on each of the classified
farming systems (mixed crop−livestock and specialised crops or livestock), as well as the
total sample. The analyses presented in this study start with the impacts on all farms (the
entire sample) and then each farming system is examined separately. Multiple regression
models of net revenue were estimated across three samples for each farm type (dryland,
irrigation and total sample).
The explanatory variables consist of seasonal climate variables, soils, water flow and
socio-economic factors. The regression models estimate the impacts of these factors on
farm net revenues. Rainfall and temperature are unevenly distributed in Africa between
distinct wet and dry seasons. To capture the impacts of these seasonal variations in
climate on net revenue, the empirical models included seasonal temperature and
precipitation variables. Presentation of monthly temperatures and precipitation data in a
Ricardian regression model is not self-evident and the correlation between adjacent
months is too high to include every month (Kurukulasuriya & Mendelsohn, 2007a). The
temperature and precipitation data were thus grouped into three-month average seasons

59
winter, spring, summer, and fall. The seasons were adjusted for the fact that seasons in
the southern hemisphere occur at exactly the opposite months of the year compared to the
northern hemisphere (for more details see Kurukulasuriya & Mendelsohn, 2007a).
Altogether four soil types − jcMFU (calcaric fluvisols), lcU (chromic luvisols), lfCU
(ferric luvisols), and qlCU (luvic arenosols) − were identified as significant in the
empirical models. The arenosols are extensively developed and are usually high
productivity soils. Fluvisols and luvisols were also identified as high productivity soils.
The chromic luvisols were identified as unproductive soils. Some other soil types were
unique to small areas and could therefore not be included in the analyses.
Other studies based on the same GEF/WB/CEEPA dataset found different results on the
impacts of soils on net revenues. For example, Kurukulasuriya and Mendelsohn (2007a)
found 12 soil types to be significant in the Africa sample for cropland regressions, while
Kurukulasuriya et al. (2006) found only nine soil types to be significant for dryland
regressions: six for irrigated regressions and eleven for livestock regressions. Seo and
Mendelsohn (2007a) dropped all soil variables as they were found to be statistically
insignificant.
The mean water flow variable (long run flow in m3 across the continent) was included to
determine the impacts of additional water sources on net farm revenue. The hydrological
variable was obtained from the University of Colorado (IWMI/University of Colorado
2003). The hydrology team used a hydrological model for Africa to calculate flow and
runoff for each district in the surveyed countries.
Socio-economic factors in the empirical model include household ownership of farm
assets (farmland, tractors); household access to agricultural extension services; household
size; and technology variables (household access to electricity; household access to
tractors and irrigation technologies). Dummy variables for mixed crop−livestock and
specialised crops were included. Regional dummies were included to control for regional
differences across agro-ecosystems in Africa. These factors were selected based on

60
literature on similar climate impact studies (see Kurukulasuriya & Mendelsohn, 2007a;
Seo & Mendelsohn, 2007a; Mano & Nhemachena, 2007).
The explanatory variables included in this study have been shown to affect net farm
revenue in many other African Ricardian models (Kurukulasuriya et al., 2006;
Kurukulasuriya & Mendelsohn, 2007a; Mano & Nhemachena, 2007; Benhin, 2006).
Table 4.3 presents a summary of the explanatory variables and their expected impacts on
net farm revenues.
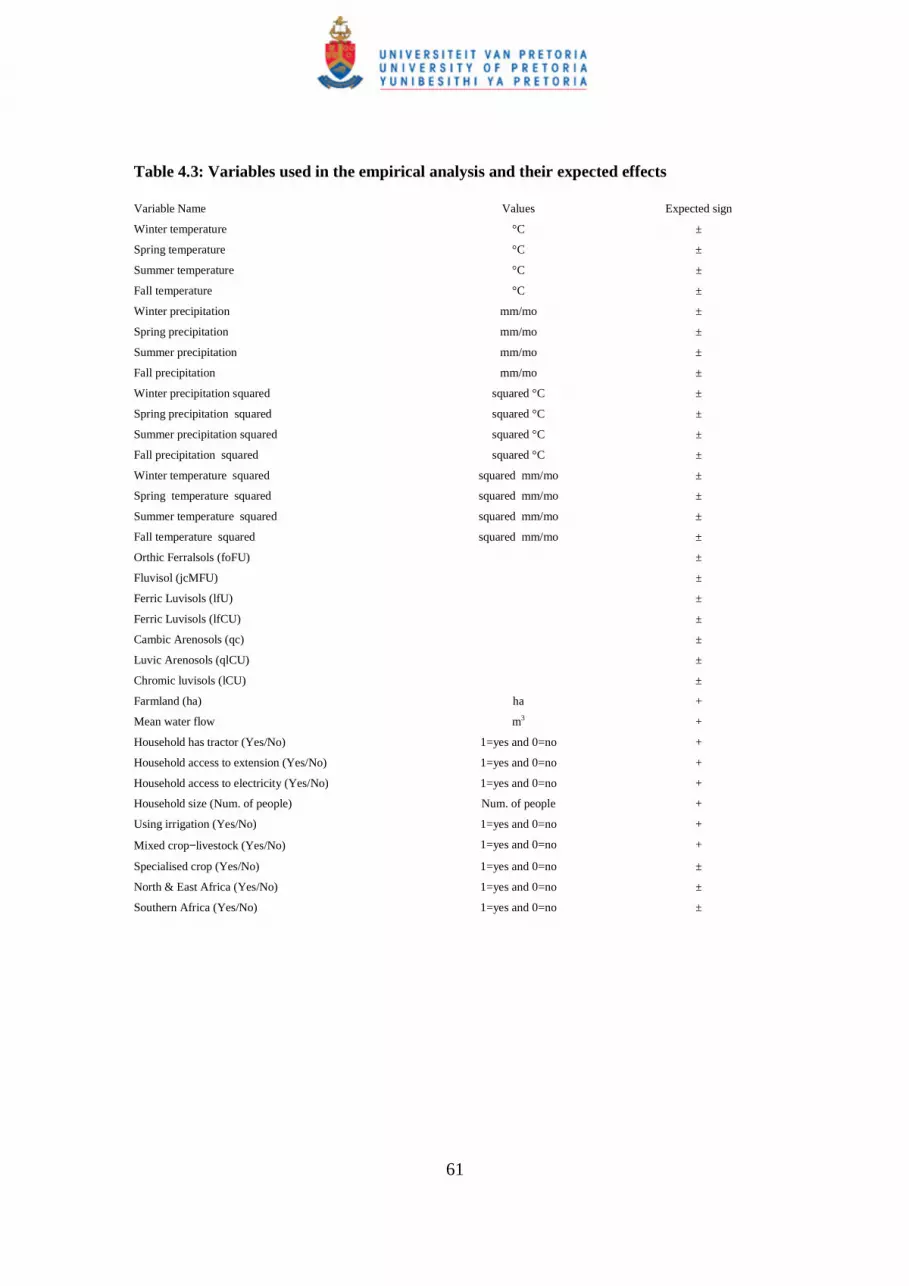
61
Table 4.3: Variables used in the empirical analysis and their expected effects
Variable Name Values Expected sign
Winter temperature °C ±
Spring temperature °C ±
Summer temperature °C ±
Fall temperature °C ±
Winter precipitation mm/mo ±
Spring precipitation mm/mo ±
Summer precipitation mm/mo ±
Fall precipitation mm/mo ±
Winter precipitation squared squared °C ±
Spring precipitation squared squared °C ±
Summer precipitation squared squared °C ±
Fall precipitation squared squared °C ±
Winter temperature squared squared mm/mo ±
Spring temperature squared squared mm/mo ±
Summer temperature squared squared mm/mo ±
Fall temperature squared squared mm/mo ±
Orthic Ferralsols (foFU) ± Fluvisol (jcMFU) ± Ferric Luvisols (lfU) ± Ferric Luvisols (lfCU) ± Cambic Arenosols (qc) ± Luvic Arenosols (qlCU) ± Chromic luvisols (lCU) ± Farmland (ha) ha +
Mean water flow m3 +
Household has tractor (Yes/No) 1=yes and 0=no +
Household access to extension (Yes/No) 1=yes and 0=no +
Household access to electricity (Yes/No) 1=yes and 0=no +
Household size (Num. of people) Num. of people +
Using irrigation (Yes/No) 1=yes and 0=no +
Mixed crop−livestock (Yes/No) 1=yes and 0=no +
Specialised crop (Yes/No) 1=yes and 0=no ±
North & East Africa (Yes/No) 1=yes and 0=no ±
Southern Africa (Yes/No) 1=yes and 0=no ±

62
Econometric estimation of empirical model parameters
Econometric analysis with cross-sectional data is usually associated with problems of
heteroscedasticity and multicollinearity (Cameron & Trivedi, 2005; Green, 2003).
Multicollinearity among explanatory variables can lead to imprecise parameter estimates.
To explore potential multicollinearity among the explanatory variables, the correlation
between continuous independent variables was calculated. The results of the correlation
analysis indicate that climate variables were highly correlated. To address this problem,
temperature and precipitation data were grouped into three-month average seasons:
winter, spring, summer, and fall (see Kurukulasuriya & Mendelsohn, 2007a). These
seasonal definitions provided the best fit with the data and reflected the mid-point for key
rainy seasons in the sample.
An Ordinary Least Squares model was fitted and tested for multicollinearity using the
variance inflation factor (VIF). The variance inflation factors of the final estimated
variables were less than 10 which indicate that multicollinearity is not a serious problem
in the reduced model. For dummy variables the chi-square test for independence was
used to determine dependencies between variables. To address the possibilities of
heteroscedacity in the model, a robust model was estimated that computes a robust
variance estimator based on a variable list of equation-level scores and a covariance
matrix (StataCorp, 2005).
4.3 Results and discussion
Table 4.4 presents results from the Ricardian regressions for the whole sample, mixed
crop−livestock, specialised crop and specialised livestock samples. The impacts on
dryland and irrigated farms were estimated for each farming system and the results are
presented in Appendix 1A and 1B. The results show the effect of climate, soils, flow and
socio-economic variables on net revenue per farm for each farm type. The results indicate
that the explanatory variables have differential impacts on dryland, irrigated farms and

63
the total sample across farm types. The effects of some soils, as well as household
characteristics (e.g. age, gender and education of head) were found to be not significant
and were therefore dropped from the analyses.

64
Table 4.4: Ricardian regression results
***; **; * significant at 1%, 5% and 10% level respectively
Variable Name All farms
Mixed crop−
livestock farms
Specialised crop farms Specialised livestock
farms
Winter temperature -1.641*** -1.692*** -2.056***
Spring temperature 1.255*** 1.257*** 1.277*
Summer temperature -0.824*** -0.426 -1.937*** 7.116
Fall temperature 1.794*** 0.797 4.143***
Winter precipitation 0.036*** 0.033*** 0.036*** 5.787*
Spring precipitation -0.011** -0.012* -0.005 -5.721*
Summer precipitation 0.015*** 0.024*** -0.003 -1.804*
Fall precipitation -0.003 -0.012*** 0.017*** 3.254*
Winter precipitation squared -0.000*** -0.000*** -0.000* -0.054*
Spring precipitation squared 0.000* 0.000 0.000 0.079*
Summer precipitation squared -0.000*** -0.000*** 0.000 0.014*
Fall precipitation squared 0.000*** 0.000*** -0.000 -0.011*
Winter temperature squared 0.019*** 0.019*** 0.027*** -0.838**
Spring temperature squared -0.015*** -0.014*** -0.017* 0.549**
Summer temperature squared 0.005 -0.002 0.027*** -0.614*
Fall temperature squared -0.018*** -0.002 -0.057*** 0.726**
Orthic Ferralsols (foFU) -0.278 -0.378 0.030
Fluvisol (jcMFU) 0.443** 0.446** 0.582
Ferric Luvisols (lfU) -0.372** -0.533*** -0.076
Ferric Luvisols (lfCU) 0.488*** 0.315** 1.096*** 1.603
Cambic Arenosols (qc) -0.111 -0.053 -0.617 0.311
Luvic Arenosols (qlCU) 0.730*** 0.647*** 1.352*** 0.556
Chromic luvisols (lCU) -0.469*** -0.495*** -2.033** 0.000
Farmland (ha) 0.643*** 0.642*** 0.693*** 0.154
Mean water flow 0.010*** 0.009*** -0.011*** -0.111*
Household has tractor (Yes/No) 0.331*** 0.271*** 0.395* -1.089
Household access to extension
(Yes/No)
0.169*** 0.168*** 0.177* 0.158
Household access to electricity
(Yes/No)
0.333*** 0.378*** 0.150 -0.267
Household size (Num. of people) 0.183*** 0.154*** 0.283*** 0.626
Using irrigation (Yes/No) 0.053 0.091 0.092 -3.280*
Mixed crop-livestock Yes/No) 0.447***
Specialised crop (Yes/No) 0.455**
North & East Africa (Yes/No) -0.029 -0.007 0.180 -6.409
Southern Africa (Yes/No) -2.011*** -1.846*** -2.025***
Constant -6.667 4.923 -23.161** -272.491
R Square 0.5102 0.4537 0.6490 0.7343
N 5607 4317 1226 64

65
The models account for about 45% to 73% of the variability in net revenues from farm to
farm. Note that a relatively high proportion of the variation in net revenue is not
accounted for by the explanatory variables in the models. The important sources of error
accounting for this unmeasured variation include omitted variables and misreporting of
net revenue.
This same dataset was used to conduct parallel regional studies of climate change impacts
on crops and livestock separately. Kurukulasuriya and Mendelsohn (2007a) analysed the
economic impacts of climate change on African cropland, and Seo and Mendelsohn
(2007a) studied the economic impacts of climate change on African livestock. As
mentioned earlier, this study combined analyses of both crop and livestock systems. The
results of these combined analyses are now compared with results from the earlier
specialised studies.
The results show that most of the explanatory variables are statistically significant at 10
percent or lower and the signs on most variables are as expected except for a few, which
are discussed below. Larger farm size appears to have a strong positive influence on net
farm revenues across all farm types, suggesting that more land allows farmers to diversify
crop and livestock enterprises per farm, leading to more income although per hectare
value may be low. The previous studies found contrasting results of the impact of farm
size on net revenue. For example, Kurukulasuriya and Mendelsohn (2007a) found that
farm area reduces the value per hectare of farms at a decreasing rate, implying that they
small farms are more productive on a per hectare basis. In contrast Seo and Mendelsohn
(2007a) found that the dummy for large farms was insignificant, implying no difference
in the net revenue per animal for small and big farms.
Larger families seem to be associated with higher net farm revenues across all farm types.
This suggests that agriculture in Africa is more labour demanding. Better access to other
farm assets, such as heavy machinery like tractors, appears to strongly and positively
influence net farm revenues for all farms, mixed crop−livestock farms and specialised
crop farms. These results suggest that capital, land and labour serve as important

66
production factors in African agriculture. Attaining higher net farm revenues strongly
depends on factor endowments (i.e. family size, land area and capital resources) at the
disposal of farming households. Kurukulasuriya and Mendelsohn (2007a), Seo and
Mendelsohn (2007a), and Kurukulasuriya et al. (2006) found similar positive effects of
access to technology variables (electricity and heavy machinery) on net revenue. In terms
of the impact of household size, Kurukulasuriya & Mendelsohn (2007a) and
Kurukulasuriya et al. (2006) found similar positive effects. In contrast, Seo and
Mendelsohn (2007a) found that large households tend to have lower livestock net
revenues per farm.
Better access to agricultural extension services seems to have a strong positive influence
on net farm revenue on all farms, mixed crop−livestock farms and specialised crop farms.
The effect on net revenue from specialised livestock farms, though positive, is
insignificant. Access to electricity is strongly associated with higher net farm revenue on
all farms and mixed crop−livestock farms. Both mixed crop−livestock and specialised
crop variables positively affect net farm revenues. Among the regional dummies,
southern Africa appears to have a strong negative influence on net farm revenue. On the
other hand, North and East Africa show negative or insignificant effects on all farm types
except specialised crops. These results suggest that the climatic, soil and other conditions
in the southern, east and north African regions are less favourable for highly productive
agricultural production.
Water flow has a significant positive effect on the total sample and mixed crop−livestock
farms. Kurukulasuriya and Mendelsohn (2007a) also found that water flow strongly
influences net farm revenue, especially for irrigated farms. Using irrigation appears to
positively influence net farm revenue for all farm types, except specialised livestock
farms. The possible explanation is that during the dry season water flow provides water
for livestock watering and irrigation systems.
The soils variables show that arenosols (qlCU), fluvisols (jcMFU) and ferric luvisols
(lfCU) that are extensively developed and are usually high productive soils, appear to
67
have a strong positive influence on net farm revenues across all farming systems. Net
farm revenues increase in areas that exhibit these high productivity soils. On the other
hand, soil types lcU (chromic luvisols) and lfU (ferric luvisols) that are unproductive
show a strong negative influence on net farm revenues across all farming systems.
The seasonal climate variables show that climate effects vary across models and farm
types. The coefficients of the linear and quadratic terms of climate variables are
significant in some seasons, indicating a non-linear relationship between these variables
and net revenue. Although a positive/negative sign of the quadratic term shows that the
relationship between climate variables and net revenue is an inverted U-shaped/U-shaped
respectively, the effect of quadratic seasonal climate variables on net revenue cannot be
easily inferred, as both linear and quadratic terms influence net revenue.
To interpret the climate coefficients, marginal climate impacts at the mean temperature
and precipitation were calculated for the all farm types and results from the dryland and
irrigation farms shown in Appendix 1 (Table 4.5). In each case, the marginal effect of
temperature and precipitation was evaluated at the mean for each sample. For example,
the marginal effect of temperature on mixed crop−livestock farms was evaluated at the
mean temperature of mixed crop−livestock farms, and the marginal effect of precipitation
on specialised crop farms was evaluated at the mean precipitation for specialised crop
farms. The results suggest that better watered regions (i.e. in all wetter seasons) strongly
influence net farm revenues for all farms, mixed crop−livestock and specialised crops.
For example, a wetter summer season increases net revenue per farm by $99 and $93 per
mm of monthly precipitation for mixed crop−livestock and specialised crop farms
respectively. The effect is strongest for mixed crop−livestock farms, suggesting that more
water allows farmers to diversify crop and livestock enterprises throughout the year.
Kurukulasuriya and Mendelsohn (2007a) found similar results on marginal impacts of
summer precipitation on crop revenue. Their study found that the marginal precipitation
effects for dryland and irrigated farms are similar ($3.8/mm/mo for irrigated farms and
$2.7/mm/mo for dryland) because irrigated farms are located in dry locations.

68
Warmer winter and spring appears to positively influence net farm revenues for all farms
and mixed crop−livestock farms, especially for irrigated farms. Warming in summer
tends to be associated with a strong negative influence on net farm revenues across all
farming systems. The magnitudes of the marginal effects show that the negative effects
are strongest for specialised farm types, compared to mixed crop−livestock farms,
suggesting that the combined farming systems offers an important adaptation option for
farmers. Also dryland farms are strongly affected compared to all farms and irrigated
farms. Similar results were noted by Seo and Mendelsohn (2007a) who found that the
income of small farms is stable over a range of temperatures, while that of large farms
declines sharply as temperatures rise. Larger farms tend to be more specialised compared
to small farms which tend to exhibit diverse farm enterprises.
In addition to marginal effects, climate elasticities (the percentage change in net revenue
as a result of percentage change in climate variables) were computed. The elasticities are
given in parentheses in Table 4.5. The temperature elasticities for dryland farms, as well
as for specialised crop or livestock farms, are relatively higher compared to irrigated
farms and mixed crop−livestock farms. Since irrigated farms and mixed crop−livestock
farms are buffered from temperature changes as a result of irrigation and diversity of
options respectively, it is expected that they are less sensitive to warming.
Kurukulasuriya and Mendelsohn (2007a) and Seo and Mendelsohn (2007a) also found
that warmer temperatures increase the net revenues of irrigated farms because the mean
temperature of irrigated farms is relatively cool and thus irrigation buffers net revenues
from temperature effects.
A marginal increase in precipitation increases net revenue for all farm types. The
precipitation elasticity is relatively high for dryland farms in each farm type category and
for specialised crop and livestock farms. Because mixed crop−livestock farms are more
diverse in their enterprises and options, they are expected to be less sensitive to drying.
Mixed crop−livestock enterprises can easily shift between crop and livestock options.
69
From an adaptation perspective, mixed crop−livestock farming becomes a good
alternative compared to specialised crop or livestock farming.
An interesting observation from the results is that net revenue decreases with falling
precipitation (in spring, summer and fall seasons) for specialised livestock farms. This is
in contrast to findings from the regional Ricardian livestock analyses, in which Seo and
Mendelsohn (2007a) found that net revenue increased with falling precipitation, as
farmers shifted from livestock to crops, from forests to grasslands, and diseases became
less prevalent. Note that while wet conditions are expected to improve quantity and
quality of grazing pastures, they may also be associated with high levels of diseases that
may reduce the gains from improved pastures. The sensitivity of dryland farms and
specialised crop or livestock farms to warming and drying is relatively higher compared
to irrigated farms.

70
Table 4.5: Marginal impacts and elasticities of climate variables on net revenue
($/farm)
All farms Mixed crop livestock farms Specialised crop farms Specialised livestock farms Season
Temperature Precipitation Temperature Precipitation Temperature Precipitation Temperature Precipitation
Winter 154.20***
(2.24)
12.86***
(0.10)
132.11***
(1.52)
54.73***
(0.09)
-155.99**
(-2.27)
32.67**
(0.14)
Spring 126.08***
(1.29)
-9.36**
(-0.04)
-113.23***
(-0.73)
84.12**
(0.04)
128.87
(1.40)
39.79
(0.02)
Summer -156.78***
(-2.56)
29.53***
(0.07)
-104.62***
(-0.27)
99.25**
(0.10)
-172.47**
(-3.08)
92.94*
(0.01)
Fall 176.13***
(3.16)
10.49
(0.05)
121.55***
(1.14)
70.18*
(0.03)
192.08
(3.61)
58.93
(0.19)
Dryland farms
Winter -85.34***
(-2.04)
17.65**
(0.11)
139.18***
(2.30)
19.60***
(0.10)
-130.40*
(-4.70)
36.85**
(0.21)
259.76**
(4.38)
56.08***
(0.03)
Spring 122.31**
(4.40)
-14.36
(-0.10)
-125.43***
(-1.66)
-21.93**
(-0.09)
135.62
(2.08)
-17.79**
(-0.16)
193.49**
(3.01)
-39.18***
(0.15)
Summer -61.85***
(-3.34)
103.53***
(0.13)
-97.55***
-0.18)
98.81***
(0.14)
-188.99**
(-4.37)
29.21***
(0.20)
-195.11**
(-0.36)
-78.19*
(-0.73)
Fall 137.66***
(2.19)
15.49*
(0.04)
-124.32***
(1.57)
-9.88**
(-0.02)
162.97*
(3.30)
15.98*
(0.13)
262.44***
(1.42)
-52.47*
(0.07)
Irrigated farms
Winter 59.62***
(1.77)
74.03***
(0.07)
168.31***
(1.80)
93.70**
(0.07)
41.12**
(2.68)
91.12**
(0.09)
Spring 128.61***
(1.44)
57.29**
(0.09)
116.84**
(0.89)
69.08
(0.03)
233.16
(2.80)
49.38
(0.02)
Summer -40.55***
(-2.58)
102.60***
(0.20)
-226.37***
(-1.05)
112.19***
(0.18)
-55.20**
(-1.69)
76.80*
(0.08)
Fall 347.28***
(1.52)
69.73**
(0.03)
340.18***
(1.41)
89.88**
(0.01)
210.37*
(0.51)
68.61
(0.22)
Note: Values calculated at the mean of the sample using OLS coefficients from Table 4.4 and from
Appendix 1 for dryland and irrigated farms. Numbers in parenthesis are elasticities.
***; **; * significant at 1%, 5% and 10% level respectively
To provide a more complete analysis of the impacts of climate, this study estimated
climate response functions based on the regression results in Table 4.4 and Appendix 1.
The net revenues of an average farm at different temperature and rainfall levels were
plotted. Figures 4.1 to 4.8 below present the climate response functions for the entire

71
sample (combining specialised crop, livestock and mixed farms), and each of the farming
systems separately. The response functions show a hill-shaped response of net revenue to
temperature and rainfall.
All farms temperature response function
-6
-4
-2
0
2
4
6
8
0 3 6 9 12 15 18 21 24 27 30 33 36 40
Temperature (°Celcius)
Log n
et
reve
nue
US
$/fa
rm
Figure 4.2: Temperature response function – all farms
All farms precipitation response function
0
2
4
6
8
10
12
14
0 50 100 150 200 250 300 350 400 450 500 550 650 700 750 800
Precipitation (mm)
Ln
net r
even
ue U
S$
/farm
Figure 4.3: Precipitation response function −−−− all farms

72
Mixed farms temperature response function
-2
-1
0
1
2
3
4
5
6
7
0 3 6 9 12 15 18 21 24 27 30 33 36 40
Temperature (°Celcius)
Log n
et r
eve
nue U
S$/fa
rm
Figure 4.4: Temperature response function – mixed crop−−−−livestock farms
Mixed farms precipitation response function
0
1
2
3
4
5
6
7
8
9
10
0 50 100 150 200 250 300 350 400 450 500 550 650 700 750 800
Precipitation (mm)
Ln
net r
even
ue U
S$
/farm
Figure 4.5: Precipitation response function −−−− mixed crop−−−−livestock farms

73
Specialised crop farms temperature response function
-25
-20
-15
-10
-5
0
5
0 3 6 9 12 15 18 21 24 27 27 33 36 40
Temperature (°Celcius)
Log
net
rev
enu
e U
S$/
farm
Figure 4.6: Temperature response function – specialised crop farms
Specialised crop farms precipitation response function
-8
-6
-4
-2
0
2
4
6
8
10
0 50 100 150 200 250 300 350 400 450 500 550 650 700 750 800
Precipitation (mm)
Lo
g n
et r
even
ue U
S$
/farm
Figure 4.7: Precipitation response function – specialised crop farms

74
Specialised livetock farms temperature response function
-140
-120
-100
-80
-60
-40
-20
0
20
40
0 3 6 9 12 15 18 21 24 27 30 33 36 40
Temperature (°Celcius)
Log
net
rev
enue
US
$/f
arm
Figure 4.8: Temperature response function – specialised livestock farms
Specialised livestock farms precipitation response function
-100
-80
-60
-40
-20
0
20
0 50 100 150 200 250 300 350 400 450 500 550 650 700 750 800
Precipitation (mm)
Lo
g n
et r
eve
nue
US
$/fa
rm
Figure 4.9: Precipitation response function – specialised livestock farms
75
The results show that net revenues for all farms increase with increasing temperature up
to 24°C, while further increases in temperature are associated with declines in net
revenue (Figure 4.2). The annual mean average temperature in Africa is currently about
24°C, indicating that further warming will be harmful to African agriculture. The
response to precipitation shows that net revenues increase with increasing rainfall up to
450mm and then decline with further wetness (Figure 4.3). This implies that above
450mm seasonal average, wetter conditions become harmful to agricultural production.
The response functions for temperature and rainfall show that reductions in net revenues
with further warming are higher than with wetter conditions. These results confirm the
findings from the earlier Ricardian analysis on Africa cropland conducted by
Kurukulasuriya and Mendelsohn (2007a).
This study also examined the response functions for mixed crop−livestock farms,
specialised crop and livestock farms as well as dryland and irrigation farms in each
system separately. Figure 4.4 shows that for mixed farms, net revenues increase with
increasing temperature up to 25°C, after which they decline with further warming. For
specialised crop farms (Figure 4.6) and specialised livestock farms (Figure 4.8), net
revenues also increase with increasing temperature and decline with further warming
above 23°C and 27°C respectively. The results from the temperature response functions
show that the net revenue curve for mixed farms covers a larger area compared to
specialised crop and livestock response curves. This implies that mixed farms are less
affected by temperature changes compared to the specialised systems. In addition, results
show that net revenues for mixed farms (Figure 4.5) increase with increasing rainfall up
to about 450mm and decline with increasing wet conditions. Precipitation response
curves for specialised crop (Figure 4.7) and livestock (Figure 4.9) farms show that net
revenues increase with increasing rainfall up to 350mm and 300mm respectively. Further
wetness above these levels has negative impacts of net farm revenues.
The shapes of the response functions are worth noting. These results show that
specialised crop (Figures 4.6 and 4.7) and livestock systems (Figures 4.8 and 4.9) in
Africa are highly sensitive to climate. The climate sensitivity varies, however, according

76
to whether farming depends entirely on rainfall or uses irrigation. Irrigation acts as a
buffer against adverse impacts from harsh climatic conditions and hence irrigated farms
are less sensitive to climate. Mixed crop−livestock farms (Figures 4.4 and 4.5) and
irrigated farms appear to be more resilient to harsh climate conditions. The results
suggest that specialised crop or livestock agriculture is more vulnerable to climate change
than mixed systems. Generally, response curves for temperature and precipitation show
that net revenues are more sensitive to temperature changes. This implies that
temperature changes are more harmful to agricultural production in the region.
4.4 Forecasting impacts of climate change on net revenue
This section predicts impacts of future climate changes on net revenue from crop and
livestock farming under various climate scenarios. Estimated model parameters from the
Ricardian analyses above were used to predict the potential impacts of future climate
changes on net farm revenue across different farming systems. To make a comparative
assessment with other regional studies (Kurukulasuriya et al., 2006; Kurukulasuriya &
Mendelsohn, 2007a; Seo & Mendelsohn, 2007a), this study uses the same sets of
scenarios as the cited studies. This study examined the impacts of future changes in
climate both for a set of simple scenarios (section 4.4.1), as well as a set of climate
change scenarios predicted by the Atmospheric-Oceanic Global Circulation Models
(AOGCMs) (section 4.4.2).
4.4.1 Climate sensitivity scenarios
This study tested four climate change scenarios: +2.5°C and +5°C increases in
temperature and -7% and -14% decreases in precipitation. The simulations allowed only
one climate variable to change at a time. Although these assumptions are not realistic in
the real world, they provide important insights into likely responses to changes in climate
variables.

77
Table 4.6 presents the results of the four climate scenarios compared to the baseline
income for each farm type and category. The results show that increases in warming of
2.5°C and 5°C seem to predict losses in net farm revenue per farm for all farms, mixed
crop−livestock farms and specialised crop and livestock systems. The losses are strongest
for specialised crop systems, for example at 5°C warming specialised crop farms lose
87% net farm revenue per farm, compared to losses of 57% and 49% for mixed
crop−livestock systems and specialised livestock farms respectively.
Reductions in precipitation (7% and 14%) predict higher losses in net farm revenue per
farm for specialised crop and livestock systems, compared to all farms and mixed
crop−livestock farms. For example, 14% reduction in precipitation predicts 65% and 46%
losses in net revenue per farm for specialised crop and livestock systems respectively,
compared to losses of 26% for all farms and 19% for mixed crop−livestock farms. These
results suggest that specialised crop or livestock systems tend to suffer most from
increases in warming and drying. Mixed crop−livestock farms that are less sensitive to
climate changes suffer minimal damages compared to other farm types.
Results also show that warmer temperatures, namely increases of both 2.5°C and 5°C,
tend to predict losses for dryland systems and gains for irrigated systems. The magnitudes
of the losses are highest for specialised crop systems compared to all farms and mixed
crop−livestock systems, suggesting that the risk of specialised systems is higher with
warming in general. Reductions in precipitations of 7% and 14% appear to predict losses
both for dryland and irrigated farming systems. Similarly, the magnitudes of the predicted
losses suggest that drying has strong negative effects for specialised crop systems
compared to all farms and mixed crop−livestock farms.

78
Table 4.6: Predicted impacts of climate change on net revenue from simple
scenarios
All farms
Mixed crop livestock
farms Specialised crop farms
Specialised livestock
farms
Climate scenario
∆Net Revenue (USD per
farm)
% of net farm
income
∆Net Revenue (USD per
farm)
% of net farm
income
∆Net Revenue (USD per
farm)
% of net farm
income
∆Net Revenue (USD per
farm)
% of net farm
income
Baseline: 506.42 Baseline: 563.39 Baseline: 333.18 Baseline: 569.95
2.5˚C Warming -214.49 -42.35 -165.65 -29.40 -76.08 -22.84 -120.82 -21.20
5˚C Warming -51.36 -10.14 -318.31 -56.50 -291.30 -87.43 -276.46 -48.51
7% Decreased
Precipitation -64.83 -12.80 -52.02 -9.23 -75.55 -22.68 -186.28 -32.68
14% Decreased
Precipitation -130.86 -25.84 -105.56 -18.74 -152.48 -45.76 -370.49 -65.00
Dryland farms Baseline: 443.58 Baseline 502.21 Baseline: 283.86
2.5˚C Warming -87.34 -19.69 -337.22 -67.15 -238.71 -84.09
5˚C Warming -110.01 -24.80 -54.86 -10.92 -263.28 -92.75
7% Decreased
Precipitation 60.77 13.70 -175.00 -34.85 -226.76 -79.88
14% Decreased
Precipitation -78.48 -17.69 -221.92 -44.19 -234.36 -82.56
Irrigated farms Baseline: 777.83 Baseline: 790.36 Baseline: 669.42
2.5˚C Warming 201.58 25.92 154.89 19.60 192.30 28.73
5˚C Warming 232.59 29.90 172.93 21.88 228.69 34.16
7% Decreased
Precipitation -158.85 -20.42 -120.66 -15.27 -131.56 -19.65
14% Decreased
Precipitation -167.42 -21.52 -130.63 -16.53 -146.27 -21.85
Note: Estimated using coefficients from regression results (Table 4.4 and the other models presented in Appendix 1)

79
4.4.2 AOGCM climate scenarios
This study also examined a set of climate change scenarios from AOGCMs, in particular
two scenarios that predict a wide range of outcomes consistent with the most recent IPCC
report (Houghton et al., 2001). The specific scenarios used in this study are A17 scenarios
from the following models: PCM (Parallel Climate Model) (Washington et al., 2000), and
the CCC (Canadian Climate Centre) (Boer, Flato & Ramsden, 2000). Country level
impacts for each of these scenarios for the year 2100 were examined. The climate model
predicted change in temperature was added to the baseline temperature in each district
under each climate scenario. For changes in precipitation, the climate model predicted
change was multiplied by the baseline precipitation in each district.
Table 4.7 summarises the mean temperature and precipitation predicted by the two
models for the year 2100. The models have a range of predictions: the PCM predicts a
3°C increase in temperature for 2100 and the CCC an increase of 6°C. For both models
temperature shows a rising trend over time.
Table 4.7: Climate predictions of AOGCM models for 2100
Model CURRENT 2100
CCC 23.29 29.96
PCM TEMP
23.29 25.79
CCC 79.75 65.08
PCM PRECIP
79.75 83.18
7 “The difference between the A1 and B1 worlds which share identical population growth projections is
primarily due to the higher level of economic development in the A1 world which allows higher market
prices” (Parry et al., 2004).

80
In terms of rainfall, PCM predicts an increase in precipitation of 4% by 2100 and the
CCC a reduction of 15% for the same year. Despite these predictions, rainfall distribution
varies greatly across countries. An important point to note is that there is spatial and
temporal variability in predictions of temperature and precipitation in Africa.
To predict the impact of each climate scenario on net revenue, the changes in net farm
revenues from baseline values in Table 4.6 and under each new climate scenario were
calculated. The difference between the two levels of net revenues yields the change in net
revenue per farm in each district. The predictions were based on the Ricardian regression
results in Table 4.4 and Appendix 1.
Table 4.8 presents the results of the changes in net revenue per farm predicted using the
two climate scenarios for the year 2100. The PCM scenario that forecasts mild changes in
climate predicts some increases in net revenue. The CCC scenario that forecasts
substantial increases in warming and drying, predicts severe losses in net farm revenues
across Africa. Dryland farms and specialised crop or livestock farms tend to suffer most
from harsh climatic conditions. On the other hand, irrigated farms and mixed
crop−livestock farms are less sensitive to changes in climate and experience fewer
negative impacts from increases in warming and drying. These results support the
observation that irrigation and mixed crop−livestock farms offer an important adaptation
alternative for farmers.

81
Table 4.8: Predicted impacts from AOGM climate scenarios (PCM and CCC) for
the year 2100
All farms
Mixed crop livestock
farms
Specialised crop farms Specialised livestock
farms
Climate
scenarios ∆Net Revenue
(USD per
farm)
% of net farm
income
∆Net Revenue
(USD per farm)
% of net farm
income
∆Net Revenue (USD per
farm)
% of net farm
income
∆Net Revenue (USD per
farm)
% of net farm
income
Baseline: 506.42 Baseline: 563.39 Baseline: 333.18 Baseline: 569.95
PCM 2100 14.92 2.95 15.90 2.82 -120.08 -36.04 405.06 25.70
CCC 2100 -298.17 -58.88 -107.55 -19.09 -189.61 -56.91 -357.35 -22.68
Dryland
farms
Baseline: 443.58 Baseline: 502.21 Baseline: 283.86
PCM 2100 -62.81 -14.16 -66.91 -13.32 -181.39 -63.90
CCC 2100 -76.14 -17.17 -245.02 -48.79 -224.21 -78.99
Irrigated
farms
Baseline: 777.83 Baseline: 790.36 Baseline: 669.42
PCM 2100 255.91 32.90 172.33 21.80 209.70 31.32
CCC 2100 -219.54 -28.22 -110.49 -13.98 -232.85 -33.29
Note: Estimated using coefficients from regression results (Table 4.4 and Appendix 1) and AOGCM country specific climate scenarios
4.5 Summary and policy implications
This chapter analysed the impacts of changes in climate on net farm revenues in Africa.
The empirical analyses were based on a cross-sectional database of over 6900 surveys
from 11 African countries. Additional climate, soils and flow variables were obtained
from other sources and combined with the cross-sectional survey data.
The study used a Ricardian approach to measure the impacts of climate change on
combined crop and livestock net revenue. Net revenue per farm was regressed against
climate, soils, hydrological and socio-economic variables to measure the effects of each
variable on net farm revenue. The impacts of climate change were examined for the total
82
sample as well as for three main farming types: specialised crop; specialised livestock;
and mixed crop and livestock; and for dryland and irrigated farms within each farm type.
The study also examined four particular climate sensitivity scenarios, as well as two
climate scenarios from the Atmospheric Oceanic General Circulation Models (AOGCMs).
The results show that larger farm sizes appear to have a strong positive influence on net
farm revenues across all farm types, suggesting that more land allows more crop and
livestock enterprises per farm, thus leading to more income, although per hectare value
may be low. Larger families seem to be associated with higher net farm revenues across
all farm types. Better access to other farm assets, such as heavy machinery like tractors,
appears to strongly and positively influence net farm revenues for all farms, mixed
crop−livestock farms and specialised crop farms. These results suggest that capital, land
and labour serve as important production factors in African agriculture. National policies
need to invest more in improving factor endowments (i.e. family size, land area and
capital resources) at the disposal of farming households in order to enhance farm
performance in the face of climate change.
Better access to extension services seems to have a strong positive influence on net farm
revenue on all farms, mixed crop−livestock farms and specialised crop farms. Improving
access to extension ensures that farmers have the information for decision making to
improve their production activities. Policies aimed at improving farm-level performance
need to emphasise the critical role of providing information (through extension services)
to enhance farm-level decision making.
Improving access to technology (in this case electricity) has significant potential in
improving farm-level production activities and hence net revenues. For example, the use
of irrigation and intensive livestock production systems (which are usually capital
intensive), increases when farmers have access to electricity and machinery. Improving
access to technology such as electricity and machines is therefore important to enhance
agricultural production in the face of climate change.

83
The arenosols, fluvisols and ferric luvisols soils that are extensively developed and are
usually high productive soils, appear to have a strong positive influence on net farm
revenues across all farming systems. On the other hand, the soil type chromic luvisols
that is unproductive shows a strong negative influence on net farm revenues across all
farming systems.
Marginal analyses of the impacts of seasonal climate variables show that African net
farm revenues are highly sensitive to changes in climate. The sensitivity is relatively
higher for changes in temperature than for changes in precipitation. Further warming and
drying will have severe adverse effects on farm net revenues. The results show variations
in sensitivity to climate, based on farm type and whether a farm is dryland or irrigated.
Dryland and specialised crop or livestock farms suffer most from increases in warming
and drying, compared to irrigated and mixed crop−livestock farms. Predictions of future
climate impacts also indicate that mixed crop−livestock and irrigated farms are less
sensitive to climate changes and will experience less damages, compared to highly
sensitive dryland and specialised crop or livestock farms. Results show that net farm
revenues are in general negatively affected by warmer and dryer climates. The small-
scale mixed crop and livestock system predominant in Africa is the most tolerant system,
whereas specialised crop production is the most vulnerable to warming and lower rainfall.
Generally farming systems located in dry semi-arid and arid regions (for example most
southern parts of the continent) will suffer most from increases in warming and drying
compared to more humid regions. It is therefore important for Africa to enhance
adaptation efforts both at the micro (farm) and macro (national) levels. Governments
need to integrate adaptation strategies into national economic policies and strengthen
community based adaptations to help farmers reduce potential damage from climate
change. These results have important policy implications, especially regarding the
suitability of the increasing tendency toward large-scale mono-cropping strategies for
agricultural development in Africa and other parts of the developing world, in the light of
expected climate changes. Mixed crop and livestock farming and irrigation offer better

84
adaptation options for farmers against further warming and drying predicted under
various future climate scenarios.

85
Chapter 5
Theoretical and empirical studies relating to the economics of climate change
adaptation in agriculture
5.0 Introduction
This chapter briefly reviews selected theoretical and empirical studies relating to the
economics of climate change adaptation in agriculture, starting by defining and
discussing climate change adaptation in agriculture. This is followed by a discussion of
the various approaches and methods that have been used for assessing adaptation to
climate change in agriculture (section 5.2). Empirical studies that have analysed
determinants of adaptation strategies in agriculture are discussed in section 5.3. The
chapter concludes with a summary of the approach chosen to implement the empirical
analysis of determinants of climate change adaptation strategies of African farmers and
the expected contributions of this study.
5.1 Adaptation to climate change in agriculture
Adaptation to climate change refers to adjustments in management strategies to reduce
risks or realise opportunities from actual or expected changes in climatic conditions
(IPCC, 2001; Smit, Burton, Klein & Wandel, 2000; Kandlinkar & Risbey, 2000).
Agricultural adaptations to climate change involve modifications in farm-level practices
due to changing climatic and non-climatic conditions (Wall & Smit, 2005;
Kurukulasuriya & Rosenthal, 2003; Kandlinkar & Risbey, 2000). Adaptation occurs at
two main scales: (a) the farm (or micro) level that focuses on micro analysis of farmer
decision making; and (b) the national (or macro) level that is concerned about agricultural
production at national and regional scales and its relationships with domestic and
international policy (Bradshaw, Dolan & Smit, 2004; Kurukulasuriya & Rosenthal, 2003;

86
Kandlinkar & Risbey, 2000). Micro-level analysis of adaptation8 focuses on tactical
decisions farmers make in response to seasonal variations in climatic, economic, and
other factors. Macro-level analysis, on the other hand, focuses on strategic national
decisions and policies on local to regional scales, taking into account long term changes
in climatic, market and other conditions (Bradshaw et al., 2004; Kurukulasuriya &
Rosenthal, 2003; Kandlinkar & Risbey, 2000).
Further changes in climate are unavoidable even under stringent mitigation9 measures
over the next few decades (IPCC, 2007; Houghton et al., 1996). These changes are
unavoidable due to high concentrations of greenhouse gasses (higher than pre-industrial
levels), and high residual levels of greenhouse gasses in the atmosphere (Klein et al.,
2007). Mitigation efforts to reduce the sources of or to enhance the sinks of greenhouse
gasses will take time. Furthermore, effective mitigation requires collaboration and
commitment from many countries (Klein et al., 2007).
Adaptation is therefore critical and of concern in developing countries, particularly in
Africa where vulnerability is high because ability to adapt is low. Adaptation helps
reduce the impacts of climate change in the short to medium term, and is motivated from
local priorities or regional risks, without requiring multi-country commitments. The
benefits of adaptation are realised in the short term and are felt at the local community
level. Adaptation measures are therefore critical in the short to medium term, while in the
long run mitigation efforts are required to reduce risks and create sinks for further
greenhouse gas emissions. Human and natural risks associated with climate change are
determined by both adaptation and mitigation actions (Smit et al., 2000). Therefore, 8 “Adaptation strategies are defined as longer-term (beyond a single season) strategies that are needed for
people to respond to a new set of evolving conditions (biophysical, social and economic) that they have
not previously experienced. Coping strategies are defined as strategies that have evolved over time
through people’s long experience in dealing with the known and understood natural variation that they
expect in seasons combined with their specific responses to the season as it unfolds” (Dinar et al., 2008).
9 Mitigation to climate change refers to responses aimed at reducing greenhouse gas emissions and
enhancing sinks (IPCC, 2007).

87
effective climate policy must integrate diverse adaptation and mitigation actions to
reduce the adverse effects of climate change on human and natural systems (Klein et al.,
2007).
Climate change is expected to affect food and water resources that are critical for
livelihood in Africa where much of the population, especially the poor, rely on local
supply systems that are sensitive to climate variation. Disruptions of the existing food and
water systems will have devastating implications for development and livelihood, and are
expected to add to the challenges climate change already poses for poverty eradication
(De Wit & Stankiewicz, 2006; IISD, 2007). Adaptation helps farmers achieve their food,
income and livelihood security objectives in the face of changing climatic and
socioeconomic conditions, including climate variability, extreme weather conditions such
as droughts and floods, and volatile short-term changes in local and large-scale markets
(Kurukulasuriya & Rosenthal, 2003; Kandlinkar & Risbey, 2000). Farmers can reduce
potential damage by making tactical responses to climate changes. Analysing adaptation
mechanisms is therefore important in finding ways to help farmers adapt in the rural
economies of Africa.
Although African farmers have a low capacity to adapt to such changes, they have
survived and coped in various ways over time. Better understanding of how they have
done this is essential for designing incentives to enhance private adaptation. Supporting
the coping strategies of local farmers through appropriate public policy and investment
and collective actions can help increase the adoption of adaptation measures. Such
measures will reduce the negative consequences of predicted changes in future climate
conditions, with great benefits to vulnerable rural communities in Africa.
5.2 Approaches for assessing adaptation to climate change in agriculture
Adaptation to climate change at the macro and micro levels defined above has been
studied and analysed employing different approaches which were discussed in chapter 3
on measuring the impacts of climate change. Macro level analyses of adaptation have

88
been based on regional structural (agronomic-economic) models (e.g. Adams et al., 1990,
1995; 1998b; Easterling et al., 1993), integrated assessment models (e.g. Yates &
Strzepek, 1998; Crosson & Rosenburg, 1993; Rosenzweig & Parry, 1993) and the Future
Agricultural Resources Model (FARM) (Darwin et al., 1994, 1995).
At the micro level, cross-section (Ricardian) models (e.g. Kurukulasuriya & Mendelsohn,
2007a; Seo & Mendelsohn, 2007ba; Gbetibouo & Hassan, 2005; Deressa et al., 2005;
Mano & Nhemachena, 2007), agronomic-economic models (e.g. Kaiser et al., 1993) and
multinomial choice (adoption) models (e.g. Kurukulasuriya & Mendelsohn, 2007b, 2007c;
Seo & Mendelsohn, 2007b; Maddison, 2007) have been employed to analyse adaptation.
Adoption literature at the farm level has been based on multinomial choice (adoption)
models. The present study accordingly employs the multinomial logit (MNL) approach to
conduct the intended analyses. The reason for the choice of the MNL logit model to
analyse the determinants of farmers’ decisions is that it is widely used in adoption
decision studies involving multiple choices (see section 6.3).
5.2.1 Agronomic-economic models
The structural approaches (agronomic-economic models) start by using crop simulation
models (e.g. the CERES family models, CROPWAT or EPIC models), based on detailed
experiments to determine the response of specific crops and crop varieties to different
climatic and other conditions. Farm management practices can be included in structural
models, for example, modelling the impacts of changing timing of field operations, crop
choices, adding irrigation (Adams, 1999; Adams et al., 1998a; Schimmelpfenning et al.,
1996).
Agronomic-economic models successfully incorporate adaptation into crop simulation
models (Mendelsohn, 2000). Mendelsohn cites a number of farm-level studies based on
this approach that have examined efficient responses by farmers to climate change.
Examples include: Kaiser et al. (1993) who showed that altering crop mixes, crop
varieties, sowing and harvesting dates, and water saving technologies in the United States

89
can reduce the negative impacts of climate change on agriculture. These farm-level
studies and others (Reilly, 1994, 1995) showed that adaptation can reduce the damage
from warming on crop yields by up to 50 percent. The strength of using this approach is
that it allows for detailed understanding of the physical, biological responses, as well as
adjustments that farmers can make in response to changing climatic and other conditions
(Adams 1999; Schimmelpfenning et al., 1996). Such information might be important for
focused policy and adaptation planning in identifying which group of people to target and
in which ways they should be supported.
However, Mendelsohn (2000) argues that it is very expensive to carefully include
microeconomic farm responses and thus it is rarely done. Only a few studies have been
able to carefully include adaptation in developing countries, with current examples
coming from the developed world, especially the United States. The other limitation of
this approach is the failure to take into account economic considerations and human
capital limitations which affect farm-level decision making (Mendelsohn, 2000).
Mendelsohn (2000) cites a number of studies that examined various adaptation strategies,
but failed to estimate the effects on net revenue. Examples include Elshar et al. (1997)
who examined climate adaptation strategies (changes in water, land and crop
management) in Egypt, and Iglesias and Minguez (1997) who examined changes in
sowing dates, new hybrids and double cropping for wheat and maize in Spain. None of
these studies measured the effects on net revenues from taking these adaptation strategies
into account (Mendelsohn, 2000). In addition, if an economist fails to correctly anticipate
potential farmer adjustments and adaptations, the estimates might be biased (either
overestimating the damages or underestimating the potential benefits of climate change)
(Adams, 1999).
5.2.2 Cross-sectional methods
The two main cross-sectional methods developed to account for adaptation in response to
changes in climate are: (a) the Ricardian approach by Mendelsohn et al. (1994), and (b)
90
the Future Agricultural Resources Model (FARM) by Darwin et al. (1994, 1995). The
basic assumption underlying both these methods is that similar climates mean similar
production practices. This assumption allows both approaches to implicitly capture
changes in crop or livestock outputs, production inputs or management practices that
farmers are likely to take in response to changing climatic and other conditions (Darwin,
1999).
The cross-sectional methods fully incorporate farmer adaptations. First round adaptations
by farmers are captured in the estimates of climate-induced changes that represent the
economic value of climate change on agriculture (Mendelsohn et al., 1996, 1994). The
measurement of long-term impacts of climate change considers the costs and benefits
associated with changes in management decisions and practices taken by farmers in
response to changes in local climate, as well as the effect of other explanatory variables
such as soils, infrastructure, agricultural services and other socio-economic variables
(Mendelsohn & Dinar, 2005; Mendelsohn et al., 1996, 1994). The underlying assumption
is that farmers will automatically make adjustments in their management practices in
response to changes in climate (Mendelsohn & Dinar 2003; Mendelsohn et al., 1996,
1994; Adams 1999; Adams et al., 1998a).
5.2.3 Discrete multinomial choice models
Although both agronomic and cross-sectional models address adaptation issues, they both
fail to explicitly consider issues related to farmer adoption of the various adaptation
strategies. Adaptation to climate change in agriculture involves the adoption of new
technologies such as new crop varieties and irrigation technologies. Maddison (2007)
reviewed the adoption process of new agricultural technologies in detail. He cites various
other studies and their approaches in investigating the adoption of agricultural
innovations. The two main approaches reported in the literature that have been used to
analyse the determinants of adoption of agricultural innovations are the probit and logit
models. Recent studies that have addressed adoption related issues in adaptation to

91
climate change in agriculture include Kurukulasuriya and Mendelsohn (2007b; 2007c)
Seo and Mendelsohn (2007b) and Maddison (2007). These studies were based on discrete
choice models addressing the determinants of adoption of various adaptation strategies.
The next chapter discusses some of the determinants of adoption of adaptation measures
from these and other studies (see section 6.4).
Kurukulasuriya and Mendelsohn (2007b), and Seo and Mendelsohn (2007b) used
multinomial logit models to analyse respectively crop and livestock choice as adaptation
options. The study on crop choice shows that crop type is climate sensitive and farmers
adapt to changes in climate by switching crops. The results from the choice models in the
livestock study show that farmers in warmer temperatures tend to choose goats and sheep
as opposed to beef cattle and chicken. Goats and sheep can do better in dry and harsher
conditions than beef cattle.
Kurukulasuriya and Mendelsohn (2007c), and Mendelsohn and Dinar (2003) explored the
importance of water availability in the Ricardian model by estimating the role of
irrigation as an adaptation measure against unfavourable climatic conditions. This was a
significant step in addressing the shortcomings of past Ricardian studies of agriculture
(Mendelsohn et al., 1994, 1996) that were criticised for failing to take into account the
effects of irrigation and other water supplies (Cline 1996; Darwin, 1999). The recent
studies showed that irrigation is an important adaptation measure that can significantly
help reduce the negative impacts associated with changes in climate.
Maddison (2007) applied a Heckman selection probit model to help explain determinants
of African farmers’ adaptation strategies using the GEF data set. The empirical results
indicate that farmers with the greatest farming experience are more likely to notice
changes in climatic conditions which are consistent with farmers engaging in Bayesian
updating of their prior beliefs. The study also reported that farmer experience, access to
free extension services and markets are some of the important determinants of adaptation.
92
Bradshaw et al. (2004) assessed the adoption of crop diversification in Canadian prairie
agriculture for the period 1994-2002, reflecting upon its strengths and limitations for
managing a variety of risks, including climatic ones. Results based on data from over
15000 operations show that individual farms have become more specialised in their
cropping patterns since 1994. This trend is unlikely to change in the immediate future,
notwithstanding anticipated climate change, due to the known risk-reducing benefits of
crop diversification. The recommendation from that study was that there is a need to
assess and understand the wider strengths and limitations of various ‘suitable’ and
‘possible’ adaptations to changes in climate.
5.3 Summary
Empirical studies measuring the economic impacts of climate change on agriculture in
Africa discussed above show that such impacts can be significantly reduced through
adaptation. The present study adds to these analyses by studying the determinants of
farmers’ choices between alternative adaptation measures available to rural households in
Africa. This analysis is different from other adaptation studies in that farmers’ actual
adaptation10 measures are considered. This can be compared with Maddison’s (2007)
analysis of farmers’ perceptions of climate change and the adaptations they perceive as
appropriate, using the same sample of African farmers.
This study considers the choice between many adaptation measures simultaneously,
whereas other studies analysed such joint endogenous decisions in separate analyses for
crop selection (Kurukulasuriya & Mendelsohn, 2007b), irrigation modelling
(Kurukulasuriya & Mendelsohn, 2007c), and livestock choice (Seo & Mendelsohn,
2007b). Other important contributions of this study include identification of relevant
adaptation options for farmers in Africa and assessment of the probability of farmers’
choice among these adaptation options, given certain relevant factors. The present study 10 The different combinations of actual measures and practices may be grouped into the following
adaptation options: diversifying into multiple crops and mixed crop−livestock systems, switching from
crops to livestock and from dryland to irrigation (For details see section 6.2).

93
accordingly employs the multinomial logit approach to conduct the required analyses.
The level of analysis for this study is the local farm level where micro analysis of
adaptation mechanisms was applied to find potential ways of improving agricultural
production at this level.

94
Chapter 6
Determinants of climate adaptation strategies of African farmers: Multinomial choice analysis
6.0 Introduction
This chapter analyses adaptation measures used by African farmers and the determinants
of their choices. The chapter begins by presenting a brief analytical summary of the
perceptions of African farmers on climate change and commonly followed measures for
coping with it (section 6.1). Section 6.2 discusses the classification of actual farmers’
adaptation decisions. The analytical framework for studying actual farmers’ choices of
adaptation measures and determinants of their decisions are discussed in section 6.3.
Section 6.4 develops the empirical components for implementing the analytical model
and results are discussed in section 6.5. Conclusions and implications are distilled in
section 6.6.
6.1 Perceived adaptation strategies of African farmers
Based on data from a comprehensive survey of agricultural households across 11
countries in Africa, this section presents brief summaries of farmers’ perceptions of
climate change and what strategies they perceive to be suitable for adapting to those
changes. Details of the sample of more than 8000 questionnaires are given in chapter 4,
section 4.2. In this survey farmers were asked questions about their perceptions of long-
term temperature and precipitation changes, as well as what measures and practices they
have typically opted for in order to cope with such changes over the years11. The results
11 In this study, these options typically stated by farmers in response to changes in short-term and long-
term changes in climate are defined as ‘perceived’ adaptation measures (see Table 6.2). The assumption
for this study is that farmers might have stated adaptation options which they did not actually implement.
‘Actual’ adaptation measures analysed in this study refer to practices farmers were using at the time of

95
(Table 6.1) show that the majority (50%) of farmers perceive that long-term temperatures
are warming, precipitation is declining, and there are pronounced changes in the timing
of rains (32%) and frequency of droughts (16%).
Table 6.1: Farmer perceptions on long term temperature and precipitation changes
(% of respondents)
Variable Percentage of respondents
(a) Temperature
Increased temperature 51
Decreased temperature 5
Altered climatic range 9
Other changes 7
No change 14
Don’t know 6
(b) Precipitation
Increase precipitation 5
Decreased precipitation 50
Changed timing of rains 32
Frequency of droughts 16
Other changes 5
No change 13
Don’t know 4
Number of observations 8208
Farmers’ perceived adaptation strategies in responding to the changing climate include:
crop diversification, using different crop varieties, varying planting and harvesting dates,
the interviews. The study by Maddison (2007), based on the same data set, used stated adaptation
measures (referred to as ‘perceived’ adaptation options in this study) as opposed to actual farmer
practices (for example, a farmer may actually have had multiple crops and livestock, irrigation etc, as
opposed to listed adjustments in farming activities which might not have been implemented) (see Table
6.3).
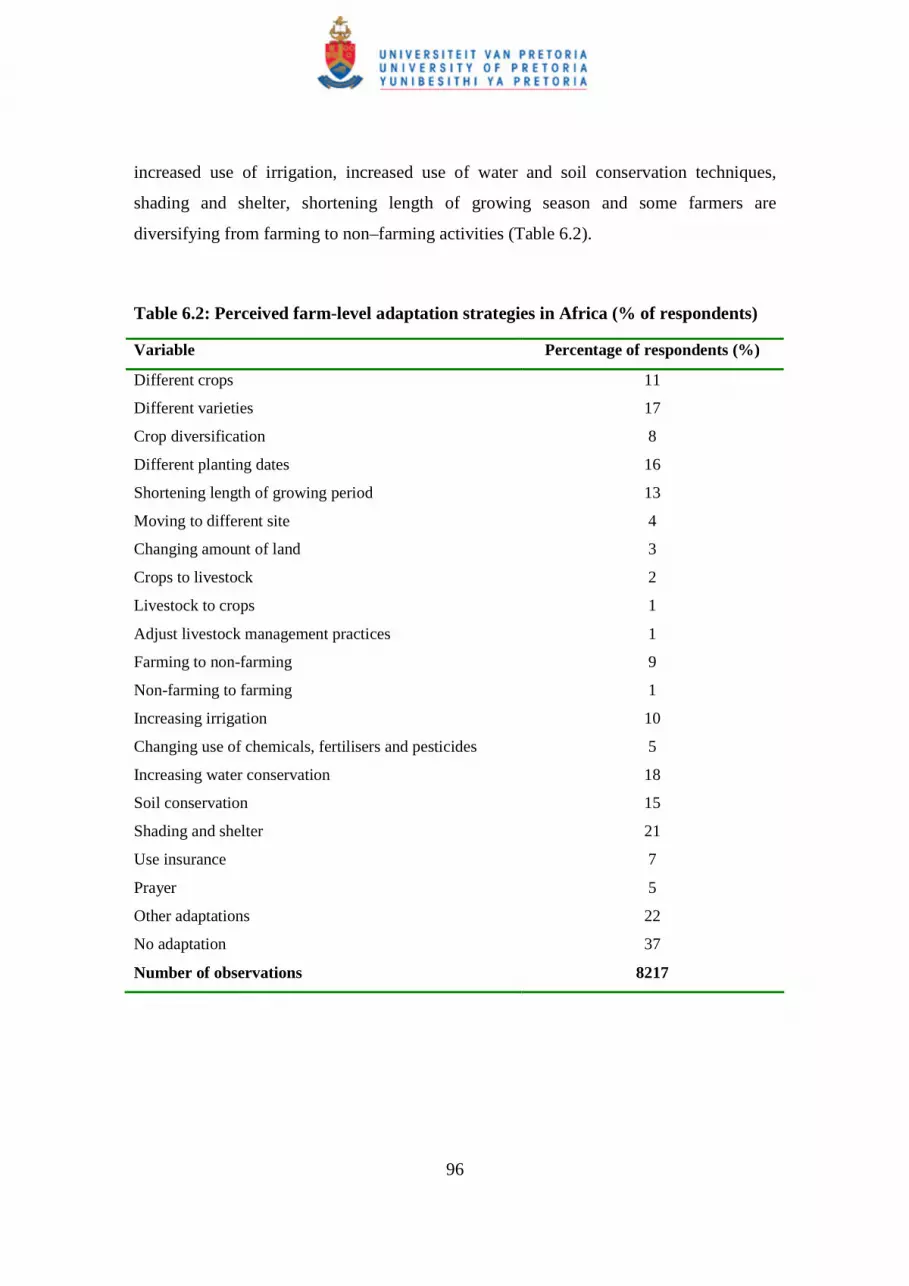
96
increased use of irrigation, increased use of water and soil conservation techniques,
shading and shelter, shortening length of growing season and some farmers are
diversifying from farming to non–farming activities (Table 6.2).
Table 6.2: Perceived farm-level adaptation strategies in Africa (% of respondents)
Variable Percentage of respondents (%)
Different crops 11
Different varieties 17
Crop diversification 8
Different planting dates 16
Shortening length of growing period 13
Moving to different site 4
Changing amount of land 3
Crops to livestock 2
Livestock to crops 1
Adjust livestock management practices 1
Farming to non-farming 9
Non-farming to farming 1
Increasing irrigation 10
Changing use of chemicals, fertilisers and pesticides 5
Increasing water conservation 18
Soil conservation 15
Shading and shelter 21
Use insurance 7
Prayer 5
Other adaptations 22
No adaptation 37
Number of observations 8217

97
6.2 Classification of actual farmers’ adaptation decisions
This section moves to analyse actual adaptation measures used by farmers, as opposed to
perceived adaptations described above. The main practices actually followed by farmers
during the survey year (2002) are grouped into eleven combinations of choices (Table
6.3). It is important to note that many of the adaptation strategies identified by farmers in
Table 6.2 form components of their observed actual practices reported in Table 6.3.
Those measures however, are mostly implemented in combination with other measures
and not alone.
The different combinations of measures and practices may be grouped into the following
adaptation options: diversifying into multiple crops and mixed crop−livestock systems,
switching from crops to livestock and from dryland to irrigation. It is clear from Table
6.3 that multiple cropping mixed with livestock rearing under dryland conditions is the
most dominant system in Africa (52% of farms). Multiple cropping with livestock under
irrigation has the second highest frequency (14%) and multiple cropping without
livestock under dryland conditions comes third (13%). Mixing livestock with crops is by
far the most common practice of African farmers (79%), whether under irrigation or
dryland. Also note that while about 24% of African farms irrigate, using irrigation to
support specialised livestock production is very rare (Table 6.3).
It is clear that African farmers rarely specialise in rearing livestock only, whether under
irrigation or dryland conditions (Table 6.3)12. However, a possible explanation for the
observation that specialised livestock is rarely practised might be a limitation of the
original survey design and data collection, as there are some farmers specialising in
livestock only. While specialising in livestock production is not a feature of African
agriculture, it can be observed that specialised rain-fed and irrigated crop cultivation
12 It is common that smallholder African farmers typically cultivate part of their own farm land with at
least one staple food crop besides the farm animals they keep. Even large commercial diary and beef
farms in Africa also produce some fodder crops for animal feed.
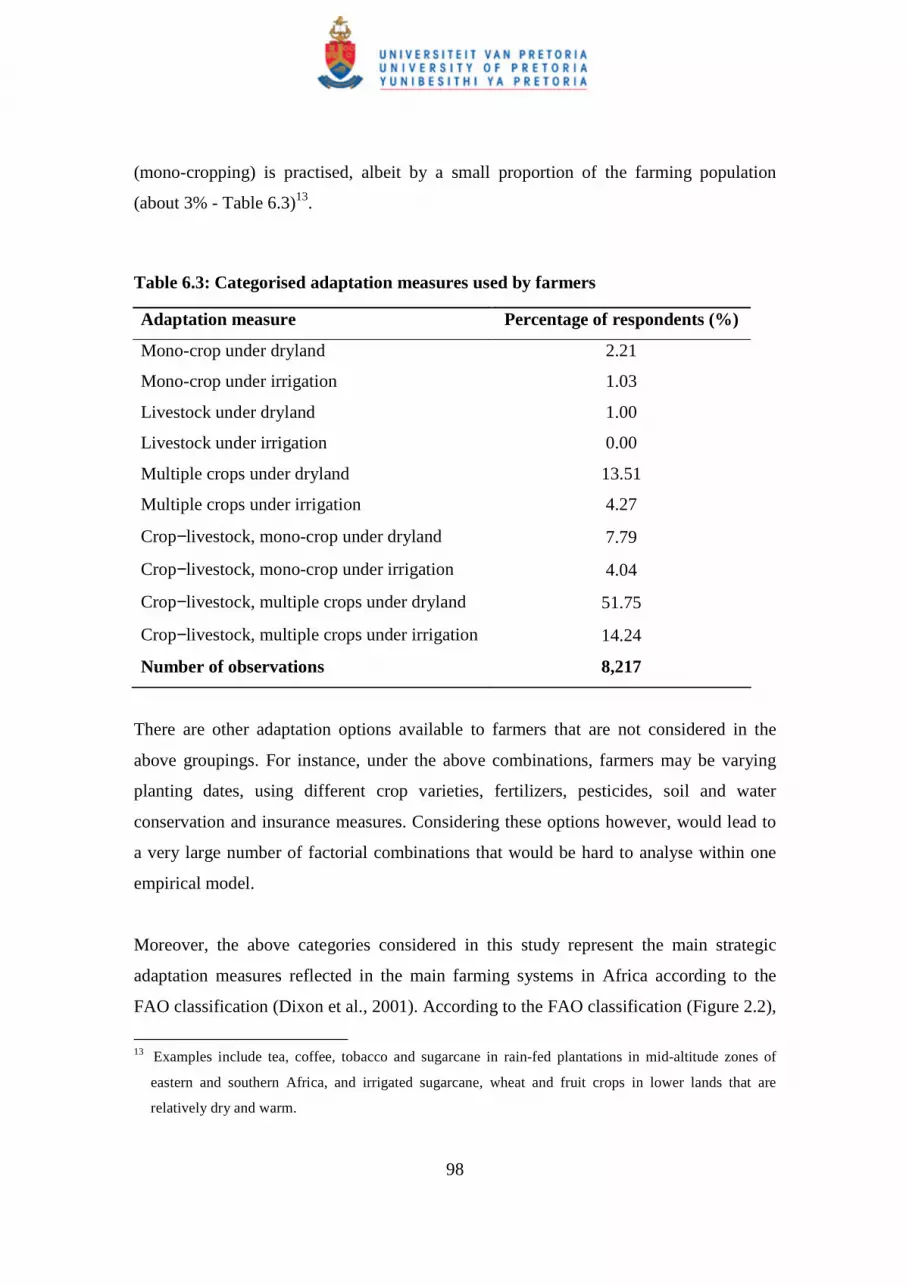
98
(mono-cropping) is practised, albeit by a small proportion of the farming population
(about 3% - Table 6.3)13.
Table 6.3: Categorised adaptation measures used by farmers
Adaptation measure Percentage of respondents (%)
Mono-crop under dryland 2.21
Mono-crop under irrigation 1.03
Livestock under dryland 1.00
Livestock under irrigation 0.00
Multiple crops under dryland 13.51
Multiple crops under irrigation 4.27
Crop−livestock, mono-crop under dryland 7.79
Crop−livestock, mono-crop under irrigation 4.04
Crop−livestock, multiple crops under dryland 51.75
Crop−livestock, multiple crops under irrigation 14.24
Number of observations 8,217
There are other adaptation options available to farmers that are not considered in the
above groupings. For instance, under the above combinations, farmers may be varying
planting dates, using different crop varieties, fertilizers, pesticides, soil and water
conservation and insurance measures. Considering these options however, would lead to
a very large number of factorial combinations that would be hard to analyse within one
empirical model.
Moreover, the above categories considered in this study represent the main strategic
adaptation measures reflected in the main farming systems in Africa according to the
FAO classification (Dixon et al., 2001). According to the FAO classification (Figure 2.2),
13 Examples include tea, coffee, tobacco and sugarcane in rain-fed plantations in mid-altitude zones of
eastern and southern Africa, and irrigated sugarcane, wheat and fruit crops in lower lands that are
relatively dry and warm.

99
the maize-mixed, cereal-root crop mixed and root crops are the principal farming systems
in sub-Saharan Africa, supporting about 41% of the agricultural population. Other
important farming systems include: agro-pastoral millet/sorghum, highland perennial,
pastoral, forest based and highland temperate mixed. The irrigated farming system
occupies only 1% of the total land area and supports 2% of the agricultural population
(Dixon et al., 2001). The principal farming systems in southern Africa are: maize-mixed;
large scale commercial, pastoral, sparse arid root crop, agro-pastoral millet and cereal
root crop mixed. In east and central Africa the main farming systems are: maize-mixed,
forest based, root crop, pastoral, agro-pastoral, and highland temperate mixed. Root crop,
cereal-root crop mixed, tree crop, pastoral, agro-pastoral millet/sorghum, and sparse (arid)
are the major farming systems in north and West Africa.
The present study therefore focuses on the ten combination options listed in Table 6.3 as
the main adaptation choices of African farmers for coping with climate change. Based on
this classification, this study assumes that the mono-crop (either on rain-fed or irrigated
lands) is the base category that represents ‘no adaptation’ and hence in this study ‘no
adaptation’ refers to those farmers who do mono-cropping. This however should not be
understood as suggesting that mono-cropping is not an adapted system where it is
practised in Africa. It is only used as the reference point against which other more
complex adaptation regimes are contrasted, to reflect the fact that African farmers have
had to adapt to a world that is hotter and dryer than where well adapted mono-cropping
systems continue to be practised in wetter temperate climates (e.g. France and
Midwestern USA). While irrigation and choice of livestock may be considered as
adaptations, our sample did not include farmers practising these options under specialised
systems, as observed earlier.
6.3 The analytical framework
Adaptation measures help farmers to reduce losses due to warming temperatures and
declining precipitation. The analyses presented in this study identify the important
100
determinants of adoption of various adaptation measures. The results provide policy
information on which factors to target and influence, and in which way, in order to
increase the use of different adaptation measures by farmers.
The analytical approaches that are commonly used in adoption decision studies involving
multiple choices are the multinomial logit (MNL) and multinomial probit (MNP) models.
Both the MNL and MNP models are important for analysing farmer adaptation decisions
as these are usually made jointly. These approaches are also appropriate for evaluating
alternative combinations of adaptation strategies including individual strategies
(Hausman & Wise, 1978; Wu & Babcock, 1998).
This study uses a MNL model to analyse the determinants of the decision problem of
farmers in choosing between alternative measures to adapt to climate change. The MNL
model is chosen in this study as it is widely used in adoption decision problems involving
multiple choices, and it is easier to compute than its alternative, the MNP model.
The advantage of using a MNL model is its computational simplicity in calculating the
choice probabilities that are expressible in analytical form (Tse, 1987). The MNL model
provides a convenient closed form for underlying choice probabilities, with no need for
multivariate integration, thus making it simple to compute choice situations characterised
by many alternatives. In addition, the computational burden of the MNL specification is
made easier by its likelihood function which is globally concave (Hausman & McFadden,
1984). The main limitation of the MNL model is the independence of irrelevant
alternatives property (IIA), which states that the ratio of the probabilities of choosing any
two alternatives is independent of the attributes of any other alternative in the choice set14
(Tse, 1987; Hausman & McFadden, 1984).
14 A ‘universal’ logit model avoids the independence of irrelevant alternatives property while maintaining
the multinomial logit form, by making each ratio of probabilities a function of attributes of all
alternatives. It is difficult, however, to give an economic interpretation of this model other than “a
flexible approximation to a general functional form” (Hausman & McFadden, 1984).
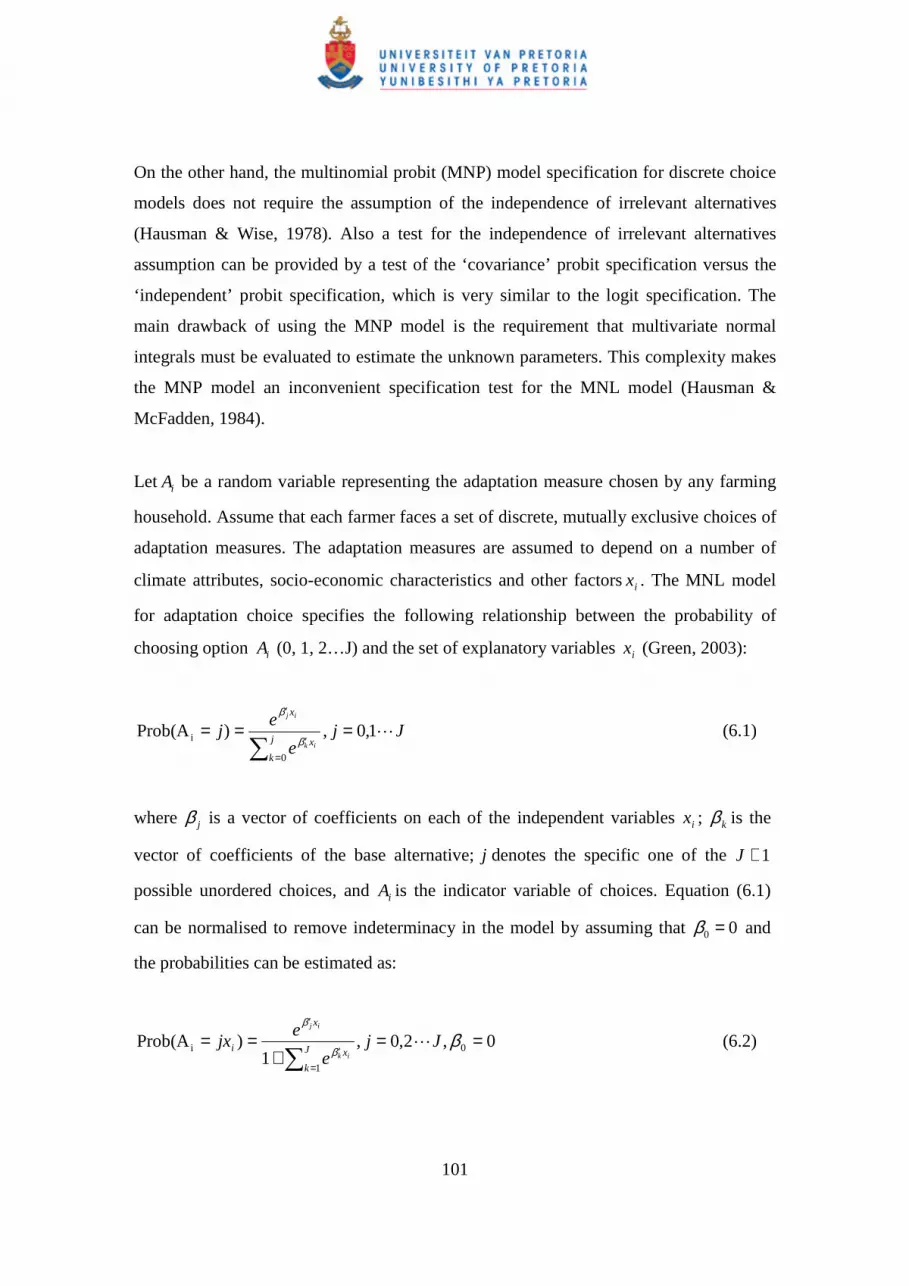
101
On the other hand, the multinomial probit (MNP) model specification for discrete choice
models does not require the assumption of the independence of irrelevant alternatives
(Hausman & Wise, 1978). Also a test for the independence of irrelevant alternatives
assumption can be provided by a test of the ‘covariance’ probit specification versus the
‘independent’ probit specification, which is very similar to the logit specification. The
main drawback of using the MNP model is the requirement that multivariate normal
integrals must be evaluated to estimate the unknown parameters. This complexity makes
the MNP model an inconvenient specification test for the MNL model (Hausman &
McFadden, 1984).
Let iA be a random variable representing the adaptation measure chosen by any farming
household. Assume that each farmer faces a set of discrete, mutually exclusive choices of
adaptation measures. The adaptation measures are assumed to depend on a number of
climate attributes, socio-economic characteristics and other factorsix . The MNL model
for adaptation choice specifies the following relationship between the probability of
choosing option iA (0, 1, 2…J) and the set of explanatory variables ix (Green, 2003):
Jje
ej
j
k
x
x
ik
ij
L1,0,)Prob(A0
i ===∑ =
′
′
β
β
(6.1)
where jβ is a vector of coefficients on each of the independent variables ix ; kβ is the
vector of coefficients of the base alternative;j denotes the specific one of the 1+J
possible unordered choices, and iA is the indicator variable of choices. Equation (6.1)
can be normalised to remove indeterminacy in the model by assuming that 0 0β = and
the probabilities can be estimated as:
0,2,0,1
)Prob(A 0
1
i ==+
==∑ =
′
′
ββ
β
Jje
ejx
J
k
x
x
iik
ij
L (6.2)
102
Estimating equation (6.2) yields the J log-odds ratios:
ln ( )i ji j k i j
ik
Px x
Pβ β β
′ ′= − =
, if 0k = (6.3)
The dependent variable is therefore the log of one alternative relative to the base
alternative.
The MNL coefficients are difficult to interpret and associating thejβ with the jth outcome
is tempting and misleading. To interpret the effects of the explanatory variables on the
probabilities, marginal effects are usually derived as follows (Green, 2003):
( )0
Jj
j j j k k j jki
PP P P
xδ β β β β
=
∂ = = − = − ∂ ∑ (6.4)
The marginal effects measure the expected change in probability of a particular choice
being made with respect to a unit change in an explanatory variable (Green, 2000; Long,
1997). The signs of the marginal effects and respective coefficients may be different as
the former depend on the sign and magnitude of all other coefficients.
6.4 The data and empirical specifications of the model variables
This part of the study is based on the same dataset used for measuring the economic
impacts of climate change on agriculture (see chapter 4, section 4.2). The dependent
variable in the empirical estimation for this study is the choice of an adaptation option
from the set of adaptation measures listed in Table 6.3. For the purposes of this study,
specialised crop cultivation (mono-cropping under both irrigation and rain-fed systems) is
used as the base category as a measure of no adaptation. Also note that other specialised
systems (specialised irrigated and rain-fed livestock) were dropped as they had no
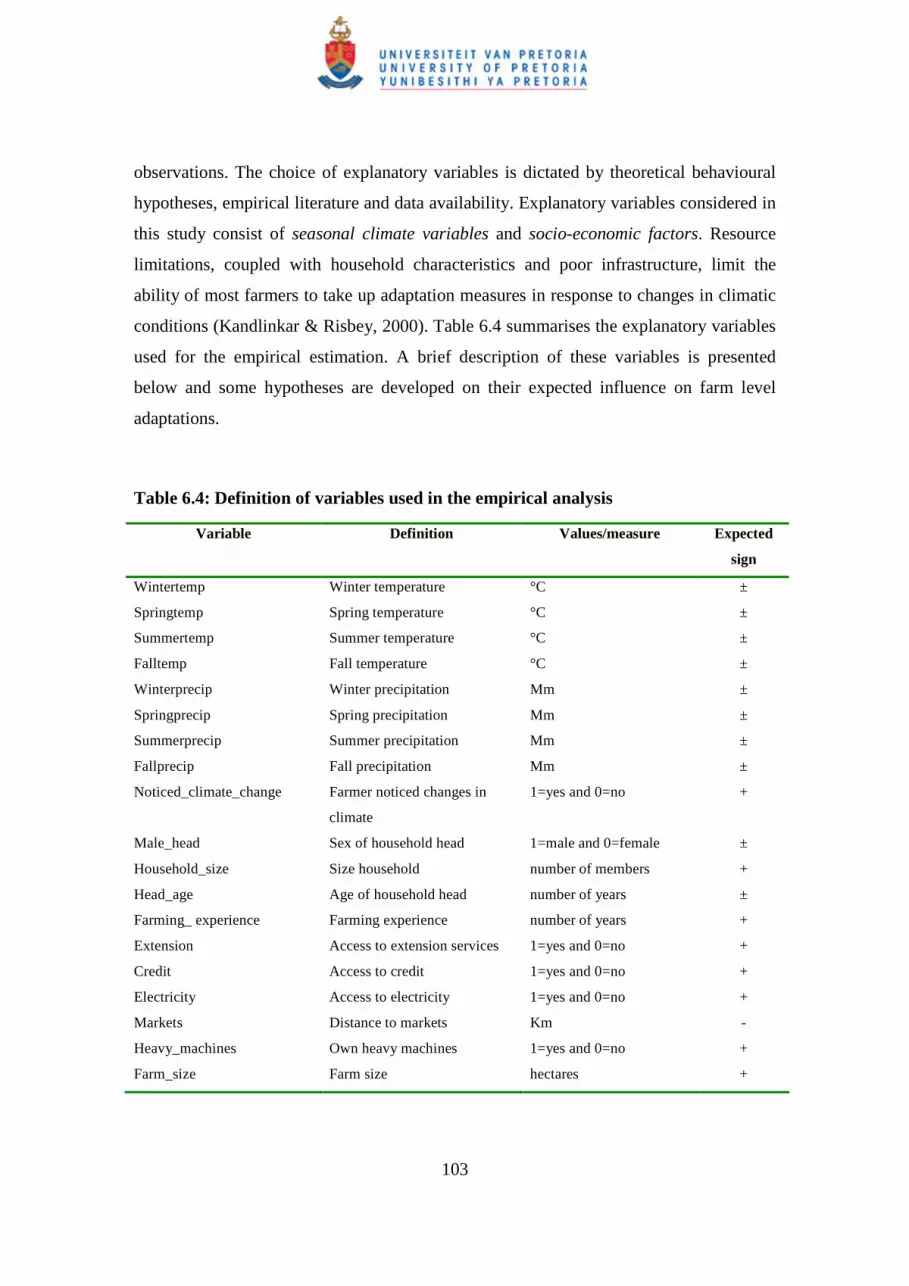
103
observations. The choice of explanatory variables is dictated by theoretical behavioural
hypotheses, empirical literature and data availability. Explanatory variables considered in
this study consist of seasonal climate variables and socio-economic factors. Resource
limitations, coupled with household characteristics and poor infrastructure, limit the
ability of most farmers to take up adaptation measures in response to changes in climatic
conditions (Kandlinkar & Risbey, 2000). Table 6.4 summarises the explanatory variables
used for the empirical estimation. A brief description of these variables is presented
below and some hypotheses are developed on their expected influence on farm level
adaptations.
Table 6.4: Definition of variables used in the empirical analysis
Variable Definition Values/measure Expected
sign
Wintertemp Winter temperature °C ±
Springtemp Spring temperature °C ±
Summertemp Summer temperature °C ±
Falltemp Fall temperature °C ±
Winterprecip Winter precipitation Mm ±
Springprecip Spring precipitation Mm ±
Summerprecip Summer precipitation Mm ±
Fallprecip Fall precipitation Mm ±
Noticed_climate_change Farmer noticed changes in
climate
1=yes and 0=no +
Male_head Sex of household head 1=male and 0=female ±
Household_size Size household number of members +
Head_age Age of household head number of years ±
Farming_ experience Farming experience number of years +
Extension Access to extension services 1=yes and 0=no +
Credit Access to credit 1=yes and 0=no +
Electricity Access to electricity 1=yes and 0=no +
Markets Distance to markets Km -
Heavy_machines Own heavy machines 1=yes and 0=no +
Farm_size Farm size hectares +
104
Seasonal climate variables: Differences in seasonal temperature and precipitation across
regions influence farmers’ choices of adaptation measures. Empirical studies measuring
the economic impacts of climate change on agriculture in Africa (Kurukulasuriya &
Mendelsohn 2007a; Seo & Mendelsohn 2007a; Mano & Nhemachena, 2007; Benhin,
2006) showed that climate attributes (temperature and precipitation) significantly affect
net farm revenue and such impacts can be significantly reduced through adaptation.
Regional African studies have shown that choice of different crops and livestock species
is sensitive to seasonal climate variables (Kurukulasuriya & Mendelsohn, 2007b; Seo &
Mendelsohn, 2007b). Crop choice analysis by Kurukulasuriya and Mendelsohn (2007b)
found that the choice of different crops is affected in various ways by seasonal climate
variables. Livestock choice analysis by Seo and Mendelsohn (2007b) found that the
choice of beef cattle had an inverted U-shaped shaped probability response to summer
temperature, while winter temperature had a U-shaped response for both beef cattle and
sheep, and was an inverted U-shaped for dairy cattle and goats.
The studies cited illustrate the importance of seasonal climate variables in influencing
farmers’ choice decisions. To capture the effects of seasonal variations in climate on the
uptake of adaptation measures, this study included seasonal temperature and precipitation
variables in the empirical specification. The same definitions and adjustments of seasons
used by Kurukulasuriya and Mendelsohn (2007a), as indicated in chapter 4, were used in
this study to cater for uneven distribution of rainfall and temperature across Africa, as
well as seasonal differences in the southern and northern hemispheres. It is a hypothesis
of this study that dryer and warmer climates favour livestock production and irrigation
but reduce the incidence of crop cultivation, especially under rain-fed conditions.
Farmer socioeconomic attributes: Empirical adoption literature shows that household
size has mixed impacts on farmers’ adoption of agricultural technologies. Larger family
size is expected to enable farmers to implement various adaptation measures when these
are labour intensive (Nyangena, 2006; Dolisca, Carter, McDaniel, Shannon & Jolly, 2006;
Anley et al., 2007; Birungi, 2007). Alternatively, large families might be forced to divert
part of their labour force to non-farm activities to generate more income and reduce
105
consumption demands of the large family (Tizale, 2007). However, the opportunity cost
of labour might be low in most smallholder farming systems as off-farm opportunities are
rare. Although farmers can hire extra labour, most rural farmers are cannot afford to do
so, thus limiting their ability to take on labour intensive crop and livestock activities. The
current study hypothesise that multiple cropping, irrigation and mixed farming systems
are more labour intensive and hence expects a positive influence of family size on the
adoption of such adaptation options. This implies that farm households with more labour
are better able to take on adaptations in response to changes in climatic conditions.
The influence of age on adoption decision has been found in the literature to be varied.
Some studies found that age had no influence on a farmer’s decision to participate in
forest, soil and water management activities (Bekele & Drake, 2003; Zhang & Flick,
2001; Anim 1999; Thacher, Lee & Schelhas, 1997). Other studies, however, found that
age is significantly and negatively related to farmers’ decisions to adapt (Anley et al.,
2007; Dolisca et al., 2006; Nyangena 2006; Burton et al., 1999; Lapar & Pandely, 1999;
Featherstone & Goodwin, 1993; Gould, Saupe & Klemme, 1989). However Bayard, Jolly
and Shannon (2007), and Okoye (1998) found that age is positively related to the
adoption of conservation measures. This study hypothesises that the age of the head of
household has both positive and negative impacts on different adaptation measures. One
assumes that old age is associated with more experience and we expect older farmers to
adapt to changes in climate. However, we also expect young farmers to have a longer
planning horizon and to thus take up long-term adaptation measures such as irrigation
and mixed crop−livestock systems.
Various studies have shown that gender is an important variable affecting adoption
decision at the farm level. Female farmers have been found to be more likely to adopt
natural resource management and conservation practices (Bayard et al., 2007; Dolisca et
al., 2006; Burton et al., 1999; Newmark, Leonard, Sariko & Gamassa, 1993). However,
some studies found that household gender was not a significant factor influencing
farmers’ decision to adopt conservation measures (Bekele & Drake, 2003). This study
hypothesises that there are significant differences between female and male headed
106
households in their ability to adapt to climate change, due to major differences between
them in terms of access to assets, education and other critical services such as credit,
technology and input supply.
Education, farming experience and perceptions are important factors influencing
adoption decisions. Several studies have shown that improving education and knowledge
are important policy measures for stimulating local participation in various development
and natural resource management initiatives (Anley et al., 2007; Tizale, 2007; Dolisca et
al., 2006; Glendinning, Mahapatra & Mitchell, 2001; Higman, Bass, Judd, Mayers &
Nussbaum, 1999; Anim, 1999; Lapar & Pandely, 1999; Traore, Landry & Amara, 1998;
Heinen, 1996; Shields et al., 1993; Anderson & Thampallai, 1990; Bultena & Hoiberg,
1983). Better education and more farming experience improve awareness of potential
benefits and willingness to participate in local natural resource management and
conservation activities. However Clay, Reardon and Kangasniemi (1998) found that
education was an insignificant determinant in influencing adoption decisions, while
Okoye (1998) and Gould et al. (1989) found that education was negatively correlated
with adoption. Educated and experienced farmers are expected to have more knowledge
and information about climate change and agronomic practices that they can use in
response to climate challenges (Maddison, 2007). This study expects that improved
knowledge and farming experience will positively influence farmers’ decisions to adopt
different adaptation measures.
Awareness of the problem and potential benefits of taking action is another important
determinant of adoption of agricultural technologies. Maddison (2007) found that
farmers’ awareness of changes in climate attributes (temperature and precipitation) is
important for adaptation decision making. Several studies found that farmers’ awareness
and perceptions of soil erosion problems positively and significantly affected their
decisions to adopt soil conservation measures (Araya & Adjaye, 2001; Anim, 1999;
Traore et al., 1998; Gould et al., 1989). This study expects that farmers who notice and
are aware of changes in climate will take up adaptation measures that help them reduce
107
losses or take advantage of the opportunities associated with these changes. In this study
awareness is represented by the variable “Noticed_climate_change” in Table 6.4
Farm assets and wealth factors: Empirical adoption studies have found mixed effects of
farm size on adoption. For example, a study on soil conservation measures in South
Africa showed that farm size was not a significant adoption factor (Anim, 1999). Other
studies, however, found that farmers with larger farms had more land to allocate for the
construction of soil bund and improved cut-off drains in Haiti (Anley et al., 2007) and
Nigeria (Okoye, 1998). On the contrary, Nyangena (2006) found that farmers with small
land sizes were more likely to invest in soil conservation practices, compared to those
with large land sizes. This study hypothesises that farmers with more land will adopt
measures that require more land such as livestock systems, while farmers with small
farms are expected to diversify their options.
Various studies of determinants of soil and water conservation technologies have shown
that farm assets (e.g. machinery) significantly affect adoption decisions (e.g. Lapar &
Pandely, 1999; Barbier, 1998; Pender & Kerr, 1998). Kurukulasuriya and Mendelsohn
(2007a) found that ownership of heavy machinery significantly and positively increased
net farm revenue on African cropland. This study expects that ownership of more farm
assets (land and machinery) improves the ability of farmers to adapt.
Access to agricultural services: Extension services are an important source of
information on agronomic practices as well as on climate. Extension education was found
to be an important factor motivating increased intensity of use of specific soil and water
conservation practices (De Harrera & Sain, 1999; Traore et al., 1998; Tizale, 2007;
Baidu-Forson, 1999; Anderson & Thampallai, 1990; Bekele & Drake, 2003). In Haiti
farmers with better access to extension services were more likely to adopt improved cut-
off drain and fanyajuu15 technologies (Anley et al., 2007). Other adoption studies,
15 Kiswahili: ‘Throw it upwards.’ ‘Terrace bund in association with a ditch, along the contour or on a gentle
lateral gradient. Soil is thrown on the upper side of the ditch to form the bund, which is often stabilised by
planting a fodder grass.’ WOCAT (World Overview of Conservation Approaches and Technologies).
108
however, have found that extension is not a significant factor affecting adoption of soil
conservation measures (Birungi, 2007; Nkonya, Pender, Kaizzi, Kato & Mugarura, 2005;
Pender, Ssewanyana, Kato & Nkonya, 2004). This study postulates that availability of
better climate and agricultural information helps farmers to make comparative decisions
among alternative crop management practices and hence to choose those that enable them
to cope better with changes in climatic conditions (Baethgen, Meinke & Gimene, 2003;
Jones, 2003; Kandlinkar & Risbey, 2000).
Several studies have shown that access to credit is an important determinant enhancing
the adoption of various technologies (Tizale, 2007; Hassan, Kiarie, Mugo, Robin &
Laboso, 1998; Yirga, Shapiro & Demeke, 1996; Anderson & Thampallai, 1990;
Kandlinkar & Risbey, 2000). With more financial and other resources at their disposal,
farmers are able to make use of all available information they might have to change their
management practices in response to changing climatic and other conditions. For instance,
with financial resources and access to markets, farmers are able to buy new crop varieties,
new irrigation technologies and other important inputs they may need to change their
practices to suit forecasted climatic changes.
Market access 16 is another important factor affecting the adoption of agricultural
technologies (Feder, Just & Zilberman, 1985). Input markets allow farmers to acquire the
necessary inputs they might need for their farming operations, such as different seed
varieties, fertilizers, and irrigation technologies. Furthermore, access to output markets
provides farmers with positive incentives to produce cash crops that can help improve
their resource base and hence their ability to respond to changes in climatic conditions
(Mano, Isaacson & Dardel, 2003). Long distances to markets decreased the probability of
farm adaptation measures in Africa (Maddison, 2007). Madison (2007) also noted that
markets provide an important platform for information gathering and sharing for farmers.
Lapar and Pandely (1999) found that in the Philippines, access to markets significantly
http://www.fao.org/ag/agl/agll/wocat/wqtsum2.asp?questid=KEN05 Accessed 3 March 2008. 16 For this study the assumption is that farmers used the same market for purchasing input and selling
output.
109
affected use of conservation technologies by farmers. Nyangena (2006) showed that in
Kenya, distance to markets negatively and significantly affected use of soil and water
conservation technologies.
Access to electricity was found to be an important factor explaining crop choice
(Kurukulasuriya & Mendelsohn, 2007b) and livestock choice (Seo & Mendelsohn, 2007).
Household access to electricity and ownership of heavy machinery may reflect either
higher levels of technology use and/or market access. Farmers with better access to
higher levels of technology and market access are expected to be able to take up
adaptation measures that require high levels of technology use, such as irrigation systems.
Econometric estimation of empirical model parameters
Econometric analysis with cross-sectional data is usually associated with problems of
heteroscedacity and multicollinearity (Cameron & Trivedi, 2005; Green, 2003).
Multicollinearity among explanatory variables can lead to imprecise parameter estimates.
To explore potential multicollinearity among the explanatory variables, the correlation
between continuous independent variables was calculated (Appendix 2). The results of
the correlation analysis indicated that seasonal climate variables were highly correlated
and therefore spring had to be combined with the winter season, and fall with the summer
season. For dummy variables the chi-square test for independence was used to determine
dependencies between variables. An Ordinary Least Squares model was fitted and the
model was tested for multicollinearity using the variance inflation factor (VIF) (see
Appendix 3). The variance inflation factors of all included variables are less than 10,
which indicate that multicollinearity is not a serious problem in the reduced model.
In spite of the high multicollinearity detected between seasonal climate attributes, the
empirical model was estimated with: (a) all four seasons separately, and (b) combined
seasonal variables that collapsed the four seasons into two. As expected, empirical model
estimation results confirmed the superiority of the combined season variables, and hence
subsequent sections report only results obtained from this specification. Moreover, high

110
multicollinearity was also observed between measures of perceptions of long-term
changes in climate and a number of key explanatory variables, particularly farmers’
characteristics such as education, age, experience and access to extension and credit,
suggesting that perceptions may be endogenous to farmers’ choices. This was confirmed
by the poor statistical performance of preliminary regression runs, including perception
factors which were accordingly excluded from the final empirical specifications.
To address the possibilities of heteroscedacity in the model, a robust model was estimated,
that computes a robust variance estimator based on a variable list of equation-level scores
and a covariance matrix (StataCorp, 2005).
Another potential limitation associated with estimating a MNL model is its restrictive
assumption of independence of irrelevant alternatives (IIA). Based on the IIA assumption,
the ratio of the utility levels between two choices (such as multiple crops under irrigation
and mixed crop−livestock under dryland) remains constant, irrespective of choices made
(Hausman & McFadden, 1984). We used the Hausman test (Hausman & McFadden,
1984) to check for the validity of the IIA assumption using STATA software (StataCorp,
2005). The results from the Hausman test indicate that we fail to reject the null
hypothesis of independence of the adaptation measures under consideration. The results
imply that the application of the MNL specification to model the determinants of
adaptation measures is justified.
6.5 Results and discussions
Table 6.5 presents the estimated marginal effects and P-levels from the multinomial logit
model and the estimated coefficients are given in Appendix 4. The results show that most
of the explanatory variables are statistically significant at 10 percent or lower, and the
signs on most variables are as expected, except for a few, which are discussed below. The
chi-square results show that the likelihood ratio statistics is highly significant (P<00001)
suggesting a strong explanatory power of the model.
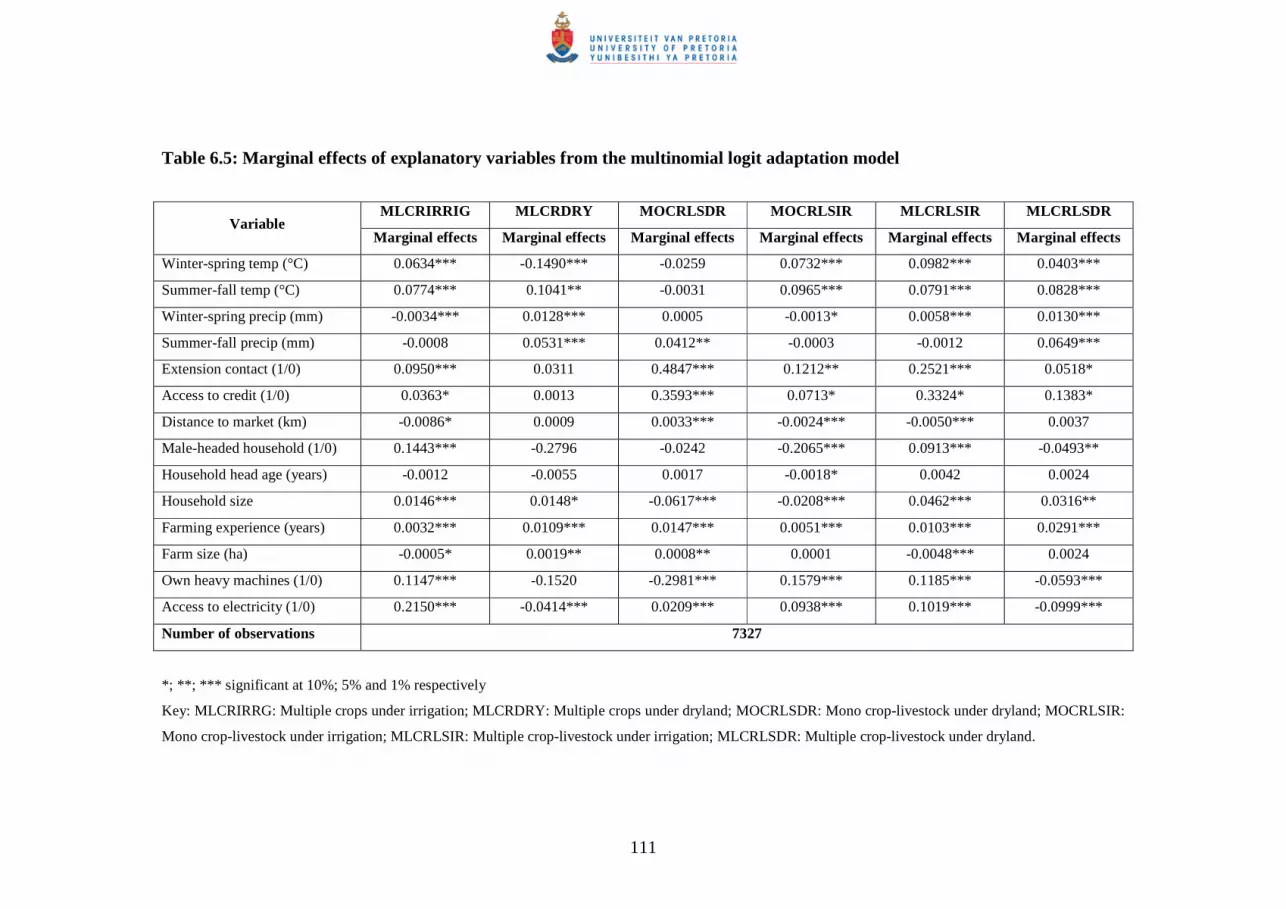
111
Table 6.5: Marginal effects of explanatory variables from the multinomial logit adaptation model
MLCRIRRIG MLCRDRY MOCRLSDR MOCRLSIR MLCRLSIR MLCRLSDR Variable
Marginal effects Marginal effects Marginal effects Marginal effects Marginal effects Marginal effects
Winter-spring temp (°C) 0.0634*** -0.1490*** -0.0259 0.0732*** 0.0982*** 0.0403***
Summer-fall temp (°C) 0.0774*** 0.1041** -0.0031 0.0965*** 0.0791*** 0.0828***
Winter-spring precip (mm) -0.0034*** 0.0128*** 0.0005 -0.0013* 0.0058*** 0.0130***
Summer-fall precip (mm) -0.0008 0.0531*** 0.0412** -0.0003 -0.0012 0.0649***
Extension contact (1/0) 0.0950*** 0.0311 0.4847*** 0.1212** 0.2521*** 0.0518*
Access to credit (1/0) 0.0363* 0.0013 0.3593*** 0.0713* 0.3324* 0.1383*
Distance to market (km) -0.0086* 0.0009 0.0033*** -0.0024*** -0.0050*** 0.0037
Male-headed household (1/0) 0.1443*** -0.2796 -0.0242 -0.2065*** 0.0913*** -0.0493**
Household head age (years) -0.0012 -0.0055 0.0017 -0.0018* 0.0042 0.0024
Household size 0.0146*** 0.0148* -0.0617*** -0.0208*** 0.0462*** 0.0316**
Farming experience (years) 0.0032*** 0.0109*** 0.0147*** 0.0051*** 0.0103*** 0.0291***
Farm size (ha) -0.0005* 0.0019** 0.0008** 0.0001 -0.0048*** 0.0024
Own heavy machines (1/0) 0.1147*** -0.1520 -0.2981*** 0.1579*** 0.1185*** -0.0593***
Access to electricity (1/0) 0.2150*** -0.0414*** 0.0209*** 0.0938*** 0.1019*** -0.0999***
Number of observations 7327
*; **; *** significant at 10%; 5% and 1% respectively
Key: MLCRIRRG: Multiple crops under irrigation; MLCRDRY: Multiple crops under dryland; MOCRLSDR: Mono crop-livestock under dryland; MOCRLSIR:
Mono crop-livestock under irrigation; MLCRLSIR: Multiple crop-livestock under irrigation; MLCRLSDR: Multiple crop-livestock under dryland.

112
As mentioned earlier, this analysis uses specialised (mono) cropping as the base category
for no adaptation and evaluates the other choices as alternatives to this option. The first
column of Table 6.5 for instance, compares the choice of multiple crops under irrigation
(MLCRIRRIG) over no adaptation, where the marginal effects and their signs reflect the
expected change in probability of preferring to grow multiple crops under irrigation over
mono cropping (the base) per unit change in an explanatory variable. The same applies to
the remaining choices in the table.
The marginal effects measure the expected change in probability of a particular choice
being made with respect to a unit change in an explanatory variable (Green, 2000; Long,
1997). The signs of the marginal effects and respective coefficients may be different, as
the former depend on the sign and magnitude of all other coefficients. The marginal
probabilities in the MNL model as a result of a unit change in an independent variable
sum to zero, since expected increases in marginal probabilities for a certain option induce
concomitant decreases for the other option(s) within the choice set. The interpretation of
the marginal effects is dependent on the units of measurement of the independent
variables. For instance, a unit increase in the winter-spring temperature would result in a
6.3% and 9.8% increase in the probability of using multiple crops under irrigation
(MLCRIRRG) and multiple crop−livestock under irrigation (MLCRLSIR). Also, a unit
increase in access to extension for an average farmer would result in a 9.5%, 4.8% and
25.21% increase in the probability of using multiple crops under irrigation (MLCRIRRG),
mono crop−livestock under dryland (MOCRLSDR) and multiple crop−livestock under
irrigation (MLCRLSIR). In all cases, the estimated coefficients should be compared with
mono cropping (the base alternative).
The results suggest that warmer winter−spring promotes switching to use of irrigation,
multiple cropping and mixing crop and livestock activities, especially under irrigation
(MLCRIRRG, MOCRLSIR and MLCRLSIR). Warming in summer−fall also tends to be
associated with shifting away from mono-cropping (MOCRLSDR and MOCRLSIR).
While it is clear that irrigation is the strongest adaptation measure against warming for all
113
systems, mixing livestock with crop cultivation seems to work only with multiple
cropping under dryland conditions (MLCRDRY).
Dryland farming (MLCRDRY, MOCRLSDR and MLCRLSDR) tends to dominate in
better watered regions (i.e. in wetter summer-fall and winter-spring seasons). In other
words, the dryer it gets the higher the demand for irrigation. The biggest influence on the
probability of switching away from mono-cropping (MOCRLSDR and MOCRLSIR) is
associated with changes in summer-fall precipitation compared to changes in winter-
spring rainfall levels. Similarly, the magnitude of the marginal coefficients suggests that
warming is the stronger factor influencing the probability of switching to more adapted
systems based on changes in precipitation. That means the risks of mono-cropping are
higher with warming in general.
Better access to extension and credit services seems to have strong positive influence on
the probability of adopting all adaptation measures and abandoning the relatively risky
mono-cropping systems (MOCRLSDR and MOCRLSIR). Access to electricity is
strongly associated with the use of irrigation (MLCRIRRG, MOCRLSIR and
MLCRLSIR). This could be due to the fact that the bulk of irrigation water in Africa is
supplied from dams that are also used for power generation. Similar to the effect of
electricity, proximity to markets appears to be associated with the use of irrigation.
The results indicate a positive relationship between distance to market and adaptation to
dryland farming. That is, the further away the market the higher the probability to adapt
to dryland farming. Based on this finding, dryland farmers appear to have relatively
poorer access to markets (i.e. market development tends to concentrate within irrigation
areas). At the same time, remoteness from markets tends to favour multiple cropping and
mixing of livestock and crops over specialised crop cultivation. This is an indication that
more market integration promotes specialisation in production and hence is an important
area for public investment in adaptation infrastructure.
114
Larger families are able to practice multiple cropping, whereas smaller families tend to
practice only mono-cropping with a livestock activity, whether under dryland or
irrigation (MOCRLSDR and MOCRLSIR). This suggests that multiple cropping is more
labour demanding. Larger farm sizes appear to be associated with dryland systems
(MLCRDRY, MOCRLSDR and MLCRLSDR), suggesting a relatively higher population
density or scarcer land resources within irrigation agriculture in Africa. This probably
reflects the effect of Egypt, which is the typical case of a very high man-to-land ratio and
100% irrigation agriculture. Better access to other farm assets, such as heavy machinery,
is found to promote the use of irrigation and mixing of livestock with cropping activities.
These results suggest that capital, land and labour serve as important factors for coping
with and adapting to climate change. The choice of the suitable adaptation measure
depends on factor endowments (i.e. family size, land area and capital resources) at the
disposal of farming households.
More experienced farmers are more likely to adapt, compared to those with less farming
experience. The age of the farmer, on the other hand, does not seem to be of significance
in influencing adaptation, as almost all marginal effect coefficients are statistically
insignificant and their signs do not suggest any particular pattern. These results suggest
that it is experience rather than age that matters for adapting to climate change. The data
do not suggest a clear cut effect for the gender factor, other than that male-headed
households are more likely to adapt by switching from mono cropping to irrigation,
multiple cropping and mixed systems (MLCRIRRG, MLCRLSIR), compared to female-
headed farming families who tend to switch to mono crop−livestock under irrigation
(MOCRLSIR) and multiple crop−livestock under dryland (MLCRLSDR).
115
6.6 Summary and policy implications
This chapter analysed actual adaptation choices made by farmers based on a cross-section
survey of over 8000 farming households from 11 countries in Africa. The main practices
actually followed by farmers during the survey year (2002) are implemented mostly in
combination with other measures and not alone. The different combinations of measures
and practices are grouped into three major adaptation options: diversifying into multiple
crops and mixed crop−livestock systems, switching from crops to livestock, and
switching from dryland to irrigation.
A multinomial discrete choice model was used to analyse the determinants of farm-level
adaptation measures. The results show that warming in all seasons promoted adoption of
irrigation, multiple cropping and mixed crop−livestock systems. Farmers appear to
abandon mono-cropping as temperatures get warmer. With most parts of the region
already warm and dry, any further warming will compel farmers to take up various
irrigation and multiple and mixed crop−livestock adaptation measures.
On the other hand, more rainfall reduces the probability of choosing irrigation. The
influence of changes in the summer-fall precipitation is stronger than winter rainfall
effects on the probability of switching away from mono-cropping. As most of the farming
systems in Africa rely on rainfall, increased precipitation would be beneficial to dryland
crop systems. Alternatively, low rainfall in all seasons induces the need for irrigation to
buffer the negative impacts on agricultural production during dry periods. At the same
time, limited rainfall also implies reduced availability of water for irrigation; thus it is
important for policies to support efficient and effective irrigation systems. Nevertheless,
the results suggest that warming influences on the probability of switching to more
adapted systems are more powerful compared to the effects of changes in rainfall. That
means that the risks of mono-cropping under dryland conditions are higher with warming
in general.

116
More farming experience was found to promote adaptation. Experienced farmers usually
have better knowledge and information on climate change and agronomic practices that
they can use to cope with changes in climate and other socio-economic conditions. This
suggests that farmers’ education to improve their awareness of the potential benefits from
adaptation is an important policy measure for stimulating farm-level climate adaptation.
Results of the empirical analyses confirm the role of improved access to information
(climate and production) and credit in enhancing farmers’ awareness, which is crucial for
adaptation decision making and planning. Combining access to extension services and
credit ensures that farmers have the information for decision making and the means to
take up adaptation measures. Policies aimed at promoting farm-level adaptation need to
emphasise the critical role of providing information (through extension services) and the
means to implement adaptations through affordable credit facilities.
Other enabling factors of significant potential in promoting adaptation, especially the use
of irrigation and intensive livestock production systems (which are usually capital
intensive), are household access to electricity and ownership of farm capital (such as
machinery). Improving access to technology such as electricity and machines increases
the chances of farmers taking up adaptation measures.
Better access to markets reduces transport and other market-related transaction costs, and
enhances the uptake of farm-level adaptation measures. For instance, better access to
markets enables farmers to buy new crop varieties, new irrigation technologies and other
important inputs they may need to change their practices in order to cope with predicted
changes in climate. This study reveals that market development in Africa tends to
concentrate within irrigation agricultural areas, and hence there is a need to improve the
relatively poor access of dryland farmers to markets.
Larger farm sizes were found to encourage the use of multiple cropping and integration
of a livestock component, especially under dryland conditions. Large farm sizes allow
farmers to diversify their crop and livestock options and help to spread the risk of losses
117
associated with changes in climate. This suggests that availability of labour may be a
critical factor constraining the switch away from the risky mono-cropping systems.
The above findings illustrate the importance of government policies and strategic
investment plans that support improved access to climate forecasting, research in the
development of and information about appropriate farm-level climate adaptation
technologies, access to credit, farmer education, and market development especially in
areas where dryland farming currently dominates.

118
Chapter 7
Summary, conclusions and implications for policy and research
This study had two main objectives. The first main objective was to measure the
aggregate impact of climate change on net revenue from all agricultural production
systems (crop, livestock and mixed) in Africa, and to predict future impacts under various
climate scenarios. In addition to measuring economic impacts, the second objective of the
study was to analyse determinants of farmers’ choices between alternative adaptation
measures available to African farmers. The empirical estimations were based on a cross-
section survey of over 8000 farming households collected by the GEF/WB/CEEPA
Africa study on climate change and agriculture. The study covered eleven countries:
Burkina Faso, Cameroon, Egypt, Ethiopia, Ghana, Kenya, Niger, Senegal, South Africa,
Zambia and Zimbabwe.
Other studies based on the GEF Project estimated the economic impacts of climate
change on African agriculture. These studies, however, analysed impacts on dryland
crops, irrigated crops and livestock separately. This represents an important limitation,
since the choice between crop and livestock production, or their combination (mixed
systems), must be considered an endogenous decision made by agricultural producers in
response to varying climates and other circumstances. The decision as to what to produce
and how to produce it is accordingly an important adaptation mechanism in the face of
changing climate and other ecological economic circumstances. This is of special
importance for Africa, where the majority of poor small-scale farmers practise mixed
crop−livestock agriculture and few depend on crops or livestock only (Dixon et al., 2001).
An important contribution of this study is measuring the aggregate impact of climate
change on income from all agricultural production systems (crop, livestock and mixed) in
Africa, and predicting future impacts under various climate scenarios. In addition to
estimating impacts on mixed crop−livestock farms, the study also measured and
119
compared impacts on specialised crop and livestock farms. The results were contrasted
with findings of other regional studies using the same data, but generating different
climate response functions for crop and livestock farming separately. Another important
contribution of the Ricardian cross-sectional approach used in this study is its ability to
incorporate autonomous adaptation mechanisms. Such private adaptation initiatives
involve adjustments that have been made by farmers in response to changes in climatic
and non-climatic conditions, to increase their profits.
To achieve the first objective, the study adopted the cross-section (Ricardian) approach to
measure the impact of change in climate attributes (rainfall and temperature levels) on
income from all agricultural production systems (crop, livestock and mixed) in Africa,
controlling for other production factors. The analyses controlled for effects of key socio-
economic, technology, soil and hydrological factors influencing agricultural production.
The results show that larger farm sizes appear to have a strong positive influence on net
farm revenues across all farm types, suggesting that more land allows farmers to produce
more crop and livestock enterprises per farm, thus leading to more income. Further,
results show that larger families are associated with higher net farm revenues across all
farm types. Better access to other farm assets, such as heavy machinery like tractors,
appears to strongly and positively influence net farm revenues for all farms, mixed
crop−livestock farms and specialised crop farms. These results suggest that capital, land
and labour serve as important production factors in African agriculture. National policies
need to invest more in improving factor endowments (i.e. family size, land area and
capital resources) at the disposal of farming households, in order to enhance farm
performances in the face of climate change.
Better access to extension services seems to have strong positive influence on net farm
revenue on all farms, mixed crop−livestock farms and specialised crop farms. Improving
access to extension ensures that farmers have the information for decision making to
improve their production activities. Policies aimed at improving farm-level performance
120
need to emphasise the critical role of providing information (through extension services)
to enhance farm-level decision making.
Improving access to technology such as electricity has significant potential in improving
farm-level production activities and hence net revenues. For example, the use of
irrigation and intensive livestock production systems (which are usually capital intensive),
increases when farmers have access to technologies like electricity and other machinery.
Improving access to technology such as electricity and machines is therefore important to
enhance agricultural production in the face of climate change.
Results from the marginal analysis of the impacts of seasonal climate variables show that
net farm revenues are in general negatively affected by warmer and dryer climates. The
small-scale mixed crop and livestock system predominant in Africa is the most tolerant
system, whereas specialised crop production is the most vulnerable to warming and lower
rainfall. For example, a one degree increase in summer temperature resulted in net
revenue losses of $98, $189 and $195 per farm for dryland: mixed crop−livestock farms,
specialised crop and specialised livestock farms respectively. In all farm types, dryland
farms are the worst affected by increases in warming and drying, compared to irrigated
farms. Predictions of future climate impacts also indicate that mixed crop−livestock and
irrigated farms are less sensitive to climate changes and will experience fewer damages,
compared to highly sensitive dryland and specialised crop or livestock farms.
Generally farming systems located in dry semi-arid and arid regions (for example most
southern parts of the continent) will suffer most from increases in warming and drying
compared to more humid regions. This is likely because of farming systems that are
based on natural rainfall (which is unreliable and inadequate) and the prevalence of mono
cropping. The results confirm the negative impact of climate change on African
agriculture (e.g. Kurukulasuriya & Mendelsohn, 2007a, 2007b; Seo & Mendelsohn,
2007a; Kurukulasuriya et al., 2006) with differing impacts for various systems and scales
of farming. It is therefore important for Africa to enhance adaptation efforts both at the
micro (farm) and macro (national) levels. Governments need to integrate adaptation

121
strategies into national economic policies, and strengthen micro-level adaptations (such
as: diversifying into multiple crops and mixed crop−livestock systems, switching from
crops to livestock and from dryland to irrigation), to help farmers reduce potential
damage from climate change.
These results have important policy implications, especially regarding the suitability of
the increasing tendency toward large-scale mono-cropping strategies for agricultural
development in Africa and other parts of the developing world, in the light of expected
climate changes. Mixed crop and livestock farming and irrigation offer better adaptation
options for farmers against further warming and drying predicted under various future
climate scenarios.
For the second objective, the study employed a multinomial choice model to analyse
determinants of farm-level climate adaptation measures in Africa. This analysis is
different from the analysis carried by Maddison (2007) and all other adaptation studies, in
that actual adaptation measures being taken by farmers were considered, using the same
sample of African farmers, and based on farmers’ perceived adaptations. This study also
considered the choice between many adaptation measures simultaneously. This can be
compared with studies that analysed such joint endogenous decisions in separate analyses
for crop selection (Kurukulasuriya & Mendelsohn, 2007b), irrigation modelling
(Kurukulasuriya & Mendelsohn, 2007c), and livestock choice (Seo & Mendelsohn,
2007b). The integrated approach of this study is very important in directing policy to
influence the appropriate choice of adaptation mechanisms. Accordingly this study
provides an important contribution to knowledge on the economics of climate and
adaptation in the agriculture sector in Africa.
The results of the empirical analysis of determinants of adaptation choices indicate that
specialised crop cultivation (mono-cropping) is the most vulnerable agricultural practice
in Africa in the face of climate change. Based on these findings, there is a trade-off
between economies of scale and vulnerability to climate change. Warming, especially in
summer, poses the highest climate risk which tends to promote switching away from
122
mono-cropping towards the use of irrigation, multiple cropping and integration of
livestock activities. Increased precipitation reduces the probability of irrigation and will
be beneficial to most African farming systems, especially in drier areas. Better access to
markets, extension and credit services, technology and farm assets (such as labour, land
and capital) are critical enabling factors to enhance the capacity of African farmers to
adapt to climate change.
An important policy message indicated by the results might be the need for more within-
country, region-specific adaptation plans depending on predicted changes in temperature
and precipitation. Furthermore, government policies and investment strategies that
supports the provision of and access to markets, credit, and information on climate and
adaptation measures, including suitable technological and institutional mechanisms that
facilitate climate adaptation, are required for coping with climate change, particularly
among poor resource farmers in the dry areas of Africa.
As indicated above, the first part of the study assessed the impact of climate change on
agricultural systems across Africa, and the second part evaluated the determinants of
various adaptation mechanisms used by African farmers. The former applied a (cross-
sectional) Ricardian approach, while the later used a multinomial logit model. The study
differs from other studies in that the former objective considered the whole agricultural
system and measured the impacts on a per farm basis, incorporating crop, livestock and
mixed-farming enterprises, and correcting for the endogeneity problems associated with
studies that focus on only crop or livestock farming. The results of the first analysis
confirm the negative impact of climate change, with differing impacts for different
systems and scales of farming. More important is the contribution of the latter analysis,
relating to the clear categorisation of six possible adaptations options available to African
farmers, and the degree of probability of choice among these options, given changes in
precipitation, temperature and other socio-economic variables. These findings are very
important in terms of directing policy to influence appropriate choices of adaptation
mechanisms.

123
7.1 Limitations of the study and areas for further research
The study has some limitations that readers should bear in mind. First, combining net
revenue from crop and livestock production caused some problems. Crop net revenues
could be calculated for each unit of land used. The same was not possible for livestock
production, where many smallholder farmers rely on communal grazing lands. This
required the analyses to be on a per farm basis, and not per hectare. Furthermore,
categorising farms into specialised crop, livestock and mixed crop−livestock enterprises
was based on a subjective assessment of the proportion of land under crops and the
number of livestock units on a farm. Although this categorisation made it possible to
assess the impacts on these different systems, future studies will need to capture the type
of farming system at the outset. Despite this limitation, the results of the study generally
show that agricultural production, especially dryland systems, will be adversely affected
by climate change, which agrees with other studies based on per hectare crop/farm
revenue (see Kurukulasuriya et al., 2006; Kurukulasuriya & Mendelsohn, 2007a, 2007b;
Seo & Mendelsohn, 2007a).
Another limitation of this study is the restrictive assumptions of the Ricardian cross-
sectional method used for the economic analysis. The method assumes that future
economic structures and behaviour will replicate the past. However, economic variables
such as prices, policy (e.g. trade restrictions, subsidies and taxes) and technology that
may influence net revenue vary over time. Predicted impacts based on the Ricardian
cross-sectional method reflect current agricultural policies, and fail to account for future
policy and other structural economic changes. Further, the model fails to account for
spatial and temporal variability in climate variables (temperature and precipitation).
Future variations in climate variables may not follow the same past patterns, and
variations in climate across space are not necessarily the same as changes over time.
The challenge for future research is to correct for the restrictive assumptions of the cross-
sectional method. This analysis was based on cross-sectional data and assumed that
prices remain constant. However, welfare calculations based on such an assumption

124
underestimate damages and overestimate benefits as they omit consumer surplus (Cline,
1996). For example, if large and widespread changes in climate result in long-term
sustained changes in crop prices, the Ricardian estimates would be inaccurate and the
resulting price changes would determine the magnitude and direction of error
(Schimmelpfenning et al., 1996). Estimations that fail to take price changes and other
factors into account will produce biased estimates of impacts of climate change. Policy
recommendations based on such results would be inaccurate and might lead to
misdirection and mismanagement of limited resources.
However, Mendelsohn (2000) argues that it is difficult to include the effects of price
changes using any method. Given that prices of most crops are determined in the world
market, predictions of the likely effects of climate change on each crop would require a
global model. However, global crop models are poorly calibrated, making it difficult to
predict the likely impacts of the new climate on each crop. In addition, global models
predict small aggregate changes on aggregate supply in the 21st century (Reilly,
Hohmann & Kane, 1994; Reilly et al., 1996). Furthermore, assuming moderate aggregate
changes in supply will have a relatively small bias on estimates of future impacts of
climate change. The assumption of constant prices may not be a serious problem for the
Ricardian approach, unless there are catastrophic changes in climate (Mendelsohn, 2000).
Furthermore, the Ricardian method fails to account for the effects of variables that do not
vary across space, for example, the effects of carbon fertilization. To address this
problem, although not done in this study, cross-sectional approaches can be used to
provide experimental evidence of the likely impacts of higher carbon dioxide levels in the
future.
Another important limitation of this study is the fact that it includes all crops in one
category and all livestock types in another category. Different crop types and different
animal species among livestock types are impacted differently by climate change and
hence there is a need for further disaggregation. While the selection of animal and crop
types was beyond the scope of this study, given the broad scale of the analysis conducted,
125
it is recommended, as a second step, to conduct more crop and animal type-specific
analyses. This is necessary since farm-level adaptation is conditioned by local
circumstances and the specifics of the available options for various agricultural activities.
There are other adaptation options available to farmers that are not considered in the
groupings considered in this study. For instance, under the above combinations of
adaptation measures farmers may vary planting dates, use different crop varieties, and
implement fertilizers, pesticides, soil and water conservation techniques, and insurance
measures. Considering all these options however, would lead to a very large number of
factorial combinations that would be difficult to analyse within one empirical model.
Nevertheless, some of these factors measured by the survey were included as explanatory
variables in the empirical analyses that were conducted (e.g. technology factors).

126
References
Adams R.M. 1999. On the search for the correct economic assessment method − an
editorial comment. Climatic Change, 41: 363–370.
Adams R.M., R.A. Fleming, C.C. Chang, B.A. McCarl & C. Rosenzweig. 1995. A
reassessment of the economic impacts of global change on U.S. agriculture. Climate
Research, 30: 147–167.
Adams R.M, B.H. Hurd, S. Lenhart & N. Leary. 1998a. Effects of global change on
agriculture: an interpretative review. Climate Research, 11: 19–30.
Adams, R.M., B.A. McCarl, K. Segerson, C. Rosenzweig, K.J. Bryant, B.L. Dixon, R.
Conner, R.E. Evenson, D. Ojima. 1998b. The economic impacts of climate change on
U.S. agriculture. In: R. Mendelsohn, J. Neumann, (Eds.), The economic impacts of
climate change. Cambridge University Press, Cambridge.
Adams R.M., C. Rosenzweig, R. Peart, B.A. McCarl, D. Glyer, B. Curry, J. Jones, K.
Boote & H. Allen. 1990. Global climate change and US agriculture, Nature, 345: 219–
223.
Anderson, J.R. & J. Thampallai. 1990. Soil conservation in developing countries.
Agriculture and Rural Development Department, The World Bank. Washington DC.
Anim, F.D.K. 1999. A note on the adoption of soil conservation measures in the Northern
Province of South Africa. Journal of Agricultural Economics, 50: 336–345.

127
Anley Y., A. Bogale & A. Haile-Gabriel. 2007. Adoption decision and use intensity of
soil and water conservation measures by smallholder subsistence farmers in Dedo district,
Western Ethiopia. Land Degradation and Development, 18: 289–302.
Antle, J.M., Capalbo, S.M., Elliott, E.T. & Paustian, K.H. 2004. Adaptation, spatial
heterogeneity, and the vulnerability of agricultural systems to climate change and CO2
fertilization: an integrated assessment approach. Climate Change, 64: 289–315.
APN (Asia-Pacific Network for Global Change Research). 2002. International Workshop
on Reducing Vulnerability of Agriculture and Forestry to Climate Variability and
Climate Change (APN 2002-07),
http://www.apn.gr.jp/en/products/project_reports/2002/2002-07.html (Accessed 20
August 2006).
Araya B. & J.A. Adjaye. 2001. Adoption of farm level soil conservation practices in
Eritrea. Indian Journal of Agricultural Economics, 56: 239–252.
Baethgen W.E., H. Meinke & A. Gimene. 2003. Adaptation of agricultural production
systems to climate variability and climate change: lessons learned and proposed research
approach. Insights and Tools for Adaptation: Learning from Climate Variability, 18–20
November, 2003, Washington, DC.
Baidu-Forson G. 1999. Factors influencing adoption of land-enhancing technology in the
Sahel: lessons from a case study in Niger. Agricultural Economics, 20: 231–239.
Barbier B. 1998. Induced innovation and land degradation: results from a bioeconomic
model of a village in West Africa. Agricultural Economics, 19: 15–25.
Basist A., C. Williams Jr., N. Grody, T.E. Ross, S. Shen, A. Chang, R. Ferraro, M.
Menne. 2001. Using the Special Sensor Microwave Imager to monitor surface wetness.
Journal of Hydrometeorology 2, 297-308.

128
Bayard B., C.M. Jolly & D.A. Shannon. 2007. The economics of adoption and
management of alley cropping in Haiti. Journal of Environmental Management, 84: 62–
70.
Bekele W. & L. Drake. 2003. Soil and water conservation decision behavior of
subsistence farmers in the Eastern Highlands of Ethiopia: a case study of the Hunde-
Lafto area. Ecological Economics, 46: 437–451.
Benhin J.K.A. 2006. Climate change and South Africa agriculture: impacts and
adaptation options. CEEPA Discussion Paper No. 21. Centre for Environmental
Economics and Policy in Africa, University of Pretoria.
Birungi P.B. 2007. The linkages between land degradation, poverty and social capital in
Uganda, Department of Agricultural Economics, Extension and Rural Development,
Faculty of Natural and Agricultural Sciences, University of Pretoria, South Africa (PhD
thesis).
Boer G, G. Flato & D. Ramsden. 2000. A transient climate change simulation with
greenhouse gas and aerosol forcing: Projected climate for the 21st century. Climate
Dynamics, 16: 427–450.
Bradshaw B., H. Dolan & B. Smit. 2004. Farm-Level Adaptation to Climatic Variability
and Change: Crop Diversification in the Canadian Prairies. Climatic Change, 67: 119–
141.
Bultena G.L. & E.O. Hoiberg. 1983. Factors affecting farmers’ adoption of conservation
tillage. Journal of Soil and Water Conservation, 38: 281–284.
Burton M., D. Rigby & T. Young. 1999. Analysis of the determinants of adoption of
organic horticultural techniques in the UK. Journal of Agricultural Economics, 50: 47–63.

129
Cameron, A.C. & Trivedi, P.K. 2005. Micro-econometrics: Methods and Applications.
Cambridge University Press. New York, USA.
Clay D., T. Reardon & J. Kangasniemi. 1998. Sustainable intensification in the highland
tropics: Rwandan Farmers' Investments in Land Conservation and Soil Fertility.
Economic Development and Cultural Change, 46(2): 351–78.
Chang C.C. 2002. The potential impact of climate change on Taiwan’s agriculture.
Agricultural Economics, 227, 51–64.
Cline, WR, 1996. The impact of global warming on agriculture: Comment. American
Economic Review, 86, 1309–12.
Crosson P.R. & N.J. Rosenburg. 1993. An overview of the MINK study. Climatic
Change, 24: 159–173.
Darwin R. 1999. A farmer’s view of the Ricardian approach to measuring agricultural
effects of climate change. Climatic Change, 41: 371–411.
Darwin R.F., J. Lewandrowski, B. McDonald & M. Tsigas. 1994. Global climate change:
analysing environmental issues and agricultural trade within a global context. In: Sullivan
J (Ed.), Environmental policies: implications for agricultural trade. Foreign Agricultural
Economic Report Number 252, United States Department of Agriculture, Economic
Research Service, Washington DC.
Darwin R.F., M. Tsigas, J. Lewandrowski & A. Raneses. 1995. World agriculture and
climate change: economic adaptations, Agricultural Economic Report Number 703,
United States Department of Agriculture, Economic Research Service, Washington DC.
De Harrera, A.P. & Sain, G. 1999. Adoption of maize conservation tillage in Azuero,
Panama. Economics Working Paper 99-01. CIMMYT.
130
Deressa T.T. 2007. Measuring the economic impact of climate change on Ethiopian
agriculture: a Ricardian approach. Policy Research Working Paper 4342, Development
Research Group, Sustainable Rural and Urban Development Team. Washington DC: The
World Bank.
Deressa T., R. Hassan & D. Poonyth. 2005. Measuring the economic impact of climate
change on South Africa's sugarcane growing regions. Agrekon, 44(4): 524–542.
De Wit, M & Stankiewicz, J, 2006. Changes in surface water supply across Africa with
predicted climate change. Science, 311: 1917–21.
Dinar, A., Hassan, R., Mendelsohn, R., & Benhin, J., 2008. Climate change and
agriculture in Africa: impact assessment and adaptation strategies. London: EarthScan.
Dixon, J., A. Gulliver, & D. Gibbon. 2001. Farming systems and poverty: improving
farmers’ livelihoods in a changing world. Rome and Washington, D.C.: FAO and World
Bank.
Dolisca F., R.D. Carter, J.M. McDaniel, D.A. Shannon & C.M. Jolly. 2006. Factors
influencing farmers’ participation in forestry management programs: A case study from
Haiti. Forest Ecology and Management, 236: 324–331.
Du Toit A.S., M.A. Prinsloo, W. Durand and G. Kiker. 2002. Vulnerability of maize
production to climate change and adaptation in South Africa. Combined Congress: South
African Society of Crop Protection and South African Society of Horticultural Science,
Pietermaritzburg, South Africa.
Easterling W.E III, P.R. Crosson, N.J. Rosenberg, M.S. McKenny, L.A. Katz & K.A.
Lemon. 1993. Agricultural impacts of and response to climate change in the Missouri-
Iowa-Nebraska-Kansas (MINK) region. Climate Research, 24, 23–61.

131
Eid H.M., S.M. El-Marsafawy & S.A. Ouda. 2007. Assessing the economic impacts of
climate change on agriculture in Egypt: a Ricardian approach. Policy Research Working
Paper 4293, Development Research Group, Sustainable Rural and Urban Development
Team. Washington DC: The World Bank.
Elshar, M.H., Eid, H.M., Rosenweig, C., Iglesias, A. & Hillel, D. 1997. Agricultural
Adaptation to climate change in Egypt. In J. Smith, N. Bhati, G. Menzhulin, R. Benioff,
M.I. Budyko, M. Campos, B. Jallow & F. Rijsberman, (Eds.), Adapting to climate change:
An international perspective. New York: Springer-Verlag.
FAO (Food and Agriculture Organization). 1993. CLIMWAT for CROPWAT, a climatic
database for irrigation planning and management by M. Smith. FAO Irrigation and
Drainage Paper No. 49. Rome.
FAO (Food and Agriculture Organization). 2001. Global Farming Systems Study:
Challenges and Priorities to 2030, Regional Analysis Sub-Saharan Africa. Rome: FAO
and World Bank.
FAO (Food and Agriculture Organization). 2003. The digital soil map of the world:
Version 3.6 (January), Rome, Italy.
Featherstone A.M. & B.K. Goodwin. 1993. Factors influencing a farmer’s decision to
invest in long-term conservation improvements. Land Economics, 69: 67–81.
Feder G., R. Just & D. Zilberman, D. 1985. Adoption of agricultural innovations in
developing countries: a survey. Economic Development and Cultural Change, 33(2):
255–298.
Fischer, G., van Velthuizen, H., Shah, M. & Nachtergaele, F.O. 2002. Global agro-
ecological assessment for agriculture in the 21st century: methodology and results.
Research Report RR-02-02. ISBN 3-7045-0141-7., International Institute for Applied
Systems Analysis, Laxenburg, Austria, 119 pp and CD-Rom.
132
Fischer, G., M. Shah, F.N. Tubiello & H. van Velthuizen. 2005. Socio-economic and
climate change impacts on agriculture: an integrated assessment, 1990-2080.
Philosophical Transactions of the Royal Society B: Biological Sciences, 360, 2067-2083.
Gbetibouo G. & R. Hassan. 2005. Measuring the Economic Impact of Climate Change on
Major South African Field Crops: A Ricardian Approach. Global and Planetary Change,
47(2–4): 143–52.
Glendinning, A., J. Mahapatra & C.P. Mitchell. 2001. Modes of communication and
effectives of agroforestry extension in eastern India. Human Ecology, 29(3): 283–305.
Gould, B.W., W.E. Saupe & R.M Klemme. 1989. Conservation tillage: the role of farm
and operator characteristics and the perception of soil erosion. Land Economics, 65: 167–
182.
Green, W. H. 2000. Econometric Analysis (4th edition). New Jersey: Prentice Hall,.
Green, W.H. 2003. Econometric Analysis (5th edition). New Jersey: Prentice Hall.
Güther, F., van Velthuizen, H., Shah, M. & Naehtergaele, F.O. 2002. Global Agro-
ecological Assessment for Agriculture in the 21st Century: Methodology and Results.
Australia: International Institute for Applied System Analysis (IISA).
Hassan, R.M., N. Kiarie, N. Mugo, O. Robin & A. Laboso. 1998. Adoption and
performance of maize in Kenya. In: Hassan R.M. (Ed.), Maize technology development
and transfer: a GIS approach to research planning in Kenya. London: CAB International.
Hausman J. & D. McFadden. 1984. Specification tests for the multinomial logit model.
Econometrica, 52 (5): 1219–1240.
133
Hausman J. & D. Wise. 1978. A conditional probit model for qualitative choice: Discrete
decisions recognizing interdependence and heterogeneous preferences. Econometrica, 46:
403–426.
Heinen J.T. 1996. Human behavior, incentives and protected areas management.
Conservation Biology, 10 (2): 681–684.
Higman S., S. Bass, N. Judd, J. Mayers & R. Nussbaum. 1999. The Sustainable Forestry
Handbook. London: Earthscan Publications.
Houghton J.T., Y. Ding, D.J. Griggs, M. Noguer, P.J. van der Linden, X. Dai, K.
Maskell, C.A. Johnson, (Eds.), 2001. Climate Change 2001: The Scientific Basis.
Contribution of Working Group I to the third assessment report of the Intergovernmental
Panel on Climate Change. Cambridge: Cambridge University Press.
Houghton J., L. Meira Filho, B. Callander, N. Harris, A. Kattenberg & K. Maskell (Eds.).
1996. Climate change 1995: The science of climate change. Cambridge: Cambridge
University Press.
Hulme M., R.M. Doherty, T. Ngara, M.G. New & D. Lister. 2001. African climate
change: 1900-2100. Climate Research, 17, 145–168.
Hulme, M. (Ed.). 1996. Climate change in Southern Africa: An exploration of some
potential impacts and implications in the SADC Region. University of East Anglia,
Norwich, United Kingdom: Climatic Research Unit, 96 pp.
IAC (Inter Academy Council) Report. 2004. Realizing the promise and potential of
African agriculture. Royal Netherlands Academy of Arts and Sciences, NL-1000 GC
Amsterdam, The Netherlands.

134
Iglesias A., C. Rosenzweig & D. Pereira. 1999. Agricultural impacts of climate change in
Spain: developing tools for a spatial analysis. Global Environmental Change, 10: 69–80.
IISD (International Institute for Sustainable Development). 2007. Community Based
Adaptation to Climate Change Bulletin. A Summary of the Second International
Workshop on Community-Based Adaptation to Climate Change. IISD Reporting Services.
IPCC. 2001. Climate Change 2001: Impacts, adaptation, and vulnerability,
intergovernmental panel on climate change. Cambridge: Cambridge University Press.
IPCC. 2007. Climate Change 2007: Mitigation. Contribution of Working Group III to the
Fourth Assessment Report of the Intergovernmental Panel on Climate Change. In B.
Metz, O. Davidson, P. Bosch, R.Dave & L. Meyer, (Eds.). Cambridge: Cambridge
University Press.
Jain S. 2007. An empirical economic assessment of impacts of climate change on
agriculture in Zambia. Policy Research Working Paper 4291, Development Research
Group, Sustainable Rural and Urban Development Team. Washington, DC: The World
Bank.
Jones, J.W. 2003. Agricultural responses to climate variability and climate change. Paper
presented at the Climate Adaptation.net conference: Insights and Tools for Adaptation:
Learning from Climate Variability, 18–20 November, 2003, Washington, DC.
Kabubo-Mariara J. & F. Karanja. 2007. The economic impact of climate change on
Kenya crop agriculture: a Ricardian approach. Global and Planetary Change, 57: 319–
330.
Kaiser H.M., S.J. Riha, D.S. Wilks, D.G. Rossier & R. Sampath. 1993. A farm-level
analysis of economic impacts of economic and agronomic impacts of gradual warming.
American Journal of Agricultural Economics, 75: 387–398.
135
Kandlinkar, M. & J. Risbey. 2000. Agricultural impacts of climate change: if adaptation
is the answer, what is the question? Climatic Change, 45: 529–539.
Klein R.J.T., S. Huq, F. Denton, T.E. Downing, R.G. Richels, J.B. Robinson & F.L. Toth.
2007. Inter-relationships between adaptation and mitigation. Climate Change 2007:
Impacts, adaptation and vulnerability. Contribution of Working Group II to the Fourth
Assessment Report of the Intergovernmental Panel on Climate Change. In M.L. Parry,
O.F. Canziani, J.P. Palutikof, P.J. van der Linden & C.E. Hanson, (Eds.). (pp. 745-777).
Cambridge: Cambridge University Press.
Kumar, K.S.K. & Parikh, J. 1998. Climate change impacts on Indian agriculture: The
Ricardian approach. In A. Dinar et al. (Eds.). Measuring the impact of climate change on
Indian agriculture. World Bank Technical paper 402. Washington, DC.
Kumar, K.S.K. & J. Parikh. 2001. Socio-economic impacts of climate change on Indian
agriculture. International Review for Environmental Studies, 2(2): 277–293.
Kurukulasuriya, P., Mendelsohn, R., Hassan, R., Benhin, J., Deressa, T., Diop, M., Eid,
H.M., Fosu, K.Y., Gbetibouo, G., Jain, S., Mahamadou, A., Mano, R., Kabubo-Mariara,
J., El-Marsafawy, S., Moula, E., Ouda, S., Ouedraogo, M., Séne, I., Maddison, D., Seo
S.N., Dinar, A., 2006. Will African agriculture survive climate change? The World Bank
Economic Review, 20 (3), 367-388.
Kurukulasuriya P. & R. Mendelsohn. 2007a. A Ricardian analysis of the impact of
climate change on African cropland. Policy Research Working Paper 4305, Development
Research Group, Sustainable Rural and Urban Development Team. Washington DC: The
World Bank.

136
Kurukulasuriya P. & R. Mendelsohn. 2007b. Endogenous irrigation: the impact of
climate change on farmers in Africa. Policy Research Working Paper 4278, Development
Research Group, Sustainable Rural and Urban Development Team. Washington DC: The
World Bank.
Kurukulasuriya P. & R. Mendelsohn. 2007c. Crop selection: adapting to climate change
in Africa. Policy Research Working Paper 4307, Development Research Group,
Sustainable Rural and Urban Development Team. Washington DC: The World Bank.
Kurukulasuriya, P. & S. Rosenthal. 2003. Climate change and agriculture: a review of
impacts and adaptations, Climate Change Series 91, Agriculture and Rural Development
and Environment Department, Washington DC: The World Bank.
Lapar MLA & S. Pandely. 1999. Adoption of soil conservation: the case of Philippine
uplands. Agricultural Economics, 21: 241–256.
Leary, N., Adejuwon, J., Bailey, W., Barros, V., Caffera, M., Chinvanno, S., Conde, C.,
De Comarmond, A., De Sherbinin, A., Downing, T., Eakin, H., Nyong, A., Opondo, M.,
Osman, B., Payet, R., Pulhin, F., Pulhin, J., Ratnasiri, J., Sanjak, E., von Maltitz, G.,
Wehbe, M., Yin, Y., Ziervogel, G., 2005. For whom the bell tolls- vulnerability in a
changing climate, a synthesis from the AIACC project. www.aiaccproject.org
Long, J.S. 1997. Regression models for categorical and limited dependent variables:
advanced quantitative techniques in the social science. Series 7, Thousand Oaks,
California: Sage Publications.
Maddison, D. 2007. The perception of and adaptation to climate change in Africa, Policy
Research Working Paper 4308, Development Research Group, Sustainable Rural and
Urban Development Team. Washington DC: The World Bank.

137
Magadza, C.H.D. 1994. Climate Change, some likely multiple impacts in Southern
Africa. Food Policy, 19(2): 165–191.
Makadho, J.M. 1996. Potential effects of climate change on corn production in
Zimbabwe. Climate Research, 6(2): 147–151.
Mano, R., & C. Nhemachena. 2007. Assessment of the economic impacts of climate
change on agriculture in Zimbabwe: a Ricardian approach. Policy Research Working
Paper 4292, Development Research Group, Sustainable Rural and Urban Development
Team. Washington DC: The World Bank.
Mano R., B. Isaacson & P. Dardel. 2003. Identifying policy determinants of food security
response and recovery in the SADC region: the case of the 2002 food emergency.
FANRPAN Policy Paper, FANRPAN.
Mendelsohn R. 2000. Measuring the effect of climate change on developing country
agriculture. Two essays on climate change and agriculture: a developing country
perspective. FAO Economic and Social Development Paper 145.
Mendelsohn, R. & A. Dinar. 1999. Climate change, agriculture, and developing countries:
Does adaptation matter? The World Bank Research Observer, 14(2): 277–293.
Mendelsohn, R. & A. Dinar. 2003. Climate, water, and agriculture. Land Economics,
79(3): 328–341.
Mendelsohn, R. & A. Dinar. 2005. Exploring adaptation to climate change in agriculture:
the potential of cross-sectional analysis. Agriculture and Rural Development, Washington
DC: The World Bank.
Mendelsohn, R., W. Nordhaus & D. Shaw. 1994. The impact of global warming on
agriculture: A Ricardian analysis. American Economic Review, 84: 753–771.
138
Mendelsohn, R., W. Nordhaus & D. Shaw. 1996. Climate impacts on aggregate farm
values: Accounting for adaptation. Agriculture and Forest Meteorology, 80: 55–67.
Mitchell, T. & T. Tanner. 2006. Adapting to climate change-challenges and opportunities
for the development community. Teddington, UK: Institute of Development Studies and
Tearfund.
Molua, E.L. & C.M. Lambi. 2007. The impact of climate change on agriculture in
Cameroon, Policy Research Working Paper 4364, Development Research Group,
Sustainable Rural and Urban Development Team. Washington DC: The World Bank.
Muchena P. 1994. Implication of climate change for maize yields in Zimbabwe. In
Rosenzweig C & A. Iglesias (Eds.), Implications of climate change for international
agriculture: Crop modeling study. EPA, Washinghton DC: 230-B-003.
Newmark W.D., N.L. Leonard, H.I. Sariko & D.M. Gamassa. 1993. Conservation
attitudes of local people living adjacent to five protected areas in Tanzania. Biological
Conservation, 63(2): 177–183.
Naiken, L. 2002. FAO methodology for estimating the prevalence of undernourishment.
In Measurement and assessment of food deprivation and undernutrition. Proceedings of
an international scientific symposium convened by the Agriculture and Economic
Development Analysis Division, Food and Agriculture Organization of the United
Nations (FAO), June 26–28. Rome: FAO.
Nicholson, S.E. & D. Entekhapi. 1986. The quasi-periodic behavior of rainfall variability
in Africa and its relationship to the Southern Oscillation. Journal of Climate and Applied
Meteorology, 34: 331–348.
Nicholson, S.E. & J. Kim. 1997. The relationship of the El Niño Southern Oscillation to
African rainfall. International Journal of Climatology, 17: 117–135.
139
Nkonya E., J. Pender, C. Kaizzi, E. Kato & S. Mugarura. 2005. Policy Options for
Increasing Crop Productivity and Reducing Soil Nutrient Depletion and Poverty in
Uganda. IFPRI-EPTD Paper No. 134.
Nyangena W. 2006. Social determinants of soil and water conservation in rural Kenya.
Environ Dev Sustain. DOI 10.1007/s10668-007-9083-6.
Nyong A. 2005. Impacts of climate change in the tropics: the African experience, a
keynote presentation at the scientific symposium on stabilisation of greenhouse gases:
avoiding dangerous climate change. Meteorological Office, Exeter, United Kingdom.
Okoye, C.U. 1998. Comparative analysis of factors in the adoption of traditional and
recommended soil erosion control practices in Nigeria. Soil & Tillage Research, 45: 251–
263.
Parry, M.L. 2004. Global impacts of climate change under the SRES scenarios. Global
Environmental Change, 14: 1–2.
Parry, M.L., C. Rosenzweig, A. Iglesias, G. Fischer & M. Livermore. 1999. Climate
change and world food security: a new assessment. Global Environmental Change, 9: 51-
67.
Parry, M., Rosenzweig, C. & Livermore, M. 2005. Climate change, global food supply
and risk of hunger. Philosophical Transactions of the Royal Society B: Biological
Sciences, 360: 2125–2138.
Pender, J., S. Ssewanyana, E. Kato & E. Nkonya. 2004. Linkages between Poverty and
Land Management in Rural Uganda: Evidence from Uganda National Household Survey,
1999/00. Paper presented at a workshop on Poverty, NRM linkage, held at hotel Africana
– Kampala, Uganda.
140
Pender, J. & J. Kerr. 1998. Determinants of farmers’ indigenous soil and water
conservation investments in semi-arid India. Agricultural Economics, 19: 113–125.
Polsky, C. 2004. Putting space and time in Ricardian climate change impact studies:
Agriculture in the US Great Plains, 1969–1992. Annals of the Association of American
Geographers, 94(3): 549–564.
Polsky, C. & W.E. Easterling III. 2001. Adaptation to climate variability and change in
the US Great Plains: A multi-scale analysis of Ricardian climate sensitivities. Agriculture,
Ecosystems and Environment, 85: 133–144.
Porter, J.R. & Semenov, M.A. 2005. Crop responses to climatic variation. Philosophical
Transactions of the Royal Society B: Biological Sciences, 360: 2021–2035.
Reilly J. 1999. What does climate change mean for agriculture in developing countries?
A comment on Mendelsohn and Dinar. The World Bank Research Observer, 14(2): 295–
305.
Reilly, J, Baethgen, W, Chege, F, van de Geijn, S, Erda, L, Iglesias, A, Kenny, G,
Patterson, D, Rogasik, J, Rotter, R, Rosenzweig, C, Somboek, W & Westbrook, J. 1996.
Agriculture in a changing climate: Impacts and adaptations. In R. Watson, M. Zinyowera,
R. Moss & D. Dokken (Eds.), Climate Change 1995: Impacts, adaptations, and
mitigation of climate change: Scientific-technical analyses. Cambridge: Cambridge
University Press for the Intergovernmental Panel on Climate Change.
Reilly, J., N. Hohmann, & S. Kane. 1994. Climate Change and Agricultural Trade: Who
Benefits, Who Loses? Global Environmental Change, 4(1): 24–36.
Ritchie, J., Singh, U., Goodwin, D., Hunt, L. 1989. A user’s guide to CERES–Maize 2.10.
Michigan State University–IFDC–IBSNAT, Muscle Shoals, AL

141
Roach, R. 2005. Dried up, drowned out-voices from the developing world on a changing
climate, Tearfund, 100 Church Road, Teddington, Middlesex, TWAA 8QE, United
Kingdom.
Rosegrant, M.W., X. Cai & S.A. Cline. 2002. World Water and Food to 2025: Dealing
With Scarcity. Washington, DC: International Food Policy Research Institute.
Rosenzweig, C. & M. Parry. 1993. Potential impacts of climate change on world food
supply: a summary of a recent international study. In H. Kaiser & T. Dremen (Eds.),
Agricultural dimensions of global climate change. FL: St Lucie Press, pp. 87-116.
Rosenzweig, C. & M. Parry. 1994. Potential impacts of climate change on world food
supply. Nature, 367: 133–138.
Sanghi, A., Mendelsohn, R. & Dinar, A. 1998. The climate sensitivity of Indian
agriculture. In A. Dinar et al. (Eds.), Measuring the impact of climate change on Indian
agriculture. Washington, DC: World Bank Technical Paper Number 402.
Schimmelpfennig, D., J. Lewandrowski, J. Reilly, M. Tsigas & I Parry. 1996.
Agricultural Adaptation to Climate Change: Issues of Long-run Sustainability,
Agricultural Economic Report No. (AER740), United States Department of Agriculture,
USA.
Schneider S.H., W.E. Easterling & L.O. Mearns. 2000. Adaptation: sensitivity to natural
variability, agent assumptions and dynamic climatic changes. Climatic Change, 45: 203–
221.
Schulze, R.E., G.A. Kiker & Kunz, R.P. 1993. Global climate change and agricultural
productivity in Southern Africa. Global Environ. Change, 3(4): 330–349.
142
Sene, I.M., M. Diop & A. Dieng. 2006. Impacts of climate change on the revenues and
adaptation of farmers in Senegal. CEEPA Discussion Paper No. 19. Centre for
Environmental Economics and Policy in Africa, University of Pretoria.
Seo N. & R. Mendelsohn. 2007a. Climate change impacts on animal husbandry in Africa:
a Ricardian analysis. Policy Research Working Paper 4279, Development Research
Group, Sustainable Rural and Urban Development Team. Washington DC: The World
Bank.
Seo N. & R. Mendelsohn. 2007b. Climate change adaptation in Africa: a microeconomic
analysis of livestock choice. Policy Research Working Paper 4277, Development
Research Group, Sustainable Rural and Urban Development Team. Washington DC: The
World Bank.
Shields M.L., G.P. Rayuniyar & F.M. Goode. 1993. A longitudinal analysis of factors
influencing increased technology adoption in Swaziland, 1985–1991. The Journal of
Developing Areas, 27: 469–484.
Smit B., I. Burton, R. Klein & J. Wandel. 2000. An anatomy of adaptation to climate
change and variability. Climatic Change, 45: 223–251.
StataCorp. 2005. Stata base reference manual. Volume 2, K-Q, release 8. College Station,
TX: Stata Corporation.
Stern, N. 2006. Stern review on the economics of climate change. London: Her Majesty’s
Treasury.
Strzepek K. & A. McCluskey. 2007. District level hydroclimatic time series and scenario
analysis to assess the impacts of climate change on regional water resources and
agriculture in Africa. Policy Research Working Paper 4290, Development Research
143
Group, Sustainable Rural and Urban Development Team. Washington DC: The World
Bank.
Thacher T., D.R. Lee & J.W. Schelhas. 1997. Farmer participation in reforestation
incentive programs in Costa Rica. Agroforestry Systems, 35(3): 269–289.
Tizale, C.Y. 2007. The dynamics of soil degradation and incentives for optimal
management in the Central Highlands of Ethiopia. PhD thesis: Department of
Agricultural Economics, Extension and Rural Development, Faculty of Natural and
Agricultural Sciences, University of Pretoria, South Africa.
Traore, N., R. Landry & N. Amara. 1998. On-farm adoption of conservation practices:
the role of farm and farmer characteristics, perceptions, and health hazards. Land
Economics, 74: 114–127.
Todd, B. 2004. Africa’s Food and Nutrition Security Situation, Where Are We and How
Did We Get Here? 2020 Discussion Paper 37. International Food Policy Research
Institute, 2033 K Street, NW Washington, DC 20006–1002 USA
Tse, Y.K. 1987. A diagnostic test for the multinomial logit model. Journal of Business
and Economic Statistics, 5(2):, 283–286.
Tubiello, F.N. & Fischer, G. 2006. Reducing climate change impacts on agriculture:
global and regional effects of mitigation, 2000-2080. Technological Forecasting and
Social Change, doi: 10.1016/j.techfore.2006.05.027.
UNEP-GRID-Arendal. 2002. http://www.grida.no/climate/vitalafrica/english (Accessed
11 March 2006).
Wall E. & B. Smit 2005. Climate Change Adaptation in Light of Sustainable Agriculture.
Journal of Sustainable Agriculture, 27(1): 113–123.

144
Washington, W.M., Weatherly, J.W., Meehl, G.A., Semtner Jr., A.J., Bettge, T.W., Craig,
A.P., Strand Jr., W.G., Arblaster, J., Wayland, V.B., James, R., Zhang, Y., 2000. Parallel
Climate Model (PCM): Control and transient scenarios. Climate Dynamics, 16, 755-774.
Weng, F. & N. Grody. 1998. Physical retrieval of land surface temperature using the
Special Sensor Microwave Imager, Journal of Geophysical Research, 103: 8839-8848.
Wilson, S. E. 2001. Global warming changes the forecast for agriculture. In: Pinstrup
Andersen, P., and R. J. Lorch (Eds.), The unfinished agenda: Perspectives on overcoming
hunger, poverty, and environmental degradation. Washington DC: International Food
Policy Research Institute.
World Bank. 2003. Africa Rainfall and Temperature Evaluation System. Washington DC:
World Bank.
WRI (World Resources Institute). 1998: 1998–99 World Resources Database Diskette: A
Guide to the Global Environment. Washington DC: World Resources Institute (diskettes).
Wu, J. & B.A. Babcock. 1998. The choice of tillage, rotation, and soil testing practices:
economic and environmental implications. American Journal of Agricultural Economics,
80: 494–511.
Yates, D.N. & K.M. Strzepek. 1996. Modelling economy-wide climate change impacts
on Egypt: a case for an integrated approach. Environmental Modelling and Assessment, 1:
119–135.
Yates, D.N. & K.M. Strzepek. 1998. An assessment of integrated climate change impacts
on the agricultural economy of Egypt. Climatic Change, 38: 261–287.
145
Yirga C., B.I. Shapiro & M. Demeke. 1996. Factors influencing adoption of new wheat
technologies in Wolemera and Addis Alem areas of Ethiopia. Ethiopian Journal of
Agricultural Economics, 1(1): 63–84.
Zhang, D. & W. Flick. 2001. Sticks, carrots, and reforestation investment. Land
Economics, 77(3): 443–456.

146
Appendix 1A: Regression results for dryland farms
Variable name All farms Mixed crop-livestock farms Specialised crop farms
Winter temperature -0.534 -0.350 -1.514**
Spring temperature -0.562 -0.527 -0.389
Summer temperature -0.058 0.350 -0.742
Fall temperature 1.173** 0.436 3.206***
Winter precipitation 0.035*** 0.033*** 0.045***
Spring precipitation -0.025*** -0.024*** -0.034**
Summer precipitation 0.013*** 0.016*** 0.010
Fall precipitation -0.001 -0.007 0.012
Winter precipitation squared -0.000*** -0.000** -0.000*
Spring precipitation squared 0.000*** 0.000** 0.000**
Summer precipitation squared -0.000 -0.000 0.000
Fall precipitation squared 0.000 0.000* -0.000
Winter temperature squared 0.005 0.001 0.023*
Spring temperature squared 0.009 0.010 0.002
Summer temperature squared -0.005 -0.011* 0.009
Fall temperature squared -0.010 0.001 -0.042***
Orthic Ferralsols (foFU) -0.244 -0.375 -0.056
Fluvisol (jcMFU) 1.096 1.005 -0.087
Ferric Luvisols (lfU) -0.421** -0.765*** 0.176
Ferric Luvisols (lfCU) 0.383*** 0.280* 0.794**
Cambic Arenosols (qc) 0.316 0.312 -0.097
Luvic Arenosol (qlCU) 0.519*** 0.458*** 1.485***
Chromic luvisols (lCU) 0.605*** 0.694*** -3.133***
Farmland (ha) 0.656*** 0.689*** 0.581***
Mean water flow 0.009*** 0.007*** 0.019***
Household has tractor 0.431*** 0.307* 0.958***
Household access to extension 0.143*** 0.150** 0.174*
Household access to electricity
(Yes/No)
0.202*** 0.236*** 0.074
Household size (Num. of people) 0.198*** 0.146** 0.324***
Using irrigation (Yes/No)
Mixed crop-livestock Yes/No) 0.420***
Specialised crop (Yes/No) 0.566***
North & East Africa (Yes/No) -0.252 -0.555* 0.881*
Southern Africa (Yes/No) -2.100*** -1.879*** -3.108***
Constant 5.021* 8.541*** -9.863*
R Square 0.5087 0.4457 0.6535 N 4303 3237 1010
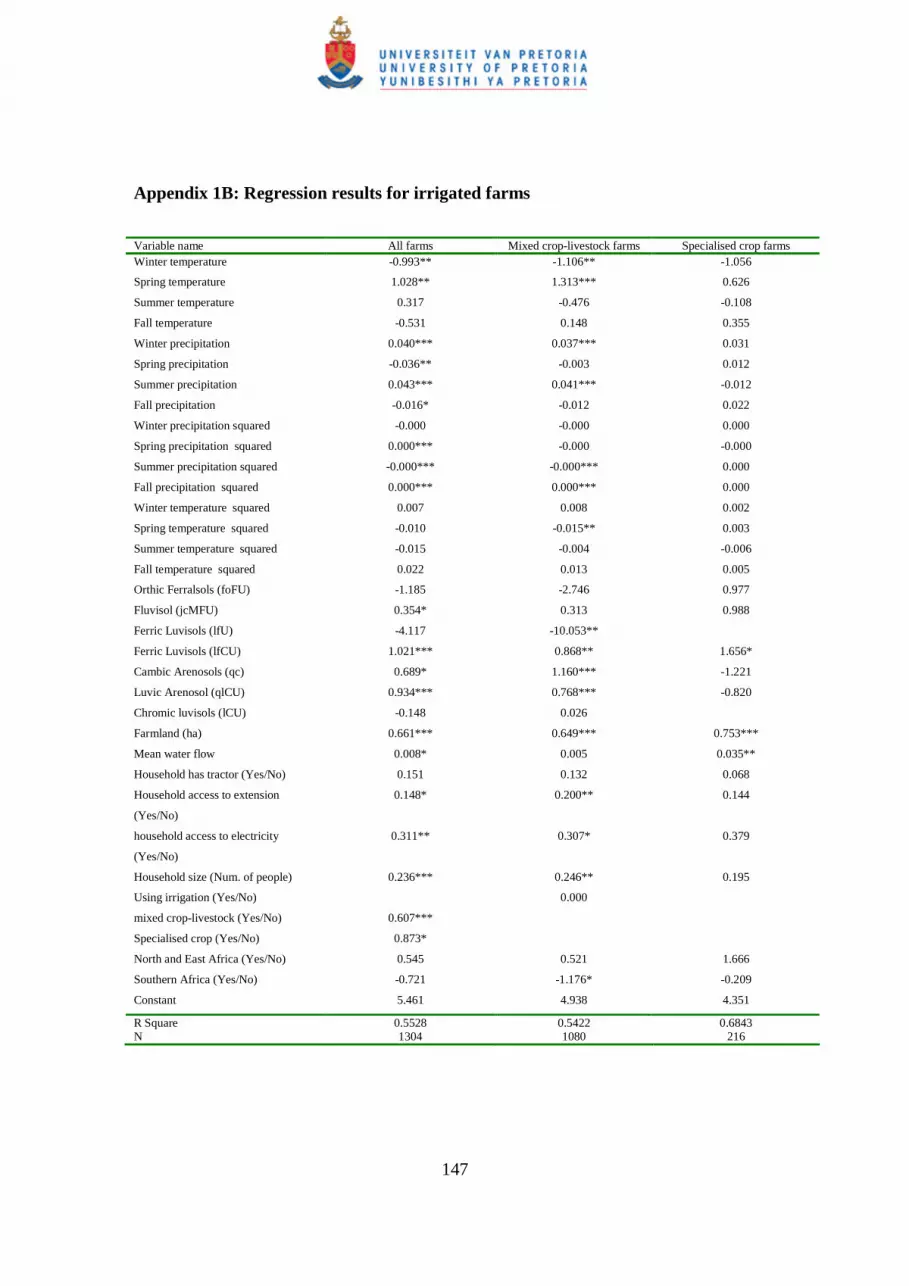
147
Appendix 1B: Regression results for irrigated farms
Variable name All farms Mixed crop-livestock farms Specialised crop farms Winter temperature -0.993** -1.106** -1.056
Spring temperature 1.028** 1.313*** 0.626
Summer temperature 0.317 -0.476 -0.108
Fall temperature -0.531 0.148 0.355
Winter precipitation 0.040*** 0.037*** 0.031
Spring precipitation -0.036** -0.003 0.012
Summer precipitation 0.043*** 0.041*** -0.012
Fall precipitation -0.016* -0.012 0.022
Winter precipitation squared -0.000 -0.000 0.000
Spring precipitation squared 0.000*** -0.000 -0.000
Summer precipitation squared -0.000*** -0.000*** 0.000
Fall precipitation squared 0.000*** 0.000*** 0.000
Winter temperature squared 0.007 0.008 0.002
Spring temperature squared -0.010 -0.015** 0.003
Summer temperature squared -0.015 -0.004 -0.006
Fall temperature squared 0.022 0.013 0.005
Orthic Ferralsols (foFU) -1.185 -2.746 0.977
Fluvisol (jcMFU) 0.354* 0.313 0.988
Ferric Luvisols (lfU) -4.117 -10.053**
Ferric Luvisols (lfCU) 1.021*** 0.868** 1.656*
Cambic Arenosols (qc) 0.689* 1.160*** -1.221
Luvic Arenosol (qlCU) 0.934*** 0.768*** -0.820
Chromic luvisols (lCU) -0.148 0.026
Farmland (ha) 0.661*** 0.649*** 0.753***
Mean water flow 0.008* 0.005 0.035**
Household has tractor (Yes/No) 0.151 0.132 0.068
Household access to extension
(Yes/No)
0.148* 0.200** 0.144
household access to electricity
(Yes/No)
0.311** 0.307* 0.379
Household size (Num. of people) 0.236*** 0.246** 0.195
Using irrigation (Yes/No) 0.000
mixed crop-livestock (Yes/No) 0.607***
Specialised crop (Yes/No) 0.873*
North and East Africa (Yes/No) 0.545 0.521 1.666
Southern Africa (Yes/No) -0.721 -1.176* -0.209
Constant 5.461 4.938 4.351
R Square 0.5528 0.5422 0.6843 N 1304 1080 216

148
Appendix 2: Correlation analysis of continuous explanatory variables
Winter-
spring temp
Summer-fall
temp
Winter-
spring precip
Summer-fall
precip Head_age
Household_
size
Farming_
experience Farm_size
Markets_
distance
Winter-spring temp 1
Summer-fall temp 0.4769 1
Winter-spring precip -0.1036 -0.4638 1
Summer-fall precip 0.2351 -0.2056 0.0809 1
Head_age -0.0174 0.0537 -0.0652 -0.0794 1
Household_size 0.3136 0.3014 -0.199 0.0104 0.2504 1
Farming_ experience 0.018 0.2114 -0.1975 -0.2294 0.3338 0.2509 1
Farm_size -0.0849 -0.0452 -0.0169 -0.0209 0.0033 -0.0007 -0.0087 1
Markets_distance 0.0541 0.1203 -0.0704 -0.0111 -0.0924 0.0195 -0.0635 0.0016 1
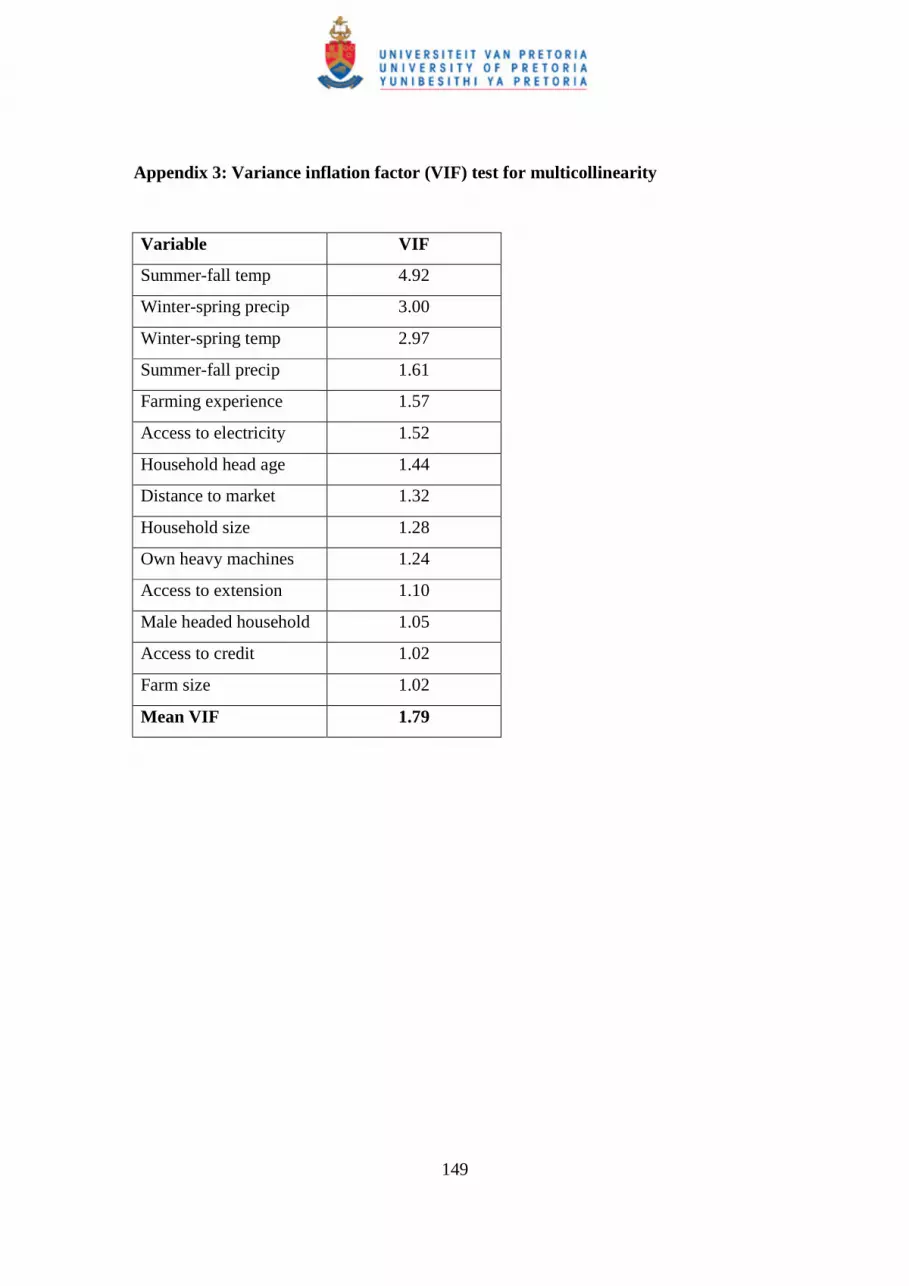
149
Appendix 3: Variance inflation factor (VIF) test for multicollinearity
Variable VIF
Summer-fall temp 4.92
Winter-spring precip 3.00
Winter-spring temp 2.97
Summer-fall precip 1.61
Farming experience 1.57
Access to electricity 1.52
Household head age 1.44
Distance to market 1.32
Household size 1.28
Own heavy machines 1.24
Access to extension 1.10
Male headed household 1.05
Access to credit 1.02
Farm size 1.02
Mean VIF 1.79
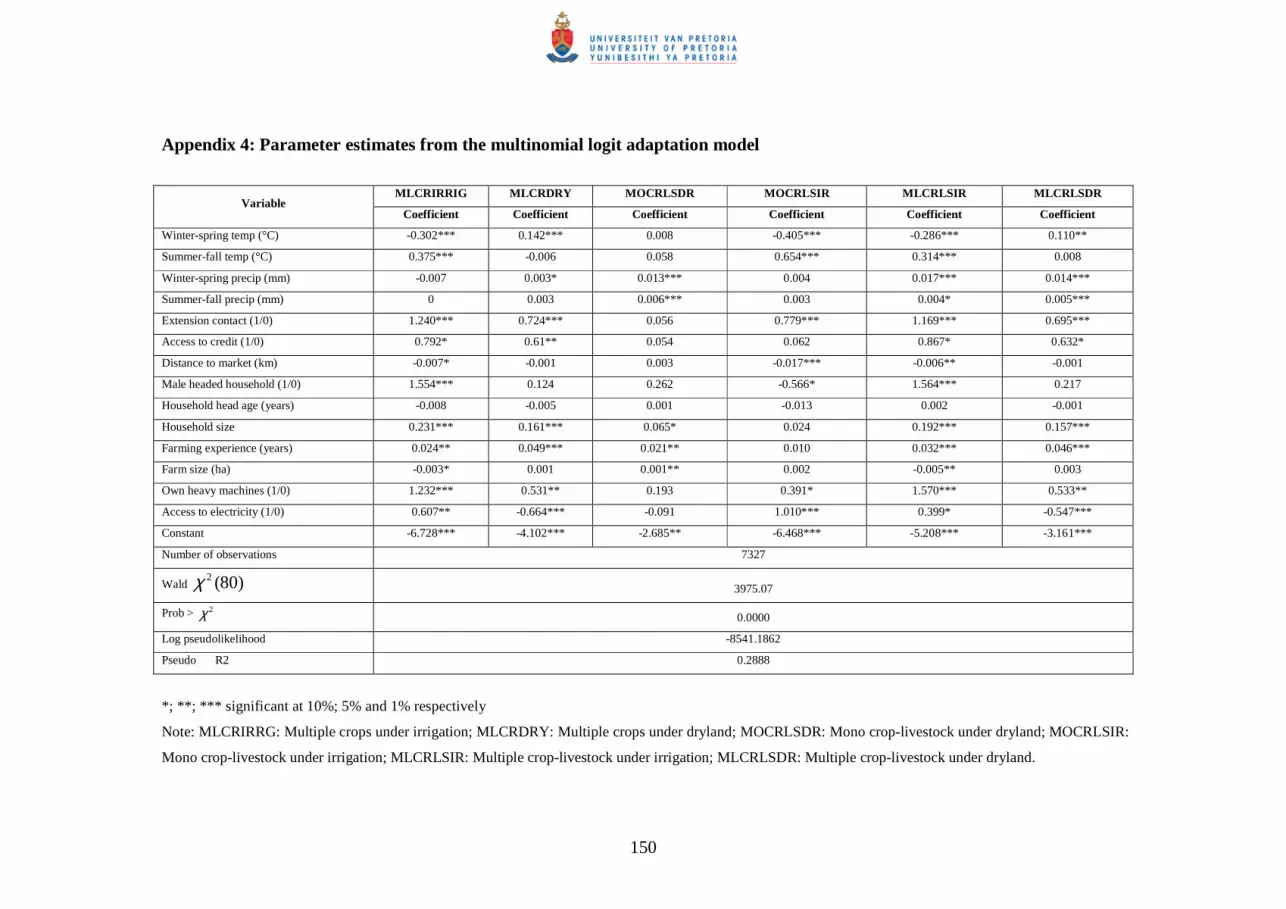
150
Appendix 4: Parameter estimates from the multinomial logit adaptation model
MLCRIRRIG MLCRDRY MOCRLSDR MOCRLSIR MLCRLSIR MLCRLSDR Variable
Coefficient Coefficient Coefficient Coefficient Coefficient Coefficient
Winter-spring temp (°C) -0.302*** 0.142*** 0.008 -0.405*** -0.286*** 0.110**
Summer-fall temp (°C) 0.375*** -0.006 0.058 0.654*** 0.314*** 0.008
Winter-spring precip (mm) -0.007 0.003* 0.013*** 0.004 0.017*** 0.014***
Summer-fall precip (mm) 0 0.003 0.006*** 0.003 0.004* 0.005***
Extension contact (1/0) 1.240*** 0.724*** 0.056 0.779*** 1.169*** 0.695***
Access to credit (1/0) 0.792* 0.61** 0.054 0.062 0.867* 0.632*
Distance to market (km) -0.007* -0.001 0.003 -0.017*** -0.006** -0.001
Male headed household (1/0) 1.554*** 0.124 0.262 -0.566* 1.564*** 0.217
Household head age (years) -0.008 -0.005 0.001 -0.013 0.002 -0.001
Household size 0.231*** 0.161*** 0.065* 0.024 0.192*** 0.157***
Farming experience (years) 0.024** 0.049*** 0.021** 0.010 0.032*** 0.046***
Farm size (ha) -0.003* 0.001 0.001** 0.002 -0.005** 0.003
Own heavy machines (1/0) 1.232*** 0.531** 0.193 0.391* 1.570*** 0.533**
Access to electricity (1/0) 0.607** -0.664*** -0.091 1.010*** 0.399* -0.547***
Constant -6.728*** -4.102*** -2.685** -6.468*** -5.208*** -3.161***
Number of observations 7327
Wald )80(2χ 3975.07
Prob > 2χ 0.0000
Log pseudolikelihood -8541.1862
Pseudo R2 0.2888
*; **; *** significant at 10%; 5% and 1% respectively
Note: MLCRIRRG: Multiple crops under irrigation; MLCRDRY: Multiple crops under dryland; MOCRLSDR: Mono crop-livestock under dryland; MOCRLSIR:
Mono crop-livestock under irrigation; MLCRLSIR: Multiple crop-livestock under irrigation; MLCRLSDR: Multiple crop-livestock under dryland.


