Embed Size (px)
Citation preview
Edited by
Agricultural Cooperative in the Face of the Challenges of Globalization, Sustainability and Digitalization
Adoración Mozas Moral and Domingo Fernandez UclesPrinted Edition of the Special Issue Published in Agriculture
www.mdpi.com/journal/agriculture

Agricultural Cooperative in the Face ofthe Challenges of Globalization,Sustainability and Digitalization

Agricultural Cooperative in the Face ofthe Challenges of Globalization,Sustainability and Digitalization
Editors
Adoracion Mozas Moral
Domingo Fernandez Ucles
MDPI • Basel • Beijing • Wuhan • Barcelona • Belgrade • Manchester • Tokyo • Cluj • Tianjin
Editors
Adoracion Mozas Moral
University of Jaen
Spain
Domingo Fernandez Ucles
University of Jaen
Spain
Editorial Office
MDPI
St. Alban-Anlage 66
4052 Basel, Switzerland
This is a reprint of articles from the Special Issue published online in the open access journal
Agriculture (ISSN 2077-0472) (available at: https://www.mdpi.com/journal/agriculture/special
issues/agricultural cooperative).
For citation purposes, cite each article independently as indicated on the article page online and as
indicated below:
LastName, A.A.; LastName, B.B.; LastName, C.C. Article Title. Journal Name Year, Volume Number,
Page Range.
ISBN 978-3-0365-3763-4 (Hbk)
ISBN 978-3-0365-3764-1 (PDF)
© 2022 by the authors. Articles in this book are Open Access and distributed under the Creative
Commons Attribution (CC BY) license, which allows users to download, copy and build upon
published articles, as long as the author and publisher are properly credited, which ensures maximum
dissemination and a wider impact of our publications.
The book as a whole is distributed by MDPI under the terms and conditions of the Creative Commons
license CC BY-NC-ND.

Contents
About the Editors . . . . . . . . . . . . . . . . . . . . . . . . . . . . . . . . . . . . . . . . . . . . . . ix
Adoracion Mozas Moral and Domingo Fernandez Ucles
The Agricultural Cooperative in the Face of the Challenges of Globalization, Sustainability andDigitalizationReprinted from: Agriculture 2022, 12, 424, doi:10.3390/agriculture12030424 . . . . . . . . . . . . . 1
Katarzyna Zietek-Kwasniewska, Maria Zuba-Ciszewska and Joanna Nucinska
Technical Efficiency of Cooperative and Non-Cooperative Dairies in Poland: Toward the FirstLink of the Supply ChainReprinted from: Agriculture 2022, 12, 52, doi:10.3390/agriculture12010052 . . . . . . . . . . . . . 5
Juan Ramon Gallego-Bono and MariaR Tapia-Baranda
A Territorial-Driven Approach to Capture the Transformative Momentum of the SocialEconomy Especially from the Agricultural CooperativesReprinted from: Agriculture 2021, 11, 1281, doi:10.3390/agriculture11121281 . . . . . . . . . . . . 27
Elena Melia-Martı, Natalia Lajara-Camilleri, Ana Martınez-Garcıa and Juan F. Julia-Igual
Why Do Agricultural Cooperative Mergers Not Cross the Finishing Line?Reprinted from: Agriculture 2021, 11, 1173, doi:10.3390/agriculture11111173 . . . . . . . . . . . . 49
Leszek Sieczko, Anna Justyna Parzonko and Anna Sieczko
Trust in Collective Entrepreneurship in the Context of the Development of Rural Areas inPolandReprinted from: Agriculture 2021, 11, 1151, doi:10.3390/agriculture11111151 . . . . . . . . . . . . 69
Jolanta Drozdz, Vlada Vitunskiene and Lina Novickyte
Profile of the Small-Scale Farms Willing to Cooperate—Evidence from LithuaniaReprinted from: Agriculture 2021, 11, 1071, doi:10.3390/agriculture11111071 . . . . . . . . . . . . 95
Mateus de Carvalho Reis Neves, Felipe de Figueiredo Silva, Carlos Otavio de Freitas and
Marcelo Jose Braga
The Role of Cooperatives in Brazilian Agricultural ProductionReprinted from: Agriculture 2021, 11, 948, doi:10.3390/agriculture11100948 . . . . . . . . . . . . 117
Jimena Andrieu, Domingo Fernandez-Ucles, Adoracion Mozas-Moral and Enrique Bernal-Jurado
Popularity in Social Networks. The Case of Argentine Beekeeping Production EntitiesReprinted from: Agriculture 2021, 11, 694, doi:10.3390/agriculture11080694 . . . . . . . . . . . . 133
Xingping Cao, ZeYuan Luo, Manli He, Yan Liu and JunLin Qiu
Does the Self-Identity of Chinese Farmers in Rural Tourism Destinations Affect TheirLand-Responsibility Behaviour Intention? The Mediating Effect of MultifunctionAgriculture PerceptionReprinted from: Agriculture 2021, 11, 649, doi:10.3390/agriculture11070649 . . . . . . . . . . . . 145
Samal Kaliyeva, Francisco Jose Areal and Yiorgos Gadanakis
Would Kazakh Citizens Support a Milk Co-Operative System?Reprinted from: Agriculture 2021, 11, 642, doi:10.3390/agriculture11070642 . . . . . . . . . . . . . 159
vi

Javier Jorge-Vazquez, Mª Peana Chivite-Cebolla and Francisco Salinas-Ramos
The Digitalization of the European Agri-Food Cooperative Sector. Determining Factors toEmbrace Information and Communication TechnologiesReprinted from: Agriculture 2021, 11, 514, doi:10.3390/agriculture11060514 . . . . . . . . . . . . . 179
vii

About the Editors
Adoracion Mozas Moral (Professor) She is Professor of University, Department of
Business Organization, Marketing and Sociology. Doctor in Economic and Business Sciences
and Extraordinary Doctorate Award from the University of Jaen. She has participated in 50
projects/research contracts (group leader in 14). He has written 18 books, 31 book chapters, 70
scientific articles that have been published in journals of the highest international and national
prestige. She has received 9 Research Awards, 1 Teaching Award. She has made 5 stays in foreign
centers. She has held many positions related to university management, among which she stands
out as Vice-Rector of Students and Labor Insertion. She is currently President of the CIRIEC-Spain
and Counselor of Number in the Institute of Giennenses Studies.
Domingo Fernandez Ucles (PhD in Social Sciences) He is Assistant professor in the Business
Organization Area of the University of Jaen. He is degree in Business Administration and PhD, with
international mention, in Social and Legal Sciences from the University of Jaen. He has focused his
research on Information and Communication Technologies, on organic products and on the Social
Economy, in the agri-food sector. He has participated in national and international projects and
conferences. He is the author of several publications presented at conferences, research articles of
the highest international and national prestige and book chapters. http://www4.ujaen.es/∼dfucles/.
ORCID: 0000-0001-7335-0296.
ix

Citation: Moral, A.M.; Uclés, D.F.
The Agricultural Cooperative in the
Face of the Challenges of
Globalization, Sustainability and
Digitalization. Agriculture 2022, 12,
424. https://doi.org/10.3390/
agriculture12030424
Received: 15 March 2022
Accepted: 15 March 2022
Published: 18 March 2022
Publisher’s Note: MDPI stays neutral
with regard to jurisdictional claims in
published maps and institutional affil-
iations.
Copyright: © 2022 by the authors.
Licensee MDPI, Basel, Switzerland.
This article is an open access article
distributed under the terms and
conditions of the Creative Commons
Attribution (CC BY) license (https://
creativecommons.org/licenses/by/
4.0/).
agriculture
Editorial
The Agricultural Cooperative in the Face of the Challenges ofGlobalization, Sustainability and Digitalization
Adoración Mozas Moral and Domingo Fernández Uclés *
Department of Business Organization, Marketing and Sociology, Campus Las Lagunillas s/n, University of Jaén,23071 Jaén, Spain; [email protected]* Correspondence: [email protected]; Tel.: +34-953-213-624
The enormous contribution of agricultural cooperative societies to the rural worldhas not gone unnoticed. This is corroborated by many international entities such asthe International Cooperative Alliance, COPA-COGECA, the European Economic andSocial Committee (EESC), the United Nations Inter-Agency Working Group on Social andSolidarity Economy and CIRIEC International. The International Cooperative Allianceestimates that 12% of the world’s population is linked to one of the 3 million cooperativesthat exist worldwide, most of them linked to rural areas. Therefore, cooperative societiesare not a marginal phenomenon.
In relation to the role played by agricultural cooperatives in the world, it shouldbe stated that the agricultural cooperative is an enterprise unconditionally and stablylinked to the rural environment, to the farmer and the stockbreeder. For this reason, itplays a leading role in the local economy and in the fixation of the population to theterritory, thus contributing to the balance and management of the territory, which makesthe cooperatives true agents of rural development. On the other hand, cooperative societieshave been the guarantors of the structuring of agriculture in rural areas in many countries.These organizations constitute the main structured, organized, professionalized and stablenetwork established throughout the territory, in contact with the rural environment, withthe capacity to communicate with and influence farmers and stockbreeders. They directlyor indirectly provide much of the employment in the rural world, and cooperative societiesby nature develop their activity under cooperative principles and values that make themexponents of socially responsible enterprises. They can therefore be seen as the key tosustainable development as promulgated by the United Nations through the SDGs.
The aim of this Special Issue has been to highlight the importance of agriculturalcooperatives in the face of the challenges of globalization, sustainability and digitalizationin rural areas. The contributions made to this issue apply to different products, sectors andregions around the world. Below is a summary of these 10 contributions, which are of greatinterest and topicality.
The efficiency of dairy cooperatives and non-cooperatives in Poland has been evalu-ated [1]. The results show that, assuming constant returns to scale, dairy cooperatives aretechnically less efficient than non-cooperatives, while, assuming variable returns to scale,these differences are not statistically significant. Such findings reveal that the technicalefficiency of dairy farms in Poland is not differentiated by regional milk production poten-tial. It is recommended to improve the technical efficiency of dairies through the processof consolidation.
Another study develops a micro-meso-macro and territorial evolutionary theoreticalframework to study SSE-driven transformation in the sugarcane cluster of Veracruz (Mex-ico) [2]. The main findings of the article are that the SSE drives the beneficiaries, while theprotagonists of the transformation cannot be defined a priori but are shaped by vectorsof transformation promoted by the SSE: its values shared by a broad spectrum of actors,the socioeconomic and organizational specificities of the SSE, and its rootedness in the
Agriculture 2022, 12, 424. https://doi.org/10.3390/agriculture12030424 https://www.mdpi.com/journal/agriculture
1
Agriculture 2022, 12, 424
productive system. The fundamental conclusion of the article is the need for a “territorialapproach” to SSE impact, as opposed to the dominant “stakeholder-driven approach”.
On the other hand, the process of a cooperative merger and its relevant role in thedevelopment of these organizations has been investigated [3]. Specifically, the economic,socio-cultural, organizational and process management factors underlying merger pro-cesses that fail have been identified: some are aborted at the negotiation stage and othersare not approved by the members. The results reveal that, far from being economic factors,defensive localisms, lack of commitment to the merger on the part of partners and directorsand communication failures are the most significant factors.
It has also been analyzed whether trust influences the functioning of various formsof collective entrepreneurship in rural Poland [4]. The research shows: the superior roleof personal trust over institutional trust in the emergence and functioning of the studiedforms of collective entrepreneurship in rural areas; the greater importance of social ratherthan economic factors in determining the functioning of rural collective entrepreneurship;the positive impact of generalized trust on the trust placed in the forms of entrepreneurshipcovered by the analysis; the increase of trust over the time of cooperation; and the impactof trust on the functioning of collective entrepreneurship, both in the economic and socialdimensions, with a slight advantage of the latter.
Other researchers assess the level of willingness to cooperate among small farmersin Lithuania and elaborate the profiles of small farms that participate and intend to joincooperatives and, conversely, that do not participate in cooperatives and do not intend to doso [5]. The results show that only 8% of the surveyed farms participate in producer groupsor cooperatives, while another 8% intend to participate. Small-scale farms in Lithuaniahave weak market integration, with no bargaining power in input and output markets. Thevast majority of small-scale farms are reluctant to participate in cooperative activities inLithuania. Thus, the main economic factors of farms and social characteristics of managerswilling to cooperate are identified.
Another study estimates the factors associated with municipal participation in cooper-ative membership (MSCM) in Brazil and how the value of production at the municipal levelchanges with MSCM [6]. The results show that higher education and smaller ownershipsize are associated with membership in agricultural cooperatives in Brazil. We also estimatehow MSCM is associated with agricultural earnings.
The importance of digitalization is also addressed. Specifically, another study identifieswhich organizational characteristics are directly related to the popularity of Argentinebeekeeping organizations in social networks, measured by the number of followers intheir accounts [7]. The results show that, beyond the use of Facebook itself, the bestorganizational practices are associated with factors linked to the cooperative nature ofthe organization, its localization, environmental sensitivity and its presence on otherdigital platforms.
Other researchers analyze four rural tourism sites in the suburbs of Chengdu to analyzethe influence of farmers’ self-identity on their intention to behave responsibly towards theland under multifunctional agricultural perception conditions as variable mediation [8].The results show that in rural tourism destinations in suburban districts of China farmers’self-identity is an important variable affecting their intention of responsible land behavior.Moreover, the perception of agricultural economic function mediates the relationshipbetween farmers’ self-identity and the behavioral intention of land responsibility.
Another study estimates the monetary value of a policy aimed at increasing ruralcooperative production in Kazakhstan in order to increase milk production [9]. It analyzesthe factors associated with public support for such a policy. In addition, changes in people’sWTP before and during the CO-VID-19 pandemic are examined. Among the resultsobtained, it is shown that psychological factors, i.e., attitude, perceived social pressure andperceived behavioral control, and respondents’ awareness of the policy and opinions aboutthe Soviet Union regime are associated with their willingness to pay; sociodemographic
2
Agriculture 2022, 12, 424
factors, namely, age, income and education, are also statistically significant; finally, theeffect of COVID-19 fear is negatively associated with respondents’ willingness to pay.
To conclude, another study analyzes the level of digitization of the European agri-foodcooperative sector based on the construction of a composite synthetic index [10]. The resultsof the study reveal the existence of a suboptimal and heterogeneous degree of digitizationof European agri-food cooperatives, clearly conditioned by their size and the wealth ofthe country where they operate. The authors recommend promoting public policies thatguarantee high-performance digital connectivity, improved training in digital skills andthe promotion of cooperative integration processes.
Funding: The funders had no role in the design of the study; in the collection, analyses, or interpreta-tion of data; in the writing of the manuscript, or in the decision to publish the results.
Acknowledgments: We would like to thank the Journal for trusting us with the development of thisSpecial Issue. We would also like to thank all the authors who have submitted their proposals, aswell as the reviewers who have participated in the evaluation and improvement of the manuscripts.
Conflicts of Interest: The authors declare no conflict of interest.
References
1. Zietek-Kwasniewska, K.; Zuba-Ciszewska, M.; Nucinska, J. Technical Efficiency of Cooperative and Non-Cooperative Dairies inPoland: Toward the First Link of the Supply Chain. Agriculture 2022, 12, 52. [CrossRef]
2. Gallego-Bono, J.R.; Tapia-Baranda, M. A Territorial-Driven Approach to Capture the Transformative Momentum of the SocialEconomy Especially from the Agricultural Cooperatives. Agriculture 2021, 11, 1281. [CrossRef]
3. Meliá-Martí, E.; Lajara-Camilleri, N.; Martínez-García, A.; Juliá-Igual, J.F. Why Do Agricultural Cooperative Mergers Not Crossthe Finishing Line. Agriculture 2021, 11, 1173. [CrossRef]
4. Sieczko, L.; Parzonko, A.J.; Sieczko, A. Trust in Collective Entrepreneurship in the Context of the Development of Rural Areas inPoland. Agriculture 2021, 11, 1151. [CrossRef]
5. Droždz, J.; Vitunskiene, V.; Novickyte, L. Profile of the Small-Scale Farms Willing to Cooperate—Evidence from Lithuania.Agriculture 2021, 11, 1071. [CrossRef]
6. Neves, M.D.C.R.; Silva, F.D.F.; Freitas, C.O.D.; Braga, M.J. The Role of Cooperatives in Brazilian Agricultural Production.Agriculture 2021, 11, 948. [CrossRef]
7. Andrieu, J.; Fernández-Uclés, D.; Mozas-Moral, A.; Bernal-Jurado, E. Popularity in Social Networks. The Case of ArgentineBeekeeping Production Entities. Agriculture 2021, 11, 694. [CrossRef]
8. Cao, X.; Luo, Z.; He, M.; Liu, Y.; Qiu, J. Does the Self-Identity of Chinese Farmers in Rural Tourism Destinations Affect TheirLand-Responsibility Behaviour Intention? The Mediating Effect of Multifunction Agriculture Perception. Agriculture 2021, 11, 649.[CrossRef]
9. Kaliyeva, S.; Areal, F.J.; Gadanakis, Y. Would Kazakh Citizens Support a Milk Co-Operative System? Agriculture 2022, 11, 642.[CrossRef]
10. Jorge-Vázquez, J.; Chivite-Cebolla, M.; Salinas-Ramos, F. The digitalization of the European agri-food cooperative sector.Determining factors to embrace information and communication technologies. Agriculture 2021, 11, 514. [CrossRef]
3

Citation: Zietek-Kwasniewska, K.;
Zuba-Ciszewska, M.; Nucinska, J.
Technical Efficiency of Cooperative
and Non-Cooperative Dairies in
Poland: Toward the First Link of the
Supply Chain. Agriculture 2022, 12,
52. https://doi.org/10.3390/
agriculture12010052
Academic Editors: Adoración
Mozas Moral and Domingo
Fernandez Ucles
Received: 19 November 2021
Accepted: 29 December 2021
Published: 1 January 2022
Publisher’s Note: MDPI stays neutral
with regard to jurisdictional claims in
published maps and institutional affil-
iations.
Copyright: © 2022 by the authors.
Licensee MDPI, Basel, Switzerland.
This article is an open access article
distributed under the terms and
conditions of the Creative Commons
Attribution (CC BY) license (https://
creativecommons.org/licenses/by/
4.0/).
agriculture
Article
Technical Efficiency of Cooperative and Non-CooperativeDairies in Poland: Toward the First Link of the Supply Chain
Katarzyna Zietek-Kwasniewska *, Maria Zuba-Ciszewska and Joanna Nucinska
The Institute of Economics and Finance, Faculty of Social Sciences, The John Paul II Catholic University of Lublin,Al. Racławickie 14, 20-950 Lublin, Poland; [email protected] (M.Z.-C.); [email protected] (J.N.)* Correspondence: [email protected]
Abstract: Several studies conducted in various countries have addressed the technical efficiencyof dairies. However, there is a paucity of research on the technical efficiency of dairies in Poland,particularly in relation to their legal form (i.e., cooperatives vs. non-cooperatives). The existingliterature also does not provide insights into the technical efficiency of these entities with respect todifferent regions’ milk production capacity. Therefore, this paper aims to: (1) evaluate and comparethe technical efficiency of cooperative and non-cooperative dairies in Poland, and (2) examine dairies’technical efficiency due to spatial disparities in milk production potential. We use data envelopmentanalysis (DEA) to investigate the technical efficiency of 108 dairies in Poland for the year 2019.The milk production capacity of provinces is examined by applying the zero unitarization method.The results show that when assuming constant returns to scale (CRS), dairy cooperatives are lesstechnically efficient than non-cooperatives, whereas when assuming variable returns to scale (VRS),these differences are not statistically significant. For inefficient dairies, we observe the greatestpotential for improvement in labor costs and depreciation. Both cooperatives and non-cooperativesoperate mostly under decreasing returns to scale. Thus, the potential for enhancing the technicalefficiency of dairies through the consolidation process seems to be exploited. Our findings reveal thatthe technical efficiency of dairies in Poland is not differentiated by regional milk production potential.
Keywords: technical efficiency; cooperatives; dairy processing sector; sustainability; milk productioncapacity; supply chain; data envelopment analysis
1. Introduction
The concept of sustainable development is central to political as well as scientificdebate. Although definitions of sustainability are varied and fluid depending on differentactors’ viewpoints [1], this concept has become the cornerstone of global dialogue on thefuture of humanity [2].
In the presence of limited resources, a growing world population, and climate change,global food security is a major concern [3]. The significance of this problem is stronglyemphasized in the United Nations (UN) 2030 Agenda for Sustainable Development [4] bysetting 17 Sustainable Development Goals (SDGs), the second of which refers to endinghunger, achieving food security and improved nutrition, and promoting sustainable agri-culture (SDG2). In particular, target 2.4 aims to ensure, by 2030, sustainable food productionsystems and implement resilient agricultural practices [4].
Food systems are extremely diverse and dynamic [5] as well as intrinsically complex,involving many different processes, value chains, actors, and interactions [6]. The concept ofa sustainable food system implies sustainability in three dimensions: economic, social, andenvironmental [7]. The ability to use resources efficiently in production is a prerequisitefor the sustainability and competitiveness of the agrifood sector. The significance offood security has been additionally strengthened at the national level by the COVID-19pandemic [8].
Agriculture 2022, 12, 52. https://doi.org/10.3390/agriculture12010052 https://www.mdpi.com/journal/agriculture
5
Agriculture 2022, 12, 52
Milk and dairy products are an essential food for human nutrition worldwide [9,10].Hence, the dairy sector can be considered one of the key building blocks of food systems.The sustainability of the dairy industry can be seen as providing consumers with thenutritional dairy products they demand in an economically viable, environmentally sound,and socially responsible way, now and in the future [11]. The sustainable milk and dairyproduction life cycle ranges from on-farm milk production, the industrialization andprocessing of dairy products, all the way to their marketing [10], creating a networkstructure [12] and a closely knitted process called a supply chain [13].
Performance evaluation has become a significant topic in supply chain manage-ment [12], including the dairy sector. Although a number of studies have been conductedon economic sustainability at the farm level (e.g., [14–17]), the discussion cannot be limitedto this initial link of the dairy supply chain. Given that milk is a perishable commodity thatcannot be stored in its raw form, its processing and transformation are crucial in the dairysector [18]. For this reason also, the economic sustainability of dairies, which are the nextlink in the supply chain, should be given equal attention. Nevertheless, research in thisarea remains scarce. As economic sustainability is considered a complex problem, in thisstudy, and similarly to Popovic and Panic [19], we refer to efficiency as its component.
The dairy processing industry belongs to the major subsectors of the food processingindustry in the European Union (EU) [8]. An efficient and competitive milk processingindustry has been deemed crucial to maintaining sustainable milk production [20].
The relationship between the initial and the intermediate segments of the dairy supplychain has become the rationale for the establishment of cooperatives. Farmers’ cooperativeownership has a long tradition in many parts of the world and is the most prevalent formof vertical integration in dairy supply chains [21]. Dairy cooperatives have played animportant role in the dairy processing sector in Europe [22]. Poland is a prime example,as more than 70% of its dairies operate as a cooperative compared to about 20% in mostEU countries [23]. Poland is one of the leading cow’s milk producers and processors inthe EU (12.2 million tons cows’ milk delivered to dairies in 2019 [24]), characterized byconsiderable spatial diversity in its milk production capacity [25].
There is a debate concerning the relative efficiency of cooperatives versus explicitlyfor-profit forms of organization in the dairy processing industry [22,26]. Empirical analysesin this field have employed various methods. Data envelopment analysis (DEA) is acommonly used approach for measuring the relative efficiency and competitiveness of thefood and drink industry worldwide (as reviewed in [27]).
Given the importance of the dairy industry’s efficiency, the aim of this study is twofold:(1) to evaluate and compare the technical efficiency of cooperative and non-cooperativedairies in Poland, and (2) to examine dairies’ technical efficiency due to spatial disparitiesin milk production potential. We evaluate the technical efficiency of dairies using the DEAapproach. By exploring the issue of the dairy sector’s efficiency with a focus on the legalform of milk processors, our study contributes to the stream of research on agriculturalcooperatives within the context of sustainability.
The article is structured as follows. Section 2 presents the condition of the Polish dairysector and provides a literature review. Section 3 describes the data and methods. Section 4presents and discusses the research results. Finally, Section 5 concludes and outlines areasfor future research.
2. Theoretical Background
2.1. The Condition of the Dairy Sector in Poland
The agrifood industry is the largest manufacturing sector in the EU, of which the dairyprocessing industry is a relevant subsector [8]. The EU is the most important supplier ofmilk and dairy products on the world market [28].
When it comes to dairy products, Poland remains self-sufficient. Indeed, the country’sdegree of food self-sufficiency in the case of milk and its products, i.e., the ratio of domesticproduction to domestic consumption [29], has been practically systematically increasing
6
Agriculture 2022, 12, 52
for the past 20 years [30]. Polish dairy cooperatives ensure food security in dairy products,especially the basic ones, in every region of the country [31].
The number of dairy cows in 2019 amounted to 2.16 million, a continuation of adownward trend. In 2019, the number of farms keeping cows was 220,000, but only 118,000of these supplied milk to the dairy industry, 95% of which were family farms. Despite theincrease in the average herd of cows (from 3.9 in 2005 to 11.2 in 2019), most of the farms arestill characterized by their low scale of production [32,33]. According to Eurostat data for2016, the share of farms with more than 30 dairy cows in Poland was only 20%, while forother major milk producers, the figure was as high as 85–97% (specifically in Germany, theUnited Kingdom, France, and the Netherlands) [34]. However, the process of concentratingcows in large and efficient farms continues, as does the modernization of milk productionthrough improving production technology and the genetics of dairy cattle (farms withsmall-scale production and low profitability have abandoned dairy cattle breeding). SincePoland’s accession to the EU in 2004, the marketability of its milk production has improvedsignificantly (in 2019, over 84% of the volume of raw material produced went to the dairyindustry), although it remains below the EU average (94%) [32,33,35].
From the beginning of the market transformation, we have observed a practicallysystematic downward trend in the number of dairies. Since 1990, when 348 dairies, allof which were cooperative, operated on the market, the share of the cooperative sectorboth in the number of dairies and in the purchase of milk has declined (to 62.5% and 72.3%in 2017, respectively [31]). However, the dairy industry is currently the only industry inPoland dominated by cooperatives, strengthening the integration of agriculture with theprocessing industry. Thanks to the concentration and modernization of the dairy industry,which began in the 1990s and continues to the present day, the technical and economicproductivity of the average dairies has systematically improved [32,36].
The value of sales has been growing systematically, especially since Poland’s accessionto the EU (by 84% to PLN 34.7 billion), as well as the share of direct exports in the value ofsales (up to 18.4% in 2019). The milk processing sector is characterized by its continued netsales profitability (for over 20 years), and the level thereof has increased from 0.2% in 1999to 1.4% in 2019, although the share of profitable entities in the industry changed in thatperiod (in 2019 it amounted to 68.1%). The sector also maintains current financial liquidity,albeit the investment rate in 2019 was 1.45, i.e., lower than 20 years earlier. Throughout thisperiod, investment activity increased in years of good economic conditions on the worldmarket along with growing exports of dairy products. Especially since 2011, it has shown asystematic increase (except for 2018, when it decreased, albeit only slightly). This meansthat in each year, investment expenditures in relation to the annual depreciation increased.These were intended, to the greatest extent, for the purchase of machinery, equipment, andmeans of transport, i.e., for the modernization of dairies’ production potential [32,35–37].
Given that it deals with the industrial processing of collected milk into finishedproducts for consumption or refined raw material for other industries, the dairy industryis closely related to farms. Domestic milk production is characterized by considerableterritorial differentiation [25]. Connecting the spatial distribution of processing plants withtheir raw material base is important due to the territorial dispersion and fragmentation ofthe production of agricultural raw materials between many farms [38].
In recent years, the phenomenon of the concentration of a fragmented food industryhas been clearly noticeable in Poland, because the scale effect is readily apparent, consistingin the dependence of production costs and profits at the scale of production. Food pro-cessing thus follows the footsteps of concentration in agriculture [38]. The entity structureof the food industry in Poland is changing, both as a result of Poland’s accession to theEU and continued economic globalization. The fact that processes of concentration andconsolidation are underway is reflected by the takeovers of Polish enterprises by foreignand domestic investors, as well as the mergers taking place among Polish enterprises [39].Although the process of concentration of subjective structures in the dairy industry hasbeen faster since 2004 than the average for the entire food industry [40], the industry itself
7
Agriculture 2022, 12, 52
is characterized by its low degree of internationalization [41]. The growing share of largeenterprises in the sold production of the dairy sector [42] further evidences the existingtrend of industrialization of production in food processing [43]. Currently, the rapid de-velopment of large retail chains (often with foreign capital) has changed the balance ofpower in the national food chain, causing the dominant position of processing companiesto decline [44].
2.2. Efficiency of Dairies: Literature Review
The efficient use of resources is an evident driver of economic development [45]. Hence,improvement in this area often becomes one of the sustainability goals of any industry [46].Enhancing the productivity and efficiency of agriculture input use is regarded as the firststep to meeting the challenge of sustainable use of natural resources as well as reducingenvironmental impacts [47].
The dairy sector’s efficiency has been the subject of a number of studies worldwide.While many of them have addressed the question of efficiency at the farm level [28,47–65],the problem of dairy efficiency seems to have received less attention.
The performance of dairy processors has been assessed with various methods. Onestream of literature focuses on the financial performance of dairies. Another explores theseentities’ technical efficiency using DEA or stochastic frontier analysis (SFA) [66]. The SFAapproach has been applied to the dairy processing industry by, for instance, Doucouliagosand Hune [67], Soboh et al. [68], Hirsch et al. [23], Cechura and Žáková Kroupová [8], andBeber et al. [69]. The DEA method has also been widely used in studies on the technicalefficiency of dairies in various countries. Table A1 in Appendix A summarizes the literaturereview on the application of DEA to the dairy processing industry.
Not many papers have been published on the efficiency of the dairy processingindustry in Poland. Five such studies using the DEA method [9,70–73] are included inthe literature review (Table A1). These studies have addressed the following aspects ofdairy efficiency: technical efficiency [73], its changes [9,70,71], and scale efficiency [72].Furthermore, the aforementioned evaluation of technical efficiency has been supplementedby analyses of selected financial ratios for dairies [9,70,71,73]. The data used in these studiescover a specific region [71,73], a whole country [70,72], or more than one country [9].
The aforementioned studies have examined cooperatives, among other forms of dairyprocessing entities in Poland. Additionally, Špicka [9] has emphasized the significance ofcooperatives’ prevalence in the Polish dairy industry. As the existing body of literature lacksa comprehensive analysis of the technical efficiency of dairy cooperatives in comparisonwith other organizational forms of dairies in Poland, our study aims to fill this gap.
Previous studies on the efficiency of dairies vary on many dimensions. While theliterature does not provide a complete list of sources of efficiency differences, Berger andMester [74], though in the context of financial institutions, have indicated three of them:(1) the concept of efficiency employed; (2) the methods used to measure efficiency underthese concepts; and (3) potential correlates of efficiency. The third source covers at leastpartially exogenous characteristics that may explain some of the efficiency differences thatremain after controlling for conceptual and measurement issues. Correlates of efficiencyinclude, for example, regulatory, market type, or organizational form [74]. Therefore, fol-lowing this view, the cooperative as a dominant organizational form of dairies is considereda determinant that may have a significant impact on their (in)efficiency [69].
According to Pietrzak [75], farmer cooperatives can pursue a variety of objectives.They show potential to improve the welfare of farmer-members and society as a wholein comparison with profit-maximizing enterprises (investor-owned firms, IOFs) [75]. It isassumed that differences in objectives and organizational structures between IOFs and co-operatives affect their production technology and technical efficiency [68]. On the one hand,cooperatives are less oriented toward efficient input use (especially members’ products)and value-added production than on exploiting economies of scale (Hind, 1999, as citedin [22]). On the other hand, their relatively conservative financial structure, low ownership
8
Agriculture 2022, 12, 52
costs, and the homogeneity of member’s interests are recognized as factors that make themsucceed [69].
Farmer cooperatives are common and significant commercial organizations in manyparts of the world [76]. Previous empirical studies on the technical efficiency of dairycooperatives and IOFs have indicated that the efficiency of both cooperatives and IOFscan be greater depending on the context, the data employed, and the objective of theperformance measured [69]. This provides motivation for further research in this area.
3. Data and Methods
3.1. Data
In this paper, we focus on dairies in Poland (NACE Rev. 2 Class 10.51) that wereoperating in 2019 and were still active as of 20 February 2021 (thus, excluding entitiesclosed and in liquidation). The data used in this paper were obtained from balance sheetsand income statements of dairies for the year 2019 retrieved from the Emerging MarketsInformation Service database (EMIS) [77]. Considering the scope and type of data required,the following criteria guided the selection of entities for the study: (1) availability offinancial statements for the year 2019, and (2) presentation of income statement by natureof expense.
Initially, 116 dairies meeting these criteria were selected, i.e., 71% of 163 dairiesoperating in 2019 [35]. Entities with missing records were then removed. We also eliminatedthe outliers due to the sensitivity of efficiency scores to their presence: if there is an outlieramong the observations, it can result in a significant reduction in the level of technicalefficiency of inefficient units [78,79]. The outliers were identified using output to inputratios [66] according to the following procedure. We identified a unit as an outlier if thevalue of any of the output to input ratios fell outside the interval of the mean plus/minusthree standard deviations. Finally, a sample of 108 dairies was used for the empiricalinvestigation. Taking one output and four inputs in our study, this sample size fullysatisfied the rule of thumb for determining the appropriate number of decision-makingunits (DMUs) in DEA, stating that n ≥ max{m × s, 3(m + s)} where n stands for thenumber of DMUs, m is the number of inputs, and s is the number of outputs [80]. Thesample comprised 65 (60.2%) cooperative and 43 (39.8%) non-cooperative dairies. Thiscorresponded to the structure of dairies in Poland by legal form in 2019 (57.5% and 42.5%,respectively) [77].
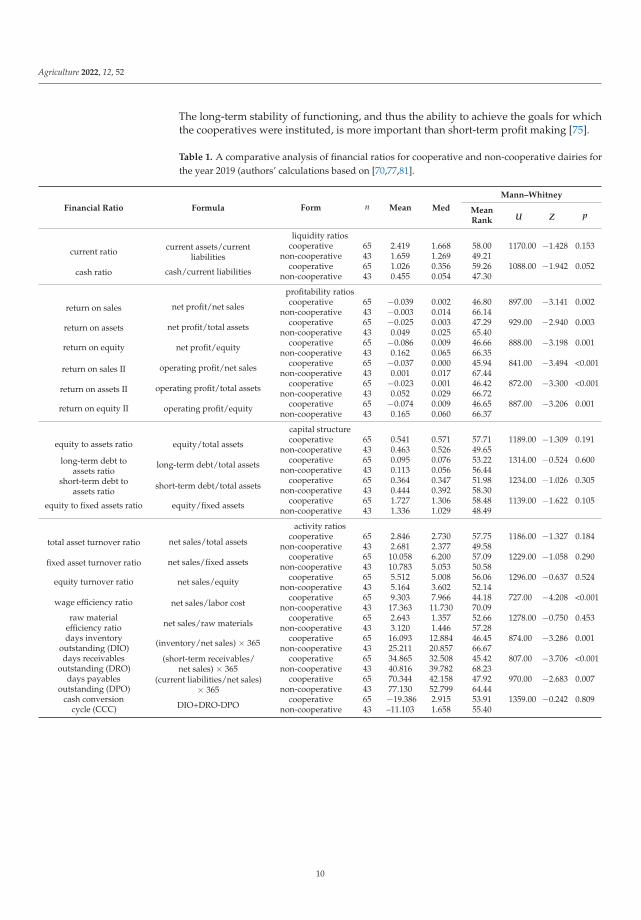
Table 1 presents the results of a comparative analysis of the financial ratios for cooper-ative and non-cooperative dairies in the areas of liquidity, profitability, capital structure,and activity. The Mann–Whitney U test was employed for between-group comparisonsdue to the failure to meet the assumptions of parametric testing. We observed a statis-tically significant difference between cooperative and non-cooperative dairies in termsof profitability ratios; this applied to ratios based on net profit and operating profit. Theprofitability ratios were significantly higher in non-cooperative dairies compared to theircooperative counterparts. We also identified statistically significant differences in daysreceivables outstanding, days payable outstanding, and days inventory outstanding. TheMann–Whitney U test revealed that the cooperative dairies managed their inventoriesmore efficiently, collected receivables more quickly, and also paid off their liabilities faster.Nevertheless, as there was no significant difference in the cash conversion cycle betweenthese groups, the above-mentioned differences ultimately canceled out. We also identifieda statistically significant difference in the wage efficiency ratio, i.e., non-cooperative dairiesgenerated significantly higher sales revenue per each PLN paid for the labor factor. In thecase of liquidity and capital structure ratios, there were no significant differences betweenthe two groups of dairies. Our findings suggest that for cooperative dairies, maintainingfinancial security is more important than achieving profitability, and this attitude resultsfrom their specificity. This is because dairy cooperatives have a bimodal character, i.e., theyinvolve a community of members and are enterprises that this community has established.
9
Agriculture 2022, 12, 52
The long-term stability of functioning, and thus the ability to achieve the goals for whichthe cooperatives were instituted, is more important than short-term profit making [75].
Table 1. A comparative analysis of financial ratios for cooperative and non-cooperative dairies forthe year 2019 (authors’ calculations based on [70,77,81].
Financial Ratio Formula Form n Mean Med
Mann–Whitney
MeanRank U Z p
liquidity ratios
current ratio current assets/currentliabilities
cooperative 65 2.419 1.668 58.00 1170.00 −1.428 0.153non-cooperative 43 1.659 1.269 49.21
cash ratio cash/current liabilitiescooperative 65 1.026 0.356 59.26 1088.00 −1.942 0.052
non-cooperative 43 0.455 0.054 47.30
profitability ratios
return on sales net profit/net sales cooperative 65 −0.039 0.002 46.80 897.00 −3.141 0.002non-cooperative 43 −0.003 0.014 66.14
return on assets net profit/total assets cooperative 65 −0.025 0.003 47.29 929.00 −2.940 0.003non-cooperative 43 0.049 0.025 65.40
return on equity net profit/equity cooperative 65 −0.086 0.009 46.66 888.00 −3.198 0.001non-cooperative 43 0.162 0.065 66.35
return on sales II operating profit/net sales cooperative 65 −0.037 0.000 45.94 841.00 −3.494 <0.001non-cooperative 43 0.001 0.017 67.44
return on assets II operating profit/total assets cooperative 65 −0.023 0.001 46.42 872.00 −3.300 <0.001non-cooperative 43 0.052 0.029 66.72
return on equity II operating profit/equity cooperative 65 −0.074 0.009 46.65 887.00 −3.206 0.001non-cooperative 43 0.165 0.060 66.37
capital structure
equity to assets ratio equity/total assets cooperative 65 0.541 0.571 57.71 1189.00 −1.309 0.191non-cooperative 43 0.463 0.526 49.65
long-term debt toassets ratio
long-term debt/total assets cooperative 65 0.095 0.076 53.22 1314.00 −0.524 0.600non-cooperative 43 0.113 0.056 56.44
short-term debt toassets ratio
short-term debt/total assetscooperative 65 0.364 0.347 51.98 1234.00 −1.026 0.305
non-cooperative 43 0.444 0.392 58.30
equity to fixed assets ratio equity/fixed assets cooperative 65 1.727 1.306 58.48 1139.00 −1.622 0.105non-cooperative 43 1.336 1.029 48.49
activity ratios
total asset turnover ratio net sales/total assetscooperative 65 2.846 2.730 57.75 1186.00 −1.327 0.184
non-cooperative 43 2.681 2.377 49.58
fixed asset turnover ratio net sales/fixed assetscooperative 65 10.058 6.200 57.09 1229.00 −1.058 0.290
non-cooperative 43 10.783 5.053 50.58
equity turnover ratio net sales/equity cooperative 65 5.512 5.008 56.06 1296.00 −0.637 0.524non-cooperative 43 5.164 3.602 52.14
wage efficiency ratio net sales/labor costcooperative 65 9.303 7.966 44.18 727.00 −4.208 <0.001
non-cooperative 43 17.363 11.730 70.09raw material
efficiency ratio net sales/raw materialscooperative 65 2.643 1.357 52.66 1278.00 −0.750 0.453
non-cooperative 43 3.120 1.446 57.28days inventory
outstanding (DIO) (inventory/net sales) × 365 cooperative 65 16.093 12.884 46.45 874.00 −3.286 0.001non-cooperative 43 25.211 20.857 66.67
days receivablesoutstanding (DRO)
(short-term receivables/net sales) × 365
cooperative 65 34.865 32.508 45.42 807.00 −3.706 <0.001non-cooperative 43 40.816 39.782 68.23
days payablesoutstanding (DPO)
(current liabilities/net sales)× 365
cooperative 65 70.344 42.158 47.92 970.00 −2.683 0.007non-cooperative 43 77.130 52.799 64.44
cash conversioncycle (CCC) DIO+DRO-DPO
cooperative 65 −19.386 2.915 53.91 1359.00 −0.242 0.809non-cooperative 43 –11.103 1.658 55.40
10
Agriculture 2022, 12, 52
3.2. Method
Our research design consisted of the following phases: (1) assessment of the techni-cal efficiency of cooperative and non-cooperative dairies in Poland; and (2) examinationof the technical efficiency of dairies in the context of spatial disparities in milk produc-tion potential.
3.2.1. DEA Method
The technical efficiency of cooperative and non-cooperative dairies in Poland wasdetermined by using DEA, a non-parametric approach used in evaluating the performanceof DMUs on the basis of multiple inputs and multiple outputs [12]. This method isdescribed, for example, in [82,83].
In order to evaluate the technical efficiency of dairies in Poland, the constant returnsto scale (CRS) model was applied first. Whereas the CRS assumption is regarded asappropriate if all units operate at optimal scale [83], when there are differences in the scale ofoperation of units, the variable returns to scale (VRS) model is considered more suitable [84].Therefore, in the next step we applied this approach. Using the VRS specification allowedus to calculate the technical efficiency while excluding scale efficiency (SE) effects [82,83].The SE score is the result of dividing the technical efficiency (TE) obtained under theCRS assumption by the pure technical efficiency (PTE) score from the VRS model. Thus,differences between CRS and VRS technical efficiency scores indicate the presence of scaleinefficiency [52,85]. Under the VRS assumption, scale-inefficient DMUs are compared onlywith efficient ones of similar size [9,61]. The decomposition of the CRS TE score into thePTE and SE allowed us to determine the extent to which the inefficiency of dairies in Polandis related to management issues and an inappropriate scale size (see [86]).
Within the CRS and VRS assumptions, two approaches (i.e., input oriented and outputoriented) can be employed. The choice of orientation should take into account “whichquantities (inputs or outputs) the managers have most control over” [83], p. 180. For dairyoperations, the input-oriented model has been indicated as being more appropriate [72].This orientation has also been widely adopted in dairy sector efficiency studies [20,66,72,85].In the present study, therefore, we followed this approach, viewing the dairies, similarlyto [66], as cost minimizers.
One output and four input variables were used in the DEA models. The variables wereselected on the basis of the literature review (Table A1). The selected output variable wasnet sales revenue. Given that dairies may offer a variety of products and data on productionin physical terms are not presented in their financial statements, the choice of this variableas the output variable seemed appropriate and reasonable. The input variables were:
• Labor costs—due to the lack of data on labor inputs in physical terms, this costcategory represents the factor of production in question; it consists of salaries andsocial security costs;
• Raw material costs—raw materials are of key importance for dairies; by includingthis cost category, we refer to the involvement of raw materials, mainly milk, in theproduction process of dairy products;
• Depreciation expense—capital is one of the major factors of production; given that netsales revenue is used as the output variable, for consistency purposes, depreciationexpense is adopted as the input of capital factor due to its flow nature; this cost categorycan be seen as “the financial value of consumption of the long-term assets” [9], p. 177;
• Other operating costs—including other costs related to the production process.
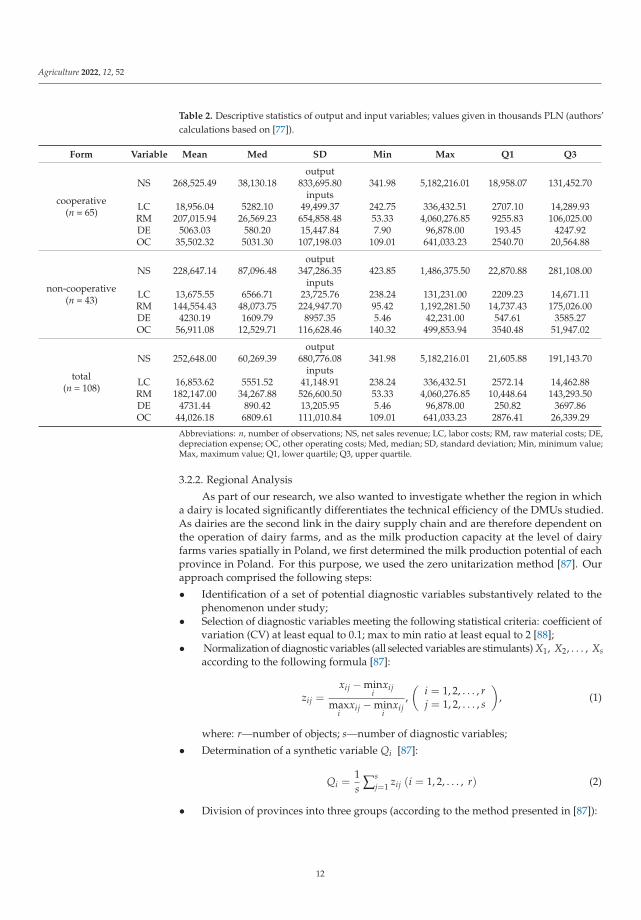
Table 2 presents the descriptive statistics of the output and input variables.
11
Agriculture 2022, 12, 52
Table 2. Descriptive statistics of output and input variables; values given in thousands PLN (authors’calculations based on [77]).
Form Variable Mean Med SD Min Max Q1 Q3
cooperative(n = 65)
outputNS 268,525.49 38,130.18 833,695.80 341.98 5,182,216.01 18,958.07 131,452.70
inputsLC 18,956.04 5282.10 49,499.37 242.75 336,432.51 2707.10 14,289.93RM 207,015.94 26,569.23 654,858.48 53.33 4,060,276.85 9255.83 106,025.00DE 5063.03 580.20 15,447.84 7.90 96,878.00 193.45 4247.92OC 35,502.32 5031.30 107,198.03 109.01 641,033.23 2540.70 20,564.88
non-cooperative(n = 43)
outputNS 228,647.14 87,096.48 347,286.35 423.85 1,486,375.50 22,870.88 281,108.00
inputsLC 13,675.55 6566.71 23,725.76 238.24 131,231.00 2209.23 14,671.11RM 144,554.43 48,073.75 224,947.70 95.42 1,192,281.50 14,737.43 175,026.00DE 4230.19 1609.79 8957.35 5.46 42,231.00 547.61 3585.27OC 56,911.08 12,529.71 116,628.46 140.32 499,853.94 3540.48 51,947.02
total(n = 108)
outputNS 252,648.00 60,269.39 680,776.08 341.98 5,182,216.01 21,605.88 191,143.70
inputsLC 16,853.62 5551.52 41,148.91 238.24 336,432.51 2572.14 14,462.88RM 182,147.00 34,267.88 526,600.50 53.33 4,060,276.85 10,448.64 143,293.50DE 4731.44 890.42 13,205.95 5.46 96,878.00 250.82 3697.86OC 44,026.18 6809.61 111,010.84 109.01 641,033.23 2876.41 26,339.29
Abbreviations: n, number of observations; NS, net sales revenue; LC, labor costs; RM, raw material costs; DE,depreciation expense; OC, other operating costs; Med, median; SD, standard deviation; Min, minimum value;Max, maximum value; Q1, lower quartile; Q3, upper quartile.
3.2.2. Regional Analysis
As part of our research, we also wanted to investigate whether the region in whicha dairy is located significantly differentiates the technical efficiency of the DMUs studied.As dairies are the second link in the dairy supply chain and are therefore dependent onthe operation of dairy farms, and as the milk production capacity at the level of dairyfarms varies spatially in Poland, we first determined the milk production potential of eachprovince in Poland. For this purpose, we used the zero unitarization method [87]. Ourapproach comprised the following steps:
• Identification of a set of potential diagnostic variables substantively related to thephenomenon under study;
• Selection of diagnostic variables meeting the following statistical criteria: coefficient ofvariation (CV) at least equal to 0.1; max to min ratio at least equal to 2 [88];
• Normalization of diagnostic variables (all selected variables are stimulants) X1, X2, . . . , Xsaccording to the following formula [87]:
zij =xij − min
ixij
maxi
xij − mini
xij,(
i = 1, 2, . . . , rj = 1, 2, . . . , s
), (1)
where: r—number of objects; s—number of diagnostic variables;
• Determination of a synthetic variable Qi [87]:
Qi =1s ∑s
j=1 zij (i = 1, 2, . . . , r) (2)
• Division of provinces into three groups (according to the method presented in [87]):
12
Agriculture 2022, 12, 52
◦ Group I—provinces with a high level of milk production capacity:
Qi ε (maxi
Qi − U, maxi
Qi] (3)
◦ Group II—provinces with a medium level of milk production capacity:
Qi ε (maxi
Qi − 2U, maxi
Qi − U] (4)
◦ Group III—provinces with a low level of milk production capacity:
Qi ε [mini
Qi, maxi
Qi − 2U] (5)
where:
U =max
iQi − min
iQi
3(6)
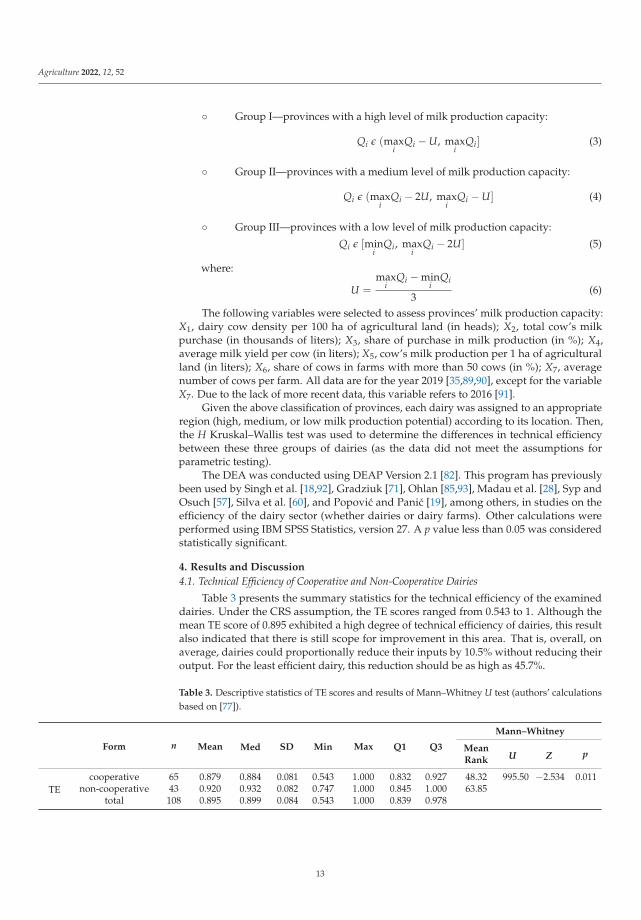
The following variables were selected to assess provinces’ milk production capacity:X1, dairy cow density per 100 ha of agricultural land (in heads); X2, total cow’s milkpurchase (in thousands of liters); X3, share of purchase in milk production (in %); X4,average milk yield per cow (in liters); X5, cow’s milk production per 1 ha of agriculturalland (in liters); X6, share of cows in farms with more than 50 cows (in %); X7, averagenumber of cows per farm. All data are for the year 2019 [35,89,90], except for the variableX7. Due to the lack of more recent data, this variable refers to 2016 [91].
Given the above classification of provinces, each dairy was assigned to an appropriateregion (high, medium, or low milk production potential) according to its location. Then,the H Kruskal–Wallis test was used to determine the differences in technical efficiencybetween these three groups of dairies (as the data did not meet the assumptions forparametric testing).
The DEA was conducted using DEAP Version 2.1 [82]. This program has previouslybeen used by Singh et al. [18,92], Gradziuk [71], Ohlan [85,93], Madau et al. [28], Syp andOsuch [57], Silva et al. [60], and Popovic and Panic [19], among others, in studies on theefficiency of the dairy sector (whether dairies or dairy farms). Other calculations wereperformed using IBM SPSS Statistics, version 27. A p value less than 0.05 was consideredstatistically significant.
4. Results and Discussion
4.1. Technical Efficiency of Cooperative and Non-Cooperative Dairies
Table 3 presents the summary statistics for the technical efficiency of the examineddairies. Under the CRS assumption, the TE scores ranged from 0.543 to 1. Although themean TE score of 0.895 exhibited a high degree of technical efficiency of dairies, this resultalso indicated that there is still scope for improvement in this area. That is, overall, onaverage, dairies could proportionally reduce their inputs by 10.5% without reducing theiroutput. For the least efficient dairy, this reduction should be as high as 45.7%.
Table 3. Descriptive statistics of TE scores and results of Mann–Whitney U test (authors’ calculationsbased on [77]).
Form n Mean Med SD Min Max Q1 Q3
Mann–Whitney
MeanRank U Z p
TEcooperative 65 0.879 0.884 0.081 0.543 1.000 0.832 0.927 48.32 995.50 −2.534 0.011
non-cooperative 43 0.920 0.932 0.082 0.747 1.000 0.845 1.000 63.85total 108 0.895 0.899 0.084 0.543 1.000 0.839 0.978
13
Agriculture 2022, 12, 52
It is generally assumed that cooperatives are less efficient than other legal forms ofplants [18]. Due to the specific nature of cooperatives as presented by Soboh et al. [22], co-operative dairies were expected to have a lower value of input-oriented technical efficiency.
Examination of the TE scores by legal form indeed showed that non-cooperativedairies outperformed their cooperative counterparts. The mean and quartile values of theTE scores for non-cooperative dairies exceeded those for cooperatives. In this regard, aMann–Whitney U test indicated that technical efficiency in the group of non-cooperativeswas statistically significantly higher than in the group of cooperatives (Table 3).
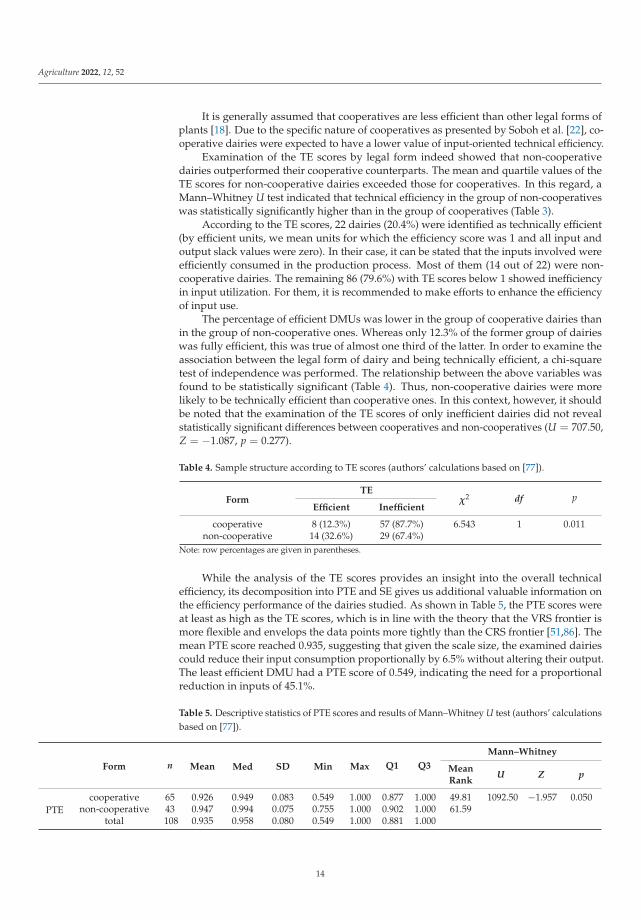
According to the TE scores, 22 dairies (20.4%) were identified as technically efficient(by efficient units, we mean units for which the efficiency score was 1 and all input andoutput slack values were zero). In their case, it can be stated that the inputs involved wereefficiently consumed in the production process. Most of them (14 out of 22) were non-cooperative dairies. The remaining 86 (79.6%) with TE scores below 1 showed inefficiencyin input utilization. For them, it is recommended to make efforts to enhance the efficiencyof input use.
The percentage of efficient DMUs was lower in the group of cooperative dairies thanin the group of non-cooperative ones. Whereas only 12.3% of the former group of dairieswas fully efficient, this was true of almost one third of the latter. In order to examine theassociation between the legal form of dairy and being technically efficient, a chi-squaretest of independence was performed. The relationship between the above variables wasfound to be statistically significant (Table 4). Thus, non-cooperative dairies were morelikely to be technically efficient than cooperative ones. In this context, however, it shouldbe noted that the examination of the TE scores of only inefficient dairies did not revealstatistically significant differences between cooperatives and non-cooperatives (U = 707.50,Z = −1.087, p = 0.277).
Table 4. Sample structure according to TE scores (authors’ calculations based on [77]).
FormTE
χ2 df pEfficient Inefficient
cooperative 8 (12.3%) 57 (87.7%) 6.543 1 0.011non-cooperative 14 (32.6%) 29 (67.4%)
Note: row percentages are given in parentheses.
While the analysis of the TE scores provides an insight into the overall technicalefficiency, its decomposition into PTE and SE gives us additional valuable information onthe efficiency performance of the dairies studied. As shown in Table 5, the PTE scores wereat least as high as the TE scores, which is in line with the theory that the VRS frontier ismore flexible and envelops the data points more tightly than the CRS frontier [51,86]. Themean PTE score reached 0.935, suggesting that given the scale size, the examined dairiescould reduce their input consumption proportionally by 6.5% without altering their output.The least efficient DMU had a PTE score of 0.549, indicating the need for a proportionalreduction in inputs of 45.1%.
Table 5. Descriptive statistics of PTE scores and results of Mann–Whitney U test (authors’ calculationsbased on [77]).
Mann–Whitney
Form n Mean Med SD Min Max Q1 Q3 MeanRank
U Z p
PTEcooperative 65 0.926 0.949 0.083 0.549 1.000 0.877 1.000 49.81 1092.50 −1.957 0.050
non-cooperative 43 0.947 0.994 0.075 0.755 1.000 0.902 1.000 61.59total 108 0.935 0.958 0.080 0.549 1.000 0.881 1.000
14
Agriculture 2022, 12, 52
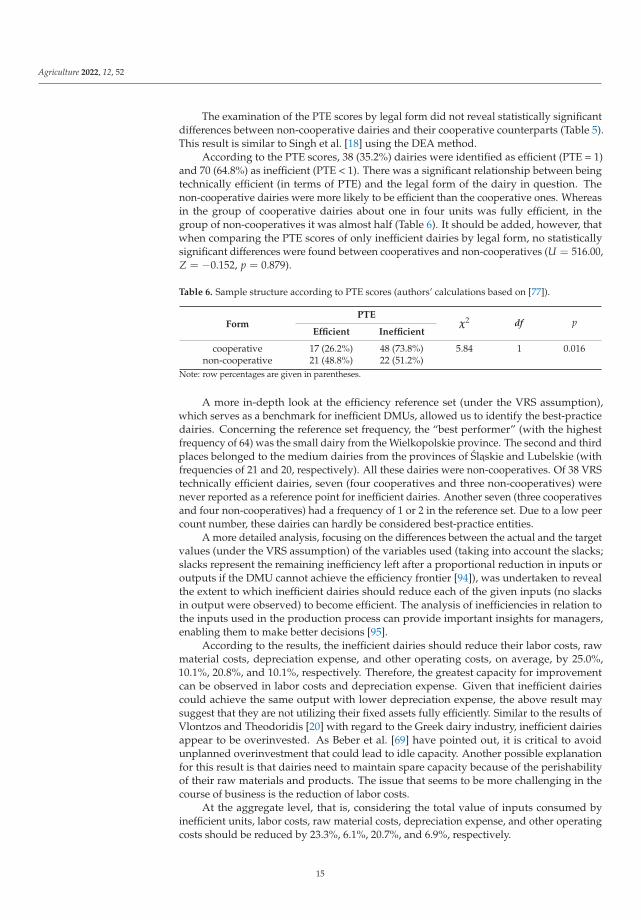
The examination of the PTE scores by legal form did not reveal statistically significantdifferences between non-cooperative dairies and their cooperative counterparts (Table 5).This result is similar to Singh et al. [18] using the DEA method.
According to the PTE scores, 38 (35.2%) dairies were identified as efficient (PTE = 1)and 70 (64.8%) as inefficient (PTE < 1). There was a significant relationship between beingtechnically efficient (in terms of PTE) and the legal form of the dairy in question. Thenon-cooperative dairies were more likely to be efficient than the cooperative ones. Whereasin the group of cooperative dairies about one in four units was fully efficient, in thegroup of non-cooperatives it was almost half (Table 6). It should be added, however, thatwhen comparing the PTE scores of only inefficient dairies by legal form, no statisticallysignificant differences were found between cooperatives and non-cooperatives (U = 516.00,Z = −0.152, p = 0.879).
Table 6. Sample structure according to PTE scores (authors’ calculations based on [77]).
FormPTE
χ2 df pEfficient Inefficient
cooperative 17 (26.2%) 48 (73.8%) 5.84 1 0.016non-cooperative 21 (48.8%) 22 (51.2%)
Note: row percentages are given in parentheses.
A more in-depth look at the efficiency reference set (under the VRS assumption),which serves as a benchmark for inefficient DMUs, allowed us to identify the best-practicedairies. Concerning the reference set frequency, the “best performer” (with the highestfrequency of 64) was the small dairy from the Wielkopolskie province. The second and thirdplaces belonged to the medium dairies from the provinces of Slaskie and Lubelskie (withfrequencies of 21 and 20, respectively). All these dairies were non-cooperatives. Of 38 VRStechnically efficient dairies, seven (four cooperatives and three non-cooperatives) werenever reported as a reference point for inefficient dairies. Another seven (three cooperativesand four non-cooperatives) had a frequency of 1 or 2 in the reference set. Due to a low peercount number, these dairies can hardly be considered best-practice entities.
A more detailed analysis, focusing on the differences between the actual and the targetvalues (under the VRS assumption) of the variables used (taking into account the slacks;slacks represent the remaining inefficiency left after a proportional reduction in inputs oroutputs if the DMU cannot achieve the efficiency frontier [94]), was undertaken to revealthe extent to which inefficient dairies should reduce each of the given inputs (no slacksin output were observed) to become efficient. The analysis of inefficiencies in relation tothe inputs used in the production process can provide important insights for managers,enabling them to make better decisions [95].
According to the results, the inefficient dairies should reduce their labor costs, rawmaterial costs, depreciation expense, and other operating costs, on average, by 25.0%,10.1%, 20.8%, and 10.1%, respectively. Therefore, the greatest capacity for improvementcan be observed in labor costs and depreciation expense. Given that inefficient dairiescould achieve the same output with lower depreciation expense, the above result maysuggest that they are not utilizing their fixed assets fully efficiently. Similar to the results ofVlontzos and Theodoridis [20] with regard to the Greek dairy industry, inefficient dairiesappear to be overinvested. As Beber et al. [69] have pointed out, it is critical to avoidunplanned overinvestment that could lead to idle capacity. Another possible explanationfor this result is that dairies need to maintain spare capacity because of the perishabilityof their raw materials and products. The issue that seems to be more challenging in thecourse of business is the reduction of labor costs.
At the aggregate level, that is, considering the total value of inputs consumed byinefficient units, labor costs, raw material costs, depreciation expense, and other operatingcosts should be reduced by 23.3%, 6.1%, 20.7%, and 6.9%, respectively.
15
Agriculture 2022, 12, 52
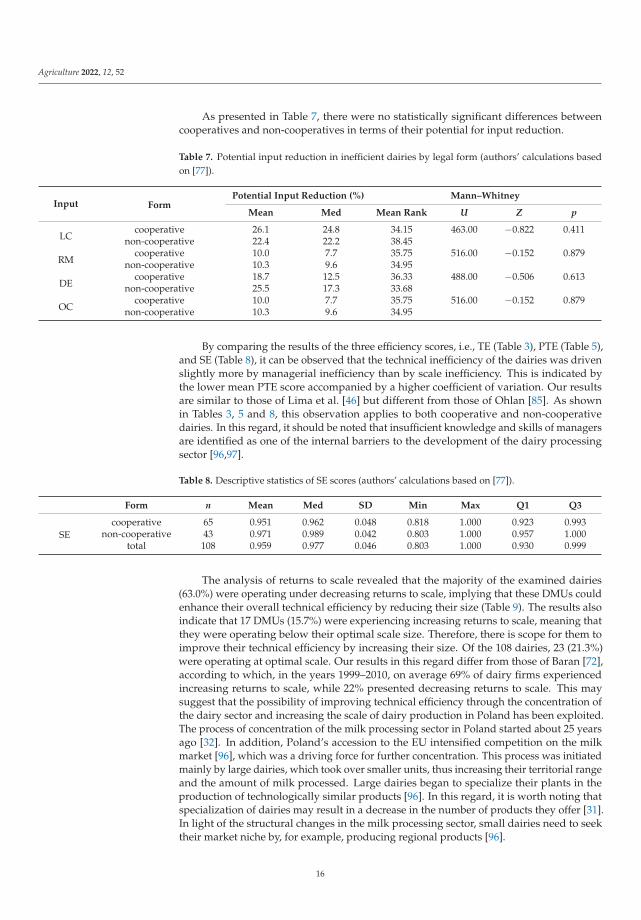
As presented in Table 7, there were no statistically significant differences betweencooperatives and non-cooperatives in terms of their potential for input reduction.
Table 7. Potential input reduction in inefficient dairies by legal form (authors’ calculations basedon [77]).
Input FormPotential Input Reduction (%) Mann–Whitney
Mean Med Mean Rank U Z p
LCcooperative 26.1 24.8 34.15 463.00 −0.822 0.411
non-cooperative 22.4 22.2 38.45
RMcooperative 10.0 7.7 35.75 516.00 −0.152 0.879
non-cooperative 10.3 9.6 34.95
DEcooperative 18.7 12.5 36.33 488.00 −0.506 0.613
non-cooperative 25.5 17.3 33.68
OCcooperative 10.0 7.7 35.75 516.00 −0.152 0.879
non-cooperative 10.3 9.6 34.95
By comparing the results of the three efficiency scores, i.e., TE (Table 3), PTE (Table 5),and SE (Table 8), it can be observed that the technical inefficiency of the dairies was drivenslightly more by managerial inefficiency than by scale inefficiency. This is indicated bythe lower mean PTE score accompanied by a higher coefficient of variation. Our resultsare similar to those of Lima et al. [46] but different from those of Ohlan [85]. As shownin Tables 3, 5 and 8, this observation applies to both cooperative and non-cooperativedairies. In this regard, it should be noted that insufficient knowledge and skills of managersare identified as one of the internal barriers to the development of the dairy processingsector [96,97].
Table 8. Descriptive statistics of SE scores (authors’ calculations based on [77]).
Form n Mean Med SD Min Max Q1 Q3
SEcooperative 65 0.951 0.962 0.048 0.818 1.000 0.923 0.993
non-cooperative 43 0.971 0.989 0.042 0.803 1.000 0.957 1.000total 108 0.959 0.977 0.046 0.803 1.000 0.930 0.999
The analysis of returns to scale revealed that the majority of the examined dairies(63.0%) were operating under decreasing returns to scale, implying that these DMUs couldenhance their overall technical efficiency by reducing their size (Table 9). The results alsoindicate that 17 DMUs (15.7%) were experiencing increasing returns to scale, meaning thatthey were operating below their optimal scale size. Therefore, there is scope for them toimprove their technical efficiency by increasing their size. Of the 108 dairies, 23 (21.3%)were operating at optimal scale. Our results in this regard differ from those of Baran [72],according to which, in the years 1999–2010, on average 69% of dairy firms experiencedincreasing returns to scale, while 22% presented decreasing returns to scale. This maysuggest that the possibility of improving technical efficiency through the concentration ofthe dairy sector and increasing the scale of dairy production in Poland has been exploited.The process of concentration of the milk processing sector in Poland started about 25 yearsago [32]. In addition, Poland’s accession to the EU intensified competition on the milkmarket [96], which was a driving force for further concentration. This process was initiatedmainly by large dairies, which took over smaller units, thus increasing their territorial rangeand the amount of milk processed. Large dairies began to specialize their plants in theproduction of technologically similar products [96]. In this regard, it is worth noting thatspecialization of dairies may result in a decrease in the number of products they offer [31].In light of the structural changes in the milk processing sector, small dairies need to seektheir market niche by, for example, producing regional products [96].
16
Agriculture 2022, 12, 52
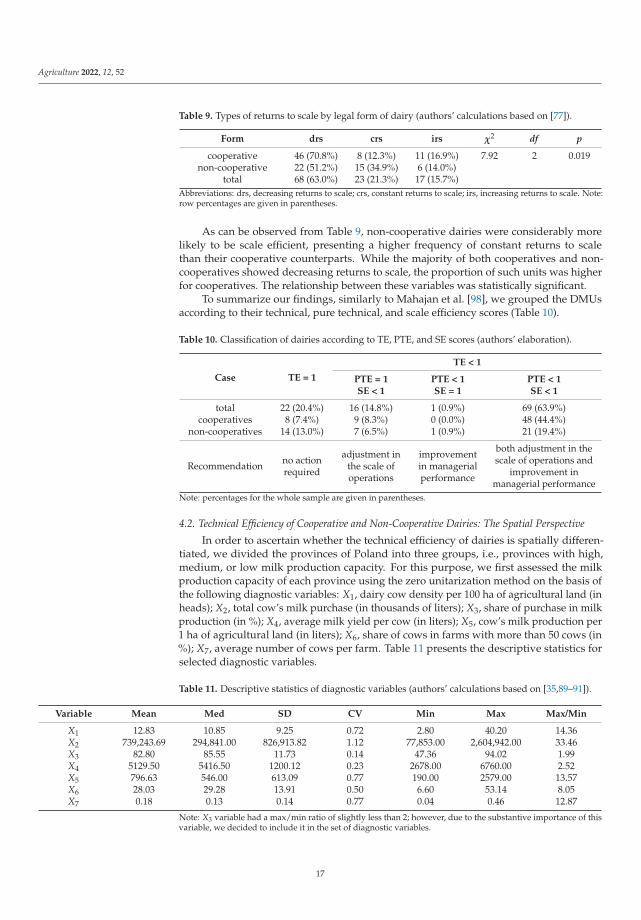
Table 9. Types of returns to scale by legal form of dairy (authors’ calculations based on [77]).
Form drs crs irs χ2 df p
cooperative 46 (70.8%) 8 (12.3%) 11 (16.9%) 7.92 2 0.019non-cooperative 22 (51.2%) 15 (34.9%) 6 (14.0%)
total 68 (63.0%) 23 (21.3%) 17 (15.7%)Abbreviations: drs, decreasing returns to scale; crs, constant returns to scale; irs, increasing returns to scale. Note:row percentages are given in parentheses.
As can be observed from Table 9, non-cooperative dairies were considerably morelikely to be scale efficient, presenting a higher frequency of constant returns to scalethan their cooperative counterparts. While the majority of both cooperatives and non-cooperatives showed decreasing returns to scale, the proportion of such units was higherfor cooperatives. The relationship between these variables was statistically significant.
To summarize our findings, similarly to Mahajan et al. [98], we grouped the DMUsaccording to their technical, pure technical, and scale efficiency scores (Table 10).
Table 10. Classification of dairies according to TE, PTE, and SE scores (authors’ elaboration).
Case TE = 1
TE < 1
PTE = 1 PTE < 1 PTE < 1SE < 1 SE = 1 SE < 1
total 22 (20.4%) 16 (14.8%) 1 (0.9%) 69 (63.9%)cooperatives 8 (7.4%) 9 (8.3%) 0 (0.0%) 48 (44.4%)
non-cooperatives 14 (13.0%) 7 (6.5%) 1 (0.9%) 21 (19.4%)
Recommendation no actionrequired
adjustment inthe scale ofoperations
improvementin managerialperformance
both adjustment in thescale of operations and
improvement inmanagerial performance
Note: percentages for the whole sample are given in parentheses.
4.2. Technical Efficiency of Cooperative and Non-Cooperative Dairies: The Spatial Perspective
In order to ascertain whether the technical efficiency of dairies is spatially differen-tiated, we divided the provinces of Poland into three groups, i.e., provinces with high,medium, or low milk production capacity. For this purpose, we first assessed the milkproduction capacity of each province using the zero unitarization method on the basis ofthe following diagnostic variables: X1, dairy cow density per 100 ha of agricultural land (inheads); X2, total cow’s milk purchase (in thousands of liters); X3, share of purchase in milkproduction (in %); X4, average milk yield per cow (in liters); X5, cow’s milk production per1 ha of agricultural land (in liters); X6, share of cows in farms with more than 50 cows (in%); X7, average number of cows per farm. Table 11 presents the descriptive statistics forselected diagnostic variables.
Table 11. Descriptive statistics of diagnostic variables (authors’ calculations based on [35,89–91]).
Variable Mean Med SD CV Min Max Max/Min
X1 12.83 10.85 9.25 0.72 2.80 40.20 14.36X2 739,243.69 294,841.00 826,913.82 1.12 77,853.00 2,604,942.00 33.46X3 82.80 85.55 11.73 0.14 47.36 94.02 1.99X4 5129.50 5416.50 1200.12 0.23 2678.00 6760.00 2.52X5 796.63 546.00 613.09 0.77 190.00 2579.00 13.57X6 28.03 29.28 13.91 0.50 6.60 53.14 8.05X7 0.18 0.13 0.14 0.77 0.04 0.46 12.87
Note: X3 variable had a max/min ratio of slightly less than 2; however, due to the substantive importance of thisvariable, we decided to include it in the set of diagnostic variables.
17
Agriculture 2022, 12, 52
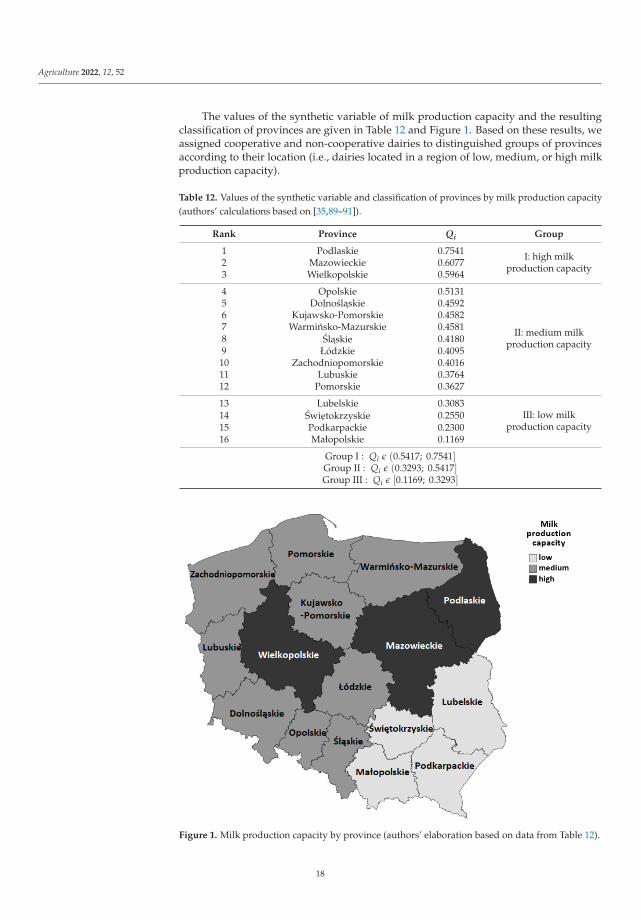
The values of the synthetic variable of milk production capacity and the resultingclassification of provinces are given in Table 12 and Figure 1. Based on these results, weassigned cooperative and non-cooperative dairies to distinguished groups of provincesaccording to their location (i.e., dairies located in a region of low, medium, or high milkproduction capacity).
Table 12. Values of the synthetic variable and classification of provinces by milk production capacity(authors’ calculations based on [35,89–91]).
Rank Province Qi Group
1 Podlaskie 0.7541 I: high milkproduction capacity2 Mazowieckie 0.6077
3 Wielkopolskie 0.5964
4 Opolskie 0.5131
II: medium milkproduction capacity
5 Dolnoslaskie 0.45926 Kujawsko-Pomorskie 0.45827 Warminsko-Mazurskie 0.45818 Slaskie 0.41809 Łódzkie 0.409510 Zachodniopomorskie 0.401611 Lubuskie 0.376412 Pomorskie 0.3627
13 Lubelskie 0.3083III: low milk
production capacity14 Swietokrzyskie 0.255015 Podkarpackie 0.230016 Małopolskie 0.1169
Group I : Qi ε (0.5417; 0.7541]Group II : Qi ε (0.3293; 0.5417]Group III : Qi ε [0.1169; 0.3293]
Figure 1. Milk production capacity by province (authors’ elaboration based on data from Table 12).
18
Agriculture 2022, 12, 52
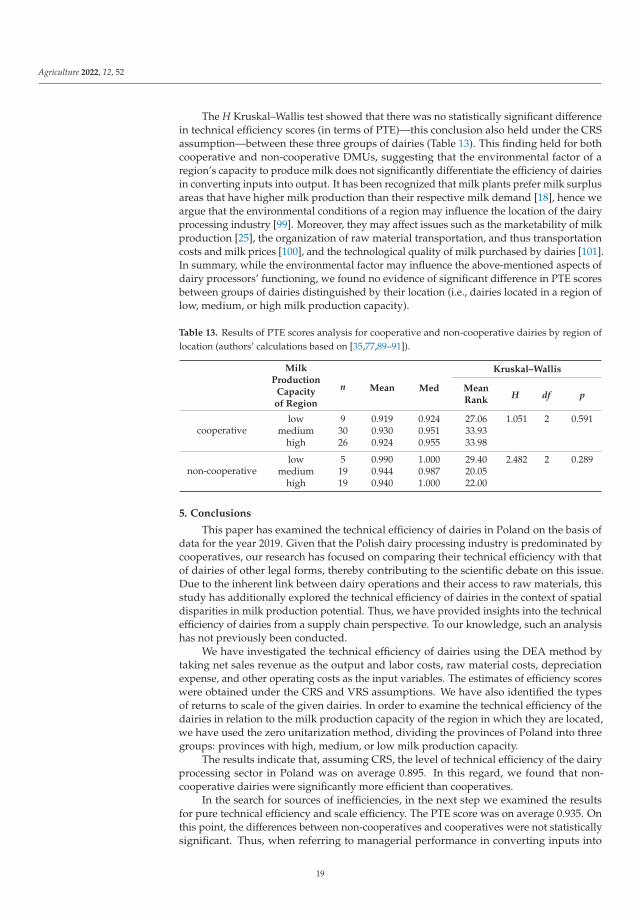
The H Kruskal–Wallis test showed that there was no statistically significant differencein technical efficiency scores (in terms of PTE)—this conclusion also held under the CRSassumption—between these three groups of dairies (Table 13). This finding held for bothcooperative and non-cooperative DMUs, suggesting that the environmental factor of aregion’s capacity to produce milk does not significantly differentiate the efficiency of dairiesin converting inputs into output. It has been recognized that milk plants prefer milk surplusareas that have higher milk production than their respective milk demand [18], hence weargue that the environmental conditions of a region may influence the location of the dairyprocessing industry [99]. Moreover, they may affect issues such as the marketability of milkproduction [25], the organization of raw material transportation, and thus transportationcosts and milk prices [100], and the technological quality of milk purchased by dairies [101].In summary, while the environmental factor may influence the above-mentioned aspects ofdairy processors’ functioning, we found no evidence of significant difference in PTE scoresbetween groups of dairies distinguished by their location (i.e., dairies located in a region oflow, medium, or high milk production capacity).
Table 13. Results of PTE scores analysis for cooperative and non-cooperative dairies by region oflocation (authors’ calculations based on [35,77,89–91]).
Kruskal–WallisMilkProduction
Capacityof Region
n Mean Med MeanRank
H df p
cooperativelow 9 0.919 0.924 27.06 1.051 2 0.591
medium 30 0.930 0.951 33.93high 26 0.924 0.955 33.98
non-cooperativelow 5 0.990 1.000 29.40 2.482 2 0.289
medium 19 0.944 0.987 20.05high 19 0.940 1.000 22.00
5. Conclusions
This paper has examined the technical efficiency of dairies in Poland on the basis ofdata for the year 2019. Given that the Polish dairy processing industry is predominated bycooperatives, our research has focused on comparing their technical efficiency with thatof dairies of other legal forms, thereby contributing to the scientific debate on this issue.Due to the inherent link between dairy operations and their access to raw materials, thisstudy has additionally explored the technical efficiency of dairies in the context of spatialdisparities in milk production potential. Thus, we have provided insights into the technicalefficiency of dairies from a supply chain perspective. To our knowledge, such an analysishas not previously been conducted.
We have investigated the technical efficiency of dairies using the DEA method bytaking net sales revenue as the output and labor costs, raw material costs, depreciationexpense, and other operating costs as the input variables. The estimates of efficiency scoreswere obtained under the CRS and VRS assumptions. We have also identified the typesof returns to scale of the given dairies. In order to examine the technical efficiency of thedairies in relation to the milk production capacity of the region in which they are located,we have used the zero unitarization method, dividing the provinces of Poland into threegroups: provinces with high, medium, or low milk production capacity.
The results indicate that, assuming CRS, the level of technical efficiency of the dairyprocessing sector in Poland was on average 0.895. In this regard, we found that non-cooperative dairies were significantly more efficient than cooperatives.
In the search for sources of inefficiencies, in the next step we examined the resultsfor pure technical efficiency and scale efficiency. The PTE score was on average 0.935. Onthis point, the differences between non-cooperatives and cooperatives were not statisticallysignificant. Thus, when referring to managerial performance in converting inputs into
19
Agriculture 2022, 12, 52
output, we found no evidence of lower efficiency in dairy cooperatives. For both the TEand PTE scores, dairy non-cooperatives revealed a greater proportion of units identifiedas efficient. However, it is important to note the limitations of such a zero-one approach,as an entity may not be fully efficient (with an efficiency score of 1) and yet still exhibithigh efficiency.
According to our results, inefficient dairies presented the greatest potential for reduc-ing labor costs and depreciation expense. This implies that dairies in Poland could reducethese costs while maintaining the same level of output. We did not identify significantdifferences in potential for input reduction between cooperatives and non-cooperatives.
About one in five of all the dairies studied were scale efficient. For non-cooperativedairies, the proportion of such units was nearly three times that of cooperatives. Mostdairies showed decreasing returns to scale, meaning that they were too large relative to theiroptimal scale. This observation applied to both cooperative and non-cooperative dairies;however, the former group showed a higher proportion of units operating under decreasingreturns to scale. The prevalence of dairies exhibiting decreasing returns to scale may bea result of the intensification of the concentration process in the milk processing sector,caused in particular by Poland’s accession to the EU. Our results can be perceived as a signof the saturation of the dairy sector in Poland with the consolidation process. Therefore, inlight of the above, the continuation of this process does not seem to be recommended as faras technical efficiency is concerned. Due to structural changes in the milk processing sector,small dairies need to find a market niche if they want to compete with large units.
The examination of the PTE scores taking into account the spatial disparities in milkproduction potential did not provide evidence for the claim that the technical efficiencyof dairies was affected by the milk production capacity of their location region. Thisfinding indicates that although the availability and abundance of raw milk may affect thedensity of and the competition among dairies, they do not significantly differentiate theirtechnical efficiency.
The results suggest some directions for further research. Given that only one year ofdata was used in this study, it would be valuable to examine the technical efficiency ofcooperative and non-cooperative dairies in Poland over a longer period of time. Moreover,in further research it would be beneficial to investigate technical efficiency from a supplychain perspective more broadly, i.e., taking into account the distribution conditions asthe next link in the supply chain. Such a perspective would provide a more holistic viewregarding the efficiency of the dairy sector in Poland. Another possible stream of researchwould consider the economic sustainability of the Polish dairy supply chain in associationwith its environmental and social dimensions.
Author Contributions: Conceptualization, K.Z.-K., M.Z.-C. and J.N.; methodology, K.Z.-K., M.Z.-C.and J.N.; software, K.Z.-K.; validation, K.Z.-K. and J.N.; formal analysis, K.Z.-K.; investigation,K.Z.-K., M.Z.-C. and J.N.; resources, K.Z.-K., M.Z.-C. and J.N.; data curation, K.Z.-K., M.Z.-C. andJ.N.; writing—original draft preparation, K.Z.-K., M.Z.-C. and J.N.; writing—review and editing,K.Z.-K., M.Z.-C. and J.N.; visualization, K.Z.-K.; project administration, K.Z.-K.; funding acquisition,K.Z.-K. All authors have read and agreed to the published version of the manuscript.
Funding: The APC was funded by The John Paul II Catholic University of Lublin, grant number1/6-20-21-05-0501-0002-0593.
Institutional Review Board Statement: Not applicable.
Informed Consent Statement: Not applicable.
Data Availability Statement: EMIS data: restrictions apply to the availability of these data; dataobtained from EMIS are available from the authors with the permission of EMIS. Publicly availabledatasets were also analyzed in this study. These data can be found here: https://stat.gov.pl/ (accessedon 6 November 2021); https://ec.europa.eu/eurostat/data/database (accessed on 2 November 2021).
Conflicts of Interest: The authors declare no conflict of interest.
20
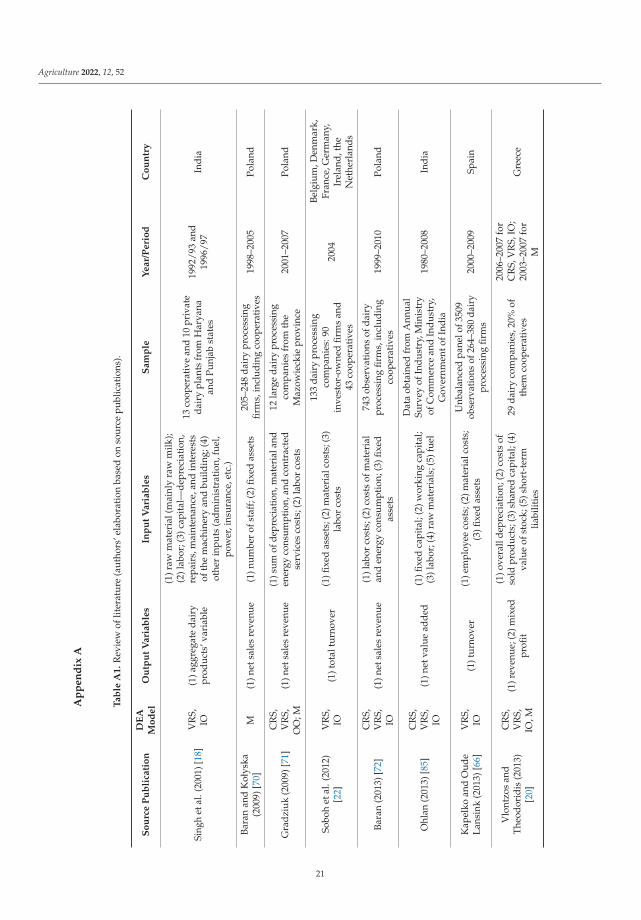
Agriculture 2022, 12, 52A
pp
en
dix
A
Ta
ble
A1
.R
evie
wof
liter
atur
e(a
utho
rs’e
labo
rati
onba
sed
onso
urce
publ
icat
ions
).
So
urc
eP
ub
lica
tio
nD
EA
Mo
de
lO
utp
ut
Va
ria
ble
sIn
pu
tV
ari
ab
les
Sa
mp
leY
ea
r/P
eri
od
Co
un
try
Sing
het
al.(
2001
)[18
]V
RS,
IO(1
)agg
rega
teda
iry
prod
ucts
’var
iabl
e
(1)r
awm
ater
ial(
mai
nly
raw
milk
);(2
)lab
or;(
3)ca
pita
l—de
prec
iati
on,
repa
irs,
mai
nten
ance
,and
inte
rest
sof
the
mac
hine
ryan
dbu
ildin
g;(4
)ot
her
inpu
ts(a
dmin
istr
atio
n,fu
el,
pow
er,i
nsur
ance
,etc
.)
13co
oper
ativ
ean
d10
priv
ate
dair
ypl
ants
from
Har
yana
and
Punj
abst
ates
1992
/93
and
1996
/97
Indi
a
Bara
nan
dK
ołys
ka(2
009)
[70]
M(1
)net
sale
sre
venu
e(1
)num
ber
ofst
aff;
(2)fi
xed
asse
ts20
5–24
8da
iry
proc
essi
ngfir
ms,
incl
udin
gco
oper
ativ
es19
98–2
005
Pola
nd
Gra
dziu
k(2
009)
[71]
CR
S,V
RS,
OO
;M(1
)net
sale
sre
venu
e(1
)sum
ofde
prec
iatio
n,m
ater
iala
nden
ergy
cons
umpt
ion,
and
cont
ract
edse
rvic
esco
sts;
(2)l
abor
cost
s
12la
rge
dair
ypr
oces
sing
com
pani
esfr
omth
eM
azow
ieck
iepr
ovin
ce20
01–2
007
Pola
nd
Sobo
het
al.(
2012
)[2
2]V
RS,
IO(1
)tot
altu
rnov
er(1
)fixe
das
sets
;(2)
mat
eria
lcos
ts;(
3)la
bor
cost
s
133
dair
ypr
oces
sing
com
pani
es:9
0in
vest
or-o
wne
dfir
ms
and
43co
oper
ativ
es
2004
Belg
ium
,Den
mar
k,Fr
ance
,Ger
man
y,Ir
elan
d,th
eN
ethe
rlan
ds
Bara
n(2
013)
[72]
CR
S,V
RS,
IO(1
)net
sale
sre
venu
e(1
)lab
orco
sts;
(2)c
osts
ofm
ater
ial
and
ener
gyco
nsum
ptio
n;(3
)fixe
das
sets
743
obse
rvat
ions
ofda
iry
proc
essi
ngfir
ms,
incl
udin
gco
oper
ativ
es19
99–2
010
Pola
nd
Ohl
an(2
013)
[85]
CR
S,V
RS,
IO(1
)net
valu
ead
ded
(1)fi
xed
capi
tal;
(2)w
orki
ngca
pita
l;(3
)lab
or;(
4)ra
wm
ater
ials
;(5)
fuel
Dat
aob
tain
edfr
omA
nnua
lSu
rvey
ofIn
dust
ry,M
inis
try
ofC
omm
erce
and
Indu
stry
,G
over
nmen
tofI
ndia
1980
–200
8In
dia
Kap
elko
and
Oud
eLa
nsin
k(2
013)
[66]
VR
S,IO
(1)t
urno
ver
(1)e
mpl
oyee
cost
s;(2
)mat
eria
lcos
ts;
(3)fi
xed
asse
ts
Unb
alan
ced
pane
lof3
509
obse
rvat
ions
of26
4–38
0da
iry
proc
essi
ngfir
ms
2000
–200
9Sp
ain
Vlo
ntzo
san
dTh
eodo
ridi
s(2
013)
[20]
CR
S,V
RS,
IO,M
(1)r
even
ue;(
2)m
ixed
profi
t
(1)o
vera
llde
prec
iati
on;(
2)co
sts
ofso
ldpr
oduc
ts;(
3)sh
ared
capi
tal;
(4)
valu
eof
stoc
k;(5
)sho
rt-t
erm
liabi
litie
s
29da
iry
com
pani
es,2
0%of
them
coop
erat
ives
2006
–200
7fo
rC
RS,
VR
S,IO
;20
03–2
007
for
M
Gre
ece
21
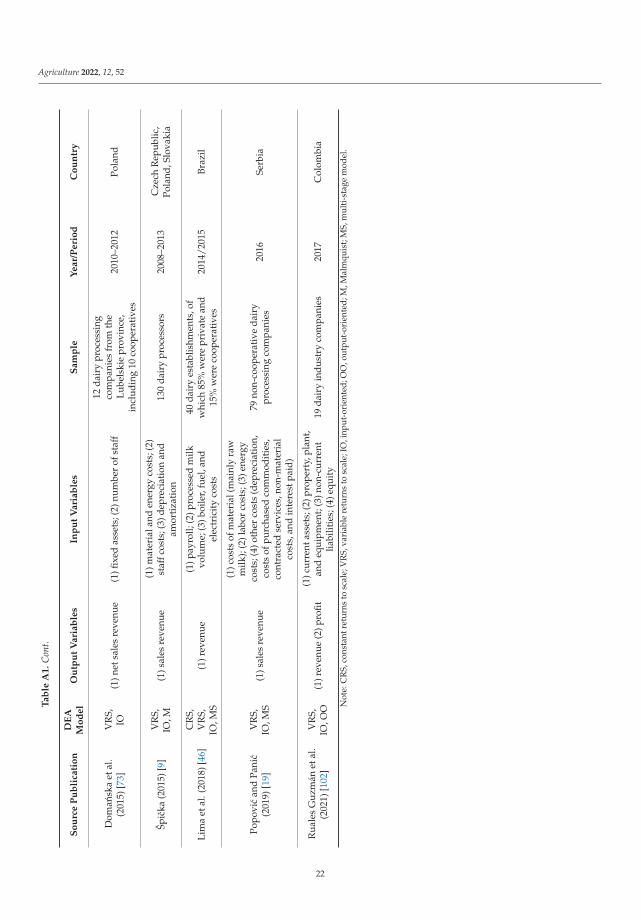
Agriculture 2022, 12, 52
Ta
ble
A1
.C
ont.
So
urc
eP
ub
lica
tio
nD
EA
Mo
de
lO
utp
ut
Va
ria
ble
sIn
pu
tV
ari
ab
les
Sa
mp
leY
ea
r/P
eri
od
Co
un
try
Dom
ansk
aet
al.
(201
5)[7
3]V
RS,
IO(1
)net
sale
sre
venu
e(1
)fixe
das
sets
;(2)
num
ber
ofst
aff
12da
iry
proc
essi
ngco
mpa
nies
from
the
Lube
lski
epr
ovin
ce,
incl
udin
g10
coop
erat
ives
2010
–201
2Po
land
Špic
ka(2
015)
[9]
VR
S,IO
,M(1
)sal
esre
venu
e(1
)mat
eria
land
ener
gyco
sts;
(2)
staf
fcos
ts;(
3)de
prec
iati
onan
dam
orti
zati
on13
0da
iry
proc
esso
rs20
08–2
013
Cze
chR
epub
lic,
Pola
nd,S
lova
kia
Lim
aet
al.(
2018
)[46
]C
RS,
VR
S,IO
,MS
(1)r
even
ue(1
)pay
roll;
(2)p
roce
ssed
milk
volu
me;
(3)b
oile
r,fu
el,a
ndel
ectr
icit
yco
sts
40da
iry
esta
blis
hmen
ts,o
fw
hich
85%
wer
epr
ivat
ean
d15
%w
ere
coop
erat
ives
2014
/201
5Br
azil
Popo
vic
and
Pani
c(2
019)
[19]
VR
S,IO
,MS
(1)s
ales
reve
nue
(1)c
osts
ofm
ater
ial(
mai
nly
raw
milk
);(2
)lab
orco
sts;
(3)e
nerg
yco
sts;
(4)o
ther
cost
s(d
epre
ciat
ion,
cost
sof
purc
hase
dco
mm
odit
ies,
cont
ract
edse
rvic
es,n
on-m
ater
ial
cost
s,an
din
tere
stpa
id)
79no
n-co
oper
ativ
eda
iry
proc
essi
ngco
mpa
nies
2016
Serb
ia
Rua
les
Guz
mán
etal
.(2
021)
[102
]V
RS,
IO,O
O(1
)rev
enue
(2)p
rofit
(1)c
urre
ntas
sets
;(2)
prop
erty
,pla
nt,
and
equi
pmen
t;(3
)non
-cur
rent
liabi
litie
s;(4
)equ
ity
19da
iry
indu
stry
com
pani
es20
17C
olom
bia
Not
e:C
RS,
cons
tant
retu
rns
tosc
ale;
VR
S,va
riab
lere
turn
sto
scal
e;IO
,inp
ut-o
rien
ted;
OO
,out
put-
orie
nted
;M,M
alm
quis
t;M
S,m
ulti
-sta
gem
odel
.
22
Agriculture 2022, 12, 52
References
1. Hooks, T.; Macken-Walsh, Á.; McCarthy, O.; Power, C. Farm-Level Viability, Sustainability and Resilience: A Focus on CooperativeAction and Values-Based Supply Chains. Stud. Agric. Econ. 2017, 119, 123–129. [CrossRef]
2. Orr, D.W. Four Challenges of Sustainability. Conserv. Biol. 2002, 16, 1457–1460.3. Augustin, M.A.; Udabage, P.; Juliano, P.; Clarke, P.T. Towards a More Sustainable Dairy Industry: Integration across the
Farm–Factory Interface and the Dairy Factory of the Future. Int. Dairy J. 2013, 31, 2–11. [CrossRef]4. United Nations. Transforming Our World: The 2030 Agenda for Sustainable Development. Available online: https:
//sustainabledevelopment.un.org/content/documents/21252030%20Agenda%20for%20Sustainable%20Development%20web.pdf (accessed on 6 November 2021).
5. Bricas, N. The Scope of the Analysis: Food Systems. In Food Systems at Risk. New Trends and Challenges; Dury, S., Bendjebbar, P.,Hainzelin, E., Giordano, T., Bricas, N., Eds.; FAO: Rome, Italy; CIRAD: Montpellier, France; European Commission: Brussels,Belgium, 2019; pp. 15–18, ISBN 978-92-5-131732-7.
6. Tendall, D.M.; Joerin, J.; Kopainsky, B.; Edwards, P.; Shreck, A.; Le, Q.B.; Kruetli, P.; Grant, M.; Six, J. Food System Resilience:Defining the Concept. Glob. Food Sec. 2015, 6, 17–23. [CrossRef]
7. Nguyen, H. Sustainable Food Systems: Concept and Framework. Available online: https://www.fao.org/3/ca2079en/CA2079EN.pdf (accessed on 6 November 2021).
8. Cechura, L.; Žáková Kroupová, Z. Technical Efficiency in the European Dairy Industry: Can We Observe Systematic Failures inthe Efficiency of Input Use? Sustainability 2021, 13, 1830. [CrossRef]
9. Špicka, J. The Efficiency Improvement of Central European Corporate Milk Processors in 2008–2013. Agris -Online Pap. Econ.Inform. 2015, 7, 175–188. [CrossRef]
10. Feil, A.A.; Schreiber, D.; Haetinger, C.; Haberkamp, Â.M.; Kist, J.I.; Rempel, C.; Maehler, A.E.; Gomes, M.C.; da Silva, G.R.Sustainability in the Dairy Industry: A Systematic Literature Review. Environ. Sci. Pollut. Res. 2020, 27, 33527–33542. [CrossRef]
11. Miller, G.D.; Auestad, N. Towards a Sustainable Dairy Sector: Leadership in Sustainable Nutrition. Int. J. Dairy Technol. 2013, 66,307–316. [CrossRef]
12. Ang, S.; Zhu, Y.; Yang, F. Efficiency Evaluation and Ranking of Supply Chains Based on Stochastic Multicriteria AcceptabilityAnalysis and Data Envelopment Analysis. Int. Trans. Oper. Res. 2021, 28, 3190–3219. [CrossRef]
13. Rao, K.H.; Raju, P.N.; Reddy, G.P.; Hussain, S.A. Public-Private Partnership and Value Addition: A Two-Pronged Approach forSustainable Dairy Supply Chain Management. IUP J. Supply Chain. Manag. 2013, 10, 15–25.
14. Zorn, A.; Esteves, M.; Baur, I.; Lips, M. Financial Ratios as Indicators of Economic Sustainability: A Quantitative Analysis forSwiss Dairy Farms. Sustainability 2018, 10, 2942. [CrossRef]
15. Wilczynski, A. Farm Economic Sustainability—Financial Ratio Analysis. Res. Pap. Wroc. Univ. Econ. Bus. 2020, 64, 120–131.[CrossRef]
16. Bórawski, P.; Pawlewicz, A.; Mickiewicz, B.; Pawlewicz, K.; Bełdycka-Bórawska, A.; Holden, L.; Brelik, A. Economic Sustainabilityof Dairy Farms in the EU. Eur. Res. Stud. J. 2020, 23, 955–978. [CrossRef]
17. Bánkuti, F.I.; Prizon, R.C.; Damasceno, J.C.; Brito, M.M.D.; Pozza, M.S.S.; Lima, P.G.L. Farmers’ Actions toward Sustainability: ATypology of Dairy Farms According to Sustainability Indicators. Animal 2020, 14, s417–s423. [CrossRef]
18. Singh, S.; Coelli, T.; Fleming, E. Performance of Dairy Plants in the Cooperative and Private Sectors in India. Ann. Public Coop.Econ. 2001, 72, 453–479. [CrossRef]
19. Popovic, R.; Panic, D. Economic Sustainability of Dairy Processing Sector in Serbia. In Sustainable Agriculture and Rural Developmentin Terms of the Republic of Serbia Strategic Goals Realization within the Danube Region. Sustainability and Multifunctionality; Subic,J., Jelocnik, M., Kuzman, B., Andrei, J.V., Eds.; Institute of Agricultural Economics: Belgrade, Serbia, 2019; pp. 686–700, ISBN978-86-6269-068-5.
20. Vlontzos, G.; Theodoridis, A. Efficiency and Productivity Change in the Greek Dairy Industry. Agric. Econ. Rev. 2013, 14, 14–28.21. Jansik, C.; Irz, X.; Kuosmanen, N. Competitiveness of Northern European Dairy Chains; MTT Economic Research, Agrifood Research
Finland: Helsinki, Finland, 2014; ISBN 978-951-687-177-9.22. Soboh, R.; Oude Lansink, A.; Van Dijk, G. Efficiency of Cooperatives and Investor Owned Firms Revisited. J. Agric. Econ. 2012, 63,
142–157. [CrossRef]23. Hirsch, S.; Mishra, A.; Möhring, N.; Finger, R. Revisiting Firm Flexibility and Efficiency: Evidence from the EU Dairy Processing
Industry. Eur. Rev. Agric. Econ. 2020, 47, 971–1008. [CrossRef]24. Eurostat. Cows’ Milk Collection and Products Obtained-Annual Data. Available online: https://appsso.eurostat.ec.europa.eu/
nui/show.do?dataset=apro_mk_cola&lang=en (accessed on 2 November 2021).25. Parzonko, A. Globalne i Lokalne Uwarunkowania Rozwoju Produkcji Mleka; Wydawnictwo SGGW: Warszawa, Poland, 2013; ISBN
978-83-7583-461-1.26. Boyle, G.E. The Economic Efficiency of Irish Dairy Marketing Co-Operatives. Agribusiness 2004, 20, 143–153. [CrossRef]27. Gardijan Kedžo, M.; Lukac, Z. The Financial Efficiency of Small Food and Drink Producers across Selected European Union
Countries Using Data Envelopment Analysis. Eur. J. Oper. Res. 2021, 291, 586–600. [CrossRef]28. Madau, F.A.; Furesi, R.; Pulina, P. Technical Efficiency and Total Factor Productivity Changes in European Dairy Farm Sectors.
Agric. Food Econ. 2017, 5, 17:1–17:14. [CrossRef]
23
Agriculture 2022, 12, 52
29. Thomson, A.; Metz, M. Implications of Economic Policy for Food Security: A Training Manual; FAO: Rome, Italy, 1999; ISBN92-5-104379-5.
30. Zuba-Ciszewska, M. Structural Changes in the Milk Production Sector and Food Security—The Case of Poland. Ann. Pol. Assoc.Agric. Agribus. Econ. 2019, 21, 318–327. [CrossRef]
31. Zuba-Ciszewska, M. Rola spółdzielni w zapewnieniu dostepnosci zywnosci w Polsce − na przykładzie produktów mleczarskich.Wies Rolnictwo 2020, 186, 93–119. [CrossRef]
32. Seremak-Bulge, J.; Hryszko, K.; Pieniazek, K.; Rembeza, J.; Szajner, P.; Swietlik, K. Rozwój Rynku Mleczarskiego i Zmiany JegoFunkcjonowania w Latach 1990–2005; Instytut Ekonomiki Rolnictwa i Gospodarki Zywnosciowej—Panstwowy Instytut Badawczy:Warszawa, Poland, 2005; ISBN 83-89666-34-0.
33. Szajner, P. (Ed.) Rynek Mleka. Stan i Perspektywy; Instytut Ekonomiki Rolnictwa i Gospodarki Zywnosciowej: Warszawa, Poland,2019; Volume 57.
34. Eurostat. Bovine Animals by NUTS 2 Regions—Annual Data. Available online: https://appsso.eurostat.ec.europa.eu/nui/show.do?dataset=ef_lsk_bovine&lang=en (accessed on 2 November 2021).
35. Szajner, P. (Ed.) Rynek Mleka. Stan i Perspektywy; Instytut Ekonomiki Rolnictwa i Gospodarki Zywnosciowej: Warszawa, Poland,2020; Volume 58.
36. Zuba-Ciszewska, M. Structural Changes in the Dairy Industry and Their Impact on the Efficiency of Dairies—A Polish Example.In Proceedings of the 2018 International Scientific Conference ‘Economic Sciences for Agribusiness and Rural Economy’, Warsaw,Poland, 7 June 2018; Volume 2, pp. 116–123. [CrossRef]
37. Szczepaniak, I.; Tereszczuk, M. Confronting the Polish Dairy Industry with the International Competition in the EU Food Market.Rev. Socio Econ. Perspect. 2017, 2, 31–51. [CrossRef]
38. Urban, S. Trzeci agregat agrobiznesu—Przetwórstwo surowców rolniczych zywnosciowych i niezywnosciowych. In Agrobiznes iBiobiznes. Teoria i Praktyka; Urban, S., Ed.; Wydawnictwo Uniwersytetu Ekonomicznego we Wrocławiu: Wrocław, Poland, 2014;pp. 46–58, ISBN 978-83-7695-408-0.
39. Kraciuk, J. Koncentracja produkcji w polskim przemysle spozywczym. Zeszyty Naukowe SGGW w Warszawie. Problemy RolnictwaSwiatowego 2008, 5, 33–41.
40. Chechelski, P. Ocena procesów koncentracji struktur podmiotowych w branzach przetwórstwa produktów pochodzeniazwierzecego w Polsce. Ann. Pol. Assoc. Agric. Agribus. Econ. 2017, 19, 62–67. [CrossRef]
41. Baran, J. Intensywnosc i Zasieg Geograficzny Internacjonalizacji Sektora Przetwórstwa Mleka; Wydawnictwo SGGW: Warszawa, Poland,2019; ISBN 978-83-7583-848-0.
42. Zuba-Ciszewska, M. Rola przemysłu spozywczego w gospodarce Polski. Nierównosci Społeczne a Wzrost Gospodarczy 2020, 64,69–86. [CrossRef]
43. Mroczek, R. Pozycja przemysłu spozywczego w łancuchu zywnosciowym w Polsce na przełomie XX/XXI wieku. ZeszytyNaukowe SGGW w Warszawie. Problemy Rolnictwa Swiatowego 2018, 18, 23–37. [CrossRef]
44. Chechelski, P. Ewolucja łancucha zywnosciowego. In Przemysł Spozywczy—Makrootoczenie, Inwestycje, Ekspansja Zagraniczna;Firlej, K., Szczepaniak, I., Eds.; Fundacja Uniwersytetu Ekonomicznego w Krakowie: Kraków, Poland, 2015; pp. 45–64, ISBN978-83-65173-07-2.
45. Nazarko, J.; Chodakowska, E. Labour Efficiency in Construction Industry in Europe Based on Frontier Methods: Data Envelop-ment Analysis and Stochastic Frontier Analysis. J. Civ. Eng. Manag. 2017, 23, 787–795. [CrossRef]
46. Lima, L.P.; Ribeiro, G.B.D.; Silva, C.A.B.; Perez, R. An Analysis of the Brazilian Dairy Industry Efficiency Level. Int. Food Res. J.2018, 25, 2478–2485.
47. Alem, H. The Role of Technical Efficiency Achieving Sustainable Development: A Dynamic Analysis of Norwegian Dairy Farms.Sustainability 2021, 13, 1841. [CrossRef]
48. Mbaga, M.D.; Romain, R.; Larue, B.; Lebel, L. Assessing Technical Efficiency of Québec Dairy Farms. Can. J. Agric. Econ. 2003, 51,121–137. [CrossRef]
49. Le, S.; Jeffrey, S.; An, H. Greenhouse Gas Emissions and Technical Efficiency in Alberta Dairy Production: What Are theTrade-Offs? J. Agric. Appl. Econ. 2020, 52, 177–193. [CrossRef]
50. Skevas, I.; Emvalomatis, G.; Brümmer, B. Heterogeneity of Long-Run Technical Efficiency of German Dairy Farms: A BayesianApproach*. J. Agric. Econ. 2018, 69, 58–75. [CrossRef]
51. Theodoridis, A.M.; Psychoudakis, A. Efficiency Measurement in Greek Dairy Farms: Stochastic Frontier vs. Data EnvelopmentAnalysis. Int. J. Econ. Sci. Appl. Res. 2008, 1, 53–67.
52. Kelly, E.; Shalloo, L.; Geary, U.; Kinsella, A.; Wallace, M. Application of Data Envelopment Analysis to Measure TechnicalEfficiency on a Sample of Irish Dairy Farms. Ir. J. Agric. Food Res. 2012, 51, 63–77.
53. Mohd Suhaimi, N.A.B.; de Mey, Y.; Oude Lansink, A. Measuring and Explaining Multi-Directional Inefficiency in the MalaysianDairy Industry. Br. Food J. 2017, 119, 2788–2803. [CrossRef] [PubMed]
54. Skevas, I.; Oude Lansink, A. Dynamic Inefficiency and Spatial Spillovers in Dutch Dairy Farming. J. Agric. Econ. 2020, 71, 742–759.[CrossRef]
55. Jaforullah, M.; Whiteman, J. Scale Efficiency in the New Zealand Dairy Industry: A Non-Parametric Approach. Aust. J. Agric.Resour. Econ. 1999, 43, 523–541. [CrossRef]
24
Agriculture 2022, 12, 52
56. Soliman, T.; Djanibekov, U. Assessing Dairy Farming Eco-Efficiency in New Zealand: A Two-Stage Data Envelopment Analysis.N. Z. J. Agric. Res. 2021, 64, 411–428. [CrossRef]
57. Syp, A.; Osuch, D. Zmiany efektywnosci i produktywnosci gospodarstw polowych i mlecznych w województwie lubelskim wlatach 2014–2016. Ann. Pol. Assoc. Agric. Agribus. Econ. 2018, 20, 137–142. [CrossRef]
58. Wilczynski, A.; Kołoszycz, E.; Switłyk, M. Technical Efficiency of Dairy Farms: An Empirical Study of Producers in Poland. Eur.Res. Stud. J. 2020, 23, 117–127. [CrossRef]
59. Switłyk, M.; Sompolska-Rzechuła, A.; Kurdys-Kujawska, A. Measurement and Evaluation of the Efficiency and Total Productivityof Dairy Farms in Poland. Agronomy 2021, 11, 2095. [CrossRef]
60. Silva, E.; Almeida, B.; Marta-Costa, A.A. Efficiency of the Dairy Farms: A Study from Azores (Portugal). Eur. Countrys. 2018, 10,725–734. [CrossRef]
61. Barnes, A.P. Does Multi-Functionality Affect Technical Efficiency? A Non-Parametric Analysis of the Scottish Dairy Industry. J.Environ. Manage. 2006, 80, 287–294. [CrossRef] [PubMed]
62. Demircan, V.; Binici, T.; Zulauf, C.R. Assessing Pure Technical Efficiency of Dairy Farms in Turkey. Agric. Econ. Czech 2010, 56,141–148. [CrossRef]
63. Tauer, L.W. Productivity of New York Dairy Farms Measured by Nonparametric Malmquist Indices. J. Agric. Econ. 1998, 49,234–249. [CrossRef]
64. Stokes, J.R.; Tozer, P.R.; Hyde, J. Identifying Efficient Dairy Producers Using Data Envelopment Analysis. J. Dairy Sci. 2007, 90,2555–2562. [CrossRef] [PubMed]
65. Mugera, A.W. Measuring Technical Efficiency of Dairy Farms with Imprecise Data: A Fuzzy Data Envelopment AnalysisApproach. Aust. J. Agric. Resour. Econ. 2013, 57, 501–520. [CrossRef]
66. Kapelko, M.; Oude Lansink, A. Technical Efficiency of the Spanish Dairy Processing Industry: Do Size and Exporting Matter? InEfficiency Measures in the Agricultural Sector: With Applications; Mendes, A.B., Soares da Silva, E.L.D.G., Azevedo Santos, J.M., Eds.;Springer: Dordrecht, The Netherlands, 2013; pp. 93–106, ISBN 978-94-007-5739-4.
67. Doucouliagos, H.; Hone, P. The Efficiency of the Australian Dairy Processing Industry. Aust. J. Agric. Resour. Econ. 2000, 44,423–438. [CrossRef]
68. Soboh, R.A.M.E.; Oude Lansink, A.; Van Dijk, G. Efficiency of European Dairy Processing Firms. NJAS Wagen. J. Life Sc. 2014,70–71, 53–59. [CrossRef]
69. Beber, C.L.; Lakner, S.; Skevas, I. Organizational Forms and Technical Efficiency of the Dairy Processing Industry in SouthernBrazil. Agric. Food Econ. 2021, 9, 23:1–23:22. [CrossRef]
70. Baran, J.; Kołyska, J. Porównanie wykorzystania zasobów małych, srednich i duzych przedsiebiorstw przemysłu mleczarskiegow latach 1998–2005. EQUIL 2009, 2, 159–169. [CrossRef]
71. Gradziuk, K. Efektywnosc przedsiebiorstw przemysłu spozywczego na przykładzie branzy mleczarskiej. Ann. Pol. Assoc. Agric.Agribus. Econ. 2009, 11, 117–122.
72. Baran, J. Efficiency of the Production Scale of Polish Dairy Companies Based on Data Envelopment Analysis. Acta Sci. Pol., Oecon.2013, 12, 5–13.
73. Domanska, K.; Kijek, T.; Tomczynska-Mleko, M. Efektywnosc przedsiebiorstw przemysłu mleczarskiego w województwielubelskim. Ann. Pol. Assoc. Agric. Agribus. Econ. 2015, 17, 29–34.
74. Berger, A.N.; Mester, L.J. Inside the Black Box: What Explains Differences in the Efficiencies of Financial Institutions? J. Bank.Financ. 1997, 21, 895–947. [CrossRef]
75. Pietrzak, M. Fenomen Spółdzielni Rolników. Pomiedzy Rynkiem, Hierarchia i Klanem; CeDeWu: Warszawa, Poland, 2019; ISBN978-83-8102-191-3.
76. Grashuis, J.; Su, Y. A Review of the Empirical Literature on Farmer Cooperatives: Performance, Ownership and Governance,Finance, and Member Attitude. Ann. Public Coop. Econ. 2019, 90, 77–102. [CrossRef]
77. Emerging Markets Information Service (EMIS). Available online: https://www.emis.com/ (accessed on 6 November 2021).78. Guzik, B. Podstawowe Modele DEA w Badaniu Efektywnosci Gospodarczej i Społecznej; Wydawnictwo Uniwersytetu Ekonomicznego
w Poznaniu: Poznan, Poland, 2009; ISBN 978-83-7417-368-1.79. Predki, A. Modelowanie Zmiennosci Danych w Ramach Metody DEA; Wydawnictwo Uniwersytetu Ekonomicznego w Krakowie:
Kraków, Poland, 2016; ISBN 978-83-7252-725-7.80. Cooper, W.W.; Li, S.; Seiford, L.M.; Zhu, J. Sensitivity Analysis in DEA. In Handbook on Data Envelopment Analysis; Cooper, W.W.,
Seiford, L.M., Zhu, J., Eds.; International Series in Operations Research & Management Science; Springer: New York, NY, USA,2011; pp. 71–91, ISBN 978-1-4419-6151-8.
81. Nowak, E. Analiza Sprawozdan Finansowych, 4th ed.; Polskie Wydawnictwo Ekonomiczne: Warszawa, Poland, 2017; ISBN978-83-208-2256-4.
82. Coelli, T. A Guide to DEAP Version 2.1: A Data Envelopment Analysis (Computer) Program. CEPA Work. Pap. 1996, 96/08, 1–49.83. Coelli, T.J.; Rao, D.S.P.; O’Donnell, C.J.; Battese, G.E. An Introduction to Efficiency and Productivity Analysis, 2nd ed.; Springer: New
York, NY, USA, 2005; ISBN 978-0-387-24266-8.84. Pai, P.; Khan, B.M.; Kachwala, T. Data Envelopment Analysis—Is BCC Model Better than CCR Model? Case of Indian Life
Insurance Companies. NMIMS Manag. Rev. 2020, 38, 17–35.85. Ohlan, R. Efficiency and Total Factor Productivity Growth in Indian Dairy Sector. Q. J. Int. Agric. 2013, 52, 51–77.
25
Agriculture 2022, 12, 52
86. Kumar, S.; Gulati, R. An Examination of Technical, Pure Technical, and Scale Efficiencies in Indian Public Sector Banks UsingData Envelopment Analysis. Eurasian J. Bus. Econ. 2008, 1, 33–69.
87. Jedrzejczyk, Z.; Kukuła, K.; Skrzypek, J.; Walkosz, A. Badania Operacyjne w Przykładach i Zadaniach, 6th ed.; WydawnictwoNaukowe PWN: Warszawa, Poland, 2011; ISBN 978-83-01-16483-6.
88. Kukuła, K.; Luty, L. O wyborze metody porzadkowania liniowego do oceny gospodarki odpadami w Polsce w ujeciu przestrzen-nym. Zeszyty Naukowe SGGW w Warszawie. Problemy Rolnictwa Swiatowego 2018, 18, 183–192. [CrossRef]
89. GUS [Statistics Poland]. Fizyczne Rozmiary Produkcji Zwierzecej w 2019 roku. Available online: https://stat.gov.pl/obszary-tematyczne/rolnictwo-lesnictwo/produkcja-zwierzeca-zwierzeta-gospodarskie/fizyczne-rozmiary-produkcji-zwierzecej-w-2019-roku,3,15.html (accessed on 6 November 2021).
90. GUS [Statistics Poland]. Zwierzeta Gospodarskie w 2019 Roku. Available online: https://stat.gov.pl/obszary-tematyczne/rolnictwo-lesnictwo/produkcja-zwierzeca-zwierzeta-gospodarskie/zwierzeta-gospodarskie-w-2019-roku,6,20.html (accessedon 6 November 2021).
91. GUS [Statistics Poland]. Charakterystyka Gospodarstw Rolnych w 2016 r. Available online: https://stat.gov.pl/obszary-tematyczne/rolnictwo-lesnictwo/rolnictwo/charakterystyka-gospodarstw-rolnych-w-2016-r-,5,5.html (accessed on 6 Novem-ber 2021).
92. Singh, S.; Fleming, E.; Coelli, T. Efficiency and Productivity Analysis of Cooperative Dairy Plants in Haryana and Punjab States ofIndia. Work. Pap. Ser. Agric. Resour. Econ. 2000, 2000-2, 1–18.
93. Ohlan, R. Productivity and Efficiency Analysis of Haryana’s Dairy Industry. Productivity 2011, 52, 42–50.94. Ozcan, Y.A. Health Care Benchmarking and Performance Evaluation. An Assessment Using Data Envelopment Analysis (DEA), 2nd ed.;
Springer: New York, NY, USA, 2014; ISBN 978-1-4899-7472-3.95. Kapelko, M. Measuring Inefficiency for Specific Inputs Using Data Envelopment Analysis: Evidence from Construction Industry
in Spain and Portugal. Cent. Eur. J. Oper. Res. 2018, 26, 43–66. [CrossRef] [PubMed]96. Malak-Rawlikowska, A.; Milczarek-Andrzejewska, D.; Fałkowski, J. Restrukturyzacja sektora mleczarskiego w Polsce—Przyczyny
i skutki. Roczniki Nauk Rolniczych, Seria G 2007, 94, 95–108.97. Brodzinski, M.G. Oblicza Polskiej Spółdzielczosci Wiejskiej. Geneza-Rozwój-Przyszłosc; Wydawnictwo FREL: Warszawa, Poland, 2014;
ISBN 978-83-64691-04-1.98. Mahajan, V.; Nauriyal, D.K.; Singh, S.P. Technical Efficiency Analysis of the Indian Drug and Pharmaceutical Industry: A
Non-Parametric Approach. Benchmarking Int. J. 2014, 21, 734–755. [CrossRef]99. Nowak, M.M. Wpływ spółdzielni mleczarskich na przemiany przestrzenne, ekonomiczne i srodowiskowe we współczesnej
gospodarce. Prace Naukowe Uniwersytetu Ekonomicznego we Wrocławiu 2013, 296, 251–260.100. Roman, M. Uwarunkowania i Kierunki Zmian Zasiegu Geograficznego Rynku Mleka Surowego w Polsce; Wydawnictwo SGGW:
Warszawa, Poland, 2017; ISBN 978-83-7583-756-8.101. Rudzinski, R. Organizacja logistyki w zakładach przetwórstwa mleka. Zeszyty Naukowe Uniwersytetu Przyrodniczo-Humanistycznego
w Siedlcach, Seria: Administracja i Zarzadzanie 2010, 87, 157–177.102. Ruales Guzmán, B.V.; Rodríguez Lozano, G.I.; Castellanos Domínguez, O.F. Measuring Productivity of Dairy Industry Companies:
An Approach with Data Envelopment Analysis. J. Agribus. Dev. Emerg. Econ. 2021, 11, 160–177. [CrossRef]
26
agriculture
Article
A Territorial-Driven Approach to Capture the TransformativeMomentum of the Social Economy Especially from theAgricultural Cooperatives
Juan Ramón Gallego-Bono 1,* and MariaR Tapia-Baranda 2,*
Citation: Gallego-Bono, J.R.;
Tapia-Baranda, M.R. A Territorial-
Driven Approach to Capture the
Transformative Momentum of the
Social Economy Especially from the
Agricultural Cooperatives.
Agriculture 2021, 11, 1281.
https://doi.org/10.3390/
agriculture11121281
Academic Editors: Adoración Mozas
Moral and Domingo Fernandez Ucles
Received: 5 November 2021
Accepted: 13 December 2021
Published: 16 December 2021
Publisher’s Note: MDPI stays neutral
with regard to jurisdictional claims in
published maps and institutional affil-
iations.
Copyright: © 2021 by the authors.
Licensee MDPI, Basel, Switzerland.
This article is an open access article
distributed under the terms and
conditions of the Creative Commons
Attribution (CC BY) license (https://
creativecommons.org/licenses/by/
4.0/).
1 Department of Applied Economics, University of Valencia, Avda. de Tarongers s/n, 46022 Valencia, Spain2 Instituto Tecnológico de Estudios Superiores de Monterrey, Avda. Eugenio Garza Sada, 2501 Sur,
Monterrrey 64849, Mexico* Correspondence: [email protected] (J.R.G.-B.); [email protected] (M.R.T.-B.)
Abstract: In the last few lustrums, the literature has searched for more precise methods to assess thesocio-economic importance of the Social and Solidarity Economy (SSE). On that basis, this articleoffers a new way of assessing the SSE impact, enhancing the understanding of the SSE potentialfor socio-economic transformation. An evolutionary micro–meso–macro and territorial theoreticalframework is developed, utilizing, along with the assistance of a qualitative methodology, studies onthe transformation promoted by the SSE on the sugar cane cluster of Veracruz (Mexico). The mainresults of the article are that the SSE boost beneficiaries, while the protagonists of the transformationcannot be defined a priori, but are rather conformed by transformation vectors promoted by theSSE: their values shared by a wide spectrum of actors, the SSE socio-economic and organizationalspecificities, and their rooting in the productive system. The fundamental conclusion of the articleis the need for a “territorial-driven approach” of the SSE’s impact, compared to the dominant“stakeholder-driven approach”. The main limitations (and suggestions for future studies) are theempirical investigation of a single case, and the need to develop a qualitative and quantitative systemof indicators of the transformative drive of SSE.
Keywords: social and solidarity economy; evolutionary approach; territorial-driven approach;agricultural cooperatives
1. Introduction
In recent decades, an extensive literature has been developed to explain how to valueand measure the socioeconomic importance of SSE (Social and Solidarity Economy) [1–7].A part of this literature quantified the sets of SSE activities with a series of variables, suchas production, employment, etc. This exercise has also been carried out at different levelson the reality of the SSE, covering individual initiatives (micro-level), initiatives in differentsectors or regions (meso level), or the economic level as a whole (macro-level) [2,3,5,6]. Theanalysis underlying the SSE, measured in these terms, is very important, especially whenits evolution over time is analyzed, showing some highly relevant dynamic aspects suchas its greater resilience than capitalist companies when faced with crises, measured, forexample, by their greater ability to maintain employment or production [8,9].
Nowadays, this way of measuring the significance of the SSE is only an indication thatdoes not allow us to capture other aspects that acquire great importance in the projectionof the SSE within the whole socio-economic system.
We will argue that SSE constitutes an essential transformation instrument for socioeco-nomic systems. However, this role goes beyond the scope of the SSE itself. Thus, to captureand measure this transformation potential, we need to understand how it contributes to,and drives, change on the path of socio-economic development.
Agriculture 2021, 11, 1281. https://doi.org/10.3390/agriculture11121281 https://www.mdpi.com/journal/agriculture
27
Agriculture 2021, 11, 1281
This article will try to demonstrate the transformative potential in SSE by showingits ability to promote a more socially inclusive and environmentally friendly develop-ment path.
We have considered that analyzing the potential for transformation that SSE maypossess, is not separate from the socio-economic structures in a social formation. Therefore,it is convenient to delimit the type of realities under study.
In this sense, although the analysis contained in this work could have a more gen-eral field of validity, the article will focus on the problems of Latin America and, morespecifically, on a set of countries and regions that face important obstacles to their develop-ment. Such is the case of the different behaviors of SSE entities in the sugarcane cluster inVeracruz, Mexico.
Indeed, the article will pay special attention to a type of society in which the entitiesthat are created following the legal forms of the SSE, especially cooperatives, are capturedsince their formation by the network of dominant political and economic actors.
Recently, however, this has not prevented some of these initiatives from developingin a spontaneous, endogenous, and territorial-rooted process, generating a new transfor-mative path promoted by the SSE values. This process will be connected with other localmovements and civil society, which have shown a huge transformation capacity [10–13].This is the case, in particular, of a series of regions and clusters in Latin America that showa certain capacity to exhibit a more inclusive and environmentally sustainable developmentprocess [14].
In line with the latter, is important to clarify the different types of SSE entities thatexist in the Veracruz sugarcane cluster and whose essential role will be analyzed in thisarticle. In the first place, it must be said that in the sugar cane of Veracruz we have notfound companies that had the legal form of cooperatives, surely for the reasons indicatedabove. However, we do find a new type of SMEs (small and medium-sized companies)organized almost strictly following cooperative principles, although without presentingthe cooperative legal form. This is specifically true regarding firms such as Mastevia orBalandra Foundry both in Cordoba, Veracruz, México. Along with these firms, we alsohave two types of associations. On the one hand, the associations of sugarcane producersor sugarcane growers. While some of them are part of the politico-economic sugarcanesystem dominated by multinationals, other alternative associations have recently appearedthat behave according to the principles of the SSE and that have developed a differentstrategy. Among the associations also stand out Asociación de Cañeros Independientes(ACI), and the UPV (Union of Piloncilleros de Veracruz); this last one has behavior similarto that of a second grade agri-food cooperative.
In this sense, the theoretical–empirical originality of the article lies in showing how,compared to the business model of the sugarcane cluster organized and dominated bymultinationals, which has high participation in the sugar mills (sugarcane producing com-panies and derived from it), based on a standardized product and a plot that minimizesrelationships and marginalizes local knowledge and actors, another alternative organiza-tion is possible. Indeed, another trajectory has emerged that tries to develop a differentiatedproduct based on local relationships and knowledge.
In this context, this article offers in the following section a conceptual frameworkthat will show the SSE capacity to promote a process of the clusters transformation indeveloping countries (particularly in Latin America).
To address this conceptual challenge, and this is the main theoretical contribution ofthe article, a micro–meso–macro evolutionary approach (initially conceptualized by Dopfer,Foster, and Potts [15,16] will be developed, in which these three different levels are definedin dynamic and structural terms, with meanings in some cases different from how they areusually understood. In a third section, we will use this framework to illustrate the case ofthe Veracruz sugarcane cluster, where the SSE is managing to promote the creation of anew path of inclusive and environmentally sustainable development. The leadership that aseries of SSE entities exercises over a broader set of actors will be evidenced, thanks to the
28
Agriculture 2021, 11, 1281
existence of a series of world views and values shared by these actors, which are largelythose of the SSE: cooperation, trust, acknowledgement, and transparency relationships.The article will end with a discussion and conclusions section.
The theoretical contribution of this article develops an evolutionary approach thatarticulates the micro and meso levels, allowing the derivation of a series of vectors forexplaining an essentially spontaneous process of endogenous base transformation drivenby SSE entities.
In the practical field, the capacity for self-organization of civil society led by the SSE isevident. Furthermore, this process may indeed have limitations in the absence of supportfrom public administrations. However, it is no less true that this process of self-organizationshows a series of behaviors and relationships that could constitute safe references (becausethey are rooted in the territory and the local actors themselves) for the definition of analternative policy to promote an endogenous trajectory and development of the territoriesand clusters of Latin America.
2. Conceptual Framework and Methods
2.1. Moving from a Stakeholder-Driven Approach to a Territorial-Driven Approach2.1.1. Evolutionary Roots of the Shift from the SSE Impact
We will start with the thought that, “the evaluation of the social economy reflects therole the social economy is expected to play in the development model and its transforma-tion”, Bouchard [2]. Insisting on this same idea, Richez-Battesti [14,17] emphasizes that,“what is at stake with the evaluation is also—and above all the definition of the field of theSSE and its modes of regulation.”
Bouchard argues that diverse evaluation approaches are associated with differentunderlying theoretical approaches or paradigms. She connects the managerial and strategicperspective, the neo-institutionalist economics, and the institutionalist sociology perspec-tive with different approaches to assessing the importance of the SSE [2]. In this sense, theemphasis of [2,17] on the transformation and modes of regulation that the SSE is capable ofprinting, is part of the latter institutionalist approach. Now, based on our perspective, it iskey to complete this institutionalist sociology approach with an evolutionary approach,where retaining the sociological importance of power relations, and in the search for amore democratic and inclusive economic model, the contribution of the SSE to a process ofchange and transformation is inserted, where new actors, competencies, relationships, andvalues appear.
Both at the theoretical and empirical levels, the article focuses on the problem ofclusters and territories. By cluster, we understand a network of companies connectedby their link to the same value chain that participates in the production of a good, aswell as a set, of activities of actors and support activities (universities, technology centers,service companies, etc.) within a more or less wide geographic space [18]. By territory,we understand a space socially constructed by the actors through their individual andcollective interactions, and their interaction with the environment [19–22]. A key hypothesisof this article is that in the same movement, SSE entities enhance relations and territorialknowledge and could also contribute to developing the clusters that a territory hosts.
The SSE actors can promote a transformation in the clusters and territories in whichthey operate because, by involving a plurality of players with partially different competen-cies, relationships, and values, they are capable of promoting (through interaction withthese other actors) the shift (territorial) from the micro to the meso level, and this shift is ofvital importance for the effective institutionalization of individual SSE initiatives [2,23,24].
In this sense, an important literature advancement to evaluate the incidence of SSEis the work of Ebrahim and Rangan [4]. As they synthetically point out, “outputs don’tnecessarily translate into outcomes, and outcomes don’t necessarily translate into impact”.What this means is that the true impact of SSE entities lies in the meso-sphere of thediffusion and institutionalization of individual (micro) initiatives. Now, to appreciatethe true impact of the SSE on this meso level, we have to conceptualize how this meso
29
Agriculture 2021, 11, 1281
impact goes beyond the SSE entities themselves, and how this process is linked to thetransformation mechanism associated with the SSE. For that purpose, first, we are going toformulate this general principle of transformation in the remainder of this section. Then, inthe next section, it will be shown how the SSE gives direction and how this transformationprocess is supported in its productive territorial rooting, which precisely confers to theSSE its scope in terms of generating a path towards more inclusive and environmentallysustainable development.
We will begin by advancing the general element of the evolutionary foundationof the need for a territorial-driven approach to the impact of SSE. A characteristic thatSaïd et al. [5] attribute to some quantitative approaches that try to assess the impact of SSE,is that of stakeholder-driven approaches. In other words, a static approach that seeks toassess the impact of the SSE by measuring the effects of its entities on the stakeholders(interest groups) [5]. With this approach, stakeholders are defined a priori. Now, froman evolutionary perspective, SSE initiatives generate ideas and innovations that in turnconnect with other ideas and innovations, which likewise stimulate the development ofnew ones [25]. An emerging process of transformation and structural change is generated,which cannot be anticipated a priori [25–27]. The territory is expected to constitute aprivileged space within which these chains of ideas, innovations, and connections areproduced. Especially when it is reasonable to expect that the actors are going to befavored by interacting with other actors on these same terms, and which are also veryclose concerning their expectations, worldviews, and values [28]. Hence, in this article,we support the hypothesis that there is a need to assess the impact of SSE as territorialdriven. Because, in coherence, with the open nature of the interaction and change incomplex systems [26], the stakeholders will define themselves by the process of structuraltransformation itself, while they will also give it feedback. This is what we are going toconceptualize in more detail below with the help of the micro–meso–macro approach, butconnecting it with the territorial roots of the SSE.
2.1.2. The Values of the SSE: Motor of Transformation and Basis of the DevelopmentTrajectory and Its Rooting in the Production SystemThe Micro–Meso Articulation
We are defending the hypothesis that in the context of clusters in developing countries,SSE may be the engine of a change in the dominant development model in the territory.
This development model consists of the emergence of new economic activities anda new development path in the territory [28]. To support this hypothesis, we devel-oped an evolutionary approach that emphasizes the generation of micro-variety (actors,competencies, relationships, and values) at the heart of change [25,27,29–32]. Now, inthe micro–meso–macro evolutionary approach [15,16] being defended, innovations andchanges do not occur when they are generated by an entity or organization (micro), butthrough a meso-trajectory of generation, adoption, diffusion, and institutionalization ofthese innovations (meso-rule) in the set of entities or organizations that define a popula-tion. These meso-rules are new routines in the behavioral, cognitive, technological, andsocio-organizational fields [15,16].
The macro-order is generated through the adjustment between different meso-trajectories.Therefore, the deployment of a meso-trajectory can destabilize it, which frequently doesnot happen because there is a set of institutions or meta-institutions that operate at a highlevel of abstraction (values, beliefs, etc.), which allow coordination behaviors, limiting thevariation margins of the meso-trajectories, so that they are compatible within a macro-order [16,33,34].
From an evolutionary perspective, the macro-order supposes the existence of a be-havior pattern and this can only happen when there is a structural coherence between theactivities that make up this order [25]. This reasoning is very important to appreciate themacro level of incidence of SSE from a new perspective. The core of the approach thatconcerns us constitutes the passage from the micro to the meso. We will anticipate that it is
30
Agriculture 2021, 11, 1281
the internal heterogeneity of the aforementioned population, which can promote both theinstitutionalization of change and the transformation process itself.
In this sense, emphasis is placed on the need to focus on the capabilities of the SSEto reach the underlying problems (of inequality, discrimination, etc.) [4] or, as previouslyadvanced, the need to institutionalize individual SSE initiatives [23]. In Latin America,Coraggio has pointed out that, “there is a clash between: (1) The urgent survival needs of theimpoverished and excluded sectors, as well as the targeted public programs of individualsor small groups related to self-employment designed to deal with this urgent situation;and (2) The longer time frames required to give proper consideration to the possibilitiesof building a system of SSE and to allow for the cultural changes it entails.” Both levelsare needed. At the very least it is necessary to intervene at the first level while keepingthe second level in mind, to shift from a micro to a meso-level perspective (promotingarticulation, complementarity, in territories, and communities)” (Coraggio) [24].
Our perspective also places the micro–meso articulation as being of vital importancefor the SSE, but placing more emphasis on the dynamic and all-encompassing virtues of theSSE. In effect, we argue that the actors, competencies, relationships, and values of the SSEcan promote a transformation in clusters and territories by promoting interaction betweenactors that are at the same time similar as well as different. This capacity of the SSE will besupported by two key elements. First, the ability of SSE values to bring together differentplayers who share a series of world views and essential values in the face of the statusquo, represented by the dominant actors [10,13,14,32,35]. These values are supported bya set of principles “involved in the institutionalization of new economic activities” [24].Principles that go from the market or the in-depth use of power relations, which are usuallyused by the dominant actors [14,24,36], to other values more typical of the SSE, such asreciprocity, fair trade, redistribution, non-exploitation of work, non-extractive development,responsible consumption, the transformation of property relations [24], and the recognitionof knowledge from other actors, transparency, trust, and non-discrimination [13]. Second,linking the SSE to the productive system gives it a potential capacity to transform thedevelopment model. Thus, for example, Coraggio [24] highlights that policies to stimulatethe development of new forms of production should be seen as a necessary complement toredistributive policies.
The combination of both elements gives the SSE entities the ability (so far dismissed)to have an impact on the territory. It has been argued that the principles and values ofthe SSE lead them to commit to the needs of the community in which they operate. Thiscan favor both a commitment to local development initiatives (which favors the inclusionof groups with difficulties/disadvantaged groups), as well as a predisposition to addressenvironmental problems and to attract people committed to both, inclusiveness and equity,as well as to environmental sustainability [37,38]. Now, the connection with the productivesystems in the framework of clusters in Latin America, means that there is an impact ata deeper level, from a structural perspective, in which the SSE and its integration in theterritory can promote a process of change and transformation through a new developmentmodel. From this perspective, on the issue of inclusiveness, it is not only about showing thecapacity of the SSE to develop programs and activities that incorporate people and groupswith difficulties into employment and services. It is about showing that the SSE, becauseof its values, socio-economic, and organizational characteristics, promotes a shift towardsa development model based on previously marginalized resources, actors, capacities,and relationships.
In the same way, these values and worldview, are what make a certain type of institu-tions (rules of the game) and coordination mechanisms between actors based on reciprocity,trust, recognition, and acceptance of grass-root knowledge (for example, a tacit characterand based on the experience of the others) [13,36]. This then causes a type of embed-dedness [39] and an organized (cognitive, organizational, and institutional) proximitybetween actors [20,21,40], which constitutes an essential condition for cooperation between
31
Agriculture 2021, 11, 1281
actors so they can introduce innovations in industrial ecology (the use of waste from someproductive activities as inputs to others, as occurs in natural ecosystems) [13,41,42].
In this section, we have shown that the essential drivers of micro–meso articulationand the basis of the role of the SSE to drive this process are: the generation of micro-diversity that SSE entities can set in motion and the capacity of the SSE itself to bringtogether various actors, linked in turn, to the nature of their values and the roots of theSSE in the production system. Both engines define the transformative capacity of the SSE,which is at the core of this article. Now, these two engines operate concretely through theirarticulation with the organizational characteristics of the SSE, and this will allow us todeduce a series of transformation channels promoted by the SSE.
The Channels of Transformation Carried by the SSE in Terms of Territorial Networks
It should be noted, on the one hand, the link between values and principles of theSSE are shared by actors who do not always belong to the SSE, but who are marginalized(in various ways) by the status quo, and, on the other hand, the development of SSE’sinnovative initiatives from the production system itself. These two elements have anotheressential implication from the (meso) perspective of the institutionalization process ofthe SSE’s innovations [23]. It is about the SSE capacity to promote the development ofa whole series of practice, epistemic, and political communities among different actorscapable to spread transformative impulses from the micro to the meso level, creating atransformative territorial network [13,25]. This ability of the SSE proceeds in three essentialways. First, the organization of the SSE into second- and higher-degree entities gives thema great capacity to spread the new routines among all the other SSE entities that are relatedto each other [43,44]. This is an area in which agricultural cooperatives have played anessential role because they constitute the paradigm of commitment to the communityand the territory highlighted above. This commitment leads a cooperative, concerning itsmembers, or in a second-degree cooperative concerning its base cooperatives, to exerciseits voice in the sense of Hirschman [45]. For example, when the production of the membersor the base cooperatives, respectively do not meet the quality standards required for thesuccessful commercialization of agricultural production, the cooperatives do not suspendthese members, or these base cooperatives (exit), nor do they maintain the relationship asif there was no problem (loyalty). On the contrary, what cooperatives do is express (voice)their dissatisfaction with the situation and systematically demand, as well as aid, membersto improve their routines and achievements. This enables the cooperatives and grass-rootcooperatives to raise the skills and capacity for innovation of their members [43]. However,in the framework of social and political realities where cooperatives are systematicallycaptured and denatured by the dominant political-economic powers, other collectiveentities such as associations could play a similar role.
Second, through the specific resources and know-how of the territory. The commit-ment of cooperatives and other entities of the SSE with the community and the territory,places them in excellent condition to mobilize a set of resources that are the result ofcollective-learning processes developed by local actors when dealing with productive,organizational, and commercial problems [19,46], as well as the in-house know-how de-veloped by the actors who actively participate in this process. It is a process in which thecooperatives and other entities of the SSE reinforce the ties of their organizations with thecommunity and the territory through a whole web of social relations and social capitallinked overall to the productive system [47].
Third, due to the richness of inter-sectoral relationships that innovative actors fre-quently carry in clusters of developing countries. This is usually associated with thedevelopment of a great diversity of venture activities in the territory by the most proactiveand critical actors with the status quo, as a way to face uncertainty and improve theirresilience. The growth of this productive diversity makes the same (more dynamic) localactors belong to and vitalize different practice and epistemic communities, which operatewith different values, organizations, and knowledge. This process is going to have a special
32
Agriculture 2021, 11, 1281
scope in terms of creating a space of structural coherence when the activities of thesepioneering actors develop simultaneously, not only in different links of the sugar valuechain but also in various value chain activities (of clusters and economic sectors) [48].
Succinctly, we understand from the above, the need to move from a stakeholderdriven to a territorial-driven evaluation logic. We mean that the territory itself channelsan essentially “meso-generating process” of a whole set of connections and interactionsbetween actors that diffuse and amplify in complexity the innovative SSE initiatives,toward: (a) other SSE entities; (b) other entities that behave with the same principles andvalues or (c) other entities that only share certain world views and values; and (d) diffusionof routines or innovations by exaptation, this is to serve a different objective for whichit was originally developed [49]. However, we should not underestimate “the capacityof appropriation and co-optation of any forms of innovation by corporate power in thedominant food system” (Rossi et al.) [2,50], and that could completely neutralize thistransformative power of innovation by exaptation carried out by entities other than SSEs.All this makes it difficult to define a priori the stakeholders that ultimately benefit from theimpact of the SSE.
The Characterization of the Generation Process of New Connections
Now, this creative process of generating new connections is a process with fewer fea-tures of indeterminacy than those contemplated in the general explanation of Metcalfe [20].This is because in our framework, as in the reality that it is intended to represent, there ispolarization and fragmentation (social, political, and economic) that causes the actors toonly selectively engage with certain actors. The shared values then are those that definethe top priority when selecting the actors with whom they will be preferentially linked.
This process of expansion of innovations in the territory, only partially indeterminate,allows us to see the meaning of the macro-order in a new light. Indeed, we have highlightedabove that the deployment of meso-rules by meso-trajectories generates tensions, butalso evolutionary opportunities [44], in other meso-rules and meso-trajectories and candestabilize the macro-order that links the different meso-rules [16]. We have also seenthe importance of a series of institutions that operate at a high level of abstraction (meta-institutions) to regulate the macro-order, thanks to the establishment of certain limits tomeso changes so that they do not destabilize the macro-order [16]. “The [macro] orderproduces a pattern” [7,25], in such a way that there must be a certain structural fit betweenthe meso-rules so that a minimum coherence is generated, which is often very complex.This is where the question of intermediary actors that can generate a space of confluencebetween different development paths arises [28], that in regions and clusters of developingregions are often the reflection of different meso-rules and meso-trajectories. This is alsoa crucial aspect from the perspective of shaping spaces for overcoming socio-economicfragmentation, capable of leading to the shaping of more integrated and less polarizedrealities, and therefore more coherent from a structural perspective.
This space capable of expanding to the macro-order, understood in a structural sense,opens a new field of research for the assessment of the impact of the SSE. For example,given the predominance of extractive behaviors [24], and little concern for efficiency in theclusters of Latin America [32], the attitudes that seek better use of resources through theindustrial ecology could generate a broad cross-sectorial space. This process could stimulatea movement shared by various actors (such as companies, technicians, researchers, andpublic officials) at the system’s margin, those who are uncomfortable with the status quoand are willing to change it [14]. This movement could contribute to the territorial extensionof some of the new routines and innovations driven by the SSE values and defended by SSEentities and other leading actors of the network, and the progressive shaping of discoursein favor of a transformative frame [51], more extensive, with more options to sustainablytransform the cluster. Nonetheless, the synchronous coexistence of different discourses oreven of different socio-technical micro-systems is highly probable.
33
Agriculture 2021, 11, 1281
2.2. Methodology and Information Sources
The empirical objective of this article is to explain the transformation process of theVeracruz sugarcane cluster and identify the actors, competencies, and relationships thatdrive this process. The central hypothesis to be shown is that the scope of the SSE goesfar beyond the importance and presence of the entities with a formal legal structure ofSSE. Consequently, a reality in which the dominant (public and private) actors capturesome lawful entities of the SSE, defines an exceptional case to contrast this hypothesis. Theresearch is based on a qualitative methodology with field visits and 110 in-depth personalinterviews conducted between 2017 and 2021. A closed questionnaire was used for 43 keyinformants (23 experts, 8 local politicians, and 12 researchers) and an open questionnairefor 67 stakeholders (28 farmers, 4 farmer associations, 9 sugar mills, 16 piloncillo makersand 10 entrepreneurs). A pilot study was conducted to check the relevance of the questionsby interviewing five reliable actors. In general, it was sought to delve into the origin of thebusiness, their markets, the internal and external relations, and the nature of their networksand innovations.
The sample intentionally includes all the sugarcane players. However, consideringthe objective of this research, the sample gives special importance to the actors that be-long to the SSE (Union of Piloncilleros de Veracruz—UPV- and Asociación de CañerosIndependientes—ACI-) and to the emerging business initiatives that belong to the ESS, orthat are organized following the principles of the ESS. The group of experts, based on theirreliability and leadership, are businessmen, professionals, public servants, researchers, anduniversity professors.
The sample was made using the networking or snowball technique that increasedwith the contacts of the interviewees until the saturation of the information was achieved.
The interviews were audio-recorded and transcribed to obtain the results by makinga systematic language analysis. It was sought to clarify: who are the actors that lead thegeneration and diffusion of innovations (social, environmental); the type of link (direct orindirect) that they have with the SSE, and their involvement in the innovation processes inthe territory. Special attention was also paid to the processes of generation of organizedproximity and shared identities between actors, in so far as they can constitute the basis forthe creation of networks of diverse nature and scope between them. The main blocks ofquestions directed towards the different actors in the value chain were the following. Origin,motivation, and form of organization of the entrepreneurial initiative. Main products andmarkets. Leading innovations developed in recent years and actors participating in them.Main forms of cooperation, main networks with other companies and institutions, mainprinciples and values that guide business activity, and main elements that help bring themcloser to or distance them from other actors in the territory. Role of insertion in markets andexternal value chains as a mechanism for consolidating and/or changing existing routinesin the sugarcane cluster.
3. Results
3.1. SSE as a Driver of Structural Change in the Sugarcane Cluster in Veracruz (Mexico)3.1.1. Historic Roots
Historically, the high mountain region in Veracruz, Mexico, has stood out since colonialtimes for its economic importance since the sugarcane plantation was favored, which is asector that has been the economic and social engine of this territory. The VC (value chain)of sugarcane extends to consumers in the countries that make up the United States–Mexico–Canada Agreement (USMCA), but sugar production in this region is sold as a commodity,without adding more value to the GVC (global value chain). Currently, it has a crowdedrural-urban territory with 65 urban centers, abundant water, and biodiversity [13,52].
The purpose of the USMCA, the extension of the North American Free Trade Agree-ment (NAFTA), is to give the region advantages to compete with the Asian giants, incorpo-rating some axes of the Circular Economy and the Sustainable Development Goals (ODS).
34
Agriculture 2021, 11, 1281
There is also the challenge of stopping corruption. The relevance of the economic actors inthis territory to face these challenges is set out below.
3.1.2. Internal and External Cluster Organization: The Formation of Two Polar Networks
The (external) insertion of the cluster as a whole in USMCA has contributed bothto the consolidation of a conservative network and to the emergence of a transformativenetwork [13]. Now, we can better understand these networks if we take into account thatthey diverge both in their organization within the Veracruz cluster and in the organizationof their relations with the outside world.
External Dependency and Internal Hierarchical Organization: The Conservative Network
The integration of the Mexican sugar sector into NAFTA in 1990 has simultaneouslydefined two radically different socio-economic realities. On the one hand, the verticalintegration to the GVCs, driven by powerful multinational actors, “has had a strongnegative impact on agricultural products, on the quality of employment and on the envi-ronment” [53], accelerating migration and fragmenting knowledge that drives innovations.These large multinational groups operate in many other activities, including the foodand beverage industry, and have taken important positions in the traditional sugarcaneproduction mills (with an increase in control over agricultural production) and maintainclose ties with the public powers. They also have solid connections with universities andnational research centers linked to sugarcane cultivation, forming a conservative network.This network focuses its innovations on the field of agricultural production and, within it,on scientific–technological aspects. In this way, local knowledge based on experience islargely neglected, marginalizing the actors who possess it, and making it difficult for theselocal actors to have access to new scientific–technological knowledge [13].
On the other hand, aided by globalization, different Mexican SMEs have appeared,benefiting from the territory’s competitive advantage to compete on the internationalmarket with more specialized products and services. This way, a transformative networkwill be formed around this local resource that is opposed to the status quo represented bythe conservative network. As a consequence of the greater circulation of local resources,the value chain expands within the territory [13]. From 1990, the Mexican sugar sectorwas “cartelized”, guarantee prices for sugar cane and exchange quotas for sweeteners(cane sugar and corn syrup) were set between countries [54]. Government actions (lawsand policies) are shaped by the interests of different networks and levels of power. Theconservative network is made up of the large corporate groups highly integrated intoglobalization (Cornbelt, sugar industry, and US oil refineries). National business groupsand organized groups with great social and political power are also incorporated into thisnetwork, such as farmers’ associations (Confederación Nacional Campesina—CNC- andConfederación Nacional de Propietarios Rurales—CNPR-), sometimes infiltrated by drugtrafficking. This power dynamic in the conservative network shows little commitment tohealth (healthy food) and fair trade, key dimensions for socio-technical change. By beingisolated from these objectives (socio-technical and environmental), and by ignoring theinclusion of new actors and knowledge, the opportunity of insertion into the territory andin other economic sectors of the sugar cane cultivation and the sugar mills is reduced [13].In the last two years, the CNC has managed to free itself from its traditional ties to thePRI (Partido Revolucionario Institucional) and now acts with notable autonomy andindependence from the political parties.
The opportunities to promote inclusion through cooperative initiatives (especiallyagricultural ones), and other forms of SSE are captured since their formation by some actorsof this conservative network, to divert public money and for electoral purposes: “federaldeputies ask us for 10% or up to 50% of the money destined to the formation of agriculturalcooperatives” (interviews with the cane, coffee, and papaya producers 2016–2020).
In terms of Industrial Ecology initiatives within this conservative network, they arebased on inter-industrial relationships, such as the use of biomass to produce electricity for
35
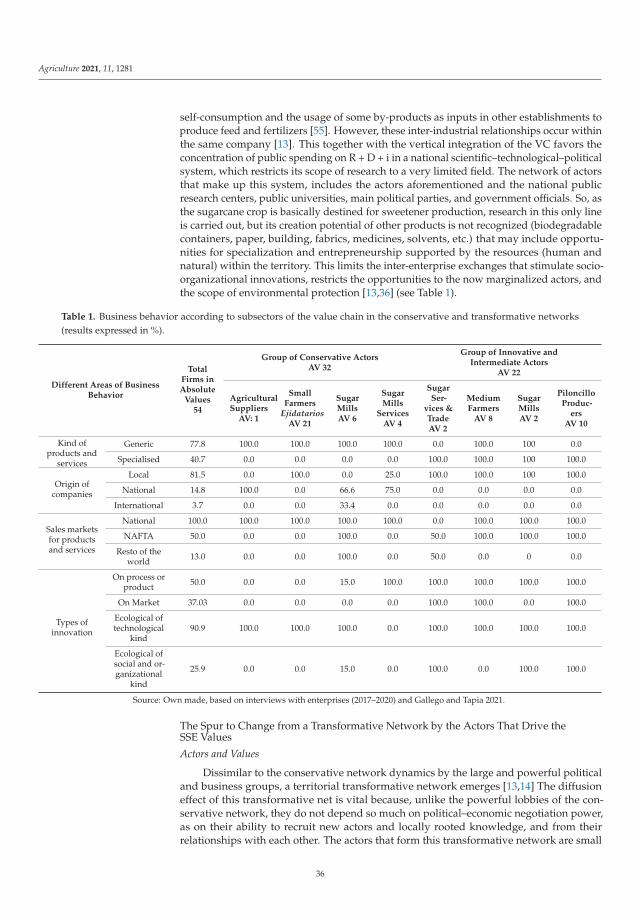
Agriculture 2021, 11, 1281
self-consumption and the usage of some by-products as inputs in other establishments toproduce feed and fertilizers [55]. However, these inter-industrial relationships occur withinthe same company [13]. This together with the vertical integration of the VC favors theconcentration of public spending on R + D + i in a national scientific–technological–politicalsystem, which restricts its scope of research to a very limited field. The network of actorsthat make up this system, includes the actors aforementioned and the national publicresearch centers, public universities, main political parties, and government officials. So, asthe sugarcane crop is basically destined for sweetener production, research in this only lineis carried out, but its creation potential of other products is not recognized (biodegradablecontainers, paper, building, fabrics, medicines, solvents, etc.) that may include opportu-nities for specialization and entrepreneurship supported by the resources (human andnatural) within the territory. This limits the inter-enterprise exchanges that stimulate socio-organizational innovations, restricts the opportunities to the now marginalized actors, andthe scope of environmental protection [13,36] (see Table 1).
Table 1. Business behavior according to subsectors of the value chain in the conservative and transformative networks(results expressed in %).
Different Areas of BusinessBehavior
TotalFirms inAbsolute
Values54
Group of Conservative ActorsAV 32
Group of Innovative andIntermediate Actors
AV 22
AgriculturalSuppliers
AV: 1
SmallFarmers
EjidatariosAV 21
SugarMillsAV 6
SugarMills
ServicesAV 4
SugarSer-
vices &TradeAV 2
MediumFarmers
AV 8
SugarMillsAV 2
PiloncilloProduc-
ersAV 10
Kind ofproducts and
services
Generic 77.8 100.0 100.0 100.0 100.0 0.0 100.0 100 0.0
Specialised 40.7 0.0 0.0 0.0 0.0 100.0 100.0 100 100.0
Origin ofcompanies
Local 81.5 0.0 100.0 0.0 25.0 100.0 100.0 100 100.0
National 14.8 100.0 0.0 66.6 75.0 0.0 0.0 0.0 0.0
International 3.7 0.0 0.0 33.4 0.0 0.0 0.0 0.0 0.0
Sales marketsfor productsand services
National 100.0 100.0 100.0 100.0 100.0 0.0 100.0 100.0 100.0
NAFTA 50.0 0.0 0.0 100.0 0.0 50.0 100.0 100.0 100.0
Resto of theworld 13.0 0.0 0.0 100.0 0.0 50.0 0.0 0 0.0
Types ofinnovation
On process orproduct 50.0 0.0 0.0 15.0 100.0 100.0 100.0 100.0 100.0
On Market 37.03 0.0 0.0 0.0 0.0 100.0 100.0 0.0 100.0
Ecological oftechnological
kind90.9 100.0 100.0 100.0 0.0 100.0 100.0 100.0 100.0
Ecological ofsocial and or-ganizational
kind
25.9 0.0 0.0 15.0 0.0 100.0 0.0 100.0 100.0
Source: Own made, based on interviews with enterprises (2017–2020) and Gallego and Tapia 2021.
The Spur to Change from a Transformative Network by the Actors That Drive theSSE Values
Actors and Values
Dissimilar to the conservative network dynamics by the large and powerful politicaland business groups, a territorial transformative network emerges [13,14] The diffusioneffect of this transformative net is vital because, unlike the powerful lobbies of the con-servative network, they do not depend so much on political–economic negotiation power,as on their ability to recruit new actors and locally rooted knowledge, and from theirrelationships with each other. The actors that form this transformative network are small
36
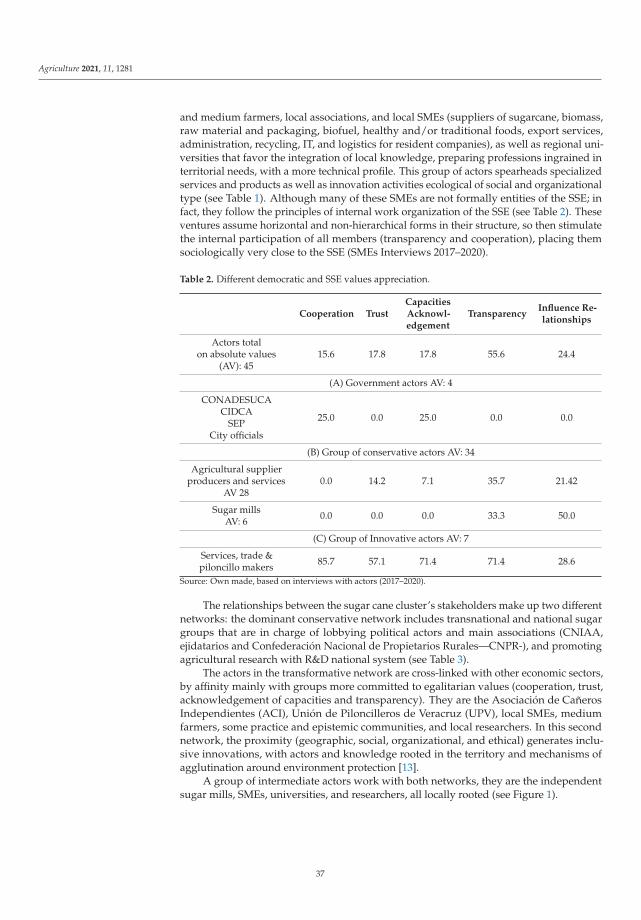
Agriculture 2021, 11, 1281
and medium farmers, local associations, and local SMEs (suppliers of sugarcane, biomass,raw material and packaging, biofuel, healthy and/or traditional foods, export services,administration, recycling, IT, and logistics for resident companies), as well as regional uni-versities that favor the integration of local knowledge, preparing professions ingrained interritorial needs, with a more technical profile. This group of actors spearheads specializedservices and products as well as innovation activities ecological of social and organizationaltype (see Table 1). Although many of these SMEs are not formally entities of the SSE; infact, they follow the principles of internal work organization of the SSE (see Table 2). Theseventures assume horizontal and non-hierarchical forms in their structure, so then stimulatethe internal participation of all members (transparency and cooperation), placing themsociologically very close to the SSE (SMEs Interviews 2017–2020).
Table 2. Different democratic and SSE values appreciation.
Cooperation TrustCapacitiesAcknowl-edgement
TransparencyInfluence Re-lationships
Actors totalon absolute values
(AV): 4515.6 17.8 17.8 55.6 24.4
(A) Government actors AV: 4
CONADESUCACIDCA
SEPCity officials
25.0 0.0 25.0 0.0 0.0
(B) Group of conservative actors AV: 34
Agricultural supplierproducers and services
AV 280.0 14.2 7.1 35.7 21.42
Sugar millsAV: 6 0.0 0.0 0.0 33.3 50.0
(C) Group of Innovative actors AV: 7
Services, trade &piloncillo makers 85.7 57.1 71.4 71.4 28.6
Source: Own made, based on interviews with actors (2017–2020).
The relationships between the sugar cane cluster’s stakeholders make up two differentnetworks: the dominant conservative network includes transnational and national sugargroups that are in charge of lobbying political actors and main associations (CNIAA,ejidatarios and Confederación Nacional de Propietarios Rurales—CNPR-), and promotingagricultural research with R&D national system (see Table 3).
The actors in the transformative network are cross-linked with other economic sectors,by affinity mainly with groups more committed to egalitarian values (cooperation, trust,acknowledgement of capacities and transparency). They are the Asociación de CañerosIndependientes (ACI), Unión de Piloncilleros de Veracruz (UPV), local SMEs, mediumfarmers, some practice and epistemic communities, and local researchers. In this secondnetwork, the proximity (geographic, social, organizational, and ethical) generates inclu-sive innovations, with actors and knowledge rooted in the territory and mechanisms ofagglutination around environment protection [13].
A group of intermediate actors work with both networks, they are the independentsugar mills, SMEs, universities, and researchers, all locally rooted (see Figure 1).
37
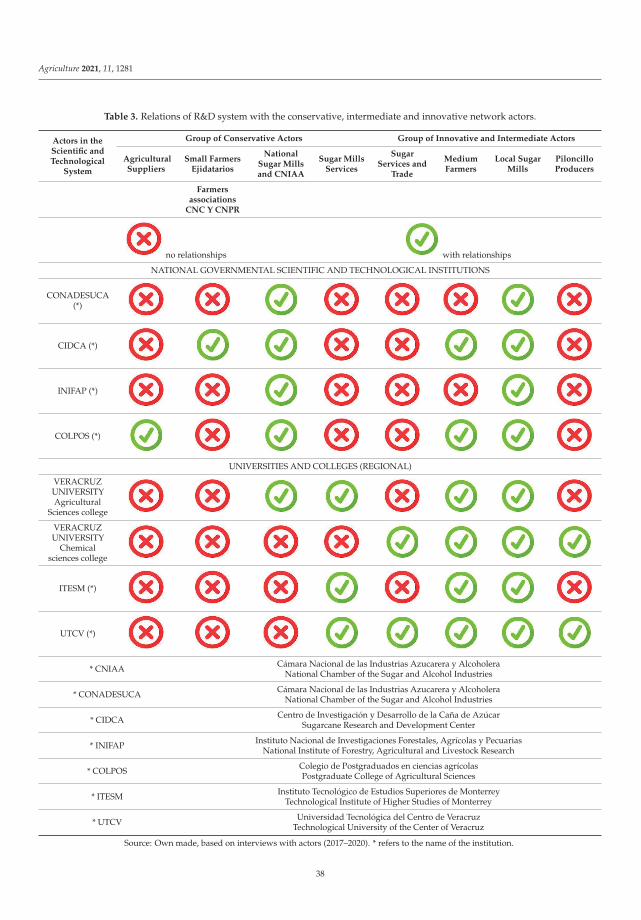
Agriculture 2021, 11, 1281
Table 3. Relations of R&D system with the conservative, intermediate and innovative network actors.
Actors in theScientific andTechnological
System
Group of Conservative Actors Group of Innovative and Intermediate Actors
AgriculturalSuppliers
Small FarmersEjidatarios
NationalSugar Millsand CNIAA
Sugar MillsServices
SugarServices and
Trade
MediumFarmers
Local SugarMills
PiloncilloProducers
Farmersassociations
CNC Y CNPR
no relationships with relationships
NATIONAL GOVERNMENTAL SCIENTIFIC AND TECHNOLOGICAL INSTITUTIONS
CONADESUCA(*)
CIDCA (*)
INIFAP (*)
COLPOS (*)
UNIVERSITIES AND COLLEGES (REGIONAL)
VERACRUZUNIVERSITYAgricultural
Sciences college VERACRUZUNIVERSITY
Chemicalsciences college
ITESM (*)
UTCV (*)
* CNIAA Cámara Nacional de las Industrias Azucarera y AlcoholeraNational Chamber of the Sugar and Alcohol Industries
* CONADESUCA Cámara Nacional de las Industrias Azucarera y AlcoholeraNational Chamber of the Sugar and Alcohol Industries
* CIDCA Centro de Investigación y Desarrollo de la Caña de AzúcarSugarcane Research and Development Center
* INIFAP Instituto Nacional de Investigaciones Forestales, Agrícolas y PecuariasNational Institute of Forestry, Agricultural and Livestock Research
* COLPOS Colegio de Postgraduados en ciencias agrícolasPostgraduate College of Agricultural Sciences
* ITESM Instituto Tecnológico de Estudios Superiores de MonterreyTechnological Institute of Higher Studies of Monterrey
* UTCV Universidad Tecnológica del Centro de VeracruzTechnological University of the Center of Veracruz
Source: Own made, based on interviews with actors (2017–2020). * refers to the name of the institution.
38
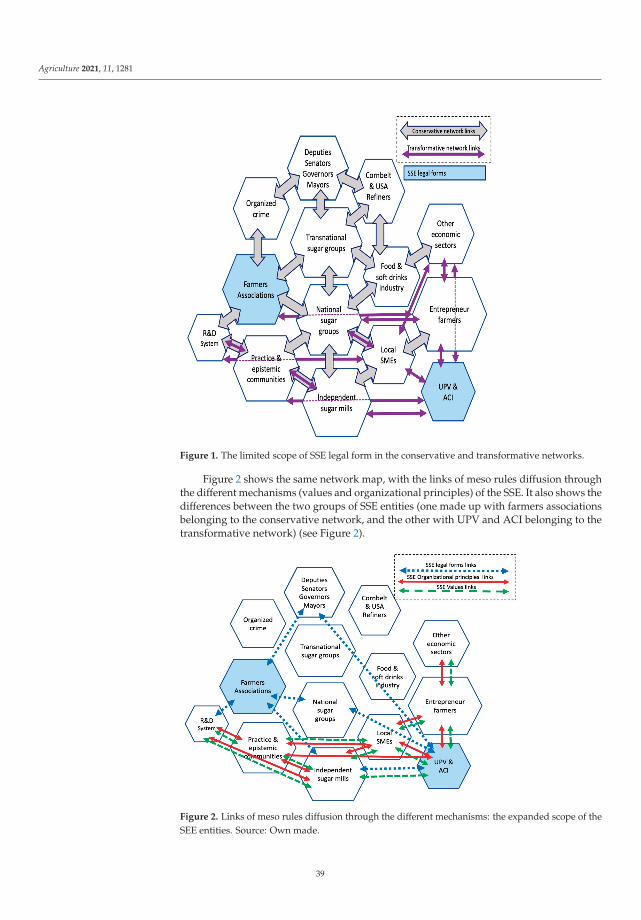
Agriculture 2021, 11, 1281
Figure 1. The limited scope of SSE legal form in the conservative and transformative networks.
Figure 2 shows the same network map, with the links of meso rules diffusion throughthe different mechanisms (values and organizational principles) of the SSE. It also shows thedifferences between the two groups of SSE entities (one made up with farmers associationsbelonging to the conservative network, and the other with UPV and ACI belonging to thetransformative network) (see Figure 2).
Figure 2. Links of meso rules diffusion through the different mechanisms: the expanded scope of theSEE entities. Source: Own made.
39
Agriculture 2021, 11, 1281
The Emergence of the Shorter Supply Chain
Linked by this vision on proximity and trust, members of SSE local associations,(such as the Unión de Piloncilleros de Veracruz (UPV) and the Asociación de CañerosIndependientes (ACI) and other actors who are not part of the SSE, but who share someof its principles and values, are connected. The actors meet, organize, and offer theirgoods and services among themselves, creating a shorter supply chain and a more circularsustainable (socially, environmentally, and economically) development process withinthe territory.
The UPV was created in 2005 with approximately 200 medium-sized cane produc-ers/owners from the municipalities of Huatusco and Zentla Veracruz. They are artisanmanufacturers of piloncillo (artisan sweet) that saw the need to rely on a quality stan-dard/certification for their manufacture. This standard/certification requires that 100%pure cane juice is used to obtain a culturally recognized product of high nutritional quality,using renewable energy, thereby creating a cycle that protects the ecosystem. “To leave abetter planet for our children” (interview with a piloncillo maker, 2018). This statementshows the commitment with the territory as a key to the cultural and institutional proximityamong local actors. The associates are professionals and entrepreneurs who grow sugarcane and, unlike the small owners (ejidatarios), obtain better yields in their crops, and hireharvest groups (workers who organize informally). In this way, they not only disseminatethe demands for improvement and the obligation to comply with a series of norms andstandards (meso-rules) for all members of the association following the operating model ofagricultural cooperatives, but they also push to improve the groups of workers who run aswage earners for a significant number of farmers (inclusiveness). As we will see below, thepiloncillo makers also operate and improve other areas of the production, marketing, andthe sugar cane value chain and its derivatives. Jointly they diversify their yields with othercrops, livestock, and trees to serve specialized markets that demand quality and naturalproducts (environmental innovation). This association enabled them to take advantageof their personal relationships (neighbors, relatives, and colleagues) and cultural identity(most are descendants of Italian migrants or their neighbors), coordinating their knowledgeand vision of development to solve the problems they are faced with (intermediaries,health, environment, transparency, employment, security, etc.). The partners strengthenthe density of their relationships by including some small farmers (ejidatarios) who sharethis vision, and expand into a series of activities (commerce, transportation, leisure, andservices) that broaden the value chain within the territory. At the same time, through theUSMCA, they are engaged with markets, practice and epistemic communities in the USAand the rest of the world, updating their formal and empirical know-how. Driven by thesame values (trust, cooperation, and transparency) and vision that brings together actorsof the transforming network, and based on proximity (geographical, social, organizational,and ethical), small and medium-sized sugarcane producers, tired of the corruption andthe few benefits that they obtain from being forced to depend on one of the main pro-ducer associations (Comisión Nacional Campesina—CNC- y CNPR, which belongs to theInstitutional Revolutionary Party (PRI)), join independent associations [13].
For example, in the municipalities of Omealca Veracruz and its surroundings, the ACIwas created with the support of another political party. The purpose of this associationwas to provide greater transparency over the management of the resources that are used toimprove the harvest yields (reduction in the waiting time of the trucks that transport thecane from the fields to the batey to unload them, detection of pests, the price of implementsand products for till and harvest, shared load transport, etc.) [13]. The ACI also coordinateshealth campaigns, scholarships for students, sports tournaments, and participates in thelocal religious festivals.
It must also be taken into account that Mexico’s insertion into NAFTA and laterinto the USMCA, makes the actors from the other two more developed countries of theagreement (especially the USA) monitor the behaviors of the Mexican actors with whomthey cooperate. Thus, recently the car manufacturers of the USA filed a complaint against
40
Agriculture 2021, 11, 1281
the non-transparent practices of Mexican unions in this sector, which has led to a radicalchange in union representation in this sector. Everything points in the direction that asimilar process could be taking place in the sugarcane cluster. They are, therefore, facing anexternal exercise of the voice in the presence of the behaviors considered inappropriate bythe Mexican partners belonging to the same network. By forcing a change in the routinesof some actors (associations) of the conservative network of the cluster, they can alsochange the framework of the relationships within the transforming network as well as therelationships between both networks. In effect, on the one hand, they represent support forthe change in routines already initiated by some actors within the transforming network.We are thinking, for example, of the emergence of the ACI, which, as we have seen,came about due to the dissatisfaction of many producers concerning the other traditionalassociations integrated into the conservative network. On the other hand, it can turn thesenewly emerged associations into references of their peers in the conservative network.Thus, this process can bring about, unintentionally, external actors as vectors of change andexternal intermediaries that contribute to the creation of new meeting space (transparentand trustworthy) between different networks and, consequently, to the expansion of astructural coherent space meso–macro.
The ambivalent role of the insertion into the GVC and, in particular, into NAFTA andUSMCA, based on the dynamics of change in the sugarcane cluster derived from all ofthe above. The insertion into groups with interests in other sectors (fuel, food, beverages,etc.) and the encouragement of vertical integration around the mills generates inertia,because it minimizes the interaction with other actors and with local forms of knowledgeand reinforces the actors and dominant routines of the conservative network. However,as some of these routines of its Mexican partners go against their economic interests, theexternal actors react by becoming determined agents of change and with a reach that cantranscend the conservative network itself.
The Role of Intermediate Actors
The transformative net integration includes actors that can be considered intermedi-aries between the two polar networks (local independent mills—San José de Abajo andMotzorongo-, R&D system, and SMEs from other regions and other sectors). The doubleactors that make up this intermediate network are organized crosswise and horizontally,they create relationships with other communities of practice and epistemic communitiesand markets that sometimes coincide, but often are different from the relationships thatthe other two networks have. By including local knowledge, they carry out their research,with local universities, with their suppliers, other professionals, and with other sectors andcountries. The processes of these actors are also more transparent and specialized, usingand developing local resources (human and material), which include a greater diversity ofactivities and, as a result, the products are more specialized and comply with internationalquality standards (SMEs interviews 2018). Although the innovations that are producedhere have an impact on the territory, very slowly they can reach diffusion/transmission(meso) in the context of violence and corruption that prevails in the territory. That is why,these actors strengthen their relationships in safe spaces, such as in local events (sports,religious, and cultural), school, or family, “where the attendees are well known and for along time” (interview with a manager of independent sugar mill, 2018). Along with thisintermediation work that some actors can often carry out on an individual basis, it is alsoimportant to highlight the special capacity to take on this role of intermediaries betweenpolar networks played by some actors integrated into collective entities.
In this sense, along with the leading piloncillo makers who play a key role in thedissemination of norms and standards among other piloncillo makers, but who are muchmore advanced than the vast majority of small owners (ejidatarios), there are other pi-loncillo makers who are more followers than leaders who can also play an importantrole. In effect, this condition of followers makes them suitable references for some restlessejidatarios who would like to modernize their productive and commercial practices but ina non-disruptive way. This discussion shows that in this case, the conditions are optimal
41
Agriculture 2021, 11, 1281
for a perfect combination to be made between the degree of homophily (similarity) andheterophily (difference) among actors. This is key so that the actors involved are similarenough to be able to imitate one another but are also sufficiently different so that informa-tion and new routines can flow between them [56]. Some non-leading piloncillo makerswould be imitated by some proactive ejidatarios, which would actually provide positivefeedback on an important kind of actor in the conservative network. Now, in additionto this combination of similarity/difference between the actors, which encourages thedissemination of innovations of the two networks, there is another element that is vitalin the ability of the actors to bridge between both network groups especially linked toagricultural production. It is that agricultural production best represents the structuralbases of the productive system, where the key aspects of inequality, discrimination, andenvironmental problems will be defined, as well as the terrain where to most effectivelyattack all these imbalances.
4. Discussion and Conclusions
This article is part of recent works that have defended the SSE’s capacity to transformthe economic model [2] and the institutions of socio-economic regulation [17] as a startingpoint and nucleus of assessment of the importance of the SSE. In this case, our articlepresents itself as a novelty, in that it adopts an evolutionary and territorial perspective.This allows us to see in a new light this transformation capacity of the SSE and, conse-quently, the way to value and measure it. Thus, it is a question of deepening the researchline opened by the works that have emphasized the importance of assessing the SSE’sincidence beyond the direct weight that their entities have [4], the analyses that highlightthe importance of the transition from the micro to the meso [4,5,24], or even the key role ofits institutionalization [23].
This discussion section and conclusions will focus on this transformation capacity ofthe SSE territory, highlighting three dimensions of the process: (a) the territorial-drivenapproach; (b) the role of meso dynamic; and (c) the economic policy perspective.
Regarding the first aspect, what differentiates our article from those works is thatit defends and provides evidence in favor of the hypothesis that the SSE transformationcapacity goes beyond the importance of its entities, but its path cannot be limited a priori tostakeholders (interest groups), this being the “stakeholder-driven approach” [5]. In effect,we advocate a “territorial-driven approach” because we consider (as was theoreticallyand empirically evidenced) that the SSE effective field of influence (and, consequently, thestakeholders) cannot be defined a priori but are the result of a creative and open process ofinteraction of ideas, innovations, and connections [25] driven by the territory itself. How-ever, because it is guided by the territory, it is not an indeterminate process, as Metcalfe [25]argues, but only partially indeterminate. Indeed, it is shown that the SSE values are whatallow it to expand its sphere of action, through a “transformative network” creation, whichencompasses many more actors than the formal SSE entities, but it is selective. In otherwords, the cumulative sequences of innovations and connections are essentially limitedto actors who share worldviews and values, although these too are transformed by theprocess. This transformative network demonstrates the capacity of local actors to challengethe capture of SSE entities by the established political–economic network [10,32,36,57]. Thisprocess is possible because SSE’s entities and other entities that do not have the legal SSEform, but follow their routines and principles of organization, are capable of generatingcreative processes around themselves. This includes not only innovations generation butalso their diffusion among a wide spectrum of actors in the territory. These actors areprogressively enrolled in the new transformative network [13]. This enrollment occursthrough a set of communities of practice, epistemic, and political, which are based on(and contribute to extend) shared expectations, worldview, and values. In addition, thisprocess supports the embedding of the SSE in the production system. This means thatinclusive and environmental innovations (for example, industrial ecology) have a greaterscope than has been considered so far in the literature. Indeed, as the Veracruz sugarcane
42
Agriculture 2021, 11, 1281
case shows, inclusive innovation allows actors to emerge and enroll in the transformativenetwork, whose resources, knowledge, and relationships have been marginalized fromthe productive system until now. A transformation that goes far beyond redistributiveprocesses in the form of helping disadvantaged actors [24]. This transformative networkthat was formed in Veracruz also promotes the adoption of industrial ecology innovationsthrough inter-sectoral cooperation between actors based on organized proximity [13]. Ul-timately, it is the endogenous linkage of the SSE that gives it this enormous, and at thesame time, open potential for territorial transformation. However, the development of amicro–meso–macro approach allows us to advance our understanding of the (dynamic)forces that guide this process.
In fact, and as a second highlight of the article, the micro–meso–macro approachthat we have followed, and whose development we are trying to contribute in this article,has argued that changes occur in the meso domain; that is, while a new rule (routineor innovation) is diffused among the entities of the same nature that make up a popula-tion [15,16]. Now, based on our article, it is possible to defend the idea that the populationof entities cannot be defined a priori, but rather is defined with the process of generationand diffusion of innovation (meso-rule). Hence, the need for a territorial-driven approachto understanding the ultimate reach of the SSE, and also, the possibility of building atypology of mechanisms for the diffusion of innovation from the SSE that could expandthe number of actors (population) who adopt the innovations even beyond the area ofreach of the SSE entities. In this sense, it has been possible to demonstrate the strategicrole of several agricultural associations and other entities that follow the principles oforganization of the SSE in the dissemination of new routines, and the formation of a broadtransformative network that houses a large number of actors that end up being in the orbitof the ESS. Therefore, we can conclude that as the meso-rule that originated in the SSEspreads to increasingly different actors, the greater, is also the structural (macro), scope ofthe diffusion and institutionalization of the meso-rule and, therefore, its impact is also morecomprehensive. Following this reasoning, we expose an inclusion effect associated with:(1) the promotion of activities based on new organizational principles; (2) the mobilizationof knowledge, which by itself, is marginalized by the dominant network; (3) the use ofproximity relationships between actors; and (4) a key aspect that has not been very promi-nent until now, and that causes our work to the surface, is that through the simultaneousaffiliation of the same entrepreneurs to several very different communities of practice, cangenerate a cross-sectional diffusion of some meso-rules. While this process could desta-bilize the macro-order [16], and generate opportunities in other areas [44], it could alsobroaden the scope of the transformative process and extend along with it the macro-orderfrom a structural perspective. Indeed, through the dissemination of the meso-rule, newspaces of structural coherence are opened between productive activities that are part of thesame value chain or different value chains that intersect at some points.
In the following Table 4, we present some basic aspects of this theoretical framework,connecting the specific features and actors of sugarcane with a typology of mechanismsof diffusion, proximity, and transmission of the meso rules from the entities of the SSE.Explaining the possible transformative scope in the specific case of the Veracruz sugarcane cluster.
The article offers some clues to advance future work with more accurate measurementsof the transforming scope of the ESS. This constitutes a contribution to the development ofa micro–meso–macro approach. The most important issue is that the article allows us toderive from a double conceptual and empirical perspective, a series of guiding criteria forthe selection and definition of a system of indicators. At the micro level, it is about puttingthe focus on the diversity and heterogeneity of the actors (new and already established) askey factors in generating innovations. The SSE stand out in this regard for their innovativesocial and environmental dynamism, their commitment to the territory and their link tothe productive system. At the meso level, the indicator selection criteria must capture thevarious mechanisms for the diffusion of micro innovations. The organizational advantages
43
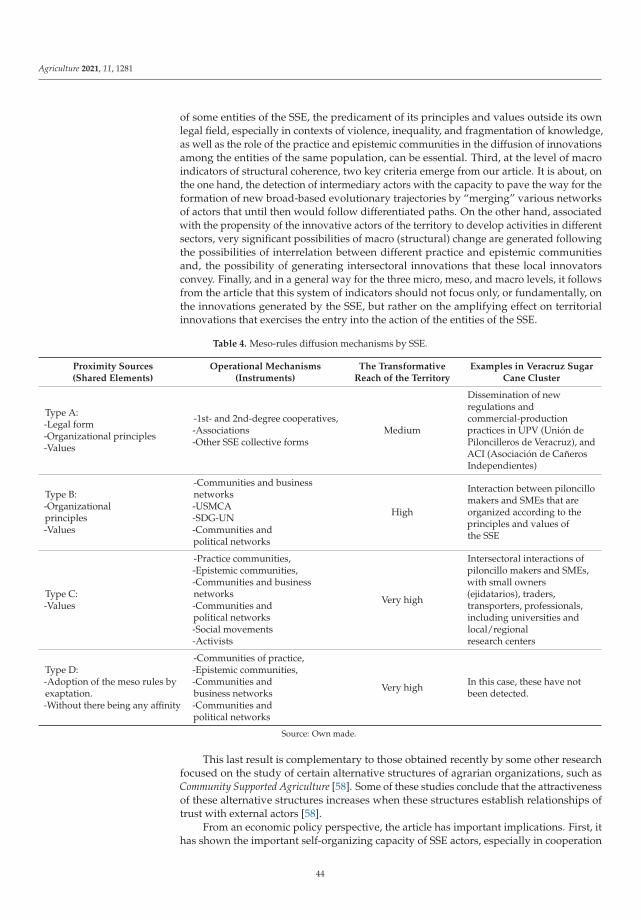
Agriculture 2021, 11, 1281
of some entities of the SSE, the predicament of its principles and values outside its ownlegal field, especially in contexts of violence, inequality, and fragmentation of knowledge,as well as the role of the practice and epistemic communities in the diffusion of innovationsamong the entities of the same population, can be essential. Third, at the level of macroindicators of structural coherence, two key criteria emerge from our article. It is about, onthe one hand, the detection of intermediary actors with the capacity to pave the way for theformation of new broad-based evolutionary trajectories by “merging” various networksof actors that until then would follow differentiated paths. On the other hand, associatedwith the propensity of the innovative actors of the territory to develop activities in differentsectors, very significant possibilities of macro (structural) change are generated followingthe possibilities of interrelation between different practice and epistemic communitiesand, the possibility of generating intersectoral innovations that these local innovatorsconvey. Finally, and in a general way for the three micro, meso, and macro levels, it followsfrom the article that this system of indicators should not focus only, or fundamentally, onthe innovations generated by the SSE, but rather on the amplifying effect on territorialinnovations that exercises the entry into the action of the entities of the SSE.
Table 4. Meso-rules diffusion mechanisms by SSE.
Proximity Sources(Shared Elements)
Operational Mechanisms(Instruments)
The TransformativeReach of the Territory
Examples in Veracruz SugarCane Cluster
Type A:-Legal form-Organizational principles-Values
-1st- and 2nd-degree cooperatives,-Associations-Other SSE collective forms
Medium
Dissemination of newregulations andcommercial-productionpractices in UPV (Unión dePiloncilleros de Veracruz), andACI (Asociación de CañerosIndependientes)
Type B:-Organizationalprinciples-Values
-Communities and businessnetworks-USMCA-SDG-UN-Communities andpolitical networks
High
Interaction between piloncillomakers and SMEs that areorganized according to theprinciples and values ofthe SSE
Type C:-Values
-Practice communities,-Epistemic communities,-Communities and businessnetworks-Communities andpolitical networks-Social movements-Activists
Very high
Intersectoral interactions ofpiloncillo makers and SMEs,with small owners(ejidatarios), traders,transporters, professionals,including universities andlocal/regionalresearch centers
Type D:-Adoption of the meso rules byexaptation.-Without there being any affinity
-Communities of practice,-Epistemic communities,-Communities andbusiness networks-Communities andpolitical networks
Very high In this case, these have notbeen detected.
Source: Own made.
This last result is complementary to those obtained recently by some other researchfocused on the study of certain alternative structures of agrarian organizations, such asCommunity Supported Agriculture [58]. Some of these studies conclude that the attractivenessof these alternative structures increases when these structures establish relationships oftrust with external actors [58].
From an economic policy perspective, the article has important implications. First, ithas shown the important self-organizing capacity of SSE actors, especially in cooperation
44
Agriculture 2021, 11, 1281
with actors who share their organizational principles and values. However, even if thesetransformation processes have largely taken place outside the public authorities, their roleshould not be underestimated. Indeed, the actors in the transforming network sometimesrely on public actors occupying peripheral positions, generating a symbiotic relationshipbased on mutual respect and recognition, which is very useful for the performance of thespecific functions of both. Secondly, these processes are an example of the transformativecapacity associated with individual and collective actors (e.g., associations) that are actingas entities that have a great deal of autonomy from the public authorities, especially themainstream political parties. This contrasts with the traditional strong linkage of individualand collective actors in the conservative network with the public authorities, and inparticular the political parties. Third, and connected with the contrast we have just seen, thepossible demonstration effect of some minority actors of the transforming network on somemajority actors of the conservative network should not be underestimated. Consequently,the transforming network’s status as a lever of territorial change should make it the focus ofany public policy to stimulate democracy, the fight against corruption and the commitmentto an endogenous development model fully inserted in the international economy. Inthis sense, after we conducted the bulk of the interviews that served as the basis for thisresearch, there has been a process of growing autonomy or independence by one of thelarge associations of sugarcane producers with respect to the major political parties. Tryingto deepen the connections that may exist between the latter process and the developmentand consolidation of a transformative network appears as an interesting field of researchfor the future that can help to understand the complex dynamic interrelationship betweenthe formal entities of the SSE (agricultural associations and cooperatives, etc.) and otherentities that share its organizational principles and values.
Even though we believe that the article opens up some interesting lines of research,to make them effective, it is necessary to address some of the limitations of the article.Firstly, the article has focused on the study of the Veracruz sugarcane cluster (Mexico).No doubt studying the cases of other regions (developing and developed) and comparingthem with each other would help to refine the theoretical framework and to fine-tune theproposed system of indicators. Secondly, the methodology used in the empirical analysis isessentially qualitative. Now, it would be necessary to develop some quantitative tools to tryto measure the different defining categories of proximity between actors and the diffusionof the meso-rules identified in the article. This could make an important contributionto the development of an operational methodology for the measurement of the SSE thatintegrates the various methods that revolve strictly around the entities of the SSE and thequalitative method developed here to capture the ability of the SSE to drive a process ofbroader (territorial) transformation.
Author Contributions: Conceptualization, J.R.G.-B.; methodology, M.R.T.-B. and J.R.G.-B.; validation,M.R.T.-B. and J.R.G.-B.; formal analysis, J.R.G.-B. and M.R.T.-B.; investigation, J.R.G.-B. and M.R.T.-B.;resources, J.R.G.-B. and M.R.T.-B.; data curation, M.R.T.-B.; writing—original draft preparation andwriting—review and edition, J.R.G.-B. and M.R.T.-B.; funding acquisition, J.R.G.-B. and M.R.T.-B. Allauthors have read and agreed to the published version of the manuscript.
Funding: This work was supported by the Spanish Ministry of Science, Innovation, and Universities(GOBEFTER II Project, CSO2016-78169-R) and by the Mexican National Council of Science andTechnology (CONACYT) (grant number CVU 442382).
Acknowledgments: This article is a revised version of the communication presented in the 8thCIRIEC International Research Conference on Social Economy “Solidarity and Social Economy andThe Agenda 2030: Inclusive and Sustainable Development through Innovative Social Practices”, SanJosé (Costa Rica), 8–10 September 2021. The authors appreciate the suggestions of the participants,especially Roberto Cañedo Villarreal. The authors also appreciate the interesting and detailedsuggestions of three anonymous reviewers who have helped us many to improve the quality of thearticle, although only the authors are responsible for the final work.
45
Agriculture 2021, 11, 1281
Conflicts of Interest: The authors declare that they have no conflict of interest concerning the researchreported in this manuscript.
References
1. Defourny, J.; Monzon, J.L. Économie Sociale. Entre Economie Capitaliste et Economie Publique/The Third Sector. In Cooperative,Mutual and Nonprofit Organizations; De Boeck Université—CIRIEC: Brussels, Belgium, 1992.
2. Bouchard, M.-J. Methods and Indicators for Evaluating the Social Economy. In The Worth of the Social Economy: An InternationalPerspective; Bouchard, M.-J., Ed.; Peter Lang: Brussels, Belgium, 2009; pp. 19–34.
3. Bouchard, M.-J.; Rousselière, D. The Weight of the Social Economy: An International Perspective; International Centre of Research andInformation on the Public, Social and Cooperative Economy: Liège, Belgium, 2015; p. 333.
4. Ebrahim, A.S.; Rangan, V.K. What Impact? A Framework for Measuring the Scale and Scope of Social Performace. Calif. Manag.Rev. 2014, 56, 118–141. [CrossRef]
5. Saïd, I.; Ladd, P.; Yi, I. Measuring the Scale and Impact of Social and Solidarity Economy; UNRISD: Geneva, Switzerland, 2018; pp.1–6. Available online: https://www.unrisd.org/80256B3C005BCCF9/(httpAuxPages)/B35B595F32BF48C6C12582F900363EC4/$file/IB9%20-%20Measurement-SSE.pdf (accessed on 25 January 2021).
6. Barea, J.; Monzon, J.L. Manual for Drawing Up Cooperative and Mutual Society Satellite Accounts; European Commission, D.G. forEnterprise and Industry: Brussels, Belgium, 2008; p. 194.
7. Salathé-Beaulieu, G.; Bouchard, M.J.; Mendell, M. Sustainable Development Impact Indicators for Social and Solidarity Economy.State of the Art; UNRISD (United Nations Research Institute for Social Development): Geneva, Switzerland, 2019; pp. 1–39.Available online: https://www.unrisd.org/80256B3C005BCCF9/(httpPublications)/5A72131687B4AE478025848D003847E4?OpenDocument (accessed on 5 October 2020).
8. Chaves-Ávila, R. Crisis del Covid-19: Impacto y respuestas de la economía social. Not. de la Econ. Pública Soc. Y Coop. 2020, 63,28–43.
9. Bretos, I.; Bouchard, M.J.; Zevi, A. Institutional and Organizational Trajectories in Social Economy Enterprises: Resilience,Transformation and Regeneration. Ann. Public Coop. Econ. 2020, 91, 351–358. [CrossRef]
10. Develtere, P. Cooperative Movements in the Developing Countries: Old and New Orientations. Ann. Public Coop. Econ. 1993, 64,179–208. [CrossRef]
11. Tomás Carpi, J.A. The prospects for a Social Economy in a changing world. Ann. Public Cooperative Econ. 1997, 68, 247–279. [CrossRef]12. Defourny, J.; Develtere, P. The Social Economy: The Worldwide Making of a Third Sector. In L’économie Sociale au Nord et au Sud;
De Boeck Université: Paris, France, 1999; pp. 1–35. Available online: https://www.researchgate.net/publication/240335888(accessed on 2 February 2021).
13. Gallego-Bono, J.R.; Tapia-Baranda, M.R. Industrial ecology and sustainable change: Inertia and transformation in Mexicanagro-industrial sugarcane clusters. Eur. Plan. Stud. 2021, 1–21. [CrossRef]
14. Berdegué, J.A.; Bebbington, A.; Escobal, J. Conceptualizing Spatial Diversity in Latin American Rural Development: Structures,Institutions and Coalitions. World Dev. 2015, 73, 1–10. [CrossRef]
15. Dopfer, K.; Foster, J.; Potts, J. Micro-meso-macro. J. Evol. Econ. 2004, 14, 263–279. [CrossRef]16. Dopfer, K.; Potts, J. The General Theory of Economic Evolution; Routledge: London, UK, 2008; p. 134.17. Richez-Battesti, N.; Trouvé, H.; Rousseau, F.; Eme, B.; Fraisse, L. Evaluation the Social and Solidarity-Based Economy in France. In
The Worth of the Social Economy: An International Perspective; Bouchard, M.-J., Ed.; Peter Lang: Brussels, Belgium, 2009; pp. 87–110.18. Porter, M.E. Clusters and the new economics of competition. Harv. Bus. Rev. 1998, 76, 77–90.19. Colletis, G.; Pecqueur, B. Intégration des espaces et quasi-intégration des firmes: Vers de nouvelles rencontres productives? Rev.
Econ. Reg. Urb. 1993, 3, 489–508.20. Torre, A.; Rallet, A. Proximity and localization. Reg. Stud. 2005, 39, 47–59. [CrossRef]21. Torre, A. Territorial development and proximity relationships. In Handbook of Regional and Development Theories; Edward Elgar
Publishers: Cheltenham, UK, 2019; p. 674.22. Gallego-Bono, J.R.; Nácher-Escriche, J.M. Elementos Básicos de Economía; Un enfoque Institucional, Tirant lo Blanch: Valencia,
Spain, 2001; p. 525.23. Spear, R. Social Accounting and Social Audit in the UK. In The Worth of the Social Economy: An International Perspective; Bouchard,
M.-J., Ed.; Peter Lang: Brussels, Belgium, 2009; pp. 133–150.24. Coraggio, J.L. Institutionalising the social and solidarity economy in Latin America. In Social and Solidarity Economy: Beyond the
Fringe; Utting, P., Ed.; Zed Books Ltd.: London, UK, 2015; pp. 130–149.25. Metcalfe, J.S. Knowledge of growth and the growth of knowledge. J. Evol. Econ. 2002, 12, 3–15. [CrossRef]26. Potts, J. Complexity, economics, and innovation policy: How two kinds of science lead to two kinds of economics and two kinds
of policy. Complex. Gov. Netw. Spec. Issue: Complex. Innov. Policy 2017, 3, 22–34. [CrossRef]27. Nelson, R.R. A perspective on the evolution of evolutionary economics. Ind. Corp. Chang. 2020, 29, 1101–1118. [CrossRef]28. Hassink, R.; Isaksen, A.; Trippl, M. Towards a comprehensive understanding of new regional industrial path development. Reg.
Stud. 2019, 53, 1636–1645. [CrossRef]29. Nelson, R.R.; Winter, S.G. An Evolutionary Theory of Economic Change; Harvard University Press: Cambridge, MA, USA, 1982; p. 437.30. Nooteboom, B. A Cognitive Theory of the Firm. Learning, Governance and Dynamic Capabilities; Edward Elgar: Cheltenham, UK, 2009; p. 280.
46
Agriculture 2021, 11, 1281
31. Castells, M.; Banet-Weiser, S.; Hlebik, S.; Kallis, G.; Pink, S.; Seale, K.; Servor, L.J.; Swartz, L.; Varvarousis, A. Another Economy IsPossible; Polity Press: Cambridge, UK, 2017; p. 224.
32. Tomás Carpi, J.A.; Sánchez Andrés, A. Conflictos de Mercado y de Estado en la Política Económica; Tirant lo Blanch: Valencia, Spain,2017; p. 160.
33. Hayek, F.A. The Fatal Conceit: The Errors of Socialism; University of Chicago Press: Chicago, IL, USA, 1988; p. 194.34. Dopfer, K. The origins of meso economics. J. Evol. Econ. 2012, 22, 133–160. [CrossRef]35. Magrini, M.B.; Martin, G.; Magne, M.A.; Duru, M.; Couix, N.; Hazard, L.; Plumecocq, G. Agroecological transition from farms to
Territorialised agri-food systems: Issues and Drivers. In Agroecological Transitions: From Theory to Practice in Local ParticipatoryDesign; Berget, J.-E., Audouin, E., Therond, O., Eds.; Springer: Cham, Switzerland, 2019; pp. 69–98. [CrossRef]
36. Gallego-Bono, J.R.; Tapia-Baranda, M.R. Los valores de la Economía Social como impulsores del cambio en clústeres con fuertefragmentación del conocimiento: El caso de la caña de azúcar de Veracruz (México). CIRIEC España Rev. Econ. Pública Soc. Coop.2019, 97, 75–109. [CrossRef]
37. Chataway, J.; Hanlin, R.; Kaplinsky, R. Inclusive innovation: An architecture for policy development. Innov. Dev. 2014, 4,33–54. [CrossRef]
38. Millstone, C. Can Social and Solidarity Economy organisations complement or replace publicly traded companies. In Social andSolidarity Economy: Beyond the Fringe; Utting, P., Ed.; Zed Books: London, UK, 2015; pp. 86–99.
39. Boons, F.; Howard-Grenville, J.A. The Social Embeddedness of Industrial Ecology; Edward Elgar Publishing: Cheltenham, UK, 2009;p. 284.
40. Boschma, R.A. Proximity and innovation: A critical assessment. Reg. Stud. 2005, 9, 61–74. [CrossRef]41. Velenturf, A.; Jensen, P.D. Promoting Industrial Symbiosis: Using the Concept of Proximity to Explore Social Network Develop-
ment. J. Ind. Ecol. 2015, 20, 700–709. [CrossRef]42. Niang, A.; Torre, A.; Bourdin, S. Territorial governance and actors’ coordination in a local project of anaerobic digestion. A social
network analysis. Eur. Plan. Stud. 2021. [CrossRef]43. Gallego-Bono, J.R.; Chaves-Ávila, R. El modelo cooperativo de sistemas agroalimentarios de innovación: El caso ANECOOP y el
sistema citrícola valenciano. ITEA Inf. Tec. Econ. Agrar. 2015, 111, 366–383. [CrossRef]44. Gallego-Bono, J.R.; Chaves-Avila, R. Innovation cooperative systems and structural change. An evolutionary analysis of
ANECOOP and Mondragón cases. J. Bus. Res. 2016, 69, 4907–4911. [CrossRef]45. Hirschman, A.O. Exit, Voice, and Loyalty: Responses to Decline in Firms, Organizations and States; Harvard University Press:
Cambridge, MA, USA, 1970; p. 176.46. Gallego-Bono, J.R.; Lamanthe, A. Relations de pouvoir et regulations extra-locales dans l’adaptation des systèmes agroalimentaires
au contexte de mondialisation. Une étude de cas France/Espagne. J. Food Agric. Environ. 2009, 90, 185–213.47. Mozas-Moral, A.; Bernal-Jurado, E. Desarrollo territorial y economía social. CIRIEC España Rev. Econ. Pública Soc. Coop. 2006, 55,
125–140.48. Gadille, M.; Gallego-Bono, J.R. Rebuilding a Cluster While Protecting Knowledge within Low-Medium-Tech Supplier SMEs: A
Spanish and French Comparison. Sustainability 2021, 13, 11313. [CrossRef]49. Gallego-Bono, J.R.; Chaves-Avila, R. How to boost clusters and regional change through cooperative social innovation. Econ. Res.
-Ekon. Istraživanja 2020, 33, 3108–3124. [CrossRef]50. Rossi, A.; Coscarello, M.; Biolghini, D. (Re)Commoning Food and Food Systems. The Contribution of Social Innovation from
Solidarity Economy. Agriculture 2021, 11, 548. [CrossRef]51. Schot, J.; Steinmueller, W.E. Three frames for innovation policy: R&D, systems of innovation and transformative change. Res
Policy 2018, 47, 1554–1567. [CrossRef]52. GEV (Gobierno del Estado de Veracruz). Programas Regionales Veracruzanos. Programa Región de las Montañas. 2013–2016; Secretaría
de Finanzas y Planeación: Xalapa, Mexico, 2013; p. 11. Available online: http://www.veracruz.gob.mx/wp-content/uploads/sites/2/2014/04/tf07-pr-montana.pdf (accessed on 2 February 2021).
53. Riquelme, R. Libre Comercio de América del Norte. 11 Datos Para Comprender el TLCAN, el Acuerdo Que Trump QuiereNegociar. El Economista, 27 August 2018. Available online: https://www.eleconomista.com.mx/internacionales/Que-es-el-Tratado-de-Libre-Comercio-de-America-del-Norte-20161123-0111.html (accessed on 4 July 2019).
54. Morales, R. Refresqueras, con intereses cruzados en disputa de azúcar. El Economista, 14 May 2017. Available online: https://www.eleconmista.com.mx/empresas/refresqueras-cn-intereses-cruzados-en-disputa-de-azucar-20170515.html (accessed on4 July 2018).
55. Aguilar-Rivera, N. A Framework for the Analysis of Socioeconomic and Geographic Sugarcane Agro Industry Sustainability.Socio-Econ. Plan. Sci. 2019, 66, 149–160. [CrossRef]
56. Rogers, E.M. Diffusion of Innovations; Free Press: Nueva York, NY, USA, 1983; p. 453.57. Lévesque, B. Le potential d’innovation et de transformation de l’économie social: Quelques élements de problématique. Interações
2008, 9, 191–216. [CrossRef]58. Gugerell, C.; Sato, T.; Hvitsand, C.; Toriyama, D.; Suzuki, N.; Penker, M. Know the Farmer That Feeds You: A Cross-Country
Analysis of Spatial-Relational Proximities and the Attractiveness of Community Supported Agriculture. Agriculture 2021,11, 1006. [CrossRef]
47

agriculture
Article
Why Do Agricultural Cooperative Mergers Not Crossthe Finishing Line?
Elena Meliá-Martí 1,*, Natalia Lajara-Camilleri 1, Ana Martínez-García 2 and Juan F. Juliá-Igual 1
Citation: Meliá-Martí, E.;
Lajara-Camilleri, N.; Martínez-García,
A.; Juliá-Igual, J.F. Why Do
Agricultural Cooperative Mergers
Not Cross the Finishing Line?
Agriculture 2021, 11, 1173. https://
doi.org/10.3390/agriculture11111173
Academic Editors: Adoración Mozas
Moral and Domingo Fernandez Ucles
Received: 22 October 2021
Accepted: 18 November 2021
Published: 20 November 2021
Publisher’s Note: MDPI stays neutral
with regard to jurisdictional claims in
published maps and institutional affil-
iations.
Copyright: © 2021 by the authors.
Licensee MDPI, Basel, Switzerland.
This article is an open access article
distributed under the terms and
conditions of the Creative Commons
Attribution (CC BY) license (https://
creativecommons.org/licenses/by/
4.0/).
1 Centro de Investigación en Gestión de Empresas, CEGEA, Universitat Politècnica de València,46071 Valencia, Spain; [email protected] (N.L.-C.); [email protected] (J.F.J.-I.)
2 ALIMER, Alimentos del Mediterráneo, 30815 Murcia, Spain; [email protected]* Correspondence: [email protected]
Abstract: Mergers have played a relevant role in the business development of many agri-foodcooperatives and have led to the consolidation of large cooperative groups which are leaders intheir respective business sectors. However, many of the merger processes undertaken fail: someare aborted at the negotiation stage, and others are not approved by members. These failures entailfinancial and social costs due to frustrated expectations and the time invested in the negotiationprocess. The objective of this paper is to establish the economic, socio-cultural, organisational andprocess management factors that underlie this outcome. A survey was conducted among the directorsand administrators of a sample of Spanish agri-food cooperatives that had participated in mergerprocesses which were aborted at the negotiation stage or were not approved by their members. Factorand discriminant analyses established the aspects which had the greatest impact on the failure of themerger processes. Far from being economic factors, these analyses reveal that defensive localisms, alack of commitment to the merger on the part of members and directors, and communication failureswere more significant.
Keywords: mergers; agri-food cooperatives; failure; integration; approval; negotiations
1. Introduction
The agri-food sector is subject to many sources of uncertainty. Collaborative networkshave emerged to mitigate them and ensure competitive advantages. They also aim toshorten social and physical distances between consumers and producers and reduce thenumber of intermediaries in the food supply chain [1,2]. This process of shortening complexagri-food supply chains is engendering new market relationships which are built aroundnew forms of association and collaborative organizational structures [3], which can improvecompetitiveness [4]. These processes include diversification into new activities, increasingthe value added to farm products, e.g., through an ecological or regional identity, andinvolving new forms of cost reduction [5].
Integration processes, including mergers, are one of the ways used by agri-foodcompanies to reduce costs and become more competitive.
Mergers and integration processes are highly complex operations in which numerousinterests are at stake. The outcome of these processes is significantly affected by the samefactors that influence and shape agri-food collaborative networks: governance, behaviour(trust, transparency), performance assessment, intensity of collaboration, strategy andoperations management, amongst others [5]. They are also shaped by various factorswhich stakeholders often find difficult to control or predict, thus hindering their success [6].Much of the research into mergers and acquisitions has looked at strategic and financialaspects without addressing socio-cultural, organisational and managerial issues. Evenso, there is a growing consensus among researchers that these variables are at least asimportant for value creation in an integration process as financial ones [7–10]. Cooperativesare mutual undertakings. This means the success or failure of their mergers is not just
Agriculture 2021, 11, 1173. https://doi.org/10.3390/agriculture11111173 https://www.mdpi.com/journal/agriculture
49
Agriculture 2021, 11, 1173
influenced or determined by factors which might be considered standard in an integrationprocess. This occurs because of the special relationship between cooperatives and theirmembers [11], who are both its owners and users and may also play the role of proprietor,employee, consumer or supplier [12]. Moreover, cooperative mergers are a result of theapplication of one of the Principles of the International Cooperative Alliance: cooperationamong cooperatives. This states that cooperatives serve their members most effectivelyand strengthen the cooperative movement by working together through local, national,regional and international structures. Indeed, the issues which may drive cooperativemembers to back a merger are not simply the traditional expectation of generating valuefor the shareholder, which is characteristic of limited liability companies. In these cases,other operational and social aspects take on greater importance. Thus, member concernsabout a merger depend on the ability of the process to address questions such as: Willthe services the cooperative delivers to its members get better after the merger? Will theimportance and power of each member or group of members in the resulting cooperativebe lessened? Will the merger lead to the relocation of the cooperative’s facilities? Will thecooperative’s job offering in the municipality or region in which it is located be affected?
Meanwhile, studies about the factors underlying the failure of merger processes tendto focus on ex-post analyses of the merger [6,13–15]. They examine the company’s evolutionduring the following years to unpack the impact which various aspects, decisions or actionstaken by the cooperative may have had on this unsatisfactory performance.
Nonetheless, a large number of merger processes fail to cross the finishing line. In somecases, they are shelved due to disagreements in the negotiation stage itself, while in others,General Meetings do not endorse them after being submitted for approval. Although rarelyanalysed, these processes may also be considered failures as they entail considerable costs.These include the time spent by directors and administrators, the financial outlay of thestudies and experts hired, and what might well be even more serious, the opportunity costof not carrying out the merger or the value of not choosing the best option.
1.1. Objectives and Structure
This study has sought to add to knowledge of these processes in their earliest stagesas these have not been explored in the cooperative arena. The general purpose of this paperwas to establish the cultural, organisational, social (related to both members and employees)and operational (tied to the implementation of the process) grounds which shape thetermination or failure of some of the merger processes undertaken by cooperatives and todetermine their degree of impact on the rejection of the merger. To this end, a survey wassent to directors and administrators of Spanish agri-food cooperatives which took part in afailed merger project in the period 2005–2015 in the aforementioned terms.
The study was conducted in Spain as this is one of the European Union countries withthe greatest problem of fragmentation in its agri-food cooperatives [16–20]. Numerousmerger processes between cooperatives had been instigated over the study period, whichenabled the build-up of a sufficient population of aborted processes.
Firstly, the mergers that yielded this outcome were described (type of process under-taken, number of merging cooperatives, existence of collaborative relationships prior tothe merger, whether they are in the same or a different subsector of activity, geographicalproximity, etc.). Secondly, the extent of rejection or abandonment of the merger plan ineach of the stages was determined by establishing in which ones the cooperative mergerprocess was halted.
Thirdly, the factors or groups of factors which are triggers for this kind of outcomewere pinpointed together with the ones that influenced or caused the merger process to becalled off in one or other of the identified stages.
Finally, the study aimed to validate a hypothesis that has been much discussed in theliterature on cooperative mergers, albeit not confirmed to date by other research, which isthat “emotional factors, especially ones related to ties with the territory, colloquially known
50
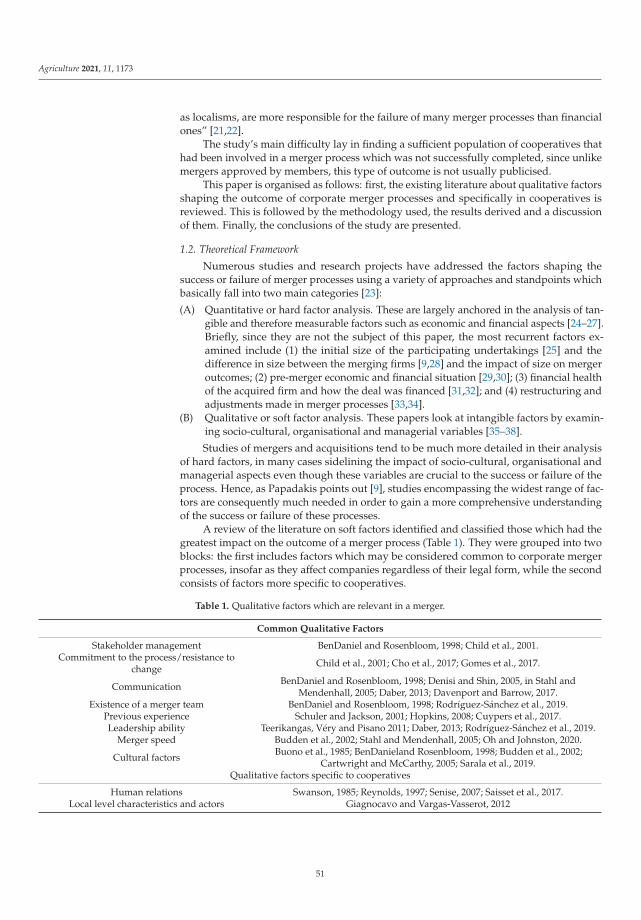
Agriculture 2021, 11, 1173
as localisms, are more responsible for the failure of many merger processes than financialones” [21,22].
The study’s main difficulty lay in finding a sufficient population of cooperatives thathad been involved in a merger process which was not successfully completed, since unlikemergers approved by members, this type of outcome is not usually publicised.
This paper is organised as follows: first, the existing literature about qualitative factorsshaping the outcome of corporate merger processes and specifically in cooperatives isreviewed. This is followed by the methodology used, the results derived and a discussionof them. Finally, the conclusions of the study are presented.
1.2. Theoretical Framework
Numerous studies and research projects have addressed the factors shaping thesuccess or failure of merger processes using a variety of approaches and standpoints whichbasically fall into two main categories [23]:
(A) Quantitative or hard factor analysis. These are largely anchored in the analysis of tan-gible and therefore measurable factors such as economic and financial aspects [24–27].Briefly, since they are not the subject of this paper, the most recurrent factors ex-amined include (1) the initial size of the participating undertakings [25] and thedifference in size between the merging firms [9,28] and the impact of size on mergeroutcomes; (2) pre-merger economic and financial situation [29,30]; (3) financial healthof the acquired firm and how the deal was financed [31,32]; and (4) restructuring andadjustments made in merger processes [33,34].
(B) Qualitative or soft factor analysis. These papers look at intangible factors by examin-ing socio-cultural, organisational and managerial variables [35–38].
Studies of mergers and acquisitions tend to be much more detailed in their analysisof hard factors, in many cases sidelining the impact of socio-cultural, organisational andmanagerial aspects even though these variables are crucial to the success or failure of theprocess. Hence, as Papadakis points out [9], studies encompassing the widest range of fac-tors are consequently much needed in order to gain a more comprehensive understandingof the success or failure of these processes.
A review of the literature on soft factors identified and classified those which had thegreatest impact on the outcome of a merger process (Table 1). They were grouped into twoblocks: the first includes factors which may be considered common to corporate mergerprocesses, insofar as they affect companies regardless of their legal form, while the secondconsists of factors more specific to cooperatives.
Table 1. Qualitative factors which are relevant in a merger.
Common Qualitative Factors
Stakeholder management BenDaniel and Rosenbloom, 1998; Child et al., 2001.Commitment to the process/resistance to
change Child et al., 2001; Cho et al., 2017; Gomes et al., 2017.
Communication BenDaniel and Rosenbloom, 1998; Denisi and Shin, 2005, in Stahl andMendenhall, 2005; Daber, 2013; Davenport and Barrow, 2017.
Existence of a merger team BenDaniel and Rosenbloom, 1998; Rodríguez-Sánchez et al., 2019.Previous experience Schuler and Jackson, 2001; Hopkins, 2008; Cuypers et al., 2017.Leadership ability Teerikangas, Véry and Pisano 2011; Daber, 2013; Rodríguez-Sánchez et al., 2019.
Merger speed Budden et al., 2002; Stahl and Mendenhall, 2005; Oh and Johnston, 2020.
Cultural factors Buono et al., 1985; BenDanieland Rosenbloom, 1998; Budden et al., 2002;Cartwright and McCarthy, 2005; Sarala et al., 2019.
Qualitative factors specific to cooperatives
Human relations Swanson, 1985; Reynolds, 1997; Senise, 2007; Saisset et al., 2017.Local level characteristics and actors Giagnocavo and Vargas-Vasserot, 2012
51
Agriculture 2021, 11, 1173
1.2.1. Common Qualitative Factors (Not Specific to Cooperatives) Which Have a MajorInfluence on the Success of a Merger
Qualitative factors that have an impact on the outcome of a merger include the following:Handling the interests of the stakeholders in a merger (members of the board of
directors (BD), managing directors, managers, members and employees): Some studiessuggest that it is not uncommon for several of these groups, especially the members ofthe BD or managing directors, to put their own interests before those of the shareholdersor members, often driven by the expectation of seeing their salaries increase, earninghigher profits or improving promotion opportunities due to the larger size of the companyresulting from the merger [39]. Being the managing director in a larger firm is also oftenassociated with higher social status than a similar post in a smaller firm [35].
Commitment to the process, professional competence and resistance to change areundisputed determinants of merger outcomes. Regardless of the way in which the mergerhas been conducted, the chances of success are greatly diminished if human resourcesare not involved and committed to it as the engagement and motivation of the team areessential success factors [35,40–42].
Managing communication in the process and controlling information about it amongemployees are crucial. Meynerts-Stiller et al. [43] and Davenport and Barrow [44] arguethat having a communication plan in place is a decisive factor for the success of theprocess. Hence, information should be clear and timely to prevent some employees ormembers from feeling left out. Furthermore, communication can lessen stress levels amongemployees and thus increase the chances of a successful merger [45]. Anticipating changesand problems is pivotal so that they can be controlled or forestalled [40].
A further factor for success in the view of BenDaniel and Rosenbloom [40] andRodríguez-Sánchez et al. [46] is the existence of a merger team that handles the process.Setting up this type of a team builds confidence in the company’s commitment to theprocess while providing assurance of the utmost thoroughness and professionalism, anassessment which spreads across different strata of the company and engenders feedback.
In relation to previous experience, Schuler and Jackson [47] maintain that companieswith previous merger experience achieve better results, suggesting that there is a learningcurve whereby firms that have dealt with previous mergers are more likely to delivermore successful integrations. Here, Cuypers et al. [48] argue that experience can lead tothe creation of a capability that helps with another important M&A issue, that is, valuecapturing, plausibly through improved bargaining and negotiation skills. In addition, theyhighlight the importance of considering differential experience between both parties as thesource of experience advantage. Conversely, Hopkins [49] asserts that too much experiencecan be as detrimental as no experience at all since it can lead to arrogance or overconfidence.However, Greenberg et al., in Stahl and Mendenhall [50], qualify the contribution thisfactor may make to success by pointing out that experience helps to some extent as eachsituation and agreement is unique and different.
Leadership and good management: Leadership is a crucial organisational requirementas it provides a mechanism for control, efficiency, commitment and understanding in acompany and has been shown to be a key factor in a successful merger [6]. Teerikangaset al. define the “integration manager” as the project manager appointed by the companyto coordinate all integration-related activities [51].
Integration speed and time horizon: The speed of the integration is another influentialvariable. Budden et al. contend that the faster the integration, the better the outcomes [36].Decisions should be made promptly, and they suggest a timeframe of about 90 days asthe period in which it is feasible to consolidate the process. Oh and Johnson look atpost-merger integration duration and suggest that slower integration minimises conflictsbetween merger partners, enhances trust-building and reduces the disruption of existingresources and processes in both firms, which may benefit M&As [52]. Reynolds et al. stressthat all sides need sufficient time to grasp the impact of the process and emphasise that
52
Agriculture 2021, 11, 1173
excessive delays or continuous postponements often have negative consequences, thusincreasing the likelihood of failure [53].
Cultural factors: Cartwright and McCarthy argue that corporate culture is the mostimportant facet of organisational adjustment in a merger [54]. Buono et al. note that eachorganisation has a unique, individual corporate culture and that unexpected problems andconflicts often arise when two or more corporate cultures meet [55]. The prevailing view isthat the greater the differences between them, the greater the conflicts and problems forthe resulting company [40]. Hence, scholars such as Budden et al. recommend that theseprocesses should take place between companies in the same industry, thereby leveragingany strategic similarities between them [36].
1.2.2. Specific Factors Influencing the Outcome of a Merger of Cooperatives
Numerous factors in a cooperative may have a positive or negative impact on membersand other stakeholders when it comes to backing or rejecting a merger. Del Real Sánchez-Flor notes that in any cooperative integration process, it is essential to work in two areas inlockstep: firstly, on human relations, and secondly on technical aspects (legal, financial,labour, etc.) [56], which although in principle are the most important part of the process, inthe cooperative industry are often overshadowed by personal issues.
Human relations (members, employees and managing directors): One distinctiveelement that sets cooperatives apart from other types of firms is the dual condition oftheir members as both proprietors and suppliers or clients [12]. Within this framework,authors such as Reynolds et al. point out that a major challenge in merging cooperatives isbringing together different cultures and standards for decision-making [53]. They suggestthat the negotiation process is an initial test for cooperatives to overcome their differencesin order to reach an agreement. They also advocate the appointment of an impartial, fairfacilitator to assist in the process. In interpersonal dynamics, Vandeburg et al. specifytrust, communication and commitment coupled with the role of the managing directorand the rest of the cooperative’s staff as key factors for the success of mergers [57]. Theseconclusions are endorsed by other papers such as the ones by Van Duren et al. [58] andFulton et al. [59].
At the negotiation stage, it is critical to avoid digressions about who is contributing themost to the process and also to keep an open mind in shaping the new unified cooperativeundertaking. It is incumbent upon the organisations involved to be prepared and able tomake difficult concessions and even sacrifices, as many negotiations break down whenan issue stalls and cannot be resolved [53]. Others point out that managing and handlingstakeholders who might oppose the merger transaction is particularly relevant [56,60]and who may be: (1) board members (fearing the loss of prestige and authority), (2)employees (who fear the loss of their employment status in their cooperative) and (3)members, either because of a lack of confidence that the process will yield appropriateresults or fear that it may, in some way, alter their operations in the cooperative, especiallyin terms of the services provided to them, or sometimes because of mere antagonism to theboard’s management.
Negotiating the makeup of the first board of the ensuing cooperative is often a boneof contention, frequently related to the number of representatives of each cooperative andthe choice of chair. When choosing the chair and the members of the board of the resultingcooperative, it is advisable to put a premium on competence and experience rather thanthe mere fact that they come from one cooperative or another, bearing in mind that inmany cooperatives, there is still high demand for professional management and competentmembers to occupy positions in different bodies [61]. The same principles apply to thechoice of managing director.
Local level characteristics and actors: Another recurrent problem and cause of failurein many cooperative merger processes is localism. This refers to the preference of membersand staff for the cooperative to remain tied to the municipality, town, region and eventhe country in which it is domiciled and their refusal to see this situation change after
53
Agriculture 2021, 11, 1173
the merger. Regional identity, related to agri-food products, is a key element in theconfiguration of agri-food networks, which has given rise to different designations of origin(protected designation of origin, protected geographical indication, etc.) [3]. This senseof identity, which goes beyond the fact that the cooperative has a differentiated productwith one of these designations, can become a problem when it overrides economic criteriaand the interests of the member, the cooperatives’ main asset. Giagnocavo and Vargas-Vasserot cite overcoming resistance to change and localism as one of the main challengesfacing cooperatives in Spain [18]. Montero [62] argues that the solution lies in havingopen-minded managing directors who are capable of overcoming individualist approaches,localism, grandstanding, politicisation and vested interests. Likewise, Swanson pinpointsother problematic strategic factors such as choosing the new undertaking’s name, mappingout its general objectives and approach, unifying operations and deciding which facilitiesshould be closed or sold after the merger and which should be kept running [60].
Opportunism, meaning the shrewd pursuit of self-interest [63]: This kind of behaviouris found in inter-organisational and internal relationships and has very harmful conse-quences. Wathne and Heide point to passive opportunistic behaviour as a reluctance toadapt [64]. As Sánchez-Navarro et al. noted, this behaviour can lead to long-term negativeeffects, including the abandonment of the project in the case of a merger process [63].
Equity valuation: Performance assessment is a key element in sustainable agri-foodnetworks. Its accurate quantification of efficiency, effectiveness and relationships betweenfirms according to social, environmental and economic perspectives is essential [65]. Acommon problem in merger negotiations comes from the financial valuation of the cooper-atives’ equity and setting the share capital to be recognised in the resultant cooperativefor the members of the cooperatives involved. Wadsworth and Chesnick note that man-aging fairness in members’ equity is perhaps the trickiest financial issue in a merger andadvocate respecting and protecting members’ contributions [66], while members shouldunderstand that their financial stake in the merged cooperative is significant. Likewise,Swanson points out that the evaluation of assets and liabilities and the transfer of capitalduring cooperative mergers are thorny issues which have to be handled fairly or in amutually acceptable way by putting in place a plan that includes alternative methods andimplications (impacts whether positive or negative) for combining the assets, liabilities andequity of the cooperatives involved [60]. Scholars suggest that the capital to be recognisedfor each member in the resulting cooperative should be calculated in real terms along withthe monetary compensation (or merger fee) which the members of a cooperative may haveto pay in order to offset equity imbalances. Similarly, García Sanz argues that the value ofthe cooperative as established in the negotiations between the boards of directors shouldbe used to calculate the exchange ratio rather than the book value [67].
Strategy-related aspects: The study “Support for Farmer Cooperatives” points outthat an inherent problem in many merger processes is that the merger is not the resultof a purposeful, considered decision, and consequently, its strategy is not sufficientlydiscussed [61]. Indeed, Saisset et al., following an analysis of 14 wine cooperative mergersin Languedoc-Roussillon, found that some were done without any backup strategy, othersresponded to local policies, and finally, in other cases, mergers were based on real corporatestrategic projects leading to synergies between the involved cooperatives [68]. Thus, inmany cases, the decision to undertake a merger is often made in response to several yearsof losses, either due to poor management or periods of crisis. Similarly, Reynolds et al.contend that not all combinations of cooperatives are economically profitable and that attimes, some members may be reluctant to merge with a much larger cooperative as theythink that it might weaken control over the quality and type of services provided [53].Meanwhile, Martínez Morillo-Velarde argues that cooperatives have traditionally beenwary of gaining size, expanding and internationalising. In a nutshell, they are afraid oflosing control [69].
Communication in the process: Duft and Zagelow [70] and Montero [62] stress thenegative effect of failing to properly explain to members and directors the benefits of the
54
Agriculture 2021, 11, 1173
merger as well as the features and operations of the resulting cooperative, very much in linewith what has been noted above in the general factors. They point to disinformation as agenerator of uncertainty and as a propitiator of rumours or fake information, while honesty,integrity and effective communication are the only factors proven to be useful in addressingthe problems arising from a lack of information. Likewise, Del Real Sánchez-Flor contendsthat good management of internal information to members averts rumours, informationdistortion and unjustified misgivings while building a climate of trust and transparencywhich, in the long run, will help to achieve the expected goal and to sound out the viewsof members and anticipate any problems that may come up [56]. It is additionally essentialto ensure the cohesion of the largest number of individuals on each board and draw up anagreed message to members and employees stressing the benefits of the integration process.
Team ability: A firm’s staff, with their knowledge, skills, experience and motivation,is considered one of the resources with the greatest potential for generating sustainablecompetitive advantages [71,72]. However, as noted by a good part of the social economyliterature, cooperative firms have difficulties in attracting and retaining executives whoare both valuable and committed to cooperative values [72–75]. Accordingly, it is essentialin a merger process to bring in professional management with the appropriate training,experience and skills as this is one of the most influential and decisive factors in the successof the cooperative resulting from the integration process [76]. The aim, therefore, is toeschew monistic management models, in which both the cooperative’s democratic structure(distribution of decision-making power) and business structure (relations between staff andmanagement) are controlled by the actual members, who may behave in an exploitative oropportunistic manner.
The above review of the literature is now followed by an empirical comparison ofthe main factors determining the failure of mergers of agri-food cooperatives in the equityvaluation, negotiation and General Meeting approval stages.
2. Materials and Methods
2.1. Study Population
There are no databases or sources which include failed merger processes (called off atthe negotiation or approval stage), which meant that the information had to be compiledby asking the federations (representative organisations) of agri-food co-operatives inSpain’s 17 autonomous regions. Information was gathered from all of them bar three(Canary Islands, Navarre and the Basque Country).
The population identified after making enquiries to the cooperative federations wasmade up of 104 agri-food cooperatives which had been involved in 36 unsuccessful oraborted mergers between 1995 and 2015 (Table 2).
For the purposes of this research, a failed merger was defined as a merger that did notsucceed due to one of the following reasons:
(a) During the initial analysis or assessment stage, the boards of directors or negotiatingteams decided not to press ahead with the negotiation and did not submit it to themembers for approval at the General Meeting.
(b) The merger plan was submitted to the General Meetings for approval and was turneddown by the members.
There are 3669 agri-food cooperatives in Spain [77]. Therefore, the cooperatives whichhad taken part in a failed merger process accounted for around 2.7% of the total in theperiod under study. The difficulty of getting hold of this population should be stressed.Although merger processes have to be announced in newspapers and official journalsonce they have been approved by the General Meetings, information on mergers whichwere not completed is not available except through the cooperatives themselves and, inthis case, their federations. This problem is compounded by the fact that cooperativesoften have an overt interest in not publicising these processes because they have not beensuccessfully concluded.
55
Agriculture 2021, 11, 1173
2.2. Sample Selection
The reliability of the conclusions drawn in a study depends to a large extent on theway in which the sample is selected [78]. In this case, the questionnaire was addressed tothe 104 agri-food co-operatives identified by the cooperative federations as participantsin 36 failed or aborted merger processes. The response rate was 42%, which means theanalysed sample was made up of 44 cooperatives and was thus representative of theanalysed population at 94% (Table 2).
Table 2. Survey factsheet.
Confidence Interval 94%Margin of error for a sample proportion 6%
Population 104 (finite)Sample size 44Fieldwork 29/01/2015 to 01/03/2016
Type of interview Electronic survey via emailScope of action National (Spain)
2.3. Survey
The data collection methodology used was a survey (see Supplementary Materials),which is one of the most commonly employed approaches in social science research toempirically study the characteristics and interrelationships of socio-economic and organi-sational variables [79,80].
The surveys were conducted via email and addressed to the managing directors andadministrators of the cooperatives.
2.4. Conducting the Questionnaire
The first part of the questionnaire consisted of general information about the coopera-tives, such as their type, their geographical location and the sector they operated in. Thesecond part investigated the features of the merger process itself including the numberof cooperatives involved, the year in which the process took place, the sector which theorganisations involved were in and the type of merger proposed.
The third part looked at the reasons why the merger failed. A Likert scale of 1 to 5 waschosen for measurement purposes, ranging from 1 (low influence of the factor analysedon the failure of the merger) to 5 (high influence of the factor analysed on the failureof the merger). Although a Likert-type scale has limitations, such as the absence of acontinuous relationship between values and the distances there may be between them, itwas chosen because it enables the multidimensionality of the variables to be appropriatelyaddressed [78].
The fourth and last part of the questionnaire summarised the three main reasonswhich, in the respondent’s opinion, led to the failure of the merger in order of importance.It also included other information which may have influenced the outcome of the merger,such as whether the cooperatives involved were engaged in shared business activities priorto the merger. Finally, they were asked whether they considered that their cooperativewould have been better positioned if the merger had taken place or whether they hadsubsequently thought about taking part in other integration processes.
3. Results and Discussion
3.1. Descriptive Analysis of the Results
An analysis of the data extracted from the survey showed that the majority werefirst-tier cooperatives (95%) and only 5% were second-tier cooperatives (Table 3).
When classified by the core business of the organisations, most of the cooperativeswhich were involved in failed mergers in the sample were in the olive oil and table olive(39%), fruit and vegetable (19%) and wine (14%) industries (Table 3).
56
Agriculture 2021, 11, 1173
Table 3. Type of cooperatives in the sample.
Type
First tier 95%Federated cooperative 5%
Main activity
Olive oil and olives 39%Wine 14%
Fruit and vegetables 19%Sheep and goats 7%
Supplies 5%Other or a combination of the above 16%
The second part of the survey included questions about the merger process itself(Table 4). In 75% of the cases, the merger processes were conducted by two cooperatives,while only 25% involved more than two cooperatives.
As might have been expected, in 93% of the cases, the cooperatives were in the sameproduction industry, and only the remaining 7% were engaged in distinct operations(Table 4).
The proximity between organisations was another of the factors analysed in thesurvey. In this case, 43% of the cooperatives were in the same municipality and 39% inneighbouring or very nearby municipalities (Table 4).
In terms of the type of merger proposed, 55% of the cooperatives opted for merger byacquisition, while 45% opted for merger by setting up a new company.
Table 4. Merger process information.
Number of Cooperatives Involved in the Merger Process % of the Sample
Two 75%More than two 25%
Were the cooperatives in the same sector?
Yes 93%No 7%
Had there been any previous relationship between the organisationsprior to the merger process?
Yes 68%No 32%
The cooperatives involved in the merger were located in the samemunicipality
In the same municipality 43%In neighbouring or nearby municipalities 39%
In different and not so close municipalities, albeit in the same province 11%In different provinces, albeit in the same autonomous region 5%
In different autonomous regions 2%
Type of integration envisaged
Merger by setting up a new company 45%Merger by acquisition 55%
Stage of the process in which the merger was halted
Initial analysis or assessment 27%Negotiation (not approved by boards of directors) 25%
Approval by the General Meeting 48%
Another relevant issue was the stage at which the process was halted. Forty-eightpercent of the processes failed in the last stage, i.e., approval by the General Meeting. Therest of the mergers were not submitted to the General Meetings, 27% of them ended in theinitial analysis or assessment stage and 25% in the negotiation stage, i.e., after the initial
57

Agriculture 2021, 11, 1173
assessment, the boards of directors started talks about the merger but were unable to cometo a satisfactory agreement.
The third section of the survey explored the reasons why the merger did not succeed.The highest scores were given to members’ lack of commitment, localisms, communicationfailures and the lack of support and trust of the boards. The factors with the lowest scoreswere potential staff cost overruns after the merger, lack of previous business relationshipsand opportunism by the managing director (Table 5).
Table 5. Responses on the assessment of the reasons why the merger between cooperatives did not succeed, ranked frommost to least perceived importance.
Mean Median SD % of Respondents Rating 4 or 5
Lack of members’ commitment to and motivation for the merger 3.32 3 1.46 46%Entirely due to localism 3.22 3 1.65 51%
Failure of communication and information management for members,managing directors and employees 3.21 3 1.39 44%
On the board of directorsLack of support for and confidence in the merger process 3.09 3 1.52 45%
Lack of commitment to and motivation for the merger 3 3 1.53 42%Differences between corporate cultures (ways of interacting with
members, working methods, etc.) 2.88 3 1.53 37%
The chair’s lack of commitment to and motivation for the merger 2,84 2 1,63 37%Members’ fear of restructuring or relocation of assets 2.84 3 1.58 40%
Lack of leadership from chairs and directors to deal with the process 2.81 3 1.38 30%Employees’ lack of commitment to and motivation for the merger 2.76 3 1.36 28%
Lack of confidence in the viability of the common business project of theresulting cooperative 2.7 2 1.61 37%
Members putting personal interests before the cooperative’s 2.67 2 1.43 30%Disagreement on the equity valuation 2.6 2 1.68 35%
Lack of chairs’ and directors’ previous experience in dealing withthe process 2.55 3 1.39 25%
The board putting personal interests before the cooperative’s 2.52 2.5 1.42 34%Lack of managerial leadership in dealing with the process 2.51 3 1.35 26%
Disagreement on the layout of the new workforce organisation chart 2.45 2 1.45 24%Lack of training of chairs and directors to cope with the process 2.44 2 1.37 21%
The chair putting personal interests before the cooperative’s 2.41 2 1.54 32%Dissatisfaction with the makeup of the new board or its election system 2,41 2 1.37 23%
Staff or members’ fear of workforce restructuring 2.40 2 1.4 24%Managing director’s lack of commitment to and motivation for
the merger 2.38 2 1.36 19%
Member reluctance due to potential reduction in their payments afterthe merger 2.34 1 1.61 27%
Poor planning in process delivery 2.33 2 1.34 18%Problems arising from slow decision-making in moving the
process forward 2.33 2 1.39 21%
Employees putting personal interests before the cooperative’s 2.28 2 1.14 12%Underestimation of the costs of the merger process 2.25 1 1.59 30%
Lack of managing director’s prior experience in dealing with the process 2.23 2 1.19 16%Lack of support from government and/or financial institutions 2.16 2 1.45 21%
Member reluctance to make extra cash contributions to the merger so asto offset equity imbalances 2.09 1 1.43 20%
Dissatisfaction with the type of merger chosen 2.02 1 1.24 14%Members’ fear of losing services provided by the cooperative 2.02 1 1.32 21%
Lack of managerial training to cope with the process 2.02 2 1.16 10%Lack of previous experience in mergers 2 2 1.44 24%
Managing director putting personal interests before the cooperative’s 1.98 1.5 1.22 15%Lack of pre-merger relations with the other cooperative 1.93 1 1.28 11%
Expected staff cost overruns due to the need to standardise salaries 1.84 1 1.15 11%
Consequently, four process management reasons were picked out with an average rat-ing of more than 3, i.e., they were more to blame for the failure of the process. One was themembers’ lack of commitment to the merger with a rating of 3.32, and the other was what iscalled “localism” with an average score of 3.22. This is by no means surprising since manyscholars point to this as one of the main causes of the failure of merger processes [18,62].They all stress the importance of overcoming individualistic approaches and localism as akey issue in achieving greater business concentration in the cooperative industry.
58
Agriculture 2021, 11, 1173
Failures in communication and information management for members, employees andmanaging directors were the third problem highlighted, with 44% of respondents givingthis factor a rating of 4 or 5. Again, these results match the findings of researchers such asBenDaniel and Rosenbloom [40] as well as Denisi and Shin in Stahl and Mendenhall [45],who advocate open, clear communication as a decisive factor in increasing a merger’schances of success.
Lack of support for and confidence in the merger process from boards of directorswas the fourth most important reason with an average score of 3.09. As suggested byresearchers such as Swanson [60] and Del Real Sánchez-Flor [56], this rejection may bedriven by the fear of losing influence, prestige or authority in the cooperative resultingfrom the merger.
The reason with the lowest impact, with an average score of less than 2, was the lackof pre-merger relations, a response that is most likely due to the finding in Table 4 whichrevealed that most of the organisations had already conducted joint operations prior tothe merger.
Finally, another two key factors in the failure of the merger process were the lack ofcommitment to and motivation for the merger, with an average rating of 3.32 in the case ofmembers and 3 in the case of the boards of directors. As noted by Van Duren et al. [58],BenDaniel and Rosenbloom [40], Fulton et al. [59] and Vandeburg et al. [57], in humanrelations, confidence and commitment are crucial to the success of this type of process. Theresults suggest that members’ lack of commitment to and motivation for the merger in 46%of cases, and on the part of the board of directors in another 42%, contributed to the failureof the processes. The rest of the social factors (personal interests, managing directors’ orchairs’ lack of capacity and lack of previous experience) were not seen as relevant.
The fourth and last block of the survey (Table 6) summarises the main reasons, inorder of importance, cited by the respondents as the principal grounds for the failureof the merger so as to validate or add to the previous ones. The three most recurrentreasons are: (1) members’ reluctance due to sheer localism (15%), (2) lack of support for andconfidence in the merger process from boards of directors (12%) and (3) lack of confidencein the viability of the resulting cooperative’s common business plan (11%). In this case, inaddition to the localisms and lack of confidence in the merger process already identifiedin the previous section, the third most important factor was the lack of confidence in thefinancial viability of the plan.
Furthermore, it was also found that after the failed merger attempt, the cooperativesinvolved continued to keep up shared business activities in 69% of cases, where the mostsignificant relationship was being part of the same second-tier cooperative (17%) or havingmembers in common (12%) (Table 6).
The respondents’ views as to whether they think that their cooperative would bein a better business situation if the merger had taken place are striking. The answer isoverwhelmingly yes at 82.5%. Given that the main reasons pinpointed as accounting forthe failure of the merger were non-financial (lack of confidence in the process, localism,communication and information management failures and lack of commitment to themerger by managing directors and board members), it is somewhat surprising that oncethe process had been called off and with the benefit of hindsight, they thought that theircooperative would have been better off if the merger had gone ahead. This suggests thatthe approach was almost certainly flawed in these processes. There was a failure to fullyexplore the real strategy and purpose of the merger, to explain and grasp the advantagesand synergies it might bring in business terms with respect to cutting costs, expandingmarkets and so on, and fundamentally, it seems that communicating this strategy tomembers and directors failed, leading to their lack of motivation and commitment to theprocess. By contrast, other aspects which had nothing to do with the company’s finances,such as localism, played a key role and contributed to the demise of the merger.
It is paradoxical that the very people involved in a merger who, during the processitself, show and convey little conviction and commitment to the process or prioritise aspects
59
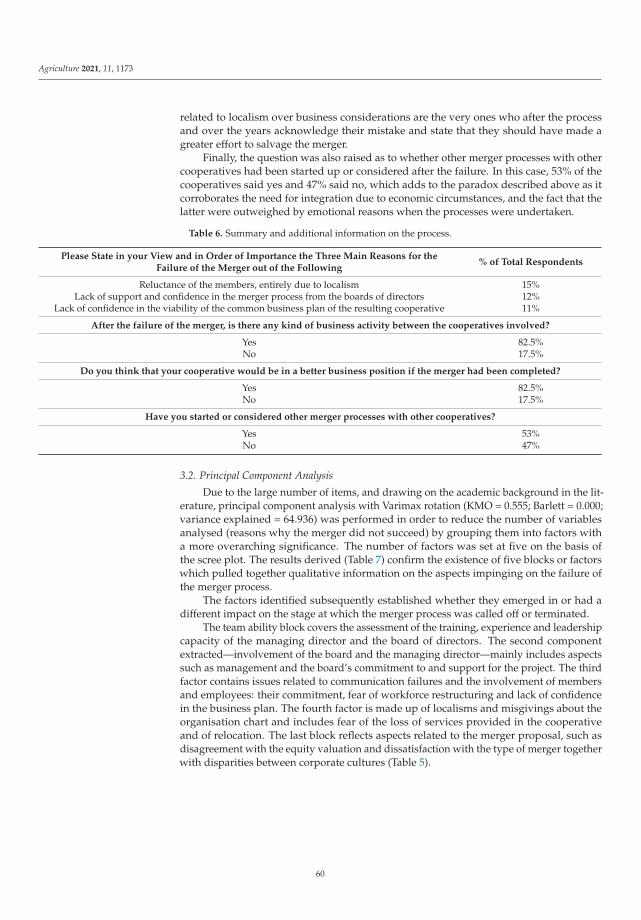
Agriculture 2021, 11, 1173
related to localism over business considerations are the very ones who after the processand over the years acknowledge their mistake and state that they should have made agreater effort to salvage the merger.
Finally, the question was also raised as to whether other merger processes with othercooperatives had been started up or considered after the failure. In this case, 53% of thecooperatives said yes and 47% said no, which adds to the paradox described above as itcorroborates the need for integration due to economic circumstances, and the fact that thelatter were outweighed by emotional reasons when the processes were undertaken.
Table 6. Summary and additional information on the process.
Please State in your View and in Order of Importance the Three Main Reasons for theFailure of the Merger out of the Following
% of Total Respondents
Reluctance of the members, entirely due to localism 15%Lack of support and confidence in the merger process from the boards of directors 12%
Lack of confidence in the viability of the common business plan of the resulting cooperative 11%
After the failure of the merger, is there any kind of business activity between the cooperatives involved?
Yes 82.5%No 17.5%
Do you think that your cooperative would be in a better business position if the merger had been completed?
Yes 82.5%No 17.5%
Have you started or considered other merger processes with other cooperatives?
Yes 53%No 47%
3.2. Principal Component Analysis
Due to the large number of items, and drawing on the academic background in the lit-erature, principal component analysis with Varimax rotation (KMO = 0.555; Barlett = 0.000;variance explained = 64.936) was performed in order to reduce the number of variablesanalysed (reasons why the merger did not succeed) by grouping them into factors witha more overarching significance. The number of factors was set at five on the basis ofthe scree plot. The results derived (Table 7) confirm the existence of five blocks or factorswhich pulled together qualitative information on the aspects impinging on the failure ofthe merger process.
The factors identified subsequently established whether they emerged in or had adifferent impact on the stage at which the merger process was called off or terminated.
The team ability block covers the assessment of the training, experience and leadershipcapacity of the managing director and the board of directors. The second componentextracted—involvement of the board and the managing director—mainly includes aspectssuch as management and the board’s commitment to and support for the project. The thirdfactor contains issues related to communication failures and the involvement of membersand employees: their commitment, fear of workforce restructuring and lack of confidencein the business plan. The fourth factor is made up of localisms and misgivings about theorganisation chart and includes fear of the loss of services provided in the cooperativeand of relocation. The last block reflects aspects related to the merger proposal, such asdisagreement with the equity valuation and dissatisfaction with the type of merger togetherwith disparities between corporate cultures (Table 5).
60
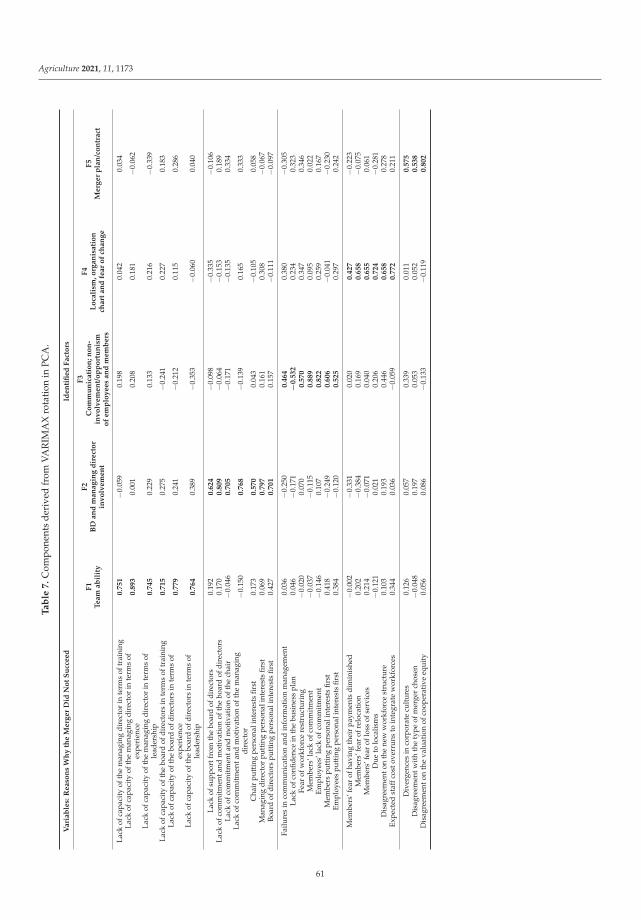
Agriculture 2021, 11, 1173
Ta
ble
7.
Com
pone
nts
deri
ved
from
VAR
IMA
Xro
tati
onin
PCA
.
Va
ria
ble
s:R
ea
son
sW
hy
the
Me
rge
rD
idN
ot
Su
cce
ed
Ide
nti
fie
dF
act
ors
F1
Te
am
ab
ilit
y
F2
BD
an
dm
an
ag
ing
dir
ect
or
inv
olv
em
en
t
F3
Co
mm
un
ica
tio
n;
no
n-
inv
olv
em
en
t/o
pp
ort
un
ism
of
em
plo
ye
es
an
dm
em
be
rs
F4
Lo
cali
sm,
org
an
isa
tio
nch
art
an
dfe
ar
of
cha
ng
e
F5
Me
rge
rp
lan
/co
ntr
act
Lack
ofca
paci
tyof
the
man
agin
gdi
rect
orin
term
sof
trai
ning
0.7
51
−0.0
590.
198
0.04
20.
034
Lack
ofca
paci
tyof
the
man
agin
gdi
rect
orin
term
sof
expe
rien
ce0
.89
30.
001
0.20
80.
181
−0.0
62
Lack
ofca
paci
tyof
the
man
agin
gdi
rect
orin
term
sof
lead
ersh
ip0
.74
50.
229
0.13
30.
216
−0.3
39
Lack
ofca
paci
tyof
the
boar
dof
dire
ctor
sin
term
sof
trai
ning
0.7
15
0.27
5−0
.241
0.22
70.
183
Lack
ofca
paci
tyof
the
boar
dof
dire
ctor
sin
term
sof
expe
rien
ce0
.77
90.
241
−0.2
120.
115
0.28
6
Lack
ofca
paci
tyof
the
boar
dof
dire
ctor
sin
term
sof
lead
ersh
ip0
.76
40.
389
−0.3
53−0
.060
0.04
0
Lack
ofsu
ppor
tfro
mth
ebo
ard
ofdi
rect
ors
0.19
20
.62
4−0
.098
−0.3
35−0
.106
Lack
ofco
mm
itm
enta
ndm
otiv
atio
nof
the
boar
dof
dire
ctor
s0.
170
0.8
09
−0.0
64−0
.153
0.18
9La
ckof
com
mit
men
tand
mot
ivat
ion
ofth
ech
air
−0.0
460
.70
5−0
.171
−0.1
350.
334
Lack
ofco
mm
itm
enta
ndm
otiv
atio
nof
the
man
agin
gdi
rect
or−0
.150
0.7
68
−0.1
390.
165
0.33
3
Cha
irpu
ttin
gpe
rson
alin
tere
sts
first
0.17
30
.57
00.
043
−0.1
050.
058
Man
agin
gdi
rect
orpu
ttin
gpe
rson
alin
tere
sts
first
0.06
90
.79
70.
161
0.30
8−0
.067
Boar
dof
dire
ctor
spu
ttin
gpe
rson
alin
tere
sts
first
0.42
70
.70
10.
157
−0.1
11−0
.097
Failu
res
inco
mm
unic
atio
nan
din
form
atio
nm
anag
emen
t0.
036
−0.2
500
.46
40.
380
−0.3
05La
ckof
confi
denc
ein
the
busi
ness
plan
0.04
6−0
.171
−0
.53
20.
234
0.32
3Fe
arof
wor
kfor
cere
stru
ctur
ing
−0.0
200.
070
0.5
70
0.34
70.
346
Mem
bers
’lac
kof
com
mit
men
t−0
.037
−0.1
150
.88
90.
095
0.02
2Em
ploy
ees’
lack
ofco
mm
itm
ent
−0.1
460.
107
0.8
22
0.25
90.
167
Mem
bers
putt
ing
pers
onal
inte
rest
sfir
st0.
418
−0.2
490
.60
6−0
.041
−0.2
30Em
ploy
ees
putt
ing
pers
onal
inte
rest
sfir
st0.
384
−0.1
200
.52
50.
297
0.24
2
Mem
bers
’fea
rof
havi
ngth
eir
paym
ents
dim
inis
hed
−0.0
02−0
.331
0.02
00
.42
7−0
.223
Mem
bers
’fea
rof
relo
cati
on0.
202
−0.3
840.
169
0.6
58
−0.0
75M
embe
rs’f
ear
oflo
ssof
serv
ices
0.21
4−0
.071
0.04
00
.65
50.
061
Due
tolo
calis
ms
−0.1
210.
021
0.20
60
.72
4−0
.281
Dis
agre
emen
ton
the
new
wor
kfor
cest
ruct
ure
0.10
30.
193
0.44
60
.65
80.
278
Expe
cted
staf
fcos
tove
rrun
sto
inte
grat
ew
orkf
orce
s0.
344
0.03
6−0
.059
0.7
72
0.21
1
Div
erge
nces
inco
rpor
ate
cult
ures
0.12
60.
057
0.33
90.
011
0.5
75
Dis
agre
emen
twit
hth
ety
peof
mer
ger
chos
en−0
.048
0.19
70.
053
0.05
20
.53
8D
isag
reem
ento
nth
eva
luat
ion
ofco
oper
ativ
eeq
uity
0.05
60.
086
−0.1
33−0
.119
0.8
02
61
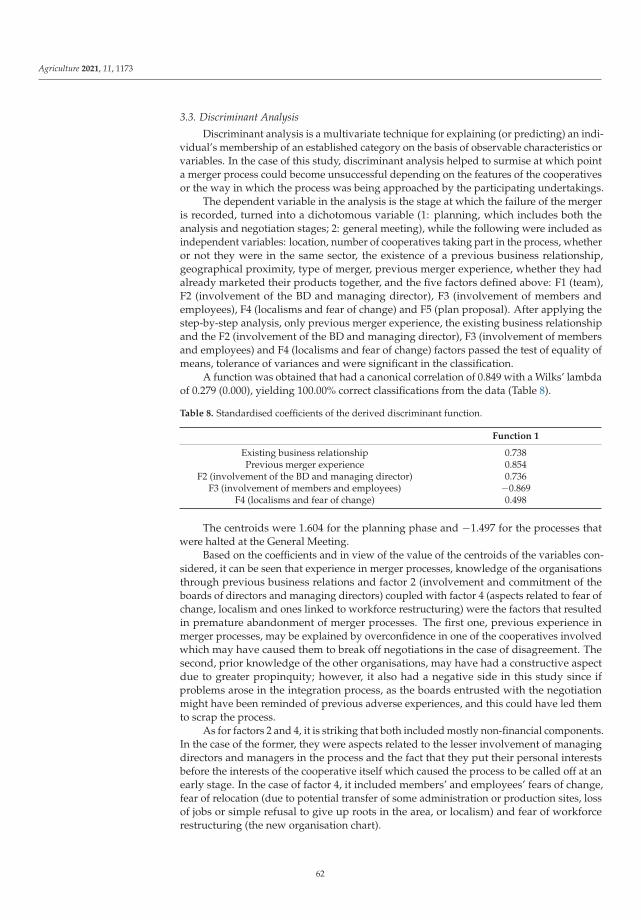
Agriculture 2021, 11, 1173
3.3. Discriminant Analysis
Discriminant analysis is a multivariate technique for explaining (or predicting) an indi-vidual’s membership of an established category on the basis of observable characteristics orvariables. In the case of this study, discriminant analysis helped to surmise at which pointa merger process could become unsuccessful depending on the features of the cooperativesor the way in which the process was being approached by the participating undertakings.
The dependent variable in the analysis is the stage at which the failure of the mergeris recorded, turned into a dichotomous variable (1: planning, which includes both theanalysis and negotiation stages; 2: general meeting), while the following were included asindependent variables: location, number of cooperatives taking part in the process, whetheror not they were in the same sector, the existence of a previous business relationship,geographical proximity, type of merger, previous merger experience, whether they hadalready marketed their products together, and the five factors defined above: F1 (team),F2 (involvement of the BD and managing director), F3 (involvement of members andemployees), F4 (localisms and fear of change) and F5 (plan proposal). After applying thestep-by-step analysis, only previous merger experience, the existing business relationshipand the F2 (involvement of the BD and managing director), F3 (involvement of membersand employees) and F4 (localisms and fear of change) factors passed the test of equality ofmeans, tolerance of variances and were significant in the classification.
A function was obtained that had a canonical correlation of 0.849 with a Wilks’ lambdaof 0.279 (0.000), yielding 100.00% correct classifications from the data (Table 8).
Table 8. Standardised coefficients of the derived discriminant function.
Function 1
Existing business relationship 0.738Previous merger experience 0.854
F2 (involvement of the BD and managing director) 0.736F3 (involvement of members and employees) −0.869
F4 (localisms and fear of change) 0.498
The centroids were 1.604 for the planning phase and −1.497 for the processes thatwere halted at the General Meeting.
Based on the coefficients and in view of the value of the centroids of the variables con-sidered, it can be seen that experience in merger processes, knowledge of the organisationsthrough previous business relations and factor 2 (involvement and commitment of theboards of directors and managing directors) coupled with factor 4 (aspects related to fear ofchange, localism and ones linked to workforce restructuring) were the factors that resultedin premature abandonment of merger processes. The first one, previous experience inmerger processes, may be explained by overconfidence in one of the cooperatives involvedwhich may have caused them to break off negotiations in the case of disagreement. Thesecond, prior knowledge of the other organisations, may have had a constructive aspectdue to greater propinquity; however, it also had a negative side in this study since ifproblems arose in the integration process, as the boards entrusted with the negotiationmight have been reminded of previous adverse experiences, and this could have led themto scrap the process.
As for factors 2 and 4, it is striking that both included mostly non-financial components.In the case of the former, they were aspects related to the lesser involvement of managingdirectors and managers in the process and the fact that they put their personal interestsbefore the interests of the cooperative itself which caused the process to be called off at anearly stage. In the case of factor 4, it included members’ and employees’ fears of change,fear of relocation (due to potential transfer of some administration or production sites, lossof jobs or simple refusal to give up roots in the area, or localism) and fear of workforcerestructuring (the new organisation chart).
62
Agriculture 2021, 11, 1173
When a merger process was not submitted to the General Meeting for approval, thismeans that members were denied the opportunity to examine, assess and discuss thebenefits or drawbacks which this process could have had for the cooperative.
It should be stressed that the reasons why some processes were not even submittedfor approval by the General Meeting, therefore depriving members of the option to make achoice, mostly concerned aspects which had nothing to do with the viability of the mergerplan. Instead, they arose out of fears or mistrust of boards of directors and managingdirectors, putting the personal interests of all the groups in the cooperative before those ofthe merger itself, as well as sheer localism.
4. Conclusions
The key problem of agricultural cooperatives in Spain lies in their size. Integrationprocesses have been encouraged in the last few decades, but some of them have not cometo fruition. It is evident that, given the core role that members play in these organisations,qualitative factors are particularly relevant when it comes to explaining what leads to thefailure of a merger process in cooperatives. Therefore, in line with several aspects suchas mutual trust, commitment and taking risks towards a common goal, which are deter-minant factors in agri-food networks to achieve shared goals, are essential to integrationprocesses [81,82].
For the first time, this study empirically shows that there are numerous aspects inSpanish agricultural cooperatives which influence the failed outcome of cooperative mergerprocesses. It concludes that there are four influential factors: localism (of considerable ormajor importance in 48% of the cooperatives), the lack of support for and confidence in themerger process on the part of boards of directors (of considerable or major importance in thefailure of 45% of the cooperatives surveyed), communication and information managementfailures (singled out as relevant and very relevant in 44% of the processes) and the lack ofcommitment and motivation before the merger on the part of members (identified in 46%)and boards of directors (in 42%).
Hence, localisms or regionalisms play a key role and often take precedence overwell-founded financial grounds. They diminish the business vision of the cooperativeby confining it to a small geographical area and thereby hinder its development andundermine its competitive capacity, which goes to confirm the hypothesis formulated inthe study objectives.
Another shortcoming identified in aborted mergers is information and communicationmanagement, just as previous papers by Davenport and Barrow [44] pointed out. In amerger, the conflicting interests, and sometimes excessive zeal, of the parties mean thatinformation is either not properly circulated or sends incorrect or incomplete messages,and this can generate opposition to the process on no other bases than ignorance, fearof embarking on new ventures and even the interests of groups which in no case are ina majority.
The third and last factor picked out as a cause of the failure of these processes is the lackof support and motivation for the merger from boards of directors and from members. Thislack of support may stem from numerous sources yet should only really surface followingpainstaking scrutiny of the merger’s consequences for the cooperative and its members.The results point to a number of factors which may influence this scant commitment. In47% of the processes, respondents acknowledged that the lack of confidence in the viabilityof the joint business plan of the resulting cooperative was either fairly or very important,and in 40%, there were fears over the relocation of the cooperative’s facilities. Likewise, thislack of support from members may be the upshot of the aforementioned poor informationand communication management.
Principal component analysis was used to determine the extent to which the factorswere involved in failed merger processes. Five factors were identified: team ability, boardand management involvement, member commitment, social aspects such as localism and
63
Agriculture 2021, 11, 1173
fear of loss of services by members, and the merger plan proposal. These blocks are consis-tent with proposals in previous studies such as the one by BenDaniel and Rosenbloom [40].
This work has analysed which variables may predict how likely a merger project willbe aborted in its early stages. The issues which appear to be crucial in processes whichare called off at an early stage, and therefore are not submitted for approval by members,are previous experience in merger processes and mutual knowledge through existingbusiness relationships. The previous relationship and shared experiences (assumed tobe off-putting) may mean the process is called off in the event of uncertainty, mistrust ordisagreement without submitting it for discussion at the General Meeting. Thus, projectsbetween cooperatives that already have business links and an integration team to guidethe process would seem to be sensible recommendations.
The results suggest that the aspects triggering abandonment of merger projects instages prior to approval by the General Meeting, and which deny members the chance toexamine, evaluate and choose, are for the most part far removed from business strategyand more bound up with the personal interests of groups of people in the cooperative,which are called localisms, fear of change or simply rejection of new organisation charts.A cooperative’s members and board of directors should either back a merger process orobject to it on the basis of thorough economic, financial and social analysis which identifieshow the cooperative’s economic and financial position will be better or worse (cuttingaverage costs, greater profitability, enhanced stability, achieving critical mass in productionand/or marketing, etc.). It is these kinds of factors which ultimately shape and determine amember’s return from the cooperative that should have the greatest bearing on whether themember is for or against the merger. However, and as noted above, a large proportion ofprocesses are not even submitted for approval and, for the most part, on grounds unrelatedto the foregoing points.
Nonetheless, one final aspect confirms these issues, which is that in 82.5% of theaborted processes and after a period of reflection, chairs and managing directors think thattheir cooperative would have been better off had the merger been successfully concluded.Several alternatives can be derived from this: (i) either the merger was not properlyexamined and this led to its rejection when actually it was a profitable plan; or (ii) theanalysis was correct but the results of this analysis were not properly put across to members;or (iii) it is also possible that, having duly examined the merger and properly conveyed thefindings to members, other aspects such as localisms or the fear of relocation of assets hada greater impact on their decision.
This paper contributes to increase existing knowledge and evidence about integra-tion processes in cooperatives. It also provides valuable information about qualitativeaspects that are relevant to the success of a merger, reinforcing the idea that cooperatives,like any other business, need to be managed by professionals. In this sense, training,education and guidance from representative organisations or government would help toensure integration.
5. Study Limitations
The limitations of this study include, firstly, the fact that the survey respondents were9% cooperative chairs, 37% managing directors and the remaining 54% other managers(not members of the board of directors). This spread unquestionably entails a bias towardsmanagers and the results should therefore be interpreted in this light.
Another aspect to take into account is the potential endogeneity and thus the effectthat unobserved or non-included factors (e.g., size) might have on the outcome of themerger process.
Furthermore, some of the cooperatives involved in the processes studied are no longergoing concerns as they have been wound up, so it was impossible to gather their feedbackabout these processes. Another group of cooperatives declined to collaborate with thisstudy. In some of these cases, the surveys were answered by the heads of the federations onbehalf of these cooperatives as they were involved in the project at the time of the process.
64
Agriculture 2021, 11, 1173
Supplementary Materials: The following are available online at https://www.mdpi.com/article/10.3390/agriculture11111173/s1.
Author Contributions: Conceptualization, E.M.-M. and A.M.-G.; methodology, E.M.-M.; software,N.L.-C.; validation, E.M.-M., N.L.-C. and A.M.-G.; formal analysis, A.M.-G.; investigation, J.F.J.-I.;resources, J.F.J.-I.; data curation, N.L.-C.; writing—original draft preparation, J.F.J.-I.; writing—reviewand editing, E.M.-M. and N.L.-C.; visualization, J.F.J.-I.; supervision, J.F.J.-I.; project administration,E.M.-M.; All authors have read and agreed to the published version of the manuscript.
Funding: This research received no external funding.
Informed Consent Statement: Informed consent was obtained from all subjects involved in the study.
Acknowledgments: We would like to thank Cooperativas Agroalimentarias de España and its officesin Spain’s autonomous regions for their wholehearted cooperation with this paper; without them, itwould have been impossible to conduct this first empirical study as they identified the populationof aborted mergers which enabled us to carry it out. We would also like to thank the cooperativessurveyed for their willingness to collaborate. We would like to thank the reviewers for their commentsand suggestions, as they have definitely helped to improve the manuscript.
Conflicts of Interest: The authors declare no conflict of interest.
References
1. Dos-Santos, R.R.; Guarnieri, P. Social gains for artisanal agroindustrial producers induced by cooperation and collaboration inagri-food supply chain. Soc. Responsib. J. 2021, 17, 1131–1149. [CrossRef]
2. Ammirato, S.; Felicetti, A.M.; Ferrara, M.; Raso, C.; Violi, A. Collaborative Organization Models for Sustainable Development inthe Agri-Food Sector. Sustainability 2021, 13, 2301. [CrossRef]
3. Renting, H.; Marsden, T.K.; Banks, J. Understanding alternative food networks: Exploring the role of short food supply chains inrural development. Environ. Plan. 2003, 35, 393–411. [CrossRef]
4. Allen, P.; FitzSimmons, M.; Goodman, M.; Warner, K. Shifting plates in the agrifood landscape: The tectonics of alternativeagrifood initiatives in California. J. Rural. Stud. 2003, 19, 61–75. [CrossRef]
5. Marsden, T.; Banks, J.; Bristow, G. Food supply chain approaches: Exploring their role in rural development. Sociol. Rural. 2000,40, 424–438. [CrossRef]
6. Melia-Marti, E.; Martinez-Garcia, A.M. Characterization and analysis of cooperative mergers and their results. Ann. Public Coop.Econ. 2015, 86, 479–504. [CrossRef]
7. Junni, P.; Sarala, R.; Tarba, S.; Weber, Y. The Role of Strategic Agility in Acquisitions. Br. J. Manag. 2015, 26, 596–616. [CrossRef]8. Stahl, G.K.; Mendenhall, M.E.; Pablo, A.L.; Javidan, M. Sociocultural Integration in Mergers and Acquisitions. In Mergers and
Acquisitions: Managing Culture and Human Resources; Stahl, G.K., Mendenhall, M.E., Eds.; Stanford Business Books: Stanford,CA, USA, 2005; pp. 3–17.
9. Papadakis, V.M. The role of broader context and the communication program in merger and acquisition implementation success.Manag. Decis. 2005, 43, 236–255. [CrossRef]
10. Epstein, M.J. The drivers of success in post-merger integration. Organ. Dyn. 2004, 33, 174–189. [CrossRef]11. Romero, M.; Carmona, P.; Pozuelo, J. The prediction of the business failure of the Spanish cooperatives. Application of the
Extreme Gradient Boosting Algorithm. CIRIEC—España Rev. Econ. Pública Soc. Coop. 2021, 101, 255–288. [CrossRef]12. Grashuis, J.; Elliott, M. The role of capital capacity, spatial competition, and strategic orientation to mergers and acquisitions by
U.S. farmer cooperatives. J. Co-Oper. Organ. Manag. 2018, 6, 78–85. [CrossRef]13. Clark, K.; Ofek, E. Mergers as a Means of Restructuring Distressed Firms: An Empirical Investigation. J. Financ. Quant. Anal.
1994, 29, 541–565. [CrossRef]14. Sharma, D.S.; Ho, J. The impact of acquisitions on operating performance: Some Australian evidence. J. Bus. Financ. Account.
2002, 29, 155–200. [CrossRef]15. Kumar, R. Post-merger corporate performance: An Indian perspective. Manag. Res. News 2009, 32, 145–157. [CrossRef]16. Server Izquierdo, R.; Meliá-Martí, E. Caracterización empresarial de los grupos y otras formas de integración cooperativa al
amparo del nuevo marco legislativo. REVESCO Rev. Estud. Coop. 1999, 69, 199–215.17. Arcas, N.; García, D.; Guzmán, I. Effect of size on performance of Spanish agricultural cooperatives. Outlook Agric. 2011, 40,
201–206. [CrossRef]18. Giagnocavo, C.; Vargas-Vasserot, C. Support for Farmers’ Cooperatives. Country Report Spain; Wageningen UR: Wageningen, The
Netherlands, 2012.19. Cos-Sánchez, P.; Escadíbul, B.; Colom, A. La diversificación geográfica de los destinos de exportación de las empresas y cooperati-
vas agroalimentarias. Influencia de los factores externos para su selección. Ciriec-España. Rev. Econ. Pública Soc. Coop. 2021, 102,161–195. [CrossRef]
65
Agriculture 2021, 11, 1173
20. Mozas-Moral, A.; Fernández-Uclés, D.; Medina-Viruel, M.J.; Bernal-Jurado, E. The role of the SDGs as enhancers of theperformance of Spanish wine cooperatives. Technol. Forecast. Soc. Change 2021, 173, 121176. [CrossRef]
21. Montero García, A. Cooperativismo Agrario de Segundo Grado; IRYDA: Madrid, Spain, 1991.22. Meliá-Martí, E.; Martínez-García, A. Aspectos sociales y culturales determinantes de los fracasos de fusiones de cooperativas.
In Proceedings of the XVI Congreso de Investigadores en Economía Social y Cooperativa CIRIEC, Valencia, Spain, 19–21 October 2016.23. Ribes Giner, G. Análisis de las variables organizativas que influyen en los procesos de fusión y adquisición de empresas. El caso
de la industria auxiliar el automóvil. Acad. Manag. Rev. 2009, 11, 145–163.24. Rao-Nicholson, R.; Salaber, J.; Cao, T.H. Long-term performance of mergers and acquisitions in ASEAN countries. Res. Int. Bus.
Financ. 2016, 36, 373–387. [CrossRef]25. Zhang, W.; Wang, K.; Li, L.; Chen, Y.; Wang, X. The impact of firms’ mergers and acquisitions on their performance in emerging
economies. Technol. Forecast. Soc. Change 2018, 135, 208–216. [CrossRef]26. Agrawal, A.; Jaffe, J.F. The post-merger performance puzzle. In Advances in Mergers and Acquisitions; Emerald Group Publishing
Limited: Bingley, UK, 2000.27. Brouthers, K.; van Hastenburg, P.; van den Ven, J. If most mergers fail why are they so popular? Long Range Plan. 1998, 31,
347–353. [CrossRef]28. Ismail, A.; Davidson, I. The Determinants of Target Returns in European Bank Mergers. Serv. Ind. J. 2007, 27, 617–634. [CrossRef]29. Morck, R.; Schleifer, A.; Vishney, R. Do managerial objectives drive bad acquisitions? J. Financ. 1990, 45, 31–48. [CrossRef]30. Ketelhöhn, N.; Martín, N. Determinantes de éxito en fusiones y adquisiciones. INCAE Bus. Rev. 2009, 1, 16–23.31. Ogden, J.P.; Jen, F.C.; O’Connor, P.F. Advanced Corporate Finance: Policies and Strategies; Pearson Education Inc.: New Jersey,
NJ, USA, 2003.32. Goergen, M.; Renneboog, L. Shareholder Wealth Effects of European Domestic and Cross-border Takeover Bids. Eur. Financ.
Manag. 2004, 10, 9–45. [CrossRef]33. Harrison, D.T. Do Mergers Really Reduce Costs? Evidence from Hospitals. Econ. Inq. 2011, 49, 1054–1060. [CrossRef]34. Healy, P.M.; Palepu, K.G. Effectiveness of accounting-based dividend covenants. J. Account. Econ. 1990, 12, 97–123. [CrossRef]35. Child, J.; Faulkner, D.; Pitkethly, R. The Management of International Acquisitions; Oxford University Press: Oxford, UK, 2001.36. Budden, G.; Slater, N.; Cooper, T. Delivering the Merger Promise; Telecommunications International: Geneva, Switzerland, 2002;
Volume 36, No. 10; pp. 48–50.37. Sarala, R.M.; Vaara, E.; Junni, P. Beyond merger syndrome and cultural differences: New avenues for research on the “human
side” of global mergers and acquisitions (M&As). J. World Bus. 2019, 54, 307–321.38. Bari, M.W.; Abrar, M.; Bashir, M.; Baig, S.A.; Fanchen, M. Soft issues during cross-border mergers and acquisitions and industry
performance, China–Pakistan economic corridor based view. SAGE Open 2019, 9, 2158244019845180. [CrossRef]39. Ratis, J.; Harikkala-Laihinen, R.; Hassett, M.; Nummela, N. Socio-Cultural Integration in Mergers and Acquisitions; PalgravePivot:
London, UK, 2018.40. BenDaniel, D.J.; RosenBloom, A.H. International M&A, Joint Ventures, & Beyond; John Wiley & Sons Inc.: New York, NY, USA, 1998.41. Cho, I.; Park, H.; Dahlgaard-Park, S.M. The impacts of organisational justice and psychological resilience on employee commit-
ment to change in an M&A context. Total. Qual. Manag. Bus. Excell. 2017, 28, 989–1002.42. Gomes, E.; Mellahi, K.; Sahadev, S.; Harvey, A. Perceptions of justice and organisational commitment in international mergers
and acquisitions. Int. Mark. Rev. 2017, 34, 582–605. [CrossRef]43. Meynerts-Stiller, K.; Rohloff, C. Profile of an Integration Manager. In Post-Merger Management; Emerald Publishing Limited:
Bingley, UK, 2019.44. Davenport, J.; Barrow, S. Employee Communication during Mergers and Acquisitions; Routledge: Abingdon, UK, 2017.45. Denisi, A.S.; Shin, S.J. Psychological Communication Interventions in Mergers and Acquisitions. In Mergers and Acquisitions:
Managing Culture and Human Resources; Stahl, G.K., Mendenhall, M.E., Eds.; Stanford Business Books: Stanford, CA, USA, 2005;pp. 228–250.
46. Rodríguez-Sánchez, J.L.; Ortiz-de-Urbina-Criado, M.; Mora-Valentín, E.M. Thinking about people in mergers and acquisitionsprocesses. Int. J. Manpow. 2019, 40, 643–657. [CrossRef]
47. Schuler, R.; Jackson, S. HR Issues and activities in mergers and acquisitions. Eur. Manag. J. 2001, 19, 239–253. [CrossRef]48. Cuypers, I.R.; Cuypers, Y.; Martin, X. When the target may know better: Effects of experience and information asymmetries on
value from mergers and acquisitions. Strateg. Manag. J. 2017, 38, 609–625. [CrossRef]49. Hopkins, H.D. International Acquisitions: Strategic Considerations. Int. Res. J. Financ. Econ. 2008, 15, 261–270.50. Greenberg, D.N.; Lane, H.W.; Bahde, K. Organizational Learning in Cross-Border Mergers and Acquisitions. In Mergers and
Acquisitions: Managing Culture and Human Resources; Stahl, G.K., Mendenhall, M.E., Eds.; Stanford Business Books: Stanford,CA, USA, 2005; pp. 53–77.
51. Teerikangas, S.; Véry, P.; Pisano, V. Integration managers’ value-capturing roles and acquisition performance. Hum. Resour.Manag. 2011, 50, 651–683. [CrossRef]
52. Oh, J.H.; Johnston, W.J. How post-merger integration duration affects merger outcomes. J. Bus. Ind. Mark. 2020, 36, 807–820.[CrossRef]
66
Agriculture 2021, 11, 1173
53. Reynolds, B.J.; Wadsworth, J.J.; Donald, A.F. Cooperative Merger/Consolidation Negotiations. The Important Role of Facilitation;Cooperative Information Report 52; United States Department of Agriculture, Rural Business/Cooperative Service: Washington,DC, USA, 1997.
54. Cartwright, S.; McCarthy, S. Developing a Framework for Cultural Due Diligence in Mergers and Acquisitions: Issues and Ideas.In Mergers and Acquisitions: Managing Culture and Human Resources; Stahl, G.K., Mendenhall, M.E., Eds.; Stanford Business Books:Stanford, CA, USA, 2005; pp. 253–268.
55. Buono, A.F.; Bowditch, J.L.; Lewis, J.W. When Cultures Collide: The Anatomy of a Merger. Hum. Relat. 1985, 38, 477–500.[CrossRef]
56. Del Real Sánchez-Flor, J.M. La dimensión como clave para la mejora de la competitividad. Cooperativas Agro-alimentariasCastilla La-Mancha. Mediterráneo Económico 2012, 24, 321–344.
57. Vandeburg, J.; Fulton, J.R.; Hine, S.; Mcnamara, K. Driving forces and success factors for mergers, acquisitions, joint ventures,and strategic alliances among local cooperatives. In Proceedings of the NCR 194 Annual Meeting, Las Vegas, NV, USA,23–25 June 2000.
58. Van Duren, E.; Howard, W.; McKay, H. Forging Vertical Alliances. Choices 1995, 10, 31–33.59. Fulton, J.R.; Popp, M.P.; Gray, C. Strategic Alliance and Joint Venture Agreements in Grain Marketing Cooperatives. J. Coop.
1996, 11, 1–14.60. Swanson, B.L. Merging Cooperatives: Planning, Negotiating, Implementing; Research Report 43; Program Leader—Management and
Operations Cooperative Management Division, Agricultural Cooperative Service: Washington, DC, USA, 1985.61. Bijman, J. Support for Farmers’ Cooperatives. Country Report Spain; Wageningen UR: Wageningen, The Netherlands, 2012.62. Montero García, A. El Cooperativismo Agroalimentario y Formas de Integración; Ministerio de Agricultura, Pesca y Alimentación:
Madrid, Spain, 1999.63. Sánchez-Navarro, J.L.; Arcas-Lario, N.; Hernández-Espallardo, M. Antecedentes del oportunismo en las cooperativas agroalimen-
tarias. CIRIEC—España Rev. Econ. Pública Soc. Coop. 2019, 97, 111–136. [CrossRef]64. Watne, K.; Heide, B. Opportunism in Interfirm Relationships: Forms, Outcomes and Solutions. J. Mark. 2000, 64, 36–51. [CrossRef]65. Maestrini, V.; Luzzini, D.; Caniato, F.; Ronchi, S. Effects of monitoring and in- centives on supplier performance: An agency
theory perspective. Int. J. Prod. Econ. 2018, 203, 322–332. [CrossRef]66. Wadsworth, J.; Chesnick, D. Consolidation of Balance Sheet Components during Cooperative Mergers; Research Report 139;
USDA Rural Development: Washinton, DC, USA, 1995; p. 32.67. García Sanz, D. Concentración de Empresas Cooperativas. Aspectos Económico-Contables y Financieros; CES Colección Documentación:
Madrid, Spain, 2001.68. Saisset, L.A.; Cheriet, F.; Couderc, J.P. Cognitive and partnership dimensions in merger processes in agricultural cooperatives:
The case of winery cooperatives in Languedoc-Roussillon. Int. J. Entrep. Small Bus. 2017, 32, 181–207. [CrossRef]69. Martínez Morillo-Velarde, L. La Internacionalización de las Cooperativas Agroalimentarias: Dificultades y perspectivas.
Master’s Thesis, Universidad de Córdoba, Córdoba, Spain, 2015.70. Duft, K.D.; Zagelow, R.L. Cooperative Director Liability Exposure: Issues and Resolutions; Washington State University; Available online:
http://www.agribusiness-mgmt.wsu.edu/ExtensionNewsletters/coop/CoopDirLiability.pdf (accessed on 15 October 2020).71. Pffefer, J. The Human Equation; Harvard Business School Press: Boston, MA, USA, 1998.72. Basterretxea, I.; Albizu, E. Management training as a source of perceived competitive advantage: The Mondragon Cooperative
Group case. Econ. Ind. Democr. 2010, 32, 199–222. [CrossRef]73. Morales, A.C. La dirección en la empresa de trabajo asociado: Una revisión de estudios empíricos. CIRIEC—España Rev. Econ.
Pública Soc. Coop. 2004, 48, 99–122.74. Münkner, H.H. Corporate governance in German co-operatives—What happenend to Co-op Dortmund? Rev. Int. Co-Oper.
2000, 92–93, 78–89.75. Spear, R. Governance in Democratic Member Based Organisations. Ann. Public Coop. Econ. 2004, 75, 33–60. [CrossRef]76. Calderón García, H.; Fayos Gardó, T.; Mir Piqueras, J. La internacionalización de las cooperativas agroalimentarias necesidad
y problemática. Mediterráneo Económico 2012, 24, 61–76.77. Cooperativas Agroalimentarias. Cooperativismo Agroalimentario en Cifras. 2020. Available online: http://www.agro-alimentar
ias.coop/cooperativismo_en_cifras (accessed on 10 July 2021).78. Groves, R.M.; Fowler, F.J., Jr.; Couper, M.P.; Lepkowski, J.M.; Singer, E.; Tourangeau, R. Survey Methodology; John Wiley & Sons:
Hoboken, NJ, USA, 2011; Volume 561.79. Roberts, E.S. In defense of the survey method: An illustration from a study of user information satisfaction. Account. Financ.
1999, 39, 53–77. [CrossRef]80. Dillman, D.A. Mail and Internet Surveys: The Tailored Design Method, 2nd ed.; John Wiley Co.: New York, NY, USA, 2000.81. Camarinha-Matos, L.M.; Afsarmanesh, H. On reference models for collaborative networked organizations. Int. J. Prod. Res.
2008, 46, 2453–2469. [CrossRef]82. Volpentesta, A.P.; Ammirato, S. Alternative agrifood networks in a regional area: A case study. Int. J. Comput. Integr. Manuf.
2013, 26, 55–66. [CrossRef]
67

agriculture
Article
Trust in Collective Entrepreneurship in the Context of theDevelopment of Rural Areas in Poland
Leszek Sieczko 1,*, Anna Justyna Parzonko 2 and Anna Sieczko 2
Citation: Sieczko, L.; Parzonko, A.J.;
Sieczko, A. Trust in Collective
Entrepreneurship in the Context of
the Development of Rural Areas in
Poland. Agriculture 2021, 11, 1151.
https://doi.org/10.3390/
agriculture11111151
Academic Editors: Adoración Mozas
Moral and Domingo Fernandez Ucles
Received: 19 October 2021
Accepted: 11 November 2021
Published: 16 November 2021
Publisher’s Note: MDPI stays neutral
with regard to jurisdictional claims in
published maps and institutional affil-
iations.
Copyright: © 2021 by the authors.
Licensee MDPI, Basel, Switzerland.
This article is an open access article
distributed under the terms and
conditions of the Creative Commons
Attribution (CC BY) license (https://
creativecommons.org/licenses/by/
4.0/).
1 Department of Biometry, Institute of Agriculture, Warsaw University of Life Sciences-SGGW,02-787 Warsaw, Poland
2 Department of Tourism, Social Communication and Consulting, Institute of Economics and Finance,Warsaw University of Life Sciences-SGGW, 02-787 Warsaw, Poland; [email protected] (A.J.P.);[email protected] (A.S.)
* Correspondence: [email protected]
Abstract: The aim of this research was to examine whether trust influences the functioning ofvarious forms of collective entrepreneurship in rural areas. The study focused on organizationswhich are most common in rural Poland: agricultural producer organizations, rural women’s circles,and local action groups. Hence, the survey sample included people engaged in these types ofcollective entrepreneurship. Data collection was based on a standardized questionnaire distributedonline utilizing the computer-assisted web interviewing method. The statistical analysis of theempirical material obtained from 132 respondents involved Pearson and Spearman correlation andprincipal component analysis. The conducted research shows (1) the superior role of personaltrust over institutional trust in the emergence and functioning of the studied forms of collectiveentrepreneurship in rural areas, (2) the greater importance of social than economic factors determiningthe functioning of rural collective entrepreneurship, (3) the positive impact of generalized trust ontrust placed in the forms of entrepreneurship covered by the analysis, (4) the increase in trust over timeof cooperation, and (5) the impact of trust on the functioning of collective entrepreneurship, in boththe economic and the social dimensions, with a slight advantage of the latter. By focusing on trust,this article contributes to the literature on the role of trust in developing collective entrepreneurshipin rural areas. The authors point out that this article only opens the space for a discussion on trust inthe concept of the economics of trust.
Keywords: agricultural producer organizations; rural women’s circles; local action groups
1. Introduction
In Poland, rural areas have great social, environmental, and economic importance.This is mainly due to the fact that they cover the vast majority of the country’s area andare inhabited by a high percentage of the population. The political transformation inPoland in 1989 revealed that, despite the fact that most of the farms were privately owned,farmers were not prepared for the changes that followed. One of the negative effects ofthe transformation was unemployment, practically unknown in Poland after World WarII. It became obvious that unprofitable agricultural production had to be replaced by newoff-farm jobs or additional on-farm activities. The structure of Polish agriculture is highlyfragmented. Private sector farms dominate, including family farms, which account forslightly more than 99% of the total number of farms. As for the farm size, in 2019, more thanhalf of the households were small farms with agricultural land not exceeding 5 ha (53.5%).The largest farms with an area of 50 ha of agricultural land accounted for only 2.4%. Theaverage agricultural land per farm has remained at the level of approximately 10 ha forseveral years [1]. The agricultural policy implemented after the political transformationand after Poland’s accession to the European Union has not led to an improvement in thestructure of Polish agriculture. The productivity of the factors of production, especially
Agriculture 2021, 11, 1151. https://doi.org/10.3390/agriculture11111151 https://www.mdpi.com/journal/agriculture
69
Agriculture 2021, 11, 1151
labor, is unsatisfactory. It is visible mainly in the weak flow of land from farms that arenot very productive or use land poorly to farms that are more effective in this respect.The agrarian structure of Polish agriculture remains flawed, especially when comparedto other European Union countries. Currently, over 70% of economically active peopleliving in rural areas do not derive any income from agriculture [2]. Micro-enterprises basedon self-employment dominate in the employment structure. Thus, there is an increase innonagricultural jobs in rural areas, but it is too low to meet the needs of the existing ruralsurplus of labor. For this reason, Polish rural areas and agriculture require continuoussupport for modernization and restructuring, as well as strengthening their competitiveposition in global markets.
The socioeconomic development of rural areas is a derivative of many factors, theimportance of which cannot be overestimated. Some of them are exogenous, partly ortotally independent of the activities of the local community, while others are endogenous.Research on the use of available resources (endogenous and exogenous) located in ruralareas is necessary in order to stimulate positive attitudes toward entrepreneurial initiatives,including collective endeavors. In the literature, attitudes of this type are referred to asentrepreneurial attitudes [3–5].
The concept of entrepreneurship is often discussed in the literature. Entrepreneurshipis a multidimensional phenomenon. All attempts to define the concept of “entrepreneur-ship” prove its interdisciplinarity. It has been a point of interest for researchers representingscientific disciples, such as psychology, sociology, economics, and management. Most of-ten, entrepreneurship is associated with economic issues and a certain attitude involvinglooking for opportunities and achieving specific goals. In the literature on managementand economics, entrepreneurship is most often treated as a process. In this case, theessence of entrepreneurship lies in initiating projects, as well as new forms of activity thatwould satisfy the needs and generate profits, and it would enable the reproduction anddevelopment of entrepreneurship. Entrepreneurship understood as a process involvesactivities undertaken in a specific space and time, with the use of specific resources byentities characterized by the features and skills desired in this process.
Entrepreneurship in the economic dimension involves the following [6,7]:
• creating new companies;• increasing efficiency;• creating new products, services, and techniques;• revitalizing competition in the market.
Another understanding of entrepreneurship as a process assumes that it is the courseof action involving setting up and running a business, including the following components:identifying opportunities and possibilities for operating on the market, developing abusiness plan and gathering the necessary resources, setting up an enterprise, and leadingit through the subsequent phases of its development. Therefore, we can risk a statementthat entrepreneurship is an organized activity, focused on the ability to generate anduse innovative ideas in order to obtain measurable benefits, carried out under riskconditions [5,8–10].
When considering entrepreneurship in rural areas, one should not only focus on settingup and running a business [11]. Such an approach would considerably narrow the conceptitself, as it also includes other activities contributing to the multidimensional developmentof rural areas, such as the activities of rural women’s circles or local action groups. Then,entrepreneurship is associated with the attitude of a person toward the outside worldand is expressed in a creative and active pursuit of new activities or expansion of theexisting ones. Entrepreneurship can also be understood as a specific type of human activity,defined by behavior, the ability to use ideas, and opportunities that come unnoticedor are underestimated by others. Entrepreneurship, understood as a specific type ofhuman endeavor, may take the form of an individual or collective activity. Collectiveentrepreneurship can be understood as organized, conscious, and voluntary cooperationof people aimed at achieving a common goal [12]. Its essence is the expression of the
70
Agriculture 2021, 11, 1151
interests of the group and the representation of these interests in the external environment.It requires close working relationships between people, utilization of their talents andcreative abilities, and mutual trust.
Trust can appear at different levels of social life. It may arise as a result of directcontacts and strong family and friendship ties in the traditional culture of the community,as well as in communities where secondary groups dominate, as a result of participationin the workplace environment, associations, and civic groups [13]. In the former case,the trust phenomenon derives from mutual relations: the more reciprocal the relationsbetween individual members of the community or positive experiences in neighborlycooperation, the greater the credit of trust. In the latter case, trust is generalized and isbased on a generally positive attitude toward others and public institutions. Trust in asituation of cooperation means that there is a widespread belief that others will participatein cooperation to a similar extent, that cooperation will be based on the principles of fairplay, and that it is “profitable”, i.e., brings benefits for all partners [14,15].
Collaborative networks are mutual relations that take place between individual mem-bers of a community, informal groups, and formal organizations. Through them, thecommunity establishes strategic contacts, selects leaders, defines and agrees with localinterests, identifies problems, and mobilizes material resources and residents to solvethem [16]. People and organizations within such networks often gain two benefits: influ-ence and power. They have greater opportunities to negotiate various types of transactions,because they have easier access to information, as well as greater control over its circulationand, thus better chances to use the emerging opportunities. Local leaders play a hugerole in their use [14]. One of the programs facilitating the network cooperation in ruralareas is the LEADER program, which contributes to the activation of rural communitiesby involving social and economic partners in the planning and implementation of localinitiatives. It is a program implemented by local action groups (LAGs), which by linkingrepresentatives of three sectors, public, economic, and social, contribute to strengtheningsocial capital and economic development of rural areas. Another manifestation of thecooperation network in rural areas, which has tradition dating back to the 19th century, isrepresented by rural women’s circles. They represent the interests and work to improve thesocial and professional situation of rural women and their families, as well as support thecomprehensive development of rural areas. Next, there are agricultural producer organiza-tions, created to enable farmers to become partners for large buyers of agricultural products,as well as means of production. As an organization, farmers are able to meet the increasingrequirements imposed by the market regarding the quality of agricultural and food prod-ucts, but also share expenses on the purchase of equipment or organization of transport,negotiate contracts, trade together in the marketplace, or undertake marketing activities.
The abovementioned forms of collective entrepreneurship are part of the new directionof rural development by creating conditions for effective, efficient, and partnership-basedimplementation of territorially oriented development activities. The literature suggests that,in this area, it is important to support the so-called collective trust, so that the participantscan share their experiences, be open to creative ideas, and find new directions for theirenterprises through mutual help and support [17–20].
A manifestation of favorable changes in the perception of the impact of various factorson the economy, including the “soft” ones, is the development of a new trend in economicsciences—the economics of trust. Traditional (neoclassical) economics, despite being a so-cial science, took into account only one type of human behavior, based on rational principleand driven by the maximization of utility [21,22]. The exclusion of social aspects from theanalyses, which has been described in the literature as “desocialization” [23], was one ofthe levels of criticism of mainstream economics and the reason for a significant limitationof its ability to explain many phenomena. Evidence provided by behavioral economics [24],experimental economics [25], or game theory [26] shows that individuals not only as-sume the existence of noneconomic values, but also make choices guided by these values.One of such values is trust, which plays a crucial role in both social and economic life [27].
71
Agriculture 2021, 11, 1151
In business, trust is recognized as an important component of success [28,29]. The eco-nomics of trust is detectable at various levels of social and economic life, from savingmoney that would have to be spent on security, to improving the functioning of the po-litical system. However, primarily, trust fosters business relationships. Employees whotrust each other are more collaborative and more willing to share ideas and informa-tion, which facilitates innovation and ultimately increases productivity [30,31]. Lack oftrust may stimulate hesitant attitudes toward teamwork or even antisocial attitudes whenteam members hold back good ideas or vital observations and do not share their experi-ences with each other [32]; they also have lower tolerance for organizational change [33].Consequently, absence of trust leads to lower wages, profits, and employment, while itspresence facilitates trade and encourages activities that add economic value [34]. In thissense, trust is like an interdependent network that connects all actors in an economy anddetermines how they interact to drive the economic growth [35,36].
Research in the field of the economics of trust is based on the thesis that trust is relatedto equality understood in two dimensions: economic equality and equal opportunities [37].In countries with a high level of generalized trust, the level of economic equality and equalopportunities is high [38], in contrast to countries with a low level of generalized trust. It isalso visible in the approach to entrepreneurship. Specifically, societies characterized byeconomic equality and equal opportunities, i.e., open, knowledge-based societies with awell-developed welfare state, have the best conditions for intrapreneurship and ultimatelyeconomic growth [39]. It is worth emphasizing that trust, both institutional and individual,tends to decline when socioeconomic conditions deteriorate [40,41].
Nature of the relationship between generalized trust and economic dynamics is stillminimally explored and understood, and the research carried out so far is mainly positionedin a macroeconomic perspective [42].
The aim of the presented research was to find an answer to the question whether andto what extent trust influences the functioning of various forms of collective entrepreneur-ship in rural areas. We focused on those forms of collective entrepreneurship that arecommon in Poland—agricultural producer organizations, rural women’s circles, and localaction groups.
The issue of trust and its role in the creation and management of an enterprise havebeen widely discussed in the literature. However, the researchers mostly focused on itsrole in three areas of economic behavior: consumption of goods and services, relationsbetween enterprises, and the superior–subordinate relationship. Unfortunately, the ruralcontext has largely been neglected. As emphasized by Gillath, Ai, Branicky, Keshmiri,Davison, and Spaulding [43], the lack of trust (whatever the cause) can result in limitedcooperation, efficiency, and productivity. Few researchers have focused on trust in collectiveentrepreneurship, which makes this study fit into the existing research gap.
Given the lack or a very limited scale of research focused on trust in collective en-trepreneurship in rural areas, and having taken into account its role in business man-agement and in economic and social development, the following research hypotheseswere formulated:
Hypothesis 1 (H1). People engaged in the studied forms of collective entrepreneurship in ruralareas have greater personal than institutional trust.
Hypothesis 2 (H2). Social factors determine the functioning of the studied forms of collectiveentrepreneurship to a greater extent than economic factors.
Hypothesis 3 (H3). According to the concept of the economics of trust, the higher the level ofgeneralized trust is, the higher the trust in various forms of cooperation will be.
72
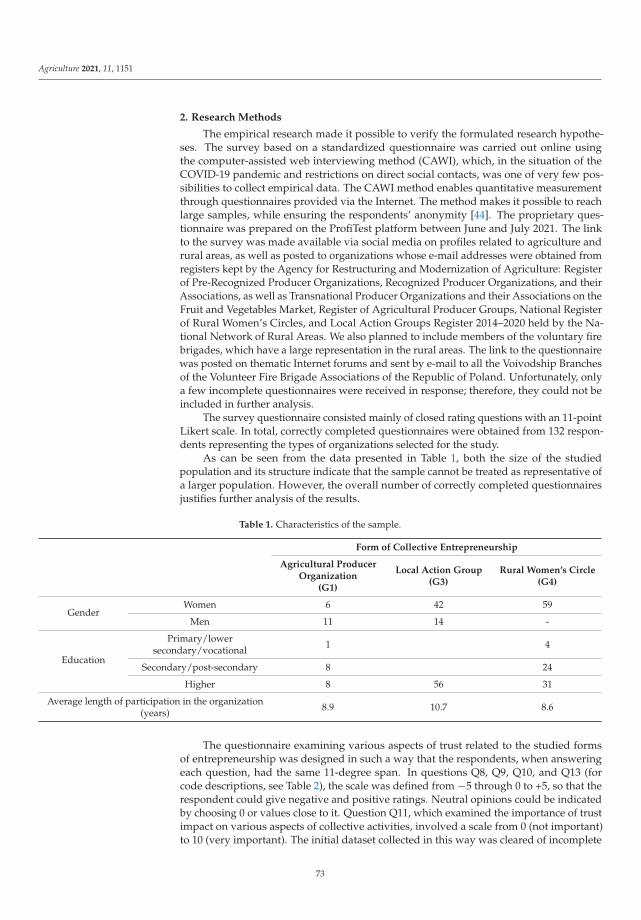
Agriculture 2021, 11, 1151
2. Research Methods
The empirical research made it possible to verify the formulated research hypothe-ses. The survey based on a standardized questionnaire was carried out online usingthe computer-assisted web interviewing method (CAWI), which, in the situation of theCOVID-19 pandemic and restrictions on direct social contacts, was one of very few pos-sibilities to collect empirical data. The CAWI method enables quantitative measurementthrough questionnaires provided via the Internet. The method makes it possible to reachlarge samples, while ensuring the respondents’ anonymity [44]. The proprietary ques-tionnaire was prepared on the ProfiTest platform between June and July 2021. The linkto the survey was made available via social media on profiles related to agriculture andrural areas, as well as posted to organizations whose e-mail addresses were obtained fromregisters kept by the Agency for Restructuring and Modernization of Agriculture: Registerof Pre-Recognized Producer Organizations, Recognized Producer Organizations, and theirAssociations, as well as Transnational Producer Organizations and their Associations on theFruit and Vegetables Market, Register of Agricultural Producer Groups, National Registerof Rural Women’s Circles, and Local Action Groups Register 2014–2020 held by the Na-tional Network of Rural Areas. We also planned to include members of the voluntary firebrigades, which have a large representation in the rural areas. The link to the questionnairewas posted on thematic Internet forums and sent by e-mail to all the Voivodship Branchesof the Volunteer Fire Brigade Associations of the Republic of Poland. Unfortunately, onlya few incomplete questionnaires were received in response; therefore, they could not beincluded in further analysis.
The survey questionnaire consisted mainly of closed rating questions with an 11-pointLikert scale. In total, correctly completed questionnaires were obtained from 132 respon-dents representing the types of organizations selected for the study.
As can be seen from the data presented in Table 1, both the size of the studiedpopulation and its structure indicate that the sample cannot be treated as representative ofa larger population. However, the overall number of correctly completed questionnairesjustifies further analysis of the results.
Table 1. Characteristics of the sample.
Form of Collective Entrepreneurship
Agricultural ProducerOrganization
(G1)
Local Action Group(G3)
Rural Women’s Circle(G4)
GenderWomen 6 42 59
Men 11 14 -
Education
Primary/lowersecondary/vocational 1 4
Secondary/post-secondary 8 24
Higher 8 56 31
Average length of participation in the organization(years) 8.9 10.7 8.6
The questionnaire examining various aspects of trust related to the studied formsof entrepreneurship was designed in such a way that the respondents, when answeringeach question, had the same 11-degree span. In questions Q8, Q9, Q10, and Q13 (forcode descriptions, see Table 2), the scale was defined from −5 through 0 to +5, so that therespondent could give negative and positive ratings. Neutral opinions could be indicatedby choosing 0 or values close to it. Question Q11, which examined the importance of trustimpact on various aspects of collective activities, involved a scale from 0 (not important)to 10 (very important). The initial dataset collected in this way was cleared of incomplete
73
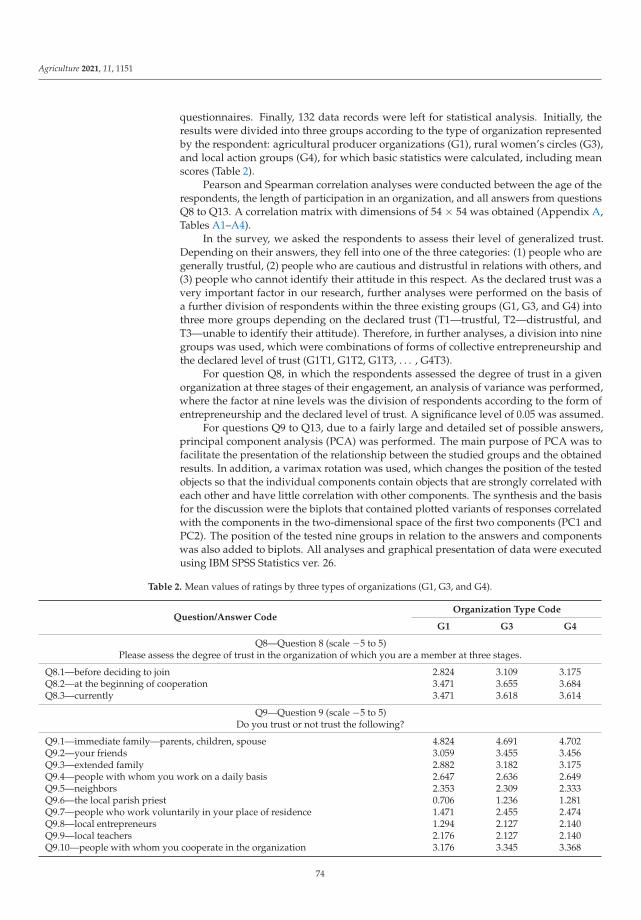
Agriculture 2021, 11, 1151
questionnaires. Finally, 132 data records were left for statistical analysis. Initially, theresults were divided into three groups according to the type of organization representedby the respondent: agricultural producer organizations (G1), rural women’s circles (G3),and local action groups (G4), for which basic statistics were calculated, including meanscores (Table 2).
Pearson and Spearman correlation analyses were conducted between the age of therespondents, the length of participation in an organization, and all answers from questionsQ8 to Q13. A correlation matrix with dimensions of 54 × 54 was obtained (Appendix A,Tables A1–A4).
In the survey, we asked the respondents to assess their level of generalized trust.Depending on their answers, they fell into one of the three categories: (1) people who aregenerally trustful, (2) people who are cautious and distrustful in relations with others, and(3) people who cannot identify their attitude in this respect. As the declared trust was avery important factor in our research, further analyses were performed on the basis ofa further division of respondents within the three existing groups (G1, G3, and G4) intothree more groups depending on the declared trust (T1—trustful, T2—distrustful, andT3—unable to identify their attitude). Therefore, in further analyses, a division into ninegroups was used, which were combinations of forms of collective entrepreneurship andthe declared level of trust (G1T1, G1T2, G1T3, . . . , G4T3).
For question Q8, in which the respondents assessed the degree of trust in a givenorganization at three stages of their engagement, an analysis of variance was performed,where the factor at nine levels was the division of respondents according to the form ofentrepreneurship and the declared level of trust. A significance level of 0.05 was assumed.
For questions Q9 to Q13, due to a fairly large and detailed set of possible answers,principal component analysis (PCA) was performed. The main purpose of PCA was tofacilitate the presentation of the relationship between the studied groups and the obtainedresults. In addition, a varimax rotation was used, which changes the position of the testedobjects so that the individual components contain objects that are strongly correlated witheach other and have little correlation with other components. The synthesis and the basisfor the discussion were the biplots that contained plotted variants of responses correlatedwith the components in the two-dimensional space of the first two components (PC1 andPC2). The position of the tested nine groups in relation to the answers and componentswas also added to biplots. All analyses and graphical presentation of data were executedusing IBM SPSS Statistics ver. 26.
Table 2. Mean values of ratings by three types of organizations (G1, G3, and G4).
Question/Answer CodeOrganization Type Code
G1 G3 G4
Q8—Question 8 (scale −5 to 5)Please assess the degree of trust in the organization of which you are a member at three stages.
Q8.1—before deciding to join 2.824 3.109 3.175Q8.2—at the beginning of cooperation 3.471 3.655 3.684Q8.3—currently 3.471 3.618 3.614
Q9—Question 9 (scale −5 to 5)Do you trust or not trust the following?
Q9.1—immediate family—parents, children, spouse 4.824 4.691 4.702Q9.2—your friends 3.059 3.455 3.456Q9.3—extended family 2.882 3.182 3.175Q9.4—people with whom you work on a daily basis 2.647 2.636 2.649Q9.5—neighbors 2.353 2.309 2.333Q9.6—the local parish priest 0.706 1.236 1.281Q9.7—people who work voluntarily in your place of residence 1.471 2.455 2.474Q9.8—local entrepreneurs 1.294 2.127 2.140Q9.9—local teachers 2.176 2.127 2.140Q9.10—people with whom you cooperate in the organization 3.176 3.345 3.368
74
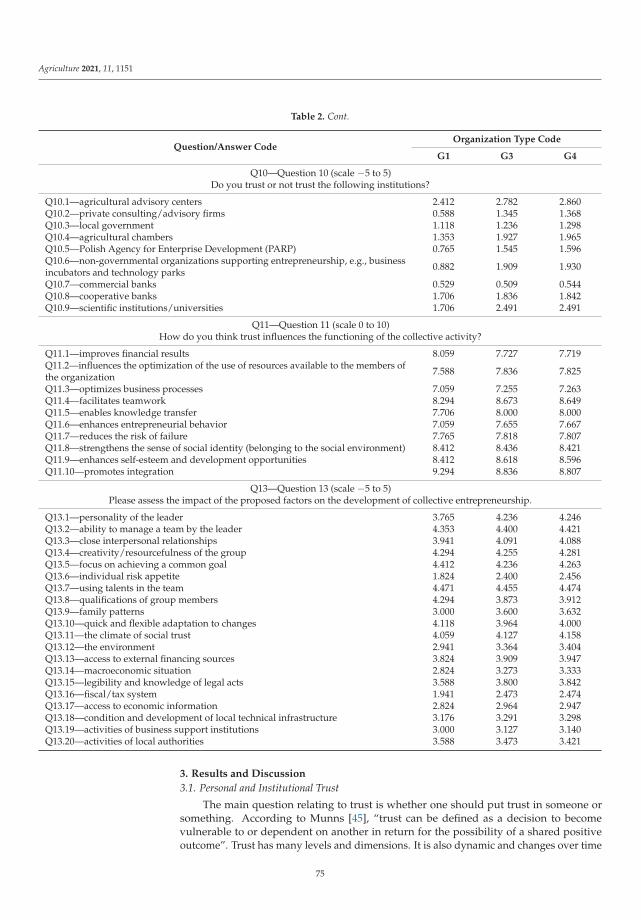
Agriculture 2021, 11, 1151
Table 2. Cont.
Question/Answer CodeOrganization Type Code
G1 G3 G4
Q10—Question 10 (scale −5 to 5)Do you trust or not trust the following institutions?
Q10.1—agricultural advisory centers 2.412 2.782 2.860Q10.2—private consulting/advisory firms 0.588 1.345 1.368Q10.3—local government 1.118 1.236 1.298Q10.4—agricultural chambers 1.353 1.927 1.965Q10.5—Polish Agency for Enterprise Development (PARP) 0.765 1.545 1.596Q10.6—non-governmental organizations supporting entrepreneurship, e.g., businessincubators and technology parks 0.882 1.909 1.930
Q10.7—commercial banks 0.529 0.509 0.544Q10.8—cooperative banks 1.706 1.836 1.842Q10.9—scientific institutions/universities 1.706 2.491 2.491
Q11—Question 11 (scale 0 to 10)How do you think trust influences the functioning of the collective activity?
Q11.1—improves financial results 8.059 7.727 7.719Q11.2—influences the optimization of the use of resources available to the members ofthe organization 7.588 7.836 7.825
Q11.3—optimizes business processes 7.059 7.255 7.263Q11.4—facilitates teamwork 8.294 8.673 8.649Q11.5—enables knowledge transfer 7.706 8.000 8.000Q11.6—enhances entrepreneurial behavior 7.059 7.655 7.667Q11.7—reduces the risk of failure 7.765 7.818 7.807Q11.8—strengthens the sense of social identity (belonging to the social environment) 8.412 8.436 8.421Q11.9—enhances self-esteem and development opportunities 8.412 8.618 8.596Q11.10—promotes integration 9.294 8.836 8.807
Q13—Question 13 (scale −5 to 5)Please assess the impact of the proposed factors on the development of collective entrepreneurship.
Q13.1—personality of the leader 3.765 4.236 4.246Q13.2—ability to manage a team by the leader 4.353 4.400 4.421Q13.3—close interpersonal relationships 3.941 4.091 4.088Q13.4—creativity/resourcefulness of the group 4.294 4.255 4.281Q13.5—focus on achieving a common goal 4.412 4.236 4.263Q13.6—individual risk appetite 1.824 2.400 2.456Q13.7—using talents in the team 4.471 4.455 4.474Q13.8—qualifications of group members 4.294 3.873 3.912Q13.9—family patterns 3.000 3.600 3.632Q13.10—quick and flexible adaptation to changes 4.118 3.964 4.000Q13.11—the climate of social trust 4.059 4.127 4.158Q13.12—the environment 2.941 3.364 3.404Q13.13—access to external financing sources 3.824 3.909 3.947Q13.14—macroeconomic situation 2.824 3.273 3.333Q13.15—legibility and knowledge of legal acts 3.588 3.800 3.842Q13.16—fiscal/tax system 1.941 2.473 2.474Q13.17—access to economic information 2.824 2.964 2.947Q13.18—condition and development of local technical infrastructure 3.176 3.291 3.298Q13.19—activities of business support institutions 3.000 3.127 3.140Q13.20—activities of local authorities 3.588 3.473 3.421
3. Results and Discussion
3.1. Personal and Institutional Trust
The main question relating to trust is whether one should put trust in someone orsomething. According to Munns [45], “trust can be defined as a decision to becomevulnerable to or dependent on another in return for the possibility of a shared positiveoutcome”. Trust has many levels and dimensions. It is also dynamic and changes over time
75
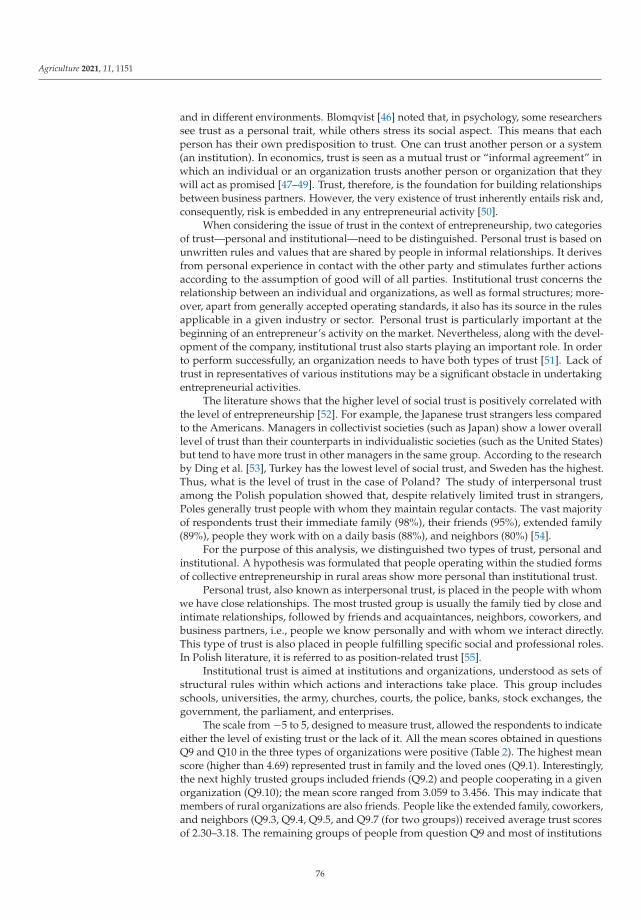
Agriculture 2021, 11, 1151
and in different environments. Blomqvist [46] noted that, in psychology, some researcherssee trust as a personal trait, while others stress its social aspect. This means that eachperson has their own predisposition to trust. One can trust another person or a system(an institution). In economics, trust is seen as a mutual trust or “informal agreement” inwhich an individual or an organization trusts another person or organization that theywill act as promised [47–49]. Trust, therefore, is the foundation for building relationshipsbetween business partners. However, the very existence of trust inherently entails risk and,consequently, risk is embedded in any entrepreneurial activity [50].
When considering the issue of trust in the context of entrepreneurship, two categoriesof trust—personal and institutional—need to be distinguished. Personal trust is based onunwritten rules and values that are shared by people in informal relationships. It derivesfrom personal experience in contact with the other party and stimulates further actionsaccording to the assumption of good will of all parties. Institutional trust concerns therelationship between an individual and organizations, as well as formal structures; more-over, apart from generally accepted operating standards, it also has its source in the rulesapplicable in a given industry or sector. Personal trust is particularly important at thebeginning of an entrepreneur’s activity on the market. Nevertheless, along with the devel-opment of the company, institutional trust also starts playing an important role. In orderto perform successfully, an organization needs to have both types of trust [51]. Lack oftrust in representatives of various institutions may be a significant obstacle in undertakingentrepreneurial activities.
The literature shows that the higher level of social trust is positively correlated withthe level of entrepreneurship [52]. For example, the Japanese trust strangers less comparedto the Americans. Managers in collectivist societies (such as Japan) show a lower overalllevel of trust than their counterparts in individualistic societies (such as the United States)but tend to have more trust in other managers in the same group. According to the researchby Ding et al. [53], Turkey has the lowest level of social trust, and Sweden has the highest.Thus, what is the level of trust in the case of Poland? The study of interpersonal trustamong the Polish population showed that, despite relatively limited trust in strangers,Poles generally trust people with whom they maintain regular contacts. The vast majorityof respondents trust their immediate family (98%), their friends (95%), extended family(89%), people they work with on a daily basis (88%), and neighbors (80%) [54].
For the purpose of this analysis, we distinguished two types of trust, personal andinstitutional. A hypothesis was formulated that people operating within the studied formsof collective entrepreneurship in rural areas show more personal than institutional trust.
Personal trust, also known as interpersonal trust, is placed in the people with whomwe have close relationships. The most trusted group is usually the family tied by close andintimate relationships, followed by friends and acquaintances, neighbors, coworkers, andbusiness partners, i.e., people we know personally and with whom we interact directly.This type of trust is also placed in people fulfilling specific social and professional roles.In Polish literature, it is referred to as position-related trust [55].
Institutional trust is aimed at institutions and organizations, understood as sets ofstructural rules within which actions and interactions take place. This group includesschools, universities, the army, churches, courts, the police, banks, stock exchanges, thegovernment, the parliament, and enterprises.
The scale from −5 to 5, designed to measure trust, allowed the respondents to indicateeither the level of existing trust or the lack of it. All the mean scores obtained in questionsQ9 and Q10 in the three types of organizations were positive (Table 2). The highest meanscore (higher than 4.69) represented trust in family and the loved ones (Q9.1). Interestingly,the next highly trusted groups included friends (Q9.2) and people cooperating in a givenorganization (Q9.10); the mean score ranged from 3.059 to 3.456. This may indicate thatmembers of rural organizations are also friends. People like the extended family, coworkers,and neighbors (Q9.3, Q9.4, Q9.5, and Q9.7 (for two groups)) received average trust scoresof 2.30–3.18. The remaining groups of people from question Q9 and most of institutions
76
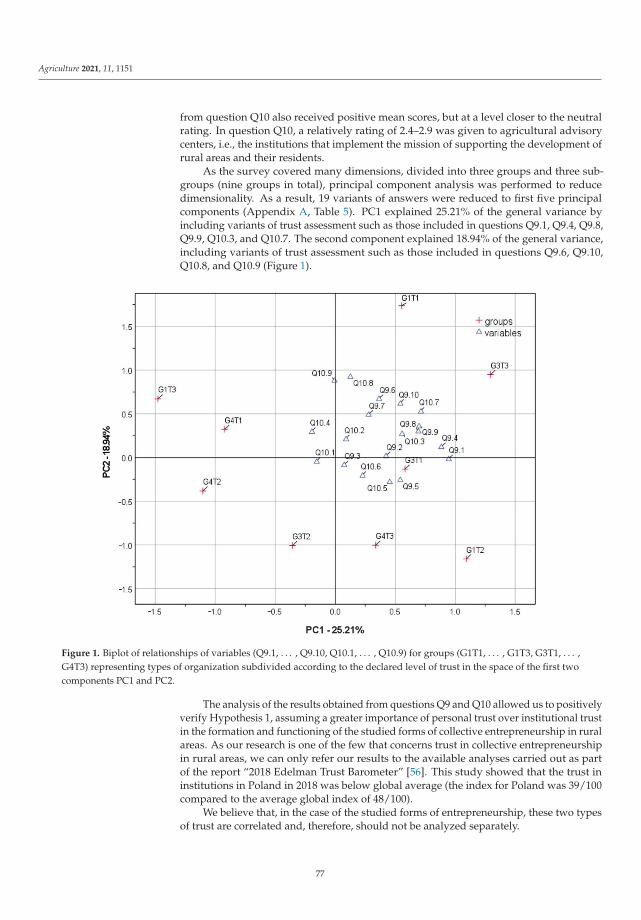
Agriculture 2021, 11, 1151
from question Q10 also received positive mean scores, but at a level closer to the neutralrating. In question Q10, a relatively rating of 2.4–2.9 was given to agricultural advisorycenters, i.e., the institutions that implement the mission of supporting the development ofrural areas and their residents.
As the survey covered many dimensions, divided into three groups and three sub-groups (nine groups in total), principal component analysis was performed to reducedimensionality. As a result, 19 variants of answers were reduced to first five principalcomponents (Appendix A, Table 5). PC1 explained 25.21% of the general variance byincluding variants of trust assessment such as those included in questions Q9.1, Q9.4, Q9.8,Q9.9, Q10.3, and Q10.7. The second component explained 18.94% of the general variance,including variants of trust assessment such as those included in questions Q9.6, Q9.10,Q10.8, and Q10.9 (Figure 1).
Figure 1. Biplot of relationships of variables (Q9.1, . . . , Q9.10, Q10.1, . . . , Q10.9) for groups (G1T1, . . . , G1T3, G3T1, . . . ,G4T3) representing types of organization subdivided according to the declared level of trust in the space of the first twocomponents PC1 and PC2.
The analysis of the results obtained from questions Q9 and Q10 allowed us to positivelyverify Hypothesis 1, assuming a greater importance of personal trust over institutional trustin the formation and functioning of the studied forms of collective entrepreneurship in ruralareas. As our research is one of the few that concerns trust in collective entrepreneurshipin rural areas, we can only refer our results to the available analyses carried out as partof the report “2018 Edelman Trust Barometer” [56]. This study showed that the trust ininstitutions in Poland in 2018 was below global average (the index for Poland was 39/100compared to the average global index of 48/100).
We believe that, in the case of the studied forms of entrepreneurship, these two typesof trust are correlated and, therefore, should not be analyzed separately.
77
Agriculture 2021, 11, 1151
3.2. Social and Economic Determinants of Collective Entrepreneurship Development
An attempt was made to evaluate the factors determining the development of collec-tive entrepreneurship. The designed rating scale was from −5 (inhibiting development)through 0 (having no influence) to 5 (stimulating development). Twenty determinantswere presented to be evaluated. All determinants obtained average positive scores, whichsuggests that, according to the respondents, they stimulate the development of collectiveentrepreneurship in rural areas. The highest mean scores (within the range from 4.00 to4.65 depending on a group) were achieved by factors related to the leader—personality andmanagerial skills (Q13.1, Q13.2). Other highly stimulating determinants included workingtoward a common goal (Q13.5), as well as talents and creativity present in the team (Q13.4,Q13.7), which, in individual groups, were assessed at an average level of 2.94 to 4.42. Theremaining determinants were also assessed positively but depending on the studied groupat a lower level (Table 2).
The applied PCA reduced the studied space from 20 dimensions to the first fourprincipal components. PC1 accounted for 37.73% of the overall variance, concentratingon determinants such as Q13.4, Q13.5, Q13.6, Q13.7, Q13.8, Q13.10, Q13.12, Q13.13, andQ13.20 (Appendix A, Table 6). This group contained high- and medium-rated determi-nants. The applied varimax rotation revealed that they are mutually correlated. PC2accounted for 25.62% of the total variance and the determinants most strongly correlatedwith it were variables Q13.1, Q13.2, Q13.3, Q13.11, Q13.14, Q13.18, and Q13.19. The firstthree determinants also had some of the highest ratings. Therefore, this component canbe interpreted as gathering the most important features of collective entrepreneurshipdevelopment (Figure 2). PC3 accounted for 17.76% of the overall variance. Determinantsrelated to family patterns (Q13.9), fiscal systems (Q13.16), and the availability of economicinformation (Q13.17) correlated with it most strongly. Interestingly, PC4 was stronglycorrelated with only one feature related to the legibility and knowledge of legal acts, and itexplained 10.57% of the overall variance.
Figure 2. Biplot of relationships of variables (Q13.1, . . . , Q13.20) for groups (G1T1, . . . , G1T3, G3T1, . . . , G4T3) representingtypes of organization subdivided according to the declared level of trust in the space of the first two components PC1and PC2.
78
Agriculture 2021, 11, 1151
The reduction of 20 initial variables to four principal components enabled explanationin a simplified manner of 91.69% of the total variance.
The PCA allowed for the positive verification of Hypothesis 2, assuming that socialfactors determine the functioning of the studied forms of collective entrepreneurship to agreater extent than economic factors.
A significant correlation (at the level of 0.35) was revealed between how the respon-dents assessed the impact of family relationships, neighborly relations, friendship, and theperformance of social roles on the level of trust and the assessment of the importance ofsocial factors influencing the development of collective entrepreneurship (Appendix A,Table 7).
A similar comparative analysis of the impact of social and economic factors on thedevelopment of cooperatives was carried out by Pan [57]. This study showed that theinfluence of social factors on this collective form of entrepreneurship is stronger thanof the economic ones. According to Brodzinski, the influence of social and economicfactors on the development of entrepreneurship among agricultural producers is the same,although the author pointed to creativity, optimism and commitment as the primary driveof entrepreneurship [58]. Furthermore, studies of other researchers indicated a greaterimpact of these factors on the development of entrepreneurship in rural areas [59,60].According to Björklund, it is easier for entrepreneurs to overcome barriers to innovation ifthey have specific cognitive abilities. These abilities include sufficient knowledge, accessto information, and decision flexibility. Positive attitudes facilitate the implementation ofinnovations, while negative attitudes make it difficult. A positive attitude toward work andothers can enhance individual performance and creativity, foster new relationships, andexpand the use of intellectual and social resources [61]. Colombo and Perujo-Villanueva,on the other hand, emphasized that relations between agricultural neighbors are themain determinant of cooperation, not only between small entities [62]. In the researchby Krzyzanowska [63] conducted on a group of 132 leaders of agricultural producergroups, trust was assessed as one of the most important interpersonal skills essentialin leadership processes. It was rated 3.98 on a Likert scale from 1 to 5, where 1 meantunimportant and 5 meant very important. The importance of trust in entrepreneurialteams was also confirmed by the results of the research conducted by Falkowski et al. [64]among members of agricultural producer organizations in Poland. In this case, 70% ofthe surveyed farmers most often indicated lack of trust as a factor hindering the creationof producer organizations. Only in the case of producer organizations based on familyties was this aspect not so important. This is probably a manifestation of the mentalitybarrier resulting from the negative experiences of farmers in the times of centrally plannedeconomy and forced collectivization of agricultural sector, which now still influences thepreference for private (family) farming. In rural areas in Poland, the generalized trust indexis still relatively low compared to larger cities (on a seven-point scale from −3 to +3, themean value was −0.88 for rural areas, 0.22 for larger cities, and −0.90 for farmers) [54].
3.3. Trust in Collective Entrepreneurship
It was assumed in the study (H3) that, according to the concept of the economicsof trust, a higher level of generalized trust would result in a greater trust in variousforms of cooperation; furthermore, as participants gain common experiences, the level oftrust in group cooperation increases. The analysis performed with the use of descriptivestatistics, i.e., the statistics of the distribution of the feature value (location and dispersion)confirmed this hypothesis (H3). The data presented in Figure 3 show that those people whobelieved that most people could be trusted (T1) (and, therefore, showed a higher level ofgeneralized trust than the remaining respondents) were more likely to trust joint ventures.It is interesting, however, that, regardless of the level of generalized trust, after startingcooperation under the researched forms of entrepreneurship, the trust in the organizationvisibly increases. The highest increase was recorded in the G3T3 group. The exceptionswere respondents representing rural women’s circles, who did not define their level of
79
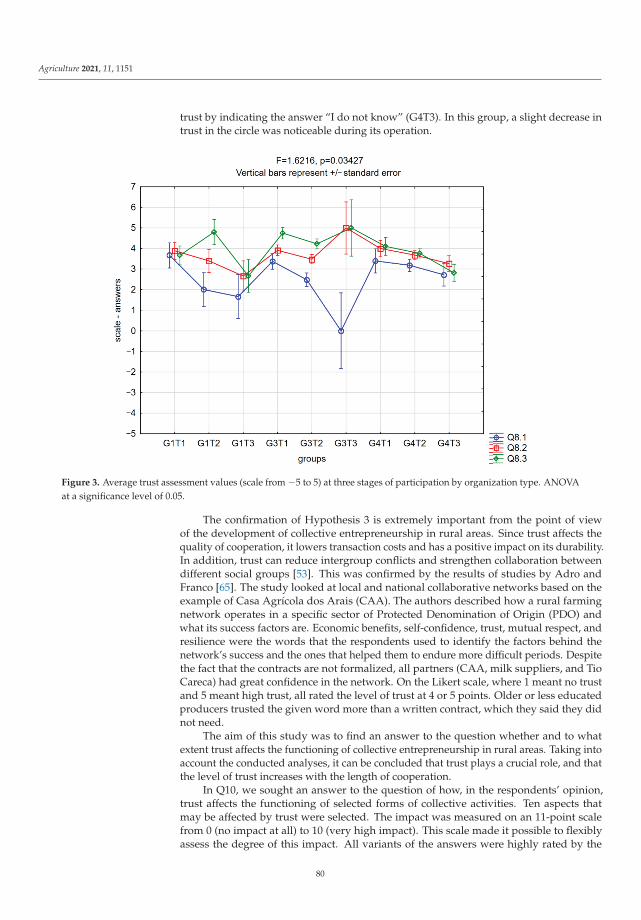
Agriculture 2021, 11, 1151
trust by indicating the answer “I do not know” (G4T3). In this group, a slight decrease intrust in the circle was noticeable during its operation.
Figure 3. Average trust assessment values (scale from −5 to 5) at three stages of participation by organization type. ANOVAat a significance level of 0.05.
The confirmation of Hypothesis 3 is extremely important from the point of viewof the development of collective entrepreneurship in rural areas. Since trust affects thequality of cooperation, it lowers transaction costs and has a positive impact on its durability.In addition, trust can reduce intergroup conflicts and strengthen collaboration betweendifferent social groups [53]. This was confirmed by the results of studies by Adro andFranco [65]. The study looked at local and national collaborative networks based on theexample of Casa Agrícola dos Arais (CAA). The authors described how a rural farmingnetwork operates in a specific sector of Protected Denomination of Origin (PDO) andwhat its success factors are. Economic benefits, self-confidence, trust, mutual respect, andresilience were the words that the respondents used to identify the factors behind thenetwork’s success and the ones that helped them to endure more difficult periods. Despitethe fact that the contracts are not formalized, all partners (CAA, milk suppliers, and TioCareca) had great confidence in the network. On the Likert scale, where 1 meant no trustand 5 meant high trust, all rated the level of trust at 4 or 5 points. Older or less educatedproducers trusted the given word more than a written contract, which they said they didnot need.
The aim of this study was to find an answer to the question whether and to whatextent trust affects the functioning of collective entrepreneurship in rural areas. Taking intoaccount the conducted analyses, it can be concluded that trust plays a crucial role, and thatthe level of trust increases with the length of cooperation.
In Q10, we sought an answer to the question of how, in the respondents’ opinion,trust affects the functioning of selected forms of collective activities. Ten aspects thatmay be affected by trust were selected. The impact was measured on an 11-point scalefrom 0 (no impact at all) to 10 (very high impact). This scale made it possible to flexiblyassess the degree of this impact. All variants of the answers were highly rated by the
80
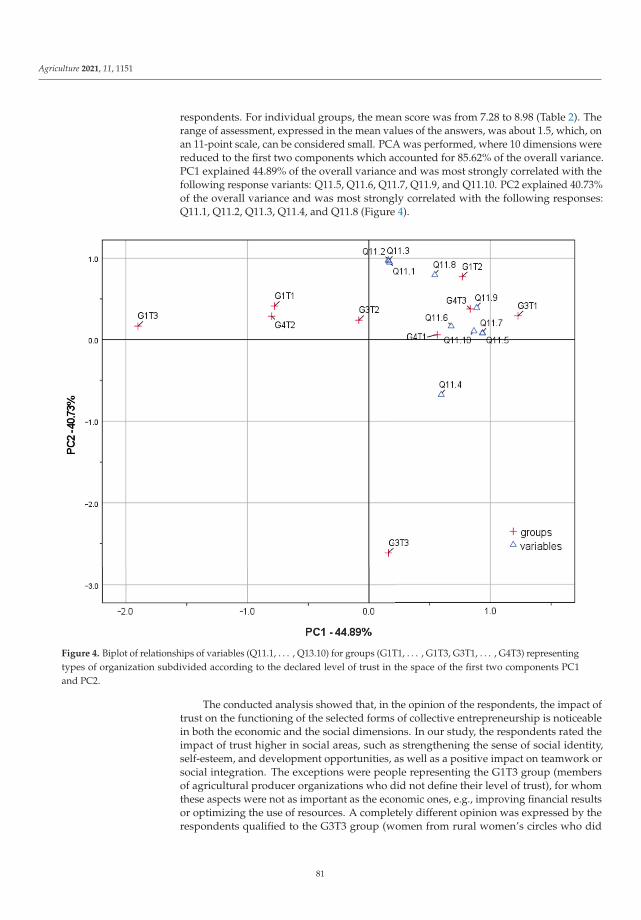
Agriculture 2021, 11, 1151
respondents. For individual groups, the mean score was from 7.28 to 8.98 (Table 2). Therange of assessment, expressed in the mean values of the answers, was about 1.5, which, onan 11-point scale, can be considered small. PCA was performed, where 10 dimensions werereduced to the first two components which accounted for 85.62% of the overall variance.PC1 explained 44.89% of the overall variance and was most strongly correlated with thefollowing response variants: Q11.5, Q11.6, Q11.7, Q11.9, and Q11.10. PC2 explained 40.73%of the overall variance and was most strongly correlated with the following responses:Q11.1, Q11.2, Q11.3, Q11.4, and Q11.8 (Figure 4).
Figure 4. Biplot of relationships of variables (Q11.1, . . . , Q13.10) for groups (G1T1, . . . , G1T3, G3T1, . . . , G4T3) representingtypes of organization subdivided according to the declared level of trust in the space of the first two components PC1and PC2.
The conducted analysis showed that, in the opinion of the respondents, the impact oftrust on the functioning of the selected forms of collective entrepreneurship is noticeablein both the economic and the social dimensions. In our study, the respondents rated theimpact of trust higher in social areas, such as strengthening the sense of social identity,self-esteem, and development opportunities, as well as a positive impact on teamwork orsocial integration. The exceptions were people representing the G1T3 group (membersof agricultural producer organizations who did not define their level of trust), for whomthese aspects were not as important as the economic ones, e.g., improving financial resultsor optimizing the use of resources. A completely different opinion was expressed by therespondents qualified to the G3T3 group (women from rural women’s circles who did
81
Agriculture 2021, 11, 1151
not define their level of generalized trust), for whom these economic aspects were theleast important.
4. Conclusions
The development of entrepreneurship in rural areas has been, for many reasons,a more difficult process than in urbanized areas [7,66]. This is caused by many factorsincluding location, dispersion, small scale of activity, shallowness of local markets, thelevel of infrastructure development, and the level of education of rural residents.
Due to the fact that the sample selected for this research was not representative,it does not allow for generalizations. However, as our findings correspond with the resultsof other authors, as shown in the paper, they provide sufficient grounds for verification ofthe research hypotheses.
The literature implies that entrepreneurial activity is related to both the most basictrust we place in people with whom we maintain social relations and other types of trust,including trust in institutions. Trust is a value that facilitates cooperation between en-trepreneurs and their partners [67–69]. This was confirmed by our research. The conductedPCA showed that the respondents are more likely to trust their family, friends, peoplethey work with, local entrepreneurs, and teachers. In the conducted analysis, institutionaltrust was rated much lower. The exceptions were agricultural advisory centers, whichobtained higher trust mean scores (2.4–2.9) compared to other institutions. This result canbe explained by the fact that their activity is directly dedicated to rural residents, and therespondents are familiar with it. Moreover, the PCA analysis revealed that the respondentswere also willing to trust institutions such as local authorities, commercial and cooperativebanks, and scientific centers. Hypothesis 1 was, thus, confirmed.
The socioeconomic development of rural areas is, inter alia, determined by the effectivecooperation between entities operating locally. There is no doubt that the main factorlimiting cooperation is insufficient knowledge and, above all, the uncertainty resultingfrom limited trust. This study shows that trust is a necessary condition for effectivecooperation. This was also confirmed by the studies of other researchers [70]. Apartfrom the influence of trust on the development of collective entrepreneurship, this studyshows that other factors, of both a social and an economic nature, also play an importantrole. The respondents highly rated the impact of social factors including personality traitsand skills such as the leader’s ability to manage a team, creativity of the members, andorientation toward a common goal. Moreover, conditions such as the climate of trustplay an important role. In the opinion of the respondents who actively participate in theanalyzed forms of collective entrepreneurship, equally important were economic factorssuch as the availability of external sources of financing, the macroeconomic situation ofthe country, the condition of infrastructure, and access to business support institutions.The abovementioned social factors, highly rated by respondents, basically constitute thesocial capital, which in rural areas is identified mainly with local organizations such asassociations, civic groups or producer organizations, rural women’s circles, and local actiongroups covered by this research. Summing up, Hypothesis 2 was positively verified, as theprevalence of social factors over economic factors was demonstrated.
There seems to be a consensus among researchers that a higher level of trust facilitatesforming multi-actor networks of entrepreneurs and their successful performance [71,72].Trust has a considerable impact on cooperation between entrepreneurs in small networkswhere the relationships are more personal [64]. Our research also shows that people with ahigher level of generalized trust are more likely to trust joint ventures, especially beforejoining a collective endeavor. This confirms Hypothesis 3. However, a new relationshipemerged. The local action group members who did not indicate their level of generalizedtrust declared that their trust increased with the length of participation. Unfortunately,in the remaining groups, i.e., agricultural producers and rural women’s circles, such trustgrowth was not statistically confirmed. The most surprising results were obtained inthe group of people who indicated a low level of generalized trust. In this case, in all
82
Agriculture 2021, 11, 1151
the studied groups, the level of trust increased along with the length of participation inthe organization.
We are aware that our study is one of the first undertaken in this field. The positivelyverified hypotheses formulated in the research do not, however, justify the formulationof general conclusions. Firstly, to make this possible, further in-depth research would berequired in this area, with particular emphasis on the dominant character of the activitiestypical for different forms of entrepreneurship. Agricultural producer organizations pursuemainly economic goals, while rural women’s circles and local action groups focus ratheron the social aspects of local community life. Secondly, there was an overrepresentation ofwomen in the sample. This was due to the following reasons: the survey was carried outusing the CAWI method, which subjected the process of sampling to a large extent to fateand, despite targeting a diverse population including producer groups, local action groups,rural women’s circles, and volunteer fire brigades, responses were obtained mostly fromrural women’s circles and local action groups represented mainly by women. While our em-pirical research contributes to the existing literature on trust in collective entrepreneurshipin rural areas, it does show some limitations. We believe that the conducted analysis willinspire future research on the role of trust in the development of collective entrepreneurshipin rural areas. It seems important to consider the following research areas:
(1) the role of trust in the economics of trust paradigm in the perspective of rural development,(2) the conditions for the formation and functioning of collective entrepreneurship in
rural areas, which is an impulse stimulating the local community to undertake en-trepreneurial activity,
(3) defining the factors strengthening the social trust of rural residents.
We hope that the presented research areas will serve as inspiration for future studies.By focusing on trust, this paper contributes to the literature examining the role of trustin the development of collective entrepreneurship in rural areas. Trust is a complex,difficult-to-study topic, both theoretically and methodologically. The limitation of this typeof research is the credibility of the respondents in terms of competence and perception. Tocounteract that, in-depth, qualitative research using the interview technique is required. Webelieve that our study, which is one of the first in this field, should be seen as a pilot study.
Author Contributions: Conceptualization, L.S., A.J.P. and A.S.; methodology, L.S., A.J.P. and A.S.;formal analysis, L.S., A.J.P. and A.S.; investigation, L.S., A.J.P. and A.S.; writing—original draftpreparation, L.S., A.J.P. and A.S.; visualization, L.S. All authors have read and agreed to the publishedversion of the manuscript.
Funding: This research received no external funding.
Institutional Review Board Statement: Not applicable.
Data Availability Statement: Not applicable.
Conflicts of Interest: The authors declare no conflict of interest.
83
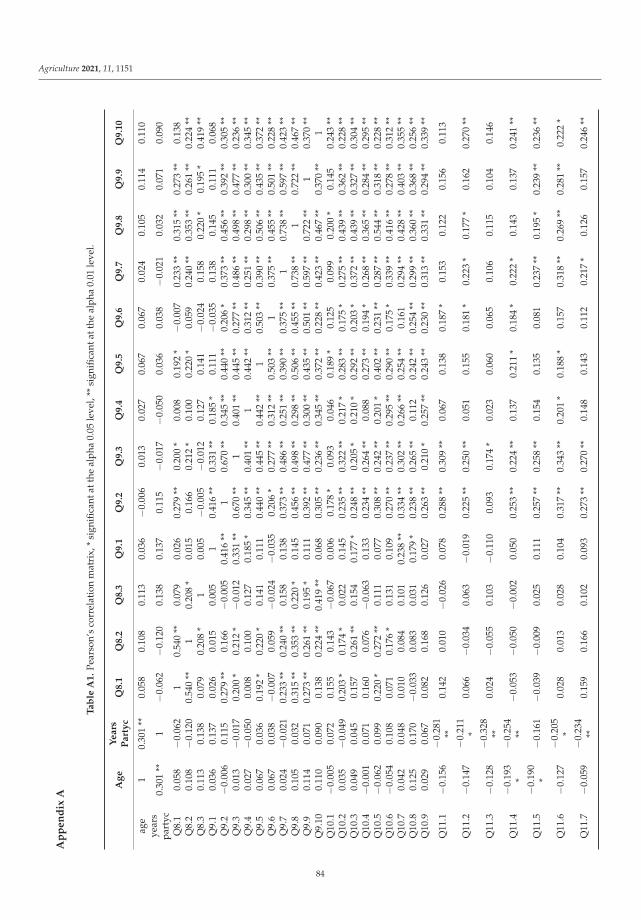
Agriculture 2021, 11, 1151A
pp
en
dix
A
Ta
ble
A1
.Pe
arso
n’s
corr
elat
ion
mat
rix,
*si
gnifi
cant
atth
eal
pha
0.05
leve
l,**
sign
ifica
ntat
the
alph
a0.
01le
vel.
Ag
eY
ea
rsP
art
yc
Q8
.1Q
8.2
Q8
.3Q
9.1
Q9
.2Q
9.3
Q9
.4Q
9.5
Q9
.6Q
9.7
Q9
.8Q
9.9
Q9
.10
age
10.
301
**0.
058
0.10
80.
113
0.03
6−0
.006
0.01
30.
027
0.06
70.
067
0.02
40.
105
0.11
40.
110
year
spa
rtyc
0.30
1**
1−0
.062
−0.1
200.
138
0.13
70.
115
−0.0
17−0
.050
0.03
60.
038
−0.0
210.
032
0.07
10.
090
Q8.
10.
058
−0.0
621
0.54
0**
0.07
90.
026
0.27
9**
0.20
0*
0.00
80.
192
*−0
.007
0.23
3**
0.31
5**
0.27
3**
0.13
8Q
8.2
0.10
8−0
.120
0.54
0**
10.
208
*0.
015
0.16
60.
212
*0.
100
0.22
0*
0.05
90.
240
**0.
353
**0.
261
**0.
224
**Q
8.3
0.11
30.
138
0.07
90.
208
*1
0.00
5−0
.005
−0.0
120.
127
0.14
1−0
.024
0.15
80.
220
*0.
195
*0.
419
**Q
9.1
0.03
60.
137
0.02
60.
015
0.00
51
0.41
6**
0.33
1**
0.18
5*
0.11
1−0
.035
0.13
80.
145
0.11
10.
068
Q9.
2−0
.006
0.11
50.
279
**0.
166
−0.0
050.
416
**1
0.67
0**
0.34
5**
0.44
0**
0.20
6*
0.37
3**
0.45
6**
0.39
2**
0.30
5**
Q9.
30.
013
−0.0
170.
200
*0.
212
*−0
.012
0.33
1**
0.67
0**
10.
401
**0.
445
**0.
277
**0.
486
**0.
498
**0.
477
**0.
236
**Q
9.4
0.02
7−0
.050
0.00
80.
100
0.12
70.
185
*0.
345
**0.
401
**1
0.44
2**
0.31
2**
0.25
1**
0.29
8**
0.30
0**
0.34
5**
Q9.
50.
067
0.03
60.
192
*0.
220
*0.
141
0.11
10.
440
**0.
445
**0.
442
**1
0.50
3**
0.39
0**
0.50
6**
0.43
5**
0.37
2**
Q9.
60.
067
0.03
8−0
.007
0.05
9−0
.024
−0.0
350.
206
*0.
277
**0.
312
**0.
503
**1
0.37
5**
0.45
5**
0.50
1**
0.22
8**
Q9.
70.
024
−0.0
210.
233
**0.
240
**0.
158
0.13
80.
373
**0.
486
**0.
251
**0.
390
**0.
375
**1
0.73
8**
0.59
7**
0.42
3**
Q9.
80.
105
0.03
20.
315
**0.
353
**0.
220
*0.
145
0.45
6**
0.49
8**
0.29
8**
0.50
6**
0.45
5**
0.73
8**
10.
722
**0.
467
**Q
9.9
0.11
40.
071
0.27
3**
0.26
1**
0.19
5*
0.11
10.
392
**0.
477
**0.
300
**0.
435
**0.
501
**0.
597
**0.
722
**1
0.37
0**
Q9.
100.
110
0.09
00.
138
0.22
4**
0.41
9**
0.06
80.
305
**0.
236
**0.
345
**0.
372
**0.
228
**0.
423
**0.
467
**0.
370
**1
Q10
.1−0
.005
0.07
20.
155
0.14
3−0
.067
0.00
60.
178
*0.
093
0.04
60.
189
*0.
125
0.09
90.
200
*0.
145
0.24
3**
Q10
.20.
035
−0.0
490.
203
*0.
174
*0.
022
0.14
50.
235
**0.
322
**0.
217
*0.
283
**0.
175
*0.
275
**0.
439
**0.
362
**0.
228
**Q
10.3
0.04
90.
045
0.15
70.
261
**0.
154
0.17
7*
0.24
8**
0.20
5*
0.21
0*
0.29
2**
0.20
3*
0.37
2**
0.43
9**
0.32
7**
0.30
4**
Q10
.4−0
.001
0.07
10.
160
0.07
6−0
.063
0.13
30.
234
**0.
264
**0.
088
0.27
3**
0.19
4*
0.26
8**
0.36
5**
0.28
4**
0.29
5**
Q10
.5−0
.062
0.09
90.
220
*0.
272
**0.
111
0.07
70.
308
**0.
242
**0.
201
*0.
402
**0.
231
**0.
287
**0.
544
**0.
318
**0.
228
**Q
10.6
−0.0
540.
108
0.07
10.
176
*0.
131
0.10
90.
270
**0.
237
**0.
295
**0.
290
**0.
175
*0.
339
**0.
416
**0.
278
**0.
312
**Q
10.7
0.04
20.
048
0.01
00.
084
0.10
10.
238
**0.
334
**0.
302
**0.
266
**0.
254
**0.
161
0.29
4**
0.42
8**
0.40
3**
0.35
5**
Q10
.80.
125
0.17
0−0
.033
0.08
30.
031
0.17
9*
0.23
8**
0.26
5**
0.11
20.
242
**0.
254
**0.
299
**0.
360
**0.
368
**0.
256
**Q
10.9
0.02
90.
067
0.08
20.
168
0.12
60.
027
0.26
3**
0.21
0*
0.25
7**
0.24
3**
0.23
0**
0.31
3**
0.33
1**
0.29
4**
0.33
9**
Q11
.1−0
.156
−0.2
81**
0.14
20.
010
−0.0
260.
078
0.28
8**
0.30
9**
0.06
70.
138
0.18
7*
0.15
30.
122
0.15
60.
113
Q11
.2−0
.147
−0.2
11*
0.06
6−0
.034
0.06
3−0
.019
0.22
5**
0.25
0**
0.05
10.
155
0.18
1*
0.22
3*
0.17
7*
0.16
20.
270
**
Q11
.3−0
.128
−0.3
28**
0.02
4−0
.055
0.10
3−0
.110
0.09
30.
174
*0.
023
0.06
00.
065
0.10
60.
115
0.10
40.
146
Q11
.4−0
.193
*−0
.254
**−0
.053
−0.0
50−0
.002
0.05
00.
253
**0.
224
**0.
137
0.21
1*
0.18
4*
0.22
2*
0.14
30.
137
0.24
1**
Q11
.5−0
.190
*−0
.161
−0.0
39−0
.009
0.02
50.
111
0.25
7**
0.25
8**
0.15
40.
135
0.08
10.
237
**0.
195
*0.
239
**0.
236
**
Q11
.6−0
.127
−0.2
05*
0.02
80.
013
0.02
80.
104
0.31
7**
0.34
3**
0.20
1*
0.18
8*
0.15
70.
318
**0.
269
**0.
281
**0.
222
*
Q11
.7−0
.059
−0.2
34**
0.15
90.
166
0.10
20.
093
0.27
3**
0.27
0**
0.14
80.
143
0.11
20.
217
*0.
126
0.15
70.
246
**
84
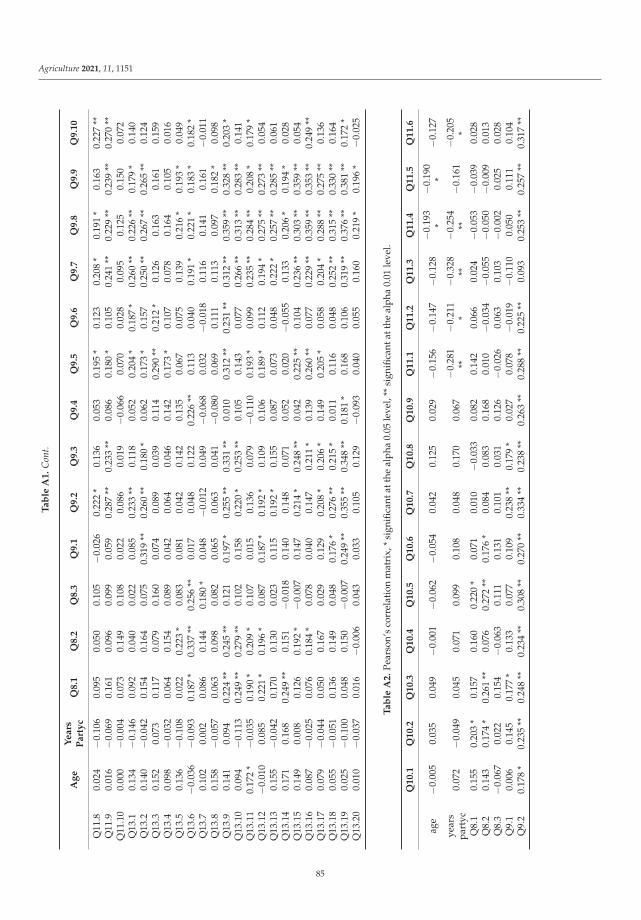
Agriculture 2021, 11, 1151
Ta
ble
A1
.C
ont.
Ag
eY
ea
rsP
art
yc
Q8
.1Q
8.2
Q8
.3Q
9.1
Q9
.2Q
9.3
Q9
.4Q
9.5
Q9
.6Q
9.7
Q9
.8Q
9.9
Q9
.10
Q11
.80.
024
−0.1
060.
095
0.05
00.
105
−0.0
260.
222
*0.
136
0.05
30.
195
*0.
123
0.20
8*
0.19
1*
0.16
30.
227
**Q
11.9
0.01
6−0
.069
0.16
10.
096
0.09
90.
059
0.28
7**
0.23
3**
0.08
60.
180
*0.
105
0.24
1**
0.22
9**
0.23
9**
0.27
0**
Q11
.10
0.00
0−0
.004
0.07
30.
149
0.10
80.
022
0.08
60.
019
−0.0
660.
070
0.02
80.
095
0.12
50.
150
0.07
2Q
13.1
0.13
4−0
.146
0.09
20.
040
0.02
20.
085
0.23
3**
0.11
80.
052
0.20
4*
0.18
7*
0.26
0**
0.22
6**
0.17
9*
0.14
0Q
13.2
0.14
0−0
.042
0.15
40.
164
0.07
50.
319
**0.
260
**0.
180
*0.
062
0.17
3*
0.15
70.
250
**0.
267
**0.
265
**0.
124
Q13
.30.
152
0.07
30.
117
0.07
90.
160
0.07
40.
089
0.03
90.
114
0.29
0**
0.21
2*
0.12
60.
163
0.16
10.
159
Q13
.40.
098
−0.0
320.
064
0.15
40.
089
0.04
20.
064
0.04
60.
142
0.17
3*
0.10
70.
078
0.16
40.
105
0.01
6Q
13.5
0.13
6−0
.108
0.02
20.
223
*0.
083
0.08
10.
042
0.14
20.
135
0.06
70.
075
0.13
90.
216
*0.
193
*0.
049
Q13
.6−0
.036
−0.0
930.
187
*0.
337
**0.
256
**0.
017
0.04
80.
122
0.22
6**
0.11
30.
040
0.19
1*
0.22
1*
0.18
3*
0.18
2*
Q13
.70.
102
0.00
20.
086
0.14
40.
180
*0.
048
−0.0
120.
049
−0.0
680.
032
−0.0
180.
116
0.14
10.
161
−0.0
11Q
13.8
0.15
8−0
.057
0.06
30.
098
0.08
20.
065
0.06
30.
041
−0.0
800.
069
0.11
10.
113
0.09
70.
182
*0.
098
Q13
.90.
141
0.09
40.
224
**0.
245
**0.
121
0.19
7*
0.25
5**
0.33
1**
0.01
00.
312
**0.
231
**0.
312
**0.
359
**0.
328
**0.
203
*Q
13.1
00.
094
−0.1
130.
249
**0.
279
**0.
102
0.15
80.
220
*0.
253
**0.
105
0.14
30.
077
0.26
6**
0.31
3**
0.28
3**
0.14
1Q
13.1
10.
172
*−0
.035
0.19
0*
0.20
9*
0.10
70.
015
0.13
60.
079
−0.1
100.
193
*0.
099
0.23
5**
0.28
4**
0.20
8*
0.17
9*
Q13
.12
−0.0
100.
085
0.22
1*
0.19
6*
0.08
70.
187
*0.
192
*0.
109
0.10
60.
189
*0.
112
0.19
4*
0.27
5**
0.27
3**
0.05
4Q
13.1
30.
155
−0.0
420.
170
0.13
00.
023
0.11
50.
192
*0.
155
0.08
70.
073
0.04
80.
222
*0.
257
**0.
285
**0.
061
Q13
.14
0.17
10.
168
0.24
9**
0.15
1−0
.018
0.14
00.
148
0.07
10.
052
0.02
0−0
.055
0.13
30.
206
*0.
194
*0.
028
Q13
.15
0.14
90.
008
0.12
60.
192
*−0
.007
0.14
70.
214
*0.
248
**0.
042
0.22
5**
0.10
40.
236
**0.
303
**0.
359
**0.
054
Q13
.16
0.08
7−0
.025
0.07
60.
184
*0.
078
0.04
00.
147
0.21
1*
0.13
90.
260
**0.
077
0.22
9**
0.35
9**
0.35
3**
0.24
9**
Q13
.17
0.07
9−0
.044
0.05
00.
167
0.02
90.
129
0.20
8*
0.20
6*
0.14
90.
205
*0.
058
0.20
4*
0.28
8**
0.27
5**
0.13
6Q
13.1
80.
055
−0.0
510.
136
0.14
90.
048
0.17
6*
0.27
6**
0.21
5*
0.01
10.
116
0.04
80.
252
**0.
315
**0.
330
**0.
164
Q13
.19
0.02
5−0
.100
0.04
80.
150
−0.0
070.
249
**0.
355
**0.
348
**0.
181
*0.
168
0.10
60.
319
**0.
376
**0.
381
**0.
172
*Q
13.2
00.
010
−0.0
370.
016
−0.0
060.
043
0.03
30.
105
0.12
9−0
.093
0.04
00.
055
0.16
00.
219
*0.
196
*−0
.025
Ta
ble
A2
.Pe
arso
n’s
corr
elat
ion
mat
rix,
*si
gnifi
cant
atth
eal
pha
0.05
leve
l,**
sign
ifica
ntat
the
alph
a0.
01le
vel.
Q1
0.1
Q1
0.2
Q1
0.3
Q1
0.4
Q1
0.5
Q1
0.6
Q1
0.7
Q1
0.8
Q1
0.9
Q1
1.1
Q1
1.2
Q1
1.3
Q1
1.4
Q1
1.5
Q1
1.6
age
−0.0
050.
035
0.04
9−0
.001
−0.0
62−0
.054
0.04
20.
125
0.02
9−0
.156
−0.1
47−0
.128
−0.1
93*
−0.1
90*
−0.1
27
year
spa
rtyc
0.07
2−0
.049
0.04
50.
071
0.09
90.
108
0.04
80.
170
0.06
7−0
.281
**−0
.211
*−0
.328
**−0
.254
**−0
.161
−0.2
05*
Q8.
10.
155
0.20
3*
0.15
70.
160
0.22
0*
0.07
10.
010
−0.0
330.
082
0.14
20.
066
0.02
4−0
.053
−0.0
390.
028
Q8.
20.
143
0.17
4*
0.26
1**
0.07
60.
272
**0.
176
*0.
084
0.08
30.
168
0.01
0−0
.034
−0.0
55−0
.050
−0.0
090.
013
Q8.
3−0
.067
0.02
20.
154
−0.0
630.
111
0.13
10.
101
0.03
10.
126
−0.0
260.
063
0.10
3−0
.002
0.02
50.
028
Q9.
10.
006
0.14
50.
177
*0.
133
0.07
70.
109
0.23
8**
0.17
9*
0.02
70.
078
−0.0
19−0
.110
0.05
00.
111
0.10
4Q
9.2
0.17
8*
0.23
5**
0.24
8**
0.23
4**
0.30
8**
0.27
0**
0.33
4**
0.23
8**
0.26
3**
0.28
8**
0.22
5**
0.09
30.
253
**0.
257
**0.
317
**
85
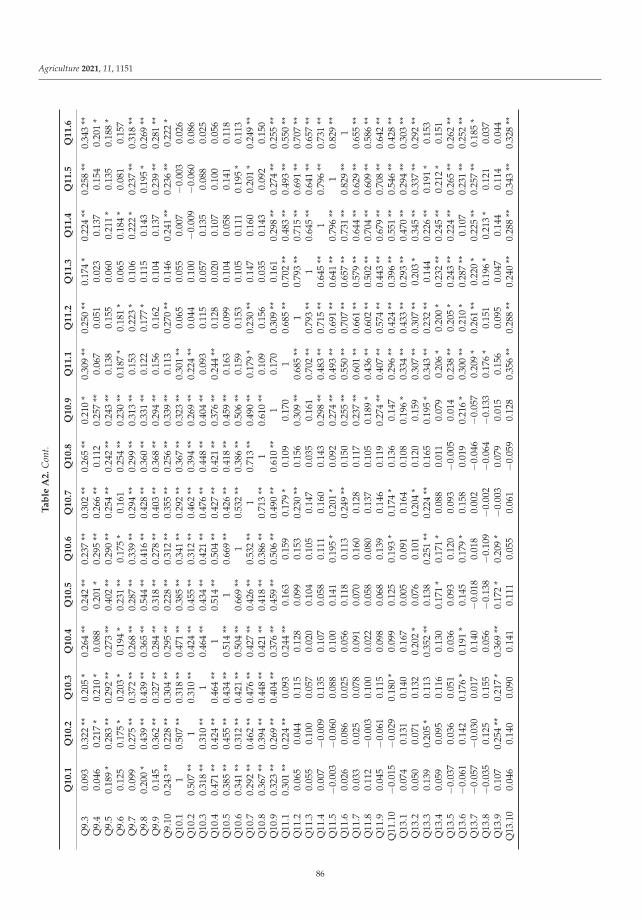
Agriculture 2021, 11, 1151
Ta
ble
A2
.C
ont.
Q1
0.1
Q1
0.2
Q1
0.3
Q1
0.4
Q1
0.5
Q1
0.6
Q1
0.7
Q1
0.8
Q1
0.9
Q1
1.1
Q1
1.2
Q1
1.3
Q1
1.4
Q1
1.5
Q1
1.6
Q9.
30.
093
0.32
2**
0.20
5*
0.26
4**
0.24
2**
0.23
7**
0.30
2**
0.26
5**
0.21
0*
0.30
9**
0.25
0**
0.17
4*
0.22
4**
0.25
8**
0.34
3**
Q9.
40.
046
0.21
7*
0.21
0*
0.08
80.
201
*0.
295
**0.
266
**0.
112
0.25
7**
0.06
70.
051
0.02
30.
137
0.15
40.
201
*Q
9.5
0.18
9*
0.28
3**
0.29
2**
0.27
3**
0.40
2**
0.29
0**
0.25
4**
0.24
2**
0.24
3**
0.13
80.
155
0.06
00.
211
*0.
135
0.18
8*
Q9.
60.
125
0.17
5*
0.20
3*
0.19
4*
0.23
1**
0.17
5*
0.16
10.
254
**0.
230
**0.
187
*0.
181
*0.
065
0.18
4*
0.08
10.
157
Q9.
70.
099
0.27
5**
0.37
2**
0.26
8**
0.28
7**
0.33
9**
0.29
4**
0.29
9**
0.31
3**
0.15
30.
223
*0.
106
0.22
2*
0.23
7**
0.31
8**
Q9.
80.
200
*0.
439
**0.
439
**0.
365
**0.
544
**0.
416
**0.
428
**0.
360
**0.
331
**0.
122
0.17
7*
0.11
50.
143
0.19
5*
0.26
9**
Q9.
90.
145
0.36
2**
0.32
7**
0.28
4**
0.31
8**
0.27
8**
0.40
3**
0.36
8**
0.29
4**
0.15
60.
162
0.10
40.
137
0.23
9**
0.28
1**
Q9.
100.
243
**0.
228
**0.
304
**0.
295
**0.
228
**0.
312
**0.
355
**0.
256
**0.
339
**0.
113
0.27
0**
0.14
60.
241
**0.
236
**0.
222
*Q
10.1
10.
507
**0.
318
**0.
471
**0.
385
**0.
341
**0.
292
**0.
367
**0.
323
**0.
301
**0.
065
0.05
50.
007
−0.0
030.
026
Q10
.20.
507
**1
0.31
0**
0.42
4**
0.45
5**
0.31
2**
0.46
2**
0.39
4**
0.26
9**
0.22
4**
0.04
40.
100
−0.0
09−0
.060
0.08
6Q
10.3
0.31
8**
0.31
0**
10.
464
**0.
434
**0.
421
**0.
476
**0.
448
**0.
404
**0.
093
0.11
50.
057
0.13
50.
088
0.02
5Q
10.4
0.47
1**
0.42
4**
0.46
4**
10.
514
**0.
504
**0.
427
**0.
421
**0.
376
**0.
244
**0.
128
0.02
00.
107
0.10
00.
056
Q10
.50.
385
**0.
455
**0.
434
**0.
514
**1
0.66
9**
0.42
6**
0.41
8**
0.45
9**
0.16
30.
099
0.10
40.
058
0.14
10.
118
Q10
.60.
341
**0.
312
**0.
421
**0.
504
**0.
669
**1
0.53
2**
0.38
6**
0.50
6**
0.15
90.
153
0.10
50.
111
0.19
5*
0.11
3Q
10.7
0.29
2**
0.46
2**
0.47
6**
0.42
7**
0.42
6**
0.53
2**
10.
713
**0.
490
**0.
179
*0.
230
**0.
147
0.16
00.
201
*0.
249
**Q
10.8
0.36
7**
0.39
4**
0.44
8**
0.42
1**
0.41
8**
0.38
6**
0.71
3**
10.
610
**0.
109
0.15
60.
035
0.14
30.
092
0.15
0Q
10.9
0.32
3**
0.26
9**
0.40
4**
0.37
6**
0.45
9**
0.50
6**
0.49
0**
0.61
0**
10.
170
0.30
9**
0.16
10.
298
**0.
274
**0.
255
**Q
11.1
0.30
1**
0.22
4**
0.09
30.
244
**0.
163
0.15
90.
179
*0.
109
0.17
01
0.68
5**
0.70
2**
0.48
3**
0.49
3**
0.55
0**
Q11
.20.
065
0.04
40.
115
0.12
80.
099
0.15
30.
230
**0.
156
0.30
9**
0.68
5**
10.
793
**0.
715
**0.
691
**0.
707
**Q
11.3
0.05
50.
100
0.05
70.
020
0.10
40.
105
0.14
70.
035
0.16
10.
702
**0.
793
**1
0.64
5**
0.64
1**
0.65
7**
Q11
.40.
007
−0.0
090.
135
0.10
70.
058
0.11
10.
160
0.14
30.
298
**0.
483
**0.
715
**0.
645
**1
0.79
6**
0.73
1**
Q11
.5−0
.003
−0.0
600.
088
0.10
00.
141
0.19
5*
0.20
1*
0.09
20.
274
**0.
493
**0.
691
**0.
641
**0.
796
**1
0.82
9**
Q11
.60.
026
0.08
60.
025
0.05
60.
118
0.11
30.
249
**0.
150
0.25
5**
0.55
0**
0.70
7**
0.65
7**
0.73
1**
0.82
9**
1Q
11.7
0.03
30.
025
0.07
80.
091
0.07
00.
160
0.12
80.
117
0.23
7**
0.60
1**
0.66
1**
0.57
9**
0.64
4**
0.62
9**
0.65
5**
Q11
.80.
112
−0.0
030.
100
0.02
20.
058
0.08
00.
137
0.10
50.
189
*0.
436
**0.
602
**0.
502
**0.
704
**0.
609
**0.
586
**Q
11.9
0.04
5−0
.061
0.11
50.
098
0.06
80.
139
0.14
60.
119
0.27
4**
0.40
7**
0.57
4**
0.44
3**
0.67
9**
0.70
8**
0.64
2**
Q11
.10
−0.0
15−0
.029
0.18
0*
0.09
90.
125
0.19
3*
0.17
4*
0.13
60.
147
0.29
6**
0.42
4**
0.39
6**
0.55
1**
0.54
6**
0.42
8**
Q13
.10.
074
0.13
10.
140
0.16
70.
005
0.09
10.
164
0.10
80.
196
*0.
334
**0.
433
**0.
293
**0.
470
**0.
294
**0.
303
**Q
13.2
0.05
00.
071
0.13
20.
202
*0.
076
0.10
10.
204
*0.
120
0.15
90.
307
**0.
307
**0.
203
*0.
345
**0.
337
**0.
292
**Q
13.3
0.13
90.
205
*0.
113
0.35
2**
0.13
80.
251
**0.
224
**0.
165
0.19
5*
0.34
3**
0.23
2**
0.14
40.
226
**0.
191
*0.
153
Q13
.40.
059
0.09
50.
116
0.13
00.
171
*0.
171
*0.
088
0.01
10.
079
0.20
6*
0.20
0*
0.23
2**
0.24
5**
0.21
2*
0.15
1Q
13.5
−0.0
370.
036
0.05
10.
036
0.09
30.
120
0.09
3−0
.005
0.01
40.
238
**0.
205
*0.
243
**0.
224
**0.
265
**0.
262
**Q
13.6
−0.0
610.
142
0.17
6*
0.19
1*
0.14
50.
179
*0.
158
0.01
90.
216
*0.
300
**0.
210
*0.
287
**0.
107
0.23
1**
0.25
2**
Q13
.7−0
.057
−0.0
300.
017
0.14
0−0
.018
0.01
80.
002
−0.0
46−0
.057
0.20
9*
0.26
1**
0.22
0*
0.22
5**
0.25
7**
0.18
5*
Q13
.8−0
.035
0.12
50.
155
0.05
6−0
.138
−0.1
09−0
.002
−0.0
64−0
.133
0.17
6*
0.15
10.
196
*0.
213
*0.
121
0.03
7Q
13.9
0.10
70.
254
**0.
217
*0.
369
**0.
172
*0.
209
*−0
.003
0.07
90.
015
0.15
60.
095
0.04
70.
144
0.11
40.
044
Q13
.10
0.04
60.
140
0.09
00.
141
0.11
10.
055
0.06
1−0
.059
0.12
80.
356
**0.
288
**0.
240
**0.
288
**0.
343
**0.
328
**
86
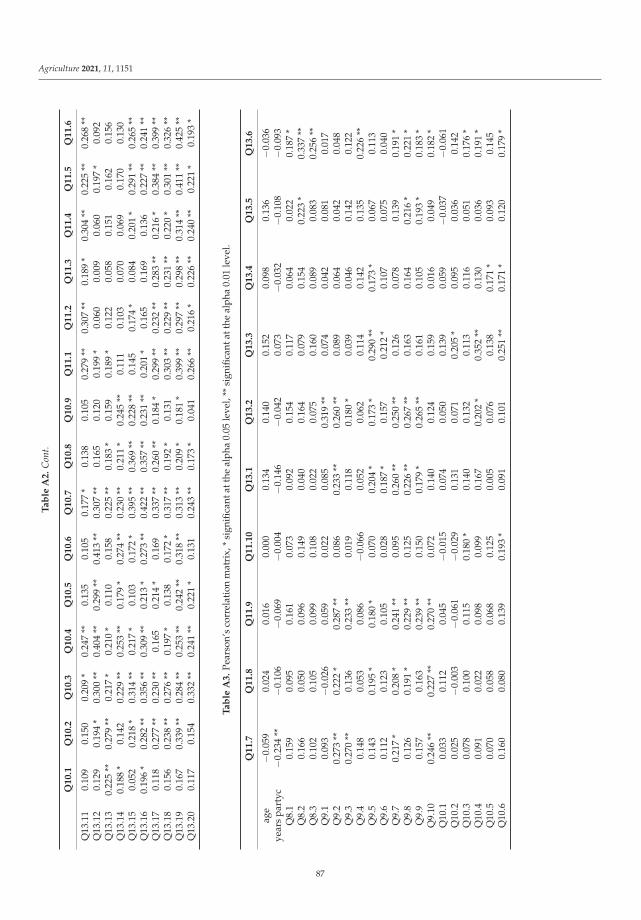
Agriculture 2021, 11, 1151
Ta
ble
A2
.C
ont.
Q1
0.1
Q1
0.2
Q1
0.3
Q1
0.4
Q1
0.5
Q1
0.6
Q1
0.7
Q1
0.8
Q1
0.9
Q1
1.1
Q1
1.2
Q1
1.3
Q1
1.4
Q1
1.5
Q1
1.6
Q13
.11
0.10
90.
150
0.20
9*
0.24
7**
0.13
50.
105
0.17
7*
0.13
80.
105
0.27
9**
0.30
7**
0.18
9*
0.30
4**
0.22
5**
0.26
8**
Q13
.12
0.12
90.
194
*0.
300
**0.
404
**0.
299
**0.
413
**0.
307
**0.
165
0.12
00.
199
*0.
060
0.00
90.
060
0.19
7*
0.09
2Q
13.1
30.
225
**0.
279
**0.
217
*0.
210
*0.
110
0.15
80.
225
**0.
183
*0.
159
0.18
9*
0.12
20.
058
0.15
10.
162
0.15
6Q
13.1
40.
188
*0.
142
0.22
9**
0.25
3**
0.17
9*
0.27
4**
0.23
0**
0.21
1*
0.24
5**
0.11
10.
103
0.07
00.
069
0.17
00.
130
Q13
.15
0.05
20.
218
*0.
314
**0.
217
*0.
103
0.17
2*
0.39
5**
0.36
9**
0.22
8**
0.14
50.
174
*0.
084
0.20
1*
0.29
1**
0.26
5**
Q13
.16
0.19
6*
0.28
2**
0.35
6**
0.30
9**
0.21
3*
0.27
3**
0.42
2**
0.35
7**
0.23
1**
0.20
1*
0.16
50.
169
0.13
60.
227
**0.
241
**Q
13.1
70.
118
0.27
7**
0.23
0**
0.16
50.
214
*0.
169
0.33
7**
0.26
0**
0.18
4*
0.29
9**
0.23
2**
0.28
3**
0.21
6*
0.38
4**
0.39
9**
Q13
.18
0.15
60.
238
**0.
276
**0.
197
*0.
138
0.17
2*
0.31
7**
0.19
2*
0.13
10.
303
**0.
229
**0.
231
**0.
220
*0.
301
**0.
326
**Q
13.1
90.
167
0.33
9**
0.28
4**
0.25
3**
0.24
2**
0.31
8**
0.31
3**
0.20
9*
0.18
1*
0.39
9**
0.29
7**
0.29
8**
0.31
4**
0.41
1**
0.42
5**
Q13
.20
0.11
70.
154
0.33
2**
0.24
1**
0.22
1*
0.13
10.
243
**0.
173
*0.
041
0.26
6**
0.21
6*
0.22
6**
0.24
0**
0.22
1*
0.19
3*
Ta
ble
A3
.Pe
arso
n’s
corr
elat
ion
mat
rix,
*si
gnifi
cant
atth
eal
pha
0.05
leve
l,**
sign
ifica
ntat
the
alph
a0.
01le
vel.
Q1
1.7
Q1
1.8
Q1
1.9
Q1
1.1
0Q
13
.1Q
13
.2Q
13
.3Q
13
.4Q
13
.5Q
13
.6
age
−0.0
590.
024
0.01
60.
000
0.13
40.
140
0.15
20.
098
0.13
6−0
.036
year
spa
rtyc
−0.2
34**
−0.1
06−0
.069
−0.0
04−0
.146
−0.0
420.
073
−0.0
32−0
.108
−0.0
93Q
8.1
0.15
90.
095
0.16
10.
073
0.09
20.
154
0.11
70.
064
0.02
20.
187
*Q
8.2
0.16
60.
050
0.09
60.
149
0.04
00.
164
0.07
90.
154
0.22
3*
0.33
7**
Q8.
30.
102
0.10
50.
099
0.10
80.
022
0.07
50.
160
0.08
90.
083
0.25
6**
Q9.
10.
093
−0.0
260.
059
0.02
20.
085
0.31
9**
0.07
40.
042
0.08
10.
017
Q9.
20.
273
**0.
222
*0.
287
**0.
086
0.23
3**
0.26
0**
0.08
90.
064
0.04
20.
048
Q9.
30.
270
**0.
136
0.23
3**
0.01
90.
118
0.18
0*
0.03
90.
046
0.14
20.
122
Q9.
40.
148
0.05
30.
086
−0.0
660.
052
0.06
20.
114
0.14
20.
135
0.22
6**
Q9.
50.
143
0.19
5*
0.18
0*
0.07
00.
204
*0.
173
*0.
290
**0.
173
*0.
067
0.11
3Q
9.6
0.11
20.
123
0.10
50.
028
0.18
7*
0.15
70.
212
*0.
107
0.07
50.
040
Q9.
70.
217
*0.
208
*0.
241
**0.
095
0.26
0**
0.25
0**
0.12
60.
078
0.13
90.
191
*Q
9.8
0.12
60.
191
*0.
229
**0.
125
0.22
6**
0.26
7**
0.16
30.
164
0.21
6*
0.22
1*
Q9.
90.
157
0.16
30.
239
**0.
150
0.17
9*
0.26
5**
0.16
10.
105
0.19
3*
0.18
3*
Q9.
100.
246
**0.
227
**0.
270
**0.
072
0.14
00.
124
0.15
90.
016
0.04
90.
182
*Q
10.1
0.03
30.
112
0.04
5−0
.015
0.07
40.
050
0.13
90.
059
−0.0
37−0
.061
Q10
.20.
025
−0.0
03−0
.061
−0.0
290.
131
0.07
10.
205
*0.
095
0.03
60.
142
Q10
.30.
078
0.10
00.
115
0.18
0*
0.14
00.
132
0.11
30.
116
0.05
10.
176
*Q
10.4
0.09
10.
022
0.09
80.
099
0.16
70.
202
*0.
352
**0.
130
0.03
60.
191
*Q
10.5
0.07
00.
058
0.06
80.
125
0.00
50.
076
0.13
80.
171
*0.
093
0.14
5Q
10.6
0.16
00.
080
0.13
90.
193
*0.
091
0.10
10.
251
**0.
171
*0.
120
0.17
9*
87
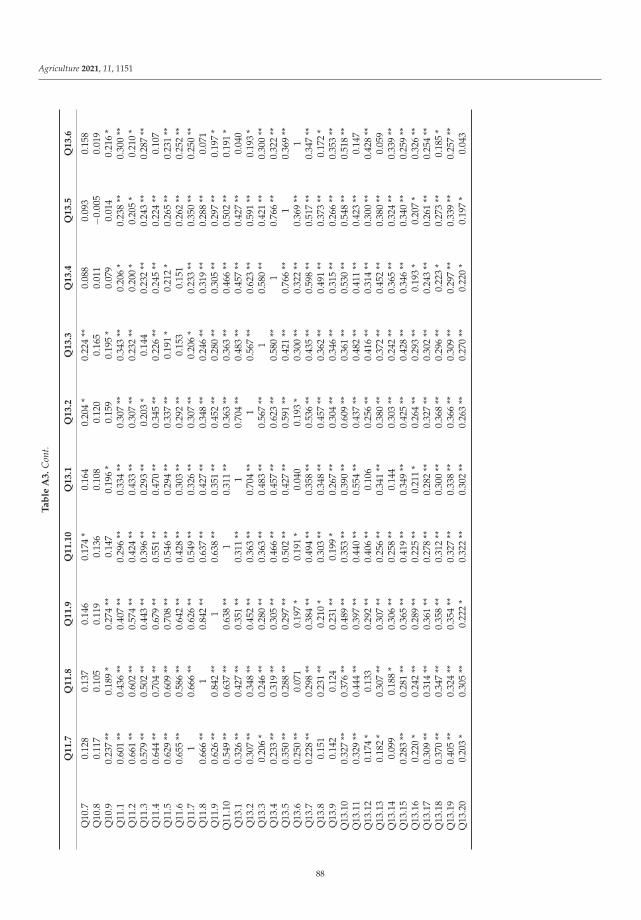
Agriculture 2021, 11, 1151
Ta
ble
A3
.C
ont.
Q1
1.7
Q1
1.8
Q1
1.9
Q1
1.1
0Q
13
.1Q
13
.2Q
13
.3Q
13
.4Q
13
.5Q
13
.6
Q10
.70.
128
0.13
70.
146
0.17
4*
0.16
40.
204
*0.
224
**0.
088
0.09
30.
158
Q10
.80.
117
0.10
50.
119
0.13
60.
108
0.12
00.
165
0.01
1−0
.005
0.01
9Q
10.9
0.23
7**
0.18
9*
0.27
4**
0.14
70.
196
*0.
159
0.19
5*
0.07
90.
014
0.21
6*
Q11
.10.
601
**0.
436
**0.
407
**0.
296
**0.
334
**0.
307
**0.
343
**0.
206
*0.
238
**0.
300
**Q
11.2
0.66
1**
0.60
2**
0.57
4**
0.42
4**
0.43
3**
0.30
7**
0.23
2**
0.20
0*
0.20
5*
0.21
0*
Q11
.30.
579
**0.
502
**0.
443
**0.
396
**0.
293
**0.
203
*0.
144
0.23
2**
0.24
3**
0.28
7**
Q11
.40.
644
**0.
704
**0.
679
**0.
551
**0.
470
**0.
345
**0.
226
**0.
245
**0.
224
**0.
107
Q11
.50.
629
**0.
609
**0.
708
**0.
546
**0.
294
**0.
337
**0.
191
*0.
212
*0.
265
**0.
231
**Q
11.6
0.65
5**
0.58
6**
0.64
2**
0.42
8**
0.30
3**
0.29
2**
0.15
30.
151
0.26
2**
0.25
2**
Q11
.71
0.66
6**
0.62
6**
0.54
9**
0.32
6**
0.30
7**
0.20
6*
0.23
3**
0.35
0**
0.25
0**
Q11
.80.
666
**1
0.84
2**
0.63
7**
0.42
7**
0.34
8**
0.24
6**
0.31
9**
0.28
8**
0.07
1Q
11.9
0.62
6**
0.84
2**
10.
638
**0.
351
**0.
452
**0.
280
**0.
305
**0.
297
**0.
197
*Q
11.1
00.
549
**0.
637
**0.
638
**1
0.31
1**
0.36
3**
0.36
3**
0.46
6**
0.50
2**
0.19
1*
Q13
.10.
326
**0.
427
**0.
351
**0.
311
**1
0.70
4**
0.48
3**
0.45
7**
0.42
7**
0.04
0Q
13.2
0.30
7**
0.34
8**
0.45
2**
0.36
3**
0.70
4**
10.
567
**0.
623
**0.
591
**0.
193
*Q
13.3
0.20
6*
0.24
6**
0.28
0**
0.36
3**
0.48
3**
0.56
7**
10.
580
**0.
421
**0.
300
**Q
13.4
0.23
3**
0.31
9**
0.30
5**
0.46
6**
0.45
7**
0.62
3**
0.58
0**
10.
766
**0.
322
**Q
13.5
0.35
0**
0.28
8**
0.29
7**
0.50
2**
0.42
7**
0.59
1**
0.42
1**
0.76
6**
10.
369
**Q
13.6
0.25
0**
0.07
10.
197
*0.
191
*0.
040
0.19
3*
0.30
0**
0.32
2**
0.36
9**
1Q
13.7
0.22
8**
0.29
8**
0.38
4**
0.49
4**
0.35
8**
0.53
6**
0.43
5**
0.59
8**
0.51
7**
0.34
7**
Q13
.80.
151
0.23
1**
0.21
0*
0.30
3**
0.34
8**
0.45
7**
0.36
2**
0.49
1**
0.37
3**
0.17
2*
Q13
.90.
142
0.12
40.
231
**0.
199
*0.
267
**0.
304
**0.
346
**0.
315
**0.
266
**0.
353
**Q
13.1
00.
327
**0.
376
**0.
489
**0.
353
**0.
390
**0.
609
**0.
361
**0.
530
**0.
548
**0.
518
**Q
13.1
10.
329
**0.
444
**0.
397
**0.
440
**0.
554
**0.
437
**0.
482
**0.
411
**0.
423
**0.
147
Q13
.12
0.17
4*
0.13
30.
292
**0.
406
**0.
106
0.25
6**
0.41
6**
0.31
4**
0.30
0**
0.42
8**
Q13
.13
0.18
2*
0.30
7**
0.30
7**
0.25
6**
0.34
1**
0.38
0**
0.37
2**
0.45
2**
0.38
0**
0.05
9Q
13.1
40.
099
0.18
8*
0.30
6**
0.25
8**
0.14
40.
303
**0.
242
**0.
365
**0.
324
**0.
339
**Q
13.1
50.
283
**0.
281
**0.
365
**0.
419
**0.
349
**0.
425
**0.
428
**0.
346
**0.
340
**0.
259
**Q
13.1
60.
220
*0.
242
**0.
289
**0.
225
**0.
211
*0.
264
**0.
293
**0.
193
*0.
207
*0.
326
**Q
13.1
70.
309
**0.
314
**0.
361
**0.
278
**0.
282
**0.
327
**0.
302
**0.
243
**0.
261
**0.
254
**Q
13.1
80.
370
**0.
347
**0.
358
**0.
312
**0.
300
**0.
368
**0.
296
**0.
223
*0.
273
**0.
185
*Q
13.1
90.
405
**0.
324
**0.
354
**0.
327
**0.
338
**0.
366
**0.
309
**0.
297
**0.
339
**0.
257
**Q
13.2
00.
203
*0.
305
**0.
222
*0.
322
**0.
302
**0.
263
**0.
270
**0.
220
*0.
197
*0.
043
88
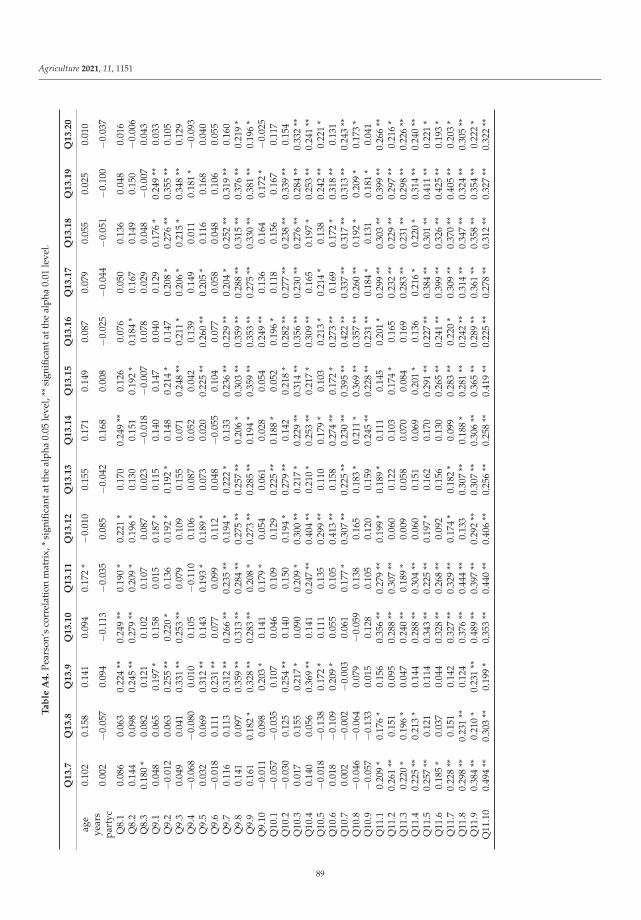
Agriculture 2021, 11, 1151
Ta
ble
A4
.Pe
arso
n’s
corr
elat
ion
mat
rix,
*si
gnifi
cant
atth
eal
pha
0.05
leve
l,**
sign
ifica
ntat
the
alph
a0.
01le
vel.
Q1
3.7
Q1
3.8
Q1
3.9
Q1
3.1
0Q
13
.11
Q1
3.1
2Q
13
.13
Q1
3.1
4Q
13
.15
Q1
3.1
6Q
13
.17
Q1
3.1
8Q
13
.19
Q1
3.2
0
age
0.10
20.
158
0.14
10.
094
0.17
2*
−0.0
100.
155
0.17
10.
149
0.08
70.
079
0.05
50.
025
0.01
0ye
ars
part
yc0.
002
−0.0
570.
094
−0.1
13−0
.035
0.08
5−0
.042
0.16
80.
008
−0.0
25−0
.044
−0.0
51−0
.100
−0.0
37
Q8.
10.
086
0.06
30.
224
**0.
249
**0.
190
*0.
221
*0.
170
0.24
9**
0.12
60.
076
0.05
00.
136
0.04
80.
016
Q8.
20.
144
0.09
80.
245
**0.
279
**0.
209
*0.
196
*0.
130
0.15
10.
192
*0.
184
*0.
167
0.14
90.
150
−0.0
06Q
8.3
0.18
0*
0.08
20.
121
0.10
20.
107
0.08
70.
023
−0.0
18−0
.007
0.07
80.
029
0.04
8−0
.007
0.04
3Q
9.1
0.04
80.
065
0.19
7*
0.15
80.
015
0.18
7*
0.11
50.
140
0.14
70.
040
0.12
90.
176
*0.
249
**0.
033
Q9.
2−0
.012
0.06
30.
255
**0.
220
*0.
136
0.19
2*
0.19
2*
0.14
80.
214
*0.
147
0.20
8*
0.27
6**
0.35
5**
0.10
5Q
9.3
0.04
90.
041
0.33
1**
0.25
3**
0.07
90.
109
0.15
50.
071
0.24
8**
0.21
1*
0.20
6*
0.21
5*
0.34
8**
0.12
9Q
9.4
−0.0
68−0
.080
0.01
00.
105
−0.1
100.
106
0.08
70.
052
0.04
20.
139
0.14
90.
011
0.18
1*
−0.0
93Q
9.5
0.03
20.
069
0.31
2**
0.14
30.
193
*0.
189
*0.
073
0.02
00.
225
**0.
260
**0.
205
*0.
116
0.16
80.
040
Q9.
6−0
.018
0.11
10.
231
**0.
077
0.09
90.
112
0.04
8−0
.055
0.10
40.
077
0.05
80.
048
0.10
60.
055
Q9.
70.
116
0.11
30.
312
**0.
266
**0.
235
**0.
194
*0.
222
*0.
133
0.23
6**
0.22
9**
0.20
4*
0.25
2**
0.31
9**
0.16
0Q
9.8
0.14
10.
097
0.35
9**
0.31
3**
0.28
4**
0.27
5**
0.25
7**
0.20
6*
0.30
3**
0.35
9**
0.28
8**
0.31
5**
0.37
6**
0.21
9*
Q9.
90.
161
0.18
2*
0.32
8**
0.28
3**
0.20
8*
0.27
3**
0.28
5**
0.19
4*
0.35
9**
0.35
3**
0.27
5**
0.33
0**
0.38
1**
0.19
6*
Q9.
10−0
.011
0.09
80.
203
*0.
141
0.17
9*
0.05
40.
061
0.02
80.
054
0.24
9**
0.13
60.
164
0.17
2*
−0.0
25Q
10.1
−0.0
57−0
.035
0.10
70.
046
0.10
90.
129
0.22
5**
0.18
8*
0.05
20.
196
*0.
118
0.15
60.
167
0.11
7Q
10.2
−0.0
300.
125
0.25
4**
0.14
00.
150
0.19
4*
0.27
9**
0.14
20.
218
*0.
282
**0.
277
**0.
238
**0.
339
**0.
154
Q10
.30.
017
0.15
50.
217
*0.
090
0.20
9*
0.30
0**
0.21
7*
0.22
9**
0.31
4**
0.35
6**
0.23
0**
0.27
6**
0.28
4**
0.33
2**
Q10
.40.
140
0.05
60.
369
**0.
141
0.24
7**
0.40
4**
0.21
0*
0.25
3**
0.21
7*
0.30
9**
0.16
50.
197
*0.
253
**0.
241
**Q
10.5
−0.0
18−0
.138
0.17
2*
0.11
10.
135
0.29
9**
0.11
00.
179
*0.
103
0.21
3*
0.21
4*
0.13
80.
242
**0.
221
*Q
10.6
0.01
8−0
.109
0.20
9*
0.05
50.
105
0.41
3**
0.15
80.
274
**0.
172
*0.
273
**0.
169
0.17
2*
0.31
8**
0.13
1Q
10.7
0.00
2−0
.002
−0.0
030.
061
0.17
7*
0.30
7**
0.22
5**
0.23
0**
0.39
5**
0.42
2**
0.33
7**
0.31
7**
0.31
3**
0.24
3**
Q10
.8−0
.046
−0.0
640.
079
−0.0
590.
138
0.16
50.
183
*0.
211
*0.
369
**0.
357
**0.
260
**0.
192
*0.
209
*0.
173
*Q
10.9
−0.0
57−0
.133
0.01
50.
128
0.10
50.
120
0.15
90.
245
**0.
228
**0.
231
**0.
184
*0.
131
0.18
1*
0.04
1Q
11.1
0.20
9*
0.17
6*
0.15
60.
356
**0.
279
**0.
199
*0.
189
*0.
111
0.14
50.
201
*0.
299
**0.
303
**0.
399
**0.
266
**Q
11.2
0.26
1**
0.15
10.
095
0.28
8**
0.30
7**
0.06
00.
122
0.10
30.
174
*0.
165
0.23
2**
0.22
9**
0.29
7**
0.21
6*
Q11
.30.
220
*0.
196
*0.
047
0.24
0**
0.18
9*
0.00
90.
058
0.07
00.
084
0.16
90.
283
**0.
231
**0.
298
**0.
226
**Q
11.4
0.22
5**
0.21
3*
0.14
40.
288
**0.
304
**0.
060
0.15
10.
069
0.20
1*
0.13
60.
216
*0.
220
*0.
314
**0.
240
**Q
11.5
0.25
7**
0.12
10.
114
0.34
3**
0.22
5**
0.19
7*
0.16
20.
170
0.29
1**
0.22
7**
0.38
4**
0.30
1**
0.41
1**
0.22
1*
Q11
.60.
185
*0.
037
0.04
40.
328
**0.
268
**0.
092
0.15
60.
130
0.26
5**
0.24
1**
0.39
9**
0.32
6**
0.42
5**
0.19
3*
Q11
.70.
228
**0.
151
0.14
20.
327
**0.
329
**0.
174
*0.
182
*0.
099
0.28
3**
0.22
0*
0.30
9**
0.37
0**
0.40
5**
0.20
3*
Q11
.80.
298
**0.
231
**0.
124
0.37
6**
0.44
4**
0.13
30.
307
**0.
188
*0.
281
**0.
242
**0.
314
**0.
347
**0.
324
**0.
305
**Q
11.9
0.38
4**
0.21
0*
0.23
1**
0.48
9**
0.39
7**
0.29
2**
0.30
7**
0.30
6**
0.36
5**
0.28
9**
0.36
1**
0.35
8**
0.35
4**
0.22
2*
Q11
.10
0.49
4**
0.30
3**
0.19
9*
0.35
3**
0.44
0**
0.40
6**
0.25
6**
0.25
8**
0.41
9**
0.22
5**
0.27
8**
0.31
2**
0.32
7**
0.32
2**
89
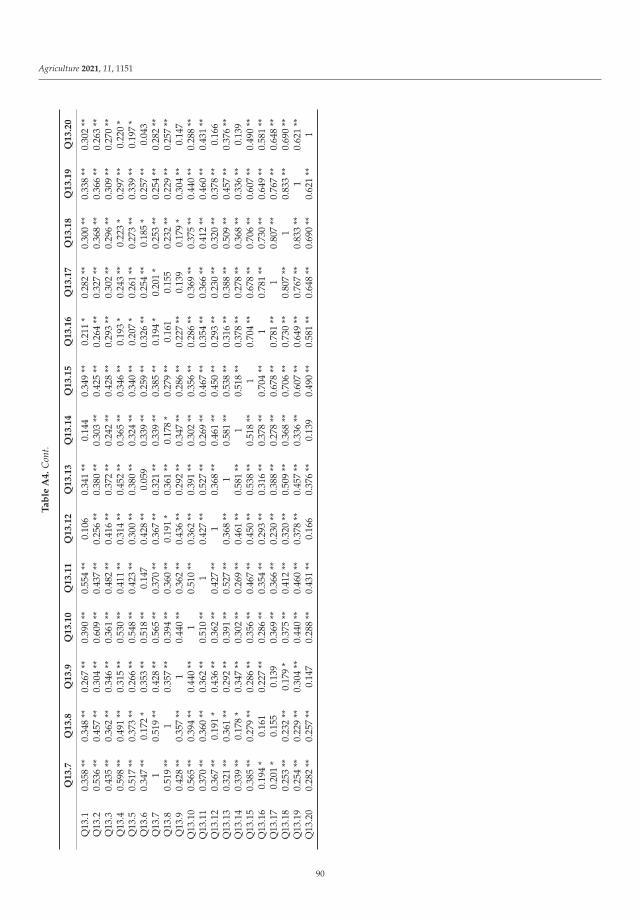
Agriculture 2021, 11, 1151
Ta
ble
A4
.C
ont.
Q1
3.7
Q1
3.8
Q1
3.9
Q1
3.1
0Q
13
.11
Q1
3.1
2Q
13
.13
Q1
3.1
4Q
13
.15
Q1
3.1
6Q
13
.17
Q1
3.1
8Q
13
.19
Q1
3.2
0
Q13
.10.
358
**0.
348
**0.
267
**0.
390
**0.
554
**0.
106
0.34
1**
0.14
40.
349
**0.
211
*0.
282
**0.
300
**0.
338
**0.
302
**Q
13.2
0.53
6**
0.45
7**
0.30
4**
0.60
9**
0.43
7**
0.25
6**
0.38
0**
0.30
3**
0.42
5**
0.26
4**
0.32
7**
0.36
8**
0.36
6**
0.26
3**
Q13
.30.
435
**0.
362
**0.
346
**0.
361
**0.
482
**0.
416
**0.
372
**0.
242
**0.
428
**0.
293
**0.
302
**0.
296
**0.
309
**0.
270
**Q
13.4
0.59
8**
0.49
1**
0.31
5**
0.53
0**
0.41
1**
0.31
4**
0.45
2**
0.36
5**
0.34
6**
0.19
3*
0.24
3**
0.22
3*
0.29
7**
0.22
0*
Q13
.50.
517
**0.
373
**0.
266
**0.
548
**0.
423
**0.
300
**0.
380
**0.
324
**0.
340
**0.
207
*0.
261
**0.
273
**0.
339
**0.
197
*Q
13.6
0.34
7**
0.17
2*
0.35
3**
0.51
8**
0.14
70.
428
**0.
059
0.33
9**
0.25
9**
0.32
6**
0.25
4**
0.18
5*
0.25
7**
0.04
3Q
13.7
10.
519
**0.
428
**0.
565
**0.
370
**0.
367
**0.
321
**0.
339
**0.
385
**0.
194
*0.
201
*0.
253
**0.
254
**0.
282
**Q
13.8
0.51
9**
10.
357
**0.
394
**0.
360
**0.
191
*0.
361
**0.
178
*0.
279
**0.
161
0.15
50.
232
**0.
229
**0.
257
**Q
13.9
0.42
8**
0.35
7**
10.
440
**0.
362
**0.
436
**0.
292
**0.
347
**0.
286
**0.
227
**0.
139
0.17
9*
0.30
4**
0.14
7Q
13.1
00.
565
**0.
394
**0.
440
**1
0.51
0**
0.36
2**
0.39
1**
0.30
2**
0.35
6**
0.28
6**
0.36
9**
0.37
5**
0.44
0**
0.28
8**
Q13
.11
0.37
0**
0.36
0**
0.36
2**
0.51
0**
10.
427
**0.
527
**0.
269
**0.
467
**0.
354
**0.
366
**0.
412
**0.
460
**0.
431
**Q
13.1
20.
367
**0.
191
*0.
436
**0.
362
**0.
427
**1
0.36
8**
0.46
1**
0.45
0**
0.29
3**
0.23
0**
0.32
0**
0.37
8**
0.16
6Q
13.1
30.
321
**0.
361
**0.
292
**0.
391
**0.
527
**0.
368
**1
0.58
1**
0.53
8**
0.31
6**
0.38
8**
0.50
9**
0.45
7**
0.37
6**
Q13
.14
0.33
9**
0.17
8*
0.34
7**
0.30
2**
0.26
9**
0.46
1**
0.58
1**
10.
518
**0.
378
**0.
278
**0.
368
**0.
336
**0.
139
Q13
.15
0.38
5**
0.27
9**
0.28
6**
0.35
6**
0.46
7**
0.45
0**
0.53
8**
0.51
8**
10.
704
**0.
678
**0.
706
**0.
607
**0.
490
**Q
13.1
60.
194
*0.
161
0.22
7**
0.28
6**
0.35
4**
0.29
3**
0.31
6**
0.37
8**
0.70
4**
10.
781
**0.
730
**0.
649
**0.
581
**Q
13.1
70.
201
*0.
155
0.13
90.
369
**0.
366
**0.
230
**0.
388
**0.
278
**0.
678
**0.
781
**1
0.80
7**
0.76
7**
0.64
8**
Q13
.18
0.25
3**
0.23
2**
0.17
9*
0.37
5**
0.41
2**
0.32
0**
0.50
9**
0.36
8**
0.70
6**
0.73
0**
0.80
7**
10.
833
**0.
690
**Q
13.1
90.
254
**0.
229
**0.
304
**0.
440
**0.
460
**0.
378
**0.
457
**0.
336
**0.
607
**0.
649
**0.
767
**0.
833
**1
0.62
1**
Q13
.20
0.28
2**
0.25
7**
0.14
70.
288
**0.
431
**0.
166
0.37
6**
0.13
90.
490
**0.
581
**0.
648
**0.
690
**0.
621
**1
90
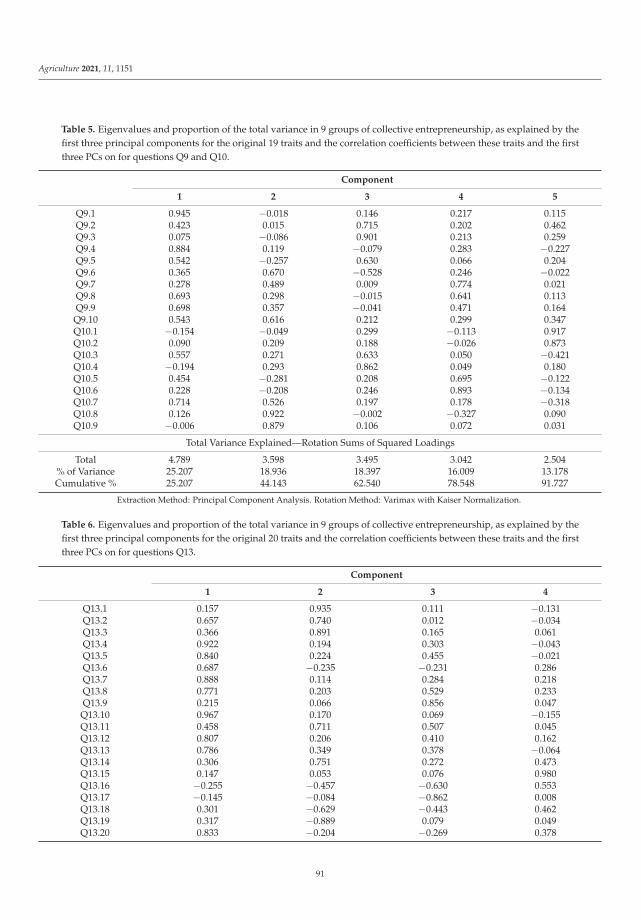
Agriculture 2021, 11, 1151
Table 5. Eigenvalues and proportion of the total variance in 9 groups of collective entrepreneurship, as explained by thefirst three principal components for the original 19 traits and the correlation coefficients between these traits and the firstthree PCs on for questions Q9 and Q10.
Component
1 2 3 4 5
Q9.1 0.945 −0.018 0.146 0.217 0.115Q9.2 0.423 0.015 0.715 0.202 0.462Q9.3 0.075 −0.086 0.901 0.213 0.259Q9.4 0.884 0.119 −0.079 0.283 −0.227Q9.5 0.542 −0.257 0.630 0.066 0.204Q9.6 0.365 0.670 −0.528 0.246 −0.022Q9.7 0.278 0.489 0.009 0.774 0.021Q9.8 0.693 0.298 −0.015 0.641 0.113Q9.9 0.698 0.357 −0.041 0.471 0.164
Q9.10 0.543 0.616 0.212 0.299 0.347Q10.1 −0.154 −0.049 0.299 −0.113 0.917Q10.2 0.090 0.209 0.188 −0.026 0.873Q10.3 0.557 0.271 0.633 0.050 −0.421Q10.4 −0.194 0.293 0.862 0.049 0.180Q10.5 0.454 −0.281 0.208 0.695 −0.122Q10.6 0.228 −0.208 0.246 0.893 −0.134Q10.7 0.714 0.526 0.197 0.178 −0.318Q10.8 0.126 0.922 −0.002 −0.327 0.090Q10.9 −0.006 0.879 0.106 0.072 0.031
Total Variance Explained—Rotation Sums of Squared Loadings
Total 4.789 3.598 3.495 3.042 2.504% of Variance 25.207 18.936 18.397 16.009 13.178Cumulative % 25.207 44.143 62.540 78.548 91.727
Extraction Method: Principal Component Analysis. Rotation Method: Varimax with Kaiser Normalization.
Table 6. Eigenvalues and proportion of the total variance in 9 groups of collective entrepreneurship, as explained by thefirst three principal components for the original 20 traits and the correlation coefficients between these traits and the firstthree PCs on for questions Q13.
Component
1 2 3 4
Q13.1 0.157 0.935 0.111 −0.131Q13.2 0.657 0.740 0.012 −0.034Q13.3 0.366 0.891 0.165 0.061Q13.4 0.922 0.194 0.303 −0.043Q13.5 0.840 0.224 0.455 −0.021Q13.6 0.687 −0.235 −0.231 0.286Q13.7 0.888 0.114 0.284 0.218Q13.8 0.771 0.203 0.529 0.233Q13.9 0.215 0.066 0.856 0.047Q13.10 0.967 0.170 0.069 −0.155Q13.11 0.458 0.711 0.507 0.045Q13.12 0.807 0.206 0.410 0.162Q13.13 0.786 0.349 0.378 −0.064Q13.14 0.306 0.751 0.272 0.473Q13.15 0.147 0.053 0.076 0.980Q13.16 −0.255 −0.457 −0.630 0.553Q13.17 −0.145 −0.084 −0.862 0.008Q13.18 0.301 −0.629 −0.443 0.462Q13.19 0.317 −0.889 0.079 0.049Q13.20 0.833 −0.204 −0.269 0.378
91
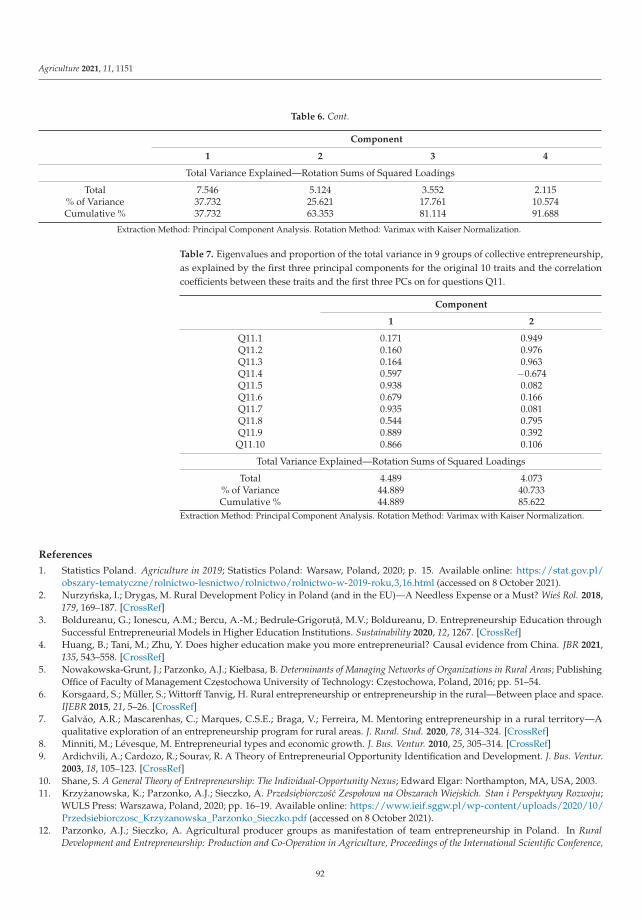
Agriculture 2021, 11, 1151
Table 6. Cont.
Component
1 2 3 4
Total Variance Explained—Rotation Sums of Squared Loadings
Total 7.546 5.124 3.552 2.115% of Variance 37.732 25.621 17.761 10.574Cumulative % 37.732 63.353 81.114 91.688
Extraction Method: Principal Component Analysis. Rotation Method: Varimax with Kaiser Normalization.
Table 7. Eigenvalues and proportion of the total variance in 9 groups of collective entrepreneurship,as explained by the first three principal components for the original 10 traits and the correlationcoefficients between these traits and the first three PCs on for questions Q11.
Component
1 2
Q11.1 0.171 0.949Q11.2 0.160 0.976Q11.3 0.164 0.963Q11.4 0.597 −0.674Q11.5 0.938 0.082Q11.6 0.679 0.166Q11.7 0.935 0.081Q11.8 0.544 0.795Q11.9 0.889 0.392Q11.10 0.866 0.106
Total Variance Explained—Rotation Sums of Squared Loadings
Total 4.489 4.073% of Variance 44.889 40.733Cumulative % 44.889 85.622
Extraction Method: Principal Component Analysis. Rotation Method: Varimax with Kaiser Normalization.
References
1. Statistics Poland. Agriculture in 2019; Statistics Poland: Warsaw, Poland, 2020; p. 15. Available online: https://stat.gov.pl/obszary-tematyczne/rolnictwo-lesnictwo/rolnictwo/rolnictwo-w-2019-roku,3,16.html (accessed on 8 October 2021).
2. Nurzynska, I.; Drygas, M. Rural Development Policy in Poland (and in the EU)—A Needless Expense or a Must? Wies Rol. 2018,179, 169–187. [CrossRef]
3. Boldureanu, G.; Ionescu, A.M.; Bercu, A.-M.; Bedrule-Grigorut,ă, M.V.; Boldureanu, D. Entrepreneurship Education throughSuccessful Entrepreneurial Models in Higher Education Institutions. Sustainability 2020, 12, 1267. [CrossRef]
4. Huang, B.; Tani, M.; Zhu, Y. Does higher education make you more entrepreneurial? Causal evidence from China. JBR 2021,135, 543–558. [CrossRef]
5. Nowakowska-Grunt, J.; Parzonko, A.J.; Kiełbasa, B. Determinants of Managing Networks of Organizations in Rural Areas; PublishingOffice of Faculty of Management Czestochowa University of Technology: Czestochowa, Poland, 2016; pp. 51–54.
6. Korsgaard, S.; Müller, S.; Wittorff Tanvig, H. Rural entrepreneurship or entrepreneurship in the rural—Between place and space.IJEBR 2015, 21, 5–26. [CrossRef]
7. Galvão, A.R.; Mascarenhas, C.; Marques, C.S.E.; Braga, V.; Ferreira, M. Mentoring entrepreneurship in a rural territory—Aqualitative exploration of an entrepreneurship program for rural areas. J. Rural. Stud. 2020, 78, 314–324. [CrossRef]
8. Minniti, M.; Lévesque, M. Entrepreneurial types and economic growth. J. Bus. Ventur. 2010, 25, 305–314. [CrossRef]9. Ardichvili, A.; Cardozo, R.; Sourav, R. A Theory of Entrepreneurial Opportunity Identification and Development. J. Bus. Ventur.
2003, 18, 105–123. [CrossRef]10. Shane, S. A General Theory of Entrepreneurship: The Individual-Opportunity Nexus; Edward Elgar: Northampton, MA, USA, 2003.11. Krzyzanowska, K.; Parzonko, A.J.; Sieczko, A. Przedsiebiorczosc Zespołowa na Obszarach Wiejskich. Stan i Perspektywy Rozwoju;
WULS Press: Warszawa, Poland, 2020; pp. 16–19. Available online: https://www.ieif.sggw.pl/wp-content/uploads/2020/10/Przedsiebiorczosc_Krzyzanowska_Parzonko_Sieczko.pdf (accessed on 8 October 2021).
12. Parzonko, A.J.; Sieczko, A. Agricultural producer groups as manifestation of team entrepreneurship in Poland. In RuralDevelopment and Entrepreneurship: Production and Co-Operation in Agriculture, Proceedings of the International Scientific Conference,
92
Agriculture 2021, 11, 1151
Vladivostok, Russia, 2–4 October 2018; Auzina, A., Ed.; Latvia University of Life Sciences and Technologies: Jelgava, Latvia, 2018;pp. 221–228.
13. Sztompka, P. Trust: A Sociological Theory; Cambridge University Press: Warsaw, Poland, 2000.14. Lewenstein, B. Nowe paradygmaty rozwoju układów lokalnych. In Oblicza Lokalnosci. Róznorodnosc Miejsc i Czasu;
Kurczewska, J., Ed.; Wydawnictwo IFiS PAN: Warszawa, Poland, 2006; p. 229.15. Ayupova, S.; Bents, D.; Kozlova, E. Trust as a Factor of Interaction Efficiency. In Smart Technologies and Innovations in Design for Con-
trol of Technological Processes and Objects: Economy and Production. Smart Innovation, Systems and Technologies (139); Solovev, D., Ed.;Springer: Cham, Switzerland, 2019. [CrossRef]
16. Camarinha-Matos, L.M.; Afsarmanesh, H. Collaborative Networks. In Knowledge Enterprise: Intelligent Strategies in Product Design,Manufacturing, and Management. IFIP International Federation for Information Processing (207); Wang, K., Kovacs, G.L., Wozny, M.,Fang, M., Eds.; Springer: Boston, MA, USA, 2006. [CrossRef]
17. Levin, D.Z.; Cross, R. The Strength of Weak Ties You Can Trust: The Mediating Role of Trust in Effective Knowledge. Transfer.Manag. Sci. 2004, 50, 1477–1490. [CrossRef]
18. Taylor, B.M.; Van Grieken, M. Local institutions and farmer participation in agri-environmental schemes. J. Rural. Stud. 2015,37, 10–19. [CrossRef]
19. Quinn, B.; McKitterick, L.; Tregear, A.; McAdam, R. Trust in the programme: An exploration of trust dynamics within ruralgroup-based support programmes. J. Rural. Stud. 2021. [CrossRef]
20. Welter, F. “All you need is trust?” A critical review of the trust and entrepreneurship literature. Int. Small Bus. J. 2012, 30, 193–212.[CrossRef]
21. Persky, J.J. Retrospectives The Ethology of Homo Economicus. J. Econ. Perspect. 1995, 9, 221–231. [CrossRef]22. Bruni, L.; Guala, F. Vilfredo Pareto and the Epistemological Foundations of Choice Theory. HOPE 2001, 33, 21–49. Available
online: http://muse.jhu.edu/journals/hpe/summary/v033/33.1bruni.html (accessed on 8 October 2021). [CrossRef]23. Milonakis, D.; Fine, B. From Political Economy to Economics. Method, the Social and the Historical in the Evolution of Economic Theory;
Routledge: London, UK; New York, NY, USA, 2009; Available online: http://pauladaunt.com/books/From_Political_Economy_to_Freakonomics.pdf (accessed on 8 October 2021).
24. Thaler, R.H. Behavioral Economics: Past, Present, and Future. AER 2016, 106, 1577–1600. [CrossRef]25. Smith, V. Microeconomic systems as an experimental science. AER 1982, 72, 923–955. Available online: https://www.jstor.org/
stable/1812014 (accessed on 8 October 2021).26. Samuelson, L. Game Theory in Economics and Beyond. JEP 2016, 30, 107–130. [CrossRef]27. Mikłowicz, D. Zaufanie jako wartosc społeczna. Studia Ekon. 2016, 259, 80–88.28. Besser, T.; Miller, N. The structural, social and strategic factors associated with successful business networks. Enterpren. Reg. Dev.
2011, 23, 113–133. [CrossRef]29. Newbery, R.; Sauer, J.; Gorton, M.; Phillipson, J.; Atterton, J. Determinants of the performance of business associations in rural
settlements in the United Kingdom: An analysis of members’ satisfaction and willingness-to-pay for association survival. Environ.Plann. 2013, 45, 967–985. [CrossRef]
30. Rauch, J.E. Productivity Gains from Geographic Concentration of Human Capital: Evidence from the Cities; Working Paper No. 3905;National Bureau of Economic Research: Cambridge, MA, USA, 1991; Available online: https://www.nber.org/system/files/working_papers/w3905/w3905.pdf (accessed on 8 October 2021).
31. Chalker, M.; Loosemore, M. Trust and productivity in Australian construction projects: A subcontractor perspective. ECAM 2016,23, 192–210. [CrossRef]
32. Kayes, A.; Kayes, D.C. Nurturing Trust. In The Learning Advantage; Palgrave Macmillan: London, UK, 2011; pp. 154–170.[CrossRef]
33. Sørensen, O.H.; Hasle, P.; Pejtersen, J.H. Trust relations in management of change. SJM 2011, 27, 405–417. [CrossRef]34. Dincer, O.; Uslaner, E.M. Trust and growth. Public Choice 2010, 142, 59–67. [CrossRef]35. Deelmann, T.; Loos, P. Trust economy: Aspects of reputation and trust building for SMEs in e-business in e-business. AMCIS 2002
Proc. 2002, 2002, 302. Available online: http://aisel.aisnet.org/amcis2002/302 (accessed on 8 October 2021).36. Khalifa, S. Trust, Landscape, And Economic Development. JED 2016, 41, 19–32. Available online: http://www.jed.or.kr/full-text/
41-1/2.pdf (accessed on 8 October 2021).37. Bjørnskov, C. Determinants of generalized trust: A cross-country comparison. Public Choice 2007, 130, 1–21. [CrossRef]38. Algan, Y.; Cahuc, P. Inherited Trust and Growth. AER 2010, 100, 2060–2092. [CrossRef]39. Elert, N.; Stam, E.; Stenkula, M. Intrapreneurship and Trust; Working Papers 19-08. U.S.E.; Research Institute: Utrecht, The
Netherlands, 2019; pp. 1–27. Available online: https://www.uu.nl/sites/default/files/rebo_use_wp_2019_1908.pdf (accessed on8 October 2021).
40. Dotti Sani, G.M.; Magistro, B. Increasingly unequal? The economic crisis, social inequalities and trust in the European Parliamentin 20 European countries. EJPR 2016, 55, 246–264. [CrossRef]
41. Lipps, J.; Schraff, D. Regional inequality and institutional trust in Europe. EJPR 2021, 60, 892–913. [CrossRef]42. Burciu, A.; Kicsi, R.; Bostan, I. Social Trust and Dynamics of Capitalist Economies in the Context of Clashing Managerial Factors
with Risks and Severe Turbulence: A Conceptual Inquiry. Sustainability 2020, 12, 8794. [CrossRef]
93
Agriculture 2021, 11, 1151
43. Gillath, O.; Ai, T.; Branicky, M.S.; Keshmiri, S.; Davison, R.B.; Spaulding, R. Attachment and trust in artificial intelligence. Comput.Hum. Behav. 2021, 115, 106607. [CrossRef]
44. Parzonko, A.; Balinska, A.; Sieczko, A. Pro-Environmental Behaviors of Generation Z in the Context of the Concept of HomoSocio-Oeconomicus. Energies 2021, 14, 1597. [CrossRef]
45. Munns, A. Potential influence of trust on the successful completion of a project. IJPM 1995, 13, 19–24. [CrossRef]46. Blomqvist, K. The many faces of trust. SJM 1997, 13, 271–286. [CrossRef]47. Hotte, N.; Kozak, R.; Wyatt, S. How institutions shape trust during collective action: A case study of forest governance on Haida
Gwaii. For. Policy Econ. 2019, 107, 101921. [CrossRef]48. Miller, G.J.; Whitford, A.B. Trust and incentives in principal-agent negotiations: The “insurance/incentive trade-off”. JTP 2002,
14, 231–267. [CrossRef]49. Ceric, A.; Vukomanovic, M.; Ivic, I.; Kolaric, S. Trust in megaprojects: A comprehensive literature review of research trends. IJPM
2020, 39, 325–338. [CrossRef]50. Paliszkiewicz, J. Zaufanie w Zarzadzaniu; WN PWN: Warsaw, Poland, 2013.51. Krawczyk-Bryłka, B. Zaufanie do siebie jako jeden z aspektów zaufania w aktywnosci przedsiebiorczej. In Przedsiebiorczosc:
Jednostka, Organizacja, Kontekst; Postuła, A., Majczyk, J., Darecki, M., Eds.; Scientific Publishing House FMUW: Warsaw, Poland,2015; pp. 90–102. [CrossRef]
52. Kwon, S.-W.; Arenius, P. Nations of entrepreneurs: A social capital perspective. JBV 2010, 25, 315–330. [CrossRef]53. Ding, Z.; Au, K.; Chiang, F. Social trust and angel investors’ decisions: A multilevel analysis across nations. JBV 2015, 30, 307–321.
[CrossRef]54. Centrum Badania Opinii Społecznej. Zaufanie Społeczne. Komunikat z Badan nr 43/2020; CBOS: Warszawa, Poland, 2020; Available
online: https://cbos.pl/SPISKOM.POL/2020/K_043_20.PDF (accessed on 8 October 2021).55. Moczydłowska, J.M. Zaufanie jako determinanta relacji przedsiebiorcy—Przedstawiciele administracji samorzadowej. Zarzadzanie
Finanse 2012, 10, 75–85. Available online: http://jmf.wzr.pl/pim/2012_4_2_6.pdf (accessed on 8 October 2021).56. Trust Barometer. Global Report. Edelman. 2018. Available online: https://www.edelman.com/sites/g/files/aatuss191/files/20
18-10/2018_Edelman_Trust_Barometer_Global_Report_FEB.pdf (accessed on 21 December 2020).57. Pan, L. Willingness of Farmers Joining Professional Cooperatives. Based on the Questionnaire Survey of Nanjing. Asian Agric.
Res. 2011, 3, 1–5. [CrossRef]58. Brodzinski, Z. Entrepreneurship of Agricultural Producers—Determinants of Development. Ann. PAAAE 2019, 3. [CrossRef]59. Phillipson, J.; Gorton, M.; Laschewski, L. Local Business Co-operation and the Dilemmas of Collective Action: Rural Micro-
business Networks in the North of England. Sociol. Rural. 2006, 46, 40–60. [CrossRef]60. Sgroi, F.; Trapani, A.M.D.; Testa, R.; Tudisca, S. The Rural Tourism as Development Opportunity or Farms. The Case of Direct
Sales in Sicily. AJABS 2014, 9, 407–419. [CrossRef]61. Björklund, J.C. Barriers to Sustainable Business Model Innovation in Swedish Agriculture. JEMI 2018, 14, 65–90. [CrossRef]62. Colombo, S.; Perujo-Villanueva, M. Analysis of the spatial relationship between small olive farms to increase their competitiveness
through cooperation. Land Use Policy 2017, 63, 226–235. [CrossRef]63. Krzyzanowska, K. Ekonomiczno—Społeczne Uwarunkowania Innowacji w Zespołowym Działaniu w Rolnictwie; WULS Press:
Warsaw, Poland, 2016; Available online: https://www.ieif.sggw.pl/wp-content/uploads/2021/05/Ekonomiczno-spoleczne_KrzyzanowskaK.pdf (accessed on 8 October 2021).
64. Fałkowski, J.; Chlebicka, A.; Łopaciuk-Gonczaryk, B. Social relationships and governing collaborative actions in rural areas:Some evidence from agricultural producer groups in Poland. J. Rural. Stud. 2017, 49, 104–116. [CrossRef]
65. do Adro, F.; Franco, M. Rural and agri-entrepreneurial networks: A qualitative case study. Land Use Policy 2020, 99, 105117.[CrossRef]
66. Fortunato, M.W.P. Supporting rural entrepreneurship: A review of conceptual developments from research to practice. CommunityDev. 2014, 45, 387–408. [CrossRef]
67. Skandrani, H.; Triki, A.; Baratli, B. Trust in supply chains, meanings, determinants and demonstrations: A qualitative study in anemerging market context. Qual. Mark. Res. 2011, 14, 391–409. [CrossRef]
68. Fawcett, S.E.; Jones, S.L.; Fawcett, A.M. Supply chain trust: The catalyst for collaborative innovation. Bus. Horiz. 2012, 55, 163–178.[CrossRef]
69. Day, M.; Fawcett, S.E.; Fawcett, A.M.; Magnan, G.M. Trust and relational embeddedness: Exploring a paradox of trust patterndevelopment in key supplier relationships. Ind. Mark. Manag. 2013, 42, 152–165. [CrossRef]
70. Szabó, G.G. The importance and role of trust in agricultural marketing co-operatives. Stud. Agric. Econ. 2010, 112, 5–22. [CrossRef]71. Pulfer, I.; Möhring, A.; Dobricki, M.; Lips, M. Success factors for farming collectives. In Proceedings of the 12th Congress of the
European Association of Agricultural Economists—EAAE 2008, Ghent, Belgium, 26–29 August 2008. [CrossRef]72. Davies, P.; Mason-Jones, R. Communities of interest as a lens to explore the advantage of collaborative behaviour for developing
economies: An example of the Welsh organic food sector. IJEIM 2017, 18, 5–13. [CrossRef]
94
agriculture
Article
Profile of the Small-Scale Farms Willing toCooperate—Evidence from Lithuania
Jolanta Droždz 1,*, Vlada Vitunskiene 2 and Lina Novickyte 3
Citation: Droždz, J.; Vitunskiene, V.;
Novickyte, L. Profile of the
Small-Scale Farms Willing to
Cooperate—Evidence from Lithuania.
Agriculture 2021, 11, 1071. https://
doi.org/10.3390/agriculture11111071
Academic Editors: Adoración
Mozas Moral and Domingo
Fernandez Ucles
Received: 4 October 2021
Accepted: 29 October 2021
Published: 30 October 2021
Publisher’s Note: MDPI stays neutral
with regard to jurisdictional claims in
published maps and institutional affil-
iations.
Copyright: © 2021 by the authors.
Licensee MDPI, Basel, Switzerland.
This article is an open access article
distributed under the terms and
conditions of the Creative Commons
Attribution (CC BY) license (https://
creativecommons.org/licenses/by/
4.0/).
1 Faculty of Economics and Business Administration, Vilnius University, 10222 Vilnius, Lithuania2 Faculty of Bioeconomy Development, Vytautas Magnus University, 44248 Kaunas, Lithuania;
[email protected] Government Strategic Analysis Center, 01108 Vilnius, Lithuania; [email protected]* Correspondence: [email protected]
Abstract: Cooperatives cover a large part of the agricultural sectors and have substantial marketshares in agri-food supply chains in the EU Western countries. They account for approximately halfof agricultural trade in the EU. By contrast, in the EU Western countries, where farmer cooperativesare widespread and successful, agricultural cooperation in Lithuania has developed intermittently inthe last century. We still have very limited knowledge of why the country’s agricultural producers(especially smallholder farmers) are reluctant to cooperate in Lithuania. The aim of this study isto assess the level of the willingness to cooperate among smallholder farmers in Lithuania and todraw up the profiles of small-scale farms that participate in and intend to join cooperatives and,conversely, that do not participate in cooperatives and do not intend to do so. To achieve this goal, arepresentative survey of small-scale farms was conducted. Results of surveys carried out in 2019 inLithuania on a group of 1002 small-scale farms showed that only 8% of the surveyed farms participatein producer groups or cooperatives, while another 8% intend to participate. Small-scale farms inLithuania have weak market integration, with no bargaining power on input and output markets.The vast majority of small-scale farms are reluctant to participate in cooperative activities in Lithuania.Therefore, this study aimed to determine the profile of a small farm that tends to cooperate. Themain social characteristics of farm managers and economic factors of farms willing to cooperate havebeen identified.
Keywords: small-scale farm; cooperation; contractual integration; willingness to cooperate; farmprofile; Lithuanian case
1. Introduction
There are more than forty thousand agricultural cooperatives in Europe with ninemillion farmer members [1]. Cooperatives cover a large part of the agricultural sectorsand have substantial market shares in agri-food supply chains in the European Union (EU)western countries. They account for approximately half of agricultural trade in the EU andover half in some member states such as Austria, Denmark, Finland, France, Ireland, theNetherlands, and Sweden. Moreover, the market shares of cooperatives differ considerablywith respect to sectors [2,3]. According to Ollila [4], not only ideological or sociological butalso economic reasons justify the existence of cooperatives. The existence of cooperativeorganizations in today’s business environment, particularly in agriculture, signals theircontinued ability to provide value to their members [5] by increasing farms’ (especiallysmall-scale farms) competitiveness on the national and international markets [6,7]. Agricul-tural cooperatives have provided a model for overcoming the disadvantages of small-scalefarming for more than 150 years [8]. It should be added that the process of farm coopera-tion in modern Lithuania was decisively influenced by the historical path of agriculturaldevelopment and the experience of the agricultural community.
Agriculture 2021, 11, 1071. https://doi.org/10.3390/agriculture11111071 https://www.mdpi.com/journal/agriculture
95
Agriculture 2021, 11, 1071
By contrast, in the EU Western countries where farmers’ cooperatives are widespreadand successful, agricultural cooperation in Lithuania has developed intermittently in thelast century. The cooperation of farmers developed in the second and third decades of the20th century, based on the classical principles of cooperation, was completely destroyed bythe collectivization of farms into pseudo-cooperative kolkhoz at the beginning of the Sovietera. Moreover, farmers’ households were allowed to use only up to 60 acres of land. Thecollective farms that operated during the Soviet regime (1945–1989) still maintain a non-beneficial image of anti-cooperation, deterring farmers from joining cooperatives. Afterthe restructuring of independent Lithuanian agriculture in the early 1990s, cooperationbetween newly established family farms and corporate companies in agriculture has notbeen expanding and is still very weak. Cooperation among farmers is not widespread inLithuania—only about 12% of the country’s farmers are involved in cooperatives [9]. Theresearch of Borychowski et al. [10] included Lithuania and showed that the production scalewas the key determinant of the resilience of small-scale farms in the countries. Moreover, themain way to achieve the higher benefits of increasing the production should be combinedwith strengthening the market integration of agricultural producers, so the cooperationissue becomes even more relevant. This study extends an established direction of theresilient development of the small-scale farms in Lithuania.
EU Western researchers are looking for the reasons why agricultural producers in the21st century are choosing a cooperative structure based on classical principles of coop-eration [11], and we still have very limited knowledge of why the country’s agriculturalproducers (especially smallholder farmers) are reluctant to cooperate in Lithuania. Themain aim of this study is to assess the level of the willingness to cooperate among small-holder farmers in Lithuania and to draw up the profiles of small-scale farms that participatein and intend to join cooperatives and, conversely, that do not participate in cooperativesand do not intend to do so.
To achieve this aim, a representative survey of small-scale farms was conducted. Weemployed the results of surveys carried out in 2019 in Lithuania on a group of 1002 small-scale farms. The study results contribute to a better understanding of the cooperative ornon-cooperative behaviour of small-scale farms.
2. Literature Overview
2.1. Reluctance to Cooperate
An overview of the research conducted on farm co-operation in Lithuania revealedthat the main reasons for the attitude of Lithuanian farmers towards co-operation havenot changed for a long time. The farmer and expert survey data show [12] that the mainreasons for farmers’ reluctance to cooperate and change are their individuality, lack of trustin collective (cooperative) actions and new ideas, internal competition, and inability to finda joint agreement on different issues.
Both farmers and managers of agricultural companies do not consider cooperationto be a matter of necessity; for them, according to experts, daily work on the farm is ofgreater value than changes in the area of cooperation. In addition, they feel that thereis a lack of time for collaborative actions due to the high workload. Other authors havealso identified distrust between people, unwillingness to change their habits, and a lack oftime for cooperative activities as the main barriers of the development of farm cooperationprocesses in Lithuania [13–15]. Tuna and Karantininis [15] conducted a social networkanalysis and found that there are low levels of social capital (structural, which refers to thepresence of a network of access to people and resources, as well as cognitive aspects, suchas norms, values, trust, attitudes, and beliefs) in agricultural cooperatives in post-socialistcountries. A lack of time and money for cooperative activities, a lack of leaders, andbureaucratic shortcomings have been emphasized as the main obstacles for cooperation inRussia [7].
In some studies, a low awareness of the benefits of contractual integration amongfarmers was observed along with a weak willingness to cooperate because of the low
96
Agriculture 2021, 11, 1071
bargaining power of farmers [16,17]. Kahneman and Tversky’s Prospect Theory [18]shows that individuals tend to avoid potential losses rather than seek potential benefits.Agricultural cooperatives in post-socialistic countries often fail to justify their purpose [15].Czyzewski et al. [19] confirm that human capital plays a significant role in contractualgovernance and requires special attention. The positive correlations between the length ofeducation and willingness to join agricultural cooperatives have been observed in severalstudies [20–23]. Education contributes to the quality of human capital. Martey et al. [24]argue that, through educational processes, farmers gain the ability to cooperate and toparticipate in social activities, while others conclude that better educated and self-confidentfarmers appreciate contractual integration more than others [20–22].
Other research claims that it can be difficult to organize work and communicationprocesses in cooperative enterprises and it is time consuming to establish new collabora-tions [25]. On the other hand, an expansion in production is expected to increase productioncosts unless it is achieved solely through an increase in productivity via costless improvedmanagement practices [26]. In addition, exchanges of raw agricultural products are gov-erned by stable contractual relations between farms and buyers when talking about modernmarkets [27], which also hinders the merging of farms into cooperatives in Lithuania. Thedata also show that farmers tend to compete with each other and cannot understand thebenefits of cooperation [28]. The study from Miceikiene et al. [29] shows that difficult accessto financial funds also limits the growth potential of agricultural cooperatives. Agriculturalcooperatives face the problem of financing due to higher operational risk.
The low involvement of small-scale family farms in the activities of formal cooper-atives is influenced by informal mutual assistance when farmers share machinery andexperience in agricultural production and help each other with a high workload during theseason [25]. Informal cooperation is of continual importance for small-scale farms [25,30].Such informal cooperation, similar to mutual assistance and based on trust and the constantfostering of personal relationships, often occurs in Lithuania between neighbours or rela-tives. Informal cooperation between farmers was identified as one of the main reasons fornon-cooperation of farmers in Lithuania [14]. This can be thought of as being particularlycommon for small-scale farmers.
In summary, three groups of factors can be distinguished, due to which farmers inLithuania are reluctant to cooperate:
• Psychological factors include a bad association with the Soviet-era “kolchozes”, pro-ducers’ distrust of each other, a low level of economic awareness among farmers, alack of leaders, a lack of successful stories, and exaggeration of negative experiencesbeing a cooperative member.
• Economic factors and legal issues include a lack of financial funds to start a successfuleconomic activity, the employment of specialists, a lack of financial support, the lackof a system for regulating the equitable distribution of value added throughout thevalue chain, and changing law.
• Organisational factors include a lack of awareness of the benefits cooperatives bring, alack of professional consulting and coaching facilities available to cooperative mem-bers, and a diverse level of knowledge and skills of existing consultants.
Nevertheless, small-scale farms have little opportunity to compete in the traditionalmarket through individual activities, so one of the options is local food systems, and theway they are created is through farmers’ cooperation [25,31]. As long as the level of farmers’cooperation is low, the market share is low as well [32], so market integration throughcooperation is essential for small-scale farms in order to improve their market position.
2.2. Incentives for Cooperation
The establishment and development of different forms of business cooperation, par-ticularly in small-scale agriculture, must depend on the initiative and willingness of thefarmer to actively participate in and join the different forms of business cooperation [6].Many authors have raised the problem of contractual integration of farms and their drivers.
97
Agriculture 2021, 11, 1071
Recent examples are Abate [33], Kispál-Vitai et al. [11], Ciliberti et al. [34], Ncube [35],Souza et al. [36], and Candemir et al. [3]. Many positive effects have been found on farmsparticipating in cooperation activities, which should be an incentive for other farms toget involved in the process as well. The efficiency of farm activities increases after theyjoin a cooperative and the financial situation of all farms improves [37]. Cooperatives canhelp producers in several ways, two of which are specific to their activities in the market:countervailing power and competitive criterion, i.e., market price regulator [11]. In the caseof horticulture, producer groups and organisations play a significant role in the modernisa-tion processes [38]. Cooperatives or other producer organizations give small-scale farmsthe opportunity to get involved in modern agricultural value chains, especially as tradi-tional markets are dominated by large farms [39]. Producer organizations help to reducebarriers to market entry for small producers [40]. The experience of Western European andScandinavian countries proves that small and medium-sized farms operating through acooperative increase their bargaining power in the market, become more competitive, andreduce production and logistics costs.
It is therefore important to emphasize, that cooperation not only contributes to thereduction of production costs, but also helps to organize certain markets [36]. Cooper-atives can improve smallholder farmers’ access to both input and output markets andstrengthen their competitive position in different ways, both on an internal and interna-tional level [6,13]. For instance, cooperatives enable farmers to bargain collectively withboth sellers of inputs and buyers of farm products, can decrease transaction costs andimprove transaction efficiency, and can support the information flow between farmers andthe market and thus help farmers to meet the specific requirements of high value-addedfood markets [41]. Ortega et al. [42] proved this positive effect for coffee producers inRwanda, where cooperative membership was linked to greater access to inputs and anincrease in income. Cooperatives can reduce market risk for their members and jointliability groups to enable access to microfinance when there is limited collateral [43], canuse a collective quality label or create their own brands and create a product differentiation,and can help farmers to cope with market imperfections [3]. Cooperatives are as responseto the weak bargaining power of individual farms on a market [41,44].
Cooperation promotes the development of common infrastructure (machinery, logis-tics, and transport), integrated food production and processing methods, and commonagricultural practices [25]. Joint activities help farmers to improve production processes andlogistics management and reduce food loss and waste along the entire supply chain [45].Cooperatives and other types of organization in agriculture provide increased access toinformation, but also access to credits, equipment, and other types of subsidies and sup-port [15]. Agarwal and Dorin’s [46] study on group farming in France identified reasonswhy farmers in some regions are more likely to cooperate than in others: cooperation ismore prevalent in regions with low economic inequality and with a predominance of smallor medium-sized farms; more labour-intensive farms engaged in agricultural activities, i.e.,livestock farmers are more likely to cooperate than cereal farmers; and it is influenced bydemographic factors, such as the agricultural education of farmers. It can be added thatthis is influenced by the historical conditions of agricultural development in the regions orcountries. Members of the agricultural cooperatives to a large extent assess their groups insocial terms rather than only on economic ones [47]. Cooperation activities not only have apositive impact on the welfare of the members of cooperatives, but in general, joint activi-ties also increase living standards in rural areas, preserve and influence the developmentof rural lifestyles, and prevent some rural territories from becoming extinct [7]. Thus, thesocial aspect of the analysed problem is also important. Based on the analysed literature,both social and economic factors were selected for further analysis.
3. Materials and Methods
In the preparation stage for this study, we defined small-scale farms in Lithuania andperformed a regression analysis to determine whether there is a relationship between the
98
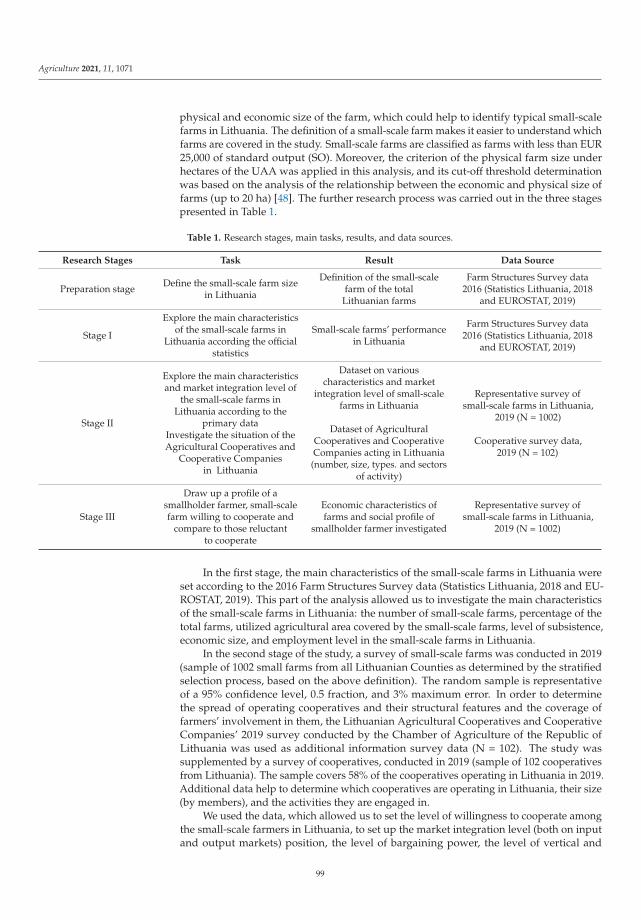
Agriculture 2021, 11, 1071
physical and economic size of the farm, which could help to identify typical small-scalefarms in Lithuania. The definition of a small-scale farm makes it easier to understand whichfarms are covered in the study. Small-scale farms are classified as farms with less than EUR25,000 of standard output (SO). Moreover, the criterion of the physical farm size underhectares of the UAA was applied in this analysis, and its cut-off threshold determinationwas based on the analysis of the relationship between the economic and physical size offarms (up to 20 ha) [48]. The further research process was carried out in the three stagespresented in Table 1.
Table 1. Research stages, main tasks, results, and data sources.
Research Stages Task Result Data Source
Preparation stage Define the small-scale farm sizein Lithuania
Definition of the small-scalefarm of the total
Lithuanian farms
Farm Structures Survey data2016 (Statistics Lithuania, 2018
and EUROSTAT, 2019)
Stage I
Explore the main characteristicsof the small-scale farms in
Lithuania according the officialstatistics
Small-scale farms’ performancein Lithuania
Farm Structures Survey data2016 (Statistics Lithuania, 2018
and EUROSTAT, 2019)
Stage II
Explore the main characteristicsand market integration level of
the small-scale farms inLithuania according to the
primary dataInvestigate the situation of theAgricultural Cooperatives and
Cooperative Companiesin Lithuania
Dataset on variouscharacteristics and market
integration level of small-scalefarms in Lithuania
Dataset of AgriculturalCooperatives and CooperativeCompanies acting in Lithuania
(number, size, types. and sectorsof activity)
Representative survey ofsmall-scale farms in Lithuania,
2019 (N = 1002)
Cooperative survey data,2019 (N = 102)
Stage III
Draw up a profile of asmallholder farmer, small-scalefarm willing to cooperate and
compare to those reluctantto cooperate
Economic characteristics offarms and social profile of
smallholder farmer investigated
Representative survey ofsmall-scale farms in Lithuania,
2019 (N = 1002)
In the first stage, the main characteristics of the small-scale farms in Lithuania wereset according to the 2016 Farm Structures Survey data (Statistics Lithuania, 2018 and EU-ROSTAT, 2019). This part of the analysis allowed us to investigate the main characteristicsof the small-scale farms in Lithuania: the number of small-scale farms, percentage of thetotal farms, utilized agricultural area covered by the small-scale farms, level of subsistence,economic size, and employment level in the small-scale farms in Lithuania.
In the second stage of the study, a survey of small-scale farms was conducted in 2019(sample of 1002 small farms from all Lithuanian Counties as determined by the stratifiedselection process, based on the above definition). The random sample is representativeof a 95% confidence level, 0.5 fraction, and 3% maximum error. In order to determinethe spread of operating cooperatives and their structural features and the coverage offarmers’ involvement in them, the Lithuanian Agricultural Cooperatives and CooperativeCompanies’ 2019 survey conducted by the Chamber of Agriculture of the Republic ofLithuania was used as additional information survey data (N = 102). The study wassupplemented by a survey of cooperatives, conducted in 2019 (sample of 102 cooperativesfrom Lithuania). The sample covers 58% of the cooperatives operating in Lithuania in 2019.Additional data help to determine which cooperatives are operating in Lithuania, their size(by members), and the activities they are engaged in.
We used the data, which allowed us to set the level of willingness to cooperate amongthe small-scale farmers in Lithuania, to set up the market integration level (both on inputand output markets) position, the level of bargaining power, the level of vertical and
99
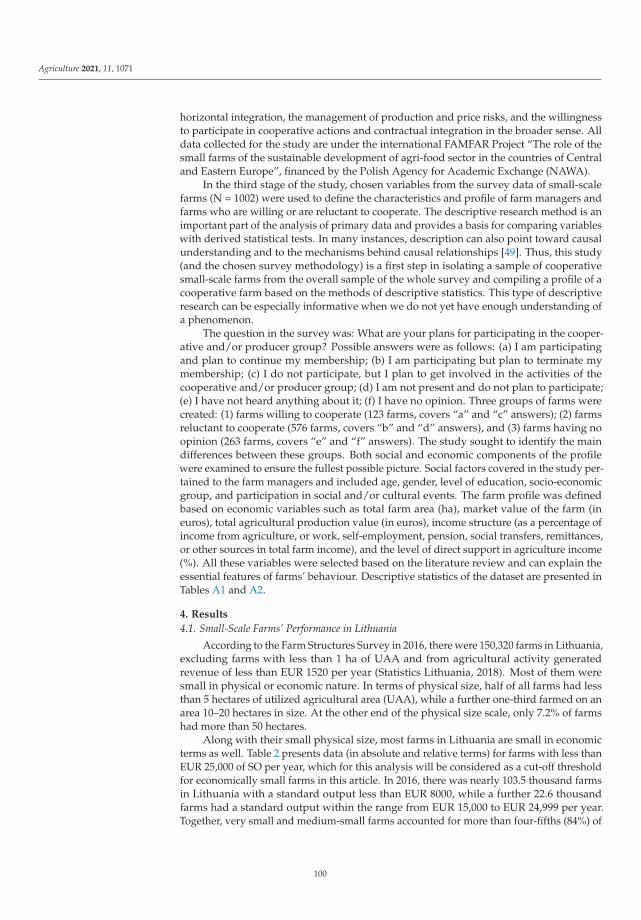
Agriculture 2021, 11, 1071
horizontal integration, the management of production and price risks, and the willingnessto participate in cooperative actions and contractual integration in the broader sense. Alldata collected for the study are under the international FAMFAR Project “The role of thesmall farms of the sustainable development of agri-food sector in the countries of Centraland Eastern Europe”, financed by the Polish Agency for Academic Exchange (NAWA).
In the third stage of the study, chosen variables from the survey data of small-scalefarms (N = 1002) were used to define the characteristics and profile of farm managers andfarms who are willing or are reluctant to cooperate. The descriptive research method is animportant part of the analysis of primary data and provides a basis for comparing variableswith derived statistical tests. In many instances, description can also point toward causalunderstanding and to the mechanisms behind causal relationships [49]. Thus, this study(and the chosen survey methodology) is a first step in isolating a sample of cooperativesmall-scale farms from the overall sample of the whole survey and compiling a profile of acooperative farm based on the methods of descriptive statistics. This type of descriptiveresearch can be especially informative when we do not yet have enough understanding ofa phenomenon.
The question in the survey was: What are your plans for participating in the cooper-ative and/or producer group? Possible answers were as follows: (a) I am participatingand plan to continue my membership; (b) I am participating but plan to terminate mymembership; (c) I do not participate, but I plan to get involved in the activities of thecooperative and/or producer group; (d) I am not present and do not plan to participate;(e) I have not heard anything about it; (f) I have no opinion. Three groups of farms werecreated: (1) farms willing to cooperate (123 farms, covers “a” and “c” answers); (2) farmsreluctant to cooperate (576 farms, covers “b” and “d” answers), and (3) farms having noopinion (263 farms, covers “e” and “f” answers). The study sought to identify the maindifferences between these groups. Both social and economic components of the profilewere examined to ensure the fullest possible picture. Social factors covered in the study per-tained to the farm managers and included age, gender, level of education, socio-economicgroup, and participation in social and/or cultural events. The farm profile was definedbased on economic variables such as total farm area (ha), market value of the farm (ineuros), total agricultural production value (in euros), income structure (as a percentage ofincome from agriculture, or work, self-employment, pension, social transfers, remittances,or other sources in total farm income), and the level of direct support in agriculture income(%). All these variables were selected based on the literature review and can explain theessential features of farms’ behaviour. Descriptive statistics of the dataset are presented inTables A1 and A2.
4. Results
4.1. Small-Scale Farms’ Performance in Lithuania
According to the Farm Structures Survey in 2016, there were 150,320 farms in Lithuania,excluding farms with less than 1 ha of UAA and from agricultural activity generatedrevenue of less than EUR 1520 per year (Statistics Lithuania, 2018). Most of them weresmall in physical or economic nature. In terms of physical size, half of all farms had lessthan 5 hectares of utilized agricultural area (UAA), while a further one-third farmed on anarea 10–20 hectares in size. At the other end of the physical size scale, only 7.2% of farmshad more than 50 hectares.
Along with their small physical size, most farms in Lithuania are small in economicterms as well. Table 2 presents data (in absolute and relative terms) for farms with less thanEUR 25,000 of SO per year, which for this analysis will be considered as a cut-off thresholdfor economically small farms in this article. In 2016, there was nearly 103.5 thousand farmsin Lithuania with a standard output less than EUR 8000, while a further 22.6 thousandfarms had a standard output within the range from EUR 15,000 to EUR 24,999 per year.Together, very small and medium-small farms accounted for more than four-fifths (84%) of
100
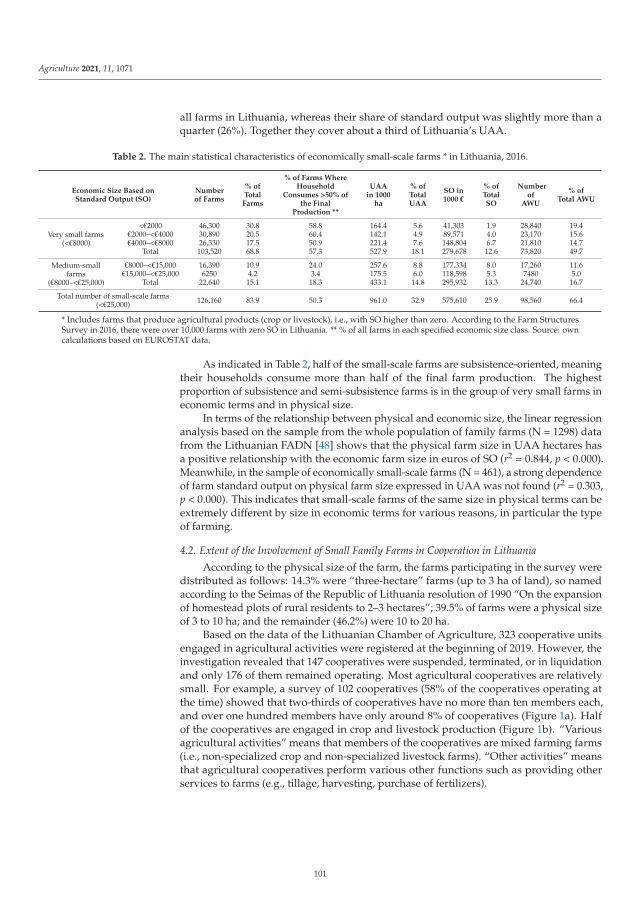
Agriculture 2021, 11, 1071
all farms in Lithuania, whereas their share of standard output was slightly more than aquarter (26%). Together they cover about a third of Lithuania’s UAA.
Table 2. The main statistical characteristics of economically small-scale farms * in Lithuania, 2016.
Economic Size Based onStandard Output (SO)
Numberof Farms
% ofTotalFarms
% of Farms WhereHousehold
Consumes >50% ofthe Final
Production **
UAAin 1000
ha
% ofTotalUAA
SO in1000 €
% ofTotalSO
Numberof
AWU
% ofTotal AWU
Very small farms(<€8000)
<€2000 46,300 30.8 58.8 164.4 5.6 41,303 1.9 28,840 19.4€2000–<€4000 30,890 20.5 60.4 142.1 4.9 89,571 4.0 23,170 15.6€4000–<€8000 26,330 17.5 50.9 221.4 7.6 148,804 6.7 21,810 14.7
Total 103,520 68.8 57.3 527.9 18.1 279,678 12.6 73,820 49.7
Medium-smallfarms
(€8000–<€25,000)
€8000–<€15,000 16,390 10.9 24.0 257.6 8.8 177,334 8.0 17,260 11.6€15,000–<€25,000 6250 4.2 3.4 175.5 6.0 118,598 5.3 7480 5.0
Total 22,640 15.1 18.3 433.1 14.8 295,932 13.3 24,740 16.7
Total number of small-scale farms(<€25,000) 126,160 83.9 50.3 961.0 32.9 575,610 25.9 98,560 66.4
* Includes farms that produce agricultural products (crop or livestock), i.e., with SO higher than zero. According to the Farm StructuresSurvey in 2016, there were over 10,000 farms with zero SO in Lithuania. ** % of all farms in each specified economic size class. Source: owncalculations based on EUROSTAT data.
As indicated in Table 2, half of the small-scale farms are subsistence-oriented, meaningtheir households consume more than half of the final farm production. The highestproportion of subsistence and semi-subsistence farms is in the group of very small farms ineconomic terms and in physical size.
In terms of the relationship between physical and economic size, the linear regressionanalysis based on the sample from the whole population of family farms (N = 1298) datafrom the Lithuanian FADN [48] shows that the physical farm size in UAA hectares hasa positive relationship with the economic farm size in euros of SO (r2 = 0.844, p < 0.000).Meanwhile, in the sample of economically small-scale farms (N = 461), a strong dependenceof farm standard output on physical farm size expressed in UAA was not found (r2 = 0.303,p < 0.000). This indicates that small-scale farms of the same size in physical terms can beextremely different by size in economic terms for various reasons, in particular the typeof farming.
4.2. Extent of the Involvement of Small Family Farms in Cooperation in Lithuania
According to the physical size of the farm, the farms participating in the survey weredistributed as follows: 14.3% were “three-hectare” farms (up to 3 ha of land), so namedaccording to the Seimas of the Republic of Lithuania resolution of 1990 “On the expansionof homestead plots of rural residents to 2–3 hectares”; 39.5% of farms were a physical sizeof 3 to 10 ha; and the remainder (46.2%) were 10 to 20 ha.
Based on the data of the Lithuanian Chamber of Agriculture, 323 cooperative unitsengaged in agricultural activities were registered at the beginning of 2019. However, theinvestigation revealed that 147 cooperatives were suspended, terminated, or in liquidationand only 176 of them remained operating. Most agricultural cooperatives are relativelysmall. For example, a survey of 102 cooperatives (58% of the cooperatives operating atthe time) showed that two-thirds of cooperatives have no more than ten members each,and over one hundred members have only around 8% of cooperatives (Figure 1a). Halfof the cooperatives are engaged in crop and livestock production (Figure 1b). “Variousagricultural activities” means that members of the cooperatives are mixed farming farms(i.e., non-specialized crop and non-specialized livestock farms). “Other activities” meansthat agricultural cooperatives perform various other functions such as providing otherservices to farms (e.g., tillage, harvesting, purchase of fertilizers).
101
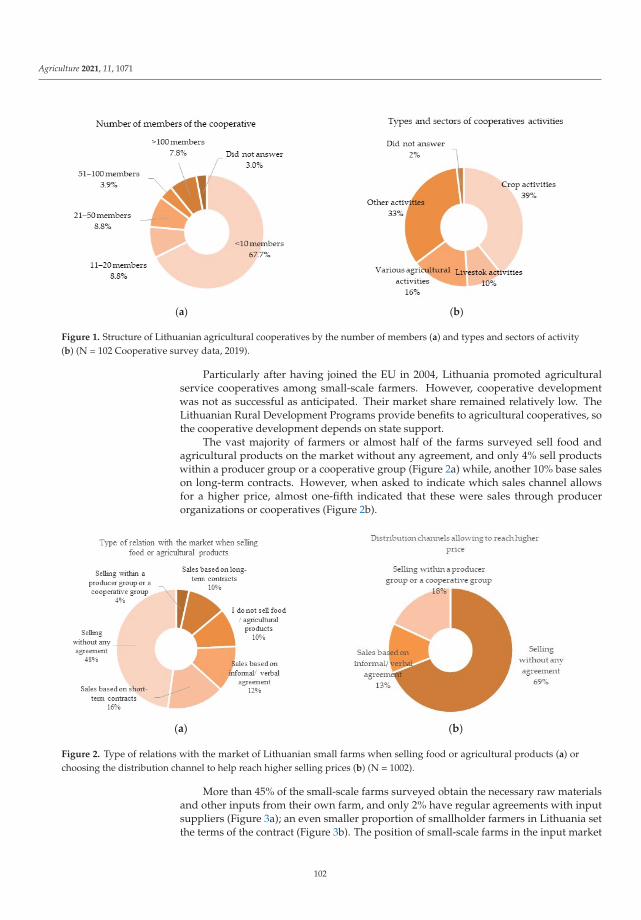
Agriculture 2021, 11, 1071
(a) (b)
Figure 1. Structure of Lithuanian agricultural cooperatives by the number of members (a) and types and sectors of activity(b) (N = 102 Cooperative survey data, 2019).
Particularly after having joined the EU in 2004, Lithuania promoted agriculturalservice cooperatives among small-scale farmers. However, cooperative developmentwas not as successful as anticipated. Their market share remained relatively low. TheLithuanian Rural Development Programs provide benefits to agricultural cooperatives, sothe cooperative development depends on state support.
The vast majority of farmers or almost half of the farms surveyed sell food andagricultural products on the market without any agreement, and only 4% sell productswithin a producer group or a cooperative group (Figure 2a) while, another 10% base saleson long-term contracts. However, when asked to indicate which sales channel allowsfor a higher price, almost one-fifth indicated that these were sales through producerorganizations or cooperatives (Figure 2b).
(a) (b)
Figure 2. Type of relations with the market of Lithuanian small farms when selling food or agricultural products (a) orchoosing the distribution channel to help reach higher selling prices (b) (N = 1002).
More than 45% of the small-scale farms surveyed obtain the necessary raw materialsand other inputs from their own farm, and only 2% have regular agreements with inputsuppliers (Figure 3a); an even smaller proportion of smallholder farmers in Lithuania setthe terms of the contract (Figure 3b). The position of small-scale farms in the input market
102
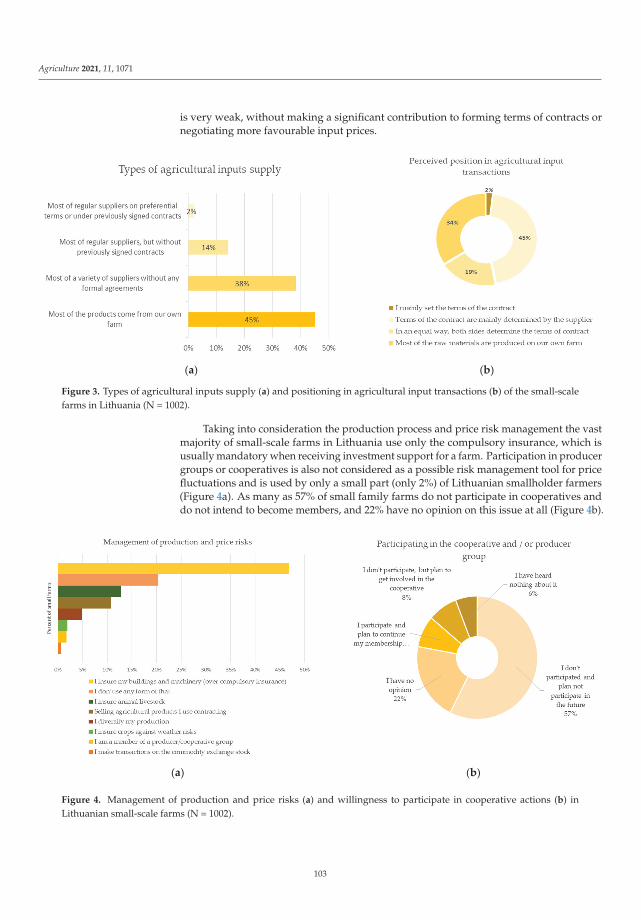
Agriculture 2021, 11, 1071
is very weak, without making a significant contribution to forming terms of contracts ornegotiating more favourable input prices.
(a) (b)
Figure 3. Types of agricultural inputs supply (a) and positioning in agricultural input transactions (b) of the small-scalefarms in Lithuania (N = 1002).
Taking into consideration the production process and price risk management the vastmajority of small-scale farms in Lithuania use only the compulsory insurance, which isusually mandatory when receiving investment support for a farm. Participation in producergroups or cooperatives is also not considered as a possible risk management tool for pricefluctuations and is used by only a small part (only 2%) of Lithuanian smallholder farmers(Figure 4a). As many as 57% of small family farms do not participate in cooperatives anddo not intend to become members, and 22% have no opinion on this issue at all (Figure 4b).
(a) (b)
Figure 4. Management of production and price risks (a) and willingness to participate in cooperative actions (b) inLithuanian small-scale farms (N = 1002).
103
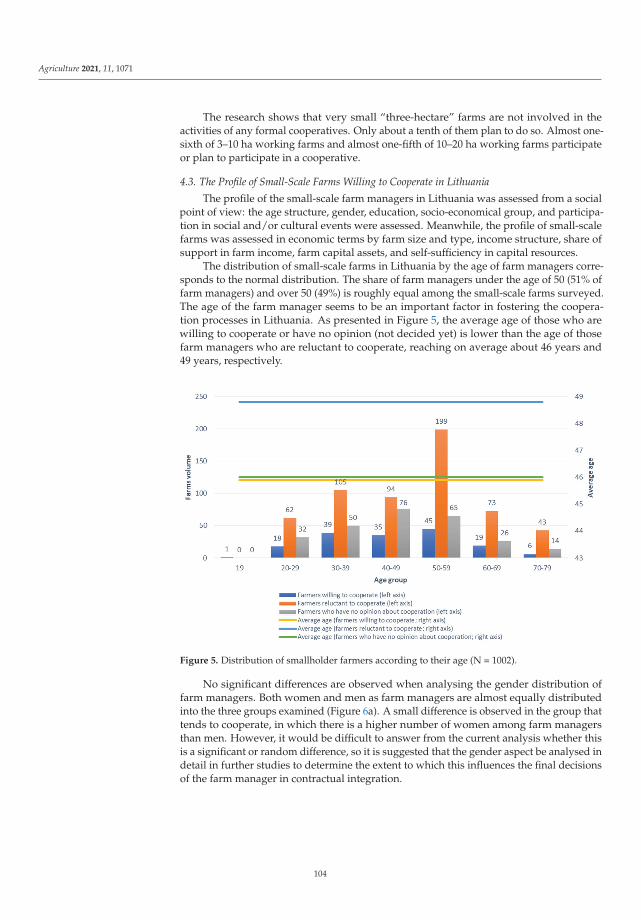
Agriculture 2021, 11, 1071
The research shows that very small “three-hectare” farms are not involved in theactivities of any formal cooperatives. Only about a tenth of them plan to do so. Almost one-sixth of 3–10 ha working farms and almost one-fifth of 10–20 ha working farms participateor plan to participate in a cooperative.
4.3. The Profile of Small-Scale Farms Willing to Cooperate in Lithuania
The profile of the small-scale farm managers in Lithuania was assessed from a socialpoint of view: the age structure, gender, education, socio-economical group, and participa-tion in social and/or cultural events were assessed. Meanwhile, the profile of small-scalefarms was assessed in economic terms by farm size and type, income structure, share ofsupport in farm income, farm capital assets, and self-sufficiency in capital resources.
The distribution of small-scale farms in Lithuania by the age of farm managers corre-sponds to the normal distribution. The share of farm managers under the age of 50 (51% offarm managers) and over 50 (49%) is roughly equal among the small-scale farms surveyed.The age of the farm manager seems to be an important factor in fostering the coopera-tion processes in Lithuania. As presented in Figure 5, the average age of those who arewilling to cooperate or have no opinion (not decided yet) is lower than the age of thosefarm managers who are reluctant to cooperate, reaching on average about 46 years and49 years, respectively.
Figure 5. Distribution of smallholder farmers according to their age (N = 1002).
No significant differences are observed when analysing the gender distribution offarm managers. Both women and men as farm managers are almost equally distributedinto the three groups examined (Figure 6a). A small difference is observed in the group thattends to cooperate, in which there is a higher number of women among farm managersthan men. However, it would be difficult to answer from the current analysis whether thisis a significant or random difference, so it is suggested that the gender aspect be analysed indetail in further studies to determine the extent to which this influences the final decisionsof the farm manager in contractual integration.
104
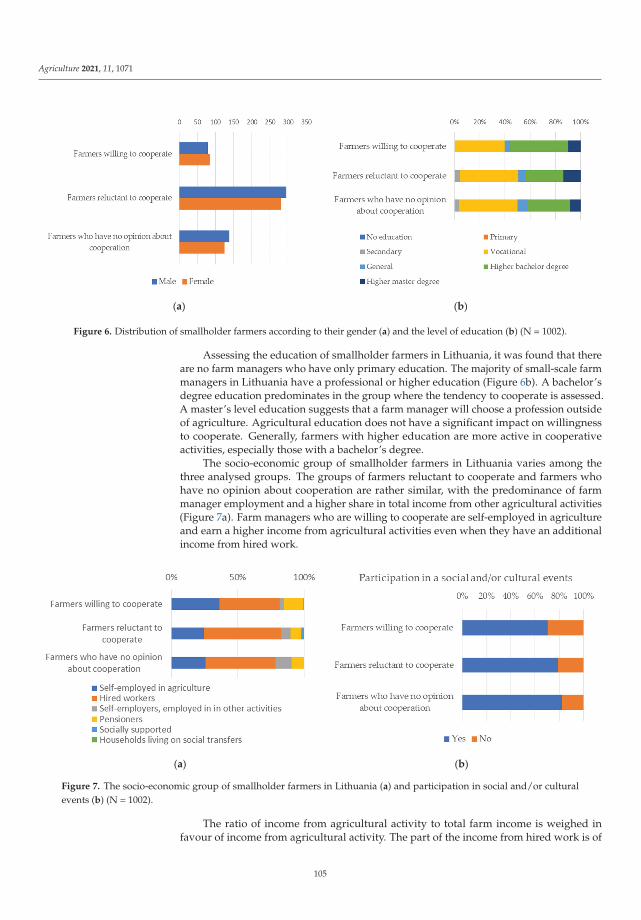
Agriculture 2021, 11, 1071
(a) (b)
Figure 6. Distribution of smallholder farmers according to their gender (a) and the level of education (b) (N = 1002).
Assessing the education of smallholder farmers in Lithuania, it was found that thereare no farm managers who have only primary education. The majority of small-scale farmmanagers in Lithuania have a professional or higher education (Figure 6b). A bachelor’sdegree education predominates in the group where the tendency to cooperate is assessed.A master’s level education suggests that a farm manager will choose a profession outsideof agriculture. Agricultural education does not have a significant impact on willingnessto cooperate. Generally, farmers with higher education are more active in cooperativeactivities, especially those with a bachelor’s degree.
The socio-economic group of smallholder farmers in Lithuania varies among thethree analysed groups. The groups of farmers reluctant to cooperate and farmers whohave no opinion about cooperation are rather similar, with the predominance of farmmanager employment and a higher share in total income from other agricultural activities(Figure 7a). Farm managers who are willing to cooperate are self-employed in agricultureand earn a higher income from agricultural activities even when they have an additionalincome from hired work.
(a) (b)
Figure 7. The socio-economic group of smallholder farmers in Lithuania (a) and participation in social and/or culturalevents (b) (N = 1002).
The ratio of income from agricultural activity to total farm income is weighed infavour of income from agricultural activity. The part of the income from hired work is of
105
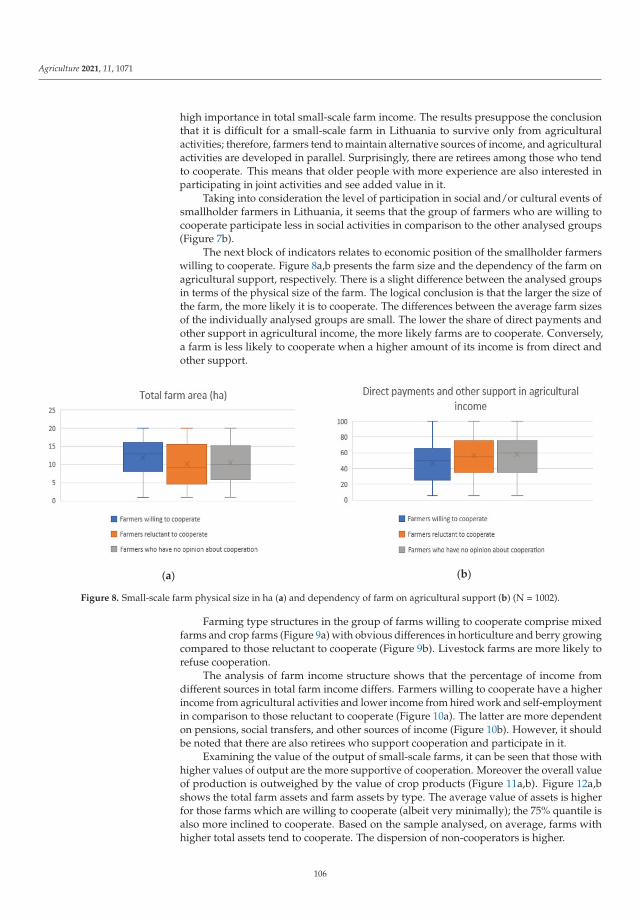
Agriculture 2021, 11, 1071
high importance in total small-scale farm income. The results presuppose the conclusionthat it is difficult for a small-scale farm in Lithuania to survive only from agriculturalactivities; therefore, farmers tend to maintain alternative sources of income, and agriculturalactivities are developed in parallel. Surprisingly, there are retirees among those who tendto cooperate. This means that older people with more experience are also interested inparticipating in joint activities and see added value in it.
Taking into consideration the level of participation in social and/or cultural events ofsmallholder farmers in Lithuania, it seems that the group of farmers who are willing tocooperate participate less in social activities in comparison to the other analysed groups(Figure 7b).
The next block of indicators relates to economic position of the smallholder farmerswilling to cooperate. Figure 8a,b presents the farm size and the dependency of the farm onagricultural support, respectively. There is a slight difference between the analysed groupsin terms of the physical size of the farm. The logical conclusion is that the larger the size ofthe farm, the more likely it is to cooperate. The differences between the average farm sizesof the individually analysed groups are small. The lower the share of direct payments andother support in agricultural income, the more likely farms are to cooperate. Conversely,a farm is less likely to cooperate when a higher amount of its income is from direct andother support.
(a)
(b)
Figure 8. Small-scale farm physical size in ha (a) and dependency of farm on agricultural support (b) (N = 1002).
Farming type structures in the group of farms willing to cooperate comprise mixedfarms and crop farms (Figure 9a) with obvious differences in horticulture and berry growingcompared to those reluctant to cooperate (Figure 9b). Livestock farms are more likely torefuse cooperation.
The analysis of farm income structure shows that the percentage of income fromdifferent sources in total farm income differs. Farmers willing to cooperate have a higherincome from agricultural activities and lower income from hired work and self-employmentin comparison to those reluctant to cooperate (Figure 10a). The latter are more dependenton pensions, social transfers, and other sources of income (Figure 10b). However, it shouldbe noted that there are also retirees who support cooperation and participate in it.
Examining the value of the output of small-scale farms, it can be seen that those withhigher values of output are the more supportive of cooperation. Moreover the overall valueof production is outweighed by the value of crop products (Figure 11a,b). Figure 12a,bshows the total farm assets and farm assets by type. The average value of assets is higherfor those farms which are willing to cooperate (albeit very minimally); the 75% quantile isalso more inclined to cooperate. Based on the sample analysed, on average, farms withhigher total assets tend to cooperate. The dispersion of non-cooperators is higher.
106
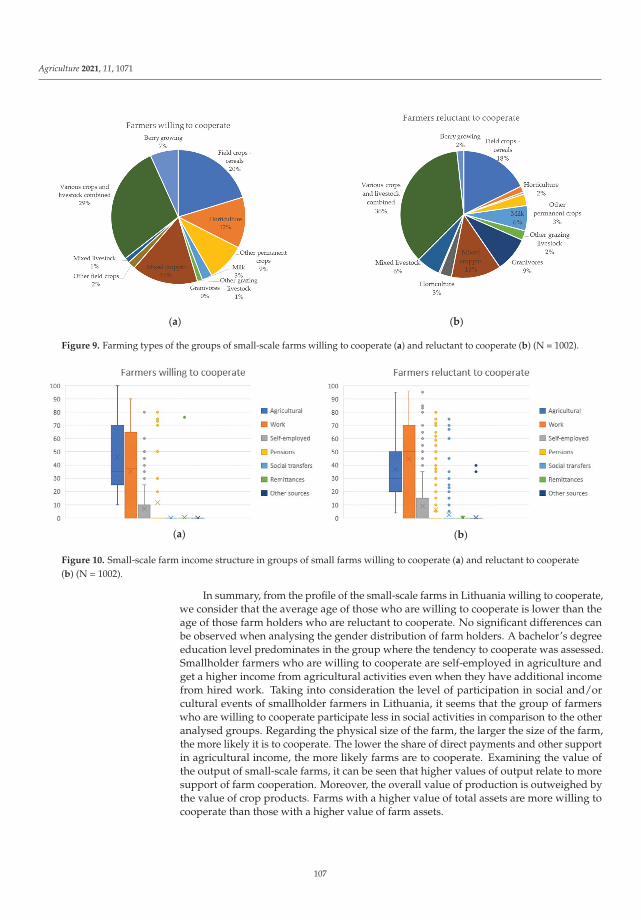
Agriculture 2021, 11, 1071
(a) (b)
Figure 9. Farming types of the groups of small-scale farms willing to cooperate (a) and reluctant to cooperate (b) (N = 1002).
(a) (b)
Figure 10. Small-scale farm income structure in groups of small farms willing to cooperate (a) and reluctant to cooperate(b) (N = 1002).
In summary, from the profile of the small-scale farms in Lithuania willing to cooperate,we consider that the average age of those who are willing to cooperate is lower than theage of those farm holders who are reluctant to cooperate. No significant differences canbe observed when analysing the gender distribution of farm holders. A bachelor’s degreeeducation level predominates in the group where the tendency to cooperate was assessed.Smallholder farmers who are willing to cooperate are self-employed in agriculture andget a higher income from agricultural activities even when they have additional incomefrom hired work. Taking into consideration the level of participation in social and/orcultural events of smallholder farmers in Lithuania, it seems that the group of farmerswho are willing to cooperate participate less in social activities in comparison to the otheranalysed groups. Regarding the physical size of the farm, the larger the size of the farm,the more likely it is to cooperate. The lower the share of direct payments and other supportin agricultural income, the more likely farms are to cooperate. Examining the value ofthe output of small-scale farms, it can be seen that higher values of output relate to moresupport of farm cooperation. Moreover, the overall value of production is outweighed bythe value of crop products. Farms with a higher value of total assets are more willing tocooperate than those with a higher value of farm assets.
107
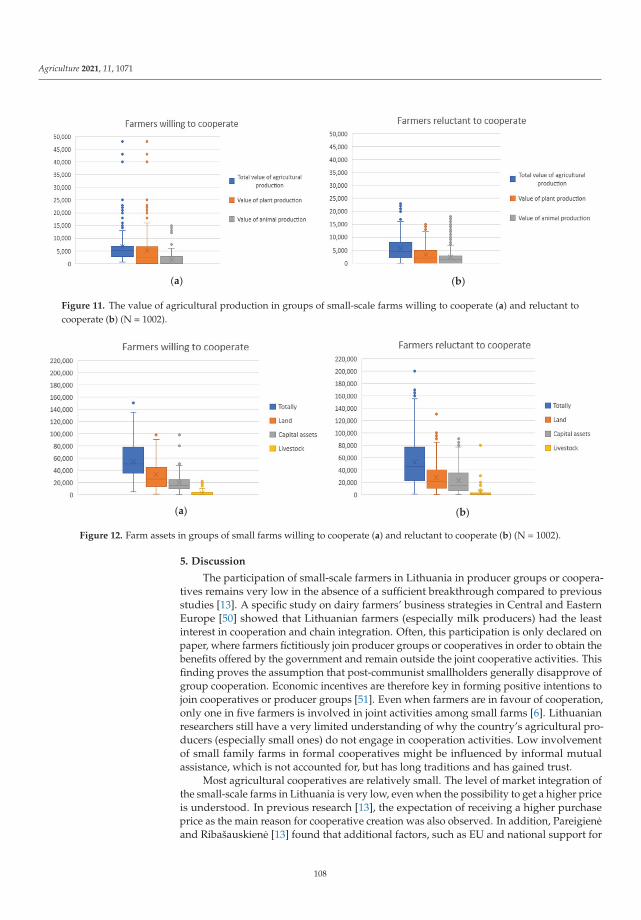
Agriculture 2021, 11, 1071
(a)
(b)
Figure 11. The value of agricultural production in groups of small-scale farms willing to cooperate (a) and reluctant tocooperate (b) (N = 1002).
(a)
(b)
Figure 12. Farm assets in groups of small farms willing to cooperate (a) and reluctant to cooperate (b) (N = 1002).
5. Discussion
The participation of small-scale farmers in Lithuania in producer groups or coopera-tives remains very low in the absence of a sufficient breakthrough compared to previousstudies [13]. A specific study on dairy farmers’ business strategies in Central and EasternEurope [50] showed that Lithuanian farmers (especially milk producers) had the leastinterest in cooperation and chain integration. Often, this participation is only declared onpaper, where farmers fictitiously join producer groups or cooperatives in order to obtain thebenefits offered by the government and remain outside the joint cooperative activities. Thisfinding proves the assumption that post-communist smallholders generally disapprove ofgroup cooperation. Economic incentives are therefore key in forming positive intentions tojoin cooperatives or producer groups [51]. Even when farmers are in favour of cooperation,only one in five farmers is involved in joint activities among small farms [6]. Lithuanianresearchers still have a very limited understanding of why the country’s agricultural pro-ducers (especially small ones) do not engage in cooperation activities. Low involvementof small family farms in formal cooperatives might be influenced by informal mutualassistance, which is not accounted for, but has long traditions and has gained trust.
Most agricultural cooperatives are relatively small. The level of market integration ofthe small-scale farms in Lithuania is very low, even when the possibility to get a higher priceis understood. In previous research [13], the expectation of receiving a higher purchaseprice as the main reason for cooperative creation was also observed. In addition, Pareigieneand Ribašauskiene [13] found that additional factors, such as EU and national support for
108
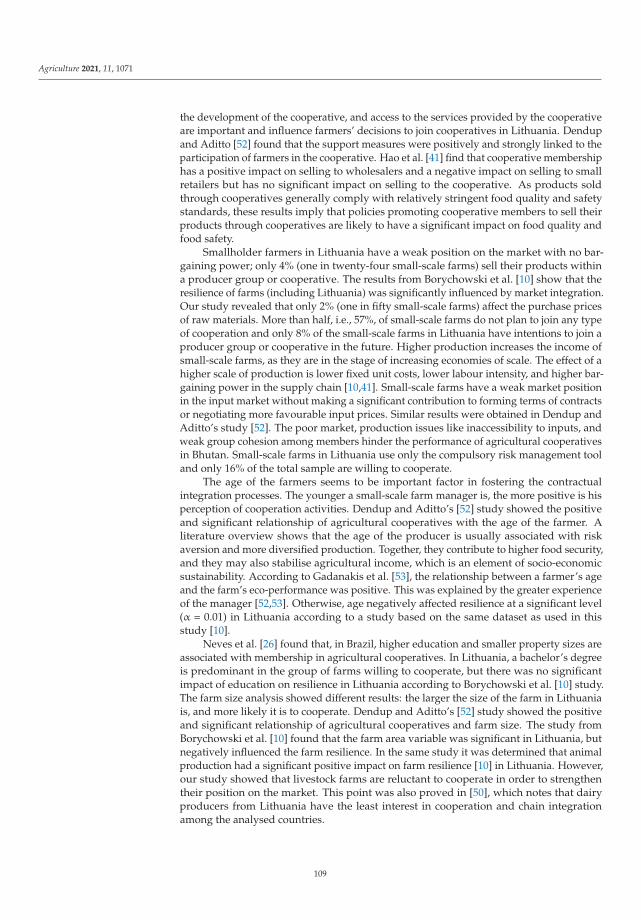
Agriculture 2021, 11, 1071
the development of the cooperative, and access to the services provided by the cooperativeare important and influence farmers’ decisions to join cooperatives in Lithuania. Dendupand Aditto [52] found that the support measures were positively and strongly linked to theparticipation of farmers in the cooperative. Hao et al. [41] find that cooperative membershiphas a positive impact on selling to wholesalers and a negative impact on selling to smallretailers but has no significant impact on selling to the cooperative. As products soldthrough cooperatives generally comply with relatively stringent food quality and safetystandards, these results imply that policies promoting cooperative members to sell theirproducts through cooperatives are likely to have a significant impact on food quality andfood safety.
Smallholder farmers in Lithuania have a weak position on the market with no bar-gaining power; only 4% (one in twenty-four small-scale farms) sell their products withina producer group or cooperative. The results from Borychowski et al. [10] show that theresilience of farms (including Lithuania) was significantly influenced by market integration.Our study revealed that only 2% (one in fifty small-scale farms) affect the purchase pricesof raw materials. More than half, i.e., 57%, of small-scale farms do not plan to join any typeof cooperation and only 8% of the small-scale farms in Lithuania have intentions to join aproducer group or cooperative in the future. Higher production increases the income ofsmall-scale farms, as they are in the stage of increasing economies of scale. The effect of ahigher scale of production is lower fixed unit costs, lower labour intensity, and higher bar-gaining power in the supply chain [10,41]. Small-scale farms have a weak market positionin the input market without making a significant contribution to forming terms of contractsor negotiating more favourable input prices. Similar results were obtained in Dendup andAditto’s study [52]. The poor market, production issues like inaccessibility to inputs, andweak group cohesion among members hinder the performance of agricultural cooperativesin Bhutan. Small-scale farms in Lithuania use only the compulsory risk management tooland only 16% of the total sample are willing to cooperate.
The age of the farmers seems to be important factor in fostering the contractualintegration processes. The younger a small-scale farm manager is, the more positive is hisperception of cooperation activities. Dendup and Aditto’s [52] study showed the positiveand significant relationship of agricultural cooperatives with the age of the farmer. Aliterature overview shows that the age of the producer is usually associated with riskaversion and more diversified production. Together, they contribute to higher food security,and they may also stabilise agricultural income, which is an element of socio-economicsustainability. According to Gadanakis et al. [53], the relationship between a farmer’s ageand the farm’s eco-performance was positive. This was explained by the greater experienceof the manager [52,53]. Otherwise, age negatively affected resilience at a significant level(α = 0.01) in Lithuania according to a study based on the same dataset as used in thisstudy [10].
Neves et al. [26] found that, in Brazil, higher education and smaller property sizes areassociated with membership in agricultural cooperatives. In Lithuania, a bachelor’s degreeis predominant in the group of farms willing to cooperate, but there was no significantimpact of education on resilience in Lithuania according to Borychowski et al. [10] study.The farm size analysis showed different results: the larger the size of the farm in Lithuaniais, and more likely it is to cooperate. Dendup and Aditto’s [52] study showed the positiveand significant relationship of agricultural cooperatives and farm size. The study fromBorychowski et al. [10] found that the farm area variable was significant in Lithuania, butnegatively influenced the farm resilience. In the same study it was determined that animalproduction had a significant positive impact on farm resilience [10] in Lithuania. However,our study showed that livestock farms are reluctant to cooperate in order to strengthentheir position on the market. This point was also proved in [50], which notes that dairyproducers from Lithuania have the least interest in cooperation and chain integrationamong the analysed countries.
109
Agriculture 2021, 11, 1071
In the conditions of the dominance of corporations in food chains (vertical integration),reasoning would require horizontal cooperation, as the scale of production in family farmsmay turn out to be too small [54]. Offering large product batches is a necessity for farmersfor their overall presence on the market (both domestic and foreign) as there is a growinglevel of concentration of the wholesale and retail commercial network in most countriesin the world [55]. A structural approach to the issue of the organisation of the producergroups or cooperatives on the market and long-term financial and institutional stimulationis needed, accompanied by promotion actions.
Despite the low level of cooperation in Lithuania, farmers’ willingness to cooperateshould be maintained by explaining the benefits of cooperation. Kovacic et al. [6] sug-gested supporting small-scale farms in the joint purchase of reproduction materials, jointappearance on the market, and cross-funding (loans), detecting those which could be theinitiators of cooperation activities. Generalizing the main resources, regulating work in acooperative, promoting leadership, and informing farmers about the main benefits of coop-eration are suggested as the main points in the cooperation development study carried outin Russia by Nekrasov et al. [7]. Proper agricultural and food price policies can incentiviseprivate investment in agriculture and private banking institutions (including cooperatives)to increase their coverage in rural areas, thus strengthening farmers’ resilience and risk-coping capacities [56]. Authors have even suggested international financial cooperationmodels. Dendup and Aditto [52] suggested promoting contractual integration throughhigher value-added products and improved processing, active education, and training.
Special attention should be paid to the strengthening of human capital, e.g., thetraining of cooperation managers, qualitative development of the network of marketingspecialists, and consultants presenting and highlighting the added value generated bythe cooperation. Other key variables are access to credit and extension services. Jean-neaux et al. [57] suggested implementing a strategic management approach, where co-operative members can identify their own situations with the help of a third party. Theprovision of governmental rural extension services mostly targets family-owned farms [26].Providing positive examples of joining agricultural cooperatives should deliver additionalincentives for farmers to cooperate in order to extract these additional benefits from co-operation [15]. Although this may be a difficult task, as young farmers in Lithuania arereluctant to use the advisory services for the development of cooperative activities [58].
New forms of information provision and inclusive cooperative activities should beencouraged in order to attract farmers, especially those of a younger age. New formsof cooperation must be offered to farmers, especially to smallholder ones. This requiresthe preparation of a legal framework for the establishment and development of serviceprovision cooperatives, introducing sharing-economy principles in farming, etc. Fultonand Giannakas [59] found that procompetitive and distributional impacts of cooperativesdepend critically on the sensitivity of price in the downstream retail market, the natureof the cooperative’s governance structure, and the open or closed nature of cooperativemembership. Ramanauskas [60] suggests that the perspective organisational form ofthe producer groups might be a combination of a net cooperative and a private (public)company or state capital institution. However, there is no legal basis for that in Lithuania.Šumyle and Ribašauskiene [61] emphasized that the future of the producer groups inLithuania lies in servitisation.
6. Conclusions
This study aims to assess the level of the willingness to cooperate among smallholderfarmers in Lithuania and to draw up the profiles of small-scale farms that participate inand intend to join cooperatives. The profiles of the smallholder farmers were assessed froma social point of view: the age structure, gender, education, socio-economical group, andparticipation in social and/or cultural events were assessed. In addition, farms’ economicaland financial ratios were included to draw the profile of the small-scale farm; the mainindicators used in the analysis were farm size and type, income structure, share of support
110
Agriculture 2021, 11, 1071
in total farm income, the farm market value of assets, and the level of capital resources.The research results show that participation of small-scale farms in the co-operatives orproducers’ groups is very low. The small-scale farms which are willing to cooperate aredistinguished by the larger physical size of the farm, the lower share of direct payments andother support in agricultural income, a higher value of output, and a higher value of totalassets. Additionally, younger farmers with a bachelor’s degree who are self-employed inagriculture and get higher income from agricultural activities are more willing to participatein cooperative activities, regardless of gender.
In this case, the chosen analysis method (descriptive statistics) stands on its ownas a research product, because the position of the small-scale farms in Lithuania andits characteristics have not previously been investigated. The analysis is based on theunique sample of small-scale farms of the Republic of Lithuania. A descriptive researchmethod was chosen to identify the factors and characteristics of cooperative farms. Thecreation and description of a cooperative farm profile allows (in further research) thepicture of the farm to be defined and the essential features of the farm to be identified,which are thought to form the basis for the development of farm cooperation. The directionof further research would allow for the identification of causal relationships and theestablishment of a list of factors that significantly determine the participation of farms injoint activities (cooperation).
The findings of this study are important in guiding policy makers with regard todecisions on small-scale farms’ cooperation development. The results of this study are alsoimportant for the farmers themselves and for other stakeholders because they can buildcloser relationships to develop common and sustainable future partnerships.
The presented study did not evaluate the causal relationship between the differentindicators which may influence the participation in contractual integration; future researchcould fill in this gap which in turn could be expanded to a deeper analysis of smallholderfarmers’ behaviour and willingness to participate in cooperation using causal analysis andother econometric and statistical methods. Based on this research, we propose that thefarmers’ preferences for participating in cooperation should be assessed using qualitativeresearch methods such as co-creation and design thinking.
Author Contributions: Conceptualization, J.D. and V.V.; methodology, J.D. and V.V.; validation, J.D.and V.V.; investigation, J.D. and V.V.; literature review, J.D. and V.V.; data curation, V.V. and L.N.;writing—original draft preparation, J.D. and V.V.; writing—review and editing, J.D., V.V. and L.N.;visualization, V.V. and L.N.; supervision, V.V.; project administration, J.D. All authors have read andagreed to the published version of the manuscript.
Funding: This research was funded under the international FAMFAR Project “The role of the smallfarms of the sustainable development of agri-food sector in the countries of Central and EasternEurope” (2019–2021), financed by the Polish National Agency for Academic Exchange (NAWA),agreement no. PPI/APM/2018/1/00011/U/001.
Institutional Review Board Statement: Not applicable.
Informed Consent Statement: Not applicable.
Data Availability Statement: Data is contained within the article.
Acknowledgments: We appreciate the Chamber of Agriculture of the Republic of Lithuania for theassistance in conducting the interviews and gathering the data for the study.
Conflicts of Interest: The authors declare no conflict of interest. The views expressed are those ofthe author(s) and do not necessarily represent those of the Government Strategic Analysis Center.
111
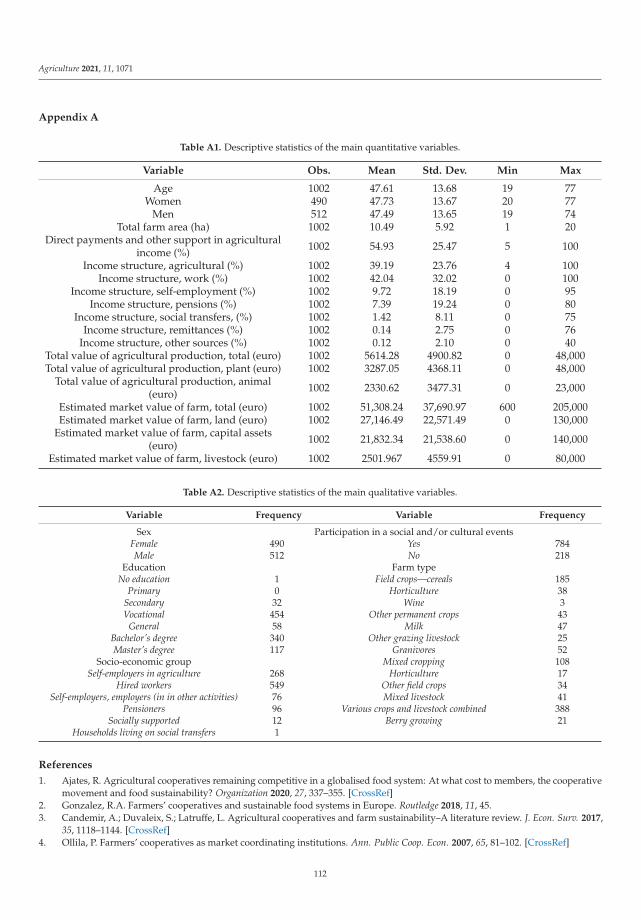
Agriculture 2021, 11, 1071
Appendix A
Table A1. Descriptive statistics of the main quantitative variables.
Variable Obs. Mean Std. Dev. Min Max
Age 1002 47.61 13.68 19 77Women 490 47.73 13.67 20 77
Men 512 47.49 13.65 19 74Total farm area (ha) 1002 10.49 5.92 1 20
Direct payments and other support in agriculturalincome (%) 1002 54.93 25.47 5 100
Income structure, agricultural (%) 1002 39.19 23.76 4 100Income structure, work (%) 1002 42.04 32.02 0 100
Income structure, self-employment (%) 1002 9.72 18.19 0 95Income structure, pensions (%) 1002 7.39 19.24 0 80
Income structure, social transfers, (%) 1002 1.42 8.11 0 75Income structure, remittances (%) 1002 0.14 2.75 0 76
Income structure, other sources (%) 1002 0.12 2.10 0 40Total value of agricultural production, total (euro) 1002 5614.28 4900.82 0 48,000Total value of agricultural production, plant (euro) 1002 3287.05 4368.11 0 48,000
Total value of agricultural production, animal(euro) 1002 2330.62 3477.31 0 23,000
Estimated market value of farm, total (euro) 1002 51,308.24 37,690.97 600 205,000Estimated market value of farm, land (euro) 1002 27,146.49 22,571.49 0 130,000
Estimated market value of farm, capital assets(euro) 1002 21,832.34 21,538.60 0 140,000
Estimated market value of farm, livestock (euro) 1002 2501.967 4559.91 0 80,000
Table A2. Descriptive statistics of the main qualitative variables.
Variable Frequency Variable Frequency
Sex Participation in a social and/or cultural eventsFemale 490 Yes 784Male 512 No 218
Education Farm typeNo education 1 Field crops—cereals 185
Primary 0 Horticulture 38Secondary 32 Wine 3Vocational 454 Other permanent crops 43
General 58 Milk 47Bachelor’s degree 340 Other grazing livestock 25Master’s degree 117 Granivores 52
Socio-economic group Mixed cropping 108Self-employers in agriculture 268 Horticulture 17
Hired workers 549 Other field crops 34Self-employers, employers (in in other activities) 76 Mixed livestock 41
Pensioners 96 Various crops and livestock combined 388Socially supported 12 Berry growing 21
Households living on social transfers 1
References
1. Ajates, R. Agricultural cooperatives remaining competitive in a globalised food system: At what cost to members, the cooperativemovement and food sustainability? Organization 2020, 27, 337–355. [CrossRef]
2. Gonzalez, R.A. Farmers’ cooperatives and sustainable food systems in Europe. Routledge 2018, 11, 45.3. Candemir, A.; Duvaleix, S.; Latruffe, L. Agricultural cooperatives and farm sustainability–A literature review. J. Econ. Surv. 2017,
35, 1118–1144. [CrossRef]4. Ollila, P. Farmers’ cooperatives as market coordinating institutions. Ann. Public Coop. Econ. 2007, 65, 81–102. [CrossRef]
112
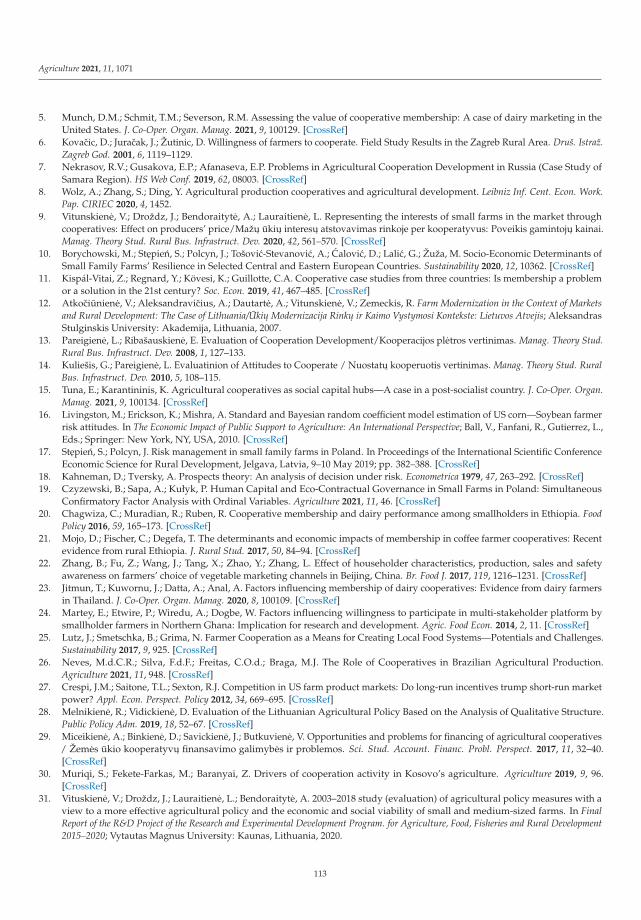
Agriculture 2021, 11, 1071
5. Munch, D.M.; Schmit, T.M.; Severson, R.M. Assessing the value of cooperative membership: A case of dairy marketing in theUnited States. J. Co-Oper. Organ. Manag. 2021, 9, 100129. [CrossRef]
6. Kovacic, D.; Juracak, J.; Žutinic, D. Willingness of farmers to cooperate. Field Study Results in the Zagreb Rural Area. Druš. Istraž.Zagreb God. 2001, 6, 1119–1129.
7. Nekrasov, R.V.; Gusakova, E.P.; Afanaseva, E.P. Problems in Agricultural Cooperation Development in Russia (Case Study ofSamara Region). HS Web Conf. 2019, 62, 08003. [CrossRef]
8. Wolz, A.; Zhang, S.; Ding, Y. Agricultural production cooperatives and agricultural development. Leibniz Inf. Cent. Econ. Work.Pap. CIRIEC 2020, 4, 1452.
9. Vitunskiene, V.; Droždz, J.; Bendoraityte, A.; Lauraitiene, L. Representing the interests of small farms in the market throughcooperatives: Effect on producers’ price/Mažu ukiu interesu atstovavimas rinkoje per kooperatyvus: Poveikis gamintoju kainai.Manag. Theory Stud. Rural Bus. Infrastruct. Dev. 2020, 42, 561–570. [CrossRef]
10. Borychowski, M.; Stepien, S.; Polcyn, J.; Tošovic-Stevanovic, A.; Calovic, D.; Lalic, G.; Žuža, M. Socio-Economic Determinants ofSmall Family Farms’ Resilience in Selected Central and Eastern European Countries. Sustainability 2020, 12, 10362. [CrossRef]
11. Kispál-Vitai, Z.; Regnard, Y.; Kövesi, K.; Guillotte, C.A. Cooperative case studies from three countries: Is membership a problemor a solution in the 21st century? Soc. Econ. 2019, 41, 467–485. [CrossRef]
12. Atkociuniene, V.; Aleksandravicius, A.; Dautarte, A.; Vitunskiene, V.; Zemeckis, R. Farm Modernization in the Context of Marketsand Rural Development: The Case of Lithuania/Ukiu Modernizacija Rinku ir Kaimo Vystymosi Kontekste: Lietuvos Atvejis; AleksandrasStulginskis University: Akademija, Lithuania, 2007.
13. Pareigiene, L.; Ribašauskiene, E. Evaluation of Cooperation Development/Kooperacijos pletros vertinimas. Manag. Theory Stud.Rural Bus. Infrastruct. Dev. 2008, 1, 127–133.
14. Kuliešis, G.; Pareigiene, L. Evaluatinion of Attitudes to Cooperate / Nuostatu kooperuotis vertinimas. Manag. Theory Stud. RuralBus. Infrastruct. Dev. 2010, 5, 108–115.
15. Tuna, E.; Karantininis, K. Agricultural cooperatives as social capital hubs—A case in a post-socialist country. J. Co-Oper. Organ.Manag. 2021, 9, 100134. [CrossRef]
16. Livingston, M.; Erickson, K.; Mishra, A. Standard and Bayesian random coefficient model estimation of US corn—Soybean farmerrisk attitudes. In The Economic Impact of Public Support to Agriculture: An International Perspective; Ball, V., Fanfani, R., Gutierrez, L.,Eds.; Springer: New York, NY, USA, 2010. [CrossRef]
17. Stepien, S.; Polcyn, J. Risk management in small family farms in Poland. In Proceedings of the International Scientific ConferenceEconomic Science for Rural Development, Jelgava, Latvia, 9–10 May 2019; pp. 382–388. [CrossRef]
18. Kahneman, D.; Tversky, A. Prospects theory: An analysis of decision under risk. Econometrica 1979, 47, 263–292. [CrossRef]19. Czyzewski, B.; Sapa, A.; Kułyk, P. Human Capital and Eco-Contractual Governance in Small Farms in Poland: Simultaneous
Confirmatory Factor Analysis with Ordinal Variables. Agriculture 2021, 11, 46. [CrossRef]20. Chagwiza, C.; Muradian, R.; Ruben, R. Cooperative membership and dairy performance among smallholders in Ethiopia. Food
Policy 2016, 59, 165–173. [CrossRef]21. Mojo, D.; Fischer, C.; Degefa, T. The determinants and economic impacts of membership in coffee farmer cooperatives: Recent
evidence from rural Ethiopia. J. Rural Stud. 2017, 50, 84–94. [CrossRef]22. Zhang, B.; Fu, Z.; Wang, J.; Tang, X.; Zhao, Y.; Zhang, L. Effect of householder characteristics, production, sales and safety
awareness on farmers’ choice of vegetable marketing channels in Beijing, China. Br. Food J. 2017, 119, 1216–1231. [CrossRef]23. Jitmun, T.; Kuwornu, J.; Datta, A.; Anal, A. Factors influencing membership of dairy cooperatives: Evidence from dairy farmers
in Thailand. J. Co-Oper. Organ. Manag. 2020, 8, 100109. [CrossRef]24. Martey, E.; Etwire, P.; Wiredu, A.; Dogbe, W. Factors influencing willingness to participate in multi-stakeholder platform by
smallholder farmers in Northern Ghana: Implication for research and development. Agric. Food Econ. 2014, 2, 11. [CrossRef]25. Lutz, J.; Smetschka, B.; Grima, N. Farmer Cooperation as a Means for Creating Local Food Systems—Potentials and Challenges.
Sustainability 2017, 9, 925. [CrossRef]26. Neves, M.d.C.R.; Silva, F.d.F.; Freitas, C.O.d.; Braga, M.J. The Role of Cooperatives in Brazilian Agricultural Production.
Agriculture 2021, 11, 948. [CrossRef]27. Crespi, J.M.; Saitone, T.L.; Sexton, R.J. Competition in US farm product markets: Do long-run incentives trump short-run market
power? Appl. Econ. Perspect. Policy 2012, 34, 669–695. [CrossRef]28. Melnikiene, R.; Vidickiene, D. Evaluation of the Lithuanian Agricultural Policy Based on the Analysis of Qualitative Structure.
Public Policy Adm. 2019, 18, 52–67. [CrossRef]29. Miceikiene, A.; Binkiene, D.; Savickiene, J.; Butkuviene, V. Opportunities and problems for financing of agricultural cooperatives
/ Žemes ukio kooperatyvu finansavimo galimybes ir problemos. Sci. Stud. Account. Financ. Probl. Perspect. 2017, 11, 32–40.[CrossRef]
30. Muriqi, S.; Fekete-Farkas, M.; Baranyai, Z. Drivers of cooperation activity in Kosovo’s agriculture. Agriculture 2019, 9, 96.[CrossRef]
31. Vituskiene, V.; Droždz, J.; Lauraitiene, L.; Bendoraityte, A. 2003–2018 study (evaluation) of agricultural policy measures with aview to a more effective agricultural policy and the economic and social viability of small and medium-sized farms. In FinalReport of the R&D Project of the Research and Experimental Development Program. for Agriculture, Food, Fisheries and Rural Development2015–2020; Vytautas Magnus University: Kaunas, Lithuania, 2020.
113
Agriculture 2021, 11, 1071
32. Ciburiene, J. Farmers’ Cooperative in the Context of Economic Transformations in Lithuania. In Proceedings of the 2015International Conference “Economic Science for Rural Development”, Jelgava, Latvia, 23–24 April 2015; pp. 134–141.
33. Abate, G.T. Drivers of agricultural cooperative formation and farmers’ membership and patronage decisions in Ethiopia. J.Co-Oper. Organ. Manag. 2018, 6, 53–63. [CrossRef]
34. Ciliberti, S.; Frascarelli, A.; Martino, G. Drivers of Participation in Collective Arrangements in the Agri-Food Supply Chain.Evidence from Italy Using a Transaction Costs Economics Perspective. Ann. Public Coop. Econ. 2020, 91, 387–409. [CrossRef]
35. Ncube, D. The importance of contract farming to small-scale farmers in Africa and the implications for policy: A review scenario.Open Agric. J. 2020, 14, 59–86. [CrossRef]
36. Souza, A.B.D.; Fornazier, A.; Delgrossi, M.E. Local food systems: Potential for new market connections for family farming.Ambiente Soc. 2020, 23, 4422. [CrossRef]
37. Makutenas, V.; Šukiene, A. Kooperacijos reikšme ukininku ukiu veiklos efektyvumui. Manag. Theory Stud. Rural Bus. Infrastruct.Dev. 2017, 39, 203–214. [CrossRef]
38. Klepacki, B.; Krajewski, J. Wykorzystanie srodków pomocowych Unii Europejskiej w rozwoju infrastruktury logistycznej grupproducenckich w ogrodnictwie (The use of the European Union’s aid funds in the development of logistics infrastructure of fruitproducer groups in horticulture). Rocz. Nauk. Stowarzyszenia Ekon. Rol. I Agrobiz. 2015, 5, 136–140.
39. Zakic, N.; Vukotic, S.; Cvijanovic, D. Organisational models in agriculture with special reference to small farmers. Econ. Agric.2014, 61, 225–237.
40. Herbel, D.; Haddad, O.N. Successful farmer collective action to integrate food production into value chains. Food Chain 2012, 2,164–182. [CrossRef]
41. Hao, J.; Bijman, J.; Gardebroek, C.; Heerink, N.; Heijman, W.; Huo, X. Cooperative membership and farmers’ choice of marketingchannels–Evidence from apple farmers in Shaanxi and Shandong Provinces, China. Food Policy 2018, 74, 53–64. [CrossRef]
42. Ortega, D.L.; Bro, A.S.; Clay, D.C.; Lopez, M.C.; Tuyisenge, E.; Church, R.A.; Bizoza, A.R. Cooperative Membership and CoffeeProductivity in Rwanda’s Specialty Coffee Sector. Food Secur. 2019, 11, 967–979. [CrossRef]
43. Meuwissen, M.P.; Bottema, M.J.; Ho, L.H.; Chamsai, S.; Manjur, K.; de Mey, Y. The role of group-based contracts for risk-sharing;what are the opportunities to cover catastrophic risk? Curr. Opin. Environ. Sustain. 2019, 41, 80–84. [CrossRef]
44. Vitunskiene, V. Žalio pieno vidaus rinkos struktura ir koncentracija Lietuvoje. Manag. Theory Stud. Rural Bus. Infrastruct. Dev.2019, 41, 576–588. [CrossRef]
45. Radzevicius, G.; Ramanauskas, J.; Contò, F. Possibilities for reduction of food loss and waste: The case study of Lithuania’sproducer cooperatives. Ital. J. Food Sci. 2015, 14, 99–102.
46. Agarwal, B.; Dorin, B. Group farming in France: Why do some regions have more cooperative ventures than others? Env. Plan. AEcon. Space 2019, 51, 781–804. [CrossRef]
47. Apparao, D.; Garnevska, A.; Shadbolt, N. Examining commitment, heterogeneity and social capital within the membership baseof agricultural co-operatives—A conceptual framework. J. Co-Oper. Organ. Manag. 2019, 7, 42–50. [CrossRef]
48. Vitunskiene, V.; Droždz, J.; Bendoraityte, A.; Sapa, A. Small farms in Lithuania. In Small farms in the paradigm of sustainabledevelopment Case studies of selected Central and Eastern European countries; Stepien, S., Maican, S., Eds.; Wydawnictwo AdamMarszałek: Torun, Poland, 2020; Volume 14, pp. 75–99. Available online: https://marszalek.com.pl/small_farms.pdf (accessedon 28 October 2021).
49. Loeb, S.; Dynarski, S.; McFarland, D.; Morris, P.; Reardon, S.; Reber, S. Descriptive Analysis in Education: A Guide for Researchers;NCEE 2017-4023; Department of Education, Institute of Education Sciences, National Center for Education Evaluation andRegional Assistance: Washington, DC, USA, 2017.
50. Verhees, F.; Malak-Rawlikowska, A.; Stalgiene, A.; Kuipers, A.; Klopcic, M. Dairy farmers’ business strategies in Central andEastern Europe based on evidence from Lithuania, Poland and Slovenia. Ital. J. Anim. Sci. 2018, 17, 755–766. [CrossRef]
51. Möllers, J.; Traikova, D.; Bîrhală, B.A.M.; Wolz, A. Why (not) cooperate? A cognitive model of farmers’ intention to join producergroups in Romania. Post-Communist Econ. 2018, 30, 56–77. [CrossRef]
52. Dendup, T.; Aditto, S. Performance and challenges of agriculture cooperatives in Bhutan. Khon Kaen Agr. J. 2020, 48, 1194–1205.[CrossRef]
53. Gadanakis, Y.; Bennett, R.; Park, J.; Areal, F.J. Evaluating the Sustainable Intensification of arable farms. J. Environ. Manag. 2015,150, 288–298. [CrossRef] [PubMed]
54. Zegar, J.S. Kwestia agrarna w Polsce (The agrarian issue in Poland). Warsaw IERiGZ-PIB 2018, 14, 575.55. Nosecka, B. Czynniki i Mierniki Konkurencyjnosci Zewnetrznej Sektora Ogrodniczego i Jego Produktów (Factors and Measures of External
Competitiveness of the Horticultural Sector and its Products); Institute of Agricultural and Food Economics: Warsaw, Poland, 2017.56. Calicioglu, O.; Flammini, A.; Bracco, S.; Bellù, L.; Sims, R. The Future Challenges of Food and Agriculture: An Integrated Analysis
of Trends and Solutions. Sustainability 2019, 11, 222. [CrossRef]57. Jeanneaux, P.; Capitaine, M.; Mauclair, A. PerfCuma: A framework to manage the sustainable development of small cooperatives.
Int. J. Agric. Manag. 2018, 7, 68–79.58. Baležentis, T.; Ribašauskiene, E.; Morkunas, M.; Volkov, A.; Štreimikiene, D.; Toma, P. Young farmers’ support under the common
agricultural policy and sustainability of rural regions: Evidence from lithuania. Land Use Policy 2020, 94, 104542.59. Fulton, M.; Giannakas, K. The Future of Agricultural Cooperatives. Annu. Rev. Resour. Econ. 2013, 5, 61–91. [CrossRef]
114
Agriculture 2021, 11, 1071
60. Ramanauskas, J. Komanditine kooperatine bendrove (kooperatyvas). Socialines inovacijos skatinant žemes ukio gamintojuorganizaciju ir kooperacijos pletra: Tarptautine moksline konferencija: 2016 m. birželio 16-17 d.: Conference proceedings. VilniusLAEI 2016, 11, 50–52.
61. Šumyle, D.; Ribašauskiene, E. Servitization of Lithuanian agricultural cooperatives. Manag. Theory Stud. Rural Bus. Infrastruct.Dev. 2017, 39, 510–523. [CrossRef]
115

agriculture
Article
The Role of Cooperatives in Brazilian Agricultural Production
Mateus de Carvalho Reis Neves 1,*, Felipe de Figueiredo Silva 2, Carlos Otávio de Freitas 3
and Marcelo José Braga 1
Citation: Neves, M.d.C.R.;
Silva, F.d.F.; Freitas, C.O.d.;
Braga, M.J. The Role of Cooperatives
in Brazilian Agricultural Production.
Agriculture 2021, 11, 948. https://
doi.org/10.3390/agriculture11100948
Academic Editors: Adoración
Mozas Moral and Domingo
Fernandez Ucles
Received: 3 September 2021
Accepted: 27 September 2021
Published: 29 September 2021
Publisher’s Note: MDPI stays neutral
with regard to jurisdictional claims in
published maps and institutional affil-
iations.
Copyright: © 2021 by the authors.
Licensee MDPI, Basel, Switzerland.
This article is an open access article
distributed under the terms and
conditions of the Creative Commons
Attribution (CC BY) license (https://
creativecommons.org/licenses/by/
4.0/).
1 Departamento de Economia Rural, Universidade Federal de Viçosa, Edson Potsch Magalhães Building,Purdue St., Campus Universitário, Viçosa 36570-900, Brazil; [email protected]
2 Department of Agricultural Sciences, Clemson University, 235 McAdams Hall, Clemson, SC 29634, USA;[email protected]
3 Departamento de Ciências Administrativas, Universidade Federal Rural do Rio de Janeiro, BR 465 Rd.,Km 07, Seropédica 23890-000, Brazil; [email protected]
* Correspondence: [email protected]; Tel.: +55-031-3612-4342
Abstract: Much of the established literature on agricultural cooperatives describes their myriadcontributions to farmers’ economic performance. In Brazil, one of the world’s leading agriculturalexporters, there were more than 1500 agricultural cooperatives with 1 million members in 2020, andin 2017, 11% of all Brazilian farms were associated with one of these cooperatives. In this paper, weestimate the factors associated with the municipality share of cooperative membership (MSCM) andhow municipality-level production value changes with MSCM. Our analysis is at the municipalitylevel using aggregate data from the 2017 Agricultural Census. We find that in Brazil, higher educationand smaller property sizes are associated with membership in agricultural cooperatives. To estimatehow MSCM is associated with farm profits, we use a generalized propensity score and find that anincrease in MSCM increases net municipal farm income, driven mostly by an increase in the value ofagricultural production compared to a smaller increase in the cost of production.
Keywords: agricultural markets; generalized propensity score; cooperative organizations
JEL Classification: Q12; Q13; C31
1. Introduction
Brazil is one of the largest net exporters of agricultural commodities in the world [1].However, three-quarters of its agricultural sector’s income is produced by the largest farms,which represent fewer than 10% of the farms in the country [2], indicating that Brazil’sagricultural sector is composed mostly of small farms. Small farmers often encountermarketing obstacles that result in lower profits [3], and this phenomenon is particularlypronounced in developing countries, such as Brazil, where marketing channels are oftencharacterized by market failures.
Cooperatives (although the word “cooperative” can be applied to different types ofcollectively developed activities, we use the term to describe a democratically controlledand managed business model. In many countries, as in Brazil, cooperatives are definedlegally as a specific kind of corporation and are subject to specific national legislation [4])can serve as an alternative marketing option, especially for small farms, and may be used tonarrow this wide disparity between large and small farms [5–9]. Agricultural cooperativescan help farmers obtain higher prices compared to alternatives such as capital-ownedfirms [10–13]. These small farmers also benefit from the support provided by cooperativesfor adopting better agricultural practices and new technologies, as well as from accessto inputs at lower prices [14–17]. For example, members of cooperatives in the Brazilianstate of Paraná were the first farms to introduce a new technology in the 1980s, so-called“no-till farming” (Portuguese: plantio direto), which minimizes the impact of cultivationon the soil [1]. In Brazil, cooperatives can have a great impact on household income.
Agriculture 2021, 11, 948. https://doi.org/10.3390/agriculture11100948 https://www.mdpi.com/journal/agriculture
117
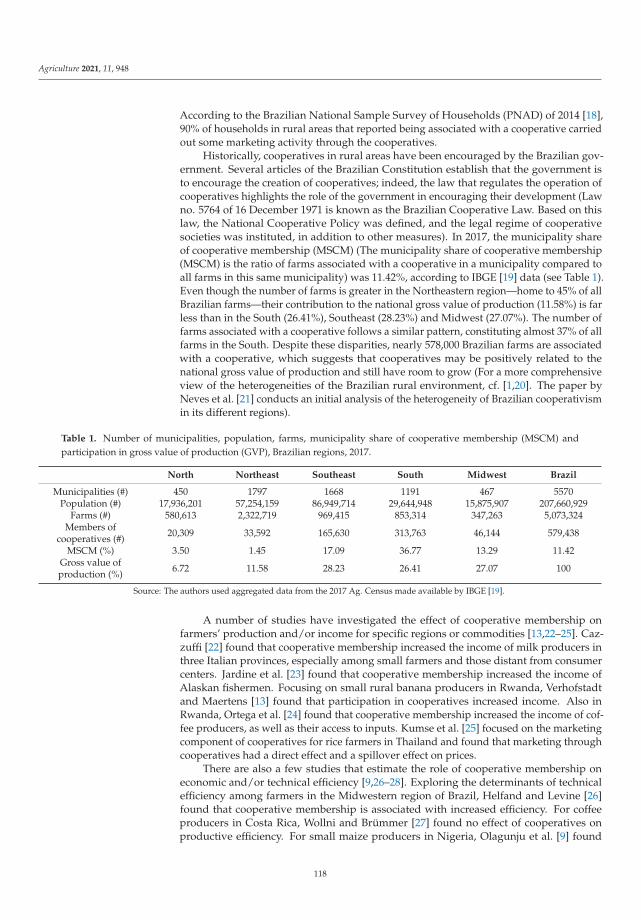
Agriculture 2021, 11, 948
According to the Brazilian National Sample Survey of Households (PNAD) of 2014 [18],90% of households in rural areas that reported being associated with a cooperative carriedout some marketing activity through the cooperatives.
Historically, cooperatives in rural areas have been encouraged by the Brazilian gov-ernment. Several articles of the Brazilian Constitution establish that the government isto encourage the creation of cooperatives; indeed, the law that regulates the operation ofcooperatives highlights the role of the government in encouraging their development (Lawno. 5764 of 16 December 1971 is known as the Brazilian Cooperative Law. Based on thislaw, the National Cooperative Policy was defined, and the legal regime of cooperativesocieties was instituted, in addition to other measures). In 2017, the municipality shareof cooperative membership (MSCM) (The municipality share of cooperative membership(MSCM) is the ratio of farms associated with a cooperative in a municipality compared toall farms in this same municipality) was 11.42%, according to IBGE [19] data (see Table 1).Even though the number of farms is greater in the Northeastern region—home to 45% of allBrazilian farms—their contribution to the national gross value of production (11.58%) is farless than in the South (26.41%), Southeast (28.23%) and Midwest (27.07%). The number offarms associated with a cooperative follows a similar pattern, constituting almost 37% of allfarms in the South. Despite these disparities, nearly 578,000 Brazilian farms are associatedwith a cooperative, which suggests that cooperatives may be positively related to thenational gross value of production and still have room to grow (For a more comprehensiveview of the heterogeneities of the Brazilian rural environment, cf. [1,20]. The paper byNeves et al. [21] conducts an initial analysis of the heterogeneity of Brazilian cooperativismin its different regions).
Table 1. Number of municipalities, population, farms, municipality share of cooperative membership (MSCM) andparticipation in gross value of production (GVP), Brazilian regions, 2017.
North Northeast Southeast South Midwest Brazil
Municipalities (#) 450 1797 1668 1191 467 5570Population (#) 17,936,201 57,254,159 86,949,714 29,644,948 15,875,907 207,660,929
Farms (#) 580,613 2,322,719 969,415 853,314 347,263 5,073,324Members of
cooperatives (#) 20,309 33,592 165,630 313,763 46,144 579,438
MSCM (%) 3.50 1.45 17.09 36.77 13.29 11.42Gross value ofproduction (%) 6.72 11.58 28.23 26.41 27.07 100
Source: The authors used aggregated data from the 2017 Ag. Census made available by IBGE [19].
A number of studies have investigated the effect of cooperative membership onfarmers’ production and/or income for specific regions or commodities [13,22–25]. Caz-zuffi [22] found that cooperative membership increased the income of milk producers inthree Italian provinces, especially among small farmers and those distant from consumercenters. Jardine et al. [23] found that cooperative membership increased the income ofAlaskan fishermen. Focusing on small rural banana producers in Rwanda, Verhofstadtand Maertens [13] found that participation in cooperatives increased income. Also inRwanda, Ortega et al. [24] found that cooperative membership increased the income of cof-fee producers, as well as their access to inputs. Kumse et al. [25] focused on the marketingcomponent of cooperatives for rice farmers in Thailand and found that marketing throughcooperatives had a direct effect and a spillover effect on prices.
There are also a few studies that estimate the role of cooperative membership oneconomic and/or technical efficiency [9,26–28]. Exploring the determinants of technicalefficiency among farmers in the Midwestern region of Brazil, Helfand and Levine [26]found that cooperative membership is associated with increased efficiency. For coffeeproducers in Costa Rica, Wollni and Brümmer [27] found no effect of cooperatives onproductive efficiency. For small maize producers in Nigeria, Olagunju et al. [9] found
118
Agriculture 2021, 11, 948
that cooperative membership increased technical production efficiency. For Brazil, Costaet al. [28] found that cooperative membership is associated (as constructed in this paper)with higher technical efficiency among family-owned farms. In another paper concerningBrazil, Neves et al. [29] estimated an agricultural production function and found a positiveeffect for the share of cooperative membership on the gross value of production (GVP) inthe Southern and Southeastern regions, where there are more cooperative members.
In 2018, the Organization of Brazilian Cooperatives (Organização das CooperativasBrasileiras—OCB) [30], which has more than 6000 cooperatives as members, released arequest for application (RFA) to stimulate research on cooperatives (The RFA 07/2018was carried out and conducted by the National Council for Scientific and TechnologicalDevelopment (CNPq), aiming to use the wide expertise of CNPq in this type of activity.It also aimed to guarantee the impartiality and absence of conflicts of interest betweenresearchers and the research funding entity, the Organization of Brazilian Cooperatives(OCB)). One of the priority areas of the RFA was the estimation of the economic impactof cooperatives. This is also evidence of the lack of studies on the economic impact ofcooperatives. In this paper, we estimate the effect of municipality share of cooperativemembership (MSCM) on net income in Brazil, breaking it down into the effect on GVPproduction costs (e.g., wages, fertilizers, seeds, pesticides, veterinary medicines and animalfeed). To estimate how MSCM is associated with farm profits, we use a generalizedpropensity score that allows us to control for bias from the observable characteristics ofBrazilian rural establishments.
Our study contributes to the literature in that it is one of the first to analyze the roleof cooperatives for all types of farms using the most recent available data from the 2017Census of Agriculture. Although Costa et al. [28] used the same dataset, they focusedon family-owned farms, whereas we consider all farms in Brazilian municipalities. Ouranalysis also sheds light on the drivers of the effect of MSCM on agricultural producers’net income. Although only a few papers are studying this topic for Brazil, several studieshave found a positive effect for cooperatives in other countries [13,22–25].
2. Materials and Methods
2.1. Empirical Strategy
To estimate the effect of MSCM on agricultural income in Brazil, we used the gener-alized propensity score (GPS) method proposed by Imbens [31]. Hirano and Imbens [32]argued that GPS accounts for the selection bias caused by observable characteristics whendealing with a continuous treatment variable. Our measure of cooperatives is the ratioof producers associated with cooperatives in each Brazilian municipality compared toall producers in the same municipality. It implies that traditional methods of treatmenteffect, such as propensity score matching proposed by Rosenbaum and Rubin [33], wouldnot be adequate for this analysis, as they are applicable in situations where treatment is adichotomous variable.
2.1.1. Generalized Propensity Score
The objective of the generalized propensity score (GPS) is to estimate an average dose-response function, which allows for the identification of the treatment effect consideringdifferent intensities of this treatment. In the context of this investigation, it allows usto identify the average effect of cooperatives for different levels of the MSCM. We firstbuild a control group based on a vector of observable characteristics, simulating a quasi-experimental scenario.
For the application of the method, consider a sample consisting of i = 1, . . . , Nmunicipalities. According to Hirano and Imbens [32], for each i, there is a set of potentialresults called Y (t), with t being the level of treatment, such that t ∈ Ti. The mean dose-response function can be defined as:
μ(t) = E[Y(t)], ∀ t > 0 (1)
119
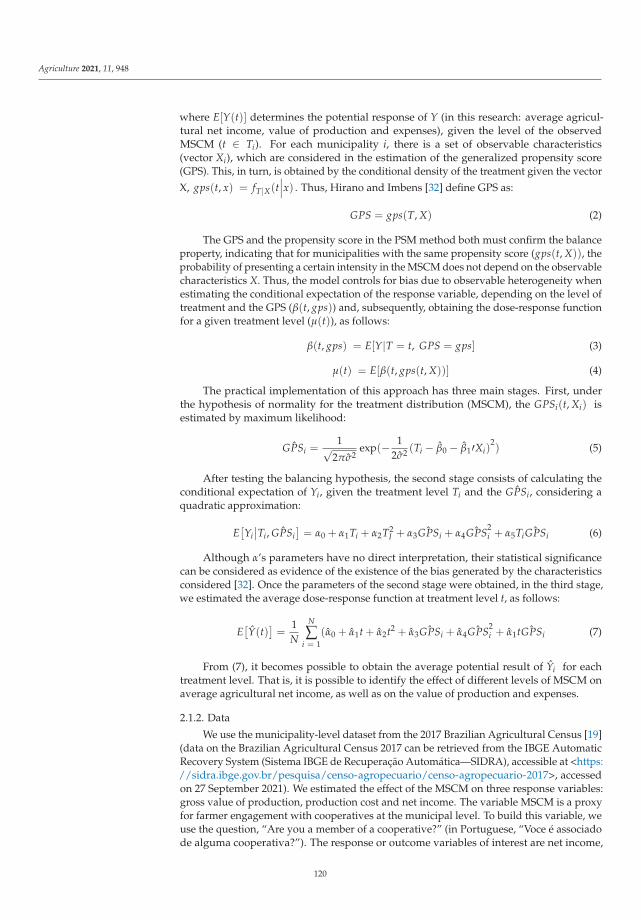
Agriculture 2021, 11, 948
where E[Y(t)] determines the potential response of Y (in this research: average agricul-tural net income, value of production and expenses), given the level of the observedMSCM (t ∈ Ti). For each municipality i, there is a set of observable characteristics(vector Xi), which are considered in the estimation of the generalized propensity score(GPS). This, in turn, is obtained by the conditional density of the treatment given the vectorX, gps(t, x) = fT|X(t
∣∣∣x) . Thus, Hirano and Imbens [32] define GPS as:
GPS = gps(T, X) (2)
The GPS and the propensity score in the PSM method both must confirm the balanceproperty, indicating that for municipalities with the same propensity score (gps(t, X)), theprobability of presenting a certain intensity in the MSCM does not depend on the observablecharacteristics X. Thus, the model controls for bias due to observable heterogeneity whenestimating the conditional expectation of the response variable, depending on the level oftreatment and the GPS (β(t, gps)) and, subsequently, obtaining the dose-response functionfor a given treatment level (μ(t)), as follows:
β(t, gps) = E[Y|T = t, GPS = gps] (3)
μ(t) = E[β(t, gps(t, X))] (4)
The practical implementation of this approach has three main stages. First, underthe hypothesis of normality for the treatment distribution (MSCM), the GPSi(t, Xi) isestimated by maximum likelihood:
ˆGPSi =1√
2πσ2exp(− 1
2σ2 (Ti − β0 − β1′Xi)2) (5)
After testing the balancing hypothesis, the second stage consists of calculating theconditional expectation of Yi, given the treatment level Ti and the ˆGPSi, considering aquadratic approximation:
E[Yi∣∣Ti, ˆGPSi
]= α0 + α1Ti + α2T2
I + α3 ˆGPSi + α4 ˆGPS2i + α5Ti ˆGPSi (6)
Although α’s parameters have no direct interpretation, their statistical significancecan be considered as evidence of the existence of the bias generated by the characteristicsconsidered [32]. Once the parameters of the second stage were obtained, in the third stage,we estimated the average dose-response function at treatment level t, as follows:
E[Y(t)
]=
1N
N
∑i = 1
(α0 + α1t + α2t2 + α3 ˆGPSi + α4 ˆGPS2i + α1t ˆGPSi (7)
From (7), it becomes possible to obtain the average potential result of Yi for eachtreatment level. That is, it is possible to identify the effect of different levels of MSCM onaverage agricultural net income, as well as on the value of production and expenses.
2.1.2. Data
We use the municipality-level dataset from the 2017 Brazilian Agricultural Census [19](data on the Brazilian Agricultural Census 2017 can be retrieved from the IBGE AutomaticRecovery System (Sistema IBGE de Recuperação Automática—SIDRA), accessible at <https://sidra.ibge.gov.br/pesquisa/censo-agropecuario/censo-agropecuario-2017>, accessedon 27 September 2021). We estimated the effect of the MSCM on three response variables:gross value of production, production cost and net income. The variable MSCM is a proxyfor farmer engagement with cooperatives at the municipal level. To build this variable, weuse the question, “Are you a member of a cooperative?” (in Portuguese, “Voce é associadode alguma cooperativa?”). The response or outcome variables of interest are net income,
120
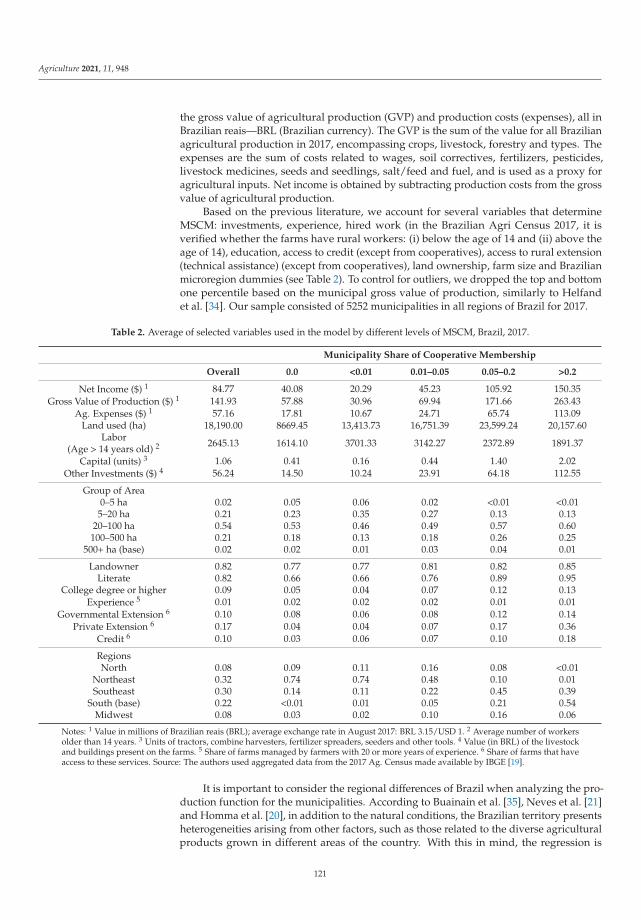
Agriculture 2021, 11, 948
the gross value of agricultural production (GVP) and production costs (expenses), all inBrazilian reais—BRL (Brazilian currency). The GVP is the sum of the value for all Brazilianagricultural production in 2017, encompassing crops, livestock, forestry and types. Theexpenses are the sum of costs related to wages, soil correctives, fertilizers, pesticides,livestock medicines, seeds and seedlings, salt/feed and fuel, and is used as a proxy foragricultural inputs. Net income is obtained by subtracting production costs from the grossvalue of agricultural production.
Based on the previous literature, we account for several variables that determineMSCM: investments, experience, hired work (in the Brazilian Agri Census 2017, it isverified whether the farms have rural workers: (i) below the age of 14 and (ii) above theage of 14), education, access to credit (except from cooperatives), access to rural extension(technical assistance) (except from cooperatives), land ownership, farm size and Brazilianmicroregion dummies (see Table 2). To control for outliers, we dropped the top and bottomone percentile based on the municipal gross value of production, similarly to Helfandet al. [34]. Our sample consisted of 5252 municipalities in all regions of Brazil for 2017.
Table 2. Average of selected variables used in the model by different levels of MSCM, Brazil, 2017.
Municipality Share of Cooperative Membership
Overall 0.0 <0.01 0.01–0.05 0.05–0.2 >0.2
Net Income ($) 1 84.77 40.08 20.29 45.23 105.92 150.35Gross Value of Production ($) 1 141.93 57.88 30.96 69.94 171.66 263.43
Ag. Expenses ($) 1 57.16 17.81 10.67 24.71 65.74 113.09Land used (ha) 18,190.00 8669.45 13,413.73 16,751.39 23,599.24 20,157.60
Labor(Age > 14 years old) 2 2645.13 1614.10 3701.33 3142.27 2372.89 1891.37
Capital (units) 3 1.06 0.41 0.16 0.44 1.40 2.02Other Investments ($) 4 56.24 14.50 10.24 23.91 64.18 112.55
Group of Area0–5 ha 0.02 0.05 0.06 0.02 <0.01 <0.015–20 ha 0.21 0.23 0.35 0.27 0.13 0.13
20–100 ha 0.54 0.53 0.46 0.49 0.57 0.60100–500 ha 0.21 0.18 0.13 0.18 0.26 0.25
500+ ha (base) 0.02 0.02 0.01 0.03 0.04 0.01
Landowner 0.82 0.77 0.77 0.81 0.82 0.85Literate 0.82 0.66 0.66 0.76 0.89 0.95
College degree or higher 0.09 0.05 0.04 0.07 0.12 0.13Experience 5 0.01 0.02 0.02 0.02 0.01 0.01
Governmental Extension 6 0.10 0.08 0.06 0.08 0.12 0.14Private Extension 6 0.17 0.04 0.04 0.07 0.17 0.36
Credit 6 0.10 0.03 0.06 0.07 0.10 0.18
RegionsNorth 0.08 0.09 0.11 0.16 0.08 <0.01
Northeast 0.32 0.74 0.74 0.48 0.10 0.01Southeast 0.30 0.14 0.11 0.22 0.45 0.39
South (base) 0.22 <0.01 0.01 0.05 0.21 0.54Midwest 0.08 0.03 0.02 0.10 0.16 0.06
Notes: 1 Value in millions of Brazilian reais (BRL); average exchange rate in August 2017: BRL 3.15/USD 1. 2 Average number of workersolder than 14 years. 3 Units of tractors, combine harvesters, fertilizer spreaders, seeders and other tools. 4 Value (in BRL) of the livestockand buildings present on the farms. 5 Share of farms managed by farmers with 20 or more years of experience. 6 Share of farms that haveaccess to these services. Source: The authors used aggregated data from the 2017 Ag. Census made available by IBGE [19].
It is important to consider the regional differences of Brazil when analyzing the pro-duction function for the municipalities. According to Buainain et al. [35], Neves et al. [21]and Homma et al. [20], in addition to the natural conditions, the Brazilian territory presentsheterogeneities arising from other factors, such as those related to the diverse agriculturalproducts grown in different areas of the country. With this in mind, the regression is
121
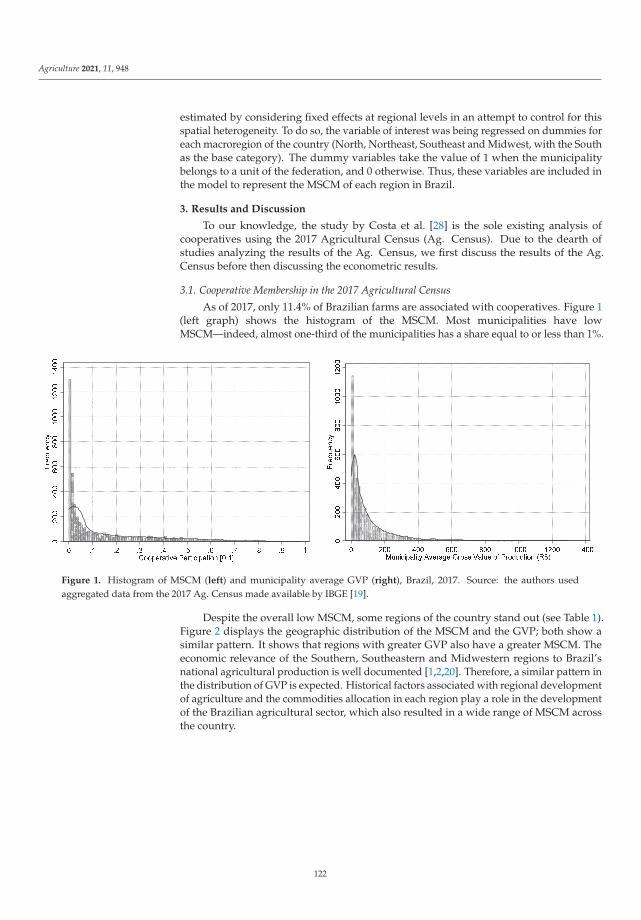
Agriculture 2021, 11, 948
estimated by considering fixed effects at regional levels in an attempt to control for thisspatial heterogeneity. To do so, the variable of interest was being regressed on dummies foreach macroregion of the country (North, Northeast, Southeast and Midwest, with the Southas the base category). The dummy variables take the value of 1 when the municipalitybelongs to a unit of the federation, and 0 otherwise. Thus, these variables are included inthe model to represent the MSCM of each region in Brazil.
3. Results and Discussion
To our knowledge, the study by Costa et al. [28] is the sole existing analysis ofcooperatives using the 2017 Agricultural Census (Ag. Census). Due to the dearth ofstudies analyzing the results of the Ag. Census, we first discuss the results of the Ag.Census before then discussing the econometric results.
3.1. Cooperative Membership in the 2017 Agricultural Census
As of 2017, only 11.4% of Brazilian farms are associated with cooperatives. Figure 1(left graph) shows the histogram of the MSCM. Most municipalities have lowMSCM—indeed, almost one-third of the municipalities has a share equal to or less than 1%.
Figure 1. Histogram of MSCM (left) and municipality average GVP (right), Brazil, 2017. Source: the authors usedaggregated data from the 2017 Ag. Census made available by IBGE [19].
Despite the overall low MSCM, some regions of the country stand out (see Table 1).Figure 2 displays the geographic distribution of the MSCM and the GVP; both show asimilar pattern. It shows that regions with greater GVP also have a greater MSCM. Theeconomic relevance of the Southern, Southeastern and Midwestern regions to Brazil’snational agricultural production is well documented [1,2,20]. Therefore, a similar pattern inthe distribution of GVP is expected. Historical factors associated with regional developmentof agriculture and the commodities allocation in each region play a role in the developmentof the Brazilian agricultural sector, which also resulted in a wide range of MSCM acrossthe country.
122
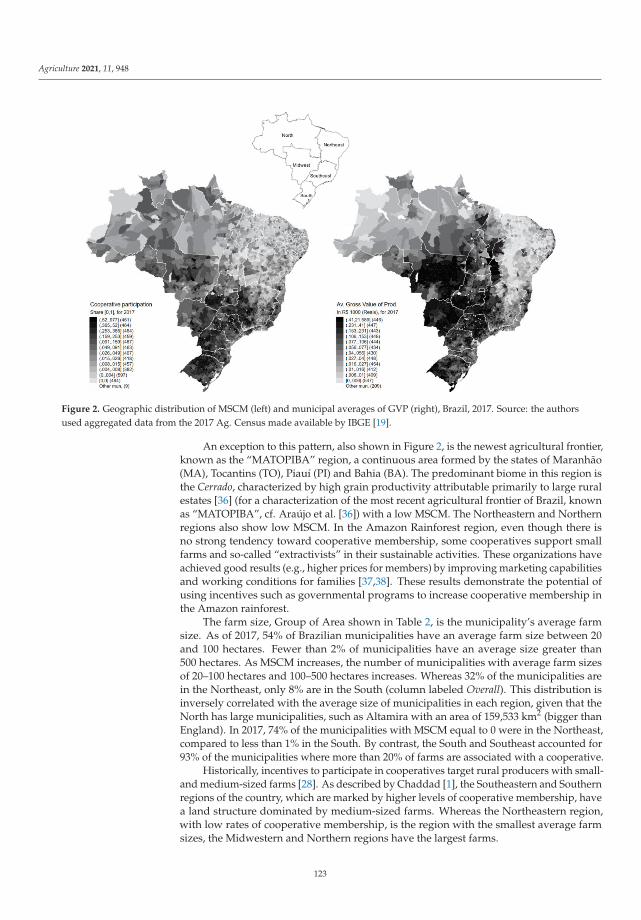
Agriculture 2021, 11, 948
Figure 2. Geographic distribution of MSCM (left) and municipal averages of GVP (right), Brazil, 2017. Source: the authorsused aggregated data from the 2017 Ag. Census made available by IBGE [19].
An exception to this pattern, also shown in Figure 2, is the newest agricultural frontier,known as the “MATOPIBA” region, a continuous area formed by the states of Maranhão(MA), Tocantins (TO), Piauí (PI) and Bahia (BA). The predominant biome in this region isthe Cerrado, characterized by high grain productivity attributable primarily to large ruralestates [36] (for a characterization of the most recent agricultural frontier of Brazil, knownas “MATOPIBA”, cf. Araújo et al. [36]) with a low MSCM. The Northeastern and Northernregions also show low MSCM. In the Amazon Rainforest region, even though there isno strong tendency toward cooperative membership, some cooperatives support smallfarms and so-called “extractivists” in their sustainable activities. These organizations haveachieved good results (e.g., higher prices for members) by improving marketing capabilitiesand working conditions for families [37,38]. These results demonstrate the potential ofusing incentives such as governmental programs to increase cooperative membership inthe Amazon rainforest.
The farm size, Group of Area shown in Table 2, is the municipality’s average farmsize. As of 2017, 54% of Brazilian municipalities have an average farm size between 20and 100 hectares. Fewer than 2% of municipalities have an average size greater than500 hectares. As MSCM increases, the number of municipalities with average farm sizesof 20–100 hectares and 100–500 hectares increases. Whereas 32% of the municipalities arein the Northeast, only 8% are in the South (column labeled Overall). This distribution isinversely correlated with the average size of municipalities in each region, given that theNorth has large municipalities, such as Altamira with an area of 159,533 km2 (bigger thanEngland). In 2017, 74% of the municipalities with MSCM equal to 0 were in the Northeast,compared to less than 1% in the South. By contrast, the South and Southeast accounted for93% of the municipalities where more than 20% of farms are associated with a cooperative.
Historically, incentives to participate in cooperatives target rural producers with small-and medium-sized farms [28]. As described by Chaddad [1], the Southeastern and Southernregions of the country, which are marked by higher levels of cooperative membership, havea land structure dominated by medium-sized farms. Whereas the Northeastern region,with low rates of cooperative membership, is the region with the smallest average farmsizes, the Midwestern and Northern regions have the largest farms.
123
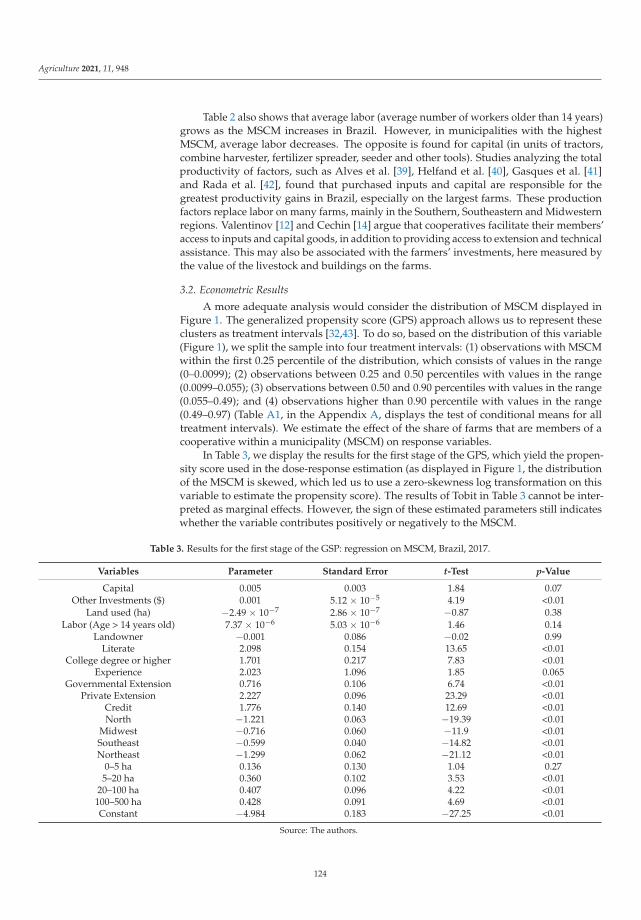
Agriculture 2021, 11, 948
Table 2 also shows that average labor (average number of workers older than 14 years)grows as the MSCM increases in Brazil. However, in municipalities with the highestMSCM, average labor decreases. The opposite is found for capital (in units of tractors,combine harvester, fertilizer spreader, seeder and other tools). Studies analyzing the totalproductivity of factors, such as Alves et al. [39], Helfand et al. [40], Gasques et al. [41]and Rada et al. [42], found that purchased inputs and capital are responsible for thegreatest productivity gains in Brazil, especially on the largest farms. These productionfactors replace labor on many farms, mainly in the Southern, Southeastern and Midwesternregions. Valentinov [12] and Cechin [14] argue that cooperatives facilitate their members’access to inputs and capital goods, in addition to providing access to extension and technicalassistance. This may also be associated with the farmers’ investments, here measured bythe value of the livestock and buildings on the farms.
3.2. Econometric Results
A more adequate analysis would consider the distribution of MSCM displayed inFigure 1. The generalized propensity score (GPS) approach allows us to represent theseclusters as treatment intervals [32,43]. To do so, based on the distribution of this variable(Figure 1), we split the sample into four treatment intervals: (1) observations with MSCMwithin the first 0.25 percentile of the distribution, which consists of values in the range(0–0.0099); (2) observations between 0.25 and 0.50 percentiles with values in the range(0.0099–0.055); (3) observations between 0.50 and 0.90 percentiles with values in the range(0.055–0.49); and (4) observations higher than 0.90 percentile with values in the range(0.49–0.97) (Table A1, in the Appendix A, displays the test of conditional means for alltreatment intervals). We estimate the effect of the share of farms that are members of acooperative within a municipality (MSCM) on response variables.
In Table 3, we display the results for the first stage of the GPS, which yield the propen-sity score used in the dose-response estimation (as displayed in Figure 1, the distributionof the MSCM is skewed, which led us to use a zero-skewness log transformation on thisvariable to estimate the propensity score). The results of Tobit in Table 3 cannot be inter-preted as marginal effects. However, the sign of these estimated parameters still indicateswhether the variable contributes positively or negatively to the MSCM.
Table 3. Results for the first stage of the GSP: regression on MSCM, Brazil, 2017.
Variables Parameter Standard Error t-Test p-Value
Capital 0.005 0.003 1.84 0.07Other Investments ($) 0.001 5.12 × 10⁻⁵ 4.19 <0.01
Land used (ha) −2.49 × 10⁻⁷ 2.86 × 10⁻⁷ −0.87 0.38Labor (Age > 14 years old) 7.37 × 10⁻⁶ 5.03 × 10⁻⁶ 1.46 0.14
Landowner −0.001 0.086 −0.02 0.99Literate 2.098 0.154 13.65 <0.01
College degree or higher 1.701 0.217 7.83 <0.01Experience 2.023 1.096 1.85 0.065
Governmental Extension 0.716 0.106 6.74 <0.01Private Extension 2.227 0.096 23.29 <0.01
Credit 1.776 0.140 12.69 <0.01North −1.221 0.063 −19.39 <0.01
Midwest −0.716 0.060 −11.9 <0.01Southeast −0.599 0.040 −14.82 <0.01Northeast −1.299 0.062 −21.12 <0.01
0–5 ha 0.136 0.130 1.04 0.275–20 ha 0.360 0.102 3.53 <0.01
20–100 ha 0.407 0.096 4.22 <0.01100–500 ha 0.428 0.091 4.69 <0.01Constant −4.984 0.183 −27.25 <0.01
Source: The authors.
124
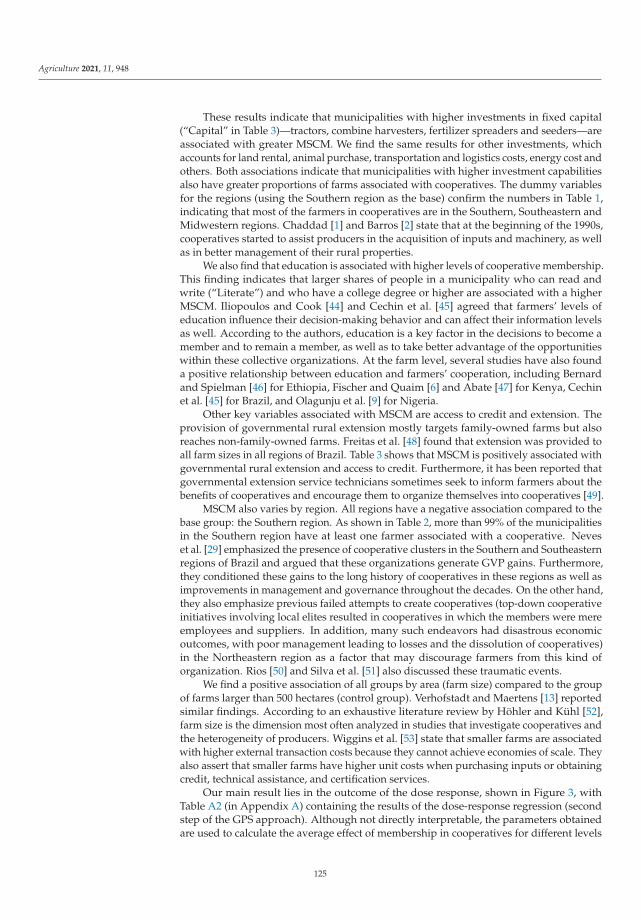
Agriculture 2021, 11, 948
These results indicate that municipalities with higher investments in fixed capital(“Capital” in Table 3)—tractors, combine harvesters, fertilizer spreaders and seeders—areassociated with greater MSCM. We find the same results for other investments, whichaccounts for land rental, animal purchase, transportation and logistics costs, energy cost andothers. Both associations indicate that municipalities with higher investment capabilitiesalso have greater proportions of farms associated with cooperatives. The dummy variablesfor the regions (using the Southern region as the base) confirm the numbers in Table 1,indicating that most of the farmers in cooperatives are in the Southern, Southeastern andMidwestern regions. Chaddad [1] and Barros [2] state that at the beginning of the 1990s,cooperatives started to assist producers in the acquisition of inputs and machinery, as wellas in better management of their rural properties.
We also find that education is associated with higher levels of cooperative membership.This finding indicates that larger shares of people in a municipality who can read andwrite (“Literate”) and who have a college degree or higher are associated with a higherMSCM. Iliopoulos and Cook [44] and Cechin et al. [45] agreed that farmers’ levels ofeducation influence their decision-making behavior and can affect their information levelsas well. According to the authors, education is a key factor in the decisions to become amember and to remain a member, as well as to take better advantage of the opportunitieswithin these collective organizations. At the farm level, several studies have also founda positive relationship between education and farmers’ cooperation, including Bernardand Spielman [46] for Ethiopia, Fischer and Quaim [6] and Abate [47] for Kenya, Cechinet al. [45] for Brazil, and Olagunju et al. [9] for Nigeria.
Other key variables associated with MSCM are access to credit and extension. Theprovision of governmental rural extension mostly targets family-owned farms but alsoreaches non-family-owned farms. Freitas et al. [48] found that extension was provided toall farm sizes in all regions of Brazil. Table 3 shows that MSCM is positively associated withgovernmental rural extension and access to credit. Furthermore, it has been reported thatgovernmental extension service technicians sometimes seek to inform farmers about thebenefits of cooperatives and encourage them to organize themselves into cooperatives [49].
MSCM also varies by region. All regions have a negative association compared to thebase group: the Southern region. As shown in Table 2, more than 99% of the municipalitiesin the Southern region have at least one farmer associated with a cooperative. Neveset al. [29] emphasized the presence of cooperative clusters in the Southern and Southeasternregions of Brazil and argued that these organizations generate GVP gains. Furthermore,they conditioned these gains to the long history of cooperatives in these regions as well asimprovements in management and governance throughout the decades. On the other hand,they also emphasize previous failed attempts to create cooperatives (top-down cooperativeinitiatives involving local elites resulted in cooperatives in which the members were mereemployees and suppliers. In addition, many such endeavors had disastrous economicoutcomes, with poor management leading to losses and the dissolution of cooperatives)in the Northeastern region as a factor that may discourage farmers from this kind oforganization. Rios [50] and Silva et al. [51] also discussed these traumatic events.
We find a positive association of all groups by area (farm size) compared to the groupof farms larger than 500 hectares (control group). Verhofstadt and Maertens [13] reportedsimilar findings. According to an exhaustive literature review by Höhler and Kühl [52],farm size is the dimension most often analyzed in studies that investigate cooperatives andthe heterogeneity of producers. Wiggins et al. [53] state that smaller farms are associatedwith higher external transaction costs because they cannot achieve economies of scale. Theyalso assert that smaller farms have higher unit costs when purchasing inputs or obtainingcredit, technical assistance, and certification services.
Our main result lies in the outcome of the dose response, shown in Figure 3, withTable A2 (in Appendix A) containing the results of the dose-response regression (secondstep of the GPS approach). Although not directly interpretable, the parameters obtainedare used to calculate the average effect of membership in cooperatives for different levels
125
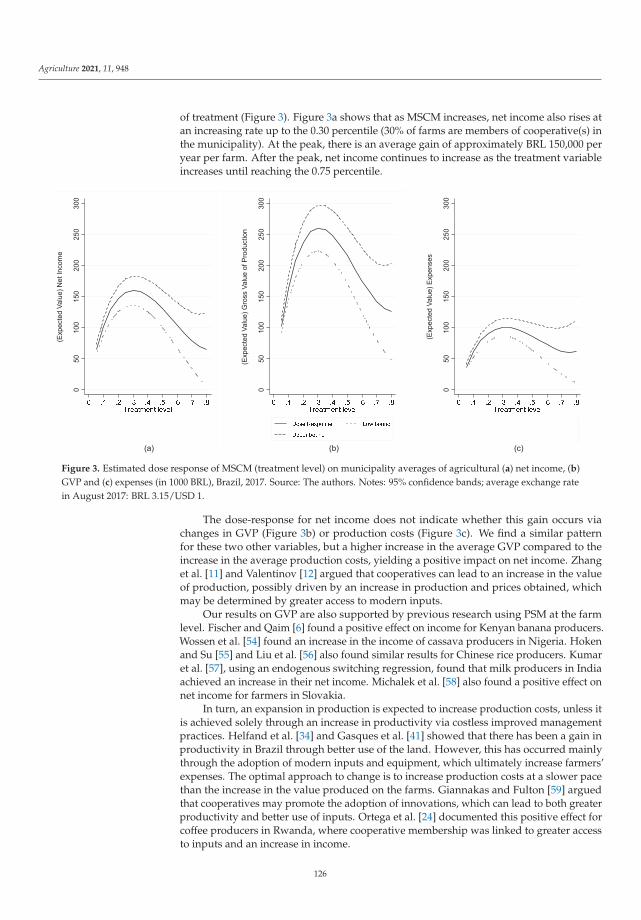
Agriculture 2021, 11, 948
of treatment (Figure 3). Figure 3a shows that as MSCM increases, net income also rises atan increasing rate up to the 0.30 percentile (30% of farms are members of cooperative(s) inthe municipality). At the peak, there is an average gain of approximately BRL 150,000 peryear per farm. After the peak, net income continues to increase as the treatment variableincreases until reaching the 0.75 percentile.
Figure 3. Estimated dose response of MSCM (treatment level) on municipality averages of agricultural (a) net income, (b)GVP and (c) expenses (in 1000 BRL), Brazil, 2017. Source: The authors. Notes: 95% confidence bands; average exchange ratein August 2017: BRL 3.15/USD 1.
The dose-response for net income does not indicate whether this gain occurs viachanges in GVP (Figure 3b) or production costs (Figure 3c). We find a similar patternfor these two other variables, but a higher increase in the average GVP compared to theincrease in the average production costs, yielding a positive impact on net income. Zhanget al. [11] and Valentinov [12] argued that cooperatives can lead to an increase in the valueof production, possibly driven by an increase in production and prices obtained, whichmay be determined by greater access to modern inputs.
Our results on GVP are also supported by previous research using PSM at the farmlevel. Fischer and Qaim [6] found a positive effect on income for Kenyan banana producers.Wossen et al. [54] found an increase in the income of cassava producers in Nigeria. Hokenand Su [55] and Liu et al. [56] also found similar results for Chinese rice producers. Kumaret al. [57], using an endogenous switching regression, found that milk producers in Indiaachieved an increase in their net income. Michalek et al. [58] also found a positive effect onnet income for farmers in Slovakia.
In turn, an expansion in production is expected to increase production costs, unless itis achieved solely through an increase in productivity via costless improved managementpractices. Helfand et al. [34] and Gasques et al. [41] showed that there has been a gain inproductivity in Brazil through better use of the land. However, this has occurred mainlythrough the adoption of modern inputs and equipment, which ultimately increase farmers’expenses. The optimal approach to change is to increase production costs at a slower pacethan the increase in the value produced on the farms. Giannakas and Fulton [59] arguedthat cooperatives may promote the adoption of innovations, which can lead to both greaterproductivity and better use of inputs. Ortega et al. [24] documented this positive effect forcoffee producers in Rwanda, where cooperative membership was linked to greater accessto inputs and an increase in income.
126
Agriculture 2021, 11, 948
4. Conclusions
In this paper, we estimate how municipality share of cooperative membership (MSCM)affects the value of production, production cost and net income using the generalizedpropensity score approach and aggregate data from the 2017 Ag. Census. We find thatincreases in cooperative membership share among farmers in Brazilian municipalities(MSCM) result in increases in net income, mostly driven by a greater expansion in thevalue of agricultural production compared to the increase in the production cost.
The findings of this study have important implications for public policies in Brazil.The results suggest that incentivizing cooperative membership may be a good instrumentto improve the value of production of Brazilian farmers. Thus, public policies seeking topromote cooperatives and increase cooperative membership would have positive effects onthe net income of farms. Public policies that directly and indirectly encourage and supportcooperatives, such as the “Capitalization of Agricultural Cooperatives Program” (PROCAP-Agro) (program carried out by the National Bank for Economic and Social Development(BNDES). It aims to offer financing for working capital to cooperatives) [60] and the “MoreCooperative Brazil Program” (Programa Brasil Mais Cooperativo) (an initiative of the Min-istry of Agriculture, Livestock and Supply (MAPA), the "Brasil Mais Cooperativo Program"aims to support rural cooperatives through the provision of specialized assistance, thepromotion of cooperation among cooperatives, technical training and the qualification ofmanagement, production processes and marketing) [61] can increase net income. However,farmers who are already marginalized because of low educational attainment, land access,social status and market accessibility may require additional support systems to improvetheir capacities, skills and resources before they can benefit from cooperative membership.
The method used in this paper does not allow us to rule out the possibility that part ofthese positive effects of cooperatives may be linked to spillovers caused by the presence ofcooperatives’ members in the Brazilian municipalities. This method also does not accountfor potential endogeneity issues arising from unobserved characteristics. Future researchshould account for these limitations. One suggestion could be to use more than one Ag.Census, with farm-level data, and the application of methodologies that correct bias ofunobservable characteristics, such as Diff-Diff.
Author Contributions: Conceptualization, M.d.C.R.N., F.d.F.S., C.O.d.F. and M.J.B.; data curation,C.O.d.F.; formal analysis, M.d.C.R.N., F.d.F.S., C.O.d.F. and M.J.B.; funding acquisition, M.d.C.R.N.,F.d.F.S., C.O.d.F. and M.J.B.; methodology, M.d.C.R.N., F.d.F.S. and C.O.d.F.; project administration,M.d.C.R.N.; resources, M.d.C.R.N., F.d.F.S., C.O.d.F. and M.J.B.; software, M.d.C.R.N., F.d.F.S. andC.O.d.F.; supervision, M.d.C.R.N. and M.J.B.; Validation, M.d.C.R.N., F.d.F.S., C.O.d.F. and M.J.B.;writing—original draft, M.d.C.R.N., F.d.F.S. and C.O.d.F.; Writing—review and editing, M.d.C.R.N.,F.d.F.S., C.O.d.F. and M.J.B. All authors have read and agreed to the published version of themanuscript.
Funding: This research is financed by the Chamada CNPq # 01/2018, process # 427764/2018-1 andChamada CNPq/Sescoop # 07/2018, process # 403068/2018-5. It is also supported by OCEMG.Opinions, mistakes and omissions are the authors’ own.
Institutional Review Board Statement: Not applicable.
Informed Consent Statement: Not applicable.
Acknowledgments: Conselho Nacional de Desenvolvimento Científico e Tecnológico (CNPq),Serviço Nacional de Aprendizagem do Cooperativismo (Sescoop) e Organização das Cooperati-vas do Estado de Minas Gerais (OCEMG).
Conflicts of Interest: The authors declare no conflict of interest.
127
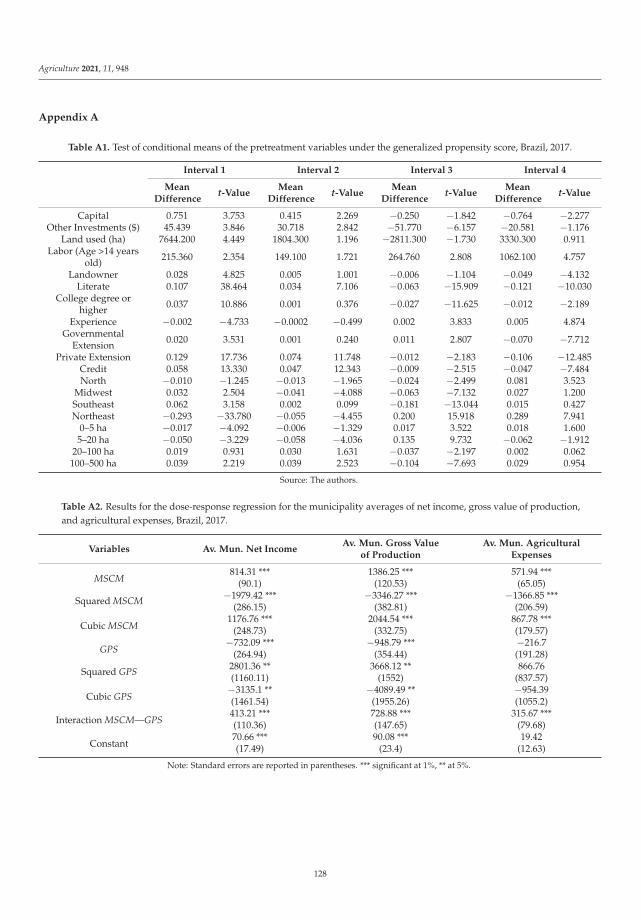
Agriculture 2021, 11, 948
Appendix A
Table A1. Test of conditional means of the pretreatment variables under the generalized propensity score, Brazil, 2017.
Interval 1 Interval 2 Interval 3 Interval 4
MeanDifference
t-ValueMean
Differencet-Value
MeanDifference
t-ValueMean
Differencet-Value
Capital 0.751 3.753 0.415 2.269 −0.250 −1.842 −0.764 −2.277Other Investments ($) 45.439 3.846 30.718 2.842 −51.770 −6.157 −20.581 −1.176
Land used (ha) 7644.200 4.449 1804.300 1.196 −2811.300 −1.730 3330.300 0.911Labor (Age >14 years
old) 215.360 2.354 149.100 1.721 264.760 2.808 1062.100 4.757
Landowner 0.028 4.825 0.005 1.001 −0.006 −1.104 −0.049 −4.132Literate 0.107 38.464 0.034 7.106 −0.063 −15.909 −0.121 −10.030
College degree orhigher 0.037 10.886 0.001 0.376 −0.027 −11.625 −0.012 −2.189
Experience −0.002 −4.733 −0.0002 −0.499 0.002 3.833 0.005 4.874Governmental
Extension 0.020 3.531 0.001 0.240 0.011 2.807 −0.070 −7.712
Private Extension 0.129 17.736 0.074 11.748 −0.012 −2.183 −0.106 −12.485Credit 0.058 13.330 0.047 12.343 −0.009 −2.515 −0.047 −7.484North −0.010 −1.245 −0.013 −1.965 −0.024 −2.499 0.081 3.523
Midwest 0.032 2.504 −0.041 −4.088 −0.063 −7.132 0.027 1.200Southeast 0.062 3.158 0.002 0.099 −0.181 −13.044 0.015 0.427Northeast −0.293 −33.780 −0.055 −4.455 0.200 15.918 0.289 7.941
0–5 ha −0.017 −4.092 −0.006 −1.329 0.017 3.522 0.018 1.6005–20 ha −0.050 −3.229 −0.058 −4.036 0.135 9.732 −0.062 −1.912
20–100 ha 0.019 0.931 0.030 1.631 −0.037 −2.197 0.002 0.062100–500 ha 0.039 2.219 0.039 2.523 −0.104 −7.693 0.029 0.954
Source: The authors.
Table A2. Results for the dose-response regression for the municipality averages of net income, gross value of production,and agricultural expenses, Brazil, 2017.
Variables Av. Mun. Net IncomeAv. Mun. Gross Value
of ProductionAv. Mun. Agricultural
Expenses
MSCM814.31 *** 1386.25 *** 571.94 ***
(90.1) (120.53) (65.05)
Squared MSCM −1979.42 *** −3346.27 *** −1366.85 ***(286.15) (382.81) (206.59)
Cubic MSCM1176.76 *** 2044.54 *** 867.78 ***
(248.73) (332.75) (179.57)
GPS−732.09 *** −948.79 *** −216.7
(264.94) (354.44) (191.28)
Squared GPS 2801.36 ** 3668.12 ** 866.76(1160.11) (1552) (837.57)
Cubic GPS−3135.1 ** −4089.49 ** −954.39(1461.54) (1955.26) (1055.2)
Interaction MSCM—GPS413.21 *** 728.88 *** 315.67 ***(110.36) (147.65) (79.68)
Constant70.66 *** 90.08 *** 19.42(17.49) (23.4) (12.63)
Note: Standard errors are reported in parentheses. *** significant at 1%, ** at 5%.
128
Agriculture 2021, 11, 948
References
1. Chaddad, F. The Economics and Organization of Brazilian Agriculture, 1st ed.; Elsevier: London, UK, 2016; ISBN 9780128016954.2. Barros, G.S.C. Agriculture, industry and the economy: From extensive farming to a global agro-food power. In Agricultural
Development in Brazil: The Rise of a Global Agro-Food Power; Series: Routledge Studies in Agricultural Economics, 2019; Buainain,A.M., Lanna, R., Navarro, Z., Eds.; Routledge: New York, NY, USA, 2019; pp. 12–29. ISBN 9781351029742.
3. Jayne, T.S.; Zulu, B.; Nijhoff, J.J. Stabilizing Food Markets in Eastern and Southern Africa. Food Policy 2006, 31, 328–341. [CrossRef]4. Zeuli, K.A.; Radel, J. Cooperatives as a Community Development Strategy: Linking Theory and Practice. J. Reg. Anal. Policy 2005,
35, 43–54.5. Bernard, T.; Taffesse, A.S.; Gabre-Madhin, E. Impact of Cooperatives on Smallholders’ Commercialization Behavior: Evidence
from Ethiopia. Agric. Econ. 2008, 39, 147–161. [CrossRef]6. Fischer, E.; Qaim, M. Linking Smallholders to Markets: Determinants and Impacts of Farmer Collective Action in Kenya. World
Dev. 2012, 40, 1255–1268. [CrossRef]7. Bizikova, L.; Nkonya, E.; Minah, M.; Hanisch, M.; Turaga, R.M.R.; Speranza, C.I.; Karthikeyan, M.; Tang, L.; Ghezzi-Kopel, K.;
Kelly, J.; et al. A Scoping Review of the Contributions of Farmers’ Organizations to Smallholder Agriculture. Nat. Food 2020, 1,620–630. [CrossRef]
8. Batzios, A.; Kontogeorgos, A.; Chatzitheodoridis, F.; Sergaki, P. What Makes Producers Participate in Marketing Cooperatives?The Northern Greece Case. Sustainability 2021, 13, 1676. [CrossRef]
9. Olagunju, K.O.; Ogunniyi, A.I.; Oyetunde-Usman, Z.; Omotayo, A.O.; Awotide, B.A. Does Agricultural Cooperative MembershipImpact Technical Efficiency of Maize Production in Nigeria: An Analysis Correcting for Biases from Observed and UnobservedAttributes. PLoS ONE 2021, 16, e0245426. [CrossRef]
10. Merrett, C.D.; Walzer, N. A Cooperative Approach to Local Economic Development, 1st ed.; Quorum Books: Westport, CT, USA, 2001;ISBN 9781567203950.
11. Zhang, J.; Goddard, E.; Lerohl, M. Estimating Pricing Games in the Wheat-handling Market in Saskatchewan: The Role of aMajor Cooperative. In Cooperative Firms in Global Markets; Novkovic, S., Sena, V., Eds.; Emerald Group Publishing Limited: WestYorkshire, UK, 2007; ISBN 9780762313891.
12. Valentinov, V. Why Are Cooperatives Important in Agriculture? An Organizational Economics Perspective. J. Inst. Econ. 2007, 3,55–69. [CrossRef]
13. Verhofstadt, E.; Maertens, M. Can Agricultural Cooperatives Reduce Poverty? Heterogeneous Impact of Cooperative Membershipon Farmers’ Welfare in Rwanda. Appl. Econ. Perspect. Policy 2015, 37, 86–106. [CrossRef]
14. Cechin, A. Cooperativas brasileiras nos mercados agroalimentares contemporâneos. In O Mundo Rural no Brasil do Século 21: AFormação de um Novo Padrão Agrário e Agrícola; Buainain, A.M., Alves, E., da Silveira, J.M., Navarro, Z., Eds.; Embrapa: Brasília,Brazil, 2014; pp. 479–507.
15. Herrera, G.P.; Lourival, R.; da Costa, R.B.; Mendes, D.R.F.; Moreira, T.B.S.; de Abreu, U.G.P.; Constantino, M. EconometricAnalysis of Income, Productivity and Diversification among Smallholders in Brazil. Land Use Policy 2018, 76, 455–459. [CrossRef]
16. Ma, W.; Abdulai, A.; Goetz, R. Agricultural Cooperatives and Investment in Organic Soil Amendments and Chemical Fertilizer inChina. Am. J. Agric. Econ. 2018, 100, 502–520. [CrossRef]
17. Zhang, S.; Sun, Z.; Ma, W.; Valentinov, V. The Effect of Cooperative Membership on Agricultural Technology Adoption in Sichuan,China. China Econ. Rev. 2020, 62, 101334. [CrossRef]
18. IBGE. Instituto Brasileiro de Geografia e Estatística. Microdados da Pesquisa Nacional por Amostra de Domicílios (PNAD).Available online: https://www.ibge.gov.br/estatisticas/sociais/populacao/9127-pesquisa-nacional-por-amostra-de-domicilios.html?edicao=9451&t=downloads (accessed on 22 May 2021).
19. IBGE. Instituto Brasileiro de Geografia e Estatística. SIDRA - Sistema IBGE de Recuperação Automática: Censo Agropecuário. 2017.Available online: https://sidra.ibge.gov.br/pesquisa/censo-agropecuario/censo-agropecuario-2017 (accessed on 22 April 2020).
20. Homma, A.K.O.; Lima, J.R.F.; Vieira, P.A. Structural heterogeneity in rural Brazil: Three regional cases. In Agricultural Developmentin Brazil: The Rise of a Global Agro-Food Power; Buainain, A.M., Lanna, R., Navarro, Z., Eds.; Routledge: New York, NY, USA, 2019;pp. 189–207.
21. Neves, M.C.R.; Castro, L.S.; Freitas, C.O. Cooperatives and Brazilian Agricultural Production: A Spatial Analysis. In Proceedingsof the 46th Brazilian Economics Meeting, Rio de Janeiro, Brazil, 11–14 December 2018. ANPEC—Associação Nacional dos Centrosde Pós-graduação em Economia [Brazilian Association of Post-Graduate Programs in Economics].
22. Cazzuffi, C. Small Scale Farmers in the Market and the Role of Processing and Marketing Cooperatives: A Case Study of ItalianDairy Farmers. Ph.D. Thesis, University of Sussex, Brighton, UK, 2012.
23. Jardine, S.L.; Lin, C.Y.C.; Sanchirico, J.N. Measuring Benefits from a Marketing Cooperative in the Copper River Fishery. Am. J.Agric. Econ. 2014, 96, 1084–1101. [CrossRef]
24. Ortega, D.L.; Bro, A.S.; Clay, D.C.; Lopez, M.C.; Tuyisenge, E.; Church, R.A.; Bizoza, A.R. Cooperative Membership and CoffeeProductivity in Rwanda’s Specialty Coffee Sector. Food Secur. 2019, 11, 967–979. [CrossRef]
25. Kumse, K.; Suzuki, N.; Sato, T.; Demont, M. The Spillover Effect of Direct Competition between Marketing Cooperatives andPrivate Intermediaries: Evidence from the Thai Rice Value Chain. Food Policy 2021, 101, 102051. [CrossRef]
26. Helfand, S.; Levine, E. Farm Size and the Determinants of Productive Efficiency in the Brazilian Center-West. Agric. Econ. 2004,31, 241–249. [CrossRef]
129
Agriculture 2021, 11, 948
27. Wollni, M.; Brümmer, B. Productive Efficiency of Specialty and Conventional Coffee Farmers in Costa Rica: Accounting forTechnological Heterogeneity and Self-Selection. Food Policy 2012, 37, 67–76. [CrossRef]
28. Costa, R.A.; Vizcaino, C.A.C.; Costa, E.M. Participação em Cooperativas e Eficiência Técnica entre Agricultores Familiares noBrasil. In Uma Jornada Pelos Contrastes do Brasil: Cem anos de Censo Agropecuário; Vieira Filho, J.E.R., Gasques, J.G., Eds.; IPEA:Brasília, Brazil, 2020; pp. 243–255. ISBN 9786556350110.
29. Neves, M.D.C.R.; Castro, L.S.D.; Freitas, C.O.D. O Impacto das Cooperativas na Produção Agropecuária Brasileira: Uma AnáliseEconométrica Espacial. Rev. Econ. Sociol. Rural. 2019, 57, 559–576. [CrossRef]
30. OCB. Organização das Cooperativas Brasileiras. Anuário do Cooperativismo Brasileiro 2020; OCB: Hochiminh City, Vietnam, 2020.31. Imbens, G. The Role of the Propensity Score in Estimating Dose-Response Functions; Biometrika: Cambridge, MA, USA, 1999.32. Hirano, K.; Imbens, G.W. The Propensity Score with Continuous Treatments. In Applied Bayesian Modeling and Causal Inference
from Incomplete-Data Perspectives; John Wiley & Sons: Hoboken, NJ, USA, 2004.33. Rosenbaum, P.R.; Rubin, D.B. The Central Role of the Propensity Score in Observational Studies for Causal Effects. Biometrika
1983, 70, 41–55. [CrossRef]34. Helfand, S.M.; Magalhães, M.M.; Rada, N.E. Brazil’s Agricultural Total Factor Productivity Growth by Farm Size; IDB Working Paper
Series; Inter-American Development Bank: Washington, DC, USA, 2015.35. Buainain, A.M.; Gonzáles, M.G.; Souza Filho, H.M.; Vieira, A.C.P. Alternativas de Financiamento Agropecuário: Experiências no Brasil
e na América Latina; Buainain, A.M., Gonzáles, M.G., Eds.; IICA: Brasília, Brazil, 2007.36. de Araújo, M.L.S.; Sano, E.E.; Bolfe, E.L.; Santos, J.R.N.; dos Santos, J.S.; Silva, F.B. Spatiotemporal Dynamics of Soybean Crop in
the Matopiba Region, Brazil (1990–2015). Land Use Policy 2019, 80, 57–67. [CrossRef]37. Silva, L.D.J.D.S.; Pinheiro, J.O.C.; Dos Santos, E.M.; Da Costa, J.I.; Meneghetti, G.A. O Cooperativismo Como Instrumento Para a
Autonomia de Comunidades Rurais da Amazônia: A Experiência dos Agricultores Extrativistas do Municipio de Lábrea, AM.Boletín Asoc. Int. Derecho Coop. 2019, 55, 199–226. [CrossRef]
38. Futemma, C.; de Castro, F.; Brondizio, E.S. Farmers and Social Innovations in Rural Development: Collaborative Arrangementsin Eastern Brazilian Amazon. Land Use Policy 2020, 99, 104999. [CrossRef]
39. Alves, E.; Souza, G.D.S.; Rocha, D.D.P. Lucratividade da Agricultura. Rev. Política Agrícola 2012, 21, 45–63.40. Helfand, S.M.; Rada, N.E.; Magalhães, M.M. L’agriculture Brésilienne: S’agit-Il Uniquement de Grandes Exploitations? EuroChoices
2017, 16, 17–22. [CrossRef]41. Gasques, J.G.; Bacchi, M.R.P.; Bastos, E.T. Nota Técnica IV-Crescimento e Produtividade da Agricultura Brasileira de 1975 a 2016.
Carta Conjunt. 2018, 1–9.42. Rada, N.; Helfand, S.; Magalhães, M. Agricultural Productivity Growth in Brazil: Large and Small Farms Excel. Food Policy 2019,
84, 176–185. [CrossRef]43. Bia, M.; Mattei, A. A Stata Package for the Estimation of the Dose-Response Function through Adjustment for the Generalized
Propensity Score. Stata J. Promot. Commun. Stat. Stata 2008, 8, 354–373. [CrossRef]44. Iliopoulos, C.; Cook, M.L. The Efficiency of Internal Resource Allocation Decisions in Customer-Owned Firms: The Influence
Costs Problem. In Proceedings of the Annals of 3rd Annual Conference of the International Society for New InstitutionalEconomics, Washington, DC, USA, 16–18 September 1999.
45. Cechin, A.; Bijman, J.; Pascucci, S.; Zylbersztajn, D.; Omta, O. Drivers of Pro-Active Member Participation in AgriculturalCooperatives: Evidence from Brazil. Ann. Public Coop. Econ. 2013, 84, 443–468. [CrossRef]
46. Bernard, T.; Spielman, D.J. Reaching the Rural Poor through Rural Producer Organizations? A Study of Agricultural MarketingCooperatives in Ethiopia. Food Policy 2009, 34, 60–69. [CrossRef]
47. Abate, G.T. Drivers of Agricultural Cooperative Formation and Farmers’ Membership and Patronage Decisions in Ethiopia.J. Co-Oper. Organ. Manag. 2018, 6, 53–63. [CrossRef]
48. de Freitas, C.O.; Silva, F.D.F.; Braga, M.J.; Neves, M.D.C.R. Rural Extension and Technical Efficiency in the Brazilian AgriculturalSector. Int. Food Agribus. Manag. Rev. 2021, 24, 215–232. [CrossRef]
49. Costa, B.A.L.; Junior, P.C.G.A.; Da Silva, M.G. As Cooperativas de Agricultura Familiar e o Mercado de Compras GovernamentaisEm Minas Gerais. Rev. Econ. Sociol. Rural. 2015, 53, 109–126. [CrossRef]
50. Rios, G.S.L. Pré-cooperativismo: Etapa queimada. In A Problemática Cooperativista no Desenvolvimento Econômico; Uwe, J., Ed.;Fundação Friedrich Naumann: São Paulo, Brazil, 1973; pp. 315–347.
51. Silva, E.S.; Salomão, I.L.; McIntyre, J.P.; Guerreiro, J.; Pires, M.L.L.S.; Albuquerque, P.P.; Bergonsi, S.; Vaz, S.C. Panorama doCooperativismo Brasileiro: História, Cenários e Tendências. Rev. uniRcoop 2003, 1, 75–102.
52. Höhler, J.; Kühl, R. Dimensions of member heterogeneity in cooperatives and their impact on organization—A literature review.Ann. Public Coop. Econ. 2018, 89, 697–712. [CrossRef]
53. Wiggins, S.; Kirsten, J.; Llambí, L. The Future of Small Farms. World Dev. 2010, 38, 1341–1348. [CrossRef]54. Wossen, T.; Abdoulaye, T.; Alene, A.; Haile, M.G.; Feleke, S.; Olanrewaju, A.; Manyong, V. Impacts of Extension Access and
Cooperative Membership on Technology Adoption and Household Welfare. J. Rural. Stud. 2017, 54, 223–233. [CrossRef][PubMed]
55. Hoken, H.; Su, Q. Measuring the Effect of Agricultural Cooperatives on Household Income: Case Study of a Rice-ProducingCooperative in China. Agribusiness 2018, 34, 831–846. [CrossRef]
130
Agriculture 2021, 11, 948
56. Liu, Y.; Ma, W.; Renwick, A.; Fu, X. The Role of Agricultural Cooperatives in Serving as a Marketing Channel: Evidence fromLow-Income Regions of Sichuan Province in China. Int. Food Agribus. Manag. Rev. 2019, 22, 265–282. [CrossRef]
57. Kumar, A.; Saroj, S.; Joshi, P.K.; Takeshima, H. Does Cooperative Membership Improve Household Welfare? Evidence from aPanel Data Analysis of Smallholder Dairy Farmers in Bihar, India. Food Policy 2018, 75, 24–36. [CrossRef]
58. Michalek, J.; Ciaian, P.; Pokrivcak, J. The Impact of Producer Organizations on Farm Performance: The Case Study of Large Farmsfrom Slovakia. Food Policy 2018, 75, 80–92. [CrossRef]
59. Giannakas, K.; Fulton, M. Process Innovation Activity in a Mixed Oligopoly: The Role of Cooperatives. Am. J. Agric. Econ. 2005,87, 406–422. [CrossRef]
60. BNDES. Banco Nacional de Desenvolvimento Econômico e Social. PROCAP-Agro. Available online: https://www.bndes.gov.br/wps/portal/site/home/financiamento/produto/procap-agro (accessed on 3 February 2021).
61. MAPA. Ministério da Agricultura, Pecuária e Abastecimento. Programa Brasil Mais Cooperativo. Available online: https://www.gov.br/agricultura/pt-br/assuntos/agricultura-familiar/brasil-mais-cooperativo (accessed on 3 February 2021).
131

agriculture
Article
Popularity in Social Networks. The Case of ArgentineBeekeeping Production Entities
Jimena Andrieu 1,*, Domingo Fernández-Uclés 2, Adoración Mozas-Moral 2 and Enrique Bernal-Jurado 3
Citation: Andrieu, J.;
Fernández-Uclés, D.; Mozas-Moral,
A.; Bernal-Jurado, E. Popularity in
Social Networks. The Case of
Argentine Beekeeping Production
Entities. Agriculture 2021, 11, 694.
https://doi.org/10.3390/
agriculture11080694
Academic Editor:
Manuel García-Herreros
Received: 23 June 2021
Accepted: 21 July 2021
Published: 23 July 2021
Publisher’s Note: MDPI stays neutral
with regard to jurisdictional claims in
published maps and institutional affil-
iations.
Copyright: © 2021 by the authors.
Licensee MDPI, Basel, Switzerland.
This article is an open access article
distributed under the terms and
conditions of the Creative Commons
Attribution (CC BY) license (https://
creativecommons.org/licenses/by/
4.0/).
1 National Institute of Agricultural Technology (INTA), EEA San Juan-Argentina/National University of SanJuan (UNSJ), San Juan 5400, Argentina
2 Faculty of Social and Legal Sciences, Department of Business Organization, Marketing and Sociology,University of Jaén, 23071 Jaén, Spain; [email protected] (D.F.-U.); [email protected] (A.M.-M.)
3 Faculty of Social and Legal Sciences, Department of Economics, University of Jaén, 23071 Jaén, Spain;[email protected]
* Correspondence: [email protected]; Tel.: +54-92644921079 (ext. 144)
Abstract: The context of the COVID pandemic has accelerated the pace of the digitalization ofsociety, especially of its business fabric. Among the various applications offered by the Internet,social networking platforms have been identified as powerful tools that organizations have at theirdisposal for the development of their online business activities. This is due to the closeness and trustgenerated by word-of-mouth communication. In this context, the aim of this article is to identifywhich organizational characteristics are directly related to popularity on social networks, measuredby the number of followers on these accounts. In order to achieve this objective, the Argentineanbeekeeping organizations have been taken as a case study and the fuzzy set Qualitative ComparativeAnalysis method has been used. The results obtained allow us to validate the different organizationalfactors which, beyond the use of Facebook itself, lead to better results for the organizations in theirsocial network strategies. These factors include their cooperative nature, localization, environmentalsensitivity and presence on other digital platforms.
Keywords: Facebook; cooperatives; beekeeping; fuzzy set qualitative comparative analysis
1. Introduction
Argentina plays a central role in beekeeping production, both regionally and globally.Thus, in 2018 it was ranked as the first honey-producing country in America and thethird in the world, after China and Turkey. This importance is maintained not only involume produced, but also in volume marketed. Thus, in 2018, on a world export volumeof approximately 650 thousand tons of honey, Argentina contributed 10.5%, being onlysurpassed by China, with 19% of the total. Between the two countries, they concentratedalmost a third of the international sales of this product [1].
Despite Argentina’s global importance in the world beekeeping market, the sector hasbeen facing important difficulties, both in production and marketing. On the one hand,primary production has been suffering a drop in average yields since the beginning of the21st century, due to a series of factors that negatively affect the beehive environment andbeekeeping practice. Examples include the loss of biodiversity, the advance of agricultureover pastures and natural forests, homogenization of landscapes and the increased presenceof diseases, among others [2,3]. On the other hand, with respect to the structure of theproduction system, this is characterized by a high atomization in primary production,a low relative size of the productive units and, as a consequence, a strong dependenceon distribution. Argentina has a total of 13,722 beekeeping registries located throughoutthe country, most of which have fewer than 500 hives (The same negative trend can beobserved in sales of honey certified as organic. Since 2008, Argentina’s share in the worldorganic market has been declining despite its favorable evolution in both demand andworld prices) [4–6].
Agriculture 2021, 11, 694. https://doi.org/10.3390/agriculture11080694 https://www.mdpi.com/journal/agriculture
133
Agriculture 2021, 11, 694
In addition to these problems present in the field of production, there are others relatedto the marketing of these products, such as the significant dependence on foreign marketsand their evolution, the lack of differentiation derived from the preferential sale in bulkand the concentration of sales from a few exporting companies. Indeed, in 2018, 85% ofdomestic production was destined to international markets, mainly to the United States,Germany and Japan [1,7]; a figure that has shown a downward trend if we consider that ithad reached up to 95% in previous years [8]. Another commercial problem is related tothe pursuit of a commercial strategy based on the exchange of large volumes of honey (indrums). This form of sale has an impact on the average prices per kilo exported, causingArgentine prices to be below the world average (An analysis of the evolution of prices forthe Americas throughout the 21st century shows that they are, on average, intermediateprices between those of Europe (mainly Western Europe) and Asia. Oceania, based on thedifferentiation of “Manuka” honey, shows considerably higher prices.) [1,8].
This problem tends to worsen as exports in this large-volume format become more andmore frequent, making product differentiation difficult. The sector also loses a large part ofthe added value generated in the packaging and distribution stages (The same negativetrend can be observed in sales of honey certified as organic. Since 2008, Argentina’s sharein the world organic market has been declining despite its favorable evolution in bothdemand and world prices.) [9–11]. In turn, it is estimated that only three entities controlapproximately half of the exported volume [10,12]. The way of organizing such commer-cialization has traditionally been structured on the basis of the figure of the “stockpiler” asthe main intermediary. However, during the last few years there has been an advance inbackward integration in the chain by exporting companies through the implementation ofdirect contracts with producers [10]. This situation tends to reinforce a distancing betweenthe primary production sector and the final consumer, and with it the loss of participationof the first sector in the honey valorization process [8,13].
This is taking place in a context in which, in general terms, honey consumption isshowing a favorable evolution (In 2018, the apparent honey consumption data implies avalue of 243 grams per person per year. This figure is higher than the average value for theperiod 2011–2016 that implies 156 grams per person per year (p. 21). However, these valuesstill represent a low level of national domestic consumption.) [1,7,14,15]. Thus, honeyhas managed to consolidate itself within the group of natural products related to healthyeating [16,17], due to its characteristic as a natural sweetener, in addition to other propertiesthat expand its potential use [18,19]. In the Argentine case, its consumption will be favoredin the future to the extent that strategies tending to improve the diet of the local populationare developed based on a reduction in the consumption of ultra-processed products andan increase in the consumption of natural products with an intersectional look. This iscoupled with a commitment to the implementation of production and distribution systemsthat are more sustainable [20–22].
The above problems suggest the need for the sector to adopt measures to improvethe supply of this food product, not only from the perspective of production but alsoalong the distribution chain [23]. Such measures should include those aimed at improvingexchange networks in order to achieve greater differentiation of production and more directcommunication with the consumer [13,24]. In this sense, several authors have highlightedthe determining role that can be played by the use of virtual applications, such as companywebsites or social networks [25–27] especially in the case of natural products, as is thecase of honey [26,28]. Thus, certain “experiential” agricultural products, due to theirintrinsic characteristics, are particularly suitable for marketing through the Web [29]. Forexample, the purchase and consumption of products such as honey or wine are based on anintensive exchange of information on tangible aspects of the product as well as on symbols,tradition, culture, tourism and gastronomy; all aspects that can significantly enhance thevalue perceived by the consumer [30]. Thus, social networks, due to their closeness andinteractivity with users, are positioned as an ideal communication channel for transmittingsuch information [31].
134
Agriculture 2021, 11, 694
In line with the above, some authors have defended the need to address the linkbetween the beekeeping subsector and ICT (Information and Communications Technol-ogy) [32]. However, the literature review shows that there are no studies focused on the bee-keeping sector that have tried to investigate the degree of use of social networks and whichfactors are associated with greater success in the use of these technologies. Indeed, studiesfocused on the beekeeping sector can be divided into three groups: first, those that havefocused on the analysis of honey markets and their potential at the local scale [12,33,34];a second group has focused on the analysis of production, its socio-economic structureand the analysis of technical efficiency [10,35]; and, finally, a third group of studies hasfocused on the transformations of the digital era, paying more attention to productionthan to interactions between producers and consumers [36,37]. Thus, the focus of theselatter studies tends to be on the analysis of the digital impact on machinery, equipmentand other inputs needed to increase production efficiency, with less frequent studies ad-dressing the benefits of a comprehensive use of the Internet in terms of communicationand management improvements [38].
Based on the premise that social networks are tools that can provide answers to theproblematic situation described above, especially the commercial one, the objective ofthis paper is to analyze which characteristics of beekeeping organizations are directlyrelated to greater success in the use of these technologies. To achieve this objective, theArgentine beekeeping organizations have been taken as a case study and their use of thesocial network Facebook and the factors related to greater popularity in this network havebeen analyzed using the fuzzy set Qualitative Comparative Analysis method. The paper isstructured as follows: after this introduction, the contextual framework detailing the studypropositions is presented, followed by the technical characteristics of the research in themethodology section, after which the results are presented and finally, the conclusions andreflections are derived from the data analysis.
2. Materials and Methods
2.1. Contextual Framework
In this sense, transaction cost theory has often been used as a basis for analyzingand highlighting the potential of information and communication technologies (ICT) forbusiness, especially in the commercial sphere [39]. Social media, as the main example ofthis phenomenon, brings multiple benefits in terms of business performance and reductionof different types of costs. Thus, information costs decrease thanks to the informationalpotential of online social networks, which facilitate, improve and speed up informationexchanges [40]. Negotiation costs decrease because online media can improve customers’access to the organization and enable them to receive more personalized offers [40]. Fi-nally, assurance costs are minimized because users are offered reliable and good qualityinformation and feedback [41].
However, experience indicates that not all companies have the same ability to takeadvantage of the benefits offered by the Internet. Rather, several studies indicate thatadaptation to the Internet and social media in which one operates in this medium dependson several factors, which differ according to the sector or region in which the companyoperates [42]. In the specific case of agricultural markets, McFarlane el al. [43]. foundthat the characteristics of the distribution chain, the scope of the company and the type ofproduct it sells (organic) influence the intensity of adoption of the ICT strategy.
The literature has been concerned with investigating the challenges and organizationalcharacteristics of cooperative entities that delay or could delay the adoption of technologyand the use of ICT [44]. This happens despite the fact that aspects shared between SocialEconomy entities and Web 2.0 technologies and the different tools that integrate them arehighlighted. Particular reference is made to the affinity of these types of tools with cooper-ative principles, such as their participatory and democratic nature and the predominanceof the social component of capital [45]. Thus, it is identified that the benefits of ICT areincreased in cooperative societies due to their ability to coordinate activities, people and
135
Agriculture 2021, 11, 694
processes [46]. In short, the potential of ICT use within cooperative societies for informationexchange and communication is recognized as a key factor for their management [46]. Inturn, this potential is identified in terms of improving aspects that determine the economicviability of organizations [47]. Thus, the following assertion is established:
Proposition 1. Having the legal form of a cooperative is directly related to popularity in socialnetworks.
The literature points out the importance of agglomeration economies for the circulationof knowledge and innovation of firms located in the same geographical space. Thus, therole of the network of linkages will be key to the extent that it is also structured beyondthe local level [48]. In this line, several studies in Argentine companies account for theimportance of connections with third parties and cooperation links for the circulation ofinformation and on the innovation process [10,12,49]. Thus, the literature makes it clearhow clusters are an element that enhances competitiveness, improving the innovativeperformance of the organization and its commercial actions [50]. Based on these arguments,the following proposition is put forward:
Proposition 2. The location of the entity in a central area for beekeeping production favors greaterpopularity in social networks.
On the other hand, a growing social concern for environmental issues and environ-mental conservation can be observed. An increasing number of consumers are seekinginformation in this regard and are considering environmental aspects in their purchasingdecision process [51]. In this sense, these consumers are increasingly resorting to the useof digital media as an alternative purchasing channel [52]. In addition, consumers oforganic products tend to be more active on the Internet, in part because of their greaterneed for information [53]. Precisely, among the various tools offered by the Internet, socialnetworks are the ideal platforms for acquiring trusted information and mitigating existingmisinformation when purchasing organic food [54]. From the business point of view,Mozas et al. [55] identify that the organic character of the organization positively affects itsinnovative character. Moreover, Fernández-Uclés et al. [52] show how organizations of agreener character are likely to achieve higher performance in the use of social networks.Thus, the following proposition is established:
Proposition 3. The environmental sensitivity of companies favors the increase of their popularityin social networks.
Virtual social networks are a key communication channel in the commercial strategyof organizations to increase their notoriety and improve their performance [56]. To do this,it is necessary to make a solid commitment to these tools, which will give the organizationgreater competitiveness and better business results [57]. Furthermore, when an organi-zation integrates a technology, a learning process begins that will lead to a better use ofthe technology [58]. This know-how, the result of the experience of using an innovation,makes it possible to improve business performance in an innovative environment, favoringan increase in performance and even the ability to obtain sustainable competitive advan-tages [59]. Therefore, experience is going to be a factor that will go hand in hand with anincreasingly efficient use of social networks [60]. This line of argument leads us to putforward the following proposition:
Proposition 4. The experience of using social networks favors the greater popularity of the entitiesin them.
A key aspect in organizational performance is the integration and combination ofdifferent social media [61]. Having a corporate website when accompanied by virtual
136
Agriculture 2021, 11, 694
social networks facilitates contact, information exchange and interaction with consumers,improving the company’s positioning on the Internet [62]. The interconnectivity of thedifferent online platforms gives them greater visibility and therefore better results in thismedium [63]. The existence of an increasingly sophisticated audience requires companiesto increase the amount of company information on the internet and its presence on differentplatforms [64]. Thus, the optimization of social networks requires an effective strategybased on the interaction with the different platforms where the organization is present [65].In this line, we find the strategies of so-called Inbound Marketing, based on the intercon-nection of all the virtual platforms in which the company has a presence and aimed at theconsumer, which will supposedly increase the performance of these technologies and thecompany itself [66]. Thus, we put forward the following propositions:
Proposition 5. The interconnectivity of social networks with the website leads to greater popularityin social networks.
Proposition 6. Presence on digital platforms other than the entities’ websites favors greaterpopularity in social networks.
2.2. Population and Methodology2.2.1. Population
In order to determine the organizational structure of the Argentine beekeeping sector,information was obtained on the population and basic commercial characteristics of theset of legal entities taxed under the category “beekeeping production” during the fiscalyear 2019/2020 [67]. In July 2020, a total of 228 legal entities registered in the category“beekeeping production” in the Argentine territory were identified [67]. The populationunder study in this study will be only those entities present on the social network Facebook.Precisely, the population thus defined implies a total of 65 entities, of which 43% had thelegal form of cooperative. It should be noted that this group of 65 entities concentratesapproximately half (47%) of the employment generated within the category analyzed andcontains 67% of the entities with a high-income level, 42% of those with a medium incomeand 27% of those with a low income within the Argentine beekeeping sector.
2.2.2. Methodology
With respect to the methodology used, the Qualitative Comparative Analysis (QCA)technique was employed, using the fuzzy sets approach (fsQCA), in order to establishtechnological and organizational variables that are jointly associated with a higher level ofefficiency. The QCA technique, based on Boolean algebra, uses a verbal, conceptual andmathematical language that configures it as a qualitative and quantitative approach, usefulfor small samples by combining the main advantages of both [68]. Thus, by applying QCAit is possible to systematically analyze a set of cases to determine causal patterns in the formof necessity and sufficiency relationships between a set of conditions and an outcome [69].This method has the advantage over a regression technique of establishing relationshipsbetween subsets of variables in order to explain relationships. Specifically, QCA has threemain variations: crisp-set QCA (csQCA), multi-valued QCA (mvQCA) and fuzzy-set QCA(fsQCA). Fuzzy set (fsQCA) is positioned as one of the most widely used QCA variants, asit resolves one of the main drawbacks and criticisms of the initial approach called csQCA,namely its strictly dichotomous approach [70].
Thus, fsQCA will provide as a result one or more antecedent combinations sufficientfor obtaining a particular result, such as: X1*~X2*X3 sufficient for a result (Y). Making useof the symbology of this technique (X1*~X2*X3→Y). Being: X1, X2 and X3, antecedents; Y,the result; * the union and ~ the absence or negation, in this case the opposite value to X2 (1− X2). Thus, this technique makes it possible to identify logically simplified statements that
137
Agriculture 2021, 11, 694
describe different combinations (or configurations) of conditions that indicate a specificresult [68].
The fsQCA technique was developed for small sample or population environments [68],so it is not an inconvenience for this research, in which the study universe was small. Forthe correct execution of this technique, the phases recommended in the literature werefollowed: (1) data calibration (transform variables into fuzzy sets), (2) simplify the multiplesolutions, (3) interpret the results [69]. Next, a necessity analysis of the efficiency scores onthe different causal conditions was carried out to verify that none of the values obtainedexceeded the threshold recommended in the literature of 0.9, established by Ragin [71],and this was corroborated.
In this study, the number of followers of the different organizational accounts on Face-book was used as the outcome (dependent variable). In turn, as conditions (independentvariables), the different variables shown below (Table 1) were used.
Table 1. Description of the variables used in this study.
Variable Description Type of Variable
Followers (dependent variable) Number of followers on Facebook Continuous 1
Coop Organization is a cooperative society Dichotomous 2
Location Location in a central productive region Dichotomous 2
Environmental Degree of environmental sensitivity 3 Continuous 1
Experience Days of use of the social network Facebook Continuous 1
Social web Website interfaced with social network Continuous 1
Other sites Presence on other digital platforms Dichotomous 2
1 The continuous variables were calibrated using the fsQCA 3.0 software. 2 Dichotomous variables (1: yes; 0: no).3 This variable is constructed by evaluating both the presence and frequency with which different environmentalaspects appear in the network. The information was structured along four axes: (i) explanation of the contributionof beekeeping to sustainability, (ii) manifestation of environmental concern, (iii) characteristics of the type ofproduct (organic/ecological/agro-ecological) and (iv) indication of the health benefits of consuming the mainproduct of the activity, honey. Source: own compilation.
3. Results and Discussion
3.1. Descriptive Analysis
In a first approach to the study, Table 2 shows the average descriptive values of thevariables considered in this study.
Table 2. Descriptive values of the variables used.
Variable Description
Coop 43% of the companies have a cooperative legal formLocation 75% of the companies are located in a central production region for beekeeping.Environmental 70% have some degree of environmental sensitivity.Experience The average company has been on this social network for 3.8 years (1397 days).
Social web 32% of companies have a website that leads to user interaction, linking social networksand including comments and ratings.
Other sites 63% of the organizations are present on other online platforms, different from thewebsite and social networks.
Source: own compilation.
The information included in Table 2 is here interpreted according to the trends ob-served in the international literature. Firstly, several studies have shown the potential useof ICTs by agri-food cooperatives [44–47]. Our data reveals that the cooperative naturebecomes more important when the population is analyzed by its presence on social media(28/65 over 85/228). Secondly, there is evidence that the problems with generating websitesinterconnected with social networks still persist for an important group of entities in theagri-food sector [52,55,62]. Table 2 shows that only one of three entities has this interconnec-tivity. Thirdly, there are other studies that show that the concern for sustainability aspectsis more frequently found in products classified as natural [25–31]. Here we can see howenvironmental sensitivity is present in almost two of three cases. Finally, it is recognized in
138
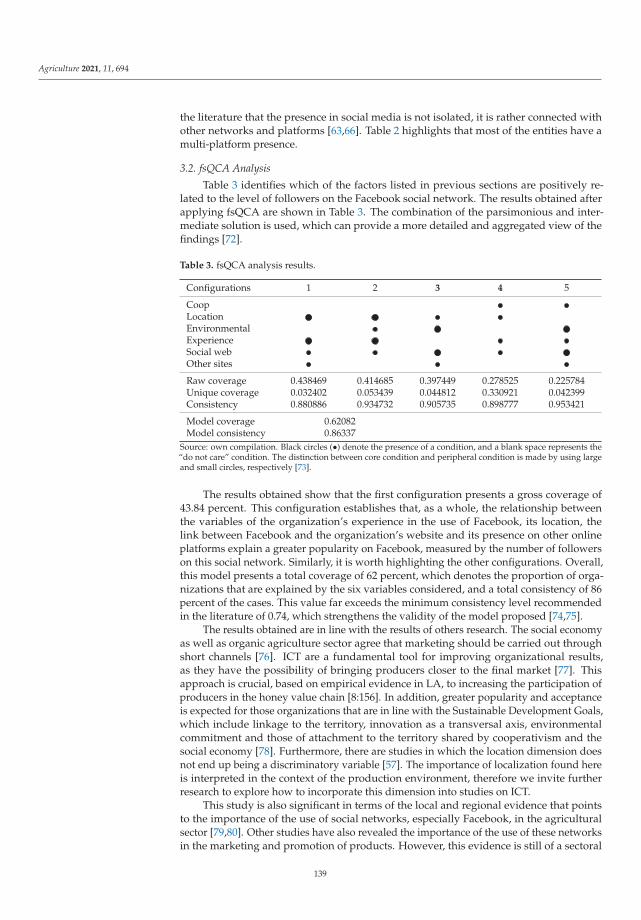
Agriculture 2021, 11, 694
the literature that the presence in social media is not isolated, it is rather connected withother networks and platforms [63,66]. Table 2 highlights that most of the entities have amulti-platform presence.
3.2. fsQCA Analysis
Table 3 identifies which of the factors listed in previous sections are positively re-lated to the level of followers on the Facebook social network. The results obtained afterapplying fsQCA are shown in Table 3. The combination of the parsimonious and inter-mediate solution is used, which can provide a more detailed and aggregated view of thefindings [72].
Table 3. fsQCA analysis results.
Configurations 1 2 3 4 5
CoopLocationEnvironmentalExperienceSocial webOther sites
Raw coverage 0.438469 0.414685 0.397449 0.278525 0.225784Unique coverage 0.032402 0.053439 0.044812 0.330921 0.042399Consistency 0.880886 0.934732 0.905735 0.898777 0.953421
Model coverage 0.62082Model consistency 0.86337
Source: own compilation. Black circles (•) denote the presence of a condition, and a blank space represents the“do not care” condition. The distinction between core condition and peripheral condition is made by using largeand small circles, respectively [73].
The results obtained show that the first configuration presents a gross coverage of43.84 percent. This configuration establishes that, as a whole, the relationship betweenthe variables of the organization’s experience in the use of Facebook, its location, thelink between Facebook and the organization’s website and its presence on other onlineplatforms explain a greater popularity on Facebook, measured by the number of followerson this social network. Similarly, it is worth highlighting the other configurations. Overall,this model presents a total coverage of 62 percent, which denotes the proportion of orga-nizations that are explained by the six variables considered, and a total consistency of 86percent of the cases. This value far exceeds the minimum consistency level recommendedin the literature of 0.74, which strengthens the validity of the model proposed [74,75].
The results obtained are in line with the results of others research. The social economyas well as organic agriculture sector agree that marketing should be carried out throughshort channels [76]. ICT are a fundamental tool for improving organizational results,as they have the possibility of bringing producers closer to the final market [77]. Thisapproach is crucial, based on empirical evidence in LA, to increasing the participation ofproducers in the honey value chain [8:156]. In addition, greater popularity and acceptanceis expected for those organizations that are in line with the Sustainable Development Goals,which include linkage to the territory, innovation as a transversal axis, environmentalcommitment and those of attachment to the territory shared by cooperativism and thesocial economy [78]. Furthermore, there are studies in which the location dimension doesnot end up being a discriminatory variable [57]. The importance of localization found hereis interpreted in the context of the production environment, therefore we invite furtherresearch to explore how to incorporate this dimension into studies on ICT.
This study is also significant in terms of the local and regional evidence that pointsto the importance of the use of social networks, especially Facebook, in the agriculturalsector [79,80]. Other studies have also revealed the importance of the use of these networksin the marketing and promotion of products. However, this evidence is still of a sectoral
139
Agriculture 2021, 11, 694
and spatial nature [81,82]. Furthermore, it is noted that both for Argentina and for LatinAmerica the volume of electronic commerce is lower than that recorded in other regions ofthe world [83]. In this way, it is necessary to examine in more detail both the use of ICTand its impact within the entities related to the beekeeping sub-sector and the agriculturalsector in Latin America [32,38].
4. Conclusions
The Argentine beekeeping sector, the third largest honey producer in the world, facesimportant problems that challenge the sustainability of the activity. Among them are theatomization and the scale of work in the primary sector, which implies a strong dependenceon distribution. This situation is intensified by the concentration of the commercial exportsector and the sale of the product, preferably in bulk, thus losing much of the addedvalue generated in the packaging and marketing stages. In response to this situation, itis necessary to improve the exchange networks in order to achieve greater differentiationof production and more direct communication with the consumer. Several authors havehighlighted the decisive role that the use of social networks can play as a communicationand information channel due to the trust they generate among users as a result of theircloseness and interactivity [45,56]. Accordingly, the aim of this paper is to analyze whichcharacteristics of beekeeping organizations are directly related to greater success in the useof these technologies, taking as a case study the third largest honey producer in the world:The Argentine beekeeping sector.
The results obtained offer empirical evidence to accept the premise that all the propo-sitions analyzed here are relevant to explaining the popularity of organizations in the mostimportant worldwide social networks, such as Facebook. In this way, and beyond aspectsrelated to the use of the network itself, the cooperative nature, environmental sensitivity,appropriate location and the linkage of the company with different online platforms arereasons that lead companies to improve their positioning in social networks. It is identifiedthat the variables of location of the entity and the interconnection between the network andits own website become necessary conditions in most of the configurations. It is also notedthat the variables of environmental sensitivity and presence on other platforms will be ofparticular importance, especially for cooperatives that are not located in a central area.
The results obtained can help to make beekeeping sector entities aware of the potentialof social networks to address the commercial problems they face and their best position totake advantage of it, given the specific characteristics of this market. At the same time, theyshould serve as an incentive for both public and private organizations to take measures tocorrect in time the possible lags that may occur with respect to other sectors in terms ofthe use of online social networks for commercial purposes. The relevance and topicality ofthe beekeeping sector, as well as the presence of a society that is increasingly technologicaland demanding of natural products, makes it relevant to continue delving into this line ofresearch. As a proposal for future developments, it is interesting to analyze other sectorsor to quantify economically the impact of these tools on the organizational structure ofbeekeeping organizations.
At this point, it is necessary to point out the main limitations of this study. On the onehand, it is worth mentioning that this research has been directed especially at beekeepingsector entities, although we believe that these contributions can be extrapolated to a largepart of the agri-food sector, which presents, in general terms, a similar basic problem interms of marketing. On the other hand, we also note as a limitation that this study hasfocused on the national level. In this sense, although Argentina occupies a privilegedposition in honey production, it might be interesting to contrast its situation with that ofother producing countries.
Author Contributions: Conceptualization, methodology and formal analysis, D.F.-U., A.M.-M., andE.B.-J. Investigation and resources, J.A. All authors have read and agreed to the published version ofthe manuscript.
140
Agriculture 2021, 11, 694
Funding: This research received no external funding.
Institutional Review Board Statement: Not applicable.
Informed Consent Statement: Not applicable.
Data Availability Statement: This study did not report any data.
Conflicts of Interest: The authors declare no conflict of interest. The funders had no role in the designof the study; in the collection, analyses, or interpretation of data; in the writing of the manuscript, orin the decision to publish the results.
References
1. Food and Agriculture Organization of the United Nations. FAOSTAT- Producción y Comercio Agropecuario. Available online:http://www.fao.org/faostat/es/#data/QL (accessed on 26 March 2020).
2. Andrieu, J. De tranqueras y candados. Las mujeres, su acceso a la tierra y bienes comunes. In Economía Feminista Para laSostenibilidad de la Vida; Friedrich-Ebert-Stiftung: Buenos Aires, Argentina, 2020; pp. 18–24. Available online: https://www.fes-argentina.org/publicaciones/ (accessed on 10 December 2020).
3. De-Groot, G.S.; Aizen, M.A.; Sáez, A.; Morales, C.L. Large-scale monoculture reduces honey yield: The case of soybean expansionin Argentina. Agric. Ecosyst. Environ. 2021, 306, 107203. [CrossRef]
4. MAGYP. Cadena Apícola: Informe Coyuntura Mensual N186. Área Apícola—Ministerio de Agroindustria: Capital Fed-eral, Argentina. 2019. Available online: http://www.alimentosargentinos.gob.ar/HomeAlimentos/Apicultura/documentos/SintesisApic186.pdf (accessed on 10 April 2020).
5. MAGYP. Alimentos Argentinos. Apicultura. RENAPA. MAGyP: Capital Federal, Argentina. 2020. Available online: http://www.alimentosargentinos.gob.ar/HomeAlimentos/Apicultura/renapa.php (accessed on 23 April 2021).
6. MAGYP. Alimentos Argentinos. Apicultura. Síntesis Apícola. MAGyP: Capital Federal, Argentina. 2020. Available online:http://www.alimentosargentinos.gob.ar/HomeAlimentos/Apicultura/documentos/Sintesis-Apicola-Julio2020.pdf (accessedon 23 April 2021).
7. TRADEMAP. Estadísticas del Comercio Para el Desarrollo Internacional de las Empresas. Available online: http://www.trademap.org (accessed on 26 March 2020).
8. Tonantzi, K. Mercado y Comercialización de la Miel: Un Acercamiento a Oaxaca. Master’s Thesis, Ciencias en EstrategiaAgroempresarial, Universidad Autónoma Chapingo, Chapingo, Mexico, 2020.
9. MAGYP. Alimentos Argentinos. Apicultura. Tendencias Producción Orgánica. MAGYP: Capital Federal, Argentina. 2019.Available online: http://www.alimentosargentinos.gob.ar/HomeAlimentos/Organicos/documentos/TendenciaORGANICO12.pdf (accessed on 10 April 2020).
10. Estrada, M.E. Rasgos de la Territorialización en Complejos Productivos no Tradicionales Basados en Recursos Naturales: LaApicultura en el Sudoeste Bonaerense. Ph.D. Thesis, Departamento de Geografía y Turismo, Universidad Nacional del Sur, BahíaBlanca, Argentina, 2015.
11. MAGYP. Alimentos Argentinos. Apicultura. Argentina Exportó Miel Fraccionada a Brasil Después de Más de Una Década.MAGYP: Capital Federal, Argentina. 2018. Available online: http://www.alimentosargentinos.gob.ar/HomeAlimentos/Noticias/nota/1124/argentina-exporto-miel-fraccionada-a-brasil-despues-de-mas-de-una-decada (accessed on 10 April 2020).
12. Goslino, M. Apicultura en el Sudoeste Bonaerense: Una Propuesta de Eficiencia y Sustentabilidad en Esquemas de Comercial-ización Conjunta. Master’s Thesis, Economía Agraria y Administración Rural, Universidad Nacional del Sur, Bahía Blanca,Argentina, 2017.
13. Malak-Rawlikowska, A.; Majewski, E.; Was, A.; Borgen, S.O.; Csillag, P.; Donati, M.; Freeman, R.; Hoang, V.; Lecoeur, J.-P.; Mancini,M.C.; et al. Measuring the Economic, Environmental, and Social Sustainability of Short Food Supply Chains. Sustainability 2019,11, 4004. [CrossRef]
14. World Bank. Datos Por País. Argentina. Población. Available online: https://datos.bancomundial.org/indicador/SP.POP.TOTL?locations=AR (accessed on 26 March 2020).
15. Sanchez, C.; Castignani, H.; Rabaglio, M. Mercado Apícola Internacional; INTA Ediciones: Buenos Aires, Argentina, 2018; pp. 1–23.16. Instituto Nacional de Tecnología Agropecuaria. Alimentos: El Consumo Responsable Cambia Paradigmas. 2018. Available online:
https://intainforma.inta.gob.ar/alimentos-el-consumo-responsable-cambia-paradigmas/ (accessed on 7 May 2021).17. Pippinato, L.; Blanc, S.; Mancuso, T.; Brun, F. A Sustainable Niche Market: How Does Honey Behave? Sustainability 2020, 12, 678.
[CrossRef]18. Garry, S.; Parada Gómez, Á.M.; Salido Marcos, J. Incorporación de mayor valor en la cadena de la miel y productos derivados de
la colmena en el Pacífico Central, Costa Rica. Ciudad de México. 2017. Available online: https://repositorio.cepal.org/bitstream/handle/11362/42232/1/S1700970_es.pdf (accessed on 5 May 2021).
19. Urquiza-Jozami, J.; Berges, M.; Casellas, K.; De-Greef, G.; Gil, J.M.; Liseras, N. Preferencias del consumidor y canales cortos decomercialización de miel en Mar del Plata. Doc. Trab. CIEP 2019, 2, 1–40.
20. Sebillotte, C. L’Argentine dans le contexte latino-américain: Consommations alimentaires, santé et politiques nutritionnelles.OCL Oilseeds Fats Crop. Lipids EDP 2018, 25, 1–20. [CrossRef]
141
Agriculture 2021, 11, 694
21. Blacha, L. El menú del agronegocio: Monocultivo y malnutrición del productor al consumidor (1996–2019). Rev. Hist. Debates ETend. 2020, 20, 9–24. [CrossRef]
22. Aguirre, P. Feeding, cooking, sharing: A brief social history of food. Mètode Sci. Stud. J. Annu. Rev. 2021, 11. [CrossRef]23. Potts, J.; Lynch, M.; Wilkings, A.; Hupp, G.; Cunningham, M.; Voora, V. The Sate of Sustainability Initiatives Review 2014: Standards
and the Green Economy; International Institute for Sustainable Development (IISD): Winnipeg, MB, Canada; International Institutefor Environment and Development (IIED): London, UK, 2014; pp. 1–345.
24. Filippi, M.; Chapdaniel, A. Sustainable demand-supply chain: An innovative approach for improving sustainability in agrifoodchains. Int. Food Agribus. Manag. 2020, 24, 1–16. [CrossRef]
25. Scuderi, A.; Bellia, C.; Foti, V.T.; Sturiale, L.; Timpanaro, G. Evaluation of consumers’ purchasing process for organic foodproducts. AIMS Agric. Food 2019, 4, 251–265. [CrossRef]
26. Kim, J. Analysis for Growth Potential in Response to Changes in the Online Food Market. Sustainability 2020, 12, 4386. [CrossRef]27. Cristobal-Fransi, E.; Montegut-Salla, Y.; Ferrer-Rosell, B.; Daries, N. Rural cooperatives in the digital age: An analysis of the
Internet presence and degree of maturity of agri-food cooperatives’ e-commerce. J. Rural. Stud. 2020, 74, 55–66. [CrossRef]28. Lyubenov, L. Beekeeping Markets outside the Honey Category. J. Mt. Agric. Balk. 2020, 23, 73–92. Available online: http:
//www.rimsa.eu/images/stockbreeding_vol_23-2_2020.pdf (accessed on 10 April 2021).29. Stricker, S.; Mueller, R.A.; Sumner, D.A. Marketing Wine on the Web. Choices Mag. 2007, 22, 31–34. Available online: http:
//www.choicesmagazine.org/2007_1/foodchains/2007_1_06.htm (accessed on 26 March 2020).30. Canavari, M.; Regazzi, D.; Spadoni, R. Origin Labels on the World Wide Web; Working Paper; Università di Bologna, Dipartimento
di Economia e Ingegneria Agrarie: Bologna, Italy, 2002.31. Ribeiro-Soriano, D. Small business and entrepreneurship: Their role in economic and social development. Entrep. Reg. Dev. 2017,
29, 1–3. [CrossRef]32. Gallacher, M.; Justo, A. Uso de TICs en el Sector Agropecuario con Énfasis en el Subsector Apícola de Argentina, Uruguay, República
Dominicana y Costa Rica; INTA CIEP: Buenos Aires, Argentina, 2016; pp. 1–22.33. Scaglione, A. Percepción del Consumidor de Miel de Abejas en la Ciudad de La Plata. Tesis de Grado, Facultad de Ciencias
Agrarias y Forestales, Universidad Nacional de La Plata, La Plata, Argentina. 2016. Available online: http://sedici.unlp.edu.ar/handle/10915/56144 (accessed on 10 April 2021).
34. Mouteira, M.C.; Dedomenici, A.C.; Alberto, C.M.; Pérez, R.C.; Paradela, M.P. Productos agroalimentarios: Hábito de compra yconsumo de miel en la localidad de La Plata. In Proceedings of the IV Reunión Transdisciplinaria en Ciencias Agropecuarias, LaPlata, Argentina, 11–12 December 2019; Available online: http://sedici.unlp.edu.ar/handle/10915/88223 (accessed on 5 May2021).
35. ESIC Market Submitter; Bragulat, T.; Angón, E.; Giorgis, A.; Perea, J. Typology and Characterization of the Pampean BeekeepingSystems. ESIC Mark. Econ. Bus. J. 2020, 51, 299–318. Available online: https://ssrn.com/abstract=3609956 (accessed on 5 May2021). [CrossRef]
36. Lavarello, P.; Bil, D.; Vidosa, R.; Langard, F. Reconfiguración del oligopolio mundial y cambio tecnológico frente a la agricultura4.0: Implicancias para la trayectoria de la maquinaria agrícola en Argentina. Ciclos 2019, XXVI, 163–193. Available online:http://hdl.handle.net/11336/123424 (accessed on 10 April 2021).
37. Di-Bartolo, A.L.; Martin, M. Evaluación de Potencial Innovador y de Mercado de Plataforma de Gestión Para EmpresasAgropecuarias. Tesis de Grado, Facultad de Ingeniería, Universidad Nacional de Mar del Plata, Mar del Plata, Argentina. 2020,pp. 1–102. Available online: http://rinfi.fi.mdp.edu.ar/xmlui/handle/123456789/447 (accessed on 10 April 2021).
38. Bellini-Saibene, Y.; Caldera, J.; Ramos, L. Cosechando Datos. Desarrollos para la agricultura en la era digital. Electron. J. Sadio EJS2020, 19, 64–95. Available online: https://ojs.sadio.org.ar/index.php/EJS/article/view/158 (accessed on 10 April 2021).
39. Powell, T.C.; Dent-Micallef, A. Information technology as competitive advantage: The roles of human, business and technologyresources. Strateg. Manag. J. 1997, 18, 375–405. [CrossRef]
40. Karoui, M.; Dudezert, A.; Leidner, D.E. Strategies and symbolism in the adoption of organizational social networking systems. J.Strateg. Inf. Syst. 2015, 24, 15–32. [CrossRef]
41. Laroche, M.; Habibi, M.R.; Richard, M.O. To be or not to be in social media: How brand loyalty is affected by social media. Int. J.Inf. Manag. 2013, 33, 76–82. [CrossRef]
42. Vlachvei, A.; Notta, O.; Diotallevi, F.; Marchini, A. Web marketing strategies in Agro Food SMES—Evidence from Greek andItalian wine SMEs. In E-Innovation for Sustainable Development of Rural Resources during Global Economic Crisis; Andreopoulou, Z.,Samathrakis, V., Louca, S., Vlachopoulou, M., Eds.; IGI Global: Hershey, PA, USA, 2014; pp. 199–220.
43. Befecadu, J.; Chembezi, D.M.; McFarlane, D. Internet Adoption and Use of E-Commerce Strategies by Agribusiness Firms inAlabama. In Proceedings of the Southern Agricultural Economics Association Annual Meeting, Mobile, AL, USA, 1–5 February2003. [CrossRef]
44. Mozas, A.; Bernal, E. Posibilidades y aplicaciones de la Web 2.0: Un caso de estudio aplicado a la economía social. CIRIEC Esp.Rev. Econ. Pública Soc. Coop. 2012, 74, 261–283.
45. Fernández-Uclés, D.; Mozas-Moral, A.; Bernal-Jurado, E.; Medina-Viruel, M.J. Uso y eficiencia de la social media. Un análisisdesde la economía social. CIRIEC Esp. Rev. Econ. Pública Soc. Coop. 2016, 88, 4–27. [CrossRef]
46. Montegut, Y.; Cristóbal, E.; Gómez, M.J. La implementación de las TIC en la gestión de las cooperativas agroalimentarias: El casode la provincia de Lleida. REVESCO Rev. Estud. Coop. 2013, 110, 223–253. [CrossRef]
142
Agriculture 2021, 11, 694
47. López, E.I.; Arcas, N.; Alcón, F. Uso y calidad de los sitios Web: Evaluación en las empresas agroalimentarias murcianas. Rev. Esp.Estud. Agrosoc. Pesq. 2014, 237, 155–179.
48. Boschma, R.A.; Ter Wal, A.L. Knowledge networks and innovative performance in an industrial district: The case of a footweardistrict in the South of Italy. Ind. Innov. 2007, 14, 177–199. [CrossRef]
49. Arza, V.; López, E. Obstacles to innovation and firm size. Obstacles of innovation and firm size: A quantitative study forArgentina. Int. Dev. Bank. 2018. Available online: https://publications.iadb.org/publications/english/document/Obstacles-to-Innovation-and-Firm-Size-A-Quantitative-Study-for-Argentina.pdf (accessed on 3 August 2020).
50. Claver-Cortés, E.; Marco-Lajara, B.; Sánchez-García, E.; Seva-Larrosa, P.; Manresa-Marhuenda, E.; Ruiz-Fernández, L.; Poveda-Pareja, E. A Literature Review on the Effect of Industrial Clusters and the Absorptive Capacity on Innovation. Int. J. Ind. Manuf.Eng. 2020, 14, 489–498.
51. Hilverda, F.; Kuttschreuter, M.; Giebels, E. Social media mediated interaction with peers, experts and anonymous authors:Conversation partner and message framing effects on risk perception and sense-making of organic food. Food Qual. Prefer. 2017,56, 107–118. [CrossRef]
52. Fernández-Uclés, D.; Mozas-Moral, A.; Bernal-Jurado, E.; Medina-Viruel, M.J. The importance of websites for organic agri-foodproducers. Econ. Res. Ekon. Istraž. 2019, 33, 2867–2880. [CrossRef]
53. Lee, H.J.; Yun, Z.S. Consumers’ perceptions of organic food attributes and cognitive and affective attitudes as determinants oftheir purchase intentions toward organic food. Food Qual. Prefer. 2015, 39, 259–267. [CrossRef]
54. Evelyn, C.; Qiang, L.; Rohan, M. Social media, customer relationship management, and consumers’ organic food purchasebehavior. In Strategic Customer Relationship Management in the Age of Social Media; Khanlari, A., Ed.; IGI Global: Hershey, PA, USA,2015; pp. 198–215.
55. Mozas-Moral, A.; Bernal-Jurado, E.; Fernández-Uclés, D.; Medina-Viruel, M.J. Innovation as the Backbone of SustainableDevelopment Goals. Sustainability 2020, 12, 4747. [CrossRef]
56. Shiau, W.L.; Dwivedi, Y.K.; Yang, H.S. Co-citation and cluster analyses of extant literature on social networks. Int. J. Inf. Manag.2017, 37, 390–399. [CrossRef]
57. Jorge-Vázquez, J.; Cebolla, C.; Peana, M.; Salinas Ramos, F. La transformación digital en el sector cooperativo agroalimentarioespañol: Situación y perspectivas. CIRIEC Esp. Rev. Econ. Pública Soc. Coop. 2019, 95, 39–70. [CrossRef]
58. Fagerberg, J.; Mowery, D.C.; Nelson, R.R. The Oxford Handbook of Innovation; Oxford University Press: New York, NY, USA, 2005.59. Jiménez, D.; Sanz, R. Innovation, organizational learning, and performance. J. Bus. Res. 2011, 64, 408–417. [CrossRef]60. Mozas, A.; Bernal, E.; Medina, M.J.; Fernández, D. Factors for success in online social networks: An fsQCA approach. J. Bus. Res.
2016, 69, 5261–5264. [CrossRef]61. Kaplan, A.M.; Haenlein, M. Users of the world, unite The challenges and opportunities of Social Media. Bus. Horiz. 2010, 53,
59–68. [CrossRef]62. Tian, Y.; Robinson, J.D. Media use and health information seeking: An empirical test of complementarity theory. Health Commun.
2008, 23, 184–190. [CrossRef]63. Ghulam, A.; Depar, M.H.; Ali, S.; Rahu, S. On-Page Search Engine Optimization (SEO) Techniques Model: A Use Case Scenario of
a Business Entity Website. Int. J. Res. Appl. Sci. Eng. Technol. 2017, 11, 3076–3083.64. Revilia, D.; Irwansyah, I. Social Media Optimization: Promotional Strategy towards Library 4.0 Era. Proc. Int. Conf. Doc. Inf. 2019,
2, 37–71. [CrossRef]65. Sahai, S.; Goel, R.; Malik, P.; Krishnan, C.; Singh, G.; Bajpai, C. Role of social media optimization in digital marketing with special
reference to Trupay. Int. J. Eng. Technol. 2018, 7, 52–57. [CrossRef]66. Patrutiu, L. Inbound Marketing-the most important digital marketing strategy. Bull. Transilv. Univ. Brasov Econ. Sci. Ser. V 2016, 9,
61–68.67. NOSIS. Investigación y Desarrollo. Available online: http://www.nosis.com.ar (accessed on 14 August 2020).68. Ragin, C. The Comparative Method: Moving beyond Qualitative and Quantitative Strategies; University of California Press: Berkeley,
CA, USA, 1987.69. Schneider, C.Q.; Wagemann, C. Standards of good practice in qualitative comparative analysis (QCA) and fuzzy-sets. Comp.
Sociol. 2010, 9, 397–418. [CrossRef]70. Sehring, J.; Korhonen, K.; Brockhaus, M. Qualitative Comparative Analysis (QCA): An Application to Compare National REDD+, Policy
Processes; CIFOR: Bogor, Indonesia, 2013. [CrossRef]71. Ragin, C.C. Set relations in social research: Evaluating their consistency and coverage. Political Anal. 2006, 14, 291–310. [CrossRef]72. Fiss, P.C. A set-theoretic approach to organizational configurations. Acad. Manag. Rev. 2007, 32, 1180–1198. [CrossRef]73. Pappas, I.O.; Woodside, A.G. Fuzzy-set Qualitative Comparative Analysis (fsQCA): Guidelines for research practice in Information
Systems and marketing. Int. J. Inf. Manag. 2021, 58, 102310. [CrossRef]74. Ragin, C.C. Redesigning Social Inquiry: Fuzzy Sets and beyond; University of Chicago Press: Chicago, IL, USA, 2008.75. Woodside, A.G. Moving beyond multiple regression analysis to algorithms: Calling for adoption of a paradigm shift from
symmetric to asymmetric thinking in data analysis and crafting theory. J. Bus. Res. 2013, 66, 463–472. [CrossRef]76. Schwab, F.; Calle-Collado, A.; Muñoz, R. Economía social y solidaria y agroecología en cooperativas de agricultura familiar
en Brasil como forma de desarrollo de una agricultura sostenible. CIRIEC Esp. Rev. Econ. Pública Soc. Coop. 2020, 98, 189–211.[CrossRef]
143
Agriculture 2021, 11, 694
77. Mozas, A.; Bernal, E.; Fernández, D.; Medina, M.J.; Puentes, R. Cooperativismo de segundo grado y adopción de las TIC. CIRIECEsp. Rev. Econ. Pública Soc. Coop. 2020, 100, 67–85. [CrossRef]
78. Alarcón, M.Á.; Álvarez, J.F. El balance social y las relaciones entre los objetivos de desarrollo sostenible y los principioscooperativos mediante un análisis de redes sociales. CIRIEC Esp. Rev. Econ. Pública Soc. Coop. 2020, 99, 57–87. [CrossRef]
79. Santini, S.; Ghezan, G.; Bontempo, M. Uso de las TIC por parte de Agricultores Familiares en el Sudeste de la provincia deBuenos Aires. In Proceedings of the X Jornadas Interdisciplinarias de Estudios Agrarios y Agroindustriales Argentinos yLatinoamericanos, Buenos Aires, Argentina, 7–10 November 2017; Available online: http://hdl.handle.net/20.500.12123/4172(accessed on 5 May 2021).
80. Urcola, M. Articulación de las TIC en el sector agrícola pampeano: La apropiación de la telefonía celular, las computadoras eInternet entre los productores de una localidad del sur santafesino. Rev. Temas Debates 2012. [CrossRef]
81. Santini, S.; Ghezan, G. Uso y resignificación de las TIC en una red de comercio electrónico de alimentos agroecológicos. InProceedings of the II Jornadas de Sociología Facultad de Humanidades-UNMP, Mar del Plata, Argentina, 28–29 March 2019;Available online: http://hdl.handle.net/20.500.12123/4780 (accessed on 5 May 2021).
82. Jones, C.; Motta, J.; Alderete, M.V. Gestión estratégica de tecnologías de información y comunicación y adopción del comercioelectrónico en Mipymes de Córdoba, Argentina. Estud. Gerenc. 2016, 32, 4–13. [CrossRef]
83. Perdigón, R.; Pérez, M. Holistic analysis of the social impact of electronic business in Latin America, from 2014 to 2019. Análisisholístico del impacto social de los negocios electrónicos en América Latina, de 2014 a 2019. Paakat Rev. Tecnol. Soc. 2020, 10, 1–23.[CrossRef]
144
agriculture
Article
Does the Self-Identity of Chinese Farmers in Rural TourismDestinations Affect Their Land-Responsibility BehaviourIntention? The Mediating Effect of MultifunctionAgriculture Perception
Xingping Cao 1, Zeyuan Luo 1, Manli He 2, Yan Liu 1,* and Junlin Qiu 1
Citation: Cao, X.; Luo, Z.; He, M.;
Liu, Y.; Qiu, J. Does the Self-Identity
of Chinese Farmers in Rural Tourism
Destinations Affect Their Land-
Responsibility Behaviour Intention?
The Mediating Effect of Multifunction
Agriculture Perception. Agriculture
2021, 11, 649. https://doi.org/
10.3390/agriculture11070649
Academic Editors: Domingo
Fernandez Ucles and Adoración
Mozas Moral
Received: 20 May 2021
Accepted: 28 June 2021
Published: 9 July 2021
Publisher’s Note: MDPI stays neutral
with regard to jurisdictional claims in
published maps and institutional affil-
iations.
Copyright: © 2021 by the authors.
Licensee MDPI, Basel, Switzerland.
This article is an open access article
distributed under the terms and
conditions of the Creative Commons
Attribution (CC BY) license (https://
creativecommons.org/licenses/by/
4.0/).
1 Business and Tourism School, Sichuan Agricultural University, No. 288, Jianshe Road,Dujiangyan 611830, China; [email protected] (X.C.); [email protected] (Z.L.);[email protected] (J.Q.)
2 School of Economics and Management, Fuzhou University, No. 2, Wulongjiang North Avenue,Xue Yuan Road, University Town, Fuzhou 350108, China; [email protected]
* Correspondence: [email protected]
Abstract: Farmers are the heart of rural tourism destinations, and their land-responsibility behavioursaffect sustainable development. In this study, four rural tourist sites in the suburbs of Chengduwere selected, and the structural equation model was used to analyse the influence of farmers’self-identity on their land-responsibility behaviours intention under the condition of agriculturalmultifunction perception as a mediation variable. The results show that, in rural tourism destinationsof suburban districts of China, farmers’ self-identity is an important variable that affects theirland-responsibility behaviour intention. Agricultural economic function perception mediates therelationship between farmers’ self-identity and land-responsibility behaviour intention. Agriculturalnon-economic function perception positively affects their agricultural economic function perception.
Keywords: self-identity; agricultural non-economic function perception; agricultural economicfunction perception; land-responsibility behaviour intention
1. Introduction
In recent years, China’s sustainable rural development has faced many challenges,some of which involve farmers’ land decisions such land-responsibility behaviour inten-tion. For example, farmers are confronted with decisions on non-point source pollutioncaused by the overuse of pesticides, the loss of traditional farming culture caused by theabandonment of peasants, as well as vegetable and food safety problems caused by pes-ticide residues. Farmers are the main subjects of the countryside and the principal forcepromoting the revitalisation of China’s rural areas. Therefore, understanding farmers’ landbehaviour could help to clarify the role of policies in development of rural areas, and to aidthe integrated and coordinated development of multiple industries, such as agriculture,forestry, and tourism, as well as encourage the protective use of environmental and culturalfactors in land-planning.
Researchers have primarily used the research framework of the theory of plannedbehaviour (TPB) [1] to investigate farmers’ land behaviour and policy interactions. TheTheory of Planned Behaviour (TPB) is an extension of the theory of reasoned action [2].The theory uses factors such as attitudes, social norms, and personal abilities to predictindividual farmers’ behavioural intentions and directions [3–6]. Farmers’ decision makingin agricultural practice can be rooted in certain social and cultural backgrounds, andmany behaviours cannot be explained by the theoretical framework of rational behaviouralone. Indeed, the included variables in the TPB cannot fully explain the large variances inindividual behavioural intentions [7,8]. Therefore, increasingly, researchers have attempted
Agriculture 2021, 11, 649. https://doi.org/10.3390/agriculture11070649 https://www.mdpi.com/journal/agriculture
145
Agriculture 2021, 11, 649
to combine the rational logic of TPB with farmers’ personal emotions, feelings, and otherpsychological factors to more accurately predict and manage farmers’ land behavioursand policy responses [9,10]. To enhance the predictive power of TBP in farmers’ decisionmaking, social psychologists have renewed their interests recently in articulating howself-identity can play an important role [10,11]. Self-identity has a strong correlationwith behavioural intention across a wide range of public health areas [12–14], consumerbehaviour [15,16], and environmental behaviour [17–19]
The role of self-identity to farmers’ behavioural intentions has been illustrated empiri-cally in many studies [20,21]. Based on Self-Identity Theory, self is envisaged as a socialconstruct in which a distinctive self-component represents each of the roles we occupy indifferent social settings, internally generated role-expectation [22]. It views self as a societalrole and incorporates the meanings and expectations associated with that role. For farmers,when their self-perception positively matches with the behavioural outcomes, they wouldhave more intention to undertake the action. To summarise, self-identity is one of the mostimportant non-rational factors [23] for predicting farmers’ land-responsibility behaviour.
At present, the process of urbanisation in China is quickly advancing to the country-side, and rural tourism around large cities is developing rapidly. This rapid developmentcan be expected to affect the thinking, especially in terms of how to re-recognise themselves,agriculture and land. The development of rural tourism has changed the way that ruralresidents and urban populations interact, forming a new social interaction context. On theone hand, more and more Chinese urban residents flock to the countryside to experiencerural life. This may cause farmers to re-examine their environment and self-identity, andthus generate a new self-identity. On the other hand, in these rural areas, part of the land isdedicated to rural tourism, and agriculture has gradually developed from having a singlefunction (food and vegetable production) to multiple functions, such as natural landscapeprovision, cultural atmosphere creation, and education; furthermore, these non-economicfunctions are linked to economic functions through the tourism industry. At the sametime, farmers’ land decisions such as land-responsibility behaviour can also be affected byfarmers’ perception of internal self and external environment.
Self-Identity Theory emphasises that self-identity affects the cognitive style of indi-viduals and can predict the direction of individual perception and cognitive process. Leeet al. [24] used it within the context of the Technology Acceptance Model (TAM), intro-ducing an extension of a validated framework, and proved that self-identity influencesthe adoption behaviour of WebCT through perceived usefulness. From this perspective,how does farmers’ self-identity affect their cognition of agricultural function? Additionally,whether it determines their land responsibility behaviour? This has not been discussed inthe literature before.
The environmental protection behaviour of farmers and the issue of inheritanceof traditional culture are related to future rural sustainable development. The studydefined the land decision-making behaviours that are conducive to sustainable ruraldevelopment as land responsibility behaviour intention. In rural tourism text, farmers’land-responsibility behaviour intention refers to their intention of behaviour aimed theenvironmental protection, social profit, and inheritance of traditional culture that arerelated to future rural sustainable development. Land-responsibility behaviour is the mostimportant factor related to sustainable development of rural areas. The aim of sustainabledevelopment is to achieve a balance between the complementary goals of providingenvironmental, economic, and social opportunities for the benefit of present and futuregenerations, while also maintaining and enhancing the quality of the land resource [25].
From a farm level, contributing to the preservation of the landscape’s character,strengthening the landscape’s quality, and sustainable development, the study presents therelations of farmers self-identity, agricultural multifunction perception (including agricul-tural non-economic function perception and agricultural economic function perception),and their land responsibility behaviour. This empirical study sought to answer how farm-ers’ self-identity affects their perception of agricultural economic function, non-economic
146
Agriculture 2021, 11, 649
function and land responsibility behaviour. The findings could assist policymakers andland use planners in decision making related to sustainable rural tourism in China.
2. Literature Review and Research Hypotheses
2.1. Farmers’ Self-Identity and Its Impact on Farmers’ Land-Responsibility Behaviour Intention
Self-identity, also known as role identity, is derived from Identity Theory [26]. IdentityTheory is an important theory in the field of sociology that focuses on the social structuralattributes of people’s connection with others. Self-identity is defined by the specific rolethat a person plays, or considers themselves to play, in the existing social structure, such associal roles (parent or child), professional roles (farmer, student), and group roles (manager,employee). These different role classifications lead to the formation of different behaviouralintentions, and people spontaneously behave according to their role expectations [27,28].Scholars introduced the concept of self-identity to modify the traditional theoretical modelof planned behaviour. They pointed out that the role positioning of self-identity triggereda habitual behaviour that supports self-concept verification [29]. In this way, people try toestablish self-identity consistency between attitudes and behaviours [30,31]. Self-identityalso reflects the enduring characteristics of individual self-cognition [32], and the predictionof individual behaviour through self-identity is stable. Therefore, the socio-psychologicalfactor of self-identity is a key influencer of individual behavioural intentions [23]. Thelink between self-identity and the behavioural intentions of farmers has been confirmedby many studies. For example, farmers’ pro-environmental behaviours, environmentalprotection behaviours under non-economic subsidies, as well as land decisions not onlydepend on rational decisions [10,33], but also variables such as perception of farmers’ jobindependence, pride [30,34], and farmers’ lifestyles [35], which have been reported to havea direct or indirect effect on farmers’ individual behavioural intentions. Research fromLokhorst et al. [33] has shown that farmers’ self-identity affects their pro-environmentalbehaviours by affecting their connectedness to nature.
Self-identity can be a direct or intermediary condition that affects farmers’ land be-haviour by affecting their cognition and other socio-psychological factors (such as attitudesand social norms). Therefore, based on the perspective of farmers’ self-identity, this studyexplored the impact path of farmers’ land-responsibility behaviour intention in suburbanrural tourism destinations. As such, we made the following hypothesis:
Hypothesis (H1). Farmers’ self-identity has a positive significant impact on farmers’ land-responsibility behaviour intention.
2.2. Farmers’ Perception of Agricultural Multifunction: Agricultural Non-Economic FunctionPerception and Agricultural Economic Function Perception
The concept of “agricultural multifunction” or “agricultural versatility” describes themultiple non-productive benefits of agricultural systems and land. It has been highlightedthat, in addition to food production, agriculture also exerts unique production functionssuch as economy, society, environment, and culture, and is the result of the joint productionof economic and non-economic products (Millennium Ecosystem Assessment, 2005).
With the continuous changes in agriculture and land functions in modern society, aswell as the development of agricultural tourism and rural tourism, the theme of agricul-tural multifunction has received more and more academic attention. Much research onagricultural multifunction has focused on the national and regional levels, mainly inves-tigating the value judgement of agricultural multifunction, land multifunction planning,agricultural compensation system design, urban agricultural development positioning,and agricultural multifunction technical practice. Practical technical methods, such as ruralgovernance and village planning, need to be studied from multiple dimensions, such assubject and function. Multifunctional agriculture is the basic unit of decision making and adirect expression of multifunctional agriculture in families, farms, and rural communities;in particular, the agricultural multifunction at the family farm level is closely related tofarmers’ attitudes, ideas, and identity [36].
147
Agriculture 2021, 11, 649
From the perspective of European land management practices, there is reportedly aprofound interaction between the policy of agricultural multifunction and farmers [37].However, in the context of China’s tourism development, previous research on the multi-function of agriculture in China has overlooked the micro-levels of communities, businesses,families, and individual farmers. Instead, it has mainly focused on human geography,environmental science and resource utilisation, and landscape planning, involving the eval-uation of the multifunction of agricultural landscapes, spatial identification, and planningmanagement. In response to this gap in the literature, this study took farmers who are mostclosely connected to the land as the research object. From the perspective of the perceptionof agricultural “multifunction”, we focused on the micro-expression of the “agriculturalmultifunction” of rural tourism destinations; additionally, we combined the self-identityof farmers in rural tourism destinations, the perception of the importance of agriculturalmultifunction, and farmers’ land-responsibility behaviour intention, and in such a way, amicro-perspective for multifunctional agricultural research is provided.
Social logic and economic studies have traditionally studied agriculture as a means ofmaking money and improving the livelihoods of farmers. At the same time, agriculturalactivities are also affected by various irrational factors, such as culture, family, and lifestylepreferences [38]. Therefore, we believe that farmers’ perception of agricultural multifunc-tion can be divided into two dimensions: agricultural economic function perception andagricultural non-economic function perception. Some studies have shown that there arelarge differences between farmers’ perceptions and practices of multifunctional agriculture.For example, a survey results of Norwegian farmers’ showed that the respondents iden-tified themselves as producing not only high-quality food, but also public goods such ascultural landscapes and cultural heritage, and income maximisation is less important [39].Another study found that residents in the state of Maine felt protecting farmland wasimportant, but that protecting natural resources/wild landscapes was more important [40].Hence, this study puts forward the following research hypotheses:
Hypothesis (H2a). Farmers’ self-identity positively affects their agricultural non-economic func-tion perception.
Hypothesis (H2b). Farmers’ self-identity positively affects their agricultural economic func-tion perception.
Farmers’ perception of agricultural multifunction may influence their land-responsibilitybehaviour intention. Previous studies have shown that, at the farm level, the perceptionand practice of multifunctional agriculture affects farmers’ environmental protection be-haviours (such as reducing the use of pesticides), and farmers’ protection and inheritanceof traditional culture [41]. The awareness of agricultural landscape values enable farmersto create new strategies [42].
Kontogeorgos et al. [43] mentioned that the farmers’ perceptions towards land environ-ment impact their responsibility to protect it. While, the farmers were beginning to realisethe importance of landscape culture and tourism and leisure functions of cultivated land.Taking tourism and leisure functions as an example, in order to create a good atmosphereand to create their own farm characteristics to attract tourists, farmers will learn how toimprove the ecological environment protection of their cultivated land. Then, we believethat the farmers’ agricultural non-economic perception will affect their willingness to takeland responsibility behaviour positively.
Previous study has investigated farmers’ attitudes about farming, the results indicatedthat land is always closely related to farmers’ income and livelihoods, then they viewthemselves in a caretaker role for the land and showed their greater concern for the soilas a resource [44]. Emerton and Snyder [45] identified characteristics such as the abilityto generate higher crop yields, better food supplies influence farmers’ sustainable landmanagement choices. Hence, we consider that farmers’ economic perception of agriculturalmay influence their land-responsibility behavioural intention.
148
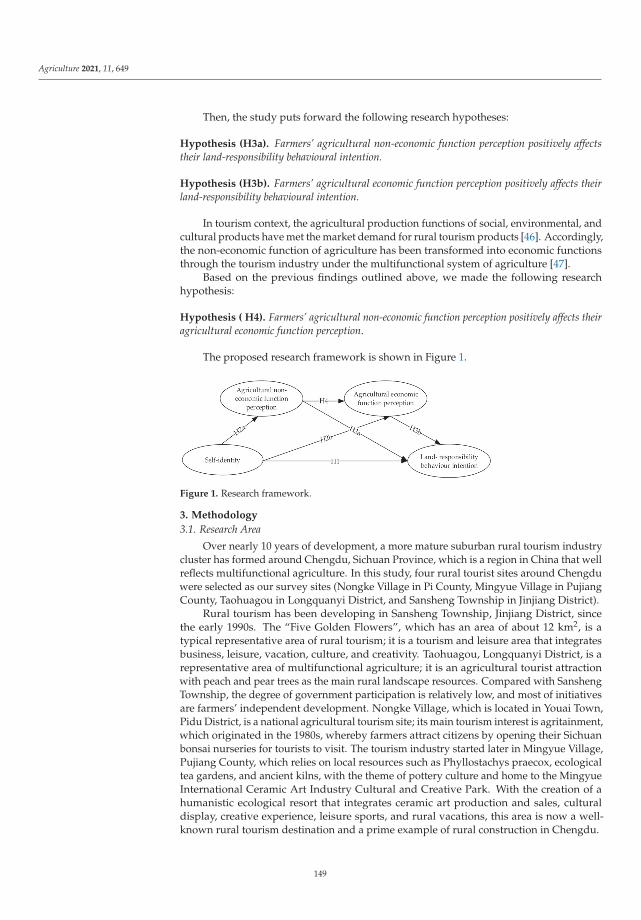
Agriculture 2021, 11, 649
Then, the study puts forward the following research hypotheses:
Hypothesis (H3a). Farmers’ agricultural non-economic function perception positively affectstheir land-responsibility behavioural intention.
Hypothesis (H3b). Farmers’ agricultural economic function perception positively affects theirland-responsibility behavioural intention.
In tourism context, the agricultural production functions of social, environmental, andcultural products have met the market demand for rural tourism products [46]. Accordingly,the non-economic function of agriculture has been transformed into economic functionsthrough the tourism industry under the multifunctional system of agriculture [47].
Based on the previous findings outlined above, we made the following researchhypothesis:
Hypothesis ( H4). Farmers’ agricultural non-economic function perception positively affects theiragricultural economic function perception.
The proposed research framework is shown in Figure 1.
Figure 1. Research framework.
3. Methodology
3.1. Research Area
Over nearly 10 years of development, a more mature suburban rural tourism industrycluster has formed around Chengdu, Sichuan Province, which is a region in China that wellreflects multifunctional agriculture. In this study, four rural tourist sites around Chengduwere selected as our survey sites (Nongke Village in Pi County, Mingyue Village in PujiangCounty, Taohuagou in Longquanyi District, and Sansheng Township in Jinjiang District).
Rural tourism has been developing in Sansheng Township, Jinjiang District, sincethe early 1990s. The “Five Golden Flowers”, which has an area of about 12 km2, is atypical representative area of rural tourism; it is a tourism and leisure area that integratesbusiness, leisure, vacation, culture, and creativity. Taohuagou, Longquanyi District, is arepresentative area of multifunctional agriculture; it is an agricultural tourist attractionwith peach and pear trees as the main rural landscape resources. Compared with SanshengTownship, the degree of government participation is relatively low, and most of initiativesare farmers’ independent development. Nongke Village, which is located in Youai Town,Pidu District, is a national agricultural tourism site; its main tourism interest is agritainment,which originated in the 1980s, whereby farmers attract citizens by opening their Sichuanbonsai nurseries for tourists to visit. The tourism industry started later in Mingyue Village,Pujiang County, which relies on local resources such as Phyllostachys praecox, ecologicaltea gardens, and ancient kilns, with the theme of pottery culture and home to the MingyueInternational Ceramic Art Industry Cultural and Creative Park. With the creation of ahumanistic ecological resort that integrates ceramic art production and sales, culturaldisplay, creative experience, leisure sports, and rural vacations, this area is now a well-known rural tourism destination and a prime example of rural construction in Chengdu.
149
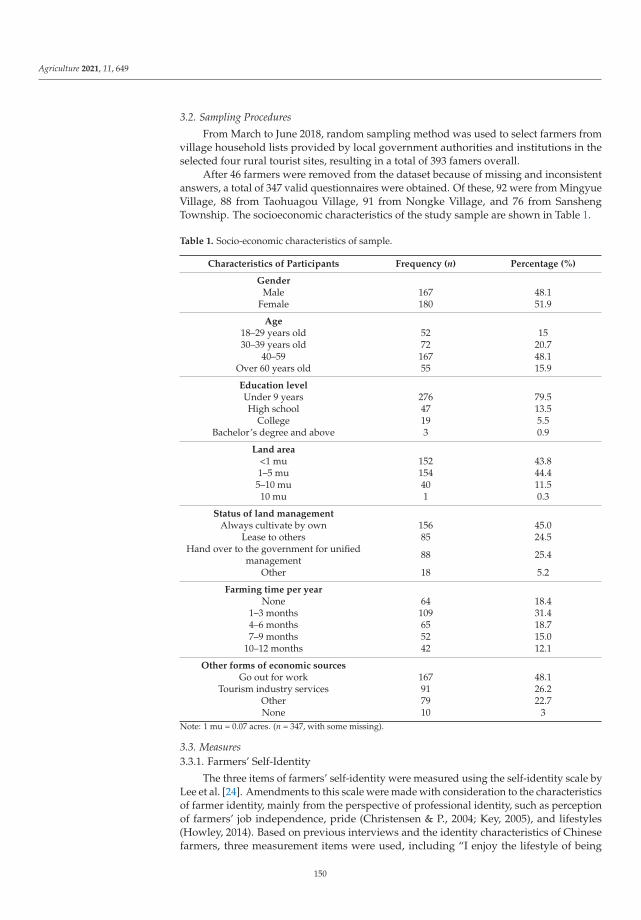
Agriculture 2021, 11, 649
3.2. Sampling Procedures
From March to June 2018, random sampling method was used to select farmers fromvillage household lists provided by local government authorities and institutions in theselected four rural tourist sites, resulting in a total of 393 famers overall.
After 46 farmers were removed from the dataset because of missing and inconsistentanswers, a total of 347 valid questionnaires were obtained. Of these, 92 were from MingyueVillage, 88 from Taohuagou Village, 91 from Nongke Village, and 76 from SanshengTownship. The socioeconomic characteristics of the study sample are shown in Table 1.
Table 1. Socio-economic characteristics of sample.
Characteristics of Participants Frequency (n) Percentage (%)
GenderMale 167 48.1
Female 180 51.9
Age18–29 years old 52 1530–39 years old 72 20.7
40–59 167 48.1Over 60 years old 55 15.9
Education levelUnder 9 years 276 79.5High school 47 13.5
College 19 5.5Bachelor’s degree and above 3 0.9
Land area<1 mu 152 43.81–5 mu 154 44.45–10 mu 40 11.510 mu 1 0.3
Status of land managementAlways cultivate by own 156 45.0
Lease to others 85 24.5Hand over to the government for unified
management 88 25.4
Other 18 5.2
Farming time per yearNone 64 18.4
1–3 months 109 31.44–6 months 65 18.77–9 months 52 15.0
10–12 months 42 12.1
Other forms of economic sourcesGo out for work 167 48.1
Tourism industry services 91 26.2Other 79 22.7None 10 3
Note: 1 mu = 0.07 acres. (n = 347, with some missing).
3.3. Measures3.3.1. Farmers’ Self-Identity
The three items of farmers’ self-identity were measured using the self-identity scale byLee et al. [24]. Amendments to this scale were made with consideration to the characteristicsof farmer identity, mainly from the perspective of professional identity, such as perceptionof farmers’ job independence, pride (Christensen & P., 2004; Key, 2005), and lifestyles(Howley, 2014). Based on previous interviews and the identity characteristics of Chinesefarmers, three measurement items were used, including “I enjoy the lifestyle of being
150
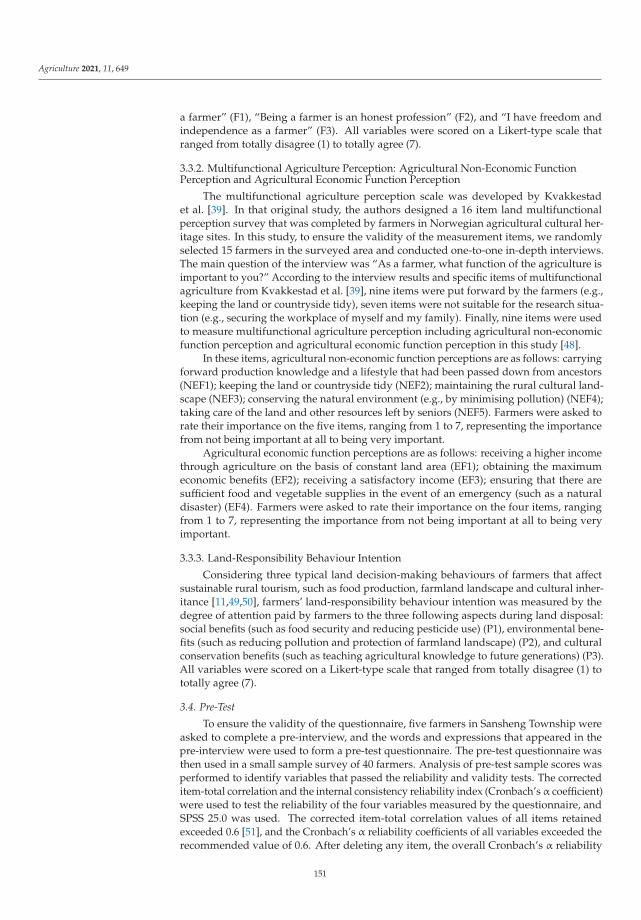
Agriculture 2021, 11, 649
a farmer” (F1), “Being a farmer is an honest profession” (F2), and “I have freedom andindependence as a farmer” (F3). All variables were scored on a Likert-type scale thatranged from totally disagree (1) to totally agree (7).
3.3.2. Multifunctional Agriculture Perception: Agricultural Non-Economic FunctionPerception and Agricultural Economic Function Perception
The multifunctional agriculture perception scale was developed by Kvakkestadet al. [39]. In that original study, the authors designed a 16 item land multifunctionalperception survey that was completed by farmers in Norwegian agricultural cultural her-itage sites. In this study, to ensure the validity of the measurement items, we randomlyselected 15 farmers in the surveyed area and conducted one-to-one in-depth interviews.The main question of the interview was “As a farmer, what function of the agriculture isimportant to you?” According to the interview results and specific items of multifunctionalagriculture from Kvakkestad et al. [39], nine items were put forward by the farmers (e.g.,keeping the land or countryside tidy), seven items were not suitable for the research situa-tion (e.g., securing the workplace of myself and my family). Finally, nine items were usedto measure multifunctional agriculture perception including agricultural non-economicfunction perception and agricultural economic function perception in this study [48].
In these items, agricultural non-economic function perceptions are as follows: carryingforward production knowledge and a lifestyle that had been passed down from ancestors(NEF1); keeping the land or countryside tidy (NEF2); maintaining the rural cultural land-scape (NEF3); conserving the natural environment (e.g., by minimising pollution) (NEF4);taking care of the land and other resources left by seniors (NEF5). Farmers were asked torate their importance on the five items, ranging from 1 to 7, representing the importancefrom not being important at all to being very important.
Agricultural economic function perceptions are as follows: receiving a higher incomethrough agriculture on the basis of constant land area (EF1); obtaining the maximumeconomic benefits (EF2); receiving a satisfactory income (EF3); ensuring that there aresufficient food and vegetable supplies in the event of an emergency (such as a naturaldisaster) (EF4). Farmers were asked to rate their importance on the four items, rangingfrom 1 to 7, representing the importance from not being important at all to being veryimportant.
3.3.3. Land-Responsibility Behaviour Intention
Considering three typical land decision-making behaviours of farmers that affectsustainable rural tourism, such as food production, farmland landscape and cultural inher-itance [11,49,50], farmers’ land-responsibility behaviour intention was measured by thedegree of attention paid by farmers to the three following aspects during land disposal:social benefits (such as food security and reducing pesticide use) (P1), environmental bene-fits (such as reducing pollution and protection of farmland landscape) (P2), and culturalconservation benefits (such as teaching agricultural knowledge to future generations) (P3).All variables were scored on a Likert-type scale that ranged from totally disagree (1) tototally agree (7).
3.4. Pre-Test
To ensure the validity of the questionnaire, five farmers in Sansheng Township wereasked to complete a pre-interview, and the words and expressions that appeared in thepre-interview were used to form a pre-test questionnaire. The pre-test questionnaire wasthen used in a small sample survey of 40 farmers. Analysis of pre-test sample scores wasperformed to identify variables that passed the reliability and validity tests. The correcteditem-total correlation and the internal consistency reliability index (Cronbach’s α coefficient)were used to test the reliability of the four variables measured by the questionnaire, andSPSS 25.0 was used. The corrected item-total correlation values of all items retainedexceeded 0.6 [51], and the Cronbach’s α reliability coefficients of all variables exceeded therecommended value of 0.6. After deleting any item, the overall Cronbach’s α reliability
151
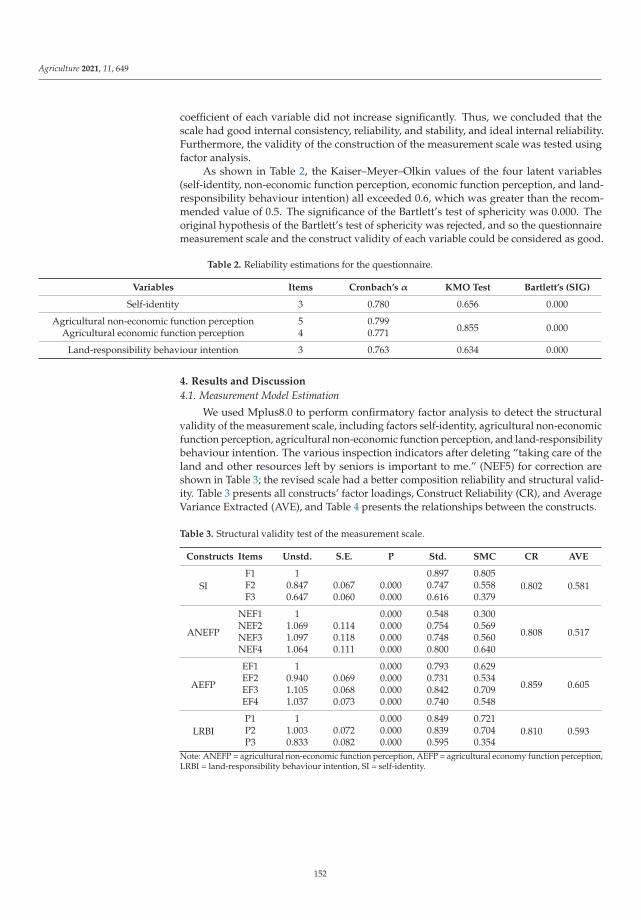
Agriculture 2021, 11, 649
coefficient of each variable did not increase significantly. Thus, we concluded that thescale had good internal consistency, reliability, and stability, and ideal internal reliability.Furthermore, the validity of the construction of the measurement scale was tested usingfactor analysis.
As shown in Table 2, the Kaiser–Meyer–Olkin values of the four latent variables(self-identity, non-economic function perception, economic function perception, and land-responsibility behaviour intention) all exceeded 0.6, which was greater than the recom-mended value of 0.5. The significance of the Bartlett’s test of sphericity was 0.000. Theoriginal hypothesis of the Bartlett’s test of sphericity was rejected, and so the questionnairemeasurement scale and the construct validity of each variable could be considered as good.
Table 2. Reliability estimations for the questionnaire.
Variables Items Cronbach’s α KMO Test Bartlett’s (SIG)
Self-identity 3 0.780 0.656 0.000
Agricultural non-economic function perception 5 0.7990.855 0.000Agricultural economic function perception 4 0.771
Land-responsibility behaviour intention 3 0.763 0.634 0.000
4. Results and Discussion
4.1. Measurement Model Estimation
We used Mplus8.0 to perform confirmatory factor analysis to detect the structuralvalidity of the measurement scale, including factors self-identity, agricultural non-economicfunction perception, agricultural non-economic function perception, and land-responsibilitybehaviour intention. The various inspection indicators after deleting “taking care of theland and other resources left by seniors is important to me.” (NEF5) for correction areshown in Table 3; the revised scale had a better composition reliability and structural valid-ity. Table 3 presents all constructs’ factor loadings, Construct Reliability (CR), and AverageVariance Extracted (AVE), and Table 4 presents the relationships between the constructs.
Table 3. Structural validity test of the measurement scale.
Constructs Items Unstd. S.E. P Std. SMC CR AVE
SIF1 1 0.897 0.805
0.802 0.581F2 0.847 0.067 0.000 0.747 0.558F3 0.647 0.060 0.000 0.616 0.379
ANEFP
NEF1 1 0.000 0.548 0.300
0.808 0.517NEF2 1.069 0.114 0.000 0.754 0.569NEF3 1.097 0.118 0.000 0.748 0.560NEF4 1.064 0.111 0.000 0.800 0.640
AEFP
EF1 1 0.000 0.793 0.629
0.859 0.605EF2 0.940 0.069 0.000 0.731 0.534EF3 1.105 0.068 0.000 0.842 0.709EF4 1.037 0.073 0.000 0.740 0.548
LRBIP1 1 0.000 0.849 0.721
0.810 0.593P2 1.003 0.072 0.000 0.839 0.704P3 0.833 0.082 0.000 0.595 0.354
Note: ANEFP = agricultural non-economic function perception, AEFP = agricultural economy function perception,LRBI = land-responsibility behaviour intention, SI = self-identity.
152
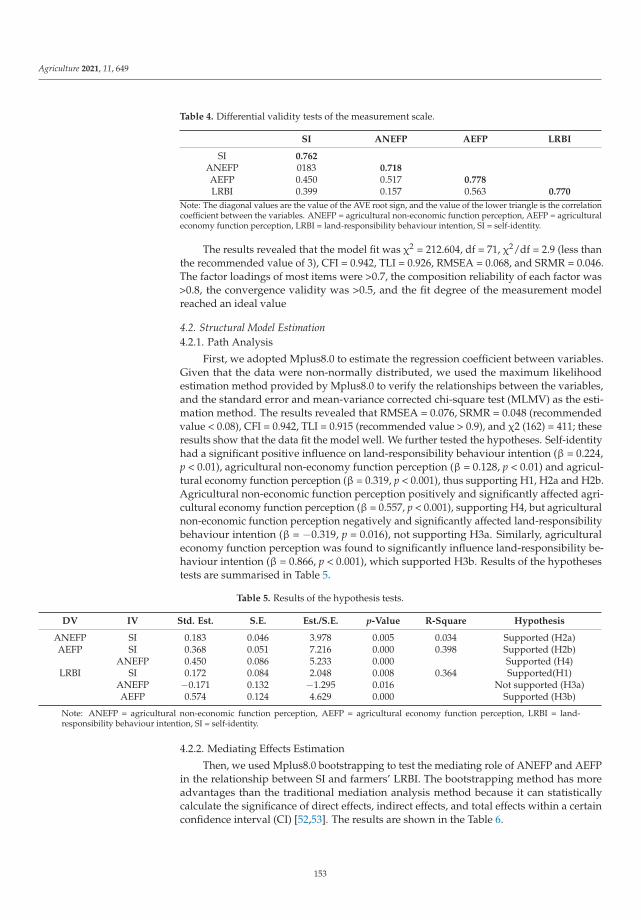
Agriculture 2021, 11, 649
Table 4. Differential validity tests of the measurement scale.
SI ANEFP AEFP LRBI
SI 0.762ANEFP 0183 0.718AEFP 0.450 0.517 0.778LRBI 0.399 0.157 0.563 0.770
Note: The diagonal values are the value of the AVE root sign, and the value of the lower triangle is the correlationcoefficient between the variables. ANEFP = agricultural non-economic function perception, AEFP = agriculturaleconomy function perception, LRBI = land-responsibility behaviour intention, SI = self-identity.
The results revealed that the model fit was χ2 = 212.604, df = 71, χ2/df = 2.9 (less thanthe recommended value of 3), CFI = 0.942, TLI = 0.926, RMSEA = 0.068, and SRMR = 0.046.The factor loadings of most items were >0.7, the composition reliability of each factor was>0.8, the convergence validity was >0.5, and the fit degree of the measurement modelreached an ideal value
4.2. Structural Model Estimation4.2.1. Path Analysis
First, we adopted Mplus8.0 to estimate the regression coefficient between variables.Given that the data were non-normally distributed, we used the maximum likelihoodestimation method provided by Mplus8.0 to verify the relationships between the variables,and the standard error and mean-variance corrected chi-square test (MLMV) as the esti-mation method. The results revealed that RMSEA = 0.076, SRMR = 0.048 (recommendedvalue < 0.08), CFI = 0.942, TLI = 0.915 (recommended value > 0.9), and χ2 (162) = 411; theseresults show that the data fit the model well. We further tested the hypotheses. Self-identityhad a significant positive influence on land-responsibility behaviour intention (β = 0.224,p < 0.01), agricultural non-economy function perception (β = 0.128, p < 0.01) and agricul-tural economy function perception (β = 0.319, p < 0.001), thus supporting H1, H2a and H2b.Agricultural non-economic function perception positively and significantly affected agri-cultural economy function perception (β = 0.557, p < 0.001), supporting H4, but agriculturalnon-economic function perception negatively and significantly affected land-responsibilitybehaviour intention (β = −0.319, p = 0.016), not supporting H3a. Similarly, agriculturaleconomy function perception was found to significantly influence land-responsibility be-haviour intention (β = 0.866, p < 0.001), which supported H3b. Results of the hypothesestests are summarised in Table 5.
Table 5. Results of the hypothesis tests.
DV IV Std. Est. S.E. Est./S.E. p-Value R-Square Hypothesis
ANEFP SI 0.183 0.046 3.978 0.005 0.034 Supported (H2a)AEFP SI 0.368 0.051 7.216 0.000 0.398 Supported (H2b)
ANEFP 0.450 0.086 5.233 0.000 Supported (H4)LRBI SI 0.172 0.084 2.048 0.008 0.364 Supported(H1)
ANEFP −0.171 0.132 −1.295 0.016 Not supported (H3a)AEFP 0.574 0.124 4.629 0.000 Supported (H3b)
Note: ANEFP = agricultural non-economic function perception, AEFP = agricultural economy function perception, LRBI = land-responsibility behaviour intention, SI = self-identity.
4.2.2. Mediating Effects Estimation
Then, we used Mplus8.0 bootstrapping to test the mediating role of ANEFP and AEFPin the relationship between SI and farmers’ LRBI. The bootstrapping method has moreadvantages than the traditional mediation analysis method because it can statisticallycalculate the significance of direct effects, indirect effects, and total effects within a certainconfidence interval (CI) [52,53]. The results are shown in the Table 6.
153
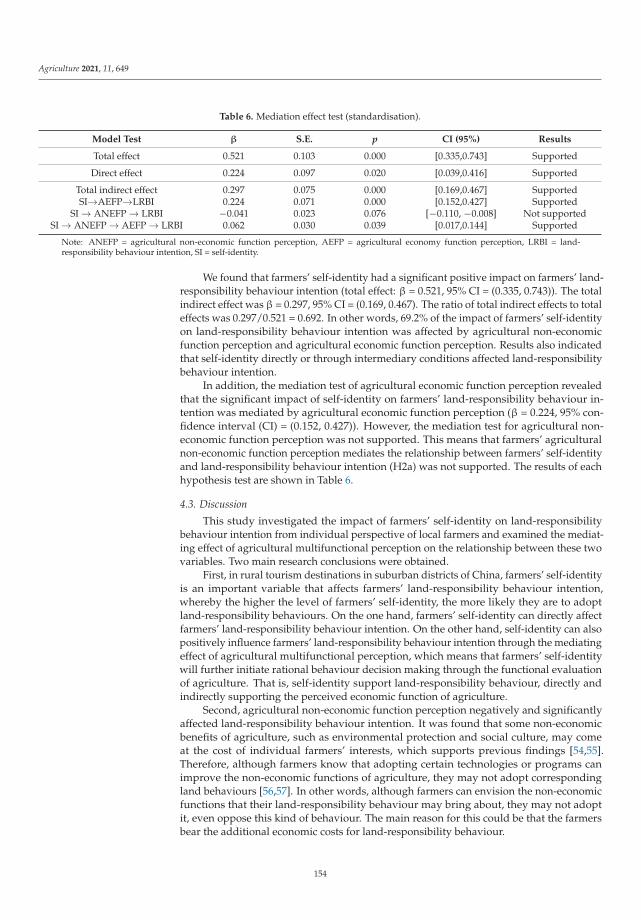
Agriculture 2021, 11, 649
Table 6. Mediation effect test (standardisation).
Model Test β S.E. p CI (95%) Results
Total effect 0.521 0.103 0.000 [0.335,0.743] Supported
Direct effect 0.224 0.097 0.020 [0.039,0.416] Supported
Total indirect effect 0.297 0.075 0.000 [0.169,0.467] SupportedSI→AEFP→LRBI 0.224 0.071 0.000 [0.152,0.427] Supported
SI → ANEFP → LRBI −0.041 0.023 0.076 [−0.110, −0.008] Not supportedSI → ANEFP → AEFP → LRBI 0.062 0.030 0.039 [0.017,0.144] Supported
Note: ANEFP = agricultural non-economic function perception, AEFP = agricultural economy function perception, LRBI = land-responsibility behaviour intention, SI = self-identity.
We found that farmers’ self-identity had a significant positive impact on farmers’ land-responsibility behaviour intention (total effect: β = 0.521, 95% CI = (0.335, 0.743)). The totalindirect effect was β = 0.297, 95% CI = (0.169, 0.467). The ratio of total indirect effects to totaleffects was 0.297/0.521 = 0.692. In other words, 69.2% of the impact of farmers’ self-identityon land-responsibility behaviour intention was affected by agricultural non-economicfunction perception and agricultural economic function perception. Results also indicatedthat self-identity directly or through intermediary conditions affected land-responsibilitybehaviour intention.
In addition, the mediation test of agricultural economic function perception revealedthat the significant impact of self-identity on farmers’ land-responsibility behaviour in-tention was mediated by agricultural economic function perception (β = 0.224, 95% con-fidence interval (CI) = (0.152, 0.427)). However, the mediation test for agricultural non-economic function perception was not supported. This means that farmers’ agriculturalnon-economic function perception mediates the relationship between farmers’ self-identityand land-responsibility behaviour intention (H2a) was not supported. The results of eachhypothesis test are shown in Table 6.
4.3. Discussion
This study investigated the impact of farmers’ self-identity on land-responsibilitybehaviour intention from individual perspective of local farmers and examined the mediat-ing effect of agricultural multifunctional perception on the relationship between these twovariables. Two main research conclusions were obtained.
First, in rural tourism destinations in suburban districts of China, farmers’ self-identityis an important variable that affects farmers’ land-responsibility behaviour intention,whereby the higher the level of farmers’ self-identity, the more likely they are to adoptland-responsibility behaviours. On the one hand, farmers’ self-identity can directly affectfarmers’ land-responsibility behaviour intention. On the other hand, self-identity can alsopositively influence farmers’ land-responsibility behaviour intention through the mediatingeffect of agricultural multifunctional perception, which means that farmers’ self-identitywill further initiate rational behaviour decision making through the functional evaluationof agriculture. That is, self-identity support land-responsibility behaviour, directly andindirectly supporting the perceived economic function of agriculture.
Second, agricultural non-economic function perception negatively and significantlyaffected land-responsibility behaviour intention. It was found that some non-economicbenefits of agriculture, such as environmental protection and social culture, may comeat the cost of individual farmers’ interests, which supports previous findings [54,55].Therefore, although farmers know that adopting certain technologies or programs canimprove the non-economic functions of agriculture, they may not adopt correspondingland behaviours [56,57]. In other words, although farmers can envision the non-economicfunctions that their land-responsibility behaviour may bring about, they may not adoptit, even oppose this kind of behaviour. The main reason for this could be that the farmersbear the additional economic costs for land-responsibility behaviour.
154
Agriculture 2021, 11, 649
Third, the analysis of the mediating effect shows that the perception of the importanceof agricultural multifunction is an important mediating condition for the influence of farm-ers’ self-identity on farmers’ land-responsibility behaviour intention. However, the utilityof importance perception of agricultural economic function and that of non-economicfunction are different. Self-identity can influence farmers’ land-responsibility behaviour in-tention through the mediating role of agricultural economic function perception. However,agricultural non-economic function perception does not have a direct mediating effect; thatis, although farmers perceive the non-economic functions that their land-responsibilitybehaviour may bring, this does not directly stimulate them to generate land-responsibilitybehaviour intention. Farmers’ agricultural non-economic functions perception can only sig-nificantly influence their land-responsibility behaviour intention through the intermediaryeffect of agricultural economic functions of land. That is, only when farmers perceive thatnon-economic function is positively related to economic function does the correspondingland-responsibility behaviour intention occur. Furthermore, the likelihood of adoptingland-responsibility behaviours will increase if farmers feel that the non-economic functionsof agriculture are accompanied by economic functions that can offset the perceived costs.
5. Conclusions
The results indicate that self-identity is a vital factor that affects Chinese farmers’ land-responsibility behaviour intention in rural tourism areas. What is more, “not well respected,rather perceived as a low-rank profession” and “the low social status” are primary factorsdiscourage youths from getting involved with farming [58]. Therefore, the governmentshould understand how farmer perspective the value of farming and consider its role ingrowing the rural economy and rural development.
Second, the conclusions of this study highlight the path dependence of farmers onthe economic functions of agriculture. The income of farmers is generally low in Chinaand obtaining economic benefits through agriculture remains the most important motiva-tion for farmers to take land-responsibility behaviour. Therefore, only when farmers getthe economic benefits of the tourism industry caused by the non-economic functions ofagriculture, will farmers’ land-responsibility decisions be effectively stimulated.
Third, farmers’ agricultural non-economic function perception positively affects theiragricultural economic function perception. That is, farmers can perceive the transformationof agricultural non-economic functions into economic functions, thereby increasing theirunderstanding and support for sustainable land policies. For the sustainable developmentof villages, our findings are consistent with those of Ahnström et al. [56] and Reimeret al. [57], among others. We believe that investing in the non-economic functions ofagriculture will be beneficial to rural communities and their sustainable development. Themultifunctional development of agriculture is of great significance to the protection of therural landscape, ecology, the cultural environment, and the protection of biodiversity andcultural heritage; these factors form the basis for agriculture to generate economic benefitsin tourism and other industries. The tourism industry is an important means by which totransform agricultural non-economic functions into economic functions. When farmersin these areas understand that agricultural non-economic functions can achieve economicfunctions through tourism and other industries, they could be more likely to adopt landbehaviours that are more conducive to sustainable development. For agricultural heritagesites and remote rural tourism sites with abundant tourism resources, agriculture andfarming culture are important tourist attractions, and rural tourism can be developed withthe help of agricultural non-economic functions. Therefore, rural tourism can not only beused as a means by which to alleviate poverty through the development of rural areas butcould also enable farmers to experience the transformation of agricultural non-economicfunctions into agricultural economic functions, thereby stimulating local farmers to adoptmore sustainable land decisions.
155
Agriculture 2021, 11, 649
6. Limitations and Future Research
Due to differences in economic development levels, land policies, and location rela-tionships between these sites and central cities, the conclusion from the four destinationscannot fully represent other rural tourist destinations in China. All the variables selectedin this study were assessed using cross-sectional data, and future work could further trackvariables such as farmers’ self-identity, agricultural multifunction perception, to betterunderstand how these variables impact farmers’ land awareness, and land-responsibilitybehaviour intention in the context of rural tourism development. In addition, farmers’attitudes, values, and land behaviour were different [59]. Therefore, future research shouldacknowledge the heterogeneity between “farmers”, and strengthen the localisation anddifferentiation of cultural and social factors. For example, the large wave of people re-turning home to start a business in China has resulted in huge, ongoing alterations inthe structure of farmers in rural tourism destinations. Future work should also considerfurther analysing the psychology and land decision-making behaviours of different typesof agricultural practitioners.
Author Contributions: Conceptualization, X.C.; Z.L.; Y.L. and J.Q.; methodology, X.C.; software,X.C.; validation, X.C.; formal analysis, Z.L. and J.Q.; investigation, X.C.; Z.L. and M.H.; resources,X.C.; data curation, Z.L.; writing—original draft preparation, X.C. and Z.L.; writing—review andediting, Y.L. and X.C.; visualization, J.Q.; supervision, X.C. and Y.L.; project administration, Y.L.;funding acquisition, X.C. and Y.L. All authors have read and agreed to the published version ofthe manuscript.
Funding: This research was funded by the Education Department of Sichuan Province in China [GrantNo. 15sb0002]; System Science and Enterprise Development Research Center (Grant No. Xq20C05).
Conflicts of Interest: The authors declare no conflict of interest.
References
1. Ajzen, I. The Theory of Planned Behavior. Organ. Behav. Hum. Decis. Process. 1991, 50, 179–211. [CrossRef]2. Ajzen, I.; Fishbein, M.J.E.C. Understanding Attitudes and Predicting Social Behavior; Prentice-Hall, Inc.: Englewood Cliffs, NJ, USA,
1980; p. 278.3. Lokhorst, A.M.; Staats, H.; Dijk, J.V.; Dijk, E.V.; Snoo, G.D. What’s in it for Me? Motivational Differences between Farmers’
Subsidised and Non-Subsidised Conservation Practices. Appl. Psychol. 2011, 60, 337–353. [CrossRef]4. Rob, J.F.; Burton, U.H.P. Creating culturally sustainableagri-environmental schemes. J. Rural Stud. 2011, 27, 95–104.5. Rob, J.F.; Burton, C.; Kuczera, G. Exploring Farmers’ Cultural Resistance to Voluntary Agri-environmental Schemes. Sociol.
Ruralis 2008, 48, 16–37.6. Van Dijk, W.F.A.; Schaffers, A.P.; Leewis, L.; Berendse, F.; De Snoo, G.R. Temporal effects of agri-environment schemes on ditch
bank plant species. Basic Appl. Ecol. 2013, 14, 289–297. [CrossRef]7. Dean, M.; Raats, M.M.; Shepherd, R. The Role of Self-Identity, Past Behavior, and Their Interaction in Predicting Intention to
Purchase Fresh and Processed Organic Food. J. Appl. Soc. Psychol. 2012, 42, 669–688. [CrossRef]8. Sparks, P.; Shepherd, R. Self-Identity and the Theory of Planned Behavior: Assessing the Role of Identification with “Green
Consumerism”. Soc. Psychol. Q. 1992, 55, 388–399. [CrossRef]9. Defrancesco, E.; Gatto, P.; Runge, F.; Trestini, S. Factors affecting farmers’ participation in agri-environmental measures: A
northern Italian perspective. J. Agric. Econ. 2008, 59, 114–131. [CrossRef]10. Van Dijk, W.F.A.; Lokhorst, A.M.; Berendse, F.; de Snoo, G.R. Factors underlying farmers’ intentions to perform unsubsidised
agri-environmental measures. Land Use Policy 2016, 59, 207–216. [CrossRef]11. Aliabadi, V.; Gholamrezai, S.; Ataei, P. Rural people’s intention to adopt sustainable water management by rainwater harvesting
practices: Application of TPB and HBM models. Water Supply 2020, 20, 1847–1861. [CrossRef]12. Karimy, M.; Niknami, S.; Hidarnia, A.R.; Hajizadeh, I. Intention to start cigarette smoking among Iranian male adolescents:
Usefulness of an extended version of the theory of planned behaviour. Heart Asia 2012, 4, 120–124. [CrossRef]13. Leske, S.; Strodl, E.; Hou, X.-Y. Predictors of dieting and non-dieting approaches among adults living in Australia. BMC Public
Health 2017, 17, 214–233. [CrossRef] [PubMed]14. Zerbini, C.; Luceri, B.; Vergura, D.T. Leveraging consumer’s behaviour to promote generic drugs in Italy. Health Policy 2017, 121,
397–406. [CrossRef]15. O’Connor, E.L.; Sims, L.; White, K.M. Ethical food choices: Examining people’s Fair Trade purchasing decisions. Food Qual. Prefer.
2017, 60, 105–112. [CrossRef]
156
Agriculture 2021, 11, 649
16. Pyo, L.K.; Kwon, S.M. The Effects of Fair-tourism’ Perceptions on Buying Intention and Willingness to Pay Premium Price: Anapplication of the Extended Theory of Planned Behavior. J. Tour. Leis. Res. 2016, 28, 23–39.
17. Ates, H. Merging Theory of Planned Behavior and Value Identity Personal norm model to explain pro-environmental behaviors.Sustain. Prod. Consumption 2020, 24, 169–180. [CrossRef]
18. Gkargkavouzi, A.; Halkos, G.; Matsiori, S. Environmental behavior in a private-sphere context: Integrating theories of plannedbehavior and value belief norm, self-identity and habit. Resour. Conserv. Recycl. 2019, 148, 145–156. [CrossRef]
19. Anastasia, G.; George, H.; Steriani, M. Environmental behavior in a private-sphere context: Integrating theories of plannedbehavior and value belief norm, self-identity and habit. Sustain. Prod. Consumption 2019, 148, 145–156.
20. Fielding, K.S.; Terry, D.J.; Masser, B.M.; Hogg, M.A. Integrating social identity theory and the theory of planned behaviour toexplain decisions to engage in sustainable agricultural practices. Br. J. Soc. Psychol. 2008, 47, 23–48. [CrossRef]
21. Borges, J.A.R.; Domingues, C.H.D.F.; Caldara, F.R.; da Rosa, N.P.; Senger, I.; Guidolin, D.G.F. Identifying the factors impacting onfarmers’ intention to adopt animal friendly practices. Prev. Vet. Med. 2019, 170, 104718. [CrossRef]
22. Thoits, P.A.; Virshup, L.K. Me’s and we’s: Forms and functions of social identities. In Self and Identity: Fundamental Issues; OxfordUniversity Press: Oxford, UK, 1997; pp. 106–133.
23. Paquin, R.S.; Keating, D.M. Fitting identity in the reasoned action framework: A meta-analysis and model comparison. J. Soc.Psychol. 2016, 157, 47–63. [CrossRef] [PubMed]
24. Lee, Y.; Lee, J.; Lee, Z. Social influence on technology acceptance behavior. ACM Sigmis Database 2006, 37, 60–75. [CrossRef]25. Dumanski, J. Criteria and indicators for land quality and sustainable land management. ITC J. 1997, 1997, 216–222.26. Stryker, S.; Serpe, R.T. Commitment, Identity Salience, and Role Behavior: Theory and Research Example; Springer: New York, NY,
USA, 1982.27. De Bruijn, G.J.; Verkooijen, K.; De Vries, N.K.; Bas, V.D.P. Antecedents of self identity and consequences for action control: An
application of the theory of planned behaviour in the exercise domain. Psychol. Sport Exerc. 2012, 13, 771–778. [CrossRef]28. Hagger, M.; Chatzisarantis, N. Self-identity and the theory of planned behaviour: Between- and within-participants analyses. Br.
J. Soc. Psychol. 2011, 45, 731–757. [CrossRef] [PubMed]29. Burke, S.P.J. Identity Theory and Social Identity Theory. Soc. Psychol. Q. 2000, 63, 224–237.30. Christensen, P.N.; Rothgerber, H.; Wood, W.; Matz, D.C. Social norms and identity relevance: A motivational approach to
normative behavior. Pers. Soc. Psychol. Bull. 2004, 30, 1295–1309. [CrossRef] [PubMed]31. Laverie, D.A.; Arnett, D.B. Factors Affecting Fan Attendance: The Influence of Identity Salience and Satisfaction. J. Leis. Res. 2000,
32, 225–246. [CrossRef]32. Sparks, P. Subjective Expected Utility-Based Attitude-Behavior Models: The Utility of Self-Identity. In Attitudes, Behavior and
Social Context: The Role of Norms and Group Membership; Psychology Press: London, UK, 2000.33. Lokhorst, A.M.; Hoon, C.; Le Rutte, R.; De Snoo, G. There is an I in nature: The crucial role of the self in nature conservation. Land
Use Policy 2014, 39, 121–126. [CrossRef]34. Key, N. How much do farmers value their independence? Agric. Econ. 2005, 33, 117–126. [CrossRef]35. Howley, P.; Dillon, E.; Hennessy, T. It’s not all about the money: Understanding farmers’ labour allocation decisions. Agric. Hum.
Values 2014, 31, 261–271. [CrossRef]36. Wilson, G.A. The spatiality of multifunctional agriculture: A human geography perspective. Geoforum 2009, 40, 269–280.
[CrossRef]37. Morgan, S.L.; Marsden, T.; Miele, M.; Morley, A. Agricultural multifunctionality and farmers’ entrepreneurial skills: A study of
Tuscan and Welsh farmers. J. Rural Stud. 2010, 26, 116–129. [CrossRef]38. Van der Ploeg, J.D.; Roep, D. Multifunctionality and rural development: The actual situation in Europe. In Multifunctional
Agriculture: A New Paradigm for European Agriculture and Rural Development; Ashgate: Aldershot, UK, 2003.39. Kvakkestad, V.; Rorstad, P.K.; Vatn, A. Norwegian farmers’ perspectives on agriculture and agricultural payments: Between
productivism and cultural landscapes. Land Use Policy 2015, 42, 83–92. [CrossRef]40. Walker, A.J.; Ryan, R.L. Place attachment and landscape preservation in rural New England: A Maine case study. Landsc. Urban
Plan. 2008, 86, 141–152. [CrossRef]41. Ravikumar, R.K.; Thakur, D.; Choudhary, H.; Kumar, V.; Kumar, V. Social engineering of societal knowledge in livestock science:
Can we be more empathetic? Vet. World 2017, 10, 86–91. [CrossRef] [PubMed]42. Slamova, M.; Kruse, A.; Belcakova, I.; Dreer, J. Old but Not Old Fashioned: Agricultural Landscapes as European Heritage and
Basis for Sustainable Multifunctional Farming to Earn a Living. Sustainability 2021, 13, 4650. [CrossRef]43. Kontogeorgos, A.; Tsampra, M.; Chatzitheodoridis, F. Agricultural Policy and the Environment Protection through the Eyes of
New Farmers: Evidence from a Country of Southeast Europe. Procedia Econ. Financ. 2015, 19, 296–303. [CrossRef]44. Shannon, S.; Mccann, E.; De Young, R.; Erickson, D. Farmers’ attitudes about farming and the environment: A survey of
conventional and organic farmers. J. Agric. Environ. Ethics 1996, 9, 123–143.45. Emerton, L.; Snyder, K.A. Rethinking sustainable land management planning: Understanding the social and economic drivers of
farmer decision-making in Africa. Land Use Policy 2018, 79, 684–694. [CrossRef]46. Cawley, M.; Gillmor, D.A. Integrated rural tourism: Concepts and Practice. Ann. Tour. Res. 2008, 35, 316–337. [CrossRef]47. Vanclay, F. Multifunctional Agriculture: A Transition Theory Perspective—By Geoff A. Wilson. Geogr. Res. 2009, 47, 221–222.
[CrossRef]
157
Agriculture 2021, 11, 649
48. Peng, J.; Liu, Z.C.; Liu, Y.X. Research progress on assessing multi-functionality of agriculture. Chin. J. Agric. Resour. Reg. Plan.2014, 35, 1–8.
49. Raymond, C.M.; Bieling, C.; Fagerholm, N.; Martin-Lopez, B.; Plieninger, T. The farmer as a landscape steward: Comparing localunderstandings of landscape stewardship, landscape values, and land management actions. Ambio 2016, 45, 173–184. [CrossRef]
50. Vuillot, C.; Coron, N.; Calatayud, F.; Sirami, C.; Mathevet, R.; Gibon, A. Ways of farming and ways of thinking: Do farmers’mental models of the landscape relate to their land management practices? Ecol. Soc. 2016, 21, 35–58. [CrossRef]
51. Shimp, A.T.; Sharma, S. Consumer Ethnocentrism: Construction and Validation of the cetscale. J. Mark. Res. 1987, 24, 280–289.[CrossRef]
52. Kenny, D.A.; Judd, C.M. Power anomalies in testing mediation. Psychol. Sci. 2014, 25, 334–339. [CrossRef]53. Zhao, X.; Lynch, J.G., Jr.; Chen, Q. Reconsidering Baron and Kenny: Myths and Truths about Mediation Analysis. J. Consum. Res.
2010, 37, 197–206. [CrossRef]54. Kabii, T.; Horwitz, P. A review of landholder motivations and determinants for participation in conservation covenanting
programmes. Environ. Conserv. 2006, 33, 11–20. [CrossRef]55. Ryan, R.; Erickson, D.; De Young, R. Farmers’ Motivations for Adopting Conservation Practices along Riparian Zones in a
Mid-western Agricultural Watershed. J. Environ. Plan. Manag. 2003, 46, 19–37. [CrossRef]56. Ahnström, J.; Höckert, J.; Bergeå, H.L.; Francis, C.A.; Skelton, P.; Hallgren, L. Farmers and nature conservation: What is known
about attitudes, context factors and actions affecting conservation? Renew. Agric. Food Syst. 2009, 24, 38–47. [CrossRef]57. Reimer, A.P.; Thompson, A.W.; Prokopy, L.S. The multi-dimensional nature of environmental attitudes among farmers in Indiana:
Implications for conservation adoption. Agric. Hum. Values 2012, 29, 29–40. [CrossRef]58. Raj, K.G.C.; Hall, R.P. The Commercialization of Smallholder Farming-A Case Study from the Rural Western Middle Hills of
Nepal. Agriculture 2020, 10, 143–158.59. Darnhofer, I.; Schneeberger, W.; Freyer, B. Converting or not converting to organic farming in Austria:Farmer types and their
rationale. Agric. Hum. Values 2005, 22, 39–52. [CrossRef]
158
agriculture
Article
Would Kazakh Citizens Support a Milk Co-Operative System?
Samal Kaliyeva 1,*, Francisco Jose Areal 2 and Yiorgos Gadanakis 1
Citation: Kaliyeva, S.; Areal, F.J.;
Gadanakis, Y. Would Kazakh Citizens
Support a Milk Co-Operative
System?. Agriculture 2021, 11, 642.
https://doi.org/10.3390/
agriculture11070642
Academic Editors: Adoración Mozas
Moral and Domingo Fernandez Ucles
Received: 18 June 2021
Accepted: 6 July 2021
Published: 8 July 2021
Publisher’s Note: MDPI stays neutral
with regard to jurisdictional claims in
published maps and institutional affil-
iations.
Copyright: © 2021 by the authors.
Licensee MDPI, Basel, Switzerland.
This article is an open access article
distributed under the terms and
conditions of the Creative Commons
Attribution (CC BY) license (https://
creativecommons.org/licenses/by/
4.0/).
1 School of Agriculture Policy and Development, University of Reading, Reading RG6 6AR, UK;[email protected]
2 Centre for Rural Economy, School of Natural and Environmental Sciences, Newcastle University,Newcastle upon Tyne NE1 7RU, UK; [email protected]
* Correspondence: [email protected]
Abstract: We estimate the monetary value of a policy aimed at increasing rural co-operative pro-duction in Kazakhstan to increase milk production. We analyse the drivers associated with publicsupport for such policy using the contingent valuation method. The role of individuals’ psychologicalaspects, based on the reasoned action approach, along with individuals’ views on the country’s pastregime (i.e., to the former Soviet Union), their awareness about the governmental policy, their sociode-mographic characteristics, and household location on their willingness to pay (WTP) for the policy isanalysed using an interval regression model. Additionally, we examine changes in individuals’ WTPbefore and during the COVID-19 pandemic. The estimated total economic value of the policy is KZT1335 bn for the length of the program at KZT 267 bn per year, which is approximately half the totalprogram budget, which includes other interventions beyond the creation of production co-operatives.The total economic value of the policy would equal the cost of the whole program after 10 years,indicating public support for this policy amongst Kazakh citizens. Psychological factors, i.e., attitude,perceived social pressure, and perceived behavioural control, and the respondents’ awareness ofthe policy and views on the Soviet Union regime are associated with their WTP. Sociodemographicfactors, namely, age, income, and education, are also statistically significant. Finally, the effect of theshocks of COVID-19 is negatively associated with the respondents’ WTP.
Keywords: co-operative creation policy; contingent valuation; reasoned action approach; Kazakhstan;COVID-19
1. Introduction
Prior to Kazakhstan joining the World Trade Organisation in 2015, Kazakhstan joinedBelarus and Russia in 2014 to create the Eurasian Economic Union (EAEU), a free tradezone. Later Armenia, Belarus, and Kyrgyzstan also joined the EAEU. The opening of Kaza-khstan’s economy to international markets challenged its agricultural competitiveness,which was detrimental to the rural economy, highly dependent on agricultural produc-tion [1]. Hence, improving agriculture productivity is key for the development of the ruraleconomy of Kazakhstan. Consequently, the government decided to stimulate the produc-tion of agricultural products by allocating a significant part of its governmental budget,2374.2 billion tenges (KZT) for 5 years, for the development of the country’s agriculturalsector, part of which also considers the creation of agricultural co-operatives. This is arelatively large budget, accounting for 9% of the revenue of the state, republican, andlocal budgets in 2017. To compare, 1868.4 billion tenges (KZT) was budgeted under thestate program for the development of education and science for the period 2016–2019;1385.6 billion was budgeted for the development of tourism for the period 2019–2025, and1762.5 billion tenges was budgeted for regional development for the period 2015–2020 [2].
Amongst agricultural products produced in Kazakhstan, dairy is one of the keyagricultural sectors, representing 16% of the total agricultural production of the country [3].Milk production has increased by 16% in the last 5 years reaching a total of 5,820,000 t
Agriculture 2021, 11, 642. https://doi.org/10.3390/agriculture11070642 https://www.mdpi.com/journal/agriculture
159
Agriculture 2021, 11, 642
of cow’s milk produced in 2019 compared to 5,020,000 t in 2014. However, the domesticsupply of dairy products is insufficient to meet the internal demand. Specifically, dairyproduct exports amounted to USD 53,517,500 (1 US dollar (USD) is equal to 426.84 tenges(KZT) as of 27 June 2021), whereas the imports were USD 252,450,400 in 2019, indicating a198,932,900 trade deficit. Hence, a transformation of the structure of the dairy sector seemskey to reduce this gap.
Currently, the structure of Kazakh’s dairy is dominated by small-scale producers, suchas rural households and individual/peasant farms, representing 93% of total production (ofwhich rural households are 78% and individual/peasants are 22%), whereas only 7% of themilk was produced by agricultural enterprises. Thus, due to the prevailing of small-scaleproduction, dairy factories face a deficit of milk for processing, and consequently, the coun-try experiences a low supply of processed dairy products [4,5]. In 2019, a total of 262,000 t ofmilk went to the processing factories in Kazakhstan, only 4.5% of the 5,820,000 t producedthat year. Considering therefore the status of the agricultural sector, the government’sintervention plan aimed at reducing the number of agricultural activities conducted bysmall farm/household with the objective of expanding agricultural production (includingdairy) in enterprises through the creation of co-operatives in rural areas. It is worth notingthat although there are other supply chain pathways to reach dairy factories (e.g., peasantand small farms, merchants), more than 70% of milk is produced by rural households,consequently making them the main body in the dairy supply chain.
The legislative basis of co-operatives is set out in the law “On Agricultural Coop-eration”, adopted in 2015. The policy on creating co-operatives was introduced in 2017.However, the initial government plan was revised in July 2018, and is no longer aimingto create more co-operatives under the Programme (the reason of which remains unclear).Despite this fact, the idea of creating co-operatives is still relevant and it has been includedin the Strategic Plan of noncommercial organization “Atameken” for 2018–2023; thus, in2019, the number of rural households involved in co-operative production was 27.2 thou-sand whereas the production of cow’s milk by co-operatives was 65.4 thousand tonnes (thecountry’s total production was 5820.1 thousand tonnes of milk in the same year).
According to the law, an agricultural co-operative is created when there are at leastthree members. All members of the co-operative are obliged to pay an entrance fee, inaccordance with the charter of the co-operative. If necessary, members of the co-operativecan make additional contributions (on a voluntary basis). In addition, the founders andmembers of the co-operative can also make a material (share) contribution. The basicprinciples of the creation and functioning of co-operatives are expected to comply with theinternational principles specified in the International Co-operative Alliance (ICA). Accord-ing to the ICA, there are seven main international co-operative principles: (1) voluntaryand open membership; (2) democratic member control; (3) member economic participation;(4) autonomy and independence; (5) provision of education, training, and information;(6) co-operation among co-operatives; and (7) concern for the community.
Unlike the Soviet Union where production output and all assets (productive and social,except land) were owned jointly by the collective (i.e., kolkhozes) and by the state (i.e.,sovkhozes/state farms) [6], under the current policy, the individuals do not own the meansof production and share the means of production to produce an output. Nevertheless,access to technologies, equipment, feeding, and subsidies are expected to be facilitatedthrough co-operatives.
Although co-operatives can potentially be organised in many forms, e.g., service co-operatives, the main focus of the policy and therefore of this study is focused on productionco-operatives. Rural households are expected to be engaged in the supply chain to facilitateconstant milk supply to dairy factories via co-operatives. Members of production co-operatives, i.e., rural households and individual/peasant farms, are expected to supply theco-operatives with fresh milk that goes directly to the dairy processing industry. As thereare no intermediates, rural households (and individual/peasant farms) will be paid from
160
Agriculture 2021, 11, 642
the dairy processing units directly. In turn, co-operatives receive KZT 10 per litre of milk inthe form of subsidies from the government [7].
Co-operatives can contribute to uplifting livelihoods by reducing poverty and foodinsecurity in rural areas through the improved use of technology, share of knowledgebetween members, and distribute income from a market-oriented output [8–11].
We estimate the consumer’s willingness to pay (WTP) for a Kazakh’s governmentintervention to create production co-operatives in rural areas to obtain the total economicvalue of the policy. We also analyse the heterogeneity in WTP and investigate whetherthe COVID-19 pandemic affected consumer WTP for the government’s policy. Estimatingthe total economic value of agricultural policies, or any other policy for that matter, isparamount for policy decision-making under constrained budgets. As Price [12] points out,an “unbiased and focused evaluation of unpriced benefits is an important pre-conditionfor needed policy interventions”. The estimation of monetary value of agricultural policies,such as conservation of agricultural genetic resources [13], safe vegetables [14], and agri-environment schemes [15] has been previously studied. Although the attitudes of Kazakhrural households towards joining and creating co-operatives was previously studied [16],to the best of our knowledge, no study has estimated the total economic value of a policyaimed at increasing milk production through co-operative creation. More specifically, wecontribute to the literature in three ways: (1) by estimating the total economic value a ofthe transformation of the milk production system from small-scale production to industrialproduction through a policy aiming at creating co-operatives; (2) to our knowledge, thisis the first paper that has used and expanded the reasoned action approach to gaining anunderstanding of how the total economic value for the policy is moderated by a numberof elements. These include individual psychological aspects based on the reasoned actionapproach (RAA), views on the past regime (i.e., to the former Soviet Union), awarenessconcerning the governmental policy, sociodemographic characteristics, and geographicallocation; and (3) by analysing whether a pandemic shock such as COVID-19 may beassociated with changes in individuals’ WTP for the policy.
2. Materials and Methods
We used the contingent valuation (CV) method to elicit the total economic valueof the policy through the respondents’ WTP for a premium price on a litre of milk inorder to support the government policy. The program allows farmers to receive supportfrom government and other co-operatives, such as a subsidy in the amount of KZT 10per litre of milk and discounted animal feed products. This information was provided torespondents along with the policy objective of supporting dairy producing households toexpand dairy production in Kazakhstan. We used the RAA to analyse how psychologicalfactors may be associated to respondents’ WTP. We extend the RAA to integrate therespondents’ (a) views on the past regime (i.e., to the former Soviet Union), (b) theirsociodemographic characteristics and the location, (c) awareness about the governmentalpolicy, and (d) COVID-19 into our framework to investigate the role of these elements onrespondents’ WTP.
2.1. Contingent Valuation Method
The total value associated with the implementation of governmental policies includesnot only the provision of market goods, but the provision of nonmarket goods and services,too (i.e., those that cannot be traded in the marketplace, and consequently do not have amarket price). The policy might provide substantial benefits for the society, such as increas-ing milk production whilst supporting rural development and allowing farmers to increasetheir livelihoods as a result of receiving higher returns for their products. Co-operativeproduction promotes sustainable agriculture, enhancing not only the environment butalso the social sustainability of local communities [17]. The stated preferences method isemployed as a double-bounded dichotomous choice contingent valuation (CV) to elicit thetotal value of the policy. Although the majority of the stated preference research focuses on
161
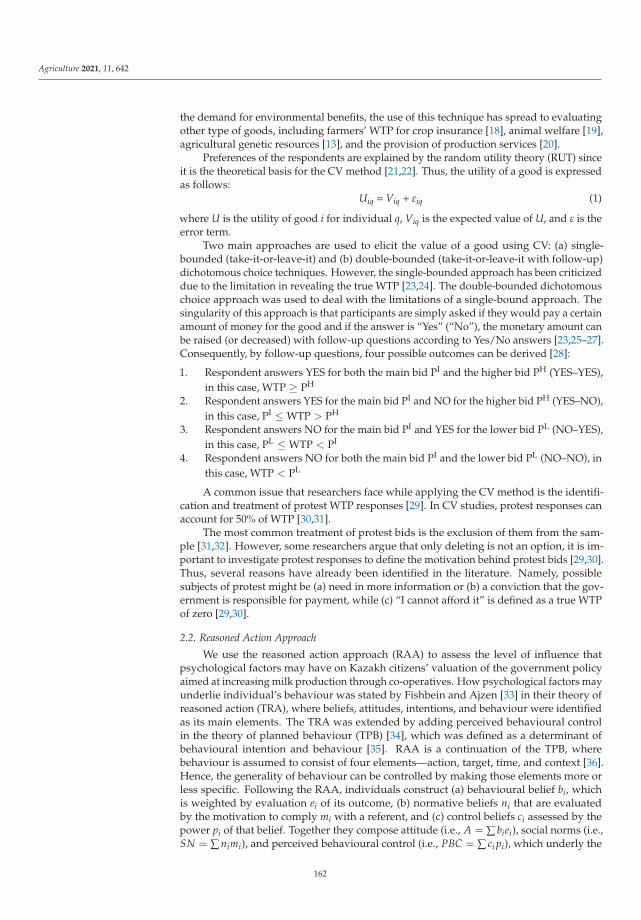
Agriculture 2021, 11, 642
the demand for environmental benefits, the use of this technique has spread to evaluatingother type of goods, including farmers’ WTP for crop insurance [18], animal welfare [19],agricultural genetic resources [13], and the provision of production services [20].
Preferences of the respondents are explained by the random utility theory (RUT) sinceit is the theoretical basis for the CV method [21,22]. Thus, the utility of a good is expressedas follows:
Uiq = Viq + εiq (1)
where U is the utility of good i for individual q, Viq is the expected value of U, and ε is theerror term.
Two main approaches are used to elicit the value of a good using CV: (a) single-bounded (take-it-or-leave-it) and (b) double-bounded (take-it-or-leave-it with follow-up)dichotomous choice techniques. However, the single-bounded approach has been criticizeddue to the limitation in revealing the true WTP [23,24]. The double-bounded dichotomouschoice approach was used to deal with the limitations of a single-bound approach. Thesingularity of this approach is that participants are simply asked if they would pay a certainamount of money for the good and if the answer is “Yes” (“No”), the monetary amount canbe raised (or decreased) with follow-up questions according to Yes/No answers [23,25–27].Consequently, by follow-up questions, four possible outcomes can be derived [28]:
1. Respondent answers YES for both the main bid PI and the higher bid PH (YES–YES),in this case, WTP ≥ PH
2. Respondent answers YES for the main bid PI and NO for the higher bid PH (YES–NO),in this case, PI ≤ WTP > PH
3. Respondent answers NO for the main bid PI and YES for the lower bid PL (NO–YES),in this case, PL ≤ WTP < PI
4. Respondent answers NO for both the main bid PI and the lower bid PL (NO–NO), inthis case, WTP < PL
A common issue that researchers face while applying the CV method is the identifi-cation and treatment of protest WTP responses [29]. In CV studies, protest responses canaccount for 50% of WTP [30,31].
The most common treatment of protest bids is the exclusion of them from the sam-ple [31,32]. However, some researchers argue that only deleting is not an option, it is im-portant to investigate protest responses to define the motivation behind protest bids [29,30].Thus, several reasons have already been identified in the literature. Namely, possiblesubjects of protest might be (a) need in more information or (b) a conviction that the gov-ernment is responsible for payment, while (c) “I cannot afford it” is defined as a true WTPof zero [29,30].
2.2. Reasoned Action Approach
We use the reasoned action approach (RAA) to assess the level of influence thatpsychological factors may have on Kazakh citizens’ valuation of the government policyaimed at increasing milk production through co-operatives. How psychological factors mayunderlie individual’s behaviour was stated by Fishbein and Ajzen [33] in their theory ofreasoned action (TRA), where beliefs, attitudes, intentions, and behaviour were identifiedas its main elements. The TRA was extended by adding perceived behavioural controlin the theory of planned behaviour (TPB) [34], which was defined as a determinant ofbehavioural intention and behaviour [35]. RAA is a continuation of the TPB, wherebehaviour is assumed to consist of four elements—action, target, time, and context [36].Hence, the generality of behaviour can be controlled by making those elements more orless specific. Following the RAA, individuals construct (a) behavioural belief bi, whichis weighted by evaluation ei of its outcome, (b) normative beliefs ni that are evaluatedby the motivation to comply mi with a referent, and (c) control beliefs ci assessed by thepower pi of that belief. Together they compose attitude (i.e., A = ∑ biei), social norms (i.e.,SN = ∑ nimi), and perceived behavioural control (i.e., PBC = ∑ ci pi), which underly the
162
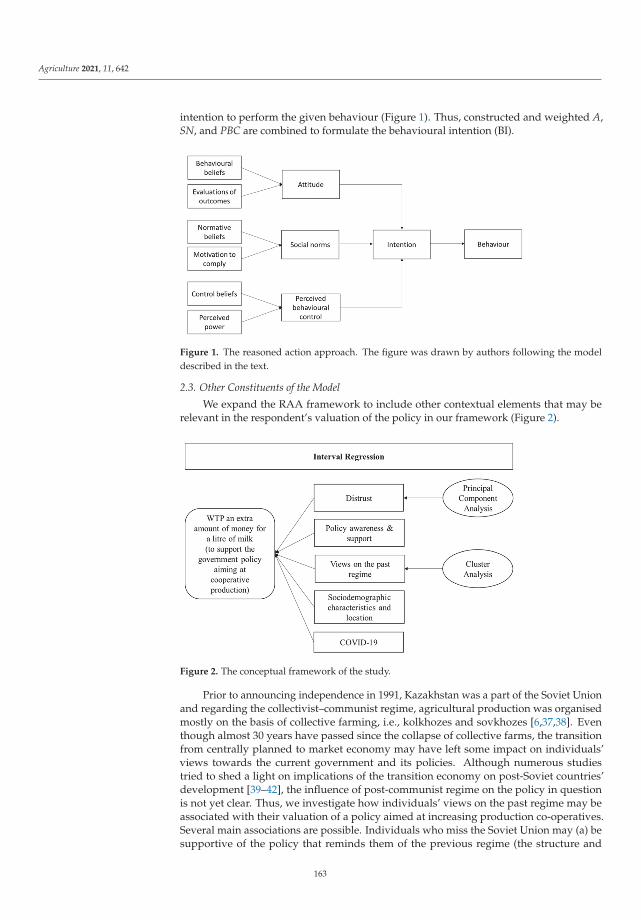
Agriculture 2021, 11, 642
intention to perform the given behaviour (Figure 1). Thus, constructed and weighted A,SN, and PBC are combined to formulate the behavioural intention (BI).
Figure 1. The reasoned action approach. The figure was drawn by authors following the modeldescribed in the text.
2.3. Other Constituents of the Model
We expand the RAA framework to include other contextual elements that may berelevant in the respondent’s valuation of the policy in our framework (Figure 2).
Figure 2. The conceptual framework of the study.
Prior to announcing independence in 1991, Kazakhstan was a part of the Soviet Unionand regarding the collectivist–communist regime, agricultural production was organisedmostly on the basis of collective farming, i.e., kolkhozes and sovkhozes [6,37,38]. Eventhough almost 30 years have passed since the collapse of collective farms, the transitionfrom centrally planned to market economy may have left some impact on individuals’views towards the current government and its policies. Although numerous studiestried to shed a light on implications of the transition economy on post-Soviet countries’development [39–42], the influence of post-communist regime on the policy in questionis not yet clear. Thus, we investigate how individuals’ views on the past regime may beassociated with their valuation of a policy aimed at increasing production co-operatives.Several main associations are possible. Individuals who miss the Soviet Union may (a) besupportive of the policy that reminds them of the previous regime (the structure and
163
Agriculture 2021, 11, 642
function of kolkhozes as agricultural production systems), but they may also (b) be scepticalabout the current regime delivering the policy on co-operative production as one in thepast, and as a result, may be less likely to support it. Thus, the mistrust of the currentregime and unattractiveness of current policies compared with the Soviet Union regimemight lead to less support of the current regime by the general public.
Moreover, we investigate the association of (a) sociodemographic characteristics,(b) the location where a respondent resides, (c) awareness of the policy in question, and(d) COVID-19 relationship with respondents’ intention to pay extra money for a litreof milk.
2.4. Survey and Questionnaire
A snowball sampling technique was used to contact Kazakh citizens to voluntarilytake part in the study, i.e., by using an already existing network of contacts via social mediaplatforms to distribute the link to the questionnaire. The questionnaire was approvedby the Ethics Committee of the University of Reading (protocol code/ethical clearanceapplication number 001151P, approved on 2 December 2019).
The instrument used to collect information was a questionnaire survey using QualtricsXM (Version 12, Qualtrics, Provo, UT, USA). All participants were provided with aninformation sheet and consent form containing information about the aims and objectivesof the research. The questionnaire was created in English and translated to Kazakh andRussian. To guarantee accuracy, a second, independent person reviewed and edited thetranslation for accuracy, natural flow in the target language, and adherence to the needs ofthe survey.
The data were collected in two periods, before and during the COVID-19 pandemic.The first wave of data collection (n = 272) was completed in a month period, between 10December 2019 and 10 January 2020.
In March 2020, the first case of COVID-19 was reported in Kazakhstan and the govern-ment implemented a lockdown for two months, until May 2020. However, as soon as therestriction was eased, the number of cases of the disease increased sharply, reaching its peakin June–July 2020. Considering the situation and the government’s measures to deal with it,in June 2020, we took the opportunity of exploring the effect of COVID-19 on respondents’WTP. Therefore, during the period of a month, between 13 June and 13 July 2020, 234 fullycomplete additional responses were collected, making a total of 506 observations.
The questionnaire consisted of five sections (awareness and support, CV, RAA, viewson the past regime, sociodemographics, and location) and included a total 37 questions.
The aim and features of the governmental policy were delivered in the form of shortinformative text within the first section of the survey and respondents were asked torespond (a) if they have had information about co-operative creation and (b) if they agreedwith the aim of the policy.
Within the CV section, respondents were asked to answer the WTP questions. Duringthe pilot study in August 2018, we used open-ended questions allowing respondentsto decide without giving options, then received an amount of money that was used toadjust main bids for WTP. Information from the pilot questionnaire was used to assign theprices for the WTP questions (KZT 10, 40, 70, 100, and 130). Thus, the amount of moneyKazakh citizens are willing to pay for the transformation in the dairy sector was obtainedby providing information about the governmental policy and asking them the followingquestion: “Would you be willing to pay extra X amount of money for a litre of milk in orderto support the government’s policy?” where X amount of money was chosen randomlyfrom the given bids.
If respondent answered ”No”, then the requested amount of money was decreased byKZT 15 (PL) or it was increased to KZT 15 (PH) if the answer was “Yes”.
If a respondent ticked the fourth option and answers No–No, then further questioningwas used to indicate the reasons. The third section of the questionnaire included questionson RAA in order to reveal psychological aspects underlying Kazakhs citizens’ intention
164
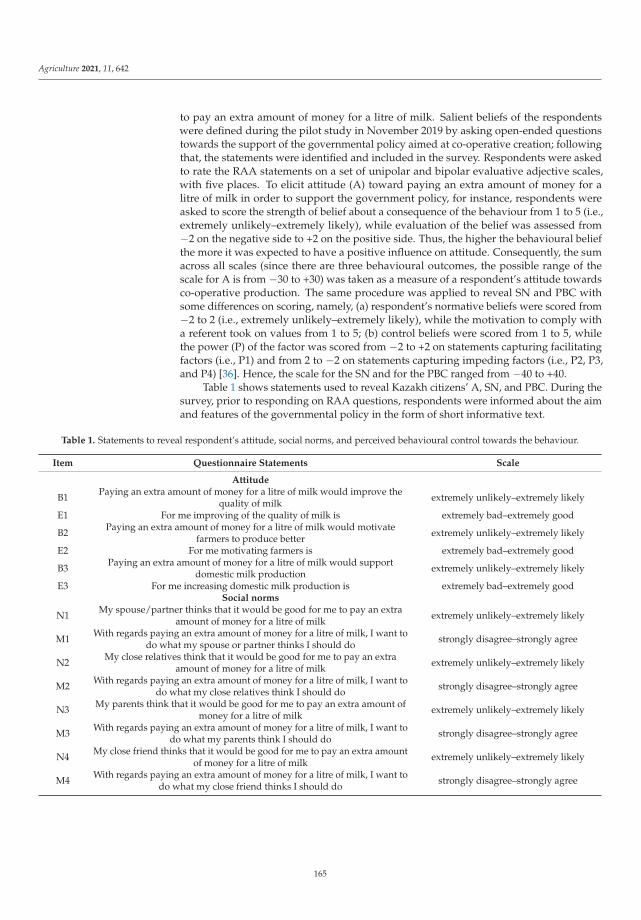
Agriculture 2021, 11, 642
to pay an extra amount of money for a litre of milk. Salient beliefs of the respondentswere defined during the pilot study in November 2019 by asking open-ended questionstowards the support of the governmental policy aimed at co-operative creation; followingthat, the statements were identified and included in the survey. Respondents were askedto rate the RAA statements on a set of unipolar and bipolar evaluative adjective scales,with five places. To elicit attitude (A) toward paying an extra amount of money for alitre of milk in order to support the government policy, for instance, respondents wereasked to score the strength of belief about a consequence of the behaviour from 1 to 5 (i.e.,extremely unlikely–extremely likely), while evaluation of the belief was assessed from−2 on the negative side to +2 on the positive side. Thus, the higher the behavioural beliefthe more it was expected to have a positive influence on attitude. Consequently, the sumacross all scales (since there are three behavioural outcomes, the possible range of thescale for A is from −30 to +30) was taken as a measure of a respondent’s attitude towardsco-operative production. The same procedure was applied to reveal SN and PBC withsome differences on scoring, namely, (a) respondent’s normative beliefs were scored from−2 to 2 (i.e., extremely unlikely–extremely likely), while the motivation to comply witha referent took on values from 1 to 5; (b) control beliefs were scored from 1 to 5, whilethe power (P) of the factor was scored from −2 to +2 on statements capturing facilitatingfactors (i.e., P1) and from 2 to −2 on statements capturing impeding factors (i.e., P2, P3,and P4) [36]. Hence, the scale for the SN and for the PBC ranged from −40 to +40.
Table 1 shows statements used to reveal Kazakh citizens’ A, SN, and PBC. During thesurvey, prior to responding on RAA questions, respondents were informed about the aimand features of the governmental policy in the form of short informative text.
Table 1. Statements to reveal respondent’s attitude, social norms, and perceived behavioural control towards the behaviour.
Item Questionnaire Statements Scale
Attitude
B1 Paying an extra amount of money for a litre of milk would improve thequality of milk extremely unlikely–extremely likely
E1 For me improving of the quality of milk is extremely bad–extremely good
B2 Paying an extra amount of money for a litre of milk would motivatefarmers to produce better extremely unlikely–extremely likely
E2 For me motivating farmers is extremely bad–extremely good
B3 Paying an extra amount of money for a litre of milk would supportdomestic milk production extremely unlikely–extremely likely
E3 For me increasing domestic milk production is extremely bad–extremely goodSocial norms
N1 My spouse/partner thinks that it would be good for me to pay an extraamount of money for a litre of milk extremely unlikely–extremely likely
M1 With regards paying an extra amount of money for a litre of milk, I want todo what my spouse or partner thinks I should do strongly disagree–strongly agree
N2 My close relatives think that it would be good for me to pay an extraamount of money for a litre of milk extremely unlikely–extremely likely
M2 With regards paying an extra amount of money for a litre of milk, I want todo what my close relatives think I should do strongly disagree–strongly agree
N3 My parents think that it would be good for me to pay an extra amount ofmoney for a litre of milk extremely unlikely–extremely likely
M3 With regards paying an extra amount of money for a litre of milk, I want todo what my parents think I should do strongly disagree–strongly agree
N4 My close friend thinks that it would be good for me to pay an extra amountof money for a litre of milk extremely unlikely–extremely likely
M4 With regards paying an extra amount of money for a litre of milk, I want todo what my close friend thinks I should do strongly disagree–strongly agree
165
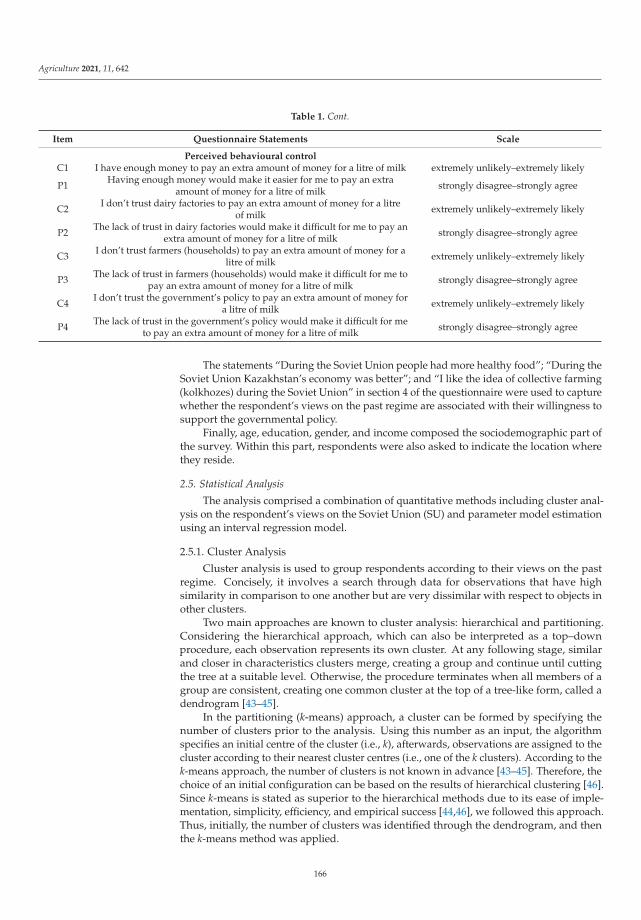
Agriculture 2021, 11, 642
Table 1. Cont.
Item Questionnaire Statements Scale
Perceived behavioural controlC1 I have enough money to pay an extra amount of money for a litre of milk extremely unlikely–extremely likely
P1 Having enough money would make it easier for me to pay an extraamount of money for a litre of milk strongly disagree–strongly agree
C2 I don’t trust dairy factories to pay an extra amount of money for a litreof milk extremely unlikely–extremely likely
P2 The lack of trust in dairy factories would make it difficult for me to pay anextra amount of money for a litre of milk strongly disagree–strongly agree
C3 I don’t trust farmers (households) to pay an extra amount of money for alitre of milk extremely unlikely–extremely likely
P3 The lack of trust in farmers (households) would make it difficult for me topay an extra amount of money for a litre of milk strongly disagree–strongly agree
C4 I don’t trust the government’s policy to pay an extra amount of money fora litre of milk extremely unlikely–extremely likely
P4 The lack of trust in the government’s policy would make it difficult for meto pay an extra amount of money for a litre of milk strongly disagree–strongly agree
The statements “During the Soviet Union people had more healthy food”; “During theSoviet Union Kazakhstan’s economy was better”; and “I like the idea of collective farming(kolkhozes) during the Soviet Union” in section 4 of the questionnaire were used to capturewhether the respondent’s views on the past regime are associated with their willingness tosupport the governmental policy.
Finally, age, education, gender, and income composed the sociodemographic part ofthe survey. Within this part, respondents were also asked to indicate the location wherethey reside.
2.5. Statistical Analysis
The analysis comprised a combination of quantitative methods including cluster anal-ysis on the respondent’s views on the Soviet Union (SU) and parameter model estimationusing an interval regression model.
2.5.1. Cluster Analysis
Cluster analysis is used to group respondents according to their views on the pastregime. Concisely, it involves a search through data for observations that have highsimilarity in comparison to one another but are very dissimilar with respect to objects inother clusters.
Two main approaches are known to cluster analysis: hierarchical and partitioning.Considering the hierarchical approach, which can also be interpreted as a top–downprocedure, each observation represents its own cluster. At any following stage, similarand closer in characteristics clusters merge, creating a group and continue until cuttingthe tree at a suitable level. Otherwise, the procedure terminates when all members of agroup are consistent, creating one common cluster at the top of a tree-like form, called adendrogram [43–45].
In the partitioning (k-means) approach, a cluster can be formed by specifying thenumber of clusters prior to the analysis. Using this number as an input, the algorithmspecifies an initial centre of the cluster (i.e., k), afterwards, observations are assigned to thecluster according to their nearest cluster centres (i.e., one of the k clusters). According to thek-means approach, the number of clusters is not known in advance [43–45]. Therefore, thechoice of an initial configuration can be based on the results of hierarchical clustering [46].Since k-means is stated as superior to the hierarchical methods due to its ease of imple-mentation, simplicity, efficiency, and empirical success [44,46], we followed this approach.Thus, initially, the number of clusters was identified through the dendrogram, and thenthe k-means method was applied.
166
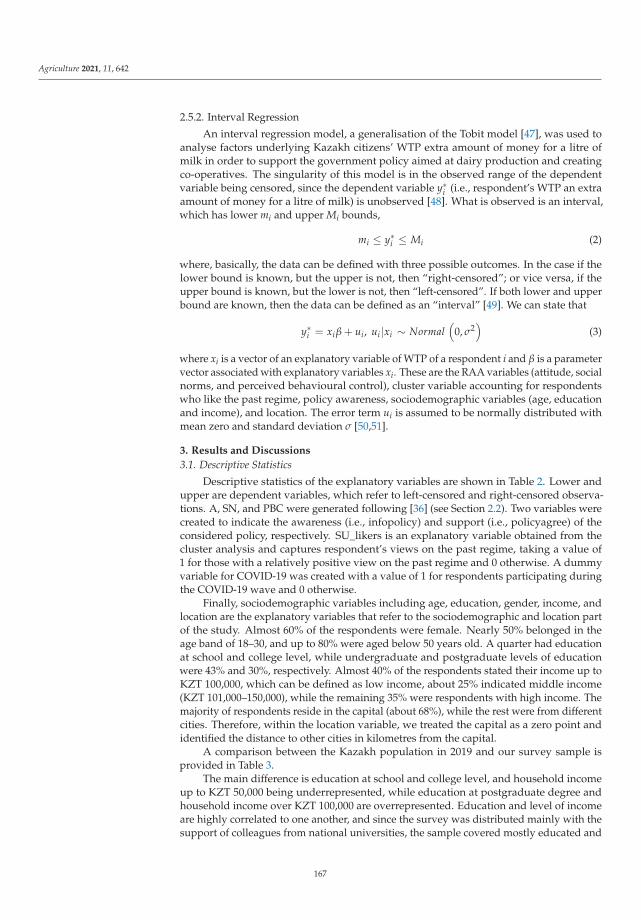
Agriculture 2021, 11, 642
2.5.2. Interval Regression
An interval regression model, a generalisation of the Tobit model [47], was used toanalyse factors underlying Kazakh citizens’ WTP extra amount of money for a litre ofmilk in order to support the government policy aimed at dairy production and creatingco-operatives. The singularity of this model is in the observed range of the dependentvariable being censored, since the dependent variable y∗i (i.e., respondent’s WTP an extraamount of money for a litre of milk) is unobserved [48]. What is observed is an interval,which has lower mi and upper Mi bounds,
mi ≤ y∗i ≤ Mi (2)
where, basically, the data can be defined with three possible outcomes. In the case if thelower bound is known, but the upper is not, then “right-censored”; or vice versa, if theupper bound is known, but the lower is not, then “left-censored”. If both lower and upperbound are known, then the data can be defined as an “interval” [49]. We can state that
y∗i = xiβ + ui, ui|xi ∼ Normal(
0, σ2)
(3)
where xi is a vector of an explanatory variable of WTP of a respondent i and β is a parametervector associated with explanatory variables xi. These are the RAA variables (attitude, socialnorms, and perceived behavioural control), cluster variable accounting for respondentswho like the past regime, policy awareness, sociodemographic variables (age, educationand income), and location. The error term ui is assumed to be normally distributed withmean zero and standard deviation σ [50,51].
3. Results and Discussions
3.1. Descriptive Statistics
Descriptive statistics of the explanatory variables are shown in Table 2. Lower andupper are dependent variables, which refer to left-censored and right-censored observa-tions. A, SN, and PBC were generated following [36] (see Section 2.2). Two variables werecreated to indicate the awareness (i.e., infopolicy) and support (i.e., policyagree) of theconsidered policy, respectively. SU_likers is an explanatory variable obtained from thecluster analysis and captures respondent’s views on the past regime, taking a value of1 for those with a relatively positive view on the past regime and 0 otherwise. A dummyvariable for COVID-19 was created with a value of 1 for respondents participating duringthe COVID-19 wave and 0 otherwise.
Finally, sociodemographic variables including age, education, gender, income, andlocation are the explanatory variables that refer to the sociodemographic and location partof the study. Almost 60% of the respondents were female. Nearly 50% belonged in theage band of 18–30, and up to 80% were aged below 50 years old. A quarter had educationat school and college level, while undergraduate and postgraduate levels of educationwere 43% and 30%, respectively. Almost 40% of the respondents stated their income up toKZT 100,000, which can be defined as low income, about 25% indicated middle income(KZT 101,000–150,000), while the remaining 35% were respondents with high income. Themajority of respondents reside in the capital (about 68%), while the rest were from differentcities. Therefore, within the location variable, we treated the capital as a zero point andidentified the distance to other cities in kilometres from the capital.
A comparison between the Kazakh population in 2019 and our survey sample isprovided in Table 3.
The main difference is education at school and college level, and household incomeup to KZT 50,000 being underrepresented, while education at postgraduate degree andhousehold income over KZT 100,000 are overrepresented. Education and level of incomeare highly correlated to one another, and since the survey was distributed mainly with thesupport of colleagues from national universities, the sample covered mostly educated and
167
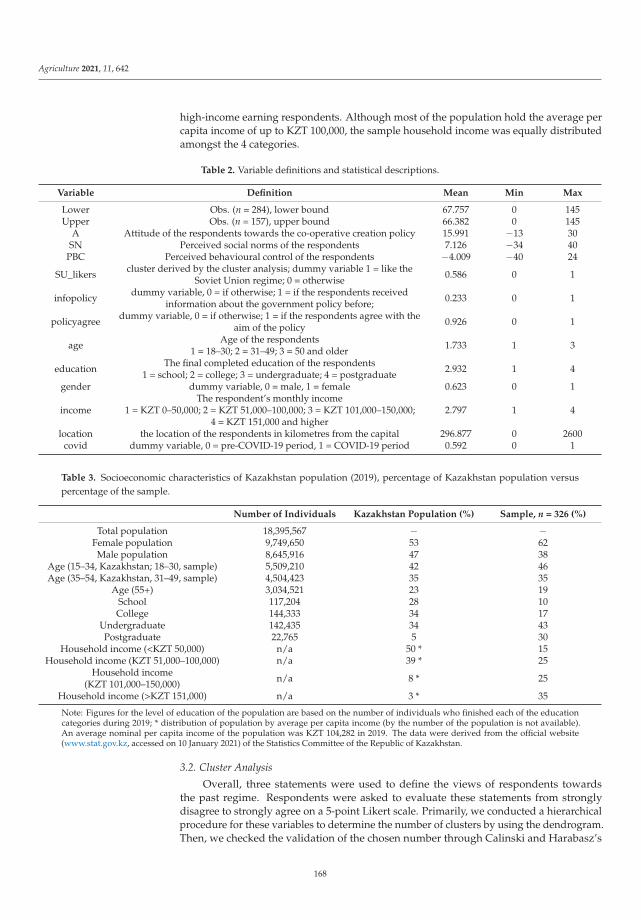
Agriculture 2021, 11, 642
high-income earning respondents. Although most of the population hold the average percapita income of up to KZT 100,000, the sample household income was equally distributedamongst the 4 categories.
Table 2. Variable definitions and statistical descriptions.
Variable Definition Mean Min Max
Lower Obs. (n = 284), lower bound 67.757 0 145Upper Obs. (n = 157), upper bound 66.382 0 145
A Attitude of the respondents towards the co-operative creation policy 15.991 −13 30SN Perceived social norms of the respondents 7.126 −34 40
PBC Perceived behavioural control of the respondents −4.009 −40 24
SU_likers cluster derived by the cluster analysis; dummy variable 1 = like theSoviet Union regime; 0 = otherwise 0.586 0 1
infopolicy dummy variable, 0 = if otherwise; 1 = if the respondents receivedinformation about the government policy before; 0.233 0 1
policyagree dummy variable, 0 = if otherwise; 1 = if the respondents agree with theaim of the policy 0.926 0 1
age Age of the respondents1 = 18–30; 2 = 31–49; 3 = 50 and older 1.733 1 3
education The final completed education of the respondents1 = school; 2 = college; 3 = undergraduate; 4 = postgraduate 2.932 1 4
gender dummy variable, 0 = male, 1 = female 0.623 0 1
incomeThe respondent’s monthly income
1 = KZT 0–50,000; 2 = KZT 51,000–100,000; 3 = KZT 101,000–150,000;4 = KZT 151,000 and higher
2.797 1 4
location the location of the respondents in kilometres from the capital 296.877 0 2600covid dummy variable, 0 = pre-COVID-19 period, 1 = COVID-19 period 0.592 0 1
Table 3. Socioeconomic characteristics of Kazakhstan population (2019), percentage of Kazakhstan population versuspercentage of the sample.
Number of Individuals Kazakhstan Population (%) Sample, n = 326 (%)
Total population 18,395,567 − −Female population 9,749,650 53 62Male population 8,645,916 47 38
Age (15–34, Kazakhstan; 18–30, sample) 5,509,210 42 46Age (35–54, Kazakhstan, 31–49, sample) 4,504,423 35 35
Age (55+) 3,034,521 23 19School 117,204 28 10College 144,333 34 17
Undergraduate 142,435 34 43Postgraduate 22,765 5 30
Household income (<KZT 50,000) n/a 50 * 15Household income (KZT 51,000–100,000) n/a 39 * 25
Household income(KZT 101,000–150,000) n/a 8 * 25
Household income (>KZT 151,000) n/a 3 * 35
Note: Figures for the level of education of the population are based on the number of individuals who finished each of the educationcategories during 2019; * distribution of population by average per capita income (by the number of the population is not available).An average nominal per capita income of the population was KZT 104,282 in 2019. The data were derived from the official website(www.stat.gov.kz, accessed on 10 January 2021) of the Statistics Committee of the Republic of Kazakhstan.
3.2. Cluster Analysis
Overall, three statements were used to define the views of respondents towardsthe past regime. Respondents were asked to evaluate these statements from stronglydisagree to strongly agree on a 5-point Likert scale. Primarily, we conducted a hierarchicalprocedure for these variables to determine the number of clusters by using the dendrogram.Then, we checked the validation of the chosen number through Calinski and Harabasz’s
168
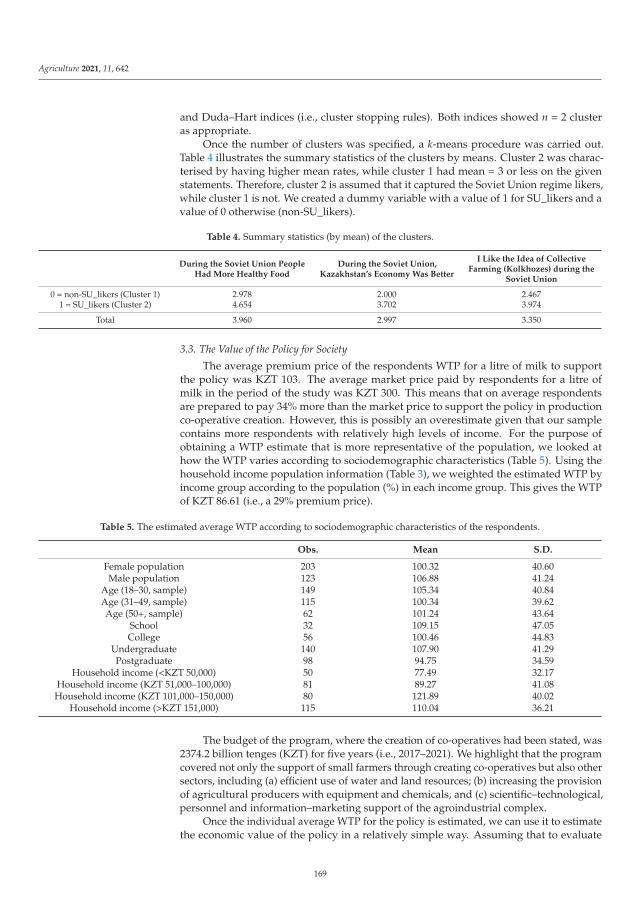
Agriculture 2021, 11, 642
and Duda–Hart indices (i.e., cluster stopping rules). Both indices showed n = 2 clusteras appropriate.
Once the number of clusters was specified, a k-means procedure was carried out.Table 4 illustrates the summary statistics of the clusters by means. Cluster 2 was charac-terised by having higher mean rates, while cluster 1 had mean = 3 or less on the givenstatements. Therefore, cluster 2 is assumed that it captured the Soviet Union regime likers,while cluster 1 is not. We created a dummy variable with a value of 1 for SU_likers and avalue of 0 otherwise (non-SU_likers).
Table 4. Summary statistics (by mean) of the clusters.
During the Soviet Union PeopleHad More Healthy Food
During the Soviet Union,Kazakhstan’s Economy Was Better
I Like the Idea of CollectiveFarming (Kolkhozes) during the
Soviet Union
0 = non-SU_likers (Cluster 1) 2.978 2.000 2.4671 = SU_likers (Cluster 2) 4.654 3.702 3.974
Total 3.960 2.997 3.350
3.3. The Value of the Policy for Society
The average premium price of the respondents WTP for a litre of milk to supportthe policy was KZT 103. The average market price paid by respondents for a litre ofmilk in the period of the study was KZT 300. This means that on average respondentsare prepared to pay 34% more than the market price to support the policy in productionco-operative creation. However, this is possibly an overestimate given that our samplecontains more respondents with relatively high levels of income. For the purpose ofobtaining a WTP estimate that is more representative of the population, we looked athow the WTP varies according to sociodemographic characteristics (Table 5). Using thehousehold income population information (Table 3), we weighted the estimated WTP byincome group according to the population (%) in each income group. This gives the WTPof KZT 86.61 (i.e., a 29% premium price).
Table 5. The estimated average WTP according to sociodemographic characteristics of the respondents.
Obs. Mean S.D.
Female population 203 100.32 40.60Male population 123 106.88 41.24
Age (18–30, sample) 149 105.34 40.84Age (31–49, sample) 115 100.34 39.62Age (50+, sample) 62 101.24 43.64
School 32 109.15 47.05College 56 100.46 44.83
Undergraduate 140 107.90 41.29Postgraduate 98 94.75 34.59
Household income (<KZT 50,000) 50 77.49 32.17Household income (KZT 51,000–100,000) 81 89.27 41.08
Household income (KZT 101,000–150,000) 80 121.89 40.02Household income (>KZT 151,000) 115 110.04 36.21
The budget of the program, where the creation of co-operatives had been stated, was2374.2 billion tenges (KZT) for five years (i.e., 2017–2021). We highlight that the programcovered not only the support of small farmers through creating co-operatives but also othersectors, including (a) efficient use of water and land resources; (b) increasing the provisionof agricultural producers with equipment and chemicals, and (c) scientific–technological,personnel and information–marketing support of the agroindustrial complex.
Once the individual average WTP for the policy is estimated, we can use it to estimatethe economic value of the policy in a relatively simple way. Assuming that to evaluate
169
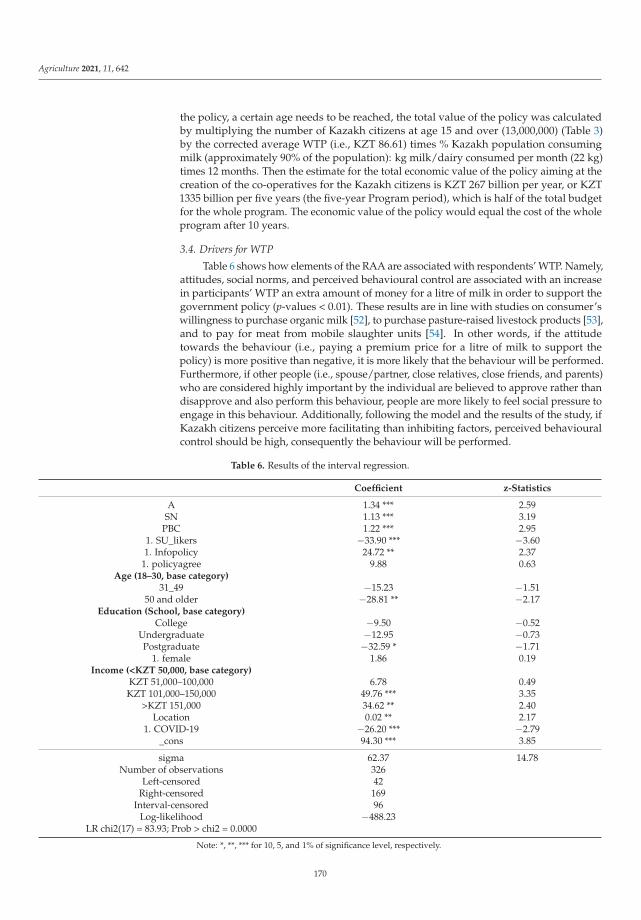
Agriculture 2021, 11, 642
the policy, a certain age needs to be reached, the total value of the policy was calculatedby multiplying the number of Kazakh citizens at age 15 and over (13,000,000) (Table 3)by the corrected average WTP (i.e., KZT 86.61) times % Kazakh population consumingmilk (approximately 90% of the population): kg milk/dairy consumed per month (22 kg)times 12 months. Then the estimate for the total economic value of the policy aiming at thecreation of the co-operatives for the Kazakh citizens is KZT 267 billion per year, or KZT1335 billion per five years (the five-year Program period), which is half of the total budgetfor the whole program. The economic value of the policy would equal the cost of the wholeprogram after 10 years.
3.4. Drivers for WTP
Table 6 shows how elements of the RAA are associated with respondents’ WTP. Namely,attitudes, social norms, and perceived behavioural control are associated with an increasein participants’ WTP an extra amount of money for a litre of milk in order to support thegovernment policy (p-values < 0.01). These results are in line with studies on consumer’swillingness to purchase organic milk [52], to purchase pasture-raised livestock products [53],and to pay for meat from mobile slaughter units [54]. In other words, if the attitudetowards the behaviour (i.e., paying a premium price for a litre of milk to support thepolicy) is more positive than negative, it is more likely that the behaviour will be performed.Furthermore, if other people (i.e., spouse/partner, close relatives, close friends, and parents)who are considered highly important by the individual are believed to approve rather thandisapprove and also perform this behaviour, people are more likely to feel social pressure toengage in this behaviour. Additionally, following the model and the results of the study, ifKazakh citizens perceive more facilitating than inhibiting factors, perceived behaviouralcontrol should be high, consequently the behaviour will be performed.
Table 6. Results of the interval regression.
Coefficient z-Statistics
A 1.34 *** 2.59SN 1.13 *** 3.19
PBC 1.22 *** 2.951. SU_likers −33.90 *** −3.601. Infopolicy 24.72 ** 2.37
1. policyagree 9.88 0.63Age (18–30, base category)
31_49 −15.23 −1.5150 and older −28.81 ** −2.17
Education (School, base category)College −9.50 −0.52
Undergraduate −12.95 −0.73Postgraduate −32.59 * −1.71
1. female 1.86 0.19Income (<KZT 50,000, base category)
KZT 51,000–100,000 6.78 0.49KZT 101,000–150,000 49.76 *** 3.35
>KZT 151,000 34.62 ** 2.40Location 0.02 ** 2.17
1. COVID-19 −26.20 *** −2.79_cons 94.30 *** 3.85
sigma 62.37 14.78Number of observations 326
Left-censored 42Right-censored 169
Interval-censored 96Log-likelihood −488.23
LR chi2(17) = 83.93; Prob > chi2 = 0.0000
Note: *, **, *** for 10, 5, and 1% of significance level, respectively.
170
Agriculture 2021, 11, 642
The results also show that Kazakh citizens who like the Soviet Union regime werewilling to pay KZT 33.90 (1 US dollar (USD) is equal to 426.84 tenges (KZT) as of 27 June2021) less to support the policy on production co-operatives creation than citizens whodo not like the Soviet Union regime (p-value < 0.01). Possible reasons for this result mayrelate to the possibility that individuals who like the Soviet Union (i.e., who perceive thepast Communist as a better regime than the current regime) may also have a feeling offrustration with democracy [55]. Moreover, one of the reasons behind satisfaction withthe past regime was its stability and guarantee of basic needs [55]. As pointed out byToleubayev et al. [56], “Kazakhstani people express great nostalgia for their past lives in theSoviet era and their narratives express a strong appreciation for the level of social security,income stability, low food prices, and the sense of a more egalitarian communal life”.This frustration present in post-communist countries may be consequence of a transitioneconomy towards a “wild capitalism” characterized by “rapid and massive liberalization,by the lack or the inefficiency of the state intervention in the economy, by corruption, andsignificant social movements of protest”, and not achieving the similar level of democracysuch as in Western Europe [57,58].
The lower support for the policy on production co-operatives creation by Kazakhcitizens who like the Soviet Union is reinforced by the finding that people aged over 50 areless supportive of the policy (Table 6). Hence, results suggest that Kazakh citizens with apositive attitude towards the old Soviet Union regime, and aged over 50, are more likely toperceive policies from the new regime (since independence) as unattractive and ineffective.
The results indicate that respondents’ WTP is positively associated with having ade-quate information about the policy (p-value < 0.05). Kazakh citizens with relatively higherawareness about the policy are ready to pay about KZT 25 (1 US dollar (USD) is equal to426.84 tenges (KZT) as of 27 June 2021) more than those who had no knowledge before.Undoubtedly, for a respondent receiving essential information about the product may becrucial for decision making. A similar finding was also reported by Stampa et al. [53] andZhang et al. [14]. Moreover, Zhang et al. [59] found that increasing awareness of culturedmeat influenced positively on Chinese consumer’s acceptance of it. A similar effect wasfound by Roosen et al. [60], when investigating consumers’ WTP for nanotechnology fooddiffered according to the information provided.
The results showed an increase in income is associated with a higher WTP. Respon-dents with the income between KZT 101,000 and KZT 150,000, and more than KZT 151,000are willing to pay KZT 50 and KZT 35 (1 US dollar (USD) is equal to 426.84 tenges (KZT)as of 27 June 2021) more, respectively, than respondents with monthly income up to KZT50,000. This finding is expected and in line with [13,61], where a WTP was stated beingincreased with higher levels of income.
Although the respondents holding postgraduate level of education are less likely tosupport the policy (p-value < 0.10), the reason for this is unclear. However, it is noted thatthe share of highly educated respondents was higher in the sample of the study.
The location is found to be statistically significant (p-value < 0.05), and thus, individu-als living apart from the capital are more inclined to pay a premium price for a litre of milkto support the policy. This is justified since the policy is oriented for the development ofthe rural areas and Kazakh citizens’ living in regions (apart from the capital) perceive morethe importance of the policy.
The parameter measuring the relationship between COVID-19 and respondents’ WTPwas found to be statistically significant (p-value < 0.01) suggesting that COVID-19 mighthave had some impact on individual’s WTP. Kazakh citizens seem less likely to support thegovernment policy on creating co-operatives under the COVID-19 situation. Results showthat individuals average WTP for the government policy aimed at increasing the numberof co-operatives was lower during the pandemic period compared to the pre-pandemicperiod. Thus, the average WTP to support the policy was KZT 118 (1 US dollar (USD) isequal to 426.84 tenges (KZT) as of 27 June 2021) prior to COVID-19 outbreak, whereasduring the pandemic it decreased by 22% and was KZT 92. This can be due to the rise of
171
Agriculture 2021, 11, 642
unemployment [62], stated as one of the dramatic implications of the COVID-19, whichtouched Kazakhstan as well. According to the news agency “Khabar 24” [63], during thepandemic, the number of unemployed Kazakh citizens only in one city has increased by3.5 times. Thousands of entrepreneurs were forced to pause their work; about 1.6 millionemployees were sent to leave without payment. Thus, widespread dissatisfaction with themeasures taken by the government to stop the spread of the virus might cause decreasedsupport of the current government by the general public.
3.5. Protest WTP Responds
Within n = 506 observations, n = 180 were labelled as protest bids and deleted, whichis almost 35% of the sample.
Respondents were asked to state the reason for zero WTP, where the most commonfour reasons are found. Both “I am already paying tax and think that the governmenthas to use that money to support” and “The prices of milk/dairy products are alreadyexpensive” were stated 67 times. Next was, “I am sceptical about that the money will go tothe farmers” that was repeated in 52 places; 45 times protestors mentioned, “I will need tohave more information about this policy”. Although “I don’t have enough income to payextra money” was stated 56 times, this reason was labelled as true WTP of zero, thereforewere not excluded from the sample.
3.6. Policy Implications
Our results show the readiness of the general public to support the government’splan in creating production co-operatives and the economic viability of the plan. However,it is important to acknowledge that the success of the policy also depends on the ruralhouseholds’ willingness to participate in the policy. Kaliyeva et al. [16] revealed the existinginterest of rural households in joining and creating co-operatives in Kazakhstan. Hence,policies aimed at the creation of co-operatives can be a viable solution to increasing milkproduction in Kazakhstan. It is worth noting that the government could also take otherapproaches to increase dairy/milk production. For instance, policies such as promotingfamily farming by introducing tax relief and/or subsidies could also achieve the aimof increasing milk production, but farmers would not have the same level of access toinformation and technology that a co-operative would offer. The level of public supportfor policies promoting family farming is unknown, but this policy may find less oppositionfrom individuals liking the SU.
The policy on co-operative creation might facilitate connection of farmers (rural house-holds) with supply chains (dairy factories). Not only producers (farmers, dairy factories)might benefit from the policy, but also society. It is acknowledged that co-operatives can helpdeveloping local value chains as well as facilitate the access to local and global markets [64].The structural changes in the dairy sector may enhance the production of domestic products,and as a result may positively affect the country’s trade balance by reducing the demand onimported dairy products. Moreover, co-operatives are an acknowledged way of reducingpoverty in rural areas and enhancing sustainable development [8–10].
Considering research findings in other countries, there are two points worth dis-cussing: (a) what kind of co-operatives can help competitiveness in agriculture and (b) whathas been the experience of policies supporting the creation of co-operatives. It is worthnoting that research conducted in other countries on agricultural co-operatives is diverseand provides useful information to understand how regional characteristics/conditionsmay influence the potential effects of creating co-operatives on agricultural productionand markets. The creation of co-operatives among enterprises in direct competition witheach other allow producers to take advantage of synergies and reinforce bargaining powerwithout major losses of freedom or flexibility [65]. This may be particularly important indeveloping countries where the size of the farming system is small. Li and Ito [66] showthat agricultural co-operatives in regions where agricultural land size is relatively small(e.g., China) can help in developing other markets associated with agricultural production
172
Agriculture 2021, 11, 642
(e.g., development of land rental markets by reducing transaction costs). Liang [67] arguesthat producer co-operatives act as a competitive yardstick of markets leading to competitivemarkets. Liang [67] also shows that this yardstick effect resulted into higher farm gateprices for hog producers in China. In addition, the yardstick effect may lead to a reductionin production costs [67].
Co-operative and community-based forms of doing agriculture are common in mostcountries, especially in developed countries where “the access of small farmers to markets isusually facilitated by agricultural service co-operatives” [68]. According to recent research,134 agricultural co-operatives in the US celebrated their 100th anniversary in 2014 [69].Research on the longevity of agricultural co-operatives in developed countries listedseveral main reasons for that, such as the achievement of scale economic gains and theability to adapt to dynamic situations. The success or failure of policies supporting thecreation of co-operatives may depend on the existing institutional conditions as wellas in the level of trust on the government by producers and the degree the regulatorypolicy with too regulatory policies being less likely to succeed, particularly in post-Sovietcountries [70]. Research on the success and failure cases of agricultural co-operatives indeveloping countries revealed the lack of comprehensive support, including advice onbest practices and monitoring co-operative activities as the main reasons for the failure ofbanana co-operatives in Rwanda [71]. Moreover, Moon [71] suggested that the success ofthe creation of co-operatives might be possible through the efforts of both the aid agencyand the beneficiaries.
Although what share of the total budget was aimed to be used for co-operativescreation is not clear, the results of the study showed the importance of the policy for theKazakh society. Extrapolating to the Kazakh population who consume milk/dairy productswould mean that the economic value of the policy would be KZT 1335 bn for the length ofthe program at KZT 267 bn per year, which is approximately half the total program budget,and includes other interventions beyond the creation of co-operatives. The economic valueof the policy would equal the cost of the program after 10 years. This indicates there ispublic support for this policy.
Our findings suggest that although there is general support for the policy, there arestill parts of the population, i.e., individuals missing the SU regime, who may mistrustnewly created organisational forms of the current government. Therefore, as a countrywith a transition economy, the Kazakhstan government may face nonacceptance of thepolicy by some of the population. The main reason is found to be the implications of thewild capitalism that Kazakh people faced after the transition from communism to a marketeconomy. Public rejection of the policy might also be connected with COVID-19, whichhad dramatic damage to the economy of the country. Therefore, the government attemptsfor increasing its attractiveness will lead the policy to be more widely supported.
Provision of information about the policy (e.g., aims, implementation) was foundto be important in respondents supporting the policy. We therefore recommend thatpolicymakers need to resolve any unambiguity in definitions of the use of the term “co-operative” under the current policy, “that will prevent any possibility of misunderstandingor misinterpreting the strategic intentions” [68]. Hence, in order to gain policy support forincreasing dairy/milk production by creating co-operatives, good communication of thepolicy seems key to building trust amongst Kazakh citizens. Finally, a “top–down” routeto the creation of agricultural co-operatives has been widely criticized around the worlddue to its nonviability and noneffectiveness [68]. Survey results in this research showedthat information on the policy aimed at creating co-operatives had neither been widelydistributed nor explained to Kazakh citizens and rural households [16]. The majority of theparticipants only discovered the existence of the program from the researchers during thesurvey. However, in the developing world the “top–down” process can be a legitimate wayof organising co-operatives [72]. For instance, the classic form of establishing co-operativesin China that involves the participation of the state and farmers has been regarded aswidespread and effective. In post-socialist Vietnam, state involvement also played a crucial
173
Agriculture 2021, 11, 642
role in the development of agricultural co-operatives, where the sector suffered from lowlevels of initiative on the part of farmers [72,73]. Despite this, we believe that the initiativeto create co-operatives should come from rural households. Moreover, dairy factories needto also be involved in such initiatives from the outset. Otherwise, the top–down processmay not be implemented successfully.
4. Conclusions
We assessed the public support for a policy aimed at increasing milk productionthrough co-operatives by estimating the monetary value for society of the policy. It wasfound that Kazakh citizens showed support for the government policy. The findingspresented in this paper might also be relevant for post-communist countries, such asRussia, Ukraine, and Kyrgyzstan, the agricultural development of which has a similarpattern to Kazakhstan’s.
Psychological factors played an important role in the success of the policy—namely,holding a positive attitude towards the behaviour, having positive endorsement regardingthe behaviour (the support of the policy) from the social referent (e.g., family membersand friends), and being in a position to control the behaviour, i.e., A, SN, and PBC, sig-nificantly influence Kazakh citizens’ WTP support of the policy. Moreover, individualawareness of the policy was found to be important in supporting the policy. Therefore,good communication of the policy and its aims to the general public is key for policysupport. Findings suggest that countries that have transitioned to new policy regimes canface difficulties in implementing policy programmes in cases where significant parts ofthe population miss characteristics of the past regime. We also found some evidence ofreprioritisation of people’s preferences under COVID-19, with relatively lower support forthe policy. Therefore, to achieve the support of the general public, the government shouldtake measures to increase its attractiveness and try to earn public acceptance.
In this study, we investigate the success of the Kazakh government policy aimed atincreasing milk production through an increase in co-operative production. We mainlybased our analysis on the opinion and reactions of the general public in Kazakhstan.However, other policy outcomes, such as an increase in the competitiveness of Kazakh’smilk production in international markets, could also generate further benefits (e.g., extragovernment revenue). In addition, accounting for any environmental effects (e.g., landscapeand habitat, biodiversity, soil) associated with a change from current production to co-operative production would also be needed in a cost–benefit analysis.
Additionally, it should be emphasized that this research considered only a single at-tribute, i.e., the value of the policy on creation of production co-operatives. However, thereis a potential for exploring the general public’s willingness to pay for co-operatives throughincluding other specifications. These might include other attributes, including diversityof co-operatives such as service co-operatives. Alternatively, consumers’ preferences canbe explained by extending product attributes, e.g., quality and price of the milk fromco-operatives. In such a case, a choice experiment approach can be utilized to investigateindividuals’ WTP for welfare changes by offering different attributes of goods/policiesand choosing a preferred option across several sets [74,75].
Author Contributions: Conceptualization, S.K., F.J.A. and Y.G.; methodology, S.K., F.J.A. and Y.G.;software, S.K., F.J.A. and Y.G.; formal analysis, S.K., F.J.A. and Y.G.; investigation, S.K., F.J.A. andY.G.; data curation, S.K.; writing—original draft preparation, S.K.; writing—review and editing, F.J.A.and Y.G.; visualization, S.K., F.J.A. and Y.G.; supervision, F.J.A. and Y.G. All authors have read andagreed to the published version of the manuscript.
Funding: This study was funded by the University of Reading and the Centre for InternationalPrograms (CIP) “Bolashak” of the Republic of Kazakhstan.
Institutional Review Board Statement: This study was approved by the Ethics Committee of theUniversity of Reading (protocol code/ethical clearance application number 001151P, approved on 2December 2019.
174
Agriculture 2021, 11, 642
Informed Consent Statement: Informed consent was obtained from all subjects involved in the study.
Conflicts of Interest: The authors declare no conflict of interest.
References
1. Kinyakin, A. The Eurasian Economic Union: Between co-existence, confrontation and cooperation with the EU. Rocz. Integr. Eur.2016, 461–480. [CrossRef]
2. Legal Information System of Regulatory Legal Acts of the Republic of Kazakhstan. Available online: http://adilet.zan.kz/eng(accessed on 10 January 2021).
3. OECD. Strengthening Agricultural Co-Operatives in Kazakhstan; OECD: Paris, France, 2015.4. Schmitz, A.; Meyers, W.H. Transition to Agricultural Market Economies: The Future of Kazakhstan, Russia and Ukraine; CABI:
Wallingford, UK, 2015. [CrossRef]5. Sheikin, D.; Kulbayeva, A. Food Industry of the Republic of Kazakhstan; JSC Rating Agency of the Regional Financial Center of
Almaty: Almaty, Kazakhstan, 2015.6. Csaki, C.; Gray, K.; Lerman, Z.; Thiesenhusen, W. Land Reform and the Restructuring of Kolkhozes and Sovkhozes. In Food and
Agricultural Policy Reforms in the Former USSR: An Agenda for Transition; World Bank, Europe and Central Asia Region: Washington,DC, USA, 1992; p. WP3.1.
7. Ministry of Agriculture of the Republic of Kazakhstan. State Program for the Development of the Agro-Inductrial Complexof the Republic of Kazakhstan for 2017–2021. 2017. Available online: https://primeminister.kz/ru/page/view/razvitie_agropromishlennogo_kompleksa (accessed on 9 July 2018).
8. Ajates, R. An integrated conceptual framework for the study of agricultural cooperatives: From repolitisation to cooperativesustainability. J. Rural. Stud. 2020, 78, 467–479. [CrossRef]
9. Ishak, S.; Omar, A.R.C.; Sum, S.M.; Othman, A.S.; Jaafar, J. Smallholder Agriculture Co-operatives’ Performance: What Is in theMinds of Management? J. Co-Oper. Organ. Manag. 2020, 8, 100110. [CrossRef]
10. Milovanovic, V.; Smutka, L. Cooperative rice farming within rural Bangladesh. J. Co-Oper. Organ. Manag. 2018, 6, 11–19.[CrossRef]
11. Sultana, M.; Ahmed, J.U.; Shiratake, Y. Sustainable conditions of agriculture cooperative with a case study of dairy cooperative ofSirajgonj District in Bangladesh. J. Co-Oper. Organ. Manag. 2020, 8, 100105. [CrossRef]
12. Price, C. Valuation of unpriced products: Contingent valuation, cost–benefit analysis and participatory democracy. Land UsePolicy 2000, 17, 187–196. [CrossRef]
13. Tienhaara, A.; Ahtiainen, H.; Pouta, E. Consumer and citizen roles and motives in the valuation of agricultural genetic resourcesin Finland. Ecol. Econ. 2015, 114, 1–10. [CrossRef]
14. Zhang, B.; Fu, Z.; Huang, J.; Wang, J.; Xu, S.; Zhang, L. Consumers’ perceptions, purchase intention, and willingness to pay apremium price for safe vegetables: A case study of Beijing, China. J. Clean. Prod. 2018, 197, 1498–1507. [CrossRef]
15. McGurk, E.; Hynes, S.; Thorne, F. Participation in agri-environmental schemes: A contingent valuation study of farmers inIreland. J. Environ. Manag. 2020, 262, 110243. [CrossRef] [PubMed]
16. Kaliyeva, S.; Areal, F.J.; Gadanakis, Y. Attitudes of Kazakh Rural Households towards Joining and Creating Cooperatives.Agriculture 2020, 10, 568. [CrossRef]
17. Luo, J.; Han, H.; Jia, F.; Dong, H. Agricultural Co-operatives in the western world: A bibliometric analysis. J. Clean. Prod. 2020,273, 122945. [CrossRef]
18. Fahad, S.; Jing, W. Evaluation of Pakistani farmers’ willingness to pay for crop insurance using contingent valuation method: Thecase of Khyber Pakhtunkhwa province. Land Use Policy 2018, 72, 570–577. [CrossRef]
19. Elbakidze, L.; Nayga, R. The effects of information on willingness to pay for animal welfare in dairy production: Application ofnonhypothetical valuation mechanisms. J. Dairy Sci. 2012, 95, 1099–1107. [CrossRef]
20. Bett, R.; Bett, H.; Kahi, A.; Peters, K. Evaluation and effectiveness of breeding and production services for dairy goat farmers inKenya. Ecol. Econ. 2009, 68, 2451–2460. [CrossRef]
21. Mogas, J.; Riera, P.; Bennett, J. A comparison of contingent valuation and choice modelling with second-order interactions. J. For.Econ. 2006, 12, 5–30. [CrossRef]
22. Tuan, T.H.; Navrud, S. Valuing cultural heritage in developing countries: Comparing and pooling contingent valuation andchoice modelling estimates. Environ. Resour. Econ. 2007, 38, 51–69. [CrossRef]
23. Bradford, W.D.; Kleit, A.N.; A Krousel-Wood, M.; Re, R.M. Willingness to pay for telemedicine assessed by the double-boundeddichotomous choice method. J. Telemed. Telecare 2004, 10, 325–330. [CrossRef] [PubMed]
24. Venkatachalam, L. The contingent valuation method: A review. Environ. Impact Assess. Rev. 2004, 24, 89–124. [CrossRef]25. Bennett, R.; Balcombe, K. Farmers’ Willingness to Pay for a Tuberculosis Cattle Vaccine. J. Agric. Econ. 2012, 63, 408–424.
[CrossRef]26. Hanemann, M.; Loomis, J.; Kanninen, B. Statistical Efficiency of Double-Bounded Dichotomous Choice Contingent Valuation.
Am. J. Agric. Econ. 1991, 73, 1255–1263. [CrossRef]27. Kanninen, B.J. Erratum: Optimal Experimental Design for Double-Bounded Dichotomous Choice Contingent Valuation. Land
Econ. 1993, 69, 443. [CrossRef]
175
Agriculture 2021, 11, 642
28. Kajale, D.B.; Becker, T. Willingness to Pay for Golden Rice in India: A Contingent Valuation Method Analysis. J. Food Prod. Mark.2015, 21, 319–336. [CrossRef]
29. Hernandez, J.I.; Hunt, A.; Pazzona, M.; Lavín, F.V. Protest treatment and its impact on the WTP and WTA estimates for theft androbbery in the UK. Oxf. Econ. Pap. 2018, 70, 468–484. [CrossRef]
30. Frey, U.J.; Pirscher, F. Distinguishing protest responses in contingent valuation: A conceptualization of motivations and attitudesbehind them. PLoS ONE 2019, 14, e0209872. [CrossRef]
31. Halstead, J.M.; Luloff, A.; Stevens, T.H. Protest Bidders in Contingent Valuation. Northeast. J. Agric. Resour. Econ. 1992, 21,160–169. [CrossRef]
32. Johansson, P.-O.; Kriström, B. Why rational agents report zero or negative WTPs in valuation experiments. J. Environ. Econ. Policy2021, 10, 22–27. [CrossRef]
33. Fishbein, M.; Ajzen, I. Belief, Attitude, Intention, and Behavior: An Introduction to Theory and Research; Adison-Wesley: Reading, MA,USA, 1975.
34. Armitage, C.J.; Conner, M. Efficacy of the Theory of Planned Behaviour: A meta-analytic review. Br. J. Soc. Psychol. 2001, 40,471–499. [CrossRef]
35. Ajzen, I. The theory of planned behavior. Organ. Behav. Hum. Decis. Process. 1991, 50, 179–211. [CrossRef]36. Fishbein, M.; Ajzen, I. Predicting and Changing Behavior: The Reasoned Action Approach; Psychology Press: London, UK, 2010.
[CrossRef]37. FAO. Dairy Development in Kazakhstan; FAO: Rome, Italy, 2011.38. Kucherov, S. The Future of the Soviet Collective Farm. Am. Slav. East Eur. Rev. 1960, 19, 180. [CrossRef]39. Dadabaev, T. Evaluations of perestroika in post-Soviet Central Asia: Public views in contemporary Uzbekistan, Kazakhstan and
Kyrgyzstan. Communist Post-Communist Stud. 2016, 49, 179–192. [CrossRef]40. Easterlin, R.A. Lost in transition: Life satisfaction on the road to capitalism. J. Econ. Behav. Organ. 2009, 71, 130–145. [CrossRef]41. Hinks, T. Bribery, motivations for bribery and life satisfaction in transitional countries. World Dev. Perspect. 2020, 17, 100172.
[CrossRef]42. Valiyev, A.; Babayev, A.; Huseynova, H.; Jafarova, K. Do citizens of the former Soviet Union trust state institutions and why: The
case of Azerbaijan. Communist Post-Communist Stud. 2017, 50, 221–231. [CrossRef]43. Babu, S.C.; Sanyal, P. Classifying households on food security and poverty dimensions—Application of K-mean cluster analysis.
Food Secur. Poverty Nutr. Policy Anal. 2009, 265–277. [CrossRef]44. Jain, A.K. Data clustering: 50 years beyond K-means. Pattern Recognit. Lett. 2010, 31, 651–666. [CrossRef]45. Mooi, E.; Sarstedt, M.; Mooi-Reci, I. Market Research: The Process, Data, and Methods Using Stata; Springer: Singapore, 2018.
[CrossRef]46. Hyland, J.J.; Heanue, K.; McKillop, J.; Micha, E. Factors underlying farmers’ intentions to adopt best practices: The case of
paddock based grazing systems. Agric. Syst. 2018, 162, 97–106. [CrossRef]47. Gustavsen, G.W.; Hegnes, A.W. Individuals’ personality and consumption of organic food. J. Clean. Prod. 2020, 245, 118772.
[CrossRef]48. Bettin, G.; Lucchetti, R. Interval regression models with endogenous explanatory variables. Empir. Econ. 2012, 43, 475–498.
[CrossRef]49. Martinez-Ribaya, B.; Areal, F.J. Is there an opportunity for product differentiation between GM and non-GM soya-based products
in Argentina? Food Control 2020, 109, 106895. [CrossRef]50. Shen, J. Understanding the Determinants of Consumers’ Willingness to Pay for Eco-Labeled Products: An Empirical Analysis of
the China Environmental Label. J. Serv. Sci. Manag. 2012, 5, 87–94. [CrossRef]51. Wooldridge, M.J. Econometric Analysis of Cross Section and Panel Data; The MIT Press: London, UK, 2010.52. Carfora, V.; Cavallo, C.; Caso, D.; Del Giudice, T.; De Devitiis, B.; Viscecchia, R.; Nardone, G.; Cicia, G. Explaining consumer
purchase behavior for organic milk: Including trust and green self-identity within the theory of planned behavior. Food Qual.Prefer. 2019, 76, 1–9. [CrossRef]
53. Stampa, E.; Schipmann-Schwarze, C.; Hamm, U. Consumer perceptions, preferences, and behavior regarding pasture-raisedlivestock products: A review. Food Qual. Prefer. 2020, 82, 103872. [CrossRef]
54. Hoeksma, D.L.; Gerritzen, M.A.; Lokhorst, A.M.; Poortvliet, P.M. An extended theory of planned behavior to predict consumers’willingness to buy mobile slaughter unit meat. Meat Sci. 2017, 128, 15–23. [CrossRef]
55. Klicperova-Baker, M.; Koštál, J. Post-communist democracy vs. totalitarianism: Contrasting patterns of need satisfaction andsocietal frustration. Communist Post-Communist Stud. 2017, 50, 99–111. [CrossRef]
56. Toleubayev, K.; Jansen, K.; Van Huis, A. Knowledge and agrarian de-collectivisation in Kazakhstan. J. Peasant. Stud. 2010, 37,353–377. [CrossRef]
57. Dascălu, D.I. Individualism and Morality in the Post-communist Capitalism. Procedia Soc. Behav. Sci. 2014, 149, 280–285.[CrossRef]
58. Rabikowska, M. The ghosts of the past: 20 years after the fall of communism in Europe. Communist Post-Communist Stud. 2009, 42,165–179. [CrossRef]
59. Zhang, M.; Li, L.; Bai, J. Consumer acceptance of cultured meat in urban areas of three cities in China. Food Control 2020,118, 107390. [CrossRef]
176
Agriculture 2021, 11, 642
60. Roosen, J.; Bieberstein, A.; Blanchemanche, S.; Goddard, E.; Marette, S.; Vandermoere, F. Trust and willingness to pay fornanotechnology food. Food Policy 2015, 52, 75–83. [CrossRef]
61. Yu, H.; Neal, J.A.; Sirsat, S.A. Consumers’ food safety risk perceptions and willingness to pay for fresh-cut produce with lowerrisk of foodborne illness. Food Control 2018, 86, 83–89. [CrossRef]
62. Blustein, D.L.; Duffy, R.; Ferreira, J.A.; Cohen-Scali, V.; Cinamon, R.G.; Allan, B.A. Unemployment in the time of COVID-19: Aresearch agenda. J. Vocat. Behav. 2020, 119, 103436. [CrossRef]
63. During the Dangerous Epidemic, the Number of Unemployed in Atyrau Increased by 3 and a Half Times. Available online: https://24.kz/kz/zha-aly-tar/o-am/item/420240-auipti-indet-kezinde-atyrauda-zh-myssyzdar-sany-3-zharym-esege-art-an (ac-cessed on 18 August 2020). (In Kazakh)
64. Gava, O.; Ardakani, Z.; Delalic, A.; Azzi, N.; Bartolini, F. Agricultural cooperatives contributing to the alleviation of rural poverty.The case of Konjic (Bosnia and Herzegovina). J. Rural. Stud. 2021, 82, 328–339. [CrossRef]
65. Hannachi, M.; Fares, M.; Coleno, F.; Assens, C. The “new agricultural collectivism”: How cooperatives horizontal coordinationdrive multi-stakeholders self-organization. J. Co-Oper. Organ. Manag. 2020, 8, 100111. [CrossRef]
66. Li, X.; Ito, J. An empirical study of land rental development in rural Gansu, China: The role of agricultural cooperatives andtransaction costs. Land Use Policy 2021, 109, 105621. [CrossRef]
67. Liang, Q.; Wang, X. Cooperatives as competitive yardstick in the hog industry?—Evidence from China. Agribusiness 2020, 36,127–145. [CrossRef]
68. Lerman, Z. Co-Operative Development in Central Asia; Policy Studies on Rural Transition No. 2013-4; FAO: Rome, Italy, 2013; 38p.69. Iliopoulos, C.; Valentinov, V. Cooperative Longevity: Why Are So Many Cooperatives So Successful? Sustainability 2018, 10, 3449.
[CrossRef]70. Niyazmetov, D.; Soliev, I.; Theesfeld, I. Ordered to volunteer? Institutional compatibility assessment of establishing agricultural
cooperatives in Uzbekistan. Land Use Policy 2021, 108, 105538. [CrossRef]71. Moon, S.; Lee, S. A Strategy for Sustainable Development of Cooperatives in Developing Countries: The Success and Failure Case
of Agricultural Cooperatives in Musambira Sector, Rwanda. Sustainability 2020, 12, 8632. [CrossRef]72. Kurakin, A.; Visser, O. Post-socialist agricultural cooperatives in Russia: A case study of top-down cooperatives in the Belgorod
region. Post-Communist Econ. 2017, 29, 158–181. [CrossRef]73. Deng, H.; Huang, J.; Xu, Z.; Rozelle, S. Policy support and emerging farmer professional cooperatives in rural China. China Econ.
Rev. 2010, 21, 495–507. [CrossRef]74. Concu, G.B. Investigating distance effects on environmental values: A choice modelling approach. Aust. J. Agric. Resour. Econ.
2007, 51, 175–194. [CrossRef]75. Schreiner, J.; Latacz-Lohmann, U. Farmers’ valuation of incentives to produce genetically modified organism-free milk: Insights
from a discrete choice experiment in Germany. J. Dairy Sci. 2015, 98, 7498–7509. [CrossRef]
177

agriculture
Article
The Digitalization of the European Agri-Food CooperativeSector. Determining Factors to Embrace Information andCommunication Technologies
Javier Jorge-Vázquez 1,*, Mª Peana Chivite-Cebolla 1 and Francisco Salinas-Ramos 2
Citation: Jorge-Vázquez, J.;
Chivite-Cebolla, M.P.; Salinas-Ramos,
F. The Digitalization of the European
Agri-Food Cooperative Sector.
Determining Factors to Embrace
Information and Communication
Technologies. Agriculture 2021, 11,
514. https://doi.org/10.3390/
agriculture11060514
Academic Editors: Adoración
Mozas Moral and Domingo
Fernandez Ucles
Received: 8 May 2021
Accepted: 28 May 2021
Published: 2 June 2021
Publisher’s Note: MDPI stays neutral
with regard to jurisdictional claims in
published maps and institutional affil-
iations.
Copyright: © 2021 by the authors.
Licensee MDPI, Basel, Switzerland.
This article is an open access article
distributed under the terms and
conditions of the Creative Commons
Attribution (CC BY) license (https://
creativecommons.org/licenses/by/
4.0/).
1 DEKIS Research Group, Department of Economics, Catholic University of Ávila, 05005 Avila, Spain;[email protected]
2 Department of Economics, Catholic University of Ávila, 05005 Avila, Spain; [email protected]* Correspondence: [email protected]
Abstract: The digitization of the agri-food sector is a strategic priority in the political agendaof European institutions. The opportunity to improve the competitiveness and efficiency of thesector offered by new technologies comes together with its potential to face new economic andenvironmental challenges. This research aims to analyze the level of digitalization of the Europeanagri-food cooperative sector from the construction of a composite synthetic index. Such an index is tobe based on a diverse set of variables related to electronic commerce and the services offered throughthe internet. It also evaluates how European cooperatives influence the degree of technologicaladoption depending on their size or the wealth of the country where they carry out their activity.The empirical analytical method is thus used, through the analysis of frequencies and correlations.The results obtained reveal the existence of a suboptimal and heterogeneous degree of digitizationof European agri-food cooperatives, clearly conditioned by their size and the wealth of the countrywhere they operate. In this situation, it is recommended to promote public policies that guaranteehigh-performance digital connectivity, an improvement in training in digital skills and the promotionof cooperative integration processes.
Keywords: agroindustrial; agricultural cooperative; technology adoption; technology and competi-tiveness; information and communication technology; digital transformation; agri-food cooperatives
1. Introduction
In the last few decades, society has digitalized in a generalized way in most of thedeveloped countries and has also adopted a character of transversality that is encouragingreconsideration of the traditional forms and balances of economic and social organization.This phenomenon is inseparable from the vigorous and accelerated development of newdigital technologies.
The vertiginous development of digital infrastructures together with the globalizationof an increasingly agile and reliable network access and interconnection is causing a globaldigital ecosystem. Its configuration drives the concurrence of multiple disruptive processes,with a noticeable incidence in all productive sectors, pushing towards the transformationof business models and the change in economic growth patterns of developed countries.There is no doubt that the digital transformation comes today as a lever that drives de-velopment and economic growth while favoring profits in terms of competitiveness andbusiness efficiency.
In this dynamic and highly competitive environment, the European agri-food cooper-ative sector must undertake a digitalization strategy that allows it to take advantage of theopportunities that arise from a hyperconnected global market such as the current one is.The access new technologies and the implementation of technical and organizational inno-vations must therefore be a priority for agri-food cooperatives that seek to obtain profits interms of competitiveness and productivity and thus improve their market positioning.
Agriculture 2021, 11, 514. https://doi.org/10.3390/agriculture11060514 https://www.mdpi.com/journal/agriculture
179
Agriculture 2021, 11, 514
This research intends to contribute to the study of the degree of implementation of newdigital technologies in business organizations and, more particularly, in the European agri-food cooperative sector, which has unquestionable strategic importance for the EuropeanUnion (EU) [1]. In this way, the main objectives set forth can be defined as two: (i) developan exploratory study on the degree of digitalization of European agri-food cooperativesbased on two specific dimensions of analysis: their presence on the Internet and theuse of information and communication technology (ICT) for commercial purposes byevaluating the online sales channels and tools present on their websites; and (ii) identifythe determining factors of the digitization index of European agri-food cooperatives, basedon two variables: the size of the cooperative societies and the wealth of the country wherethey carry out their activity.
In order to achieve both objectives, we propose to build a composite index to allowfor the development of a comparative analysis of the degree of technological integration ofa representative sample composed of 454 EU (28) agri-food cooperatives. Additionally, theanalysis of frequencies and correlations will allow for the determination of the degree ofinfluence of the different factors on the digitization index of cooperatives.
The sequence of research is as follows: after defining the scope of research and, oncethe objectives of the study have been defined, we proceed to develop a brief review ofthe background of the research around the conditions of the issue that allow us to lay thegroundwork to make research assumptions. Once the methodology has been thoroughlydefined and the proposed assumptions presented, the analysis and discussion of the resultsobtained in the investigation, as well as the main conclusions reached, are presentedby highlighting the implications of the findings and summarizing directions of ongoingresearch.
2. Theoretical Framework
Analyzing the economic effects associated with the process of digitalization of theeconomy has been a common object of interest for the scientific community in recentdecades. These investigations have focused on the study of the economic impact of addingnew technologies, mainly in three different areas: productivity gains, economic growthand the labor market.
Far from undertaking a systematic review of the literature on the current status,an objective that exceeds the scope and purpose of this research, we present below themain works that highlight the background of the investigation and the current stateof knowledge.
The economic literature we reviewed evidences the existence of a large group of worksthat confirm the significant influence that implementing ICT has on profits in terms of totalproductivity of productive factors. In particular, Nordhaus [2] attributes the rebound weobserved in the average productivity of the business sector since 1995 to the strong growthof productivity in sectors that are intensive in information and communication technologies.Along these lines, Besnaham et al. [3] also conclude that adopting information technologiescauses positive effects on business productivity. However, they argue that such productivityincreases when combined with certain organizational investments. Hernando et al. [4] alsofind evidence of a positive and relevant contribution of ICT to the growth of productionand productivity in Spain in the period 1991–2000, while Astrostic et al. [5] assert that thereis a clear link between information technology and productivity gains. For their part, Draca,M. [6] present a neoclassical framework to understand the role of ICT and productivity. Intheir study, they find that there is evidence of a strong association between informationtechnologies and firm performance. For his part, Torrent [7] maintains that communicationtechnologies, although they are not the only causal factor, “are consolidated as an essentialinstrument for the development of production, work and consumption in the network”(p. 19). Cardona et al. [8], after reviewing empirical literature, found that most studiespoint out the positive and significant effect of ICTs on productivity, although they arguethat research in this field is still insufficient to better understand the externalities of ICTs in
180
Agriculture 2021, 11, 514
the economy. Other research has shown the significantly positive impact on agriculturalproductivity [9] and that such improvement in agricultural yields associated with theadoption of new technologies has contributed to reducing poverty and food insecurity ratesin the most disadvantaged rural areas and, consequently, to economic growth [10]. On thecontrary, some authors [11] have found certain limitations and a reduced impact of publicprograms for easy adoption of technology through extension programs based on ICT in theagricultural field. In any case, most studies coincide in pointing out the positive impact ofinvestment in information technology (IT) on world economic growth, especially in themost industrialized economies and in developing Asian countries [12]. Other works [13,14]have also analyzed the impact of ICTs in Europe, concluding that the deployment and use ofICTs drives economic growth in developed European countries. Additionally, the use of ITCand, in particular, digital empowerment have positive economic effects on the labor marketand on the inclusion of disadvantaged groups [15]. This positive impact on the economyresponds largely to the improvement of the international competitiveness of companies [16]and the internal efficiency of companies [17]. In particular, some studies have analyzed thepositive impact of ITCs on the economic efficiency of companies operating in the agri-foodsector [18]. In most of these studies, the main benefits of the use of new technologies are thegreater growth, development and economic efficiency of companies [19] by complementingother production factors and promoting innovation by significantly reducing transactioncosts [20].
Along these same lines, some works [21] have confirmed that adopting ICT in theagri-food sector, along with other structural and organizational variables, constitutes arelevant factor to be considered in improving competitiveness, gains in economic efficiencyand the development of the sector itself, while contributing to sustainability in agricultureand food systems [22].
On the other hand, the existence of conditioning factors to adopt new technologies inthe agri-food sector has also been a common object matter of scientific interest.
Most studies on technological adoption in firms are based on the theories of the diffu-sion of innovation (DOI) and technology, organization and environment (TOE) [23]. In bothmodels, the size of the firm measured by the number of employees is considered one of thedetermining factors in the adoption of innovation and technology in organizations [24,25].Along these lines, some research such as that developed by [26] has explored the influencethat social and demographic factors, commercial orientation or the size of farms generatein the adoption of information systems based on ICT.
Other studies have found that the level of ICT adoption has higher levels in the richestcountries and that the return obtained from such implementation is also higher than in thepoorest countries [9].
The studies on digital transformation developed in the field of the agri-food cooper-ative sector agree to point out the existence of some delay in adopting new technologiesfor business purposes [27]. Such a delay is conditioned by the size and subsector wherecooperatives carry out their activity [28] and by the quality of their website [29]. Ultimately,this makes it difficult to include advanced functions on websites [30] or to take advantageof the opportunities offered by ICTs, such as traceability systems for the agri-food supplychain based on blockchain technology [31], among others.
In several areas and regions, there are still works that present digitization as a solutionto the sustainability of agri-food systems around the world. In this regard, there areworks that focus on studying the regions of the Middle East and North Africa [32]. Inthe Barents Region [33], digitalization can create conditions that are necessary to diversifyorganizational schemes and effectively monitor food processing operations that will helpto promote food and nutrition security.
181
Agriculture 2021, 11, 514
In Spain, for example, research indicates that, although the growing importance ofdigital communication stands out, Spanish cooperatives still do not invest or include thismatter in their strategic plans [34]. For wine cooperatives to be competitive and improvethe quality of their website, they will need to improve their digital communication [35].Domestically, in the Catalonia region, it will be reported that cooperatives in this regioncontinue to show very low levels due to the lack of presence of websites on the internet [36].
Based on the review of the research background and the current status of the issueraised, the following research assumptions are made for subsequent contrast:
Hypothesis 1. Agri-food cooperatives in the EU (28) have a degree of digitalization below theaverage level observed in the European business sector as a whole.
Hypothesis 2. The size of the agri-food cooperative in the EU (28) constitutes a conditioning factorin the adoption of new technologies.
Hypothesis 3. The wealth of the country where the agri-food cooperative develops its activityexerts a significant influence on its degree of digital transformation.
3. Materials and Methods
In order to comply with the scientific objectives formulated and proceed to contrastthe research assumptions raised on the degree of digitalization of the European agri-foodcooperative sector, it is proposed to apply the empirical analytical method, through theanalysis of frequencies and correlations. To evaluate the website, we will choose the methodof accounting and will apply content analysis techniques.
3.1. Population and Sample
The agri-food cooperatives that are active in the EU (28) make the study populationof this work. The source used to obtain the European cooperatives operating in the agri-food sector is the Orbis database [37]. For this search, we obtained a total population of35,384 cooperatives. By including the most updated availability criterion of the reportedinformation as an indicator of business activity and taking cooperatives with data after2016, the population is 16,184 registered cooperatives.
Once the population under study was identified, the sample size was determinedthrough randomized stratified probabilistic sampling according to the country, for a 95%confidence level and a sampling error of 4.6%. That gave us a sample size of 441.52cooperatives. Applying stratified random probabilistic sampling according to the coun-try allows everyone to be represented, especially those with the largest number of co-operatives, according to that base, to a greater extent, which allows for an additionalinter-territorial analysis.
To determine the sample size for each country, it is established that any countries thathave the most cooperatives have up to 24, those that are average have 16, and those withthe lowest number or least data availability (5 countries) have between 9 and 5, dependingon said availability. Thus, the country with the lowest representation is Luxembourg,holding 5 cooperatives. The sample broken down by countries is distributed as shown inTable 1.
Although the sample came up to 442 cooperatives, 454 have finally been selected toallow greater representation.
182
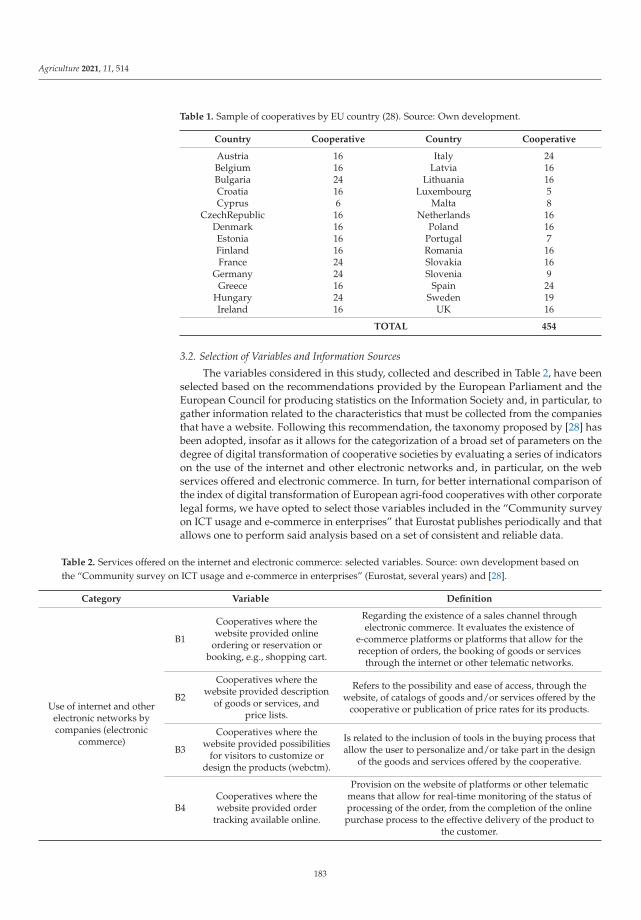
Agriculture 2021, 11, 514
Table 1. Sample of cooperatives by EU country (28). Source: Own development.
Country Cooperative Country Cooperative
Austria 16 Italy 24Belgium 16 Latvia 16Bulgaria 24 Lithuania 16Croatia 16 Luxembourg 5Cyprus 6 Malta 8
CzechRepublic 16 Netherlands 16Denmark 16 Poland 16Estonia 16 Portugal 7Finland 16 Romania 16France 24 Slovakia 16
Germany 24 Slovenia 9Greece 16 Spain 24
Hungary 24 Sweden 19Ireland 16 UK 16
TOTAL 454
3.2. Selection of Variables and Information Sources
The variables considered in this study, collected and described in Table 2, have beenselected based on the recommendations provided by the European Parliament and theEuropean Council for producing statistics on the Information Society and, in particular, togather information related to the characteristics that must be collected from the companiesthat have a website. Following this recommendation, the taxonomy proposed by [28] hasbeen adopted, insofar as it allows for the categorization of a broad set of parameters on thedegree of digital transformation of cooperative societies by evaluating a series of indicatorson the use of the internet and other electronic networks and, in particular, on the webservices offered and electronic commerce. In turn, for better international comparison ofthe index of digital transformation of European agri-food cooperatives with other corporatelegal forms, we have opted to select those variables included in the “Community surveyon ICT usage and e-commerce in enterprises” that Eurostat publishes periodically and thatallows one to perform said analysis based on a set of consistent and reliable data.
Table 2. Services offered on the internet and electronic commerce: selected variables. Source: own development based onthe “Community survey on ICT usage and e-commerce in enterprises” (Eurostat, several years) and [28].
Category Variable Definition
Use of internet and otherelectronic networks bycompanies (electronic
commerce)
B1
Cooperatives where thewebsite provided online
ordering or reservation orbooking, e.g., shopping cart.
Regarding the existence of a sales channel throughelectronic commerce. It evaluates the existence of
e-commerce platforms or platforms that allow for thereception of orders, the booking of goods or services
through the internet or other telematic networks.
B2
Cooperatives where thewebsite provided description
of goods or services, andprice lists.
Refers to the possibility and ease of access, through thewebsite, of catalogs of goods and/or services offered by the
cooperative or publication of price rates for its products.
B3
Cooperatives where thewebsite provided possibilities
for visitors to customize ordesign the products (webctm).
Is related to the inclusion of tools in the buying process thatallow the user to personalize and/or take part in the design
of the goods and services offered by the cooperative.
B4Cooperatives where thewebsite provided order
tracking available online.
Provision on the website of platforms or other telematicmeans that allow for real-time monitoring of the status ofprocessing of the order, from the completion of the onlinepurchase process to the effective delivery of the product to
the customer.
183
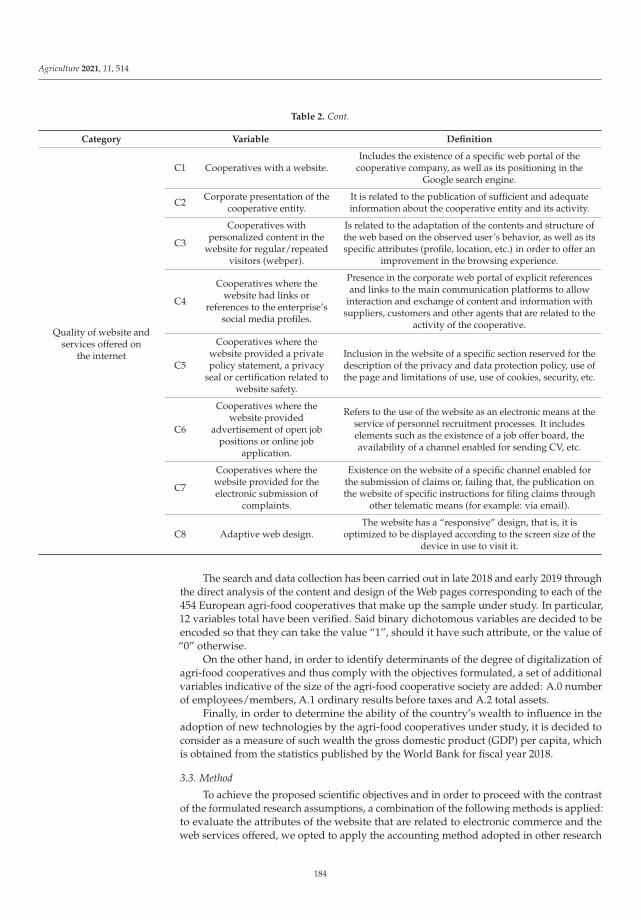
Agriculture 2021, 11, 514
Table 2. Cont.
Category Variable Definition
Quality of website andservices offered on
the internet
C1 Cooperatives with a website.Includes the existence of a specific web portal of the
cooperative company, as well as its positioning in theGoogle search engine.
C2 Corporate presentation of thecooperative entity.
It is related to the publication of sufficient and adequateinformation about the cooperative entity and its activity.
C3
Cooperatives withpersonalized content in the
website for regular/repeatedvisitors (webper).
Is related to the adaptation of the contents and structure ofthe web based on the observed user’s behavior, as well as itsspecific attributes (profile, location, etc.) in order to offer an
improvement in the browsing experience.
C4
Cooperatives where thewebsite had links or
references to the enterprise’ssocial media profiles.
Presence in the corporate web portal of explicit referencesand links to the main communication platforms to allow
interaction and exchange of content and information withsuppliers, customers and other agents that are related to the
activity of the cooperative.
C5
Cooperatives where thewebsite provided a privatepolicy statement, a privacy
seal or certification related towebsite safety.
Inclusion in the website of a specific section reserved for thedescription of the privacy and data protection policy, use ofthe page and limitations of use, use of cookies, security, etc.
C6
Cooperatives where thewebsite provided
advertisement of open jobpositions or online job
application.
Refers to the use of the website as an electronic means at theservice of personnel recruitment processes. It includeselements such as the existence of a job offer board, theavailability of a channel enabled for sending CV, etc.
C7
Cooperatives where thewebsite provided for theelectronic submission of
complaints.
Existence on the website of a specific channel enabled forthe submission of claims or, failing that, the publication onthe website of specific instructions for filing claims through
other telematic means (for example: via email).
C8 Adaptive web design.The website has a “responsive” design, that is, it is
optimized to be displayed according to the screen size of thedevice in use to visit it.
The search and data collection has been carried out in late 2018 and early 2019 throughthe direct analysis of the content and design of the Web pages corresponding to each of the454 European agri-food cooperatives that make up the sample under study. In particular,12 variables total have been verified. Said binary dichotomous variables are decided to beencoded so that they can take the value “1”, should it have such attribute, or the value of“0” otherwise.
On the other hand, in order to identify determinants of the degree of digitalization ofagri-food cooperatives and thus comply with the objectives formulated, a set of additionalvariables indicative of the size of the agri-food cooperative society are added: A.0 numberof employees/members, A.1 ordinary results before taxes and A.2 total assets.
Finally, in order to determine the ability of the country’s wealth to influence in theadoption of new technologies by the agri-food cooperatives under study, it is decided toconsider as a measure of such wealth the gross domestic product (GDP) per capita, whichis obtained from the statistics published by the World Bank for fiscal year 2018.
3.3. Method
To achieve the proposed scientific objectives and in order to proceed with the contrastof the formulated research assumptions, a combination of the following methods is applied:to evaluate the attributes of the website that are related to electronic commerce and theweb services offered, we opted to apply the accounting method adopted in other research
184
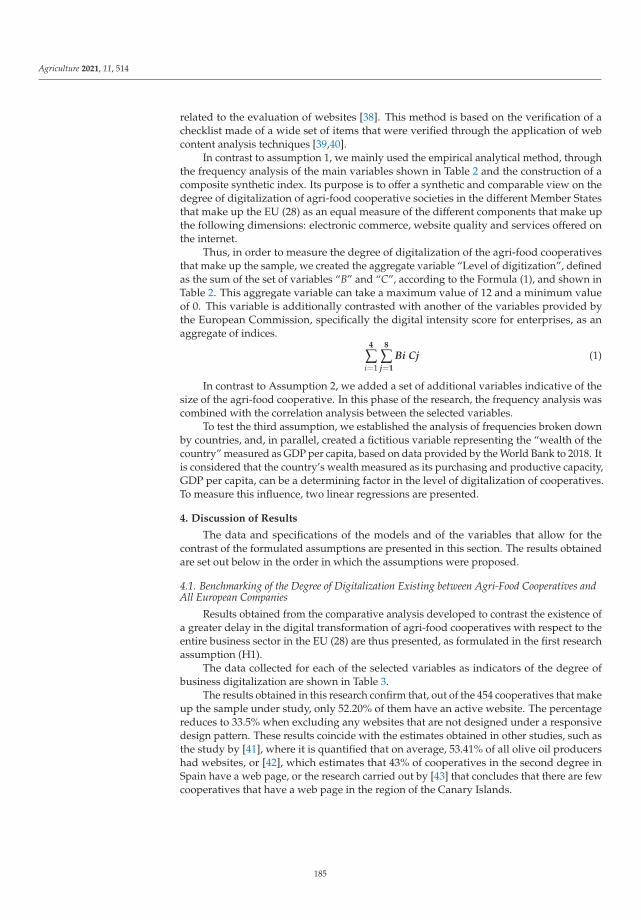
Agriculture 2021, 11, 514
related to the evaluation of websites [38]. This method is based on the verification of achecklist made of a wide set of items that were verified through the application of webcontent analysis techniques [39,40].
In contrast to assumption 1, we mainly used the empirical analytical method, throughthe frequency analysis of the main variables shown in Table 2 and the construction of acomposite synthetic index. Its purpose is to offer a synthetic and comparable view on thedegree of digitalization of agri-food cooperative societies in the different Member Statesthat make up the EU (28) as an equal measure of the different components that make upthe following dimensions: electronic commerce, website quality and services offered onthe internet.
Thus, in order to measure the degree of digitalization of the agri-food cooperativesthat make up the sample, we created the aggregate variable “Level of digitization”, definedas the sum of the set of variables “B” and “C”, according to the Formula (1), and shown inTable 2. This aggregate variable can take a maximum value of 12 and a minimum valueof 0. This variable is additionally contrasted with another of the variables provided bythe European Commission, specifically the digital intensity score for enterprises, as anaggregate of indices.
4
∑i=1
8
∑j=1
Bi Cj (1)
In contrast to Assumption 2, we added a set of additional variables indicative of thesize of the agri-food cooperative. In this phase of the research, the frequency analysis wascombined with the correlation analysis between the selected variables.
To test the third assumption, we established the analysis of frequencies broken downby countries, and, in parallel, created a fictitious variable representing the “wealth of thecountry” measured as GDP per capita, based on data provided by the World Bank to 2018. Itis considered that the country’s wealth measured as its purchasing and productive capacity,GDP per capita, can be a determining factor in the level of digitalization of cooperatives.To measure this influence, two linear regressions are presented.
4. Discussion of Results
The data and specifications of the models and of the variables that allow for thecontrast of the formulated assumptions are presented in this section. The results obtainedare set out below in the order in which the assumptions were proposed.
4.1. Benchmarking of the Degree of Digitalization Existing between Agri-Food Cooperatives andAll European Companies
Results obtained from the comparative analysis developed to contrast the existence ofa greater delay in the digital transformation of agri-food cooperatives with respect to theentire business sector in the EU (28) are thus presented, as formulated in the first researchassumption (H1).
The data collected for each of the selected variables as indicators of the degree ofbusiness digitalization are shown in Table 3.
The results obtained in this research confirm that, out of the 454 cooperatives that makeup the sample under study, only 52.20% of them have an active website. The percentagereduces to 33.5% when excluding any websites that are not designed under a responsivedesign pattern. These results coincide with the estimates obtained in other studies, such asthe study by [41], where it is quantified that on average, 53.41% of all olive oil producershad websites, or [42], which estimates that 43% of cooperatives in the second degree inSpain have a web page, or the research carried out by [43] that concludes that there are fewcooperatives that have a web page in the region of the Canary Islands.
185
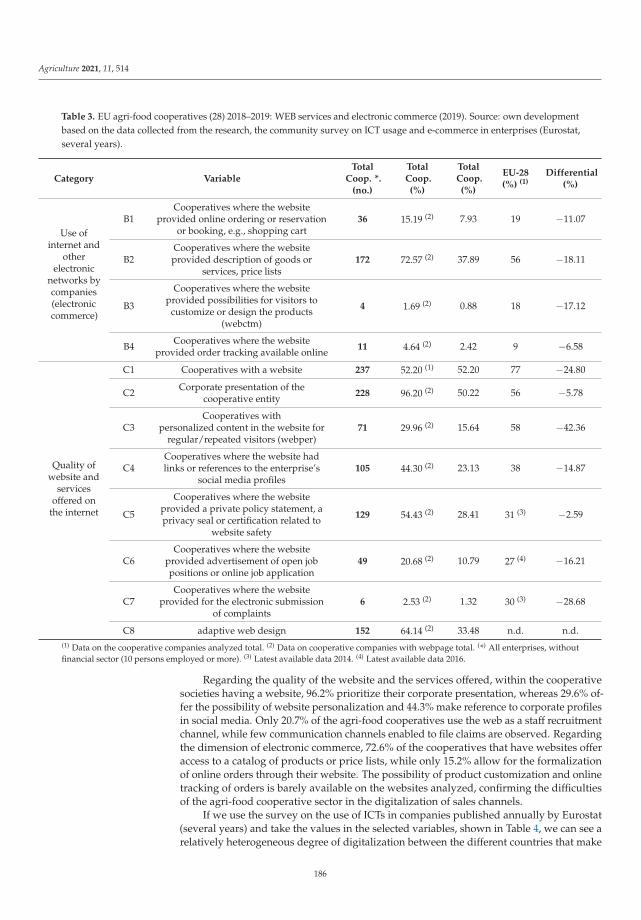
Agriculture 2021, 11, 514
Table 3. EU agri-food cooperatives (28) 2018–2019: WEB services and electronic commerce (2019). Source: own developmentbased on the data collected from the research, the community survey on ICT usage and e-commerce in enterprises (Eurostat,several years).
Category VariableTotal
Coop. *.(no.)
TotalCoop.(%)
TotalCoop.(%)
EU-28(%) (1)
Differential(%)
Use ofinternet and
otherelectronic
networks bycompanies(electroniccommerce)
B1Cooperatives where the website
provided online ordering or reservationor booking, e.g., shopping cart
36 15.19 (2) 7.93 19 −11.07
B2Cooperatives where the websiteprovided description of goods or
services, price lists172 72.57 (2) 37.89 56 −18.11
B3
Cooperatives where the websiteprovided possibilities for visitors to
customize or design the products(webctm)
4 1.69 (2) 0.88 18 −17.12
B4 Cooperatives where the websiteprovided order tracking available online 11 4.64 (2) 2.42 9 −6.58
Quality ofwebsite and
servicesoffered on
the internet
C1 Cooperatives with a website 237 52.20 (1) 52.20 77 −24.80
C2 Corporate presentation of thecooperative entity 228 96.20 (2) 50.22 56 −5.78
C3Cooperatives with
personalized content in the website forregular/repeated visitors (webper)
71 29.96 (2) 15.64 58 −42.36
C4Cooperatives where the website hadlinks or references to the enterprise’s
social media profiles105 44.30 (2) 23.13 38 −14.87
C5
Cooperatives where the websiteprovided a private policy statement, aprivacy seal or certification related to
website safety
129 54.43 (2) 28.41 31 (3) −2.59
C6Cooperatives where the website
provided advertisement of open jobpositions or online job application
49 20.68 (2) 10.79 27 (4) −16.21
C7Cooperatives where the website
provided for the electronic submissionof complaints
6 2.53 (2) 1.32 30 (3) −28.68
C8 adaptive web design 152 64.14 (2) 33.48 n.d. n.d.(1) Data on the cooperative companies analyzed total. (2) Data on cooperative companies with webpage total. (*) All enterprises, withoutfinancial sector (10 persons employed or more). (3) Latest available data 2014. (4) Latest available data 2016.
Regarding the quality of the website and the services offered, within the cooperativesocieties having a website, 96.2% prioritize their corporate presentation, whereas 29.6% of-fer the possibility of website personalization and 44.3% make reference to corporate profilesin social media. Only 20.7% of the agri-food cooperatives use the web as a staff recruitmentchannel, while few communication channels enabled to file claims are observed. Regardingthe dimension of electronic commerce, 72.6% of the cooperatives that have websites offeraccess to a catalog of products or price lists, while only 15.2% allow for the formalizationof online orders through their website. The possibility of product customization and onlinetracking of orders is barely available on the websites analyzed, confirming the difficultiesof the agri-food cooperative sector in the digitalization of sales channels.
If we use the survey on the use of ICTs in companies published annually by Eurostat(several years) and take the values in the selected variables, shown in Table 4, we can see arelatively heterogeneous degree of digitalization between the different countries that make
186
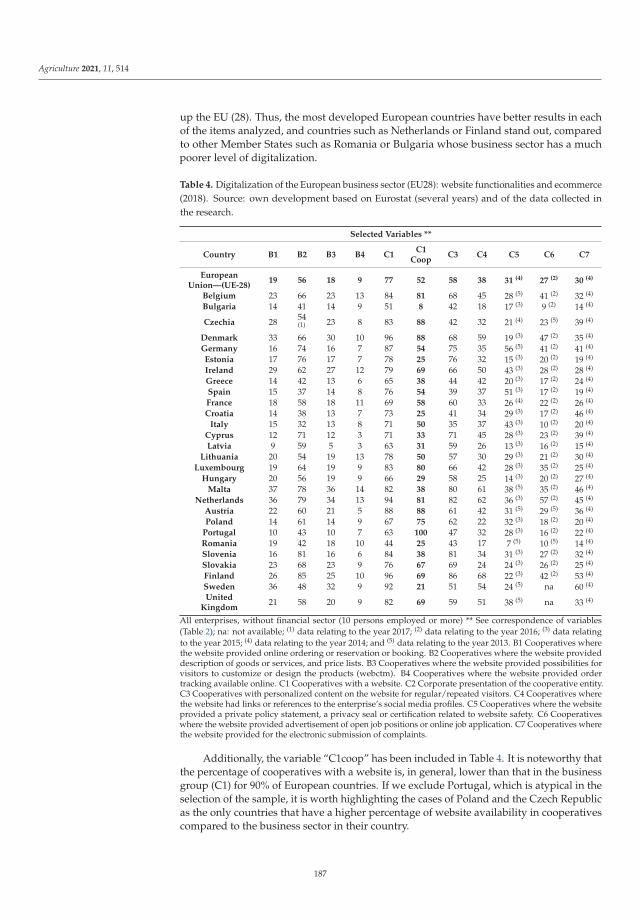
Agriculture 2021, 11, 514
up the EU (28). Thus, the most developed European countries have better results in eachof the items analyzed, and countries such as Netherlands or Finland stand out, comparedto other Member States such as Romania or Bulgaria whose business sector has a muchpoorer level of digitalization.
Table 4. Digitalization of the European business sector (EU28): website functionalities and ecommerce(2018). Source: own development based on Eurostat (several years) and of the data collected inthe research.
Selected Variables **
Country B1 B2 B3 B4 C1C1
CoopC3 C4 C5 C6 C7
EuropeanUnion—(UE-28)
19 56 18 9 77 52 58 38 31 (4) 27 (2) 30 (4)
Belgium 23 66 23 13 84 81 68 45 28 (5) 41 (2) 32 (4)
Bulgaria 14 41 14 9 51 8 42 18 17 (3) 9 (2) 14 (4)
Czechia 28 54(1) 23 8 83 88 42 32 21 (4) 23 (5) 39 (4)
Denmark 33 66 30 10 96 88 68 59 19 (3) 47 (2) 35 (4)
Germany 16 74 16 7 87 54 75 35 56 (5) 41 (2) 41 (4)
Estonia 17 76 17 7 78 25 76 32 15 (3) 20 (2) 19 (4)
Ireland 29 62 27 12 79 69 66 50 43 (3) 28 (2) 28 (4)
Greece 14 42 13 6 65 38 44 42 20 (3) 17 (2) 24 (4)
Spain 15 37 14 8 76 54 39 37 51 (3) 17 (2) 19 (4)
France 18 58 18 11 69 58 60 33 26 (4) 22 (2) 26 (4)
Croatia 14 38 13 7 73 25 41 34 29 (3) 17 (2) 46 (4)
Italy 15 32 13 8 71 50 35 37 43 (3) 10 (2) 20 (4)
Cyprus 12 71 12 3 71 33 71 45 28 (3) 23 (2) 39 (4)
Latvia 9 59 5 3 63 31 59 26 13 (3) 16 (2) 15 (4)
Lithuania 20 54 19 13 78 50 57 30 29 (3) 21 (2) 30 (4)
Luxembourg 19 64 19 9 83 80 66 42 28 (3) 35 (2) 25 (4)
Hungary 20 56 19 9 66 29 58 25 14 (3) 20 (2) 27 (4)
Malta 37 78 36 14 82 38 80 61 38 (5) 35 (2) 46 (4)
Netherlands 36 79 34 13 94 81 82 62 36 (3) 57 (2) 45 (4)
Austria 22 60 21 5 88 88 61 42 31 (5) 29 (5) 36 (4)
Poland 14 61 14 9 67 75 62 22 32 (3) 18 (2) 20 (4)
Portugal 10 43 10 7 63 100 47 32 28 (3) 16 (2) 22 (4)
Romania 19 42 18 10 44 25 43 17 7 (5) 10 (5) 14 (4)
Slovenia 16 81 16 6 84 38 81 34 31 (3) 27 (2) 32 (4)
Slovakia 23 68 23 9 76 67 69 24 24 (3) 26 (2) 25 (4)
Finland 26 85 25 10 96 69 86 68 22 (3) 42 (2) 53 (4)
Sweden 36 48 32 9 92 21 51 54 24 (5) na 60 (4)
UnitedKingdom
21 58 20 9 82 69 59 51 38 (5) na 33 (4)
All enterprises, without financial sector (10 persons employed or more) ** See correspondence of variables(Table 2); na: not available; (1) data relating to the year 2017; (2) data relating to the year 2016; (3) data relatingto the year 2015; (4) data relating to the year 2014; and (5) data relating to the year 2013. B1 Cooperatives wherethe website provided online ordering or reservation or booking. B2 Cooperatives where the website provideddescription of goods or services, and price lists. B3 Cooperatives where the website provided possibilities forvisitors to customize or design the products (webctm). B4 Cooperatives where the website provided ordertracking available online. C1 Cooperatives with a website. C2 Corporate presentation of the cooperative entity.C3 Cooperatives with personalized content on the website for regular/repeated visitors. C4 Cooperatives wherethe website had links or references to the enterprise’s social media profiles. C5 Cooperatives where the websiteprovided a private policy statement, a privacy seal or certification related to website safety. C6 Cooperativeswhere the website provided advertisement of open job positions or online job application. C7 Cooperatives wherethe website provided for the electronic submission of complaints.
Additionally, the variable “C1coop” has been included in Table 4. It is noteworthy thatthe percentage of cooperatives with a website is, in general, lower than that in the businessgroup (C1) for 90% of European countries. If we exclude Portugal, which is atypical in theselection of the sample, it is worth highlighting the cases of Poland and the Czech Republicas the only countries that have a higher percentage of website availability in cooperativescompared to the business sector in their country.
187
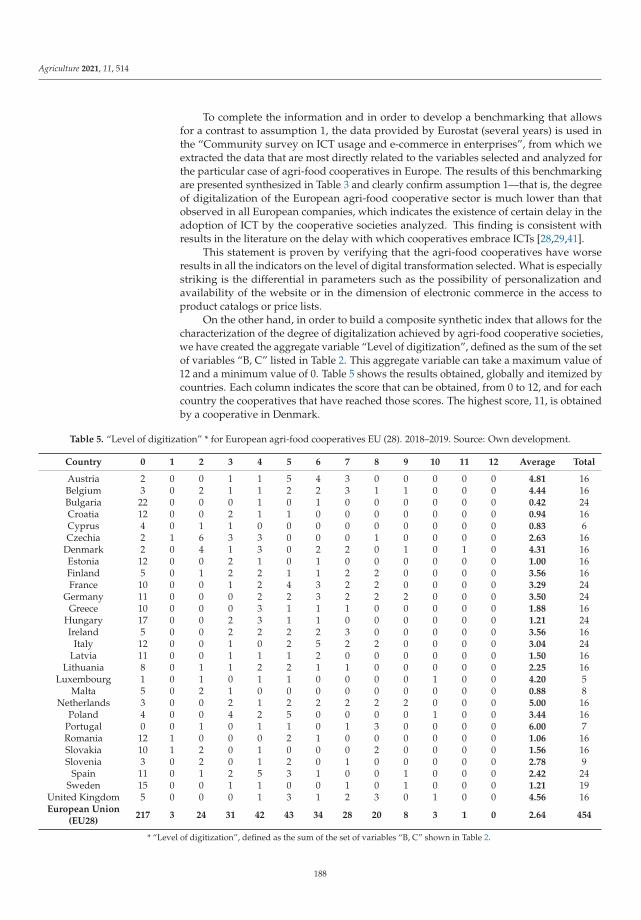
Agriculture 2021, 11, 514
To complete the information and in order to develop a benchmarking that allowsfor a contrast to assumption 1, the data provided by Eurostat (several years) is used inthe “Community survey on ICT usage and e-commerce in enterprises”, from which weextracted the data that are most directly related to the variables selected and analyzed forthe particular case of agri-food cooperatives in Europe. The results of this benchmarkingare presented synthesized in Table 3 and clearly confirm assumption 1—that is, the degreeof digitalization of the European agri-food cooperative sector is much lower than thatobserved in all European companies, which indicates the existence of certain delay in theadoption of ICT by the cooperative societies analyzed. This finding is consistent withresults in the literature on the delay with which cooperatives embrace ICTs [28,29,41].
This statement is proven by verifying that the agri-food cooperatives have worseresults in all the indicators on the level of digital transformation selected. What is especiallystriking is the differential in parameters such as the possibility of personalization andavailability of the website or in the dimension of electronic commerce in the access toproduct catalogs or price lists.
On the other hand, in order to build a composite synthetic index that allows for thecharacterization of the degree of digitalization achieved by agri-food cooperative societies,we have created the aggregate variable “Level of digitization”, defined as the sum of the setof variables “B, C” listed in Table 2. This aggregate variable can take a maximum value of12 and a minimum value of 0. Table 5 shows the results obtained, globally and itemized bycountries. Each column indicates the score that can be obtained, from 0 to 12, and for eachcountry the cooperatives that have reached those scores. The highest score, 11, is obtainedby a cooperative in Denmark.
Table 5. “Level of digitization” * for European agri-food cooperatives EU (28). 2018–2019. Source: Own development.
Country 0 1 2 3 4 5 6 7 8 9 10 11 12 Average Total
Austria 2 0 0 1 1 5 4 3 0 0 0 0 0 4.81 16Belgium 3 0 2 1 1 2 2 3 1 1 0 0 0 4.44 16Bulgaria 22 0 0 0 1 0 1 0 0 0 0 0 0 0.42 24Croatia 12 0 0 2 1 1 0 0 0 0 0 0 0 0.94 16Cyprus 4 0 1 1 0 0 0 0 0 0 0 0 0 0.83 6Czechia 2 1 6 3 3 0 0 0 1 0 0 0 0 2.63 16
Denmark 2 0 4 1 3 0 2 2 0 1 0 1 0 4.31 16Estonia 12 0 0 2 1 0 1 0 0 0 0 0 0 1.00 16Finland 5 0 1 2 2 1 1 2 2 0 0 0 0 3.56 16France 10 0 0 1 2 4 3 2 2 0 0 0 0 3.29 24
Germany 11 0 0 0 2 2 3 2 2 2 0 0 0 3.50 24Greece 10 0 0 0 3 1 1 1 0 0 0 0 0 1.88 16
Hungary 17 0 0 2 3 1 1 0 0 0 0 0 0 1.21 24Ireland 5 0 0 2 2 2 2 3 0 0 0 0 0 3.56 16
Italy 12 0 0 1 0 2 5 2 2 0 0 0 0 3.04 24Latvia 11 0 0 1 1 1 2 0 0 0 0 0 0 1.50 16
Lithuania 8 0 1 1 2 2 1 1 0 0 0 0 0 2.25 16Luxembourg 1 0 1 0 1 1 0 0 0 0 1 0 0 4.20 5
Malta 5 0 2 1 0 0 0 0 0 0 0 0 0 0.88 8Netherlands 3 0 0 2 1 2 2 2 2 2 0 0 0 5.00 16
Poland 4 0 0 4 2 5 0 0 0 0 1 0 0 3.44 16Portugal 0 0 1 0 1 1 0 1 3 0 0 0 0 6.00 7Romania 12 1 0 0 0 2 1 0 0 0 0 0 0 1.06 16Slovakia 10 1 2 0 1 0 0 0 2 0 0 0 0 1.56 16Slovenia 3 0 2 0 1 2 0 1 0 0 0 0 0 2.78 9
Spain 11 0 1 2 5 3 1 0 0 1 0 0 0 2.42 24Sweden 15 0 0 1 1 0 0 1 0 1 0 0 0 1.21 19
United Kingdom 5 0 0 0 1 3 1 2 3 0 1 0 0 4.56 16European Union
(EU28)217 3 24 31 42 43 34 28 20 8 3 1 0 2.64 454
* “Level of digitization”, defined as the sum of the set of variables “B, C” shown in Table 2.
188
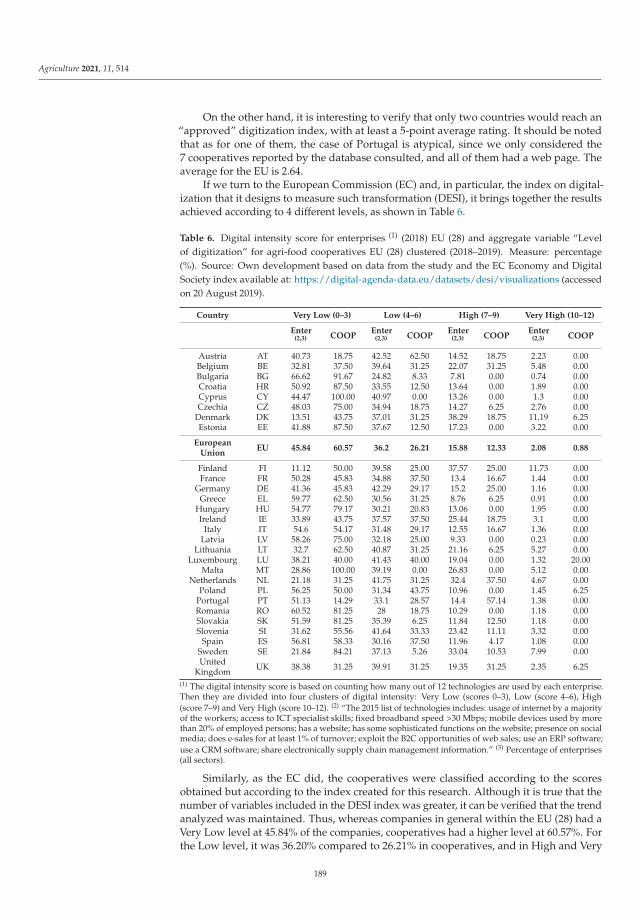
Agriculture 2021, 11, 514
On the other hand, it is interesting to verify that only two countries would reach an“approved” digitization index, with at least a 5-point average rating. It should be notedthat as for one of them, the case of Portugal is atypical, since we only considered the7 cooperatives reported by the database consulted, and all of them had a web page. Theaverage for the EU is 2.64.
If we turn to the European Commission (EC) and, in particular, the index on digital-ization that it designs to measure such transformation (DESI), it brings together the resultsachieved according to 4 different levels, as shown in Table 6.
Table 6. Digital intensity score for enterprises (1) (2018) EU (28) and aggregate variable “Levelof digitization” for agri-food cooperatives EU (28) clustered (2018–2019). Measure: percentage(%). Source: Own development based on data from the study and the EC Economy and DigitalSociety index available at: https://digital-agenda-data.eu/datasets/desi/visualizations (accessedon 20 August 2019).
Country Very Low (0–3) Low (4–6) High (7–9) Very High (10–12)
Enter(2,3) COOP
Enter(2,3) COOP
Enter(2,3) COOP
Enter(2,3) COOP
Austria AT 40.73 18.75 42.52 62.50 14.52 18.75 2.23 0.00Belgium BE 32.81 37.50 39.64 31.25 22.07 31.25 5.48 0.00Bulgaria BG 66.62 91.67 24.82 8.33 7.81 0.00 0.74 0.00Croatia HR 50.92 87.50 33.55 12.50 13.64 0.00 1.89 0.00Cyprus CY 44.47 100.00 40.97 0.00 13.26 0.00 1.3 0.00Czechia CZ 48.03 75.00 34.94 18.75 14.27 6.25 2.76 0.00
Denmark DK 13.51 43.75 37.01 31.25 38.29 18.75 11.19 6.25Estonia EE 41.88 87.50 37.67 12.50 17.23 0.00 3.22 0.00
EuropeanUnion
EU 45.84 60.57 36.2 26.21 15.88 12.33 2.08 0.88
Finland FI 11.12 50.00 39.58 25.00 37.57 25.00 11.73 0.00France FR 50.28 45.83 34.88 37.50 13.4 16.67 1.44 0.00
Germany DE 41.36 45.83 42.29 29.17 15.2 25.00 1.16 0.00Greece EL 59.77 62.50 30.56 31.25 8.76 6.25 0.91 0.00
Hungary HU 54.77 79.17 30.21 20.83 13.06 0.00 1.95 0.00Ireland IE 33.89 43.75 37.57 37.50 25.44 18.75 3.1 0.00
Italy IT 54.6 54.17 31.48 29.17 12.55 16.67 1.36 0.00Latvia LV 58.26 75.00 32.18 25.00 9.33 0.00 0.23 0.00
Lithuania LT 32.7 62.50 40.87 31.25 21.16 6.25 5.27 0.00Luxembourg LU 38.21 40.00 41.43 40.00 19.04 0.00 1.32 20.00
Malta MT 28.86 100.00 39.19 0.00 26.83 0.00 5.12 0.00Netherlands NL 21.18 31.25 41.75 31.25 32.4 37.50 4.67 0.00
Poland PL 56.25 50.00 31.34 43.75 10.96 0.00 1.45 6.25Portugal PT 51.13 14.29 33.1 28.57 14.4 57.14 1.38 0.00Romania RO 60.52 81.25 28 18.75 10.29 0.00 1.18 0.00Slovakia SK 51.59 81.25 35.39 6.25 11.84 12.50 1.18 0.00Slovenia SI 31.62 55.56 41.64 33.33 23.42 11.11 3.32 0.00
Spain ES 56.81 58.33 30.16 37.50 11.96 4.17 1.08 0.00Sweden SE 21.84 84.21 37.13 5.26 33.04 10.53 7.99 0.00United
Kingdom UK 38.38 31.25 39.91 31.25 19.35 31.25 2.35 6.25
(1) The digital intensity score is based on counting how many out of 12 technologies are used by each enterprise.Then they are divided into four clusters of digital intensity: Very Low (scores 0–3), Low (score 4–6), High(score 7–9) and Very High (score 10–12). (2) “The 2015 list of technologies includes: usage of internet by a majorityof the workers; access to ICT specialist skills; fixed broadband speed >30 Mbps; mobile devices used by morethan 20% of employed persons; has a website; has some sophisticated functions on the website; presence on socialmedia; does e-sales for at least 1% of turnover; exploit the B2C opportunities of web sales; use an ERP software;use a CRM software; share electronically supply chain management information.” (3) Percentage of enterprises(all sectors).
Similarly, as the EC did, the cooperatives were classified according to the scoresobtained but according to the index created for this research. Although it is true that thenumber of variables included in the DESI index was greater, it can be verified that the trendanalyzed was maintained. Thus, whereas companies in general within the EU (28) had aVery Low level at 45.84% of the companies, cooperatives had a higher level at 60.57%. Forthe Low level, it was 36.20% compared to 26.21% in cooperatives, and in High and Very
189
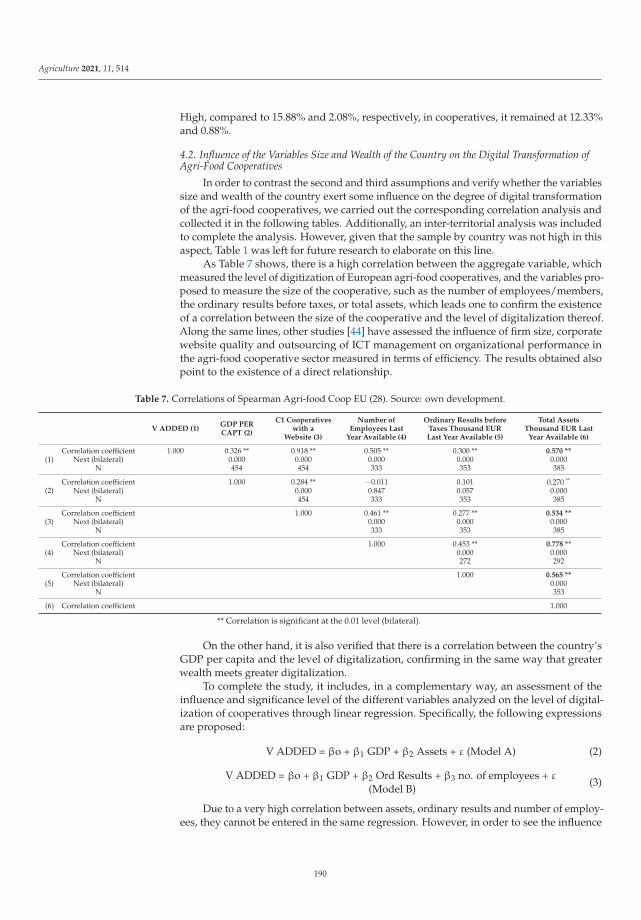
Agriculture 2021, 11, 514
High, compared to 15.88% and 2.08%, respectively, in cooperatives, it remained at 12.33%and 0.88%.
4.2. Influence of the Variables Size and Wealth of the Country on the Digital Transformation ofAgri-Food Cooperatives
In order to contrast the second and third assumptions and verify whether the variablessize and wealth of the country exert some influence on the degree of digital transformationof the agri-food cooperatives, we carried out the corresponding correlation analysis andcollected it in the following tables. Additionally, an inter-territorial analysis was includedto complete the analysis. However, given that the sample by country was not high in thisaspect, Table 1 was left for future research to elaborate on this line.
As Table 7 shows, there is a high correlation between the aggregate variable, whichmeasured the level of digitization of European agri-food cooperatives, and the variables pro-posed to measure the size of the cooperative, such as the number of employees/members,the ordinary results before taxes, or total assets, which leads one to confirm the existenceof a correlation between the size of the cooperative and the level of digitalization thereof.Along the same lines, other studies [44] have assessed the influence of firm size, corporatewebsite quality and outsourcing of ICT management on organizational performance inthe agri-food cooperative sector measured in terms of efficiency. The results obtained alsopoint to the existence of a direct relationship.
Table 7. Correlations of Spearman Agri-food Coop EU (28). Source: own development.
V ADDED (1)GDP PERCAPT (2)
C1 Cooperativeswith a
Website (3)
Number ofEmployees Last
Year Available (4)
Ordinary Results beforeTaxes Thousand EURLast Year Available (5)
Total AssetsThousand EUR Last
Year Available (6)
(1)Correlation coefficient 1.000 0.326 ** 0.918 ** 0.505 ** 0.300 ** 0.570 **
Next (bilateral) 0.000 0.000 0.000 0.000 0.000N 454 454 333 353 385
(2)Correlation coefficient 1.000 0.284 ** −0.011 0.101 0.270 **
Next (bilateral) 0.000 0.847 0.057 0.000N 454 333 353 385
(3)Correlation coefficient 1.000 0.461 ** 0.277 ** 0.534 **
Next (bilateral) 0.000 0.000 0.000N 333 353 385
(4)Correlation coefficient 1.000 0.453 ** 0.778 **
Next (bilateral) 0.000 0.000N 272 292
(5)Correlation coefficient 1.000 0.565 **
Next (bilateral) 0.000N 353
(6) Correlation coefficient 1.000
** Correlation is significant at the 0.01 level (bilateral).
On the other hand, it is also verified that there is a correlation between the country’sGDP per capita and the level of digitalization, confirming in the same way that greaterwealth meets greater digitalization.
To complete the study, it includes, in a complementary way, an assessment of theinfluence and significance level of the different variables analyzed on the level of digital-ization of cooperatives through linear regression. Specifically, the following expressionsare proposed:
V ADDED = βo + β1 GDP + β2 Assets + ε (Model A) (2)
V ADDED = βo + β1 GDP + β2 Ord Results + β3 no. of employees + ε
(Model B)(3)
Due to a very high correlation between assets, ordinary results and number of employ-ees, they cannot be entered in the same regression. However, in order to see the influence
190
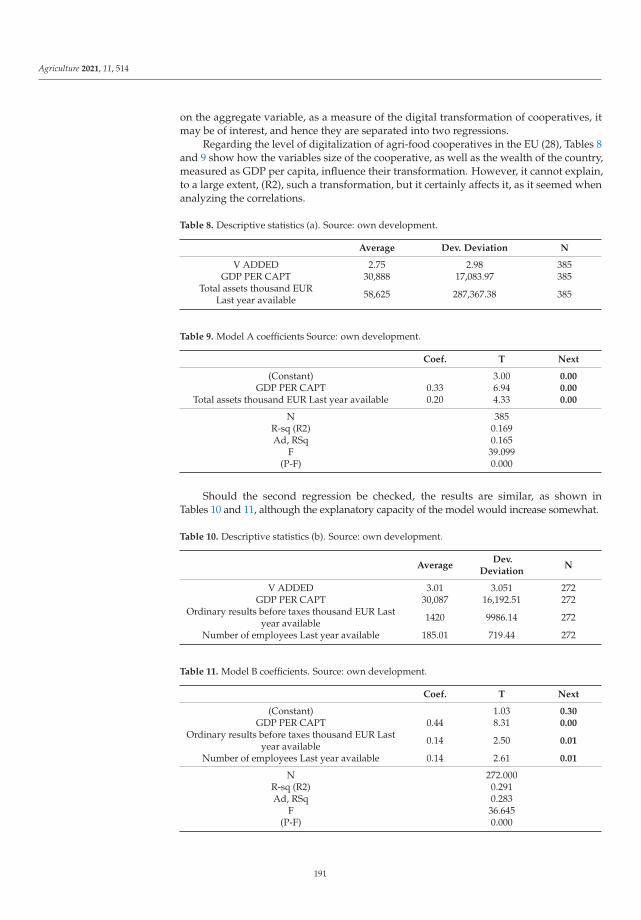
Agriculture 2021, 11, 514
on the aggregate variable, as a measure of the digital transformation of cooperatives, itmay be of interest, and hence they are separated into two regressions.
Regarding the level of digitalization of agri-food cooperatives in the EU (28), Tables 8and 9 show how the variables size of the cooperative, as well as the wealth of the country,measured as GDP per capita, influence their transformation. However, it cannot explain,to a large extent, (R2), such a transformation, but it certainly affects it, as it seemed whenanalyzing the correlations.
Table 8. Descriptive statistics (a). Source: own development.
Average Dev. Deviation N
V ADDED 2.75 2.98 385GDP PER CAPT 30,888 17,083.97 385
Total assets thousand EURLast year available 58,625 287,367.38 385
Table 9. Model A coefficients Source: own development.
Coef. T Next
(Constant) 3.00 0.00GDP PER CAPT 0.33 6.94 0.00
Total assets thousand EUR Last year available 0.20 4.33 0.00
N 385R-sq (R2) 0.169Ad, RSq 0.165
F 39.099(P-F) 0.000
Should the second regression be checked, the results are similar, as shown inTables 10 and 11, although the explanatory capacity of the model would increase somewhat.
Table 10. Descriptive statistics (b). Source: own development.
AverageDev.
DeviationN
V ADDED 3.01 3.051 272GDP PER CAPT 30,087 16,192.51 272
Ordinary results before taxes thousand EUR Lastyear available 1420 9986.14 272
Number of employees Last year available 185.01 719.44 272
Table 11. Model B coefficients. Source: own development.
Coef. T Next
(Constant) 1.03 0.30GDP PER CAPT 0.44 8.31 0.00
Ordinary results before taxes thousand EUR Lastyear available 0.14 2.50 0.01
Number of employees Last year available 0.14 2.61 0.01
N 272.000R-sq (R2) 0.291Ad, RSq 0.283
F 36.645(P-F) 0.000
191
Agriculture 2021, 11, 514
Again, one can check that the proposed model B shows again significance in theinfluence of the size of the cooperative, as well as of the country’s wealth does in the levelof digital transformation of the cooperative. In the latter case, the model has some moreexplanatory capacity.
5. Conclusions
The analysis of the processes of digitalization of business structures constitutes anindisputable element of interest as a catalyst phenomenon of a set of disruptive processesthat lead to profit in terms of efficiency, productivity and business competitiveness. Theagri-food sector, as a strategic sector of the European productive model, cannot be left outof this opportunity. On the contrary, the adoption of ICT offers competitive advantages byimproving the productive yields of the sector while promoting the development of moresustainable, efficient and safe production models.
This research is based on three main research hypotheses that, after being contrasted,were all accepted. In the first place, considering Hypothesis 1, the degree of development ofthe level of digitization of European agri-food cooperatives is in general terms suboptimal,which entails the existence of a certain “technological backwardness”. We can observe saiddeficiency in technological adoption by cooperatives applied to electronic commerce andservices offered on the Internet. Such deficiency is even greater when compared with thedata relating to the whole of the European business net. All the indicators analyzed on thedegree of digital transformation show worse results in the cooperative agri-food sector. Thisis also confirmed by the synthetic index “digitization level” constructed in this research.The results obtained in this digitization index show an extremely low average score forEuropean agri-food cooperatives, in particular 2.64 out of 12 points. Second, accordingto Hypothesis 2, the size of the cooperative is determining for the degree of digitizationof European agri-food cooperatives. Thus, those cooperatives that have greater size orvolume of resources clearly present a higher level of digitization in the two dimensions ofanalysis observed: electronic commerce and web services offered. We can also say that thelevel of digitization has a positive influence on size. There is a similar correlation betweenthe benefit of the cooperative and digitization, and although it has been interpreted in onesense, the analysis could be done in the opposite direction, concluding that the greater thedigitization, the greater the benefit, size and therefore growth. In this context, we needto adopt policies that promote cooperative integration processes to allow cooperatives toincrease their size and thus improve the conditions for better adopting technology. Third,the contrast of hypothesis 3 allows us to affirm the significant influence of the country’swealth on the degree of digital transformation of the cooperatives under study. Froma territorial point of view, the analysis carried out confirms that there has been a veryuneven digital transformation among the EU Member States (28) and, in particular, thatnew technologies are more frequently adopted by cooperatives whose activity develops interritories with greater wealth per capita.
This research has revealed the deficient degree of digital transformation of the Euro-pean agri-food cooperative sector. Additionally, there is an urgent need to promote publicpolicies that encourage greater adoption of technology in the sector to improve levels ofcompetitiveness, productivity and efficiency. To this end, European public administrationsare encouraged to guarantee high-performance digital connectivity in rural areas wherethe agri-food industry is mostly located. Additionally, promoting training programs indigital skills and information on existing technologies that could be applied to productionprocesses and marketing channels is important. This would allow for a greater dynamismof electronic commerce and an increase in the number of services offered on the internet byagri-food cooperatives. It would also make it possible to face new challenges such as thedigitization of the value chain or the integration of new technologies such as artificial intel-ligence (AI), blockchain, robotics or the internet of things (IoT). In short, the digitizationof the agri-food cooperative sector offers a real opportunity to reshape the functioning of
192
Agriculture 2021, 11, 514
the agri-food markets and respond to the economic and environmental challenges facingthe sector.
However, we are aware of the limitations of the study, since there are factors that havenot been studied in depth. Among them, it is recommended, for future work, to analyzethe type of cooperatives, the different subsectors and the greatest need or convenienceof digitization, according to the specific circumstances of each cooperative. These effortscould help focus the efforts of institutions on more efficient digitization.
Author Contributions: Conceptualization, J.J.-V. and M.P.C.-C.; methodology, J.J.-V. and M.P.C.-C.;software, M.P.C.-C.; validation, J.J.-V., M.P.C.-C. and F.S-.R.; formal analysis, J.J.-V. and M.P.C.-C.;investigation, J.J.-V. and M.P.C.-C.; resources, J.J.-V. and M.P.C.-C.; data curation, M.P.C.-C.; writing—original draft preparation, J.J.-V. and M.P.C.-C.; writing—review and editing, J.J.-V., M.P.C.-C. andF.S.-R.; visualization, J.J.-V. and F.S.-R.; supervision, J.J.-V.; project administration, J.J.-V.; fundingacquisition, J.J.-V. All authors have read and agreed to the published version of the manuscript.
Funding: This research was funded by AAUCAV, grant number BI1920 and The APC was partiallyfunded by the incentive granted to the authors by the Catholic University of Ávila.
Institutional Review Board Statement: Not applicable.
Informed Consent Statement: Not applicable.
Data Availability Statement: Not applicable.
Conflicts of Interest: The authors declare no conflict of interest.
References
1. Colom Gorgues, A.; Cos Sánchez, P.; Florensa Guiu, R.M. Cooperativismo agroalimentario en Europa. Dimensión, gobernanza yanálisis BCG de las sociedades cooperativas TOP25 de la UE-28 y TOP10 en España. REVESCO. Rev. Estud. Coop. 2019, 130, 73–98.[CrossRef]
2. Nordhaus, W.D. Productivity growth and the new economy. Brook. Pap. Econ. Act. 2002, 33, 211–265. [CrossRef]3. Bresnahan, T.F.; Brynjolfsson, E.; Hitt, L.M. Information Technology, Workplace Organization, and the Demand for Skilled Labor:
Firm-Level Evidence. Q. J. Econ. 2002, 117, 339–376. [CrossRef]4. Hernando, I.; Nuñez, S. The Contribution of ICT to Economic Activity: A Growth Accounting Exercise with Spanish Firm-level
Data. Investig. Econ. 2004, 28, 315–348.5. Atrostic, B.K.; Nguyen, S.V. IT and Productivity in U.S. Manufacturing: Do Computer Networks Matter? Econ. Inq. 2005, 43,
493–506. [CrossRef]6. Draca, M.; Sadun, R.; Van Reenen, J. Productivity and ICTs: A Review of the Evidence. In The Oxford Handbook of Information and
Communication Technologies; Mansell, R., Ed.; Oxford University Press: Oxford, UK, 2007; pp. 100–147.7. Torrent, J. La Empresa red. Tecnologías de la Información y la Comunicación, Productividad y Competitividad; Ariel: Barcelona, Spain, 2008.8. Cardona, M.; Kretschmer, T.; Strobel, T. ICT and productivity: Conclusions from the empirical literature. Inf. Econ. Policy 2013, 25,
109–125. [CrossRef]9. Lio, M.; Liu, M.-C. ICT and agricultural productivity: Evidence from cross-country data. Agric. Econ. 2006, 34, 221–228. [CrossRef]10. Minten, B.; Barrett, C.B. Agricultural Technology, Productivity, and Poverty in Madagascar. World Dev. 2008, 36, 797–822.
[CrossRef]11. Aker, J.C. Dial “A” for Agriculture: A Review of Information and Communication Technologies for Agricultural Extension in
Developing Countries. Agric. Econ. 2011, 42, 631–647. [CrossRef]12. Jorgenson, D.W.; Vu, K. Information Technology and the World Growth Resurgence. Ger. Econ. Rev. 2007, 8, 125–145. [CrossRef]13. Fernández-Portillo, A.; Almodóvar-González, M.; Hernández-Mogollón, R. Impact of ICT development on economic growth.
A study of OECD European union countries. Technol. Soc. 2020, 63, 101420. [CrossRef]14. Hanclova, J.; Doucek, P.; Fischer, J.; Vltavska, K. Does ict capital affect economic growth in the EU-15 and EU-12 countries?
J. Bus. Econ. Manag. 2014, 16, 387–406. [CrossRef]15. Evangelista, R.; Guerrieri, P.; Meliciani, V. The economic impact of digital technologies in Europe. Econ. Innov. New Technol.
2014, 23, 802–824. [CrossRef]16. Peña-Vinces, J.C.; Cepeda-Carrión, G.; Chin, W.W. Effect of ITC on the international competitiveness of firms. Manag. Decis.
2012, 50, 1045–1061. [CrossRef]17. García, E.; Rialp, A.; Rialp, J. Tecnologías de la información y comunicación (TIC) y crecimiento de la empresa. Infor-mación
Comercial Española. ICE. Rev. de Econ. 2007, 838, 125–145.18. Bernal-Jurado, E.; Mozas-Moral, A.; Fernández-Uclés, D.; Medina-Viruel, M. Determining Factors for Economic Efficiency in the
Organic Olive Oil Sector. Sustainability 2017, 9, 784. [CrossRef]
193
Agriculture 2021, 11, 514
19. Fernández-Uclés, D.; Elfkih, S.; Mozas-Moral, A.; Bernal-Jurado, E.; Medina-Viruel, M.J.; Ben Abdallah, S. Economic Efficiency inthe Tunisian Olive Oil Sector. Agriculture 2020, 10, 391. [CrossRef]
20. Deichmann, U.; Goyal, A.; Mishra, D. Will digital technologies transform agriculture in developing countries? Agric. Econ.2016, 47, 21–33. [CrossRef]
21. Bernal-Jurado, E.; Mozas-Moral, A.; Medina-Viruel, M.; Fernández-Uclés, D. Evaluation of Corporate Websites and TheirInfluence on the Performance of Olive Oil Companies. Sustainability 2018, 10, 1274. [CrossRef]
22. El Bilali, H.; Allahyari, M.S. Transition towards sustainability in agriculture and food systems: Role of information andcommunication technologies. Inf. Process. Agric. 2018, 5, 456–464. [CrossRef]
23. Kossaï, M.; De Souza, M.L.L.; Ben Zaied, Y.; Nguyen, P. Determinants of the Adoption of Information and CommunicationTechnologies (ICTs): The Case of Tunisian Electrical and Electronics Sector. J. Knowl. Econ. 2019, 11, 845–864. [CrossRef]
24. Drazin, R. The processes of technological innovation. J. Technol. Transfer. 1991, 16, 45–46. [CrossRef]25. Rogers, E.M. Diffusion of Innovations, 4th ed.; EEUU; Free Press: New York, NY, USA, 1995.26. Ali, J. Factors Affecting the Adoption of Information and Communication Technologies (ICTs) for Farming Decisions. J. Agric.
Food Inf. 2012, 13, 78–96. [CrossRef]27. Cristobal-Fransi, E.; Montegut-Salla, Y.; Ferrer-Rosell, B.; Daries, N. Rural cooperatives in the digital age: An analysis of the
Internet presence and degree of maturity of agri-food cooperatives’ e-commerce. J. Rural. Stud. 2020, 74, 55–66. [CrossRef]28. Jorge-Vázquez, J.; Chivite-Cebolla, M.P.; Salinas-Ramos, F. La transformación digital en el sector cooperativo agroalimentario
español: Situación y perspectivas. CIRIEC-Esp. Rev. Econ. Pública Soc. Coop. 2019, 95, 39–70. [CrossRef]29. Bernal-Jurado, E.; Mozas-Moral, A.; Fernández-Uclés, D.; Medina-Viruel, M.; Poyatos, R.P. Calidad de los sitios web en el sector
agroalimentario ecológico y sus factores explicativos: El papel del cooperativismo. CIRIEC-Esp. Rev. Econ. Pública Soc. Coop.2019, 95, 95–118. [CrossRef]
30. Fernández-Uclés, D.; Bernal-Jurado, E.; Medina-Viruel, M.; Mozas-Moral, A. El sector cooperativo oleícolas y el uso de las TIC:Un estudio comparativo respecto a otras formas jurídicas. REVESCO. Rev. Estud. Coop. 2016, 120, 53–75. [CrossRef]
31. Borrero, J.D. Sistema de trazabilidad de la cadena de suministro agroalimentario para cooperativas de frutas y hortalizas basadoen la tecnología Blockchain. CIRIEC-Esp. Rev. Econ. Pública Soc. Coop. 2019, 95, 71–94. [CrossRef]
32. Bahn, R.; Yehya, A.; Zurayk, R. Digitalization for Sustainable Agri-Food Systems: Potential, Status, and Risks for the MENARegion. Sustainability 2021, 13, 3223. [CrossRef]
33. Raheem, D.; Shishaev, M.; Dikovitsky, V. Food System Digitalization as a Means to Promote Food and Nutrition Security in theBarents Region. Agriculture 2019, 9, 168. [CrossRef]
34. Dueñas, P.P.M.; Carmona, D.G. La gestión de la comunicación digital en las cooperativas españolas. CIRIEC-Esp. Rev. Econ.Pública Soc. Coop. 2021, 101, 193–225. [CrossRef]
35. Bernal-Jurado, E.; Mozas-Moral, A.; Fernández-Uclés, D.; Medina-Viruel, M.J. Online popularity as a development factor forcooperatives in the winegrowing sector. J. Bus. Res. 2021, 123, 79–85. [CrossRef]
36. Araujo, A.; Serrano, E.; Jordan, V. La presencia de las cooperativas de Catalunya en Internet. CIRIEC-Esp. Rev. Econ. Pública Soc.Coop. 2020, 99, 37–56. [CrossRef]
37. ORBIS. Detailed Information on Companies, Several Years. BvD (Bureau van Dijk). Available online: https://www.informa.es/en/business-risk/sabi/orbis (accessed on 23 March 2019).
38. Law, R.; Qi, S.; Buhalis, D. Progress in tourism management: A review of website evaluation in tourism research. Tour. Manag.2010, 31, 297–313. [CrossRef]
39. McMillan, S.J. The Microscope and the Moving Target: The Challenge of Applying Content Analysis to the World Wide Web.J. Mass Commun. Q. 2000, 77, 80–98. [CrossRef]
40. Weare, C.; Lin, W.-Y. Content Analysis of the World Wide Web: Opportunities and Challenges. Soc. Sci. Comput. Rev. 2000, 18,272–292. [CrossRef]
41. Fernández-Uclés, D.; Bernal-Jurado, E.; Mozas-Moral, A.; Medina-Viruel, M.J. The importance of websites for organic agri-foodproducers. Econ. Res. Ekon. Istraž. 2019, 33, 2867–2880. [CrossRef]
42. Bernal-Jurado, E.; Mozas-Moral, A. Evaluación del uso comercial de la World Wide Web por parte de las cooperativas de segundogrado españolas. Rev. Esp. Estud. Agrosoc. Pesq. 2008, 219, 181–200.
43. González-Aponcio, Z. Determinantes de la calidad de la información divulgada vía Web por las pequeñas y medianas cooperativasde Canarias. REVESCO. Rev. Estud. Coop. 2020, 133, 1–15. [CrossRef]
44. Cristóba-Fransi, E.; Montegut-Salla, Y.; Daries-Ramon, N. Cooperativismo 2.0: Presencia en Internet y desarrollo del comercioelectrónico en las cooperativas oleícolas de Cataluña. REVESCO. Rev. Estud. Coop. 2017, 124, 47–73. [CrossRef]
194
MDPISt. Alban-Anlage 66
4052 BaselSwitzerland
Tel. +41 61 683 77 34Fax +41 61 302 89 18
www.mdpi.com
Agriculture Editorial OfficeE-mail: [email protected]
www.mdpi.com/journal/agriculture


MDPI St. Alban-Anlage 66 4052 Basel Switzerland
Tel: +41 61 683 77 34 Fax: +41 61 302 89 18
www.mdpi.com ISBN 978-3-0365-3764-1


