Embed Size (px)
Citation preview

December 2011ISSN 1996-0808 DOI: 10.5897/AJMRwww.academicjournals.org
O P EN A C C ESS
African Journal of
Microbiology Research
About AJMR
The African Journal of Microbiology Research (AJMR) is a peer reviewed open access journal. The journal commenced publication in May 2007. The journal covers all areas of microbiology such as environmental microbiology, clinical microbiology, immunology, virology, bacteriology, phycology, molecular and cellular biology, molecular microbiology, food microbiology, mycology and parasitology, microbial ecology, probiotics and prebiotics and industrial microbiology.
Indexing
CAB Abstracts, CABI’s Global Health Database, Chemical Abstracts (CAS Source Index)
Dimensions Database, Google Scholar, Matrix of Information for The Analysis of Journals (MIAR), Microsoft Academic, Research Gate
Open Access Policy
Open Access is a publication model that enables the dissemination of research articles to the global community without restriction through the internet. All articles published under open access can be accessed by anyone with internet connection.
The African Journal of Microbiology Research is an Open Access journal. Abstracts and full texts of all articles published in this journal are freely accessible to everyone immediately after publication without any form of restriction.
Article License
All articles published by African Journal of Microbiology Research are licensed under the Creative Commons Attribution 4.0 International License. This permits anyone to copy, redistribute, remix, transmit and adapt the work provided the original work and source is appropriately cited. Citation should include the article DOI. The article license is displayed on the abstract page the following statement:
This article is published under the terms of the Creative Commons Attribution License 4.0
Please refer to https://creativecommons.org/licenses/by/4.0/legalcode for details about Creative Commons Attribution License 4.0

Article Copyright
When an article is published by in the African Journal of Microbiology Research, the author(s) of the article retain the copyright of article. Author(s) may republish the article as part of a book or other materials. When reusing a published article, author(s) should; Cite the original source of the publication when reusing the article. i.e. cite that the article was originally published in the African Journal of Microbiology Research. Include the article DOI, Accept that the article remains published by the African Journal of Microbiology Research (except in occasion of a retraction of the article). The article is licensed under the Creative Commons Attribution 4.0 International License.
A copyright statement is stated in the abstract page of each article. The following statement is an example of a copyright statement on an abstract page. Copyright ©2016 Author(s) retains the copyright of this article. Self-Archiving Policy
The African Journal of Microbiology Research is a RoMEO green journal. This permits authors to archive any version of their article they find most suitable, including the published version on their institutional repository and any other suitable website.
Digital Archiving Policy
The African Journal of Microbiology Research is committed to the long-term preservation of its content. All articles published by the journal are preserved by Portico. In addition, the journal encourages authors to archive the published version of their articles on their institutional repositories and as well as other appropriate websites. https://www.portico.org/publishers/ajournals/
Metadata Harvesting
The African Journal of Microbiology Research encourages metadata harvesting of all its content. The journal fully supports and implement the OAI version 2.0, which comes in a standard XML format. See Harvesting Parameter

Memberships and Standards
Academic Journals strongly supports the Open Access initiative. Abstracts and full texts of all
articles published by Academic Journals are freely accessible to everyone immediately after
publication.
All articles published by Academic Journals are licensed under the Creative Commons
Attribution 4.0 International License (CC BY 4.0). This permits anyone to copy, redistribute,
remix, transmit and adapt the work provided the original work and source is appropriately
cited.
Crossref is an association of scholarly publishers that developed Digital Object Identification
(DOI) system for the unique identification published materials. Academic Journals is a
member of Crossref and uses the DOI system. All articles published by Academic Journals
are issued DOI.
Similarity Check powered by iThenticate is an initiative started by CrossRef to help its
members actively engage in efforts to prevent scholarly and professional plagiarism.
Academic Journals is a member of Similarity Check.
CrossRef Cited-by Linking (formerly Forward Linking) is a service that allows you to discover
how your publications are being cited and to incorporate that information into your online
publication platform. Academic Journals is a member of CrossRef Cited-by.
Academic Journals is a member of the International Digital Publishing Forum (IDPF).
The IDPF is the global trade and standards organization dedicated to the
development and promotion of electronic publishing and content consumption.

Contact
Editorial Office: [email protected]
Help Desk: [email protected]
Website: http://www.academicjournals.org/journal/AJMR
Submit manuscript online http://ms.academicjournals.org
Academic Journals 73023 Victoria Island, Lagos, Nigeria
ICEA Building, 17th Floor, Kenyatta Avenue, Nairobi, Kenya.

Editors
Prof. Adriano Gomes da Cruz University of Campinas (UNICAMP), Brazil. Prof. Ashok Kumar School of Biotechnology Banaras Hindu UniversityUttar Pradesh, India. Dr. Mohd Fuat Abd Razak Infectious Disease Research Centre, Institute for Medical Research, Jalan Pahang, Malaysia. Dr. Adibe Maxwell Ogochukwu Department of Clinical Pharmacy and Pharmacy Management, University of Nigeria Nsukka, Nigeria. Dr. Nadezhda Fursova Molecular Microbiology, State Research Center for Applied Microbiology and Biotechnology, Russia. Dr. Mehdi Azami Parasitology & Mycology Department Baghaeei Lab. Isfahan, Iran. Dr. Franco Mutinelli Istituto Zooprofilattico Sperimentale delle Venezie Italy. Prof. Ebiamadon Andi Brisibe University of Calabar, Calabar, Nigeria.
Prof. Nazime Mercan Dogan Department of Biology Faculty of Science and Arts University Denizli Turkey. Prof. Long-Liu Lin Department of Applied Chemistry National Chiayi University Chiayi County Taiwan. Prof. Natasha Potgieter University of Venda South Africa. Dr. Tamer Edirne Department of Family Medicine University of Pamukkale Turkey. Dr. Kwabena Ofori-Kwakye Department of Pharmaceutics Kwame Nkrumah University of Science & Technology Kumasi, Ghana. Dr. Tülin Askun Department of Biology Faculty of Sciences & Arts Balikesir University Turkey. Dr. James Stefan Rokem Department of Microbiology & Molecular Genetics Institute of Medical Research Israel – Canada The Hebrew University – Hadassah Medical School Jerusalem, Israel.

Dr. Afework Kassu University of Gondar Ethiopia. Dr. Wael Elnaggar Faculty of Pharmacy Northern Border University Rafha Saudi Arabia. Dr. Maulin Shah Industrial Waste Water Research Laboratory Division of Applied & Environmental Microbiology, Enviro Technology Limited Gujarat, India. Dr. Ahmed Mohammed Pathological Analysis Department Thi-Qar University College of Science Iraq. Prof. Naziha Hassanein Department of Microbiology Faculty of Science Ain Shams University Egypt. Dr. Shikha Thakur Department of Microbiology Sai Institute of Paramedical and Allied Sciences India. Prof. Pongsak Rattanachaikunsopon Department of Biological Science, Ubon Ratchathani University, Thailand. Dr. Rafael Lopes e Oliveira Chemical Engineering, Amazon State University - Uea, Brazil. Dr. Annalisa Serio Faculty of Bioscience and Technology for Food, Agriculture and Environment, University of Teramo. Italy .
Dr. Samuel K Ameyaw Civista Medical Center USA. Dr. Mahmoud A. M. Mohammed Department of Food Hygiene and Control Faculty of Veterinary Medicine Mansoura University Egypt. Dr. Anubrata Ghosal Department of Biology MIT - Massachusetts Institute of Technology USA. Dr. Bellamkonda Ramesh Department of Food Technology Vikrama Simhapuri University India. Dr. Sabiha Yusuf Essack Department of Pharmaceutical Sciences University of KwaZulu-Natal South Africa. Dr. Navneet Rai Genome Center University of California Davis USA. Dr. Iheanyi Omezuruike Okonko Department of Virology Faculty of Basic Medical Sciences University of Ibadan Ibadan, Nigeria. Dr. Mike Agenbag Municipal Health Services, Joe Gqabi, South Africa. Dr. Abdel-Hady El-Gilany Department of Public Health & Community Medicine, Faculty of Medicine Mansoura University Egypt. Dr. Bachir Raho Ghalem Biology Department, Faculty of natural sciences and life, Mascara university, Algeria.
Table of Content
Utility and importance of walnut, Juglans regia Linn: A review 5796 Nael Abu Taha and Mohammed A. Al-wadaan
The use of gamma irradiation in agriculture 5806 Issa. Piri, Mehdi. Babayan, Abolfazl. Tavassoli and Mehdi. Javaheri
In vitro antiviral activities of Jrani caprifig latex and its related terpenes 5812 Houda LAZREG AREF, Mahjoub AOUNI, Jean Pierre CHAUMON, Khaled SAID and Abdelwaheb FEKIH
71
Role of the quorum-sensing system in biofilm formation and virulence of Aeromonas hydrophila 5819 Weihua Chu, Yan Jiang, Liu Yongwang and Wei Zhu
Detection of H9N2 avian influenza virus in various organs of experimentally infected chickens 5826 Somayeh Asadzadeh Manjili, Iradj sohrabi Haghdoost, Pejman Mortazavi, Hamid Habibi, Hadi lashini and Esmaeil Saberfar
Biological wastewater treatment: Microbiology, chemistry, and diversity measurement of ammonia oxidizing bacteria 5831 AYANDA Olushola Sunday and AKINSOJI Olatunbosun Seun
Purification and Characterization of 56 kDa cold active Protease from Serratia marcescens 5841 A.L. TARIQ, A. L. REYAZ and J. JOHN PRABAKARAN
Overlap effects of cyromazine concentration, treatment method and rearing temperature on the Southern cowpea weevil (Callosobruchus maculatus F.) reared on cowpea 5848 Fahd Abdu Al-Mekhlafi, Ashraf Mohamed Ali Mashaly, Ahmed A. Mahmoud Abdel Mageed, Mohamed AhmedWadaan and Nazar M. Al-Mallah
Antioxidant and antibacterial activities of Camptotheca acuminate D. seed oil 5854 Lin Wang, Zhiwei Yang, Sicen Wang, Shuqiu Wang and Junxing Liu
Preparation, characterization and in vitro antimicrobial activity of compound sustained-release periodontal suppository of ornidazole and pefloxacin mesylate 5863 Rui Liu, Yan Jiang, Yan-hua Duan, Nan Li, Guo-dong Zhang, Xin Nie and Lu-chuan Liu
Emergence of oligoclonal Acinetobacter baumannii nosocomial infection in a Hospital in Nepal 5872 Badri Thapa, Chanwit Tribuddharat and Sulochana Mahat Basnet
The effects of bifidobacterium lactis and galactooligosaccharide (GOS) on ileum and distal colon motility: In vitro study 5877 Nevcihan Gursoy
Cloning, expression and characterization of a glucose dehydrogenase from Bacillus sp. G3 in Escherichia coli 5882 Xuejiao Chen, Haitao Ding, Yiqing Du, Hui Lin, Zeli Li and Yuhua Zhao
Investigation of bioremediation of arsenic by bacteria isolated from contaminated soil 5889 Hadis Ghodsi, Mehran Hoodaji, Arezoo Tahmourespour and Mohammad Mehdi Gheisari
Effects of temperature on recruitment and phytoplankton community composition 5896 Xiao Tan
Assessing antibiotic resistance profiles in Escherichia coli and Salmonella species from groundwater in the Mafikeng area, South Africa 5902 Philemon Thabo Phokela, Collins Njie Ateba and David Tonderai Kawadza
Determination of hepatitis C virus genotypes among HCV positive patients in Shahrekord, Iran 5910 Elahe Tajbakhsh, Abbas Dosti, Sara Tajbakhsh, Manochehr Momeni and Forough Tajbakhsh
Analysis of agricultural input-output based on Cobb–Douglas production function in Hebei Province, North China 5916 Zaijian Yuan
Management of viral disease in banana using certified and virus tested plant material 5923 El-Dougdoug, Kh. A. and M. M. El-Shamy

Scavenging and anti-fatigue activity of Wu-Wei-Zi aqueous extracts 5933 Chen Xiang and Zhang Guohai
Proteomic analysis of differentially expressed proteins in intestinal epithelial cell in response to Enteroinvasive Escherichia coli infection and Lactobacillus plantarun treatment 5941 Zhongwei Zhang and Minghua Mao
A survey on the prevalence of poultry salmonellosis and detection of different Salmonella serovars isolated from poultry in broiler chicken farms 5950 Jafar Akbarmehr
Isolation and exploitation of Aspergillus ochraceus RM82 against human pathogenic bacteria 5955 Riaz Muhammad, Sajid Ali and Bashir Ahmad
Seroprevalence of avian origin H3N2 canine influenza virus infection in pet dogs in Shenzhen, China 5960 Fu-Rong Zhao, Shou-Jun Li, Dong-Hui Zhou, Ning Chen, Yan-Zhong Zhang, Wen-Bao Qi, Pei-Rong Jiao, Ming Liao, Guang-Zhi Tong, and Gui-Hong Zhang Assessment of inflammatory cytokines and soluble adhesion molecules in patients with systemic inflammatory response syndrome in an intensive care unit of a Saudi tertiary hospital 5964 Obeid E. Obeid and Manal I. Hassan
Seroprevalence of hepatitis-A virus among children aged 1-16 years in Eastern Anatolia, Turkey 5969 Ugur DEVECI, Cemal USTUN and Ozlem HAMANCA
Diversity of nifH gene sequences in the sediments of South China Sea Lixian Wu, Yanhua Cui and Sanfeng Chen 5972
Difference in photoinhibition and photoprotection between seedings and saplings leaves of Taxuscuspidata under high irradiance 5978 Wei Li, Yu-Sen Zhao and Zhi-Qiang Zhou
Response of Cercospora beticola in sugar beet at different cultivars and fertilization level 5985 Yong-Gang Li, Li Zhang and Feng-Ming Mang

In vitro antioxidant activities of polysaccharides from endophytic fungus Fusarium oxysporum Dzf17 5990 Peiqin Li, Chao Luo, Weibo Sun, Shiqiong Lu, Yan Mou, Youliang Peng and Ligang Zhou
Production of calcium gluconate from cassava by Penicillium citrinum SCG-112 5994 Hai-Yan Sun, Pingjuan Zhao, Juanhua Li, Enshi Liu and Ming Peng
African Journal of Microbiology Research Vol. 5(32), pp. 5796-5805, 30 December, 2011 Available online at http://www.academicjournals.org/AJMR ISSN 1996-0808 ©2011 Academic Journals DOI: 10.5897/AJMR11.610
Review
Utility and importance of walnut, Juglans regia Linn: A review
Nael Abu Taha and Mohammed A. Al-wadaan
Chair of Advanced Proteomics and Cytomics Research, Faculty of Science, King Saud University, Riyadh 11415, Saudi Arabia.
Accepted 9 September, 2011
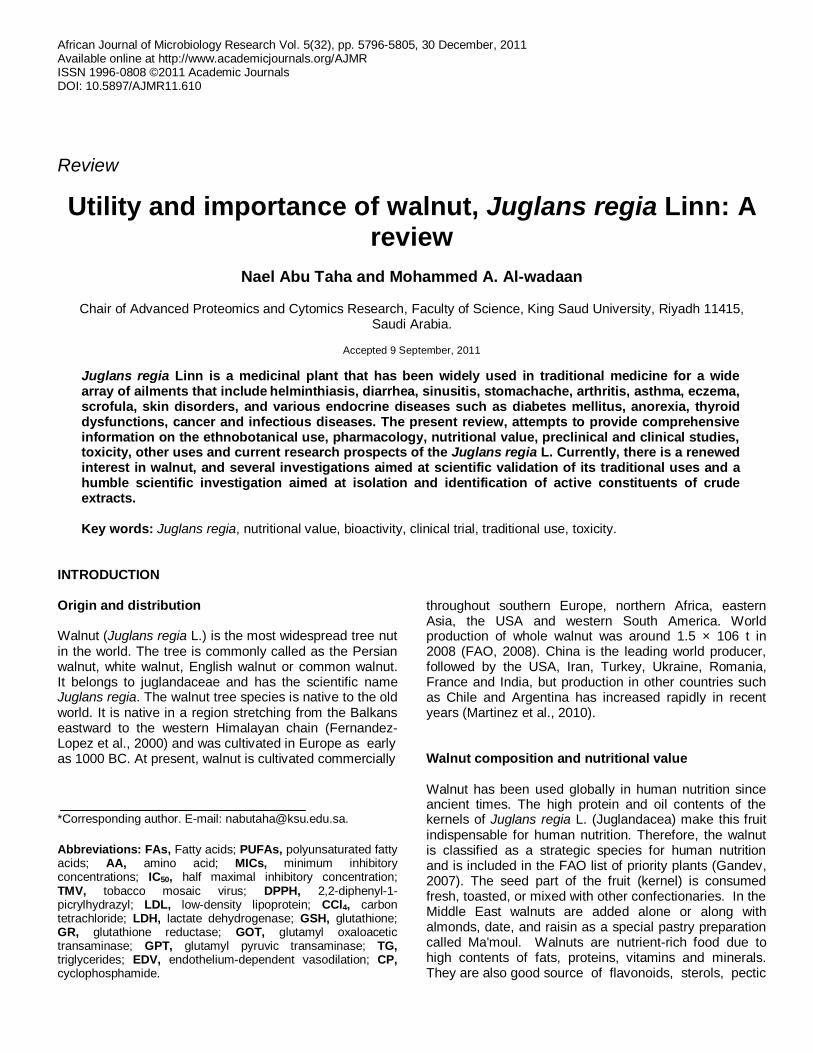
Juglans regia Linn is a medicinal plant that has been widely used in traditional medicine for a wide array of ailments that include helminthiasis, diarrhea, sinusitis, stomachache, arthritis, asthma, eczema, scrofula, skin disorders, and various endocrine diseases such as diabetes mellitus, anorexia, thyroid dysfunctions, cancer and infectious diseases. The present review, attempts to provide comprehensive information on the ethnobotanical use, pharmacology, nutritional value, preclinical and clinical studies, toxicity, other uses and current research prospects of the Juglans regia L. Currently, there is a renewed interest in walnut, and several investigations aimed at scientific validation of its traditional uses and a humble scientific investigation aimed at isolation and identification of active constituents of crude extracts. Key words: Juglans regia, nutritional value, bioactivity, clinical trial, traditional use, toxicity.
INTRODUCTION Origin and distribution Walnut (Juglans regia L.) is the most widespread tree nut in the world. The tree is commonly called as the Persian walnut, white walnut, English walnut or common walnut. It belongs to juglandaceae and has the scientific name Juglans regia. The walnut tree species is native to the old world. It is native in a region stretching from the Balkans eastward to the western Himalayan chain (Fernandez-Lopez et al., 2000) and was cultivated in Europe as early as 1000 BC. At present, walnut is cultivated commercially *Corresponding author. E-mail: [email protected].
Abbreviations: FAs, Fatty acids; PUFAs, polyunsaturated fatty acids; AA, amino acid; MICs, minimum inhibitory concentrations; IC50, half maximal inhibitory concentration; TMV, tobacco mosaic virus; DPPH, 2,2-diphenyl-1-picrylhydrazyl; LDL, low-density lipoprotein; CCl4, carbon tetrachloride; LDH, lactate dehydrogenase; GSH, glutathione; GR, glutathione reductase; GOT, glutamyl oxaloacetic transaminase; GPT, glutamyl pyruvic transaminase; TG, triglycerides; EDV, endothelium-dependent vasodilation; CP, cyclophosphamide.
throughout southern Europe, northern Africa, eastern Asia, the USA and western South America. World production of whole walnut was around 1.5 × 10⁶ t in 2008 (FAO, 2008). China is the leading world producer, followed by the USA, Iran, Turkey, Ukraine, Romania, France and India, but production in other countries such as Chile and Argentina has increased rapidly in recent years (Martinez et al., 2010). Walnut composition and nutritional value Walnut has been used globally in human nutrition since ancient times. The high protein and oil contents of the kernels of Juglans regia L. (Juglandacea) make this fruit indispensable for human nutrition. Therefore, the walnut is classified as a strategic species for human nutrition and is included in the FAO list of priority plants (Gandev, 2007). The seed part of the fruit (kernel) is consumed fresh, toasted, or mixed with other confectionaries. In the Middle East walnuts are added alone or along with almonds, date, and raisin as a special pastry preparation called Ma'moul. Walnuts are nutrient-rich food due to high contents of fats, proteins, vitamins and minerals. They are also good source of flavonoids, sterols, pectic
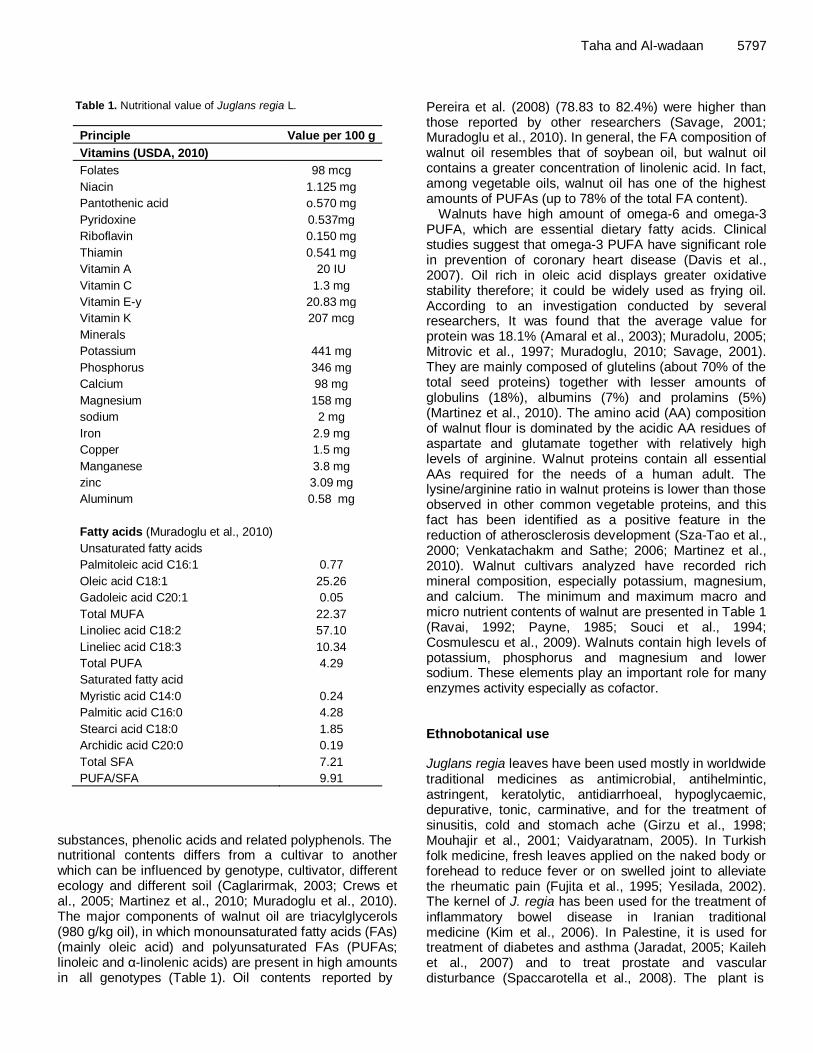
Table 1. Nutritional value of Juglans regia L.
Principle Value per 100 g
Vitamins (USDA, 2010)
Folates 98 mcg
Niacin 1.125 mg
Pantothenic acid o.570 mg
Pyridoxine 0.537mg
Riboflavin 0.150 mg
Thiamin 0.541 mg
Vitamin A 20 IU
Vitamin C 1.3 mg
Vitamin E-y 20.83 mg
Vitamin K 207 mcg
Minerals
Potassium 441 mg
Phosphorus 346 mg
Calcium 98 mg
Magnesium 158 mg
sodium 2 mg
Iron 2.9 mg
Copper 1.5 mg
Manganese 3.8 mg
zinc 3.09 mg
Aluminum 0.58 mg
Fatty acids (Muradoglu et al., 2010)
Unsaturated fatty acids
Palmitoleic acid C16:1 0.77
Oleic acid C18:1 25.26
Gadoleic acid C20:1 0.05
Total MUFA 22.37
Linoliec acid C18:2 57.10
Lineliec acid C18:3 10.34
Total PUFA 4.29
Saturated fatty acid
Myristic acid C14:0 0.24
Palmitic acid C16:0 4.28
Stearci acid C18:0 1.85
Archidic acid C20:0 0.19
Total SFA 7.21
PUFA/SFA 9.91
substances, phenolic acids and related polyphenols. The nutritional contents differs from a cultivar to another which can be influenced by genotype, cultivator, different ecology and different soil (Caglarirmak, 2003; Crews et al., 2005; Martinez et al., 2010; Muradoglu et al., 2010). The major components of walnut oil are triacylglycerols (980 g/kg oil), in which monounsaturated fatty acids (FAs) (mainly oleic acid) and polyunsaturated FAs (PUFAs; linoleic and α-linolenic acids) are present in high amounts in all genotypes (Table 1). Oil contents reported by
Taha and Al-wadaan 5797 Pereira et al. (2008) (78.83 to 82.4%) were higher than those reported by other researchers (Savage, 2001; Muradoglu et al., 2010). In general, the FA composition of walnut oil resembles that of soybean oil, but walnut oil contains a greater concentration of linolenic acid. In fact, among vegetable oils, walnut oil has one of the highest amounts of PUFAs (up to 78% of the total FA content).
Walnuts have high amount of omega-6 and omega-3 PUFA, which are essential dietary fatty acids. Clinical studies suggest that omega-3 PUFA have significant role in prevention of coronary heart disease (Davis et al., 2007). Oil rich in oleic acid displays greater oxidative stability therefore; it could be widely used as frying oil. According to an investigation conducted by several researchers, It was found that the average value for protein was 18.1% (Amaral et al., 2003); Muradolu, 2005; Mitrovic et al., 1997; Muradoglu, 2010; Savage, 2001). They are mainly composed of glutelins (about 70% of the total seed proteins) together with lesser amounts of globulins (18%), albumins (7%) and prolamins (5%) (Martinez et al., 2010). The amino acid (AA) composition of walnut flour is dominated by the acidic AA residues of aspartate and glutamate together with relatively high levels of arginine. Walnut proteins contain all essential AAs required for the needs of a human adult. The lysine/arginine ratio in walnut proteins is lower than those observed in other common vegetable proteins, and this fact has been identified as a positive feature in the reduction of atherosclerosis development (Sza-Tao et al., 2000; Venkatachakm and Sathe; 2006; Martinez et al., 2010). Walnut cultivars analyzed have recorded rich mineral composition, especially potassium, magnesium, and calcium. The minimum and maximum macro and micro nutrient contents of walnut are presented in Table 1 (Ravai, 1992; Payne, 1985; Souci et al., 1994; Cosmulescu et al., 2009). Walnuts contain high levels of potassium, phosphorus and magnesium and lower sodium. These elements play an important role for many enzymes activity especially as cofactor. Ethnobotanical use Juglans regia leaves have been used mostly in worldwide traditional medicines as antimicrobial, antihelmintic, astringent, keratolytic, antidiarrhoeal, hypoglycaemic, depurative, tonic, carminative, and for the treatment of sinusitis, cold and stomach ache (Girzu et al., 1998; Mouhajir et al., 2001; Vaidyaratnam, 2005). In Turkish folk medicine, fresh leaves applied on the naked body or forehead to reduce fever or on swelled joint to alleviate the rheumatic pain (Fujita et al., 1995; Yesilada, 2002). The kernel of J. regia has been used for the treatment of inflammatory bowel disease in Iranian traditional medicine (Kim et al., 2006). In Palestine, it is used for treatment of diabetes and asthma (Jaradat, 2005; Kaileh et al., 2007) and to treat prostate and vascular disturbance (Spaccarotella et al., 2008). The plant is
5798 Afr. J. Microbiol. Res. used as a topical remedy for dermal inflammation and excessive perspiration of the hands and feet. It is also a common home remedy for the treatment of chronic eczema and scrofula. The leaves of this plant is used topically to treat scalp itching and dandruff, sunburn and superficial burns as well as an adjunctive emollient in skin disorders (Gruenwald et al., 2001; Robbers et al., 1999; Ali-Shtayeh and Abu Ghdeib, 1999; Blumenthal, 2000; Baytop, 1999). It also has high anti-atherogenic potential and a remarkable osteoblastic activity that adds to the beneficial effect of a walnut enriched diet on cardioprotection and bone loss (Papoutsi et al., 2008). The bark, branches and exocarp of the immature green fruit of this medicinal plant have been used to treat gastric, liver and lung cancer a long time in China (Liu et al., 2004; Baytop, 1999). It is used by traditional healer in northeastern region of Mexico to protect against liver damage (Torres-gonzalea et al., 2011). The bark is used as miswaks for teeth cleaning (Ibrar et al., 2007). In Nepal the bark paste is useful in arthritis, skin diseases, toothache, and hair growth. Seed coat is used for healing wounds (Kunwar and Adhikari, 2005). The shell of Juglans regia is used in Calabria folk medicine to heal malaria (Tagarelli et al., 2010). Antibacterial activity Hot and cold solvent and aqueous extract of leaves, barks, fruits and green husks of J. regia from different countries revealed broad spectrum antibacterial activity against gram-positive and gram-negative bacteria viz. Bacillus cereus, Bacillus subtilis, Staphylococcus aureus, Pseudomonas aeruginosa, Escherichia coli, Klebsiella pneumoniae, Staphylococcus epidermidis, Micrococcus luteus, Salmonella typhimurium, Enterococcus faecalis, Bacillus thuringiensis, Protomonas extroquens, and Proteus sp. using agar streak method, disc diffusion method and microplate alalmar blue assay (Deshpande et al., 2011; Poyrazolu et al., 2010; Pereira et al., 2008; Oliveira et al., 2008; Pereira et al., 2007; Qa’dan et al., 2005a b; Citoglu and Altanlar, 2003; Upadhyay et al., 2010b). The antimicrobial activity against gram-negative bacteria were selective since not all the fruit extract of J. regia cultivator inhibited the growth of Pseudomonas aeruginosa and E. coli. cv. Lara inhibited the growth of K. pneumoniae (MIC of 100 mg/mL), cv. Mayette inhibited the development of P. aeruginosa and E. coli with minimum inhibitory concentrations (MICs) of 50 and 10 mg/mL, respectively, and cv. Mellanaise inhibited the growth of E. coli and K. pneumoniae at concentration of 100 mg/mL (Ali-Shtayah et al., 1999). Mexican aqueous bark and leaves extract exhibited no antimycobacterial activity. Only the hexane and methanol extract showed antimycobacterial activity with MIC of 100 and 125 mg/ml, respectively using Soxhlet extractor (Cruz-Vega et al., 2008). Over 45% of Iranian clinical isolates of
Helicobacter pylori strain were inhibited by J. regia aqueous and equal mixture of methanol, diethyl ether and petroleum benzene extract (Nariman et al., 2004). In a recent study, juglone was shown to potently inhibit the three key enzymes from Helicobacter pylori, cystathionine γ-synthase (HpCGS), malonyl-CoAacyl carrier protein transacylase (HpFabD), and β-hydroxyacyl-ACP dehydratase (HpFabZ) with the half maximal inhibitory concentration (IC50) values of 7.0±0.7, 20±1, and 30±4 μmol/L, respectively. Therefore, HpCGS, HpFabD, and HpFabZ are considered to be the potential targets of juglone (Kong et al., 2008). The antibacterial activity of Jordanian J. regia leaves extract to acne developing organism revealed that 12.5% S. epidermidis isolates were resistant to the leaf extract where as all Propionibacterium acnes isolates were sensitive even to 10% of the extract (Qa'dan et al., 2005b). Antifungal activity J. regia fruits, leaves and bark aqueous and solvents extract exhibited antifungal activity against wide range of fungi using disc diffusion method, agar dilution method, agar streak dilution and Raddish method. Pereira et al. (2008) reported that all the walnut varieties exhibited antifungal activity against Candida albicans and Cryptococcus neoformans when soxhleted with light petroleum ether (b.p. 40-60°C). The higher inhibition was observed with cv. Lara extract (MIC of 1 mg/mL). However, C. albicans and C. neoformans were only resistant to cv Mallanaise extract. Cold extraction of fruit, leaves and bark inhibited the growth of Microsporum canis, Trichophyton mentagrophytes, and Trichophyton violaceum (Ali-Shtayah et al., 1999). On the other hand, the aqueous extract of green husks showed no antifungal activity against C. albicans and C. neoformans (Oliveira et al., 2008). Methanol, acetone, chloroform and ethyl acetate bark extract revealed antifungal activity against A. niger, Alternaria alternata, Trihoderma viresn, fusarium solani, Pichia guiliermondii, Pichia jadinii and all Candida speices tested (Upadhyay et al., 2010c; Ahmad et al., 1973). Antiviral activity Mei-zhi et al. (2007) reported that 95% ethanol and ethyl acetate leaves extract of J. regia, inhibited tobacco mosaic virus (TMV). The methanol extract of J. regia inhibited Sindbis virus at a minimum concentration of 1.5 µg/ml (Mouhajir et al., 2001). Antioxidant activity The antioxidant potential of ethyl acetate, butanol, meta-
nol, ether and aqueous methanol extract of walnut kernels, husks and leaves were measured by different methods such as reducing power, scavenging activity on 2,2-diphenyl-1-picrylhydrazyl (DPPH) radicals and lipid oxidation inhibition by β-carotene linoleate system. All the extracts showed strong antioxidant activity (Qamar and Sultana, 2011; Carvalho et al., 2010; Abbasi et al., 2010; Rahimipanah et al., 2010; Zhang et al., 2009b; Almeida et al., 2008; Oliveira et al., 2008; Pereira et al., 2008; Pereira et al., 2007; Fukuda et al., 2003). Bullo et al. (2010) reported a decrease in the antioxidant burden observed in enzymatic and non-enzymatic antioxidant systems after the consumption of a whole-walnut or a walnut-skin diet in C57BL/6 mice. The same author also reported that consumption of walnuts and walnut skins have no deleterious effect on low-density lipoprotein (LDL) oxidizing capability, despite their higher contents of omega-6 PUFAs. Several phenolic compounds isolated from J. regia such as pyrogallol, p-hydroxybenzoic acid, vanillic acid, ethyl gallate, protocatechuic acid, gallic acid, 3,4,8,9,10-pentahydroxydibenzo pyran-6-one, tannins, glansrins, adenosine, adenine, etc, could provide a chemical basis for some of the health benefits claimed for J. regia in foods and folk medicine (Zhang et al., 2009a; Fukuda et al., 2003). Antidiabetic activity Fukuda et al. (2004) demonstrated a strong inhibitory activity of walnut polyphenols and the polyphenolic components like Casuarictin, tellimagradin II and Tellimagradin I on different enzymes like glycosidase, sucrose, maltase and amylase. In addition to the above findings, researchers also noticed that walnut polyphenol-rich fraction has triglyceride lowering effect and urine peroxide lowering effect in genetically inherited Type II diabetes mellitus (db/db) mice at the dose of 200mg/kg/day. The consumption of walnut leaf pellets in alloxan induced diabetic rats at the dose of 185 mg/kg reduced fasting blood sugar significantly and the histomorphometric study of pancreas showed a sign of regeneration of β-cells in the treated group (Jelodar et al., 2007). J. regia leaves methanolic extract at dose of 250 mg/kg decreases the postprandinal plasma blood glucose levels in both short and long term models. The plant extract significantly inhibited α-glucosidase activity in vitro for both maltase and sucrase enzymes and showed no changes in the insulin and glut-4 genes expression. The author attributed the inhibitory action of the plant extract to gallic acid and caffeoylquinic acid in the leaves (Teimori et al., 2010). Anthelmintic activity Kale et al. (2011) reported that stem park of J. regia
Taha and Al-wadaan 5799 acetone extract exhibited significant activity at all dilution tested when compared to the Albendazole standard against Eicinia feotida. The benzene, methanol and ethanol soxhlet extracts of J. regia stem bark on adult Indian earthworm, Pheretima posthuma exhibited significant anthelmintic activity as comparable to that of standard drug Piperazine citrate (Upadhyay et al., 2010a). The 95% ethanol, petroleum ether and ethyl acetate extract of green walnut hull have obvious anti-feeding effect on armyworm and the small vegetable-moth. The research group indicated that anti-feeding rate, death rates as well as growth inhibition rate of armyworm have correspondingly changed in dose dependant manner (Me-zhi et al., 2006).
Anti-inflammatory activity
The ethanolic extracts of J. regia leaves exhibited potent anti-inflammatory activity as potent as indomethacin against carrageenan-induced hind paw edema model in mice without inducing any gastric damage (Erdemoglu et al., 2003). Mokhtari et al. (2008) stated that the alcohol extract of walnut leaves in dose of 1.5 mg/kg caused a significant nociception decrease in acute phase of formalin test where as the aqueous (2.87 and 1.64 g/kg) and ethanolic (2.044 and 1.17 g/kg) extracts of leaves showed antinociceptive activity in hotplate test suggesting a promising analgesic and anti-inflammatory agents against diseases such as rheumatoid arthritis. On the basis of Qamar and Sultana (2011) result, a protective role of methanolic J. regia extract against CSE-induced acute lung toxicity in Wistar rats was suggested. The extract significantly decreased the levels of Lactate dehydrogenase (LDH), total cell count, total protein and increased the glutathione (GSH) level in bronchoalveolar lavage fluid. It also significantly restored the levels of Glutathione reductase (GR), catalase and reduced the xanthine oxidase (XO) activity in lung tissue.
Antidepressant activity
The macerated hexane extract of J. regia fruit produced significant antidepressant activity at both doses of 100 and 150 mg/kg body weight when compared with standard drug fluoxetine on male Wistar rats. The antidepressant activity was evaluated by forced swimming and tail suspension test (Rath and Pradhan, 2009).
Antityrosinase activity
Ozer et al. (2007) suggested that gel formulation containing ellagic acid and plant leaves extract of J. regia is effective in treating uneven skin pigmentation. The ethanolic leaves extract could be suggested as new

5800 Afr. J. Microbiol. Res. sources of skin-whitening agents. Aitani and Shimoda (2005) reported that melanin formation was inhibited at concentration 1 to 30 μg/ml in Pre-cultured B16 melanoma cells incubated with medium containing walnut polyphenols and their result indicated that walnut polyphenols is more superior to the popular skin-lightening agent, ascorbic acid and arbutin upon data comparison.
Hepatoprotective activity
Orally fed Walnut polyphenols prepared from the kernelpellicle demonstrated a dose dependent lowering effect in glutamyl oxaloacetic transaminase (GOT) and glutamyl pyruvic transaminase (GPT) in carbon tetrachloride (CCl4) induced liver damage in mice model after a single oral administration (200 g/kg). Result indicated that walnut polyphenols is more superior to Curcumin, a commonly used hepatoprotective agent. The effect of each active component of in vitro evaluation of walnut polyphenols on CCl4-induced cytotoxicity in primary cultured rat hepatocytes showed that tellimagrandin I, casuarictin, tellimagrandin II, and rugosin C (Figure 1) are inhibitory on CCl4-induced cytotoxicity in primary cultured rat hepatocytes however, tellimagrandin I of walnut polyphenols is believed to be the most important active compound responsible for hepatoprotective effect (Hiroshi et al., 2008). The same author, Hiroshi et al. (2006) reported that 50% EtOH extract from endocarps of walnuts on mice liver injury models induced by carbon tetrachloride at the dose of 100 and 200 mg/kg significantly suppressed GOT and GPT deviations. Polyphenolic constituents, tellimagrandins I and II, rugosin C and casuarictin were found to be principal constituents with hepatoprotective activity against oxidative damage.
Hypotriglyceridemic activity
Oral administration of a polyphenol-rich extract (WP) from walnuts (100 and 200 mg/kg) in high fat diet fed mice significantly reduced liver weight and serum triglycerides (TG) where as hepatic β-oxidation in cytosol, including peroxisome, was enhanced by WP (50-200 mg/kg). A polyphenol-rich extract was found to possess hypotriglyceridemic activity via enhancement of peroxisomal fatty acid β-oxidation in the liver. These results suggest that tellimagrandin I is involved in the hypotriglyceridemic mechanism (Shimoda et al., 2009).
Anticancer activity
Juglone has been reported to inhibit intestinal carcinogenesis induced by azoxymethane in rats and
might be a promising chemopreventive agent in human intestinal neoplasia (Sugie et al., 1998). Juglone was also proven to be a potent cytotoxic agent in vitro in human tumor cell lines, including human colon carcinoma (HCT-15) cells, human leukemia (HL-60) cells and doxorubicin-resistant human leukemia (HL-60R) cells (Kamei et al., 1998; Segura-Aguilaretal, 1992). In a recent study, Juglone inhibited the growth and induce apoptosis of sarcoma and 180 SGC-7901 cells in vivo. The mechanism is mediated by the activation of the mitochondrial death pathway, which requires the generation of reactive oxygen species (ROS), down-regulation of Bcl-2 protein expression and up-regulation of Bax protein expression (Ji et al., 2011). Walnut methanolic extracts obtained from J. regia seed, green husk and leaf showed concentration dependent growth inhibition against human renal cancer cell lines A-498, 769-P and the colon cancer cell line Caco-2. Concerning A-498 renal cancer cells, all extracts exhibited similar growth inhibition activity (IC50 values between 0.226 and 0.291 mg/mL), while 769-P renal and Caco-2 colon cancer cells, walnut leaf extract showed a higher antiproliferative efficiency (IC50 values of 0.352 and 0.229 mg/mL, respectively) than green husk or seed extracts (Carvalho et al., 2010). The tested dried fine powder of J. regia light petroleum seed extract in cancer induced in Swiss albino mice with the help of 7,12-Dimethylbenz(a)anthracene (DMBA) and croton oil showed the petroleum extract was significant in reducing the cancer cells (Kumudhavalli et al., 2010). Other medicinal uses
Willis et al. (2009) examined the effects of walnut diet on motor and cognitive ability in aged rats for 8 weeks. The three treated groups (2, 6 and 9%) revealed that the 2% walnut diet improved performance on rod walking, while the 6% walnut diet improved performance on the medium plank walk; the higher dose of the 9% walnut diet impaired reference memory, however the researcher attributed this to the number of polyphenolic compounds that could be negatively effecting reference memory at a higher dose. A 2004 study by the NYS Institute for Basic Research in Developmental Disabilities (OMRDD) revealed that methanolic extract of walnut was able to inhibit and defibrillize fibrillar amyloid β- protein (the principal component of amyloid plaques in the brains of patients with Alzheimer's). It is proposed that polyphenolic compounds present in walnuts may be responsible for its anti-amyloidogenic activity (Chauhan et al., 2004). Similarly, it was found that two of its major components in walnuts, gallic and ellagic acid, act as "dual-inhibitors" of the enzyme acetylcholinesterase which, in association with amyloid inhibits protein aggregation, and inhibit the site of acetylcholinesterase responsible for the breakdown of acetylcholine. These results suggest that walnuts may reduce the risk or delay

Taha and Al-wadaan 5801
OH
HO
HO
HO
HO
OH
OO
OO
O
OHHO
O
O
HOOH
OH
Strictinin (Shimoda et al., 2009)
OH O
O Juglone (Kong et al., 2008)
O
R1 R2
R3
Juglanin A
(JA)
R1=CH3O R2=OH R3==O
Rhoiptelol (RH)
R1=CH3O R2=OH R3=-OH
Juglanin (C ) R1=OH R2=H R3==O
(Liu et al., 2008)
O
OH
OCH3
Juglanin B (Liu et al., 2008)
Figure 1. Chemical structures of compounds isolated from Juglans regia L.
Figure 1 contd.

5802 Afr. J. Microbiol. Res. the onset of Alzheimer's disease by maintaining amyloid-protein in the soluble form and prevent the breakdown of acetylcholine (Society for Neuroscience, 2007). Clinical study
A daily intake of 43 to 57g of walnuts incorporated into Japanese diet for 4 weeks to 40 healthy Japanese men and women lowered blood cholesterol, particularly in women (Iwamoto et al., 2000). In double-blind case with either plasma triglyceride (TG) concentration more that 350 mg/dl or total cholesterol concentration more that 250 mg/dl were randomized into two groups, group A subject were administered 6 capsules, each filled with 500 mg of the extracted walnut oil, per day for 45 days, group B individual serve as control and received placebo for 45 days. The result of this lowered plasma triglyceride level by 19 to 33% (Zibaeenezhad et al., 2003). Ros et al. (2004) reported that substituting walnuts for monounsaturated fat in a Mediterranean diet improves endothelium-dependent vasodilation (EDV) in hypercholesterolemic subjects. A daily intake of 8-13 walnuts for 4 weeks significantly improves the EDV of 21 hypercholesterolemic males and females.
On the other hand, walnut-enriched meals effectively prevented post prandial lipidemia where triacylglycerol was significantly reduced (Bellido et al., 2004). Spaccarotella et al. (2008) assessed the effect of walnuts on markers of prostate cancer between 45 and 75 years of age. Results suggest that walnuts improved serum γ-T and α-T: γ-T, two biomarkers that are important in prostate and vascular health. Total bilirubin, total protein, albumin, aspartate aminotransferase (AST), alanine aminotransferase (ALT), lactate dehydrogenase (LDH), leucine aminopeptidase (LAP), gamma-glutamyltranspeptidase (γ-GTP), cholinesterase, amylase, lipase, Lecithin: cholesterol acyltransferase (L-CAT), LDL-cholesterol, total cholesterol, triglyceride, phospholipid, free fatty acid (FFA), high-density lipoprotein (HDL)-cholesterol, Na, K, serum Fe, total iron binding capacity (TIBC), unsaturated iron binding capacity (UIBC), urea nitrogen, uric acid, glucose, hemocytes revealed no abnormal reading for four male volunteers were given oral walnut polyphenols at the dose of 50 mg/day for 4 weeks (Oryza, 2007). Toxicity A review of the literature showed that juglone can cause irritant reactions as well as skin hyper pigmentation but, although it has been found to be a strong sensitizer in guinea pigs, contact allergy is considered a very rare event in man (Wood and Calnan, 1976; Hausen, 1981). However, a case report of 65- year-old woman complaints of skin hyper pigmentation and large tense blisters involving the palms and fingers caused by the
cumulative effect of 15 kilos of walnuts shelled in the 3 days was reported by Bonamonte et al. (2001). Haque et al. (2003) investigated the modulatory effects of walnut aqueous extract on the toxicity of an anticancer drug, cyclophosphamide (CP) with special reference to protection against disruption of drug metabolizing and antioxidant enzymes during the chemotherapy. The extract showed a significant increase in the activity and level of glutathione and glutathione peroxidase in both liver and kidney tissues and catalase in liver only. While the extract CP treated group showed a significant decrease in the lipid peroxidation in liver and kidneys when compared with the CP-treated group. Aqueous extract from J. regia leaves reduced 3-(4,5-Dimethyl thiazol-2yl)-2,5-diphenyl tetrazolium bromide (MTT) formation by about 60% at concentration of 500 µl/ml
on
HepG2 cell. Additionally, the co-culture of HepG2 with THP1 revealed no sign of any negative effect at all concentration tested after exposure to the extract. The investigator also reported no significant changes of LDH and albumin levels on the culture medium after 24 h of exposure to the extract (Saad et al., 2006). Hosseinzadeh et al. (2011) calculated the half-maximal lethal dose (LD50) values of intraperitoneal injection of J. regia aqueous and ethanolic leaves extract and found it to be 5.5 and 3.3 g/kg, respectively. Acute dermal toxicity studies showed that petroleum ether extract of J. regia gives lethal effect at 2000 mg/kg (Kumudhavalli et al., 2010). Other uses The seeds contain unusual fatty acids which are industrially important, as they are used in protective coatings, dispersants, pharmaceuticals, cosmetics, soaps and a variety of synthetic intermediates as stabilizers in plastic formulations (Hosamani et al., 2000; Eganathan et al., 2006). The wood is of very high quality, and is used to make furniture, and gunstocks. The dye is used as a coloring and tonic for dark hair (Brwon, 1995). The unripe fruits are pickled in vinegar (Facciola, 1990). Conclusions
The present review article documents the publications on walnut and its constituents in the recent and last few years. The paper highlights the traditional use of this plant and some scientific validation of the claimed biological activity in vivo as well as in vitro. To best of our knowledge and internet survey only one case of contact dermatitis was reported after shelling 15 kilos of walnuts. The toxicological studies of various secondary metabolites which contribute to its medicinal value are still in its infancy and are becoming an important limiting factor for utilizing the metabolites as therapeutic agent.
Besides, isolation and characterization of active

secondary metabolites responsible for various biological activities have not yet been structurally elucidated, mode of action, target organ of toxicity and molecular mechanism also need to be investigated. Further trials in humans are required to determine the efficacy of walnut extract or one or more of its constituents and to establish what, if any, adverse effects are observed. ACKNOWLEDGEMENT The authors extend their appreciation to the Deanship of Scientific Research at king Saud Univer-sity for funding the work through the research group pro-ject No. RGP- VPP-028
REFERENCES Abbasi MA, Raza A, Riaz T, Shahzadi T, Aziz-ur-Rehman, Jahangir M,
Shahwar D, Siddiqui SZ, Chaudhary AR, Ahmad N (2010). Investigation on the volatile constituents of Juglans regia and their in vitro antioxidant potential. Pakistan Acad. Sci., 47:137-141.
Ahmad S, Mukhtar, Wahid A, Bukhari AQS (1973). Fungistatic Action of Juglans. Antimicrob. Agents Chemother., 3:436-438.
Aitani M, Shimoda H (2005).The Effect of Ascorbic Acid and Arbutin on
B16 Melanoma cells. Japan Food Sci.,44: 58-63. Akhtar N, Ali M, Alam MS (2009). New phytoconstituents from the stem
bark of Juglans regia L. J. Saudi. Chem. Soc., 13: 111-118.
Ali-Shtayeh MS, Abu Ghdeib SI (1999). Antifungal activity of plant extracts against dermatophytes. Mycoses., 42: 665-772.
Almeida IF, Fernandes E, Lima JLFC, Costa PC, Bahia MF (2008). Walnut (Juglans regia) leaf extracts are strong scavengers of pro-
oxidant reactive species. Food Chem., 106:1014-1020. Amaral JS, Casal S, Pereira J, Seabra R, Oliveira B (2003).
Determination of sterol and fatty acid compositions, oxidative stability, and nutritional value of six walnut (Juglans regia L.) cultivars grown in
Portugal. J. Agric. Food Chem., 51: 7698-7702.
Baytop T (1999). Therapy with Medicinal Plants in Turkey (Past and Present), 2nd Ed., Nobel Medicine Publisher, Turkey.
Bellido C, Lopez-Miranda J, Blanco-Colio LM, Perez-Martinez P,
Muriana FJ, Martin-Ventura JL, Marin C, Gomez P, Fuentes F, Egido, Perez-Jimenez F (2004). Butter and walnuts, but not olive oil, elicit postprandial activation of nuclear transcription factor κB in peripheral blood mononuclear cells from healthy men. Am. J. Clin. Nutr., 80:
1487-1491. Blumenthal M (2000). Herbal Medicine (Expanded Commision E
Monographs), Integrative Medicine Communications, Newton
Publisher, England. Bonamonte D, Foti C, Angelini G (2001). Hyperpigmentation and
contact dermatitis due to Juglans regia. Contact Dermatitis., 44: 101.
Brwon D (1995). Encyclopedia of herbs and their uses. Dorling Kindersley publishers, London.
Bullo M, Nogues MR, Lopez-Uriarte P, Salas-Salvado J, Romeu M
(2010). Effect of whole walnuts and walnut-skin extracts on oxidant status in mice. J. Nutr., 26: 823-828.
Caglarirmak N (2003). Biochemical and physical properties of some walnut genotypes (Juglans regia L). Nahrung Food 47:28–32.
Carvalho M, Ferreira PJ, Mendes VS, Silva R, Pereira JA, Jenimo C. Silva BM (2010). Human cancer cell antiproliferative and antioxidant activities of Juglans regia L. Food Chem. Toxicol., 48: 441-447.
Chauhan N, Wang KC, Wegiel J, Malik MN (2004). Walnut extract inhibits the fibrillization of amyloid beta-protein, and also defibrillizes
its preformed fibrils. Cur. Alzheimer Res., 1:183-188. Citoglu GS, Altanlar N (2003). Antimicrobial activity of some plants used
in folk medicine. J. Fac. Pharm. Ankara., 32:159-163.
Company, New York. Cosmulescu S, Baciu A, Achim G, Botu M, Trandafir I (2009). Mineral
Taha and Al-wadaan 5803 composition of fruits in different walnut (Juglans regia L.) Cultivars. Not.
Bot. Hort. Agrobot. Cluj., 37:156-160. Crews C, Hough P, Godward J, Brereton P, Lees M, Guiet S (2005).
Study of the main constituents of some authentic walnut oils. J. Agric. Food. Chem., 53:4853-4860.
Cruz-Vega DE, Verde-Star MJ, Salinas-Gonzalez N, Rosales-
Hernandez B, Estrada-Garcia I, Mendez-Aragon P, Carranza-Rosales P, Gonzalez-Garza MT, Castro-Garza J (2008). Antimycobacterial activity of Juglans regia, Juglans mollis, Carya
illinoensis and Bocconia frutescens. Phytother. Res., 22:557-559.
Davis L, Stonehouse W, Loots DT, Mukuddem-Petersen J, Van Der Westhuizen F, Hanekom SJ, Jerling JC (2007). The effects of high
walnut and cashew nut diets on the antioxidant status of subjects with metabolic syndrome. Eur. J. Nutr., 46: 155-164.
Deshpande RR, Kale AR, Ruikar AD, Panvalkar PS. Kulkarni AA,
Deshpande NR, Salvekar JP (2011). Antimicrobial Activity Of different extracts of Juglans Regia L. against Oral Microflora. Int. J.
Pharm. Pharm. Sci., 3:200-201.
Eganathan P, Subramanian HMSR, Latha R, Srinivasa Rao, C (2006). Oil Analysis in Seeds of Salicornia Brachiata, Ind. Crops Prod.,
23:177.
Erdemoglu N, Kupeli E, Yesilada E (2003). Anti-inflammatory and antinociceptive activity assessment of plants used as remedy in Turkish folk medicine. J. Ethnopharmacol., 89: 123-129.
Facciola S (1990). Cornucopoia . A source book of edible plants. kampong Publisher,USA.
FAO (2008). FAOSTAT Data. Food and Agriculture Organisation,
Rome. Fernandez-Lopez J, Aleta N, Alıas R (2000). Forest Genetic Resources
Conservation of Juglans regia L. IPGRI Publishers, Rome.
Fujita T, Sezik E, Tabata M, Yesilada E, Honda G, Takeda Y, Tanaka T, Takaishi Y (1995). Traditional medicine in Turkey VII. Folk medicine in Middle and West Black Sea regions. Econ. Bot., 49: 406-
422. Fukuda T, Ito H, Yoshida T (2004). Effect of the walnut polyphenol
fraction on oxidative stress in type 33 2 diabetes mice. Biofactors., 2:
251-253. Fukuda T, Ito H, Yoshida Y (2003). Antioxidative polyphenols from
walnuts (Juglans regia L.) Phytochem., 63: 795-801.
Gandev, S (2007). Budding and grafting of the walnut (Juglans regia L.)
and their effectiveness in Bulgaria (Review). Bulgar. J. Agri. Sci., 13:683-689.
Girzu M, Carnat A, Privat AM, Fialip J, Carnat AP, Lamaison JL (1998). Sedative effect of walnut leaf extract and juglone, an isolated constituents. Pharm. Biol., 36: 280-286.
Gruenwald J, Brendler T, Jaenjke C (2001). PDR for Herbal Medicines, Medicinal Economic
Hanusa LJ, Goldshlag P, Dembitskya VM (2008). Identification of cyclopropyl fatty acids in walnut (Juglans regia L.) OIL Biomed Pap.
Med. Fac. Univ. Palacky Olomouc. Czech. Repub., 152:41-45. Haque R, Bin-Hafeez B, Parvez S, Pandey S, Sayeed I, Ali M,
Raisuddin S (2003). Aqueous extract of walnut (Juglans regia L.)
protects mice against cyclophosphamide-induced biochemical toxicity. Hum. Exp. Toxicol., 22:473-80. Hausen B (1981). Woods injurious to human health. Berlin: Publisher,
Walter de Gruyter, pp 119–121. Hiroshi S, Junji T, Toshiyuki F, Hideyuki I, Tsuyoshi H, Takashi
Y(2006). Hepatoprotective constituents in endocarps of walnut. J.
Pharm. Soc. Japan 126:108-109. Hiroshi S, Tanaka J, Kikuchi M, Fukuda T, Ito H, Hatano T, Yoshida T
(2008). Walnut polyphenols prevent liver damage induced by carbon
tetrachloride and d-galactosamine: hepatoprotective hydrolyzable tannins in the kernel pellicles of walnut. J. Agric. Food Chem., 56: 4444-4449.
Hosamani, KM, Sattigeri RM (2000). Industrial utilization of Rivea Ornata seed oil: A moderate source of vernolic acid. Ind. Crops
Prod., 12: 93.
Hosseinzadeh H, Zarei H, Taghiabadi E (2011). Antinociceptive, anti-Inflammatory and acute toxicity effects of juglans regia L. Leaves in
mice. Iran Red Crescent Med. J., 13:27-33.
Ibrar MFH, Sultan A (2007). Ethnobotanical studies on plant resources of Ranyal Hill, District Shangla, Pakistan. Pak.J.Bot., 39:329-337.
5804 Afr. J. Microbiol. Res. Iwamoto M, Sato M, Kono M, Hirooka Y, Saka K, Takeshita A, Imaizumi
K (2000).Walnuts lower serum cholesterol in Japanese men and women. J. Nutr., 130: 171-176.
Jaradat NA (2005). Medical plants utilized in Palestinian folk medicine for treatment of diabetes mellitus and cardiac diseases. J. Al-Aqsa Unv., 19:1-28
Jelodar G, Mohsen M, Shahram S (2007). Effect of walnut leaf, coriander and pomegranate on blood glucose and histopathology of pancreas of alloxan induced diabetic rats. Afr. J. Trad. CAM., 43:
299-305. Ji Y, hong-YuanQua Z, XiangZou (2011). Juglone induced apoptosis in
human gastric cancer SGC-7901cells via the mitochondrial pathway.
Exp. Toxicol. Pathol., 63: 69-78. Kaileh Mb, Berghea WV, Boonec E, Essawib T, Haegemana G (2007).
Screening of indigenous Palestinian medicinal plants for potential
anti-inflammatory and cytotoxic activity J. Ethnopharmacol., 113: 510-516
Kale AA, Sucheta A, Gaikwada, Gayatri S, Kamblea NR, Deshpandea, Salvekara JP (2011). In vitro anthelmintic activity of stem bark of Juglans regia L. J. Chem. Pharm. Res., 3:298-302.
Kamei H, Koide T, Kojima T, Hashimoto Y, Hasegawa M (1998).
Inhibition of cell growth in culture by quinones. Cancer Biother Radiopharm., 13:185–8.
Kim HG, Cho JH, Jeong EY, Lim JH, Lee SH, Lee HS (2006). Growth-inhibiting activity of active component isolated from Terminalia chebula fruits against intestinal bacteria. J. Food Prot., 69:2205-2209.
Kong Y, Zhang L, Yang Z, Han C, Li-hong (2008). Natural product Juglone targets three key enzymes from Helicobacter pylori: inhibition
assay with crystal structure characterization. Acta Pharmacologica Sinica., 29: 870-876.
Kumudhavalli MV, Jayakar B, Kumar GA (2010). Phytochemical and pharmacological evaluation of the dried fruit of the plant Juglans regia
linn. Oil Drug Invent. Today 2: 362-365.
Kunwar RM, Adhikari N (2005). Ethnomedicine of Dolpa district, Nepal: the plants, their vernacular names and uses. J. Ecol. App., 8:43-49
Liu J, Meng M, Li C, Huang X, Di D (2008). Simultaneous determination
of three diarylheptanoids and an alpha-tetralone derivative in the green walnut husks (Juglans regia L.) by high-performance liquid
chromatography with photodiode array detector. J. Chromatogr. A.,
1190: 80-85. Liu L, LiW, KoikeK, Zhang S, Nikaido T (2004). Newalpha-
tetralonylglucosides from the fruit of Juglans mandshurica.
Chem.Pharm.Bull. Tokyo 52:566-569. Martinez ML, Labuckas DO, Lamarque AL, Maestri DM (2010). Walnut
(Juglans regia L.): genetic resources, chemistry, by-products. J. Sci.
Food. Agric., 90: 1959-1967. Mei-zhi Z, Bing-nian J, Cai-xia J, Chao-bin L (2007). Study on
Extraction Conditions of Active Antiviral Substance from Walnut Leaves. Chemistry and Industry of Forest Products. 02 [Abstract].
Mei-zhi Z, Feng-yun Z , Hua W, Wei W (2006). A Study on the Bioactivity of Secondary Metabolites from Walnut Green Gull University. Journal of Northwest Forestry University-01 [Abstract].
Mitrovic M, Stanisavljevic M, Danjanovic JG (1997). Biochemical composition of fruits of some important walnut cultivars and
selections. Proceeding of the third International walnut held at
Alcobaca, Portugal, Congress. Acta. Hortcult 442: 205- 207. Mokhtari M, Shariati M, Sadeghi N (2008). Effect of alcohol extract from
leave Juglans regia on antinociceptive induced by morphine in
formalin test. Med. Sci. J. Islam. Azad. Uni., 18: 85-90. Mouhajir F, Hudson JB, Rejdali M, Towers GHN )2001(. Multiple
antiviral activities of endemic medicinal plants used by Berber people
of Morocco. Pharm. Biol., 39: 364-374. Muradoglu FH, Oguz I, Yildiz K, Yilmaz H (2010). Some chemical
composition of walnut (Juglans regia L.) selections from Eastern
Turkey. Afr. J. Agric. Res., 5: 2379-2385. Muradolu F (2005). Selection of promosing genotypes in native walnut
(Juglans regia L.) populations of Hakkari central and Ahlat (Bitlis)
districht, and genetic diversty. PhD dissertation, University of Yuzuncu Yil, Turkey.
Nariman F, Eftekhar F, Habibi Z, Falsafi T (2004). Anti-Helicobacter
pylori activities of six Iranian Plants. Helicobacter., 9:2.
Oliveira I, Sousa A, Ferreira ICFR, Bento A, stevinhol LE, Pereira JA
(2008). Total phenols, antioxidant potential and antimicrobial activity of
walnut (Juglans regia L.) green husks. Food Chem. Toxicol., 46:
2326-2331.
Oryza (2007). Hepatoprotective and anti-oxidative extract for metabolic syndrome walnut polyphenol. ver.1.0 HS Oryza Oil and Fat Chemical Co., Ltd
(http://www.oryza.co.jp/html/english/pdf/Walnut_polyphenol1.0.pdf). Ozer B, Kivc MB (2007). Antityrosinase activity of some plant extracts
and formulations containing ellagic acid. Pharm. Biol., 45: 519-524.
Papoutsi Z, Kassi E, Chinou I, Halabalaki M, Skaltsounis LA, Moutsatsou P (2008). Walnut extract (Juglans regia L.) and its
component ellagic acid exhibit anti-inflammatory activity in human
aorta endothelial cells and osteoblastic activity in the cell line KS483. British J. Nutr., 99:715-722.
Payne T (1985). California walnuts and light food. Cereal Foods World
30: 215-218. Pereira JA, Oliveira I, Sousa A, Ferreira ICFR, Bento A, Estevinho L
(2008). Bioactive properties and chemical composition of six walnut (Juglans regia L.) cultivars. Food Chem. Toxicol., 46: 2103-2111.
Poyrazolu EC, Biyik H (2010). Antimicrobial activity of the ethanol extracts of some plants natural growing in Aydin, Turkey. Afr. J.
Microbiol. Res., 4: 2318-2323. Qa’dan F, Al-Adham1 IS, Nahrstedt A. (2005a). Characterization of
antimicrobial polymeric procyanidins from Juglans regia leaf extract.
Eur. J. Sci. Res., 11:438-443. Qa’dan F, Thewaini A, Ali D, Afifi R, Elkhawad A, Matalka K
(2005b).The Antimicrobial Activities of Psidium guajava and Juglans
regia Leaf Extracts to acne-developing organisms. Am. J. Chin. Med.,
33: 197–204. Qamar W, Sultana S (2011). Polyphenols from Juglans regia L.
(Walnut) kernel modulate cigarette smoke extract induced acute inflammation, oxidative stress and lung injury in Wistar rats. Hum. Exp. Toxicol., 30:499-506.
Rahimipanah M, Hamedi M, Mirzapour M (2010). Antioxidant activity and phenolic contents of Persian walnut (Juglans regia L.) green
husk extract. Afr. J. Food Sci. Technol., 1:105-111. Rath BP, Pradhan D (2009). Antidepressant Activity of Juglans regia L.
fruit extract. Int. J. Toxicol. Pharmacol. Res., 1: 24-26. Ravai M (1992). Quality characteristics of califonia walnuts. Cereal
Foods World 37: 362-366. Robbers JE, Tyler VE (1999). Tyler's Herbs of Choise: The therapeutic
use of phytomedicinals, The Havvorth Herbal Press, New York.
Ros E, Nnez I, Perez-Heras A, Merce S, Gilabert R, Casals E, Deulofeu R (2004). Walnut diet improves endothelial functions in hypercholesterolemic subject. Circulation 109: 1609-1614.
Saad B, Dakwar S, Said O, Abu-Hijleh G, Al-Battah F, Kmeel A, Aziazeh H (2006). Evaluation of medicinal plant hepatotoxicity in co-cultures of hepatocytes and monocytes. eCAM., 3:93-98.
Salicornia Brachiata, Ind. Crops Prod., 23:177.
Savage GP (2001). Chemical composition of walnuts (Juglans regia L.)
grown in New Zealand. Plant Foods Hum. Nutr., 56: 75-82. Segura-Aguilar J, Jonsson K, Tidefelt U, Paul C (1992). The cytotoxic
effects of 5-OH-1, 4-naphthoquinone and 5, 8-diOH-1,4-naphthoquinone on doxorubicin-resistant human leukemia cells (HL-60). Leuk Res., 16: 631–637.
Shimoda H, Tanaka J, Kikuchi M, Fukuda T, Ito H, Hatano T, Yoshida T (2009). Effect of polyphenol-rich extract from walnut on diet-induced hypertriglyceridemia in mice via enhancement of fatty acid oxidation
in the liver. J. Agric. Food Chem., 57:1786-92. Society for Neuroscience (2007). "News Release: Diet of walnuts,
blueberries improve cognition; may help maintain brain function",
Society for Neuroscience, 5 November 2007 [http://www.sfn.org/index.aspx?pagename=news_110507b].
Souci SW, Fachmann W, Kraut H (1994). Food composition and
nutrition tables. Medpharm, CRC Press, Stuttgart. Spaccarotella KJ, Kris-Etherton PM, Stone WL, Bagshaw DM, Fishell
VK, West SG, Lawrence FR, Hartman TJ (2008). The effect of
walnut intake on factors related to prostate and vascular health in older men. Nutr. J., 7:13.
Sugie S, Okamoto K, Rahman KM, Tanaka T, Kawai K, Yamahara J
(1998). Inhibitory effects of plumbagin and juglone on azoxymethane- induced intestinal carcinogenesis in rats. Cancer Lett., 127:177–183.
Sze-Tao KWC, Sathe SK (2000).Walnut (Juglans regia L): proximate
composition, protein solubility, protein amino acid composition and protein in vitro digestibility. J. Sci. Food Agric., 80:1393–1401.
Tagarelli G, Tagarelli A, Piro A (2010). Folk medicine used to heal malaria in Calabria (southern Italy). J. Ethnobiol. Ethnomed., 6:27
Teimori M, Montasser KS, Ghafarzadegan R, Hajiaghaee R (2010). Study of Hypoglycemic Effect of Juglans regia leaves and its
Mechanism, J. Med. Plants 9:57-65. Torres-Gonzalez (2011). Protective effect of four Mexican plants against
CCl4 –induced damage in the hyh7 human hepatoma cell. Annals hematology., 10:73-79.
Upadhyay V, Kambhoja S, Harshaleena K (2010c). Antifungal activity
and preliminary phytochemical analysis of stem bark extracts of Juglans regia linn. IJPBA., 1:442-447
Upadhyay V, Kambhoja S, Harshaleena K, Veeresh, Dhruva K (2010a) Anthelmintic activity of the stem bark of Juglans regia Linn. Res J.
Pharm. Phytochem. (RJPP) 2: 465-467 Upadhyay V, Kambhoja S, Leena HK (2010b). Antibacterial activity and
preliminary phytochemical analysis of stem bark extract of juglans regia linn. Pharmacologyonline 3: 274-279 Newsletter.
USDA (2010). National Nutrient Database for Standard Reference,
Release 23. Vaidyaratnam PSV (2005). Indian Medicinal Plants a Compendium of
500 species. Orient Longman Private Limited, Chennai 3: 264-65.
Taha and Al-wadaan 5805 Venkatachakm M, Sathe SK (2006) Chemical composition of selected
edible nut seeds. J. Agric. Food. Chem., 54:4705–4714. Willis L, Shukitt-Hale B, Cheng V, Joseph J (2009). Dose-dependent
effects of walnuts on motor and cognitive function in aged rats. Br. J. Nutr., 101: 1140-1144.
Woods B, Calnan CD (1976). Toxic woods. Br. J. Dermatol., 94 (suppl,
13): 17. Yesilada E (2002). Biodiversity in Turkish Folk Medicine. In: Sener, B.
(Ed.), Biodiversity: Biomolecular Aspects of Biodiversity and
Innovative Utilization. Kluwer Academic/Plenum Publishers, London, pp. 119–135.
Zhang J, Jun-xi L, Fei Z, Duo-long D (2009a). Chemical constituents in green walnut husks of Juglans regia. Chinese Traditional and Herbal
Drugs. 06 [Abstract]. Zhang Z, Liao L, Moore J, Wua T, Wang Z (2009b). Antioxidant
phenolic compounds from walnut kernels (Juglans regia L.). Food
Chem., 113: 160-165. Zibaeenezhad MJ, Rezaiezadeh M, Mowla A, Ayatollahi SMT,
Panjehshahin MR (2003). Antihypertriglyceridemic effect of walnut oil. Angiology., 54: 4.

African Journal of Microbiology Research Vol. 5(32), pp. 5806-5811, 30 December, 2011 Available online at http://www.academicjournals.org/AJMR ISSN 1996-0808 ©2011 Academic Journals DOI: 10.5897/AJMR11.949
Review
The use of gamma irradiation in agriculture
Issa. Piri1, Mehdi. Babayan2*, Abolfazl. Tavassoli2 and Mehdi. Javaheri2
1Departmant of Agriculture, Payame noor University, PO Box 19395-4697, IR. Of Iran.
2Department of Agriculture, Esfarayen Branch, Islamic Azad University, Esfarayen, Iran.
Accepted 9 November, 2011
Lately, radiation technology is widely used to produce changes in the product characteristics leading to the development of new products. Gamma irradiation is capable of hydrolyzing chemical bonds, thereby cleaving large molecules of starch into smaller fragments of dextrin that may be either electrically charged or uncharged as free radicals. These changes may affect the physical and rheological properties of irradiated foods, resulting in increased solubility of starch, decreased swelling power, and decreased viscosity of starch paste. Irradiation of gamma rays on bud wood can produce higher frequencies of mutation, leading to the creation of new variants compared to the control. Macronutrients (carbohydrates, proteins and lipids) content are relatively stable against irradiation doses up to 10 kGy, on the other hand, gamma irradiation affects proteins by causing conformational changes, oxidation of amino acids, rupturing of covalent bonds and formation of protein free radicals. Radiation mediated morphological, structural and functional changes in a plant are governed by the intensity and duration of the gamma irradiation. Key words: Irradiation, Foods sterilized, Mutation, Biochemical change, Agriculture.
INTRODUCTION Irradiation is an ionic, no-heat process that continues to receive attention as a preservation and functional modification agent in polymer research and application (Abu et al., 2006). It was considered as one of the physical modification methods of nature polysaccharide (Hai et al., 2003; Relleve et al., 2005; Rombo et al., 2004). In comparison with other physical modification methods, such as microwave, UV, ultrahigh hydrostatic pressure and hydrothermal treatment, irradiation treatment is rapid, convenient and more extensive because ionizing energy penetrates through the polysaccharide granule rapidly (Bao et al., 2005). This process is useful in solving various agricultural problems: reduction of post-harvest losses through suppressing sprouting and contamination, eradication or control of insect pests, reduction of food-borne diseases and in extension of shelf life, and breeding of high performance well adapted and disease resistant agricultural crop varieties (Andress, 1994; Emovon, 1996). *Corresponding author. E-mail: [email protected].
Mutation Nuclear techniques, in contrast to conventional breeding techniques, are widely applied in agriculture for improving genetically diversity. Unlike conventional breeding procedures which involve the production of new genetic combinations from already existing parental genes, nuclear technology causes exclusively new gene combinations with high mutation frequency. Basic tool of nuclear technology for crop improvement is the use of ionizing radiation which causes induced mutations in plants. These mutations might be beneficial and have higher economical values (Abdul et al., 2010).
Mutagenesis has already been used to improve many useful traits affecting plant size, flowering time and fruit ripening, fruit color, self compatibility, self thinning, and resistance to pathogens. Nowadays, the number of cultivars derived from mutation induction increases constantly (Hearn, 2001; Maluszynski et al., 1995). Inducing mutations by gamma rays has been effectively used with several species of Citrus. Irradiation of gamma rays on bud wood can produce higher frequencies of mutation leading to the creation of new variants
compared to the control. Radio sensitivity (LD 50) of acute exposure of Citrus ranges from 40 to 100 Gy (Sanada and Amano, 1998; Sparow, 1968) depending on species and varieties. Scion (bud wood), seeds, foral stage embryos, and in vitro material of Citrus were exposed to gamma rays. Citrus sunki was irradiated with 20 or 40 Gy of gamma rays at three different foral stages (Spiegel-Roy and Padova, 1973) and nucellar seedling (Ikeda, 1976). A spine free mutant was selected from irradiated nuclear. In Citrus sinensis, immature seeds were exposed to gamma rays at the doses 80-100Gy (Sparow, 1968), while those polyembryonic seeds were exposed to gamma rays of 100Gy (Kukimura, 1976). Two seedless mutants were selected, leading to release of a new cultivar “Hongju 418 and Hongju 420” (Kukimura, 1976). Citrus paradisi cv Hudson were exposed with thermal neutron, leading to release of a seedless mutant ‘Star Ruby’ (Chen, 1991). Another fve nearly seedless mutants of Citrus paradisi cv Foster were also selected from irradiated bud wood at the dose 50 gray of gamma rays (Micke, 1985). Citrus limon cv Eureka and Israeli Villafranca were irradiated by 60 and 50 Gy of gamma rays respectively, and completely new seedless varieties were released (Hearn, 1985). A red color of flesh and juice mutant derived from 80 Gy gamma irradiation of Citrus paradisi cv Ruby Red was released as cultivar Rio Red in 1984 (Spiegel-Roy, 1985). Bud woods of pummel, mandarin and Navel Orange irradiated by gamma-rays at doses of 30 to 75 Gy showed high sensitivity at higher dose, while Valencia and grapefruit produced more seedless fruits from those at the higher doses (Wu, 1986). Khatri et al. (2005) collected three high grain yielding and early maturing mutants by treating seeds of Brassica juncea L. cv. S-9 with gamma rays (750 to 1000KGy) and EMS.
Shah et al. (2001) developed a new oil seed Brassica napus L cv. ABASIN-95 by induced mutation. They exposed seeds of B. napus L. cv. Tower to 1.0, 1.2 and 1.4 KGy gamma rays and the resulting new variety was high yielding, resistant to Alternaria blight and white rust.
Irradiation of gamma rays (10-60 Gy) on calli in vitro proliferation stage resulted in high mortality at the dose of 60 Gy (Predieri, 2001) When nucellus and embryonic mases of Citrus sinensis cv. Pera were exposed to gamma irradiation at the dose 0–160 Gy and 0–189 Gy respectively, normal growth of plantlets was obtained from irradiated nucellus exposed to 20 – 80 Gy (Froneman, 1996). Physiological changes in crop Gamma irradiation induced physiological changes in crop although, gamma radiation is a technology with immense applications in agriculture, industry and medicine, its potential exploitation in agriculture is limited mainly because of lack of information awareness on optimal
Piri et al. 5807 dose of irradiation which differs from one crop to another crop and from one application to another application. Radiation mediated morphological, structural and/or functional changes in a plant are governed by the intensity and duration of the gamma irradiation. In wheat, particularly, research efforts are needed to develop plant types with reduced height, which would enable them to tolerate gusty wind and contain losses due to lodging and subsequently grain yield. Mashev et al. (1995) used high irradiation dose of 5000–15 000 R to achieve a decrease in plant height and an increase in yield and suggested that even higher irradiation dose could be used to develop yield efficient wheat plant types. Wheat grains from irradiated plants were also rich in proteins and essential amino acids (Mashev et al., 1995). Din et al. (2003) studied the effect of gamma irradiation on different wheat varieties at seed irradiation dose of 10, 20, 30 and 35 krad. A higher dose of 30 and 35 krad created some abnormalities in plant types for example, a tiller having two ears attached with each and/or prevalence of sterile ears etc. Mashev et al. (1995), observed a significant decline in grain yield of wheat at doses above 0.10 kGy, however, lower doses of 0.01 and 0.025 kGy increased grain yields. Spielmeyer et al. (2007) had used a high vigour breeding line vigour 18 to identify a QTL on chromosome 6A that accounted for up to 8% of the variation for coleoptile length, 14% of seedling leaf width and was associated with increased plant height. They found a SSR marker, NW 3106, nearest to the 6A QTL that was associated with greater leaf width in a breeding population. The Vigour 18 allele of the QTL on chromosome 6A promoted coleoptile length and leaf width not only during early plant growth but was also found to be associated with increased plant height at maturity (Spielmeyer et al., 2007). Biochemical change in crop Extensive research showed that the macronutrients (carbohydrates, proteins and lipids) content are relatively stable against irradiation doses up to 10 kGy (WHO, 1994). However, Lee et al. (2005) reported that gamma irradiation affects proteins by causing conformational changes, oxidation of amino acids, rupturing of covalent bonds and formation of protein free radicals. Also, chemi-cal changes in the proteins caused by gamma irradiation include fragmentation, cross-linking, aggregation and oxidation by oxygen radicals that are generated in the radiolysis of water. Gamma irradiation has a slight effect on the amino acid profile at recommended doses to foods (WHO, 1999). This effect could be related to the structure of each amino acid as revealed by many authors (Simic, 1983; Urbain, 1986; Elias and Cohen, 1997; Matloubi et al., 2004; Erkan and Ozden, 2007). The previous authors concluded that simple amino acids increased upon irradiation, such as glycine, which undergo reductive

5808 Afr. J. Microbiol. Res. deamination and decarboxylation. In addition, aliphatic amino acids with increasing chain length, provide addi-tional C–H bonds for interaction with OH radicals which reduces the extent of oxidative deamination. Wang and von Sonntage (1991) reported that sulfur containing as well as aromatic amino acids are, in general, the most sensitive to irradiation, while simple amino acids could be formed by destruction of other amino acids. Diehl (1995) and Matloubi et al. (2004) reported that there is a mutual protection exerted when different substances are irradiated together.
The results of irradiating multiple compounds together will, generally, not cause much chemical change in any one of the compounds, when irradiated alone. The effects of gamma irradiation on physicochemical changes in proteins have been described in previous studies, where chemical trans-formations of amino acids, breakdown of peptide bonds, hydrogen and disulphide bridges were observed (Ambe et al., 1961; Bernofsky et al., 1959; Nisizawa, 1988; Puchala et al., 1979; Zabielski et al., 1984).
Delincee and Pushpa (1981) observed cross-linking of the chain influences of the tertiary structure of proteins and their physicochemical properties. Decomposition and denaturation were detected in irradiated proteins (Ciesla et al., 2000). The decrease of apparent amylose content was possibly originated from the breakage or cleavage of long chains in amylopectin caused by gamma irradiation (Wu et al., 2002). It also agreed with Descherider and Grant’s observation (Descherider, 1960; Grant and D’Apponlonia, 1991) that the decreasing apparent amylose content results from the shortening of polysaccharide chains. Ciesla et al. (2000), stated that indicating modification of proteins occurring after gamma irradiation similar to the transformations taking place under heating.
Kanemaru, et al. (2005), reported that protein content for the irradiated semolina and semolina obtained from irradiated wheat grains was not affected with gamma irradiation and ranged around 10.6-10.9%. Similarly, these results also agreed with the findings of Marathe et al. (2002), Agundez-Arvizu et al. (2006) and Azzeh and Amr (2009). Kwon et al. (1988) concluded from their studies on a Korean garlic cultivar that immediately after gamma irradiation with 100 Gy there are no differences in the levels of linoleic, palmitic, oleic and linolenic acids, the predominant fatty acids of bulbs.
The low radiation dose used could have produced its long-term effects in part by means of the stimulation of lipid degradation, possibly mediated through the action of free radicals that are known to be generated after irradiation (Katsaras et al., 1986; Voisine et al., 1991). In plant tissues subject to different forms of stress, polar lipids are degraded to generate free fatty acids and diacylglycerols, resulting in an eventual accumulation of TG as a defense mechanism (Olsson, 1995; Navari-Izzo et al., 1990).
Effect of irradiation on crop growth and seed germination When ionizing radiation is absorbed in biological materials, it acts directly on critical cell targets or indirectly through the generation of metabolites that can modify important cell components. Low doses of gamma irradiation have been used to advantage in order to control the degree of ripeness and extend the shelf life of fruits and vegetables. The use of ionizing radiation depends on a country as food irradiation is illegal in some countries. Detection methods of ionizing radiation are also required for enforcing good control. Methods such as inhibition of seed germination and elongation of roots and shoots from germinating seeds have been reported for the detection of irradiated seeds of crop species (Qiongying et al., 1993; Zhu et al., 1993; Selvan and Thomas, 1999; Barros et al., 2000). Chaudhuri (2002) reported a simple and reliable method to detect gamma irradiated lentil seeds by germination efficiency and seedling growth test.
There is a difference in the detection of irradiated seeds of kabuli -type chickpeas and wild Cicer species. Toker and Cagirgan (2004) reported that the shoot length of kabulitype chickpeas was induced by 100Gy irradiation as compared to the controls. For this reason, only 200, 300 and 400 Gy doses were taken into account for irradiation. Chaudhuri (2002) found similar results with lentil. Villavicencio et al. (1998) showed that root growth and the almost totally retarded shoot elongation of irradiated common bean and mung bean were markedly reduced as compared to the non-irradiated checks. They stated that the critical dose that prevented shoot and root elongation varied among species and also ranged from genotype to genotype within species. The kabuli types were more affected than the desi ones. This is a certain and reliable way to identify the effects of gamma rays on Cicer seeds in a very short time. These effects might in time be developed into a method for irradiation detection. Higher doses inhibit germination.
Chromatographic analysis of some herbal extracts indicated that changes in total yield and constituents of volatile oil following irradiation were ranged from none to slight depending upon dose-based irradiation in variety of herbs (IAEA, 1992; Venskutonis et al., 1996; Chatterjee et al., 2000). It can be assumed, therefore, that the dose which can be applied and hence extent to the microbial kill may be limited by undesirable changes in volatile oil constituents, their yield and flavor quality. Farag et al. (1995) that reported terpenes were converted to monoterpe-nesalcohols. b-Eudesmol, an oxygenated monoterpenes, was the major compound in this group, while verbenol, a-eudesmol, verbenone, and (E)-r-2-menthen-1-ol were also detected. The a-and b-eudesmol were increased to 9.52% from 6.91%, with no major variation between the different irradiation doses. The remaining oxygenated terpene levels also did not vary
significantly during irradiation. Quantity of paeoniflorin in Paeoniae radix, i.e. no change with irradiation as cited by Yu et al. (2004). In addition, Owczarczyk et al. (2000) have reported that the content of biologically active substances, including the essential oils, flavonoids, glycosides, anthocyanins, and plants mucus did not change significantly after irradiation. Irradiation can also increase the alkaloids percentage in the different organs of plant, particularly the leaves (Abo Elseud, 1983; El-Kholy, 1987; Habba, 1989). The increase or decrease in the germination percentage was found to attributed to gamma rays treatments. The stimulating effects of gamma ray on germination may be attributed to the activation of RNA synthesis (Kuzin at al., 1975) on coster bean, or protein synthesis (Kuzin et al., 1976) which occurred during the early stage of germination after seeds irradiated with 4 K-rad. These results are in agreement with the findings of Grover and Dhanju, (1980) on Papaver somniferum and Donge et al. (1986) on tea seeds. Habba (1989) who reported that increasing the dose of gamma rays up to 100 Gy, gradually increased the germination percentage, and then decreased gradually with increasing the gamma ray dose in the second season in Hyoscyamus muticus. Hell et al., (1974) stated that on Phaseolus vulgaris, treating seeds with high rates of gamma radiation reduced germination. Abo Elsauod and Omran (1976) indicated that irradiation snap bean seeds with 50, 100 and 150 Gy resulted in greater percentage of germination than the control. Regarding the effect of GA on seed germination an increase in germination percentage was observed by 3 increasing GA concentration was in confirmity with Ruminska et al. (1978) Who reported that the seed 3 soaking, preceding the sowing, in solutions 500, 1000, 1500 and 2000 ppm of GA improved germination ability of seven species of seeds, particularly good effects were achieved with Lavandula vera and Atropa belladonna where not only germination ability was not only increased but also accelerated and even shooting was obtained. Increase in higher germination percentage at higher doses might be due to their stimulating effects on activating RNA synthesis or protein synthesis (Kuzin et al., 1975; 1976) or it could be due to the elimination of germinating bacterial populations, their spores and mould fungi (Gruner et al., 1992) Food irradiation
Research on food irradiation dates back to the turn of the twentieth century with the first United States of America and British patents being issued in 1905. It allowed the use of ionising radiation to kill bacteria in food (ICGFI 1999). The United States have since amended their drug regulations to allow the irradiation of certain food products to control food-borne pathogens (USEPA 2002). Food irradiation is a process in which products are exposed to ionizing energy, such as gamma rays,
Piri et al. 5809 electron beams and X-rays for a specified time (FDA, 1986). A food is irradiated to utilize the destructive power of ionization radiation on the microorganisms with minimum changes in food constituents (Zenthen and Sorensen, 2003). Nowadays, irradiation of food is permitted in over than 60 countries for the purpose of food preservation by destruction of microbes, worms, insects and parasites, as well as for the inhibition of sprouting of potatoes and onions (IAEA, 2007). According to international health and safety authorities; Joint FAO/IAEA/WHO Expert Committee on the Wholesomeness of Irradiated Foods (JECFI), foods irradiated up to 10 kGy are considered safe and present no toxicological hazard and no special nutritional or microbiological problems in food (Anonymous, 1981). Gamma radiation of 30–1000 Gy has been applied to achieve a delay in the ripening of some fruits and vegetables (WHO 1988). A reduction in the amount of visible and total mould present in bread during a storage period of up to 20 weeks was reportedly achieved by applying a gamma radiation dose of 150 Gy to the flour (Adejumo 1998). Bansa and Appiah (2003) have also reported the successful use of gamma radiation dose of 120 Gy to effectively inhibit sprouting in yams for six months under tropical ambient conditions. Furthermore, higher gamma radiation doses of 2–4 kGy have been used to successfully reduce the infection rate in sugar beet seeds (Rizk and Moussa 2003)while a dose of approximately 500 Gy has been employed to disinfect and also reduce microbial populations in cocoa beans (Adesuyi 1996). Foods sterilized During the last decade interest has increased in the methods of food sterilization and modification applying medium (1–10 kGy) and high doses (10–70 kGy) of irradiation as well as radiation processing of industrial products that contain starch. Foods sterilized at high doses may be consumed by immunologically depressed patients and can be stored at room temperature (for example bakery products, readily prepared meals). Radiation modification enables, moreover, removal of ant nutritional factors and inhibition of food allergies Doses of several dozen kGy are used for sterilization of pharmaceuticals and medical devices and for starch modification. Accordingly, it appears desirable to acquire knowledge about the functional and structural properties of foods and starch alone irradiated using medium and high doses and in the development of appropriate physicochemical testing methods. CONCLUSION
Many investigate on effect of gamma radiation on crop were carried out and their results showed usage of

5810 Afr. J. Microbiol. Res. gamma radiation have different effect on crop such as Biochemical and physiological change, growth and germination inhibition. Inhibition of seed germination and elongation of roots and shoots from germinating seeds have been reported for the detection of irradiated seeds of crop species. Gamma irradiation affects proteins by causing conformational changes, oxidation of amino acids, rupturing of covalent bonds and formation of protein free radicals. Also, chemical changes in the proteins caused by gamma irradiation include fragmen-tation, cross-linking, aggregation and oxidation by oxygen radicals that are generated in the radiolysis of water. Irradiation is effective method for microbiological decontamination of them, and the content of essential biologically active substances and pharmacological activity of medicinal herbs not change significantly with irradiation.
REFERENCES Abdul Majeed, Asif Ur Rehman Khan, Habib Ahmad, Zahir Muhammad
(2010). Gamma irradiation effect on some growth parameters of Lepidium sativum L. ARPN, J. Agric. Biol. Sci., 5(1): 39-42.
Abo Elseud MA (1983). Biochemical Studies on Some Medicinal Plants
As Affected By Radiation And Protective Agents. M.Sc. Thesis, Fac. Agric. Menoufia Univ., 65-69.
Abu JO, Muller K, Duodu KG, Minnaar A (2005). Functional properties of cowpea (Vigna unguiculata L. Walp) flours and pastes as affected
by c-irradiation. Food Chem., 93: 103–111. Adejumo J (1998). Food preservation by gamma irradiation BSc Project
Department of Physics, Obafemi Awolowo University, Ile-Ife, Nigeria. Adesuyi SA (1996). Use of irradiation for post-harvest preservation of
crops with special reference to Nigeria, J. Irradiation National Dev.,
11: 46–9. Agundez-Arvizu Z, Fernandez-Ramirez M, Arce-Corrales M, Cruz-
Zaragoza E, Melendrez R, Chenov V, Barboza Flores M (2006).
Gamma irradiation effects on commercial Mexican bread making wheat flour. Nucl. Instrum. Methods Phys. Res. B, 245: 455–458.
Ambe KS, Kumta US, Tappel AI (1961). Radiation damage to
cytochrome C and hemoglobin. Radiat. Res., 15: 709–719. Andress EL, Delaplane KS, Schuler GA (1994). Food Irradiation. Fact
sheet HE 8467 (Institute of Food and Agricultural Sciences University
of Florida, USA). Anonymous (1981). Wholesomeness of irradiated food report of a joint
FAO/IAEA/ WHO expert committee. Technical Report Series: 659.
WHO, Geneva. Azzeh F, Amr A (2009). Effect of gamma irradiation on physical
characteristics of Jordanian durum wheat and quality of semolina and
lasagna products. Radiat. Phys. Chem., 78: 818–822. Bansa D, Appiah V (2003). Preservation of yams by gamma radiation J.
Ghana Sci. Assoc., 1: 3.
Bao JS, Ao ZH, Jane JL (2005). Characterization of physical properties of flour and starch obtained from gamma-irradiated white rice. Starch, 57: 480–487.
Barros AC, Freund MTL, Villavicencio ALCH, Delin-cee H, Arthur V (2000). Identification of irradiated wheat by germination test, DNA comet assay and electron spin resonance. Radiat. Phys. Chem., 63:
423–426. Bernofsky C, Fox Jr. JB, Schweigert BS (1959). Biochemistry of
myoglobin VI: the effect of low dosage gamma irradiation on beef
myoglobin. Arch. Biochem. Biophys., 80: 9–21. Chatterjee S, Variyar PS, Gholap AS, Pudwal-Desai SR, Bongir- war
DR (2000). Effect of g-irradiation on the volatile oil constituents of turmeric (Curcuma longa). Food Res. Int., 33: 103–106.
Chaudhuri SK (2002). A simple and reliable method to detect gamma irradiated lentil (Lens culinaris.) seeds by germination efficiency and
seedling growth test. Radiat. Phys. Chem., 64: 131–136.
Chen S (1991). Studies on the seedless character of Citrus induced by
irradiation. Mutat. Breeding Newslett., 37: 8-9. Ciesla K, Roos Y, Gluszewski W (2000). Denaturation processes in
gamma irradiated proteins studied by differential scanning calorimetry. Radiat. Phys. Chem., 58: 233–243.
Descherider AR (1960). Changes in starch and its degradation products
on irradiating wheat flour with gamma rays. Starch/Staerke 12: 197. Diehl J (1995). Safety of Irradiated Foods, second ed. Marcel Dekker,
New York, USA. pp. 89-95.
Din R, Ahmed QK, Jehan S (2003). Studies for days taken to earing initiation and earing completion in M1 generation of different wheat genotypes irradiated with various doses of gamma radiation. Asian J.
Plant Sci., 2: 894–896. Elias P, Cohen A (1997). Radiation Chemistry of Major Food
Components. Elsevier Scientific, Amsterdam, Netherlands. 159-163. Emovon EU (1996). Keynote Address: Symposium Irradiation for
National Development (Shelda Science and Technology Complex, SHESTCO, Abuja, Nigeria). pp. 156-164.
Erkan N, Ozden O (2007). The changes of fatty acid and amino acid
compositions in sea bream (Sparus aurata) during irradiation process. Radiat. Phys. Chem., 76: 1636–1641.
Farag SED, Aziz Attia ESA (1995). Effect of irradiation on the microbiological status and flavouring materials of selected spices.
Eur. Food Res. Technol., 201: 283–288. FDA (1986). Irradiation in the production, processing and handling of
food. Food and Drug Administration (Federal Register), 51(75):
13376–13399. Froneman IJ (1996). Producing seedless Citrus cultivars with gamma
irradiation. Proc Int. Soc. Citriculture, pp.159-163.
Grant LA, D’ Aponlonia BL (1991). Effect of low-level gamma radiation on water-soluble non-starchy polysaccharides isolated from hard red spring wheat flour and bran. Cereal Chem., 68: 651.
Grover IS, Dhanju MS (1980). Effect of gamma radiation on the germination of papaver somniferum and papaver. rhoeas. Indian J.
Plant Physiol., (1979), 22(1): 75-77. Hort. Abst., 1980, 50: 6595.
Habba IE (1989). Physiological Effect of Gamma Rays on Growth And Productivity Of Hyoscyamus muticus L. and Atropa belladonna L.
Ph.D. Thesis, Fac. Agric. Cairo Univ., Cairo, Egypt. 65-73.
Hai L, Diep TB, Nagasawa N, Yoshii F, Kume T (2003). Radiation depolymerization of chitosan to prepare oligomers. Nucl. Instrum. Methods Phys. Res. B, 208: 466–470.
Hearn CJ (1985). Development of seedless grapefruit cultivars through budwood irradiation. Hortscience, 20: 84.
Hearn CJ (2001). Development of seedless grapefruit cultivars through
budwood irradiation. Hortscience, 20: 84. Hell KG, Silveira M (1974). Imbibition and germination of gamma
irradiation Phaseolus vulgaris seeds. Field Crop Abst., 38(6): 300.
IAEA (1992). Irradiation of spices, herbs and other vegetable seasonings. IAEA-TECDOC-639.
IAEA (2007). Food Irradiation: A Powerful Nuclear Tool for Food Safety.
Retrieved from: http://www.IAEA-food-irrad-tool0807S. ICGFI (International Consultative Group of Food Irradiation) (1999).
Facts about food irradiation. Series of fact sheets (Vienna: ICGFI).
Ikeda F (1976). Induced bud sports in Citrus sunski from Nucellar seedlings. In: Improvement of vegetatively propagated plants and tree crops through induced mutation, 95-96: 12.
Katsaras J, Stinson RH, Kendal EJ, McKersie BD (1986). Structural simulation of free radical damage in amodelmembrane system: a smallangle X-ray diffraction study. Biochim. Biophys. Acta 861: 243–
250. Kukimura HF (1976). Brief description of mutation in vegetatively
propagated and tree crops. Gamma Field Symp., 15: 79-82. Kuzin AM, Vagabova ME Revin AF (1976). Molecular mechanisms of
the stimulating action of ionizing radiation on seeds. 2. Activation of protein and high molecular RNA synthesis. Radiobiologiya, 16: 259-
261. Kuzin AM, Vagabova ME, Prinak-Mirolyubov VN (1975). Molecular
mechanisms of the stimulating effect of ionizing radiation on seed.
Activation of RNA synthesis. Radiobiologiya., 15: 747-750. Kwon JH, Yoon HS, Byun MW, Cho HO (1988). Chemical changes in
garlic bulbs resulting from ionizing energy treatment at sprout-
inhibition dose. J. Kor. Agric. Chem. Soc., 31: 147–153.

Lee S, Lee M, Song K (2005). Effect of gamma-irradiation on the
physicochemical properties of gluten films. Food Chem., 92: 621–925.
Maluszynski M (1995). Application of in vivo and in vitro mutation techniques for crop improvement. Euphytica, 85: 303–315.
Marathe S, Machaiah J, Rao B, Pednekar M, Sudha Rao V (2002).
Extension of shelf life of whole-wheat flour by gamma radiation. Int. J. Food Sci. Technol., 37: 163–168.
Mashev N, Vassilev G, Ivanov K (1995). A study of N-allyl N-2 pyridyl
thiourea and gamma radiation treatment on growth and quality of peas and wheat. Bulgerian J. Plant Physiol., 21(4): 56–63.
Matloubi H, Aflaki F, Hadjiesadegan M (2004). Effect of gamma
irradiation on amino acids content of baby food proteins. J. Food Compos. Anal., 17: 133–139.
Micke A (1985). Plant cultivars derived from mutation induction or the
use of induced mutants in crop breeding. Mutation Breeding Rev., 3: 1-92.
Navari-Izzo F, Vangioni N, Quartacci MF (1990). Lipids of soybean and
sunflowers seedlings grown under drought conditions. Phytochemistry, 29: 2119–2123.
Nisizawa M (1988). Radiation induced sol–gel transition of protein:
effect of radiation on amino-acid composition and viscosity. J. Appl. Polym. Sci., 36: 979–981.
Olsson M (1995). Alterations in lipid composition, lipid peroxidation and
anti-oxidative protection during senescence in drought stressed plants and non-drought stressed plants of Pisum sativum. Plant Physiol. Biochem., 33: 547–553.
Owczarczyk HB, Migdal W, Kedzia B (2000). The pharmacological activity of medical herbs after microbiological decontamination by irradiation. Radiat. Phys. Chem., 57: 331–335.
Predieri S (2001). Mutation induction and tissue culture in improving fruits. Plant Cell. Tissue and Organ Culture 64: 185-210.
Puchala M, Szweda-Lewandowska Z, Leyko W (1979). g-Irradiation of
aqueous solutions of human hemoglobin in atmosphers of air and argon. Radiat. Res., 78: 379–389.
Qiongying L, Yanhua K, Yuemei Z (1993). Studies on the method of
identification of irradiated food. I. Seedling growth test. Radiat. Phys. Chem., 42: 387–389.
Relleve L, Nagasawa N, Luan LQ Yagi T, Aranilla C, Abad L (2005).
Degradation of carrageenan by radiation. Polymer Degradation and Stability, 87: 403–410.
Rizk MA, Moussa TAA (2003). Impact of gamma irradiation stresses I.
Response of gamma-irradiated sugarbeat seeds to infection by soil-borne fungal pathogens Pak. J. Plant Pathol., 2: 28–38.
Rombo GO, Taylor JRN, Minnaar A (2004). Irradiation of maize and
bean flours: Effects on starch physicochemical properties. J. Sci. Food Agric., 84: 350–356.
Ruminska A, Suchorska K, Weglarz Z (1978). Effect of gibberellic acid on seeds germination of some vegetable and medicinal plants.
International Symposium on Spices and Medicinal plants, ISHS Acta Horticulturae 73: I .
Sanada T, Amano E (1998). Induced mutation in fruit trees. In JAIN,
Somaclonal variation and induced mutations in crop improvement. Kluwer Academic Publishers, England, pp. 401- 419.
Selvan E, Thomas P (1999). A simple method to detect gamma-
irradiated onions and shallots by root morphology. Radiat. Phys. Chem., 55: 423–427.
Simic M (1983). Radiation chemistry of water-soluble food components.
In: first ed. In: Josephon, E., Peterson, M. (Eds.), Preservation of Food by Ionizing Radiation, CRC Press, London, 2: 1–73.
Sparow AH (1968). Radiosensitivity studies with woody plants. I. Acute
gamma irradiation survival data for 28 species and predictions for 190 species. Radiat. Bot., 8: 149-186.
Spiegel-Roy P (1985). Seedless induced mutant in highly seeded lemon (Citrus limon). Mutation Breeding Newslett., 26: 1-2.
Spiegel-Roy P, Padova R (1973). Radiosensitivity of Shamouti orange (Citrus sinensis) seeds and buds. Radiation Bot., 13: 105-110.
Piri et al. 5811 Spielmeyer W, Hyles J, Joaquim P, Azanza F, Bonnett D, Ellis ME,
Moore C, Richards RA (2007). A QTL on chromosome 6A in bread wheat (Triticum aestivum) is associated with longer coleoptiles,
greater seedling vigour and final plant height. TAG Theoretical Appl. Gene., 115(1): 59–66.
Toker C, Cagirgan MI (2004). Spectrum and frequency of induced
mutations in chickpea. Int. Chickpea Pigeonpea Newslett. 11: 8–10. Urbain W (1986). Food Irradiation. Academic Press, Orlando, USA. 88-
94.
USEPA (United States Environmental Protection Agency) (2002). The history of food irradiation Bull. USEPA. 96-100.
Venskutonis R, Poll L, Larsen M (1996). Effect of irradiation and storage on the composition of volatile compounds in Basil (Ocimum basilicum L.). Flavour Fragr. J., 11: 117–121.
Villavicencio ALCH, Mancini-Filho J, Delinciee H (1998). Application of
different techniques to identify the effects of irradiation on brazilian beans after six months storage. Radiat. Phys. Chem., 52: 161–166.
Voisine R, V´ ezina LP, Willemont C (1991). Induction of senescence-
like deterioration of micro small membranes from cauliflower by free radicals generated during gamma irradiation. Plant Physiol., 97: 545–550.
Wang D, von Sonntage C (1991). Radiation industrial oxidation of phenylalanine. In: Leonardi, M., Raffi, J., Belliardo, J. (Eds.), Proceedings of the Workshop on Recent Advances on Detection of
Irradiated Foods, BRC Information, Chemical Analysis Commission of the European Communities, Brussels, pp. 212–217 (Report EUR 13331 En).
WHO (World Health Organization) (1988). Food Irradiation: A Technique for Preserving and Improving the Safety of Food (WHO Publication in Collaboration with FAO). pp. 144-149.
WHO (1994). Safety and Nutritional Adequacy of Irradiated Food. WHO, Geneva. WHO, 1999. High-dose Irradiation: Wholesomeness of Food Irradiated with Doses above 10 kGy. WHO, Geneva (WHO Technical
Report Series no: 890). 120-124. Wu S (1986). Using Gamma-rays to induce mutations for seedlessness
in Citrus. Mutat. Breeding Newslett., 27: 14.
Yu YB, Jeong IY, Park HR, Oh H, Jung U, Jo SK (2004). Toxicological safety and stability of the components of an irradiated Korean medicinal herb, Paeoniae Radix. Radiat. Phys. Chem., 71: 115–119.
Zabielski J, Kijowski J, Fiser W, Niewiarowicz A (1984). The effect of irradiation on technological properties and protein solubility of broiler chicken meat. J. Sci. Food Agric., 35: 662–670.
Zenthen P, Sorensen L (2003). Food Preservation Technique. Wood head Publishing Limited, Cambridge. pp. 89-96.
Zhu S, Kume T, Ishigaki I (1993). Detection of irradiated wheat by
germination. Radiat. Phys. Chem., 42: 421–427. Kuzin AM, Vagabova ME, Prinak Mirolyubov VN (1975). Molecular
mechanisms of the stimulating effect of ionizing radiation on seed. Activation of RNA synthesis. Radiobiologiya, 15: 747-750.
Kuzin AM, Vagabova ME, Revin AF (1976). Molecular mechanisms of the stimulating action of ionizing radiation on seeds. 2. Activation of protein and high molecular RNA synthesis. Radiobiologiya, 16: 259-
261. Gruner MM, Horvatic D, Kujundzic, Magdalenic B (1992). Effect of
gamma irradiation on the lipid components of soy protein products.
Nahrung, 36: 443-450. Shah SA, Ali I, Rahman K (2001). Abasin 95 a new oilseed rape cultivar
developed through induced mutations. Mut. Breed. Newslett., 45: 3-4.
Khatri A, Khan IA, Siddiqui MA, Raza S, Nizamani GS (2005). Evaluation of high yielding mutants of Brassica Juncea cv. S-9
developed through Gamma rays and EMS. Pak. J. Bot., 37(2): 279-
284.
African Journal of Microbiology Research Vol. 5(32), pp. 5812-5818, 30 December, 2011 Available online at http://www.academicjournals.org/AJMR ISSN 1996-0808 ©2011 Academic Journals DOI: 10.5897/AJMR10.104
Full Length Research Paper
In vitro antiviral activities of Jrani caprifig latex and its related terpenes
Houda LAZREG AREF1*, Mahjoub AOUNI2, Jean Pierre CHAUMON3, Khaled SAID1 and Abdelwaheb FEKIH4
1Laboratoire de Génétique, Biodiversité et Valorisation des Bio ressources (UR 03ES09),
Institut Supérieur de Biotechnologie, 5000 Monastir, Tunisie. 2Laboratoire des Maladies Transmissibles et Substances Biologiquement Actives, Faculté de Pharmacie 5000 Monastir,
Tunisie. 3Laboratoire de Botanique et cryptogamie, Faculté de Pharmacie Besançon 25000 cedex, France.
4Laboratoire de Chimie, 03/UR/1202, Faculté de Médecine Dentaire, 5000 Monastir, Tunisie.
Accepted 29 November, 2011
The aim of this study was to search for new antiviral agents from Tunisian Jrani caprifig latex (Ficus carica L., Moraceae). Terpenes and coumarins were identified by gas chromatography–mass spectrometry (GC-MS) analysis in hexane and hexane ethyl-acetate (1:1, v/v) extracts, and used in experiments to test their influence on a series of viruses, namely Herpes simplex (HSV-1), Adenovirus (ADV) and Echovirus type 11 (ECV-11). To evaluate the capacity of the extracts inhibition of viruses replication cycles by preventing their adsorption and their penetrations in the cells (by interaction with the cellular receivers designed for these viruses) or by inhibition of their intracellular replication or by virus inhibition after a direct contact under microscopic observation of cytopathic effect (CPE). Extracts inhibited virus multiplication in tested techniques at the concentrations of 19.5 and 39 µg/ml, respectively. All extracts had no cytotoxic effect on Vero cells at all tested concentrations. In conclusion, some compounds of Jrani latex which possess antiviral activities may be due to the high level of Triterpens. Their mode of action against the tested viruses was found to be at all stages of multiplication, suggesting the potential use of this compound for treatment of the infection caused by these viruses. Key words: Ficus carica, caprifig, latex, HSV-1, HSV-2, ECV-11, ADV, coumarins, terpens.
INTRODUCTION The use of herbs and medicinal plant as the first medicines is a universal phenomenon. Every culture on the earth, through written or oral tradition, has relied on the vast variety of natural chemistries found in plants for *Corresponding author. E-mail: [email protected]. Tel: +216 97 654 133. Fax: 00216 73 568 900.
Abbreviations: CPE, Cytopathic effect; PBS, phosphate buffered saline; MEM, minimum essential medium; FBS, fetal bovine serum; HSV-1, herpes simplex virus type 1; CPE, cytopathic effect.
their therapeutic properties. All drugs from the plant are substances with a particular therapeutic action extracted from plants (Serrentino, 1991). The usage of herbal plants as traditional health remedies is the most popular for 80% of the world population in Asia, Latin America and Africa and is reported to have minimal side effect (Doughari, 2006). In this study Jrani caprifig variety which belongs to the genus Ficus carica L. (Moraceae) has been selected. Unlike common figs, the caprifig is a fig tree which produces both male and female flowers and is used to fertilize the female trees of the species. The name caprifig is derived from caprificus (or “goat fig” in Italian) (Storey et al., 1977) produces three crops of syconia. These are known by their Italian terms, profichi,

mammoni and mamme. The fig is a deciduous tree, which probably originated in Western Asia, and spread to the Mediterranean is commonly known as fig tree (Tous and Ferguson, 1996). Its products are widely used both as a food and in traditional medicine in the Mediterranean; the roots are used in treatment of leucoderma and ringworms and its fruits which are sweet, have antipyretic, purgative, aphrodisiac properties and have shown to be useful in inflammations and paralysis (Kirthikar and Basu, 1996). F. carica is claimed to be useful in liver and spleen disorders, to cure piles and in treatment of gout. The leaf decoction affected lipid catabolism in hyperglyceridemic rats (Perez et al., 1999). Several phytochemical investigations of F. carica leaves have been published, but with no biological data.
Athnasios et al. (1962) have isolated prosalen, -sitosterol and Bergapten. Others have isolated triterpenoids (Abu-Mustafa et al., 1964). F. carica latex released on picking the fruits is used to treat skin tumors and warts (Ghazanfar, 1994). The first scientific investi-gation of the activity of fig latex was done by Ullman et al. (1945, 1952). The dialysate of the latex contained the active ingredient. Although, isolation of the active com-ponents was not pursued further, some pharmacological work was reported by Ullman (1952) and Ullman et al. (1952). Fig latex has also been tested for its anthelmitic activity (De-Amorin et al., 1999).
In this modern age it is very important to provide scientific proof to justify the various medicinal uses of herbs. Herbal drugs are prescribed widely even when their biologically active components are unknown because of their effectiveness, fewer side effects and relatively low cost (Valiathan, 1998). However, we are not aware of a satisfactory remedy for serious viral diseases and search for effective and safe drugs.
In this paper we describe the identification of a potent antiviral terpenes and coumarins from Tunisian caprifig latex, Jrani variety. MATERIALS AND METHODS
Latex collection
The Jrani caprifig latex was collected from unripe inedible fig fruit growing in Mesjed Aissa agricultural field located in the central cost of Tunisia. The latex was held in ice during the period of collection. The identification of this variety was established by Pr. Massoud MARS, professor of arboriculture at the high school of horticulture
of Chott Meriam Sousse, Tunisia, Department of Agriculture, and Arboriculture, the code collection of the tree is JR1. This fig fruit was cat open from its top then slightly squeezed to collect few drops of latex directly into polyethylene centrifuge tubes, frozen immediately in Dry-Ice and maintained in frozen state at –30°C until the analyses were performed.
Extracts preparation
The gum, approximately 30% by weight in F. carica latex was
Aref et al. 5813 removed from the aqueous solution by centrifugation in a refrigerated centrifuge (Bakemann Avanti TM30) at 15 000 rpm for 60 min at 0°C. The clear, straw-colored aqueous solution that was designated as a soluble material was frozen and stored at –30°C until required for analysis.
100 g of defrosted F. carica latex were macerated, (on cold) in 300 ml of methanol, over night, and repeated three times (Sarang et al., 2005), then evaporated under reduced pressure to afford (15 g) of yellow brown solid extract product 1 (P1).
The resulted residue was subjected to silica gel flash column chromatography eluted with hexane, hexane-ethyl acetate (1:1 v/v), and finally with ethyl acetate to obtain product 2 (P2), 3 (P3), and 4 (P4) of 4.10 g, 2.10 g and 0.60 g, respectively.
Furthermore, methanol was added to elute the polar compounds, which concentrated under reduced pressure, and then was re-dissolved in H2O, and re-extracted with chloroform to afford product 5 (P5) of 3 g. All solvent were purchased from Merck, Germany.
GC-MS analysis
The analysis of Jrani caprifig latex hexane and ethyl-acetate (1/1,
v/v) extracts was performed on a GC-MS HP model 1909S-433 inert MSD (Agilent Technologies, J and W Scientific Products, Palo Alto, CA, USA), equipped with an Agilent Technologies capillary DB-5MS column (30 m in length; 0.25 mm i.d.; 0.25 mm film thickness), and coupled to a mass selective detector (MSD1909S-433, ionization voltage 70 eV; all Agilent, Santa Clara, CA). The carrier gas was He and was used at 1 ml/min flow rate. The oven temperature program was as follows: 2 min at 150°C ramped from
150 to 240°C at 10°C/min and 1 min at 240°C then ramped from 240 to 280°C at 5°C/min and 15 min at 280°C. The chromatograph was equipped with a split/splitless injector used in the split mode. The split ratio was 1:100. Bis-(trimethylsilyl)-acetamide (BSTFA) (100 ml) was added to 100 ml of extract. The control of the GC/MS system and the data peak processing were carried out by means of MSDCHEM software. Identification of components was assigned by matching their mass spectra with Wiley and NIST library data, standards of the main components.
Cell and virus culture
The cell line used was Cercopithecus aethiops African green monkey kidney cells (Vero cell line ATCC CCL-81). The cellular lines maintained in the laboratory of transmissible diseases and bioactive substance (Faculté de Pharmacie de Monastir).
Briefly, the protocol used to obtain primary cell culture from the biopsy was as follows, each biopsy was washed three times with phosphate buffered saline (PBS) containing 200 units/ml of penicillin, 200 µg/ml of streptomycin and 0.5 µg/ml of amphotericin B. The skin was discarded the cartilage and the subcutaneous tissue were minced. Finely, the pieces of tissue were phased in 25 cm
2 cell culture flasks with just enough growth medium, that is
eagle minimum essential medium (MEM) with 2 mM L-glutamine,
1% vitamins, 1% non essential amino acids, 100 units/ml of penicillin, 100 µg/ml of streptomycin, 0.25 µg/ml of amphotericin B, and 10% of fetal bovine serum (FBS) to cover the pieces of tissue when the fibroblasts had proliferated to 30 or 40% confluence, the pieces of tissue were discarded by gently shaking with PBS and again the cells were fed with 50% of used medium and 50% of fresh medium. When 80% confluence was reached, the cells were trypsinized and cultured in 150 cm
2 flasks. Once the cells had
covered about 80% of the surface, they were trypsinized,
centrifuged and cryopreserved. All cells were grown in MEM supplemented with 10% (FBS), 100 units/ml of penicillin, 100 µg/ml of streptomycin (4 ml), 2 mM L-glutamine (2 ml), 0.07% NaHCO3,

5814 Afr. J. Microbiol. Res. 1% non essential amino acids and vitamin solution. The cultures were maintained at 37°C in humidified 5% CO2 atmosphere.
Herpes Simplex (herpes Viridae family) virus Type 1 (HSV-1) was obtained from the Laboratoire des Maladies Transmissibles et Substances Biologiquement actives, Faculté de Pharmacie 5000 Monastir Tunisia. Echovirus (ECV-11): Type 11 (Picornaviridae family) clinical strains. Adenovirus (ADV): non serotyped (Adenoviridae family) clinical stain.
Titration of viral strains
The virus strains were prepared from HSV-1 infected Vero cell
cultures. The infected cultures were subjected to three cycles of freezing-thawing and centrifuged at 2000 rpm for 10 min. The supernatant was collected, titrated, and stored at – 80°C in 1 ml aliquots. Viral strain was carried out on 96-well flat-bottomed plate containing confluent cells into monolayer; decimal dilutions of the initial viral suspension were made then inoculated in to deprived cells from their growth medium. Each dilution was divided up in to a column of 8 wells at a density of 100 µl/well. The last column was reserved for control cells not infected by the virus and containing
only the survival medium; then the plaque was incubated at 37°C in humidified 5% CO2 atmosphere and controlled every 24 h by taking note of each time the number of well showed a CPE, when the CPE ceased to progress (5 to 7 days).
We evaluated the infectious title of the virus according to the method of Reed and Muench (1938) (Watanabe et al., 1994): the title of a virus is expressed by the TCID50 (infectious amount on cultured tissue), it shows the dilution of the viral suspension of
which 50% of the cells degenerate. The exploitation of dilution DL50 or TCID50 (in absolute value) corresponds to the dilution which is giving a degeneration immediately above 50%, increased product of the proportional distance X by the logarithm of dilution factor. The proportional distance X between two critical dilutions at which the TCID50 is located and obtained by spearman Kàber formula: X = (D > 50% - 50)/(D > 50% to D 50%). D > 50%: degeneration immediately grater than 50%. D < 50%: degeneration immediately lesser than 50% (Lorenz and Bögel, 1973).
To titer the virus suspension, confluent monolayer Vero cells were grown in 96-well flat-bottomed plates, and were infected with 0.1 ml of serial 12-fold dilutions of the virus suspension by 0.1 ml quadruplicated for a period of 48 h. The virus titer was 10
3.5 (the
dilution of the virus required to TCID50/0.1ml lytic effect, 50% of the inoculated cultures).
Solvent cytotoxicity assay
The solutions of extracts were already prepared with 100 mg/ml, a serial dilutions (1, 1/10, 1/20, 1/40, 1/80, 1/160, 1/320, 1/640, 1/1280, 1/2560 and 1/5120 mg/ml) were done in a medium, made up of RPMI 1640 supplemented with 1% L. glutamine, 2% of antibiotic and 10% (FBS) (serum of be worth fetal) (Chiang et al., 2002). Cells monolayer were trypsinized, washed with culture
medium and plated in 96-well flat-bottomed plate with 2. 104 cells
per well. After 24 h of incubation, each diluted extract was added to the appropriate wells, some wells containing only cells with the medium of dilution [Cat 2% (FBS)] were taken as a cellular control and the plate were incubated for a further 48 h at 37°C in humidified incubator with 5% CO2. The supernatants were removed from the cells and cells viability during 5 days was evaluated by supervising the state of the cells until the appearance of cytopathic effect (CPE). That effect generally appears when cells become round and
fall with repression of the cores in the cellular membranes, phenomenon observed during the cells bursting by a serial of freezing and defrosting. The results are obtained from triplicate
assays with at least five extract concentrations.
Antiviral activity assay
Viral reproduction inhibitory, extract can act on the reproduction itself, or on the adsorption, or during the penetration of the virus in the cell. Three tests were carried out.
Contact between the virus and the extract before inoculation with the cells. This test allowed us to know, if the extract is able to deteriorate the integrity of the virus and so to prevent it from carrying out its infectious process. Contact between cells and extract before virus attaching, and so, the extract has the possibility
of acting on the cellular receivers and can therefore prevent the adsorption, thus the penetration of the virus in the cell. In both cases, extracts will prevent the adsorption and so the penetration of virus in the cell.
Contact between cells and viral suspension then we add the extract. In this case, the virus has enough time to penetrate in the cell and to begin the replication process. The inhibition of viral multiplication after adding the extract was due to the blocking effect of the viral replication by the extract. These three tests were applied
to the viruses and the two extracts (P2 and P3) of which their cytotoxicity has already being studied.
Incubation of the extract with the viral suspension
The various concentrations of the extract were contacted with the viral suspension from line 2 to 11 and from column B to G in 96-well
flat-bottomed plate at a density of 10 TCID 50 /ml (v/v) equalized volumes (Grazìa et al., 2003). In line 1, non infected cells were held in their growth medium used as a negative control, line 12, columns A and H were reserved to infected cells as a positive control. The plate was incubated at 37°C for 1 h, and then inoculated on cultured Vero cells, presenting a confluent layer at a density of 200 µl/well. The cells were again incubated at 37°C and observed for 5 to 7 days until the appearance of a total CPE by the viral control (Ooi et al., 2004; Tshikalange et al., 2005).
Incubation of the cells with the extract
The incubation of the cells, which were separated from their growth medium were contacted with various concentrations of the extract at a density of 100 µl/well for 1 h at 37°C. Then, 100 µl of the viral
suspension were added in each well of the plate which was again incubated at 37°C and observed for 5 to 7 days until the appearance of the viral CPE on the control as explained above (Beloin et al., 2005).
Incubation of the cells with the viral suspension
The cells were infected by the viral suspension at a density of 100 µl/well incubated for 1 h at 37°C, then 100 µl/well of various extract concentrations were added, and incubated for 5 to 7 days until the appearance of total CPE on the viral control (Cos et al., 2002). These tests were performed in triplicate for the three viral strains, each test performed used as a negative control of none infected cells held in their growth medium, and as a positive control of the cells infected by the viruses at equal concentration used for all tests (Tshikalange et al., 2005; Beloin et al., 2005). The absence of the
CPE at a concentration level of the extract when the viral control expresses a CPE indicates that the extract has an antiviral activity with a specific concentration (Meyer et al., 1996).
RESULTS
GC-MS analysis
The average percentage of individual compounds of caprifig latex (Jrani variety) hexanic and hexane ethyl acetate (v/v) extracts were presented in Tables 1 and 2, respectively. GC-MS analysis of extracts resulted in the identification of 36 and 17 compounds representing 96.12 and 77.46%, respectively. Among the identified com-pounds, were sesquiterpens, triterpens, monoterpene (bornanone-3), coumarins and alcans, Furthermore, the most abundant compounds (> 8%) of extracts were lanosta-8 (13.17 and 30.82%), urs-12-en-24-oic acid (21.52 and 22.36%), aristolone (15.63 and 10.30%), olean-12-en-3-ol, (23.47, 3.66%), maragenin I acetate (8.78%) and A’-Neogammacer-22(29)-en-3-ol (22.06%).
Extracts cytotoxicity assay
The optical densities obtained after spectrophotometric measurement at 540 nm, were useful to determine the percentage of cellular viability. Only the concentrations having a little or no cytotoxic effect on the cells (cellular viability from 90 to 100%) were tested for antiviral activity.
Effect of hexanic extract (P2)
The observation of the cells state under a microscope after 48 h of contact with the extract and incubated at 37°C did not show any CPE. We note that the percentage of cellular viability is higher than 90% at all concen-trations of the extract. We can deduce that P2 does not have any cytotoxic effect on the cells. All tested concentrations were used thereafter for antiviral activity.
Effects of ethyl acetate-hexane (v/v) extract (P3)
We note that this extract does not have any cytotoxic effect on the Vero cells. Thus, all the concentrations were tested for antiviral activity.
We could demonstrate for these tested extracts that all concentration range of the pure extract and the different dilutions were tolerable by the cells and gave a percentage of viability higher than 90%. From the cytotoxicity results of the tested extracts towards the Vero cells, we understand that a cellular fall, in the presence of an extract and of a virus was really due to the cytopathic effect CPE of the virus and not to the cytotoxic effect of the extract. Activity against HSV-1, ECV-11 and ADV The results of the three antiviral tests which were carried out against HSV-1, ECV-11 and ADV are presented in Table 3 and proved that P2 and P3 extracts had an
Aref et al. 5815 antiviral activity by deteriorating the integrity of the virus and to prevent it, from carrying out its infectious course. These extracts acted on the cellular receivers and prevented the adsorption and the virus penetration in the cell and blocked the viral replication in the infected cell. It is noticed, that these positive tests which were obtained in all concentration range starting from the pure extracts to the highest dilution (1/5120). DISCUSSION
Infectious diseases are leading cause of death world wide due to multidrug resistant strains of viruses. Many medicinal plants remain unexplored; screening of antiviral resistance modifying compounds from plants sources are expected to provide the basis for identifying leads for the isolation of therapeutically useful compounds. This study will definitely open scope for future utilization of the waste products for therapeutic purpose.
The contact type of the first antiviral activity test showed the competition between extracts and viruses on the cellular receivers. If an extract is able to stick to the cellular receivers, it can prevent the adsorption and thus the penetration of the virus on the cells. In this case, the viral CPE will be absent and the antiviral activity of the extract in question will be proved. Among the studied latex extracts P2 and P3 proved to be active against three viral strains (HSV-1, ECV-11 and ADV). The sensitivity of HSV-1 against natural substances was also showed by Beloin et al. (2005) by testing various extracts of Momordica charantia (Cucurbitaceae).
In the second test the virus had sufficient time to be adsorbed and penetrated in the cell. Thus, the absence of the viral CPE proved that the extract acted to prevent viral replication progress within the cell therefore, proving the antiviral activity of this extract. Both extracts P2 and P3 expressed an antiviral activity against these three tested strains. Thereafter, these extracts were able to inhibit simultaneously, the DNA viruses HSV-1 and ADV and ARN viruses ECV-11 replication. Cos et al. (2002) studied the antiviral activity of Colenrs kilimandschari and Leonotis neptaeflia extracts witch belongs to Lamiacées family. Only C. kilimandschari leaves extract showed an anti-HSV-1 capacity. The type contact of the third test showed no viral CPE, means that viruses were already inhibited, and showed the antiviral activity.
These tests demonstrate that, ECV-11, HSV-1 and ADV were sensitive to both extracts. Grazia et al. (2003) studied the antiviral activity of essential oils from eight (Lamiaceae) plants of which Hyptes mutabilis did not detect any anti-HSV-1 activity. Therefore the studied extracts P2 and P3, were able to stop the replication cycles of HSV-1, ECV-11 and ADV by preventing their adsorption and their penetrations in the cells (by interaction with the cellular receivers designed for these viruses), or by inhibition of their intracellular replication, or by virus inhibition after a direct contact. These results

5816 Afr. J. Microbiol. Res. Table 1. Chemical composition of hexane extract obtained by GC/MS.
Retention time
(min)
Area
(%) Constituent
Wiley library
Reference No CAS No Quality
4.70 0.06 GERMACRENE-D 121792 023986-74-5 98
5.04 0.01 Delta-Cadinene 121465 000483-76-1 97
7.03 0.33 2, 6, 10-Dodecatrien-1-ol 148283 004602-84-0 83
8.88 0.05 Dodecan-2-on 93122 006175-49-1 72
9.09 0.38 Hexadecanoic acid 213894 000112-39-0 98
10.73 0.33 CIS-LINOLEIC ACID METHYL ESTER 243137 000112-63-0 99
11.69 0.08 Pentadecane 134011 000629-62-9 96
11.88 0.04 1, E-8, z-10-Hexadecatriene 145418 080625-33-8 87
12.76 0.03 Tricosane 275685 000638-67-5 96
13.90 0.13 Triacontane 34922 000638-68-6 91
14.51 0.02 8-dimethoxynaphthalene 120716 105372-17-6 90
15.76 0.51 Bis (2-ethylhexyl) phthalate 326908 000117-81-7 91
16.30 0.05 Hexacosane 311168 000630-01-3 94
16.72 0.06 7-Pentadecyne 128099 022089-89-0 64
17.55 0.13 Heptacosane 32679 000593-49-7 95
18.79 0.10 Octacosane 329269 000630-02-4 96
19.23 0.33 Squalene 337959 007683-64-9 93
20.05 0.13 Nanocosane 337002 000630-03-5 97
20.61 0.37 Oxirane 345735 007200-26-2 89
21.73 0.29 1-ethyl-3-acetyl-5 182541 112482-88-9 86
22.51 0.72 4-methoxycarbonyl-2, 6-diphenylpyridine 237065 069209-39-8 74
22.98 1.04 Bornanone-3 49880 013854-85-8 70
23.38 0.19 1-ethyl-3-acetyl-5 182541 112482-88-9 78
23.54 0.15 1, 6, 10, 14, 18, 22-Tetracosahexaen-3-ol 345737 054159-46-5 64
23.67 1.02 [3.2] metacyclophane-10-ene 145464 121733-15-1 91
24.79 0.77 5-HYDROXY-6 236998 063955-63-5 78
27.96 0.98 9, 19-Cyclolanost-24-en-3-ol 345634 000469-38-5 93
28.96 0.94 Beta.-Amyrin 345611 000559-70-6 83
29.47 13.17 Lanosta-8 360770 002671-68-3 96
30.20 0.24 6-Aza-B-homo-5.alpha.-cholestane 345497 066233-39-4 92
30.25 0.37 Lupeol 345599 000545-47-1 87
32.33 21.52 Urs-12-en-24-oic acid 360707 020475-86-9 91
32.75 15.63 Aristolone 141923 006831-17-0 86
32.95 23.47 Olean-12-en-3-ol 360750 001616-93-9 93
33.38 8.78 Maragenin I acetate 360711 071545-16-9 89
33.62 2.32 alpha.-amyrenyl acetate 360746 000863-76-3 64
Table 2. Chemical composition of ethyl acetate extract obtained by GC/MS.
Retention time
(min)
Area
(%) Constituent
Wiley library
Reference No CAS No Quality
8.424 0.10 (+)-Aromadendrene 121608 000489-39-4 96
8.767 0.19 delta.-Cadinene 121454 000483-76-1 99
9.174 1.08 1H-Cycloprop[e]azulen-7-ol 145016 006750-60-3 95
10.398 0.72 Tetradecanal 133817 000124-25-4 81
10.867 0.30 Hexadecanoic acid 213911 000112-39-0 93
11.297 1.24 1H-Naphtho[2,1-b]pyran 238701 001227-93-6 94
11.531 1.06 Heptadecene-(8)-carbonic acid-(1) 228686 000000-00-0 90

Aref et al. 5817 Table 2. Contd.
19.616 30.75 Lanosta-8 360770 002671-68-3 95
19.879 1.17 Silicone grease 392047 000000-00-0 58
20.331 10.30 Olean-12-en-3-ol 360750 001616-93-9 93
21.024 19.80 alpha.-Amyrenyl acetate 360746 000863-76-3 76
22.597 10.82 A'-Neogammacer-22(29)-en-3-ol 360754 002085-25-8 86
Total area: 77.5%.
Table 3. Antiviral activity of Ficus carica extracts.
Extracts Antiviral activity (%)
P2 P3
Extracts last dilution 1/5120 1/2560
(E+V) + C
HSV 100 100
ECV 100 100
ADV 100 100
(C+E) + V
HSV 100 100
ECV 100 100
ADV 100 100
(C+V) + E
HSV 100 100
ECV 100 100
ADV 100 100
P2: hexanic extract; P3: (v/v) ethyl acetate-hexane extract; (E+V) + C: extract effect against
virus; (C+E) + V: extract effect against Vero cells; (C+V) + E: extract effect against viral cycle after adsorption.
confirmed the evidence that, P2 and P3 extracts had an interesting antiviral activity. ACKNOWLEDGEMENTS The authors are grateful to Pr. BEN OUADA Hafed Directeur de l’Institut Supérieur des Sciences Appliquées et de Technologie de MAHDIA. REFERENCES
Abu-Mustafa E A, El Tawil BAH, Fayez MBE (1964). Constituents of
local plants IV. Phytochemistry., 3: 701-703. Athnasios AK, El Kholy, Soliman G, Shaban MAM (1962). Constituents
of the leaves of Ficus carica L. part I. Isolation of psoralen,
Bergapten,i-taraxastorol and -sitosterof. Int. J. Chem. Soc., 62: 4253-4254.
Beloin N, Gbassor M, Akpagana K, Hudson J, de Soussa K, Koumagolo K, Arnason JT (2005). Ethnomedicinal uses of Momordica charantia
(Cucurbitaceae) in Togo and relation to its phytochemistry and biological activity. J. Ethnopharmacol., 96: 49-55.
Chiang LC, Chiang W, Chang MY, Ng LT, Lin CC (2002). Antiviral activity of Plantago major extracts and related compounds in vitro.
Antiviral Res., 55: 53-62.
Cos P, Hermans N, De Bruyne T, Apers S, Sindambiwe JB, Vanden
Berghe D, Pieters L, Vlietinck AJ (2002). Further evaluation of Rwandan medicinal plant extracts for their antimicrobial and antiviral activities. J. Ethnophamacol., 79: 155-163.
De-Amorin A, Borba HR, Carauta J P, Lopes D, Kaplan MA (1999). Anthelmintic activity of the latex of Ficus species. J. Ethnopharmacol., 64: 255-258.
Doughari JH (2006). Antibacterial activity of Tamarindus indica Linn.
Trop. J. Pharm. Res., 5: 597-603. Ghazanfar S (1994). A. Handbook of Arabian Medicinal Plants; CRC
Press: Boca Raton., pp. 148.
Grazìa CC, Talarico L, Almeida N, Colombres S, Duschatzky C, Damonte EB (2003). Virucidal activity of essential oils from aromatic plants of San Luis, Argentina. Phytother. Res., 17: 1073-1075.
Kirthikar KR, Basu BD (1996). Indian medicinal plants. Vol. 3, 2nd ed, India: International Book Distributors, pp. 2329-2331.
Lorenz RJ, Bögel K (1973). Laboratory techniques in rabies. In Kaplan
MM, Koprowski H (eds), Laboratory Techniques and Virology, World health Organization, Genova, pp. 321.
Meyer JJM, Afoloyan AJ, Taylor MB, Enelbrecht L (1996). Inhibition of
herpes simplex virus type 1 by aqueous extracts from shoots of Helichrysum aureonitens (Asteracae). J. Ethnophamacol., 52: 41-43.
Ooi LSM, Wang H, Luk C-W, Ooi VEC (2004 ). Anticancer and antiviral
activities of Youngia japonica (L.) DC (Asteraceae, Compositae). J. Ethnopharmacol., 94: 117-122.
Perez C, Canal JR, Campillo JE (1999). Hypotriglyceridaemic of Ficus
carica leaves in experimental hypertriglyceridaemic rats. Phytother.
Res., 13: 188-191. Sarang B, Anpurna K, Beenish K, Sheikh FA, Suri KA, Satti NK,

5818 Afr. J. Microbiol. Res. Musarat A, Qazi, GN (2005). Immunosuppressive properties of an ethyl
acetate fraction from Euphorbia royleana. J. Ethnopharmacol., 99:
185-192.
Serrentino J (1991). How Natural Remedies Work. Harley and Marks Publishers, Point Robert, WA. pp. 20-22.
Storey WB, Enderund JE, Saleeb WS, Nauer EM (1977). The Fig (Ficus
carica Linnaeus). Its Biology, History, Culture and Utilisation. Jurupa
Mountains Cultural Centre, California USA. Tous J, Ferguson L (1996). Mediterranean fruits. In J. Janick (Ed.),
Progress in new crops. Arlington, VA: ASHS Press. pp. 416–430. Tshikalange TE, Meyer JJM, Hussein AA (2005). Antimicrobial activity,
toxicity and the isolation of a bioactive compound from plants used to
treat sexually transmitted diseases. J. Ethnopharmacol., 69: 515-519. Ullman SB (1952). The inhibitory and necrosis- inducing effects of the
latex of Ficus carica L. on transplanted and spontaneous tumours.
Exp. Med. Surg., 10: 26-49.
Ullman SB, Clark GM, Roan KM (1952). The effects of the fraction R3 of
the latex of Ficus carica L. on the tissues of mice bearing
spontaneous mammary tumors. Exp. Med. Surg., 10:287-305.
Ullman SB, Halberstaedter L, Leibowitz J (1945). Some Pharmacological and Biological Effects of the Latex of Ficus carica L.
Exp. Med. Surg., 3: 11-23.
Valiathan MS (1998). Healing plants. Curr. Sci., 75: 1122-1127. Watanabe W, Konno K, Ijichi K, Inonue H, Yokota T, Shigeta S (1994).
MTT colorimetric system for the screening of anti-orthomyxo- and
anti-paramyxoviral agents. J. Virol. Methods., 48: 257-265.

African Journal of Microbiology Research Vol. 5(32) pp. 5819-5825, 30 December, 2011 Available online at http://www.academicjournals.org/AJMR ISSN 1996-0808 © 2011 Academic Journals DOI: 10.5897/AJMR10.684
Full Length Research Paper
Role of the quorum-sensing system in biofilm formation and virulence of Aeromonas hydrophila
Weihua Chu1*, Yan Jiang2, Liu Yongwang3 and Wei Zhu1
1Department of microbiology, School of Life Science and Technology, China Pharmaceutical University,
Nanjing, P. R. China, 210009. 2Jiangsu Entry-Exit Inspection and Quarantine Buearu, Nanjing P. R. China, 210001.
3College of Veterinary Medicine, Nanjing Agricultural University, Nanjing, P. R. China, 210095.
Accepted 28 March, 2011
Aeromonas hydrophila is a pathogen that causes disease in a wide range of homeothermic and poikilothermic hosts due to its multifactorial virulence. The production of many of these virulence determinants is associated with high cell density, a phenomenon that might be regulated by quorum sensing. The quorum sensing system regulates the expression of several virulence factors in a wide variety of pathogenic bacteria. To investigate the pathogenic role of quorum sensing system in A. hydrophila, We constructed an ahyI mutant strain of a fish-clinical isolate YJ-1, named YJ-1∆AhyI. Compared with the wild-type strain, the ahyI mutant strain exhibited a significant decrease of total extracellular virulent activity, and decreased in biofilm formation, intraperitoneal LD50 of YJ-1∆AhyI were more than 10
9 CFU, about 10
4 times higher than the parent strain. These results suggest that A.
hydrophila is able to regulate its extracellular virulent factors and biofilm formation by quorum sensing systems, and indicate that disruption of quorum sensing could be a good alternative strategy to combat infections caused by A. hydrophila. Key words: Aeromonas hydrophila, quorum sensing, biofilm, virulence factors.
INTRODUCTION Aeromonas hydrophila is a ubiquitous Gram-negative bacterium
of aquatic environments, which has been
implicated as a causative agent of motile aeromonad
septicemia in a variety of aquatic
animals especially freshwater fish species (Hänninen et al., 1997). It causes
gastrointestinal and extraintestinal infections in humans, including
septicemia, wound infections, gastroenteritis
and peritonitis (Daskalov, 2006). A number of virulence
factors have been identified in A. hydrophila, such as,
adhesins (e.g. pili), S-layers, exotoxins such as hemolysins and enterotoxin, and a repertoire of exoenzymes which digest
cellular components such as
proteases, amylases, and lipases
(Cahill, 1990; Pemberton, 1997).
Quorum sensing (QS) (Fuqua et al., 1994) is a mecha- *Corresponding author. E-mail: [email protected].
nism for controlling gene expression in response to an expanding bacterial population. In many Gram-negative bacteria, the diffusible quorum sensing signal molecule is a member of the N-acylhomoserine lactone (AHL) family (Fuqua et al., 1994; March and Bentley, 2004). Several virulence-associated phenotypes in pathogens have been shown to be controlled by their quorum sensing systems (Winzer and Williams, 2001). These phenotypes include biofilm formation (Croxatto et al., 2002), the production of virulence factors such as proteases (Swift et al., 1997, 1999; Croxatto et al., 2002), haemolysin (Kim et al., 2003), a type III secretion system (Henke and Bassler, 2004), extracellular toxin (Manefield et al., 2000) and a siderophore (Lilley and Bassler, 2000). A. hydrophila has been found to have homologues of the Vibrio fischeri quorum sensing genes luxI and luxR, designated ahyI and ahyR (Swift et al., 1997). In this study, we explored the role of the ahyRI dependent QS system of A. hydrophila by construction an analysis of the ahyI mutant.
We evaluated whether deletion of the ahyI
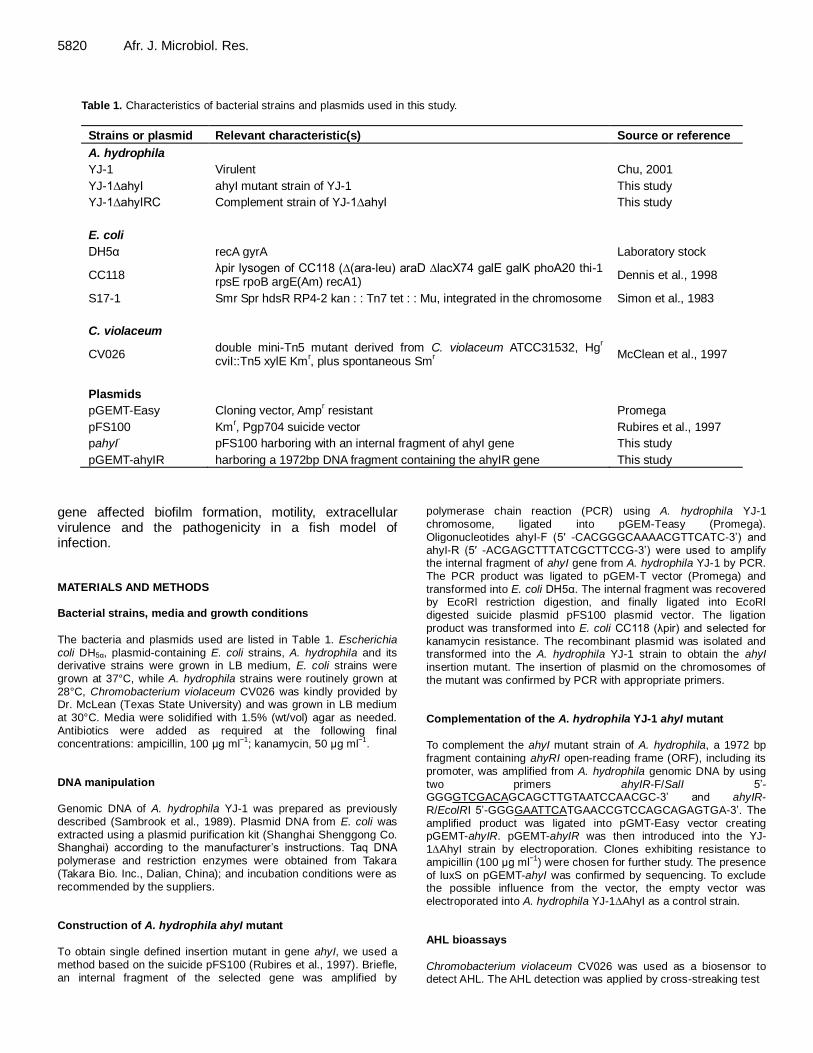
5820 Afr. J. Microbiol. Res.
Table 1. Characteristics of bacterial strains and plasmids used in this study.
Strains or plasmid Relevant characteristic(s) Source or reference
A. hydrophila
YJ-1 Virulent Chu, 2001
YJ-1∆ahyI ahyI mutant strain of YJ-1 This study
YJ-1∆ahyIRC Complement strain of YJ-1∆ahyI This study
E. coli
DH5α recA gyrA Laboratory stock
CC118 λpir lysogen of CC118 (∆(ara-leu) araD ∆lacX74 galE galK phoA20 thi-1 rpsE rpoB argE(Am) recA1)
Dennis et al., 1998
S17-1 Smr Spr hdsR RP4-2 kan : : Tn7 tet : : Mu, integrated in the chromosome Simon et al., 1983
C. violaceum
CV026 double mini-Tn5 mutant derived from C. violaceum ATCC31532, Hg
r
cviI::Tn5 xylE Kmr, plus spontaneous Sm
r
McClean et al., 1997
Plasmids
pGEMT-Easy Cloning vector, Ampr resistant Promega
pFS100 Kmr, Pgp704 suicide vector Rubires et al., 1997
pahyI- pFS100 harboring with an internal fragment of ahyI gene This study
pGEMT-ahyIR harboring a 1972bp DNA fragment containing the ahyIR gene This study
gene affected biofilm formation, motility, extracellular virulence and the pathogenicity in a fish model of infection. MATERIALS AND METHODS
Bacterial strains, media and growth conditions
The bacteria and plasmids used are listed in Table 1. Escherichia
coli DH5α, plasmid-containing E. coli strains, A. hydrophila and its derivative strains were grown in LB medium, E. coli strains were grown at 37°C, while A. hydrophila strains were routinely grown at 28°C, Chromobacterium violaceum CV026 was kindly provided by Dr. McLean (Texas State University) and was grown in LB medium at 30°C. Media were solidified with 1.5% (wt/vol) agar as needed.
Antibiotics were added as required at the following final concentrations: ampicillin, 100 μg ml
−1; kanamycin, 50 μg ml
−1.
DNA manipulation
Genomic DNA of A. hydrophila YJ-1 was prepared as previously described (Sambrook et al., 1989). Plasmid DNA from E. coli was
extracted using a plasmid purification kit (Shanghai Shenggong Co. Shanghai) according to the manufacturer’s instructions. Taq DNA polymerase and restriction enzymes were obtained from Takara (Takara Bio. Inc., Dalian, China); and incubation conditions were as recommended by the suppliers. Construction of A. hydrophila ahyI mutant
To obtain single defined insertion mutant in gene ahyI, we used a method based on the suicide pFS100 (Rubires et al., 1997). Briefle, an internal fragment of the selected gene was amplified by
polymerase chain reaction (PCR) using A. hydrophila YJ-1 chromosome, ligated into pGEM-Teasy (Promega). Oligonucleotides ahyI-F (5′ -CACGGGCAAAACGTTCATC-3’) and ahyI-R (5′ -ACGAGCTTTATCGCTTCCG-3’) were used to amplify the internal fragment of ahyI gene from A. hydrophila YJ-1 by PCR. The PCR product was ligated to pGEM-T vector (Promega) and transformed into E. coli DH5α. The internal fragment was recovered by EcoRl restriction digestion, and finally ligated into EcoRl
digested suicide plasmid pFS100 plasmid vector. The ligation product was transformed into E. coli CC118 (λpir) and selected for kanamycin resistance. The recombinant plasmid was isolated and transformed into the A. hydrophila YJ-1 strain to obtain the ahyI insertion mutant. The insertion of plasmid on the chromosomes of the mutant was confirmed by PCR with appropriate primers. Complementation of the A. hydrophila YJ-1 ahyI mutant
To complement the ahyI mutant strain of A. hydrophila, a 1972 bp fragment containing ahyRI open-reading frame (ORF), including its promoter, was amplified from A. hydrophila genomic DNA by using two primers ahyIR-F/SalI 5’-GGGGTCGACAGCAGCTTGTAATCCAACGC-3’ and ahyIR-R/EcolRI 5’-GGGGAATTCATGAACCGTCCAGCAGAGTGA-3’. The amplified product was ligated into pGMT-Easy vector creating pGEMT-ahyIR. pGEMT-ahyIR was then introduced into the YJ-1∆AhyI strain by electroporation. Clones exhibiting resistance to ampicillin (100 μg ml
−1) were chosen for further study. The presence
of luxS on pGEMT-ahyI was confirmed by sequencing. To exclude the possible influence from the vector, the empty vector was electroporated into A. hydrophila YJ-1∆AhyI as a control strain. AHL bioassays
Chromobacterium violaceum CV026 was used as a biosensor to detect AHL. The AHL detection was applied by cross-streaking test
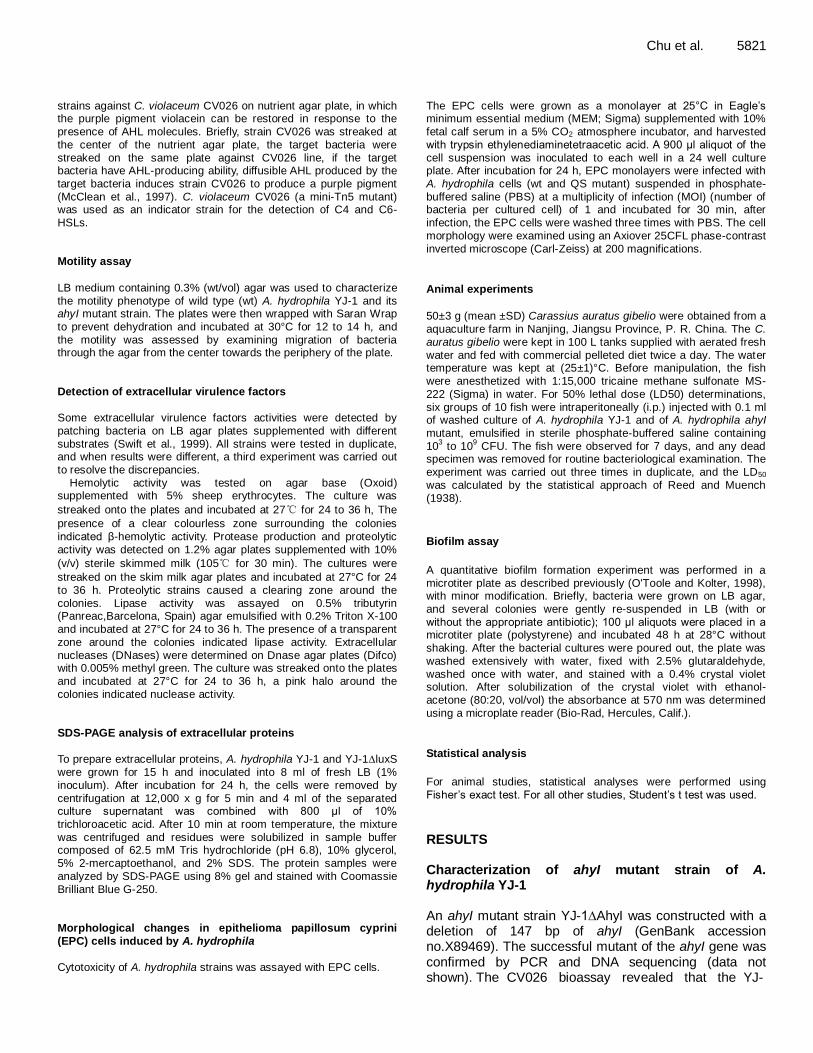
strains against C. violaceum CV026 on nutrient agar plate, in which the purple pigment violacein can be restored in response to the presence of AHL molecules. Briefly, strain CV026 was streaked at the center of the nutrient agar plate, the target bacteria were streaked on the same plate against CV026 line, if the target bacteria have AHL-producing ability, diffusible AHL produced by the target bacteria induces strain CV026 to produce a purple pigment (McClean et al., 1997). C. violaceum CV026 (a mini-Tn5 mutant) was used as an indicator strain for the detection of C4 and C6-HSLs. Motility assay
LB medium containing 0.3% (wt/vol) agar was used to characterize the motility phenotype of wild type (wt) A. hydrophila YJ-1 and its ahyI mutant strain. The plates were then wrapped with Saran Wrap to prevent dehydration and incubated at 30°C for 12 to 14 h, and the motility was assessed by examining migration of bacteria through the agar from the center towards the periphery of the plate. Detection of extracellular virulence factors Some extracellular virulence factors activities were detected by patching bacteria on LB agar plates supplemented with different substrates (Swift et al., 1999). All strains were tested in duplicate, and when results were different, a third experiment was carried out to resolve the discrepancies.
Hemolytic activity was tested on agar base (Oxoid) supplemented with 5% sheep erythrocytes. The culture was
streaked onto the plates and incubated at 27℃ for 24 to 36 h, The
presence of a clear colourless zone surrounding the colonies indicated β-hemolytic activity. Protease production and proteolytic activity was detected on 1.2% agar plates supplemented with 10%
(v/v) sterile skimmed milk (105℃ for 30 min). The cultures were
streaked on the skim milk agar plates and incubated at 27°C for 24 to 36 h. Proteolytic strains caused a clearing zone around the colonies. Lipase activity was assayed on 0.5% tributyrin (Panreac,Barcelona, Spain) agar emulsified with 0.2% Triton X-100 and incubated at 27°C for 24 to 36 h. The presence of a transparent zone around the colonies indicated lipase activity. Extracellular nucleases (DNases) were determined on Dnase agar plates (Difco) with 0.005% methyl green. The culture was streaked onto the plates and incubated at 27°C for 24 to 36 h, a pink halo around the colonies indicated nuclease activity.
SDS-PAGE analysis of extracellular proteins
To prepare extracellular proteins, A. hydrophila YJ-1 and YJ-1∆luxS were grown for 15 h and inoculated into 8 ml of fresh LB (1% inoculum). After incubation for 24 h, the cells were removed by centrifugation at 12,000 x g for 5 min and 4 ml of the separated culture supernatant was combined with 800 μl of 10% trichloroacetic acid. After 10 min at room temperature, the mixture
was centrifuged and residues were solubilized in sample buffer composed of 62.5 mM Tris hydrochloride (pH 6.8), 10% glycerol, 5% 2-mercaptoethanol, and 2% SDS. The protein samples were analyzed by SDS-PAGE using 8% gel and stained with Coomassie Brilliant Blue G-250. Morphological changes in epithelioma papillosum cyprini (EPC) cells induced by A. hydrophila
Cytotoxicity of A. hydrophila strains was assayed with EPC cells.
Chu et al. 5821 The EPC cells were grown as a monolayer at 25°C in Eagle’s minimum essential medium (MEM; Sigma) supplemented with 10% fetal calf serum in a 5% CO2 atmosphere incubator, and harvested with trypsin ethylenediaminetetraacetic acid. A 900 μl aliquot of the cell suspension was inoculated to each well in a 24 well culture plate. After incubation for 24 h, EPC monolayers were infected with A. hydrophila cells (wt and QS mutant) suspended in phosphate-buffered saline (PBS) at a multiplicity of infection (MOI) (number of bacteria per cultured cell) of 1 and incubated for 30 min, after infection, the EPC cells were washed three times with PBS. The cell morphology were examined using an Axiover 25CFL phase-contrast inverted microscope (Carl-Zeiss) at 200 magnifications.
Animal experiments
50±3 g (mean ±SD) Carassius auratus gibelio were obtained from a aquaculture farm in Nanjing, Jiangsu Province, P. R. China. The C.
auratus gibelio were kept in 100 L tanks supplied with aerated fresh water and fed with commercial pelleted diet twice a day. The water temperature was kept at (25±1)°C. Before manipulation, the fish were anesthetized with 1:15,000 tricaine methane sulfonate MS-
222 (Sigma) in water. For 50% lethal dose (LD50) determinations, six groups of 10 fish were intraperitoneally (i.p.) injected with 0.1 ml of washed culture of A. hydrophila YJ-1 and of A. hydrophila ahyI mutant, emulsified in sterile phosphate-buffered saline containing 10
3 to 10
9 CFU. The fish were observed for 7 days, and any dead
specimen was removed for routine bacteriological examination. The experiment was carried out three times in duplicate, and the LD50 was calculated by the statistical approach of Reed and Muench
(1938).
Biofilm assay
A quantitative biofilm formation experiment was performed in a microtiter plate as described previously (O'Toole and Kolter, 1998), with minor modification. Briefly, bacteria were grown on LB agar,
and several colonies were gently re-suspended in LB (with or without the appropriate antibiotic); 100 μl aliquots were placed in a microtiter plate (polystyrene) and incubated 48 h at 28°C without shaking. After the bacterial cultures were poured out, the plate was washed extensively with water, fixed with 2.5% glutaraldehyde, washed once with water, and stained with a 0.4% crystal violet solution. After solubilization of the crystal violet with ethanol-acetone (80:20, vol/vol) the absorbance at 570 nm was determined using a microplate reader (Bio-Rad, Hercules, Calif.).
Statistical analysis
For animal studies, statistical analyses were performed using Fisher’s exact test. For all other studies, Student’s t test was used. RESULTS Characterization of ahyI mutant strain of A. hydrophila YJ-1 An ahyI mutant strain YJ-1∆AhyI was constructed with a deletion of 147 bp of ahyI (GenBank accession no.X89469). The successful mutant of the ahyI gene was confirmed by PCR and DNA sequencing (data not shown). The CV026 bioassay revealed that the YJ-
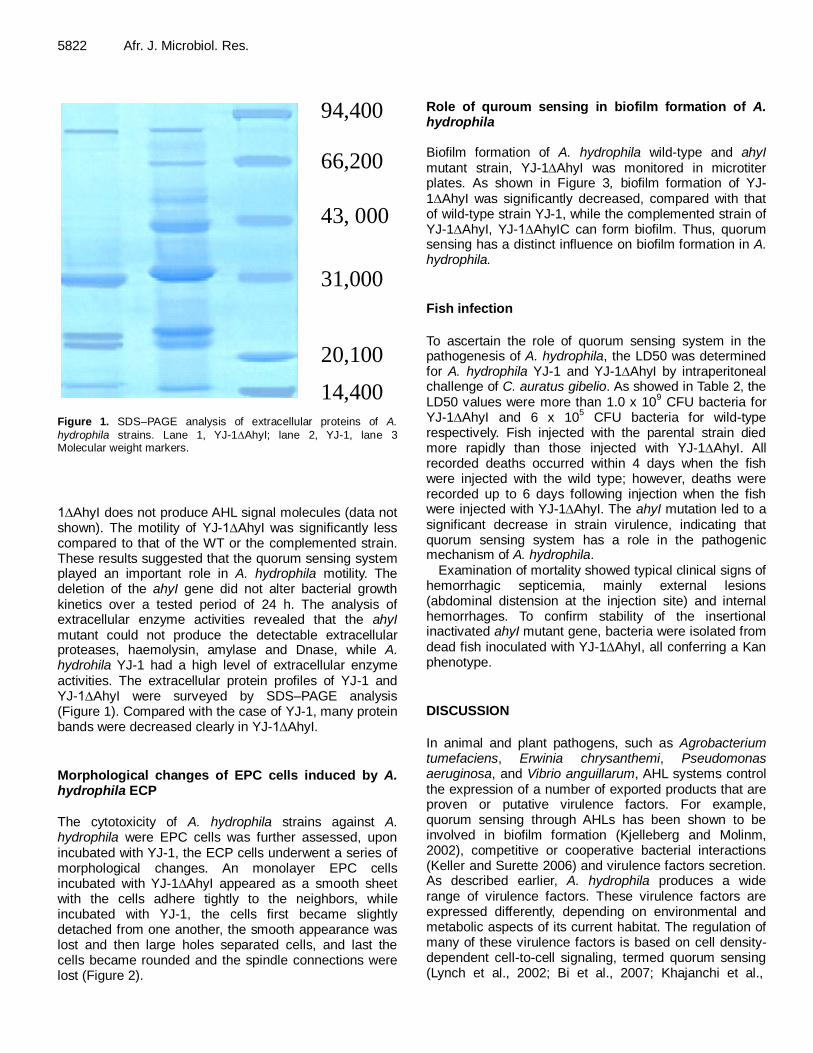
5822 Afr. J. Microbiol. Res.
Fig 1
94,400
66,200
43, 00 0
31,000
20,100
14,400 Figure 1. SDS–PAGE analysis of extracellular proteins of A.
hydrophila strains. Lane 1, YJ-1∆AhyI; lane 2, YJ-1, lane 3 Molecular weight markers.
1∆AhyI does not produce AHL signal molecules (data not shown). The motility of YJ-1∆AhyI was significantly less compared to that of the WT or the complemented strain. These results suggested that the quorum sensing system played an important role in A. hydrophila motility. The deletion of the ahyI gene did not alter bacterial growth kinetics over a tested period of 24 h. The analysis of extracellular enzyme activities revealed that the ahyI mutant could not produce the detectable extracellular proteases, haemolysin, amylase and Dnase, while A. hydrohila YJ-1 had a high level of extracellular enzyme activities. The extracellular protein profiles of YJ-1 and YJ-1∆AhyI were surveyed by SDS–PAGE analysis (Figure 1). Compared with the case of YJ-1, many protein bands were decreased clearly in YJ-1∆AhyI.
Morphological changes of EPC cells induced by A. hydrophila ECP
The cytotoxicity of A. hydrophila strains against A. hydrophila were EPC cells was further assessed, upon incubated with YJ-1, the ECP cells underwent a series of morphological changes. An monolayer EPC cells incubated with YJ-1∆AhyI appeared as a smooth sheet with the cells adhere tightly to the neighbors, while incubated with YJ-1, the cells first became slightly detached from one another, the smooth appearance was lost and then large holes separated cells, and last the cells became rounded and the spindle connections were lost (Figure 2).
Role of quroum sensing in biofilm formation of A. hydrophila Biofilm formation of A. hydrophila wild-type and ahyI mutant strain, YJ-1∆AhyI was monitored in microtiter plates. As shown in Figure 3, biofilm formation of YJ-1∆AhyI was significantly decreased, compared with that of wild-type strain YJ-1, while the complemented strain of YJ-1∆AhyI, YJ-1∆AhyIC can form biofilm. Thus, quorum sensing has a distinct influence on biofilm formation in A. hydrophila.
Fish infection
To ascertain the role of quorum sensing system in the pathogenesis of A. hydrophila, the LD50 was determined for A. hydrophila YJ-1 and YJ-1∆AhyI by intraperitoneal challenge of C. auratus gibelio. As showed in Table 2, the LD50 values were more than 1.0 x 10
9 CFU bacteria for
YJ-1∆AhyI and 6 x 10⁵ CFU bacteria for wild-type
respectively. Fish injected with the parental strain died more rapidly than those injected with YJ-1∆AhyI. All recorded deaths occurred within 4 days when the fish were injected with the wild type; however, deaths were recorded up to 6 days following injection when the fish were injected with YJ-1∆AhyI. The ahyI mutation led to a significant decrease in strain virulence, indicating that quorum sensing system has a role in the pathogenic mechanism of A. hydrophila.
Examination of mortality showed typical clinical signs of hemorrhagic septicemia, mainly external lesions (abdominal distension at the injection site) and internal hemorrhages. To confirm stability of the insertional inactivated ahyI mutant gene, bacteria were isolated from dead fish inoculated with YJ-1∆AhyI, all conferring a Kan phenotype.
DISCUSSION
In animal and plant pathogens, such as Agrobacterium tumefaciens, Erwinia chrysanthemi, Pseudomonas aeruginosa, and Vibrio anguillarum, AHL systems control the expression of a number of exported products that are proven or putative virulence factors. For example, quorum sensing through AHLs has been shown to be involved in biofilm formation (Kjelleberg and Molinm, 2002), competitive or cooperative bacterial interactions (Keller and Surette 2006) and virulence factors secretion. As described earlier, A. hydrophila produces a wide range of virulence factors. These virulence factors are expressed differently, depending on environmental and metabolic aspects of its current habitat. The regulation of many of these virulence factors is based on cell density-dependent cell-to-cell signaling, termed quorum sensing (Lynch et al., 2002; Bi et al., 2007; Khajanchi et al.,
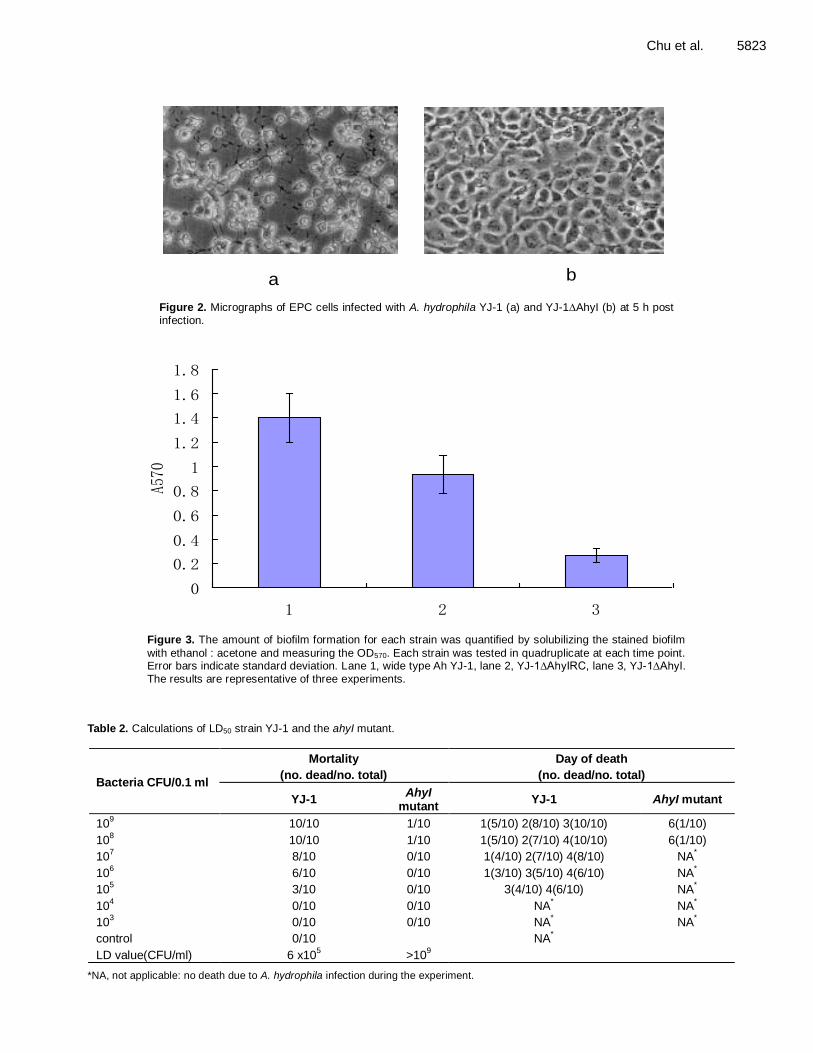
Chu et al. 5823
a b
Figure 2. Micrographs of EPC cells infected with A. hydrophila YJ-1 (a) and YJ-1∆AhyI (b) at 5 h post infection.
0
0.2
0.4
0.6
0.8
1
1.2
1.4
1.6
1.8
1 2 3
A570
Figure 3. The amount of biofilm formation for each strain was quantified by solubilizing the stained biofilm
with ethanol : acetone and measuring the OD570. Each strain was tested in quadruplicate at each time point. Error bars indicate standard deviation. Lane 1, wide type Ah YJ-1, lane 2, YJ-1∆AhyIRC, lane 3, YJ-1∆AhyI. The results are representative of three experiments.
Table 2. Calculations of LD50 strain YJ-1 and the ahyI mutant.
Bacteria CFU/0.1 ml
Mortality
(no. dead/no. total)
Day of death
(no. dead/no. total)
YJ-1 AhyI
mutant YJ-1 AhyI mutant
109
10/10 1/10 1(5/10) 2(8/10) 3(10/10) 6(1/10)
108
10/10 1/10 1(5/10) 2(7/10) 4(10/10) 6(1/10)
107
8/10 0/10 1(4/10) 2(7/10) 4(8/10) NA*
106
6/10 0/10 1(3/10) 3(5/10) 4(6/10) NA*
105
3/10 0/10 3(4/10) 4(6/10) NA*
104
0/10 0/10 NA* NA
*
103
0/10 0/10 NA*
NA*
control 0/10 NA*
LD value(CFU/ml) 6 x10⁵
>109
*NA, not applicable: no death due to A. hydrophila infection during the experiment.

5824 Afr. J. Microbiol. Res. 2009). To explore the role of quorum sensing system in regulating the extracellular virulent factors secretion and biofilm formation, we constructed an ahyI mutant strain of a fish-clinical isolate YJ-1, named YJ-1∆AhyI. Inactivation of the ahyI gene of A. hydrophila did not result in noticeable changes in growth patterns compared with those of the wild-type strain. This finding indicates that ahyi has no significant effect on basic cellular metabolic processes required for growth of A. hydrophila in vitro. This is in contrast to some other bacteria in which luxS had an effect on growth, Lyon et al. (2001) reported that disruptions of Streptococcus pyogenes, s luxS shown a media-dependent growth defect, and the effect of quorum sensing on Vibrio harveyi growth rate can be either positive or negative (Nackerdien et al., 2008).
Decreased virulence has been seen in ∆luxS mutants of several pathogenic bacteria (Winzer and Williams, 2001). A Vibrio cholerae luxO mutant is severely defective in colonization of the small intestine in an infant mouse model, inactivation of the rhlA gene in P. aeruginosa prevents rhamnolipid production, disabling the protection against polymorphonuclear leukocytes (Van et al., 2009), and quorum sensing is necessary for the virulence of P. aeruginosa during urinary tract infection (Kumar et al., 2009), and Vibrio alginolyticus luxO-luxRval regulatory system control the expression of alkaline serine protease (Rui et al., 2009). In contrast, the S. epidermidis luxS mutant shows increased virulence in a model of catheter- associated infection. Most likely, the increased virulence may be partly attributed to the increased synthesis of PIA and more-intense biofilm formation. In this study, virulence factors were detected by patching bacteria on LB agar plates supplemented with different substrates, and the results shown that the virulence factors were decreased in the ahyI mutant strain, and on the PAGE, many proteins bands were lost or decreased, this phenomena suggest that QS control the extracellular proteins production, these band not only include the virulence factors, this results is consistent with the report on the protease.
The biofilm formation has been documented as survival strategy of pathogens, regulation of biofilm formation by quorum sensing systems has been shown in a number of bacteria. In vitro biofilm formation in A. hydrophila has been demonstrated using crystal violet staining assays as well as SEM. We could detect the difference between the parent strain and the QS mutant. Our data showed that the ahyI mutant strain was unable to develop a complete biofilm. This effect on biofilm formation by luxS in vitro was also observed in Streptococcal (Cvitkovitch et al., 2003), Streptococcus (Kong et al., 2006) and V. cholerae (Waters et al., 2008), while the luxS mutant of Edwardsiella tarda (Xiao et al., 2009) and Streptococcus mutans (Huang et al., 2009) were considerably increased biofilm formation. Thus, the quorum sensing signaling molecules have contrasting effects on biofilm formation in
different strains.
In conclusion, we show quorum sensing system in A. hydrophila is functional for the secretion of extracellular virulence factors, the formation of mature biofilm and its pathogenicity, and these findings indicate that disrupt quorum sensing systems of pathogenic bacteria is a promising alternative for antibiotics in fighting bacterial infections. ACKNOWLEDGEMENTS This work was supported by State Administration for Entry and Exit Inspection and Quarantine of P. R. China. The authors are much indebted to Dr. RJC McLean, Department of Biology, Texas State University, for generous provision of the AHL bioassay strain and for his helpful comments on the manuscript. REFERENCES
Bi ZX, Liu YJ, Lu CP (2007). Contribution of AhyR to virulence of Aeromonas hydrophila J-1. Res. Vet. Sci., 83: 150-156.
Cahill MM (1990). Virulence factors in motile Aeromonas species: a
review. J. Appl. Bacteriol., 69: 1-16. Chu WH (2001). Studies on the pathology and control of the bacterial
hemorrhage disease in a hybrid crussian carp. Reservoir Fisheries,
21: 40. Croxatto A, Chalker VJ, Lauritz J, Jass J, Hardman A, Williams P,
Camara M, Milton DL (2002). VanT, a homologue of Vibrio harveyi
LuxR, regulates serine, metalloprotease, pigment, and biofilm production in Vibrio anguillarum. J. Bacteriol., 184: 1617–1629.
Cvitkovitch DG, Li YH, Ellen RP (2003). Quorum sensing and biofilm formation in Streptococcal infections. J. Clin. Invest., 112: 1626-1632.
Daskalov H (2006). The importance of Aeromonas hydrophila in food
safety. Food Control, 17: 474-483.
Dennis JJ, Zylstra GJ (1998). Plasposons: Modular self-cloning minitransposon derivatives for rapid genetic analysis of Gram-negative bacterial genomes. Appl. Environ. Microbiol., 64: 2710-2715.
Fuqua WC, Winans SC, Greenberg EP (1994). Quorum sensing in bacteria-the LuxR-LuxI family of cell density-responsive transcriptional regulators. J. Bacteriol., 176: 269–275.
Hänninen ML, Oivanen P, Hirvelä-Koski V (1997). Aeromonas species
in fish, fish-eggs, shrimp and freshwater. Int. J. Food Microbiol., 34: 17-26.
Henke JM, Bassler BL (2004). Quorum sensing regulates type III secretion in Vibrio harveyi and Vibrio parahaemolyticus. J. Bacteriol.,
186: 3794–3805.
Huang Z, Meric G, Liu Z, Ma R, Tang Z, Lejeune P (2009). luxS-based quorum-sensing signaling affects Biofilm formation in Streptococcus mutans. J. Mol. Microbiol. Biotechnol., 17: 12-19.
Keller L, Surette MG (2006). Communication in bacteria: an ecological and evolutionary perspective. Nat. Rev. Microbiol., 4: 249–258.
Khajanchi BK, Sha J, Kozlova EV, Erova TE, Suarez G, Sierra JC,
Popov VL, Horneman AJ, Chopra AK (2009). N-Acylhomoserine lactones involved in quorum sensing control the type VI secretion system, biofilm formation, protease production, and in vivo virulence
in a clinical isolate of Aeromonas hydrophila. Microbiol. 155: 3518-3531.
Kim SY, Lee SE, Kim YR, Kim CH, Ryu PY, Choy HE, Chung SS, Rhee JH (2003). Regulation of Vibrio vulnificus virulence by the LuxS
quorum-sensing system. Mol. Microbiol., 48: 1647–1664. Kjelleberg S, Molin S (2002). Is there a role for quorum sensing signals
in bacterial biofilms? Curr. Opin. Microbiol., 5: 254–258. Kong KF, Cuong V, Michael O (2006). Staphylococcus quorum sensing
in biofilm formation and infection. Int. J. Med. Microbiol., 296: 133-
139.

Kumar R, Chhibber S, Harjai K (2009). Quorum sensing is necessary
for the virulence of Pseudomonas aeruginosa during urinary tract
infection. Kidney Int., 76: 286-292. Lilley BN, Bassler BL (2000). Regulation of quorum sensing in Vibrio
harveyi by LuxO and sigma-54. Mol. Microbiol., 36: 940–954.
Lynch MJ, Swift S, Kirke DF, Keevil CW, Dodd CER, Williams P (2002).
The regulation of biofilm development by quorum sensing in Aeromonas hydrophila. Environ. Microbiol., 4: 18-28.
Lyon WR, Madden JC, Levin JC, Stein JL, Caparon MG (2001).
Mutation of luxS affects growth and virulence factor expression in Streptococcus pyogenes. Mol. Microbiol., 42: 145–157.
Manefield M, Harris L, Rice SA, de Nys R, Kjelleberg S (2000).
Inhibition of luminescence and virulence in the black tiger prawn (Penaeus monodon) pathogen Vibrio harveyi by intercellular signal
antagonists. Appl .Environ. Microbiol., 66: 2079–2084.
March JC, Bentley WE (2004). Quorum sensing and bacterial cross-talk in biotechnology. Cur. Opin. Biotechnol., 15: 495–502.
McClean KH, Winson MK, Fish L, Taylor A, Chhabra SR, Camara M,
Daykin M, Lamb JH, Swift S, Bycroft BW, Stewart GS, Williams P (1997). Quorum sensing and Chromobacterium violaceum:
exploitation of violacein production and inhibition for the detection of
N-acylhomoserine lactones. Microbiol., 143: 3703–3711. Nackerdien ZE, Keynan A, Bassler BL, Lederberg J, Thaler DS (2008).
Quorum Sensing Influences Vibrio harveyi Growth Rates in a Manner
Not Fully Accounted For by the Marker Effect of Bioluminescence. PLoS ONE 3(2): e1671. doi:10.1371/journal.pone.0001671.
O'Toole GA, Kolter R (1998). Flagellar and twitching motility are necessary for Pseudomonas aeruginosa biofilm development. Mol.
Microbiol., 30: 295-304. Pemberton JM, Kidd SP, Schmidt R (1997). Secreted enzymes of
Aeromonas. FEMS Microbiol Lett. 152: 1-10. Penfold RJ, Pemberton JM (1992). An improved suicide vector for
construction of chromosomal insertion mutations in bacteria. Gene.,
118: 145–146. Reed LJ, Muench H (1938). A simple method of estimating fifty percent
endpoints. Am. J. Hyg., 27: 493–497.
Rubires X, Saigí F, Pigué N, Climent N, Merino S, Albertí S, Tomás JM, Regué M (1997). A gene (wbbL) from Serratia marcescens N28b (O4) complements the rfb-50 mutation of Escherichia coli K-12
derivates. J. Bacteriol., 179: 7581-7586. Rui HP, Liu Q, Wang QY, Ma Y, Liu H, Shi CB, Zhang YX (2009). Role of
alkaline serine protease, Asp, in Vibrio alginolyticus virulence and
regulation of its expression by LuxO-LuxR regulatory system. J. Microbiol. Biotechnol., 19: 431-438.
Sambrook J, Fritsch E, Maniatis T (1989). Molecular Cloning: A
Laboratory Manual, 2nd Ed, Cold Spring Harbor Laboratory, Press Cold Spring Harbor, New York, U.S.A.
Simon R, Priefer U, Pühler A (1983). Vector plasmids for in vivo and in vitro manipulations of Gram-negative bacteria. In Molecular Genetics
of the Bacteria–Plant Interaction, pp. 98–106. Edited by A. Pühler.
Heidelberg: Springer.
Chu et al. 5825 Swift S, Karlyshev AV, Fish L, Durant EL, Winson MK, Chhabra SR,
Williams P, Macintyre S, Stewart GS (1997). Quorum sensing in Aeromonas hydrophila and Aeromonas salmonicida: identification of
the LuxRI homologs AhyRI and AsaRI and their cognate N-acylhomoserine lactone signal molecules. J. Bacteriol., 179: 5271-5281.
Swift S, Lynch MJ, Fish L, Kirke DF, Tomas JM, Stewart GSAB, Williams P (1999). Quorum sensing-dependent regulation and blockade of exoprotease production in Aeromonas hydrophila. Infect Immun., 67:
5192–5199. Van GM, Christensen LD, Alhede M, Phipps R, Jensen PØ,
Christophersen L, Pamp SJ, Moser C, Mikkelsen PJ, Koh AY, Tolker-
Nielsen T, Pier GB, Høiby N, Givskov M, Bjarnsholt T (2009). Inactivation of the rhlA gene in Pseudomonas aeruginosa prevents
rhamnolipid production, disabling the protection against
polymorphonuclear leukocytes. APMIS., 117: 537-546. Waters CM, Lu W, Rabinowitz JD, Bassler BL (2008). Quorum sensing
controls biofilm formation in Vibrio cholerae through modulation of
cyclic di-GMP levels and repression of vpsT. J. Bacteriol., 190: 2527-2536.
Winzer K, Williams P (2001). Quorum sensing and the regulation of
virulence gene expression in pathogenic bacteria. Int. J. Med. Microbiol., 291: 131-143.
Xiao J, Wang Q, Liu Q, Xu L, Wang X, Wu H, Zhang Y (2009). Characterization of Edwardsiella tarda rpoS: effect on serum
resistance, chondroitinase activity, biofilm formation, and autoinducer synthetases expression. Appl. Microbiol. Biotechnol., 83: 151-60.

African Journal of Microbiology Research Vol. 5(32), pp. 5826-5830, 30 December, 2011 Available online at http://www.academicjournals.org/AJMR ISSN 1996-0808 ©2011 Academic Journals DOI: 10.5897/AJMR11.214
Full Length Research Paper
Detection of H9N2 avian influenza virus in various organs of experimentally infected chickens
Somayeh Asadzadeh Manjili1, Iradj sohrabi Haghdoost1, Pejman Mortazavi1, Hamid Habibi2, Hadi lashini3 and Esmaeil Saberfar3*
¹Department of veterinary pathology, Faculty of Specialized Veterinary Sciences, Islamic Azad University, Science and
Researches Branch, Tehran, Iran. ²Department of Veterinary, Saveh, Markazi Province, Iran.
3
Research Center for applied virology, Baqiyatallah University of Medical Sciences Tehran, IR Iran.
Accepted 30 September, 2011
H9N2 Avian influenza virus (AVI) infection is a major cause of economic losses in poultry industry. Therefore further study to explain the virus pathogenesis is necessary. In this study tissue tropism and dissemination of A/chicken/Iran/11T/99(H9N2) virus in various organs of specific pathogen free (SPF) chickens were investigated. Fifty 2-week-old chickens hatched from SPF eggs were divided randomly into two groups. Forty chicks in the experimental and ten chicks in the control group. Experimental chicks were inoculated intranasally-intraorally with the virus. Samples of lung, trachea, pancreas, thymus, spleen, brain, bursa of fabricius, proventriclus, cloaca and kidney were aseptically collected at 1, 3, 5, 7, 9 and 10 day post inoculation (DPI). A reverse transcriptase polymerase chain Reaction (RT-PCR) test was performed for virus detection. Viral RNA was detected in the respiratory system on days 3, 5 and 7 PI. The virus was also found in the kidney on days 3,5,7,9 PI and in the pancreas on days 3 and 5 PI. Viral RNA was observed only on day 5 PI in cloaca. The virus was not detected in the blood, brain and immune system. The virus was not found from any organs on day 10 PI. These results suggest that H9N2 AIV has tropism for respiratory, digestive and urinary system following intranasal/intraoral inoculation. Key words: Avian influenza, H9N2, SPF, RT-PCR.
INTRODUCTION Avian influenza viruses (AIVs) belong to the family orthomyxoviridae and to the type A influenza virus. These viruses are classified into subtypes based on their surface haemagglutinin (H) and neuraminidase (N) glycoproteins. So far, 16 different H subtypes (H1-H16) and 9 different N subtypes have been indentified (Fouchier et al., 2005). According to the pathogenicity of AIV to domestic and wild bird species these viruses are categorized into two pathotype groups including Highly Pathogenic Avian Influenza (HPAI) viruses and non-Highly Pathogenic Avian influenza (nHPAI) viruses
*Corresponding author. E-mail: [email protected]. Tel: +98-21-66949644.
(Capua and Alexander, 2006). The H9N2 AIV outbreaks occurred in domestic poultry in Asia and the Middle East since the 1990s, and have caused severe economic losses in many countries. In 1998 an AI outbreak in Iran caused great economic losses in poultry industry and an non-highly pathogenic avian influenza virus (H9N2) has been reported as causative agent (Pourbakhsh et al., 2000). H9N2 AIVs induce significant troubles for the poultry industry in Iran due to decreased production, increased mortality and cost of vaccination. Avian influenza disease due to H9N2 subtype has been markedly common during 1994 to 1999 in many parts of the world (Vasfi Marandi and Bozorgmehrifard, 2002). H9N2 influenza viruses are also discussed to be one of the potential candidate for the next human widespread epidemic disease (Butt et al., 2005). Experimental infection

in specific pathogen-free (SPF) chickens announced that the H9N2 AIV is not capable to cause pathological lesions, severe clinical signs and mortality by itself (Lee et al., 2007; Pourbakhsh et al., 2000). During outbreaks of non-highly pathogenic AIVs co-infection with other pathogens especially in severe stress conditions may complicate the syndrome and induce sings of respiratory disease and even mortality in field. Because of widespread incident of the disease and ambiguous behavior of the H9N2 AIV further study to explain the virus pathogenesis is necessary. In a characteristic manner non-highly pathogenic AIVs have been isolated from respiratory exudate and feces of infected birds, and AIV nucleoprotein has been demonstrated in epithelial cells of the intestine, trachea, lungs and air sacs (Shalaby et al., 1994; Swayne et al., 1994). LPAI viruses often need trypsin like enzyme activity to cleave the Hemagglutinin into HA1 and HA2 proteins in order to make the infectious virus particle (Klenk et al., 1975). Hence respiratory and gastrointestinal epithelia that contain these types of enzyme and organs containing epithelial cells like pancreas and kidney are principal places for non-highly pathogenic AIV replication and lesion formation (Klenk et al., 1975; Shalaby et al., 1994). Anyway the pathway of virus distribution into these organs remains ambiguous and it needs more studies to be investigated well. Virus isolation in SPF chickens for identification of AI viruses is time consuming and require specific facilities. Molecular tests like reverse transcription PCR (RT-PCR) are being introduced in order to detection of AIV due to their premium such as rapidity, delicacy and sensitivity (Saberfar et al., 2008). The aim of this study was assessment of the H9N2 virus spreading in various organs of the infected SPF chickens at different days after inoculation. RT-PCR test was performed to diagnose the presence of the virus in different body tissues. It may further help us to investigate the virus pathogenesis. MATERIALS AND METHODS Virus strain The influenza virus A/chicken/Iran/11T/99 H9N2 that was isolated from outbreak among poultry in Iran,was provided by Razi Vaccine and Serum Research Institute (Karaj, Iran). The virus was propagated two times in the allantoic cavity of 9 to 11-day-old
embryonated chicken specific pathogen free eggs. Hemagglutination (HA) titers of the viruses ranged from 512 to 1024 HA unit, when tested according to the methods as described previously (Burleson et al., 1992). SPF chickens
Fifty 2-week-old chickens hatched from SPF eggs were randomly
divided in two groups (forty chicks in experimental group and ten chicks in control group). Both groups were housed in same condition in two separate isolated rooms. Feed and water were
Manjili et al. 5827 available ad libitum. Experimental design
All birds were bled and serologically tested using Hemagglutination inhibition test (HI) (Burleson et al., 1992). They were negative for antibodies to H9N2 influenza virus antigens. Five chickens from treated group were sacrificed and their organs were investigated from virus detection. All of these samples were also negative for virus detection. Subsequently, chickens of the experimental group were inoculated via intranasal/intraoral routes with 120 µl of infectious allantoic fluid containing 10
7.5 EID 50 of the applied virus
strain diluted in sterile PBS solution. The control group was received sterile PBS with the same manner. All the birds were monitored daily for 15 days to investigate the changes of antibody titre to H9N2 and mortality. Five chickens from the experimental group and one chicken from the control group were randomly selected on days 1, 3, 5, 7, 9 and 10 post inoculation (PI). They were bled and sacrificed. During this period, all chickens were observed if they have clinical signs of disease or not and observations were recorded. Necropsy was done on sacrificed
chickens and all gross lesions were recorded. Samples of lung, trachea, pancreas, thymus, spleen, brain, bursa of fabricius, proventriclus, cloaca and kidney were aseptically collected for virus detection and RT-PCR assay. Blood samples were collected in EDTA tubes. Sera of the birds were also collected at the same days for HI test. All tissue samples were immediately stored at -70º until used.
Serology
Serum samples were collected on the pre-inoculation, first to fifteenth days post inoculation from all chickens and were tested against specific antibodies to H9 antigen by using Haemagglutination Inhibition (HI) test, according to the manual of standards for diagnostic test (OIE, 2008).
Extraction of viral RNA RNA of blood and tissue samples was extracted using the RNX TM (-Plus) kit (CinnaGen Inc.) according to the manufacturer's protocol. 50 to 100 mg of tissue or 100 µl of blood sample was mixed with 1ml RNX and incubated at room temperature for 5 minutes. After addition of 200 µl chloroform and mixing, the liquid was clarified by centrifugation at 12,000 rpm at 4º for 15 min. The supernatant was transferred into a new tube and mixed with an equal volume of isopropanol followed by centrifugation at 12000 rpm at 4º for 15 min. The pellet was washed with 1ml of 75% ethanol. Finally, the pellet was dissolved in 50 µl of DEPC treated water.
RT-PCR
The cDNA was synthesized using AccuPower RT-Premix kit (BioNeer corporation, South Korea) according to the manufacturer's protocol. The primer sequences are shown in Table 1. 1 µg of total RNA and 20 pmol of each primer were used for cDNA preparation. PCR was performed to amplify 510 bp fragment of matrix protein gene of influenza virus using the AccuPower PCR PreMix kit (BioNeer Corporation, South Korea).The reaction mixture contained 5 µl cDNA in a final volume 20 µl was subjected to 94ºC for 5 min an 35 cycles of 94°C for 30 s, 49°C for 30 s, 72ºC for 40 s and
followed by final extension at 72°C for 5 min. The PCR products were separated by electrophoresis using a 1.5% agarose gel in 1xTBE buffer.

5828 Afr. J. Microbiol. Res.
Table 1. RT-PCR Primer Sequences.
Specificity primers sequences size
Influenza A virus MF GGC TCT CAT GGA ATG GCT AA 510
Influenza A virus MR CTG GCC TGA CTA GCA ACC TC 510
Table 2. H9N2 serum antibody titration (Mean titer) of the test and control groups of chickens experimentally infected with H9N2 AI virus.
DPI Day 0 Day 1 Day 3 Day 5 Day 7 Day 9 Day 10 Day 13 Day 15
test Group 0 0 0.4 1.4 2.4 3.6 4 6.6 7.4
control Group 0 0 0 0 0 0 0 0 0
Figure 1. Results of the RT-PCR assay.
Amplifying 510-bp segment of M gene of AIV. Lane 1: DNA marker (100-bp), Lane 2: negative control, lane 5,6 and 7: negative samples, lane 3: positive control, lane 4: positive sample.
Amplified products were visualized under ultraviolet light after staining with 0.1 µg /ml ethidium bromide. A 100 base pair ladder was used as a molecular weight marker. RESULTS Clinical signs Daily monitoring did not show any sign of illness in the chickens from control group. The clinical signs observed in the inoculated chickens were depression, facial edema, conjunctivitis, ruffled feather, decrease feed consumption and diarrhoea. Clinical signs were observed
from third day post inoculation. On day 7 PI the number of chickens showing clinical signs reduced. The clinical signs disappeared at 12 DPI. No mortality was recorded from each isolate. Gross Lesions No gross lesions were observed in the uninfected control group. In experimental chickens the lesions such as mild congestion of the trachea and lungs, hemorrhage in small intestine and pancreas and swollen kidneys were observed. HI test There was no evidence of any change in specific antibodies against AIV in pre and post inoculation of control chickens. As shown in Table 2 the mean of antibody titer was increased at 5 DPI and reached to
at 15 DPI in the experimental group.
RT-PCR The presence of the virus in various organs obtained from the inoculated and control birds at different DPI was determined by RT-PCR test. Tissue samples from 5 different birds that had been taken before inoculation and samples from control group were all negative for virus detection. First positive samples were seen on day 3 PI and the last positive sample was detected on day 9 PI (Figure 1). The virus was detected in the trachea, lungs, pancreas, cloaca and kidney of infected birds during the experiment course. The results of the virus detection are shown in Table 3. The results show that most positive samples were detected on days 5 PI. All brain, blood, thymus, spleen, proventriclus and bursa of fabricius,

Manjili et al. 5829
Table 3. The results of virus detection from various organs of SPF chickens at different days post inoculation with H9N2 AI virus.
Day PI Group Tr L Th Sp Pr Cl Bu P K Br Bl
1 T
C
0/5*
0/1
0/5
0/1
0/5
0/1
0/5
0/1
0/5
0/1
0/5
0/1
0/5
0/1
0/5
0/1
0/5
0/1
0/5
0/1
0/5
0/1
3 T
C
2/5
0/1
3/5
0/1
0/5
0/1
0/5
0/1
0/5
0/1
0/5
0/1
0/5
0/1
1/5
0/1
2/5
0/1
0/5
0/1
0/5
0/1
5 T
C
2/5
0/1
4/5
0/1
0/5
0/1
0/5
0/1
0/5
0/1
2/5
0/1
0/5
0/1
4/5
0/1
3/5
0/1
0/5
0/1
0/5
0/1
7 T
C
0/5
0/1
2/5
0/1
0/5
0/1
0/5
0/1
0/5
0/1
0/5
0/1
0/5
0/1
0/5
0/1
1/5
0/1
0/5
0/1
0/5
0/1
9 T
C
0/5
0/1
0/5
0/1
0/5
0/1
0/5
0/1
0/5
0/1
0/5
0/1
0/5
0/1
0/5
0/1
1/5
0/1
0/5
0/1
0/5
0/1
10 T
C
0/5
0/1
0/5
0/1
0/5
0/1
0/5
0/1
0/5
0/1
0/5
0/1
0/5
0/1
0/5
0/1
0/5
0/1
0/5
0/1
0/5
0/1
T= test group C= control group Tr= Trachea, L= Lung, Th= Thymus, Sp= Spleen, Pr= Proventriclus, Cl= Cloaca, Bu= Bursa of Fabricius, P= Pancreas, K= Kidney, Br= Brain, Bl= Blood. *= No. of positive samples/total samples taken.
samples were negative for virus detection. DISCUSSION In this study tissue tropism and dissemination of H9N2 virus throughout the various organs were evaluated following intranasal/intraoral inoculation. The clinical signs and gross lesions found at post mortem examination were alike and milder than lesions reported in naturally infected birds with H9N2 (Pourbakhsh et al., 2000). Although In Some researches (Shalaby et al., 1994; Swayne et al., 1994) as well as present study, inoculation of low pathogenicity AIVs in SPF or broiler chickens have produced absence of mortality, but mortality between 20 and 60% in natural outbreaks have been reported (Naeem et al., 2003; Nili et al., 2003; Vasfi Marandi and Bozorgmehrifard, 2002). Previous studies have shown that the M gene RT-PCR is sensitive and specific method for the detection of influenza A viruses of human and avian origin (Saberfar et al., 2009).
In this study predominant infection in the respiratory organs was observed between days 3 and 7 PI. Detection of the virus from the trachea and lungs indicates that H9N2 AI virus is pneumotropic following intranasal/intraoral inoculation. Repetition of virus recovery in respiratory system was mostly higher for lung tissues. Viral RNA was identified in lung tissue on days 3, 5 and 7 PI. Previous studies (Kwon et al., 2008) have reported that H9N2 viral antigen were detected in the trachea, lungs, thymus, spleen, bursa, cecal tonsils and
kidneys of SPF chickens on day 5 PI. We observed infections that are localized to the GI tract at days 3 and 5 PI. The H9N2 virus were detected in the cloaca at day 5 PI and in the pancrease at day 3 and 5 PI. Detect of the H9N2 virus in cloaca only on day 5 PI perhaps originated in temporary replication of the virus in GI tract. Swayne and Halverson reported that LPAI viruses produce infections in respiratory and GI tracts of chickens. AIV nucleoprotein has been identified in epithelial cells of the trachea, lungs, and intestine (Shalaby et al., 1994; Slemons and Swayne, 1995; Swayne et al., 1994). Hablolvarid et al. (2004) detected nucleoproteins of the H9N2 virus in the trachea, lungs and cecal tonsils of experimentally infected 5-week-old SPF chickens using immunoperoxidase assay. We detected H9N2 virus in the pancreas on day 3 and 5 post inoculation. Shinya et al. (1995) reported positive immunoreaction to H5N3 virus antigen in the pancreas of inoculated chicks. Hablolvarid et al. (2003) detected H9N2 virus nucleoproteins in the pancreas of experimentally infected 5-week-old chickens using immunoperoxidase assay following intravenous inoculation. Sometimes LPAIV can spread further than the respiratory and GI tracts, replicate and cause lesions in primarily visceral organs including epithelial cells such as pancreas and kidney (Shalaby et al., 1994; Vasfi Marandi and Bozorgmehrifard, 2002).
Mosleh et al. (2009) showed that A/Chicken/Iran/772/1998 (H9N2) had tissue tropism and pathogenicity for the respiratory system (lung and trachea), immune system (spleen), urinary system (kidneys) and digestive system of commercial broiler
5830 Afr. J. Microbiol. Res. chicks following IN inoculation. We observed predominant infection in the kidney at days 3, 5, 7, and 9 PI. Virus detection in the kidney could indicate virus tropism for the urinary system as previously reported (Shalaby et al., 1994; Swayne and Slemons, 1995; Vasfi Marandi and Bozorgmehrifard, 2002). Swayne and Slemons (1994) reported that LPAIVs were nephrotropic following IV inoculation and pneumotropic following intranasal inoculation, but they did not detect the virus antigens in kidney using immunohistochemistry assay. In other study LPAI virus was not detected in parenchymal cells of the kidneys following IN inoculation (Swayne and Beck, 2005). In previous studies the H9N2 AIV detected from trachea, kidney and lung tissues using indirect immunoperoxidase test (Shamsedini et al., 2002). H9N2 viral antigen was detected from different tissues of experimental infected three-week-old SPF chickens such as spleen, kidney, lung, trachea, thymus, bursa and cecal tonsil (Kwon et al., 2008). However In this study we did not detect the viral RNA in the lymphoid tissues. Viral RNA was not detected in the blood of the chickens in experimental group. Mosleh et al, (2009) did not also detect the virus from blood samples. Conclusion Most of the Non Highly Pathogenic AIVs have two basic amino acids at the proteolytic cleavage site of the hemagglutinin protein (Wood et al., 1993) and require cleavage by a trypsin-like enzyme to be infectious and perform multiple virus replication cycles (Klenk et al., 1975). Respiratory and gastrointestinal tracts have this enzyme activity in some cells or lumenal contents and it is responsible for the GI and respiratory tracts being primary sites for LPAI virus replication and lesion production. Therefore more studies must be investigated to realise the ability of replication of the virus in the organs with no trypsin-like enzyme such as lymphoid tissues. The virus was not detected from any organs on day 10 PI. It might be resulted from increasing of the specific AIV antibody titer in chicken's blood. Current study showed that H9N2 AIV has tropism for the respiratory organs, urinary system and digestive system. REFERENCES Burleson FG, Chambers TM, Wiedbrauk DL (1992). Nucleic Acids
Research 25: 3389-3402. A Laboratory Manual Academic Press. Inc. London. Butt KM, Smith GJ, chen H (2005). Human infection with an avian H9N2
influenza A virus in Hong Kong in 2003. J. Clin. Microbiol., 43: 5760-5767.
Capua I, Alexander DJ (2006). The challenge of avian influenza to the
veterinary community Avian Pathol., 3: 189-205. Fouchier R, Munster V, Wallensten A, Bestebroer T, Herfst S, Smith D,
Rimmelzwaan G, Olsen B, Osterhaus A (2005). characterization of a
novel influenza A virus hemagglutinin subtype (H16) obtained from Black-Headed gulls. J. Virol., 79: 2814-2822.
Hablolvarid MH, Sohrabi HI, Pourbakhsh SA, Gholami MR (2003). A
study on histopathologic changes in chicken following intravenous inoculation with avian influenza virus A/Iran/259/1998 (H9N2). Arch.
Razi Inst., 55: 41-54. Hablolvarid MH, Sohraby Haghdost I, Pourbakhsh SA, Gholami MR
(2004). Histopathological study of intranasally inoculated
A/chicken/Iran/259/1998 (H9N2) influenza virus in chicken. Arch. Razi Inst., 58: 51-62.
Klenk HD, Rott R, Orlich M, Blodorn J (1975). Activation of influenza A
viruses by trypsin treatment. Virology, 168: 426-439. Kwon JS, Lee HJ, Lee DH, Lee YJ, Mo IP, Nahm SS, Kim MJ, Lee JB,
Park SY (2008). Immune response and pathogenesis in
immunocompromised chickens in response to infection with H9N2 Low phathogenic avian influenza virus. Virus Res., 133: 187-194.
Lee YJ, Shin JY, Song HW, Kim JH, kwon YK, kwon JH, kim CJ, Webby
RJ, Webster RG, Choi YK (2007). continuing evoluation of H9 influenza viruses in korean poultry. Virology. 359: 313-323.
Mosleh N, Dadras H, Mohammadi A (2009). Evaluation of H9N2 avian
influenza virus dissemination in various organs of experimentally infected broiler chickens using RT-PCR. Iran. J. Vet. Res., 10: 12-20.
Naeem K, Naurin M, Rashid S (2003). Seroprevalence of avian
influenza virus and its relationship with increased mortality and decreased egg production. Avian Pathol., 32: 285-289.
Nili H, Asasi K (2003). Avian influenza (H9N2) Outbreak in Iran. Avian
Dis., 47: 828-837. Office International Des Epizooties (OIE) (2008) Chapter 2.3.4 Avian
influenza In: MANUAL OF DIAGNOSTIC TESTS AND VACCINES
FOR TERRESTRIAL ANIMALS (mammals, birds and bees). Pourbakhsh SA, khodashenas M, kianizadeh M, Goodarzi H (2000).
Isolation and identification of avian influenza virus H9N2 subtype.
Arch. Razi Inst., 51: 27-38. Saberfar E, Najafi A, Goodarzi Z, Lashini H (2009). Multiplex Reverse
Transcription-PCR Assay for Detection of Type A Influenza Virus plus
Differentiation of Avian H7 and H9 Hemagglutinin Subtypes in Iran. Iranian J Pub Health., 38: 29-34.
Shalaby AA, Slemons RD Swayne DE (1994). pathological studies of
A/chicken/Alabama/7395/75 (H4N8) influenza virus in specific pathogen free laying hens. Avian Dis., 38: 22-32.
Shamsedini M, Bahmani-Nejad M Khazraee-Nia P (2002). The use of
indirect immunoperoxidase assay in diagrosis of type A (H9N2) avian influenza virus antigen on frozen tissue sections. Arch. Razi Inst., 53: 11-21.
Shinya K, Awakura A, Shimada A, Silvano FD, Umemura T, Otsuka K (1995). Pathogenesis of pancreatic atrophy by avian influenza A virus infection. Avian Pathol., 24:623-632.
Slemons RD, Swayne DE (1995). Tissue tropism and replicative properties of waterfowl-origin influenza viruses in chickens. Avian Dis., 39: 521-527.
Swayne DE, Beck JR (2005). Experimental study to determine if low-
pathogenicity and high-pathogenicity avian influenza viruses can be present in chicken breast and thigh meat following intranasal virus inoculation. Avian Dis., 49: 81-85.
Swayne DE, Slemons RD (1994). comparative pathology of a chicken-origin and two duck-origin influenza virus isolates in chickens the effect of route of inoculation. Vet. Pathol., 31: 237-245.
Swayne DE, Slemons RD (1995). comparative pathology of intravenously inoculated wild duck- and turkey-origin type A influenza Virus in chickens. Avian Dis., 39: 74-84.
Vasfi MM, Bozorgmehrifard MH (2002). Isolation of H9N2 subtype of avian influenza viruses during an outbreak in chickens in Iran. Iran. Biomed. J., 6: 13-17.
Wood GW, Mccauley JW, Bashiruddin JB, Alexander DJ (1993). Deduced acid sequences at the haemagglutinin cleavage site of avian influenza A viruses of H5 and H7 subtypes. Arch. Virol., 130:
209-217.

African Journal of Microbiology Research Vol. 5(32), pp. 5831-5840, 30 December, 2011 Available online at http://www.academicjournals.org/AJMR ISSN 1996-0808 ©2011 Academic Journals DOI: 10.5897/AJMR11.307
Full Length Research Paper
Biological wastewater treatment: Microbiology, chemistry, and diversity measurement of ammonia
oxidizing bacteria
AYANDA Olushola Sunday* and AKINSOJI Olatunbosun Se un
Department of Chemistry, Faculty of Applied Sciences, Cape Peninsula University of Technology, Cape Town, South Africa.
Accepted 22 November, 2011
Nitrification is an important biological process in nitrogen cycling and has a significant effect on effluent quality in wastewater treatment. Nitrifica tion occurs in two steps by two types of chemoautotrophic bacteria, the ammonia oxidizing ba cteria (AOB) and nitrite oxidizing bacteria (NOB). The ammonia oxidizing bacteria is responsible for t he oxidation of ammonia with oxygen into nitrite an d is often the rate-limiting step in nitrification in wastewater treatment plants. Hence, a better understanding of the ecology, microbiology and chem istry of ammonia oxidizing bacteria in biological wastewater treatment systems is necessary in order to enhance treatment performance and control. A detailed review of various biological wastewater tr eatment processes, ammonia oxidizing bacteria and archaea; economic importance, problems, various mol ecular techniques for the investigation of the diversity and community structure, as well as the i solation of ammonia oxidizing bacteria were discussed. Key words: Wastewater, activated sludge process, nitrification, ammonia oxidizing bacteria, ammonia oxidizing archaea, nitrite oxidizing bacteria, PCR primers.
INTRODUCTION Wastewater treatment is the process of taking wastewater and making it suitable for discharge back into the environment. Wastewater results from a number of different activities, including industrial activities, rainwater runoff and domestic activities (Van der Hoek, 2004; Thomas, 2005). No matter where the wastewater comes from, this water is full of bacteria, chemicals, and other contaminants. Wastewater treatment therefore reduces the contaminants to acceptable levels so as to be safe for discharge into the environment. There are two types of wastewater treatment systems: a biological treatment plant and a physical/chemical treatment plant. Either of the treatment plants are utilized depending on the nature and components of pollution but some other pollution will *Corresponding author. E-mail: [email protected]. Tel.: +27784417935 or +2348054642362.
require a combination of both wastewater treatment systems. When considering either a chemical or biological wastewater treatment for a particular application, it is very important to understand the sources of the wastewater generated, typical wastewater composition, discharge requirements, events and practices within a facility that can affect the quantity and quality of the wastewater, and pretreatment ramifications. Consideration of these factors will allow for maximization of the benefits the treatment plant will gain from effective wastewater treatment.
The various wastewater treatment processes have the following objectives: To confer and preserve the inherent physical, chemical and biological qualities of water of different origins which make it suitable for specific uses such as water for drinking and for use in productive processes, to protect the public from health risks without causing any damage to the environment and to confer and preserve those characteristics of water in its natural

5832 Afr. J. Microbiol. Res. environment which are necessary for the conservation and development of fauna and aquatic vegetation, and for provision of drinking water for cattle and wild animals or for recreational and aesthetic purposes (Boari et al., 1997). Ammonia wastewater treatments Nitrogen appears in wastewater as ammonia, nitrite, nitrate and organic nitrogen (Sotirakou, 1999). With the advancement in technology, there have been various biological and chemical wastewater treatments meant to address the problems of ammonia in wastewater (Jorgensen and Weatherley, 2003). The various treatment processes for treating ammonia include; lagoon systems, membrane bioreactor, fixed film treatment processes etc.
Lagoon systems are not expensive and are much easier to operate than mechanical wastewater treatment systems. Its components use little concrete and built through excavation. However, the effluent quality can become substandard because it is hard to control the wastewater's temperature, return rate, and oxygen level inside the system (Middlebrooks et al., 1999).
Membrane bioreactor (MBR) technology which combines biological-activated sludge process and membrane filtration has become more popular, abundant, and accepted in recent years for the treatment of many types of wastewaters, whereas the conventional activated sludge (CAS) process cannot cope with either composition of wastewater or fluctuations of wastewater flow rate (Jelena et al., 2007). The MBR has three essential components - the anoxic basin, the pre-aeration basins, and the MBR basin. The raw wastewater is poured into a fine screen for filtration, before placing it inside the anoxic basin. In the anoxic basin, the mixed liquor gushes into the pre-aeration basins until it reach the MBR basins. The fluids will then pass through the membranes of the MBR basins, wherein the membrane that pushes the effluent for disinfection is connected. The effluent must be sent first to the disinfection stage to ensure the quality of wastewater prior to release. The membranes lessen the repeat clarification process, making wastewater treatment more practical and convenient (Churchouse, 1997; Maryam et al., 2009). The MBR treatment process is known for its high effluent quality. Unlike other treatments, MBR treatment does not need additional filtration or clarification because the membranes are designed to clear the impurities in wastewater, and removes the total nitrogen from wastewater. The MBR machine is also less cumbersome and fits to small areas compared to other wastewater treatment machines. The costs involved in operating MBR are thus much higher compared to other wastewater systems.
BOD removal and b iological nitrification can also be
achieved using fixed film treatment (Park et al., 1996). This technique involves the use of microorganisms such as the ammonia oxidizing bacteria (AOB) to treat wastewater. It uses a trickling filter/activated sludge treatment process wherein a plastic media contains microorganisms, which will grow inside a tower where the wastewater is placed for treatment. It is then followed by activated sludge process. The trickling filters/activated sludge treatment process harness the best quality of wastewater. Trickling filters are more energy efficient and reduce the production of low quality effluent. The disadvantages of fixed film treatment include high solid retention and foul odour. Activated sludge process The activated sludge process is a system used for the treatment of sewage and industrial wastewaters that involves the mixture of biological mass and wastewater (Beychok, 1967). It is a complex biological wastewater treatment system that is currently designed for removing carbon (Akpor, 2011), phosphorus (Metcalf and Eddy, 1991; Henze, 1996) and/or nitrogen constituents (Metcalf and Eddy, 1991; Larsdotter, 2006) in the wastewater. In activated sludge process, organic waste is fed to the system and leaves the process depending on the desired treatment efficiency set by the operator. The process begins by mixing the biological waste present in industrial wastewater or sewage with an aerobic bacterial culture in the reactor and air. This mixture is known as the mixed liquor. Once in the reactor, the mixed liquor is aerated for a particular period of time in order to ensure that this solution is fully mixed. This mixture therefore undergoes separation through the gravity clarifier, where the waste activated sludge is removed from the treatment and mixed with primary treated wastewater before it is recycled back to the beginning of the process in order to maintain the desired concentration of organisms and sludge. Lastly, the sludge goes through further treatment and the result of all this process is the treated wastewater that can be safely disposed to nature. A generalize schematic diagram of an activated sludge process is as shown in Figure 1.
There are basically three types of activated sludge processes, they are conventional activated sludge processes (Brucculeri et al., 2005; Marcos, 2007), contact stabilization processes (Gujer and Jenkins, 1975) which uses two separate aeration processes, and the extended aeration processes (Lowe and Gaudy, 1989; Sotirakou et al., 1999). The different activated sludge processes all accomplish the biochemical reduction of organics using aeration basins and the return and waste sludge systems. It is the detention times, mixed liquor suspended solids (MLSS), and food/microorganism ratio (F:M) loadings that are different. Other modifications are oxidation ditch, complete mix activated sludge process,

Ayanda and Akinsoji 5833
Air
Clarifier-settler
Treated water
Aeration tank
Raw water
Recycle sludge
Water sludge
To sludge treatment Figure 1. A generalize schematic diagram of an activated sludge process.
step feed, tapered aeration and Kraus process. The different types of activated sludge plants include: Package plants, oxidation ditch, deep Shaft and surface-aerated Basins/Lagoons (Beychok, 1967). Ammonium oxidizing bacteria and archaea Ammonia in water environments is toxic to fish and other aquatic life at high concentrations, and also contributes to eutrophication. Biodegradation and elimination of ammonia in wastewater is thus one of the main functions of wastewater treatment plants (WWTPs) and can be achieved by nitrification. Nitrification is the biological oxidation of ammonia with oxygen into nitrite followed by the oxidation of these nitrites into nitrates and can be represented by equation 1 and 2, respectively. A chemolithotrophic nitrification is a two-step process and is carried out by two different groups of organisms, the AOB and the nitrite oxidizing bacteria (NOB) (Bin et al., 2009). AOB are primarily responsible for the first step which is the oxidation of ammonia with oxygen into nitrite and often the rate-limiting step in nitrification. It is this process that is essential for the removal of ammonia from the wastewater. NH3 + O2 → NO2
-+ 3H+ + 2e- (1) NO2
- + H2O → NO3- + 2H+ +2e- (2)
It is generally accepted that ammonia (NH3) and not ammonium (NH4
+) is used as substrate, and the ammonia/ammonium ratio may therefore affect the growth of AOB. AOB are obligatory chemolithoautotrophs and can be found among the beta-proteobacteria and gamma-proteobacteria (Purkhold, 2000). Most AOB are phylogenetically closely related to other activated sludge bacteria within the beta subdivision class of Proteobacteria (Harms, 2003). AOB are generally rod-shaped, spherical, spirillar, or lobular, typically Gram-
negative, and flagellation of motile cells is polar to sub-polar or peritrichous. Most species are aerobic but can grow at reduced oxygen partial pressure. Studies suggest that there are physiological and ecological differences between the different AOB genera and lineages and that environmental factors such as salinity, pH, and concentrations of ammonia and suspended particulate matter select for certain species of AOB (Kowalchuk and Steven, 2001; Bin et al., 2009). The physiological activity and abundance of AOB in wastewater processing is important in the design and operation of waste treatment systems, particularly since these organisms display low growth rate and high sensitivity to environmental disturbances and inhibitor (Okabe, 1999). Ammonia oxidizing archaea Autotrophic ammonia/ammonium oxidation was initially assumed to be restricted to aerobic AOB and anaerobic ammonium oxidizing (Anammox) bacteria until recent molecular and culture-dependent evidence showed that autotrophic ammonia oxidation also occurs in the domain Archaea. The first strain of ammonia oxidizing archaea (AOA), Nitrosopumilis maritimus, was isolated from the rocky substratum of a tropical marine aquarium tank (Erguder et al., 2009). Some evidences showed that AOA are more abundant than AOB in marine, lake waters and soil environments (Sonthiphand and Limpiyakorn, 2010). AOA have also been detected in activated sludge bioreactors by using specific PCR primers targeting archaeal amoA gene. However, AOA abundances seemed to be much lower (four orders or more) in most cases than AOB based on analysis of amoA gene copy number (Jin et al., 2010; Limpiyakorn et al., 2011). The factors influencing the presence or/and dominance of AOA in different environments are ammonium levels, salinity, temperature, organic carbon, dissolved oxygen (DO) levels, pH, sulphide levels, and phosphate levels.

5834 Afr. J. Microbiol. Res. Ammonia monooxygenase Ammonia monooxygenase (AMO) is a membrane-bound enzyme in Nitrosomonas europaea and other autotrophic AOB of the beta and gamma-subclasses of Proteobacteria. The enzyme contains multiple subunits; amoA, amoB and amoC. All the three AMO genes have been cloned and sequenced from several AOB (McTavish et al., 1993). AMO is responsible for the conversion of ammonia to hydroxylamine. Hydroxylamine is then oxidized to nitrite by hydroxylamine oxidoreductase (HAO) in an endergonic reaction. HAO is an unusual enzyme with a highly complex structure, located as a soluble enzyme in the perplasmic space, but anchored in the cytoplasmic membrane. AMO and HAO enzymes are necessary for energy conversion during the oxidation of ammonia. The initial oxidation of ammonia, which yields hydroxylamine as a reduced product, is an O2-dependent reaction catalyzed by AMO: NH3 + O2 + 2e- + 2H+ → NH2OH + H2O (4) Hydroxylamine is further oxidized to nitrite by HAO: NH2OH + H2O → NO2
- + 5H+ + 4e- (5) Two of the four electrons generated from hydroxylamine are used to support the oxidation of additional ammonia molecules; the other two enter the electron transfer chain and are used for CO2 reduction and ATP biosynthesis (Wood, 1986).
Ammonia monooxygenase subunit A (amoA) gene and 16S rRNA genes has been widely used to analyze the diversity and abundance of AOB in various samples. Based on comparative analysis of 16S rRNA and amoA gene sequences, it was found that 16S rRNA gene is more conserved than amoA gene and the suggested similarity thresholds of 16S rRNA and amoA genes to define different AOB species are 97 and 80%, respectively (Ye and Zhang, 2011). Economic importance of ammonium oxidizing bacteria Nitrogenous wastes are increasing as a result of the expansion of animal husbandry, nitrogen-producing industries, and human activities and have therefore become a critical factor in environmental management. The removal of nitrogen from wastewater treatment is of extreme environmental importance. This is because the release of untreated waste can result to toxic effect on aquatic animals and can lead to eutrophication of the environment. Even in cases where treatment does not lead to successful denitrification, nitrification helps to avoid environmental contamination with potentially toxic ammonia salts (Painter, 1986). The broad specificity of the AMO complex common to all AOB often permits the
co-oxidation of numerous recalcitrant aliphatic, aromatic, and halogenated molecules. AOB may also play a role in methane oxidation and biofilter systems. Biofilter systems have been used for the elimination of odours associated with waste treatment and composting (Bohn, 1992) and also for purposes as providing long-term filtering capacity suitable for manned spacecraft (Joshi et al., 2000). The reduction of ammonia released into the environment reduces the risk of local oxygen depletion. Problems associated with ammonia oxidizing bacteria AOB can lead to the production of the ozone-depleting gas NO or the greenhouse gas N2O either at low or high levels via partial-denitrification processes under reduced oxygen conditions (Cho and Kim, 2000). The process of ammonia oxidation leads to a net acidification of the environment. The acidification of forest soils may thus have a detrimental effect on tree, and high levels of nitrification may intensify problems involving the effects of acid rain. Nitrogen transformations that lead to an increased proton load can lead to the release of metals such as aluminum, which can contribute to root damage and forest decline. AOB may generate elevated levels of nitrous acid and can lead to corrosion of natural stones, historical monuments, and building materials (Meincke et al., 1989). Diversity, abundance and community structure measurement A better understanding of the microbial ecology of AOB and AOA in wastewater treatment systems could potentially enhance the treatment performance and control, and would also help engineers to utilize the functional characteristics of the microbial population to model and improve the design and operation of the systems (Wang et al., 2010). The development of culture independent molecular techniques has enhanced the ability of researchers to analyze environmental samples. Denaturing gradient gel electrophoresis (DGGE) DGGE is a molecular fingerprinting method that separates polymerase chain reaction (PCR)-generated DNA products. The technique enables sequence diversity of PCR-amplified genes from a large number of samples to be compared in one gel to reveal changes in community structure over time or space. This approach separates DNA sequences and allows 95% of single base sequence differences to be detected. This approach also has the ability to separate genomic sequences differing by more than one base (Muyzer et al., 1993).
DGGE is a useful method for bacterial community
profiling by targeting the 16S rRNA and/or amoA genes of AOB (Nicolaisen and Ramsing, 2002). This method is less time consuming for comparing AOB communities than conventional analysis by cloning and sequencing.
Hornek et al. (2006) reported the communities of AOB in activated sludge of a municipal wastewater treatment plant (WWTP) located in Linz (Austria) by the use of DGGE technique. DGGE analyses of PCR products generated by the amoA primers; amoA-1F, amoA-2R, amoAf-I, and amoAr-I were performed with the D-gene system. Selected bands were recovered, sequenced and subsequently submitted to BLAST to allocate to available partial amoA sequences. Sequences were aligned using the program ClustalX 1.81. The application of the primer set amoA-1F in combination with amoA-2R and amoAr-I was suggested for a rapid PCR-DGGE analysis, because they seem to complement each other to screen for present AOB in the environment.
The microbial community composition and dominant bacterial populations in anoxic-oxic activated sludge from a full-scale WWTP in Liaoning, China were investigated with PCR-DGGE coupled with sequence analysis of 16S rRNA gene fragments from dominant bands by Ding et al (2011). PCR amplification of bacterial 16S rRNA gene fragments was performed using primer 968F-GC (5’-CGC CCG GGG CGC GCC CCG GGC GGG GCG GGG GCA CGG GGG GAA CGC GAA GAA CCT TAC-3’) and primer 1401R (5’-CGG TGT GTA CAA GGC CCG GGA ACG-3’) for the Domain Bacteria, corresponding to positions 968 and 1401 in the 16S rDNA of Escherichia coli, with a 40 bp-GC-rich sequence (5’- CGC CCG GGG CGC GCC CCG GGC GGG GCG GGG GCA CGG GGG G - 3’) attached to the 5’ end of the forward primer to stabilize the melting behavior of the DNA fragments. DGGE of the PCR amplified 16S rDNA was carried out using the DCodeTM Universal Mutation Detection System. The prominent DGGE bands were selected and excised for nucleotide sequence determination. The sequences obtained from the DGGE were then analyzed in comparison with the 16S rDNA sequences in the GenBank database by using the basic local alignment search tool (BLAST). The alignment was calculated by the neighbor-joining method using Clustal X. The phylogenetic affiliation of the sequences was further analyzed and a phylogenetic tree was plotted by Mega 3.1 program.
Because of high similarity of the 16S rDNA sequences that makes it difficult to identify closely related ammonia oxidizing species, some difficulties have been experienced in studying ammonia oxidizing bacterial diversity using DGGE of 16S rDNA gene sequence. Another method based on the same principle is the temperature gradient gel electrophoresis (TGGE). Real-time PCR Real-time PCR is a highly sensitive technique that
Ayanda and Akinsoji 5835 facilitates amplification and quantification of a specific DNA sequence with the detection of the PCR product in real time. Quantification of DNA targets can easily be achieved by determination of the cycle when the PCR product can first be detected. Thus, Real-time PCR technique is reliable and reproducible for AOB and for evaluating correlations between microbial activities, cell numbers and population changes in time and space. Real-time PCR analysis has been applied to numerous environmental samples to reveal the comparative abundance of AOA and AOB. In many cases, according to Caffrey et al. (2007), the archaeal amoA gene outnumbered that of AOB.
The abundance of amoA genes of AOB and AOA in activated sludge of seven full-scale wastewater treatment plants in Thailand was investigated by Limpiyakorn (2011). Quantitative real-time PCR was performed with duplicate sets of extracted DNA. Each set of extracted DNA was prepared by pooling the DNA extracted in triplicate, then diluted for four different 10-fold dilutions and a quantitative real-time PCR was carried out for each dilution in duplicate with a Brilliant II SYBR Green QPCR Master Mix in an Mx3005P instrument. Archaeal amoA genes were quantified using the primers Arch-amoAF (5’-STA ATG GTC TGG CTT AGA CG-3’) and Arch-amoAR (5’-GCG GCC ATC CAT CTG TAT GT-3’), the quantification of bacterial amoA genes was performed using the primers amoA 1F (5’-GGG GTT TCT ACT GGT GGT-30) and amoA 2R (5’-CCC CTC KGS AAA GCC TTC TTC-3’) while AOB 16S rRNA gene was quantified using the primers CTO 189A/Bf (5’-GGA GRA AAG CAG GGG ATC G-3’), CTO189Cf (5’-GGA GGA AAG TAG GGG ATC G-3’), and CTO 654r (50-CTA GCY TTG TAG TTT CAA ACG C-3’). To confirm the single target fragment of the PCR amplified products, dissociation curves were analyzed and plotted at the end of every quantitative real-time PCR reaction and to verify the correct amplification of the target microorganisms’ DNA, few clones from the clone libraries constructed from the real-time PCR amplified products were randomly selected for sequencing and the results for every reaction tested verified the correct amplification of the target microorganisms’ DNA. Terminal restriction fragment length polymorphism (T-RFLP) T-RFLP is a molecular biology technique for profiling of microbial communities based on the position of a restriction site closest to a labeled end of an amplified gene. The method is based on the digestion of a mixture of PCR amplified variants of a single gene using one or more restriction enzymes and detecting the size of each of the individual resulting terminal fragments using a DNA sequencer. The result is a graph image where the X axis represents the sizes of the fragment and the Y axis represents their fluorescence intensity.

5836 Afr. J. Microbiol. Res.
Wang et al. (2010) investigated the communities of AOB in activated sludge collected from eight wastewater treatment systems in Beijing using polymerase chain reaction (PCR) followed by T-RFLP, cloning, and sequencing of the α-subunit of the amoA gene. The primers amoA-1F (5’-GGG GTT TCT ACT GGT GGT-3’) and amoA-2R (5’-CCC CTC KGS AAA GCC TTC TTC-3’) were used to amplify a 491 base pairs (bp) fragment of the amoA gene of AOB. A Clone library was constructed and the software Clustal X 1.81 was used to align sequences of the recovered clones with other published amoA sequences and software Mega 4.0 was used to generate a phylogenetic tree using the neighbor joining method. Their results (T-RFLP fingerprint analysis) showed that the different wastewater treatment systems harbored distinct AOB communities and that the source of influent affected the AOB community with the WWTPs treating domestic wastewater containing a higher AOB diversity than those receiving mixed domestic and industrial wastewater. A combination of the results of sequencing the amoA gene and the T-RFLP profiles of clones clearly indicated which species each peak represented.
The AOB populations in Marshall WWTP (an aerated-anoxic Orbal process treating 900 ~ 1,300 m3/day of domestic wastewater) and Nine Springs WWTP (a variation of the UCT process and treats 150,000 ~ 200,000 m3/day of domestic wastewater) with T-RFLP was investigated by Park et al (2001). Primers amoA-1F and amoA-2R were used to amplify a 491-bp fragment of the amoA gene.
The analysis was complemented by cloning and sequencing the amoA gene fragment to detect and identify AOB.
TRFLP is one of several molecular methods aimed to generate a fingerprint of an unknown microbial community (Liu et al., 1997). Because of its relatively high resolution and reproducibility, T-RFLP has been widely used to assess the AOB community (Osborn et al., 2000).
Other molecular techniques are fluorescent in situ hybridization (FISH), restriction fragment length polymorphism (RFLP), amplified ribosomal DNA restriction analysis (ARDRA), singlestranded-conformation polymorphism (SSCP), randomly amplified polymorphic DNA (RAPD) or DNA amplification fingerprinting (DAF), bisbenzimide-polyethyleneglycol (Bb-PEG) electrophoresis, etc. Fluorescent in situ Hybridization (FISH) FISH (fluorescent in situ hybridization) is a cytogenetic technique developed by Christoph Lengauer that is used to detect and localize the presence or absence of specific DNA sequences on chromosomes. The technique is one of the methods that have been described for direct
visualization of AOB. Hybridization techniques generally use directly extracted DNA as a “probe” for specific detection of various microorganism species. The application of In situ Hybridization approaches to AOB has been most effective in detecting AOB that dominate total bacterial community in environment such as the sewage treatment plants (Wagner et al., 1995). Restriction fragment length polymorphism (RFLP) RFLP is a technique that exploits variations in homologous DNA sequences. Ribotyping (RFLP of rRNA genes) combines restriction enzyme digestion of the total genomic DNA with a Southern analysis, in which rRNA gene-specific DNA probes are used. The hybridization pattern obtained is a characteristic of each organism. RFLP determines the multiplicity, the arrangement and the relative location of rRNA genes in bacterial genomes and also contain taxonomic information. Aakra et al. (1999) in their study, ribotyped 12 isolates of AOB, and the sequences of the 16s-23s rDNA intergenic spacer region (ISR) were determined and used in a phylogenetic study. Amplified ribosomal DNA restriction analysis (ARDRA) ARDRA is a DNA fingerprint technique based on PCR amplification of 16S ribosomal DNA using primers for conserved regions, followed by enzyme digestions and agarose gel electrophoresis (Smit el al., 1997).
T-RFLP is different from ARDRA and RFLP in that only the terminal fragments (i.e. the labeled end or ends of the amplicon) are read and all other fragments ignored whereas all restriction fragments are visualized for ARDRA and RFLP. Singlestranded-conformation polymorphism (SSCP) With SSCP, DNA fragments such as PCR products obtained with primers specific for the 16S rRNA gene, are denatured and directly electrophoresed on a non-denaturing gel. Separation is based on differences in the folded conformation of single-stranded DNA, which influences the electrophoretic mobility. Randomly amplified polymorphic DNA (RAPD) and DNA amplification fingerprinting (DAF) RAPD and a similar approach termed DAF use short (5-10 nucleotides) random primers, which anneal at different sites of the genomic DNA, generating PCR products of various lengths. The products are separated on agarose
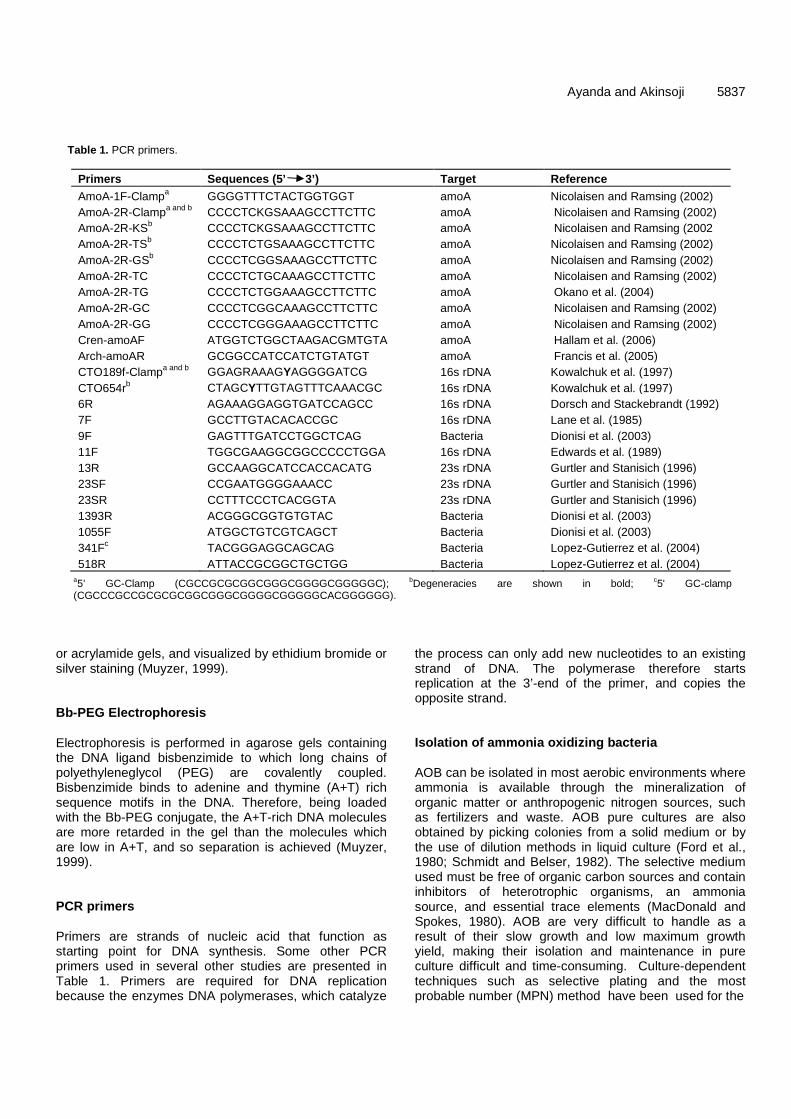
Ayanda and Akinsoji 5837
Table 1. PCR primers.
Primers Sequences (5’ 3’) Target Reference
AmoA-1F-Clampa GGGGTTTCTACTGGTGGT amoA Nicolaisen and Ramsing (2002) AmoA-2R-Clampa and b CCCCTCKGSAAAGCCTTCTTC amoA Nicolaisen and Ramsing (2002) AmoA-2R-KSb CCCCTCKGSAAAGCCTTCTTC amoA Nicolaisen and Ramsing (2002 AmoA-2R-TSb CCCCTCTGSAAAGCCTTCTTC amoA Nicolaisen and Ramsing (2002) AmoA-2R-GSb CCCCTCGGSAAAGCCTTCTTC amoA Nicolaisen and Ramsing (2002) AmoA-2R-TC CCCCTCTGCAAAGCCTTCTTC amoA Nicolaisen and Ramsing (2002) AmoA-2R-TG CCCCTCTGGAAAGCCTTCTTC amoA Okano et al. (2004) AmoA-2R-GC CCCCTCGGCAAAGCCTTCTTC amoA Nicolaisen and Ramsing (2002) AmoA-2R-GG CCCCTCGGGAAAGCCTTCTTC amoA Nicolaisen and Ramsing (2002) Cren-amoAF ATGGTCTGGCTAAGACGMTGTA amoA Hallam et al. (2006) Arch-amoAR GCGGCCATCCATCTGTATGT amoA Francis et al. (2005) CTO189f-Clampa and b GGAGRAAAGYAGGGGATCG 16s rDNA Kowalchuk et al. (1997) CTO654rb CTAGCYTTGTAGTTTCAAACGC 16s rDNA Kowalchuk et al. (1997) 6R AGAAAGGAGGTGATCCAGCC 16s rDNA Dorsch and Stackebrandt (1992) 7F GCCTTGTACACACCGC 16s rDNA Lane et al. (1985) 9F GAGTTTGATCCTGGCTCAG Bacteria Dionisi et al. (2003) 11F TGGCGAAGGCGGCCCCCTGGA 16s rDNA Edwards et al. (1989) 13R GCCAAGGCATCCACCACATG 23s rDNA Gurtler and Stanisich (1996) 23SF CCGAATGGGGAAACC 23s rDNA Gurtler and Stanisich (1996) 23SR CCTTTCCCTCACGGTA 23s rDNA Gurtler and Stanisich (1996) 1393R ACGGGCGGTGTGTAC Bacteria Dionisi et al. (2003) 1055F ATGGCTGTCGTCAGCT Bacteria Dionisi et al. (2003) 341Fc TACGGGAGGCAGCAG Bacteria Lopez-Gutierrez et al. (2004) 518R ATTACCGCGGCTGCTGG Bacteria Lopez-Gutierrez et al. (2004)
a5’ GC-Clamp (CGCCGCGCGGCGGGCGGGGCGGGGGC); bDegeneracies are shown in bold; c5' GC-clamp (CGCCCGCCGCGCGCGGCGGGCGGGGCGGGGGCACGGGGGG).
or acrylamide gels, and visualized by ethidium bromide or silver staining (Muyzer, 1999). Bb-PEG Electrophoresis Electrophoresis is performed in agarose gels containing the DNA ligand bisbenzimide to which long chains of polyethyleneglycol (PEG) are covalently coupled. Bisbenzimide binds to adenine and thymine (A+T) rich sequence motifs in the DNA. Therefore, being loaded with the Bb-PEG conjugate, the A+T-rich DNA molecules are more retarded in the gel than the molecules which are low in A+T, and so separation is achieved (Muyzer, 1999). PCR primers Primers are strands of nucleic acid that function as starting point for DNA synthesis. Some other PCR primers used in several other studies are presented in Table 1. Primers are required for DNA replication because the enzymes DNA polymerases, which catalyze
the process can only add new nucleotides to an existing strand of DNA. The polymerase therefore starts replication at the 3’-end of the primer, and copies the opposite strand. Isolation of ammonia oxidizing bacteria AOB can be isolated in most aerobic environments where ammonia is available through the mineralization of organic matter or anthropogenic nitrogen sources, such as fertilizers and waste. AOB pure cultures are also obtained by picking colonies from a solid medium or by the use of dilution methods in liquid culture (Ford et al., 1980; Schmidt and Belser, 1982). The selective medium used must be free of organic carbon sources and contain inhibitors of heterotrophic organisms, an ammonia source, and essential trace elements (MacDonald and Spokes, 1980). AOB are very difficult to handle as a result of their slow growth and low maximum growth yield, making their isolation and maintenance in pure culture difficult and time-consuming. Culture-dependent techniques such as selective plating and the most probable number (MPN) method have been used for the

5838 Afr. J. Microbiol. Res. enumeration of AOB; however, such techniques are thought to underestimate actual cell numbers. In addition to medium selectivity and bias, MPN underestimation may also stem from inadequate suspension of cells from solid substrates in the environmental sample or dispersal of flocks and microcolonies. Cell damage due to rigorous disruption methods or osmotic shock and the possible dependence on inter- or intraspecies interactions for growth may also generate inaccuracies (Kowalchuk and Steven, 2001). Conclusion Ammonia has been found to be very dangerous to water environment especially to fishes and other aquatic life, its high concentration is mostly responsible for this. It is therefore necessary to convert ammonia to other nitrogen compounds that will have little or no effect on water environment. An example of microorganisms widely used for this purpose are the AOB, they are used for the oxidation of ammonia into nitrite in biological WWTPs. AOB are ecologically important, being the only group of organisms that oxidize ammonia to nitrite in significant amounts, and they appear to be present in all environments in which nitrogen is mineralized (Aakra et al., 1999). Because these microorganisms display low growth rate and high sensitivity to environmental disturbances and inhibitor, the physiological activity and abundance of AOB in wastewater processing is important in the design and operation of waste treatment systems. AOB can be isolated in most aerobic environments as well as low-oxygen environments. The different techniques for the investigation of diversity and community structure of AOB are: denaturing gradient gel electrophoresis (DGGE), Real-Time PCR, fluorescent in situ hybridization (FISH), terminal restriction fragment length polymorphism (T-RFLP), restriction fragment length polymorphism (RFLP), amplified ribosomal DNA restriction analysis (ARDRA), singlestranded-conformation polymorphism (SSCP), randomly amplified polymorphic DNA (RAPD) or DNA amplification fingerprinting (DAF), and bisbenzimide-polyethyleneglycol (Bb-PEG) electrophoresis. Among the various techniques, DGGE appears to be the most frequently used community fingerprinting method. It allows a rapid comparison of the microbial communities between the samples and is generally used to detect shifts in microbial population under different environmental conditions. DGGE technique based on 16S rDNA gene enables the investigation of the spatial and temporal variability of the population in environment, provide information on the predominant species in a community and analyze multiple samples simultaneously. However, it should also be noted that none of these methods is absolutely perfect; they all have their advantages and disadvantages (Muyzer, 1999). Hence, only a polyphasic approach combining different molecular
biological techniques, microbiological methods, and methods to determine the environmental parameters will lead to an unbiased understanding of the role of microorganisms in their environment. REFERENCES
Aakra A, Utaker JB, Nes IF (1999). RFLP of rRNA genes and
sequencing of the 165-235 rDNA intergenic spacer region of ammonia-oxidizing bacteria: a phylogenetic approach. Int. J. Syst. Bacteriol., 49: 123-130.
Akpor OB (2011). Wastewater effluent discharge: Effects and treatment processes. 3rd International Conference on Chemical, Biological and Environmental Engineering, IACSIT Press, Singapore.
Beychok MR (1967). Aqueous wastes from petroleum and petrochemical plants (1st ed.). John Wiley & Sons Ltd. LCCN 67019834.
Bin Z, Baosheng S, Min J, Huina L (2009). Population dynamic succession and quantification of ammonia-oxidizing bacteria in a membrane bioreactor treating municipal wastewater. J. Hazardous Mater., 165: 796–803.
Boari G, Mancini IM, Trulli E (1997). Technologies for water and waste water treatment. Ciheam-Options mediteraneene, pp 261-287.
Bohn H (1992). Consider biofiltration for decontaminating gases. Chem. Eng. Prog., 88:34–40.
Brucculeri M, Bolzonella D, Battistoni P, Cecchi F (2005). Treatment of mixed municipal and winery wastewaters in a conventional activated sludge process: a case study. Wat. Sci. Technol., 51: 89-98.
Caffrey JM, Bano N, Kalanetra K, Hollibaugh JT (2007). Ammonia oxidation and ammonia oxidizing bacteria and archaea from estuaries with differing histories of hypoxia. ISME J., 1: 660–662.
Cho JC, Kim SJ (2000). Increase in bacterial community diversity in subsurface aquifers receiving livestock wastewater input. Appl. Environ. Microbiol., 66: 956–65.
Churchouse S (1997). Membrane bioreactors for wastewater treatment - operating experiences with the Kubota submerged membrane activated sludge process. Membrane Technol., 83: 5-9.
Ding L, Zhou Q, Wang L, Zhang Q (2011). Dynamics of bacterial community structure in a fullscale wastewater treatment plant with anoxic-oxic configuration using 16S rDNA PCR-DGGE fingerprints. Afri. J. Biotechnol., 10: 589-600.
Dionisi HM, Hamrs G, Layton AC, Gregory IR, Parker J, Hawkins SA, Robinson KG, Sayler GS (2003). Power analysis for real-time PCR quantification of genes in activated sludge and analysis of the variability introduced by DNA extraction. Appl. Environ. Microbiol., 69: 6597-6604.
Dorsch M, Stackebrandt E (1992). Some modifications in the procedure of direct sequencing of PCR amplified 16s rDNA. J. Microbiol. Methods 16: 271-279.
Edwards U, Rogall T, Blocker H, Emde M, Bottger EC (1989). Isolation and direct complete nucleotide determination of entire genes. Characterization of a gene coding for 16s ribosomal RNA. Nucleic Acids Res., 17: 7843-7853.
Erguder TH, Boon BN, Wittebolle L, Marzorati M, Verstraete W (2009). Environmental factors shaping the ecological niches of ammonia oxidizing archaea. FEMS Microbiol. Rev., 33: 855–869.
Ford DL, Curchwell RL, Kachtick JW (1980). Comprehensive analysis of nitrification of chemical processing wastewaters. J. Water Pollut. Control Fed., 52: 2726–45.
Francis CA, Roberts KJ, Beman JM, Santoro AE, Oakley BB (2005). Ubiquity and diversity of ammonia-oxidizing archaea in water columns and sediments of the ocean. Proc. Natl. Acad. Sci., 102: 14683–14688.
Gujer W, Jenkins D (1975). The contact stabilization activated sludge process—oxygen utilization, sludge production and efficiency. Water Res., 9: 553-560. Gurtler V, Stanisich VA (1996). New approaches to typing and
identification of bacteria using the 16s-23s rDNA spacer region. Microbiol., 142: 3-16.
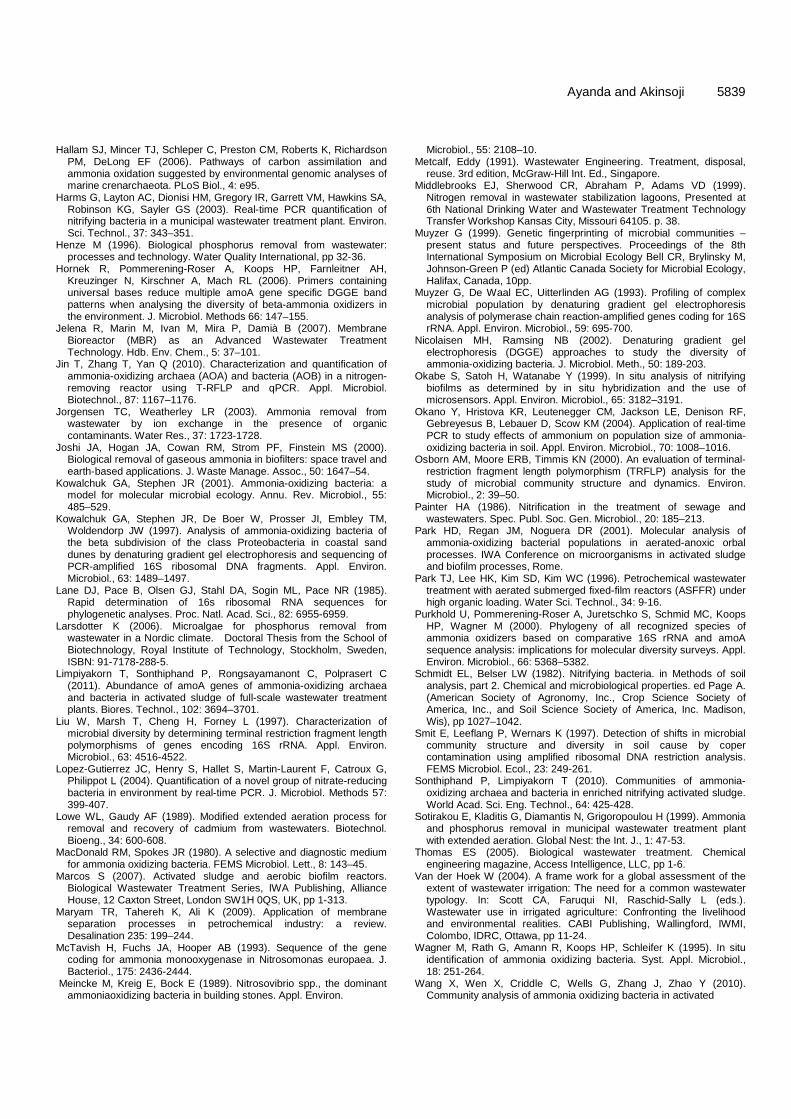
Hallam SJ, Mincer TJ, Schleper C, Preston CM, Roberts K, Richardson
PM, DeLong EF (2006). Pathways of carbon assimilation and ammonia oxidation suggested by environmental genomic analyses of marine crenarchaeota. PLoS Biol., 4: e95.
Harms G, Layton AC, Dionisi HM, Gregory IR, Garrett VM, Hawkins SA, Robinson KG, Sayler GS (2003). Real-time PCR quantification of nitrifying bacteria in a municipal wastewater treatment plant. Environ. Sci. Technol., 37: 343–351.
Henze M (1996). Biological phosphorus removal from wastewater: processes and technology. Water Quality International, pp 32-36.
Hornek R, Pommerening-Roser A, Koops HP, Farnleitner AH, Kreuzinger N, Kirschner A, Mach RL (2006). Primers containing universal bases reduce multiple amoA gene specific DGGE band patterns when analysing the diversity of beta-ammonia oxidizers in the environment. J. Microbiol. Methods 66: 147–155.
Jelena R, Marin M, Ivan M, Mira P, Damià B (2007). Membrane Bioreactor (MBR) as an Advanced Wastewater Treatment Technology. Hdb. Env. Chem., 5: 37–101.
Jin T, Zhang T, Yan Q (2010). Characterization and quantification of ammonia-oxidizing archaea (AOA) and bacteria (AOB) in a nitrogen-removing reactor using T-RFLP and qPCR. Appl. Microbiol. Biotechnol., 87: 1167–1176.
Jorgensen TC, Weatherley LR (2003). Ammonia removal from wastewater by ion exchange in the presence of organic contaminants. Water Res., 37: 1723-1728.
Joshi JA, Hogan JA, Cowan RM, Strom PF, Finstein MS (2000). Biological removal of gaseous ammonia in biofilters: space travel and earth-based applications. J. Waste Manage. Assoc., 50: 1647–54.
Kowalchuk GA, Stephen JR (2001). Ammonia-oxidizing bacteria: a model for molecular microbial ecology. Annu. Rev. Microbiol., 55: 485–529.
Kowalchuk GA, Stephen JR, De Boer W, Prosser JI, Embley TM, Woldendorp JW (1997). Analysis of ammonia-oxidizing bacteria of the beta subdivision of the class Proteobacteria in coastal sand dunes by denaturing gradient gel electrophoresis and sequencing of PCR-amplified 16S ribosomal DNA fragments. Appl. Environ. Microbiol., 63: 1489–1497.
Lane DJ, Pace B, Olsen GJ, Stahl DA, Sogin ML, Pace NR (1985). Rapid determination of 16s ribosomal RNA sequences for phylogenetic analyses. Proc. Natl. Acad. Sci., 82: 6955-6959.
Larsdotter K (2006). Microalgae for phosphorus removal from wastewater in a Nordic climate. Doctoral Thesis from the School of Biotechnology, Royal Institute of Technology, Stockholm, Sweden, ISBN: 91-7178-288-5.
Limpiyakorn T, Sonthiphand P, Rongsayamanont C, Polprasert C (2011). Abundance of amoA genes of ammonia-oxidizing archaea and bacteria in activated sludge of full-scale wastewater treatment plants. Biores. Technol., 102: 3694–3701.
Liu W, Marsh T, Cheng H, Forney L (1997). Characterization of microbial diversity by determining terminal restriction fragment length polymorphisms of genes encoding 16S rRNA. Appl. Environ. Microbiol., 63: 4516-4522.
Lopez-Gutierrez JC, Henry S, Hallet S, Martin-Laurent F, Catroux G, Philippot L (2004). Quantification of a novel group of nitrate-reducing bacteria in environment by real-time PCR. J. Microbiol. Methods 57: 399-407.
Lowe WL, Gaudy AF (1989). Modified extended aeration process for removal and recovery of cadmium from wastewaters. Biotechnol. Bioeng., 34: 600-608.
MacDonald RM, Spokes JR (1980). A selective and diagnostic medium for ammonia oxidizing bacteria. FEMS Microbiol. Lett., 8: 143–45.
Marcos S (2007). Activated sludge and aerobic biofilm reactors. Biological Wastewater Treatment Series, IWA Publishing, Alliance House, 12 Caxton Street, London SW1H 0QS, UK, pp 1-313.
Maryam TR, Tahereh K, Ali K (2009). Application of membrane separation processes in petrochemical industry: a review. Desalination 235: 199–244.
McTavish H, Fuchs JA, Hooper AB (1993). Sequence of the gene coding for ammonia monooxygenase in Nitrosomonas europaea. J. Bacteriol., 175: 2436-2444.
Meincke M, Kreig E, Bock E (1989). Nitrosovibrio spp., the dominant ammoniaoxidizing bacteria in building stones. Appl. Environ.
Ayanda and Akinsoji 5839
Microbiol., 55: 2108–10. Metcalf, Eddy (1991). Wastewater Engineering. Treatment, disposal,
reuse. 3rd edition, McGraw-Hill Int. Ed., Singapore. Middlebrooks EJ, Sherwood CR, Abraham P, Adams VD (1999).
Nitrogen removal in wastewater stabilization lagoons, Presented at 6th National Drinking Water and Wastewater Treatment Technology Transfer Workshop Kansas City, Missouri 64105. p. 38.
Muyzer G (1999). Genetic fingerprinting of microbial communities – present status and future perspectives. Proceedings of the 8th International Symposium on Microbial Ecology Bell CR, Brylinsky M, Johnson-Green P (ed) Atlantic Canada Society for Microbial Ecology, Halifax, Canada, 10pp.
Muyzer G, De Waal EC, Uitterlinden AG (1993). Profiling of complex microbial population by denaturing gradient gel electrophoresis analysis of polymerase chain reaction-amplified genes coding for 16S rRNA. Appl. Environ. Microbiol., 59: 695-700.
Nicolaisen MH, Ramsing NB (2002). Denaturing gradient gel electrophoresis (DGGE) approaches to study the diversity of ammonia-oxidizing bacteria. J. Microbiol. Meth., 50: 189-203.
Okabe S, Satoh H, Watanabe Y (1999). In situ analysis of nitrifying biofilms as determined by in situ hybridization and the use of microsensors. Appl. Environ. Microbiol., 65: 3182–3191.
Okano Y, Hristova KR, Leutenegger CM, Jackson LE, Denison RF, Gebreyesus B, Lebauer D, Scow KM (2004). Application of real-time PCR to study effects of ammonium on population size of ammonia-oxidizing bacteria in soil. Appl. Environ. Microbiol., 70: 1008–1016.
Osborn AM, Moore ERB, Timmis KN (2000). An evaluation of terminal-restriction fragment length polymorphism (TRFLP) analysis for the study of microbial community structure and dynamics. Environ. Microbiol., 2: 39–50.
Painter HA (1986). Nitrification in the treatment of sewage and wastewaters. Spec. Publ. Soc. Gen. Microbiol., 20: 185–213.
Park HD, Regan JM, Noguera DR (2001). Molecular analysis of ammonia-oxidizing bacterial populations in aerated-anoxic orbal processes. IWA Conference on microorganisms in activated sludge and biofilm processes, Rome.
Park TJ, Lee HK, Kim SD, Kim WC (1996). Petrochemical wastewater treatment with aerated submerged fixed-film reactors (ASFFR) under high organic loading. Water Sci. Technol., 34: 9-16.
Purkhold U, Pommerening-Roser A, Juretschko S, Schmid MC, Koops HP, Wagner M (2000). Phylogeny of all recognized species of ammonia oxidizers based on comparative 16S rRNA and amoA sequence analysis: implications for molecular diversity surveys. Appl. Environ. Microbiol., 66: 5368–5382.
Schmidt EL, Belser LW (1982). Nitrifying bacteria. in Methods of soil analysis, part 2. Chemical and microbiological properties. ed Page A. (American Society of Agronomy, Inc., Crop Science Society of America, Inc., and Soil Science Society of America, Inc. Madison, Wis), pp 1027–1042.
Smit E, Leeflang P, Wernars K (1997). Detection of shifts in microbial community structure and diversity in soil cause by coper contamination using amplified ribosomal DNA restriction analysis. FEMS Microbiol. Ecol., 23: 249-261.
Sonthiphand P, Limpiyakorn T (2010). Communities of ammonia-oxidizing archaea and bacteria in enriched nitrifying activated sludge. World Acad. Sci. Eng. Technol., 64: 425-428.
Sotirakou E, Kladitis G, Diamantis N, Grigoropoulou H (1999). Ammonia and phosphorus removal in municipal wastewater treatment plant with extended aeration. Global Nest: the Int. J., 1: 47-53.
Thomas ES (2005). Biological wastewater treatment. Chemical engineering magazine, Access Intelligence, LLC, pp 1-6.
Van der Hoek W (2004). A frame work for a global assessment of the extent of wastewater irrigation: The need for a common wastewater typology. In: Scott CA, Faruqui NI, Raschid-Sally L (eds.). Wastewater use in irrigated agriculture: Confronting the livelihood and environmental realities. CABI Publishing, Wallingford, IWMI, Colombo, IDRC, Ottawa, pp 11-24.
Wagner M, Rath G, Amann R, Koops HP, Schleifer K (1995). In situ identification of ammonia oxidizing bacteria. Syst. Appl. Microbiol., 18: 251-264.
Wang X, Wen X, Criddle C, Wells G, Zhang J, Zhao Y (2010). Community analysis of ammonia oxidizing bacteria in activated

5840 Afr. J. Microbiol. Res. sludge of eight wastewater treatment systems. J. Environ. Sci., 22:
627–634. wastewater stabilization lagoons, Presented at 6th National Drinking
Water and Wastewater Treatment Technology Transfer Workshop Kansas City, Missouri 64105. 38pp.
Wood PM (1986). Nitrification as a bacterial energy source, Nitrification Spec. Publ. Soc. Gen. Microbiol., IRL Press, Oxford. 20: 39-62.
Ye L, Zhang T (2011). Ammonia-oxidizing bacteria dominates over ammonia-oxidizing archaea in a saline nitrification reactor under low DO and high nitrogen loading. Biotechnol. Bioeng,, 108: 2544-2552.

African Journal of Microbiology Research Vol. 5(32), pp. 5841-5847, 30 December, 2011 Available online at http://www.academicjournals.org/AJMR ISSN 1996-0808 ©2011 Academic Journals DOI: 10.5897/AJMR11.351
Full Length Research Paper
Purification and Characterization of 56 KDa cold active Protease from Serratia marcescens
A. L. TARIQ*, A. L. REYAZ and J. JOHN PRABAKARAN
Department of Biotechnology, K.S.R College of Arts and Science Autonomous, Tiruchengode-637215, Tamilnadu, India.
Accepted 30 July, 2011
The extracellular cold active protease produced from Serratia marcescens TS1. The protease was purified to homogeneity from the production medium by ammonium sulphateation then followed by acetone precipitation with 80% saturation. The cold active protease was fractionized by diethylaminoethyl (DEAE) cellulose column chromotography. The molecular weight of protease was approximately 56 KDa. The isoelectric point was close to 6.4. The maximal activity towards casein was found at 40°C and its pH activity was at 8.0. The protease was strongly inactivated by HgCl2 metal ion and reactivated by FeSO4 thus indicated as metalloprotease. The protease was inhibited by Na2 ethylenediaminetetraacetic acid (EDTA). The protease of S. marcescens TS1 showed a potential application in the laundry industry by removeing the blood, chocolate and egg youlk stains from the white cotton cloths in a short period without changing texture of cloths. Key words: Cold active Protease, S. marcescens TS1, extracellular protease, metalloprotease, laundry application.
INTRODUCTION Serratia marcescens is a gram-negative bacteria belonging to the genus Serratia and family enterobacteriaceae (Grimont and Grimont, 2006). The protease secreted by Serratia marcescen was purified by thin layer chromatography (Matsuyama et al., 1986). The advance in biotechnological techniques and enzyme engineering paves way for industrial application of protease (White et al., 1973). Proteolytic enzymes from microorganisms may be located within the cell or excreted into the media (Kohlman et al., 1991). Proteases added to laundry detergent enable to release the proteinaceious materials from stained cloths (Masse and Tilburg, 1983). In addition it improves washing efficiency allows shorter period of agitation, often after a preliminary period of soaking (Nielsen et al., 1981; Demidyuk et al., 2008). Many other keratinolytic alkaline proteases were used in feed technology for the production of peptides for degrading waste keratinous materials in bathtub and drains in public places (Takami *Corresponding author. E-mail: [email protected].
et al., 1992). It is now firmly established that enzymes in organic solvents can expand the applications of biocatalysts in synthetic chemistry (Zaks and Kilbanov, 1984; Zaks, 1991). Some studies have demonstrated the possibility of using alkaline protease to catalyse peptide synthesis in organic solvents (Golobov et al., 1994). The mechanism in each case is the ability of an enzyme to cleave or cut proten target in to two or more pieces usually at a very specific cleavage sites (Mazzone et al., 1990). MATERIALS AND METHODS
Bacterial strains
The psychrotrophic bacterial strain S. marcescens TS1 screened from the soil of dense apple garden around Badran Magam in Ksahmir at altitude of 1630 meters above the sea level. The bacterial strain was grown at 15°C for 24 h in casein enzyme hydrolysate medium (Rifaat et al., 2007). The strain TS1 has the high proteolytic activity was identified by morphological and
biochemical test. Then confirmed based on 16s ribosomal deoxyribonucleic acid (rDNA) gene sequence which were submitted to the Gene Bank and compared with other bacteria by
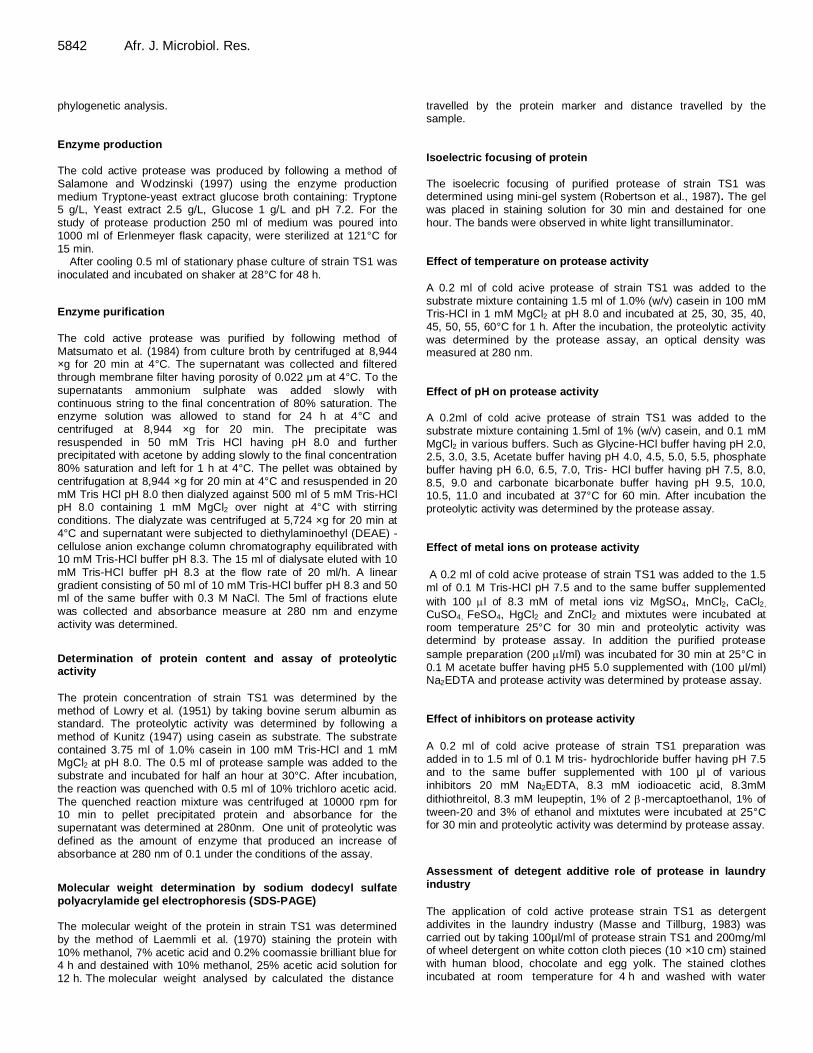
5842 Afr. J. Microbiol. Res. phylogenetic analysis. Enzyme production
The cold active protease was produced by following a method of Salamone and Wodzinski (1997) using the enzyme production medium Tryptone-yeast extract glucose broth containing: Tryptone 5 g/L, Yeast extract 2.5 g/L, Glucose 1 g/L and pH 7.2. For the study of protease production 250 ml of medium was poured into 1000 ml of Erlenmeyer flask capacity, were sterilized at 121°C for 15 min.
After cooling 0.5 ml of stationary phase culture of strain TS1 was
inoculated and incubated on shaker at 28°C for 48 h. Enzyme purification
The cold active protease was purified by following method of Matsumato et al. (1984) from culture broth by centrifuged at 8,944 ×g for 20 min at 4°C. The supernatant was collected and filtered through membrane filter having porosity of 0.022 μm at 4°C. To the
supernatants ammonium sulphate was added slowly with continuous string to the final concentration of 80% saturation. The enzyme solution was allowed to stand for 24 h at 4°C and centrifuged at 8,944 ×g for 20 min. The precipitate was resuspended in 50 mM Tris HCl having pH
8.0 and further
precipitated with acetone by adding slowly to the final concentration 80% saturation and left for 1 h at 4°C. The pellet was obtained by centrifugation at 8,944 ×g for 20 min at 4°C and resuspended in 20 mM Tris HCl pH 8.0 then dialyzed against 500 ml of 5 mM Tris-HCl pH 8.0 containing 1 mM MgCl2 over night at 4°C with stirring conditions. The dialyzate was centrifuged at 5,724 ×g for 20 min at 4°C and supernatant were subjected to diethylaminoethyl (DEAE) -cellulose anion exchange column chromatography equilibrated with 10 mM Tris-HCl buffer pH 8.3. The 15 ml of dialysate eluted with 10 mM Tris-HCl buffer pH 8.3 at the flow rate of 20 ml/h. A linear gradient consisting of 50 ml of 10 mM Tris-HCl buffer pH 8.3 and 50 ml of the same buffer with 0.3 M NaCl. The 5ml of fractions elute
was collected and absorbance measure at 280 nm and enzyme activity was determined.
Determination of protein content and assay of proteolytic activity
The protein concentration of strain TS1 was determined by the method of Lowry et al. (1951) by taking bovine serum albumin as standard. The proteolytic activity was determined by following a method of Kunitz (1947) using casein as substrate. The substrate contained 3.75 ml of 1.0% casein in 100 mM Tris-HCl and 1 mM MgCl2 at pH 8.0. The 0.5 ml of protease sample was added to the substrate and incubated for half an hour at 30°C. After incubation, the reaction was quenched with 0.5 ml of 10% trichloro acetic acid. The quenched reaction mixture was centrifuged at 10000 rpm for 10 min to pellet precipitated protein and absorbance for the supernatant was determined at 280nm. One unit of proteolytic was
defined as the amount of enzyme that produced an increase of absorbance at 280 nm of 0.1 under the conditions of the assay.
Molecular weight determination by sodium dodecyl sulfate polyacrylamide gel electrophoresis (SDS-PAGE)
The molecular weight of the protein in strain TS1 was determined by the method of Laemmli et al. (1970) staining the protein with
10% methanol, 7% acetic acid and 0.2% coomassie brilliant blue for 4 h and destained with 10% methanol, 25% acetic acid solution for 12 h. The molecular weight analysed by calculated the distance
travelled by the protein marker and distance travelled by the sample. Isoelectric focusing of protein
The isoelecric focusing of purified protease of strain TS1 was determined using mini-gel system (Robertson et al., 1987). The gel was placed in staining solution for 30 min and destained for one hour. The bands were observed in white light transilluminator. Effect of temperature on protease activity
A 0.2 ml of cold acive protease of strain TS1 was added to the substrate mixture containing 1.5 ml of 1.0% (w/v) casein in 100 mM Tris-HCl in 1 mM MgCl2 at pH 8.0 and incubated at 25, 30, 35, 40, 45, 50, 55, 60°C for 1 h. After the incubation, the proteolytic activity was determined by the protease assay, an optical density was measured at 280 nm. Effect of pH on protease activity A 0.2ml of cold acive protease of strain TS1 was added to the substrate mixture containing 1.5ml of 1% (w/v) casein, and 0.1 mM MgCl2 in various buffers. Such as Glycine-HCl buffer having pH 2.0, 2.5, 3.0, 3.5, Acetate buffer having pH 4.0, 4.5, 5.0, 5.5, phosphate buffer having pH 6.0, 6.5, 7.0, Tris- HCl buffer having pH 7.5, 8.0, 8.5, 9.0 and carbonate bicarbonate buffer having pH 9.5, 10.0, 10.5, 11.0 and incubated at 37°C for 60 min. After incubation the
proteolytic activity was determined by the protease assay. Effect of metal ions on protease activity
A 0.2 ml of cold acive protease of strain TS1 was added to the 1.5 ml of 0.1 M Tris-HCl pH 7.5 and to the same buffer supplemented
with 100 l of 8.3 mM of metal ions viz MgSO4, MnCl2, CaCl2, CuSO4, FeSO4, HgCl2 and ZnCl2 and mixtutes were incubated at room temperature 25°C for 30 min and proteolytic activity was determind by protease assay. In addition the purified protease
sample preparation (200 l/ml) was incubated for 30 min at 25°C in 0.1 M acetate buffer having pH5 5.0 supplemented with (100 μl/ml) Na2EDTA and protease activity was determined by protease assay. Effect of inhibitors on protease activity
A 0.2 ml of cold acive protease of strain TS1 preparation was added in to 1.5 ml of 0.1 M tris- hydrochloride buffer having pH 7.5 and to the same buffer supplemented with 100 μl of various inhibitors 20 mM Na2EDTA, 8.3 mM iodioacetic acid, 8.3mM
dithiothreitol, 8.3 mM leupeptin, 1% of 2 -mercaptoethanol, 1% of tween-20 and 3% of ethanol and mixtutes were incubated at 25°C for 30 min and proteolytic activity was determind by protease assay.
Assessment of detegent additive role of protease in laundry industry
The application of cold active protease strain TS1 as detergent addivites in the laundry industry (Masse and Tillburg, 1983) was carried out by taking 100µl/ml of protease strain TS1 and 200mg/ml of wheel detergent on white cotton cloth pieces (10 ×10 cm) stained with human blood, chocolate and egg yolk. The stained clothes incubated at room temperature for 4 h and washed with water
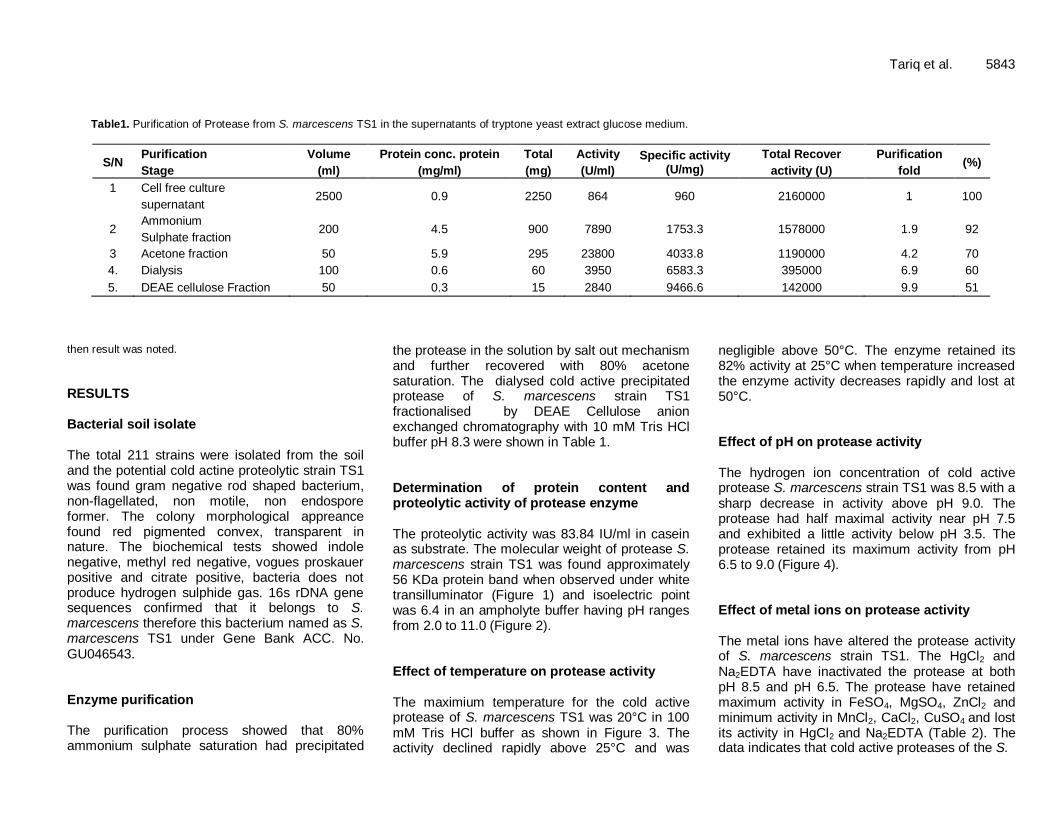
Tariq et al. 5843
Table1. Purification of Protease from S. marcescens TS1 in the supernatants of tryptone yeast extract glucose medium.
S/N Purification
Stage
Volume
(ml)
Protein conc. protein
(mg/ml)
Total
(mg)
Activity
(U/ml)
Specific activity (U/mg)
Total Recover
activity (U)
Purification
fold (%)
1
Cell free culture
supernatant 2500 0.9 2250 864 960 2160000 1 100
2 Ammonium
Sulphate fraction 200 4.5 900 7890 1753.3 1578000 1.9 92
3 Acetone fraction 50 5.9 295 23800 4033.8 1190000 4.2 70
4. Dialysis 100 0.6 60 3950 6583.3 395000 6.9 60
5. DEAE cellulose Fraction 50 0.3 15 2840 9466.6 142000 9.9 51
then result was noted.
RESULTS Bacterial soil isolate The total 211 strains were isolated from the soil and the potential cold actine proteolytic strain TS1 was found gram negative rod shaped bacterium, non-flagellated, non motile, non endospore former. The colony morphological appreance found red pigmented convex, transparent in nature. The biochemical tests showed indole negative, methyl red negative, vogues proskauer positive and citrate positive, bacteria does not produce hydrogen sulphide gas. 16s rDNA gene sequences confirmed that it belongs to S. marcescens therefore this bacterium named as S. marcescens TS1 under Gene Bank ACC. No. GU046543. Enzyme purification The purification process showed that 80% ammonium sulphate saturation had precipitated
the protease in the solution by salt out mechanism and further recovered with 80% acetone saturation. The dialysed cold active precipitated protease of S. marcescens strain TS1 fractionalised by DEAE Cellulose anion exchanged chromatography with 10 mM Tris HCl buffer pH 8.3 were shown in Table 1. Determination of protein content and proteolytic activity of protease enzyme The proteolytic activity was 83.84 IU/ml in casein as substrate. The molecular weight of protease S. marcescens strain TS1 was found approximately 56 KDa protein band when observed under white transilluminator (Figure 1) and isoelectric point was 6.4 in an ampholyte buffer having pH ranges from 2.0 to 11.0 (Figure 2). Effect of temperature on protease activity The maximium temperature for the cold active protease of S. marcescens TS1 was 20°C in 100 mM Tris HCl buffer as shown in Figure 3. The activity declined rapidly above 25°C and was
negligible above 50°C. The enzyme retained its 82% activity at 25°C when temperature increased the enzyme activity decreases rapidly and lost at 50°C. Effect of pH on protease activity The hydrogen ion concentration of cold active protease S. marcescens strain TS1 was 8.5 with a sharp decrease in activity above pH 9.0. The protease had half maximal activity near pH 7.5 and exhibited a little activity below pH 3.5. The protease retained its maximum activity from pH 6.5 to 9.0 (Figure 4). Effect of metal ions on protease activity The metal ions have altered the protease activity of S. marcescens strain TS1. The HgCl2 and Na2EDTA have inactivated the protease at both pH 8.5 and pH 6.5. The protease have retained maximum activity in FeSO4, MgSO4, ZnCl2 and minimum activity in MnCl2, CaCl2, CuSO4 and lost its activity in HgCl2 and Na2EDTA (Table 2). The data indicates that cold active proteases of the S.
5844 Afr. J. Microbiol. Res.
Figure 1. Determination of molecular weight of proteases by sodium dodecyl sulphate agarose
gel electrophoresis.
L1—Molecular marker mass standards: phosphorylase b (97 kDa), tyrosine (85kDa), acid
phosphate (75kDa), bovine serum albumin (66 kDa), glutamic dehydrogenase (55 kDa) and
aldolase (40 kDa)
L2--Protease sample of S. marcescens TS1 (56kDa)
97
85 75 70
66
55
40
56 TS1
L1 L2
Figure 1. Determination of molecular weight of proteases by sodium dodecyl sulphate agarose gel electrophoresis. L1—
Molecular marker mass standards: phosphorylase b (97 kDa), tyrosine (85 kDa), acid phosphate (75 kDa), bovine serum albumin (66 kDa), glutamic dehydrogenase (55 kDa) and aldolase (40 kDa), L2--Protease sample of S. marcescens TS1
(56 kDa).
Figure 2 . Isoelectric focusing electrophoretogram, pH 2.0 to 11.0 stained with coomassie blue.
M—Isoelectric focusing standards: amyloglucosidase (pI 3.6), trypsin inhibitor (pI 4.5), carbonic
anhydrase II (pI 6.5), lentil lectin (pI 8.3) and ribonuclease A (pI 9.6)
L1 & L2--Serratia marcescens TS1 showing pI 6.4
M L1 L2
3.6
4.5
6.5
8.3
9.6
Figure 2. Isoelectric focusing
electrophoretogram, pH 2.0 to 11.0 stained with coomassie blue. M—Isoelectric focusing
standards: amyloglucosidase (pI 3.6), trypsin inhibitor (pI 4.5), carbonic anhydrase II (pI 6.5), lentil lectin (pI 8.3) and ribonuclease A (pI 9.6), L1 and L2--Serratia marcescens TS1 showing pI 6.4.
marcescens strain TS1was to be a metalloprotease because inactivated by the Na2EDTA and reactivated by the Mg
2+, Fe
2+, Zn
2+ is due to increase in the absorbance
value at 280 nm and their residual enzyme activity. Effect of inhibitors on protease activity The cold active protease of S. marcescens strain TS1
Figure 3. Effect of Temperature on protease activity was
examined in 100 mM Tris-HCl buffer having pH 8.0 at 5, 10, 15, 20, 25, 30, 35, 40, 45, 50 and 55°C for 30 min. The Serratia
marcescens strain TS1 showed maximum activity at optimum 25°C.
showed the resistant against the all inhibitors except 20 mM EDTA. The protease retained 80% activity in iodioatic acid, 83% activity in 2-mercaptoethanol, 90% activity in tween 20, 87% activity in 3% ethanol, 73% activity in leupeptin but lost its activity in 20 mM EDTA (Table 3). Detergent application There was the litte blood stain in the white cotton cloth which was treated with detergent only but the blood stain was completely removed from the white cotton cloths which were treated with both detergent and protease of S.marcescens strain TS1. In case of chocklate and egg yolk there was a stains even when treated with detergent but completely removed when treated with both detergent and protease of S. marcescens strain TS1. Thus indicated that protease in presence of detergent removed the stains completely from white cotton cloth pieces (Figure 5). DISCUSSION The S. marcescens strain TSI secreates large extracellular enzyme protease in the surrounding medium (Yanagida et al., 1988). The production was stoped at early stationnary phase at that time maximium protease was produced (Henriette et al., 1993). The 80% ammonium sulphate saturation leads the precipitation of the protease at 4°C and fractional precipitation with acetone (Salamone and Wodzinski, 1997). The excess salt removed from protease by means of a dialysis (Morita et al., 1997). The dialyzate of S. marcescens strain TS1 purified by ion exchange chromatography

Tariq et al. 5845
0
10
20
30
40
50
60
Effect of Hydrogen ion concentration
Enzy
me
Act
ivit
y IU
/ml
Figure 4. Effect of pH on protease activity was examined in various buffers such as
Glycine-HCl buffer having pH 2.0 to 3.5, Acetate buffer having pH 4.0 to 5.5, Phosphate
buffer having pH 6.0 to7.0, Tris-HCl buffer having pH 7.5 to 9.0 and Carbonate-Bicarbonate buffer having pH 9.5 to 11.0 at 30°C for 30 min. The pH optimum of Serratia marcescens strain TS1 was at pH 8.5 Tris-HCl buffer.
Table 2. Effect of metal ions on protease activity was examined in 8.3 mM of MgSO4, MnCl2, CaCl2, CuSO4, FeSO4, HgCl2 and ZnCl2 in 0.1 M Tris-HCl buffer having pH 7.5 at 25°C for 30 min. The metal ions HgCl2 and 20
mM Na2EDTA have inactivated the protease of Serratia marcescens TS1.
S/n Metal ion Residual protease activity (%)
1 Native protease 100
2 FeSO4 81
3 MnCl2 22
4 CaCl2 15
5 CoSO4 11
6 ZnCl2 70
7 MgSO4 78
8 HgCl2 00
9 Na2EDTA 00
Table 3. Effect of inhibitors on protease activity was examined in 20 mM EDTA, 8.3 mM Iodioacetic acid, 8.3 mM Dithiothreitol, 8.3 mM Leupeptin, 1% of 2- β Mercaptoethanol, 1% of Tween 20 and 3% of ethanol in 0.1 M Tris-HCl having pH 7.5 at 25°C for 30 min. The protease of Seratia marcescens strain TS1 was inactivated completely by 20 mM EDTA.
S/N Inhibitor Residual protease activity (%)
1 Native protease 100
2 Iodioacetic acid 80
3 2- Mercaptoethanol 83
4 Tween 20 90
5 3% Ethanol 8
6 Dithiothreitol 73
7 Leupeptin 82
8 20 mM EDTA 00
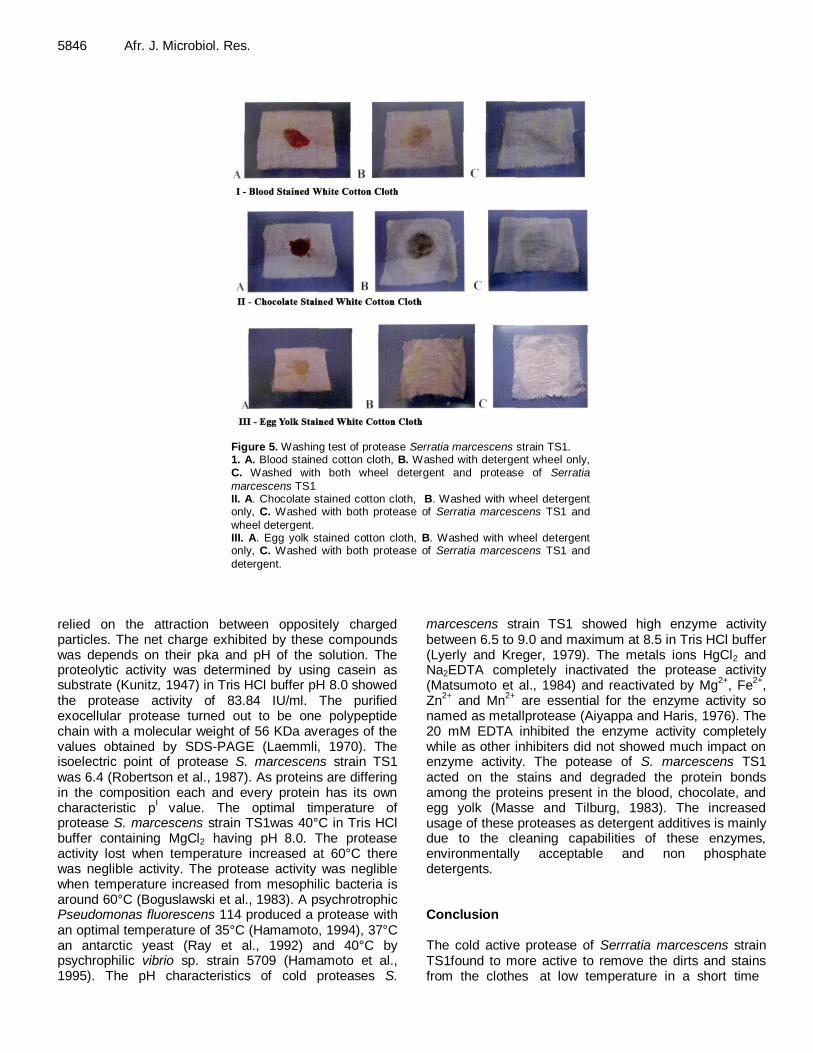
5846 Afr. J. Microbiol. Res.
Figure 5. Washing test of protease Serratia marcescens strain TS1. 1. A. Blood stained cotton cloth, B. Washed with detergent wheel only, C. Washed with both wheel detergent and protease of Serratia
marcescens TS1 II. A. Chocolate stained cotton cloth, B. Washed with wheel detergent only, C. Washed with both protease of Serratia marcescens TS1 and
wheel detergent. III. A. Egg yolk stained cotton cloth, B. Washed with wheel detergent only, C. Washed with both protease of Serratia marcescens TS1 and
detergent.
relied on the attraction between oppositely charged particles. The net charge exhibited by these compounds was depends on their pka and pH of the solution. The proteolytic activity was determined by using casein as substrate (Kunitz, 1947) in Tris HCl buffer pH 8.0 showed the protease activity of 83.84 IU/ml. The purified exocellular protease turned out to be one polypeptide chain with a molecular weight of 56 KDa averages of the values obtained by SDS-PAGE (Laemmli, 1970). The isoelectric point of protease S. marcescens strain TS1 was 6.4 (Robertson et al., 1987). As proteins are differing in the composition each and every protein has its own characteristic p
I value. The optimal timperature of
protease S. marcescens strain TS1was 40°C in Tris HCl buffer containing MgCl2 having pH
8.0. The protease
activity lost when temperature increased at 60°C there was neglible activity. The protease activity was neglible when temperature increased from mesophilic bacteria is around 60°C (Boguslawski et al., 1983). A psychrotrophic Pseudomonas fluorescens 114 produced a protease with an optimal temperature of 35°C (Hamamoto, 1994), 37°C an antarctic yeast (Ray et al., 1992) and 40°C by psychrophilic vibrio sp. strain 5709 (Hamamoto et al., 1995). The pH characteristics of cold proteases S.
marcescens strain TS1 showed high enzyme activity between 6.5 to 9.0 and maximum at 8.5 in Tris HCl buffer (Lyerly and Kreger, 1979). The metals ions HgCl2 and Na2EDTA completely inactivated the protease activity (Matsumoto et al., 1984) and reactivated by Mg
2+, Fe
2+,
Zn2+
and Mn2+
are essential for the enzyme activity so named as metallprotease (Aiyappa and Haris, 1976). The 20 mM EDTA inhibited the enzyme activity completely while as other inhibiters did not showed much impact on enzyme activity. The potease of S. marcescens TS1 acted on the stains and degraded the protein bonds among the proteins present in the blood, chocolate, and egg yolk (Masse and Tilburg, 1983). The increased usage of these proteases as detergent additives is mainly due to the cleaning capabilities of these enzymes, environmentally acceptable and non phosphate detergents. Conclusion The cold active protease of Serrratia marcescens strain TS1found to more active to remove the dirts and stains from the clothes at low temperature in a short time

without damaging the nature of the cloth. So the economic values and enhencer actions will be boom to the detergent industry as detergent additives. REFERENCES Aiyappa PS, Harris JO (1976). The extracellular metalloprotease of
Serratia marcescens: I. Purification and characterization. Mole
Cellular Biochem., 13(2): 95-100. Boguslawski G, Shults JL, Yehle CO (1983). Purification and characterization of an extracellular protease from flavobacterium
arborescens. Anal. Biochem., 132: 41-49.
Demidyuk IV, Gasanov EV, Safina DR, Kostrov SV (2008). Structural
organization of precursors of Thermolysin-like proteinases. J. Protein., 27: 343–354.
Golobov MY, Stepanov VM, Voyushina TL, Morozoea IP, Adlvereutz P
(1994). Side reactions in enzymatic peptide synthesis in organic media; Effect of enzyme, solvent and substrate concentration. Enzy. Micrbial Technol., 16:522-528.
Grimont F, Grimont PAD (2006). The Genus Serratia. J. Prokaryotes.,
6:219-244. Hamamoto T, Kaneda M, Horikoshi K, Kudo T (1994). Characterization
of a protease from psychrotroph, Pseudomonas fluroescens 114.
Appl. Envinron. Microbiol., 60: 3878-3880. Hamamoto T, Kaneda M, Kudo T, Horikoshi K (1995). Characterization
of protease from psychrophilic Vibrio sp. strain 5709. J. Mar.
Biotechnol., 2: 219 -222. Henriette C, Zinebi S, Aumaitre MF, Petitdemange E, Petitdemange H
(1993). Protease and lipase production by a strain of S. marcescens
(532 S). J. Indstrl. Microbiol., 12:129-135. Kunitz M (1974). Crystalline soybean trypsin inhibitor.II.General
properties. J. Gen. Physiol., 30:291-297. Laemmli UK (1970). Clearage of structural proteins during the assembly
of the head of bacteriophage. J. T. Nat., 227: 680– 685.
Lowry OH, Rosebrough NJ, Farr AL, Randall RJ (1951). Protein measurement with the Folin phenol reagent. J. Biol. Chem., 193: 265-275.
Lyerly D, Kreger A (1979). Purification and characterization of a S. marcescens metalloprotease. J. Infect. Immunity., 24(2): 411-421.
Masse FWJ, Tilburg RV (1983). The benfit of detergents enzymes
under changing washind conditions. J. Oil Chem. Soci., 60: 1672-1675.
Matsumoto KMH, Takata K, Kamata R, Okamura R (1984). Purification and characterization of four proteases from clinical isolates of S. marcescens kums 3958. J. Bacteriol., 157(11): 225-232.
Tariq et al. 5847 Matsuyama T, Murakami T, Fujita M, Fujita S, Yano I (1986).
Extracellular vesicle formation and biosurfactant production by Serratia marcescens. J. Genrl. Microbiol., 132: 865-875.
Mazzone M, Catalani M, Costanzo D (1990). Evaluation of Serratia peptidase in acute or chronic inflamation of otorhinolaryngology pathology: a multicentre, double-blind, randomized trial verses
placebo. J. Int. Med. Res., 18(5): 379-388. Morita Y, Kondoh K, Quamaral H, Sakaguchi T, Murakami Y,
Yokoyama K, Tamiya E (1997). Purification and characterization of a cold-active protease from psychrotrophic S. marcescens AP3801.
J.A.O.C.S., 74: 1377-1383. Nielsen MH, Jenson SJ, Outtrup H (1981). Enzymes for a low
temperature washing. J. Amr. oil Chem. Soci., 58:644-649. Ray MK, Devi KU, Kumar GS, Shivaji S (1992). Extracelluar protease
from the Antarctic yeast candida humicola, Ibid., 58: 1918 – 1923.
Rifaat HM, Said OHE, Hassanein SM, Selim MSM (2007). Protease activity of some mesophilic Streptomycetes isolated from Egyptian
habitats. J. Cultu. Collection., 5:16-24.
Robertson EF, Dannelly HK, Malloy PJ, Reeves HC (1987). Rapid isoelectric focusing in a vertical polyacrylamide mini gel system. Anal. Biochem., 167: 290-294
Salamone PR, Wodzinski RJ (1997). Production, purification and characterization of a 50-KDa extracellular metalloprotease from Serratia marcescens. Appl. Microbiol. Biotechnol., 48: 317-324.
Takami HT, Akiba A, Horikoshi K (1992) Substrate specificity of Thermostable Alkaline Protease from Bacillus spp. No . AH – 101.
Biosci. Biotechnol. Biochem., 56: 333-341.
White A, Handler P, Smith E L (1973) Principles of Biochemistry. 5th
edition 1296. Williams and Wilkins. 787. Yanagida N, Uozumi T, Beppu T (1988). Specific excretion of S.
marcescens protease through the outer membrane of Escherichia coli. J. Bacteriol., 166: 937-944.
Zaks A (1991). Enzyme in organic solvent. In: Dordisk. J. S., ed
Biocatalyst for industry. New York: Plenum Press. 166-180. Zaks A, Kilbanov AM (1984). Enzymatic catalysis in organic media at
100°C. Enzy. Microb. Technol., 224:1145-1152.

African Journal of Microbiology Research Vol. 5(32), pp. 5848-5853, 30 December, 2011 Available online at http://www.academicjournals.org/AJMR ISSN 1996-0808 ©2011 Academic Journals DOI: 10.5897/AJMR11.703
Full Length Research Paper
Overlap effects of cyromazine concentration, treatment method and rearing temperature on the Southern
cowpea weevil (Callosobruchus maculatus F.) reared on cowpea
Fahd Abdu Al-Mekhlafi1, Ashraf Mohamed Ali Mashaly1*, Ahmed A. Mahmoud Abdel Mageed2, Mohamed Ahmed Wadaan1 and Nazar M. Al-Mallah3
1Chair of Advanced Proteomics and Cytomics Research, Department of Zoology, College of Science, King Saud
University, Riyadh 11451, Kingdom of Saudi Arabia. 2Department of Botany and Microbiology, King Saud University, Riyadh 11451,
Kingdom of Saudi Arabia. 3Plant Protection Department, College of Agriculture and Forestry, Mosul University, Mosul, Iraq.
Accepted 31 October, 2011
Overlap of insect growth regulator (cyromazine) concentration, treatment method and rearing temperature was studied on the southern cowpea weevil, Callosobruchus maculatus F. (Bruchidae: Coleoptera), under laboratory conditions. A concentration of 5% cyromazine and dipping treatment at 30°C showed a significant reduction in the reproductive rate by 0.5%. Moreover, increasing the cyromazine concentration led to a decrease in food consumption. Hence, treatment of cowpea seeds via dipping method provided more protection compared to spraying method. Also, the increase of cyromazine concentration led to an increase of generation's lifespan. The longest generation lifespan recorded was 33.33 days when treated with 5% cyromazine by dipping at 30°C. On the other hand, the shortest generation lifespan recorded was 25.33 days when treated with 1% cyromazine concentration by dipping at 30°C. This study showed that there is no effect of the overlap between studied factors, neither in the disparity of sex ratio nor in the disparity of males and females body weights. Key words: IGR, Insect pest, reproductive rate, sex ratio, Trigard, cyromazine.
INTRODUCTION Legumes are considered as important crops in the world, as they are used for feeding human and animals in the form of green crops or dry seeds. Legumes are attacked by many insect pests in the field and in stores. The southern cowpeas weevil, Callosobruchus maculates, is one of the most common pests, with more than 35 kinds (in the field and stores) of which the most important of them is the cowpea weevil. This insect inflicts heavy losses to seeds up to 62%, since a single larva consumes about 50% of single seed weight during its *Corresponding author. E-mail: [email protected]. Tel: +966552574903. Fax: +96614678514.
development (Elazawe and Mahadi, 1983). Saplina (1980) reported that this insect is spread over more than 30 countries around the world. Its ability to fly facilitates the operation of transferring from store to field and reverse easily. The damage is caused as a result of the larvae feeding on the growing seeds, and this damage increases as larvae continue to grow due to increasing consumption of seeds contents (Howe and Currie, 1964; Pajni, 1965; Elazawe et al., 1990). Bastos (1973) found out when testing 241 samples of cowpea seeds that the rate of hit with southern cowpea was 37.8% of the tested samples and after storage for 56 days the damage percentage reached 68.6%, which subsequently led to decrease of the trade value of cowpea seeds by 56%.
The presence of residues in food, resistance develop-
ment by pest species, health risks (Arthur, 1996), increased cost (Hagstrum and Subramanyam, 2006) and toxicity to non-target organisms (Fields, 1992) has created strong concerns with the use of synthetic chemicals in controlling stored-product insects. Thus, insect growth regulators (IGR) are considered one of the most suitable alternative natural pesticides as they may adversely affect insects by regulating or inhibiting specific biochemical pathways or processes essential for insect growth and development. Some insects exposed to such compounds may die due to abnormal regulation of hormone-mediated cell or organ development. Other insects may die either from a prolonged exposure at the developmental stage to other mortality factors (susceptibility to natural enemies, environmental conditions, etc) or from an abnormal termination of a developmental stage itself (Tunaz, 2004). Miller et al. (1981) pointed out that the use of insect growth regulator (cyromazine) 0.25, 0.5 and 0.1% concentration against the larvae of Musca domestica Linn caused 95% mortality, recording rate of success of 3 to 10 over the growth regulator diflubenzuron. In addition, Saito (1988) reported that adding 75% of cyromazine to water resulted in 88% mortality amongst larvae of Liriomyza bryoniae Kalt. In an experiment involving the use of cyromazine at the rate of 0.1, 0.5 and 1.1% g/ kg weight of animal in the field of milk cows, Miller et al. (1996) found that its residue in cows' waste discouraged the development of M. domestica larvae. Levot and Sates (1998) also found that the use of cyromazine and dezinion each individually against M. domestica by concentration 0.4 g/L led to a reduction in the number of M. domestica at rate of 69% after one day of treatment and 99.97% in three days of treatment. Vazirianzadeh et al. (2007) concluded that cyromazine (Trigard) should be used in a larvicidal program to control house-fly. More importantly, insect growth regulators were considered to be better used in an integrated pest management program, rather than being used alone (Oberlander et al., 1997).
The objectives of the current study were to determine the impact of overlapping between the different concentrations of growth regulator (cyromazine), treatment methods and the temperatures in the biological activity of southern cowpea weevils. MATERIALS AND METHODS
Experimental insects
The southern cowpea weevil, Callosobruchus maculatus F. (Bruchidae: Coleoptera), was obtained from an entomological research laboratory in the College of Agriculture and Forestry, University of Mosul. All cowpeas (Vigna unguiculata) seeds were put in glass jar (1/2 kg each). The southern cowpea weevils were added (20 weevil/jar), covered with a piece of cloth, bond with rubber firmly and then incubated at 30 ± 2°C or 50 ± 5% (Ishimoto
et al., 1996). Cultures were renewed after each generation by taking the newly emerged insects for construction of a new culture to conduct further studies.
Al-Mekhlafi et al. 5849 Insect growth regulator (cyromazine) This pesticide works as a growth regulator and is used to control larvae of Diptera and Coleoptera. It is being used as a powder in water containing 750 g /kg effective cyromazine (N-cyclopropyl 1, 3, 5-triazine-2, 4, 6-triamine) and sold under the names of various commercial (Larvadex, Premix) classifies toxically within the Class III according to the classification of the World Health Organization (WHO). Solutions of cyromazine were freshly prepared immediately prior to the experiments (Awad and Mulla, 1984). Pesticide bioassays
Three concentrations of cyromazine were applied (1, 3 and 5%) in the treatment of chickpea seeds. Seeds (25 g per time) were treated twelve times and six times treated in a spraying manner using the Potter Tower at 5 lbs/inches pressure and 2.5 ml of cyromazine solution, ensuring coverage of the surface of seeds. The remaining six were treated by dipping in the cyromazine solution for 1 min. For the control, seeds were treated with water only. Drought seeds have been placed in plastic pots (7 × 7 cm)
then five pairs (males and females) of newly emerged adults were transferred into each pot and covered with a piece of cloth sealed with a rubber bond. Pots were then incubated at 25 ± 1 or 30 ± 1°C and 50 ± 5% RH. Treatments were followed up to two successive generations to specify the overlap between different concentrations of cyromazine, treatment method and rearing temperature on the following: Reproductive rate of the southern cowpea weevils is calculated for two successive generations using the formula of Krebs (1978):
r =
dn / dt
n Where r is the reproductive rate; n is the number of colony individuals; dn is the change in the number of colony individual; and dt is the change in time.
The rate of food consumption was measured by weighing the treated seeds after the end of experiment and deducted from the original weight (25 g). Generation lifespan was calculated from the new adult emergence (from the pupae) until the advent of insects in the second-generation. Sex ratio and weight of males and females were tested by taking a random group of full complete insects each in pot and calculating the number of males and females and their weight. Data analysis
For conducting the test and analyzing its data, the factorial completely randomized design and Duncan's multiple range tests to change the averages of endurable level 5% (Daoud and Elyass, 1990) were used.
RESULTS AND DISCUSSION
The results presented in Table 1 indicate that increasing in the cyromazine concentration resulted in significant reduction in the reproductive rate of the treated southern cowpea weevils compared to control ones. Cyromazine-treated insects (with a concentration of 5%) showed reproductive rate of 2.58% compared to 36.1% in control ones. House et al. (1978) stated that when they used

5850 Afr. J. Microbiol. Res.
Table 1. Summarized results of studied parameters on the southern cowpea weevil, C. maculatus, reared on cowpeas with the different concentrations of cyromazine, treatment methods and temperatures.
Concentration (%) Treatment methods Temperatures
1 3 5 Control Dipping Spraying 25°C 30°C
Reproductive rate 23.3C 8.74
B 2.58
A 36.11
D 14.41
A 21
B 18.50
B 16.9
A
Food consumption 8.87C 5.61
B 2.89
A 18.28
D 6.89
A 10.94
B 9.29
B 8.54
A
Generation lifespan 28.7C 29.79
B 30.67
A 27.71
D 28.81
B 29.63
A 31.79
A 26.65
B
Sex ratio
M 1.05A 1.18
A 1.19
A 1.11
A 1.16
A 1.11
A 1.10
A 1.17
A
F 1.14A 1.05
A 1.05
A 1.04
A 1.07
A 1.07
A 1.07
A 1.07
A
Average weights M 0.96
A 1.07
B 1.05
B 0.95
A 0.99
A 1.02
A 1.02
A 0.99
A
F 1.36A 1.59
B 1.42
A 1.44
A 1.42
A 1.49
A 1.45
A 1.46
A
Averages of similar characters refer to the existence of significant differences at the 0.05% level of probability. M, Male; F, female.
diflubenzuron to control the boll weevils, Anthonomus grandis (Boheman), at a rate of 35, 70 and 140 g/ha, there was an effective reduction in the total percentage of adult emergence from pupae (37.7, 22.21 and 15.8%, respectively). The use of 4 growth regulator, hydroprene, methoprene, diflubenzuron, and MV-678 to control Ephestia cautella (Walker) on the peanut, with increased concentration resulted to a decrease of adult emergence (Nickle, 1979). These growth regulators led to down-regulation of the rate of the fertility among treated insects. In oblique-banded leafroller Choristoneura rosaceana (Harris), the pupation and adult emergence was significantly delayed at pyriproxyfen concentrations higher than 1 ppm (Sial and Brunner, 2010).
Considering the effect of treatment methods on the reproductive rate, Table 1 shows a decrease in the southern cowpea weevils’ number when treated via dipping method (14.41%), compared with the spraying methods (21%). The production rate was monitored with temperature since it was 16.90 at 30°C, while at 25°C it was 18.50. Buholzer et al. (1992) also tested the efficiency of growth regulator (Match) at three different degrees of temperature 18, 24, 30°C in controlling cotton leaf worm Spodoptera littoralis (Boisd.) and reported a positive relation between temperature and the efficiency of the Match. The mortality rate increase accordingly with increase in temperature, perhaps that relevant to increasing of insect activity at high temperature leading to increase of growth regulator pick up.
The data from overlap experiment indicated that dipping-treated cowpea seeds (in 5% cyromazine solution at 30°C) showed significant decrease of the production rate of the southern cowpea weevil, recording 0.5, where it was 36.43 in spraying methods (Table 2). The obtained results as shown in Table 1 revealed that the rate of food consumption (8.87, 5.61, and 2.89 g) decreased when cyromazine concentration (1, 3, and 5%) increased compared to control (18.28 g). A significant influence of treatment methods, preferring the
dipping method over spraying one where the dipping method resulted in decrease in the rate of food consumption (6.89 g) compared to that of the spraying methods (10.94 g). Temperature also had a significant impact, where at 25°C the rate of food consumption was high (2.29 g), compared to that at 30°C (3.30 g). Gabouri (2000) mentioned that Southern cowpea weevils at 25°C consumed 17.17 g of the food during a complete generation in contrast with that raised at 30-35°C which consumed 12.38 g, and 10.88 g, respectively. Data from overlap experiment indicated that cowpea seeds treated via dipping method in 5% cyromazine solution at 30°C led to significant decrease of the food consumption rate of the southern cowpea weevil, recording 0.5, whereas it was 4.04% in spraying methods (Table 2).
The generation lifespan reached 28.71, 29.79, and 30.67 days at the concentration of 1, 3, and 5% respectively, in contrast with water treated control. The generation lifespan clearly decreased when the dipping method was applied at 28.81 days, while in spraying method was 29.63 days. Temperature plays important role; at 30°C the average of the generation lifespan was 26.65 days, in contrast with generation lifespan at 25°C recorded 31.79 days (Table 1). The highest generation lifespan recorded was 33.33 days in spraying treatment at 5% concentration and 25°C, and the lowest generation lifespan was 26.33 days in dipping treatment at 1% concentration and 30°C (Table 2). Furthermore, Tables 1 and 3 showed no significant differences observed for the sex ratio in any test concentration, treatment method and the temperature compared to the control. Similarly, in Chironomus riparius, no significant differences to solvent control were observed in any test concentration, although an exclusive production of males by Daphnia was observed with pyriproxyfen at 100 ng/L (Wang et al., 2005; Tatarazako et al., 2003). Other studies with C. riparius which reported sex-related effects at sensitive (molecular) level also exist (Hahn et al., 2001; Hahn and Schulz, 2002). For example Hahn and Schulz (2002)

Al-Mekhlafi et al. 5851 Table 2. Overlap effect of different concentrations of cyromazine, treatment methods and temperatures on the reproductive rate, food consumption rate and generation lifespan of the southern cowpea weevil, C. maculates reared on cowpeas.
Concentration (%) Treatment method Temperature Reproductive rate Food consumption rate Generation lifespan
1
Dipping
25
20.60 ± 0.26F 7.23 ± 0.16
F 31.17 ± 0.17
C
3 3.27 ± 0.15C 4.93 ± 0.23
E 32.33 ± 0.17
B
5 1.53 ± 0.15B 2.56 ± 0.09
B 32.5 ± 0.29
AB
Control 36.07 ± 0.23J 12.72 ± 0.14
K 30.17 ± 0.17
D
1
Spraying
30 ± 0.29I 11.18 ± 0.16
G 32 ± 0.50
B
3 15.47 ± 0.15E 7.75 ± 0.25
I 32.67 ± 0.33
AD
5 4.9 ± 0.06D 4.46 ± 0.07
DE 33.33 ± 0.33
A
Control 36.2 ± 0.12J 23.45 ± 0.21
N 30.17 ± 0.17
D
1
Dipping
30
15.5 ± 0.29E 7.02 ± 0.18
FH 25.33 ± 0.17
HI
3 1.4 ± 0.21B 3.19 ± 0.04
C 26.67 ± 0.33
H
5 0.05 ± 0.06A 0.50 ± 0.06
A 27.67 ± 0.17
F
Control 36.43 ± 35J 16.94 ± 0.24
L 24.67 ± 0.17
J
1
Spraying
27.43 ± 0.07H 10.04 ± 0.28
J 26.33 ± 0.17
H
3 14.83 ± 0.44E 6.55 ± 0.16
F 27.5 ± 0.50
F
5 3.4 ± 0.21C 4.04 ± 0.18
D 29.17 ± 0.17
E
Control 35.73 ± 0.15J 20.02 ± 0.13
M 25.83 ± 0.17
HI
Averages of similar characters refer to the existence of significant differences at the 0.05% level of probability.
Table 3. Overlap effect of different concentrations of cyromazine, treatment methods and temperatures on the sex ratio
of the southern cowpea weevil, C. maculates reared on cowpeas.
Concentration (%) Treatment method Temperature Mean of the sex ratio ± S.E
Male Female
1
Dipping
25
1.05 ± 0.05A 1.12 ± 0.12
AB
3 1.13 ± 0.13A 1.O3 ± 0.02
AB
5 1.09 ± 09A 1.06 ± 0.06
AB
Control 1.11 ± 0.08A 1.06 ± 0.06
AB
1
Spraying
1.07 ± 0.07A 1.04 ± 0.03
AB
3 1.15 ± 0.10A 1.09 ± 0.09
AB
5 1.09 ± 0.09A 1.12 ± 0.08
AB
Control 1.O7 ± 0.07A 1.04 ± 0.04
AB
1
Dipping
30
1 ± 0A 1.32 ± 0.27
B
3 1.25 ± 0.09AB
1 ± 0A
5 1.47 ± 0.14B 1 ± 0
A
Control 1.17 ± 0.17A 1 ± 0
A
1
Spraying
1.07 ± 0.04A 1.O7 ± 0.07
AB
3 1.19 ± 0.10AB
1.06 ± 0.06AB
5 1.11 ± 0.08A 1.04 ± 0.04
AB
Control 1.07 ± 0.07A 1.07 ± 0.07
AB
Averages of similar characters refer to the existence of significant differences at the 0.05% level of probability.

5852 Afr. J. Microbiol. Res.
Table 4. Overlap effect of different concentrations of cyromazine, treatment methods and temperatures on the average weights of the southern cowpea weevil, C. maculates reared on cowpeas.
Concentration (%) Treatment method Temperature Mean of the average weights ± S.E
Male Female
1
Dipping
25
1.07 ± 0.7CDE
1.37 ± 0.02AB
3 1.05 ± 0.05BCDE
1.52 ± 0.02BC
5 1 ± 0.03BCDE
1.53 ± 0.15BC
Control 1 ± 0.03BCDE
1.45 ± 0.1AB
1
Spraying
0.95 ± 0.03ABCD
1.27 ± 0.07A
3 1.08 ± 0.04CDE
1.83 ± 0.14D
5 1.02 ± 0.11BCDE
1.30 ± 0.03AB
Control 1.02 ± 0.02BCDE
1.32 ± 0.03AB
1
Dipping
30
0.82 ± 0.04A 1.30 ± 0.09
AB
3 1.02 ± 0.03BCDE
1.32 ± 0.06AB
5 1.07 ± 0.04CDE
1.37 ± 0.03AB
Control 0.92 ± 0.04ABC
1.5 ± 0.06ABC
1
Spraying
1 ± 0.05BCDE
1.52 ± 0.06BC
3 1.12 ± 0.02DE
1.70 ± 0.06CD
5 1.13 ± 0.07E
1.48 ± 0.02ABC
Control 0.88 ± 0.05AB
1.50 ± 0.05ABC
Averages of similar characters refer to the existence of significant differences at the 0.05% level of probability.
observed a sex-related effect of tributyltin on the ecdysteroid synthesis and the imaginal disk development by C. riparius. In Leptomastix dactylopii (Howard), when kinoprene was applied, Rothwangl et al. (2004) found that the sex ratio was equivalent in the petri dish experiment, whereas in the cage experiment the sex ratio was biased toward males.
Regarding the rate of male weight, the increase of cyromazine concentration led to increase of male weight recording 0.96, 1.5 and 1.7 mg at concentrations of 1, 3 and 5, respectively (Table 1), in contrast with control treatment (0.95 mg). Also the study concluded a non significant effect of concentration, temperature and treatment method in the average of male weight recording 1.13 mg at 5% concentration using the spraying method at 30°C as the highest weight. However the lowest male weight recorded was 0.82 mg at 1% concentration via dipping method and at 30°C. For the female average weight, the weight recorded was 1.59 mg at concentration 3% and recorded 1.36, 1.42 mg at 1 and 5% concentration, respectively. Taking together, these results showed no significant differences in the average weight of female between the two concentrations (1 and 5%) and the control, but there was a little difference in female weight at 3% concentration. Also there were no differences in the female weight at 25 to 30°C and the two different methods of treatment (Table 1). The highest female average weight recorded was 1.83 mg at 3%
concentration via spraying method at 25°C and the lowest weight recorded was 1.27 mg at 1% concentration via spraying method at 25°C (Table 4). Sial and Brunner (2010) studied the effect of pyriproxyfen, on oblique-banded leafroller C. rosaceana (Harris) and found that the weights of adults were significantly increased.
In conclusion, the study of the overlap between cyromazine concentration, treatment method and temperature on the southern cowpea weevil for two successive generations indicated the existence of a difference in the reproductive rate, the rate of food consumption and average of generation lifespan. However, there was no effect neither in the disparity of sex ratio nor in the disparity in the weight of males and females. ACKNOWLEDGEMENT The authors extend their appreciation to the Deanship of Scientific Research at king Saud University for funding the work through the research group project no. RGP- VPP-028. REFERENCES
Arthur FH (1996). Grain protectants: current status and prospects for the future. J. Stored Prod. Res. 32: 293-302.

Awad TI, Mulla MS (1984). Morphogenetic and histo pathological effects
induced by the insect growth regulator Cyromazine in Musca domistica L Diptera: Muscidae. J. Med. Entomol. 21(4): 419-426.
Bastos JAM (1973). Evaluations of the damage caused by the weevil C. maculatus (F.) in samples of coupea vigna sinensis (L) collected at
Fortaleza ceara. Pesquisa Agropecualia Brasileira Seric Agronomia
8(7):131-132, Cited by The Rev. Appl. Entomol., 64(2): 936. Buholzer F, Draber J, Bourgeois F, Guyer W (1992). CGA, 184; 699
anew acylurea insecticide Med. Fac. Landbouw. Univ Gent. 57(3):
790. Daoud KM, Elyass ZA (1990). Statistical methods for agricultural
research, National Library of Printing and Publishing, University of
Mosul, Iraq. Elazawe AF, Mahadi MT (1983). Stored products insect. Directorate of
University Press, Mosul, Iraq.
Elazawe AF, Quado IQ, Al Haydary HS (1990). Economic insects. Dar Al-Hekma Press, University of Baghdad, Iraq.
Fields PG (1992). The control of stored-product insects and mites with
extreme temperatures. J. Stored Prod. Res., 28: 89-118. Gabouri IAH (2000). Food preference of the Southern cowpea weevil,
Callosobruchus maculatus (F.) (Bruchidae: Coleoptera) and the effect
of different temperatures on the biology, Master thesis, Faculty of Agriculture and Forestry, University of Mosul, Iraq.
Hagstrum DW, Subramanyam BH (2006). Fundamentals of Stored-
Product Entomology. AACC International, St. Paul. Hahn T, Liess M, Schulz R (2001). Effects of the hormone mimetic
insecticide tebufenozide on Chironomus riparius larvae in two
different exposure setups. Ecotoxicol. Environ. Saf. 49(2): 171–178. Hahn T, Schulz R (2002). Ecdysteroid synthesis and imaginal disc
development in the midge Chironomus riparius as biomarkers for
endocrine effects of tributyltin. Environ. Toxicol. Chem. 21(5): 1052–1057.
House VS, Ables JR, Jones SL, Bull DL (1978). Diflubenzuron for
control of the Boll weevil in unisalated isolated cotton fields. J. Econ. Entomol. 71: 797-800.
Howe RW, Currie JE (1964). Some laboratory observations on the rates
of development mortality and oviposition of several species of Bruchidae breeding in stored pulses. Bull. Entomol. Res. 55(3): 437-477
Ishimoto M, Sato T, Chrispeels MJ, kitamura K (1996). Bruchid resistance of transgenic azuki bean expressing seed amylase inhibitor of common bean. Entomolgia Experimentalis et Applicata,
79: 309-315 Krebs J (1978). The experimental analysis of distribution and
abundance. Harper and Row Publishers. New York, U.S.A.
Levot GW, Sastes N (1998). Effectiveness of amixture of Cyromazine and Diazinon for controlling fly strike on sheep, Aust. Vet. J. 76(5): 343-344.
Miller RW, Corlex C, Cohen CF (1981). (GA-19255 and CGA-72662:
Efficacy against flies and possible mode of action and metabolism. South Western Entomol. 6(2): 272-278.
Al-Mekhlafi et al. 5853 Miller RW, Schmidtmann ET, Wauchope RD, Clegg CM, Herner AE,
Weber H (1996). Urine delivery of Cyromazine for suppressing house and stable flies in outdoor dairy calf hutches. J. Econ. Entomol. 89(3):
689-694. Nickle DA (1979). Insect Growth Regulators: New protectants against
the almond moth in stored in shell peanuts. J. Econ. Entomol. 72:
816-819 Oberlander H, Silhacek DL, Shaaya E, Ishaaya I (1997). Current status
and future perspectives of the use of insect growth regulators for the
control of stored product insects. J. Stored Prod. Res. 33: 1-6 Pajni HR (1965). Bioassay of insecticides relative toxicity of films of
different insecticides against the adults of C. maculatus (F.). Res. Bull
Bonjab Univ. 16(4): 559-341. Rothwangl KB, Cloyd RA, Wiedenmann RN (2004). Effects of insect
growth regulators on citrus mealybug parasitoid Leptomastix
dactylopii (Hymenoptera: Encyrtidae). J. Econ. Entomol. 97(4): 1239-
44. Saito T (1988). Insecticide activity of several chemicals to the bryony
Leafminer Liriomyza bryoniae and their application methods. Plant
Protect. 35: 168-171 Saplina GS (1980). Callosobruchus maculates. Zashchita Rastenii, 7:
41. Sial AA, Brunner JF (2010). Lethal and Sublethal Effects of an Insect
Growth Regulator, Pyriproxyfen, on Obliquebanded Leafroller
(Lepidoptera: Tortricidae). J. Econ. Entomol. 103(2): 340-347. Tatarazako N, Oda S, Watanabe H, Morita M, Iguchi T (2003). Juvenile
hormone agonists affect the occurrence of male Daphnia.
Chemosphere, 53(8): 827–833 Tunaz H (2004). Insect Growth Regulators for Insect Pest Control.
Turkish J. Agric. Forest. 28: 377-387.
Vazirianzadeh B, Jervis MA, Kidd NAC (2007). The Effects of Oral Application of Cyromazine and Triflumuron on House-Fly Larvae. Iranian J. Arthropod-Borne Dis. 1(2): 7-13.
Wang HY, Olmstead AW, Li H, LeBlanc GA (2005). The screening of chemicals for juvenoid-related endocrine activity using the water flea Daphnia magna. Aquatic Toxicol. 74(3): 193–204.
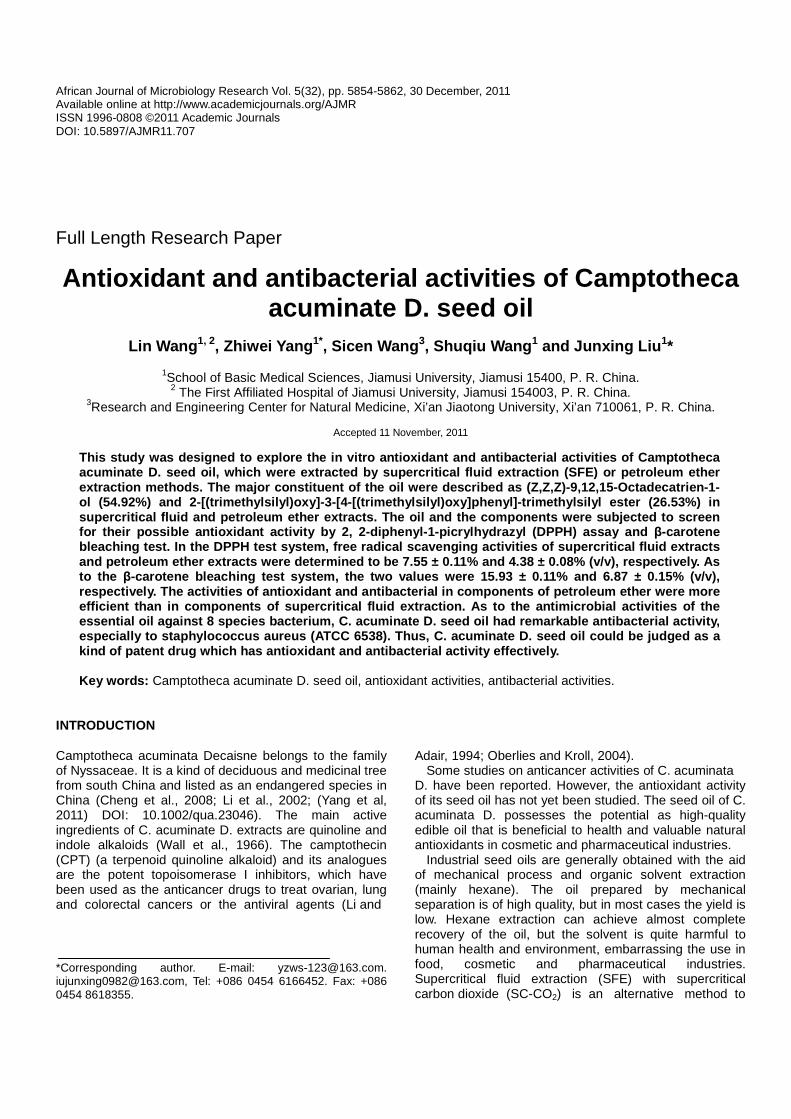
African Journal of Microbiology Research Vol. 5(32), pp. 5854-5862, 30 December, 2011 Available online at http://www.academicjournals.org/AJMR ISSN 1996-0808 ©2011 Academic Journals DOI: 10.5897/AJMR11.707
Full Length Research Paper
Antioxidant and antibacterial activities of Camptotheca acuminate D. seed oil
Lin Wang 1, 2, Zhiwei Yang 1*, Sicen Wang 3, Shuqiu Wang 1 and Junxing Liu 1*
1School of Basic Medical Sciences, Jiamusi University, Jiamusi 15400, P. R. China.
2 The First Affiliated Hospital of Jiamusi University, Jiamusi 154003, P. R. China. 3Research and Engineering Center for Natural Medicine, Xi’an Jiaotong University, Xi’an 710061, P. R. China.
Accepted 11 November, 2011
This study was designed to explore the in vitro antioxidant and antibacterial activities of Camptotheca acuminate D. seed oil, which were extracted by supercritical fluid extraction (SFE) or petroleum ether extraction methods. The major constituent of the oi l were described as (Z,Z,Z)-9,12,15-Octadecatrien-1 -ol (54.92%) and 2-[(trimethylsilyl)oxy]-3-[4-[(trim ethylsilyl)oxy]phenyl]-trimethylsilyl ester (26.53% ) in supercritical fluid and petroleum ether extracts. T he oil and the components were subjected to screen for their possible antioxidant activity by 2, 2-dip henyl-1-picrylhydrazyl (DPPH) assay and β-carotene bleaching test. In the DPPH test system, free radic al scavenging activities of supercritical fluid ext racts and petroleum ether extracts were determined to be 7.55 ± 0.11% and 4.38 ± 0.08% (v/v), respectively. As to the β-carotene bleaching test system, the two values wer e 15.93 ± 0.11% and 6.87 ± 0.15% (v/v), respectively. The activities of antioxidant and ant ibacterial in components of petroleum ether were mo re efficient than in components of supercritical fluid extraction. As to the antimicrobial activities of the essential oil against 8 species bacterium, C. acuminate D. seed oil had remarkable antibacterial activity, especially to staphylococcus aureus (ATCC 6538). Thus, C. acuminate D. seed oil could be judged as a kind of patent drug which has antioxidant and antib acterial activity effectively. Key words: Camptotheca acuminate D. seed oil, antioxidant activities, antibacterial activities.
INTRODUCTION Camptotheca acuminata Decaisne belongs to the family of Nyssaceae. It is a kind of deciduous and medicinal tree from south China and listed as an endangered species in China (Cheng et al., 2008; Li et al., 2002; (Yang et al, 2011) DOI: 10.1002/qua.23046). The main active ingredients of C. acuminate D. extracts are quinoline and indole alkaloids (Wall et al., 1966). The camptothecin (CPT) (a terpenoid quinoline alkaloid) and its analogues are the potent topoisomerase I inhibitors, which have been used as the anticancer drugs to treat ovarian, lung and colorectal cancers or the antiviral agents (Li and *Corresponding author. E-mail: [email protected]. [email protected], Tel: +086 0454 6166452. Fax: +086 0454 8618355.
Adair, 1994; Oberlies and Kroll, 2004). Some studies on anticancer activities of C. acuminata
D. have been reported. However, the antioxidant activity of its seed oil has not yet been studied. The seed oil of C. acuminata D. possesses the potential as high-quality edible oil that is beneficial to health and valuable natural antioxidants in cosmetic and pharmaceutical industries.
Industrial seed oils are generally obtained with the aid of mechanical process and organic solvent extraction (mainly hexane). The oil prepared by mechanical separation is of high quality, but in most cases the yield is low. Hexane extraction can achieve almost complete recovery of the oil, but the solvent is quite harmful to human health and environment, embarrassing the use in food, cosmetic and pharmaceutical industries. Supercritical fluid extraction (SFE) with supercritical carbon dioxide (SC-CO2) is an alternative method to

extract the oils from natural products and has received considerable attention (Gomes et al., 2007; Lu et al., 2007; SalgIn, 2007). The oil obtained by SC-CO2 extraction is of high quality, and the yield is comparable with those of organic solvent extractions (Friedrich et al., 1982; Molero Gómez et al., 1996). In fact, CO2 extracts have been generally considered as safety in food applications (Gerard and May, 2002), and SFE has been served as a very potential technology in food and pharmaceutical operations (King, 2000).
To the best of our knowledge, the antioxidant and antibacterial activities of C. acuminate D. seed oil in vitro have not yet been evaluated. Therefore, in this work, the oil will be separately extracted by SFE and petroleum ether extraction methods, and the activities will be evaluated by 2, 2-diphenyl-1-picrylhydrazyl (DPPH) assay, β-carotene bleaching test, as well as minimal inhibitory concentration (MIC) and minimal bactericidal concentration (MBC) determinations. We anticipate that the investigation will be of value in the development of antioxidant and antibacterial agents. MATERIALS AND METHODS Preparation of extract Isolation of C. acuminata seed oil by petroleum ether C. acuminate D. seeds were air dried at room temperature and ground, and 100 g were subjected to the distillation with a British-type clevenger apparatus at 100°C for 3 h. Then, the extracts were filtered and concentrated in vacuum at 45°C, yieldin g the seed soil in yellow. Supercritical carbon dioxide (SC-CO2) extraction C. acuminate D. seeds were air dried at room temperature and ground in a grinder with a mesh of 2 mm in diameter. Then, they were passed through a 0.5 mm sieve to obtain a fine powder. The extraction temperature was 45°C and the pressure was 5 .5 MPa. The flow rate was determined using a watch. The flow rate of CO2 was 10 kg/h; and the extraction time was 2 h. Liquid CO2 was supplied from a gas cylinder. Before passing into the extraction vessel filled with the samples by pump, the liquid CO2 was adjusted to the desired pressure and heated to a specified temperature to reach the supercritical state. Finally, the extracts were lyophilized and kept in dark at 4°C until the next step. Gas chromatography The sample was diluted by ethyl acetate (1:100) and mixed. The analysis of the essential oil was performed using a VG platform II Gas chromatography-Mass spectroscopy (GC–MS) system equipped with an Rtx-5MS capillary column (30 × 0.25 mm; film thickness 0.25 mm). For the Rtx-5MS detection, the injector temperature was set at 280°C; split injection with a ratio of 100: 1; and the injection volume was 1 µl with a flow controlled by a linear model. Helium was the carrier gas at a flow rate of 1.6 ml/min. Starting from 60°C, the temperature was raised to 280 a t 10°C /min and held for 5 min. Injector and detector MS transfer line temperatures were set at 200 and 280°C, respecti vely, and the
Wang et al. 5855 sample collection time was 3 min (m/z = 40 to 500). Antioxidant activity General description Antioxidant activity was assessed by DPPH assay and β-carotene bleaching test. All data collected for each assay were the average of the measurements of three independent experiments. DPPH radical scavenging assay and the oil obtained by SC-CO2 extraction We measured the bleaching of purple-colored ethanol solution of DPPH. This spectrophotometric assay uses the stable radical DPPH as a reagent (Wu et al., 2010). An aliquot of the sample (100 µl) was mixed with 1.4 ml of ethanol and then added to 1 ml of 0.004% DPPH (Sigma–Aldrich) in ethanol. The mixture was vigorously shaken and then immediately placed in a UV–Vis spectrophotometer (AWARENESS) to monitor the decrease in absorbance at 517 nm. Monitoring was continued for 70 min until the reaction reached a plateau. Ascorbic acid (Sigma–Aldrich), a stable antioxidant, was used as a synthetic reference. The radical scavenging activities of samples were calculated as the inhibition percentage of DPPH according to the formula:
where AB and AA are the absorbance values of the blank sample and the tested samples examined after 70 min, respectively. β-Carotene-linoleic acid bleaching assay Antioxidant activity of the samples was determined with β-carotene bleaching test (Wu et al., 2010). Approximately 10 mg of β-carotene (type I synthetic, Sigma–Aldrich) was dissolved in 10 ml chloroform. The carotene–chloroform solution of 0.2 ml was pipetted into a boiling flask containing 20 mg linoleic acid (Sigma–Aldrich) and 200 mg Tween 40 (Sigma–Aldrich). Chloroform was removed by a rotary evaporator (RE-52AA) at 40°C for 5 min, and to th e residue, 50 mL of distilled water was added, slowly with vigorous agitation, to form an emulsion. The emulsion (5 ml) was added to a tube containing 0.2 ml of the sample solution and the absorbance was immediately measured at 470 nm against a blank consisting of an emulsion without β-carotene. The tubes were placed in a water bath at 50°C, and the oxidation of the emulsion was moni tored by a spectrophotometer at 470 nm over a period of 60 min. Control samples contained 10 ml of water instead. Butylated hydroxytoluene (BHT) (Sigma–Aldrich), a stable antioxidant, was used as a synthetic reference. The antioxidant activity was expressed as the inhibition percentage relative to the control after 60 min incubation with the following equation:
Where AA, antioxidant activity; DRC, degradation rate of the control [ln(a/b)/60]; DRS, degradation rate in the presence of the sample [ln(a/b)/60]; a, absorbance at time 0; b, absorbance at 60 min. Antimicrobial activity The microorganisms used for testing antimicrobial sensitivity included Bacillus subtilis 6633, Staphylococcus aureus ATCC 6538
Inhibition percentage (Ip) = [(AB-AA)/AB] ×100 (Yen and Duh, 1994)
AA = 100(DRC - RS)/DRC
5856 Afr. J. Microbiol. Res. and Staphylococcus epidermidis ATCC 49134, Escherichia coli ATCC 11229, Proteus vulgaris, Pseudomonas aeruginosa, Candida albicans and Aspergillus niger V. Tiegh. They were obtained from the Center for Microbiology Research, Jiamusi Medical Research Institute. Minimal inhibitory concentration (MIC) and minimal bactericidal concentration (MBC) determination of Camptotheca acuminate D. seed oil The MIC and MBC were measured by the broth micro-dilution method (NCCLS, 2002). The essential oils were individually dissolved in sterilized physiological saline solution (0.9% w/v) supplemented with Tween 80 (Sigma) at a final concentration of 0.5% (v/v). Serial doubling dilutions of the oils were prepared in a 96-well microtiter (µL) plate in the range of 0.156 to 4.000% (v/v). Each essential oil dilution (100 µL) was dispensed into the wells of a microtiter plate, and each well was then inoculated with 100 µL of the suspension. The obtained suspensions were mixed with a micro-pipette. The final concentration of each strain was adjusted to 105 to 106 CFU/mL. All microtiter plates against all microorganisms were incubated at 37°C for 24 h, except for A. niger that was incubated at 25°C for 5 days. After incubation, the wells were examined for the microorganism growth, and the MICs were determined. The MIC was defined as the lowest concentration of the essential oil at which the microorganism did not show visible growth. The MBCs were confirmed by reinoculating on agar plates with 10 µL of each culture medium from the microplates. The MBCs were defined as the lowest concentration of the essential oil at which incubated microorganisms were completely killed. Streptomycin and Amphotericin B were served as the positive controls. Each experiment was repeated for three times. RESULTS AND DISCUSSION Chemical composition We identified 50 components in the C. acuminate D. seed oil obtained by SC-CO2 extraction (Table 1). Fifty-three (53) components were identified in the oil obtained by petroleum ether (Table 2). The major components were (Z,Z,Z) - 9, 12, 15 - Octadecatrien- 1- oil (54.92%), octadecanoic acid (13.46%), n-hexadecanoic acid (11.63%) in the seed oil (Table 1) obtained by SC-CO2. While the major components were [4-[(trimethylsilyl)oxy]phenyl]-2-[(trimethylsilyl)oxy]-3-2-propenoicacid trimethylsilyl ester (26.53%), gamma-sitosterol (23.49%), (Z,Z,Z)-9,12,15-octadecatrienoic acid, and methyl ester (19.19%) in the seed oil obtained by petroleum ether. Antioxidant activity The antioxidant activities of the essential C. acuminate D. seed oil obtained by SC-CO2 extraction or petroleum ether were determined by two complementary test systems: DPPH assay and β-carotene bleaching tests. The results of antioxidant activity in these test systems were collected and shown in Figures 1 to 3. In the DPPH test system, free radical - scavenging activity of C.
acuminate D. seed oil obtained by SC-CO2 extraction was determined to be 81.39 ± 0.92%; whereas the oil obtained by petroleum ether was 87.13 ± 1.81% (Figure 1). As for the lipid peroxidation inhibitory activity of the essential oil by the β-carotene bleaching test, the results were consistent with the data obtained from the DPPH test (Figure 2). Compared with BHT, the effects of C. acuminate D. seed oil obtained by SC-CO2 extraction or petroleum ether were 80.82 ± 0.32% and 85.47 ± 0.54%, respectively. The concentration of 50% inhibition (IC50) values of BHT, C. acuminate D. seed oil obtained by SC-CO2 or petroleum ether were 3.24 ± 0.12%, 7.55 ± 0.11% and 4.20 ± 0.08%, respectively (Figure 3). It seemed that the antioxidant activities of all the tested samples were mostly related to their concentrations, and the IC50 values of these two types of seed oil were both higher than that of the synthetic antioxidant BHT (Figures 2 and 3). Antimicrobial activity Minimal inhibitory concentration (MICs) and minimal bactericidal concentration (MBCs) of Camptotheca acuminate D. seed oil As shown in Tables 3 and 4, the essential oils exhibited inhibitory effects of all the testing organisms. The oil obtained by SC-CO2 exhibited somewhat higher antimicrobial activity on S. epidermidis ATCC 49134 rather than other microorganisms; whereas the oil obtained by petroleum ether showed more potent on S. aureus ATCC 6538, P. aeruginosa and C. albicans. The antimicrobial activities of the seed oil obtained by SC-CO2 against B. subtilis 6633, P. vulgaris and A. niger V. Tiegh were less than those of other microorganisms; whereas the oil obtained by petroleum ether showed less inhibitory effects on B. subtilis 6633 and P. vulgaris. The MICs of the oil obtained by SC-CO2 extraction ranged from 0.625% (v/v) to more than 5.000% (v/v) for all testing microorganisms; while as to petroleum ether, the values ranged from 0.625% (v/v) to more than 5.000% (v/v). The MBCs were similar or even higher than the corresponding MIC values. The activity components of Camptotheca acuminate D. seed oil The essential oil of C. sativum obtained on hydro-distillation was analyzed by GC–MS. We identified 24 components, representing 92.7% of the total oil. Table 1 summarized the constituents identified by GC–MS analysis, their retention indices and area percentages (concentrations). The oil was dominated by aldehydes and alcohols, which accounted for 55.5 and 36.3%, respectively. The major aldehydes were 2E-decenal (15.9%) and decanal (14.3%), while the alcohols mainly consisted of 2E-decen-1-ol (14.2%) and n-decanol

Wang et al. 5857 Table 1. The chemical compositions of C. acuminate D. seed oil obtained by supercritical carbon dioxide extraction (SC-CO2).
No. RT Compounds Molecular formula MW Relative
1. 3.246 Nonane 128 C9H20 0.25 2. 3.652 propyl-cyclohexane, 126 C9H18 0.10 3. 4.097 Hexanoic acid 116 C6H12O2 0.19 4. 4.443 (E,E)-2,4-Heptadienal, 110 C7H10O 0.14 5. 4.627 1-ethyl-Cyclohexene, 110 C8H14 0.05 6. 6.079 Phenylethyl Alcohol 122 C8H10O 0.06 7. 8.510 8-Methylene-3 oxatricyclo[5.2.0.0(2,4)]nonane 136 C9H12O 0.13 8. 8.552 (E,E)-2,4-Decadienal, 152 C10H16O 0.09 9. 8.872 2,7-Dimethyl-1,3,7-Octatriene, 136 C10H16 0.33 10. 12.737 7-Bromomethyl-Pentadec-7-ene, 302 C16H31Br 0.06 11. 14.169 Tetradecanoic acid 228 C14H28O2 0.07 12. 14.574 Heneicosane 296 C21H44 0.09 13. 15.015 3,7,11,15-Tetramethyl-2-hexadecen-1-ol 296 C20H40O 0.07 14. 15.090 6,10,14-Trimethyl-2-Pentadecanone, 268 C18H36O 0.09 15. 15.225 Pentadecanoic acid 242 C15H30O2 0.06 16. 15.417 1,2-Benzenedicarboxylic acid, bis(2-methylpropyl) ester 278 C16H22O4 0.79 17. 15.888 1,2-Benzenedicarboxylic acid, butyl octyl ester 334 C20H30O4 0.09 18. 16.077 9-Hexadecenoic acid 254 C16H30O2 0.14 19. 16.329 n-Hexadecanoic acid 256 C16H32O2 11.63 20. 16.595 Heneicosane 296 C21H44 0.28 21. 17.217 Heptadecanoic acid 270 C17H34O2 0.07 22. 17.424 1-Octadecanol 270 C18H38O 0.14 23. 17.537 2,6,10,15-Tetramethyl-Heptadecane, 296 C21H44 0.12 24. 17.618 (Z,Z,Z)-9,12,15-Octadecatrienoic acid, methyl ester, 292 C19H32O2 0.10 25. 17.714 Phytol 296 C20H40O 0.15 26. 18.195 (Z,Z,Z)-9,12,15-Octadecatrien-1-ol, 264 C18H32O 54.92 27. 18.265 Octadecanoic acid 284 C18H36O2 13.46 28. 18.917 cis,cis,cis-7,10,13-Hexadecatrienal 234 C16H26O 0.55 29. 19.297 Pentacosane 352 C25H52 0.15 30. 19.542 11,14,17-Eicosatrienoic acid, methyl ester 320 C21H36O2 0.29 31. 19.882 E-8-Methyl-7-dodecen-1-ol acetate 240 C15H28O2 0.24 32. 20.912 Tetratetracontane 618 C44H90 0.56 33. 21.084 2-Mono-Palmitin, 330 C19H38O4 0.99 34. 21.672 Pentatriacontane 492 C35H72 0.16 35. 21.975 Octadecanal 268 C18H36O 0.07 36. 22.281 (Z,Z)-9,12-Octadecadienoic acid, trimethylsilyl ester 352 C21H40O2Si 0.18 37. 22.350 (all-Z)-4,7,10,13,16,19-Docosahexaenoic acid, methyl ester, 342 C23H34O2 0.14 38. 22.502 E,Z-1,3,12-Nonadecatriene 262 C19H34 3.94 39. 22.585 Methyl(Z)-5,11,14,17-eicosatetraenoate 318 C21H34O2 4.30 40. 22.683 1-Mono-Stearin, 358 C21H42O4 0.63 41. 23.251 1-Hentetracontanol 592 C41H84O 0.66 42. 23.667 (all-E)- 2,6,10,15,19,23-hexamethyl-2,6,10,14,18,22 Tetracosahexaene, 410 C30H50 1.39 43. 24.183 6,6-Dimethyl-Bicyclo[3.1.1] hept-2-ene-2-ethanol, 166 C11H18O 0.06 44. 24.268 Triacontane 422 C30H62 0.66 45. 24.331 17-Pentatriacontene 490 C35H70 0.51 46. 24.540 2-Nonadecanone 282 C19H38O 0.14 47. 25.074 8-Methyltocol 402 C27H46O2 0.18 48. 26.091 Octadecanal 268 C18H36O 0.10 49. 26.519 β-Tocopherol 416 C28H48O2 0.28 50. 26.862 Tetratriacontane 478 C34H70 0.15

5858 Afr. J. Microbiol. Res. Table 2. The chemical compositions of C. acuminate D. seed oil obtained by petroleum ether.
No. RT Compounds Molecular formula MW Relative
1. 3.235 1,3,5,7-Cyclooctatetraene 104 C8H8 0.10
2. 5.199 3,6-dimethyl-Decane, 170 C12H26 0.06
3. 6.183 1,2,4,5-tetramethyl-Benzene, 134 C10H14 0.07
4. 8.071 Pentadecane 212 C15H32 0.07
5. 8.301 4,6-dimethyl-Dodecane, 198 C14H30 0.15
6. 8.923 Heptadecane 240 C17H36 0.04
7. 11.008 Acetamidocyclohexane 141 C8H15NO 0.07
8. 11.120 Cetyl iodide 352 C16H33I 0.12
9. 11.158 Heptadecane 240 C17H36 0.06
10. 11.393 2,4-bis(1,1-dimethylethyl)-Phenol, 206 C14H22O 0.07
11. 11.668 Heneicosane 296 C21H44 0.04
12. 13.629 Eicosane 282 C20H42 0.08
13. 14.103 Hexadecane 226 C16H34 0.04
14. 14.177 Tetradecanoic acid 228 C14H28O2 0.11
15. 15.008 5-Isopropyl-1-methyl-1-cyclohexene 138 C10H18 0.07
16. 15.095 6,10,14-trimethyl-2-Pentadecanone, 268 C18H36O 0.06
17. 15.419 1,2-Benzenedicarboxylic acid, bis(2-methylpropyl) ester 278 C16H22O4 0.16
18. 15.600 diethyl-Borinic acid, 86 C4H11BO 0.05
19. 15.878 2,6,10,14-tetramethyl-Hexadecane, 282 C20H42 0.06
20. 16.270 n-Hexadecanoic acid 256 C16H32O2 3.19
21. 17.424 1-Octadecanol 270 C18H38O 0.06
22. 17.538 Heneicosane 296 C21H44 0.08
23. 17.714 Phytol 296 C20H40O 0.13
24. 18.037 (Z,Z,Z)-9,12,15-Octadecatrienoic acid, methyl ester, 292 C19H32O2 19.19
25. 18.162 (Z,Z)-9,12-Octadecadienoic acid 280 C18H32O2 3.35
26. 18.442 1,54-Dibromotetrapentacontane 914 C54H108Br2 0.60
27. 19.292 Pentacosane 352 C25H52 0.11
28. 20.118 Tetracosane 338 C24H50 0.08
29. 20.792 trans-9-Octadecen-1-ol 268 C18H36O 0.09
30. 20.910 Tetratetracontane 618 C44H90 0.37
31. 21.078 2-mono-Palmitin, 330 C19H38O4 0.14
32. 21.673 Pentatriacontane 492 C35H72 0.07
33. 21.906 (3.beta.)-Ergost-5-en-3-ol, 400 C28H48O 1.98
34. 22.142 3-Fluorobenzoic acid, 4-hexadecyl ester 364 C23H37FO2 0.23
35. 22.342 1-Pent-3-ynylcyclopenta-1,3-diene 132 C10H12 0.10
36. 22.441 1,54-dibromo-Tetrapentacontane, 914 C54H108Br2 0.46
37. 22.489 9-Octadecenoic acid, (E,E,E)-1,2,3-propanetriyl ester, 884 C57H104O6 0.31
38. 22.569 (Z,Z,Z)-9,12,15-Octadecatrienoic acid, ethyl ester, 306 C20H34O2 0.34
39. 22.608 2-Nonadecanone 282 C19H38O 0.29
40. 22.675 Stigmastane-3,6-dione 428 C29H48O2 0.18
41. 23.250 Pentafluoropropionic acid, heptadecyl ester 402 C20H35F5O2 0.28
42. 23.483 1-Hexadecanesulfonyl chloride 324 C16H33ClO2S 0.46
43. 23.664 All-trans-Squalene 410 C30H50 0.85
44. 24.167 [4-[(trimethylsilyl)oxy]phenyl]-2-[(trimethylsilyl)oxy]-3-2-Propenoic acid, trimethylsilyl ester 396 C18H32O4Si3 26.53
45. 24.265 .gamma.-Sitosterol 414 C29H50O 23.49
46. 24.578 Fucosterol 412 C29H48O 1.38
47. 25.034 [3S-(3.alpha.,5a.alpha.,7a.alpha.,11a.beta.,11b.alpha.)]-dodecahydro
-3,8,8,11a-tetramethyl-5H-3,5a-Epoxynaphth[2,1-c]oxepin, , 278 C18H30O2 1.39
48. 25.318 Betulin 442 C30H50O2 0.43
49. 25.560 Cedran-8-yl acetate 264 C17H28O2 3.32
50. 25.725 Lup-20(29)-en-3-one 424 C30H48O 4.30
51. 26.091 cis-1-Chloro-9-octadecene 286 C18H35Cl 0.52
52. 26.323 Lupenyl acetate 468 C32H52O2 3.79
53. 26.514 .beta.-Tocopherol 416 C28H48O2 0.41
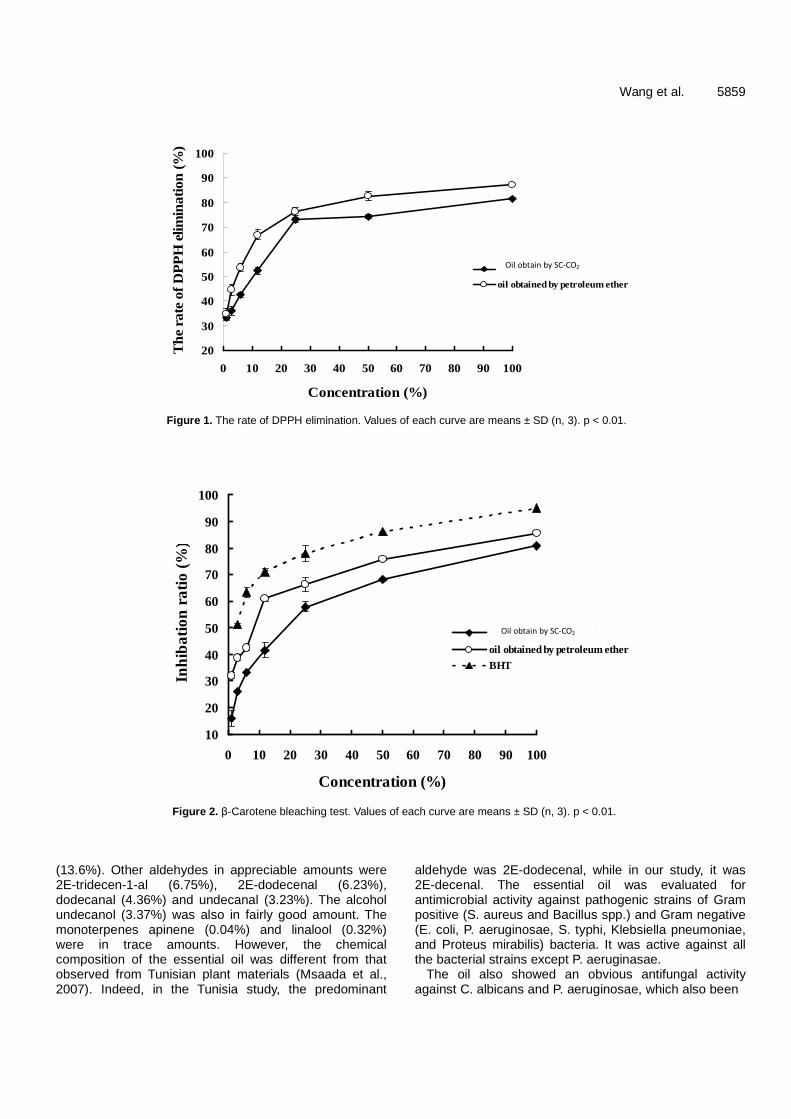
Wang et al. 5859
Figure 1. The rate of DPPH elimination. Values of each curve are means ± SD (n, 3). p < 0.01.
Figure 2. β-Carotene bleaching test. Values of each curve are means ± SD (n, 3). p < 0.01. (13.6%). Other aldehydes in appreciable amounts were 2E-tridecen-1-al (6.75%), 2E-dodecenal (6.23%), dodecanal (4.36%) and undecanal (3.23%). The alcohol undecanol (3.37%) was also in fairly good amount. The monoterpenes apinene (0.04%) and linalool (0.32%) were in trace amounts. However, the chemical composition of the essential oil was different from that observed from Tunisian plant materials (Msaada et al., 2007). Indeed, in the Tunisia study, the predominant
aldehyde was 2E-dodecenal, while in our study, it was 2E-decenal. The essential oil was evaluated for antimicrobial activity against pathogenic strains of Gram positive (S. aureus and Bacillus spp.) and Gram negative (E. coli, P. aeruginosae, S. typhi, Klebsiella pneumoniae, and Proteus mirabilis) bacteria. It was active against all the bacterial strains except P. aeruginasae.
The oil also showed an obvious antifungal activity against C. albicans and P. aeruginosae, which also been
20
30
40
50
60
70
80
90
100
0 10 20 30 40 50 60 70 80 90 100
Concentration (%)
Th
e ra
te o
f D
PP
H e
limin
atio
n (
%)
oil obtained by SC-CO2
oil obtained by petroleum ether
Oil obtain by SC-CO2
10
20
30
40
50
60
70
80
90
100
0 10 20 30 40 50 60 70 80 90 100
Concentration (%)
Inh
ibat
ion
rat
io (
%)
oil obtained by SC-CO2
oil obtained by petroleum ether
BHT
Oil obtain by SC-CO2
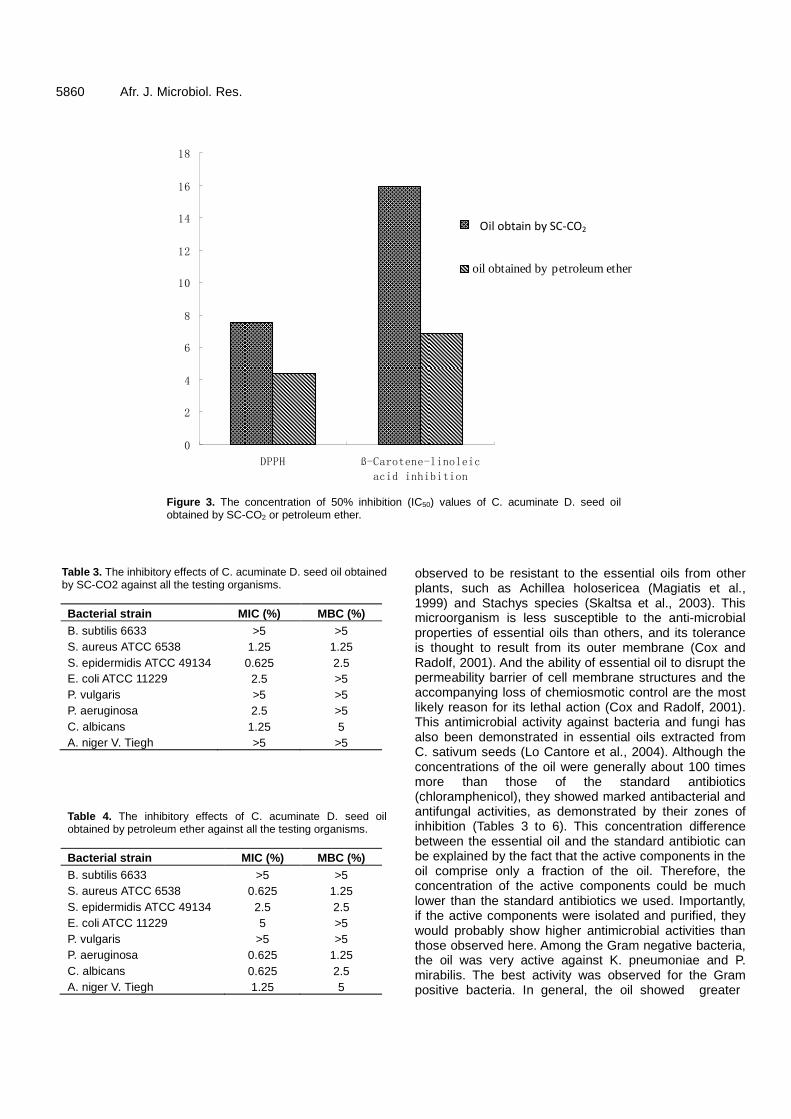
5860 Afr. J. Microbiol. Res.
Figure 3. The concentration of 50% inhibition (IC50) values of C. acuminate D. seed oil obtained by SC-CO2 or petroleum ether.
Table 3. The inhibitory effects of C. acuminate D. seed oil obtained by SC-CO2 against all the testing organisms.
Bacterial strain MIC (%) MBC (%) B. subtilis 6633 >5 >5 S. aureus ATCC 6538 1.25 1.25 S. epidermidis ATCC 49134 0.625 2.5 E. coli ATCC 11229 2.5 >5 P. vulgaris >5 >5 P. aeruginosa 2.5 >5 C. albicans 1.25 5 A. niger V. Tiegh >5 >5
Table 4. The inhibitory effects of C. acuminate D. seed oil obtained by petroleum ether against all the testing organisms.
Bacterial strain MIC (%) MBC (%) B. subtilis 6633 >5 >5 S. aureus ATCC 6538 0.625 1.25 S. epidermidis ATCC 49134 2.5 2.5 E. coli ATCC 11229 5 >5 P. vulgaris >5 >5 P. aeruginosa 0.625 1.25 C. albicans 0.625 2.5 A. niger V. Tiegh 1.25 5
observed to be resistant to the essential oils from other plants, such as Achillea holosericea (Magiatis et al., 1999) and Stachys species (Skaltsa et al., 2003). This microorganism is less susceptible to the anti-microbial properties of essential oils than others, and its tolerance is thought to result from its outer membrane (Cox and Radolf, 2001). And the ability of essential oil to disrupt the permeability barrier of cell membrane structures and the accompanying loss of chemiosmotic control are the most likely reason for its lethal action (Cox and Radolf, 2001). This antimicrobial activity against bacteria and fungi has also been demonstrated in essential oils extracted from C. sativum seeds (Lo Cantore et al., 2004). Although the concentrations of the oil were generally about 100 times more than those of the standard antibiotics (chloramphenicol), they showed marked antibacterial and antifungal activities, as demonstrated by their zones of inhibition (Tables 3 to 6). This concentration difference between the essential oil and the standard antibiotic can be explained by the fact that the active components in the oil comprise only a fraction of the oil. Therefore, the concentration of the active components could be much lower than the standard antibiotics we used. Importantly, if the active components were isolated and purified, they would probably show higher antimicrobial activities than those observed here. Among the Gram negative bacteria, the oil was very active against K. pneumoniae and P. mirabilis. The best activity was observed for the Gram positive bacteria. In general, the oil showed greater
0
2
4
6
8
10
12
14
16
18
DPPH ß-Carotene-linoleic
acid inhibition
oil obtained by SC-CO2
oil obtained by petroleum ether
Oil obtain by SC-CO2
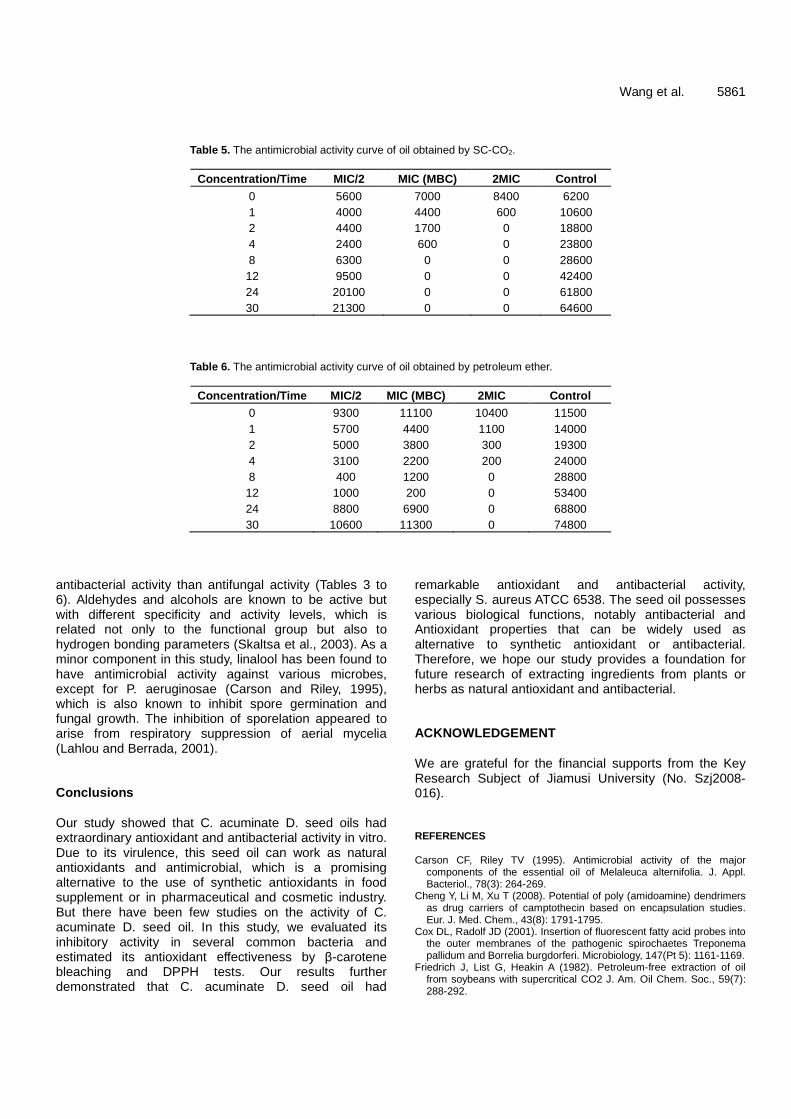
Wang et al. 5861
Table 5. The antimicrobial activity curve of oil obtained by SC-CO2.
Concentration/Time MIC/2 MIC (MBC) 2MIC Control
0 5600 7000 8400 6200 1 4000 4400 600 10600 2 4400 1700 0 18800 4 2400 600 0 23800 8 6300 0 0 28600 12 9500 0 0 42400 24 20100 0 0 61800 30 21300 0 0 64600
Table 6. The antimicrobial activity curve of oil obtained by petroleum ether.
Concentration/Time MIC/2 MIC (MBC) 2MIC Control 0 9300 11100 10400 11500 1 5700 4400 1100 14000 2 5000 3800 300 19300 4 3100 2200 200 24000 8 400 1200 0 28800 12 1000 200 0 53400 24 8800 6900 0 68800 30 10600 11300 0 74800
antibacterial activity than antifungal activity (Tables 3 to 6). Aldehydes and alcohols are known to be active but with different specificity and activity levels, which is related not only to the functional group but also to hydrogen bonding parameters (Skaltsa et al., 2003). As a minor component in this study, linalool has been found to have antimicrobial activity against various microbes, except for P. aeruginosae (Carson and Riley, 1995), which is also known to inhibit spore germination and fungal growth. The inhibition of sporelation appeared to arise from respiratory suppression of aerial mycelia (Lahlou and Berrada, 2001). Conclusions Our study showed that C. acuminate D. seed oils had extraordinary antioxidant and antibacterial activity in vitro. Due to its virulence, this seed oil can work as natural antioxidants and antimicrobial, which is a promising alternative to the use of synthetic antioxidants in food supplement or in pharmaceutical and cosmetic industry. But there have been few studies on the activity of C. acuminate D. seed oil. In this study, we evaluated its inhibitory activity in several common bacteria and estimated its antioxidant effectiveness by β-carotene bleaching and DPPH tests. Our results further demonstrated that C. acuminate D. seed oil had
remarkable antioxidant and antibacterial activity, especially S. aureus ATCC 6538. The seed oil possesses various biological functions, notably antibacterial and Antioxidant properties that can be widely used as alternative to synthetic antioxidant or antibacterial. Therefore, we hope our study provides a foundation for future research of extracting ingredients from plants or herbs as natural antioxidant and antibacterial. ACKNOWLEDGEMENT We are grateful for the financial supports from the Key Research Subject of Jiamusi University (No. Szj2008-016). REFERENCES Carson CF, Riley TV (1995). Antimicrobial activity of the major
components of the essential oil of Melaleuca alternifolia. J. Appl. Bacteriol., 78(3): 264-269.
Cheng Y, Li M, Xu T (2008). Potential of poly (amidoamine) dendrimers as drug carriers of camptothecin based on encapsulation studies. Eur. J. Med. Chem., 43(8): 1791-1795.
Cox DL, Radolf JD (2001). Insertion of fluorescent fatty acid probes into the outer membranes of the pathogenic spirochaetes Treponema pallidum and Borrelia burgdorferi. Microbiology, 147(Pt 5): 1161-1169.
Friedrich J, List G, Heakin A (1982). Petroleum-free extraction of oil from soybeans with supercritical CO2 J. Am. Oil Chem. Soc., 59(7): 288-292.

5862 Afr. J. Microbiol. Res. Gerard D, May P (2002). Herb and spice carbon dioxide extracts-
versatile, safe ingredients for premium food and health food. Food Tech. p 1-5.
Gomes PB, Mata VG, Rodrigues AE (2007). Production of rose geranium oil using supercritical fluid extraction. J. Supercrit. Fluids,
41(1): 50-60. King JW (2000). Advances in critical fluid technology for food
processing. Food Sci. Tech. Today, 14(4): 186-191. Lahlou M, Berrada R (2001). Composition and niticidal activity of
essential oils of three chemotypes of Rosmarinas officinalis L. Pharmaceutical Biol., I41: 207-210.
Li S, Adair KT (1994). Camptotheca acuminata Decaisne. Xi Shu, a promising anti-tumor and anti-viral tree for the 21st century. Nacogdoches: Stephen F. Austin State University Press.
Li S, Yi Y, Wang Y, Zhang Z, Beasley RS (2002). Camptothecin accumulation and variations in camptotheca. Planta Med., 68(11): 1010-1016.
Lo Cantore P, Iacobellis NS, De Marco A, Capasso F, Senatore F (2004). Antibacterial Activity of Coriandrum sativum L. and Foeniculum vulgare Miller Var. vulgare (Miller) Essential Oils. J. Agric. Food Chem., 52(26): 7862-7866.
Lu ZG, Zheng GC, Yu SM (2007). Composition analysis of groundcherry seed oil by supercritical CO_2 extraction. Food & Machinery, 2: 88-89+113.
Magiatis P, Melliou E, Skaltsounis AL, Chinou IB, Mitaku S (1999). Chemical composition and antimicrobial activity of the essential oils of Pistacia lentiscus var. chia. Planta Med., 65(8): 749-752.
Molero Gómez A, Pereyra López C, Martinez de la Ossa E (1996). Recovery of grape seed oil by liquid and supercritical carbon dioxide extraction: a comparison with conventional solvent extraction. Chem. Eng. J. Biochem. Eng. J., 61(3): 227-231.
Msaada K, Hosni K, Taarit MB, Chahed T, Marzouk B (2007). Variations in the essential oil composition from different parts of Coriandrum sativum L. cultivated in Tunisia. Ital. J. Biochem., 56(1): 47-52.
NCCLS (2002). In National Committee for Clinical Laboratory
Standards. Reference method for broth dilution antifungal susceptibility testing of yeasts: proposed standard. P 1-25.
Oberlies NH, Kroll DJ (2004). Camptothecin and Taxol: Historic Achievements in Natural Products Research. J. Nat. Prod., 67(2): 129-135.
SalgIn U (2007). Extraction of jojoba seed oil using supercritical CO2+ethanol mixture in green and high-tech separation process. J. Supercrit. Fluids, 39(3): 330-337.
Skaltsa HD, Demetzos C, Lazari D, Sokovic M (2003). Essential oil analysis and antimicrobial activity of eight Stachys species from Greece. Phytochemistry, 64(3): 743-752.
Wall ME, Wani MC, Cook CE, Palmer KH, McPhail AT, Sim GA (1966). Plant Antitumor Agents. I. The Isolation and Structure of Camptothecin, a Novel Alkaloidal Leukemia and Tumor Inhibitor from Camptotheca acuminata1, 2. J. Am. Chem. Soc., 88(16): 3888-3890.
Wu N, Zu Y, Fu Y, Kong Y, Zhao J, Li X, Li J, Wink M, Efferth T (2010). Antioxidant Activities and Xanthine Oxidase Inhibitory Effects of Extracts and Main Polyphenolic Compounds Obtained from Geranium sibiricum L. J. Agric. Food Chem., 58(8): 4737-4743.
Yang ZW, Wu XM, Zu YG, Yang G, ZHou LJ (DOI: 10.1002/qua.23046). Understanding the chiral recognitions between neuraminidases and inhibitors: studies with DFT, docking and MD methods Int. J. Quantum. Chem.,
Yen GC, Duh PD (1994). Scavenging Effect of Methanolic Extracts of Peanut Hulls on Free-Radical and Active-Oxygen Species. J. Agric. Food Chem., 42(3): 629-632.

African Journal of Microbiology Research Vol. 5(32), pp. 5863-5871, 30 December, 2011 Available online at http://www.academicjournals.org/AJMR ISSN 1996-0808 ©2011 Academic Journals DOI: 10.5897/AJMR11.729
Full Length Research Paper
Preparation, characterization and in vitro antimicrobial activity of compound sustained-release periodontal suppository of ornidazole and pefloxacin mesylate
Rui Liu, Yan Jiang, Yan-hua Duan, Nan Li, Guo-dong Zhang, Xin Nie and Lu-chuan Liu*
Department of Stomatology, Research Institute of Surgery and Daping Hospital, the Third Military Medical University, Chongqing 400042, China.
Accepted 26 August, 2011
Local delivery of sustained-release drugs in periodontal pocket is an effective approach for the treatment of periodontitis. The present study aimed to optimize and characterize the sustained-release periodontal suppository of compound ornidazole and pefloxacin mesylate (O&P) in vitro. Before suppository was prepared, the combined effect of O&P against dominant anaerobe and facultative anaerobe in periodontitis was investigated and then the optimal ratio of each drug was determined. After the compound suppository of O&P was prepared by cold compression, the optimal content of the suppository was determined through evaluating the bacteriostatic effect and then the sustained-release level of optimized suppository was investigated. There was no incompatibility between ornidazole and pefloxacin mesylate. When being applied in combination, they could exert synergistic bacteriostatic effect against ‘porphyromonas gingivalid’ and ‘fusobacterium nucleatum’, and additive effect against ‘prevotella intermedia’ and ‘peptostreptococcus spp’ and inhibit anaerobe growth at a low concentration. The optimal ratio of O&P is 2:3 and the optimal content of suppository 20% in vitro; this suppository could release both drugs in a sustained manner for 12 h. The compound suppository of O&P can serve as one of the potential candidates for the treatment of periodontitis and has favorable sustained-release ability which can meet the requirement of clinical treatment of periodontitis. Key words: Ornidazole, pefloxacin mesylate, periodontitis, sustained-release delivery system.
INTRODUCTION Periodontitis is a group of dentoalveolar infections and remains one of the major causes of adult tooth loss. These infections involve a variety of bacteria in local periodontal tissues. Plaques and their products are the original cause of parodontopathy (Zambon, 1996). To date, numerous investigations have been confirmed that anaerobe is a dominant type of pathogenic bacteria, including Porphyromonas gingivalid (Pg), Fusobacterium nucleatum (Fn), Prevotella intermedia (Pi) and Peptostreptococcus spp (Ps). Additionally, these facultative anaerobe such as Staphylococcus aureus (Sa), Staphylococcus epidermidis (Se), etc (Takahashi,
*Corresponding author. E-mail: [email protected]. Fax: 86-23-68715568.
1998; Paju et al., 2009), also have synergistic action in the process of pathogenesis. Although, the use of systemic antibiotic treatment of periodontitis has shown some benefits, multiple systemic doses of antibiotics have several drawbacks including inadequate antibiotic concentration (subtherapeutic level) at the site of periodontal pocket and high plasma concentration. Inadequate antibiotic concentration is not able to continuously inhibit or kill the pathogenic microorganisms, and fail to control the periodontal inflammation which may facilitate the reconstruction of damaged tissues. High plasma concentration may be associated with bacterial resistance and occurrence of side effects (Bidault et al., 2007a, b). These disadvantages have evoked an interest in the development of novel local drug delivery systems for the treatment of periodontal diseases (Greenstein, 2006; Hussein et al., 2007).

5864 Afr. J. Microbiol. Res.
With the development of modern pharmacy, sustained-release drug has been used in the treatment of parodontopathy (Vandekerckhove et al., 1997; Vyas et al., 2000). If a therapeutic effective concentration can be maintained in the periodontal pocket for a desired period, local sustained-release drug may significantly improve the therapeutic efficacy of periodontitis. Moreover, side-effects can also be greatly decreased due to avoidance of high plasma concentration (Vyas et al., 2000). Ornidazole is a nitroimidazole antiprotozoal agent and has better anti-anaerobic activity than quinolones (Quirynen et al., 2002). Although, anaerobe is the dominant population involving in periodontitis, facultative anaerobe also plays a part role in the periodontal destruction. Pefloxacin mesylate is a quinolone antibiotic and has better activity against facultative anaerobes than nitroimidazoles (Wang et al., 2007). In the present study, the optimal ratio and optimal content of ornidazole (O) and pefloxacin mesylate (P) were determined to prepare the compound O&P sustained-release periodontal suppository for the treatment of periodontitis. MATERIALS AND METHODS Dominant pathogenic bacteria of periodontitis
Pg, Fn, Pi, Ps, Mutans streptococcu (Ms), Sa and Se are standard strain purchased from the R&D Department of P&G company. Instruments for experiments
Agar medium (Shanghai Li Chen Biotechnology Co., Ltd.), drug susceptibility papers (Shanghai Wufeng Scientific Instruments Co., Ltd.), high performance liquid chromatograph (HPLC) (Shanghai Wufeng Scientific Instruments Co., Ltd.), O&P standard substance and chromatography-pure methanol (Shanghai Shengke Biotechnology Co., Ltd.) were used. SPSS13.0 was used for statistical analysis. In vitro study on the anti-microbic characteristic of O&P
To investigate whether O&P have synergic anti-microbic action, the Kirby-Bauer test was applied. Round arid anti-microbic filter papers measuring 6 mm in diameter were prepared and soaked with 5 µg of ornidazole or pefloxacin mesylate, respectively. Then, these papers were put onto the agar plate containing Pg, Fn, Pi, Ps, Sa or Se. There were one ornidazole paper and one pefloxacin mesylate paper on each agar plate. Then, the synergic action was preliminarily estimated by the shape of intersecting angles between
two inhibition rings. The interaction was further assessed by using agar dilution method and the effects evaluated with fractional inhibitory concentration (FIC) and minimun inhibitory concentration (MIC). In brief, Pg, Fn, Pi, Pa, Sa, Se (2 × 10⁷ ml) were inoculated into a Mueller-Hinton broth and dispensed at 0.1 ml/well in 96-well plates. MICs were determined by a serial twofold dilution of ornidazole and/or pefloxacin mesylate from 2 to 1/32 of MIC alone.
After 24 h of incubation at 37°C, the minimal compound concentration at which the ornidazole/pefloxacin mesylate
prevented the growth of a given organism was determined and defined as the MIC of the compound. The MIC was determined in three independent assays.
Screen on the optimal ratio of O&P In the agar plates of Pg, Fn, Pi, Ps and Fn, the ditch plate method of agar diffusion was employed to detect anti-anaerobic effects of O&P at different ratios. L36 (62) orthogonal table was designed to select the optimal ratio of O&P on the 4 strains of anaerobes. In the orthogonal table, O&P are two factors and each factor is classified into 6 levels. In the orthogonal experiment, there were 36 groups in which the ratio of O&P varied from 1:6 to 6:1 and only 23 groups were finally subjected to analysis because sever groups were integrated into one (for example ratios at 1:2, 2:4 and 3:6 were the same to 1:2) (Table 1). According to findings in the orthogonal experiment, the range of each factor was calculated: the larger the
range, the higher the antibacterial effect. Single-factor analysis of variance was used to identify the critical point of ratio for each anaerobe.
In order to get the optimal ratio, the MIC and MIC50 of dominant periodontal pathogenic bacteria were determined according to each critical point. Preparation of compound O&P sustained-release periodontal
suppository A special mold (Figure 1) of suppository was designed according to anatomic shape and the depths of different periodontal pockets. Cold compression was employed for the preparation of suppository. The carrier which can reduce the application of antibacterial agents was composed of ethyl cellulose (EC) and hydroxypropyl methyl cellulose (HPMC). Firstly, EC was swollen with 95% alcohol, and then with sufficient distilled water. The glycerine, pefloxacin
mesylate and ornidazole were added in a proper order. When all these materials were mixed sufficiently, HPMC was then added to the mixture. After agitation, alcohol was volatilized, the mixture was swollen to doughing time and then it was taken into the mold. Screening optimal content of compound O&P periodontal suppository
Different contents (1, 2, 5, 10 and 20%) of O&P periodontal suppository were prepared. In every content group, three suppositories with same content were completely dissolved in 3 ml of purified water. After being filtrated, 5 μl of drug-filtrate was put into the drug -sensitive paper plates measuring 6 mm in diameter. So, in the paper plate of each group, the drug content was 0.5, 1, 2.5, 5 and 10 μg; which corresponded to the contents of suppositories. Then, Kirby-Bauer method was used to estimate the bacteriostatic effect on the 4 strains of anaerobic bacteria (Pg, Fn, Pi and Ps), and 3 strains of facultative anaerobe (Ms, Sa and Se). The optimized content of suppository was determined by comparing the size of inhibition rings. Medicine release level of compound sustained-release periodontal suppository in vitro
Cumulative release ratio of drugs was detected through HPLC. The conditions for HPLC were chromatographic column: C18 (250 × 4.6 mm, 5 µm); mobile phase: 0.1 mol/L monopotassium phosphate solution-methanol (60:40); detecting wavelength: 277 nm; flow velocity: 1.0 ml/min; sampling size: 20 µl; column temperature: 30°C. Firstly, the standard curves of O&P were delineated and the peak areas were corresponding to the drug concentration. Then, the suppositories with 20% drug were soaked into a beaker
containing 5 ml of purified water and stirred every 10 min (n = 5). At the designed time points (0.5, 1, 2, 3, 4, 5, 6, 7, 8, 9, 10, 11, 13, 15, 18 and 24 h), 200 µl of fluid were collected for the detection and
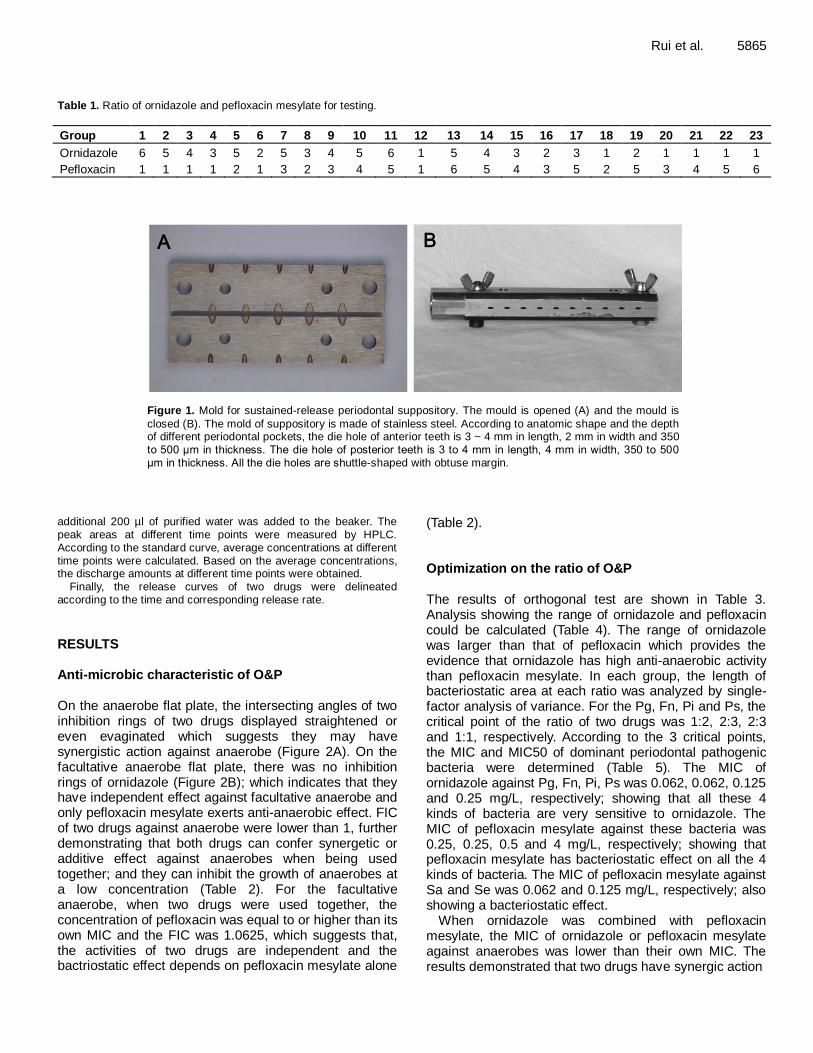
Rui et al. 5865 Table 1. Ratio of ornidazole and pefloxacin mesylate for testing.
Group 1 2 3 4 5 6 7 8 9 10 11 12 13 14 15 16 17 18 19 20 21 22 23
Ornidazole 6 5 4 3 5 2 5 3 4 5 6 1 5 4 3 2 3 1 2 1 1 1 1
Pefloxacin 1 1 1 1 2 1 3 2 3 4 5 1 6 5 4 3 5 2 5 3 4 5 6
Figure 1. Mold for sustained-release periodontal suppository. The mould is opened (A) and the mould is
closed (B). The mold of suppository is made of stainless steel. According to anatomic shape and the depth of different periodontal pockets, the die hole of anterior teeth is 3 ~ 4 mm in length, 2 mm in width and 350 to 500 μm in thickness. The die hole of posterior teeth is 3 to 4 mm in length, 4 mm in width, 350 to 500 μm in thickness. All the die holes are shuttle-shaped with obtuse margin.
additional 200 µl of purified water was added to the beaker. The peak areas at different time points were measured by HPLC. According to the standard curve, average concentrations at different time points were calculated. Based on the average concentrations, the discharge amounts at different time points were obtained.
Finally, the release curves of two drugs were delineated according to the time and corresponding release rate.
RESULTS Anti-microbic characteristic of O&P On the anaerobe flat plate, the intersecting angles of two inhibition rings of two drugs displayed straightened or even evaginated which suggests they may have synergistic action against anaerobe (Figure 2A). On the facultative anaerobe flat plate, there was no inhibition rings of ornidazole (Figure 2B); which indicates that they have independent effect against facultative anaerobe and only pefloxacin mesylate exerts anti-anaerobic effect. FIC of two drugs against anaerobe were lower than 1, further demonstrating that both drugs can confer synergetic or additive effect against anaerobes when being used together; and they can inhibit the growth of anaerobes at a low concentration (Table 2). For the facultative anaerobe, when two drugs were used together, the concentration of pefloxacin was equal to or higher than its own MIC and the FIC was 1.0625, which suggests that, the activities of two drugs are independent and the bactriostatic effect depends on pefloxacin mesylate alone
(Table 2). Optimization on the ratio of O&P The results of orthogonal test are shown in Table 3. Analysis showing the range of ornidazole and pefloxacin could be calculated (Table 4). The range of ornidazole was larger than that of pefloxacin which provides the evidence that ornidazole has high anti-anaerobic activity than pefloxacin mesylate. In each group, the length of bacteriostatic area at each ratio was analyzed by single-factor analysis of variance. For the Pg, Fn, Pi and Ps, the critical point of the ratio of two drugs was 1:2, 2:3, 2:3 and 1:1, respectively. According to the 3 critical points, the MIC and MIC50 of dominant periodontal pathogenic bacteria were determined (Table 5). The MIC of ornidazole against Pg, Fn, Pi, Ps was 0.062, 0.062, 0.125 and 0.25 mg/L, respectively; showing that all these 4 kinds of bacteria are very sensitive to ornidazole. The MIC of pefloxacin mesylate against these bacteria was 0.25, 0.25, 0.5 and 4 mg/L, respectively; showing that pefloxacin mesylate has bacteriostatic effect on all the 4 kinds of bacteria. The MIC of pefloxacin mesylate against Sa and Se was 0.062 and 0.125 mg/L, respectively; also showing a bacteriostatic effect.
When ornidazole was combined with pefloxacin mesylate, the MIC of ornidazole or pefloxacin mesylate against anaerobes was lower than their own MIC. The results demonstrated that two drugs have synergic action
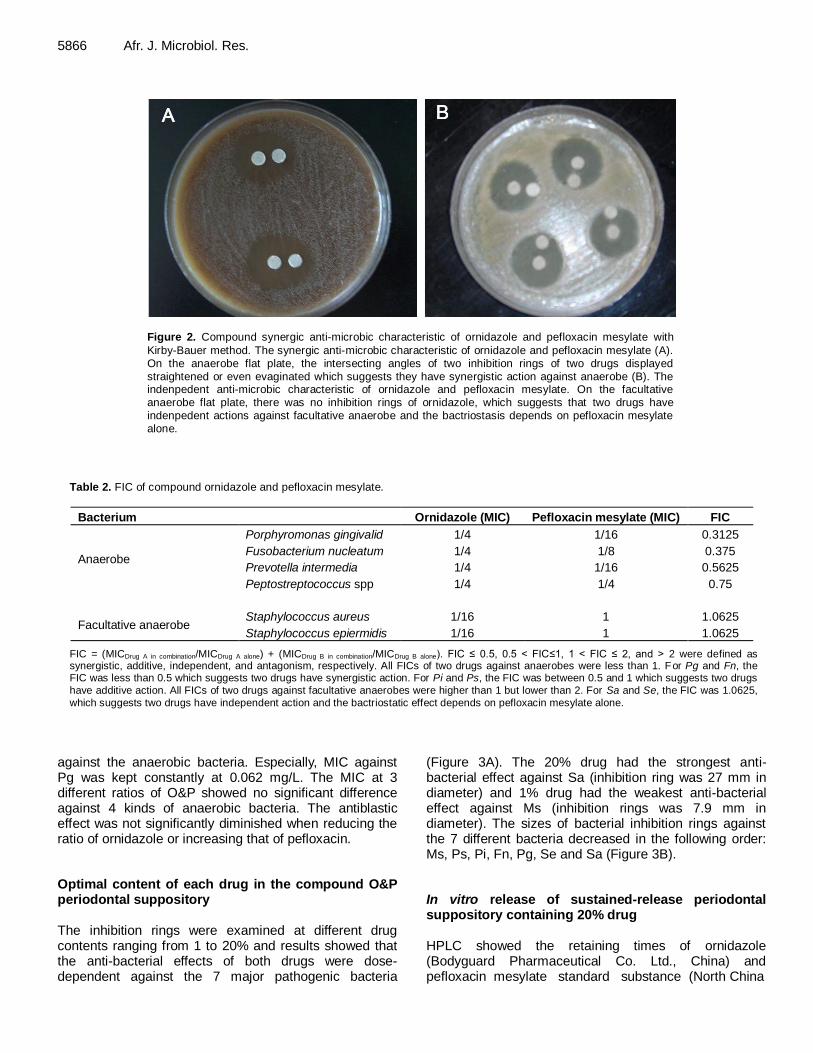
5866 Afr. J. Microbiol. Res.
Figure 2. Compound synergic anti-microbic characteristic of ornidazole and pefloxacin mesylate with
Kirby-Bauer method. The synergic anti-microbic characteristic of ornidazole and pefloxacin mesylate (A). On the anaerobe flat plate, the intersecting angles of two inhibition rings of two drugs displayed straightened or even evaginated which suggests they have synergistic action against anaerobe (B). The indenpedent anti-microbic characteristic of ornidazole and pefloxacin mesylate. On the facultative anaerobe flat plate, there was no inhibition rings of ornidazole, which suggests that two drugs have indenpedent actions against facultative anaerobe and the bactriostasis depends on pefloxacin mesylate alone.
Table 2. FIC of compound ornidazole and pefloxacin mesylate.
Bacterium Ornidazole (MIC) Pefloxacin mesylate (MIC) FIC
Anaerobe
Porphyromonas gingivalid 1/4 1/16 0.3125
Fusobacterium nucleatum 1/4 1/8 0.375
Prevotella intermedia 1/4 1/16 0.5625
Peptostreptococcus spp 1/4 1/4 0.75
Facultative anaerobe Staphylococcus aureus 1/16 1 1.0625
Staphylococcus epiermidis 1/16 1 1.0625
FIC = (MICDrug A in combination/MICDrug A alone) + (MICDrug B in combination/MICDrug B alone). FIC ≤ 0.5, 0.5 < FIC≤1, 1 < FIC ≤ 2, and > 2 were defined as synergistic, additive, independent, and antagonism, respectively. All FICs of two drugs against anaerobes were less than 1. For Pg and Fn, the FIC was less than 0.5 which suggests two drugs have synergistic action. For Pi and Ps, the FIC was between 0.5 and 1 which suggests two drugs
have additive action. All FICs of two drugs against facultative anaerobes were higher than 1 but lower than 2. For Sa and Se, the FIC was 1.0625,
which suggests two drugs have independent action and the bactriostatic effect depends on pefloxacin mesylate alone.
against the anaerobic bacteria. Especially, MIC against Pg was kept constantly at 0.062 mg/L. The MIC at 3 different ratios of O&P showed no significant difference against 4 kinds of anaerobic bacteria. The antiblastic effect was not significantly diminished when reducing the ratio of ornidazole or increasing that of pefloxacin. Optimal content of each drug in the compound O&P periodontal suppository The inhibition rings were examined at different drug contents ranging from 1 to 20% and results showed that the anti-bacterial effects of both drugs were dose-dependent against the 7 major pathogenic bacteria
(Figure 3A). The 20% drug had the strongest anti-bacterial effect against Sa (inhibition ring was 27 mm in diameter) and 1% drug had the weakest anti-bacterial effect against Ms (inhibition rings was 7.9 mm in diameter). The sizes of bacterial inhibition rings against the 7 different bacteria decreased in the following order: Ms, Ps, Pi, Fn, Pg, Se and Sa (Figure 3B). In vitro release of sustained-release periodontal suppository containing 20% drug HPLC showed the retaining times of ornidazole (Bodyguard Pharmaceutical Co. Ltd., China) and pefloxacin mesylate standard substance (North China

Rui et al. 5867
Table 3. Anti-anaerobic effect of different ratios of ornidazole and pefloxacin mesylate.
Factor Anti-anaerobic effects (mm)
No. O P Pg Fn Pi Ps
y1 6 1 31.2±1.37 31.0±1.17 28.3±1.06 26.4±1.28
y2 6 2 30.5±1.07 30.9±1.22 28.3±0.87 26.3±0.91
y3 6 3 30.8±1.05 30.83±1.35 27.91±0.95 25.72±0.87
y4 6 4 30.5±1.61 30.6±0.93 27.3±0.74 25.1±1.16
y5 6 5 30.4 ±1.21 30.6±1.07 27.0±1.13 24.8±1.13
y6 6 6 30.0±0.94 30.4±1.02 26.9±1.02 24.5±0.74
y7 5 1 31.4±1.53 31.1±1.45 28.3±0.87 26.0±.1.03
y8 5 2 31.0± 1.32 30.7±1.10 28.1±0.89 26.1±1.01
y9 5 3 30.2±1.32 30.7±1.01 27.6±0.86 25.1±0.99
y10 5 4 30.5±1.34 30.4±0.95 27.1±0.81 25.1±1.15
y11 5 5 30.0±0.94 30.4±1.02 26.9±1.02 24.5±0.74
y12 5 6 29.9±1.32 30.0±1.55 26.8±1.11 23.4±0.85
y13 4 1 31.2± 1.36 31.1±1.42 28.2±0.94 26.4±0.96
y14 4 2 30.86±1.05 30.83±1.35 27.91±0.95 25.72±0.87
y15 4 3 29.9 ±1.26 30.5±1.09 27.3±0.97 25.0±0.99
y16 4 4 30.0±0.94 30.4±1.02 26.9±1.02 24.5±0.74
y17 4 5 29.9±1.33 29.8±1.07 26.8±1.22 23.2±0.67
y18 4 6 30.1±1.05 29.5±1.06 26.7±1.01 22.8±0.99
y19 3 1 30.5±1.07 30.9±1.22 28.3±0.87 26.3±0.91
y20 3 2 30.5±1.61 30.6±0.93 27.3±0.74 25.1±1.16
y21 3 3 30.0±0.94 30.4±1.02 26.9±1.02 24.5±0.74
y22 3 4 30.2±1.50 30.0±1.02 26.9±0.99 22.9±0.87
y23 3 5 29.3±1.33 29.0±0.94 26.5±0.74 22.8±1.02
y24 3 6 29.2±1.52 28.6±0.72 25.9±1.00 22.6±1.20
y25 2 1 30.4±1.29 30.8±1.37 27.7±1.13 25.5±1.35
y26 2 2 30.0±0.94 30.4±1.02 26.9±1.02 24.5±0.74
y27 2 3 30.1±1.05 29.5±1.06 26.7±1.01 22.8±0.99
y28 2 4 29.2±1.52 28.6±0.72 25.9±1.00 22.6±1.20
y29 2 5 28.3±0.95 27.6±0.96 24.2±1.16 22.4±1.29
y30 2 6 27.1±1.12 26.5±1.16 23.6±1.01 21.8±0.94
y31 1 1 30.0±0.94 30.4±1.02 26.9±1.02 24.5±0.74
y32 1 2 29.2±1.52 28.6±0.72 25.9±1.00 22.6±1.20
y33 1 3 27.1±1.12 26.5±1.16 23.6±1.01 21.8±0.94
y34 1 4 26.7±1.17 26.0±0.81 22.7±0.91 21.5±1.02
y35 1 5 26.0±1.13 25.5±0.89 22.1±1.15 20.2±0.98
y36 1 6 26.0± 0.78 25.1±0.80 21.3±1.59 19.8±0.89
Pharmaceutical Group Co. Ltd., China) were 10.1 and 13.7 min, respectively (Figure 4A). The regression equation of ornidazole was y = 5.7507x + 1.0714, r = 0.9993 (Figure 4B) and that of pefloxacin mesylate was y = 1.1279x + 0.9904, r = 0.9999 (Figure 4C). The peak areas, average concentrations and release amounts of O&P at different time points are shown in Tables 6 and 7. Ornidazole was released by 9.08% at 30 min, 59.50% at 5 h and 98.30% at 13 h, while pefloxacin mesylate was released by 15.26% at 30 min, 45.00% at 5 h and 96.01% at 13 h (Figure 4D).
DISCUSSION The appearance of periodontal pocket is one of the important signs of periodontitis (Liu et al., 2003). The periodontal pocket provides a natural space for the local delivery system (Mundargi et al., 2007). Meanwhile, the gingival crevicular fluid provides a liquid medium for the release of drug from a carrier and for its distribution throughout the periodontium (Jain et al., 2008). Therefore, a therapeutic effective concentration of an anti-microbial agent could be maintained in the periodontal

5868 Afr. J. Microbiol. Res.
Table 4. Antibacterial index of ornidazole and pefloxacin mesylate with range analysis.
Bacterium Ornidazole Pefloxacin mesylate
Porphyromonas gingivalid R(1)
= 7.5955 R(2)
= 2.6142
Fusobacterium nucleatum R(1)
= 3.3219 R(2)
= 1.8027
Prevotella intermedia R(1)
= 8.3327 R(2)
= 2.7861
Peptostreptococcus spp R(1)
= 10.8025 R(2)
= 4.7611
The range of ornidazole was larger than that of pefloxacin which provides the evidence that ornidazole has stronger sensitivity than pefloxacin mesylate against anaerobes. The range
can be calculated from Table 3. R(1)
= [ k 1(1)
— µ]2
+ [ k 2(1)
— µ]2
+ [ k 3(1)
— µ]2
+ [ k 4(1)
—
µ]2 + [ k 5
(1) — µ]
2 + [ k 6
(1) — µ]
2; R
(2) = [ k 1
(2) — µ]
2 + [ k 2
(2) — µ]
2 + [ k 3
(2) — µ]
2 + [ k 4
(2 )—
µ]2 + [ k 5
(2) — µ]
2 + [ k 6
(2) — µ]
2; µ = (y1 + y2 + y3 + y4………. +.y36) × 1/36; k1
(1) = y1 + y2 + y3 +
y4 + y5 + y6: k 1(1)
= 1/6 k1(1)
: k2(1)
= y7 + y8 + y9 + y10 + y11 + y12: k 2(1)
= 1/6 k2(1)
; k1(2)
= y1 + y7 +
y13 + y19 + y25 + y31 k 1(2)
= 1/6 k1(2)
: k2(2)
= y2 + y8 + y14 + y20 + y26 + y32: k 2(2)
= 1/6 k2(2)
and so
on.
Table 5. MIC in 4 strains of anaerobes and 3 strains of facultative anaerobes with 3 different critical points in ratio.
Bacterium (strain) Ornidazole Pefloxacin mesylate 1:1 2:3 1:2
MIC/MIC50 MIC/MIC50 MIC/MIC50 MIC/MIC50 MIC/MIC50
Pg 0.062 0.25 0.062 0.062 0.062
Fn 0.062 0.25 0.062 0.062 0.125
Pi 0.125 0.5 0.125 0.25 0.25
Ps 0.25 4 0.25 0.5 1
Sa >256 0.06~8/0.5 0.125~32/1 0.06~16/0.5 0.06~8/0.5
Se >256 0.125~16/1 0.25~32/2 0.25~32/1 0.25~16/1
Ms >256 0.125~64/4 0.25~64/8 0.25~64/4 0.125~64/4
Figure 3. In vitro bacteriostatic effect of ornidazole and pefloxacin mesylate periodontal suppository with five different drug contents.
Diameters of inhibition zones at five different drug contents against one bacterium (A); bacteriostatic effect against differ ent bacteria at different drug contents (B). An obvious dose-dependent manner was observed in the anti-bacterial effect against the 7 major suspected pathogenic bacteria.

Rui et al. 5869
Figure 4. In vitro release of sustained-release suppository containing 20% drug. Chromatography of ornidazole
and pefloxacin mesylate standard substance (A); A represents ornidazole TR = 10.166 min and B pefloxacin TR
= 13.722 min; the standard curve of ornidazole (B); the standard curve of pefloxacin mesylate (C) and the release curve of ornidazole and pefloxacin mesylate in vitro (D).
Table 6. The peak area and delayed release of ornidazole in the periodontal suppository.
Time (h) Peak area Average concentration (mg/ml) Release amount (mg) Accumulative release degrees (%)
0.5 5.757 0.036 0.18 9.08
1 8.781 0.055 0.10 14.63
2 12.793 0.080 0.14 22.01
3 20.629 0.129 0.26 36.25
4 26.227 0.164 0.20 47.20
5 32.623 0.204 0.23 59.50
6 37.900 0.237 0.21 70.86
7 41.579 0.260 0.16 79.47
8 44.137 0.276 0.13 86.55
9 47.816 0.299 0.07 90.18
10 47.816 0.299 0.06 93.34
11 48.775 0.305 0.03 96.79
13 47.655 0.298 0.03 98.30
pocket for a desired period, which is the basis of; and ensure the successful treatment of periodontitis. A variety
of potentials of sustained-release preparations have been displayed in this treatment (Chen et al., 2006). In this

5870 Afr. J. Microbiol. Res.
Table 7. The peak area and delayed release of pefloxacin mesylate in the periodontal suppository.
Time (h) Peak area Average concentration
(mg/ml) Release amount (mg) Accumulative release degrees (%)
0.5 101.470 0.084 0.42 15.26
1 155.154 0.128 0.24 24.10
2 199.423 0.164 0.22 32.11
3 215.410 0.177 0.10 35.80
4 236.315 0.194 0.12 40.23
5 258.449 0.212 0.13 45.00
6 319.935 0.262 0.29 55.45
7 388.110 0.317 0.33 67.62
8 444.136 0.363 0.29 78.33
9 467.500 0.382 0.17 84.48
10 483.486 0.395 0.14 89.64
11 498.243 0.407 0.14 94.57
13 488.405 0.399 0.04 96.01
study, in order to provide a high anti-microbial activity, we designed local compound O&P periodontal suppository which consisted of ornidazole, pefloxacin mesylate and carrier. The carrier was composed of EC and HPMC, materials widely used in controlled release system and its application reduced the content of antibacterial agents.
The Kirby-Bauer test and FIC detection indicated that there was no incompatibility between ornidazole and pefloxacinmesylate, and they could exert synergetic effect against anaerobe and inhibit the anaerobic growth at a low concentration when they were applied together. For facultative anaerobe, however, the anti-bacterial effect depended on pefloxacin mesylate alone. In this study, the ratio of two drugs was for the first time optimized. Orthogonal experiment was performed to determine the optimal ratio against 4 strains of anaerobes. Through single-factor analysis of variance, three critical points of ratio were identified: 1:2, 2:3 and 1:1. According to 3 critical points, the MIC and MIC50 of the dominant periodontal pathogenic bacteria were determined. Among the 3 different critical points, for the anaerobes, there were no significant differences in the anti-bacterial activities and their MIC. The present study also demonstrated that the antibacterial activities of the compound increased with the increase of pefloxacin when the anti--bacterial effect against facultative anaerobes was taken into account. Because two drugs have independent anti-bacterial effect against facultative anaerobe and the bactriostatic effect depends on pefloxacin mesylate alone; that is to say, the ratio of 1:2 is preferred. However, periodontal diseases are predominantly caused by anaerobic infection, and quinolones have been clinically applied for years, there is a possibility of drug resistance.
In addition, ornidazole has first expose effect and its anti-bacterial effect is concentration dependent (Kamma et al., 2000). Moreover, the anti-bacterial activity of
pefloxacin mesylate against anaerobes in vivo should be further studied (Appelbaum, 1999). Taking the reasons earlier mentioned into account, we speculate that the ratio of 2:3 is a preferred ratio. O&P are freely soluble in gingival crevicular fluid, and hence selection of release-retarding excipient is necessary to achieve a constant input rate in the gingival crevicular (Paquette et al., 2008; Akncbay et al., 2007; Bosco et al., 2009). Because of its flexibility, HPMC (a hydrophilic polymer matrix) was used to obtain a desirable drug release profile and broad regulatory acceptance. HPMC has been well known to retard drug release by swelling in aqueous media (Li et al., 2005). However, for a water soluble drug, application of a hydrophilic matrix system alone is restricted because of rapid diffusion of dissolved drug through the hydrophilic gel network. In such circumstances, EC, one of hydrophobic polymers is required along with the HPMC for developing sustained-release delivery system (Barat et al., 2007).
Incorporation of a high concentration of EC controls the drug release in a better manner, which may be attributed to the decreased penetration of solvent molecules in the presence of hydrophobic polymer, leading to decreased drug diffusion from the matrix (Bromberg et al., 2001). Furthermore, because of the presence of EC which is generally responsible for the hardness of suppository, the suppository is not susceptible to being cracked when it is held by pliers. The sustained-release materials used in this study have certain drug saturation. When the drug content is higher than 20%, the precipitation of drug may occur. So, 5 different contents (1, 2, 5, 10 and 20%) were applied. The optimal content was selected by comparing the size of inhibition rings. Statistical analysis demonstrated that content at 20% has obvious advantages. The in vitro experiment on the sustained-release periodontal suppository containing 20% drug revealed that the average release rates of ornidazole and
pefloxacin mesylate were 0.14 and 0.20 mg/h, respectively; and the accumulated release percentages of ornidazole and pefloxacin mesylate at 13 h were 98.3 and 96.01%, respectively. Moreover, the initial burst release was not observed. All the parameters related to sustained-release behavior were within the limits proposed by the pharmacopeia.
The present study indicated that the compound periodontal suppository containing 20% drug had potent sustained-release bacteriostatic effect against the suspected pathogenic bacteria. Especially, for the sensitive bacteria, the sustained-release could be sustained for about 24 h. For the non-sensitive bacteria such as Ps and Ms, the sustained-release could be sustained for about 10 h. These features demonstrated that the suppository can meet the requirement of sustained-release. So, in the treatment of periodontitis, the suppository may be medicated every other day. This study affirmatively provides a better understanding of the synergistic effect of O&P which may be helpful for the periodontal therapies. Our results provide convincing evidence and useful information for future clinical application of sustained-release periodontal suppository containing 20% drug. In future study, we will further optimize the periodontal suppository. For example, the ratio of sustained-release materials should be optimized which may prolong the sustained-release time.
In addition, the therapeutic effect of periodontal suppository will be investigated in rats with ligature-induced periodontitis. ACKNOWLEDGEMENT This work was supported by a grant from the Science and Technology foundation of Chongqing China (Project No.2004BB5065 and No.2009AC5019) REFERENCES Akncbay H, Senel S, Ay ZY (2007). Application of chitosan gel in the
treatment of chronic periodontitis. J. Biomed. Mater. Res. B. Appl. Biomater. 80 (2): 290-296.
Appelbaum PC (1999). Quinolone activity against anaerobes. Drugs 58
Suppl 2: 60-64. Barat R, Srinatha A, Pandit JK, Mittal N, Anupurba S (2007).
Ethylcellulose inserts of an orphan drug for periodontitis: preparation,
in vitro, and clinical studies. Drug Deliv. 14 (8): 531-538. Bidault P, Chandad F, Grenier D (2007a). Risk of bacterial resistance
associated with systemic antibiotic therapy in periodontology. J. Can.
Dent. Assoc. 73(8): 721-725. Bidault P, Chandad F, Grenier D (2007b). Systemic antibiotic therapy in
the treatment of periodontitis. J. Can. Dent. Assoc. 73(6): 515-520.
Bosco JM, Lopes BM, Bosco AF, Spolidorio DM, Marcantonio RA (2009). Local application of tetracycline solution with a microbrush: an alternative treatment for persistent periodontitis. Quintessence.
Int. 40(1): 29-40. Bromberg LE, Buxton DK, Friden PM (2001). Novel periodontal drug
delivery system for treatment of periodontitis. J. Control Release,
71(3): 251-259.
Rui et al. 5871 Chen FM, Zhao YM, Wu H, Deng ZH, Wang QT, Zhou W, Liu Q, Dong
GY, Li K, Wu ZF, Jin Y (2006). Enhancement of periodontal tissue regeneration by locally controlled delivery of insulin-like growth factor-
I from dextran-co-gelatin microspheres. J. Control. Release. 114(2): 209-222.
Greenstein G (2006). Local drug delivery in the treatment of periodontal
diseases: assessing the clinical significance of the results. J. Periodontol. 77 (4):565-578.
Hussein I, Ranka M, Gilbert A, Davey K (2007). Locally delivered
antimicrobials in the management of periodontitis: a critical review of the evidence for their use in practice. Dent. Update. 34(8): 494-496, 499-502, 505-496.
Jain N, Jain GK, Javed S, Iqbal Z, Talegaonkar S, Ahmad FJ, Khar RK (2008). Recent approaches for the treatment of periodontitis. Drug. Discov. Today. 13 (21-22):932-943.
Kamma JJ, Nakou M, Mitsis FJ (2000). The clinical and microbiological effects of systemic ornidazole in sites with and without subgingival debridement in early-onset periodontitis patients. J. Periodontol.
71(12): 1862-1873. Li CL, Martini LG, Ford JL, Roberts M (2005). The use of hypromellose
in oral drug delivery. J. Pharm. Pharmacol. 57(5): 533-546.
Liu L, Wen X, He H, Shi J, Ji C (2003). Species-specific DNA probe for the detection of Porphyromonas gingivalis from adult Chinese periodontal patients and healthy subjects. J. Periodontol. 74(7): 1000-
1006. Mundargi RC, Srirangarajan S, Agnihotri SA, Patil SA, Ravindra S, Setty
SB, Aminabhavi TM (2007). Development and evaluation of novel
biodegradable microspheres based on poly(d,l-lactide-co-glycolide) and poly(epsilon-caprolactone) for controlled delivery of doxycycline in the treatment of human periodontal pocket: in vitro and in vivo
studies. J. Control. Release, 119 (1):59-68. Paju S, Pussinen PJ, Suominen-Taipale L, Hyvonen M, Knuuttila M,
Kononen E (2009). Detection of multiple pathogenic species in saliva
is associated with periodontal infection in adults. J. Clin. Microbiol. 47(1): 235-238.
Paquette DW, Ryan ME, Wilder RS (2008). Locally delivered
antimicrobials: clinical evidence and relevance. J. Dent. Hyg. 82 Suppl 3: 10-15.
Quirynen M, Teughels W, De Soete M, van Steenberghe D (2002)
Topical antiseptics and antibiotics in the initial therapy of chronic adult periodontitis: Microbiological aspects. Periodontology, 28: 72-90.
Takahashi K (1998). Microbiological, pathological, inflammatory,
immunological and molecular biological aspects of periradicular disease. Int. Endod. J. 31(5): 311-325
Vandekerckhove BN, Quirynen M, van Steenberghe D (1997). The use
of tetracycline-containing controlled-release fibers in the treatment of refractory periodontitis. J. Periodontol. 68(4): 353-361
Vyas SP, Sihorkar V, Mishra V (2000). Controlled and targeted drug delivery strategies towards intraperiodontal pocket diseases. J. Clin.
Pharm. Ther. 25(1): 21-42. Wang LC, Chen XG, Zhong DY, Xu QC (2007). Study on poly(vinyl
alcohol)/carboxymethyl-chitosan blend film as local drug delivery
system. J. Mater. Sci. Mater. Med. 18(6): 1125-1133. Zambon JJ (1996). Periodontal diseases: microbial factors. Ann.
Periodontol. 1(1): 879-925.

African Journal of Microbiology Research Vol. 5(32), pp. 5872-5876, 30 December, 2011 Available online at http://www.academicjournals.org/AJMR ISSN 1996-0808 ©2011 Academic Journals DOI: 10.5897/AJMR11.751
Full Length Research Paper
Emergence of oligoclonal Acinetobacter baumannii nosocomial infection in a Hospital in Nepal
Badri Thapa1, Chanwit Tribuddharat2 and Sulochana Mahat Basnet3
1Department of Microbiology, Kathmandu Medical College, Kathmandu, Nepal, Microbiology Section, Genesis
Laboratory and Research, Kathmandu, Nepal. 2Department of Microbiology, Siriraj Hospital, Mahidol University, Bangkok, Thailand.
3Faculty of Health, University of Canberra, Canberra, Australia.
Accepted 13 September, 2011
The molecular epidemiology of fifteen clinical strains of Acinetobacter baumannii recovered from various clinical specimens from different wards during January to June, 2010 from a hospital in Nepal was evaluated. Kirby-Bauer disk diffusion test was used for determining in-vitro activities of antibiotics. Molecular epidemiology was investigated by polymerase chain reaction-randomly amplified polymorphic DNA (PCR-RAPD) and plasmid profiling. A. baumannii recovered were multidrug resistant. Isolates represented three antibiotypes (a, b and c). Isolates in antibiotype c (n=12) were resistant to all antibiotics tested while isolates in antibiotype a (n=2) was susceptible to netilmicin and b (n=1) was susceptible to aminoglycosides and fluoroquinolones tested. Four plasmid profiles (i) 1 isolate; (ii) 1 isolate; (iii) 1 isolate; and (iv) 12 isolates and four PCR-RAPD types (I)1isolate; (II) 8 isolates; (III) 1 isolate; (IV) 5 isolates revealed oligoclonal population of A. baumannii. Antibiotypes, plasmid profiles and PCR-RAPD types showed no empirical association. A. baumannii isolates were oligoclonal and multi-drug resistant. The emergence of multi-drug resistant oligoclonal population of this pathogen in a hospital warrants for development of appropriate antibiotic policies and immediate implementation of infection prevention and control measures. Key words: Acinetobacter baumannii, multidrug-resistant, oligoclonal, Nepal.
INTRODUCTION Acinetobacter baumannii is emerging as a nosocomial pathogen around the globe. This pathogen is ubiquitous in the hospital environment, is multidrug, pandrug to extensively drug-resistant, can survive wide range of pH, salinity, humidity, and can thrive on almost all nutrient sources. They frequently colonize respiratory and digestive tract, skin, and throat causing wide array of infections especially in immunocompromised and debilitated patients admitted in intensive care units (ICU) (Montefour et al., 2008; Rosenthal and Tager, 1975; Somerville and Noble, 2008). Acinetobacter spp. is responsible for 3 to 4% of ventilator associated pneumonia and crude mortality rate due to A. baumannii
*Corresponding author. E-mail: [email protected]. Tel: 977-1-4426059. Fax: 977-1-4426461.
is 30 to 70% (CDC, 1984). Since its emergence as nosocomial infection in USA in
1991, A. baumannii has been isolated in numerous health care facilities and city, country and continent wide outbreak of this pathogen have been documented (Go et al., 1994; Peleg et al., 2008). This pathogen has successfully overcome therapeutic armament by accumulating its innate and acquired resistance repertoire (Peleg et al., 2008). A. baumannii resistant to all beta-lactams has already emerged (Peleg et al., 2008). Polymyxins, tigecycline and rifampin are considered as magic bullets to treat A. baumannii infections but resistant strains to these antibiotics are emerging (Ko et al., 2007; Thapa et al., 2009a).
Multidrug resistant strains of Enterobacteriaceae like, Escherichia coli Klebsiella pneumoniae, Citrobacter spp., Proteus spp., and Enterobacter spp., have been the subject of attention in Nepal but nosocomial infection by

Badri et al. 5873 Table 1. Antibiotypes, plasmid profiles and PCR-RAPD types of isolates studied.
Isolates PCR-RAPD Plasmid profile Antibiotypes AST, sensitive to
104 I iv c -
106, 107, 1011, 1012, 1015, 1016 II iv
c
-
109 -
1010 II iv a AK, G, K, NT, NX, CF
108 III iii c -
101 IV i a AK, G, K, NT, NX, CF
102 IV ii b NT
105,1013,1014 IV iv c -
AST, Antibiotic susceptibility test; AK, Amikacin; G, Gentamicin; K, Kanamycin; NT, Netilmicin; NX, Norfloxacin; CF, Ciprofloxacin.
non-Enterobacteriaceae, like A. baumannii is also emerging (Banjara et al., 2003; Gaur et al., 2007; Thapa et al., 2009b). Molecular studies of A. baumannii from Nepal are scarce. Here, we studied the molecular epidemiology of nosocomial strains of A. baumannii isolated from Nepal. MATERIALS AND METHODS
Bacterial strains
Out of 36 strains of A. baumannii isolated from various specimen sources in Microbiology laboratory of Kathmandu Medical College and Teaching Hospital (KMCTH), Kathmandu, Nepal during 6 months period (January to June, 2010), 15 were studied. The isolates were identified based on the published reports (Malini et al., 2009).
Antibiotic susceptibility test
Antibiotic susceptibilities of these pathogens were tested using Kerby-Bauer disk diffusion assay following CLSI guidelines (CLSI, 2005). The disk containing antibiotics (µg/disk) (HiMedia Pvt. Ltd, India) used were; Amoxicillin (20), Amoxicillin-Clavulanic acid
(20+10), Piperacillin (100), Ceftizoxime (30), Ceftriaxone (30), Ceftazidime (30), Cefazolin (30), Cefoxitin (30), Amikacin (30), Gentamicin (30), Kanamycin (30), Netilmicin (30), Norfloxacin(10), and Ciprofloxacin (5). Genetic analysis
Genomic and plasmid DNA from these isolates were extracted
using Genomic DNA extraction Kit (Puregene, Minneapolis, Minnesota, USA) and Plasmid Miniprep (MN, Germany), respectively. polymerase chain reaction-randomly amplified polymorphic DNA (PCR-RAPD) was performed on Genomic DNA extract as described previously (Thapa et al., 2010).
Briefly, PCR
reaction was carried in 20 µl containing 50 ng of genomic DNA template, 0.2 µM primer (R003, 5’ CTTGACGCA 3’), 0.2 mM dNTPs (FINZYMES), 2.5 µl of supplied PCR buffer, and 1.0 U of Taq polymerase (FINZYMES). 5% dimethylsulfoxide was added
into the reaction. The PCR (PERKIN ELMER) profile used was: initial denaturation at 94°C for 2 min; followed by 40 cycles of 94°C for 10 s, 36°C for 30 s, and 72°C for 1 min; and a final heating at
72°C for 2 min. Amplified products and extracted plasmids were resolved in 1% TAE agarose (Research organics, inc. USA).
Plasmid profiles were interpreted on the basis of the number and size of the plasmids. The study was approved by the institutional review board, Kathmandu Medical College, Nepal.
RESULTS Antibiotic sensitivity test and antibiotype The in-vitro activities of 14 antibiotics were tested against these isolates. All strains were multidrug-resistant (Table 1). Most of the isolates (n=13) were resistant to all antibiotics tested. All isolates were also resistant to beta-lactam antibiotics tested. Aminoglycosides and fluoroquinolones were effective against two isolates (101, 1010) while netilmicin was only effective to an isolate, 102. Based on the antibiotic susceptibility test these isolates were grouped into three antibiotypes, a, b, and c (Table 1). Most isolates (n=12) in antibiotype c were resistant to all antibiotics while antibiotype a (n=2) was sensitive to amino glycosides and fluroquinolones and b (n=1) was sensitive to netilmicin. Plasmid profile The size and number of the plasmids were able to categorize isolates into 4 plasmid profiles (i, ii, iii, and iv) (Figure 1 and Table 1). Most isolates (n=12) were grouped into plasmid profile iv while rest of the isolates represented individual plasmid profile type i, ii, and iii (Table 1). PCR-RAPD PCR-RAPD analysis of these strains revealed three RAPD types (I, II, and III) (Figure 2 and Table 1). Most of the isolates (n=8) accounted for type II and isolates 104 and 108 accounted for type I and III, respectively. Few

5874 Afr. J. Microbiol. Res.
Figure 1. RAPD for A. baumannii studied. Lane M, molecular weight marker (1 kb+, Invitrogen);
Numbers above lanes (2-17) indicates the isolates.
Figure 2. Plasmid profile of A. baumannii studied.
Lane M, Molecular weight marker (1 kb+, Invitrogen);
lanes (2-5) indicates different plasmid profiles.
isolates (n=5) were not amplified and were grouped as type IV. DISCUSSION
The indiscriminate use of antibiotics has led to the
emergence of MDR, PDR and XDR strains of A. baumannii which was conventionally considered as less virulent and clinically unimportant. A. baumannii infection is a growing concern around the globe but the evidence of the emergence of this pathogen in Nepal is scarce. Out of 195 bacterial isolates obtained from surgical wound infection in Nepal, 13 bacterial species were identified and Acinetobacter spp. ranked 5th with the prevalence rate of 7.6%, and 9 strains were MDR (Banjara et al., 2003). In this study, all A. baumannii isolates were multidrug resistant. All were resistant to beta-lactam antibiotics tested. Some isolates were resistant to all antibiotics tested (antibiotype c) while others were sensitive to aminoglycosides and fluoroquinolones. Strains resistant to these antibiotics and to carbapenems have already been reported elsewhere (Chaiwarith et al., 2005; Thapa et al., 2010). At the time of conducting this study, carbapenems were just introduced in the clinical practice in Nepal and carbapenem susceptibility was not performed. Carbapenems including polymyxin, tigecycline, and rifampin in combination with other antibiotics which have been recommended for the management of multidrug-resistant A. baumannii can be the choices (Kasiakou et al., 2005; Thapa et al., 2009a). There are no current guidelines for treating A. baumannii in Nepal and the susceptibility data to these antibiotics should be generated before formulating such guidelines.
The clonality of the isolates was evaluated using antibiotypes, plasmid profiles, and PCR-RAPD. The evaluation of genetic relatedness using PCR-RAPD is an easy, cost effective, and rapid (Thapa et al., 2010). Using this arbitrarily primed PCR, we successfully identified the circulating local oligoclones (I to IV). Similar olioglonal outbreaks of A. baumannii have been reported (Thapa et al., 2010; Naas et al., 2005; Jeon et al., 2005). Plasmid
profiling a conventional typing tool grouped these isolates into four types (i to iv), and the isolates were grouped into three antibiotypes (a, b and c). Type II PCR-RAPD clone was most commonly encountered (n=8). These isolates also had similar plasmid profile and antibiotype. Similar plasmid profiles (type iv) and antibiotypes (type a and c) were observed among the isolates in PCR-RAPD types II and IV suggesting transfer of plasmids and resistance genes among different lineages. Two isolates (101 and102) within same PCR-RAPD type IV had independent plasmid profile and antibiotype. This reflected high rate of genetic promiscuity among similar genotypes. The difference of plasmid profiles and antibiotypes among different PCR-RAPD types can be explained by the high transformation capability of Acinetobacter spp. to expand its genetic pool of resistance (resistant plasmids and genes) (Metzgar et al., 2004). The same genotype of A. baumannii was found circulating in different wards. This suggests that the particular clone is hovering between wards and urge for prompt detection and elimination of the source.
Acinetobacter can be found in normal human skin, nosopharynx and digestive tract of hospitalized patients and infects debilitated and immunocompromised patients (Rosenthal and Tager, 1975). Most of the A. baumannii nosocomial outbreaks are also linked to the environmental sources in the hospital like, particles, air, injectable intravenous fluids, hands of medical staffs, and medical equipments (Deitz et al., 1988). These sources must be detected to control the spread of these clones. MDR international A. baumannii clones known as European clones I, II, and II have been reported in several European countries and also in United States (Nemec et al., 2004, van Dessel et al., 2004; Wroblewska et al., 2007). The rise in A. baumanni in United States has been contributed by the injured military personal returning from war in Iraq and Afghanistan (Scott et al., 2007; Davis et al., 2005). There was also an increase in prevalence of MDR A. baumannii between 1997 to 2001 in South American countries like, Argentina, Colombia, Chile, and Brazil (Tognim et al., 2004). Similarly, numerous PDR A. baumannii outbreaks have been reported from Asian hospitals (Thapa et al., 2010; Koh et al., 2007; Ying et al., 2006). Multidrug- and pandrug-
resistant A. baumannii have been reported from almost all continents and is now a global problem.
This study, for the first time showed inter-ward spread of the A. baumannii clones and sensitized the need for monitoring of inter-institutional and international clones in Nepal. PCR-RAPD offers a dynamic platform to investigate clones in rapid and cost effective manner, has high sensitivity and high resolution for local epidemiological studies but it lacks reproducibility and produce categorical data that cannot be used to understand global epidemiology (Grundmann et al., 1997). More robust molecular typing tool-multi locus sequence typing-is necessary to establish the spread of
Badri et al. 5875 these clones outside this institution (Bartual et al., 2005).
In conclusion, oligoclonal multidrug resistant A. baumannii has emerged as a successful nosocomial pathogen in this hospital in Nepal and warrants for tracing and elimination of the source. Prudent use of antibiotics, infection control and prevention practices, monitoring of these multidrug oligoclonal A. baumannii will help to stop the emergence and spread of the pathogen and its resistance genes across Nepal and internationally.
ACKNOWLEDGEMENT
Authors would like to acknowledge Dr. Chanwit Tribuddharat, Department of Microbiology, Siriraj Hospital, Mahidol University, a coauthor of this study for providing laboratory space and reagents for this study. REFERENCES
Banjara MR, Sharma AP, Joshi AB, Tuladhar NR, Ghimire P, Bhatta DR
(2003). Surgical wound infections in patients of Tribhuvan University
Teaching Hospital. Nepal Health Res Counc. 3: 41-45. Bartual S, Seifert H, Hippler C, Luzon MA, Wisplinghoff H, Rodriguez-
Valera F (2005). Development of a multilocus sequence typing scheme for characterization of clinical isolates of Acinetobacter baumannii. J Clin Microbiol. 43: 4382-4390.
Centers for Disease Control (CDC) (1984). Nosocomial infection
surveillance. CDC Summ. 35:17SS-29SS. Clinical and Laboratory Standards Institute (CLSI ) (2005). Performance
standards for antimicrobial susceptibility testing; 15th informational
supplement. CLSI document M100-S15. Clinical Laboratory Standards Institute, Wayne, PA.
Chaiwarith R, Mahattanaphak S, Boonchoo M, Supparatpinyo K, Sirisanthana K (2005). Pandrug-resistant Acinetobacter baumannii at
Maharaj Nakorn Chaingmai Hospital. J. Infect. Dis. Antimicrob Agents, 22:1-8.
Davis KA, Moran KA, McAllister CK, Gray PJ (2005). Multidrug-resistant Acinetobacter extremity infections in soldiers. Emerg. Infect. Dis. 11:
1218-1224. Deitz JW, Goodrich JA, Brown WB (1988). Acinetobacter calcoaceticus
foot infection following to high pressure injection injury: a case report. Foot Ankle. 8: 216-222.
Naas T, Levy M, Hirschauer C, Marchandin H, Nordmann P (2005). Outbreak of carbapenem-resistant Acinetobacter baumannii
producing the carbapenemase OXA-23 in a tertiary care hospital of Papeete, French Polynesia. J. Clin. Microbiol. 43: 4826-4829.
Gaur A, Prakash A, Anupurba S, Mohapatra TM (2007). Possible role of integrase gene polymerase chain reaction as an epidemiological marker: study of multidrug-resistant Acinetobacter baumannii isolated
from nosocomial infections. Int. J. Antimicrob Agents. 4: 446-450. Go ES, Urban C, Burns J, Kreiswirth B, Eisner W, Mariann N, Mosinka-
Snipas K (1994). Clinical and molecular epidemiology of Acinetobacter infections sensitive only to polymyxin B and sulbactam.
Lancet. 344: 1329-1332. Grundmann HJ, Towner KJ, Dijkshoorn L, Gerner-Smidt P, Maher M,
Seifert H, et al (1997). Multicenter study using standardized protocols and reagents for evaluation of reproducibility of PCR-based fingerprinting of Acinetobacter spp. J. Clin. Microbiol. 35: 3071-3077.
Jeon BC, Jeong SH, Bae IK, et al (2005). Investigation of a nosocomial outbreak of imipenemresistant Acinetobacter baumannii producing
the OXA-23 β-lactamase in Korea. J Clin Microbiol. 43: 2241-2245.
Kasiakou SK, Michalopoulos A, Soteriades ES, Samonis G, Sermaides GJ, Falagas ME (2005). Combination therapy with intravenous colistin for management of infections due to multidrug-resistant
Gram-negative bacteria in patients without cystic fibrosis. Antimicrob

5876 Afr. J. Microbiol. Res.
Agents Chemother, 49: 3136-3146. Ko KS, Suh JY, Kwon KT, Jung SI, Park KH, Kang CI, et al (2007). High
rates of resistance to colistin and polymyxin B in subgroups of Acinetobacter baumannii isolates from Korea. J. Antimicrob
Chemother. 60: 1163-1167. Koh TH, Sng TH, Wang GCY, Hsu LY, Zhao Y (2007). Carbapenemase
and efflux pump genes in Acinetobacter calcoaceticus-Acinetobacter baumannii complex strains from Singapore. J. Antimicrob Chemother.
5: 1173-1174.
Malini A, Deepa EK, Gokul BN, Prasad SR (2009). Nonfermenting Gram-negative bacilli infections in tertiary care hospital in Kolar, Karnataka. J. Lab. Physician. 1: 62-66.
Metzgar D, Bacher JM, Pezo V, Reader J, Doring V, Schimmel P (2004). Acinetobacter spp. ADP1: an ideal model organism for
genetic analysis and genome engineering. Nucleic Acids Res.
32:5780-5790. Montefour K, Frieden J, Hurst S, Helmich C, Headley D, Martin Mary
(2008). An emerging multidrug resistant pathogen in critical care. Crit.
Care Nurse. 28:15-25. Nemec A, Dijkshoorn L, van der Reijden TJ (2004). Long-term
predominance of two pan-European clones among multi-resistant Acinetobacter baumannii strains in the Czech Republic. J. Med.
Microbiol. 53:147-153. Peleg AY, Seifert H, Paterson DL (2008). Acinetobacter baumannii:
Emergence of a successful pathogen. Clin Micobiol Rev. 21: 538–582.
Rosenthal S, Tager IB (1975). Prevalence of Gram-negative rods in the
normal pharyngeal flora. Ann Intern Med. 83: 355–337. Scott P, Deye G, Srinivasan A, Murray C, Moran K, Hulten E (2007). An
Outbreak of Multidrug-resistant Acinetobacter baumannii-
calcoaceticus complex infection in the US military health care system
associated with military operations in Iraq. Clin. Infect. Dis. 44: 1577-1584.
Somerville DA, Noble WC (1970). A note on the gram-negative bacilli of human skin. Eur. J. Clin. Biol. Res. 40: 669-670.
Thapa B, Tribuddharat C, Rugdeekha S, Techachaiwiwat W,
Srifuengfung S, Dhiraputra C (2009a). Rifampin resistance in carbapenem-resistant Acinetobacter baumannii in Siriraj Hospital,
Thailand. Nepal Med. Coll. J. 11: 232-237.
Thapa B, Adhikari P, Mahat K, Chhetri MR, Joshi LN (2009b).
Multidrug-resistant nosocomial Citrobacter in a Hospital in Kathmandu. Nepal Med. Coll. J. 11: 195-199.
Thapa B, Tribuddharat C, Srifuengfung S, Dhiraputra C (2010). High prevalence of blaOXA-23 in oligoclonal carbapenem resistant Acinetobacter baumannii from Siriraj Hospital, Madhidol University,
Bangkok, Thailand. South East Asian J. Trop. Med. 4: 625-635. Tognim MC, Andrade SS, Silbert S, Gales AC, Jones RN, Sader HS
(2004). Resistance trends of Acinetobacter spp. in Latin America and
characterization of international dissemination of multi-drug resistant strains: five-year report of the SENTRY Antimicrobial Surveillance Program. Int. J. Infect. Dis. 8:284-291.
Van Dessel H, Dijkshoorn L, Van der Reijden T, Bakker N, A Paauw, Van den Broek Pl (2004). Identification of a new geographically widespread multiresistant Acinetobacter baumannii clone from
European hospitals. Res Microbiol. 155: 105-112. Wroblewska MM, Towner KJ, Marchel H, Luczak M (2007). Emergence
and spread of carbapenem-resistant strains of Acinetobacter
baumannii in a tertiary-care hospital in Poland. Clin Microbiol
Infect.13: 490-496. Ying CM, Ling TK, Lee CC, Ling JM (2006). Characterization of
carbapenem-resistant Acinetobacter baumannii in Shanghai and
Hong Kong. J. Med. Microbiol.55: 799-802.

African Journal of Microbiology Research Vol. 5(32), pp. 5877-5881, 30 December, 2011 Available online at http://www.academicjournals.org/AJMR ISSN 1996-0808 ©2011 Academic Journals DOI: 10.5897/AJMR11.801
Full Length Research Paper
The effects of bifidobacterium lactis and galactooligosaccharide (GOS) on ileum and distal colon
motility: In vitro study
Nevcihan Gursoy
Department of Food Engineering, Faculty of Engineering, Cumhuriyet University, Sivas, TR-58140, Turkey. E-mail: [email protected] and [email protected]. Tel: + 90-346-219 10 10 ext. 2889.
Fax: + 90-346-219 11 77.
Accepted 13 September, 2011
Twenty one male Wistar albino rats each weighing approximately 280 g were used in this study. Animals were divided into three groups. The first group (n = 7) consisted of sham controls, in the second (n = 7), rats were administrated 0.1 g/1 ml/galactooligosaccharide by by oral gavage for 4 weeks. In the third group (n = 7), rats were administrated 10
9 CFU/1ml/day Bifidobacterium lactis by oral gavage
for 4 weeks. After 4 weeks, rats were sacrified; ileum and proximal colon segments were removed. The spontaneous contractions of ileum and proximal colon were evaluated by using organ bath. It has been detected that both prebiotics and probiotics increased intestinal motility. While probiotics have effects on both ileum and proximal colon, prebiotics seem to be effective in colon. All data are expressed as mean ± SEM (standard error of mean). Statistical comparisons between groups were performed using general linear models of analysis of variance (ANOVA) followed by the Turkey test. Key words: Bifidobacterium lactis, galactooligosaccharide, ileum, rat, distal colon, in vitro.
INTRODUCTION Epidemiological studies indicate that diet has a major impact on human health: a diet low in fat and high in fruit and vegetables has been correlated with a decreased incidence of so-called Western diseases such as coronary heart disease and colon cancer (Trock et al., 1990). Such a diet contains not only nutrients that are readily absorbed in the small intestine but also coponents that escape digestion by pancreatic and small bowel enzymes. The latter are the principal substrates of the bacteria resident in the human intestinal tract. Since a Abbreviations: GOS, galactooligosaccharide; KBS, Krebsbicarbonate solution; CFU, colony forming units; NDO, non-digestible oligosaccharides; NaH2PO4, sodium
phosphate; NaCl, sodium chloride; KCl, potassium chloride; CaCl2, calcium chloride; MgCl2, magnesium chloride; NaHCO3, sodium bicarbonate; SEM, standart error of mean; ANOVA, analysis of variance.
number of nutritional health effects are mediated by the intestinal microflora, diet is key in influencing their composition and activity. It has been increasingly recognized that the bacterial community in the intestine influences human health and well-being (Cummings and Macfarlane, 1997). Consequently, nutrition may be considered as a tool for influencing the intestinal microbiota in such a way that harmful bacteria are suppressed and beneficial bacteria are stimulated. Dietary strategies that serve to support health-promoting effects of the intestinal microflora include the ingestion of probiotics (Goldin, 1998) and or prebiotics (Gibson and Roberfroid, 1995), as well as a diet rich in fiber (Salminen et al., 1998).
Three approaches exist to increase the number of health-promoting organisms in the gastrointestinal tract. The first is the oral administration of live beneficial microorganisms. At present, these microorganisms, called probiotics, have been selected mostly from lactic acid bacteria and bifidobacteria that form a part of the

5878 Afr. J. Microbiol. Res. normal intestinal microflora of humans, these organisms are also indigenous to the colon. These bacteria have been suggested to be useful in the treatment of diarrhea (Rota virus, traveler‟s diarrhea, and Clostridium difficile), constipation, irritable bowel syndrome, and inflammatory bowel disease. They also have putative effects on enhancing the immune system and decreasing lactose intolerance (Bhutto and Morley, 2008).
The mechanisms of probiotic action appear to be multifactorial. Probiotic bacteria can promote fermen-tation processes that metabolize varying quantities of lactic, acetic, and formic acids; synthesis of vitamins; and the production of antimicrobial bacteriocidins and fatty acids (Bourlioux et al., 2002). Probiotics can also affect innate intestinal host defenses, including strengthening intestinal tight junctions, increasing mucous secretion, enhancing motility, and producing metabolic products (amino acids such as arginine and glutamine and short-chain fatty acids) that secondarily function as protective nutrients. They contribute to microflora diversity, thus helping to establish a normal commensal flora that protect
against potential microbial pathogens (Neu and Caicedo, 2005).
The second strategy for increasing their number is to supply those already present in the intestine with selective carbon and energy source that provides them with competitive advantage over other bacteria in this ecosystem, thus selectively modifying the composition of the microflora using dietary supplements. These selective dietary components were named “prebiotics”.
A prebiotic has been defined as “a non-digestible food ingredient that beneficially affects the host by selectively stimulating the growth and or activity of one or a limited number of bacteria in the colon” (Gibson and Roberfroid, 1995). Prebiotics are intended to modify the intestinal microbiota in such a way that bacterial activities advantageous to the host are stimulated and bacterial activities adverse to host health are suppressed. The concept of prebiotics arose from the observation that inulin and fructooligosaccharides selectively stimulate the growth of bifidobacteria (Potter et al., 1993; Cummings, 1994) which are considered to be beneficial for human health (Gibson and Roberfroid, 1995). Although most research has been done on inulin and fructooligosaccharides, other non-digestible oligosaccharides (NDO) including xylooligosaccharides, galactooligosaccharides and isomalto oligosaccharides have also been tested for their prebiotic effect (Fuchs et al., 1999). The majority of candidate prebiotics are oligosaccharides but also include polysaccharides.To serve as a bacterial substrate in the colon, a prebiotic may not be hydrolyzed or absorbed in the upper part of the gastrointestinal tract.
And the last approach is a mixture of probiotic and prebiotic “synbiotic” has recently been proposed to characterise health-enhancing food and supplements used as functional food ingredients in human (Kontula et al., 1998).
Like probiotics, the prebiotics belong to a more general class of “colonic foods”, that is foods entering the colon and serving as substrates for the endogenous colonic bacteria, thus indirectly providing the host with energy, metabolihc substrate and essential micronutrients (Gibson and Roberfroid, 1995).
Although it has been shown in clinical studies that pre and probiotics have positive effects on gastrointestinal motility, in vitro effects of pre and probiotics are not clear.
In this study we aimed to investigate and compare the effects of pre and probiotics on gastrointestinal motility in different segments of gastrointestinal track. MATERIALS AND METHODS
Animal preparation twenty one male Wistar albino rats each weighing approximately 280 g were used in this study. The study was approved by. Animals were divided into three groups. The first group (n = 7) consisted of sham controls in which rats were
administrated 1% ml 0.9 NaCl/ day by oral gavage for 4 weeks. In the second group (n = 7), rats were administrated 0.1 g/1 ml/day galactooligosaccharide (GOS) used as a prebiotic by oral gavage for 4 weeks. In the third group (n = 7), rats were administrated 10
9
CFU/1ml/day Bifidobacterium lactis used as a probiotic by oral gavage for 4 weeks. B. lactis were grown from frozen stocks (-80 oC) prepared for ingestion and counted as in Kamiya at al. (2006).
At the end of the four weeks, rats were killed by cervical dislocation.
The abdomen was opened with a midline incision. Ileum and proximal colon was removed and placed in previously aerated (95% O2 and 5% CO2) Krebs-bicarbonate solution (composition in mmol/L: NaCl, 120; KCl, 4.6; CaCl2, 2.5; MgCl2, 1.2; NaHCO3, 22; NaH2PO4 and glucose 11.5). Whole full-thickness segments of ileum and proximal colon were placed in circular direction in a 10 mL tissue baths, filled with pre-aerated Krebsbicarbonate solution (KBS) at 37°C. The upper end of the preparation was tied to an isometric transducer (Grass FT 03, Quincy, MA, USA) and
preloaded with 1 to 1.5 g. Tissues were allowed to equilibrate for 30 min. In vitro muscle contractility studies
Muscle segments from each group were contracted with 80 mmol/L KCl to ensure that they worked properly at the beginning and end of
each experiment. At the beginning of each experiment, 80 mmol/L KCl was added
to the organ bath, and the contraction was considered as reference response. Subsequently, the amplitude of spontaneous contractions of the isolated Ileum and proximal colon muscle segments were calculated as a percentage of the contraction induced by KCl (80 mmol/L) from both control, prebiotic and probiotic groups. Changes in the frequency (number or min.) of spontaneous contractions were expressed as the number of contractions for 10 min intervals. Isometric tensions were recorded on a Grass model 79 E polygraph. All experiments were performed in duplicate.
Data analysis
All data are expressed as mean ± SEM (standard error of mean). Statistical comparisons between groups were performed using
general linear models of analysis of variance (ANOVA) followed by the Turkey test and P-values of less than 0.05 were considered to be statistically significant.

Figure 1. KCl (80 mmol/L) induced contractions of
isolated ileum muscle segments in control, prebiotic and probiotic groups. No statistical difference was observed between groups (P > 0.05).
RESULTS Contractions induced by 80 mmol/L KCl were not significantly different between control, prebiotic and probiotic groups in isolated ileum smooth muscle segments which indicated that muscle segments from both groups worked properly (Figure 1).
In the smooth muscle segments from ileum, the mean amplitude of the spontaneous contractions was 70.6 ± 4.6 in the control group, 74.2 ± 5.2 in prebiotic group and 95.5 ± 7.1 in probiotic group, respectively. There was no significant difference between the amplitude responses of control and prebiotic groups (p > 0.05). But the amplitude of probiotic group was significantly higher than both control and prebiotic groups (p < 0.05) (Figure 2A).
In the smooth muscle segments from proximal colon, the mean amplitude of the spontaneous contractions was 62.4 ± 3.5 in the control group, 81.4 ± 4.4 in prebiotic group and 87.5 ± 5.2 in probiotic group, respectively. Both amplitude responses of spontaneous contractions of
Gursoy 5879
Figure 2. Changes in the spontaneous contraction
amplitudes of the isolated smooth muscle segments. A. Ileum B. Proximal Colon.
prebiotic and probiotic groups were significantly high when compared to the control group (p < 0.05). There was significant difference between prebiotic and probiotic groups (p > 0.05) (Figure 2B).
In the smooth muscle segments from ileum, the mean frequency of the spontaneous contractions was 27.2 ± 1.6 in the control group, 28.8 ± 2.2 in prebiotic group and 35.7 ± 4.1 in probiotic group, respectively. There was no significant difference between the frequency responses of control and prebiotic groups (p > 0.05). But the frequency of probiotic group was significantly higher than both control and prebiotic groups (p < 0.05) (Figure 3A).
In the smooth muscle segments from proximal colon, the mean frequency of the spontaneous contractions was 12.3 ± 1.5 in the control group, 11.1 ± 1.4 in prebiotic group and 17.5 ± 2.2 in probiotic group, respectively. Although there was no significant difference between the frequency responses of control and prebiotic groups (p > 0.05), spontaneous contraction amplitude responses of probiotic group was significantly high when compared to the control and prebiotic groups (p < 0.05) (Figure 3B).

5880 Afr. J. Microbiol. Res.
Figure 3. Changes in the spontaneous contraction
frequency of the isolated smooth muscle segments. A. Ileum B. Proximal Colon.
DISCUSSION
The gut represents a complex and dynamic microbial ecosystem in which intestinal micro flora has an important and specific metabolic, trophic, and protective function. Normal gut structure and function are the end-point of a complex set of interactions between the host and microorganisms colonizing the gut (Guarner and Malagelada, 2003). Bacteria can be used to improve human health. A bacterium that provides specific health benefits when consumed as a food component or supplement would be called a probiotic. A consensus definition of the term was issued a few years ago and states that oral probiotics are living microorganisms that upon ingestion in specific numbers exert health benefits beyond those of inherent basic nutrition (Guarner and Schaafsma, 1998; Guarner et al., 2005). While probiotics are the live microbial feed supplements that beneficially affect the host animal by improving its intestinal microbial
balance (Fuller, 1989); prebiotics are defined as food ingredients that promote the growth or activity of a limited number of bacterial species for the benefit of host health (Gibson and Roberfroid, 1995). Organisms used as probiotics are most frequently of the Lactobacillus or Bifidobacterium species, and clinically beneficial effects of probiotics have been described in travellers‟ diarrhea, irritable bowel syndrome and inflammatory bowel disease (Walker and Buckley, 2006; Shanahan, 2007).
There are many conflicting studies about the effects of pro and prebiotics on gastrointestinal motility. While some of these studies suggest that pro and prebiotics increase intestinal motility, others suggest opposite. It has been shown that Lactobacillus reuteri ingestion consistently alters the motility of colon segments in an ex vivo organ bath recording setup. The effect is a decrease in the amplitudes of contractions at constant luminal filling preasure, and an increase in the threshold luminal pressure required to evoke rhythmic contractions (Wang et al., 2010). On the other hand, an in vivo study showed that administration of probiotics induces increased colonic propulsive contractions and defecation rate in pigs (Ohashi et al., 2001). It has been shown in a human clinical study that probiotic supplements may have a positive effect on bowel movements among orthopedic rehabilitation elderly patients (Zaharoni et al., 2011). In addition, Tabbers et al. (2009) suggested that B. lactis strain DN-173 010 is effective in increasing stool frequency after 3 weeks of product consumption in children with functional constipation and a defecation frequency less than 3 weeks.
There are little data available related to the influence of prebiotics on gastrointestinal motility in preterm infants. In a study in healthy preterm infants, Boehm et al. (2002) demonstrated that preterm infants fed with mother‟s milk had lower stool consistency and higher stool frequency than infants fed a preterm bovine milk formula. Supplementation of the same formula with a mixture of scGOS and lcFOS resulted in a reduction in stool consistency and an increase in stool frequency. More recently, Mihatsch et al. (2006) demonstrated a clinically relevant reduction in the gastrointestinal transit time in preterm infants fed a formula supplemented with these prebiotics.
In this study, consistent with these positive studies, we found that probiotics increased spontaneous contraction amplitude and frequency of both ileum and proximal colon. On the other side, while prebiotics increasing spontaneous contraction amplitudes of proximal colon, did not changed spontaneous contraction amplitude of ileum. Also prebiotics did change neither spontaneous contraction frequency of ileum nor spontaneous contraction frequency of proximal colon. The difference between the effect of pro- and prebiotics on ileum spontaneous contraction amplitude may be related to the difference in physiology and bacterial colonization between ileum and proximal colon. It is clear that a complex, resident gut microflora is present in human

subjects. While the transit of residual foodstuffs through the stomach and small intestine is probably too rapid for the microbiota to exert a significant impact, this slows markedly in the colon. Colonic micro-organisms have ample opportunity to degrade available substrates (Cherbut, 2003; Gibson et al., 2004; Flint et al., 2008). Due to the high residence time of colonic contents, as well as a diverse and profuse flora, the colonic microbiota plays a more important role in host health and well-being than is the case in the small intestine. As a result, it has been defined that both prebiotics and probiotics increased intestinal motility. While probiotics have effects on both ileum and proximal colon, prebiotics seem to be effective in colon. The difference possibly related to the microbial flora. It is well known that changes in gastrointestinal micro flora exhibit an intestinal motility response and that such change can be initiated by addition of synbiotics to the diet. According to these findings it seems that food supplemented with probiotic and prebiotics would prevent impared motility seen in lots of gastrointestinal diseases. Further work is necessary in order to identify the underlying mechanisms responsible for diet/bacterial induced changes in gastrointestinal motility. REFERENCES
Bhutto A, Morley JE (2008). The clinical significance of gastrointestinal
changes with aging. Curr. Opin. Clin. Nutr. Metab. Care 11(5):651-
660. Boehm G, Lidestri M, Casetta P, Jelinek J, Negretti F, Stahl B (2002).
Supplementation of an oligosaccharide mixture to a bovine milk
formula increases counts of faecal bifidobacteria in preterm infants. Arch. Dis. Child., 86:F178–81.
Bourlioux P, Koletzko B, Guarner F, Braesco V (2002). The intestine
and its microflora are partners for the protection of the host: report on the Danone Symposium „„The Intelligent Intestine,‟‟ held in Paris, June 14. Am. J. Clin. Nutr., 78:675-683.
Cherbut C (2003). Motor effects of short-chain fatty acids and lactate in the gastrointestinal tract. Proc. Nutr. Soc., 62: 95–99.
Cummings JH (1994). Anatomy and physiology of the human colon.
ILSI Workshop on Colonic Microflora: Nutrition and health, Barcelona, Spain.
Cummings JH, Macfarlane GT (1997). Colonic microflora: Nutr.Health
Nutr., 13:476–478 Flint HJ, Bayer EA, Rincon MT, Lamed R, White BA (2008).
Polysaccharide utilization by gut bacteria: potential for new insights
from genomic analysis. Nat. Rev. Microbiol., 6:121–131. Fuchs CS, Giovannucci EL, Colditz GA, Hunter DJ, Stampfer MJ,
Rosner B, Speizer FE, Willett WC (1999). Dietary fiber and the risk of
colorectal cancer and adenoma in women. Nutr. Engl. J. Med., 340:169–176.
Fuller R (1989). Probiotics in man and animals. J. App. Bacteriol., 66(5):
365–378. Gibson GR, Probert HM, Van Loo JAE, Rastall RA, Roberfroid MB
(2004). Dietary modulation of the human colonic microbiota: updating
the concept of prebiotics. Nutr. Res. Rev., 17: 259–275.
Gursoy 5881 Gibson GR, Roberfroid MB (1995). Dietary modulation of the human
colonic microbiota: introducing the concept of prebiotics. J. Nutr., 125:1401–1412.
Goldin BR (1998). Health benefits of probiotics. Br. J. Nutr., 80:S203–207.
Guarner F, Malagelada JR (2003). Gut flora in health and disease.
Lancet 361: 512-519. Guarner F, Perdigon G, Corthier G, Salminen S, Koletzko B, Morelli L
(2005). "Should yoghurt cultures be considered probiotic?", Br. J.
Nutr., 93(6):783-786. Guarner F, Schaafsma G (1989). Probiotics. Int. J. Food Microbiol., 39:
237–238.
Kamiya T, Wang L, Forsythe P, Goettsche G, Mao Y, Wang Y (2006). Inhibitory effects of Lactobacillus reuteri on visceral pain induced by
colorectal distension in Sprague-Dawley rats. Gut., 55: 191–196.
Kontula P, Jaskary J, Nollet L, De Smet I, Von Wright A, Poutanen K, Mattila-Sandholm T (1998). The colonization of the Simulator of the Human Intestinal Microbial Ecosystem (SHIME) by a probiotic strain
fed in a fermented oat bran product: Effects on the gastrointestinal microbiota. Appl. Microbiol. Biotechnol., 50: 242–252.
Mihatsch WA, Hoegel J, Pohlandt F (2006). Prebiotic oligosaccharides
reduce stool viscosity and accelerate gastrointestinal transport in preterm infants. Acta Paediatr., 95:843–848.
Neu J, Caicedo R (2005). Probiotics: protecting the intestinal
ecosystem? J. Pediatr., 147(2):143-146. Ohashi Y, Inoue R, Tanaka K, Umesaki Y, Ushida K (2001). Strain
gauge force transducer and its application in an pig model to evaluate
the effect of probiotic on colonic motility. J. Nutr. Sci. Vitaminol., 47: 351–356.
Potter JD, Slattery ML, Bostick RM, Gapstur SM (1993). Colon cancer:
a review of the epidemiology. Epidemiol. Rev., 15:499–545. Salminen S, Bouley C, Boutron-Ruault MC, Cummings JH, Franck A,
Gibson GR, Isolauri E, Moreau MC, Roberfroid M, Rowland I (1998).
Functional food science and gastrointestinal physiology and function. Br. J. Nutr., 80(1): S147–171.
Shanahan F (2007). Irritable bowel syndrome: shifting the focus toward
the gut microbiota. Gastroenterol., 133: 340–342. Tabbers MM, Chmielewska A, Roseboom MG, Boudet C, Perrin C,
Szajewska H, Benninga MA (2009). Effect of the consumption of a fermented dairy product containing Bifidobacterium lactis DN-173 010
on constipation in childhood: a multicenter randomised controlled trial (NTRTC: 1571). BMC Pediatr., 18:9-22.
Trock B, Lanza E, Greenwald P (1990). Dietary fiber,vegetables,and colon cancer: critical review and meta-analyses of the epidemiologic evidence. J. Natl. Cancer Inst., 82:650–661.
Walker R, Buckley M (2006). Probiotic microbes: the scientific basis. In A Report of the American Academy of Microbiology. Walker, R & Buckley, M. (Eds.) Washington, D.C.: American Society for Microbiology.
Wang B, Mao YK, Diorio C, Wang L, Huizinga JD, Bienenstock J, Kunze W (2010). Lactobacillus reuteri ingestion and IK(Ca) channel
blockade have similar effects on rat colon motility and myenteric
neurones. Neurogastroenterol. Motil., 22(1):98-107. Zaharoni H, Rimon E, Vardi H, Friger M, Bolotin A, Shahar DR (2011).
Probiotics improve bowel movements in hospitalized elderly patients-
-the PROAGE study. J. Nutr. Health Aging., 15(3):215-220.

African Journal of Microbiology Research Vol. 5(32) pp. 5882-5888, 30 December, 2011 Available online at http://www.academicjournals.org/AJMR ISSN 1996-0808 ©2011 Academic Journals DOI: 10.5897/AJMR11.831
Full Length Research Paper
Cloning, expression and characterization of a glucose dehydrogenase from Bacillus sp. G3 in Escherichia coli
Xuejiao Chen1,2, Haitao Ding1, Yiqing Du1, Hui Lin1, Zeli Li1 and Yuhua Zhao1*
1Institute of Microbiology, College of Life Science, Zhejiang University, Hangzhou 310058, China.
2Hangzhou Wahaha Group Co., Ltd, Hangzhou 310000, China.
Accepted 17 October, 2011
The glucose dehydrogenase gene (gdh), cloned from Bacillus sp. G3, was composed of 786 bp nucleotide and the deduced protein molecular mass of one subunit was 28.1 kDa. The recombinant glucose dehydrogenase (rGDH-G3) was functionally expressed in Escherichia coli. The results revealed that expressed rGDH-G3 had a high specific activity of 371.9 U/mg at 25°C and pH 8.0, with oxidized nicotinamide adenine dinucleotide (NAD
+) as the cofactor. The enzyme was optimally active at 40°C and
pH 9.0. The enzyme displayed broad specificity for other sugars such as D-galactose or maltose. The catalytic efficiency of the rGDH-G3 would be improved 4 times when oxidized nicotinamide adenine dinucleotide phosphate (NADP
+) was used as cofactor instead of NAD
+.
Key words: Bacillus sp. G3, enzymatic property, glucose dehydrogenase, inverse polymerase chain reaction (IPCR), optimal pH.
INTRODUCTION Glucose dehydrogenase (GDH, EC 1.1.1.47), a member of the short-chain family of alcohol dehydrogenase, consists of four identical subunits (30 kDa) (Pauly and Pfleiderer, 1975), it catalyzes the oxidation of β-D-glucose to D-glucono-δ-lactone in the presence of cofactor oxidized nicotinamide adenine dinucleotide (NAD
+) or oxidized nicotinamide adenine dinucleotide
phosphate (NADP+), and it posses the property of dual
*Corresponding author. E-mail: [email protected]. Tel: 86-571-88208557. Fax: 86-571-88206995.
Abbreviations: gdh, Glucose dehydrogenase gene; GDH, glucose dehydrogenase; GDH-G3, glucose dehydrogenase from Bacillus sp. G3; PCR, polymerase chain reaction; IPCR, inverse PCR; ORF, open reading frame; rGDH-G3, recombinant glucose dehydrogenase; NAD
+, oxidized nicotinamide adenine
dinucleotide; NADP+, oxidized nicotinamide adenine
dinucleotide phosphate; SDS-PAGE, sodium dodecyl sulfate-polyacrylamide gel electrophoresis.
cofactor specificity. It has been shown that the GDH plays an important role in spore germination, and is a marker enzyme synthesized at sporulation stage (Nakatani et al., 1989). In recent years, GDH has been widely studied and used in many fields including biofuel cells (Okuda-Shimazaki et al., 2008), clinical tests (Du et al., 2008), and as a catalyst for coenzyme regeneration in large-scale chiral synthesis (Lin et al., 1999; Wong and Drueckhammer, 1985) .
In order to meet the increasing demands for the above applications, the glucose dehydrogenase gene (gdh) of microorganism have been cloned and over-expressed in Escherichia coli from sporulating cells of Bacillus megaterium (Heilmann et al., 1988; Nagao et al., 1992) and Bacillus subtilis (Vasantha et al., 1983). The characteristics of GDH from B. megaterium (Makino et al., 1989a; Mitamura et al., 1989; Nagao et al., 1992) and B. subtilis (Fujita et al., 1977) have been investigated in detail. In this paper, we reported the results of a study that was aimed at isolating the gdh from Bacillus sp. G3, expressing in E. coli BL21 (DE3), as well as purifying and

Xuejiao et al. 5883
Table 1. Oligonucleotide primers used for gdh isolation, DNA amplification and cloning.
Primer Sequence
dG3F 5’-GAYRTNATGATHAAYAAYGC-3’
dG3R 5’-ATRTANCCCATNGGDATCAT-3’
iG3F 5’-AATCGCTTCACGGCTTCC-3’
iG3R 5’-AGGGCGGATTGAAACTAA-3’
GDH3F 5’-GGAATTCCATATGTATAGTGATTTAGAAGGA-3’
GDH3R 5’-CGGGATCCTATTACCCACGCCCAGC-3’
aUnderlined bases are restriction sites (NdeI in GDH3F and BamHI in GDH3R).
characterizing this new enzyme. MATERIALS AND METHODS
Bacterial strains, plasmid and chemicals
The strain E. coli DH5α and E. coli BL21 (DE3) were used, respectively for cloning and expression. Bacillus sp.G3 used as the source of gdh was cloned and identified by our laboratory. Plasmids pMD19-T (Takara, Dalian, China) and pET28 (a+) (Invitrogen, Shanghai, China) were used as vectors for the cloning and expression of the gdh, respectively. Restriction enzymes and other modification enzymes, Taq DNA polymerase, and T4 DNA ligase were purchased from Takara, Dalian, China. Primers were
synthesized by Invitrogen, Shanghai, China. Ni-NTA-resin was purchased from Invitrogen, Shanghai, China. DNA gel extraction kit was purchased from Axygen, Shanghai, China. NAD
+ and NADP
+
were purchased from Alfa Aesar, Tianjin, China. All other chemicals and solvents used were of analytical grade and available commercially.
Enzyme activity assays
The activity of glucose dehydrogenase from Bacillus sp. G3 (GDH-G3) was assayed by measuring the increase in absorbance of nicotinamide adenine dinucleotide (NADH) at 340 nm. The standard reaction mixture contained 100 mM sodium phosphate buffer (pH 8.0), 200 mM glucose, and 1 mM NAD
+ with a final volume of 1 ml.
One microlitre (1 μl) diluted enzyme solution was added to the assay mixture and incubated at 25°C for 5 min. The apparent
extinction coefficient of NADH was 6220 M–1
cm–1
. One unit of GDH activity was defined as the amount of enzyme required to release 1 μM of NADH per minute at 25°C and the pH of 8.0. All assays were repeated three times. Cloning of the glucose dehydrogenase gene (gdh)
To clone a fragment of gdh from Bacillus sp.G3, a polymerase
chain reaction (PCR) strategy with degenerate primers were used. Primers dG3F and dG3R (Table 1) were designed based on the conserved amino acid sequence (D V/I MINNA and M V/I PMGYI) of GDHs from different species of Bacillus. The PCR was conducted under the following conditions: 94°C for 5 min; 5 cycles of 94°C for 30 s, 45°C for 30 s, 72°C for 30 s; followed by 30 cycles of 94°C for 30 s, 55°C for 30 s and 72°C for 30 s; and a terminal extension at 72°C for 2 min. After separation and purification, a 400 bp PCR product was sequenced. The complete GDH-G3 gene was
obtained by using the inverse PCR (IPCR) technique (Ochman et al., 1988). The genomic DNA from Bacillus sp.G3 was digested with several endonucleases, and then self-ligated by using T4 DNA
ligase at 16°C overnight. The ligation products were used as template for IPCR. A pair of primers iG3F and iG3R (Table 1) used were designed based on the above product using Primer Premier 5.0. And the reaction was conducted for 30 cycles: 94°C for 30 s, 55°C for 30 s and 72°C for 3 min. The resultant fragment was sequenced, and then the complete GDH-G3 gene was assembled according to overlapping sequences from the two fragments.
Construction of expression plasmid Recombinant DNA techniques were carried out according to standard methods described by Sambrook and Russell (2001). The open reading frame (ORF) of GDH-G3 was amplified by PCR with the genomic DNA of Bccillus sp. G3 as the template, and GDH3F
and GDH3R (Table 1) as primers, respectively. The purified PCR product was digested with NdeI and BamHI, and ligated with the pET-28a (+) that was linearized with the same enzymes, forming a new ORF that encoded an N-terminal His6-tag. The recombined plasmids were transformed into E. coli DH5α competent cells for amplification. Expression and purification of recombinant glucose
dehydrogenase (rGDH-G3) To express 6his-tagged gdh, the recombinant vector was transformed into E. coli BL21 (DE3) competent cells using CaCl2-heat shock method (Sambrook and Russell, 2001). The positive transformants were cultured at 37°C in Luria–Bertani (LB) medium containing 50 μg ml
-1 kanamycin to an OD600 = 0.6. After induction
with 0.1 mM IPTG at 25°C for 16 h, the culture was harvested. The cell pellet was washed twice with Buffer A (25 mM NaH2PO4, 250 mM NaCl, pH 8.0) and lysed by the ultrasonic disruption, followed by centrifugation at 14000 rpm for 30 min at 4°C. The supernatants were loaded onto a Ni-NTA-resin (Invitrogen, Shanghai, China) column pre-equilibrated with Buffer A. After washed with the Buffer B (25 mM NaH2PO4, 250 mM NaCl, 20 mM imidazole, pH 8.0), the rGDH-G3 was eluted with 10 ml Buffer C (50 mM NaH2PO4, 250 mM NaCl, 250 mM imidazole, pH 8.0), and then supplemented with 20% (v/v) glycerol. The purified enzyme fractions were dialyzed and
stored at 4°C. The protein concentration was determined by the method of Bradford with BSA as the standard (Bradford, 1976). The purity and molecular mass of the enzyme was analyzed by 14% sodium dodecyl sulfate-polyacrylamide gel electrophoresis (SDS-PAGE) (Laemmli, 1970) and stained with 0.05% Coomassie brilliant blue R-250 (Varghese and Diwan, 1983). Characterization of the recombinant glucose dehydrogenase (rGDH-G3)
The optimal temperature of rGDH-G3 was studied at various

5884 Afr. J. Microbiol. Res. temperatures between 25 and 65°C under standard conditions. To determine the thermostability, the enzyme solution was preincubated in sodium phosphate buffer (25 mM, pH 8.0) at 25–65°C for 60 min, respectively. To investigate the optimum reaction pH range for rGDH-G3, four buffers were used and they include 100 mM citrate buffer (pH 4.0–6.0), 100 mM sodium phosphate buffer (pH 6.0–8.0), 100 mM Tris/HCl (pH 7.0–9.0), and 100 mM Gly/NaOH (pH 8.5–10.5). The pH stability was determined by pre-incubating diluted enzyme in the above buffers at 25°C for 60 min. For kinetic studies, the reaction rates were measured for a variety of substrates concentrations and the kinetic parameters were evaluated by Lineweaver–Burk plots method.
RESULTS AND DISCUSSION Isolation and sequence analysis of gdh from Bacillus sp.G3 A BLAST search in the GenBank database showed that the fragment was highly identical to other gdh in the database (Table 1). Based on the conserved DNA sequence, a pair of gene-specific primers iG3F and iG3R (Table 1) for IPCR were designed. The digested genomic DNA from Bacillus sp.G3 was self-ligated, and was used as template for IPCR to clone the flanking sequence of the GDH-G3 gene. A notable 1500 bp band was amplified only from NdeI-digested genomic DNA. It was sequenced and then the complete GDH-G3 gene was assembled according to overlapping sequences of the two fragments. The DNA sequence of GDH-G3 gene showed significant homology (97-78% identities) with other gdh sequences present in NCBI.
The nucleotide sequence of the gene and the deduced amino acid sequence were deposited in GenBank (Accession no. GQ402830). The gene contained a 786 bp ORF encoding a subunit of 261 residues with a predicted molecular mass of 28.1 kDa.
The deduced amino acid sequence of GDH-G3 showed 99% (maximum) identity with GDH subunit from B. cereus BDRD-ST26 (Accession no. ZP_04269989) and B. cereus H3081.97 (Accession no. ZP_03238186). In addition, it showed more than 80% sequence homology with the GDHs from most species of Bacillus. Sequence alignment of the deduced amino acid sequence of the GDH-G3 with other GDH sequences in GenBank database revealed the presence of highly conserved regions (Figure 1). Expression and purification of glucose dehydrogenase (GDH) After transformation and induction, the recombinant plasmid was successfully expressed in heterologous host strain E. coli BL21 (DE3). The recombinant protein was further purified by using Ni
2+-chelating affinity
chromatography. With the His6-tag at the N terminus, which facilitated strongly binding of the protein to the Ni-
NTA matrix, most unbound proteins were washed away by the wash buffer. As shown in Figure 2, portion of the enzyme was expressed in a highly soluble form and the purified enzyme revealed a single protein band corresponding to approximately 28 kDa on SDS-PAGE, which was agreed with the predicted 28.1 kDa molecular mass. After being purified 20-fold, the specific activity of the enzyme was 371.9 U/mg (25°C, pH 8.0, with NAD
+ as
the cofactor). Effects of pH and temperature on enzyme activity The rGDH-G3 had optimal activity at 40°C (Figure 3A) and pH 9.0 (100 mM Tris/HCl, Figure 3B), respectively. The enzyme had more than 60% of the maximum activity in a pH range of 7.5–9.5 and a temperature range of 30-50°C. The assays of optimal temperature indicated that the activity increased in an almost linear fashion from 25-40°C, but decreased once the temperature was above 45°C. The activity was hardly detected at temperature higher than 70°C. It was observed that the activity of rGDH-G3 was affected by the buffers used. The recombinant enzyme in Tris/HCl performed much better than in Gly/NaOH buffers, while sodium phosphate buffer was better than Tris/HCl at the same pH.
As shown in Figure 3B, the pH/activity profile of GDH-G3 was similar to GDH-I, GDH-II and GDH-Iwg3 (Mitamura et al., 1989), with the optimal activity shifted a little towards a higher value. Optimal rGDH-G3 activity occurred at pH 9.0 while that of others from B. megaterium (Mitamura et al., 1989), B. thuringiensis M 15 (Boontim et al., 2004), B. subtilis (Fujita et al., 1977) occurred at pH 8.0, but the optimal pH in this study was lower than pH 9.5 for LsGDH from L. sphaericus G10 (Ding et al., 2010). Figure 1 showed the amino acid residues in GDH-G3 that are different from the other GDHs. Maybe the surrounding residues near the acid/base catalytic center affect the protonation and then effect a change in optimal pH (Shibuya et al., 2005).
Effects of pH and temperature on enzyme stability The assays of enzyme thermostability indicated that the enzyme was stable below 40°C. After 60 min incubation, there was 72% of enzyme activity remained with 40°C treatment, whereas only 29% of the activity remained at 45°C (Figure 4A). The thermostability of GDH-G3 was similar to its homologous counterparts, except GDH-III from B. megaterium IAM1030. Nagao et al. (1992) have reported that the two alterations, Leu-167 to Gln and Ala-258 to Thr, weakened the intersubunit interaction of the tetramer of GDH-III (Nagao et al., 1992). Therefore, it could be presumed that, maybe, the replacement of Gln-167, Thr-258 of GDH-III with the Leu and Aln could have promoted the thermostability of GDH-G3. And it is

Xuejiao et al. 5885
Figure 1. Sequence alignment of glucose dehydrogenases of Bacillus sp.G3 and other species of Bacillus.
Sequences were aligned using Clustalx1.83. Identical residues and conserved substitutions are shaded black and gray by BOXSHADE 3.21 (K. Hofmann and M. Baron), respectively. GDH-I (Accession no. BAA14098.1), GDH-II (Accession no. BAA14100.1), GDH-III (Accession no. BAA01475.1), and GDH-IV
(Accession no. BAA01476.1) were cloned from Bacillus megaterium IAM1030. GDH-Iwg3 (Accession no. 1RWB_A) was cloned from Bacillus megaterium Iwg3. GDH-G3 (Accession no.ACU78107) was cloned from Bacillus sp. G3.
possible that the presence of Leu-252 instead of Lys increased the heat resistance of GDH-G3, as described in previous reports (Makino et al., 1989b; Mitamura et al., 1989).
The pH-stability of GDH was examined by incubation at 25°C at various pH for 60 min and measurement of residual activity taken. The rGDH-G3 preserved its activity at the pH range between 4.0 and 9.0 (Figure 4B). Almost all of the GDHs from Bacillus, either wide type or mutant, were stable in the range of pH 6.0-7.5, particularly at 6.0 or 6.5, but the rGDH-G3 was more stability at pH 7.0. The GDH-G3 and GDH-Iwg3 are
similar in the sequence (88% identity), and stable in the acidic range although GDH-Iwg3’s stability was comparatively higher. The observed stability of the clones could be attributed to the effects of replacements as earlier reported by Mitamura et al. (1989). Substrate specificity and enzyme kinetics Table 2 illustrated that the rGDH-G3 possessed broad substrate specificity toward aldose sugars and disaccharides than others, particularly for D-galactose,

5886 Afr. J. Microbiol. Res.
Figure 2. SDS-PAGE analysis of the rGDH-G3 from E. coli BL21 (DE3). Lane 1, Uninduced cellular extract; Lane 2, induced protein sample; Lane 3, the recombinant GDH (corresponds to 28 kDa) purified by Ni
2+-NTA; Lane M,
standard protein molecular weight markers.
Figure 3. Effects of pH and temperature on enzyme activity. A, Effect of temperature on enzyme activity of the rGDH-
G3 from 25-65°C in 100 mM sodium phosphate buffer (pH 8.0); B, effect of pH on enzyme activity of the rGDH-G3. pH
range from 4.0-10.5 was used with the following buffers: ◆, 100 mM citrate buffer (pH 4.0–6.0); △, 100 mM sodium
phosphate buffer(pH 6.0–8.0); ■, 100 mM Tris/HCl (pH 7.0–9.0); ○, 100 mM Gly/NaOH (pH 8.5–10.5).
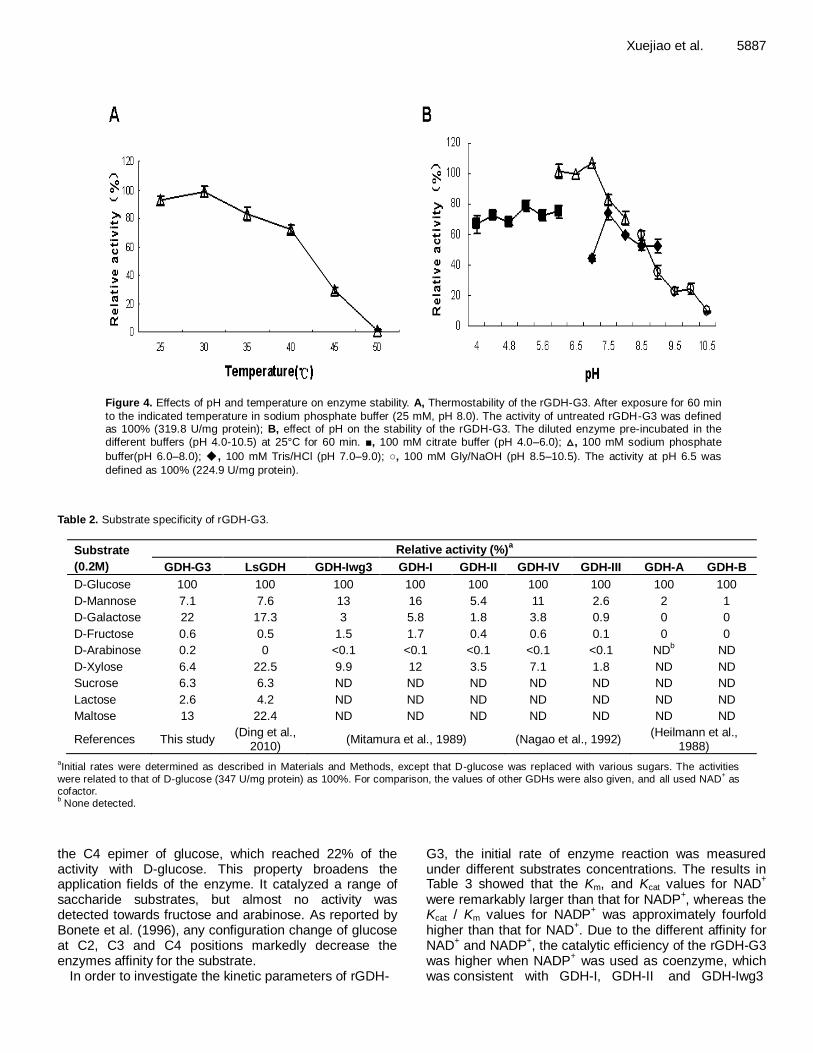
Xuejiao et al. 5887
Figure 4. Effects of pH and temperature on enzyme stability. A, Thermostability of the rGDH-G3. After exposure for 60 min
to the indicated temperature in sodium phosphate buffer (25 mM, pH 8.0). The activity of untreated rGDH-G3 was defined as 100% (319.8 U/mg protein); B, effect of pH on the stability of the rGDH-G3. The diluted enzyme pre-incubated in the different buffers (pH 4.0-10.5) at 25°C for 60 min. ■, 100 mM citrate buffer (pH 4.0–6.0); △, 100 mM sodium phosphate
buffer(pH 6.0–8.0); ◆, 100 mM Tris/HCl (pH 7.0–9.0); ○, 100 mM Gly/NaOH (pH 8.5–10.5). The activity at pH 6.5 was
defined as 100% (224.9 U/mg protein).
Table 2. Substrate specificity of rGDH-G3.
Substrate
(0.2M)
Relative activity (%)a
GDH-G3 LsGDH GDH-Iwg3 GDH-I GDH-II GDH-IV GDH-III GDH-A GDH-B
D-Glucose 100 100 100 100 100 100 100 100 100
D-Mannose 7.1 7.6 13 16 5.4 11 2.6 2 1
D-Galactose 22 17.3 3 5.8 1.8 3.8 0.9 0 0
D-Fructose 0.6 0.5 1.5 1.7 0.4 0.6 0.1 0 0
D-Arabinose 0.2 0 <0.1 <0.1 <0.1 <0.1 <0.1 NDb ND
D-Xylose 6.4 22.5 9.9 12 3.5 7.1 1.8 ND ND
Sucrose 6.3 6.3 ND ND ND ND ND ND ND
Lactose 2.6 4.2 ND ND ND ND ND ND ND
Maltose 13 22.4 ND ND ND ND ND ND ND
References This study (Ding et al.,
2010) (Mitamura et al., 1989) (Nagao et al., 1992)
(Heilmann et al., 1988)
aInitial rates were determined as described in Materials and Methods, except that D-glucose was replaced with various sugars. The activities
were related to that of D-glucose (347 U/mg protein) as 100%. For comparison, the values of other GDHs were also given, and all used NAD+ as
cofactor. b None detected.
the C4 epimer of glucose, which reached 22% of the activity with D-glucose. This property broadens the application fields of the enzyme. It catalyzed a range of saccharide substrates, but almost no activity was detected towards fructose and arabinose. As reported by Bonete et al. (1996), any configuration change of glucose at C2, C3 and C4 positions markedly decrease the enzymes affinity for the substrate.
In order to investigate the kinetic parameters of rGDH-
G3, the initial rate of enzyme reaction was measured under different substrates concentrations. The results in Table 3 showed that the Km, and Kcat values for NAD
+
were remarkably larger than that for NADP+, whereas the
Kcat / Km values for NADP+ was approximately fourfold
higher than that for NAD+. Due to the different affinity for
NAD+ and NADP
+, the catalytic efficiency of the rGDH-G3
was higher when NADP+ was used as coenzyme, which
was consistent with GDH-I, GDH-II and GDH-Iwg3

5888 Afr. J. Microbiol. Res.
Table 3. The kinetic analysis of the recombinant GDH.
Km (mM) a Vmax(μΜ s
-1 mg
-1 ) Kcat (s
-1) b Kcat/Km (mM
-1 s
-1)
D-glucose 31.8±0.4 0.82±0.05 23±1 0.73±0.06
NAD+ 0.210±0.001 5.131±0.005 144±0.1 687.5±3.6
NADP+ 0.0095±0.0018 1.20±0.02 33.8±0.6 3687±629
aThe kinetic parameters were determined as described in Materials and Methods. The Km of glucose was
determined in the range of 10-200 mM, with a fixed NAD+ 1 mM. The Km for NAD
+ (0.05–1 mM) and
NADP+ (0.005–0.1 mM) was determined with a fixed glucose concentration of 200 mM.
b The values of Kcat were calculated for one subunit.
(Mitamura et al., 1989). However, the amino acid residues involved in the kinetic constants are still unknown. Therefore, further studies based on directed evolution, site-directed mutagenesis and crystallography is necessary to unravel the exact relationship between structure and function of GDH-G3. ACKNOWLEDGEMENTS This study was supported by the National Hi-Tech Research and Development Program (863) of China (No. 2007AA06Z329), National Natural Science Foundation of China (31070079), the Science and Technology Project of Zhejiang Province (2008C13014-3), and the International Cooperation Project in Science and Technology of Zhejiang Province (No. 2008C14038). REFERENCES
Bonete MJ, Pire C, FI LL, Camacho ML (1996). Glucose dehydrogenase from the halophilic archaeon Haloferax mediterranei:
enzyme purification, characterisation and N-terminal sequence. FEBS Lett., 383(3): 227-229.
Boontim N, Yoshimune K, Lumyong S, Moriguchi M (2004). Purification and characterization of D-glucose dehydrogenase from Bacillus
thuringiensis M15. Ann Microbiol, 54(4): 481-492.
Bradford MM ( 1976). Rapid and sensitive method for quantitation of microgram quantities of protein utilizing principle of protein-dye binding. Anal. Biochem., 72: 248-254.
Ding HT, Du YQ, Liu DF, Li ZL, Chen XJ, Zhao YH (2010). Cloning and expression in E. coli of an organic solvent-tolerant and alkali-resistant
glucose 1-dehydrogenase from Lysinibacillus sphaericus G10. Bioresour. Technol., 102(2): 1528-1536.
Du P, Wu P, Cai C (2008). A glucose biosensor based on electrocatalytic
oxidation of NADPH at single-walled carbon nanotubes functionalized with poly(nile blue A). J. Electroanal. Chem., 624(1-2): 21-26.
Fujita Y, Ramaley R, Freese E (1977). Location and properties of glucose dehydrogenase in sporulating cells and spores of Bacillus subtilis. J. Bacteriol., 132(1): 282-293.
Heilmann HJ, Magert HJ, Gassen HG (1988). Identification and isolation of glucose dehydrogenase genes of Bacillus megaterium M1286 and their expression in Escherichia coli. FEBS J., 174(3): 485-490.
Laemmli UK (1970). Cleavage of structural proteins during the assembly of the head of bacteriophage T4. Nature, 227(5259): 680-
685. Lin SS, Miyawaki O, Nakamura K (1999). Continuous production of L-
carnitine with NADH regeneration by a nanofiltration membrane
reactor with coimmobilized L-carnitine dehydrogenase and glucose dehydrogenase. J. Biosci. Bioeng., 87(3): 361-364.
Makino Y, Ding JY, Negoro S, Urabe I, Okada H (1989a). Purification
and characterization of a new glucose dehydrogenase from vegetative cells of Bacillus megaterium. J. Ferment. Bioeng., 67(6):
374-379.
Makino Y, Negoro S, Urabe I, Okada H (1989b). Stability-increasing mutants of glucose dehydrogenase from Bacillus megaterium IWG3. J. Biol. Chem., 264(11): 6381-6385.
Mitamura T, Urabe I, Okada H (1989). Enzymatic properties of isozymes and variants of glucose dehydrogenase from Bacillus megaterium. FEBS J., 186(1-2): 389-393.
Nagao T, Mitamura T, Wang XH, Negoro S, Yomo T, Urabe I, Okada H (1992). Cloning, nucleotide sequences, and enzymatic properties of glucose dehydrogenase isozymes from Bacillus megaterium
IAM1030. J. Bacteriol., 174(15): 5013-5020.
Nakatani Y, Nicholson WL, Neitzke KD, Setlow P, Freese E (1989). Sigma G RNA polymerase controls forespore-specific expression of the glucose dehydrogenase operon in Bacillus subtilis. Nucleic Acids Res., 17(3): 999-1017.
Ochman H, Gerber AS, Hartl DL (1988). Genetic applications of an inverse polymerase chain reaction. Genetics, 120(3): 621-623.
Okuda-Shimazaki J, Kakehi N, Yamazaki T, Tomiyama M, Sode K (2008). Biofuel cell system employing thermostable glucose dehydrogenase. Biotechnol. Lett., 30(10): 1753-1758.
Pauly HE, Pfleiderer G (1975). D-Glucose Dehydrogenase from Bacillus-Megaterium M-1286-Purification, Properties and Structure. H.S. Z. Physiol. Chem., 356(10): 1613-1623.
Sambrook J, Russell DW (2001). Molecular cloning: a laboratory manual. Cold Spring Harbor Laboratory Press, New York, pp. 1.84-
1.88, 1.116-1.119. Shibuya H, Kaneko S, Hayashi K (2005). A single amino acid
substitution enhances the catalytic activity of family 11 xylanase at alkaline pH. Biosci. Biotechnol. Biochem., 69(8): 1492-1497.
Varghese G, Diwan AM (1983). Simultaneous staining of proteins during polyacrylamide-gel electrophoresis in acidic gels by countermigration of coomassie Brilliant blue R-250. Anal. Biochem., 132: 481-483.
Vasantha N, Uratani B, Ramaley RF, Freese E (1983). Isolation of a developmental gene of Bacillus subtilis and its expression in Escherichia coli. Proc. Natl. Acad. Sci. U. S. A., 80(3): 785-789.
Wong CH, Drueckhammer DG (1985). Enzymatic synthesis of chiral hydroxy compounds using immobilized glucose dehydrogenase from Bacillus cereus for NAD(P)H regeneration. Bio-Technol, 3(7): 649-
651.
African Journal of Microbiology Research Vol. 5(32), pp. 5889-5895, 30 December, 2011 Available online at http://www.academicjournals.org/AJMR ISSN 1996-0808 ©2011 Academic Journals DOI: 10.5897/AJMR11.837
Full Length Research Paper
Investigation of bioremediation of arsenic by bacteria isolated from contaminated soil
Hadis Ghodsi1, Mehran Hoodaji1*, Arezoo Tahmourespour2 and Mohammad Mehdi Gheisari3
1Department of soil science, Khorasgan (Isfahan) branch, Islamic Azad University, Isfahan, Iran.
2Department of microbiology, Khorasgan(Isfahan) branch, Islamic Azad University, Isfahan, Iran.
3Department of basic science, Khorasgan (Isfahan) branch, Islamic Azad University, Isfahan, Iran.
Accepted 9 November, 2011
The aims of this study are isolating arsenite-resistant bacteria from arsenic contaminated soil and the investigation of arsenite bioremediation efficiency by the most resistant isolates. Isolation of arsenite-resistant bacteria and the minimum inhibitory concentration (MIC) were conducted by spread plate method and the agar dilution method on PHG-II agar plates supplemented with sodium arsenite respectively. The results showed that, 69 and 25% of arsenite resistant isolates were geram positive and negative bacilli, respectively. Its maximum MIC was 128 mM/L, which is related to such bacteria as Bacillus macerans, Bacillus megaterimand Corynebacterium vitarumen. There is a significant difference (P< 0.01) between three isolates in arsenite removal potential and arsenite bioaccumulation. The maximum percentage of arsenite removal potential (92%) and arsenite bioaccumulation (36%) were related to B. macerans. The removal efficiency of arsenite for B. macerans, C. (vitaromen) and B. megaterim were 60, 43 and 38% after 48 h of growth, respectively, while after 144 h of Bacillus macerans, Corynebacterium (vitaromen) growth and 120 h of Bacillus megaterimgrowth were 92, 80 and 73% respectively. The results also were shown the highest percentage of arsenite in biomass (36%), arsenate from oxidation (27%) were related to B. macerans, B. megaterium and B. megaterium. These results express the probability of finding more arsenic accumulating bacteria from the contaminated soil environment and can be concluded that arsenic resistant and/or accumulating bacteria, such as Bacillus sp., are widespread in the polluted soils and are valuable candidates for bioremediation of arsenic contaminated ecosystems. Key words: Arsenite, bacteria, bioremediation, MIC.
INTRODUCTION Human activities over the centuries has contaminated many areas of developing and developed countries (Evangelou et al., 2007). Soil contamination with heavy metals is one of the great problems of modern societies. Heavy metals periodically increase in the environment due to industrial activities and technology development. Increasing of these pollutants in the environment is considered as a serious threat to human and environmental health (Banaa Araghi et al., 2010). Unlike many organic contaminants disintegrated in the soil,
*Corresponding author. E.mail: [email protected]. Tel/ Fax: 00983115354045.
heavy metals are kept in the soil storage and according to their nature a group of pollutants are of most interest because of their danger and of course plenty of stability in most environments (Garbisu and Alkorta, 2001). Arsenic has long been an important environmental pollutant and in long term has been as a health risk to humans and other living organisms. In the past, arsenic compounds have been widely used in pesticides, herbicides and soil disinfectors, thus in some soils was in high concentrations (Pais and Jons, 1997). Arsenic is highly toxic metal element that annually threatens the health of millions of people in the world (Chen and Shao, 2009). Inorganic arsenic forms are more dangerous than other forms for human health and in terms of classification fall in cancer-causing ingredient (Andrews,
5890 Afr. J. Microbiol. Res. 2001). In recent decades following increasing environmental pollution by heavy metals, scientists attracted to biological purification methods. In most cases of cleaning the contaminated ecosystems with chemical methods involves heavy costs and irreparable damages (Brooks, 1995; Nwuche and ugoji, 2008). Therefore one appropriate method is using biological method. Generally population and microbial activities in soil and water contaminated with the presence of metal will be reduced and modified (Kelly et al., 1998). On the other hand resistant microorganisms have evolved mechanisms to tolerate the toxicity of heavy metals. Application of microorganisms for heavy metals remediation is considered as a natural, stable and economical solution. Previous researches have described the isolation and characterization of arsenic resistant bacteria from different environments and have indicated that these bacteria are able to grow chemolithotrophically with oxygen as an electron acceptor and As(III) as an electron donor (Duquesne et al., 2008; Santini et al., 2000). Arsenic-resistant bacteria play an important role in controlling the speciation and cycling of arsenic in the ecosystems (Inskeep et al., 2007). The aims of this study are isolating arsenite-resistant bacteria from arsenic contaminated soil and the investigation of arsenite bioremediation efficiency by high resistant isolates. MATERIALS AND METHODS Sampling Soil samples were collected from the three different points of soil surface (0-20 cm) of the Research Farm (in Lavark, Najaf Abad)
located in southwest of Isfahan, Iran. This soil was contaminated previously with arsenic through using of urban sewage sludge. The samples were mixed, transferred to the laboratory, passed through 2 mm sieve and used for physical-chemical and microbial analysis (Nwuche and ugoji, 2008). Arsenic measurement
In this study to measure arsenic the spectrophotometry method was used along with a reagent called Leuco malachite green (LMG). In this method arsenic reacts with Potassium iodate (KIO3) in the acidic environment and iodine will be released. Released iodine oxidizes LMG to MG and changes the color to the color of malachite green. Detection range of arsenic concentration in this method is 0.09-0.9 micro g/ml. The MG dye shows maximum absorption at 617 nm (Revanasiddappa et al., 2007).
Arsenite measurement (As III)
Initially for the preparation of arsenite stock solution (1,000 μg ml), amount of 0.1734g NaAsO2 (sodium arsenite) resolved in 100 ml deionized distilled water. The standard solutions including 0.9-9.0 μg of arsenite removed and poured in 10 ml volumetric balloons. Then 1 ml of Potassium iodate 1%, 0.5 ml of 1 M hydrochloric acid were added and the reaction mixture was shaked for 2 min. Then 0.5 ml of 0.05 LMG was added with shaking. Finally 2 ml acetat buffer (pH =4.5) was added and heated (40°C) in a water bath for 5
min, cooled and diluted with distilled water. After 5 min, absorbance of the dye was measured at 617 nm against the reagent blank. The concentration of arsenic (III) content was established by reference to the calibration graph (Revanasiddappa et al., 2007). Arsenate measurement (As V)
After filtering of this sample a certain volume will be removed, then 0.5 ml of 5% KI and 5 M HCL were added to the samples. All of the available arsenate were reduced to arsenite. In order to remove yellow to brown color which is due to the high amount of released iodine, the droplets of ascorbic acid were added (Pillai et al., 2000)
then the amount of total arsenic in samples were measured by the method of arsenite measurment. Soil arsenic measurement
One gram of soil sample was placed in the nickel plate that already covered its bottom with NaOH. Heat the Nickel plate in order to NaOH be fully melted and mixed with soil (alkaline digestion). After
cooling, the nickel plate was immersed in HCL (0.5 N) and waited in order to be digested slowly (Almond, 1953) then the amount of arsenite was measured. Isolation of arsenite-resistant bacteria
One gram of each soil samples was used to provide series. 0.1 ml of each dilution was added to each of PHG-II agar plates (4 g
pepton, 1 g yeast extract and 2 g glucose and 15 g agar per liter) supplemented with 0.5 mM sodium arsenite (pH=7) by spread-plate method. The plates were incubated at 30°C for 3-5 days. This experiment was conducted in three replicates. After isolation of resistant colonies, their enrichment, purification and identification were done by the help of Gram Staining and biochemical tests (catalase- Licetinase- citrate – MR- VP -manitol fermentation and acid production - fermentation of glucose, sucrose and galactose -
nitrate reduction test, urease and Esculine Hydrolysis) (Sneat et al., 1989; Cappuccino and Sherman, 1996). Minimum inhibitory concentration (MIC) determination
The (MIC) of arsenite at which no colony growth occurred was determined by the agar dilution method. PHG-II agar plates supplemented with different concentration of arsenite the level of resistance (0.5, 1, 2, 4, ... and 192 mM /L) were inoculatedas aseptically with a culture of bacterial isolates in exponential growth phase. The plates were incubated for 48 h at 35°C. Minimum concentration of arsenite allowing growth of the isolates was an indication of positive tolerance (Hassen et al., 1998). Growth curve and arsenite removal by bacterial strains
The growth curve of the most resistant bacteria at sub MIC concentration of arsenite were monitored by measuring the optical density (OD) of the cultures at 600 nm using a spectrophotometer. At each intervales a certain volum of medium was removed, after measuring OD at 600 nm. It was centrifuged and filtered. Than, the arsenite and arsenate concentration were measured by the above mentioned method (Chen and Shao, 2008; Revanasiddappa et al., 2007; Pillai et al., 2000). At the end of growth phase arsenite
concentration in bacterial cell structure was measured by the method of Takeuchi et al., 2007. Briefly, the culture media were shake at 100 rpm, centrifuged at 5000 ×g at 4°C for 20 min. The
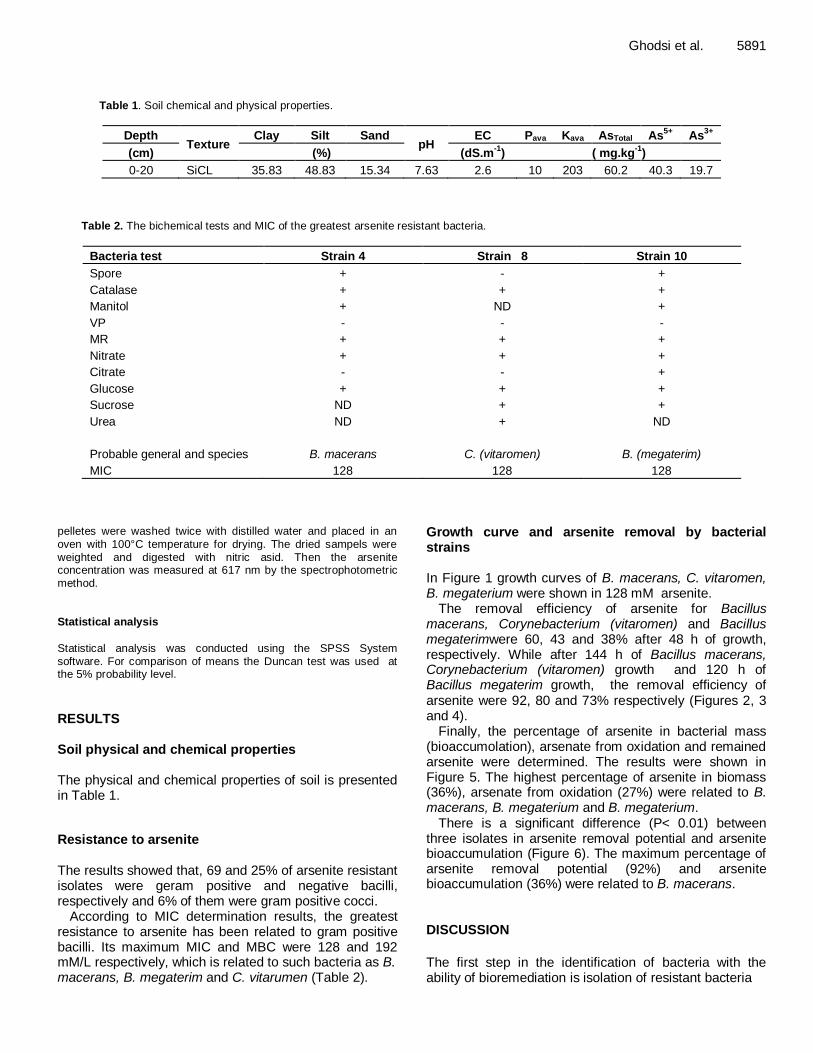
Ghodsi et al. 5891
Table 1. Soil chemical and physical properties.
Depth Texture
Clay Silt Sand pH
EC Pava Kava AsTotal As5+
As3+
(cm) (%) (dS.m-1
) ( mg.kg-1
)
0-20 SiCL 35.83 48.83 15.34 7.63 2.6 10 203 60.2 40.3 19.7
Table 2. The bichemical tests and MIC of the greatest arsenite resistant bacteria.
Bacteria test Strain 4 Strain 8 Strain 10
Spore + - +
Catalase + + +
Manitol + ND +
VP - - -
MR + + +
Nitrate + + +
Citrate - - +
Glucose + + +
Sucrose ND + +
Urea ND + ND
Probable general and species B. macerans C. (vitaromen) B. (megaterim)
MIC 128 128 128
pelletes were washed twice with distilled water and placed in an oven with 100°C temperature for drying. The dried sampels were weighted and digested with nitric asid. Then the arsenite concentration was measured at 617 nm by the spectrophotometric method.
Statistical analysis
Statistical analysis was conducted using the SPSS System software. For comparison of means the Duncan test was used at the 5% probability level.
RESULTS Soil physical and chemical properties The physical and chemical properties of soil is presented in Table 1.
Resistance to arsenite The results showed that, 69 and 25% of arsenite resistant isolates were geram positive and negative bacilli, respectively and 6% of them were gram positive cocci.
According to MIC determination results, the greatest resistance to arsenite has been related to gram positive bacilli. Its maximum MIC and MBC were 128 and 192 mM/L respectively, which is related to such bacteria as B. macerans, B. megaterim and C. vitarumen (Table 2).
Growth curve and arsenite removal by bacterial strains In Figure 1 growth curves of B. macerans, C. vitaromen, B. megaterium were shown in 128 mM arsenite.
The removal efficiency of arsenite for Bacillus macerans, Corynebacterium (vitaromen) and Bacillus megaterimwere 60, 43 and 38% after 48 h of growth, respectively. While after 144 h of Bacillus macerans, Corynebacterium (vitaromen) growth and 120 h of Bacillus megaterim growth, the removal efficiency of arsenite were 92, 80 and 73% respectively (Figures 2, 3 and 4).
Finally, the percentage of arsenite in bacterial mass (bioaccumolation), arsenate from oxidation and remained arsenite were determined. The results were shown in Figure 5. The highest percentage of arsenite in biomass (36%), arsenate from oxidation (27%) were related to B. macerans, B. megaterium and B. megaterium.
There is a significant difference (P< 0.01) between three isolates in arsenite removal potential and arsenite bioaccumulation (Figure 6). The maximum percentage of arsenite removal potential (92%) and arsenite bioaccumulation (36%) were related to B. macerans. DISCUSSION
The first step in the identification of bacteria with the ability of bioremediation is isolation of resistant bacteria

5892 Afr. J. Microbiol. Res.
0
0.05
0.1
0.15
0.2
0.25
0.3
0.35
0 12 24 32 48 60 72 84 96 108120132144156168180192
OD
(6
00
nm
)
B. macerans C. vitaromen B. megatrium
Time (hr)Time (h)
Time (h)
Figure 1. Bacterial growth curves of Bacillus macerans, Corynebacterium vitaromen and
Bacillus megaterium in 128 mM of arsenite.
00.050.1
0.15
0.20.250.3
0.35
0 24 48 72 96 120 144 168Time (hr)
Gro
wth
OD
(6
00
nm
)
0102030405060708090100
Co
ncen
tra
tio
n -
arse
nit
e (
%)
Growth Concentration
Time (h) Figure 2. Growth and arsenite removal curvs of Bacillus macerans.
00.050.1
0.150.2
0.250.3
0.35
0 24 48 72 96 120 144 168
Time (hr)
Gro
wth
OD
(6
00
nm
)
0102030405060708090100
Co
ncen
tra
tio
n -
arse
nit
(%
)
Growth Concentration
Time (h) Figure 3. Growth and arsenite removal curvs of Corynebacterium vitaromen.
which tolerate high concentrations of heavy metals (Trevors et al., 1985). Most arsenic resistant bacteria are separated from arsenic-rich environments. In natural environments, the number of arsenite resistant bacteria is
less than arsenate resistant bacteria. Arsenate is more toxic than arsenite (Jackson et al., 2005). Among the isolated resistant strains from contaminated soil , three strains demonstrated dramatic resistance to arsenite 128

Ghodsi et al. 5893
0
0.05
0.1
0.15
0.2
0.25
0.3
0 24 48 72 96 120 144
Time (hr)
Gro
wth
OD
(6
00
nm
)
0102030405060708090100
Co
ncen
tra
tio
n -
arse
nit
e (
%)
Growth Concentration
Time (h) Figure 4. Growth and arsenite removal curvs of Bacillus megaterium.
Figure 5. Arsenite in biomass (bioaccumulation), arsenate from oxidation and remaind arsenite percentage of A: Bacillus macerans, B: Corynebacterium vitaromen and C: Bacillus
megaterium.
0
10
20
30
40
50
60
70
80
90
100
Remove arsenite
bioaccumulation
(%)
B. ( macerans)
C. (vitaromen)
B. (megaterium)
a
bc
a
b
c
Figure 6. The comparision of arsenite removal potential in 3 isolates.
Mm. These arsenite-resistant strains were probably B. macerans, C. vitaromen and B. megaterium. Concentrations of metals used in this study are also used in the similar studies for bacteria that their medium contains extracted yeast. Abu-shnab et al. (2003) showed that in a contaminated soil the 11.1% of isolated bacteria
were resistant to As with the MIC of 20 mM/L. High levels of soil metal concentration can lead to achieving such a high MIC in resistant strains. Also Chitpirom et al. (2009), in Thailand, isolated arsenic-resistant bacteria from tannery effluent and agricultural soils that were belonged to Klebsiella, Pseudomonas, Comamonas and
5894 Afr. J. Microbiol. Res. Enterobacter genera with the MIC of 40 mM (arsenite) and 400 mM (arsenate). Pepi et al. (2007) isolated 3 arsenic resistant genera (Aeromonas, Bacillus and Pseudomonas) from contaminated sediments with the MIC of 16.66 mM (arsenite) and 133.47 mM (arsenate). They also concluded that these bacteria are suitable for arsenic bioremediation in contaminated sediments. In a study by Luis et al. (2006) in Spain with the aim of biological removing of arsenic, Corynebacterium glutamicum with over 60 mM arsenite resistance identified as one of the most tolerant species to arsenic. This results are in agreement with our findings but our isolates could tolerate the higher concentration of arsenite that was related to high level of arsenite in soil. In the study after 144 h of B. macerans, C. vitaromen growth and 120 h of Bacillus (megaterium) growth, the removal efficiency of arsenite were 92, 80 and 73% respectively. The highest percentage of arsenite in biomass (36%), arsenate from oxidation (27%) were related to B. macerans, B. megaterium and B. megaterium. Among resistant isolates, B. macerans was able to remove 92% of arsenite in the medium and also store 36% of it in the cell mass which is introduced as superior strain in this regard. Studies by Mondal et al. (2008) on three strains of Ralstonia eutropha, Pseudomonas putida and Bacillus indicus showed that these strains were able to remove (67, 60 and 61% respectively) arsenic from wastewater.
Takeuchi et al. (2007) could isolate a non- genetically engineered potent arsenic accumulating bacterium, Marinomonas communis, from marine and non marine environment in Japan which accumulated 2290 μg Asg dw
-1 of arsenic in presence of 5 mg As/ l of arsenat
(45.8%). Our results are in agree with Takeuchi et al. (2007) and although details of such mechanisms are not yet clear, accumulation of arsenic into the cell would be a result of higher uptake and lower efflux. The high effective concentration of As in this study and previous study (Takeuchi et al., 2007) could be related to the presence of arsenic resistance systems such as regulatory protein of the ars operon that has a specific binding site available for arsenite. However, presence of ars operon in bacteria is known to extrude arsenate from the cell by an efflux system. Consequently, arsenic is not accumulated in bacteria. Furthermore, the other known arsenic-resistant system, the phosphate-specific transport (Pst) system, would also lead to lower uptake of arsenat by the cell. Therefore, the present results obtained in our isolates and previousley isolated M. communis with its higher resistance and higher accumulation of arsenic contradict the known arsenic- resistant systems, suggesting existence of an as yet unknown arsenic resistance system for these strains. Cai et al. (1998) also could isolate Pseudomonas strains without the ars operon with a yet unknown arsenic resistance system.
These results express the probability of finding more
arsenic accumulation bacteria from the contaminated soil environment. It can be concluded that arsenic resistant and/or accumulating bacteria are widespread in the polluted soil environment,and that arsenic-accumulating bacteria such as Bacillus sp. are valuable candidates for arsenic contaminated ecosystems bioremediation.
REFERENCES
Abu-Shanab RAI, Delorme TA, Angle JS, Chaney RL, Ghanem K, Moawad H, Ghozlan HA (2003). Phenotypic characterization of microbes in rhizosphere of Alyssum murale. Int J Phyto 5: 367-380.
Almond H (1953). Field method for determination of trace of arsenic in soils. J. Anal. Chem., 25: 1766-1767.
Andrews JM (2001). Determination of minimum inhibitory
Concentration. J. Antimicrob. Chemother., 48:5-16. Banaa AN, Hoodaji M, Afyuni M (2010). Use of EDTA and EDDS for
enhanced zeamays’ phytoextraction of heavy metals from a
contaminated soil. J. Residual. Sci. Tech., 7(3): 139- 145. Brookes PC (1995). The use of microbial parameters in monitoring soil
pollution by heavy metals. J. Biol. Fertile Soils 19:269-279.
Cai J, Salmon K, Du Bow MS (1998). A chromosomal ars opran homologue of Pseudomonas aeruginosa confers increased
resistance to arsenic ana antimony in Escherichia coli. J. Microbiol.,
144:2705-2713. Cappuccino J, Sherman N (1996). Microbiology (a laboratory manual) .
Benjamin/ Cumming publishing company INC.
Chen Sh, Shao Z (2009). Isolation and diversity analysis of arsenite- resistant bacteria in communities enriched from deep- sea sediments of the South west Indian Ocean Ridge. J. Extremophiles 13:39-48.
Chitpirom K, Akaracharanya A, Tanasupawat S, Leepipatpibooim N, Woong Kim K (2009). Isolation and characterization of arsenic resistant bacteria from tannery wastes and agricultural soils in
Thailand. J. Ecol. Environ. Microbiol., 59(4): 649-656. Duquesne K, Lieutaud A, Ratouchniak J, Muller D, Lett M-C, Bonnefy V
(2008). Arsenite oxidation by a chemoautotrophic moderately
acidophilic Thiomonas sp.: from the strain isolation to the gene study. Environ. Microbiol., 10: 228–237.
Evangelou MWH, Ebel M, Schaeffer A (2007). Chelate assisted
phytoextraction of heavy metals from soil. Effect, mechanism, toxicity and fate of chelating agents. Chemosphere 68: 989-1004.
Garbisu C, Alkorta I (2001). Phytoextraction: a cost- effective plant-
based technology for the removal of metals from the environment. J. biores Technol., 77: 229-236.
Hassen A, Saidi N, Cherif M and Boudabous A (1998). Resistance of environmental bacteria to heavy metals. Biores Technol., 64: 7-15.
Inskeep WP, Maser RE, Hamamura N,Warelow TP,Ward SA, Santini JM (2007). Detection, diversity and expression of aerobic bacterial arsenite oxidase genes. Environ. Microbiol., 9:934–943.
Jackson CR, Dugas SL, Harrison KG (2005). Enumeration and characterization of arsenat-resistant bacteria in arsenic free soils. J. Soil Biol. Biochem., 37(12): 2319-2322.
Kelly JJ, Tate RL. (1998). Effects of heavy metals contamination and remediation on soil microbial communities in the vicinity of a zinc smelter. J. Environ. Qual., 27. pp: 1458-1467.
Luis M, Ordonez E, Letek M, Gil J (2006). Corynebacterium glutamicum
as a model bacterium for bioremediation of arsenic. Int. J. Microbiol., 9: 207-215.
Mondal P, Majumder CB, Mohanty B (2008). Growth of three bacteria in arsenic solution and their application for arsenic removal from wastewater. J. Basic Microbiol., 48(6): 521-525.
Nwuche CO, Ugoji EO (2008). Effects of heavy metal pollution on the soil microbialactivity. J. Environ. Sci. Technol., 5:409-4140.
Pais IJ, Benton Jons JR (1997). The hand book of trace elements.
Publishing by: St. Luice press Boca Rrton Florida. Pepi M, Volterrani M, Renzi M, Marvasi M, Gasperini S, Franchi E,
Focardi SE (2007). Arsenic-resistant bacteria isolated from
contaminated sediments of the Orbetello Lagoon, Italy, and their characterization. J. Appl. Microbiol., 103(6):2299-308.

Pillai A, Sunitha G, Gupta VK (2000). A new system for the
spectrophotometric determination of arsenic in environmental and biological semples. J. Anal. Chem. Acta 408: 111-115.
Revanasiddappa HD, Dayananda BP, Kumar TNK (2007). A sensitive spectrophotometric method for the determination of arsenic in environmental sampeles. J. Environ. Chem. let., 5: 151-155.
Santini JM, Sly LI, Schnagl RD, Macy JM (2000). A new chemolithotrophic arsenite-oxidizing bacterium isolated from a gold mine:phylogenetic, physiological and preliminary biochemical studies.
Appl. Environ. Microbiol., 66:92–97.
Ghodsi et al. 5895 Sneat PH, Mair ANS, Sharp ME, Holt JG (1989). Bergeys manual of
systematic bacteriology. Vol (2). Williams and Wilkins. Takeuchi M, kawahata H, Prasad Gupta L, Kita N, Morishita Y, Ono Y,
Komai T (2007). Arsenic resistance and removal by marine and non-marine bacteria. J Biotechnol 127: 434-442.
Trevors JT, Oddie KM, Belliveau BH (1985). Metal resistance in
bacteria. FEMS Microbiol. Lett., 32:39-54.

African Journal of Microbiology Research Vol. 5(32), pp. 5896-5901, 30 December, 2011 Available online at http://www.academicjournals.org/AJMR ISSN 1996-0808 ©2011 Academic Journals DOI: 10.5897/AJMR11.841
Full Length Research Paper
Effects of temperature on recruitment and phytoplankton community composition
Xiao Tan
College of Environment, Hohai University, Nanjing 210098, China. E-mail: [email protected]. Tel: +8613057610908.
Accepted 11 November, 2011
Effects of temperature on phytoplankton recruitment and variations in phytoplankton community were studied by using hiemal sediment from Taihu Lake and performing a simulation experiment. Sediment samples were cultured in filtered lake water with elevated temperatures. Recruitment patterns and photosynthetic capacity of cyanobacteria, chlorophytes and diatoms were recorded, respectively. Results showed that recruitment of chlorophytes and diatoms was observed above 9°C, but recruitment of cyanobacteria was not evidently detected until 12.5°C. Chlorophytes dominated the phytoplankton
community at 12.5 and 16C, subsequently cyanobacteria established dominance above 19.5C. In this study, algal cells remained weak photochemical vitality at lower temperatures before recruitment, which reactivated and increased gradually with elevated temperatures. Key words: Recruitment, temperature threshold, cyanobacteria, blooms, Taihu Lake, phytoplankton community.
INTRODUCTION In winter, some species of phytoplankton are capable of dormancy on lake sediment after autumnal sedimentation (Tsujimura et al., 2000; Brunberg and Blomqvist, 2002). These benthic portions are able to renew growth and return to the pelagic phase with increased temperature in spring (Ståhl-Delbanco and Hansson, 2002; Karlsson-Elfgren and Brunberg, 2004; Verspagen et al., 2005). Especially, in some eutrophic lakes, recruitment is a key process in cyanobacteria life cycle and blooms formation (Oliver and Ganf, 2000; Kong and Gao, 2005). Various versions of migration traps had been designed to study cyanobacteria recruitment in lakes (Hansson et al., 1994; Brunberg and Blomqvist, 2003; Cao et al., 2005). In labs, some simulation experiments were performed to investigate influences of environmental factors on cyanobacteria recruitment (Ståhl-Delbanco and Hansson, 2002; Li et al., 2004; Tao et al., 2005). According to these field studies and simulation experiment, temperature had been confirmed to play an important role in driving cyanobacteria recruitment (Latour et al., 2004a; Li et al., 2004; Tao et al., 2005). However, previous studies mainly focused on the recruitment of some species of cyanobacteria and did not adequately analyze the variations in phytoplankton community composition
synchronously. Furthermore, cyanobacteria undergo a series of biomass accumulation and population competitive processes with other algae from recruitment to dominance establishment before blooms formation (Cao et al., 2005).
These processes remained to be further understood. Variable chlorophyll a fluorescence yield has become an important tool for studying phytoplankton photosynthesis (Schreiber, 1994; Oliver and Whittington, 1998), because it is sensitive to photon flux density and is reliable as a parameter to offer insight into the immediate past light history of phytoplankton (Zhang et al., 2008). The ratio of maximum variable fluorescence to the maximum yield (Fv/Fm) has been used to estimate changes in the proportion of functional reaction centers and as an indicator of the photosynthetic capacity of phytoplankton (Falkowski and Kolber, 1995). Moreover, PHYTO-PAM fluorometer allows a separate measurement of the fluorescence signal of each algal group in mixed phytoplankton populations. Accordingly, effects of temperature on photosynthetic capacity of different algal groups could be detected synchronously, which is an important physiological index to analyze recruitment and competitive processes (Latour et al., 2004a). In this

Tan 5897
Figure 1. Location of the sampling site.
paper, a simulation experiment was performed by using hiemal sediment samples from Taihu Lake, which were static cultured in light incubator, so as to study the temperature threshold for algae recruitment and effects of temperature changes on algal community composition. Additionally, variations of algal fluorescence were also analyzed to investigate responses of different algal groups to temperature changes. MATERIALS AND METHODS
Lake and sampling site description
Taihu Lake is a large eutrophic lake in China (with an area of 2, 338 km
2 and the annual average water depth of 1.9 m and maximum of
2.6 m) (Hu et al., 2006). Major cyanobacteria blooms composed of Microcystis spp. had appeared annually for decades in this lake (Chen et al., 2003). Meiliang Bay lies in the northern part of Taihu Lake, where serious blooms frequently occurred in summer (Chen et al., 2003; Tan et al., 2009). In the present study, the sampling site (31°28´46´´N, 120°11´34´´E) is located between Meiliang Bay and offshore regions (Figure 1).
Sample collection and treatment
On January 9, 2008, about 300 g of surface sediment (0 to 3 cm) was collected at the sampling site by a columnar sampler (KC-Denmark). During the sampling period, underwater environmental parameters (such as depth, water temperature,
density of cyanobacteria cells and chlorophyll a concentration) were real-time recorded by using a multi-parameter water quality sonde (YSI 6600V2, USA). Sediment samples were transferred to
laboratory immediately and were divided into three equal aliquots approximately. Each portion was laid on the bottom of a beaker. Subsequently, sterilized in situ lake water (5 L of 0.22 µm filtrate by Whatman GF/C membrane) were gently added. The three beakers were then incubated under an illumination intensity of 40 μmol photons m
–2 s
–1, provided by cool white fluorescent lamps (36W
FSL, China), with a light-dark period of 12/12 h . The incubation temperature increased along eight levels (5.5, 9, 12.5, 16, 19.5, 23,
26.5 and 30C), with each temperature being maintained for three days.
Microscopic analysis of phytoplankton
At the beginning and the end of each temperature level, 110 mL of
the culture liquid were obtained gently from each beaker by a plastic tube (length=20 cm, diameter=2 cm). 10 ml of the culture liquid were used for algal fluorescence analysis immediately; the residual 100 ml were fixed with Lugol’s iodine and sedimented for 48 h prior to microscopic analysis. Phytoplankton cell densities were enumerated by using a haemocytometer. And then, their specific growth rates (SGRs) were calculated according to the following equation:
SGR = ln(Ct/C0)/t
Where C0 is the initial cell density at the beginning of each temperature level, Ct is the cell density at the end and t is the duration of incubation period under each temperature level in days. Moreover, unicells, dividing cells (two connected cells), and colonies were enumerated. Colonies were grouped into consecutive groups: small colonies (cell number per colony between 2 and with a
maximum of 10 cells), middle colonies (cell number per colony was up to 10 and maximum of 100 cells), and large colonies (cell number per colony with more than 100).

5898 Afr. J. Microbiol. Res.
Table 1. Mean and ranges of real-time recorded environmental parameters at the sampling site.
Environmental parameter Mean and ranges
Depth (m) 1.95 (1.93 to 1.97)
Water temperature (C) 5.2 (5.1 to 5.3)
Chlorophyll a (µg L-1
) 0.09 (0.07 to 0.11)
Cyanobacteria cell density (cells mL-1
) 129 (118 to 139)
0
2
4
6
8
10
12
14
5.5 9 12.5 16 19.5 23 26.5 30
Temperature ( ℃ )
Cyanobacteria
Chlorophytes
Diatom
Cell d
en
sit
y (
10
8 c
ell
s m
L-1
Figure 2. Phytoplankton dynamics during the experiment.
PHYTO-PAM fluorometer analysis
Algal fluorescence was measured by using a multiwavelength phytoplankton pulse-amplitude-modulated fluorometer (Phyto-PAM Walz, Germany) after dark adaption for 15 min. The Phyto-PAM fluorometer equipped with a special emitter-detector unit (Phyto-ED) for distinguishing cyanobacteria, chlorophytes and diatoms/dinoflagellates by means of four excitation wavelengths (665, 645, 520 and 470 nm). For instance, in chorophytes chlorophyll fluorescence is much more effectively excited by blue and red light (470, 645 and 665 nm) than by green light (520 nm). In the case of cyanobacteria, almost no chlorophyll fluorescence is excited by blue light (470 nm), while excitation at 645 nm is particular strong due to phycocyanin and allophycocyanin absorption. As for diatoms and dinoflagellates, excitation by blue (470 nm) and green (520 nm) is relatively high resulted from strong absorption by fucoxanthin, chlorophyll c and carotenoids. The fluorescence signals from the four wavelengths excitation were assigned to the three algal groups by using the Phyto-WIN software
(version 1.47) and the reference spectra (Zhang et al., 2008). The maximal efficiency of photosystem II photochemistry was determined as Fv/Fm, which was used for an indicator of the photosynthetic capacity of phytoplankton (Falkowski and Kolber, 1995). Fv/Fm was calculated by the following equation:
Fv/Fm = (Fm - F0)/Fm Where F0 is the fluorescence of dark-adapted algal cells stimulated by a weak probe light immediately after 15 min of darkness and Fm
is the maximum fluorescence signal after the closure of all reaction centers by 600 ms pulse of saturating irradiance (Schreiber et al.,
2002).
RESULTS Environmental parameters at the sampling site Sediment samples were collected in a sunny and windless day. Environmental parameters at the sampling site are displayed in Table 1. During the sampling period, water depth of the sampling site fluctuated between 1.93 and 1.97 m. This range was near to the average depth of
Taihu Lake. Water temperature was about 5.2C, which
was very close to the initial culture temperature (5.5C) and was easier for hiemal algae to accommodate. At the sampling site, chlorophyll a concentration and the density of cyanobacteria cells were fairly low in water. Phytoplankton dynamics According to the algae growth curves (Figure 2) and the calculated SGRs, recruitment of chlorophytes and
diatoms was observed at 9C, but the recruitment of
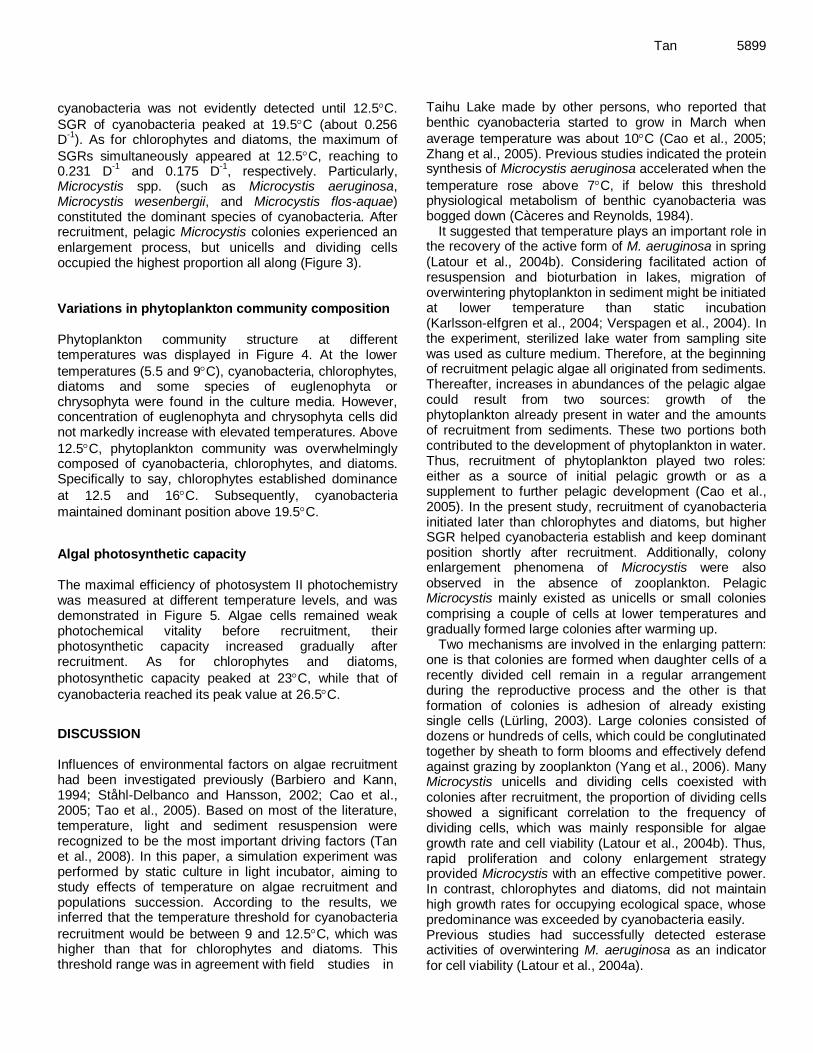
cyanobacteria was not evidently detected until 12.5C.
SGR of cyanobacteria peaked at 19.5C (about 0.256 D
-1). As for chlorophytes and diatoms, the maximum of
SGRs simultaneously appeared at 12.5C, reaching to 0.231 D
-1 and 0.175 D
-1, respectively. Particularly,
Microcystis spp. (such as Microcystis aeruginosa, Microcystis wesenbergii, and Microcystis flos-aquae) constituted the dominant species of cyanobacteria. After recruitment, pelagic Microcystis colonies experienced an enlargement process, but unicells and dividing cells occupied the highest proportion all along (Figure 3). Variations in phytoplankton community composition Phytoplankton community structure at different temperatures was displayed in Figure 4. At the lower
temperatures (5.5 and 9C), cyanobacteria, chlorophytes, diatoms and some species of euglenophyta or chrysophyta were found in the culture media. However, concentration of euglenophyta and chrysophyta cells did not markedly increase with elevated temperatures. Above
12.5C, phytoplankton community was overwhelmingly composed of cyanobacteria, chlorophytes, and diatoms. Specifically to say, chlorophytes established dominance
at 12.5 and 16C. Subsequently, cyanobacteria
maintained dominant position above 19.5C.
Algal photosynthetic capacity The maximal efficiency of photosystem II photochemistry was measured at different temperature levels, and was demonstrated in Figure 5. Algae cells remained weak photochemical vitality before recruitment, their photosynthetic capacity increased gradually after recruitment. As for chlorophytes and diatoms,
photosynthetic capacity peaked at 23C, while that of
cyanobacteria reached its peak value at 26.5C.
DISCUSSION Influences of environmental factors on algae recruitment had been investigated previously (Barbiero and Kann, 1994; Ståhl-Delbanco and Hansson, 2002; Cao et al., 2005; Tao et al., 2005). Based on most of the literature, temperature, light and sediment resuspension were recognized to be the most important driving factors (Tan et al., 2008). In this paper, a simulation experiment was performed by static culture in light incubator, aiming to study effects of temperature on algae recruitment and populations succession. According to the results, we inferred that the temperature threshold for cyanobacteria
recruitment would be between 9 and 12.5C, which was higher than that for chlorophytes and diatoms. This threshold range was in agreement with field studies in
Tan 5899 Taihu Lake made by other persons, who reported that benthic cyanobacteria started to grow in March when
average temperature was about 10C (Cao et al., 2005; Zhang et al., 2005). Previous studies indicated the protein synthesis of Microcystis aeruginosa accelerated when the
temperature rose above 7C, if below this threshold physiological metabolism of benthic cyanobacteria was bogged down (Càceres and Reynolds, 1984).
It suggested that temperature plays an important role in the recovery of the active form of M. aeruginosa in spring (Latour et al., 2004b). Considering facilitated action of resuspension and bioturbation in lakes, migration of overwintering phytoplankton in sediment might be initiated at lower temperature than static incubation (Karlsson-elfgren et al., 2004; Verspagen et al., 2004). In the experiment, sterilized lake water from sampling site was used as culture medium. Therefore, at the beginning of recruitment pelagic algae all originated from sediments. Thereafter, increases in abundances of the pelagic algae could result from two sources: growth of the phytoplankton already present in water and the amounts of recruitment from sediments. These two portions both contributed to the development of phytoplankton in water. Thus, recruitment of phytoplankton played two roles: either as a source of initial pelagic growth or as a supplement to further pelagic development (Cao et al., 2005). In the present study, recruitment of cyanobacteria initiated later than chlorophytes and diatoms, but higher SGR helped cyanobacteria establish and keep dominant position shortly after recruitment. Additionally, colony enlargement phenomena of Microcystis were also observed in the absence of zooplankton. Pelagic Microcystis mainly existed as unicells or small colonies comprising a couple of cells at lower temperatures and gradually formed large colonies after warming up.
Two mechanisms are involved in the enlarging pattern: one is that colonies are formed when daughter cells of a recently divided cell remain in a regular arrangement during the reproductive process and the other is that formation of colonies is adhesion of already existing single cells (Lürling, 2003). Large colonies consisted of dozens or hundreds of cells, which could be conglutinated together by sheath to form blooms and effectively defend against grazing by zooplankton (Yang et al., 2006). Many Microcystis unicells and dividing cells coexisted with colonies after recruitment, the proportion of dividing cells showed a significant correlation to the frequency of dividing cells, which was mainly responsible for algae growth rate and cell viability (Latour et al., 2004b). Thus, rapid proliferation and colony enlargement strategy provided Microcystis with an effective competitive power. In contrast, chlorophytes and diatoms, did not maintain high growth rates for occupying ecological space, whose predominance was exceeded by cyanobacteria easily. Previous studies had successfully detected esterase activities of overwintering M. aeruginosa as an indicator for cell viability (Latour et al., 2004a).
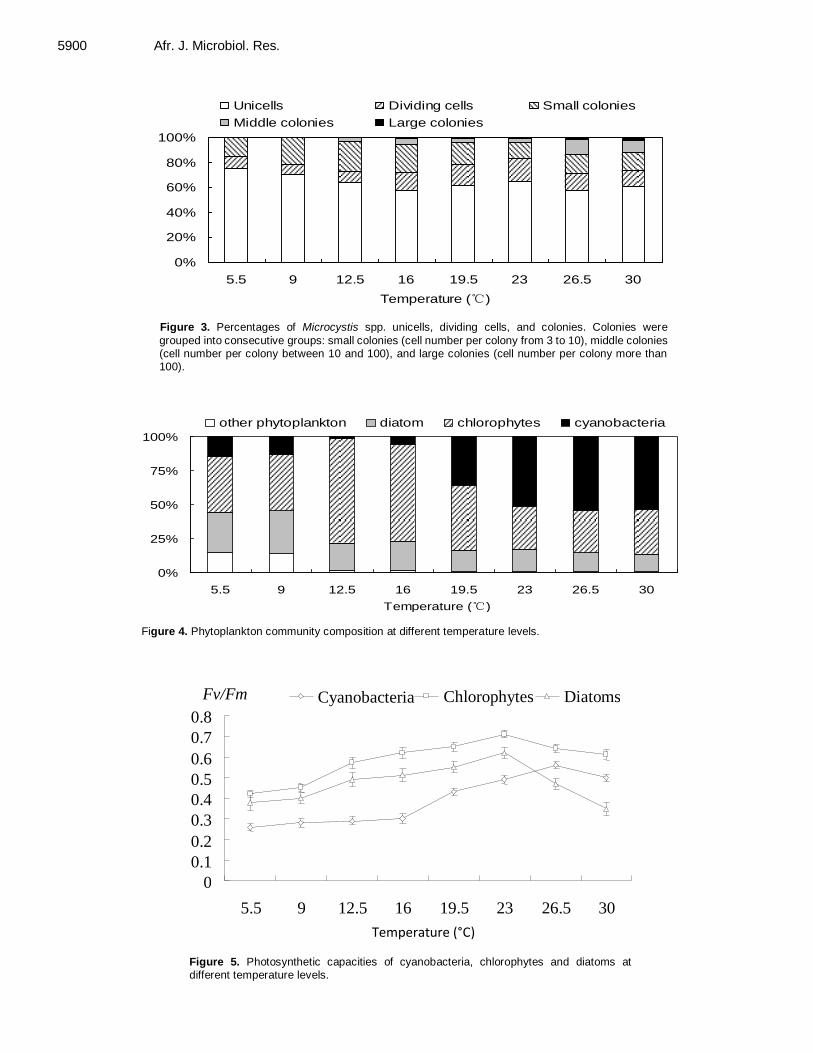
5900 Afr. J. Microbiol. Res.
0%
20%
40%
60%
80%
100%
5.5 9 12.5 16 19.5 23 26.5 30
Temperature (℃)
Unicells Dividing cells Small colonies
Middle colonies Large colonies
Figure 3. Percentages of Microcystis spp. unicells, dividing cells, and colonies. Colonies were
grouped into consecutive groups: small colonies (cell number per colony from 3 to 10), middle colonies (cell number per colony between 10 and 100), and large colonies (cell number per colony more than 100).
0%
25%
50%
75%
100%
5.5 9 12.5 16 19.5 23 26.5 30
Temperature (℃)
other phytoplankton diatom chlorophytes cyanobacteria
Figure 4. Phytoplankton community composition at different temperature levels.
0
0.1
0.2
0.3
0.4
0.5
0.6
0.7
0.8
5.5 9 12.5 16 19.5 23 26.5 30
Temperature ( ℃ )
Fv/Fm Cyanobacteria Chlorophytes Diatoms
Temperature (°C)
Figure 5. Photosynthetic capacities of cyanobacteria, chlorophytes and diatoms at different temperature levels.

While, esterase activities of different algal groups hardly could be measured separately in mixed samples. In the present study, photosynthetic capacities of cyanobacteria, chlorophytes and diatoms were analyzed by using Phyto-PAM (Walz, Germany) and displayed by Fv/Fm index, respectively, owing to the absence of dinoflagellates all along. Before recruitment, phytoplankton remained weak photochemical vitality, these dormant algae cells could be referred to as ‘physiologically resting cells’ (Sicko-goad, 1986). They could be reactivated and increased gradually with elevated temperature (Li et al., 2004). Their maximum of photosynthetic capacity usually occurred at the optimum temperature for physiological metabolism (Blanchard et al., 1996). Interestingly, the maximal efficiency of photosystem II photochemistry did not change with growth rate synchronously. Frequency of algal dividing cells might be under the control of an endogenous component (Latour et al., 2004b), which merits further studies. ACKNOWLEDGEMENTS This work was supported by the National Natural Science Foundation of China (31000220) and China Postdoctoral Foundation (20110491341). REFERENCES
Barbiero RP, Kann J (1994). The importance of benthic recruitment to
the population development of Aphanizomenon flos-aquae and
internal loading in a shallow lake. J. Plankton Res., 16: 1581-1588. Blanchard G, Guarini JM, Richard P, Gros P, Mornet F (1996).
Quantifying the short-term temperature effect on light-saturated
photosynthesis of intertidal microphytobenthos. Mar. Ecol. Prog. Ser., 134: 309-313.
Brunberg AK, Blomqvist P (2002). Benthic overwintering of Microcystis
colonies under different environmental conditions. J. Plankton Res., 24:1247-1252.
Brunberg AK, Blomqvist P (2003). Recruitment of Microcystis from lake
sediments: the importance of littoral inocula. J. Phycol., 39: 58-63.
Càceres O, Reynolds CS (1984). Some effects of artificiallyenhanced anoxia and the growth of Microcystis aeruginosa Kütz Emend, with
special reference to the initiation of its annual cycle in lakes. Arch.
Hydrobiol., 99: 379-397. Cao HS, Kong FX, Tan JK, Zhang XF, Tao Y, Yang Z (2005).
Recruitment of total phytoplankton, chlorophytes and cyanobacteria
from lake sediments recorded by photosynthetic pigments in a large, shallow lake (Lake Taihu, China). Internat. Rev. Hydrobiol., 90: 345-355.
Chen YW, Qin BQ, Teubner K, Dokulil M (2003). Long-term dynamics of phytoplankton assembles: Microcystis-domination in Lake Taihu, a
large shallow lake in China. J. Plankton Res., 25: 445-453.
Falkowski PG, Kolber Z (1995). Variations in chlorophyll fluorescence yields in phytoplankton in the world oceans. Aust. J. Plant Physiol., 22: 341-355.
Hansson LA, Rudstam LG, Johnson TB, Soranno P, Allen Y (1994). Patterns in algal recruitment from sediment to water in a dimictic, eutrophic lake. Can. J. Fish. Aquat. Sci., 51: 2825-2833.
Hu WP, Jørgensen SE, Zhang FB (2006). A vertical-compressed three-dimensional ecological model in Lake Taihu, China. Ecol. Model., 190: 367-398.
Karlsson-Elfgren I, Brunberg AK (2004). The importance of shallow sediments in the recruitment of Anabaena and Aphanizomenon
Tan 5901 (cyanophyceae). J. Phycol., 40: 831-836. Kong FX, GAO G (2005). Hypothesis on cyanobacteria bloom-forming
mechanism in large shallow lakes. Acta Ecol. Sinica, 25: 589-595 (in
Chinese with English abstract). Latour D, Giraudet H, Berthon JL (2004a). Frequency of dividing cells
and viability of Microcystis aeruginosa in sediment of a eutrophic
reservoir. Aquat. Microb. Ecol., 36: 117-122. Latour D, Sabido O, Salençon MJ, Giraudet H (2004b). Dynamics and
metabolic activity of the benthic cyanobacterium Microcystis
aeruginosa in the Grangent reservoir (France). J. Plankton Res., 26:
1-8. Li KY, Song LR, Wan N (2004). Studies on recruitment and growth
characteristic of Microcystis in sediment. Acta Hydrobiol. Sinica, 28:
113-118 (in Chinese with English abstract). Lürling M (2003). Phenotypic plasticity in the green algae Desmodesmus
and Scenedesmus with special reference to the induction of defensive
morphology. Ann. Limnol. – Int. J. Lim., 39: 85 -101. Oliver RL, Ganf GG (2000). Freshwater blooms. In Whitton BA, Potts M
(eds) The Ecology of Cynobacteria, Kluwer Academic Publishier, Netherlands, pp149-194.
Oliver RL, Whittington J (1998). Using measurements of variable
chlorophyll-a fluorescence to investigate the influences of water movement on the photochemistry of phytoplankton. Physical Processes in Lakes and Oceans. In Imberger J (ed), Physical
Processes in Lake and Oceans. Coastal and Estuarine Studies, American Geophysical Union, Washington, pp 517-534.
Schreiber U (1994). New emitter-detector-cuvette assembly for
measuring modulated chlorophyll fluorescence of highly diluted suspensions in conjunctions with the standard PAM fluorometer. Zeitschrift für Naturforschung C – J. Biosci., 49: 646-656.
Schreiber U, Gademann R, Bird P, Ralph PJ, Larkum AWD, Kühl M (2002). Apparent light requirement for activation of photosynthesis upon rehydration of desiccated beachrock microbial mats. J. Phycol.,
38: 125-134. Sicko-Goad L (1986). Rejuvenation of Melosira granulata
(Bacillariophyceae) resting cells from the anoxic sediments of
Douglas Lake, Michigan. II. electron microscopy. J. Phycol., 22: 28-35 Ståhl-Delbanco A, Hansson LA (2002). Effects of bioturbation on
recruitment of algal cells from the ‘seed bank’ of lake sediments.
Limnol. Oceanogr., 47: 1836-1843 Tan X, Kong FX, Zeng QF, Cao HS, Qian SQ, Zhang M (2009).
Seasonal variation of Microcystis in Lake Taihu and its relationships
with environmental factors. J. Environ. Sci., 21: 892-897. Tan X, Kong FX, Cao HS, Yu Y, Zhang M (2008). Recruitment of
bloom-forming cyanobacteria and its driving factors. Afr. J.
Biotechnol., 7: 4726-4731. Tao Y, Kong FX, CAO HS, ZHANG XF (2005). Laboratory investigations
on recruitment of Microcystis in sediment of Taihu Lake. J. Lake Sci.,
17: 231-236 (in Chinese with English abstract).
Tsujimura S, Tsukada H, Nakahara H, Nakajima T, Nishino M (2000). Seasonal variations of Microcystis populations in sediments of Lake
Biwa, Japan. Hydrobiologia, 434: 183-192.
Verspagen JMH, Snelder EOFM, Visser PM, Huisman JEF, Mur LR, Ibelings BW (2004). Recruitment of benthic Microcystis
(cyanophyceae) to the water column: internal buoyancy changes or
resuspension? J. Phycol., 40: 260-270. Verspagen JMH, Snelder EOFM, Visser PM, Jöhnk KD, Ibelings BW,
Mur LR, Huisman JEF (2005). Benthic–pelagic coupling in the population dynamics of the harmful cyanobacterium Microcystis.
Freshwater Biol., 50: 854-867. Yang Z, Kong FX, Shi XL, Cao HS (2006). Morphological response of
Microcystis aeruginosa to grazing by different sorts of zooplankton.
Hydrobiologia, 563: 225-230. Zhang M, Kong FX, Wu XD, Xing P (2008). Different photochemical
responses of phytoplankters from the large shallow Taihu Lake of subtropical China in relation to light and mixing. Hydrobiologia, 603: 267-278.
Zhang XF, Kong FX, Cao HS, Tan JK, Tao Y, Wang ML (2005). Research on recruitment dynamics of bloom- forming cyanobacteria in Meiliang Bay, Taihu Lake. Chin. J. Appl. Ecol., 16:1346-1350 (in
Chinese with English abstract).

African Journal of Microbiology Research Vol. 5(32), pp. 5902-5909, 30 December, 2011 Available online at http://www.academicjournals.org/AJMR ISSN 1996-0808 ©2011 Academic Journals DOI: 10.5897/AJMR11.934
Full Length Research Paper
Assessing antibiotic resistance profiles in Escherichia coli and Salmonella species from groundwater in the
Mafikeng area, South Africa
Philemon Thabo Phokela, Collins Njie Ateba* and David Tonderai Kawadza
Department of Biological Sciences, School of Environmental and Health Sciences, Faculty of Agriculture, Science and
Technology, North-West University Mafikeng Campus, Private Bag X2046, South Africa.
Accepted 11 November, 2011
Escherichia coli and Salmonella species occur as normal flora in the gastrointestinal tract of animals and humans. However, pathogenic strains exist that cause disease in humans. Infections may result from the consumption of water and food contaminated with faeces of human and animal origin. In South Africa, residents of most rural communities rely on untreated ground water for survival. This practice results to the transfer of pathogenic micro-organism to humans and thus amplifies the need to identify contaminated water systems. Results obtained may adequately address water quality problems and hence protect public health. The study was conducted to isolate and determine the antibiotic resistance profiles of E. coli and Salmonella species from the groundwater obtained from two rural communities in the North-West province, S.A. Nineteen ground water samples were analyzed for characters of E. coli and Salmonella species. Only those isolates that satisfied all the primary (oxidase and the triple sugar iron) and secondary identification criteria (API 20E and rapid slide agglutination test) for E. coli and Salmonella species were used. A total of 63 E. coli and 64 Salmonella isolates were identified. The antibiotic susceptibilities of these isolates were evaluated against a panel of 10 antibiotics. A large proportion (56.7 to 57.6%) of the E. coli isolated from both Dibate and Verdwall were resistant to vancomycin. Similarly, large proportions (51.5 to 78.8%) of the E. coli isolated from Verdwall were resistant to ampicilin and erythromycin when compared to those isolated from Dibate. Furthermore, a higher percentage (90.0 to 100%) of Salmonella isolated from both Dibate and Verdwall were resistant to ampicillin, erythromycin and vancomycin. AP-E-VA was the predominant phenotype for E. coli isolated from both Dibate and Verdwall in 40 and 20%, respectively, while the phenotypes AP-E-T-VA and AP-E-VA were dominant among the Salmonella species isolated in this study. The results indicated that E. coli and Salmonella could serve as indicator organisms necessary to assess the quality of ground water and their levels are critical parameters that could help to drive management strategies. This will limit the effect of these pathogens on consumers, as some water samples were visibly identified to be contaminated. Key words: Salmonella, E. coli, multiple antibiotic resistant (MAR), phenotype.
INTRODUCTION Access to drinking water is a fundamental human need and therefore a basic right of every individual, since contaminated water jeopardizes both the physical and *Corresponding author. E-mail: [email protected].
social health to consumers (WHO, 2003). In South Africa, residents of most rural communities use untreated groundwater for drinking and household activities. Generally, ground water from boreholes in these rural communities is usually of poor quality that results from chemical and microbial contamination hence considered to be unsafe (Momba et al., 2003, 2005, 2006; Obi et al.,
2006). Despite this, it is still used for drinking by residents in many communities who do not usually have access to portable water. Residents of Dibate and Verdwall in the Mafikeng area face these same problems. Although the infections such as diarrhoea that are caused by pathogens in water can be self-limiting in some patients, they may also be life-threatening in infants, the elderly and immune-compromised individuals (Momba et al., 2008). The high prevalence of Human immunodeficiency virus/ acquired immune deficiency syndrome (HIV/AIDS) in South Africa amplifies the risks associated with drinking water from these sources (Bessong et al., 2009). Antibiotic resistant faecal coliforms have been isolated from different water sources in the area (Mulamattathil et al., 2000). Multiple antibiotic resistant E. coli O157strains, enterococci species and Staphylococcus aureus have also been isolated from animal faeces, human stool samples and milk in the area (Ateba et al., 2008; Ateba and Bezuidenhout, 2008; Moneoang and Bezuidenhout, 2009; Ateba et al., 2010).
These isolates could be deposited in water bodies if proper hygiene standards are not implemented and later contaminate ground water (Sorum and L’Abee-Lund, 2002). Consequently, this could contribute in the pool of antibiotic resistant genes among bacteria species in the area and hence negatively affect the treatment of infections caused by these pathogens. Under these cir-cumstances, it is important to determine the prevalence of faecal bacterial contaminants in drinking water so as to reduce mortality caused by these pathogens. Prior to 1994, between 14 to 18 million South Africans were not receiving adequate water supply (Momba et al., 2006). However, as of 2004 about 4 million inhabitants in South Africa still rely on untreated water sources which include rivers, ponds and springs (Kasrils, 2004). Recently, 3.3 million inhabitants of South Africa were identified to be living without access to portable water while about 15.3 million did not have access to adequate sanitation (Council for Scientific and Industrial Research, 2008). Although the government is continually setting up strategies to ensure that residents in rural communities have access to portable water, these facilities are usually faced with maintenance problems. Residents are often left with no option but to revert to use the unprotected water sources like boreholes (WRC, 1993).
These unprotected water sources easily get conta-minated with faecal matter of both human and animal origin through rainfall runoffs and human defecations (Ahmed et al., 2005). Bacteria that belong to the family of Enterobacteriaceae are a major threat to humans as they frequently contaminate drinking water and hence have the potential of causing water-borne diseases (Young, 1996). However, it is difficult to determine the effect of these pathogens in rural societies due to the fact that individuals that encounter diarrhoea related infections rarely report cases to hospitals (Pascal et al., 2009). This amplifies the need to identify contaminated water systems so as to adequately address water quality
Phokela et al. 5903 problems and hence protect human health. Furthermore, there is a need to regularly determine the bacterial load in these water systems. This might reduce water borne infections in humans that live in these poverty driven communities. This could reduce the health risks associated with the pathogens that are found in ground water. The study was aimed at isolating and determining the antibiotic resistance profiles of E. coli and Salmonella species from ground water obtained from two rural communities in the North-West province of South Africa. MATERIALS AND METHODS Area of the study This research was conducted in the North-West University, Mafikeng Campus, North-West Province, South Africa. 19 ground water samples were collected from two rural communities in the Mafikeng area. This consisted of 10 from Dibate and 9 from Verdwall. Verdwall is situated approximately 5 km to Itsoseng and Dibate is on the west of Megacity shopping complex in Mmabatho. The samples were collected from both storage tanks and borehole taps. Prior to collecting the samples, the taps were made to run for about 1 min. Water samples were collected into sterile 500 ml Duran Schott bottles and were immediately transported on ice to the laboratory for analysis. Laboratory analysis Media utilized in the study To determine the bacterial load from water samples m-Fc, m-ENDO and plate count agar obtained from Biolab (UK) and supplied by Merck, South Africa were utilized. Plate count agar was used to determine the heterotrophic bacterial count while m-ENDO and m-Fc media were used to determine the total and faecal coliform counts, respectively. Salmonella-shigella agar (SSA) and eosin methylene blue agar (EMBA) were used to selectively isolate Salmonella species and E. coli, respectively. Determination of bacterial load
Water samples were analyzed within 2 h upon arrival in the laboratory according to standard methods (APHA, 1998). Each sample was analyzed in triplicates. An aliquot of 100 ml from each sample was filtered using 0.45 µm filter paper (Whatman®Glass Microfiber GS Filterpaper) on a water pump machine (model Sartorius 16824). A sterile forcep was used to remove the membrane filters from the machine. These filter papers were placed on m-FC and m-ENDO agar, respectively. Aliquots of 50 µl of the samples were spread-plated on plate count agar. Plate count agar and m-ENDO agar plates were incubated at 37°C for 24 h while m-FC plates were incubated at 45°C for 48 h.
After incubation typical blue colonies on the m-FC plates were regarded as potential faecal coliforms. However, on m-ENDO agar plates, characteristic metallic-sheen colonies were considered potential total coliform bacteria. These isolates were counted using a colony counter. The results were recorded and averages computed. The colonies on the agar were also counted and the results were reported as colony forming units (CFU) per 100 ml of sample plated.
5904 Afr. J. Microbiol. Res. Selective isolation of E. coli and Salmonella species Aliquots of 50 µl from each water sample was spread-plated onto eosin methylene blue agar (EMBA) and salmonella-shigella agar (SSA) plates for selective isolation of E. coli and Salmonella species, respectively. The plates were incubated at 37°C for 24 h. After incubation, characteristic metallic-sheen colonies on EMBA and pale yellow colonies with black spots on their centres on SSA were considered to be presumptive E. coli and Salmonella species, respectively. These isolates were sub-cultured on EMBA and SSA plates for E. coli and Salmonella species, respectively and the plates were incubated at 37°C for 24 h. Pure isolates for E. coli and Salmonella, respectively were retained for identification using specific biochemical tests. Control strains E. coli (ATCC 25922), Salmonella arizonae (ATCC 13314) and Salmonella paratyphi (ATCC 1950) were used as positive control strains in all experiments. Bacterial identification Presumptive isolates were identified using the following criteria. Cellular morphology Isolates were gram stained using the method of Cruikshank et al. (1975). All gram-negative isolates from EMBA and SSA plates were subjected to primary and secondary biochemical identification tests. Preliminary biochemical identification tests for E. coli and Salmonella spp Triple sugar iron agar test: Triple sugar iron (TSI) agar (Biolab) obtained from Merck, S.A. was used to determine the potential of E. coli and Salmonella isolates in utilizing three sugars, (glucose, sucrose and lactose) at final concentrations of 0.1, 1.0 and 1.0%, respectively. The test was performed as previously recommended by (United States Pharmacopeial Convention; Incorporated 2001). The results were recorded and data interpreted as previously determined by (Forbes and Weissfeld, 1998). Oxidase test: The oxidase test was performed using the oxidase test reagent from Pro-Lab Diagnostics, United Kingdom and the test was performed as instructed by the manufacturer (Whatman International Limited, Maidstone, England). All isolates that satisfied the preliminary identification criteria for E. coli and Salmonella, respectively were subjected to confirmatory biochemical identification test. Confirmatory identification tests for E. coli and Salmonella spp Analytical profile index (API) API 20E All the presumptive E. coli and Salmonella spp. were confirmed using the API 20E test which is a standardized test kit designed to facilitate the identification of bacteria that belong to the family Enterobacteriaceae. The test was performed as instructed by the manufacturer (BioMerieux®, France). The indices obtained after reading the results were interpreted using the API web software (BioMerieux® S.A).
Antibiotic susceptibility test Antibiotic susceptibility tests were performed on all E. coli and Salmonella species to determine their antibiotic resistant profiles using the Kirby-Bauer disc diffusion technique (Kirby et al., 1966). Before antibiotic sensitivity testing, the isolates were revived by culturing onto EMBA and SSA plates for E. coli and Salmonella, respectively. The plates were incubated aerobically at 37°C for 24 h. Bacterial suspensions were prepared using these pure isolates and aliquots of 100 µl from these suspensions were spread-plated on Mueller Hinton agar (Biolab, Merck, South Africa). The susceptibilities of the isolates against a panel of ten different antibiotic discs obtained from Mast Diagnostics, United Kingdom were determined. The antibiotic discs were gently pressed onto the inoculated Mueller Hinton agar to ensure intimate contact with the surface and plates were incubated aerobically at 37°C for 24 h (CLSI,1999) formerly (NCCLS, 1999). The antibiotic inhibition zone diameters were measured and results obtained were used to classify isolates as being resistant, intermediate resistant or susceptible to a particular antibiotic based on standard reference values (CLSI,1999) formerly (NCCLS, 1999). Table 1 indicates the details of antibiotics that were used in the study. The antibiotics tested are those to which resistance have been reported in the area (Ateba and Bezuidenhout, 2008; Bezuidenhout and Moneoang, 2009). Moreover, some antibiotics that are used to treat human infections were also included. Multiple antibiotic resistant (MAR) phenotypes MAR phenotypes were generated for isolates that were resistant to 3 and more antibiotics (Rota et al., 1996). Phenotypes were generated using the abbreviations that appear on the antibiotic discs. Statistical analysis Statistical analysis was done using SPSS software (version 14.0). Pearson’s moment correlation product (P<0.05) was used to determine whether the antibiotics tested exhibited similar reactions against the E. coli and Salmonella spp. isolated from the different sampling stations. Cluster analysis was performed using the Statistica software (version 9.0). RESULTS Bacterial load in ground water samples A total of 19 ground water samples were analyzed to determine the faecal coliform, total coliform and heterotrophic bacterial counts. Results obtained were recorded as number of colony forming units (cfu) per 100 ml of water sample for m-FC and m-ENDO while for heterotrophic counts the results were recorded as number of cfu per 1 ml of water sample. Results obtained are shown in Tables 2 and 3 for samples obtained from Dibate and Vredwall, respectively. The results in Table 2 indicate that a large number (9 of 10) of the water samples obtained from Dibate village were contaminated with microbial pathogens. Generally, the number of colonies per sample was higher for the heterotrophic bacterial count than the total coliform and the faecal coliform count (Table 2). Although one of the samples did
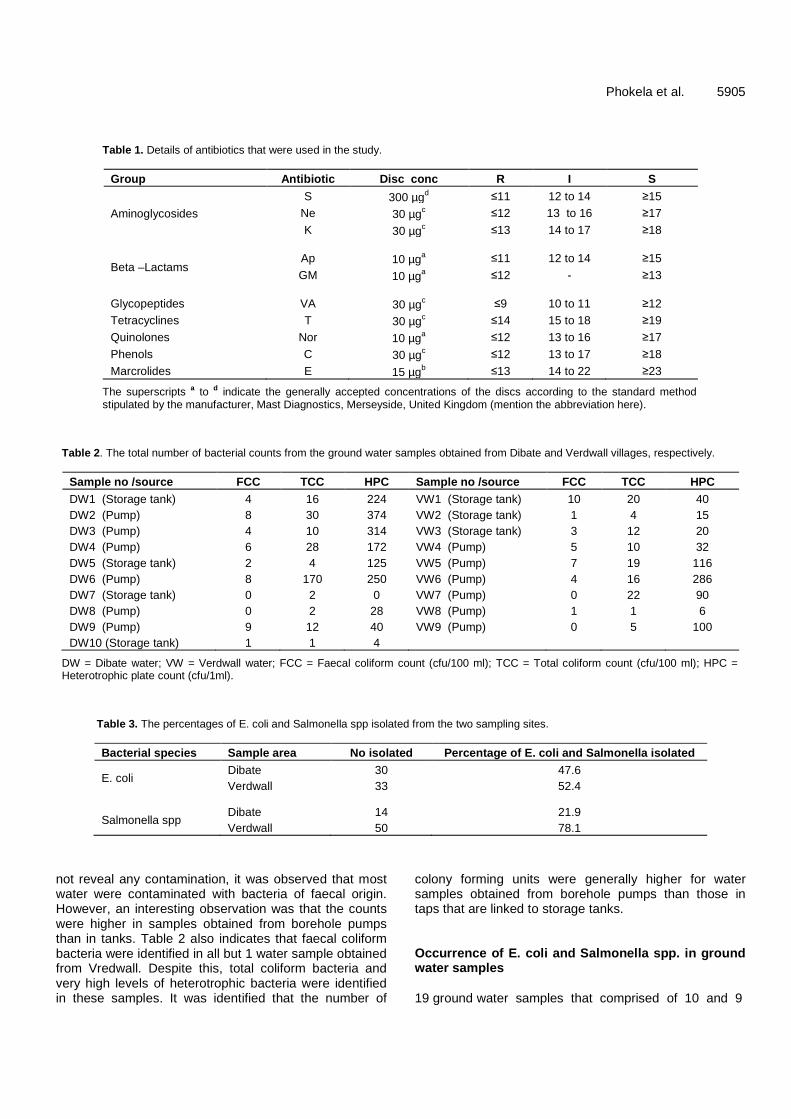
Phokela et al. 5905
Table 1. Details of antibiotics that were used in the study.
Group Antibiotic Disc conc R I S
Aminoglycosides
S 300 µgd ≤11 12 to 14 ≥15 Ne 30 µgc ≤12 13 to 16 ≥17
K 30 µgc ≤13 14 to 17 ≥18
Beta –Lactams Ap 10 µga ≤11 12 to 14 ≥15
GM 10 µga ≤12 - ≥13
Glycopeptides VA 30 µgc ≤9 10 to 11 ≥12 Tetracyclines T 30 µgc ≤14 15 to 18 ≥19
Quinolones Nor 10 µga ≤12 13 to 16 ≥17
Phenols C 30 µgc ≤12 13 to 17 ≥18
Marcrolides E 15 µgb ≤13 14 to 22 ≥23
The superscripts a to d indicate the generally accepted concentrations of the discs according to the standard method stipulated by the manufacturer, Mast Diagnostics, Merseyside, United Kingdom (mention the abbreviation here).
Table 2. The total number of bacterial counts from the ground water samples obtained from Dibate and Verdwall villages, respectively.
Sample no /source FCC TCC HPC Sample no /source FCC TCC HPC DW1 (Storage tank) 4 16 224 VW1 (Storage tank) 10 20 40 DW2 (Pump) 8 30 374 VW2 (Storage tank) 1 4 15 DW3 (Pump) 4 10 314 VW3 (Storage tank) 3 12 20 DW4 (Pump) 6 28 172 VW4 (Pump) 5 10 32 DW5 (Storage tank) 2 4 125 VW5 (Pump) 7 19 116 DW6 (Pump) 8 170 250 VW6 (Pump) 4 16 286 DW7 (Storage tank) 0 2 0 VW7 (Pump) 0 22 90 DW8 (Pump) 0 2 28 VW8 (Pump) 1 1 6 DW9 (Pump) 9 12 40 VW9 (Pump) 0 5 100 DW10 (Storage tank) 1 1 4
DW = Dibate water; VW = Verdwall water; FCC = Faecal coliform count (cfu/100 ml); TCC = Total coliform count (cfu/100 ml); HPC = Heterotrophic plate count (cfu/1ml).
Table 3. The percentages of E. coli and Salmonella spp isolated from the two sampling sites.
Bacterial species Sample area No isolated Percentage of E. coli and Salmonella isolated
E. coli Dibate 30 47.6 Verdwall 33 52.4
Salmonella spp Dibate Verdwall
14 50
21.9 78.1
not reveal any contamination, it was observed that most water were contaminated with bacteria of faecal origin. However, an interesting observation was that the counts were higher in samples obtained from borehole pumps than in tanks. Table 2 also indicates that faecal coliform bacteria were identified in all but 1 water sample obtained from Vredwall. Despite this, total coliform bacteria and very high levels of heterotrophic bacteria were identified in these samples. It was identified that the number of
colony forming units were generally higher for water samples obtained from borehole pumps than those in taps that are linked to storage tanks. Occurrence of E. coli and Salmonella spp. in ground water samples 19 ground water samples that comprised of 10 and 9

5906 Afr. J. Microbiol. Res.
Table 4. Percentage antibiotic resistance of E. coli and Salmonella isolated from the different sampling stations.
Antibiotics
E. coli (N=63) Salmonella spp (N=64) Sampling site Sampling site
Dibate (N=30) Verdwall (N=33) Dibate (N=14) Verdwall (N=50) Ap 33.0 78.8 100 100 E 20.0 51.5 92.9 90.0 T 23.3 12.1 14.3 64.0
GM 0 24.2 0 2.0 VA 56.7 57.6 100 100 Ne 0 30.0 0 4.0 C 3.3 27.3 7.1 26.0 K 0 27.3 0 30.0 S 0 15.2 0 6.0
Nor 0 9.1 0 16.0
Ap (ampicillin), E (erythromycin), T (tetracycline),GM (gentamicin), VA (vancomycin), Ne (neomycin), C (chloramphenicol), K (kanamycin), S (streptomycin), Nor (norfloxacin).
from Dibate and Verdwall villages respectively were collected directly from the pumps and storage tanks. These samples were analyzed for the presence of Salmonella spp. and E. coli, respectively. Isolates that satisfied both the preliminary and confirmatory identi-fication tests for these pathogens were retained. A total of 63 E. coli isolates and 64 Salmonella arizonae were positively identified as shown in Table 3. The proportion of both E. coli and Salmonella spp. isolated were higher (33) and 50, respectively in water samples obtained from Verdwall. Moreover, the proportion of Salmonella isolated from Verdwal (50) was higher when compared to those isolated from water obtained in Dibate (14). Antibiotic resistance of E. coli and Salmonella spp. in ground water samples All the E. coli and Salmonella isolated were tested to evaluate their susceptibilities to 10 different antibiotics. Results obtained are depicted in Table 4. A large proportion (51.5 to 78.8%) of the E. coli isolated from Verdwall was resistant to ampicillin and erythromycin when compared to those isolated from Dibate. Similarly, a large proportion (56.7 to 57.6%) of the E. coli isolates from both Dibate and Verdwall were resistant to vancomycin. Despite the fact that a small proportion (9.1 to 30.3%) of the E. coli isolates from Verdwall were resistant to gentamicin, neomycin, kanamycin, streptomycin and norfloxacin, none of those isolated from Dibate were resistant to these antimicrobial agents. Small proportions (12.1 to 23.3%) of the E. coli isolates from both sample sites were resistant to tetracycline. A very large proportion (90.0 to 100%) of the Salmonella isolates from both Dibate and Verdwall were resistant to ampicillin, erythromycin and vancomycin. Despite the fact that only a small proportion (14.3%) of the Salmonella
isolates from Dibate were resistant to tetracycline, a relatively larger proportion (64.0%) of those isolated from Verdwall were resistant to this drug. Salmonella isolates from Verdwall showed little resistance (2.0 to 30.0%) to gentamycin, neomycin, kanamycin, streptomycin and norfloxacin. However, none of those isolated from Dibate were resistant to these antimicrobial agents (Table 4). MAR phenotypes of E. coli isolated The predominant antibiotic resistant phenotypes that were determined for E. coli isolated from ground water were obtained from Dibate and Verdwall, respectively are shown in Table 5. The MAR phenotype AP-E-VA was dominant among 40.0 and 20.0% of the E. coli isolates from Dibate and Verdwall, respectively. Furthermore, the phenotype AP-T-VA was also identified in 40.0% of the isolates from Dibate (Table 5). Although none of the E. coli isolated from Dibate was resistant to more than four antibiotics, an isolate from Verdwall was resistant to nine of the ten antibiotics tested. However, all of the E. coli isolated from both sites sampled was resistant to three or more antibiotics. MAR phenotypes of Salmonella species isolated The dominant MAR phenotypes amongst Salmonella isolated from ground water in the sampled sites were AP-E-VA and AP-E-T-VA in 85.7 and 22% for those isolated from Dibate and Verdwall, respectively. Phenotypes AP-E-VA and AP-E-T-VA-K-C were also identified in 20 and 14%, respectively for the Salmonella isolates obtained from Verdwall (Table 5). Salmonella species from Dibate were not resistant to more than four of the ten antibiotics tested. An isolate from Verdwall was resistant to eight of
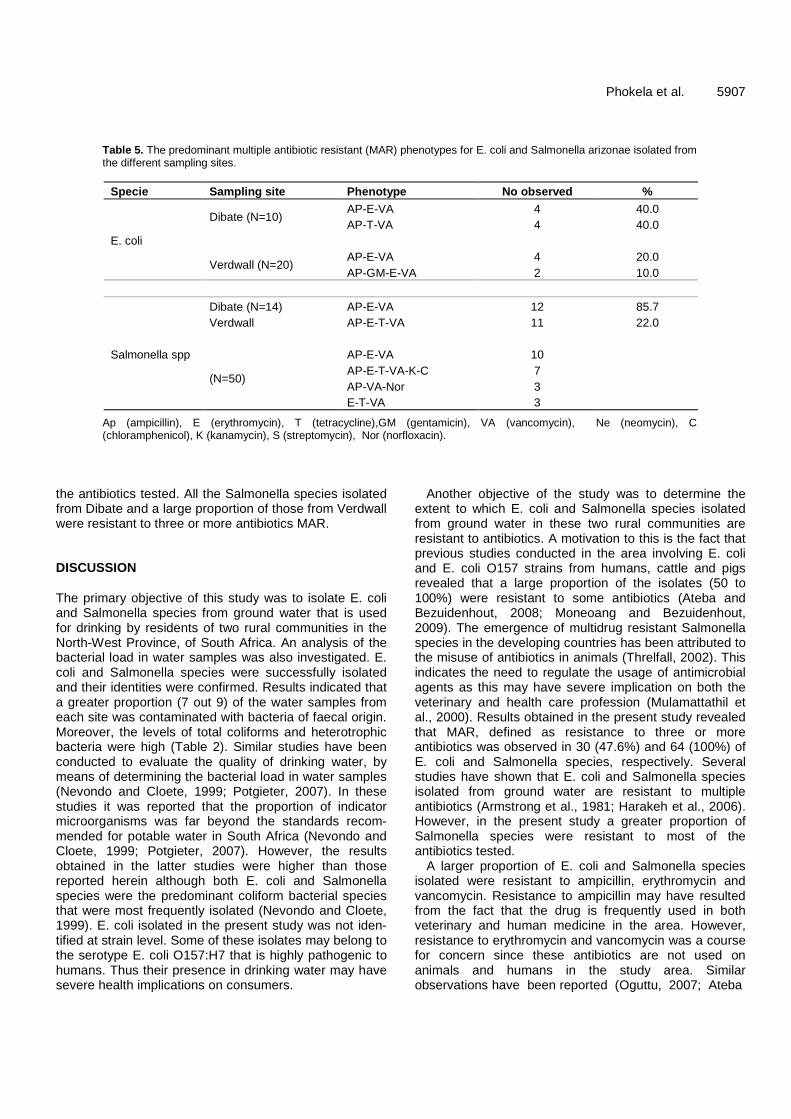
Phokela et al. 5907
Table 5. The predominant multiple antibiotic resistant (MAR) phenotypes for E. coli and Salmonella arizonae isolated from the different sampling sites.
Specie Sampling site Phenotype No observed %
E. coli
Dibate (N=10) AP-E-VA 4 40.0 AP-T-VA 4 40.0
Verdwall (N=20) AP-E-VA 4 20.0 AP-GM-E-VA 2 10.0
Salmonella spp
Dibate (N=14) AP-E-VA 12 85.7 Verdwall AP-E-T-VA 11 22.0
(N=50)
AP-E-VA 10 AP-E-T-VA-K-C 7 AP-VA-Nor 3 E-T-VA 3
Ap (ampicillin), E (erythromycin), T (tetracycline),GM (gentamicin), VA (vancomycin), Ne (neomycin), C (chloramphenicol), K (kanamycin), S (streptomycin), Nor (norfloxacin).
the antibiotics tested. All the Salmonella species isolated from Dibate and a large proportion of those from Verdwall were resistant to three or more antibiotics MAR. DISCUSSION The primary objective of this study was to isolate E. coli and Salmonella species from ground water that is used for drinking by residents of two rural communities in the North-West Province, of South Africa. An analysis of the bacterial load in water samples was also investigated. E. coli and Salmonella species were successfully isolated and their identities were confirmed. Results indicated that a greater proportion (7 out 9) of the water samples from each site was contaminated with bacteria of faecal origin. Moreover, the levels of total coliforms and heterotrophic bacteria were high (Table 2). Similar studies have been conducted to evaluate the quality of drinking water, by means of determining the bacterial load in water samples (Nevondo and Cloete, 1999; Potgieter, 2007). In these studies it was reported that the proportion of indicator microorganisms was far beyond the standards recom-mended for potable water in South Africa (Nevondo and Cloete, 1999; Potgieter, 2007). However, the results obtained in the latter studies were higher than those reported herein although both E. coli and Salmonella species were the predominant coliform bacterial species that were most frequently isolated (Nevondo and Cloete, 1999). E. coli isolated in the present study was not iden-tified at strain level. Some of these isolates may belong to the serotype E. coli O157:H7 that is highly pathogenic to humans. Thus their presence in drinking water may have severe health implications on consumers.
Another objective of the study was to determine the extent to which E. coli and Salmonella species isolated from ground water in these two rural communities are resistant to antibiotics. A motivation to this is the fact that previous studies conducted in the area involving E. coli and E. coli O157 strains from humans, cattle and pigs revealed that a large proportion of the isolates (50 to 100%) were resistant to some antibiotics (Ateba and Bezuidenhout, 2008; Moneoang and Bezuidenhout, 2009). The emergence of multidrug resistant Salmonella species in the developing countries has been attributed to the misuse of antibiotics in animals (Threlfall, 2002). This indicates the need to regulate the usage of antimicrobial agents as this may have severe implication on both the veterinary and health care profession (Mulamattathil et al., 2000). Results obtained in the present study revealed that MAR, defined as resistance to three or more antibiotics was observed in 30 (47.6%) and 64 (100%) of E. coli and Salmonella species, respectively. Several studies have shown that E. coli and Salmonella species isolated from ground water are resistant to multiple antibiotics (Armstrong et al., 1981; Harakeh et al., 2006). However, in the present study a greater proportion of Salmonella species were resistant to most of the antibiotics tested.
A larger proportion of E. coli and Salmonella species isolated were resistant to ampicillin, erythromycin and vancomycin. Resistance to ampicillin may have resulted from the fact that the drug is frequently used in both veterinary and human medicine in the area. However, resistance to erythromycin and vancomycin was a course for concern since these antibiotics are not used on animals and humans in the study area. Similar observations have been reported (Oguttu, 2007; Ateba

5908 Afr. J. Microbiol. Res. and Bezuidenhout, 2008). E. coli and Salmonella species from both sites showed little or no resistance to gentamycin, neomycin, kanamycin, streptomycin and norfloxacin. However, both E. coli and Salmonella species from Verdwall showed high levels of resistant to these drugs as compared to those from Dibate (Table 4). This indicates the difficulty that may arise in treating water-borne infections in humans that are resident in Verdwall if caused by these multiple antibiotic resistant strains. A small proportion (3.3 to 27.3%) of the E. coli and Salmonella isolates showed resistance to chloramphenicol (Table 4). Chloramphenicol had been banned for inclusion as additives in feeds for animals (Bischoff et al., 2002). Moreover, it is not used in veterinary medicine in the area. The predominant MAR phenotypes for Salmonella and E. coli isolated was AP-E-VA, AP-E-VA and AP-GM-E-VA. Resistance phenotypes arise from different genetic determinants that present specific epidemiological features (Lanz et al., 2003). Consequently, an assessment of the resistance situation at genetic level would be of great importance in controlling antimicrobial resistance. Although a large proportion of these isolates were resistant to most of the antibiotics that were tested, high levels of resistance were observed against ampicillin. Although nothing is known about the distribution and contribution of antibiotic resistance genes in Salmonella species in the area, little has been documented for E. coli (Ateba and Bezuidenhout, 2008). This is therefore an aspect that needs further investigation. ACKNOWLEDGEMENTS Authors are grateful to the North-West University, Mafikeng Campus for providing the funds and work space needed to conduct the research. And the assistance received from the laboratory technician Mrs. Rika Hyser is highly acknowledged. REFERENCES Ahmed W, Neller R, Katouli M (2005). Host spices-specific metabolic
fingerprint database for Enterococci and Escherichia coli and its application to identify source of faecal contamination in surface water. Appl. Environ. Microbiol. 71(8): 4461-4468.
American Public Health Association (APHA) (1998). Standard Methods for the examination of water and wastewater, 19th edition. American Public Health Association, Washington DC.
Armstrong JL, Shigeno DS, Calomiris JJ, Seidler RJ (1981). Antibiotic resistant bacteria in drinking water. Appl. Environ. Microbiol. 42(2): 277-283.
Ateba CN, Bezuidenhout CC (2008). Characterization of Escherichia coli O157 strains from humans, cattle and pigs in the North-West Province, South Africa. Int. J. Food Microbiol., 128: 181-188.
Ateba CN, Mbewe M, Bezuidenhout CC (2008). The Prevalence of Escherichia coli O157 strains in cattle, pigs and humans in the North-West Province, South Africa. SAJS, 104: 7-8.
Ateba CN, Mbewe M, Moneoang MS, Bezuidenhout CC (2010). Antibiotic resistant Staphylococcus aureus from milk in the Mafikeng Area, North West Province, South Africa. SAJS 106: (11/12) 1-6.
Bessong PO, Odiyo JO, Musekene JN, Tessema A (2009). Spatial
Distribution of Diarrhoea and Microbial Quality of Domestic Water during an Outbreak of Diarrhoea in the Tshikuwi Community in Vhenda, South Africa. J. Health Pop. Nutri., 27 (5): 652-659.
Bischoff KM, White DG, McDermott PF, Zhao S, Gaines S, Maurer JJ, Nisbet DJ (2002). Characterization of chlororampenicol resistance in beta-haemolytic Escherichia coli associated with diarrhoea in neonatal swine. Clin. Microbiol., 40(2): 389-394.
Council for Scientific and Industrial Research (CSIR) (2008). Water Quality and Pollution: Parliamentary Portfolio Committee on Water Affairs and Forestry. Pp. 1-173
Cruikshank R, Duguid JP, Marmoin BP, Swain RH (1975). Medical Microbiology, 12th ed. Longman, New York. (2): 3-4.
Forbes S, Weissfeld (1998). Bailey and Scott’s diagnostic microbiology, 10th ed. Mosby, Inc., St. Louis, Mosby.
Harakeh S, Yassine H, El-Faidel M (2006). Antibiotic resistant patterns of Escherichia coli and Salmonella strains in the aquatic Lebanese environments. Environ. Pollut., 143: 269-277.
Kasrils R (2004). A decade of delivery. Minister of Water Affairs and Forestry.
Kirby WMM, Bauer AW, Sherris JC, Turck M (1966). Antibiotic susceptibility testing by single disc method. Am. J. Clin. Pathol., 45: 4.
Lanz R, Kuhnert P, Boerlin P (2003). Antimicrobial resistance and resistance gene determinants in clinical Escherichia coli from different animal species in Switzerland. Vet. Microbiol., 91: 73-84.
Momba MNB, Abongo BO, Mwambakana JN (2008). Prevalence of enterohaemorrhagic Escherichia coli O157:H7 in drinking water and its predicted impact on diarrhoeic HIV/AIDS patients in the Amathole District, Eastern Cape Province, South Africa. Water SA., 34(3): 365-372.
Momba MNB, Makala N, Zani B, Brouckaert BM (2005). Key causes of drinking water quality failure in a rural small water supply of South Africa. In: JH Lehr and J Keeley (eds.) Water Encyclopedia- Domestic, Municipal, and Industrial Water Supply and Waste Disposal. John Wiley and Sons, Inc. New Jersey, pp. 221-227.
Momba MNB, Ndaliso S, Binda MA (2003). Effect of a combined chlorine-monochloramine process on the inhibition of biofilm re-growth in potable water systems. Water Supp., 3(1-2): 215-221.
Momba MNB, Tyafa Z, Makala N, Brouekaert BM, Obi CL (2006). Safe drinking water is still a dream in the rural areas of South Africa. Case study: The Eastern Cape Province. Water SA., 32(5): 715-720.
Moneoang MS, Bezuidenhout CC (2009). Characterization of enterococci and E. coli isolated from commercial and communal pigs from Mafikeng in the North-West Province, South Africa. AJMR, 3(3): 088-096.
Mulamattathil SG, Esterhysen HA, Pretorius PJ (2000). Antibiotic-resistant gram-negative bacteria in a virtually closed water reticulation system. Appl. Microbiol., 88: 30-937.
National Committee for Clinical Laboratory Standards. (NCCLS) (1999). Performance standards for antimicrobial disc and dilution susceptibility test for bacteria isolated from animals. National Committee for Clinical Laboratory Standards, Wayne, Pennsylvania, Approved Standards M, 31-A19 (11).
Nevondo TS, Cloete TE (1999). Bacterial and chemical quality of water supply in the Dertig village settlement. Water SA. 25 (2): 215-220.
Obi CL, Onabulu B, Igumbor EO, Ramalivhana J, Bessong PO, Van Rensburg EJ, Lukoto M, Green E, Ndou S, Mulaudzi TB (2006). The interesting cross-paths of HIV/AIDS and water in Southern Africa with special reference to South Africa. Water SA., 32 (3): 322-344.
Oguttu JW (2007). Antimicrobial drug resistance of enteric bacteria from broilers fed antimicrobial growth enhances and exposed poultry abattoir workers. MSc thesis, University of Pretoria.
Potgieter N (2007). Water storage in rural households: Intervention strategies to prevent water borne diseases. PhD thesis, University of Pretoria.
Rota C, Yanguela J, Blanco D, Carrminana JJ, Arino A, Herrera A (1996). High prevalence of multiple resistance to antibiotics in 144 Listeria isolates from Spanish dairy and meat products. Food Protect., 59: 938-943.
Sorum H, L’Abee-Lund TM (2002). Antibiotic resistance in food-related bacteria result of interfering with the global web of bacterial genetics.

Int. J. Food Microbiol., 78: 43-56. Threlfall J (2002). Antimicrobial drug resistance in Salmonella:
Problems and perspective in food and water-borne infections. FEMS Microbiol. Rev., 26: 141-148.
United States Pharmacopeial Convention, Inc. (2001). The United States Pharmacopeia 25. Rockville, M.D.
Water Research Commission (WRC) (1993). Guidelines on the cost effectiveness of rural water supply and sanitation projects. Water Research Commission Report No. 231/1/93, Pretoria.
Phokela et al. 5909 World Health Organisation (2003). Emerging Issues in Water and
Infectious Disease, World Health Organisation, Geneva, Switzerland. Young P (1996). Safe drinking water: A call for global action. ASM
News, 62: 349-352.

African Journal of Microbiology Research Vol. 5(32), pp. 5910-5915, 30 December, 2011 Available online at http://www.academicjournals.org/AJMR ISSN 1996-0808 ©2011 Academic Journals DOI: 10.5897/AJMR11.942
Full Length Research Paper
Determination of hepatitis C virus genotypes among HCV positive patients in Shahrekord, Iran
Elahe Tajbakhsh1*, Abbas Dosti2, Sara Tajbakhsh3, Manochehr Momeni4 and Forough Tajbakhsh5
1Department of Microbiology, Faculty of Basic Sciences, Islamic Azad University Shahrekord branch, Shahrekord Iran.
2Department of Microbiology, Faculty of Basic Sciences, Islamic Azad University Shahrekord branch, Shahrekord Iran.
3University of Medical Sciences, Shahre-kord, Iran.
4Biotechnology Research Center, Islamic Azad University Shahrekord branch, Shahrekord Iran.
5Young Researchers Club, Islamic Azad University, Shahrekord Branch, Shahrekord-Iran.
Accepted 20 October, 2011
Hepatitis C is one of the most common causes of the liver failure and cancer and represents a major public health problem. Recent studies have focused on whether different hepatitis C virus (HCV) genotypes, are associated with different profiles of pathogenicity, infectivity and response to antiviral therapy. Genotyping system based on polymerase chain reaction (PCR) of the core region with genotype-specific PCR primers for the determination of HCV genotypes 1a, 1b, 2a, 2b, 3a, 3b, 4, 5a, and 6a was developed. Different genotypes have been reported in different parts of the world. Genotype 1 is difficult to treat, while genotypes 2 and 3 are easy to treat. Therefore, identification of HCV genotype in patients is necessary to begin and follow up the treatment. In this study, viral genomic of 94 patients extracted from sera were detected by nested-real time (RT) PCR. PCR products were digested with proper enzymes and studied by restriction fragment length polymorphism (RFLP). The results of PCR-RFLP were as follows: 1a (54.26%), 1b (11.71%), 3a (27.66%), 2a (2.12%) and 4 (4.25%). This indicates that a high percentage of HCV infected patients. Key words: Genotyping, Hepatitis C Virus, PCR, RFLP, Iran.
INTRODUCTION Hepatitis C virus (HCV) is a single stranded ribonucleic acid (RNA) virus; approximately 9.5 kb which belongs to the Flaviviridae family, HCV demonstrates a high degree of sequence variation throughout its genome (Choo et al., 1989). HCV is a causative agent for chronic, acute and fulminant hepatitis (Alavian et al., 2002). The association of HCV among patients with cirrhosis of liver and *Corresponding author. E-mail: [email protected] or [email protected]. Tel/Fax: 0098 3813361060.
Abbreviations; HCV, Hepatitis C virus; RT PCR, reverse transcriptation polymerase chain reaction; 5'-UTR, 5' untranslated region; DNA, deoxyribonucleic acid; RIBA, recombinant immunoblot assay.
hepatocellular carcinoma has been reported (Alavian et al., 2006). HCV infection is a global health problem and it is estimated that 200 million people of the world population are infected with HCV (Lee et al., 2008). Serological tests detecting antibody to HCV have shown that HCV is the major etiological agent for both transfusion acquired and sporadic non-A, non-B hepatitis (Alter et al., 1989; Kuo et al., 1989; Mosley et al., 1990). Chronic hepatitis occurs in more than 50% of HCV infected patients and can lead to cirrhosis and liver cancer. HCV causes 20% of acute hepatitis cases, 70% of all chronic hepatitis cases, 40% of all cases of cirrhosis of the liver, 60% of hepatocellular carcinomas, and 30% of liver transplants in Europe.
The study of genetic variability of HCV strains has led the consensus classification into six major genotypes. Some studies suggest that the clinical features of liver
disease depend on HCV genotypes (Farshad et al., 2010). Classification of HCV is based on the diversity of the genome, and the criterion for HCV classification was proposed by Simmonds and colleagues (Simmonds et al., 1993).
The HCV genotypes have been determined primarily based on analysis of partial genome sequences. The most extensive database exists for the 5'-UTR, core, E1, and NS5B (Bukh et al., 1992a; Furione et al., 1999). Whereas the 5'-UTR is highly conserved and therefore preferred for diagnosis, the core, envelope, and NS5B regions are less conserved and therefore highly discriminative and may be preferred for subtyping (Prescott et al., 1997).
Sequence analysis of multiple strains of HCV has demonstrated that the nucleotide sequence can differ by as much as 30%. However, the levels of heterogeneity differ considerably among various regions of the virus. For example, sequence variation ranges from as little as 10% in the 5' untranslated region (5'-UTR) to as much as 50% or more within the E1 region. HCV isolates from around the world can be divided into distinct major groups or genotypes with about 66 to 69% nucleotide similarity, which can in turn be divided further into subtypes with about 77 to 80% nucleotide similarity (Chan et al., 1992; Bukh et al., 1993).
Since the first report of the HCV genome by the Chiron research group numerous complete or partial nucleotide sequences of HCV isolates have been reported worldwide. Comparison of these sequences revealed marked genetic heterogeneity of the HCV genome (Okamato et al., 1990; 1992; Choo et al., 1991; Inchauspe et al., 1991).
Investigators of HCV genotyping have used sequence analysis of HCV NS5, core, E1, and 5'-UTRs. HCV genotyping by Okamoto et al. using type-specific primers was first introduced by using primers specific for the core region. (Okamoto et al., 1996) This method lacked acceptable sensitivity and specificity (McOmish et al., 1993). Several deoxyribonucleic acid (DNA) hybridization assays for HCV genotyping have been described.
A commercial kit for HCV genotyping has been introduced in Europe by Innogenetics (InnoLipa, Belgium) and is based on hybridization of 5'- UTR amplification products with genotype specific probes. Others have used restriction enzymes to determine viral genotype by restriction fragment length polymorphism (RFLP).
In this method, a PCR-amplified DNA fragment is digested into fragments with different lengths by enzymes (restriction endonucleases) that recognize cleavage sites specific for each genotype (Stuyver et al., 1993). Although all these methods are able to identify the major genotypic groups, only direct nucleotide sequencing is efficient in discriminating subtypes (Bukh et al., 1995).
In the current study, we have typed HCV strains with RFLP rapidly and reliably by digesting the amplified DNA from the primary specimens by selected restriction
Tajbakhsh et al. 5911 enzymes and some by sequencing. MATERIALS AND METHODS Serological data
The sera were collected from 94 HCV infected patients, referred to Al Mahdi Laboratory (Shahrekord, Iran) during 2009-2010. All patients had elevated serum aminotransferases for at least 6 months, a positive test for anti-HCV antibodies (third generation ELISA [ORTHO HCV 3.0 ELISA Test system; Ortho Diagnostics, Raritan, New Jersey, USA], the confirmatory recombinant immunoblot assay (RIBA) test (Inno-LIA TM HCV Score) and HCV RNA in serum by reverse transcription nested PCR for the 5'-UTR of the HCV genome (Simmonds et al., 1993). The average age was varying from 18 to 64 year. while the mean age was 41. HCV RNA extraction and cDNA synthesis
For detection of HCV RNA in serum and for genotyping studies,
RNA was extracted from 50 μl of serum by using STRPTM
HCV detection kit (Cinna Gen Inc Company). For extraction of HCV RNA, add 50 μl serum to 450 μl cold RNX
TM plus solution and vortex
sample to dissolve clamps, then add 100 μl of chloroform and centrifuged at 12000 g and transfer the aqueous phase to a new tube then add equal volume of isopropanol, and stored at -20°C for at least 20 min, and centrifuged at 12000 g. Then discard aqueous phase and to the pellet 200 μl 70% ethanol and centrifuged at 12000 g, and discard aqueous phase and dry the pellet (RNA). At
least dissolve RNA in 30 μl DEPC treated water and stored in -70°C
. According to the kit protocol, cDNA was synthesis and by use
specific primers RT-PCR was done. PCR genotyping primers
For specific and nested PCR, four oligonucleotide primers form 5'-UTR of HCV were designed using generunr (Hastings software)
and synthesized at the Cinna Gene Company (Iran). In the first round of PCR, the primers corresponded to HCV-1 sense oriented nucleotides -268 to -251 F1 (AGCGTCTAGCCATGGCGT), numbered according to Bukh et al., (1992b) and antisense nucleotides -4 to -22 R1 (GCACGGTCTACGAGACCT). For the second round, the primer F2 (GTGGTCTGCGGAACCGG) corresponded to sense-oriented nucleotides -199 to -183 and R2 (GGGCACTCGCAAGCACCC) corresponded to antisense
nucleotides -26 to -43.
PCR
The first round was carried out for 30 cycles which consisted of initial denaturation at 94°C for 5 min, denaturation at 94°C for 35 s, annealing at 58°C for 40 s, extension at 72°C for 45 s and, the final extension at 72°C for 5 min. The second round was followed for 25
cycles which consisted of initial denaturation at 94°C for 5 min, denaturation at 94°C for 35 s, annealing at 64°C for 40 s, extension at 72°C for 45 s, and the final extension at 72°C for 5 min. The 174-bp second PCR product was submitted to electrophoresis by using a 1.5% agarose gel in 0.5X TBE buffer, and was visualized by ethidium bromide staining under ultraviolet light (Han et al., 1991).
Genotyping by RFLP
Total volumes of each nested-PCR product (25 μl) were divided into

5912 Afr. J. Microbiol. Res.
Figure 1. Ethidium bromide stained gel of PCR products amplified with HCV primers. DNA 100 bp markers (lane M), samples positive (lanes 1, 2 and 3).
Table 1. Demonstrates cutting sites of Hinf I, Apa I, EcoR II and Bsh1236 I restriction enzymes for different strains of HCV as published by Bukh et al. (1992).
Genotype Segment (bp)
Tube A Tube B Tube C
1a 97 97 129
1b 97 97 99
2a 97 174 174
2b 174 174 174
3a 129 145 99
3b 97 145 99
4 97 145 129
5 97 174 99
6 97 97 174
three tubes containing appropriate buffers. Restriction enzymes, Apa I, Hinf I, EcoR II and Bsh1236 (Fermentas, Co.) used as the following combinations: 1.Apa I / Hinf I; 2. EcoR II/Hinf I; 3. Bsh1236 I. The other enzymes were similar to McOmish et al (1994) method.
The tubes were incubated with 1 U of the enzyme mixture for 3 h at 37°C. The digestion temperature was 37°C. If the samples could not be analyzed immediately after digestion, they were stored at -20°C before the analysis vertical 12% polyacrylamide gel electrophoresis and the digested products were heated for 5 min. After ethidium bromide staining, the DNA fragments were identified
under ultraviolet light. Molecular weight 100 bp plus marker (Fermentas, Co.) and undigested PCR products was included in each analysis. The genotypes were deduced from the
fragmentation patterns of the amplified DNA. RESULTS The 5'- UTR of 94 HCV positive serum samples were amplified and digested by appropriate restriction enzymes for genotype determination. The RFLP results revealed: 1a (54.26%), 1b (11.71%), 3a (27.66%), 2a (2.12%), 4 (4.25%). Figure 1 shows the 174 bp nested RT-PCR amplification of HCV RNA extracted from blood samples. Table 1 show fragments yielded upon restriction

Tajbakhsh et al. 5913
A B
C D
E
A B
C D
E Figure 2. 12% polyacrylamide gel electrophoresis of the digestion products
of the amplified DNA from different genotypes. Marker; DNA 100 bp (lane M), A : Genotype 1a (129. 97 and 97 bp). B: Genotype 1b (99, 97 and 97 bp), C: Genotype 2a (97, 174 and 174 bp), D: Genotype 3a (129, 145 and 99 bp) E: Genotype 4 (97, 145 and 129 bp).
enzyme digestion of 5'-UTR region. The cutting sites of restriction enzymes are shown (Tube A) Apa I/Hinf I; (Tube B) EcoR II /Hinf I; (Tube C) Bsh1236 I.
Figure 2 demonstrates the analytical polyacrylamide gel electrophoresis of HCV types 1a, 1b, 2a, 3a and 4 after digestion of the amplified DNA with the selected restriction enzymes.
Genotyping of 94 sera from patients who were either recently infected by HCV or with history of previous HCV infection and positive PCR results were performed. The results of PCR-RFLP were as follows: 1a (54.26%), 1b (11.71%), 3a (27.66%), 2a (2.12%) and 4 (4.25%). This
indicates that a high percentage of HCV infected patients in Iran are infected with 1a or 3a genotypes (Table 2).
Out of 94 patients, 63 patients were male and 32 were female. Analysis of population previously infected with HCV showed that 26 patients (27 %) were less than 30 years of age, 43 patients (45.74%) between 30-50 and 25 patients (26.5%) were above 50 yr of age. The most frequent genotype in patients above 50 was 3a, while 1a genotype was more prevalent in patients under 50 years old. Hemodialysis patients and cases by known history of transfusion were known to be infected by only subtypes 1a and 3a. Also the patients fewer than 30 year old were

5914 Afr. J. Microbiol. Res. Table 2. Hepatitis C virus genotypes in 94 Iranian patients with RFLP method.
Genotype Number %
1a 51 54/26
1b 11 11/71
2a 2 2/12
3a 26 27/66
4 4 4/25
Total 94 100
infected by only subtypes 1a and 3a. DISCUSSION The study of viral diversity provides a better under-standing of the origin and dynamics of viral infections. Genetics variants of HCV are known to be widely spread around the world. Genotypes 1, 2 and 3 are found on all countries, but in some geographical areas, such as Africa and Southeast Asia, viral isolates are highly divergent and particular genotypes or subtypes are predominant (Moller et al., 1995). These data suggest the existence of a long term endemic infection in these areas and some researchers have hypothesized that HCV have originated in such places (Simmonds et al., 1993).
Epidemiological studies in different regions of the world show the virus is distributed worldwide with prevalence varying between different countries from 0.2 up to 40%. It is clearly revealed that the incidence of HCV is higher among less developed nations. In Iran, HCV prevalence in general population is less than 1%.
In our study HCV genotypes were found, 1a (54.26%), 1b (11.73%), 3a (27.66%), 2a (2.12%), 4 (4.25%). HCV is highly variable, leading to the classification of at least six genotypes, each with several subtypes. This heterogeneity is, at least partly, responsible for lack of availability of an effective vaccine (Samimi-Rad et al., 2004). Investigators of HCV genotyping have used sequence analysis of HCV NS5, Core, E1 and 5'-UTRs. However, direct sequencing is not practical on a large scale. RFLP has been used widely for this aim, especially for screening of large number of specimens.
The use of 5'-UTR assay designed for the detection of HCV in clinical specimens provides a sensitive, standardized amplification protocol specifically designed for large-volume testing and rapid turnaround time and is also used widely for HCV genotyping by different investigators. In this report, we have focused on chronically infected group of patients, to determine the most prevalent genotypes in Iran (Ahmadi et al., 2006).
RFLP of HCV PCR positive sera and sequencing of 174 bp fragment of 5'-UTR region was used to achieve this purpose. In our study, HCV genotype 1a was the
most frequent (%54/26), followed by genotype 3a (%27/66) and genotype 1b (%11/71). This is compatible with the findings of Zali et al. (2000), Samimi-Rad et al. (2004) and Ahmadi et al. (2006) in Iranian patient.
Ahmad et al. (2006) reported 1a (%52.88), 3a (%27.57) and 1b (14%) genotypes HCV among Iranian patients by RFLP method. Samimi-Rad et al. (2004) found 1a (47%), 3a (36%) and 1b (8%) genotypes HCV among Iranian patients, and revealed that genotype 1a is frequent in the South of Iran (70%), while 3a is more prevalent in the North-West of Iran (83%).
In the present study, our data showed the same result as those demonstrated by Zali et al. (2000), Samimi-Rad et al. (2004) and Ahmadi et al. (2006). Although the frequency of genotype 1a was slightly higher in theses study. Patients infected by blood products more frequently had genotype 1a (57%), while younger drug users had genotype 3a (54%) more frequently (Farshad et al., 2010).
Keyvani et al. (2007), reported HCV genotypes in Iran. In their study, genotype 1a with 39.7% had the highest frequency. Genotype 3a (27.5%) and 1b (12.1%) were the other frequent genotypes (Farshad et al., 2010). The prevalence of HCV among blood donors is less than 1% in Northern European countries (Choo et al., 1989). Higher rates have been reported in South East Asian countries, including India (1.5%), Malaysia (2.3%), and the Philippines (2.3%) (Farshad et al., 2010).
The incidence in Japan is 1.2% (Kato et al., 1990). Alarming rates of 14.5% are reported in Egypt (Farshad et al., 2010). HCV genotype 4 is common in countries such as Yemen, Kuwait, Iraq, and Saudi Arabia (Samimi-Rad et al., 2004).
However, in Turkey genotype 1b, in Pakistan genotypes 3a and 3b, in Uzbekistan 1a, 1b, 2a, 2k and 3a, in Lebanon 1g are reported to be the dominant genotypes (Pavio and Lai, 2003).
Genotype 4 is the main genotype circulating in most Arabic countries. In Bahrein 4a and in Saudi Arabia HCV genotype 4 were detected in 50% of patients and genotype 1b was found in nearly 40% of patients (Elahi et al., 2003).
Genotype information is important when HCV treatment is being considered, since some genotypes respond more favorably to the medications. Genotype also deter-mines the length of therapy, for example, treatment for genotypes 2 and 3 requires only 24 weeks while genotypes 1 and 4 require 48 weeks (44).
In addition to treatment purposes, detection of HCV genotypes in different regions can be used for the purpose of molecular epidemiology (Pavio and Lai, 2003).
REFERENCES
Alavian SM, Gholami B, Masarrat S (2002). Hepatitis C risk factor in Iranian volunteer blood donors: A case-control study. J. Gastroentroll. Hepatol., 17(10): 1092-1097.
Alavian SM, Gholami B, Massarat S (2006). Hepatitis C, Chronic Renal
Failure, Control Is Possible! Hepatitis Monthly, 6 (2): 51-52. Alter HJ, Purcell RH, Shih JW, Melpolder JC, Houghton M, Choo QL,
Kuo G (1989). Detection of antibody to hepatitis C virus in prospectively followed transfusion recipients with acute and chronic non-A, non-B hepatitis. Engl. J. Med., 30 (321): 1494-1500.
Ahmadi pour MH, Keivani H, Sabahi F, Alavian SM (2006). Determination of HCV genotypes, in Iran by PCR-RFLP. Iranian J. Public Health, 35: 54-61.
Bukh J, Puecell RH, Miller RH (1992a). Sequence analysis of The 5' non coding region of hepatitis C virus. Proc Natl. Acad. Sci. USA., 89(11): 4942-4946.
Bukh J, Purcell RH, Miller RH (1993). At least 12 genotypes of hepatitis C virus predicted by sequence analysis of the putative E1 gene of isolates collected worldwide. Proc. Natl. Acad. Sci., USA, 90(17):
8234-8238. Bukh J, Purcell RH, Miller RH (1992b). Importance of primer selection
for the detection of hepatitis C virus RNA with the polymerase chain
reaction assay. Proc. Natl. Acad. Sci., USA, 1 89): 187-191. Bukh J, Miller RH, Purcell RH (1995). Genetic heterogeneity of hepatitis
C virus: quasispecies and genotypes. Semin. Liver Dis., 15(1): 41-63.
Chan SW, McOmish, Hlmes EC, Dow B, Peutherer JF, Follet E Yap PL, Simmonds P (1992). Analysis of a new hepatitis C virus type and its phylogenetic relationship to existing variant. J. Gen. Virol., 73: 1131-
1141. Choo QL, Kuo G, Weiner AJ, Overby LR, Bradley DW, Houghton M
(1989). Isolation of a cDNA clone derived from a blood-borne non-A,
non-B viral hepatitis genome. Science, 244: 359-62. Choo QL, Richman KH, Han JH, Berger K, Lee C, Dong C, Gallegos C,
Coit D, Medina-Selby R , Barr PJ (1991). Genetic organization and
diversity of the hepatitis C virus. Proc. Natl. Acad. Sci., USA, 88: 2451–2455.
Elahi E, Pourmand N, Chaung R, Rofoogaran A, Boisver J, Samimi Rad
K, Davis RW, Ronaghi M (2003). Determination of hepatitis C virus genotype by pyrosequencing. J. Virol. Methods, 109(2): 171- 176.
Farshad pour F, Makvandi M, Samarbafzadeh AR, Jalalifar MA (2010).
Datermination of hepatitis C virus genotypes among blood donors in Ahvaz, Iran. Iranian J. Med. Microbiol., 28(1): 54-56
Furione M, Simoncini L, Gatti M, Baldanti F, Revello MG, Gerna G
(1999). HCV genotyping by three methods: analysis by discordant results based on sequencing. J. Clin. Virol., 13(3): 121-130.
Han JH, Shyamala V, Richman KH, Brauer MJ, Irvine B, Urdea MS,
Tekamp-Olson P, Kuo G, Choo QL, Houghton M. (1991). Charachterization of the terminal regions hepatitis C viral RNA: Identification of conserved sequence in the 5 untranslated region and
poly A tails at the 3 end. Proc. Natl. Acad. Sci., 88 (5): 1711-1715. Inchauspe G, Zebedee SI, Lee DHH, Sugitani M, Nasoff M, A. M. Prince
AM (1991). Genomic structure of the human prototype strain H of hepatitis C virus: comparison with American and Japanese isolates.
Proc. Natl. Acad. Sci., USA, 88(22): 10292–10296. Kato N, Hijikata M, Ootsuyama Y, Nakagawa M, Ohkoshi S, Sugiura T,
Shimotohono K (1990). Molecular cloning of the human hepatitis C
virus genome from Japanese patients with non-A, non-B hepatitis. Acad. Sci., USA, 87(24): 9524–9528.
Keyvani H, Alizadeh AH, Alavian SM, Ranjbar M, Hatami S (2007).
Distribution frequency of hepatitis C virus genotypes in 2231 patients in Iran. Hepatol. Res., 37 (2): 101-103.
Kuo G, Cho QL, Alter HJ, Gitnick GL, Redeker AG, Purcell RH,
Miamura T, Finestag JL, Alter M J, Stevence C E, Tegtmeier GE, Bonono F, Colombo M, Lee W S, Kuo C, Berger K, Shuster JR, Overby LR, Bradley DW, Houghton M (1989). An assay for circulating
antibodies to a major etiologic virus of human non-A, non-B hepatitis. Science, 244(4902): 362-364.
Tajbakhsh et al. 5915 Lee CM, Hung CH, Lu SN, Changchien CS (2008). Hepatitis C virus
genotypes: Clinical relevance and therapeutic implications. Chang Gung Med. J., 31(1): 16-25.
McOmish F, Yap PL, Dow BC, Follett EAC, Seed C, Keller AJ, Cobain TJ, Krusius T, Kolho E, Naukkarinen R, Lin C, Lai C, Leong S, Medgyest GA, Hejjas M, Kiyokawa H, Fukada K, Cuypers T, Saeed
AA, AL-Rasheed AM, Lin M, Simmonds P (1994). Geographical distribution of hepatitis C virus genotypes in blood donors: an international collaborative survey. J. Clin. Microbiol., 32 (4): 884-892.
McOmish F, Chan SW, Dow BC, Gillon J, Frame WD, Crawford RJ, Yap PL, Follett EA, Simmonds P (1993). Detection of three types of hepatitis C virus in blood donors: investigation of typespecific
differences in serologic reactivity and rate of alanine amino transferase abnormalities. Transfusion, 33 (1): 7–13.
Moller J, Holmes EC, Jarvis LM, Yap PL, Simmonds P (1995).
Investigation of the pattern of hepatitis C virus sequence diversity in different geographical regions: implications for virus classification. The international HCV collaborative study group. J. Gen. Virol., 76
(10): 2493-2507. Mosley JW, Aach RD, Hollinger FB, Stevens CE, Barbosa LH, Nemo
GJ, Holland PV, Bancroft WH, Zimmerman HJ, Kuo G, Choo QL,
Houghton M (1990). Non-A Non-B hepatitis and antibody to hepatitis C virus. JAMA, 263(1): 77-78.
Okamoto H, Kurai K, Okada S, Yamamoto K, Iizuka H, Tanaka T,
Fukuda S, Tsuda F, Mishiro S (1992). Full-length sequence of a hepatitis C virus genome having poor homology to reported isolates: comparative study of four distinct genotypes. Virology, 188: 331–341.
Okamato H, Okada S, Sugiyama Y, Yotsumoto S, Tanaka T, Yoshizawa H, Tsuda F, Miyakawa Y, Mayumi M (1990). The 59-terminal sequence of the hepatitis C virus genome. Jpn J. Exp. Med., 60:
167–177. Okamato H, Kobata S, Tokita H, Inoue T, Woodfield GD, Holland PV,
Al-Knawy BA, Uzunalimoglu O, Miyakawa Y, Mayumi M. (1996). A
second-generation method of genotyping hepatitis C virus by polymerase chain reaction with sense and antisense primers deduced from the core gene. J Virol Methods, 57(1) 31-45.
Pavio N, Lai M (2003). The hepatitis C virus persistence: how to evade the immune system. J. Biosci., 28: 287-304.
Prescott LE, Berger A, Pawlotsky JM, Conjeevaram P, Simmonds P
(1997). Sequence analysis of hepatitis C virus variants producing discrepant results with two different genotyping assays. J. Med. Virol., 53 (3): 237-244.
Samimi-Rad K, Nategh R, Malekzadeh R, Norder H, Magnius L (2004). Molecular pidemiology of hepatitis C virus in Iran as reflected by phylogenetic analysis of the NS5B region. J. Med. Virol., 74 (2): 246-
252. Simmonds P, Holmes EC, Cha TA, Chan SW, McOmish F, Irvine B,
Beall E, Yap PL, Kolberg J, Urdea MS (1993). Classification of hepatitis C virus into six major genotypes and a series of subtypes by
phylogenetic analysis of the NS-5 region. J. Gen. Virol., 74 (11): 2391-2399.
Stuyver L, Rossau R, Wyseur A, Duhamel M, Vanderborght B, Van
Heuverswyn H, Maertens G (1993). Typing of hepatitis C virus isolates and characterization of new subtypes using a line probe assay. J. Gen. Virol., 74: 1093-1102.
Zali MR, Mayumi M, Raoufi M, Nowroozi A (2000). Hepatitis C virus genotypes in the Islamic Republic of Iran: a preliminary study. East Mediterr. Health J., 6 (2-3): 372-377.

African Journal of Microbiology Research Vol. 5(32), pp. 5916-5922, 30 December, 2011 Available online at http://www.academicjournals.org/AJMR ISSN 1996-0808 ©2011 Academic Journals DOI: 10.5897/AJMR11.961
Full Length Research Paper
Analysis of agricultural input-output based on Cobb–Douglas production function in Hebei Province,
North China
Zaijian Yuan
School of Economics and Management, Hebei University of Science and Technology, Shijiazhuang, Hebei 050018, PR China. E-mail: [email protected].
Accepted 15 November, 2011
This study is to analyze the temporal and spatial variation of the agricultural input-output and the relation between agricultural output and input factors in Hebei Province by Cobb-Douglas production function in which cultivated area, effective irrigation area, chemical fertilizer usage, agricultural machinery power, rural electricity consumption and manpower are taken as independent variables. It proves that the agricultural output, effective irrigation area, chemical fertilizer usage, agricultural machinery power and rural electricity consumption have an upward trend from 1999 to 2008, but the cultivated area and agricultural manpower have a downward trend. In terms of spatial distribution, the agricultural input and output in the southeastern part of the province are higher than those in northwest. In the 6 input factors, the effective irrigation area has the biggest influence on agricultural output, chemical fertilizer and agricultural machinery power of the second, and other factors have relatively small influence. Therefore, Hebei should pay attention to effective use of water resources and accelerate investment in technology and mechanization to promote agriculture sustainable development. Key words: Agricultural input-output, temporal and spatial variation, Cobb-Douglas production function.
INTRODUCTION Agriculture is the human activity in which solar energy is utilized for the production of sugars that are used in the plant to construct carbohydrates, proteins, lipids and other compounds (Van and Rabbinge, 1997). Agricultural activity results in outputs, such as grain, potatoes, nutrient emissions and so on. Thus, agricultural production systems can be characterized by their inputs and outputs, that is, input-output combinations. Agriculture is a significant component of China’s economy constitution, accounting for 11.3% it of gross domestic product (GDP) and 23.1% of it employment rate (2008). China now accounts for over 18% of global agricultural production, substantially, more than traditional agricultural production and trade heavyweights such as the European Union, the United States, India and Brazil (Huang et al., 2009).
Some research has been done on the input-output of China’s agriculture: Wu et al. (2008) constructed an input-output model for Changde City of Hunan Province using EViews software by choosing the production of
agriculture as output factor and labor, fertilizer inputs, dynamic mechanical total, arable land area and the area of effective irrigation as input factor. Dong (2009) analyzed the relationship between input and output of agriculture in China by the partial least squares regression method, and the result showed that: the agricultural output is mainly affected by the expenditure for household management, the financial expenditure for supporting agriculture and the fertilizer input, and is less affected by the input of cultivated area. Jiang and Zhang (2010) established an input-output model about regional agriculture of the southern Xinjiang Province by principal component analysis according to the input and output data in the years 2002 to 2007. Unfortunately, previous studies were based on a single spatial scale (for example, one county, one province or the whole country) in short time series, and less attention has focused on the
agricultural input-out of different temporal and spatial scales in China’s agriculture.

The main purpose of this paper is to analyze the agricultural input and output in the last 10 years. The objectives of this study are: 1. To analyze temporal and spatial variation of agricultural input-output in Hebei Province; 2. To construct an agricultural input-output potential model based on Cobb-Douglas production function; 3. To analyze the main influence factors to affect the
agricultural output in Hebei. MATERIALS AND METHODS
Hebei Province
Hebei Province (Figure 1) is 190,000 km
2 area with a population of
69 million (2009), and is divided into 11 prefecture level cities (including 138 counties). The topography consists of mountains, hills,
and plateaus in the northwest, and a broad plain in the central and southeastern region. A total of 34% of the area is cropland with mainly winter wheat and summer maize double cropping system (winter wheat is cultivated from early October to early June, summer maize is grown from mid-June to late September).
The study area is located in a temperate and continental monsoon climate zone with a mean annual precipitation of 498 mm, 69% of which occurs between June and September (1999 to 2008). Mean annual temperature is 11°C (1999 to 2008). Precipitation and
temperature decrease from southeast to northwest.
Data
The economic statistics data for each county from 1999 to 2008, including grain yield, grain price, cultivated area and effective irrigation area, chemical fertilizer usage, agricultural machinery
power, rural electricity consumption, and rural manpower, were obtained from Hebei economic statistical yearbooks (2000 to 2009).
Agricultural input-output potential model
Agricultural input factors mainly include labor, irrigation, cultivated land, fertilizer, machinery power and electricity. Accordingly, the agricultural input-output potential model is focused on seven variables: output (Y, 10
4 Yuan), cultivated land area (Ac, ha),
effective irrigation area (Ai, ha), rural electricity consumption (Ce, 10
4 kWh), agricultural machinery power (Pm, KW), chemical
fertilizer usage (Fc, T) and rural manpower (Mr, person). The relation of agricultural output and input can be expressed as,
))(),(),(),(),(),(()( tMrtFctPmtCetAitAcftY (1)
In economics, the Cobb-Douglas functional form of production functions is widely used to represent the relationship of an output to inputs, and it appears to be a good approximation to actual production (Romer, 2001). So Cobb-Douglas production function is used and it is shown as below:
)()()()()()()( tMrtFctPmtCetAitAcAtY
(2)
where α, β, γ, δ, λ, and ψ are the output elasticities of cultivated land
Yuan 5917 area, effective irrigation area, rural electricity consumption, agricultural machinery power, chemical fertilizer usage and rural manpower respectively, and 0<α, β, γ, δ, λ, ψ<1.
If
1 A (3)
The reduction function has constant returns to scale in its six arguments. However, if
1 A (4)
returns to scale are decreasing, and if
1 A (5)
returns to scale are increasing. Equation 2 can be changed as below:
)(ln)(ln)(ln)(ln)(ln)(lnln)(ln tMrtFctPmtCetAitAcAtY
(6)
RESULTS Temporal variability of agricultural input-output Trend analysis shows that the agricultural output of Hebei Province has an upward trend in the last ten years, especially after 2003 the output increased rapidly (Figure 2a); in the six input factors, except cultivated land area (Figure 2b) and rural manpower (Figure 2g) are decreasing, the other five factors are increasing (Figure 2c, d, e and f). Spatial distribution of agricultural input-output Based on prefecture level city spatial scale, the distribution of agricultural input and output was analyzed (Figure 3) and the results showed that: in 11 cities of Hebei, Baoding City's agricultural output value is the greatest, followed by Shijiazhuang and the least is Zhangjiakou (Figure 3a); Baoding City’s cultivated land area is the biggest, followed by Zhangjiakou and the least is Qinhuangdao (Figure 3b); Baoding City’s effective irrigation area is the biggest too, followed by Cangzhou and the least is Chengde (Figure 3c); Tangshan City’s rural electricity consumption is the most, followed by Shijiazhuang and Zhangjiakou is the least (Figure 3d); Shijiazhuang City’ agricultural machinery power is the greatest, followed by Handan and Chengde is the least (Figure 3e); Shijiazhuang City’ chemical fertilizer usage is the most, followed by Handan and Baoding and Zhangjiakou is the least (Figure 3f); Baoding City’ rural

5918 Afr. J. Microbiol. Res.
Figure 1. Geographical position of Hebei Province. The contour lines and the points indicate average precipitation
(1984 to 2008) and locations of weather stations respectively.
manpower is the most, followed by Handan and Qinhuangdao is the least.
Spatial variability of agricultural input-output In order to discuss the spatial variability of agricultural input-output, we analyzed the change of agricultural output and the six input factors from the periods of 1999 and 2003 to 2004 and 2008 for 11 cities in Hebei and the results showed that: the agricultural output is increased in all cities and the value of Cangzhou is the largest and with Qinhuangdao is the smallest (Figure 4a); the cultivated land area is decreased except Langfang (Figure 4b); the effective irrigation area is increased except Shijiazhuang, Baoding and Qinhuangdao (Figure 4c); the rural electricity consumption is increased in all cities and the value of Tangshan is the largest (Figure 4d); the agricultural
machinery power is increased in all cities and the value of Handan is the largest (Figure 4e); the chemical fertilizer usage is increased except Shijiazhuang and Langfang (Figure 4f); and the rural manpower is decreased except Qinhuangdao and Zhangjiakou (Figure 4g).
Main influence factors to affect the agricultural output According to Equation 3, an agricultural input-output potential model was constructed by regression analysis based on county spatial scale, and it is shown as follows,
)7()138(85.079.122)(ln03.0
)(ln09.0)(ln01.0)(ln07.0)(ln64.0)(ln14.087.7)(ln
2
nRFtMr
tFctPmtCetAitActY
The elasticity coefficient of effective irrigation area (with0.64) is the highest which indicates that the effective irrigation area is the biggest influent factor on the
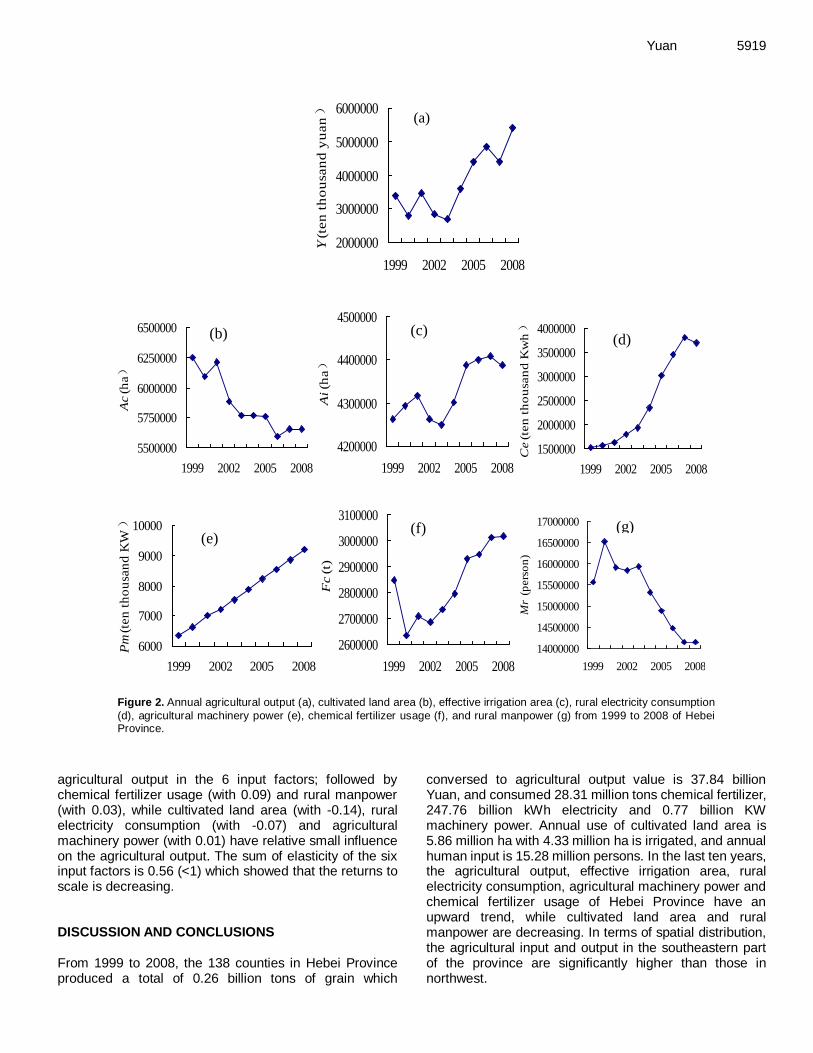
Yuan 5919
2000000
3000000
4000000
5000000
6000000
1999 2002 2005 2008
Y(t
en
th
ou
san
d y
uan)
5500000
5750000
6000000
6250000
6500000
1999 2002 2005 2008
Ac
(ha)
4200000
4300000
4400000
4500000
1999 2002 2005 2008
Ai(h
a)
1500000
2000000
2500000
3000000
3500000
4000000
1999 2002 2005 2008
Ce
(ten
th
ou
san
d K
wh)
6000
7000
8000
9000
10000
1999 2002 2005 2008
Pm
(ten
th
ou
san
d K
W)
2600000
2700000
2800000
2900000
3000000
3100000
1999 2002 2005 2008
Fc
(t)
14000000
14500000
15000000
15500000
16000000
16500000
17000000
1999 2002 2005 2008
Mr
(p
ers
on
)
(b) (c) (d)
(e) (f) (g)
(a)
(a)
Figure 2. Annual agricultural output (a), cultivated land area (b), effective irrigation area (c), rural electricity consumption
(d), agricultural machinery power (e), chemical fertilizer usage (f), and rural manpower (g) from 1999 to 2008 of Hebei Province.
agricultural output in the 6 input factors; followed by chemical fertilizer usage (with 0.09) and rural manpower (with 0.03), while cultivated land area (with -0.14), rural electricity consumption (with -0.07) and agricultural machinery power (with 0.01) have relative small influence on the agricultural output. The sum of elasticity of the six input factors is 0.56 (<1) which showed that the returns to scale is decreasing. DISCUSSION AND CONCLUSIONS From 1999 to 2008, the 138 counties in Hebei Province produced a total of 0.26 billion tons of grain which
conversed to agricultural output value is 37.84 billion Yuan, and consumed 28.31 million tons chemical fertilizer, 247.76 billion kWh electricity and 0.77 billion KW machinery power. Annual use of cultivated land area is 5.86 million ha with 4.33 million ha is irrigated, and annual human input is 15.28 million persons. In the last ten years, the agricultural output, effective irrigation area, rural electricity consumption, agricultural machinery power and chemical fertilizer usage of Hebei Province have an upward trend, while cultivated land area and rural manpower are decreasing. In terms of spatial distribution, the agricultural input and output in the southeastern part of the province are significantly higher than those in northwest.

5920 Afr. J. Microbiol. Res.
(b) (c) (d)
(e) (f) (g)
(a)
(a)
Figure 3. Annual mean agricultural output (a), cultivated land area (b), effective irrigation area (c), rural electricity
consumption (d), agricultural machinery power (e), chemical fertilizer usage (f), and rural manpower (g) from 1999 to 2008 of 11 cities in Hebei Province.
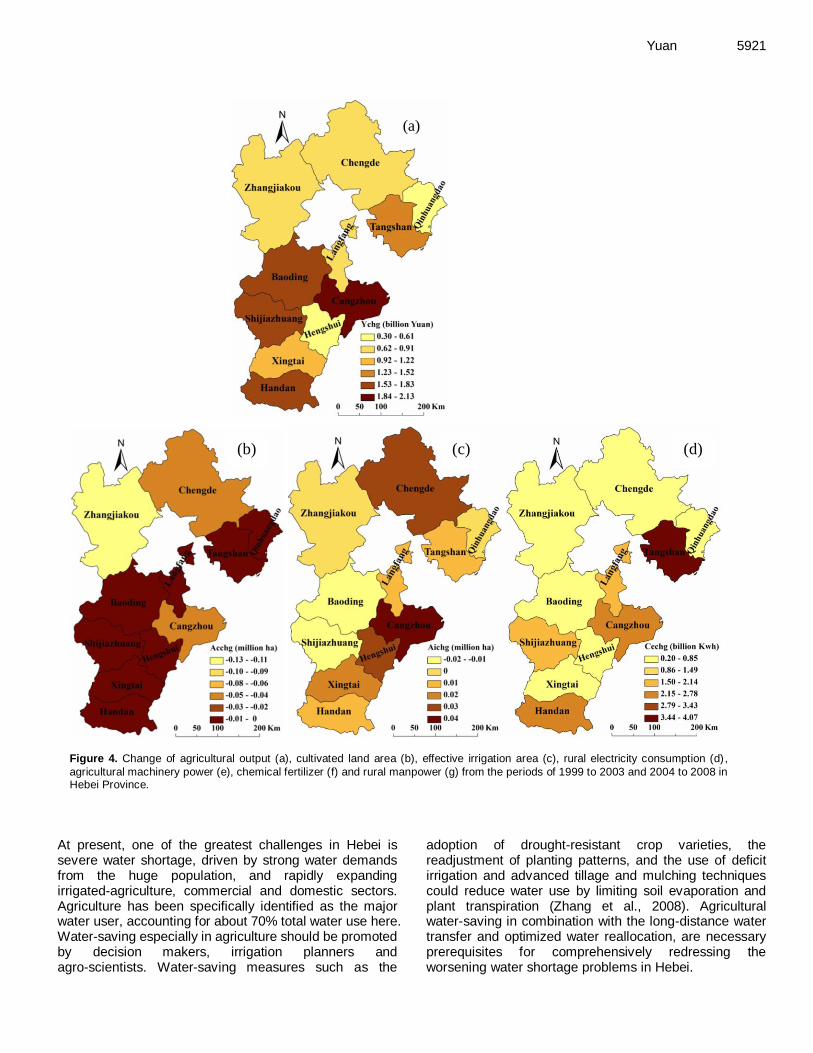
Yuan 5921
(b) (c) (d)
(a)
(a)
Figure 4. Change of agricultural output (a), cultivated land area (b), effective irrigation area (c), rural electricity consumption (d),
agricultural machinery power (e), chemical fertilizer (f) and rural manpower (g) from the periods of 1999 to 2003 and 2004 to 2008 in Hebei Province.
At present, one of the greatest challenges in Hebei is severe water shortage, driven by strong water demands from the huge population, and rapidly expanding irrigated-agriculture, commercial and domestic sectors. Agriculture has been specifically identified as the major water user, accounting for about 70% total water use here. Water-saving especially in agriculture should be promoted by decision makers, irrigation planners and agro-scientists. Water-saving measures such as the
adoption of drought-resistant crop varieties, the readjustment of planting patterns, and the use of deficit irrigation and advanced tillage and mulching techniques could reduce water use by limiting soil evaporation and plant transpiration (Zhang et al., 2008). Agricultural water-saving in combination with the long-distance water transfer and optimized water reallocation, are necessary prerequisites for comprehensively redressing the worsening water shortage problems in Hebei.
5922 Afr. J. Microbiol. Res.
There are many factors that affect agricultural output except the above six factors, such as temperature, precipitation and crop breed. In this study, we only analyzed the relation of agricultural output and six main input factors and found in the six factors, the effective irrigation area has the biggest influence on agricultural output. This study has provided scientific information for developing efficient irrigation practices to improve crop water productivity and help to maintain sustainable development of agriculture in Hebei. ACKNOWLEDGEMENTS The paper was supported by the Natural Science Foundation of China (40901130) and the Instruction Project of Hebei Province Palace of Science (10457205D-2). We are also grateful to the editors and reviewers. REFERENCES Dong MS (2009). The relationship between input and output of
agriculture in China: analysis based on partial least squares regression model. Technol. Econ., 28(1): 37-41 (in Chinese with English abstract).
Huang JK, Liu Y, Martin W, Rozelle S (2009). Changes in trade and
domestic distortions affecting China’s agriculture. Food Policy, 34: 407-416.
Jiang QS, Zhang XJ (2010). Regional agricultural input-output model and countermeasure for production and income increase of farmers in southern Xinjiang. J. Anhui Agric. Sci., 38(28): 15932-15935 (in
Chinese with English abstract). Van Ittersum MK, Rabbinge R (1997). Concepts in production ecology
for analysis and quantification of agricultural input-output
combinations. Field Crops Res., 52, 197-208. Wu HL, He HB (2008). Research on agricultural production input-output
model of Changde City. Econ. Res. guide, 11, 53-56 (in Chinese with
English abstract). Zhang XY, Chen SY, Sun HY, Pei D, Wang YM (2008). Dry matter,
harvest index, grain yield and water use efficiency as affected by
water supply in winter wheat. Irrig. Sci., 27 (1), 1-10.

African Journal of Microbiology Research Vol. 5(32), pp. 5923-5932, 30 December, 2011 Available online at http://www.academicjournals.org/AJMR ISSN 1996-0808 ©2011 Academic Journals DOI: 10.5897/AJMR11.966
Full Length Research Paper
Management of viral disease in banana using certified and virus tested plant material
El-Dougdoug, Kh. A.1 and M. M. El-Shamy2
1Department
of Microbiology, Faculty of Agriculture, Ain Shams University, P. O. Box 68 Hadayek Shobra 11241 Cairo,
Egypt. 2Department of
Botany, Faculty of Science, Menoufia University, Egypt.
Accepted 22 November, 2011
Viruses are major limitations to cultivation. These viruses were detected by double antibody sandwich enzyme-linked immunosorbent assay (DAS-ELISA) using specific polyclonal antibodies for Banana bunchy top virus (BBTV) and Cauliflower mosaic virus (CMV). Polymerase chain reaction, (PCR) based detection of a 500 bp amplicon from BBTV infected tissues and or a 600 bp amplicon from infection Brome mosaic virus (BMV) infected tissues confirmed the presence of the viruses in these plants. As well as the major deoxyribonucleic acid (DNA) fragments of expected size, 500 bp was amplified from BBTV infected tissues and the size of the major amplified product in BMV infected tissues was 600 bp. The application of banana meristem tip (0.3 mm) is more effective for BBTV and or BMV eradication in vitro. Chitosan (0.12%), treatment for infected plants was more effective for BBTV and BMV eradication in vivo. The results proved that there is five important precautions for success of the rouging program of banana viral control included: (1) To ensure that the nursery stock is clean and free from latent virus infection via starting tissue culture seedlings virus tested or suckers treated with 0.12% chitosan, (2) Detecting infected plants periodically every month by fortnightly inspection via external symptoms and every season by a DAS-ELISA test for the presence viral diseases (3) Rouging the infected plants after two inspections. The rouged plants were destroyed by burning at the end of growing season, (4) Spraying the plants and weeds with malathion and cilecron every two weeks alternatively to kill the aphid vectors from the first April to end of growing season is December, (5) Eradication of woods and grasses from plantations (secondary virus hosts) by digging up and inherbicide. Dealing with this problem as a community. Key words:Banana, nursery, orchard, banana bunchy top virus (BBTV), Brome mosaic virus (BMV) in vitro, in vivo, eradication, PCR, ELISA.
INTRODUCTION Banana is one of the most important fruit in Egypt and cultivated in wide areas. Banana production increased to 512.5 thousand metric tons and the average crop was 11.27 to 13.71 feddan (Ministry of Agriculture, ARE, 1996) as a result of cultivation of new varieties high in production. Two viruses, Banana bunchy top virus (BBTV) and banana Cauliflower mosaic virus Bean common mosaic virus (BCMV) are considered able as one of the limiting factors in the production of banana *Corresponding author. E-mail: [email protected].
crop. The virus causes serious losses in many countries (about 20 to 30% and occasionally reaching 50 to 80%). They are usually spread from plant to plant in nature by insect vectors, but often are also transmitted over long distances and from one crop cycle to another in vegetative planting material. The use of healthy planting materials and destruction of infected or diseased plants are essential for the control of viruses. The control strategy using pathogen-free stocks is to dilute the effects of disease through the supply of large quantities of healthy planting material. An important feature of this approach is the maintenance of pathogen-free foundation materials, which are protected from re-infection (Ang and

5924 Afr. J. Microbiol. Res. Ong, 1998).
Four factors influenced the success of a rouging program for the control of BBTV. These are incubation period of the virus, relative infection rate, detection efficiency and eradication efficiency (Allen, 1978). The control measures of BBTV consist of: (a) Early disease recognition and prompt eradication of infected plants, (b) Control of its insect vector, Pentalonia nigronervasa, (c) use of virus-free planting materials and (d) Quarantine for areas that are free from disease (Nakahara, 2000).
This study aims to eradicate the banana viruses via detection of the virus from naturally infected banana plants and produced virus-free banana plants by applying two programs: Establishment of adeptic culture in vitro and continuation of banana plants growth and control the vectors and weeds in open field orchards and nursery. MATERIALS AND METHODS
Source of plant materials The banana seedlings and suckers (200 samples with 20 to 30 cm) were collected from mother plants Musa spp. cv. Williams, Cavendish subgroup cultivated in Meet El-Attar, Benha, Qualubia Governorate. The mother plants exhibited BBTV and Brome mosaic virus (BMV) distinct external symptoms. The selected plants were
investigated depending on serological and molecular detection. Virus detection The viruses were detected in naturally infected and treated banana plants, in this study, by their external symptoms. This was also by double antibody sandwich enzyme-linked immunosorbent assay (DAS-ELISA) and polymerase chain reaction (PCR). The virus
isolates (BBTV and BMV) were detected in banana plants by DAS-ELISA according to Clark and Adam (1977) using specific poly clonal IgG BBTV and BMV. Enzyme-Linked Immunosorbent Assays (ELISA) Kits were provided by Sanofi Sante Animal Paris, France. PCR and reverse transcriptase PCR (RT-PCR) techniques were used to detect BBTV and BMV nucleic acids in banana plants. Total DNA of infected banana leaves was extracted using a version of CTAB (Cetyl trimethyl ammonium bromide) according to Dellaporta et al. (1983). Total Ribonucleic acids (RNA) of infected banana
leaves were extracted according to Gibbs and Mackenzie (1997). PCR amplification of BBTV Oligonucleotide primers (Table 1) for PCR were derived from the published sequences of BBTV- DNA N (Harding et al., 1993). The PCR reactions were performed according to condition and parameters described by Harding et al. (1993). The complementary DNA (cDNA) of BMV-RNA was done using the CMV/CP complementary primer (Table 1) of the conserved ultimate of CMV-RNA-3 and Avion Myeloblastosis virus reverse transcriptase (AMV-RS). The PCR reaction was performed according to conditions and cycling parameters described by Quenmada et al. (1991). Preparation of chitosan
Chitosan with a degree of deacetylation 72% was obtained from Aldrish Chemical Company. Chitosan was dissolved in 0.05% (W/V)
acetic acid and pH was adjusted to 5.5 with NaOH (Mahmoud et al., 2003).
Two programs of virus controlling in banana plants were carried out.
Establishment of an aseptic culture of banana
Micropropagtion of banana in vitro
The infected banana plants cv. Williams confirmed by PCR technique was used as source of meristems for tissue culture.
Meristems tip
The meristems were excised from shoot apices with rhizomatous base (about 2.5 cm² × 5 cm length). Individual meristem (the dome with 2 to 4 leaf primordial with rhizomatous base) were then excised with 0.3 mm under the binocular using fragments of a razor blade attached to a scalpel handles. The meristem tip was soaked in
ethanol 76% for sec. before transferred to the culture medium. Individual meristem tip was cultured on MS starting medium. The cultured jars were incubated in growth room under incubation conditions at 3 weeks. The meristems were transferred on MS multiplication medium. Monthly subcultured of the plantlets to a fresh multiplication medium was carried on at subculture fourth. After that, the plantlets were transferred on MS rooting medium (Table 2).
Virus indexing To be sure of virus free banana plantlets resulted by meristem tip culture confirmed using DAS-ELISA.
No. of virus free plantlets Percentage of virus-free plantlets = × 100 Total No. of survived plantlets
Acclimatization
Healthy plantlets that showed negative results by DAS-ELISA were removed from the culture jars. The roots were rinsed with tap water and shortened to 3 cm. The roots of plantlets were immersed in
penlate solution (1 gL-1
) and transferred into steam sterilized soil (peat: sand: vermiculite mixture by 2:1:1 ratio) in pots (12 cm Q) and covered with wet polyethylene for 10 days under greenhouse conditions. The air humidity exceeds 90% during the first days and decrease gradually.
Production of banana seedlings under nursery
Naturally infected banana plants cv. Williams exhibited typical bunchy top and stunting or mosaic symptoms (+ve results with DAS-ELISA) as well as healthy one was used to produce virus free banana seedlings. The corm of these plants was subjected to treatment with 0.5 to 1.0 ml of 0.12% chitosan. The treated seedlings were planted in clay soil at farm (30 × 20 m²³) in Meet El-Attar contains 200 lots and designed to produce virus-free banana seedlings. The distance between lots was 1 m². The seedlings were fixed to a 25 cm depth in the lots at the first march.
The seedling (healthy and infected) were treated with chitosan by two ways. a- Injected by syringe in the corms and with paraffin wax

El-Dougdoug and El-Shamy 5925
Table 1. Oligonucleotide primers for BBTV and CMV.
Virus Nucleotide sequence
BBTV Reverse 5`GCTAGGTATCCGAAGAATC-3`
Forward 5`-TCAAACATGATATGTAATTC-3`
CMV Reverse 5`-CCCCGGATCCTGGTCTCCTT-3
Forward 5`-CCCCGGATCCACATCAYAGTTTTRAGRTTCAATTC-3
Table 2. Chemical constituents of MS media for different growth stages of banana production in vitro.
Constituents Medium of growth stages
Starting Multiplication Rooting * Stock salts gL
-1 4.5 4.5 4.5
Sucrose gL-1
30 30 30
6-benzyl amino purine mgL-1
3 5 -
Nphthalene acetic acid mgL-1
- - 2
pH 5.8 5.8 5.8
Phytagel gL-1
2.2 2.2 -
Agar gL-1
- - 7
Muo-inositol gL-1
0.1 0.1 0.1
Culture’s containers 250 ml 500 ml 500 ml
Size of media/container 30 ml³
40 ml³
40 ml³
* Stock salts
days for 2 months). After 6 months data were recorded on survival before planting. B- Sprayed with chitosen periodically (each 15 percentage, average of shoot length or pant; number and leaf area, diameter of pseudostem, number and thickness of roots. Leaves tissues were obtained from the plants and tested by DAS-ELISA for
the presence of BBTV and BMV.
Eradication of banana virus in orchards The second content program was done in banana groves (about-five feddan including 200 lots) in banana groves, Meet Attar Benha, Qualubia Governorate. Mother banana plants were grown under
natural conditions. The control program was based on: Detecting infected plants periodically every month by fortnightly
inspection via external symptoms and DAS-ELISA test for the presence viral diseases. BBTV and BMV rouging the infected plants after two inspections. The rogued plants were destroyed by burning at the end of growing season. The plants and weeds were sprayed with malathion cilecron with 1.5% alternatively to the end of growing season in December. Eradication of woods and grasses from plantations (secondary virus hosts) by digging up and insecticide.
The percentage of virus infection was determined four times by DAS-ELISA through this a program.
RESULTS Virus detection It is easy to detect the viral infection on banana plants in the nursery and orchards because the external symptoms
are clear and distinctive. Symptoms of BBTV
The symptoms of infected banana with BBTV were dark green streaks on the midrib, reduced size, brittle of the leaves and gather at the top of plant making a resetting shape. Some leaves, veins are dark green colored and form a “hook” shape, as the midrib is approached (Figures 1a and b).
Symptoms of CMV
The symptoms of infected banana with Cauliflower mosaic virus (CMV) are characterized by a conspicuous molting and mosaic of the leaves, green streaks on midrib of leaves and are wavy (Figure 1c). Common observation of infected pants is stunted growth. In severe cases this is accompanied by rotting of the heart and central cylinder.
Using DAS-ELISA, indicate the presence and the percentage of BBTV, BMV and mixing of them naturally infected banana cv. Williams was 73.6; 46.6 and 20%, respectively. It also noticed that banana plants infected with BBTV or and BMV gave less number of suckers compared with corresponding healthy ones. As well as,
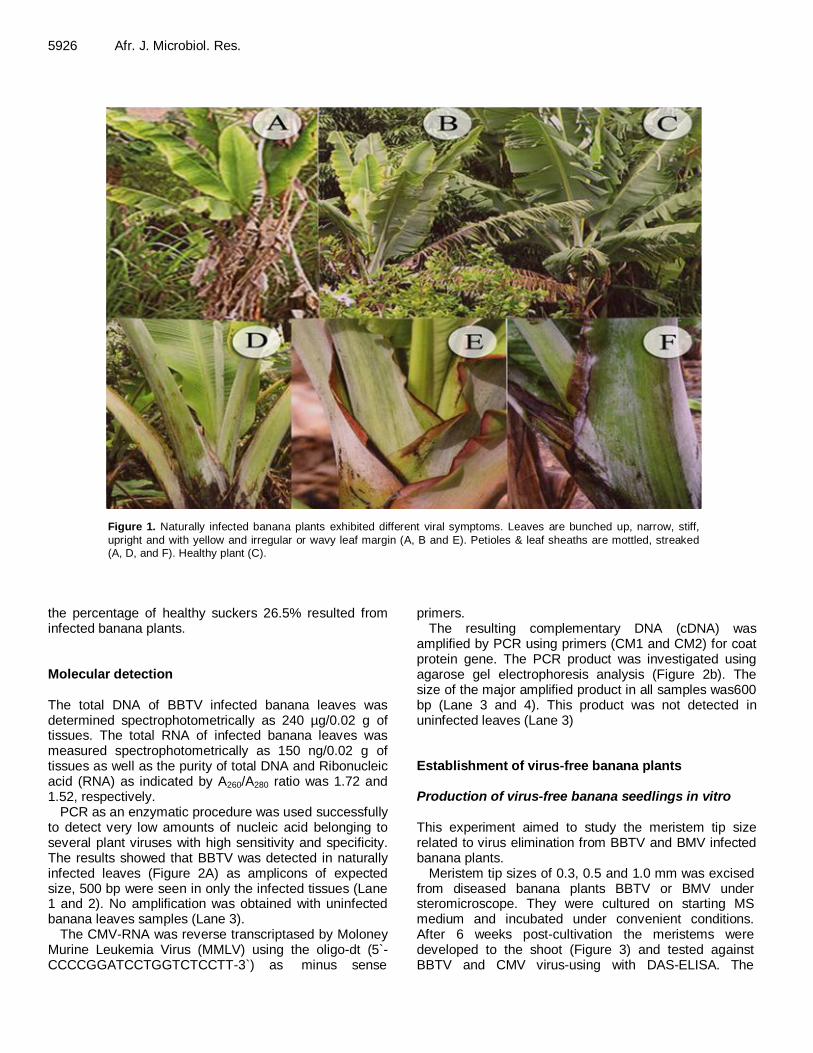
5926 Afr. J. Microbiol. Res.
Figure 1. Naturally infected banana plants exhibited different viral symptoms. Leaves are bunched up, narrow, stiff,
upright and with yellow and irregular or wavy leaf margin (A, B and E). Petioles & leaf sheaths are mottled, streaked (A, D, and F). Healthy plant (C).
the percentage of healthy suckers 26.5% resulted from infected banana plants. Molecular detection The total DNA of BBTV infected banana leaves was determined spectrophotometrically as 240 µg/0.02 g of tissues. The total RNA of infected banana leaves was measured spectrophotometrically as 150 ng/0.02 g of tissues as well as the purity of total DNA and Ribonucleic acid (RNA) as indicated by A260/A280 ratio was 1.72 and 1.52, respectively.
PCR as an enzymatic procedure was used successfully to detect very low amounts of nucleic acid belonging to several plant viruses with high sensitivity and specificity. The results showed that BBTV was detected in naturally infected leaves (Figure 2A) as amplicons of expected size, 500 bp were seen in only the infected tissues (Lane 1 and 2). No amplification was obtained with uninfected banana leaves samples (Lane 3).
The CMV-RNA was reverse transcriptased by Moloney Murine Leukemia Virus (MMLV) using the oligo-dt (5`-CCCCGGATCCTGGTCTCCTT-3`) as minus sense
primers. The resulting complementary DNA (cDNA) was
amplified by PCR using primers (CM1 and CM2) for coat protein gene. The PCR product was investigated using agarose gel electrophoresis analysis (Figure 2b). The size of the major amplified product in all samples was600 bp (Lane 3 and 4). This product was not detected in uninfected leaves (Lane 3) Establishment of virus-free banana plants Production of virus-free banana seedlings in vitro This experiment aimed to study the meristem tip size related to virus elimination from BBTV and BMV infected banana plants.
Meristem tip sizes of 0.3, 0.5 and 1.0 mm was excised from diseased banana plants BBTV or BMV under steromicroscope. They were cultured on starting MS medium and incubated under convenient conditions. After 6 weeks post-cultivation the meristems were developed to the shoot (Figure 3) and tested against BBTV and CMV virus-using with DAS-ELISA. The

El-Dougdoug and El-Shamy 5927
Figure 2. Agrose gel (0.7%) showing PCR products (CP gene amplified) of BBTV and BMV.
(A)BBTV-PCR products Lanes 1,2 infected banana plants and Lane 3 healthy ones, (B) BMV-PCR products, Lanes 1,2 infected banana plants and Lane 3 healthy ones. M: DNA Molecular weight marker (XVI, Roche). The arrow indicates the correct size of amplified PCR products.
Figure 3. Different stages of healthy banana production in vitro
from infected plants using (0.3 min) meristem tip culture.
(A)
600 bp
bp
2642
1500
1000
500
400
300
200
100
M 1 2
600 bp
bp
2642
1500
1000
500
400
300
200
100
M 1 2
(A)
(A)
M 1 2 3
500 bp
3000
2000
1250
1000
750
500
250
M 1 2 3
500 bp500 bp
3000
2000
1250
1000
750
500
250
3000
2000
1250
1000
750
500
250
600 bp
500 bp
(B)

5928 Afr. J. Microbiol. Res. Table 3. Production of virus-free banana seedlings using meristem tip culture in vitro.
Parameter
Size of
Meristem (mm)
BBTV BMV
Survival (%) Virus free No. Virus infected No. Virus free (%) Virus free No. Virus infected No. Virus free (%)
0.3 mm 75 65 10 86.66 70 5 93.33
0.5 mm 85 45 40 52.94 50 35 58.82
1.0 mm 100 10 90 10 12 88 12.00
smallest size (0.3 mm) gave 75% survival with 86.66 and 93.33% virus free (BBTV and BMV, respectively) plants. But using the size of 0.5 mm, gave 85% survival with 52.94 and 58.82 virus free plants (BBTV and BMV respectively). While using the size 1.0 mm gave 100% survival with 10 and 12% of virus free plants (BBTV and BMV, respectively; Table 3).
The explants (subculture 1) virus tested were transplanted on multiplication medium and incu-bated under convenient conditions. The explants (sub culture 2) were generated at subculture 6 on multiplication medium. The explants (subculture 6) were transplanted on rooting medium and incubated under convenient conditions at about 3 to 4 weeks until formation of roots. Acclimatization The plantlets were adapted into steam-sterilized soil in pots and grown under greenhouse conditions (Figure 3). Production of virus-free banana seedling in nursery All banana suckers (200 samples) were tested against BBTV and BMV in nursery through two seasons via external symptoms and confirmed
with DAS-ELISA test. The results revealed that, BBTV and BMV were detected in about 75 and 45% (about 200 plants), respectively. The suckers treated by injection and spraying with 0.12% chitosan solution did not have any external viral symptoms. While, the percentage of BBTV infected plants in 1st and 2nd seasons were 9 and 5% as well as BMV infected plants were 5 and 2% respectively by using DAS-ELISA test. So, chitosan showed actively against viral infection and induction of the plants growth: Whereas, the chitosan treatment due to increasing in survival of suckers with 14.5 and 10% compared with BBTV and BMV infected plants respectively. As investigation results of suckers excised from infected banana mother plants, it was found that the BBTV or BMV infection due to reduction in suckers growth whereas reduction in morpholo-gical characters (Table 4) compared with suckers excised from healthy mother plants. Data in Table 4 show the effect of chitosan an morphological characters of infected banana plants after 6 months post-chitosan treatment in vivo, data revealed that, the increasing of shoot length/plant; no. of leaves/plant, leaf area; diameter of pseudostem; corm diameter; No. of roots and root diameter of infected banana suckers with BBTV or BMV compared with pre-chitosan treatment (Table 4). As well as, increasing in chlorophyll a and b and carotenoids contents of infected banana plants treated with 0.12% chitosan, than
un-treated banana ones. Continuation of growth of banana plants and virus control in orchards The application of the procedures as described in materials and methods very effective in controlling banana viruses and producing virus free suckers. The viruses were detected via external symptoms and confirmed by DAS-ELISA test. The data in Table 5 showed that, the previous procedures due to reduction of BBTV and BMV infected banana plants were 73.66, 29.2 and 15.5% in the first year to 4.25 and 1.75% in the second year, respectively.
The present investigation also clearly indicated that, BBTV or BMV naturally infected banana mother plants gave lowest number of suckers compared with corresponding healthy plants. It also be noticed the lowest number of healthy suckers (1 and 3 suckers, respectively) compared with 6 sucker per healthy plant based on DAS-ELISA test. The percentage of virus in infection in cv. Williams was decreased season after season. It was 73.3 and 46.6% in first season(start experiment), 10.75 and 2.5% second season and 3.50 and zero% in third season for BBTV and BMV, respectively. In addition, the number of healthy suckers per plant was increased 1, 4, 5 (BBTV); 2, 5, 6 (BMV) and 3.5.6 (BBTV + BMV) at

El-Dougdoug and El-Shamy 5929
Table 4. Effect of chitosan solution in growth of banana plants infected with BBTV and BMV*.
Treatments
Morphological
parameters
BBTV BMV
Healthy Without chitosan Post chitosan treatment Without chitosan Post chitosan treatment
Survival (%) 100 85.5 100 90 100
Shoot length/plant (cm) 75 34 65 52 70
No. of leaves/plant 5 7 8 5 6
Leaf area (cm) 450 200 350 300 400
Pseudostem diameter (cm) 20 9 15 12 17
No. of roots/plant 10 8 9 8 10
Thickness of roots 0.7 0.3 0.5 0.4 0.6
Corm diameter (cm) 22 15 18 17 19
Chlorophyll a 3.75 1.50 3.15 1.25 3.25
Chlorophyll b 2.25 0.91 2.10 0.75 1.95
Carotenoids 3.25 1.85 2.95 1.65 2.50
* First season.
Table 5. Percentage of BBTV and BMV infection in banana plants and their suckers growing under environmental conditions in orchards.
Parameters
Growing
seasons
Percentage of infection
Mother plants Suckers per plant
BBTV BMV BBTV BMV BBTV + BMV
1st season
2nd
season
3rd
season
73.66*
10.75*
3.50*
46.6
2.5
0.0
5/6**
2/6
1/6
4/6** 1/6
0/6
3/6**
1/6
0/6
* Average of sucker plant-1
calculated from 100 mother plants. ** No. of infected suckers/No. of total sucker plat, calculated from 100 plants based on DAS-ELISA test.
1st, 2nd season respectively, (Table 5).
On the other hand, the suckers associated of mother plants not appeared viral like symptoms as those of healthy ones in the field. The rate of infection was higher in the winter season than in
the summer season. Young plants that were virus infected early after planting showed severe symptoms and never grow more than one meter at the end of growth season. Old plants that were virus infected showed no significant change in the
growth. It was also observed that the suckers in the same lot may exhibit infection. But if one of the suckers is in one lot, the lot became infected after 3 month of planting. The mother plant rarely exhibited any symptoms by the end of growth
5930 Afr. J. Microbiol. Res. season.
The eradication of viruses in banana groves in this experiment was based on: 1) periodically detection of BBTV and BMV via external symptoms and yearly by random method using ELISA test. 2) Rouging and destruction of the infected plants outside in the groves and +ve ELISA tested. The rouged plants destroyed by burning at the end of growing season. 3) At the same time control of aphid vectors by spraying with (0.2%) an effective insecticide. 4) Eradication of weeds and grasses by using glyphosate. DISCUSSION BBTV and BMV are of the most widespread banana viruses in different countries of the world (Smith et al., 1990) which are concerned with banana cultivation in Egypt (Allam et al., 1988). In Egypt, the most threatening viral diseases are those caused by BBTV and BMV, these viruses are considered as limiting factors in banana production (Allam et al., 1988; El-Dougdoug et al., 2002). Banana plantations are propagated asexually by suckers since almost all of their cultivars are seedless or seed sterile. Banana diseases subjected to many natural caliseases constitute a major problem, virus diseases are serious as insect vectors are abundant and there are many alternate hosts.
We noticed that, the first symptoms of banana infected with BBTV were dark green streaks on the lower portions of the midrib of the leaf; the fresh infected leaves were brittle, reduced in the size and gather at the top of plant making a resetting shape. These symptoms reported also by Allam et al. (1988), El-Sayed (1994), Othman et al. 1996) and El-Dougdoug et al. (2006). The symptoms of BMV are characterized by a conspicuous interveinal chlorosis of the leaves. Common observation of infected (plants stunted growth. In severe cases this is accompanied by rotting of the heart leaf and central cylinder as stated by Nurhadi and Setyobudi (1998), Allam et al. (2000) and El-Dougdoug et al. (2006).
All banana plants used for starting this work were found to be infected with either BBTV or BMV and were detected in leaf samples by different methods as the biological, serological and molecular. DAS-ELISA was used to detect BBTV and BMV because of their sensitivity, specificity and speed (Clark and Adam, 1977; El-Dougdoug et al., 2002, 2006). We obtained the same conclusion.
A polymerase chain reaction (PCR) assay was developed for detection of BBTV and BMV of banana plants as well as single aphid (Xie and Hu, 1995). They added that, dot blot hybridization assay were as sensitive as ELISA, while PCR was 1.000 times more sensitive than dot blot immunoassay and ELISA. Furthermore El-Sayed (1994) found that PCR and dot blot hybridization were more sensitive than other traditional methods for the
detection of BBTV and BMV.
The smallest size of meristem tip 0.3 mm more effective for elimination of banana viruses than 0.5 and 1.0 cm meristem size, whereas gave largest number of virus-free plants.
The active growing points of the plant shoot are meristem and nodel cuttings. They contain the truly meristemic cells, which surrounded by leaf primordial and primary leaves. Since more differentiated vascular tissues are found in meristem from a distance. Vascular elements of the leaf primordial are still incipient, and have not yet made contact with main strand system in the stem. Therefore, virus particles can reach the meristematic region of the apex only through cell to cell movement slowly. For this reason, virus concentration decreases in both apical axillary buds of infected plants (Perez et al., 1999).
Recent investigations of tissue culture methods proved that the number of virus free plants produced is inversely proportional to the size of the explants cultured. Thus, in some instances it is possible to excise a meristem tip free of the virus present in the infected parent and regenerate them into a healthy plant (Zilkah et al., 1992). Moreover, they indicated the importance of explants size in the successful elimination of some viruses and the role of certain host virus combination in determining the success of virus elimination (George, 1993). Virus eradication procedure depends partly on the nature of viruses; some of these viruses are more readily eliminated than others. The mechanism of such in vitro virus inactivation remains unknown, but whatever the explantation it seems probable that this type of virus eradication is more likely to occur if low, rather than high concentrations of virus particles are present in the tip (Walkey, 1991).
Four factors influence the success of a rouging program for the control of BBTV. These are incubation period of the virus, relative infection rates, detection efficiency and eradication efficiency (Allen, 1978). The virus activity might be prevented by alternation of the charge on the virus particles caused by polybasic substances. Such effects could be produced by chitosan (Mahmoud et al., 2003). Usually chitosan is obtained from decaylation of chitin crusts in crustacea. The chitosan possess a wide biological activity including induction of many plant defense responses such as accumulation of chitinases, production of phytoalexin (Walter-Simmons et al., 1983); synthesis of proteinase inhibitors (Walter-Simmons et al., 1989), lignification (Barber et al., 1984) and callose synthesis (Lienart et al., 1993). Chitosan was found to inhibit plant viral infections such as alfalfa mosaic virus, tobacco mosaic virus; potato virus X, peaut stunt virus, tobacco necrosis virus; cucumber mosaic virus and BBTV and BMV (Posppieszny et al., 1991 and Mahmoud et al., 2003). In addition, it was exhibited antiviroid action (Posppieszny, 1997). Mahmoud et al. (2003) postulated that, chitosan may be substitute for the virus particles when attached to
cell receptors. Compared to suckers, the use of plantlets grown by tissue culture has many advantages. Tissue culture plantlets are cheaper and easier to propagate and transport. They have a higher survival rate in the field. They reduce the cost of controlling foliar diseases by 50%. Their uniformity of growth makes it possible to control the time of flowering and harvesting and give a significant increase in yield and fruit quality (Hwang et al., 1984).
Tissue culture is now standard practice in banana propagation to ensure that the nursery stock is clean and free from latent infection of BBTV and BMV (Magnaye and Valnayor, 1995). For banana which is propagated vegetative, production of virus-free starting material (seedling and rhizomes) is very important to reduce yield loss due to over viral infection in field. Espino et al. (1998) reported that a control measure of BBTV consists of a) early disease recognition and prompt eradication of infected plants, b) Control of insect vector Pentalonia nigonervosa, c) use of virus-free planting materials and d) quarantine for areas that are free from the disease.
Quarantine laws should be revised and enforced on the import of new suckers and on the movement of infected suckers within the country. With the use of tissue culture techniques disease free planting material (suckers) can be produced and used for new plantation (Leghari, 2002). To control banana viruses removing the infected plants, control woods and aphid vectors during the growing period, use virus-free planting materials and continuous monitoring and inspection of banana plants (Calo, 2005).
It was noticed that for established plantings, effective control of the diseases requires early detection and immediate eradication of infected plants followed by replanting with disease free planting materials. As most banana virus produces character symptoms on the eaves, eradication was commonly done under symptomatology basis as stated by Nurhadi and Steyobudi (1998).
The control program can be summarized as follows: Detecting infected mother plants periodically every month by fortnightly inspection via external symptoms and ELISA test for the presence of viral diseases. Rouging the infected plants after two inspections the rouge plants were destroyed by burning at the end of growing season. Spraying the plants and weeds with malathion to kill the aphid vectors every two weeks from first of April to the end of growing season in December), eradication of weeds and grasses from plantations (secondary virus hosts) by insecticide. Quarantie regulation must be implemented. This control program is similar to that done by Allam et al. (1988). REFERENCES
Allam EK, Abo El-Aid AF, Abd El-Wahab S, Sowailam HF Ouf RA Omar
MA Abo El-Nasr MM, Deiab AE, Mohammed AS, Sadik G (1988).
Annual report of pests and diseases of banana in Egypt. Academic of Technology and Scientific Research Ministry of Scientific Research,
El-Dougdoug and El-Shamy 5931 Cairo, Egypt. (22): 79-85 Allam EK,Othman A, El-Sawy A, Thabet SD (2000). Eradication of
banana bunchy top virus (BBTV) and banana mosaic virus (BMV)
from diseased banana plants. Annals Agric. Sci., Cairo, 45: 1: 33-48. Allen RN (1978). The spread of bunchy top disease within a banana
plantation to rouging. Plant Dis. Survey, pp. 25-26.
Ang OC, Ong L (1998). Virus and virus like diseases of banana and citrus in Malaysia: Status and Control Strategies. In: Imanaging banana and citrus diseases. Proceedings of a regional workshop on
disease management of banana and citrus through the use of disease-free planting materials held in Davao City Philippines, pp. 14-16.
Barber MS, Bertram RF, Ride JP (1989). Chitin oligosaccharides elicit lignification in wounded leaves. Physiol. Molec. Plant Pathol., 34: 2-12.
Calo T (2005). All about banana in Carage. Department of Science and Technology Carage Region. Extension Butuan City, Philippine. pp. 321.
Clark MF, Adams AN (1977). Characteristics of the microplate method of enzyme-linked immunosorbent assay for the detection of plant viruses. J. Gen. Virol., 34: 475-483.
Dellaporta S, Wood J, Hicks JB (1983). A plant DNA mini preparation; Version II. Plant Mol. Biol. Rep., 1: 19-21.
El-Dougdoug KHA, Taha RM, Hazaa AK (2002). Sensitivity of two
banana cultivars for banana mosaic and banana bunchy top viruses. Az. J. Microbiol., 9(56): 268-280.
El-Dougdoug KA, Hazaa MM, Hanan HA, Sabah Abo El-Maaty (2006).
Eradication of banana virus from naturally infected banana plants. 1. Biological and Molecular detection of cucumber mosaic virus and banana bunchy top virus. J. Appl. Sci. Res., 2(12): 1156-1163.
El-Sayed SA (1994). Studies on viruses affecting banana in Egypt. Ph.D. Thesis, Fac. Agric., Ain Shams Univ., Cairo, pp. 125.
Espino RRC, Ligat BS, Magnaye LV, Espino TM (1998). Rehabitation of
BBTV-affected Areas in the Philippines: Experiences and problems. In; managing banana and citrus diseases Proceedings of a regional workshop on disease management of banana and citrus through the
use of disease free planting materials held in Davao City, Philippines, pp. 14-16.
George EF (1993). Plant propagation by tissue culture (Part 1 and 2).
Exeyetics Lid Edington, pp. 1361. Gibbs A, Mackenzie A (1997). A primer pair for amplifying part of the
genome of all potyvirids by RT-PCR. J. Virological. Methods, 63: 9-
16. Harding RM, Burns tM, Hafner G, Dietzgen RG, Dale JL (1993).
Nucleotide sequence of one component of banana bunchy top virus
genome contains a putative replicase gene. J. Gen. Virol., 74: 323- 328.
Hwang SC, Chen CL, Lin JC. Lin HL (1984). Cultivation of banana using plantlets from meristem culture. Hortic. Sci., 19: 231-233.
Leghari HB (2002). Banana bunchy top virus in Sindi DAWN Business. The Internet Edition http://DAWN.com.
Lienart Y, Gautier C, Dubois-Dauphin D, Domord A (1993). Chitin
(chitosan) as elicitors in Rubus protoplasts RAA Mzzarelli ed., Chitin Enzymol., 1: 271-278.
Magnaye LV, Valmayor RV (1995). BBTV, BMV and other viruses
affecting banana, in Asia and bacific. Bureau of Plant industry, Davao, Philippines INIBAP Asia and Pacific Network. C/O PCARRD, Los Bafies, Layuna Laguina. Philippines, (19): 532-544.
Mahmoud SYM, El-Dougdoug KhA, Abdel-Ghafar MH, Aly AS (2003). Inhibitory effects of chitosan and its derivatives on some plant viruses. N. Egypt. J. Microbiol., (4): 108-124.
Nakahara L (2000). In: Banana bunchy top virus found in Kohala from net Keation @ Westhawaiitoday.com.
Nurhadi A, Setyobudi L (1998). Status of banana and citrus viral
diseases in Indonesia. In: Managing banana and citrus diseases. Proceedings of a regional workshop on disease among of banana and citrus through the use of disease-free planting materials held in
Davao City, Philippines, 14-16. Othman B, El-Dougdoug KhA, Sadik M (1996). Detection of banana
bunchy top virus in some banana plantations in Kalubia Governorate.
Annals Agric. Sci., Ain Shams Univ., Cairo, 41(2): 627-634. Posppieszny H (1997). Antiviral activity of chitosan. Crop Protect.,

5932 Afr. J. Microbiol. Res. 16(2): 105-106. Posppieszny H, Chirkov S, Atabekov JG (1991). Induction of antiviral
resistance in plant by chitosan Plant Sci., (79): 64-68.
Perez Tornero O, Burgas H, Egea J (1999). Introduction and establishment of apricot in vitro through the regeneration of shoots from meristem tip. In vitro cell. Dev. Biol. Plant, (85): 249-253.
Quenmada H, Hostis BL, Gonsalves P, Reardon IM, Heinriksan R, Herbert EL, Sten LC, Slightom JL (1991). The nucleotide sequence of the 3` terminal regions of papaya ring-spot virus strains. W and P. J.
Gen. Virol., (71): 203-210. Smith MK, Drew RA (1990). Current applications of tissue culture in
plant propagation and improvement. Australian J. Plant Physiol.,
(17): 267-289. Walkey DA (1991). Applied plant virology. Chapman and Hall, London,
pp. 338.
Walter-Simmons M, Hadwiger L, Ryan CA (1983). Chitosan and pectic
polysaccharides both induce the accumulation of the antifungal phytoalexin in pea pods and antinutrient proteinase inhibitors in
tomato leaves. Biochem. Biophys. Res. Commun., (110): 194-199. Walter-Simmons M, Hadwiger L, Ryan CA (1984). Proteinase inhibitors
synthesis in tomato leaves. Plant Physiol., (76): 787-790.
Xie W, Hu J (1995). Molecular cloning sequence analysis and detection of banana bunchy top virus in Hawair, Phytopath., 85(3): 339-347.
Zilkah S, Paingersh E, rotbanum A (1992). In vitro propagation of three M x M (Prunus avium X Prunus mahaleb) Cherry rootstocks Acta
Hortic., 314: 93-97.

African Journal of Microbiology Research Vol. 5(32), pp. 5933-5940, 30 December, 2011 Available online at http://www.academicjournals.org/AJMR ISSN 1996-0808 ©2011 Academic Journals DOI: 10.5897/AJMR11.992
Full Length Research Paper
Scavenging and anti-fatigue activity of Wu-Wei-Zi aqueous extracts
Chen Xiang* and Zhang Guohai
College of Physical Education, Wenzhou University, Wenzhou 325035, China.
Accepted 11 November, 2011
In this study, the radical scavenging properties and the anti-fatigue activity of Wu-Wei-Zi aqueous extracts (WAE) were evaluated, respectively. Forced swimming exercise of mice was carried out after 4 weeks of WAE administration and biochemical parameters related to fatigue, such as blood lactic acid (BLA), blood urea nitrogen (BUN), hepatic glycogen (HG), superoxide dismutase (SOD) and glutathione peroxidase (GPX) contents were determined. Results showed that WAE had strong scavenging activity to superoxide anion and 1,1-diphenyl-2-picrylhydrazyl (DPPH) radical. And it had significant anti-fatigue activity, which could not only increase the hepatic glycogen, SOD and GPX contents but also extend the swimming time of the mice. It indicated that WAE is worthy of further study. Key words: Scavenging, anti-fatigue, Wu-Wei-Zi, mice.
INTRODUCTION Schisandra chinensis (Turcz.) Baill, a perennial lignifying liana, is mainly distributed in northeastern China. Fruits from S. chinensis (Turcz.) Baill, is called Wu-Wei-Zi in Chinese and is a traditional Chinese herb originally recorded in Shen Nong Ben Cao Jing (over 2000 year old Herbal Pharmacopoeia in China) (Xu et al., 2008; Kim et al., 2010). The main effective constituents of Wu-Wei-Zi are essentially oil and lignans (schisandrin A, deoxyschizandrin, schisandrin B and schisandrin C) (Gao et al., 2003; Ma et al., 2007). Wu-Wei-Zi has been used for nourishing heart and stomach and strengthening immune function in traditional Chinese medicine (Huang et al., 2005; Ma et al., 2007). It is also used as a tonic for the treatment of chronic fatigue, night sweats, wasting disorders, irritability, palpitations and insomnia (Siwicki et al., 2004). Fatigue can be defined as the reversible decline in skeletal muscle contractile performance due to intense muscle activity (Mach et al., 2010). Fatigue can be divided into two categories: physical and mental fatigue. Physical fatigue is caused by such things as forced *Corresponding author. E-mail: [email protected] or [email protected]. Tel: +8613868551014. Fax: +86057786680835.
exercise or swimming, while mental fatigue is caused by sleep deprivation, etc (Chen et al., 2009).
There are several theories about the mechanisms of physical fatigue: ‘‘exhaustion theory”, ‘‘clogging theory”, ‘‘radical theory”, ‘‘homeostasis disturbance theory”, ‘‘protective inhibition theory” and ‘‘mutation theory” (Wang et al., 2008; You et al., 2011). The ‘‘radical theory” suggests that intense exercise can produce an imbalance between the body’s oxidation system and its anti-oxidation system. The accumulation of reactive free radicals will put the body in a state of oxidative stress and bring injury to the body by attacking large molecules and cell organs (Wang et al., 2008). Muscle cells contain several anti- oxidant defense mechanisms to protect themselves from free radical injury, including endogenous antioxidants and antioxidant enzymes. Moreover, many studies have indicated that exogenous dietary antioxidants can decrease the contribution of exercise-induced oxidative stress and improve the animal’s physiological condition. The reason may be that exogenous antioxidants can promote or interact with endogenous antioxidants to form a cooperative network of cellular antioxidants (Morillas-Ruiz et al., 2006; Mizuno et al., 2008; Muñoz et al., 2010). Reports from recent studies demonstrated that a large number of traditional Chinese herbs have been found to act as antioxidants by scavenging free
5934 Afr. J. Microbiol. Res. radicals/reactive oxygen species (ROS) and some of them have anti-fatigue activity (Yang et al., 2000; Morihara et al., 2006; Yu et al., 2010). In traditional Chinese medicine, Wu-Wei-Zi has been widely used for the treatment of chronic fatigue (Saito et al., 1974). However, this has not been validated by scientific approach. Therefore, the present study was designed to determine the radical scavenging properties of WAE and Further the anti-fatigue activity of WAE was investigated through forced swimming exercise of mice. MATERIALS AND METHODS Plant materials
Wu-Wei-Zi was purchased from Dongfeng Medicinal Materials Factory, Wenzhou, China and judged by Chinese Traditional Medicine Research Institute in Zhejiang and fitted for Chinese Pharmacopoeia. The voucher specimen (Number: WU-KO 0231) was deposited in the Herbarium of Wenzhou University. Chemicals and reagents Butylated hydroxytoluene (BHT), DPPH and nitro blue tetrazolium (NBT) were purchased from Sigma Chemicals Company (St. Louis, MO). Methionine was purchased from Sangon Biotech Company
Limited (Shanghai, China). Riboflavin was purchased from Huamei Biochemical Company (Shanghai, China). BUN reagent kit was purchased from Biosino Biotechnology and Science Incoporated. (Beijing, China). BLA, HG, SOD and GPX reagent kits were purchased from Jianchen Biological Engineering Institute (Nanjing, China). All other chemicals were of analytical grade and were purchased from Zhejiang Chemical Reagent Company Limited (Hang Zhou, China).
Experiment animal
Male Kunming mice (3 month old, weighing 18 to 22 g) were obtained from the Animal Center of the Wenzhou Medical College, Wenzhou, China. To avoid possible individual’s differences, only male mice were studied in this study. Because male animals have small individuals differences and there is no obvious physical characteristics when compared with female animals. The study was carried out according to the ‘‘Principles of Laboratory Animal Care’’ World Health Organization (WHO) (Chronicle, 1985). The mice were acclimatized for 1 week before being used for the experiment. Before and during the experiment the mice were housed under controlled environmental conditions of temperature (22 ± 2°C) and a 12 h light and dark cycle and maintained on (unless otherwise stated) standard food pellets and tap water ad libitum.
Preparation of Wu-Wei-Zi aqueous extracts
WAE was prepared by boiling the dried Wu-Wei-Zi with distilled water for 5 h. The extract was filtered, freeze-dried and kept at 4°C. The yield of extraction was approximately 11.62% (w/w). The direct extract was dissolved in distilled water before being used. Superoxide anion radical scavenging assay
Superoxide anion radical scavenging activity of WAE was
determined according to the method described by Prasad et al. (2010) with slight modifications. Briefly, all solutions were prepared in 0.2 M phosphate buffer (pH 7.4). The test samples at different concentrations (12.5, 25, 37.5 and 50 ug/ml) were mixed with 3 ml of reaction buffer solution (pH 7.4) containing 1.3 uM riboflavin, 0.02 M methionine and 5.1 uM NBT. The reaction solution was illuminated by exposing them to two 30 W fluorescent lamps for 20 min and the absorbance was measured at 560 nm. BHT was used as positive control. Superoxide anion radical scavenging activity (SRSA) was calculated by the following equation:
1001
(%)
control
sample
A
ASRSA
Where Acontrol and Asample represent the absorbance of blank control group and sample group under 560 nm. DPPH radical scavenging assay
DPPH radical scavenging activity of WAE was determined according to the method described by Schlesier et al. (2002) with slight modifications. Briefly, 0.1 ml of the samples at different concen- trations (25, 50, 75 and 100 ug/ml) was mixed with 1 ml of 0.2 mM DPPH (dissolved in methanol). The reaction mixture was incubated for 20 min at 28°C under dark. The control contained all reagents without the sample while methanol was used as blank. The DPPH radical scavenging activity was determined by measuring the absorbance at 517 nm. BHT was used as positive control. DPPH radical scavenging activity (DRSA) was calculated by the following equation:
1001
(%)
control
sample
A
ADRSA
Where Acontrol and Asample represent the absorbance of blank control
group and sample group under 510 nm. In this study, scavenging activity of the sample was expressed as 50% effective concentration (EC50), which represented the sample concentration (μg/ml) inhibiting 50% of the DPPH radical activity. Acute toxicity assay
Acute toxicity test of WAE was carried out on Kunming mice
(weighing 18 to 22 g) of the either sex. Animal were randomly divided into five equal groups (n = 10) and were orally administered with the WAE at 12.5, 25, 50, 100 and 200 g/kg body weight, respectively. The following profiles of animals were observed continuously for 2 h (Li et al., 2009). Behavioral profile: Alertness, restlessness, irritability and fearfulness; Neurological profile: Spontaneous activity, reactivity, touch response, pain response and gait; Autonomic profile: Defecation and urination. After a period of 24 and 72 h lethality or
death was observed.
Anti-fatigue activity assay
Anti-fatigue activity of WAE was investigated through forced swimming exercise of mice. The model was a reliable measure of anti-fatigue treatment as established in both laboratory animals and humans (Tang et al., 2007; Zhang et al., 2009). WAE was given to
mice at concentrations of 0, 5, 10 and 20 g/kg body weight, named as negative control dose group (CD group), low dose treatment group (LD group), middle-dose treatment group (MD group) and
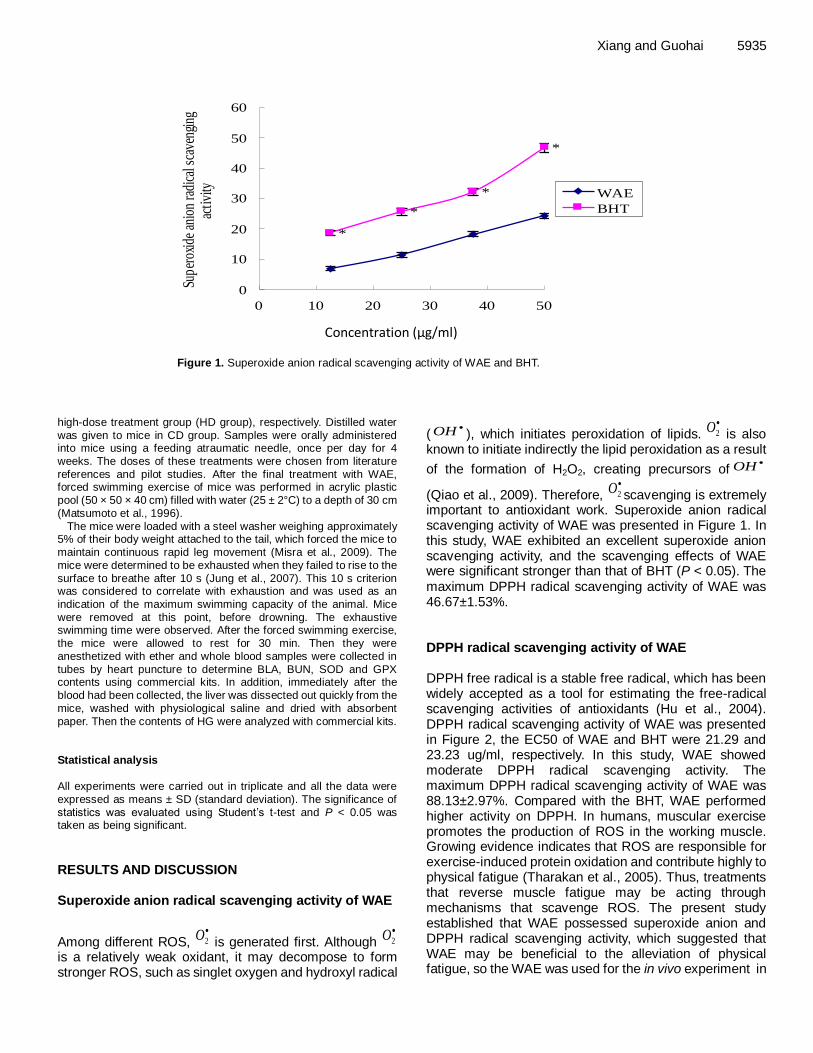
Xiang and Guohai 5935
0
10
20
30
40
50
60
0 10 20 30 40 50
*
*
*
*
Concentration(ug/ml)
Supe
roxi
de a
nion
radi
cal s
cave
ngin
g
activ
ity
WAE
BHT
Concentration (µg/ml)
Figure 1. Superoxide anion radical scavenging activity of WAE and BHT.
high-dose treatment group (HD group), respectively. Distilled water was given to mice in CD group. Samples were orally administered into mice using a feeding atraumatic needle, once per day for 4 weeks. The doses of these treatments were chosen from literature references and pilot studies. After the final treatment with WAE, forced swimming exercise of mice was performed in acrylic plastic
pool (50 × 50 × 40 cm) filled with water (25 ± 2°C) to a depth of 30 cm (Matsumoto et al., 1996).
The mice were loaded with a steel washer weighing approximately 5% of their body weight attached to the tail, which forced the mice to maintain continuous rapid leg movement (Misra et al., 2009). The mice were determined to be exhausted when they failed to rise to the surface to breathe after 10 s (Jung et al., 2007). This 10 s criterion was considered to correlate with exhaustion and was used as an indication of the maximum swimming capacity of the animal. Mice
were removed at this point, before drowning. The exhaustive swimming time were observed. After the forced swimming exercise, the mice were allowed to rest for 30 min. Then they were anesthetized with ether and whole blood samples were collected in tubes by heart puncture to determine BLA, BUN, SOD and GPX contents using commercial kits. In addition, immediately after the blood had been collected, the liver was dissected out quickly from the mice, washed with physiological saline and dried with absorbent
paper. Then the contents of HG were analyzed with commercial kits. Statistical analysis All experiments were carried out in triplicate and all the data were expressed as means ± SD (standard deviation). The significance of statistics was evaluated using Student’s t-test and P < 0.05 was taken as being significant.
RESULTS AND DISCUSSION Superoxide anion radical scavenging activity of WAE
Among different ROS,
2O is generated first. Although
2O
is a relatively weak oxidant, it may decompose to form stronger ROS, such as singlet oxygen and hydroxyl radical
(OH ), which initiates peroxidation of lipids.
2O is also
known to initiate indirectly the lipid peroxidation as a result
of the formation of H2O2, creating precursors ofOH
(Qiao et al., 2009). Therefore,
2Oscavenging is extremely
important to antioxidant work. Superoxide anion radical scavenging activity of WAE was presented in Figure 1. In this study, WAE exhibited an excellent superoxide anion scavenging activity, and the scavenging effects of WAE were significant stronger than that of BHT (P < 0.05). The maximum DPPH radical scavenging activity of WAE was 46.67±1.53%. DPPH radical scavenging activity of WAE DPPH free radical is a stable free radical, which has been widely accepted as a tool for estimating the free-radical scavenging activities of antioxidants (Hu et al., 2004). DPPH radical scavenging activity of WAE was presented in Figure 2, the EC50 of WAE and BHT were 21.29 and 23.23 ug/ml, respectively. In this study, WAE showed moderate DPPH radical scavenging activity. The maximum DPPH radical scavenging activity of WAE was 88.13±2.97%. Compared with the BHT, WAE performed higher activity on DPPH. In humans, muscular exercise promotes the production of ROS in the working muscle. Growing evidence indicates that ROS are responsible for exercise-induced protein oxidation and contribute highly to physical fatigue (Tharakan et al., 2005). Thus, treatments that reverse muscle fatigue may be acting through mechanisms that scavenge ROS. The present study established that WAE possessed superoxide anion and DPPH radical scavenging activity, which suggested that WAE may be beneficial to the alleviation of physical fatigue, so the WAE was used for the in vivo experiment in

5936 Afr. J. Microbiol. Res.
0
20
40
60
80
100
0 20 40 60 80 100
Concentration(ug/ml)
DP
PH
rad
ical
sca
veng
ing
acti
vity
(%
)
WAE
BHT
Concentration (µg/ml)
Figure 2. DPPH radical scavenging activity of WAE and BHT.
*
*
*
0
5
10
15
20
CD LD MD HD
Groups
Ex
hau
stiv
e sw
imm
ing
tim
e (m
in)
Figure 3. Effect of WAE on the exhaustive swimming time of mice.
mice to estimate the anti-fatigue activity. Acute toxicity test Acute toxicity test revealed the non-toxic nature of the WAE. There was no lethality or any toxic reactions found at any of the doses selected until the end of the study period.
Effect of WAE on the exhaustive swimming time of mice Swimming to exhaustion is an experimental exercise model to evaluate anti-fatigue activity; it works well for evaluating the endurance capacity of mice and gives a high reproducibility (Zhang et al., 2006; Yao and Li, 2010; You et al., 2011). Effects of WAE on the exhaustive swimming time of mice were presented in Figure 3. There

Xiang and Guohai 5937
**
** * *
0
2
4
6
8
10
12
14
16
CD LD MD HD
Groups
Blood lactic acid(mmol/l) Blood urea nitrogen(mmol/l)
Figure 4. Effect of WAE on the blood lactic acid and blood urea nitrogen contents of mice.
are significant differences in the exhaustive swimming time between the negative control group and each treatment group. The swimming time to exhaustion of the CD, LD, MD and HD groups were 7.4 ± 0.8, 11.7 ± 1.1, 14.9 ± 1.0 and 16.8 ± 1.4 min, respectively. Thus, the exhaustive swimming time of the LD, MD and HD groups were significantly longer than that of the CD group (P < 0.05). This result suggested that WAE had significant anti-fatigue activity. Fatigue is one of the most frequent physiological reactions. It often occurred in aging, cancer, depression, Human immunodeficiency virus (HIV) infection, multiple sclerosis and Parkinson’s disease (Tharakan et al., 2006). However, there were very few pharmacological drugs or therapies available for the treatment of fatigue (Uthayathas et al., 2007). Natural products not only could improve athletic ability, postpone fatigue and accelerate the elimination of fatigue in human beings, but also had few side effects (Kim et al., 2001). Data from previous investigations indicated that some traditional Chinese herbs extracts have anti-fatigue activity, including Radix Rehmanniae Preparata (Tan et al., 2011), Ganoderma lucidum (Guo et al., 2011), Cordyceps sinensis (Kumar et al., 2011), Acanthopanax senticosus (Zhang et al., 2010; Huang et al., 2011), Ginseng (Wang et al., 1983; Zhao et al., 2009; Wang et al., 2010), Eucommia (Deyama et al., 2001), Rhodiola rosea (Panossian et al., 2007; Olsson et al., 2009), Cynomorium songaricum (Yu et al., 2010), Morinda officinalis (Zhang et al., 2009), etc. In the present study, it has also been shown that WAE enhanced the swimming capacity by lessening of fatigue in mice. To explore the mechanism of anti-fatigue activity, some biochemical parameters such as BLA, BUN, HG, SOD and GPX contents in the mice were determined after they have swam for 30 min.
Effect of WAE on the BLA and BUN contents of mice BLA and BUN are important blood biochemical parameters related to fatigue (Xu and Luo, 2001). BLA is the glycolysis product of carbohydrate under an anaerobic condition and glycolysis is the main energy source for intense exercise in a short time (Ding et al., 2011). According to the study of Wilber (1959), violent swimming to exhaustion results in a significantly elevated BLA contents and the rate at which BLA accumulates in the blood showed an inverse relation to swimming time. Therefore, blood lactate acid represents the degree of fatigue after exercise and the condition of recovery (Wang et al., 2006). As shown in Figure 4, the BLA contents in the CD, LD, MD and HD groups were 12.48 ± 0.86, 10.13 ± 0.79, 9.47 ± 0.96 and 8.56 ± 0.84 mmol/l, respectively. Thus, the BLA contents in all treat- ment groups (LD, MD and HD groups) were lower than that in the CD group (P <0.05). This result suggests that WAE can effectively retard and lower the BLA produced and postpone the appearance of fatigue. BUN, which is the metabolism outcome of protein and amino acid, is a sensitive index to evaluate the bearing capability when human bodies suffer from a physical load (Huang et al., 2011). Wu (1999) pointed out that the BUN in the blood rises significantly for a long-run athlete after exercise. In other words, the worse the body is adapted to exercise tolerance, the more significantly the BUN contents increase. Therefore, BUN is another index of fatigue status. As shown in Figure 4, the BUN contents in the CD, LD, MD and HD groups were 10.34 ± 0.71, 9.06 ± 0.86, 8.57 ± 0.85 and 8.25 ± 0.93 mmol/l, respectively. Thus, the BUN contents of the LD, MD and HD groups were significantly lower than that of the CD group (P < 0.05). This result suggests that WAE may reduce catabolic decomposition

5938 Afr. J. Microbiol. Res.
**
*
0
5
10
15
20
25
CD LD MD HD
Groups
Hep
atic
gly
cog
en (
mg
/g)
Figure 5. Effect of WAE on the hepatic glycogen contents of mice.
of protein for energy. Effect of WAE on the hepatic glycogen contents of mice The liver converts lactate back to glycogen and releases glycogen into the blood. Energy for exercise is derived initially from the breakdown of glycogen and later from circulation glycogen released by the liver and from non-esterified fatty acids (Dorchy, 2002). So increasing the HG storage conduces to enhancing the endurance capacity and locomotory capacity (Tang et al., 2008). HG is a sensitive parameters related to fatigue. Effects of WAE on the HG contents of mice were presented in Figure 5. There are significant differences in the HG contents between the negative control group and each treatment group. The HG contents of the CD, LD, MD and HD groups were 7.35 ± 1.21, 10.48 ±2.17, 15.69±3.19 and 16.74±2.82 mg/g, respectively. Thus, the HG contents of the LD, MD and HD groups were significantly higher than that of the CD group (P < 0.05). This result suggests that the anti-fatigue activity of WAE may be related to the improvement in the metabolic control of exercise and the activation of energy metabolism (Wang et al., 2006). Effect of WAE on the SOD and GPX contents of mice It has been demonstrated that ROS are responsible for exercise-induced protein oxidation and contribute strongly
to muscle fatigue (You et al., 2009). To protect against exercise-induced oxidative injury, muscle cells contain complex endogenous cellular defense mechanisms (enzymatic and non-enzymatic antioxidants) to eliminate ROS (Powers et al., 2004). Antioxidant agents such as reduced glutathione (GSH), vitamin C, E and enzymes such as SOD, catalase (CAT) and GPX, are important factors (Hassan and Schellhorn, 1988). SOD reduces superoxide to hydrogen peroxide; and GPX reduces hydrogen peroxide from the SOD reaction to water. In addition, GPX can reduce lipid peroxides directly (Finaud et al., 2006). Growing evidence indicates that the improvement in the activities of antioxidant enzymes can help to fight against fatigue (You et al., 2011). As shown in Figure 6, the SOD contents of the CD, LD, MD and HD groups were 96.54 ± 7.84, 146.81 ± 8.93, 163.48 ± 11.26 and 171.29 ± 13.21 U/mg.pro, respectively. And the GPX contents of the CD, LD, MD, and HD groups were 4.68 ± 0.94, 8.37 ± 1.23, 10.45 ± 1.17 and 12.67 ± 1.36 U/mg.pro, respectively. Thus, SOD and GPX contents of the LD, MD and HD groups were significantly higher than that of the CD group (P < 0.05). This result suggests that WAE can promote increase in the activities of these antioxidant enzymes and again supporting that WAE has anti-fatigue activity. Conclusions WAE had strong scavenging activity to superoxide anion and DPPH radical. And it had significant anti-fatigue

Xiang and Guohai 5939
**
*
* **
0
20
40
60
80
100
120
140
160
180
200
CD LD MD HD
Groups
SOD(U/mg.pro) GPX(U/mg.pro)
Figure 6. Effect of WAE on the superoxide dismutase and glutathione peroxidase contents of mice.
activity, which could not only extend the swimming time of the mice, increase the hepatic glycogen and antioxidant enzymes (SOD and GPX) contents, but also decrease the BLA and BUN contents. However, further research needs to be carried out to evaluate its antioxidant and anti-fatigue activity at cellular and molecular levels. REFERENCES
Chen JR, Wang TJ, Huang HY, Chen LJ, Huang YS, Wang YJ, Tseng GF (2009). Fatigue reversibly reduced cortical and hippocampal dendritic spines concurrent with compromise of motor endurance and spatial
memory. Neuroscience, 161(4):1104-1113. Deyama T, Nishibe S, Nakazawa Y (2001). Constituents and
pharmacological effects of Eucommia and Siberian ginseng. Acta
Pharmacol. Sin., 22(12):1057-1070. Ding JF, Li YY, Xu JJ, Su XR, GaoX, Yue FP (2011). Study on effect of
jellyfish collagen hydrolysate on anti-fatigue and anti-oxidation. Food
Hydrocol., 25: 1350-1353. Dorchy H (2002). Sports and type I diabetes: personal experience. Rev
Med. Brux., 23(4):A211-217.
Finaud J, Lac G, Filaire E (2006). Oxidative stress: Relationship with exercise and training. Sport. Med., 36: 327–358.
Gao JP, Yu YQ, Chen DF (2003). Determination of lignans of Schisandra
rubriflora by HPLC. Chin. Tradit. Herbal Drug., 34: 950-951. Guo Y, Luo X, Yu M, Zheng L (2011). Active ingredients and efficacies of
Ganoderma lucidum cultivated on non-medicinal parts of Chinese
medicinal herbs. Wei Sheng Wu Xue Bao, 51(6):764-768 Hassan HM, Schellhorn HE (1988). Superoxide dismutase an antioxidant
defense enzyme. In: Cerruti PA, Fridovich I, McCord JM (eds).
Oxyradicals in Molecular Biology and Pathology. Alan R. Liss Inc, New York, pp. 183–93.
Hu F, Lu R, Huang B, Liang M (2004). Free radical scavenging activity of
extracts prepared from fresh leaves of selected Chinesemedicinal plants. Fitoterapia, 75(1):14-23.
Huang LZ, Huang BK, Ye Q, Qin LP (2011). Bioactivity-guided
fractionation for anti-fatigue property of Acanthopanax senticosus. J. Ethnopharmacol., 133(1):213-219.
Huang T, Shen P, Shen Y (2005). Preparative separation and purification of deoxyschisandrin and gamma-schisandrin from Schisandra chinensis (Turcz.) Baill by high-speed counter-current chromatography.
J. Chromatogr A., 1066(1-2): 239-242. Jung KA, Han D, Kwon EK, Lee CH, Kim YE (2007). Antifatigue effect of
Rubus coreanus Miquel extract in mice. J. Med. Food, 10(4):689-693.
Kim KM, Yu KW, Kang DH, Koh JH, Hong BS, Suh HJ (2001). Anti-stress and anti-fatigue effects of fermented rice bran. Biosci Biotechnol Biochem., 65(10):2294-2296.
Kim MG, Lee CH, Lee HS (2010). Anti-platelet Aggregation Activity of Lignans Isolated from Schisandra chinensis Fruits. J. Korean Soc. Appl. Biol. Chem., 53(6): 740-745.
Kumar R, Negi PS, Singh B, Ilavazhagan G, Bhargava K, Sethy NK (2011). Cordyceps sinensis promotes exercise endurance capacity of rats by activating skeletal muscle metabolic regulators. .J
Ethnopharmacol., 136(1):260-266. Li F, Li Q, Gao D, Peng Y (2009). The optimal extraction parameters and
anti-diabetic activity of flavonoids from Ipomoea batatas leaf. Afr J
Tradit. Complement. Altern. Med., 6(2):195-202. Ma DY, Liu YQ, Liu SW, Li QD, Shan AS (2007). Influence of Ligustrum
lucidum and Schisandra chinensis Fruits on Antioxidative Metabolism
and Immunological Parameters of Layer Chicks. Asian-Aust. J. Anim. Sci., 20(9): 1438-1443.
Mach J, Midgley AW, Dank S, Grant RS, Bentley DJ (2010). The Effect of
Antioxidant Supplementation on Fatigue during Exercise: Potential Role for NAD+(H). Nutrients, 2: 319-329.
Misra DS, Maiti R, Ghosh D (2009). Protection of swimming-induced
oxidative stress in some vital organs by the treatment of composite extract of Withania somnifera, Ocimum sanctum and Zingiber officinalis in malerat. Afr. J. Tradit. Complement. Altern. Med.,
6(4):534-543. Morihara N, Ushijima M, Kashimoto N, Sumioka I, Nishihama T, Hayama
M, Takeda H (2006). Aged garlic extract ameliorates physical fatigue.
Biol. Pharm. Bull., 29(5):962-966. Morillas-Ruiz JM, Villegas García JA, López FJ, Vidal-Guevara ML,
Zafrilla P (2006). Effects of polyphenolic antioxidants on
exercise-induced oxidative stress. Clin. Nutr., 25(3):444-453. Muñoz ME, Galan AI, Palacios E, Diez MA, Muguerza B, Cobaleda C,
Calvo JI, Aruoma OI, Sanchez-Garcia I, Jimenez R (2010). Effect of an
antioxidant functional food beverage on exercise-induced oxidative stress: a long-term and large-scale clinical intervention study.

5940 Afr. J. Microbiol. Res. Toxicology, 278(1):101-111. Olsson EM, von Schéele B, Panossian AG (2009). A randomised,
double-blind, placebo-controlled, parallel-group study of the
standardised extract shr-5 of the roots of Rhodiola rosea in the treatment of subjects with stress-related fatigue. Planta Med., 75(2):105-112.
Panossian A, Hambardzumyan M, Hovhanissyan A, Wikman G (2007). The adaptogens rhodiola and schizandra modify the response to immobilization stress in rabbits by suppressing the increase of
phosphorylated stress-activated protein kinase, nitric oxide and cortisol. Drug Target Insights, 2:39-54.
Powers SK, DeRuisseau KC, Quindry J, Hamilton KL (2004). Dietary
antioxidants and exercise. J. Sports Sci., 22(1):81-94. Prasad KN, Xie HH, Hao J, Yang B, Qiu SX, Wei XY (2010). Antioxidant
and anticancer activities of 8-hydroxypsoralen isolated from wampee [Clausena lansium (Lour.) Skeels] peel. Food Chem. Qiao D, Ke C, Hu
B, Luo JG, Ye H, Sun Y, Yan XY, Zeng XX (2009). Antioxidant activities of polysaccharides from Hyriopsis cumingii. Carbohyd. Polym., 78:
199–204. Schlesier K, Harwat M, Böhm V, Bitsch R (2002). Assessment of
antioxidant activity by using different in vitro methods. Free Radic.
Res., 36(2): 177-87. Siwicki AK, Skopińska-Różewska E, Nartowska J, Małaczewska J,
Wojcik R, Sommer E, Trapkowska S, Filewska M, Skurzak H (2004).
Effect of Immunostim plus – a standardized fixed combination of Schizandra chinensis with Eleutherococcus senticosus extracts on granulocyte activity and tumor angiogenesis in mice. Bull. Vet. Inst.
Pulawy., 48: 489-492. Tan W, Yu KQ, Liu YY, Ouyang MZ, Yan MH, Luo R, Zhao XS (2011).
Anti-fatigue activity of polysaccharides extract from Radix
Rehmanniae Preparata. Int. J. Biol. Macromol., Epub ahead of prin. Tang J, Hu ZY, Chen XW (2007). Free radical scavenging and antioxidant
enzymes activation of polysaccharide extract from Nostoc
sphaeroides. Am. J. Chin. Med., 5(5):887-896. Tang W, Zhang Y, Gao J, Ding X, Gao S (2008). The anti-fatigue effect of
20(R)-ginsenoside Rg3 in mice by intranasally administratio. Biol.
Pharm. Bull., 31(11):2024-2027. Tharakan B, Dhanasekaran M, Brown-Borg HM, Manyam BV (2006).
Trichopus zeylanicus combats fatigue without amphetamine-mimetic
activity. Phytother. Res., 20(3):165-168. Tharakan B, Dhanasekaran M, Manyam BV (2005). Antioxidant and DNA
protecting properties of anti-fatigue herb Trichopus zeylanicus.
Phytother Res., 19: 669-673. Uthayathas S, Karuppagounder SS, Tamer SI, Parameshwaran K, Degim
T, Suppiramaniam V, Dhanasekaran M (2007). Evaluation of
neuroprotective and anti-fatigue effects of sildenafil. Life Sci., 81(12):988-992.
Wang BX, Cui JC, Liu AJ, Wu SK (1983). Studies on the anti-fatigue effect of the saponins of stems and leaves of panax ginseng (SSLG). J.
Tradit. Chin. Med., 3(2):89-94.
Wang J, Li S, Fan Y, Chen Y, Liu D, Cheng H, Gao X, Zhou Y (2010).
Anti-fatigue activity of the water-soluble polysaccharides isolated from Panax ginseng C. A. Meyer. J. Ethnopharmacol., 130(2):421-423
Wang JJ, Shieh MJ, Kuo SL, Lee CL, Pan TM (2006). Effect of red mold rice on antifatigue and exercise-related changes in lipid peroxidation in endurance exercise. Appl. Microbiol. Biotechnol., 70(2):247-253.
Wang L, Zhang HL, Lu R, Zhou YJ, Ma R, Lv JQ, Li XL, Chen LJ, Yao Z (2008). The decapeptide CMS001 enhances swimming endurance in mice. Peptides, 29(7):1176-1182.
Wilber CG (1959). Some factors which are correlated with swimming capacity in guinea pigs. J. Appl. Physiol., 14(2):199-203.
Wu IT (1999). The effects of serum biochemical value with different
beverage to replenish and intermittent exercise in high intensity. Tahan Jr. College Engr. Business J., 13: 387-400.
Xu GD, Luo QM (2001). A study on the relationship between blood acid
lactate in motion and hemoglobin saturation density-a new hemoglobinmetry. Wuhan Ti Yu Xue Yuan Xue Bao., 35(3): 40–42.
Xu M, Wang G, Xie H, Huang Q, Wang W, Jia Y (2008). Pharmacokinetic
comparisons of schizandrin after oral administration of schizandrin monomer, Fructus Schisandrae aqueous extract and Sheng-Mai-San to rats. J. Ethnopharmacol., 115(3): 483-488.
Yang QS, Zhao HL, Chen L (2000). Studies on senility retarding effect of qiangshengye liquid. Zhongguo Zhong Yao Za Zhi. 25(6):367-369.
Yao LQ, Li FL (2010). Lycium barbarum polysaccharides ameliorates
physical fatigue. Afr. J. Agric. Res., 5: 2153–2157. You LJ, Zhao MM, Regenstein JM, Ren JY (2011). In vitro antioxidant
activity and in vivo anti-fatigue effect of loach (Misgurnus
anguillicaudatus) peptides prepared by papain digestion. Food Chem., 124: 188–194.
You Y, Park J, Yoon HG, Lee YH, Hwang K, Lee J, Kim K, Lee KW, Shim
S, Jun W (2009). Stimulatory effects of ferulic acid on endurance exercise capacity in mice. Biosci. Biotechnol. Biochem., 73(6):1392-1397.
Yu FR, Liu Y, Cui YZ, Chan EQ, Xie MR, McGuire PP, Yu FH (2010). Effects of a flavonoid extract from Cynomorium songaricum on the swimming endurance of rats. Am. J. Chin. Med., 38(1): 65-73.
Zhang HL, Li J, Li G, Wang DM, Zhu LP, Yang DP (2009). Structural characterization and anti-fatigue activity of polysaccharides from the roots of Morinda officinalis. Int J Biol Macromol., 44(3): 257-261.
Zhang XL, Ren F, Huang W, Ding RT, Zhou QS, Liu XW (2010). Anti-fatigue activity of extracts of stem bark from Acanthopanax senticosus. Molecules, 16(1):28-37.
Zhang Y, Yao X, Bao B, Zhang Y (2006). Anti-fatigue activity of a triterpenoid-rich extract from Chinese bamboo shavings (Caulisbamfusae in taeniam). Phytother. Res., 20(10): 872-876.
Zhao W, Zhang X, Wang W, Zhang L (2009). Experimental study for the anti-fatigue effect of ginseng general ginsenosides P.E. in vivo. Wei Sheng Yan Jiu., 38(2):184-187.

African Journal of Microbiology Research Vol. 5(32), pp. 5941-5949, 30 December, 2011 Available online at http://www.academicjournals.org/AJMR ISSN 1996-0808 ©2011 Academic Journals DOI: 10.5897/AJMR11.995
Full Length Research Paper
Proteomic analysis of differentially expressed proteins in intestinal epithelial cell in response to Enteroinvasive Escherichia coli infection and Lactobacillus plantarun
treatment
Zhongwei Zhang and Minghua Mao*
Department of Geriatrics, The 6th People’s Hospital Affiliated to Shanghai Jiaotong University, Shanghai 200233, China.
Accepted 27 October, 2011
A proteomic approach was taken to compare the proteomes of Enteroinvasive Escherichia coli (EIEC) infection alone, Lactobacillus plantarun pre-treatment and control group. Two-dimensional gel electrophoresis (2-DE), coupled with mass spectroscopy and protein database searching, 8 differentially expressed proteins was identified. Of them, Glutathione Transferase (down-regulated), Peroxisomal enoyl-coenzyme (up-regulated) and Peroxiredoxin (up-regulated) in EIEC infection group were compared with control group which are all associated with antioxidant-related proteins. Glyceraldehyde-3-phosphate dehydrogenase (up-regulated) and Triosephosphate Isomerase (up-regulated) were identified related with carbohydrate metabolism in EIEC infection group compared with control group. Keratin 8 (up-regulated) and hnRNP C1/C2 (down-regulated) were linked to antagonize cytoskeleton reorganization and apoptosis in L. plantarun pre-treatment group. Identification of these proteins provides insights that may lead to a better understanding of the molecular basis for EIEC infection process and L. plantarun protection function. Key words: Lactobacillus plantarun, Enteroinvasive Escherichia coli, tight junction.
INTRODUCTION Enteroinvasive Escherichia coli (EIEC) is a human intestinal pathogen responsible for the majority of cases of endemic bacillary dysentery prevalent in developing country (Song et al., 2005). The underlying pathogenesis is proposed as follows (Parsot, 2005; Croxen and Finlay, 2009). In the colonic mucosa, bacteria are supposed to cross the epithelial layer by invading M cells overlaying lymphoid follicles. Entry into epithelial cells involves rearrangements of the cell cytoskeleton (Cossart and Sansonetti, 2004). Bacteria released from M cells or *Corresponding author. E-mail:[email protected]. Tel: +86-021-64369181. Fax: +86-021-64701361.
Abbreviations: EIEC, enteroinvasive Escherichia coli; EPEC, enteropathogenic Escherichia coli.
epithelial cells interact with macrophages, escape from the phagocytic vacuole and induce apoptosis of infected cells. Apoptotic macrophages release pro-inflammatory cytokines facilitates further invasion by luminal bacteria (Steiner et al., 2000; Lahouassa et al., 2007). Recently, there are also evident that probiotic bacteria protect and enhance human intestinal epithelial barrier function. For example, enteropathogenic E. coli (EPEC)-induced neutrophil migration and EPEC binding to monolayers were inhibited by viable Lactobacillus plantarum but only when added to the monolayers before EPEC (Michail and Abernathy, 2003).
Identically, live Streptococcus thermophilus (ST)/Lactobacillus acidophilus (LA) interact with intestinal epithelial cells to protect them from the deleterious effect of EIEC via mechanisms that include interference with pathogen adhesion and invasion (Resta-Lenert and Barrett, 2003; Resta-Lenert and Barrett, 2006). In

5942 Afr. J. Microbiol. Res. addition, L. plantarum have also been demonstrated reduce EIEC adhesion to Caco-2 by reducing intestinal permeability and increasing tight junction proteins (such as ZO-1, occludin and claudin-1 protein) in our previous reports (Qin et al., 2009). However, the detail mechanism was not very clear. Therefore, it is valuable to explore the regulation mechanism between L. plantarun, EIEC and intestinal epidermal-barrier function. In this study, we have, for the first time, taken a proteomic approach to identify differential proteins in EIEC infection alone, L. plantarun pre-treatment and control group. We anticipate these proteins may provide initial insights into the role of EIEC infection process and L. plantarun protection function. MATERIALS AND METHODS
Preparation of bacteria
L. plantarum strain CGMCC No.1258 collected from Institute of Science Life of Onlly, Shanghai Jiao Tong University, Shanghai, China, a gift from Dr. Hang Xiaomin (Institute of Science Life of Onlly, Shanghai Jiao Tong University, Shanghai, China) was maintained on MRS agar (Difco Laboratories, Detroit, MI, U.S.A.). Enteroinvasive Escherichia coli EIEC strain 0124:NM (ATCC 43893, serotype O124:NM) was obtained from the Center of Diseases Prevention and Control of Shanghai, China and maintained in LB
medium (Difco Laboratories, Detroit, MI, U.S.A). They were cultivated at 37°C for 16 h to reach stationary phase. The L.
plantarun and EIEC suspensions were centrifuged for 5 min at 1500 × g. After removing the supernatant, the pellet was re-suspended in sterile PBS buffer to determine the bacterial concentration. Quantification of bacterial suspension was determined using a standard curve for visible absorbance (600 nm; Beckman DU-50 spectrophotometer) and adjusted the final concentration to 1 × 10
8/ml.
Preparation of monolayer
DMEM supplemented with 10% fetal bovine serum, 1 × 10
5 U/L of
penicillin and 100 mg/L streptomycin was used as a standard medium to cultivate Caco-2 cells (human colonic epithelial-like
cancer cell line obtained from the Cell Institute Affiliated China Science Research Institute, Shanghai, China). When cell growing to 80 to 90% fusion cells under 5% CO2 saturated humidity and 37°C conditions, 0.25% pancreatic enzyme with 0.03% EDTA was performed to digest cells to subculture (1:3). Then, the cells were inoculated to glass slide in six-well culture plate (gelatin treatment) and cell concentration was 5 × 10⁴ cells/cm
2. After 7 to 10 days,
monolayer cells were collected and used in later experiment.
Infection of intestinal epithelial monolayer
Caco-2 cells were washed three times in Hank's balanced salt solution (Life Technologies) to remove the antibiotic media. For rapid infection of the monolayer, 100 μl EIEC at 1.0 × 10
8 /ml was
added to the apical side of the cell culture insert, and the insert was placed in a 50 ml tube and centrifuged at 200 g for 4 min. L.
plantarum (100 μl of 1.0 × 10⁸/ml) was added to the monolayers in
different groups for 24 h. Caco-2 cells monolayers were cultured and served as the control group, Caco-2 cells were infected EIEC
as the EIEC group, Caco-2 cells infected EIEC were co-incultured with L. plantarum as the L. plantarum group. The average number of Caco-2 cells in each monolayer was approximately 1 × 10
6. The
inoculation ratio of EIEC to Caco-2 cells was 100:1. The ratio of lactobacillus to EIEC was 10:1. Protein sample preparation The Caco-2 cells monolayer cells in each group were harvested by centrifugation, rinsed in phosphate-buffered saline and re-suspended in 300 µl lysis buffer (9.5 M urea, 4% CHAPS, 65 mM DTT, 2% carrier ampholyte and protease inhibitor cocktail). Then,
the Caco-2 cells were removed from the surface with a cell scraper and collected to a 1.5 Eppendorf tube. The crude extract solution was obtained by ultrasonic disruption (80 W, 2 min, with a 15 s interval every 10 s) and centrifugation (14000 rpm, 60 min). The resulting supernatant was concentrated on Biomax-5 K ultra-filtration membrane. The protein concentration was determined by a standard Bradford protein assay and stored at -80°C until use for 2-DE analysis.
Gel electrophoresis and analysis
First-dimensional electrophoresis was carried out using an IPGphor II (Amersham Biosciences) isoelectric focusing system. 100 g of total extract were loaded. IPG dry strips (pH 3-10, linear) were rehydrated at 30 V for 12 h. After rehydration, isoelectric focusing was performed under the following conditions: 500 V for 1 h, 1000 V for 1 h, 8000 V for 6 h and 500 V for 4 h. After equilibration of the
isoelectric focusing strips, SDS electrophoresis was performed on 12.5% gels. SDS-PAGE was performed using a Hofer SE 600 System (Amersham Biosciences): 15 mA for 30 min and 30 mA until the Bromophenol Blue front reached 0.5 cm of the gel. After two-dimensional gel electrophoresis, proteins were stained with silver for subsequent mass spectrometry. To ensure data reliability, sample preparation and 2-DE were performed in triplicate. Silver-stained gels were scanned with Bio-Rad GS710 scanner. Images
were analyzed using the specialized software program Image Master 2D Elite software (Amersham Biosciences). MALDI-TOF mass spectrometry and protein identification
Proteins of interest were excised and digested in gel using trypsin for 20 h (sequencing grade, Promega, Charbonnie`res, France). Digest products were completely dehydrated in a vacuum centrifuge and resuspended in 10 ul of formic acid (2%), desalted using Zip Tips C18 (Millipore, Bedford, MA), eluted with acidα-cyano-4-hydroxy-trans-cinnamic acid (Sigma, 5 mg/ml in 0.1% TFA) and loaded on the target of a Bruker-Daltonics AutoFlex TOF−TOF LIFT mass spectrometer (Bruker Daltonics, Bremen, Germany). Analysis was performed in reflectron mode with an accelerating voltage of 20 kV. Identification of proteins was performed using both Mascot and PeptIdent software (available at www.matrixscience.com and www.expasy.org/tools/peptident.html, respectively). Search parameters were as follows: database: NCBInr (release date: 20070326); taxonomy: homo sapiens (human); type of search: peptide mass fingerprint; enzyme: trypsin; fixed modifications: carbamidomethyl (C); mass values: monoisotopic; protein mass: unrestricted; peptide mass tolerance: ± 100 ppm; peptide charge state: 1+; and max missed cleavages: 1. Statistics analysis
All data were analyzed by SPSS13.0 and the results were

Zhongwei and Minghua 5943 Table 1. Differentially expressed proteins between EIEC and normal group.
Group ID Normal group EIEC infection group Group ID Normal group EIEC infection group
3780 -6.46544 6.46544 4399 1.94149 -1.94149
4075 -3.90939 3.90939 3676 -1.93011 1.93011
3959 -3.35281 3.35281 4388 1.87136 -1.87136
3969 -3.03349 3.03349 4118 -1.75635 1.75635
4364 3.00393 -3.00393 4448 1.74678 -1.74678
3863 -2.66937 2.66937 4106 -1.74489 1.74489
3792 -2.48479 2.48479 3096 -1.6833 1.6833
4435 2.46231 -2.46231 3410 -1.6324 1.6324
4241 2.37954 -2.37954 3368 1.6012 -1.6012
4445 2.30779 -2.30779 3392 1.56976 -1.56976
4250 -2.30228 2.30228 3777 -1.56414 1.56414
4110 -2.27937 2.27937 3597 -1.56405 1.56405
4070 2.19601 -2.19601 3380 -1.51271 1.51271
3299 -2.05878 2.05878 4050 -1.51244 1.51244
4337 1.96883 -1.96883 2930 -1.50543 1.50543
measured by average ± standard deviation. One-way ANOVA was performed on all experiments with Tukey Kramer post-hoc comparison. P < 0.05 was considered as statistically significant.
RESULTS Differentially expressed proteins analysis The differentially expressed proteins between different groups were analyzed based on image master software (class report ratio > = 1.5). The results showed that there were 30 spots identified as differentially expressed between normal group and EIEC group. Of this, 19 genes were up-regulated and 11 genes were down-regulated expression compared with normal group (Table 1, Figures 1 and 2). When comparison betweennormal group and L. plantarum group, the results indicated 25 differentially expressed proteins (14 genes up-regulated and 11 genes down-regulated) (Table 2, Figures 3 and 4). 15 differentially expressed proteins were identified between L. plantarum group and EIEC group. Among them, 5 genes were down-regulated expression, and 10 genes were up-regulated expression compared with EIEC group (Table 3, Figures 5 and 6). MALDI-TOF mass spectrometry and protein identification Total of 16 differentially expressed proteins were excised from 2-DE gels, in-gel digested by trypsin and subjected to MALDI-TOF-TOF/MS analysis. Of them, 8 differentially expressed proteins have been identified by NCBInr database searching (Table 4).
DISCUSSION
In this study, we have used 2-DE and MS to establish the proteomic profiles of intestinal epithelial cell in response to EIEC infection and L. plantarun pre-treatment. 2-DE was employed as it permits the identification of the alteration of protein isoforms and determination of protein expression levels and post translational modifications. The 2-DE gel in each group was analyzed to screen differentially expressed proteins by Image Master 2D Elite software. Based on this analysis, 16 significantly differential proteins was chosen to identify by MALDI-TOF-TOF/MS, of them, 8 differentially expressed proteins have been identified by NCBInr database searching. Literature searches were conducted for all the proteins identified in the up- and down-expressed lists to find possible links of the change in expression and their implications in intestinal epithelial cell in general. Most proteins identified show homology with antioxidant-related proteins, such as glutathione transferase, peroxisomal enoyl-coenzyme A hydratase-like protein and peroxiredoxin. Glutathione-S-transferases (GSTs) are a family of Phase II detoxification enzymes that catalyse the conjugation of glutathione (GSH) to a wide variety of endogenous and exogenous electrophilic compounds (Townsend and Tew, 2003; Wu et al., 2004). GST was down-regulated expression in EIEC group, indicating decrease in detoxification function. This result led to EIEC invasion and damage intestinal epithelial cell. Peroxiredoxin 1 (PRDX1) is a ubiquitously expressed antioxidant with vital roles in basal metabolic functions. In addition, PRDX1 is involved in cell differentiation and proliferation, apoptosis and innate immunity (Daly et al., 2008). In addition, glyceraldehyde-3-phosphate
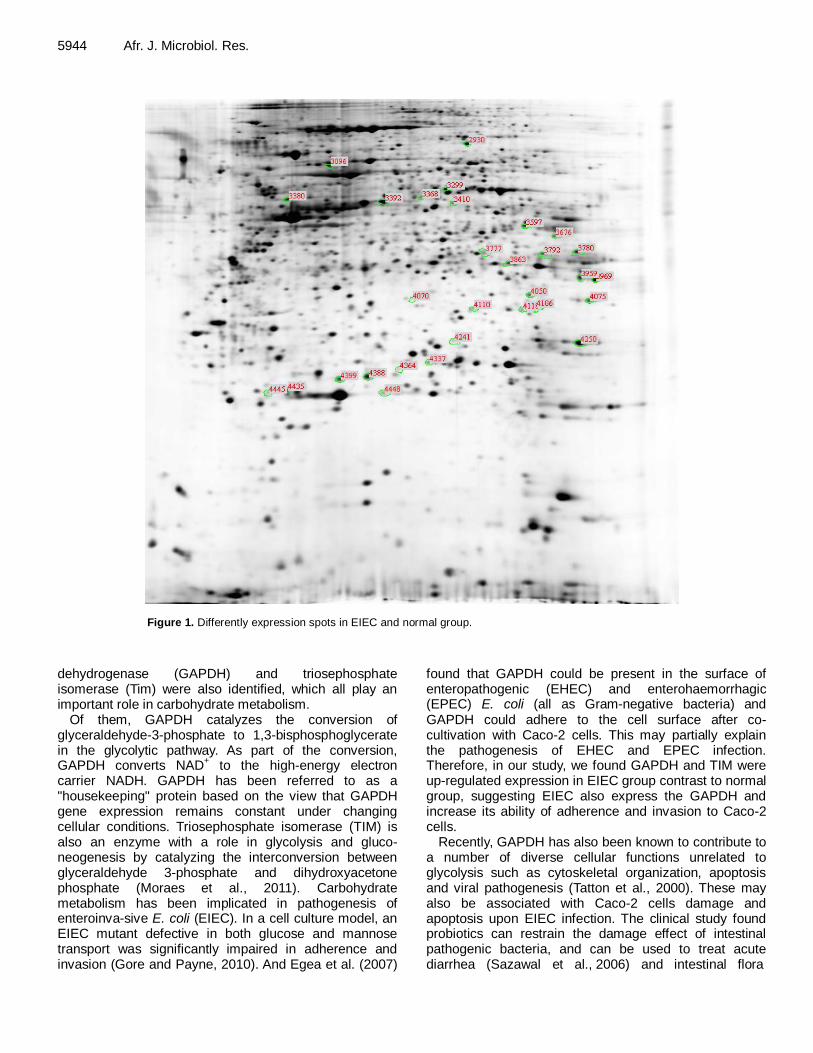
5944 Afr. J. Microbiol. Res.
Figure 1. Differently expression spots in EIEC and normal group.
dehydrogenase (GAPDH) and triosephosphate isomerase (Tim) were also identified, which all play an important role in carbohydrate metabolism.
Of them, GAPDH catalyzes the conversion of glyceraldehyde-3-phosphate to 1,3-bisphosphoglycerate in the glycolytic pathway. As part of the conversion, GAPDH converts NAD
+ to the high-energy electron
carrier NADH. GAPDH has been referred to as a "housekeeping" protein based on the view that GAPDH gene expression remains constant under changing cellular conditions. Triosephosphate isomerase (TIM) is also an enzyme with a role in glycolysis and gluco-neogenesis by catalyzing the interconversion between glyceraldehyde 3-phosphate and dihydroxyacetone phosphate (Moraes et al., 2011). Carbohydrate metabolism has been implicated in pathogenesis of enteroinva-sive E. coli (EIEC). In a cell culture model, an EIEC mutant defective in both glucose and mannose transport was significantly impaired in adherence and invasion (Gore and Payne, 2010). And Egea et al. (2007)
found that GAPDH could be present in the surface of enteropathogenic (EHEC) and enterohaemorrhagic (EPEC) E. coli (all as Gram-negative bacteria) and GAPDH could adhere to the cell surface after co-cultivation with Caco-2 cells. This may partially explain the pathogenesis of EHEC and EPEC infection. Therefore, in our study, we found GAPDH and TIM were up-regulated expression in EIEC group contrast to normal group, suggesting EIEC also express the GAPDH and increase its ability of adherence and invasion to Caco-2 cells.
Recently, GAPDH has also been known to contribute to a number of diverse cellular functions unrelated to glycolysis such as cytoskeletal organization, apoptosis and viral pathogenesis (Tatton et al., 2000). These may also be associated with Caco-2 cells damage and apoptosis upon EIEC infection. The clinical study found probiotics can restrain the damage effect of intestinal pathogenic bacteria, and can be used to treat acute diarrhea (Sazawal et al., 2006) and intestinal flora

Zhongwei and Minghua 5945
Figure 2. Relative expression profile of differently expression spots in EIEC and normal group.
Table 2. Differentially expressed proteins between L. plantarum and normal group.
Group ID Normal group L. plantarum group Group ID Normal group L. plantarum group
1122 -3.01255 3.01255 1118 -1.85844 1.85844
1615 -2.79918 2.79918 1804 -1.78829 1.78829
2007 -2.67766 2.67766 1955 1.75013 -1.75013
900 -2.58965 2.58965 1698 1.72375 -1.72375
1746 -2.56488 2.56488 639 -1.59668 1.59668
1656 2.51169 -2.51169 925 -1.59597 1.59597
1558 -2.49958 2.49958 1842 -1.5682 1.5682
1944 2.46618 -2.46618 641 -1.55929 1.55929
390 -2.04106 2.04106 1684 1.54977 -1.54977
1917 1.99593 -1.99593 1754 1.53794 -1.53794
1914 1.9928 -1.9928 638 -1.52214 1.52214
1883 1.90046 -1.90046 2159 1.51294 -1.51294
1886 1.89765 -1.89765
(Kuehbacher et al., 2006). Keratin 8 was induced up-regulated expression upon L. plantarum treatment. Keratins 8 and 18 belong to the keratin family of intermediate filament proteins and they can be covalently conjugated to constitute a hallmark for all simple epithelia
(Gilbert et al., 2001; Magin et al., 2007). Phosphorylation in some sites may affect the structure and function of this protein and even cells signal transduction (Feng et al., 1999; Ridge et al., 2005). Phosphorylation facilitates formation of Keratin 8/18 aggregates, but is not crucial.
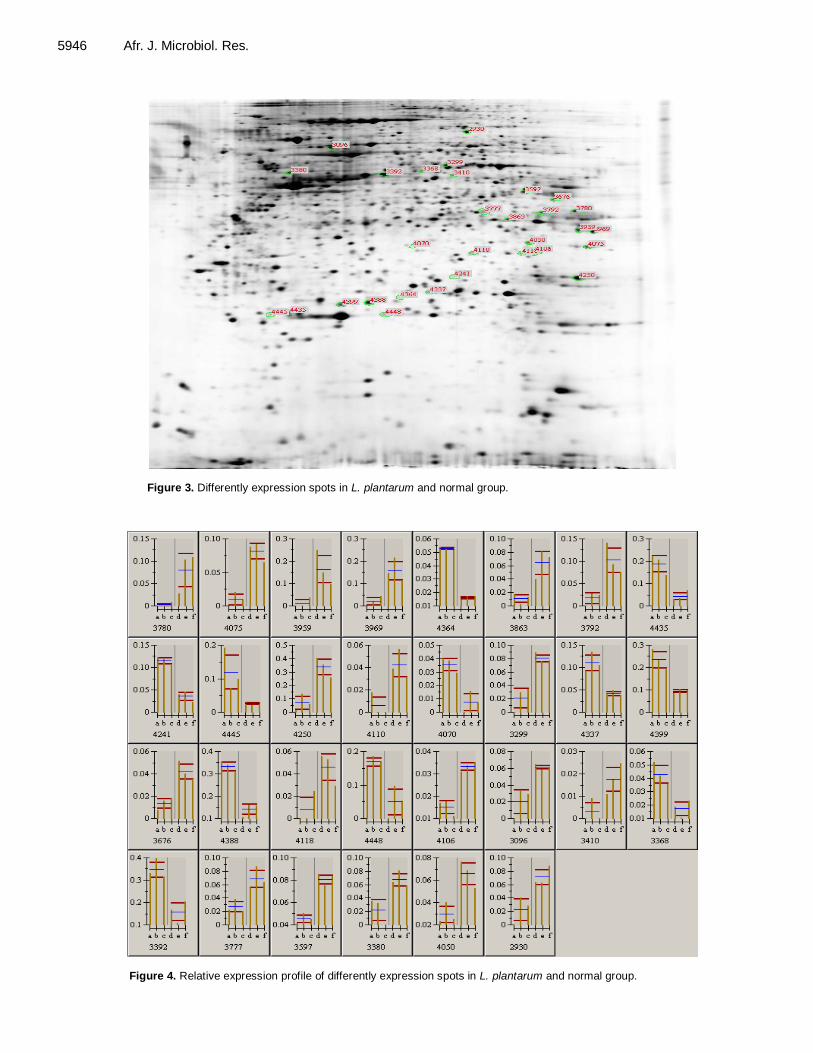
5946 Afr. J. Microbiol. Res.
Figure 3. Differently expression spots in L. plantarum and normal group.
Figure 4. Relative expression profile of differently expression spots in L. plantarum and normal group.
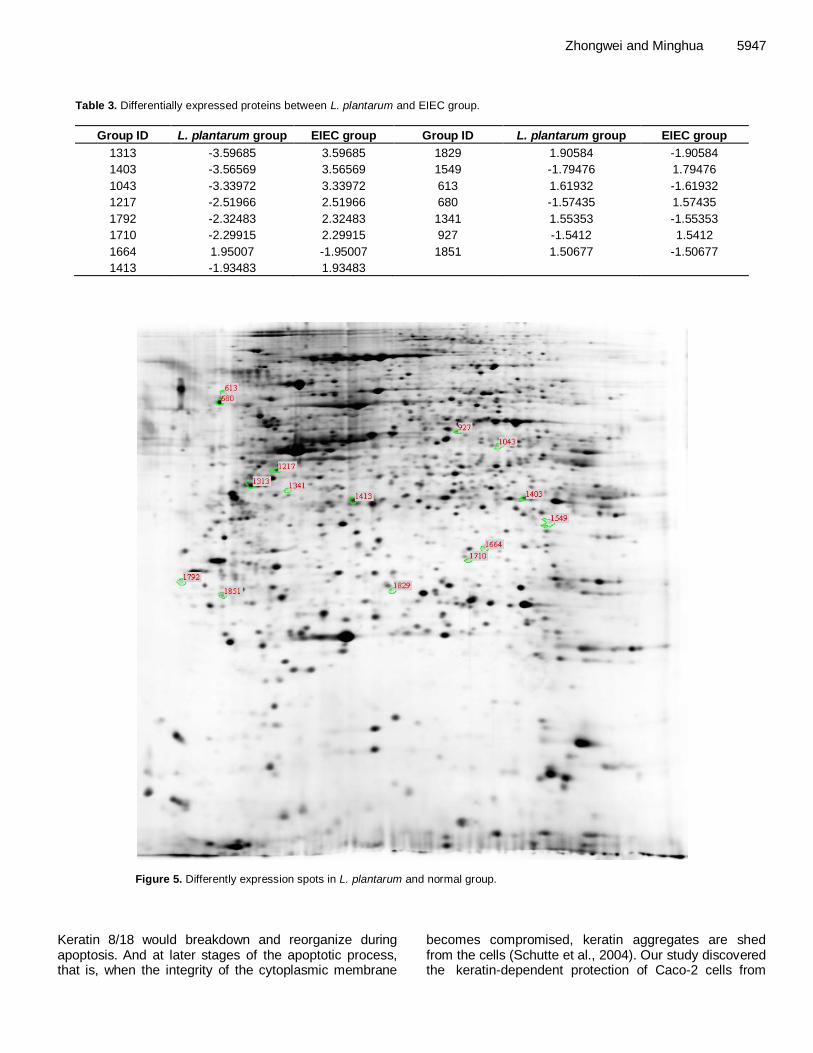
Zhongwei and Minghua 5947
Table 3. Differentially expressed proteins between L. plantarum and EIEC group.
Group ID L. plantarum group EIEC group Group ID L. plantarum group EIEC group
1313 -3.59685 3.59685 1829 1.90584 -1.90584
1403 -3.56569 3.56569 1549 -1.79476 1.79476
1043 -3.33972 3.33972 613 1.61932 -1.61932
1217 -2.51966 2.51966 680 -1.57435 1.57435
1792 -2.32483 2.32483 1341 1.55353 -1.55353
1710 -2.29915 2.29915 927 -1.5412 1.5412
1664 1.95007 -1.95007 1851 1.50677 -1.50677
1413 -1.93483 1.93483
Figure 5. Differently expression spots in L. plantarum and normal group.
Keratin 8/18 would breakdown and reorganize during apoptosis. And at later stages of the apoptotic process, that is, when the integrity of the cytoplasmic membrane
becomes compromised, keratin aggregates are shed from the cells (Schutte et al., 2004). Our study discovered the keratin-dependent protection of Caco-2 cells from
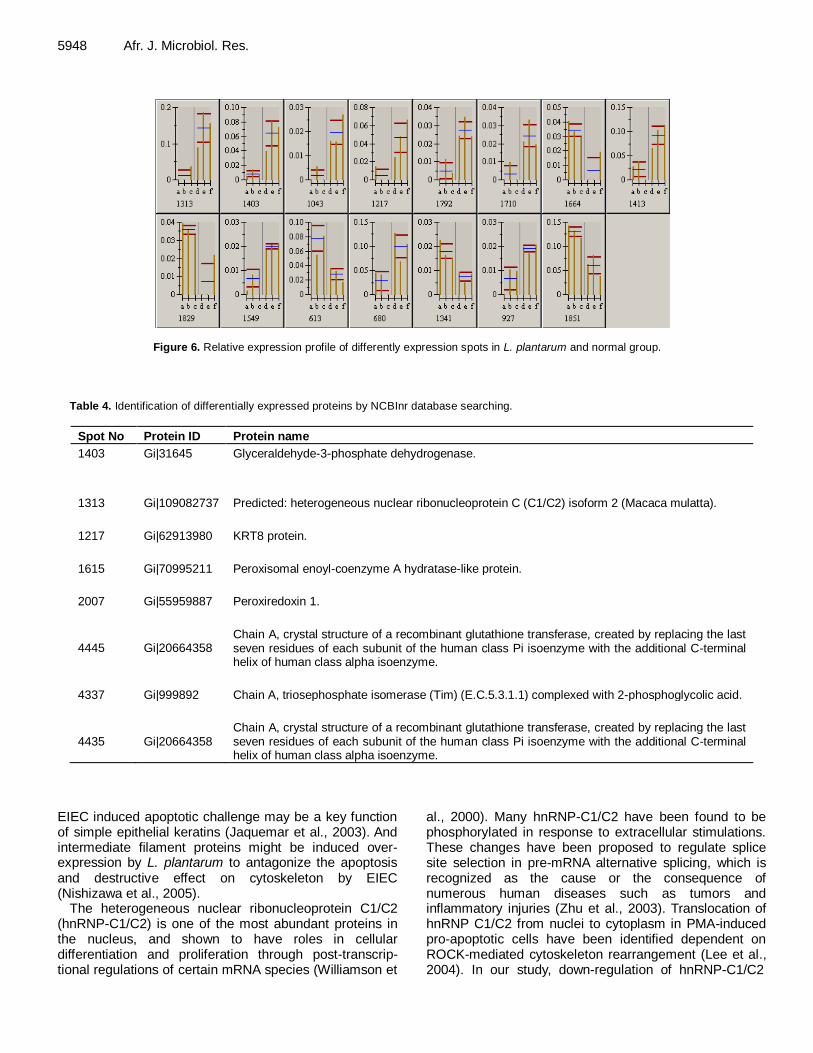
5948 Afr. J. Microbiol. Res.
Figure 6. Relative expression profile of differently expression spots in L. plantarum and normal group.
Table 4. Identification of differentially expressed proteins by NCBInr database searching.
Spot No Protein ID Protein name
1403 Gi|31645 Glyceraldehyde-3-phosphate dehydrogenase.
1313 Gi|109082737 Predicted: heterogeneous nuclear ribonucleoprotein C (C1/C2) isoform 2 (Macaca mulatta).
1217 Gi|62913980 KRT8 protein.
1615 Gi|70995211 Peroxisomal enoyl-coenzyme A hydratase-like protein.
2007 Gi|55959887 Peroxiredoxin 1.
4445 Gi|20664358 Chain A, crystal structure of a recombinant glutathione transferase, created by replacing the last seven residues of each subunit of the human class Pi isoenzyme with the additional C-terminal helix of human class alpha isoenzyme.
4337 Gi|999892 Chain A, triosephosphate isomerase (Tim) (E.C.5.3.1.1) complexed with 2-phosphoglycolic acid.
4435 Gi|20664358 Chain A, crystal structure of a recombinant glutathione transferase, created by replacing the last seven residues of each subunit of the human class Pi isoenzyme with the additional C-terminal helix of human class alpha isoenzyme.
EIEC induced apoptotic challenge may be a key function of simple epithelial keratins (Jaquemar et al., 2003). And intermediate filament proteins might be induced over-expression by L. plantarum to antagonize the apoptosis and destructive effect on cytoskeleton by EIEC (Nishizawa et al., 2005).
The heterogeneous nuclear ribonucleoprotein C1/C2 (hnRNP-C1/C2) is one of the most abundant proteins in the nucleus, and shown to have roles in cellular differentiation and proliferation through post-transcrip-tional regulations of certain mRNA species (Williamson et
al., 2000). Many hnRNP-C1/C2 have been found to be phosphorylated in response to extracellular stimulations. These changes have been proposed to regulate splice site selection in pre-mRNA alternative splicing, which is recognized as the cause or the consequence of numerous human diseases such as tumors and inflammatory injuries (Zhu et al., 2003). Translocation of hnRNP C1/C2 from nuclei to cytoplasm in PMA-induced pro-apoptotic cells have been identified dependent on ROCK-mediated cytoskeleton rearrangement (Lee et al., 2004). In our study, down-regulation of hnRNP-C1/C2

upon L. plantarum treatment might be as a novel mechanism to enhance the resistance of Caco-2 cells to apoptosis, inflammatory and indirectly decrease the hnRNP C1/C2 translocation. REFERENCES
Cossart P, Sansonetti PJ (2004). Bacterial invasion: the paradigms of enteroinvasive pathogens. Science, 304(5668): 242-248.
Croxen MA, Finlay BB (2009). Molecular mechanisms of Escherichia
coli pathogenicity. Nat. Rev. Microbiol., 8(1): 26-38.
Daly KA, Lefévre C, Nicholas K, Deane E, Williamson P (2008). Characterization and expression of Peroxiredoxin 1 in the neonatal
tammar wallaby (Macropus eugenii). Comp. Biochem. Physiol. Biochem. Mol. Biol., 149(1): 108-119.
Egea L, Aguilera L, Giménez R, Sorolla M, Aguilar J, Badía J, Baldoma
L (2007). Role of secreted glyceraldehyde-3-phosphate dehydrogenase in the infection mechanism of enterohemorrhagic and enteropathogenic Escherichia coli: interaction of the extracellular
enzyme with human plasminogen and fibrinogen. Int. J. Biochem. Cell Biol., 39(6): 1190-1203.
Feng L, Zhou X, Liao J, Omary MB (1999). Pervanadate-mediated
tyrosine phosphorylation of keratins 8 and 19 via a p38 mitogen-activated protein kinase-dependent pathway. J. Cell. Sci., 112(13): 2081-2090.
Gilbert S, Loranger A, Daigle N, Marceau N (2001). Simple epithelium keratins 8 and 18 provide resistance to Fas-mediated apoptosis. The protection occurs through a receptor-targeting modulation. J. Cell
Biol., 154(4): 763-73. Gore AL, Payne SM (2010). CsrA and Cra influence Shigella flexneri
pathogenesis. Infect Immun., 78(11): 4674-82.
Jaquemar D, Kupriyanov S, Wankell M, Avis J, Benirschke K, Baribault H, Oshima RG (2003). Keratin 8 protection of placental barrier function. J. Cell Biol., 161(4): 749-56.
Kuehbacher T, Ott SJ, Helwig U, Mimura T, Rizzello F, Kleessen B, Gionchetti P, Blaut M, Campieri M, F lsch UR (2006). Bacterial and fungal microbiota in relation to probiotic therapy (VSL# 3) in pouchitis.
Gut., 55(6): 833-41. Lahouassa H, Moussay E, Rainard P, Riollet C (2007). Differential
cytokine and chemokine responses of bovine mammary epithelial cells to Staphylococcus aureus and Escherichia coli. Cytokine., 38(1):
12-21. Lee HH, Chien CL, Liao HK, Chen YJ, Chang ZF (2004). Nuclear efflux
of heterogeneous nuclear ribonucleoprotein C1/C2 in apoptotic cells: a novel nuclear export dependent on Rho-associated kinase activation. J. Cell. Sci., 117(23): 5579-89.
Magin TM, Vijayaraj P, Leube RE (2007). Structural and regulatory functions of keratins. Exp. Cell Res., 313(10): 2021-2032.
Michail S, Abernathy F (2003). Lactobacillus plantarum inhibits the
intestinal epithelial migration of neutrophils induced by enteropathogenic Escherichia coli. J. Pediatr. Gastroenterol. Nutr.,
36(3): 385-91.
Zhongwei and Minghua 5949 Moraes J, Arreola R, Cabrera N, Saramago L, Freitas D, Masuda A
(2011). Structural and biochemical characterization of a recombinant triosephosphate isomerase from Rhipicephalus (Boophilus)
microplus. Insect Biochem. Mol. Biol., 41(6): 400-9. Nishizawa M, Izawa I, Inoko A, Hayashi Y, Nagata K, Yokoyama T,
Usukura J, Inagaki M (2005). Identification of trichoplein, a novel
keratin filament-binding protein. J. Cell. Sci., 118(5): 1081-90. Parsot C (2005). Shigella spp. and enteroinvasive Escherichia coli
pathogenicity factors. FEMS Microbiol. Lett., 252(1): 11-18.
Qin H, Zhang Z, Hang X, Jiang Y (2009). L. plantarum prevents enteroinvasive Escherichia coli-induced tight junction proteins
changes in intestinal epithelial cells. BMC Microbiol., 9(1): 63.
Resta-Lenert S, Barrett K (2003). Live probiotics protect intestinal epithelial cells from the effects of infection with enteroinvasive Escherichia coli (EIEC). Gut., 52(7): 988-97.
Resta-Lenert S, Barrett KE (2006). Probiotics and commensals reverse TNF-[alpha]-and IFN-[gamma]-induced dysfunction in human intestinal epithelial cells. Gastroenterology, 130(3): 731-746.
Ridge KM, Linz L, Flitney FW, Kuczmarski ER, Chou YH, Omary MB, Sznajder JI, Goldman RD (2005). Keratin 8 phosphorylation by protein kinase C delta regulates shear stress-mediated disassembly
of keratin intermediate filaments in alveolar epithelial cells. J. Biol. Chem., 280(34): 30400-5.
Sazawal S, Hiremath G, Dhingra U, Malik P, Deb S, Black RE (2006).
Efficacy of probiotics in prevention of acute diarrhoea: a meta-analysis of masked, randomised, placebo-controlled trials. Lancet Infect. Dis., 6(6): 374-382.
Schutte B, Henfling M, K lgen W, Bouman M, Meex S, Leers MPG, Nap M, Bj rklund V, Bj rklund P, Bj rklund B (2004). Keratin 8/18 breakdown and reorganization during apoptosis. Exp. Cell Res.,
297(1): 11-26. Song T, Toma C, Nakasone N, Iwanaga M (2005). Sensitive and rapid
detection of Shigella and enteroinvasive Escherichia coli by a loop-
mediated isothermal amplification method. FEMS Microbiol. Immunol., 243(1): 259-263.
Steiner TS, Nataro JP, Poteet-Smith CE, Smith JA, Guerrant RL (2000). Enteroaggregative Escherichia coli expresses a novel flagellin that
causes IL-8 release from intestinal epithelial cells. J. Clin. Invest., 105(12):1769-1778.
Tatton WG, Chalmers-Redman RM, Elstner M, Leesch W, Jagodzinski FB, Stupak DP, Sugrue MM, Tatton NA (2000). Glyceraldehyde-3-phosphate dehydrogenase in neurodegeneration and apoptosis
signaling. J. Neural. Transm. Suppl., 60: 77-100. Townsend DM, Tew KD (2003). The role of glutathione-S-transferase in
anti-cancer drug resistance. Oncogene, 22(47): 7369-7375.
Williamson DJ, Banik-Maiti S, DeGregori J, Ruley HE (2000). hnRNP C is required for postimplantation mouse development but is dispensable for cell viability. Mol. Cell. Biol., 20(11): 4094-105.
Wu G, Fang YZ, Yang S, Lupton JR, Turner ND (2004). Glutathione
metabolism and its implications for health. J. Nutr., 134(3): 489-492. Zhu YQ, Lu Y, Tan XD (2003). Monochloramine induces reorganization
of nuclear speckles and phosphorylation of SRp30 in human colonic
epithelial cells: role of protein kinase C. Am. J. Physiol., Cell Physiol., 285(5): C1294-303.
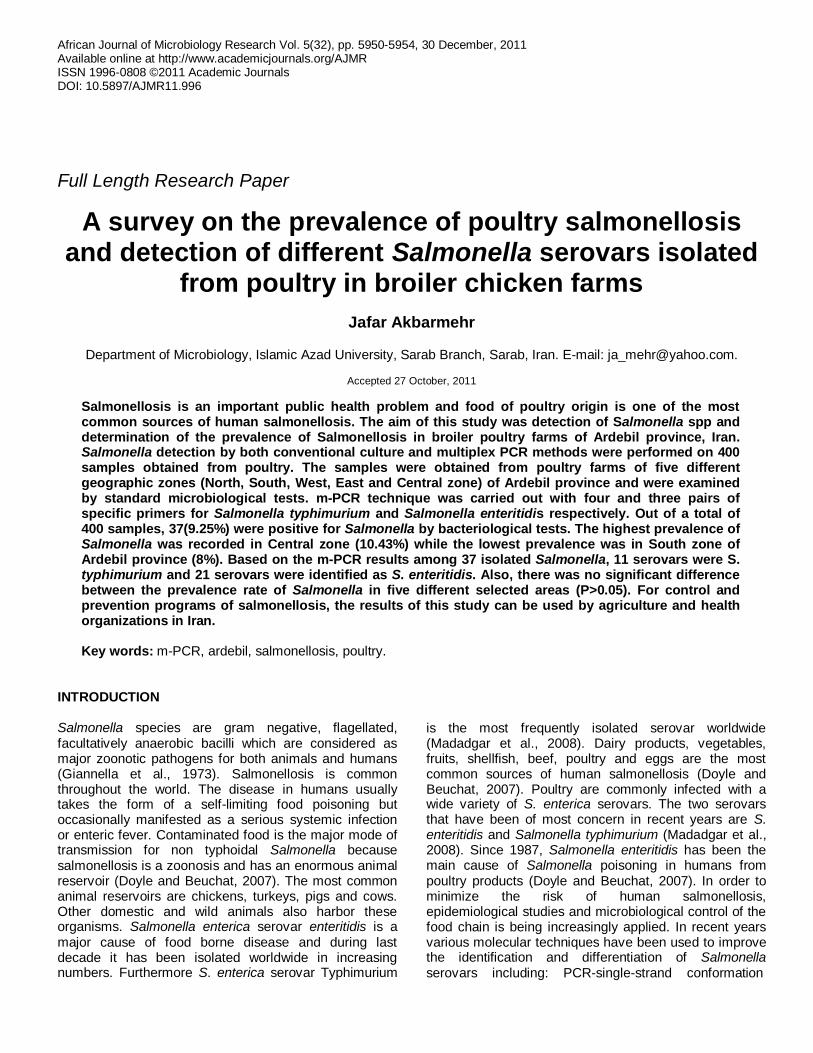
African Journal of Microbiology Research Vol. 5(32), pp. 5950-5954, 30 December, 2011 Available online at http://www.academicjournals.org/AJMR ISSN 1996-0808 ©2011 Academic Journals DOI: 10.5897/AJMR11.996
Full Length Research Paper
A survey on the prevalence of poultry salmonellosis and detection of different Salmonella serovars isolated
from poultry in broiler chicken farms
Jafar Akbarmehr
Department of Microbiology, Islamic Azad University, Sarab Branch, Sarab, Iran. E-mail: [email protected].
Accepted 27 October, 2011
Salmonellosis is an important public health problem and food of poultry origin is one of the most common sources of human salmonellosis. The aim of this study was detection of Salmonella spp and determination of the prevalence of Salmonellosis in broiler poultry farms of Ardebil province, Iran. Salmonella detection by both conventional culture and multiplex PCR methods were performed on 400 samples obtained from poultry. The samples were obtained from poultry farms of five different geographic zones (North, South, West, East and Central zone) of Ardebil province and were examined by standard microbiological tests. m-PCR technique was carried out with four and three pairs of specific primers for Salmonella typhimurium and Salmonella enteritidis respectively. Out of a total of 400 samples, 37(9.25%) were positive for Salmonella by bacteriological tests. The highest prevalence of Salmonella was recorded in Central zone (10.43%) while the lowest prevalence was in South zone of Ardebil province (8%). Based on the m-PCR results among 37 isolated Salmonella, 11 serovars were S. typhimurium and 21 serovars were identified as S. enteritidis. Also, there was no significant difference between the prevalence rate of Salmonella in five different selected areas (P>0.05). For control and prevention programs of salmonellosis, the results of this study can be used by agriculture and health organizations in Iran. Key words: m-PCR, ardebil, salmonellosis, poultry.
INTRODUCTION Salmonella species are gram negative, flagellated, facultatively anaerobic bacilli which are considered as major zoonotic pathogens for both animals and humans (Giannella et al., 1973). Salmonellosis is common throughout the world. The disease in humans usually takes the form of a self-limiting food poisoning but occasionally manifested as a serious systemic infection or enteric fever. Contaminated food is the major mode of transmission for non typhoidal Salmonella because salmonellosis is a zoonosis and has an enormous animal reservoir (Doyle and Beuchat, 2007). The most common animal reservoirs are chickens, turkeys, pigs and cows. Other domestic and wild animals also harbor these organisms. Salmonella enterica serovar enteritidis is a major cause of food borne disease and during last decade it has been isolated worldwide in increasing numbers. Furthermore S. enterica serovar Typhimurium
is the most frequently isolated serovar worldwide (Madadgar et al., 2008). Dairy products, vegetables, fruits, shellfish, beef, poultry and eggs are the most common sources of human salmonellosis (Doyle and Beuchat, 2007). Poultry are commonly infected with a wide variety of S. enterica serovars. The two serovars that have been of most concern in recent years are S. enteritidis and Salmonella typhimurium (Madadgar et al., 2008). Since 1987, Salmonella enteritidis has been the main cause of Salmonella poisoning in humans from poultry products (Doyle and Beuchat, 2007). In order to minimize the risk of human salmonellosis, epidemiological studies and microbiological control of the food chain is being increasingly applied. In recent years various molecular techniques have been used to improve the identification and differentiation of Salmonella serovars including: PCR-single-strand conformation

Akbarmehr 5951 Table 1. Sequences of oligonucleotides used as primers in m- PCR for S. typhimurium (a) and S. enteritidis (b) (Rahn et al., 1992).
Primer Sequence Target gene Amplicon fragment(bp)
RfbJ-s 5'-CCAJCACCAGTTCCAACTTGATAC rfbJ 663
RfbJ-as (a) 5'-GGCTTCCGGCTTTATTGGTAAGCA
FliC-s 5'-ATAGCCATCTTTACCAGTTCCCCC fjlC 183
FliC –as (a) 5'-GCTGCAACTGTTACAGGATATGCC
FljB-s 5'-ACGAATGGTACGGCTTCTGTAACC fljB 526
FljB -as (a) 5'-TACCGTCGATAGTAACGACTTCGG
ST 139-s 5'-GTGAAATTATCGCCACGTTCGGGCAA invA 284
ST141-as (a) 5'-TCATCGCACCGTCAAAGGAACC
ST11 5'-GCCAACCATTGCTAAATTGGCGCA Random sequence 429
ST14 (b) 5'-GGTAGAAATTCCCAGCGGGTACTGG
S1 5'-GCCGTACACGAGCTTATAGA spv 250
S4 (b) 5'-ACCTACAGGGGCACAATAAC
SEFA2 5'-GCAGCGGTTACTATTGCAGC sefA 310
SEFA4 (b) 5'-TGTGACAGGGACATTTAGCG
polymorphism analysis (Satheesh et al., 2002), genomic and phenotyping evaluation (Madadgar et al., 2008), pulsed field gel electrophoresis (Mhand et al., 1999; Thong, 1998), PCR assay (Hoorfar and Ahrens, 2000; Feeder et al., 2001; Kongmuang et al., 1994; Lin and Tsen, 1999; Malorny et al., 2003), RFLP (Aarts et al., 1998). One of the most important used techniques for identification of Salmonella serovars is PCR technique using Salmonella genes (Kisiela and Kuczkowki, 2005).
In 2004, Alvarez et al. (2004) have desecribed m- PCR as a method for Salmonella diagnosis that is simple, inexpensive and sensitive and enables the quick and precise detection of the most prevalent serotypes of Salmonella in human clinical samples. In recent years several studies were carried out by different authors in order to determine the prevalence of poultry salmonellosis in Iran. Based on these studies the prevalence of Salmonella in poultry were reported in different areas in Iran (Zahraei et al., 2005; Madadgar et al., 2008; Jamshidi et al., 2008; Akbarmehr, 2010). But until now epidemiological study about poultry salmonellosis in Ardebil province which is located in Northwest of Iran has not been widely studied. Therefore in the present study we investigated the poultry salmonellosis in broiler chicken farms of Ardebil province using conventional culture and mPCR assay. MATERIALS AND METHODS
Sampling and microbiological tests
This study was carried out in Ardebil province, Iran. The province
was divided into five different geographic areas as follows: North, South, west, East and Central zone. A total of 400 samples were collected from broiler poultry farms in the aforementioned areas from January 2010 to June 2011(60, 50, 85, 90, 115 samples were obtained from North, South, west, East and Central zone respectively). The samples were harvested from yolk sac, spleen, intestine and liver of chickens and examined by standard procedures (enrichment 24 h in selenite F (Merk) at 37°C, plated on XLD agar and incubated at 37°C for 24 h, confirmation of suspected
colonies by biochemical tests) as described by Quinn et al. (1994). PCR amplification
The Salmonella isolates were grown overnight at 37°C in brain heart infusion broth. 2 ml of the bacteria culture were centrifuged for 10 min at 16000 rpm. Purified DNA was used as a templet for the PCR assay. For the m- PCR, seven primer pairs were used. Four pairs of primers were used for S. typhimurium and three pairs of them for S. enteritidis (Table 1). PCR was carried out in a 25 µl amplification mixture consisting of 200 mM dNTPs, 1 µm of each primer, 40 ng of genomic DNA, 1.5 mM MgCl2 and 1U of Taq DNA polymerase (fermentase). Amplification was performed in a thermal cycler (Biosystem). The cycling condition was as follows: initial denaturation at 95°C for 5 min, followed by 35 cycles of denaturation at 94°C for 60 s, annealing at 65°C for 30 s,
elongation at 72°C for 30 s and final extenstion period for 7 min (Zahraei et al., 2005). Amplified products were subjected to electrophresis at 100 V on a 1.2% agarose gel for 1 h and a 100 bp DNA ladder was used as a size reference. After staining with ethidium bromide, the gel was documented and photographed under ultra violet light. S. typhimurium with ATCC- 14025 and S. enteritidis with RTCC-1624 were used as positive control.
RESULTS
The prevalence of salmonellosis in poultry in the five

5952 Afr. J. Microbiol. Res.
Table 2. Prevalence of salmonellosis in the broiler farms of five selected zones of Ardebil province, Iran.
Zone No. of examined samples No. positive samples Prevalence rate (%)
North 60 5 8.33
South 50 4 8
West 85 8 9.4
East 90 8 8.88
Central 115 12 10.43
Total 400 37 9.25
Figure 1. Multiplex PCR with four pairs of primers for S .typhimurium isolated from poultry. The 183 bp bands produced by fliC gene (specific for S .typhimurium) and the 284 bp bands produced by invA gene (specific for the genus Salmonella). The 526 and 663 bp bands produced by fljB and rfbJ genes respectively. M: marker )100 bp). PC: positive control (S. typhimurium with ATCC- 14025). Lanes 1, 3 and 4 are positive samples for S. typhimurium. Lanes 2, 5, 6 and 7 are positive samples for genus of Salmonella.
selected zones of Ardebil province are shown in Table 1. Out of a total 400 samples, 37(9.25%) were positive for Salmonella by bacteriological tests. As Table 2 shows the highest, prevalence was recorded in Central zone (10.43%) while the lowest prevalence was in south zone of Ardebil province (8%). MPCR technique which was carried out with specific primers for S. typhimurium and S. enteritidis (Table1). Among 37 isolated Salmonella, 11 serovars of S. typhimurium and 21 serovars of S. enteritidis were confirmed by MPCR technique. Distri-bution of S. typhimurium and S. enteritidis in different geographic area of Ardebil province is shown in Table 2. Also, Figures 1 and 2 shows the MPCR results (Table 3) of S. typhimurium and S. enteritidis respectively. DISCUSSION Salmonella is an important cause of food-borne infections. Most of these infections are caused by Salmonella originated from poultry (Doyle and Beuchat,
2007). As Table 1 shows out of 400 samples which was examined by bacteriological tests 37(9.25%) of them had positive results for Salmonella strains. This finding is comparable to the reports of previous works from other cities and provinces in Iran. While some previous authors reported higher prevalences of Salmonella in poultry, the others reported lower prevalence compared to this study. In a study which was conducted in Fars province, Iran the prevalence of poultry salmonellosis was determined 15.62% (Zahraei et al., 2005). Another survey which was conducted in Mashhad city, Iran; the prevalence of Salmonella in poultry carcasses was determined by 8.3% (Jamshidi et al., 2008). In 2010, Akbarmehr et al. (2010) reported the prevalence of poultry salmonellosis in Sarab city, Iran as 7.25%. According to Table 1 although the prevalence of Salmonella is widely distributed in all over the five selected geographic area in Ardebil province but the prevalence rates were varied from 8% (South zone) to 10.43% (Central zone). This may be due to confirement system of poultry farms in central zone of Ardebil province which provides the easily distribution of
M PC 1 2 3 4 5 6 7
Akbarmehr 5953
Figure 2. m-PCR with three pairs of primers for S. enteritidis isolated from poultry: the 250 bp bands
produced by Salmonella plasmid virulent gene. The 310 bp bands produced by S.enteritidis fimbrial antigen gene and the 429 bp bands produced by randomly cloned sequence which is specific for the genus Salmonella. M: marker (100 bp). PC: positive control (S. enteritidis with RTCC-1624). Lanes 2, 3 and 5 are positive samples for S. enteritidis. Lanes 1, 4 and 6 are positive samples for genus of Salmonella.
Table 3. Distribution of S. typhimurium and S. enteritidis in different geographic area of Ardebil province based on MPCR results.
Zone No. of positive samples S. typhimurium S. enteritidis
No % No %
North 5 1 20 3 60
South 4 1 25 3 75
West 8 2 25 5 62.5
East 8 3 37.5 4 50
Central 12 4 33.33 6 50
Total 37 11 29.72 21 56.75
Salmonella between poultry farms. Although there were no significant differences between different prevalence rates (P>0.05). According to Figure 1, S. typhimurium serovars confirmed with four pairs of primers by m-PCR method. As Figure 1 shows the 284 bp bands produced by invA genes which were found in all of the S. typhimurium serovars. Primers targeting the rfbJ, fliC and fljB genes were used for specific identification of S. typhimurium which produced 663, 183 and 526 bp bands respectively. Olivera reported that the m-PCR technique using invA gene for detection of Salmonella and fliC gene for identification of S. typhimurium from poultry- related samples was 100% specific (Oliveira et al., 2002). Also, S. enteritidis serovars comfirmed with three pairs of primers in this study (Figure 2).
The 429 bp bands were found in all of the Salmonella serovars produced by randomly cloned sequenced which were specific for the genus Salmonella. Salmonella plasmid virulent gene (Spv) and S. enteritidis fimbrial
antigen gene (sefA) (which produced 250 and 310 bp bands respectively) were used for specific identification of S. enteritidis serovars (Madadgar et al., 2008). Based on m-PCR results, S. enteritidis with 56.75% frequency and S. typhimurium with 29.72% frequency were the most common serovars in five different zones of poultry farms in Ardebil province. Out of 37 Salmonella isolates, 5 (13.51%) were other seovars which were not identified in this study. It should be considered that the predominant Salmonella serovars differ in different countries. But in Iran many authors showed that S. enteritidis and S. typhimurium are the most prevalent serotypes of Salmonella (Zahraei et al., 2005; Akbarmehr et al., 2010; Madadgar et al., 2008). Because of the ability of Salmonella in poultry meat and egg that are not thoroughly cooked, poultry originated products are the main vehicle of transmission (Gianella, 1973). Finally the present research is the first precise study about epidemiology of salmonellosis in poultry farms of Ardebil
5 4 3 2 1 M PC 6

5954 Afr. J. Microbiol. Res. province, Iran using conventional culture and m-PCR Assay and our results revealed an important public health and veterinary problem which must be considered by agriculture and public health organizations in Iran. ACKNOWLEDGEMENTS This work was supported by the Islamic Azad University of Sarab Branch. We are thankful to Mr. S. S. Taheri for his valuable collaboration. REFERENCES Aarts HJ, Vanlith J T, Keljer J (1998). High resolution genotyping of
Salmonella Strains by AFLP fingerprinting. Lett. Appl. Microbiol.,
26:131-135. Akbarmehr J, zahraei Salehi T, Nikbakht Gh (2010). Identification of
Salmonella isolated From poultry by MPCR technique and evaluation
of their hsp groEL gene diversity based on the PCR-RFLP analysis. Afr. J. Microbiol. Res., 4(15):1599-16o4.
Alvarez J, Sota M, Vivanco AB, Perales I, Cisterna R, Rementeria A,
Garaizar J (2004). Development of multiplex PCR technique for detection and epidemiological typing of Salmonella in human clinical
samples. J. Clin. Microbiol., 42:1734-1738.
Doyle MP, Beuchat LR (2007). Food Microbiology.third edition ASM Press. Washington D.C., pp. 187-219.
Feeder I, Nietfeld JC, Galland J, Yeary T, Sargeant JM, Oberst R,
Tamplin ML, Luchansky JB(2001). Comparison of Cultivation and PCR hybridization for detection of Salmonella in porcine fecal and
Water samples. J. Clin. Microbiol., 39:2477_2484
Giannella RA, Formal SB, Dammin GJ (1973). Pathogenesis of salmonellosis :studies of fluid secretion, mucosal invasion, and morphological reaction in the rabit ileum. J. Clin. Invest., 52:441.
Hoorfar JP, Ahrens P (2000).Automated 5' nuclease PCR assay for identification of Salmonella enterica .J. Clin. Microbiol., 38:3429-
3435.
Jamshidi A, Bassami MR, Afshari-Nic S (2008).Identification of Salmonella spp and Salmonella typhimurium by multiplex PCR-based
assay from poultry caracasses in Mashhad –Iran. Int. J. Vet Res.,
3(1):43-48.
Kisiela D, Kuczkowki M (2005). Differentiation of Salmonella gallinarum
biovar gallinarum from Salmonella gallinarum biovar pullorum by
PCR-RFLP of the fim H gene. J. Vet. Med., B52:214-218.
Kongmuang U, Luk JMC, Lindberg AA (1994). Comparison of three stool- processing methods for detection of Salmonella serogroups
B,C2, and D by PCR. J. Clin. Microbiol., 23:3072-3074.
Lin JS, Tsen HY (1999). Development and use of polymerase chain reaction for the detection of S. typhimurium in stool and food
samples. J. Food Prot., 62:1103-1110.
Madadgar O, Zahraei Salehi T, Tadjbakhsh H, Mahzounieh M, Feizabadi M (2008). Genomic and phenotypic evaluation of Salmonella typhimurium and Salmonella enteritidis in Iran. Comp.
Clin. Pathol., 17:229-235. Mhand RA, Brahimi N, Moustaoui N, Mdaghri NE, Amarouch H, Grimont
F (1999). Characterization of extended spectrum beta lactamase producing Salmonella typhimurium by phenotypic and genotypic
typing methods. J. Clin. Microbiol., 37:3769-3773. Malorny B, Hoorfar JC, Bunge C, Helmuth R (2003). Multicenter
validation of the analytic accuracy of Salmonella PCR:towards an
international standard . Appl. Environ. Microbiol., 69:290-296. Oliveira SD, Santos LRD, Schuch M T, Silva ABC, SalleT P, Canal CW
(2002). Detection and identification of Salmonella from
poultry_related samples by PCR. Vet. Microbiol., 87:25_35. Quinn PJ, Carter ME, Markey B, Carter GR (1994). Clinical Vet
Microbiology .Wolf publishing. pp. 209-236. Rahn K, DeGrandis S, Clarke R, Mcewen S (1992). Amplification of an
invA gene seguence of Salmonella typhimurium by polymerase chain
reaction as a specific method of detection of Salmonella. Mol. Cell.
Probe, 6:271_279. Satheesh N, Thong KL , Tikki P, Martin A (2002). Characterization of
Salmonella serovars by PCR-Single-Strand Conformation
Polymorphism analysis. J. Clin. Microbiol., pp. 2346-2351. Thong KL (1998).Molecular analysis of S.paratyphi A from outbreak in
New Dehli, India. Emerg. Infect. Dis., 4:507-508. Zahraei Salehi T, Mahzounieh M, Saeedzadeh, A (2005).The isolation
of antibiotic-resistant Salmonella from intestine and Liver of poultry in
Shiraz province of Iran. Int. J. Poult. Sci., 4(5):320-322.
African Journal of Microbiology Research Vol. 5(32), pp. 5955-5959, 30 December, 2011 Available online at http://www.academicjournals.org/AJMR ISSN 1996-0808 ©2011 Academic Journals DOI: 10.5897/AJMR11.1000
Full Length Research Paper
Isolation and exploitation of Aspergillus ochraceus RM82 against human pathogenic bacteria
Riaz Muhammad, Sajid Ali and Bashir Ahmad*
Pharma biotech Research Laboratory, Centre for Biotechnology and Microbiology, University of Peshawar, KPK,
Pakistan.
Accepted 11 November, 2011
In the present research work, soil samples were col lected from different hospitals of District Peshawa r, Khyber Pakhtunkhwa, Pakistan, contaminated with hos pital disposable materials. Aspergillus ochraceus was isolated from the soil through serial dilution followed by morphological identification. Furthermore, different strains of human pathogenic bacteria were isolated from hospitalized patient’s blood, urine and pus samples. The isolated A. ochraceus was tested against the isolated pathogenic bacterial strains for antimicrobial activities. Ant ibacterial results were observed against multi drug s resistant (MDR) human pathogenic bacteria. Key words: Aspergillus ochraceus, pustule, antimicrobial, multi drugs resistant.
INTRODUCTION Multi drugs resistant bacteria such as methiciline-resistant Staphylococcus aureus (MRSA) emerged during the last decade and clinically are the cause of serious problems (Levin and Andreasen, 1999). The last choice for the treatment of MDR is vancomycin. Due to vancomycin-resistant Enterococci (VRE) and vancomycin-intermediate resistant S. aureusarises a global health concerns (Gilmore and Hoch, 1999). Accordingly it is the cry of the day to exploit antibiotic producing microorganisms for the extraction of novel antimicrobial compounds against MDR, VRE and VISA (Levy, 1998).
Although very important compounds have been extracted from microorganisms but antibiotics have prominent importance due to therapeutic value (McCarthy and Williams, 1990; Ouhdouch et al., 2001; Saadoun and Gharaibeh, 2003). It has been found that emergence of high antibacterial resistance is the alarming problem throughout the world. It is obvious from the irrational use *Corresponding author. E-mail: [email protected]. Tel: +92-921-6701, Ext. 3070.
of antibiotics that the efficacies of present antibiotics are decreasing slowly and steadily due to antibiotic resistance. In the perspective of documented reports it is the need of the hour to search for novel compounds (Barbara and Clewes, 2003; Shahghasi et al., 2004). Search for microorganisms producing novel antimicro-bials, is still have prime importance due to the continuous emergence of antibiotic resistance (Zrimec et al., 2004).
It has been found that the divers medium of soil has essential macro and micronutrients, playing a vital role in the metabolic pathways of microorganisms (Luzhetskyy et al., 2007; Thomashow et al., 2008). Since micro biologist believed that only a minute fraction of soil micro- flora has been identified (Thomashow et al., 2008).
After the discovery of magic bullet penicillin, a lot of different antibiotics have been investigated and searched out largely from soil inhabiting microbes. During the last 20-30 years, researchers interest in the soil inhabiting microorganism have been enhanced, due to the increased possibility of searching novel bioactive com-pounds, like antibiotics and enzymes, active in diverse environmental parameters (Nedialkova and Naidenova, 2004).
A large numbers of antimicrobial secondary metabolites
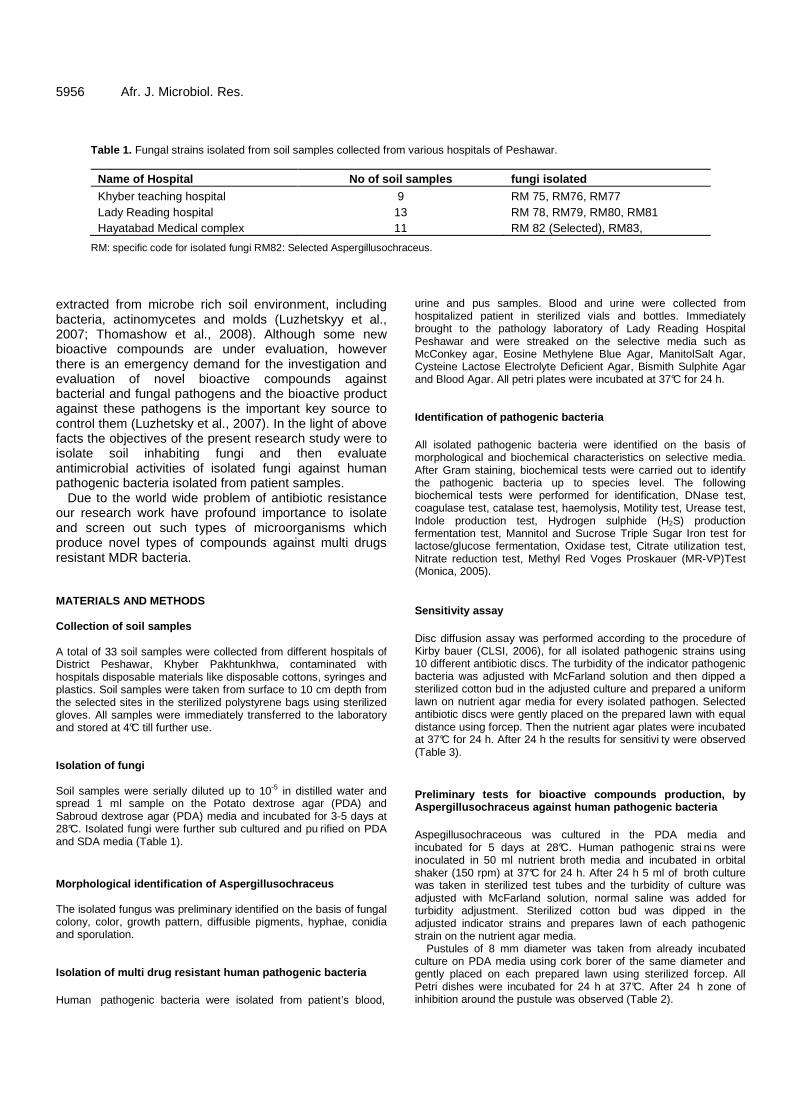
5956 Afr. J. Microbiol. Res.
Table 1. Fungal strains isolated from soil samples collected from various hospitals of Peshawar.
Name of Hospital No of soil samples fungi isolated
Khyber teaching hospital 9 RM 75, RM76, RM77 Lady Reading hospital 13 RM 78, RM79, RM80, RM81 Hayatabad Medical complex 11 RM 82 (Selected), RM83,
RM: specific code for isolated fungi RM82: Selected Aspergillusochraceus. extracted from microbe rich soil environment, including bacteria, actinomycetes and molds (Luzhetskyy et al., 2007; Thomashow et al., 2008). Although some new bioactive compounds are under evaluation, however there is an emergency demand for the investigation and evaluation of novel bioactive compounds against bacterial and fungal pathogens and the bioactive product against these pathogens is the important key source to control them (Luzhetsky et al., 2007). In the light of above facts the objectives of the present research study were to isolate soil inhabiting fungi and then evaluate antimicrobial activities of isolated fungi against human pathogenic bacteria isolated from patient samples.
Due to the world wide problem of antibiotic resistance our research work have profound importance to isolate and screen out such types of microorganisms which produce novel types of compounds against multi drugs resistant MDR bacteria. MATERIALS AND METHODS Collection of soil samples A total of 33 soil samples were collected from different hospitals of District Peshawar, Khyber Pakhtunkhwa, contaminated with hospitals disposable materials like disposable cottons, syringes and plastics. Soil samples were taken from surface to 10 cm depth from the selected sites in the sterilized polystyrene bags using sterilized gloves. All samples were immediately transferred to the laboratory and stored at 4°C till further use. Isolation of fungi Soil samples were serially diluted up to 10-5 in distilled water and spread 1 ml sample on the Potato dextrose agar (PDA) and Sabroud dextrose agar (PDA) media and incubated for 3-5 days at 28°C. Isolated fungi were further sub cultured and pu rified on PDA and SDA media (Table 1). Morphological identification of Aspergillusochraceus The isolated fungus was preliminary identified on the basis of fungal colony, color, growth pattern, diffusible pigments, hyphae, conidia and sporulation. Isolation of multi drug resistant human pathogenic bacte ria Human pathogenic bacteria were isolated from patient’s blood,
urine and pus samples. Blood and urine were collected from hospitalized patient in sterilized vials and bottles. Immediately brought to the pathology laboratory of Lady Reading Hospital Peshawar and were streaked on the selective media such as McConkey agar, Eosine Methylene Blue Agar, ManitolSalt Agar, Cysteine Lactose Electrolyte Deficient Agar, Bismith Sulphite Agar and Blood Agar. All petri plates were incubated at 37°C for 24 h. Identification of pathogenic bacteria All isolated pathogenic bacteria were identified on the basis of morphological and biochemical characteristics on selective media. After Gram staining, biochemical tests were carried out to identify the pathogenic bacteria up to species level. The following biochemical tests were performed for identification, DNase test, coagulase test, catalase test, haemolysis, Motility test, Urease test, Indole production test, Hydrogen sulphide (H2S) production fermentation test, Mannitol and Sucrose Triple Sugar Iron test for lactose/glucose fermentation, Oxidase test, Citrate utilization test, Nitrate reduction test, Methyl Red Voges Proskauer (MR-VP)Test (Monica, 2005). Sensitivity assay Disc diffusion assay was performed according to the procedure of Kirby bauer (CLSI, 2006), for all isolated pathogenic strains using 10 different antibiotic discs. The turbidity of the indicator pathogenic bacteria was adjusted with McFarland solution and then dipped a sterilized cotton bud in the adjusted culture and prepared a uniform lawn on nutrient agar media for every isolated pathogen. Selected antibiotic discs were gently placed on the prepared lawn with equal distance using forcep. Then the nutrient agar plates were incubated at 37°C for 24 h. After 24 h the results for sensitivi ty were observed (Table 3). Preliminary tests for bioactive compounds production , by Aspergillusochraceus against human pathogenic bacteria Aspegillusochraceous was cultured in the PDA media and incubated for 5 days at 28°C. Human pathogenic strai ns were inoculated in 50 ml nutrient broth media and incubated in orbital shaker (150 rpm) at 37°C for 24 h. After 24 h 5 ml of broth culture was taken in sterilized test tubes and the turbidity of culture was adjusted with McFarland solution, normal saline was added for turbidity adjustment. Sterilized cotton bud was dipped in the adjusted indicator strains and prepares lawn of each pathogenic strain on the nutrient agar media.
Pustules of 8 mm diameter was taken from already incubated culture on PDA media using cork borer of the same diameter and gently placed on each prepared lawn using sterilized forcep. All Petri dishes were incubated for 24 h at 37°C. After 24 h zone of inhibition around the pustule was observed (Table 2).
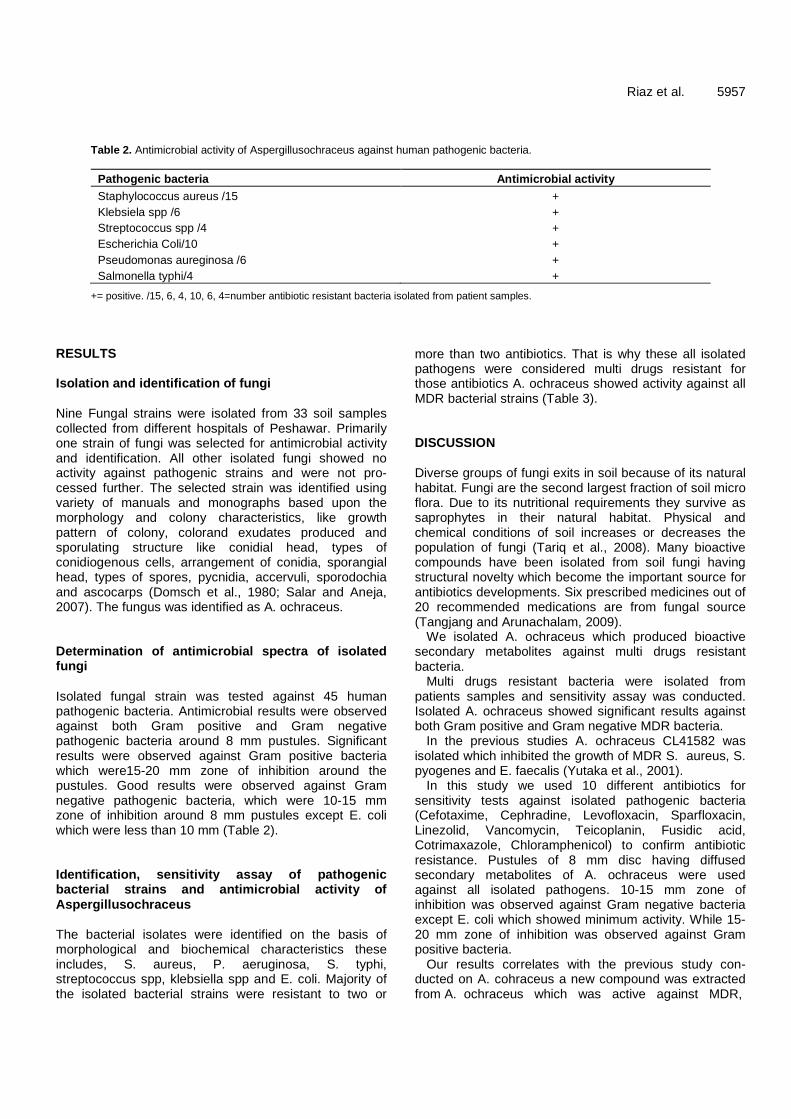
Riaz et al. 5957
Table 2. Antimicrobial activity of Aspergillusochraceus against human pathogenic bacteria.
Pathogenic bacteria Antimicrobial activity Staphylococcus aureus /15 + Klebsiela spp /6 + Streptococcus spp /4 + Escherichia Coli/10 + Pseudomonas aureginosa /6 + Salmonella typhi/4 +
+= positive. /15, 6, 4, 10, 6, 4=number antibiotic resistant bacteria isolated from patient samples. RESULTS Isolation and identification of fungi Nine Fungal strains were isolated from 33 soil samples collected from different hospitals of Peshawar. Primarily one strain of fungi was selected for antimicrobial activity and identification. All other isolated fungi showed no activity against pathogenic strains and were not pro-cessed further. The selected strain was identified using variety of manuals and monographs based upon the morphology and colony characteristics, like growth pattern of colony, colorand exudates produced and sporulating structure like conidial head, types of conidiogenous cells, arrangement of conidia, sporangial head, types of spores, pycnidia, accervuli, sporodochia and ascocarps (Domsch et al., 1980; Salar and Aneja, 2007). The fungus was identified as A. ochraceus. Determination of antimicrobial spectra of isolated fungi Isolated fungal strain was tested against 45 human pathogenic bacteria. Antimicrobial results were observed against both Gram positive and Gram negative pathogenic bacteria around 8 mm pustules. Significant results were observed against Gram positive bacteria which were15-20 mm zone of inhibition around the pustules. Good results were observed against Gram negative pathogenic bacteria, which were 10-15 mm zone of inhibition around 8 mm pustules except E. coli which were less than 10 mm (Table 2). Identification, sensitivity assay of pathogenic bacterial strains and antimicrobial activity of Aspergillusochraceus The bacterial isolates were identified on the basis of morphological and biochemical characteristics these includes, S. aureus, P. aeruginosa, S. typhi, streptococcus spp, klebsiella spp and E. coli. Majority of the isolated bacterial strains were resistant to two or
more than two antibiotics. That is why these all isolated pathogens were considered multi drugs resistant for those antibiotics A. ochraceus showed activity against all MDR bacterial strains (Table 3). DISCUSSION Diverse groups of fungi exits in soil because of its natural habitat. Fungi are the second largest fraction of soil micro flora. Due to its nutritional requirements they survive as saprophytes in their natural habitat. Physical and chemical conditions of soil increases or decreases the population of fungi (Tariq et al., 2008). Many bioactive compounds have been isolated from soil fungi having structural novelty which become the important source for antibiotics developments. Six prescribed medicines out of 20 recommended medications are from fungal source (Tangjang and Arunachalam, 2009).
We isolated A. ochraceus which produced bioactive secondary metabolites against multi drugs resistant bacteria.
Multi drugs resistant bacteria were isolated from patients samples and sensitivity assay was conducted. Isolated A. ochraceus showed significant results against both Gram positive and Gram negative MDR bacteria.
In the previous studies A. ochraceus CL41582 was isolated which inhibited the growth of MDR S. aureus, S. pyogenes and E. faecalis (Yutaka et al., 2001).
In this study we used 10 different antibiotics for sensitivity tests against isolated pathogenic bacteria (Cefotaxime, Cephradine, Levofloxacin, Sparfloxacin, Linezolid, Vancomycin, Teicoplanin, Fusidic acid, Cotrimaxazole, Chloramphenicol) to confirm antibiotic resistance. Pustules of 8 mm disc having diffused secondary metabolites of A. ochraceus were used against all isolated pathogens. 10-15 mm zone of inhibition was observed against Gram negative bacteria except E. coli which showed minimum activity. While 15-20 mm zone of inhibition was observed against Gram positive bacteria.
Our results correlates with the previous study con-ducted on A. cohraceus a new compound was extracted from A. ochraceus which was active against MDR,
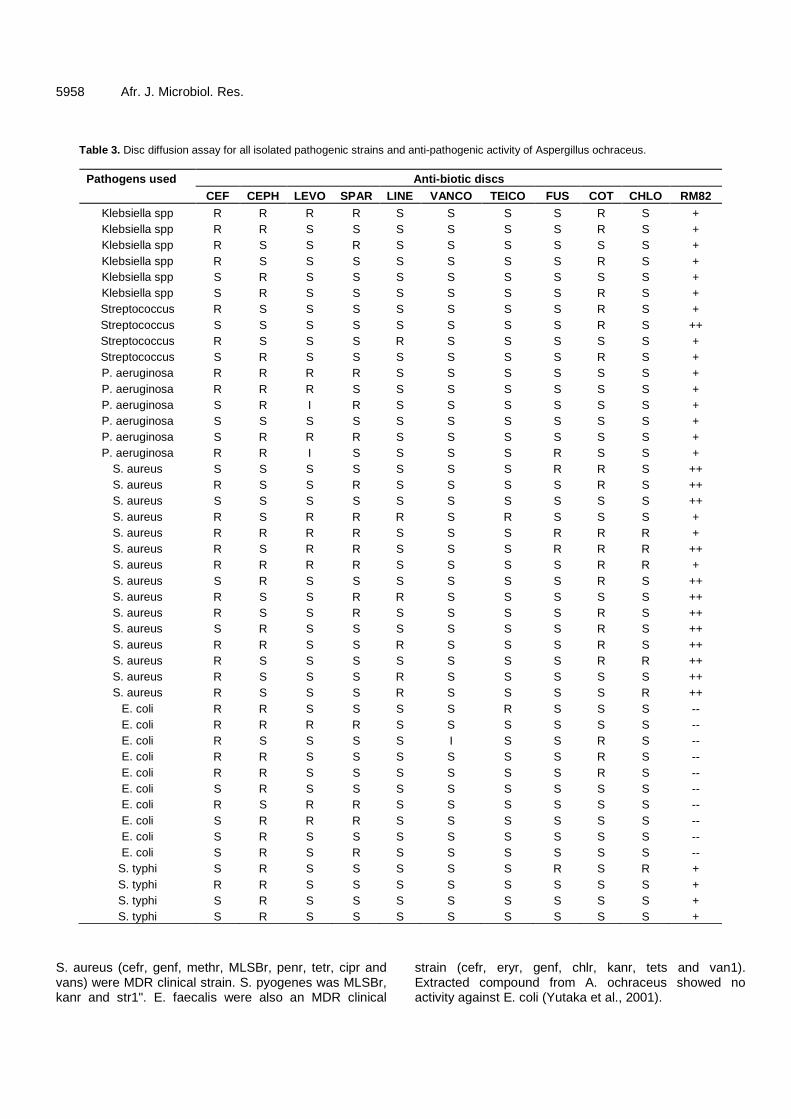
5958 Afr. J. Microbiol. Res.
Table 3. Disc diffusion assay for all isolated pathogenic strains and anti-pathogenic activity of Aspergillus ochraceus.
Pathogens used Anti-biotic discs CEF CEPH LEVO SPAR LINE VANCO TEICO FUS COT CHLO RM 82
Klebsiella spp R R R R S S S S R S + Klebsiella spp R R S S S S S S R S + Klebsiella spp R S S R S S S S S S + Klebsiella spp R S S S S S S S R S + Klebsiella spp S R S S S S S S S S + Klebsiella spp S R S S S S S S R S + Streptococcus R S S S S S S S R S + Streptococcus S S S S S S S S R S ++ Streptococcus R S S S R S S S S S + Streptococcus S R S S S S S S R S + P. aeruginosa R R R R S S S S S S + P. aeruginosa R R R S S S S S S S + P. aeruginosa S R I R S S S S S S + P. aeruginosa S S S S S S S S S S + P. aeruginosa S R R R S S S S S S + P. aeruginosa R R I S S S S R S S +
S. aureus S S S S S S S R R S ++ S. aureus R S S R S S S S R S ++ S. aureus S S S S S S S S S S ++ S. aureus R S R R R S R S S S + S. aureus R R R R S S S R R R + S. aureus R S R R S S S R R R ++ S. aureus R R R R S S S S R R + S. aureus S R S S S S S S R S ++ S. aureus R S S R R S S S S S ++ S. aureus R S S R S S S S R S ++ S. aureus S R S S S S S S R S ++ S. aureus R R S S R S S S R S ++ S. aureus R S S S S S S S R R ++ S. aureus R S S S R S S S S S ++ S. aureus R S S S R S S S S R ++
E. coli R R S S S S R S S S -- E. coli R R R R S S S S S S -- E. coli R S S S S I S S R S -- E. coli R R S S S S S S R S -- E. coli R R S S S S S S R S -- E. coli S R S S S S S S S S -- E. coli R S R R S S S S S S -- E. coli S R R R S S S S S S -- E. coli S R S S S S S S S S -- E. coli S R S R S S S S S S --
S. typhi S R S S S S S R S R + S. typhi R R S S S S S S S S + S. typhi S R S S S S S S S S + S. typhi S R S S S S S S S S +
S. aureus (cefr, genf, methr, MLSBr, penr, tetr, cipr and vans) were MDR clinical strain. S. pyogenes was MLSBr, kanr and str1". E. faecalis were also an MDR clinical
strain (cefr, eryr, genf, chlr, kanr, tets and van1). Extracted compound from A. ochraceus showed no activity against E. coli (Yutaka et al., 2001).

In another study carried out on molds bioactive compounds seven fungal species were isolated and evaluated against clinical isolates, the results revealed the presence of bioactive compounds with antimicrobial activity against 22 clinical bacterial isolates including eleven isolates of Gram positive and remaining were Gram negative. The fractions extracted from molds were thoroughly more active on Gram positive bacteria than Gram negative (Amal and Mekawey, 2010).
We used forty five clinical isolates and isolate nine fungal species, A. ochraceus have antibacterial activity. Significant antimicrobial activity was observed against Gram positive bacteria while good and minimum results were observed against Gram negative bacteria. In conclusion we need further evaluation and purification of bioactive fractions produced by A. ochraceus, so as to minimize resistance associated with MDR bacteria. ACKNOWLEDGEMENTS Author is greatly thankful to the administration of Lady Reading Hospital (LRH), Peshawar especially Sardar Ali senior technician pathology laboratory LRH. We are also thankful for University of Peshawar to support us in this research. REFERENCES Amal AI, Mekawey (2010). The Antibiotic Properties of Several Strains
of Fungi Australian Journal of Basic and Applied Sciences, 4(8): 3441-3454.
Barbara DJ, Clewes E (2003). Plant pathogenic Verticillium species: How many of them are there?"Molecular Plant Pathology, 4(4): 297-305.
Clinical and Laboratory Standards Institute (CLSI) (2006).CLSI: Performance Standard for Antimicrobial Susceptibility Testing. 16th Informational supplement. CLSI document M100-S16.
Gilmore MS, Hoch JA (1999). A vancomycin surprise. Nature, 399: 524-527.
Riaz et al. 5959 Levy SB (1998). The challenge of antibiotic resistance. Scientific Am.,
pp. 46-53. Levin SA,Andreasen V (1999). Disease transmission dynamics and the
evolution of antibiotic resistance inhospitals and communal settings. Proc. Natl. Acad. Sci.USA. pp. 800-801.
Luzhetskyy A, Pelzer S, Bechthold A (2007). The future of natural products as a source of new antibiotics. Curr. Opin. Investigat. Drugs, 8: 608-613.
Shahghasi AGH, Shahidi, Fooladi MH, Mahdavi MJ (2004). Broadspectrim, a novel antibacterial from Streptomyces sp. Biotechnology, 3(2): 126-130.
McCarthy AJ, Williams ST (1990). Methods for Studying the Ecology of Actinomycetes. Methods In Microbiology. Ed. by. Grigorova R and Norris JR, Academic Press Limited, London, 22: 533-363.
Monica C (2005). District laboratory practice in tropical countries. 2nd edition: pp. 62-72.
Nedialkova D, Naidenova M (2004). Screening the antimicrobial activity of actinomycetes strains isolated from Antarctica. J. Cult. Collections, 4: 29-35.
Domsch KH, Gams W, Anderson TH (1980). Compendium of Soil Fungi. Academic Press, London.
Ouhdouch Y, Barakate M, Finanse C (2001). Actinomycetes of Moroccan habitats: Isolation and screening for antifungal activities. Eur. J. Soil Biol., 37: 69-74.
Saadoun I, Gharaibeh R (2003).The Streptomyces flora of Badia region of Jordan and its potential as a source of antibiotics active against antibiotic- resistant bacteria. J. Arid Environ., 53: 365 - 371.
Salar RK, Aneja KR (2007).Thermophilic fungi: Taxonomy and biogeography. J. Agri. Technol., 3: 77-107.
Tangjang S, Arunachalam K (2009). Microbial population dynamics of soil under traditional agroforestry system in northern India. Res. J. Soil. Biol. 1: 1-7.
Tariq M, Dawar M, Mehdi FA (2008). Studies on the rhizosphere mycoflora of mangroves. Turk. J. Bot., 32: 97-101.
Thomashow LS, Bonsall RF, David M (2008). Detection of antibiotics produced by soil and rhizosphere microbes in situ. In: Karlovsky, P. (Ed.). Secondary Metabolites in Soil Ecology. Springer Berlin, Heidelberg, 23-36.
Yutaka S, Hideo H, Taisuke I, Masaru I, Yoon. Jm, Yasuhiro K, Tatsuo Sa, Shinichi S, Akemi S, Yumiko S, Lori B, Joan D, Liang HH, Joyce S, Nakao K (2001). A New Antibiotic CJ-17,665 from Aspergillus ochraceus. J. Antibiotics, 54: 911 – 916.
Zrimec MB, Zrimec AP, Slanc, Kreft S (2004).Screening for antibacterial activity in 72 species of wood-colonizing fungi by the Vibrio fisheri bioluminescence method. J. Basic Microbiol., 44(5): 407-412.
African Journal of Microbiology Research Vol. 5(32), pp. 5960-5963, 30 December, 2011 Available online at http://www.academicjournals.org/AJMR ISSN 1996-0808 ©2011 Academic Journals DOI: 10.5897/AJMR11.1082
Full Length Research Paper
Seroprevalence of avian origin H3N2 canine influenza virus infection in pet dogs in Shenzhen, China
Fu-Rong Zhao1,2#, Shou-Jun Li1#, Dong-Hui Zhou2, Ning Chen3, Yan-Zhong Zhang4, Wen-Bao
Qi1, Pei-Rong Jiao1, Ming Liao1, Guang-Zhi Tong5 and Gui-Hong Zhang1*
1College of Veterinary Medicine, South China Agricultural University, Guangzhou, Guangdong Province 510642, People’s Republic of China.
2State Key Laboratory of Veterinary Etiological Biology, Key Laboratory of Veterinary Parasitology of Gansu Province, Lanzhou Veterinary Research Institute, CAAS, Lanzhou, Gansu Province 730046, People’s Republic of China.
3Shenzhen Institute for Drug Control, Shenzhen, Guangdong Province 518057, PR China. 4Shenzhen Rui-Peng Pet Hospitol, Shenzhen, Guangdong Province 518001, PR China.
5Division of Swine Infectious Diseases, Shanghai Veterinary Research Institute, CAAS Shanghai 200241,People’s Republic of China.
Accepted 22 November, 2011
Canine influenza virus (CIV) is an emerging pathogen that causes severe and acute respiratory disease in dogs. Canine influenza is caused by two subtypes of influenza. A virus: H3N2 and H3N8. In recent years, surveys of avian origin CIV infection in dogs have been reported worldwide. However, little is known about the prevalence of CIV in pet dogs in China. In the present study, the prevalence of avian origin CIV H3N2 in pet dogs in Shenzhen, Southern China was investigated using the enzyme-linked immunosorbent assay (ELISA) and hemagglutination inhibition (HI) assay. Thirty-one (6.71%) of the 462 serum samples tested were seropositive for avian origin CIV by ELISA. Use of the HI test revealed the presence of anti-H3 antibodies in 28 (6.06%) of 462 serum samples. The prevalence ranged from 4.87% (HI) or 6.19% (ELISA) to 7.41% among dogs of different ages, with high prevalence in pet dogs of 1 to 3 years old, but low prevalence in pet dogs ≤1 year. The seroprevalence in female dogs was 5.21%, and in male dogs it was 7.78% (ELISA) or 6.67% (HI). These findings demonstrated that avian origin canine influenza virus infection is prevalent in pet dogs and can spread rapidly through local dog populations, which indicates its potential for becoming established in pet dogs throughout China. Key words: Canine influenza virus, seropervalence, pet dog, enzyme-linked immunosorbent assay (ELISA), hemagglutination inhibition (HI) assay.
INTRODUCTION Canine influenza virus (CIV) is a member of the influenza virus A genus in the family Orthomyxoviridae and an emerging pathogen that causes severe and acute respiratory disease in dogs (Jirjis et al., 2010; Lee et al., 2010). CIV was first identified in racing greyhounds in *Corresponding author. E-mail: [email protected]. #These authors contributed equally to this work.
Florida in January 2004 (Payungporn et al., 2008). Canine influenza is caused by 2 subtypes of influenza A virus: H3N2 and H3N8. In 2005, the H3N8 CIV is known to be an equine-derived H3N8 influenza virus and was first identified in dogs in the United States, and in 2007, the H3N2 CIVs are of avian origin and detected in dogs in Korea and China (Crawford et al., 2005; Payungporn et al., 2008; Song et al., 2011b; Lee et al., 2010; Li et al., 2010).
Regardless of subtype, avian origin H3N8 or H3N2 CIV could infect nascent individuals and causes clinical signs. The most common sign of canine influenza is a mild
respiratory disease that resembles infectious tracheobronchitis. The experimental reproduction of the disease caused by H3N2 CIV induced clinical signs including coughing, sneezing, nasal discharge, fever, and shedding of the virus in nasal discharge (Song et al., 2011a, 2009; Lee et al., 2010). In previous pathological findings, the infection produced a distinctively severe and persistent bronchopneumonia with neutrophil infiltration and apoptosis in the tracheal epithelium (Jung et al., 2010).
Epidemics of avian origin H3N2 CIV among dogs have been observed in Korea, specifically in contaminated kennels in veterinary clinics. Serologic and virological survey of the avian-origin H3N2 CIV in dogs in South Korea suggest that the epidemiological situation resembles that of equine origin H3N8 CIV currently circulating in the dog populations of the United States (Payungporn et al., 2008; Song et al., 2008; Lee et al., 2009). However, no such serological or etiological studies have been carried out in pet dogs in Shenzhen, Southern China.
The objectives of the present investigation were to examine avian origin H3N2 CIV in pet dogs in five pet hospitals in Shenzhen, Southern China under the present husbandry practice and animal welfare, and to evaluate the risk factors for CIV infection in different ages and genders of pet dogs. MATERIALS AND METHODS Study area Shenzhen is located in the very South of Guangdong province, overlooking HongKong to the South and bordering kowloon. It has an area of 1984.69 square meters, it is east to the Daya and Dapeng Bays, west to Pearl River, North to Dongguan and Huizhou and south to Hong Kong Special Administrative Regions of the People’s Republic of China. It consists of 6 districts: Luohu, Futian, Nanshan, Yantian, Bao’an and Longgang which the first two are mainly urban areas. It has a mild subtropical oceanic climate with an annual
average temperature of 22.3°C. Serum preparation A total of 462 blood samples were collected from 5 different pet hospitals which are distributed in Futian and Luohu districts of Shenzhen city between May and July 2009. 82, 114, 127, 101 and 38 blood samples were obtained from pet dogs in Cuizhu, Futian, Honggui, Meilin and Shangbu pet hospitals, respectively. These samples were put aside for solidification followed by centrifugation at 1,000 × g for 10 min, and supernatants were transferred to new centrifuge tubes and saved at -20℃ until use. Serological tests ELISA test The 462 serum samples described above were analyzed for CIV-specific antibodies by using a commercial ELISA Kit (Animal
Zhao et al. 5961 Genetics Inc., South Korea) that can detect anti-nucleoprotein (NP) antibodies based on competition principles. The use of this ELISA kit for CIV detection has been previously reported (Lee et al., 2009; An et al., 2010). Briefly, ELISA plates coated with the antigen (nucleoprotein) are incubated with an equal mixture of 50 µl serum and 50 µl anti AIV antibody-HRP (Horseradish Peroxidase, 1:100 dilution in the conjugate diluent) for 30 min at 37°C. Then, the wells were washed 6 times with 350 µl of diluted washing solution. Then, 100 µl substrate was added to each well and incubated for 10 minutes at room temperature. Finally, 100 µl of stopping solution was added to each well. The absorbance of the wells was read with a bichromatic spectrophotometer at 450 nm with reference wavelength at 620 nm. Reading must be completed within 1 hour from the end of an assay. Positive and negative control sera were provided by the kit with 2 wells for each.
The mean absorbance of the negative controls was calculated, and then the PI (Percent inhibition) value of each serum was calculated, using the following formula: PI value = [1-(OD sample/mean OD negative)] × 100 Based on PI value, classification of each sample was as follows: PI<50, negative (-); PI ≥ 50, positive (+). Hemagglutination inhibition (HI) assay In the present study, the A/canine/Guangdong/01/2007(H3N2) avian origin canine influenza virus strain was used in the serological tests. Genetically, this strain is highly similar to the avian influenza H3N2 virus and was isolated at the Animal Clinics of South China Agricultural University in 2007 (Li et al., 2010). The HI assay was performed according to procedures recommended by the World Organization of Animal Health (OIE). These samples were also analyzed by the HI test, which measures the ability of the sera to inhibit the hemagglutinating activity of the reference virus. The following antigens were also used for HI tested: H1N2 influenza virus (A/swine/Guang dong/06/2009/GH5) for H1, H3N2 influenza virus (A/Swine/Guangdong/01/2005) for H3, H5N1 influenza virus (A/Swan/Guangdong/197/2004) for H5, H9N2 influenza virus (A/Chicken/Guangdong/HL/2006) for H9. These viruses were isolated by the College of Veterinary Medicine, South China Agricultural University. All serum samples were treated with receptor-destroying enzyme (RDE) before testing in HI assays. Briefly, 25 µl of serial two-fold dilutions of the treated serum samples were mixed with 4 HA units of virus in V-shaped microtiter plates and incubated at room temperature for 30 min. Then, 25 µl of 0.5% (v/v) chicken red blood cells (RBCs) was added to each well and incubated at room temperature for 40 min. The HI titer was expressed as the reciprocal of highest serum dilution that completely inhibited hemagglutination of 4 HA units of the virus. RESULTS In this investigation, a total of 462 pet dogs (219 females and 243 males) from Shenzhen, Southern China were examined by ELISA and HI for avian origin CIV antibodies. All serum was subjected to NP-specific ELISAs, anti-influenza virus antibodies were detected in 31 samples (6.71%). Use of the HI test revealed the presence of anti-H3 antibodies in 28 of the 462 samples (6.06%). Five samples were seropositive for avian origin H3N2 CIV by ELISA and HI test. Different levels of seropositivity were detected in different pet hospitals,
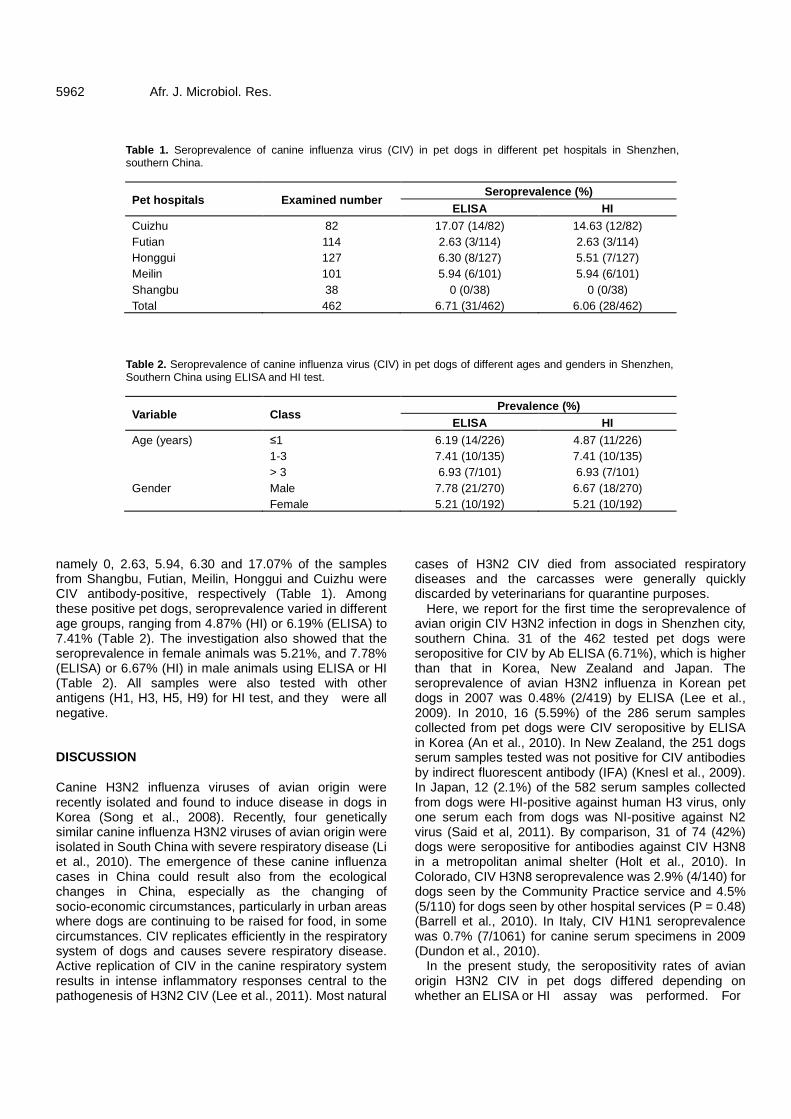
5962 Afr. J. Microbiol. Res.
Table 1. Seroprevalence of canine influenza virus (CIV) in pet dogs in different pet hospitals in Shenzhen, southern China.
Pet hospitals Examined number Seroprevalence (%)
ELISA HI Cuizhu 82 17.07 (14/82) 14.63 (12/82) Futian 114 2.63 (3/114) 2.63 (3/114) Honggui 127 6.30 (8/127) 5.51 (7/127) Meilin 101 5.94 (6/101) 5.94 (6/101) Shangbu 38 0 (0/38) 0 (0/38) Total 462 6.71 (31/462) 6.06 (28/462)
Table 2. Seroprevalence of canine influenza virus (CIV) in pet dogs of different ages and genders in Shenzhen, Southern China using ELISA and HI test.
Variable Class Prevalence (%)
ELISA HI Age (years) ≤1 6.19 (14/226) 4.87 (11/226) 1-3 7.41 (10/135) 7.41 (10/135) > 3 6.93 (7/101) 6.93 (7/101) Gender Male 7.78 (21/270) 6.67 (18/270) Female 5.21 (10/192) 5.21 (10/192)
namely 0, 2.63, 5.94, 6.30 and 17.07% of the samples from Shangbu, Futian, Meilin, Honggui and Cuizhu were CIV antibody-positive, respectively (Table 1). Among these positive pet dogs, seroprevalence varied in different age groups, ranging from 4.87% (HI) or 6.19% (ELISA) to 7.41% (Table 2). The investigation also showed that the seroprevalence in female animals was 5.21%, and 7.78% (ELISA) or 6.67% (HI) in male animals using ELISA or HI (Table 2). All samples were also tested with other antigens (H1, H3, H5, H9) for HI test, and they were all negative. DISCUSSION Canine H3N2 influenza viruses of avian origin were recently isolated and found to induce disease in dogs in Korea (Song et al., 2008). Recently, four genetically similar canine influenza H3N2 viruses of avian origin were isolated in South China with severe respiratory disease (Li et al., 2010). The emergence of these canine influenza cases in China could result also from the ecological changes in China, especially as the changing of socio-economic circumstances, particularly in urban areas where dogs are continuing to be raised for food, in some circumstances. CIV replicates efficiently in the respiratory system of dogs and causes severe respiratory disease. Active replication of CIV in the canine respiratory system results in intense inflammatory responses central to the pathogenesis of H3N2 CIV (Lee et al., 2011). Most natural
cases of H3N2 CIV died from associated respiratory diseases and the carcasses were generally quickly discarded by veterinarians for quarantine purposes.
Here, we report for the first time the seroprevalence of avian origin CIV H3N2 infection in dogs in Shenzhen city, southern China. 31 of the 462 tested pet dogs were seropositive for CIV by Ab ELISA (6.71%), which is higher than that in Korea, New Zealand and Japan. The seroprevalence of avian H3N2 influenza in Korean pet dogs in 2007 was 0.48% (2/419) by ELISA (Lee et al., 2009). In 2010, 16 (5.59%) of the 286 serum samples collected from pet dogs were CIV seropositive by ELISA in Korea (An et al., 2010). In New Zealand, the 251 dogs serum samples tested was not positive for CIV antibodies by indirect fluorescent antibody (IFA) (Knesl et al., 2009). In Japan, 12 (2.1%) of the 582 serum samples collected from dogs were HI-positive against human H3 virus, only one serum each from dogs was NI-positive against N2 virus (Said et al, 2011). By comparison, 31 of 74 (42%) dogs were seropositive for antibodies against CIV H3N8 in a metropolitan animal shelter (Holt et al., 2010). In Colorado, CIV H3N8 seroprevalence was 2.9% (4/140) for dogs seen by the Community Practice service and 4.5% (5/110) for dogs seen by other hospital services (P = 0.48) (Barrell et al., 2010). In Italy, CIV H1N1 seroprevalence was 0.7% (7/1061) for canine serum specimens in 2009 (Dundon et al., 2010).
In the present study, the seropositivity rates of avian origin H3N2 CIV in pet dogs differed depending on whether an ELISA or HI assay was performed. For
example, while ELISA text found that 6.30 and 17.07% of the pet dogs from Honggui and Cuizhu were exposed to avian origin CIV, the HI test detected seropositivity rates of 5.51 and 14.63%, respectively. While the HI assay is often used to detect antibodies against viral hemagglutinin (HA) in human and animal serum, it is not very reliable in detecting antibodies to avian influenza viruses in mammalian serum because nonspecific hemagglutination inhibitors in the sera can result in false positives (Lu et al., 1982). In addition, Lee et al. (2009) found that the HI assay detected anti-influenza H3N2 virus antibodies 2 days later than the NP-based ELISA test. These results suggest that the NP-based ELISA is a better method for the serological survey of CIV infections in pet dogs. Conclusions In summary, the present survey revealed a relatively low seropositivity of CIVs in pet dogs in Shenzhen, Southern China, which raises the concerns regarding the rapid spread of avian origin CIV in pet dogs in animal hospitals in China. These findings suggest that commercial vaccines against canine influenza virus must be developed and used in pet dog population. ACKNOWLEDGEMENTS This project was supported in part by the National Natural Science Foundation of China (grant No. 30972233), the National Key Basic Research Program (Project 973) of China (grant no. 2011CB504700-G), the Natural Science Foundation of Guangdong Province (No. 8251064201000008) and the Basic Conditions for Science and Technology Projects of Guangdong Province (No. 2011B060400015). REFERENCES An DJ, Jeoung HY, Jeong W, Chae S, Song DS, Oh JS, Park BK (2010).
A serological survey of canine respiratory coronavirus and canine influenza virus in Korean dogs. J. Vet. Med. Sci., 72: 1217-1219.
Barrell EA, Pecoraro HL, Torres-Henderson C, Morley PS, Lunn KF, Landolt GA (2010). Seroprevalence and risk factors for canine H3N8 influenza virus exposure in household dogs in Colorado. J. Vet. Intern. Med., 24: 1524-1527.
Crawford PC, Dubovi EJ, Castleman WL, Stephenson I, Gibbs EP, Chen L, Smith C, Hill RC, Ferro P, Pompey J, Bright RA, Medina MJ, Johnson CM, Olsen CW, Cox NJ, Klimov AI, Katz JM, Donis RO (2005). Transmission of equine influenza virus to dogs. Science, 310: 482-485.
Dundon WG, De Benedictis P, Viale E, Capua I (2010). Serologic evidence of pandemic (H1N1) 2009 infection in dogs, Italy. Emerg. Infect. Dis., 16: 2019-2021.
Holt DE, Mover MR, Brown DC (2010). Serologic prevalence of antibodies against canine influenza virus (H3N8) in dogs in a metropolitan animal shelter. J. Am. Vet. Med. Assoc., 237: 71-73.
Jirjis FF, Deshpande MS, Tubbs AL, Jayappa H, Lakshmanan N, Wasmoen TL (2010). Transmission of canine influenza virus (H3N8)
Zhao et al. 5963 among susceptible dogs. Vet. Microbiol., 144: 303-309. Jung K, Lee CS, Kang BK, Park BK, Oh JS, Song DS (2010). Pathology
in dogs with experimental canine H3N2 influenza virus infection. Res. Vet. Sci., 88: 523-527.
Knesl O, Allan FJ, Shields S (2009). The seroprevalence of canine respiratory coronavirus and canine influenza virus in dogs in New Zealand. N. Z. Vet. J., 57: 295-298.
Lee C, Jung K, Oh J, Oh T, Han S, Hwang J, Yeom M, Son D, Kim J, Park B, Moon H, Song D, Kang B (2010). Protective efficacy and immunogenicity of an inactivated avian-origin H3N2 canine influenza vaccine in dogs challenged with the virulent virus. Vet. Microbiol., 143: 184-188.
Lee C, Song D, Kang B, Kang D, Yoo J, Jung K, Na G, Lee K, Park B, Oh J (2009). A serological survey of avian origin canine H3N2 influenza virus in dogs in Korea. Vet. Microbiol., 137: 359-362.
Lee YN, Lee HJ, Lee DH, Kim JH, Park HM, Nahm SS, Lee JB, Park SY, Choi IS, Song CS (2011). Severe canine influenza in dogs correlates with hyperchemokinemia and high viral load. Virol., 417: 57-63.
Li S, Shi Z, Jiao P, Zhang G, Zhong Z, Tian W, Long LP, Cai Z, Zhu X, Liao M, Wan XF (2010). Avian-origin H3N2 canine influenza A viruses in Southern China. Infect. Genet. Evol., 10: 1286-1288.
Lu BL, Webster RG, Hinshaw VS (1982). Failure to detect hemagglutination-inhibiting antibodies with intact avian influenza virions. Infect. Immun., 38: 530-535.
Payungporn S, Crawford PC, Kouo TS, Chen LM, Pompey J, Castleman WL, Dubovi EJ, Katz JM, Donis RO (2008). Influenza A virus (H3N8) in dogs with respiratory disease, Florida. Emerg. Infect. Dis., 14: 902-908.
Said AW, Usui T, Shinya K, Ono E, Ito T, Hikasa Y, Matsuu A, Takeuchi T, Sugiyama A, Nishii N, Yamaguchi T (2011). A sero-survey of subtype H3 influenza A virus infection in dogs and cats in Japan. J. Vet. Med. Sci., 73: 541-544.
Song D, Kang B, Lee C, Jung K, Ha G, Kang D, Park S, Park B, Oh J (2008). Transmission of avian influenza virus (H3N2) to dogs. Emerg. Infect. Dis., 14: 741-746.
Song D, Lee C, Kang B, Jung K, Oh T, Kim H, Park B, Oh J (2009). Experimental infection of dogs with avian-origin canine influenza A virus (H3N2). Emerg. Infect. Dis., 15: 56-58.
Song D, Moon H, Jung K, Yeom M, Kim H, Han S, An D, Oh J, Kim J, Park B, Kang B (2011a). Association between nasal shedding and fever that influenza A (H3N2) induces in dogs. Virol. J., 8: 1.
Song DS, An DJ, Moon HJ, Yeom MJ, Jeong HY, Jeong WS, Park SJ, Kim HK, Han SY, Oh JS, Park BK, Kim JK, Poo H, Webster RG, Jung K, Kang BK (2011b). Interspecies transmission of the canine influenza H3N2 virus to domestic cats in South Korea, 2010. J. Gen. Virol., 92: 2350-2355.

African Journal of Microbiology Research Vol. 5(32), pp. 5964-5968, 30 December, 2011 Available online at http://www.academicjournals.org/AJMR ISSN 1996-0808 ©2011 Academic Journals DOI: 10.5897/AJMR11.1103
Full Length Research Paper
Assessment of inflammatory cytokines and soluble adhesion molecules in patients with systemic
inflammatory response syndrome in an intensive care unit of a Saudi tertiary hospital
Obeid E. Obeid* and Manal I. Hassan
Department of Microbiology, College of Medicine, University of Dammam, P.O. Box 2114, Dammam 31451,
Saudi Arabia.
Accepted 18 November, 2011
Cytokines are endogenous inflammatory mediators, which play a central role in the pathophysiology of sepsis and in the expression of the adhesion molecules. The aims of this study are to analyze the levels of cytokines and the soluble adhesion in serum of infected (N = 68) and non-infected (N = 41) patients with systemic inflammatory response molecules (SIRS). 109 patients in the intensive care unit (ICU) of a tertiary hospital were included. IL-6, TNF-α, IL-10, IL-13, sICAM-1 and VCAM-1 were measured using enzyme-linked immunosorbent assay (ELISA). Patients with infectious SIRS, the levels of IL-6 varied between 27.65 to 39.6 pg/L(mean = 33.4 pg/L); the levels of sVCAM-1 varied between 543 and 1079 ng/ml (mean = 782 ng/ml) and the levels of sICAM-1 varied between 320 and 664 ng/ml (mean = 458 ng/ml). In patients with non-infectious SIRS the levels of IL-6 varied between 18.2 to 20.3 pg/L(mean 19.2 pg/L); the levels of sVCAM-1 varied between 251 and 635 ng/ml (mean = 286 ng/ml) and the levels of sICAM-1 varied between 98 and 351 ng/ml (mean = 168 ng/ml). The levels of IL-6, sVCAM-1 and s ICAM-1 were significantly higher in septic patients than in non-septic patients (p = 0.002; p = 0.003 and p = 0.0002, respectively). There was no statistically significant difference in the levels of TNF-α, IL-10 and IL-13 between infectious and non-infectious SIRS patients. Measurement of pro-and anti- inflammatory cytokines and soluble adhesion molecules may be useful in the follow up of ICU patients and in providing a point of care tests that will help in decision making and in management of ICU patients. Key words: Cytokines, adhesion molecules, enzyme-linked immunosorbent assay (ELISA), intensive care unit (ICU) patients.
INTRODUCTION Systemic inflammation is a highly organized response to infectious and noninfectious threats to homeostasis (Shubin et al., 2011). The main effectors of systemic inflammation are inflammatory cytokines, such as tumor necrosis factor (TNF)-α, interleukin (IL)-1β, and IL-6; chemokines and other mediators of inflammation (Shubin et al., 2011; Kibe et al., 2011).
Cytokines (including chemokines) are endogenous *Corresponding author. E-mail: [email protected]. Tel: 00966509929487.
inflammatory mediators, which play a central role in the pathophysiology of sepsis (Nagai et al, 2011). TNF-α is a principal pro-inflammatory cytokine that induces systemic inflammatory response against the infectious insult (Nagai et al., 2011). Other pro-inflammatory cytokines include IL-1β, IL6, IL-8, interferon (IFN) γ, and macrophage migration inhibitory factor (MIF) (Eggimann and Pittet, 2001; Martin et al., 1994; Goldie et al., 1995; Pinsky et al., 1993). Excessive production of pro-inflammatory cytokines by immunocompetent cells may induce systemic inflammatory response syndrome (SIRS) (Damas et al., 1992; Oda et al., 2005).
Sepsis also activates the production and release of

specific anti-inflammatory substances, including the cytokine receptor antagonists, the soluble cytokine receptors and the anti-inflammatory cytokines (Makhija, 2005; Delsesto and Opal, 2011; Tamayo et al., 2011). IL-10, IL-13 and transforming growth factor β (TGF- β) are anti-inflammatory cytokine, which probably have an important down-regulatory function in decreasing the production of various pro-inflammatory cytokines, such as TNF-α and IL-6 (Marchant et al., 1994; Martin et al., 1997).
Nosocomial infections (NIs) are today by far the commonest complications affecting hospitalised patients. Currently, 5 to 10% of patients admitted to acute care hospitals acquire one or more infections, and the risks have steadily increased during recent decades (Esposito and Leone, 2007; Jarvis, 2001). Although representing only 5 to 15% of hospital beds, intensive care units (ICUs) account for 10 to 25% of healthcare costs, corresponding to 1 to 2% of the gross national product of the United States (Esposito and Leone, 2007).
Vascular cell adhesion molecule-1 (VCAM-1) and intercellular adhesion molecule-1 (ICAM-1) are mediators
of endothelial-leukocyte adhesion in inflammatory states (Shapiro et al., 2010; Gando et al., 2005; Figueras-Aloy et al., 2007). They mediate tight binding and extravasation of leukocytes through endothelial cell junctions (Brenner et al., 2010). Low levels of adhesion molecules are detected in serum of normal individuals and several investigators have recently documented increased levels in patients with sepsis and other critical illnesses (Brenner et al., 2010; Cumming et al., 1997). There is interest in examining serum levels of adhesion molecules in sepsis and other inflammatory conditions and relating their measurement to outcome from critical illness (Newman et al., 1993). Up-regulation of membrane-bound and soluble forms of adhesion molecules and their corresponding ligands on endothelial cells is induced by inflammatory mediators, such as TNF-α and IL-6. Soluble isoforms of adhesion molecules are critical for the early events of leukocyte recruitment (Jaber et al., 2009).
The published data on the relationship between the serum levels of soluble adhesion molecules and SIRS is sparse. Serum levels of cytokines and adhesion molecules could be different in different groups of SIRS patients because of the differences in the underlying cause. The purpose of this study was to assess the level of cytokines and soluble adhesion molecules in different groups of SIRS patients in the ICU of a tertiary hospital. MATERIALS AND METHODS Study population All patients admitted to the ICU with SIRS over a period of 12 months (2007 to 2008) were included (N = 109). The study was conducted in a tertiary hospital in Eastern Saudi Arabia (Alzahrani et al., 2009). Patients were categorized into the following groups:
Obeid and Hassan 5965
patients with sepsis (N = 68) and those with SIRS without infection (N = 41). Clinically suspected infection was defined by the attending physician including the suspicion of an ongoing infection, combined with the initiation of a diagnostic work-up. Patients with SIRS were defined as having two or more of the following criteria (Rosengart, 2006): fever (body temperature >38°C) or hypothermia (body temperature <35.5°C), tachycardia (heart rate >90 beat s min 1), tachypnea (>20 breaths min 1) and leukocytosis or leukopenia (white blood cell count >12 000 or <4000/mm3 . The infection was confirmed if the patient has an identifiable site of infection which is confirmed by positive microbiological cultures. Bacterial cultures were obtained from trachea, urine, abdominal or mediastinal drains or from perioperative or percutaneous bacteriological samples. A written consent was obtained. Measurements For cytokine assays, peripheral blood samples were collected from the subjects by venepuncture in plain tube, left to coagulate and fresh serum samples were separated and aliquots and stored at −70°C prior to analysis. Aliquots were frozen within 8 of collection. The samples were taken within 24 h of admission to the ICU (day 1). Cytokine and soluble adhesion (IL-4, IL-6, IL-10, IL-13, TNF-α, sVCAM-1 and sICAM-1) analyses were performed with commercially available enzyme-linked immunosorbent assays (Quantikine®, R and D Systems, Minneapolis, Minn., USA; Biosource International, Camarillo; Pelikine CompactTM, Central Laboratory of the Netherlands Red Cross Transfusion Service, Amsterdam, the Netherlands) according to the manufacturer’s recommendations. In addition, complete blood counts were obtained on all patients including a full white blood cell (WBC) differential. Bacterial, viral and candida cultures/molecular detection of cytomegalovirus, respiratory syncytial virus and adenovirus were done using established assays. Statistical analysis Data was entered in a personal computer and statistical analyses were performed using the statistical package for social sciences (SPSS-PC version 16). The descriptive statistics were reported as mean and range values. The patient groups were compared using the unpaired Student's t-test, the chi-squared test and the Friedman's test as indicated. P-values below 0.05 was considered significant in the SPSS software. RESULTS The present study used the same study population of ICU patients that we used in previous study (Alzahrani et al., 2009). We evaluated a total of 109 SIRS patients admitted to ICUs in a tertiary hospital over the period of the study. Out of 109 patients, 68 fulfilled the criteria of infectious SIRS. The remaining 41 patients were classified as non-infectious SIRS, with no defined source of infection as proved by negative bacterial cultures. The mean age of the study population (45 males and 64 females) was 49.8 ± 20.9 years. The clinical diagnosis included infection with varying degrees of sepsis (68), trauma (12), respiratory failure (10), post surgical (7), non infective complications requiring ICU (5), heart failure (3), sickle cell with crisis (3) and seizure disorder (1). Among

5966 Afr. J. Microbiol. Res.
Table 1. Cytokines levels in infectious and non-infectious SIRS patients.
Cytokine Level in infectious SIRS Level in non-infectious SIRS
IL-6 27.65-39.6 pg/L(mean=33.4 pg/L) 18.2-20.3 pg/L(mean 19.2 pg/L) TNFα 2.5-5.6 pg/ml (mean 2.8 pg/ml) 2.3-4.2 pg/ml (mean 2.6 pg/ml) IL-10 11.2-14.2 pg/L(mean=13.4 pg/L) 10.7-14.8 pg/L(mean 12.7 pg/L) IL-13 22.5-39.2 pg/L(mean 31.5 pg/ml) 28.3-41.1 pg/L(mean=32.2 pg/ml)
Table 2. levels of soluble adhesion molecules (SAM) in infectious and non-infectious SIRS patients.
SAM Level in infectious SIRS Level in non- infectious SIRS sVCAM-1 543-1079 ng/ml (mean=782 ng/ml) 251-635 ng/ml (mean=286 ng/ml) sICAM 320-664 ng/ml (mean=458 ng/ml) 98-351 ng/ml (mean=168 ng/ml)
patients with defined source of infection, blood stream infection, lower respiratory tract infection, soft tissue infection and urinary tract infection constituted the most common infections.
The levels of proinflammatory cytokines were measures using enzyme-linked immunosorbent assay (ELISA) (Table 1). In patients with infectious SIRS, the levels of IL-6 varied between 27.65 to 39.6 pg/L(mean = 33.4 pg/l) and in patients with non-infectious SIRS the levels varied between 18.2 to 20.3 pg/L(mean 19.2 pg/L). In patients with infectious SIRS, the levels of TNF-α varied between 2.5 to 5.6 pg/ml (mean 2.8 pg/ml) and in patients with non-infectious SIRS the levels varied between 2.3 to 4.2 pg/ml (mean = 2.6 pg/ml). The levels of IL-6 was significantly higher in septic patients than in non-septic patients (p = 0.002). There was no statistically significant difference in TNF-α levels between infectious and non-infectious SIRS patients.
The levels of anti-inflammatory cytokines were measures using ELISA (Table 1). In patients with infectious SIRS, the levels of IL-10 varied between 11.2 to 14.2 pg/L(mean = 13.4 pg/l) and in patients with non-infectious SIRS the levels varied between 10.7 to 14.8 pg/L(mean 12.7 pg/l). In patients infectious SIRS, the levels of IL-13 varied between 22.5 to 39.2 pg/L(mean 31.5 pg/ml) and in patients with non- infectious SIRS the levels varied between 28.3 to 41.1 pg/L(mean = 32.2 pg/ml). There was no statistically significant difference in IL-10 and IL-13 levels between infectious and non-infectious SIRS patients.
The levels of sICAM-1 and sVCAM-1 were measured using ELISA (Table 2). The levels of sVCAM-1 in patients with infectious varied between 543 and 1079 ng/ml (mean = 782 ng/ml) and in non-infectious SIRS the levels varied between 251 and 635 ng/ml (mean = 286 ng/ml). The levels of sICAM in infectious SIRS varied between 320 and 664 ng/ml (mean = 458 ng/ml) and the levels in non-infectious SIRS varied between 98 and 351 ng/ml (mean = 168 ng/ml). The levels of sVCAM and sICAM
were significantly higher in the infectious SIRS than non-infectious SIRS patients (p = 0.003 and = 0.0002 respectively). DISCUSSION Excessive production of pro-inflammatory cytokines by immunocompetent cells can induce SIRS and that these cytokines may play an important role in the development of acute respiratory distress syndrome (ARDS) or multiple organ dysfunction syndromes (MODS) (Oda et al., 2005; Delsesto and Opal, 2011). It has been reported that blood levels of these pro-inflammatory cytokines are elevated in patients with ARDS and septic shock, and that measurement of blood levels of these cytokines is useful in evaluating the severity and in predicting the outcome of the patients with these pathophysiological conditions (Delsesto and Opal, 2011). Among these pro-inflammatory cytokines, IL-6 has a longer half-life than TNF-α and IL-1β and its blood level remains consistently elevated in the presence of various diseases (Tamayo et al., 2011). For these reasons, the measurement of cytokines such as IL-6 blood levels is potentially useful in severity assessment and outcome prediction in patients with septic shock, trauma, severe acute pancreatitis, and cardiogenic shock (Martin et al., 1997). The rapid measurement system that allows blood IL-6 levels to be measured within about 30 min using chemiluminescent enzyme immunoassay (CLEIA) has recently been reported. This system can yield results of IL-6 measurement on approximately real-time basis when incorporated into the clinical laboratory test menu. The longer half-life of IL-6 in comparison with TNF-αmay explains why we can demonstrate a difference in the level of IL-6 and not in the level of TNF-α.
IL-6 levels are significantly elevated in the majority of patients with sepsis and the circulating IL-6 levels have correlated with the severity of sepsis in most studies

(Damas et al., 1992; Oda et al., 2005). The persistently high levels of IL-6 have been associated with the development of multiple organ failure (MOF) and poor prognosis (Tamayo et al., 2011). It has been suggested that elevated IL-6 levels reflect the activation of inflammatory response in sepsis, although the exact role of IL-6 in the pathogenesis of sepsis is not clear.
There was no statistically significant difference in IL-10 and IL-13 levels between infectious and non-infectious SIRS patients. This could be explained by the short half-life that leads to transient increase in their level in the plasma which makes their measurement in the plasma more difficult. Although many cell types express IL-10 mRNA, not all make detectable amounts of protein, and this variation can be accounted for by posttranscriptional mechanisms (Powell et al., 2000). Intra-cellular measurement of cytokines may provide more sensitive mean of cytokine analysis. Theoretically, these anti-inflammatory substances may have an important regulatory function in controlling and attenuating the systemic inflammatory response in sepsis (Delsesto and Opal 2011). However, patients with an excessive compensatory anti-inflammatory response syndrome may be immunosuppressed and at increased risk of infection or death.
The published data on the relationship between the serum levels of soluble adhesion molecules and SIRS is sparse (Brenner et al., 2010). To assess the serum soluble adhesion molecules in the SIRS ICU patients, the levels of, soluble Inter-cellular adhesion molecule-1 (sICAM-1) and Soluble Form of Vascular Cell Adhesion Molecule 1(sVCAM-1) were measured using ELISA. The levels of sVCAM and sICAM were significantly higher in the infectious SIRS than non-infectious SIRS patients. This could be due to the vital role of adhesion molecules in the process of leukocyte adhesion and migration that occur during inflammation. ICAM-1 participates in the adhesion of leukocytes to the endothelium and may be crucial in regulating leukocyte activation at a very early inflammatory response. Expression of adhesion molecules is regulated by cytokine activation and recent studies examined the role of sICAM-1 in neonatal infections, but with controversial results.
Both mononuclear cells and endothelial cells secrete ICAM-1, and ICAM-l expression on endothelial cells is up-regulated by cytokines such as IL-6. ICAM-1 is a ligand for lymphocyte function-associated antigen-i (LFA-1) and is one of the receptors responsible for adhesion of T lymphocytes, monocytes and granulocytes to endothelium. VCAM-I is expressed on dendritic cells and vascular endothelium activated by TNF, IL-I and IL-4. It plays a major role in the adhesion of leucocytes to the endothelium by interaction with its ligand very late activation antigen-4 (VLA-4), which is expressed by lymphocytes and monocytes (Jaber et al., 2009).
In conclusion, measurement of IL-6, sVCAM-1 and sICAM-1 appear to correlate with the development of
Obeid and Hassan 5967 infection and sepsis in SIRS patients. Measurement of pro-and anti-inflammatory cytokines and soluble adhesion molecules may be useful in the follow up of ICU patients and in providing a point of care tests that will help in decision making and in management of ICU patients. There is a need for more studies to establish a clear strategy for a diagnostic algorithm for cytokine and adhesion molecules measurements before such tests are eventually used in practice. ACKNOWLEDGEMENT Authors gratefully acknowledge the Dean of Scientific Research at the University of Dammam (grant No. 90065) for the financial support. REFERENCES Alzahrani AJ, Hassan MI, Obeid OE, Diab AE, Qutub HO, Gupta RK
(2009). Rapid detection of procalcitonin as an early marker of sepsis in intensive care unit in a tertiary hospital. Intern. J Med. Med. Sci., 1: 516-522.
Brenner T, Hofer S, Rosenhagen C, Steppan J, Lichtenstern C, Weitz J, Bruckner T, Lukic IK, Martin E, Bierhaus A, Hoffmann U, Weigand MA (2010). Macrophage migration inhibitory factor (MIF) and manganese superoxide dismutase (MnSOD) as early predictors for survival in patients with severe sepsis or septic shock. J. Surg. Res., 164:163-171.
Cumming CJ, Sessler CN, Beal LD, Fisher BJ, Best AM, Fowler III AA (1997). Soluble E-Selectin Levels in Sepsis and Critical Illness Correlation with Infection and Hemodynamic Dysfunction. Am. J. Respir. Crit. Care Med., 156: 431-437.
Damas P, Ledoux D, Nys M, Vrindts Y, De Groote D, Franchimont P, Lamy M (1992). Cytokine serum level during severe sepsis in human IL-6 as a marker of severity. Ann. Surg., 215: 356–362.
Delsesto D, Opal SM (2011). Future perspectives on regulating pro-and anti-inflammatory responses in sepsis. Contrib. Microbiol., 17:137-156.
Eggimann P, Pittet D (2001). Infection control in the ICU. Chest, 120: 2059–2093.
Esposito S, Leone S (2007). Antimicrobial treatment for Intensive Care Unit (ICU) infections including the role of the infectious disease specialist. Intern. J. Antimicrb. Agents, 29: 494-500.
Figueras-Aloy J, Gómez-López L, Rodríguez-Miguélez JM, Salvia-Roiges MD, Jordán-García I, Ferrer-Codina I, Carbonell-Estrany X, Jiménez-González R (2007). Serum soluble ICAM-1, VCAM-1, L-selectin, and P-selectin levels as markers of infection and their relation to clinical severity in neonatal sepsis. Am. J. Perinatol., 24: 331-338.
Gando S, Kameue T, Matsuda N, Hayakawa M, Hoshino H, Kato H (2005). Serial changes in neutrophil-endothelial activation markers during the course of sepsis associated with disseminated intravascular coagulation. Thromb. Res., 116: 91-100.
Goldie AS, Fearon KC, Ross JA, Barclay GR, Jackson RE, Grant IS, Ramsay G, Blyth AS, Howie JC (1995). Natural cytokine antagonist and endogenous antiendotoxin core antibodies in sepsis syndrome. The sepsis intervention group. JAMA., 274: 172–177.
Jaber SM, Hamed EA, Hamed SA (2009). Adhesion molecule levels in serum and cerebrospinal fluid in children with bacterial meningitis and
sepsis. J. Pediatr. Neurosci., 4: 76-85. Jarvis WR (2001). Infection control and changing health-care delivery
systems. Emerg. Infect. Dis., 7: 170–173. Kibe S, Adams K, Barlow G (2011). Diagnostic and prognostic
biomarkers of sepsis in critical care. J. Antimicrob. Chemother., 2: 33-40.
5968 Afr. J. Microbiol. Res. Makhija P, Yadav S, Thakur A (2005). Tumor necrosis factor alpha and
interleukin 6 in infants with sepsis. Indian Pediatr., 42: 1024-1028. Marchant A, Devière J, Byl B, De Groote D, Vincent JL, Goldman M
(1994). Interleukin-10 production during septicemia. Lancet, 343: 707–708.
Martin C, Boisson C, Haccoun M, Thomachot L, Mege JL (1997). Patterns of cytokine evolution (tumor necrosis factor-α and interleukin-6 after septic shock, hemorrhagic shock, and severe trauma. Crit. Care Med., 25: 1813–1819.
Martin C, Saux P, Mege JL, Perrin G, Papazian L, Gouin F (1994). Prognostic value of serum cytokines in septic shock. Intensive Care Med., 20: 272–277.
Nagai M, Hirayama K, Ebihara I, Higuchi T, Imaizumi M, Maruyama H, Miyamoto Y, Kakita T, Ogawa Y, Fujita S, Shimohata H, Kobayashi M (2011). Serum TNF-Related and Weak Inducer of Apoptosis Levels in Septic Shock Patients. Ther. Apher. Dial., 15: 342-348.
Newman W, Beall LD, Carson CW, Hunder GC, Graben N, Randhawa ZI, Gopal TV, Wiener-Kronish J, Matthay MA (1993). Soluble E-selectin is found in supernatants of activated endothelial cells and is elevated in the serum of patients with septic shock. J. Immunol., 150: 644-654.
Oda S, Hirasawa H, Shiga H, Nakanishi K, Matsuda K and Nakamua M (2005). Sequential measurement of IL-6 blood levels in patients with
systemic inflammatory response syndrome (SIRS)/sepsis. Cytokine, 29: 169-175.
Pinsky MR, Vincent JL, Deviere J, Alegre M, Kahn RJ, Dupont E (1993).
Serum cytokine levels in human septic shock. Relation to multiple-system organ failure and mortality. Chest, 103: 565–575.
Powell MJ, Thompson SA, Tone Y, Waldmann H, Tone M (2000). Posttranscriptional regulation of IL-10 gene expression through sequences in the 3'-untranslated region. J. Immunol., 165: 292-296.
Rosengart MR (2006). Critical care medicine: landmarks and legends. Surg. Clin. North. Am., 86: 1305-1321.
Shapiro NI, Schuetz P, Yano K, Sorasaki M, Parikh SM, Jones AE, Trzeciak S, Ngo L, Aird WC (2010). The association of endothelial cell signaling, severity of illness, and organ dysfunction in sepsis. Crit. Care, 4 :182.
Shubin NJ, Monaghan SF, Ayala A (2011). Anti-inflammatory mechanisms of sepsis. Contrib. Microbiol., 17: 108-124.
Tamayo E, Fernández A, Almansa R, Carrasco E, Heredia M, Lajo C, Goncalves L, Gómez-Herreras JI, de Lejarazu RO, Bermejo-Martin JF (2011). Pro- and anti-inflammatory responses are regulated simultaneously from the first moments of septic shock. Eur. Cytokine Netw., 22: 82-87.
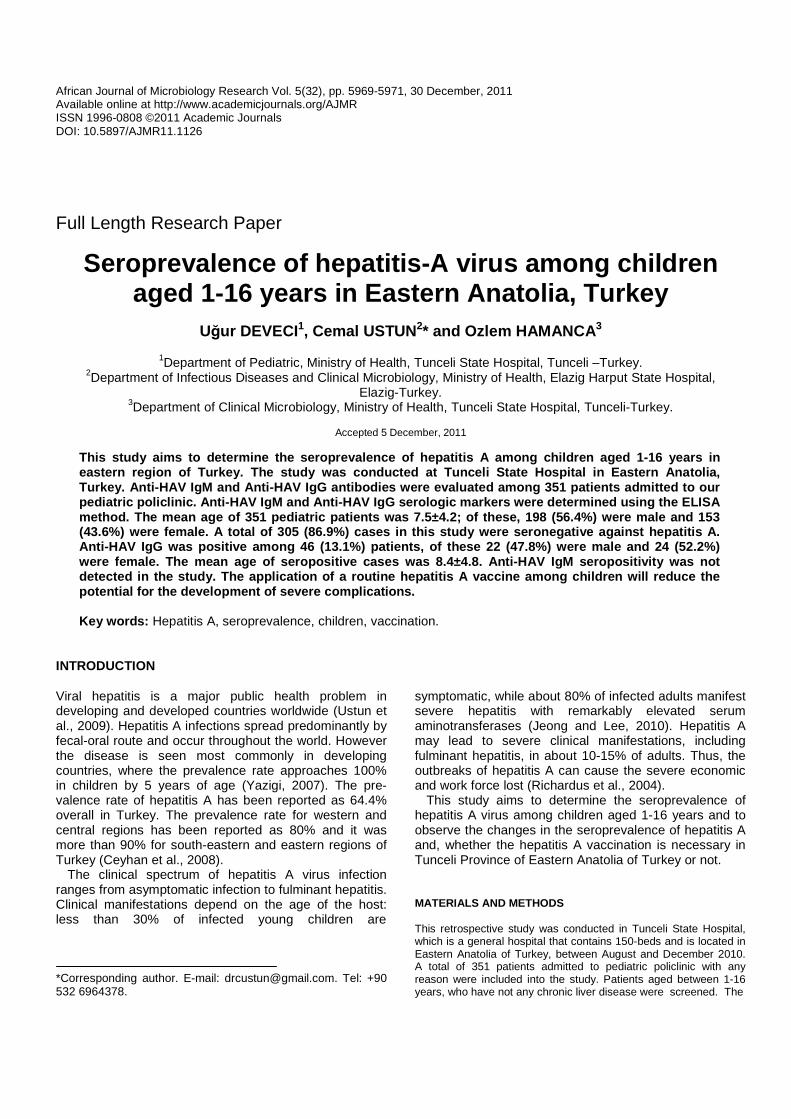
African Journal of Microbiology Research Vol. 5(32), pp. 5969-5971, 30 December, 2011 Available online at http://www.academicjournals.org/AJMR ISSN 1996-0808 ©2011 Academic Journals DOI: 10.5897/AJMR11.1126
Full Length Research Paper
Seroprevalence of hepatitis-A virus among children aged 1-16 years in Eastern Anatolia, Turkey
Uğur DEVECI1, Cemal USTUN 2* and Ozlem HAMANCA 3
1Department of Pediatric, Ministry of Health, Tunceli State Hospital, Tunceli –Turkey.
2Department of Infectious Diseases and Clinical Microbiology, Ministry of Health, Elazig Harput State Hospital, Elazig-Turkey.
3Department of Clinical Microbiology, Ministry of Health, Tunceli State Hospital, Tunceli-Turkey.
Accepted 5 December, 2011
This study aims to determine the seroprevalence of hepatitis A among children aged 1-16 years in eastern region of Turkey. The study was conducted a t Tunceli State Hospital in Eastern Anatolia, Turkey. Anti-HAV IgM and Anti-HAV IgG antibodies we re evaluated among 351 patients admitted to our pediatric policlinic. Anti-HAV IgM and Anti-HAV IgG serologic markers were determined using the ELISA method. The mean age of 351 pediatric patients was 7.5±4.2; of these, 198 (56.4%) were male and 153 (43.6%) were female. A total of 305 (86.9%) cases i n this study were seronegative against hepatitis A. Anti-HAV IgG was positive among 46 (13.1%) patients , of these 22 (47.8%) were male and 24 (52.2%) were female. The mean age of seropositive cases was 8.4±4.8. Anti-HAV IgM seropositivity was not detected in the study. The application of a routine hepatitis A vaccine among children will reduce the potential for the development of severe complicatio ns. Key words: Hepatitis A, seroprevalence, children, vaccination.
INTRODUCTION Viral hepatitis is a major public health problem in developing and developed countries worldwide (Ustun et al., 2009). Hepatitis A infections spread predominantly by fecal-oral route and occur throughout the world. However the disease is seen most commonly in developing countries, where the prevalence rate approaches 100% in children by 5 years of age (Yazigi, 2007). The pre-valence rate of hepatitis A has been reported as 64.4% overall in Turkey. The prevalence rate for western and central regions has been reported as 80% and it was more than 90% for south-eastern and eastern regions of Turkey (Ceyhan et al., 2008).
The clinical spectrum of hepatitis A virus infection ranges from asymptomatic infection to fulminant hepatitis. Clinical manifestations depend on the age of the host: less than 30% of infected young children are *Corresponding author. E-mail: [email protected]. Tel: +90 532 6964378.
symptomatic, while about 80% of infected adults manifest severe hepatitis with remarkably elevated serum aminotransferases (Jeong and Lee, 2010). Hepatitis A may lead to severe clinical manifestations, including fulminant hepatitis, in about 10-15% of adults. Thus, the outbreaks of hepatitis A can cause the severe economic and work force lost (Richardus et al., 2004).
This study aims to determine the seroprevalence of hepatitis A virus among children aged 1-16 years and to observe the changes in the seroprevalence of hepatitis A and, whether the hepatitis A vaccination is necessary in Tunceli Province of Eastern Anatolia of Turkey or not. MATERIALS AND METHODS This retrospective study was conducted in Tunceli State Hospital, which is a general hospital that contains 150-beds and is located in Eastern Anatolia of Turkey, between August and December 2010. A total of 351 patients admitted to pediatric policlinic with any reason were included into the study. Patients aged between 1-16 years, who have not any chronic liver disease were screened. The

5970 Afr. J. Microbiol. Res.
Table 1. The demographic characteristics of 351 patients.
Patient count (%) Mean Age ± Sd* Male (%) Female ( %)
All cases 351 (100) 7.5 ±4.2 198 (56.4) 153 (43.6) Seropositive cases 46 (13.1) 8.4 ±4.8 22 (47.8) 24 (52.2) Seronegative cases 305 (86.9) 7.4 ±4.0 176 (57.7) 129 (42.3)
*Sd: Standard deviation.
Table 2. The studies of hepatitis A seroprevalence conducted in Turkey.
Researcher Location of Turkey Date Age Case number Seropositivity rate (%) Kanra et al. (2002) General 2002 1-4 years 727 42.7 Alabaz et al. (2005) Southern 2005 12 months 147 36.1 Ozen et al. (2006) Eastern 2006 3-6 years 286 17.5 Ceyhan et al. (2008) Southeastern 2006 0-14 years 701 90 Aslan et al. (2001) Southeastern 1999 2-64 years 400 66.5 Tekay (2006) Eastern 2004 0-14 years 416 63 Present study Eastern 2010 1-16 years 351 13.1
data of hepatitis A serological markers were retrospectively collected from patients’ files. Anti-HAV IgM and Anti-HAV IgG serological markers were tested by using the ELISA method (Abbott Architect I 2000 SR).
Statistical analysis of the data was done by SPSS for Windows 16.0 software (SPSS Inc, Chicago, USA). Student’s t-test was used to compare the data of patients. RESULTS The demographic characteristics of 351 patients are shown in Table 1. Anti-HAV IgG seropositivity was found among 46 (13.1%) patients. Anti-HAV IgM seropositivity was not detected in any case during study period. There were no statistical significant differences between seropositive and seronagative cases in terms of the mean age of cases (p=0.7). DISCUSSION To our knowledge, this is the first study to investigate the seroprevalence of hepatitis A virus in Tunceli Province in Eastern of Turkey. The seroprevalence rates of hepatitis A virus in previous studies conducted in the eastern and south-eastern region of our country is presented in Table 2. According to these results, the seroprevalence rate of hepatitis A virus in our study was lower than the other studies presented in Table 2. This discordance has been considered probably due to the high socioeconomic level of population admitted to our hospital. Also, improved sanitary and hygienic condition of the population included to present study because of the fact that the present government has increased the investment for sewerage,
and sanitary and hygienic condition in our region in the last 8 years. In Turkey, socio-economic improvements and drinking water quality have been followed by a decrease in HAV infection. [http://www.saglik.gov.tr]. Our lowest rate of hepatitis A virus seropositivity among children indicates the requirement of vaccination against hepatitis A virus; because hepatitis A leads to severe complication as the child gets older. Nowadays, age of exposure to hepatitis A virus infection is increasing towards puberty worldwide. This is probably because of the epidemiological changes of hepatitis A virus (Jeong and Lee, 2010). Similarly, nowadays, hepatitis A virus is the most common detected cause of fulminant hepatitis among children in our country as well as worldwide (Santos et al., 2009; Aydogdu et al., 2003). In this study, being the 8.4±4.8 years of the mean age of hepatitis A seropositivity may be due to the exposure to hepatitis A during school and nursery school age. Improved sanitary conditions and hygienic practices have reduced the incidence of HAV infection, especially in developed countries. Reduction in the number of new cases is generally accompanied by a shift in the age of first contact with HAV towards older age groups. As a consequence, both the severity of the reported cases and the risk of outbreaks of disease would increase (Ceyhan et al., 2008). In the present study, the reason for not detecting anti HAV IgM seropositivity may be due to the population including to the study and the time of study which was made between August and December 2010.
In our country, Topal et al. (2011) have reported that the seropositivity rate of hepatitis A virus among children aged between 1-6 years is 9.4% in western region. Ince et al. (2011) have reported that the seroprevalence rate of hepatitis A virus among infants aged 12-month old is
23.5% in central region. It is noticed that Turkey has intermediate endemicity of hepatitis A infections, and endemicity may be change by the geographical and socio-economic conditions (Ceyhan et al., 2008). The results of present study have confirmed this condition as the reported previous studies. The lower results from this study have shown that the age of exposure to hepatitis A has increased toward puberty. Thus, the vaccination is necessary for children older than 2 years in order to prevent the severe complications of the disease among adults.
Routine vaccination of young children can prevent infection at a later age which likely would be more serious. Universal vaccination of young children in Israel and Catalonia has resulted in significant reductions in the incidence of hepatitis A disease in these countries (Dagan et al., 2005; Dominguez et al., 2004).
The limitation of this study is that its results do not indicate the general population of our region, because this study is limited with patients admitted to pediatric policlinic. Conclusion The present study demonstrated that the age of exposure to hepatitis A infection has been increasing towards puberty in our region. The immunization against hepatitis A is necessary. The application of a routine hepatitis A vaccine among children will reduce the potential for the development of severe complications. REFERENCES Alabaz D, Aksaray N, Alhan E, Yaman A (2005). Decline of maternal
hepatitis A antibodies during the first two years of life in infants born in Turkey. Am. J. Trop. Med. Hyg., 73: 457-459.
Aslan G, Seyrek A, Iscan A, Sevinc E, Ulukanligil M, Bakir M (2001). Hepatit A seroprevalence in Sanliurfa. J. Viral. Hepat., 7: 270-273.
Deveci et al. 5971 Aydogdu S, Ozgenc F, Yurtsever S, Akman SA, Tokat Y, Yagcı RV
(2003). Our experience with fulminant hepatic failure in Turkish children: etiology and outcome. J. Trop. Pediatr., 49: 367-370.
Ceyhan M, Yıldırım I, Kurt N (2008). Differences in hepatitis A seroprevalence among geographical regions in Turkey: a need for regional vaccination recommendations. J. Viral. Hepat., l5: 69-72.
Dagan R, Leventhal A, Anis E, Slater P, Ashur Y, Shouval D (2005). Incidence of hepatitis A in Israel following universal immunization of toddlers. JAMA, 294(2): 202–210.
Dominguez A, Bruguera M, Plans P, Costa J, Salleras L (2004). Prevalence of hepatitis A antibodies in schoolchildren in Catalonia (Spain) after the introduction of universal hepatitis A immunization. J. Med. Virol., 73(2): 172–176.
Ince TO, Yalcın S, Yurdakok K, Ozmert EN (2011), Hepatitis A seroprevalence among infants aged 12 months in Ankara. Turk J. Pediatr., 53:114-116.
Jeong SH, Lee HS (2010). Hepatitis A: clinical manifestations and management. J. Intervirol., 53(1): 15-19.
Kanra G, Tezcan S, Badur S and Turkish National Study Team (2002). Hepatitis A seroprevalence in a random sample of the Turkish population by simultaneous EPI cluster and comparison with surveys in Turkey. Turk. J. Pediatr., 44: 204-210.
Ozen M, Yologlu S, Isık Y, Tekerekoglu MS (2006). Anti-HAV IgG seropositivity in children aged 2-16 years who were admitted to Turgut Ozal Medical Center. Turk. J. Pediatr. Arch., 41: 36-40.
Richardus JH, Vos D, Veldhuijzen IK, Groen J (2004). Seroprevalence of hepatitis A virus antibodies in Turkish and Moroccan children in Rotterdam. J. Med. Virol., 72:197- 202.
Santos DC, Martinho JM, Pacheco-Moreira LF(2009). Fulminant hepatitis failure in adults and children from a Public Hospital in Rio de Janerio, Brasil. Braz. J. Infect. Dis., 13: 323-329.
Tekay F (2006). Hepatitis A frequency in children aged between 0-14 years who admitted to Hakkâri State Hospital. Dicle Med. J., 33: 245-247.
Topal E, Hatipoglu N, Turel O, Aydogmus C, Hatipoglu H, Erkal S, Siraneci R (2011). Seroprevalence of Hepatitis A and Hepatitis A vaccination rate in preschool age in Istanbul Urban. J. Pediatr. Inf., 5: 12-15.
Ustun C, Basuguy E, Deveci U (2009). Seroprevalence of hepatitis B and hepatitis C in children admitted to pediatric surgery policilinic. Nobel Med., 5 (Sup. 1): 4-9.
Yazigi N (2007). Viral Hepatitis. In: Kliegman virus RM, Behrman RE, Jenson HB, Stanton BF. Nelson textbook of pediatrics. 18th ed. Philadelphia: Saunders, pp. 1680-1690.

African Journal of Microbiology Research Vol. 5(32), pp. 5972-5977, 30 December, 2011 Available online at http://www.academicjournals.org/AJMR ISSN 1996-0808 ©2011 Academic Journals DOI: 10.5897/AJMR11.1173
Full Length Research Paper
Diversity of nifH gene sequences in the sediments of South China Sea
Lixian Wu1,2#, Yanhua Cui3# and Sanfeng Chen1*
1State Key Laboratory of Agrobiotechnology and College of Biological Sciences, China Agricultural University,
Beijing 100193, China. 2Department of Pathogen Biology, Hainan Medical University, Haikou 571101, China.
3School of Food Science and Engineering, Harbin Institute of Technology, Harbin 150090, China.
Accepted 21 October, 2011
In order to contribute to knowledge about structure of marine diazotrophic communities in the sediments of South China Sea, the molecular diversity of the nifH gene, which encodes the Fe protein of the nitrogenase complex, was assessed by polymerase chain reaction (PCR) amplification using PolF/R primers, followed by cloning and sequencing. Sequences of nifH genes were amplified from environmental deoxyribonucleic acid (DNA) samples collected during three stations including shallow sea (75 m, station L10), shelf (450 m, station L2) and deep sea (1000 m, station L21), and covering an area between 17 to 19°N and 111 to 119°E. Samples from shallow sea contained β-, and δ- proteobacteria; the shelf contained α-, β-, δ- proteobacteria; the deep sea contained α-, δ-, γ-proteobacteria, firmicutes, and green nonsulfur (GNS) bacterium. These results suggested that diazotroph was significant component potentially contributing to nitrogen fixation in South China Sea. Key words: nifH, diversity, sediment, the South China Sea.
INTRODUCTION The diazotroph, which is a fundamental component of ecosystems, catalyses the reduction of atmospheric N2 gas to biologically available ammonium, providing an important source of fixed nitrogen for the biosphere (Moir, 2011). Most microorganisms that perform biological N2 fixation with the nitrogen fixation (nif) gene cluster (Rees et al., 2005). The nifH gene, which encodes the iron protein of nitrogenase, is a highly conserved functional gene useful in phylogenetic studies (Zehr et al., 2003). Culture-independent and molecular methods were developed and applied in assessment of diazotroph diversity by amplifying, cloning and sequencing of the nifH gene from environmental DNA samples (Falcon et *Corresponding author. E-mail: [email protected]. Tel: +86 10 62731551. Fax: +86 10 62731551. #, The first and the second authors contributed equally to this work.
al., 2002; Jenkins et al., 2004; Moisander et al., 2007, 2008; Langlois et al., 2008). The diversity of diazotrophs was accessed in many different habitats by this approach, including soils, freshwater and saltwater lakes, salt marshes, deep-sea vents and so on (Falcon et al., 2002; Jenkins et al., 2004; Moisander et al., 2007, 2008; Langlois et al., 2008).
The South China Sea (SCS) is one of the largest marginal seas in the tropical Pacific that potentially shares microbial community components from coastal and open ocean ecosystems (Moisander et al., 2008). The SCS has a deep basin with a maximum depth of 5000 m and a shelf less than 100 m deep, the conditions such as warm, permanently stratified, oligotrophic, and dust rich. The environment is favorable for nitrogen fixation (Karl et al., 2002; Moisander et al., 2008; Zhang et al., 2011).
In the present study, diazotrophic bacteria associated with sediments were investigated by the diversity analysis of sequences amplified by polymerase chain reaction (PCR) from deoxyribonucleic acid (DNA) extracted from
different depths of the SCS. The amplified nifH products were characterized by DNA sequencing and were compared with the sequences of nitrogenase genes available in database from different environment. Investigations of nifH diversity and phylogenetic analysis in the SCS sediments may help to understand the distribution of diazotrophic bacteria. MATERIALS AND METHODS
Sampling and DNA extraction
Samples were collected from the subsurface sediment of the SCS of different depths of water column in the range of 70-1,000 m. Samples from shallow sea (75 m, station L10), shelf (450 m, station L2) and deep sea (1000 m, station L21). Three sediment samples were collected during the month of July 2007; collection was three times in one sample. Undisturbed surface sediments down to 1-5 m depth were sampled using sterile techniques and stored in liquid
nitrogen during the cruise and at -80°C after returning to the laboratory. Sediment DNA was extracted by a previously established procedure (Zhou et al., 1997). Polymerase chain reaction (PCR), cloning and restriction fragment length polymorphism (RFLP) analysis
Bacterial nitrogenase reductase genes were amplified with primers PolF (5'-TGCGAYCCSAARGCBGAC TC-3') and PolR (5'-ATS GCCATCATYTCRCCGGA-3') (Poly et al., 2001). Thermal cycling conditions were 95°C for 5 min, followed by 30 cycles of 94°C for 30 s, 53°C for 1 min, 72°C for 40 s, and a final extension step of 72°C for 5 min. The PCR products were then cloned using a TAKARA TA cloning kit (TOYOBO Shanghai, Shanghai, China). PCR amplification products containing the right-size (402 bp) insert were digested with 1 U of restriction enzymes Mbo Ι, Rsa Ι, Msp Ι (MBI) for 4 to 8 h at 37°C. The restriction profiles were evaluated by
electrophoresis in 3% agarose gel. Clones that produced the same RFLP pattern were grouped together and considered representatives of the same operational taxonomic unit (OTU). The PCR products showing different RFLP patterns were randomly selected for sequencing. Plasmid DNA was prepared and sequenced, at least twice in both directions, by using an ABI PRISM 377 DNA sequencer (Perkin-Elmer Cetus Instruments, Norwalk, CT).
Sequence alignment and phylogenetic analysis
The product of about 402 bp fragment was obtained by PCR reaction. The sequences of nifH gene from the NCBI GenBank database were selected on the basis of sequence similarity to one or more of the marine sequences. These diazotrophs sequences were utilized for phylogenetic reconstructions. Protein sequences for each major sequence cluster were aligned in Clustal W (Thompson et al., 1994). Maximum likelihood phylogenies were constructed in MEGA (ver. 5.0) by the Bootstrap method using pair wise deletion of gaps and missing data with 1000 bootstrap resamplings (Tamura et al., 2011). Nucleotide sequence accession numbers
The nifH sequences determined in this study are available in the GenBank database, accession numbers HM063747-HM063831.
Lixian et al. 5973 RESULTS AND DISCUSSION Analysis of all nifH clones in three stations The nifH gene has been one of the most important functional genes used when studying diversity in numerous habitats in last few years. In this study, the nifH gene was used as a molecular marker for studying the diazotrophic diversity and abundance in the SCS sediments in three stations. A total of 203 nifH clones from three sediment samples were obtained (station L10, 43 clones; station L2, 91 clones; station L21, 69 clones). The diversity of nifH sequences was analyzed by restriction fragment length polymorphism (RFLP), and 48 restriction profiles were obtained in this study. The deduced amino acid sequences shared 39% to 99% similarity to the closest match GenBank nifH and nifH-like sequences. Phylogenetic analysis indicated that most nifH protein sequences might be obtained from currently uncultured or uncharacterized bacteria, and covered diverse environments. The similarity of sequenced nifH genes ranged from 73 to 100% between each other.
nifH diversity in station L10 In shallow sea (75 m, station L10), 9 protein sequences (43 clones) clustered into three major groups, including β-δ- subdivisions of proteobacteria (Figure 1). The most sequences were belonging to δ-proteobacteria, including L10-H10, L10-H66, L10-H134, L10-H192, L10-H244, L10-H290 and L10-H297. These sequences were very similar to sequences previously recovered from various environments, including rhizosphere of plant, soil, corals, oligotrophic tropical sea grass bed communities, salt marsh, beach, marine sediment, and bay (Zhang et al., 2006; Musat et al., 2006; Coelho et al., 2008; Lovell et al., 2008; Teng et al., 2009). These sequences showed high homology with nifH genes of the Desulfovibrio sp. (Desulfovibrio magneticus, Desulfovibrio aespoeenisis), Desulfonatronospira thiodism, Sinorhizobium sp., and Bradyrhizobium japonicum. The sequences L10-H134 and L10-H290 had high identity with sequences previously recovered from northern South China Sea (ADT90055.1), Chesapeake Bay (AAZ06761.1), Jiaozhou Bay (ACN77086.1), eastern Mediterranean Sea (ABQ50774.1, Man-Aharonovich et al., 2007). The L10-H10, L10-H244, and L10-H297 showed a high homology with the nifH gene of Sinorhizobium sp. TJ170 and Methylococcus capsulatus str.
The β-proteobacteria cluster contains L10-H200 and L10-H243. The protein sequence L10-H200 had a high identity with with the nifH genes of Dechloromonas sp. SIUL and Zoogloea oryzae. The latter bacterium was isolated from rice paddy soil (Xie and Yokota, 2006). The protein sequence L10-H243 showed a high homology with the nifH gene of uncultured bacterium which was

5974 Afr. J. Microbiol. Res.
Figure 1. Phylogenetic trees for nifH of the station L10 constructed in MEGA (ver. 5.0) based on amino acid
sequences using the Bootstrap method. Phylogenetic relationships were bootstrapped 1000 times, and
bootstrap values are shown.
found in the eastern Mediterranean Sea (Man-Aharonovich et al., 2007). nifH diversity in station L2 In shelf site (450 m, station L2), 20 protein sequences (91 clones) clustered into four major groups, including α-, β-, δ- subdivisions of proteobacteria (Figure 2). The α-proteobacteria cluster contained a distinct sequence L2-H81. It had a 98% protein sequence similarity with the nifH sequences affiliated with Azospirillum brasilense, an aerobic, plant growth-promoting rhizobacteria (PGPR) isolated from cereal root (Umali-Garcia et al., 1980; Steenhoudt and Vanderleyden, 2000; Bashan et al., 2004; Cui et al., 2006).
Among the β-proteobacteria, Dechloromonas sp. SIUL was the dominant diazotroph covering 50.5% (46/91) of the clone library. These protein sequences showed high similarity to sequences previously obtained from various environments, including rhizospheres, soil, corals, coast, salt marsh, eastern Mediterranean Sea, and wastewater (Man-Aharonovich et al., 2007; Bowers et al., 2008). The protein sequences L2-H1, L2-H9 and L2-H10 showed high identity with Dechloromonas sp. SIUL. The protein sequences L2-H39 and L2-H111 had 92.9% similarity of uncultured marine bacteria (ADT89967 and ADT89983) which were found in the northern SCS (Kong et al., 2011).
The most sequences belonging to δ-proteobacteria, including L2-H3, L2-H4, L2-H6, L2-H15, L2-H18, L2-H19, L2-H22, L2-H37, L2-H66, L2-H75, L2-H90, L2-H95, L2-H106 and L2-H142. The protein sequences of L2-H3, L2-H75, L2-H90 and L2-H106 showed 89%-91% similarity with nifH sequences of uncultured bacterium (AAT48890, AAT48897) which were found in the Tibetan plateau (Zhang et al., 2006). L2-H4 and L2-H22 had high protein sequence identity with the nifH sequences of B. japonicum which is a species of legume-root nodulating, microsymbiotic nitrogen-fixing bacterium species (Dashti et al., 1997). L2-H6, L2-H15, L2-H18, L2-H37, L2-H66 and L2-H142 had high identity of protein sequences with nifH sequences of Desulfuromonas acetoxidans DSM 684 and Desulfovibrio dechloracetivorans (Ju et al., 2007). nifH diversity in station L21 In deep sea (1000 m, station L21), 19 protein sequences (69 clones) clustered into seven major groups, including α-, δ-, γ-proteobacteria, firmicutes, and green nonsulfur (GNS) bacterium (Figure 3).
The α-proteobacteria cluster contained a single protein sequence L21-H146. It had a 91% protein sequence similarity with the nifH sequences of A. brasilense which is an important diazotroph isolated from cereal root (Umali-Garcia et al., 1980; Steenhoudt and
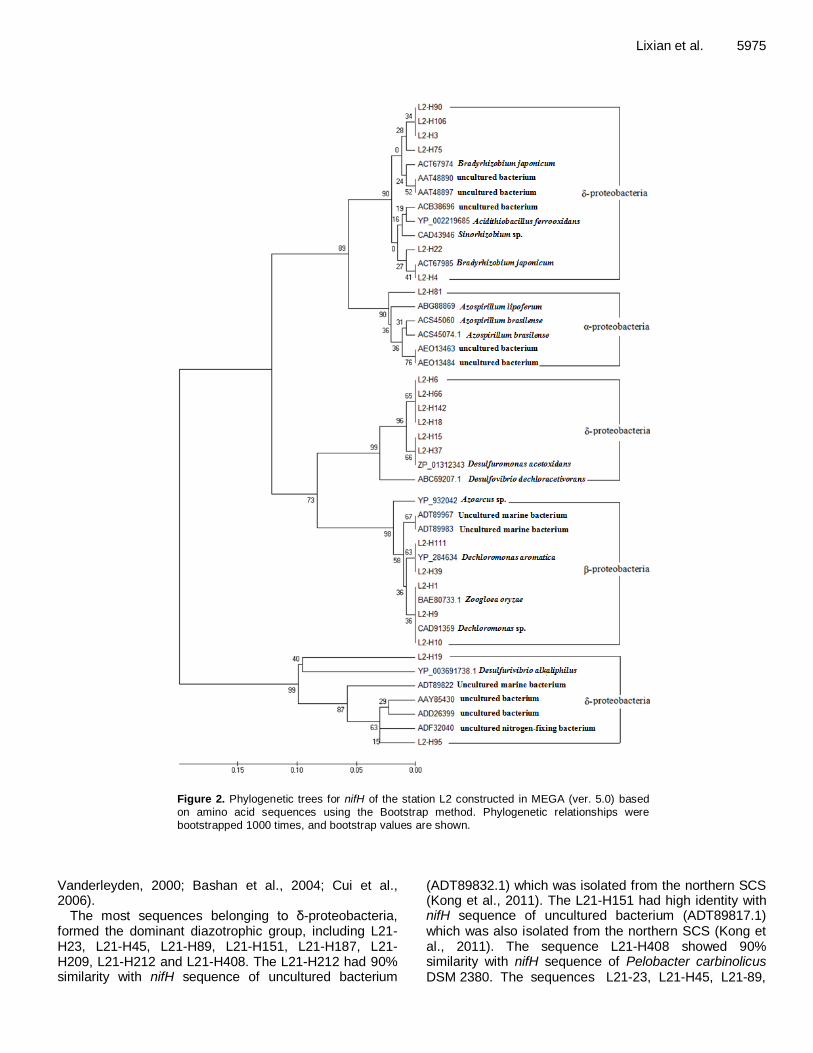
Lixian et al. 5975
Figure 2. Phylogenetic trees for nifH of the station L2 constructed in MEGA (ver. 5.0) based on amino acid sequences using the Bootstrap method. Phylogenetic relationships were bootstrapped 1000 times, and bootstrap values are shown.
Vanderleyden, 2000; Bashan et al., 2004; Cui et al., 2006).
The most sequences belonging to δ-proteobacteria, formed the dominant diazotrophic group, including L21-H23, L21-H45, L21-H89, L21-H151, L21-H187, L21-H209, L21-H212 and L21-H408. The L21-H212 had 90% similarity with nifH sequence of uncultured bacterium
(ADT89832.1) which was isolated from the northern SCS (Kong et al., 2011). The L21-H151 had high identity with nifH sequence of uncultured bacterium (ADT89817.1) which was also isolated from the northern SCS (Kong et al., 2011). The sequence L21-H408 showed 90% similarity with nifH sequence of Pelobacter carbinolicus DSM 2380. The sequences L21-23, L21-H45, L21-89,
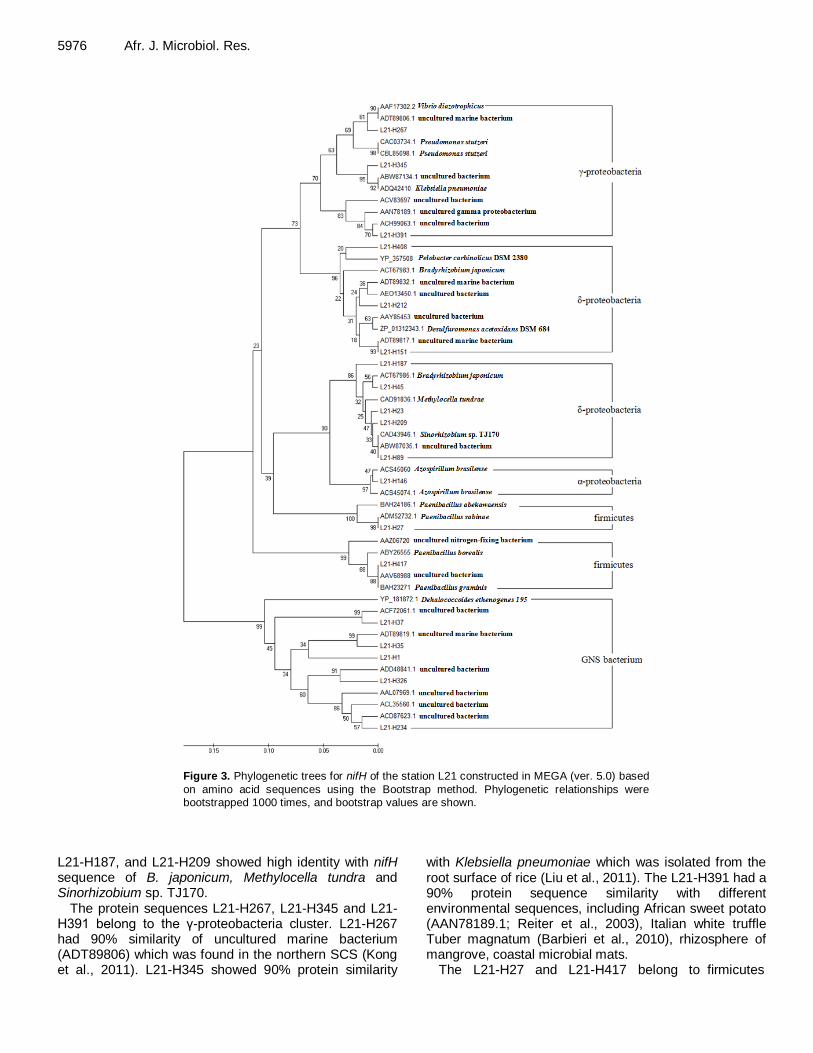
5976 Afr. J. Microbiol. Res.
Figure 3. Phylogenetic trees for nifH of the station L21 constructed in MEGA (ver. 5.0) based
on amino acid sequences using the Bootstrap method. Phylogenetic relationships were bootstrapped 1000 times, and bootstrap values are shown.
L21-H187, and L21-H209 showed high identity with nifH sequence of B. japonicum, Methylocella tundra and Sinorhizobium sp. TJ170.
The protein sequences L21-H267, L21-H345 and L21-H391 belong to the γ-proteobacteria cluster. L21-H267 had 90% similarity of uncultured marine bacterium (ADT89806) which was found in the northern SCS (Kong et al., 2011). L21-H345 showed 90% protein similarity
with Klebsiella pneumoniae which was isolated from the root surface of rice (Liu et al., 2011). The L21-H391 had a 90% protein sequence similarity with different environmental sequences, including African sweet potato (AAN78189.1; Reiter et al., 2003), Italian white truffle Tuber magnatum (Barbieri et al., 2010), rhizosphere of mangrove, coastal microbial mats.
The L21-H27 and L21-H417 belong to firmicutes

cluster, which had high identity with nifH sequences of firmicutes Paenibacillus sp. The GNS bacterium cluster contained L21-H1, L21-H35, L21-H37, H21-H234 and L21-H326. These protein sequences showed high similarity with Dehalococcoides ethenogenes 195 (Seshadri et al., 2005).
In this study, we examined the phylogenetic diversity and abundance of diazotrophs in the SCS by analysis of nifH gene from three different stations. The results indicated that deep sea sediment had higher diversity of diazotrophic bacteria than those of shelf site and shallow sea. ACKNOWLEDGEMENTS This work was supported by the National Nature Science Foundation of China (Grant No. 30470028). REFERENCES
Barbieri E, Ceccaroli P, Saltarelli R, Guidi C, Potenza L, Basaglia M, Fontana F, Baldan E, Casella S, Ryahi O, Zambonelli A, Stocchi V (2010). New evidence for nitrogen fixation within the Italian white truffle,Tuber magnatum. Fungal Biol., 114(11-12): 936-942.
Bashan Y, Holguin G, de-Bashan LE (2004). Azospirillum-plant
relationships: physiological, molecular, agricultural, and
environmental advances (1997-2003). Can. J. Microbiol., 50: 521-577.
Bowers TH, Reid NM, Lloyd-Jones G (2008). Composition of nifH in a
wastewater treatment system reliant on N2 fixation. Appl. Microbiol. Biotechnol., 79 (5): 811-818.
Coelho MR, de Vos M, Carneiro NP, Marriel IE, Paiva E, Seldin L (2008). Diversity of nifH gene pools in the rhizosphere of two cultivars of sorghum (Sorghum bicolor) treated with contrasting levels of
nitrogen fertilizer. FEMS Microbiol. Lett., 279 (1): 15-22.
Cui YH, Tu R, Guan Y, Chen SF (2006). Cloning, sequencing and characterization of the Azospirillum brasilense fhuE gene. Curr.
Microbiol., 52(3): 169-177.
Dashti N, Zhang F, Hynes R, Smith D L (1997). Application of plant growth-promoting rhizobacteria to soybean (Glycine max [L.] Merr.)
increases protein and dry matter yield under short-season conditions. Plant Soil, 188 (1): 33-41.
Falcon LI, Cipriano F, Chistoserdov AY, Carpenter EJ (2002). Diversity of diazotrophic unicellular cyanobacteria in the tropical North Atlantic Ocean. Appl. Environ. Microbiol., 68: 5760-5764.
Jenkins BD, Steward GF, Short SM, Ward BB, Zehr JP (2004). Fingerprinting diazotroph communities in the Chesapeake Bay by using a DNA macroarray. Appl. Environ. Microbiol., 70: 1767-1776.
Ju X, Zhao L, Sun B (2007). Nitrogen fixation by reductively dechlorinating bacteria. Environ. Microbiol., 9 (4): 1078-1083.
Karl D, Michaels A, Bergman B, Capone D, Carpenter E, Letelier R,
Lipschultz F, Paerl H, Sigman D, Stal L (2002). Dinitrogen fixation in the world's oceans. Biogeochemistry, 57/58: 47-98.
Kong LL, Jing HM, Kataoka T, Sun J, Liu HB (2011). Phylogenetic diversity and spatio-temporal distribution of nitrogenase genes (nifH)
in the northern South China Sea. Aquat. Microbial. Ecol., 65: 15-27. Langlois RJ, Hummer D, LaRoche J (2008). Abundances and
distributions of the dominant nifH phylotypes in the Northern Atlantic
Ocean. Appl. Environ. Microbiol., 74: 1922-1931. Liu Y, Wang H, Sun XL, Yang HL, Wang YS, Song W (2011). Study on
mechanisms of colonization of nitrogen-fixing PGPB, Klebsiella pneumoniae NG14 on the root surface of rice and the formation of
biofilm. Curr. Microbiol., 62(4): 1113-1122.
Lovell CR, Decker PV, Bagwell CE, Thompson S, Matsui GY (2008). Analysis of a diverse assemblage of diazotrophic bacteria from
Lixian et al. 5977
Spartina alterniflora using DGGE and clone library screening. J.
Microbiol. Methods, 73 (2): 160-171. Man-Aharonovich D, Kress N, Zeev EB, Berman-Frank I, Beja O (2007).
Molecular ecology of nifH genes and transcripts in the eastern Mediterranean Sea. Environ. Microbiol., 9(9): 2354-2363.
Moir JWB (editor) (2011). Nitrogen Cycling in Bacteria: Molecular
Analysis. Caister Academic Press. ISBN 978-1-904455-86-8. Moisander PH, Beinart RA, Voss M, Zehr JP (2008). Diversity and
abundance of diazotrophic microorganisms in the South China Sea
during intermonsoon. ISME J., 2: 954-967. Moisander PH, Morrison AE, Ward BB, Jenkins BD, Zehr JP (2007).
Spatial-temporal variability in diazotroph assemblages in Chesapeake Bay using an oligonucleotide nifH microarray. Environ.
Microbiol., 9: 1823-1835. Musat F, Harder J, Widdel F (2006). Study of nitrogen fixation in
microbial communities of oil-contaminated marine sediment microcosms. Environ. Microbiol., 8 (10), 1834-1843.
Poly F, Monrozier LJ, Bally R (2001). Improvement in the RFLP
procedure for studying the diversity of nifH genes in communities of nitrogen fixers in soil. Res. Microbiol., 152: 95-103.
Rees DC, Akif Tezcan F, Haynes CA, Walton MY, Andrade S, Einsle O,
Howard JB (2005). Structural basis of biological nitrogen fixation. Philos. Transact. A Math. Phys. Eng. Sci., 363: 971-984.
Reiter B, Burgmann H, Burg K, Sessitsch A (2003). Endophytic nifH
gene diversity in African sweet potato Can. J. Microbiol., 49 (9): 549-555.
Seshadri R, Adrian L, Fouts DE, Eisen JA, Phillippy AM, Methe BA,
Ward NL, Nelson WC, Deboy RT, Khouri HM, Kolonay JF, Dodson RJ, Daugherty SC, Brinkac LM, Sullivan SA, Madupu R, Nelson KE, Kang KH, Impraim M, Tran K, Robinson JM, Forberger HA, Fraser
CM, Zinder SH, Heidelberg JF (2005). Genome sequence of the PCE-dechlorinating bacterium Dehalococcoides ethenogenes.
Science, 307 (5706): 105-108. Steenhoudt O, Vanderleyden J (2000). Azospirillum, a freeliving
nitrogen-fixing bacterium closely associated with grasses: genetic, biochemical and ecological aspects. FEMS Microbiol. Rev., 24: 487-
506. Tamura K, Peterson D, Peterson N, Stecher G, Nei M, Kumar S (2011)
MEGA5: Molecular evolutionary genetics analysis using maximum
likelihood, evolutionary distance, and maximum parsimony methods. Mol. Biol. Evol., 28: 2731-2739.
Teng Q, Sun B, Fu X, Li S, Cui Z, Cao H (2009). Analysis of nifH gene
diversity in red soil amended with manure in Jiangxi, South China. J. Microbiol., 47 (2): 135-141.
Thompson JD, Higgins DG, Gibson TJ (1994). CLUSTAL W: improving
the sensitivity of progressive multiple sequence alignment through sequence weighting, position specific gap penalties and weight matrix choice. Nucleic Acids Res., 22(22): 4673-4680.
Umali-Garcia M, Hubbell D, Gaskins M, Dazzo F (1980). Association of Azospirillum with grass roots. Appl. Environ. Microbiol., 39: 219-226.
Xie CH, Yokota A (2006). Zoogloea oryzae sp. nov., a nitrogen-fixing
bacterium isolated from rice paddy soil, and reclassification of the strain ATCC 19623 as Crabtreella saccharophila gen. nov., sp. Nov.
Int. J. Syst. Evol. Microbiol., 56 (PT 3): 619-624. Zehr JP, Jenkins BD, Short SM, Steward GF (2003). Nitrogenase gene
diversity and microbial community structure: a cross-system comparison. Environ. Microbiol., 5: 539-554.
Zhang Y, Zhao ZH, Sun J, Jiao NZ (2011). Diversity and distribution of
diazotrophic communities in the South China Sea deep basin with mesoscale cyclonic eddy perturbations. FEMS Microbiol. Ecol., 78(3): 417-427.
Zhang Y, Li D, Wang H, Xiao Q, Liu X (2006). Molecular diversity of nitrogen-fixing bacteria from the Tibetan Plateau, China. FEMS Microbiol. Lett., 260 (2): 134-142.
Zhou J, Davey ME, Figueras JB, Rivkina E, Gilichinsky D, Tiedje JM (1997). Phylogenetic diversity of a bacterial community determined from Siberian tundra soil DNA. Microbiology, 143: 3913-3919.
African Journal of Microbiology Research Vol. 5(32), pp. 5978-5984, 30 December, 2011 Available online at http://www.academicjournals.org/AJMR ISSN 1996-0808 ©2011 Academic Journals DOI: 10.5897/AJMR11.1216
Full Length Research Paper
Difference in photoinhibition and photoprotection between seedings and saplings leaves of Taxus
cuspidata under high irradiance
Wei Li1, Yu-Sen Zhao1* and Zhi-Qiang Zhou2
1College of Forestry, Northeast Forestry University, Harbin 150040, China.
2Key Laboratory of Forest Plant Ecology, Northeast Forestry University, Harbin 150040, China.
Accepted 29 November, 2011
The differences in chloroplast pigments, gas exchange and photosystemII (PSII) photochemistry as well as xanthophyll in seeding and sapling leaves of Taxus cuspidata grown in full sunlight were examined. Compared with the sapling leaves, the chlorophyll content, photosynthetic capacity and light intensity for saturation of photosynthesis were lower in seeding leaves. The response curves of PSII photochemistry demonstrated that both seeding and sapling leaves occurred a down-regulation of PSII photochemistry at high irradiance, more serious down-regulation being examined in seeding leaves. And the down-regulation of PSII photochemistry occurred significantly when measured at midday, indicating that photoinhibition occurred heavily in seeding leaves when exposed to high light. The actual PSII efficiency (ΦPSII) and the efficiency of excitation capture by open PSII centers drastically decreased with the increase of non-photochemical quenching (NPQ) at midday. The photorespiration rate in seeding leaves was lower than that in sapling leaves under high irradiance. The results indicated that the xanthophlly cycle was activated in both the seeding and sapling leaves at midday and an increase of de-epoxidation were observed, but a little higher level of de-epoxidation was measured in seeding leaves. The xanthophyll cycle may play an important role in the dissipation of excess light energy associated with NPQ to avoid photodamage. Our results suggested that photoinhibition occurred in seeding leaves significantly due to lower capacity of CO2 assimilation, photorespiration and the light intensity for saturation of photosynthesis, as well as the lower PSII photochemistry at high irradiance; therefore the T. cuspidata seeding could not adapt to growing at high irradiance. Key words: Japanese yew (Taxus cuspidata Sieb, et Zucc.), photosynthesis, chlorophyll fluorescence, photorespiration, xanthophyll cycle.
INTRODUCTION Japanese yew (Taxus cuspidata Sieb, et Zucc.) is a rare relic plant of the ‘tertiary period’, which has a wide geographical distribution (Potenko, 2001). It grows in vegetated mixed forests in mountainous regions. Taxol, an effective anticancer drug extracted from the bark of Japanese yew, receives attention (Kobayashi et al., 1994). Japanese yew is a declining species, but conservation strategies have been developed (Potenko, 2001). As we known, high light may decrease the rate of *Corresponding author. E-mail: [email protected].
photosynthesis in plant which may cause the photoinhibition (Müller et al., 2001; Huang et al., 2006). Japanese yew is a shade-tolerant species (Iszkulo and Boratynski, 2006). The saplings can survive in both shady and sunny environments, but the seedlings are always observed under the canopy of mature trees (Iszkulo and Boratynski, 2006). Therefore, when the Japanese yew seedings are exposed to the high light, photoinhibition could occur in Japanese yew seeding leaves. However, plants have developed some photoprotective mechanisms to protect the photosynthesis apparatus against photodamage (Lu et al., 2003; Chow, 1994; Anderson et al., 1997). Dissipation of excess excitation

energy as heat in order to minimize photodamage to PSII reaction centers is well known to be one of the mechanisms for the protection of the photosynthetic apparatus, which involves the xanthophyll cycle (Guo et al., 2009).
In the xanthophyll cycle, excess light energy absorbed by antennae complexes of photosystem II is converted to heat, which prevent the formation of reactive oxygen. In this process, violaxanthin (V) is converted to zeaxanthin (Z) and antheraxanthin (A) under conditions of excess excitation energy (Demmig-Adams and Adams, 1992; Gilmore, 1997; Horton et al., 1996). And photorespiration pathway is reported as a very important photoprotection mechanism against photooxidation and photoinhibition (Kozaki and Takeba, 1996; Jiang et al., 2006; Niyogi, 1999). Photorespiration could act as a sink for excess excitation energy in photosynthetic apparatus when CO2 assimilation is reduced (Niyogi, 1999). In this study, we conducted an experiment to determine the differences between T. cuspidata seeding and sapling leaves in the CO2 assimilation capacity, photorespiration capacity and xanthophyll cycle-dependent energy dissipation under high irradiance and whether the T. cuspidata seeding could adapt to full sun light. MATERIALS AND METHODS
Plant material
The research was carried out from March to August, 2010 in the Botanical Garden of North East Forestry University. The 30 T.
cuspidata seedings of 4 years and the 16 ones of 15 years which grew in plastic pots (25 cm in diameter and 20 cm in height; 80 cm in diameter and 70 cm in height, respectively) were transplanted
from 70% PPFD (photosynthetic photon flux density) of full sunlight to 90% PPFD of full sunlight. After 4 weeks under 90% PPFD of full sunlight, they were moved to the full sunlight. Six weeks later when the T. cuspidata seedlings and saplings were acclimated to full sun light, the current-year leaves from the mid-crown on the south side of each tree were studied as the experimental materials. Gas change measurements Photosynthetic rate-photosynthetic photon flux density (Pn-PFD) response curves were made at leaf chamber temperature of 30° and at 350 μmolmol
-1CO2 with an open gas exchange system (Li-
6400). PFDs were fixed in a sequence of 1800, 1600, 1200, 800, 600, 400, 200, 100, 500 μmolmolm
-2s
-1. Photosynthetic rate was
monitored at two O2 concentrations: 21% O2 + 350 μmolmol-1
CO2 and 2% O2 + 350 μmolmol
-1CO2 under 1400 μmolmolm
-2s
-1PFD and
this was used to calculate photorespiration. Chlorophyll fluorescence measurements
Chlorophyll fluorescence was measured with a pulse-modulated fluoremeter (FMS-2, Hansatech, UK). Before each measurement, the sample leaf was dark-adapted for 35 min with dark leaf clips. To
determine the Fo (initial fluorescence), the low modulated measuring light (<0.1 m
-2s
-1) was turned on and Fo was recorded.
Then the sample leaf was exposed to a 0.7 s saturating white light
Li et al. 5979 (>3000 m
-2s
-1) to obtain the Fm (maximal chl fluorescence). Fv/Fm
(the maximum quantum yield of photosystemII; Fv, the variable Chl fluorescence yield is defined as Fm - Fo) was calculated automatically. Fs (the steady-state fluorescence) and Fm’ (the maximum Chl fluorescence level) during exposure to illumination were also measured. The actual PSII efficiency (ΦPSII) was calculated as (Fm’-Fs)/Fm’ (Genty et al., 1989). Non-photochemical quenching (NPQ) was calculated as (Fm/Fm’)
-1 according to Bilger
and Björkman (1990). To examine the light response curves for the fluorescence
parameters of T. cuspidata sapling leaves and seeding leaves, the Fo was measured at first and then a saturating pulse was applied to determine the Fv/Fm. The actinic light was increased in a sequence
of 100, 200, 400, 600, 800, 1000 and 1400 in steps. Each PFD was maintained at least 10 min. Pigment determination
The content of chlorophyll in leaf were extracted with 80% acetone, being analyzed with a UV-2800 system (Hitachi, Japan) according to Lichtenthaler (1987). Leaf samples were taken at morning. The
content of carotenoid components of xanthophyll was extracted with 100% acetone under the ice-cold condition. Then the extracts were filtered through a 0.45 μm filter. Leaf samples were taken at predawn and midday. Afterwards, they were immediately frozen into liquid nitrogen. The content of the carotenoid components of xanthophyll were analyzed in the method described by Thayer and Björkman (1990) for 5 times. Statistical analyses
Data of measurements were analyzed by using SPSS 10.0. The least significant differences between the means were calculated at 95% confidence level. Plots and fit curves were performed by using Sigmaplot10.0. Unless otherwise indicated, the significant differences between seedings and saplings were given at P<0.05.
RESULTS Differences in chlorophyll content The Chl a, Chl b and total a + b content in saplings leaves were significantly higher than those in seedings leaves. The ratios Chl a/Chl b did not show significant differences between saplings leaves and seedings leaves. The result demonstrated that the content of Chl a was higher than that of Chl b under the high light (Table 1). Differences in photosynthesis and photorespiration
There were significant differences between T. cuspidata seeding and sapling in CO2 assimilation capacity and photorespiration. Measurements of light response curves for photosynthesis of T. cuspidata seeding and sapling leaves show that the maximum photosynthetic rates were 7.22 ± 0.33 and 9.6 ± 0.21 μmolm
-2s
-1 in seedlings and
saplings leaves, respectively (Figure 1). Sapling leaves exhibited higher saturation light of photosynthetic rate

5980 Afr. J. Microbiol. Res.
Table 1. Differences in chlorophll pigments between T. cuspidata seeding and sapling leaves. Each value is means of ± S.E. n = 5.
Variable Chl a (mg g-2
FW) Chl b (mg g-2
FW) Chl a+b (mg g-2
FW) Chl a/b (mg m-2
)
Seeding 314 ± 10a 88 ± 2
a 443 ± 7
a 3.56 ± 0.06
a
Sapling 362 ± 7b 98 ± 1
b 487 ± 4
b 3.62 ± 0.09
a
Figure 1. Light response curves for photosynthesis of T. cuspidata seedings and saplings leaves
measured at 26°C and the 350 μmolmol-1
CO2 in the chamber. (△) and (▲) represent sapling leaves
and seeding leaves, respectively. Values are means ± S.E., n = 3 – 5.
than that of seeding leaves. Sapling leaves had higher CO2 assimilation capacity under high irradiance. Similarly, photorespiratory in sapling leaves also showed higher than that in seeding leaves (Figure 2). Response of Chl fluorescence parameters to changes in irradiance With the irradiance increasing, the decrease in ΦPSII and Fv’/Fm’ and an increase in NPQ were observed in seeding and sapling leaves, but the sapling leaves had higher ΦPSII and Fv’/Fm’ than the seeding ones. However, NPQ in seeding leaves was significantly higher than sapling ones. The results showed that a greater down-regulation of PSII efficiency in seeding leaves in high light (Figure 3).
Fluorescence parameters at predawn and midday A significant decline in Fv/Fm, ΦPSII and Fv’/Fm’ were observed at midday in the seeding and sapling leaves, but a considerable increase in NPQ. Compared with seeding leaves, sapling leaves showed higher values for Fv/Fm, ΦPSII and Fv’/Fm’ and lower values for NPQ at midday (Table 2). The xanthophyll cycle under high irradiance There were significant differences between Japanese yew in the content of xanthophyll. We observed that the relative xanthophyll pool size (A + V + Z)/Chl in seeding leaves was higher than that in sapling leaves (Figure 4A, B and C). Compared with sapling leaves, the de-
PFD(μmol m-2
s-1
)
0 500 1000 1500 2000
Pn(μ
mol
m-2
s-1)
-2
0
2
4
6
8
10
12

Li et al. 5981
Figure 2. Light response curves for photorespiratory of T. cuspidata seedings and saplings
leaves measured at 26°C. (△) and (▲) represent sapling leaves and seeding leaves,
respectively. Values are means ± S.E., n = 3 – 5.
epoxidation components of the xanthophyll cycle pigments were more increased in seeding leaves at midday. And the results showed an increase in (A + Z)/(A + Z + V) ratio in seeding and sapling leaves at midday. DISCUSSION The data that sapling leaves had higher chlorophyll content, Chla/Chlb ratio (Table 1) and photosynthetic capacity (Figure 1) indicated that sapling leaves had a more developed photosynthetic apparatus, which more excited energy would be used in CO2 assimilation rather than dissipated. The long exposure to high irradiance levels is a major source of stress to the photosynthetic apparatus (Genty et al., 1989). When CO2 assimilation is restricted, photorespiration also acts as a key role in the protection of leaves against high irradiation and uses energy. Sapling leaves had more capacity to allocate excited energy to photorespiration than seeding ones at high irradiance (Figure 2). Increased allocation of excited energy of photorespiration can maintain the utilization of excited energy by allowing metabolism to continue using the products of photosynthetic electron transport. This can mitigate the deleterious effects such as photodamage. The maximal efficiency of PSII photochemistry (Fv/Fm) showed only a slight decrease in
seeding leaves when measured at predawn, indicating that seeding leaves had almost the same primary photochemistry as sapling leaves (Table 2), so the activity of PSII may not be the limiting step of photosynthesis in seeding leaves.
With an increasing series of irradiances, the values of ΦPSII and Fv’/Fm’ decreased gradually (Figure 3A, B and C). However, decrease in PSII efficiency (ΦPSII) and the efficiency of excitation energy captured by open PSII centers (Fv’/Fm’) in seeding leaves revealed a down-regulation of PSII in the light-response curves. The changes in the light response curves of PSII photochemistry in seeding leaves also showed higher stepwise increases in NPQ at high PFDs. This demonstrated that seeding leaves had to dissipate excess excitation energy as more heat when exposed to high light. It has been reported that xanthophyll cycle is an important photoprotection mechanism correlated to energy dissipation in plants to avoid photodamage. The data demonstrated that a ‘little more’ de-epoxidation components (A + Z) were observed in seeding leaves than that in sapling leaves when measured at midday, which was associated with NPQ. The results showed that an increase in NPQ in both seeding and sapling leaves at midday was associated with an increase in content of (A + Z) and increase in (A + Z)/(V + A + Z) ration. The higher content of (A + Z) and the higher (A + Z)/(V + A + Z) ration
PFD (μmol m-2s-1)
0 200 400 600 800 1000 1200 1400 1600 1800
Pr
(μm
ol m
-2s
-1)
0
1
2
3
4
5

5982 Afr. J. Microbiol. Res.
Figure 3. Responses of actual PSII efficiency (ΦPSII, A), the efficiency of excitation capture by open PSII reaction centers
(Fv’/Fm’, B) and non-photochemical quenching (NPQ, C) to PFDs in T. cuspidata seeding (▲) and sapling (△) leaves. Values
are means ± S.E., n = 3.
Table 2. Differential changes of chlorophyll fluorescence ratios in the maximal efficiency of PSII photochemistry (Fv/Fm), actual PSII efficiency (ΦPSII), the efficiency of excitation energy capture by
open PSII centers (Fv’/Fm’) and non-photochemical quenching (NPQ) in T. cuspidata seeding and
sapling leaves at predawn and midday with PFD 1500 μmolm-2s
-1. Values are means ± S.E., n = 4.
Variables Seeding Sapling
Predawn Midday Predawn Midday
Fv/Fm 0.80.01 0.6550.02 0.8410.04 0.7980.01
ΦPSII 0.5870.01 0.3440.02 0.6160.01 0.4760.02
Fv’/Fm’ 0.6950.01 0.4830.02 0.8160.154 0.710.01
NPQ 1.370.04 2.7020.133 1.1470.02 2.2270.07
at high irradiance might act as a strengthened acclimation to cope with excess irradiance.
In conclusion, seeding leaves can dissipate the excess energy by xanthophyll cycle, but photoinhibition occurred
in seeding leaves due to lower capacity of CO2 assimilation and photorespiration and the light intensity for saturation of photosynthesis as well as the lower PSII photochemistry at high irradiance.
C
A B
PFD(μmolm-2
s-1
)
0 200 400 600 800 1000 1200 1400 1600
Fv'
/Fm
'
0.3
0.4
0.5
0.6
0.7
0.8
0.9
PFD(μmolm-2s-1)
0 200 400 600 800 1000 1200 1400 1600
NP
Q
0.0
0.5
1.0
1.5
2.0
2.5
3.0
3.5
4.0
PFD(μmolm-2
s-1
)
0 200 400 600 800 1000 1200 1400
ΦP
SII
0.2
0.3
0.4
0.5
0.6
0.7
0.8
0.9
A B
C
C
A B
PFD(μmolm-2
s-1
)
0 200 400 600 800 1000 1200 1400 1600
Fv'
/Fm
'
0.3
0.4
0.5
0.6
0.7
0.8
0.9
PFD(μmolm-2s-1)
0 200 400 600 800 1000 1200 1400 1600
NP
Q
0.0
0.5
1.0
1.5
2.0
2.5
3.0
3.5
4.0
PFD(μmolm-2
s-1
)
0 200 400 600 800 1000 1200 1400
ΦP
SII
0.2
0.3
0.4
0.5
0.6
0.7
0.8
0.9
A B
C

Li et al. 5983
Figure 4. Changes of xanthophyll cycle pigment pool size, the de-epoxidation components per Chl, and conversion state
of the xanthophyll cycle (A + Z)/(A + Z + V) in T. cuspidata seeding and sapling leaves. Samples were taken at predawn (■black bars) and at midday (□empty bars). Values are means ± S.E., n = 3.
REFERENCES
Anderson JM, Park YI, Chow W (1997). Photoinactivation and photoprotection of photosystem II in nature. Physiol Plant, 100(2): 214-223.
Bilger W, Bj rkman O (1990). Role of the xanthophyll cycle in photoprotection elucidated by measurements of light-induced absorbance changes, fluorescence and photosynthesis in leaves of
Hedera canariensis. Photosyn. Res., 25(3): 173-185. Chow W (1994). Photoprotection and photoinhibitory damage. Adv. Mol.
Cell Biol., 10: 151-196.
Demmig-Adams B, Adams Iii W (1992). Photoprotection and other responses of plants to high light stress. Annu. Rev. Plant Biol., 43(1): 599-626.
Genty B, Briantais JM, Baker NR (1989). The relationship between the quantum yield of photosynthetic electron transport and quenching of chlorophyll fluorescence. Biophys. Acta., 990(1): 87-92.
Gilmore AM (1997). Mechanistic aspects of xanthophyll cycle©\dependent photoprotection in higher plant chloroplasts and leaves. Physiol Plant., 99(1): 197-209.
Guo WD, Guo YP, Liu JR, Mattson N (2009). Midday depression of photosynthesis is related with carboxylation efficiency decrease and
D1 degradation in bayberry (Myrica rubra) plants. Sci. Hortic., 123(2): 188-196.
Horton P, Ruban A, Walters R (1996). Regulation of light harvesting in green plants. Annu Rev Plant Biol., 47(1): 655-684.
Huang L, Zheng J, Zhang Y, Hu W, Mao W, Zhou Y, Yu J (2006). Diurnal
variations in gas exchange, chlorophyll fluorescence quenching and light allocation in soybean leaves: The cause for midday depression in CO2 assimilation. Sci. Hortic., 110(2): 214-218.
Iszkulo G, Boratynski A (2006). Analysis of the relationship between photosynthetic photon flux density and natural Taxus baccata seedlings occurrence. Acta Oecol., 29(1): 78-84.
Jiang CD, Gao HY, Zou Q, Jiang GM, Li LH (2006). Leaf orientation, photorespiration and xanthophyll cycle protect young soybean leaves against high irradiance in field. Environ. Exp. Bot., 55(1-2): 87-96.
Kobayashi J, Ogiwara A, Hosoyama H, Shigemori H, Yoshida N, Sasaki T, Li Y, Iwasaki S, Naito M, Tsuruo T (1994). Taxuspines A∼C, new taxoids from Japanese yew Taxus cuspidata inhibiting drug transport
activity of P-glycoprotein in multidrug-resistant cells. Tetrahedron., 50(25): 7401-7416.
Kozaki A, Takeba G (1996). Photorespiration protects C3 plants from
photooxidation. nature, 384: 557-560. Lichtenthaler HK (1987). [34] Chlorophylls and carotenoids: Pigments of
different age
seeding leaves sapling leaves
(V+
A+
Z)(
mm
ol m
ol-1
)
0
20
40
60
80
100
120
140
different age
seeding leaves sapling leaves
(A+
Z)(
mm
ol m
ol-1
)
0
10
20
30
40
50
60
70
different age
seeding leaves sapling leaves
[(A
+Z
)/(V
+A
+Z
)]%
0.0
0.1
0.2
0.3
0.4
0.5
0.6
A B
C
different age
seeding leaves sapling leaves
(V+
A+
Z)(
mm
ol m
ol-1
)
0
20
40
60
80
100
120
140
different age
seeding leaves sapling leaves
(A+
Z)(
mm
ol m
ol-1
)
0
10
20
30
40
50
60
70
different age
seeding leaves sapling leaves
[(A
+Z
)/(V
+A
+Z
)]%
0.0
0.1
0.2
0.3
0.4
0.5
0.6
A B
C
different age
seeding leaves sapling leaves
(V+
A+
Z)(
mm
ol m
ol-1
)
0
20
40
60
80
100
120
140
different age
seeding leaves sapling leaves
(A+
Z)(
mm
ol m
ol-1
)
0
10
20
30
40
50
60
70
different age
seeding leaves sapling leaves
[(A
+Z
)/(V
+A
+Z
)]%
0.0
0.1
0.2
0.3
0.4
0.5
0.6
A B
C

5984 Afr. J. Microbiol. Res.
photosynthetic biomembranes. Meth. Enzymol., 148: 350-382. Lu Q, Wen X, Lu C, Zhang Q, Kuang T (2003). Photoinhibition and
photoprotection in senescent leaves of field-grown wheat plants.
Plant Physiol. Biochem., 41(8): 749-754. Müller P, Li XP, Niyogi KK (2001). Non-photochemical quenching. A
response to excess light energy. Plant Physiol., 125(4): 1558.
Niyogi KK (1999). Photoprotection revisited: genetic and molecular approaches. Annu Rev Plant Biol., 50(1): 333-359.
Potenko VV (2001). Inheritance of allozymes and genetic variation in
natural population of Japanese yew in Petrov Island, Russia. For. Genet., 8(4): 307-314.
Thayer SS, Bj rkman O (1990). Leaf xanthophyll content and composition in sun and shade determined by HPLC. Photosyn. Res., 23(3): 331-343.
African Journal of Microbiology Research Vol. 5(32), pp. 5985-5989, 30 December, 2011 Available online at http://www.academicjournals.org/AJMR ISSN 1996-0808 ©2011 Academic Journals DOI: 10.5897/AJMR11.1331
Full Length Research Paper
Response of Cercospora beticola in sugar beet at different cultivars and fertilization level
Yong-Gang Li*, Li Zhang and Feng-Ming Mang
Department of Plant Protection, Agricultural College, Northeast Agricultural University, Harbin Heilongjiang, 150030,
People’s Republic of China.
Accepted 12 December, 2011
Cercospora leaf spot (CLS) caused by Cercospora beticola is one of the most destructive foliar disease of sugar beets in all sugar beet-growing areas worl dwide. In this study, field trials were carried out to determine the effect of CLS at different cultivars and fertilization level. The result showed that lev el of resistance against C. beticola from 20 variables were differed significantly (P<0 .05) and sorted KWS0149>BETA356>Hi0940>KWS6167>KWS8138>KWS4121>Hi01 66>DVA02234>BETA807> KWS0142> Ma096> KWS9522> IS0436> BSTO2431> Ma097> BETA464> B ETA812> KWS9145> Hi0474> Hi0732. But, Strong and weak of same varieties resistance from t hree locations apart from 100 km away of this trial series were significantly different. Levels of resi stance against C. beticola from optimized fertilization were significant different (P<0.05). Low nitrogen r educed sugar beet resistant against C. beticola. And level of resistance from 20 variables were differd significantly (P<0.05) and were sorted N 2P1K1> N2P2K1> N2P2K0 > N2P2K2> N2P1K2> N1P2K1> N2P3K2> N2P2K3 > N2P0K2> N1P2K2> N3P2K2> N1P1K2> N0P0K0> N0P2K2. So, resistance against C. beticola improved after balance fertilizing. It is possible to reduce the pathogen appearance by using varieties resistance a nd balance fertilizing, which enhanced host resistance to soft rot disease in a way. Key word: Sugar beet, cercospora leaf spot, varieties, resistance, fertilization level.
INTRODUCTION Cercospora leaf spot (CLS) caused by Cercospora beticola is one of the most destructive foliar disease of sugar beets in all sugar beet-growing areas worldwide (Malandrakis et al., 2006). Control of CLS in Greece and other areas in a warm climate and irrigation is based mainly on frequent fungicide applications (Karaoglanidis and Ioannidis, 2010). However, serious problems have resulted from the extensive appearance of fungicide resistant C. beticola isolates to the intensively used benzimidazoles, organotin fungicides and sterol biosynthesis inhibiting triazoles.
Agricultural scientists are becoming aware of the potential contribution of farmers in developing integrated management of crop diseases in general (Bentley and *Corresponding author: E-mail: [email protected].
Thiele, 1999). Much disease management practices such as the applications of fungicides and fumigant; focus on controlling pathogens is often too late to be effective, when disease symptoms are apparent. A more reliable approach is to concentrate on the period before infection occurs and encourage conditions that are unfavorable to the pathogen and favorable to the plant (Wolf and Verreet, 2002; Ghorbani et al., 2008).
Various control strategies, including host-plant resistance, resistant cultivars, integrated control and biological control have been developed. Breeding efforts to generate Cercospora resistance in sugar beet started in the 1920s by Munerati (1920). Historically, resistance was introgressed from the wild sea beet, Beet vulgaris L. spp. Maritima (Hecker and Helmerick, 1985). Additional resistant accessions were also found in other subspecies of B. vulgaris and in other sections of the genus Beta, namely Corollinae, Nanae and Procumbentes (Asher et

5986 Afr. J. Microbiol. Res. al., 2001). Resistant against C. beticola is a quantitative trait based on the additive effects of at least four to five major resistance genes (Smith and Gaskill, 1970). Therefore, sugar beet lines are selected for resistant against C. beticola in the greenhouse using artificial inoculation or in regions where natural infection occurs annually, namely Italy and Greece in southern Europe (Byford, 1996). As the climatic conditions in these countries are different from Germany, resistance of sugar beet varieties is influenced by environmental and cultivation factors (Märländer et al., 2003).
However, the exact number of host genes involved is unknown (Weiland and Koch, 2004). Due to highly variable climatic conditions on a single location, resistant cultivars adapted to the different sugar beet-growing areas worldwide where C. beticola occurs regularly are available (Byford, 1996; Mechelke, 2000; Pfleiderer and Schäufele, 2000). Host resistance is not efficient to prevent infection by C. beticola entirely but reduces the pathogen’s development (Rossi et al., 2000). Therefore, sugar beet lines selected for resistant against C. beticola are unreliable in different regions and variable climatic conditions in commercial breeding.
Soil conditions for plant growth can influence the occurrence and severity of plant diseases. Managing and exploiting the suppressive effects of the soil environment as part of an integrated control strategy could make a significant contribution to agricultural sustainability and environmental quality (Quimby et al., 2002). In this study, the impact of different cultivars and fertilization levels on CLS disease severity under natural infection in Heilongjiang, China in 2010. In this study, field trials were carried out to determine the effect of CLS at different cultivars and fertilization level. Secondly, resistant against C. beticola in different geographic regions were determined. MATERIALS AND METHODS Detection of disease resistant against C. beticola for sugar beet varieties Sugar beet cultivars (KWS0142, KWS0149, KWS9145, KWS8138, KWS6167, KWS9522, KWS4121, BETA807, BETA356, BETA464, BETA812, BSTO2431, Ma096, Ma097, Hi0940, Hi0166, Hi0732, Hi0474, DVA02234, IS0436) differing in the level of resistant against C. beticola were used in this study. One location with severe disease occurrence in 2009 was selected to determine cultivars resistant against C. beticola under natural infection in Heilongjiang, China in 2010. Three locations apart from 100 km away with severe disease occurrence were selected to determine KWS1049 and KWS4121 cultivars resistant against C. beticola of different geographic area.
Field trials were sown between mid and end of April with 70 cm distance between rows. The distances between plants within rows in the natural infection trial was 40 cm, and the trials were manually thinned to a density of 49,500 to 52,500 plants ha−1 in seedling trays filled with a standard soil. Weed control were carried out according to local standards.
Response of sugar beet against C. beticola at different fertilization level Field experiments with Sugar beet cultivars KWS0149 were conducted in a location of Heilongjiang province in 2010. Soil nutrients of tested field were obtained under large of 0~15 cm. Organic matter was measured, including the contents of organic matter, available nitrogen, available phosphorus and available potassium etc. for the pre-test. The results showed that the organic matter content is medium rate (20.18~50.20 g·kg-1) in tested field soils, ranging from (118.12~204.20 mg N·kg-1, 7.18~14.32 mg P·kg-1, 44.75~139.57 mg K·kg-1). Field trials were sown with 70 cm distance between rows. A 140 cm wide protective belt is left without fertilization by using randomized group (every group mean 5.6 m2) design with 4 replications.
Traditional fertilization and optimized fertilization were using to analyze effect of sugar beet against C. beticola at different fertilization level in this study. Nitrogen (N), phosphors (P) and potassium (K) were replaced respectively by using carbamide (N), diammonium phosphate (P), kalium sulfuricum (K).
Fertilizer application rates of traditional fertilization were designed as the treatments of 600 kg·ha-1 (240 kg N·ha-1,195 kg P·ha-1,165 kg K·ha-1), 675 kg·ha-1 (270 kg N·ha-1, 210 kg P·ha-1,195 kg K·ha-1), 750 kg·ha-1 (300 kg N·ha-1,255 kg P·ha-1,195 kg K·ha-1), 825 kg·ha-1 (375 kg N·ha-1, 270 kg P·ha-1,180 kg K·ha-1), and 900 kg·ha-1 (420 kg N·ha-1, 255 kg P·ha-1, 225 kg K·ha-1).
Fertilizer application rates of optimized fertilization were N0P0K0, N0P2K2, N1P2K2, N2P0K2, N2P1K2, N2P2K2, N2P3K2, N2P2K0, N2P2K1, N2P2K3, N3P2K2, N1P1K2, N1P2K1, and N2P1K1 (Detailed data refer to Table 4). Disease assessment Disease index severity of all individual sugar beet plants per treatment was assessed according to the modified agronomica disease index severity (Vereijssen et al., 2003; Battilani et al., 1990), which covers a scale from 0 (healthy) to 9 (totally destroyed foliage). Disease index severity in each treatment group was estimated in the middle of August, 2010 using a scale of 0 to 9: 0 = no symptoms on fully leaves; 1= few disease spots of most leaves; 3 = most disease spots of most leaves; 5 =most disease spots of most leaves, dead lateral 1 to 3 leaves; 7 = most disease spots of most leaves, dead lateral 3 to 5 leaves; 9 = most disease spots of most leaves, all leaves and leafstalk dead or whole plant dead. Statistics Analysis of variance was carried out with the programme SPSS version 13.0 (SPSS Inc., Chicago, IL, USA). Significant differences were indicated with different letters for probabilities (P<0.05). RESULTS Detection of disease resistant against C. beticola for sugar beet varieties Disease index investigation was carried out in the middle of August. Univariate comparisons showed that level of resistance of 20 cultivars had been differed significantly (P<0.05) and were sorted KWS0149> BETA356> Hi0940 >KWS6167> KWS8138>KWS4121> Hi0166> DVA0-2234 > BETA807> KWS0142> Ma096> KWS9522> IS0436>

Li et al. 5987
Table 1. The resistance determination of sugar beet varieties against C. beticola.
Cultivars Disease index Cultivars Disease index
KWS0142 17.36±0.54abcde Ma096 19.01±0.89bcdef KWS0149 13.08±0.49a Ma097 20.86±1.01cdefg KWS9145 23.95±2.85fgh Hi0940 15.31±0.25abc KWS8138 16.30±0.86abcd Hi0166 16.79±0.25abcd KWS6167 15.81±0.25ab Hi0732 27.61±1.39h KWS9522 19.14±0.81bcdef DVA0-2234 16.79±1.31abcd BETA807 17.04±1.13abcd BSTO-2431 19.38±1.60bcdef BETA356 14.62±4.40ab IS0436 19.26±1.86bcdef BETA464 21.73±2.51cdef Hi0474 25.80±2.50gh BETA812 22.84±1.39efgh KWS4121 16.54±1.38abcd
Data are treatment means of pooled data ± standard errors. Values of each column followed by different
letters are significantly different at P<0.05 according to Duncan’s multiple range tests.
Table 2. The determination of sugar beet resistant against C. beticola from different geographic area.
Breeds Different regions Disease index KWS1049 1 13.08±0.49a 2 27.66±0.25c 3 17.12±1.72b KWS4121 1 16.54±1.38a 2 29.14±1.37b 3 19.35±3.74a
The distance among the three zones (1,2,3) is 100 km; Data are treatment means of pooled data ± standard errors. Different letters for the same assessment date indicate significant
different at P<0.05 according to Duncan’s multiple range tests.1, 2, 3 for three locations apart from 100 km away.
BSTO-2431> Ma097> BETA464> BETA812> KWS9145> Hi0474> Hi0732 (Table 1).
Three locations apart from 100 km away with severe disease were selected to analyze relationship between KWS1049, KWS4121 cultivars resistant against C. beticola and different geographic area. The result showed that level of same varieties resistance from different geographic area were significant different (Table 2). Response of sugar beet against C. beticola at different fertilization level Traditional fertilization was designed to analyze cultivars resistant against C. beticola. The results showed that level of resistant against C. beticola from traditional fertilization were not significant different (Table 3).
Optimized fertilization was designed to analyze cultivars resistant against C. beticola from different
fertilization level. The results showed that level of resistant against C. beticola from optimized fertilization were significant different (Table 4). The results showed low nitrogen reduced sugar beet resistant against C. beticola and level of resistance from optimized fertilization were sorted N2P1K1> N2P2K1> N2P2K0 > N2P2K2> N2P1K2> N1P2K1> N2P3K2> N2P2K3 > N2P0K2> N1P2K2> N3P2K2> N1P1K2> N0P0K0> N0P2K2. DISCUSSION In this study, we aimed to estimate effect of different cultivars and fertilization level under natural infection against C. beticola in Heilongjiang, China. The 20 cultivars resistant against C. beticola were evaluated under natural infection in cultivar trial series. The result showed that KWS series varieties had the character of high resistance to disease in Heilongjiang, such as

5988 Afr. J. Microbiol. Res.
Table 3. The determination of resistant against C. beticola from traditional fertilization.
Sum (kg·ha -1) Carbamide (kg·ha -1) Diammonium phosphate (kg·ha -1) Potassium sulfate (kg·ha -1) Disease index
600 240 195 165 20.99±1.37a 675 270 210 195 22.47±1.73a 750 300 255 195 21.97±0.99a 825 375 270 180 23.21±1.73a 900 420 255 225 21.48±1.96a
Data are treatment means of pooled data ± standard errors. Different letters for the same assessment date indicate significant different at P<0.05 according to Duncan’s multiple range tests.
Table 4. The determination of resistant against C. beticola from optimized fertilization.
NPK content Disease index NPK content Disease index N0P0K0 22.48±2.52bc N2P2K0 14.79±1.72a N0P2K2 24.68±2.76c N2P2K1 13.16±1.08a N1P2K2 17.69±2.58ab N2P2K3 16.30±1.47a N2P0K2 17.08±2.22ab N3P2K2 18.43±0.40ab N2P1K2 15.55±0.85a N1P1K2 18.56±0.74ab N2P2K2 15.22±1.24a N1P2K1 15.86±1.33a N2P3K2 16.18±2.04a N2P1K1 13.01±1.30a
Data are treatment means of pooled data ± standard errors. Different letters for the same assessment
date indicate significant different at P<0.05 according to Duncan’s multiple range tests; Carbamide g/ 5.6m2: N0 mean 0.0, N1 mean 51.6, N2 mean 103.2, N3 mean 154.8; Diammonium phosphate g/ 5.6 m2: P0 mean 0.0; P1 mean 54.8; P2 mean 109.6; P3 mean 164.3; Kalium sulfuricum g/ 5.6m2: K0 mean 0.0; K1 mean 50.4; K2 mean 100.8; K3 mean 151.2.
KWS0149, KWS6167, KWS8138, KWS0142 and KWS4121. In addition, others varieties had strong resistance to CLS, such as Hi0166, Hi0940, DVA0-2234, BETA356 and BETA807 to offer basis in preventing CLS and in selecting scientific distribution of resistant variety in Heilongjiang.
In three locations apart from 100 km away, relationship between KWS1049, KWS4121 cultivars resistant against C. beticola and different geographic area was analyzed. Same varieties resistance from different geographic areas was significantly different (Table 2). Sugar beet resistant cultivars adapted to the different sugar beet-growing areas worldwide where C. beticola regularly occurs were available (Byford, 1996; Mechelke, 2000). But, the suppression of plant defence reactions plays a crucial role in causing plant diseases (Bouarab et al., 2002; Hauck et al., 2003). Schmidt et al. (2004) have shown that inducible plant defences are repressed during the development of CLS. Therefore, host resistance is not efficient to prevent infection by C. beticola (Rossi et al., 1999, 2000). So, Field identification of sugar beet resistant from different geographic area cultivars against C. beticola needs to further strengthen and expands the area.
As Walters et al. (2005) pointed out; we need to pay attention to factors that are likely to influence the
effectiveness of bio-controls in the field. There are evidences which show both a positive and a negative relationship between available plant nutrients and incidence of certain diseases (Ghorbani et al., 2008). Fertilizer application rates of traditional fertilization and optimized fertilization were designed to analyze cultivars resistant against C. beticola. The result showed that strong and weak of resistant against C. beticola from different fertilization level of traditional fertilization were not significantly different (P <0. 05) (Table 3).
However, the results showed significant differences among different fertilization level of optimized fertilization (P <0.05) (Table 4). The results showed low nitrogen could reduce host resistant against C. beticola. And balance fertilizing could enhance host resistance to CLS. Fertilizer application rates were designed for enhance sugar beet resistant against C. beticola as the treatments of adaptive rate (N:P:K=2:1:1).
Abundant nitrogen encourages succulent growth, a prolonged vegetative period, and delayed maturity of the plant, which increases the period of susceptibility to pathogens. Deficient plants are weaker and slower growing, which are also more susceptible to pathogens (Agrios, 1997). The effect of soil nitrogen level on disease development in different agricultural crops has been shown. For example, Sharma and Kolte (1994)

suggested that the plants in pots or field plots which received NK (N 90 kg ha -1) + (K 40 kg ha-1) were more resistant to infection than plants which received N (alone) or P (alone) or NP and PK combinations. Such results provide interesting evidence to support the view that balanced soil fertility could lead to better sugar beet resistant against C. beticola.
All in all, a comparative study of resistance determination of sugar beet varieties against C. beticola is needed to understand better from different geographic area in order to design comprehensive control on CLS. Accumulation of more knowledge regarding control of CLS should stimulate further conversion of conventional systems of sugar beet production, which incorporate agro-ecological strategies to optimize soil fertilization, sugar beet varieties diversity management and more natural systems of disease regulation without incurring much yield. ACKNOWLEDGEMENTS Authors wish to thank to Heilongjing Postdoctoral Science Foundation (LRB09-279), Dr. Start-Up fund research of Northeast Agricultural University (2009RC48) and Ministry of Agriculture Key Laboratory Foundation of Cold Crop Physiology Ecology (Northeast Agricultural University) for financial support. REFERENCES Agrios GN (1997). Climate change and plant diseases in Ontario. Plant
pathology. Academic Press, San Diego. Asher MJC, Luterbacher MC, Frese L (2001). Wild Beta species as a
source of resistance to sugar-beet pests and diseases. Int. Sugar J., 103: 447–456.
Battilani P, Beltrami G, Meriggini P, Ponti I, Rossi A, Rossi V, Rosso F, Tugnoli V, Zocca A (1990). Nuovo indirizzi, di difesa anticercosporica. L’Informatore Agrario, 46:53–70.
Bentley JW, Thiele G (1999). Bibliography: Farmer knowledge and management of crop disease. Agriculture and Human Values, 16: 75–81.
Bouarab K, Melton R, Peart D, Baulcombe D, Osbourn A (2002). A saponin-detoxifying enzyme mediates suppression of plant defences. Nat., 418: 889–892.
Byford WJ (1996). A survey of foliar diseases of sugar beet and their control in Europe. Paper presented at the 59th IIRB Congress, Brussels.
Ghorbani R, Wilcockson S, Koocheki A, Leifert C (2008). Soil management for sustainable crop disease control: a review. Environ. Chem. Lett., 6(3): 149-162.
Hauck P, Thilmony R, He SY (2003). A Pseudomonas syringae type III effector suppresses cell wall-based extracellular defense in susceptible Arabidopsis plants. Proc. Natl. Acad. Sci. USA., 100(14): 8577–8582.
Hecker RJ, Helmerick RH (1985). Sugar-beet breeding in the Unites States. In Progress in Plant Breeding—1 (Russell GE, ed.). London: Butterworths, pp. 37–61.
Karaoglanidis SG, Ioannidis MP (2010). Fungicide resistance of Cercospora beticola in Europe. In Cercospora leaf spot of sugar beet and related species, ed. R.T. Lartey, J.J. Weiland, L. Panella, P.W. Crous, and C.E. Windels, St. Paul, MN: The American Phytopathological Soc., pp. 189–211.
Li et al. 5989 Malandrakis AA, Markoglou AN, Nikou DC, Vontas JG, Ziogas BN
(2006). CLS caused by Cercospora beticola is one of the most serious diseases of sugar beets with world-wide economic importance. European J. Plant Pathol., 116: 155–166.
Märländer B, Hoffmann C, Koch HJ, Ladewig E, Merkes R, Petersen J, Stockfisch N (2003). Environmental Situation and Yield Performance of the Sugar Beet Crop in Germany: Heading for Sustainable Development. J. Agronomy Crop Sci., 189: 201–226.
Mechelke W (2000). Züchtungs-und Sortenstrategien zur Resistenz bei Zuckerrüben gegenüber Cercospora beticola. Zuckerindustrie, 125: 688–692.
Munerati O (1920). Osservazione e Richerche sulla Barbabietola da Zucchero. Observations and Research on Sugar Beet-Part 1. reprint 1999. Tipografica della R. Accademia dei Lincei.
Pfleiderer UE, Schäufele WR (2000). Development of a testing method for resistant against Cercospora beticola in sugar beet. In M. J. C. Asher, B. Holtschulte, M. R. Molard, F. Rosso, G. Steinrücken, & R. Beckers (Eds.), Cercospora beticola Sacc. Biology, agronomic influence and control measures in sugar beet. Advan. Sugar Beet Res., 2: 147-153.
Quimby PC, King LR, Grey WE (2002). Biological control as a means of enhancing the sustainability of crop/land management systems. Agric. Ecosyst. Environ., 88:147–152.
Rossi V, Battilani P, Chiusa G, Giosuè S, Languasco L, Racca P (2000). Components of rate-reducing resistance to CLS in sugar beet: conidiation length, spore yield. J. Plant Pathol., 82: 125–131.
Schmidt K, Heberle B, Kurrasch J, Nehls R, Stahl DJ (2004). Suppression of phenylalanine ammonia lyase expression in sugar beet by the fungal pathogen Cercospora beticola is mediated at the core promoter of the gene. Plant Molecular Biol., 55: 835–852.
Sharma SR, Kolte SJ (1994). Effect of soil-applied NPK fertilizers on severity of black spot disease (Alternaria brassicae) and yield of oilseed rape, Plant Soil, 167: 313-320.
Smith GA, Gaskill JO (1970). Inheritance of resistance to CLS in sugarbeet. J. Am. Society of Sugar Beet Technol., 16: 172–180.
Vereijssen J, Schneider JHM, Termorshuizen AJ, Jeger MJ (2003). Comparison of two disease assessment keys to assess Cercospora beticola in sugar beet. Crop Protection 1: 201–209.
Walters D, Walsh D, Newton A, Lyon G (2005). Induced resistance for plant disease control: maximizing the efficacy of resistance elicitors. Phytopathol., 95:1368–1373.
Weiland J, Koch G (2004). Sugarbeet leaf spot disease (Cercospora beticola Sacc.). Pathogen profile. Molecular Plant Pathol., 5:157–166.
Wolf PFJ, Verreet JA (2002). The IPM sugar beet model, an integrated pest management system in Germany for the control of fungal leaf diseases in sugar beet. Plant Dise., 86: 336-344.

African Journal of Microbiology Research Vol. 5(32), pp. 5990-5993, 30 December, 2011 Available online at http://www.academicjournals.org/AJMR ISSN 1996-0808 ©2011 Academic Journals DOI: 10.5897/AJMR11.1342
Full Length Research Paper
In vitro antioxidant activities of polysaccharides from endophytic fungus Fusarium oxysporum Dzf17
Peiqin Li, Chao Luo, Weibo Sun, Shiqiong Lu, Yan Mo u, Youliang Peng and Ligang Zhou*
College of Agronomy and Biotechnology, China Agricultural University, Beijing 100193, China.
Accepted 9 December, 2011
Three polysaccharides, namely exopolysaccharide (EP S), water-extracted mycelial polysaccharide (WPS) and sodium hydroxide-extracted mycelial polys accharide (SPS), from the endophytic fungus Fusarium oxysporum Dzf17 were investigated for their in vitro antioxidant activities. Among them, SPS was the most active antioxidant component, and WPS exhibited moderate antioxidant activity. The median effective concentration (EC 50) values of the polysaccharides were 162.38 µg/ml (for WPS), 63.37 µg/ml (for SPS) by DPPH radical scavenging activity assay, and 54.54 µg/ml (for WPS) and 44.91 µg/ml (for SPS) by using ferrous ions chelating activity assay. The polysaccharides from F. oxysporum Dzf17 could be an alternative source as the antioxidant c omponents. Key words: Antioxidant activity, polysaccharides, endophytic fungus, Fusarium oxysporum Dzf17.
INTRODUCTION Fungi have been regarded as important resources of natural bioactive compounds with a variety of bioactivities, and have been widely applied in agriculture, medicine and food industry (Greve et al., 2010; Zhong and Xiao, 2009; Zhou et al, 2010). Plant endophytic fungi are a special group of fungi that reside within plant tissues intercellularly or intracellularly without causing any apparent symptoms of disease (Wilson, 1995). In the past two decades, many valuable bioactive compounds with antimicrobial, insecticidal, cytotoxic and anticancer activities have been successfully obtained from the endophytic fungi (Kharwar et al., 2011; Verma et al., 2009; Zhao et al., 2011). These bioactive compounds could be mainly classified as alkaloids, terpenoids, steroids, quinones, isocoumarins, lignans, phenylpropanoids, phenols and polysaccharides (Aly et al., 2010; Yu et al., 2010; Zhang et al., 2006). To the best of our knowledge, the antioxidant activities of the polysaccharides from endophytic fungi have been rarely reported, though there were some reports from other fungi (Liu et al., 1997; Ooi and Liu, 1999).
Fusarium oxysporum Dzf17 is an endophytic fungus *Corresponding author. E-mail: [email protected].
isolated from the rhizomes of Dioscorea zingiberensis, a well known traditional Chinese medicinal herb indigenous to the south of China (Li and Ni, 2011; Zhang et al., 2009). Three polysaccharides, namely exopolysaccharide (EPS), water-extracted mycelial polysaccharide (WPS) and sodium hydroxide-extracted mycelial polysaccharide (SPS), prepared from F. oxysporum Dzf17 were observed in our previous study to have enhancement effects on cell growth and diosgenin accumulation in D. zingiberensis cell cultures (Li et al., 2011). The purpose of this study was to investigate the antioxidant activities of three kinds of polysaccharides from the endophytic fungus F. oxysporum Dzf17 in order to provide fundamental data for the research and application of the polysaccharides from this fungus. MATERIALS AND METHODS General The microplate spectrophotometer (PowerWave HT, BioTek Instruments, USA) was employed to measure the light absorption value. 1, 1-Diphenyl-2-picrylhydrazyl (DPPH) was purchased from Sigma-Aldrich (USA) in Beijing. 3-(2-Pyridyl)-5,6-bis (4-phenyl-sulfonic acid)-1,2,4-triazine (ferrozine) was obtained from Johnson Matthey (UK) in Beijing. Butylated hydroxytoluene (BHT), ferrous chloride (FeCl2), and ethylene diamine tetraacetic acid (EDTA) were

bought from Beijing Chemical Company. All other chemicals and reagents were of analytical grade. Endophytic fungus and culture conditions The endophytic fungus F. oxysporum Dzf17 (GenBank accession number EU543260) was isolated from the healthy rhizomes of the medicinal plant D. zingiberensis C. H. Wright (Dioscoreaceae) in our previous study (Zhang et al., 2009). The living culture has been deposited in China General Microbiological Culture Collection Center (CGMCC) under the number CGMCC 2472. It was also maintained on potato dextrose agar (PDA) slants at 25°C, and in 40% glycerol at -70°C at the Herbarium of the College o f Agronomy and Biotechnology, China Agricultural University. The mycelia were grown in a 1000 ml Erlenmeryer flask containing 300 ml of liquid medium consisting of glucose (50 g/L), peptone (13 g/L), NaCl (0.6 g/L), K2HPO4 (0.6 g/L), and MgSO4•7H2O (0.2 g/L). About 500 flasks were used. All flasks were maintained at 25°C on a rotary shaker at 150 rpm for 14 days. A total of 150 L of fermentation broth was harvested. The mycelia were separated from the supernatant by centrifugation at 7,741 ×g for 20 min. Mycelia were washed twice with deionized water, then lyophilized. About 600 g of mycelia in dry weight (dw) was obtained. Preparation of polysaccharides The preparation process of exopolysaccharide (EPS) has described in our previous study (Li et al., 2011). Briefly, the supernatant was concentrated under vacuum at 60°C by a rotary evaporat or to a proper volume and mixed with three volumes of 95% ethanol, then kept at 4ºC for 48 h. After that, the solution was centrifuged at 17,418 × g for 15 min, and the precipitate from ethanol dispersion was collected as crude EPS which was further subjected to deproteination with Sevag reagent (chloroform-n-butanol at 4:1, v/v), decolorization with H2O2, and re-movement of small molecular impurities by dialysis. Polysaccharide mixture with molecular weight greater than 8,000 to 14,000 Da was kept in dialysis tube. The carbohydrate content of EPS was measured by the method of anthrone-sulfuric acid spectrophotography (Wang et al., 2007), which involved sulfuric acid hydrolysis of the sample in the presence of anthrone agent at 100°C. The absorbance a t 620 nm was measured and calibrated to carbohydrate content using glucose as a reference. After lyophilization, the purified EPS (31.98 g) was stored in a desiccator at room temperature.
Water-extracted mycelial polysaccharide (WPS) and sodium hydroxide-extracted mycelial polysaccharide (SPS) were also prepared according to our previous research (Li et al., 2011). Briefly, the lyophilized mycelia (600 g) were powdered in a high disintegrator, and then subjected to heat circumfluence extraction at 50°C by 95% ethanol-petroleum ether at 1:1 (v/v) as t he refluxing solvent to remove monosaccharide, disaccharide and lipid. The ratio of mycelia powder (g) to refluxing solvent (ml) was 1:5 (w/v). Defatted mycelial powder was obtained by centrifugation (7,741 × g, 20 min) and drying in an oven at 40°C for 2 h, and t hen immersed in hot water at 90°C for 2 h with the ratio of water (ml) to the material (g) as 30:1 (v/w). After that, centrifugation was carried out at 7,741 × g for 20 min to separate the residue and the supernatant. The supernatant was condensed to a certain volume under vacuum at 60°C, and then mixed with three volumes of 95% et hanol, then kept at 4°C for 48 h. The following procedure for poly saccharide preparation and purification was the same as the treatments of exopolysaccharide (EPS). The gained polysaccharide (33.24 g) was named as water-extracted mycelial polysaccharide (WPS). The residue not containing WPS was further extracted with 10% sodium hydroxide (NaOH) solution at room temperature for 24 h. The remaining steps were the same as the treatments of EPS. The
Li et al. 5991 obtained polysaccharide (35.89 g) was designated as sodium hydroxide-extracted mycelial polysaccharide (SPS). In vitro antioxidant activity assay The polysaccharides were subjected to a screening for antioxidant activity by two complementary tests, namely the DPPH radical scavenging assay and ferrous ions chelating assay, The free radical scavenging activity of different antioxidants was measured in terms of hydrogen donating or radical scavenging ability of the stable free radical DPPH (1,1-diphenyl-2-picryhydrazyl) (Ono et al., 2008). The scavenging activity of DPPH was measured according to the method reported by Qiao et al. (2009) with some modifications. Briefly, DPPH dehydrated alcohol solution (0.2 mg/ml, 100 µl) and polysaccharide water solution (100 µl) were added to each well of the microplate and mixed. The mixture was shaken vigorously and allowed to stand at room temperature in the dark for 30 min. The absorbance was measured at 517 nm against a blank. Butylated hydroxy toluene (BHT) was used as the positive control. Lower absorbance of the reaction mixture indicates higher free-radical scavenging activity. All the tests were performed in triplicate and the graph was plotted with the mean values and standard deviations. The scavenging activity was calculated by the following equation: Scavenging activity (%) = [A0-(A1-A2)]×100/A0. Where A0 is the absorbance of DPPH solution without tested samples, A1 is the absorbance of the sample, and A2 is the absorbance of the sample under identical conditions as A1 with water instead of DPPH solution.
The median effective concentration (EC50) value was calculated using the linear relation between the effective probability and concentration logarithm according to the method of Sakuma (1998).
Metal ions chelating activity was determined according to the method of Wang et al. (2010) with some modifications. Briefly, polysaccharide solution (50 µl) was mixed with FeCl2 solution (0.2 mg/ml, 30 µl), and shaken vigorously. The ferrozine solution (2 mg/ml, 70 µl) was then added to the reaction solution. The reaction mixture was shaken vigorously and left standing at room temperature for 10 min. After the mixture reached equilibrium, the absorbance of the solution was then measured at wavelength 560 nm using a microplate spectrophotometer. EDTA was used as the positive control. Lower absorbance of the reaction mixture indicates higher chelating activity. All the tests were performed in triplicate and the graph was plotted with the mean values and standard deviations. The ferrous ions chelating effect was calculated as the percentage (%) of inhibition of ferrozine-Fe2+ complex formation determined as:
Chelating activity (%) = [B0-(B1-B2)]×100/B0. Where B0 is the absorbance of reaction solution without tested samples, B1 is the absorbance of the sample and B2 is the absorbance of the sample under identical conditions as B1 with water instead of ferrozine solution.
The EC50 value calculation for ferrous ions chelating activity was the same as that for DPPH radical scavenging activity. RESULTS AND DISCUSSION DPPH radical scavenging activity DPPH has been widely adopted as a reference for evaluating the free radical scavenging activities of the
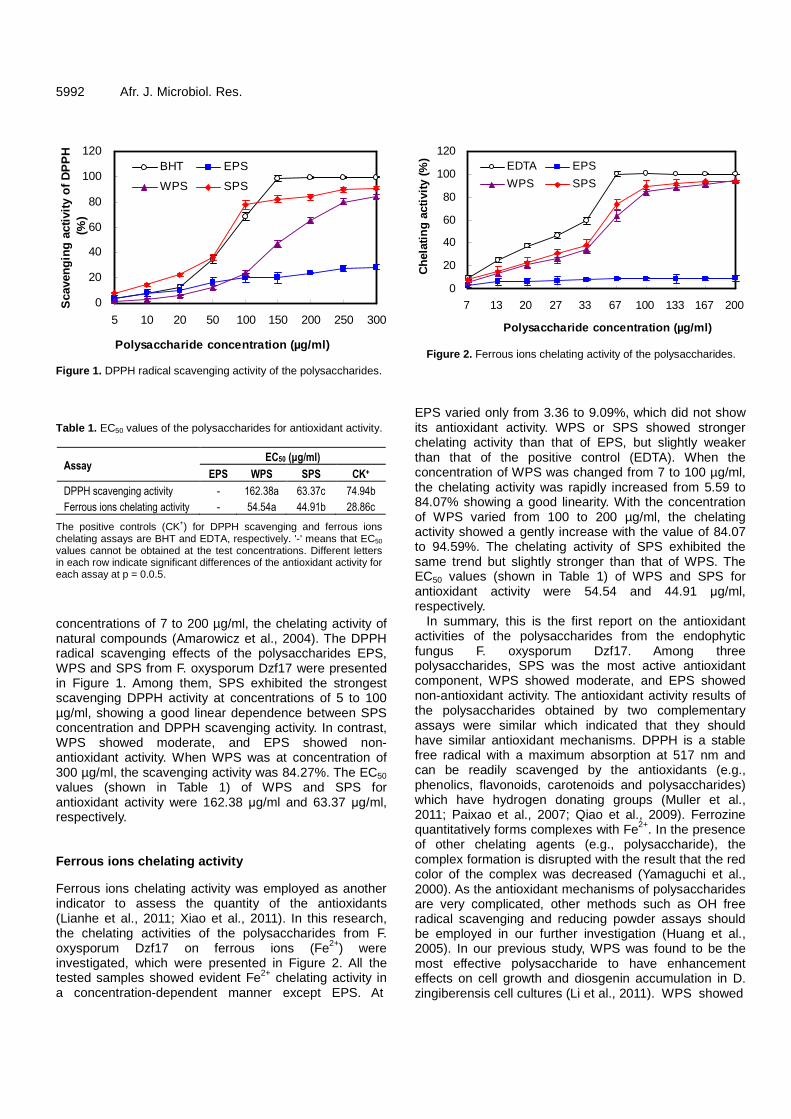
5992 Afr. J. Microbiol. Res.
Figure 1. DPPH radical scavenging activity of the polysaccharides. Table 1. EC50 values of the polysaccharides for antioxidant activity.
Assay EC50 (µg/ml)
EPS WPS SPS CK+
DPPH scavenging activity - 162.38a 63.37c 74.94b
Ferrous ions chelating activity - 54.54a 44.91b 28.86c
The positive controls (CK+) for DPPH scavenging and ferrous ions chelating assays are BHT and EDTA, respectively. '-' means that EC50 values cannot be obtained at the test concentrations. Different letters in each row indicate significant differences of the antioxidant activity for each assay at p = 0.0.5. concentrations of 7 to 200 µg/ml, the chelating activity of natural compounds (Amarowicz et al., 2004). The DPPH radical scavenging effects of the polysaccharides EPS, WPS and SPS from F. oxysporum Dzf17 were presented in Figure 1. Among them, SPS exhibited the strongest scavenging DPPH activity at concentrations of 5 to 100 µg/ml, showing a good linear dependence between SPS concentration and DPPH scavenging activity. In contrast, WPS showed moderate, and EPS showed non-antioxidant activity. When WPS was at concentration of 300 µg/ml, the scavenging activity was 84.27%. The EC50 values (shown in Table 1) of WPS and SPS for antioxidant activity were 162.38 µg/ml and 63.37 µg/ml, respectively. Ferrous ions chelating activity Ferrous ions chelating activity was employed as another indicator to assess the quantity of the antioxidants (Lianhe et al., 2011; Xiao et al., 2011). In this research, the chelating activities of the polysaccharides from F. oxysporum Dzf17 on ferrous ions (Fe2+) were investigated, which were presented in Figure 2. All the tested samples showed evident Fe2+ chelating activity in a concentration-dependent manner except EPS. At
Figure 2. Ferrous ions chelating activity of the polysaccharides.
EPS varied only from 3.36 to 9.09%, which did not show its antioxidant activity. WPS or SPS showed stronger chelating activity than that of EPS, but slightly weaker than that of the positive control (EDTA). When the concentration of WPS was changed from 7 to 100 µg/ml, the chelating activity was rapidly increased from 5.59 to 84.07% showing a good linearity. With the concentration of WPS varied from 100 to 200 µg/ml, the chelating activity showed a gently increase with the value of 84.07 to 94.59%. The chelating activity of SPS exhibited the same trend but slightly stronger than that of WPS. The EC50 values (shown in Table 1) of WPS and SPS for antioxidant activity were 54.54 and 44.91 µg/ml, respectively.
In summary, this is the first report on the antioxidant activities of the polysaccharides from the endophytic fungus F. oxysporum Dzf17. Among three polysaccharides, SPS was the most active antioxidant component, WPS showed moderate, and EPS showed non-antioxidant activity. The antioxidant activity results of the polysaccharides obtained by two complementary assays were similar which indicated that they should have similar antioxidant mechanisms. DPPH is a stable free radical with a maximum absorption at 517 nm and can be readily scavenged by the antioxidants (e.g., phenolics, flavonoids, carotenoids and polysaccharides) which have hydrogen donating groups (Muller et al., 2011; Paixao et al., 2007; Qiao et al., 2009). Ferrozine quantitatively forms complexes with Fe2+. In the presence of other chelating agents (e.g., polysaccharide), the complex formation is disrupted with the result that the red color of the complex was decreased (Yamaguchi et al., 2000). As the antioxidant mechanisms of polysaccharides are very complicated, other methods such as OH free radical scavenging and reducing powder assays should be employed in our further investigation (Huang et al., 2005). In our previous study, WPS was found to be the most effective polysaccharide to have enhancement effects on cell growth and diosgenin accumulation in D. zingiberensis cell cultures (Li et al., 2011). WPS showed
0
20
40
60
80
100
120
5 10 20 50 100 150 200 250 300
Polysaccharide concentration (µg/ml)
Sca
veng
ing
activ
ity o
f DP
PH
(%)
BHT EPS
WPS SPS
0
20
40
60
80
100
120
7 13 20 27 33 67 100 133 167 200
Polysaccharide concentration (µg/ml)
Che
latin
g ac
tivity
(%
) EDTA EPS
WPS SPS
moderate antioxidant activity in this investigation which means that WPS should be studied in detail for its enhancing effect on secondary metabolite biosynthesis and antioxidant activity. The present study will provide additional data for supporting the utilization and develop-ment of the polysaccharides from F. oxysporum Dzf17 as the antioxidant components. Further studies to clarify other biological activities (e.g. immunoregulatory and antitumor activities) of the polysaccharides, their prepara-tion on a large scale, composition including protein and carbohydrate percentage, antioxidant mechanisms, as well as the physiological and ecological roles of the polysaccharides on host plant cells are now in progress. ACKNOWLEDGEMENTS This work was co-financed by the grants from the Natural Science Foundation of Beijing (6092015), the program for Changjiang Scholars and Innovative Research Team in University of China (IRT1042), and the National Natural Science Foundation of China (30871662 and 31071710). REFERENCES Aly AH, Debbab A, Kjer J, Proksch P (2010). Fungal endophytes from
higher plants: a prolific source of phytochemicals and other bioactive natural products. Fungal Divers, 41: 1-16.
Amarowicz R, Pegg RB, Rahimi-Moghaddam P, Barl B, Weil JA (2004). Free radical scavenging capacity and antioxidant activity of selected plant species from the Canadian prairies. Food Chem., 84: 551-562.
Greve H, Mohamed IE, Pontius A, Kehraus S, Gross H, Konig GM (2010). Fungal metabolites: structural diversity as incentive for anticancer drug development. Phytochem. Rev., 9: 537-545.
Huang D, Ou B, Prior RL (2005). The chemistry behind antioxidant capacity assays. J. Agric. Food Chem., 53: 1841-1856.
Kharwar RN, Mishra A, Gong SK, Stierle A, Stierle D (2011). Anticancer compounds derived from fungal endophytes: their importance and future challenges. Nat. Prod. Rep., 28: 1208-1228.
Li N, Ni J (2011). Treatment of wastewater from Dioscorea zingiberensis tubes used for producing steroid hormones in a microbial fuel cell. Bioresource Technol., 102: 2731-2735.
Li P, Mou Y, Shan T, Xu J, Li Y, Lu S, Zhou L (2011). Effects of polysaccharide elicitors from endophytic Fusarium oxysporium Dzf17 on growth and diosgenin production in cell suspension culture of Dioscorea zingiberensis. Molecules, 16: 9003-9016.
Lianhe Z, Li W, Xing H, Zhengxing C (2011). Antioxidant activities of seed extracts from Dalbergia odorifera. Afr. J. Biotechnol., 10: 11658-11667.
Liu F, Ooi VEC, Chang ST (1997). Free radical scavenging activities of mushroom polysaccharide extracts. Life Sci., 60: 763-771.
Li et al. 5993 Muller L, Frohlich K, Bohm V (2011). Comparative antioxidant activities
of carotenoids measured by ferric reducing antioxidant power (FRAP), ABTS bleaching assay (αTEAC), DPPH assay and peroxyl radical scavenging assay. Food Chem., 129: 139-148.
Ono M, Oda E, Tanaka T, Lida Y, Yamasaki T, Masuoka C, Ikeda T, Nohara T (2008). DPPH radical-scavenging effect on some constituents from the aerial parts of Lippia triphylla. J. Nat. Med., 62: 101-106.
Ooi VEC, Liu F (1999). A review of pharmacological activities of mushroom polysaccharides. Int. J. Med. Mushrooms, 1: 195-206.
Paixao N, Perestrelo R, Marques JC, Camara JS (2007). Relationship between antioxidant capacity and total phenolic content of red, rose and white wines. Food Chem., 105: 204-214.
Qiao D, Ke C, Hu B, Luo J, Ye H, Sun Y, Yan X, Zeng X (2009). Antioxidant activities of polysaccharides from Hyriopsis cumingii. Carbohyd. Polym., 78: 199-204.
Sakuma M (1988). Probit analysis of preference data. Appl. Entomol. Zool., 33: 339-347.
Verma VC, Kharmar RN, Strobel GA (2009). Chemical and functional diversity of natural products from plant associated endophytic fungi. Nat. Prod. Commun., 4: 1511-1532.
Wang J, Zhao J, Liu H, Zhou L, Liu Z, Wang J, Han J, Yu Z, Yang F (2010). Chemical analysis and biological activity of the essential oils of two Valerianaceous species from China: Nardostachys chinensis and Valeriana officinalis. Molecules, 15: 6411-6422.
Wang Z, Luo D, Ena C (2007). Optimization of polysaccharides extraction from Gynostemma pentaphyllum Makino using uniform design. Carbohyd. Polym., 69: 311-317.
Wilson D (1995). Endophyte – the evolution of a term, and clarification of its use and definition. Oikos, 73: 274-276.
Xiao J, Xiao D, Sun Z, Xiao Y, Zhong J (2011). Antioxidative potential of polysaccharide fractions produced from traditional Chinese medicinal macrofungus Cordyceps jiangxiensis in vitro. Afr. J. Biotechnol., 10: 6607-6615.
Yamaguchi F, Ariga T, Yoshimira Y, Nakazawa H (2000). Antioxidant and anti-glycation of carcinol from Garcinia indica fruit rind. J. Agric. Food Chem., 48: 180-185.
Yu HS, Zhang L, Li L, Zheng CJ, Guo L, Li WC, Sun PX, Qin LP (2010). Recent developments and future prospects of antimicrobial metabolites produced by endophytes. Mycrobiol. Res., 165: 437-449.
Zhang HW, Song YC, Tan RX (2006). Biology and chemistry of endophytes. Nat. Prod. Rep., 23: 753-771.
Zhang R, Li P, Xu L, Chen Y, Sui P, Zhou L, Li J (2009). Enhancement of diosgenin production in Dioscorea zingiberensis cell culture by oligosaccharide elicitor from its endophytic fungus Fusarium oxysporum Dzf17. Nat. Prod. Commun., 4: 1459-1462.
Zhao J, Shan T, Mou Y, Zhou L (2011). Plant-derived bioactive compounds produced by endophytic fungi. Mini-Rev. Med. Chem., 11: 159-168.
Zhong J-J, Xiao J-H (2009). Secondary metabolites from higher fungi: discovery, bioactivity, and bioproduction. Adv. Biochem. Eng. Biotechnol., 113: 79-150.
Zhou L, Zhou J, Shan T, Cai X, Peng Y (2010). Spirobisnaphthalenes from fungi and their biological activities. Mini-Rev. Med. Chem., 10: 977-989.

African Journal of Microbiology Research Vol. 5(32), pp. 5994-5997, 30 December, 2011 Available online at http://www.academicjournals.org/AJMR ISSN 1996-0808 ©2012 Academic Journals DOI: 10.5897/AJMR11.1426
Full Length Research Paper
Production of calcium gluconate from cassava by Penicillium citrinum SCG-112
Hai-Yan Sun 1,2, Pingjuan Zhao 1,2, Juanhua Li 1, Enshi Liu 1 and Ming Peng 1,2*
1Institute of Tropical Bioscience and Biotechnology, Chinese Academy of Tropical Agricultural Sciences,
Key Laboratory of Tropical Crop Biotechnology, Ministry of Agriculture, Haikou 571101, China. 2School of Agriculture, Hainan University, Haikou 571101, China.
Accepted 14 December, 2011
The feasibility of using cassava powder as the main material for production of calcium gluconate by Penicillium citrinum SCG-112 was evaluated in this study. The effect of incubati on temperature, initial pH of the medium and inoculum size on production of calcium gluconate was investigated. The maximum yield of calcium gluconate (155 g/L) was ob tained after 36 h incubation. The result was both technically competitive and economically attractive . Key words: Calcium gluconate, cassava, Penicillium citrinum.
INTRODUCTION Calcium gluconate (C12H22CaO14·H2O) finds extensive applications in the pharmaceutical and food industry. Research is ongoing to increase the production of this salt to meet its commercial demand (Bayraktar and Mehmetoglu, 2001). Most studies on calcium gluconate production have focused on the use of pure or easily fermentable substrates such as glucose or sucrose (Mariam et al., 2010; Liang et al., 2010). Due to the high costs of these pure materials, the process is less economic for industrial applications. The production cost of calcium gluconate might be significantly reduced if cheap raw materials could be used, such as starchy and cellulosic materials. Cassava is one of the most efficient crops in terms of carbohydrate production. It is a tropical perennial plant that grows on poor or depleted soils in which the yields of other crops are very low (Peters, 2007). Cassava is very rich in starch. Starch content of cassava root and dry cassava powder reached about 30 and 70%, respectively (Shen et al., 2009). Therefore, cassava has been successfully used as the main material for production of ethanol, lactic acid and sugar etc. *Corresponding author. E-mail: [email protected]. Tel: +86-898-66963161. Fax: +86-898-66890978.
(Shanavas et al., 2011; Kostinek et al., 2007; Abdul et al., 2005; Gaouar et al., 1998). Production of calcium gluconate from cassava is a promising strategy, for it will decrease the production cost. However, till now there is still no report regarding adoption of cassava as the substrate for production of calcium gluconate.
In the present study, the starch in cassava was enzymatically hydrolyzed (liquefaction with α-amylase and saccharification with glucoamylase) into glucose, which acted as the main material for production of calcium gluconate by a high-producing calcium gluconate strain, Penicillium citrinum SCG-112. MATERIALS AND METHODS Strain P. citrinum SCG-112, a newly isolated calcium gluconate producer, was used in this study for its high yield of calcium gluconate. It was maintained on slants of potato dextrose agar and subcultured every month. The conidial suspension with the spores concentration of 108/ml was prepared form 3-4 day old slant of the strain. Medium and fermentation Cassava powder with the starch content of about 70% was purchased from local market in China. All other material and

Sun et al. 5995
Table 1. Effect of temperature on production of calcium gluconate from cassava by Penicillium citrinum SCG-112.
Temperature (°C) Maximum yield of calcium gluconate (g/L)
Time consumed to reach the maximum yield (h)
30 100±1.2 64 31 105±1.3 64 32 106±2.0 60 33 108±0.8 60 34 108±0.6 56 35 106±1.5 48 36 108±1.1 44 37 110±0.7 40 38 91±3.4 40 39 82±2.0 36 40 65±1.2 36
chemicals were also commercially available. Cassava powder was mixed with water to prepared cassava slurry with the concentration of 300 g/L. Thermo-stable α-amylase was added into the slurry according to 15 U per g cassava powder. Then the slurry was liquefied by heating it to 110°C and keeping at 110 °C for 5 min, then cooling it to 90°C and keep at 90°C for 2 h. Th e liquefied cassava was centrifugated and squeezed to remove cassava residues. The pH of obtained clarifying solution was adjusted to 4.6-4.8, added gulucoamylase at the ratio of 200 U per g cassava powder. After saccharification at 60°C for 24 h, the s tarch in cassava powder was converted to glucose thoroughly. The final glucose solution diluted to the concentration of 150 g/L with water was used for preparing medium for production of calcium gluconate. The basal medium containing (g/L): glucose 150, (NH4)2SO4 0.5, K2HPO4 0.05, CaCO3 42, natural pH (about pH 5.0). 50 ml medium in 500-ml flasks were autoclaved at 121°C for 15 min. One flask was inoculated with 1 ml spore suspension (108
spores/ml) and incubated on a rotary shake with the speed of 250 rpm. When the glucose in the medium reached less than 1 g/L, fermentation was terminated. During the process the sample was withdrawn at regular intervals to determine calcium gluconate yield and glucose concentration. The optimal levels of incubation temperature, initial pH of the medium, inoculum size were determined by varying them in the basal medium. Analytical methods Calcium gluconate present in the supernatant sample was determined by disodium ethylene diamine tetra acetic acid (dEDTA) titration. The glucose in the medium was measured by SBA-80C biosensor analyzer (Institute of Biology, Shandong Academy of Sciences, China), which could provide quick measurements of glucose based on technology of the immobilized oxidases. All the experiments were run parallel in a set of triplicates. All values given are means of three determinations ± standard deviation. RESULTS AND DISCUSSION Effect of incubation temperature on production of calcium gluconate from cassava by P. citrinum SCG-112 As shown in Table 1, 37°C proved to be the best
temperature for calcium gluconate in the present study. Incubation at lower temperature resulted in longer time to reach the maximum yield, though the maximum yield was near to the yield at 37°C. Meantime, temperature hi gher 37°C is not conducive to the production of calcium gluconate, neither. The possible reason for the observa-tion is that higher temperature affected the fungus harmfully, and then decreased the calcium gluconate production. Effect of initial pH on production of calcium gluconate from cassava by P. citrinum SCG-112 Table 2 indicated that the optimum pH of calcium gluconate production from cassava by P. citrinum was pH 6.5. pH less or more than 6.5 both decreased calcium gluconate synthesis. The possible reason may be that at pH 6.5, the strain grown best and its mycelia produced maximal enzyme glucose oxidase, then brought highest yield of calcium gluconate. These results are in agree-ment with the result reported previously by Sheu et al. (2002), Munk and Hanus (2005) and Mariam et al. (2010). Effect of inoculum size on production of calcium gluconate from cassava by P. citrinum SCG-112 The inoculum size also plays a significant role in the fermentation process. As shown in Table 3, maximum yield was obtained when the inoculum size was 2 ml spore suspension (with the count of 108/ ml) per flask. A lower level of inoculum size may not be sufficient for initiating growth and enzyme synthesis. An increase in inoculum size ensures a rapid proliferation of biomass and enzyme synthesis. After a certain limit, production could decrease because of depletion of nutrients due to the enhanced biomass, which would result in a decrease
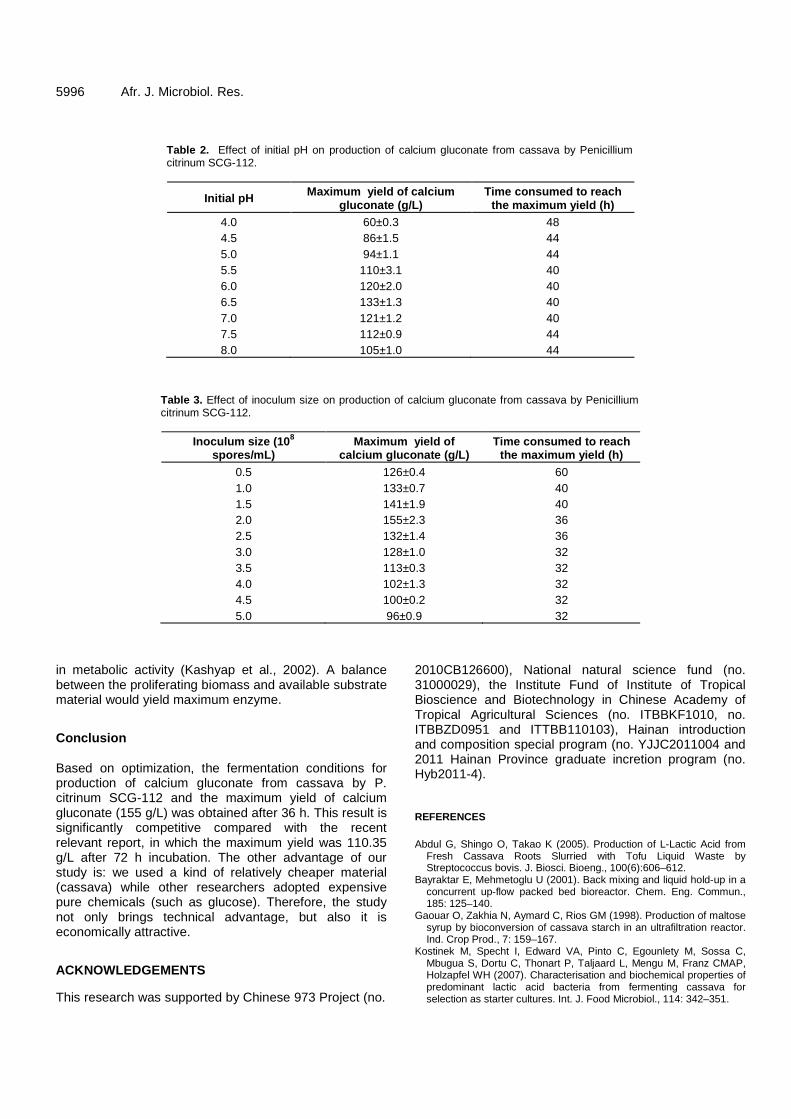
5996 Afr. J. Microbiol. Res.
Table 2. Effect of initial pH on production of calcium gluconate from cassava by Penicillium citrinum SCG-112.
Initial pH Maximum yield of calcium gluconate (g/L)
Time consumed to reach the maximum yield (h)
4.0 60±0.3 48 4.5 86±1.5 44 5.0 94±1.1 44 5.5 110±3.1 40 6.0 120±2.0 40 6.5 133±1.3 40 7.0 121±1.2 40 7.5 112±0.9 44 8.0 105±1.0 44
Table 3. Effect of inoculum size on production of calcium gluconate from cassava by Penicillium citrinum SCG-112.
Inoculum size (10 8 spores/mL)
Maximum yield of calcium gluconate (g/L)
Time consumed to reach the maximum yield (h)
0.5 126±0.4 60 1.0 133±0.7 40 1.5 141±1.9 40 2.0 155±2.3 36 2.5 132±1.4 36 3.0 128±1.0 32 3.5 113±0.3 32 4.0 102±1.3 32 4.5 100±0.2 32 5.0 96±0.9 32
in metabolic activity (Kashyap et al., 2002). A balance between the proliferating biomass and available substrate material would yield maximum enzyme. Conclusion Based on optimization, the fermentation conditions for production of calcium gluconate from cassava by P. citrinum SCG-112 and the maximum yield of calcium gluconate (155 g/L) was obtained after 36 h. This result is significantly competitive compared with the recent relevant report, in which the maximum yield was 110.35 g/L after 72 h incubation. The other advantage of our study is: we used a kind of relatively cheaper material (cassava) while other researchers adopted expensive pure chemicals (such as glucose). Therefore, the study not only brings technical advantage, but also it is economically attractive. ACKNOWLEDGEMENTS This research was supported by Chinese 973 Project (no.
2010CB126600), National natural science fund (no. 31000029), the Institute Fund of Institute of Tropical Bioscience and Biotechnology in Chinese Academy of Tropical Agricultural Sciences (no. ITBBKF1010, no. ITBBZD0951 and ITTBB110103), Hainan introduction and composition special program (no. YJJC2011004 and 2011 Hainan Province graduate incretion program (no. Hyb2011-4). REFERENCES Abdul G, Shingo O, Takao K (2005). Production of L-Lactic Acid from
Fresh Cassava Roots Slurried with Tofu Liquid Waste by Streptococcus bovis. J. Biosci. Bioeng., 100(6):606–612.
Bayraktar E, Mehmetoglu U (2001). Back mixing and liquid hold-up in a concurrent up-flow packed bed bioreactor. Chem. Eng. Commun., 185: 125–140.
Gaouar O, Zakhia N, Aymard C, Rios GM (1998). Production of maltose syrup by bioconversion of cassava starch in an ultrafiltration reactor. Ind. Crop Prod., 7: 159–167.
Kostinek M, Specht I, Edward VA, Pinto C, Egounlety M, Sossa C, Mbugua S, Dortu C, Thonart P, Taljaard L, Mengu M, Franz CMAP, Holzapfel WH (2007). Characterisation and biochemical properties of predominant lactic acid bacteria from fermenting cassava for selection as starter cultures. Int. J. Food Microbiol., 114: 342–351.

Liang JJ, Li XY, Guan W, Pang CW, Mai ZM (2010). Study on
mutagenesis of oxidase-producing Aspergillus niger and its fermentation condition of calcium gluconate production. Sci. Technol. Food Ind., 31(12):218-220.
Mariam I, Nagra SA, Haq I, Ali S (2010). Application of 2-factorial design on the enhanced production of calcium gluconate by a mutant strain of Aspergillus niger. Bioresour. Technol., 101:4075–4080.
Munk P, Hanus F (2005). Factors influencing glucose oxidase activity and gluconate production in submerged cultivation of Aspergillus niger. Folia Microbiol., 83:20–27.
Shanavas S, Padmaja G, Moorthy SN, Sajeev MS, Sheriff JT (2011). Process optimization for bioethanol production from cassava starch using novel eco-friendly enzymes. Biomass Bioenergy, 35:901-909.
Sun et al. 5997 Shen NK, Wang QY, Lu Y, Qin Y, Huang RB (2009). Study on the high-
concentration mash and high-temperature fermentation of cassava. Liquor Making, 37(5):47-51
Sheu DC, Duan KJ, Cheng CY, Bi JL, Chen JY (2002). Continuous production of high-content fructo-oligosaccharides by a complex cell system. Biotechnol. Prog., 18:1282–1286.
Peters D (2007). Raw materials. Adv. Biochem. Eng. Biotechnol., 105: 1–30.

Journal of
Microbiology and Antimicrobials
Journal of Microbiology and Antimicrobials
International Journal of
Biotechnology and Molecular
Biology Research
African Journal of
Microbiology Research
African Journal of
Microbiology Research
www.academicjournals.org
African Journal of
Biochemistry Research
African Journal of
Biochemistry Research
Journal of
Bioinformatics and Sequence Analysis
Journal of
Biophysics and Structural Biology


