Embed Size (px)
Citation preview

CHAPTER 1

CHAPTER 2
BASIC CONCEPT AND OVER VIEW
2.1 BASIC PROPERTIES:
Density (ρ): It gives the ratio of the mass of the fluid to the volume occupied. Usually varies
with pressure and temperature and can be calculated as:
Ρ = mV
Specific Gravity (γ): In case of liquids, the ratio of the liquid's density to the density of pure
water, both taken at standard conditions:
Specific gravity and API Gravity are related by the formula:
API:141.5
131.5+oAPI
Viscosity (µ): Viscosity, or more properly called dynamic viscosity, directly relates to the
fluid's resistance to flow. This resistance is caused by friction generated between moving
fluid molecules. Viscosity of a given fluid usually varies with pressure and temperature, and
has a great effect on the pressure drop of single-phase or multi-phase flows. The customary
unit of dynamic viscosity is the centipoise, cP.
Bubble point Pressure (pb): In multicomponent hydrocarbon fluid systems, changes of
pressure and temperature result in phase changes. If we start from a liquid phase and decrease
the pressure at a constant temperature, the first gas bubble comes out of solution at the bubble
point pressure of the system. At higher pressures, only liquid phase is present, at lower
pressures a two-phase mixture exists. Bubble point pressure, therefore, is a very important
parameter and can be used to determine prevailing phase conditions.
Solution Gas-Oil Ratio (Rs): Under elevated pressures, crude oil dissolves available gas and
then can release it when pressure is decreased. To quantify the gas volume crude can dissolve
at given conditions, solution GOR is used. This parameter gives the volume at standard
conditions of the dissolved gas in a crude oil. Oil volume being measured at atmospheric
conditions in a stock tank in barrels (STB = Stock Tank Barrel), the measurement unit of Rs
is scf/STB.
Rs is a function of system composition, pressure, and temperature and is defined as:

RS = V gasdissolved
V OSC
Gas solubility in water can also be described with the above principles but due to its lower
magnitude, it is usually neglected.
Volume Factor (B): The volume factor of a given fluid (gas, oil or water) is utilized to
calculate actual fluid volumes at any condition from volumes measured at standard
conditions. It includes the effects of pressure and temperature, which have an impact on
actual volume. In case of liquids, the volume factor represents the effects of dissolved gases
as well. The volume factor is sometimes called Formation Volume Factor (FVF), which is a
misnomer because it implies the specific conditions of the formation. The name FVF,
therefore, should only be used to designate the value of the volume factor at reservoir
conditions. In general, volume factor is defined as follows:
B= V (P ,T )
V SC
Where V(P,T) = volume at pressure p and temperature T, bbl or cu ft,
Vsc = fluid volume at standard conditions, STB or scf.
Behavior of Gases:
An ideal gas has molecules that are negligibly small compared to the volume occupied by the
gas. The kinetic theory of such gases states that the volume of agiven ideal gas, its absolute
pressure, its absolute temperature, and the total number of molecules are interrelated.
This relationship is described by the Ideal Gas Law.
PV = ZnRTa
Where, P = absolute pressure, psia
V = gas volume, cu ft
Z = gas deviation factor,
n = number of moles
R = 10.73, gas constant
Ta = absolute temperature = T (oF) + 460, oR

Gas Volume Factor (Bg):The Engineering Equation of State enables the direct calculation of
volume factors for gases.
Bg = 0.0283Z Ta
P
2.2 DRIVE MECHANISMS:
1. It is a Natural Energy of a reservoir can be used to move oil and gas towards the well
bore.
2. It depends on historical production data, Primary reservoir pressure data and Fluid
production ration
3. The following are the drive mechanisms (3).
A. Solution Gas
B. Gas cap Drive
C. Water Drive
A. Solution Gas drive:
1. Oil bearing rock is completely surrounding by impermeable barriers.
2. Pressure decreases during production
3. Expansion of oil and dissolved gas provides most energy and addition from rock
expansion and water.
4. Depending on its discovery pressure a solution gas drive reservoir can be initially
either unsaturated or saturated.
Unsaturated reservoir, the reservoir pressure is greater than the bubble point
pressure of oil. No free gas in the reservoir
Saturated reservoir, reservoir pressure is equal to bubble point pressure here oil
production, pressure drops and bubbles of solution gas from in respectively.
Production trend
a. Solution gas drive reservoirs show characteristic changes in reservoir pressure,
producing gas-oil ratio and oil and water production rates during the life of the
reservoir.
b. If the reservoir is initially under saturated, the reservoir pressure falls quickly during
oil production because of the small compressibility of oil, water, and rock. Pressure
drops of several hundred pounds per square inch can easily occur over a matter of
months

c. Once reservoir pressure reaches the bubble point pressure or if the reservoir was
initially saturated, the reservoir pressure declines less quickly due to the large
compressibility of the gas bubbles forming in the reservoir.
Figure: 1 Production trend of solution gas drive
B. GAS CAP DRIVE:
1. In a gas cap drive reservoir, the primary source of reservoir energy is an initial gas
cap, which expands as the reservoir pressure drops.
2. Additional energy is provided by the expansion of solution gas released from the oil.
Less significant drive contributions are provided by the expansion of the rock and its
associated water.
Production trend:
a. Reservoir pressure fall more slowly when compared to solution gas drive.
b. GOR increases as gas oil contact moves downwards and production ratio declines
slowly and little or no water is produced.
c. Oil recovery from gas cap reservoir is typically ranges from 20 to 40 % of OOIP.

Figure: 2 Production trend of Gas Cap drive
C. WATER DRIVE:
1. The oil zone is in communication with an aquifer that provides the bulk of the
reservoir's drive energy. As oil is produced, the water in the aquifer expands and
moves into the reservoir, displacing oil.
2. Depending on the aquifer's strength, additional energy may be provided by solution
gas expansion. Much less significant contributions are provided by the expansion of
the reservoir rock and its associated water.
3. The geometry of the aquifer determines whether it is bottom water or an edge water
drive. In a bottom water drive, the aquifer is present below the entire reservoir and
water influx moves vertically upward into the oil zone. In an edge water drive, the
aquifer is located on the flanks of the reservoir and the water moves upward along the
reservoir dip.

Figure: 3 Production trend of Water drive
Production trend:
a. Reservoir pressure responds to production depend on size and permeability of aquifer
and rate of production.
b. If rate of production is low, aquifer replaces fluid volume production where pressure
is constant.
c. If rate of production is high, aquifer unable to keep the withdrawal sand reservoir
pressure drops.
d. Oil rates remain high under strong water drive until water breaks through in the
producing wells.
e. Gas lift may be required for high water cut wells to continue to flow.
f. Oil recovery from water drive reservoirs typically ranges from 35 to 75% of the
OOIP.
COMBINATION DRIVE:
1. Most oil reservoirs produce under the influence of two or more reservoir drive
mechanisms, referred to collectively as a combination drive.
2. A common example is an oil reservoir with an initial gas cap and an active water
drive.
Production trend:
a. The production trends of a combination drive reservoir reflect the characteristics of
the dominant drive mechanism.

b. A reservoir with a small initial gas cap and a weak water drive will behave in a way
similar to a solution gas drive reservoir, with rapidly decreasing reservoir pressure
and rising GORs.
Figure: 4 Production trend of Combination drive
DRIVE MECHANISAM ENERGY SOURCE RECOVERY
OOIP %
Solution Gas Evolved solution gas Expansion 5-30 %
Gas cap Drive Gas cap and evolved solution gas expansion 20-40 %
Water Drive Aquifier Expantion 35-75 %
Gravity Drinage Gravity 5-30 %
Table: 1 Drive Mechanisms

2.3 INFLOW PERFORMANCE
The proper design of any artificial lift system requires an accurate knowledge of the fluid
rates that can be produced from the reservoir through the given well. Present and also future
production rates are needed to accomplish the following basic tasks of production
engineering (2):
a. Selection of the right type of lift,
b. Detailed design of production equipment,
c. Estimation of future well performance.
The production engineer, therefore, must have a clear understanding of the effects governing
fluid inflow into a well. Lack of information may lead to over-design of production
equipment or, on contrary, equipment limitations may restrict attainable liquid rates. Both of
these conditions have an undesirable impact on the economy of artificial lifting and can cause
improper decisions as well. A well and a productive formation are interconnected at the
sandface, the cylindrical surface where the reservoir is opened.
As long as the well is kept shut in, sandface pressure equals reservoir pressure and thus no
inflow occurs to the well. It is easy to see that, in analogy to flow in surface pipes, fluids in
the reservoir flow only between points having different pressures. Thus, a well starts to
produce when the pressure at its sandface is decreased below reservoir pressure. Fluid
particles in the vicinity of the well then move in the direction of pressure decrease and, after
an initial period, a stabilized rate develops. This rate is controlled mainly by the pressure
prevailing at the sand face, but is also affected by a multitude of parameters such as reservoir
properties (rock permeability, pay thickness, etc.), fluid properties (viscosity, density, etc.)
and well completion effects (perforations, well damage). These latter parameters being
constant for a given well, at least for a considerable length of time, the only means of
controlling production rates is the control of Bottomhole pressures.
The proper description of well behaviour, therefore, requires that the relationship between
bottomhole pressures and the corresponding production rates be established. The resulting
function is called the well's Inflow Performance Relationship (IPR) and is usually obtained
by running well tests.
BASIC CONCEPTS
Darcy's Law: The equation describing filtration in porous media was originally proposed by
Darcy (1) and can be written in any consistent set of units as:
qA =
−Kµ
dPdL
This formula states that the rate of liquid flow, q, per cross sectional area, A, of a given
permeable media is directly proportional to permeability, k, the pressure gradient, dp/dl, and
is inversely proportional to liquid viscosity. The negative sign is included because flow takes
place in the direction of decreasing pressure gradients. Darcy's equation assumes a steady
state, linear flow of a single-phase fluid in a homogeneous porous media saturated with the
same fluid. Although these conditions are seldom met, all practical methods are based on
Darcy's work.
Drainage Radius (re):Consider a well producing a stable fluid rate from a homogeneous
formation. Fluid particles from all directions around the well flow towards the sandface. In
idealized conditions, the drainage area, i.e. the area where fluid is moving to the well, can be
considered a circle. At the outer boundary of this circle, no flow occurs and undisturbed
reservoir conditions prevail. Drainage radius, re, is the radius of this circle and represents the
greatest distance of the given well's influence on the reservoir under steady-state conditions.
Average Reservoir Pressure (PR):The formation pressure outside the drainage area of a well
equals the undisturbed reservoir pressure, p R, which can usually be considered a steady
value over longer periods of time. This is the same pressure as the bottomhole pressure
measured in a shut- in well.
Pressure Drawdown: The difference between static and flowing bottomhole pressures is
called pressure drawdown. This drawdown causes the flow of formation fluids into the well
and has the greatest impact on the production rate of a given well.
2.4 THE PRODUCTIVITY INDEX CONCEPT
The simplest approach to describe the inflow performance of oil wells is the use of the
productivity index, PI, concept. It was developed using the following simplifying
assumptions:
a. flow is radial around the well,
b. a single phase liquid is flowing,
c. permeability distribution in the formation is homogeneous,
d. the formation is fully saturated with the given liquid.
For the above conditions, Darcy's equation can be solved for the production rate:

q=0.00708 kh
µBIn (re
rw) (PR-Pwf)
Where,q = liquid rate, STB/d
k = effective permeability, mD
h = pay thickness, ft
µ = liquid viscosity, cP
B = liquid volume factor, bbl/STB
re = drainage radius of well, ft
rw = radius of wellbore, ft.
Most parameters on the right-hand side are constant, which permits to collect them into a
single coefficient called Productivity Index, PI:
q = PI(PR-Pwf)
This equation states that liquid inflow into a well is directly proportional to pressure
drawdown. It plots as a straight line on a pressure vs. rate diagram, as shown in Fig. The
endpoints of the PI line are the average reservoir pressure (PR), at a flow rate of zero and the
maximum potential rate at a bottomhole flowing pressure of zero. This maximum rate is the
well's Absolute Open Flow Potential (AOFP) and represents the flow rate that would occur if
flowing bottomhole pressure could be reduced to zero. In practice, it is not possible to
achieve this rate, and it is only used to compare the deliverability of different wells.
2.5 INFLOW PERFORMANCE RELATIONSHIPS
In most wells on artificial lift, bottomhole pressures below bubble-point pressure are
experienced. Thus, there is a gas phase present in the reservoir near the wellbore, and the
assumptions that were used to develop the PI equation are no longer valid. This effect was
observed by noting that the productivity index was not a constant value. Test data from such
wells indicate a downward curving line, instead of the straight line shown in Fig.

Figure: 5 Inflow Performance Relationship
The main cause of a curved shape of inflow performance is the liberation of solution gas due
to the decreased pressure in the vicinity of the wellbore. This effect creates an increasing gas
saturation profile towards the well and simultaneously decreases the effective permeability to
liquid.
Liquid rate is accordingly decreased in comparison to single-phase conditions and the well
produces less liquid than indicated by a straight-line PI. Therefore, the constant PI concept
cannot be used for wells producing below the bubble-point pressure. Such wells are
characterized by their Inflow Performance Relationships or IPR curves.
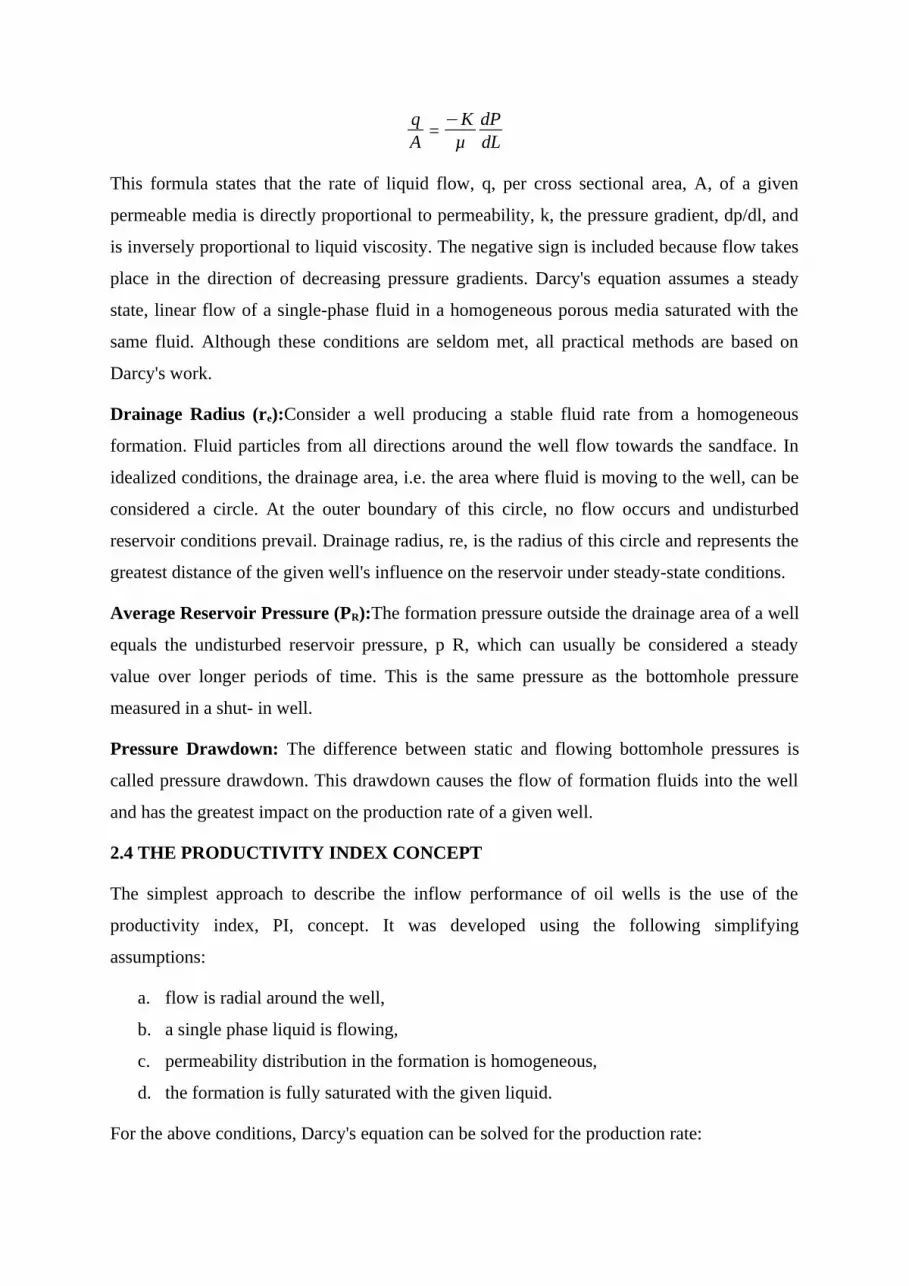
IPR in Single Phase Flow
In case of a single phase flow, the relation between the production rate and the pressure drop
is a straight line [10]. As follows from the figure, slope of the IPR is inversely proportional to
the PI value; i.e. Slope = 1/PI= Constant.
At this condition (pwf ≤ pb), the IPR is no longer a straight line. It has been illustrated in
Phase diagram fig.6 which states that at such bottom hole conditions, a two phase flow occurs
in a reservoir where both oil and gas flow together towards the well. This type of flow is
called solution gas drive.
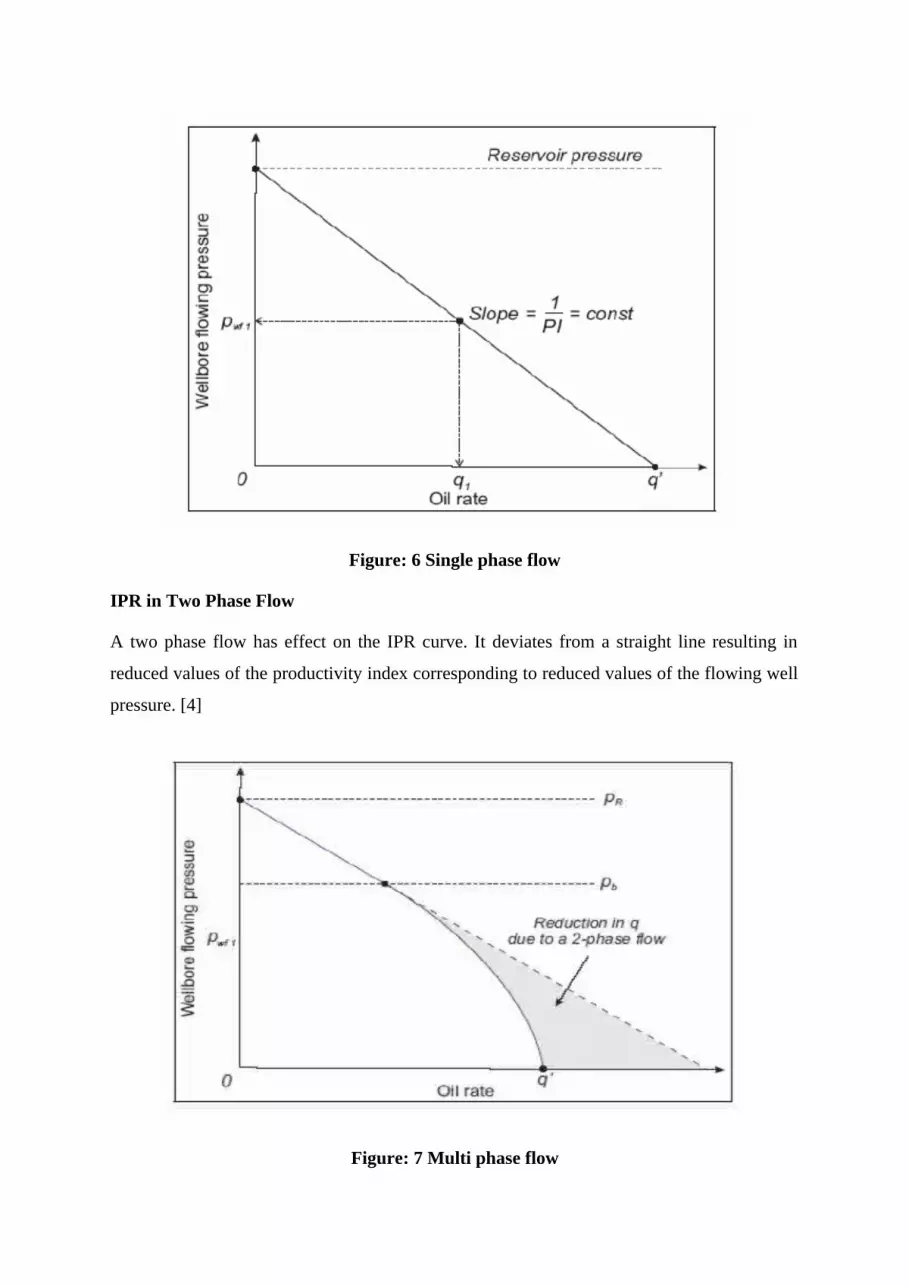
Figure: 6 Single phase flow
IPR in Two Phase Flow
A two phase flow has effect on the IPR curve. It deviates from a straight line resulting in
reduced values of the productivity index corresponding to reduced values of the flowing well
pressure. [4]
Figure: 7 Multi phase flow

Vogel's IPR Correlation: Vogel used a numerical reservoir simulator to study the inflow
performance of wells depleting solution gas drive reservoirs. He considered cases below
bubble-point pressure and varied pressure drawdowns, fluid, and rock properties. After
running several combinations on the computer, Vogel found that all the calculated IPR curves
exhibited the same general shape. This shape is best approximated by a dimensionless
equation
qqmax
=1−0.2Pwf
PR−0.8 (
Pwf
PR)2
Where:q = production rate at bottomhole pressure pwf, STB/d
qmax = maximum production rate, STB/d
PR = average reservoir pressure, psis
Although Vogel's method was originally developed for solution gas drive reservoirs, the use
of his equation is generally accepted for other drive mechanisms as well. It was found to give
reliable results for almost any well with a bottomhole pressure below the bubble point of the
crude.
In order to use Vogel's method, reservoir pressure needs to be known along with a single
stabilized rate and the corresponding flowing bottomhole pressure. With these data, it is
possible to construct the well's IPR curve by the procedure discussed in the following
example problem.
Fetkovich's Method: Fetkovich demonstrated that oil wells producing below the bubble-
point pressure and gas wells exhibit similar inflow performance curves [20]. The general gas
well deliverability equation can thus also be applied to oil wells:
q= C (PR2-Pwf
2)n
Coefficients C and n in this formula are usually found by curve-fitting of multipoint well test
data. Evaluation of well tests and especially isochronal tests is the main application for
Fetkovich's method.
2.6 OUTFLOW PERFORMANCE PREDICTION:
Outflow performance of a well depends on many factors like fluid characteristics, conduit
size, wellhead back pressure, well depth, pipe roughness etc. Efforts to predict well outflow
performance have been going on for many years which resulted in much research and

development work being done in the area of Multiphase Flow. Different multiphase flow
correlations have been developed which help in predicting the pressure losses (pressure vs
depth / length) in a vertical / horizontal pipe column of multiphase fluid (more than one phase
i.e. oil-gas, water-gas or oil-water-gas) taking into account the fluid characteristics along with
the conduit configuration and other factors affecting the flow. Tubing intake pressure /
outflow pressure is the pressure required at the bottom of the tubing to pump a required
amount of liquid (fluid mixture /) at a given well head pressure. It depends on the following
factors:
i. Tubing size
ii. Tubing head pressure
iii. Water Cut
iv. GLR
v. Depth
2.7 ARTIFICIAL LIFT
As the well flows, over a period, there could be a condition when the well inflow pressure is
not sufficient to lift the desired liquid up the tubing. This could be due to reasons like drop in
reservoir pressure, increase in water-cut etc. Under those conditions, when a self-flowing oil
well ceases to flow or is not able to deliver the required quantity to the surface, the additional
energy is supplemented either by mechanical means or by injecting compressed gas. This is
called artificial lift and the purpose of artificial lift is to create a steady low pressure or
reduced pressure in the well bore against the sand face, so as to allow the well fluid to come
into the well bore continuously. In this process, a steady stream of production to surface
would result.oil wells to increase pressure within the reservoir and encourage oil to the
surface.
This additional energy may be provided by increasing the pressure at the bottom using a
pump or by changing any of the following parameters:
i. Tubing size – this will help reduce friction
ii. Tubing head pressure – it helps reducing backpressure
iii. Water Cut – this cannot be easily changed, however chemical treatments and water
shut-off jobs may be done to achieve this
iv. GLR – by introducing gas – known as “ gas lift”

v. Depth - cannot be changed, yet zone-transfer in wells changes depths which becomes
a parameter of active consideration
2.8 Types of Artificial Lift
Artificial Lift methods fall into two groups, those that use pumps and those that use gas.
1. Gas Method: a) Continuous Gas lift
b) Intermittent Gas lift
2. Pump Types a) Sucker Rod pumps (Rod Lift)
b) Electrical Submersible Pumps
c) Progressive Cavity Pumps
d) Subsurface Hydraulic Pumps
GAS Method:
Gas lift involves injecting high-pressure gas from the surface into the producing fluid column
through one or more subsurface valves set at predetermined depths. Injected gas aerates the
fluid to reduce its density; the formation pressure is then able to lift the oil column and forces
the fluid out of the wellbore. The lifting of fluid by gas is achieved by one or the combination
of the following three processes:
Work of expansion of the compressed gas
Lightening of the fluid column
Displacement of the oil by the compressed gas
Gas lift is of two types:
a) Continuous Gas Lift: Continuous gas injection into the tubing causing a continuous
flow of reservoir fluid. It is generally used in wells of higher potential.
b) Intermittent Gas Lift: Rapid injection of very large quantities of gas into the tubing,
causing a slug of fluid in the tubing to be carried to the surface. The valve then closes,
awaiting another column of fluid to build in the tubing. Generally used in wells that
has less influx and a low potential.
PUMP Method:

SUCKER ROD PUMPS (ROD LIFT): This type of artificial lift utilizes a positive
displacement pump that is inserted or set in the tubing near the bottom of the well. The pump
plunger is connected to surface by a long rod string, called sucker rods, and operated by a
beam unit at surface. Each upstroke of the beam unit lifts the oil above the pump’s plunger.
Advantages:
High system efficiency
Optimization controls available
Economical to repair and service
Positive displacement/ strong drawdown
Upgraded materials can reduce corrosion concerns
Flexible i.e. production can be adjusted through stroke length and speed
Disadvantage:
Limited to relative low production volumes (less than 1,000 barrels per day.
ELECTRICALLY SUBMERGED PUMP:
Electrical Submersible Pump (ESP) system incorporate an electrical motor and centrifugal
pump unit run on a production string and connected back to the surface control mechanism
and transformer via an electric power cable. The down hole components are suspended from
the production tubing above the well’s perforations. In the most cases the motor is located on
the bottom of the work string. As the fluid comes into the well it must pass by the motor and
into the pump. Each stage (impeller/Diffuser combination) adds pressure on head to the fluid
at a given rate. The fluid will build up enough pressure as it reaches the top of the pump to
lift it to the surface and into the separator or flow line.
Advantages
High Volume and depth capacity
High efficiency (over 1,000 BPD)
Low maintenance
Minimal surface equipment requirements
High resistance to corrosive downhole environments such as H2S and CO2

Can be used in deviated well and verticals wells with doglegs
Adaptable to well with 4 ½’ casing or larger
Disadvantages
Poor sand pumping ability
PROGRESSIVE CAVITY PUMP:
Progressive Cavity Pumping Systems typically consist of a surface drive, drive string and
down hole progressive cavity (PC) pump. The PC pump is comprised of a single helical-
shaped rotor that turns inside a double helical elastomeric- lined stator. The stator is attached
to the production tubing string and remains stationary during pumping. In most cases the
rotor is attached to a sucker rod string which is suspended and rotated by the surface drive.
As the rotor turns eccentrically in the stator, a series of sealed cavities are formed and
progress from the inlet to the discharge end of the pump.
Advantages
Low capital investment
High system efficiency
Low power consumption
Pumps oil and water with solids
Pumps heavy oil
No internal valves to clog or gas lock
Portable, lightweight surface equipment
Disadvantages ----
Limited lift capabilities
SUBSURFACE HYDRAULIC PUMP:
Hydraulic pump systems use a power fluid usually light oil or water that is injected from the
surface to operate a down hole pump. Multiple wells can be produced using a single surface
power fluid installation.
Reciprocating hydraulic pump, the injected power fluid operates a down hole fluid engine,
which drives a piston to pump formation fluid and sent power fluid to the surface.

Jet pump is a type of hydraulic pump with no moving parts. Power fluid is injected into the
pump body and into a small-diameter nozzle, where it becomes a low-pressure, high-velocity
jet. Formation fluid mixes with the power fluid, and then passes into an expanding-diameter
diffuser.
Operating
Parameters
Rod
pump
PCP Hydraulic
Piston
ESP Hydrauli
c Jet
Gas lift Plunger
lift
Operating
Volume
BFPD BFPD BFPD BFPD
Corrosion
handling
Good to
Excellent
Fair Good Good Excellent Good to
excellent
Excellent
Gas handling Fair to
good
Good Fair Fair Good Excellent Excellent
Solids
handling
Fair to
good
Excellent Poor Fair Good Good Poor to Fair
Fluid gravity >80 API >350 API >80 API >100 API >80 API >150 API GLR = 300
SFC/bbl/10
00ft of
depth
Servicing Work over
or pulling
rig
Work
over or
pulling
rig
Hydraulic
or
wireline
Work
over or
pulling
rig
Hydrauli
c or
wireline
Wireline
or work
over rig
Wellhead
catcher or
wireline
Prime mover Gas or
electric
Gas or
electric
Multi-
cylinder
or electric
Electric
motor
Multi-
cylinder
or
electric
Compres
sor
Well’s
natural
energy
Offshore
application
Limited Good Good Excellent Excellent Excellent NA
System
efficiency
45%-60% 40%-
70%
45%-55% 35%-
60%
10%-
30%
10%-
30%
NA

ARTIFICIAL LIFT IN DEEP WATER:
The challenges posed by subsea/deepwater production, unconventional reservoirs also require
new ideas to improve recovery. Today’s definition of artificial lift must encompass a much
broader range of technologies than in the past. Also, the critical role that artificial lift plays in
increasing ultimate recovery needs to be recognized up front so that effective artificial-lift
solutions can be incorporated in field-development.
Artificial lift systems requirement is governed by the simulation studies like vertical lift
performance from subsurface to surface and flow hydraulics from seabed to process facilities.
In case of onshore, shallow offshore or deepwater dry tree systems, artificial lift is used to
produce well fluids right from the wellbore to the surface facility.
In case of deepwater development with subsea trees, installing downhole artificial lift system
alone may not be sufficient to produce the well fluid to the topside or shore facilities due to
high hydrostatic head from sea bed to the surface and/or long flow line. Under such
circumstances adding energy to the well fluid with subsea boosting at subsea wellhead/
manifold or with gas lift at riser base may be required. Hence, in broader perspective,
methods like subsea boosting with gas lift, ESP/ multiphase pump, wet gas compressor and
riser base gas lift are also considered as artificial lift system in deepwater field developments.
Therefore, in deepwater development with subsea trees, artificial lift may be required either
at downhole, at seabed or at riser base or in combination to sustain or boost production during
various stages of field life. Artificial lift systems in deepwater are classified along with
modes as:
1. Artificial lift from Subsurface to Surface
a) Downhole Gas lift
b) Downhole ESP
2. Subsea boosting
a) Multiphase flow pumps
b) Caisson separation and boosting with ESP
c) Subsea wet gas compressors
3. Artificial lift at riser base
a) Riser base Gas lift

b) Riser base ESP
As this project discuss about the gas lift, artificial lift in deep water for gas lift will be
explained further.
Selection of artificial lift in deep water (11)
The selection of artificial lift system for a given case is a result of careful evaluation, finally
based on operational and investment costs towards gained production. Selection parameters
are as follows:
a. Water depth
b. Well Completion & profile
c. Geographical & Environmental conditions
d. Reservoir characteristics
e. Reservoir pressure & Well productivity
f. Characteristics of fluids
g. Surface Constraints
h. Services available Economic considerations`
i. Operating ease
Artificial lift options & the basic parameters/criteria of selection
Table:

CHAPTER 3
GAS LIFT
3.1 INTRODUCTION:
It is one of the methods of Artificial Lift whereby relative high pressure gas is injected into a
fluid column to reduce the density of the fluid from the point of gas injection to the surface.
The injection gas supplements the formation gas and lightens the flowing fluid above the
point of injection. This allows a lower reservoir pressure to lift the fluids to the surface (4).
3.2 TYPES OF GAS LIFT: Gas lift system can broadly be classified into two main
categories:-
1. Continuous gas lift
2. Intermittent gas lift
3. Plunger lift
4. Chamber lift
1. CONTINUOUS GAS LIFT:
The basic principle of continuous flow gas lift is to inject the gas in the liquid column at some
predetermined depth at a controlled rate to aerate the liquid column above it and as a result
the density of liquid column gets reduced to a point where a flowing bottom hole pressure for
a desired rate of production is sufficient to lift the liquid to the surface. Continuous gas lift
can be seen as an extension of the self-flow period of oil well. It is applicable for high PI
and/or relatively high BHP wells.
In the continuous gas lift, only one valve will be accomplishing the gas injection work and
that this valve should be as deep as possible as per the available normal gas injection
pressure. This valve is termed as 'operating valve'. The valves above it are used to unload the
well to initiate the flow from the reservoir. Once the gas injection begins through the
operating valve, the upper valves, termed as "unloading valves" are closed. Gas injection is
done at a slow rate through GLV port sizes of 3/16", 1/4" and 5/16".
THUMB RULES:
Tubing Gradient = 0.15 psi/ft (for 2 7/8”& & 3½ ”)
Effective injection pressure ( inj.pr – Tub.head pr ) = 1 ksc/100 ft of injection

Max possible injection depth (ft) = (Inj.Pr – THP)/Gradient
Figure: 8 Continuous Gas lift
2. INTERMITTENT GAS LIFT: Intermittent gas lift is applicable for the wells which have
the following characteristics:
High PI, low bottom hole pressure
Low PI, low bottom hole pressure
Low PI, high bottom hole pressure
In intermittent gas lift, sufficient volume of gas at the available injection pressure is injected
as quickly as possible into the tubing under a liquid column and then the gas injection is
stopped. For injecting large amount of gas, large ported gas lift valves are required. That is
why gas lift valves having port sizes 1/2", 7/16", 3/8" or 5/16" are preferred.
THUMB RULES
Liquid Fall Back = 7% for every 1000 ft.
Injection Cycle time = not less than 3 min/1000 ft.
Injection period /cycle = 30 sec /1000 ft
Slug speed = not less than 1000ft/min

Figure: 9 Intermittent Gas Lift
3. PLUNGER ASSISTED INTERMITTENT LIFT:
Plunger lift was originally developed and used to unload liquids for gas wells. Later its use
was extended to produce oil from high GLR wells and those wells that stop producing due to
paraffin deposition in tubing. Due to the inherent limitations of intermittent gas lift, plungers
have been used in conjunction with it. In intermittent gas lift, as an average of 5 – 7 % of the
starting liquid slug is lost per 1000 ft of lift. By use of plunger lift this liquid fall back can be
arrested to great extent and increase the slug recovery. It also minimizes the chance of gas
break through. The plunger is simply a solid interface with or without a mechanically
triggered push- type valve inside with no driving force/energy of its own.
4. CHAMBER LIFT
Chamber lift is a special type of intermittent gas lift. In low BHP and high PI wells,
production may often be greatly increased and lift efficiencies may be improved by the
installation of chamber type of assembly. The purpose of the chamber is to make use of the
casing volume to store well fluids. For a given drawdown, more well fluids are gathered /
stored in the chamber which is of a greater cross-section when compared to the production

tubing. A custom made insert chamber can also be made that will hold still more volume than
the same length of tubing.
Figure: 10 Chamber Lift
Advantages and Limitations of gas lift:
Advantages
Offers high degree of flexibility w.r.t. production rates.
Effectively produces high and low GOR wells.
Initial cost is generally less if high pressure gas is available.
Low operating cost and ease in operations.
Suitable for deep and deviated wells.
Handles sandy conditions well
Allows full-bore tubing drift.
Use wireline retrievable valves eliminate work-over jobs and offers flexibility to
design changes.
Minimum space requirements for wellhead equipment set up.
Limitations

Availability of gas. Needs high pressure gas well or compressors.
Wet gas is subject to freezing and hydrate formation.
Valve retrieval in highly deviated wells poses problem.
Not applicable in bad casing where it is uneconomical to repair the casing
Scale, corrosion and/or paraffin problems may increase the back pressure and reduce
lift efficiency.
Not suitable if injection gas is corrosive.
Has limitation in completely depleting a low BHP, low productivity well in some
cases, and an alternate mode of lift may be required towards the end of the life of the
well.
3.3 INSTALLATION METHODS
A. Closed Installation: In Closed Installation, there is a packer in the tubing - casing
annulus, below the deepest gas lift valve and When there is a standing or non-return valve in
the tubing at the tubing shoe.
B. Semi-Closed Installation: In Semi-Closed Installation, there won’t be any non-return
valve in the tubing, only packer is there in the tubing annulus.
C. Open Installation: In open Installation, there will be neither any packer in the tubing -
casing annulus nor any standing valve in the tubing.
The installation of packer is recommended:
(i) To prevent U-tubing through the tubing, especially when reservoir pressure is very low
and the deepest gas lift valve is very near to the perforation
(ii) To prevent rise of fluid level in the annulus, especially when there is an idle period of
intermittent gas lift. So, the same liquid is to be U-tubed again through the gas lift valve
before the normal gas injection is resumed.
(iii) To prevent production casing coming in contact with the well fluid.
(iv) In case of offshore wells, it is mandatory to have packer in the annulus. This is primarily
due to safety aspect for offshore wells to prevent accidental leakage of oil and gas in the sea
through leaked casing.

Figure: 11 Gas Lift Installations
3.4 COMPONENTS OF GAS LIFT SYSTEM: Equipment required for gas lift operations
may be classified as:
1. Surface Components
2. Sub surface Components
1. Surface Components:
High Pressure gas source
Lift gas injection line
Lift gas metering
Controlling unit (chokes and time line controllers)
2. Sub surface components:
Gas Lift Valve
Gas Lift Mandrel

3.5 GAS LIFT VALVE (GLV):
Gas Lift Valve is the heart of the gas lift system through which gas is injected. The bellow
operated nitrogen pressure loaded gas lift valve is the most common type of gas lift valves
being used by oil industries.
Components of GLV: A gas lift valve has five basic components. They are:
i. Body
ii. Loading element
iii. Responsive element
iv. Transmission element
v. Metering element
BODY: The body is the outer cover of the gas lift valve and is generally of 1 1/2" O. D. or
1"O.D. Some pencil type of gas lift valve is also there, which has an O.D. of 5/8" of S.S-304
or 316. The length of the gas lift valve body varies usually from 1 to 3 feet. For the
conventional type of gas lift valve, one end of it is threaded and that is screwed with the
mandrel. For wireline type, the "O" ring or VEE seal rings are provided on the body for
isolating the required portion of the gas lift valve from the adjacent areas.
LOADING ELEMENT: The loading element can be spring, gas (N2 gas) or combination of
both. The spring or gas charge provides a required balancing force so that the valve can be
operated at a desired pressure. It means that above this pressure the valve opens and below
that it gets closed automatically spring provides the required compression force. In case of
gas charged valve i.e. nitrogen- loaded valve, the external pressure is required to overcome
force due to nitrogen pressure to make the valve open for gas injection.
RESPONSIVE ELEMENT: Responsive element can be metal bellows or piston. Bellows
type of gas lift valve is most prevalent. The bellow is made of very thin metal tube preferably
of 3-ply Monel metal. Its thickness is approximately 150th of an inch. This is hydraulically
formed into a series of convolutions. The bellow is regarded as the heart of the gas lift valve.
It can be said that if bellows is of high quality, it is reflected in the quality of gas lift valve.
TRANSMISSION ELEMENT: The transmission element is generally a metal rod, whose
one end is fitted with the lowermost portion of the bellow and the other end is rigidly
attached with the stem tip.
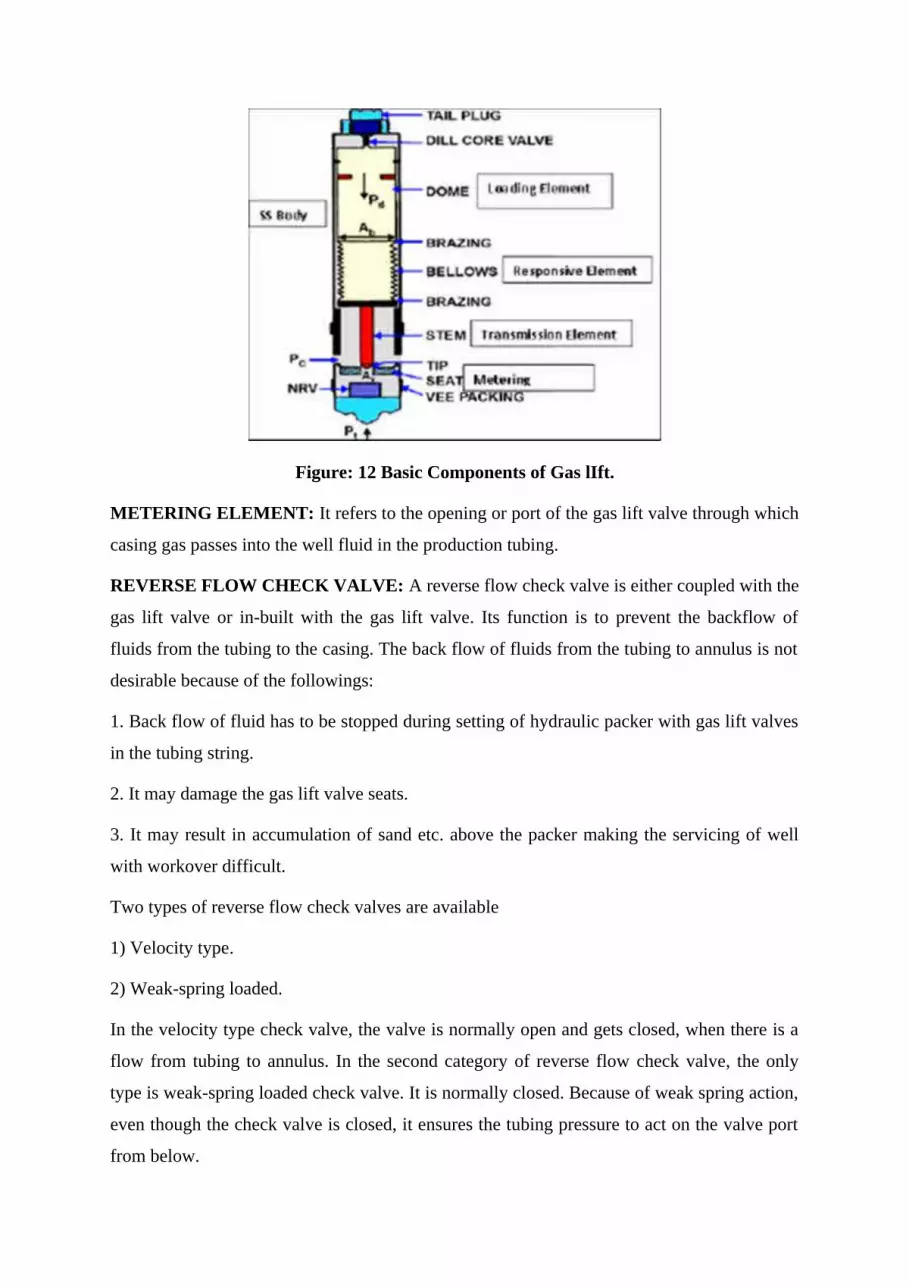
Figure: 12 Basic Components of Gas lIft.
METERING ELEMENT: It refers to the opening or port of the gas lift valve through which
casing gas passes into the well fluid in the production tubing.
REVERSE FLOW CHECK VALVE: A reverse flow check valve is either coupled with the
gas lift valve or in-built with the gas lift valve. Its function is to prevent the backflow of
fluids from the tubing to the casing. The back flow of fluids from the tubing to annulus is not
desirable because of the followings:
1. Back flow of fluid has to be stopped during setting of hydraulic packer with gas lift valves
in the tubing string.
2. It may damage the gas lift valve seats.
3. It may result in accumulation of sand etc. above the packer making the servicing of well
with workover difficult.
Two types of reverse flow check valves are available
1) Velocity type.
2) Weak-spring loaded.
In the velocity type check valve, the valve is normally open and gets closed, when there is a
flow from tubing to annulus. In the second category of reverse flow check valve, the only
type is weak-spring loaded check valve. It is normally closed. Because of weak spring action,
even though the check valve is closed, it ensures the tubing pressure to act on the valve port
from below.
3.6 GAS LIFT VALVE
The three major types of gas lift valves classified on the basis of their mode of operation are
as follows:
A. Casing pressure or Injection pressure Operated Gas Lift Valves
B. Fluid Operated or Tubing Pressure Operated Gas Lift Valve
C. Pilot Operated Gas Lift Valve
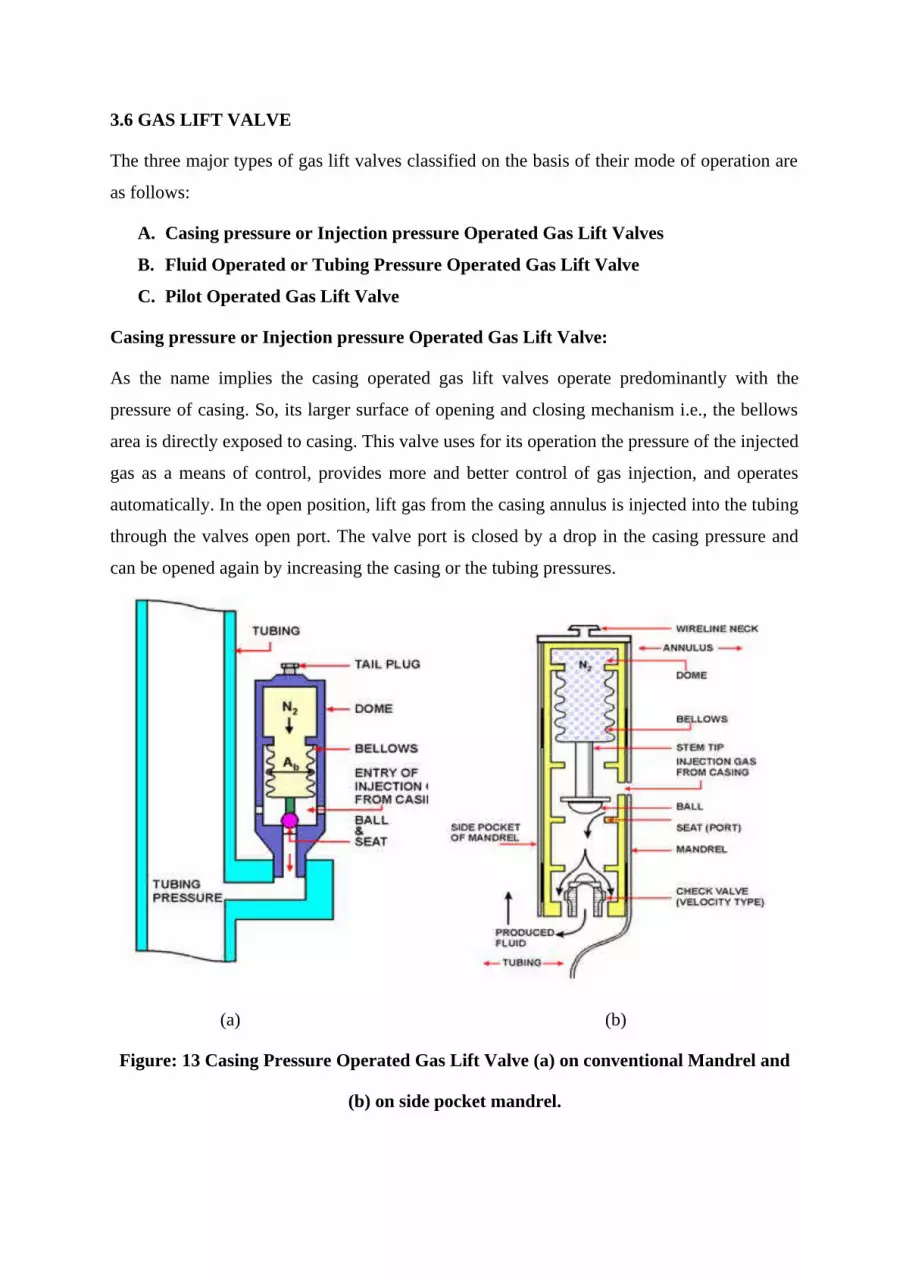
Casing pressure or Injection pressure Operated Gas Lift Valve:
As the name implies the casing operated gas lift valves operate predominantly with the
pressure of casing. So, its larger surface of opening and closing mechanism i.e., the bellows
area is directly exposed to casing. This valve uses for its operation the pressure of the injected
gas as a means of control, provides more and better control of gas injection, and operates
automatically. In the open position, lift gas from the casing annulus is injected into the tubing
through the valves open port. The valve port is closed by a drop in the casing pressure and
can be opened again by increasing the casing or the tubing pressures.
(a) (b)
Figure: 13 Casing Pressure Operated Gas Lift Valve (a) on conventional Mandrel and
(b) on side pocket mandrel.
Fluid Operated or Tubing Pressure Operated Gas Lift Valve:
As the name implies the fluid operated gas lift valves operate predominantly with the
pressure of tubing. So, its larger surface of opening and closing mechanism i.e., the bellows
area is directly exposed to tubing and not the casing pressure. That is, the tubing pressure acts
on the bellows and casing pressure on the downstream side of the seat. Due to this, the force
balance equations as described for casing pressure operated valves are reversed. If it is
required to reduce the influence of the casing pressure, it is required to reduce the port size to
as minimum as possible.
Figure: 14 Tubing / Fluid Pressure Operated Gas Lift valve
Pilot Operated Gas Lift Valve:
This is a casing pressure operated gas lift valve, but with some fundamental differences in the
construction of the valve as well as in its operating mechanism. The principle behind the
construction of this type of valve is to separate the gas flow capacity from the pressure
control system. The pilot valve has two distinct sections. One is pilot section and the other is
power section. The pilot section is very similar to an unbalanced type of valve, with the
exception that injection gas does not pass through the pilot port into the tubing. The power
section consists of- a piston, stem, spring and the valve port through which injection gas
enters into the tubing. As the casing pressure reaches the opening pressure of the valve, at
first, the pilot section port opens. The gas through the pilot port, then, exerts pressure over the
piston in the main valve section. The piston is, then pushed downward against the
compressive force of spring. This causes the downward movement of the stem and the valve

gets opened. Casing gas then, passes through the main section port to find entry in the tubing.
When the casing pressure decreases below the closing pressure of the pilot section valve, the
pilot section, like in the normal casing pressure operated valves, gets closed. Then, the
trapped gas between the pilot port and piston is bled in the tubing through a specially
constructed bleeder line in the main valve section. The same force balance equation is applied
to the pilot section only for the opening and closing of the valve, since it is the main
functional area.
Figure: 15 Pilot operated gas lift valve
3.7 GAS LIFT MANDREL:
Gas lift mandrel is the part of tubing string. It houses the gas lift valve and check valve and
its length ranges from 4 to 7 feet depending upon the length of the gas lift valve and check
valve. There are two general types of mandrels.
Mandrel for conventional gas lifts valves.
Side Pocket Mandrel for Wire-line retrievable valves.
The mandrel is a very important device as it is the tool that can change the mode of operation
of a gas lift valve from Injection pressure operated to the Production pressure operated type.
Conventional Gas Lift Mandrel: Tubing Retrievable Gas Lift Mandrels are made up as an
integral part of the production tubing when preparing a well for gas lift, chemical injection, or

other special applications. This mandrel utilizes 1-1/2 in. (38.1 mm) or 1 in. (25.4 mm) flow
control devices. When the mandrel is used in gas lift operations, it is designed to be used with
injection pressure operated gas lift valves. These mandrels are designed with long tapered top
and bottom pressure lugs to facilitate mandrel passage if installed in a dual installation. Side
guard plates are welded to the bottom pressure lug and mandrel body.
Side Pocket Mandrel: Side Pocket Mandrels are consisting of forged pocket with integral
tool discriminator, oval pipe, swages and orienting sleeves. Its orienting sleeve allows precise
and proper alignment during the insertion of positioning devices / tools into the side pocket.
The standard pocket is ported between the seal bores to communicate with the casing and
annulus and the gas is circulated down the annulus through the gas lift valve into the tubing
side pocket.
Figure: 16 Conventional and Side Pocket Mandrel

Figure: 17 Conventional Mandrel Figure: 18 Side Pocket Mandrel

CHAPTER 4
ADVANCEMENTS OF GAS LIFT
4.1 GAS LIFT SYSTEM IN DEEP WATER:
4.1.1 Introduction
Gas lift is the continuous or intermittent injection of gas into the lower section of the
production tubing or riser base to sustain, or increase, well potential. The injected gas is
commingled with the produced fluids, thereby decreasing the flowing gradient, enabling
wells to be operated at reduced flowing bottom-hole pressure, hence increasing or sustaining
production. The necessity of gas-lift application is not always obvious because gas-lift
effectiveness depends on reservoir performance, fluid properties, seabed terrain, subsea
architecture, and flowline and riser specifications.
In many cases, gas-lift for production enhancement is only needed at late life production,
when oil production rates are low and water rates might be high enough. It is clear that the
necessity of gas-lift, optimal operability and system design should be assessed from various
aspects, including flow assurance.
4.1.2 Typical Gas Lift System Requirements for Deep Water and Subsea
1. Deeper points of gas injection at higher injection pressures are required to achieve
desirable liquid production rates
2. Robust gas lift equipment that has been dynamically tested for endurance, integrity
and reliability including: liquid flow erosion testing, high volume gas injection testing
and gas injection performance.
3. Work-over at Subsea wells are costly.
4. Improved gas flow geometry stabilizes liquid production increasing the run life of the
system.
4.1.3 Basic Considerations and Method Used in the Gas Lift Design of Deepwater Wells
1. The cost of intervention in a subsea well is considerably higher than for a traditional
completion.
2. Port size of the operating valve
a) Too large a port may en-courage unstable lifting conditions.
b) Too small a port may not allow maximum production.
3. Other considerations such as:

a. Gas-lift Injection Location
b. Source of lift gas
c. Available pressure and temperature
i. Heating & compression
d. Water depths
e. Production rates
f. Tubing sizes
g. Gas injection system pressures (KO & OP)
h. Temperature profiles
i. Special metallurgy
j. Flowline Pressure
i. With and without gas lift
ii. Dead oil filled
k. Cool down time considerations
l. Consider all credible scenarios
4.1.4 Conceptual Gas Lift Design:
1. Develop a set of scenarios that will encompass the likely well performance over the
life of the well
2. Review the Base Case reservoir model. This reflected the possibility that a Water
Injection well could be added to the reservoir several months after 1st oil and that it
would be justified by the initial performance of the lone producer.
3. Analyses the pressure profile studies of the well during the early life, midlife and later
life of the field.
4. Establish appropriate sensitivity variables
a. Reservoir Pressure.
b. Water Cut
c. PI
d. Gas Injection Rate
5. Run the simulation for “Optimum Depth of Injection” Gas Lift Mode, assuming no
pressure loss in annulus, to find for each life cycle case:
a. Production Rate Range
b. Depth of Injection Range
c. Gas Injection Rate Range

4.1.5 Typical Systems Suitable for Gas-lift:
This section describes the general physical conditions of the reservoir and well to look for at
an early stage of field development, to determine whether gas-lift may be needed or not.
Oil systems
1. High water cut and/or
2. Low GOR
3. GLR < 500 scf/STB
4. High water depth: 3000 to 6000+ ft
a. J-T cooling Effect if any
5. Downhill flowlines
6. Some Uphill flowlines
7. Low to moderate viscosities
8. Low to moderate rates
Critical Physical Parameters of Reservoir Fluid and Well Configuration and its
Significance in selection of riser base gas lift as mode of artificial lift
Traditional Land based
artificial lift system
Continental shelf
operations (Platform and
subsea applications)
Deep Water subsea wells
(Predominantly subsea
applications)
Low gas injection pressure
(800 to 1500 psi)
Higher gas injection
pressure (1500 to 2500 psi)
Higher gas injection
pressure (250 to 4000 psi)
Low gas injection rates (200
to 500 mscf/d)
Higher gas injection rates
(2000 to 5000 mscf/d)
High gas injection gas rates
(5000 to 12000 mscf/d)
Shallow wells and injection
depths (3000 to 5000 ft)
Deeper wells and injection
depths (5000 to 15000 ft)
Deep wells and injection
depths
Water depth (3000 to 6000
ft)
Reservoir depth (18000 to
22000 ft from seabed)
Minimize work over
Table: 3

4.2 SUBSEA SYSTEM (9):
Subsea production wells have been around for more than 40 years. A subsea well consists
essentially of a wellhead assembly and Christmas tree (sometimes referred to as a wet tree),
which is basically identical in operation to its surface counterpart, with the primary exception
of reliability refinements, to permit operation at the seabed.
a. Well drilling or intervention requires vessels such as jack-up rigs or semisubmersibles
b. Reservoir fluids are generally tied back to a host facility for processing and export
c. Utilities, control, and chemicals are supplied from the host facility via umbilicals
Subsea wells have been used in support of fixed installations as an alternative to satellite or
minimum-facility platforms for recovering reserves located beyond the reach of the drill
string or used in conjunction with floating systems such as FPSOs and FPSs.
Figure: 19 Subsea field developments.
4.3 FLOW ASSURANCE FOR OFFSHORE AND SUBSEA FACILITIES (10):
Flow assurance is sometimes referred to as "cash assurance" because breakdown in flow
assurance anywhere in the entire cycle would be expected to lead to monetary losses. A few

specific flow assurance issues are discussed below. The full scope of flow assurance is shown
in Fig. 19. Flow assurance matters specific to subsea tieback systems are shown in Fig. 20.
Figure: 20 Full scope of flow assurance
Figure: 21 Flow assurance matters for subsea tieback systems
It is necessary for sufficient pressure to be available to transport the hydrocarbons at the
required flow rates from the reservoir to the processing unit. Matters that require
consideration in this regard include pressure loss in flowlines, separator pressure setpoint,
pressure loss in wells, artificial lift method selection, remote multiphase boosting, drag

reduction, slugging in horizontal wells, gas lift system stability, and interaction with reservoir
performance.
Components and systems should be designed and operated to ensure that flowrate targets are
achieved and that flow is continuous. Issues to be taken into account include hydrate
formation, wax deposition, asphaltenes, sand and solids transport, corrosion, erosion, scale
deposition, interaction of slugging and pipe fittings, interaction of slugging and risers, relief
and blow-down, pigging, liquid inventory management, and well shut-in pressure.
For multiphase flowlines, it is necessary for the process to be able to handle the fluid
delivery, and consideration should be given to a number of issues including interaction with
facilities performance, slugging (steady state), slugging (transient), slug-catcher design,
severe slugging prevention, effect of flow rate change, temperature loss prediction, piping
layout, remote multiphase metering, gas and dense phase export, oil and condensate export,
and separator performance.
The need for well testing and overall production system optimization contributes to flow
assurance issues. Significant advances have been made in this field. Flow assurance will
continue to remain critical technology as deepwater developments progress and as longer
tiebacks from subsea wellhead systems are considered.
Gas lift has several advantages which can be applicable for increasing production. Here are
some few cases such as T field East Malaysia where gas zone is present at the top of oil
zone and this gas is used to lift the oil from the well bore to the surface by using a Auto Gas
Lift Valve with Hydraulic control operated from surface; Block 6, Sudan, in this case heavy
oil is lifted from a well using gas lift using condensate gas, injected into the reservoir prior to
the gas injection; Single Point Gas Lift System, in this case only one gas lift valve is
installed to reduce the unloading valves which will become potentially leak path; In wells
with long perforation intervals cause insufficient velocities below the packer can cause liquid
loading. Injecting the gas below the packer to maximize the production .The cases that are
discussed below are referred from published papers.

CASE: 1
T Fields East Malaysia (6):
Introduction:
“T field” is located offshore of East Malaysia and has an oil rim structure reservoir with very
strong overlaying gas cap and relatively weak bottom water drive. T field has old platform
with limited space and is not economically feasible to place gas compressor. As a part of
development program four infill drilling wells were drilled in order to achieve the target
recovery. From geological and drilling perspective, in order to maximize the well contact
with planned oil section sands, two trajectories were designed to penetrate both top gas zone
and bottom oil zone. The target sand has a clear dipping structure with an over laying gas
zone followed by long section thin oil bearing zone. As earlier mentioned oil bearing zone at
the bottom has weak water drive. To get more contact with the target oil bearing zone, the
well trajectory was placed to touch a short section of gas zone at the top and penetrate the
whole long section of thin oil bearing sand along the dip until real time logging while drilling
petro-physical logs detect a clear oil water contact.
Figure: 22 field proposed well target sand structure map and an infill well trajectory
In this field a gas zone is present above or below the oil zone of same well, which can be
utilized to lift the oil from the wellbore. A novel Smart Auto Gas Lift (AGL) downhole
system that utilize gas from the gas cap or gas zone present at the same well to lift the oil
from wellbore. The value of auto gas lift valve was easily demonstrated as it provides a direct

replacement for conventional gas lift equipment with surface controllable downhole valve for
optimal gas injection and well lifting design.
Auto Gas Lift Well Completion Predrill Design:
A novel AGL is implemented for the T field infill wells. Smart AGL valve (i.e Wireline
Retrievable Flow Control Hydraulic Valve) is placed at the top of the gas zone to produce a
controlled natural gas volume to lift the fluid. A Dual Permanent Gauge system (PDGs) was
integrated to monitor the annuals and tubing pressures separately. The rate of injection from
the gas zone was controlled by a AGL valve through a hydraulic control line from the
surface. Both the oil and gas zones are isolated by placing a packer in between the zones.
Fig: 22 Proposed smart AGL completion configuration for the T field
To determine the feasibility of AGL completion a nodal analysis using single well model was
performed for all the four wells to evaluate the strength of the gas zone pressure and make
sure that this pressure is sufficient to inject the gas into tubing to lift the oil efficiently. To
understand the target oil zone based on the offset wells, the productivity index model was
selected to minimize sand property uncertainty. To capture the uncertainty of gas zones PI
and sand properties, a Pseudo steady state analytical model was selected to characterize sand
quality that was indicated by well petro-physical logs and sensitivity analysis also conducted

(on gas zone pressure depletion, permeability, net thickness, mechanical and skin factor).
From these quick studies two out of four wells are selected based on the main gas zone
pressure support for continuous nature gas for entire production life of the two AGL wells.
Figure: 23 Single well nodal analysis for quick candidate screening
Single Well Dynamic Simulation for Time Lapse Value Justification:
Dynamic simulation and Local Grid Refining (characterize the multi zone heterogeneities)
methods take long time to run simulation for the wells. For this case a novel single well
dynamic simulation was applied to evaluate time lapse production upside between different
completion methods. To create this, the work starts by populating near wellbore zonal sand
properties from synthetic petro-physical logs which can be extracted from full field
geological model and the minimum resolution of log data is applied to capture the
heterogeneities of multi-sand layers. After property construction, the zonal layer fluid model,
zonal pressure and contact initial conditions and zonal sand real perm scale data should be
properly defined for each layer. An advanced completion modeling method should be used to
model one smart AGL valve at top gas zone and to select either an open or sand alone screen
completion for bottom oil zone or to involve another smart downhole flow control
valve(FCV) to produce bottom oil.

Figure: 24 Construction of single well dynamic simulation model
The performance of each possible completion strategy, various cases were simulated with
constructed single well dynamic model. In AGL completion case, the following three cases
were simulated:
Case 1: NO AGL valve control in gas zone and NO FCV valve control in oil zone
Case 2: AGL valve control is ON in gas zone and three FCV valves control active in oil zone
Case 3: AGL valve control is ON active in gas zone, but NO FCV valves control in oil zone.
From the simulation results, by involving an AGL valve at gas zone for well lifting and FCVs
at oil zone for gas and water breakthrough control, the oil production incremental is high
around 13%, compared to NO AGL and NO FCV case.

Figure: 25 Simulation Dynamic Response for various combination cases of AGL valve
control
Nodal Analysis for Smart AGL Valve Sizing Optimization:
The selected AGL valve has six positions one fully close, one fully open and four
intermediate positions. These openings can be flexibly changed through a hydraulic control
line from surface. In order to make sure AGL works properly through entire life of well, these
designed openings should be further optimized to site for changing reservoir conditions and
this optimization can be conducted by a specialized nodal analysis method. The single well
nodal analysis model at initial reservoir conditions acquires same model used as discussed in
figure .23. This model changes due to reservoir dynamic conditions over time need to be
manually updated in terms of pressure depletion, water cut increase and GOR increase based
on single well dynamic modeling outputs. For an effective result noel analysis is performed at
three different times, (i.e. the early stage initial conditions upon production kick-off, the
middle stage and the last stage).
At initial stage of production, both oil and gas zone pressures are still strong and inflow is
100% oil with very little water cut. Therefore a smaller intermediate AGL valve opening
position will be effective to apply for this initial production condition shown fig.26

Figure: 26 AGL valve sizing optimization via diagnostic plots of gas lift effects at initial
reservoir conditions
At mid stage of production, when reservoir pressure depletes from both gas and oil zones
simultaneously, the water cut and GOR will increase rapidly depending on the strength of the
aquifer energy and the gas intensity decreases. At this stage liquid column will be heavier in
production tubing, a slight change in the AGL valve opening position is require to optimize
high injection rate for lifting. At late stage of production, the reservoir pressure is further
depletes and even larger port size opening should be optimized and applied for high injecting
gas rate. Sensitivity analysis was then performed from these nodal models on zonal layer
properties to analyze for any uncertainty such as zonal PI or permeability, skin, GOR and
water cut shown in fig.27

Figure: 27 Sensitivity Analysis showing the effects of uncertainties in reservoir and well
conditions on production
Auto Gas Lift Well Completion Installation and Post Job Analysis
AGL completions are installed from jack-up rig and installed successfully. The sand face was
completed by sand alone screens using swell packer to isolate the gas and oil zones shown in
fig.28. The primary AGL component includes the AGL valve and dual downhole pressure
and temperature gauges. AGL valve is installed at 2199 m with dual hydraulic control line to
surface provides the ability to adjust the port size without well intervention and a balanced
operating configuration. The installation depth was critical for efficient AGL operations from
the production modeling.
The dual pressure and temperature gauges were installed on a single permanent downhole
cable to provide tubing and annuals pressure and temperature throughout all phases of the life
of the well. Other completion components include the safety valve, 10 side pocket mandrels,
sliding sleeve for circulation of completion fluids, production packer with control line feed
through ports, X-nipple, blast joint installed across the gas zone and a seal assembly for
isolating gas and oil zone inside the screen. High level quality control test was performed
before installing in the offshore.

The completion was run in hole as per the approved completion program and tubing tally to
ensure correct depth positioning of the AGL valve and location of the seal assembly in the
Polished Bore Receptacle installed between screens of oil and gas zones. After landing the
completion, the tubing, safety valve, annulus and production packer and tubing hanger were
pressure tested to ensure the well was secured prior to removal of the BOPs. After removal of
BOPs, the permanent downhole cable and hydraulic control line were fed through the port in
the well head and terminated using the appropriate wellhead outlets. The Christmas tree was
finally installed and the well starts production.
Figure: 28 An AGL completion schematic diagram
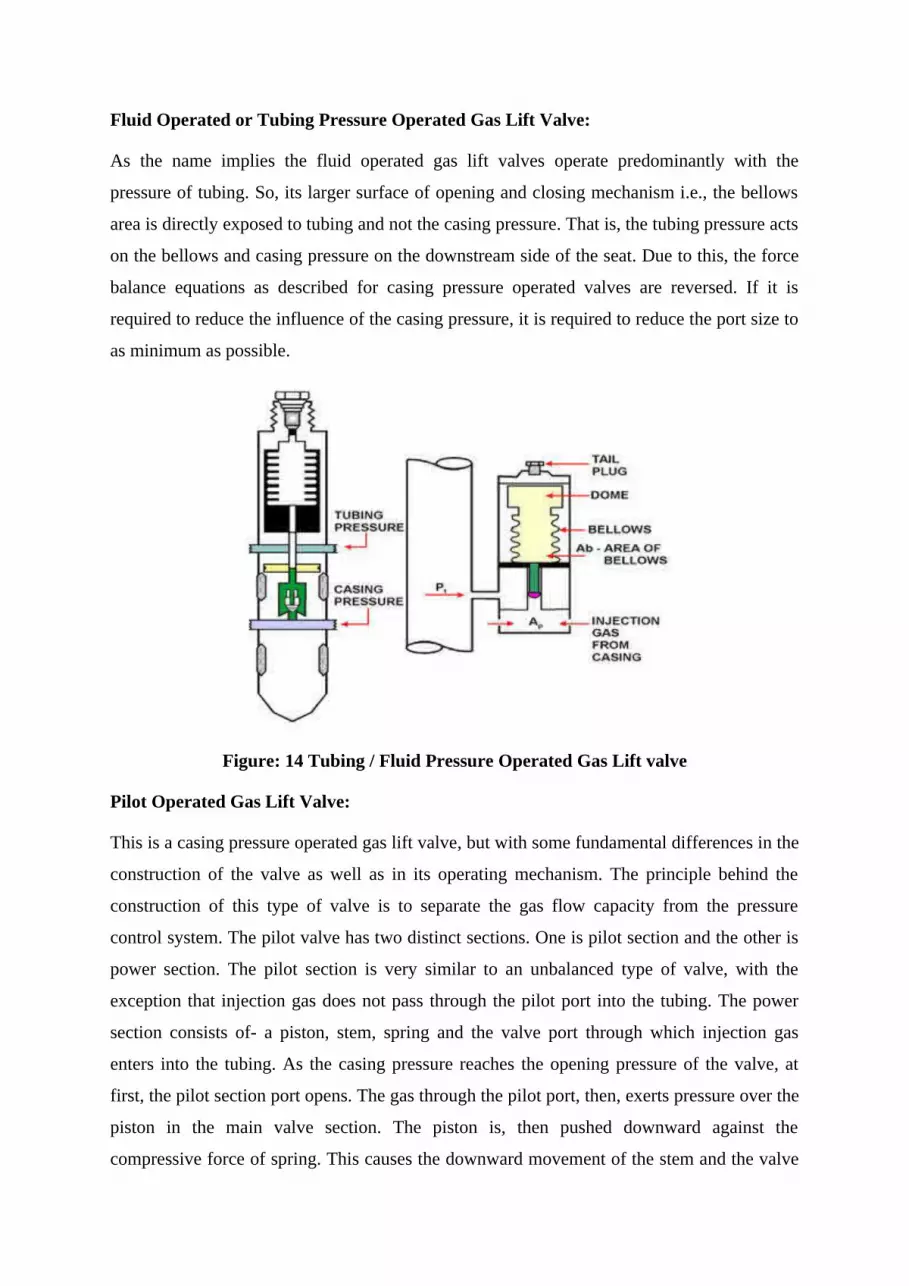
Post Installation Data Analysis and Well Performance:
Both AGL wells produce above the target rates at stable flowing conditions. The two wells
initially produced a total liquid of a couple of thousand barrels of oil per day with minimal
water cut and a high level of production is maintained. The first well is flowing naturally
without any artificial lift, while drilling through the target oil zones, the LWD tool
unexpectedly detected good quality thick oil bearing zone at deeper depths.

Firstly the deeper zone was produced and later the shallow zone after depletion of the deeper
zone with high reservoir pressure and high GOR at initial stage. The well has been producing
high volume of oil with minimal water cut without AGL. Here AGL is utilized once the
deeper zone is depleted. The AGL can also be used for the deeper reservoir production when
decreasing reservoir pressure and increasing water cut require artificial lift at later stage of
well.
The second well has also been producing a good volume of oil, but with conventional surface
gas lift rather than the auto gas lift because, it was found that the gas cap in the upper part of
the oil reservoir was not injecting gas through AGL valve from annuals to tubing. PDGs
attached to the AGL valve indicate that the pressure differential between the annuls and
tubing was minimal whether the well is flowing or shut in shown in figure.29. This
measurement indicates that gas zone above the swell packer and oil zone below are in full
communication without any sign of isolation with swell packer and annuals is full of liquid,
instead of gas from the gas cap. Above 300 psi high pressure difference in annuls is
maintained between oil gradient and gas gradient if the annuls is filled with gas from the gas
cap shown in fig.30. The gas cap which was detected with LWD is now flushed with liquid
and thus, not able to produce gas. This might have been caused because of formation damage
deep into near wellbore matrix due to high overbalance from significantly increased mud
weight that was required to control gas kick encountered during drilling. Plan is to continue
ongoing good level of production with surface gas lift and then to conduct sandface cleanup
at the gas interval when production decreases significantly.
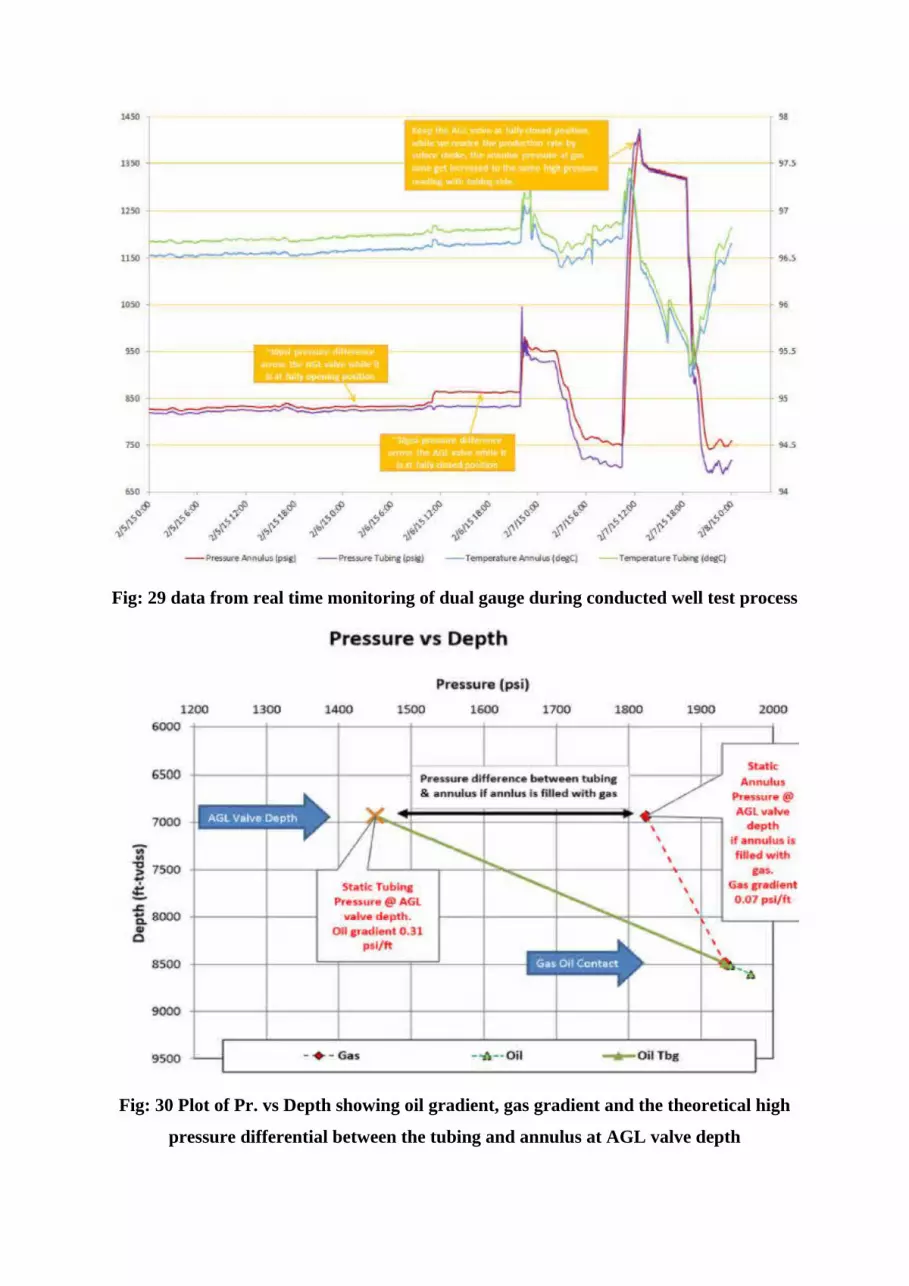
Fig: 29 data from real time monitoring of dual gauge during conducted well test process
Fig: 30 Plot of Pr. vs Depth showing oil gradient, gas gradient and the theoretical high
pressure differential between the tubing and annulus at AGL valve depth

CASE: 2
Single Point Gas Lift System (8):
Introduction:
A conventional gas lift installation has some disadvantage. Such an installation will have
several gas lift unloading valves charged with Nitrogen (the domes and bellows). The
existence of the bellows and nitrogen charge may cause the failure due to, the leakage of
nitrogen charge from the dome or bellows damage, resulting valve unusable. Unloading
valves may cause multi-pointing resulting system inefficiency. A possibility of mall function
of subsea completions and the subsequent cost of intervention is enough to motivate one to
minimize the number of unloading valves. Thus, A Single Point Gas Lift (SPGL) System is
used for deep water oil fields. In SPGL system a single orifice valve is installed at a desired
depth for well kickoff and continuous gas lift operation. It requires a higher compression.
E&P companies will prefer to install SPGL system to avoid problems in conventional gas lift
system. This system is applied to Deep water Oil field located in the East Coast of India. The
information is drawn from the current PDF stage. In the initial years the well flow on self, but
requires artificial lift in mid-stage. Gas lift is best suited for the field having high GOR and
relatively high reliability compared to other modes of lift. I deepwater environment the
subsea gas lift, flowline and riser system is expected to operate over a wide range of
conditions in terms of fluid composition, pressure, temperature, and flow rates. In this case
we carry out to evaluate single point gas lift system for the field.
Field data:
The deepwater filed is located at a distance of 45kms from shore in water depth of 400–550
m. The development strategies include clustered subsea wells with the well fluid being
produced to a FPSO to be stationed about 12kms away. There are 5 oil producers (A, B, C, D
& G) and 3 water injectors in the field with profile period of 12 years shown in fig.31. Wells
are connected to manifolds (M1 &M2) through 8 inch dia spur lines and tied back to FPSO
with 10 inch dia dual pipelines and flexible risers. Wells A, B, G are connected to M1 and
wells C & D are connected to M2.Wells are placed to be vertical at this stage (FDP) with
total depth range of 2350-2400 m. Boarding pressure us 10 kg/cm2 at FPSO is considered.
The crude oil is waxy with high pour point of 360 which makes flow assurance challenging.
The Field parameters used for simulation (Table: ) and crude oil characteristics (Table: ) are
tabulated below.

Field parameters used for simulation
Static reservoir Pressure
(kg/cm2)
Initial
260
Mid-life
150
Late life
100
Solution GOR (v/v) 135 125 >1000
Water cut (%) 0 20 75
Injection gas gravity 0.65
Water depth 350 – 550 m
Reservoir depth from sea level 2350-2400 m
Tubing size 5 ½”
Casing size 9 5/8”
Packer depth 1870 m
Tie back distance to riser base 11600 m
Spar line size 8”
Pipeline and riser size 10”
Table:
Crude oil parameters considered for the study
Crude oil parameter Value
API gravity 35.12
Pour point (oC) 36
Wax content (Wt %) 15-22
Density@ 15 oC (gm/cc) 0.8528
Avg. mole wt of crude 381.43
Table:

Figure: 31 Schematic of the deepwater field tied back to FPSO.
Requirement of Artificial lift:
The filed is in partial depletion drive requiring gas lift assistance for 3 wells- B, C, G from
mid to late life of the wells. For initial steady state calculations PROSPER, PIPESIM, OLGA,
software’s are used.
PROSPER was used to find required gas injection pressure, Injection rate, depth and orifice
size.
PIPESIM was used for calculating Preliminary hydraulic and thermal performance of the
network from subsea to top-side. For dynamic modeling of the gas lift system, from the well
bore to the FPSO
OLGA was used to investigate operability issues over a given range of injection rates, water
cuts, GORs, PI.
Simulation of startup, shut down, restart, turndown was studied to find the operability
conditions during early, mid and late life of field’s.
Flowing tubing head Pressure and Temperature profiles over the filed without any artificial
lift are obtained from the data shown in figure. But, lift assistance may require to bring back
the well on production after a well is shutdown. Once the liquid that has settled in the well
have been lifted, the well will start producing naturally without any lift. And other cases is
when there is high GOR or water cut, lift may require to maintain production.

Injection Pressure:
Injection Rate: Injection rate should be high because as well life
Gas lift valve setting depth:
Orifice size and depth:
Well unloading strategy:
Shut-in and restart:
CASE: 3
Block 6, Sudan (7):
CASE: 4
Injecting Gas below the packer to maximize the production (5):
Many operators or oil companies throughout the globe are facing challenges when producing
deep vertical and long horizontal or deviated wells. General artificial lift methods can give
negative results such as inefficient production, pressure loss.
In wells with long perforation intervals cause insufficient velocities below the packer can
cause liquid loading. Artificial lift methods are limited in their ability in controlling liquid
loading in these types of wells.
New innovations in gas lift system create adequate velocity below the packer to recover
liquids and maintain the lowest flowing bottom-hole pressure and most efficient operation.
As more wells are being drilled and completed with long perforated intervals, liquid loading
and pressure build-up often occurs as the result of inadequate velocities below the packer,
decreases effectiveness of gas lift. In order to maintain maximum reservoir drawdown in long
perforated intervals operators need alternative methods to control cost.
Several innovative methods have been developed that allows gas lift to be effective in deep
and long wells. These advancements allow gas to be injected to a deeper point in the well to
maintain adequate velocities and ensure optimum production rates without applying any back
pressure on the formation. Gas is now injected below the packer and deep into the perforated
zone by passing the lift gas through and around the packer. The injected gas aerates the liquid
in the perforation zone, decreasing the flowing gradient and improving inflow from the
formation and by increasing velocity in production string also increase liquid recovery and
reduces liquid loading. Advances in gas lift system design provide several options for

optimum recovery of fluid from well bore below packer. Of all the systems we discuss about
a few includes, Annular Bypass Assembly (ABA), Dip Tube, Enhanced Annular Velocity
(EAV), Marathon AVE and Dead String. Every system has a unique technique that allows
gas injection deep into the perforated zone by passing gas below the packer.
Annular Bypass Assembly (ABA): It is a hybrid of the conventional gas lift system with a
packer and open ended packer less system. The ABA utilizes tubing and gas lift valves above
and below the packer and a bypass assembly to allow injected gas to pass through the packer.
The point of lift is at end of the tubing, allowing for decreased flowing bottom-hole pressure
compared to a standard packer completion. This system prevents fluid re-entering the
tubing/casing annuals above the packer, as the ABA is checked from back flow. The packer
prevents upper gas lift valve from liquid and well bore contamination.

Figure: 19 Annular Bypass Assembly
Dip Tube: It is a deep lift method using a cross over flow adapter and a unique mini well
bore below the packer. Gas can be injected at deepest point without applying any additional
back pressure on the formation. A typical installation will have 2.375’’ tubing above packer
and crossover flow adaptor with 2.875” tail pipe below the packer and 1” o4 1.25” internal
injection string inside tail pipe. This system is able to accommodate most well bore
characteristics. It is a effective means of lowering the flowing bottom-hole pressure beyond
the conventional gas lift method. It is used where, wells with low reservoir pressure, where it
is important to isolate gas lift pressure from the perforated intervals

Figure: 20 Dip Tube
Enhanced Annular Velocity (EAV): This method of gas lift utilizes tubing and gas lift
valve above packer and a selectively sized injection string with inbuilt gas lift valves below.
Success of this system depends on accurate sizing of tubing and injection string by maintain
the constant velocity throughout the well below the packer to ensure there are no liquid
accumulation or liquid loading. This system can lift, making it a flexible solution where a
deep point of lift is desired.

Figure: 21 Enhanced Annular Velocity (EAV)
Marathon AVE: It is similar to Enhance Annular Velocity system. Advantage of this system
is wireline retrievable. The entire cross over flow adapter assembly and gas lift valves above
and below packer can be retrievable. With this system, we can able to know changes in well
conditions and gas lift requirements by setting wireline retrievable pressure and temperature
gauges in mandrel below the packer.

Figure: 22 Marathon AVE
Considerations when choosing a Gas Lift System:
Installing artificial lift in long perforated wells is a challenging. Gas lift is one of the major
acceptable forms of deliquification in present day industry. There are several factors to be
considered in selecting below packer gas lift are as:
1. Geometry of the wellbore ( deviated, vertical, horizontal, toe-up or toe-down
trajectory)
2. Total gas rate required
3. Liquid production
4. Others factors ( such as declining reservoir pressure, producing well head pressure,
current FBHP)
Table: 3

References:
(1) Artificial Lift method 2a by Kermit E Brown.
(2) Artificial Lift Manual by IOGPT, ONGC , MUMBAI.
(3) http://wiki.aapg.org/Reservoir_drive_mechanisms.
(4) Manual on gas lift, IOGPT, ONGC, Mumbai.
(5) SPE160003- Extending the Range of Gas Lift to Long Perforations by Darryl Polasek
& Chandrer Frost, Production Control Services (PCS) on 8-10 October 2012.
(6) SPE-176431, Smart Auto Gas Lift Completion to Unlock Natural Reservoir Potential,
A Successful Case Study from T Field In East Malaysia by K. F. Ng, M. I. Rozali, M.
R. Bacho, C. H. Roh, H. B. Bakar, A. A. B. Amsidom, A. H. B. A. Aziz, O. B.
Samuel, J. Zabala and M. H. B. Nordin, PETRONAS Carigali Sdn Bhd; K. F. G.
Goh,L. M. Zhang, I. Raw, T. T. Tina Lee, and D. t. K. Luke, Schlumberger
(7) SPE-164722, Innovative Gas Lift in Heavy Oil Wells: Case Study in Block 6, Sudan
by Tang Xueqing, Li Guocheng, Fahmi Abdalla Alawad, Yu Keqiang, Cai Bo, Petro
Energy E&P Co.Ltd, Tagwa Ahmed Musa, Sudan U. of Science & Technology.

(8) SPE-178087, Evaluation of Single Point Gas Lift System for a Deep Water Oil Field,
India by Simanta Hazarika, niladri Sinha, Rajeev Bansal, Rajan Jayaram, ONGC.
(9) http://petrowiki.org/Subsea_systems.
(10) http;//petrowiki.org/ flow assurance for offshore and subsea facilities.
(11) Artificial lift optimization increases production and recovery rates, offshore
magazine, Tim Shea, ARC Advisory Group, 14.01.2015


