Embed Size (px)
Citation preview

Advanced ReportingGuide
Version: 10.8

10.8, June 2017Copyright © 2017 by MicroStrategy Incorporated. All rights reserved.
If you have not executed a written or electronic agreement with MicroStrategy or any authorized MicroStrategy distributor (any such agreement, a"Separate Agreement"), the following terms apply:
This software and documentation are the proprietary and confidential information of MicroStrategy Incorporated and may not be provided to any other person. Copyright ©2001-2017 by MicroStrategy Incorporated. All rights reserved.
THIS SOFTWARE AND DOCUMENTATION ARE PROVIDED “AS IS” ANDWITHOUT EXPRESSOR LIMITED WARRANTY OF ANY KIND BY EITHER MICROSTRATEGYINCORPORATED OR ANYONEWHO HASBEEN INVOLVED IN THE CREATION, PRODUCTION, OR DISTRIBUTION OF THE SOFTWARE OR DOCUMENTATION,INCLUDING, BUT NOT LIMITED TO, THE IMPLIED WARRANTIESOF MERCHANTABILITY AND FITNESS FOR A PARTICULAR PURPOSE, GOOD TITLE ANDNONINFRINGMENT, QUALITY OR ACCURACY. THE ENTIRE RISK AS TO THE QUALITY AND PERFORMANCE OF THE SOFTWARE AND DOCUMENTATION ISWITHYOU. SHOULD THE SOFTWARE OR DOCUMENTATION PROVE DEFECTIVE, YOU (AND NOT MICROSTRATEGY, INC. OR ANYONE ELSEWHO HASBEEN INVOLVEDWITH THE CREATION, PRODUCTION, OR DISTRIBUTION OF THE SOFTWARE OR DOCUMENTATION) ASSUME THE ENTIRE COST OF ALL NECESSARY SERVICING,REPAIR, OR CORRECTION. SOME STATESDO NOT ALLOW THE EXCLUSION OF IMPLIED WARRANTIES, SO THE ABOVE EXCLUSIONMAY NOT APPLY TO YOU.
In no event will MicroStrategy, Incorporated. or any other person involved with the creation, production, or distribution of the Software be liable to you on account of any claimfor damage, including any lost profits, lost savings, or other special, incidental, consequential, or exemplary damages, including but not limited to any damages assessed againstor paid by you to any third party, arising from the use, inability to use, quality, or performance of such Software and Documentation, even if MicroStrategy, Inc. or any suchother person or entity has been advised of the possibility of such damages, or for the claim by any other party. In addition, MicroStrategy, Inc. or any other person involved inthe creation, production, or distribution of the Software shall not be liable for any claim by you or any other party for damages arising from the use, inability to use, quality, orperformance of such Software and Documentation, based upon principles of contract warranty, negligence, strict liability for the negligence of indemnity or contribution, thefailure of any remedy to achieve its essential purpose, or otherwise. The entire liability of MicroStrategy, Inc. and your exclusive remedy, shall not exceed, at the option ofMicroStrategy, Inc., either a full refund of the price paid, or replacement of the Software. No oral or written information given out expands the liability of MicroStrategy, Inc.beyond that specified in the above limitation of liability. Some states do not allow the limitation or exclusion of liability for incidental or consequential damages, so the abovelimitation may not apply to you.
The information contained in thismanual (the Documentation) and the Software are copyrighted and all rights are reserved by MicroStrategy, Inc. MicroStrategy, Inc. reservesthe right to make periodic modifications to the Software or the Documentation without obligation to notify any person or entity of such revision. Copying, duplicating, selling, orotherwise distributing any part of the Software or Documentation without prior written consent of an authorized representative of MicroStrategy, Inc. are prohibited. U.S.Government Restricted Rights. It is acknowledged that the Software and Documentation were developed at private expense, that no part is public domain, and that theSoftware and Documentation are Commercial Computer Software provided with RESTRICTED RIGHTS under Federal Acquisition Regulations and agency supplements tothem. Use, duplication, or disclosure by the U.S. Government is subject to restrictions as set forth in subparagraph (c)(1)(ii) of the Rights in Technical Data and ComputerSoftware clause at DFAR 252.227-7013 et. seq. or subparagraphs (c)(1) and (2) of the Commercial Computer Software-Restricted Rights at FAR 52.227-19, as applicable.Contractor isMicroStrategy, Incorporated., 1850 Towers Crescent Plaza, Tysons Corner, VA 22182. Rights are reserved under copyright laws of the United States with respect tounpublished portions of the Software.
The following terms and notices apply regardless of whether you have executed a Separate Agreement:
Trademark Information
The following are either trademarks or registered trademarks of MicroStrategy Incorporated or its affiliates in the United States and certain other countries:
MicroStrategy, MicroStrategy 10, MicroStrategy 10 Secure Enterprise, MicroStrategy 9, MicroStrategy 9s, MicroStrategy Analytics, MicroStrategy Analytics Platform, MicroStrategyDesktop, MicroStrategy OperationsManager, MicroStrategy Analytics Enterprise, MicroStrategy Evaluation Edition, MicroStrategy Secure Enterprise, MicroStrategy Web,MicroStrategy Mobile, MicroStrategy Server, MicroStrategy Parallel Relational In-Memory Engine (MicroStrategy PRIME), MicroStrategy MultiSource, MicroStrategy OLAPServices, MicroStrategy Intelligence Server, MicroStrategy Intelligence Server Universal, MicroStrategy Distribution Services, MicroStrategy Report Services, MicroStrategyTransaction Services, MicroStrategy Visual Insight, MicroStrategy WebReporter, MicroStrategy Web Analyst, MicroStrategy Office, MicroStrategy Data Mining Services,MicroStrategy Narrowcast Server, MicroStrategy Health Center, MicroStrategy Analyst, MicroStrategy Developer, MicroStrategy Web Professional, MicroStrategy Architect,MicroStrategy SDK, MicroStrategy Command Manager, MicroStrategy Enterprise Manager, MicroStrategy Object Manager, MicroStrategy Integrity Manager, MicroStrategySystem Manager, MicroStrategy Analytics App, MicroStrategy Mobile App, MicroStrategy Tech Support App, MicroStrategy Mobile App Platform, MicroStrategy Cloud,MicroStrategy R Integration, Dossier, Usher, MicroStrategy Usher, Usher Badge, Usher Security, Usher Security Server, Usher Mobile, Usher Analytics, Usher NetworkManager,Usher Professional, MicroStrategy Services, MicroStrategy Professional Services, MicroStrategy Consulting, MicroStrategy Customer Services, MicroStrategy Education,MicroStrategy University, MicroStrategy Managed Services, BI QuickStrike, Mobile QuickStrike, Transaction Services QuickStrike Perennial Education Pass, MicroStrategy WebBased Training (WBT), MicroStrategy World, Best in Business Intelligence, Pixel Perfect, Global Delivery Center, Direct Connect, Enterprise Grade Security For Every Business,Build Your Own Business Apps, Code-Free, Welcome to Ideal, The World’sMost Comprehensive Analytics Platform, The World’sMost Comprehensive Analytics Platform.Period.
Other product and company namesmentioned herein may be the trademarks of their respective owners.
Specifications subject to change without notice. MicroStrategy is not responsible for errors or omissions. MicroStrategy makes no warranties or commitments concerning theavailability of future products or versions that may be planned or under development.
Patent Information
This product is patented. One or more of the following patentsmay apply to the product sold herein: U.S. Patent Nos. 6,154,766, 6,173,310, 6,260,050, 6,263,051, 6,269,393,6,279,033, 6,567,796, 6,587,547, 6,606,596, 6,658,093, 6,658,432, 6,662,195, 6,671,715, 6,691,100, 6,694,316, 6,697,808, 6,704,723, 6,741,980, 6,765,997, 6,768,788,6,772,137, 6,788,768, 6,798,867, 6,801,910, 6,820,073, 6,829,334, 6,836,537, 6,850,603, 6,859,798, 6,873,693, 6,885,734, 6,940,953, 6,964,012, 6,977,992, 6,996,568,6,996,569, 7,003,512, 7,010,518, 7,016,480, 7,020,251, 7,039,165, 7,082,422, 7,113,993, 7,127,403, 7,174,349, 7,181,417, 7,194,457, 7,197,461, 7,228,303, 7,260,577, 7,266,181,7,272,212, 7,302,639, 7,324,942, 7,330,847, 7,340,040, 7,356,758, 7,356,840, 7,415,438, 7,428,302, 7,430,562, 7,440,898, 7,486,780, 7,509,671, 7,516,181, 7,559,048, 7,574,376,7,617,201, 7,725,811, 7,801,967, 7,836,178, 7,861,161, 7,861,253, 7,881,443, 7,925,616, 7,945,584, 7,970,782, 8,005,870, 8,051,168, 8,051,369, 8,094,788, 8,130,918, 8,296,287,8,321,411, 8,452,755, 8,521,733, 8,522,192, 8,577,902, 8,606,813, 8,607,138, 8,645,313, 8,761,659, 8,775,807, 8,782,083, 8,812,490, 8,832,588, 8,943,044, 8,943,187. 8,958,537,8,966,597, 8,983,440, 8,984,274, 8,984,288, 8,995,628, 9,027,099, 9,027,105, 9,037, 577, 9,038,152, 9,076,006, 9,086,837, 9,116,954, 9,124,630, 9,154,303, 9,154,486,9,160,727, 9,166,986, 9,171,073, 9,172,699, 9,173,101, 9,183, 317, 9,195,814, 9,208,213, 9,208,444, 9,262,481, 9,264,415, 9,264,480, 9,269,358, 9,275,127, 9,292,571, 9,300,646,9,311,683 9,313,206, 9,330,174, 9,338,157, 9,361,392, 9,378,386, 9,386,416, 9,391,782, 9,397,838, 9,397,980, 9,405,804, 9,413,710, 9,413,794, 9,430,629, 9,432,808, 9,438,597,9,444,805, 9,450,942, 9,450,958, 9,454,594, 9,507,755, 9,513,770, 9,516,018, 9,529,850, 9,563,761, 9,565,175, 9,608,970, 9,640,001, and 9,646,165. Other patent applicationsare pending.
Third Party Software
VariousMicroStrategy products contain the copyrighted technology or software of third parties ("Third Party Software"). Your use of MicroStrategy products is subject to allapplicable terms and conditions associated with any such Third Party Software
Datalogics, Inc.
Copyright 2000-2017 Datalogics, Inc.Copyright 1984-2017 Adobe Systems Incorporated and its licensors. All rights reservedAdobe®, Adobe® PDF Library™, and The Adobe Logo® are trademarks of Adobe Systems Incorporated.
CONTENTSOverview and Additional Resources 8
About this guide 9
1. Introduction to Advanced Reporting 12Before you begin 12Moving to advanced reporting 13Importing data from different data sources 14
2. Advanced Metrics 17Report Data and Calculations 17Before you begin 17Level metrics: Modifying the context of data calculations 19Nested metrics 55Conditional metrics 58Transformation metrics: Time-based and other comparisons 80Compound metrics 84Creating metrics by combining metrics, filters, and transformations 87Metric subtotals 89Metric functions 97Join specifications 104Metric-specific VLDB properties: SQL and analytical customization 106Metric column aliases: SQL identifiers and data types 106
3. Advanced Filters: Filtering Data on Reports 108Before you begin 109Attribute-to-attribute qualification 112Dynamic dates: Filtering by offsetting the current date 116Importing and exporting elements for attribute qualifications 122
© 2017, MicroStrategy Inc. 3
Advanced Reporting Guide
4 © 2017, MicroStrategy Inc.
The attribute level of set qualifications: Output level 125Resetting rank and percent metric qualifications: Break by 127Metric-to-metric comparisons 128Merging attribute qualifications 129Applying qualifications independently of relationship filters 130Custom expressions and database-specific functions 131Joint element lists: Grouping elements from multiple attributes 146Prompted filters: Asking for user input for filter conditions 147Shortcut vs. embedded filters 149
4. Custom Groups and Consolidations 153About custom groups: Grouping attribute elements with banding and filtering 154Creating a custom group 163Editing and formatting a custom group 164Deleting a custom group, element, or condition 174Consolidations: Grouping attribute elements with arithmetic and logical operators174Custom group and consolidation comparison 187
Drill Maps 189Customizing Drill Paths 189What is drilling? 189Creating custom drill maps and paths 191Drill map association: Objects containing the drill map 199
6. Advanced Prompts: Enabling User Input 202What is a prompt? 203Prompts in scheduled reports 203Types of prompts 204Prompting for a user’s login name: System prompts 215Defining how a prompt is displayed in MicroStrategy Web 216
7. Designing Reports 226Before you begin 227Accessing the Basic Report: Foundation of examples 228Filters and order of calculation on reports 229The basics of report execution 240Totaling and subtotaling data on reports 242Sorting data on reports 249Formatting a report 258
Advanced Reporting Guide
© 2017, MicroStrategy Inc. 5
Determining which attribute elements are displayed: Attribute joins 280Evaluation order of objects on reports 286Adding features for users 294Distributing reports to a user community 295Exporting large reports as delimited text files 303
8. Graphing 306Graphing best practices and troubleshooting 307Viewing graph reports 309Adding an object to a graph report 310Choosing an appropriate graph style 311Moving objects on a graph report 315Graph style usage and examples 318Advanced graph style usage and examples 340Formatting a graph report 359Choosing a graph image format for HTML documents and Web 415Exporting and sharing graphs 416Using interactive graph visualizations in documents: Widgets 418
9. Displaying Information about Reports: Report Details 419Displaying report details 420Levels of report details configuration 421Configuring report details settings 423Configuring the display of template details 428Configuring the prompt details 436Configuring the filter details 442Enabling and customizing report details preferences 457
10. Linking Reports and Documents 461Linking reports: Examples 462Prerequisites for working with links 463About links 464Creating links 481Creating linked reports 486
11. Custom SQL Queries: Freeform SQL and Query Builder 497Customize your SQL statements: Freeform SQL 498Reporting on third-party web services with XQuery 524Retrieving web folder resources with XQuery 545
Advanced Reporting Guide
6 © 2017, MicroStrategy Inc.
Updating data with Transaction Services 554Customize your SQL queries: Query Builder 568Connect to databases, Excel files, and text files 599Map data to non-project objects: Managed objects 601Creating Intelligent Cubes 605
12. Accessing Subsets of Data: Data Marts 608Getting started with data marts 609Creating data marts 609Using a data mart table as a source table 613Specifying governors, table creation options, and custom SQL statements 620
13. Data Mining Services 625Data Mining Services: Overview 625Creating a dataset report 627Creating a predictive model 639Importing the predictive model 671Using the predictive metric 676Data mining examples 677
14. VLDB Properties 698Levels of VLDB properties 698VLDB properties at the metric level 699VLDB properties at the report level 703VLDB properties at the database instance level 716
A. Logical and Mathematical Operators for Filtering 718What is an operator? 718
B. Formatting Default Values 724Default values 724Number 724
C. MicroStrategy Developer Commands 728Basics 728Enabling the MicroStrategy Developer homepage 729Viewing the MicroStrategy Developer commands 730Commands 731
D. Sorting and Browsing Standards 737Sort order of characters in MicroStrategy 737
Advanced Reporting Guide
© 2017, MicroStrategy Inc. 7
Project order in MicroStrategy Developer and Web 738
E. Using Secure Freeform SQL text prompts 741Identify database support for parameterized queries 741Enabling parameterized queries 745Define secure Freeform SQL reports 746
Index 752

OVERVIEW AND ADDITIONALRESOURCES
TheMicroStrategy Advanced Reporting Guide provides comprehensive information onadvanced topics for using the MicroStrategy query and reporting products. This guidebuilds on a basic understanding of information provided in the Basic Reporting Guide.Advanced topics include the following:
• Chapter 1, Introduction to Advanced Reporting, reviews the tasks and objects tocreate a basic report and previews advanced reporting concepts.
• Chapter 2, Advanced Metrics, explains level metrics, conditional metrics,transformation metrics, and compound metrics, which provide complex businessmeasures and key performance indicators. Numerous examples provide real-lifecontext for the explanations.
• Chapter 3, Advanced Filters: Filtering Data on Reports, describes how to createcomplex filters and how to apply them to reports.
• Chapter 4, Custom Groups and Consolidations, introduces and compares customgroups and consolidations and why to use each.
• Chapter , Drill Maps, describes how to customize drill paths to allow users to accessadditional information from reports.
• Chapter 6, Advanced Prompts: Enabling User Input, explains how to createdynamic report definitions through prompts.
• Chapter 7, Designing Reports, guides you through advanced reporting concepts in ahands-on way, providing a tutorial experience. The sample reports illustrate variousreporting concepts such as the difference between report filters and report limits,while showing you how reports are built and generated. This section also introducesthe concepts of the view definition and the data definition of a report, detailing thereport execution steps that belong to each.
• Chapter 8, Graphing, discusses how to view, format, and manipulate MicroStrategygraph reports, introduces the graph styles available in MicroStrategy, and providestips on how you can most effectively present your report data in a graph.
• Chapter 9, Displaying Information about Reports: Report Details, discusses how tocustomize the report details, which is the information that appears in the ReportDetails pane. For example, you can select whether to include view filter information
© 2017, MicroStrategy Inc. 8
Advanced Reporting Guide
9 © 2017, MicroStrategy Inc.
or the attribute name in the filter details. For report details, you can choose whetherto include information on prompts or filters.
• Chapter 10, Linking Reports and Documents, discusses how to create and use links.Links allow analysts to explore additional, related data by executing anotherdocument or report from within a document or report, in either MicroStrategyDeveloper or MicroStrategy Web. A link allows context to be passed to any promptedreport or document, whether the destination report or document is related to theoriginal.
• Chapter 11, Custom SQL Queries: Freeform SQL and Query Builder, discusses howto use Freeform SQL to access data from various data sources, including relationaldatabases, Excel files, and flat files.
• Chapter 12, Accessing Subsets of Data: Data Marts, explains how to use relationaltables known as data mart tables to create or update warehouse tables or integratewith third-party tools.
• Chapter 13, Data Mining Services, presents the data mining process, which leveragesexisting and historical data to create predictive models to project potential outcomesfor business activities and transactions.
• Chapter 14, VLDB Properties, describes the most commonly-used VLDB propertiesrelating to metrics and reports. VLDB properties allow you to customize the SQLthat MicroStrategy generates.
You can also report on data returned from MDX cube sources such as SAP BW,Microsoft Analysis Services, and Hyperion Essbase. For information on integratingMicroStrategy with these MDX cube sources, see the MDX Cube Reporting Guide.
The appendixes contain the following information:
• Appendix A, Logical and Mathematical Operators for Filtering, discusses operatorsand how to use them in filters and report limits.
• Appendix B, Formatting Default Values, provides the default values for all theformatting options, to assist you in formatting reports and creating autostyles.
• Appendix C, MicroStrategy Developer Commands, specifies the Developercommands used in MicroStrategy products, focusing on Developer home page usageand describing the commands from an HTML perspective.
• Appendix D, Sorting and Browsing Standards, describes the sorting and browsingstandards for characters and projects in MicroStrategy Developer and Web.
• Appendix E, Using Secure Freeform SQL text prompts, describes how to definesecure Freeform SQL text prompts to guard against malicious SQL injections.
About this guideThe following sections provide the location of examples, list prerequisites for using thisbook, and describe the user roles the information in this guide was designed for.
Advanced Reporting Guide
© 2017, MicroStrategy Inc. 10
The sample documents and images in this guide, as well as some example steps,were created with dates that may no longer be available in the MicroStrategyTutorial project. If you are re-creating an example, replace the year(s) shown inthis guide with the most recent year(s) available in the software.
How to find business scenarios and examplesWithin this guide, many of the concepts discussed are accompanied by business scenariosor other descriptive examples. Many of the examples use the MicroStrategy Tutorial,which is MicroStrategy’s sample warehouse and project. Information about theMicroStrategy Tutorial can be found in the Basic Reporting Guide.
PrerequisitesBefore working with this document, you should be familiar with the information in theBasic Reporting Guide, including:
• MicroStrategy Developer
• Projects, attributes, and facts (covered in the Project Design Guide)
• Simple metric and report creation
• Report manipulation such as formatting, drilling, and subtotals
• Prompts and filters
• SQL statements (basic understanding)
Who should use this guideThis document is designed for:
• Report designers who create advanced reports and advanced reporting objects suchas metrics, filters, custom groups, consolidations, and drill maps.
• Analysts who use advanced report manipulations such as data marts, Freeform SQLreports, MDX cube reports, and data mining.
EducationMicroStrategy Education Services provides a comprehensive curriculum and highlyskilled education consultants. Many customers and partners from over 800 differentorganizations have benefited from MicroStrategy instruction.
Courses that can help you prepare for using this manual or that address some of theinformation in this manual include:
• MicroStrategy Developer: Reporting Essentials
• MicroStrategy Developer: Advanced Reporting
• MicroStrategy Web for Reporters and Analysts
• MicroStrategy Web for Professionals
Advanced Reporting Guide
11 © 2017, MicroStrategy Inc.
• MicroStrategy Freeform SQL Essentials
For the most up-to-date and detailed description of education offerings and coursecurricula, visit http://www.microstrategy.com/Education.
What’s new in this guide
MicroStrategy 10.7
l When performing In-Memory calculations - such as derived metrics, subtotals, anddynamic aggregation - on simple and aggregation functions, we would ignore nullsduring the calculation of aggregation functions while still treating them as 0 for scalaroperations. The new calculation behavior is applied by default but can be reverted bythrough the Advanced VLDB Properties Editor. For more information, see Nullchecking for Analytical Engine
l When running a multi-source report in 10.7, you can execute multiple report pre- andpost-SQL statements in an expected order for both primary and all secondarydatabases. The SQL statements are also executed when the report is used in adocument or dashboard. To apply pre- and post-SQL statements, use the Pre/PostStatements VLDB setting. For more information, seeMulti-source Report Pre andPost Statements.
MicroStrategy 10.5
l Added procedure for defining secure Freeform SQL text prompts to guard againstmalicious SQL injections. For more information, see Using Secure Freeform SQL textprompts.
MicroStrategy 10.4
l Added support for Kerberos without pass-through to XQuery data source connections.You can use a single Kerberos certificate to authenticate all users for a web service. Formore information, see Using Kerberos to authenticate XQuery data sources, page533.
MicroStrategy 9.4
l The examples for creating and formatting stock graphs have been updated foradditional best practices information and requirements, which are provided in Stock,page 340 and Stock, page 340.
l Report Services document designers can enable Grid/Graphs as report conditionselectors to filter the data in a dataset, allowing users to view subsets of large amountsof data, rather than loading and displaying all the data at once. This can be supportedfor datasets created using Freeform SQL and XQuery, as described in Reportinganalysis features, page 513 and Supporting Grid/Graph filtering for documentdatasets based on large XQuery reports, page 544 respectively.
1INTRODUCTION TO ADVANCEDREPORTING
Advanced reporting allows you to create more sophisticated reports using advancedreport functionality such as data marting and Freeform SQL, and advanced objects suchas level metrics, conditional metrics, prompted filters, custom groups, and drill maps.Examples of advanced reporting in action include:
• The contribution to revenue and profit of products bought by your top customers
• The quarterly revenue, split by regions
• The inventory for time periods you select at report run-time
• A comparison of new customers this year to last year
• The revenue for electronics in the first quarter of 2003 and music in the thirdquarter of 2003, or other attribute combinations you can select at report runtime
• Allowing users to drill only to the call center level, not the employee level, for asalary report
An overview of the advanced reporting features is provided in Moving to advancedreporting, page 13. By the end of this section, you should understand what is involved increating a basic report and have an idea of what advanced reporting can do for you.
Finally, review how you can use MicroStrategy Web to import data from data sources,such as an Excel file, a table in a database, a Freeform SQL query, or a Salesforce.comreport. See Importing data from different data sources.
Warehouse data in the sample MicroStrategy projects is updated regularly, andthese changes are reflected in the documentation whenever possible. However, thesample reports, documents, objects, and images in this guide may displaywarehouse data that no longer appears in the software.
Before you beginBefore you use this guide, you should be familiar with the report concepts and processesdescribed in the Basic Reporting Guide. Advanced reporting features build on the
© 2017, MicroStrategy Inc. 12
Advanced Reporting Guide
13 © 2017, MicroStrategy Inc.
concepts and procedures presented there by providing more technical details andadvanced options for report design.
The Project Design Guide also contains useful reference material, focused on schemaobjects such as facts and attributes.
Moving to advanced reportingBefore you begin working with advanced reporting functionality, you must have aworking project containing schema objects such as attributes and facts. For informationon creating projects, facts, and attributes, refer to the Project Design Guide.
The Project Design Guide also contains a step-by-step example of designing a project forfinancial reporting and analysis. This includes standard reporting such as profit and lossreporting that provides analysis of a company’s profits compared to its losses.
You can also use the MicroStrategy Tutorial that contains predesigned report objects andreports as a simulated project to familiarize yourself with MicroStrategy. Many of thefacts, attributes, and other objects used in the examples in this guide are available in theMicroStrategy Tutorial project.
You can now create reports with more sophisticated analyses, using the conceptsdescribed in this guide. You will learn how to:
• Define level metrics, conditional metrics, transformation metrics, and compoundmetrics, and know when to use each type
• Create advanced filters such as attribute-to-attribute qualifications, relationshipfilters, joint element lists, and prompted filters, among others
• Set up custom groups to create relationships between attributes and to band, or slice,attribute elements using the values of a metric
• Create virtual attributes and perform row level math using consolidations
• Create prompts to save time by using one report to produce different results
• Define custom drill maps to set the drill paths for reports
• Customize SQL statements
• Create and use MDX Cube Reports to integrate with SAP BI, Essbase, and MicrosoftAnalysis Services
• Create and use data mart reports to establish relational tables that can be used liketables in a project schema
Once you have understood and practiced these concepts, you will be able to choose,manipulate, and format advanced reports that best answer your business questions.
Advanced Reporting Guide
© 2017, MicroStrategy Inc. 14
Importing data from different data sourcesYou can use MicroStrategy Web to import data from data sources, such as an Excel file, atable in a database, a Freeform SQL query, or a Salesforce.com report, intoMicroStrategy metadata with minimum project design requirements.
You can import the data directly into a dashboard or a document, or import the data intothe project. You can link the data to define attributes and metrics, and save it as anIntelligent Cube. An Intelligent Cube is a multi-dimensional cube (set of data) that allowsyou to use OLAP Services features on reports, as well as share sets of data amongmultiple reports. For information on Intelligent Cubes and the OLAP Services featuresthat they support, see theMerging Intelligent Cubes section in the In-memory AnalyticsGuide.
If you import data into a dashboard or a document, the imported data can be usedimmediately in the dashboard or the document. You can use the Intelligent Cube fromthe data import process, whether imported into a dashboard, document, or project, tocreate:
• A report that runs against the Intelligent Cube.
• A document that uses the Intelligent Cube as a dataset. A document is used to formatdata from multiple datasets in a single display of presentation quality. The dataset is aset of data that can be displayed on the document. In this case, the dataset is aMicroStrategy Intelligent Cube. For general information on working withdocuments, see the Document and Dashboard Analysis Guide; for generalinformation on creating documents, see the Document Creation Guide.
You can also merge multiple Intelligent Cubes to form a new dataset. Forinstructions, see theMerging Intelligent Cubes section in the In-memoryAnalytics Guide.
• A dashboard using the imported data. A dashboard is a visually-striking, interactivedisplay that takes a minimal amount of time to set up and use. You can add text,interactive data visualizations, data filtering, and multiple layers of organization toyour dashboard, then take advantage of Visual Insight's formatting options tocustomize your display. For background information on dashboards, see theMicroStrategy Web Help.
Some common uses for importing data include:
• Combining and analyzing personalized data with your project data
• Quickly integrating data into MicroStrategy as part of a proof-of-concept
• Importing and reporting on personalized data from various data sources
• Immediately building reports, documents, and dashboards without having to "model"the data source
• Modifying the data in your data source, then republishing the Intelligent Cube toquickly update the data in your reports, documents, and dashboards
• Merging two Intelligent Cubes to form a new dataset.
Advanced Reporting Guide
15 © 2017, MicroStrategy Inc.
You can import data from the following data sources:
• A BI tool, including SAP Business Objects Universe (BO), Oracle BusinessIntelligence Enterprise Edition (OBIEE), and IBM Cognos Framework Manager
• Custom data, by typing values or copying them from a file
• A database by picking relational tables, building a SQL query, or typing a customquery
• A file in a folder, URL, or file URI schema
• A file stored on Dropbox
• Google Analytics
• Google BigQuery
• Google Drive
• Hadoop
• A MicroStrategy sample file
• An OLAP source, including Microsoft Analysis Services, Cognos TM1, SAP BW, andEssbase
• A Salesforce report
• A search
• Importing data by scraping a web page (public data)
For steps to import data, as well as steps to link the imported data to project attributes,see the MicroStrategy Web Help.
You can add multiple datasets to a single dashboard or document, including datasetsfrom the Import Data process and project datasets. For more information on includingsupplemental data in a project using the Data Import feature, see the Creating andConfiguring a Project chapter in the Project Design Guide. For more information oncreating dashboards with multiple datasets, see the MicroStrategy Web Help. For moreinformation on creating documents with multiple datasets, see the Document CreationGuide.
You can manage Intelligent Cubes using the Intelligent Cube Monitor, which providesusage statistics and other information about Intelligent Cubes. For an introduction to theIntelligent Cube Monitor, as well as steps to improve performance, see theManagingIntelligent Cubes chapter of the System Administration Guide.
Analyzing system informationMicroStrategy supports importing data from search indexes, also known as search as asource. For example, you can examine data patterns by correlating events recorded in
Advanced Reporting Guide
© 2017, MicroStrategy Inc. 16
multiple sources, such as web access logs, error logs, and so on. Using search to exploreyour data provides a quick and intuitive way to access and analyze subsets of your data.
To support this type of system information analysis, you need to configure the followingsystem:
• Log management: Your log files for your system must be retrieved and combined.Various tools, such as syslog-ng, are available to provide this type of log filemanagement. Common log management tasks include formatting, classifying data,correlating related messages, logging directly into a database, and so on.
• Log collection and search creation: Once the data from your logs has been retrieved,this data must be stored and put through ETL processing to create a standard logformat. This data can then be turned into an index and search system. Tools such asApache Flume™ and Apache Solr™ can be used together to provide a system for logcollection and search creation.
• Log analysis: With your log files combined into a search system, you can integratethe search system into MicroStrategy. Along with performing search analysis on textdata, you can also take advantage of all the standard MicroStrategy reporting,dashboarding, and analysis capabilities. For example, you have error logs for serverstored in your search system, and you have performance data for that same serverstored in a database. You can include these two collections of data on a singledashboard for analysis in MicroStrategy. For steps to integrate your search systeminto MicroStrategy using Data Import, refer to the MicroStrategy Web Help.
2ADVANCED METRICSReport Data and Calculations
This section assumes you are familiar with the concepts in the Building Query Objectsand Queries, for Designers chapter of the Basic Reporting Guide. You should alreadyknow how to create a simple metric, place it in a report, and set report subtotals. Thissection covers the following advanced metric functionality:
• Level metrics: Modifying the context of data calculations, page 19
• Nested metrics, page 55
• Conditional metrics, page 58
• Transformation metrics: Time-based and other comparisons, page 80
• Compound metrics, page 84
• Creating metrics by combining metrics, filters, and transformations, page 87
• Metric subtotals, page 89
• Metric functions, page 97
• Join specifications, page 104
• Metric-specific VLDB properties: SQL and analytical customization, page 106
• Metric column aliases: SQL identifiers and data types, page 106
This section does not include Data Mining functions or predictive metrics. SeeChapter 13, Data Mining Services for information on these topics.
Before you beginThis section reviews basic concepts covered in the Basic Reporting Guide. If you need tobrush up on metrics basics, this section is designed to help you. If you need a broaderrefresher on metrics, facts, attributes, prompts, and filters, see the Basic ReportingGuide.
© 2017, MicroStrategy Inc. 17
Advanced Reporting Guide
18 © 2017, MicroStrategy Inc.
Metrics are MicroStrategy objects that represent business measures and key performanceindicators. They are calculations to be performed on data stored in the database and aresimilar to formulas in spreadsheet software. Questions such as “What were the sales forthe eastern region during the fourth quarter?”, “Are inventory levels being consistentlyreplenished at the beginning of each week?”, or “How many employees are currentlyworking for our company?” can easily be answered by creating metrics.
A metric definition must contain a formula, which determines the data to be used andthe calculations to be performed on the data. A metric is categorized as one of thefollowing types based on the functions used in its formula:
• Simple metric: The formula of a simple metric is a mathematical expression basedon at least one group function, such as sum or average, which is applied to facts,attributes, or other metrics. It can also contain non-group functions or arithmeticoperators, in addition to the required group function.
An example of the formula of a simple metric is
Sum(Profit)
where Cost and Profit are facts. The formula contains two group functions, Avg(which stands for average) and Sum.
Another example is
Avg((Cost + Profit))
where Cost and Profit are metrics instead of facts. The formula contains a groupfunction, so it is still a simple metric.
The term simple only refers to a metric’s structure; it does not restrict you tosimple calculations.
• Compound metric: The formula of a compound metric is based on arithmeticoperators and non-group functions. Arithmetic operators are +, -, *, and /; non-group functions are OLAP and scalar functions such as running sum or rank. Theoperators and functions can be applied to facts, attributes, or metrics.
An example of the formula of a compound metric is
RunningAvg(Cost)
where Cost is a metric. The formula contains a non-group function, RunningAvg(which stands for running average). Another example is
Sum(Cost) + Sum(Profit)
where Cost and Profit are metrics. The addition expression, denoted by the +operator, makes this a compound metric.
For more background on the difference between simple and compound metrics,refer to the Building Query Objects and Queries chapter of the Basic ReportingGuideFor syntax and examples of all the functions that MicroStrategy supplies, seethe Functions Reference.
In addition to a formula, a simple metric can contain the following components:
Advanced Reporting Guide
© 2017, MicroStrategy Inc. 19
• The level, or dimensionality, determines the attribute level of calculation for themetric. For example, you can choose to calculate profit at the month level or theregion level. By default, a metric is calculated at the report level, which is at the levelof the attributes of the report in which the metric is placed. For a more detaileddescription, including the components of level metrics, examples, and procedures seeLevel metrics: Modifying the context of data calculations, page 19.
• Conditionality associates a filter to the metric calculation. This is an optionalcomponent. For a more detailed description, including examples and procedures, seeConditional metrics, page 58.
• A transformation applies offset values, such as “one month ago” or “last year”, tothe selected attributes. This allows you to perform time-series analysis, such as acomparison of revenue between this year and last year. A transformation is anoptional component. For a more detailed description, including examples, seeTransformation metrics: Time-based and other comparisons, page 80.
None of these components can be set on the compound metric as a whole, although theycan be applied separately on the metric or metrics that make up a compound metric.This explains why metrics are divided into the different types—so you know whether youcan adjust the components of a metric. You can also create a metric that contains levels,a condition, and transformations, or any combination of these components. For anexample, see Example of a conditional metric with a level, page 60.
This section focuses on compound metrics and on simple metrics that use level,condition, and transformation components. For examples and steps to create simplemetrics that do not use any of these components, see the Building Query Objects andQueries, for Designers chapter in the Basic Reporting Guide.
In this section, the Metric Editor in MicroStrategy Developer is used to work withmetrics. You can also use MicroStrategy Command Manager to work with metrics.Command Manager manipulates MicroStrategy objects by means of user-created scriptsrather than a graphical user interface. This can be helpful if you have a large number ofmetrics to create or edit. For background information about Command Manager andhow to use it, see the Automating Administrative Tasks chapter in the SystemAdministration Guide. For specific Command Manager syntax for working with metrics,see the online help for Command Manager.
Level metrics: Modifying the context of datacalculations
By default, metrics are evaluated at the level of the attributes on the report; this is calledthe report level. For example, a revenue metric is set to the report level. When themetric is placed on a report containing Region, the metric calculates regional revenue.When it is placed on a report containing Customer, the revenue is calculated for eachcustomer.
You can set the level within the metric, allowing you to specify the attribute(s) to use inthe metric calculation, regardless of what is contained on any report the metric is placedupon. A metric level is sometimes also referred to as dimensionality, but the term level isused throughout this manual.
Advanced Reporting Guide
20 © 2017, MicroStrategy Inc.
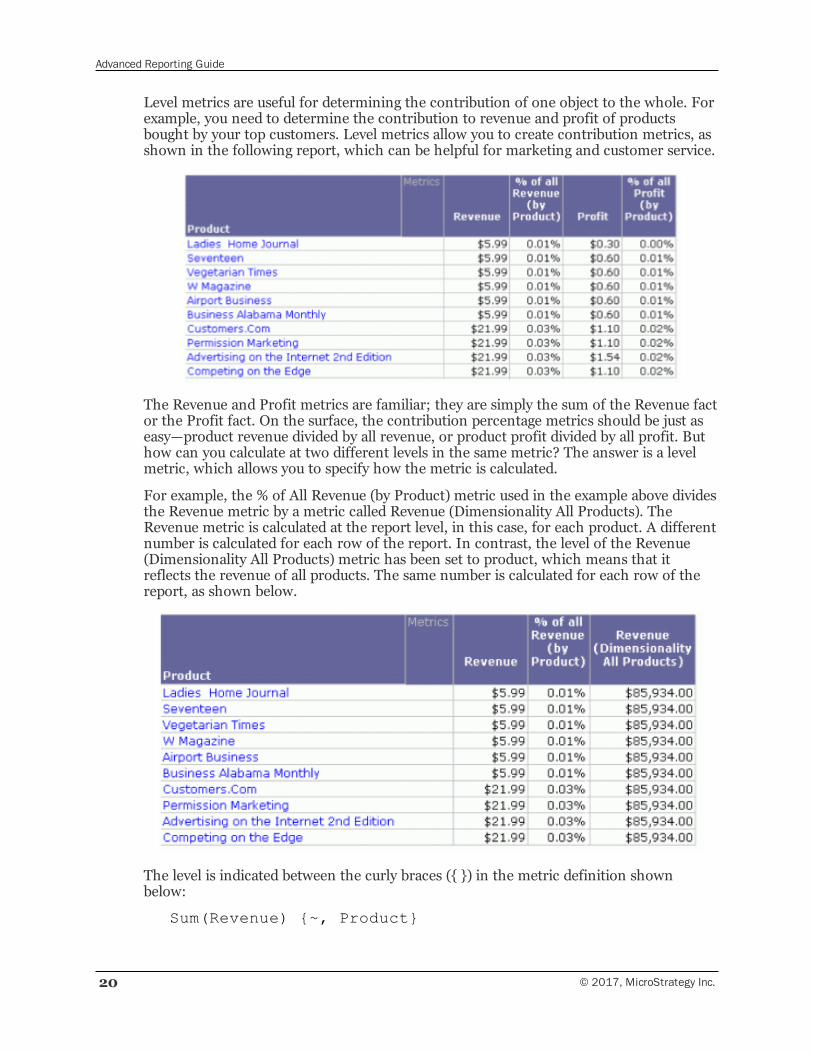
Level metrics are useful for determining the contribution of one object to the whole. Forexample, you need to determine the contribution to revenue and profit of productsbought by your top customers. Level metrics allow you to create contribution metrics, asshown in the following report, which can be helpful for marketing and customer service.
The Revenue and Profit metrics are familiar; they are simply the sum of the Revenue factor the Profit fact. On the surface, the contribution percentage metrics should be just aseasy—product revenue divided by all revenue, or product profit divided by all profit. Buthow can you calculate at two different levels in the same metric? The answer is a levelmetric, which allows you to specify how the metric is calculated.
For example, the % of All Revenue (by Product) metric used in the example above dividesthe Revenue metric by a metric called Revenue (Dimensionality All Products). TheRevenue metric is calculated at the report level, in this case, for each product. A differentnumber is calculated for each row of the report. In contrast, the level of the Revenue(Dimensionality All Products) metric has been set to product, which means that itreflects the revenue of all products. The same number is calculated for each row of thereport, as shown below.
The level is indicated between the curly braces ({ }) in the metric definition shownbelow:
Sum(Revenue) {~, Product}
Advanced Reporting Guide
© 2017, MicroStrategy Inc. 21
The tilde (~) indicates that the report level is still part of the metric level. Forinformation about how the report level provides flexibility and the effects of removing it,see Report level: Interaction with the context of reports, page 35.
Elements of a metric levelThe elements needed to specify a level for a metric are described below.
• Target: The target is the attribute level at which the metric calculation groups. For amore detailed description, see Target: The context of a calculation, page 26.
• Grouping: Grouping determines how the metric aggregates. For a more detaileddescription, see Grouping: How aggregation is performed, page 26.
• Filtering: Filtering governs how the report filter interacts with the metriccalculation. For a more detailed description, see Filtering: Interaction with reportfilters, page 32.
A target, grouping, and filtering combination composes one level unit.
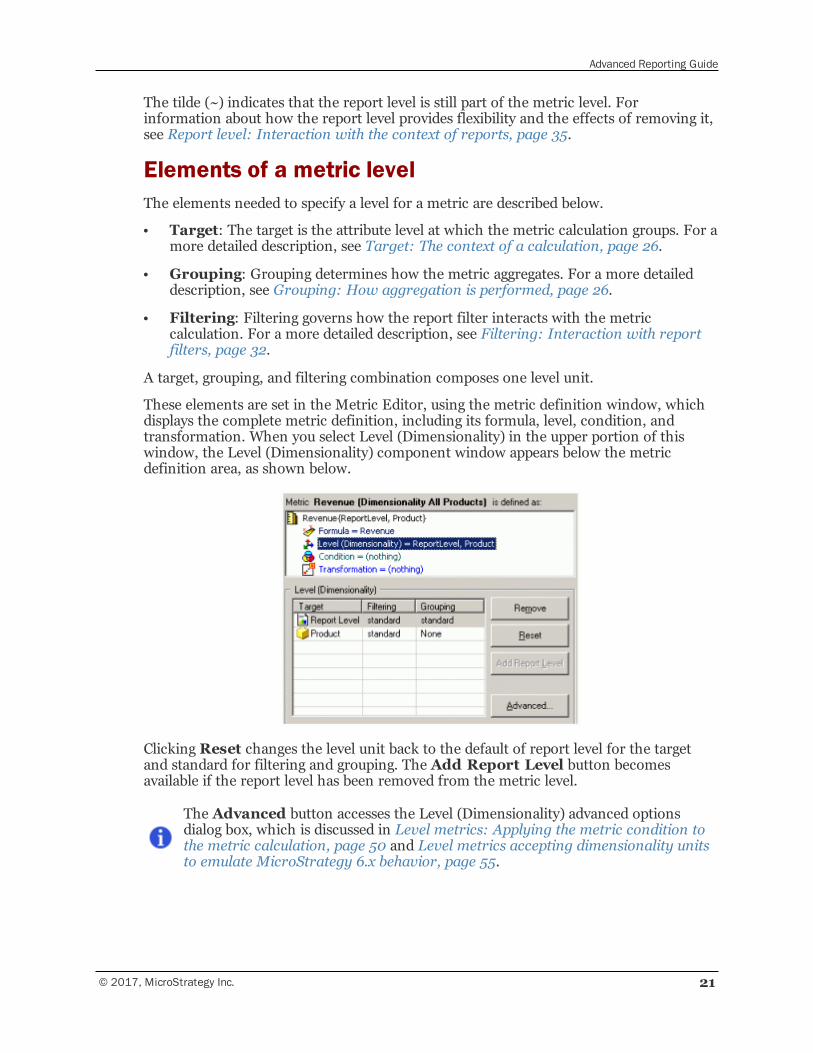
These elements are set in the Metric Editor, using the metric definition window, whichdisplays the complete metric definition, including its formula, level, condition, andtransformation. When you select Level (Dimensionality) in the upper portion of thiswindow, the Level (Dimensionality) component window appears below the metricdefinition area, as shown below.
Clicking Reset changes the level unit back to the default of report level for the targetand standard for filtering and grouping. The Add Report Level button becomesavailable if the report level has been removed from the metric level.
The Advanced button accesses the Level (Dimensionality) advanced optionsdialog box, which is discussed in Level metrics: Applying the metric condition tothe metric calculation, page 50 and Level metrics accepting dimensionality unitsto emulate MicroStrategy 6.x behavior, page 55.
Advanced Reporting Guide
22 © 2017, MicroStrategy Inc.
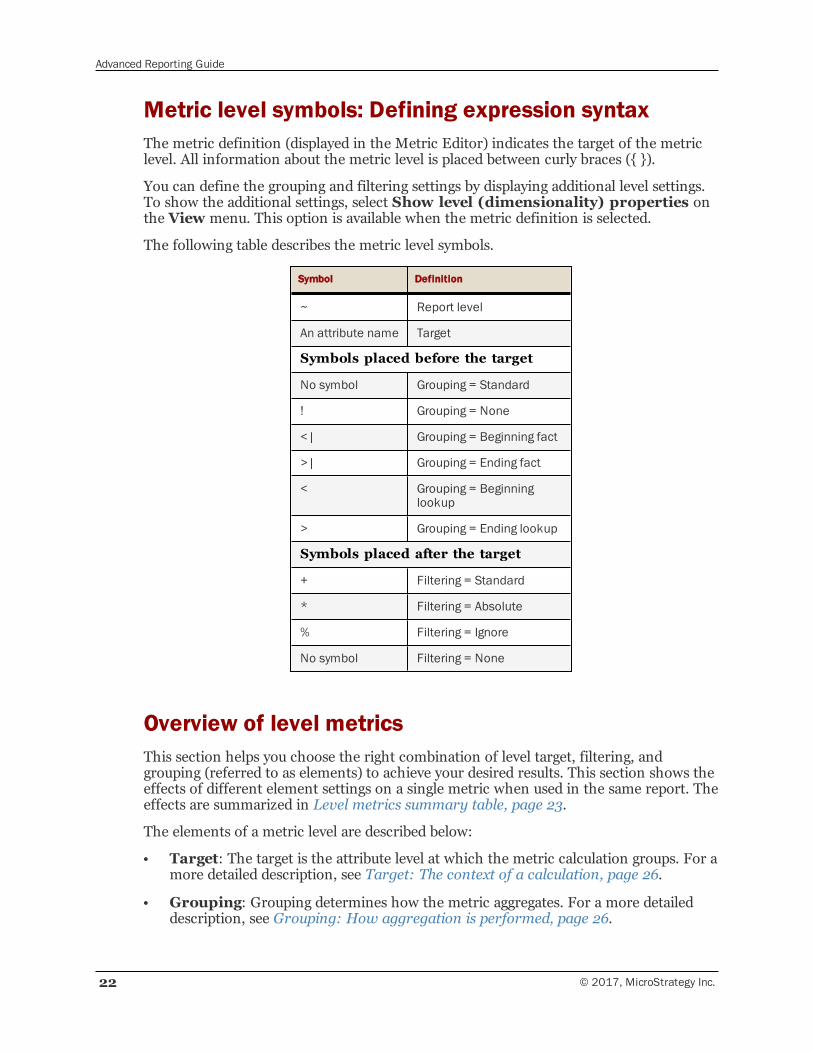
Metric level symbols: Defining expression syntaxThe metric definition (displayed in the Metric Editor) indicates the target of the metriclevel. All information about the metric level is placed between curly braces ({ }).
You can define the grouping and filtering settings by displaying additional level settings.To show the additional settings, select Show level (dimensionality) properties onthe View menu. This option is available when the metric definition is selected.
The following table describes the metric level symbols.
Symbol Definition
~ Report level
An attribute name Target
Symbols placed before the target
No symbol Grouping = Standard
! Grouping = None
<| Grouping = Beginning fact
>| Grouping = Ending fact
< Grouping = Beginninglookup
> Grouping = Ending lookup
Symbols placed after the target
+ Filtering = Standard
* Filtering = Absolute
% Filtering = Ignore
No symbol Filtering = None
Overview of level metricsThis section helps you choose the right combination of level target, filtering, andgrouping (referred to as elements) to achieve your desired results. This section shows theeffects of different element settings on a single metric when used in the same report. Theeffects are summarized in Level metrics summary table, page 23.
The elements of a metric level are described below:
• Target: The target is the attribute level at which the metric calculation groups. For amore detailed description, see Target: The context of a calculation, page 26.
• Grouping: Grouping determines how the metric aggregates. For a more detaileddescription, see Grouping: How aggregation is performed, page 26.
Advanced Reporting Guide
© 2017, MicroStrategy Inc. 23
• Filtering: Filtering governs how the report filter interacts with the metriccalculation. For a more detailed description, see Filtering: Interaction with reportfilters, page 32.
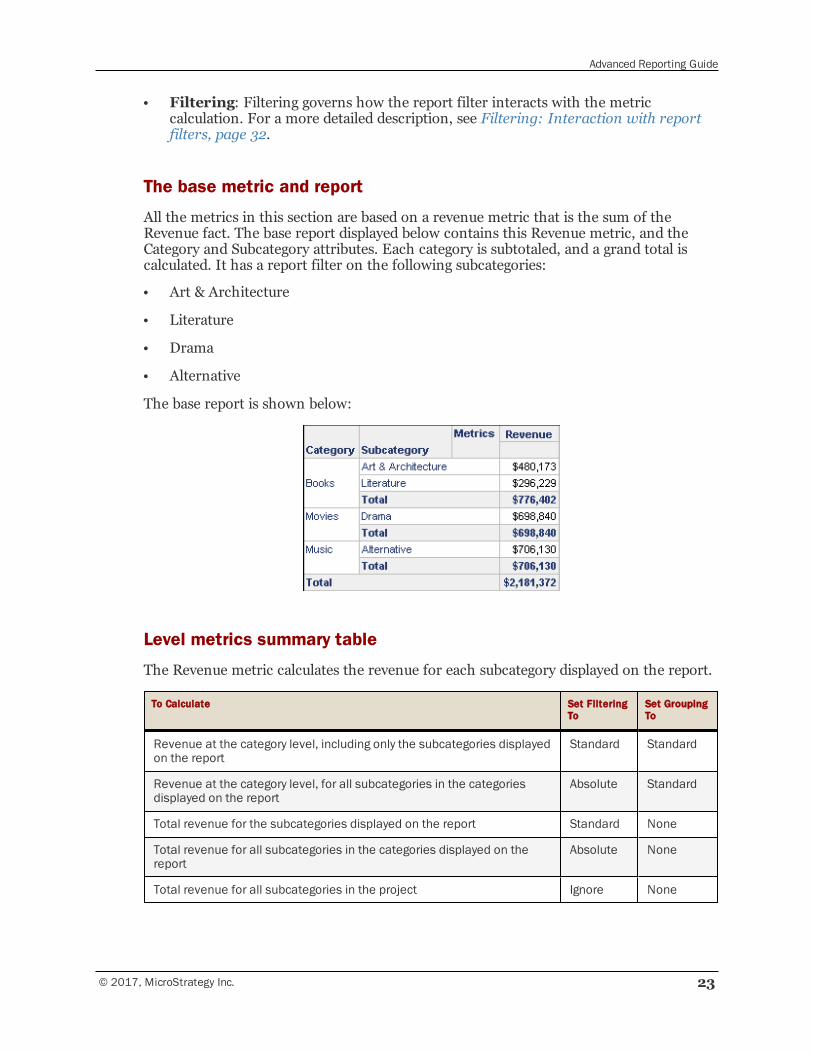
The base metric and report
All the metrics in this section are based on a revenue metric that is the sum of theRevenue fact. The base report displayed below contains this Revenue metric, and theCategory and Subcategory attributes. Each category is subtotaled, and a grand total iscalculated. It has a report filter on the following subcategories:
• Art & Architecture
• Literature
• Drama
• Alternative
The base report is shown below:
Level metrics summary table
The Revenue metric calculates the revenue for each subcategory displayed on the report.
To Calculate Set FilteringTo
Set GroupingTo
Revenue at the category level, including only the subcategories displayedon the report
Standard Standard
Revenue at the category level, for all subcategories in the categoriesdisplayed on the report
Absolute Standard
Total revenue for the subcategories displayed on the report Standard None
Total revenue for all subcategories in the categories displayed on thereport
Absolute None
Total revenue for all subcategories in the project Ignore None
Advanced Reporting Guide
24 © 2017, MicroStrategy Inc.
All the level metrics described in this section have a target of Category.
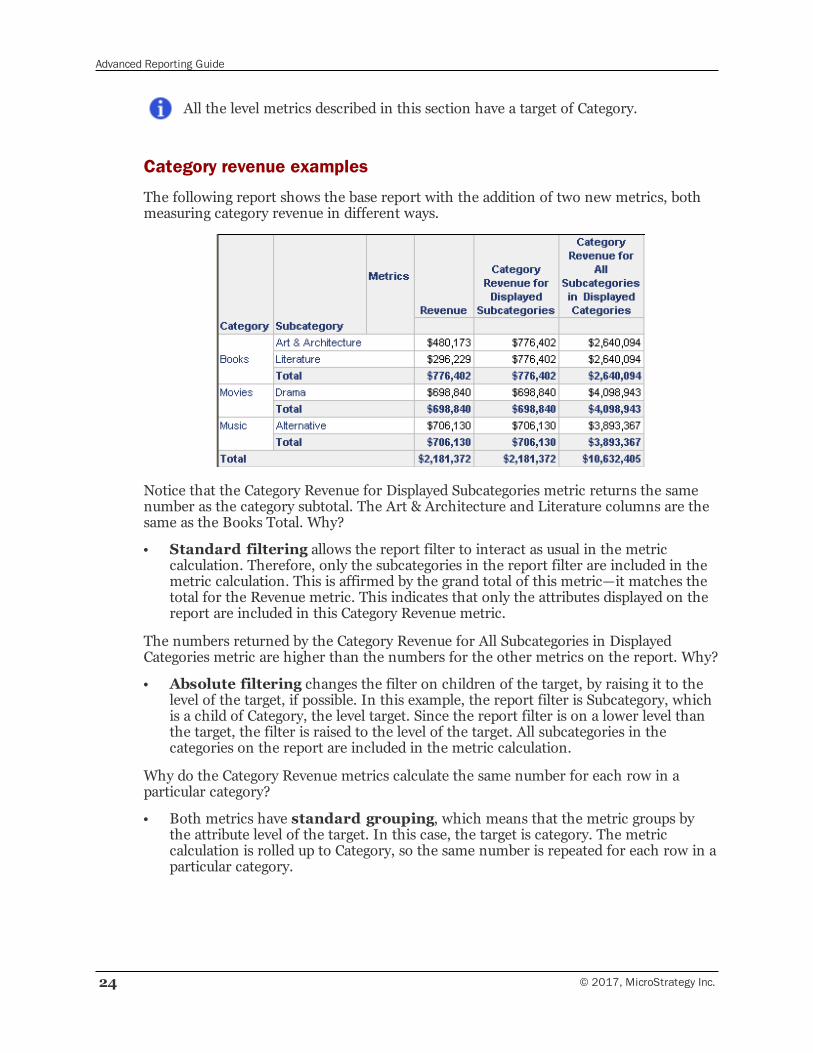
Category revenue examples
The following report shows the base report with the addition of two new metrics, bothmeasuring category revenue in different ways.
Notice that the Category Revenue for Displayed Subcategories metric returns the samenumber as the category subtotal. The Art & Architecture and Literature columns are thesame as the Books Total. Why?
• Standard filtering allows the report filter to interact as usual in the metriccalculation. Therefore, only the subcategories in the report filter are included in themetric calculation. This is affirmed by the grand total of this metric—it matches thetotal for the Revenue metric. This indicates that only the attributes displayed on thereport are included in this Category Revenue metric.
The numbers returned by the Category Revenue for All Subcategories in DisplayedCategories metric are higher than the numbers for the other metrics on the report. Why?
• Absolute filtering changes the filter on children of the target, by raising it to thelevel of the target, if possible. In this example, the report filter is Subcategory, whichis a child of Category, the level target. Since the report filter is on a lower level thanthe target, the filter is raised to the level of the target. All subcategories in thecategories on the report are included in the metric calculation.
Why do the Category Revenue metrics calculate the same number for each row in aparticular category?
• Both metrics have standard grouping, which means that the metric groups bythe attribute level of the target. In this case, the target is category. The metriccalculation is rolled up to Category, so the same number is repeated for each row in aparticular category.
Advanced Reporting Guide
© 2017, MicroStrategy Inc. 25
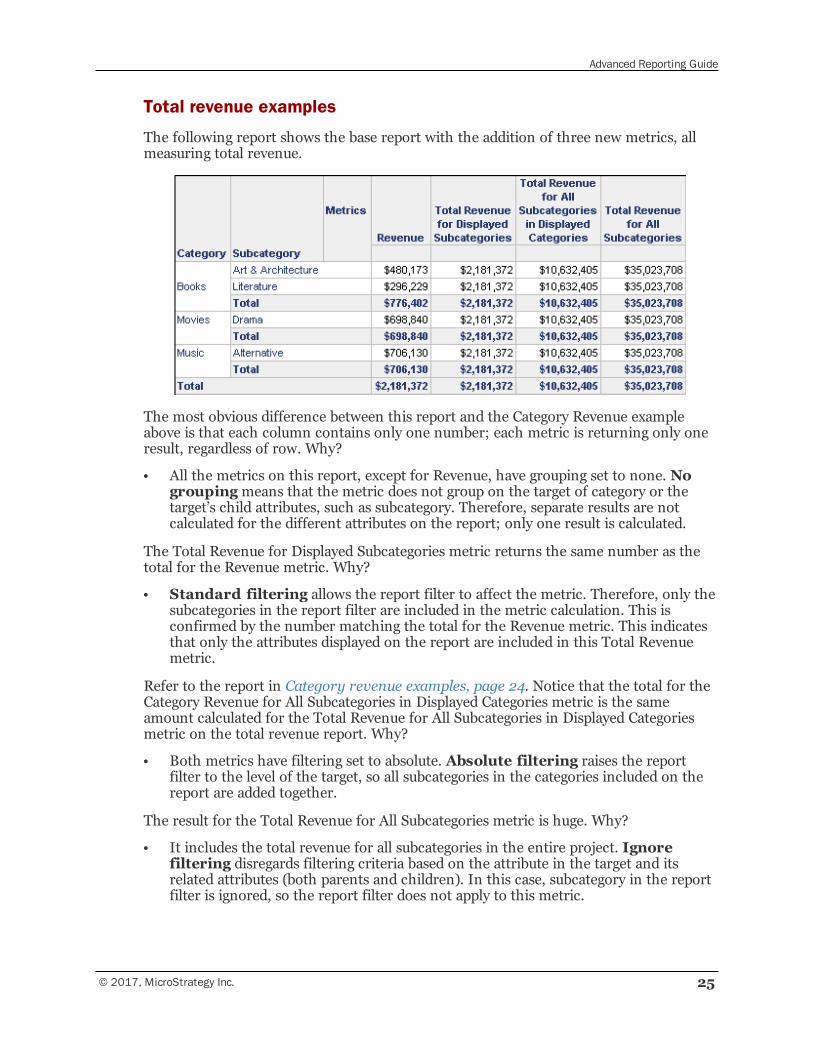
Total revenue examples
The following report shows the base report with the addition of three new metrics, allmeasuring total revenue.
The most obvious difference between this report and the Category Revenue exampleabove is that each column contains only one number; each metric is returning only oneresult, regardless of row. Why?
• All the metrics on this report, except for Revenue, have grouping set to none. Nogroupingmeans that the metric does not group on the target of category or thetarget’s child attributes, such as subcategory. Therefore, separate results are notcalculated for the different attributes on the report; only one result is calculated.
The Total Revenue for Displayed Subcategories metric returns the same number as thetotal for the Revenue metric. Why?
• Standard filtering allows the report filter to affect the metric. Therefore, only thesubcategories in the report filter are included in the metric calculation. This isconfirmed by the number matching the total for the Revenue metric. This indicatesthat only the attributes displayed on the report are included in this Total Revenuemetric.
Refer to the report in Category revenue examples, page 24. Notice that the total for theCategory Revenue for All Subcategories in Displayed Categories metric is the sameamount calculated for the Total Revenue for All Subcategories in Displayed Categoriesmetric on the total revenue report. Why?
• Both metrics have filtering set to absolute. Absolute filtering raises the reportfilter to the level of the target, so all subcategories in the categories included on thereport are added together.
The result for the Total Revenue for All Subcategories metric is huge. Why?
• It includes the total revenue for all subcategories in the entire project. Ignorefiltering disregards filtering criteria based on the attribute in the target and itsrelated attributes (both parents and children). In this case, subcategory in the reportfilter is ignored, so the report filter does not apply to this metric.
Advanced Reporting Guide
26 © 2017, MicroStrategy Inc.
Target: The context of a calculationThe target is the attribute level at which the metric calculation groups. It determinesthe table to use to calculate the metric. Any set of attributes or a hierarchy can be thetarget. A special case is the default target, which is at the report level. For a more detaileddescription of the report level, including an example, see Report level: Interaction withthe context of reports, page 35. For specifics on using a hierarchy as a target, see Using ahierarchy as the target of a metric level, page 45.
The following examples use attributes as the target; for an example using ahierarchy, see Level metrics review: Standard grouping, page 37.
In the Revenue (Dimensionality All Products) metric discussed previously (see Levelmetrics: Modifying the context of data calculations, page 19), the target is Product. Thetarget is indicated between braces in the metric definition, as shown below:
Sum(Revenue) {~, Product}
Grouping: How aggregation is performedGrouping determines how the metric aggregates. The result of this setting is reflectedin the GROUP BY clause of the SQL command. The grouping options for levels include:
• Standard groups by the attribute level of the target. The metric calculates at thelevel of the target, if possible.
• None excludes the attribute in the target from the GROUP BY clause. It alsoexcludes any of the target attribute’s children.
None is not an option if the target is set to the report level.
Grouping options for nonaggregatable metrics
The remaining grouping options are only used for nonaggregatable metrics. Anonaggregatable metric is one that should not be aggregated across an attribute. Anexample is an inventory metric. While the data warehouse records the inventory everymonth, these monthly numbers are not added together to calculate the yearly inventory.Instead, you may want to use the end-on-hand and beginning-on-hand inventorynumbers to see how the total inventory changed over the year. These grouping options,described below, are used in such cases:
• Beginning lookup uses the first value of the lookup table.
• Ending lookup uses the last value of the lookup table.
• Beginning fact accesses the first value of the fact table.
• Ending fact accesses the last value contained in the fact table.
Setting a metric level to one of the options listed above defines the metric asnonaggregatable. Whether you select a fact or lookup table largely depends on how thenecessary information is stored. For example, to find the beginning-on- hand inventory
Advanced Reporting Guide
© 2017, MicroStrategy Inc. 27
for a particular item, you need to know how the inventory information is stored. If theinventory count is not taken on the first day of the week, as the lookup table requires,the inventory count should be taken from the fact table for the first recorded entry.
There is another important difference between accessing a fact table and a lookuptable. If a value, such as April sales, is missing from a fact table, the row still existsin the table and is reported as null or zero. If that same value is missing in a lookuptable, the April row does not exist. The previous or next value (March or May) isreported, depending on whether the level is set to beginning or ending value.
Grouping in the Products - By Top 10% Customers report
Review the Products - By Top 10% Customers report described at the beginning of Levelmetrics: Modifying the context of data calculations, page 19. In the report, the % of AllRevenue (by Product) metric divides the Revenue metric by a metric called Revenue(Dimensionality All Products). The Revenue metric is calculated at the report level, inthis case, for each product. The level of the Revenue (Dimensionality All Products)metric has been set to product, with a grouping of none. This allows the calculation tototal the revenue for all products, not just the single product on the particular row of thereport. Therefore, the same number is calculated for each row of the report, producingthe revenue percentage.
The grouping is indicated in the metric definition. If the grouping is standard, anadditional indicator is not displayed. If the grouping is set to none, as in the Revenue(Dimensionality All Products) metric, an exclamation mark is placed before the targetname, as shown below:
Revenue {~+, !Product+}
If you open this metric and do not see the exclamation mark, select Show level(dimensionality) properties from the View menu.
Level grouping examples
A revenue metric is defined as:
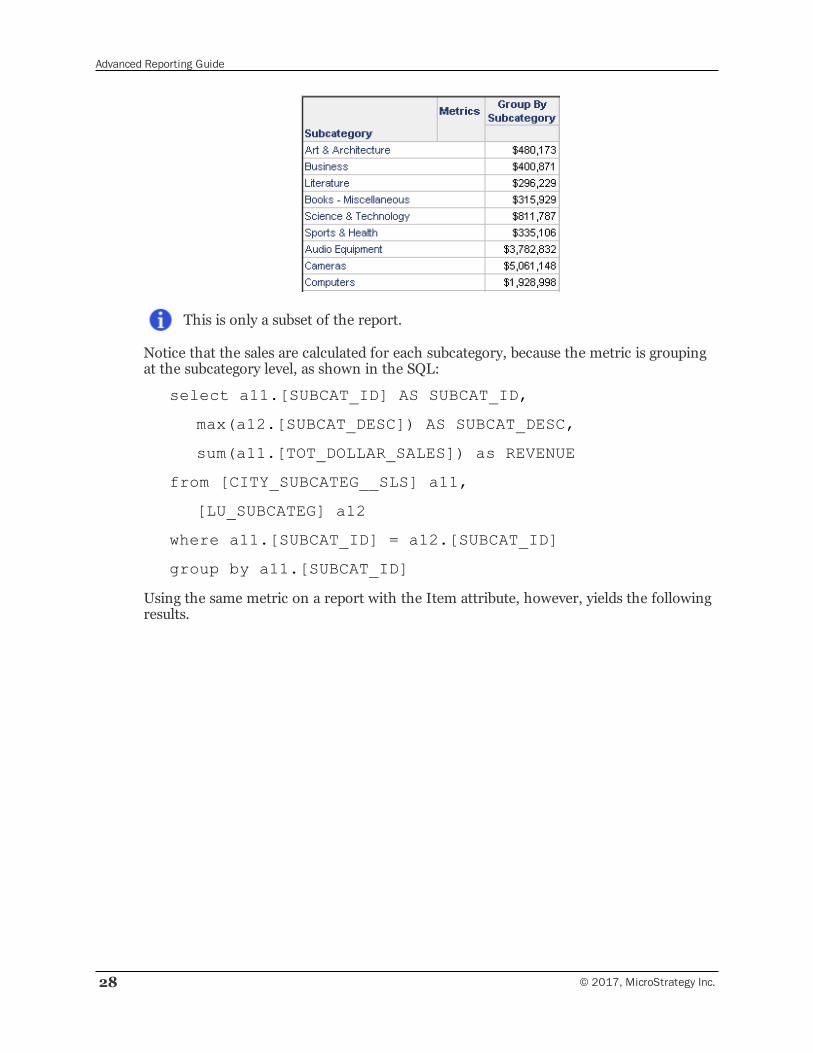
Sum(Revenue){~, Subcategory}
The level target is set to Subcategory, with standard grouping. When this metric is placedon a report with the Subcategory attribute, the report results are shown below.
Advanced Reporting Guide
28 © 2017, MicroStrategy Inc.
This is only a subset of the report.
Notice that the sales are calculated for each subcategory, because the metric is groupingat the subcategory level, as shown in the SQL:
select a11.[SUBCAT_ID] AS SUBCAT_ID,
max(a12.[SUBCAT_DESC]) AS SUBCAT_DESC,
sum(a11.[TOT_DOLLAR_SALES]) as REVENUE
from [CITY_SUBCATEG__SLS] a11,
[LU_SUBCATEG] a12
where a11.[SUBCAT_ID] = a12.[SUBCAT_ID]
group by a11.[SUBCAT_ID]
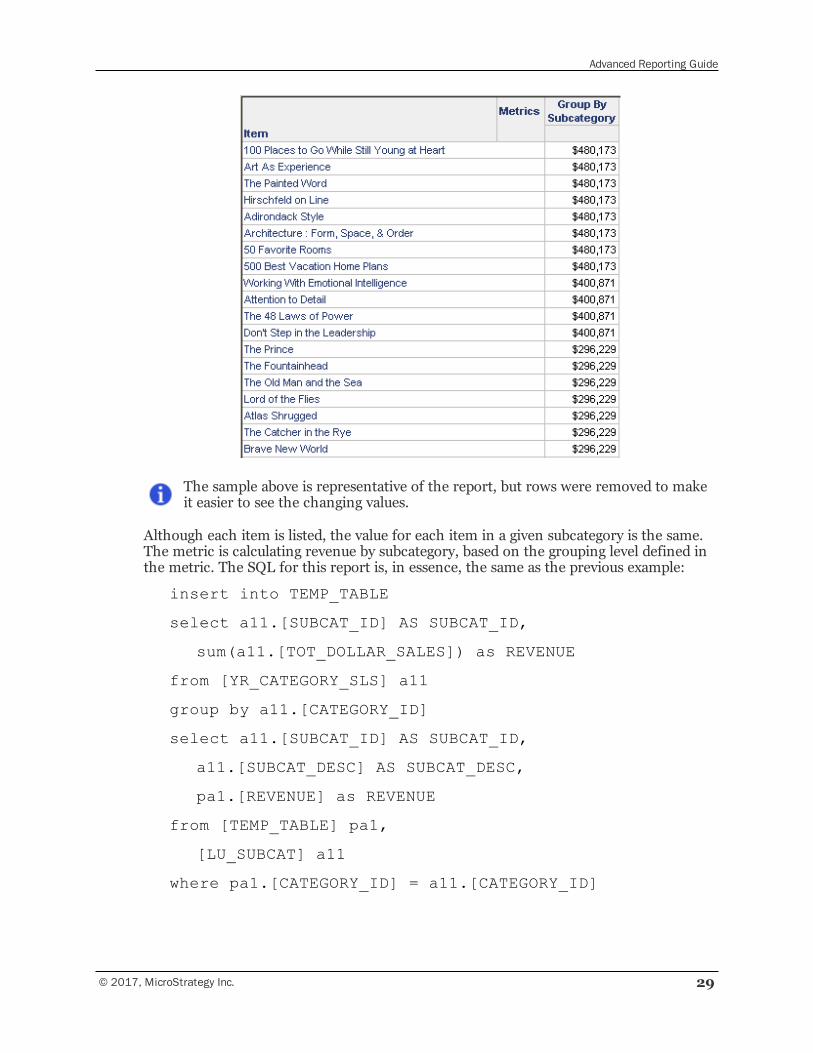
Using the same metric on a report with the Item attribute, however, yields the followingresults.
Advanced Reporting Guide
© 2017, MicroStrategy Inc. 29
The sample above is representative of the report, but rows were removed to makeit easier to see the changing values.
Although each item is listed, the value for each item in a given subcategory is the same.The metric is calculating revenue by subcategory, based on the grouping level defined inthe metric. The SQL for this report is, in essence, the same as the previous example:
insert into TEMP_TABLE
select a11.[SUBCAT_ID] AS SUBCAT_ID,
sum(a11.[TOT_DOLLAR_SALES]) as REVENUE
from [YR_CATEGORY_SLS] a11
group by a11.[CATEGORY_ID]
select a11.[SUBCAT_ID] AS SUBCAT_ID,
a11.[SUBCAT_DESC] AS SUBCAT_DESC,
pa1.[REVENUE] as REVENUE
from [TEMP_TABLE] pa1,
[LU_SUBCAT] a11
where pa1.[CATEGORY_ID] = a11.[CATEGORY_ID]
Advanced Reporting Guide
30 © 2017, MicroStrategy Inc.
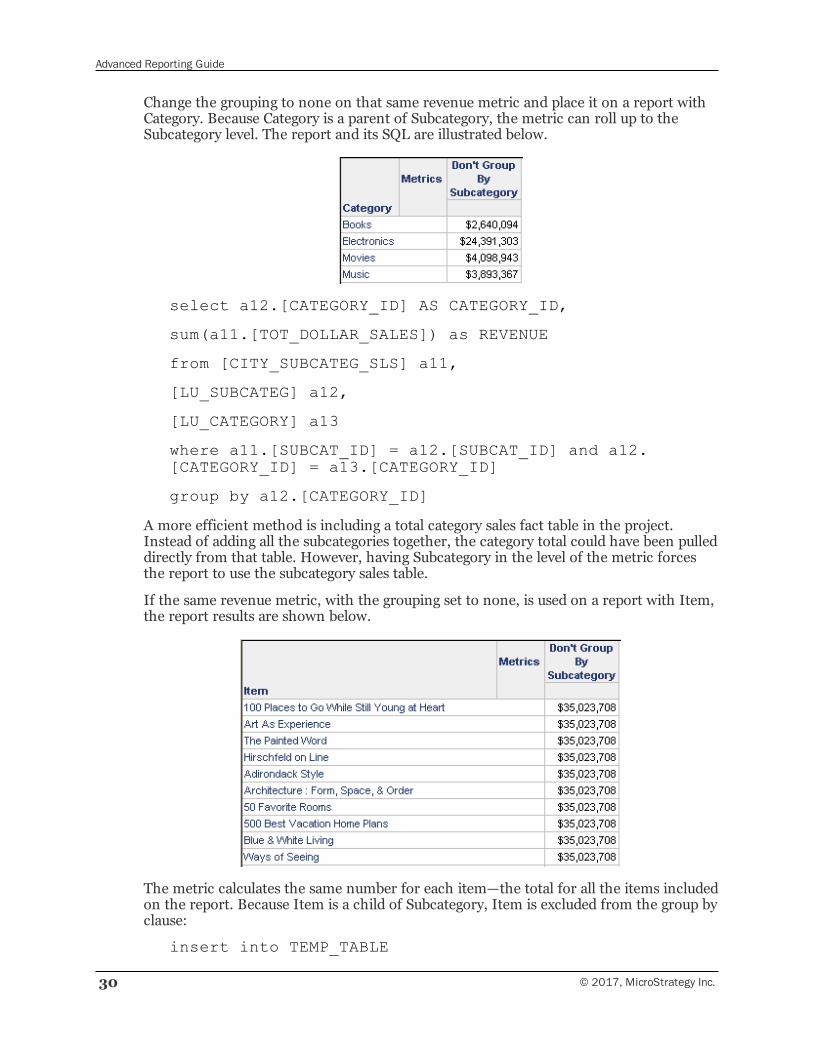
Change the grouping to none on that same revenue metric and place it on a report withCategory. Because Category is a parent of Subcategory, the metric can roll up to theSubcategory level. The report and its SQL are illustrated below.
select a12.[CATEGORY_ID] AS CATEGORY_ID,
sum(a11.[TOT_DOLLAR_SALES]) as REVENUE
from [CITY_SUBCATEG_SLS] a11,
[LU_SUBCATEG] a12,
[LU_CATEGORY] a13
where a11.[SUBCAT_ID] = a12.[SUBCAT_ID] and a12.[CATEGORY_ID] = a13.[CATEGORY_ID]
group by a12.[CATEGORY_ID]
A more efficient method is including a total category sales fact table in the project.Instead of adding all the subcategories together, the category total could have been pulleddirectly from that table. However, having Subcategory in the level of the metric forcesthe report to use the subcategory sales table.
If the same revenue metric, with the grouping set to none, is used on a report with Item,the report results are shown below.
The metric calculates the same number for each item—the total for all the items includedon the report. Because Item is a child of Subcategory, Item is excluded from the group byclause:
insert into TEMP_TABLE
Advanced Reporting Guide
© 2017, MicroStrategy Inc. 31
select sum(a11.[TOT_DOLLAR_SALES]) as REVENUE
from [CITY_SUBCATEG_SLS] a11
select a12.[ITEM_ID] AS ITEM_ID,
a12.[ITEM_DESC] AS ITEM_NAME,
pa11.[REVENUE] as REVENUE
from [TEMP_TABLE] pa11,
[LU_ITEM] a12
drop table TEMP_TABLE
Additional examples can be found in Level metrics review: Standard grouping,page 37 and Level metrics review: No grouping, page 41.
Level grouping examples with nonaggregatable metrics
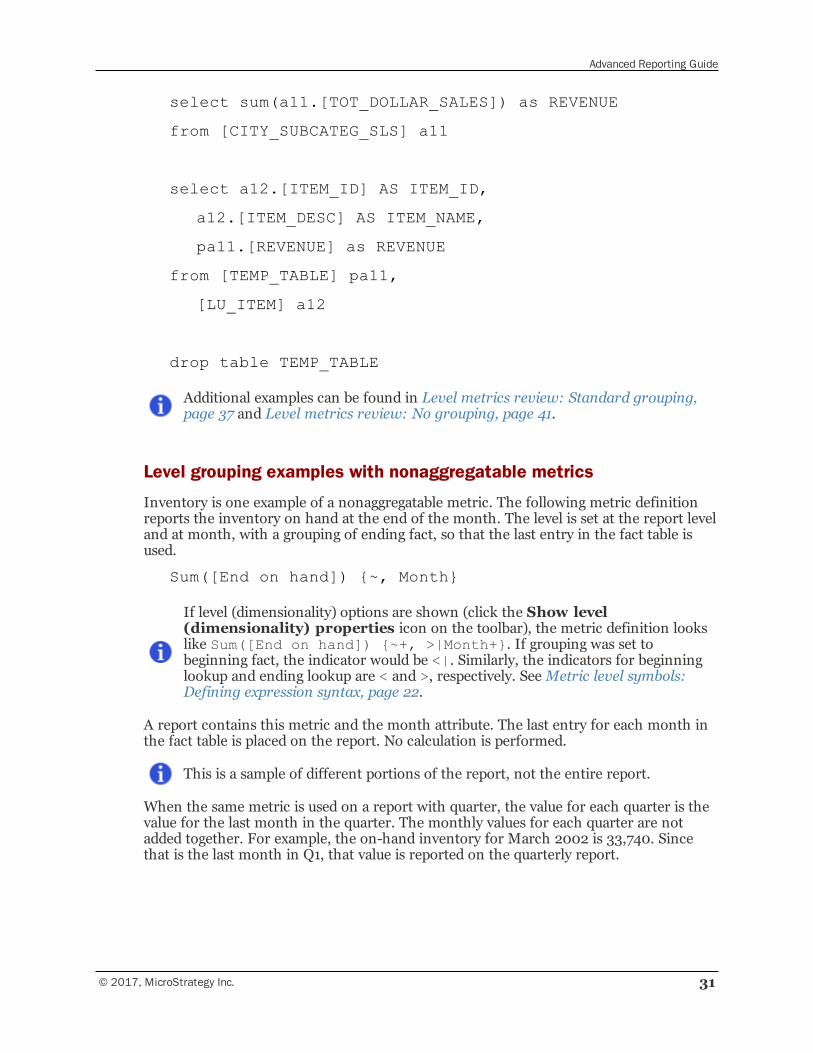
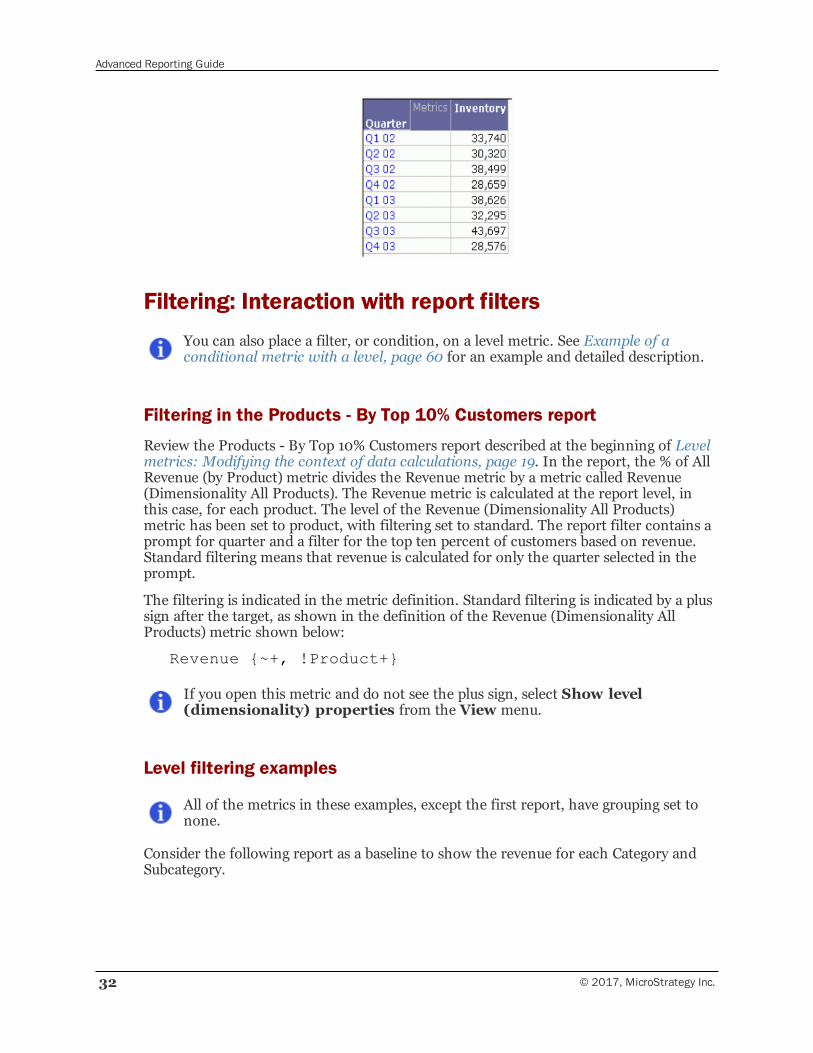
Inventory is one example of a nonaggregatable metric. The following metric definitionreports the inventory on hand at the end of the month. The level is set at the report leveland at month, with a grouping of ending fact, so that the last entry in the fact table isused.
Sum([End on hand]) {~, Month}
If level (dimensionality) options are shown (click the Show level(dimensionality) properties icon on the toolbar), the metric definition lookslike Sum([End on hand]) {~+, >|Month+}. If grouping was set tobeginning fact, the indicator would be <|. Similarly, the indicators for beginninglookup and ending lookup are < and >, respectively. SeeMetric level symbols:Defining expression syntax, page 22.
A report contains this metric and the month attribute. The last entry for each month inthe fact table is placed on the report. No calculation is performed.
This is a sample of different portions of the report, not the entire report.
When the same metric is used on a report with quarter, the value for each quarter is thevalue for the last month in the quarter. The monthly values for each quarter are notadded together. For example, the on-hand inventory for March 2002 is 33,740. Sincethat is the last month in Q1, that value is reported on the quarterly report.
Advanced Reporting Guide
32 © 2017, MicroStrategy Inc.
Filtering: Interaction with report filtersYou can also place a filter, or condition, on a level metric. See Example of aconditional metric with a level, page 60 for an example and detailed description.
Filtering in the Products - By Top 10% Customers report
Review the Products - By Top 10% Customers report described at the beginning of Levelmetrics: Modifying the context of data calculations, page 19. In the report, the % of AllRevenue (by Product) metric divides the Revenue metric by a metric called Revenue(Dimensionality All Products). The Revenue metric is calculated at the report level, inthis case, for each product. The level of the Revenue (Dimensionality All Products)metric has been set to product, with filtering set to standard. The report filter contains aprompt for quarter and a filter for the top ten percent of customers based on revenue.Standard filtering means that revenue is calculated for only the quarter selected in theprompt.
The filtering is indicated in the metric definition. Standard filtering is indicated by a plussign after the target, as shown in the definition of the Revenue (Dimensionality AllProducts) metric shown below:
Revenue {~+, !Product+}
If you open this metric and do not see the plus sign, select Show level(dimensionality) properties from the View menu.
Level filtering examples
All of the metrics in these examples, except the first report, have grouping set tonone.
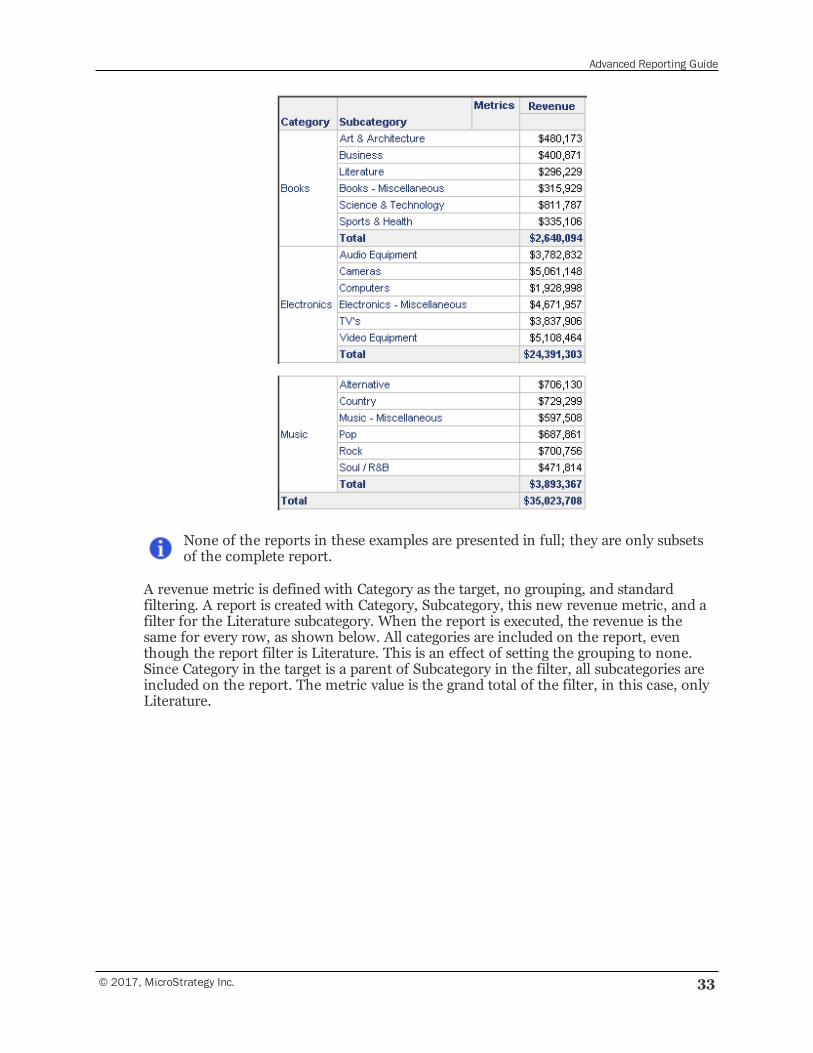
Consider the following report as a baseline to show the revenue for each Category andSubcategory.
Advanced Reporting Guide
© 2017, MicroStrategy Inc. 33
None of the reports in these examples are presented in full; they are only subsetsof the complete report.
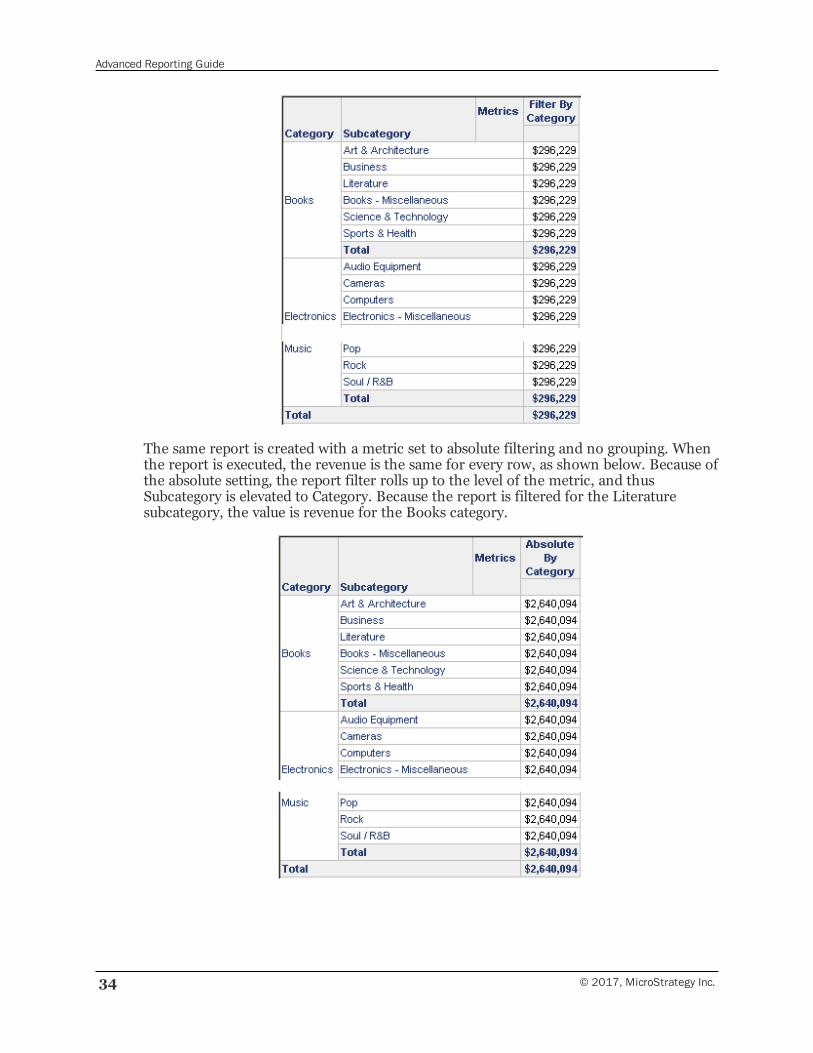
A revenue metric is defined with Category as the target, no grouping, and standardfiltering. A report is created with Category, Subcategory, this new revenue metric, and afilter for the Literature subcategory. When the report is executed, the revenue is thesame for every row, as shown below. All categories are included on the report, eventhough the report filter is Literature. This is an effect of setting the grouping to none.Since Category in the target is a parent of Subcategory in the filter, all subcategories areincluded on the report. The metric value is the grand total of the filter, in this case, onlyLiterature.
Advanced Reporting Guide
34 © 2017, MicroStrategy Inc.
The same report is created with a metric set to absolute filtering and no grouping. Whenthe report is executed, the revenue is the same for every row, as shown below. Because ofthe absolute setting, the report filter rolls up to the level of the metric, and thusSubcategory is elevated to Category. Because the report is filtered for the Literaturesubcategory, the value is revenue for the Books category.
Advanced Reporting Guide
© 2017, MicroStrategy Inc. 35
If level (dimensionality) options are shown, the metric definition looks like Sum(Revenue) {~+, !Quarter*}. The asterisk denotes absolute filtering, theexclamation mark that grouping is set to none. SeeMetric level symbols: Definingexpression syntax, page 22.
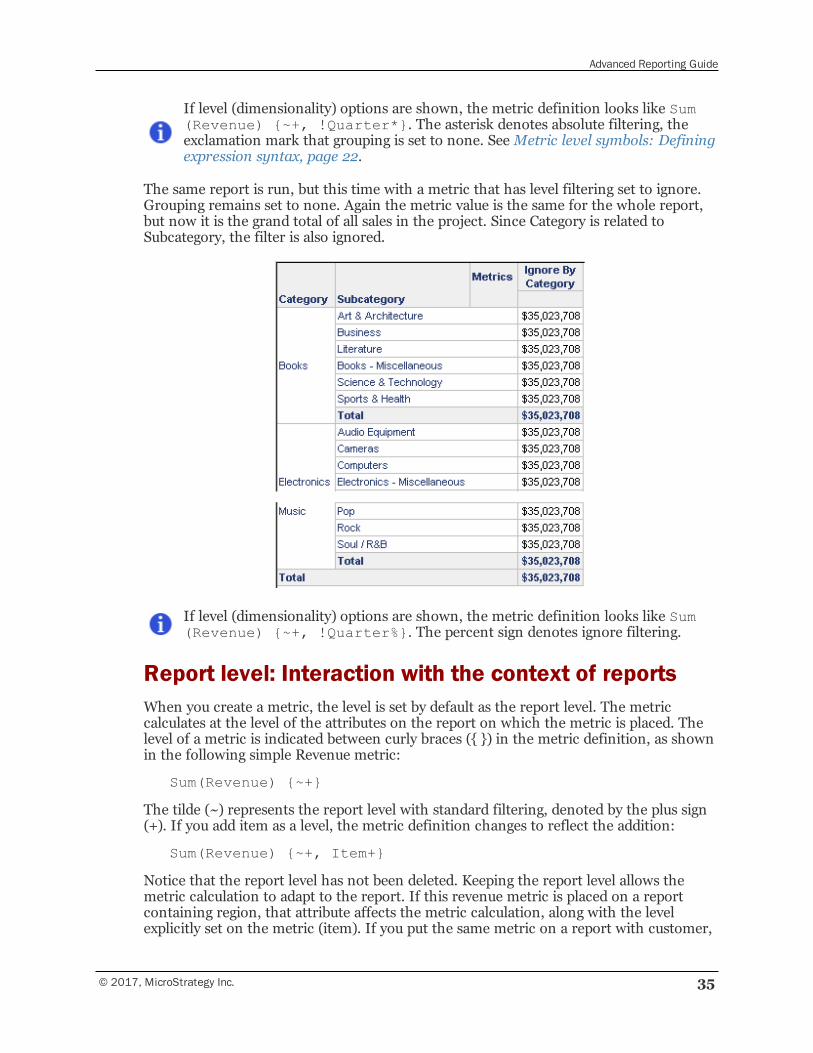
The same report is run, but this time with a metric that has level filtering set to ignore.Grouping remains set to none. Again the metric value is the same for the whole report,but now it is the grand total of all sales in the project. Since Category is related toSubcategory, the filter is also ignored.
If level (dimensionality) options are shown, the metric definition looks like Sum(Revenue) {~+, !Quarter%}. The percent sign denotes ignore filtering.
Report level: Interaction with the context of reportsWhen you create a metric, the level is set by default as the report level. The metriccalculates at the level of the attributes on the report on which the metric is placed. Thelevel of a metric is indicated between curly braces ({ }) in the metric definition, as shownin the following simple Revenue metric:
Sum(Revenue) {~+}
The tilde (~) represents the report level with standard filtering, denoted by the plus sign(+). If you add item as a level, the metric definition changes to reflect the addition:
Sum(Revenue) {~+, Item+}
Notice that the report level has not been deleted. Keeping the report level allows themetric calculation to adapt to the report. If this revenue metric is placed on a reportcontaining region, that attribute affects the metric calculation, along with the levelexplicitly set on the metric (item). If you put the same metric on a report with customer,
Advanced Reporting Guide
36 © 2017, MicroStrategy Inc.
that attribute, as well as the metric level, is used in the metric calculation. In otherwords, the report level in the metric level tells the engine to group by all the attribute IDson the report. The content of the report is reflected in the metric calculation.
Removing the report level
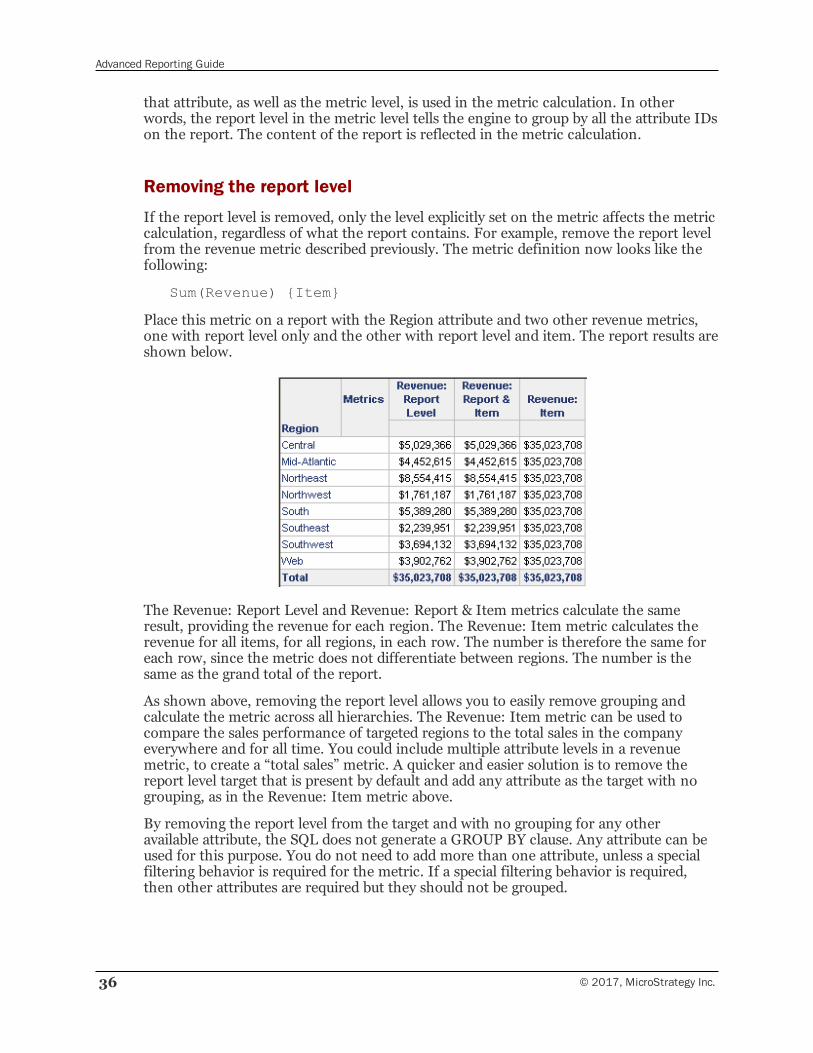
If the report level is removed, only the level explicitly set on the metric affects the metriccalculation, regardless of what the report contains. For example, remove the report levelfrom the revenue metric described previously. The metric definition now looks like thefollowing:
Sum(Revenue) {Item}
Place this metric on a report with the Region attribute and two other revenue metrics,one with report level only and the other with report level and item. The report results areshown below.
The Revenue: Report Level and Revenue: Report & Item metrics calculate the sameresult, providing the revenue for each region. The Revenue: Item metric calculates therevenue for all items, for all regions, in each row. The number is therefore the same foreach row, since the metric does not differentiate between regions. The number is thesame as the grand total of the report.
As shown above, removing the report level allows you to easily remove grouping andcalculate the metric across all hierarchies. The Revenue: Item metric can be used tocompare the sales performance of targeted regions to the total sales in the companyeverywhere and for all time. You could include multiple attribute levels in a revenuemetric, to create a “total sales” metric. A quicker and easier solution is to remove thereport level target that is present by default and add any attribute as the target with nogrouping, as in the Revenue: Item metric above.
By removing the report level from the target and with no grouping for any otheravailable attribute, the SQL does not generate a GROUP BY clause. Any attribute can beused for this purpose. You do not need to add more than one attribute, unless a specialfiltering behavior is required for the metric. If a special filtering behavior is required,then other attributes are required but they should not be grouped.
Advanced Reporting Guide
© 2017, MicroStrategy Inc. 37
This is a quick and easy way to do something that might otherwise involve multiple steps.It is especially helpful if you have many dimensions represented on a report that need tobe included in the metric calculation to obtain the desired outcome.
Level metrics review: Standard groupingThis section describes how level metrics can help you answer your report requirements.In particular, it discusses how standard grouping interacts with different filteringoptions. Report samples, SQL code, and metric definitions are used to explain the results.
Report requirements
Your company has recently kicked off a new ad campaign targeted at certain areas thatpresent high growth opportunities. In your regions, this consists of the Boston, NewYork, and Washington, DC call centers. You need to perform an analysis from differentperspectives and are looking for answers to the following:
1 How do the sales of each call center compare to the total sales of the targeted callcenters in a given region?
2 How do the sales of each call center compare to the total sales of all the call centersin a given region?
3 How do the sales of each call center compare to the total sales of all the call centersin a given region for a given category?
Report 1: Call center sales compared to total sales of targeted callcenters in a given region
Level metric: Grouping = Standard, Filtering = Standard
In this case, the Regional Sales is equal to the sum of the revenues of the call centers in agiven region. This sum takes into account only those call centers that are included in thereport filter. For example, the Mid-Atlantic Regional Sales only includes the Washington,DC call center sales as this is the only call center from that region that has been includedin the report filter. The metric groups at the target level of region because grouping isstandard, as shown in the metric definition below:
Sum(Revenue) {~+, Region+}
With standard filtering, all of the report filter elements are included in the calculation ofthe metric. This occurs by placing the report filter in the WHERE clause of the SQL passfor this metric, as shown in the following example:
sum(a11.[ORDER_AMT])as REGIONALSALES
from [ORDER_FACT] a11,[LU_EMPLOYEE]a12,
[LU_CALL_CTR] a13
where a11.[EMP_ID] = a12.[EMP_ID]
and a12.[CALL_CTR_ID] = a13.[CALL_CTR_ID]
Advanced Reporting Guide
38 © 2017, MicroStrategy Inc.
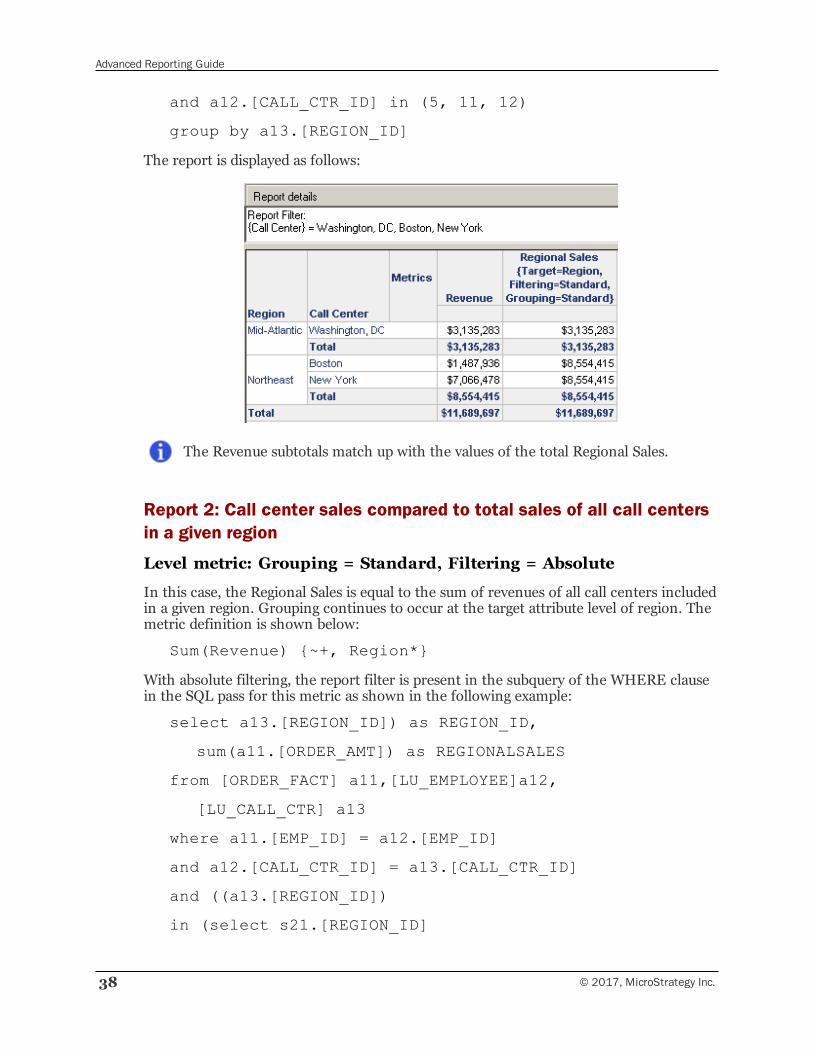
and a12.[CALL_CTR_ID] in (5, 11, 12)
group by a13.[REGION_ID]
The report is displayed as follows:
The Revenue subtotals match up with the values of the total Regional Sales.
Report 2: Call center sales compared to total sales of all call centersin a given region
Level metric: Grouping = Standard, Filtering = Absolute
In this case, the Regional Sales is equal to the sum of revenues of all call centers includedin a given region. Grouping continues to occur at the target attribute level of region. Themetric definition is shown below:
Sum(Revenue) {~+, Region*}
With absolute filtering, the report filter is present in the subquery of the WHERE clausein the SQL pass for this metric as shown in the following example:
select a13.[REGION_ID]) as REGION_ID,
sum(a11.[ORDER_AMT]) as REGIONALSALES
from [ORDER_FACT] a11,[LU_EMPLOYEE]a12,
[LU_CALL_CTR] a13
where a11.[EMP_ID] = a12.[EMP_ID]
and a12.[CALL_CTR_ID] = a13.[CALL_CTR_ID]
and ((a13.[REGION_ID])
in (select s21.[REGION_ID]
Advanced Reporting Guide
© 2017, MicroStrategy Inc. 39
from [LU_CALL_CTR] s21
where s21.[CALL_CTR_ID] in (5,11,12)))
group by a13.[REGION_ID]
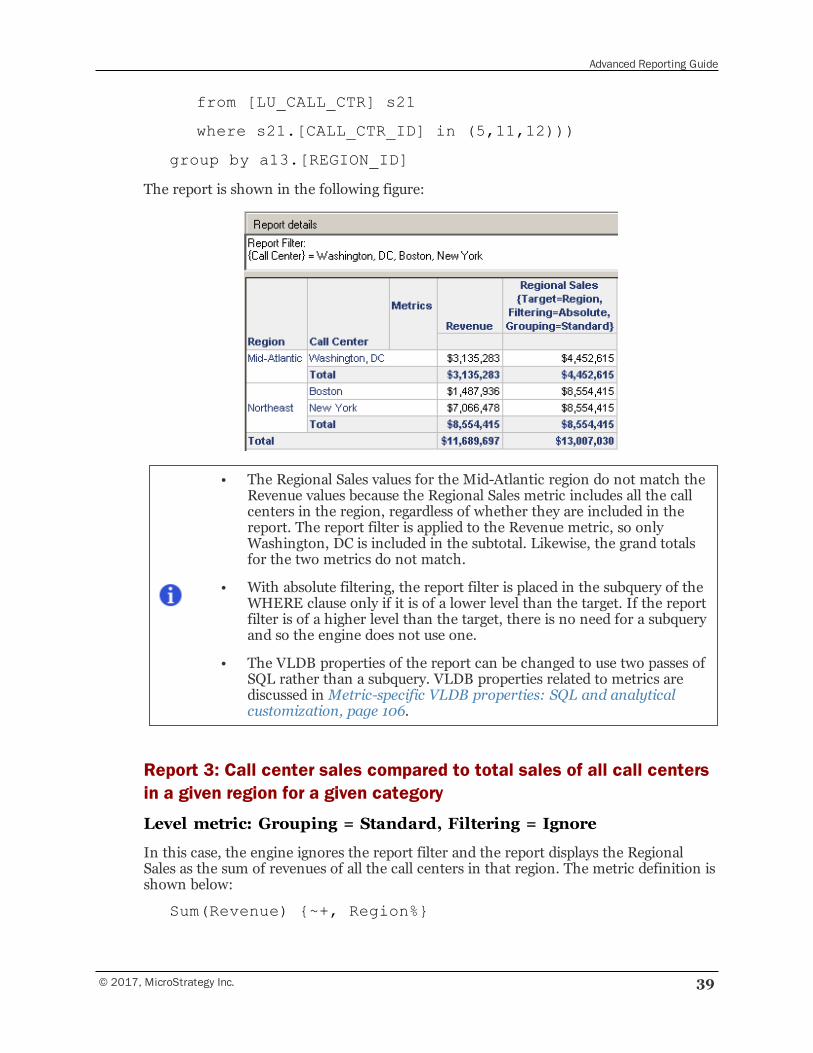
The report is shown in the following figure:
• The Regional Sales values for the Mid-Atlantic region do not match theRevenue values because the Regional Sales metric includes all the callcenters in the region, regardless of whether they are included in thereport. The report filter is applied to the Revenue metric, so onlyWashington, DC is included in the subtotal. Likewise, the grand totalsfor the two metrics do not match.
• With absolute filtering, the report filter is placed in the subquery of theWHERE clause only if it is of a lower level than the target. If the reportfilter is of a higher level than the target, there is no need for a subqueryand so the engine does not use one.
• The VLDB properties of the report can be changed to use two passes ofSQL rather than a subquery. VLDB properties related to metrics arediscussed in Metric-specific VLDB properties: SQL and analyticalcustomization, page 106.
Report 3: Call center sales compared to total sales of all call centersin a given region for a given category
Level metric: Grouping = Standard, Filtering = Ignore
In this case, the engine ignores the report filter and the report displays the RegionalSales as the sum of revenues of all the call centers in that region. The metric definition isshown below:
Sum(Revenue) {~+, Region%}
Advanced Reporting Guide
40 © 2017, MicroStrategy Inc.
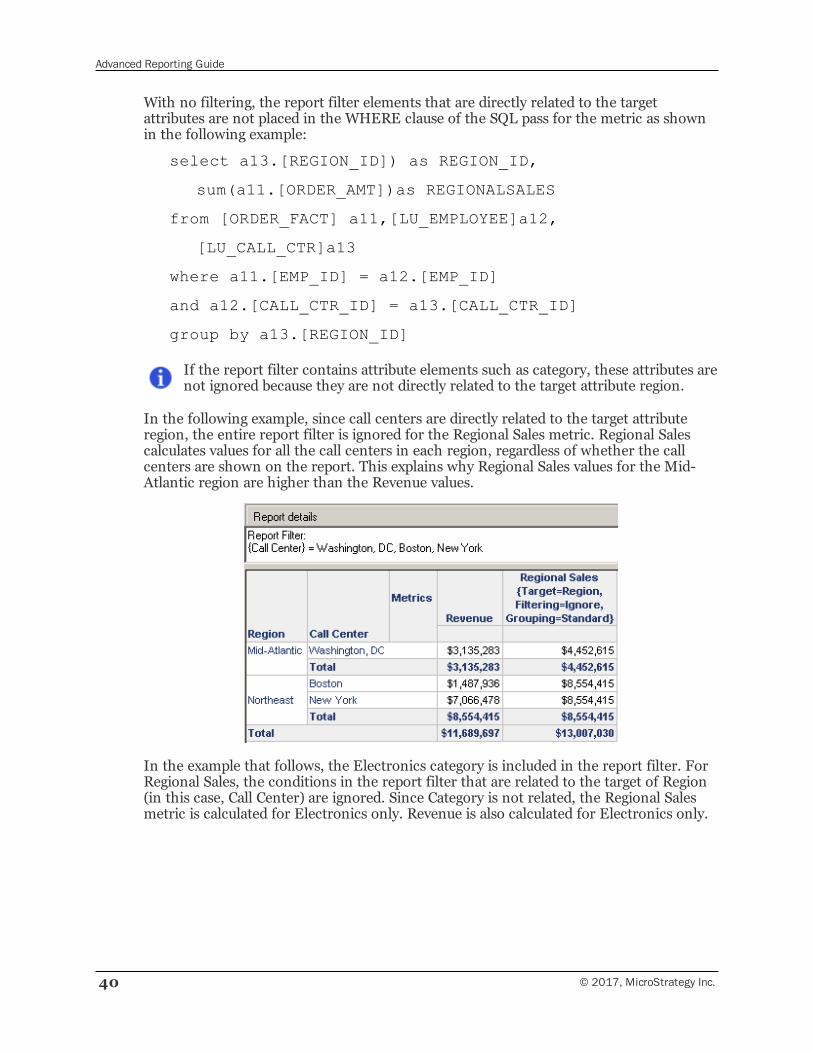
With no filtering, the report filter elements that are directly related to the targetattributes are not placed in the WHERE clause of the SQL pass for the metric as shownin the following example:
select a13.[REGION_ID]) as REGION_ID,
sum(a11.[ORDER_AMT])as REGIONALSALES
from [ORDER_FACT] a11,[LU_EMPLOYEE]a12,
[LU_CALL_CTR]a13
where a11.[EMP_ID] = a12.[EMP_ID]
and a12.[CALL_CTR_ID] = a13.[CALL_CTR_ID]
group by a13.[REGION_ID]
If the report filter contains attribute elements such as category, these attributes arenot ignored because they are not directly related to the target attribute region.
In the following example, since call centers are directly related to the target attributeregion, the entire report filter is ignored for the Regional Sales metric. Regional Salescalculates values for all the call centers in each region, regardless of whether the callcenters are shown on the report. This explains why Regional Sales values for the Mid-Atlantic region are higher than the Revenue values.
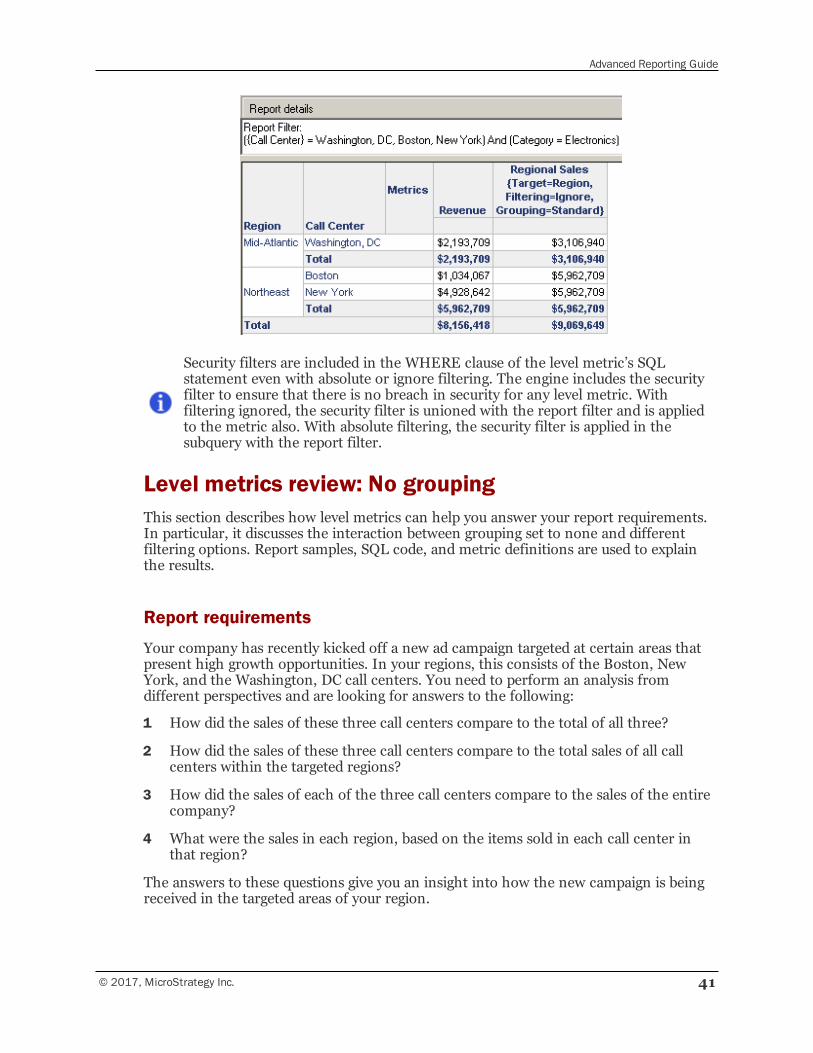
In the example that follows, the Electronics category is included in the report filter. ForRegional Sales, the conditions in the report filter that are related to the target of Region(in this case, Call Center) are ignored. Since Category is not related, the Regional Salesmetric is calculated for Electronics only. Revenue is also calculated for Electronics only.
Advanced Reporting Guide
© 2017, MicroStrategy Inc. 41
Security filters are included in the WHERE clause of the level metric’s SQLstatement even with absolute or ignore filtering. The engine includes the securityfilter to ensure that there is no breach in security for any level metric. Withfiltering ignored, the security filter is unioned with the report filter and is appliedto the metric also. With absolute filtering, the security filter is applied in thesubquery with the report filter.
Level metrics review: No groupingThis section describes how level metrics can help you answer your report requirements.In particular, it discusses the interaction between grouping set to none and differentfiltering options. Report samples, SQL code, and metric definitions are used to explainthe results.
Report requirements
Your company has recently kicked off a new ad campaign targeted at certain areas thatpresent high growth opportunities. In your regions, this consists of the Boston, NewYork, and the Washington, DC call centers. You need to perform an analysis fromdifferent perspectives and are looking for answers to the following:
1 How did the sales of these three call centers compare to the total of all three?
2 How did the sales of these three call centers compare to the total sales of all callcenters within the targeted regions?
3 How did the sales of each of the three call centers compare to the sales of the entirecompany?
4 What were the sales in each region, based on the items sold in each call center inthat region?
The answers to these questions give you an insight into how the new campaign is beingreceived in the targeted areas of your region.
Advanced Reporting Guide
42 © 2017, MicroStrategy Inc.
Report 1: Call center sales compared to total sales of targeted callcenters
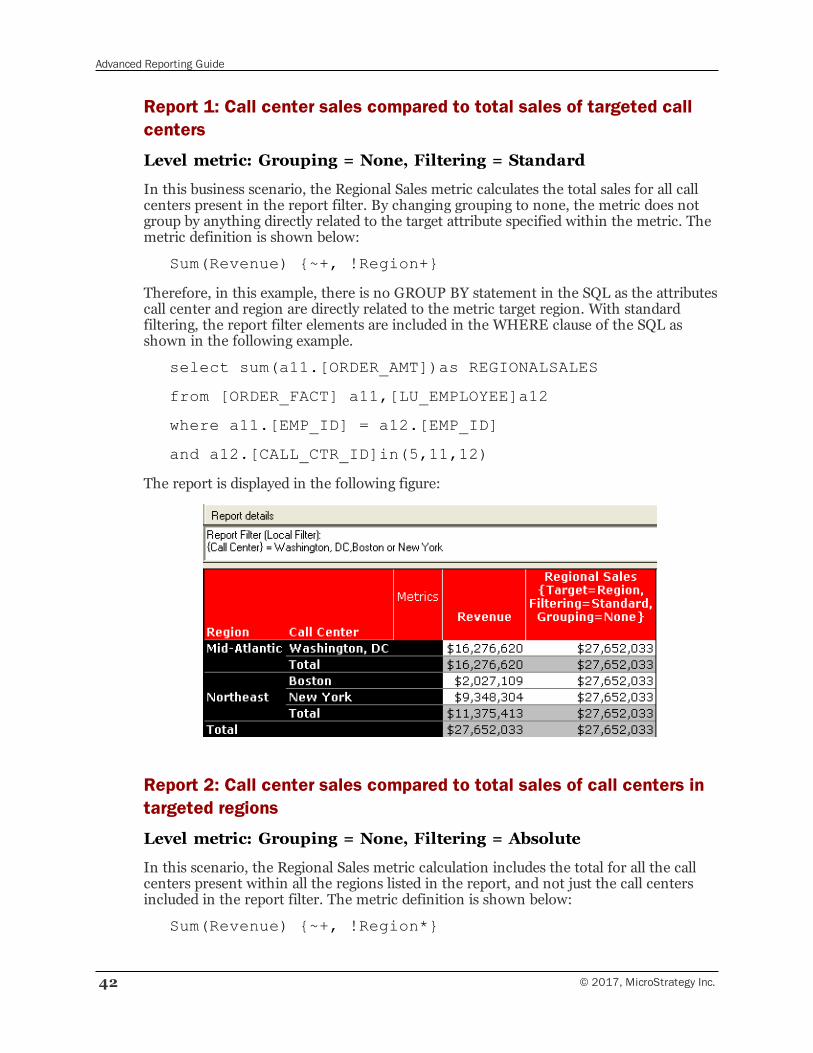
Level metric: Grouping = None, Filtering = Standard
In this business scenario, the Regional Sales metric calculates the total sales for all callcenters present in the report filter. By changing grouping to none, the metric does notgroup by anything directly related to the target attribute specified within the metric. Themetric definition is shown below:
Sum(Revenue) {~+, !Region+}
Therefore, in this example, there is no GROUP BY statement in the SQL as the attributescall center and region are directly related to the metric target region. With standardfiltering, the report filter elements are included in the WHERE clause of the SQL asshown in the following example.
select sum(a11.[ORDER_AMT])as REGIONALSALES
from [ORDER_FACT] a11,[LU_EMPLOYEE]a12
where a11.[EMP_ID] = a12.[EMP_ID]
and a12.[CALL_CTR_ID]in(5,11,12)
The report is displayed in the following figure:
Report 2: Call center sales compared to total sales of call centers intargeted regions
Level metric: Grouping = None, Filtering = Absolute
In this scenario, the Regional Sales metric calculation includes the total for all the callcenters present within all the regions listed in the report, and not just the call centersincluded in the report filter. The metric definition is shown below:
Sum(Revenue) {~+, !Region*}
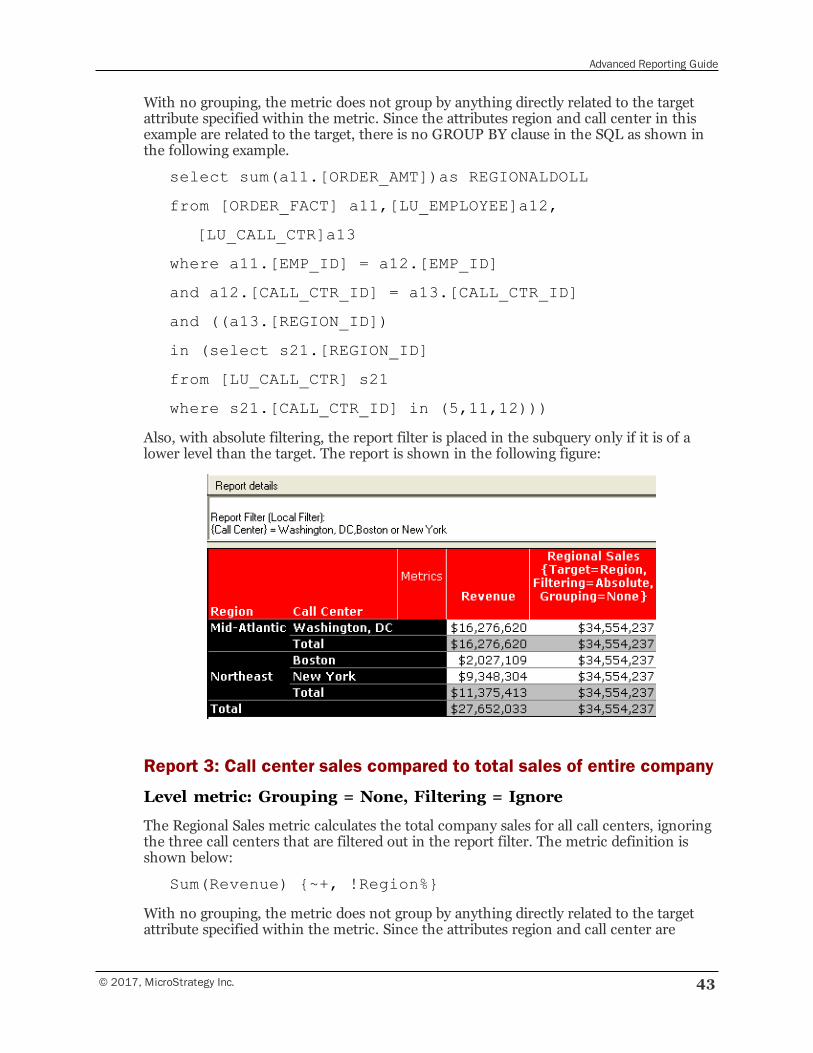
Advanced Reporting Guide
© 2017, MicroStrategy Inc. 43
With no grouping, the metric does not group by anything directly related to the targetattribute specified within the metric. Since the attributes region and call center in thisexample are related to the target, there is no GROUP BY clause in the SQL as shown inthe following example.
select sum(a11.[ORDER_AMT])as REGIONALDOLL
from [ORDER_FACT] a11,[LU_EMPLOYEE]a12,
[LU_CALL_CTR]a13
where a11.[EMP_ID] = a12.[EMP_ID]
and a12.[CALL_CTR_ID] = a13.[CALL_CTR_ID]
and ((a13.[REGION_ID])
in (select s21.[REGION_ID]
from [LU_CALL_CTR] s21
where s21.[CALL_CTR_ID] in (5,11,12)))
Also, with absolute filtering, the report filter is placed in the subquery only if it is of alower level than the target. The report is shown in the following figure:
Report 3: Call center sales compared to total sales of entire company
Level metric: Grouping = None, Filtering = Ignore
The Regional Sales metric calculates the total company sales for all call centers, ignoringthe three call centers that are filtered out in the report filter. The metric definition isshown below:
Sum(Revenue) {~+, !Region%}
With no grouping, the metric does not group by anything directly related to the targetattribute specified within the metric. Since the attributes region and call center are
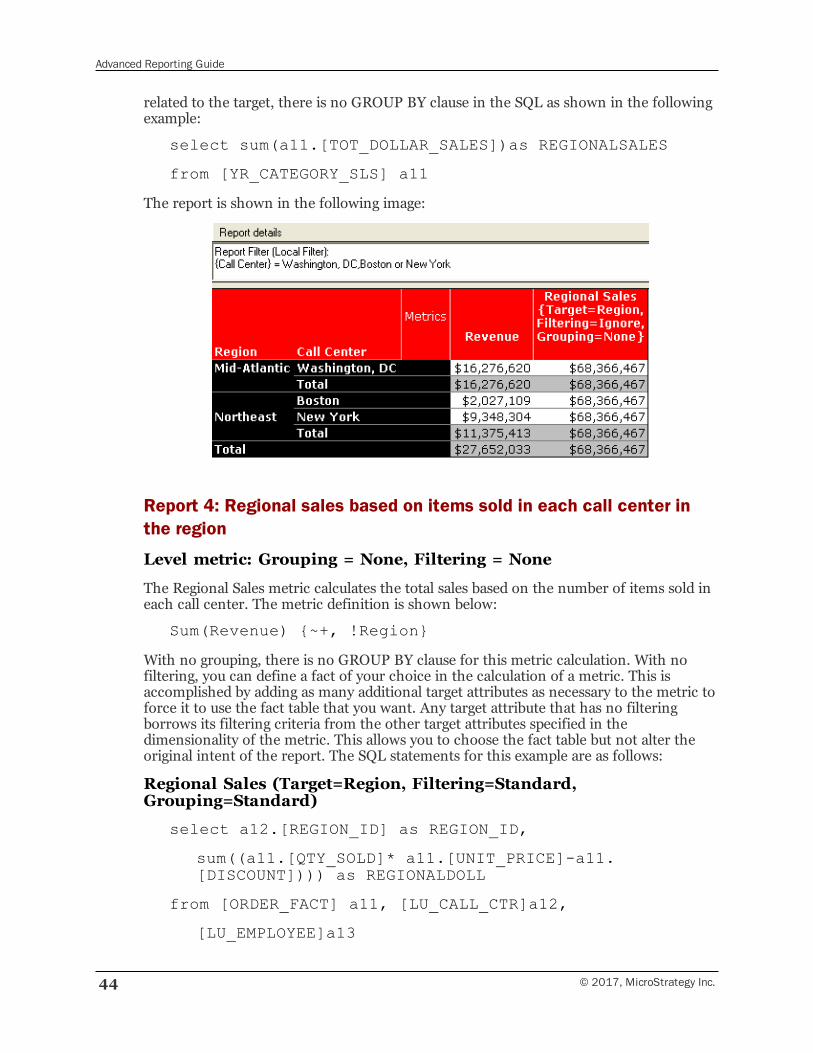
Advanced Reporting Guide
44 © 2017, MicroStrategy Inc.
related to the target, there is no GROUP BY clause in the SQL as shown in the followingexample:
select sum(a11.[TOT_DOLLAR_SALES])as REGIONALSALES
from [YR_CATEGORY_SLS] a11
The report is shown in the following image:
Report 4: Regional sales based on items sold in each call center inthe region
Level metric: Grouping = None, Filtering = None
The Regional Sales metric calculates the total sales based on the number of items sold ineach call center. The metric definition is shown below:
Sum(Revenue) {~+, !Region}
With no grouping, there is no GROUP BY clause for this metric calculation. With nofiltering, you can define a fact of your choice in the calculation of a metric. This isaccomplished by adding as many additional target attributes as necessary to the metric toforce it to use the fact table that you want. Any target attribute that has no filteringborrows its filtering criteria from the other target attributes specified in thedimensionality of the metric. This allows you to choose the fact table but not alter theoriginal intent of the report. The SQL statements for this example are as follows:
Regional Sales (Target=Region, Filtering=Standard,Grouping=Standard)
select a12.[REGION_ID] as REGION_ID,
sum((a11.[QTY_SOLD]* a11.[UNIT_PRICE]-a11.[DISCOUNT]))) as REGIONALDOLL
from [ORDER_FACT] a11, [LU_CALL_CTR]a12,
[LU_EMPLOYEE]a13
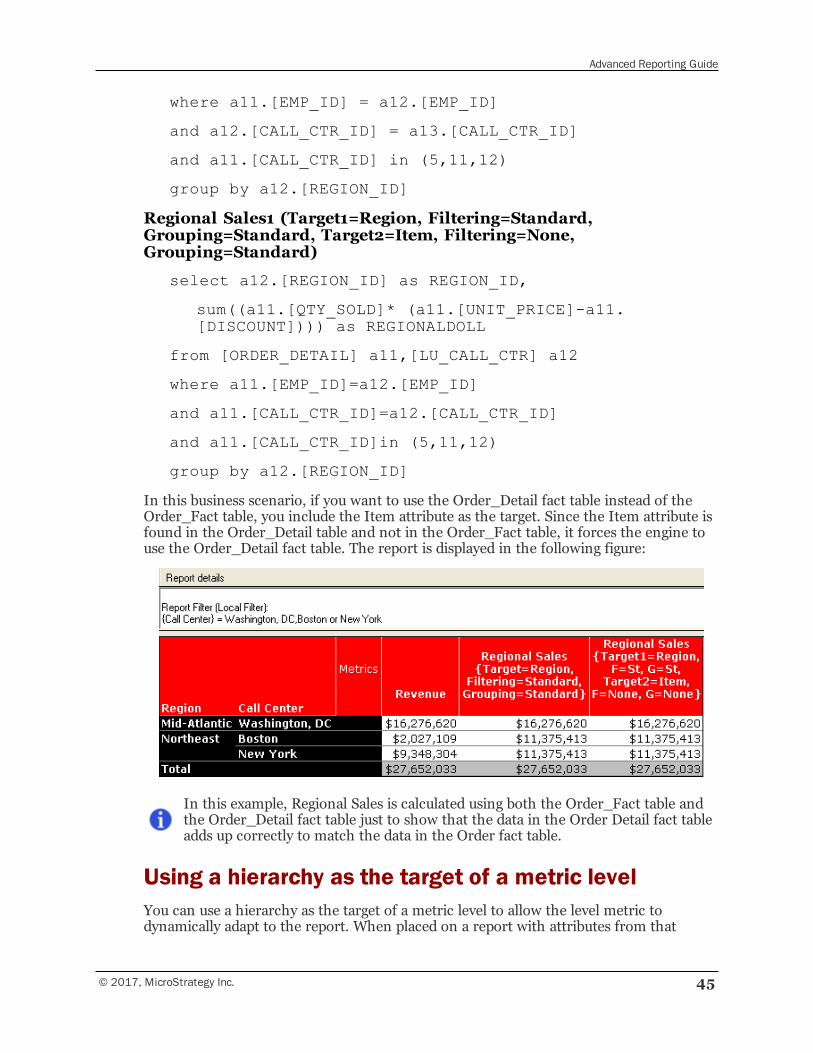
Advanced Reporting Guide
© 2017, MicroStrategy Inc. 45
where a11.[EMP_ID] = a12.[EMP_ID]
and a12.[CALL_CTR_ID] = a13.[CALL_CTR_ID]
and a11.[CALL_CTR_ID] in (5,11,12)
group by a12.[REGION_ID]
Regional Sales1 (Target1=Region, Filtering=Standard,Grouping=Standard, Target2=Item, Filtering=None,Grouping=Standard)
select a12.[REGION_ID] as REGION_ID,
sum((a11.[QTY_SOLD]* (a11.[UNIT_PRICE]-a11.[DISCOUNT]))) as REGIONALDOLL
from [ORDER_DETAIL] a11,[LU_CALL_CTR] a12
where a11.[EMP_ID]=a12.[EMP_ID]
and a11.[CALL_CTR_ID]=a12.[CALL_CTR_ID]
and a11.[CALL_CTR_ID]in (5,11,12)
group by a12.[REGION_ID]
In this business scenario, if you want to use the Order_Detail fact table instead of theOrder_Fact table, you include the Item attribute as the target. Since the Item attribute isfound in the Order_Detail table and not in the Order_Fact table, it forces the engine touse the Order_Detail fact table. The report is displayed in the following figure:
In this example, Regional Sales is calculated using both the Order_Fact table andthe Order_Detail fact table just to show that the data in the Order Detail fact tableadds up correctly to match the data in the Order fact table.
Using a hierarchy as the target of a metric levelYou can use a hierarchy as the target of a metric level to allow the level metric todynamically adapt to the report. When placed on a report with attributes from that
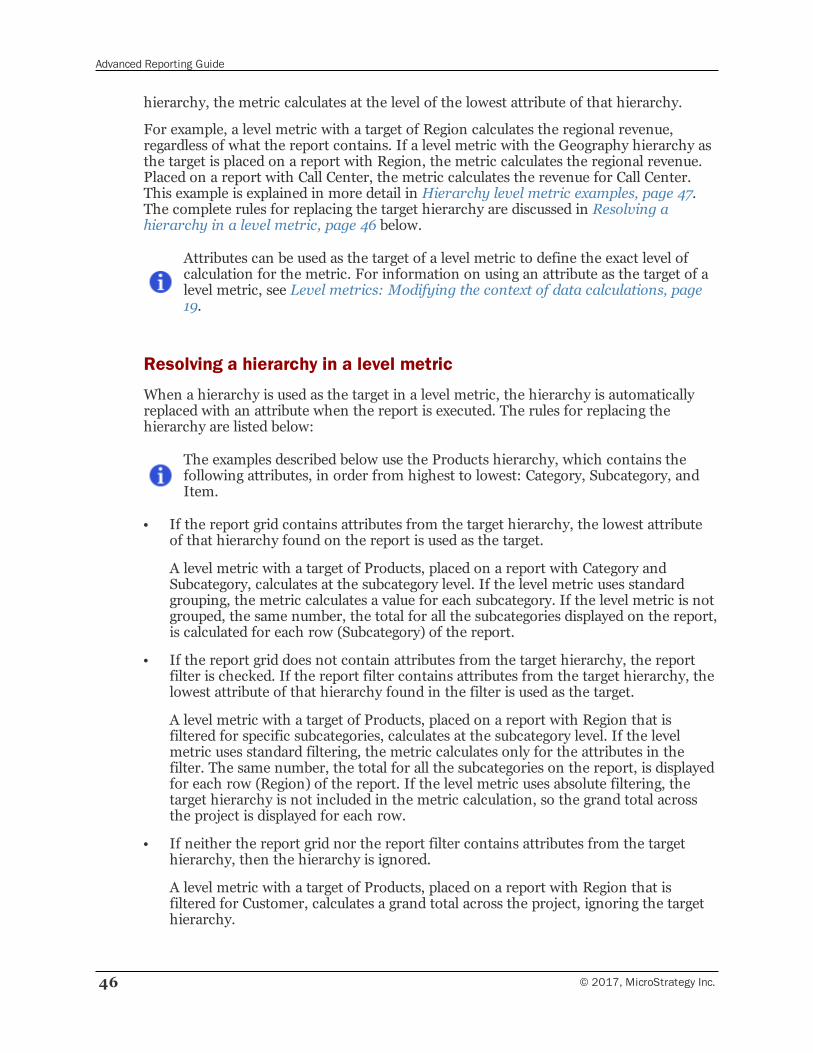
Advanced Reporting Guide
46 © 2017, MicroStrategy Inc.
hierarchy, the metric calculates at the level of the lowest attribute of that hierarchy.
For example, a level metric with a target of Region calculates the regional revenue,regardless of what the report contains. If a level metric with the Geography hierarchy asthe target is placed on a report with Region, the metric calculates the regional revenue.Placed on a report with Call Center, the metric calculates the revenue for Call Center.This example is explained in more detail in Hierarchy level metric examples, page 47.The complete rules for replacing the target hierarchy are discussed in Resolving ahierarchy in a level metric, page 46 below.
Attributes can be used as the target of a level metric to define the exact level ofcalculation for the metric. For information on using an attribute as the target of alevel metric, see Level metrics: Modifying the context of data calculations, page19.
Resolving a hierarchy in a level metric
When a hierarchy is used as the target in a level metric, the hierarchy is automaticallyreplaced with an attribute when the report is executed. The rules for replacing thehierarchy are listed below:
The examples described below use the Products hierarchy, which contains thefollowing attributes, in order from highest to lowest: Category, Subcategory, andItem.
• If the report grid contains attributes from the target hierarchy, the lowest attributeof that hierarchy found on the report is used as the target.
A level metric with a target of Products, placed on a report with Category andSubcategory, calculates at the subcategory level. If the level metric uses standardgrouping, the metric calculates a value for each subcategory. If the level metric is notgrouped, the same number, the total for all the subcategories displayed on the report,is calculated for each row (Subcategory) of the report.
• If the report grid does not contain attributes from the target hierarchy, the reportfilter is checked. If the report filter contains attributes from the target hierarchy, thelowest attribute of that hierarchy found in the filter is used as the target.
A level metric with a target of Products, placed on a report with Region that isfiltered for specific subcategories, calculates at the subcategory level. If the levelmetric uses standard filtering, the metric calculates only for the attributes in thefilter. The same number, the total for all the subcategories on the report, is displayedfor each row (Region) of the report. If the level metric uses absolute filtering, thetarget hierarchy is not included in the metric calculation, so the grand total acrossthe project is displayed for each row.
• If neither the report grid nor the report filter contains attributes from the targethierarchy, then the hierarchy is ignored.
A level metric with a target of Products, placed on a report with Region that isfiltered for Customer, calculates a grand total across the project, ignoring the targethierarchy.
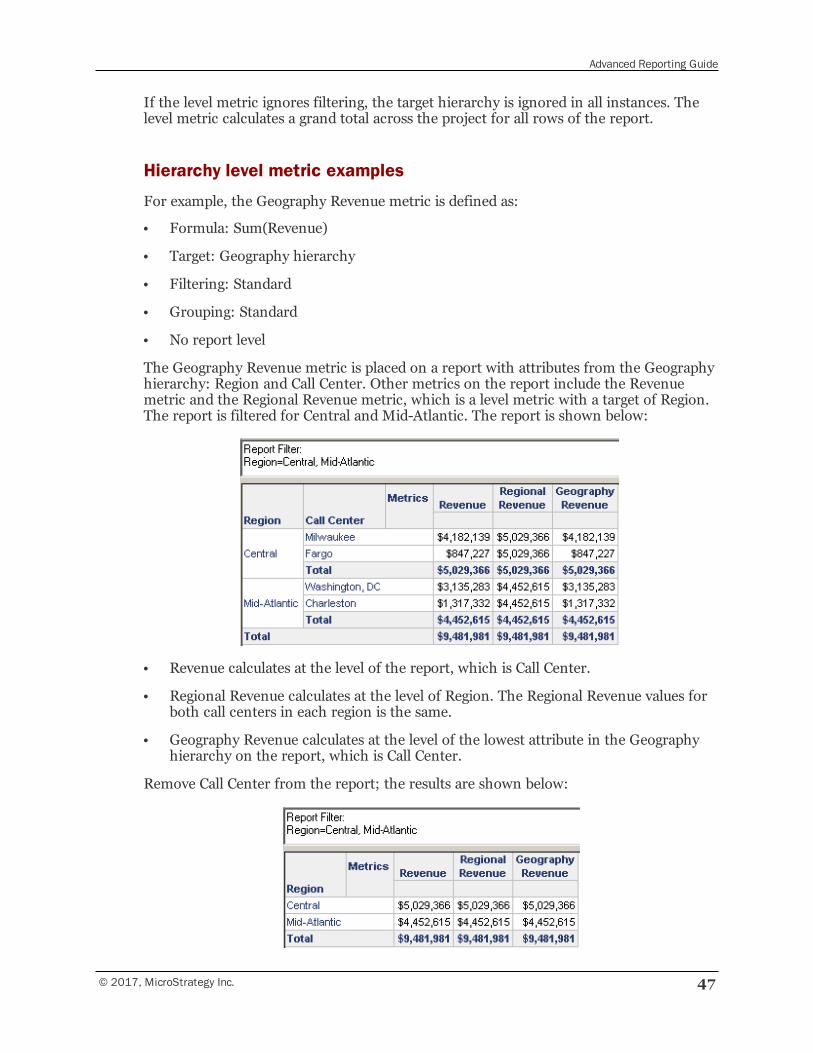
Advanced Reporting Guide
© 2017, MicroStrategy Inc. 47
If the level metric ignores filtering, the target hierarchy is ignored in all instances. Thelevel metric calculates a grand total across the project for all rows of the report.
Hierarchy level metric examples
For example, the Geography Revenue metric is defined as:
• Formula: Sum(Revenue)
• Target: Geography hierarchy
• Filtering: Standard
• Grouping: Standard
• No report level
The Geography Revenue metric is placed on a report with attributes from the Geographyhierarchy: Region and Call Center. Other metrics on the report include the Revenuemetric and the Regional Revenue metric, which is a level metric with a target of Region.The report is filtered for Central and Mid-Atlantic. The report is shown below:
• Revenue calculates at the level of the report, which is Call Center.
• Regional Revenue calculates at the level of Region. The Regional Revenue values forboth call centers in each region is the same.
• Geography Revenue calculates at the level of the lowest attribute in the Geographyhierarchy on the report, which is Call Center.
Remove Call Center from the report; the results are shown below:
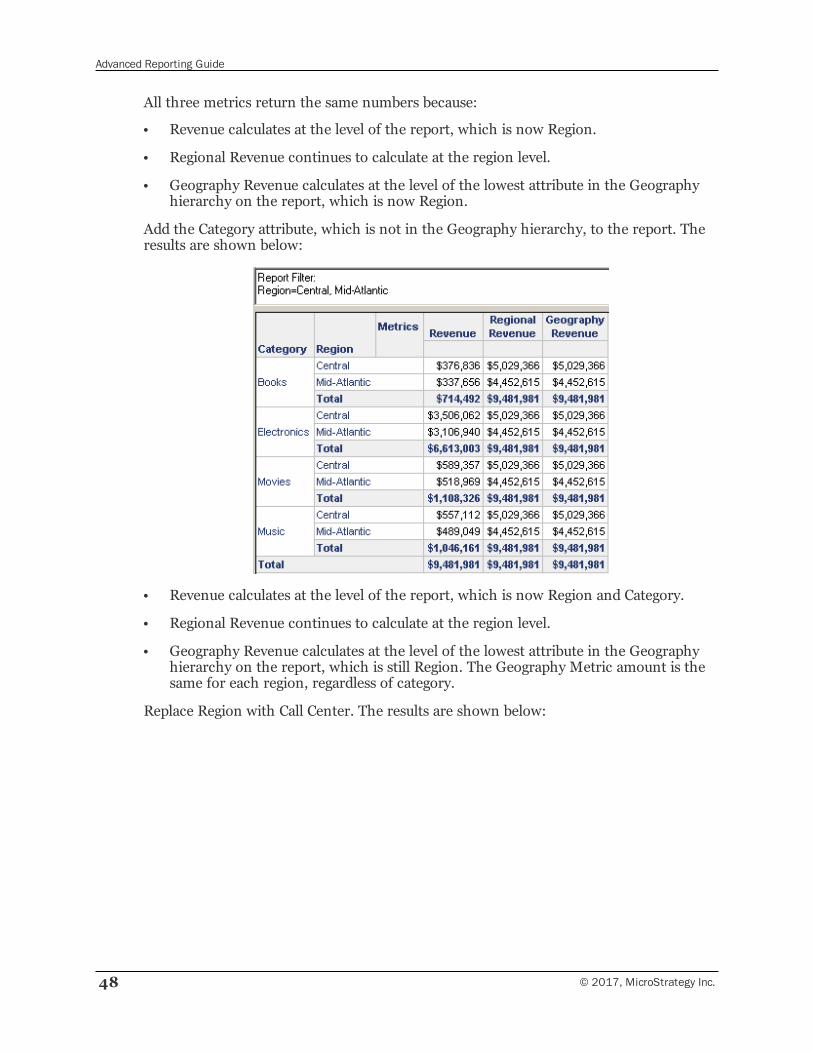
Advanced Reporting Guide
48 © 2017, MicroStrategy Inc.
All three metrics return the same numbers because:
• Revenue calculates at the level of the report, which is now Region.
• Regional Revenue continues to calculate at the region level.
• Geography Revenue calculates at the level of the lowest attribute in the Geographyhierarchy on the report, which is now Region.
Add the Category attribute, which is not in the Geography hierarchy, to the report. Theresults are shown below:
• Revenue calculates at the level of the report, which is now Region and Category.
• Regional Revenue continues to calculate at the region level.
• Geography Revenue calculates at the level of the lowest attribute in the Geographyhierarchy on the report, which is still Region. The Geography Metric amount is thesame for each region, regardless of category.
Replace Region with Call Center. The results are shown below:
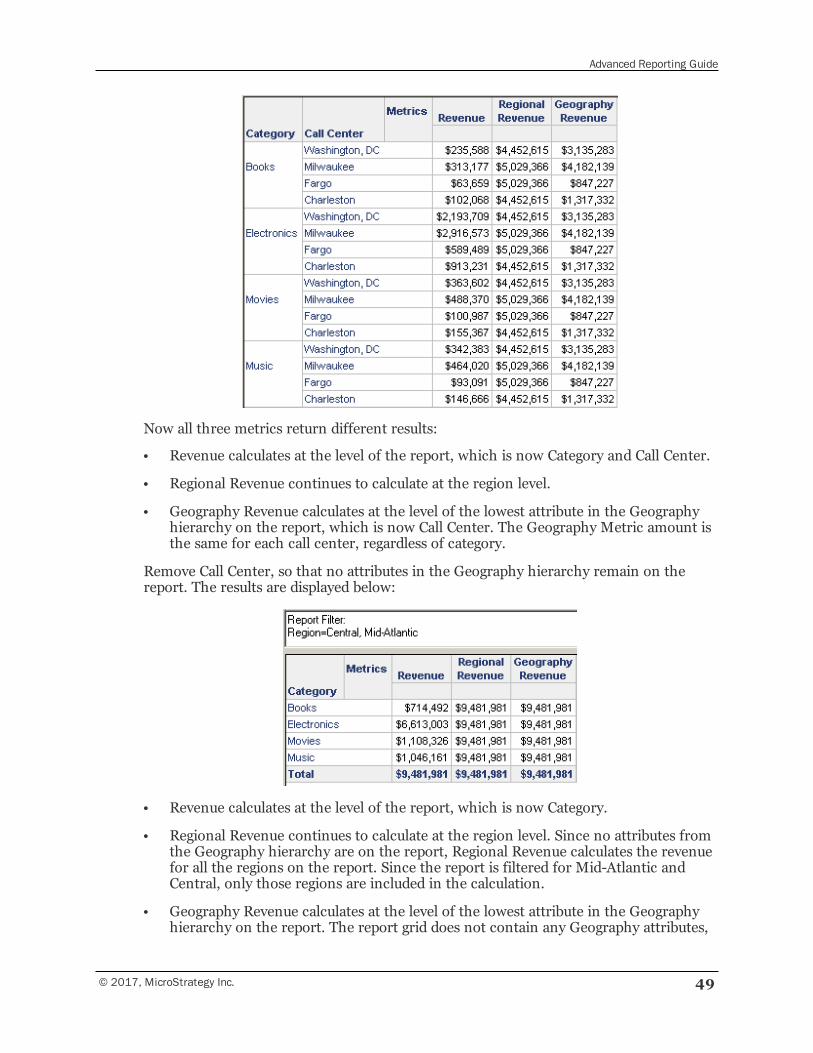
Advanced Reporting Guide
© 2017, MicroStrategy Inc. 49
Now all three metrics return different results:
• Revenue calculates at the level of the report, which is now Category and Call Center.
• Regional Revenue continues to calculate at the region level.
• Geography Revenue calculates at the level of the lowest attribute in the Geographyhierarchy on the report, which is now Call Center. The Geography Metric amount isthe same for each call center, regardless of category.
Remove Call Center, so that no attributes in the Geography hierarchy remain on thereport. The results are displayed below:
• Revenue calculates at the level of the report, which is now Category.
• Regional Revenue continues to calculate at the region level. Since no attributes fromthe Geography hierarchy are on the report, Regional Revenue calculates the revenuefor all the regions on the report. Since the report is filtered for Mid-Atlantic andCentral, only those regions are included in the calculation.
• Geography Revenue calculates at the level of the lowest attribute in the Geographyhierarchy on the report. The report grid does not contain any Geography attributes,
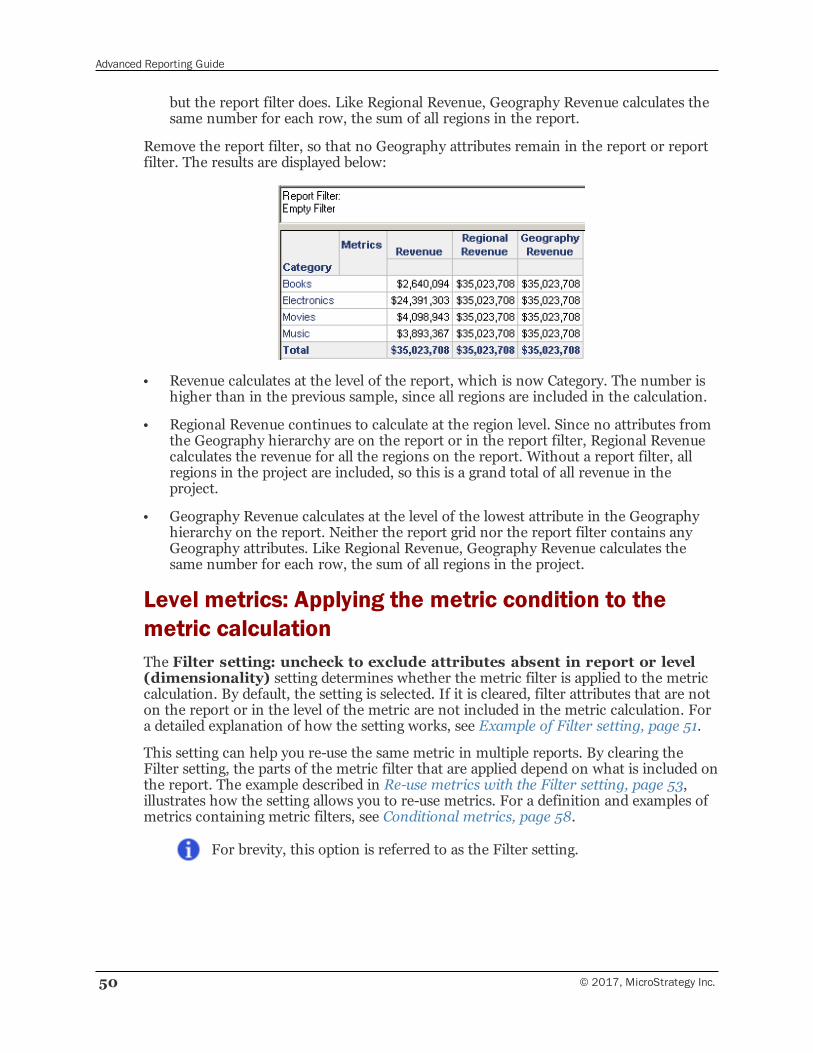
Advanced Reporting Guide
50 © 2017, MicroStrategy Inc.
but the report filter does. Like Regional Revenue, Geography Revenue calculates thesame number for each row, the sum of all regions in the report.
Remove the report filter, so that no Geography attributes remain in the report or reportfilter. The results are displayed below:
• Revenue calculates at the level of the report, which is now Category. The number ishigher than in the previous sample, since all regions are included in the calculation.
• Regional Revenue continues to calculate at the region level. Since no attributes fromthe Geography hierarchy are on the report or in the report filter, Regional Revenuecalculates the revenue for all the regions on the report. Without a report filter, allregions in the project are included, so this is a grand total of all revenue in theproject.
• Geography Revenue calculates at the level of the lowest attribute in the Geographyhierarchy on the report. Neither the report grid nor the report filter contains anyGeography attributes. Like Regional Revenue, Geography Revenue calculates thesame number for each row, the sum of all regions in the project.
Level metrics: Applying the metric condition to themetric calculationThe Filter setting: uncheck to exclude attributes absent in report or level(dimensionality) setting determines whether the metric filter is applied to the metriccalculation. By default, the setting is selected. If it is cleared, filter attributes that are noton the report or in the level of the metric are not included in the metric calculation. Fora detailed explanation of how the setting works, see Example of Filter setting, page 51.
This setting can help you re-use the same metric in multiple reports. By clearing theFilter setting, the parts of the metric filter that are applied depend on what is included onthe report. The example described in Re-use metrics with the Filter setting, page 53,illustrates how the setting allows you to re-use metrics. For a definition and examples ofmetrics containing metric filters, see Conditional metrics, page 58.
For brevity, this option is referred to as the Filter setting.
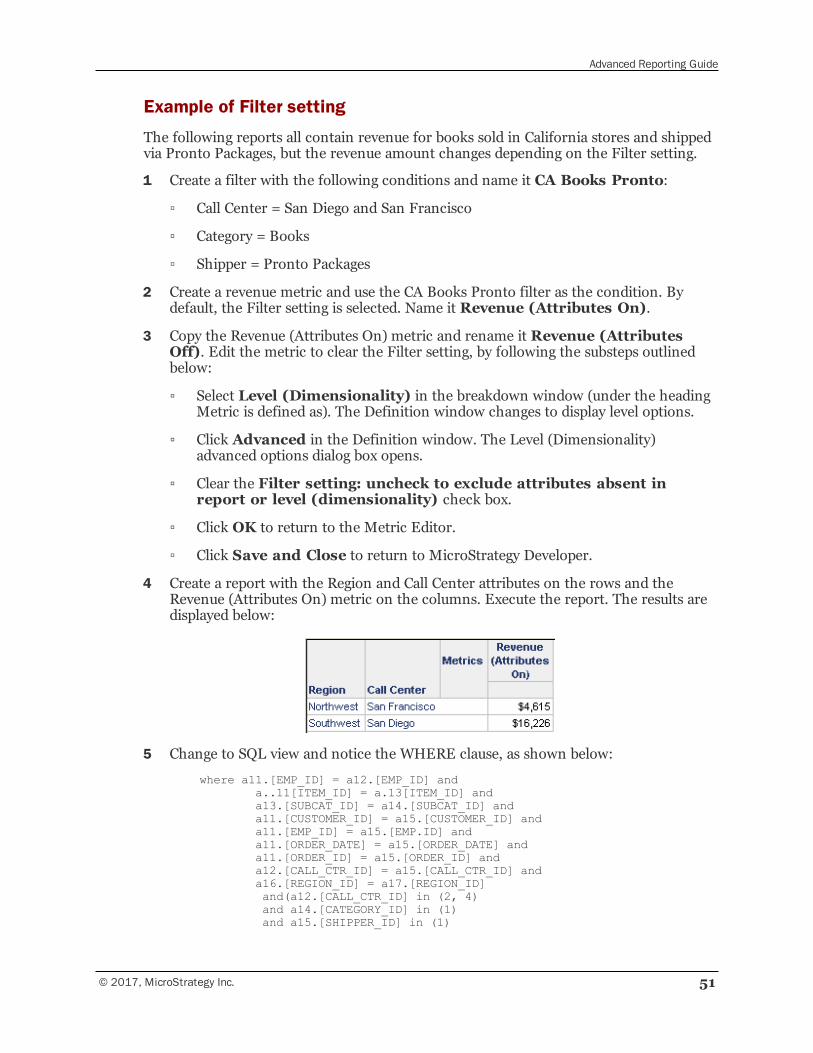
Advanced Reporting Guide
© 2017, MicroStrategy Inc. 51
Example of Filter setting
The following reports all contain revenue for books sold in California stores and shippedvia Pronto Packages, but the revenue amount changes depending on the Filter setting.
1 Create a filter with the following conditions and name it CA Books Pronto:
▫ Call Center = San Diego and San Francisco
▫ Category = Books
▫ Shipper = Pronto Packages
2 Create a revenue metric and use the CA Books Pronto filter as the condition. Bydefault, the Filter setting is selected. Name it Revenue (Attributes On).
3 Copy the Revenue (Attributes On) metric and rename it Revenue (AttributesOff). Edit the metric to clear the Filter setting, by following the substeps outlinedbelow:
▫ Select Level (Dimensionality) in the breakdown window (under the headingMetric is defined as). The Definition window changes to display level options.
▫ Click Advanced in the Definition window. The Level (Dimensionality)advanced options dialog box opens.
▫ Clear the Filter setting: uncheck to exclude attributes absent inreport or level (dimensionality) check box.
▫ Click OK to return to the Metric Editor.
▫ Click Save and Close to return to MicroStrategy Developer.
4 Create a report with the Region and Call Center attributes on the rows and theRevenue (Attributes On) metric on the columns. Execute the report. The results aredisplayed below:
5 Change to SQL view and notice the WHERE clause, as shown below:
where a11.[EMP_ID] = a12.[EMP_ID] anda..11[ITEM_ID] = a.13[ITEM_ID] anda13.[SUBCAT_ID] = a14.[SUBCAT_ID] anda11.[CUSTOMER_ID] = a15.[CUSTOMER_ID] anda11.[EMP_ID] = a15.[EMP.ID] anda11.[ORDER_DATE] = a15.[ORDER_DATE] anda11.[ORDER_ID] = a15.[ORDER_ID] anda12.[CALL_CTR_ID] = a15.[CALL_CTR_ID] anda16.[REGION_ID] = a17.[REGION_ID]and(a12.[CALL_CTR_ID] in (2, 4)and a14.[CATEGORY_ID] in (1)and a15.[SHIPPER_ID] in (1)
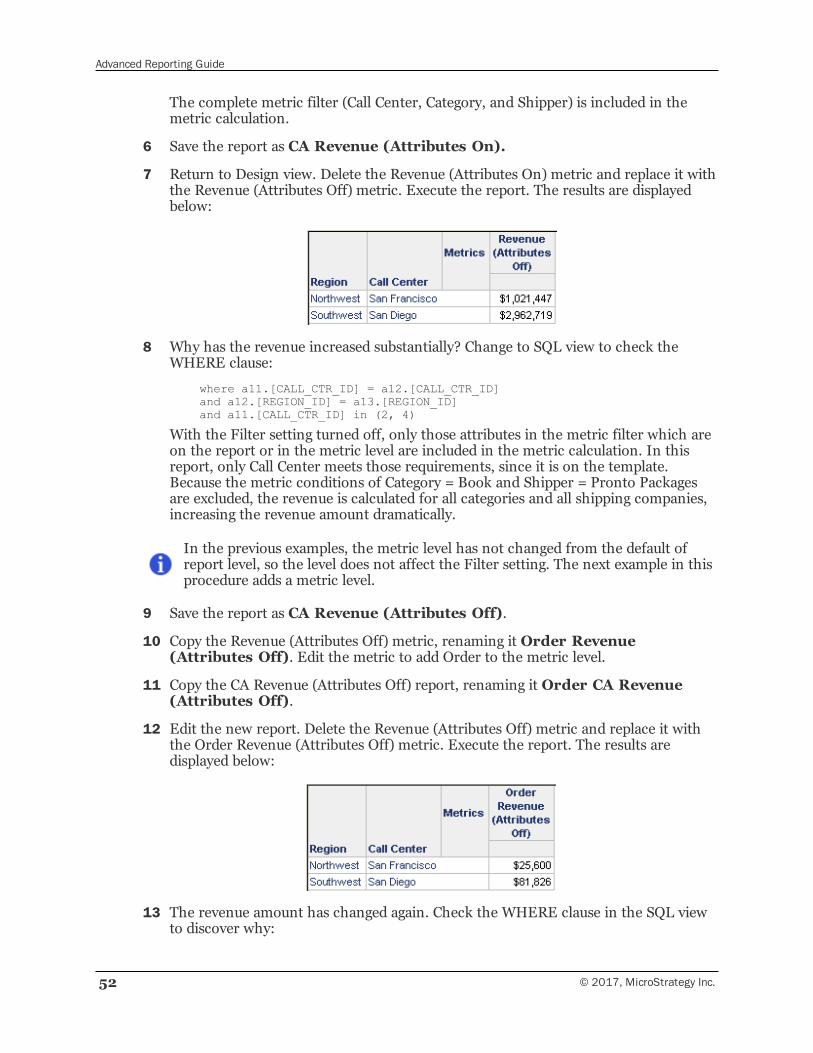
Advanced Reporting Guide
52 © 2017, MicroStrategy Inc.
The complete metric filter (Call Center, Category, and Shipper) is included in themetric calculation.
6 Save the report as CA Revenue (Attributes On).
7 Return to Design view. Delete the Revenue (Attributes On) metric and replace it withthe Revenue (Attributes Off) metric. Execute the report. The results are displayedbelow:
8 Why has the revenue increased substantially? Change to SQL view to check theWHERE clause:
where a11.[CALL_CTR_ID] = a12.[CALL_CTR_ID]and a12.[REGION_ID] = a13.[REGION_ID]and a11.[CALL_CTR_ID] in (2, 4)
With the Filter setting turned off, only those attributes in the metric filter which areon the report or in the metric level are included in the metric calculation. In thisreport, only Call Center meets those requirements, since it is on the template.Because the metric conditions of Category = Book and Shipper = Pronto Packagesare excluded, the revenue is calculated for all categories and all shipping companies,increasing the revenue amount dramatically.
In the previous examples, the metric level has not changed from the default ofreport level, so the level does not affect the Filter setting. The next example in thisprocedure adds a metric level.
9 Save the report as CA Revenue (Attributes Off).
10 Copy the Revenue (Attributes Off) metric, renaming it Order Revenue(Attributes Off). Edit the metric to add Order to the metric level.
11 Copy the CA Revenue (Attributes Off) report, renaming it Order CA Revenue(Attributes Off).
12 Edit the new report. Delete the Revenue (Attributes Off) metric and replace it withthe Order Revenue (Attributes Off) metric. Execute the report. The results aredisplayed below:
13 The revenue amount has changed again. Check the WHERE clause in the SQL viewto discover why:
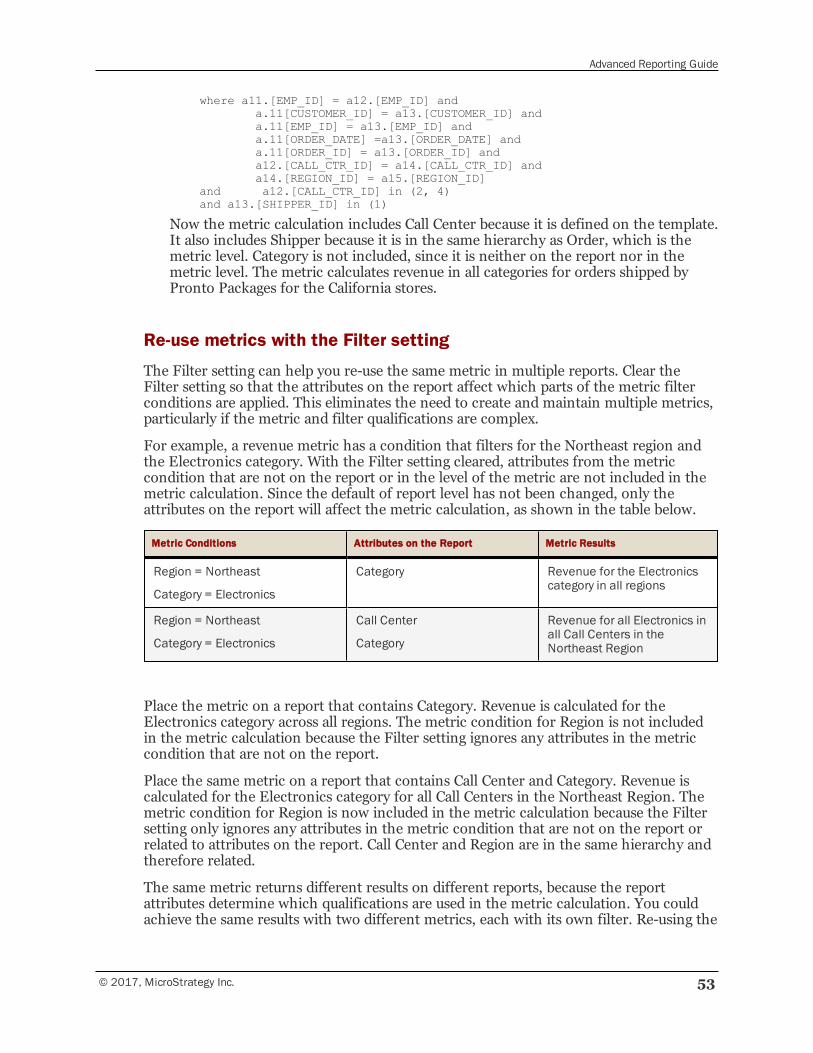
Advanced Reporting Guide
© 2017, MicroStrategy Inc. 53
where a11.[EMP_ID] = a12.[EMP_ID] anda.11[CUSTOMER_ID] = a13.[CUSTOMER_ID] anda.11[EMP_ID] = a13.[EMP_ID] anda.11[ORDER_DATE] =a13.[ORDER_DATE] anda.11[ORDER_ID] = a13.[ORDER_ID] anda12.[CALL_CTR_ID] = a14.[CALL_CTR_ID] anda14.[REGION_ID] = a15.[REGION_ID]
and a12.[CALL_CTR_ID] in (2, 4)and a13.[SHIPPER_ID] in (1)
Now the metric calculation includes Call Center because it is defined on the template.It also includes Shipper because it is in the same hierarchy as Order, which is themetric level. Category is not included, since it is neither on the report nor in themetric level. The metric calculates revenue in all categories for orders shipped byPronto Packages for the California stores.
Re-use metrics with the Filter setting
The Filter setting can help you re-use the same metric in multiple reports. Clear theFilter setting so that the attributes on the report affect which parts of the metric filterconditions are applied. This eliminates the need to create and maintain multiple metrics,particularly if the metric and filter qualifications are complex.
For example, a revenue metric has a condition that filters for the Northeast region andthe Electronics category. With the Filter setting cleared, attributes from the metriccondition that are not on the report or in the level of the metric are not included in themetric calculation. Since the default of report level has not been changed, only theattributes on the report will affect the metric calculation, as shown in the table below.
Metric Conditions Attributes on the Report Metric Results
Region = Northeast
Category = Electronics
Category Revenue for the Electronicscategory in all regions
Region = Northeast
Category = Electronics
Call Center
Category
Revenue for all Electronics inall Call Centers in theNortheast Region
Place the metric on a report that contains Category. Revenue is calculated for theElectronics category across all regions. The metric condition for Region is not includedin the metric calculation because the Filter setting ignores any attributes in the metriccondition that are not on the report.
Place the same metric on a report that contains Call Center and Category. Revenue iscalculated for the Electronics category for all Call Centers in the Northeast Region. Themetric condition for Region is now included in the metric calculation because the Filtersetting only ignores any attributes in the metric condition that are not on the report orrelated to attributes on the report. Call Center and Region are in the same hierarchy andtherefore related.
The same metric returns different results on different reports, because the reportattributes determine which qualifications are used in the metric calculation. You couldachieve the same results with two different metrics, each with its own filter. Re-using the
Advanced Reporting Guide
54 © 2017, MicroStrategy Inc.
metric and filter decreases the time spent creating and maintaining them, especially ifthe metric and filter are more complex than this simplified example.
The following procedure re-creates the example above, in particular showing how thereport SQL is affected by the Filter setting.
For a more detailed description of metrics containing metric filters, includingexamples, see Conditional metrics, page 58.
To re-use a metric with the Filter setting
1 Create a filter with the following conditions and name it Northeast Electronics:
▫ Region = Northeast
▫ Category = Electronics
2 Create a revenue metric and use the Northeast Electronics filter as the condition.Keep the metric level set at report level. By default, the Filter setting is selected. Savethe metric asNortheast Electronics Revenue -- selected.
3 Copy the Northeast Electronics Revenue -- selected metric and rename itNortheast Electronics Revenue -- cleared. Edit the metric to clear the Filtersetting, as described below:
▫ Double-click the Northeast Electronics Revenue -- cleared metric. TheMetric Editor opens.
▫ Select Level (Dimensionality) in the breakdown window (under the headingMetric is defined as). The Definition window changes to display level options.
▫ Click Advanced in the Definition window. The Level (Dimensionality)advanced options dialog box opens.
▫ Clear the Filter setting: uncheck to exclude attributes absent inreport or level (dimensionality) check box.
▫ Click OK to return to the Metric Editor.
▫ Save and close the metric.
4 Place the Northeast Electronics Revenue -- cleared metric on a report withCategory. Switch to SQL View. As shown below, the WHERE clause does not filterfor Region:
where a11.[CATEGORY_ID] = a12.[CATEGORY_ID]and a11.[CATEGORY_ID] in (2)
This occurs because Region (or any related attributes) is not on the report or in thelevel of the metric.
5 Next, create a new report. Use the same metric, but this time add Call Center to thegrid. The WHERE clause does not filter for Category:
where a11.[CALL_CTR_ID] = a12.[CALL_CTR_ID]and a12.[REGION_ID] in (1)
Advanced Reporting Guide
© 2017, MicroStrategy Inc. 55
Again, since Category is not on the report or in the level of the metric, the Categoryqualification does not affect the metric calculation. Call Center (from the report) isrelated to Region (from the metric condition) so only Northeast is included on thereport. In both cases, the report attributes determine which qualifications are used inthe metric calculation. The same metric returns different results.
6 To finish this example, place the Northeast Electronics Revenue -- selectedmetric on a new report with Category. Both the Region and Category qualificationsare used because the metric’s qualifications are not affected by the report’s contents.
where a11.[SUBCAT_ID] = a12.[SUBCAT_ID]and a.12[CATEGORY_ID] = A.13[CATEGORY_ID]and (a11.[REGION_ID] in (1)and a12.[CATEGORY_ID] in (2))
Level metrics accepting dimensionality units toemulate MicroStrategy 6.x behaviorThe Allow other users to add extra units to this definition setting is used toemulate MicroStrategy 6.x behavior and affects only those projects that have beenupgraded from 6.x. The option indicates whether the metric accepts dimensionalityunits. It is applied to metrics used at the template level and metrics used in the filter for ametric qualification. This dimensionality is merged with the original units to completethe metric level.
This option is available on the Level (Dimensionality) advanced options dialog box, whichis accessed from the Advanced button on the Level (Dimensionality) componentwindow (shown in Elements of a metric level, page 21).
Nested metricsNested metrics, or nested aggregation metrics, are a type of simple metric, where oneaggregation function is enclosed inside another. For example:
Avg(Sum(Revenue))
The inner function Sum calculates the total for the Revenue fact, and the outer functionAvg calculates the average of that result.
Nested metrics are useful when the data warehouse does not store fact data at the levelneeded for a specific analysis, and are best used with each formula aggregated at adifferent attribute level. For information on levels, see Level metrics: Modifying thecontext of data calculations, page 19.
For example, you want to know the average revenue per category for every region. Youcan create a nested metric that first calculates the revenue for all categories, and thencalculates the average for each region. The metric is defined as:
Avg(Sum(Revenue) {~, Category}) {~, Region}
The inner formula, Sum(Revenue), calculates the revenue at the Category level. Theouter formula then calculates the average of the resulting values at the Region level. Inthe Metric Editor, the inner formula appears as a child of the outer formula, as shownbelow:
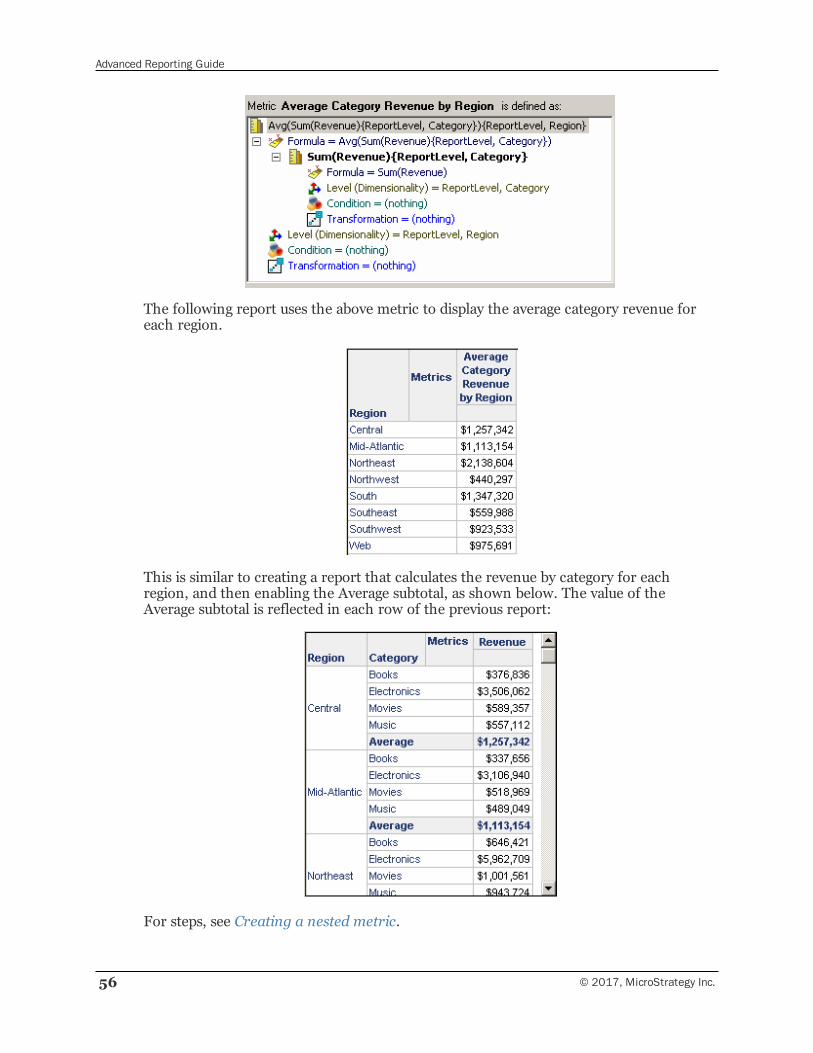
Advanced Reporting Guide
56 © 2017, MicroStrategy Inc.
The following report uses the above metric to display the average category revenue foreach region.
This is similar to creating a report that calculates the revenue by category for eachregion, and then enabling the Average subtotal, as shown below. The value of theAverage subtotal is reflected in each row of the previous report:
For steps, see Creating a nested metric.
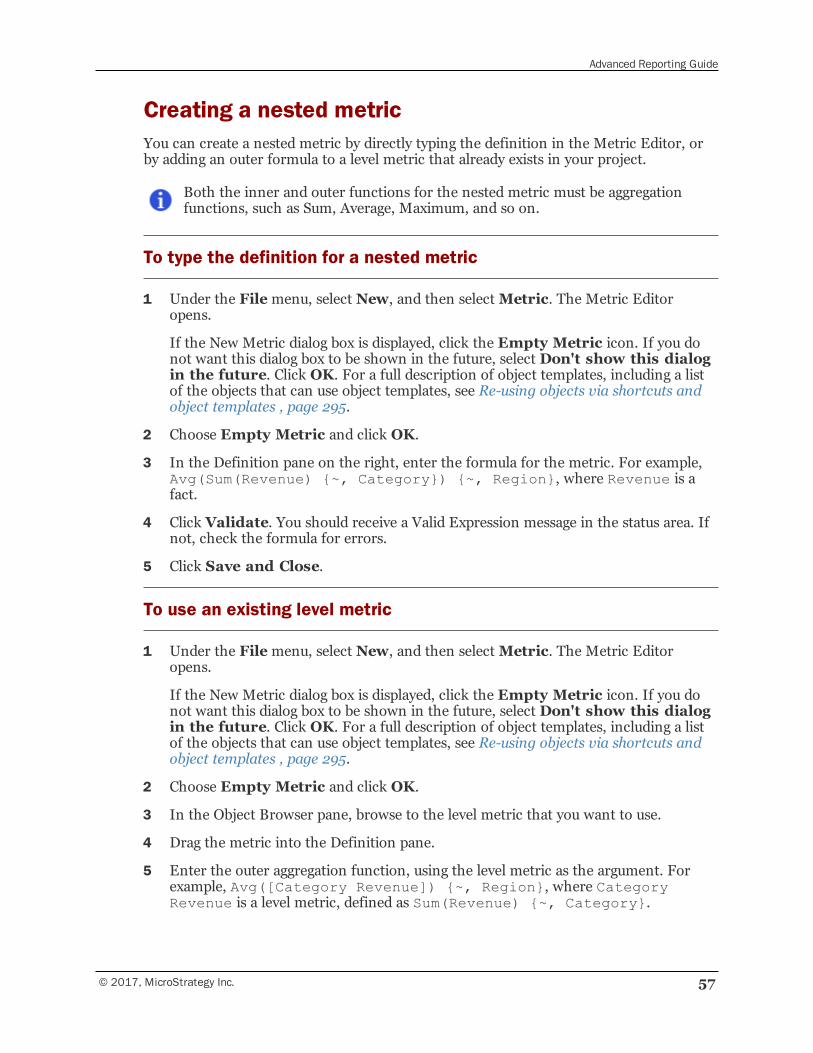
Advanced Reporting Guide
© 2017, MicroStrategy Inc. 57
Creating a nested metricYou can create a nested metric by directly typing the definition in the Metric Editor, orby adding an outer formula to a level metric that already exists in your project.
Both the inner and outer functions for the nested metric must be aggregationfunctions, such as Sum, Average, Maximum, and so on.
To type the definition for a nested metric
1 Under the Filemenu, select New, and then selectMetric. The Metric Editoropens.
If the New Metric dialog box is displayed, click the Empty Metric icon. If you donot want this dialog box to be shown in the future, select Don't show this dialogin the future. Click OK. For a full description of object templates, including a listof the objects that can use object templates, see Re-using objects via shortcuts andobject templates , page 295.
2 Choose Empty Metric and click OK.
3 In the Definition pane on the right, enter the formula for the metric. For example,Avg(Sum(Revenue) {~, Category}) {~, Region}, where Revenue is afact.
4 Click Validate. You should receive a Valid Expression message in the status area. Ifnot, check the formula for errors.
5 Click Save and Close.
To use an existing level metric
1 Under the Filemenu, select New, and then selectMetric. The Metric Editoropens.
If the New Metric dialog box is displayed, click the Empty Metric icon. If you donot want this dialog box to be shown in the future, select Don't show this dialogin the future. Click OK. For a full description of object templates, including a listof the objects that can use object templates, see Re-using objects via shortcuts andobject templates , page 295.
2 Choose Empty Metric and click OK.
3 In the Object Browser pane, browse to the level metric that you want to use.
4 Drag the metric into the Definition pane.
5 Enter the outer aggregation function, using the level metric as the argument. Forexample, Avg([Category Revenue]) {~, Region}, where CategoryRevenue is a level metric, defined as Sum(Revenue) {~, Category}.
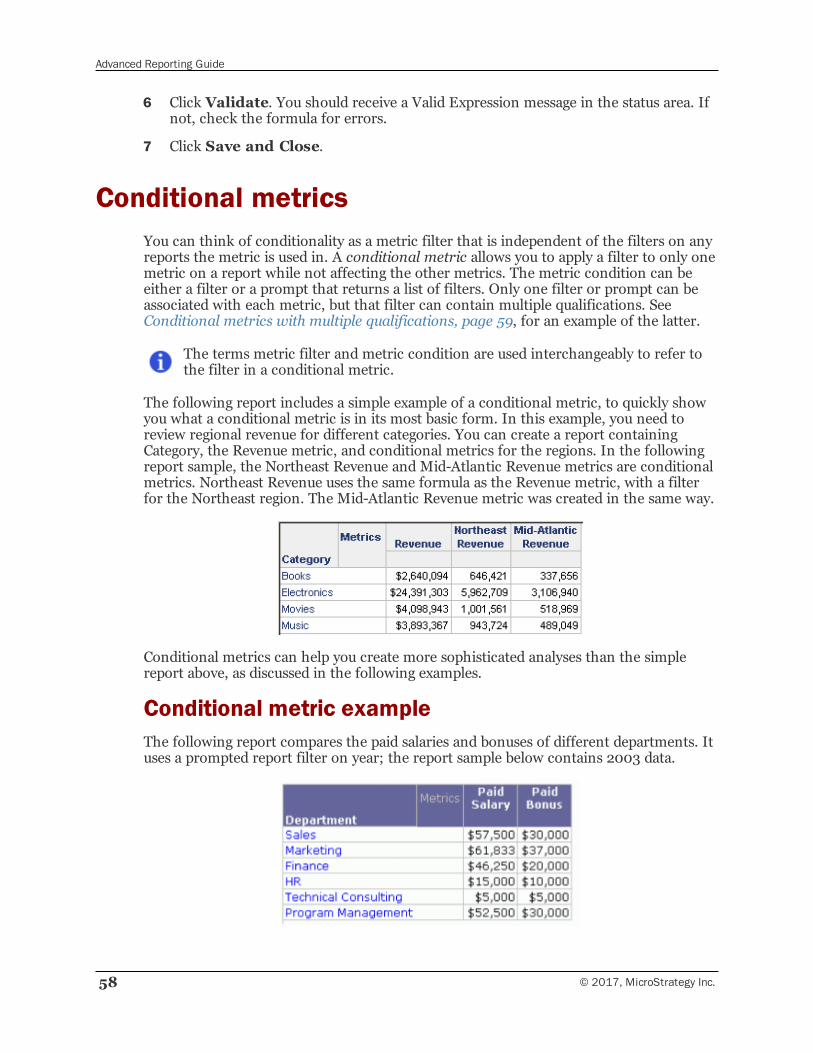
Advanced Reporting Guide
58 © 2017, MicroStrategy Inc.
6 Click Validate. You should receive a Valid Expression message in the status area. Ifnot, check the formula for errors.
7 Click Save and Close.
Conditional metricsYou can think of conditionality as a metric filter that is independent of the filters on anyreports the metric is used in. A conditional metric allows you to apply a filter to only onemetric on a report while not affecting the other metrics. The metric condition can beeither a filter or a prompt that returns a list of filters. Only one filter or prompt can beassociated with each metric, but that filter can contain multiple qualifications. SeeConditional metrics with multiple qualifications, page 59, for an example of the latter.
The terms metric filter and metric condition are used interchangeably to refer tothe filter in a conditional metric.
The following report includes a simple example of a conditional metric, to quickly showyou what a conditional metric is in its most basic form. In this example, you need toreview regional revenue for different categories. You can create a report containingCategory, the Revenue metric, and conditional metrics for the regions. In the followingreport sample, the Northeast Revenue and Mid-Atlantic Revenue metrics are conditionalmetrics. Northeast Revenue uses the same formula as the Revenue metric, with a filterfor the Northeast region. The Mid-Atlantic Revenue metric was created in the same way.
Conditional metrics can help you create more sophisticated analyses than the simplereport above, as discussed in the following examples.
Conditional metric exampleThe following report compares the paid salaries and bonuses of different departments. Ituses a prompted report filter on year; the report sample below contains 2003 data.
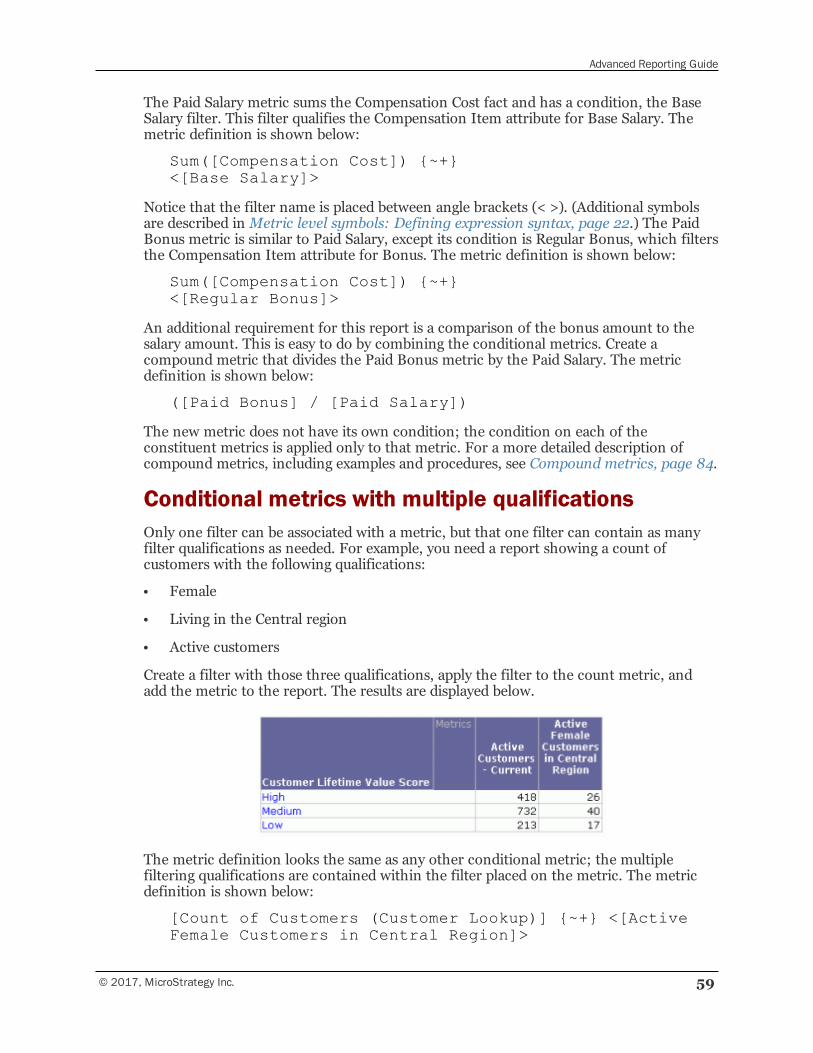
Advanced Reporting Guide
© 2017, MicroStrategy Inc. 59
The Paid Salary metric sums the Compensation Cost fact and has a condition, the BaseSalary filter. This filter qualifies the Compensation Item attribute for Base Salary. Themetric definition is shown below:
Sum([Compensation Cost]) {~+}<[Base Salary]>
Notice that the filter name is placed between angle brackets (< >). (Additional symbolsare described in Metric level symbols: Defining expression syntax, page 22.) The PaidBonus metric is similar to Paid Salary, except its condition is Regular Bonus, which filtersthe Compensation Item attribute for Bonus. The metric definition is shown below:
Sum([Compensation Cost]) {~+}<[Regular Bonus]>
An additional requirement for this report is a comparison of the bonus amount to thesalary amount. This is easy to do by combining the conditional metrics. Create acompound metric that divides the Paid Bonus metric by the Paid Salary. The metricdefinition is shown below:
([Paid Bonus] / [Paid Salary])
The new metric does not have its own condition; the condition on each of theconstituent metrics is applied only to that metric. For a more detailed description ofcompound metrics, including examples and procedures, see Compound metrics, page 84.
Conditional metrics with multiple qualificationsOnly one filter can be associated with a metric, but that one filter can contain as manyfilter qualifications as needed. For example, you need a report showing a count ofcustomers with the following qualifications:
• Female
• Living in the Central region
• Active customers
Create a filter with those three qualifications, apply the filter to the count metric, andadd the metric to the report. The results are displayed below.
The metric definition looks the same as any other conditional metric; the multiplefiltering qualifications are contained within the filter placed on the metric. The metricdefinition is shown below:
[Count of Customers (Customer Lookup)] {~+} <[ActiveFemale Customers in Central Region]>
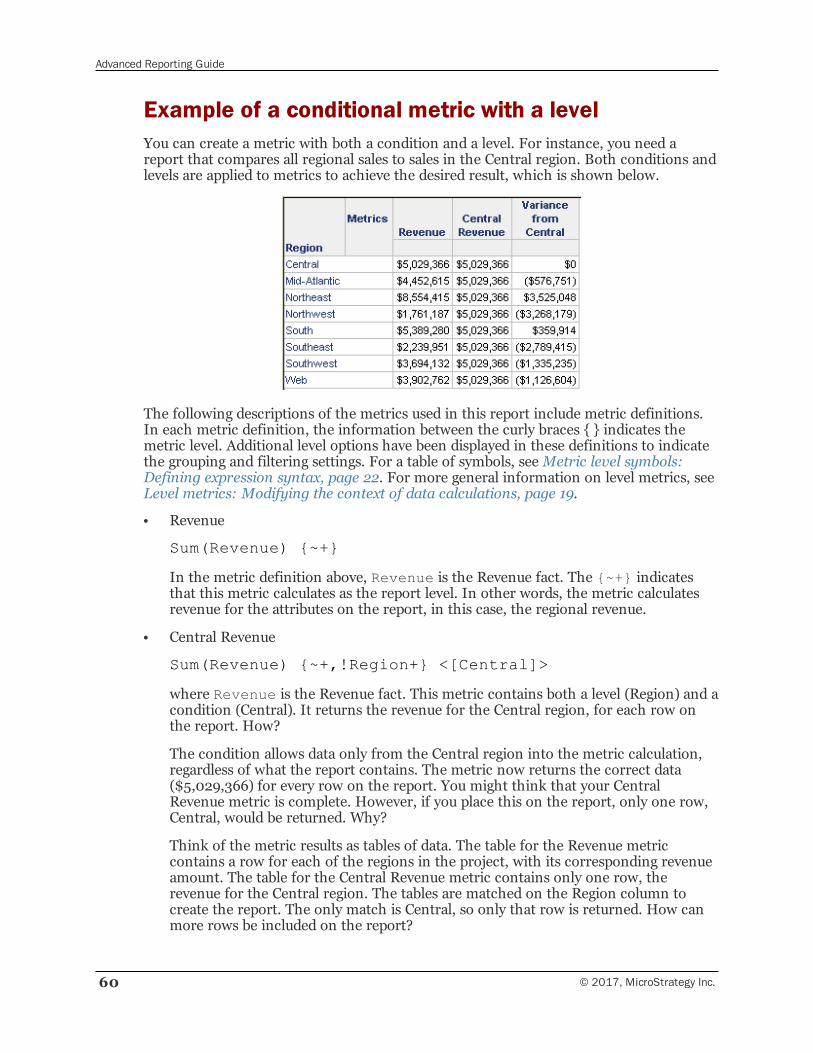
Advanced Reporting Guide
60 © 2017, MicroStrategy Inc.
Example of a conditional metric with a levelYou can create a metric with both a condition and a level. For instance, you need areport that compares all regional sales to sales in the Central region. Both conditions andlevels are applied to metrics to achieve the desired result, which is shown below.
The following descriptions of the metrics used in this report include metric definitions.In each metric definition, the information between the curly braces { } indicates themetric level. Additional level options have been displayed in these definitions to indicatethe grouping and filtering settings. For a table of symbols, seeMetric level symbols:Defining expression syntax, page 22. For more general information on level metrics, seeLevel metrics: Modifying the context of data calculations, page 19.
• Revenue
Sum(Revenue) {~+}
In the metric definition above, Revenue is the Revenue fact. The {~+} indicatesthat this metric calculates as the report level. In other words, the metric calculatesrevenue for the attributes on the report, in this case, the regional revenue.
• Central Revenue
Sum(Revenue) {~+,!Region+} <[Central]>
where Revenue is the Revenue fact. This metric contains both a level (Region) and acondition (Central). It returns the revenue for the Central region, for each row onthe report. How?
The condition allows data only from the Central region into the metric calculation,regardless of what the report contains. The metric now returns the correct data($5,029,366) for every row on the report. You might think that your CentralRevenue metric is complete. However, if you place this on the report, only one row,Central, would be returned. Why?
Think of the metric results as tables of data. The table for the Revenue metriccontains a row for each of the regions in the project, with its corresponding revenueamount. The table for the Central Revenue metric contains only one row, therevenue for the Central region. The tables are matched on the Region column tocreate the report. The only match is Central, so only that row is returned. How canmore rows be included on the report?
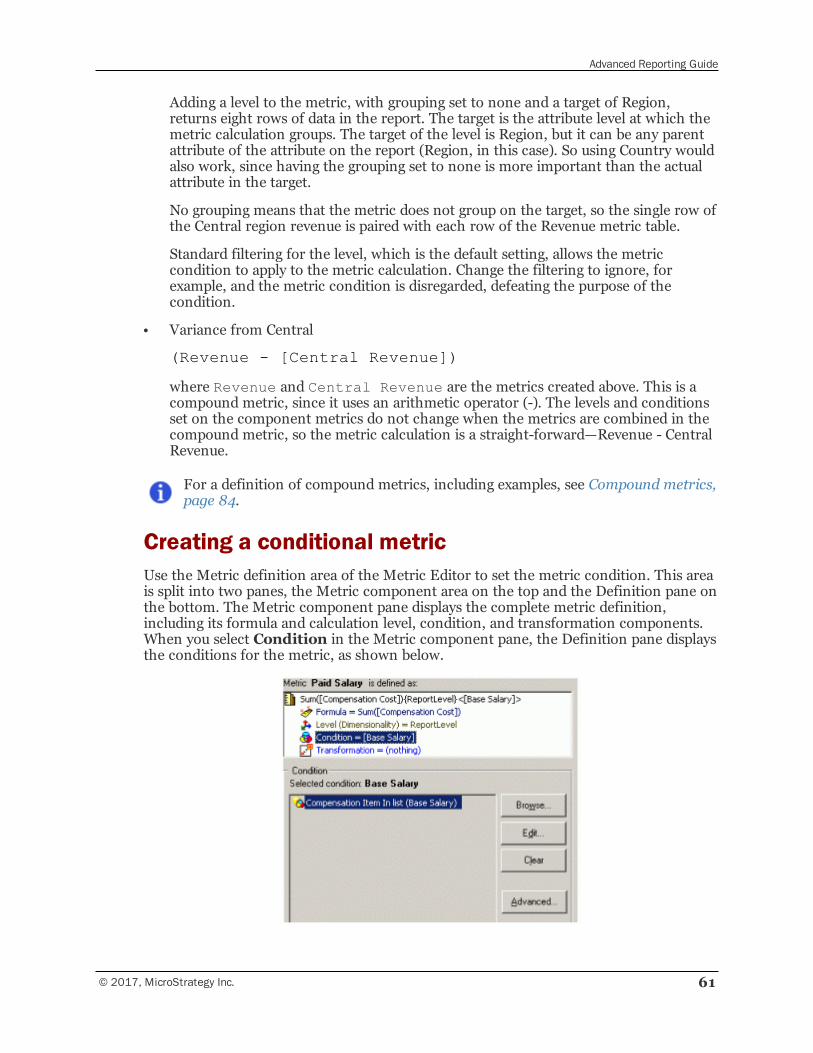
Advanced Reporting Guide
© 2017, MicroStrategy Inc. 61
Adding a level to the metric, with grouping set to none and a target of Region,returns eight rows of data in the report. The target is the attribute level at which themetric calculation groups. The target of the level is Region, but it can be any parentattribute of the attribute on the report (Region, in this case). So using Country wouldalso work, since having the grouping set to none is more important than the actualattribute in the target.
No grouping means that the metric does not group on the target, so the single row ofthe Central region revenue is paired with each row of the Revenue metric table.
Standard filtering for the level, which is the default setting, allows the metriccondition to apply to the metric calculation. Change the filtering to ignore, forexample, and the metric condition is disregarded, defeating the purpose of thecondition.
• Variance from Central
(Revenue - [Central Revenue])
where Revenue and Central Revenue are the metrics created above. This is acompound metric, since it uses an arithmetic operator (-). The levels and conditionsset on the component metrics do not change when the metrics are combined in thecompound metric, so the metric calculation is a straight-forward—Revenue - CentralRevenue.
For a definition of compound metrics, including examples, see Compound metrics,page 84.
Creating a conditional metricUse the Metric definition area of the Metric Editor to set the metric condition. This areais split into two panes, the Metric component area on the top and the Definition pane onthe bottom. The Metric component pane displays the complete metric definition,including its formula and calculation level, condition, and transformation components.When you select Condition in the Metric component pane, the Definition pane displaysthe conditions for the metric, as shown below.
Advanced Reporting Guide
62 © 2017, MicroStrategy Inc.
The steps below show you how to use the Metric Editor to create conditional metrics.The Metric Editor can be used to modify simple and compound metrics.
Rather than using the Metric Editor to apply a filter to a single metric, you can use theAdvanced Metric Assistant to combine multiple, simple metrics with multiple filters. Thiscan help reduce the time required to create the conditional metrics for a project, asdescribed in Creating metrics by combining metrics, filters, and transformations, page87.
You can also create, edit, or delete multiple metrics at the same time by using aCommand Manager script. Command Manager is a MicroStrategy tool designed toautomate certain tasks and processes. For more information about CommandManager, including steps to use Command Manager scripts, see the CommandManager chapter of the System Administration Guide.
To create a conditional metric
1 In MicroStrategy Developer, from the Filemenu, point to New and selectMetric.The Metric Editor opens.
If the New Metric dialog box is displayed, click the Empty Metric icon. If you donot want this dialog box to be shown in the future, select Don't show this dialogin the future. Click OK. For a full description of object templates, including a listof the objects that can use object templates, see Re-using objects via shortcuts andobject templates , page 295.
2 Create the metric formula by adding facts, attributes, metrics, operators, and/orfunctions. For example, to create the Paid Salary metric shown above, add theCompensation Cost fact from the Object Browser. The Sum function is automaticallyadded. For detailed procedures to create basic metrics, see the Building QueryObjects and Queries, for Designers chapter in the Basic Reporting Guide.
You can set conditionality for simple metrics but not for compound metrics.The formula of a simple metric is based on group functions (such as sum oraverage). For a quick review of simple metrics and formulas, see Before youbegin, page 17. For a more detailed description of simple metrics, includingexamples, see the Basic Reporting Guide.
3 Click Condition on the Metric component pane (located under the heading “Metric(metric name) is defined as”). The Condition definition pane displays below theMetric component pane.
4 Select the filter or prompt to place on the metric using one of the followingmethods:
▫ Use the Object Browser to locate the object, then drag it into the Conditiondefinition pane.
▫ Click Browse. The Select a Filter dialog box opens, allowing you to select a filterfrom the displayed list, or navigate to locate the correct filter.
Advanced Reporting Guide
© 2017, MicroStrategy Inc. 63
To see object prompts in the dialog box, select Object Prompt in theObjects of type list. Only an object prompt, which allows you to choose afilter, can be used as a metric condition.
5 To modify a filter or prompt, select it and click Edit. The Filter Editor or PromptGeneration Wizard opens. After you complete your changes, click Save and Close(in the Filter Editor) or Finish (in the Prompt Generation Wizard) to return to theMetric Editor.
6 To remove a filter, select it and click Clear.
7 Save the metric.
The Advanced button accesses the Condition advanced options dialog box. Theadvanced options govern the interaction of conditional metrics and report filters,as described in Conditional metric and report filter interactions, page 63,Conditional metric and report filter interactions, page 63 and Conditional metricand report filter interactions, page 63.
Conditional metric and report filter interactionsWhen a report contains a filter and a conditional metric, the report filter and the filtercontained in the metric (the metric filter or metric condition) interact to produce thedata for the conditional metric. The advanced options for the conditional metricestablish this interaction. These options are described below.
• The Embedding method, page 63 determines how the filters are merged by settingwhich filter is evaluated first. By default, the report filter is applied first.
• The Remove related report filter elements, page 67 option is used when the reportfilter includes a qualification that uses an attribute related to an attribute in themetric condition. By default, the related attributes in the report filter are ignored.
These options are dependent on one another; although they each affect the filterinteraction differently, they also work together. After you understand the optionsseparately, refer to Combining the embedding method and remove related elementssettings, page 69 to learn how they come together to affect the conditional metricresults.
Embedding method
Merging the report filter and the metric filter (also known as the metric condition) isaccomplished by embedding one filter in the other or by embedding both filters in a new,empty filter. The options are described below.
The following diagrams represent the logic of the calculations, not the actual datavalues calculated by the conditional metric. The cross-hatched area represents theresults of the conditional metric, indicating that results are calculated in eachscenario. The cross-hatching is not meant to represent that those results willnecessarily be identical sets of data.
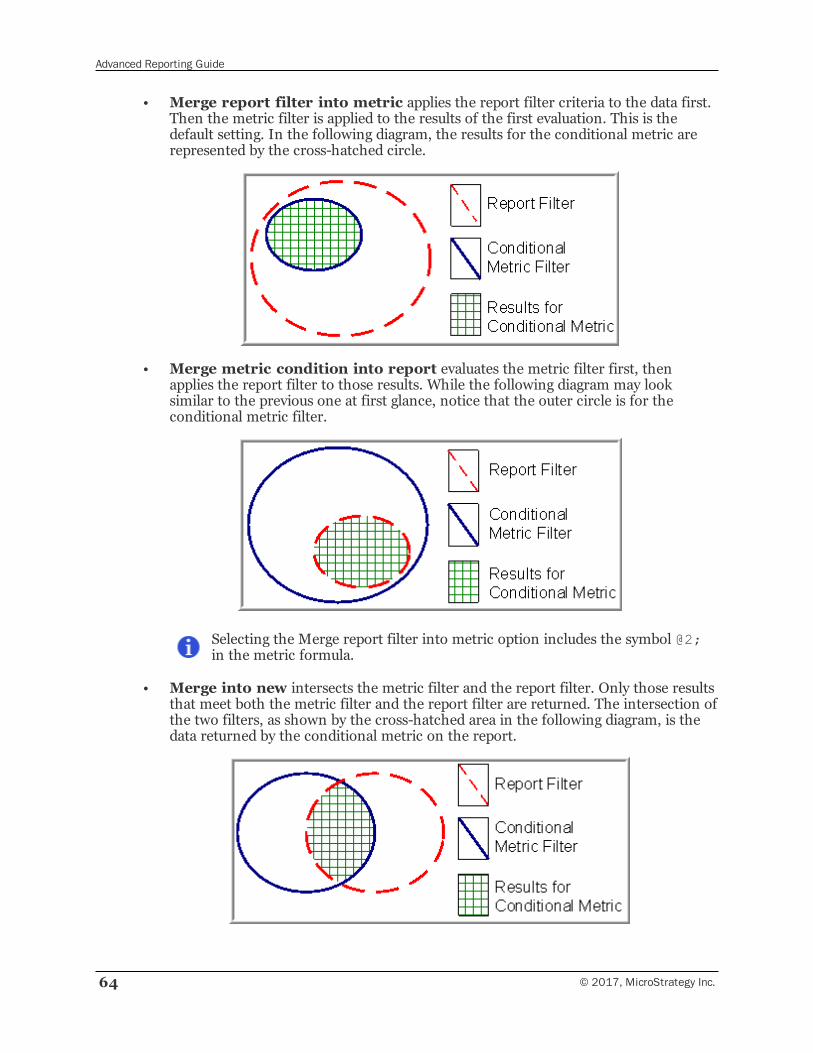
Advanced Reporting Guide
64 © 2017, MicroStrategy Inc.
• Merge report filter into metric applies the report filter criteria to the data first.Then the metric filter is applied to the results of the first evaluation. This is thedefault setting. In the following diagram, the results for the conditional metric arerepresented by the cross-hatched circle.
• Merge metric condition into report evaluates the metric filter first, thenapplies the report filter to those results. While the following diagram may looksimilar to the previous one at first glance, notice that the outer circle is for theconditional metric filter.
Selecting the Merge report filter into metric option includes the symbol @2;in the metric formula.
• Merge into new intersects the metric filter and the report filter. Only those resultsthat meet both the metric filter and the report filter are returned. The intersection ofthe two filters, as shown by the cross-hatched area in the following diagram, is thedata returned by the conditional metric on the report.
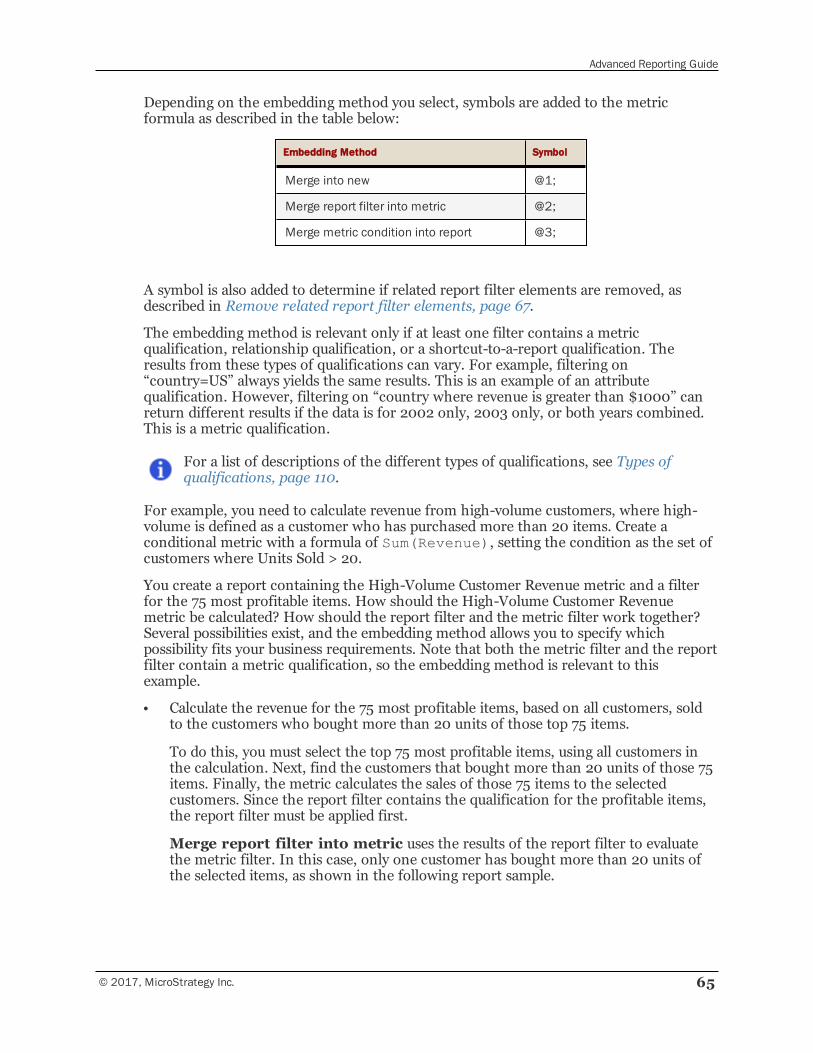
Advanced Reporting Guide
© 2017, MicroStrategy Inc. 65
Depending on the embedding method you select, symbols are added to the metricformula as described in the table below:
Embedding Method Symbol
Merge into new @1;
Merge report filter into metric @2;
Merge metric condition into report @3;
A symbol is also added to determine if related report filter elements are removed, asdescribed in Remove related report filter elements, page 67.
The embedding method is relevant only if at least one filter contains a metricqualification, relationship qualification, or a shortcut-to-a-report qualification. Theresults from these types of qualifications can vary. For example, filtering on“country=US” always yields the same results. This is an example of an attributequalification. However, filtering on “country where revenue is greater than $1000” canreturn different results if the data is for 2002 only, 2003 only, or both years combined.This is a metric qualification.
For a list of descriptions of the different types of qualifications, see Types ofqualifications, page 110.
For example, you need to calculate revenue from high-volume customers, where high-volume is defined as a customer who has purchased more than 20 items. Create aconditional metric with a formula of Sum(Revenue), setting the condition as the set ofcustomers where Units Sold > 20.
You create a report containing the High-Volume Customer Revenue metric and a filterfor the 75 most profitable items. How should the High-Volume Customer Revenuemetric be calculated? How should the report filter and the metric filter work together?Several possibilities exist, and the embedding method allows you to specify whichpossibility fits your business requirements. Note that both the metric filter and the reportfilter contain a metric qualification, so the embedding method is relevant to thisexample.
• Calculate the revenue for the 75 most profitable items, based on all customers, soldto the customers who bought more than 20 units of those top 75 items.
To do this, you must select the top 75 most profitable items, using all customers inthe calculation. Next, find the customers that bought more than 20 units of those 75items. Finally, the metric calculates the sales of those 75 items to the selectedcustomers. Since the report filter contains the qualification for the profitable items,the report filter must be applied first.
Merge report filter into metric uses the results of the report filter to evaluatethe metric filter. In this case, only one customer has bought more than 20 units ofthe selected items, as shown in the following report sample.
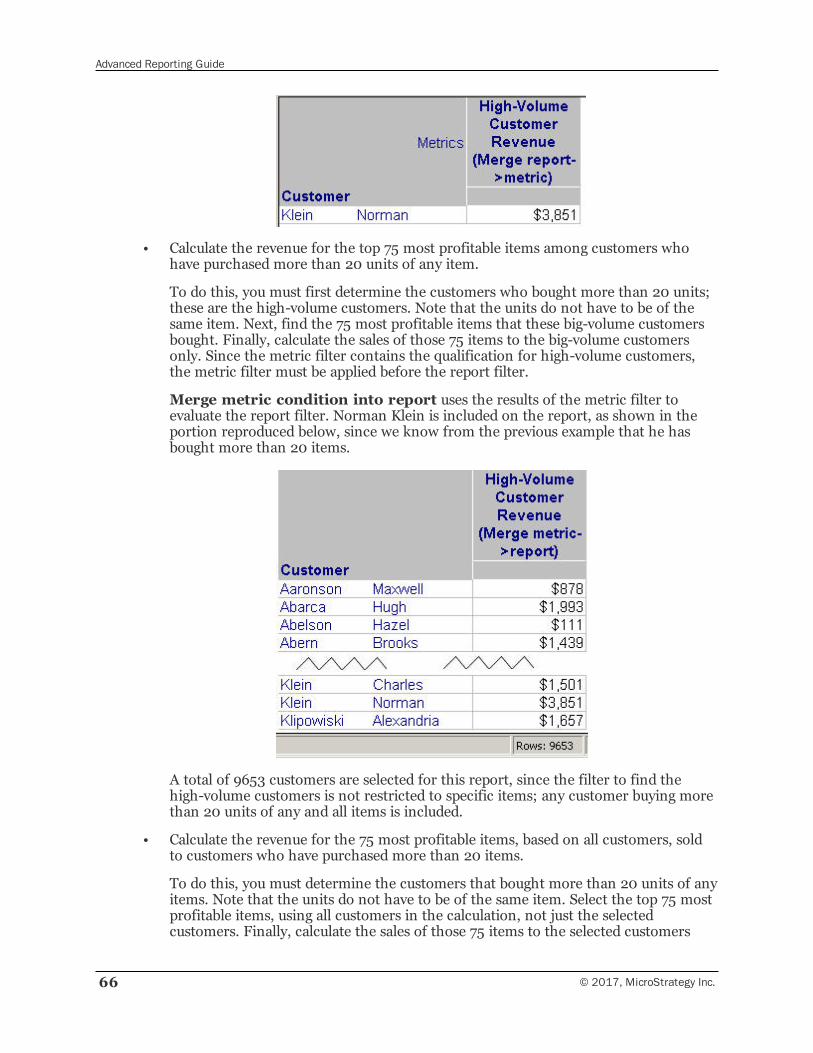
Advanced Reporting Guide
66 © 2017, MicroStrategy Inc.
• Calculate the revenue for the top 75 most profitable items among customers whohave purchased more than 20 units of any item.
To do this, you must first determine the customers who bought more than 20 units;these are the high-volume customers. Note that the units do not have to be of thesame item. Next, find the 75 most profitable items that these big-volume customersbought. Finally, calculate the sales of those 75 items to the big-volume customersonly. Since the metric filter contains the qualification for high-volume customers,the metric filter must be applied before the report filter.
Merge metric condition into report uses the results of the metric filter toevaluate the report filter. Norman Klein is included on the report, as shown in theportion reproduced below, since we know from the previous example that he hasbought more than 20 items.
A total of 9653 customers are selected for this report, since the filter to find thehigh-volume customers is not restricted to specific items; any customer buying morethan 20 units of any and all items is included.
• Calculate the revenue for the 75 most profitable items, based on all customers, soldto customers who have purchased more than 20 items.
To do this, you must determine the customers that bought more than 20 units of anyitems. Note that the units do not have to be of the same item. Select the top 75 mostprofitable items, using all customers in the calculation, not just the selectedcustomers. Finally, calculate the sales of those 75 items to the selected customers
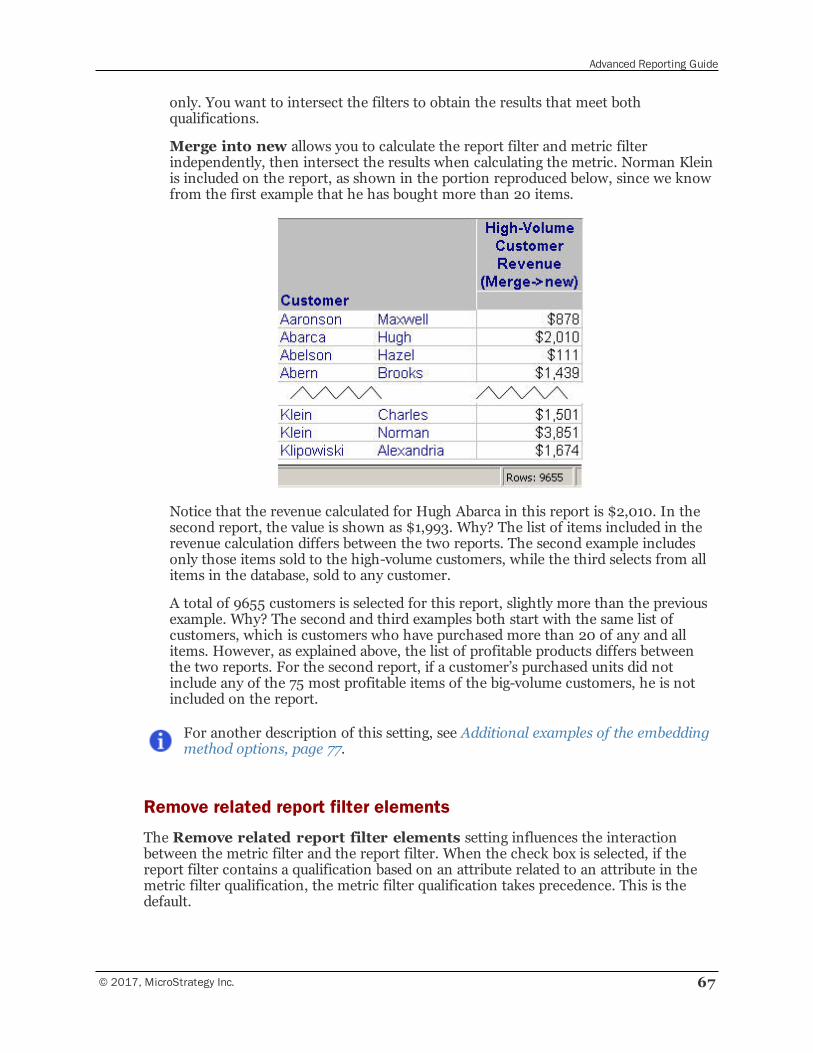
Advanced Reporting Guide
© 2017, MicroStrategy Inc. 67
only. You want to intersect the filters to obtain the results that meet bothqualifications.
Merge into new allows you to calculate the report filter and metric filterindependently, then intersect the results when calculating the metric. Norman Kleinis included on the report, as shown in the portion reproduced below, since we knowfrom the first example that he has bought more than 20 items.
Notice that the revenue calculated for Hugh Abarca in this report is $2,010. In thesecond report, the value is shown as $1,993. Why? The list of items included in therevenue calculation differs between the two reports. The second example includesonly those items sold to the high-volume customers, while the third selects from allitems in the database, sold to any customer.
A total of 9655 customers is selected for this report, slightly more than the previousexample. Why? The second and third examples both start with the same list ofcustomers, which is customers who have purchased more than 20 of any and allitems. However, as explained above, the list of profitable products differs betweenthe two reports. For the second report, if a customer’s purchased units did notinclude any of the 75 most profitable items of the big-volume customers, he is notincluded on the report.
For another description of this setting, see Additional examples of the embeddingmethod options, page 77.
Remove related report filter elements
The Remove related report filter elements setting influences the interactionbetween the metric filter and the report filter. When the check box is selected, if thereport filter contains a qualification based on an attribute related to an attribute in themetric filter qualification, the metric filter qualification takes precedence. This is thedefault.
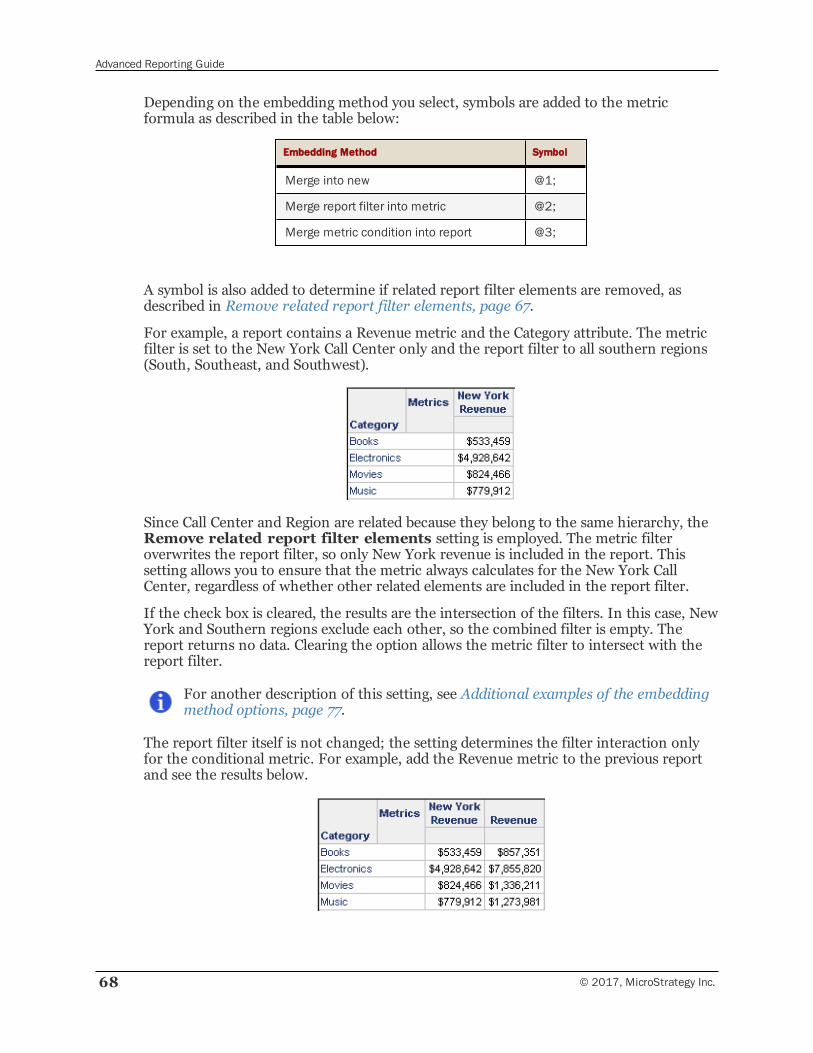
Advanced Reporting Guide
68 © 2017, MicroStrategy Inc.
Depending on the embedding method you select, symbols are added to the metricformula as described in the table below:
Embedding Method Symbol
Merge into new @1;
Merge report filter into metric @2;
Merge metric condition into report @3;
A symbol is also added to determine if related report filter elements are removed, asdescribed in Remove related report filter elements, page 67.
For example, a report contains a Revenue metric and the Category attribute. The metricfilter is set to the New York Call Center only and the report filter to all southern regions(South, Southeast, and Southwest).
Since Call Center and Region are related because they belong to the same hierarchy, theRemove related report filter elements setting is employed. The metric filteroverwrites the report filter, so only New York revenue is included in the report. Thissetting allows you to ensure that the metric always calculates for the New York CallCenter, regardless of whether other related elements are included in the report filter.
If the check box is cleared, the results are the intersection of the filters. In this case, NewYork and Southern regions exclude each other, so the combined filter is empty. Thereport returns no data. Clearing the option allows the metric filter to intersect with thereport filter.
For another description of this setting, see Additional examples of the embeddingmethod options, page 77.
The report filter itself is not changed; the setting determines the filter interaction onlyfor the conditional metric. For example, add the Revenue metric to the previous reportand see the results below.
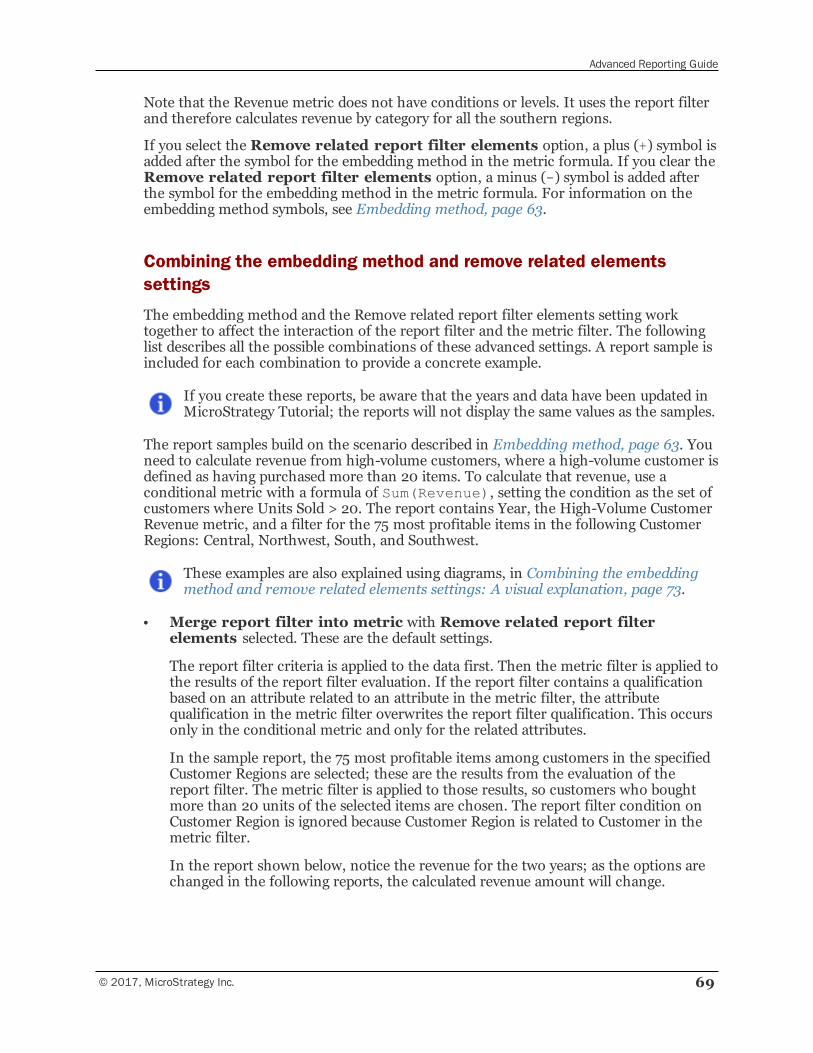
Advanced Reporting Guide
© 2017, MicroStrategy Inc. 69
Note that the Revenue metric does not have conditions or levels. It uses the report filterand therefore calculates revenue by category for all the southern regions.
If you select the Remove related report filter elements option, a plus (+) symbol isadded after the symbol for the embedding method in the metric formula. If you clear theRemove related report filter elements option, a minus (-) symbol is added afterthe symbol for the embedding method in the metric formula. For information on theembedding method symbols, see Embedding method, page 63.
Combining the embedding method and remove related elementssettings
The embedding method and the Remove related report filter elements setting worktogether to affect the interaction of the report filter and the metric filter. The followinglist describes all the possible combinations of these advanced settings. A report sample isincluded for each combination to provide a concrete example.
If you create these reports, be aware that the years and data have been updated inMicroStrategy Tutorial; the reports will not display the same values as the samples.
The report samples build on the scenario described in Embedding method, page 63. Youneed to calculate revenue from high-volume customers, where a high-volume customer isdefined as having purchased more than 20 items. To calculate that revenue, use aconditional metric with a formula of Sum(Revenue), setting the condition as the set ofcustomers where Units Sold > 20. The report contains Year, the High-Volume CustomerRevenue metric, and a filter for the 75 most profitable items in the following CustomerRegions: Central, Northwest, South, and Southwest.
These examples are also explained using diagrams, in Combining the embeddingmethod and remove related elements settings: A visual explanation, page 73.
• Merge report filter into metric with Remove related report filterelements selected. These are the default settings.
The report filter criteria is applied to the data first. Then the metric filter is applied tothe results of the report filter evaluation. If the report filter contains a qualificationbased on an attribute related to an attribute in the metric filter, the attributequalification in the metric filter overwrites the report filter qualification. This occursonly in the conditional metric and only for the related attributes.
In the sample report, the 75 most profitable items among customers in the specifiedCustomer Regions are selected; these are the results from the evaluation of thereport filter. The metric filter is applied to those results, so customers who boughtmore than 20 units of the selected items are chosen. The report filter condition onCustomer Region is ignored because Customer Region is related to Customer in themetric filter.
In the report shown below, notice the revenue for the two years; as the options arechanged in the following reports, the calculated revenue amount will change.
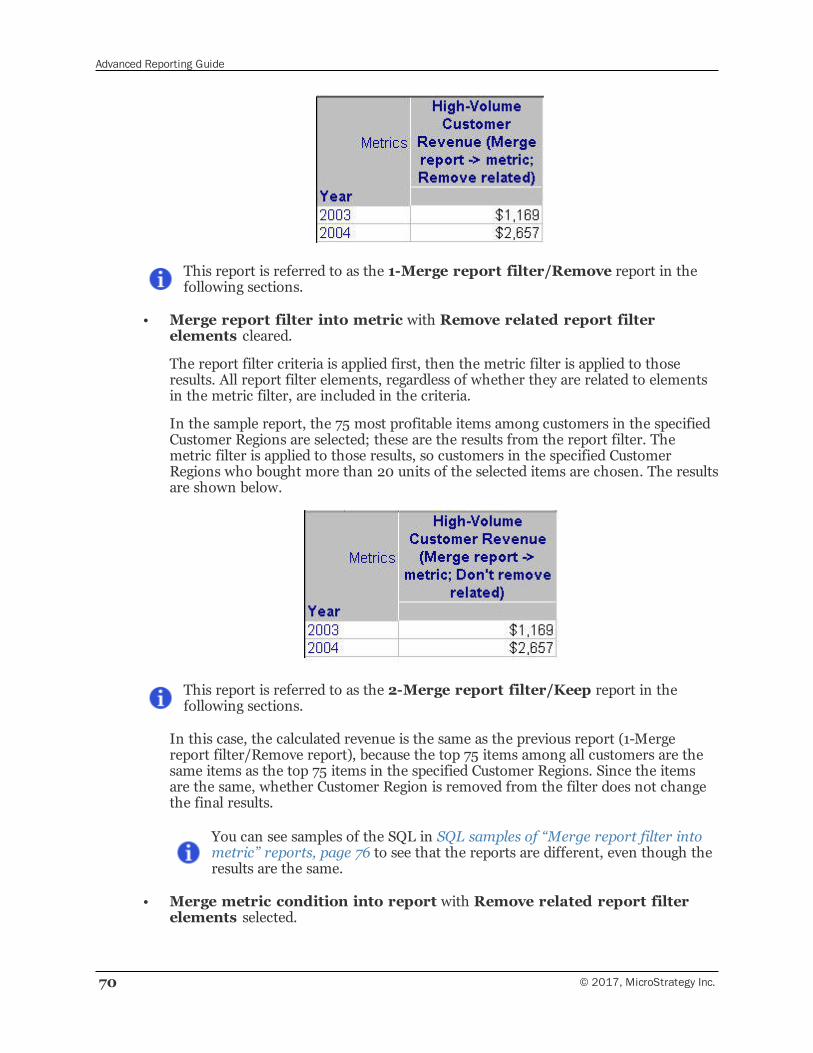
Advanced Reporting Guide
70 © 2017, MicroStrategy Inc.
This report is referred to as the 1-Merge report filter/Remove report in thefollowing sections.
• Merge report filter into metric with Remove related report filterelements cleared.
The report filter criteria is applied first, then the metric filter is applied to thoseresults. All report filter elements, regardless of whether they are related to elementsin the metric filter, are included in the criteria.
In the sample report, the 75 most profitable items among customers in the specifiedCustomer Regions are selected; these are the results from the report filter. Themetric filter is applied to those results, so customers in the specified CustomerRegions who bought more than 20 units of the selected items are chosen. The resultsare shown below.
This report is referred to as the 2-Merge report filter/Keep report in thefollowing sections.
In this case, the calculated revenue is the same as the previous report (1-Mergereport filter/Remove report), because the top 75 items among all customers are thesame items as the top 75 items in the specified Customer Regions. Since the itemsare the same, whether Customer Region is removed from the filter does not changethe final results.
You can see samples of the SQL in SQL samples of “Merge report filter intometric” reports, page 76 to see that the reports are different, even though theresults are the same.
• Merge metric condition into report with Remove related report filterelements selected.
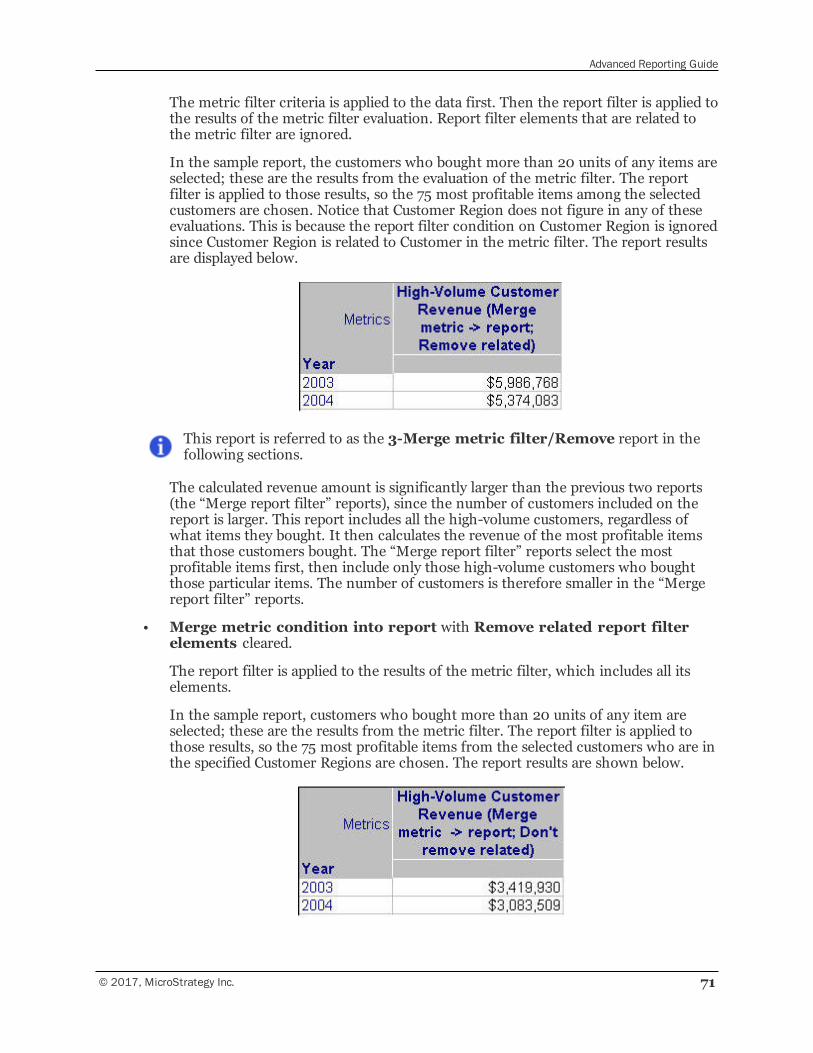
Advanced Reporting Guide
© 2017, MicroStrategy Inc. 71
The metric filter criteria is applied to the data first. Then the report filter is applied tothe results of the metric filter evaluation. Report filter elements that are related tothe metric filter are ignored.
In the sample report, the customers who bought more than 20 units of any items areselected; these are the results from the evaluation of the metric filter. The reportfilter is applied to those results, so the 75 most profitable items among the selectedcustomers are chosen. Notice that Customer Region does not figure in any of theseevaluations. This is because the report filter condition on Customer Region is ignoredsince Customer Region is related to Customer in the metric filter. The report resultsare displayed below.
This report is referred to as the 3-Merge metric filter/Remove report in thefollowing sections.
The calculated revenue amount is significantly larger than the previous two reports(the “Merge report filter” reports), since the number of customers included on thereport is larger. This report includes all the high-volume customers, regardless ofwhat items they bought. It then calculates the revenue of the most profitable itemsthat those customers bought. The “Merge report filter” reports select the mostprofitable items first, then include only those high-volume customers who boughtthose particular items. The number of customers is therefore smaller in the “Mergereport filter” reports.
• Merge metric condition into report with Remove related report filterelements cleared.
The report filter is applied to the results of the metric filter, which includes all itselements.
In the sample report, customers who bought more than 20 units of any item areselected; these are the results from the metric filter. The report filter is applied tothose results, so the 75 most profitable items from the selected customers who are inthe specified Customer Regions are chosen. The report results are shown below.
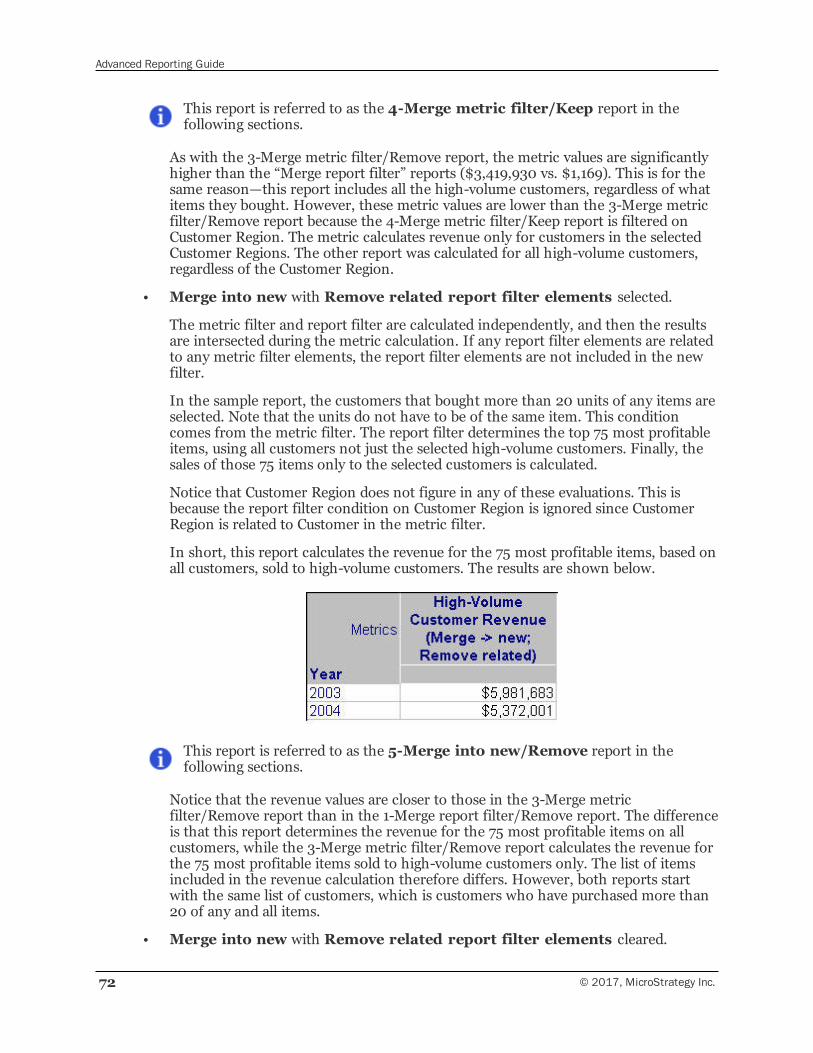
Advanced Reporting Guide
72 © 2017, MicroStrategy Inc.
This report is referred to as the 4-Merge metric filter/Keep report in thefollowing sections.
As with the 3-Merge metric filter/Remove report, the metric values are significantlyhigher than the “Merge report filter” reports ($3,419,930 vs. $1,169). This is for thesame reason—this report includes all the high-volume customers, regardless of whatitems they bought. However, these metric values are lower than the 3-Merge metricfilter/Remove report because the 4-Merge metric filter/Keep report is filtered onCustomer Region. The metric calculates revenue only for customers in the selectedCustomer Regions. The other report was calculated for all high-volume customers,regardless of the Customer Region.
• Merge into new with Remove related report filter elements selected.
The metric filter and report filter are calculated independently, and then the resultsare intersected during the metric calculation. If any report filter elements are relatedto any metric filter elements, the report filter elements are not included in the newfilter.
In the sample report, the customers that bought more than 20 units of any items areselected. Note that the units do not have to be of the same item. This conditioncomes from the metric filter. The report filter determines the top 75 most profitableitems, using all customers not just the selected high-volume customers. Finally, thesales of those 75 items only to the selected customers is calculated.
Notice that Customer Region does not figure in any of these evaluations. This isbecause the report filter condition on Customer Region is ignored since CustomerRegion is related to Customer in the metric filter.
In short, this report calculates the revenue for the 75 most profitable items, based onall customers, sold to high-volume customers. The results are shown below.
This report is referred to as the 5-Merge into new/Remove report in thefollowing sections.
Notice that the revenue values are closer to those in the 3-Merge metricfilter/Remove report than in the 1-Merge report filter/Remove report. The differenceis that this report determines the revenue for the 75 most profitable items on allcustomers, while the 3-Merge metric filter/Remove report calculates the revenue forthe 75 most profitable items sold to high-volume customers only. The list of itemsincluded in the revenue calculation therefore differs. However, both reports startwith the same list of customers, which is customers who have purchased more than20 of any and all items.
• Merge into new with Remove related report filter elements cleared.
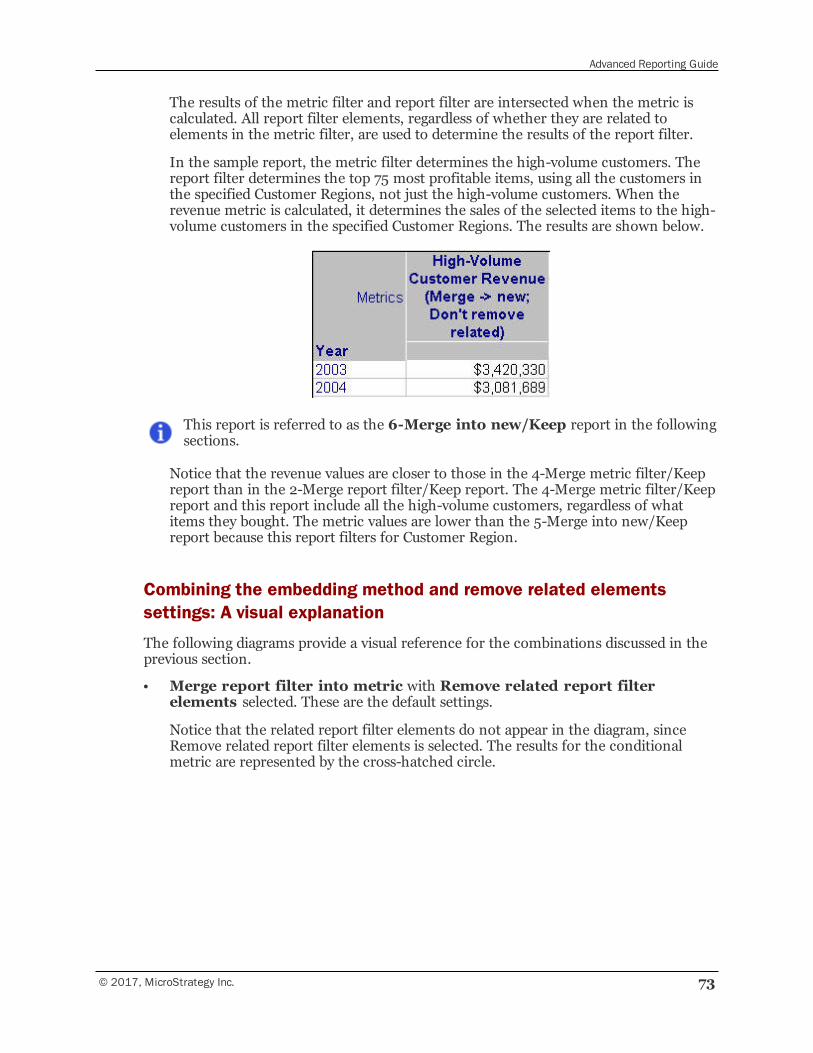
Advanced Reporting Guide
© 2017, MicroStrategy Inc. 73
The results of the metric filter and report filter are intersected when the metric iscalculated. All report filter elements, regardless of whether they are related toelements in the metric filter, are used to determine the results of the report filter.
In the sample report, the metric filter determines the high-volume customers. Thereport filter determines the top 75 most profitable items, using all the customers inthe specified Customer Regions, not just the high-volume customers. When therevenue metric is calculated, it determines the sales of the selected items to the high-volume customers in the specified Customer Regions. The results are shown below.
This report is referred to as the 6-Merge into new/Keep report in the followingsections.
Notice that the revenue values are closer to those in the 4-Merge metric filter/Keepreport than in the 2-Merge report filter/Keep report. The 4-Merge metric filter/Keepreport and this report include all the high-volume customers, regardless of whatitems they bought. The metric values are lower than the 5-Merge into new/Keepreport because this report filters for Customer Region.
Combining the embedding method and remove related elementssettings: A visual explanation
The following diagrams provide a visual reference for the combinations discussed in theprevious section.
• Merge report filter into metric with Remove related report filterelements selected. These are the default settings.
Notice that the related report filter elements do not appear in the diagram, sinceRemove related report filter elements is selected. The results for the conditionalmetric are represented by the cross-hatched circle.
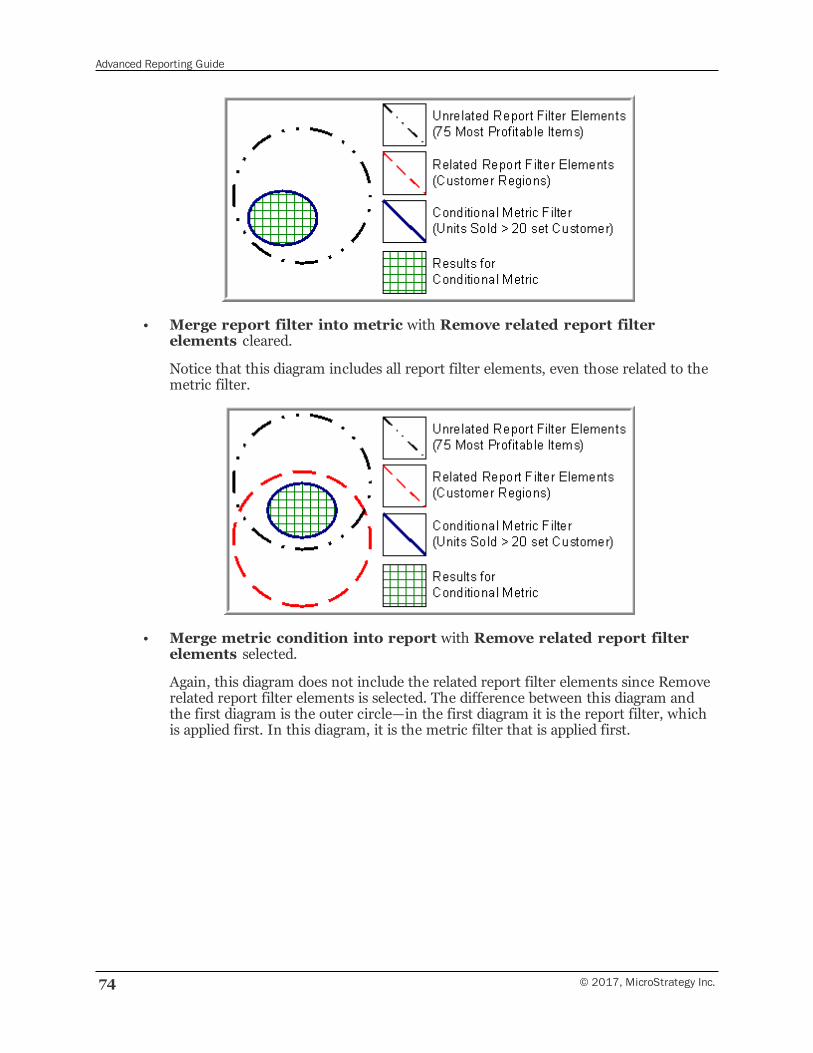
Advanced Reporting Guide
74 © 2017, MicroStrategy Inc.
• Merge report filter into metric with Remove related report filterelements cleared.
Notice that this diagram includes all report filter elements, even those related to themetric filter.
• Merge metric condition into report with Remove related report filterelements selected.
Again, this diagram does not include the related report filter elements since Removerelated report filter elements is selected. The difference between this diagram andthe first diagram is the outer circle—in the first diagram it is the report filter, whichis applied first. In this diagram, it is the metric filter that is applied first.
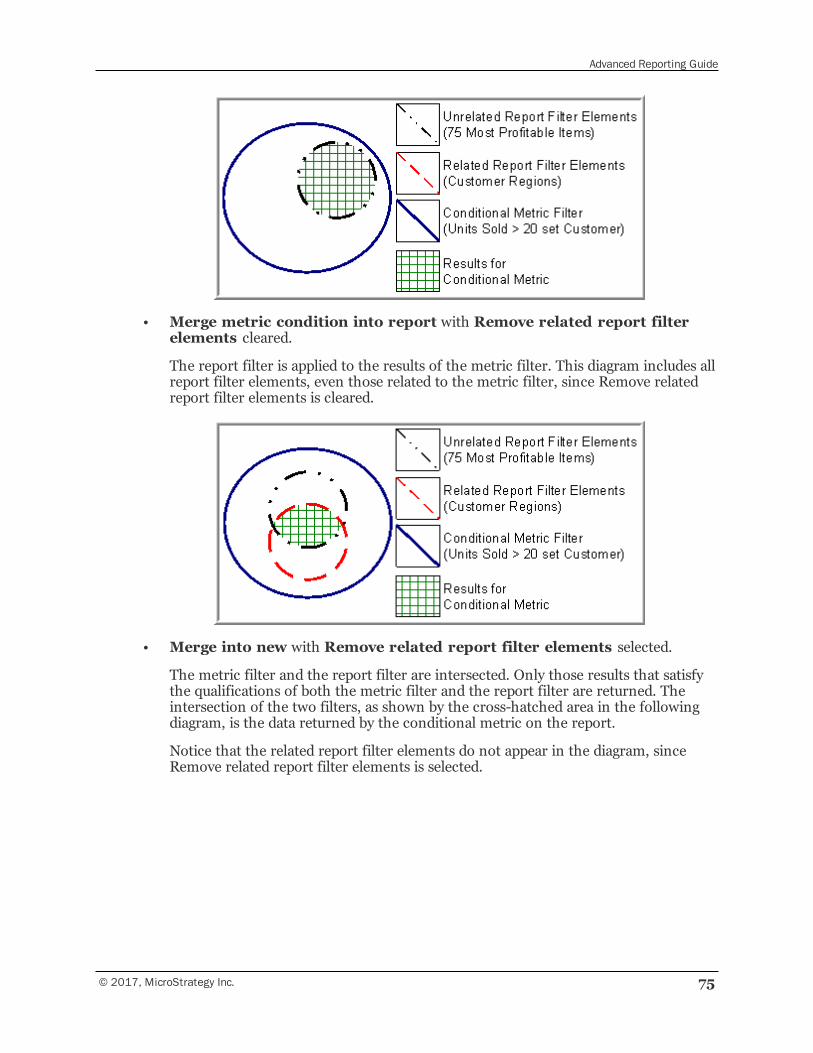
Advanced Reporting Guide
© 2017, MicroStrategy Inc. 75
• Merge metric condition into report with Remove related report filterelements cleared.
The report filter is applied to the results of the metric filter. This diagram includes allreport filter elements, even those related to the metric filter, since Remove relatedreport filter elements is cleared.
• Merge into new with Remove related report filter elements selected.
The metric filter and the report filter are intersected. Only those results that satisfythe qualifications of both the metric filter and the report filter are returned. Theintersection of the two filters, as shown by the cross-hatched area in the followingdiagram, is the data returned by the conditional metric on the report.
Notice that the related report filter elements do not appear in the diagram, sinceRemove related report filter elements is selected.
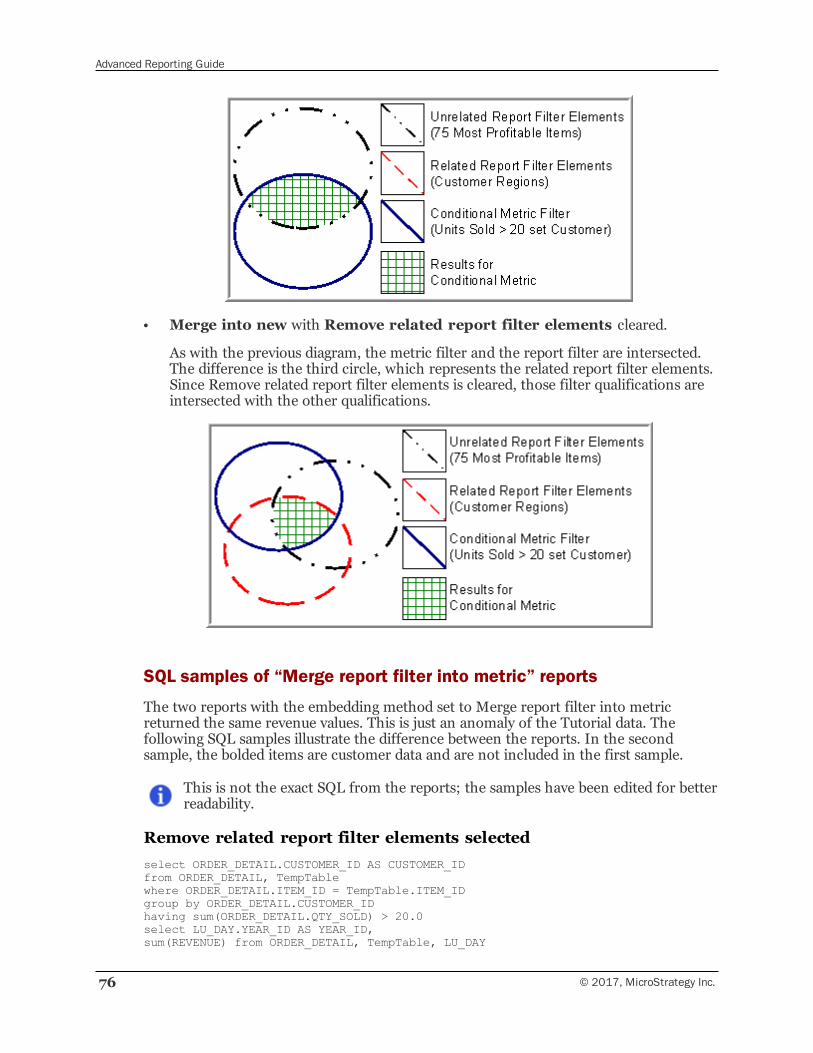
Advanced Reporting Guide
76 © 2017, MicroStrategy Inc.
• Merge into new with Remove related report filter elements cleared.
As with the previous diagram, the metric filter and the report filter are intersected.The difference is the third circle, which represents the related report filter elements.Since Remove related report filter elements is cleared, those filter qualifications areintersected with the other qualifications.
SQL samples of “Merge report filter into metric” reports
The two reports with the embedding method set to Merge report filter into metricreturned the same revenue values. This is just an anomaly of the Tutorial data. Thefollowing SQL samples illustrate the difference between the reports. In the secondsample, the bolded items are customer data and are not included in the first sample.
This is not the exact SQL from the reports; the samples have been edited for betterreadability.
Remove related report filter elements selectedselect ORDER_DETAIL.CUSTOMER_ID AS CUSTOMER_IDfrom ORDER_DETAIL, TempTablewhere ORDER_DETAIL.ITEM_ID = TempTable.ITEM_IDgroup by ORDER_DETAIL.CUSTOMER_IDhaving sum(ORDER_DETAIL.QTY_SOLD) > 20.0select LU_DAY.YEAR_ID AS YEAR_ID,sum(REVENUE) from ORDER_DETAIL, TempTable, LU_DAY
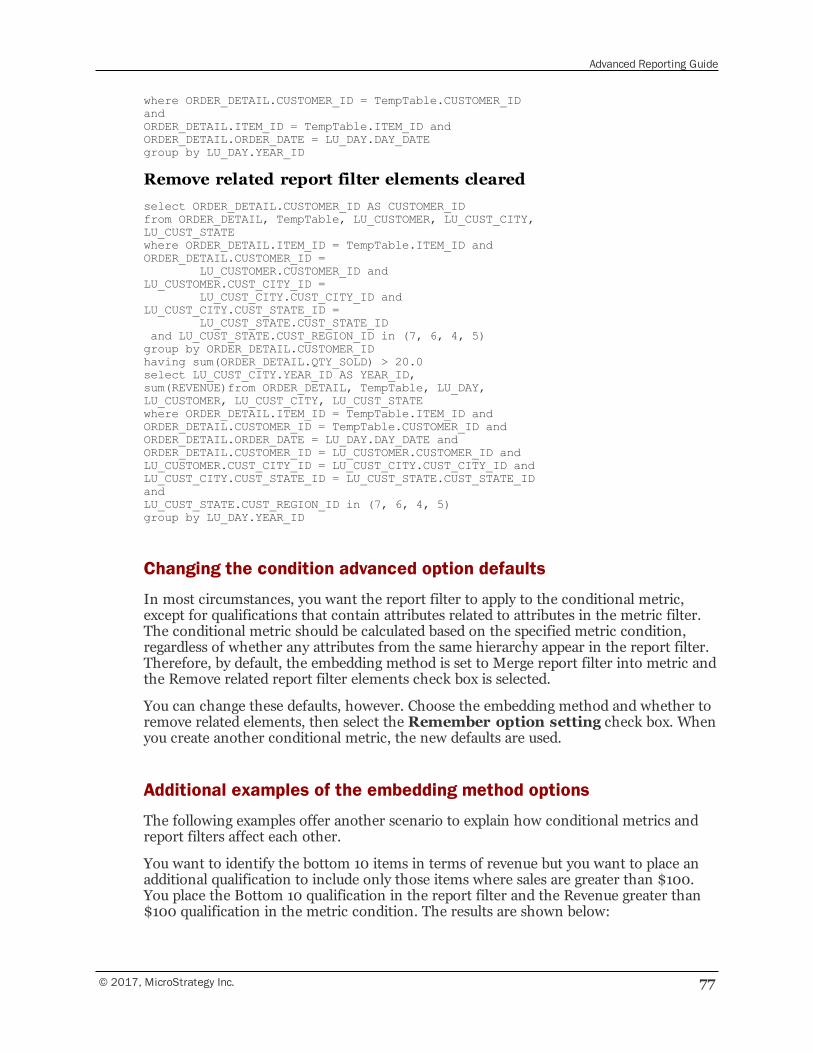
Advanced Reporting Guide
© 2017, MicroStrategy Inc. 77
where ORDER_DETAIL.CUSTOMER_ID = TempTable.CUSTOMER_IDandORDER_DETAIL.ITEM_ID = TempTable.ITEM_ID andORDER_DETAIL.ORDER_DATE = LU_DAY.DAY_DATEgroup by LU_DAY.YEAR_ID
Remove related report filter elements clearedselect ORDER_DETAIL.CUSTOMER_ID AS CUSTOMER_IDfrom ORDER_DETAIL, TempTable, LU_CUSTOMER, LU_CUST_CITY,LU_CUST_STATEwhere ORDER_DETAIL.ITEM_ID = TempTable.ITEM_ID andORDER_DETAIL.CUSTOMER_ID =
LU_CUSTOMER.CUSTOMER_ID andLU_CUSTOMER.CUST_CITY_ID =
LU_CUST_CITY.CUST_CITY_ID andLU_CUST_CITY.CUST_STATE_ID =
LU_CUST_STATE.CUST_STATE_IDand LU_CUST_STATE.CUST_REGION_ID in (7, 6, 4, 5)group by ORDER_DETAIL.CUSTOMER_IDhaving sum(ORDER_DETAIL.QTY_SOLD) > 20.0select LU_CUST_CITY.YEAR_ID AS YEAR_ID,sum(REVENUE)from ORDER_DETAIL, TempTable, LU_DAY,LU_CUSTOMER, LU_CUST_CITY, LU_CUST_STATEwhere ORDER_DETAIL.ITEM_ID = TempTable.ITEM_ID andORDER_DETAIL.CUSTOMER_ID = TempTable.CUSTOMER_ID andORDER_DETAIL.ORDER_DATE = LU_DAY.DAY_DATE andORDER_DETAIL.CUSTOMER_ID = LU_CUSTOMER.CUSTOMER_ID andLU_CUSTOMER.CUST_CITY_ID = LU_CUST_CITY.CUST_CITY_ID andLU_CUST_CITY.CUST_STATE_ID = LU_CUST_STATE.CUST_STATE_IDandLU_CUST_STATE.CUST_REGION_ID in (7, 6, 4, 5)group by LU_DAY.YEAR_ID
Changing the condition advanced option defaults
In most circumstances, you want the report filter to apply to the conditional metric,except for qualifications that contain attributes related to attributes in the metric filter.The conditional metric should be calculated based on the specified metric condition,regardless of whether any attributes from the same hierarchy appear in the report filter.Therefore, by default, the embedding method is set to Merge report filter into metric andthe Remove related report filter elements check box is selected.
You can change these defaults, however. Choose the embedding method and whether toremove related elements, then select the Remember option setting check box. Whenyou create another conditional metric, the new defaults are used.
Additional examples of the embedding method options
The following examples offer another scenario to explain how conditional metrics andreport filters affect each other.
You want to identify the bottom 10 items in terms of revenue but you want to place anadditional qualification to include only those items where sales are greater than $100.You place the Bottom 10 qualification in the report filter and the Revenue greater than$100 qualification in the metric condition. The results are shown below:
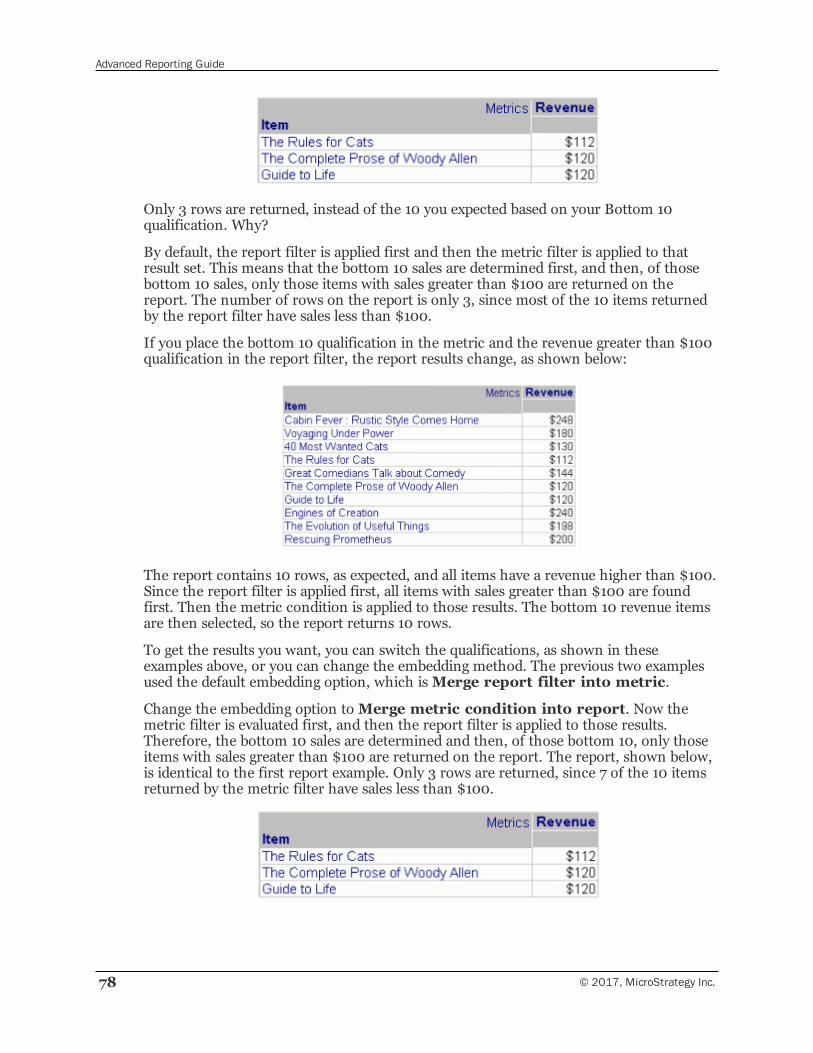
Advanced Reporting Guide
78 © 2017, MicroStrategy Inc.
Only 3 rows are returned, instead of the 10 you expected based on your Bottom 10qualification. Why?
By default, the report filter is applied first and then the metric filter is applied to thatresult set. This means that the bottom 10 sales are determined first, and then, of thosebottom 10 sales, only those items with sales greater than $100 are returned on thereport. The number of rows on the report is only 3, since most of the 10 items returnedby the report filter have sales less than $100.
If you place the bottom 10 qualification in the metric and the revenue greater than $100qualification in the report filter, the report results change, as shown below:
The report contains 10 rows, as expected, and all items have a revenue higher than $100.Since the report filter is applied first, all items with sales greater than $100 are foundfirst. Then the metric condition is applied to those results. The bottom 10 revenue itemsare then selected, so the report returns 10 rows.
To get the results you want, you can switch the qualifications, as shown in theseexamples above, or you can change the embedding method. The previous two examplesused the default embedding option, which isMerge report filter into metric.
Change the embedding option toMerge metric condition into report. Now themetric filter is evaluated first, and then the report filter is applied to those results.Therefore, the bottom 10 sales are determined and then, of those bottom 10, only thoseitems with sales greater than $100 are returned on the report. The report, shown below,is identical to the first report example. Only 3 rows are returned, since 7 of the 10 itemsreturned by the metric filter have sales less than $100.
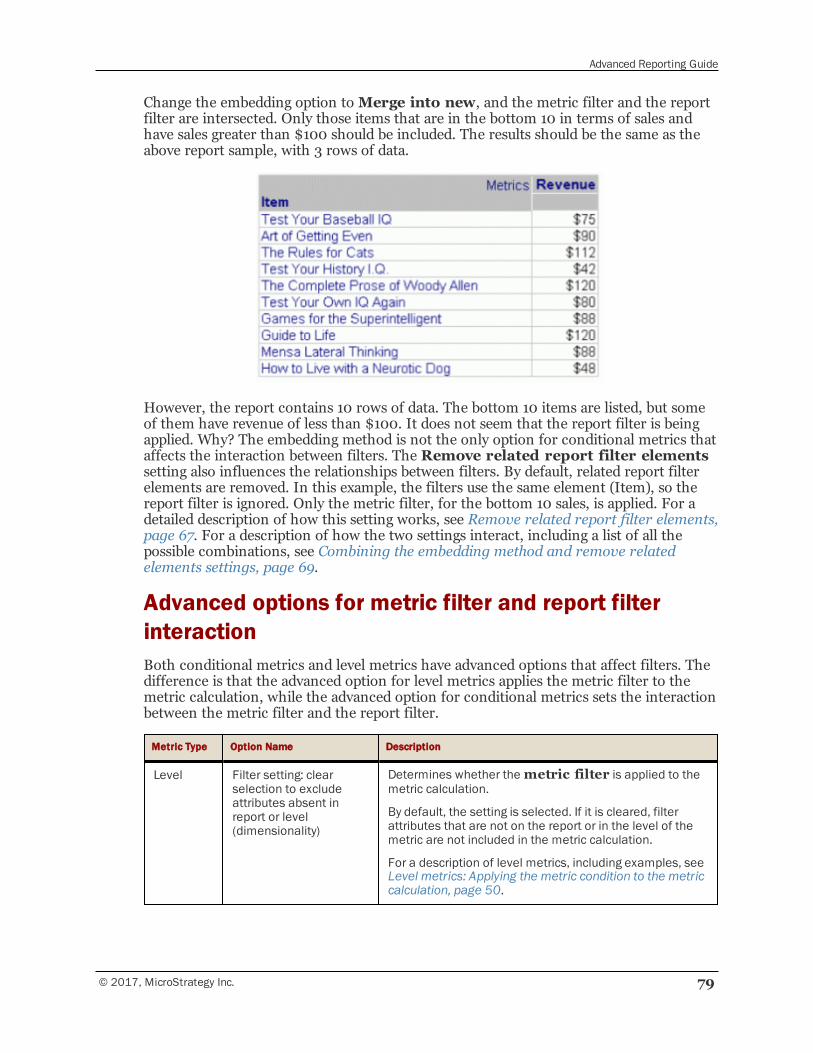
Advanced Reporting Guide
© 2017, MicroStrategy Inc. 79
Change the embedding option toMerge into new, and the metric filter and the reportfilter are intersected. Only those items that are in the bottom 10 in terms of sales andhave sales greater than $100 should be included. The results should be the same as theabove report sample, with 3 rows of data.
However, the report contains 10 rows of data. The bottom 10 items are listed, but someof them have revenue of less than $100. It does not seem that the report filter is beingapplied. Why? The embedding method is not the only option for conditional metrics thataffects the interaction between filters. The Remove related report filter elementssetting also influences the relationships between filters. By default, related report filterelements are removed. In this example, the filters use the same element (Item), so thereport filter is ignored. Only the metric filter, for the bottom 10 sales, is applied. For adetailed description of how this setting works, see Remove related report filter elements,page 67. For a description of how the two settings interact, including a list of all thepossible combinations, see Combining the embedding method and remove relatedelements settings, page 69.
Advanced options for metric filter and report filterinteractionBoth conditional metrics and level metrics have advanced options that affect filters. Thedifference is that the advanced option for level metrics applies the metric filter to themetric calculation, while the advanced option for conditional metrics sets the interactionbetween the metric filter and the report filter.
Metric Type Option Name Description
Level Filter setting: clearselection to excludeattributes absent inreport or level(dimensionality)
Determines whether the metric filter is applied to themetric calculation.
By default, the setting is selected. If it is cleared, filterattributes that are not on the report or in the level of themetric are not included in the metric calculation.
For a description of level metrics, including examples, seeLevel metrics: Applying the metric condition to the metriccalculation, page 50.
Advanced Reporting Guide
80 © 2017, MicroStrategy Inc.
Metric Type Option Name Description
Conditional Remove related reportfilter elements
Influences the interaction between the metric filter and thereport filter.
By default, the setting is selected. If the report filtercontains a qualification based on an attribute related to anattribute in the metric filter qualification, the metric filterqualification takes precedence.
For a more detailed description of how this setting workswith the report filter, including examples, see Conditionalmetric and report filter interactions, page 63.
Transformation metrics: Time-based and othercomparisons
You need to compare business unit costs on a quarterly basis. For example, the businessunit costs are represented by the Account Amount fact, which is the actual amount ofeach recorded transaction. To calculate the Account Amount, create the followingmetric, called Actual Amount, to calculate the dollar value of the accounts:
Sum([Account Amount]) {~+}
To count last quarter’s costs, you apply a transformation to your Account Amountmetric. A transformation maps a specified time period to another time period. In otherwords, it applies an offset value, such as current quarter minus one quarter.
Transformation-style analysis can also be supported using the Lag and Lead functionsprovided with MicroStrategy. These functions can be used to define metrics thatcompare values from different time periods without the use of transformation objects.For information on using these functions to support transformation-style analysis, seethe Functions Reference.
Time-based transformationsTime transformations are used in metrics to compare values at different times, such asthis year versus last year or current date versus month-to-date. The last yeartransformation maps each time period to its corresponding time period last year, whilethe month-to-date transformation maps each time period to a set of time periods thatcomprise the entire month to date.
MicroStrategy provides numerous prebuilt transformations, although you can create yourown as needed. One of the MicroStrategy-provided transformations answers our needsfor the following example.
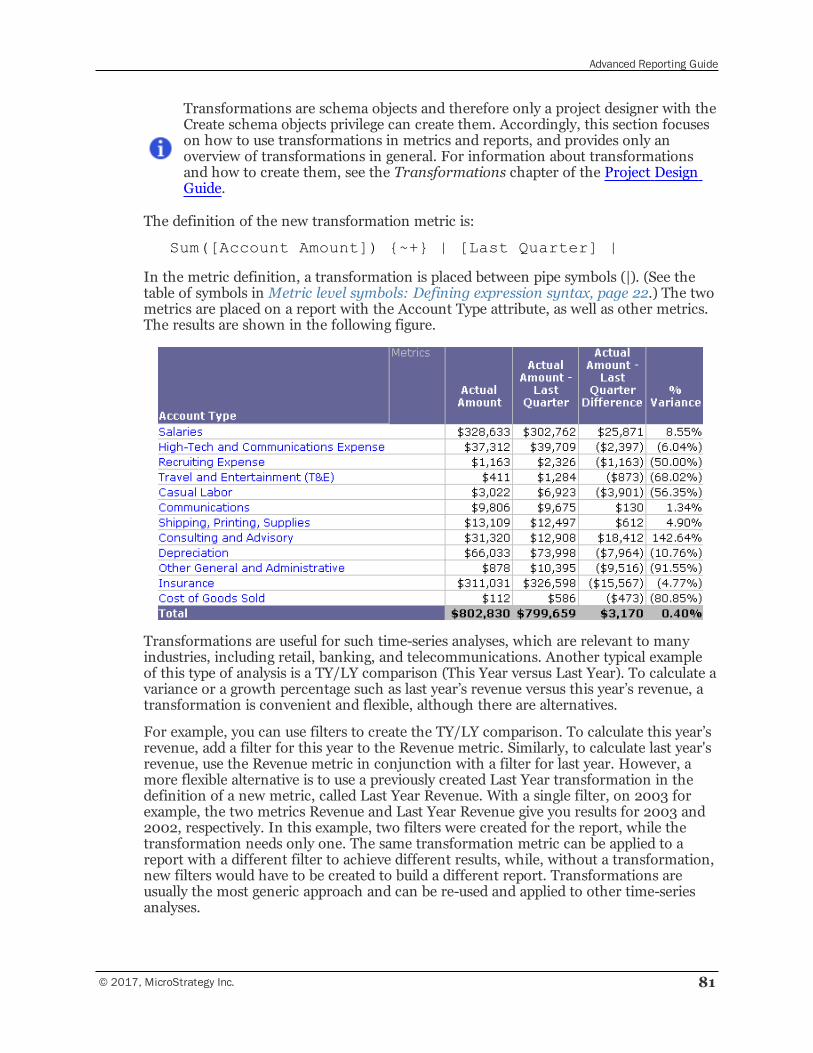
Advanced Reporting Guide
© 2017, MicroStrategy Inc. 81
Transformations are schema objects and therefore only a project designer with theCreate schema objects privilege can create them. Accordingly, this section focuseson how to use transformations in metrics and reports, and provides only anoverview of transformations in general. For information about transformationsand how to create them, see the Transformations chapter of the Project DesignGuide.
The definition of the new transformation metric is:
Sum([Account Amount]) {~+} | [Last Quarter] |
In the metric definition, a transformation is placed between pipe symbols (|). (See thetable of symbols in Metric level symbols: Defining expression syntax, page 22.) The twometrics are placed on a report with the Account Type attribute, as well as other metrics.The results are shown in the following figure.
Transformations are useful for such time-series analyses, which are relevant to manyindustries, including retail, banking, and telecommunications. Another typical exampleof this type of analysis is a TY/LY comparison (This Year versus Last Year). To calculate avariance or a growth percentage such as last year’s revenue versus this year’s revenue, atransformation is convenient and flexible, although there are alternatives.
For example, you can use filters to create the TY/LY comparison. To calculate this year’srevenue, add a filter for this year to the Revenue metric. Similarly, to calculate last year'srevenue, use the Revenue metric in conjunction with a filter for last year. However, amore flexible alternative is to use a previously created Last Year transformation in thedefinition of a new metric, called Last Year Revenue. With a single filter, on 2003 forexample, the two metrics Revenue and Last Year Revenue give you results for 2003 and2002, respectively. In this example, two filters were created for the report, while thetransformation needs only one. The same transformation metric can be applied to areport with a different filter to achieve different results, while, without a transformation,new filters would have to be created to build a different report. Transformations areusually the most generic approach and can be re-used and applied to other time-seriesanalyses.
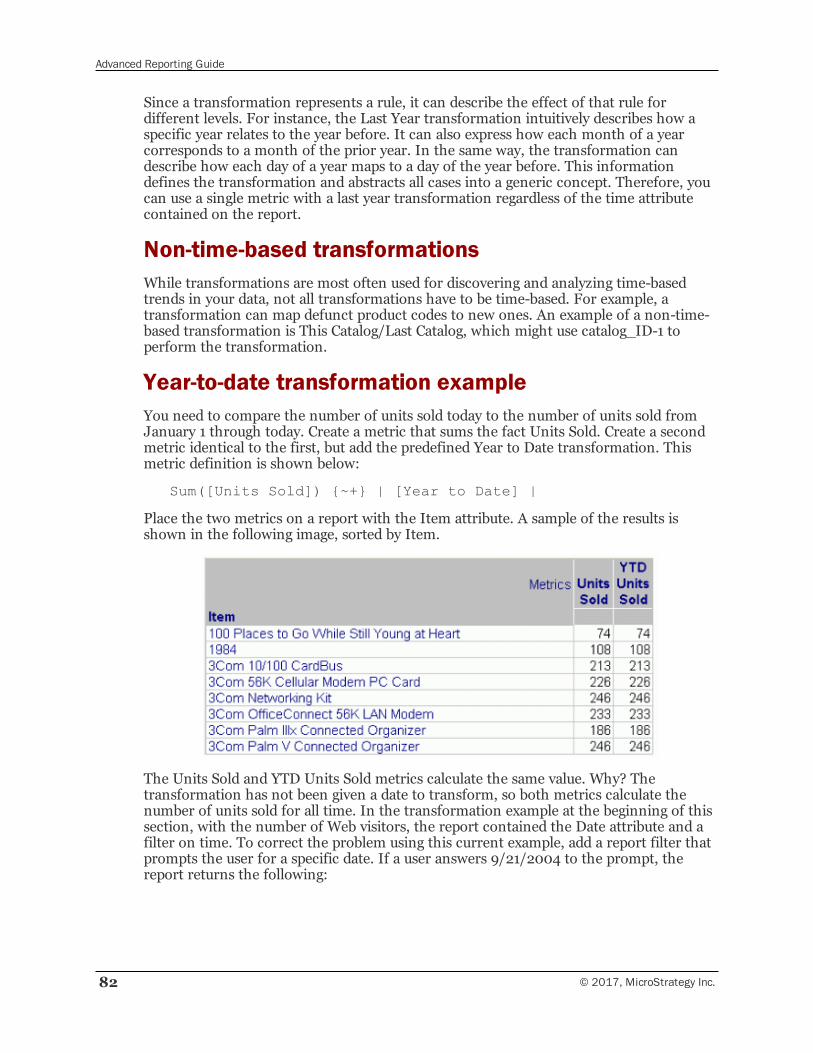
Advanced Reporting Guide
82 © 2017, MicroStrategy Inc.
Since a transformation represents a rule, it can describe the effect of that rule fordifferent levels. For instance, the Last Year transformation intuitively describes how aspecific year relates to the year before. It can also express how each month of a yearcorresponds to a month of the prior year. In the same way, the transformation candescribe how each day of a year maps to a day of the year before. This informationdefines the transformation and abstracts all cases into a generic concept. Therefore, youcan use a single metric with a last year transformation regardless of the time attributecontained on the report.
Non-time-based transformationsWhile transformations are most often used for discovering and analyzing time-basedtrends in your data, not all transformations have to be time-based. For example, atransformation can map defunct product codes to new ones. An example of a non-time-based transformation is This Catalog/Last Catalog, which might use catalog_ID-1 toperform the transformation.
Year-to-date transformation exampleYou need to compare the number of units sold today to the number of units sold fromJanuary 1 through today. Create a metric that sums the fact Units Sold. Create a secondmetric identical to the first, but add the predefined Year to Date transformation. Thismetric definition is shown below:
Sum([Units Sold]) {~+} | [Year to Date] |
Place the two metrics on a report with the Item attribute. A sample of the results isshown in the following image, sorted by Item.
The Units Sold and YTD Units Sold metrics calculate the same value. Why? Thetransformation has not been given a date to transform, so both metrics calculate thenumber of units sold for all time. In the transformation example at the beginning of thissection, with the number of Web visitors, the report contained the Date attribute and afilter on time. To correct the problem using this current example, add a report filter thatprompts the user for a specific date. If a user answers 9/21/2004 to the prompt, thereport returns the following:
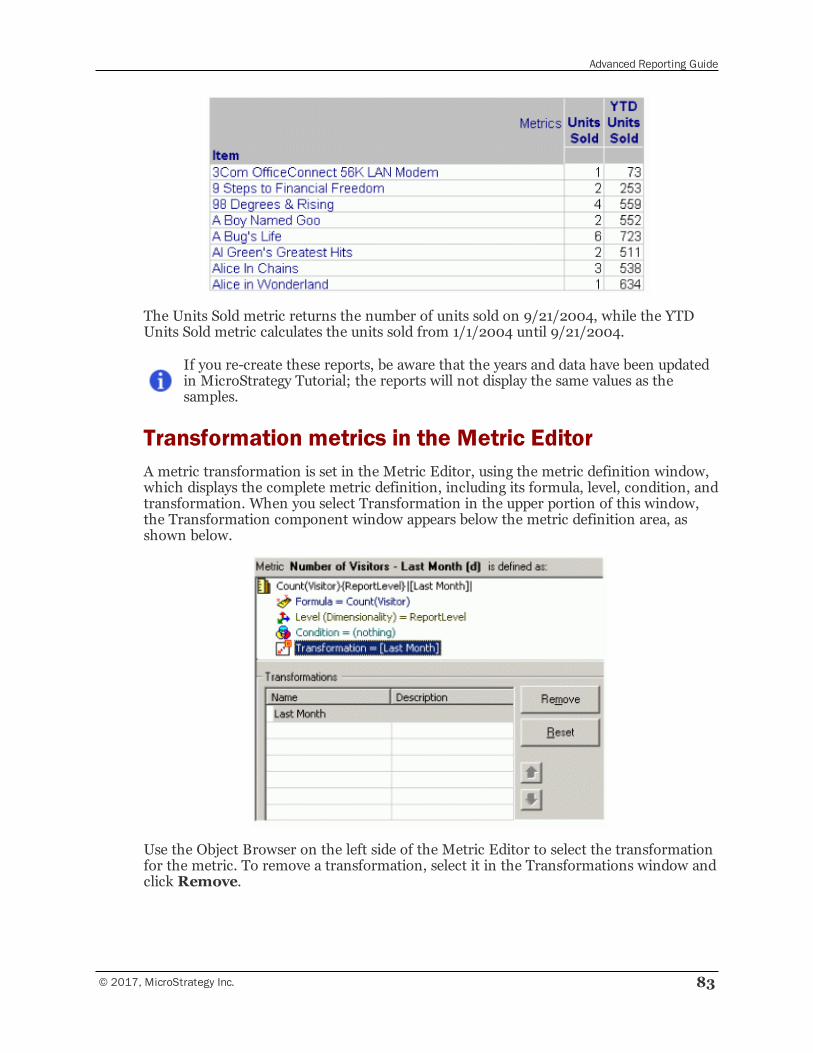
Advanced Reporting Guide
© 2017, MicroStrategy Inc. 83
The Units Sold metric returns the number of units sold on 9/21/2004, while the YTDUnits Sold metric calculates the units sold from 1/1/2004 until 9/21/2004.
If you re-create these reports, be aware that the years and data have been updatedin MicroStrategy Tutorial; the reports will not display the same values as thesamples.
Transformation metrics in the Metric EditorA metric transformation is set in the Metric Editor, using the metric definition window,which displays the complete metric definition, including its formula, level, condition, andtransformation. When you select Transformation in the upper portion of this window,the Transformation component window appears below the metric definition area, asshown below.
Use the Object Browser on the left side of the Metric Editor to select the transformationfor the metric. To remove a transformation, select it in the Transformations window andclick Remove.
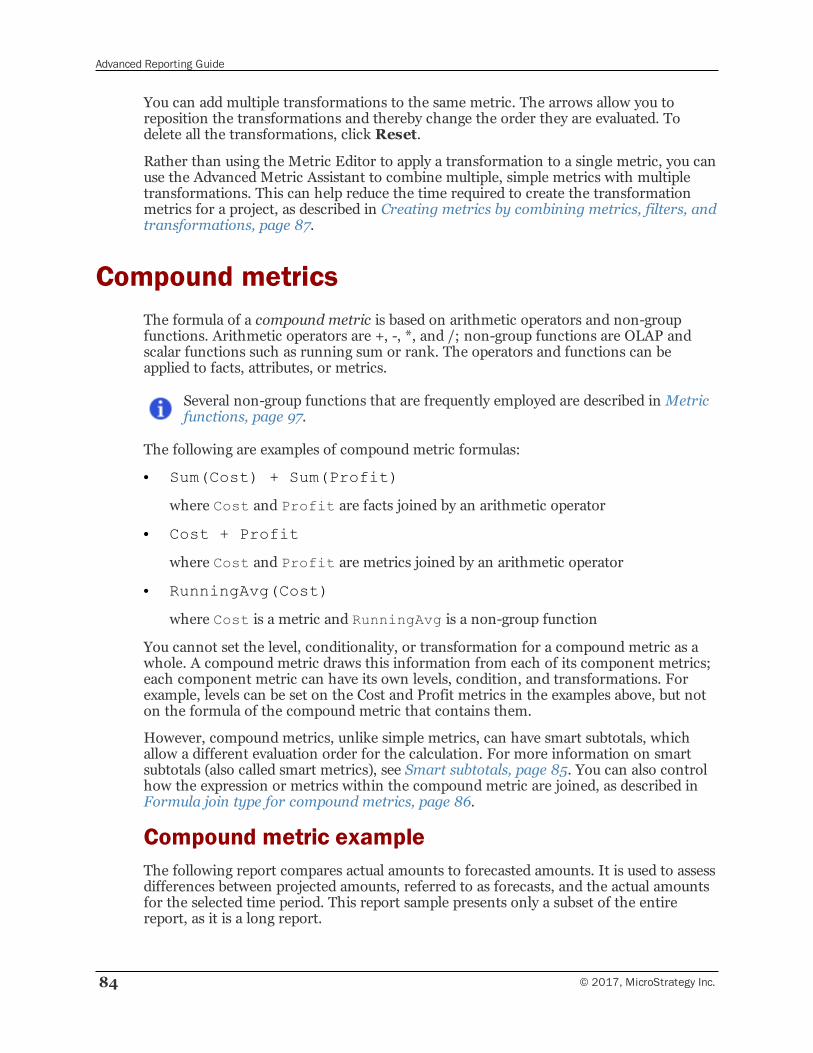
Advanced Reporting Guide
84 © 2017, MicroStrategy Inc.
You can add multiple transformations to the same metric. The arrows allow you toreposition the transformations and thereby change the order they are evaluated. Todelete all the transformations, click Reset.
Rather than using the Metric Editor to apply a transformation to a single metric, you canuse the Advanced Metric Assistant to combine multiple, simple metrics with multipletransformations. This can help reduce the time required to create the transformationmetrics for a project, as described in Creating metrics by combining metrics, filters, andtransformations, page 87.
Compound metricsThe formula of a compound metric is based on arithmetic operators and non-groupfunctions. Arithmetic operators are +, -, *, and /; non-group functions are OLAP andscalar functions such as running sum or rank. The operators and functions can beapplied to facts, attributes, or metrics.
Several non-group functions that are frequently employed are described in Metricfunctions, page 97.
The following are examples of compound metric formulas:
• Sum(Cost) + Sum(Profit)
where Cost and Profit are facts joined by an arithmetic operator
• Cost + Profit
where Cost and Profit are metrics joined by an arithmetic operator
• RunningAvg(Cost)
where Cost is a metric and RunningAvg is a non-group function
You cannot set the level, conditionality, or transformation for a compound metric as awhole. A compound metric draws this information from each of its component metrics;each component metric can have its own levels, condition, and transformations. Forexample, levels can be set on the Cost and Profit metrics in the examples above, but noton the formula of the compound metric that contains them.
However, compound metrics, unlike simple metrics, can have smart subtotals, whichallow a different evaluation order for the calculation. For more information on smartsubtotals (also called smart metrics), see Smart subtotals, page 85. You can also controlhow the expression or metrics within the compound metric are joined, as described inFormula join type for compound metrics, page 86.
Compound metric exampleThe following report compares actual amounts to forecasted amounts. It is used to assessdifferences between projected amounts, referred to as forecasts, and the actual amountsfor the selected time period. This report sample presents only a subset of the entirereport, as it is a long report.
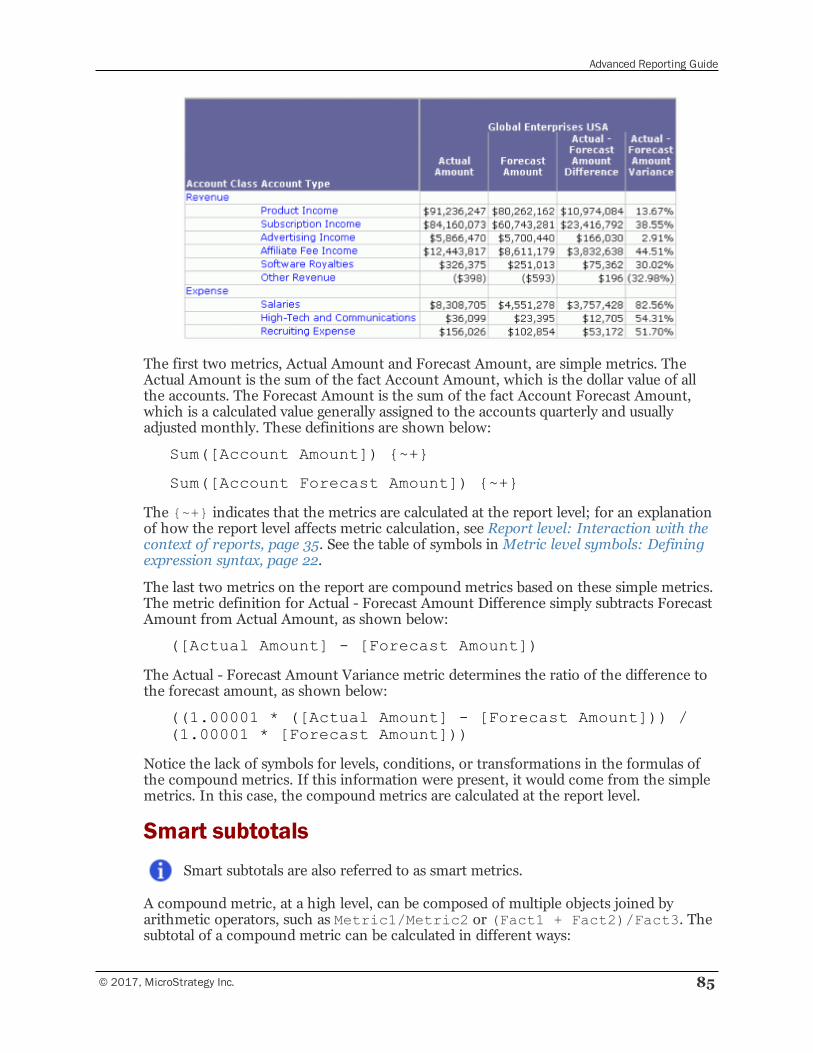
Advanced Reporting Guide
© 2017, MicroStrategy Inc. 85
The first two metrics, Actual Amount and Forecast Amount, are simple metrics. TheActual Amount is the sum of the fact Account Amount, which is the dollar value of allthe accounts. The Forecast Amount is the sum of the fact Account Forecast Amount,which is a calculated value generally assigned to the accounts quarterly and usuallyadjusted monthly. These definitions are shown below:
Sum([Account Amount]) {~+}
Sum([Account Forecast Amount]) {~+}
The {~+} indicates that the metrics are calculated at the report level; for an explanationof how the report level affects metric calculation, see Report level: Interaction with thecontext of reports, page 35. See the table of symbols in Metric level symbols: Definingexpression syntax, page 22.
The last two metrics on the report are compound metrics based on these simple metrics.The metric definition for Actual - Forecast Amount Difference simply subtracts ForecastAmount from Actual Amount, as shown below:
([Actual Amount] - [Forecast Amount])
The Actual - Forecast Amount Variance metric determines the ratio of the difference tothe forecast amount, as shown below:
((1.00001 * ([Actual Amount] - [Forecast Amount])) /(1.00001 * [Forecast Amount]))
Notice the lack of symbols for levels, conditions, or transformations in the formulas ofthe compound metrics. If this information were present, it would come from the simplemetrics. In this case, the compound metrics are calculated at the report level.
Smart subtotalsSmart subtotals are also referred to as smart metrics.
A compound metric, at a high level, can be composed of multiple objects joined byarithmetic operators, such as Metric1/Metric2 or (Fact1 + Fact2)/Fact3. Thesubtotal of a compound metric can be calculated in different ways:
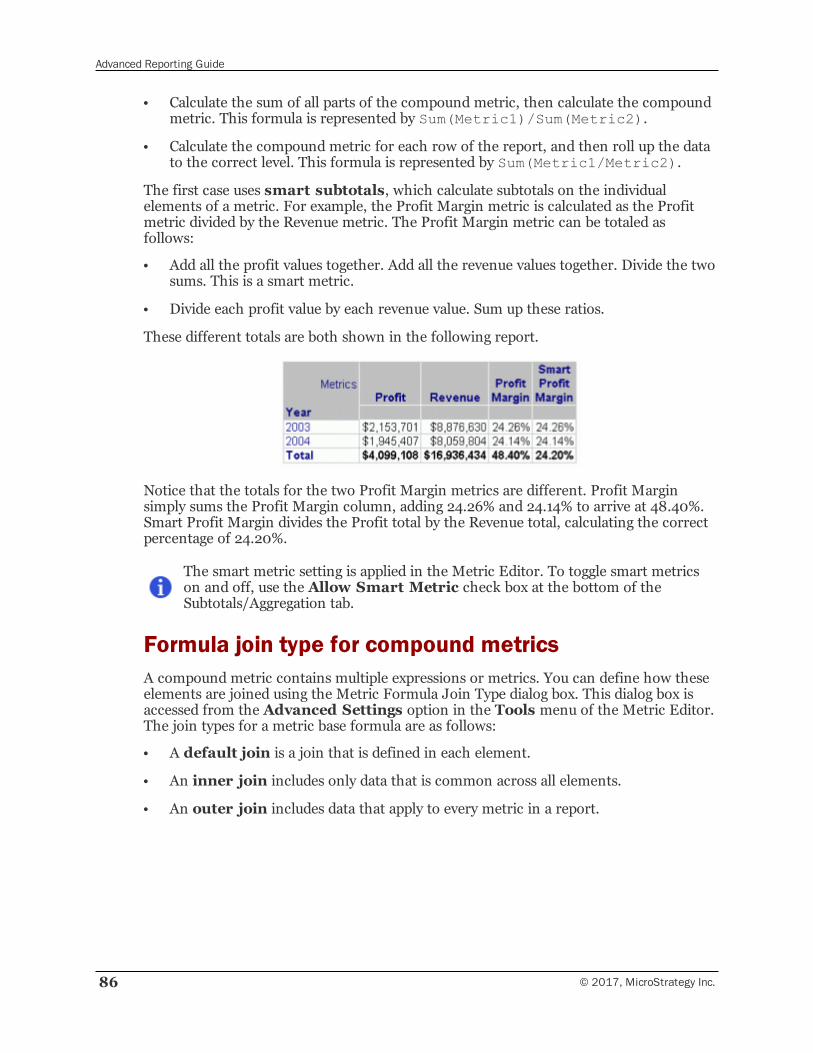
Advanced Reporting Guide
86 © 2017, MicroStrategy Inc.
• Calculate the sum of all parts of the compound metric, then calculate the compoundmetric. This formula is represented by Sum(Metric1)/Sum(Metric2).
• Calculate the compound metric for each row of the report, and then roll up the datato the correct level. This formula is represented by Sum(Metric1/Metric2).
The first case uses smart subtotals, which calculate subtotals on the individualelements of a metric. For example, the Profit Margin metric is calculated as the Profitmetric divided by the Revenue metric. The Profit Margin metric can be totaled asfollows:
• Add all the profit values together. Add all the revenue values together. Divide the twosums. This is a smart metric.
• Divide each profit value by each revenue value. Sum up these ratios.
These different totals are both shown in the following report.
Notice that the totals for the two Profit Margin metrics are different. Profit Marginsimply sums the Profit Margin column, adding 24.26% and 24.14% to arrive at 48.40%.Smart Profit Margin divides the Profit total by the Revenue total, calculating the correctpercentage of 24.20%.
The smart metric setting is applied in the Metric Editor. To toggle smart metricson and off, use the Allow Smart Metric check box at the bottom of theSubtotals/Aggregation tab.
Formula join type for compound metricsA compound metric contains multiple expressions or metrics. You can define how theseelements are joined using the Metric Formula Join Type dialog box. This dialog box isaccessed from the Advanced Settings option in the Tools menu of the Metric Editor.The join types for a metric base formula are as follows:
• A default join is a join that is defined in each element.
• An inner join includes only data that is common across all elements.
• An outer join includes data that apply to every metric in a report.
Advanced Reporting Guide
© 2017, MicroStrategy Inc. 87
Creating metrics by combining metrics, filters,and transformations
Rather than using the Metric Editor to apply a filter or transformation to a single metric,you can use the Advanced Metric Assistant to combine multiple metrics with multiplefilters or transformations. This can help reduce the time required to create the metricsfor a project.
You can also create multiple metrics at the same time by using a CommandManager script. Command Manager is a MicroStrategy tool designed to automatecertain tasks and processes. For more information about Command Manager,including steps to use scripts, see the Command Manager chapter of the SystemAdministration Guide.
The Advanced Metric Assistant allows you to combine simple metrics with filters ortransformations to create metrics with additional analytical capabilities. Combiningmetrics with filters allows you to apply conditionality to your metrics (see Conditionalmetrics, page 58), while combining metrics with transformations allows you to comparevalues at different times (see Transformation metrics: Time-based and othercomparisons, page 80).
Using the Advanced Metric Assistant, you can combine simple metrics with filters,transformations, or both to create metrics with additional analytical capabilities. Thesteps below show you how to use the Advanced Metric Assistant to combine simplemetrics with filters, transformations, or both.
Prerequisites
• You have created simple metrics to combine with filters, transformations, or both.Compound metrics, level metrics, and metrics that already use conditions ortransformations cannot be used with the Advanced Metric Assistant. Forinformation on creating simple metrics, see the Basic Reporting Guide.
• If you plan to create conditional metrics, you must have created filters. Forinformation on creating filters, see Advanced Filters: Filtering Data on Reports,page 108.
• If you plan to create transformation metrics, you must have created transformations.For information on creating transformations, see the Project Design Guide.
To combine metrics with filters, transformations, or both
1 In MicroStrategy Developer, log in to a project.
2 From the Tools menu, select Advanced Metric Assistant. The Advanced MetricAssistant opens.
Advanced Reporting Guide
88 © 2017, MicroStrategy Inc.
You can also access the Advanced Metric Assistant by first selecting metrics.Select a metric or metrics to combine with filters to create conditionalmetrics. Right-click your selection, point to Create Advanced Metrics, andselect Add Filter or Add Transformation. The Advanced Metric Assistantopens.
To select metrics
3 From theMetrics tab, you can include a metric or metrics to combine with filtersor transformations. Use the arrows to add or remove metrics to combine with filtersor transformations to create new metrics.
To select filters
4 If the Filter tab is not shown, from the Options menu, select Show Filters.
You can also choose to hide this tab if you do not plan to combine metrics withfilters. To hide the Filter tab, from the Options menu, selectHide Filters.
5 From the Filters tab, browse to and select the filters to combine with the metricsyou selected. Use the arrows to add or remove filters to use to create conditionalmetrics.
To select transformations
6 If the Transformation tab is not shown, from the Options menu, select ShowTransformations.
You can also choose to hide this tab if you do not plan to combine metrics withtransformations. To hide the Transformation tab, from the Options menu, selectHide Transformations.
7 From the Transformations tab, browse to and select the transformations tocombine with the metrics you selected. Use the arrows to add or removetransformations to use to create transformation metrics.
To select the metric combinations to create
8 If you include both filters and transformations to combine with metrics, you canspecify the types of metric combinations created, as described below:
• Metrics are always created to combine each metric with all filter andtransformation combinations. These metrics include both a filter and atransformation.
• To create metrics that combine metrics with transformations only, select theInclude no filter check box. These metrics do not include the selected filters.
Advanced Reporting Guide
© 2017, MicroStrategy Inc. 89
• To create metrics that combine metrics with filters only, select the Include notransformation check box. These metrics do not include the selectedtransformations.
To review the metrics you are about to create by selecting or clearing theoptions above, click Next to open the Run page. You can then click Back tomake any required changes.
To create metrics
9 Once you are finished selecting metrics, filters, and transformations, click Next. TheRun page opens.
10 The metrics that will be created are displayed. The names and locations for potentialmetrics are listed, along with the status of creating the metrics. Click Run to createthe metrics listed.
11 The metrics are created in the location specified. If a metric cannot be created, youcan double-click the metric to view a message describing why the metric creationfailed.
12 Once all required metrics have been created, click Exit to close the Advanced MetricAssistant.
Once the metrics are created, you can then begin to use these metrics on reports anddocuments. You can also modify the metrics using the Metric Editor. For Helpdocumentation on using the Metric Editor, with the Metric Editor open, press F1.
Metric subtotalsIn the context of metrics, subtotals allow you to compute and display quantified dataalong attribute groupings that you can specify dynamically for a report. The behavior ofsubtotal aggregations is based on the types of data included in the metric to which thesubtotal is applied.
Displaying subtotals on reportsIn a report, you can display grand totals by pressing F11 or selectingGrand Totalsfrom the Data menu. By default, the metric totals are calculated using the sum function.You can put other subtotals on the report by selecting Subtotals from the Data menu,then choosing from the list of available subtotals. By default, this list contains thestandard subtotal functions such as total, count, minimum, maximum, standarddeviation, and others. For a list of the standard subtotal functions, see Defining subtotaldefaults, page 90. You can set the display location and how the subtotal is calculated onthe report, as described in Totaling and subtotaling data on reports, page 242.
You can select the value that is displayed in place of a null value in a subtotal. Forsteps, see the Report Formatting chapter in the Basic Reporting Guide.
Advanced Reporting Guide
90 © 2017, MicroStrategy Inc.
Defining subtotal defaultsFor each metric, you can change the default grand total function and add functions tothe list of available subtotals. This allows you to use different grand total functions fordifferent metrics on the same report, for instance. These options are found on theSubtotals/Aggregation tab of the Metric Editor. The default grand total is called theTotal subtotal function. You can add functions to the list of available subtotals orremove functions. The functions listed here are available as subtotals in reports.
You can disable totaling on metrics that should not be subtotaled, such asinventory metrics or other non-aggregatable metrics. For steps to define the totalsubtotal function and available subtotals to disable subtotals, see Disablingsubtotals, page 97.
Your choices for both the total subtotal and available functions are standard predefinedsubtotal functions, which are simple aggregate functions such as Total and Count thatsatisfy many subtotaling requirements. If they do not answer your specific needs, you cancreate a user-defined subtotal and use it just like any of the built-in subtotal functions.For a list of the predefined subtotal functions, see Standard subtotal functions, page 90.For an explanation of when to use user-defined subtotals, a list of objects that can beused in them, and examples, see Creating your own subtotals, page 91.
Standard subtotal functions
The predefined subtotal functions in the following table are automatically available foruse with every metric and report. They are simple aggregate functions designed to satisfymany subtotaling requirements.
Subtotal function Description
Count Count[count] number of input values
Average Avg[average] sum of input values divided by number of input values
Minimum Min[minimum] smallest input value
Maximum Max[maximum] largest input value
Product Product[product] all input values multiplied together
Median Median[median] middle value when all values are sorted
Mode Mode[mode] most frequently found input value
Standard deviation Stdev[standard deviation] distribution of input values
Variance Var[variance] square of the distribution of input values
Geometric mean Geomean[geometric mean] square root of the product of input values
These functions reflect only those most frequently used for evaluating metric subtotals.The metric subtotal calculations and consolidations needed to create a report areperformed by the Analytical Engine, which is a component of MicroStrategy Intelligence
Advanced Reporting Guide
© 2017, MicroStrategy Inc. 91
Server. In addition to the above standard functions, the Analytical Engine also handles alarge number of statistical, mathematical, financial, date-and-time, string, and OLAPfunctions, ranging from simple to highly complex.
See the Functions Reference for examples and details on every built-in function availablein MicroStrategy.
Creating your own subtotals
The standard predefined subtotal functions, which are automatically available for usewith every metric and report, are simple aggregate functions that satisfy manysubtotaling requirements. If they do not answer your specific needs, you can create yourown user-defined subtotal using the Subtotal Editor. You can then use it in subtotaldefinitions just like any of the built-in subtotal functions such as Total and Count.
You can create your own subtotal using any combination of the following:
• An aggregation function, such as avgdev, IRR, MIRR, and NPV, that is not one of thestandard predefined subtotal functions
• Multiple functions
• Constants in conjunction with aggregation functions
• Nested functions
• Dimensional subtotals
• Other metrics in the subtotal formula
For example, you need a subtotal that always calculates at the regional level, regardless ofthe level of the report. You can create a user-defined subtotal, setting it to the Regionlevel (or dimension). Another example is a weighted subtotal, where a subtotal isweighted with another metric, such as an average profit weighted by units sold. Thisexample is included in the User-defined subtotal example (weighted subtotal), page 94.
After a user-defined subtotal is created, it is indistinguishable from the standardpredefined subtotal functions such as total or count. For a particular metric, you canchoose a user-defined subtotal as the total subtotal function or add it to the list ofavailable subtotals. When you run a report containing this metric, the total subtotalfunction calculates the grand totals for the metric. Select from the available subtotals todisplay additional subtotals for the metric. For more information, see Displayingsubtotals on reports, page 89.
Do not confuse user-defined subtotals with custom report subtotals, which aredefined for a particular report for display purposes. User-defined subtotals aremade available to metrics and can then be used on any report that uses the metric.For more information on custom report subtotals, see Custom report subtotals,page 246.
You can create a user-defined subtotal with a level, and select the subtotal as the dynamicaggregation function for a metric, to allow you to specify the level of dynamic aggregationfor that metric. (Dynamic aggregation is the roll-up of metric values that occurs when anattribute is moved from the report grid to the Report Objects.) You must also change the
Advanced Reporting Guide
92 © 2017, MicroStrategy Inc.
Subtotal Dimensionality Use VLDB property because the default behavior is to use thelevel of the metric that is being aggregated, not that metric’s dynamic aggregationfunction. For a more detailed description of this VLDB property, along with an exampleof its use, see the Supplemental Reference for System Administration.
User-defined subtotal example (First function)
You need to produce an inventory report showing the number of electronics productsreceived in 2003 by month and by product. The report must also provide the firstshipment quantity. To do this, create a user-defined subtotal using the First function.Create a metric with the Units Received fact and set the Total subtotal function,which calculates the metric’s grand totals, to the new subtotal. Next, create the report.When you apply subtotals, the user-defined subtotal displays the number of itemsreceived in the first shipment, regardless of the month in which it arrived.
Since this example focuses on user-defined subtotals and using the Subtotal Editor, stepsare provided to create the subtotal. For details to create metrics and reports, refer to theonline help.
To create and use a user-defined subtotal (using the First function)
1 In MicroStrategy Developer, from the File menu, point to New, and then selectSubtotal. The Subtotal Editor opens. Notice its resemblance to the Metric Editor—their similarity in function and appearance helps to ease the process of creatingsubtotals.
2 In the Object Browser, navigate to the Basic Functions folder, located underFunctions and Operators. Double-click the First function.
3 In the definition, right-click First, and select First parameters. The FirstParameters dialog box opens.
4 The First function must be sorted to achieve correct results. Click the Sort By tab.
5 Select Sort by objects, then click Add. The Select Objects dialog box opens.
6 Since the report will be sorted by time, in the Object Browser select Attributes,then Time. Double-click the following, in the order they appear below, to add themto the sort:
▫ Year
▫ Quarter
▫ Month
▫ Day
7 Click OK, then OK again to return to the Subtotal Editor.
For more information on the First function, including details on sorting, seethe Functions Reference.
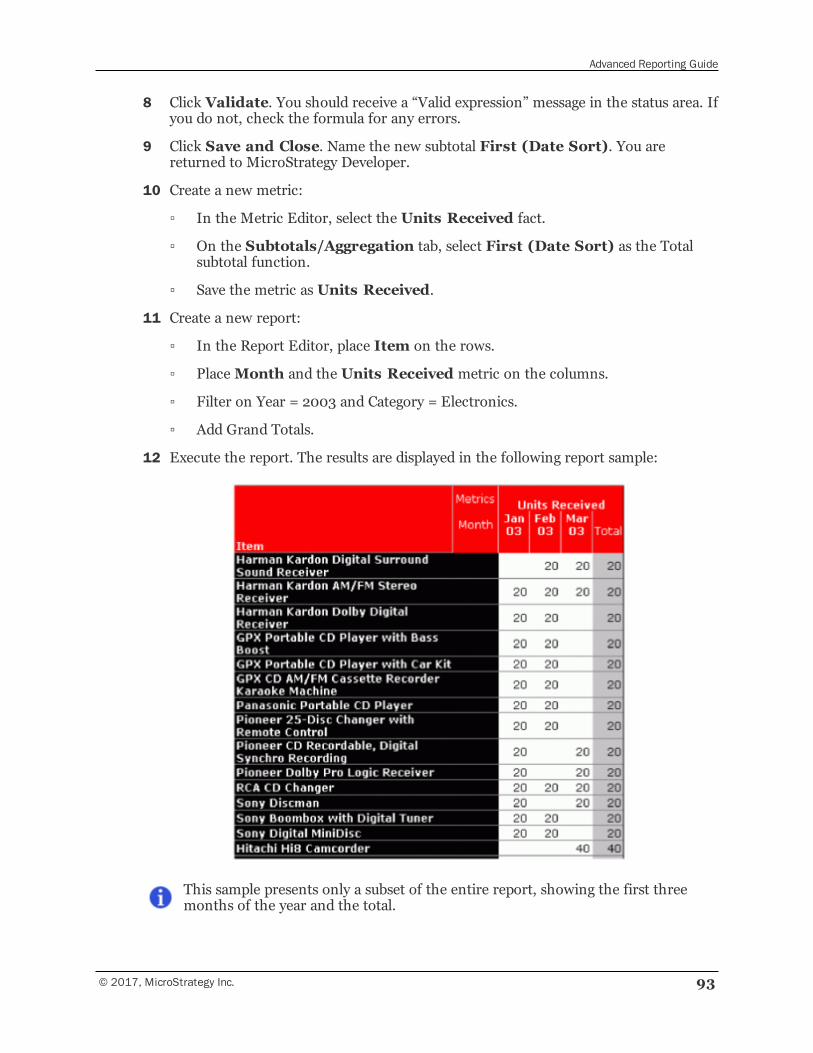
Advanced Reporting Guide
© 2017, MicroStrategy Inc. 93
8 Click Validate. You should receive a “Valid expression” message in the status area. Ifyou do not, check the formula for any errors.
9 Click Save and Close. Name the new subtotal First (Date Sort). You arereturned to MicroStrategy Developer.
10 Create a new metric:
▫ In the Metric Editor, select the Units Received fact.
▫ On the Subtotals/Aggregation tab, select First (Date Sort) as the Totalsubtotal function.
▫ Save the metric asUnits Received.
11 Create a new report:
▫ In the Report Editor, place Item on the rows.
▫ PlaceMonth and the Units Received metric on the columns.
▫ Filter on Year = 2003 and Category = Electronics.
▫ Add Grand Totals.
12 Execute the report. The results are displayed in the following report sample:
This sample presents only a subset of the entire report, showing the first threemonths of the year and the total.
Advanced Reporting Guide
94 © 2017, MicroStrategy Inc.
Notice that the Total does not add all units received throughout the year, but ratherdisplays the amount of the first shipment, regardless of what month the shipmentarrived. For example, you received 20 AM/FM Stereo Receivers each month; the total is20, the amount received in January alone. No Digital Surround Sound Receivers werereceived in January, but 20 were received in February, which the subtotal reflects.Hitachi Hi8 Camcorders, in the last line of the sample, were not received until March, sothe total is derived from the March shipment.
Remember to save the report if you want to keep it.
User-defined subtotal example (weighted subtotal)
You need to create a report containing units sold and profit by call center. For eachregion, the report must calculate the average units sold and the average profit, weightedby the number of units sold in the region. Since these two averages must be displayed onthe same line, a custom subtotal is needed. The formula for the weighted regionalaverage profit is:
Sum(x*[Units Sold]){Region}/Sum([UnitsSold]){Region}
where:
• x is the placeholder for the metric to be subtotaled. In this case, it is the Profitmetric.
• [Units Sold] is a metric that sums the fact Units Sold.
• {Region} is the level of the subtotal calculation.
For information on symbols, seeMetric level symbols: Defining expression syntax, page22.
Finally, you need to sum the weighted regional average profit over all the regions. Theformula for this subtotal is:
Sum(Sum(x*[Units Sold]){Region}/Sum([Units Sold]){Region}){}
which calculates the sum on an empty level, represented by the {}. An empty levelcalculates across the entire report. This subtotal will be used as a grand total on thereport. To use these formulas in any of the Analytics Modules, you need to create user-defined subtotals because they are not standard subtotal functions in the AnalyticsModules. The MicroStrategy Tutorial, however, offers them as standard subtotals.
The focus of this example is user-defined subtotals and using the Subtotal Editor, so stepsare provided to create the subtotal. For details to create metrics and reports, see theMicroStrategy Web Help.
To create and use a user-defined subtotal (using a weighted subtotal)
1 In MicroStrategy Developer, select File, point to New, and then Subtotal. TheSubtotal Editor opens.

Advanced Reporting Guide
© 2017, MicroStrategy Inc. 95
2 Type the formula for the weighted regional average subtotal, as described above.
3 Click Validate.
4 In the Ambiguity: ‘Units Sold’ dialog box, select the metric and click OK.
5 In the Ambiguity: ‘Region’ dialog box, select the attribute and click OK. You arereturned to the Subtotal Editor, and you should see a “Valid expression” message inthe status area. If you do not, review the formula and correct any errors.
6 Click Save and Close. Name the new subtotalWeighted Regional Average.You are returned to MicroStrategy Developer.
7 Open the Subtotal Editor again.
8 Type the formula for the sum of the weighted regional average subtotal, as describedabove.
9 Click Validate.
10 In the Ambiguity: ‘Units Sold’ dialog box, select the metric and click OK.
11 In the Ambiguity: ‘Region’ dialog box, select the attribute and click OK. You arereturned to the Subtotal Editor, and you should see a “Valid expression” message inthe status area. If you do not, review the formula and correct any errors.
12 Click Save and Close. Name the new subtotal Sum of WRA (which stands forWeighted Regional Average). You are returned to MicroStrategy Developer.
13 Open the Profit metric in the Metric Editor.
14 Click the Subtotals/Aggregation tab.
15 SelectWeighted Regional Average and Sum of WRA in the Projectsubtotals list. Click > to add them to the metric.
16 Save the metric and close the Metric Editor.
17 Create the new report:
a In the Report Editor, place Region and Call Center on the rows, and then theUnits Sold and Profit metrics on the columns.
b Next, create the subtotals for the report. Select Subtotals from the Data menu.
c Click Advanced.
d Click New to create a new custom subtotal, which will contain a standardaverage for Units Sold and the weighted regional average subtotal for Profit.
e Type Average, Weighted Regional Average as the name of the customsubtotal.
f For Units Sold, select Average from the pull-down list.
g For Profit, selectWeighted Regional Average.
h Click OK.
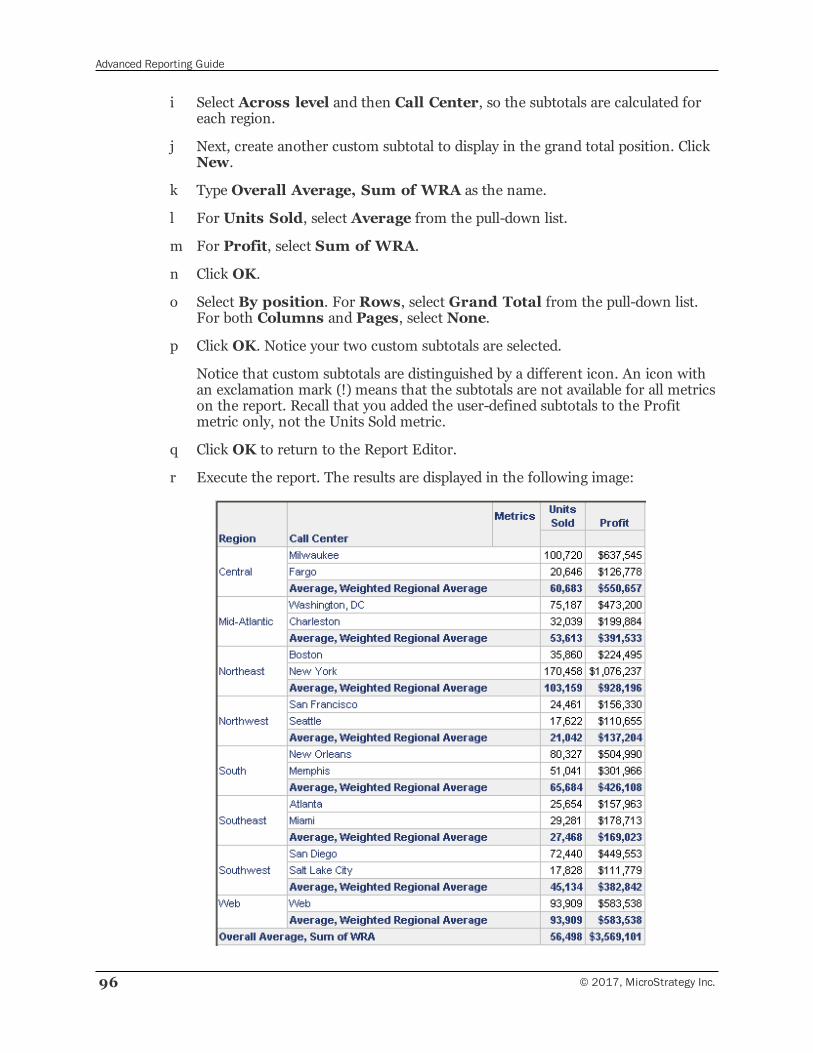
Advanced Reporting Guide
96 © 2017, MicroStrategy Inc.
i Select Across level and then Call Center, so the subtotals are calculated foreach region.
j Next, create another custom subtotal to display in the grand total position. ClickNew.
k Type Overall Average, Sum of WRA as the name.
l For Units Sold, select Average from the pull-down list.
m For Profit, select Sum of WRA.
n Click OK.
o Select By position. For Rows, select Grand Total from the pull-down list.For both Columns and Pages, select None.
p Click OK. Notice your two custom subtotals are selected.
Notice that custom subtotals are distinguished by a different icon. An icon withan exclamation mark (!) means that the subtotals are not available for all metricson the report. Recall that you added the user-defined subtotals to the Profitmetric only, not the Units Sold metric.
q Click OK to return to the Report Editor.
r Execute the report. The results are displayed in the following image:
Advanced Reporting Guide
© 2017, MicroStrategy Inc. 97
Disabling subtotalsYou can also choose to disable totaling on a metric such as an inventory metric oranother non-aggregatable metric. To do this, set the total subtotal function to None andclear all the available subtotals for the metric. If you set the total subtotal function toNone but do not clear the available subtotals, grand totals are unavailable in reports; inthis scenario, the only way you can show grand totals is by defining subtotals. If you clearthe Available subtotals for metrics list and set a total subtotal function, only that functionis available for subtotal calculation.
Metric functionsSome useful functions to use in metrics include:
• Rank, page 97
• Count, page 98
• Running and moving sums and averages, page 100 (also called OLAP functions)
• N-tile, page 101
• First and Last, page 102
All of the above except count and first/last are non-group functions. Non-groupfunctions are used in compound metrics.
• Creating your own plug-in functions, page 103
• Apply functions: Using database-specific functions in metrics, page 104
The following sections contain a brief overview of the functions in each group listedabove; for complete details about these and other functions see the Functions Reference.
Other useful functions include those used in subtotals and data mining. Fordescriptions of subtotal functions, see Defining subtotal defaults, page 90. Refer toChapter 13, Data Mining Services for information on data mining and predictivemetrics.
RankIn rank functions, you specify the metric to be ranked and whether to rank inascending or descending order. You can also specify whether to break by an attribute.
The level of the rank depends on the level in the report. For example, the followingmetric, named Revenue Rank, combined with customer on a report shows the highestrevenue customer as number one.
Rank(Revenue)
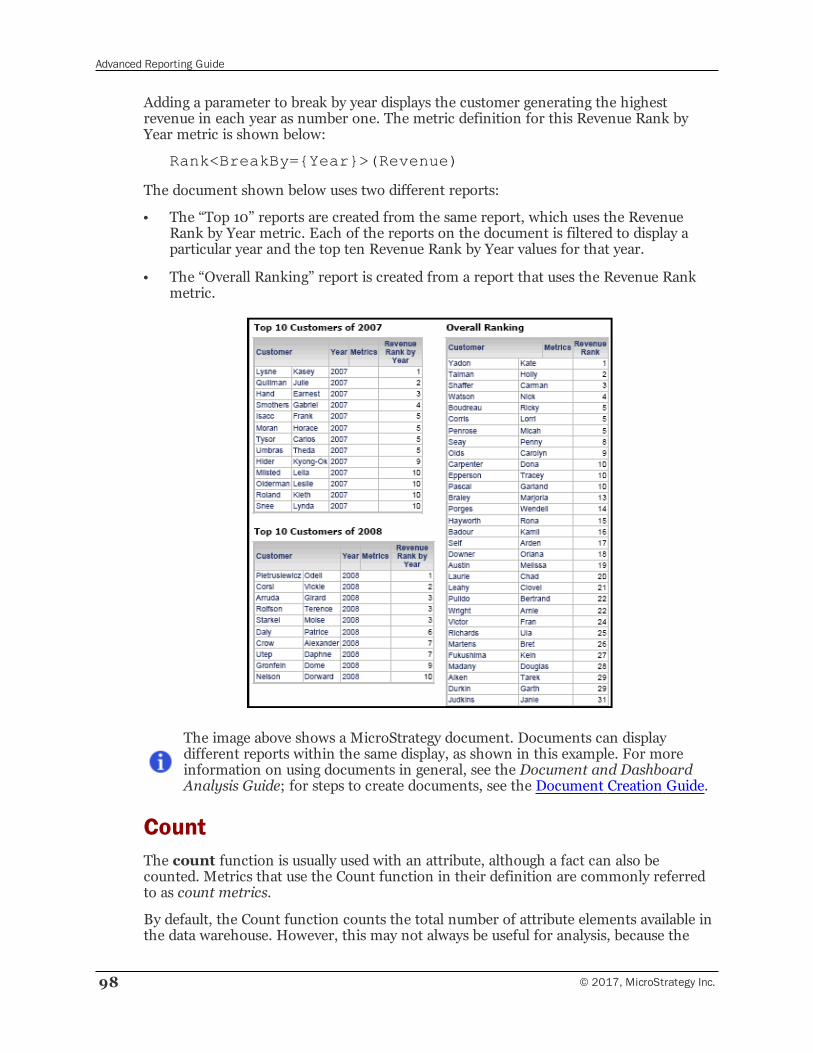
Advanced Reporting Guide
98 © 2017, MicroStrategy Inc.
Adding a parameter to break by year displays the customer generating the highestrevenue in each year as number one. The metric definition for this Revenue Rank byYear metric is shown below:
Rank<BreakBy={Year}>(Revenue)
The document shown below uses two different reports:
• The “Top 10” reports are created from the same report, which uses the RevenueRank by Year metric. Each of the reports on the document is filtered to display aparticular year and the top ten Revenue Rank by Year values for that year.
• The “Overall Ranking” report is created from a report that uses the Revenue Rankmetric.
The image above shows a MicroStrategy document. Documents can displaydifferent reports within the same display, as shown in this example. For moreinformation on using documents in general, see the Document and DashboardAnalysis Guide; for steps to create documents, see the Document Creation Guide.
CountThe count function is usually used with an attribute, although a fact can also becounted. Metrics that use the Count function in their definition are commonly referredto as count metrics.
By default, the Count function counts the total number of attribute elements available inthe data warehouse. However, this may not always be useful for analysis, because the
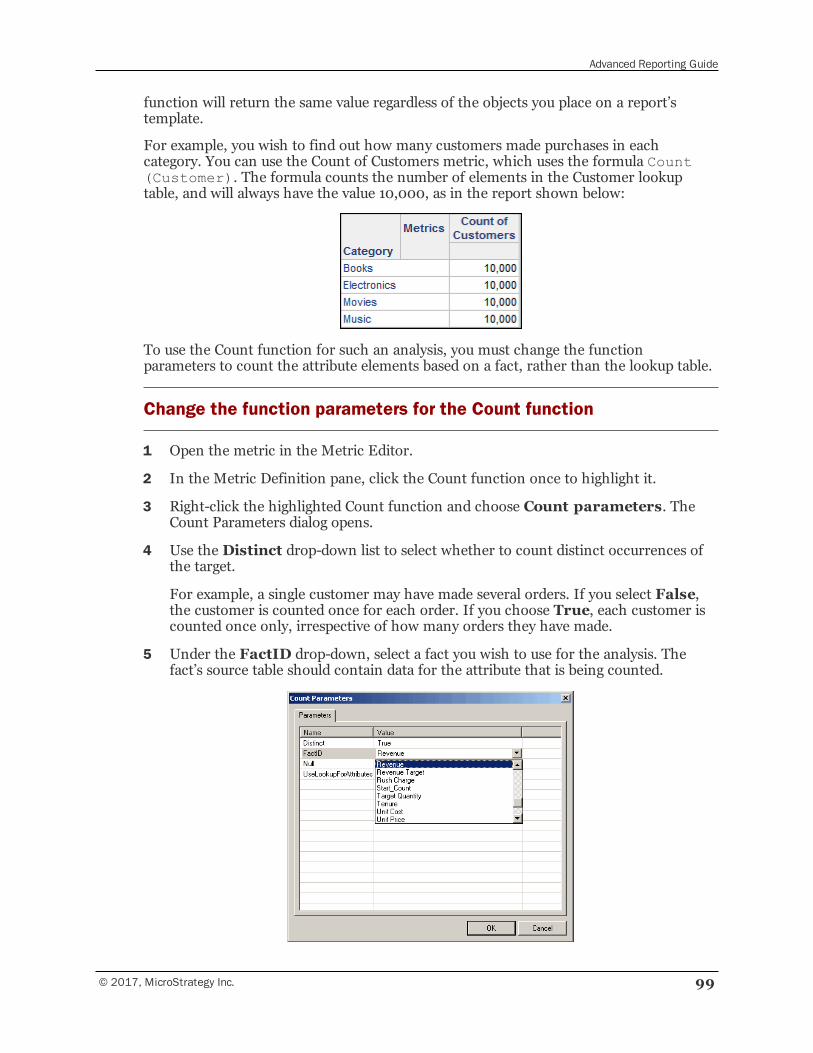
Advanced Reporting Guide
© 2017, MicroStrategy Inc. 99
function will return the same value regardless of the objects you place on a report’stemplate.
For example, you wish to find out how many customers made purchases in eachcategory. You can use the Count of Customers metric, which uses the formula Count(Customer). The formula counts the number of elements in the Customer lookuptable, and will always have the value 10,000, as in the report shown below:
To use the Count function for such an analysis, you must change the functionparameters to count the attribute elements based on a fact, rather than the lookup table.
Change the function parameters for the Count function
1 Open the metric in the Metric Editor.
2 In the Metric Definition pane, click the Count function once to highlight it.
3 Right-click the highlighted Count function and choose Count parameters. TheCount Parameters dialog opens.
4 Use the Distinct drop-down list to select whether to count distinct occurrences ofthe target.
For example, a single customer may have made several orders. If you select False,the customer is counted once for each order. If you choose True, each customer iscounted once only, irrespective of how many orders they have made.
5 Under the FactID drop-down, select a fact you wish to use for the analysis. Thefact’s source table should contain data for the attribute that is being counted.
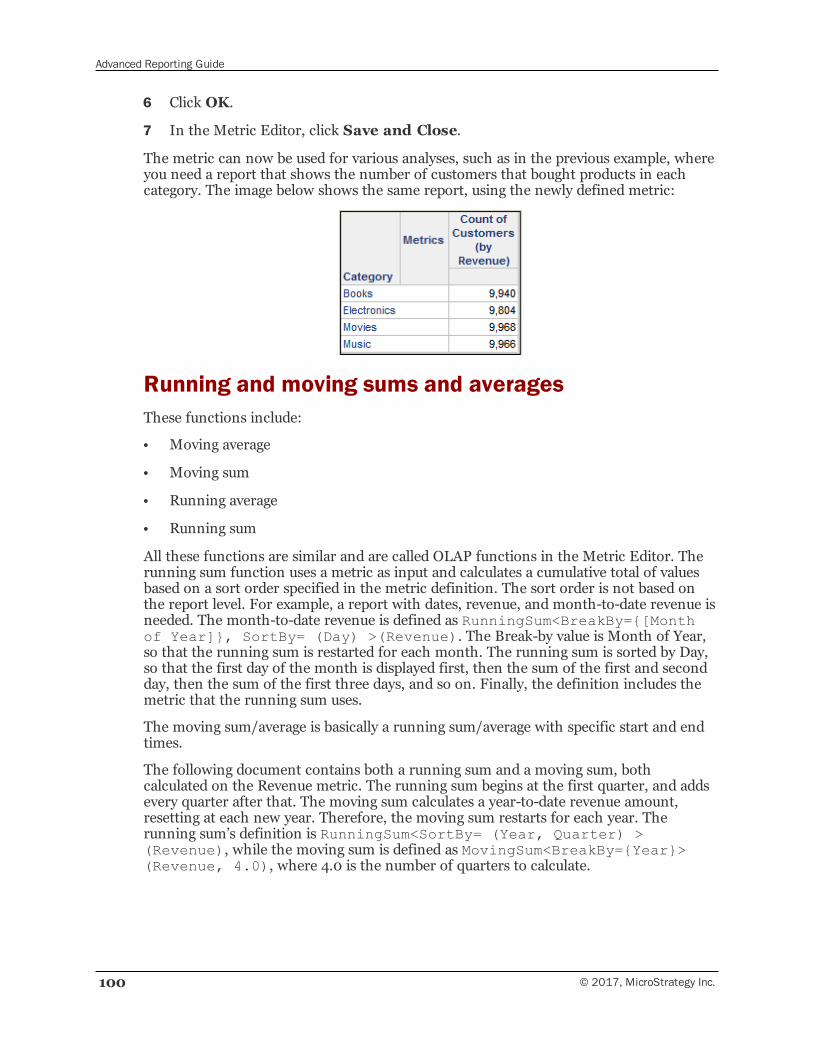
Advanced Reporting Guide
100 © 2017, MicroStrategy Inc.
6 Click OK.
7 In the Metric Editor, click Save and Close.
The metric can now be used for various analyses, such as in the previous example, whereyou need a report that shows the number of customers that bought products in eachcategory. The image below shows the same report, using the newly defined metric:
Running and moving sums and averagesThese functions include:
• Moving average
• Moving sum
• Running average
• Running sum
All these functions are similar and are called OLAP functions in the Metric Editor. Therunning sum function uses a metric as input and calculates a cumulative total of valuesbased on a sort order specified in the metric definition. The sort order is not based onthe report level. For example, a report with dates, revenue, and month-to-date revenue isneeded. The month-to-date revenue is defined as RunningSum<BreakBy={[Monthof Year]}, SortBy= (Day) >(Revenue). The Break-by value is Month of Year,so that the running sum is restarted for each month. The running sum is sorted by Day,so that the first day of the month is displayed first, then the sum of the first and secondday, then the sum of the first three days, and so on. Finally, the definition includes themetric that the running sum uses.
The moving sum/average is basically a running sum/average with specific start and endtimes.
The following document contains both a running sum and a moving sum, bothcalculated on the Revenue metric. The running sum begins at the first quarter, and addsevery quarter after that. The moving sum calculates a year-to-date revenue amount,resetting at each new year. Therefore, the moving sum restarts for each year. Therunning sum’s definition is RunningSum<SortBy= (Year, Quarter) >(Revenue), while the moving sum is defined as MovingSum<BreakBy={Year}>(Revenue, 4.0), where 4.0 is the number of quarters to calculate.
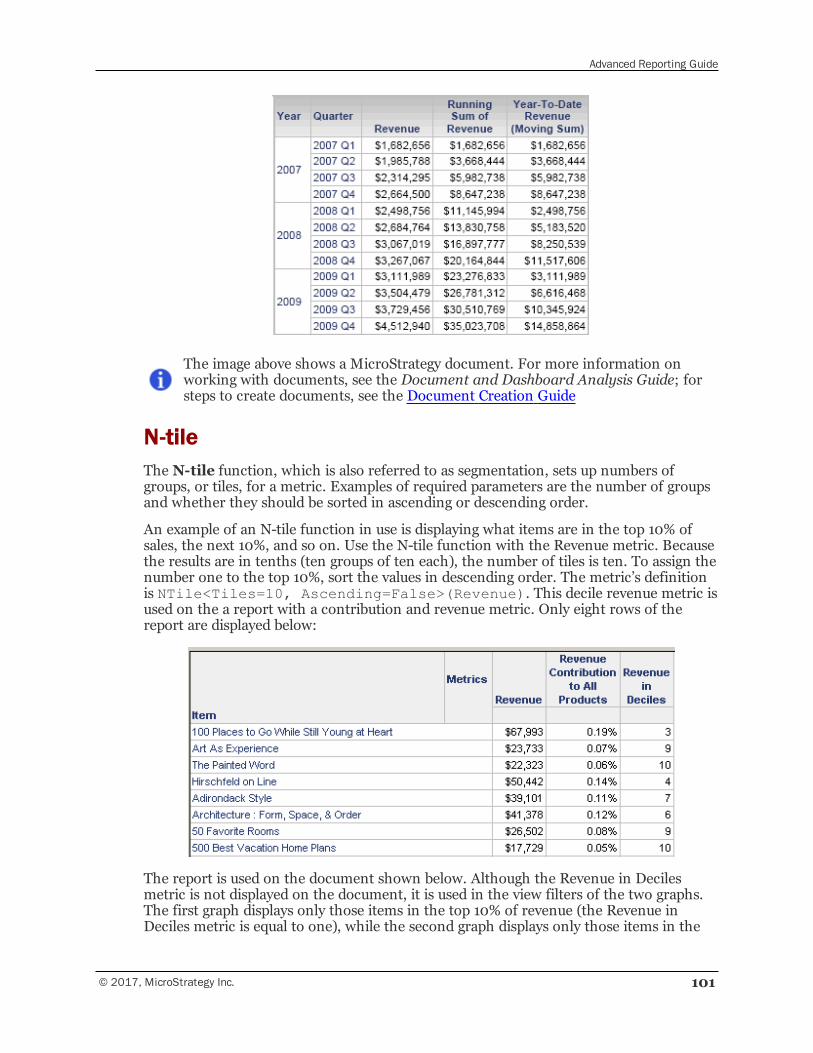
Advanced Reporting Guide
© 2017, MicroStrategy Inc. 101
The image above shows a MicroStrategy document. For more information onworking with documents, see the Document and Dashboard Analysis Guide; forsteps to create documents, see the Document Creation Guide
N-tileThe N-tile function, which is also referred to as segmentation, sets up numbers ofgroups, or tiles, for a metric. Examples of required parameters are the number of groupsand whether they should be sorted in ascending or descending order.
An example of an N-tile function in use is displaying what items are in the top 10% ofsales, the next 10%, and so on. Use the N-tile function with the Revenue metric. Becausethe results are in tenths (ten groups of ten each), the number of tiles is ten. To assign thenumber one to the top 10%, sort the values in descending order. The metric’s definitionis NTile<Tiles=10, Ascending=False>(Revenue). This decile revenue metric isused on the a report with a contribution and revenue metric. Only eight rows of thereport are displayed below:
The report is used on the document shown below. Although the Revenue in Decilesmetric is not displayed on the document, it is used in the view filters of the two graphs.The first graph displays only those items in the top 10% of revenue (the Revenue inDeciles metric is equal to one), while the second graph displays only those items in the
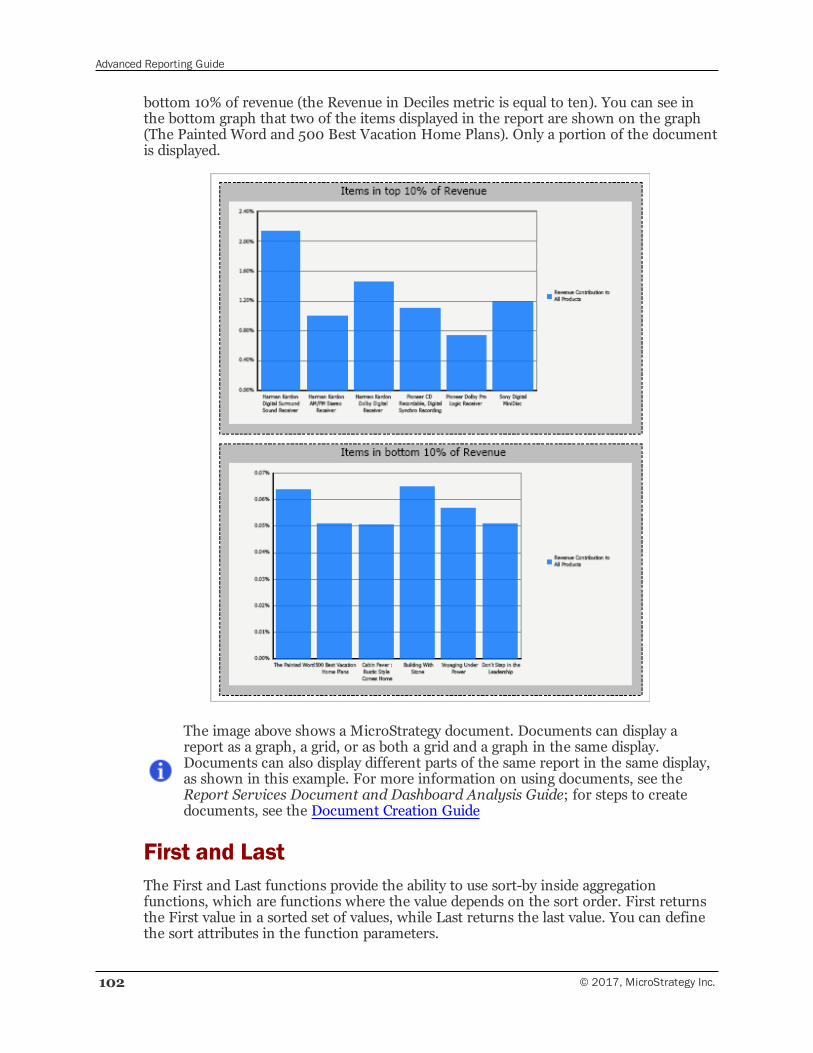
Advanced Reporting Guide
102 © 2017, MicroStrategy Inc.
bottom 10% of revenue (the Revenue in Deciles metric is equal to ten). You can see inthe bottom graph that two of the items displayed in the report are shown on the graph(The Painted Word and 500 Best Vacation Home Plans). Only a portion of the documentis displayed.
The image above shows a MicroStrategy document. Documents can display areport as a graph, a grid, or as both a grid and a graph in the same display.Documents can also display different parts of the same report in the same display,as shown in this example. For more information on using documents, see theReport Services Document and Dashboard Analysis Guide; for steps to createdocuments, see the Document Creation Guide
First and LastThe First and Last functions provide the ability to use sort-by inside aggregationfunctions, which are functions where the value depends on the sort order. First returnsthe First value in a sorted set of values, while Last returns the last value. You can definethe sort attributes in the function parameters.
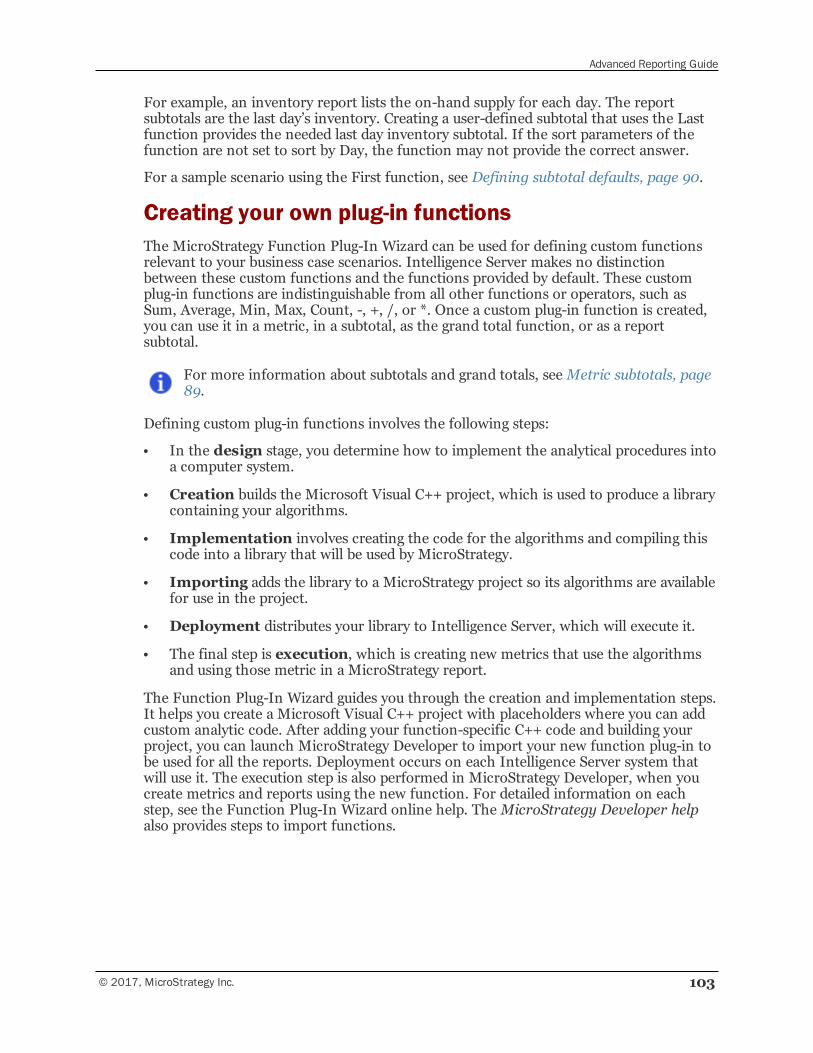
Advanced Reporting Guide
© 2017, MicroStrategy Inc. 103
For example, an inventory report lists the on-hand supply for each day. The reportsubtotals are the last day’s inventory. Creating a user-defined subtotal that uses the Lastfunction provides the needed last day inventory subtotal. If the sort parameters of thefunction are not set to sort by Day, the function may not provide the correct answer.
For a sample scenario using the First function, see Defining subtotal defaults, page 90.
Creating your own plug-in functionsThe MicroStrategy Function Plug-In Wizard can be used for defining custom functionsrelevant to your business case scenarios. Intelligence Server makes no distinctionbetween these custom functions and the functions provided by default. These customplug-in functions are indistinguishable from all other functions or operators, such asSum, Average, Min, Max, Count, -, +, /, or *. Once a custom plug-in function is created,you can use it in a metric, in a subtotal, as the grand total function, or as a reportsubtotal.
For more information about subtotals and grand totals, seeMetric subtotals, page89.
Defining custom plug-in functions involves the following steps:
• In the design stage, you determine how to implement the analytical procedures intoa computer system.
• Creation builds the Microsoft Visual C++ project, which is used to produce a librarycontaining your algorithms.
• Implementation involves creating the code for the algorithms and compiling thiscode into a library that will be used by MicroStrategy.
• Importing adds the library to a MicroStrategy project so its algorithms are availablefor use in the project.
• Deployment distributes your library to Intelligence Server, which will execute it.
• The final step is execution, which is creating new metrics that use the algorithmsand using those metric in a MicroStrategy report.
The Function Plug-In Wizard guides you through the creation and implementation steps.It helps you create a Microsoft Visual C++ project with placeholders where you can addcustom analytic code. After adding your function-specific C++ code and building yourproject, you can launch MicroStrategy Developer to import your new function plug-in tobe used for all the reports. Deployment occurs on each Intelligence Server system thatwill use it. The execution step is also performed in MicroStrategy Developer, when youcreate metrics and reports using the new function. For detailed information on eachstep, see the Function Plug-In Wizard online help. TheMicroStrategy Developer helpalso provides steps to import functions.
Advanced Reporting Guide
104 © 2017, MicroStrategy Inc.
The Function Plug-In Wizard must be installed before you can create andimplement custom plug-in functions. This installation is incorporated into thestandard MicroStrategy installation. The option to install this component isenabled only if Microsoft Visual C++ 6.0 is present on the system where theinstallation is being performed. During installation, the Function Plug-In Wizardoption is located in MicroStrategy Architect under MicroStrategy DeveloperProducts. For installation procedures, see the Functions Reference.
Integrating R analytics into MicroStrategyCustomers interested in deploying analytics from the R programming language intoMicroStrategy can do so using the R Integration Pack, available separately from theCodePlex open source community web site. For more information, go to Codeplex andsearch for the RIntegrationPack project (current as of March 1, 2013).
Apply functions: Using database-specific functions inmetricsApply functions, also called Pass-through functions, provide access to functionalitythat is not standard in MicroStrategy products but can be obtained through the relationaldatabase. When you include an Apply function in an attribute, fact, or transformationexpression, the SQL Engine recognizes it as custom SQL and treats it as such. Theexpression is then sent to the relational database as written. For a full description ofapply functions, including its types, syntax, and examples, see Apply functions inmetrics: Using database-specific functions, page 140.
Join specificationsSetting a join specification allows you to place conditions on the data selected for displayin a report. You can apply an inner or outer join, which are described in more detailbelow. In short, an inner join includes only the data common to all the elements in thejoin, whether that data is tables or metrics. An outer join includes all of the data in all ofthe elements. You can set joins at the metric and report levels:
• Join at the metric level: how the metric is joined to other metrics
• Join at the report level: how metrics are joined together in the report; overridesany metric join settings for that report only
Setting the metric join type at the report level (using the Report Data Options menuoption in the Report Editor) affects only the results for the report being modified. Forsteps, see the Analyzing Data chapter of the Basic Reporting Guide.
Setting the metric join type at the metric level affects the results for all reports using thatmetric. To set the metric join type at the metric level, use theMetric Join Type optionon the Tools menu of the Metric Editor.
By default, a report uses the metric’s join type setting. The default metric join type at themetric level uses the default inherited value, which is an inner join.
Advanced Reporting Guide
© 2017, MicroStrategy Inc. 105
For compound metrics, you can also set the join type at the formula level. This controlshow the expressions or metrics within the compound metric are joined. For moreinformation about join types at the formula level, see Formula join type for compoundmetrics, page 86. For more information about compound metrics in general, seeCompound metrics, page 84.
Inner joins versus outer joinsIn short, an inner join includes only data that is common to all components of thejoin. An outer join includes data that applies to all components. The followingdescriptions use an example of a report containing the Region attribute, the Sales metric,and the Budget metric:
• By default, inner joins are generated for all metrics in a report. The resulting reportcontains only those rows that have data returned for all the metrics. If a particularregion does not have both sales and budget data, the region is not included on thereport.
• If you switch to outer joins for all the metrics on the report, all rows with data forany of the metrics are displayed. All regions are included in the report, even if theyhave no data for one of the metrics.
You can specify different joins for each of the metrics on a report. For example, use anouter join for the Sales metric and an inner join for the Budget metric. The resultingreport displays all regions with sales data. If a particular region has budget data but notsales data, the region is not included in the report.
For a more detailed explanation of this example, with report samples, see the AnalyzingData chapter of the Basic Reporting Guide.
Joins between metricsSetting the metric join type allows you to define the default action for joining the metricto other metrics. This setting is used for the metric on any report the metric is placed on.However, you can override this metric join setting for a particular report. Forinformation on setting metric join types at a report-specific level, see the Analyzing Datachapter of the Basic Reporting Guide.
TheMetric Join Type option is accessed from the Tools menu of the Metric Editor.The metric join types are as follows:
• Default uses the default value.
• Inner includes only information contained by all the elements.
• Outer keeps all the information in all the elements.
TheMetric Join Type option is a shortcut to theMetric Join Type VLDBproperty located under Advanced Options in the same menu.
Advanced Reporting Guide
106 © 2017, MicroStrategy Inc.
Metric-specific VLDB properties: SQL andanalytical customization
VLDB (Very Large DataBase) properties allow you to customize the SQL thatMicroStrategy generates. The metric join type, described in the previous section, is notthe only VLDB property that affects metrics. The following list summarizes the metric-specific VLDB properties that can be set at the metric level. For details on each of theseproperties, see VLDB properties at the metric level, page 699. For details on all VLDBproperties available in MicroStrategy, see the Supplemental Reference for SystemAdministration.
• Integer Constant in Metric determines whether to add a “.0” after an integer.
• Null Check indicates how to handle arithmetic operations with null values.
• Zero Check indicates how to handle division by zero or when to check for zeros inthe denominator during division calculations.
• Null Checking for Analytical Engine determines whether a null value isinterpreted as zero when the Analytical Engine performs calculations.
• Subtotal Dimensionality Aware enables subtotaling based on the dimensionalityof a metric.
You can set additional metric VLDB properties at other levels, such as the reportand project levels. For more information on how the levels work together, seeLevels of VLDB properties, page 698.
Metric column aliases: SQL identifiers and datatypes
A column alias changes the name of a metric in temporary tables, which are used in datamarts and SQL generation. This renaming does not affect the actual name of the metricin the metadata but allows you to identify the metric easily, such as in a long SQL report.The column alias is set in the Metric Column Alias dialog box in the Metric Editor. Toaccess it, select Tools, then Advanced Settings, and thenMetric ColumnOptions.
For more information on data marts, see Chapter 12, Accessing Subsets of Data:Data Marts.
You can also set the data type and byte length for the metric. The MicroStrategy datatypes are Big Decimal, Binary, Char, Date, Decimal, Double, Float, Integer, LongVarBin,Long.VarChar, Numeric, Real, Time, Timestamp, Unsigned, VarBin, and VarChar.
There are several drawbacks to using the Big Decimal data type for metric values.
Advanced Reporting Guide
© 2017, MicroStrategy Inc. 107
For more information on all data types, see the Data Types appendix in the ProjectDesign Guide.
3ADVANCEDFILTERS: FILTERING DATA ONREPORTS
This section builds on knowledge provided in the Building Query Objects and Queries,for Designers chapter of the Basic Reporting Guide. You should already know how tocreate a simple filter and place it in a report. You should also know the differencebetween different types of qualifications, although Types of qualifications, page 110,provides a brief description of each type. This section discusses the concepts necessary tocreate and use the following advanced filters and qualifications:
• Attribute-to-attribute qualification, page 112
• Dynamic dates: Filtering by offsetting the current date, page 116
• Importing and exporting elements for attribute qualifications, page 122
• The attribute level of set qualifications: Output level, page 125
• Resetting rank and percent metric qualifications: Break by, page 127
• Metric-to-metric comparisons, page 128
• Merging attribute qualifications, page 129
• Applying qualifications independently of relationship filters, page 130
• Custom expressions and database-specific functions, page 131
• Joint element lists: Grouping elements from multiple attributes, page 146
• Prompted filters: Asking for user input for filter conditions, page 147
• Shortcut vs. embedded filters, page 149
© 2017, MicroStrategy Inc. 108
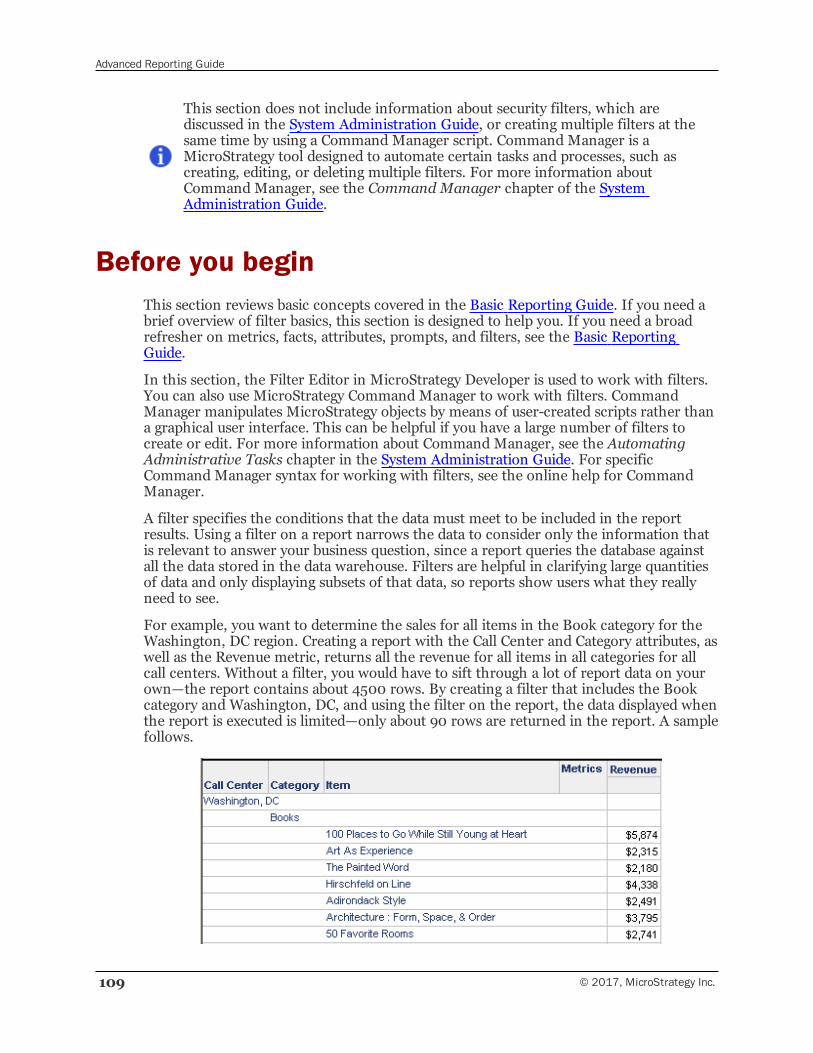
Advanced Reporting Guide
109 © 2017, MicroStrategy Inc.
This section does not include information about security filters, which arediscussed in the System Administration Guide, or creating multiple filters at thesame time by using a Command Manager script. Command Manager is aMicroStrategy tool designed to automate certain tasks and processes, such ascreating, editing, or deleting multiple filters. For more information aboutCommand Manager, see the Command Manager chapter of the SystemAdministration Guide.
Before you beginThis section reviews basic concepts covered in the Basic Reporting Guide. If you need abrief overview of filter basics, this section is designed to help you. If you need a broadrefresher on metrics, facts, attributes, prompts, and filters, see the Basic ReportingGuide.
In this section, the Filter Editor in MicroStrategy Developer is used to work with filters.You can also use MicroStrategy Command Manager to work with filters. CommandManager manipulates MicroStrategy objects by means of user-created scripts rather thana graphical user interface. This can be helpful if you have a large number of filters tocreate or edit. For more information about Command Manager, see the AutomatingAdministrative Tasks chapter in the System Administration Guide. For specificCommand Manager syntax for working with filters, see the online help for CommandManager.
A filter specifies the conditions that the data must meet to be included in the reportresults. Using a filter on a report narrows the data to consider only the information thatis relevant to answer your business question, since a report queries the database againstall the data stored in the data warehouse. Filters are helpful in clarifying large quantitiesof data and only displaying subsets of that data, so reports show users what they reallyneed to see.
For example, you want to determine the sales for all items in the Book category for theWashington, DC region. Creating a report with the Call Center and Category attributes, aswell as the Revenue metric, returns all the revenue for all items in all categories for allcall centers. Without a filter, you would have to sift through a lot of report data on yourown—the report contains about 4500 rows. By creating a filter that includes the Bookcategory and Washington, DC, and using the filter on the report, the data displayed whenthe report is executed is limited—only about 90 rows are returned in the report. A samplefollows.
Advanced Reporting Guide
© 2017, MicroStrategy Inc. 110
Types of qualificationsA filter is composed of at least one qualification. Qualifications are the actual conditionsthat must be met, for example, "Region = Northeast" or "Revenue > $1 million". You cancreate multiple qualifications for a single filter, and then combine the qualifications usingthe logical operators AND, AND NOT, OR, and OR NOT.
You can create the following types of filter qualifications:
• Attribute qualification allows you to filter on an attribute’s form (ID, description,and so on) or on elements of the attribute.
▫ An example of an attribute form qualification is a condition on theattribute form Customer Last Name for last names that start with the letter H.
▫ An attribute element list qualification on the Customer attribute consistsof a list of customers.
• Set qualification allows you to create a set of attributes based on either themetrics associated with those attributes (ametric qualification) or therelationships between them (a relationship qualification). For example:
▫ A metric qualification allows a report to display the sales data for only thoseproducts with inventory level below a specified value. It is also referred to as ametric set qualification.
▫ A relationship qualification can be used to create a report that displays all thestores selling Nike shoes in the Washington, DC area. It is also referred to as arelationship set qualification.
• Shortcut-to-a-report qualification, also known as a report qualification or areport as filter, uses the data from one report as a filter inside another report.
• Shortcut-to-a-filter qualification, also known as a filter qualification orembedded filter, uses an existing filter, either as is or with additional conditions, on areport.
• Advanced qualifications allow you to create the following:
▫ Custom expressions, which are customized filter expressions. You can useApply functions and you can create relationship filters.
▫ Joint element lists, which join attribute elements and then filter the resultsets.
By default, the Advanced Qualifications option is not displayed in the Filter Editor.You must activate it first, using the My Preferences dialog box. For steps, see theMicroStrategy Web Help or theMicroStrategy Developer Help.
The Building Query Objects and Queries, for Designers chapter of the Basic ReportingGuide provides the fundamentals of creating all these types of filters, except for advancedqualifications.
Advanced Reporting Guide
111 © 2017, MicroStrategy Inc.
Advanced filter topicsThis section builds on the fundamentals provided in the Basic Reporting Guide to helpyou create filters to answer more complex business questions. These advanced topics arelisted below, organized by the qualification type used to create them:
• Attribute qualifications:
▫ Attribute-to-attribute qualification, page 112, compare two attributes throughattribute forms.
▫ Dynamic dates: Filtering by offsetting the current date, page 116, are fixedoffsets of the current date.
▫ Importing and exporting elements for attribute qualifications, page 122, allowlists of data from existing files to be imported into the filter definition.
• Set qualifications:
▫ The attribute level of set qualifications: Output level, page 125, specifies theattribute level at which the metric or set is calculated for the qualification.
▫ The output level of relationship qualifications, page 125, specifies the relationbetween the attributes in the output level and the filter qualification.
▫ Resetting rank and percent metric qualifications: Break by, page 127, is theattribute level at which to restart counting rank or percent values for a metric.
▫ Metric-to-metric comparisons, page 128, dynamically compare the values of twometrics.
▫ Merging attribute qualifications, page 129, specifies whether existing attributequalifications should be merged into the calculation of the metric qualification.
▫ Applying qualifications independently of relationship filters, page 130, setswhether the filter criteria are applied to the entire report or to the relationshipqualification itself.
• Advanced qualifications using custom expressions and Apply functions:
▫ Custom expressions, page 131, allow you to create customized filter expressions.In situations where your report requirements cannot be satisfied viaMicroStrategy’s built-in functions, you will use Apply functions, as well.
▫ Custom expressions, page 131 allow you to create filters that are based on arelationship between two attributes or on a relationship between an attributeand a custom expression.
▫ Custom expressions, page 131, allow you to generate a list of attribute elementsas a filter based on a specified fact or table in your warehouse (which defines arelationship), a metric qualification or other filter, and a specified list ofattributes.
• Prompted filters: Asking for user input for filter conditions, page 147, providedynamic report definitions which can change with every report execution. Mostqualification types allow prompts.

Advanced Reporting Guide
© 2017, MicroStrategy Inc. 112
Attribute-to-attribute qualificationFor some purposes, you may need to filter on an attribute based on criteria related toanother attribute or related to a custom expression. For example, perhaps you need togenerate a report that lists customers who live in the same city as call centers in yourcompany. In this case, you qualify on the Customer and Call Center attributes using anattribute-to-attribute qualification filter. (See Example: Customers who live in the samecity as call centers, page 113 for steps to complete this example.)
In another scenario, your next marketing campaign is targeted towards customers withincome in a certain bracket. This requires an attribute-to-attribute qualification filter toqualify on the Income Bracket attribute, but in this case, the second item qualified on isa custom expression instead of an attribute. (See Example: Filtering on an incomebracket, page 114 for steps to complete this example.)
Attribute-to-attribute qualification filters always require the use of customexpressions, which are touched upon briefly in this section. For a morecomprehensive discussion of custom expressions, Apply functions, and examples,please refer to Custom expressions, page 131.
Creating attribute-to-attribute qualification filtersBasic steps for creating an attribute-to-attribute qualification filter in MicroStrategy Webare below, followed by specific examples of its use.
To create an attribute-to-attribute qualification
1 In MicroStrategy Web, log in to a project.
2 Open any folder page (for example, click Shared Folders on the home page).
3 Click the Create Filter icon . The New Filter page opens.
4 From the Object browser on the left, select an attribute and drag it on the filter paneon the right.
5 Click Qualify.
6 From the first drop-down list, select the attribute form to filter report data.
7 From the next drop-down list, select an operator such as Equals or Less Than.
8 Click the Select Attribute icon to select another attribute for comparison.
The Select an Object dialog box opens.
You can either select an attribute or type a custom expression for comparison. For anexample of selecting another attribute for comparison, see Example: Customers wholive in the same city as call centers, page 113. For an example of typing a customexpression for comparison, see Example: Filtering on an income bracket, page 114.
9 Select an attribute qualification and click OK.
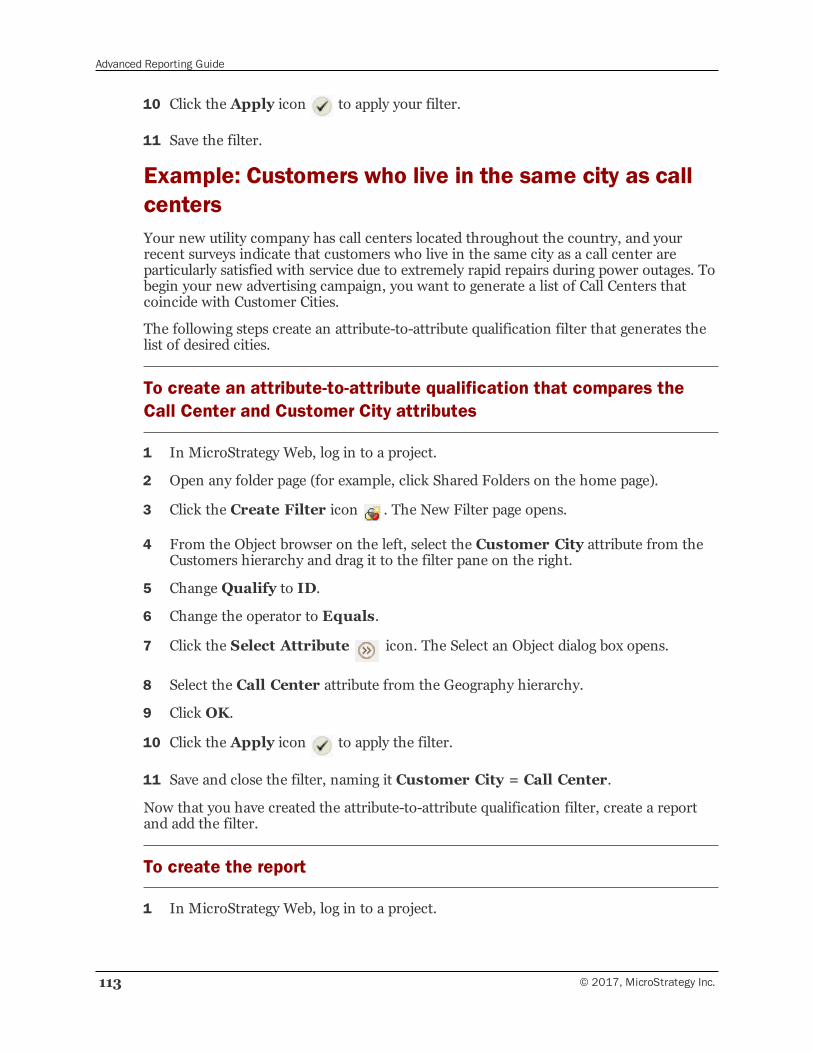
Advanced Reporting Guide
113 © 2017, MicroStrategy Inc.
10 Click the Apply icon to apply your filter.
11 Save the filter.
Example: Customers who live in the same city as callcentersYour new utility company has call centers located throughout the country, and yourrecent surveys indicate that customers who live in the same city as a call center areparticularly satisfied with service due to extremely rapid repairs during power outages. Tobegin your new advertising campaign, you want to generate a list of Call Centers thatcoincide with Customer Cities.
The following steps create an attribute-to-attribute qualification filter that generates thelist of desired cities.
To create an attribute-to-attribute qualification that compares theCall Center and Customer City attributes
1 In MicroStrategy Web, log in to a project.
2 Open any folder page (for example, click Shared Folders on the home page).
3 Click the Create Filter icon . The New Filter page opens.
4 From the Object browser on the left, select the Customer City attribute from theCustomers hierarchy and drag it to the filter pane on the right.
5 Change Qualify to ID.
6 Change the operator to Equals.
7 Click the Select Attribute icon. The Select an Object dialog box opens.
8 Select the Call Center attribute from the Geography hierarchy.
9 Click OK.
10 Click the Apply icon to apply the filter.
11 Save and close the filter, naming it Customer City = Call Center.
Now that you have created the attribute-to-attribute qualification filter, create a reportand add the filter.
To create the report
1 In MicroStrategy Web, log in to a project.
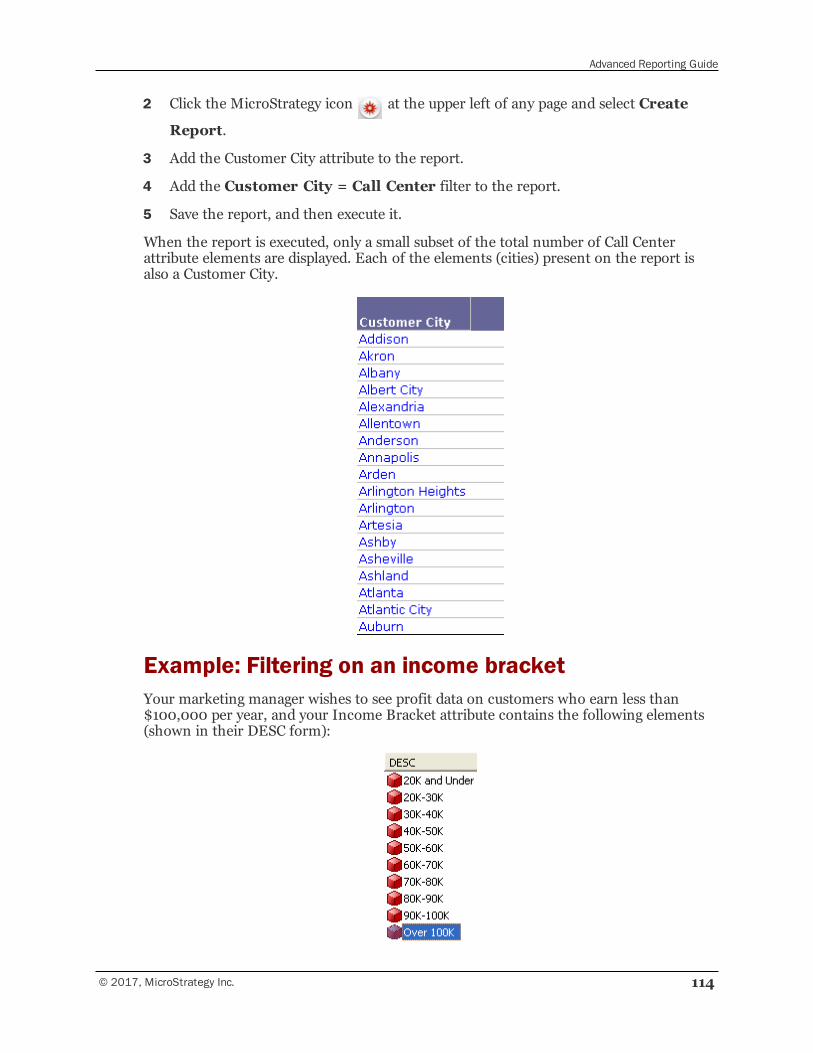
Advanced Reporting Guide
© 2017, MicroStrategy Inc. 114
2 Click the MicroStrategy icon at the upper left of any page and select Create
Report.
3 Add the Customer City attribute to the report.
4 Add the Customer City = Call Center filter to the report.
5 Save the report, and then execute it.
When the report is executed, only a small subset of the total number of Call Centerattribute elements are displayed. Each of the elements (cities) present on the report isalso a Customer City.
Example: Filtering on an income bracketYour marketing manager wishes to see profit data on customers who earn less than$100,000 per year, and your Income Bracket attribute contains the following elements(shown in their DESC form):
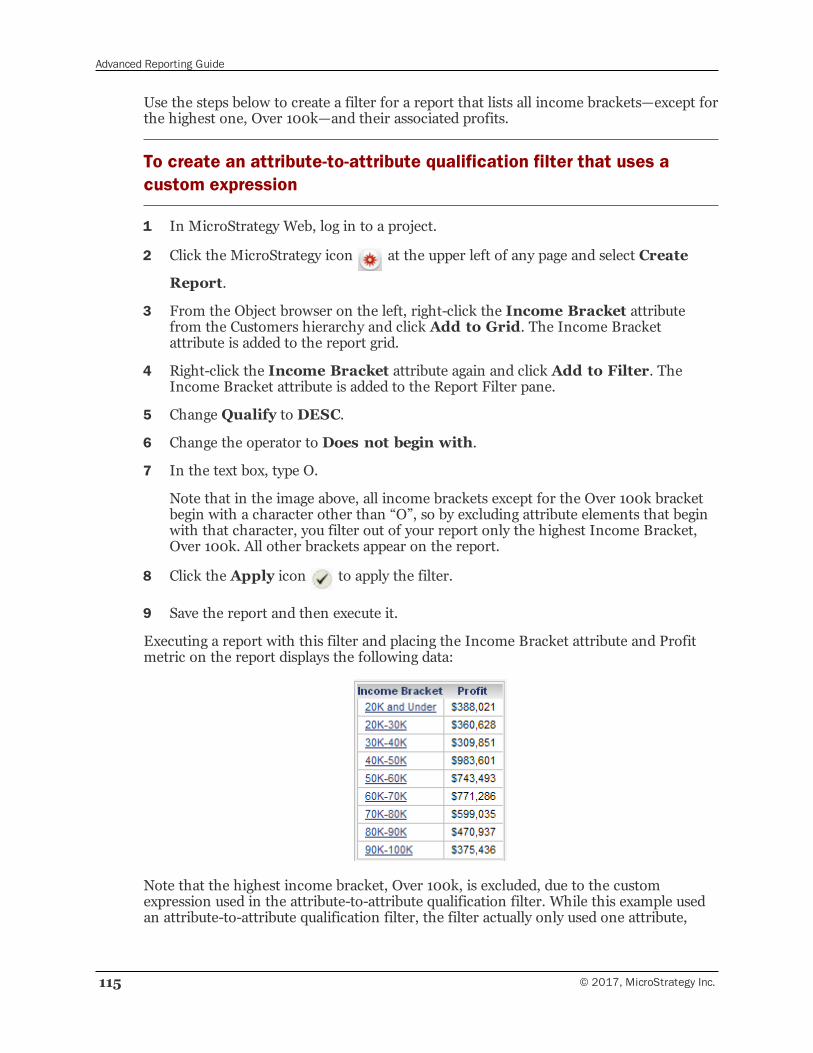
Advanced Reporting Guide
115 © 2017, MicroStrategy Inc.
Use the steps below to create a filter for a report that lists all income brackets—except forthe highest one, Over 100k—and their associated profits.
To create an attribute-to-attribute qualification filter that uses acustom expression
1 In MicroStrategy Web, log in to a project.
2 Click the MicroStrategy icon at the upper left of any page and select Create
Report.
3 From the Object browser on the left, right-click the Income Bracket attributefrom the Customers hierarchy and click Add to Grid. The Income Bracketattribute is added to the report grid.
4 Right-click the Income Bracket attribute again and click Add to Filter. TheIncome Bracket attribute is added to the Report Filter pane.
5 Change Qualify to DESC.
6 Change the operator to Does not begin with.
7 In the text box, type O.
Note that in the image above, all income brackets except for the Over 100k bracketbegin with a character other than “O”, so by excluding attribute elements that beginwith that character, you filter out of your report only the highest Income Bracket,Over 100k. All other brackets appear on the report.
8 Click the Apply icon to apply the filter.
9 Save the report and then execute it.
Executing a report with this filter and placing the Income Bracket attribute and Profitmetric on the report displays the following data:
Note that the highest income bracket, Over 100k, is excluded, due to the customexpression used in the attribute-to-attribute qualification filter. While this example usedan attribute-to-attribute qualification filter, the filter actually only used one attribute,
Advanced Reporting Guide
© 2017, MicroStrategy Inc. 116
Income Bracket, in its definition. The attribute was coupled with a custom expression toachieve the desired result.
Dynamic dates: Filtering by offsetting thecurrent date
When you qualify on a date attribute form with the date data type, you can selectdynamic dates, which are fixed offsets of the current date. They can be either a fixed setof dates or different date ranges that change through time. For example, a dynamic datecan be used in a report that examines revenue amounts in the previous two months. Thisis represented as “today” with an offset of two months.
You can express dynamic date qualifications in several ways, as shown in the followingexamples:
• An offset of four years, three months, two weeks, and one day from today
• Monday of this week
• Monday of this week with an offset of two days
• The fourth of this month
• The fourth Wednesday of this month
• May fourth of next year
• The third Wednesday in May of this year
While evaluating a dynamic date such as “first of this month minus seven days,” theorder in which these two parts are calculated is significant. The addition or subtractionof days, weeks, months, or years (the offset) is always done first, before “first of thismonth,” “this week,” “this year,” and so on is calculated. For example:
• If today is February 13th, then “today minus seven days” is February sixth, and “thefirst of the month of today minus seven days” is February first.
• However, if today is February second, then “today minus seven days” is January26th, and “the first of the month of today minus seven days” is January first.
Dynamic dates are available for any attribute form that has a Date or Datetime formattype. For an attribute form with a Datetime format type, dynamic times are alsoavailable. Hours, minutes, or both can be calculated dynamically. Hours, minutes, orboth can be defined as static. For example, if the current time is 12:40 PM:
• Then “this hour plus 1 hour” and “this minute minus 0 minutes” (dynamic hour anddynamic minute) is calculated as 1:40 PM.
• Then “this hour plus 1 hour” and “Static Minute = 24” (dynamic hour and staticminute) is calculated as 1:24 PM.
• Then “Static Hour = 11 AM” and “this minute minus 10” (static hour and dynamicminute) is calculated as 11:30 AM.
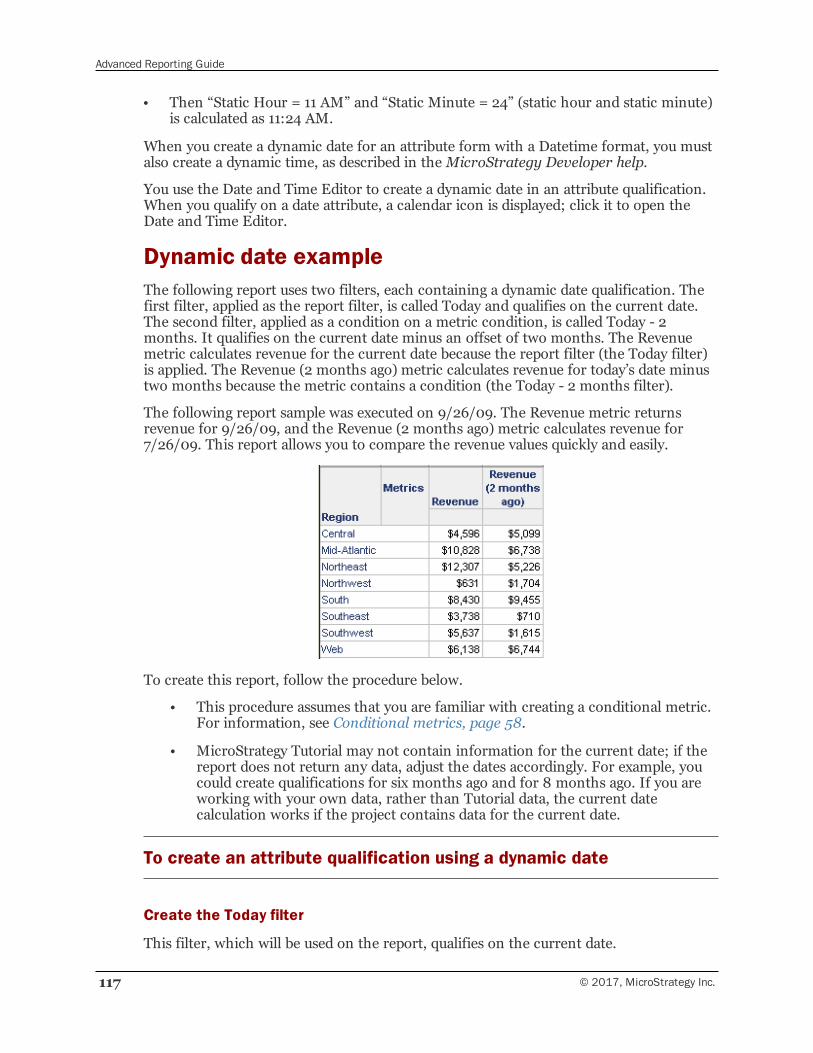
Advanced Reporting Guide
117 © 2017, MicroStrategy Inc.
• Then “Static Hour = 11 AM” and “Static Minute = 24” (static hour and static minute)is calculated as 11:24 AM.
When you create a dynamic date for an attribute form with a Datetime format, you mustalso create a dynamic time, as described in theMicroStrategy Developer help.
You use the Date and Time Editor to create a dynamic date in an attribute qualification.When you qualify on a date attribute, a calendar icon is displayed; click it to open theDate and Time Editor.
Dynamic date exampleThe following report uses two filters, each containing a dynamic date qualification. Thefirst filter, applied as the report filter, is called Today and qualifies on the current date.The second filter, applied as a condition on a metric condition, is called Today - 2months. It qualifies on the current date minus an offset of two months. The Revenuemetric calculates revenue for the current date because the report filter (the Today filter)is applied. The Revenue (2 months ago) metric calculates revenue for today’s date minustwo months because the metric contains a condition (the Today - 2 months filter).
The following report sample was executed on 9/26/09. The Revenue metric returnsrevenue for 9/26/09, and the Revenue (2 months ago) metric calculates revenue for7/26/09. This report allows you to compare the revenue values quickly and easily.
To create this report, follow the procedure below.
• This procedure assumes that you are familiar with creating a conditional metric.For information, see Conditional metrics, page 58.
• MicroStrategy Tutorial may not contain information for the current date; if thereport does not return any data, adjust the dates accordingly. For example, youcould create qualifications for six months ago and for 8 months ago. If you areworking with your own data, rather than Tutorial data, the current datecalculation works if the project contains data for the current date.
To create an attribute qualification using a dynamic date
Create the Today filter
This filter, which will be used on the report, qualifies on the current date.
Advanced Reporting Guide
© 2017, MicroStrategy Inc. 118
1 In MicroStrategy Developer, on the Filemenu, point to New, and choose Filter.The Filter Editor opens.
If the New Filter dialog box is displayed, click the Empty Filter icon. If you do notwant this dialog box to be shown in the future, select Don't show this dialog inthe future. Click OK. For a full description of object templates, including a list ofthe objects that can use object templates, see Re-using objects via shortcuts andobject templates , page 295.
2 Drag the Day attribute from the Object Browser to the Filter definition pane. TheAttribute Qualification pane opens.
3 Select ID from the Qualify On drop-down list.
4 Click the Date Editor icon (the calendar). The Date Editor opens.
5 Select Dynamic date.
6 By default, Today is selected. Note that the current date appears in the Preview area.
7 Click OK, and then OK again to return to the Filter Definition pane. Notice that thequalification is displayed as Day(ID) Exactly Today.
8 Save and close the filter, naming it Today.
Create the Today - 2 months filter
This filter subtracts two months from the current date. It will be used on the conditionalmetric.
9 Begin creating a new filter, as described in the steps above, through selectingDynamic date.
10 By default, Today is selected. In the boxes next to months, selectMinus and 2. Thisindicates an offset of two months ago. Note that the current date and the dynamicdate appear in the Preview area.
11 Click OK, and then OK again. Notice that the qualification is displayed as Day (ID)Exactly Today minus 2 months.
12 Save and close the filter, naming it Today - 2 months.
Apply the Today - 2 months to a metric
Create a conditional metric to calculate the revenue on the dynamic date.
13 On the Filemenu, point to New, and then selectMetric. The Metric Editor opens.
If the New Metric dialog box is displayed, click the Empty Metric icon. If you donot want this dialog box to be shown in the future, select Don't show this dialogin the future. Click OK. For a full description of object templates, including a listof the objects that can use object templates, see Re-using objects via shortcuts andobject templates , page 295.
14 Drag the Revenue fact from the Object Browser to the Metric Definition pane.
Advanced Reporting Guide
119 © 2017, MicroStrategy Inc.
15 Select Condition in the Metric component pane. The Condition definition paneopens.
16 Drag the Today - 2 months filter from the Object Browser to the Conditiondefinition pane.
17 Save and close the metric, naming it Revenue (2 months ago).
Create the report
18 On the Filemenu, point to New, and then select Report. The Report Editor opens.
If the New Grid dialog box is displayed, click the Empty Report icon. If you do notwant this dialog box to be shown in the future, select Don't show this dialog inthe future. Click OK. For a full description of object templates, including a list ofthe objects that can use object templates, see Re-using objects via shortcuts andobject templates , page 295.
19 Add the Region attribute, the Revenuemetric, and the Revenue (2 monthsago) metric.
20 Drag the Today filter from the Object Browser to the Report Filter pane.
21 Save the report, then execute it.
Dynamic date based on a prompt answerYou can base the dynamic date on a prompt answer, rather than today’s date. Forexample, you want to see daily revenue for the last month, starting at a particular date. Ifthe specific date is 11/8/09, you want to see the daily revenue from 10/8/09 until11/8/09, as shown in the report sample below:
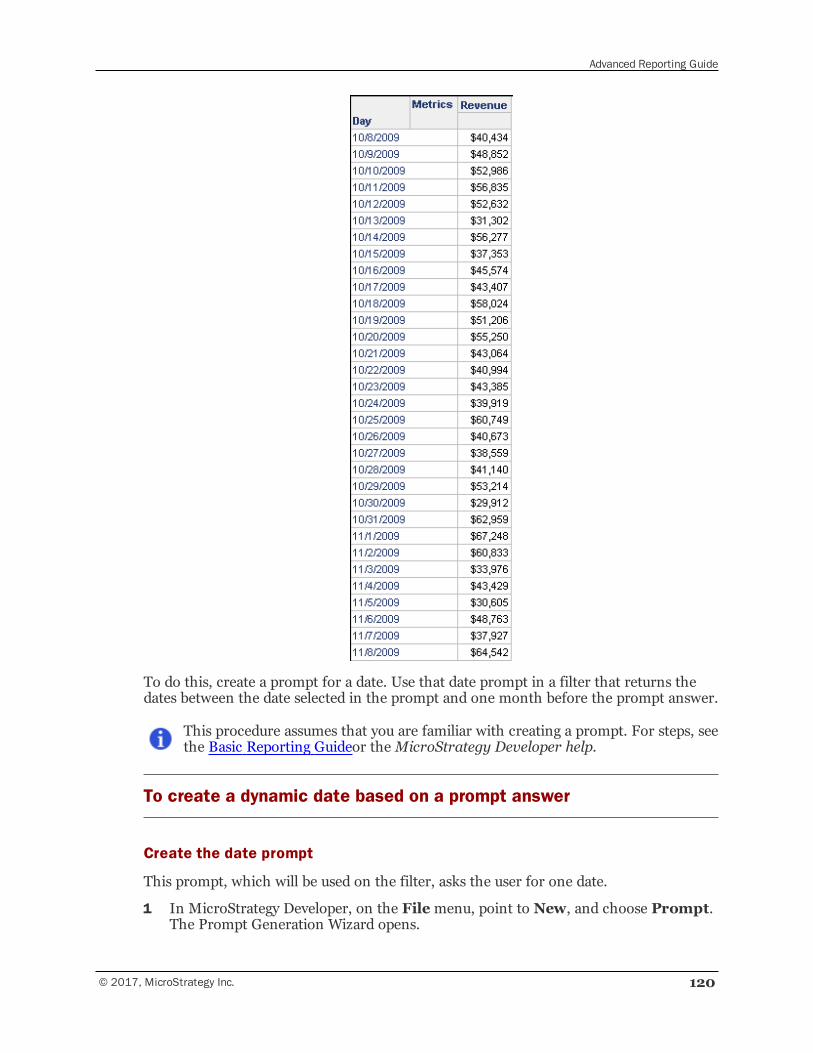
Advanced Reporting Guide
© 2017, MicroStrategy Inc. 120
To do this, create a prompt for a date. Use that date prompt in a filter that returns thedates between the date selected in the prompt and one month before the prompt answer.
This procedure assumes that you are familiar with creating a prompt. For steps, seethe Basic Reporting Guideor theMicroStrategy Developer help.
To create a dynamic date based on a prompt answer
Create the date prompt
This prompt, which will be used on the filter, asks the user for one date.
1 In MicroStrategy Developer, on the Filemenu, point to New, and choose Prompt.The Prompt Generation Wizard opens.
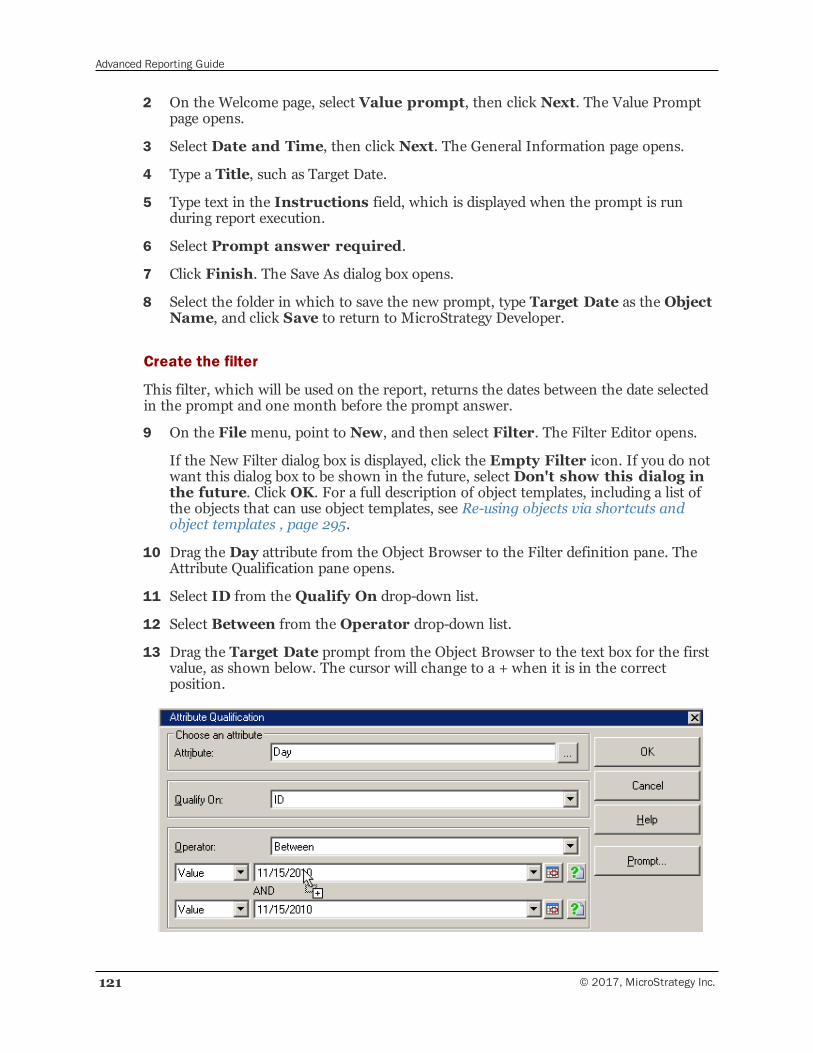
Advanced Reporting Guide
121 © 2017, MicroStrategy Inc.
2 On the Welcome page, select Value prompt, then click Next. The Value Promptpage opens.
3 Select Date and Time, then click Next. The General Information page opens.
4 Type a Title, such as Target Date.
5 Type text in the Instructions field, which is displayed when the prompt is runduring report execution.
6 Select Prompt answer required.
7 Click Finish. The Save As dialog box opens.
8 Select the folder in which to save the new prompt, type Target Date as the ObjectName, and click Save to return to MicroStrategy Developer.
Create the filter
This filter, which will be used on the report, returns the dates between the date selectedin the prompt and one month before the prompt answer.
9 On the Filemenu, point to New, and then select Filter. The Filter Editor opens.
If the New Filter dialog box is displayed, click the Empty Filter icon. If you do notwant this dialog box to be shown in the future, select Don't show this dialog inthe future. Click OK. For a full description of object templates, including a list ofthe objects that can use object templates, see Re-using objects via shortcuts andobject templates , page 295.
10 Drag the Day attribute from the Object Browser to the Filter definition pane. TheAttribute Qualification pane opens.
11 Select ID from the Qualify On drop-down list.
12 Select Between from the Operator drop-down list.
13 Drag the Target Date prompt from the Object Browser to the text box for the firstvalue, as shown below. The cursor will change to a + when it is in the correctposition.
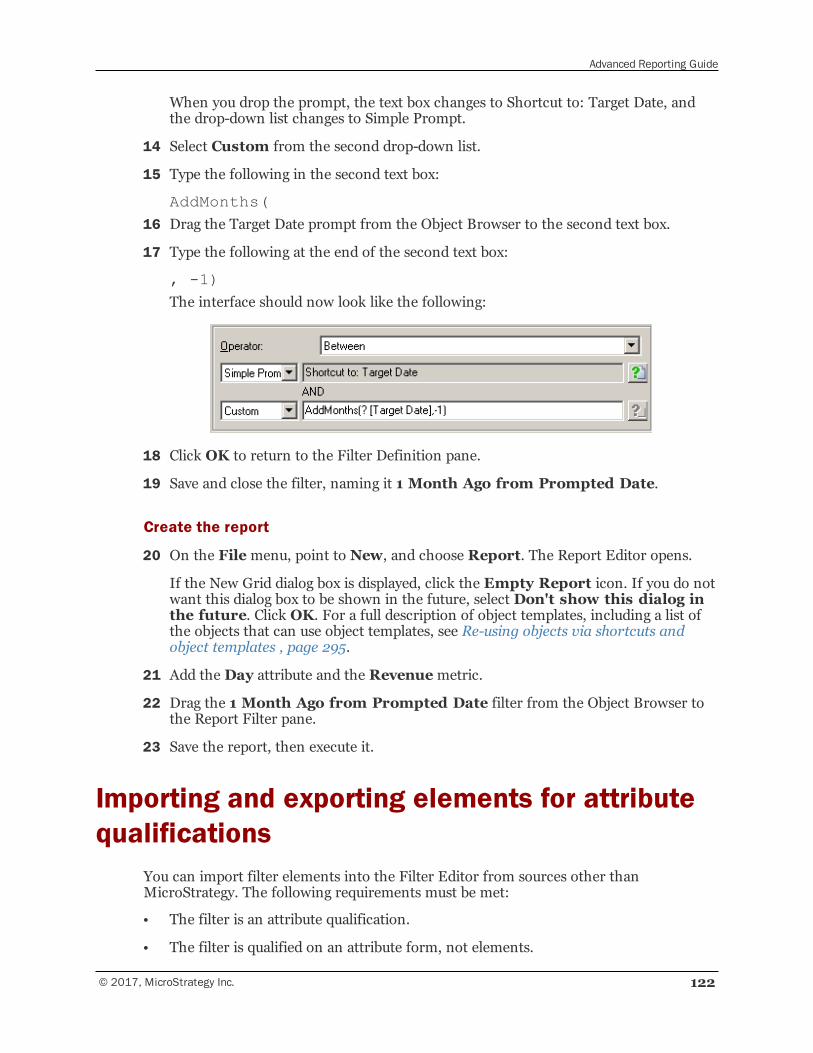
Advanced Reporting Guide
© 2017, MicroStrategy Inc. 122
When you drop the prompt, the text box changes to Shortcut to: Target Date, andthe drop-down list changes to Simple Prompt.
14 Select Custom from the second drop-down list.
15 Type the following in the second text box:
AddMonths(16 Drag the Target Date prompt from the Object Browser to the second text box.
17 Type the following at the end of the second text box:
, -1)The interface should now look like the following:
18 Click OK to return to the Filter Definition pane.
19 Save and close the filter, naming it 1 Month Ago from Prompted Date.
Create the report
20 On the Filemenu, point to New, and choose Report. The Report Editor opens.
If the New Grid dialog box is displayed, click the Empty Report icon. If you do notwant this dialog box to be shown in the future, select Don't show this dialog inthe future. Click OK. For a full description of object templates, including a list ofthe objects that can use object templates, see Re-using objects via shortcuts andobject templates , page 295.
21 Add the Day attribute and the Revenuemetric.
22 Drag the 1 Month Ago from Prompted Date filter from the Object Browser tothe Report Filter pane.
23 Save the report, then execute it.
Importing and exporting elements for attributequalifications
You can import filter elements into the Filter Editor from sources other thanMicroStrategy. The following requirements must be met:
• The filter is an attribute qualification.
• The filter is qualified on an attribute form, not elements.
Advanced Reporting Guide
123 © 2017, MicroStrategy Inc.
• The operator must be In list or Not in list.
• The elements to be imported are stored in an Excel file or a text file.
The import filter elements option adds more flexibility to the Filter Editor by allowinglists of data from pre-existing files to be imported into the filter definition. Existing filterdefinitions can also be exported to a file.
You can use a prompt to allow you to select the file to import when you run thereport.
Importing elements from a text file or a Microsoft Excel file can be quicker and moreefficient than selecting each individual element to be included in the filter. For example,you have an Excel spreadsheet that lists the products on sale this month. You need toreview last week's revenue for just these items. Rather than selecting them in the FilterEditor, you can simply import the file. Likewise, you can export existing filter definitionsto a file.
Requirements for formatting the import fileThe following rules apply to the formatting of files:
• Excel—Data can be stored in rows, columns, or both, as follows:
▫ If the data in a cell has double quotes in the first and last position, it is importedas it is, with the quotes.
▫ If the data in a cell has single quotes in the first and last position, it is importedas is, with the quotes.
▫ If the data in a cell does not satisfy conditions 1 or 2, it is checked to see if it is anumber. If the data is a number, it is imported as it is.
▫ If the data in a cell does not satisfy conditions 1 or 2, it is checked to see if it is adate. If it is a date, it is imported by adding single quotes at the beginning and atthe end to comply with the date format.
▫ If the data in a cell does not satisfy any of the above conditions, it is consideredas text data and is imported by adding double quotes at the beginning and end tocomply with the text format.
• Text—Data in a text file must be one of the following:
▫ Tab-delimited
▫ List-delimited as specified in the regional settings
▫ Return-delimited
To import filter elements
1 In MicroStrategy Developer, select File, point to New, and then choose Filter. TheFilter Editor opens.
Advanced Reporting Guide
© 2017, MicroStrategy Inc. 124
If the New Filter dialog box is displayed, click the Empty Filter icon. If you do notwant this dialog box to be shown in the future, select Don't show this dialog inthe future. Click OK. For a full description of object templates, including a list ofthe objects that can use object templates, see Re-using objects via shortcuts andobject templates , page 295.
2 Double-click in the Filter definition pane. The Filtering Options dialog box opens.
3 Select Add an Attribute qualification and click OK. The Attribute Qualificationpane opens.
4 Select an attribute by dragging the attribute from the Object Browser into theAttribute box.
5 Select any form except Elements from the Qualify On drop-down list.
6 Select In list or Not in list from the Operator drop-down list.
7 Click Import to import the filter elements. The Import Elements from File dialogbox opens.
8 Select the Excel file or text file that contains the attribute elements.
9 Click OK to close the Attribute qualification pane.
10 Save and close the filter.
To export filter elements
1 In MicroStrategy Developer, select File, point to New, and then choose Filter. TheFilter Editor opens.
If the New Filter dialog box is displayed, click the Empty Filter icon. If you do notwant this dialog box to be shown in the future, select Don't show this dialog inthe future. Click OK. For a full description of object templates, including a list ofthe objects that can use object templates, see Re-using objects via shortcuts andobject templates , page 295.
2 Double-click in the Filter definition pane. The Filtering Options dialog box opens.
3 Select Add an Attribute qualification and click OK. The Attribute Qualificationpane opens.
4 Select an attribute by dragging the attribute from the Object Browser into theAttribute box.
5 Select any form except Elements from the Qualify On drop-down list.
6 Select In list or Not in list from the Operator drop-down list.
7 In the List field, type the element IDs, descriptions, or other items, separated by acomma, as shown in the example below:
Central,Mid-Atlantic,Northeast
Advanced Reporting Guide
125 © 2017, MicroStrategy Inc.
You can drag and drop elements from the Object Browser, but you must type acomma between each item. If you drag and drop elements, they are enclosedin double quotes. If you export to an Excel spreadsheet, the quotes are notexported, but if you export to a text file instead, the quotes are exported.
8 Click Export to export the filter elements. The Export Elements to File dialog boxopens.
9 Navigate to the directory in which to save the file.
10 Type a File Name.
11 By default, the file is saved as an Excel spreadsheet. To change it to a text file, selectText Files from the Save as type drop-down list.
12 Click Save to save the export file and return to the Filter Editor.
13 Click OK to close the Attribute qualification pane.
14 Save and close the filter.
The attribute level of set qualifications: Outputlevel
The output level of a set qualification specifies the attribute level at which the metric orset is calculated for the qualification. For example, if a metric set qualification is Sales >1000, Sales could mean sales per day, month, category, or region.
You can select the attributes to use as the output level for either a metric qualification ora relationship qualification. For a metric qualification, you can set the output level to thelevel of the report or the metric instead. For details and examples, see the followingsections:
• The output level of relationship qualifications, page 125
• The output level of metric qualifications, page 126
The output level of relationship qualificationsThe output level of a relationship qualification specifies the attribute level at which theset is calculated for the qualification. It controls the contents of the relationshipqualification output. You select the attribute or attributes to use as the output level.
For example, you need a report that lists customers from the same region as a specificcustomer. This example uses Hugh Abarca as the specific customer. Create a relationshipqualification to link the Customer Region and Customer attributes, and then filter thatrelationship on Hugh Abarca. Since the report needs to filter on Customer Region, therelationship qualification must return that attribute. This is the purpose of the outputlevel, which specifies the attribute level of calculation for the set.
To build this sample report, first create a filter with an attribute qualification forCustomer = Hugh Abarca. Then create a second filter with the following qualification:
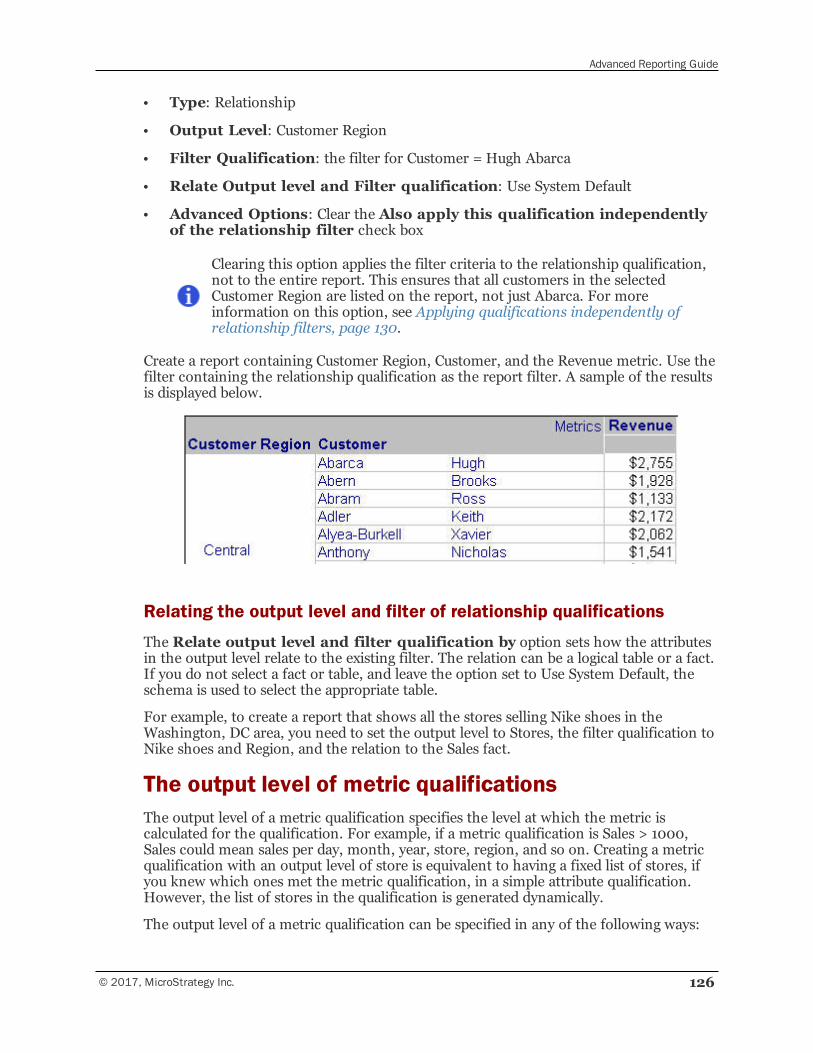
Advanced Reporting Guide
© 2017, MicroStrategy Inc. 126
• Type: Relationship
• Output Level: Customer Region
• Filter Qualification: the filter for Customer = Hugh Abarca
• Relate Output level and Filter qualification: Use System Default
• Advanced Options: Clear the Also apply this qualification independentlyof the relationship filter check box
Clearing this option applies the filter criteria to the relationship qualification,not to the entire report. This ensures that all customers in the selectedCustomer Region are listed on the report, not just Abarca. For moreinformation on this option, see Applying qualifications independently ofrelationship filters, page 130.
Create a report containing Customer Region, Customer, and the Revenue metric. Use thefilter containing the relationship qualification as the report filter. A sample of the resultsis displayed below.
Relating the output level and filter of relationship qualifications
The Relate output level and filter qualification by option sets how the attributesin the output level relate to the existing filter. The relation can be a logical table or a fact.If you do not select a fact or table, and leave the option set to Use System Default, theschema is used to select the appropriate table.
For example, to create a report that shows all the stores selling Nike shoes in theWashington, DC area, you need to set the output level to Stores, the filter qualification toNike shoes and Region, and the relation to the Sales fact.
The output level of metric qualificationsThe output level of a metric qualification specifies the level at which the metric iscalculated for the qualification. For example, if a metric qualification is Sales > 1000,Sales could mean sales per day, month, year, store, region, and so on. Creating a metricqualification with an output level of store is equivalent to having a fixed list of stores, ifyou knew which ones met the metric qualification, in a simple attribute qualification.However, the list of stores in the qualification is generated dynamically.
The output level of a metric qualification can be specified in any of the following ways:
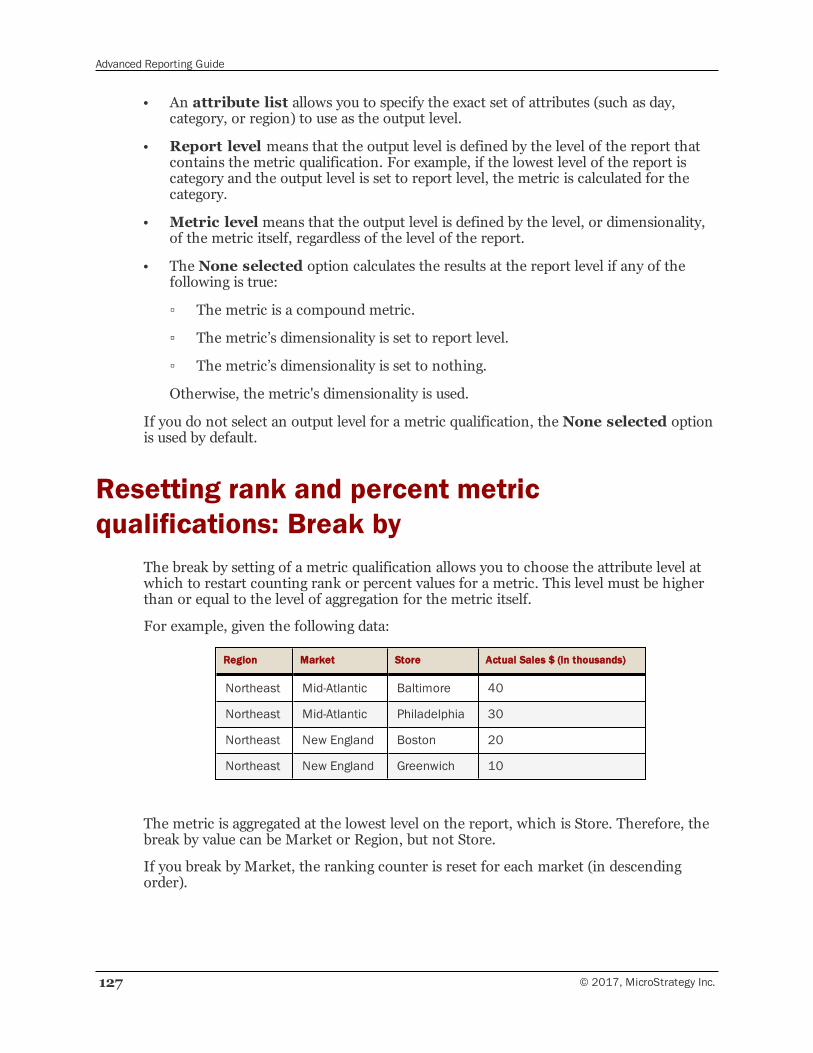
Advanced Reporting Guide
127 © 2017, MicroStrategy Inc.
• An attribute list allows you to specify the exact set of attributes (such as day,category, or region) to use as the output level.
• Report level means that the output level is defined by the level of the report thatcontains the metric qualification. For example, if the lowest level of the report iscategory and the output level is set to report level, the metric is calculated for thecategory.
• Metric level means that the output level is defined by the level, or dimensionality,of the metric itself, regardless of the level of the report.
• The None selected option calculates the results at the report level if any of thefollowing is true:
▫ The metric is a compound metric.
▫ The metric’s dimensionality is set to report level.
▫ The metric’s dimensionality is set to nothing.
Otherwise, the metric's dimensionality is used.
If you do not select an output level for a metric qualification, the None selected optionis used by default.
Resetting rank and percent metricqualifications: Break by
The break by setting of a metric qualification allows you to choose the attribute level atwhich to restart counting rank or percent values for a metric. This level must be higherthan or equal to the level of aggregation for the metric itself.
For example, given the following data:
Region Market Store Actual Sales $ (in thousands)
Northeast Mid-Atlantic Baltimore 40
Northeast Mid-Atlantic Philadelphia 30
Northeast New England Boston 20
Northeast New England Greenwich 10
The metric is aggregated at the lowest level on the report, which is Store. Therefore, thebreak by value can be Market or Region, but not Store.
If you break by Market, the ranking counter is reset for each market (in descendingorder).
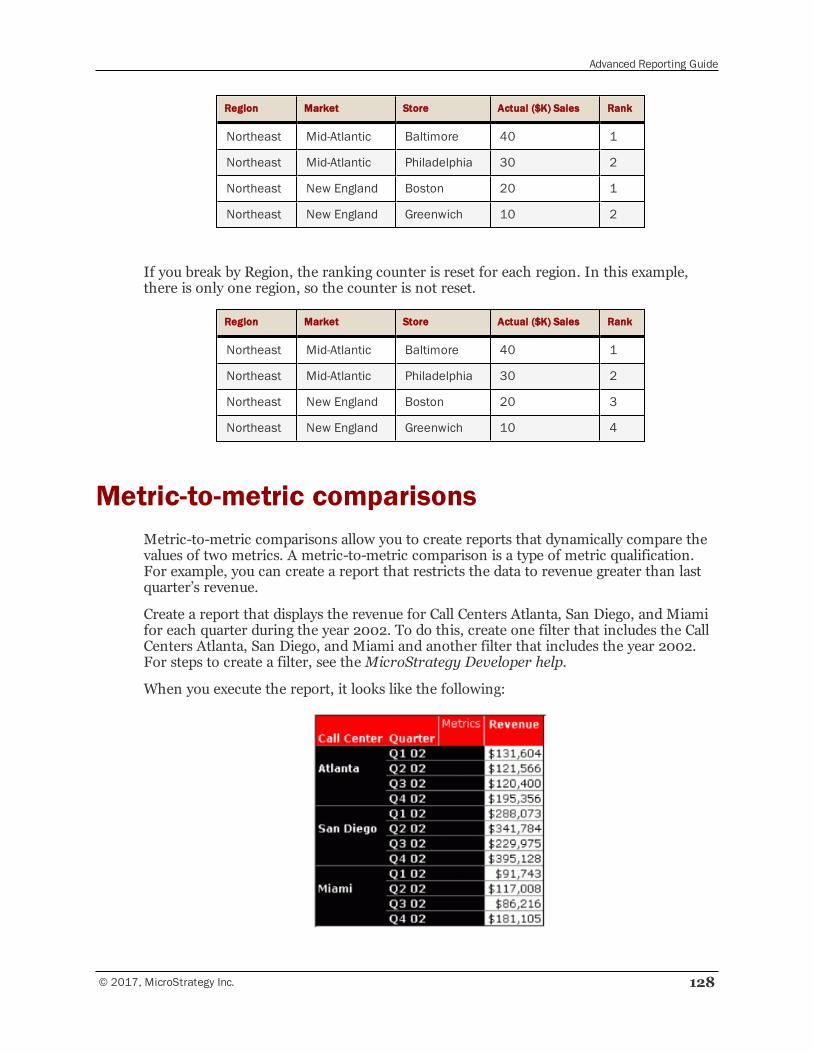
Advanced Reporting Guide
© 2017, MicroStrategy Inc. 128
Region Market Store Actual ($K) Sales Rank
Northeast Mid-Atlantic Baltimore 40 1
Northeast Mid-Atlantic Philadelphia 30 2
Northeast New England Boston 20 1
Northeast New England Greenwich 10 2
If you break by Region, the ranking counter is reset for each region. In this example,there is only one region, so the counter is not reset.
Region Market Store Actual ($K) Sales Rank
Northeast Mid-Atlantic Baltimore 40 1
Northeast Mid-Atlantic Philadelphia 30 2
Northeast New England Boston 20 3
Northeast New England Greenwich 10 4
Metric-to-metric comparisonsMetric-to-metric comparisons allow you to create reports that dynamically compare thevalues of two metrics. A metric-to-metric comparison is a type of metric qualification.For example, you can create a report that restricts the data to revenue greater than lastquarter’s revenue.
Create a report that displays the revenue for Call Centers Atlanta, San Diego, and Miamifor each quarter during the year 2002. To do this, create one filter that includes the CallCenters Atlanta, San Diego, and Miami and another filter that includes the year 2002.For steps to create a filter, see theMicroStrategy Developer help.
When you execute the report, it looks like the following:
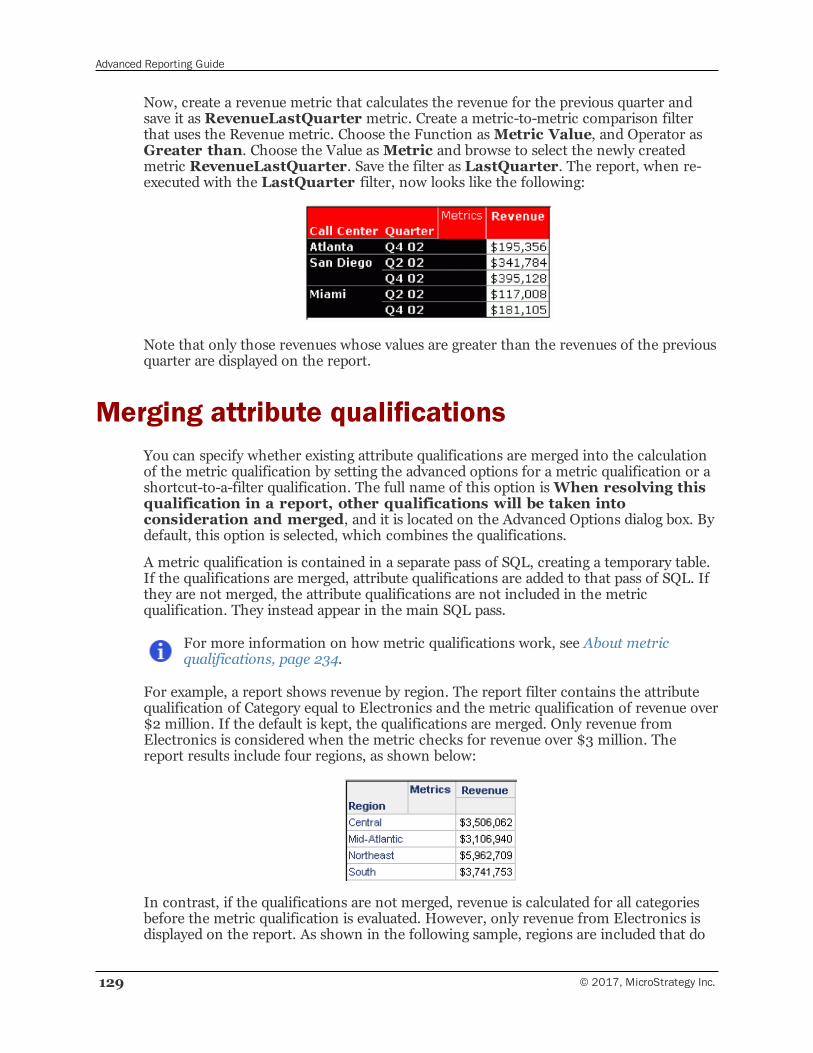
Advanced Reporting Guide
129 © 2017, MicroStrategy Inc.
Now, create a revenue metric that calculates the revenue for the previous quarter andsave it as RevenueLastQuarter metric. Create a metric-to-metric comparison filterthat uses the Revenue metric. Choose the Function asMetric Value, and Operator asGreater than. Choose the Value asMetric and browse to select the newly createdmetric RevenueLastQuarter. Save the filter as LastQuarter. The report, when re-executed with the LastQuarter filter, now looks like the following:
Note that only those revenues whose values are greater than the revenues of the previousquarter are displayed on the report.
Merging attribute qualificationsYou can specify whether existing attribute qualifications are merged into the calculationof the metric qualification by setting the advanced options for a metric qualification or ashortcut-to-a-filter qualification. The full name of this option isWhen resolving thisqualification in a report, other qualifications will be taken intoconsideration and merged, and it is located on the Advanced Options dialog box. Bydefault, this option is selected, which combines the qualifications.
A metric qualification is contained in a separate pass of SQL, creating a temporary table.If the qualifications are merged, attribute qualifications are added to that pass of SQL. Ifthey are not merged, the attribute qualifications are not included in the metricqualification. They instead appear in the main SQL pass.
For more information on how metric qualifications work, see About metricqualifications, page 234.
For example, a report shows revenue by region. The report filter contains the attributequalification of Category equal to Electronics and the metric qualification of revenue over$2 million. If the default is kept, the qualifications are merged. Only revenue fromElectronics is considered when the metric checks for revenue over $3 million. Thereport results include four regions, as shown below:
In contrast, if the qualifications are not merged, revenue is calculated for all categoriesbefore the metric qualification is evaluated. However, only revenue from Electronics isdisplayed on the report. As shown in the following sample, regions are included that do
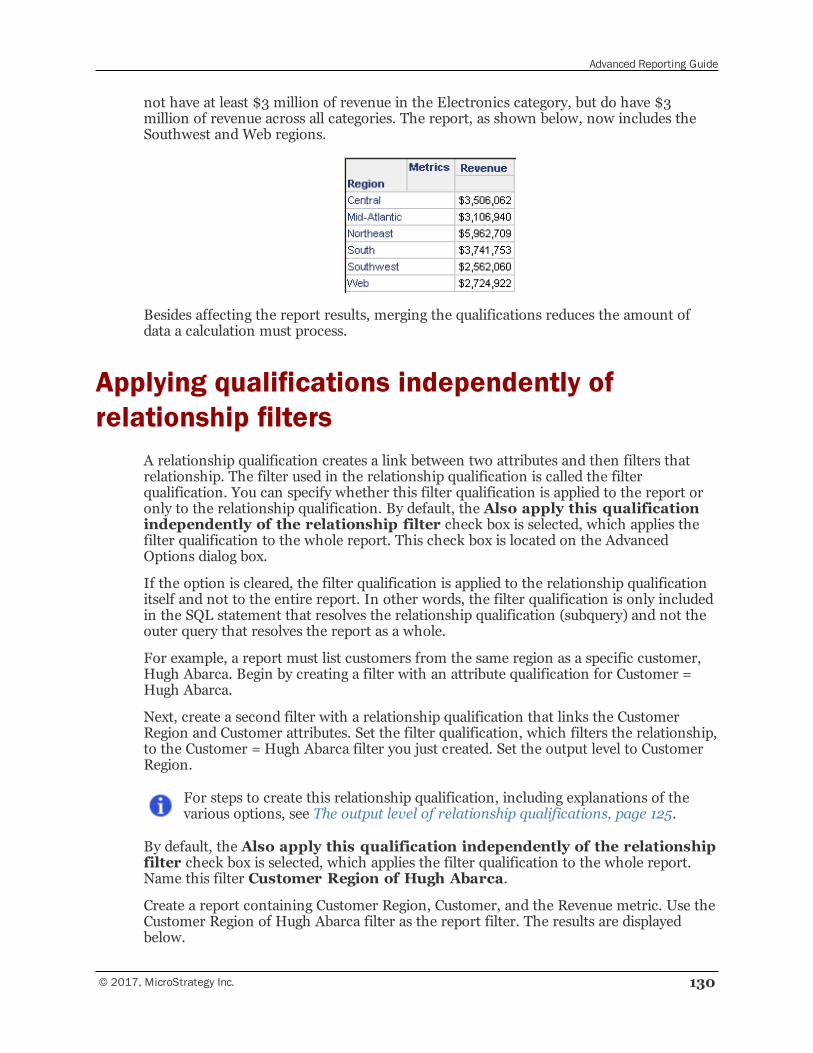
Advanced Reporting Guide
© 2017, MicroStrategy Inc. 130
not have at least $3 million of revenue in the Electronics category, but do have $3million of revenue across all categories. The report, as shown below, now includes theSouthwest and Web regions.
Besides affecting the report results, merging the qualifications reduces the amount ofdata a calculation must process.
Applying qualifications independently ofrelationship filters
A relationship qualification creates a link between two attributes and then filters thatrelationship. The filter used in the relationship qualification is called the filterqualification. You can specify whether this filter qualification is applied to the report oronly to the relationship qualification. By default, the Also apply this qualificationindependently of the relationship filter check box is selected, which applies thefilter qualification to the whole report. This check box is located on the AdvancedOptions dialog box.
If the option is cleared, the filter qualification is applied to the relationship qualificationitself and not to the entire report. In other words, the filter qualification is only includedin the SQL statement that resolves the relationship qualification (subquery) and not theouter query that resolves the report as a whole.
For example, a report must list customers from the same region as a specific customer,Hugh Abarca. Begin by creating a filter with an attribute qualification for Customer =Hugh Abarca.
Next, create a second filter with a relationship qualification that links the CustomerRegion and Customer attributes. Set the filter qualification, which filters the relationship,to the Customer = Hugh Abarca filter you just created. Set the output level to CustomerRegion.
For steps to create this relationship qualification, including explanations of thevarious options, see The output level of relationship qualifications, page 125.
By default, the Also apply this qualification independently of the relationshipfilter check box is selected, which applies the filter qualification to the whole report.Name this filter Customer Region of Hugh Abarca.
Create a report containing Customer Region, Customer, and the Revenue metric. Use theCustomer Region of Hugh Abarca filter as the report filter. The results are displayedbelow.
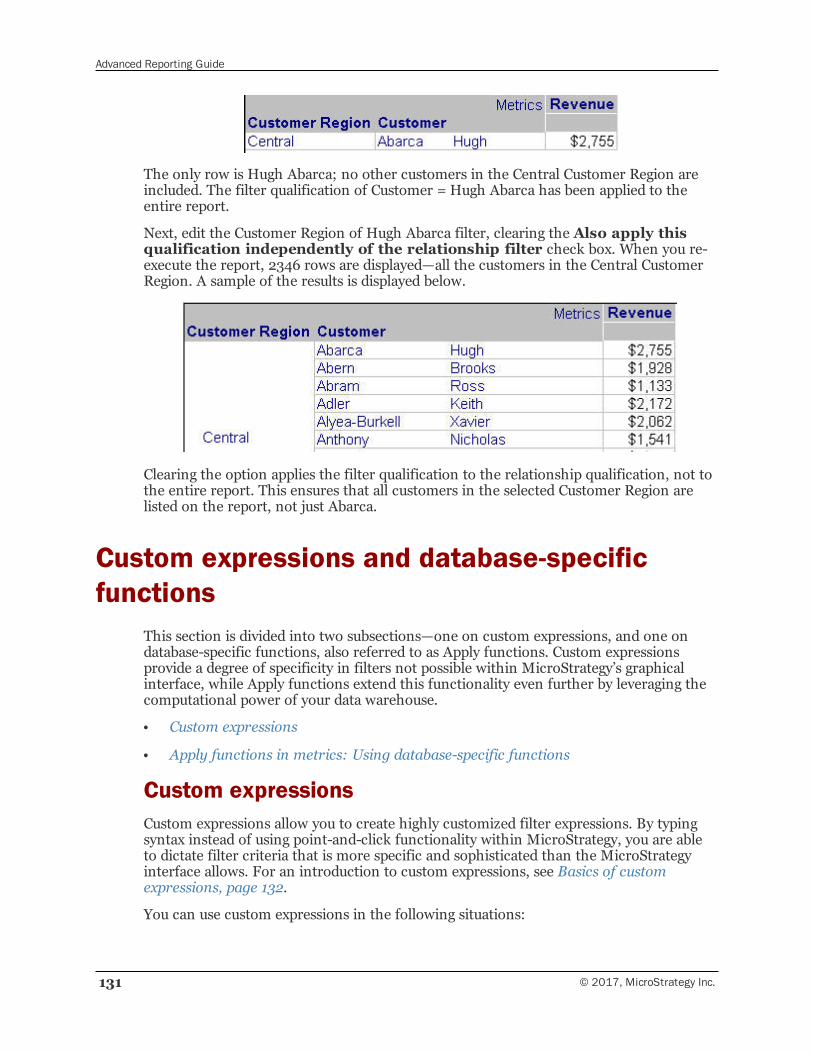
Advanced Reporting Guide
131 © 2017, MicroStrategy Inc.
The only row is Hugh Abarca; no other customers in the Central Customer Region areincluded. The filter qualification of Customer = Hugh Abarca has been applied to theentire report.
Next, edit the Customer Region of Hugh Abarca filter, clearing the Also apply thisqualification independently of the relationship filter check box. When you re-execute the report, 2346 rows are displayed—all the customers in the Central CustomerRegion. A sample of the results is displayed below.
Clearing the option applies the filter qualification to the relationship qualification, not tothe entire report. This ensures that all customers in the selected Customer Region arelisted on the report, not just Abarca.
Custom expressions and database-specificfunctions
This section is divided into two subsections—one on custom expressions, and one ondatabase-specific functions, also referred to as Apply functions. Custom expressionsprovide a degree of specificity in filters not possible within MicroStrategy’s graphicalinterface, while Apply functions extend this functionality even further by leveraging thecomputational power of your data warehouse.
• Custom expressions
• Apply functions in metrics: Using database-specific functions
Custom expressionsCustom expressions allow you to create highly customized filter expressions. By typingsyntax instead of using point-and-click functionality within MicroStrategy, you are ableto dictate filter criteria that is more specific and sophisticated than the MicroStrategyinterface allows. For an introduction to custom expressions, see Basics of customexpressions, page 132.
You can use custom expressions in the following situations:
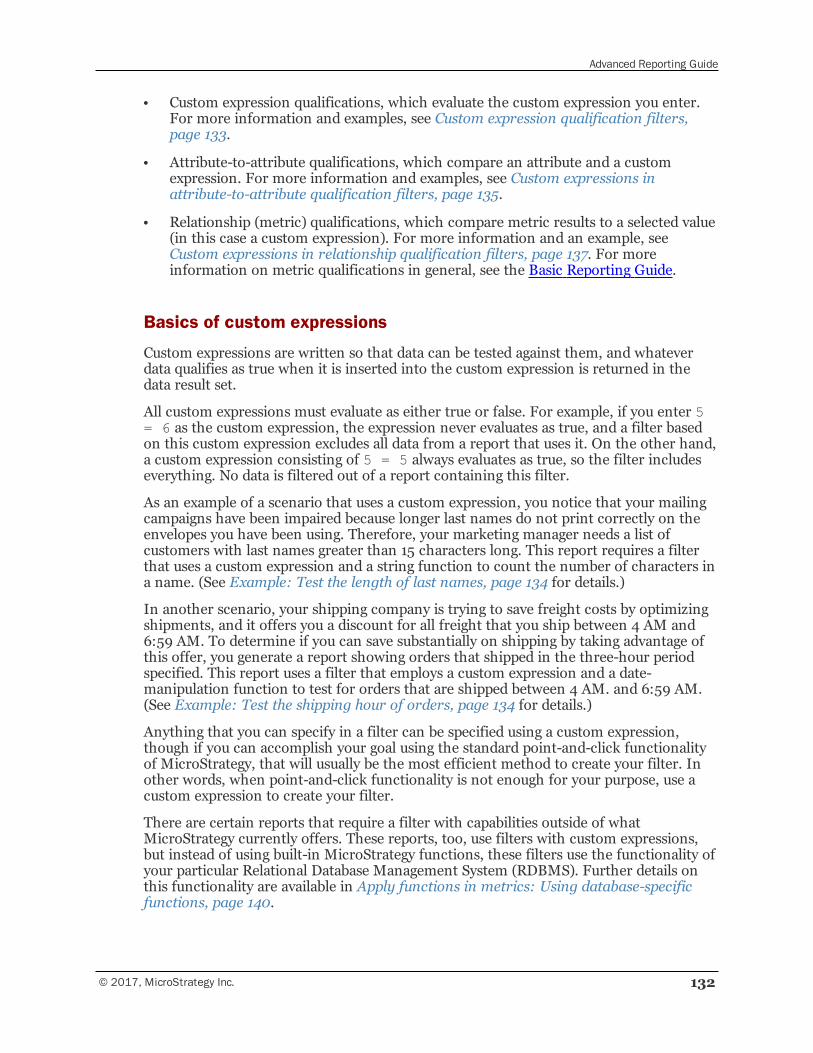
Advanced Reporting Guide
© 2017, MicroStrategy Inc. 132
• Custom expression qualifications, which evaluate the custom expression you enter.For more information and examples, see Custom expression qualification filters,page 133.
• Attribute-to-attribute qualifications, which compare an attribute and a customexpression. For more information and examples, see Custom expressions inattribute-to-attribute qualification filters, page 135.
• Relationship (metric) qualifications, which compare metric results to a selected value(in this case a custom expression). For more information and an example, seeCustom expressions in relationship qualification filters, page 137. For moreinformation on metric qualifications in general, see the Basic Reporting Guide.
Basics of custom expressions
Custom expressions are written so that data can be tested against them, and whateverdata qualifies as true when it is inserted into the custom expression is returned in thedata result set.
All custom expressions must evaluate as either true or false. For example, if you enter 5= 6 as the custom expression, the expression never evaluates as true, and a filter basedon this custom expression excludes all data from a report that uses it. On the other hand,a custom expression consisting of 5 = 5 always evaluates as true, so the filter includeseverything. No data is filtered out of a report containing this filter.
As an example of a scenario that uses a custom expression, you notice that your mailingcampaigns have been impaired because longer last names do not print correctly on theenvelopes you have been using. Therefore, your marketing manager needs a list ofcustomers with last names greater than 15 characters long. This report requires a filterthat uses a custom expression and a string function to count the number of characters ina name. (See Example: Test the length of last names, page 134 for details.)
In another scenario, your shipping company is trying to save freight costs by optimizingshipments, and it offers you a discount for all freight that you ship between 4 AM and6:59 AM. To determine if you can save substantially on shipping by taking advantage ofthis offer, you generate a report showing orders that shipped in the three-hour periodspecified. This report uses a filter that employs a custom expression and a date-manipulation function to test for orders that are shipped between 4 AM. and 6:59 AM.(See Example: Test the shipping hour of orders, page 134 for details.)
Anything that you can specify in a filter can be specified using a custom expression,though if you can accomplish your goal using the standard point-and-click functionalityof MicroStrategy, that will usually be the most efficient method to create your filter. Inother words, when point-and-click functionality is not enough for your purpose, use acustom expression to create your filter.
There are certain reports that require a filter with capabilities outside of whatMicroStrategy currently offers. These reports, too, use filters with custom expressions,but instead of using built-in MicroStrategy functions, these filters use the functionality ofyour particular Relational Database Management System (RDBMS). Further details onthis functionality are available in Apply functions in metrics: Using database-specificfunctions, page 140.
Advanced Reporting Guide
133 © 2017, MicroStrategy Inc.
Custom expression qualification filters
Custom expression qualification filters are quite flexible and allow you to create highlycustomized filters that can test data based on text content, very specific datespecifications, or other criteria. These tests are based on the structure of a customexpression qualification, since the two sides of the expression are separated by acomparison operator such as =, <, >, like, and so on.
A custom expression qualification filter is created in the Advanced Qualification pane ofthe Filter Editor. Two examples of custom expression qualification filters follow the stepsbelow.
To create a custom expression qualification
1 In MicroStrategy Developer, point to New on the Filemenu, and then select Filter.The Filter Editor opens.
If the New Filter dialog box is displayed before the Filter Editor opens, click theEmpty Filter icon. If you do not want this dialog box to be shown in the future,select Don't show this dialog in the future. Click OK. For a full description ofobject templates, including a list of the objects that can use object templates, see Re-using objects via shortcuts and object templates , page 295.
2 Double-click in the Filter definition pane. The Filtering Options dialog box opens.
3 Select Add an Advanced qualification and click OK. The AdvancedQualification pane opens.
4 From the Option drop-down list, select Custom expression.
5 Type a custom expression in the Custom expression box. (For generalinformation on custom expressions, see Basics of custom expressions, page 132.Examples of filters that use custom expression follow these steps.)
You can also enter the custom expression by doing either of the following:
— Drag objects from the Object Browser into the Custom expression box.Select the operators you want to use from the toolbar above the Customexpression box, or simply type them.
— Use the Insert Function Wizard to guide you through the process of creatingan expression that uses a function, by clicking f(x) on the toolbar above theCustom expression box. (For details, click theHelp menu.)
6 Click Validate to validate the expression. This helps ensure you spelled andpunctuated the expression correctly.
7 Click OK to close the Advanced Qualification pane.
8 Click Save and Close to save the filter and close the Filter Editor.
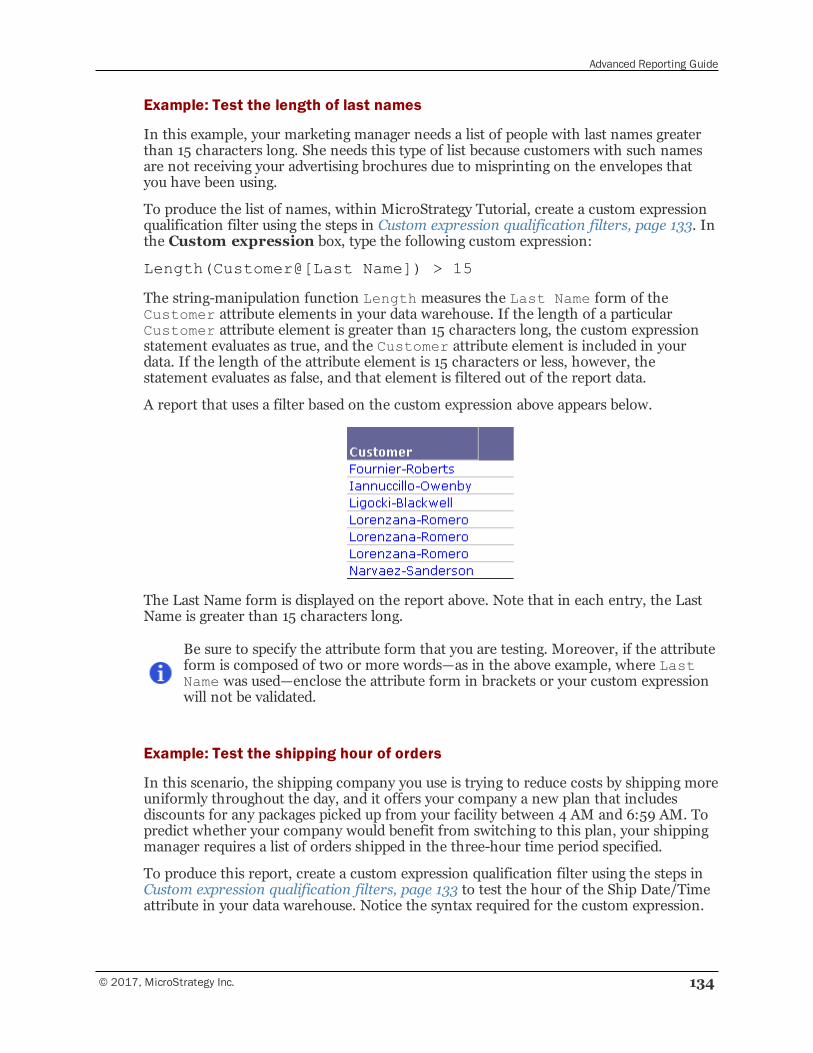
Advanced Reporting Guide
© 2017, MicroStrategy Inc. 134
Example: Test the length of last names
In this example, your marketing manager needs a list of people with last names greaterthan 15 characters long. She needs this type of list because customers with such namesare not receiving your advertising brochures due to misprinting on the envelopes thatyou have been using.
To produce the list of names, within MicroStrategy Tutorial, create a custom expressionqualification filter using the steps in Custom expression qualification filters, page 133. Inthe Custom expression box, type the following custom expression:
Length(Customer@[Last Name]) > 15
The string-manipulation function Length measures the Last Name form of theCustomer attribute elements in your data warehouse. If the length of a particularCustomer attribute element is greater than 15 characters long, the custom expressionstatement evaluates as true, and the Customer attribute element is included in yourdata. If the length of the attribute element is 15 characters or less, however, thestatement evaluates as false, and that element is filtered out of the report data.
A report that uses a filter based on the custom expression above appears below.
The Last Name form is displayed on the report above. Note that in each entry, the LastName is greater than 15 characters long.
Be sure to specify the attribute form that you are testing. Moreover, if the attributeform is composed of two or more words—as in the above example, where LastName was used—enclose the attribute form in brackets or your custom expressionwill not be validated.
Example: Test the shipping hour of orders
In this scenario, the shipping company you use is trying to reduce costs by shipping moreuniformly throughout the day, and it offers your company a new plan that includesdiscounts for any packages picked up from your facility between 4 AM and 6:59 AM. Topredict whether your company would benefit from switching to this plan, your shippingmanager requires a list of orders shipped in the three-hour time period specified.
To produce this report, create a custom expression qualification filter using the steps inCustom expression qualification filters, page 133 to test the hour of the Ship Date/Timeattribute in your data warehouse. Notice the syntax required for the custom expression.
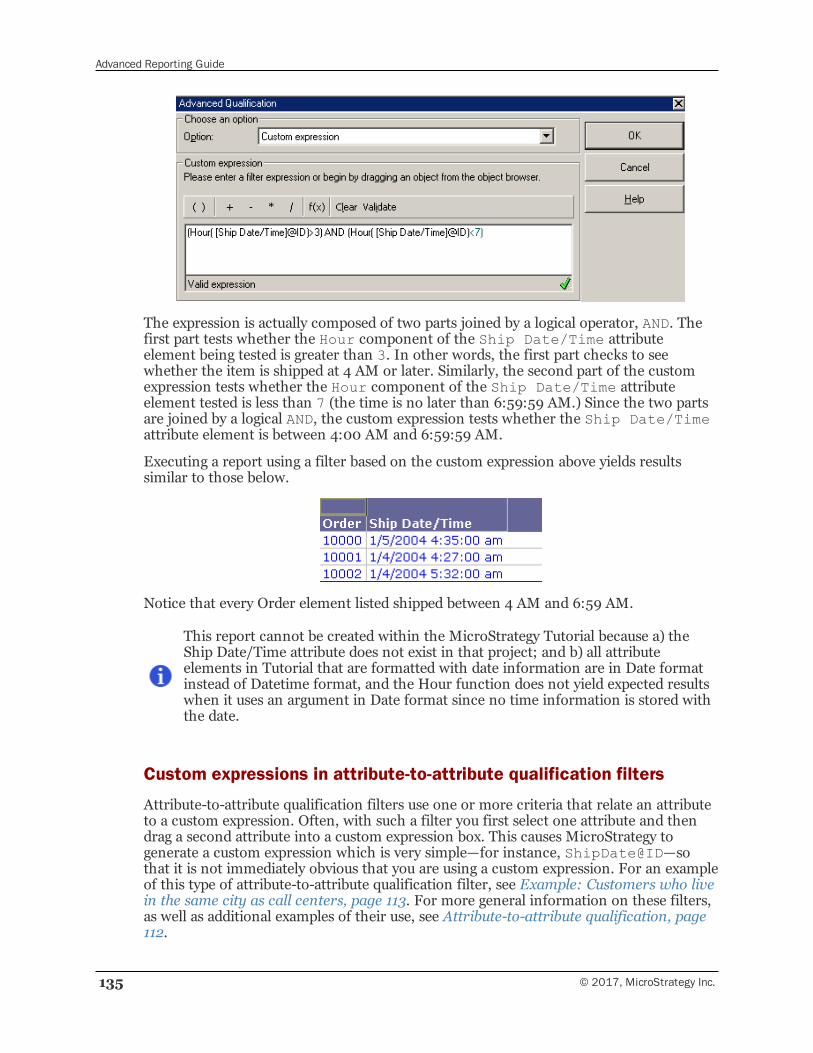
Advanced Reporting Guide
135 © 2017, MicroStrategy Inc.
The expression is actually composed of two parts joined by a logical operator, AND. Thefirst part tests whether the Hour component of the Ship Date/Time attributeelement being tested is greater than 3. In other words, the first part checks to seewhether the item is shipped at 4 AM or later. Similarly, the second part of the customexpression tests whether the Hour component of the Ship Date/Time attributeelement tested is less than 7 (the time is no later than 6:59:59 AM.) Since the two partsare joined by a logical AND, the custom expression tests whether the Ship Date/Timeattribute element is between 4:00 AM and 6:59:59 AM.
Executing a report using a filter based on the custom expression above yields resultssimilar to those below.
Notice that every Order element listed shipped between 4 AM and 6:59 AM.
This report cannot be created within the MicroStrategy Tutorial because a) theShip Date/Time attribute does not exist in that project; and b) all attributeelements in Tutorial that are formatted with date information are in Date formatinstead of Datetime format, and the Hour function does not yield expected resultswhen it uses an argument in Date format since no time information is stored withthe date.
Custom expressions in attribute-to-attribute qualification filters
Attribute-to-attribute qualification filters use one or more criteria that relate an attributeto a custom expression. Often, with such a filter you first select one attribute and thendrag a second attribute into a custom expression box. This causes MicroStrategy togenerate a custom expression which is very simple—for instance, ShipDate@ID—sothat it is not immediately obvious that you are using a custom expression. For an exampleof this type of attribute-to-attribute qualification filter, see Example: Customers who livein the same city as call centers, page 113. For more general information on these filters,as well as additional examples of their use, see Attribute-to-attribute qualification, page112.
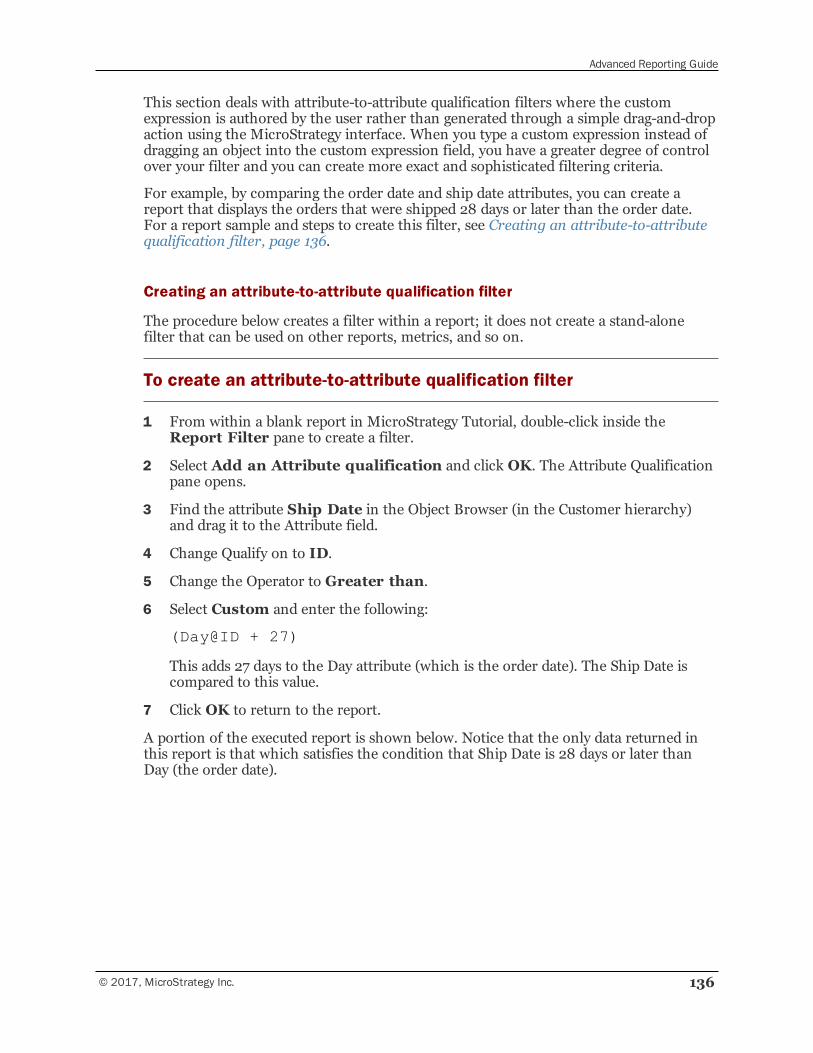
Advanced Reporting Guide
© 2017, MicroStrategy Inc. 136
This section deals with attribute-to-attribute qualification filters where the customexpression is authored by the user rather than generated through a simple drag-and-dropaction using the MicroStrategy interface. When you type a custom expression instead ofdragging an object into the custom expression field, you have a greater degree of controlover your filter and you can create more exact and sophisticated filtering criteria.
For example, by comparing the order date and ship date attributes, you can create areport that displays the orders that were shipped 28 days or later than the order date.For a report sample and steps to create this filter, see Creating an attribute-to-attributequalification filter, page 136.
Creating an attribute-to-attribute qualification filter
The procedure below creates a filter within a report; it does not create a stand-alonefilter that can be used on other reports, metrics, and so on.
To create an attribute-to-attribute qualification filter
1 From within a blank report in MicroStrategy Tutorial, double-click inside theReport Filter pane to create a filter.
2 Select Add an Attribute qualification and click OK. The Attribute Qualificationpane opens.
3 Find the attribute Ship Date in the Object Browser (in the Customer hierarchy)and drag it to the Attribute field.
4 Change Qualify on to ID.
5 Change the Operator to Greater than.
6 Select Custom and enter the following:
(Day@ID + 27)
This adds 27 days to the Day attribute (which is the order date). The Ship Date iscompared to this value.
7 Click OK to return to the report.
A portion of the executed report is shown below. Notice that the only data returned inthis report is that which satisfies the condition that Ship Date is 28 days or later thanDay (the order date).
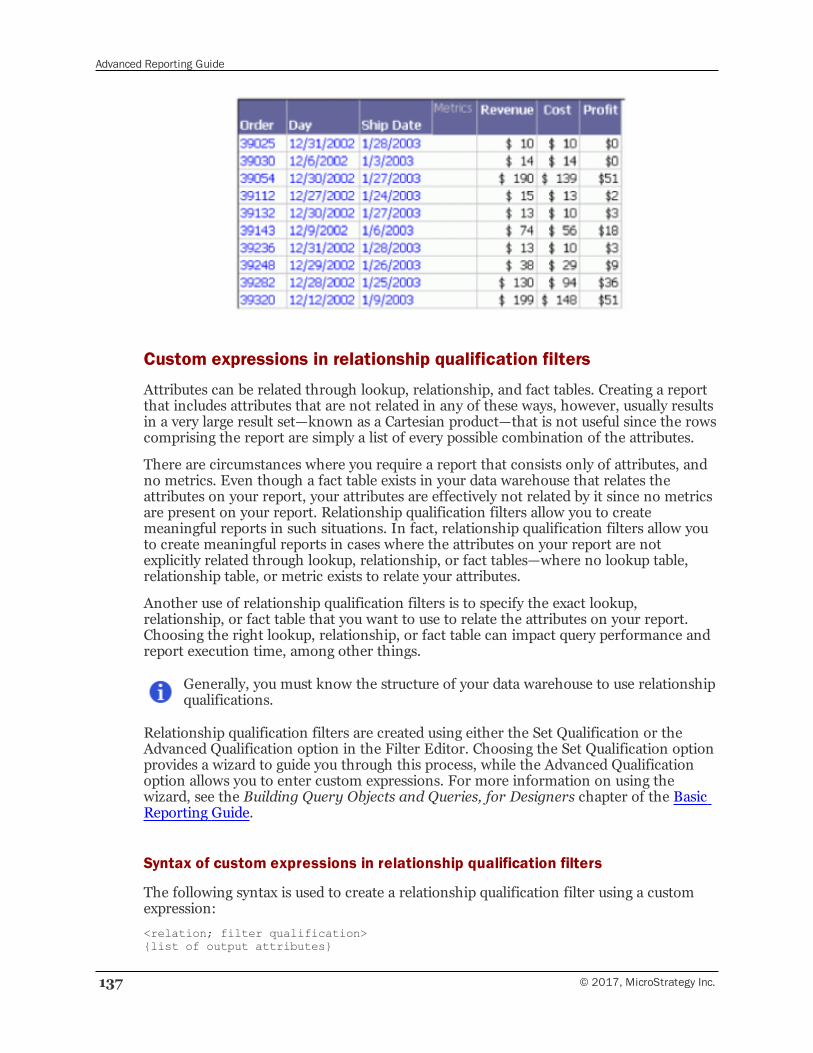
Advanced Reporting Guide
137 © 2017, MicroStrategy Inc.
Custom expressions in relationship qualification filters
Attributes can be related through lookup, relationship, and fact tables. Creating a reportthat includes attributes that are not related in any of these ways, however, usually resultsin a very large result set—known as a Cartesian product—that is not useful since the rowscomprising the report are simply a list of every possible combination of the attributes.
There are circumstances where you require a report that consists only of attributes, andno metrics. Even though a fact table exists in your data warehouse that relates theattributes on your report, your attributes are effectively not related by it since no metricsare present on your report. Relationship qualification filters allow you to createmeaningful reports in such situations. In fact, relationship qualification filters allow youto create meaningful reports in cases where the attributes on your report are notexplicitly related through lookup, relationship, or fact tables—where no lookup table,relationship table, or metric exists to relate your attributes.
Another use of relationship qualification filters is to specify the exact lookup,relationship, or fact table that you want to use to relate the attributes on your report.Choosing the right lookup, relationship, or fact table can impact query performance andreport execution time, among other things.
Generally, you must know the structure of your data warehouse to use relationshipqualifications.
Relationship qualification filters are created using either the Set Qualification or theAdvanced Qualification option in the Filter Editor. Choosing the Set Qualification optionprovides a wizard to guide you through this process, while the Advanced Qualificationoption allows you to enter custom expressions. For more information on using thewizard, see the Building Query Objects and Queries, for Designers chapter of the BasicReporting Guide.
Syntax of custom expressions in relationship qualification filters
The following syntax is used to create a relationship qualification filter using a customexpression:
<relation; filter qualification>{list of output attributes}
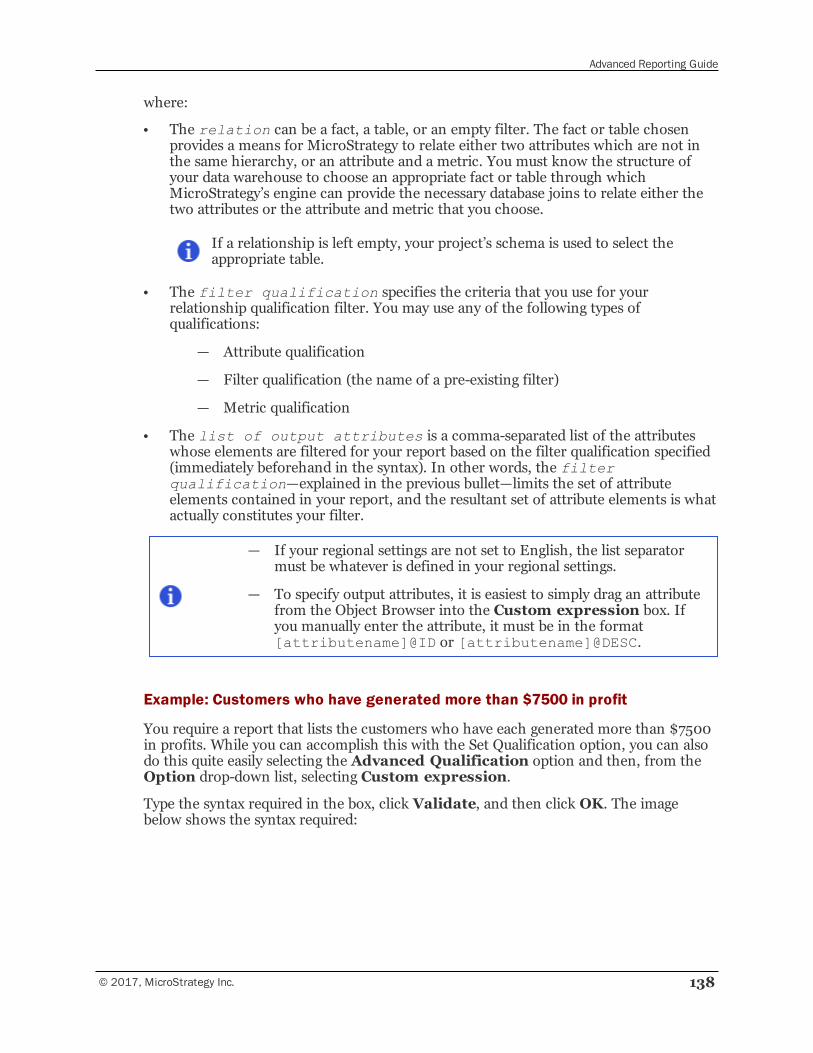
Advanced Reporting Guide
© 2017, MicroStrategy Inc. 138
where:
• The relation can be a fact, a table, or an empty filter. The fact or table chosenprovides a means for MicroStrategy to relate either two attributes which are not inthe same hierarchy, or an attribute and a metric. You must know the structure ofyour data warehouse to choose an appropriate fact or table through whichMicroStrategy’s engine can provide the necessary database joins to relate either thetwo attributes or the attribute and metric that you choose.
If a relationship is left empty, your project’s schema is used to select theappropriate table.
• The filter qualification specifies the criteria that you use for yourrelationship qualification filter. You may use any of the following types ofqualifications:
— Attribute qualification
— Filter qualification (the name of a pre-existing filter)
— Metric qualification
• The list of output attributes is a comma-separated list of the attributeswhose elements are filtered for your report based on the filter qualification specified(immediately beforehand in the syntax). In other words, the filterqualification—explained in the previous bullet—limits the set of attributeelements contained in your report, and the resultant set of attribute elements is whatactually constitutes your filter.
— If your regional settings are not set to English, the list separatormust be whatever is defined in your regional settings.
— To specify output attributes, it is easiest to simply drag an attributefrom the Object Browser into the Custom expression box. Ifyou manually enter the attribute, it must be in the format[attributename]@ID or [attributename]@DESC.
Example: Customers who have generated more than $7500 in profit
You require a report that lists the customers who have each generated more than $7500in profits. While you can accomplish this with the Set Qualification option, you can alsodo this quite easily selecting the Advanced Qualification option and then, from theOption drop-down list, selecting Custom expression.
Type the syntax required in the box, click Validate, and then click OK. The imagebelow shows the syntax required:
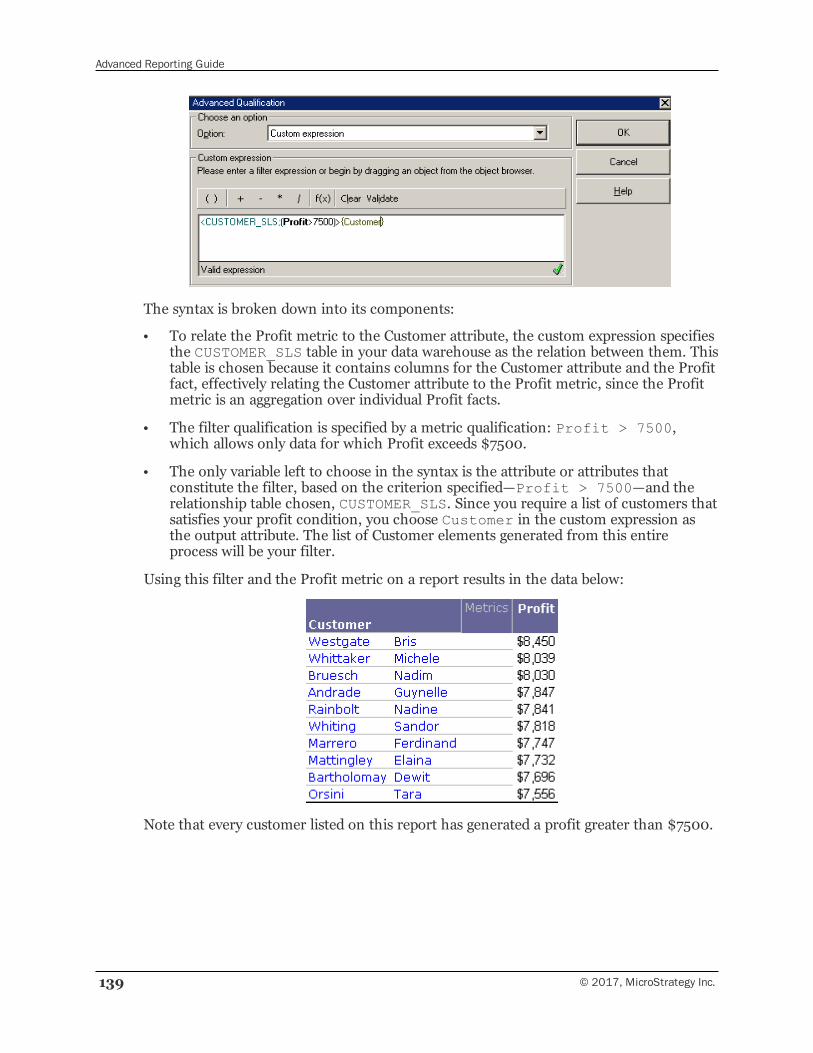
Advanced Reporting Guide
139 © 2017, MicroStrategy Inc.
The syntax is broken down into its components:
• To relate the Profit metric to the Customer attribute, the custom expression specifiesthe CUSTOMER_SLS table in your data warehouse as the relation between them. Thistable is chosen because it contains columns for the Customer attribute and the Profitfact, effectively relating the Customer attribute to the Profit metric, since the Profitmetric is an aggregation over individual Profit facts.
• The filter qualification is specified by a metric qualification: Profit > 7500,which allows only data for which Profit exceeds $7500.
• The only variable left to choose in the syntax is the attribute or attributes thatconstitute the filter, based on the criterion specified—Profit > 7500—and therelationship table chosen, CUSTOMER_SLS. Since you require a list of customers thatsatisfies your profit condition, you choose Customer in the custom expression asthe output attribute. The list of Customer elements generated from this entireprocess will be your filter.
Using this filter and the Profit metric on a report results in the data below:
Note that every customer listed on this report has generated a profit greater than $7500.
Advanced Reporting Guide
© 2017, MicroStrategy Inc. 140
Apply functions in metrics: Using database-specificfunctionsCustom expressions sometimes use Apply functions, also known as Pass-throughfunctions. Using the full power of custom expressions, therefore, may require anunderstanding of Apply functions. In MicroStrategy, these functions provide access tofunctionality and syntactic constructs that are not standard in MicroStrategy, but arefound in various RDBMS platforms.
It is not advisable to use Apply functions when functions within the MicroStrategyproduct can accomplish your goal, because using Apply functions bypasses thevalidations that MicroStrategy provides. Apply functions should only be used whenyou require functionality that MicroStrategy does not currently provide.
Apply function types
There are several types of Apply functions, each of which corresponds to a basic type ofMicroStrategy function and replaces that function when it is necessary to use acorresponding RDBMS function, instead. (See the Standard Functions chapter of theFunctions Reference for further details about when it is necessary and appropriate to useMicroStrategy Apply functions instead of their simpler MicroStrategy functioncounterparts.) Apply functions act as containers that hand off data from MicroStrategyto your RDBMS. The Apply functions also hand off to your RDBMS functions that arespecific to your database. MicroStrategy provides Apply functions as a means of handingoff these data and RDBMS-specific functions to your database, which results in yourdatabase—not MicroStrategy—performing the computations you require.
The Apply function types are listed below, along with examples of the MicroStrategyfunctions that they can replace:
• ApplySimple: Simple single-value functions, including arithmetic operators such as+ and -, date and string manipulation functions, and so on
• ApplyAgg: Group-value (otherwise known as aggregate) functions such as Sum andMax
• ApplyOLAP: OLAP functions such as Rank and NTile
• ApplyComparison: Comparison operators such as >, <, and Like
• ApplyLogical: Logical operators such as And and Or
For filters, the ApplyComparison and ApplySimple functions are most useful, althoughyou can also use Apply functions to create metrics and prompts. For examples of Applyfunctions in filters, see the rest of this section.
Advanced Reporting Guide
141 © 2017, MicroStrategy Inc.
While an Apply function can be used wherever the function group it belongs to isapplied, you should not use any Apply functions when standard MicroStrategyfunctions can be used to achieve the goal. This is because using Apply functionseffectively bypasses the validations and other benefits of the product. Therefore,use Apply functions ONLY when support does not exist in the MicroStrategyproduct for your needs, and please submit an enhancement request so thatMicroStrategy can evaluate integrating the functionality you are using in a futureproduct release.
Apply functions: syntax
This section provides a brief overview of the syntax for Apply functions. For morecomprehensive information, consult the Standard Functions chapter of the FunctionsReference.
Basic syntax of Apply functions
The syntax for Apply functions is as follows:
ApplyFUNNAME(“expression_with_placeholders”, argument_0, ...,
argument_n)
The placeholders are represented by #0, #1, and so on. The character # is a reservedcharacter for MicroStrategy and precedes the number of the argument, which starts at 0and increases in increments of 1. For example:
ApplyComparison(“<ComparisonFunction(#0,#1)>”,attribute0@ID, attribute1@ID)
Or
ApplyComparison(“#0 <ComparisonOperator>#1”,attribute0@ID, attribute1@ID)
In these examples, the code marked with angled brackets (<>) can be replaced withdatabase-specific functions or operators such as between, +, and DateAdd. See Customexpressions, page 131 and Custom expressions, page 131 for examples using theseRDBMS functions. Argument placeholders must be placed in the correct positions tomatch the syntax of the database-specific functions.
Argument types in Apply functions
The number of allowable arguments in an Apply function depends on which particularApply function you are using, among other considerations. In some instances, thenumber of arguments varies from case to case within the same Apply function. This iscommon among the logical Apply functions, in particular.
MicroStrategy does not verify arguments until the parameter markers (for instance #0,#1, and so forth) are replaced at parsing, which occurs when you click OK or Validatein an expression editor. At parsing time, the engine searches for acceptable argumenttypes for the specific Apply function used in your custom expression. An acceptable
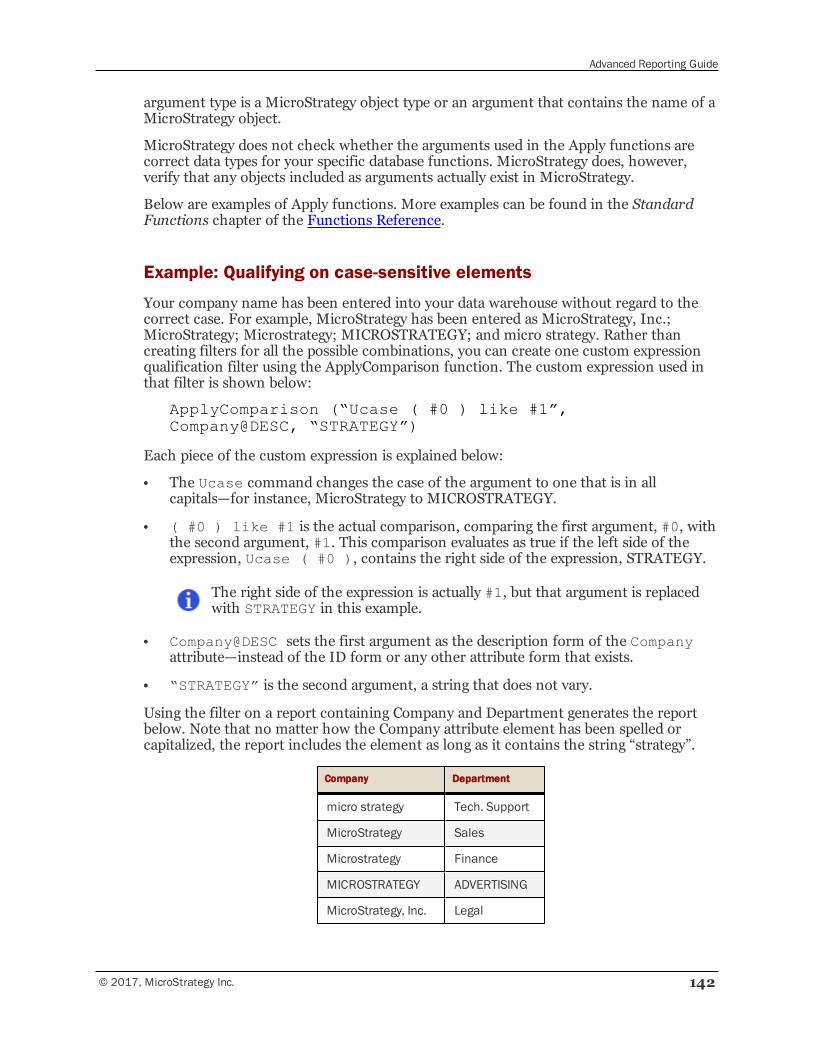
Advanced Reporting Guide
© 2017, MicroStrategy Inc. 142
argument type is a MicroStrategy object type or an argument that contains the name of aMicroStrategy object.
MicroStrategy does not check whether the arguments used in the Apply functions arecorrect data types for your specific database functions. MicroStrategy does, however,verify that any objects included as arguments actually exist in MicroStrategy.
Below are examples of Apply functions. More examples can be found in the StandardFunctions chapter of the Functions Reference.
Example: Qualifying on case-sensitive elements
Your company name has been entered into your data warehouse without regard to thecorrect case. For example, MicroStrategy has been entered as MicroStrategy, Inc.;MicroStrategy; Microstrategy; MICROSTRATEGY; and micro strategy. Rather thancreating filters for all the possible combinations, you can create one custom expressionqualification filter using the ApplyComparison function. The custom expression used inthat filter is shown below:
ApplyComparison (“Ucase ( #0 ) like #1”,Company@DESC, “STRATEGY”)
Each piece of the custom expression is explained below:
• The Ucase command changes the case of the argument to one that is in allcapitals—for instance, MicroStrategy to MICROSTRATEGY.
• ( #0 ) like #1 is the actual comparison, comparing the first argument, #0, withthe second argument, #1. This comparison evaluates as true if the left side of theexpression, Ucase ( #0 ), contains the right side of the expression, STRATEGY.
The right side of the expression is actually #1, but that argument is replacedwith STRATEGY in this example.
• Company@DESC sets the first argument as the description form of the Companyattribute—instead of the ID form or any other attribute form that exists.
• “STRATEGY” is the second argument, a string that does not vary.
Using the filter on a report containing Company and Department generates the reportbelow. Note that no matter how the Company attribute element has been spelled orcapitalized, the report includes the element as long as it contains the string “strategy”.
Company Department
micro strategy Tech. Support
MicroStrategy Sales
Microstrategy Finance
MICROSTRATEGY ADVERTISING
MicroStrategy, Inc. Legal
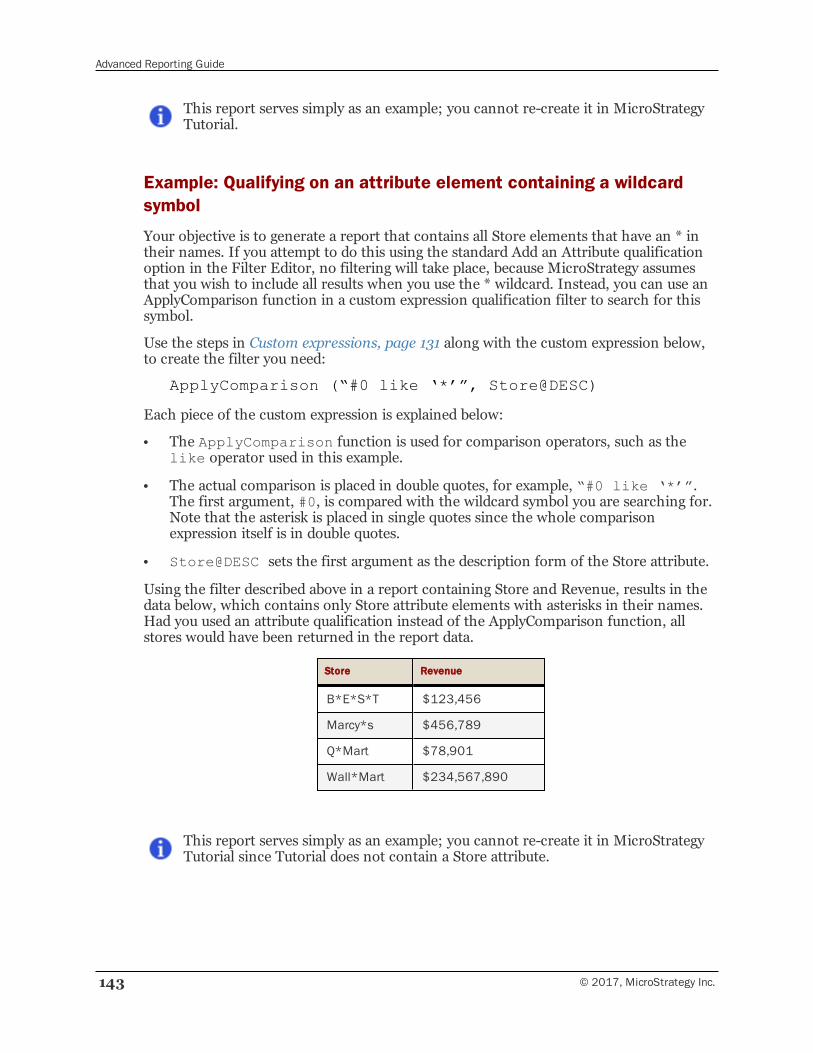
Advanced Reporting Guide
143 © 2017, MicroStrategy Inc.
This report serves simply as an example; you cannot re-create it in MicroStrategyTutorial.
Example: Qualifying on an attribute element containing a wildcardsymbol
Your objective is to generate a report that contains all Store elements that have an * intheir names. If you attempt to do this using the standard Add an Attribute qualificationoption in the Filter Editor, no filtering will take place, because MicroStrategy assumesthat you wish to include all results when you use the * wildcard. Instead, you can use anApplyComparison function in a custom expression qualification filter to search for thissymbol.
Use the steps in Custom expressions, page 131 along with the custom expression below,to create the filter you need:
ApplyComparison (“#0 like ‘*’”, Store@DESC)
Each piece of the custom expression is explained below:
• The ApplyComparison function is used for comparison operators, such as thelike operator used in this example.
• The actual comparison is placed in double quotes, for example, “#0 like ‘*’”.The first argument, #0, is compared with the wildcard symbol you are searching for.Note that the asterisk is placed in single quotes since the whole comparisonexpression itself is in double quotes.
• Store@DESC sets the first argument as the description form of the Store attribute.
Using the filter described above in a report containing Store and Revenue, results in thedata below, which contains only Store attribute elements with asterisks in their names.Had you used an attribute qualification instead of the ApplyComparison function, allstores would have been returned in the report data.
Store Revenue
B*E*S*T $123,456
Marcy*s $456,789
Q*Mart $78,901
Wall*Mart $234,567,890
This report serves simply as an example; you cannot re-create it in MicroStrategyTutorial since Tutorial does not contain a Store attribute.
Advanced Reporting Guide
© 2017, MicroStrategy Inc. 144
Example: Filtering for last month’s data using ApplySimple
Example: Filtering for last month, without transformations
An attribute-to-attribute qualification filter can be used to restrict your result set on areport to last month’s data. Follow the steps below to create this filter.
Even though this example can be duplicated using a time-based transformation(information for which can be found in Transformation metrics: Time-based andother comparisons, page 80), this example uses an Apply function to demonstratethe functionality of custom expressions and Apply functions. In general,MicroStrategy strongly advises against using Apply functions except when you areusing them for functionality which does not currently exist in the software. SeeApply functions in metrics: Using database-specific functions, page 140 for moreinformation.
To re-create this attribute-to-attribute qualification filter example
1 In MicroStrategy Developer, from the Filemenu, point to New, and then selectFilter. The Filter Editor opens.
If the New Filter dialog box is displayed, click the Empty Filter icon. If you do notwant this dialog box to be shown in the future, select Don't show this dialog inthe future. Click OK. For a full description of object templates, including a list ofthe objects that can use object templates, see Re-using objects via shortcuts andobject templates , page 295.
2 In the Filter Editor, drag theMonth attribute from the Object Browser to theFilter definition pane. The Attribute Qualification pane opens.
3 From the Qualify On drop-down list, select ID.
4 From the Operator drop-down list, select Exactly.
5 From the drop-down list, choose Custom.
6 Type the following custom expression in the text box:
ApplySimple("DatePart('yyyy',DateAdd('m', -1, date())) * 100 + DatePart('m', DateAdd('m', -1, date()))",0)
Your Relational Database Management System (RDBMS) might requireslightly different syntax than the above. Any time you use an Apply function, itmust be customized to the syntax of your particular RDBMS. The functions inthis ApplySimple expression are specific to an Access database, which isrecommended only for certain pre-production environments but never for anactual production environment.
7 Click OK to close the Attribute qualification pane.
8 Save the filter.
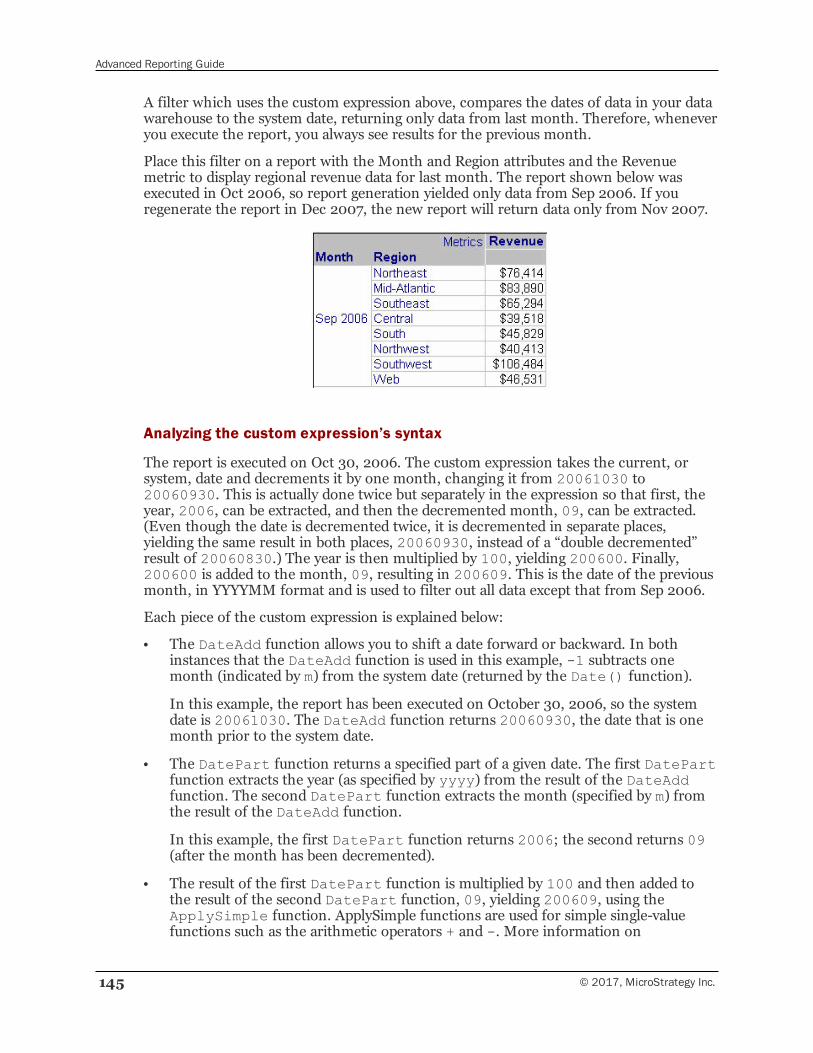
Advanced Reporting Guide
145 © 2017, MicroStrategy Inc.
A filter which uses the custom expression above, compares the dates of data in your datawarehouse to the system date, returning only data from last month. Therefore, wheneveryou execute the report, you always see results for the previous month.
Place this filter on a report with the Month and Region attributes and the Revenuemetric to display regional revenue data for last month. The report shown below wasexecuted in Oct 2006, so report generation yielded only data from Sep 2006. If youregenerate the report in Dec 2007, the new report will return data only from Nov 2007.
Analyzing the custom expression’s syntax
The report is executed on Oct 30, 2006. The custom expression takes the current, orsystem, date and decrements it by one month, changing it from 20061030 to20060930. This is actually done twice but separately in the expression so that first, theyear, 2006, can be extracted, and then the decremented month, 09, can be extracted.(Even though the date is decremented twice, it is decremented in separate places,yielding the same result in both places, 20060930, instead of a “double decremented”result of 20060830.) The year is then multiplied by 100, yielding 200600. Finally,200600 is added to the month, 09, resulting in 200609. This is the date of the previousmonth, in YYYYMM format and is used to filter out all data except that from Sep 2006.
Each piece of the custom expression is explained below:
• The DateAdd function allows you to shift a date forward or backward. In bothinstances that the DateAdd function is used in this example, -1 subtracts onemonth (indicated by m) from the system date (returned by the Date() function).
In this example, the report has been executed on October 30, 2006, so the systemdate is 20061030. The DateAdd function returns 20060930, the date that is onemonth prior to the system date.
• The DatePart function returns a specified part of a given date. The first DatePartfunction extracts the year (as specified by yyyy) from the result of the DateAddfunction. The second DatePart function extracts the month (specified by m) fromthe result of the DateAdd function.
In this example, the first DatePart function returns 2006; the second returns 09(after the month has been decremented).
• The result of the first DatePart function is multiplied by 100 and then added tothe result of the second DatePart function, 09, yielding 200609, using theApplySimple function. ApplySimple functions are used for simple single-valuefunctions such as the arithmetic operators + and -. More information on
Advanced Reporting Guide
© 2017, MicroStrategy Inc. 146
ApplySimple and other functions can be found in Apply function types, page 140, aswell as the Standard Functions chapter of the Functions Reference.
Joint element lists: Grouping elements frommultiple attributes
Joint element lists allow you to choose attribute elements from different attributes tofilter the report result set. Unlike attribute qualifications, joint element lists allow you tojoin attribute elements and then filter on that attribute result set. In other words, youcan select specific element combinations, such as quarter and category. As in the reportsample included below, you can filter on electronics in Q1 2003 and music in Q3 2003.
A joint element list is an advanced qualification.
Joint element list exampleThis example refers to objects saved in the MicroStrategy Tutorial. The directory pathwithin MicroStrategy Developer isPublic Objects\Reports\MicroStrategy Platform Capabilities\Advanced Reporting Guide. You can follow the steps to interact with the filters andreport, or you can view the samples without creating your own.
Remember to save any objects that you create under a different name, so that youdo not overwrite the samples in the MicroStrategy Tutorial.
Before creating a joint element list, you must ensure that the Advanced Qualificationoption is displayed on the Filter Editor. From MicroStrategy Developer, complete thefollowing steps:
1 SelectMy Preferences from the Tools menu.
2 Choose the Editors tab.
3 Click Filter Options.
4 Select Show advanced qualification, if it is not already selected.
5 Click OK to return to MicroStrategy Developer.
Open the Basic Report. Note that Leanne Sawyer’s revenue is $316,786. This is sales forall time and all categories. You need to see revenue for specific quarter and categorycombinations, for example, electronics in Q1 2003 and music in Q3 2003. To do this,switch to Design View and create a joint element list, as described below.
To create a joint element list
1 Double-click in the Report Filter pane to add a new qualification.
2 Select Add an Advanced Qualification and click OK. The AdvancedQualification pane opens.
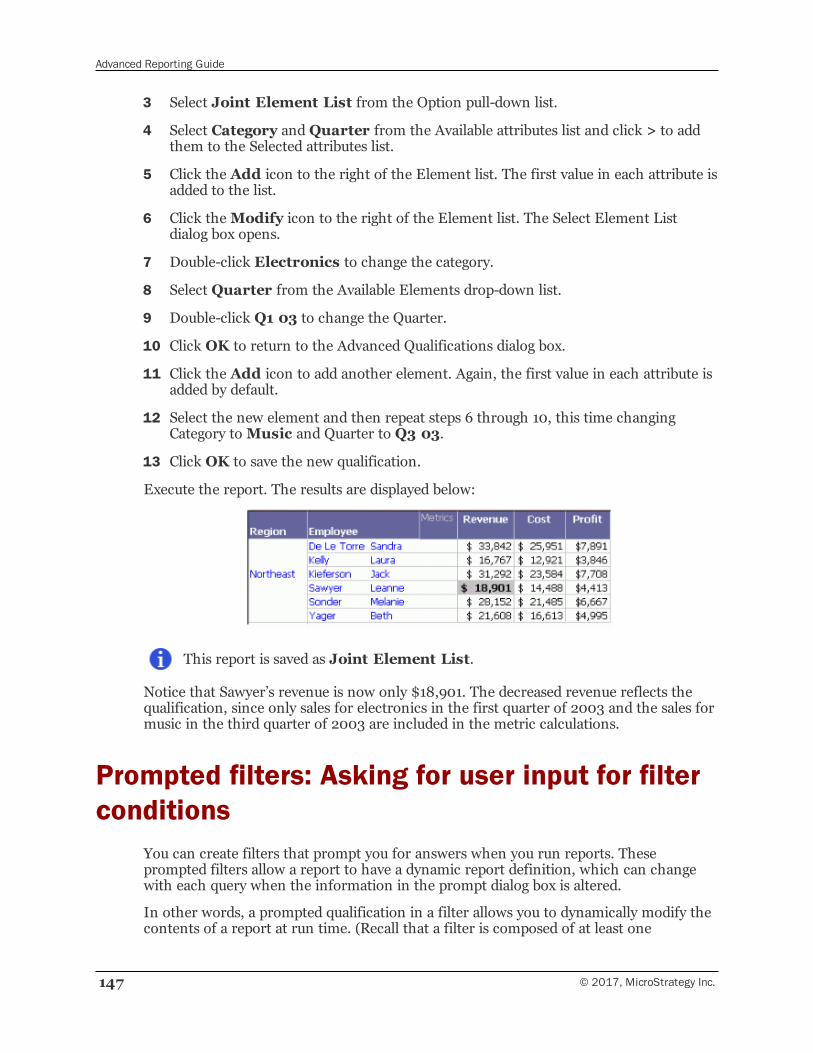
Advanced Reporting Guide
147 © 2017, MicroStrategy Inc.
3 Select Joint Element List from the Option pull-down list.
4 Select Category andQuarter from the Available attributes list and click > to addthem to the Selected attributes list.
5 Click the Add icon to the right of the Element list. The first value in each attribute isadded to the list.
6 Click theModify icon to the right of the Element list. The Select Element Listdialog box opens.
7 Double-click Electronics to change the category.
8 Select Quarter from the Available Elements drop-down list.
9 Double-click Q1 03 to change the Quarter.
10 Click OK to return to the Advanced Qualifications dialog box.
11 Click the Add icon to add another element. Again, the first value in each attribute isadded by default.
12 Select the new element and then repeat steps 6 through 10, this time changingCategory toMusic and Quarter to Q3 03.
13 Click OK to save the new qualification.
Execute the report. The results are displayed below:
This report is saved as Joint Element List.
Notice that Sawyer’s revenue is now only $18,901. The decreased revenue reflects thequalification, since only sales for electronics in the first quarter of 2003 and the sales formusic in the third quarter of 2003 are included in the metric calculations.
Prompted filters: Asking for user input for filterconditions
You can create filters that prompt you for answers when you run reports. Theseprompted filters allow a report to have a dynamic report definition, which can changewith each query when the information in the prompt dialog box is altered.
In other words, a prompted qualification in a filter allows you to dynamically modify thecontents of a report at run time. (Recall that a filter is composed of at least one
Advanced Reporting Guide
© 2017, MicroStrategy Inc. 148
qualification.) By applying certain conditions on one or more of the attributes, attributeelements, metrics, or other objects that a report can include, it is possible to:
• Apply conditions or modify components in a report at run time, eliminating the needfor preliminary definitions
• Execute a report multiple times, selecting a different answer to a given prompt eachtime, and have, as result, a set of immediate answers to compare
Most types of qualifications allow prompts. For more information on each, see:
• Prompted attribute qualifications, page 148
• Prompted metric qualifications, page 148
• Report object prompts, page 149 (using shortcut-to-a-report qualifications)
• Filter object prompts, page 149 (using shortcut-to-a-filter qualifications)
For more information on prompts, see Chapter 6, Advanced Prompts: EnablingUser Input.
Prompted attribute qualificationsA prompted attribute qualification allows you to qualify on the values of attributeelements, attribute forms, or operators when you run a report. You can create thefollowing types of attribute qualification prompts:
• Choose from all attributes in a hierarchy allows you to choose an attribute toqualify on when you run a report. You are, however, restricted to choosing only theattributes from the selected hierarchy. After selecting the attribute, you can qualifyon the ID or create an element list filter.
• Choose from an attribute element list allows you to apply qualifications to anattribute form. You can choose an attribute from a list of attributes and qualify onthe elements of the attribute.
• Value prompt allows you to select a single value on which to qualify, such as adate, a specific number, or a specific text string.
• Qualify on an attribute allows you to apply qualifications to an attribute form.You can choose an attribute from a list of attributes and qualify on an attribute form.
Prompted metric qualificationsA prompted metric qualification allows you to select a function, an operator, or a valuefor a metric when you run a report. You can create the following types of metricqualification prompts:
• Qualify on a metric prompt allows you to qualify on a metric. You can choose ametric by specifying a single metric to use, or by specifying a search object to restrictthe list of metrics from which you can choose a metric, when a report is run.
• Metric Object prompt allows you to select one or more metrics that meet specificcriteria when a report is run. For example, you could use a search to return a list of
Advanced Reporting Guide
149 © 2017, MicroStrategy Inc.
all metrics that contain a certain fact. From that list of metrics, you can then choosethe metrics that you want to see on the report.
• Value prompt allows you to select a single value on which to qualify, such as adate, a specific number, or a specific text string.
Report object promptsChoosing a prompt for a shortcut-to-a-report qualification creates a report object promptthat uses the selected report as the default answer. When you use this report objectprompt in a report, it prompts you to choose a report as the filtering criteria during runtime.
A shortcut-to-a-report qualification uses the results of one report to be included inanother report. For more information, see the Building Query Objects andQueries, for Designers chapter of the Basic Reporting Guide.
You can define a report object prompt by specifying a search object or specifying apredefined list of objects to choose from, while executing a report.
Filter object promptsChoosing a prompt for a shortcut-to-a-filter qualification creates a filter object promptand allows you to choose the filters to be included in a report. You can define a filterobject prompt by specifying a search object or specifying a predefined list of objects tochoose from, while executing a report.
A shortcut-to-a-filter qualification uses an existing filter, either as is or withadditional conditions, on a report. For more information, see the Building QueryObjects and Queries, for Designers chapter of the Basic Reporting Guide.
Shortcut vs. embedded filtersYou can add a filter to a report in either of the following ways:
• Apply a previously created, stand-alone filter to a report during report creation. Forsteps, see Adding a stand-alone filter to a report, page 150.
When you add a stand-alone filter to a report, you can choose to create a shortcut tothe filter or to embed the filter in the report. The differences are described below:
▫ When you create a shortcut to a stand-alone filter, changes that you make to thefilter are propagated to this report and to all other reports that use the filter as ashortcut. Changes that you make to this filter within this report are propagatedto the filter, and to all other reports that use the filter as a shortcut. This issometimes referred to as a linked filter.
Use this option to share report caches. For detailed information about reportcaches, see the Caching chapter in the System Administration Guide.
Advanced Reporting Guide
© 2017, MicroStrategy Inc. 150
▫ When you embed a copy of the filter in the report, changes that you make to thestand-alone filter are not propagated to this report. Changes that you make tothe embedded filter within this report are not propagated to the filter. This isalso called a local filter.
• Create a filter at the same time that you create a new report. This filter is embeddedwithin the report and cannot be used in another report. For steps, see theMicroStrategy Developer help or the Building Query Objects and Queries, forDesigners chapter in the Basic Reporting Guide.
When you save a report that contains a stand-alone filter, you can choose to keep theshortcut or to embed a copy of the filter in the report. For steps, see Saving a reportwith a shortcut to a stand-alone filter, page 151.
Analysts of report data can also apply filtering conditions to a report, for the individualinstance of the report that they are currently viewing. This is called a view filter, andrequires the MicroStrategy OLAP Services product. For steps to use a view filter, see theMicroStrategy Developer help.
Adding a stand-alone filter to a reportThe following procedure describes how to apply a previously created, stand-alone filter toa report during report creation.
To add a filter to a report
This procedure assumes that you have already created a stand-alone filter. Forsteps to create a new filter, see theMicroStrategy Developer help.
1 Edit the report to which you want to add a filter.
2 If the Object Browser is not already displayed, open it, by selectingObjectBrowser from the View menu.
3 Use the Object Browser window to search for and locate the filter that you want toadd to the report.
4 Right-click the filter, and select one of the following (the options are described inmore detail above):
• Replace Report Filter with a shortcut to this filter to connect thestand-alone filter to this report. Changes to the stand-alone filter are propagatedto the report, and vice versa.
• Replace Report Filter with a copy of this filter to embed the filter in thereport. Changes to the stand-alone filter are not propagated to the report, andvice versa.
The filter appears in the Template definition section. If it is a shortcut, the filtername is displayed. An embedded filter is named Local Filter.
If you drag and drop the filter into the Report Filter definition pane, the filteris embedded as a copy.
Advanced Reporting Guide
151 © 2017, MicroStrategy Inc.
5 Save the report. If you added the filter as a shortcut, you must save the report withthe shortcut to retain that functionality. See Saving a report with a shortcut to astand-alone filter, page 151 for steps.
Saving a report with a shortcut to a stand-alone filterWhen you save a report that contains a stand-alone filter, you can choose to save thefilter as either a copy or a shortcut.
• When you create a shortcut to a stand-alone object, changes that you make to theobject are propagated to this report and to all other reports that use the object as ashortcut. Changes that you make to this object within this report are propagated tothe object, and to all other reports that use the object as a shortcut. Use this optionto share report caches. This is sometimes referred to as a linked template or filter.
Reports with shortcuts to stand-alone templates and filters allow you to sharereport caches. If this is your intent, you must select the Retain theshortcuts option in the procedure. For detailed information about reportcaches, see the Caching chapter in the System Administration Guide.
• When you embed a copy of the object in the report, changes that you make to thestand-alone object are not propagated to this report. Changes that you make to theembedded object within this report are not propagated to the object. This issometimes referred to as a local or report-specific template or filter.
To save a report with a shortcut to a stand-alone filter
1 Save the report with a shortcut to a stand-alone filter:
a Click Save and Close on the toolbar of the Report Editor or Report Viewer.The Save Report As dialog box opens.
b Select the folder in which to save the report, then type the name of the newreport.
c Click Save. The Advanced Save Options dialog box opens.
If the report contains prompts, the Save Options dialog box opens afteryou have named the report. To access the Advanced Save Options dialogbox, click Advanced on the Save Options dialog box. For steps to save aprompted report, see theMicroStrategy Developer help.
2 Select one of the following options for saving the report:
• Create a local copy of the filter. Changes that you make to the filter are notpropagated to the original object, and vice versa. This is also called a local orembedded filter.
• Retain the shortcuts to the filter. Creating shortcuts allows you to use anobject on a report, taking advantage of the benefits of object reuse. Changes thatyou make to the filter are propagated to the original object, and vice versa. Usethis option to share report caches.

Advanced Reporting Guide
© 2017, MicroStrategy Inc. 152
3 To use the selections that you made above as the defaults, select the Rememberanswers the next time I am prompted check box.
4 Click OK to save the report.
4CUSTOM GROUPS ANDCONSOLIDATIONSGrouping Attribute Elements
A custom group is a set of special filters that can be placed on a template. A customgroup is made up of an ordered collection of elements called custom group elements.
Consolidations are used to specify the data that you want to view in your report. Theyallow you to group attribute elements in new ways without changing the metadata andwarehouse definitions.
Both of these objects allow you to qualify a report on a row-by-row basis.
Custom group and consolidation comparison, page 187 summarizes the differencesbetween these objects.
Information about custom groups includes:
• About custom groups: Grouping attribute elements with banding and filtering,page 154
• Custom group effects on SQL generation, page 158
• Custom group structure on reports, page 161
• Creating a custom group, page 163
• Editing and formatting a custom group, page 164
• Determining custom group interaction with the report filter, page 169
• Deleting a custom group, element, or condition, page 174
Information about consolidations includes:
• Consolidations: Grouping attribute elements with arithmetic and logical operators,page 174
• Consolidation elements, page 176
• Evaluation order, page 179
© 2017, MicroStrategy Inc. 153
Advanced Reporting Guide
154 © 2017, MicroStrategy Inc.
• Consolidations and SQL, page 180
• Consolidation example, page 186
If you have a large number of objects to create or edit, you can also use MicroStrategyCommand Manager to work with these objects. Command Manager manipulatesMicroStrategy objects by means of user-created scripts rather than a graphical userinterface. For more information about Command Manager, see the AutomatingAdministrative Tasks chapter in the System Administration Guide. For specificCommand Manager syntax for working with custom groups or consolidations, openCommand Manager and click Help.
About custom groups: Grouping attributeelements with banding and filtering
A custom group lets you group attribute elements from the same or different attributes tomeet your reporting requirements. This allows you to group attribute elements on areport in a way that is not defined in your data warehouse. From the perspective of thereport design process, a custom group is an object that can be placed on a template and ismade up of a collection of elements called custom group elements. Each elementcontains its own set of filtering or banding qualifications.
For example, your data warehouse contains data based on 12 months of the year, but youwant to display data in a report for each season in a year. You can create a custom groupwith elements representing each season, such as Winter and Spring, then add acondition to each custom group element to display data only for those months in eachseason. In the image below, which shows a custom group being created in MicroStrategyWeb, the Winter custom group element displays data for the months of December,January, and February; the Spring element displays data for March, April, and May; andso on.
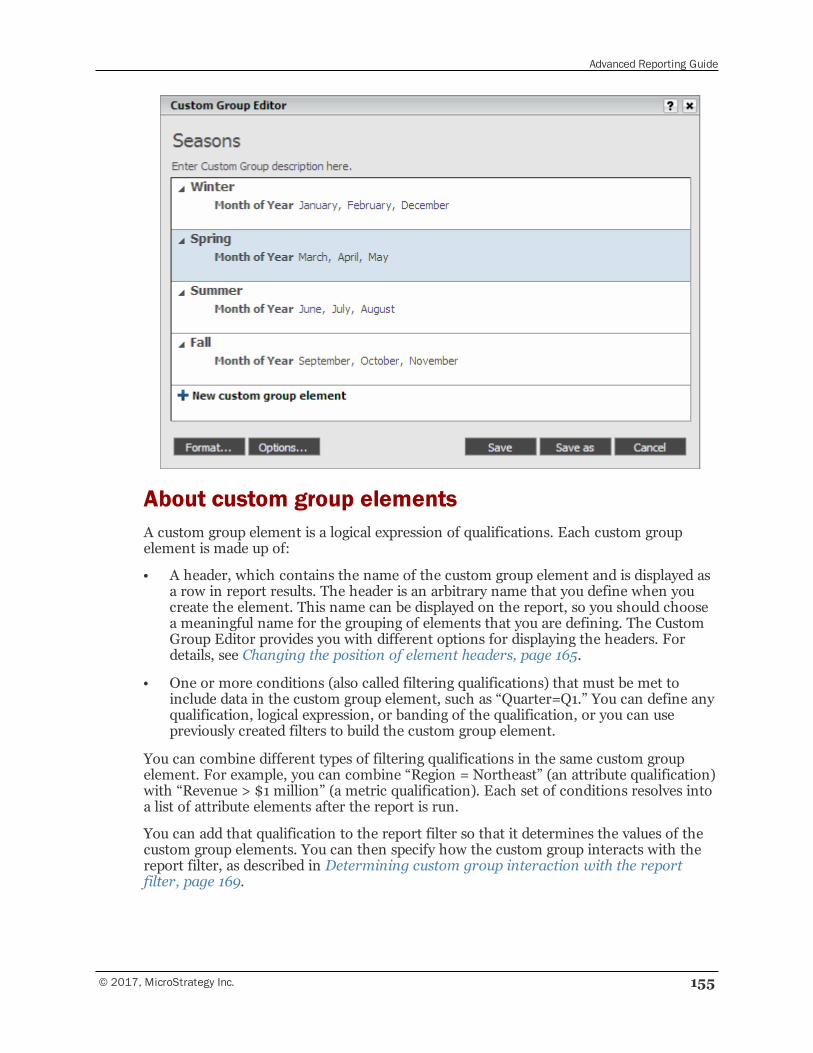
Advanced Reporting Guide
© 2017, MicroStrategy Inc. 155
About custom group elementsA custom group element is a logical expression of qualifications. Each custom groupelement is made up of:
• A header, which contains the name of the custom group element and is displayed asa row in report results. The header is an arbitrary name that you define when youcreate the element. This name can be displayed on the report, so you should choosea meaningful name for the grouping of elements that you are defining. The CustomGroup Editor provides you with different options for displaying the headers. Fordetails, see Changing the position of element headers, page 165.
• One or more conditions (also called filtering qualifications) that must be met toinclude data in the custom group element, such as “Quarter=Q1.” You can define anyqualification, logical expression, or banding of the qualification, or you can usepreviously created filters to build the custom group element.
You can combine different types of filtering qualifications in the same custom groupelement. For example, you can combine “Region = Northeast” (an attribute qualification)with “Revenue > $1 million” (a metric qualification). Each set of conditions resolves intoa list of attribute elements after the report is run.
You can add that qualification to the report filter so that it determines the values of thecustom group elements. You can then specify how the custom group interacts with thereport filter, as described in Determining custom group interaction with the reportfilter, page 169.
Advanced Reporting Guide
156 © 2017, MicroStrategy Inc.
Custom group elements can include a logical expression containing any of the followingqualification types (“Developer” and “Web” indicate which product the qualification canbe created in):
• Attribute qualification (Developer, Web): Restricts data based on the value of anattribute form; lets you view data only for attribute elements in a list; or comparestwo attributes to filter data.
• Set qualification (Developer, Web): Restricts data based on the value, rank orpercentage of a metric, or by comparing the values of two metrics.
• Custom group banding qualification (Developer): Slices data into multiple ranges, orbands, based on metric values.
You cannot combine banding qualifications with other types of qualifications.
• Shortcut-to-a-report qualification (Developer, Web): Restricts data using the resultsof an existing report. Also known as report qualifications or reports as filters.
• Shortcut-to-a-filter qualification (Developer, Web): Restricts data using an existingfilter. Also known as filter qualifications or embedded filters.
• Shortcut-to-a-prompt qualification (Web): Restricts data using the answers to anexisting prompt.
MicroStrategy Developer allows prompts in most qualification types. Fordetails, see Prompted custom groups, page 169.
Custom group examples
Store inventory examples: Example 1
In MicroStrategy Developer, you can create the custom group Store Inventory as follows:
• Small stores with low inventory
Store Sales < 50ANDStore Inventory < 200
• Large stores with low inventory
Store Sales > 50ANDStore Inventory < 200
The custom group elements in this example are:
• Small stores with low inventory, which is a logical expression of the following twometric qualifications (MQs):
Store Sales < 50 (MQ1)AND (logical operator)Store Inventory < 200 (MQ2)
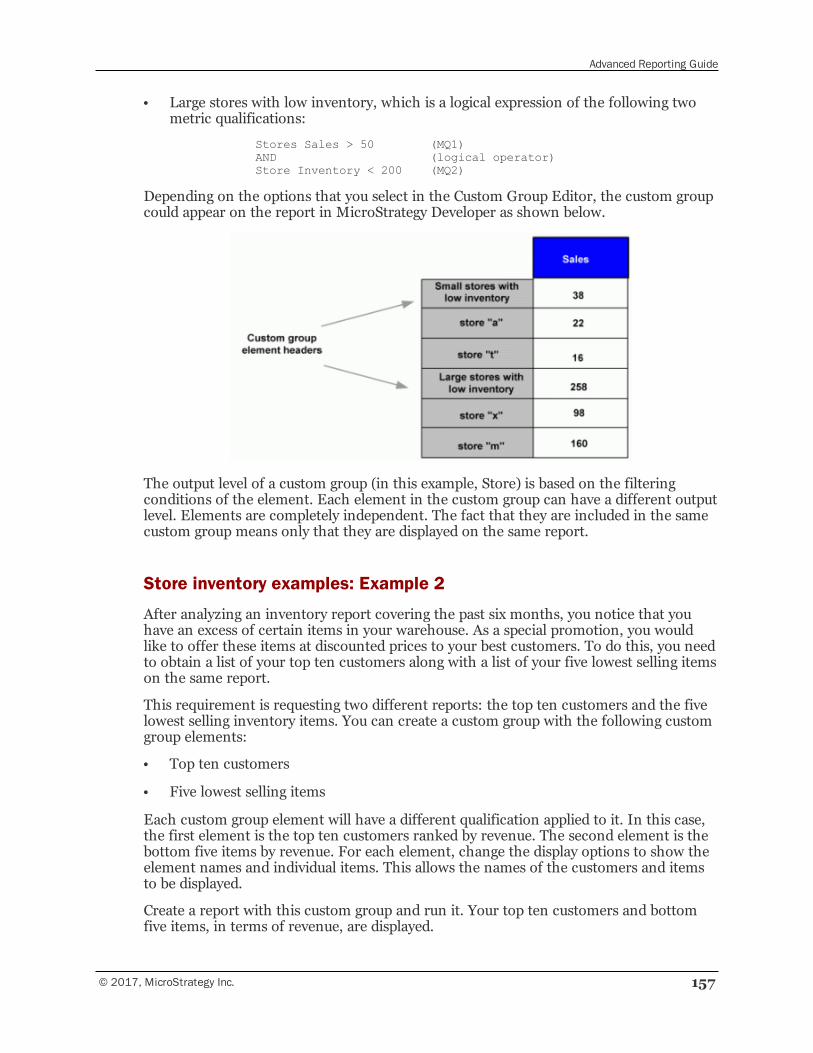
Advanced Reporting Guide
© 2017, MicroStrategy Inc. 157
• Large stores with low inventory, which is a logical expression of the following twometric qualifications:
Stores Sales > 50 (MQ1)AND (logical operator)Store Inventory < 200 (MQ2)
Depending on the options that you select in the Custom Group Editor, the custom groupcould appear on the report in MicroStrategy Developer as shown below.
The output level of a custom group (in this example, Store) is based on the filteringconditions of the element. Each element in the custom group can have a different outputlevel. Elements are completely independent. The fact that they are included in the samecustom group means only that they are displayed on the same report.
Store inventory examples: Example 2
After analyzing an inventory report covering the past six months, you notice that youhave an excess of certain items in your warehouse. As a special promotion, you wouldlike to offer these items at discounted prices to your best customers. To do this, you needto obtain a list of your top ten customers along with a list of your five lowest selling itemson the same report.
This requirement is requesting two different reports: the top ten customers and the fivelowest selling inventory items. You can create a custom group with the following customgroup elements:
• Top ten customers
• Five lowest selling items
Each custom group element will have a different qualification applied to it. In this case,the first element is the top ten customers ranked by revenue. The second element is thebottom five items by revenue. For each element, change the display options to show theelement names and individual items. This allows the names of the customers and itemsto be displayed.
Create a report with this custom group and run it. Your top ten customers and bottomfive items, in terms of revenue, are displayed.
Advanced Reporting Guide
158 © 2017, MicroStrategy Inc.
Custom group effects on SQL generationYou can consider custom groups as many different reports “stacked up” together. TheSQL for a report with a custom group is likely to be very complex. Each of the individual“mini-reports” that make up the entire custom group report will have at least one, if notmore, SQL passes of its own. The Analytical Engine stacks up all these “mini-reports” tocreate the final results. In addition, numerous temporary tables may be created anddropped to hold intermediate data.
Therefore, running a report with a custom group is equivalent to running many differentreports and putting them together. As a result, custom groups are SQL-intensive in thesense that they are likely to generate many passes of SQL to the database.
Benefits of using a custom groupThe benefit of a custom group is its ability to group attribute elements in a way that is notdefined in the data warehouse. You can create “relationships” between the attribute andthe custom group. A custom group can organize attribute elements through thefollowing:
• Attribute qualification
• Set qualification
• Banding
• Advanced qualification
• Shortcut-to-a-report qualification
• Shortcut-to-a-filter qualification
• Shortcut-to-a-prompt qualification
Refer to Chapter 3, Advanced Filters: Filtering Data on Reports, for more informationon these qualification types.
Banding qualification: Grouping by metric value intervals
Banding qualifiers enable you to create banding custom group elements. Banding is amethod of displaying the groups of custom group elements. Banding is defined by theoutput level of elements using the values of a metric. For example, you can slice the listof stores (Store attribute elements) using the values of the Total Sales metric. Supposeyou have created a report that ranks stores according to the revenue generated by eachstore. You might decide to group the stores by creating one group for the top 10 stores, asecond group for stores 11-20, and a third group for stores 21-30.
You can apply different types of banding:
• Band size: To slice the range of metric values defined by “start at” and “stop at”values into a number of bands, each defined by the parameter “step size.”
For example, in the following diagram the “start at” value is 10, “stop at” is 50, and“step size” is 10. These settings slice the group into four bands.
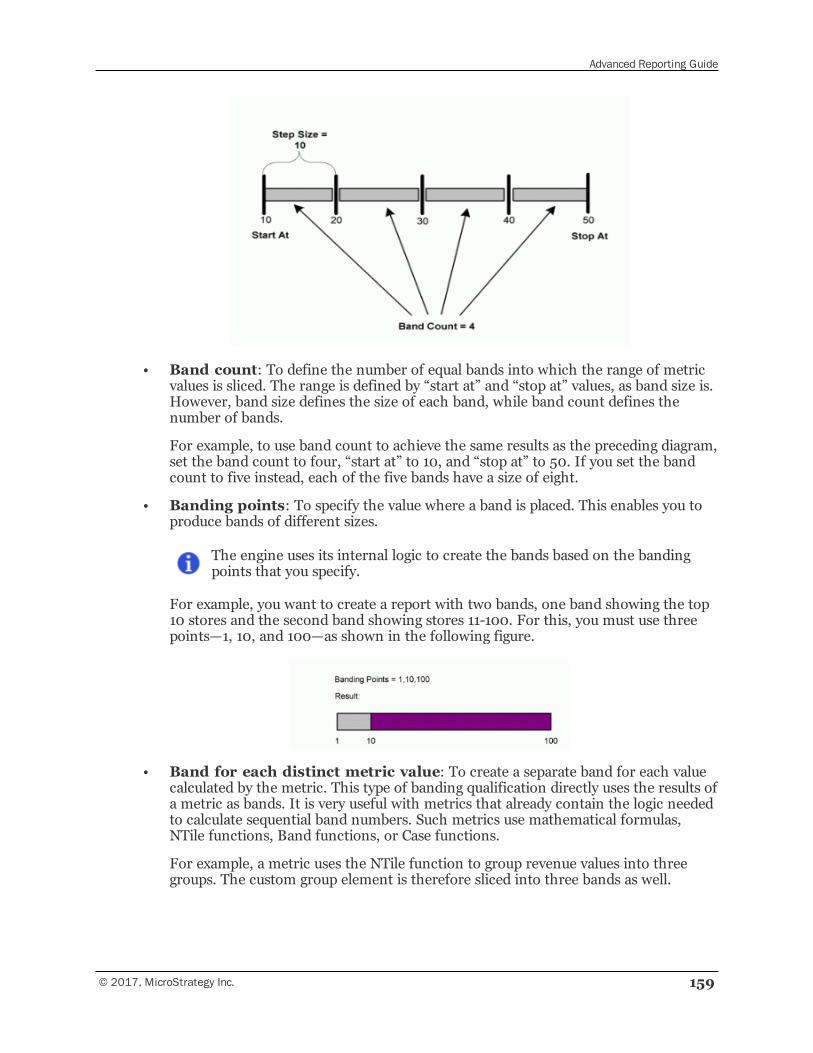
Advanced Reporting Guide
© 2017, MicroStrategy Inc. 159
• Band count: To define the number of equal bands into which the range of metricvalues is sliced. The range is defined by “start at” and “stop at” values, as band size is.However, band size defines the size of each band, while band count defines thenumber of bands.
For example, to use band count to achieve the same results as the preceding diagram,set the band count to four, “start at” to 10, and “stop at” to 50. If you set the bandcount to five instead, each of the five bands have a size of eight.
• Banding points: To specify the value where a band is placed. This enables you toproduce bands of different sizes.
The engine uses its internal logic to create the bands based on the bandingpoints that you specify.
For example, you want to create a report with two bands, one band showing the top10 stores and the second band showing stores 11-100. For this, you must use threepoints—1, 10, and 100—as shown in the following figure.
• Band for each distinct metric value: To create a separate band for each valuecalculated by the metric. This type of banding qualification directly uses the results ofa metric as bands. It is very useful with metrics that already contain the logic neededto calculate sequential band numbers. Such metrics use mathematical formulas,NTile functions, Band functions, or Case functions.
For example, a metric uses the NTile function to group revenue values into threegroups. The custom group element is therefore sliced into three bands as well.
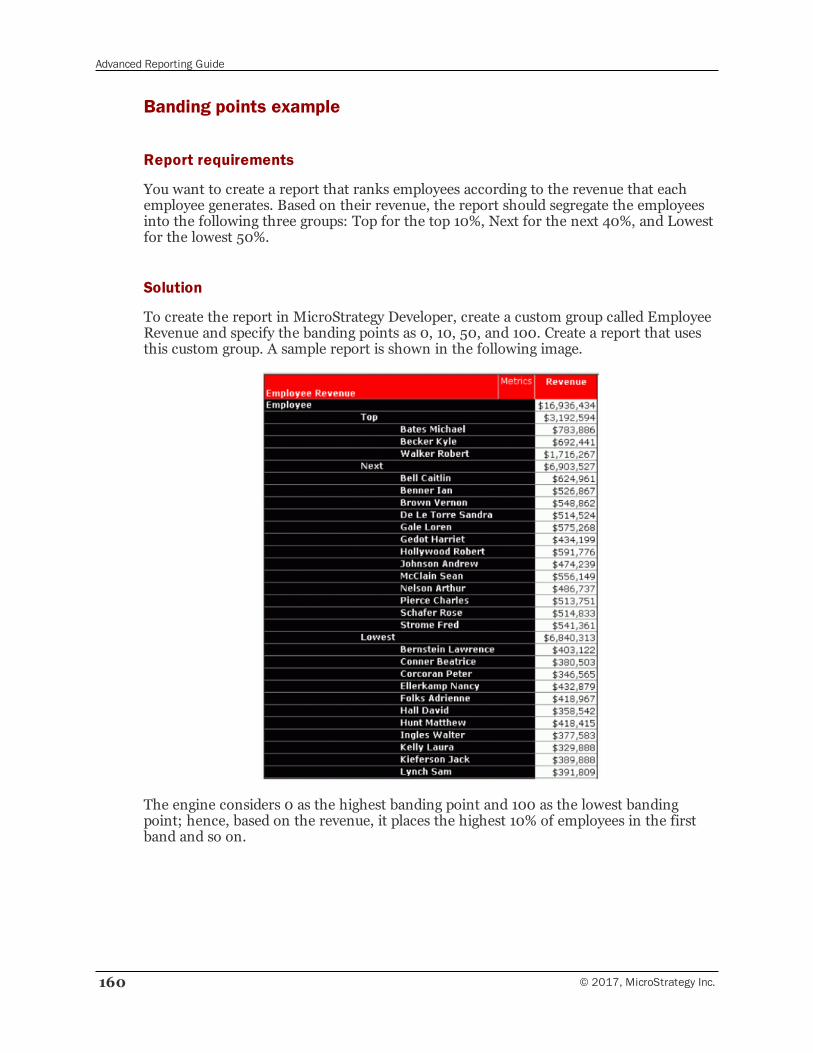
Advanced Reporting Guide
160 © 2017, MicroStrategy Inc.
Banding points example
Report requirements
You want to create a report that ranks employees according to the revenue that eachemployee generates. Based on their revenue, the report should segregate the employeesinto the following three groups: Top for the top 10%, Next for the next 40%, and Lowestfor the lowest 50%.
Solution
To create the report in MicroStrategy Developer, create a custom group called EmployeeRevenue and specify the banding points as 0, 10, 50, and 100. Create a report that usesthis custom group. A sample report is shown in the following image.
The engine considers 0 as the highest banding point and 100 as the lowest bandingpoint; hence, based on the revenue, it places the highest 10% of employees in the firstband and so on.
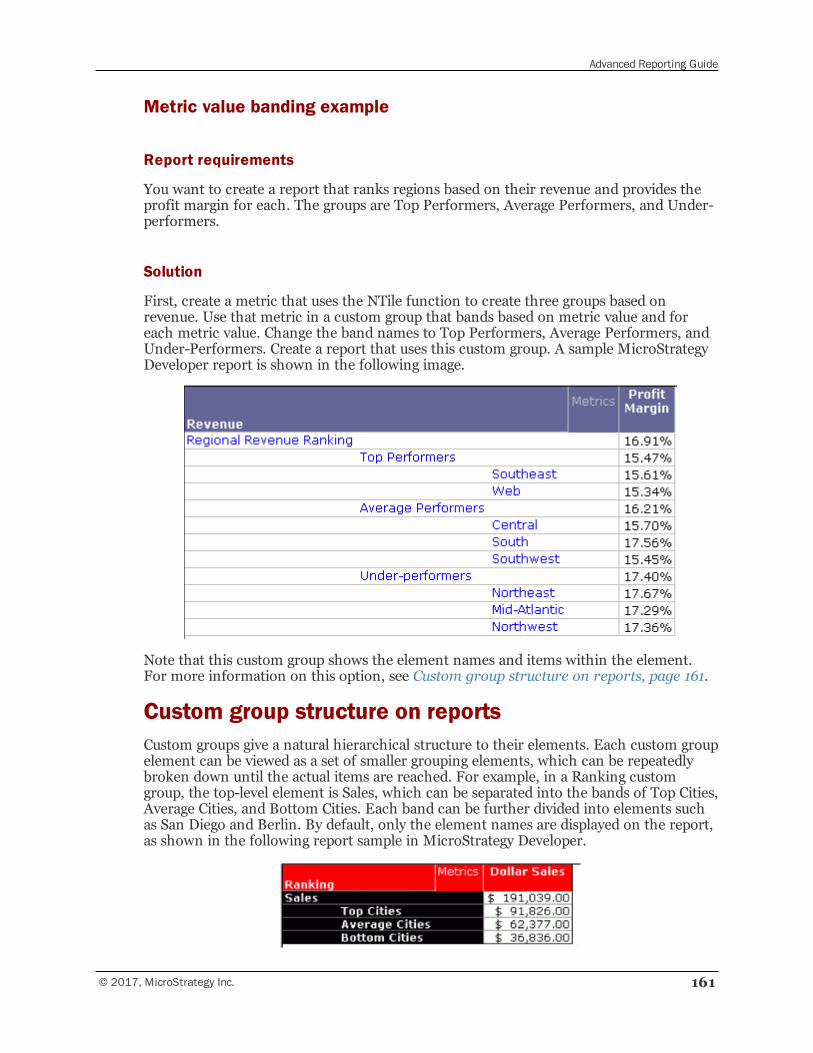
Advanced Reporting Guide
© 2017, MicroStrategy Inc. 161
Metric value banding example
Report requirements
You want to create a report that ranks regions based on their revenue and provides theprofit margin for each. The groups are Top Performers, Average Performers, and Under-performers.
Solution
First, create a metric that uses the NTile function to create three groups based onrevenue. Use that metric in a custom group that bands based on metric value and foreach metric value. Change the band names to Top Performers, Average Performers, andUnder-Performers. Create a report that uses this custom group. A sample MicroStrategyDeveloper report is shown in the following image.
Note that this custom group shows the element names and items within the element.For more information on this option, see Custom group structure on reports, page 161.
Custom group structure on reportsCustom groups give a natural hierarchical structure to their elements. Each custom groupelement can be viewed as a set of smaller grouping elements, which can be repeatedlybroken down until the actual items are reached. For example, in a Ranking customgroup, the top-level element is Sales, which can be separated into the bands of Top Cities,Average Cities, and Bottom Cities. Each band can be further divided into elements suchas San Diego and Berlin. By default, only the element names are displayed on the report,as shown in the following report sample in MicroStrategy Developer.
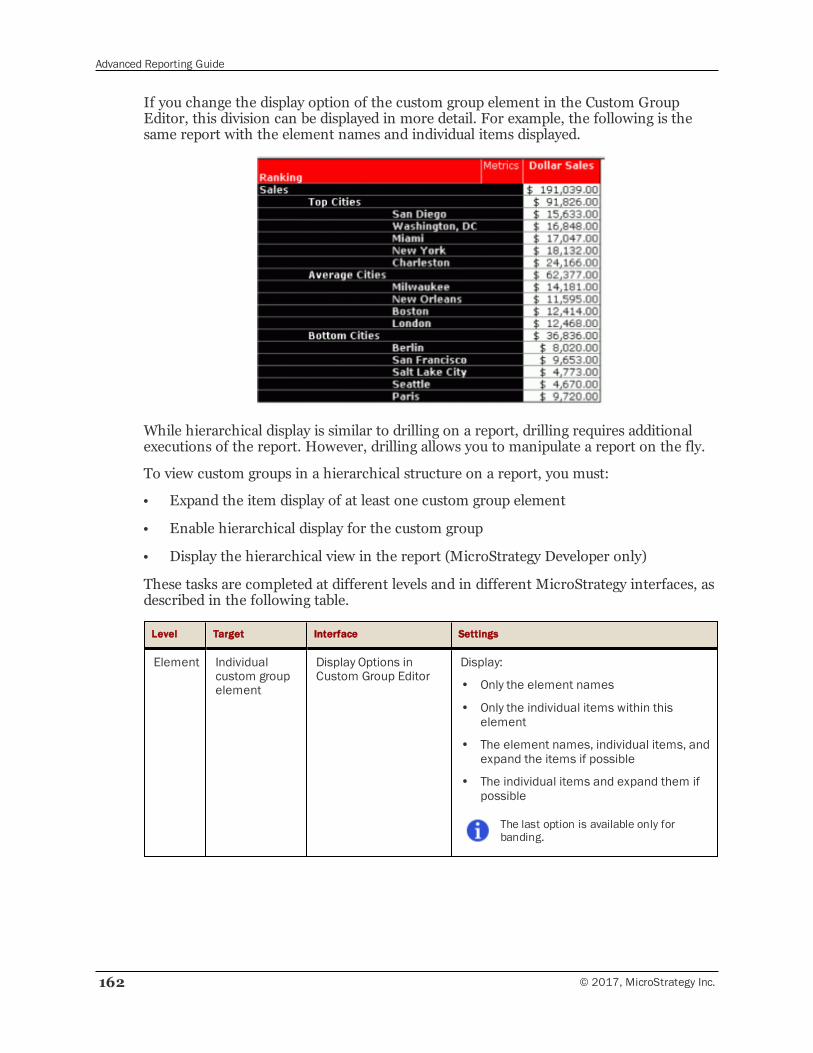
Advanced Reporting Guide
162 © 2017, MicroStrategy Inc.
If you change the display option of the custom group element in the Custom GroupEditor, this division can be displayed in more detail. For example, the following is thesame report with the element names and individual items displayed.
While hierarchical display is similar to drilling on a report, drilling requires additionalexecutions of the report. However, drilling allows you to manipulate a report on the fly.
To view custom groups in a hierarchical structure on a report, you must:
• Expand the item display of at least one custom group element
• Enable hierarchical display for the custom group
• Display the hierarchical view in the report (MicroStrategy Developer only)
These tasks are completed at different levels and in different MicroStrategy interfaces, asdescribed in the following table.
Level Target Interface Settings
Element Individualcustom groupelement
Display Options inCustom Group Editor
Display:
• Only the element names
• Only the individual items within thiselement
• The element names, individual items, andexpand the items if possible
• The individual items and expand them ifpossible
The last option is available only forbanding.
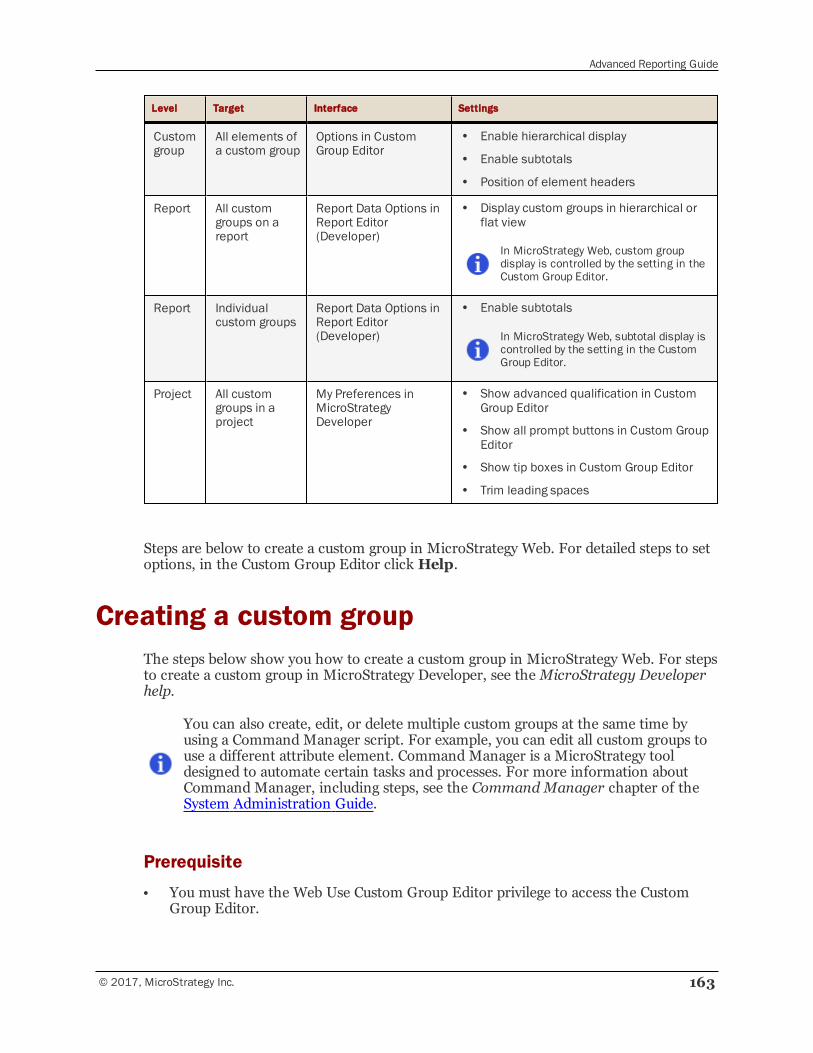
Advanced Reporting Guide
© 2017, MicroStrategy Inc. 163
Level Target Interface Settings
Customgroup
All elements ofa custom group
Options in CustomGroup Editor
• Enable hierarchical display
• Enable subtotals
• Position of element headers
Report All customgroups on areport
Report Data Options inReport Editor(Developer)
• Display custom groups in hierarchical orflat view
In MicroStrategy Web, custom groupdisplay is controlled by the setting in theCustom Group Editor.
Report Individualcustom groups
Report Data Options inReport Editor(Developer)
• Enable subtotals
In MicroStrategy Web, subtotal display iscontrolled by the setting in the CustomGroup Editor.
Project All customgroups in aproject
My Preferences inMicroStrategyDeveloper
• Show advanced qualification in CustomGroup Editor
• Show all prompt buttons in Custom GroupEditor
• Show tip boxes in Custom Group Editor
• Trim leading spaces
Steps are below to create a custom group in MicroStrategy Web. For detailed steps to setoptions, in the Custom Group Editor click Help.
Creating a custom groupThe steps below show you how to create a custom group in MicroStrategy Web. For stepsto create a custom group in MicroStrategy Developer, see theMicroStrategy Developerhelp.
You can also create, edit, or delete multiple custom groups at the same time byusing a Command Manager script. For example, you can edit all custom groups touse a different attribute element. Command Manager is a MicroStrategy tooldesigned to automate certain tasks and processes. For more information aboutCommand Manager, including steps, see the Command Manager chapter of theSystem Administration Guide.
Prerequisite
• You must have the Web Use Custom Group Editor privilege to access the CustomGroup Editor.
Advanced Reporting Guide
164 © 2017, MicroStrategy Inc.
To create a custom group
1 Browse to the folder in which to create the new custom group, then click theCreate Custom Group icon. The Custom Group Editor is displayed.
2 Type a name for the custom group in the Enter Custom Group Name Herefield.
3 Type a description for the custom group in the Enter Custom GroupDescription Here field.
To define custom group elements
4 Click New Custom Group Element. The Condition Editor opens.
5 Define the conditions to use to filter data by selecting an attribute, metric, report, orfilter, then specifying the appropriate options. For detailed steps to define acondition, click Help in the Condition Editor.
6 Specify a name for the custom group element by clicking on the name of the elementand typing a name in the field.
7 Repeat the steps above, beginning at To define custom group elements, page 164, todefine each additional custom group element.
To save the custom group
8 Click Save. The Save As dialog box opens.
9 Browse to the location to save your custom group in, then click Save.
10 Click OK to return to the Custom Group Editor.
Editing and formatting a custom groupYou can use any of the following ideas to further design your custom group so it appearson reports the way that you want it to:
• Changing the position of element headers, page 165
• Enabling subtotals for custom groups, page 165
• Sorting custom groups, page 166 (based on attribute ID or metric value)
• Determining custom group interaction with the report filter, page 169
• Prompted custom groups, page 169
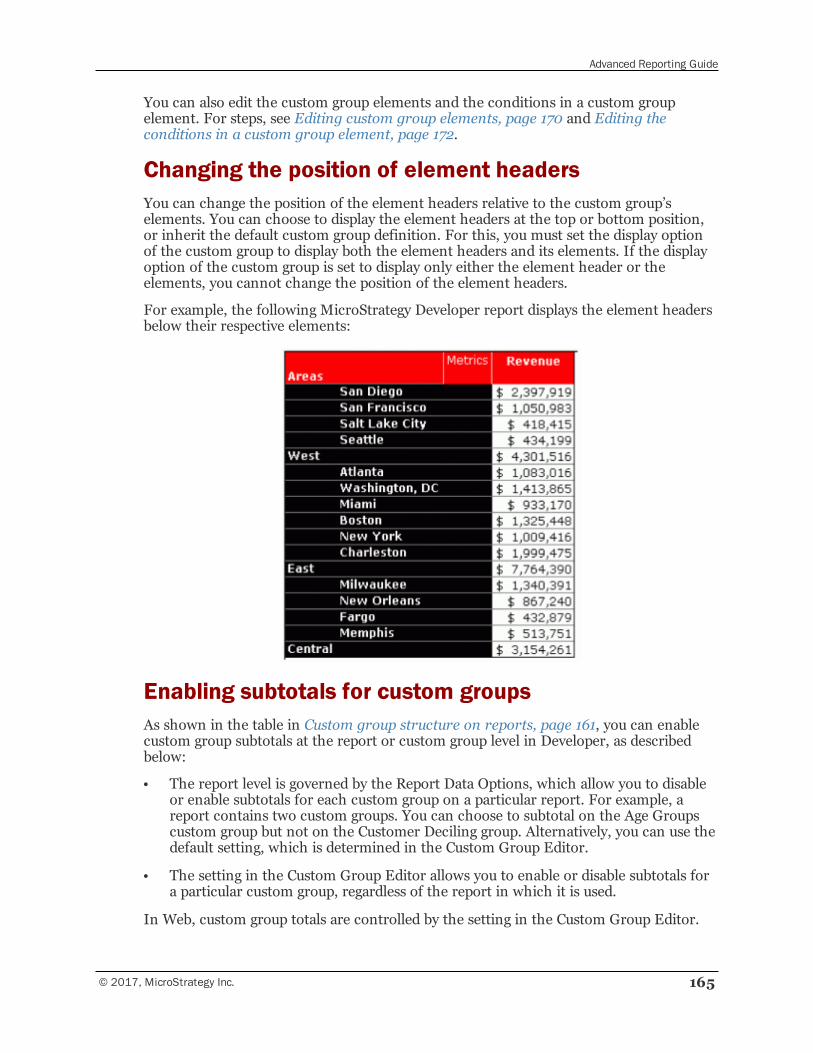
Advanced Reporting Guide
© 2017, MicroStrategy Inc. 165
You can also edit the custom group elements and the conditions in a custom groupelement. For steps, see Editing custom group elements, page 170 and Editing theconditions in a custom group element, page 172.
Changing the position of element headersYou can change the position of the element headers relative to the custom group’selements. You can choose to display the element headers at the top or bottom position,or inherit the default custom group definition. For this, you must set the display optionof the custom group to display both the element headers and its elements. If the displayoption of the custom group is set to display only either the element header or theelements, you cannot change the position of the element headers.
For example, the following MicroStrategy Developer report displays the element headersbelow their respective elements:
Enabling subtotals for custom groupsAs shown in the table in Custom group structure on reports, page 161, you can enablecustom group subtotals at the report or custom group level in Developer, as describedbelow:
• The report level is governed by the Report Data Options, which allow you to disableor enable subtotals for each custom group on a particular report. For example, areport contains two custom groups. You can choose to subtotal on the Age Groupscustom group but not on the Customer Deciling group. Alternatively, you can use thedefault setting, which is determined in the Custom Group Editor.
• The setting in the Custom Group Editor allows you to enable or disable subtotals fora particular custom group, regardless of the report in which it is used.
In Web, custom group totals are controlled by the setting in the Custom Group Editor.
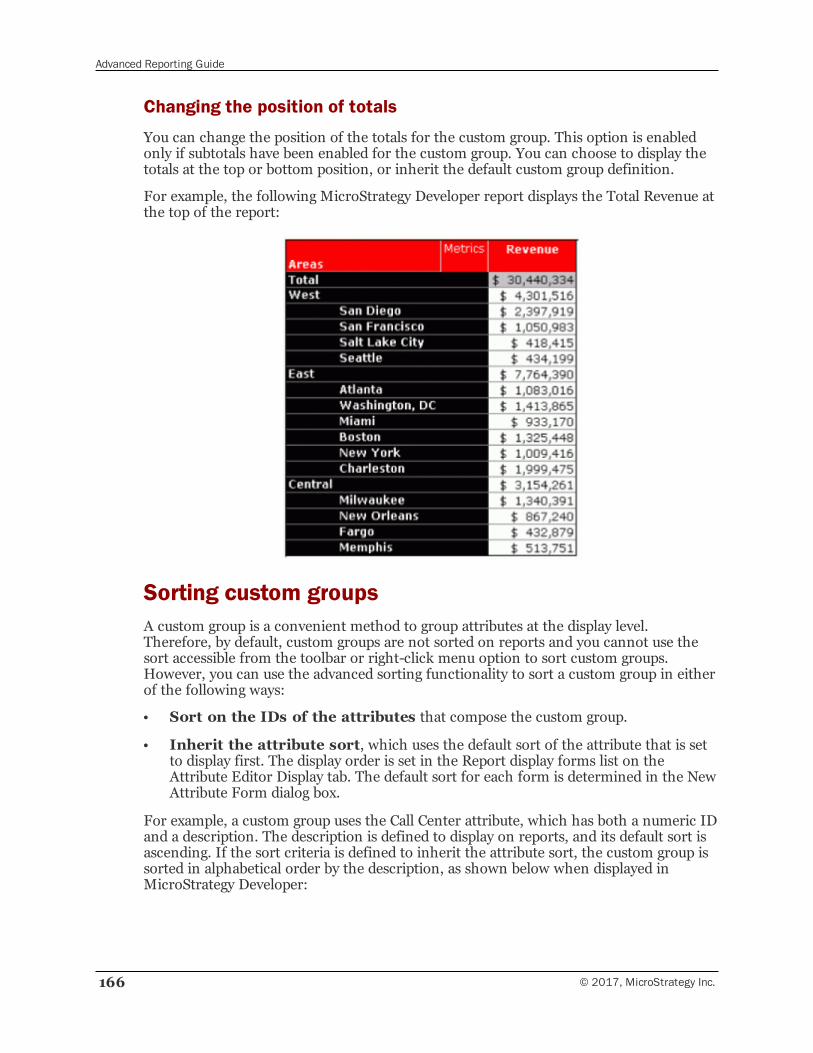
Advanced Reporting Guide
166 © 2017, MicroStrategy Inc.
Changing the position of totals
You can change the position of the totals for the custom group. This option is enabledonly if subtotals have been enabled for the custom group. You can choose to display thetotals at the top or bottom position, or inherit the default custom group definition.
For example, the following MicroStrategy Developer report displays the Total Revenue atthe top of the report:
Sorting custom groupsA custom group is a convenient method to group attributes at the display level.Therefore, by default, custom groups are not sorted on reports and you cannot use thesort accessible from the toolbar or right-click menu option to sort custom groups.However, you can use the advanced sorting functionality to sort a custom group in eitherof the following ways:
• Sort on the IDs of the attributes that compose the custom group.
• Inherit the attribute sort, which uses the default sort of the attribute that is setto display first. The display order is set in the Report display forms list on theAttribute Editor Display tab. The default sort for each form is determined in the NewAttribute Form dialog box.
For example, a custom group uses the Call Center attribute, which has both a numeric IDand a description. The description is defined to display on reports, and its default sort isascending. If the sort criteria is defined to inherit the attribute sort, the custom group issorted in alphabetical order by the description, as shown below when displayed inMicroStrategy Developer:
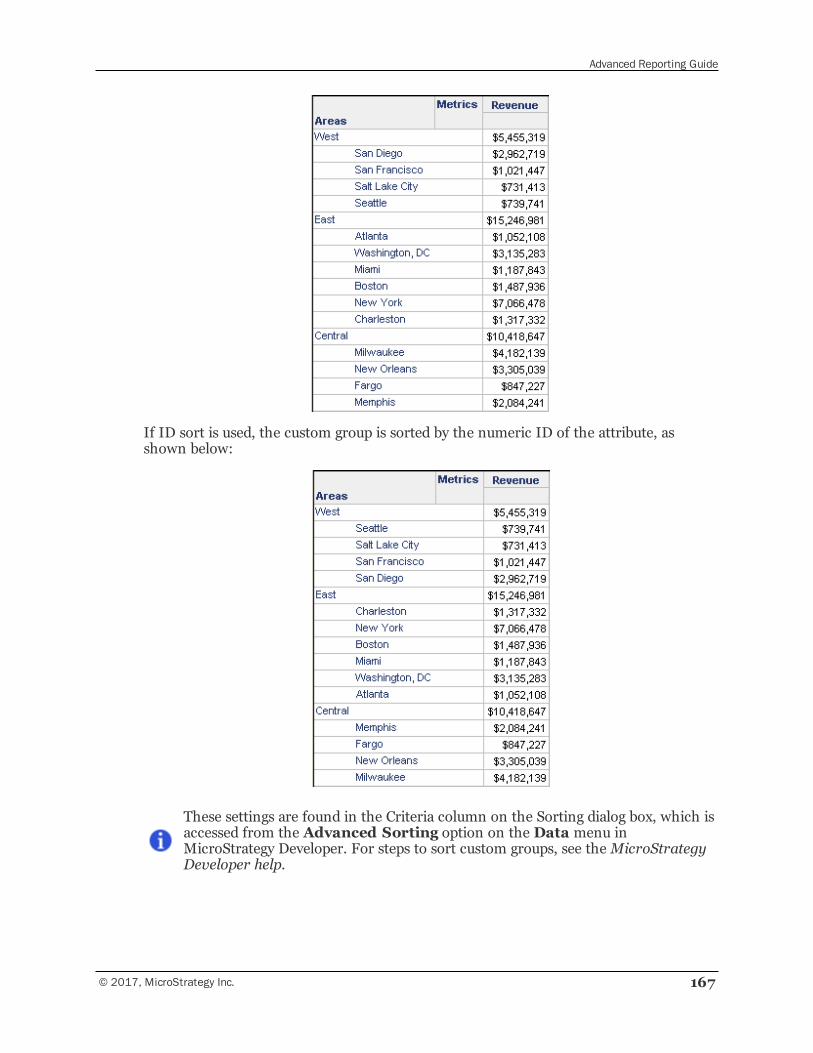
Advanced Reporting Guide
© 2017, MicroStrategy Inc. 167
If ID sort is used, the custom group is sorted by the numeric ID of the attribute, asshown below:
These settings are found in the Criteria column on the Sorting dialog box, which isaccessed from the Advanced Sorting option on the Data menu inMicroStrategy Developer. For steps to sort custom groups, see theMicroStrategyDeveloper help.
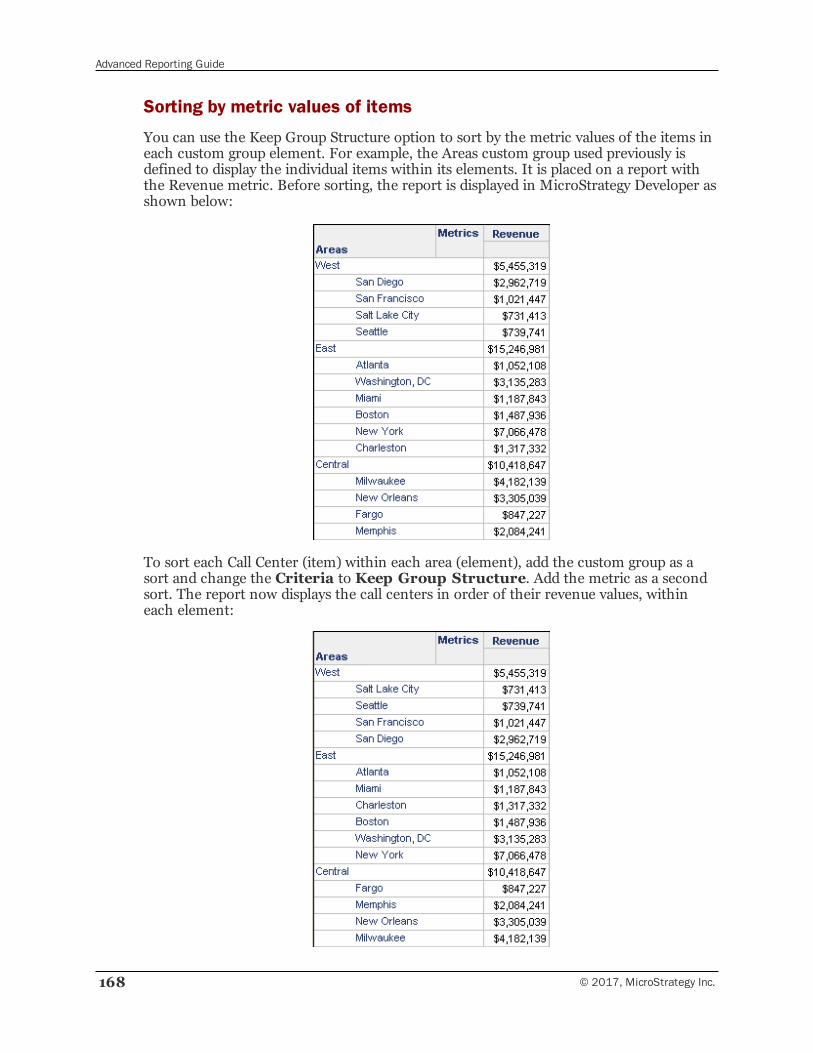
Advanced Reporting Guide
168 © 2017, MicroStrategy Inc.
Sorting by metric values of items
You can use the Keep Group Structure option to sort by the metric values of the items ineach custom group element. For example, the Areas custom group used previously isdefined to display the individual items within its elements. It is placed on a report withthe Revenue metric. Before sorting, the report is displayed in MicroStrategy Developer asshown below:
To sort each Call Center (item) within each area (element), add the custom group as asort and change the Criteria to Keep Group Structure. Add the metric as a secondsort. The report now displays the call centers in order of their revenue values, withineach element:
Advanced Reporting Guide
© 2017, MicroStrategy Inc. 169
Determining custom group interaction with the reportfilterYou cannot combine a banding qualification with another type of qualification (such asattribute qualification or metric qualification) in a custom group element. However, youcan add that qualification to the report filter so that it will determine the values of thecustom group elements. You can then specify how the custom group interacts with thereport filter.
When a custom group that uses attribute qualifications is included on a report with areport filter, the report filter is always applied to the individual custom group elements.However, if you create a custom group using metric qualifications or bandingqualifications, by default the report filter is not applied to the custom group elements.
Incorrect data can be returned in some scenarios. For example, a custom group displaysrevenue totals for customers in columns that represent the range of revenue that thecustomer has contributed. A customer that has contributed $7,500 in revenue is shownin the column for customers that contributed $5,000 to $10,000 in revenue. Thiscustom group is included on a report that has a report filter that restricts results to dataonly for the year 2007.
In this scenario, the report filter is evaluated after the custom group. If the samecustomer that has a total of $7,500 only had $2,500 in 2007, then the report would onlydisplay $2,500 for that customer. However, the customer would still show in the $5,000to $10,000 in revenue range because the custom group did not account for the reportfilter.
You can define the interaction between the report filter and the custom group to avoidthis scenario, by using the Custom Group interaction with report filter setting.This setting has the following options:
• No interaction - static custom group: Report filter qualifications are notapplied to custom groups that use metric qualifications or banding qualifications.Filtering is applied only after the custom group has been evaluated.
• Apply report filter to custom group: Report filter qualifications are applied tocustom groups and are used to determine the values for each custom group element.
• Apply report filter to custom group, but ignore related elements fromthe report filter: Report filter qualifications that do not qualify on attributeelements that are used to define the custom group elements are applied to customgroups. These filter qualifications are used to determine the values for each customgroup element. For example, a report filter that qualifies on the Customer attribute isnot applied to a custom group that also uses the Customer attribute to define itscustom group elements.
A report limit defined on a custom group report is ignored.
Prompted custom groupsA prompted qualification in a custom group allows you to dynamically modify thecontents of a report at run time. By applying certain conditions on one or more of the
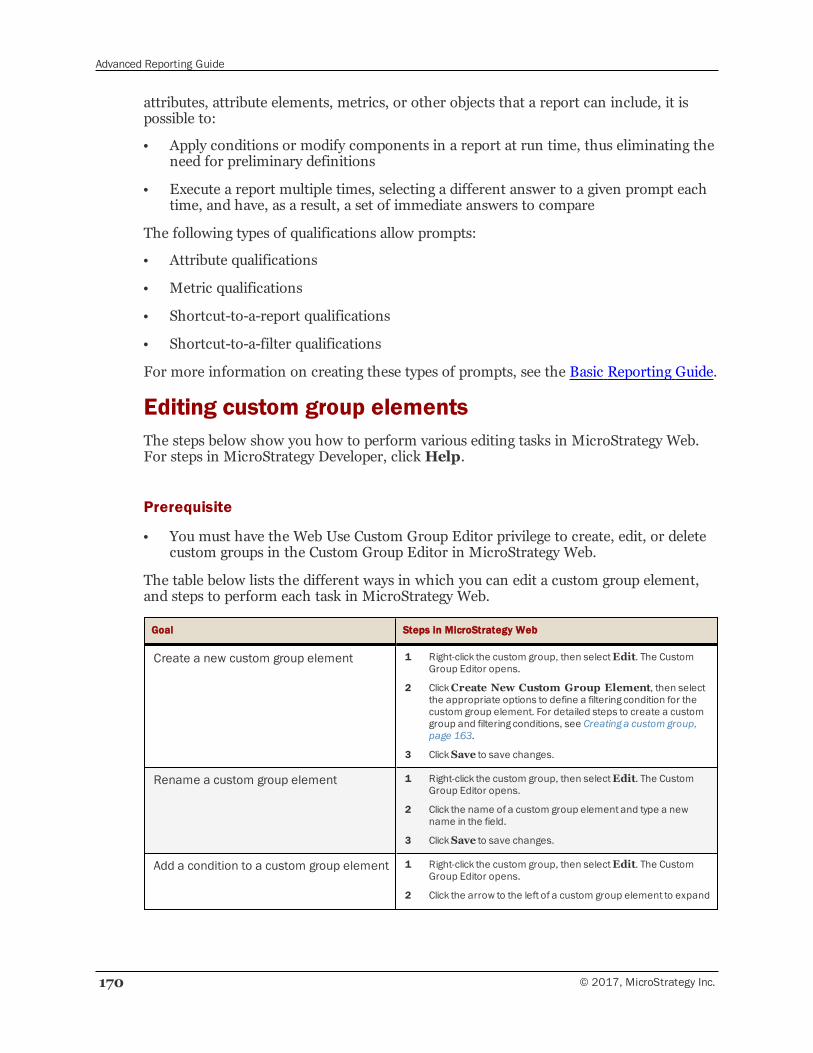
Advanced Reporting Guide
170 © 2017, MicroStrategy Inc.
attributes, attribute elements, metrics, or other objects that a report can include, it ispossible to:
• Apply conditions or modify components in a report at run time, thus eliminating theneed for preliminary definitions
• Execute a report multiple times, selecting a different answer to a given prompt eachtime, and have, as a result, a set of immediate answers to compare
The following types of qualifications allow prompts:
• Attribute qualifications
• Metric qualifications
• Shortcut-to-a-report qualifications
• Shortcut-to-a-filter qualifications
For more information on creating these types of prompts, see the Basic Reporting Guide.
Editing custom group elementsThe steps below show you how to perform various editing tasks in MicroStrategy Web.For steps in MicroStrategy Developer, click Help.
Prerequisite
• You must have the Web Use Custom Group Editor privilege to create, edit, or deletecustom groups in the Custom Group Editor in MicroStrategy Web.
The table below lists the different ways in which you can edit a custom group element,and steps to perform each task in MicroStrategy Web.
Goal Steps in MicroStrategy Web
Create a new custom group element 1 Right-click the custom group, then selectEdit. The CustomGroup Editor opens.
2 ClickCreate New Custom Group Element, then selectthe appropriate options to define a filtering condition for thecustom group element. For detailed steps to create a customgroup and filtering conditions, see Creating a custom group,page 163.
3 ClickSave to save changes.
Rename a custom group element 1 Right-click the custom group, then selectEdit. The CustomGroup Editor opens.
2 Click the name of a custom group element and type a newname in the field.
3 ClickSave to save changes.
Add a condition to a custom group element 1 Right-click the custom group, then selectEdit. The CustomGroup Editor opens.
2 Click the arrow to the left of a custom group element to expand
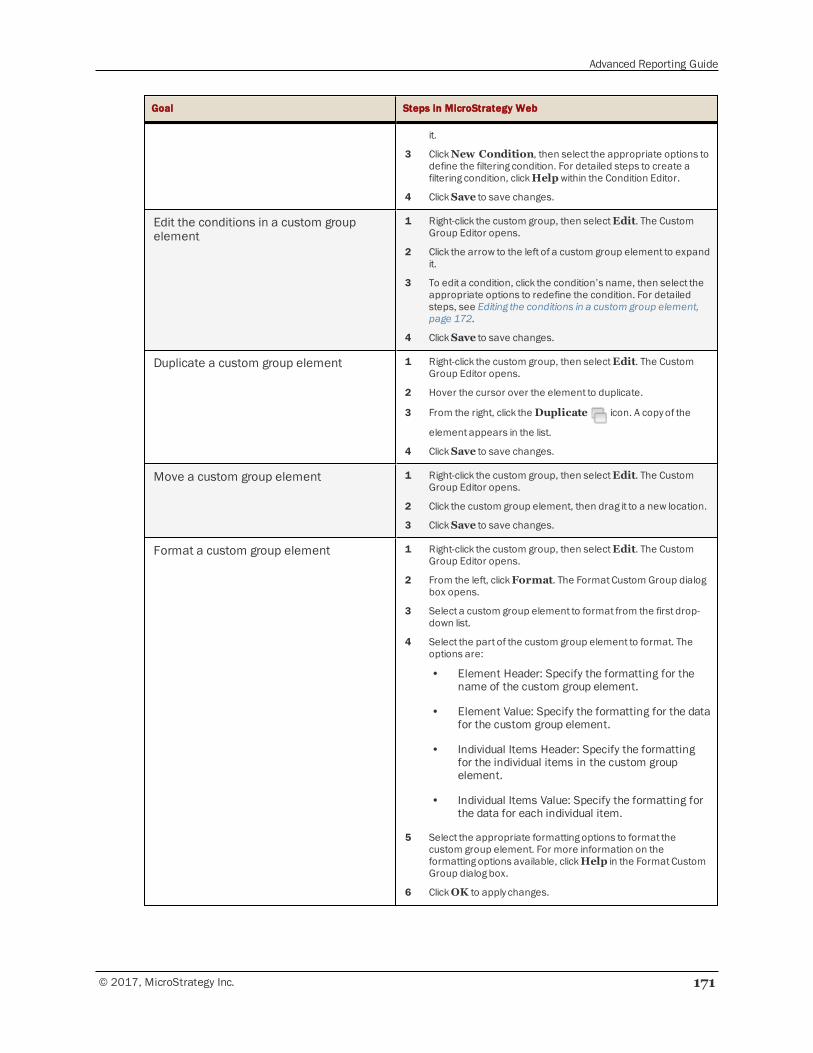
Advanced Reporting Guide
© 2017, MicroStrategy Inc. 171
Goal Steps in MicroStrategy Web
it.
3 ClickNew Condition, then select the appropriate options todefine the filtering condition. For detailed steps to create afiltering condition, clickHelpwithin the Condition Editor.
4 ClickSave to save changes.
Edit the conditions in a custom groupelement
1 Right-click the custom group, then selectEdit. The CustomGroup Editor opens.
2 Click the arrow to the left of a custom group element to expandit.
3 To edit a condition, click the condition’s name, then select theappropriate options to redefine the condition. For detailedsteps, see Editing the conditions in a custom group element,page 172.
4 ClickSave to save changes.
Duplicate a custom group element 1 Right-click the custom group, then selectEdit. The CustomGroup Editor opens.
2 Hover the cursor over the element to duplicate.
3 From the right, click theDuplicate icon. A copy of the
element appears in the list.
4 ClickSave to save changes.
Move a custom group element 1 Right-click the custom group, then selectEdit. The CustomGroup Editor opens.
2 Click the custom group element, then drag it to a new location.
3 ClickSave to save changes.
Format a custom group element 1 Right-click the custom group, then selectEdit. The CustomGroup Editor opens.
2 From the left, clickFormat. The Format Custom Group dialogbox opens.
3 Select a custom group element to format from the first drop-down list.
4 Select the part of the custom group element to format. Theoptions are:
• Element Header: Specify the formatting for thename of the custom group element.
• Element Value: Specify the formatting for the datafor the custom group element.
• Individual Items Header: Specify the formattingfor the individual items in the custom groupelement.
• Individual Items Value: Specify the formatting forthe data for each individual item.
5 Select the appropriate formatting options to format thecustom group element. For more information on theformatting options available, clickHelp in the Format CustomGroup dialog box.
6 ClickOK to apply changes.
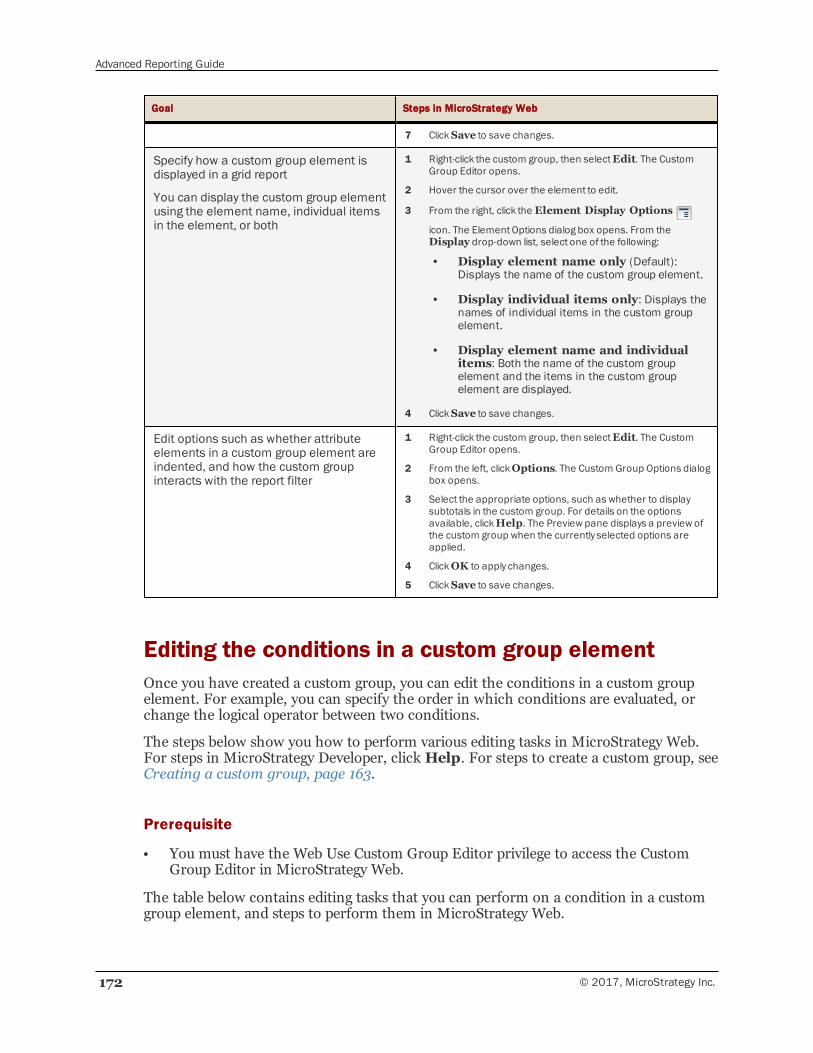
Advanced Reporting Guide
172 © 2017, MicroStrategy Inc.
Goal Steps in MicroStrategy Web
7 ClickSave to save changes.
Specify how a custom group element isdisplayed in a grid report
You can display the custom group elementusing the element name, individual itemsin the element, or both
1 Right-click the custom group, then selectEdit. The CustomGroup Editor opens.
2 Hover the cursor over the element to edit.
3 From the right, click the Element Display Options
icon. The Element Options dialog box opens. From theDisplay drop-down list, select one of the following:
• Display element name only (Default):Displays the name of the custom group element.
• Display individual items only: Displays thenames of individual items in the custom groupelement.
• Display element name and individualitems: Both the name of the custom groupelement and the items in the custom groupelement are displayed.
4 ClickSave to save changes.
Edit options such as whether attributeelements in a custom group element areindented, and how the custom groupinteracts with the report filter
1 Right-click the custom group, then selectEdit. The CustomGroup Editor opens.
2 From the left, clickOptions. The Custom Group Options dialogbox opens.
3 Select the appropriate options, such as whether to displaysubtotals in the custom group. For details on the optionsavailable, clickHelp. The Preview pane displays a preview ofthe custom group when the currently selected options areapplied.
4 ClickOK to apply changes.
5 ClickSave to save changes.
Editing the conditions in a custom group elementOnce you have created a custom group, you can edit the conditions in a custom groupelement. For example, you can specify the order in which conditions are evaluated, orchange the logical operator between two conditions.
The steps below show you how to perform various editing tasks in MicroStrategy Web.For steps in MicroStrategy Developer, click Help. For steps to create a custom group, seeCreating a custom group, page 163.
Prerequisite
• You must have the Web Use Custom Group Editor privilege to access the CustomGroup Editor in MicroStrategy Web.
The table below contains editing tasks that you can perform on a condition in a customgroup element, and steps to perform them in MicroStrategy Web.
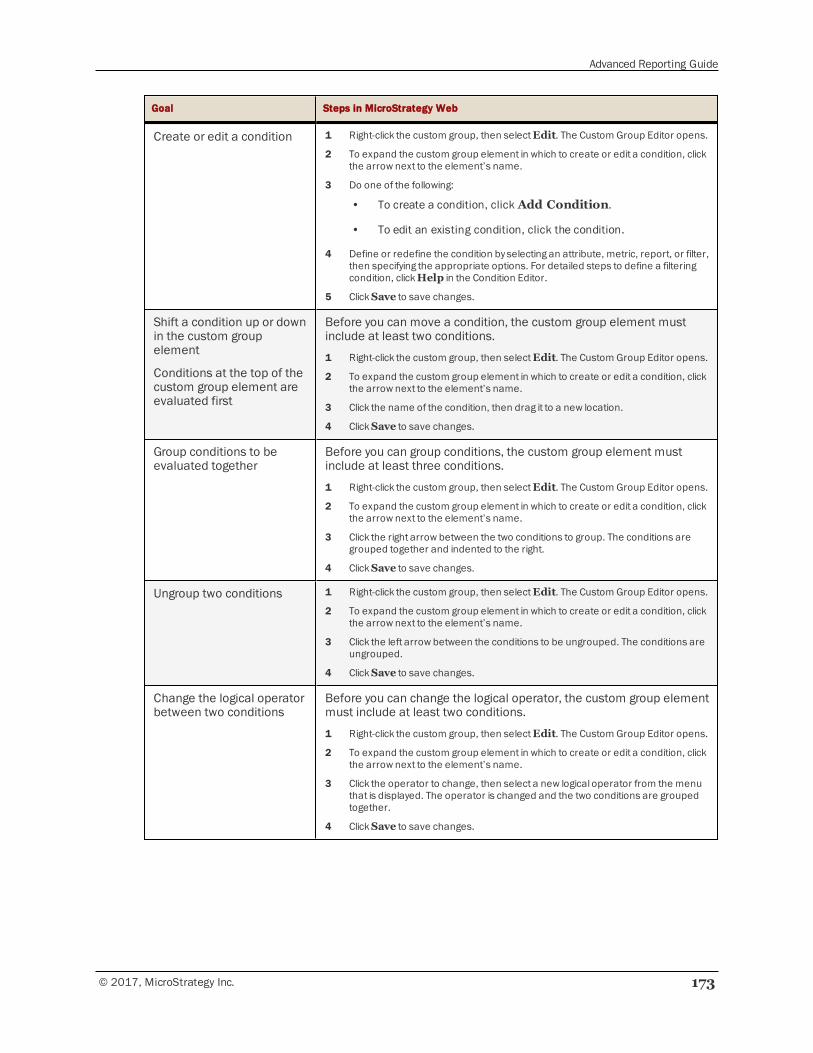
Advanced Reporting Guide
© 2017, MicroStrategy Inc. 173
Goal Steps in MicroStrategy Web
Create or edit a condition 1 Right-click the custom group, then selectEdit. The Custom Group Editor opens.
2 To expand the custom group element in which to create or edit a condition, clickthe arrow next to the element’s name.
3 Do one of the following:
• To create a condition, click Add Condition.
• To edit an existing condition, click the condition.
4 Define or redefine the condition by selecting an attribute, metric, report, or filter,then specifying the appropriate options. For detailed steps to define a filteringcondition, clickHelp in the Condition Editor.
5 ClickSave to save changes.
Shift a condition up or downin the custom groupelement
Conditions at the top of thecustom group element areevaluated first
Before you can move a condition, the custom group element mustinclude at least two conditions.
1 Right-click the custom group, then selectEdit. The Custom Group Editor opens.
2 To expand the custom group element in which to create or edit a condition, clickthe arrow next to the element’s name.
3 Click the name of the condition, then drag it to a new location.
4 ClickSave to save changes.
Group conditions to beevaluated together
Before you can group conditions, the custom group element mustinclude at least three conditions.
1 Right-click the custom group, then selectEdit. The Custom Group Editor opens.
2 To expand the custom group element in which to create or edit a condition, clickthe arrow next to the element’s name.
3 Click the right arrow between the two conditions to group. The conditions aregrouped together and indented to the right.
4 ClickSave to save changes.
Ungroup two conditions 1 Right-click the custom group, then selectEdit. The Custom Group Editor opens.
2 To expand the custom group element in which to create or edit a condition, clickthe arrow next to the element’s name.
3 Click the left arrow between the conditions to be ungrouped. The conditions areungrouped.
4 ClickSave to save changes.
Change the logical operatorbetween two conditions
Before you can change the logical operator, the custom group elementmust include at least two conditions.
1 Right-click the custom group, then selectEdit. The Custom Group Editor opens.
2 To expand the custom group element in which to create or edit a condition, clickthe arrow next to the element’s name.
3 Click the operator to change, then select a new logical operator from the menuthat is displayed. The operator is changed and the two conditions are groupedtogether.
4 ClickSave to save changes.
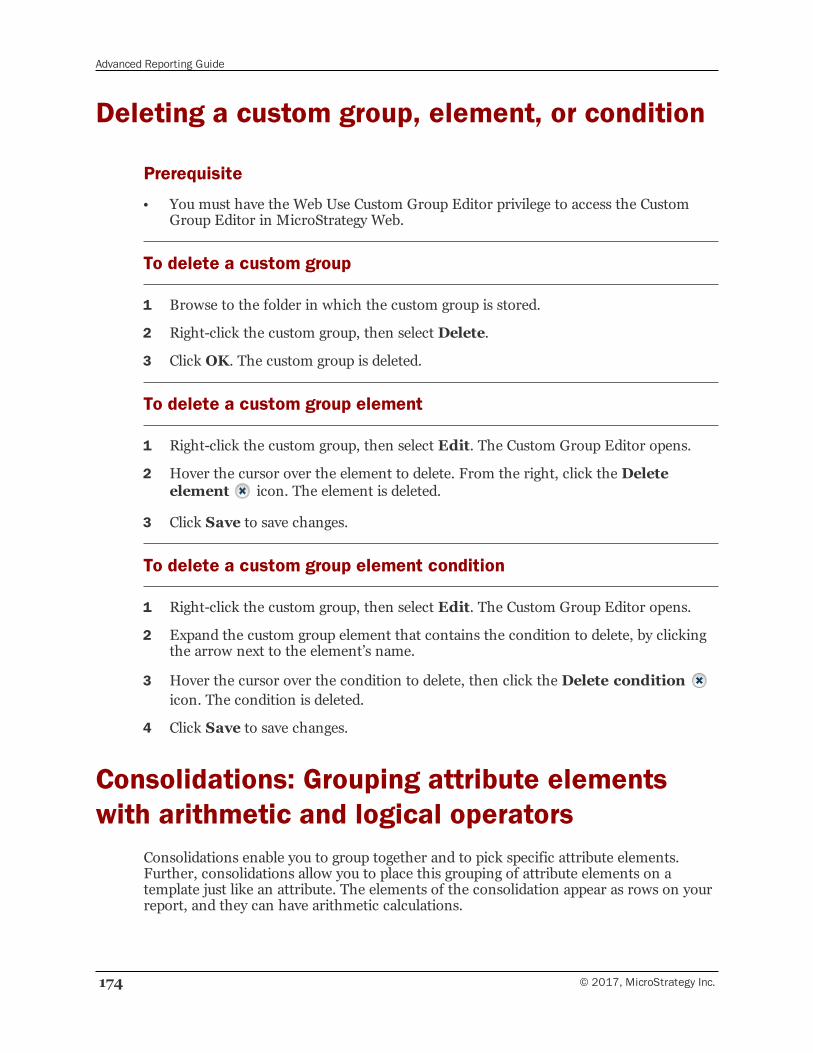
Advanced Reporting Guide
174 © 2017, MicroStrategy Inc.
Deleting a custom group, element, or condition
Prerequisite
• You must have the Web Use Custom Group Editor privilege to access the CustomGroup Editor in MicroStrategy Web.
To delete a custom group
1 Browse to the folder in which the custom group is stored.
2 Right-click the custom group, then select Delete.
3 Click OK. The custom group is deleted.
To delete a custom group element
1 Right-click the custom group, then select Edit. The Custom Group Editor opens.
2 Hover the cursor over the element to delete. From the right, click the Deleteelement icon. The element is deleted.
3 Click Save to save changes.
To delete a custom group element condition
1 Right-click the custom group, then select Edit. The Custom Group Editor opens.
2 Expand the custom group element that contains the condition to delete, by clickingthe arrow next to the element’s name.
3 Hover the cursor over the condition to delete, then click the Delete conditionicon. The condition is deleted.
4 Click Save to save changes.
Consolidations: Grouping attribute elementswith arithmetic and logical operators
Consolidations enable you to group together and to pick specific attribute elements.Further, consolidations allow you to place this grouping of attribute elements on atemplate just like an attribute. The elements of the consolidation appear as rows on yourreport, and they can have arithmetic calculations.
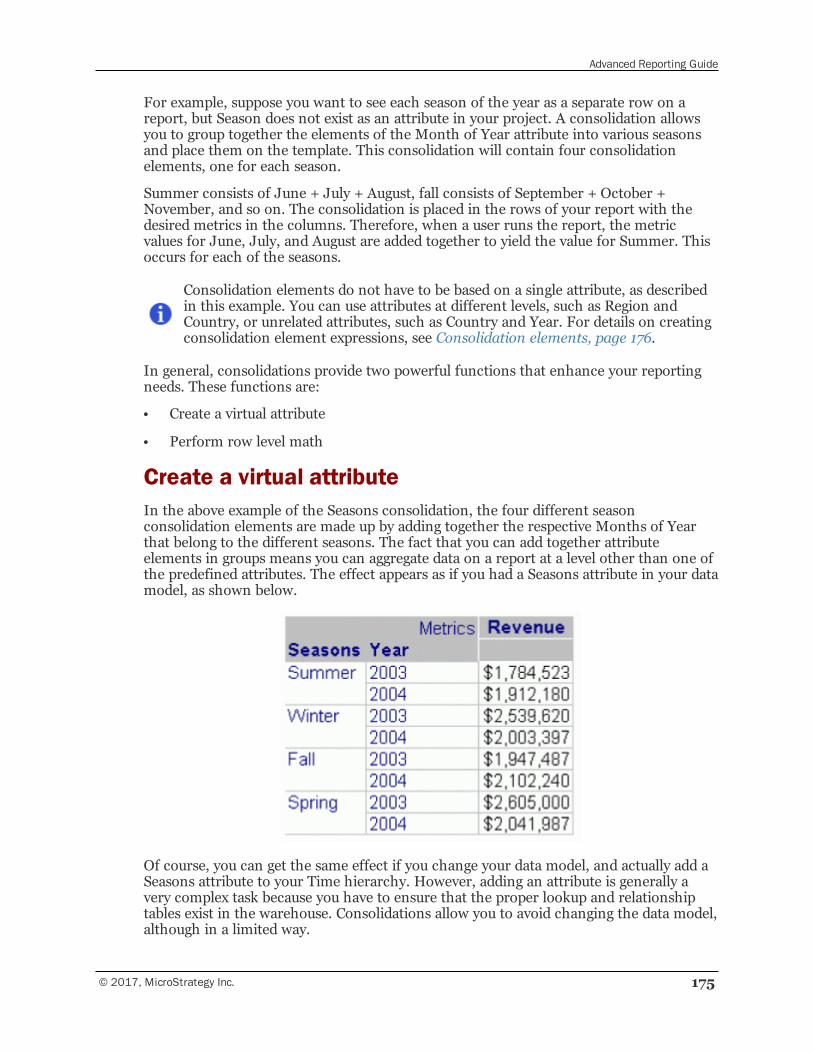
Advanced Reporting Guide
© 2017, MicroStrategy Inc. 175
For example, suppose you want to see each season of the year as a separate row on areport, but Season does not exist as an attribute in your project. A consolidation allowsyou to group together the elements of the Month of Year attribute into various seasonsand place them on the template. This consolidation will contain four consolidationelements, one for each season.
Summer consists of June + July + August, fall consists of September + October +November, and so on. The consolidation is placed in the rows of your report with thedesired metrics in the columns. Therefore, when a user runs the report, the metricvalues for June, July, and August are added together to yield the value for Summer. Thisoccurs for each of the seasons.
Consolidation elements do not have to be based on a single attribute, as describedin this example. You can use attributes at different levels, such as Region andCountry, or unrelated attributes, such as Country and Year. For details on creatingconsolidation element expressions, see Consolidation elements, page 176.
In general, consolidations provide two powerful functions that enhance your reportingneeds. These functions are:
• Create a virtual attribute
• Perform row level math
Create a virtual attributeIn the above example of the Seasons consolidation, the four different seasonconsolidation elements are made up by adding together the respective Months of Yearthat belong to the different seasons. The fact that you can add together attributeelements in groups means you can aggregate data on a report at a level other than one ofthe predefined attributes. The effect appears as if you had a Seasons attribute in your datamodel, as shown below.
Of course, you can get the same effect if you change your data model, and actually add aSeasons attribute to your Time hierarchy. However, adding an attribute is generally avery complex task because you have to ensure that the proper lookup and relationshiptables exist in the warehouse. Consolidations allow you to avoid changing the data model,although in a limited way.
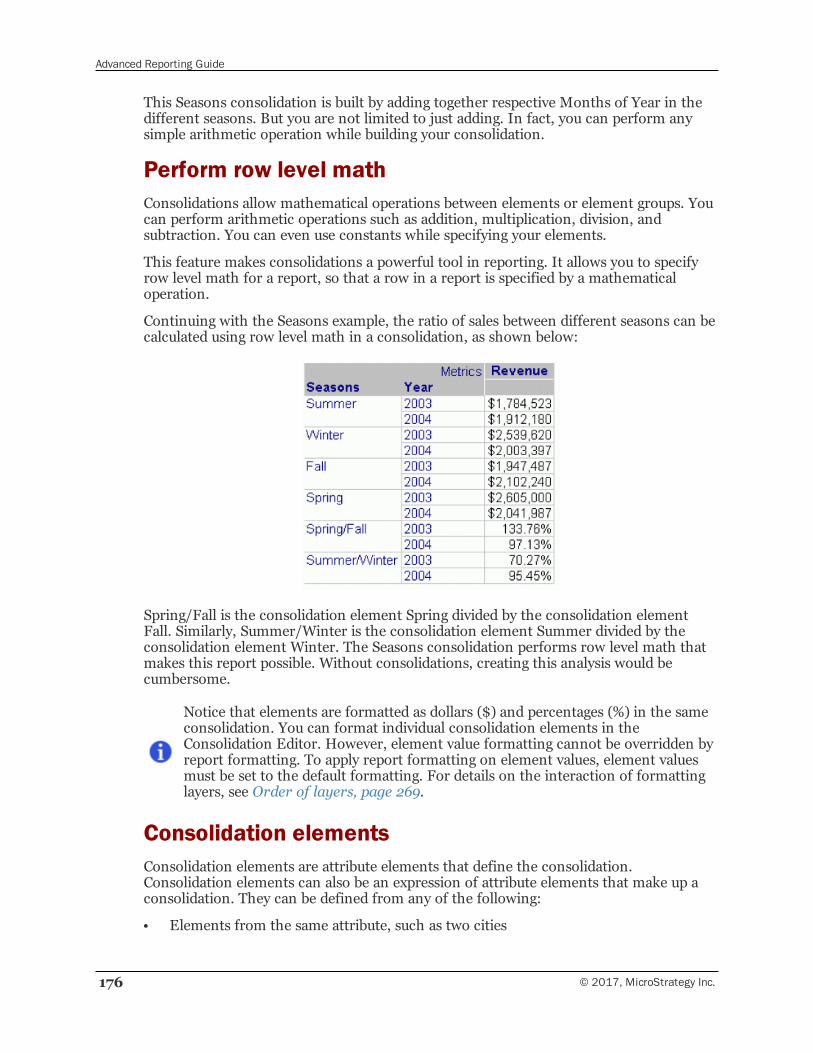
Advanced Reporting Guide
176 © 2017, MicroStrategy Inc.
This Seasons consolidation is built by adding together respective Months of Year in thedifferent seasons. But you are not limited to just adding. In fact, you can perform anysimple arithmetic operation while building your consolidation.
Perform row level mathConsolidations allow mathematical operations between elements or element groups. Youcan perform arithmetic operations such as addition, multiplication, division, andsubtraction. You can even use constants while specifying your elements.
This feature makes consolidations a powerful tool in reporting. It allows you to specifyrow level math for a report, so that a row in a report is specified by a mathematicaloperation.
Continuing with the Seasons example, the ratio of sales between different seasons can becalculated using row level math in a consolidation, as shown below:
Spring/Fall is the consolidation element Spring divided by the consolidation elementFall. Similarly, Summer/Winter is the consolidation element Summer divided by theconsolidation element Winter. The Seasons consolidation performs row level math thatmakes this report possible. Without consolidations, creating this analysis would becumbersome.
Notice that elements are formatted as dollars ($) and percentages (%) in the sameconsolidation. You can format individual consolidation elements in theConsolidation Editor. However, element value formatting cannot be overridden byreport formatting. To apply report formatting on element values, element valuesmust be set to the default formatting. For details on the interaction of formattinglayers, see Order of layers, page 269.
Consolidation elementsConsolidation elements are attribute elements that define the consolidation.Consolidation elements can also be an expression of attribute elements that make up aconsolidation. They can be defined from any of the following:
• Elements from the same attribute, such as two cities
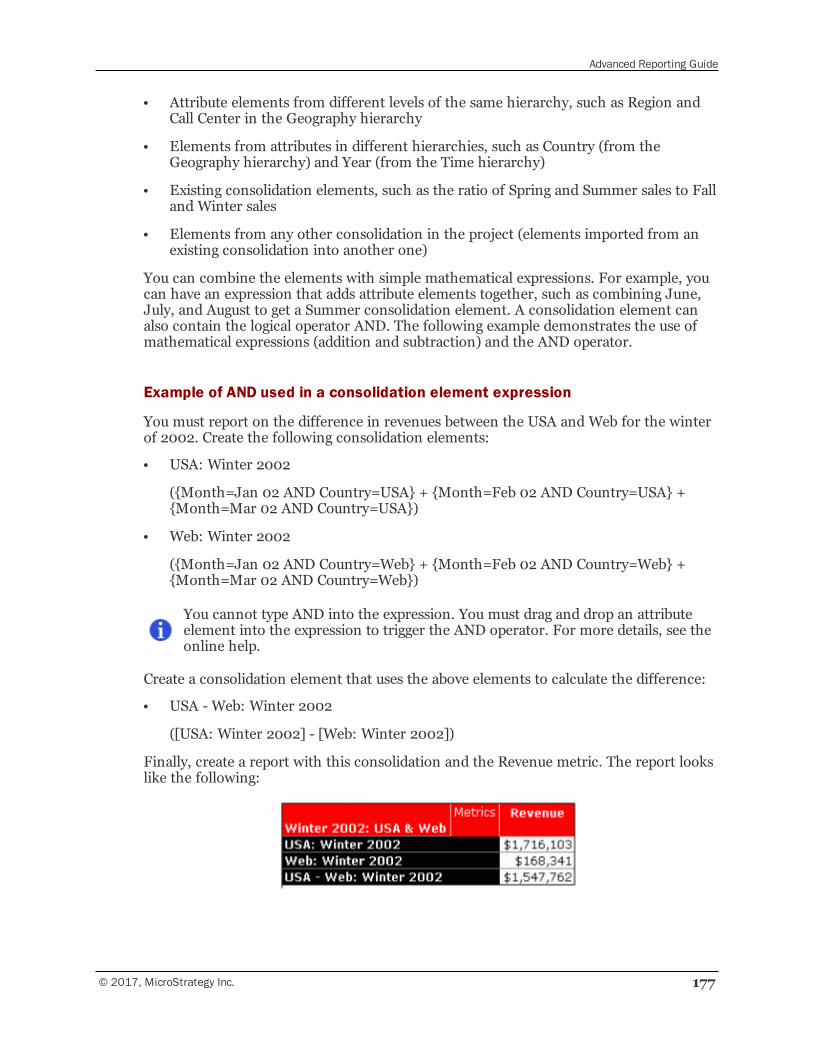
Advanced Reporting Guide
© 2017, MicroStrategy Inc. 177
• Attribute elements from different levels of the same hierarchy, such as Region andCall Center in the Geography hierarchy
• Elements from attributes in different hierarchies, such as Country (from theGeography hierarchy) and Year (from the Time hierarchy)
• Existing consolidation elements, such as the ratio of Spring and Summer sales to Falland Winter sales
• Elements from any other consolidation in the project (elements imported from anexisting consolidation into another one)
You can combine the elements with simple mathematical expressions. For example, youcan have an expression that adds attribute elements together, such as combining June,July, and August to get a Summer consolidation element. A consolidation element canalso contain the logical operator AND. The following example demonstrates the use ofmathematical expressions (addition and subtraction) and the AND operator.
Example of AND used in a consolidation element expression
You must report on the difference in revenues between the USA and Web for the winterof 2002. Create the following consolidation elements:
• USA: Winter 2002
({Month=Jan 02 AND Country=USA} + {Month=Feb 02 AND Country=USA} +{Month=Mar 02 AND Country=USA})
• Web: Winter 2002
({Month=Jan 02 AND Country=Web} + {Month=Feb 02 AND Country=Web} +{Month=Mar 02 AND Country=Web})
You cannot type AND into the expression. You must drag and drop an attributeelement into the expression to trigger the AND operator. For more details, see theonline help.
Create a consolidation element that uses the above elements to calculate the difference:
• USA - Web: Winter 2002
([USA: Winter 2002] - [Web: Winter 2002])
Finally, create a report with this consolidation and the Revenue metric. The report lookslike the following:
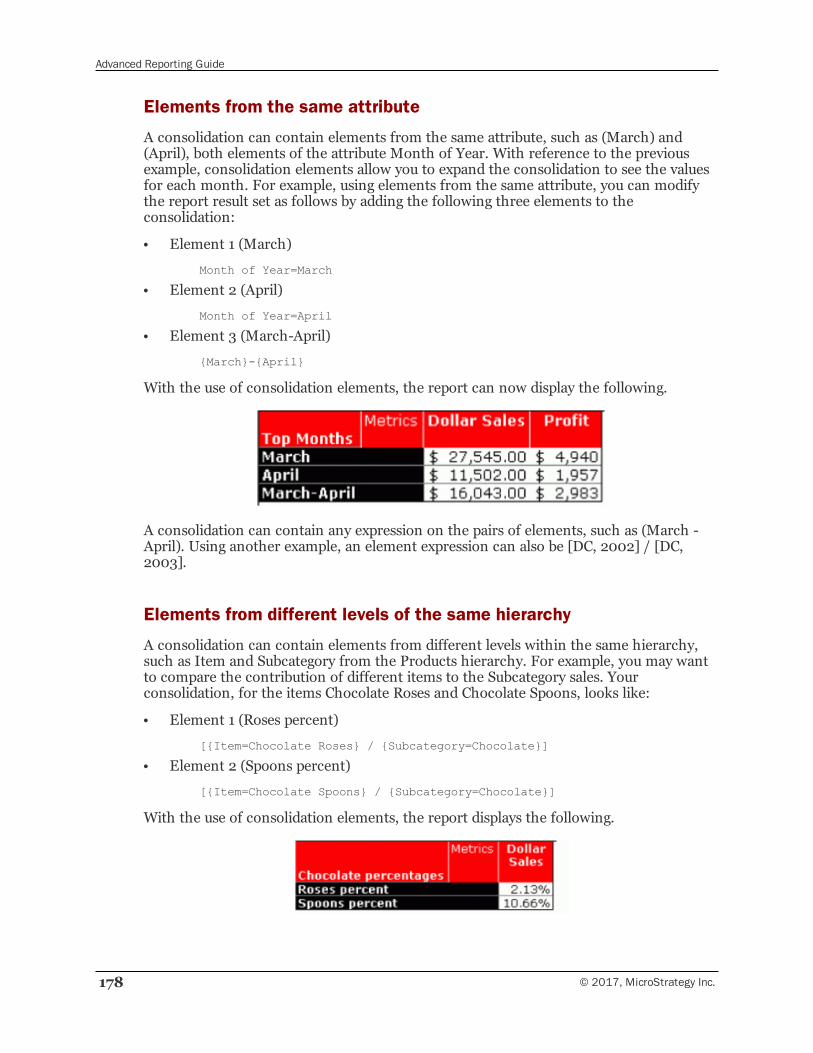
Advanced Reporting Guide
178 © 2017, MicroStrategy Inc.
Elements from the same attribute
A consolidation can contain elements from the same attribute, such as (March) and(April), both elements of the attribute Month of Year. With reference to the previousexample, consolidation elements allow you to expand the consolidation to see the valuesfor each month. For example, using elements from the same attribute, you can modifythe report result set as follows by adding the following three elements to theconsolidation:
• Element 1 (March)
Month of Year=March
• Element 2 (April)
Month of Year=April
• Element 3 (March-April)
{March}-{April}
With the use of consolidation elements, the report can now display the following.
A consolidation can contain any expression on the pairs of elements, such as (March -April). Using another example, an element expression can also be [DC, 2002] / [DC,2003].
Elements from different levels of the same hierarchy
A consolidation can contain elements from different levels within the same hierarchy,such as Item and Subcategory from the Products hierarchy. For example, you may wantto compare the contribution of different items to the Subcategory sales. Yourconsolidation, for the items Chocolate Roses and Chocolate Spoons, looks like:
• Element 1 (Roses percent)
[{Item=Chocolate Roses} / {Subcategory=Chocolate}]
• Element 2 (Spoons percent)
[{Item=Chocolate Spoons} / {Subcategory=Chocolate}]
With the use of consolidation elements, the report displays the following.
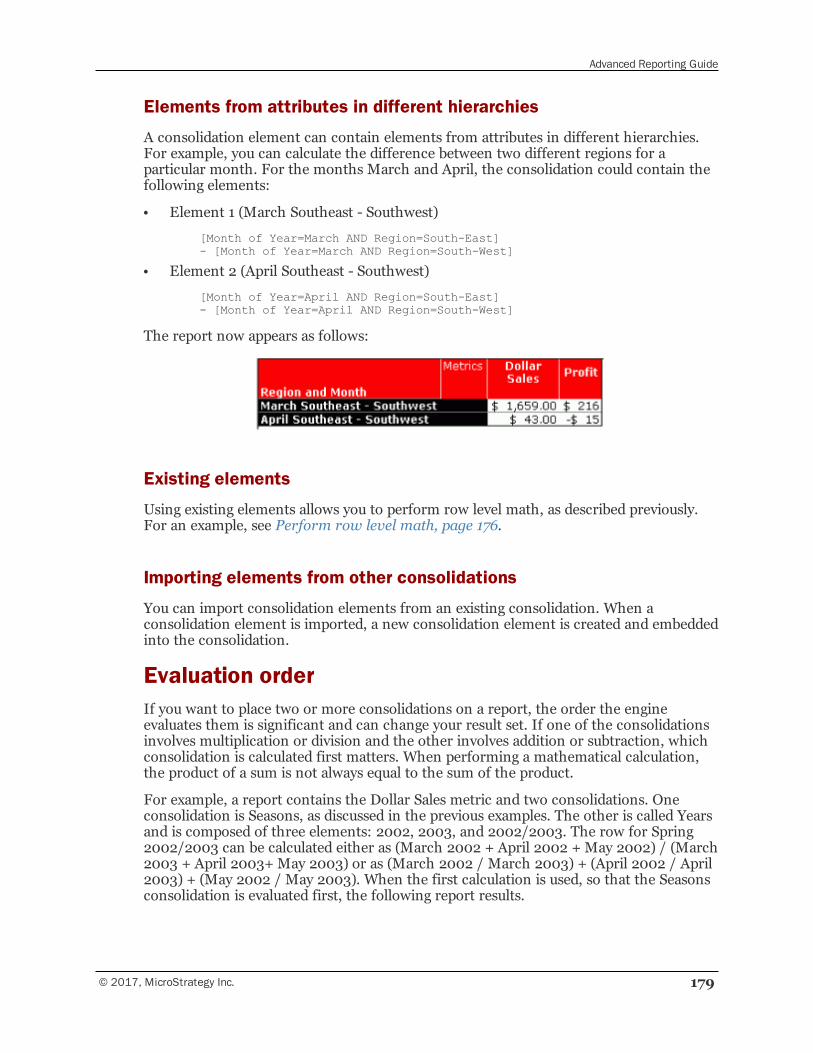
Advanced Reporting Guide
© 2017, MicroStrategy Inc. 179
Elements from attributes in different hierarchies
A consolidation element can contain elements from attributes in different hierarchies.For example, you can calculate the difference between two different regions for aparticular month. For the months March and April, the consolidation could contain thefollowing elements:
• Element 1 (March Southeast - Southwest)
[Month of Year=March AND Region=South-East]- [Month of Year=March AND Region=South-West]
• Element 2 (April Southeast - Southwest)
[Month of Year=April AND Region=South-East]- [Month of Year=April AND Region=South-West]
The report now appears as follows:
Existing elements
Using existing elements allows you to perform row level math, as described previously.For an example, see Perform row level math, page 176.
Importing elements from other consolidations
You can import consolidation elements from an existing consolidation. When aconsolidation element is imported, a new consolidation element is created and embeddedinto the consolidation.
Evaluation orderIf you want to place two or more consolidations on a report, the order the engineevaluates them is significant and can change your result set. If one of the consolidationsinvolves multiplication or division and the other involves addition or subtraction, whichconsolidation is calculated first matters. When performing a mathematical calculation,the product of a sum is not always equal to the sum of the product.
For example, a report contains the Dollar Sales metric and two consolidations. Oneconsolidation is Seasons, as discussed in the previous examples. The other is called Yearsand is composed of three elements: 2002, 2003, and 2002/2003. The row for Spring2002/2003 can be calculated either as (March 2002 + April 2002 + May 2002) / (March2003 + April 2003+ May 2003) or as (March 2002 / March 2003) + (April 2002 / April2003) + (May 2002 / May 2003). When the first calculation is used, so that the Seasonsconsolidation is evaluated first, the following report results.
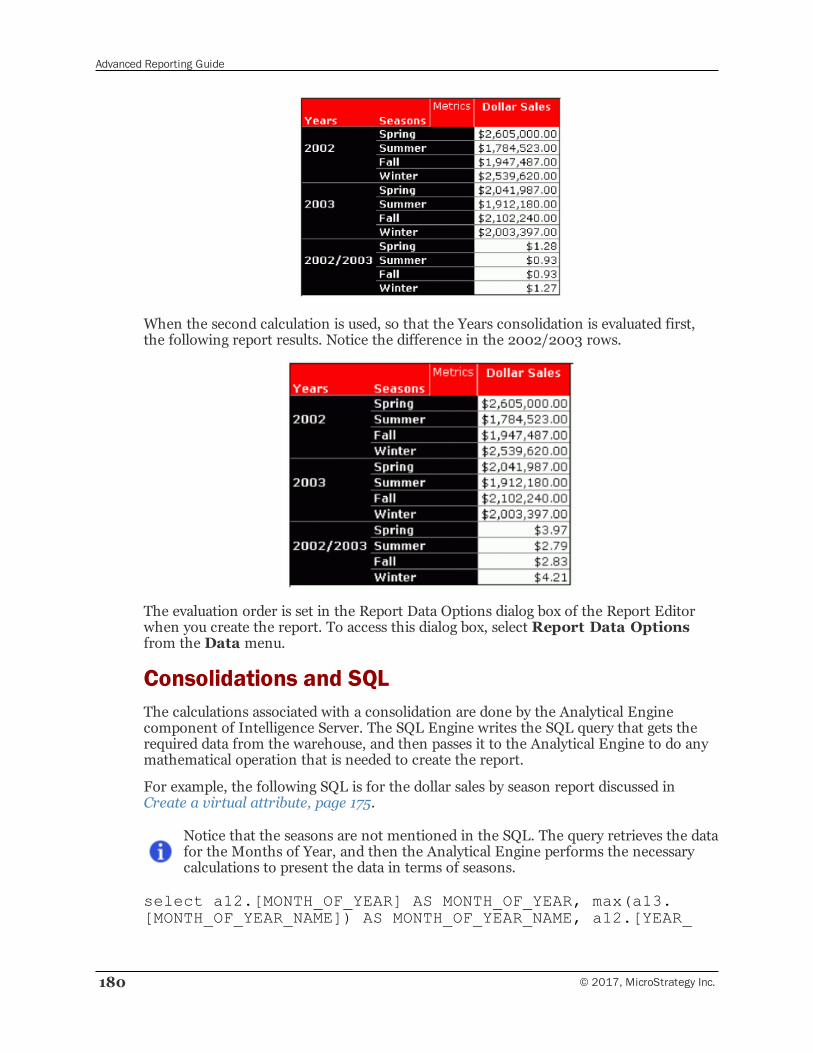
Advanced Reporting Guide
180 © 2017, MicroStrategy Inc.
When the second calculation is used, so that the Years consolidation is evaluated first,the following report results. Notice the difference in the 2002/2003 rows.
The evaluation order is set in the Report Data Options dialog box of the Report Editorwhen you create the report. To access this dialog box, select Report Data Optionsfrom the Data menu.
Consolidations and SQLThe calculations associated with a consolidation are done by the Analytical Enginecomponent of Intelligence Server. The SQL Engine writes the SQL query that gets therequired data from the warehouse, and then passes it to the Analytical Engine to do anymathematical operation that is needed to create the report.
For example, the following SQL is for the dollar sales by season report discussed inCreate a virtual attribute, page 175.
Notice that the seasons are not mentioned in the SQL. The query retrieves the datafor the Months of Year, and then the Analytical Engine performs the necessarycalculations to present the data in terms of seasons.
select a12.[MONTH_OF_YEAR] AS MONTH_OF_YEAR, max(a13.[MONTH_OF_YEAR_NAME]) AS MONTH_OF_YEAR_NAME, a12.[YEAR_
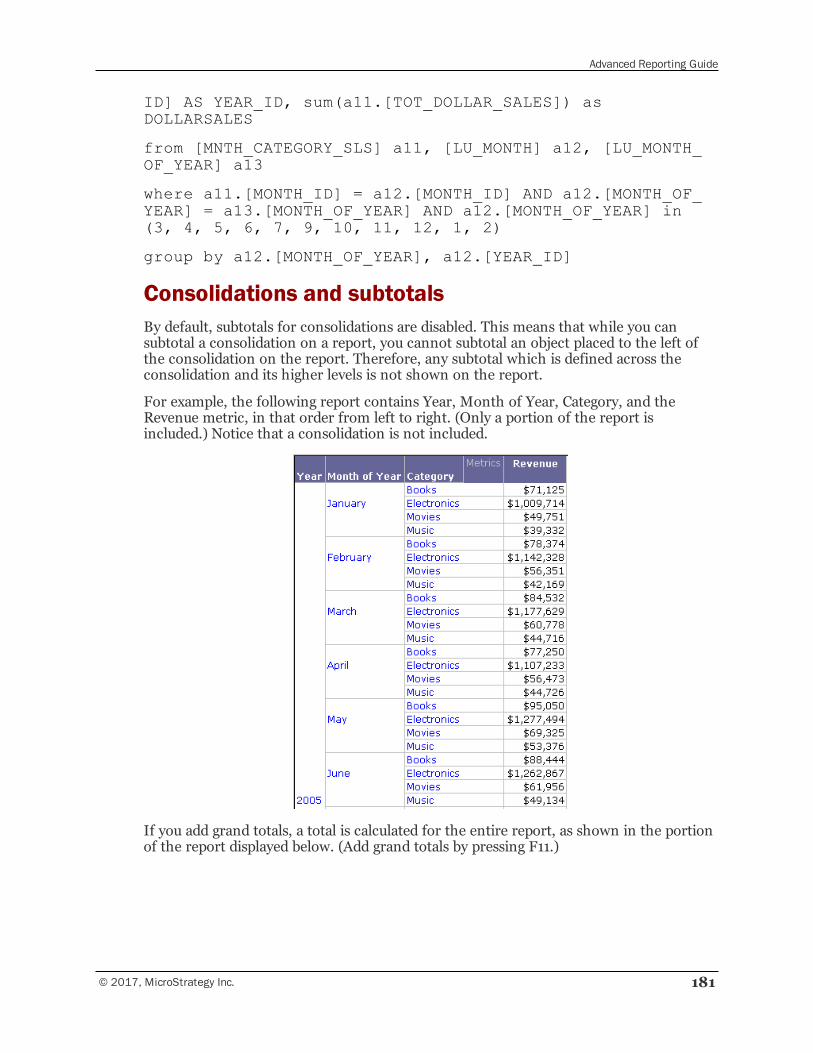
Advanced Reporting Guide
© 2017, MicroStrategy Inc. 181
ID] AS YEAR_ID, sum(a11.[TOT_DOLLAR_SALES]) asDOLLARSALES
from [MNTH_CATEGORY_SLS] a11, [LU_MONTH] a12, [LU_MONTH_OF_YEAR] a13
where a11.[MONTH_ID] = a12.[MONTH_ID] AND a12.[MONTH_OF_YEAR] = a13.[MONTH_OF_YEAR] AND a12.[MONTH_OF_YEAR] in(3, 4, 5, 6, 7, 9, 10, 11, 12, 1, 2)
group by a12.[MONTH_OF_YEAR], a12.[YEAR_ID]
Consolidations and subtotalsBy default, subtotals for consolidations are disabled. This means that while you cansubtotal a consolidation on a report, you cannot subtotal an object placed to the left ofthe consolidation on the report. Therefore, any subtotal which is defined across theconsolidation and its higher levels is not shown on the report.
For example, the following report contains Year, Month of Year, Category, and theRevenue metric, in that order from left to right. (Only a portion of the report isincluded.) Notice that a consolidation is not included.
If you add grand totals, a total is calculated for the entire report, as shown in the portionof the report displayed below. (Add grand totals by pressing F11.)
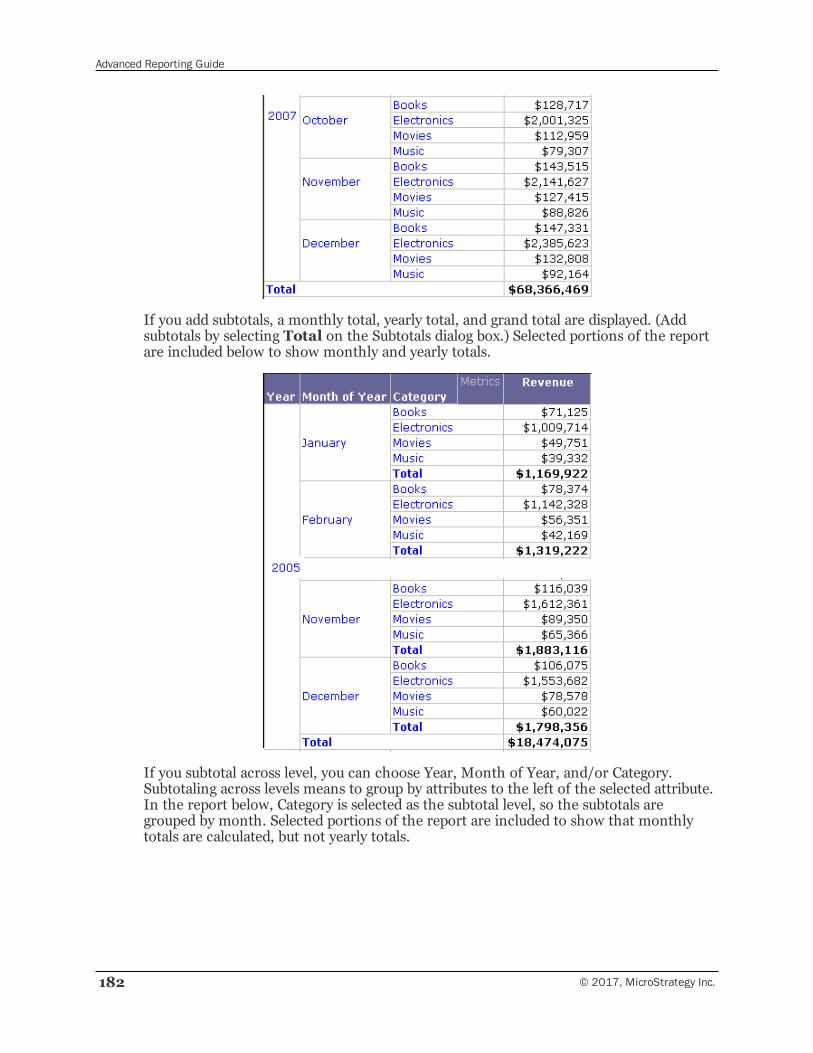
Advanced Reporting Guide
182 © 2017, MicroStrategy Inc.
If you add subtotals, a monthly total, yearly total, and grand total are displayed. (Addsubtotals by selecting Total on the Subtotals dialog box.) Selected portions of the reportare included below to show monthly and yearly totals.
If you subtotal across level, you can choose Year, Month of Year, and/or Category.Subtotaling across levels means to group by attributes to the left of the selected attribute.In the report below, Category is selected as the subtotal level, so the subtotals aregrouped by month. Selected portions of the report are included to show that monthlytotals are calculated, but not yearly totals.
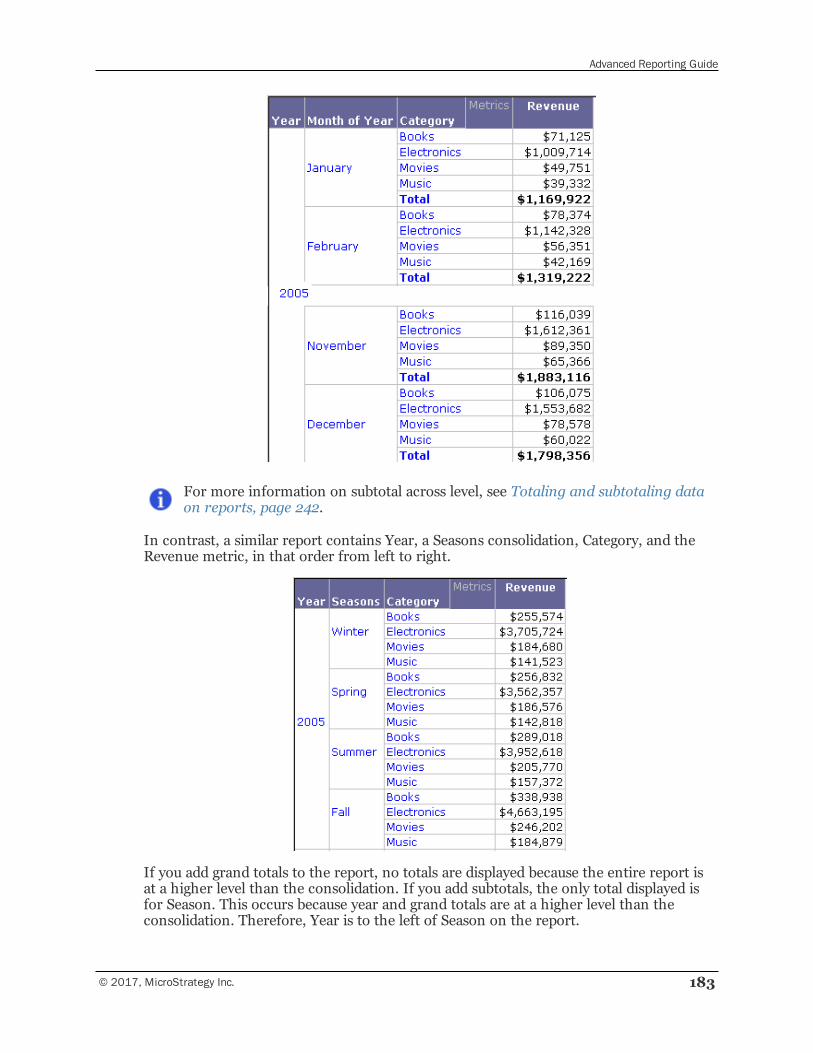
Advanced Reporting Guide
© 2017, MicroStrategy Inc. 183
For more information on subtotal across level, see Totaling and subtotaling dataon reports, page 242.
In contrast, a similar report contains Year, a Seasons consolidation, Category, and theRevenue metric, in that order from left to right.
If you add grand totals to the report, no totals are displayed because the entire report isat a higher level than the consolidation. If you add subtotals, the only total displayed isfor Season. This occurs because year and grand totals are at a higher level than theconsolidation. Therefore, Year is to the left of Season on the report.
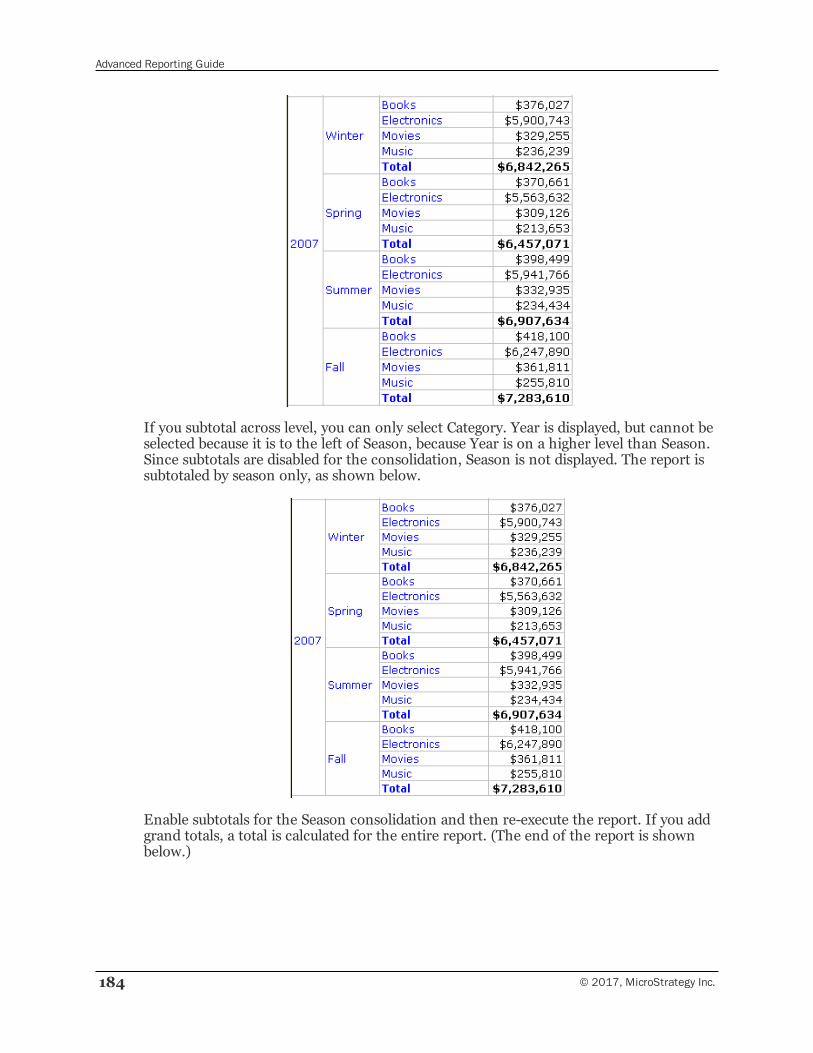
Advanced Reporting Guide
184 © 2017, MicroStrategy Inc.
If you subtotal across level, you can only select Category. Year is displayed, but cannot beselected because it is to the left of Season, because Year is on a higher level than Season.Since subtotals are disabled for the consolidation, Season is not displayed. The report issubtotaled by season only, as shown below.
Enable subtotals for the Season consolidation and then re-execute the report. If you addgrand totals, a total is calculated for the entire report. (The end of the report is shownbelow.)
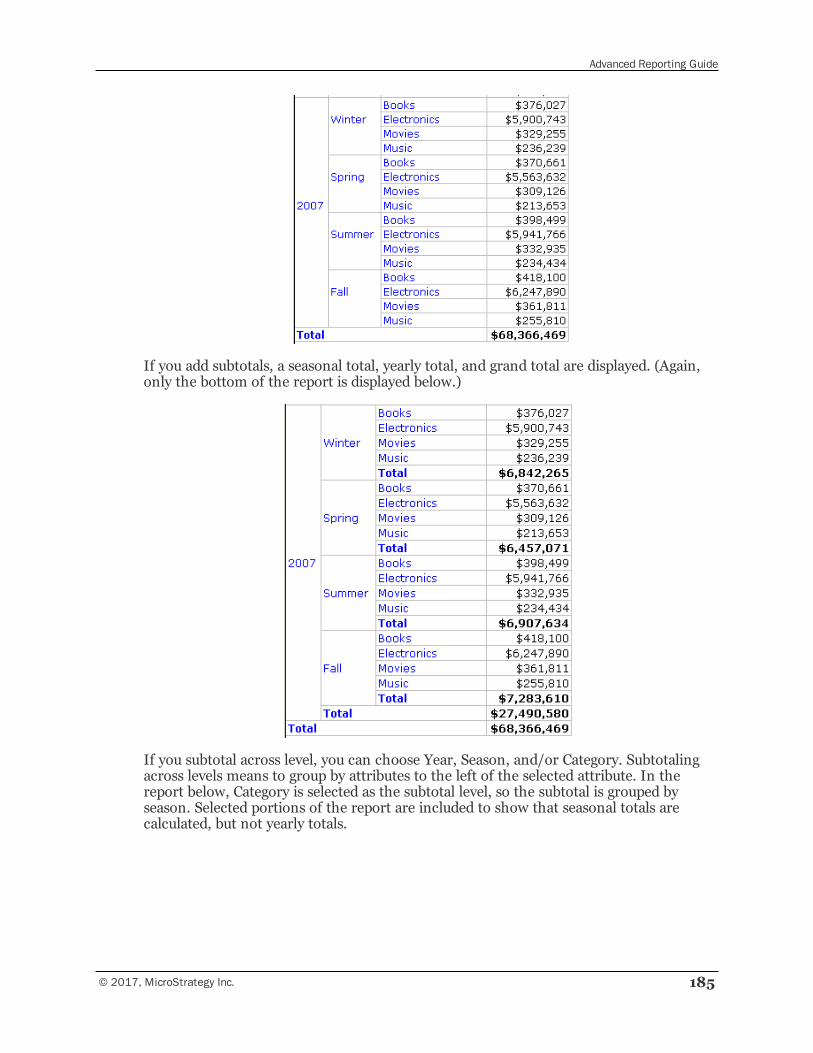
Advanced Reporting Guide
© 2017, MicroStrategy Inc. 185
If you add subtotals, a seasonal total, yearly total, and grand total are displayed. (Again,only the bottom of the report is displayed below.)
If you subtotal across level, you can choose Year, Season, and/or Category. Subtotalingacross levels means to group by attributes to the left of the selected attribute. In thereport below, Category is selected as the subtotal level, so the subtotal is grouped byseason. Selected portions of the report are included to show that seasonal totals arecalculated, but not yearly totals.
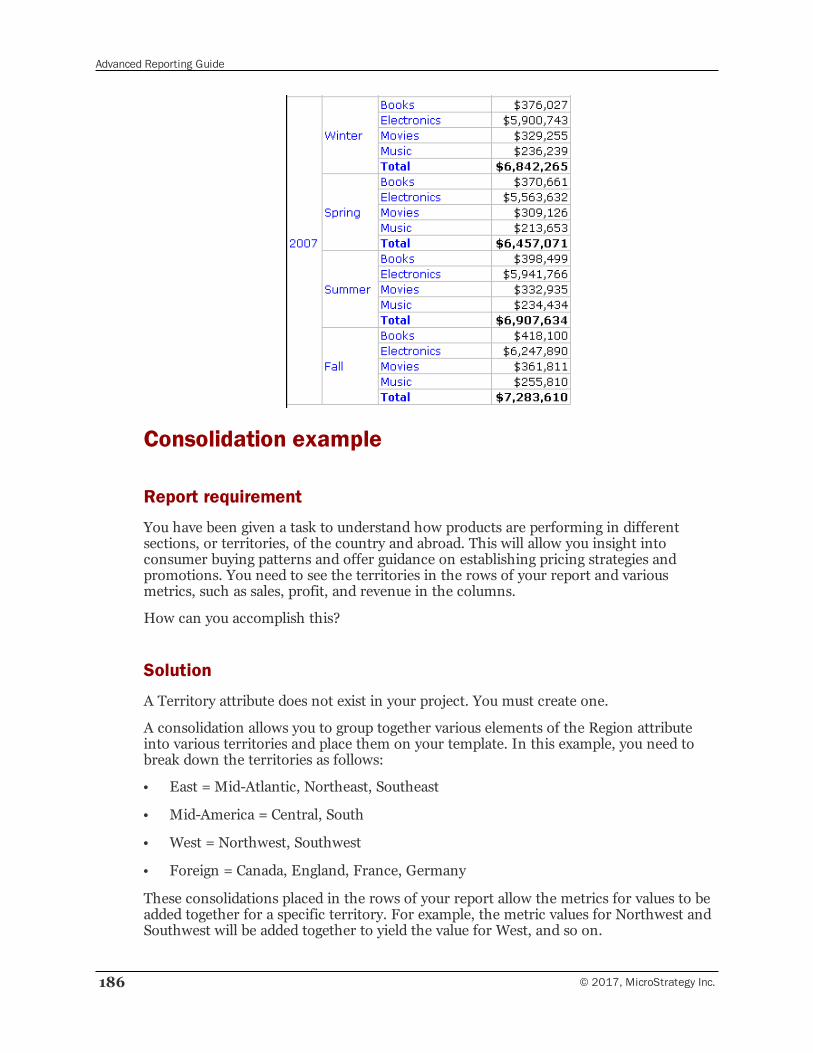
Advanced Reporting Guide
186 © 2017, MicroStrategy Inc.
Consolidation example
Report requirement
You have been given a task to understand how products are performing in differentsections, or territories, of the country and abroad. This will allow you insight intoconsumer buying patterns and offer guidance on establishing pricing strategies andpromotions. You need to see the territories in the rows of your report and variousmetrics, such as sales, profit, and revenue in the columns.
How can you accomplish this?
Solution
A Territory attribute does not exist in your project. You must create one.
A consolidation allows you to group together various elements of the Region attributeinto various territories and place them on your template. In this example, you need tobreak down the territories as follows:
• East = Mid-Atlantic, Northeast, Southeast
• Mid-America = Central, South
• West = Northwest, Southwest
• Foreign = Canada, England, France, Germany
These consolidations placed in the rows of your report allow the metrics for values to beadded together for a specific territory. For example, the metric values for Northwest andSouthwest will be added together to yield the value for West, and so on.
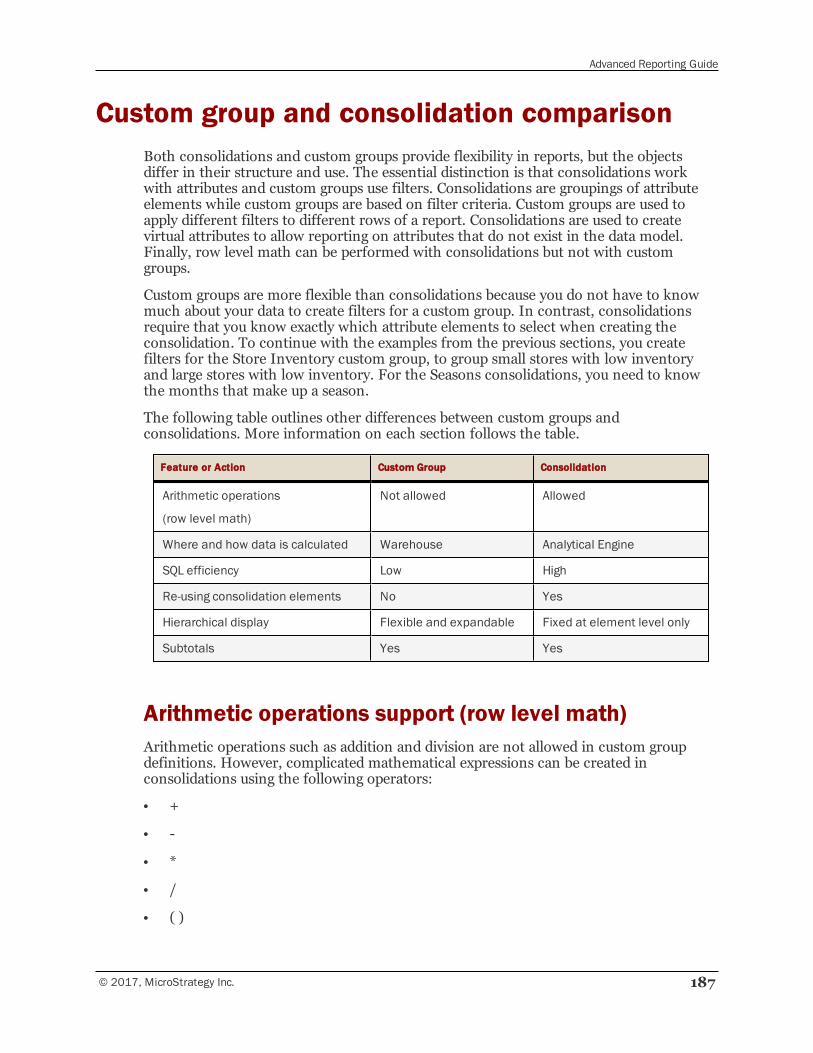
Advanced Reporting Guide
© 2017, MicroStrategy Inc. 187
Custom group and consolidation comparisonBoth consolidations and custom groups provide flexibility in reports, but the objectsdiffer in their structure and use. The essential distinction is that consolidations workwith attributes and custom groups use filters. Consolidations are groupings of attributeelements while custom groups are based on filter criteria. Custom groups are used toapply different filters to different rows of a report. Consolidations are used to createvirtual attributes to allow reporting on attributes that do not exist in the data model.Finally, row level math can be performed with consolidations but not with customgroups.
Custom groups are more flexible than consolidations because you do not have to knowmuch about your data to create filters for a custom group. In contrast, consolidationsrequire that you know exactly which attribute elements to select when creating theconsolidation. To continue with the examples from the previous sections, you createfilters for the Store Inventory custom group, to group small stores with low inventoryand large stores with low inventory. For the Seasons consolidations, you need to knowthe months that make up a season.
The following table outlines other differences between custom groups andconsolidations. More information on each section follows the table.
Feature or Action Custom Group Consolidation
Arithmetic operations
(row level math)
Not allowed Allowed
Where and how data is calculated Warehouse Analytical Engine
SQL efficiency Low High
Re-using consolidation elements No Yes
Hierarchical display Flexible and expandable Fixed at element level only
Subtotals Yes Yes
Arithmetic operations support (row level math)Arithmetic operations such as addition and division are not allowed in custom groupdefinitions. However, complicated mathematical expressions can be created inconsolidations using the following operators:
• +
• -
• *
• /
• ( )
Advanced Reporting Guide
188 © 2017, MicroStrategy Inc.
This means that row level math, or mathematical operations between elements, can beperformed in consolidations but not in custom groups. Row level math is a powerful toolin reporting, since it allows rows to be specified by mathematical operations.
Where and how data is calculatedAlthough the Analytical Engine might be needed to resolve banding in a custom group,the final stage of calculation is always in the data warehouse. For consolidations, allnecessary data is retrieved from the data warehouse and then the consolidations arecreated in the Analytical Engine. Therefore, consolidations can be assigned an evaluationorder to provide more and varied analyses. For more information on evaluation order,refer to Evaluation order, page 179.
SQL efficiencyFor each custom group element, there is at least one SQL pass. When the custom groupelement is expanded in the Custom Group Editor, up to three SQL passes must be madefor each custom group element.
Since the Query Engine uses a smart algorithm to combine consolidation elements anddetermine the minimal number of SQL passes, only one SQL pass may be needed for allthe consolidation elements.
Re-using consolidation elementsYou cannot use existing custom group elements to build a new custom group element.You must always build a custom group from attributes. In contrast, you can build newconsolidation elements based on existing consolidation elements, which is also calledrecursive definition.
Hierarchical display supportEach custom group element can be viewed as a set of smaller grouping elements, whichcan be repeatedly broken down until the actual items are reached. This functionality,along with the four different display modes, provides flexibility and deeper analysis. Formore information on viewing custom groups in a hierarchical structure, see Customgroup structure on reports, page 161.
Consolidations are displayed only at the element level; you cannot expand the elements.
Subtotal supportCustom groups act like attributes when subtotals are included.
By default, subtotals for consolidations are disabled. This means that while you cansubtotal a consolidation on a report, you cannot subtotal an object placed to the left ofthe consolidation on the report. Any subtotal which is defined across the consolidationand its higher levels is not shown on the report. For more information on consolidationsand subtotals, see Consolidations and subtotals, page 181.
5Drill MapsCustomizing Drill Paths
Drill maps allow you to create fully customized drill paths that are available to your userswhile drilling on a report. By default, the paths available are based on the systemhierarchy of the project. You can create custom drill maps that can override thesedefaults.
The following topics describe how a drill map works, how to create a drill map, and howit can affect what you see when drilling on a report:
• What is drilling?, page 189
• Creating custom drill maps and paths, page 191
• Drill map association: Objects containing the drill map, page 199
What is drilling?After executing a report in a MicroStrategy reporting environment, a user may need toexecute another report based on the original report to get more detailed or supplementalinformation. For example, after looking at annual sales of a certain city, she may want tolook at the monthly sales for the same city. Alternatively, after noticing that a certainitem had a very high profit margin, she may want to see if that is also true for the entirecategory of that item. Such actions where a user creates a related report based on anexisting report are referred to as drilling.
Even though a report generated as a result of drilling is related to the original report,they are, in essence, two entirely different reports. This means that the two reports canbe saved or changed independent of each other. The two reports are different eitherbecause they have different templates, different filters, or both.
To drill on a report, a user can right-click an object on the report and then select thedirection and destination. However, he is restricted by any settings assigned to theobject's drill map. To override the default settings for filters and parent, page-by,threshold, and subtotal display on the drilled-to report, a user can drill using the Drilldialog box, which is accessed from the Drill option on the Data menu. For drilling
© 2017, MicroStrategy Inc. 189

Advanced Reporting Guide
190 © 2017, MicroStrategy Inc.
steps, see theMicroStrategy Developer help. For details and examples of these settings,see Drill path settings, page 193.
Drill maps and drill pathsDrill maps determine the options available to an end user when drilling on a report.When a user right-clicks an object on a report and chooses the drill option, he isdisplaying drill maps.
When the drill hierarchies are created, a default drill map is created. If no drillhierarchies are created, the system hierarchy is used to create the default drill map. Thedrill map determines what options are available to users when they drill on a reportobject. These different options are referred to as drill paths, which include thedestination of the drill. The destination can be an attribute, a consolidation, a hierarchy,or a template.
All projects must have a default drill map; you cannot delete it unless you firstspecify a new default drill map. The default project drill map is specified in theProject Configuration Editor.
If you try to delete the only default drill map for a project, a message indicates thatother objects depend on it. When you search for dependent objects, none are found.The dependent object is the project itself.
In summary, a drill map determines what drill paths are available while drilling from areport object. By default, the drill paths available to a report object reflect exactly the drillhierarchies of the project.
Default drill paths: System hierarchy drill pathsBefore customizing drilling options you need to understand how the default drill pathswork.
An end user can drill from any object on a report, other than a simple metric. Forexample, drilling down from an attribute or a hierarchy allows a user to access otherchild attributes in the same hierarchy. Drilling from a consolidation allows access to theattributes that make up the consolidation. Note that by default in these types, drillingchanges a report by navigating through the drill hierarchies and selecting anotherattribute to view. The original object is replaced with the one drilled to. Drilling on acompound metric allows a user to view the metrics that compose it.
Filters and drillingHow a report’s filter is changed while drilling depends on what part of the original reportis selected when the drill is performed. By default, if an attribute element on the originalreport is selected while drilling, then that attribute element is added to the new filtercreated for the drill. The filter from the original report (the drilled-from report) is carriedover as well.
For example, a report lists revenue by state and contains a filter for the Electronicscategory. A user selects Virginia when he drills to Store. The resulting report containsElectronics revenue for Virginia stores only.
Advanced Reporting Guide
© 2017, MicroStrategy Inc. 191
You can change this default behavior for a drill path in the Drill Map Editor and for areport in Report Data Options. For descriptions of the drill path settings that affectfiltering, see Drill path settings, page 193.
The right-click menu provides two ways to drill:
• If a user right-clicks a header, a filter is not added to the drill.
• If a user right-clicks an attribute element, the filter is used.
Creating custom drill maps and pathsYou can override the default drill map by creating your own custom drill maps and paths.Once you begin customizing a drill map for an object, none of the drill paths of thesystem hierarchy are available for drilling on that object. For example, before you createa drill map for the attribute Region, the default drill map is the system hierarchy, whichallows drilling up to Country and down to Call Center. You create a drill map and add adrill path down to Employee. A user cannot drill to Country or Call Center from Regionunless you add these attributes to the new drill map as well.
To create a custom drill path, use the Drill Map Editor to select a destination and drillpath type, and define the options, as described in the following sections:
• The destination of the drill, page 191
• Drill path types: Drilling up, down, across, or to a template, page 192
• Drill path settings, page 193
▫ Drill path settings, page 193
▫ Drill path settings, page 193
▫ Drill path settings, page 193
▫ Drill path settings, page 193
▫ Drill path settings, page 193
You can:
• Create a new drill map as a stand-alone object, which allows you to associate multipleobjects with the same drill map. To do this, access the Drill Map Editor directly.From the MicroStrategy Developer, choose New, and then select Drill Map.
• Create or edit a drill map for a particular object, access the Drill Map Editor fromthat object. You can access it from an attribute, custom group, consolidation,template, or report. For steps, see theMicroStrategy Developer help.
The destination of the drillThe destination is the object which a user will drill to in the report. This can be any ofthe following:
• Attribute
Advanced Reporting Guide
192 © 2017, MicroStrategy Inc.
• Consolidation
• Hierarchy
• Template
Every time that a user selects a template drill path, a new report with the selectedtemplate is generated.
If the drill path is set to a template, every time you use this drill path a new reportwith the selected template is generated.
• Another drill map
Use this as a shortcut to the drill paths of the selected drill map.
If drill map is not displayed as an drill path destination, select View Drill MapPath List from the View menu.
You can create multiple destinations for each drill path type, and you can create multipledrill paths in each drill map.
Drill path types: Drilling up, down, across, or to atemplateA drill path can be one of the following types:
• Up—The destination can be any attribute, consolidation, custom group, orhierarchy, and does not have to be related to the original object. The destination isshown as part of the Drill Up menu when a user right-clicks and selectsDrill inthe report.
• Down—This is similar to Up, except that the destination is shown as part of theDrill Down menu when a user right-clicks and selectsDrill.
• Across—This is also similar to Up, except that the destination is shown as part ofthe Other Directions menu when a user right-clicks and selectsDrill.
• Template—This allows you to replace the template of the original report templatewith a completely different destination template. Select the template to use as thedestination template.
• Drill Map—Use this as a shortcut to the drill paths of another drill map, byselecting an existing drill map to use as the destination. You cannot select anattribute, consolidation, custom group, or hierarchy as the destination.
▫ The destinations of those drill paths are displayed along with the destinationsthat you have created. For example, you select a drill map that drills up to Brand.You already have a drill path up to Subcategory. When a user selectsDrill andUp, both Brand and Subcategory are displayed.
If you select a drill map or hierarchy as the destination, you cannot define anysettings, such as priority or page by display, for the drill path.
Advanced Reporting Guide
© 2017, MicroStrategy Inc. 193
Drill path settingsThe settings for a drill path are described in the following sections:
• Drill path display name, description, and set, page 193
• Drill priority, page 193
• Filter interaction options, page 194
• Keeping or removing the page by and base template, page 197
• Displaying the drilled-on object and thresholds, page 198
• Specifying the display mode and VLDB properties, page 199
If a drill map or hierarchy is the destination of a drill path, you cannot define anyoptions for that drill path.
The drill path settings available in the Drill Map Editor can be overwritten either:
• At the report level (see the Answering Questions about Data chapter in the BasicReporting Guide or theMicroStrategy Developer help for descriptions of the drillingoptions at the report level)
• When a user drills (if he uses the Drill dialog box)
Drill path display name, description, and set
The Drill Path Display Name is the name displayed in the right-click drill menu onthe report. You can either:
• Use the object's name, by selecting the Use name of object check box.
• Type a display name in the box.
You can also include a description of the drill path, to help identify it to other reportdesigners.
You can group drill paths together in the right-click drill menu by using the same SetName for them. This is valid for all drill path types. Sets cannot cross drill types, so usethem to group drill maps within a single drill type, such as Up. Once you create a Setname, it appears in the drop-down list of other drill paths.
Drill priority
The Priority option affects how the drill path is displayed in a report:
• Low: The drill path is available as a right-click menu option in a MicroStrategyDeveloper report. In a MicroStrategy Web report, this drill path is not available as aright-click menu option but can be accessed from the More Options link.
Advanced Reporting Guide
194 © 2017, MicroStrategy Inc.
• Medium: The drill path is available as a right-click menu option in bothMicroStrategy Developer and Web reports.
• High: The drill path is used as the default drill path in both MicroStrategy Developerand Web reports. It is still available as a right-click menu option.
When a user double-clicks an object on a MicroStrategy Developer report, the defaultdrill path is used. In Web, if an object on a grid has a default drilling option, the elementsof that object appear as hyperlinks on the grid. A user can click the hyperlink to drill onthe elements.
To set a drill path as the default, assign its priority to High. Only one high priority drillpath can exist in each drill map.
Filter interaction options
The following settings affect how the filter is manipulated:
• Apply user filter (see User filter and report filter options, page 194)
• Apply report filter (see User filter and report filter options, page 194)
• Include other filter (seeMerging or ignoring existing attribute qualifications:Include other filter setting, page 194)
• Apply additional filter (see Adding another filter to the drilled-to report, page 196)
User filter and report filter options
The Apply user filter option determines whether the object that is drilled from filtersthe drilled-to report. The Apply report filter option determines whether the filter onthe drilled-from report is applied to the drilled-to report. These options are not mutuallyexclusive. The examples in the list are based on a report that displays revenue by stateand contains a filter for the Electronics category. Virginia is selected when the report isdrilled to store.
• Apply both. This is the default. The drilled-to report contains Electronics revenue forVirginia stores only.
• Apply neither. The drilled-to report includes revenue, by city, for all categories andall states.
• Apply the user filter only. The drilled-to report displays Virginia revenue for allcategories, listed by store.
• Apply the report filter only. The resulting report shows Electronics revenue by storefor all states.
Merging or ignoring existing attribute qualifications: Include other filter setting
The Include other filter setting is related to the report filter’s advanced option. Bothdetermine whether existing attribute qualifications are merged when the filter isevaluated. The report filter setting affects the entire report, while the Drill Map Editor
Advanced Reporting Guide
© 2017, MicroStrategy Inc. 195
setting applies only when a user drills on the report. For a description of the report filtersetting, including examples, seeMerging attribute qualifications, page 129.
The options for the Include other filter setting are:
• To use the report filter’s setting, select Default.
• To include other qualifications in the drilled-to report, regardless of the report filtersetting, select Yes.
• To ignore other qualifications in the drilled-to report, regardless of the report filtersetting, select No.
The Include other filter setting is available only if both the Apply user filter settingand Apply report filter setting are set to True.
For example, the following report contains a metric qualification for the top threerevenue-producing regions. The metric qualification merges the qualifications when thefilter is evaluated. This is the default setting.
Drill down on the Central region to Customer City. The report shown below isdisplayed.
The top three revenue-producing cities in the Central region are selected and displayed.The qualifications were merged to produce this result, since by default the drill map usesthe report filter’s merge attribute setting. In this case, it is the same as setting the Includeother filter option to Yes in the Drill Map Editor.
Return to the original report, edit the drill map, and change the Include other filtersetting to No. Again drill down on the Central region to Customer City. The followingreport is displayed:
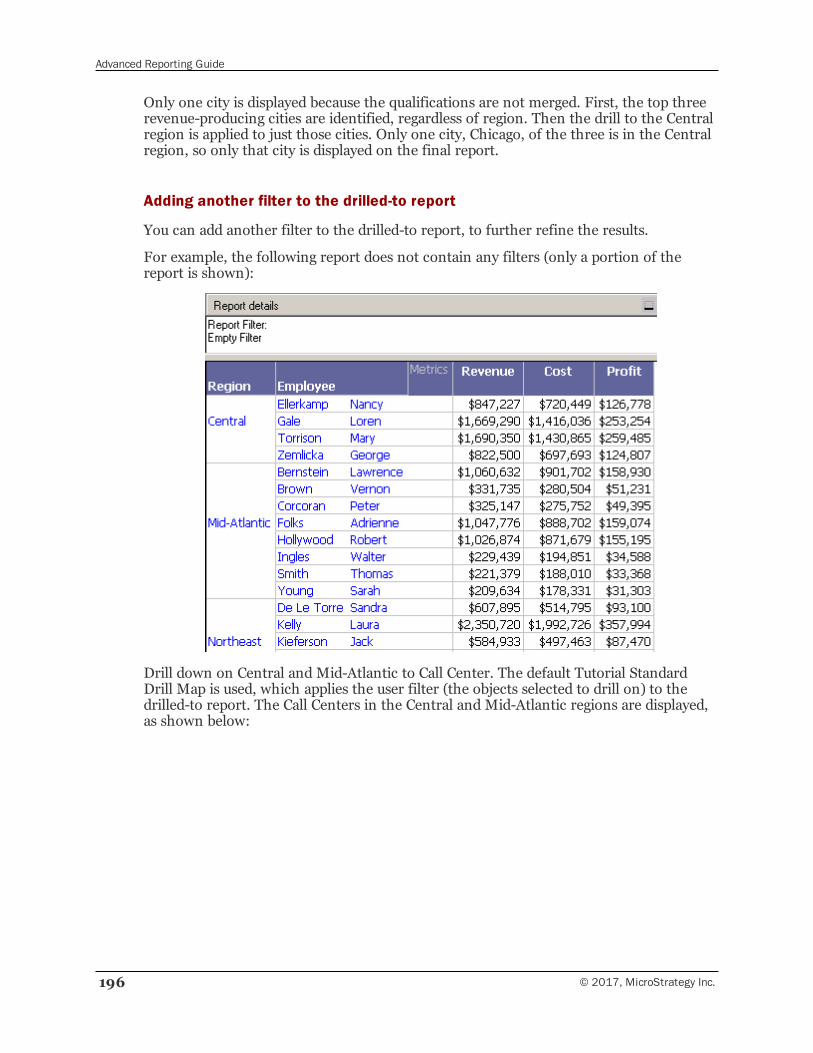
Advanced Reporting Guide
196 © 2017, MicroStrategy Inc.
Only one city is displayed because the qualifications are not merged. First, the top threerevenue-producing cities are identified, regardless of region. Then the drill to the Centralregion is applied to just those cities. Only one city, Chicago, of the three is in the Centralregion, so only that city is displayed on the final report.
Adding another filter to the drilled-to report
You can add another filter to the drilled-to report, to further refine the results.
For example, the following report does not contain any filters (only a portion of thereport is shown):
Drill down on Central and Mid-Atlantic to Call Center. The default Tutorial StandardDrill Map is used, which applies the user filter (the objects selected to drill on) to thedrilled-to report. The Call Centers in the Central and Mid-Atlantic regions are displayed,as shown below:
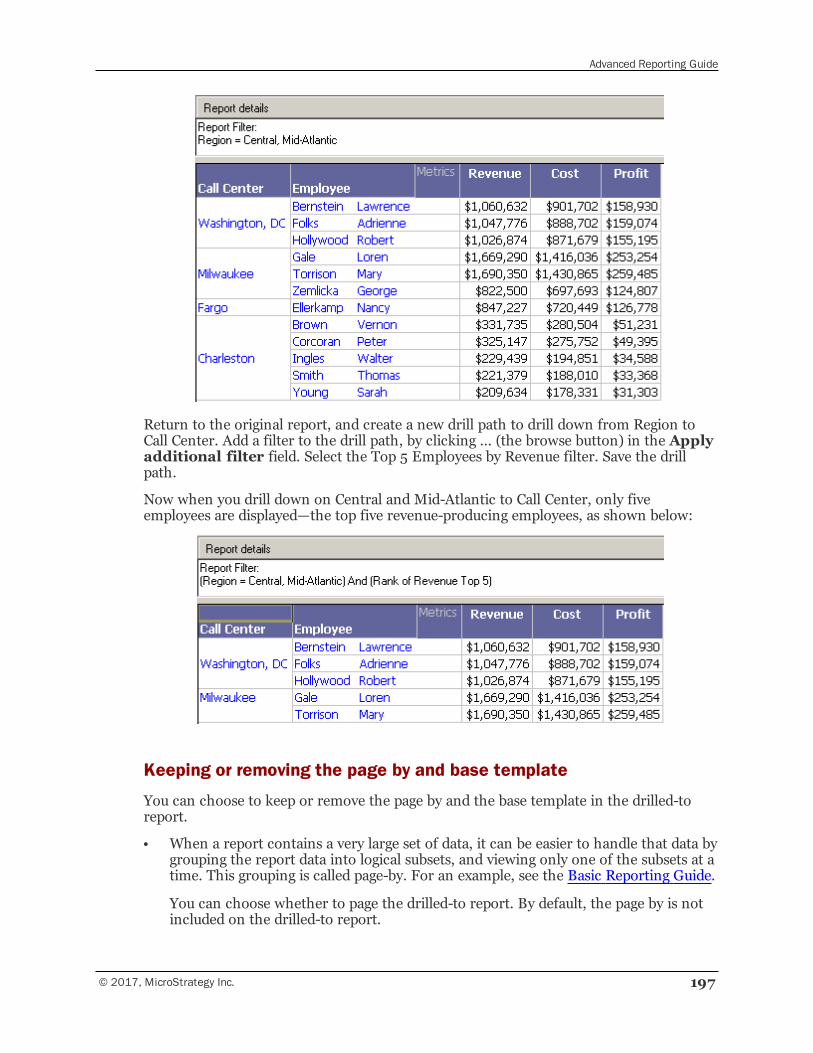
Advanced Reporting Guide
© 2017, MicroStrategy Inc. 197
Return to the original report, and create a new drill path to drill down from Region toCall Center. Add a filter to the drill path, by clicking ... (the browse button) in the Applyadditional filter field. Select the Top 5 Employees by Revenue filter. Save the drillpath.
Now when you drill down on Central and Mid-Atlantic to Call Center, only fiveemployees are displayed—the top five revenue-producing employees, as shown below:
Keeping or removing the page by and base template
You can choose to keep or remove the page by and the base template in the drilled-toreport.
• When a report contains a very large set of data, it can be easier to handle that data bygrouping the report data into logical subsets, and viewing only one of the subsets at atime. This grouping is called page-by. For an example, see the Basic Reporting Guide.
You can choose whether to page the drilled-to report. By default, the page by is notincluded on the drilled-to report.
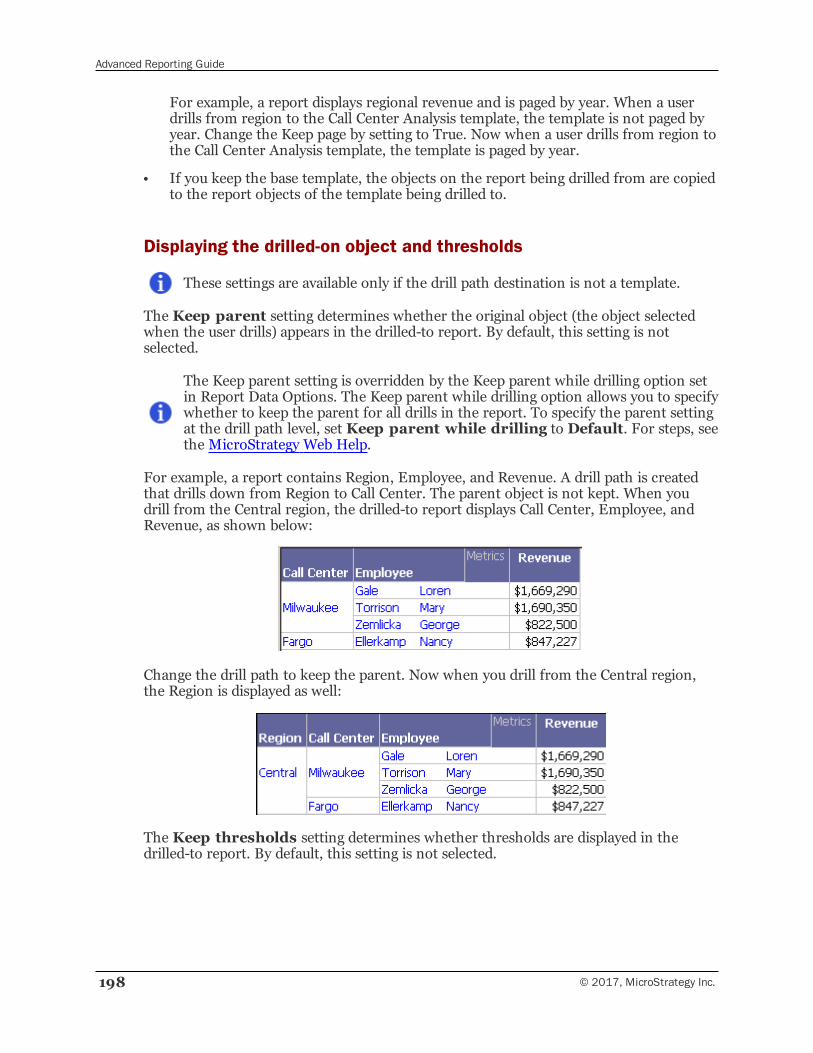
Advanced Reporting Guide
198 © 2017, MicroStrategy Inc.
For example, a report displays regional revenue and is paged by year. When a userdrills from region to the Call Center Analysis template, the template is not paged byyear. Change the Keep page by setting to True. Now when a user drills from region tothe Call Center Analysis template, the template is paged by year.
• If you keep the base template, the objects on the report being drilled from are copiedto the report objects of the template being drilled to.
Displaying the drilled-on object and thresholds
These settings are available only if the drill path destination is not a template.
The Keep parent setting determines whether the original object (the object selectedwhen the user drills) appears in the drilled-to report. By default, this setting is notselected.
The Keep parent setting is overridden by the Keep parent while drilling option setin Report Data Options. The Keep parent while drilling option allows you to specifywhether to keep the parent for all drills in the report. To specify the parent settingat the drill path level, set Keep parent while drilling to Default. For steps, seethe MicroStrategy Web Help.
For example, a report contains Region, Employee, and Revenue. A drill path is createdthat drills down from Region to Call Center. The parent object is not kept. When youdrill from the Central region, the drilled-to report displays Call Center, Employee, andRevenue, as shown below:
Change the drill path to keep the parent. Now when you drill from the Central region,the Region is displayed as well:
The Keep thresholds setting determines whether thresholds are displayed in thedrilled-to report. By default, this setting is not selected.
Advanced Reporting Guide
© 2017, MicroStrategy Inc. 199
The Keep thresholds setting is overridden by the Keep thresholds while drillingoption set in Report Data Options. The Keep thresholds while drilling optionallows you to specify whether to display thresholds for all drills in the report. Tospecify the thresholds setting at the drill path level, set Keep thresholds whiledrilling to Default. For steps, see theMicroStrategy Developer help.
Specifying the display mode and VLDB properties
These settings are available only if the drill path destination is a template.
The Display mode setting determines how the drilled-to report is displayed, as one ofthe following options:
• Default: Uses the original report's display setting.
• Grid: Displays the drilled-to report as a grid.
• Graph: Displays the drilled-to report as a graph.
• Grid graph: Displays the drilled-to report as both a grid and a graph.
The Inherit VLDB property determines whether the VLDB properties of the originalreport are applied to the drilled-to report.
Drill map association: Objects containing thedrill map
The drill map association defines which grid unit uses this drill map. In other words,drilling uses the object’s associated drill map. An object can have an association both onthe object level and on each template/report. If an association does not exist on thetemplate/report level, then the association on the object level is used when a user drillsat that object.
If an object is already associated with a drill map, that drill map is displayed in the DrillMap Editor. Otherwise, the default drill map is based on the system hierarchy. Once youbegin to modify the default, it is no longer the system hierarchy—the name changesautomatically, although you can edit this preset name. When you save your changes, anew drill map is created.
You can create and edit a drill map as a stand-alone object from the MicroStrategyDeveloper. You can associate multiple objects with the same drill map, using theAssociate with button. The associated objects appear in the Origin list on theinterface.
You can also access the Drill Map Editor from the following:
• Attribute Editor
• Consolidation Editor
• Report Editor
Advanced Reporting Guide
200 © 2017, MicroStrategy Inc.
• Template Editor
When you edit a drill map from another editor, the drill map is associated with the objectselected in the other editor. You cannot change the drill map association (the otherobjects that are associated with this drill map), but you can change which drill maps areassociated with the selected object. For example, if you are editing the Store Stateattribute and you access the Drill Map Editor, only Store State is associated with the drillmap you create.
If the original object is a template or report, the children objects are also available. Forexample, a sales report contains Store, Store State, Item, and the Revenue metric. Youcan create a drill map for each of the grid units except Revenue, because you cannotcreate drill maps for metrics.
Order of precedence of drill maps: LevelsWhen you change or customize the drill map associated with a grid unit, you can do so atseveral different levels:
• Project level—If a drill map is associated with grid units at the project level, thenall of the grid units in the project will have this drill map. Therefore, when you drillon a report, the default drill paths are those specified in this drill map. This option isfound in the Project Configuration Editor.
• Grid unit level—A drill map can be associated with individual grid units such asattributes, consolidations, and hierarchies. When the object is used in a report ortemplate, the grid unit level drill map overrides the project level drill map.
• Template level—If a drill map is associated with grid units on a particular template,it overrides the project level and grid unit level drill maps. The drill paths of this drillmap are available in all reports that use this template.
• Report level—If a drill map is associated with grid units on a report level, itoverrides the drill maps defined at the project level, grid unit level, and the templatelevel. If a grid unit is not associated with a drill map at the report level, it inherits themap from the report template. If it is not associated with a drill map through thetemplate, then the grid unit drill map is used, and so on.
The Drill Map Editor represents these levels and inheritances when you edit a report’sdrill maps. If the Name field is grayed out (disabled), the selected report object inheritedthat drill map from the project, grid unit, or template. When you overwrite it by adding adifferent drill map to the object, the Name field is enabled.
For example, you create a drill map named Customer Attribute Drills for the attributeCustomer. Create a report named Customer Revenue that displays Region, Customer, andthe Revenue metric. When you edit the drill maps for the report and select Customer, theName field is disabled but displays Customer Attribute Drills. No drill paths are displayedfor the drill map. Because this attribute does not have a drill map on the report, itinherited the drill map from the attribute level. Because you cannot edit the attribute’sdrill map from the attribute on the report, the Name field is disabled and the drill pathsdo not appear. When a new drill map is created for Customer on this particular report,Name is enabled, defaulting to Customer Sales Customer Drill Map.
Advanced Reporting Guide
© 2017, MicroStrategy Inc. 201
By default, there is a project drill map containing all of the hierarchies that have beenspecified as drill hierarchies using the Hierarchy Editor in the project. It cannot bedeleted, but it can be modified and overridden.
Drill maps associated with templates
You can also change or customize the drill map associated with a template, rather thanthe individual grid units on the template. The drill map then controls the drill paths onlyfor the metric values on the template.
For example, the Basic Report contains regions, employees, and the Revenue metric. Thedrill map contains a drill path to a Personnel report. This drill path is associated with thetemplate, not Region, Employee, or Revenue. If you drill on a number in the Revenuecolumn of the Basic Report, you can drill to the Personnel report only. If you drill on theRevenue metric heading, you can drill in other directions to various hierarchies. If youdrill on a region, you can drill up to Country, down to Call Center, or in other directions.
The drill paths of this drill map are available in all reports that use this template.
Removing associationsThe Remove Association button disassociates the object from the current drill mapand replaces it with its default map. Depending on the levels described above, this defaultmap could be the template drill map, the grid unit drill map, or the project drill map.
The Clear All button deletes all the drill path information for the whole drill map. Theobject effectively has no drilling options. Reset reverses any changes and resets the drillmap to the condition of the last save. Drill map associations are reset as well.
6ADVANCEDPROMPTS: ENABLING USERINPUT
A prompt is a MicroStrategy object that allows user interaction at report run time. Theprompt object is incomplete by design. The user is asked during the report resolutionphase of report execution to provide an answer to complete the information. Forexample, the user can enter information such as the region “Northeast” or year “2007,”and the data is returned from the data warehouse. With prompts you can create reportsthat allow users to change the report content at run time.
Prompts are useful for asking questions about the set of data you want to see in thereport. Prompts allow the report to have dynamic report definitions, which can changewith each query by altering the information in the prompt dialog box. Prompts can be apart of the report definition, filter, template, custom group, or metric.
There are benefits to using prompts as a part of these objects. Prompts are useful to keepthe number of reports in a project small, as they allow users to define how they wouldlike to view things in the report environment instead of the report designer providing aseparate report for each user’s information needs.
You can find the report that you would like to see more quickly because there will befewer options. However, prompting questions asked of the user raise the complexity ofjust running a report, and you run the risk of confusion. This confusion can be allayed byproviding good descriptions for the prompts so that the user is clear on what questionsthey are answering.
For more detailed information on what a prompt is, see:
• What is a prompt?
• Types of prompts
© 2017, MicroStrategy Inc. 202
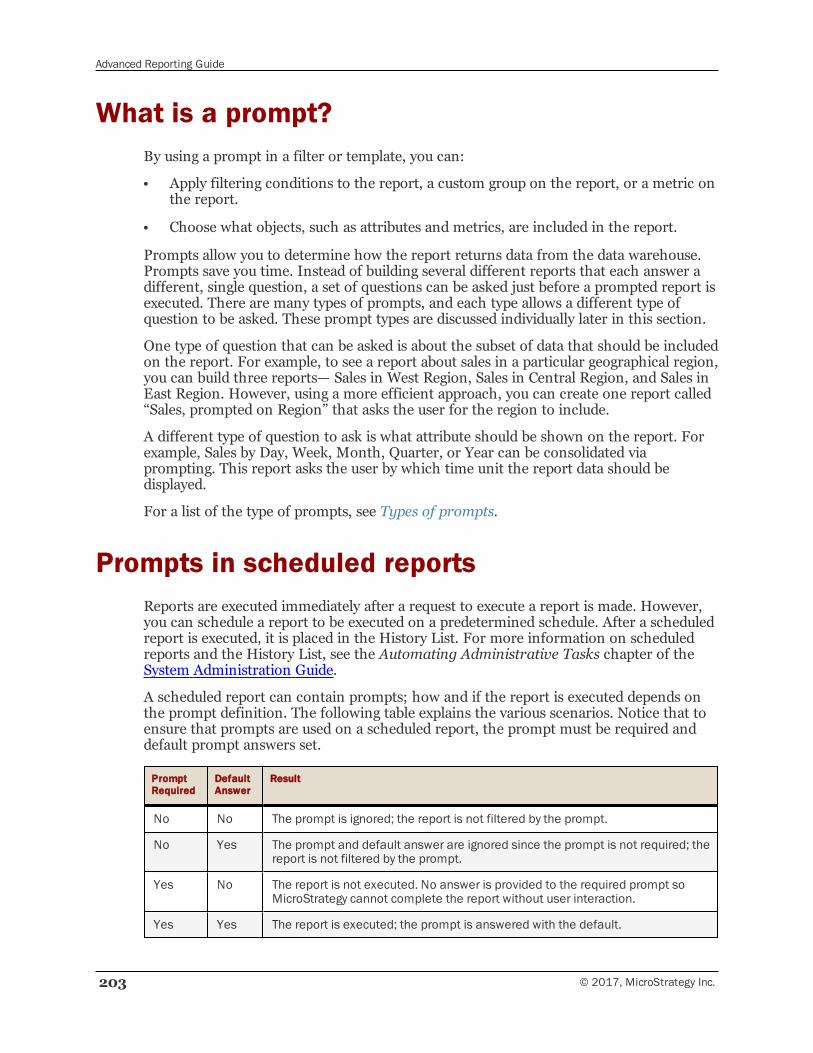
Advanced Reporting Guide
203 © 2017, MicroStrategy Inc.
What is a prompt?By using a prompt in a filter or template, you can:
• Apply filtering conditions to the report, a custom group on the report, or a metric onthe report.
• Choose what objects, such as attributes and metrics, are included in the report.
Prompts allow you to determine how the report returns data from the data warehouse.Prompts save you time. Instead of building several different reports that each answer adifferent, single question, a set of questions can be asked just before a prompted report isexecuted. There are many types of prompts, and each type allows a different type ofquestion to be asked. These prompt types are discussed individually later in this section.
One type of question that can be asked is about the subset of data that should be includedon the report. For example, to see a report about sales in a particular geographical region,you can build three reports— Sales in West Region, Sales in Central Region, and Sales inEast Region. However, using a more efficient approach, you can create one report called“Sales, prompted on Region” that asks the user for the region to include.
A different type of question to ask is what attribute should be shown on the report. Forexample, Sales by Day, Week, Month, Quarter, or Year can be consolidated viaprompting. This report asks the user by which time unit the report data should bedisplayed.
For a list of the type of prompts, see Types of prompts.
Prompts in scheduled reportsReports are executed immediately after a request to execute a report is made. However,you can schedule a report to be executed on a predetermined schedule. After a scheduledreport is executed, it is placed in the History List. For more information on scheduledreports and the History List, see the Automating Administrative Tasks chapter of theSystem Administration Guide.
A scheduled report can contain prompts; how and if the report is executed depends onthe prompt definition. The following table explains the various scenarios. Notice that toensure that prompts are used on a scheduled report, the prompt must be required anddefault prompt answers set.
PromptRequired
DefaultAnswer
Result
No No The prompt is ignored; the report is not filtered by the prompt.
No Yes The prompt and default answer are ignored since the prompt is not required; thereport is not filtered by the prompt.
Yes No The report is not executed. No answer is provided to the required prompt soMicroStrategy cannot complete the report without user interaction.
Yes Yes The report is executed; the prompt is answered with the default.
Advanced Reporting Guide
© 2017, MicroStrategy Inc. 204
Types of promptsUsing the following prompt types, you can create a prompt for nearly every part of areport. It is important to remember that prompts can be used in many objects includingreports, filters, metrics, and custom groups. All of these prompts will reveal themselves atreport execution time, but the origin of the prompt can be within any of the objects.
• The filter definition prompt encompasses four different prompt types, all ofwhich allow the user to define the filtering criteria: attributes in a hierarchy,attribute forms, attribute element lists, and metrics.
• An object prompt allows you to select which MicroStrategy objects to include in areport, such as attributes, metrics, custom groups and so on. Object prompts caneither determine the definition of the report template or the report filter.
• A value prompt allows you to select a single value such as a date, a specificnumber, or a specific text string. The value chosen by the user is compared to metricor attribute element values, and thus determines the data viewed by the user.
Prompts can also be used as part of a function expression, and value prompts areparticularly suited to provide values for function arguments. For a description of howto use prompts in function expressions, see the Functions Reference.
• A level prompt allows you to specify the level of calculation for a metric.
This section provides merely a basic review of all these types, with the exception of levelprompts. For details, examples, and procedures, see the Building Query Objects andQueries, for Designers chapter of the Basic Reporting Guide. TheMicroStrategyDeveloper help also contains detailed procedures to create the various types of prompts.
You can also create prompts for use with MicroStrategy Mobile. For examples andsteps, see the MicroStrategy Mobile Design and Administration Guide.
Filtering data on attributes, attribute forms, attributeelements, or metrics: Filter definition promptsThese prompts are used for qualifying on the value of attribute elements and metrics.The filters affected by these types of prompts can be in the report, in a filter (which inturn may be used in the conditionality of a metric in the report), or in an element of acustom group. Background information on custom groups may be found in Aboutcustom groups: Grouping attribute elements with banding and filtering, page 154.
Choose from all attributes in a hierarchy
This type of prompt is used to qualify on one or more attributes in one or morehierarchies. At least one hierarchy and all the attributes in that hierarchy are displayed.The user can then qualify on one or more of those attributes by choosing an element listor by qualifying on a particular attribute form. The choices made are included in thefiltering criteria in the report.
To define this type of prompt, you can do one of the following:
Advanced Reporting Guide
205 © 2017, MicroStrategy Inc.
• Choose a particular hierarchy.
• Use the set of hierarchies resulting from a search for hierarchies.
• List all hierarchies available in the project.
If you choose to display more than one hierarchy, you can create qualifications from allhierarchies displayed at report run time.
Qualify on an attribute
This type of prompt is used to apply conditions or qualifications to an attribute form.
One or more attributes are displayed and the user can create qualifications on an elementlist or an attribute form of the selected attribute.
To define an attribute qualification prompt, you can either:
• Choose a particular attribute.
• Display a partial or complete list of attributes that is the result of a search forattributes available in the project.
Choose from an attribute element list
This option is used to allow the user to choose from a list of attribute elements to beincluded in a filter or custom group. This list may be restricted, at prompt design time.This type of prompt can be used with any attribute in a project.
The list of elements from which the user can choose can be implemented by:
• Selecting all elements associated with an attribute
• Providing a partial list of elements by applying a filter on all of the elementsassociated with an attribute
• Providing a predefined list of elements from which the user can choose
Qualify on a metric
A metric qualification prompt allows a user to qualify on a metric. One or more metricsare displayed and the user can choose a metric for qualification.
The choice of metrics can be defined by:
• Specifying a single metric for run-time use
• Specifying a search object to restrict the list of metrics from which the user canchoose
Advanced Reporting Guide
© 2017, MicroStrategy Inc. 206
Example: Filter definition prompt
For procedures to create filter definition prompts, see theMicroStrategyDeveloper help or the Building Query Objects and Queries, for Designers chapterof the Basic Reporting Guide.
Report requirement
You need to create a report showing sales in the West, Central, and East Regions. Allother data on the report remains the same. You do not necessarily want the regions onthe same report.
Solution
To meet this requirement, the easiest solution is to create a report that includes a filterprompting the user on region. When the report is executed, the prompt dialog opens,asking the user to choose the region(s) for which to return the report results.
Filtering data based on metrics, attributes, or otherobjects: Object promptsObject prompts are used in reports and documents to allow the user to choose whatobjects will be included in the report filter or on the report template.
These are defined by specifying either a search object or a predefined list of objects fromwhich the user can choose. An object prompt allows specification of default answers aswell as maximum and minimum number of objects to be selected.
A search object defines the criteria (such as location, date, owner, and so on) for a list ofobjects to be generated. Searches defined in prompts are saved in the project. Forexample, a search object can display all metrics that are contained in a certain folder anduse a particular fact.
One prompt can contain different types of objects, such as both metrics and attributes,or attributes and custom groups. This reduces the number of prompts that are needed fora report. However, if the prompt mixes metrics with another type of object, either themetrics or the other objects are removed when the prompt is executed in a report, asdescribed below:
• If a metric is the first object in the list, all non-metric objects are removed.
• If a non-metric object is the first object in the list, all metrics are removed.
This ensures that only attributes or metrics are included on the rows of a report.Alternatively, you can create one object prompt for the metrics and another for the othertypes of objects. For an example, see Examples: Object prompts, page 207.
Advanced Reporting Guide
207 © 2017, MicroStrategy Inc.
Examples: Object prompts
For procedures to create object prompts, see theMicroStrategy Developer help orthe Building Query Objects and Queries, for Designers chapter of the BasicReporting Guide.
Report requirement
Create a report displaying item sales. At run time, the user can select whether to calculatesales at the Category or the Subcategory level.
Solution
Create an object prompt with Category and Subcategory. Create the Sales metric, usingthe object prompt as the target of the level (dimensionality). When the report isexecuted, the user is prompted to select either Category or Subcategory. Based on theuser’s choice, the Sales metric is calculated accordingly.
Report requirement
Create a report displaying item sales. At run time, the user can select whether to calculatesales at the level of Category, Subcategory, or Age Groups.
Solution
Create an object prompt with the Category and Subcategory attributes, as well as the AgeGroups custom group. Create the Sales metric, using the object prompt as the target ofthe level (dimensionality). When the report is executed, the user is prompted to selectCategory, Subcategory, or Age Groups. Based on the user’s choice, the Sales metric iscalculated accordingly.
Report requirement
The sales manager frequently asks her analysts to provide similar reports with minorchanges to the metrics. She always wants a metric to calculate revenue for eachemployee. In addition, she sometimes wants to compare the results of each employee tothe revenue results of the best or the worst employee. Other times, she wants to comparethe results of each employee to the average revenue of all the employees.
Solution
Instead of creating many different reports, you can provide the sales manager with theflexibility to select the analytical function she wants at the time of running the report.
In this case you can give her three functions to choose from:
• Minimum
Advanced Reporting Guide
© 2017, MicroStrategy Inc. 208
• Maximum
• Average
When she runs the report, she can select which function to use with the Revenue metric.Your final report can then display the following objects:
• Employee
• Revenue metric
• Revenue metric that uses the analytical function selected by the user
Value promptsValue prompts are used when the information needed at run time is a single value of aspecific data type. The value chosen by the user is compared with either an attributeform or a metric. This comparison can be done in a filtering criteria or in a customgroup.
The different types of Value prompts are:
• Date prompts for a date value.
• Numeric prompts for a numeric value. Numeric value prompts accept integers ordecimals up to 15 digits of precision.
If a user enters more than 15 digits for a numeric prompt, the data isconverted to scientific notation. If precision is needed beyond 15 digits, youshould use a Big Decimal value prompt instead.
• Text prompts for any type of text.
• Big Decimal prompts for a big decimal value. Big Decimal value prompts acceptintegers and decimals up to 38 digits of precision.
Big Decimal prompts should only be used in expressions that require highprecision, such as qualifying on a Big Decimal attribute ID.
• Long prompts for a long integer value. Long prompts accept integer numbers up to10 digits.
Although long prompts are not part of the options available by default for selection,you can enable them as part of your project preferences. To enable them:
a Double-click your project to open it.
b From the Tools menu in MicroStrategy Developer, selectMy Preferences.The My Preferences dialog box opens.
c Expand the General category on the left, and select Prompts.
d Select Add long prompts to the list of available value prompts.
e Click OK to save your changes.
Value prompts allow specification of maximum and minimum values to be applied.
Advanced Reporting Guide
209 © 2017, MicroStrategy Inc.
Example: Value prompt
For procedures to create value prompts, see theMicroStrategy Developer help orthe Building Query Objects and Queries, for Designers chapter of the BasicReporting Guide.
Report requirement
Create a report showing sales since a certain date.
Solution
Prompt the user for the date since they want to see sales data. The value they choose isapplied to a filter criteria for the attribute Date. The prompt here is included in the filteron a report.
Example: Currency conversion
Report requirement
An international company is based in the United States, so the data is saved in dollars inthe data warehouse. However, an end user is based in Europe and wants to see revenuein Euros. Create a report that converts revenue in dollars to Euros.
Solution
The report prompts the user for a conversion rate, which is applied to a revenue metric.If a user wants to see dollars, he can enter a conversion rate of one.
The high-level steps are:
1 Create a value prompt for the conversion rate.
The prompt’s instructions can include a website to find today’s conversionrate, and also direct the user to enter a conversion rate of one to keep therevenue in US dollars.
2 Use the conversion prompt in a metric. The metric’s formula should look like thefollowing, assuming revenue is the target fact and Euro Conversion Rate is the nameof the prompt:
(Sum(Revenue) {~} * ?[Euro Conversion Rate])
3 Use the metric in the report.
In the US, the report is executed, and 1 is entered at the currency conversion prompt.The results are shown below:
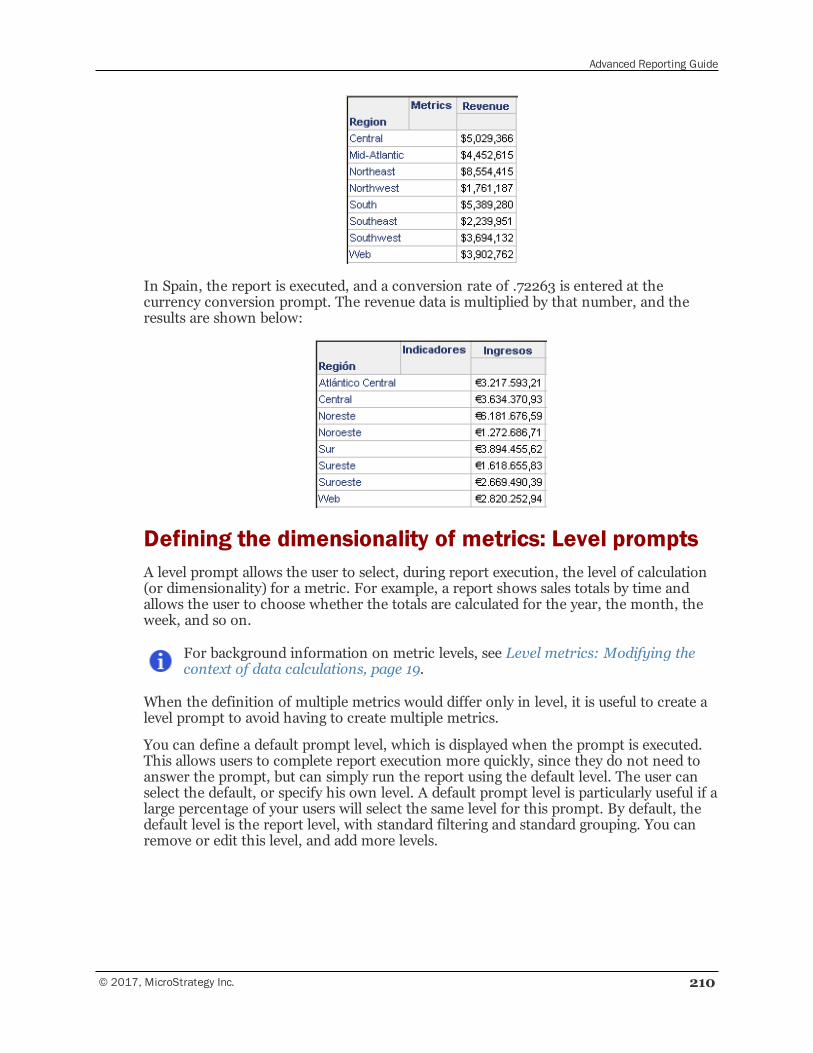
Advanced Reporting Guide
© 2017, MicroStrategy Inc. 210
In Spain, the report is executed, and a conversion rate of .72263 is entered at thecurrency conversion prompt. The revenue data is multiplied by that number, and theresults are shown below:
Defining the dimensionality of metrics: Level promptsA level prompt allows the user to select, during report execution, the level of calculation(or dimensionality) for a metric. For example, a report shows sales totals by time andallows the user to choose whether the totals are calculated for the year, the month, theweek, and so on.
For background information on metric levels, see Level metrics: Modifying thecontext of data calculations, page 19.
When the definition of multiple metrics would differ only in level, it is useful to create alevel prompt to avoid having to create multiple metrics.
You can define a default prompt level, which is displayed when the prompt is executed.This allows users to complete report execution more quickly, since they do not need toanswer the prompt, but can simply run the report using the default level. The user canselect the default, or specify his own level. A default prompt level is particularly useful if alarge percentage of your users will select the same level for this prompt. By default, thedefault level is the report level, with standard filtering and standard grouping. You canremove or edit this level, and add more levels.
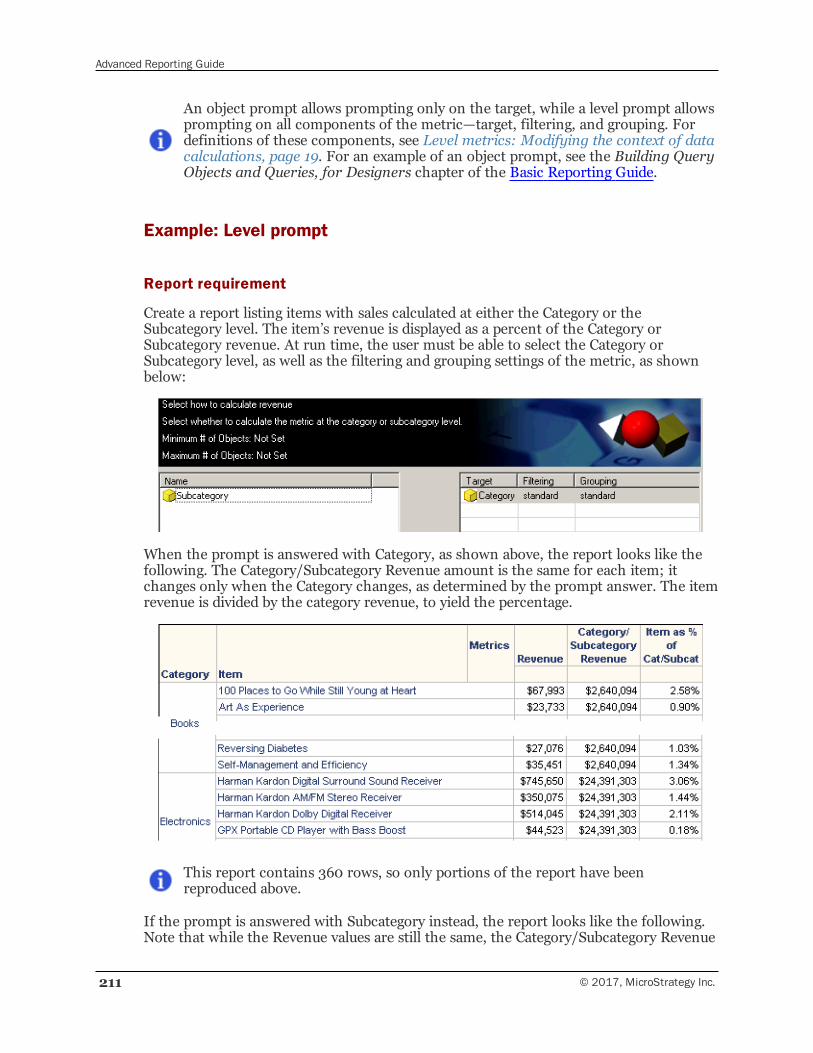
Advanced Reporting Guide
211 © 2017, MicroStrategy Inc.
An object prompt allows prompting only on the target, while a level prompt allowsprompting on all components of the metric—target, filtering, and grouping. Fordefinitions of these components, see Level metrics: Modifying the context of datacalculations, page 19. For an example of an object prompt, see the Building QueryObjects and Queries, for Designers chapter of the Basic Reporting Guide.
Example: Level prompt
Report requirement
Create a report listing items with sales calculated at either the Category or theSubcategory level. The item’s revenue is displayed as a percent of the Category orSubcategory revenue. At run time, the user must be able to select the Category orSubcategory level, as well as the filtering and grouping settings of the metric, as shownbelow:
When the prompt is answered with Category, as shown above, the report looks like thefollowing. The Category/Subcategory Revenue amount is the same for each item; itchanges only when the Category changes, as determined by the prompt answer. The itemrevenue is divided by the category revenue, to yield the percentage.
This report contains 360 rows, so only portions of the report have beenreproduced above.
If the prompt is answered with Subcategory instead, the report looks like the following.Note that while the Revenue values are still the same, the Category/Subcategory Revenue
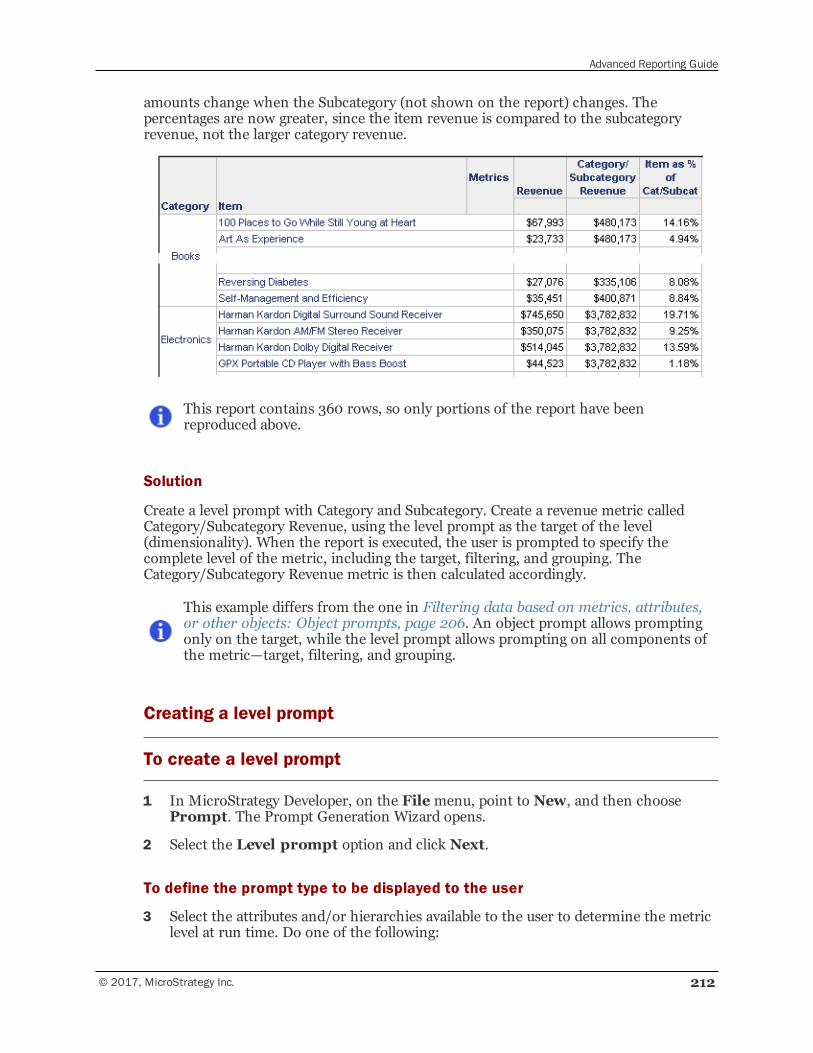
Advanced Reporting Guide
© 2017, MicroStrategy Inc. 212
amounts change when the Subcategory (not shown on the report) changes. Thepercentages are now greater, since the item revenue is compared to the subcategoryrevenue, not the larger category revenue.
This report contains 360 rows, so only portions of the report have beenreproduced above.
Solution
Create a level prompt with Category and Subcategory. Create a revenue metric calledCategory/Subcategory Revenue, using the level prompt as the target of the level(dimensionality). When the report is executed, the user is prompted to specify thecomplete level of the metric, including the target, filtering, and grouping. TheCategory/Subcategory Revenue metric is then calculated accordingly.
This example differs from the one in Filtering data based on metrics, attributes,or other objects: Object prompts, page 206. An object prompt allows promptingonly on the target, while the level prompt allows prompting on all components ofthe metric—target, filtering, and grouping.
Creating a level prompt
To create a level prompt
1 In MicroStrategy Developer, on the Filemenu, point to New, and then choosePrompt. The Prompt Generation Wizard opens.
2 Select the Level prompt option and click Next.
To define the prompt type to be displayed to the user
3 Select the attributes and/or hierarchies available to the user to determine the metriclevel at run time. Do one of the following:
Advanced Reporting Guide
213 © 2017, MicroStrategy Inc.
• To choose specific objects, complete the following steps:
a Select Use a pre-defined list of objects.
b Click Add. The Select Objects dialog box opens.
c Select the objects from the Available objects list and click > to movethem to the Selected objects list.
You can choose multiple objects by pressing CTRL or Shift whileselecting the objects.
d Click OK to return to the Prompt Generation Wizard.
e You can add more objects by clickingModify, which opens the SelectObjects dialog box so you can select additional objects.
f To remove the selected object, click Remove.
g To delete all the objects in the list, click Clear.
h To change the order that the objects are displayed in the prompt, select theobject to move and click the Up or Down arrow.
• To use a set of objects from a search object, select Use the results of asearch object. To display the object path (folder hierarchy) when using asearch, select Display using folder structure, which is useful when thesame object with the same name is saved in multiple folders. Do one of thefollowing:
▫ To use an existing search, click ... (the browse button). Navigate to thesearch object, select it, and click OK to return to the Prompt GenerationWizard.
▫ To create a new search, click New. The Search for Objects dialog box opens.Create a new search.
• To allow users to choose from all the attributes and hierarchies available in theproject, select List all attributes and hierarchies (no restriction).
To specify a title and instructions
Think about a name and instructions carefully, with your users in mind. The title andinstructions that you provide for a prompt can make the difference between usersfinding prompted report execution confusing and users completing rapid reportexecution that displays exactly the data they want to see. For examples of effectiveand ineffective titles and instructions, see the Building Query Objects and Queries,for Designers chapter in the Basic Reporting Guide.
4 Click Next. The General Information page opens.
5 Enter a Title, which is used as the default object name when you save the prompt,although you can change it.
6 Type text in the Instructions field, which is displayed when the prompt is runduring report execution.
Advanced Reporting Guide
© 2017, MicroStrategy Inc. 214
To allow personal answers
Personal answers allow a user to save prompt answers for this prompt, and thenreuse the answers on any report that this prompt is used on. For more informationon personal answers and how they can be used, see the Building Query Objects andQueries, for Designers chapter in the Basic Reporting Guide.
7 To determine whether personal answers can be saved for this prompt, select one ofthe following options from the Personal answers allowed drop-down list:
• None: No personal answers can be saved. Every time a user sees the prompt, hemust answer it manually (if it is required).
• Single: Only one personal answer can be saved for this prompt. When theprompt is used again (on this report or a different one), the personal answer isdisplayed. A user can keep the personal answer, or add or delete selections. Hecan save his changes as a new personal answer, but only one personal answercan be saved for the prompt.
• Multiple: Multiple personal answers can be named and saved, allowingdifferent answers for the same prompt. When the prompt is used again (on thisreport or a different one), the personal answers are available. The user can selectone of them, or answer the prompt manually.
To define a range within which the user’s answer must fall
8 To restrict the user to entering values within certain ranges (optional):
• Select theMinimum objects check box and enter the lowest number ofobjects allowed in the prompt answer.
• Select theMaximum objects check box and enter the highest number ofobjects allowed for the prompt answer.
9 If you choose, you can select the Prompt answer required check box to requireusers to answer the prompt before running the report. For considerations aboutrequired and optional prompt answers, see the Building Query Objects and Queries,for Designers chapter in the Basic Reporting Guide.
10 Click Next. The Default Prompt Level Selection page opens.
To specify a default prompt level
A default prompt level can allow users to complete report execution more quickly,since they do not need to answer the prompt, but can simply run the report usingthe default level. The levels that you define here are displayed when the prompt isexecuted. The user can select the default, or specify his own level. A default promptlevel is particularly useful if a large percentage of your users will select the same levelfor this prompt.
By default, the default level is the report level, with standard filtering and standardgrouping. You can remove or edit this level, and add more levels.
Advanced Reporting Guide
215 © 2017, MicroStrategy Inc.
11 To add another level, clickModify. The Select Objects dialog box opens. Select theobject(s) to use as the target(s) from the Available objects list and click > to movethem to the Selected objects list. Click OK to return to the Prompt GenerationWizard. The objects are added to the default prompt answer table, with standardfiltering and grouping.
The target is the attribute level at which the metric calculation groups. For moreinformation, see Target: The context of a calculation, page 26.
12 To change the filtering of a level, click in the Filtering column of the level andselect the new filtering option.
Filtering governs how the report filter interacts with the metric calculation. Formore information, see Filtering: Interaction with report filters, page 32.
13 To change the grouping of a level, click in the Grouping column of the level andselect the new grouping option.
Grouping determines how the metric aggregates. For more information, seeGrouping: How aggregation is performed, page 26.
14 To delete the selected level, click Remove.
15 To return to the default report level and delete any additional levels, click Reset.
16 By default, the metric filter is applied to the metric calculation. You can insteadexclude filter attributes, so that filter attributes that are not on the report or in thelevel of the metric are not included in the metric calculation. For more informationon this behavior, see Level metrics: Applying the metric condition to the metriccalculation, page 50.
To change this behavior, click Advanced, set Filter setting: uncheck toexclude attributes absent in report or level (dimensionality), and clickOK to return to the Prompt Generation Wizard.
17 Click Finish. The Save As dialog box opens.
18 Select the folder in which to save the new prompt, enter a name, and click Save toreturn to MicroStrategy Developer.
All level prompts must be added to a metric, and then the metric is added to a report.
Prompting for a user’s login name: Systemprompts
System prompts are built-in prompts that are created when the project is created. Systemprompts are created in the System prompts sub folder in the Prompts folder ofMicroStrategy Developer.
The User Login system prompt is a special prompt that returns the current user's userlogin. The user is not prompted to provide an answer to the User Login prompt, as theIntelligence Server automatically answers the prompt with the user's login when prompts
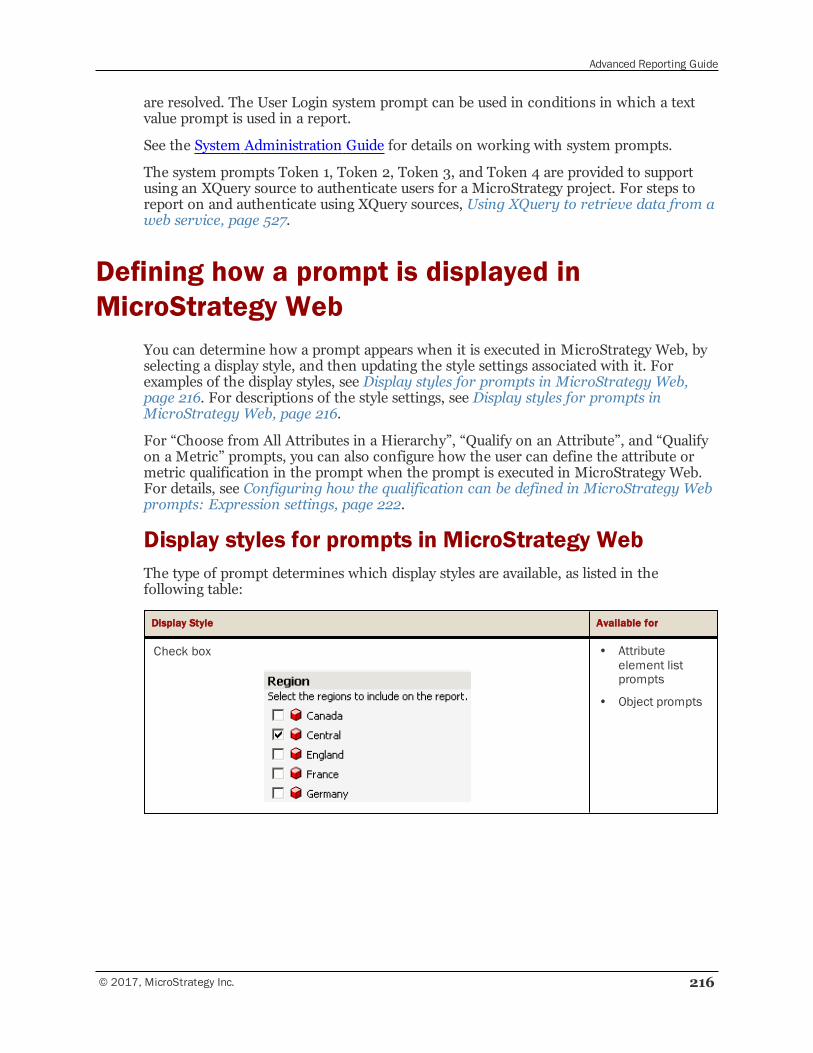
Advanced Reporting Guide
© 2017, MicroStrategy Inc. 216
are resolved. The User Login system prompt can be used in conditions in which a textvalue prompt is used in a report.
See the System Administration Guide for details on working with system prompts.
The system prompts Token 1, Token 2, Token 3, and Token 4 are provided to supportusing an XQuery source to authenticate users for a MicroStrategy project. For steps toreport on and authenticate using XQuery sources, Using XQuery to retrieve data from aweb service, page 527.
Defining how a prompt is displayed inMicroStrategy Web
You can determine how a prompt appears when it is executed in MicroStrategy Web, byselecting a display style, and then updating the style settings associated with it. Forexamples of the display styles, see Display styles for prompts in MicroStrategy Web,page 216. For descriptions of the style settings, see Display styles for prompts inMicroStrategy Web, page 216.
For “Choose from All Attributes in a Hierarchy”, “Qualify on an Attribute”, and “Qualifyon a Metric” prompts, you can also configure how the user can define the attribute ormetric qualification in the prompt when the prompt is executed in MicroStrategy Web.For details, see Configuring how the qualification can be defined in MicroStrategy Webprompts: Expression settings, page 222.
Display styles for prompts in MicroStrategy WebThe type of prompt determines which display styles are available, as listed in thefollowing table:
Display Style Available for
Check box • Attributeelement listprompts
• Object prompts
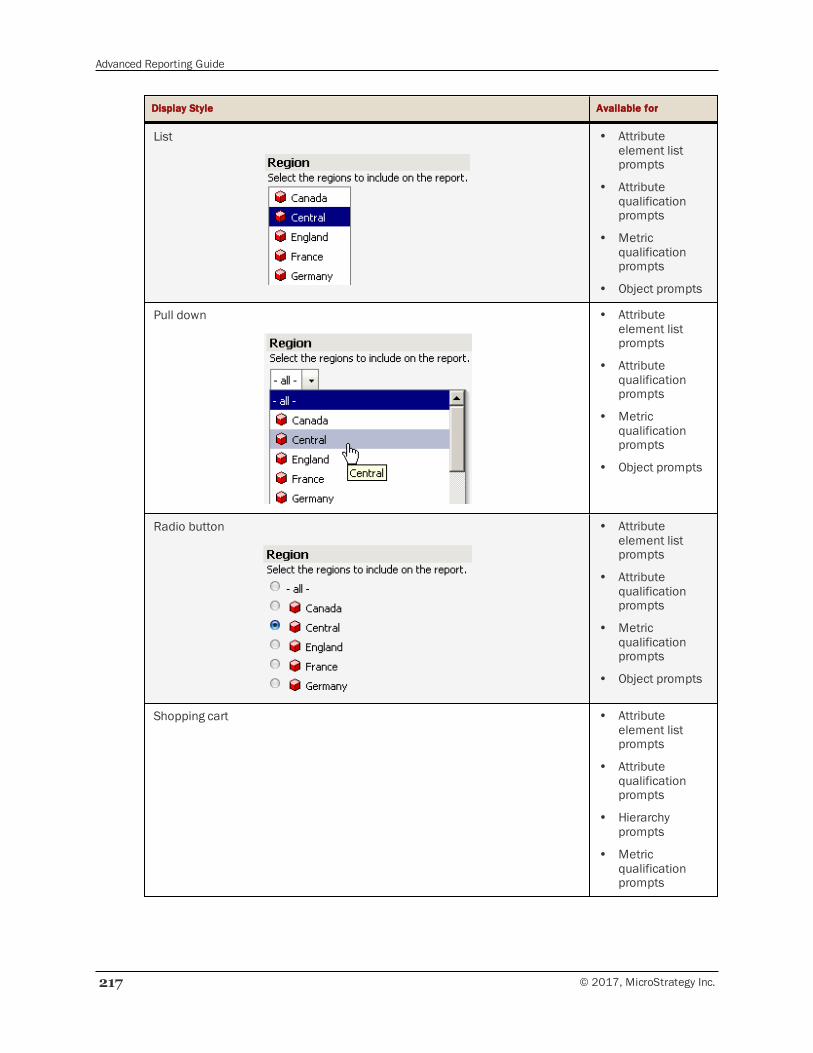
Advanced Reporting Guide
217 © 2017, MicroStrategy Inc.
Display Style Available for
List • Attributeelement listprompts
• Attributequalificationprompts
• Metricqualificationprompts
• Object prompts
Pull down • Attributeelement listprompts
• Attributequalificationprompts
• Metricqualificationprompts
• Object prompts
Radio button • Attributeelement listprompts
• Attributequalificationprompts
• Metricqualificationprompts
• Object prompts
Shopping cart • Attributeelement listprompts
• Attributequalificationprompts
• Hierarchyprompts
• Metricqualificationprompts
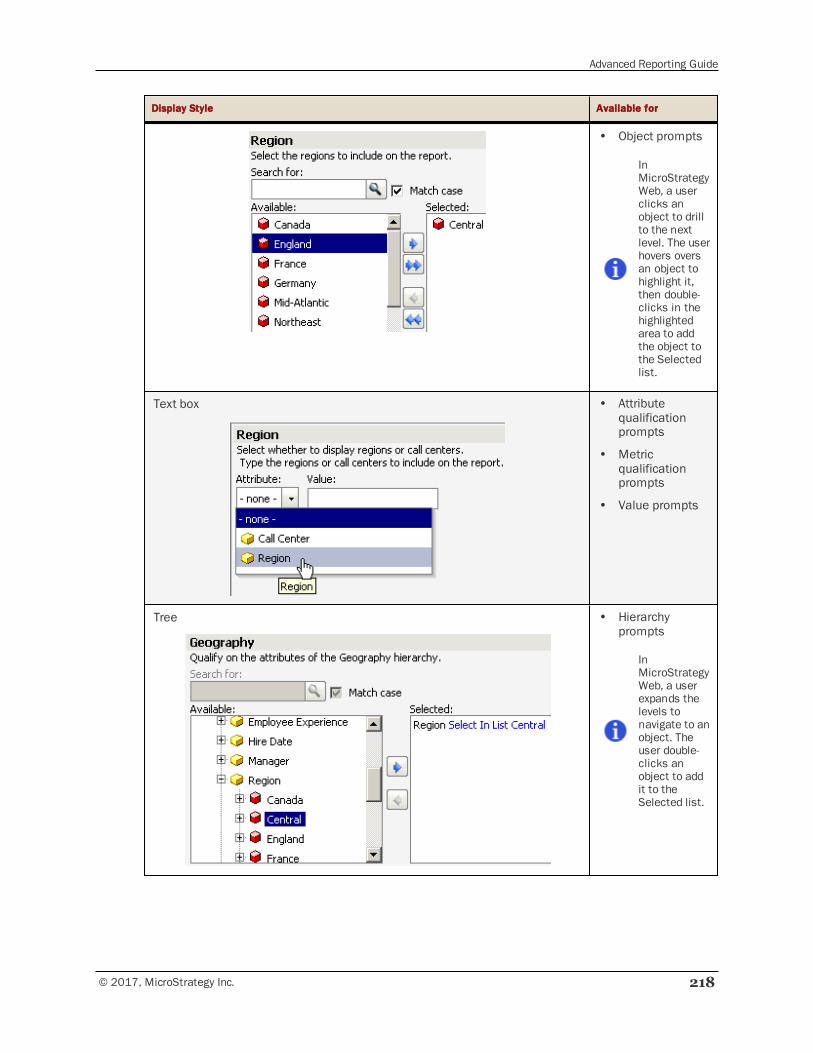
Advanced Reporting Guide
© 2017, MicroStrategy Inc. 218
Display Style Available for
• Object prompts
InMicroStrategyWeb, a userclicks anobject to drillto the nextlevel. The userhovers oversan object tohighlight it,then double-clicks in thehighlightedarea to addthe object tothe Selectedlist.
Text box • Attributequalificationprompts
• Metricqualificationprompts
• Value prompts
Tree • Hierarchyprompts
InMicroStrategyWeb, a userexpands thelevels tonavigate to anobject. Theuser double-clicks anobject to addit to theSelected list.
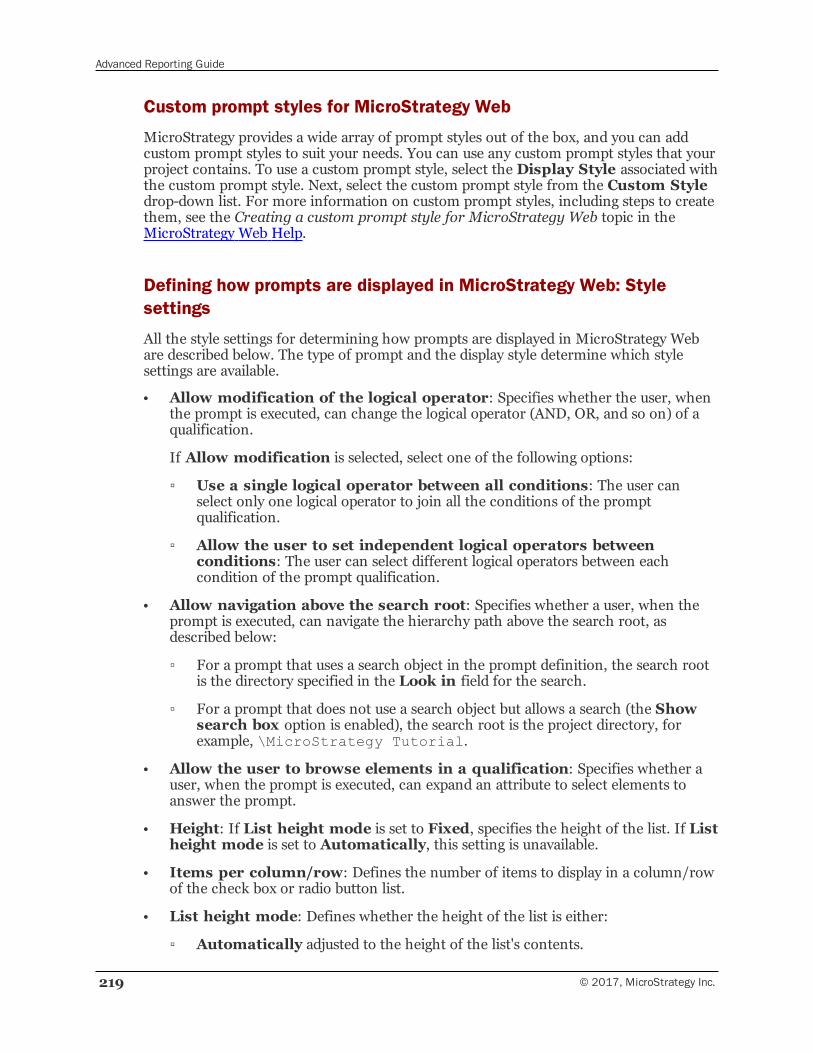
Advanced Reporting Guide
219 © 2017, MicroStrategy Inc.
Custom prompt styles for MicroStrategy Web
MicroStrategy provides a wide array of prompt styles out of the box, and you can addcustom prompt styles to suit your needs. You can use any custom prompt styles that yourproject contains. To use a custom prompt style, select the Display Style associated withthe custom prompt style. Next, select the custom prompt style from the Custom Styledrop-down list. For more information on custom prompt styles, including steps to createthem, see the Creating a custom prompt style for MicroStrategy Web topic in theMicroStrategy Web Help.
Defining how prompts are displayed in MicroStrategy Web: Stylesettings
All the style settings for determining how prompts are displayed in MicroStrategy Webare described below. The type of prompt and the display style determine which stylesettings are available.
• Allow modification of the logical operator: Specifies whether the user, whenthe prompt is executed, can change the logical operator (AND, OR, and so on) of aqualification.
If Allow modification is selected, select one of the following options:
▫ Use a single logical operator between all conditions: The user canselect only one logical operator to join all the conditions of the promptqualification.
▫ Allow the user to set independent logical operators betweenconditions: The user can select different logical operators between eachcondition of the prompt qualification.
• Allow navigation above the search root: Specifies whether a user, when theprompt is executed, can navigate the hierarchy path above the search root, asdescribed below:
▫ For a prompt that uses a search object in the prompt definition, the search rootis the directory specified in the Look in field for the search.
▫ For a prompt that does not use a search object but allows a search (the Showsearch box option is enabled), the search root is the project directory, forexample, \MicroStrategy Tutorial.
• Allow the user to browse elements in a qualification: Specifies whether auser, when the prompt is executed, can expand an attribute to select elements toanswer the prompt.
• Height: If List height mode is set to Fixed, specifies the height of the list. If Listheight mode is set to Automatically, this setting is unavailable.
• Items per column/row: Defines the number of items to display in a column/rowof the check box or radio button list.
• List height mode: Defines whether the height of the list is either:
▫ Automatically adjusted to the height of the list's contents.
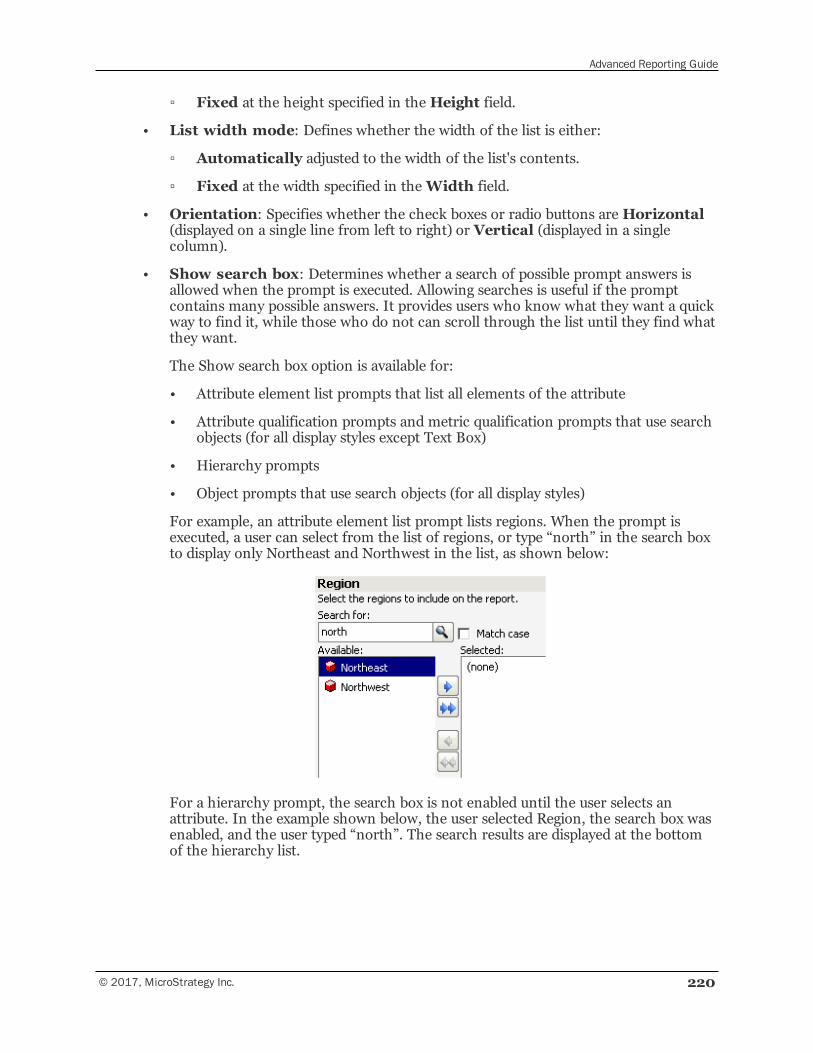
Advanced Reporting Guide
© 2017, MicroStrategy Inc. 220
▫ Fixed at the height specified in theHeight field.
• List width mode: Defines whether the width of the list is either:
▫ Automatically adjusted to the width of the list's contents.
▫ Fixed at the width specified in theWidth field.
• Orientation: Specifies whether the check boxes or radio buttons areHorizontal(displayed on a single line from left to right) or Vertical (displayed in a singlecolumn).
• Show search box: Determines whether a search of possible prompt answers isallowed when the prompt is executed. Allowing searches is useful if the promptcontains many possible answers. It provides users who know what they want a quickway to find it, while those who do not can scroll through the list until they find whatthey want.
The Show search box option is available for:
• Attribute element list prompts that list all elements of the attribute
• Attribute qualification prompts and metric qualification prompts that use searchobjects (for all display styles except Text Box)
• Hierarchy prompts
• Object prompts that use search objects (for all display styles)
For example, an attribute element list prompt lists regions. When the prompt isexecuted, a user can select from the list of regions, or type “north” in the search boxto display only Northeast and Northwest in the list, as shown below:
For a hierarchy prompt, the search box is not enabled until the user selects anattribute. In the example shown below, the user selected Region, the search box wasenabled, and the user typed “north”. The search results are displayed at the bottomof the hierarchy list.
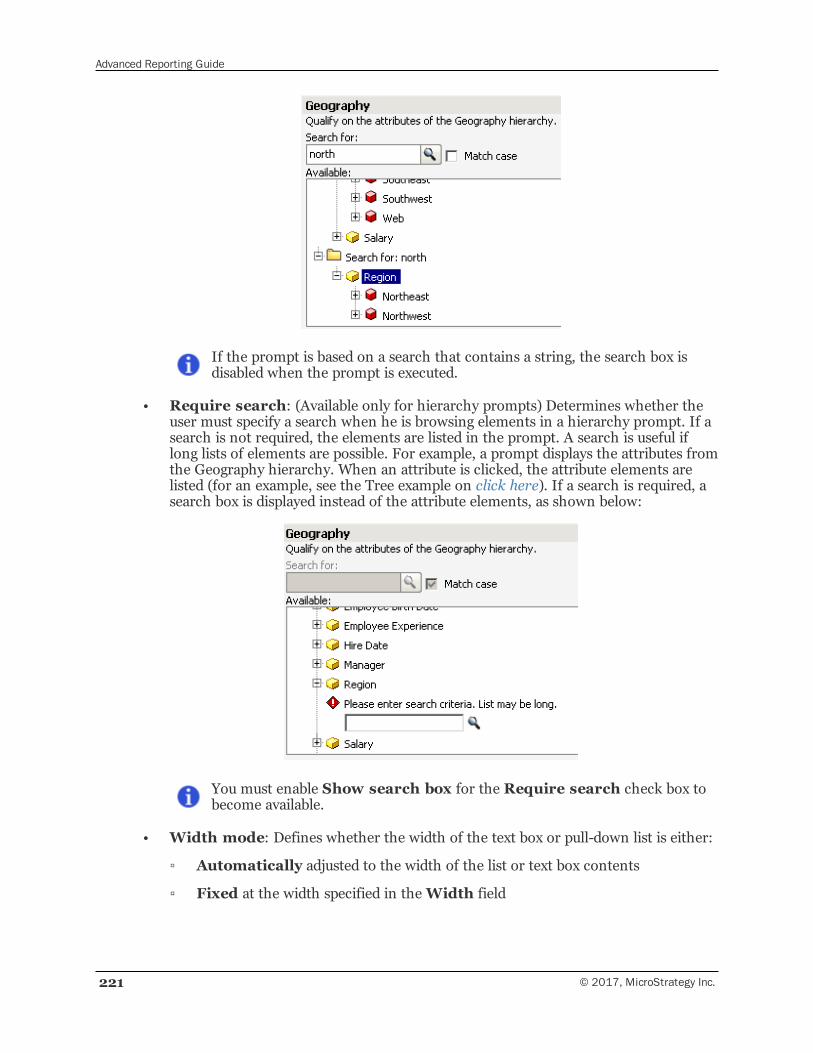
Advanced Reporting Guide
221 © 2017, MicroStrategy Inc.
If the prompt is based on a search that contains a string, the search box isdisabled when the prompt is executed.
• Require search: (Available only for hierarchy prompts) Determines whether theuser must specify a search when he is browsing elements in a hierarchy prompt. If asearch is not required, the elements are listed in the prompt. A search is useful iflong lists of elements are possible. For example, a prompt displays the attributes fromthe Geography hierarchy. When an attribute is clicked, the attribute elements arelisted (for an example, see the Tree example on click here). If a search is required, asearch box is displayed instead of the attribute elements, as shown below:
You must enable Show search box for the Require search check box tobecome available.
• Width mode: Defines whether the width of the text box or pull-down list is either:
▫ Automatically adjusted to the width of the list or text box contents
▫ Fixed at the width specified in theWidth field
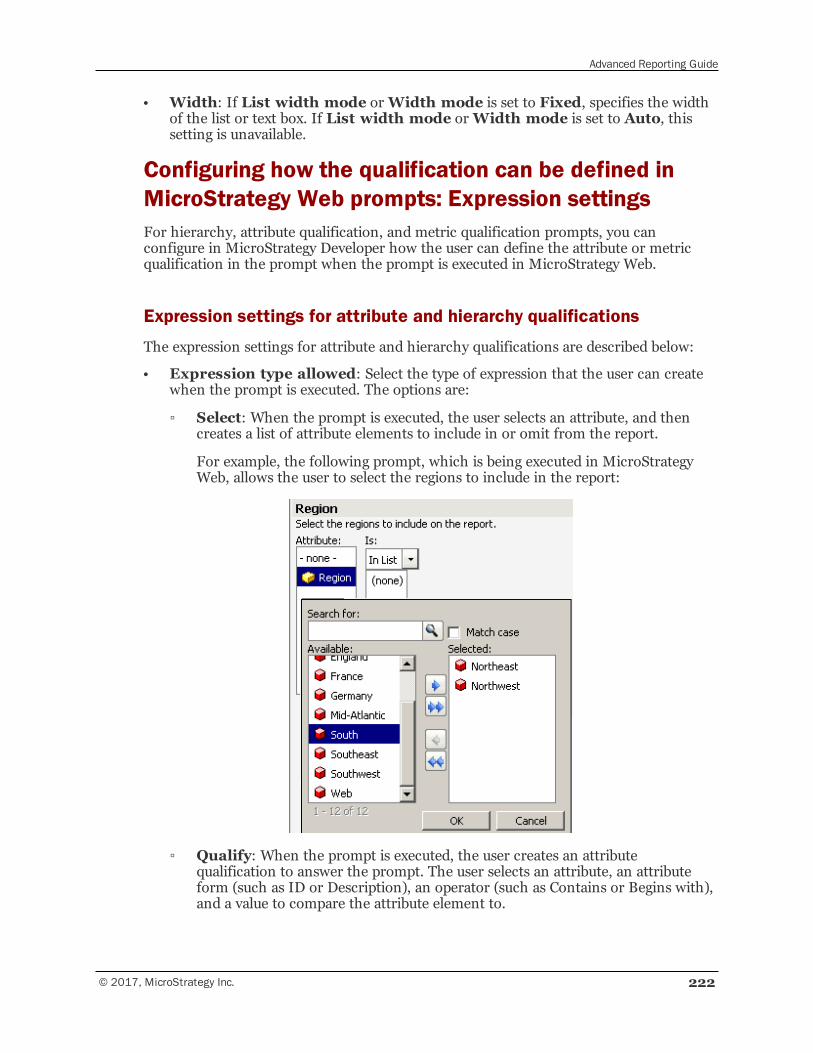
Advanced Reporting Guide
© 2017, MicroStrategy Inc. 222
• Width: If List width mode orWidth mode is set to Fixed, specifies the widthof the list or text box. If List width mode orWidth mode is set to Auto, thissetting is unavailable.
Configuring how the qualification can be defined inMicroStrategy Web prompts: Expression settingsFor hierarchy, attribute qualification, and metric qualification prompts, you canconfigure in MicroStrategy Developer how the user can define the attribute or metricqualification in the prompt when the prompt is executed in MicroStrategy Web.
Expression settings for attribute and hierarchy qualifications
The expression settings for attribute and hierarchy qualifications are described below:
• Expression type allowed: Select the type of expression that the user can createwhen the prompt is executed. The options are:
▫ Select: When the prompt is executed, the user selects an attribute, and thencreates a list of attribute elements to include in or omit from the report.
For example, the following prompt, which is being executed in MicroStrategyWeb, allows the user to select the regions to include in the report:
▫ Qualify: When the prompt is executed, the user creates an attributequalification to answer the prompt. The user selects an attribute, an attributeform (such as ID or Description), an operator (such as Contains or Begins with),and a value to compare the attribute element to.
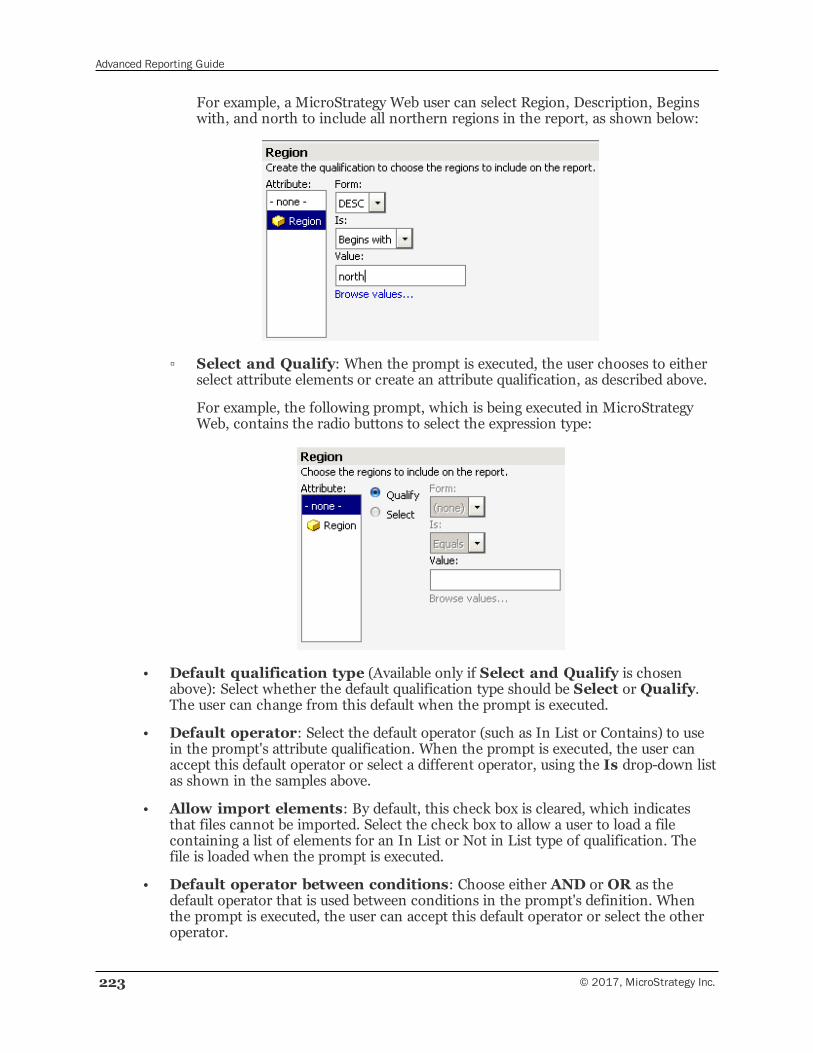
Advanced Reporting Guide
223 © 2017, MicroStrategy Inc.
For example, a MicroStrategy Web user can select Region, Description, Beginswith, and north to include all northern regions in the report, as shown below:
▫ Select and Qualify: When the prompt is executed, the user chooses to eitherselect attribute elements or create an attribute qualification, as described above.
For example, the following prompt, which is being executed in MicroStrategyWeb, contains the radio buttons to select the expression type:
• Default qualification type (Available only if Select and Qualify is chosenabove): Select whether the default qualification type should be Select or Qualify.The user can change from this default when the prompt is executed.
• Default operator: Select the default operator (such as In List or Contains) to usein the prompt's attribute qualification. When the prompt is executed, the user canaccept this default operator or select a different operator, using the Is drop-down listas shown in the samples above.
• Allow import elements: By default, this check box is cleared, which indicatesthat files cannot be imported. Select the check box to allow a user to load a filecontaining a list of elements for an In List or Not in List type of qualification. Thefile is loaded when the prompt is executed.
• Default operator between conditions: Choose either AND or OR as thedefault operator that is used between conditions in the prompt's definition. Whenthe prompt is executed, the user can accept this default operator or select the otheroperator.
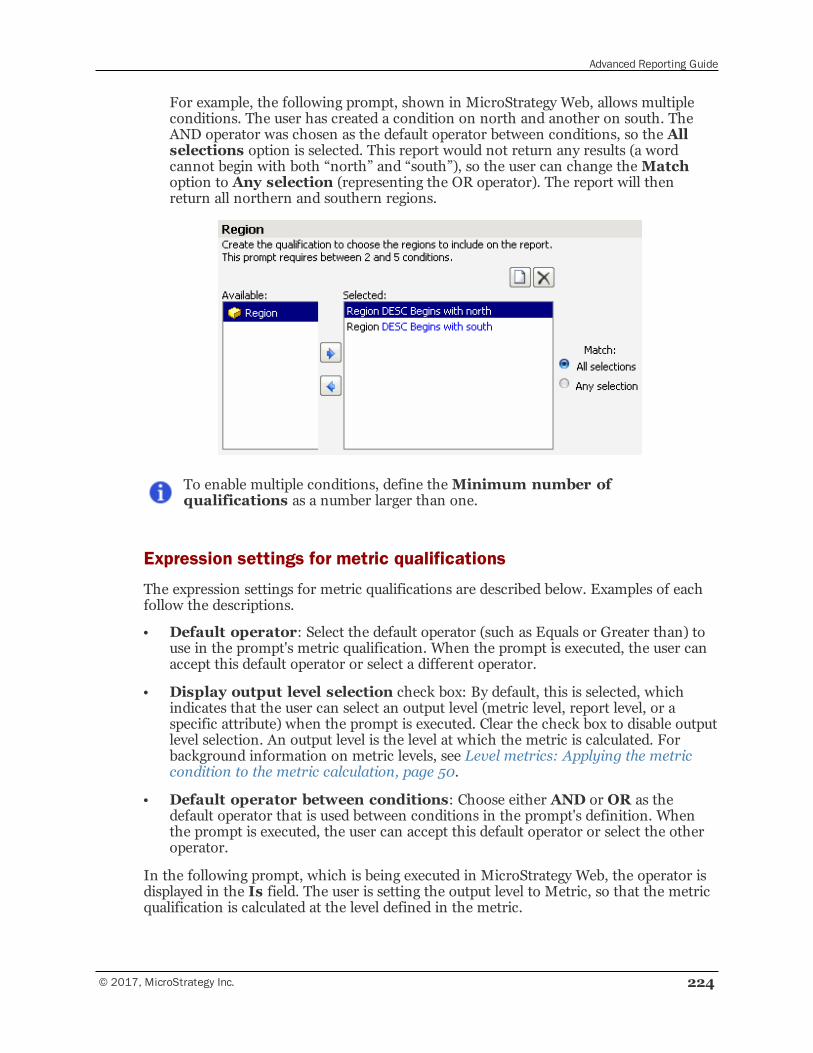
Advanced Reporting Guide
© 2017, MicroStrategy Inc. 224
For example, the following prompt, shown in MicroStrategy Web, allows multipleconditions. The user has created a condition on north and another on south. TheAND operator was chosen as the default operator between conditions, so the Allselections option is selected. This report would not return any results (a wordcannot begin with both “north” and “south”), so the user can change theMatchoption to Any selection (representing the OR operator). The report will thenreturn all northern and southern regions.
To enable multiple conditions, define theMinimum number ofqualifications as a number larger than one.
Expression settings for metric qualifications
The expression settings for metric qualifications are described below. Examples of eachfollow the descriptions.
• Default operator: Select the default operator (such as Equals or Greater than) touse in the prompt's metric qualification. When the prompt is executed, the user canaccept this default operator or select a different operator.
• Display output level selection check box: By default, this is selected, whichindicates that the user can select an output level (metric level, report level, or aspecific attribute) when the prompt is executed. Clear the check box to disable outputlevel selection. An output level is the level at which the metric is calculated. Forbackground information on metric levels, see Level metrics: Applying the metriccondition to the metric calculation, page 50.
• Default operator between conditions: Choose either AND or OR as thedefault operator that is used between conditions in the prompt's definition. Whenthe prompt is executed, the user can accept this default operator or select the otheroperator.
In the following prompt, which is being executed in MicroStrategy Web, the operator isdisplayed in the Is field. The user is setting the output level to Metric, so that the metricqualification is calculated at the level defined in the metric.
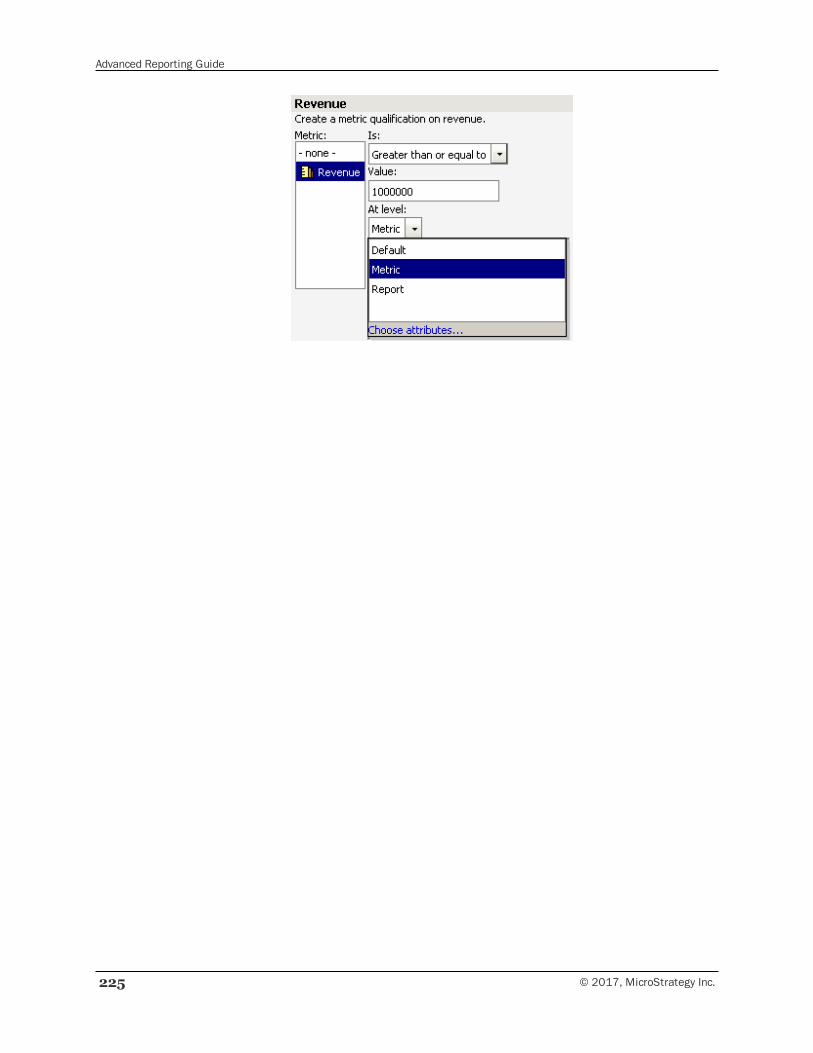
Advanced Reporting Guide
225 © 2017, MicroStrategy Inc.
7DESIGNING REPORTSUnderstanding data evaluation order anddistributing reports to users
A report is a MicroStrategy object that represents a request for a specific set of formatteddata from the data warehouse. Reports are the focus and goal of business intelligence.They allow users to gather business insight through data analysis.
The different parts of a report include:
• Attributes and facts from the warehouse
• Filters that determine how much data is used to generate the report
• Metrics that perform calculations on the facts
This section builds on the information in the Basic Reporting Guide. This section focuseson the complex interaction of various report features, and their potential impact on eachother and on the final results, during report execution. It includes the following topics:
• Before you begin
• Accessing the Basic Report: Foundation of examples
• Filters and order of calculation on reports
• The basics of report execution
• Totaling and subtotaling data on reports
• Sorting data on reports
• Formatting a report
• Determining which attribute elements are displayed: Attribute joins
• Evaluation order of objects on reports
• Adding features for users
• Distributing reports to a user community
© 2017, MicroStrategy Inc. 226
Advanced Reporting Guide
227 © 2017, MicroStrategy Inc.
• Exporting large reports as delimited text files
Before you beginThe Building Query Objects and Queries, for Designers section of the Basic ReportingGuide contains fundamental information on report design. This advanced section buildson the concepts and procedures presented there by providing more technical details andadvanced options for report design.
The reports discussed in this section are saved in the MicroStrategy Tutorial sampleproject. These reports are located inPublic Objects\Reports\MicroStrategy Platform Capabilities\Advanced Reporting Guide.
If you create reports while following steps in this section, remember to save anyreports you create under a different name than the sample report’s name in theTutorial project, so that you do not overwrite the sample reports in Tutorial.
Report design versus report creationReport design is the process of building reports from basic report components inMicroStrategy Developer and Web. While report design is the most generic method fordefining a report, it also requires the most in-depth knowledge of the project. In general,this method should be available only to the select group of advanced users and reportdesigners who will design reports for others to use.
You can also design, edit, or delete multiple reports at the same time by using aCommand Manager script. Command Manager is a MicroStrategy tool designed toautomate certain tasks and processes. For example, you can design a number ofempty reports based on the same template. For more information about CommandManager, including steps to use scripts, see the Command Manager chapter of theSystem Administration Guide.
Report creation is the process of building reports from existing, predesigned reportseither in MicroStrategy Developer or Web. Given the wealth of reporting functionalitythat you can make available to your users, you have the ability to design reports thatprovide a wide range of options for users to create their own reports, based on thereports you design.
Report creation is different from report design in that it provides a more guidedexperience and does not require your users to have a thorough understanding of theproject. This allows your users to create their own reports in a controlled, user-friendlyenvironment.
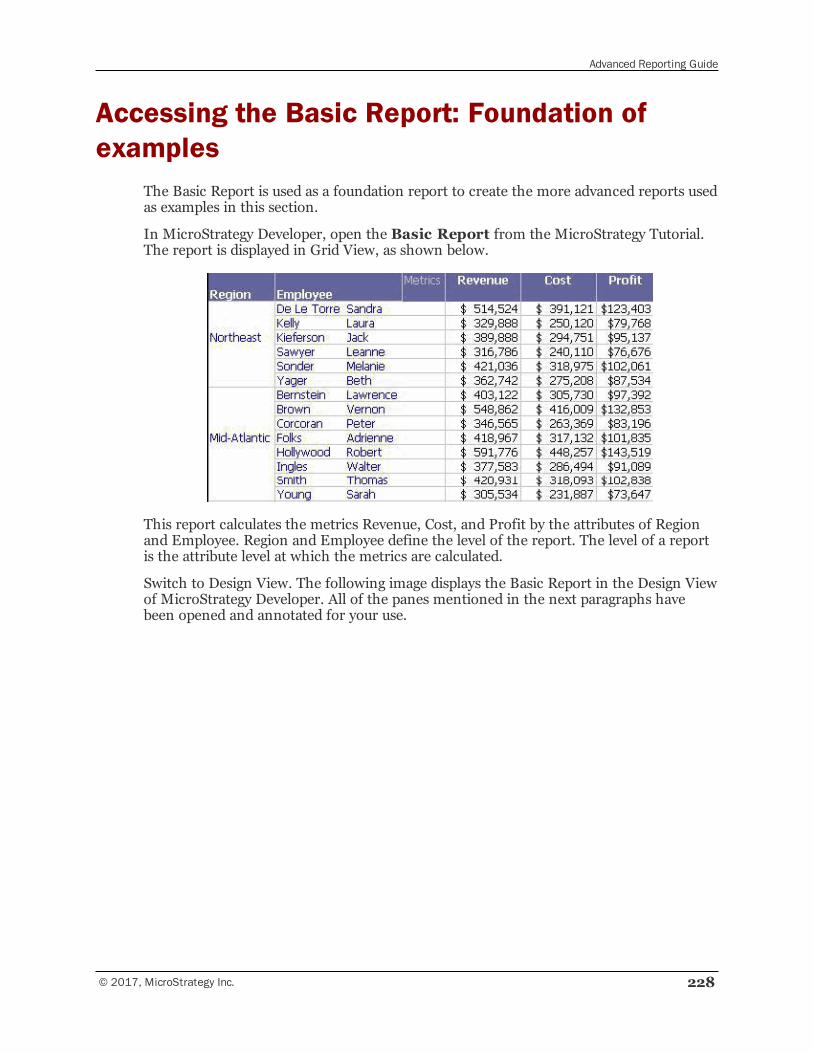
Advanced Reporting Guide
© 2017, MicroStrategy Inc. 228
Accessing the Basic Report: Foundation ofexamples
The Basic Report is used as a foundation report to create the more advanced reports usedas examples in this section.
In MicroStrategy Developer, open the Basic Report from the MicroStrategy Tutorial.The report is displayed in Grid View, as shown below.
This report calculates the metrics Revenue, Cost, and Profit by the attributes of Regionand Employee. Region and Employee define the level of the report. The level of a reportis the attribute level at which the metrics are calculated.
Switch to Design View. The following image displays the Basic Report in the Design Viewof MicroStrategy Developer. All of the panes mentioned in the next paragraphs havebeen opened and annotated for your use.
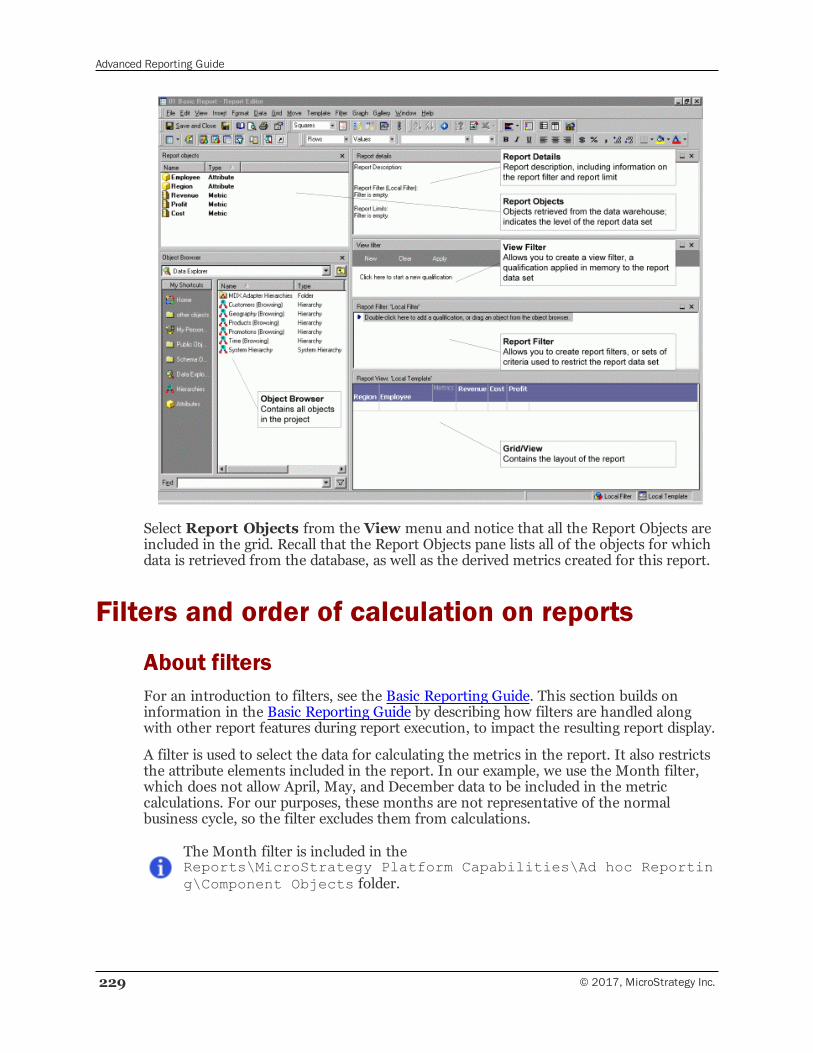
Advanced Reporting Guide
229 © 2017, MicroStrategy Inc.
Select Report Objects from the View menu and notice that all the Report Objects areincluded in the grid. Recall that the Report Objects pane lists all of the objects for whichdata is retrieved from the database, as well as the derived metrics created for this report.
Filters and order of calculation on reports
About filtersFor an introduction to filters, see the Basic Reporting Guide. This section builds oninformation in the Basic Reporting Guide by describing how filters are handled alongwith other report features during report execution, to impact the resulting report display.
A filter is used to select the data for calculating the metrics in the report. It also restrictsthe attribute elements included in the report. In our example, we use the Month filter,which does not allow April, May, and December data to be included in the metriccalculations. For our purposes, these months are not representative of the normalbusiness cycle, so the filter excludes them from calculations.
The Month filter is included in theReports\MicroStrategy Platform Capabilities\Ad hoc Reporting\Component Objects folder.
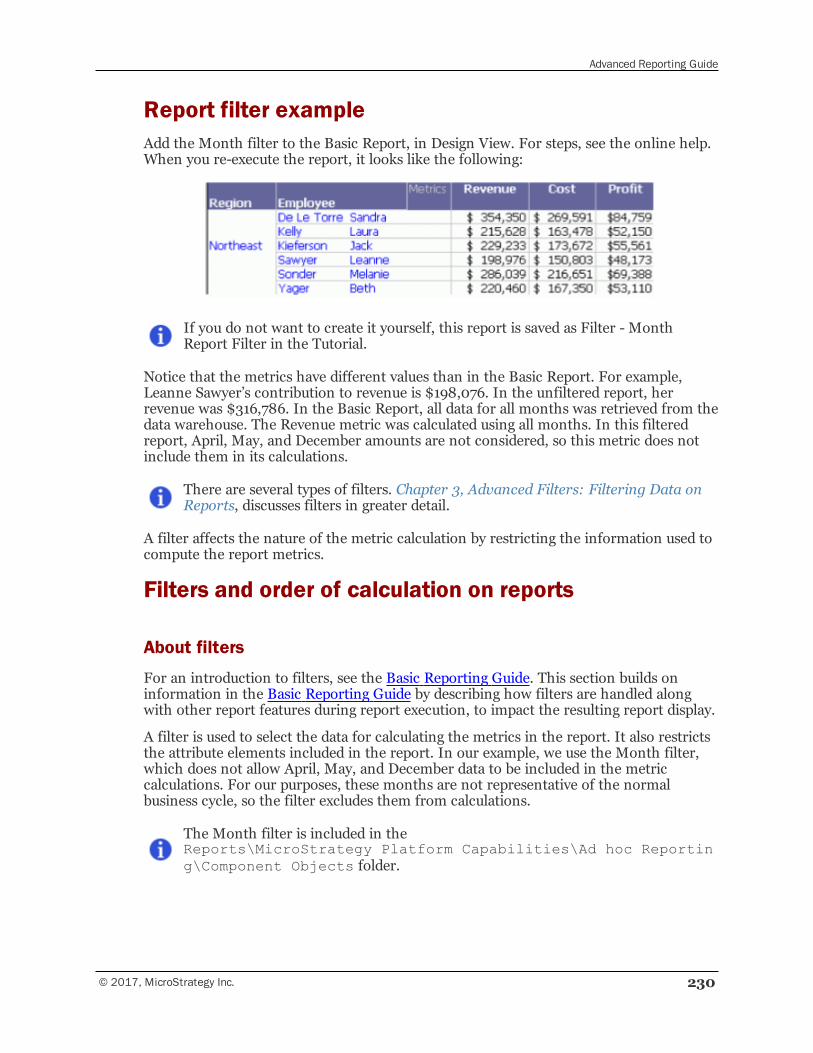
Advanced Reporting Guide
© 2017, MicroStrategy Inc. 230
Report filter exampleAdd the Month filter to the Basic Report, in Design View. For steps, see the online help.When you re-execute the report, it looks like the following:
If you do not want to create it yourself, this report is saved as Filter - MonthReport Filter in the Tutorial.
Notice that the metrics have different values than in the Basic Report. For example,Leanne Sawyer’s contribution to revenue is $198,076. In the unfiltered report, herrevenue was $316,786. In the Basic Report, all data for all months was retrieved from thedata warehouse. The Revenue metric was calculated using all months. In this filteredreport, April, May, and December amounts are not considered, so this metric does notinclude them in its calculations.
There are several types of filters. Chapter 3, Advanced Filters: Filtering Data onReports, discusses filters in greater detail.
A filter affects the nature of the metric calculation by restricting the information used tocompute the report metrics.
Filters and order of calculation on reports
About filters
For an introduction to filters, see the Basic Reporting Guide. This section builds oninformation in the Basic Reporting Guide by describing how filters are handled alongwith other report features during report execution, to impact the resulting report display.
A filter is used to select the data for calculating the metrics in the report. It also restrictsthe attribute elements included in the report. In our example, we use the Month filter,which does not allow April, May, and December data to be included in the metriccalculations. For our purposes, these months are not representative of the normalbusiness cycle, so the filter excludes them from calculations.
The Month filter is included in theReports\MicroStrategy Platform Capabilities\Ad hoc Reporting\Component Objects folder.
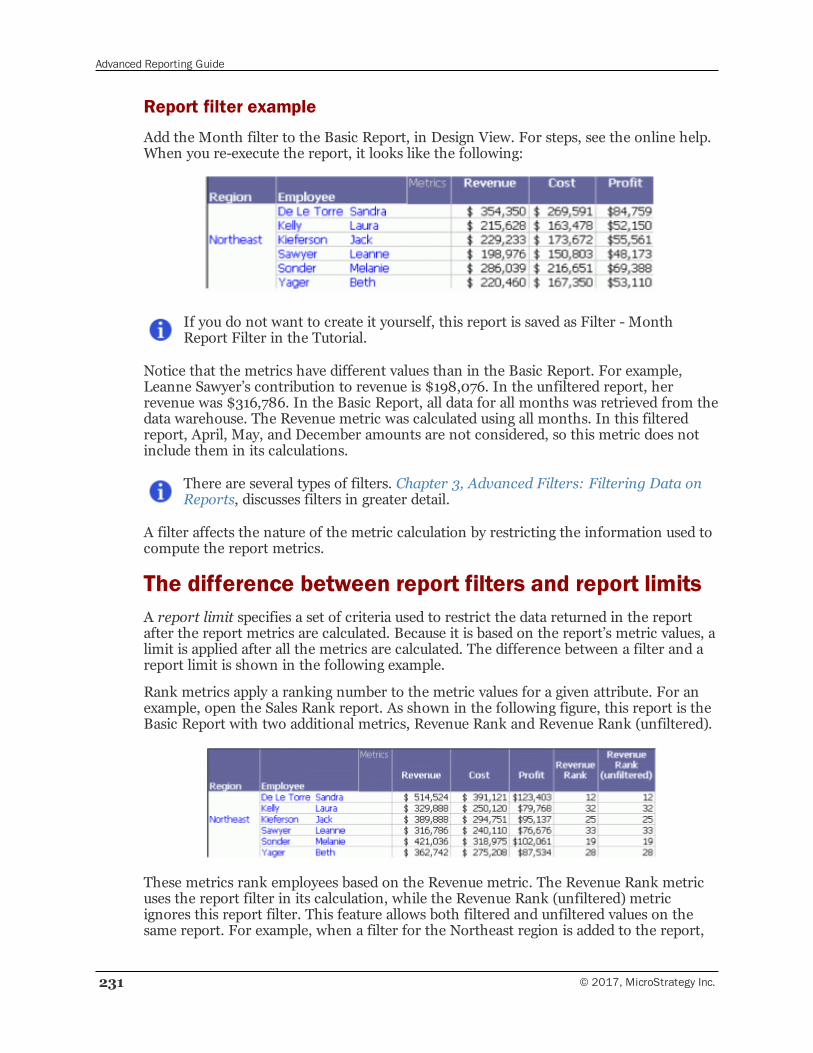
Advanced Reporting Guide
231 © 2017, MicroStrategy Inc.
Report filter example
Add the Month filter to the Basic Report, in Design View. For steps, see the online help.When you re-execute the report, it looks like the following:
If you do not want to create it yourself, this report is saved as Filter - MonthReport Filter in the Tutorial.
Notice that the metrics have different values than in the Basic Report. For example,Leanne Sawyer’s contribution to revenue is $198,076. In the unfiltered report, herrevenue was $316,786. In the Basic Report, all data for all months was retrieved from thedata warehouse. The Revenue metric was calculated using all months. In this filteredreport, April, May, and December amounts are not considered, so this metric does notinclude them in its calculations.
There are several types of filters. Chapter 3, Advanced Filters: Filtering Data onReports, discusses filters in greater detail.
A filter affects the nature of the metric calculation by restricting the information used tocompute the report metrics.
The difference between report filters and report limitsA report limit specifies a set of criteria used to restrict the data returned in the reportafter the report metrics are calculated. Because it is based on the report’s metric values, alimit is applied after all the metrics are calculated. The difference between a filter and areport limit is shown in the following example.
Rank metrics apply a ranking number to the metric values for a given attribute. For anexample, open the Sales Rank report. As shown in the following figure, this report is theBasic Report with two additional metrics, Revenue Rank and Revenue Rank (unfiltered).
These metrics rank employees based on the Revenue metric. The Revenue Rank metricuses the report filter in its calculation, while the Revenue Rank (unfiltered) metricignores this report filter. This feature allows both filtered and unfiltered values on thesame report. For example, when a filter for the Northeast region is added to the report,
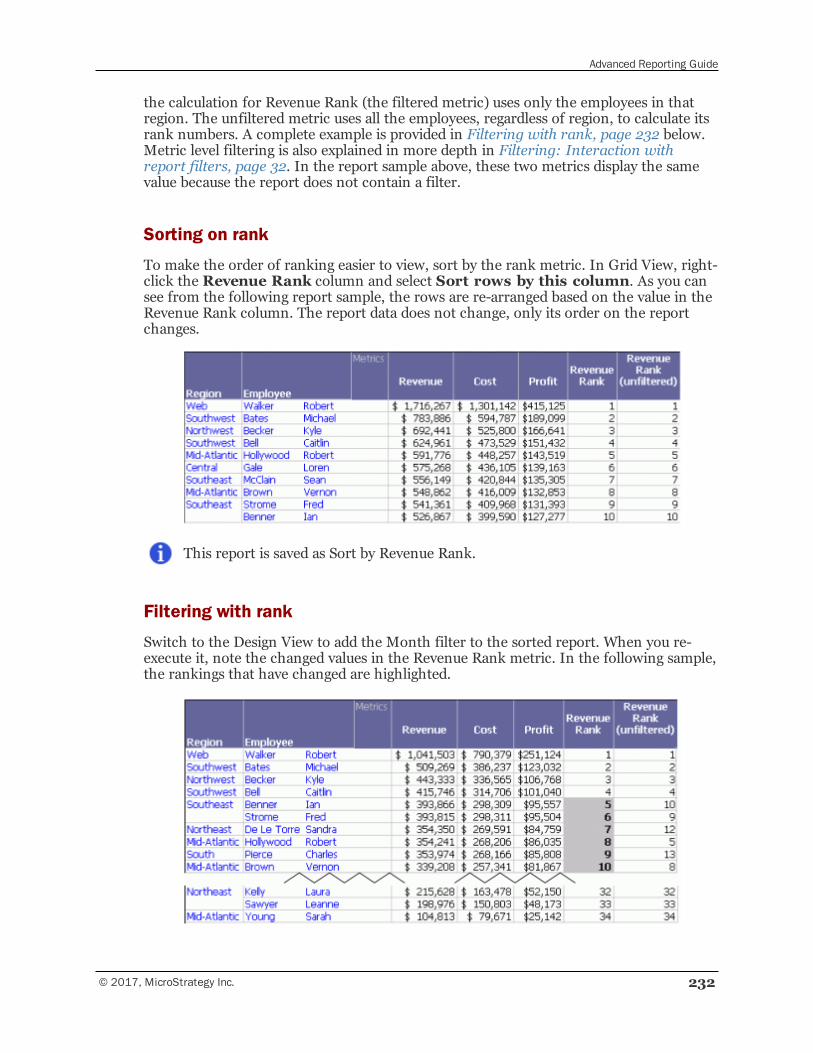
Advanced Reporting Guide
© 2017, MicroStrategy Inc. 232
the calculation for Revenue Rank (the filtered metric) uses only the employees in thatregion. The unfiltered metric uses all the employees, regardless of region, to calculate itsrank numbers. A complete example is provided in Filtering with rank, page 232 below.Metric level filtering is also explained in more depth in Filtering: Interaction withreport filters, page 32. In the report sample above, these two metrics display the samevalue because the report does not contain a filter.
Sorting on rank
To make the order of ranking easier to view, sort by the rank metric. In Grid View, right-click the Revenue Rank column and select Sort rows by this column. As you cansee from the following report sample, the rows are re-arranged based on the value in theRevenue Rank column. The report data does not change, only its order on the reportchanges.
This report is saved as Sort by Revenue Rank.
Filtering with rank
Switch to the Design View to add the Month filter to the sorted report. When you re-execute it, note the changed values in the Revenue Rank metric. In the following sample,the rankings that have changed are highlighted.
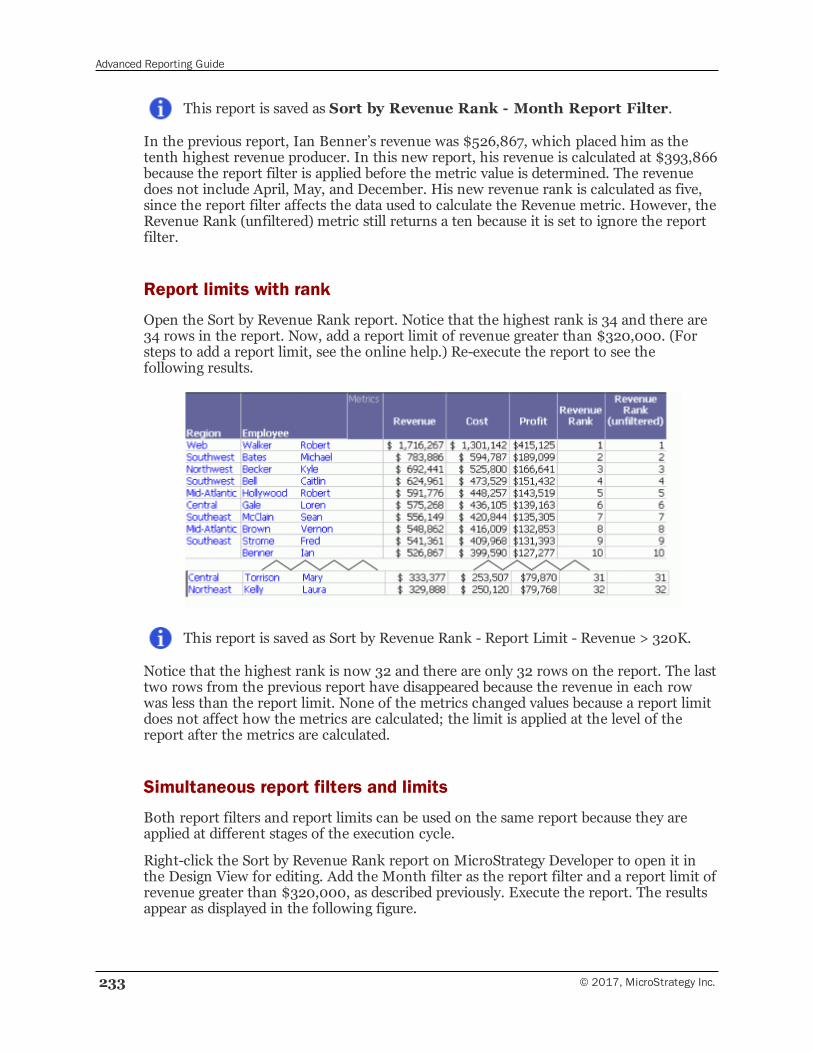
Advanced Reporting Guide
233 © 2017, MicroStrategy Inc.
This report is saved as Sort by Revenue Rank - Month Report Filter.
In the previous report, Ian Benner’s revenue was $526,867, which placed him as thetenth highest revenue producer. In this new report, his revenue is calculated at $393,866because the report filter is applied before the metric value is determined. The revenuedoes not include April, May, and December. His new revenue rank is calculated as five,since the report filter affects the data used to calculate the Revenue metric. However, theRevenue Rank (unfiltered) metric still returns a ten because it is set to ignore the reportfilter.
Report limits with rank
Open the Sort by Revenue Rank report. Notice that the highest rank is 34 and there are34 rows in the report. Now, add a report limit of revenue greater than $320,000. (Forsteps to add a report limit, see the online help.) Re-execute the report to see thefollowing results.
This report is saved as Sort by Revenue Rank - Report Limit - Revenue > 320K.
Notice that the highest rank is now 32 and there are only 32 rows on the report. The lasttwo rows from the previous report have disappeared because the revenue in each rowwas less than the report limit. None of the metrics changed values because a report limitdoes not affect how the metrics are calculated; the limit is applied at the level of thereport after the metrics are calculated.
Simultaneous report filters and limits
Both report filters and report limits can be used on the same report because they areapplied at different stages of the execution cycle.
Right-click the Sort by Revenue Rank report on MicroStrategy Developer to open it inthe Design View for editing. Add the Month filter as the report filter and a report limit ofrevenue greater than $320,000, as described previously. Execute the report. The resultsappear as displayed in the following figure.
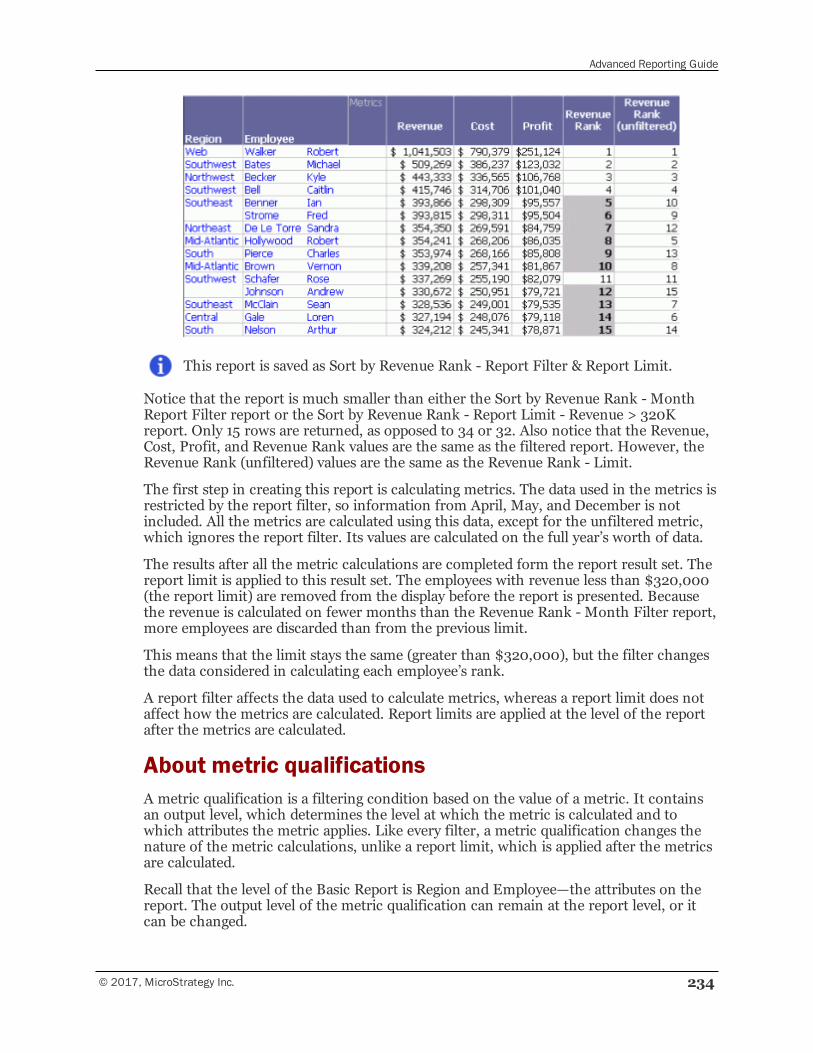
Advanced Reporting Guide
© 2017, MicroStrategy Inc. 234
This report is saved as Sort by Revenue Rank - Report Filter & Report Limit.
Notice that the report is much smaller than either the Sort by Revenue Rank - MonthReport Filter report or the Sort by Revenue Rank - Report Limit - Revenue > 320Kreport. Only 15 rows are returned, as opposed to 34 or 32. Also notice that the Revenue,Cost, Profit, and Revenue Rank values are the same as the filtered report. However, theRevenue Rank (unfiltered) values are the same as the Revenue Rank - Limit.
The first step in creating this report is calculating metrics. The data used in the metrics isrestricted by the report filter, so information from April, May, and December is notincluded. All the metrics are calculated using this data, except for the unfiltered metric,which ignores the report filter. Its values are calculated on the full year’s worth of data.
The results after all the metric calculations are completed form the report result set. Thereport limit is applied to this result set. The employees with revenue less than $320,000(the report limit) are removed from the display before the report is presented. Becausethe revenue is calculated on fewer months than the Revenue Rank - Month Filter report,more employees are discarded than from the previous limit.
This means that the limit stays the same (greater than $320,000), but the filter changesthe data considered in calculating each employee’s rank.
A report filter affects the data used to calculate metrics, whereas a report limit does notaffect how the metrics are calculated. Report limits are applied at the level of the reportafter the metrics are calculated.
About metric qualificationsA metric qualification is a filtering condition based on the value of a metric. It containsan output level, which determines the level at which the metric is calculated and towhich attributes the metric applies. Like every filter, a metric qualification changes thenature of the metric calculations, unlike a report limit, which is applied after the metricsare calculated.
Recall that the level of the Basic Report is Region and Employee—the attributes on thereport. The output level of the metric qualification can remain at the report level, or itcan be changed.
Advanced Reporting Guide
235 © 2017, MicroStrategy Inc.
If the output level is the same as the report level, the results are usually the same as usinga report limit. This is just a coincidence, however, because report limits and metricqualifications are calculated differently and at different times in the report executioncycle.
If the output level differs from the report level, the metrics are calculated at the outputlevel. In the example that follows, the report level is region and employee. In theprevious reports, the metrics were calculated for each employee using all brands and allproducts. When a metric qualification with an output level is applied to the report, themetrics are calculated with only the data that meets the metric qualification. Workingthrough the sample report will help you better understand metric qualifications andoutput levels.
Regardless of whether the output level differs from the report level, a metric qualificationaffects the report result set. On the other hand, a report limit is applied after the metricsare calculated.
Example: Metric qualification
Right-click the Sort by Revenue Rank report on MicroStrategy Developer and select Editto edit the report. Add a metric qualification by following the steps that follow.
To add a metric qualification
1 Double-click in the Report Filter pane to add a qualification.
2 Select Add a Set qualification and click OK. A set qualification is based on ametric or attribute relationships.
3 Click the browse button next to Output Level.
4 Select Calculate the output for the list of attributes. This allows you to selectthe output level for the metric qualification.
5 Select Brand under the Products folder and click > to add it to the Selectedobjects list.
6 Click OK.
7 Click the browse button next to Metric.
8 Select Revenue in the Sales Metrics folder.
9 Click OK.
10 Keep the Function as Metric Value, but select Greater than from the Operatordrop-down list.
11 Do not change Value, but type 320000 in the box next to it.
12 Click OK.
Execute the report. The results are displayed in the following figure.
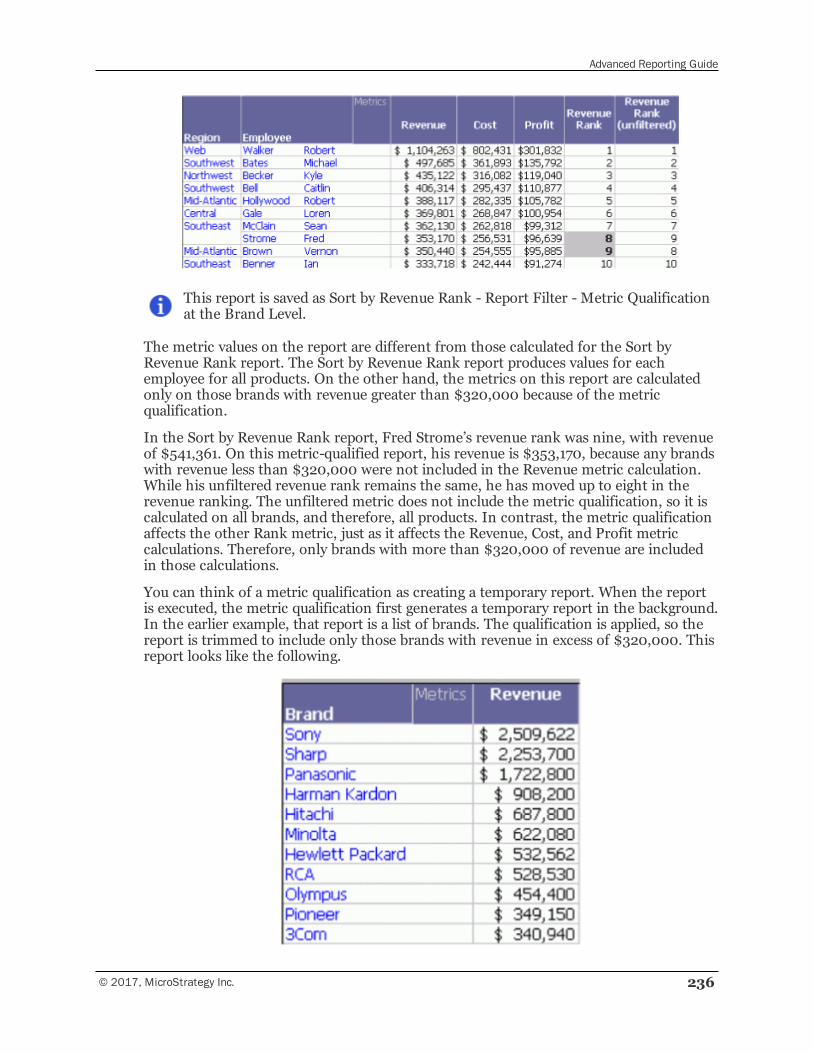
Advanced Reporting Guide
© 2017, MicroStrategy Inc. 236
This report is saved as Sort by Revenue Rank - Report Filter - Metric Qualificationat the Brand Level.
The metric values on the report are different from those calculated for the Sort byRevenue Rank report. The Sort by Revenue Rank report produces values for eachemployee for all products. On the other hand, the metrics on this report are calculatedonly on those brands with revenue greater than $320,000 because of the metricqualification.
In the Sort by Revenue Rank report, Fred Strome’s revenue rank was nine, with revenueof $541,361. On this metric-qualified report, his revenue is $353,170, because any brandswith revenue less than $320,000 were not included in the Revenue metric calculation.While his unfiltered revenue rank remains the same, he has moved up to eight in therevenue ranking. The unfiltered metric does not include the metric qualification, so it iscalculated on all brands, and therefore, all products. In contrast, the metric qualificationaffects the other Rank metric, just as it affects the Revenue, Cost, and Profit metriccalculations. Therefore, only brands with more than $320,000 of revenue are includedin those calculations.
You can think of a metric qualification as creating a temporary report. When the reportis executed, the metric qualification first generates a temporary report in the background.In the earlier example, that report is a list of brands. The qualification is applied, so thereport is trimmed to include only those brands with revenue in excess of $320,000. Thisreport looks like the following.
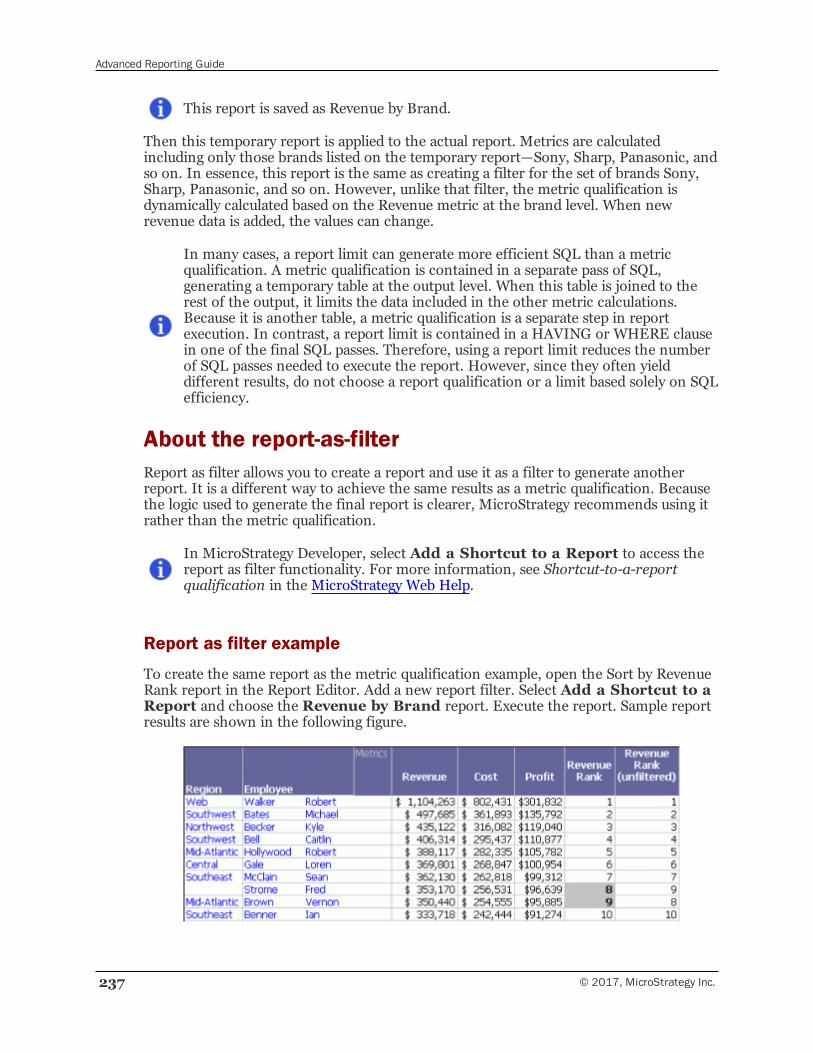
Advanced Reporting Guide
237 © 2017, MicroStrategy Inc.
This report is saved as Revenue by Brand.
Then this temporary report is applied to the actual report. Metrics are calculatedincluding only those brands listed on the temporary report—Sony, Sharp, Panasonic, andso on. In essence, this report is the same as creating a filter for the set of brands Sony,Sharp, Panasonic, and so on. However, unlike that filter, the metric qualification isdynamically calculated based on the Revenue metric at the brand level. When newrevenue data is added, the values can change.
In many cases, a report limit can generate more efficient SQL than a metricqualification. A metric qualification is contained in a separate pass of SQL,generating a temporary table at the output level. When this table is joined to therest of the output, it limits the data included in the other metric calculations.Because it is another table, a metric qualification is a separate step in reportexecution. In contrast, a report limit is contained in a HAVING or WHERE clausein one of the final SQL passes. Therefore, using a report limit reduces the numberof SQL passes needed to execute the report. However, since they often yielddifferent results, do not choose a report qualification or a limit based solely on SQLefficiency.
About the report-as-filterReport as filter allows you to create a report and use it as a filter to generate anotherreport. It is a different way to achieve the same results as a metric qualification. Becausethe logic used to generate the final report is clearer, MicroStrategy recommends using itrather than the metric qualification.
In MicroStrategy Developer, select Add a Shortcut to a Report to access thereport as filter functionality. For more information, see Shortcut-to-a-reportqualification in the MicroStrategy Web Help.
Report as filter example
To create the same report as the metric qualification example, open the Sort by RevenueRank report in the Report Editor. Add a new report filter. Select Add a Shortcut to aReport and choose the Revenue by Brand report. Execute the report. Sample reportresults are shown in the following figure.
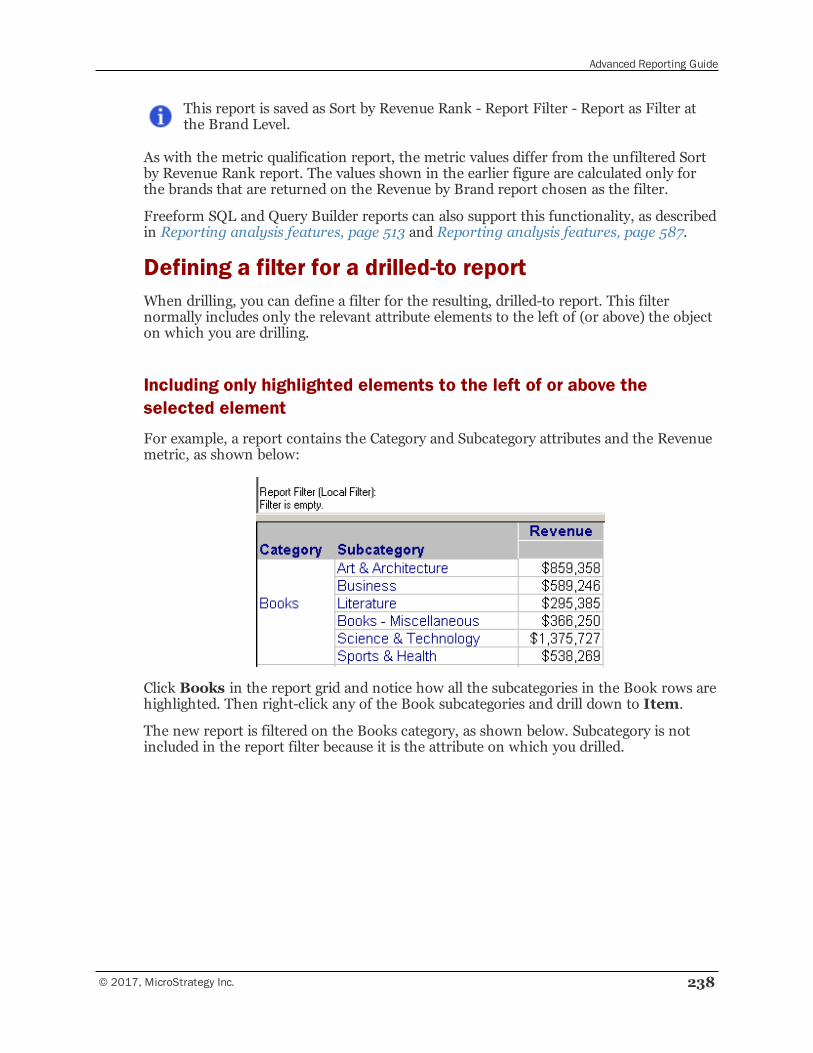
Advanced Reporting Guide
© 2017, MicroStrategy Inc. 238
This report is saved as Sort by Revenue Rank - Report Filter - Report as Filter atthe Brand Level.
As with the metric qualification report, the metric values differ from the unfiltered Sortby Revenue Rank report. The values shown in the earlier figure are calculated only forthe brands that are returned on the Revenue by Brand report chosen as the filter.
Freeform SQL and Query Builder reports can also support this functionality, as describedin Reporting analysis features, page 513 and Reporting analysis features, page 587.
Defining a filter for a drilled-to reportWhen drilling, you can define a filter for the resulting, drilled-to report. This filternormally includes only the relevant attribute elements to the left of (or above) the objecton which you are drilling.
Including only highlighted elements to the left of or above theselected element
For example, a report contains the Category and Subcategory attributes and the Revenuemetric, as shown below:
Click Books in the report grid and notice how all the subcategories in the Book rows arehighlighted. Then right-click any of the Book subcategories and drill down to Item.
The new report is filtered on the Books category, as shown below. Subcategory is notincluded in the report filter because it is the attribute on which you drilled.
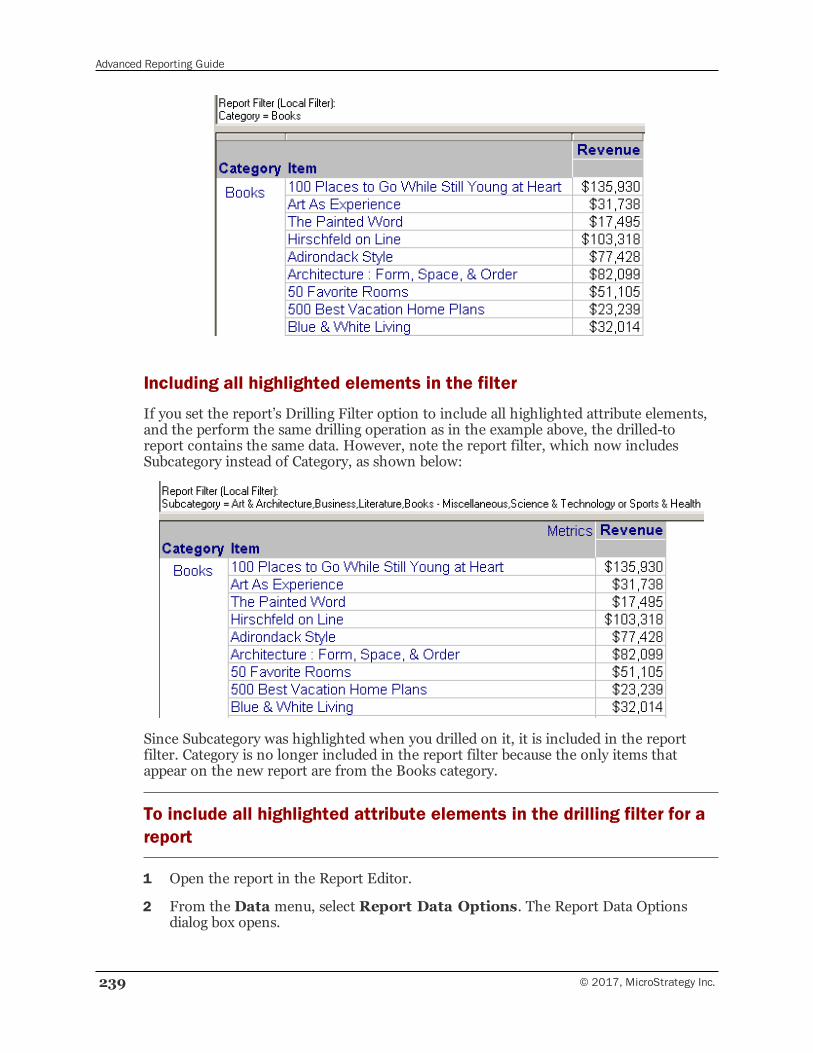
Advanced Reporting Guide
239 © 2017, MicroStrategy Inc.
Including all highlighted elements in the filter
If you set the report’s Drilling Filter option to include all highlighted attribute elements,and the perform the same drilling operation as in the example above, the drilled-toreport contains the same data. However, note the report filter, which now includesSubcategory instead of Category, as shown below:
Since Subcategory was highlighted when you drilled on it, it is included in the reportfilter. Category is no longer included in the report filter because the only items thatappear on the new report are from the Books category.
To include all highlighted attribute elements in the drilling filter for areport
1 Open the report in the Report Editor.
2 From the Data menu, select Report Data Options. The Report Data Optionsdialog box opens.
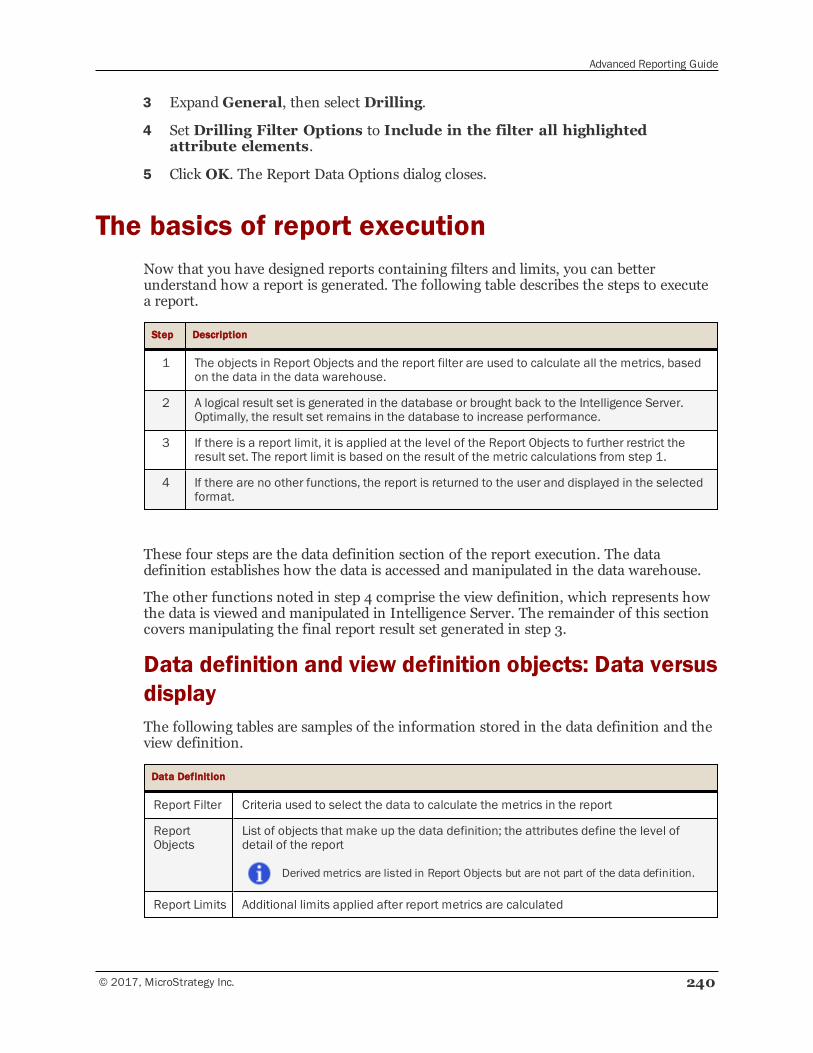
Advanced Reporting Guide
© 2017, MicroStrategy Inc. 240
3 Expand General, then select Drilling.
4 Set Drilling Filter Options to Include in the filter all highlightedattribute elements.
5 Click OK. The Report Data Options dialog closes.
The basics of report executionNow that you have designed reports containing filters and limits, you can betterunderstand how a report is generated. The following table describes the steps to executea report.
Step Description
1 The objects in Report Objects and the report filter are used to calculate all the metrics, basedon the data in the data warehouse.
2 A logical result set is generated in the database or brought back to the Intelligence Server.Optimally, the result set remains in the database to increase performance.
3 If there is a report limit, it is applied at the level of the Report Objects to further restrict theresult set. The report limit is based on the result of the metric calculations from step 1.
4 If there are no other functions, the report is returned to the user and displayed in the selectedformat.
These four steps are the data definition section of the report execution. The datadefinition establishes how the data is accessed and manipulated in the data warehouse.
The other functions noted in step 4 comprise the view definition, which represents howthe data is viewed and manipulated in Intelligence Server. The remainder of this sectioncovers manipulating the final report result set generated in step 3.
Data definition and view definition objects: Data versusdisplayThe following tables are samples of the information stored in the data definition and theview definition.
Data Definition
Report Filter Criteria used to select the data to calculate the metrics in the report
ReportObjects
List of objects that make up the data definition; the attributes define the level ofdetail of the report
Derived metrics are listed in Report Objects but are not part of the data definition.
Report Limits Additional limits applied after report metrics are calculated
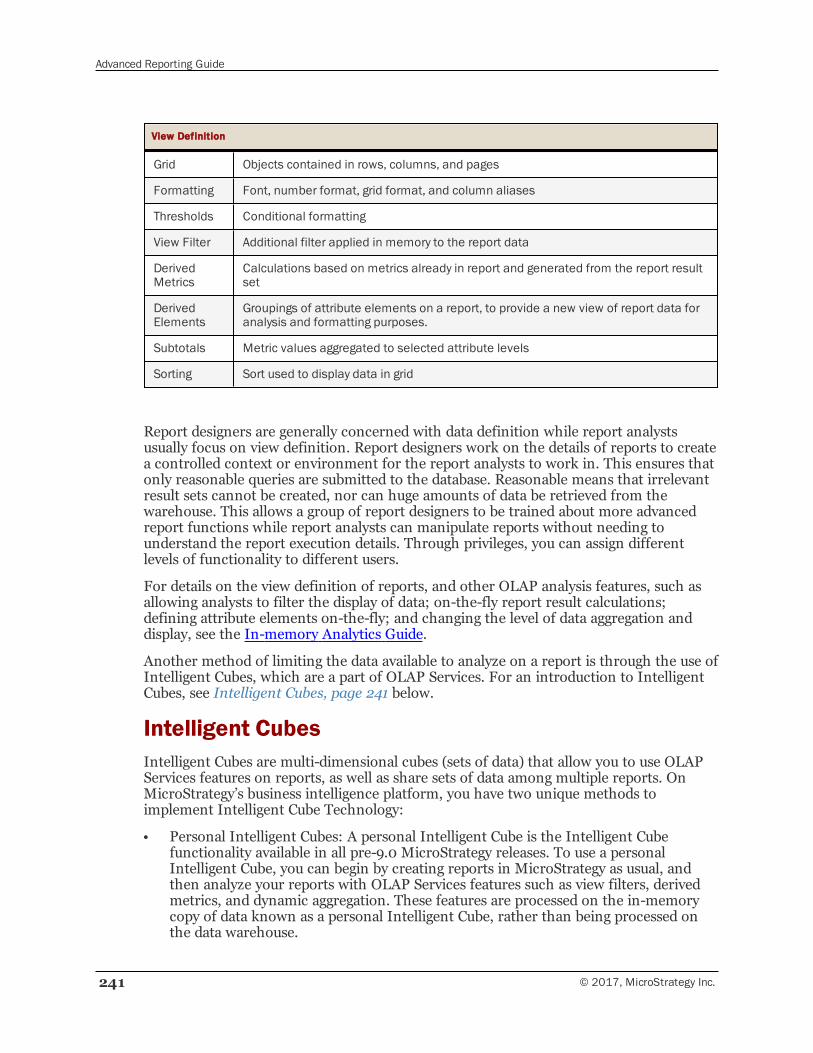
Advanced Reporting Guide
241 © 2017, MicroStrategy Inc.
View Definition
Grid Objects contained in rows, columns, and pages
Formatting Font, number format, grid format, and column aliases
Thresholds Conditional formatting
View Filter Additional filter applied in memory to the report data
DerivedMetrics
Calculations based on metrics already in report and generated from the report resultset
DerivedElements
Groupings of attribute elements on a report, to provide a new view of report data foranalysis and formatting purposes.
Subtotals Metric values aggregated to selected attribute levels
Sorting Sort used to display data in grid
Report designers are generally concerned with data definition while report analystsusually focus on view definition. Report designers work on the details of reports to createa controlled context or environment for the report analysts to work in. This ensures thatonly reasonable queries are submitted to the database. Reasonable means that irrelevantresult sets cannot be created, nor can huge amounts of data be retrieved from thewarehouse. This allows a group of report designers to be trained about more advancedreport functions while report analysts can manipulate reports without needing tounderstand the report execution details. Through privileges, you can assign differentlevels of functionality to different users.
For details on the view definition of reports, and other OLAP analysis features, such asallowing analysts to filter the display of data; on-the-fly report result calculations;defining attribute elements on-the-fly; and changing the level of data aggregation anddisplay, see the In-memory Analytics Guide.
Another method of limiting the data available to analyze on a report is through the use ofIntelligent Cubes, which are a part of OLAP Services. For an introduction to IntelligentCubes, see Intelligent Cubes, page 241 below.
Intelligent CubesIntelligent Cubes are multi-dimensional cubes (sets of data) that allow you to use OLAPServices features on reports, as well as share sets of data among multiple reports. OnMicroStrategy’s business intelligence platform, you have two unique methods toimplement Intelligent Cube Technology:
• Personal Intelligent Cubes: A personal Intelligent Cube is the Intelligent Cubefunctionality available in all pre-9.0 MicroStrategy releases. To use a personalIntelligent Cube, you can begin by creating reports in MicroStrategy as usual, andthen analyze your reports with OLAP Services features such as view filters, derivedmetrics, and dynamic aggregation. These features are processed on the in-memorycopy of data known as a personal Intelligent Cube, rather than being processed onthe data warehouse.
Advanced Reporting Guide
© 2017, MicroStrategy Inc. 242
• Intelligent Cubes: A shared Intelligent Cube (called an Intelligent Cube) is a set ofdata that can be shared as a single in-memory copy, among many different reportscreated by multiple users. Rather than returning data from the data warehouse for asingle report, you can return sets of data from your data warehouse and save themdirectly to Intelligence Server memory. The reports accessing Intelligent Cubes canuse all of the OLAP Services features for analysis and reporting purposes.
For information on Intelligent Cubes and the OLAP Services features they support, seethe In-memory Analytics Guide. For information on administering shared IntelligentCubes, see the System Administration Guide.
Totaling and subtotaling data on reportsThe term “subtotal” is used to mean all types of totaling, including grand totals, totals,and subtotals. Topics include:
• About subtotals
• Custom report subtotals
• Subtotals and memory usage
About subtotalsIn the context of reports, subtotals reflect data rolled up to the selected attribute levelsand can be applied dynamically to any report. You can apply subtotals using one of manystandard subtotal functions such as total, count, minimum, maximum, standarddeviation, and others. For a list of the standard subtotal functions, see Defining subtotaldefaults, page 90. You can create a customized user-defined subtotal using the SubtotalEditor. For more information, see Defining subtotal defaults, page 90.
On a report, you can apply the subtotal by position, across a level, or using group by. ThisApplied levels option, which is located on the Advanced Subtotals dialog box, does notaffect the location of the subtotal on the report, but rather how the subtotal is calculated.To change the display location, use the Display Options tab in the Subtotals dialogbox; for steps, see theMicroStrategy Developer help.
• Applying a subtotal across a level calculates a subtotal across the selected attributes.The subtotal is applied to particular levels-rows, columns, and pages. This means“group by attributes to the left of the selected attribute.”
For example, if you have Region and Employee, in that order, on a report (as on theBasic Report), selecting across Employee means group by Region. A subtotal for eachRegion, totaling the individual Employee-Region values, displays on the report.Likewise, across Region means group by none since there is nothing to the left of iton the report. The result is a grand total. However, if the report is pivoted and theorder of the attributes changes, the totals also change. If Employee is pivoted to theleft of Region, the across Employee subtotal means group by none.
• The by position option means applying the subtotal based on its location on thereport. The subtotal is calculated across all attributes and hierarchies on the report.It provides the same behavior as across level, but without selecting a level. Instead,the level is selected dynamically so these subtotals change as you alter the layout of
Advanced Reporting Guide
243 © 2017, MicroStrategy Inc.
the template. The two choices for by position are All subtotals, meaning “across allattributes,” and Grand Total, meaning “across the leftmost attribute.”
For example, you can choose to subtotal on rows and/or columns. The Basic Reportcontains the columns Region, Employee, Revenue, Cost, and Profit. You can subtotalby both rows and columns, which provides totals at the employee and region levelfor each metric.
By default, the by position option is selected.
• Group by applies the subtotal by the selected attribute across all other attributes onthe template, regardless of position. Group by effectively allows you to use bothsubtotal and sort by attributes that are not the furthest to the left. The Grand Totalcheck box allows you to also add a subtotal grouped by nothing, effectivelycalculating a total of all attributes on the template.
If a report contains Region, Category, and Quarter and you group by Region, aRegion subtotal always appears, regardless of where Category and Quarter are locatedwith respect to Region. You can also group by multiple attributes. For example,grouping by Region-Category on that report provides a subtotal every time a newRegion-Category combination occurs.
Group by works best if the report is sorted by the same attribute used to groupthe subtotals, regardless of position.
Subtotals by position example
Open the Subtotals report, a sample of which is displayed below. This report is based onthe Basic Report, with the addition of the attribute Quarter. Also, a view filter has beenadded, which includes only quarters 1 and 2 of Year 2002 and the Northeast, Central,and South regions.
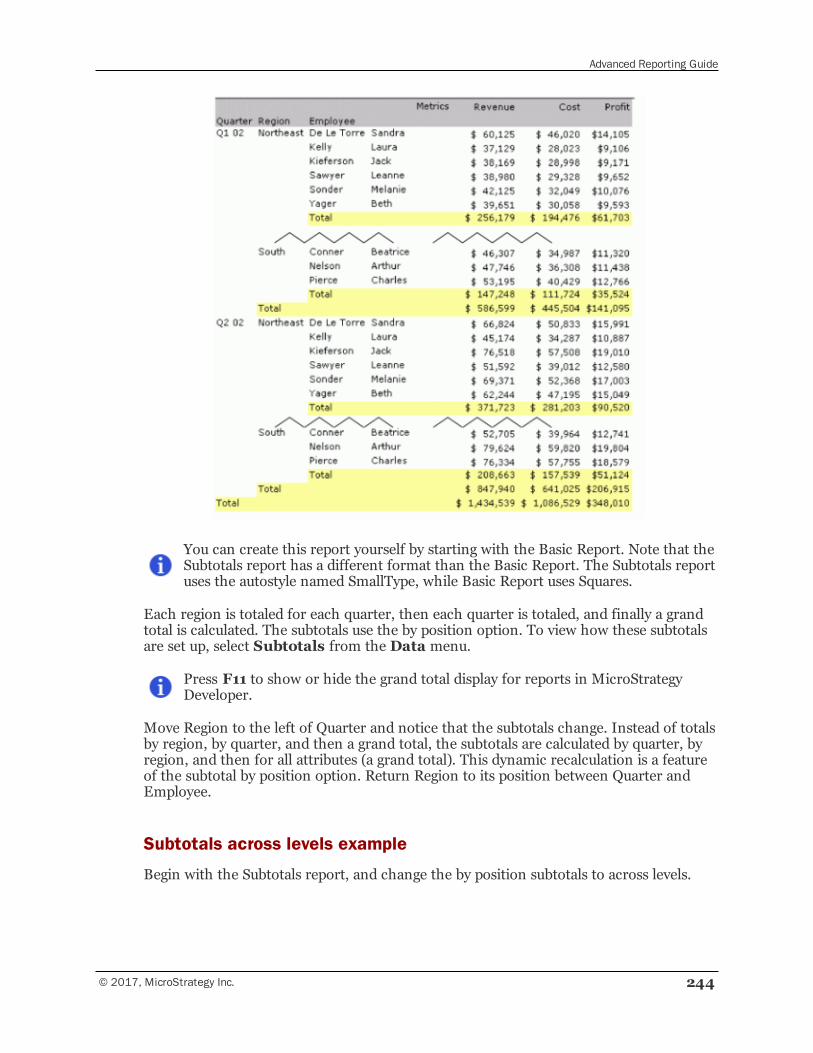
Advanced Reporting Guide
© 2017, MicroStrategy Inc. 244
You can create this report yourself by starting with the Basic Report. Note that theSubtotals report has a different format than the Basic Report. The Subtotals reportuses the autostyle named SmallType, while Basic Report uses Squares.
Each region is totaled for each quarter, then each quarter is totaled, and finally a grandtotal is calculated. The subtotals use the by position option. To view how these subtotalsare set up, select Subtotals from the Data menu.
Press F11 to show or hide the grand total display for reports in MicroStrategyDeveloper.
Move Region to the left of Quarter and notice that the subtotals change. Instead of totalsby region, by quarter, and then a grand total, the subtotals are calculated by quarter, byregion, and then for all attributes (a grand total). This dynamic recalculation is a featureof the subtotal by position option. Return Region to its position between Quarter andEmployee.
Subtotals across levels example
Begin with the Subtotals report, and change the by position subtotals to across levels.
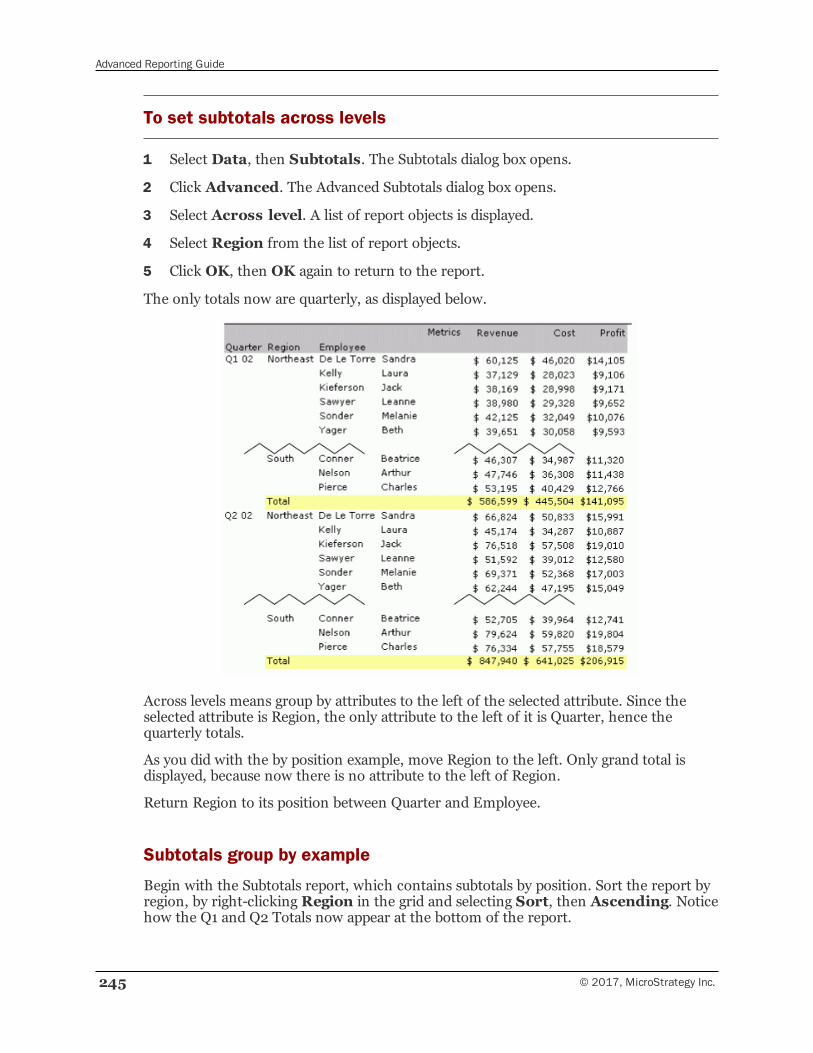
Advanced Reporting Guide
245 © 2017, MicroStrategy Inc.
To set subtotals across levels
1 Select Data, then Subtotals. The Subtotals dialog box opens.
2 Click Advanced. The Advanced Subtotals dialog box opens.
3 Select Across level. A list of report objects is displayed.
4 Select Region from the list of report objects.
5 Click OK, then OK again to return to the report.
The only totals now are quarterly, as displayed below.
Across levels means group by attributes to the left of the selected attribute. Since theselected attribute is Region, the only attribute to the left of it is Quarter, hence thequarterly totals.
As you did with the by position example, move Region to the left. Only grand total isdisplayed, because now there is no attribute to the left of Region.
Return Region to its position between Quarter and Employee.
Subtotals group by example
Begin with the Subtotals report, which contains subtotals by position. Sort the report byregion, by right-clicking Region in the grid and selecting Sort, then Ascending. Noticehow the Q1 and Q2 Totals now appear at the bottom of the report.
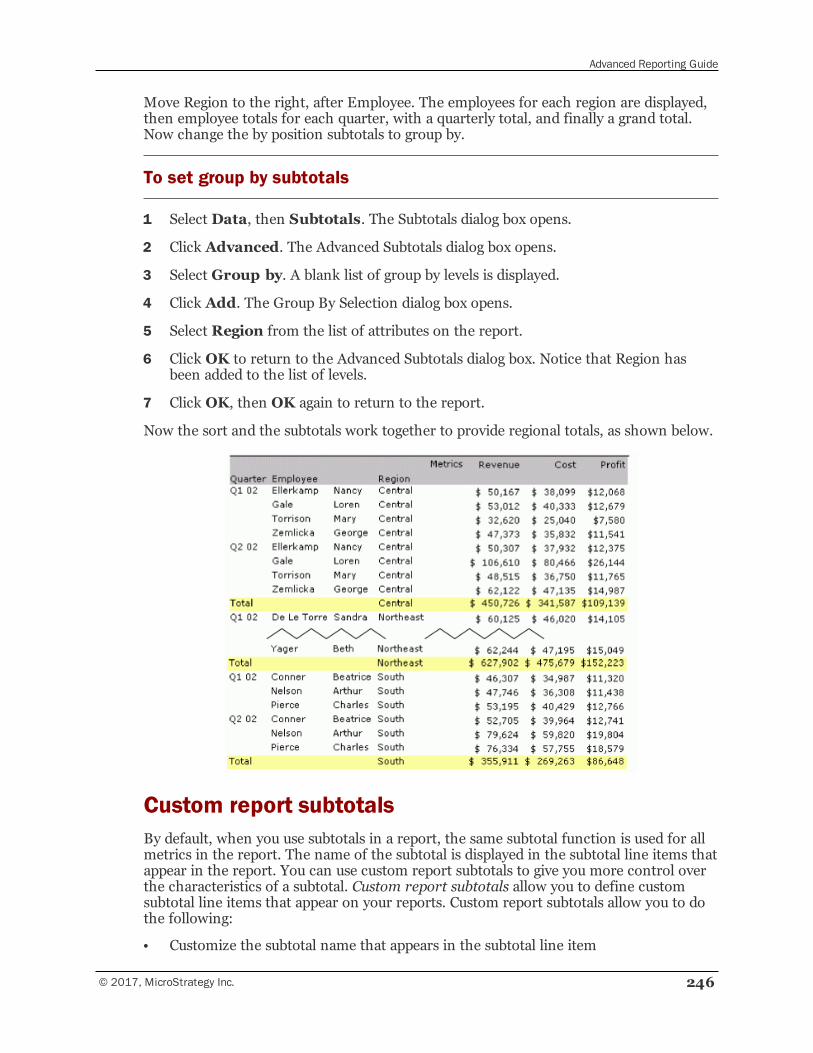
Advanced Reporting Guide
© 2017, MicroStrategy Inc. 246
Move Region to the right, after Employee. The employees for each region are displayed,then employee totals for each quarter, with a quarterly total, and finally a grand total.Now change the by position subtotals to group by.
To set group by subtotals
1 Select Data, then Subtotals. The Subtotals dialog box opens.
2 Click Advanced. The Advanced Subtotals dialog box opens.
3 Select Group by. A blank list of group by levels is displayed.
4 Click Add. The Group By Selection dialog box opens.
5 Select Region from the list of attributes on the report.
6 Click OK to return to the Advanced Subtotals dialog box. Notice that Region hasbeen added to the list of levels.
7 Click OK, then OK again to return to the report.
Now the sort and the subtotals work together to provide regional totals, as shown below.
Custom report subtotalsBy default, when you use subtotals in a report, the same subtotal function is used for allmetrics in the report. The name of the subtotal is displayed in the subtotal line items thatappear in the report. You can use custom report subtotals to give you more control overthe characteristics of a subtotal. Custom report subtotals allow you to define customsubtotal line items that appear on your reports. Custom report subtotals allow you to dothe following:
• Customize the subtotal name that appears in the subtotal line item
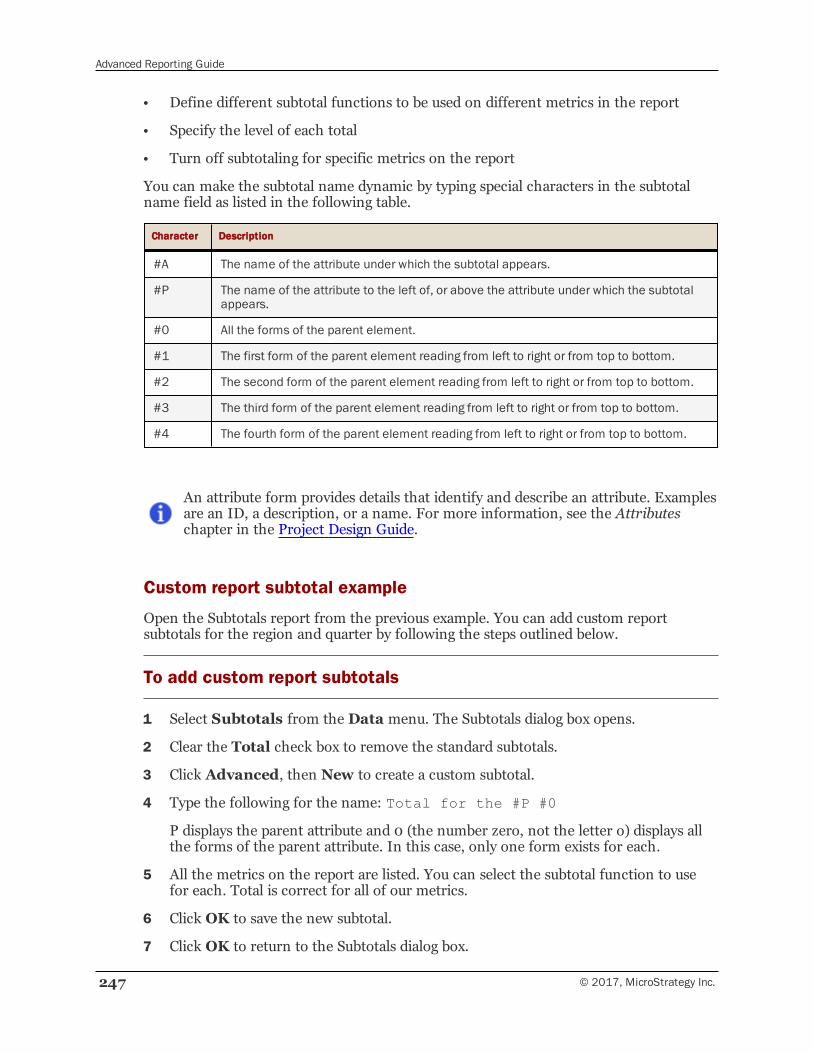
Advanced Reporting Guide
247 © 2017, MicroStrategy Inc.
• Define different subtotal functions to be used on different metrics in the report
• Specify the level of each total
• Turn off subtotaling for specific metrics on the report
You can make the subtotal name dynamic by typing special characters in the subtotalname field as listed in the following table.
Character Description
#A The name of the attribute under which the subtotal appears.
#P The name of the attribute to the left of, or above the attribute under which the subtotalappears.
#0 All the forms of the parent element.
#1 The first form of the parent element reading from left to right or from top to bottom.
#2 The second form of the parent element reading from left to right or from top to bottom.
#3 The third form of the parent element reading from left to right or from top to bottom.
#4 The fourth form of the parent element reading from left to right or from top to bottom.
An attribute form provides details that identify and describe an attribute. Examplesare an ID, a description, or a name. For more information, see the Attributeschapter in the Project Design Guide.
Custom report subtotal example
Open the Subtotals report from the previous example. You can add custom reportsubtotals for the region and quarter by following the steps outlined below.
To add custom report subtotals
1 Select Subtotals from the Data menu. The Subtotals dialog box opens.
2 Clear the Total check box to remove the standard subtotals.
3 Click Advanced, then New to create a custom subtotal.
4 Type the following for the name: Total for the #P #0
P displays the parent attribute and 0 (the number zero, not the letter o) displays allthe forms of the parent attribute. In this case, only one form exists for each.
5 All the metrics on the report are listed. You can select the subtotal function to usefor each. Total is correct for all of our metrics.
6 Click OK to save the new subtotal.
7 Click OK to return to the Subtotals dialog box.
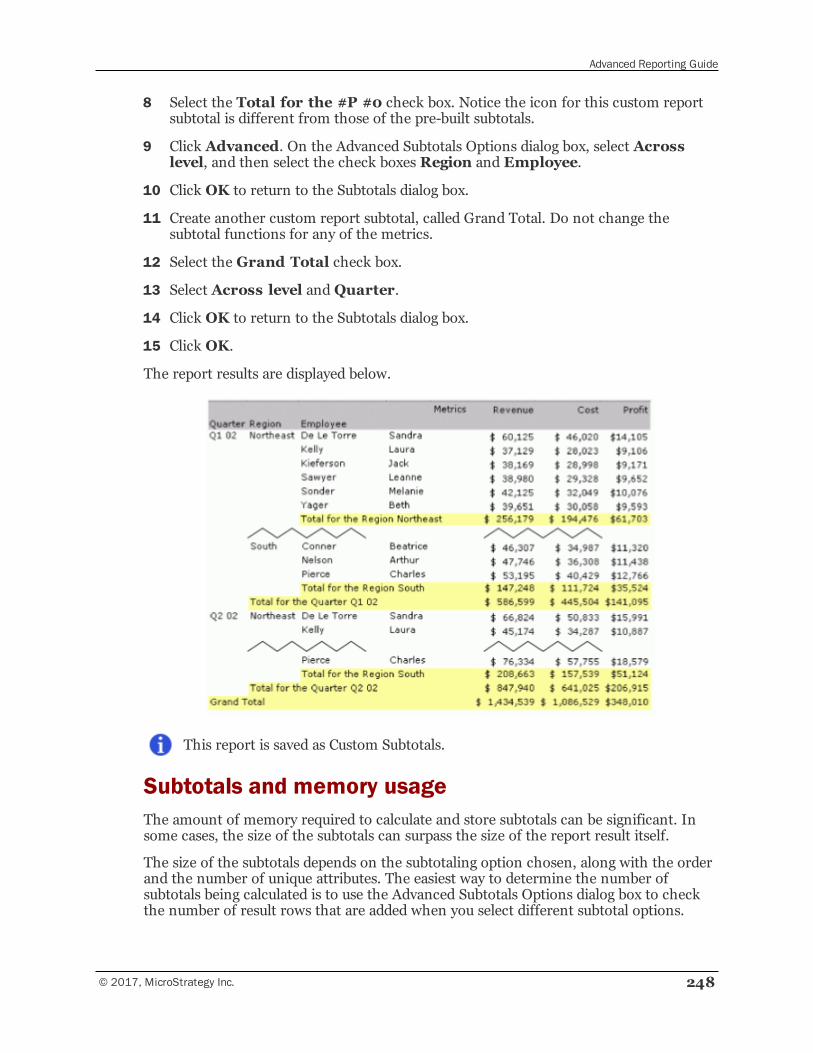
Advanced Reporting Guide
© 2017, MicroStrategy Inc. 248
8 Select the Total for the #P #0 check box. Notice the icon for this custom reportsubtotal is different from those of the pre-built subtotals.
9 Click Advanced. On the Advanced Subtotals Options dialog box, select Acrosslevel, and then select the check boxes Region and Employee.
10 Click OK to return to the Subtotals dialog box.
11 Create another custom report subtotal, called Grand Total. Do not change thesubtotal functions for any of the metrics.
12 Select the Grand Total check box.
13 Select Across level andQuarter.
14 Click OK to return to the Subtotals dialog box.
15 Click OK.
The report results are displayed below.
This report is saved as Custom Subtotals.
Subtotals and memory usageThe amount of memory required to calculate and store subtotals can be significant. Insome cases, the size of the subtotals can surpass the size of the report result itself.
The size of the subtotals depends on the subtotaling option chosen, along with the orderand the number of unique attributes. The easiest way to determine the number ofsubtotals being calculated is to use the Advanced Subtotals Options dialog box to checkthe number of result rows that are added when you select different subtotal options.
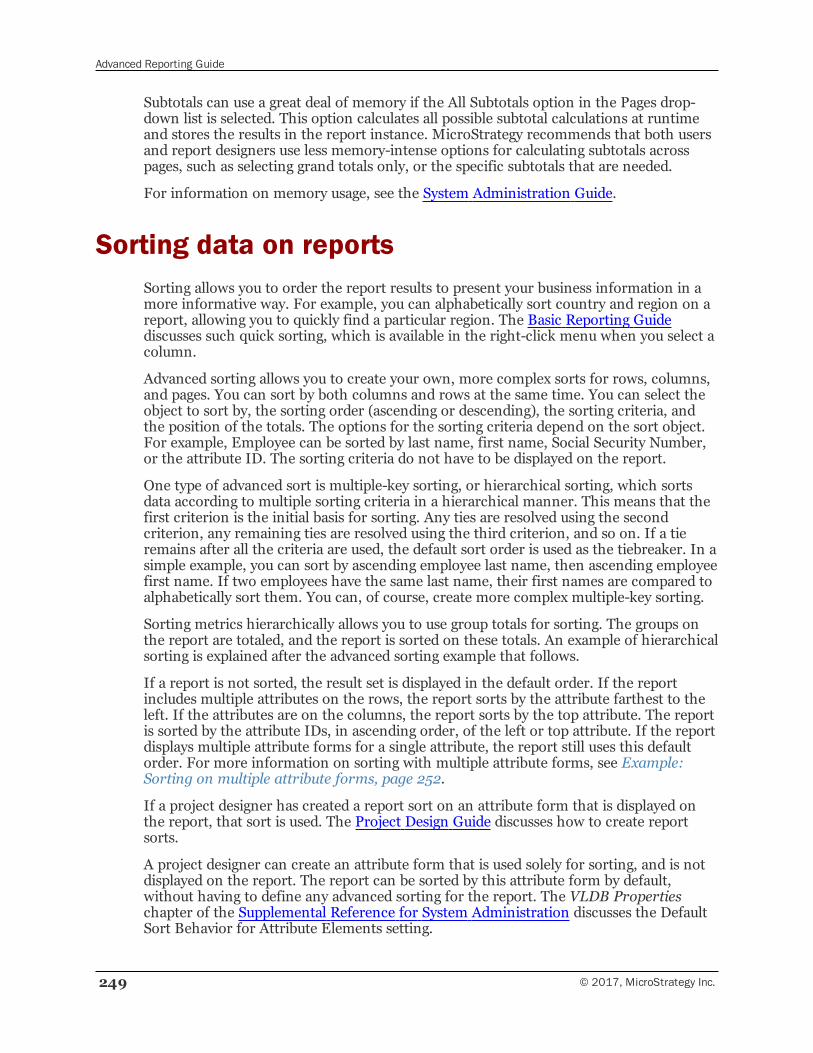
Advanced Reporting Guide
249 © 2017, MicroStrategy Inc.
Subtotals can use a great deal of memory if the All Subtotals option in the Pages drop-down list is selected. This option calculates all possible subtotal calculations at runtimeand stores the results in the report instance. MicroStrategy recommends that both usersand report designers use less memory-intense options for calculating subtotals acrosspages, such as selecting grand totals only, or the specific subtotals that are needed.
For information on memory usage, see the System Administration Guide.
Sorting data on reportsSorting allows you to order the report results to present your business information in amore informative way. For example, you can alphabetically sort country and region on areport, allowing you to quickly find a particular region. The Basic Reporting Guidediscusses such quick sorting, which is available in the right-click menu when you select acolumn.
Advanced sorting allows you to create your own, more complex sorts for rows, columns,and pages. You can sort by both columns and rows at the same time. You can select theobject to sort by, the sorting order (ascending or descending), the sorting criteria, andthe position of the totals. The options for the sorting criteria depend on the sort object.For example, Employee can be sorted by last name, first name, Social Security Number,or the attribute ID. The sorting criteria do not have to be displayed on the report.
One type of advanced sort is multiple-key sorting, or hierarchical sorting, which sortsdata according to multiple sorting criteria in a hierarchical manner. This means that thefirst criterion is the initial basis for sorting. Any ties are resolved using the secondcriterion, any remaining ties are resolved using the third criterion, and so on. If a tieremains after all the criteria are used, the default sort order is used as the tiebreaker. In asimple example, you can sort by ascending employee last name, then ascending employeefirst name. If two employees have the same last name, their first names are compared toalphabetically sort them. You can, of course, create more complex multiple-key sorting.
Sorting metrics hierarchically allows you to use group totals for sorting. The groups onthe report are totaled, and the report is sorted on these totals. An example of hierarchicalsorting is explained after the advanced sorting example that follows.
If a report is not sorted, the result set is displayed in the default order. If the reportincludes multiple attributes on the rows, the report sorts by the attribute farthest to theleft. If the attributes are on the columns, the report sorts by the top attribute. The reportis sorted by the attribute IDs, in ascending order, of the left or top attribute. If the reportdisplays multiple attribute forms for a single attribute, the report still uses this defaultorder. For more information on sorting with multiple attribute forms, see Example:Sorting on multiple attribute forms, page 252.
If a project designer has created a report sort on an attribute form that is displayed onthe report, that sort is used. The Project Design Guide discusses how to create reportsorts.
A project designer can create an attribute form that is used solely for sorting, and is notdisplayed on the report. The report can be sorted by this attribute form by default,without having to define any advanced sorting for the report. The VLDB Propertieschapter of the Supplemental Reference for System Administration discusses the DefaultSort Behavior for Attribute Elements setting.
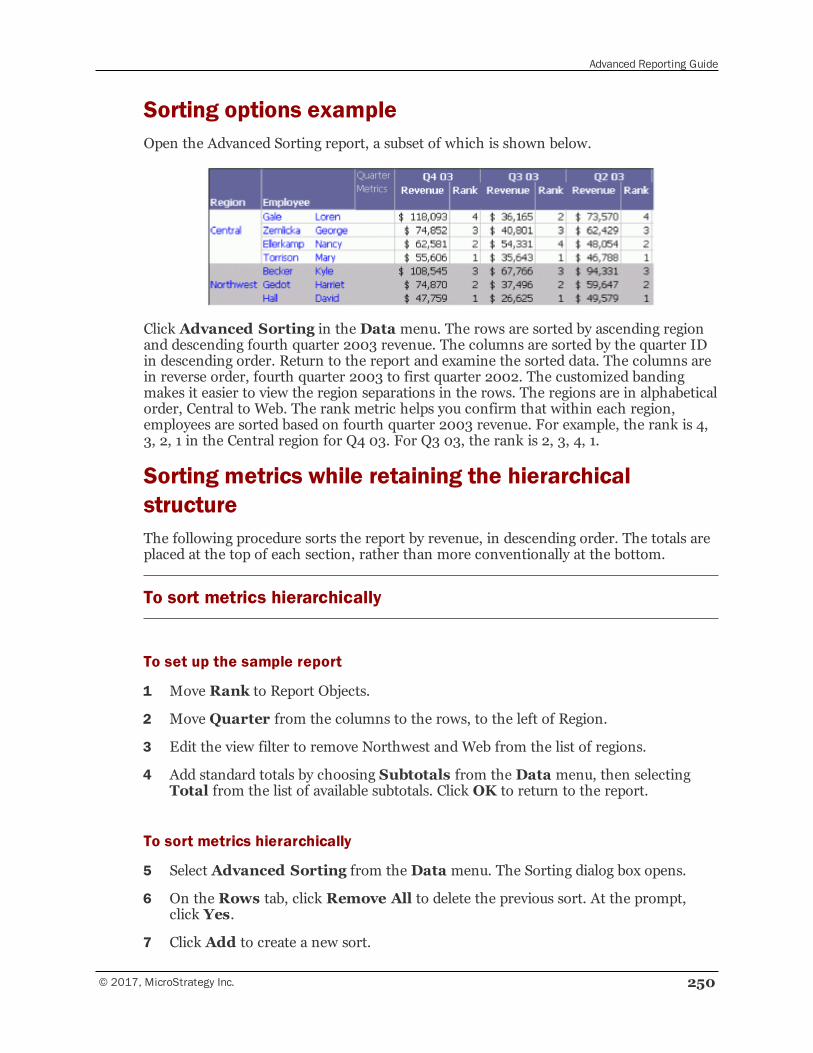
Advanced Reporting Guide
© 2017, MicroStrategy Inc. 250
Sorting options exampleOpen the Advanced Sorting report, a subset of which is shown below.
Click Advanced Sorting in the Data menu. The rows are sorted by ascending regionand descending fourth quarter 2003 revenue. The columns are sorted by the quarter IDin descending order. Return to the report and examine the sorted data. The columns arein reverse order, fourth quarter 2003 to first quarter 2002. The customized bandingmakes it easier to view the region separations in the rows. The regions are in alphabeticalorder, Central to Web. The rank metric helps you confirm that within each region,employees are sorted based on fourth quarter 2003 revenue. For example, the rank is 4,3, 2, 1 in the Central region for Q4 03. For Q3 03, the rank is 2, 3, 4, 1.
Sorting metrics while retaining the hierarchicalstructureThe following procedure sorts the report by revenue, in descending order. The totals areplaced at the top of each section, rather than more conventionally at the bottom.
To sort metrics hierarchically
To set up the sample report
1 Move Rank to Report Objects.
2 Move Quarter from the columns to the rows, to the left of Region.
3 Edit the view filter to remove Northwest and Web from the list of regions.
4 Add standard totals by choosing Subtotals from the Data menu, then selectingTotal from the list of available subtotals. Click OK to return to the report.
To sort metrics hierarchically
5 Select Advanced Sorting from the Data menu. The Sorting dialog box opens.
6 On the Rows tab, click Remove All to delete the previous sort. At the prompt,click Yes.
7 Click Add to create a new sort.
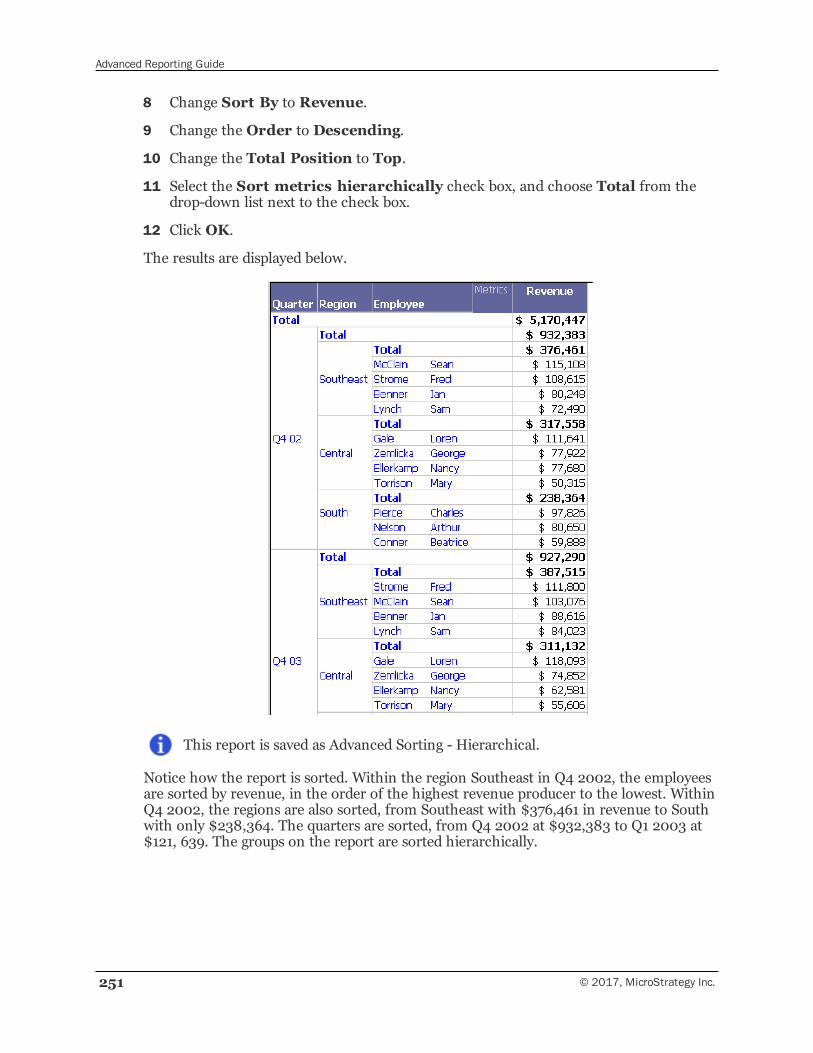
Advanced Reporting Guide
251 © 2017, MicroStrategy Inc.
8 Change Sort By to Revenue.
9 Change the Order to Descending.
10 Change the Total Position to Top.
11 Select the Sort metrics hierarchically check box, and choose Total from thedrop-down list next to the check box.
12 Click OK.
The results are displayed below.
This report is saved as Advanced Sorting - Hierarchical.
Notice how the report is sorted. Within the region Southeast in Q4 2002, the employeesare sorted by revenue, in the order of the highest revenue producer to the lowest. WithinQ4 2002, the regions are also sorted, from Southeast with $376,461 in revenue to Southwith only $238,364. The quarters are sorted, from Q4 2002 at $932,383 to Q1 2003 at$121, 639. The groups on the report are sorted hierarchically.
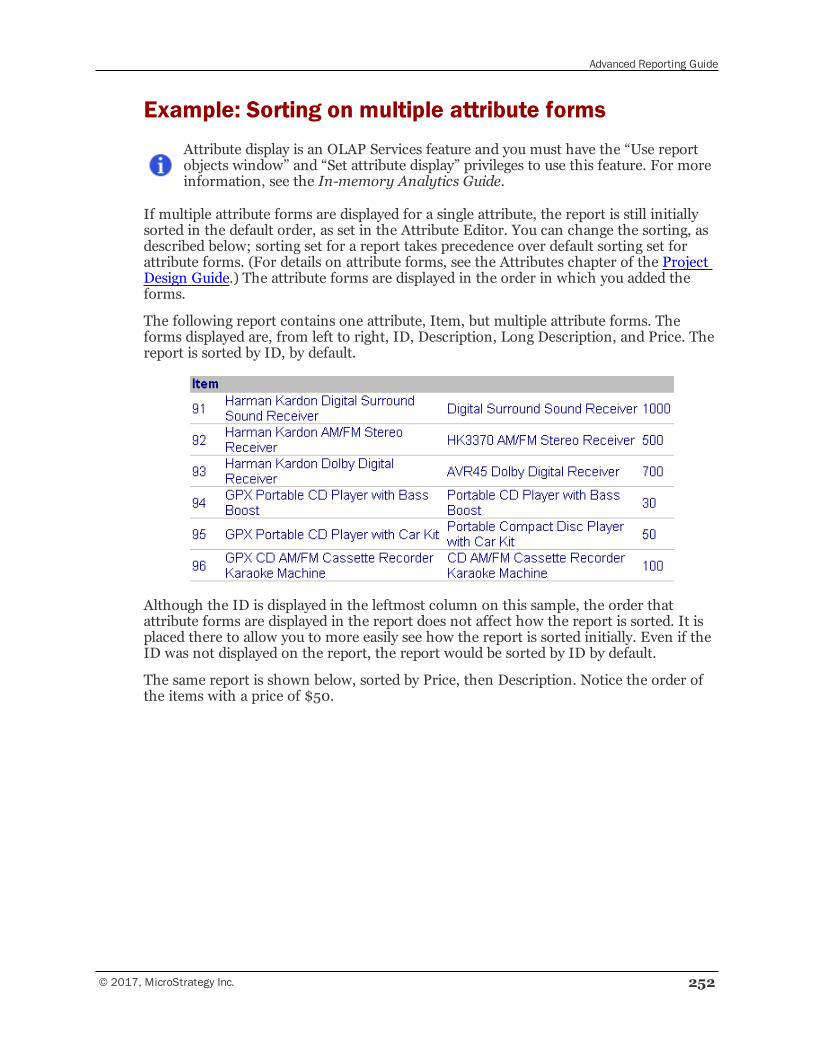
Advanced Reporting Guide
© 2017, MicroStrategy Inc. 252
Example: Sorting on multiple attribute formsAttribute display is an OLAP Services feature and you must have the “Use reportobjects window” and “Set attribute display” privileges to use this feature. For moreinformation, see the In-memory Analytics Guide.
If multiple attribute forms are displayed for a single attribute, the report is still initiallysorted in the default order, as set in the Attribute Editor. You can change the sorting, asdescribed below; sorting set for a report takes precedence over default sorting set forattribute forms. (For details on attribute forms, see the Attributes chapter of the ProjectDesign Guide.) The attribute forms are displayed in the order in which you added theforms.
The following report contains one attribute, Item, but multiple attribute forms. Theforms displayed are, from left to right, ID, Description, Long Description, and Price. Thereport is sorted by ID, by default.
Although the ID is displayed in the leftmost column on this sample, the order thatattribute forms are displayed in the report does not affect how the report is sorted. It isplaced there to allow you to more easily see how the report is sorted initially. Even if theID was not displayed on the report, the report would be sorted by ID by default.
The same report is shown below, sorted by Price, then Description. Notice the order ofthe items with a price of $50.
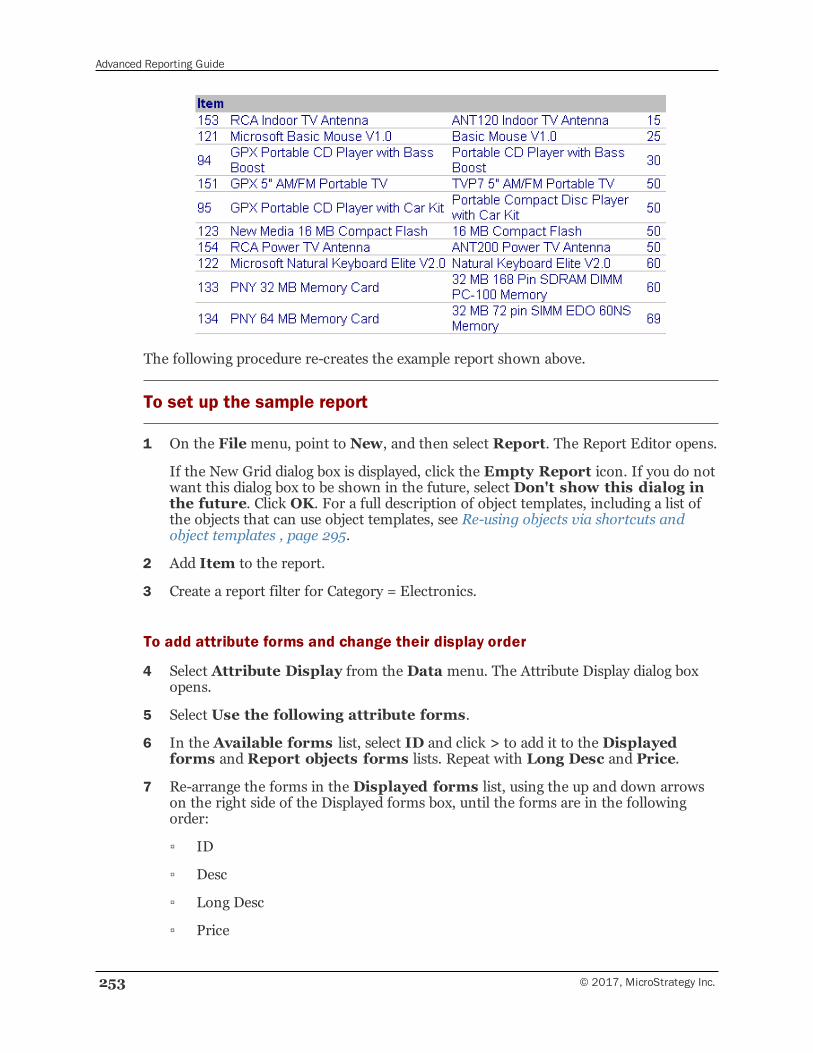
Advanced Reporting Guide
253 © 2017, MicroStrategy Inc.
The following procedure re-creates the example report shown above.
To set up the sample report
1 On the Filemenu, point to New, and then select Report. The Report Editor opens.
If the New Grid dialog box is displayed, click the Empty Report icon. If you do notwant this dialog box to be shown in the future, select Don't show this dialog inthe future. Click OK. For a full description of object templates, including a list ofthe objects that can use object templates, see Re-using objects via shortcuts andobject templates , page 295.
2 Add Item to the report.
3 Create a report filter for Category = Electronics.
To add attribute forms and change their display order
4 Select Attribute Display from the Data menu. The Attribute Display dialog boxopens.
5 Select Use the following attribute forms.
6 In the Available forms list, select ID and click > to add it to the Displayedforms and Report objects forms lists. Repeat with Long Desc and Price.
7 Re-arrange the forms in the Displayed forms list, using the up and down arrowson the right side of the Displayed forms box, until the forms are in the followingorder:
▫ ID
▫ Desc
▫ Long Desc
▫ Price
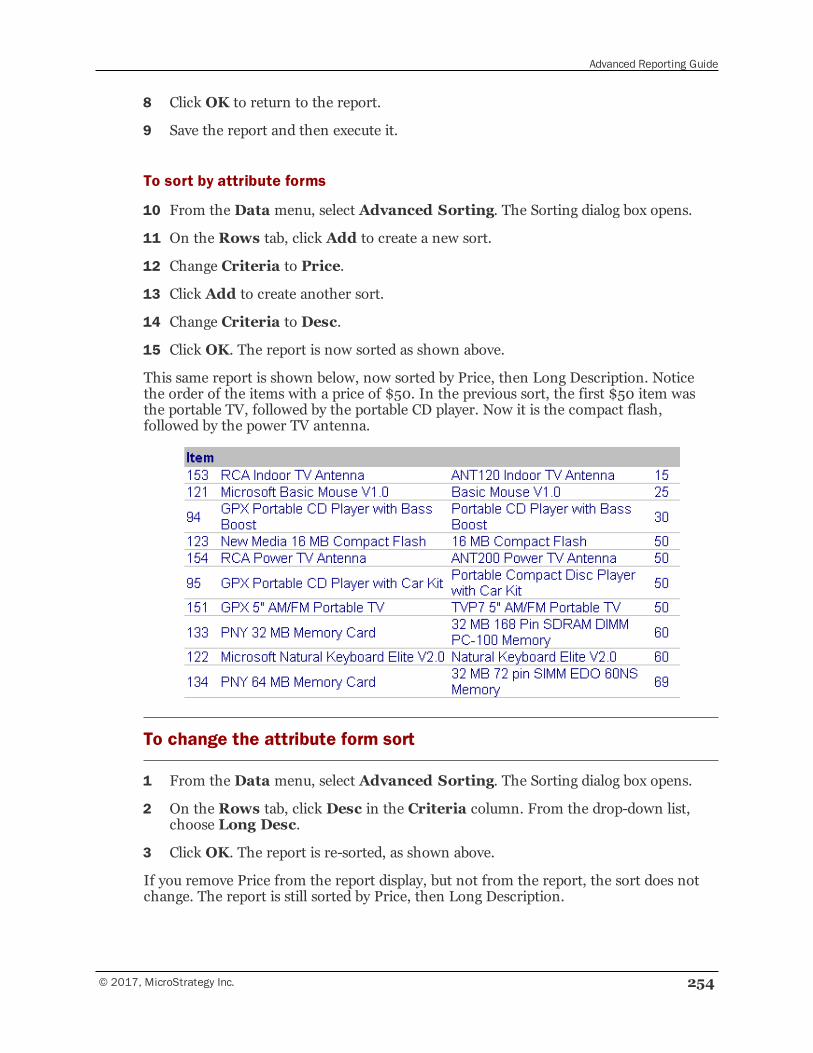
Advanced Reporting Guide
© 2017, MicroStrategy Inc. 254
8 Click OK to return to the report.
9 Save the report and then execute it.
To sort by attribute forms
10 From the Data menu, select Advanced Sorting. The Sorting dialog box opens.
11 On the Rows tab, click Add to create a new sort.
12 Change Criteria to Price.
13 Click Add to create another sort.
14 Change Criteria to Desc.
15 Click OK. The report is now sorted as shown above.
This same report is shown below, now sorted by Price, then Long Description. Noticethe order of the items with a price of $50. In the previous sort, the first $50 item wasthe portable TV, followed by the portable CD player. Now it is the compact flash,followed by the power TV antenna.
To change the attribute form sort
1 From the Data menu, select Advanced Sorting. The Sorting dialog box opens.
2 On the Rows tab, click Desc in the Criteria column. From the drop-down list,choose Long Desc.
3 Click OK. The report is re-sorted, as shown above.
If you remove Price from the report display, but not from the report, the sort does notchange. The report is still sorted by Price, then Long Description.
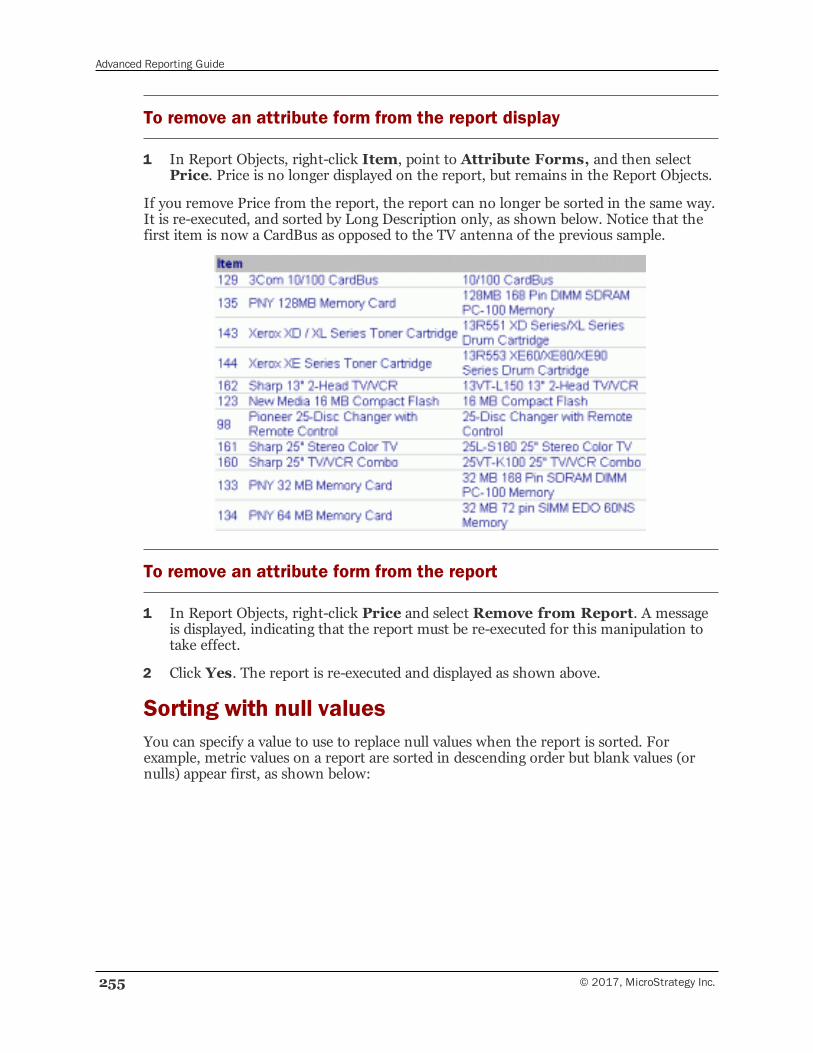
Advanced Reporting Guide
255 © 2017, MicroStrategy Inc.
To remove an attribute form from the report display
1 In Report Objects, right-click Item, point to Attribute Forms, and then selectPrice. Price is no longer displayed on the report, but remains in the Report Objects.
If you remove Price from the report, the report can no longer be sorted in the same way.It is re-executed, and sorted by Long Description only, as shown below. Notice that thefirst item is now a CardBus as opposed to the TV antenna of the previous sample.
To remove an attribute form from the report
1 In Report Objects, right-click Price and select Remove from Report. A messageis displayed, indicating that the report must be re-executed for this manipulation totake effect.
2 Click Yes. The report is re-executed and displayed as shown above.
Sorting with null valuesYou can specify a value to use to replace null values when the report is sorted. Forexample, metric values on a report are sorted in descending order but blank values (ornulls) appear first, as shown below:
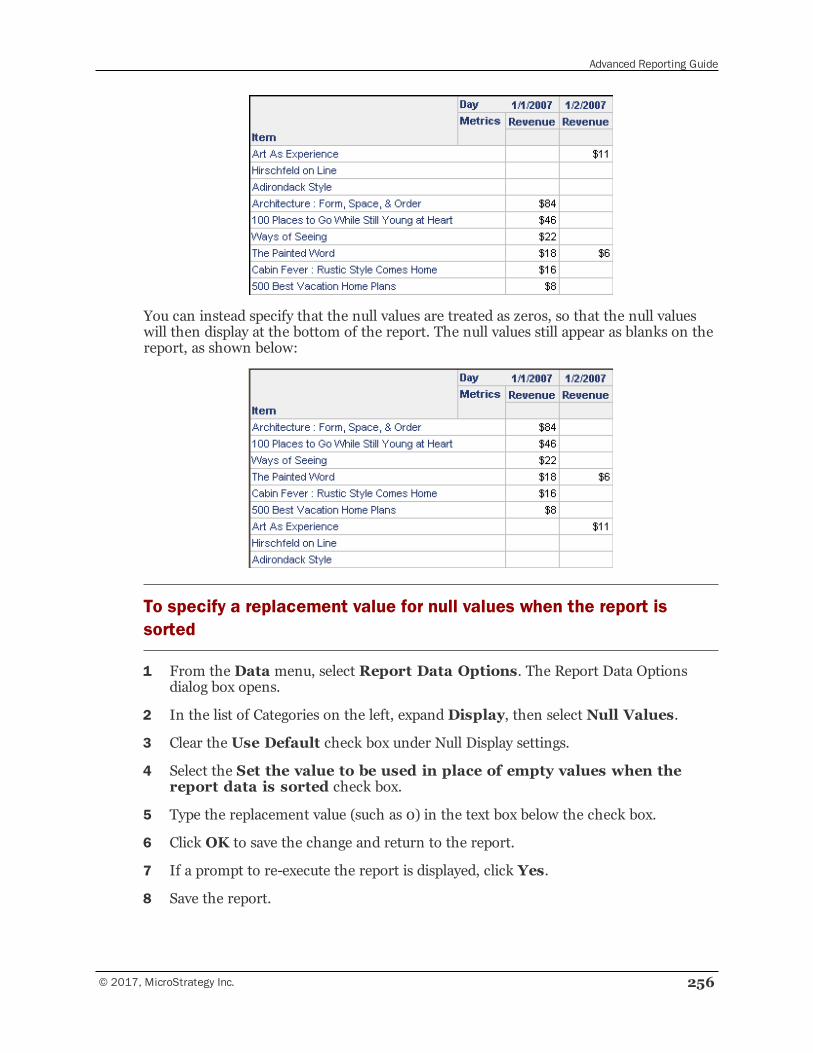
Advanced Reporting Guide
© 2017, MicroStrategy Inc. 256
You can instead specify that the null values are treated as zeros, so that the null valueswill then display at the bottom of the report. The null values still appear as blanks on thereport, as shown below:
To specify a replacement value for null values when the report issorted
1 From the Data menu, select Report Data Options. The Report Data Optionsdialog box opens.
2 In the list of Categories on the left, expandDisplay, then select Null Values.
3 Clear the Use Default check box under Null Display settings.
4 Select the Set the value to be used in place of empty values when thereport data is sorted check box.
5 Type the replacement value (such as 0) in the text box below the check box.
6 Click OK to save the change and return to the report.
7 If a prompt to re-execute the report is displayed, click Yes.
8 Save the report.
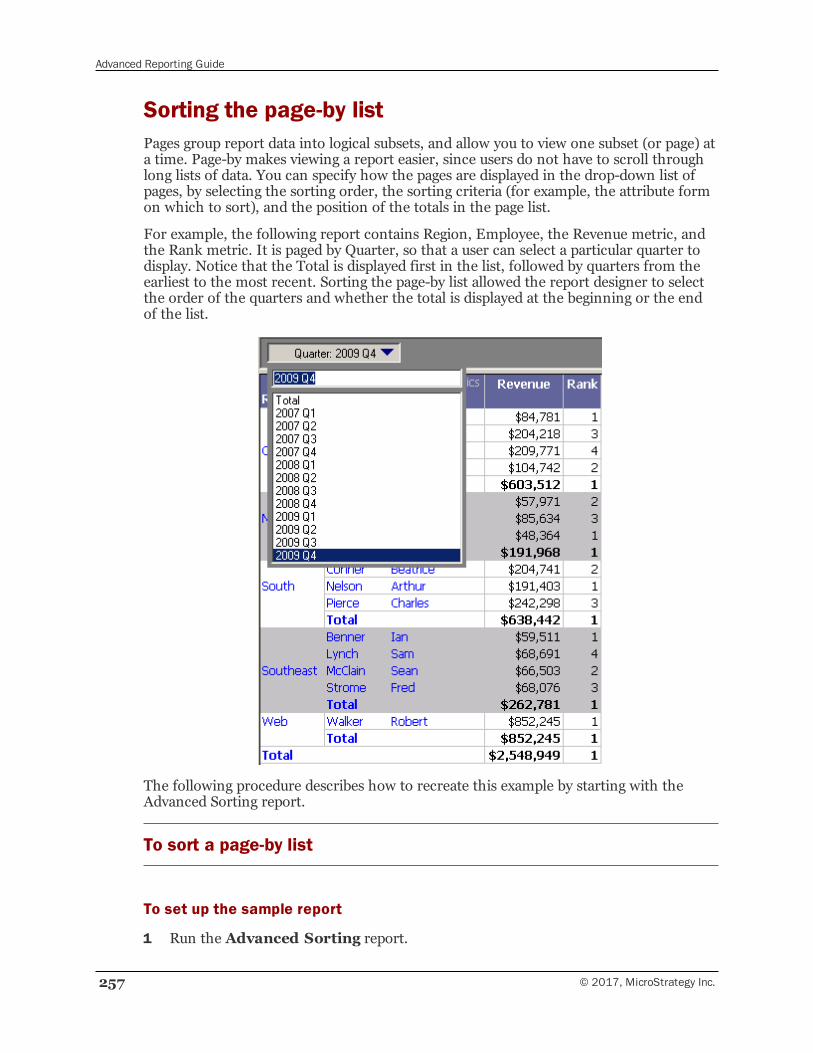
Advanced Reporting Guide
257 © 2017, MicroStrategy Inc.
Sorting the page-by listPages group report data into logical subsets, and allow you to view one subset (or page) ata time. Page-by makes viewing a report easier, since users do not have to scroll throughlong lists of data. You can specify how the pages are displayed in the drop-down list ofpages, by selecting the sorting order, the sorting criteria (for example, the attribute formon which to sort), and the position of the totals in the page list.
For example, the following report contains Region, Employee, the Revenue metric, andthe Rank metric. It is paged by Quarter, so that a user can select a particular quarter todisplay. Notice that the Total is displayed first in the list, followed by quarters from theearliest to the most recent. Sorting the page-by list allowed the report designer to selectthe order of the quarters and whether the total is displayed at the beginning or the endof the list.
The following procedure describes how to recreate this example by starting with theAdvanced Sorting report.
To sort a page-by list
To set up the sample report
1 Run the Advanced Sorting report.
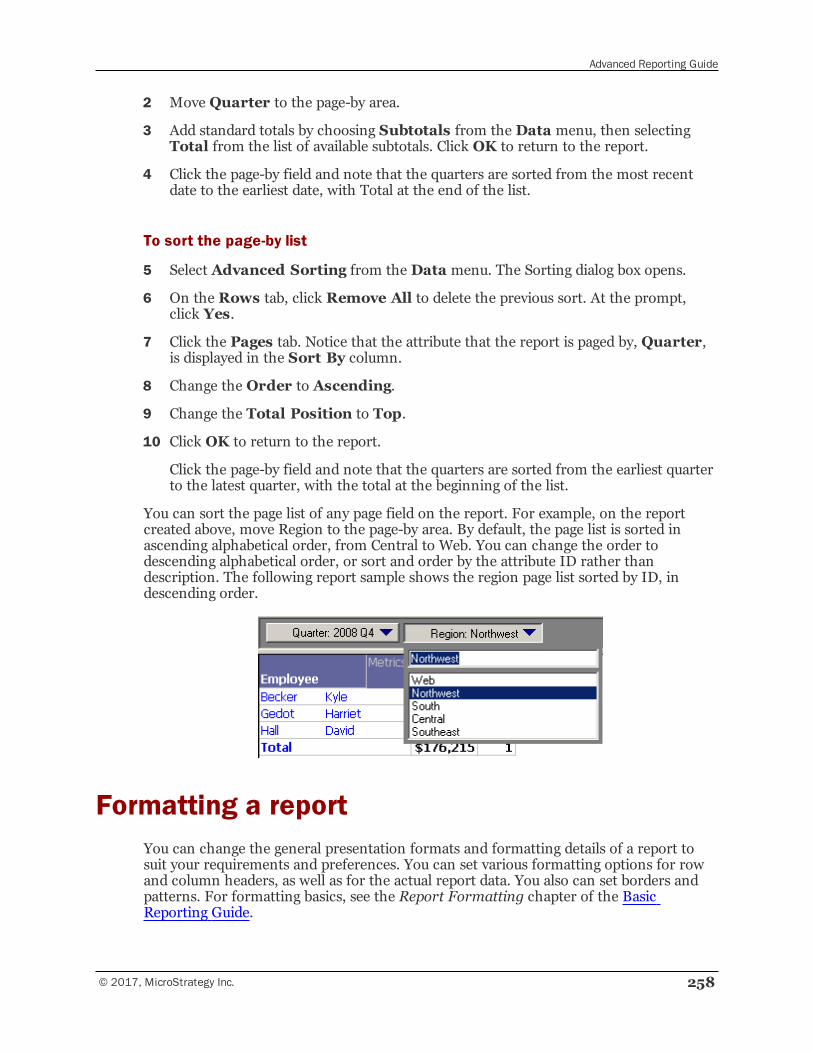
Advanced Reporting Guide
© 2017, MicroStrategy Inc. 258
2 Move Quarter to the page-by area.
3 Add standard totals by choosing Subtotals from the Data menu, then selectingTotal from the list of available subtotals. Click OK to return to the report.
4 Click the page-by field and note that the quarters are sorted from the most recentdate to the earliest date, with Total at the end of the list.
To sort the page-by list
5 Select Advanced Sorting from the Data menu. The Sorting dialog box opens.
6 On the Rows tab, click Remove All to delete the previous sort. At the prompt,click Yes.
7 Click the Pages tab. Notice that the attribute that the report is paged by, Quarter,is displayed in the Sort By column.
8 Change the Order to Ascending.
9 Change the Total Position to Top.
10 Click OK to return to the report.
Click the page-by field and note that the quarters are sorted from the earliest quarterto the latest quarter, with the total at the beginning of the list.
You can sort the page list of any page field on the report. For example, on the reportcreated above, move Region to the page-by area. By default, the page list is sorted inascending alphabetical order, from Central to Web. You can change the order todescending alphabetical order, or sort and order by the attribute ID rather thandescription. The following report sample shows the region page list sorted by ID, indescending order.
Formatting a reportYou can change the general presentation formats and formatting details of a report tosuit your requirements and preferences. You can set various formatting options for rowand column headers, as well as for the actual report data. You also can set borders andpatterns. For formatting basics, see the Report Formatting chapter of the BasicReporting Guide.
Advanced Reporting Guide
259 © 2017, MicroStrategy Inc.
Formatting report cell dataThe Format Cells dialog box consists of the following tabs:
• Number: Allows you to select the number formatting options, such as decimalspaces, currency symbol, time format, zip code format, and so on. If none of thebuilt-in number formats meet your needs, you can create your own custom numberformats using number format symbols. For more details on custom formatting, seeCustom formats, page 259.
• Alignment: Determines how the contents of the section are aligned when theformatting is applied. You can select horizontal and vertical alignment, as well asselect if you would like to wrap the text or not.
• Font: Defines the text font for the selected section. You can select the font name,font style, size, color, and effects.
• Border: Defines how the borders are displayed for the selected section.
• Background: Defines how to fill the cell background. You can choose whether thebackground is a solid color, uses gradient colors (a two-color combination), uses apattern, or is transparent to allow what is behind the cell to show.
• Chart: Applies a background pattern and color for a metric when it is displayed as aseries in a graph report.
By default, the chart color that you define for a metric overrides any defaultcolor schemes for the graph report, although you can disable this metricformatting. For steps, see Formatting a graph using colors, shading, andeffects, page 360.
Custom formats
Custom formats allow you to create your own formats for data in a report. You canformat text, numbers, and date and time using custom formats. Once you create acustom format, you can use it in other metrics and report objects as well. Each customformat can have up to four optional sections, one each for:
• Positive numbers
• Negative numbers
• Zero values
• Text
You can specify these sections, separated by semicolons in the order listed above. If youspecify only two sections, the first is used for positive numbers and zeros, and the secondis used for negative numbers. If you specify only one section, all numbers use the sameformat.
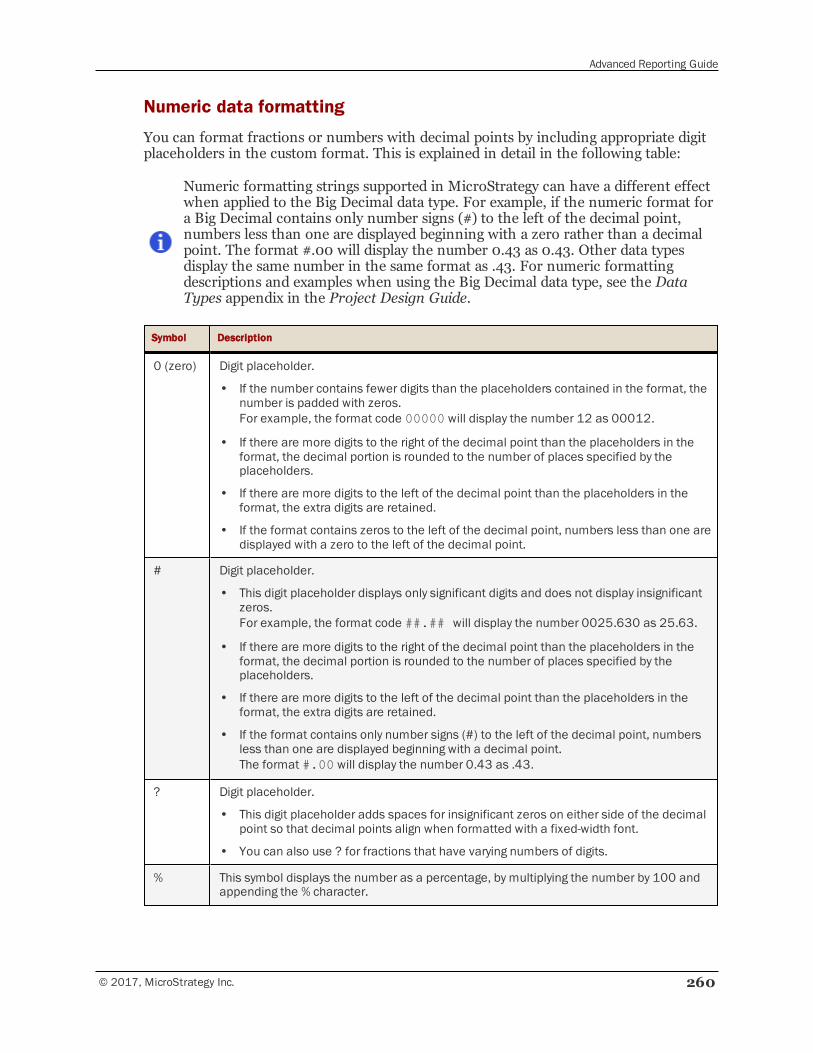
Advanced Reporting Guide
© 2017, MicroStrategy Inc. 260
Numeric data formatting
You can format fractions or numbers with decimal points by including appropriate digitplaceholders in the custom format. This is explained in detail in the following table:
Numeric formatting strings supported in MicroStrategy can have a different effectwhen applied to the Big Decimal data type. For example, if the numeric format fora Big Decimal contains only number signs (#) to the left of the decimal point,numbers less than one are displayed beginning with a zero rather than a decimalpoint. The format #.00 will display the number 0.43 as 0.43. Other data typesdisplay the same number in the same format as .43. For numeric formattingdescriptions and examples when using the Big Decimal data type, see the DataTypes appendix in the Project Design Guide.
Symbol Description
0 (zero) Digit placeholder.
• If the number contains fewer digits than the placeholders contained in the format, thenumber is padded with zeros.For example, the format code 00000 will display the number 12 as 00012.
• If there are more digits to the right of the decimal point than the placeholders in theformat, the decimal portion is rounded to the number of places specified by theplaceholders.
• If there are more digits to the left of the decimal point than the placeholders in theformat, the extra digits are retained.
• If the format contains zeros to the left of the decimal point, numbers less than one aredisplayed with a zero to the left of the decimal point.
# Digit placeholder.
• This digit placeholder displays only significant digits and does not display insignificantzeros.For example, the format code ##.## will display the number 0025.630 as 25.63.
• If there are more digits to the right of the decimal point than the placeholders in theformat, the decimal portion is rounded to the number of places specified by theplaceholders.
• If there are more digits to the left of the decimal point than the placeholders in theformat, the extra digits are retained.
• If the format contains only number signs (#) to the left of the decimal point, numbersless than one are displayed beginning with a decimal point.The format #.00 will display the number 0.43 as .43.
? Digit placeholder.
• This digit placeholder adds spaces for insignificant zeros on either side of the decimalpoint so that decimal points align when formatted with a fixed-width font.
• You can also use ? for fractions that have varying numbers of digits.
% This symbol displays the number as a percentage, by multiplying the number by 100 andappending the % character.
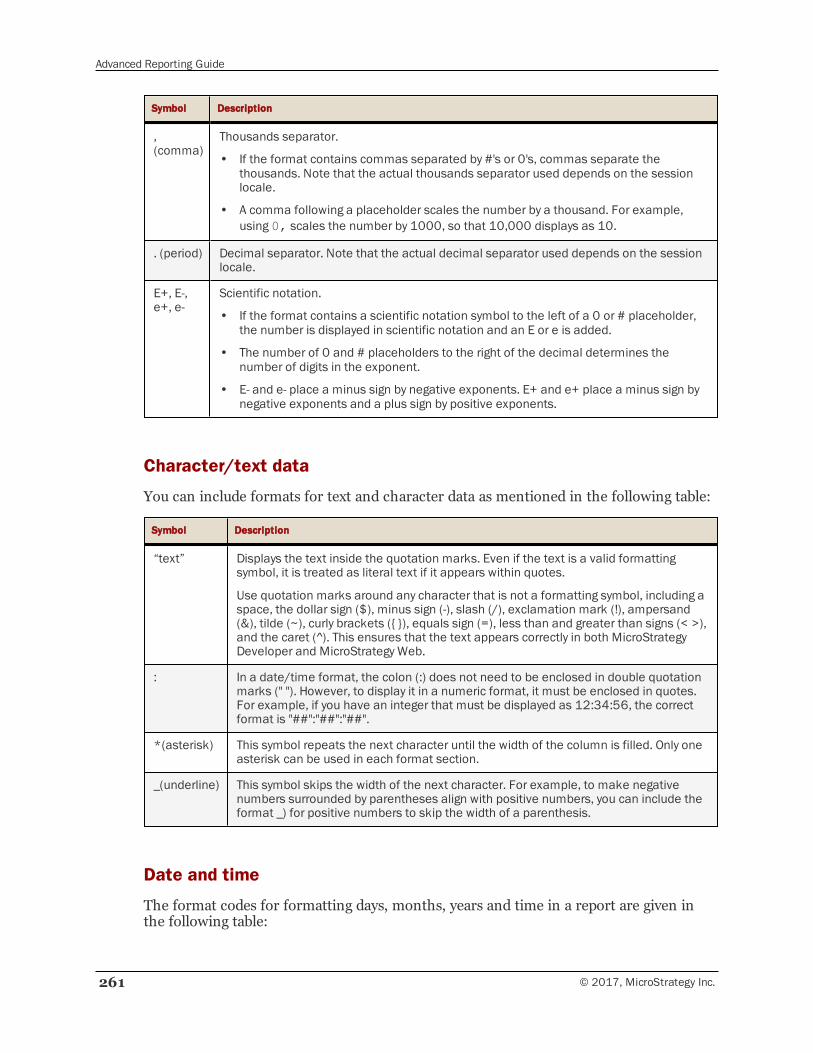
Advanced Reporting Guide
261 © 2017, MicroStrategy Inc.
Symbol Description
,(comma)
Thousands separator.
• If the format contains commas separated by #'s or 0's, commas separate thethousands. Note that the actual thousands separator used depends on the sessionlocale.
• A comma following a placeholder scales the number by a thousand. For example,using 0, scales the number by 1000, so that 10,000 displays as 10.
. (period) Decimal separator. Note that the actual decimal separator used depends on the sessionlocale.
E+, E-,e+, e-
Scientific notation.
• If the format contains a scientific notation symbol to the left of a 0 or # placeholder,the number is displayed in scientific notation and an E or e is added.
• The number of 0 and # placeholders to the right of the decimal determines thenumber of digits in the exponent.
• E- and e- place a minus sign by negative exponents. E+ and e+ place a minus sign bynegative exponents and a plus sign by positive exponents.
Character/text data
You can include formats for text and character data as mentioned in the following table:
Symbol Description
“text” Displays the text inside the quotation marks. Even if the text is a valid formattingsymbol, it is treated as literal text if it appears within quotes.
Use quotation marks around any character that is not a formatting symbol, including aspace, the dollar sign ($), minus sign (-), slash (/), exclamation mark (!), ampersand(&), tilde (~), curly brackets ({ }), equals sign (=), less than and greater than signs (< >),and the caret (^). This ensures that the text appears correctly in both MicroStrategyDeveloper and MicroStrategy Web.
: In a date/time format, the colon (:) does not need to be enclosed in double quotationmarks (" "). However, to display it in a numeric format, it must be enclosed in quotes.For example, if you have an integer that must be displayed as 12:34:56, the correctformat is "##":"##":"##".
*(asterisk) This symbol repeats the next character until the width of the column is filled. Only oneasterisk can be used in each format section.
_(underline) This symbol skips the width of the next character. For example, to make negativenumbers surrounded by parentheses align with positive numbers, you can include theformat _) for positive numbers to skip the width of a parenthesis.
Date and time
The format codes for formatting days, months, years and time in a report are given inthe following table:
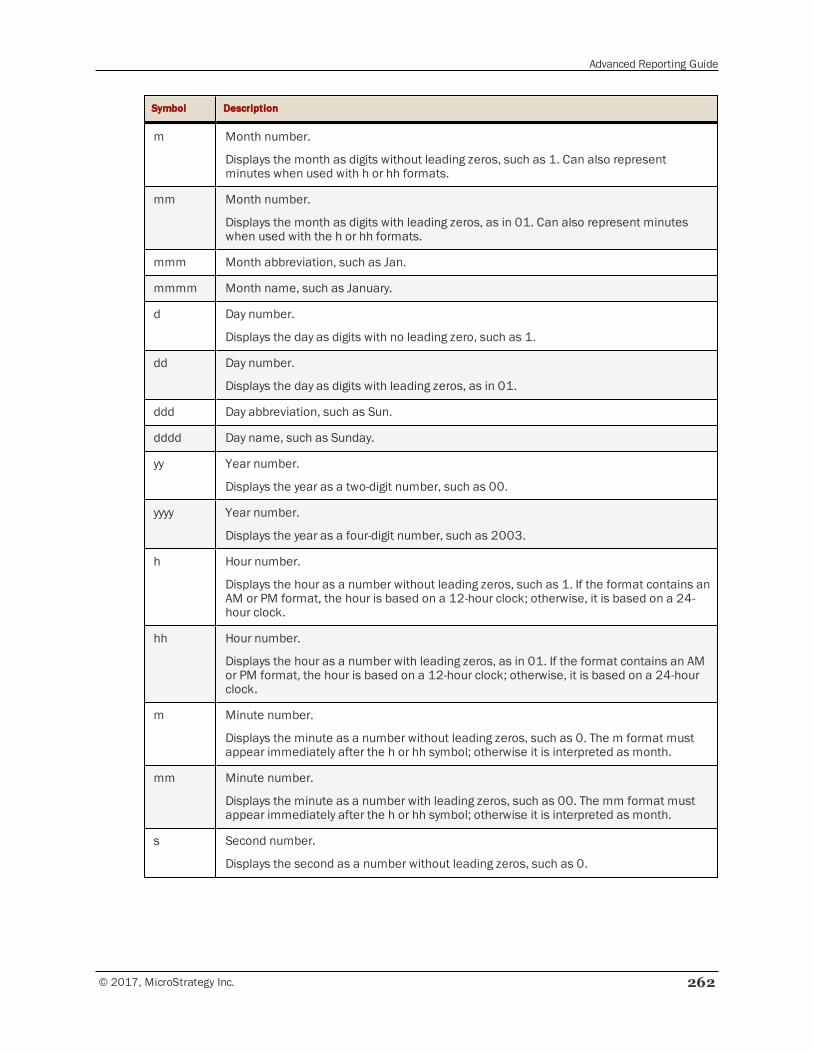
Advanced Reporting Guide
© 2017, MicroStrategy Inc. 262
Symbol Description
m Month number.
Displays the month as digits without leading zeros, such as 1. Can also representminutes when used with h or hh formats.
mm Month number.
Displays the month as digits with leading zeros, as in 01. Can also represent minuteswhen used with the h or hh formats.
mmm Month abbreviation, such as Jan.
mmmm Month name, such as January.
d Day number.
Displays the day as digits with no leading zero, such as 1.
dd Day number.
Displays the day as digits with leading zeros, as in 01.
ddd Day abbreviation, such as Sun.
dddd Day name, such as Sunday.
yy Year number.
Displays the year as a two-digit number, such as 00.
yyyy Year number.
Displays the year as a four-digit number, such as 2003.
h Hour number.
Displays the hour as a number without leading zeros, such as 1. If the format contains anAM or PM format, the hour is based on a 12-hour clock; otherwise, it is based on a 24-hour clock.
hh Hour number.
Displays the hour as a number with leading zeros, as in 01. If the format contains an AMor PM format, the hour is based on a 12-hour clock; otherwise, it is based on a 24-hourclock.
m Minute number.
Displays the minute as a number without leading zeros, such as 0. The m format mustappear immediately after the h or hh symbol; otherwise it is interpreted as month.
mm Minute number.
Displays the minute as a number with leading zeros, such as 00. The mm format mustappear immediately after the h or hh symbol; otherwise it is interpreted as month.
s Second number.
Displays the second as a number without leading zeros, such as 0.
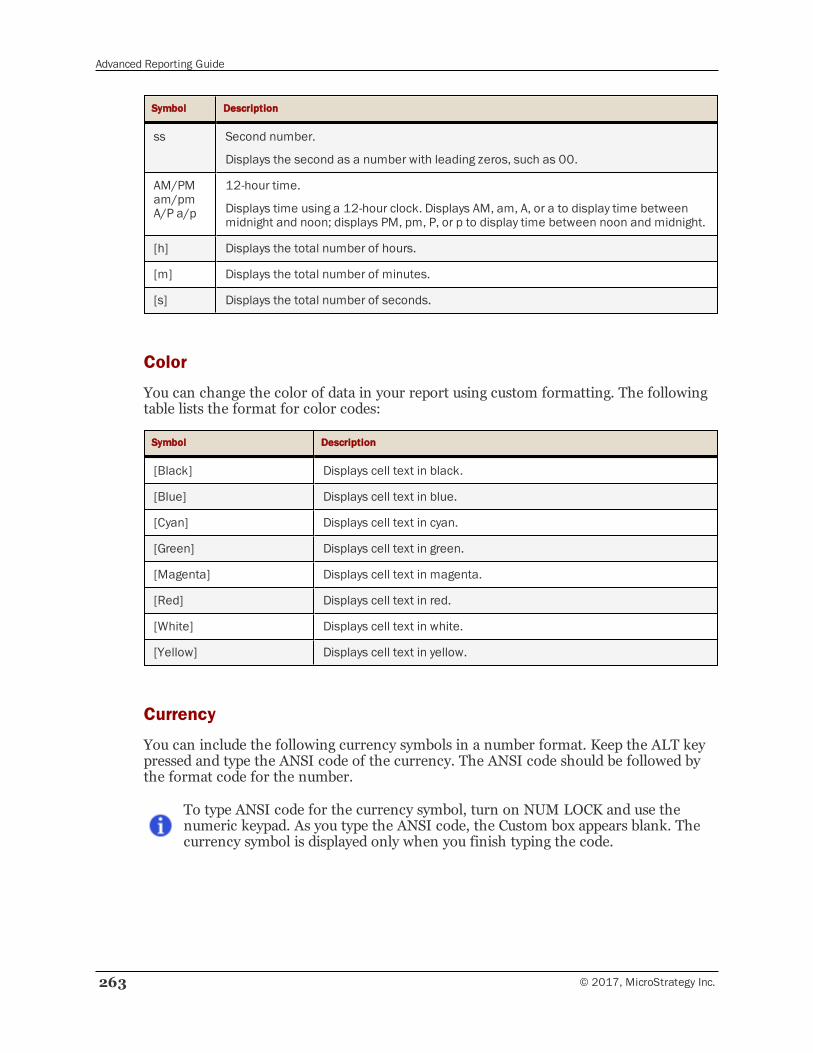
Advanced Reporting Guide
263 © 2017, MicroStrategy Inc.
Symbol Description
ss Second number.
Displays the second as a number with leading zeros, such as 00.
AM/PMam/pmA/P a/p
12-hour time.
Displays time using a 12-hour clock. Displays AM, am, A, or a to display time betweenmidnight and noon; displays PM, pm, P, or p to display time between noon and midnight.
[h] Displays the total number of hours.
[m] Displays the total number of minutes.
[s] Displays the total number of seconds.
Color
You can change the color of data in your report using custom formatting. The followingtable lists the format for color codes:
Symbol Description
[Black] Displays cell text in black.
[Blue] Displays cell text in blue.
[Cyan] Displays cell text in cyan.
[Green] Displays cell text in green.
[Magenta] Displays cell text in magenta.
[Red] Displays cell text in red.
[White] Displays cell text in white.
[Yellow] Displays cell text in yellow.
Currency
You can include the following currency symbols in a number format. Keep the ALT keypressed and type the ANSI code of the currency. The ANSI code should be followed bythe format code for the number.
To type ANSI code for the currency symbol, turn on NUM LOCK and use thenumeric keypad. As you type the ANSI code, the Custom box appears blank. Thecurrency symbol is displayed only when you finish typing the code.
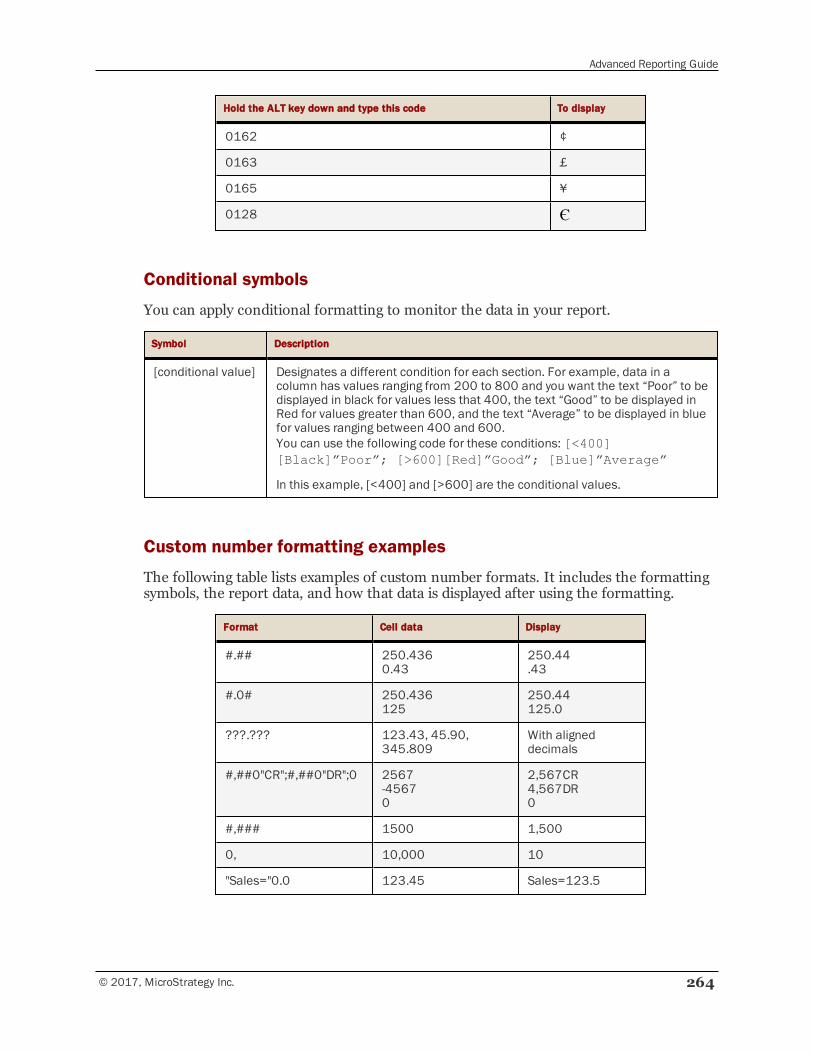
Advanced Reporting Guide
© 2017, MicroStrategy Inc. 264
Hold the ALT key down and type this code To display
0162 ¢
0163 £
0165 ¥
0128 Є
Conditional symbols
You can apply conditional formatting to monitor the data in your report.
Symbol Description
[conditional value] Designates a different condition for each section. For example, data in acolumn has values ranging from 200 to 800 and you want the text “Poor” to bedisplayed in black for values less that 400, the text “Good” to be displayed inRed for values greater than 600, and the text “Average” to be displayed in bluefor values ranging between 400 and 600.You can use the following code for these conditions: [<400][Black]”Poor”; [>600][Red]”Good”; [Blue]”Average”
In this example, [<400] and [>600] are the conditional values.
Custom number formatting examples
The following table lists examples of custom number formats. It includes the formattingsymbols, the report data, and how that data is displayed after using the formatting.
Format Cell data Display
#.## 250.4360.43
250.44.43
#.0# 250.436125
250.44125.0
???.??? 123.43, 45.90,345.809
With aligneddecimals
#,##0"CR";#,##0"DR";0 2567-45670
2,567CR4,567DR0
#,### 1500 1,500
0, 10,000 10
"Sales="0.0 123.45 Sales=123.5
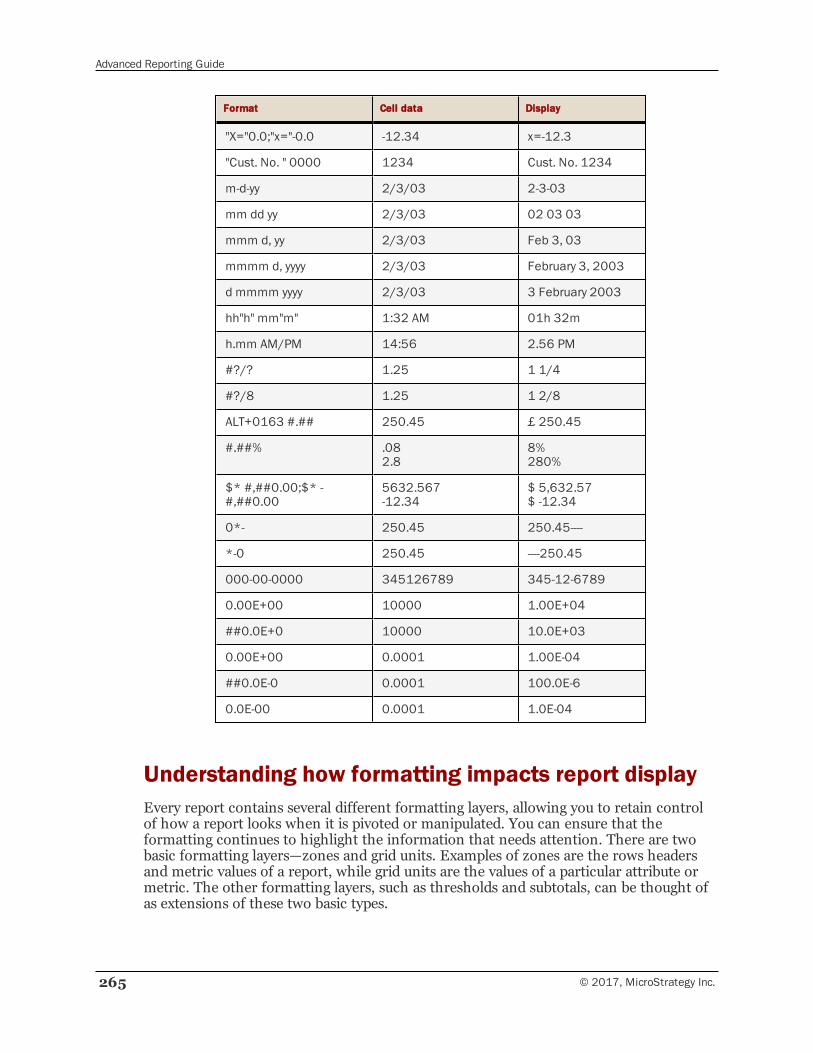
Advanced Reporting Guide
265 © 2017, MicroStrategy Inc.
Format Cell data Display
"X="0.0;"x="-0.0 -12.34 x=-12.3
"Cust. No. " 0000 1234 Cust. No. 1234
m-d-yy 2/3/03 2-3-03
mm dd yy 2/3/03 02 03 03
mmm d, yy 2/3/03 Feb 3, 03
mmmm d, yyyy 2/3/03 February 3, 2003
d mmmm yyyy 2/3/03 3 February 2003
hh"h" mm"m" 1:32 AM 01h 32m
h.mm AM/PM 14:56 2.56 PM
#?/? 1.25 1 1/4
#?/8 1.25 1 2/8
ALT+0163 #.## 250.45 £ 250.45
#.##% .082.8
8%280%
$* #,##0.00;$* -#,##0.00
5632.567-12.34
$ 5,632.57$ -12.34
0*- 250.45 250.45----
*-0 250.45 ----250.45
000-00-0000 345126789 345-12-6789
0.00E+00 10000 1.00E+04
##0.0E+0 10000 10.0E+03
0.00E+00 0.0001 1.00E-04
##0.0E-0 0.0001 100.0E-6
0.0E-00 0.0001 1.0E-04
Understanding how formatting impacts report displayEvery report contains several different formatting layers, allowing you to retain controlof how a report looks when it is pivoted or manipulated. You can ensure that theformatting continues to highlight the information that needs attention. There are twobasic formatting layers—zones and grid units. Examples of zones are the rows headersand metric values of a report, while grid units are the values of a particular attribute ormetric. The other formatting layers, such as thresholds and subtotals, can be thought ofas extensions of these two basic types.
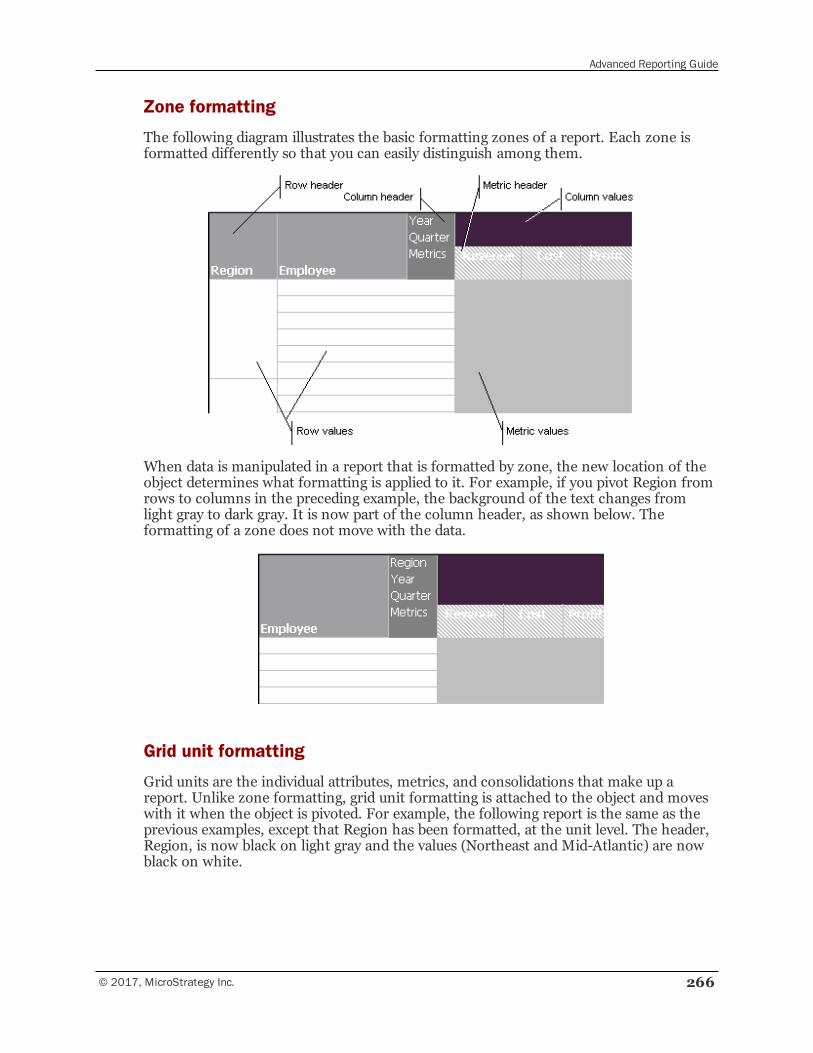
Advanced Reporting Guide
© 2017, MicroStrategy Inc. 266
Zone formatting
The following diagram illustrates the basic formatting zones of a report. Each zone isformatted differently so that you can easily distinguish among them.
When data is manipulated in a report that is formatted by zone, the new location of theobject determines what formatting is applied to it. For example, if you pivot Region fromrows to columns in the preceding example, the background of the text changes fromlight gray to dark gray. It is now part of the column header, as shown below. Theformatting of a zone does not move with the data.
Grid unit formatting
Grid units are the individual attributes, metrics, and consolidations that make up areport. Unlike zone formatting, grid unit formatting is attached to the object and moveswith it when the object is pivoted. For example, the following report is the same as theprevious examples, except that Region has been formatted, at the unit level. The header,Region, is now black on light gray and the values (Northeast and Mid-Atlantic) are nowblack on white.
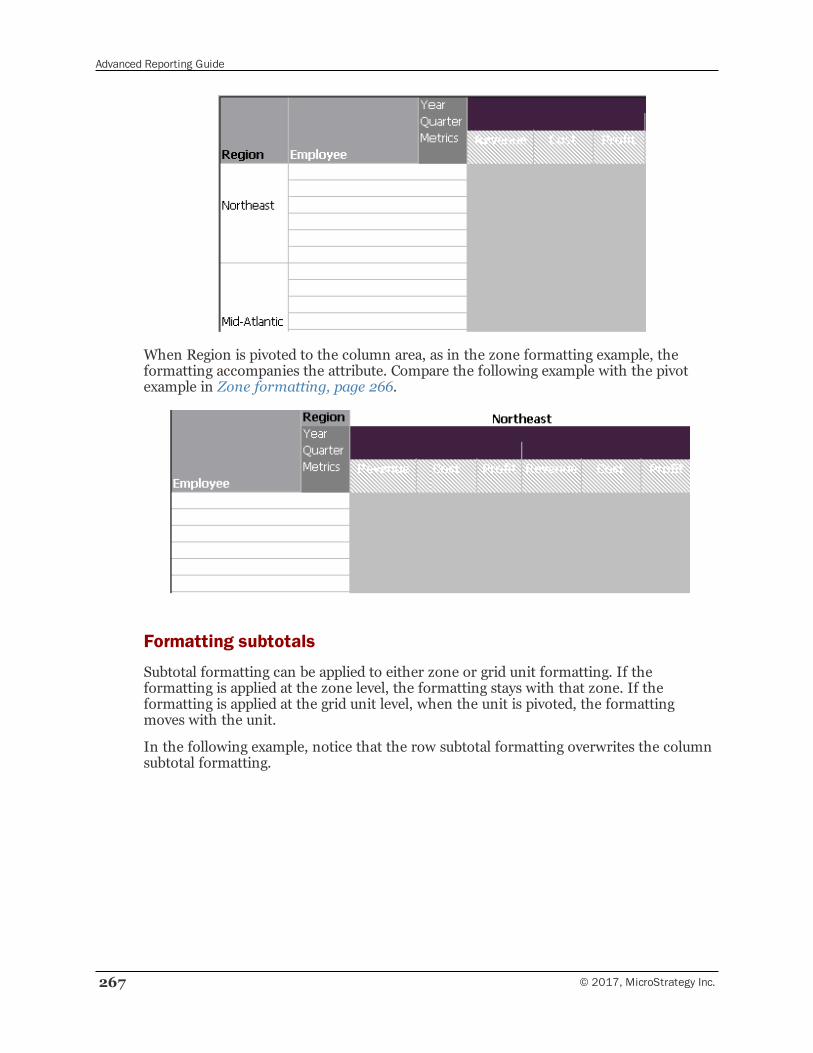
Advanced Reporting Guide
267 © 2017, MicroStrategy Inc.
When Region is pivoted to the column area, as in the zone formatting example, theformatting accompanies the attribute. Compare the following example with the pivotexample in Zone formatting, page 266.
Formatting subtotals
Subtotal formatting can be applied to either zone or grid unit formatting. If theformatting is applied at the zone level, the formatting stays with that zone. If theformatting is applied at the grid unit level, when the unit is pivoted, the formattingmoves with the unit.
In the following example, notice that the row subtotal formatting overwrites the columnsubtotal formatting.
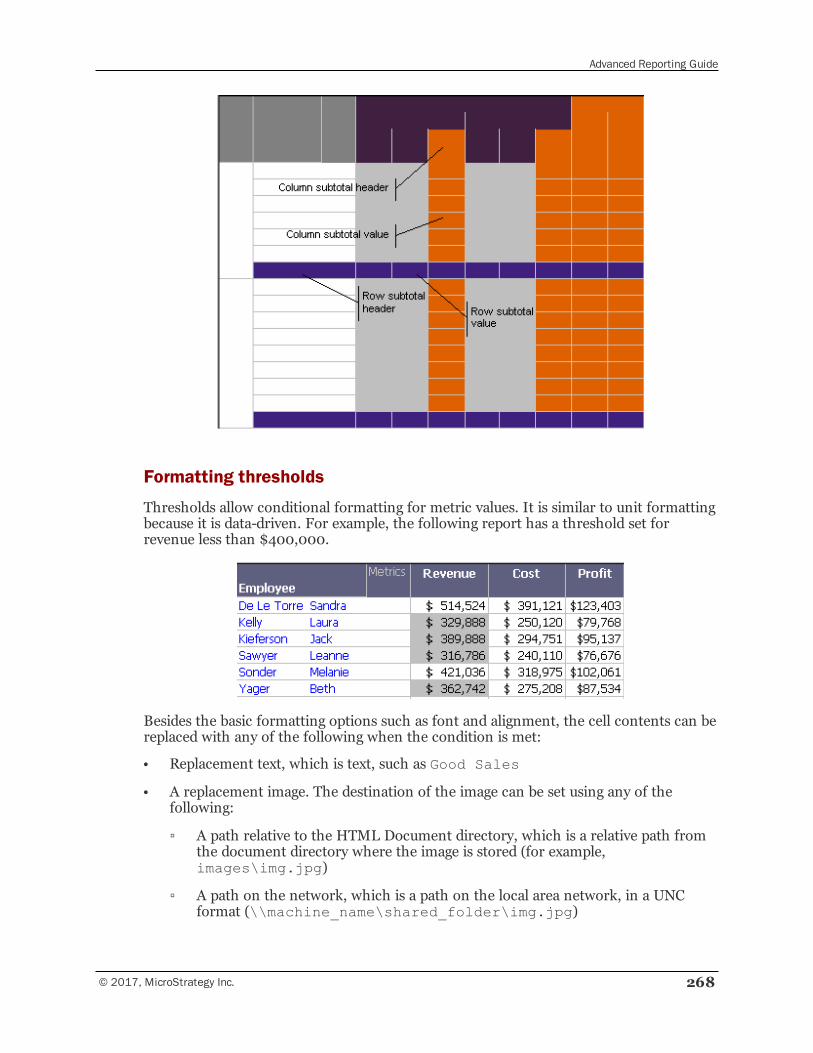
Advanced Reporting Guide
© 2017, MicroStrategy Inc. 268
Formatting thresholds
Thresholds allow conditional formatting for metric values. It is similar to unit formattingbecause it is data-driven. For example, the following report has a threshold set forrevenue less than $400,000.
Besides the basic formatting options such as font and alignment, the cell contents can bereplaced with any of the following when the condition is met:
• Replacement text, which is text, such as Good Sales
• A replacement image. The destination of the image can be set using any of thefollowing:
▫ A path relative to the HTML Document directory, which is a relative path fromthe document directory where the image is stored (for example,images\img.jpg)
▫ A path on the network, which is a path on the local area network, in a UNCformat (\\machine_name\shared_folder\img.jpg)
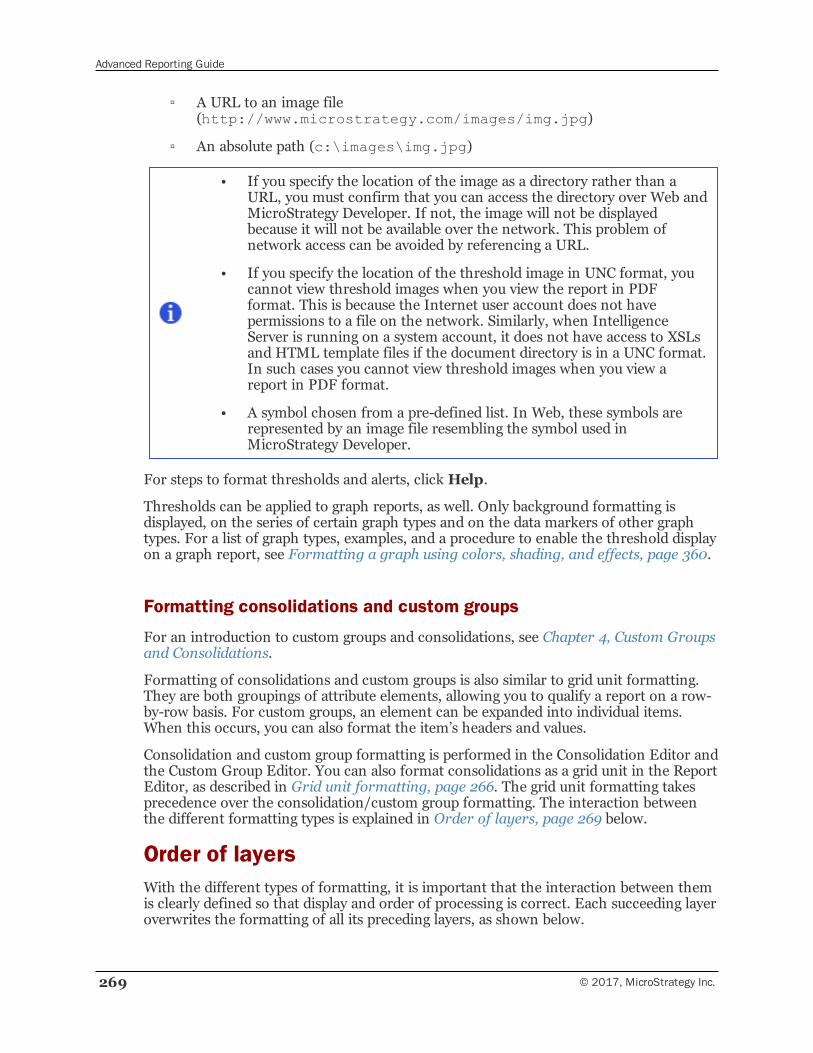
Advanced Reporting Guide
269 © 2017, MicroStrategy Inc.
▫ A URL to an image file(http://www.microstrategy.com/images/img.jpg)
▫ An absolute path (c:\images\img.jpg)
• If you specify the location of the image as a directory rather than aURL, you must confirm that you can access the directory over Web andMicroStrategy Developer. If not, the image will not be displayedbecause it will not be available over the network. This problem ofnetwork access can be avoided by referencing a URL.
• If you specify the location of the threshold image in UNC format, youcannot view threshold images when you view the report in PDFformat. This is because the Internet user account does not havepermissions to a file on the network. Similarly, when IntelligenceServer is running on a system account, it does not have access to XSLsand HTML template files if the document directory is in a UNC format.In such cases you cannot view threshold images when you view areport in PDF format.
• A symbol chosen from a pre-defined list. In Web, these symbols arerepresented by an image file resembling the symbol used inMicroStrategy Developer.
For steps to format thresholds and alerts, click Help.
Thresholds can be applied to graph reports, as well. Only background formatting isdisplayed, on the series of certain graph types and on the data markers of other graphtypes. For a list of graph types, examples, and a procedure to enable the threshold displayon a graph report, see Formatting a graph using colors, shading, and effects, page 360.
Formatting consolidations and custom groups
For an introduction to custom groups and consolidations, see Chapter 4, Custom Groupsand Consolidations.
Formatting of consolidations and custom groups is also similar to grid unit formatting.They are both groupings of attribute elements, allowing you to qualify a report on a row-by-row basis. For custom groups, an element can be expanded into individual items.When this occurs, you can also format the item’s headers and values.
Consolidation and custom group formatting is performed in the Consolidation Editor andthe Custom Group Editor. You can also format consolidations as a grid unit in the ReportEditor, as described in Grid unit formatting, page 266. The grid unit formatting takesprecedence over the consolidation/custom group formatting. The interaction betweenthe different formatting types is explained in Order of layers, page 269 below.
Order of layersWith the different types of formatting, it is important that the interaction between themis clearly defined so that display and order of processing is correct. Each succeeding layeroverwrites the formatting of all its preceding layers, as shown below.
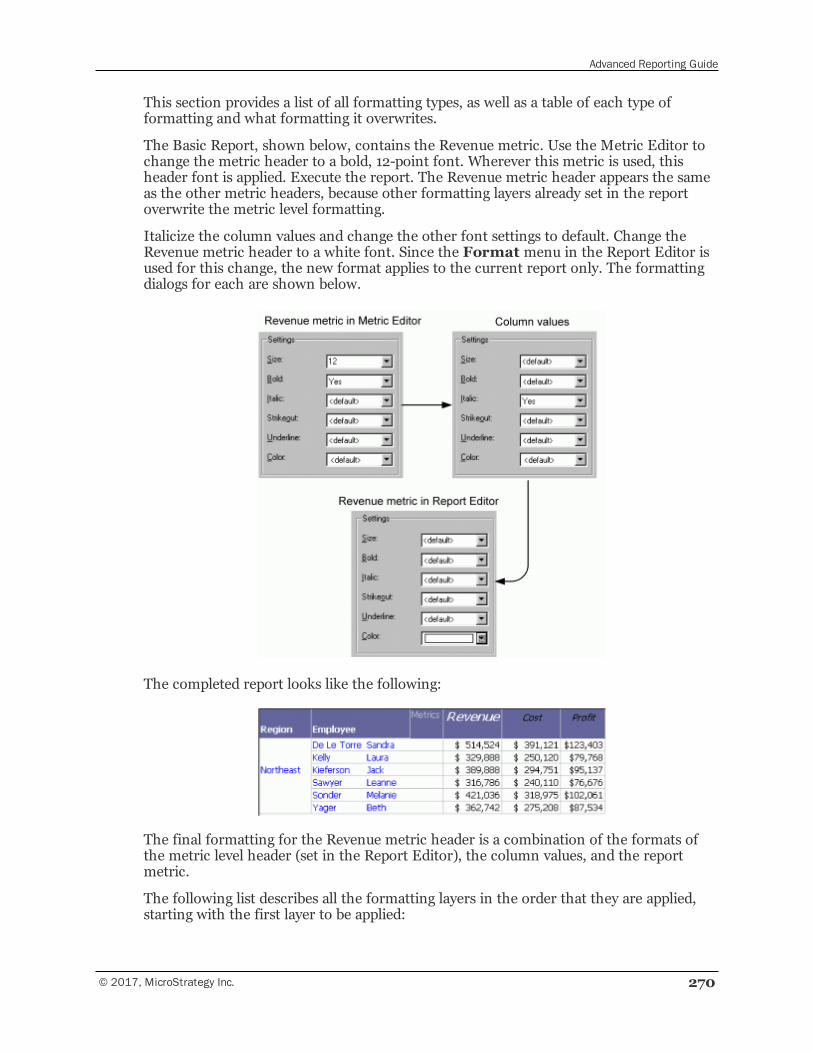
Advanced Reporting Guide
© 2017, MicroStrategy Inc. 270
This section provides a list of all formatting types, as well as a table of each type offormatting and what formatting it overwrites.
The Basic Report, shown below, contains the Revenue metric. Use the Metric Editor tochange the metric header to a bold, 12-point font. Wherever this metric is used, thisheader font is applied. Execute the report. The Revenue metric header appears the sameas the other metric headers, because other formatting layers already set in the reportoverwrite the metric level formatting.
Italicize the column values and change the other font settings to default. Change theRevenue metric header to a white font. Since the Format menu in the Report Editor isused for this change, the new format applies to the current report only. The formattingdialogs for each are shown below.
The completed report looks like the following:
The final formatting for the Revenue metric header is a combination of the formats ofthe metric level header (set in the Report Editor), the column values, and the reportmetric.
The following list describes all the formatting layers in the order that they are applied,starting with the first layer to be applied:
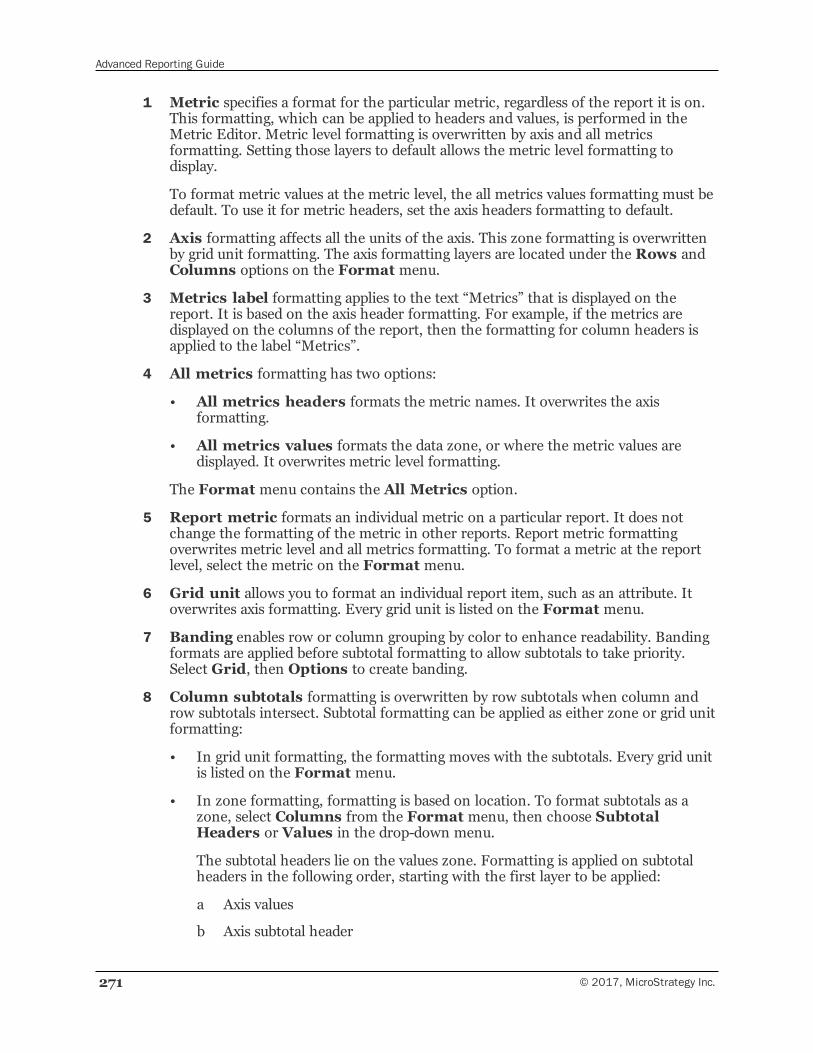
Advanced Reporting Guide
271 © 2017, MicroStrategy Inc.
1 Metric specifies a format for the particular metric, regardless of the report it is on.This formatting, which can be applied to headers and values, is performed in theMetric Editor. Metric level formatting is overwritten by axis and all metricsformatting. Setting those layers to default allows the metric level formatting todisplay.
To format metric values at the metric level, the all metrics values formatting must bedefault. To use it for metric headers, set the axis headers formatting to default.
2 Axis formatting affects all the units of the axis. This zone formatting is overwrittenby grid unit formatting. The axis formatting layers are located under the Rows andColumns options on the Format menu.
3 Metrics label formatting applies to the text “Metrics” that is displayed on thereport. It is based on the axis header formatting. For example, if the metrics aredisplayed on the columns of the report, then the formatting for column headers isapplied to the label “Metrics”.
4 All metrics formatting has two options:
• All metrics headers formats the metric names. It overwrites the axisformatting.
• All metrics values formats the data zone, or where the metric values aredisplayed. It overwrites metric level formatting.
The Format menu contains the All Metrics option.
5 Report metric formats an individual metric on a particular report. It does notchange the formatting of the metric in other reports. Report metric formattingoverwrites metric level and all metrics formatting. To format a metric at the reportlevel, select the metric on the Format menu.
6 Grid unit allows you to format an individual report item, such as an attribute. Itoverwrites axis formatting. Every grid unit is listed on the Format menu.
7 Banding enables row or column grouping by color to enhance readability. Bandingformats are applied before subtotal formatting to allow subtotals to take priority.Select Grid, then Options to create banding.
8 Column subtotals formatting is overwritten by row subtotals when column androw subtotals intersect. Subtotal formatting can be applied as either zone or grid unitformatting:
• In grid unit formatting, the formatting moves with the subtotals. Every grid unitis listed on the Format menu.
• In zone formatting, formatting is based on location. To format subtotals as azone, select Columns from the Format menu, then choose SubtotalHeaders or Values in the drop-down menu.
The subtotal headers lie on the values zone. Formatting is applied on subtotalheaders in the following order, starting with the first layer to be applied:
a Axis values
b Axis subtotal header
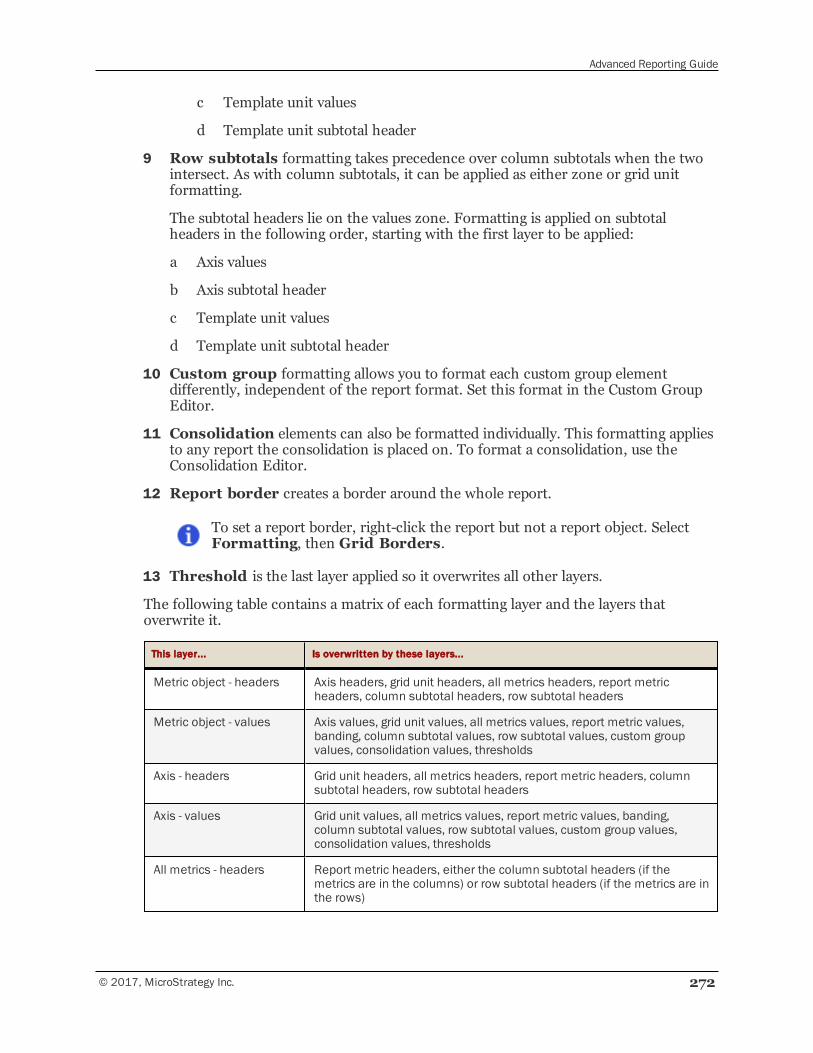
Advanced Reporting Guide
© 2017, MicroStrategy Inc. 272
c Template unit values
d Template unit subtotal header
9 Row subtotals formatting takes precedence over column subtotals when the twointersect. As with column subtotals, it can be applied as either zone or grid unitformatting.
The subtotal headers lie on the values zone. Formatting is applied on subtotalheaders in the following order, starting with the first layer to be applied:
a Axis values
b Axis subtotal header
c Template unit values
d Template unit subtotal header
10 Custom group formatting allows you to format each custom group elementdifferently, independent of the report format. Set this format in the Custom GroupEditor.
11 Consolidation elements can also be formatted individually. This formatting appliesto any report the consolidation is placed on. To format a consolidation, use theConsolidation Editor.
12 Report border creates a border around the whole report.
To set a report border, right-click the report but not a report object. SelectFormatting, then Grid Borders.
13 Threshold is the last layer applied so it overwrites all other layers.
The following table contains a matrix of each formatting layer and the layers thatoverwrite it.
This layer... Is overwritten by these layers...
Metric object - headers Axis headers, grid unit headers, all metrics headers, report metricheaders, column subtotal headers, row subtotal headers
Metric object - values Axis values, grid unit values, all metrics values, report metric values,banding, column subtotal values, row subtotal values, custom groupvalues, consolidation values, thresholds
Axis - headers Grid unit headers, all metrics headers, report metric headers, columnsubtotal headers, row subtotal headers
Axis - values Grid unit values, all metrics values, report metric values, banding,column subtotal values, row subtotal values, custom group values,consolidation values, thresholds
All metrics - headers Report metric headers, either the column subtotal headers (if themetrics are in the columns) or row subtotal headers (if the metrics are inthe rows)
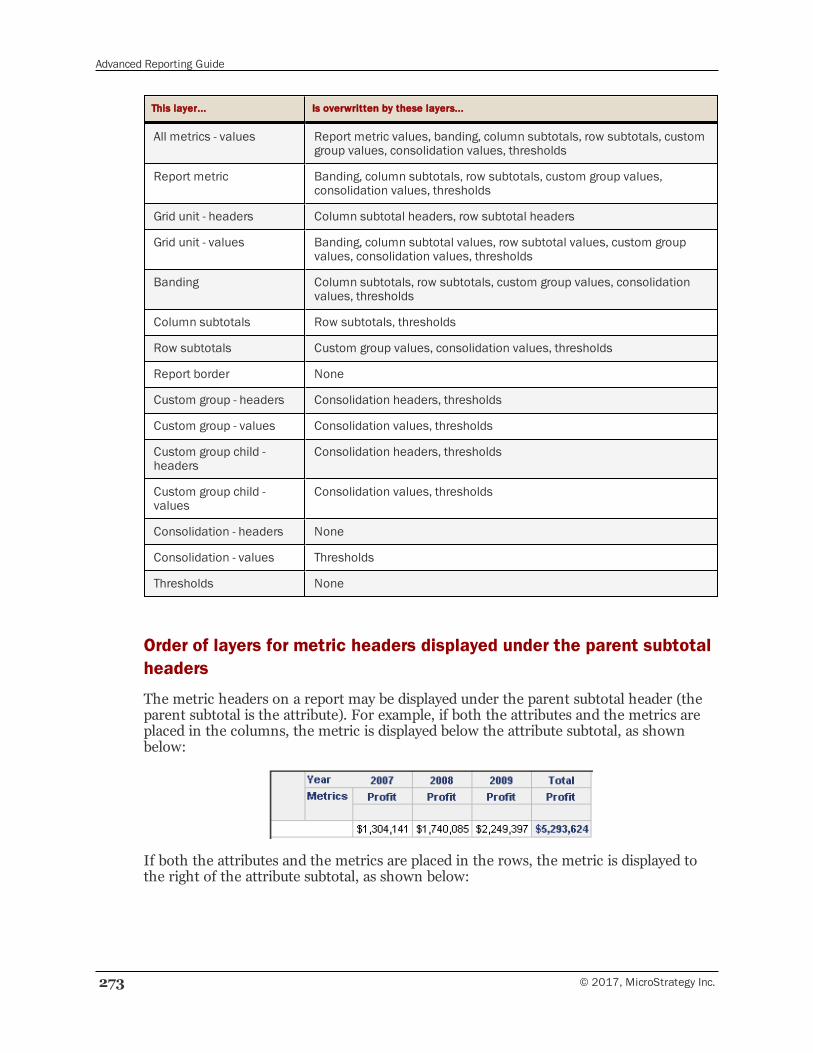
Advanced Reporting Guide
273 © 2017, MicroStrategy Inc.
This layer... Is overwritten by these layers...
All metrics - values Report metric values, banding, column subtotals, row subtotals, customgroup values, consolidation values, thresholds
Report metric Banding, column subtotals, row subtotals, custom group values,consolidation values, thresholds
Grid unit - headers Column subtotal headers, row subtotal headers
Grid unit - values Banding, column subtotal values, row subtotal values, custom groupvalues, consolidation values, thresholds
Banding Column subtotals, row subtotals, custom group values, consolidationvalues, thresholds
Column subtotals Row subtotals, thresholds
Row subtotals Custom group values, consolidation values, thresholds
Report border None
Custom group - headers Consolidation headers, thresholds
Custom group - values Consolidation values, thresholds
Custom group child -headers
Consolidation headers, thresholds
Custom group child -values
Consolidation values, thresholds
Consolidation - headers None
Consolidation - values Thresholds
Thresholds None
Order of layers for metric headers displayed under the parent subtotalheaders
The metric headers on a report may be displayed under the parent subtotal header (theparent subtotal is the attribute). For example, if both the attributes and the metrics areplaced in the columns, the metric is displayed below the attribute subtotal, as shownbelow:
If both the attributes and the metrics are placed in the rows, the metric is displayed tothe right of the attribute subtotal, as shown below:
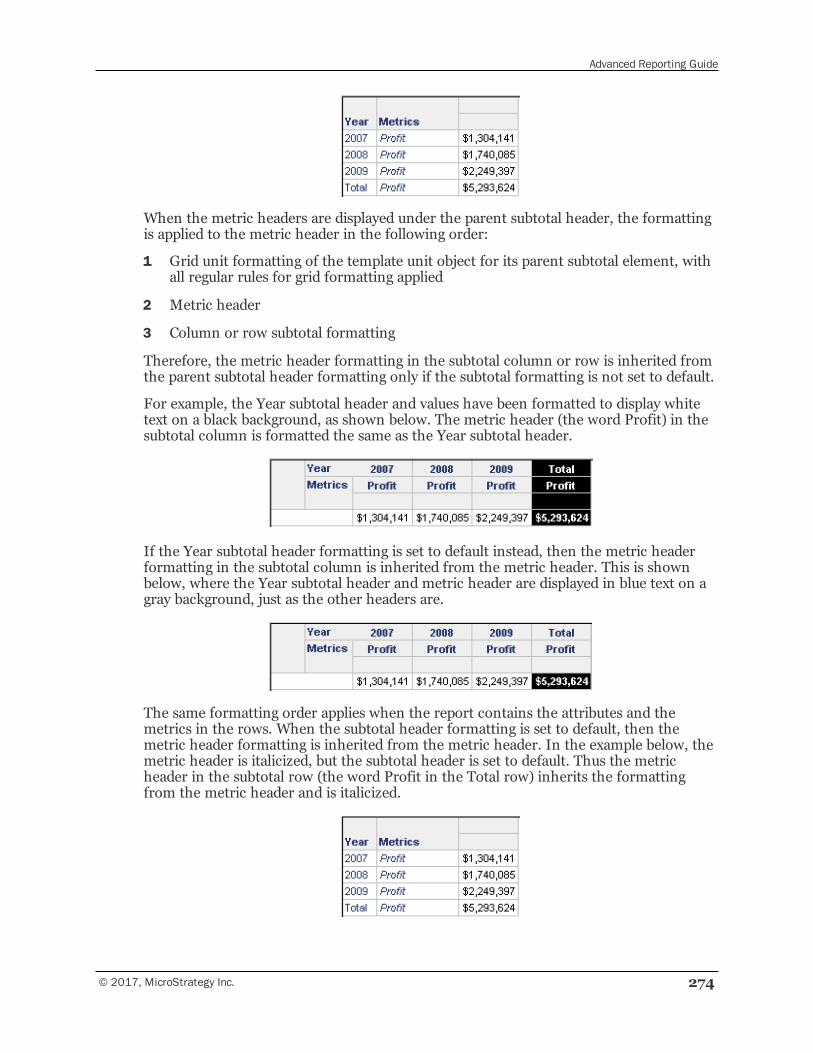
Advanced Reporting Guide
© 2017, MicroStrategy Inc. 274
When the metric headers are displayed under the parent subtotal header, the formattingis applied to the metric header in the following order:
1 Grid unit formatting of the template unit object for its parent subtotal element, withall regular rules for grid formatting applied
2 Metric header
3 Column or row subtotal formatting
Therefore, the metric header formatting in the subtotal column or row is inherited fromthe parent subtotal header formatting only if the subtotal formatting is not set to default.
For example, the Year subtotal header and values have been formatted to display whitetext on a black background, as shown below. The metric header (the word Profit) in thesubtotal column is formatted the same as the Year subtotal header.
If the Year subtotal header formatting is set to default instead, then the metric headerformatting in the subtotal column is inherited from the metric header. This is shownbelow, where the Year subtotal header and metric header are displayed in blue text on agray background, just as the other headers are.
The same formatting order applies when the report contains the attributes and themetrics in the rows. When the subtotal header formatting is set to default, then themetric header formatting is inherited from the metric header. In the example below, themetric header is italicized, but the subtotal header is set to default. Thus the metricheader in the subtotal row (the word Profit in the Total row) inherits the formattingfrom the metric header and is italicized.
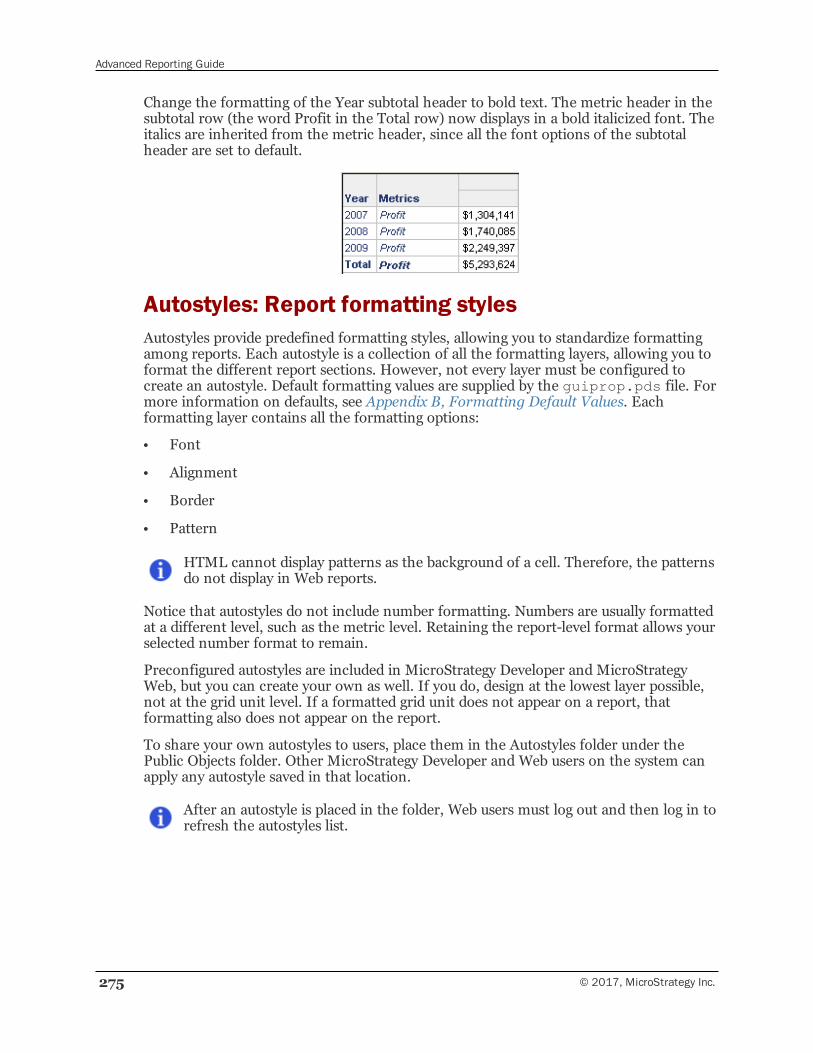
Advanced Reporting Guide
275 © 2017, MicroStrategy Inc.
Change the formatting of the Year subtotal header to bold text. The metric header in thesubtotal row (the word Profit in the Total row) now displays in a bold italicized font. Theitalics are inherited from the metric header, since all the font options of the subtotalheader are set to default.
Autostyles: Report formatting stylesAutostyles provide predefined formatting styles, allowing you to standardize formattingamong reports. Each autostyle is a collection of all the formatting layers, allowing you toformat the different report sections. However, not every layer must be configured tocreate an autostyle. Default formatting values are supplied by the guiprop.pds file. Formore information on defaults, see Appendix B, Formatting Default Values. Eachformatting layer contains all the formatting options:
• Font
• Alignment
• Border
• Pattern
HTML cannot display patterns as the background of a cell. Therefore, the patternsdo not display in Web reports.
Notice that autostyles do not include number formatting. Numbers are usually formattedat a different level, such as the metric level. Retaining the report-level format allows yourselected number format to remain.
Preconfigured autostyles are included in MicroStrategy Developer and MicroStrategyWeb, but you can create your own as well. If you do, design at the lowest layer possible,not at the grid unit level. If a formatted grid unit does not appear on a report, thatformatting also does not appear on the report.
To share your own autostyles to users, place them in the Autostyles folder under thePublic Objects folder. Other MicroStrategy Developer and Web users on the system canapply any autostyle saved in that location.
After an autostyle is placed in the folder, Web users must log out and then log in torefresh the autostyles list.
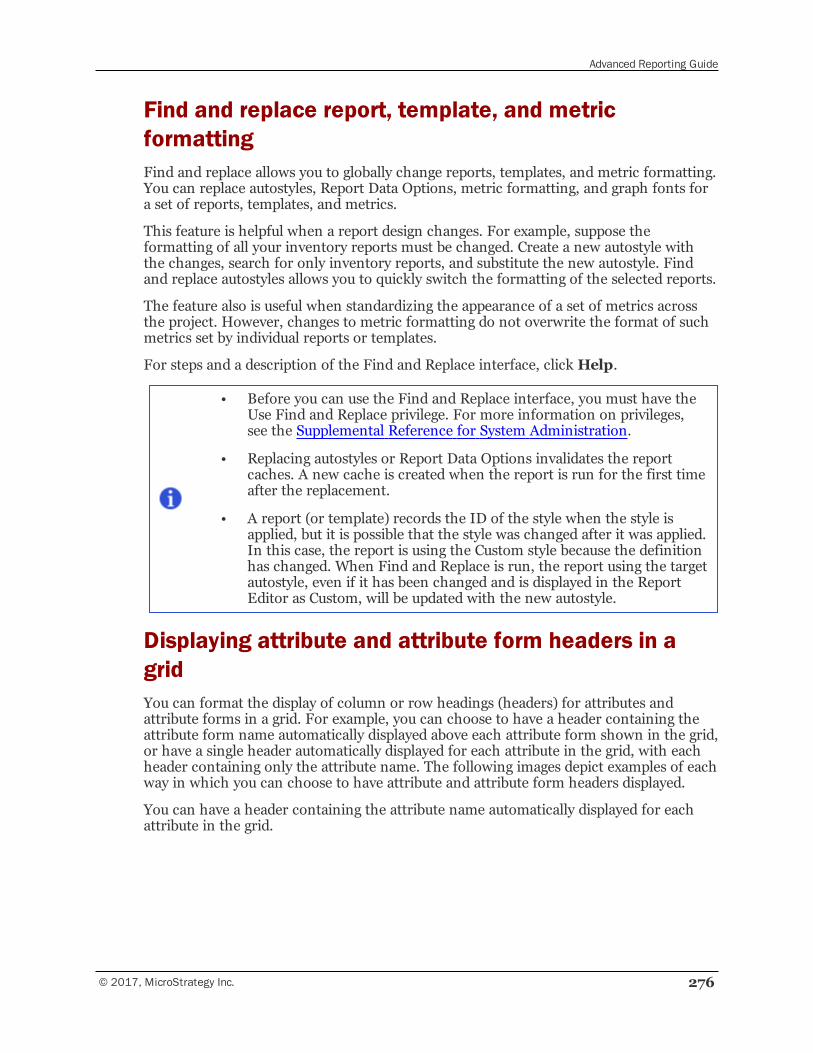
Advanced Reporting Guide
© 2017, MicroStrategy Inc. 276
Find and replace report, template, and metricformattingFind and replace allows you to globally change reports, templates, and metric formatting.You can replace autostyles, Report Data Options, metric formatting, and graph fonts fora set of reports, templates, and metrics.
This feature is helpful when a report design changes. For example, suppose theformatting of all your inventory reports must be changed. Create a new autostyle withthe changes, search for only inventory reports, and substitute the new autostyle. Findand replace autostyles allows you to quickly switch the formatting of the selected reports.
The feature also is useful when standardizing the appearance of a set of metrics acrossthe project. However, changes to metric formatting do not overwrite the format of suchmetrics set by individual reports or templates.
For steps and a description of the Find and Replace interface, click Help.
• Before you can use the Find and Replace interface, you must have theUse Find and Replace privilege. For more information on privileges,see the Supplemental Reference for System Administration.
• Replacing autostyles or Report Data Options invalidates the reportcaches. A new cache is created when the report is run for the first timeafter the replacement.
• A report (or template) records the ID of the style when the style isapplied, but it is possible that the style was changed after it was applied.In this case, the report is using the Custom style because the definitionhas changed. When Find and Replace is run, the report using the targetautostyle, even if it has been changed and is displayed in the ReportEditor as Custom, will be updated with the new autostyle.
Displaying attribute and attribute form headers in agridYou can format the display of column or row headings (headers) for attributes andattribute forms in a grid. For example, you can choose to have a header containing theattribute form name automatically displayed above each attribute form shown in the grid,or have a single header automatically displayed for each attribute in the grid, with eachheader containing only the attribute name. The following images depict examples of eachway in which you can choose to have attribute and attribute form headers displayed.
You can have a header containing the attribute name automatically displayed for eachattribute in the grid.
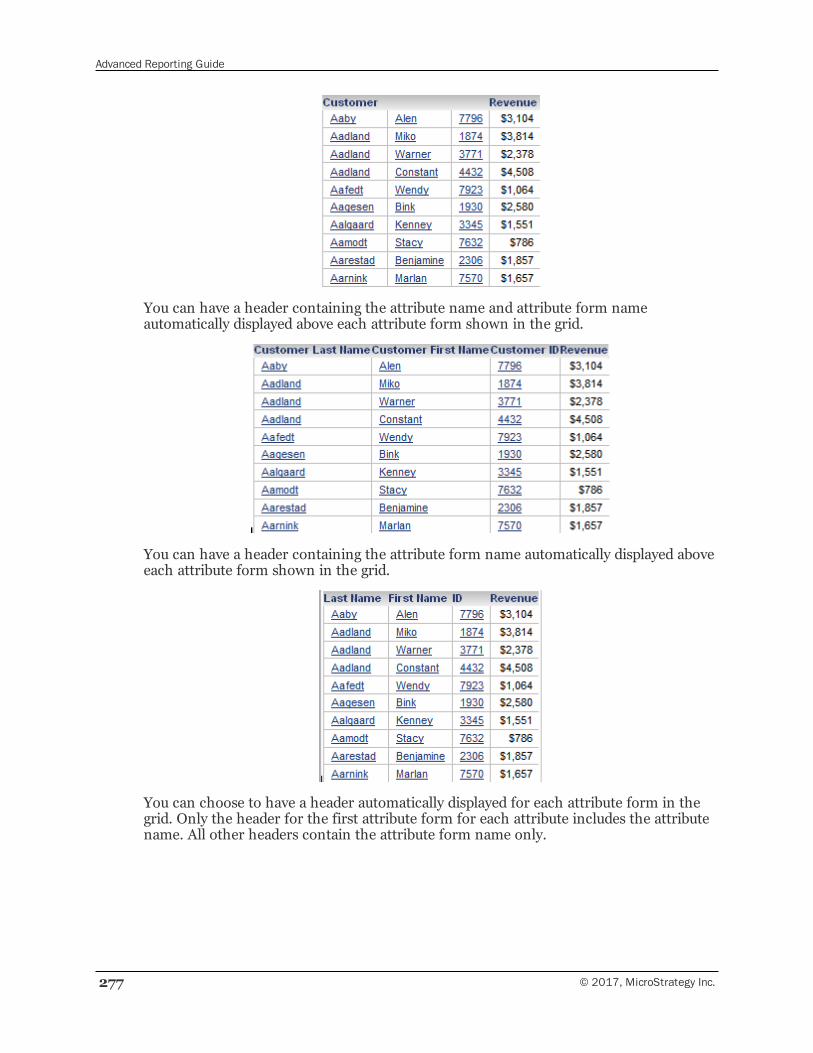
Advanced Reporting Guide
277 © 2017, MicroStrategy Inc.
You can have a header containing the attribute name and attribute form nameautomatically displayed above each attribute form shown in the grid.
You can have a header containing the attribute form name automatically displayed aboveeach attribute form shown in the grid.
You can choose to have a header automatically displayed for each attribute form in thegrid. Only the header for the first attribute form for each attribute includes the attributename. All other headers contain the attribute form name only.
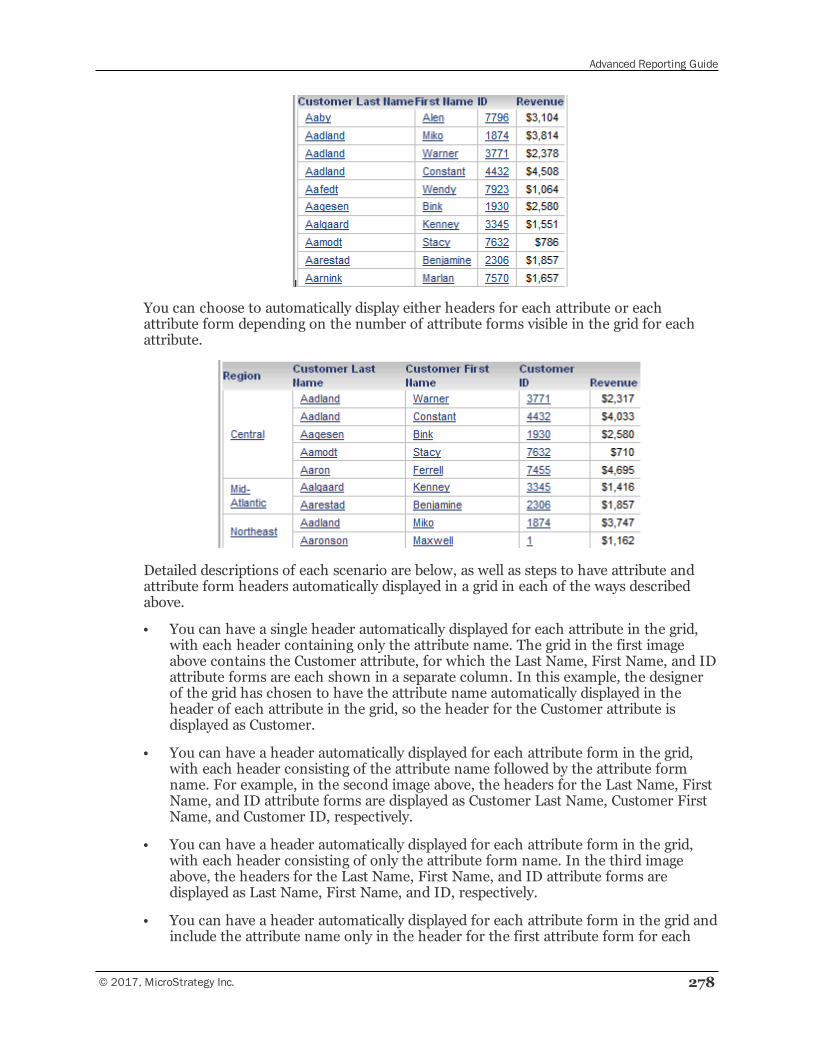
Advanced Reporting Guide
© 2017, MicroStrategy Inc. 278
You can choose to automatically display either headers for each attribute or eachattribute form depending on the number of attribute forms visible in the grid for eachattribute.
Detailed descriptions of each scenario are below, as well as steps to have attribute andattribute form headers automatically displayed in a grid in each of the ways describedabove.
• You can have a single header automatically displayed for each attribute in the grid,with each header containing only the attribute name. The grid in the first imageabove contains the Customer attribute, for which the Last Name, First Name, and IDattribute forms are each shown in a separate column. In this example, the designerof the grid has chosen to have the attribute name automatically displayed in theheader of each attribute in the grid, so the header for the Customer attribute isdisplayed as Customer.
• You can have a header automatically displayed for each attribute form in the grid,with each header consisting of the attribute name followed by the attribute formname. For example, in the second image above, the headers for the Last Name, FirstName, and ID attribute forms are displayed as Customer Last Name, Customer FirstName, and Customer ID, respectively.
• You can have a header automatically displayed for each attribute form in the grid,with each header consisting of only the attribute form name. In the third imageabove, the headers for the Last Name, First Name, and ID attribute forms aredisplayed as Last Name, First Name, and ID, respectively.
• You can have a header automatically displayed for each attribute form in the grid andinclude the attribute name only in the header for the first attribute form for each
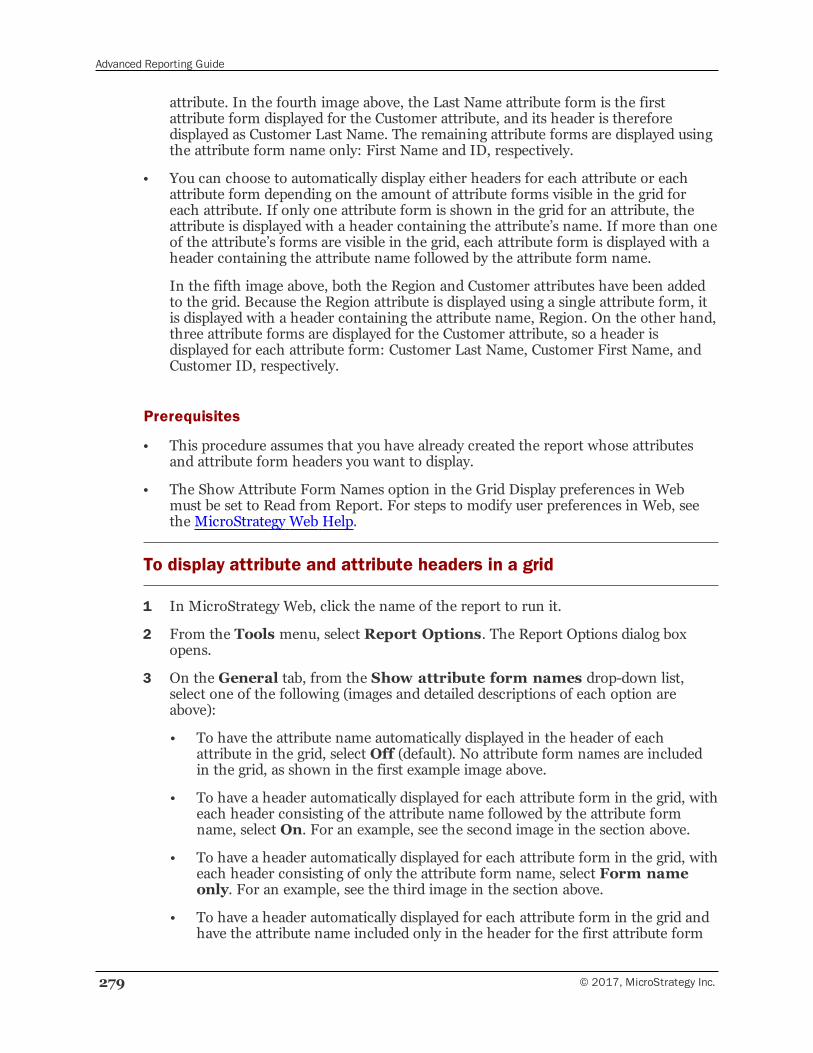
Advanced Reporting Guide
279 © 2017, MicroStrategy Inc.
attribute. In the fourth image above, the Last Name attribute form is the firstattribute form displayed for the Customer attribute, and its header is thereforedisplayed as Customer Last Name. The remaining attribute forms are displayed usingthe attribute form name only: First Name and ID, respectively.
• You can choose to automatically display either headers for each attribute or eachattribute form depending on the amount of attribute forms visible in the grid foreach attribute. If only one attribute form is shown in the grid for an attribute, theattribute is displayed with a header containing the attribute’s name. If more than oneof the attribute’s forms are visible in the grid, each attribute form is displayed with aheader containing the attribute name followed by the attribute form name.
In the fifth image above, both the Region and Customer attributes have been addedto the grid. Because the Region attribute is displayed using a single attribute form, itis displayed with a header containing the attribute name, Region. On the other hand,three attribute forms are displayed for the Customer attribute, so a header isdisplayed for each attribute form: Customer Last Name, Customer First Name, andCustomer ID, respectively.
Prerequisites
• This procedure assumes that you have already created the report whose attributesand attribute form headers you want to display.
• The Show Attribute Form Names option in the Grid Display preferences in Webmust be set to Read from Report. For steps to modify user preferences in Web, seethe MicroStrategy Web Help.
To display attribute and attribute headers in a grid
1 In MicroStrategy Web, click the name of the report to run it.
2 From the Tools menu, select Report Options. The Report Options dialog boxopens.
3 On the General tab, from the Show attribute form names drop-down list,select one of the following (images and detailed descriptions of each option areabove):
• To have the attribute name automatically displayed in the header of eachattribute in the grid, select Off (default). No attribute form names are includedin the grid, as shown in the first example image above.
• To have a header automatically displayed for each attribute form in the grid, witheach header consisting of the attribute name followed by the attribute formname, select On. For an example, see the second image in the section above.
• To have a header automatically displayed for each attribute form in the grid, witheach header consisting of only the attribute form name, select Form nameonly. For an example, see the third image in the section above.
• To have a header automatically displayed for each attribute form in the grid andhave the attribute name included only in the header for the first attribute form
Advanced Reporting Guide
© 2017, MicroStrategy Inc. 280
for each attribute, select Show attribute name once. The remaining attributeforms are displayed using the attribute form name only, as shown in the fourthexample image above.
• To automatically display either headers for each attribute or each attribute formdepending on the number of attribute forms visible in the grid for each attribute,select Automatic. If only one attribute form is shown in the grid for anattribute, the attribute is displayed with a header containing the attribute’s name.If more than one of the attribute’s forms are visible in the grid, each attributeform is displayed with a header containing the attribute name followed by theattribute form name. See the fifth image above for an example.
4 Click OK to apply your changes.
Determining which attribute elements aredisplayed: Attribute joins
For business attribute data, the most common types of joins are inner joins and outerjoins. An inner join includes in the data calculation only the data common to all theattribute elements in the join, while an outer join includes all of the data in all of theattribute elements.
Understanding the details of attribute joins requires that you have a basicunderstanding of SQL and of the tables in your data warehouse.
You can create an outer join on data coming from your data warehouse tables, for certainattributes on a report. You can also choose how the data warehouse table and final SQLpass result table are joined, and then determine the type of join, inner or outer, betweenspecific attributes.
The image below shows the attribute join type setting in the Report Data Options dialogbox. Each join type is described with an example in the next section, Understandingattribute join types, page 281.
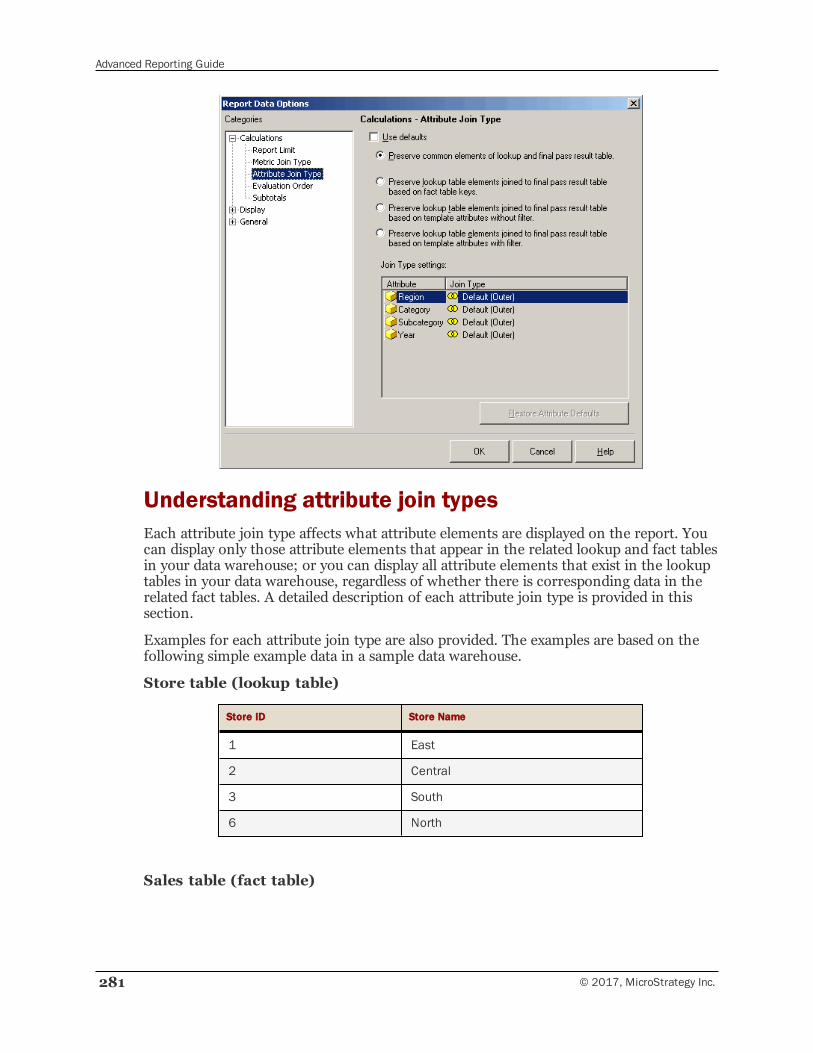
Advanced Reporting Guide
281 © 2017, MicroStrategy Inc.
Understanding attribute join typesEach attribute join type affects what attribute elements are displayed on the report. Youcan display only those attribute elements that appear in the related lookup and fact tablesin your data warehouse; or you can display all attribute elements that exist in the lookuptables in your data warehouse, regardless of whether there is corresponding data in therelated fact tables. A detailed description of each attribute join type is provided in thissection.
Examples for each attribute join type are also provided. The examples are based on thefollowing simple example data in a sample data warehouse.
Store table (lookup table)
Store ID Store Name
1 East
2 Central
3 South
6 North
Sales table (fact table)
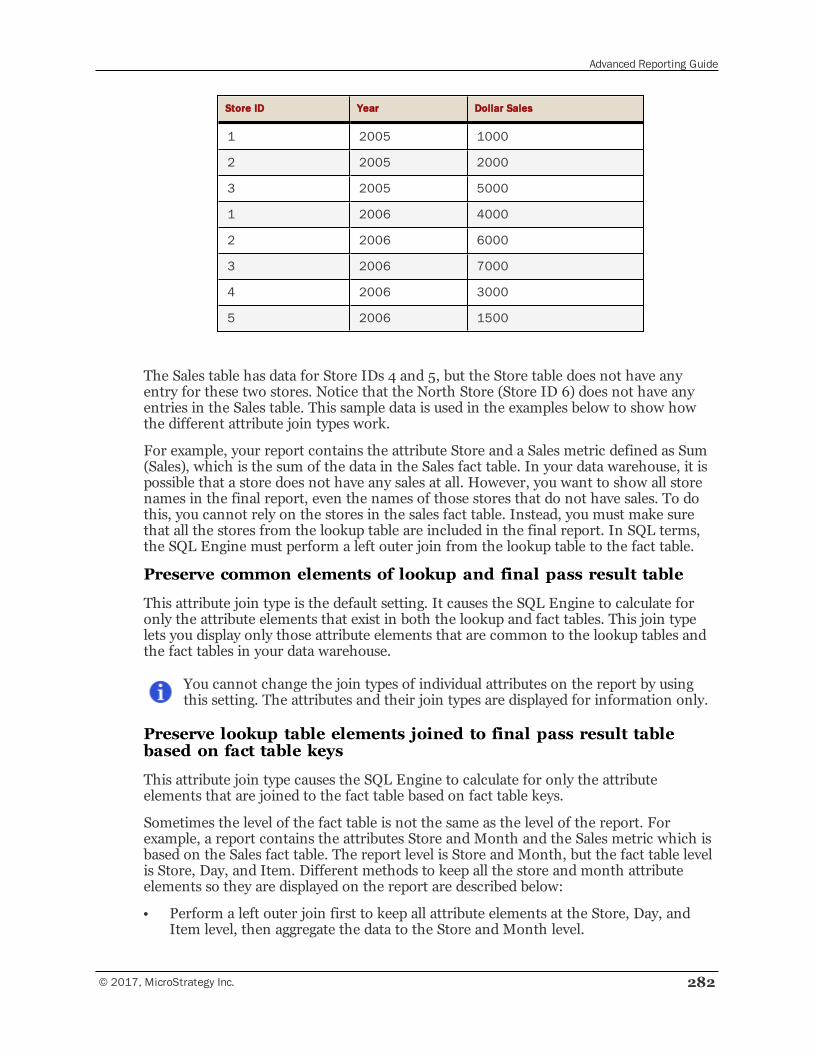
Advanced Reporting Guide
© 2017, MicroStrategy Inc. 282
Store ID Year Dollar Sales
1 2005 1000
2 2005 2000
3 2005 5000
1 2006 4000
2 2006 6000
3 2006 7000
4 2006 3000
5 2006 1500
The Sales table has data for Store IDs 4 and 5, but the Store table does not have anyentry for these two stores. Notice that the North Store (Store ID 6) does not have anyentries in the Sales table. This sample data is used in the examples below to show howthe different attribute join types work.
For example, your report contains the attribute Store and a Sales metric defined as Sum(Sales), which is the sum of the data in the Sales fact table. In your data warehouse, it ispossible that a store does not have any sales at all. However, you want to show all storenames in the final report, even the names of those stores that do not have sales. To dothis, you cannot rely on the stores in the sales fact table. Instead, you must make surethat all the stores from the lookup table are included in the final report. In SQL terms,the SQL Engine must perform a left outer join from the lookup table to the fact table.
Preserve common elements of lookup and final pass result table
This attribute join type is the default setting. It causes the SQL Engine to calculate foronly the attribute elements that exist in both the lookup and fact tables. This join typelets you display only those attribute elements that are common to the lookup tables andthe fact tables in your data warehouse.
You cannot change the join types of individual attributes on the report by usingthis setting. The attributes and their join types are displayed for information only.
Preserve lookup table elements joined to final pass result tablebased on fact table keys
This attribute join type causes the SQL Engine to calculate for only the attributeelements that are joined to the fact table based on fact table keys.
Sometimes the level of the fact table is not the same as the level of the report. Forexample, a report contains the attributes Store and Month and the Sales metric which isbased on the Sales fact table. The report level is Store and Month, but the fact table levelis Store, Day, and Item. Different methods to keep all the store and month attributeelements so they are displayed on the report are described below:
• Perform a left outer join first to keep all attribute elements at the Store, Day, andItem level, then aggregate the data to the Store and Month level.
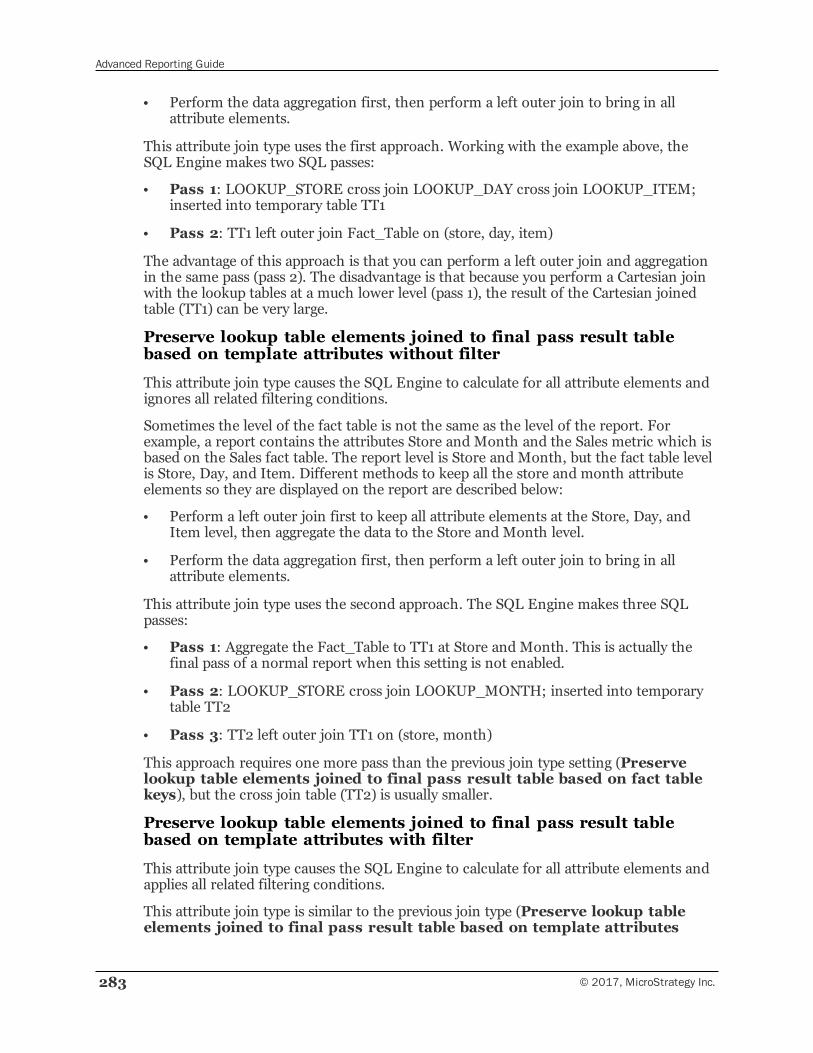
Advanced Reporting Guide
283 © 2017, MicroStrategy Inc.
• Perform the data aggregation first, then perform a left outer join to bring in allattribute elements.
This attribute join type uses the first approach. Working with the example above, theSQL Engine makes two SQL passes:
• Pass 1: LOOKUP_STORE cross join LOOKUP_DAY cross join LOOKUP_ITEM;inserted into temporary table TT1
• Pass 2: TT1 left outer join Fact_Table on (store, day, item)
The advantage of this approach is that you can perform a left outer join and aggregationin the same pass (pass 2). The disadvantage is that because you perform a Cartesian joinwith the lookup tables at a much lower level (pass 1), the result of the Cartesian joinedtable (TT1) can be very large.
Preserve lookup table elements joined to final pass result tablebased on template attributes without filter
This attribute join type causes the SQL Engine to calculate for all attribute elements andignores all related filtering conditions.
Sometimes the level of the fact table is not the same as the level of the report. Forexample, a report contains the attributes Store and Month and the Sales metric which isbased on the Sales fact table. The report level is Store and Month, but the fact table levelis Store, Day, and Item. Different methods to keep all the store and month attributeelements so they are displayed on the report are described below:
• Perform a left outer join first to keep all attribute elements at the Store, Day, andItem level, then aggregate the data to the Store and Month level.
• Perform the data aggregation first, then perform a left outer join to bring in allattribute elements.
This attribute join type uses the second approach. The SQL Engine makes three SQLpasses:
• Pass 1: Aggregate the Fact_Table to TT1 at Store and Month. This is actually thefinal pass of a normal report when this setting is not enabled.
• Pass 2: LOOKUP_STORE cross join LOOKUP_MONTH; inserted into temporarytable TT2
• Pass 3: TT2 left outer join TT1 on (store, month)
This approach requires one more pass than the previous join type setting (Preservelookup table elements joined to final pass result table based on fact tablekeys), but the cross join table (TT2) is usually smaller.
Preserve lookup table elements joined to final pass result tablebased on template attributes with filter
This attribute join type causes the SQL Engine to calculate for all attribute elements andapplies all related filtering conditions.
This attribute join type is similar to the previous join type (Preserve lookup tableelements joined to final pass result table based on template attributes
Advanced Reporting Guide
© 2017, MicroStrategy Inc. 284
without filter). The only difference is that the report filter is applied in the final pass(Pass 3). For example, a report contains Store, Month, and Sum(Sales) with a filter ofYear = 2005. You want to display every store in every month in 2005, regardless ofwhether there are sales. However, you do not want to show any months from otheryears, but only the 12 months in the year 2005. This attribute join type provides thisdata.
Selecting an attribute join typeYou can determine attribute join types in the following ways:
• Use a VLDB property setting to determine attribute join types for a given databaseinstance, report, or report template. See details about the Preserve All Lookup TableElements VLDB property in Preserve All Lookup Table Elements, page 707.
• Use the Report Data Options dialog box to individually select attributes on thetemplate that need to display attribute elements. When you change from the defaultattribute join type setting (Preserve common elements of lookup and finalpass result table), it is assumed that you want to keep ALL elements of theattributes in their lookup tables. However, sometimes you want such a setting toaffect only some of the attributes on a report. For example, for a report containingStore, Month, and Sum(Sales), you may want to show all the store names, eventhough they have no sales, but not necessarily all the months in the LOOKUP_MONTH table. To do this, use the Report Data Options dialog box as described in theprocedure below.
The four attribute join types available in the Report Data Options dialog box arethe same as those in the VLDB Properties dialog box. The system reads them fromthe same location.
To view and change attribute join types
1 Open a grid report.
2 From the Data menu, select Report Data Options. The Report Data Optionsdialog box opens.
3 Under Categories, expand Calculations, and then select Attribute Join Type.The Calculations - Attribute Join Type appears on the right side of the interface. Thissubcategory lists all attributes on the report, along with each attribute’s join type, asshown in the image on click here.
If you have a long list of attributes, you can sort them by attribute name or byjoin type, by clicking the Attribute or Join Type column headers.
4 Depending on your goals for joining attribute data, select one of the following jointypes. Details and examples for each join type are provided in Understandingattribute join types, page 281.
• Preserve common elements of lookup and final pass result table:(Default setting) This join type causes the SQL Engine to calculate for only theattribute elements that exist in both the lookup and fact tables. This join type lets
Advanced Reporting Guide
285 © 2017, MicroStrategy Inc.
you display all attribute elements that exist in the lookup tables in your datawarehouse, regardless of whether there is a corresponding fact value in the datawarehouse. You cannot change the join types of individual attributes with thissetting. The attributes and their join types are displayed for information only.
• Preserve lookup table elements joined to final pass result tablebased on fact table keys: This join type causes the SQL Engine to calculatefor only the elements that are joined to the fact table based on fact table keys.
• Preserve lookup table elements joined to final pass result tablebased on template attributes without filter: This join type causes theSQL Engine to calculate for all attribute elements and ignores all related filteringconditions.
• Preserve lookup table elements joined to final pass result tablebased on template attributes with filter: This join type causes the SQLEngine to calculate for all attribute elements and applies all related filteringconditions.
5 You can change the join type of a specific attribute, if you select any of the Preservelookup table elements join types. In the Join Type settings table, click theJoin Type for the attribute and select the join type from the drop-down list. Thejoin type options are:
• Default: This option sets the attribute to use the join type set for that individualattribute using the Attribute Editor. If a join type was not set at the attributelevel, the attribute uses the join type set at the project level.
• Inner: This option displays only the attribute elements common to all datawarehouse tables from which data is being gathered for this attribute.
• Outer: This option displays all of the attribute elements from all data warehousetables from which data is being gathered for this attribute.
If the report contains an object prompt on the report grid, the report'sattributes are not yet defined and therefore cannot be displayed in the JoinType settings table. To assign join settings to the attributes included in theobject prompt, see Join Type settings for an object prompt, page 285.
6 When you are finished making changes, click OK. The report is re-executed againstyour data warehouse, and the newly calculated results are displayed.
Join Type settings for an object prompt
If a report contains an object prompt on the report grid, the report's attributes are notyet defined and therefore cannot be displayed in the Join Type settings table. You canassign join settings to the attributes included in the object prompt by answering theprompt in SQL View. This adds the attributes to the report, so that you can assign jointype settings.
For example, the following report contains an object prompt, called Choose Attributes,on the rows:
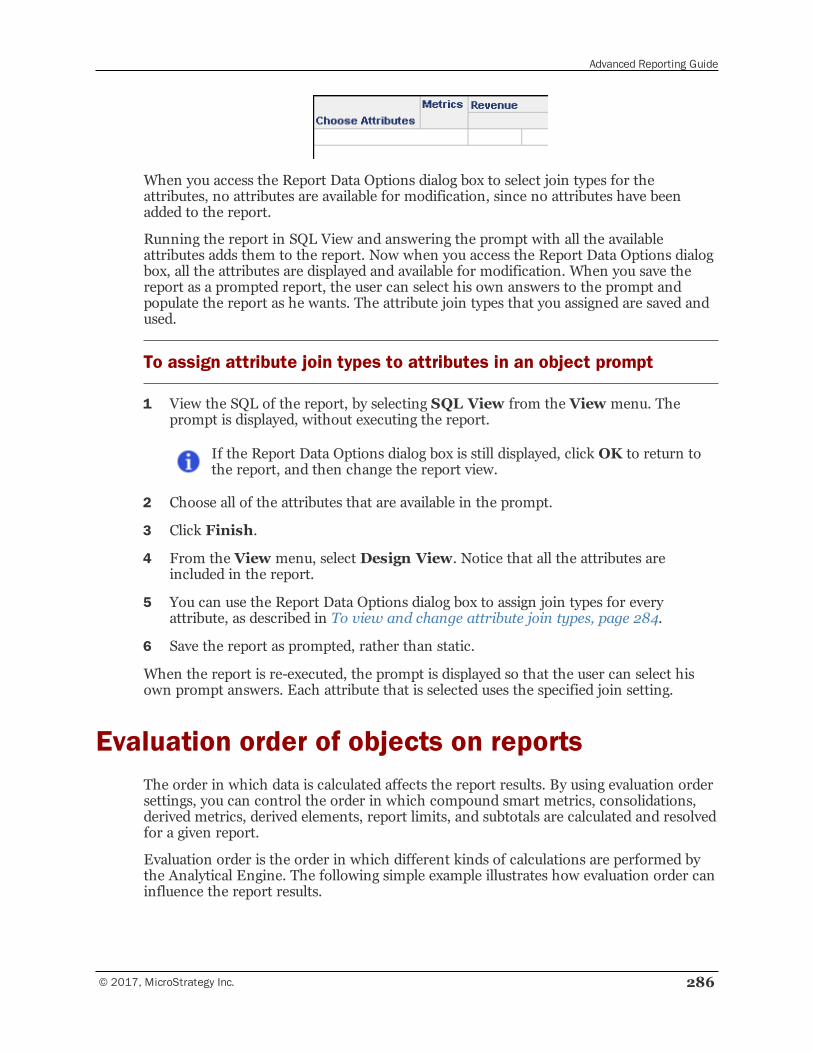
Advanced Reporting Guide
© 2017, MicroStrategy Inc. 286
When you access the Report Data Options dialog box to select join types for theattributes, no attributes are available for modification, since no attributes have beenadded to the report.
Running the report in SQL View and answering the prompt with all the availableattributes adds them to the report. Now when you access the Report Data Options dialogbox, all the attributes are displayed and available for modification. When you save thereport as a prompted report, the user can select his own answers to the prompt andpopulate the report as he wants. The attribute join types that you assigned are saved andused.
To assign attribute join types to attributes in an object prompt
1 View the SQL of the report, by selecting SQL View from the View menu. Theprompt is displayed, without executing the report.
If the Report Data Options dialog box is still displayed, click OK to return tothe report, and then change the report view.
2 Choose all of the attributes that are available in the prompt.
3 Click Finish.
4 From the View menu, select Design View. Notice that all the attributes areincluded in the report.
5 You can use the Report Data Options dialog box to assign join types for everyattribute, as described in To view and change attribute join types, page 284.
6 Save the report as prompted, rather than static.
When the report is re-executed, the prompt is displayed so that the user can select hisown prompt answers. Each attribute that is selected uses the specified join setting.
Evaluation order of objects on reportsThe order in which data is calculated affects the report results. By using evaluation ordersettings, you can control the order in which compound smart metrics, consolidations,derived metrics, derived elements, report limits, and subtotals are calculated and resolvedfor a given report.
Evaluation order is the order in which different kinds of calculations are performed bythe Analytical Engine. The following simple example illustrates how evaluation order caninfluence the report results.
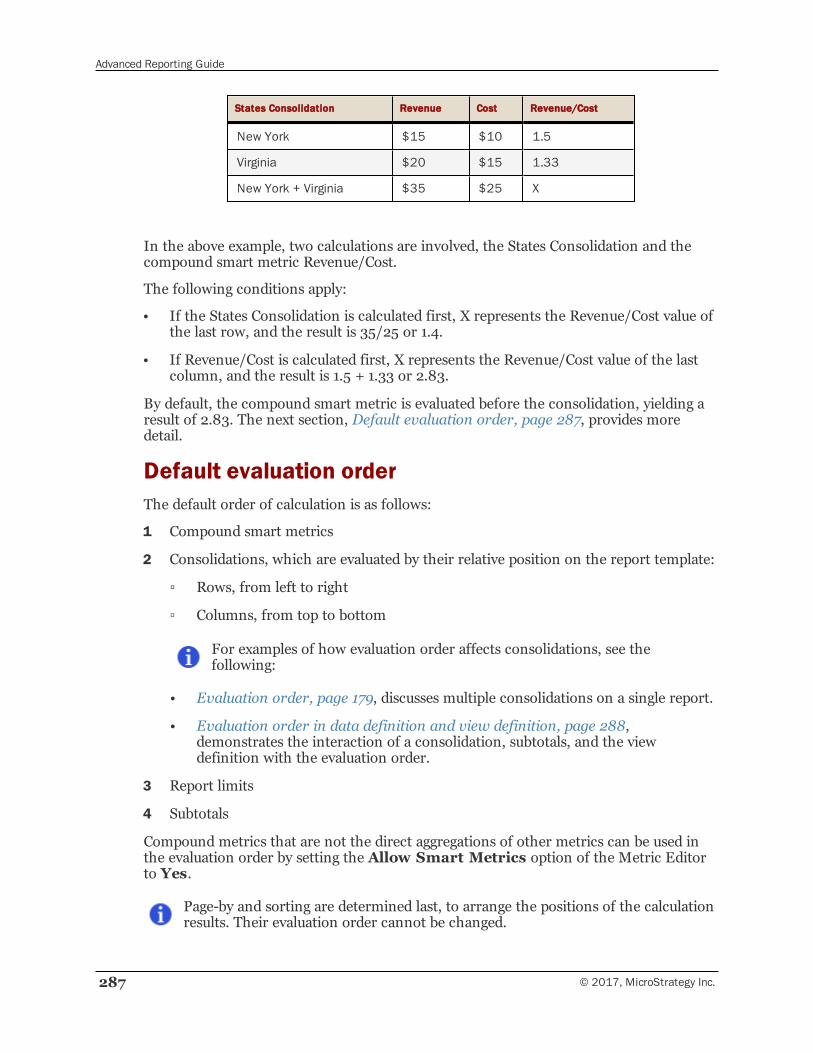
Advanced Reporting Guide
287 © 2017, MicroStrategy Inc.
States Consolidation Revenue Cost Revenue/Cost
New York $15 $10 1.5
Virginia $20 $15 1.33
New York + Virginia $35 $25 X
In the above example, two calculations are involved, the States Consolidation and thecompound smart metric Revenue/Cost.
The following conditions apply:
• If the States Consolidation is calculated first, X represents the Revenue/Cost value ofthe last row, and the result is 35/25 or 1.4.
• If Revenue/Cost is calculated first, X represents the Revenue/Cost value of the lastcolumn, and the result is 1.5 + 1.33 or 2.83.
By default, the compound smart metric is evaluated before the consolidation, yielding aresult of 2.83. The next section, Default evaluation order, page 287, provides moredetail.
Default evaluation orderThe default order of calculation is as follows:
1 Compound smart metrics
2 Consolidations, which are evaluated by their relative position on the report template:
▫ Rows, from left to right
▫ Columns, from top to bottom
For examples of how evaluation order affects consolidations, see thefollowing:
• Evaluation order, page 179, discusses multiple consolidations on a single report.
• Evaluation order in data definition and view definition, page 288,demonstrates the interaction of a consolidation, subtotals, and the viewdefinition with the evaluation order.
3 Report limits
4 Subtotals
Compound metrics that are not the direct aggregations of other metrics can be used inthe evaluation order by setting the Allow Smart Metrics option of the Metric Editorto Yes.
Page-by and sorting are determined last, to arrange the positions of the calculationresults. Their evaluation order cannot be changed.
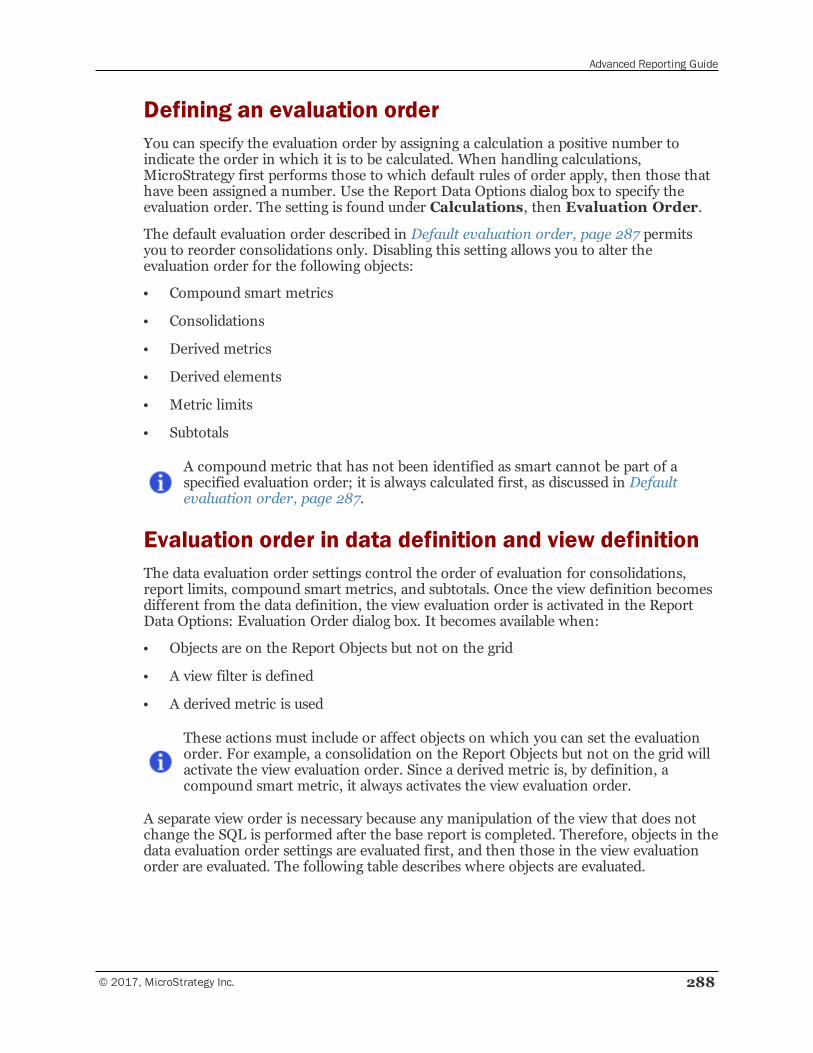
Advanced Reporting Guide
© 2017, MicroStrategy Inc. 288
Defining an evaluation orderYou can specify the evaluation order by assigning a calculation a positive number toindicate the order in which it is to be calculated. When handling calculations,MicroStrategy first performs those to which default rules of order apply, then those thathave been assigned a number. Use the Report Data Options dialog box to specify theevaluation order. The setting is found under Calculations, then Evaluation Order.
The default evaluation order described in Default evaluation order, page 287 permitsyou to reorder consolidations only. Disabling this setting allows you to alter theevaluation order for the following objects:
• Compound smart metrics
• Consolidations
• Derived metrics
• Derived elements
• Metric limits
• Subtotals
A compound metric that has not been identified as smart cannot be part of aspecified evaluation order; it is always calculated first, as discussed in Defaultevaluation order, page 287.
Evaluation order in data definition and view definitionThe data evaluation order settings control the order of evaluation for consolidations,report limits, compound smart metrics, and subtotals. Once the view definition becomesdifferent from the data definition, the view evaluation order is activated in the ReportData Options: Evaluation Order dialog box. It becomes available when:
• Objects are on the Report Objects but not on the grid
• A view filter is defined
• A derived metric is used
These actions must include or affect objects on which you can set the evaluationorder. For example, a consolidation on the Report Objects but not on the grid willactivate the view evaluation order. Since a derived metric is, by definition, acompound smart metric, it always activates the view evaluation order.
A separate view order is necessary because any manipulation of the view that does notchange the SQL is performed after the base report is completed. Therefore, objects in thedata evaluation order settings are evaluated first, and then those in the view evaluationorder are evaluated. The following table describes where objects are evaluated.
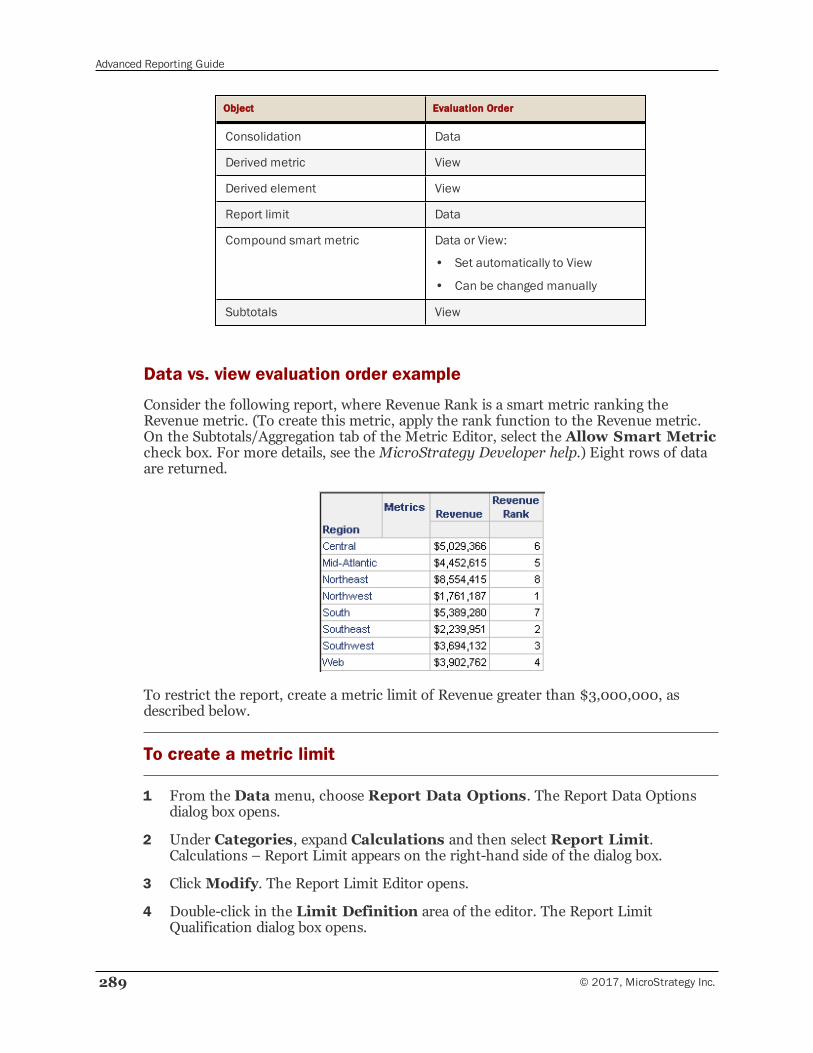
Advanced Reporting Guide
289 © 2017, MicroStrategy Inc.
Object Evaluation Order
Consolidation Data
Derived metric View
Derived element View
Report limit Data
Compound smart metric Data or View:
• Set automatically to View
• Can be changed manually
Subtotals View
Data vs. view evaluation order example
Consider the following report, where Revenue Rank is a smart metric ranking theRevenue metric. (To create this metric, apply the rank function to the Revenue metric.On the Subtotals/Aggregation tab of the Metric Editor, select the Allow Smart Metriccheck box. For more details, see theMicroStrategy Developer help.) Eight rows of dataare returned.
To restrict the report, create a metric limit of Revenue greater than $3,000,000, asdescribed below.
To create a metric limit
1 From the Data menu, choose Report Data Options. The Report Data Optionsdialog box opens.
2 Under Categories, expand Calculations and then select Report Limit.Calculations – Report Limit appears on the right-hand side of the dialog box.
3 ClickModify. The Report Limit Editor opens.
4 Double-click in the Limit Definition area of the editor. The Report LimitQualification dialog box opens.
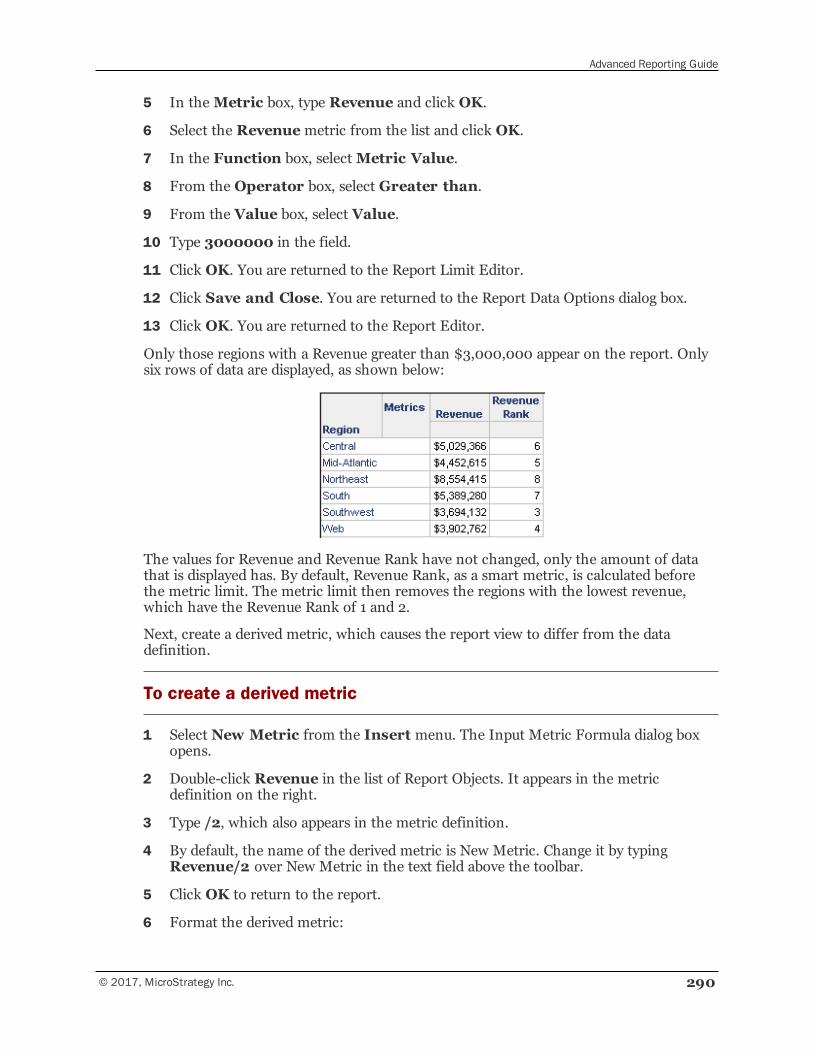
Advanced Reporting Guide
© 2017, MicroStrategy Inc. 290
5 In theMetric box, type Revenue and click OK.
6 Select the Revenuemetric from the list and click OK.
7 In the Function box, selectMetric Value.
8 From the Operator box, select Greater than.
9 From the Value box, select Value.
10 Type 3000000 in the field.
11 Click OK. You are returned to the Report Limit Editor.
12 Click Save and Close. You are returned to the Report Data Options dialog box.
13 Click OK. You are returned to the Report Editor.
Only those regions with a Revenue greater than $3,000,000 appear on the report. Onlysix rows of data are displayed, as shown below:
The values for Revenue and Revenue Rank have not changed, only the amount of datathat is displayed has. By default, Revenue Rank, as a smart metric, is calculated beforethe metric limit. The metric limit then removes the regions with the lowest revenue,which have the Revenue Rank of 1 and 2.
Next, create a derived metric, which causes the report view to differ from the datadefinition.
To create a derived metric
1 Select New Metric from the Insert menu. The Input Metric Formula dialog boxopens.
2 Double-click Revenue in the list of Report Objects. It appears in the metricdefinition on the right.
3 Type /2, which also appears in the metric definition.
4 By default, the name of the derived metric is New Metric. Change it by typingRevenue/2 over New Metric in the text field above the toolbar.
5 Click OK to return to the report.
6 Format the derived metric:
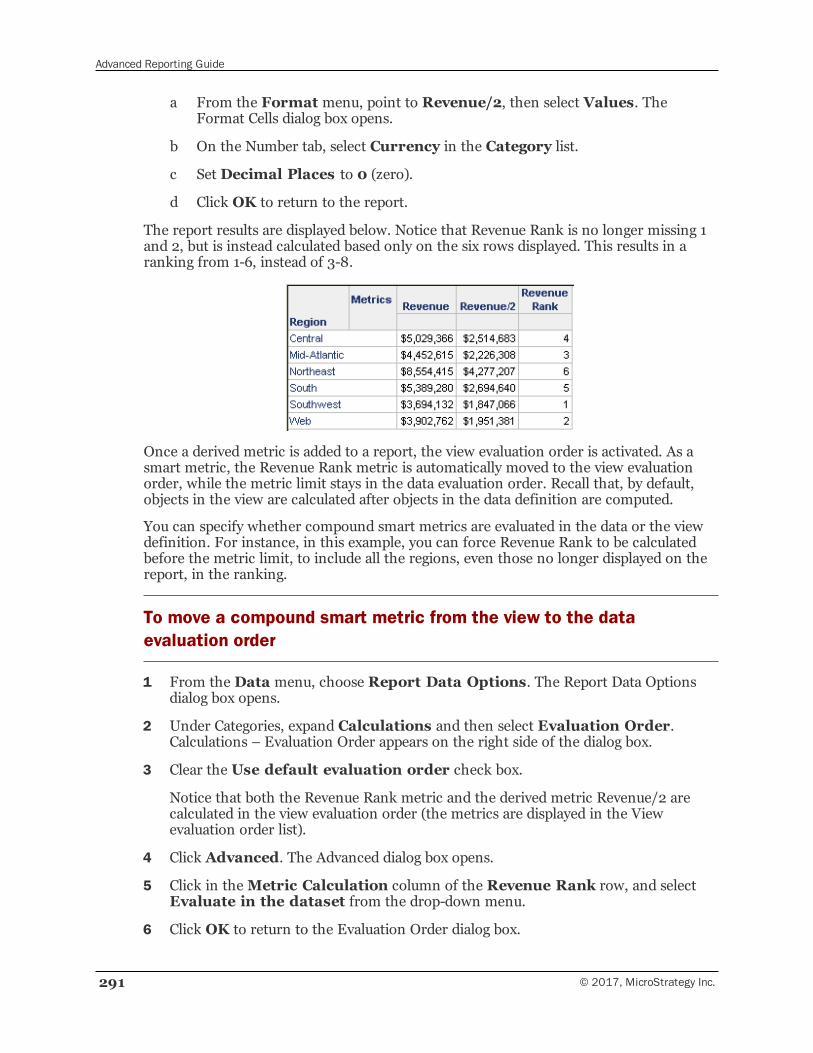
Advanced Reporting Guide
291 © 2017, MicroStrategy Inc.
a From the Format menu, point to Revenue/2, then select Values. TheFormat Cells dialog box opens.
b On the Number tab, select Currency in the Category list.
c Set Decimal Places to 0 (zero).
d Click OK to return to the report.
The report results are displayed below. Notice that Revenue Rank is no longer missing 1and 2, but is instead calculated based only on the six rows displayed. This results in aranking from 1-6, instead of 3-8.
Once a derived metric is added to a report, the view evaluation order is activated. As asmart metric, the Revenue Rank metric is automatically moved to the view evaluationorder, while the metric limit stays in the data evaluation order. Recall that, by default,objects in the view are calculated after objects in the data definition are computed.
You can specify whether compound smart metrics are evaluated in the data or the viewdefinition. For instance, in this example, you can force Revenue Rank to be calculatedbefore the metric limit, to include all the regions, even those no longer displayed on thereport, in the ranking.
To move a compound smart metric from the view to the dataevaluation order
1 From the Data menu, choose Report Data Options. The Report Data Optionsdialog box opens.
2 Under Categories, expand Calculations and then select Evaluation Order.Calculations – Evaluation Order appears on the right side of the dialog box.
3 Clear the Use default evaluation order check box.
Notice that both the Revenue Rank metric and the derived metric Revenue/2 arecalculated in the view evaluation order (the metrics are displayed in the Viewevaluation order list).
4 Click Advanced. The Advanced dialog box opens.
5 Click in theMetric Calculation column of the Revenue Rank row, and selectEvaluate in the dataset from the drop-down menu.
6 Click OK to return to the Evaluation Order dialog box.
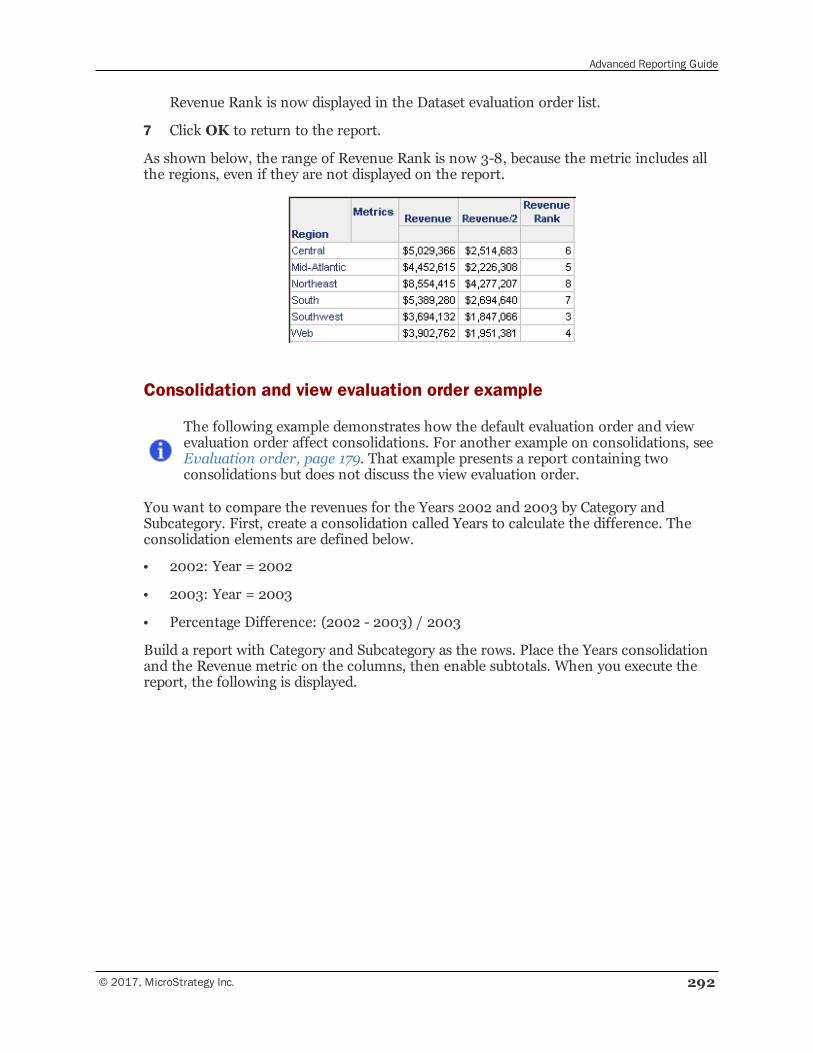
Advanced Reporting Guide
© 2017, MicroStrategy Inc. 292
Revenue Rank is now displayed in the Dataset evaluation order list.
7 Click OK to return to the report.
As shown below, the range of Revenue Rank is now 3-8, because the metric includes allthe regions, even if they are not displayed on the report.
Consolidation and view evaluation order example
The following example demonstrates how the default evaluation order and viewevaluation order affect consolidations. For another example on consolidations, seeEvaluation order, page 179. That example presents a report containing twoconsolidations but does not discuss the view evaluation order.
You want to compare the revenues for the Years 2002 and 2003 by Category andSubcategory. First, create a consolidation called Years to calculate the difference. Theconsolidation elements are defined below.
• 2002: Year = 2002
• 2003: Year = 2003
• Percentage Difference: (2002 - 2003) / 2003
Build a report with Category and Subcategory as the rows. Place the Years consolidationand the Revenue metric on the columns, then enable subtotals. When you execute thereport, the following is displayed.
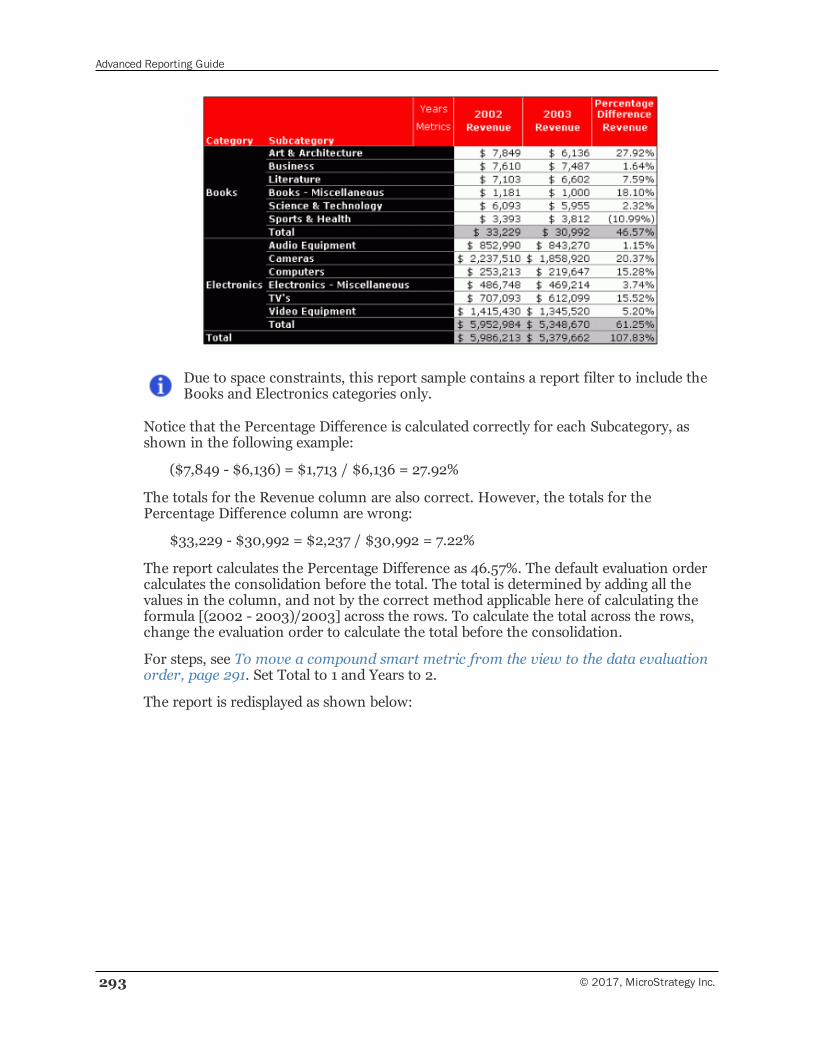
Advanced Reporting Guide
293 © 2017, MicroStrategy Inc.
Due to space constraints, this report sample contains a report filter to include theBooks and Electronics categories only.
Notice that the Percentage Difference is calculated correctly for each Subcategory, asshown in the following example:
($7,849 - $6,136) = $1,713 / $6,136 = 27.92%
The totals for the Revenue column are also correct. However, the totals for thePercentage Difference column are wrong:
$33,229 - $30,992 = $2,237 / $30,992 = 7.22%
The report calculates the Percentage Difference as 46.57%. The default evaluation ordercalculates the consolidation before the total. The total is determined by adding all thevalues in the column, and not by the correct method applicable here of calculating theformula [(2002 - 2003)/2003] across the rows. To calculate the total across the rows,change the evaluation order to calculate the total before the consolidation.
For steps, see To move a compound smart metric from the view to the data evaluationorder, page 291. Set Total to 1 and Years to 2.
The report is redisplayed as shown below:
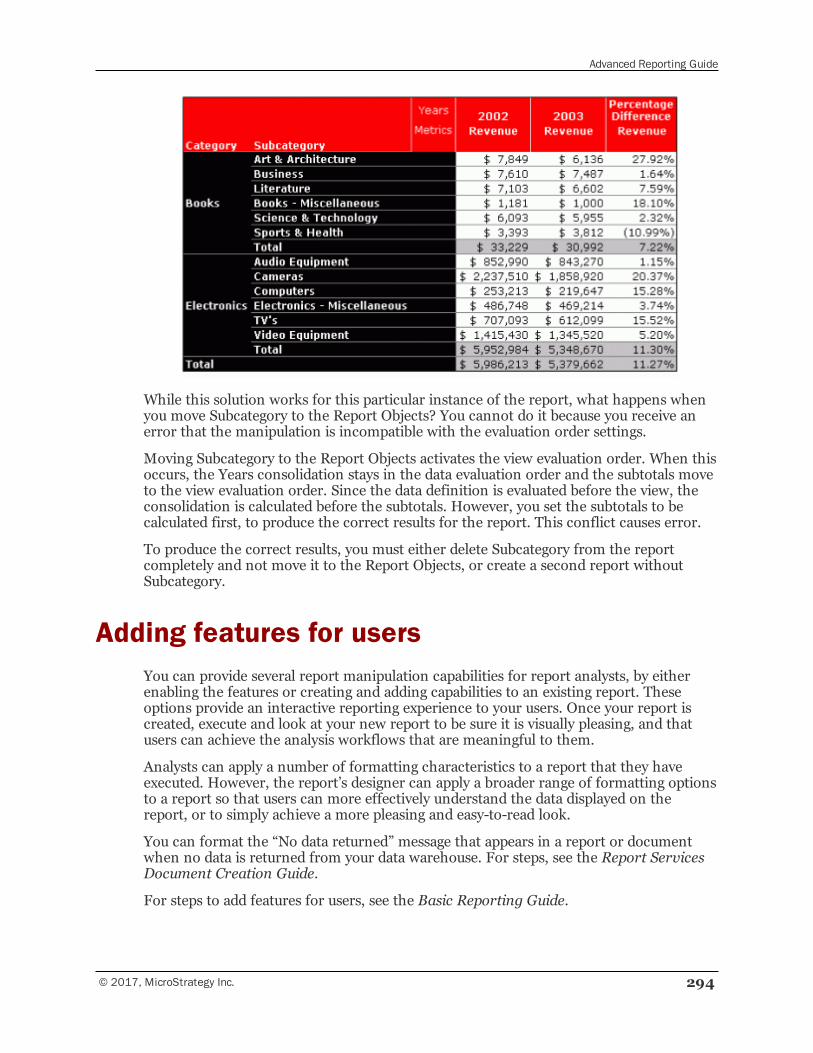
Advanced Reporting Guide
© 2017, MicroStrategy Inc. 294
While this solution works for this particular instance of the report, what happens whenyou move Subcategory to the Report Objects? You cannot do it because you receive anerror that the manipulation is incompatible with the evaluation order settings.
Moving Subcategory to the Report Objects activates the view evaluation order. When thisoccurs, the Years consolidation stays in the data evaluation order and the subtotals moveto the view evaluation order. Since the data definition is evaluated before the view, theconsolidation is calculated before the subtotals. However, you set the subtotals to becalculated first, to produce the correct results for the report. This conflict causes error.
To produce the correct results, you must either delete Subcategory from the reportcompletely and not move it to the Report Objects, or create a second report withoutSubcategory.
Adding features for usersYou can provide several report manipulation capabilities for report analysts, by eitherenabling the features or creating and adding capabilities to an existing report. Theseoptions provide an interactive reporting experience to your users. Once your report iscreated, execute and look at your new report to be sure it is visually pleasing, and thatusers can achieve the analysis workflows that are meaningful to them.
Analysts can apply a number of formatting characteristics to a report that they haveexecuted. However, the report’s designer can apply a broader range of formatting optionsto a report so that users can more effectively understand the data displayed on thereport, or to simply achieve a more pleasing and easy-to-read look.
You can format the “No data returned” message that appears in a report or documentwhen no data is returned from your data warehouse. For steps, see the Report ServicesDocument Creation Guide.
For steps to add features for users, see the Basic Reporting Guide.
Advanced Reporting Guide
295 © 2017, MicroStrategy Inc.
Distributing reports to a user communityMicroStrategy makes distributing reports to a wide range of users easier. You can useobject templates to design high-level reports that can be customized for the end-user, orinclude features like prompts, drill maps, and derived metric creation to empower usersto find answers to their business questions independently. Designing flexible reports alsoreduces the need to create new reports for every business question.
This section includes the following information:
• Object templates and shortcuts to filters and templates allow you to re-use commoncomponents of an attribute, report, or other object. For guidelines on re-using andmaintaining objects, and steps to create object templates and shortcuts, see Re-usingobjects via shortcuts and object templates , page 295
• After you have created your reports, you can make the reports accessible to users.For steps, seeMaking reports accessible, page 301.
• You can control which reports are cached. For steps and background information onreport caches, see Caching, page 302.
Re-using objects via shortcuts and object templatesRe-using objects can make distributing reports to users much easier. For example, youmay have 50 reports that are all based on the same filter. If each report uses its ownembedded filter, then that change must be performed in each of the 50 reports.However, if the filter is built as a stand-alone object and added as a shortcut to thereports, the filter can be changed once, and the change is automatically applied to all ofthe reports in which the filter is used. By creating the filter as a stand-alone object andincluding the filter as a shortcut in reports, you avoid having to manually change each ofthe reports that the filter is used in.
When planning to update objects, you can search for the objects that contain them orother objects they contain. This type of search can identify which reports, documents,and so on will be affected by changes to the object. You can, for example, search for alltemplates that contain the Profit metric by right-clicking the Profit metric and selectingSearch for Dependents. The Search dialog box is displayed with a list of the Profitmetric’s dependents. As another example, you can search for all metrics that are used bythe Store Sales template by right-clicking the Store Sales template and selecting Searchfor Components.
Objects that can be reused include filters, report templates, custom groups, andconsolidations. For information on how to take advantage of re-usable objects and stepsto create them, see the following links:
• Shortcut to a template, page 296
• Shortcut to a filter, page 298
• Object templates, page 299
Advanced Reporting Guide
© 2017, MicroStrategy Inc. 296
Shortcut to a template
A template specifies the information to retrieve from the data warehouse and how it isdisplayed in the report grid. Information on the report template includes metric defaultvalues, banding options, join type setting, and data sorting options. A template does notinclude filter information. You can create a stand-alone template in the Template Editor.
When you add a new template to a report, you can replace the default report templatewith a shortcut to the new template. Creating a shortcut to a template allows you to use astand-alone template with any number of reports. Any changes made to the stand-alonetemplate are then propagated to all reports that use that template.
You can determine whether a report’s template is a shortcut to a template by looking atthe template’s name in the Grid definition. If a shortcut icon appears in the title bar, thereport’s template is a stand-alone template.
For steps to add a stand-alone template to a report, see Adding a stand-alone template toa report, page 296.
When you modify a shortcut template in a report, you can either choose to save thosechanges to this report only, or save them to all reports that share the same template.
If you save the changes to this report only, changes made to the template in this reportdo not impact other reports. If you save the changes to all reports that use this template,changes made to the template data definition in this report are propagated to all otherreports that contain a shortcut to the same template. For example, if you add a metric toa report with a shortcut template, and then save the changes to the shortcut instead ofonly to the local copy of the report, all other reports that contain the same shortcuttemplate display the new metric in Report Objects. For steps to save the report, seeSaving a report with a shortcut to a stand-alone template, page 297.
To avoid unexpected impacts on reports when making template changes, conduct a quickimpact analysis: seeModifying a template and validating changes, page 298.
Adding a stand-alone template to a report
The following procedure describes how to apply a previously created, stand-alonetemplate to a report during report creation.
Prerequisite
• This procedure assumes that you have already created a stand-alone template. Forsteps, see theMicroStrategy Developer help.
To add a template to a report
1 In Web or Developer, open the report in Design Mode.
2 Use the Object Browser to search for and locate the template that you want to add tothe report.
• If the Object Browser is not displayed, open it by selectingObject Browserfrom the View menu.
Advanced Reporting Guide
297 © 2017, MicroStrategy Inc.
3 Right-click the template and select one of the following (the options are described inmore detail above):
• To connect a stand-alone template to this report, select Replace withshortcut to template. Going forward, changes to the stand-alone templateare propagated to the report, and vice versa.
• To embed the template in the report, select Replace with copy of template.Going forward, changes to the stand-alone template are not propagated to thereport, and vice versa.
The template’s components appear in the report’s Report View pane. If the templateis a shortcut, the template’s name is also displayed. If the report does not use ashortcut template, the template is named Local Template.
4 Save the report. If you added the template as a shortcut, you must save the reportwith the shortcut to retain that functionality. For steps, see To save a report with ashortcut to a stand-alone template, page 297.
Saving a report with a shortcut to a stand-alone template
When you save changes to a report that contains a stand-alone template, you can chooseto either save the changes to that report only (called a local copy), or save the changes toall reports that use the same template (called a template shortcut). Steps are below tosave a report’s change to a template shortcut so that those changes are automaticallypropagated to all reports that also use the stand-alone template they are all connected to.
Reports with shortcuts to stand-alone templates and filters allow you to share reportcaches. For an introduction to report caches, see the Caching chapter in the SystemAdministration Guide.
To save a report with a shortcut to a stand-alone template
1 Save the report with a shortcut to a stand-alone template:
a Click Save and Close on the toolbar of the Report Editor or Report Viewer.The Save Report As dialog box opens.
b Select the folder in which to save the report, then type the name of the newreport.
c Click Save. The Advanced Save Options dialog box opens.
▫ If the report contains prompts, the Save Options dialog box opens after youhave named the report. Click Advanced on the Save Options dialog box.For a prompted report, see theMicroStrategy Developer help.
2 Select one of the following options for saving the report:
• Create a local copy of the template. Changes that you make to thetemplate are not propagated to the original object, and vice versa. This is alsocalled a local or embedded template.
Advanced Reporting Guide
© 2017, MicroStrategy Inc. 298
• Retain the shortcuts to the template. Creating shortcuts allows you to takeadvantage of the benefits of object reuse. Changes that you make to the templateare propagated to the original object, and vice versa. Use this option to sharereport caches.
3 To use the selections that you made above as the defaults for saving reports in future,select the Remember answers the next time I am prompted check box.
4 Click OK to save the report.
Modifying a template and validating changes
Changing a template may cause unexpected issues with some of the reports that dependon the template. For example, a report has a shortcut to a template, which containsCountry, Region, Metric 1, and Metric 2. The view filter is set to “Metric 1 > 20.” Metric 1is then removed from the stand-alone template but not from the report view. When thatreport is executed, an error occurs because the view filter can no longer be evaluated(Metric 1 no longer exists).
You can check for issues like the example above by validating your template changes. Youvalidate template changes by conducting a quick impact analysis with the TemplateDependency Validator, before saving any changes to a template. When a template ismodified and saved in MicroStrategy Developer, the Template Dependency Validatorlists:
• Reports that depend on the template
• Reports that will not run if the change is completed
To resolve any issues, you can do the following in the Template Dependency Validator:
• Cancel the change and re-evaluate.
• Open each dependent report and remove the dependencies, then make your changesto the template.
For the previous example, you might remove the view filter from the view definition ofthe dependent report.
Shortcut to a filter
When you add a filter to a report, you have the option of adding it as an embedded filterwhich applies to that report only, or you can add a shortcut to an existing filter.
An embedded filter is generated when a copy of an existing filter is added to a report orwhen the filter is created on the fly from within the report. Changes made to anembedded filter affect only the report in which it is contained because the filter existsonly within that report.
In contrast, a shortcut to a filter stands alone as a filter and can be used in multiplereports. When the stand-alone filter is changed, the changes are propagated to all otherreports that contain a shortcut to the same filter. For more information and steps onhow to create an embedded filter or a shortcut to a filter, see Shortcut vs. embeddedfilters, page 149.
Advanced Reporting Guide
299 © 2017, MicroStrategy Inc.
Object templates
An object template is a predefined structure you can use to create a new object. An objecttemplate provides a foundation you can use to create reports, metrics, filters, or otherobjects. For example, you may want to create many filters that contain the currentmonth as part of the filter’s definition. You can create a filter object template thatcontains the current month and use the filter object template to automatically includethe current month condition in every new filter you create. Using an object template,you only have to define that filtering condition once.
Another example is a need to build multiple reports containing the attribute Day and themetrics Revenue, Cost, and Profit. To reduce the time spent creating these similarreports, define a report with these objects and save it in the Object Templates folder,thus creating a report object template. Multiple reports can now be based on the newreport object template, thus incorporating the template’s attributes and metrics quicklyand easily.
You can create empty object templates that define default formatting on a project levelfor new reports, templates, metrics, and documents. For a list of settings you can definefor each type of empty object template, see Empty object templates, page 299.
You can create object templates for the following objects:
• Consolidations
• Custom groups
• Documents
• Filters
• Metrics
• Reports
• Templates (A template is the part of a report that specifies the information toretrieve from the data warehouse and how it is displayed in the report grid. It doesnot include filter information. For more information on what a template includes,see Shortcut to a template, page 296.)
You can determine whether users can choose from a list of available object templateswhen creating a new object, or if they must use a default object template that you define.For steps, seeMaking object templates available to users, page 301.
If an object template is altered, the change is not propagated to previously definedobjects.
To be used as an object template, the object must be saved in the Object Templatesfolder. This is the only difference between an object (such as a report) and an objecttemplate (such as a report object template).
Empty object templates
Empty object templates define default formatting and other default settings on a projectlevel for new reports, templates, metrics, and documents. They do not contain a
Advanced Reporting Guide
© 2017, MicroStrategy Inc. 300
definition.
For example, your project has a series of reports that must be exported in Excel format toa particular location. A specific Excel macro must be run after the report is exported. Youcan create a user-defined empty report object template, called Excel Export Settings, withthese specifications. When the Excel Export Settings report object template is used tocreate a new report, the new report contains the correct Excel information.
As another example, a project requires all currency values to include cents for precisionand to distinguish negative values in red font. To meet these conditions, create an emptymetric object template named Currency Formatting and set these formats. When a usercreates a new metric that returns currency values, he selects Currency Formatting in theNew Metric dialog box. The formatting for red negative values and cents is included inthe new metric.
There are two kinds of empty object templates:
• Empty object templates provided by MicroStrategy. These are displayed in theNew Object dialog box as Empty Document, Empty Metric, Empty Report, andEmpty Template.
You can choose whether to display the empty object template for a particular objecttype. For steps, seeMaking object templates available to users, page 301.
• User-defined empty object templates. These help you control new objectscreated in your project, by specifying a default set of formatting options that shouldbe applied to each new object.
For example, you can create an empty metric template with specific currencyformatting or an empty report object template set to display data by default in outlinemode. The user-defined empty object template contains only formatting options.User-defined empty metric templates do not have formulas and user-defined emptyreport templates do not include attributes, metrics, or other grid items in the reportobjects.
Empty object templates are saved in the Object Templates folder.
The settings available in a user-defined empty object template vary with the type ofobject, as described below:
▫ An empty metric object template does not contain a formula but cancontain the following settings:
— Formatting settings
— VLDB properties
— Formula join type
— Metric join type
— Metric column settings
▫ An empty report object template does not contain any grid units, suchas attributes, metrics, consolidations, and so on. An empty report contains:
— Export options
Advanced Reporting Guide
301 © 2017, MicroStrategy Inc.
— Filters
— Formatting
— Grid options
— Report data options
— VLDB properties
— Other settings such as merging header cells and automatic column width
▫ An empty template object template is similar to an empty report objecttemplate.
Making object templates available to users
You can determine whether users can choose from a list of available object templateswhen creating a new object. By default, the New Object dialog box displays when userscreate a new object and contains a list of available object templates users can use todefine the new object.
If you choose to hide the New Object dialog box for a type of object, each new object ofthat type will be created using the default object template. If you have not defined adefault object template, the object will be created using MicroStrategy’s empty objecttemplate. Default object templates include Documents, Metrics, Reports, and Templates.
For steps to define these settings, see theMicroStrategy Developer help.
If you choose to display the New Object dialog box, you can choose to hideMicroStrategy’s empty object template. The empty object template is displayed in theNew Object dialog box as Empty Document, Empty Metric, Empty Report, or EmptyTemplate. If you hide the empty object template, users cannot create new objects withthe empty object template.
If you disable the empty object template for a particular object type, and the only objecttemplate is the project-level default object template, all new objects must use theformatting and other settings defined on the default object template. You can use thisfeature to ensure that all reports in a project adhere to specific formatting standards.
For example, you create a report object template with specific formatting and save thereport object template as Default Format. The project does not have any other reportobject templates. You set Default Format as the default object template for reports anddo not show the Empty Report object template. If a user has enabled object templates forreports, when he creates a new report, his only choice in the New Grid dialog box isDefault Format. If object templates for reports have been disabled, the New Grid dialogbox is not displayed and Default Format is automatically used.
For steps to enable and disable object templates, see theMicroStrategy Developer help.
Making reports accessibleTo distribute reports, you place the reports in a specific folder so that other users canaccess them. Reports saved in the Reports folder under the Public Objects folder can beviewed by other users on the system. A Web user can navigate to Shared Reports and run
Advanced Reporting Guide
© 2017, MicroStrategy Inc. 302
those reports by clicking them. MicroStrategy Developer users can navigate to reports inthe Public Objects\Reports folder and execute them by double-clicking them.
To save reports that are frequently used to create new reports, place the reports in theReports folder under Object Templates. They are displayed as templates on which to basea new report, when a MicroStrategy Web user clicks Create New Reports or aMicroStrategy Developer user selectsNew, then Reports.
The reports and folders described above are not special in any way except that they areavailable for other users to access.
To view the Object Templates folder, select Preferences from the Tools menu. ExpandDeveloper, and then select Browsing. Select Display Hidden Objects, and clickOK until you are returned to MicroStrategy Developer. For more information on objecttemplates, see Re-using objects via shortcuts and object templates , page 295.
CachingIn general, a cache holds recently accessed values to increase performance. Frequently-requested reports are often cached, providing faster execution because the cached reportsdo not have to access the data warehouse.
Default settings for the report caches for all reports in a project are commonlyconfigured by your system administrator. You can override the default settings forspecific reports. For example, you may want to enable caching for a specific report, evenif other reports in your system are not cached, because it puts a large load on the datawarehouse. Or, you may want to disable caching for a specific report, even if otherreports in your system are cached, because the data used in the report changes so oftenthat the cached version of the report is rarely valid.
You can also select a specific schedule for invalidating the cache. Invalidating a reportcache indicates to Intelligence Server that this cache should not be used. For example,you can schedule the cache to be invalidated every time new data is loaded into the datawarehouse. In this case, the first time the report is executed after the data load, a newcache is created, with the most up-to-date data.
For reports, the following caches are used:
• The report cache contains pre-processed report data and is stored on disk. Reportcaches are created automatically.
• Intelligent Cubes are similar to report caches in that they provide a set of data thatreports can quickly retrieve without having to re-query a data source. Unlike reportcaches, Intelligent Cubes are created manually. Intelligent Cubes also allow reports toutilize various OLAP Services features. For an introduction to Intelligent Cubes, seeIntelligent Cubes, page 241.
For detailed information about all types of caches, see the System Administration Guide.
To enable or disable caching for a specific report
1 In MicroStrategy Developer, open the report in the Report Editor.
Advanced Reporting Guide
303 © 2017, MicroStrategy Inc.
2 From the Data menu, select Report caching options. The Report CachingOptions dialog box opens.
3 Select whether to enable or disable caching of this report:
• To enable caching for this report even if caching is disabled at the project level,select the option called Enabled: This report should be cached.
• To disable caching for this report even if caching is enabled at the project level,select the option calledDisabled: This report should not be cached.
• To use the default project-level setting for caching, select the Use defaultproject-level behavior option. This indicates that the caching settingsconfigured at the project level in the Project Configuration Editor apply to thisspecific report or document as well.
4 Click OK. The Report Caching Options dialog box closes and your changes are saved.
Exporting large reports as delimited text filesThe bulk export feature allows you to select a report and export it to a delimited text file.Using this feature, you can retrieve data from large result sets without having to load theresult sets in memory. As the data is brought back incrementally, no limit is set on thesize of the result set to be retrieved.
While you can schedule a bulk export report for execution with Distribution Services, youcannot directly execute a bulk export report in MicroStrategy Developer. When you right-click a bulk export report, the Run Report option is not available. You can, however,view the report in Design View and SQL View on MicroStrategy Developer. (All the otherviews are disabled.)
You can convert a bulk export report back to a standard report, to be able toexecute the report in MicroStrategy Developer. For steps, see To convert a bulkexport report to a standard report, page 305.
Prerequisites
• To use the Bulk Export feature, you must have a Distribution Services license.
• To execute a bulk export report from MicroStrategy Web, you must have the WebSubscribe To Bulk Export privilege.
• To define a report as a bulk export report in MicroStrategy Developer, you must havethe Use Bulk Export Editor privilege.
To configure a report for bulk export
1 In MicroStrategy Developer, open a report in the Report Editor.
2 From the Data menu, select Configure Bulk Export. The Bulk Export Setupdialog box is displayed.
3 Click the General tab.
Advanced Reporting Guide
© 2017, MicroStrategy Inc. 304
4 By default, the Bulk export database instance, which is the database instancefor the database containing the report data, is defined as the data warehouse for theproject. You can specify another database instance in this field.
5 Select the Default delimiter for the exported text file, which is the characterthat separates the data in the text file. If the character that you want is not available,select Other, then type the character.
6 Click the Advanced tab.
7 Type theMaximum time for SQL execution to build table, in seconds. If thistime limit is reached before the table is built, the export is cancelled with a timeouterror.
8 Type theMaximum time for exporting data to file, in seconds. If this timelimit is reached before the file is completely written, the export is cancelled with atimeout error.
9 Type the Number of rows retrieved in each step, which is the number ofdatabase rows that the bulk export retrieves at a time.
10 Type the Table space, which is the database table space in which the temporarytable for the bulk export is created.
11 Type the Table prefix, which is the table prefix for the bulk export temporary table.
12 Click the SQL Statements tab.
13 Specify the SQL statements to be executed after the table is populated, but before thedata is exported to a file. For instance, if you need to format the warehouse data in aparticular way, you can run a SQL script to do so.
14 Click OK. The Bulk Export Setup dialog box closes and the report is now specified asa bulk export report.
15 Save the report.
After you save a report as a bulk export report, its icon in MicroStrategy Developerchanges as shown in the following figure.
Advanced Reporting Guide
305 © 2017, MicroStrategy Inc.
• If you open a bulk export report in SQL View, certain column namesare replaced by column aliases. You can view the column names bychanging the default VLDB properties for metrics. To do this, from theProject Configuration Editor, select Database instances in theProject Definition category, then click VLDB Properties, and thenselect the Default To Metric Name option from the Metrics folder.Select the Use the metric name as the default metric columnalias option, and save the changes. Restart the MicroStrategyIntelligence Server. For detailed information on VLDB Properties, seethe Supplemental Reference for System Administration.
• If you have selected multiple reports, including bulk export reports, andchoose the Run Report option from the right-click menu, all thebulk export reports are filtered out and are opened in the ReportEditor; the other reports are executed as usual.
• Bulk export reports have the same limitations and restrictions as datamart reports. In particular, bulk export reports cannot be used inHTML documents or Report Services documents. For information onHTML documents, see theMicroStrategy Developer help. Forinformation on Report Services documents, see the Report ServicesDocument Creation Guide.
• Large bulk export reports may require that a substantial amount of databe transferred between Intelligence Server and the data source. Youcan improve the performance of this process by transferring the datain multiple, incremental transfers of data. To do this, enable theIncremental Data Transfer VLDB property, in the Query OptimizationsVLDB properties group. For steps to set VLDB properties, see theVLDB Properties chapter of the Supplemental Reference for SystemAdministration. This property is available at both the project andreport levels.
To convert a bulk export report to a standard report
1 In MicroStrategy Developer, open the bulk export report in the Report Editor.
2 From the Data menu, select Remove Bulk Export Definition.
3 Save the report. It is no longer a bulk export report, and its MicroStrategy Developericon changes to the standard report icon.
8GRAPHING
This section discusses how to view, format, and work with MicroStrategy graph reports.It focuses primarily on how you can use MicroStrategy graphs to better analyze andformat your enterprise business data.
Other sections of this guide and the Basic Reporting Guide provided information on howto perform a variety of tasks with MicroStrategy reports. This section assumes that youhave a fundamental understanding of how to design MicroStrategy reports and addobjects such as attributes, metrics, and filters to them.
Specifically, this section includes the following:
• Graphing best practices and troubleshooting, page 307
• Viewing graph reports, page 309
• Adding an object to a graph report, page 310
• Choosing an appropriate graph style, page 311
• Moving objects on a graph report, page 315
• Graph style usage and examples, page 318
• Advanced graph style usage and examples , page 340
• Formatting a graph report, page 359
• Choosing a graph image format for HTML documents and Web, page 415
• Exporting and sharing graphs, page 416
• Using interactive graph visualizations in documents: Widgets, page 418
• The extent to which you can format a graph, add and manipulate data,and so on depends on the permissions granted to you by youradministrator. This section assumes you have Developer privileges, andcan therefore format various aspects of a report grid and graph.
• It is recommended you review the list of graphing best practices inGraphing best practices and troubleshooting, page 307 beforedesigning a graph in MicroStrategy.
© 2017, MicroStrategy Inc. 306
Advanced Reporting Guide
307 © 2017, MicroStrategy Inc.
Graphing best practices and troubleshootingBefore proceeding to other topics in this section, review the following list of bestpractices for designing an effective graph in MicroStrategy, as well as information onhow to troubleshoot specific graphing issues.
The information below applies to every graph style available in MicroStrategy:
• You can select Grid Graph View to see the report grid and corresponding graphside-by-side. This allows you to add and replace objects on the grid and immediatelysee how its corresponding graph changes.
In MicroStrategy Web, Grid Graph View is referred to as Grid and Graphmode.
• As an alternative to using Grid Graph View to move objects on a graph, you can alsouse the categories and series drop zones. This allows you to move objects betweenthe categories and series for the graph and immediately see how these changes affectthe graph. To show or hide the series and categories drop zones in MicroStrategyDeveloper, click the Show Drop Zones option in the toolbar.
While you can use the categories and series drop zones in both MicroStrategyDeveloper and Web, the effects of the changes you make are only shownimmediately in MicroStrategy Developer. In Web, you must execute the graph reportto see the changes.
• Your report grid must contain at least one attribute and one metric to be displayed asa graph.
• As you design your graph, try to position objects such as attributes and metrics onthe report grid (or the categories and series) in a variety of ways until the graphpresents the data in the desired manner. This is often a necessary step in designingan effective graph because it helps you determine the way you wish to display thegraph data. For example, view a report in Grid Graph mode, and try placing anattribute or two on the grid’s columns and the metrics in the rows. Then, swap therows and columns to see how the graph report changes.
For more information on how the positioning of report objects affects how agraph is generated, seeMoving objects on a graph report, page 315.
• Each graph style requires a minimum or specific number of attributes and metrics onthe report grid. For example, a Pie chart requires only one attribute and one metricon the report grid, although more attributes and metrics can be included. On theother hand, a Hi-Lo-Open-Close Stock graph requires a specific number of reportobjects: one attribute and four metrics.
For more information on the minimum requirements for each graph style, seeChoosing an appropriate graph style, page 311.
• Consider the order of the attributes, metrics, and other objects on your report grid.For example, if you have three metrics in the columns of the grid, a dual-axis graph
Advanced Reporting Guide
© 2017, MicroStrategy Inc. 308
may display the first metric using the Y-1 axis and the second and third metrics asthe Y-2 axis.
For an example of this, see Bar, page 320.
• Dual-axis graphs can improve the display of graph reports that include metrics thatreturn different types of data. For example, a report includes a Profit metric thatreturns currency information in the thousands and millions. The same report alsoincludes a Profit Margin metric that returns percentages such as 25%. These twometrics would benefit from being on different axes that use different ranges todisplay values. For information on using dual-axis graphs, see Adjusting the layout,size, and scale of a graph, page 400 and Adjusting the layout, size, and scale of agraph, page 400.
• The way in which report data is sorted on your report grid directly affects how thedata is displayed on the graph report. For example, the bars within a Bar graph canbe displayed in descending order instead of ascending order, or they can be sortedbased on a different metric in the report. As a test, view a report in Grid Graphmode, sort a metric on the grid, and notice how the graph changes accordingly.
• If you are creating a graph report to view in MicroStrategy Web, it is recommendedthat you choose the JPEG or PNG image format before you save the graph report. Ifyour graph report includes color gradients, you must use one of these formats todisplay the graph correctly in MicroStrategy Web. For more information onconfiguring image preferences for graph reports in MicroStrategy Developer for usein MicroStrategy Web, see Choosing a graph image format for HTML documentsand Web, page 415.
• If the graph is included in a Report Services document, you can provide someinteractive functionality to the graph by doing the following. In the document, add aSlider selector under the graph. Then, configure the slider to control the graph. Thisallows you and other users to navigate to different sections of the graph’s results. Forinformation about creating selectors, see the Report Services Document CreationGuide.
• Use graph formatting effects such as bevels (three-dimensional surface patterns),gradients (combinations of two colors), curved lines, and transparency to make yourgraph series and other objects stand out and look sharper.
▫ To apply gradients, bevel effects, and transparency effects, right-click yourgraph’s series and access the Graph Preferences dialog box. For these steps, seeManually formatting graph series and objects, page 372.
▫ To apply a curved effect to a Line or Area graph, from the Graph menu, selectPreferences. ExpandOptions, and select the General category. Select theEnable curved lines or Enable curved areas check box, respectively.
• Apply a glossy, rounded effect to your graph’s series. The effect is displayed in GraphView and Grid Graph View in MicroStrategy Developer and Editable, Interactive, andView Mode in MicroStrategy Web. To do so, from the Graph menu, selectPreferences. ExpandOptions, and select the General category. Select the Applyrounded effects to all series check box.
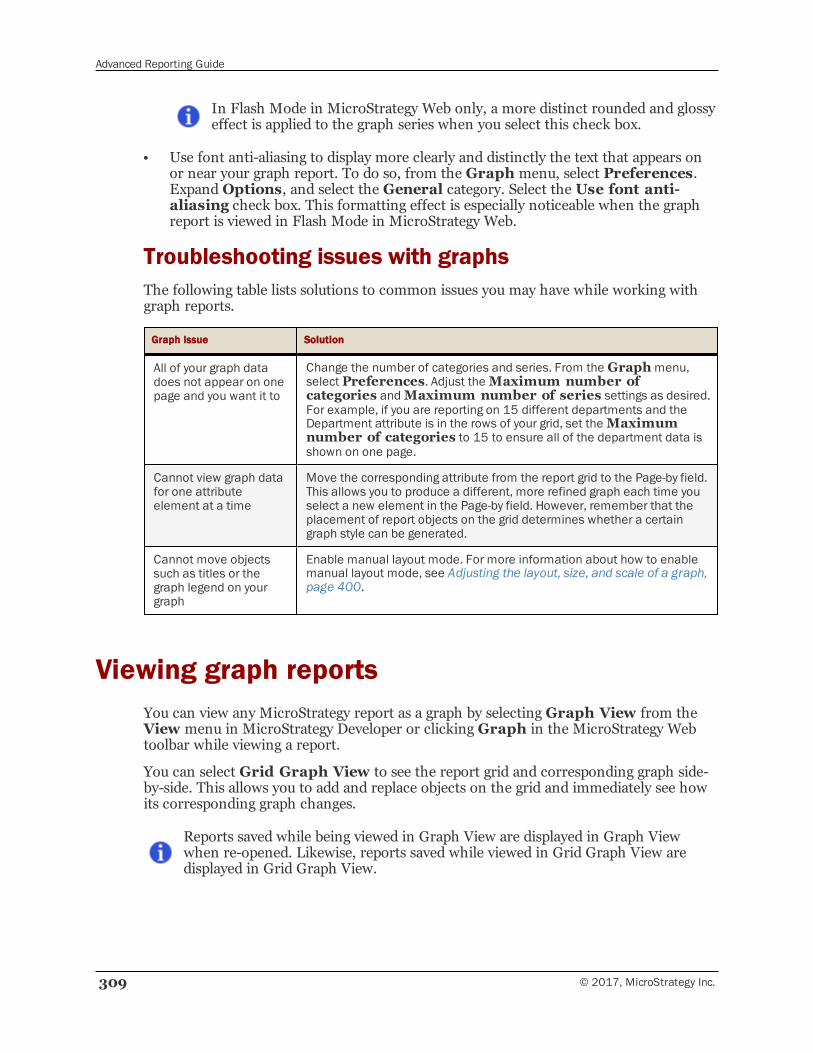
Advanced Reporting Guide
309 © 2017, MicroStrategy Inc.
In Flash Mode in MicroStrategy Web only, a more distinct rounded and glossyeffect is applied to the graph series when you select this check box.
• Use font anti-aliasing to display more clearly and distinctly the text that appears onor near your graph report. To do so, from the Graph menu, select Preferences.ExpandOptions, and select the General category. Select the Use font anti-aliasing check box. This formatting effect is especially noticeable when the graphreport is viewed in Flash Mode in MicroStrategy Web.
Troubleshooting issues with graphsThe following table lists solutions to common issues you may have while working withgraph reports.
Graph Issue Solution
All of your graph datadoes not appear on onepage and you want it to
Change the number of categories and series. From the Graphmenu,select Preferences. Adjust the Maximum number ofcategories andMaximum number of series settings as desired.For example, if you are reporting on 15 different departments and theDepartment attribute is in the rows of your grid, set the Maximumnumber of categories to 15 to ensure all of the department data isshown on one page.
Cannot view graph datafor one attributeelement at a time
Move the corresponding attribute from the report grid to the Page-by field.This allows you to produce a different, more refined graph each time youselect a new element in the Page-by field. However, remember that theplacement of report objects on the grid determines whether a certaingraph style can be generated.
Cannot move objectssuch as titles or thegraph legend on yourgraph
Enable manual layout mode. For more information about how to enablemanual layout mode, see Adjusting the layout, size, and scale of a graph,page 400.
Viewing graph reportsYou can view any MicroStrategy report as a graph by selectingGraph View from theView menu in MicroStrategy Developer or clickingGraph in the MicroStrategy Webtoolbar while viewing a report.
You can select Grid Graph View to see the report grid and corresponding graph side-by-side. This allows you to add and replace objects on the grid and immediately see howits corresponding graph changes.
Reports saved while being viewed in Graph View are displayed in Graph Viewwhen re-opened. Likewise, reports saved while viewed in Grid Graph View aredisplayed in Grid Graph View.
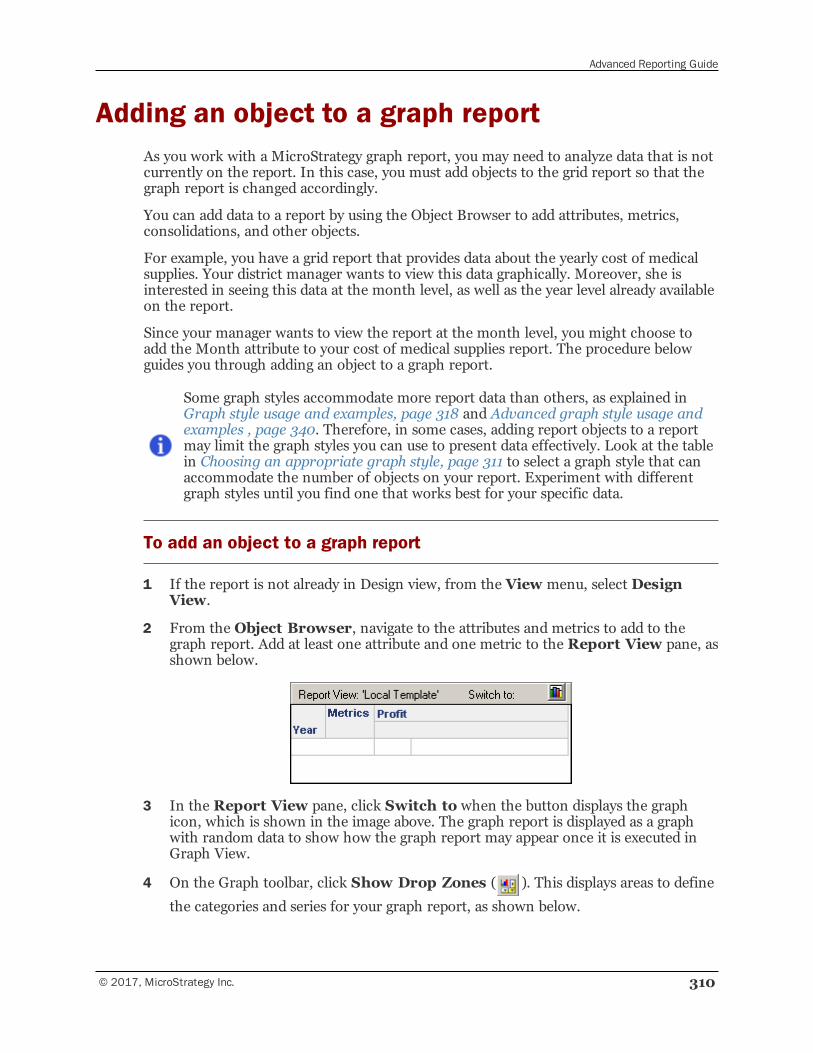
Advanced Reporting Guide
© 2017, MicroStrategy Inc. 310
Adding an object to a graph reportAs you work with a MicroStrategy graph report, you may need to analyze data that is notcurrently on the report. In this case, you must add objects to the grid report so that thegraph report is changed accordingly.
You can add data to a report by using the Object Browser to add attributes, metrics,consolidations, and other objects.
For example, you have a grid report that provides data about the yearly cost of medicalsupplies. Your district manager wants to view this data graphically. Moreover, she isinterested in seeing this data at the month level, as well as the year level already availableon the report.
Since your manager wants to view the report at the month level, you might choose toadd the Month attribute to your cost of medical supplies report. The procedure belowguides you through adding an object to a graph report.
Some graph styles accommodate more report data than others, as explained inGraph style usage and examples, page 318 and Advanced graph style usage andexamples , page 340. Therefore, in some cases, adding report objects to a reportmay limit the graph styles you can use to present data effectively. Look at the tablein Choosing an appropriate graph style, page 311 to select a graph style that canaccommodate the number of objects on your report. Experiment with differentgraph styles until you find one that works best for your specific data.
To add an object to a graph report
1 If the report is not already in Design view, from the View menu, select DesignView.
2 From the Object Browser, navigate to the attributes and metrics to add to thegraph report. Add at least one attribute and one metric to the Report View pane, asshown below.
3 In the Report View pane, click Switch to when the button displays the graphicon, which is shown in the image above. The graph report is displayed as a graphwith random data to show how the graph report may appear once it is executed inGraph View.
4 On the Graph toolbar, click Show Drop Zones ( ). This displays areas to define
the categories and series for your graph report, as shown below.
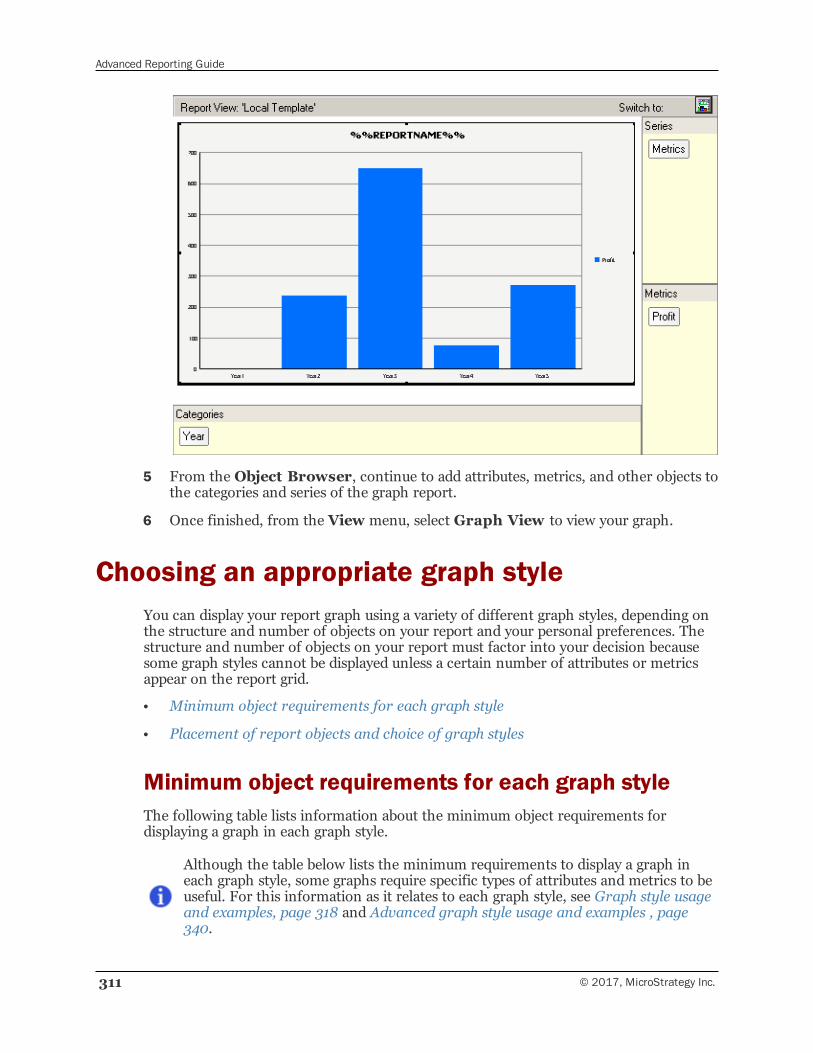
Advanced Reporting Guide
311 © 2017, MicroStrategy Inc.
5 From the Object Browser, continue to add attributes, metrics, and other objects tothe categories and series of the graph report.
6 Once finished, from the View menu, select Graph View to view your graph.
Choosing an appropriate graph styleYou can display your report graph using a variety of different graph styles, depending onthe structure and number of objects on your report and your personal preferences. Thestructure and number of objects on your report must factor into your decision becausesome graph styles cannot be displayed unless a certain number of attributes or metricsappear on the report grid.
• Minimum object requirements for each graph style
• Placement of report objects and choice of graph styles
Minimum object requirements for each graph styleThe following table lists information about the minimum object requirements fordisplaying a graph in each graph style.
Although the table below lists the minimum requirements to display a graph ineach graph style, some graphs require specific types of attributes and metrics to beuseful. For this information as it relates to each graph style, see Graph style usageand examples, page 318 and Advanced graph style usage and examples , page340.
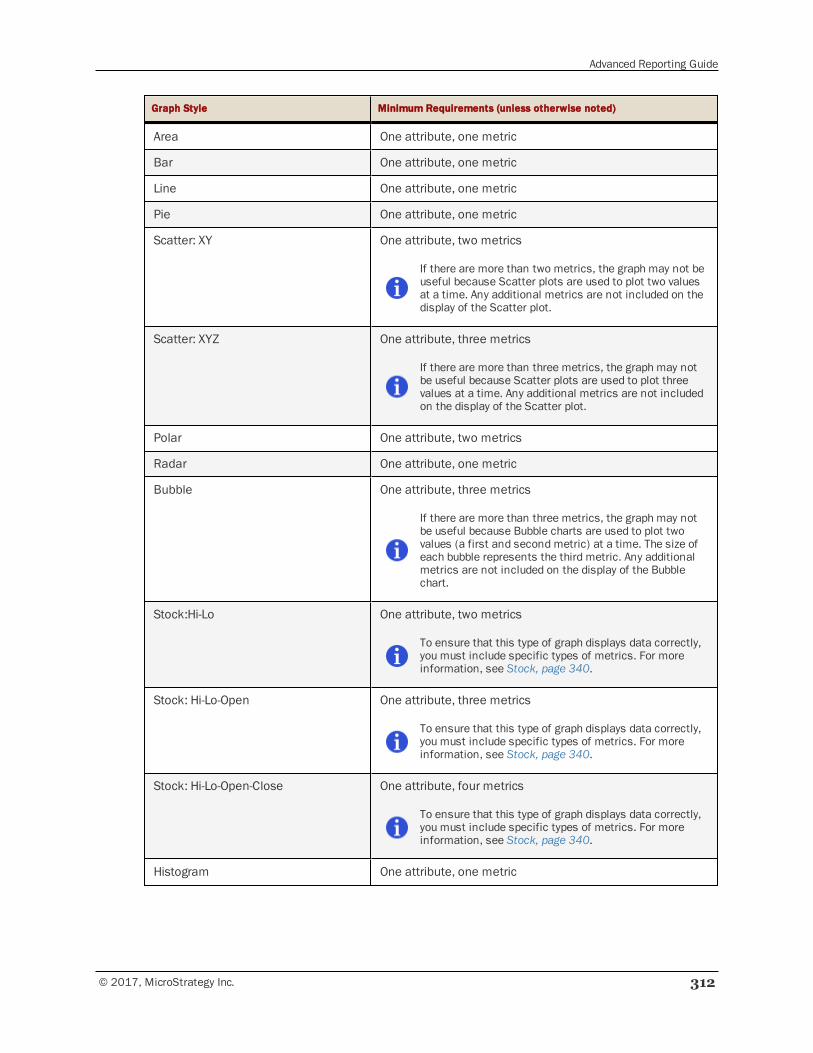
Advanced Reporting Guide
© 2017, MicroStrategy Inc. 312
Graph Style Minimum Requirements (unless otherwise noted)
Area One attribute, one metric
Bar One attribute, one metric
Line One attribute, one metric
Pie One attribute, one metric
Scatter: XY One attribute, two metrics
If there are more than two metrics, the graph may not beuseful because Scatter plots are used to plot two valuesat a time. Any additional metrics are not included on thedisplay of the Scatter plot.
Scatter: XYZ One attribute, three metrics
If there are more than three metrics, the graph may notbe useful because Scatter plots are used to plot threevalues at a time. Any additional metrics are not includedon the display of the Scatter plot.
Polar One attribute, two metrics
Radar One attribute, one metric
Bubble One attribute, three metrics
If there are more than three metrics, the graph may notbe useful because Bubble charts are used to plot twovalues (a first and second metric) at a time. The size ofeach bubble represents the third metric. Any additionalmetrics are not included on the display of the Bubblechart.
Stock:Hi-Lo One attribute, two metrics
To ensure that this type of graph displays data correctly,you must include specific types of metrics. For moreinformation, see Stock, page 340.
Stock: Hi-Lo-Open One attribute, three metrics
To ensure that this type of graph displays data correctly,you must include specific types of metrics. For moreinformation, see Stock, page 340.
Stock: Hi-Lo-Open-Close One attribute, four metrics
To ensure that this type of graph displays data correctly,you must include specific types of metrics. For moreinformation, see Stock, page 340.
Histogram One attribute, one metric
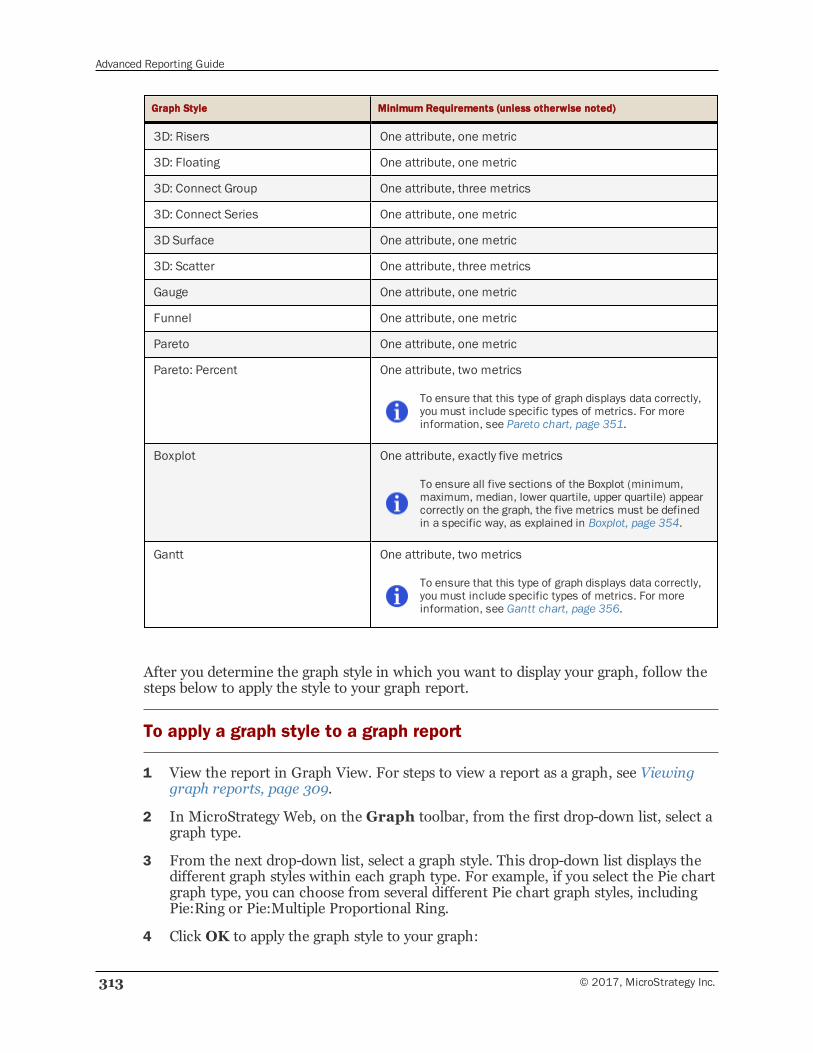
Advanced Reporting Guide
313 © 2017, MicroStrategy Inc.
Graph Style Minimum Requirements (unless otherwise noted)
3D: Risers One attribute, one metric
3D: Floating One attribute, one metric
3D: Connect Group One attribute, three metrics
3D: Connect Series One attribute, one metric
3D Surface One attribute, one metric
3D: Scatter One attribute, three metrics
Gauge One attribute, one metric
Funnel One attribute, one metric
Pareto One attribute, one metric
Pareto: Percent One attribute, two metrics
To ensure that this type of graph displays data correctly,you must include specific types of metrics. For moreinformation, see Pareto chart, page 351.
Boxplot One attribute, exactly five metrics
To ensure all five sections of the Boxplot (minimum,maximum, median, lower quartile, upper quartile) appearcorrectly on the graph, the five metrics must be definedin a specific way, as explained in Boxplot, page 354.
Gantt One attribute, two metrics
To ensure that this type of graph displays data correctly,you must include specific types of metrics. For moreinformation, see Gantt chart, page 356.
After you determine the graph style in which you want to display your graph, follow thesteps below to apply the style to your graph report.
To apply a graph style to a graph report
1 View the report in Graph View. For steps to view a report as a graph, see Viewinggraph reports, page 309.
2 In MicroStrategy Web, on the Graph toolbar, from the first drop-down list, select agraph type.
3 From the next drop-down list, select a graph style. This drop-down list displays thedifferent graph styles within each graph type. For example, if you select the Pie chartgraph type, you can choose from several different Pie chart graph styles, includingPie:Ring or Pie:Multiple Proportional Ring.
4 Click OK to apply the graph style to your graph:
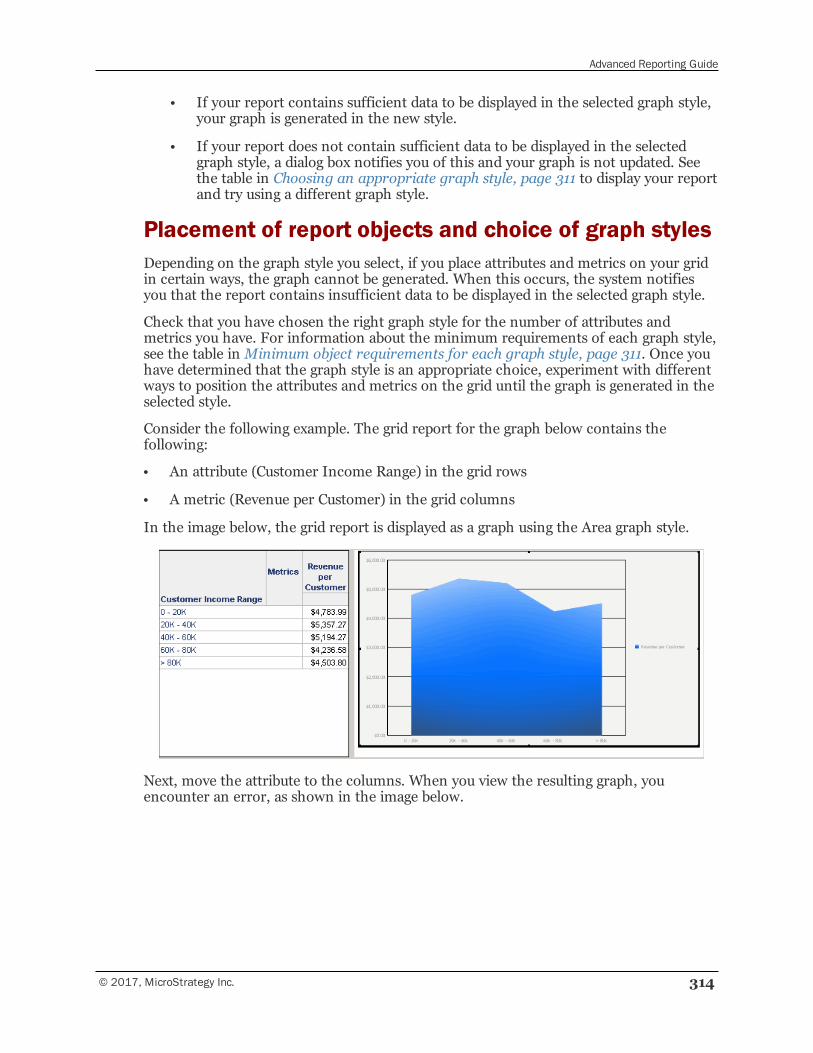
Advanced Reporting Guide
© 2017, MicroStrategy Inc. 314
• If your report contains sufficient data to be displayed in the selected graph style,your graph is generated in the new style.
• If your report does not contain sufficient data to be displayed in the selectedgraph style, a dialog box notifies you of this and your graph is not updated. Seethe table in Choosing an appropriate graph style, page 311 to display your reportand try using a different graph style.
Placement of report objects and choice of graph stylesDepending on the graph style you select, if you place attributes and metrics on your gridin certain ways, the graph cannot be generated. When this occurs, the system notifiesyou that the report contains insufficient data to be displayed in the selected graph style.
Check that you have chosen the right graph style for the number of attributes andmetrics you have. For information about the minimum requirements of each graph style,see the table in Minimum object requirements for each graph style, page 311. Once youhave determined that the graph style is an appropriate choice, experiment with differentways to position the attributes and metrics on the grid until the graph is generated in theselected style.
Consider the following example. The grid report for the graph below contains thefollowing:
• An attribute (Customer Income Range) in the grid rows
• A metric (Revenue per Customer) in the grid columns
In the image below, the grid report is displayed as a graph using the Area graph style.
Next, move the attribute to the columns. When you view the resulting graph, youencounter an error, as shown in the image below.
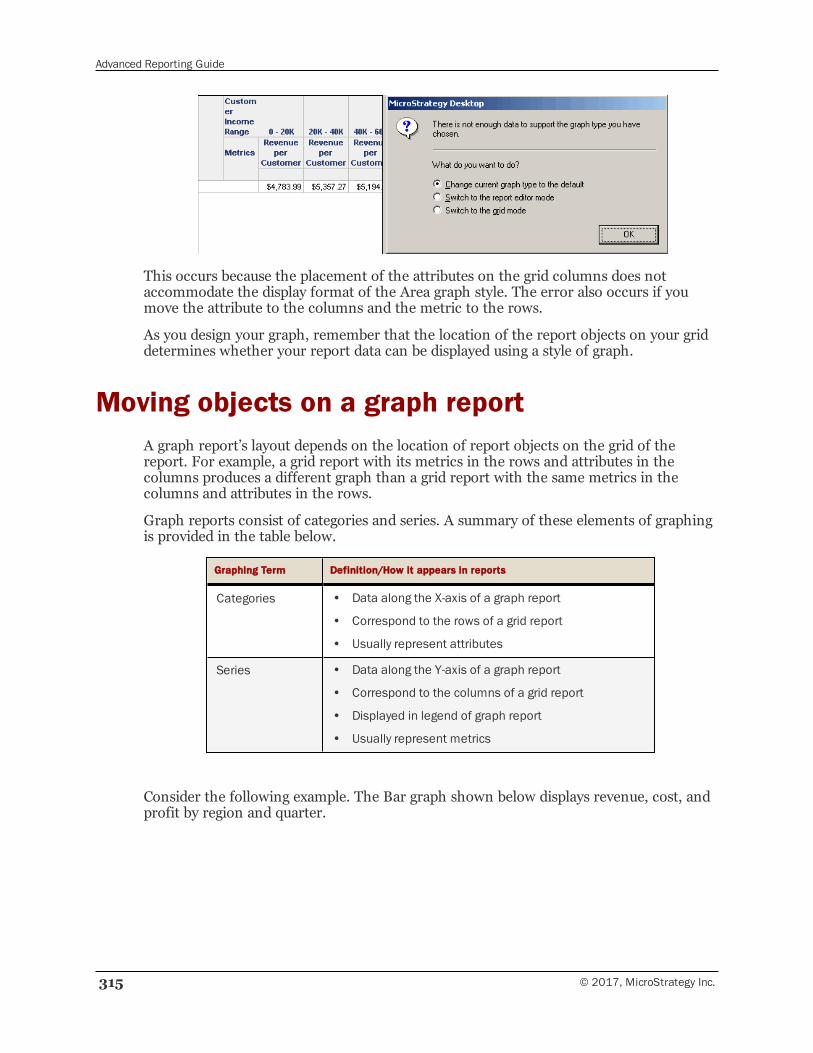
Advanced Reporting Guide
315 © 2017, MicroStrategy Inc.
This occurs because the placement of the attributes on the grid columns does notaccommodate the display format of the Area graph style. The error also occurs if youmove the attribute to the columns and the metric to the rows.
As you design your graph, remember that the location of the report objects on your griddetermines whether your report data can be displayed using a style of graph.
Moving objects on a graph reportA graph report’s layout depends on the location of report objects on the grid of thereport. For example, a grid report with its metrics in the rows and attributes in thecolumns produces a different graph than a grid report with the same metrics in thecolumns and attributes in the rows.
Graph reports consist of categories and series. A summary of these elements of graphingis provided in the table below.
Graphing Term Definition/How it appears in reports
Categories • Data along the X-axis of a graph report
• Correspond to the rows of a grid report
• Usually represent attributes
Series • Data along the Y-axis of a graph report
• Correspond to the columns of a grid report
• Displayed in legend of graph report
• Usually represent metrics
Consider the following example. The Bar graph shown below displays revenue, cost, andprofit by region and quarter.

Advanced Reporting Guide
© 2017, MicroStrategy Inc. 316
This graph report, named Bar Chart - Revenue, Cost and Profit by Region andQuarter, is available in the MicroStrategy Tutorial project.
Notice in the graph report shown above that the attribute Quarter is included in thecategories, while the metrics Revenue, Cost, and Profit are included in the series. Thisdisplays a cluster of three bars for the Revenue, Cost, and Profit metrics. Each clusterrepresents the metric values for a particular quarter. This view of data displays howrevenue, cost, and profit affect each other for a given quarter.
You can change the focus of the graph report simply by changing the series andcategories. For example, the same graph report is used to display the graph below.
Advanced Reporting Guide
317 © 2017, MicroStrategy Inc.
Notice that the only change that has been made is that the Quarter attribute is now apart of the series, while the metrics Revenue, Cost, and Profit are part of the categories.Each cluster of bars now represents a single metric over time. This view of data displayshow revenue, profit, and cost have increased or decreased over four quarters.
As shown in the previous examples, how you situate report objects such as attributes andmetrics on a grid directly affects how data is displayed on your graph, which in turn canchange the analytical focus of the graph. It is helpful to keep this in mind as you designreports you intend to display as graphs.
To display or hide the series and categories drop zones in MicroStrategy Developer,click Show Drop Zones in the toolbar.
It is also important to remember that each graph type has its own data requirements,and changing the location of objects for one graph type can have a vastly different effectthan it does for another graph type. For information on the requirements for each graphstyle, seeMinimum object requirements for each graph style, page 311.
Displaying graph data without scrollbarsOn some graph reports, the entire set of data may not fit onto one page of the graph.
• If the labels along the X-axis extend beyond one page, a horizontal scroll bar appearsat the bottom of the graph for you to scroll through the rest of the data.
• If the graphic elements of your graph, such as bars or lines, extend beyond one page,a vertical scroll bar appears to the right of the graph for you to scroll through the restof the data. For example, if you have many attributes in the columns of your grid, notall of them can be displayed on one page.
To fit the data on a single graph page, without scroll bars, use the following procedure tospecify the number of categories and series in your graph.
To change the number of categories and series in a graph
1 View the report in Graph View. For steps to view a report as a graph, see Viewinggraph reports, page 309.
2 In MicroStrategy Web, from the Format menu, select Graph. The Format:Graphdialog box opens.
3 Click General.
4 In the Maximum area, type the maximum number of categories and series in theCategories and Series fields respectively. For example, if you have 10 attributes in thecolumns of the grid and not all of them are appearing on one graph page, you canspecify 10 in the Series field. This ensures that all 10 of the attributes appear on onepage of the graph.
5 Click OK.
6 Save the report to save you graph preferences.
Advanced Reporting Guide
© 2017, MicroStrategy Inc. 318
Graph style usage and examplesThis section describes the graph styles available in MicroStrategy Developer andMicroStrategy Web. It provides a general description and images of these different graphstyles, and also offers insight on the type of data best presented with each style, as well astips to create the graphs in MicroStrategy.
A separate section, Advanced graph style usage and examples , page 340,discusses the Advanced graph styles available in MicroStrategy, including Ganttcharts and Boxplot graphs.
The following graph styles are presented:
• Area, page 318
• Bar, page 320
• Line, page 327
• Pie chart, page 329
• Scatter plot, page 331
• Polar chart, page 333
• Radar chart, page 334
• Bubble chart, page 337
• Combination, page 338
• Custom, page 339
How you position report objects on a grid report determines whether a graph can begenerated in the selected style. For more information, including an example, seePlacement of report objects and choice of graph styles, page 314.
AreaAn Area graph emphasizes changes in data values by connecting various data pointsalong a line, and then filling in the portion of the graph beneath the line. Therefore,Area graphs can often resemble a mountain range of high peaks and low valleys, witheach peak and valley representing a different data value.
Area graph types
You can create several types of Area graphs in MicroStrategy, including the following:
• Horizontal Area or Vertical Area styles:
▫ Absolute
▫ Stacked
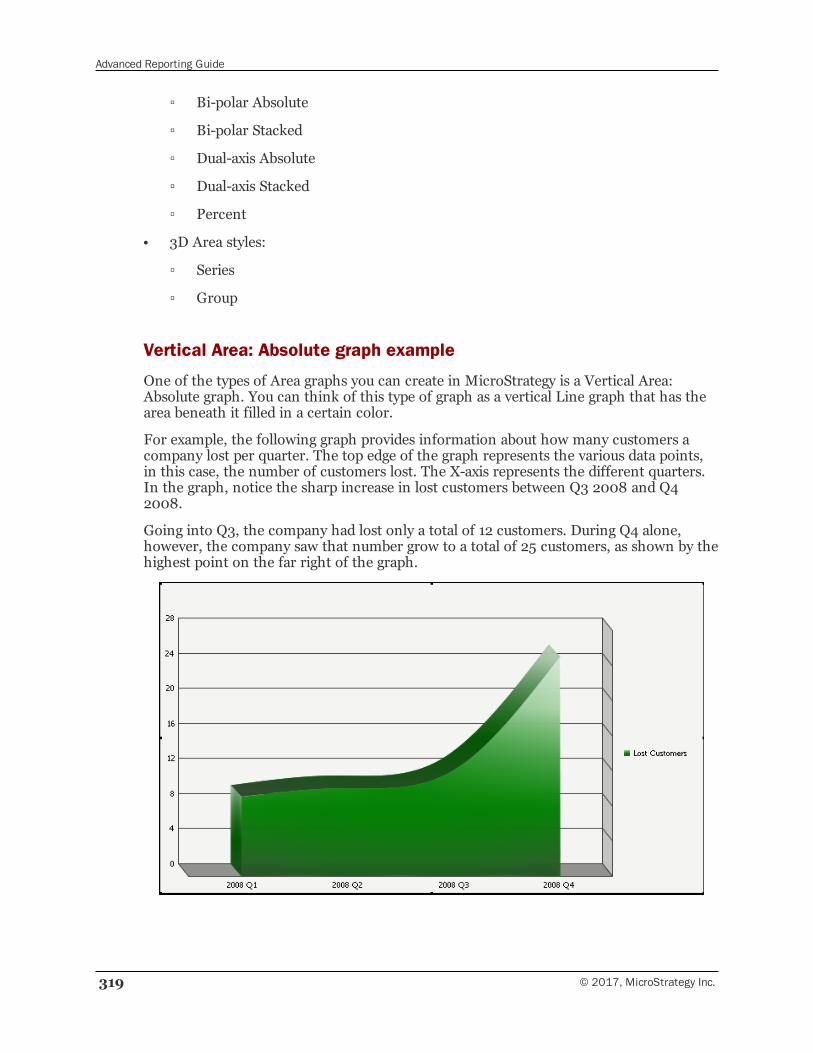
Advanced Reporting Guide
319 © 2017, MicroStrategy Inc.
▫ Bi-polar Absolute
▫ Bi-polar Stacked
▫ Dual-axis Absolute
▫ Dual-axis Stacked
▫ Percent
• 3D Area styles:
▫ Series
▫ Group
Vertical Area: Absolute graph example
One of the types of Area graphs you can create in MicroStrategy is a Vertical Area:Absolute graph. You can think of this type of graph as a vertical Line graph that has thearea beneath it filled in a certain color.
For example, the following graph provides information about how many customers acompany lost per quarter. The top edge of the graph represents the various data points,in this case, the number of customers lost. The X-axis represents the different quarters.In the graph, notice the sharp increase in lost customers between Q3 2008 and Q42008.
Going into Q3, the company had lost only a total of 12 customers. During Q4 alone,however, the company saw that number grow to a total of 25 customers, as shown by thehighest point on the far right of the graph.
Advanced Reporting Guide
© 2017, MicroStrategy Inc. 320
Using Area graphs effectively
• Overall, the Area graph is a flexible graph format because you can create one from avariety of attributes, metrics, and other report objects. Its minimum requirementsare that one attribute and one metric be present on the report grid. However, asexplained in Moving objects on a graph report, page 315, the location of theseobjects on your graph report determines whether and how the grid report can begenerated as an Area graph.
• You can apply a curved effect to the lines of the graph, as shown in the image above.To do so, from the Graph menu, select Preferences. Within the Generalcategory, select the Enable curved areas check box.
• For detailed information about specific formatting, scaling, and other options forArea graphs in MicroStrategy, see theMicroStrategy Developer help. (From withinMicroStrategy Developer, press F1.)
BarBar graphs, also known as column graphs, are one of the most commonly used graphsbecause they are easy to use, flexible, and allow you to easily compare a wide range ofdata values.
Bar graph types
You can create many types of Bar graphs in MicroStrategy, including the following:
• Horizontal Bar and Vertical Bar styles:
▫ Absolute
▫ Clustered
▫ Stacked
▫ Dual-axis Absolute
▫ Dual-axis Clustered
▫ Dual-axis Stacked
▫ Bi-polar Absolute
▫ Bi-polar Clustered
▫ Bi-polar Stacked
▫ Percent
• 3D Bar styles:
▫ Riser
▫ Floating
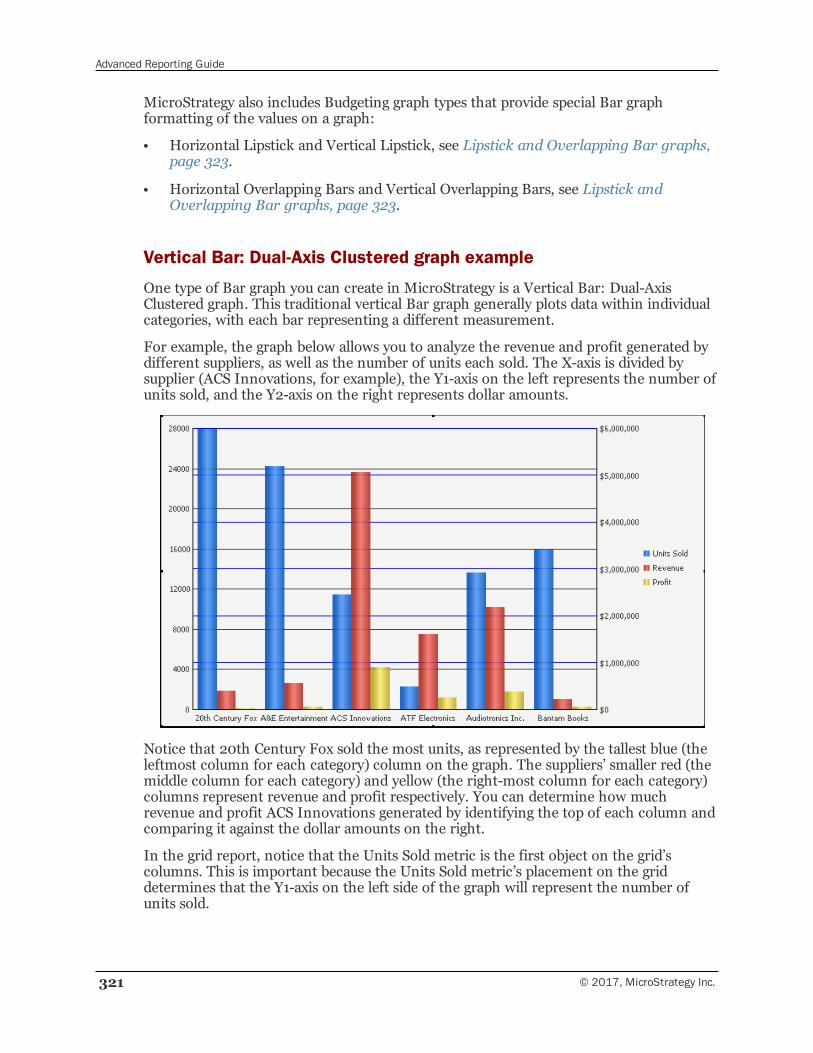
Advanced Reporting Guide
321 © 2017, MicroStrategy Inc.
MicroStrategy also includes Budgeting graph types that provide special Bar graphformatting of the values on a graph:
• Horizontal Lipstick and Vertical Lipstick, see Lipstick and Overlapping Bar graphs,page 323.
• Horizontal Overlapping Bars and Vertical Overlapping Bars, see Lipstick andOverlapping Bar graphs, page 323.
Vertical Bar: Dual-Axis Clustered graph example
One type of Bar graph you can create in MicroStrategy is a Vertical Bar: Dual-AxisClustered graph. This traditional vertical Bar graph generally plots data within individualcategories, with each bar representing a different measurement.
For example, the graph below allows you to analyze the revenue and profit generated bydifferent suppliers, as well as the number of units each sold. The X-axis is divided bysupplier (ACS Innovations, for example), the Y1-axis on the left represents the number ofunits sold, and the Y2-axis on the right represents dollar amounts.
Notice that 20th Century Fox sold the most units, as represented by the tallest blue (theleftmost column for each category) column on the graph. The suppliers’ smaller red (themiddle column for each category) and yellow (the right-most column for each category)columns represent revenue and profit respectively. You can determine how muchrevenue and profit ACS Innovations generated by identifying the top of each column andcomparing it against the dollar amounts on the right.
In the grid report, notice that the Units Sold metric is the first object on the grid’scolumns. This is important because the Units Sold metric’s placement on the griddetermines that the Y1-axis on the left side of the graph will represent the number ofunits sold.
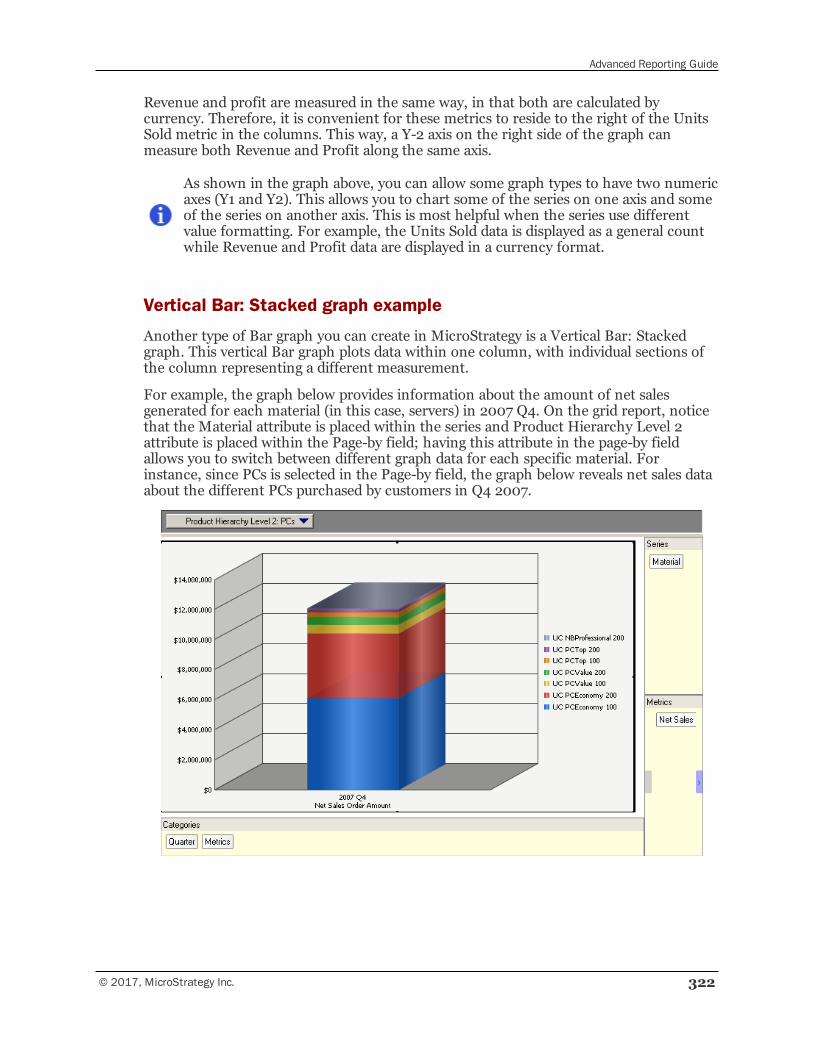
Advanced Reporting Guide
© 2017, MicroStrategy Inc. 322
Revenue and profit are measured in the same way, in that both are calculated bycurrency. Therefore, it is convenient for these metrics to reside to the right of the UnitsSold metric in the columns. This way, a Y-2 axis on the right side of the graph canmeasure both Revenue and Profit along the same axis.
As shown in the graph above, you can allow some graph types to have two numericaxes (Y1 and Y2). This allows you to chart some of the series on one axis and someof the series on another axis. This is most helpful when the series use differentvalue formatting. For example, the Units Sold data is displayed as a general countwhile Revenue and Profit data are displayed in a currency format.
Vertical Bar: Stacked graph example
Another type of Bar graph you can create in MicroStrategy is a Vertical Bar: Stackedgraph. This vertical Bar graph plots data within one column, with individual sections ofthe column representing a different measurement.
For example, the graph below provides information about the amount of net salesgenerated for each material (in this case, servers) in 2007 Q4. On the grid report, noticethat the Material attribute is placed within the series and Product Hierarchy Level 2attribute is placed within the Page-by field; having this attribute in the page-by fieldallows you to switch between different graph data for each specific material. Forinstance, since PCs is selected in the Page-by field, the graph below reveals net sales dataabout the different PCs purchased by customers in Q4 2007.
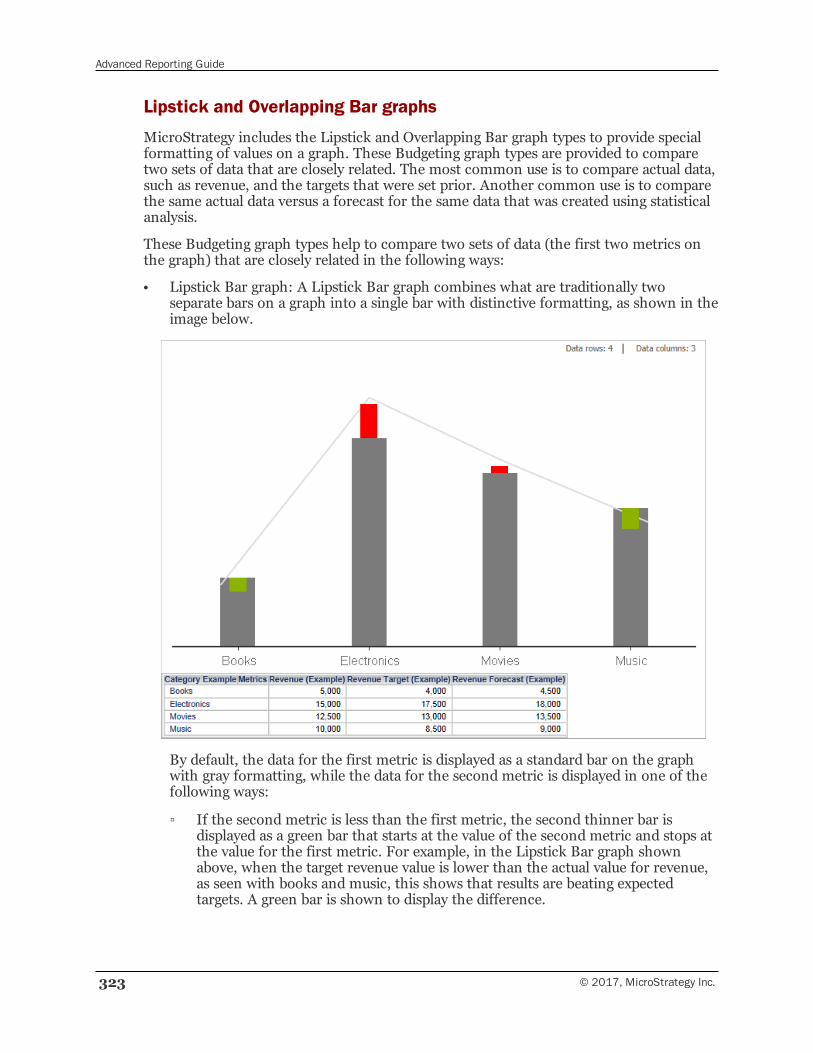
Advanced Reporting Guide
323 © 2017, MicroStrategy Inc.
Lipstick and Overlapping Bar graphs
MicroStrategy includes the Lipstick and Overlapping Bar graph types to provide specialformatting of values on a graph. These Budgeting graph types are provided to comparetwo sets of data that are closely related. The most common use is to compare actual data,such as revenue, and the targets that were set prior. Another common use is to comparethe same actual data versus a forecast for the same data that was created using statisticalanalysis.
These Budgeting graph types help to compare two sets of data (the first two metrics onthe graph) that are closely related in the following ways:
• Lipstick Bar graph: A Lipstick Bar graph combines what are traditionally twoseparate bars on a graph into a single bar with distinctive formatting, as shown in theimage below.
By default, the data for the first metric is displayed as a standard bar on the graphwith gray formatting, while the data for the second metric is displayed in one of thefollowing ways:
▫ If the second metric is less than the first metric, the second thinner bar isdisplayed as a green bar that starts at the value of the second metric and stops atthe value for the first metric. For example, in the Lipstick Bar graph shownabove, when the target revenue value is lower than the actual value for revenue,as seen with books and music, this shows that results are beating expectedtargets. A green bar is shown to display the difference.
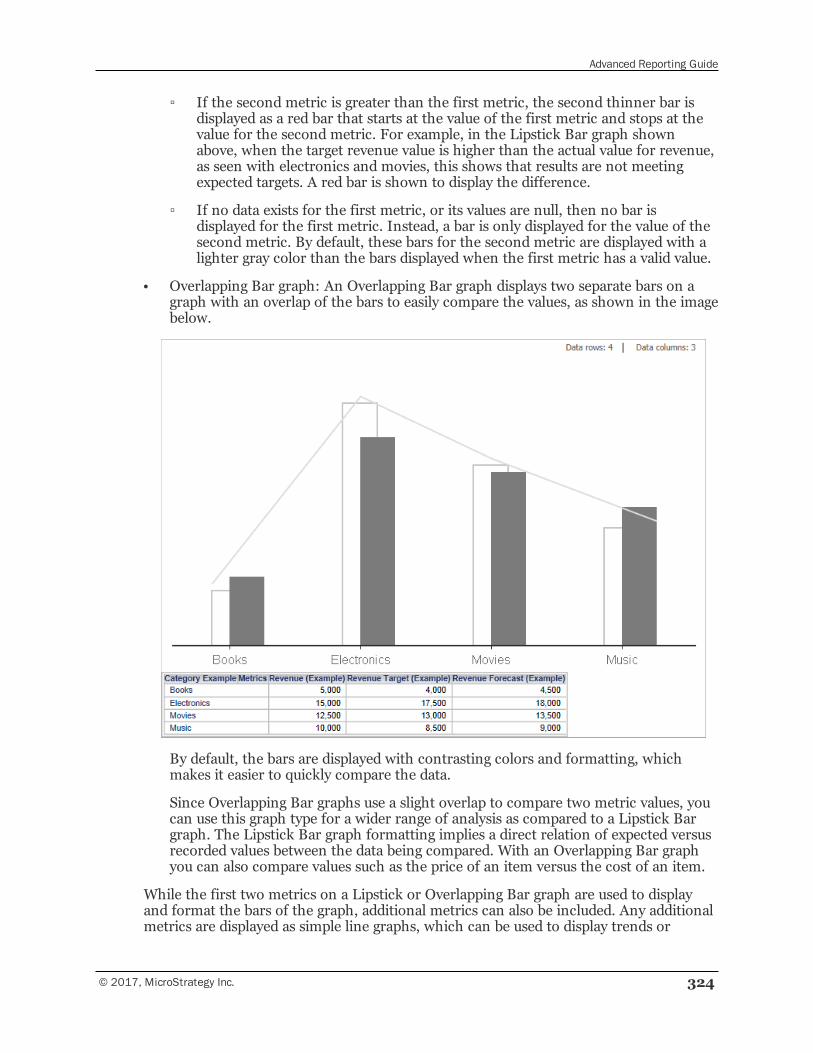
Advanced Reporting Guide
© 2017, MicroStrategy Inc. 324
▫ If the second metric is greater than the first metric, the second thinner bar isdisplayed as a red bar that starts at the value of the first metric and stops at thevalue for the second metric. For example, in the Lipstick Bar graph shownabove, when the target revenue value is higher than the actual value for revenue,as seen with electronics and movies, this shows that results are not meetingexpected targets. A red bar is shown to display the difference.
▫ If no data exists for the first metric, or its values are null, then no bar isdisplayed for the first metric. Instead, a bar is only displayed for the value of thesecond metric. By default, these bars for the second metric are displayed with alighter gray color than the bars displayed when the first metric has a valid value.
• Overlapping Bar graph: An Overlapping Bar graph displays two separate bars on agraph with an overlap of the bars to easily compare the values, as shown in the imagebelow.
By default, the bars are displayed with contrasting colors and formatting, whichmakes it easier to quickly compare the data.
Since Overlapping Bar graphs use a slight overlap to compare two metric values, youcan use this graph type for a wider range of analysis as compared to a Lipstick Bargraph. The Lipstick Bar graph formatting implies a direct relation of expected versusrecorded values between the data being compared. With an Overlapping Bar graphyou can also compare values such as the price of an item versus the cost of an item.
While the first two metrics on a Lipstick or Overlapping Bar graph are used to displayand format the bars of the graph, additional metrics can also be included. Any additionalmetrics are displayed as simple line graphs, which can be used to display trends or
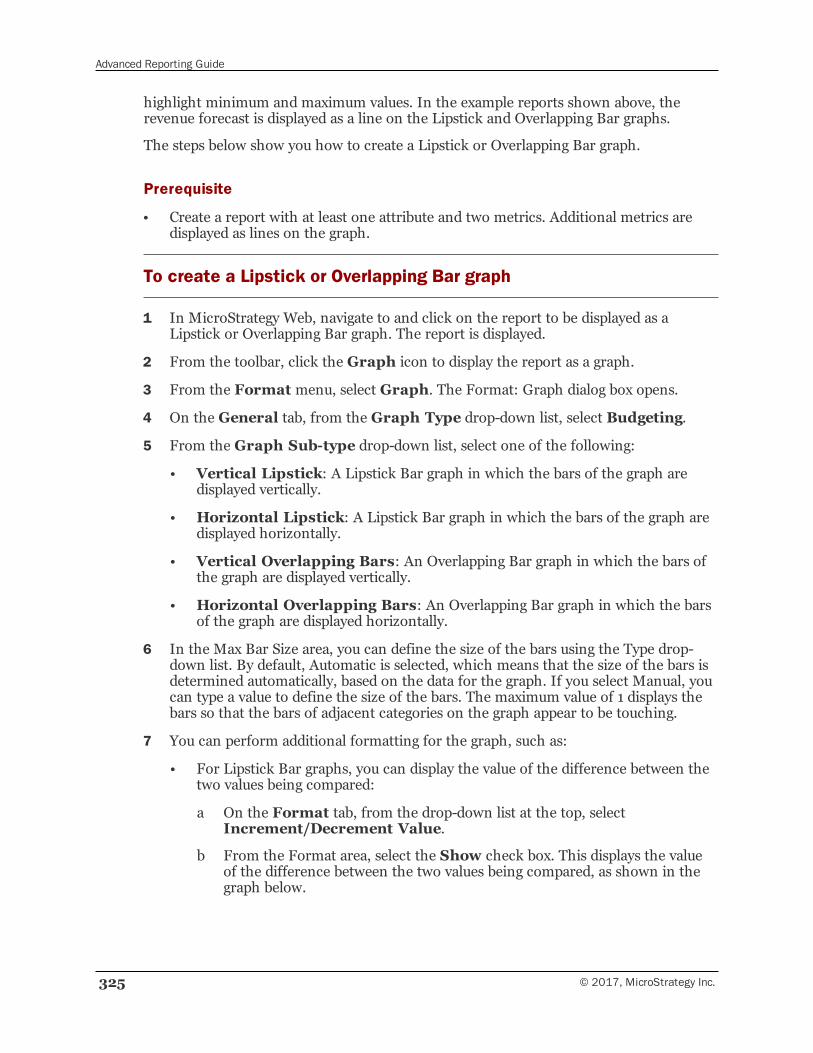
Advanced Reporting Guide
325 © 2017, MicroStrategy Inc.
highlight minimum and maximum values. In the example reports shown above, therevenue forecast is displayed as a line on the Lipstick and Overlapping Bar graphs.
The steps below show you how to create a Lipstick or Overlapping Bar graph.
Prerequisite
• Create a report with at least one attribute and two metrics. Additional metrics aredisplayed as lines on the graph.
To create a Lipstick or Overlapping Bar graph
1 In MicroStrategy Web, navigate to and click on the report to be displayed as aLipstick or Overlapping Bar graph. The report is displayed.
2 From the toolbar, click the Graph icon to display the report as a graph.
3 From the Format menu, select Graph. The Format: Graph dialog box opens.
4 On the General tab, from the Graph Type drop-down list, select Budgeting.
5 From the Graph Sub-type drop-down list, select one of the following:
• Vertical Lipstick: A Lipstick Bar graph in which the bars of the graph aredisplayed vertically.
• Horizontal Lipstick: A Lipstick Bar graph in which the bars of the graph aredisplayed horizontally.
• Vertical Overlapping Bars: An Overlapping Bar graph in which the bars ofthe graph are displayed vertically.
• Horizontal Overlapping Bars: An Overlapping Bar graph in which the barsof the graph are displayed horizontally.
6 In the Max Bar Size area, you can define the size of the bars using the Type drop-down list. By default, Automatic is selected, which means that the size of the bars isdetermined automatically, based on the data for the graph. If you select Manual, youcan type a value to define the size of the bars. The maximum value of 1 displays thebars so that the bars of adjacent categories on the graph appear to be touching.
7 You can perform additional formatting for the graph, such as:
• For Lipstick Bar graphs, you can display the value of the difference between thetwo values being compared:
a On the Format tab, from the drop-down list at the top, selectIncrement/Decrement Value.
b From the Format area, select the Show check box. This displays the valueof the difference between the two values being compared, as shown in thegraph below.
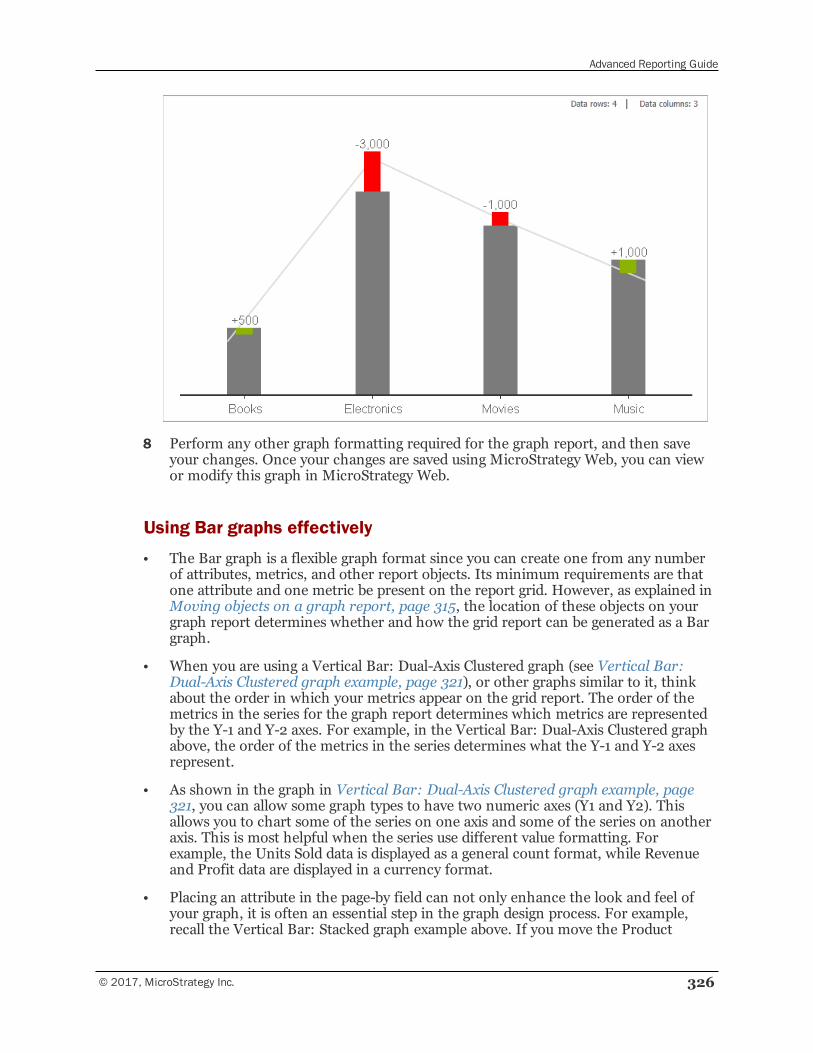
Advanced Reporting Guide
© 2017, MicroStrategy Inc. 326
8 Perform any other graph formatting required for the graph report, and then saveyour changes. Once your changes are saved using MicroStrategy Web, you can viewor modify this graph in MicroStrategy Web.
Using Bar graphs effectively
• The Bar graph is a flexible graph format since you can create one from any numberof attributes, metrics, and other report objects. Its minimum requirements are thatone attribute and one metric be present on the report grid. However, as explained inMoving objects on a graph report, page 315, the location of these objects on yourgraph report determines whether and how the grid report can be generated as a Bargraph.
• When you are using a Vertical Bar: Dual-Axis Clustered graph (see Vertical Bar:Dual-Axis Clustered graph example, page 321), or other graphs similar to it, thinkabout the order in which your metrics appear on the grid report. The order of themetrics in the series for the graph report determines which metrics are representedby the Y-1 and Y-2 axes. For example, in the Vertical Bar: Dual-Axis Clustered graphabove, the order of the metrics in the series determines what the Y-1 and Y-2 axesrepresent.
• As shown in the graph in Vertical Bar: Dual-Axis Clustered graph example, page321, you can allow some graph types to have two numeric axes (Y1 and Y2). Thisallows you to chart some of the series on one axis and some of the series on anotheraxis. This is most helpful when the series use different value formatting. Forexample, the Units Sold data is displayed as a general count format, while Revenueand Profit data are displayed in a currency format.
• Placing an attribute in the page-by field can not only enhance the look and feel ofyour graph, it is often an essential step in the graph design process. For example,recall the Vertical Bar: Stacked graph example above. If you move the Product
Advanced Reporting Guide
327 © 2017, MicroStrategy Inc.
Hierarchy Level 2 attribute off the page-by field onto the grid, the graph presents anexcessive number of columns, making it difficult to focus on specific data.
• Apply a gradient to the bars in your graph to make them stand out from the othersections of the graph. For example, the graph above has a gradient applied to itsseries. To apply gradients and other effects, right-click your graph’s series and accessthe Preferences dialog box. For these steps, seeManually formatting graph seriesand objects, page 372.
• If you are comparing two sets of data that are closely related, such as actual andtarget data, or actual and forecast data, consider using a Lipstick or Overlapping Bargraph. These Budgeting graph types are described in Lipstick and Overlapping Bargraphs, page 323.
• For detailed information about the specific options for Bar graphs in MicroStrategy,see theMicroStrategy Developer help. (From within MicroStrategy Developer, pressF1.)
LineA Line graph is a type of graph that highlights trends by connecting lines betweendifferent data points. Like the Bar graph and Pie chart, the Line graph is one of the mostcommonly used graph types. It is often used as a visual alternative to Bar graphs andother types.
Line graph types
You can create many different types of Line graphs in MicroStrategy, including thefollowing:
• Horizontal Line and Vertical Line styles:
▫ Absolute
▫ Stacked
▫ Bi-polar Absolute
▫ Bi-polar Stacked
▫ Dual-axis Absolute
▫ Dual-axis stacked
▫ Percent
• 3D Line styles:
▫ Series
▫ Group
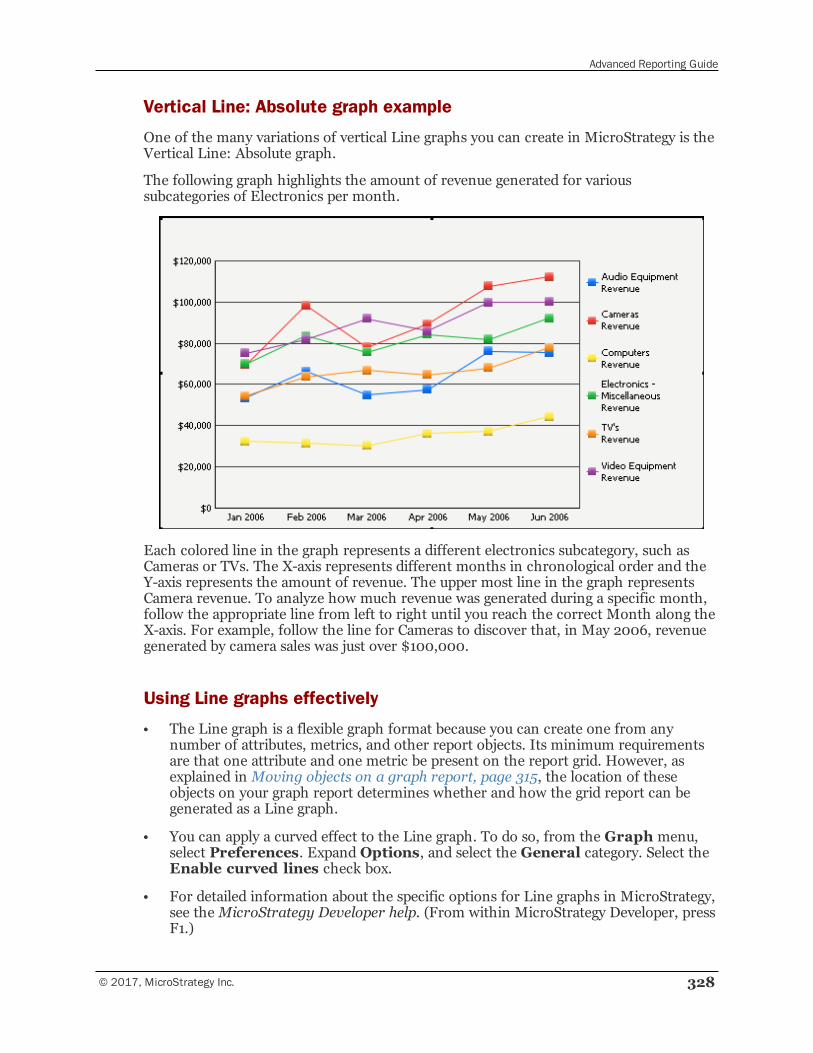
Advanced Reporting Guide
© 2017, MicroStrategy Inc. 328
Vertical Line: Absolute graph example
One of the many variations of vertical Line graphs you can create in MicroStrategy is theVertical Line: Absolute graph.
The following graph highlights the amount of revenue generated for varioussubcategories of Electronics per month.
Each colored line in the graph represents a different electronics subcategory, such asCameras or TVs. The X-axis represents different months in chronological order and theY-axis represents the amount of revenue. The upper most line in the graph representsCamera revenue. To analyze how much revenue was generated during a specific month,follow the appropriate line from left to right until you reach the correct Month along theX-axis. For example, follow the line for Cameras to discover that, in May 2006, revenuegenerated by camera sales was just over $100,000.
Using Line graphs effectively
• The Line graph is a flexible graph format because you can create one from anynumber of attributes, metrics, and other report objects. Its minimum requirementsare that one attribute and one metric be present on the report grid. However, asexplained in Moving objects on a graph report, page 315, the location of theseobjects on your graph report determines whether and how the grid report can begenerated as a Line graph.
• You can apply a curved effect to the Line graph. To do so, from the Graph menu,select Preferences. ExpandOptions, and select the General category. Select theEnable curved lines check box.
• For detailed information about the specific options for Line graphs in MicroStrategy,see theMicroStrategy Developer help. (From within MicroStrategy Developer, pressF1.)
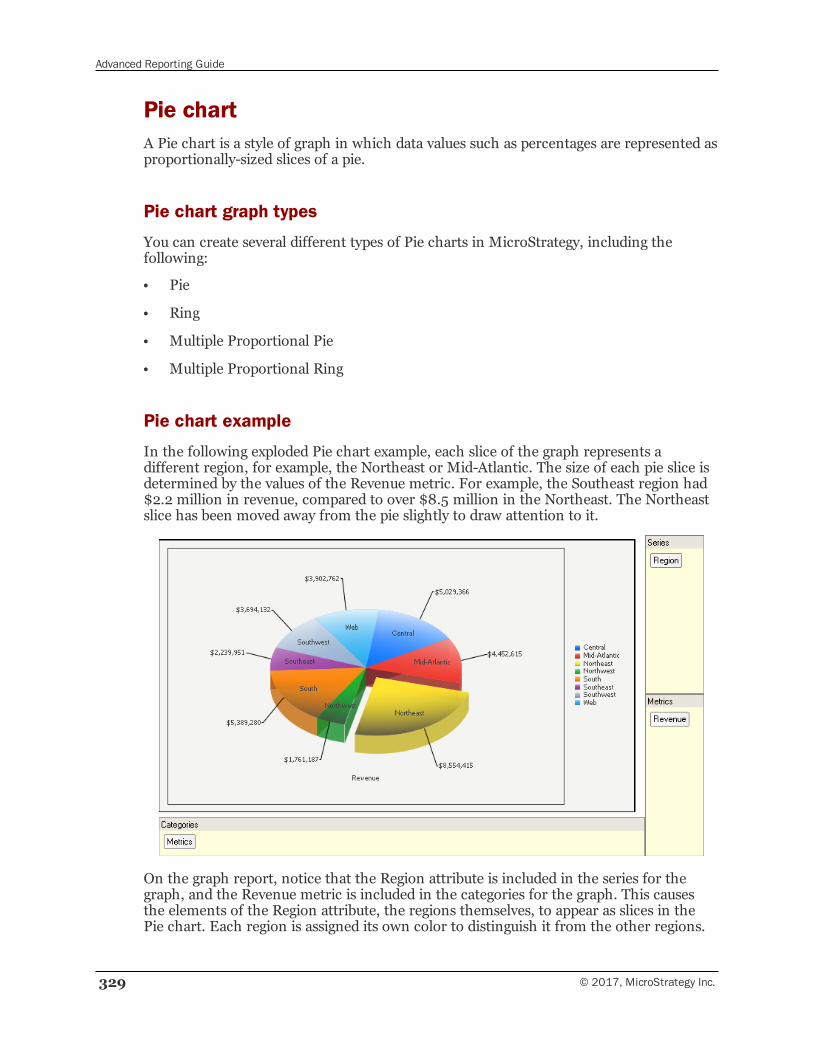
Advanced Reporting Guide
329 © 2017, MicroStrategy Inc.
Pie chartA Pie chart is a style of graph in which data values such as percentages are represented asproportionally-sized slices of a pie.
Pie chart graph types
You can create several different types of Pie charts in MicroStrategy, including thefollowing:
• Pie
• Ring
• Multiple Proportional Pie
• Multiple Proportional Ring
Pie chart example
In the following exploded Pie chart example, each slice of the graph represents adifferent region, for example, the Northeast or Mid-Atlantic. The size of each pie slice isdetermined by the values of the Revenue metric. For example, the Southeast region had$2.2 million in revenue, compared to over $8.5 million in the Northeast. The Northeastslice has been moved away from the pie slightly to draw attention to it.
On the graph report, notice that the Region attribute is included in the series for thegraph, and the Revenue metric is included in the categories for the graph. This causesthe elements of the Region attribute, the regions themselves, to appear as slices in thePie chart. Each region is assigned its own color to distinguish it from the other regions.
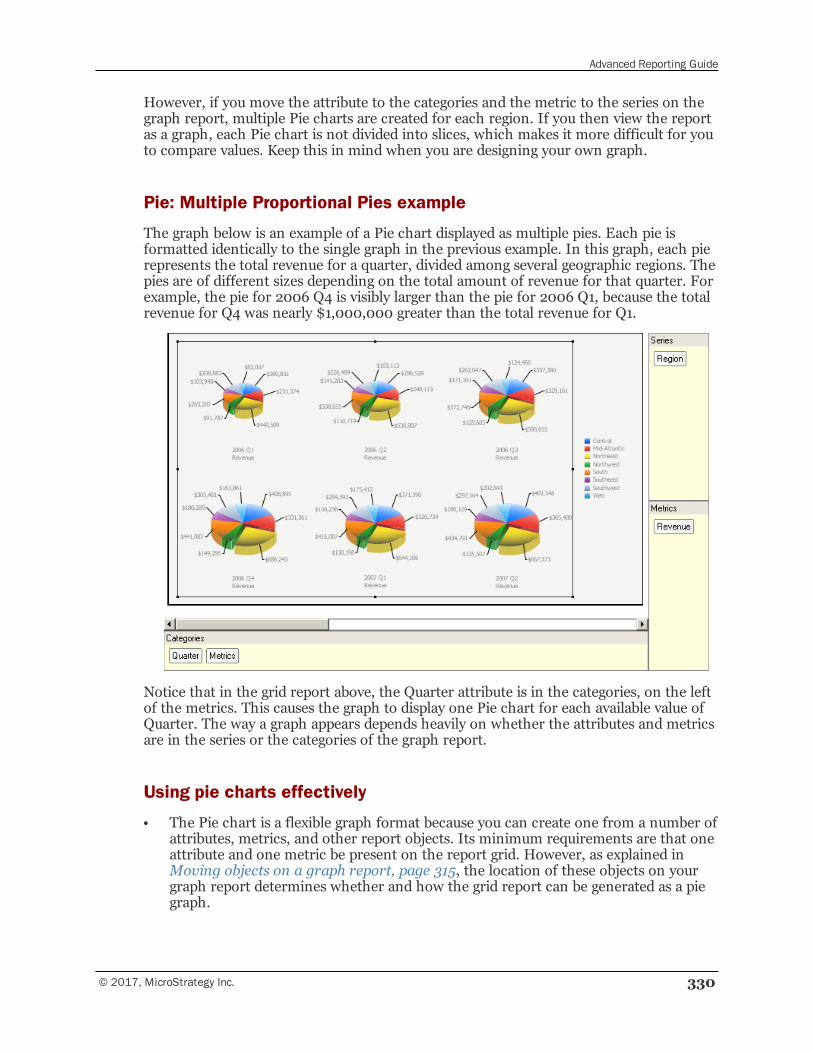
Advanced Reporting Guide
© 2017, MicroStrategy Inc. 330
However, if you move the attribute to the categories and the metric to the series on thegraph report, multiple Pie charts are created for each region. If you then view the reportas a graph, each Pie chart is not divided into slices, which makes it more difficult for youto compare values. Keep this in mind when you are designing your own graph.
Pie: Multiple Proportional Pies example
The graph below is an example of a Pie chart displayed as multiple pies. Each pie isformatted identically to the single graph in the previous example. In this graph, each pierepresents the total revenue for a quarter, divided among several geographic regions. Thepies are of different sizes depending on the total amount of revenue for that quarter. Forexample, the pie for 2006 Q4 is visibly larger than the pie for 2006 Q1, because the totalrevenue for Q4 was nearly $1,000,000 greater than the total revenue for Q1.
Notice that in the grid report above, the Quarter attribute is in the categories, on the leftof the metrics. This causes the graph to display one Pie chart for each available value ofQuarter. The way a graph appears depends heavily on whether the attributes and metricsare in the series or the categories of the graph report.
Using pie charts effectively
• The Pie chart is a flexible graph format because you can create one from a number ofattributes, metrics, and other report objects. Its minimum requirements are that oneattribute and one metric be present on the report grid. However, as explained inMoving objects on a graph report, page 315, the location of these objects on yourgraph report determines whether and how the grid report can be generated as a piegraph.
Advanced Reporting Guide
331 © 2017, MicroStrategy Inc.
• When you create a Pie chart, move the attributes and metrics of your report betweenthe series and categories until a useful and easy-to-follow graph is displayed. Thelocation of the attributes and metrics on the grid directly affects whether one Piechart with different slices is displayed or whether multiple pies are displayed. Reviewthe Pie chart examples above for an example of this.
• For detailed information about the specific options for Pie charts in MicroStrategy,see theMicroStrategy Developer help.
Scatter plotA Scatter plot is a graph showing points of data that are not connected by a line. AScatter plot can help you identify the relationships that exist between different values.Each dot on the graph represents the intersection of the data on the X and Y axes. Forexample, if you are looking at numeric profit data on a report, the profits of various callcenters are clear. However, when you display the report as a Scatter plot, thevisualization of the data reveals that a certain call center is performing significantlybetter than other call centers.
Scatter plots are often used for quality control and management. However, like mostgraph styles, they are also useful because of their distinct visual style.
Scatter plot graph types
You can create several different types of Scatter plots in MicroStrategy, including thefollowing:
• X-Y Scatter
• Dual-axis X-Y Scatter
• X-Y-Z Scatter Chart (three-dimensional)
Scatter: X-Y graph example
In the Scatter: X-Y graph below, the revenue generated by each customer appears alongthe X-axis, while the customer satisfaction for each customer appears along the Y-axis.The individual circles within the graph represent each customer.
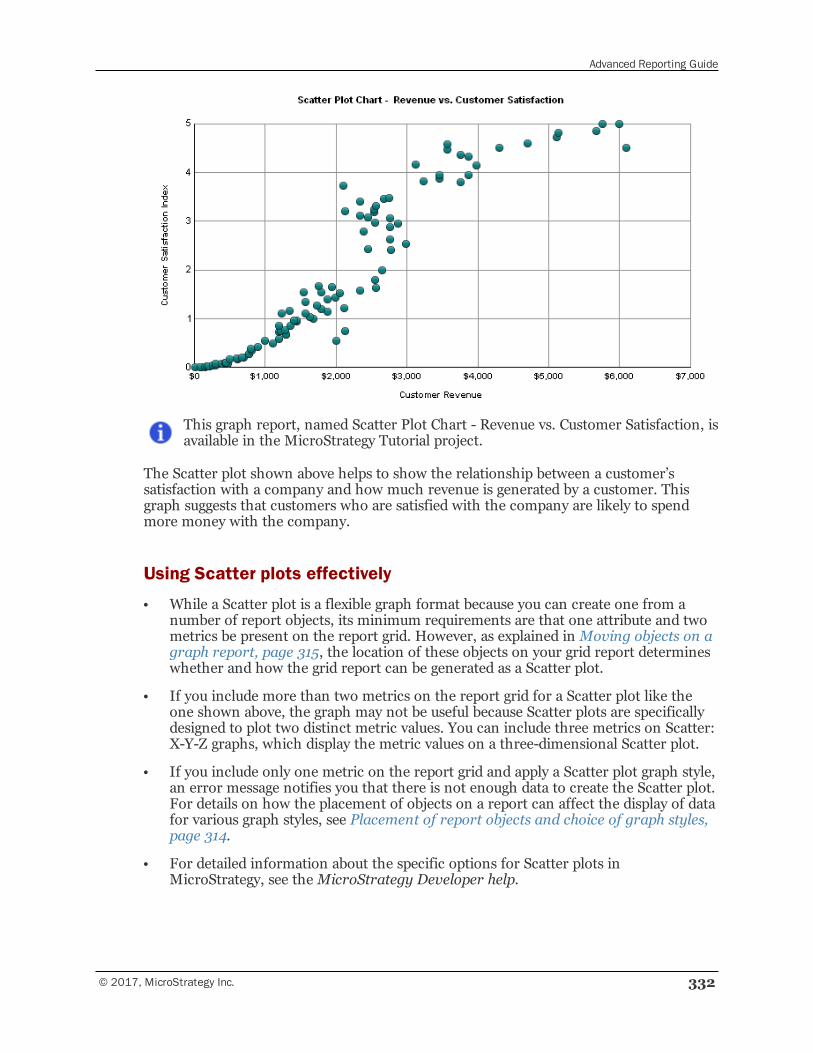
Advanced Reporting Guide
© 2017, MicroStrategy Inc. 332
This graph report, named Scatter Plot Chart - Revenue vs. Customer Satisfaction, isavailable in the MicroStrategy Tutorial project.
The Scatter plot shown above helps to show the relationship between a customer’ssatisfaction with a company and how much revenue is generated by a customer. Thisgraph suggests that customers who are satisfied with the company are likely to spendmore money with the company.
Using Scatter plots effectively
• While a Scatter plot is a flexible graph format because you can create one from anumber of report objects, its minimum requirements are that one attribute and twometrics be present on the report grid. However, as explained in Moving objects on agraph report, page 315, the location of these objects on your grid report determineswhether and how the grid report can be generated as a Scatter plot.
• If you include more than two metrics on the report grid for a Scatter plot like theone shown above, the graph may not be useful because Scatter plots are specificallydesigned to plot two distinct metric values. You can include three metrics on Scatter:X-Y-Z graphs, which display the metric values on a three-dimensional Scatter plot.
• If you include only one metric on the report grid and apply a Scatter plot graph style,an error message notifies you that there is not enough data to create the Scatter plot.For details on how the placement of objects on a report can affect the display of datafor various graph styles, see Placement of report objects and choice of graph styles,page 314.
• For detailed information about the specific options for Scatter plots inMicroStrategy, see theMicroStrategy Developer help.
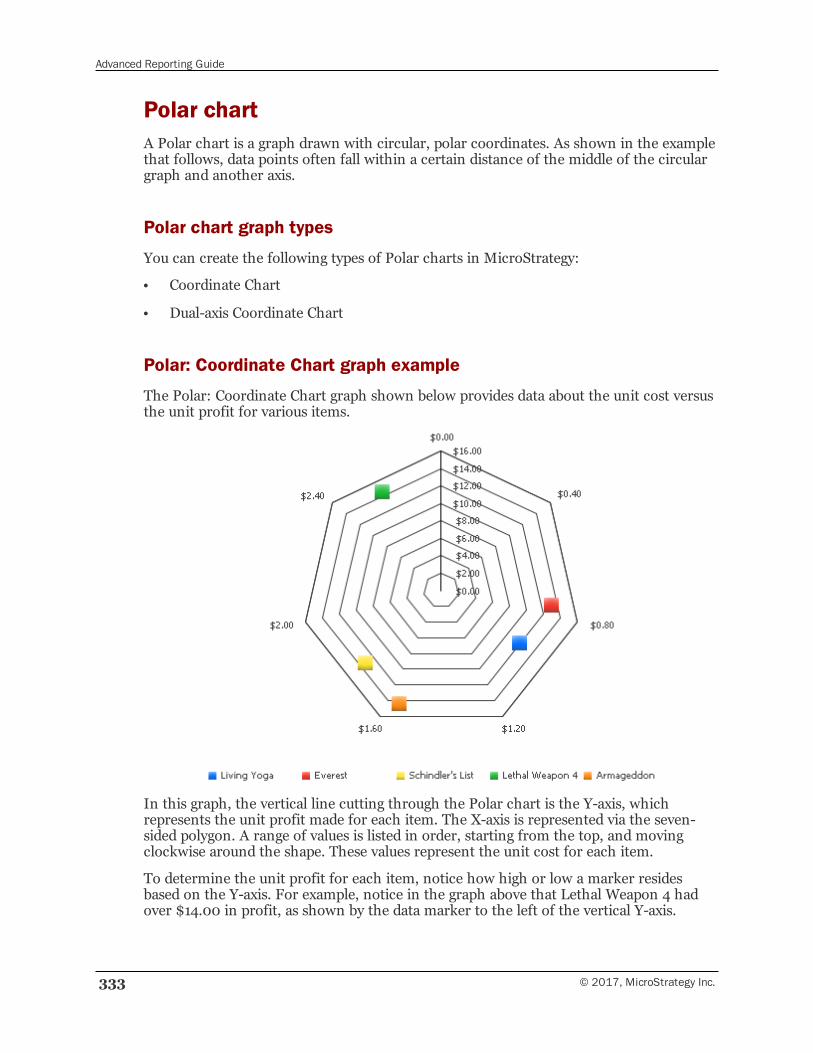
Advanced Reporting Guide
333 © 2017, MicroStrategy Inc.
Polar chartA Polar chart is a graph drawn with circular, polar coordinates. As shown in the examplethat follows, data points often fall within a certain distance of the middle of the circulargraph and another axis.
Polar chart graph types
You can create the following types of Polar charts in MicroStrategy:
• Coordinate Chart
• Dual-axis Coordinate Chart
Polar: Coordinate Chart graph example
The Polar: Coordinate Chart graph shown below provides data about the unit cost versusthe unit profit for various items.
In this graph, the vertical line cutting through the Polar chart is the Y-axis, whichrepresents the unit profit made for each item. The X-axis is represented via the seven-sided polygon. A range of values is listed in order, starting from the top, and movingclockwise around the shape. These values represent the unit cost for each item.
To determine the unit profit for each item, notice how high or low a marker residesbased on the Y-axis. For example, notice in the graph above that Lethal Weapon 4 hadover $14.00 in profit, as shown by the data marker to the left of the vertical Y-axis.
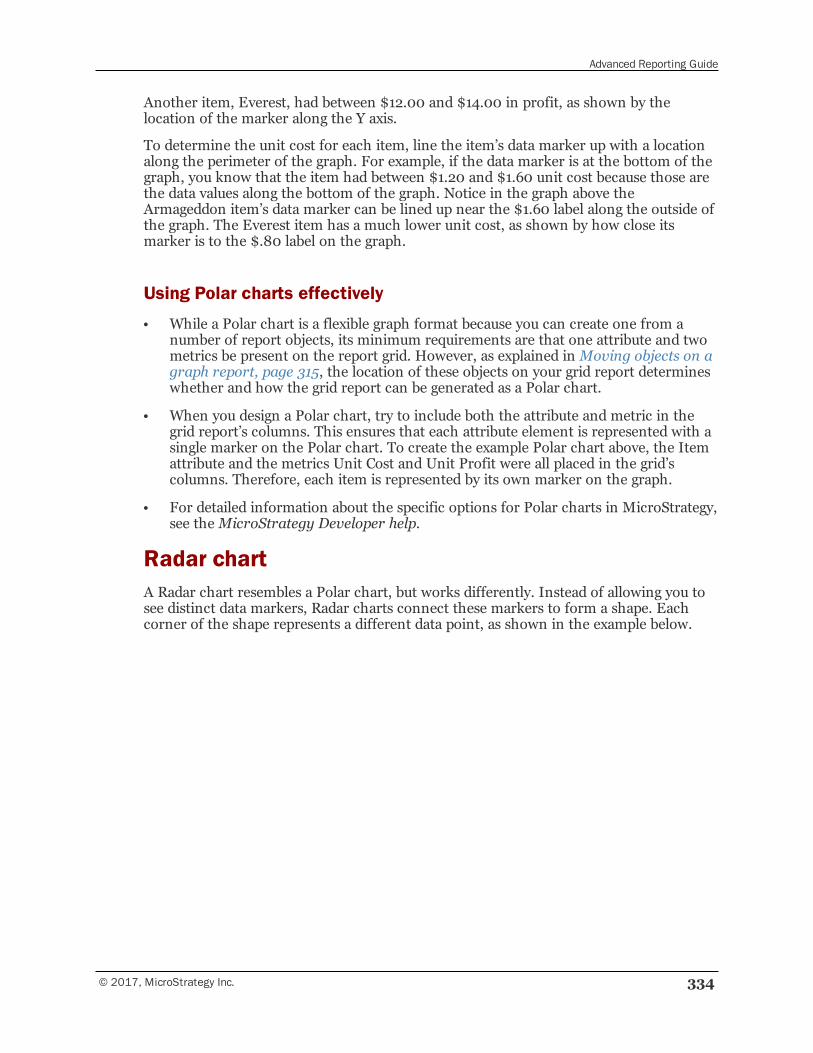
Advanced Reporting Guide
© 2017, MicroStrategy Inc. 334
Another item, Everest, had between $12.00 and $14.00 in profit, as shown by thelocation of the marker along the Y axis.
To determine the unit cost for each item, line the item’s data marker up with a locationalong the perimeter of the graph. For example, if the data marker is at the bottom of thegraph, you know that the item had between $1.20 and $1.60 unit cost because those arethe data values along the bottom of the graph. Notice in the graph above theArmageddon item’s data marker can be lined up near the $1.60 label along the outside ofthe graph. The Everest item has a much lower unit cost, as shown by how close itsmarker is to the $.80 label on the graph.
Using Polar charts effectively
• While a Polar chart is a flexible graph format because you can create one from anumber of report objects, its minimum requirements are that one attribute and twometrics be present on the report grid. However, as explained in Moving objects on agraph report, page 315, the location of these objects on your grid report determineswhether and how the grid report can be generated as a Polar chart.
• When you design a Polar chart, try to include both the attribute and metric in thegrid report’s columns. This ensures that each attribute element is represented with asingle marker on the Polar chart. To create the example Polar chart above, the Itemattribute and the metrics Unit Cost and Unit Profit were all placed in the grid’scolumns. Therefore, each item is represented by its own marker on the graph.
• For detailed information about the specific options for Polar charts in MicroStrategy,see theMicroStrategy Developer help.
Radar chartA Radar chart resembles a Polar chart, but works differently. Instead of allowing you tosee distinct data markers, Radar charts connect these markers to form a shape. Eachcorner of the shape represents a different data point, as shown in the example below.
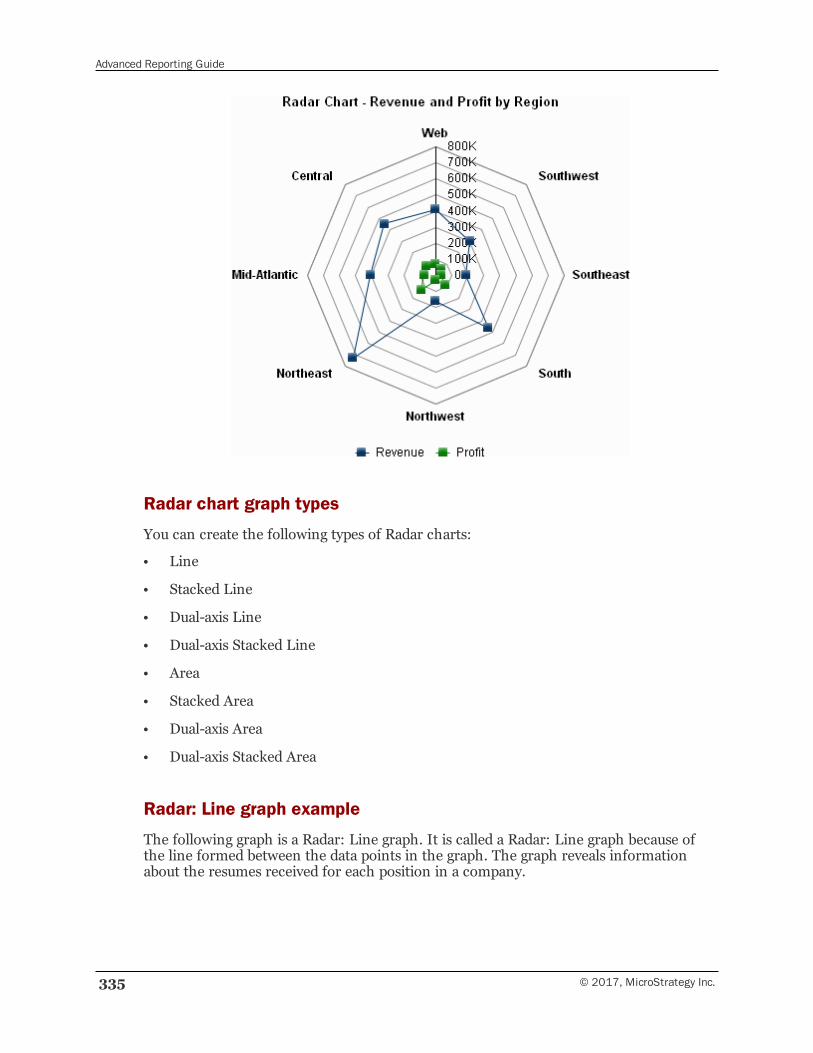
Advanced Reporting Guide
335 © 2017, MicroStrategy Inc.
Radar chart graph types
You can create the following types of Radar charts:
• Line
• Stacked Line
• Dual-axis Line
• Dual-axis Stacked Line
• Area
• Stacked Area
• Dual-axis Area
• Dual-axis Stacked Area
Radar: Line graph example
The following graph is a Radar: Line graph. It is called a Radar: Line graph because ofthe line formed between the data points in the graph. The graph reveals informationabout the resumes received for each position in a company.
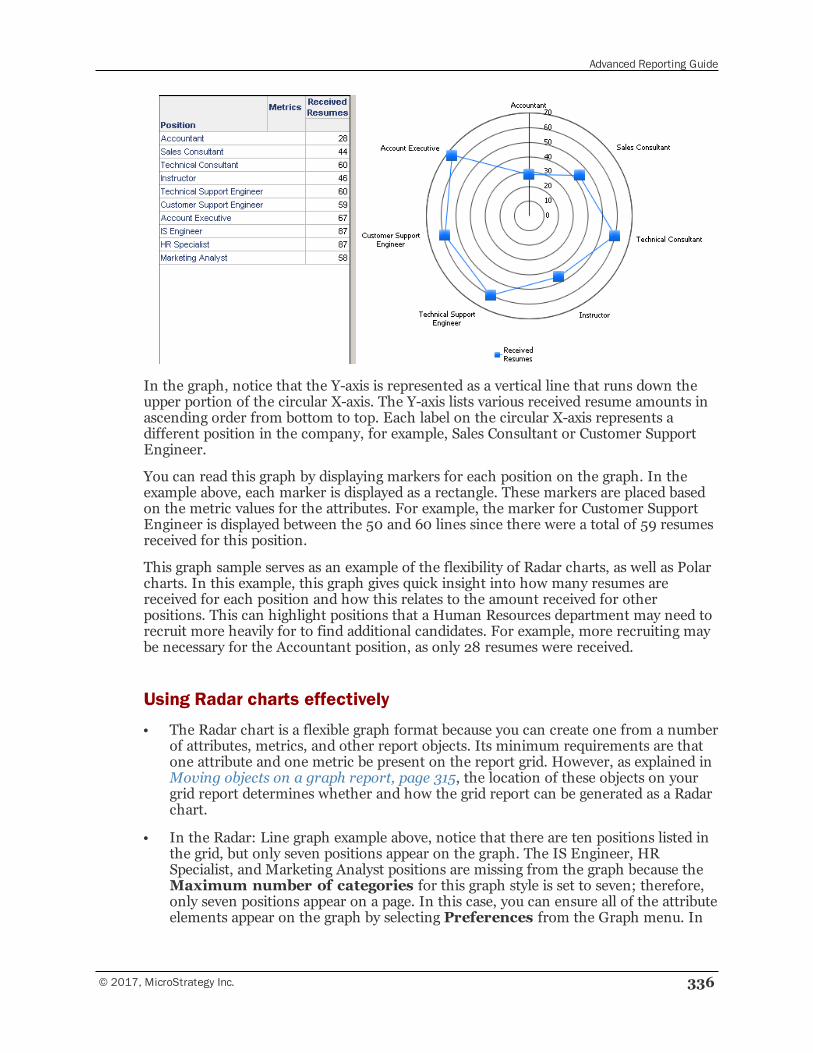
Advanced Reporting Guide
© 2017, MicroStrategy Inc. 336
In the graph, notice that the Y-axis is represented as a vertical line that runs down theupper portion of the circular X-axis. The Y-axis lists various received resume amounts inascending order from bottom to top. Each label on the circular X-axis represents adifferent position in the company, for example, Sales Consultant or Customer SupportEngineer.
You can read this graph by displaying markers for each position on the graph. In theexample above, each marker is displayed as a rectangle. These markers are placed basedon the metric values for the attributes. For example, the marker for Customer SupportEngineer is displayed between the 50 and 60 lines since there were a total of 59 resumesreceived for this position.
This graph sample serves as an example of the flexibility of Radar charts, as well as Polarcharts. In this example, this graph gives quick insight into how many resumes arereceived for each position and how this relates to the amount received for otherpositions. This can highlight positions that a Human Resources department may need torecruit more heavily for to find additional candidates. For example, more recruiting maybe necessary for the Accountant position, as only 28 resumes were received.
Using Radar charts effectively
• The Radar chart is a flexible graph format because you can create one from a numberof attributes, metrics, and other report objects. Its minimum requirements are thatone attribute and one metric be present on the report grid. However, as explained inMoving objects on a graph report, page 315, the location of these objects on yourgrid report determines whether and how the grid report can be generated as a Radarchart.
• In the Radar: Line graph example above, notice that there are ten positions listed inthe grid, but only seven positions appear on the graph. The IS Engineer, HRSpecialist, and Marketing Analyst positions are missing from the graph because theMaximum number of categories for this graph style is set to seven; therefore,only seven positions appear on a page. In this case, you can ensure all of the attributeelements appear on the graph by selecting Preferences from the Graph menu. In
Advanced Reporting Guide
337 © 2017, MicroStrategy Inc.
theMaximum number of categories field, type 10, the number of attributeelements you want to appear on the graph.
• For detailed information about the specific options for Radar charts inMicroStrategy, see theMicroStrategy Developer help.
Bubble chartA Bubble chart is a Scatter plot that also displays the size of each data marker, usingbubbles to represent the different sizes of data markers.
To create a Bubble chart, you must include at least one attribute and three metrics onyour report grid. Where you place each object on the report grid affects how that objectis displayed in the resulting graph, as follows:
• The first metric on the grid determines what is placed on the X-axis.
• The second metric on the grid determines what is placed on the Y-axis.
• The third metric on the grid determines the size of each bubble.
Bubble chart graph types
You can create the following types of Bubble charts in MicroStrategy:
• Bubble
• Dual-axis
Bubble chart example
The graph below provides an example of how three metrics are displayed within a Bubblechart. In the graph, a colored bubble is designated for each shipping point for the years2008 and 2009. The size of each bubble represents that shipping point’s average totaldelivery time for outbound items.
The X-axis represents the Outbound Deliveries metric, which displays the number ofoutbound deliveries. The Y-axis represents the Outbound Delivery Items metric. A thirdmetric, Average Total Delivery Time for Outbound Deliveries (Days), is included as thethird metric on the columns of the grid report. The third metric placed in the columnsdetermines the size of each bubble.
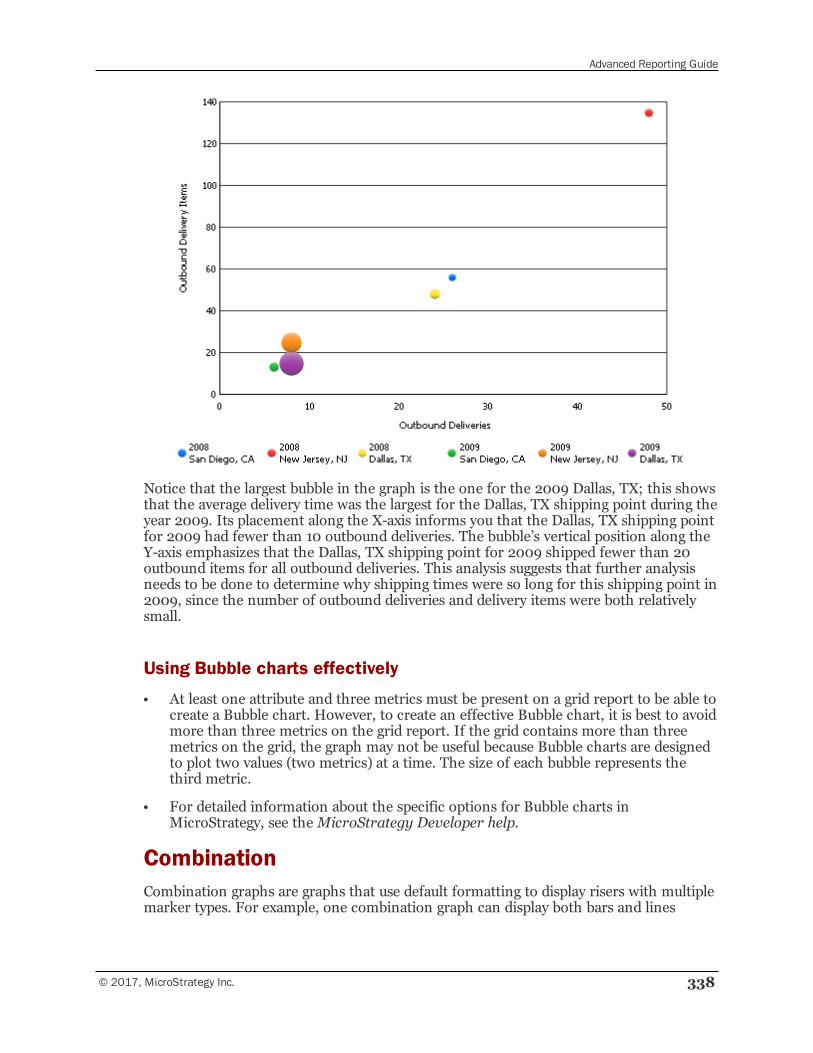
Advanced Reporting Guide
© 2017, MicroStrategy Inc. 338
Notice that the largest bubble in the graph is the one for the 2009 Dallas, TX; this showsthat the average delivery time was the largest for the Dallas, TX shipping point during theyear 2009. Its placement along the X-axis informs you that the Dallas, TX shipping pointfor 2009 had fewer than 10 outbound deliveries. The bubble’s vertical position along theY-axis emphasizes that the Dallas, TX shipping point for 2009 shipped fewer than 20outbound items for all outbound deliveries. This analysis suggests that further analysisneeds to be done to determine why shipping times were so long for this shipping point in2009, since the number of outbound deliveries and delivery items were both relativelysmall.
Using Bubble charts effectively
• At least one attribute and three metrics must be present on a grid report to be able tocreate a Bubble chart. However, to create an effective Bubble chart, it is best to avoidmore than three metrics on the grid report. If the grid contains more than threemetrics on the grid, the graph may not be useful because Bubble charts are designedto plot two values (two metrics) at a time. The size of each bubble represents thethird metric.
• For detailed information about the specific options for Bubble charts inMicroStrategy, see theMicroStrategy Developer help.
CombinationCombination graphs are graphs that use default formatting to display risers with multiplemarker types. For example, one combination graph can display both bars and lines
Advanced Reporting Guide
339 © 2017, MicroStrategy Inc.
together on the same graph. Combination graphs use the formatting options of otherstandard MicroStrategy graph types, as described below:
You can change the layout of combination graphs on the Layout category.However, if you select a three-dimensional layout, the multiple marker typeformatting is lost. All other layout types retain the multiple marker type formattingfor the combination graphs.
• Bar Area: This combination graph displays a combination of bar risers and arearisers. It uses the formatting options available for Vertical Bar graphs.
• Dual Axis Bar Area: This combination graph displays a combination of bar risers andarea risers on a dual axis. It uses the formatting options available for Vertical Bargraphs.
• Bar Line: This combination graph displays a combination of bar risers and linerisers. It uses the formatting options available for Vertical Bar graphs.
• Dual Axis Bar Line: This combination graph displays a combination of bar risers andline risers on a dual axis. It uses the formatting options available for Vertical Bargraphs.
• Area Line: This combination graph displays a combination of area risers and linerisers. It uses the formatting options available for Vertical Area graphs.
• Dual Axis Area Line: This combination graph displays a combination of area risersand line risers on a dual axis. It uses the formatting options available for VerticalArea graphs.
CustomCustom graphs are a list of graph templates that are supplied with MicroStrategyproducts. The custom graph files (.3TF files) contain attributes and data that define theformat and look of a graph.
The Custom tab has the following categories of custom graph styles:
• Basic
• Big Data Sets
• Corporate
• Gradients
• LetterSize B&W
• LetterSize Color
• Surveys
• Textured
• Trendlines
Each category corresponds to a folder in the \support files\templates\ folderwithin the MicroStrategy Common Files folder. You can create your own category by
Advanced Reporting Guide
© 2017, MicroStrategy Inc. 340
adding a new folder under this directory. Each custom graph style corresponds to a 3TFfile stored in that directory.
Advanced graph style usage and examplesThis section describes the advanced graph styles available in MicroStrategy Developerand MicroStrategy Web. It provides general descriptions and images of these graph stylesand offers insight on the type of data best presented with each style. This section alsoprovides tips on how to create the graphs in MicroStrategy.
This section provides information about the following advanced graph styles:
Some of the graphs illustrated in this section serve only as conceptual examplesand, therefore, the data shown does not necessarily exist in MicroStrategy Tutorial.
StockA Stock graph is designed to plot high, low, open, and close values. It displays thesevalues over a chosen period of time. Therefore, Stock graphs are particularly useful indepicting data that often fluctuates, such as stock prices or inventory levels.
In a Stock graph, columns are used to represent different ranges of values, from low tohigh. The size of each column represents the difference between the high and lowvalues.
Stock graphs typically consist of the following elements:
• High value: The high value is marked at the top of each column. This representsthe highest value achieved during a certain period of time.
• Low value: The low value is marked at the bottom of each column. This representsthe lowest value achieved during a certain period of time.
• Open value: The open value is marked as a tail on the left side of each column.This represents the value when it is first recorded. For example, for a daily stockprice, the open value represents the price of the stock at the beginning of the day,just as the stock market opens.
• Close value: The close value is marked as a tail on the right side of each column.This represents the value when it is last recorded. For example, for a daily stockprice, the close value represents the price of the stock when the stock marketofficially closes for the day.
Stock graph types
You can create several types of Stock graphs in MicroStrategy, including the following:
• Hi-Lo Stock graph
• Hi-Lo-Open Stock graph
• Hi-Lo-Open-Close Stock graph
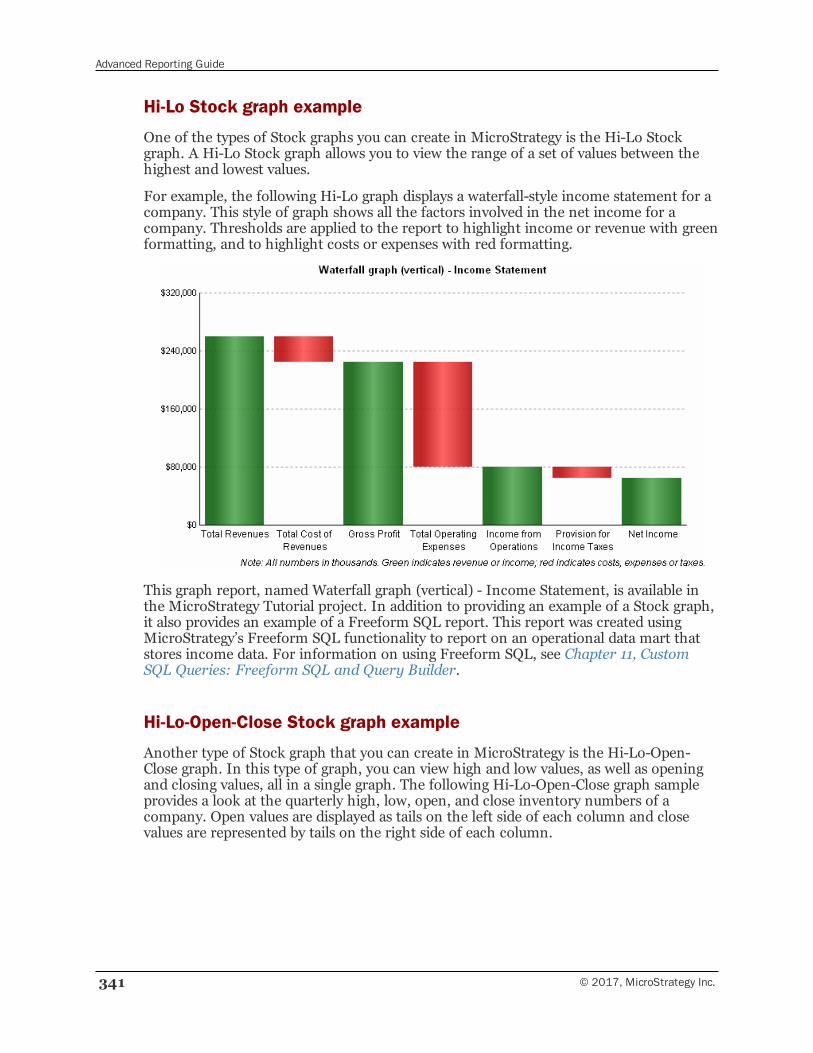
Advanced Reporting Guide
341 © 2017, MicroStrategy Inc.
Hi-Lo Stock graph example
One of the types of Stock graphs you can create in MicroStrategy is the Hi-Lo Stockgraph. A Hi-Lo Stock graph allows you to view the range of a set of values between thehighest and lowest values.
For example, the following Hi-Lo graph displays a waterfall-style income statement for acompany. This style of graph shows all the factors involved in the net income for acompany. Thresholds are applied to the report to highlight income or revenue with greenformatting, and to highlight costs or expenses with red formatting.
This graph report, named Waterfall graph (vertical) - Income Statement, is available inthe MicroStrategy Tutorial project. In addition to providing an example of a Stock graph,it also provides an example of a Freeform SQL report. This report was created usingMicroStrategy’s Freeform SQL functionality to report on an operational data mart thatstores income data. For information on using Freeform SQL, see Chapter 11, CustomSQL Queries: Freeform SQL and Query Builder.
Hi-Lo-Open-Close Stock graph example
Another type of Stock graph that you can create in MicroStrategy is the Hi-Lo-Open-Close graph. In this type of graph, you can view high and low values, as well as openingand closing values, all in a single graph. The following Hi-Lo-Open-Close graph sampleprovides a look at the quarterly high, low, open, and close inventory numbers of acompany. Open values are displayed as tails on the left side of each column and closevalues are represented by tails on the right side of each column.
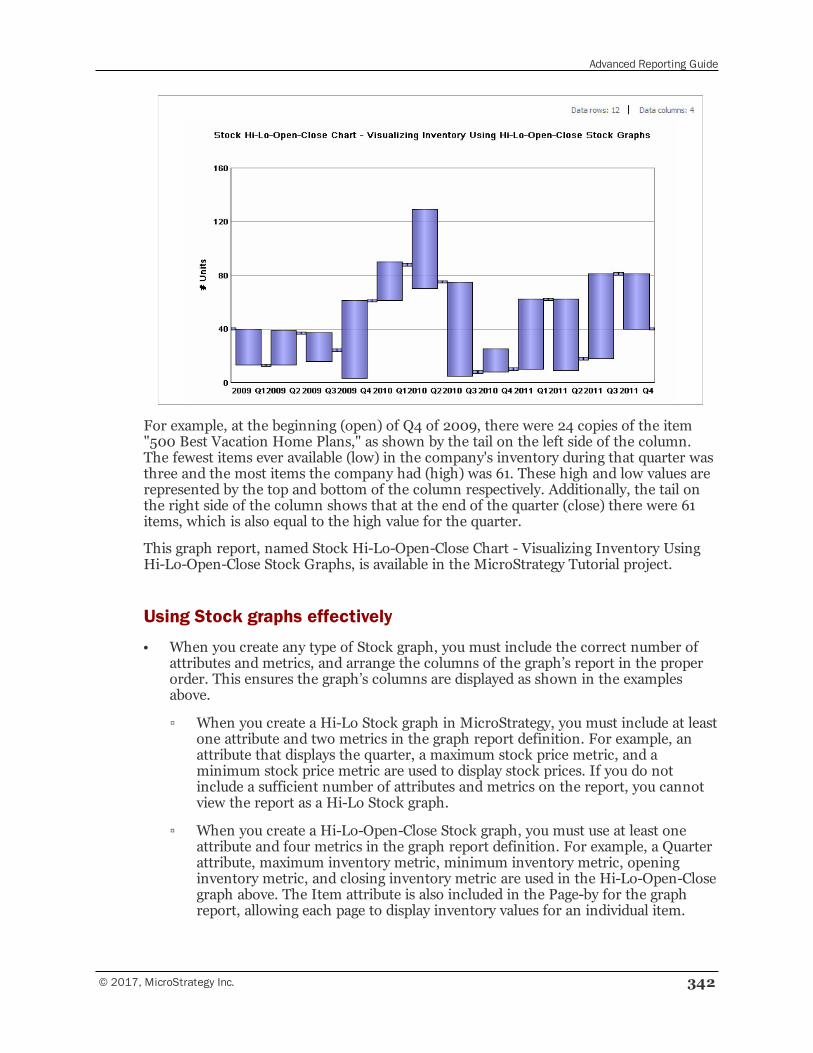
Advanced Reporting Guide
© 2017, MicroStrategy Inc. 342
For example, at the beginning (open) of Q4 of 2009, there were 24 copies of the item"500 Best Vacation Home Plans," as shown by the tail on the left side of the column.The fewest items ever available (low) in the company's inventory during that quarter wasthree and the most items the company had (high) was 61. These high and low values arerepresented by the top and bottom of the column respectively. Additionally, the tail onthe right side of the column shows that at the end of the quarter (close) there were 61items, which is also equal to the high value for the quarter.
This graph report, named Stock Hi-Lo-Open-Close Chart - Visualizing Inventory UsingHi-Lo-Open-Close Stock Graphs, is available in the MicroStrategy Tutorial project.
Using Stock graphs effectively
• When you create any type of Stock graph, you must include the correct number ofattributes and metrics, and arrange the columns of the graph’s report in the properorder. This ensures the graph’s columns are displayed as shown in the examplesabove.
▫ When you create a Hi-Lo Stock graph in MicroStrategy, you must include at leastone attribute and two metrics in the graph report definition. For example, anattribute that displays the quarter, a maximum stock price metric, and aminimum stock price metric are used to display stock prices. If you do notinclude a sufficient number of attributes and metrics on the report, you cannotview the report as a Hi-Lo Stock graph.
▫ When you create a Hi-Lo-Open-Close Stock graph, you must use at least oneattribute and four metrics in the graph report definition. For example, a Quarterattribute, maximum inventory metric, minimum inventory metric, openinginventory metric, and closing inventory metric are used in the Hi-Lo-Open-Closegraph above. The Item attribute is also included in the Page-by for the graphreport, allowing each page to display inventory values for an individual item.
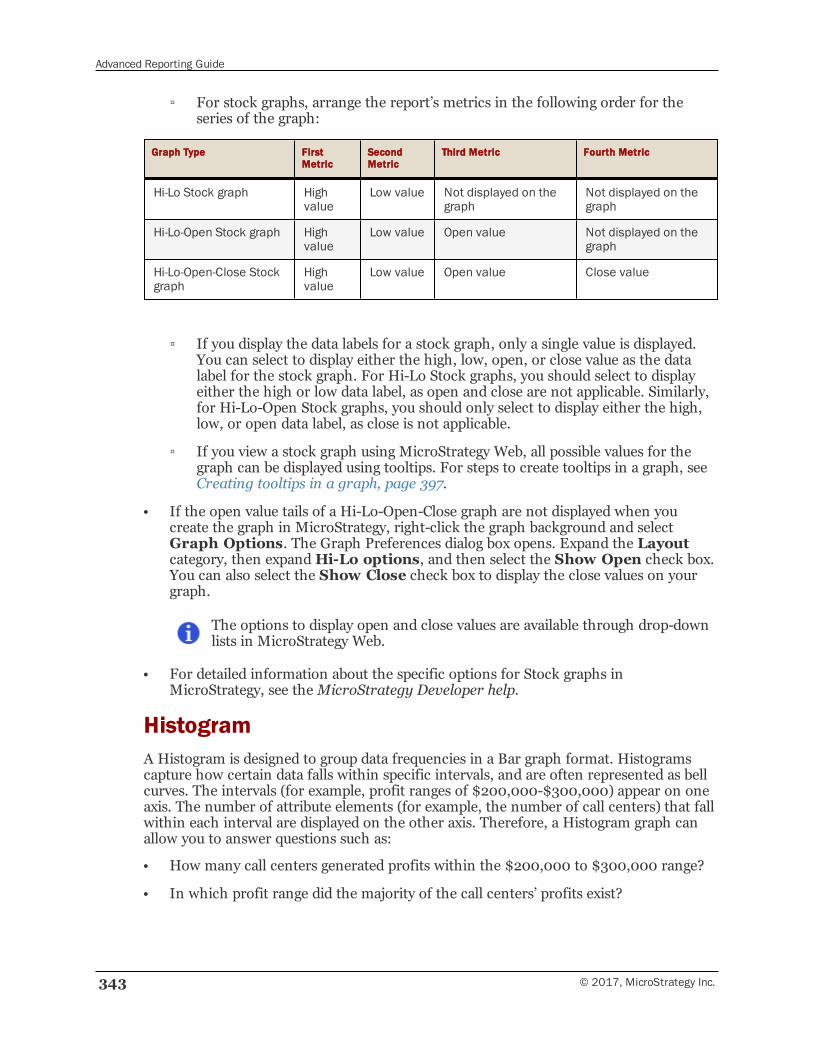
Advanced Reporting Guide
343 © 2017, MicroStrategy Inc.
▫ For stock graphs, arrange the report’s metrics in the following order for theseries of the graph:
Graph Type FirstMetric
SecondMetric
Third Metric Fourth Metric
Hi-Lo Stock graph Highvalue
Low value Not displayed on thegraph
Not displayed on thegraph
Hi-Lo-Open Stock graph Highvalue
Low value Open value Not displayed on thegraph
Hi-Lo-Open-Close Stockgraph
Highvalue
Low value Open value Close value
▫ If you display the data labels for a stock graph, only a single value is displayed.You can select to display either the high, low, open, or close value as the datalabel for the stock graph. For Hi-Lo Stock graphs, you should select to displayeither the high or low data label, as open and close are not applicable. Similarly,for Hi-Lo-Open Stock graphs, you should only select to display either the high,low, or open data label, as close is not applicable.
▫ If you view a stock graph using MicroStrategy Web, all possible values for thegraph can be displayed using tooltips. For steps to create tooltips in a graph, seeCreating tooltips in a graph, page 397.
• If the open value tails of a Hi-Lo-Open-Close graph are not displayed when youcreate the graph in MicroStrategy, right-click the graph background and selectGraph Options. The Graph Preferences dialog box opens. Expand the Layoutcategory, then expandHi-Lo options, and then select the Show Open check box.You can also select the Show Close check box to display the close values on yourgraph.
The options to display open and close values are available through drop-downlists in MicroStrategy Web.
• For detailed information about the specific options for Stock graphs inMicroStrategy, see theMicroStrategy Developer help.
HistogramA Histogram is designed to group data frequencies in a Bar graph format. Histogramscapture how certain data falls within specific intervals, and are often represented as bellcurves. The intervals (for example, profit ranges of $200,000-$300,000) appear on oneaxis. The number of attribute elements (for example, the number of call centers) that fallwithin each interval are displayed on the other axis. Therefore, a Histogram graph canallow you to answer questions such as:
• How many call centers generated profits within the $200,000 to $300,000 range?
• In which profit range did the majority of the call centers’ profits exist?
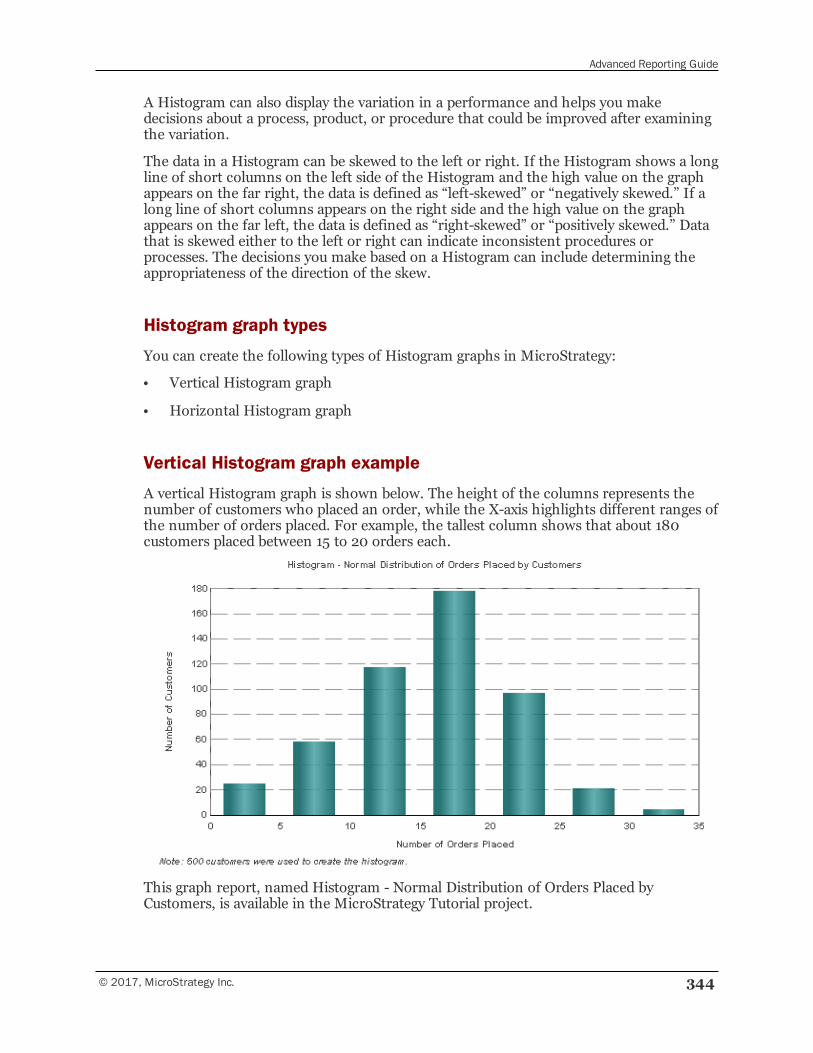
Advanced Reporting Guide
© 2017, MicroStrategy Inc. 344
A Histogram can also display the variation in a performance and helps you makedecisions about a process, product, or procedure that could be improved after examiningthe variation.
The data in a Histogram can be skewed to the left or right. If the Histogram shows a longline of short columns on the left side of the Histogram and the high value on the graphappears on the far right, the data is defined as “left-skewed” or “negatively skewed.” If along line of short columns appears on the right side and the high value on the graphappears on the far left, the data is defined as “right-skewed” or “positively skewed.” Datathat is skewed either to the left or right can indicate inconsistent procedures orprocesses. The decisions you make based on a Histogram can include determining theappropriateness of the direction of the skew.
Histogram graph types
You can create the following types of Histogram graphs in MicroStrategy:
• Vertical Histogram graph
• Horizontal Histogram graph
Vertical Histogram graph example
A vertical Histogram graph is shown below. The height of the columns represents thenumber of customers who placed an order, while the X-axis highlights different ranges ofthe number of orders placed. For example, the tallest column shows that about 180customers placed between 15 to 20 orders each.
This graph report, named Histogram - Normal Distribution of Orders Placed byCustomers, is available in the MicroStrategy Tutorial project.
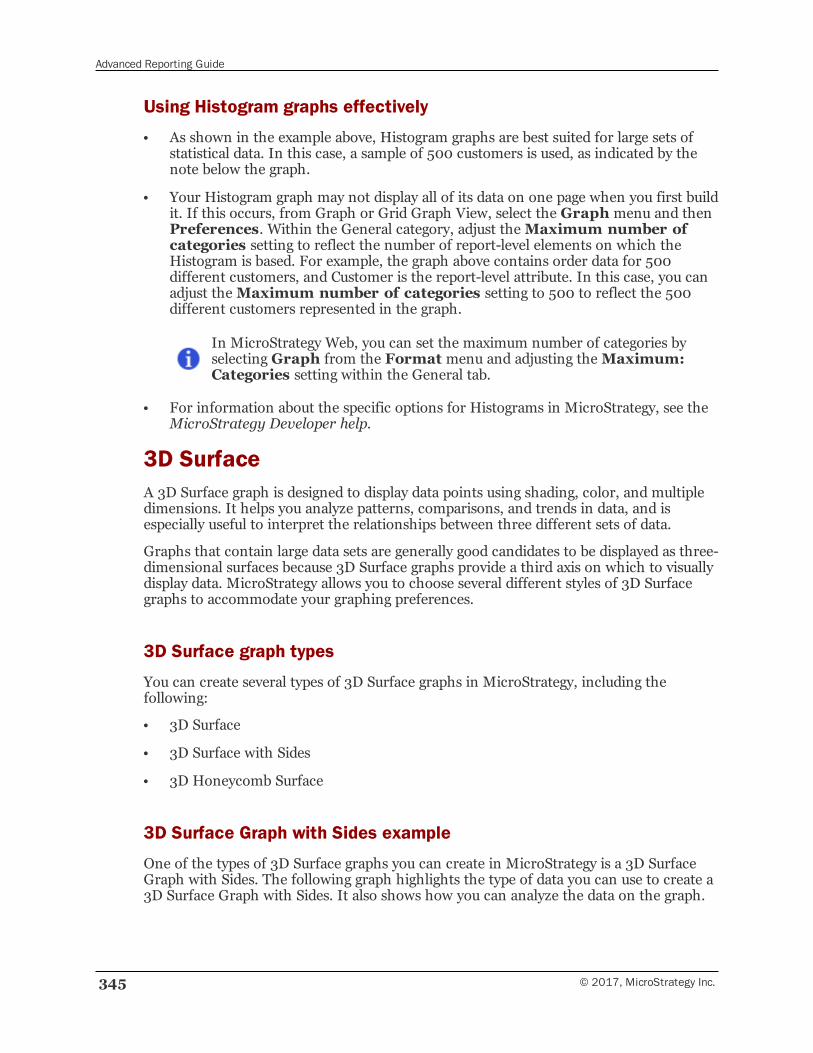
Advanced Reporting Guide
345 © 2017, MicroStrategy Inc.
Using Histogram graphs effectively
• As shown in the example above, Histogram graphs are best suited for large sets ofstatistical data. In this case, a sample of 500 customers is used, as indicated by thenote below the graph.
• Your Histogram graph may not display all of its data on one page when you first buildit. If this occurs, from Graph or Grid Graph View, select the Graph menu and thenPreferences. Within the General category, adjust theMaximum number ofcategories setting to reflect the number of report-level elements on which theHistogram is based. For example, the graph above contains order data for 500different customers, and Customer is the report-level attribute. In this case, you canadjust theMaximum number of categories setting to 500 to reflect the 500different customers represented in the graph.
In MicroStrategy Web, you can set the maximum number of categories byselectingGraph from the Format menu and adjusting theMaximum:Categories setting within the General tab.
• For information about the specific options for Histograms in MicroStrategy, see theMicroStrategy Developer help.
3D SurfaceA 3D Surface graph is designed to display data points using shading, color, and multipledimensions. It helps you analyze patterns, comparisons, and trends in data, and isespecially useful to interpret the relationships between three different sets of data.
Graphs that contain large data sets are generally good candidates to be displayed as three-dimensional surfaces because 3D Surface graphs provide a third axis on which to visuallydisplay data. MicroStrategy allows you to choose several different styles of 3D Surfacegraphs to accommodate your graphing preferences.
3D Surface graph types
You can create several types of 3D Surface graphs in MicroStrategy, including thefollowing:
• 3D Surface
• 3D Surface with Sides
• 3D Honeycomb Surface
3D Surface Graph with Sides example
One of the types of 3D Surface graphs you can create in MicroStrategy is a 3D SurfaceGraph with Sides. The following graph highlights the type of data you can use to create a3D Surface Graph with Sides. It also shows how you can analyze the data on the graph.
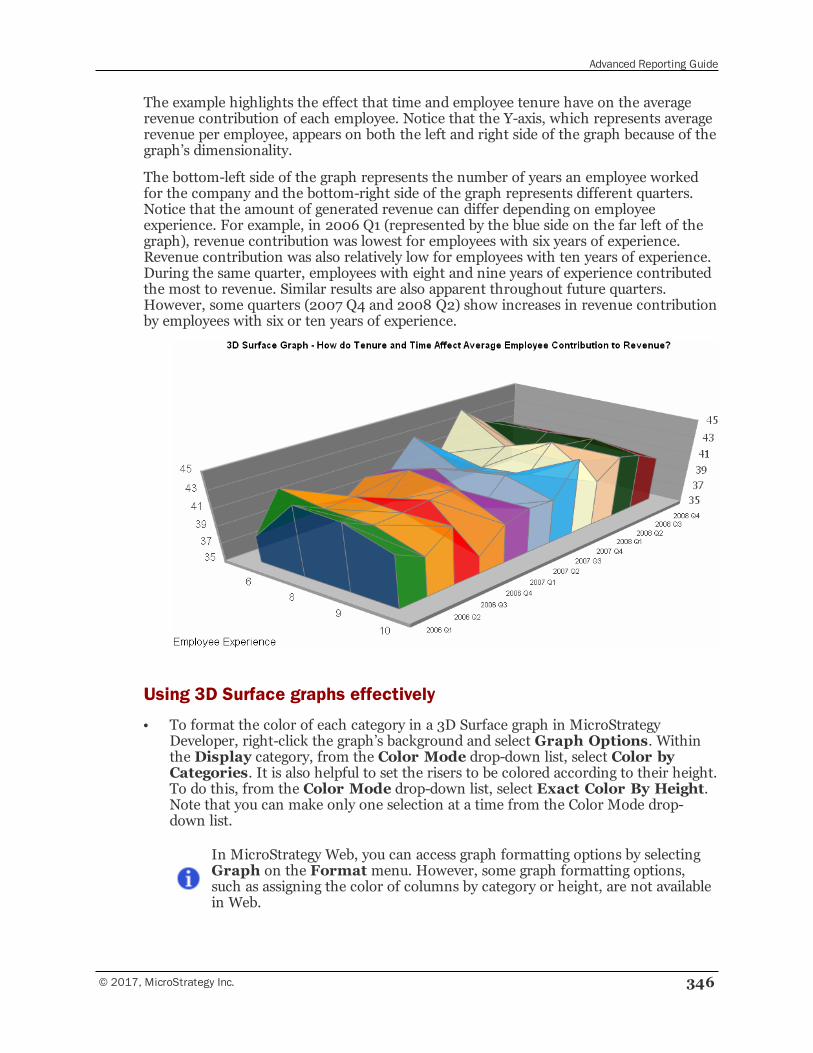
Advanced Reporting Guide
© 2017, MicroStrategy Inc. 346
The example highlights the effect that time and employee tenure have on the averagerevenue contribution of each employee. Notice that the Y-axis, which represents averagerevenue per employee, appears on both the left and right side of the graph because of thegraph’s dimensionality.
The bottom-left side of the graph represents the number of years an employee workedfor the company and the bottom-right side of the graph represents different quarters.Notice that the amount of generated revenue can differ depending on employeeexperience. For example, in 2006 Q1 (represented by the blue side on the far left of thegraph), revenue contribution was lowest for employees with six years of experience.Revenue contribution was also relatively low for employees with ten years of experience.During the same quarter, employees with eight and nine years of experience contributedthe most to revenue. Similar results are also apparent throughout future quarters.However, some quarters (2007 Q4 and 2008 Q2) show increases in revenue contributionby employees with six or ten years of experience.
Using 3D Surface graphs effectively
• To format the color of each category in a 3D Surface graph in MicroStrategyDeveloper, right-click the graph’s background and select Graph Options. Withinthe Display category, from the Color Mode drop-down list, select Color byCategories. It is also helpful to set the risers to be colored according to their height.To do this, from the Color Mode drop-down list, select Exact Color By Height.Note that you can make only one selection at a time from the Color Mode drop-down list.
In MicroStrategy Web, you can access graph formatting options by selectingGraph on the Format menu. However, some graph formatting options,such as assigning the color of columns by category or height, are not availablein Web.
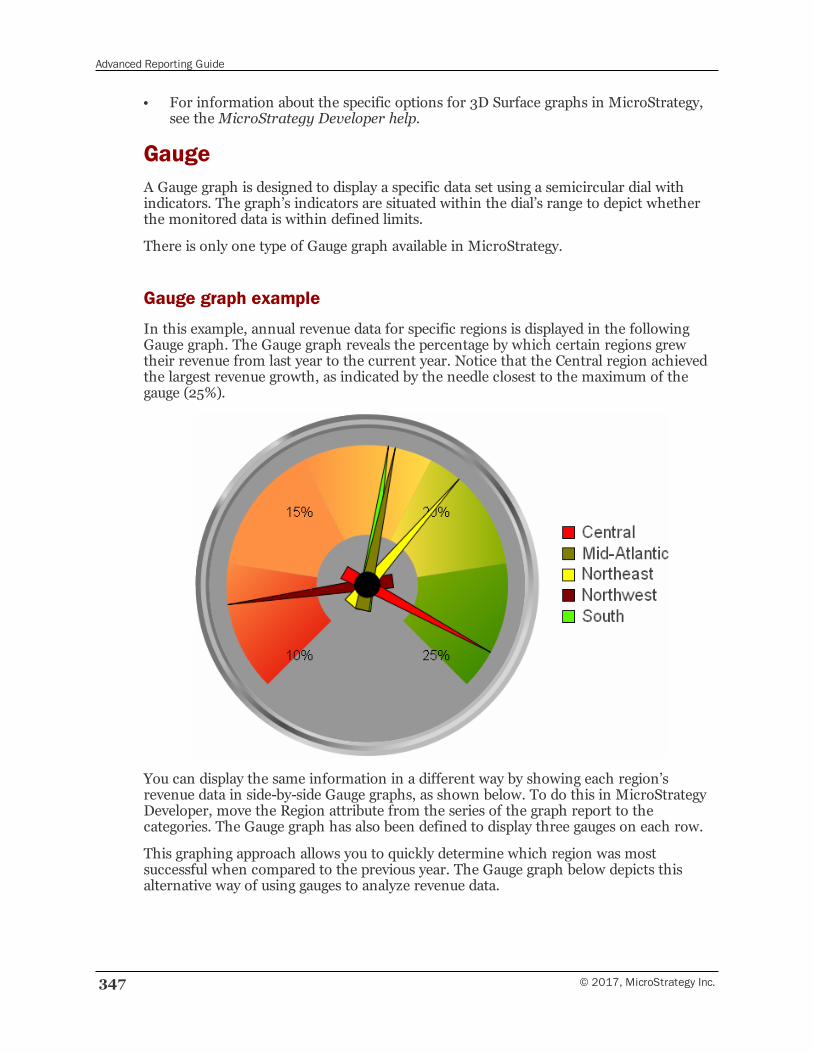
Advanced Reporting Guide
347 © 2017, MicroStrategy Inc.
• For information about the specific options for 3D Surface graphs in MicroStrategy,see theMicroStrategy Developer help.
GaugeA Gauge graph is designed to display a specific data set using a semicircular dial withindicators. The graph’s indicators are situated within the dial’s range to depict whetherthe monitored data is within defined limits.
There is only one type of Gauge graph available in MicroStrategy.
Gauge graph example
In this example, annual revenue data for specific regions is displayed in the followingGauge graph. The Gauge graph reveals the percentage by which certain regions grewtheir revenue from last year to the current year. Notice that the Central region achievedthe largest revenue growth, as indicated by the needle closest to the maximum of thegauge (25%).
You can display the same information in a different way by showing each region’srevenue data in side-by-side Gauge graphs, as shown below. To do this in MicroStrategyDeveloper, move the Region attribute from the series of the graph report to thecategories. The Gauge graph has also been defined to display three gauges on each row.
This graphing approach allows you to quickly determine which region was mostsuccessful when compared to the previous year. The Gauge graph below depicts thisalternative way of using gauges to analyze revenue data.
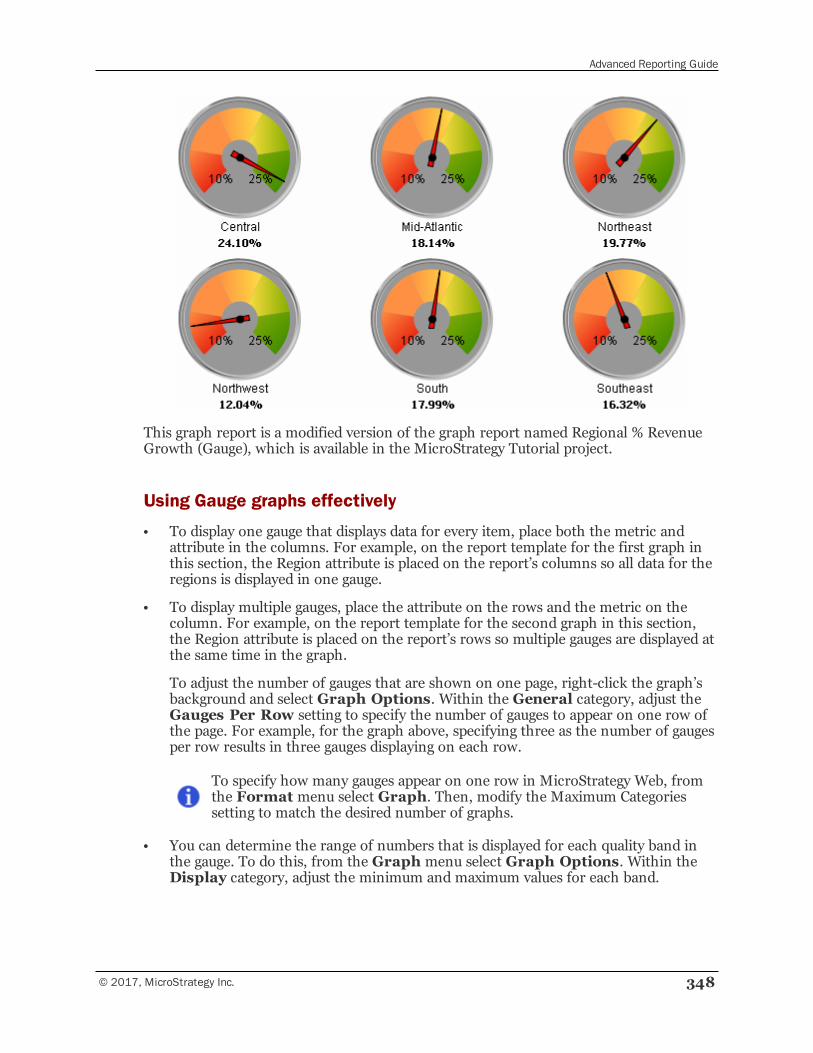
Advanced Reporting Guide
© 2017, MicroStrategy Inc. 348
This graph report is a modified version of the graph report named Regional % RevenueGrowth (Gauge), which is available in the MicroStrategy Tutorial project.
Using Gauge graphs effectively
• To display one gauge that displays data for every item, place both the metric andattribute in the columns. For example, on the report template for the first graph inthis section, the Region attribute is placed on the report’s columns so all data for theregions is displayed in one gauge.
• To display multiple gauges, place the attribute on the rows and the metric on thecolumn. For example, on the report template for the second graph in this section,the Region attribute is placed on the report’s rows so multiple gauges are displayed atthe same time in the graph.
To adjust the number of gauges that are shown on one page, right-click the graph’sbackground and select Graph Options. Within the General category, adjust theGauges Per Row setting to specify the number of gauges to appear on one row ofthe page. For example, for the graph above, specifying three as the number of gaugesper row results in three gauges displaying on each row.
To specify how many gauges appear on one row in MicroStrategy Web, fromthe Format menu select Graph. Then, modify the Maximum Categoriessetting to match the desired number of graphs.
• You can determine the range of numbers that is displayed for each quality band inthe gauge. To do this, from the Graph menu select Graph Options. Within theDisplay category, adjust the minimum and maximum values for each band.
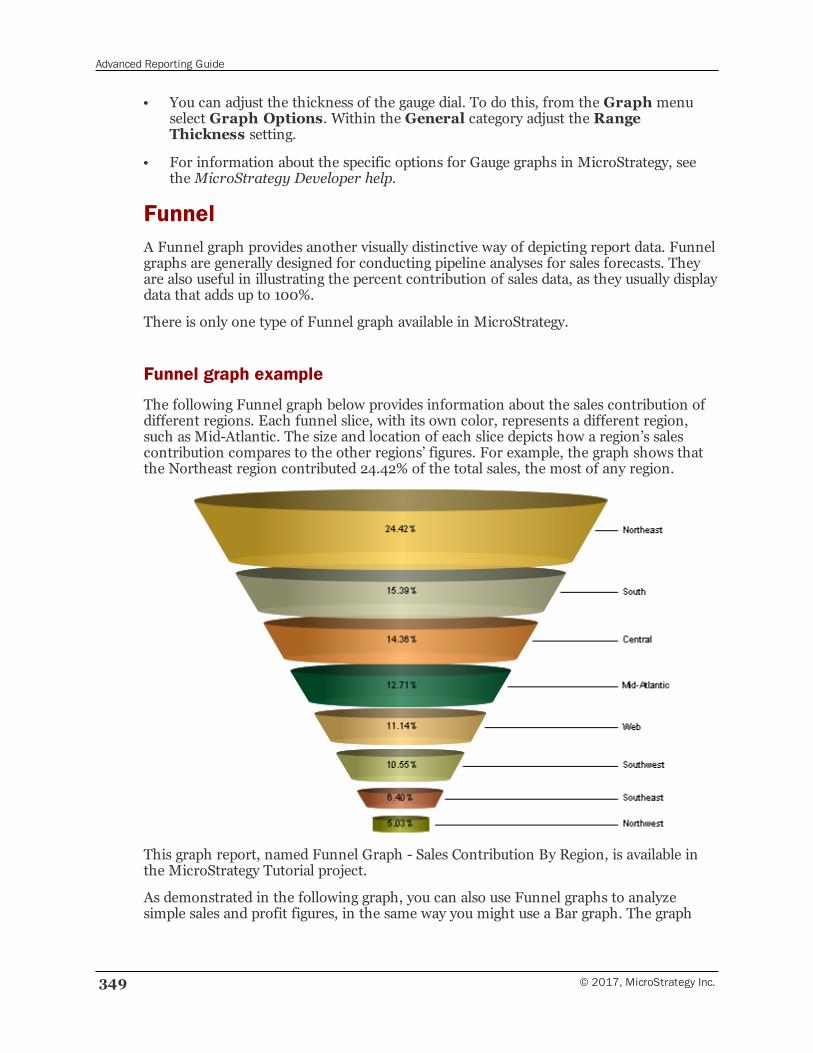
Advanced Reporting Guide
349 © 2017, MicroStrategy Inc.
• You can adjust the thickness of the gauge dial. To do this, from the Graph menuselect Graph Options. Within the General category adjust the RangeThickness setting.
• For information about the specific options for Gauge graphs in MicroStrategy, seetheMicroStrategy Developer help.
FunnelA Funnel graph provides another visually distinctive way of depicting report data. Funnelgraphs are generally designed for conducting pipeline analyses for sales forecasts. Theyare also useful in illustrating the percent contribution of sales data, as they usually displaydata that adds up to 100%.
There is only one type of Funnel graph available in MicroStrategy.
Funnel graph example
The following Funnel graph below provides information about the sales contribution ofdifferent regions. Each funnel slice, with its own color, represents a different region,such as Mid-Atlantic. The size and location of each slice depicts how a region’s salescontribution compares to the other regions’ figures. For example, the graph shows thatthe Northeast region contributed 24.42% of the total sales, the most of any region.
This graph report, named Funnel Graph - Sales Contribution By Region, is available inthe MicroStrategy Tutorial project.
As demonstrated in the following graph, you can also use Funnel graphs to analyzesimple sales and profit figures, in the same way you might use a Bar graph. The graph
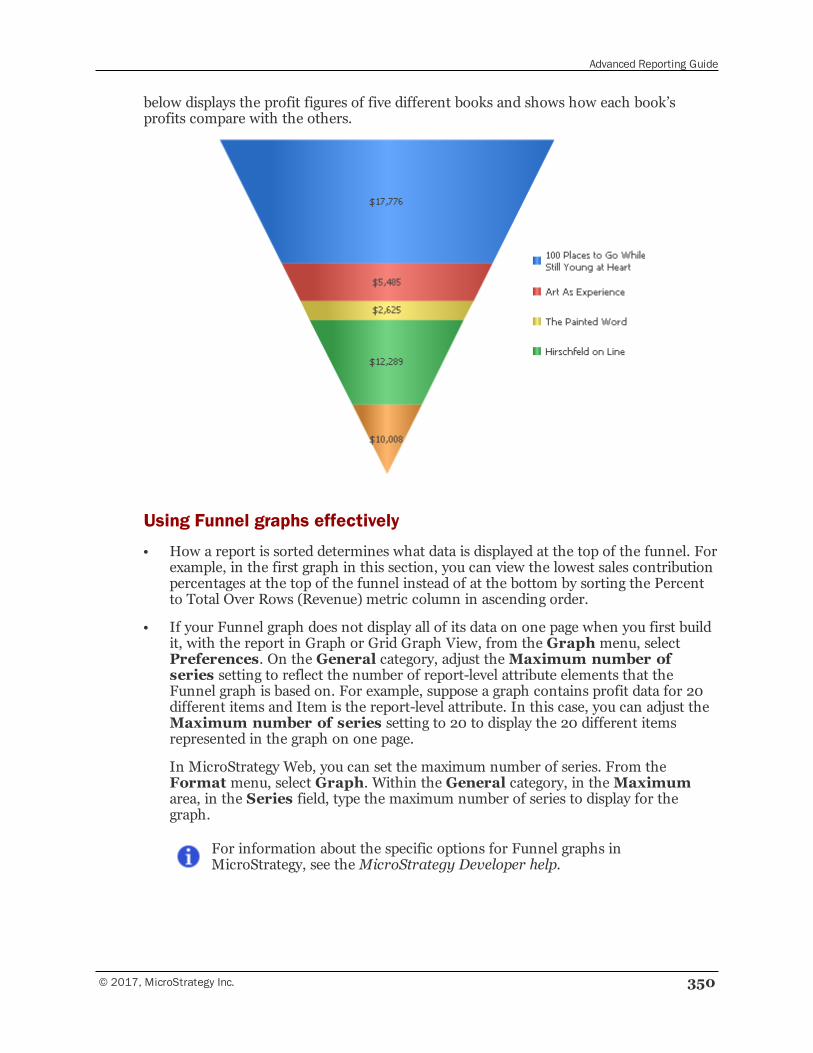
Advanced Reporting Guide
© 2017, MicroStrategy Inc. 350
below displays the profit figures of five different books and shows how each book’sprofits compare with the others.
Using Funnel graphs effectively
• How a report is sorted determines what data is displayed at the top of the funnel. Forexample, in the first graph in this section, you can view the lowest sales contributionpercentages at the top of the funnel instead of at the bottom by sorting the Percentto Total Over Rows (Revenue) metric column in ascending order.
• If your Funnel graph does not display all of its data on one page when you first buildit, with the report in Graph or Grid Graph View, from the Graph menu, selectPreferences. On the General category, adjust theMaximum number ofseries setting to reflect the number of report-level attribute elements that theFunnel graph is based on. For example, suppose a graph contains profit data for 20different items and Item is the report-level attribute. In this case, you can adjust theMaximum number of series setting to 20 to display the 20 different itemsrepresented in the graph on one page.
In MicroStrategy Web, you can set the maximum number of series. From theFormat menu, select Graph. Within the General category, in theMaximumarea, in the Series field, type the maximum number of series to display for thegraph.
For information about the specific options for Funnel graphs inMicroStrategy, see theMicroStrategy Developer help.
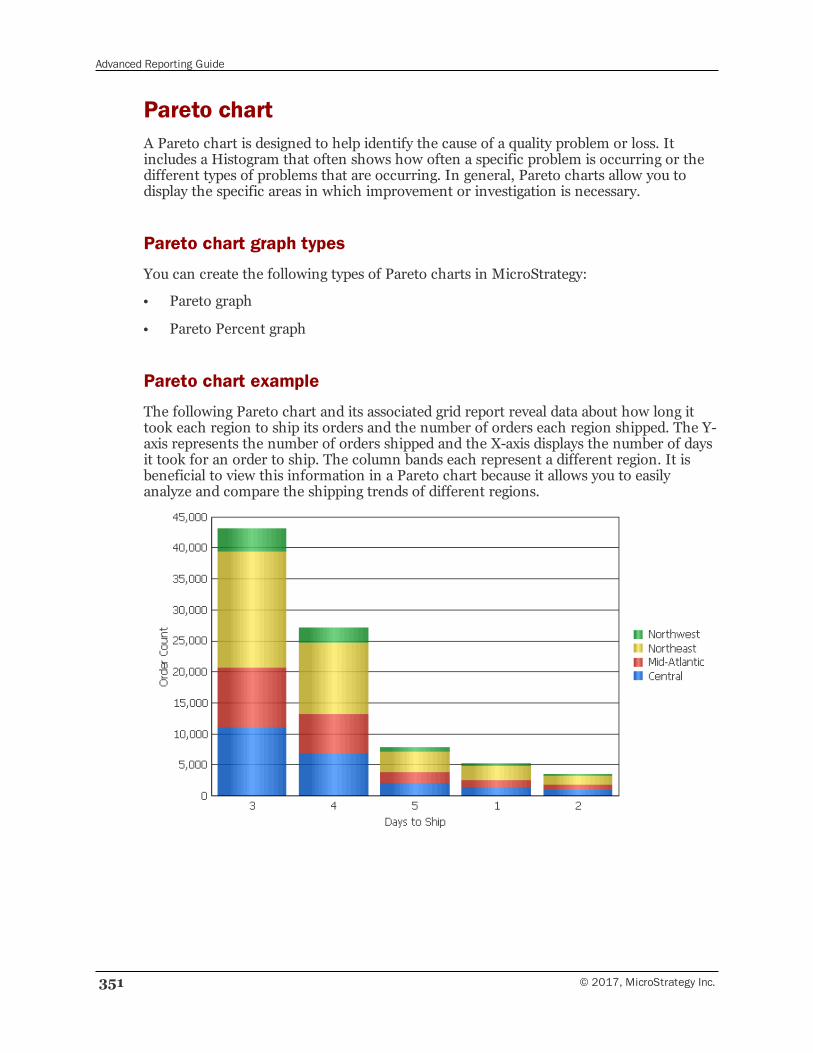
Advanced Reporting Guide
351 © 2017, MicroStrategy Inc.
Pareto chartA Pareto chart is designed to help identify the cause of a quality problem or loss. Itincludes a Histogram that often shows how often a specific problem is occurring or thedifferent types of problems that are occurring. In general, Pareto charts allow you todisplay the specific areas in which improvement or investigation is necessary.
Pareto chart graph types
You can create the following types of Pareto charts in MicroStrategy:
• Pareto graph
• Pareto Percent graph
Pareto chart example
The following Pareto chart and its associated grid report reveal data about how long ittook each region to ship its orders and the number of orders each region shipped. The Y-axis represents the number of orders shipped and the X-axis displays the number of daysit took for an order to ship. The column bands each represent a different region. It isbeneficial to view this information in a Pareto chart because it allows you to easilyanalyze and compare the shipping trends of different regions.
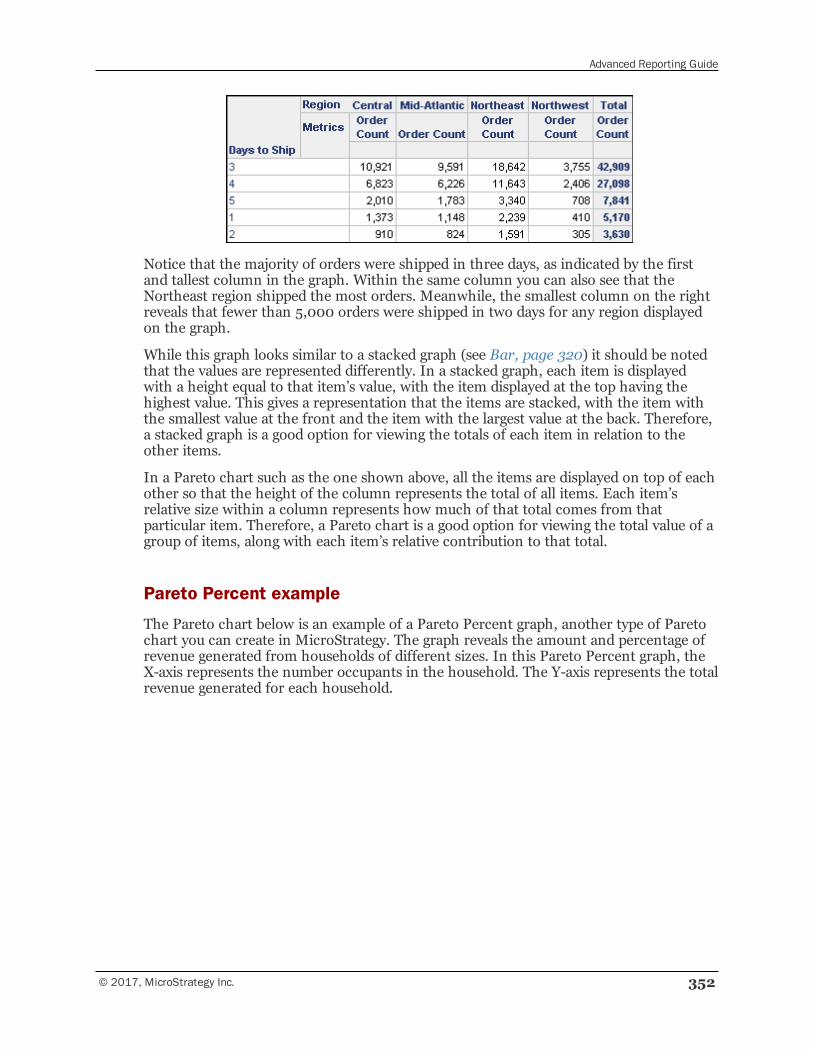
Advanced Reporting Guide
© 2017, MicroStrategy Inc. 352
Notice that the majority of orders were shipped in three days, as indicated by the firstand tallest column in the graph. Within the same column you can also see that theNortheast region shipped the most orders. Meanwhile, the smallest column on the rightreveals that fewer than 5,000 orders were shipped in two days for any region displayedon the graph.
While this graph looks similar to a stacked graph (see Bar, page 320) it should be notedthat the values are represented differently. In a stacked graph, each item is displayedwith a height equal to that item’s value, with the item displayed at the top having thehighest value. This gives a representation that the items are stacked, with the item withthe smallest value at the front and the item with the largest value at the back. Therefore,a stacked graph is a good option for viewing the totals of each item in relation to theother items.
In a Pareto chart such as the one shown above, all the items are displayed on top of eachother so that the height of the column represents the total of all items. Each item’srelative size within a column represents how much of that total comes from thatparticular item. Therefore, a Pareto chart is a good option for viewing the total value of agroup of items, along with each item’s relative contribution to that total.
Pareto Percent example
The Pareto chart below is an example of a Pareto Percent graph, another type of Paretochart you can create in MicroStrategy. The graph reveals the amount and percentage ofrevenue generated from households of different sizes. In this Pareto Percent graph, theX-axis represents the number occupants in the household. The Y-axis represents the totalrevenue generated for each household.
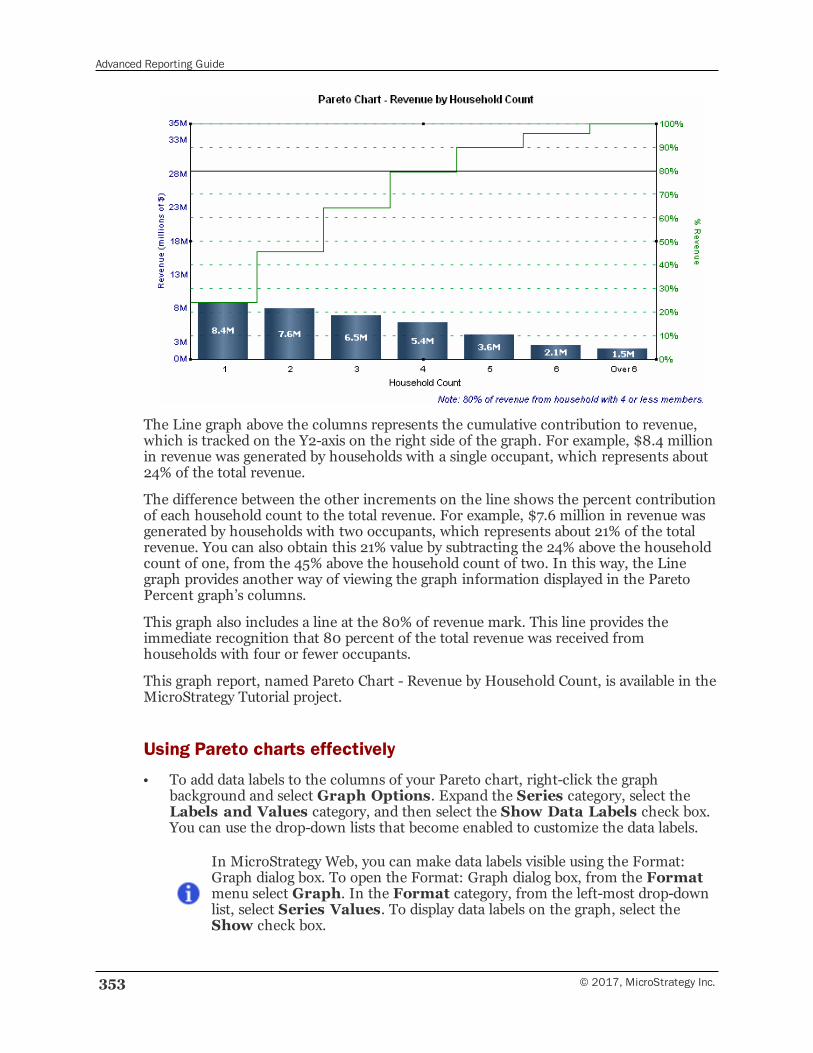
Advanced Reporting Guide
353 © 2017, MicroStrategy Inc.
The Line graph above the columns represents the cumulative contribution to revenue,which is tracked on the Y2-axis on the right side of the graph. For example, $8.4 millionin revenue was generated by households with a single occupant, which represents about24% of the total revenue.
The difference between the other increments on the line shows the percent contributionof each household count to the total revenue. For example, $7.6 million in revenue wasgenerated by households with two occupants, which represents about 21% of the totalrevenue. You can also obtain this 21% value by subtracting the 24% above the householdcount of one, from the 45% above the household count of two. In this way, the Linegraph provides another way of viewing the graph information displayed in the ParetoPercent graph’s columns.
This graph also includes a line at the 80% of revenue mark. This line provides theimmediate recognition that 80 percent of the total revenue was received fromhouseholds with four or fewer occupants.
This graph report, named Pareto Chart - Revenue by Household Count, is available in theMicroStrategy Tutorial project.
Using Pareto charts effectively
• To add data labels to the columns of your Pareto chart, right-click the graphbackground and select Graph Options. Expand the Series category, select theLabels and Values category, and then select the Show Data Labels check box.You can use the drop-down lists that become enabled to customize the data labels.
In MicroStrategy Web, you can make data labels visible using the Format:Graph dialog box. To open the Format: Graph dialog box, from the Formatmenu select Graph. In the Format category, from the left-most drop-downlist, select Series Values. To display data labels on the graph, select theShow check box.
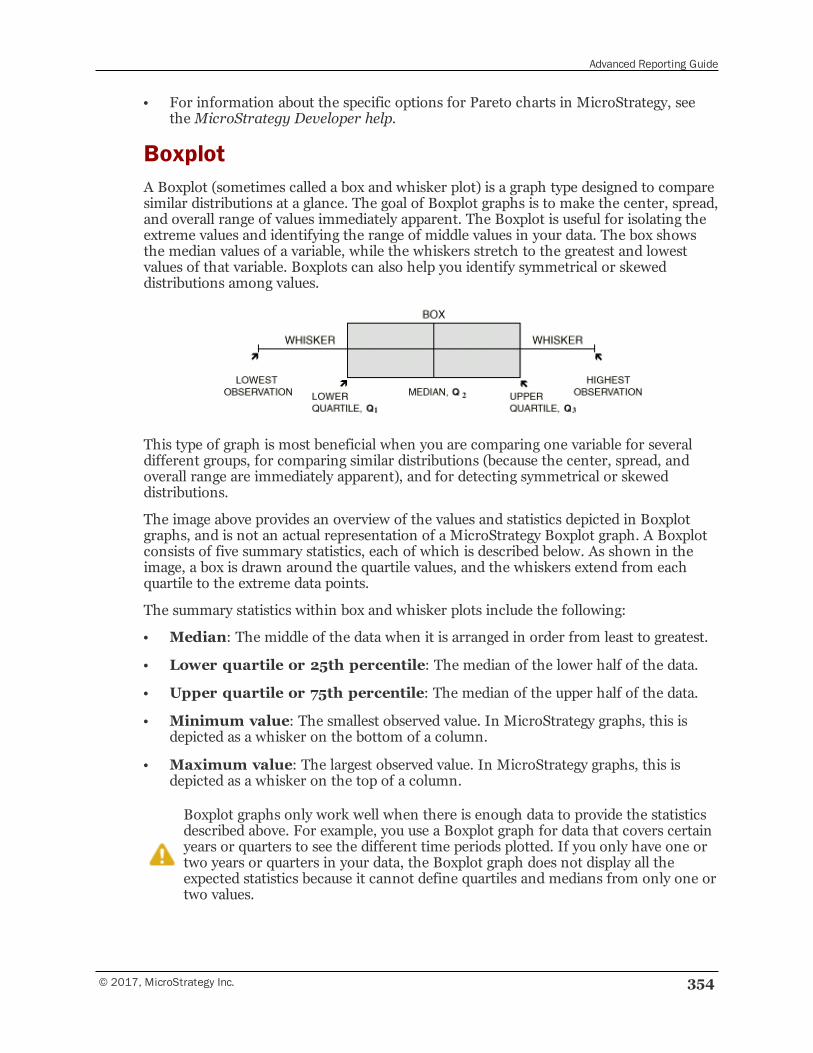
Advanced Reporting Guide
© 2017, MicroStrategy Inc. 354
• For information about the specific options for Pareto charts in MicroStrategy, seetheMicroStrategy Developer help.
BoxplotA Boxplot (sometimes called a box and whisker plot) is a graph type designed to comparesimilar distributions at a glance. The goal of Boxplot graphs is to make the center, spread,and overall range of values immediately apparent. The Boxplot is useful for isolating theextreme values and identifying the range of middle values in your data. The box showsthe median values of a variable, while the whiskers stretch to the greatest and lowestvalues of that variable. Boxplots can also help you identify symmetrical or skeweddistributions among values.
This type of graph is most beneficial when you are comparing one variable for severaldifferent groups, for comparing similar distributions (because the center, spread, andoverall range are immediately apparent), and for detecting symmetrical or skeweddistributions.
The image above provides an overview of the values and statistics depicted in Boxplotgraphs, and is not an actual representation of a MicroStrategy Boxplot graph. A Boxplotconsists of five summary statistics, each of which is described below. As shown in theimage, a box is drawn around the quartile values, and the whiskers extend from eachquartile to the extreme data points.
The summary statistics within box and whisker plots include the following:
• Median: The middle of the data when it is arranged in order from least to greatest.
• Lower quartile or 25th percentile: The median of the lower half of the data.
• Upper quartile or 75th percentile: The median of the upper half of the data.
• Minimum value: The smallest observed value. In MicroStrategy graphs, this isdepicted as a whisker on the bottom of a column.
• Maximum value: The largest observed value. In MicroStrategy graphs, this isdepicted as a whisker on the top of a column.
Boxplot graphs only work well when there is enough data to provide the statisticsdescribed above. For example, you use a Boxplot graph for data that covers certainyears or quarters to see the different time periods plotted. If you only have one ortwo years or quarters in your data, the Boxplot graph does not display all theexpected statistics because it cannot define quartiles and medians from only one ortwo values.
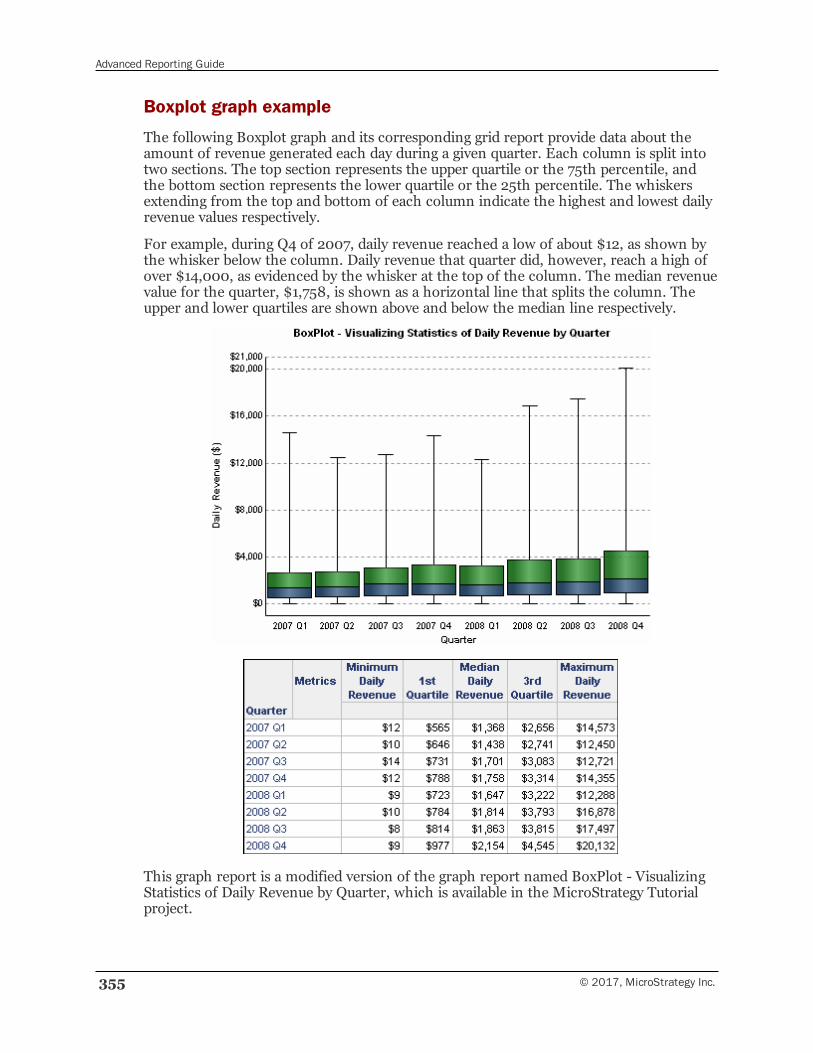
Advanced Reporting Guide
355 © 2017, MicroStrategy Inc.
Boxplot graph example
The following Boxplot graph and its corresponding grid report provide data about theamount of revenue generated each day during a given quarter. Each column is split intotwo sections. The top section represents the upper quartile or the 75th percentile, andthe bottom section represents the lower quartile or the 25th percentile. The whiskersextending from the top and bottom of each column indicate the highest and lowest dailyrevenue values respectively.
For example, during Q4 of 2007, daily revenue reached a low of about $12, as shown bythe whisker below the column. Daily revenue that quarter did, however, reach a high ofover $14,000, as evidenced by the whisker at the top of the column. The median revenuevalue for the quarter, $1,758, is shown as a horizontal line that splits the column. Theupper and lower quartiles are shown above and below the median line respectively.
This graph report is a modified version of the graph report named BoxPlot - VisualizingStatistics of Daily Revenue by Quarter, which is available in the MicroStrategy Tutorialproject.
Advanced Reporting Guide
© 2017, MicroStrategy Inc. 356
Using Boxplot graphs effectively
• When you create a Boxplot graph you must include the correct number of metricsfor the graph to resemble the example above. To view the quartile sections andmedian line within the graph columns, as well as the high-low whiskers, five metricsmust appear on your report template in the following order:
▫ Minimum value metric (for example, the Minimum Daily Revenue metric in thegraph above).
▫ Low value metric (for example, the 1st Quartile metric).
▫ Base or median value metric (for example, the Median Daily Revenue metric).
▫ High value metric (for example, the 3rd Quartile metric).
▫ Maximum value metric (for example, the Maximum Daily Revenue metric).
• For details about building the types of metrics used in the graph above, open theBoxplot graph in the Graph Styles folder in MicroStrategy Tutorial and view eachmetric’s definition.
• For information about the specific options for Boxplot graphs in MicroStrategy, seetheMicroStrategy Developer help.
Gantt chartGantt chart (also referred to as project time lines) are Bar graphs that help plan andmonitor project development or resource allocation on a horizontal time scale.
A Gantt chart is essentially a horizontal bar chart. Attributes are displayed along the X-axis and metrics are displayed along the Y-axis. The Gantt chart provides a graphicalillustration of a schedule that can help you plan, coordinate, and track specific tasks in aproject. The data analyzed in a Gantt chart has a defined starting and ending value; forexample, Project A begins 4/15/09 and lasts for a total of 40 days. The start time andduration are what allows you to display information as a Gantt chart.
Gantt chart example
Gantt charts are useful when analyzing human resources information. For example, thefollowing Gantt chart depicts how long certain employees have been working for acompany. The beginning of each horizontal bar represents a specific employee’s hire dateand the end of each bar represents the time at which an employee left the company. Theoverlap of the bars helps to visualize the workforce in the company during variousperiods of time. The report shown below displays the employee tenure for a subset ofemployees in a company.
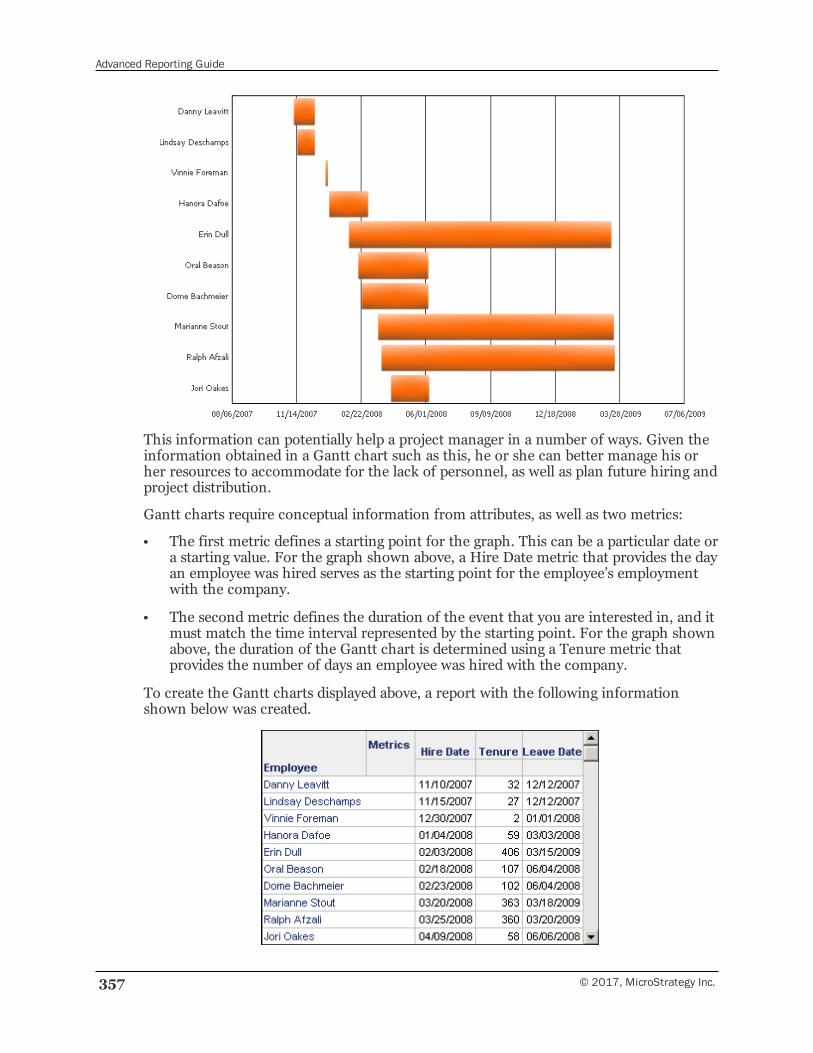
Advanced Reporting Guide
357 © 2017, MicroStrategy Inc.
This information can potentially help a project manager in a number of ways. Given theinformation obtained in a Gantt chart such as this, he or she can better manage his orher resources to accommodate for the lack of personnel, as well as plan future hiring andproject distribution.
Gantt charts require conceptual information from attributes, as well as two metrics:
• The first metric defines a starting point for the graph. This can be a particular date ora starting value. For the graph shown above, a Hire Date metric that provides the dayan employee was hired serves as the starting point for the employee’s employmentwith the company.
• The second metric defines the duration of the event that you are interested in, and itmust match the time interval represented by the starting point. For the graph shownabove, the duration of the Gantt chart is determined using a Tenure metric thatprovides the number of days an employee was hired with the company.
To create the Gantt charts displayed above, a report with the following informationshown below was created.
Advanced Reporting Guide
© 2017, MicroStrategy Inc. 358
The Hire Date metric defines the starting point for each bar in the Gantt chart. TheTenure metric defines the end point for each bar in the Gantt chart. This metric iscalculated by determining the number of days between the Hire Date and the LeaveDate. While the Leave Date metric is not part of the display of the Gantt chart, it isshown here to help understand how the data for the Gantt chart was created.
Listed below is some additional information that you can use to re-create the Gantt chartshown above, or to create a similar Gantt chart using your data:
• This Gantt chart was created using the Human Resources Analysis Module, which isa part of the MicroStrategy Analytics Modules.
• The metrics Hire Date and Leave Date were created using the Hire Date and LeaveDate facts, respectively. These facts use data that is provided in a date format, anddisplayed in mm/dd/yyyy format.
• The Tenure metric was created as a compound metric with the formula ([LeaveDate] - [Hire Date]). This metric returns integer values for the number ofdays that an employee was with the company.
• When date data is initially displayed on a graph, it may not be displayed in a dateformat by default. To display the time intervals correctly on the axis, you mustmodify the number formatting of the axis labels with a date format that matchesyour date data. For information on defining the number formatting for graphs, seeFormatting numeric values on a graph, page 387.
• The minimum value for the graph axis that displays time intervals was increased. Thedefault minimum value for a graph axis is zero, but since dates are considered asnumbers when creating the graph, this minimum must be increased to improve thedisplay of the graph. To determine the numeric values associated with the timeintervals on the axis, you can modify the number formatting of the axis labels to usethe general number format. Once you determine the numeric value, you can define arelevant minimum value for the graph axis, and then switch the axis labels back tothe proper date format for the date data. For information on defining the minimumor maximum value of a graph, see Adjusting the layout, size, and scale of a graph,page 400.
Using Gantt charts effectively
When you create a Gantt chart, consider the following:
• At least two metrics must be displayed in the columns:
▫ One metric serves as the starting data point.
▫ One metric serves as the length, or duration, from the starting point.
If you use two metrics that both return dates such as a start date and an enddate, the Gantt chart is not displayed correctly.
• A pair of metrics defines start and length values which are translated as a horizontalbar in the graph. These metrics must use the same time interval to accurately displaydata on a Gantt chart. For example, if your starting point is a specific day such as07/25/2010, the duration must be provided in terms of days. Therefore, a project
Advanced Reporting Guide
359 © 2017, MicroStrategy Inc.
that started on 07/25/2010 and ends on 07/31/2010 must have its duration providedas seven days. If, however, project start and end dates are based on a quarterlyschedule (for example, starting in quarter one of 2009 and ending in quarter one of2010) the duration must be provided as the number of quarters that the project wasactive for.
• Multiple metric pairs can be added to the columns to represent more start-lengthpairs. If you add an odd number of metrics to the report, the last metric on thereport is not displayed on the graph.
• If you use dates to define the time period for the Gantt chart, you may need tochange the minimum value of the graph’s axis to better display data. For informationon defining the minimum or maximum value of a graph, see Adjusting the layout,size, and scale of a graph, page 400.
• For information about the specific options for Gantt charts in MicroStrategy, see theMicroStrategy Developer help.
Formatting a graph reportFormatting a graph report enables you to specify font, line, and fill characteristics fortext, lines, and areas in a graph. This allows you to highlight important information, andto make your graph reports easier to read and understand.
You can format several objects within your graph, including the following:
• Title
• Legend
• Subtitle
• Footnote
• Background
• Frame
• X-axis Label
• Y1-axis Label
• Y2-axis Label
You can format the above graph elements by using the Formatting option in the Graphmenu in Grid Graph or Graph View.
The Title, Subtitle, Footnote, X-axis Label, Y1-axis Label, and Y2-axis Label optionsare enabled only if the option is used in the graph. For example, you can select theoption Title only if the graph includes a title.
You can format the following elements of a graph by selecting an item on the graph,right-clicking it, and then choosing Format <object name> from the right-clickmenu:
Advanced Reporting Guide
© 2017, MicroStrategy Inc. 360
• Labels
• Headers
• Risers (bar, area, and so on)
• Pie slices
• 3D objects
Controlling how a graph report appearsReport designers can control the look of a graph report at any time, even after it hasbeen analyzed and potentially reformatted by users.
When thinking about how to format a graph report, you must first consider the variouslayers of formatting that exist within the report. Each report in MicroStrategy containsseveral layers of formatting, including the formatting of metrics on the grid report, axes,subtotals, column banding, thresholds, and more. Report formatting is contained inthese different layers, allowing you to control different aspects of a graph’s formattingand ensure that the important information is still emphasized. For example, as explainedin Formatting numeric values on a graph, page 387, a metric’s formatting in a gridreport plays a role in how the metric is formatted in a graph. The metric’s formatting isone report formatting layer you can modify as you consider different ways to format yourgraph.
For specific details about the report formatting layers, see Understanding howformatting impacts report display, page 265.
Formatting a graph using colors, shading, and effectsYou can change the colors and overall look and feel of specific objects, such as series, onyour graph. For example, you can format individual bars in your Bar graph or pie slices inyour Pie chart using thresholds, as described in Displaying thresholds on graph reports,page 369. The graph legend or axes can be formatted as well.
You can format a graph report by adjusting colors, and applying a variety of graphicaleffects, including gradients, transparency, patterns, pictures, textures, and bevel effects.You can also apply a set of color and shading schemes to all the objects on a graphreport.
Formatting colors, shading, and effects in MicroStrategy Developer
You can change the colors, shading, and other effects on your graph report in a numberof ways. For example, you can do the following:
• Select a color/shading scheme from the Color Styles drop-down menu on theGraph toolbar. When you select a color/shading scheme for a graph report, thecolors of the graph are changed, and shading and other effects are applied as well.For these steps, follow the procedure To change the colors, shading, and othereffects on a graph report in MicroStrategy Developer, page 361 below.
Advanced Reporting Guide
361 © 2017, MicroStrategy Inc.
• Select from several color palettes in the Color Palette drop-down menu on theGraph toolbar. When you select a color palette for a graph report, the colors of thegraph are changed, but shading and other effects are not applied. For these steps,follow the procedure To change only the colors of a graph report in MicroStrategyDeveloper, page 361 below.
• Manually format the color of individual objects and apply effects such as gradients tothem. For example, you can adjust the color of and apply a texture to the bars of aBar graph. For more information, seeManually formatting graph series andobjects, page 372.
• Define metric-specific graph colors that are used when a metric is displayed as aseries in a graph. Metric-specific graph colors override any colors defined by thecolor palettes and color styles selected for the graph, as well as any manual colorformatting selected for the series of the graph. For steps to define metric-specificgraph colors, see Defining a graph color for metrics in MicroStrategy Developer,page 362.
• Define graph colors for individual graph elements such as bars in your Bar graph orpie slices in your Pie chart using thresholds, as described in Displaying thresholds ongraph reports, page 369.
The procedure below provides steps to change the colors, but not the shading and othereffects, on your graph report.
To change only the colors of a graph report in MicroStrategyDeveloper
1 View a report in Graph or Grid Graph View. To do so, from the View menu, selectGraph View or Grid Graph View.
2 On the Graph toolbar, click the arrow next to the Color Palettes icon. A list
of available color palettes is displayed.
If the Graph toolbar is not displayed, from the View menu, select Toolbars,then Graph.
3 Select a color palette to apply its color scheme to the graph report. The graph reportis updated with the new colors.
The steps below show you how to change colors, shading, and other effects on yourgraph report.
To change the colors, shading, and other effects on a graph report inMicroStrategy Developer
1 View a report in Graph or Grid Graph View. To do so, from the View menu, selectGraph View or Grid Graph View.
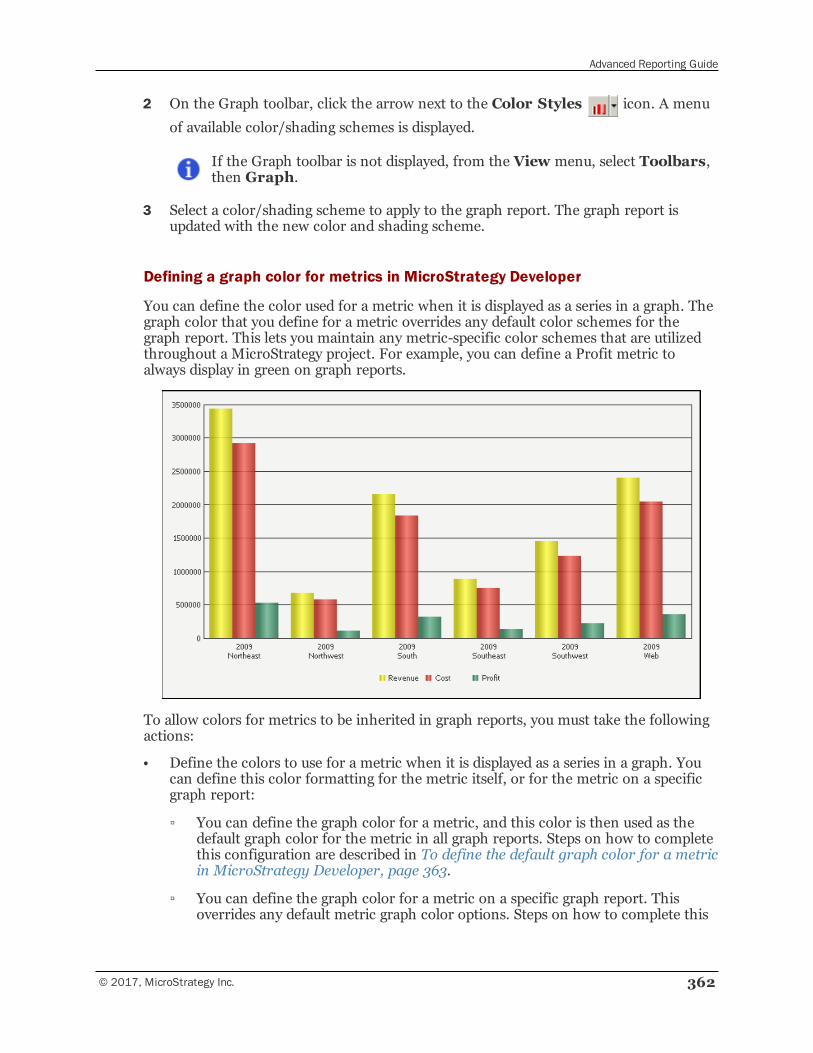
Advanced Reporting Guide
© 2017, MicroStrategy Inc. 362
2 On the Graph toolbar, click the arrow next to the Color Styles icon. A menu
of available color/shading schemes is displayed.
If the Graph toolbar is not displayed, from the View menu, select Toolbars,then Graph.
3 Select a color/shading scheme to apply to the graph report. The graph report isupdated with the new color and shading scheme.
Defining a graph color for metrics in MicroStrategy Developer
You can define the color used for a metric when it is displayed as a series in a graph. Thegraph color that you define for a metric overrides any default color schemes for thegraph report. This lets you maintain any metric-specific color schemes that are utilizedthroughout a MicroStrategy project. For example, you can define a Profit metric toalways display in green on graph reports.
To allow colors for metrics to be inherited in graph reports, you must take the followingactions:
• Define the colors to use for a metric when it is displayed as a series in a graph. Youcan define this color formatting for the metric itself, or for the metric on a specificgraph report:
▫ You can define the graph color for a metric, and this color is then used as thedefault graph color for the metric in all graph reports. Steps on how to completethis configuration are described in To define the default graph color for a metricin MicroStrategy Developer, page 363.
▫ You can define the graph color for a metric on a specific graph report. Thisoverrides any default metric graph color options. Steps on how to complete this
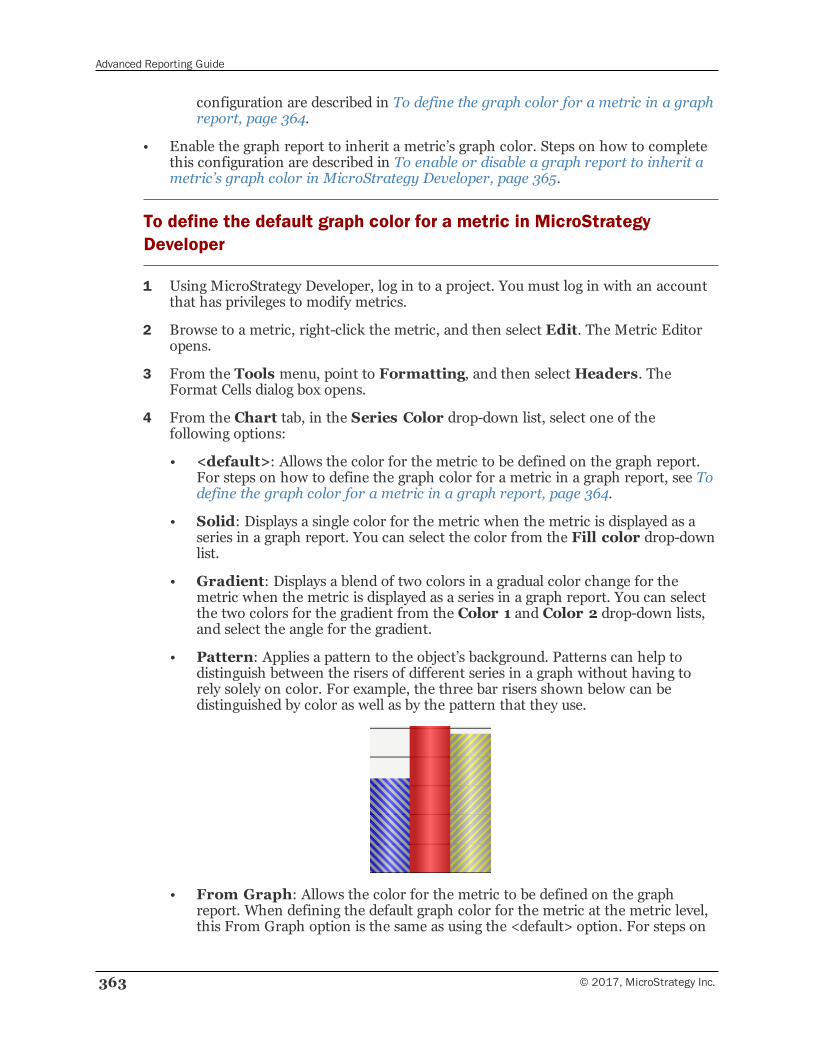
Advanced Reporting Guide
363 © 2017, MicroStrategy Inc.
configuration are described in To define the graph color for a metric in a graphreport, page 364.
• Enable the graph report to inherit a metric’s graph color. Steps on how to completethis configuration are described in To enable or disable a graph report to inherit ametric’s graph color in MicroStrategy Developer, page 365.
To define the default graph color for a metric in MicroStrategyDeveloper
1 Using MicroStrategy Developer, log in to a project. You must log in with an accountthat has privileges to modify metrics.
2 Browse to a metric, right-click the metric, and then select Edit. The Metric Editoropens.
3 From the Tools menu, point to Formatting, and then selectHeaders. TheFormat Cells dialog box opens.
4 From the Chart tab, in the Series Color drop-down list, select one of thefollowing options:
• <default>: Allows the color for the metric to be defined on the graph report.For steps on how to define the graph color for a metric in a graph report, see Todefine the graph color for a metric in a graph report, page 364.
• Solid: Displays a single color for the metric when the metric is displayed as aseries in a graph report. You can select the color from the Fill color drop-downlist.
• Gradient: Displays a blend of two colors in a gradual color change for themetric when the metric is displayed as a series in a graph report. You can selectthe two colors for the gradient from the Color 1 and Color 2 drop-down lists,and select the angle for the gradient.
• Pattern: Applies a pattern to the object’s background. Patterns can help todistinguish between the risers of different series in a graph without having torely solely on color. For example, the three bar risers shown below can bedistinguished by color as well as by the pattern that they use.
• From Graph: Allows the color for the metric to be defined on the graphreport. When defining the default graph color for the metric at the metric level,this From Graph option is the same as using the <default> option. For steps on
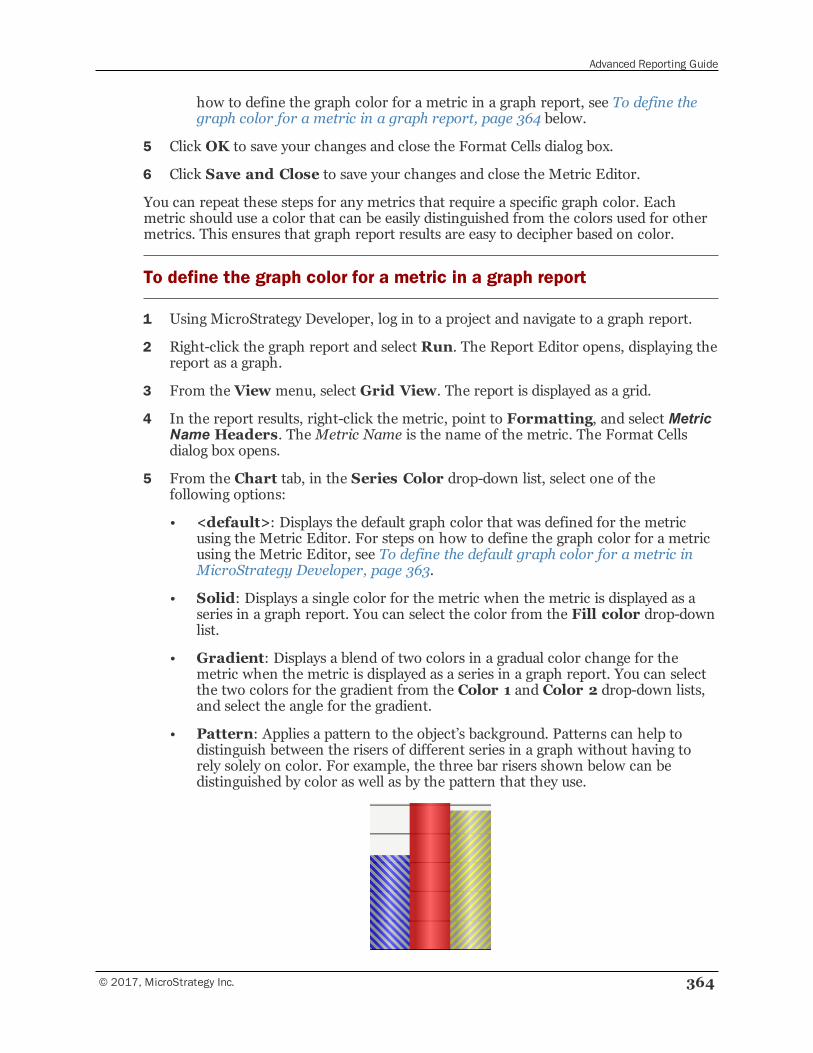
Advanced Reporting Guide
© 2017, MicroStrategy Inc. 364
how to define the graph color for a metric in a graph report, see To define thegraph color for a metric in a graph report, page 364 below.
5 Click OK to save your changes and close the Format Cells dialog box.
6 Click Save and Close to save your changes and close the Metric Editor.
You can repeat these steps for any metrics that require a specific graph color. Eachmetric should use a color that can be easily distinguished from the colors used for othermetrics. This ensures that graph report results are easy to decipher based on color.
To define the graph color for a metric in a graph report
1 Using MicroStrategy Developer, log in to a project and navigate to a graph report.
2 Right-click the graph report and select Run. The Report Editor opens, displaying thereport as a graph.
3 From the View menu, select Grid View. The report is displayed as a grid.
4 In the report results, right-click the metric, point to Formatting, and select MetricName Headers. TheMetric Name is the name of the metric. The Format Cellsdialog box opens.
5 From the Chart tab, in the Series Color drop-down list, select one of thefollowing options:
• <default>: Displays the default graph color that was defined for the metricusing the Metric Editor. For steps on how to define the graph color for a metricusing the Metric Editor, see To define the default graph color for a metric inMicroStrategy Developer, page 363.
• Solid: Displays a single color for the metric when the metric is displayed as aseries in a graph report. You can select the color from the Fill color drop-downlist.
• Gradient: Displays a blend of two colors in a gradual color change for themetric when the metric is displayed as a series in a graph report. You can selectthe two colors for the gradient from the Color 1 and Color 2 drop-down lists,and select the angle for the gradient.
• Pattern: Applies a pattern to the object’s background. Patterns can help todistinguish between the risers of different series in a graph without having torely solely on color. For example, the three bar risers shown below can bedistinguished by color as well as by the pattern that they use.
Advanced Reporting Guide
365 © 2017, MicroStrategy Inc.
• From Graph: Displays the color defined by the graph’s default color scheme.Manually selecting this option overrides any default metric graph color optionsdefined using the Metric Editor.
6 Click OK to save your changes and close the Format Cells dialog box.
7 From the View menu, select Graph View to display the report results as a graph.
You can repeat these steps for any metrics on the report that require a specific graphcolor. Each metric should use a color that can be easily distinguished from the colorsused for other metrics. This ensures that graph report results are easy to decipher basedon color.
To enable or disable a graph report to inherit a metric’s graph color inMicroStrategy Developer
Inheriting metric graph color is enabled by default. The steps below show you how toensure that metric graph colors are inherited, as well as how to disable this formatting.
1 Using MicroStrategy Developer, log in to a project and navigate to a graph report.
2 Right-click the graph report and select Run. The Report Editor opens, displaying thereport as a graph.
3 From the Graph menu, select Preferences. The Preferences dialog box opens withthe Options - General page displayed.
4 By default, all metric-specific graph colors are inherited. To disable this inheritanceand apply the graph color scheme to all metrics, in the Other area, clear the Applymetric formatting when available check box.
5 Click OK to save your changes and return to the graph report.
Formatting the Y-axis: Graph series in MicroStrategy Web
The procedure below describes how to format a graph in MicroStrategy Web using theFormat: Graph dialog box, because this dialog box contains all formatting options for agraph. As an alternative, you can quickly format a graph by right-clicking the graphcomponent and selecting a formatting option. You can also format the graph using theFormatting toolbar, which is available from the View menu.
Prerequisites
• You must have the necessary Web Professional privileges to format graph series.
To format the series of a graph in MicroStrategy Web
1 Run a report and display it in either Graph View or Grid and Graph View.
2 From theHomemenu, select Graph.
3 Right-click the graph and select Format. The Format: Graph dialog box opens.
Advanced Reporting Guide
© 2017, MicroStrategy Inc. 366
• If DHTML is disabled, click Go. The Format: Graph panel is displayed.
4 Select the Format tab.
• If DHTML is disabled, select the Format link.
5 From the left-most drop-down list at the top, select Series Shapes. From the nextdrop-down list, select the specific series to format. In a bar graph, you can select BarRiser for [name of attribute/metric combination]. For example, this may bedisplayed as Bar Riser for Electronics Revenue.
In MicroStrategy Developer, you can choose to format a metric displayed as aseries in a graph, to always display as a specific color. For example, you candefine a Profit metric to always display in green on graph reports. Thisformatting overrides the formatting options you can select in the Series Colorsoptions. For steps to assign a specific color to a metric, see Defining a graphcolor for metrics in MicroStrategy Developer, page 362.
• If DHTML is disabled: From the drop-down list, under Series Shapes, selectthe specific series to format. In a bar graph, you can select Bar Riser for[name of attribute/metric combination]. For example, this may bedisplayed as Bar Riser for Electronics Revenue. Click the check mark.
6 To apply a background color, from the Fill Color drop-down list, select thebackground color for the graph series.
7 You can apply any of the following effects to the shape of the series:
If DHTML is disabled, you cannot create custom colors. You also cannot applygradients, transparency effects, or bevel effects.
• Apply a color gradient, which is a combination of two colors. To do so, in theFill area click the arrow on the right side of the color selector, and then clickGradients. In the Gradients dialog box that opens, select the two colors to usefor the gradient. Select a shading style to determine the direction in which thetwo colors are blended together.
• Adjust the transparency of the series color using the Fill Transparency scrollbar. Click and drag the scrolling bar until you reach the desired transparency. Asyou scroll, the percentage of transparency is displayed. When you set thetransparency to a low percentage, the colors of the object appear brighter. Whenyou set the transparency to a high percentage, the colors of the object appearmore faded.
8 In the Line/Border area, you can define various formatting for the border line of theseries. For example, from the Color drop-down list, specify a color for the borderlines.
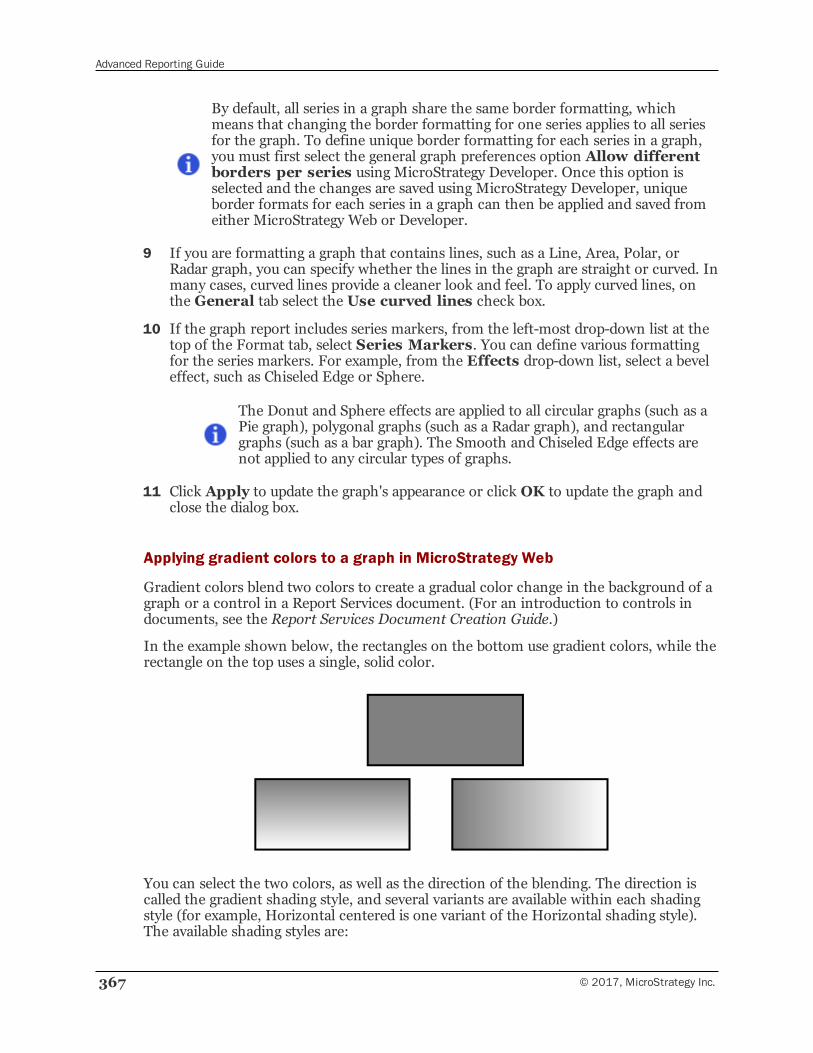
Advanced Reporting Guide
367 © 2017, MicroStrategy Inc.
By default, all series in a graph share the same border formatting, whichmeans that changing the border formatting for one series applies to all seriesfor the graph. To define unique border formatting for each series in a graph,you must first select the general graph preferences option Allow differentborders per series using MicroStrategy Developer. Once this option isselected and the changes are saved using MicroStrategy Developer, uniqueborder formats for each series in a graph can then be applied and saved fromeither MicroStrategy Web or Developer.
9 If you are formatting a graph that contains lines, such as a Line, Area, Polar, orRadar graph, you can specify whether the lines in the graph are straight or curved. Inmany cases, curved lines provide a cleaner look and feel. To apply curved lines, onthe General tab select the Use curved lines check box.
10 If the graph report includes series markers, from the left-most drop-down list at thetop of the Format tab, select Series Markers. You can define various formattingfor the series markers. For example, from the Effects drop-down list, select a beveleffect, such as Chiseled Edge or Sphere.
The Donut and Sphere effects are applied to all circular graphs (such as aPie graph), polygonal graphs (such as a Radar graph), and rectangulargraphs (such as a bar graph). The Smooth and Chiseled Edge effects arenot applied to any circular types of graphs.
11 Click Apply to update the graph's appearance or click OK to update the graph andclose the dialog box.
Applying gradient colors to a graph in MicroStrategy Web
Gradient colors blend two colors to create a gradual color change in the background of agraph or a control in a Report Services document. (For an introduction to controls indocuments, see the Report Services Document Creation Guide.)
In the example shown below, the rectangles on the bottom use gradient colors, while therectangle on the top uses a single, solid color.
You can select the two colors, as well as the direction of the blending. The direction iscalled the gradient shading style, and several variants are available within each shadingstyle (for example, Horizontal centered is one variant of the Horizontal shading style).The available shading styles are:

Advanced Reporting Guide
© 2017, MicroStrategy Inc. 368
• Horizontal
• Vertical
• Diagonal Up
• Diagonal Down
• From Corner
• From Center
• Custom
The Horizontal and Vertical shading styles contain Horizontal centered and Verticalcentered variants. These variants, shown below, are three-way or mirror gradients.
These types of gradients blend the colors from the middle of the graph series out to theedges. One color is applied in the center of the graph series and the other to the edges ofthe graph series, then the two are blended. The two halves are identical, as though amirror was placed along the center. You can choose to blend the colors horizontally orvertically, as shown in the rectangles above, by specifying the gradient shading style andvariant.
The procedure below describes how to format a graph in MicroStrategy Web usingthe Format: Graph dialog box, because this dialog box contains all formattingoptions for a graph. As an alternative, you can quickly format a graph by right-clicking the graph component and selecting a formatting option. You can alsoformat the graph using the Formatting toolbar, which is available from the Viewmenu.
To apply gradient colors to the series of a graph in MicroStrategy Web
1 Run a report, and display it in either Graph View or Grid and Graph View.
2 Right-click the graph to modify, select Fill, and then Gradients. The Gradientsdialog box opens.
3 Select the two colors to use for the gradient from the Color 1 and Color 2 drop-down lists.
4 From the Shading Styles area, select a shading style in which to display thegradient. The shading style determines the direction in which the two colors areblended together.
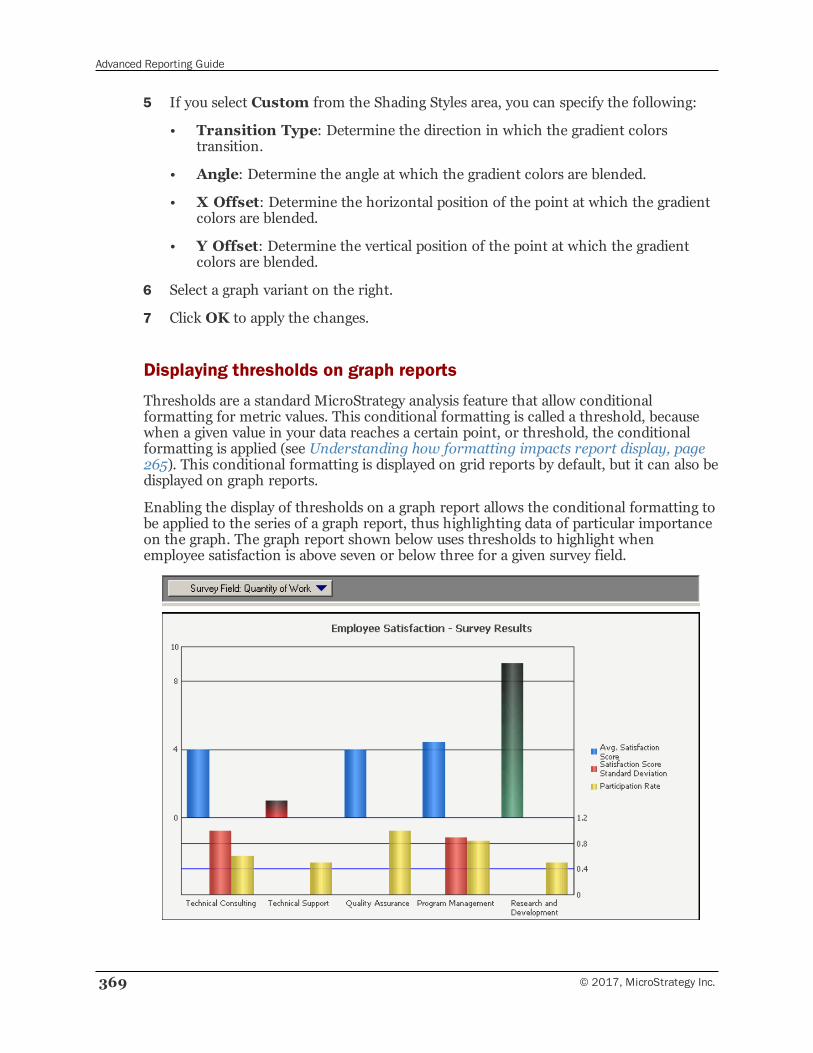
Advanced Reporting Guide
369 © 2017, MicroStrategy Inc.
5 If you select Custom from the Shading Styles area, you can specify the following:
• Transition Type: Determine the direction in which the gradient colorstransition.
• Angle: Determine the angle at which the gradient colors are blended.
• X Offset: Determine the horizontal position of the point at which the gradientcolors are blended.
• Y Offset: Determine the vertical position of the point at which the gradientcolors are blended.
6 Select a graph variant on the right.
7 Click OK to apply the changes.
Displaying thresholds on graph reports
Thresholds are a standard MicroStrategy analysis feature that allow conditionalformatting for metric values. This conditional formatting is called a threshold, becausewhen a given value in your data reaches a certain point, or threshold, the conditionalformatting is applied (see Understanding how formatting impacts report display, page265). This conditional formatting is displayed on grid reports by default, but it can also bedisplayed on graph reports.
Enabling the display of thresholds on a graph report allows the conditional formatting tobe applied to the series of a graph report, thus highlighting data of particular importanceon the graph. The graph report shown below uses thresholds to highlight whenemployee satisfaction is above seven or below three for a given survey field.
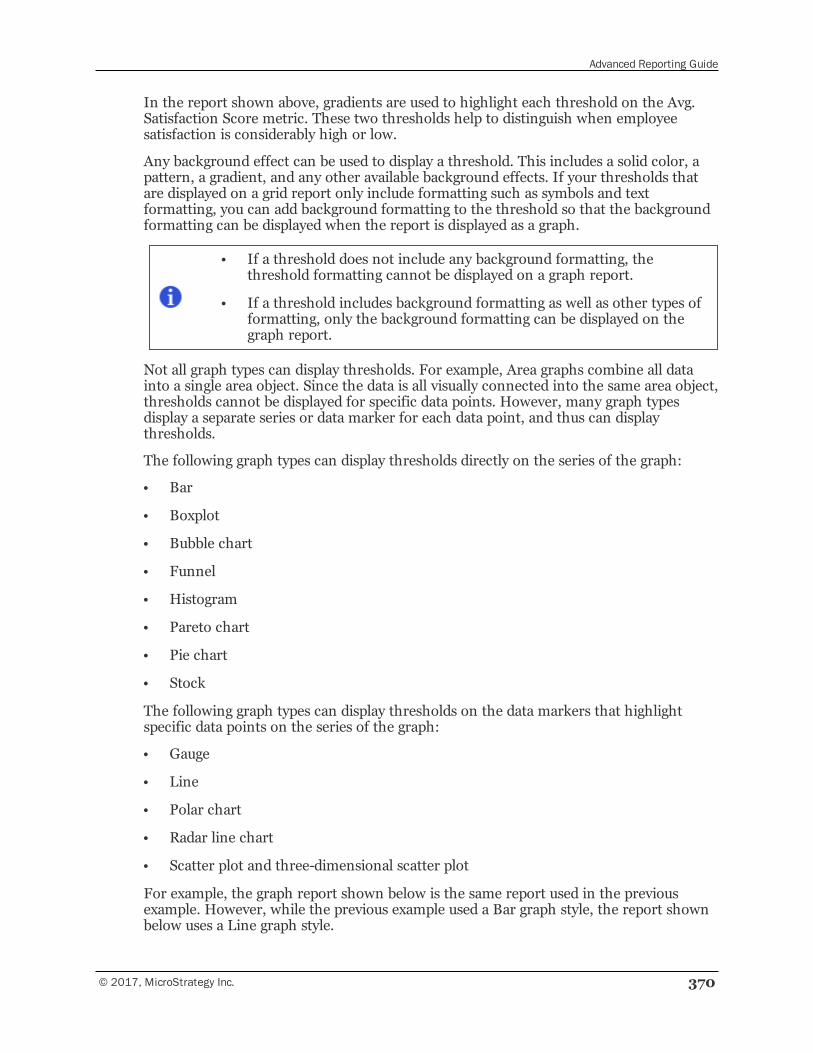
Advanced Reporting Guide
© 2017, MicroStrategy Inc. 370
In the report shown above, gradients are used to highlight each threshold on the Avg.Satisfaction Score metric. These two thresholds help to distinguish when employeesatisfaction is considerably high or low.
Any background effect can be used to display a threshold. This includes a solid color, apattern, a gradient, and any other available background effects. If your thresholds thatare displayed on a grid report only include formatting such as symbols and textformatting, you can add background formatting to the threshold so that the backgroundformatting can be displayed when the report is displayed as a graph.
• If a threshold does not include any background formatting, thethreshold formatting cannot be displayed on a graph report.
• If a threshold includes background formatting as well as other types offormatting, only the background formatting can be displayed on thegraph report.
Not all graph types can display thresholds. For example, Area graphs combine all datainto a single area object. Since the data is all visually connected into the same area object,thresholds cannot be displayed for specific data points. However, many graph typesdisplay a separate series or data marker for each data point, and thus can displaythresholds.
The following graph types can display thresholds directly on the series of the graph:
• Bar
• Boxplot
• Bubble chart
• Funnel
• Histogram
• Pareto chart
• Pie chart
• Stock
The following graph types can display thresholds on the data markers that highlightspecific data points on the series of the graph:
• Gauge
• Line
• Polar chart
• Radar line chart
• Scatter plot and three-dimensional scatter plot
For example, the graph report shown below is the same report used in the previousexample. However, while the previous example used a Bar graph style, the report shownbelow uses a Line graph style.
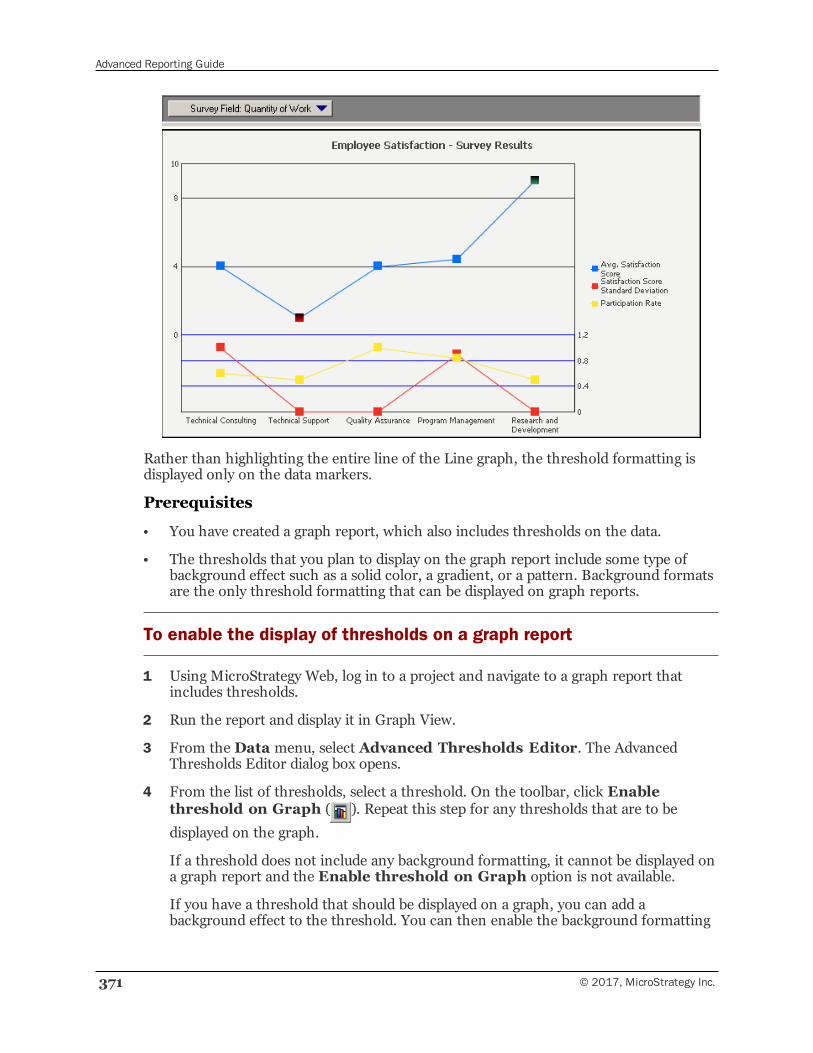
Advanced Reporting Guide
371 © 2017, MicroStrategy Inc.
Rather than highlighting the entire line of the Line graph, the threshold formatting isdisplayed only on the data markers.
Prerequisites
• You have created a graph report, which also includes thresholds on the data.
• The thresholds that you plan to display on the graph report include some type ofbackground effect such as a solid color, a gradient, or a pattern. Background formatsare the only threshold formatting that can be displayed on graph reports.
To enable the display of thresholds on a graph report
1 Using MicroStrategy Web, log in to a project and navigate to a graph report thatincludes thresholds.
2 Run the report and display it in Graph View.
3 From the Data menu, select Advanced Thresholds Editor. The AdvancedThresholds Editor dialog box opens.
4 From the list of thresholds, select a threshold. On the toolbar, click Enablethreshold on Graph ( ). Repeat this step for any thresholds that are to be
displayed on the graph.
If a threshold does not include any background formatting, it cannot be displayed ona graph report and the Enable threshold on Graph option is not available.
If you have a threshold that should be displayed on a graph, you can add abackground effect to the threshold. You can then enable the background formatting
Advanced Reporting Guide
© 2017, MicroStrategy Inc. 372
of this threshold to be displayed on the graph report. This background effect is alsodisplayed on the report when it is displayed as a grid.
5 Once you have enabled the required thresholds to be displayed on the graph report,click OK to close the Advanced Thresholds Editor dialog box.
6 Click OK.
7 Review the graph report. The thresholds should be displayed for applicable data onthe graph report.
If you are using one of the graph types that support thresholds, and you do not seethresholds on the graph report, use the steps provided below to display thethresholds:
a From the Format menu, select Graph. The Format:Graph dialog box opens.
b Click General and clear the Apply rounded effects to all series checkbox. This removes the automatic beveling effects used for the series and datamarkers of the graph report, but it also allows the display of thresholds forcertain graph types. You can still apply and create your own custom bevel effectsfor the graph report, as described in Manually formatting graph series andobjects, page 372.
c Click OK to save your changes and return to the graph report. The thresholdsshould now be displayed on the graph report.
Manually formatting graph series and objectsWhile you can apply broad formatting changes to your entire graph (as explained inFormatting a graph using colors, shading, and effects, page 360), it is often convenientto manually format and fine-tune individual graph objects. For example, you can adjustcolors, and apply a variety of graphical effects, including gradients, transparency,patterns, pictures, textures, and bevel effects to the objects.
To manually format individual graph objects
1 If the report is not already displayed as a graph, from the View menu, select GraphView to display the report as a graph.
2 Right-click a graph object such as a riser, marker, graph frame, legend, and so on,and select Format name of object from the right-click menu. The Preferencesdialog box opens.
This option is named based on the object you select. For example, for a line ina Line graph, this option is named Format Data Marker.
3 You can use the following formatting categories to format graph objects:
Advanced Reporting Guide
373 © 2017, MicroStrategy Inc.
The formatting categories Font, Line, Fill, Border, and Number Formattingare available depending on the graph object that is being formatted. Forexample, you cannot modify the font of a graph object which cannot hold anytext. Also, the Number Formatting category is only shown if the graph objectincludes numeric characters.
• Font: Select this category to modify the text of a graph object. You can modifythe font type, font size, font style, color, and text frame formatting.
• Line: Select this category to modify the formatting of a Line graph object. Youcan modify the line style, color, thickness, and transparency of the line.
This category may use a different name to reflect the type of line you areformatting such as Axis Line,Major Gridlines, Data Line, and so on.
• Border: Select this category to modify the formatting of a border graph objectsuch as a frame or background border. This category provides the same linestyle, color, thickness, and transparency of the line options available for theLine category.
By default, all series in a graph share the same border formatting, whichmeans that changing the border formatting for one series applies to allseries for the graph. To define unique border formatting for each series ina graph, you must first select the general graph preferences option Allowdifferent borders per series using MicroStrategy Developer. Oncethis option is selected and the changes are saved using MicroStrategyDeveloper, unique border formats for each series in a graph can then beapplied and saved from either MicroStrategy Web or Developer.
• Number Formatting: Select this category to modify the numeric formattingof a graph object. Each numeric format type provides various formatting optionsto match the formatting for your numeric data. For information on the NumberFormatting options and how to use them in graphs, see Formatting numericvalues on a graph, page 387.
• Fill: Select this category to modify the background effects of a graph object. Youcan modify the color, background effect type, bevel formatting, and transparencyof the graph object. Some of these formatting options include:
When defining the Fill options for a series object of a graph, the optionsdescribed below are ignored if the metric for the series has a metric-specificgraph color. To apply the manual Fill options described below for a seriesobject, you can disable the display of metric-specific graph colors by clearingthe Apply metric formatting when available check box. Steps to perform thisconfiguration are described in Formatting a graph using colors, shading, andeffects, page 360.
— From the Background type drop-down list, select Gradient to apply agradient. This type of background style displays a blended effect to graduallychange from one color to a second color. For example, the image shownbelow displays a gradient that changes from a light yellow color to a darkgreen color.
Advanced Reporting Guide
© 2017, MicroStrategy Inc. 374
— Use the Transparency slider to apply a transparency effect. The slider usesa range of zero to 100. A value of zero means the object is not transparentand thus appears as a solid object. Higher values make the object moretransparent, which allows you to see objects behind the transparent object.
— Click Bevel to apply a bevel effect to the object’s background. Bevel effectsapply three-dimensional framing effects to the graph object.
— From the Background type drop-down list, select Pattern to apply apattern to the object’s background. Patterns can help to distinguish betweendifferent series risers in a graph without having to rely solely on color. Forexample, the three bar risers shown below can be distinguished by color aswell as by the pattern they use.
— From the Background type drop-down list, select Picture to apply apicture to the object’s background. Pictures can be applied to graph framesor backgrounds to apply a standard company background style or watermarkto all graphs.
— From the Background type drop-down list, select Texture to apply atexture to the object’s background. Textures can help to distinguish betweendifferent series risers in a graph without having to rely solely on color.However, the formatting applied for each texture can be drastically differentfrom other textures. For this reason it is important to make sure the texturesyou apply to your graph objects are visually appealing when displayed on thesame graph.
4 Click Apply to apply any formatting changes to the object.
5 Click OK to close the dialog box and return to the graph.
Creating and formatting titlesAll graphs can include titles and subtitles which can help to clearly identify the graph.They can also include footnotes that provide additional information about the graph.
By default, the title of a graph is the name of the report, but you can manuallychange this as described in the procedure below.
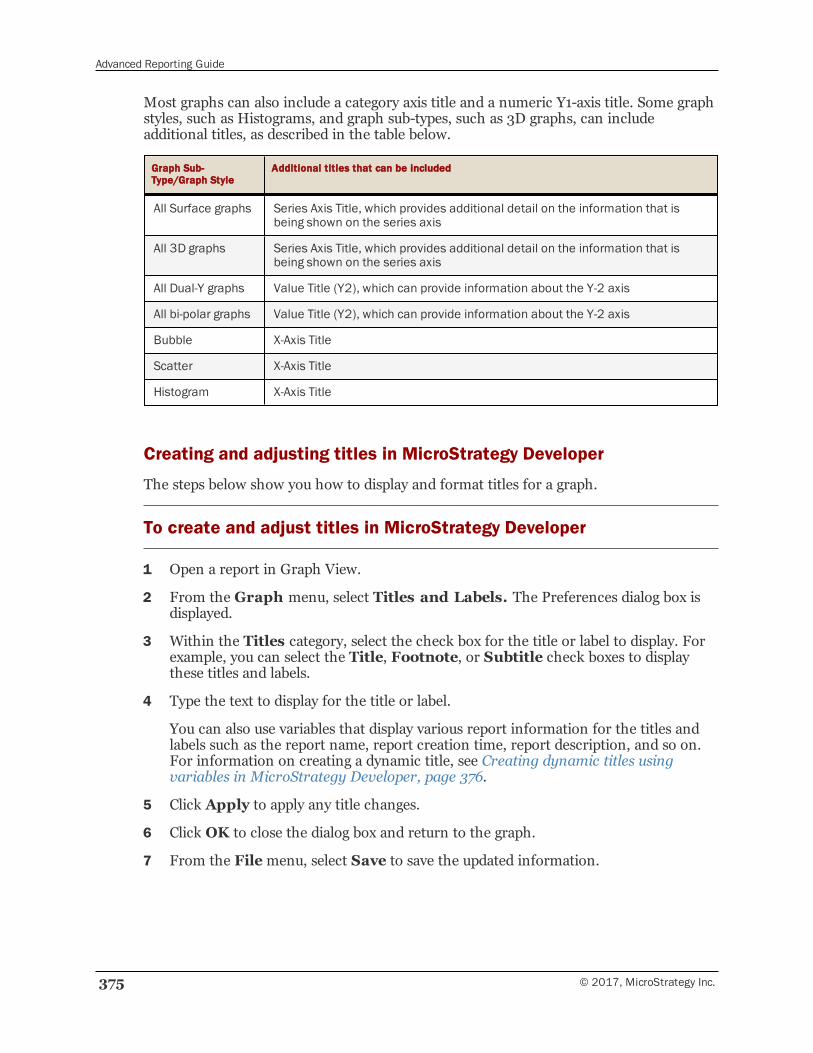
Advanced Reporting Guide
375 © 2017, MicroStrategy Inc.
Most graphs can also include a category axis title and a numeric Y1-axis title. Some graphstyles, such as Histograms, and graph sub-types, such as 3D graphs, can includeadditional titles, as described in the table below.
Graph Sub-Type/Graph Style
Additional titles that can be included
All Surface graphs Series Axis Title, which provides additional detail on the information that isbeing shown on the series axis
All 3D graphs Series Axis Title, which provides additional detail on the information that isbeing shown on the series axis
All Dual-Y graphs Value Title (Y2), which can provide information about the Y-2 axis
All bi-polar graphs Value Title (Y2), which can provide information about the Y-2 axis
Bubble X-Axis Title
Scatter X-Axis Title
Histogram X-Axis Title
Creating and adjusting titles in MicroStrategy Developer
The steps below show you how to display and format titles for a graph.
To create and adjust titles in MicroStrategy Developer
1 Open a report in Graph View.
2 From the Graph menu, select Titles and Labels. The Preferences dialog box isdisplayed.
3 Within the Titles category, select the check box for the title or label to display. Forexample, you can select the Title, Footnote, or Subtitle check boxes to displaythese titles and labels.
4 Type the text to display for the title or label.
You can also use variables that display various report information for the titles andlabels such as the report name, report creation time, report description, and so on.For information on creating a dynamic title, see Creating dynamic titles usingvariables in MicroStrategy Developer, page 376.
5 Click Apply to apply any title changes.
6 Click OK to close the dialog box and return to the graph.
7 From the Filemenu, select Save to save the updated information.
Advanced Reporting Guide
© 2017, MicroStrategy Inc. 376
Creating dynamic titles using variables in MicroStrategy Developer
For some types of titles, you can use variables so the titles become dynamic. Variablesgenerate the titles automatically every time the report is run. Variables can be used todisplay the report name, current date and time, report description, name of the project,name of the user executing the report, and so on. You can use multiple variables in thesame title or combine static text and variables.
The following table describes the variables you can use to insert dynamic text into yourgraph’s titles and labels.
Variable Description
{&REPORTNAME} Name of the report.
{&REPORTDESCRIPTION}
Report description as entered in the Properties dialog box.
{&CREATIONDATE} Date the report was created. All dates and times are displayed inthe format designated for the computer.
{&CREATIONTIME} Time the report was created. All dates and times are displayed inthe format designated for the computer.
{&AXISINFO} (Scatter plots and Bubble charts only) Innermost label from thegrid that represents either the X or Y metric.
{&PROJECT} Project in which the report is stored.
{&USER} Full name (not MicroStrategy Developer login) of the userexecuting the report.
{&PROMPTn&} User's answers to prompts in the report, where n is the number ofthe prompts, in order; {&PROMPT1&} returns the answer to thefirst prompt, {&PROMPT2&} returns the answer to the secondprompt, and so on. Applies to object prompts and attributequalification prompts only.
If n is greater than the number of prompts in the report, the codeitself is displayed in the report.
{&PROMPTDETAILS} All prompt answers for the report. Applies to metric qualificationprompts, object prompts, and attribute qualification promptsonly.
This variable is useful if you do not know the exact order ornumber of prompts in the report.
{&EXECUTIONTIME} Date and time the report was executed. All dates and times aredisplayed in the format designated for the computer.
{&FILTERDETAILS} Report filter and report limit used in the report. Applies toattribute element list prompts, hierarchy qualification prompts,metric qualification prompts, and attribute qualification promptsonly, as well as all filters and limits that do not contain prompts.
If the report does not have a filter, the text "Empty Filter" isprinted. If the report does not have a limit, the text "Empty Limit"is printed.
{&PAGEBYDETAILS} Current attribute elements selected in the page-by.
Advanced Reporting Guide
377 © 2017, MicroStrategy Inc.
Positioning and formatting graph titles in MicroStrategy Developer
You can also determine the location, font, and color of any of the titles by using variousformatting options, as described in the procedure below.
To change the formatting of a graph title in MicroStrategy Developer
1 Open a report in Graph View.
2 On the Graph menu, point to Formatting, and then choose the title to format.The Preferences dialog box opens.
3 Define the color, font, alignment, frame, and other font options for the text.
4 Click Apply to apply any formatting changes.
5 Click OK to close the dialog box and return to the graph.
6 On the Filemenu, select Save to save the new graph title format.
• When you view a report in Graph View and set the font size for theaxis label to a very large value, the graph size shrinks to accommodatethe font size for the axis label. However, this functionality differs in 3Dgraphs, as explained in Adjusting the layout, size, and scale of a graph,page 400.
• You can also apply a specific font to graph titles and labels in selectedsets of reports and templates throughout a MicroStrategy project. Todo so, use the Find and Replace feature in MicroStrategy Developer.You can access this feature from the Tools menu. For moreinformation on the Find and Replace feature, refer to Find and replacereport, template, and metric formatting, page 276.
Displaying and formatting titles in MicroStrategy Web
You can create titles for a graph or various graph components, and you can change thetitles that appear on a graph, including the font and text size. Titles include:
• Title of the graph
• Subtitles
• Footnotes
• Names of graph axes
You can automatically update a title or part of a title with variable information, such asthe name of the user who executes the report, the date and time the report was created,and so on. These are called dynamic titles. The table below provides shortcuts to use in adynamic title.
Advanced Reporting Guide
© 2017, MicroStrategy Inc. 378
To display and format titles in MicroStrategy Web
1 Run a report, and display it in either Graph View or Grid and Graph View.
2 From the Format menu, select Graph. The Format: Graph dialog box opens.
• If DHTML is disabled, click Go.
3 Select the Format tab. If DHTML is disabled, select the Format link.
4 Do one of the following:
• From the left drop-down list at the top, select Titles. From the next drop-downlist, select All Titles, Title, Subtitle, or Footnote to specify the graph title toformat. Depending on the type of graph, you may also be able to format theCategory Axis Title, Y1 Axis Title, or Y2 Axis Title.
If you select All Titles, you can format all titles on the graph at one time,but cannot change the actual text of the titles.
• If DHTML is disabled: From the drop-down list, under Titles, select All Titles,Title, Subtitle, or Footnote to specify the graph title to format. Depending onthe type of graph, you may also be able to format Category Axis Title, Y1Axis Title, or Y2 Axis Title. Then click the check mark.
5 To display the title on the graph, select the Show check box.
6 Modify the name of the title as desired. You can use dynamic titles using shortcuts;see the table below for the text you need to type to achieve a dynamic title.
7 Specify the font type, size, color, and effects to apply to the selected title.
8 Click OK to update the graph and close the dialog box.
Shortcuts for dynamic titles in MicroStrategy Web
You can create dynamic titles for a graph by typing a shortcut in the title. A dynamic titleis automatically generated every time a report is run. You can use multiple shortcuts inthe same title, and combine static text and shortcuts.
For example, if you type Profit Forecast - {&CREATIONDATE} in a graph title,when the report is executed the date that the report was created is automaticallydisplayed in the graph title, as follows: Profit Forecast - 4/15/11.
The table below lists the shortcuts you can use to create dynamic titles for a graph.
Type This Shortcut In Title Title Displays This When Report Is Run
{&REPORTNAME} Name of the report, designated by the report's creator.
Advanced Reporting Guide
379 © 2017, MicroStrategy Inc.
Type This Shortcut In Title Title Displays This When Report Is Run
{&REPORTDESCRIPTION} Report description, as it appears in the report's Propertiesdialog box.
{&CREATIONDATE} Date the report was created.
{&CREATIONTIME] Time the report was created.
{&PROJECT} Project in which the report is located.
{&USER} Full name of the user executing the report.
{&PROMPTn&} User's answer to a specific prompt in the report.
Type a number in place of n, where n is the order number ofthe prompt (for example, {&PROMPT1&} returns the answer tothe first prompt, {&PROMPT2&} returns the answer to thesecond prompt, and so on). This shortcut applies only to objectprompts and attribute qualification prompts.
If n is greater than the total number of prompts in thereport, the variable cannot be replaced with actual data, sothe code itself is displayed in the title. See the next shortcutfor an alternative if you do not know the number of prompts.
{&PROMPTDETAILS} User's answers to all prompts in the report.
This shortcut applies only to metric qualification prompts,object prompts, and attribute qualification prompts.
This variable is useful if you do not know the exact order ornumber of prompts in the report.
{&EXECUTIONTIME} Date and time the report is executed.
{&FILTERDETAILS} Report filter and any report limit used in the report.
This shortcut applies to all filters and limits in reports. It alsoapplies to reports with attribute element list prompts, hierarchyqualification prompts, metric qualification prompts, andattribute qualification prompts.
If the report does not have a filter, the text "Empty Filter" isdisplayed. If the report does not have a limit, the text "EmptyLimit" is displayed.
{&PAGEBYDETAILS} Attribute elements currently displayed in the page-by area.
Formatting number values on a graph in MicroStrategy Web
You can format the display of numbers on a graph. For example, you can display thevalues along the Y-axis as currency, with two decimal places.
The procedure below describes how to display number values on a graph inMicroStrategy Web using the Format: Graph dialog box. You can also format agraph using the Formatting toolbar, which is accessible from the View menu:point to Toolbars, then select Formatting. On the toolbar, click Data Values.
Advanced Reporting Guide
© 2017, MicroStrategy Inc. 380
To format number values on a graph in MicroStrategy Web
1 Click the name of a report to execute it. Display the report in either Graph View orGrid and Graph View.
2 From theHomemenu, select Graph.
3 Right-click the graph and select Format. The Format: Graph dialog box opens.
• If DHTML is disabled, click Go.
4 Select the Format tab. If DHTML is disabled, select the Format link.
5 From the left drop-down list at the top, select Series Labels. From the next drop-down list, select All Data Values or the specific series label to format.
If DHTML is disabled: From the drop-down list under Series Labels, select AllData Values or a specific series label to format. Then click the check mark.
6 To ensure that labels (such as currency symbols, percentages, and so on) aredisplayed on the graph, select the Show check box.
You can add tooltips that display additional information for the values on thegraph. For more information, see Creating tooltips in a graph, page 397.
7 Specify the font type, size, color, and effects to apply to the selected label.
8 To apply labels, such as currency, percentages, or fractions, select the Number tab.If DHTML is disabled, select the Number link.
9 From the Series Labels drop-down list at the top, select the series labels to format.Then select a format category to display, such as Currency or Percentage. Whenselected, some format categories have additional settings such as the number ofdecimal places and how to display negative numbers.
10 Click OK to apply the changes to the graph.
Formatting the axes on a graphThe axes of a graph help to label and give context to the data displayed on a graph.Depending on the graph style you have selected, different axes are used to display thedata as a graph:
• Y Axis (or Y1 Axis for dual-axis graphs) is a primary numeric axis for graphs of allstyles, except Pie, for which the Grids and Scales options is grayed out. It plots thevalues from the rows and columns in your data sheet. By default, the value labels onthe Y axis are drawn on the left side of a vertical graph or the bottom of a horizontalgraph. The Y axis is highlighted in the simple graph shown below.
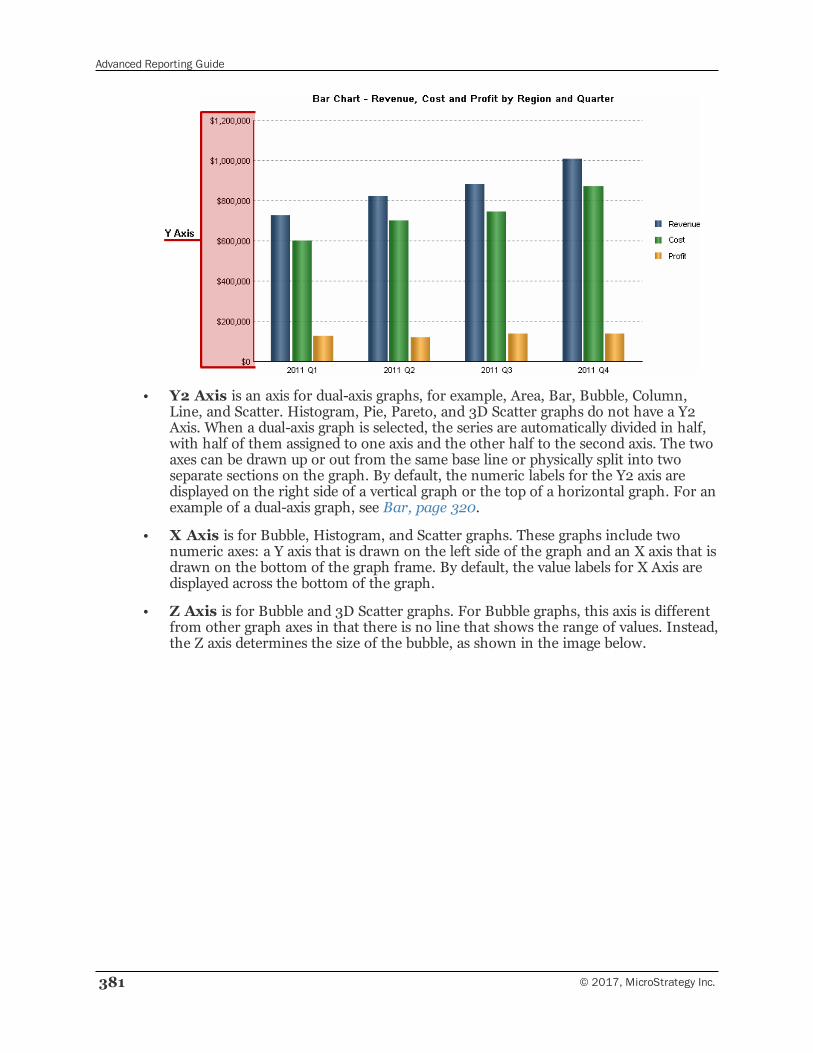
Advanced Reporting Guide
381 © 2017, MicroStrategy Inc.
• Y2 Axis is an axis for dual-axis graphs, for example, Area, Bar, Bubble, Column,Line, and Scatter. Histogram, Pie, Pareto, and 3D Scatter graphs do not have a Y2Axis. When a dual-axis graph is selected, the series are automatically divided in half,with half of them assigned to one axis and the other half to the second axis. The twoaxes can be drawn up or out from the same base line or physically split into twoseparate sections on the graph. By default, the numeric labels for the Y2 axis aredisplayed on the right side of a vertical graph or the top of a horizontal graph. For anexample of a dual-axis graph, see Bar, page 320.
• X Axis is for Bubble, Histogram, and Scatter graphs. These graphs include twonumeric axes: a Y axis that is drawn on the left side of the graph and an X axis that isdrawn on the bottom of the graph frame. By default, the value labels for X Axis aredisplayed across the bottom of the graph.
• Z Axis is for Bubble and 3D Scatter graphs. For Bubble graphs, this axis is differentfrom other graph axes in that there is no line that shows the range of values. Instead,the Z axis determines the size of the bubble, as shown in the image below.
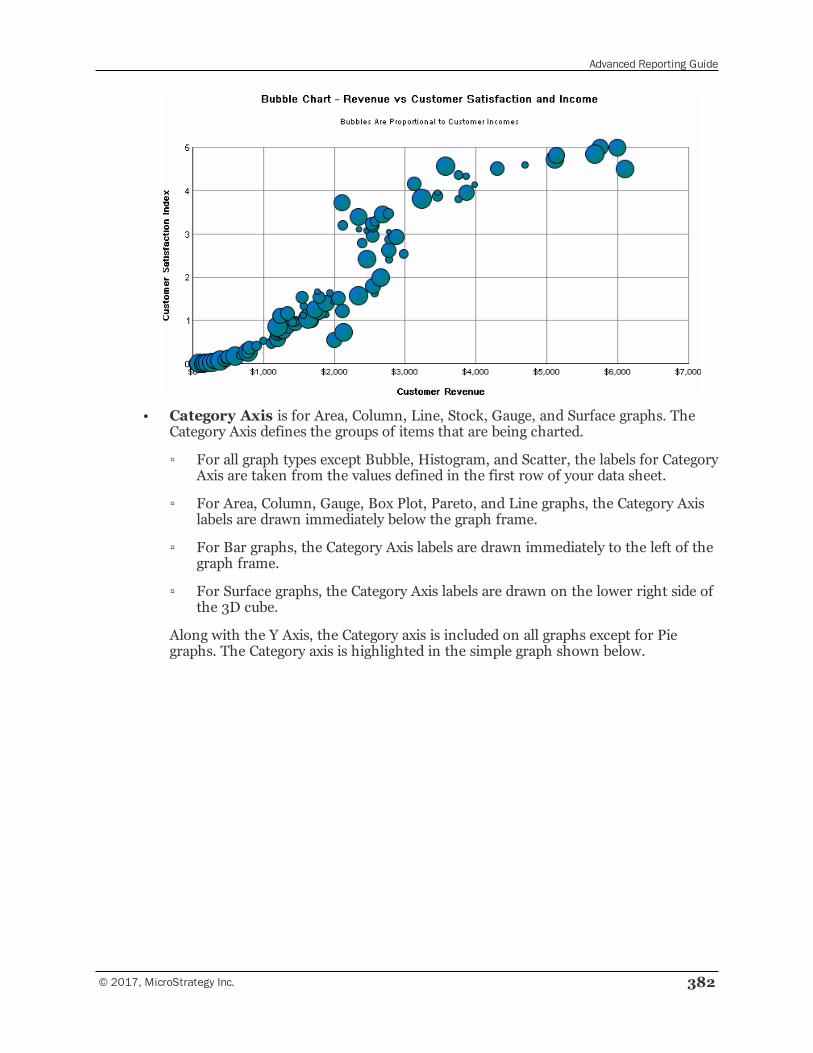
Advanced Reporting Guide
© 2017, MicroStrategy Inc. 382
• Category Axis is for Area, Column, Line, Stock, Gauge, and Surface graphs. TheCategory Axis defines the groups of items that are being charted.
▫ For all graph types except Bubble, Histogram, and Scatter, the labels for CategoryAxis are taken from the values defined in the first row of your data sheet.
▫ For Area, Column, Gauge, Box Plot, Pareto, and Line graphs, the Category Axislabels are drawn immediately below the graph frame.
▫ For Bar graphs, the Category Axis labels are drawn immediately to the left of thegraph frame.
▫ For Surface graphs, the Category Axis labels are drawn on the lower right side ofthe 3D cube.
Along with the Y Axis, the Category axis is included on all graphs except for Piegraphs. The Category axis is highlighted in the simple graph shown below.
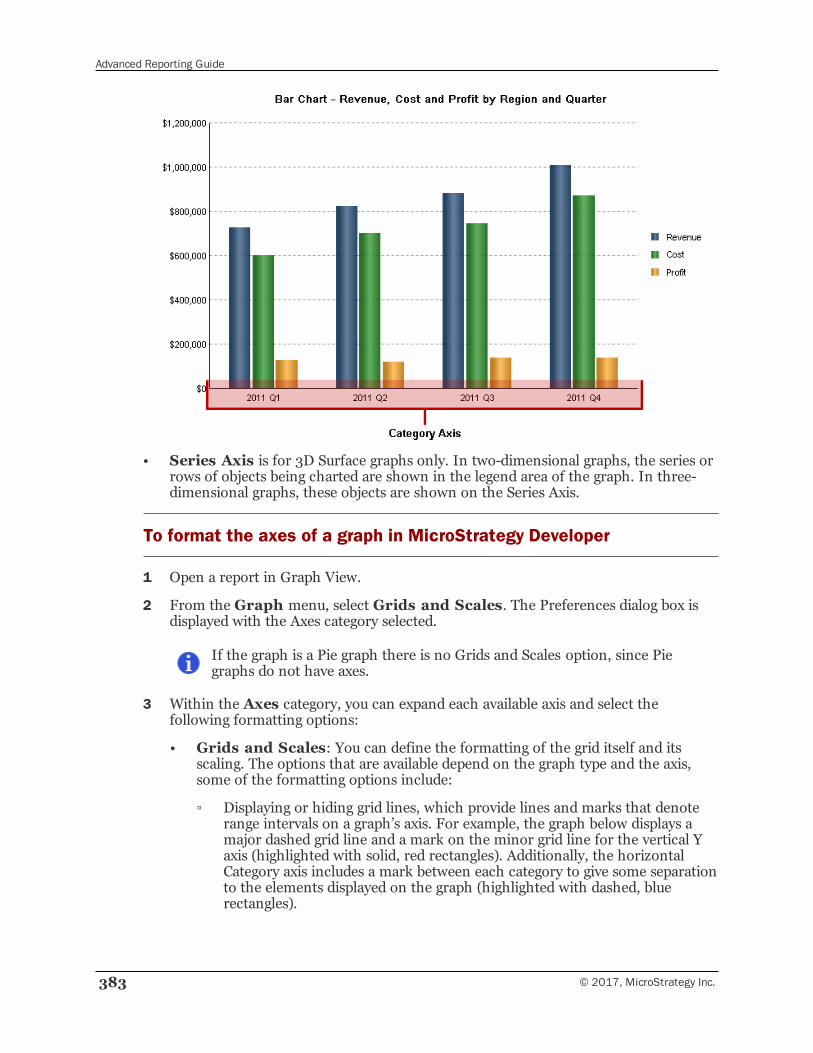
Advanced Reporting Guide
383 © 2017, MicroStrategy Inc.
• Series Axis is for 3D Surface graphs only. In two-dimensional graphs, the series orrows of objects being charted are shown in the legend area of the graph. In three-dimensional graphs, these objects are shown on the Series Axis.
To format the axes of a graph in MicroStrategy Developer
1 Open a report in Graph View.
2 From the Graph menu, select Grids and Scales. The Preferences dialog box isdisplayed with the Axes category selected.
If the graph is a Pie graph there is no Grids and Scales option, since Piegraphs do not have axes.
3 Within the Axes category, you can expand each available axis and select thefollowing formatting options:
• Grids and Scales: You can define the formatting of the grid itself and itsscaling. The options that are available depend on the graph type and the axis,some of the formatting options include:
▫ Displaying or hiding grid lines, which provide lines and marks that denoterange intervals on a graph’s axis. For example, the graph below displays amajor dashed grid line and a mark on the minor grid line for the vertical Yaxis (highlighted with solid, red rectangles). Additionally, the horizontalCategory axis includes a mark between each category to give some separationto the elements displayed on the graph (highlighted with dashed, bluerectangles).
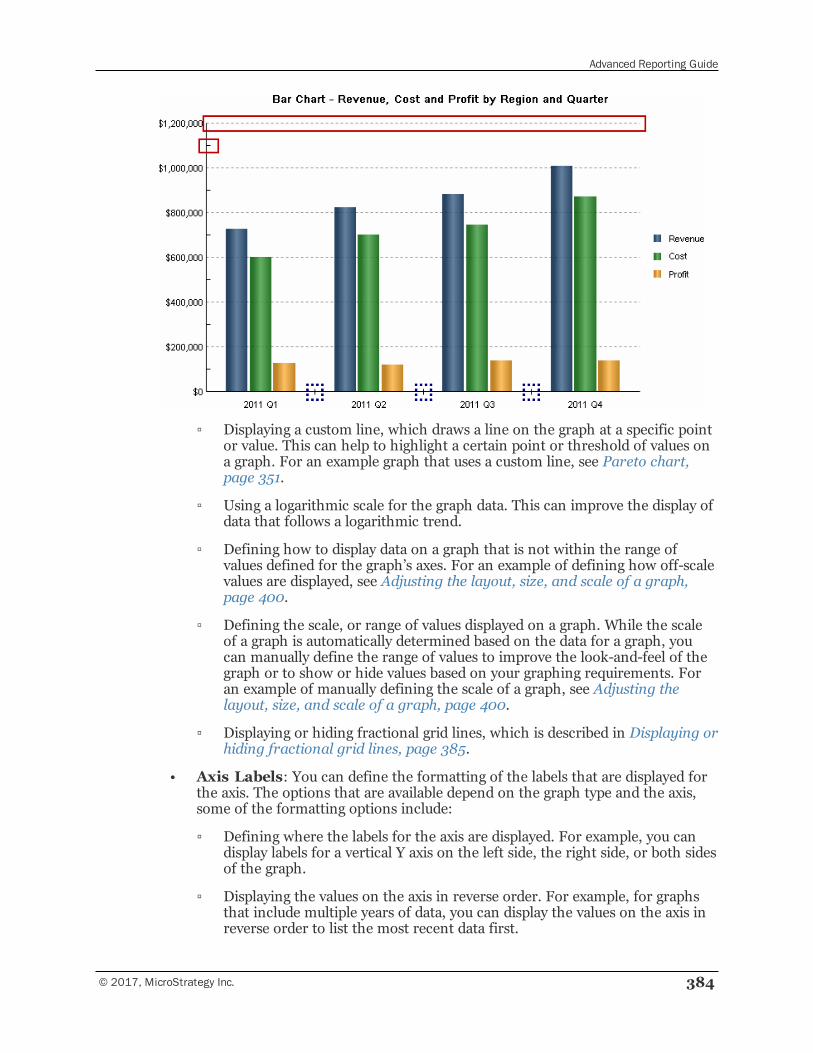
Advanced Reporting Guide
© 2017, MicroStrategy Inc. 384
▫ Displaying a custom line, which draws a line on the graph at a specific pointor value. This can help to highlight a certain point or threshold of values ona graph. For an example graph that uses a custom line, see Pareto chart,page 351.
▫ Using a logarithmic scale for the graph data. This can improve the display ofdata that follows a logarithmic trend.
▫ Defining how to display data on a graph that is not within the range ofvalues defined for the graph’s axes. For an example of defining how off-scalevalues are displayed, see Adjusting the layout, size, and scale of a graph,page 400.
▫ Defining the scale, or range of values displayed on a graph. While the scaleof a graph is automatically determined based on the data for a graph, youcan manually define the range of values to improve the look-and-feel of thegraph or to show or hide values based on your graphing requirements. Foran example of manually defining the scale of a graph, see Adjusting thelayout, size, and scale of a graph, page 400.
▫ Displaying or hiding fractional grid lines, which is described in Displaying orhiding fractional grid lines, page 385.
• Axis Labels: You can define the formatting of the labels that are displayed forthe axis. The options that are available depend on the graph type and the axis,some of the formatting options include:
▫ Defining where the labels for the axis are displayed. For example, you candisplay labels for a vertical Y axis on the left side, the right side, or both sidesof the graph.
▫ Displaying the values on the axis in reverse order. For example, for graphsthat include multiple years of data, you can display the values on the axis inreverse order to list the most recent data first.
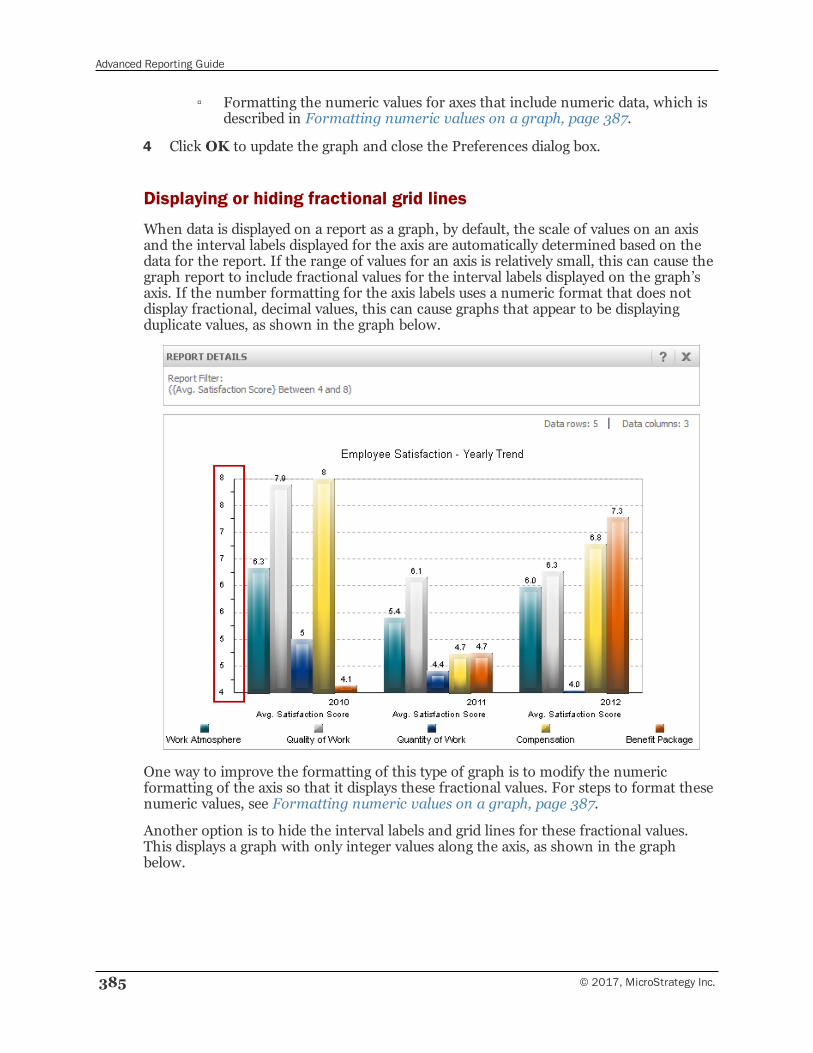
Advanced Reporting Guide
385 © 2017, MicroStrategy Inc.
▫ Formatting the numeric values for axes that include numeric data, which isdescribed in Formatting numeric values on a graph, page 387.
4 Click OK to update the graph and close the Preferences dialog box.
Displaying or hiding fractional grid lines
When data is displayed on a report as a graph, by default, the scale of values on an axisand the interval labels displayed for the axis are automatically determined based on thedata for the report. If the range of values for an axis is relatively small, this can cause thegraph report to include fractional values for the interval labels displayed on the graph’saxis. If the number formatting for the axis labels uses a numeric format that does notdisplay fractional, decimal values, this can cause graphs that appear to be displayingduplicate values, as shown in the graph below.
One way to improve the formatting of this type of graph is to modify the numericformatting of the axis so that it displays these fractional values. For steps to format thesenumeric values, see Formatting numeric values on a graph, page 387.
Another option is to hide the interval labels and grid lines for these fractional values.This displays a graph with only integer values along the axis, as shown in the graphbelow.
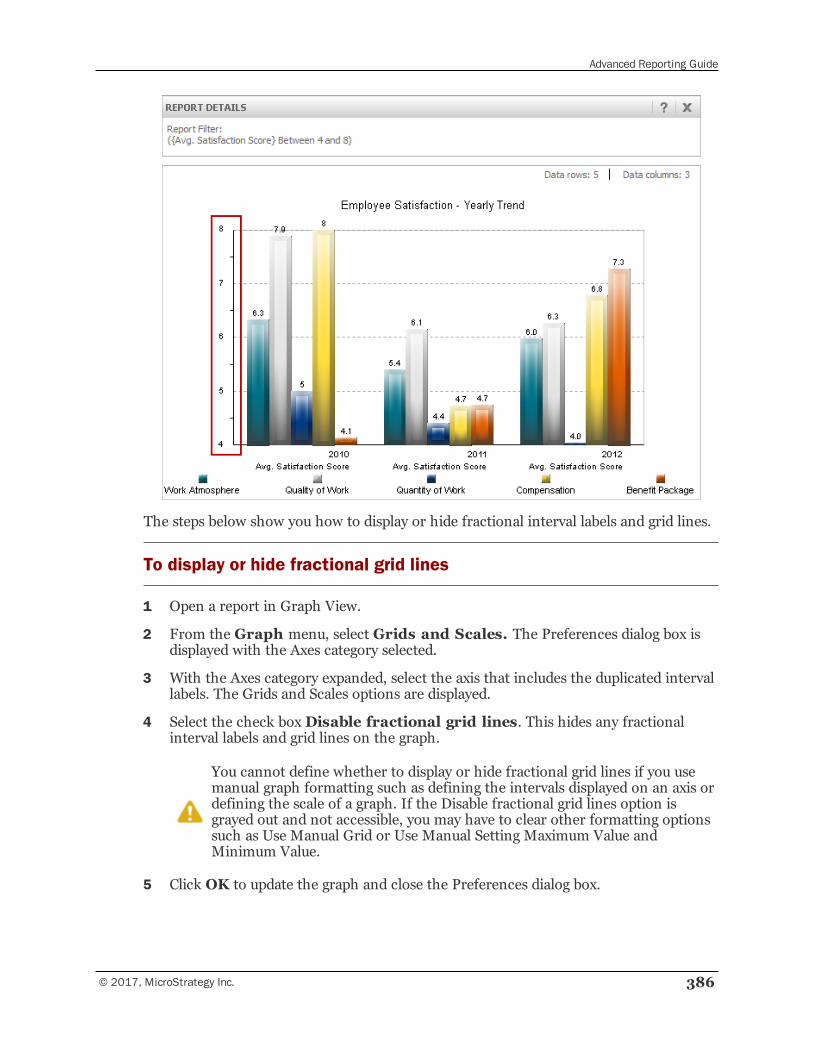
Advanced Reporting Guide
© 2017, MicroStrategy Inc. 386
The steps below show you how to display or hide fractional interval labels and grid lines.
To display or hide fractional grid lines
1 Open a report in Graph View.
2 From the Graph menu, select Grids and Scales. The Preferences dialog box isdisplayed with the Axes category selected.
3 With the Axes category expanded, select the axis that includes the duplicated intervallabels. The Grids and Scales options are displayed.
4 Select the check boxDisable fractional grid lines. This hides any fractionalinterval labels and grid lines on the graph.
You cannot define whether to display or hide fractional grid lines if you usemanual graph formatting such as defining the intervals displayed on an axis ordefining the scale of a graph. If the Disable fractional grid lines option isgrayed out and not accessible, you may have to clear other formatting optionssuch as Use Manual Grid or Use Manual Setting Maximum Value andMinimum Value.
5 Click OK to update the graph and close the Preferences dialog box.
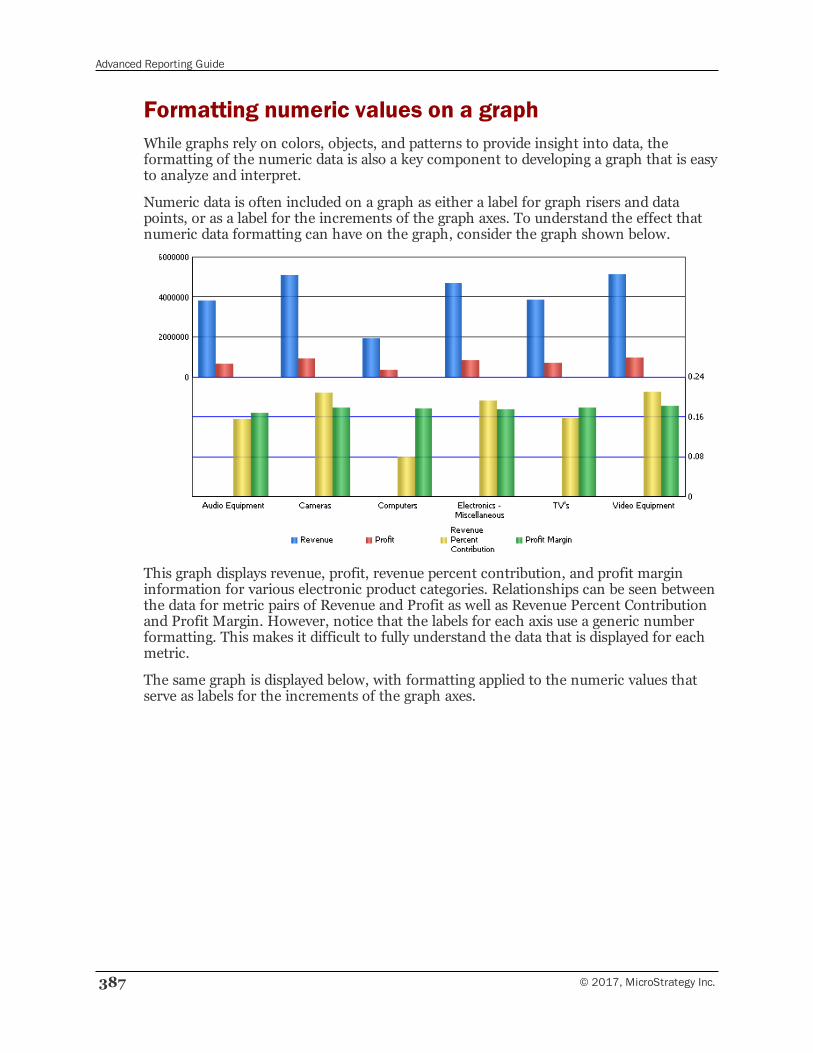
Advanced Reporting Guide
387 © 2017, MicroStrategy Inc.
Formatting numeric values on a graphWhile graphs rely on colors, objects, and patterns to provide insight into data, theformatting of the numeric data is also a key component to developing a graph that is easyto analyze and interpret.
Numeric data is often included on a graph as either a label for graph risers and datapoints, or as a label for the increments of the graph axes. To understand the effect thatnumeric data formatting can have on the graph, consider the graph shown below.
This graph displays revenue, profit, revenue percent contribution, and profit margininformation for various electronic product categories. Relationships can be seen betweenthe data for metric pairs of Revenue and Profit as well as Revenue Percent Contributionand Profit Margin. However, notice that the labels for each axis use a generic numberformatting. This makes it difficult to fully understand the data that is displayed for eachmetric.
The same graph is displayed below, with formatting applied to the numeric values thatserve as labels for the increments of the graph axes.
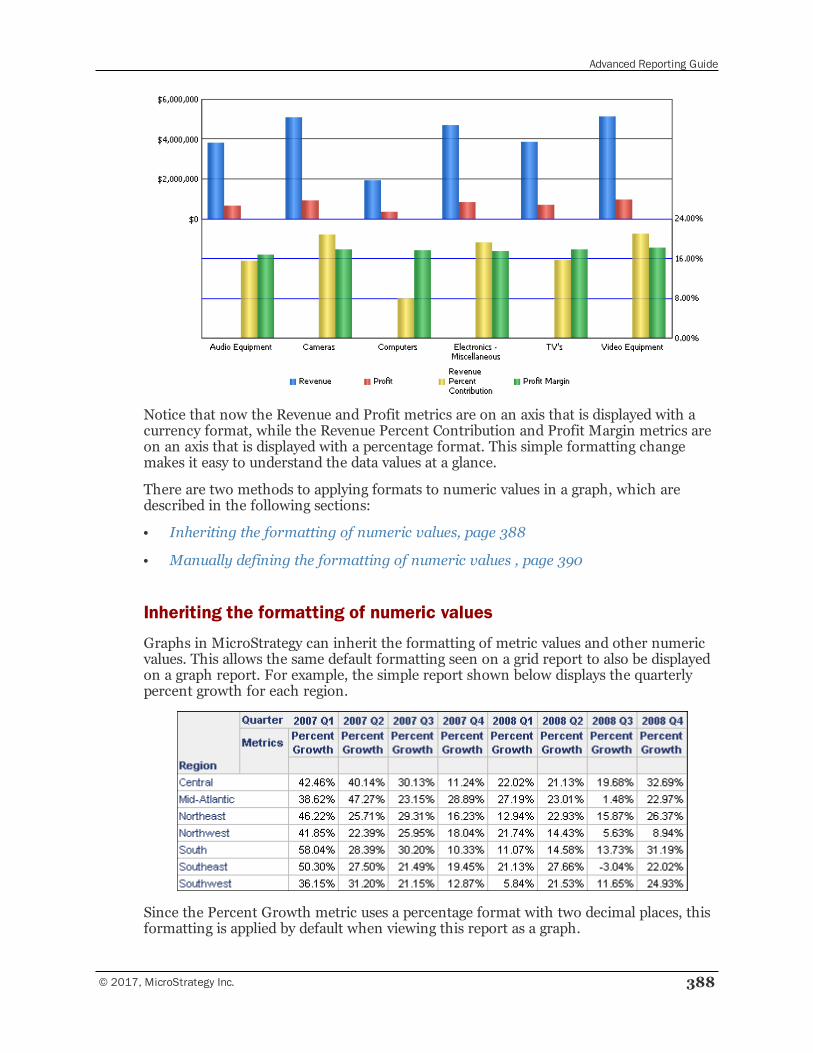
Advanced Reporting Guide
© 2017, MicroStrategy Inc. 388
Notice that now the Revenue and Profit metrics are on an axis that is displayed with acurrency format, while the Revenue Percent Contribution and Profit Margin metrics areon an axis that is displayed with a percentage format. This simple formatting changemakes it easy to understand the data values at a glance.
There are two methods to applying formats to numeric values in a graph, which aredescribed in the following sections:
• Inheriting the formatting of numeric values, page 388
• Manually defining the formatting of numeric values , page 390
Inheriting the formatting of numeric values
Graphs in MicroStrategy can inherit the formatting of metric values and other numericvalues. This allows the same default formatting seen on a grid report to also be displayedon a graph report. For example, the simple report shown below displays the quarterlypercent growth for each region.
Since the Percent Growth metric uses a percentage format with two decimal places, thisformatting is applied by default when viewing this report as a graph.
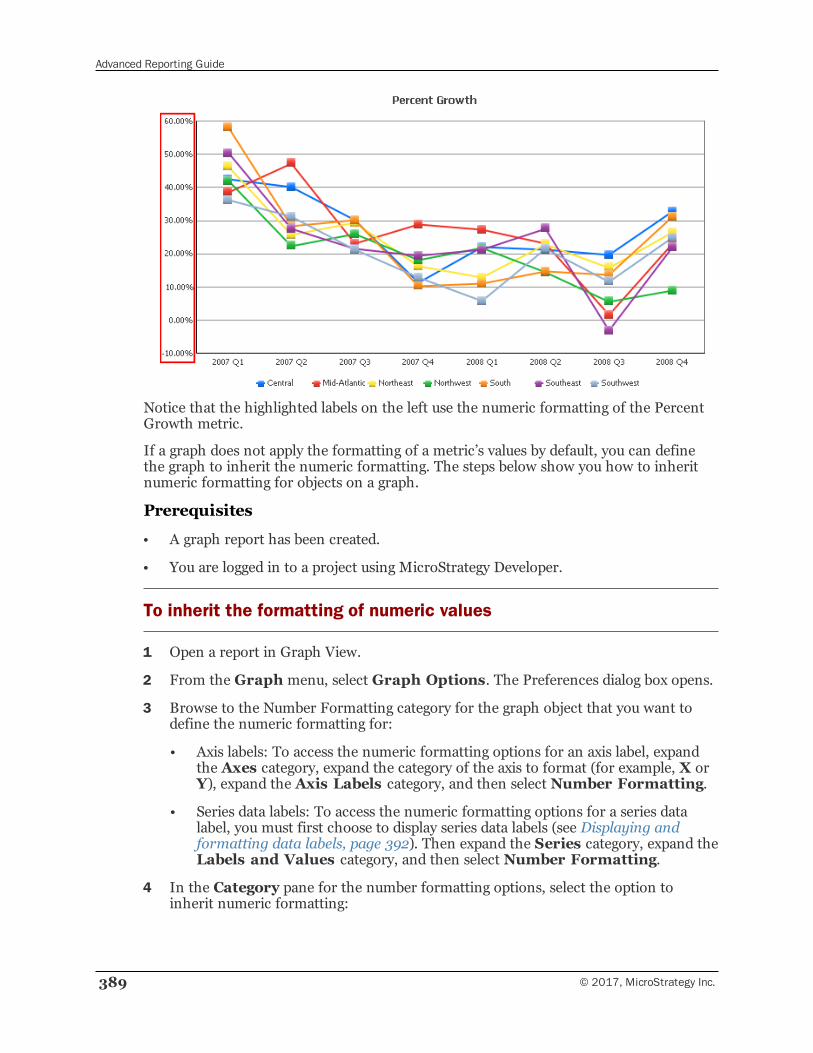
Advanced Reporting Guide
389 © 2017, MicroStrategy Inc.
Notice that the highlighted labels on the left use the numeric formatting of the PercentGrowth metric.
If a graph does not apply the formatting of a metric’s values by default, you can definethe graph to inherit the numeric formatting. The steps below show you how to inheritnumeric formatting for objects on a graph.
Prerequisites
• A graph report has been created.
• You are logged in to a project using MicroStrategy Developer.
To inherit the formatting of numeric values
1 Open a report in Graph View.
2 From the Graph menu, select Graph Options. The Preferences dialog box opens.
3 Browse to the Number Formatting category for the graph object that you want todefine the numeric formatting for:
• Axis labels: To access the numeric formatting options for an axis label, expandthe Axes category, expand the category of the axis to format (for example, X orY), expand the Axis Labels category, and then select Number Formatting.
• Series data labels: To access the numeric formatting options for a series datalabel, you must first choose to display series data labels (see Displaying andformatting data labels, page 392). Then expand the Series category, expand theLabels and Values category, and then select Number Formatting.
4 In the Category pane for the number formatting options, select the option toinherit numeric formatting:
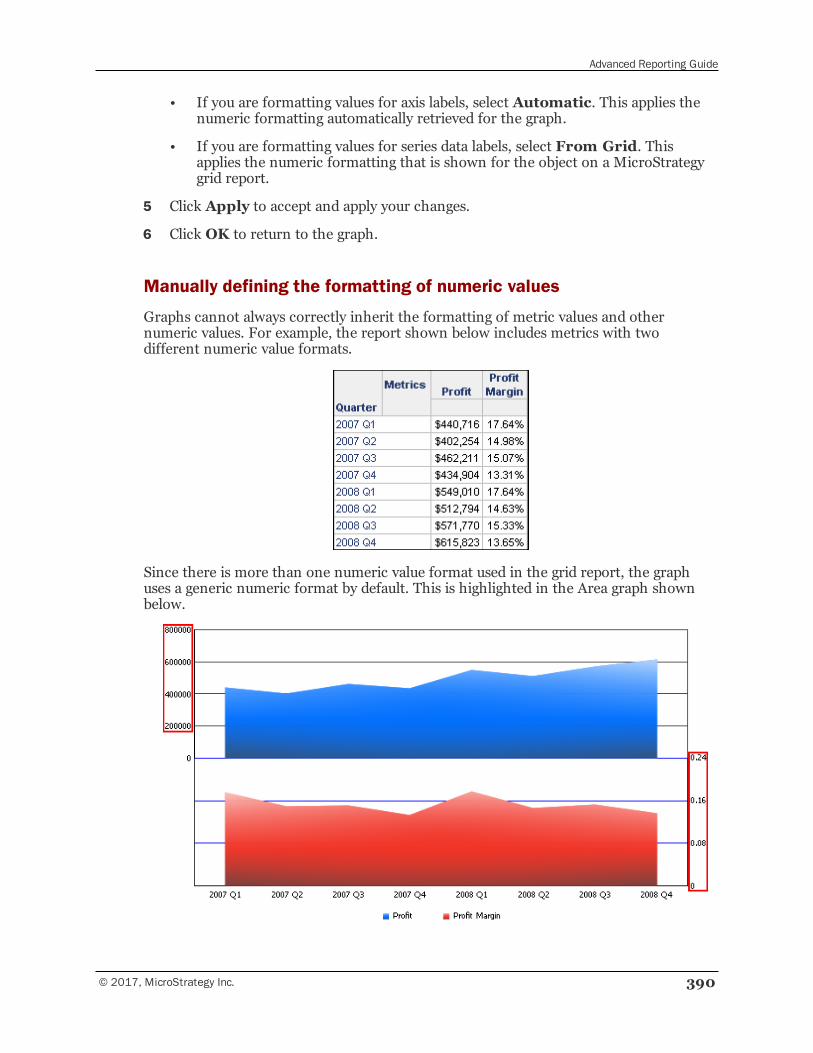
Advanced Reporting Guide
© 2017, MicroStrategy Inc. 390
• If you are formatting values for axis labels, select Automatic. This applies thenumeric formatting automatically retrieved for the graph.
• If you are formatting values for series data labels, select From Grid. Thisapplies the numeric formatting that is shown for the object on a MicroStrategygrid report.
5 Click Apply to accept and apply your changes.
6 Click OK to return to the graph.
Manually defining the formatting of numeric values
Graphs cannot always correctly inherit the formatting of metric values and othernumeric values. For example, the report shown below includes metrics with twodifferent numeric value formats.
Since there is more than one numeric value format used in the grid report, the graphuses a generic numeric format by default. This is highlighted in the Area graph shownbelow.
Advanced Reporting Guide
391 © 2017, MicroStrategy Inc.
While these values do not automatically represent the numeric formatting of the metricvalues, you can define the formatting for these values. The steps below show you how todefine numeric formatting for objects on a graph.
Prerequisites
• A graph report has been created.
• You are logged in to a project using MicroStrategy Developer.
To manually define the formatting of numeric values
1 Open a report in Graph View.
2 From the Graph menu, select Graph Options. The Preferences dialog box opens.
3 Browse to the Number Formatting category for the graph object that you want todefine the numeric formatting for:
• Axis labels: To access the numeric formatting options for an axis label, expandthe Axes category, expand the category of the axis to format (for example, X orY), expand the Axis Labels category, and then select Number Formatting.
• Series data labels: To access the numeric formatting options for a series datalabel, you must first choose to display series data labels (see Displaying andformatting data labels, page 392). Then expand the Series category, expand theLabels and Values category, and then select Number Formatting.
4 In the Category pane for the number formatting options, select the desired numericformatting option:
• General: Select this option to display numbers without any punctuation orother formatting symbols or syntax. This is often used as a default when anumeric format cannot be determined by default.
• Fixed: Select this option to define the number of decimal places to show,whether to include a thousands separator, and whether to use an abbreviationsuch as thousands, millions, or billions.
• Currency: Select this option to display number with various formatting optionsthat reflect monetary values. You can choose from many different currencysymbols, as well as how many decimal places to display.
• Date: Select this option to display numbers in a format that represents the dayof the year. A list of available formats to choose from is provided.
• Time: Select this option to display numbers in a format that represents the timeof day. A list of available formats to choose from is provided.
• Percent: Select this option to display numbers in a percentage format. Forexample, a value of .275 is displayed at 27.50% when displayed as a percent. Youcan also define how many decimal places to display.
• Fraction: Select this option to display numbers as fractions. A list of availableformats to choose from is provided.
Advanced Reporting Guide
© 2017, MicroStrategy Inc. 392
• Scientific: Select this option to display number in scientific notation. Scientificformat displays numbers as decimal numbers, with only one digit to the left ofthe decimal point. E notation is used to describe the true location of the decimalpoint.
For example, the number 123.456 in scientific format is 1.23456E+002. TheE+002 means that the decimal point’s true location is two digits to the right ofits scientific value position. Numbers that are less than zero use a slightlydifferent format. For example, the number .012345 in scientific format is1.2345E-002. The E-002 means that the decimal point’s true location is twodigits to the left of its scientific value position.
• Special: Select this option to choose from various numeric formatting options.Some of the special formatting options available include:
— Zip code
— Extended zip code
— Phone number
— Social security number
• Automatic or From Grid, see Inheriting the formatting of numeric values,page 388.
5 Click Apply to accept and apply your changes.
6 Click OK to return to the graph.
Displaying and formatting data labelsIt is often convenient to display the numeric values for each data point on a graph. Forexample, you may want to see individual numeric values along the lines in your Linegraph or the bars within your Bar graph.
If you choose to display data labels, you can also format them manually or allow thesystem to apply an automatic format style.
To display data labels on a graph report
1 Open a report in Graph View.
2 On the Graph menu, point to Display, and then choose Data Label. The datalabels are displayed on your graph report.
3 The data labels and axes numbers are automatically formatted based on theformatting of the metrics in Grid View, as long as all metrics are formatted in thesame manner. To apply different numeric formatting to the data labels, seeFormatting numeric values on a graph, page 387.
You can also manually format the data labels and axes and numbers by following thesteps below.
Advanced Reporting Guide
393 © 2017, MicroStrategy Inc.
To manually format data labels and axes numbers on a graph
1 In MicroStrategy Web, open a report in Graph View.
2 On the Format menu, select Graph. The Format:Graph dialog box opens.
3 You can define the number formatting for all data labels, or for each data labelassociated with each series in a graph:
• To define the number formatting for all data labels, click Number. From theTarget drop-down list, select All Data Values. From the Number area, choosethe required category for formatting.
• To define the number formatting for an individual data label, click Number.From the Target drop-down list, select Y Axis Values. From the Numberarea, choose the required category for formatting.
For detailed information on each numeric formatting option, see Formattingnumeric values on a graph, page 387.
4 Click Apply to accept and apply your changes.
5 Click OK to return to the graph.
6 Save your report to save the new data label or axis formatting.
Displaying and formatting a graph legendThe legend of a graph reflects the data displayed in the graph's Y-axis, also called thegraph series. This is the data that comes from the columns of the corresponding gridreport, and usually represents metrics.
A graph legend generally appears as a box to the right or left of your graph. The boxcontains small samples of each color on the graph as well as a short description of whateach color means. A graph legend is a common component of any graph report, becauseit helps the analyst understand what the colors and shapes in the graph mean in terms ofyour data.
As you format your graph, you may find that you need to make a graph legend visible orformat it. Steps are below for displaying, hiding, and formatting a graph legend in bothMicroStrategy Developer and MicroStrategy Web.
Displaying and formatting a graph legend in MicroStrategy Developer
If a graph legend does not already appear on your graph report, display it using thefollowing steps.
To display a graph legend on the graph in MicroStrategy Developer
1 Make sure you are viewing your report in Graph or Grid Graph View.
Advanced Reporting Guide
© 2017, MicroStrategy Inc. 394
2 From the Graph menu, select Display, then Legend. A graph legend is displayedon your graph.
To remove the legend from the graph, select Legend again.
Some graph types such as Histogram and 3D Surface do not use graph legends.Selecting to display a legend for these types of graphs has no effect on thegraph. These types of graphs use other titles and labels to provide context fordata.
To define display options for a graph legend
You can define various display options for a graph legend.
3 From the Graph menu, select Graph Options. The Preferences dialog box opens.
4 Expand the category for the graph style you are using. For example, if you areformatting the legend of a vertical Bar graph, expand the Vertical Bar Optionscategory.
5 Select the Display category.
6 You can define the following display options for a graph legend:
• Markers and Text: Allows you to select from the following options to positionthe markers in relation to the text in the legend:
— Markers to Left of Text
— Markers to Right of Text
— Text Centered on Markers
— Markers Above Text
— Markers Below Text
• Layout: Allows you to select from the following options to define where thelegend is displayed within the graph frame:
— Legend on Right Side
— Legend on Left Side
— Legend Below Chart
• Box Style: Allows you to select from the following options to define the type offrame to surround the text in the legend:
— No Frame
— Single Line Frame
— Double Line Frame
— Beveled Frame
— Reverse Beveled Frame
Advanced Reporting Guide
395 © 2017, MicroStrategy Inc.
7 Once your graph’s legend is visible on your graph, you can choose to format it in avariety of ways. For example, you can edit the color series markers in the legend andtherefore the colors of the series on your graph, or format the size and font of textelements in the legend. To format a graph legend, see Formatting a graph legend inMicroStrategy Developer, page 395 below.
Formatting a graph legend in MicroStrategy Developer
You can format several aspects of a graph legend, including the text.
Prerequisites
• You have created a graph and selected to display the graph legend. For steps todisplay a graph legend, see Displaying and formatting a graph legend inMicroStrategy Developer, page 393.
To format a graph legend in MicroStrategy Developer
1 View your report in Graph or Grid Graph View.
2 From the Graph menu, point to Formatting, and select Legend. The Preferencesdialog box opens.
3 The Legend category is expanded. Select from the Fill, Border, and Font formattingcategories to modify the legend formatting. For information on the options availablefor each formatting category, seeManually formatting graph series and objects,page 372.
4 Click Apply to accept and apply your changes.
5 Click OK to return to the graph.
Displaying or formatting a graph legend in MicroStrategy Web
The steps below show you how to display and format a graph legend in MicroStrategyWeb.
The procedure below describes how to format a graph using the Format: Graphdialog box in MicroStrategy Web. This dialog box contains all formatting optionsfor a graph. As an alternative, you can quickly format a graph by right-clicking thegraph component and selecting a formatting option. You can also format the graphusing the Formatting toolbar, which is available from the View menu.
To display and format a graph legend in MicroStrategy Web
1 Run a report, and display it in either Graph View or Grid and Graph View.
2 From the Format menu, select Graph. The Format: Graph dialog box opens.
Advanced Reporting Guide
© 2017, MicroStrategy Inc. 396
• If DHTML is disabled, select Graph, then click Go. The Format: Graph panel isdisplayed.
3 Select the Format tab. If DHTML is disabled, select the Format link.
4 From the left-most drop-down list at the top, select Format. From the next drop-down list, select Legend.
• If DHTML is disabled: From the drop-down list, under Format, select Legend.Click the check mark icon.
5 To ensure that the legend is displayed on the graph, select the Show check box, if itis not already selected.
6 From the Position drop-down list, specify whether the legend is positioned to theRight, Left, or at the Bottom of the graph.
7 Specify the font type, size, color, and effects to apply to the legend.
8 From the Fill Color drop-down list, specify the background color for the legend.You can also apply several effects to the color of the series, as described below.
If DHTML is disabled, you cannot create custom colors in the Fill Color drop-down list. Also, you cannot apply gradients, transparency effects, or beveleffects.
• Apply a color gradient, which is a combination of two colors, to the legend. Todo so, in the Fill area, click the arrow on the right side of the color picker, andthen select Gradients. In the Gradients dialog box, select the two colors to usefor the gradient. Then, select a shading style in which to display the gradient todetermine the direction in which the two colors are blended together.
• Adjust the transparency of the color of the legend using the Transparencyscrolling bar. Click and drag the scrolling bar until you reach the desired colortransparency. As you scroll, the percentage of transparency is displayed in atooltip. When you set the transparency to a low percentage (by dragging the barto the left), the colors of the object appear brighter and more solid. When youset the transparency to a high percentage (by dragging the bar to the right), thecolors of the object appear lighter and less solid.
• Select from several bevel effects from the Effects drop-down list, such asChiseled Edge or Sphere, to apply to the legend.
9 From the Line Color drop-down list, specify a color for the border lines of thelegend.
10 From the right-most drop-down list on the Format tab, select Legend Area toaccess formatting options for the entire background area of the legend.
• If DHTML is disabled: From the drop-down list, under Format, select LegendArea to access formatting options for the entire background area of the legend.Click the check mark icon.
11 Apply formatting changes to the legend area as described above.
Advanced Reporting Guide
397 © 2017, MicroStrategy Inc.
12 Click Apply to apply the changes to the graph, or click OK to apply the changes andclose the dialog box/panel.
Formatting the labels on a graph’s axesYou can access label formatting settings for the different axes on your graph. Thesesettings include, but are not limited to the following:
• Category axis (the axis that commonly contains the attributes):
▫ Location and positioning of labels along the axis
▫ Order of categories
▫ Include and format of axis labels
▫ Appearance of grid lines and graph tick marks
For information about what categories on a graph represent, see the table inMoving objects on a graph report, page 315.
• Y-1 axis
▫ Format and location of axis labels
▫ The range of numbers in labels
▫ Number format (for example, currency or percentage)
▫ Appearance of grid lines and graph tick marks
Depending on the type of graph you are formatting, you may also have access to scalingoptions for the X-axis, Z-axis, or Y-2 axis as well.
Click Help in MicroStrategy Developer for steps to format labels for each of these axes.
Creating tooltips in a graphA tooltip is short, descriptive text that appears when you mouse over a graph item inMicroStrategy Web. Tooltips provide information such as the value of a specific datapoint, the name of a group, or the label of a graph’s X-axis. An example of the defaulttooltip for a Boxplot in MicroStrategy Developer is shown below:
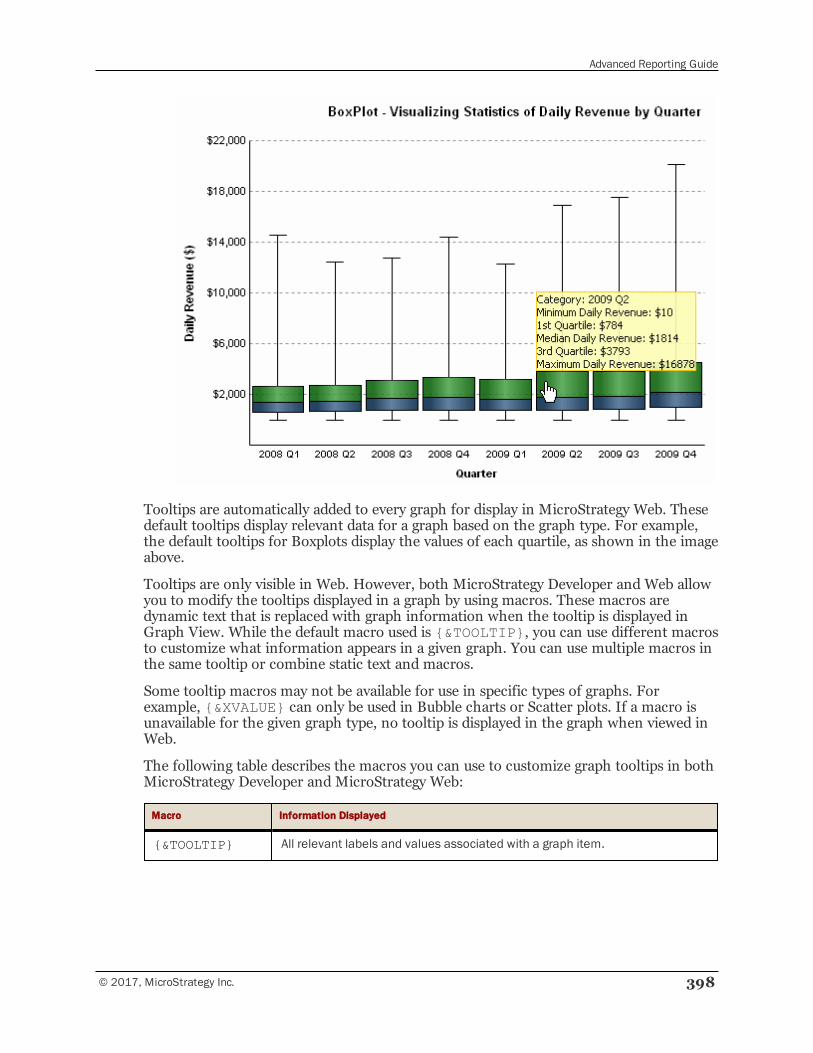
Advanced Reporting Guide
© 2017, MicroStrategy Inc. 398
Tooltips are automatically added to every graph for display in MicroStrategy Web. Thesedefault tooltips display relevant data for a graph based on the graph type. For example,the default tooltips for Boxplots display the values of each quartile, as shown in the imageabove.
Tooltips are only visible in Web. However, both MicroStrategy Developer and Web allowyou to modify the tooltips displayed in a graph by using macros. These macros aredynamic text that is replaced with graph information when the tooltip is displayed inGraph View. While the default macro used is {&TOOLTIP}, you can use different macrosto customize what information appears in a given graph. You can use multiple macros inthe same tooltip or combine static text and macros.
Some tooltip macros may not be available for use in specific types of graphs. Forexample, {&XVALUE} can only be used in Bubble charts or Scatter plots. If a macro isunavailable for the given graph type, no tooltip is displayed in the graph when viewed inWeb.
The following table describes the macros you can use to customize graph tooltips in bothMicroStrategy Developer and MicroStrategy Web:
Macro Information Displayed
{&TOOLTIP} All relevant labels and values associated with a graph item.
Advanced Reporting Guide
399 © 2017, MicroStrategy Inc.
Macro Information Displayed
{&GROUPLABEL} Name of the graph item's category. This value is often the graph item'sattribute element information, as attributes are commonly used as thecategories of graph reports.
{&SERIESLABEL} Name of the graph item’s series. This value is often the graph item's metricname information, as metrics are commonly used as the series of graphreports.
{&VALUE} The value of a given data point.
{&XVALUE} The X-value of a data point. Only applicable to Bubble charts and Scatter plots.
{&YVALUE} The Y-value of a data point. Only applicable to Bubble charts and Scatter plots.
{&ZVALUE} The Z-value of a data point. Only applicable to Bubble charts and Scatter plots.
{&XLABEL} The label of the X-axis. Only applicable to Bubble charts and Scatter plots.
{&YLABEL} The label of the Y-axis. Only applicable to Bubble charts and Scatter plots.
{&ZLABEL} The label of the Z-axis. Only applicable to Bubble charts and Scatter plots.
For information on tooltips in documents, see the Document Creation Guide.
Steps are below to apply tooltips in both MicroStrategy Developer and MicroStrategyWeb.
To apply a tooltip to a graph in MicroStrategy Developer
1 Open a report in Graph View.
2 On the Graph menu, choose Preferences. The Preferences dialog box opens.
3 Expand the Series category.
4 To apply the same tooltip to every item in the graph, select the Labels and Valuescategory. Otherwise, to define tooltips for a single series, select the name of theseries.
5 Ensure that the Show Tooltip (Web Only) check box is selected. If this box iscleared, no tooltips will be visible in the graph.
6 Type the text of the desired macro or your own static text.
7 Click Apply to apply changes.
8 Click OK to return to the graph.
9 On the Filemenu, select Save to save the new tooltip.
Advanced Reporting Guide
© 2017, MicroStrategy Inc. 400
To apply a tooltip to a graph in MicroStrategy Web
1 Open a report and display it in either Graph View or Grid and Graph View.
2 From the Format menu, select Graph. The Format:Graph dialog box opens.
3 Select Format.
4 From the first drop-down list, select Series Values. The formatting options forseries values appear.
5 Ensure that the Tooltips check box is selected. If this box is cleared, no tooltips willbe visible in the graph.
6 Type the text of the desired macro or your own static text.
7 Click Apply to apply changes.
8 Click OK to return to the graph.
Adjusting the layout, size, and scale of a graphYou can determine how your graph is scaled, the overall layout of the graph, and howgraph elements such as legends and titles are positioned on the graph.
Before you begin formatting different elements of your graph, you must first considerwhether to use manual or automatic graph layout, as explained in the following section.
Pros and cons of manual and automatic graph layout
You can control the positioning of graph elements such as legends and titles manually oryou can have the system automatically reposition these elements, which helps you avoidoverlapping elements on your graph.
For example, suppose you add an attribute to your graph report. When the graph is re-executed, you may notice that your graph’s overall layout has changed to accommodatethe additional data. You have the option to enable or disable this automatic adjustment.
If you choose the automatic layout setting, any modifications that impact the layout,such as data changes, invoke the automatic positioning of elements such as legends andlabels. For example, suppose you select a different page-by attribute on your grid, whichresults in a larger set of data with longer category names. With automatic layout thegraph frame height may need to be adjusted so the axes labels fit. This adjustment isrequired because when the number of series increases, the height and width of thelegend area may need to increase. This reduces the width of the graph’s frame.
For automatic layout, if the recalculated legend size is larger than the currentbackground frame, the size of the background frame can automatically expand. Sincethis option overrides other sizing options, it can lead to a frame size that is unexpected.
The automatic and manual layout options are in the Preferences dialog box, accessiblefrom the Graph menu. By default, automatic layout is selected.
Advanced Reporting Guide
401 © 2017, MicroStrategy Inc.
The following table provides a quick overview of the features of automatic and manualgraph layout.
Layout Type Pros Cons
Automatic • Graph elements are repositioned automaticallyas needed. For example, if you add reportobjects to the grid report, the graph reportautomatically resizes to accommodate theadditional data.
• Some objects such as graph legends can still bemoved using other methods than manuallymoving the object on the graph. For informationon displaying graph legends, see Displaying andformatting a graph legend, page 393.
You cannot manually moveany objects within the graph.
Note: If you try to move anelement manually, a dialogbox opens. If you choose tostay in automatic layoutmode, the element does notmove. If you switch to manuallayout, the element moves.
Manual • You can position graph elements yourself. Forexample, you can drag and drop a graph, legend,title, data label, and so on to a new location.
• Provides the most design flexibility.
• Provides some automatic layout options such asautomatically recalculating the size of the graphlegend and repositioning the graph frame andlegend.
You cannot benefit from theautomatic resizing featuresoffered by automatic layout.
Follow the procedure below to learn how to enable either automatic or manual graphlayout mode.
To choose automatic or manual layout for graph reports
1 View a report in Graph View.
2 On the Graph menu, select Preferences. The Preferences dialog box is displayed.
3 Within the Layout category, select from the following options:
• Automatic layout: Allows graph components to be repositioned automatically.
• Manual layout: Allows you to position graph components yourself. If youselect Manual layout, the following option becomes available:
— Re-calculate legend size automatically when data changes:Automatically re-calculates the legend size when data changes. If this optionis selected, you can also set the following option.
— Reposition chart frame and legend: Re-positions the legends to adefault location such as right or left when data changes. For example, in agraph report, initially you placed the legend frame in the center of the graphreport. If you select this check box, change the data, and re-execute thereport, the legend frame is moved to one of the default locations on thegraph. For more information about this setting, see Example: Manuallypositioning a graph legend, page 402.
Advanced Reporting Guide
© 2017, MicroStrategy Inc. 402
• Expand background frame to accommodate recalculated legendsizes: Automatically expands the size of the background frame if therecalculated legend size is larger than the current background frame. This settingis available only if the Automatic layout option or Manual layout: Re-calculatelegend size automatically when data changes option is selected.
This option overrides other sizing options and can lead to an unexpectedframe size.
4 Click Apply to accept and apply your changes.
5 Click OK to return to the graph.
Manually positioning graph elements
Sometimes you need to reposition graph objects such as the graph itself, the legend, ortitles and subtitles. The extent to which you can manually control the position of graphelements is determined by the following:
• If automatic layout mode is enabled, graph elements are automatically repositionedwhen anything is resized or readjusted on the graph. For information aboutautomatic layout, see Pros and cons of manual and automatic graph layout, page400.
Even if automatic layout mode is enabled, you can still choose to place graphelements in certain places on the graph. However, these locations are defaultlocations and are not customizable. For example, with automatic layout modeenabled, you can place a graph’s legend to the left, right, or below a graph byconfiguring options in the Graph Preferences dialog box (see Displaying andformatting a graph legend, page 393). You cannot, however, drag and drop thelegend onto another location.
• With manual layout mode enabled, you can manually drag and drop graph elementson your graph, as demonstrated in the following example. For information aboutmanual layout, see Pros and cons of manual and automatic graph layout, page 400.
Example: Manually positioning a graph legend
If you set your graph layout preference to manual layout mode (as described in Pros andcons of manual and automatic graph layout, page 400), you can select options to helpyou position the legend. The size of the legend can change automatically when the datachanges. If you select manual layout mode, the legend can be repositioned to a defaultlocation, such as right or left, when the data changes.
For example, place the legend frame in the center of a graph report. Then, from theGraph menu, select Preferences. In the Layout category in the Preferences dialogbox, select the Re-calculate legend size automatically when data changescheck box, and then the Reposition chart frame and legend check box. Changethe data of the report and re-execute it. The legend frame is moved to one of the defaultlocations on the graph report.
Advanced Reporting Guide
403 © 2017, MicroStrategy Inc.
To manually position a graph legend
1 View the report in Graph View.
2 On the Graph menu, select Preferences. The Preferences dialog box is displayed.
3 Within the Layout category, if manual layout is not already selected, selectManuallayout.
• To have the size of the legend change when the data changes, click Re-calculate legend size automatically when data changes.
• If you selected the legend size recalculation option, you can also have the legendrepositioned to a default location, such as right or left, when the data changes.To do this, select Reposition chart frame and legend. Click OK to returnto the graph.
4 On the graph, click the background of the graph legend, outside of the legend text. Aselection box with handles appears.
If boxes appear around the legend text, try clicking further outside of thelegend text area until a selection box with handles appears.
5 Drag and drop the legend to the desired location.
6 Save the graph.
Resizing a graph
You can manually resize the elements on your graph, including the graph chart itself, ifmanual layout is enabled, as explained in Pros and cons of manual and automatic graphlayout, page 400.
The following procedure guides you in resizing the actual graph chart within your graphreport.
To manually resize a graph
1 View a report in Graph View.
2 Make sure manual layout mode is enabled. See Pros and cons of manual andautomatic graph layout, page 400 for the necessary steps.
3 Click a section of the graph that is blank. For example, do not click the actual bars orlines of your graph; instead, click the graph’s background. Handles appear aroundthe graph frame.
4 Use the handles on each side and corner of the graph to manually resize the graph.
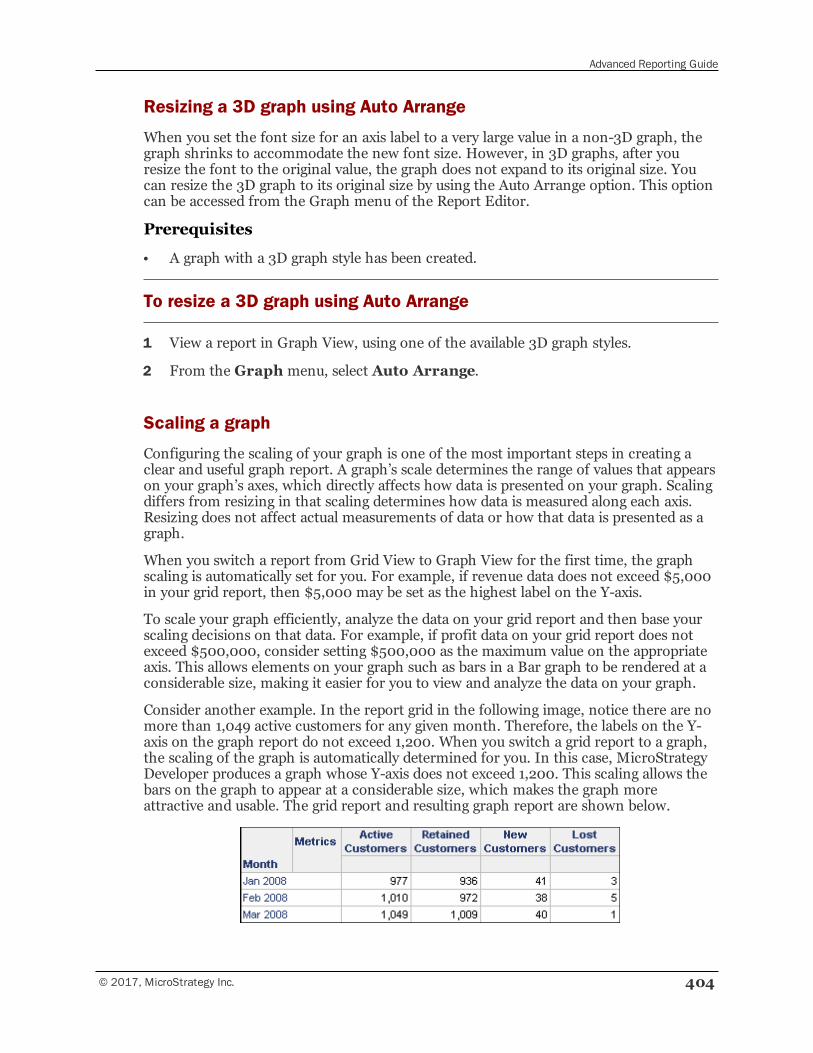
Advanced Reporting Guide
© 2017, MicroStrategy Inc. 404
Resizing a 3D graph using Auto Arrange
When you set the font size for an axis label to a very large value in a non-3D graph, thegraph shrinks to accommodate the new font size. However, in 3D graphs, after youresize the font to the original value, the graph does not expand to its original size. Youcan resize the 3D graph to its original size by using the Auto Arrange option. This optioncan be accessed from the Graph menu of the Report Editor.
Prerequisites
• A graph with a 3D graph style has been created.
To resize a 3D graph using Auto Arrange
1 View a report in Graph View, using one of the available 3D graph styles.
2 From the Graph menu, select Auto Arrange.
Scaling a graph
Configuring the scaling of your graph is one of the most important steps in creating aclear and useful graph report. A graph’s scale determines the range of values that appearson your graph’s axes, which directly affects how data is presented on your graph. Scalingdiffers from resizing in that scaling determines how data is measured along each axis.Resizing does not affect actual measurements of data or how that data is presented as agraph.
When you switch a report from Grid View to Graph View for the first time, the graphscaling is automatically set for you. For example, if revenue data does not exceed $5,000in your grid report, then $5,000 may be set as the highest label on the Y-axis.
To scale your graph efficiently, analyze the data on your grid report and then base yourscaling decisions on that data. For example, if profit data on your grid report does notexceed $500,000, consider setting $500,000 as the maximum value on the appropriateaxis. This allows elements on your graph such as bars in a Bar graph to be rendered at aconsiderable size, making it easier for you to view and analyze the data on your graph.
Consider another example. In the report grid in the following image, notice there are nomore than 1,049 active customers for any given month. Therefore, the labels on the Y-axis on the graph report do not exceed 1,200. When you switch a grid report to a graph,the scaling of the graph is automatically determined for you. In this case, MicroStrategyDeveloper produces a graph whose Y-axis does not exceed 1,200. This scaling allows thebars on the graph to appear at a considerable size, which makes the graph moreattractive and usable. The grid report and resulting graph report are shown below.
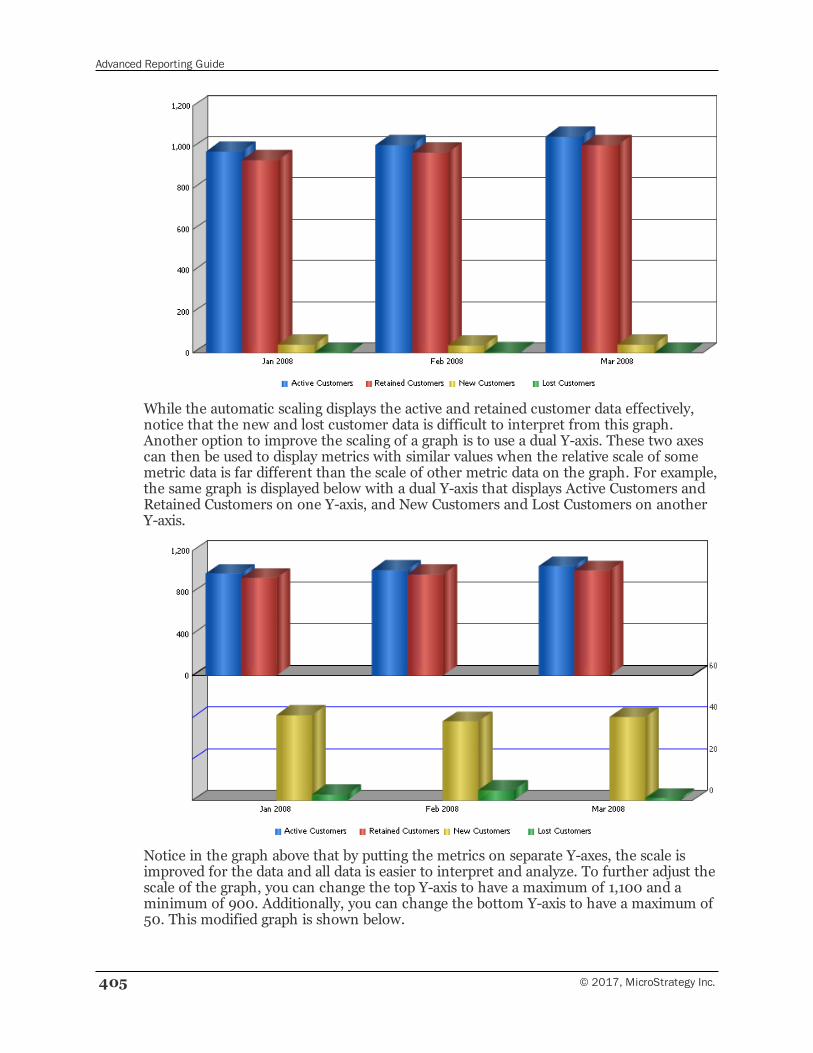
Advanced Reporting Guide
405 © 2017, MicroStrategy Inc.
While the automatic scaling displays the active and retained customer data effectively,notice that the new and lost customer data is difficult to interpret from this graph.Another option to improve the scaling of a graph is to use a dual Y-axis. These two axescan then be used to display metrics with similar values when the relative scale of somemetric data is far different than the scale of other metric data on the graph. For example,the same graph is displayed below with a dual Y-axis that displays Active Customers andRetained Customers on one Y-axis, and New Customers and Lost Customers on anotherY-axis.
Notice in the graph above that by putting the metrics on separate Y-axes, the scale isimproved for the data and all data is easier to interpret and analyze. To further adjust thescale of the graph, you can change the top Y-axis to have a maximum of 1,100 and aminimum of 900. Additionally, you can change the bottom Y-axis to have a maximum of50. This modified graph is shown below.
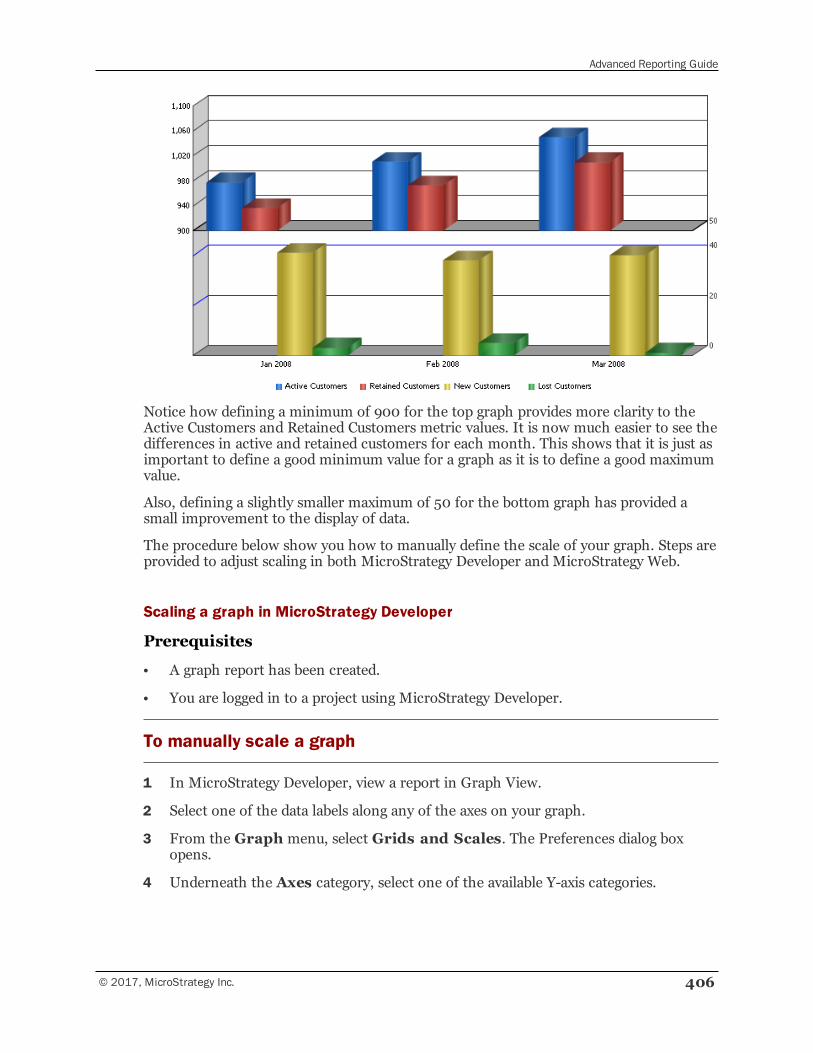
Advanced Reporting Guide
© 2017, MicroStrategy Inc. 406
Notice how defining a minimum of 900 for the top graph provides more clarity to theActive Customers and Retained Customers metric values. It is now much easier to see thedifferences in active and retained customers for each month. This shows that it is just asimportant to define a good minimum value for a graph as it is to define a good maximumvalue.
Also, defining a slightly smaller maximum of 50 for the bottom graph has provided asmall improvement to the display of data.
The procedure below show you how to manually define the scale of your graph. Steps areprovided to adjust scaling in both MicroStrategy Developer and MicroStrategy Web.
Scaling a graph in MicroStrategy Developer
Prerequisites
• A graph report has been created.
• You are logged in to a project using MicroStrategy Developer.
To manually scale a graph
1 In MicroStrategy Developer, view a report in Graph View.
2 Select one of the data labels along any of the axes on your graph.
3 From the Graph menu, select Grids and Scales. The Preferences dialog boxopens.
4 Underneath the Axes category, select one of the available Y-axis categories.
Advanced Reporting Guide
407 © 2017, MicroStrategy Inc.
If the graph uses a dual Y-axis you can define the minimum and maximum values forthe two Y-axes. To define a graph to use a dual Y-axis, see Defining a graph to use adual Y-axis in MicroStrategy Developer, page 407.
If the graph uses three-dimensional formatting, you can define the minimum andmaximum values for the X-axis and the Y-axis.
5 In the Use Manual Setting area, select theMaximum Value andMinimumValue check boxes. You can then type in the maximum and minimum values todefine for the Y-axis of the graph.
If you define a manual maximum and minimum value for a graph axis, the axisis not recalculated when modifying the objects or filtering for a graph. Thiscan cause the axis to not adequately represent the graph data when the datadisplayed for the graph changes. If the data on a graph changes, you can cleartheMaximum Value andMinimum Value check boxes and click Applyto allow the graph to automatically recalculate the size of the axis.
You should avoid defining manual maximum and minimum values for graphsthat are frequently modified such as graphs that use prompts.
6 If the graph uses a dual Y-axis you can also define the minimum and maximumvalues for the second Y-axis. If the graph uses three-dimensional formatting, you canalso define the minimum and maximum values for the X-axis.
7 Click Apply to accept and apply your changes.
8 Click OK to return to the graph.
Defining a graph to use a dual Y-axis in MicroStrategy Developer
The procedure below show you how to define a graph to use a dual Y-axis, which canimprove the scale of the graph to match the available data.
Prerequisites
• A graph report has been created. It must be displayed as one of the following graphtypes which can support a dual Y-axis:
▫ Area
▫ Bar
▫ Line
▫ Scatter
▫ Polar
▫ Radar
▫ Bubble
• Two or more objects (commonly metrics) are included in the series of the graphreport.
Advanced Reporting Guide
© 2017, MicroStrategy Inc. 408
• You are logged in to a project using MicroStrategy Developer.
To use a dual Y-axis in MicroStrategy Developer
1 In MicroStrategy Developer, view a report in Graph View.
2 From the Graph menu, select Graph Options. The Preferences dialog box opens.
3 Select the Layout category.
4 Select the Dual Axis check box. This displays each Y-axis overlaid on top of theother, with each axis using a different color.
5 If you want each Y-axis to be displayed separately, select the Split Dual Axis checkbox. Displaying a dual Y-axis in this manner can make the graph easier to analyzeand interpret.
6 Select the Dual Y Options category To define which Y-axis each series object(commonly metrics) is displayed on.
7 Select series objects in the Primary Axis or Secondary Axis panes and use thearrow button to change the axis the series object is displayed on. You should includeseries objects on the same axis if they have similar data ranges. For example, reviewthe reports described in Scaling a graph, page 404 which use one Y-axis for metricsthat have values between 900-1,000 and use a second Y-axis for metrics that havevalues between 0-50.
Graphs created in MicroStrategy 9 and later versions distribute series objectsevenly between the Primary Axis and Secondary Axis by default. Graphsupdated from MicroStrategy releases before version 9 may use a differentdefault dual Y-axis order for the series objects. These default orders can bechanged using the arrow buttons available.
8 If you selected to split each Y-axis you can also define the following options:
• Split Position: Defines what percentage of the displayed graph is taken up byeach axis. Use the slider to see a sample of how the display changes on the left.
• Show Axis Split: Displays or hides the dual axes split line. This providesadditional visual separation between each axis.
9 Click Apply to accept and apply your changes.
10 Click OK to return to the graph.
Scaling a graph in MicroStrategy Web
You can set whether Y-axis values display on the graph and, if so, what minimum andmaximum values to use on the scale. You can also specify the interval or steps to use.
Advanced Reporting Guide
409 © 2017, MicroStrategy Inc.
To scale a graph report in MicroStrategy Web
1 Click the name of a report to execute it. Display the report in either Graph View orGrid and Graph View.
2 From the Format menu, select Graph. The Format: Graph dialog box opens.
3 On the Axes tab, select from the following options. For details about each option,click Help.
• To specify the scaling for the Y1-axis, type a maximum, minimum, and gridinterval in the Y1 Axis Values - Use Manual Setting area.
• To specify the scaling for the Y2-axis, type a maximum, minimum, and gridinterval in the Y2 Axis Values - Use Manual Setting area.
• To adjust the position of the Y1 and Y2 axes, change the settings in the Dual YOptions area.
4 Click OK to apply the changes to the graph.
Displaying off-scale values in a graph
MicroStrategy Developer allows you to specify a range of values for which to displayitems in a graph. However, some graph items may fall outside a given range. When thisoccurs, you can use the Off-scale Value Display drop-down list to change how they aredisplayed. There is a separate setting for each axis in a graph.
The display options are:
• Hide Values: This option hides all elements which fall outside the specifiedminimum or maximum range for a graph. In the graph below, all data pointsrepresenting a Customer Satisfaction Index of more than four have been removedfrom view.
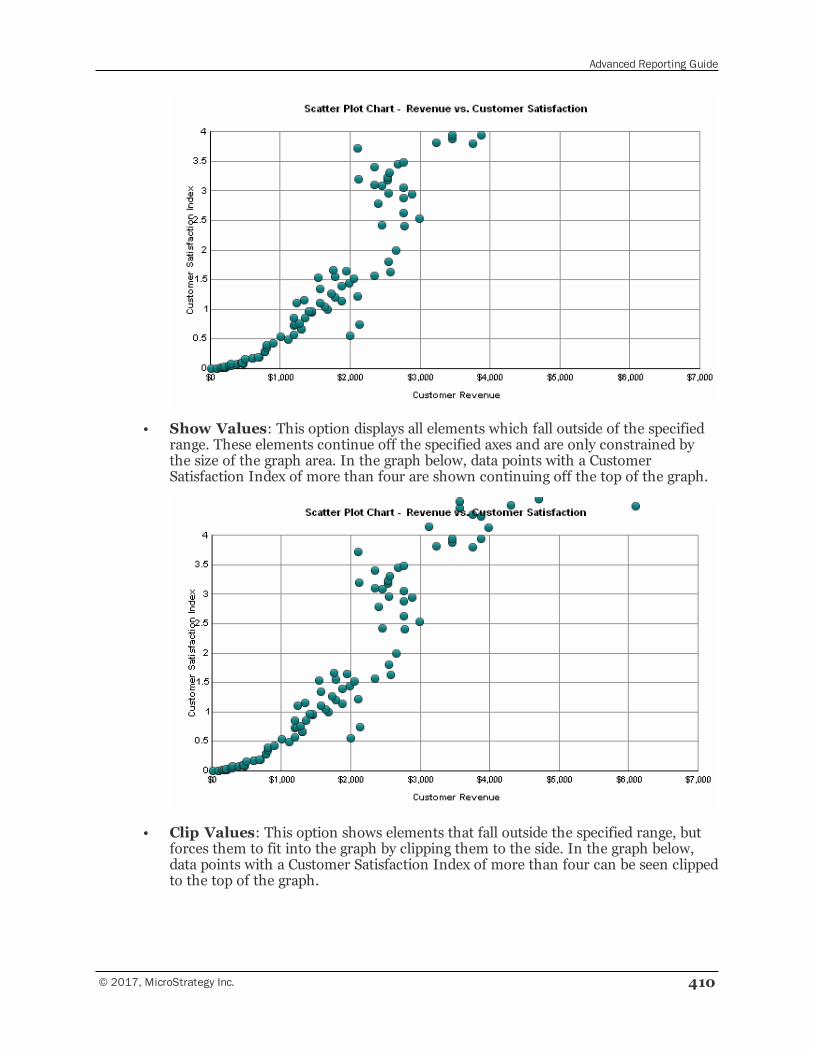
Advanced Reporting Guide
© 2017, MicroStrategy Inc. 410
• Show Values: This option displays all elements which fall outside of the specifiedrange. These elements continue off the specified axes and are only constrained bythe size of the graph area. In the graph below, data points with a CustomerSatisfaction Index of more than four are shown continuing off the top of the graph.
• Clip Values: This option shows elements that fall outside the specified range, butforces them to fit into the graph by clipping them to the side. In the graph below,data points with a Customer Satisfaction Index of more than four can be seen clippedto the top of the graph.
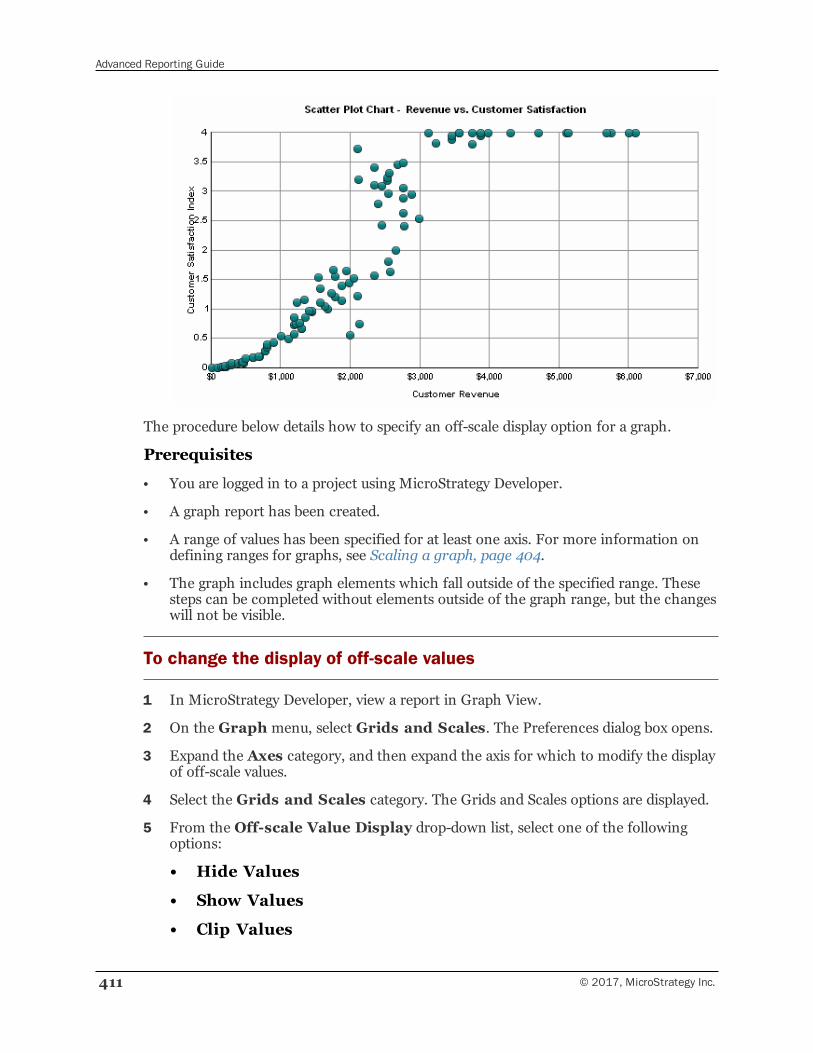
Advanced Reporting Guide
411 © 2017, MicroStrategy Inc.
The procedure below details how to specify an off-scale display option for a graph.
Prerequisites
• You are logged in to a project using MicroStrategy Developer.
• A graph report has been created.
• A range of values has been specified for at least one axis. For more information ondefining ranges for graphs, see Scaling a graph, page 404.
• The graph includes graph elements which fall outside of the specified range. Thesesteps can be completed without elements outside of the graph range, but the changeswill not be visible.
To change the display of off-scale values
1 In MicroStrategy Developer, view a report in Graph View.
2 On the Graph menu, select Grids and Scales. The Preferences dialog box opens.
3 Expand the Axes category, and then expand the axis for which to modify the displayof off-scale values.
4 Select the Grids and Scales category. The Grids and Scales options are displayed.
5 From the Off-scale Value Display drop-down list, select one of the followingoptions:
• Hide Values
• Show Values
• Clip Values
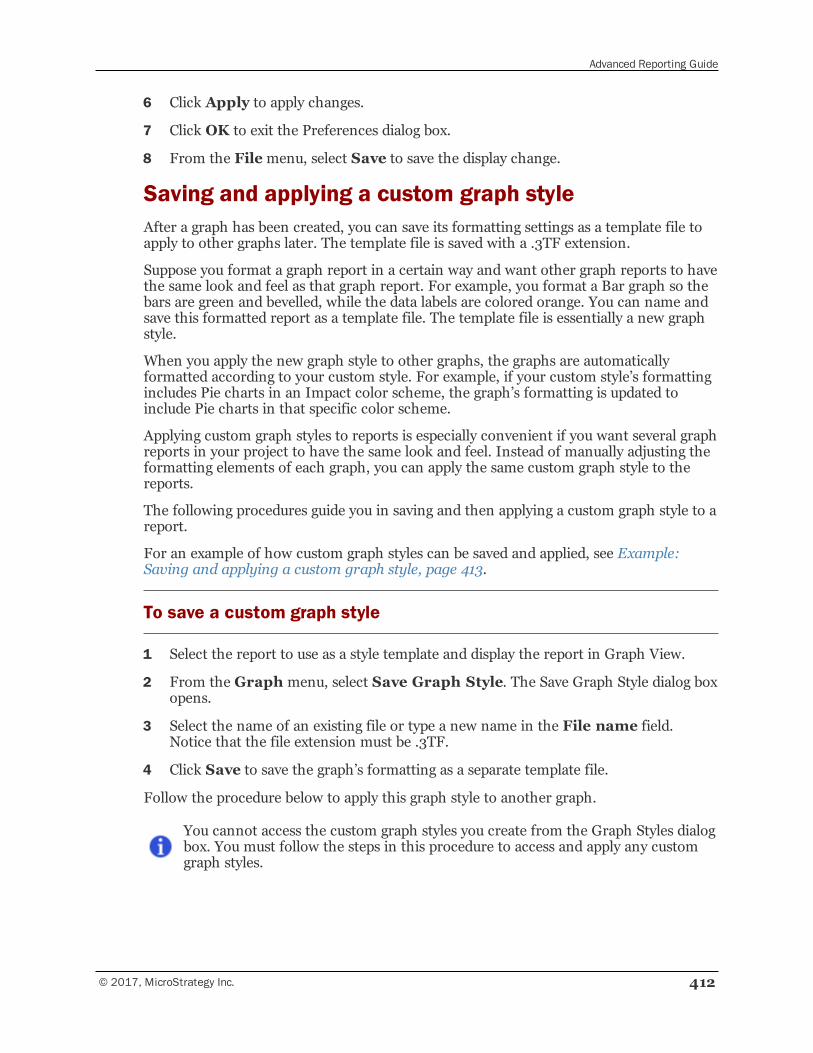
Advanced Reporting Guide
© 2017, MicroStrategy Inc. 412
6 Click Apply to apply changes.
7 Click OK to exit the Preferences dialog box.
8 From the Filemenu, select Save to save the display change.
Saving and applying a custom graph styleAfter a graph has been created, you can save its formatting settings as a template file toapply to other graphs later. The template file is saved with a .3TF extension.
Suppose you format a graph report in a certain way and want other graph reports to havethe same look and feel as that graph report. For example, you format a Bar graph so thebars are green and bevelled, while the data labels are colored orange. You can name andsave this formatted report as a template file. The template file is essentially a new graphstyle.
When you apply the new graph style to other graphs, the graphs are automaticallyformatted according to your custom style. For example, if your custom style’s formattingincludes Pie charts in an Impact color scheme, the graph’s formatting is updated toinclude Pie charts in that specific color scheme.
Applying custom graph styles to reports is especially convenient if you want several graphreports in your project to have the same look and feel. Instead of manually adjusting theformatting elements of each graph, you can apply the same custom graph style to thereports.
The following procedures guide you in saving and then applying a custom graph style to areport.
For an example of how custom graph styles can be saved and applied, see Example:Saving and applying a custom graph style, page 413.
To save a custom graph style
1 Select the report to use as a style template and display the report in Graph View.
2 From the Graph menu, select Save Graph Style. The Save Graph Style dialog boxopens.
3 Select the name of an existing file or type a new name in the File name field.Notice that the file extension must be .3TF.
4 Click Save to save the graph’s formatting as a separate template file.
Follow the procedure below to apply this graph style to another graph.
You cannot access the custom graph styles you create from the Graph Styles dialogbox. You must follow the steps in this procedure to access and apply any customgraph styles.
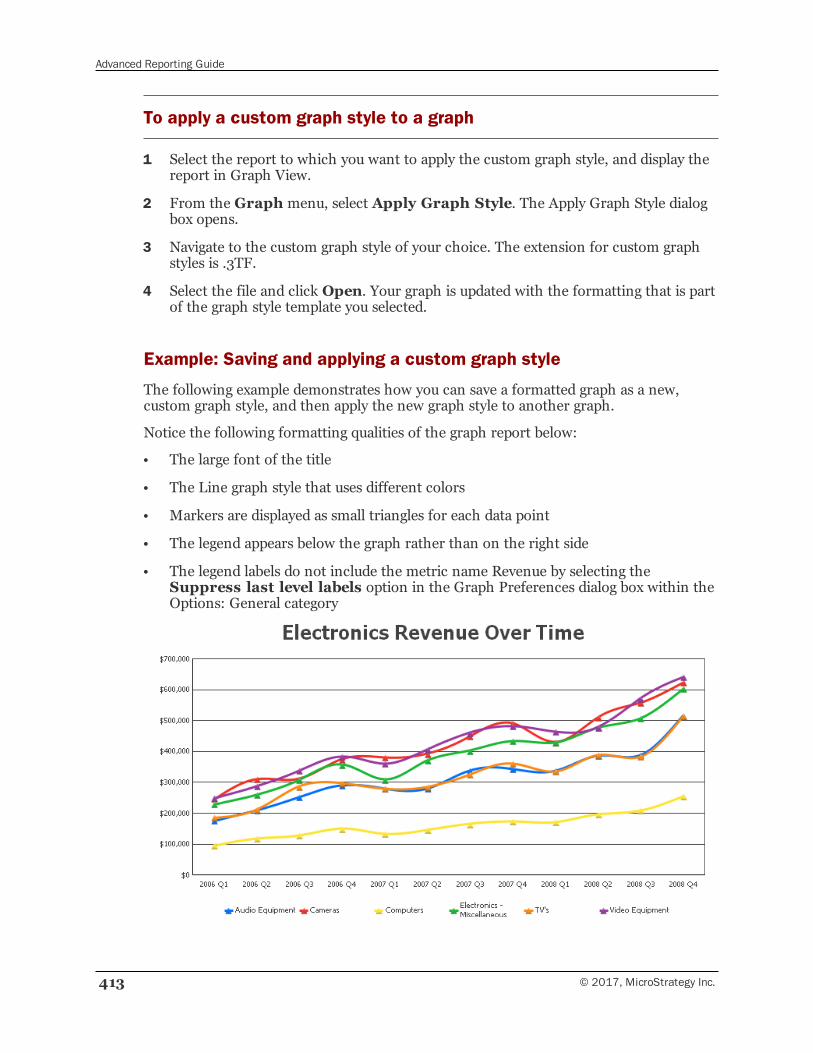
Advanced Reporting Guide
413 © 2017, MicroStrategy Inc.
To apply a custom graph style to a graph
1 Select the report to which you want to apply the custom graph style, and display thereport in Graph View.
2 From the Graph menu, select Apply Graph Style. The Apply Graph Style dialogbox opens.
3 Navigate to the custom graph style of your choice. The extension for custom graphstyles is .3TF.
4 Select the file and click Open. Your graph is updated with the formatting that is partof the graph style template you selected.
Example: Saving and applying a custom graph style
The following example demonstrates how you can save a formatted graph as a new,custom graph style, and then apply the new graph style to another graph.
Notice the following formatting qualities of the graph report below:
• The large font of the title
• The Line graph style that uses different colors
• Markers are displayed as small triangles for each data point
• The legend appears below the graph rather than on the right side
• The legend labels do not include the metric name Revenue by selecting theSuppress last level labels option in the Graph Preferences dialog box within theOptions: General category
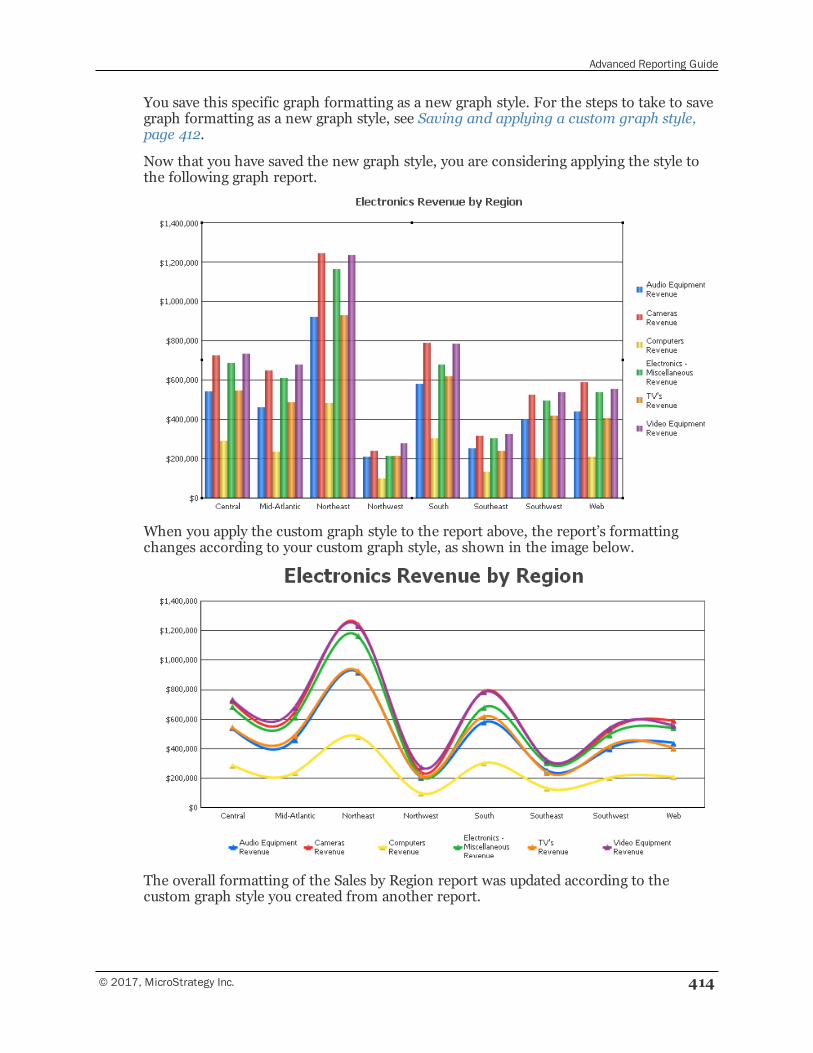
Advanced Reporting Guide
© 2017, MicroStrategy Inc. 414
You save this specific graph formatting as a new graph style. For the steps to take to savegraph formatting as a new graph style, see Saving and applying a custom graph style,page 412.
Now that you have saved the new graph style, you are considering applying the style tothe following graph report.
When you apply the custom graph style to the report above, the report’s formattingchanges according to your custom graph style, as shown in the image below.
The overall formatting of the Sales by Region report was updated according to thecustom graph style you created from another report.
Advanced Reporting Guide
415 © 2017, MicroStrategy Inc.
Choosing a graph image format for HTMLdocuments and Web
When you create and save a graph in MicroStrategy Developer, you should considerwhether users will access the graph in MicroStrategy Web, for example, in a report orHTML document. The image format assigned to a graph report directly affects how thegraph is executed in graphs and HTML documents in MicroStrategy Web.
For background information on HTML documents, see theMicroStrategyDeveloper help.
The format you choose affects the quality of the graph and how quickly it is displayed inMicroStrategy Web, as described in the procedure below. For example, when a graph issaved as a GIF, it is loaded quickly in MicroStrategy Web, but does not present colorgradients and other visual effects well.
You can determine the image file format in which to save the graphs in your graphreports in MicroStrategy Developer.
To select an image file format for a graph report in MicroStrategyDeveloper
1 Select the graph to modify and open it in Graph View in MicroStrategy Developer.
2 From the Graph menu, select Preferences. The Preferences dialog box opens.
3 Under Options, select Graph Type.
4 From the Show graph in format drop-down list, select an image format. Thefollowing section lists each image format and provides information on whether theformat is recommended for use in HTML documents or MicroStrategy Web:
• GIF: Produces the smallest file sizes and therefore allows for the fastest reportexecution. However, it is not recommended for HTML documents andMicroStrategy Web because it may not display color gradients and some othercolor elements correctly.
• PNG: Produces the second largest file sizes. While it is generally recommendedfor HTML documents and MicroStrategy Web, it is not recommended for anygraphs that include color gradients because gradients are not displayed correctly.
• JPEG: Produces the largest file sizes. It is recommended for HTML documentsand MicroStrategy Web because it allows color features such as gradients to bedisplayed correctly.
• BMP: Generally not recommended for HTML documents and MicroStrategyWeb because it may not display color gradients and some other color elementscorrectly.
5 Click OK. Save the graph report to apply the image format changes to it.
Advanced Reporting Guide
© 2017, MicroStrategy Inc. 416
Exporting and sharing graphsIn addition to viewing graphs in MicroStrategy Developer or Web, graphs can also beexported as various file types or copied into third-party applications such as MicrosoftPowerPoint or Excel. This allows you to provide graphs to your user community invarious formats and file types.
For steps, see:
• Exporting graphs
• Copying graphs into third-party applications
Exporting graphsYou can export a MicroStrategy graph into file types such as HTML, PDF, MicrosoftWord document, and Microsoft Excel document. This allows you to share MicroStrategygraphs as various file types that meet the needs of your user community. For example,you can export a graph to a PDF to share the graph with a user community that does nothave access to MicroStrategy Developer or Web.
The procedure below shows you how to export a MicroStrategy graph.
To export MicroStrategy graphs
1 In MicroStrategy Developer or Web, log in to a MicroStrategy project.
2 Browse to a MicroStrategy graph and execute it as a graph.
3 Export the MicroStrategy graph to the desired file type, using one of the followingprocedures:
• In MicroStrategy Developer, from the Data menu, point to Export To, andselect from the following export options:
— MS Excel
— MS Word
— HTML File
The MicroStrategy graph is created as the selected file type.
• In Web, from theHomemenu, click Export, and select from the followingexport options:
— Excel with formatting
— HTML
Advanced Reporting Guide
417 © 2017, MicroStrategy Inc.
If export options are displayed, select your desired export options andformatting. For information on the available export options, click Help.
Click Export. The MicroStrategy graph is created as the selected file type.
Copying graphs into third-party applicationsYou can copy MicroStrategy graphs from MicroStrategy Developer directly into third-party applications. This allows you to share MicroStrategy graphs through otherapplications that meet the needs of your user community. For example, while viewing agraph in MicroStrategy Developer, you can copy the graph display and paste it into aMicrosoft PowerPoint presentation.
You can also copy graphs into other Microsoft Office applications such as MicrosoftWord and Excel, as well as other document-authoring applications.
With MicroStrategy Office, you can fully integrate MicroStrategy reports anddocuments into your Microsoft Office applications. MicroStrategy reports anddocuments can then be refreshed with the most recent data available in yourMicroStrategy environment. For information on using and configuringMicroStrategy Office, see the Office User Guide.
The procedure below shows you how to copy a MicroStrategy graph into third-partyapplications.
To copy MicroStrategy graphs into third-party applications
1 In MicroStrategy Developer, log in to a MicroStrategy project.
2 Browse to a report, right-click the report and select Run. The Report Editor opens.
3 If the report is not displayed as a graph, from the View menu, select Graph View.
4 Modify and format the graph to fit your needs. When copying a graph, only theinformation that is currently displayed is copied. If data is on another page of thegraph, you must copy that page separately or define the graph to fit all data on onepage. For information on displaying data on a single page for a graph, see Displayinggraph data without scrollbars, page 317.
5 From the Edit menu, select Copy.
6 Open the third-party application to include the MicroStrategy graph in such asMicrosoft PowerPoint or Excel.
7 With the application open, select an area that allows images to be displayed such as aPowerPoint slide or a cell in an Excel spreadsheet. Perform the action required topaste the MicroStrategy graph into the third-party application. A common techniqueto perform this action is to right-click the area to copy the MicroStrategy graph to,and select Paste. The MicroStrategy graph is included in the third-party application.
Advanced Reporting Guide
© 2017, MicroStrategy Inc. 418
Using interactive graph visualizations indocuments: Widgets
If you are interested in creating and using interactive, Flash-based graph visualizations inReport Services documents, you may want to consider using widgets in the documents. Awidget is a type of Report Services control that presents data in a visual and interactiveway. You can think of widgets as interactive Flash-only graphs that dynamically updatewhen you select a new set of data to view. You can even use some types of widgets tomanually select a set of data to analyze. There are a number of widget types available,such as the Gauge or Interactive Stacked Area widget. Although each type of widget looksdifferent and is used in a unique way, the main purpose of widgets is the same: to providedocument analysts with a visual and interactive representation of their data.
Widgets are not available in reports; they are available only in Report Servicesdocuments. For more information, including steps to add widgets to your Report Servicesdocuments, see the Document Creation Guide.
9
DISPLAYING INFORMATIONABOUT REPORTS: REPORTDETAILS
You can determine what information appears in the Report Details pane for all reportsviewed on your machine. You can configure the following report details:
• Filter details, which display the report filter and report limit by default, althoughother types of filters can be displayed. See Configuring the filter details.
• Report limit details, which display the report limit.
• Prompt details, which display the prompt information for all prompts in the report.See Configuring the prompt details .
• Report details, which display the complete report details, including reportdescription, prompt details, filter details, and template details. See Configuringreport details.
• Template details, which display the complete template details, including attribute andmetric details. See Configuring the display of template details.
The following image displays the report description, report filter, and report limitsinformation in the Report Details pane in a report:
© 2017, MicroStrategy Inc. 419
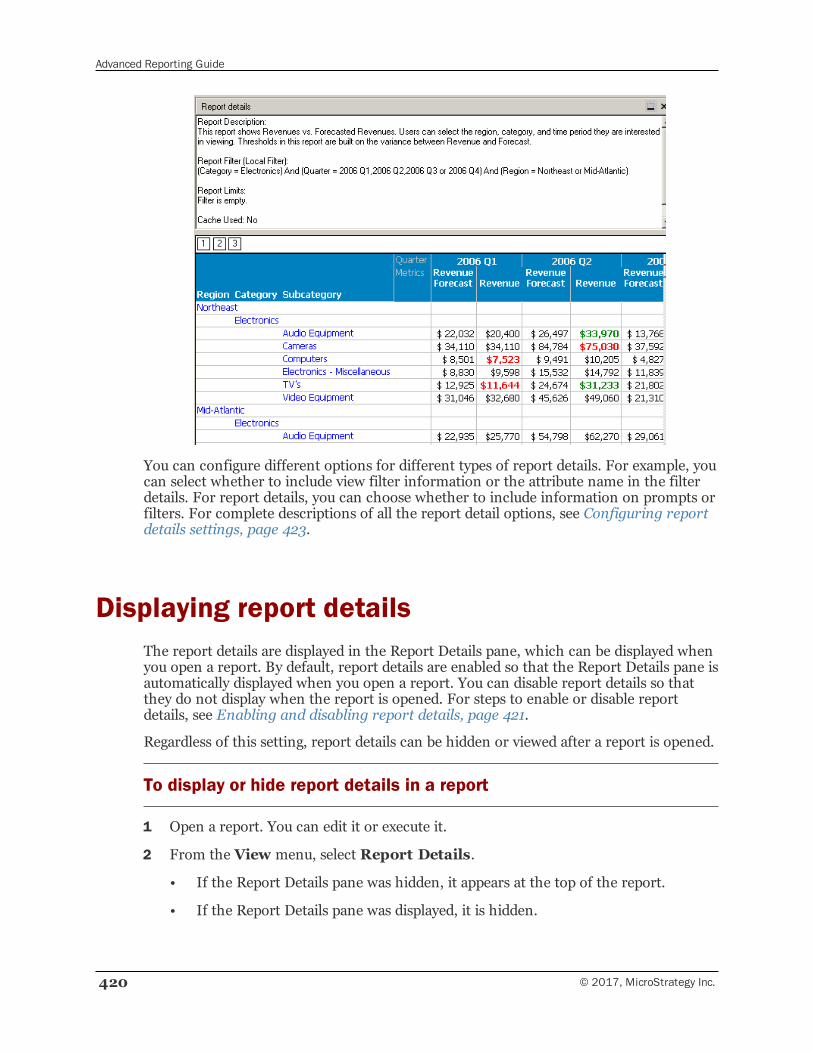
Advanced Reporting Guide
420 © 2017, MicroStrategy Inc.
You can configure different options for different types of report details. For example, youcan select whether to include view filter information or the attribute name in the filterdetails. For report details, you can choose whether to include information on prompts orfilters. For complete descriptions of all the report detail options, see Configuring reportdetails settings, page 423.
Displaying report detailsThe report details are displayed in the Report Details pane, which can be displayed whenyou open a report. By default, report details are enabled so that the Report Details pane isautomatically displayed when you open a report. You can disable report details so thatthey do not display when the report is opened. For steps to enable or disable reportdetails, see Enabling and disabling report details, page 421.
Regardless of this setting, report details can be hidden or viewed after a report is opened.
To display or hide report details in a report
1 Open a report. You can edit it or execute it.
2 From the View menu, select Report Details.
• If the Report Details pane was hidden, it appears at the top of the report.
• If the Report Details pane was displayed, it is hidden.
Advanced Reporting Guide
© 2017, MicroStrategy Inc. 421
Enabling and disabling report detailsBy default, report details are enabled so that you can view them in any report. You candisable report details so that they do not display when the report is opened. If you havedisabled them, you can enable them again.
To enable or disable report details
1 In MicroStrategy Developer, from the Tools menu, select Preferences. TheDeveloper Preferences dialog box opens.
2 Click the Report category to open it, and then click Report Details.
3 The Show report details check box governs whether the report details aredisplayed automatically:
• To enable report details, select the check box.
• To disable report details, clear the check box.
4 Click OK to save your changes.
Levels of report details configurationYou can configure:
• All the auto text codes in a specific text field in a document, from the Propertiesdialog box (the text field level)
• All the auto text codes in a specific document, from the Document Properties dialogbox (the document level)
For information on configuring auto text codes in documents, see the DocumentCreation Guide.
• The report details in the Report Editor, from the Report Details Formatting option(the report level)
• All the report details in a project, using the Project Configuration Editor (the projectlevel)
The list above also shows the order of precedence. The configuration of a particular textfield in a document overrides the configuration at the document level, which overridesthe configuration in the related dataset, which overrides the project configuration. Forexample, if an option is set one way for the project and another for the report, the reportsetting takes precedence.
The report details settings at the report and project levels are the same; the onlydifferences are where you configure the settings and what they affect. For completedescriptions of all the report detail options, see Configuring report details settings, page423.
Advanced Reporting Guide
422 © 2017, MicroStrategy Inc.
Interaction of report details preferences and reportdetails for reportsThe report details preferences specified in the Developer Preferences dialog box specifywhich types of report details are displayed. These preferences override some of the reportdetails that are configured in the Report Details Properties dialog box in the ProjectConfiguration Editor and the Report Editor. For example, you choose prompt details as areport details preference. When you open a prompted report, the name of each promptand its prompt answers are displayed in the Report Details pane. You cannot remove theprompt details display from that report, unless you remove prompt details as a reportdetails preference or disable report details preferences. In the report itself, however, youcan configure how the prompt details are displayed, such as whether the title of theprompt is displayed.
The report details preferences specify whether the following types of report details aredisplayed:
• Report description
• Prompt details
• Filter details
• Definition of shortcut filters, as opposed to the filter name
• View filter details
• Template/metric details
You can change this behavior by disabling the report details preferences, which allowsthe report details settings to be used instead. You can disable the report detailspreferences when you save changes to the report details settings or by using theDeveloper Preferences dialog box. Steps to disable them using the Developer Preferencesdialog box are below. For more information about the report details preferences ingeneral, see Enabling and customizing report details preferences, page 457.
The report details preferences do not affect auto text codes in documents; thepreferences only impact reports.
To disable report details preferences
1 From the Tools menu in MicroStrategy Developer, select Preferences. TheDeveloper Preferences dialog box opens.
2 Click the Report category to open it, and then click Report Details.
3 To use the report details settings instead of the report details preferences, clear theApply these Developer preferences to the Report Details check box.
4 Click OK to save your changes.
Advanced Reporting Guide
© 2017, MicroStrategy Inc. 423
Configuring report details settingsYou can configure the following types of report details:
• Filter details, which display the report filter and report limit by default, althoughother types of filters can be displayed.
• Report limit details, which display the report limit.
• Prompt details, which display the prompt information for all prompts in thereport.
• Report details, which display the complete report details, including reportdescription, prompt details, filter details, and template details.
• Template details, which display the complete template details, including attributedetails and metric details.
You can configure different options for different types of report details. For example, youcan select whether to include view filter information or the attribute name in the filterdetails. For report details, you can choose whether to include information on prompts orfilters. For a complete list of the report detail settings, see:
• Configuring the display of object name delimiters for report details, page 423
• Configuring report details, page 425
• Configuring the display of template details, page 428
• Configuring the prompt details , page 436
• Configuring the filter details, page 442
Configuring the display of object name delimiters forreport detailsDelimiters are the characters around attribute and metric names which set them offfrom other text. Braces { } are used as delimiters. You can apply the settingUsedelimiters around metadata object names to achieve any of the following in thedisplay of report details:
• Display delimiters for all metadata objects
• Omit delimiters for all metadata objects
• Display delimiters only for those objects that contain a special character(Automatic)
Special characters are characters other than a - z, A - Z, 0 - 9, #, _, and .(period).
For example, the following report filter shown in the Report Details pane displaysdelimiters:
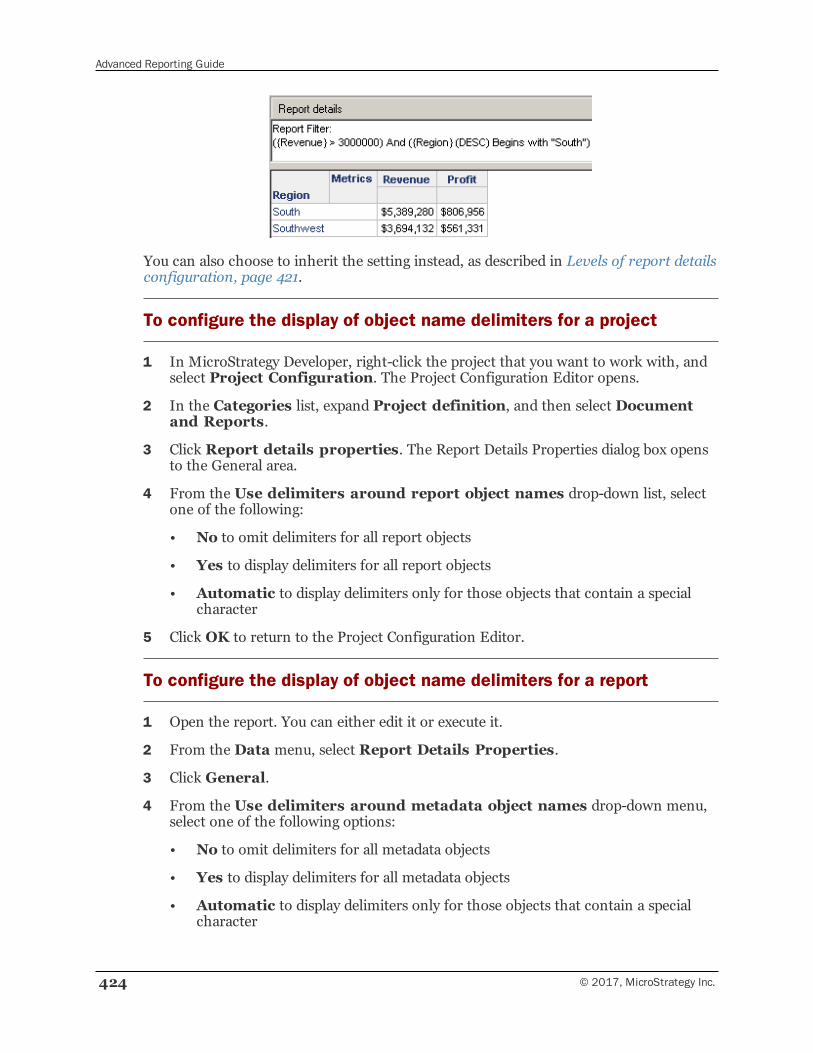
Advanced Reporting Guide
424 © 2017, MicroStrategy Inc.
You can also choose to inherit the setting instead, as described in Levels of report detailsconfiguration, page 421.
To configure the display of object name delimiters for a project
1 In MicroStrategy Developer, right-click the project that you want to work with, andselect Project Configuration. The Project Configuration Editor opens.
2 In the Categories list, expand Project definition, and then select Documentand Reports.
3 Click Report details properties. The Report Details Properties dialog box opensto the General area.
4 From the Use delimiters around report object names drop-down list, selectone of the following:
• No to omit delimiters for all report objects
• Yes to display delimiters for all report objects
• Automatic to display delimiters only for those objects that contain a specialcharacter
5 Click OK to return to the Project Configuration Editor.
To configure the display of object name delimiters for a report
1 Open the report. You can either edit it or execute it.
2 From the Data menu, select Report Details Properties.
3 Click General.
4 From the Use delimiters around metadata object names drop-down menu,select one of the following options:
• No to omit delimiters for all metadata objects
• Yes to display delimiters for all metadata objects
• Automatic to display delimiters only for those objects that contain a specialcharacter
Advanced Reporting Guide
© 2017, MicroStrategy Inc. 425
By default, this setting inherits the project setting, as described in Levels ofreport details configuration, page 421. You can return to this default byselecting <default> from the drop-down list.
5 Click OK to return to the report.
6 If report details preferences are enabled, a message opens, indicating that some ofyour changes may not be applied to the report. Object name delimiters are notaffected by report details preferences, so click No to keep report details preferencesenabled. For more information about report details preferences in general, seeEnabling and customizing report details preferences, page 457.
Configuring report detailsReport details display information about the report, including the report description,prompt details, filter details, and template details.
You can choose whether to include or omit the following:
• Report Description (the short description of the report)
• Prompt Details (the prompts on the report)
• Filter Details (the report filter, view filter, and report limits)
• Template Details (the objects on the report and the metric definitions)
You can also choose to inherit the setting instead, as described in Levels of report detailsconfiguration, page 421.
Report details: Examples
The following report sample shows the report details, as well as a portion of the executedreport. Notice that the report description, report filter, report limits, view filter, andtemplate information are displayed. The report limits information is blank because thereport does not include a report limit.
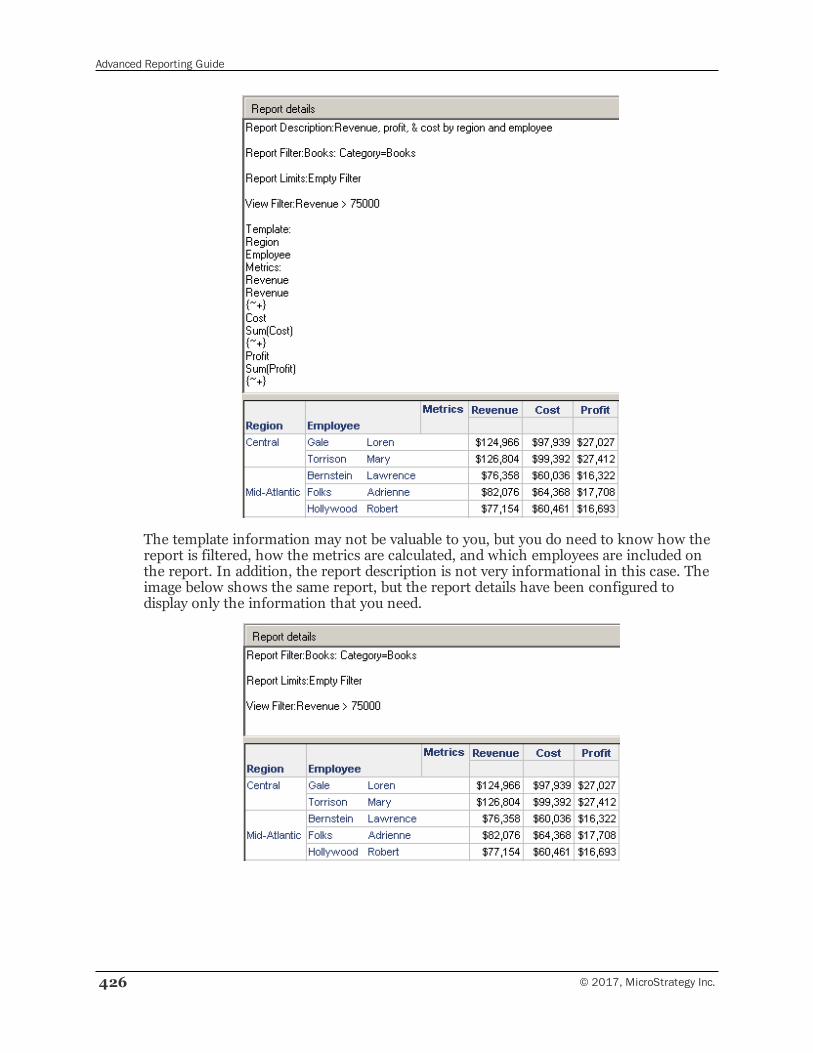
Advanced Reporting Guide
426 © 2017, MicroStrategy Inc.
The template information may not be valuable to you, but you do need to know how thereport is filtered, how the metrics are calculated, and which employees are included onthe report. In addition, the report description is not very informational in this case. Theimage below shows the same report, but the report details have been configured todisplay only the information that you need.
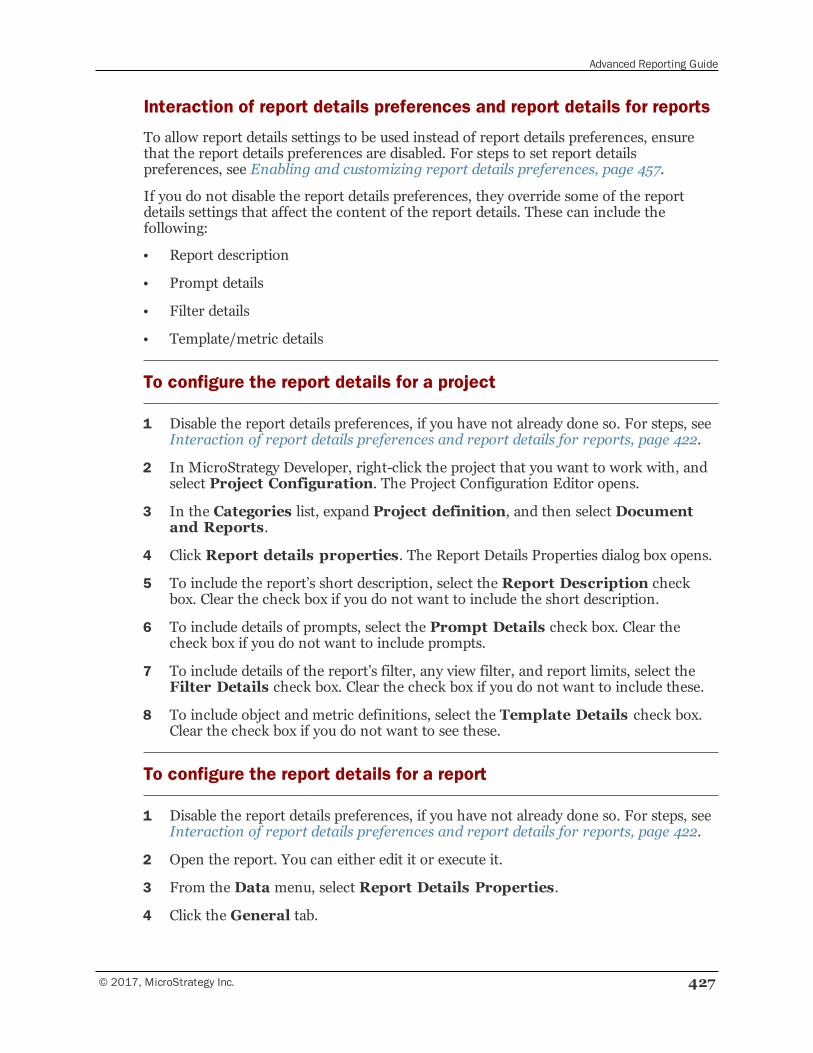
Advanced Reporting Guide
© 2017, MicroStrategy Inc. 427
Interaction of report details preferences and report details for reports
To allow report details settings to be used instead of report details preferences, ensurethat the report details preferences are disabled. For steps to set report detailspreferences, see Enabling and customizing report details preferences, page 457.
If you do not disable the report details preferences, they override some of the reportdetails settings that affect the content of the report details. These can include thefollowing:
• Report description
• Prompt details
• Filter details
• Template/metric details
To configure the report details for a project
1 Disable the report details preferences, if you have not already done so. For steps, seeInteraction of report details preferences and report details for reports, page 422.
2 In MicroStrategy Developer, right-click the project that you want to work with, andselect Project Configuration. The Project Configuration Editor opens.
3 In the Categories list, expand Project definition, and then select Documentand Reports.
4 Click Report details properties. The Report Details Properties dialog box opens.
5 To include the report’s short description, select the Report Description checkbox. Clear the check box if you do not want to include the short description.
6 To include details of prompts, select the Prompt Details check box. Clear thecheck box if you do not want to include prompts.
7 To include details of the report’s filter, any view filter, and report limits, select theFilter Details check box. Clear the check box if you do not want to include these.
8 To include object and metric definitions, select the Template Details check box.Clear the check box if you do not want to see these.
To configure the report details for a report
1 Disable the report details preferences, if you have not already done so. For steps, seeInteraction of report details preferences and report details for reports, page 422.
2 Open the report. You can either edit it or execute it.
3 From the Data menu, select Report Details Properties.
4 Click the General tab.
Advanced Reporting Guide
428 © 2017, MicroStrategy Inc.
By default, each setting on this tab inherits the project setting, as described inLevels of report details configuration, page 421. You can return to this defaultby selecting <default> from the drop-down list.
5 To determine whether to include the report's short description, select Yes or Nofrom the Report Description drop-down list.
6 To determine whether to include the prompts, select Yes or No from the PromptDetails drop-down list.
7 To determine whether to include the report filter, view filter, and report limits, selectYes or No from the Filter Details drop-down list.
8 To determine whether to include the objects and the metric definitions, select Yesor No from the Template Details drop-down list.
9 Click OK to close the Report Details Properties dialog box.
10 If report details preferences are enabled, a message opens, indicating that some ofyour changes may not be applied to the report, as described in Interaction of reportdetails preferences and report details for reports, page 427.
▫ To disable report details preferences, click Yes. The changes that you madeaffect the display of report details in this report, and report details preferencesare disabled for all reports.
▫ To keep report details preferences enabled, click No. The report detailspreferences override the changes that you made.
Configuring the display of template detailsThe template of a report contains:
• The group of objects (attribute, metrics, custom groups, and so on) that defines thecolumns of data to be included in the report
• The layout and format of those objects
The template details in the Report Details pane display information about the objects onthe report, but do not include layout and format information.
To configure the display of template details, you can:
• Choose whether to include the report objects from the base report or from the view.
A view report is created when you move objects from the grid of a report to theReport Objects, use a view filter, or create a derived metric. The report before youmade these kinds of modifications is referred to as the base report. The templatedetails can show all the objects on the report, regardless of whether they are on thereport grid, if you select Base. If you select View, only those objects on the reportgrid are included in the template details. See Including objects from the base or viewreport, page 429 for a more detailed description and examples.
Advanced Reporting Guide
© 2017, MicroStrategy Inc. 429
• Determine whether the template name of the report is displayed. If you choose todisplay the template name, you can also select whether to identify an embeddedtemplate as a local template. An embedded template is one that is part of the report,as opposed to a template saved as a stand-alone object. See Displaying the basetemplate name, page 430 for a more detailed description and examples.
• Determine whether the short description of the template is included. If the templateis embedded or does not have a description, the template description line is notdisplayed.
• Determine whether report objects other than metrics (such as attributes andconsolidations) are listed.
• Determine whether the metrics on the report are listed.
• If metrics are displayed, select whether to display each of the following:
▫ Conditional metrics only
▫ Metric formulas
▫ Metric dimensionality
▫ Metric conditionality
▫ Metric transformation
If you choose to inherit whether metrics are displayed, these settings are alsoinherited.
For steps to configure the template details, see Interaction of report details preferencesand template details for reports, page 433.
Including objects from the base or view reportYou create a view report if you do any of the following:
• Move objects from the grid of a report to the Report Objects
• Use a view filter
• Create a derived metric
The report before you made these kinds of modifications is referred to as the base report.The template details can show all the objects on the report, regardless of whether theyare on the report grid, if you select Base. If you select View, only those objects on thereport grid are included in the template details.
Base or view report setting: Examples
For example, a report contains the metrics Revenue, Cost, and Profit, but Profit is not onthe report grid. Profit is only displayed in the Report Objects.
• If you set Units from View or Base to Base, all three metrics show in theReport Details pane, as shown below:
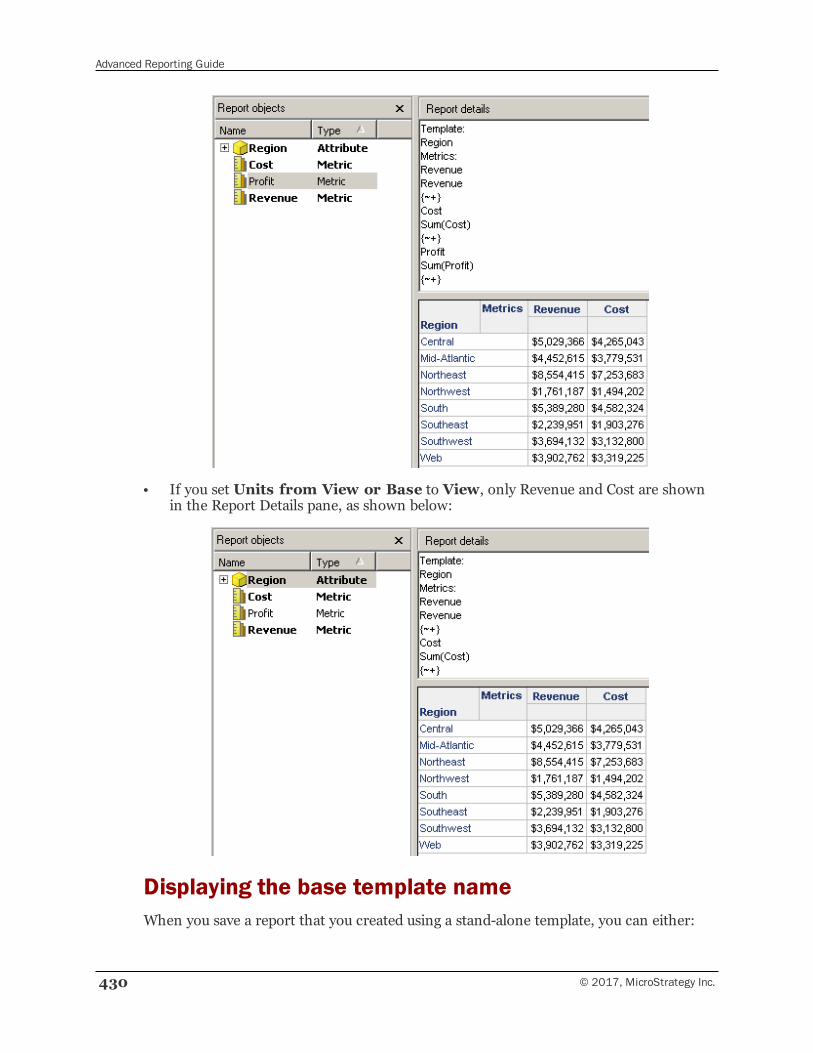
Advanced Reporting Guide
430 © 2017, MicroStrategy Inc.
• If you set Units from View or Base to View, only Revenue and Cost are shownin the Report Details pane, as shown below:
Displaying the base template nameWhen you save a report that you created using a stand-alone template, you can either:
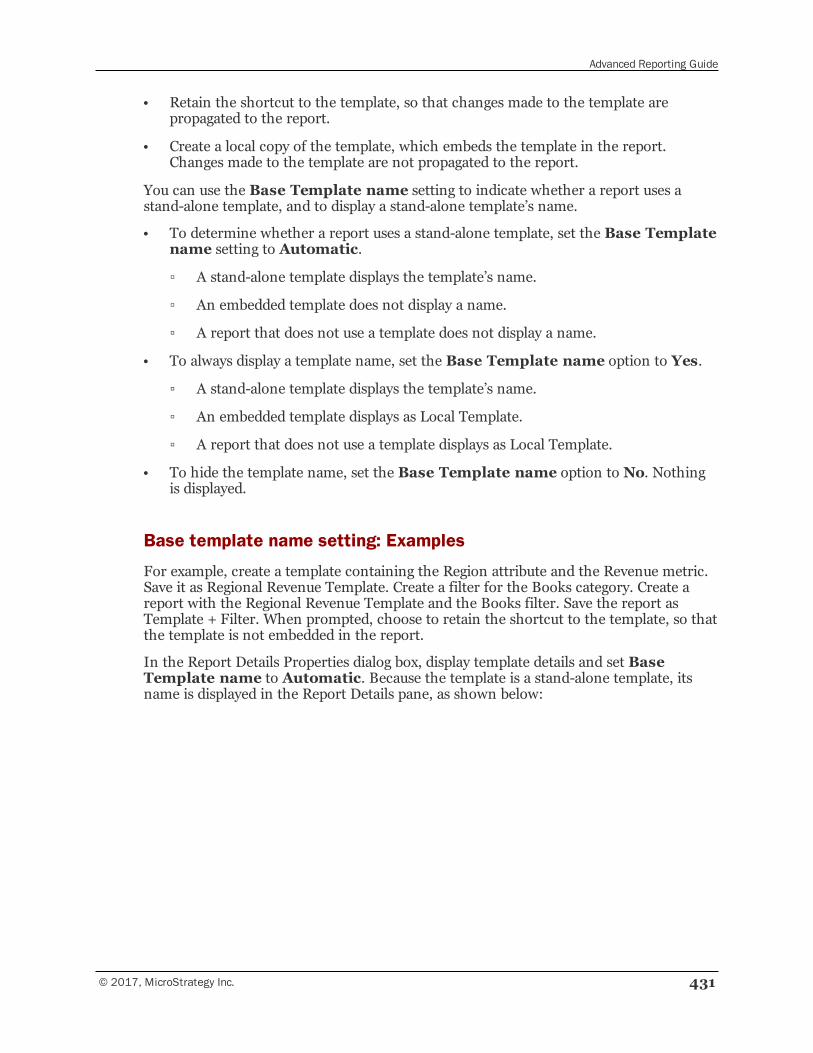
Advanced Reporting Guide
© 2017, MicroStrategy Inc. 431
• Retain the shortcut to the template, so that changes made to the template arepropagated to the report.
• Create a local copy of the template, which embeds the template in the report.Changes made to the template are not propagated to the report.
You can use the Base Template name setting to indicate whether a report uses astand-alone template, and to display a stand-alone template’s name.
• To determine whether a report uses a stand-alone template, set the Base Templatename setting to Automatic.
▫ A stand-alone template displays the template’s name.
▫ An embedded template does not display a name.
▫ A report that does not use a template does not display a name.
• To always display a template name, set the Base Template name option to Yes.
▫ A stand-alone template displays the template’s name.
▫ An embedded template displays as Local Template.
▫ A report that does not use a template displays as Local Template.
• To hide the template name, set the Base Template name option to No. Nothingis displayed.
Base template name setting: Examples
For example, create a template containing the Region attribute and the Revenue metric.Save it as Regional Revenue Template. Create a filter for the Books category. Create areport with the Regional Revenue Template and the Books filter. Save the report asTemplate + Filter. When prompted, choose to retain the shortcut to the template, so thatthe template is not embedded in the report.
In the Report Details Properties dialog box, display template details and set BaseTemplate name to Automatic. Because the template is a stand-alone template, itsname is displayed in the Report Details pane, as shown below:
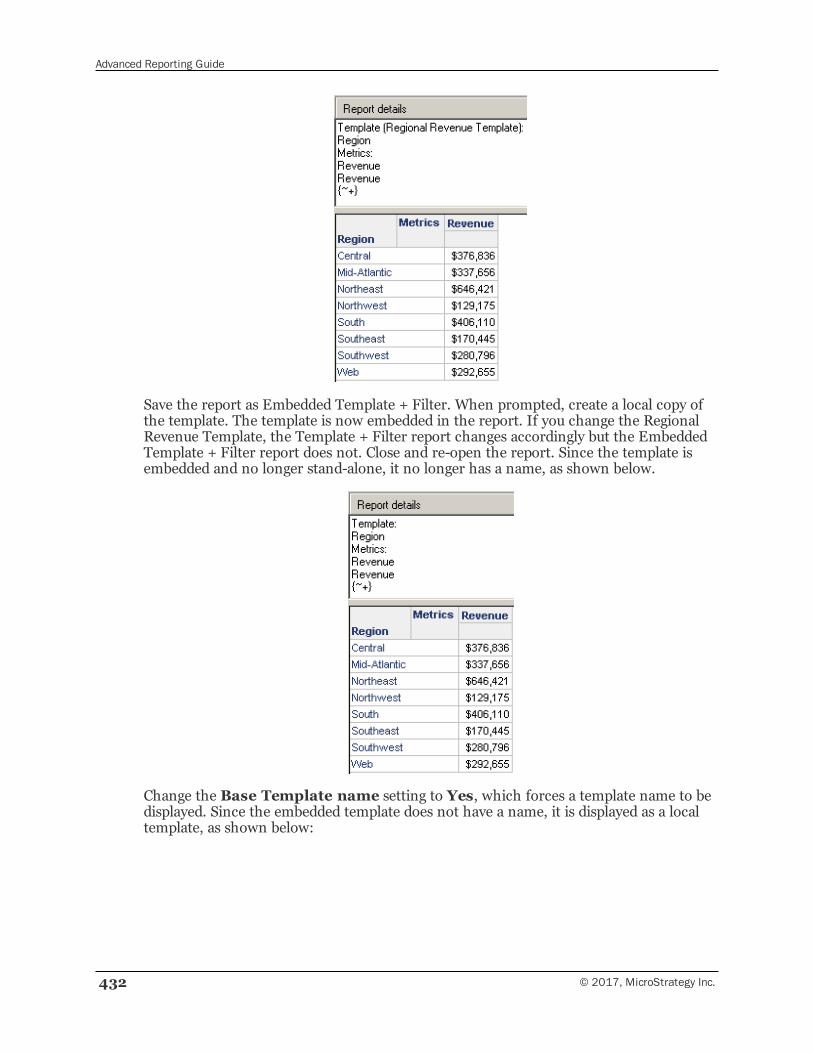
Advanced Reporting Guide
432 © 2017, MicroStrategy Inc.
Save the report as Embedded Template + Filter. When prompted, create a local copy ofthe template. The template is now embedded in the report. If you change the RegionalRevenue Template, the Template + Filter report changes accordingly but the EmbeddedTemplate + Filter report does not. Close and re-open the report. Since the template isembedded and no longer stand-alone, it no longer has a name, as shown below.
Change the Base Template name setting to Yes, which forces a template name to bedisplayed. Since the embedded template does not have a name, it is displayed as a localtemplate, as shown below:
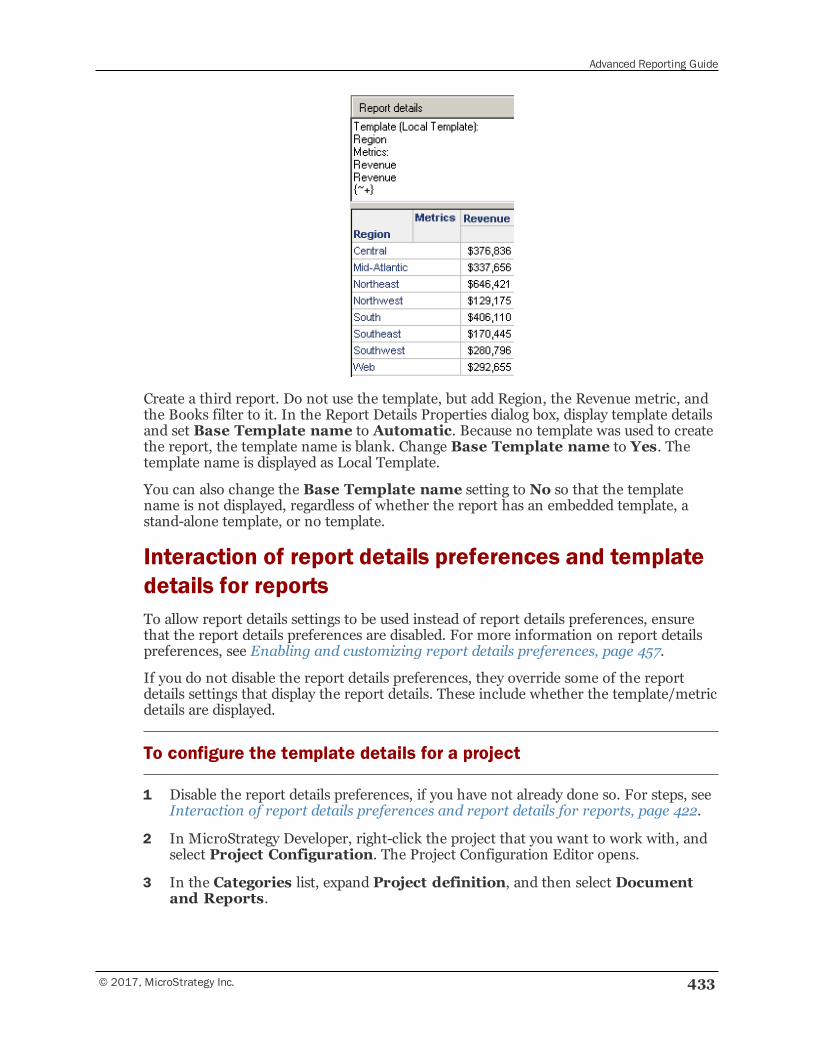
Advanced Reporting Guide
© 2017, MicroStrategy Inc. 433
Create a third report. Do not use the template, but add Region, the Revenue metric, andthe Books filter to it. In the Report Details Properties dialog box, display template detailsand set Base Template name to Automatic. Because no template was used to createthe report, the template name is blank. Change Base Template name to Yes. Thetemplate name is displayed as Local Template.
You can also change the Base Template name setting to No so that the templatename is not displayed, regardless of whether the report has an embedded template, astand-alone template, or no template.
Interaction of report details preferences and templatedetails for reportsTo allow report details settings to be used instead of report details preferences, ensurethat the report details preferences are disabled. For more information on report detailspreferences, see Enabling and customizing report details preferences, page 457.
If you do not disable the report details preferences, they override some of the reportdetails settings that display the report details. These include whether the template/metricdetails are displayed.
To configure the template details for a project
1 Disable the report details preferences, if you have not already done so. For steps, seeInteraction of report details preferences and report details for reports, page 422.
2 In MicroStrategy Developer, right-click the project that you want to work with, andselect Project Configuration. The Project Configuration Editor opens.
3 In the Categories list, expand Project definition, and then select Documentand Reports.
Advanced Reporting Guide
434 © 2017, MicroStrategy Inc.
4 Click Report details and properties. The Report Details Properties dialog boxopens.
5 Select the Template Details check box.
6 On the left, select Template Details.
7 To select whether the base or view report is used, choose one of the following fromthe Units from View or Base drop-down list:
• To include the report objects from the base report (which includes all the objectsthat make up the report’s definition, regardless of whether they are on the reportgrid), select Base.
• To include the report objects from the view report (which includes only theobjects on the report grid), select View.
See Including objects from the base or view report, page 429 for a detaileddescription and examples.
8 To select what is displayed for the template name, choose one of the following fromthe Base Template name drop-down list:
• To display the template name for a stand-alone template and “Local Template”for other reports, select Yes.
• To display the template name for a stand-alone template, but leave it blank forother reports, select Automatic.
• To omit the template name for all types of reports, choose No.
See Displaying the base template name, page 430 for a detailed description andexamples.
9 To include the short description of the template, select the Template Descriptioncheck box. Clear the check box if you do not want to include the short description.
10 To include descriptions of report objects other than metrics (such as attributes,consolidations, and custom groups), select the Non_Metric template units checkbox. Clear the check box if you do not want to include these.
11 To include metrics, select theMetrics check box. Clear the check box if you do notwant to include metrics.
12 If metrics are displayed, select or clear the check box for each of the following,depending on whether you want to display them:
• Conditional Metrics only
• Formula
• Dimensionality
• Conditionality
• Transformation
Advanced Reporting Guide
© 2017, MicroStrategy Inc. 435
If you choose to inherit whether metrics are displayed, these settings are alsoinherited.
13 Click OK to close the Report Details Properties dialog box.
To configure the template details for a report
1 Disable the report details preferences, if you have not already done so. For steps, seeInteraction of report details preferences and report details for reports, page 422.
2 Open the report. You can either edit it or execute it.
3 From the Data menu, select Report Details Properties.
4 Click the General tab.
5 Ensure that template details are displayed by setting Template Details to Yes.
6 Click the Template Details tab.
By default, each setting on this tab inherits the project setting, as described inLevels of report details configuration, page 421. You can return to this defaultby selecting <default> from the drop-down list.
7 To select whether the base or view report is used, choose one of the following fromthe Units from View or Base drop-down list:
• To include the report objects from the base report, which includes all the objectsin the report’s definition, regardless of whether they are on the report grid,select Base.
• To include the report objects from the view report, which includes only theobjects on the report grid, select View.
See Including objects from the base or view report, page 429 for a more detaileddescription and examples.
8 To select what is displayed for the template name, choose one of the following fromthe Base Template name drop-down list:
• To display the template name for a stand-alone template and “Local Template”for other reports, select Yes.
• To display the template name for a stand-alone template, but leave it blank forother reports, select Automatic.
• To omit the template name for all types of reports, choose No.
See Displaying the base template name, page 430 for a more detailed descriptionand examples.
9 To determine whether the short description of the template is included, select Yesor No from the Template Description drop-down list.
Advanced Reporting Guide
436 © 2017, MicroStrategy Inc.
If the template is embedded or does not have a description, the templatedescription line is not displayed.
10 To determine whether report objects other than metrics (such as attributes,consolidations, and custom groups) are listed, select Yes or No from the Non-metric template units drop-down list.
11 To determine whether the metrics on the report are listed, select Yes or No fromtheMetrics drop-down list.
12 If metrics are displayed, select whether to display each of the following:
• Only Conditional Metrics
• Formula
• Dimensionality
• Conditionality
• Transformation
If you choose to inherit whether metrics are displayed, these settings are alsoinherited.
13 Click OK to close the Report Details Properties dialog box.
14 If report details preferences are enabled, a message opens, indicating that some ofyour changes may not be applied to the report, as described in Interaction of reportdetails preferences and template details for reports, page 433.
▫ To disable report details preferences, click Yes. The changes that you madeaffect the display of template details in this report, and report details preferencesare disabled for all reports.
▫ To keep report details preferences enabled, click No. The report detailspreferences override the changes that you made.
Configuring the prompt detailsThe prompt details display the prompt information for all prompts in the report. You canconfigure:
• Whether the prompt title and index (a number indicating the order of the prompts inthe report) are displayed.
• The text to display when a prompt is unanswered. The options are:
▫ Display nothing
▫ Display “Prompt Not Answered”
▫ Display “No Selection”
Advanced Reporting Guide
© 2017, MicroStrategy Inc. 437
▫ Display “All/None”
Whether the word “All” or “None” displays depends on the type of prompt. Forexample, an unanswered object prompt displays as “None”, because no objectsare selected. An unanswered filter definition prompt displays as “All” because thereport is not filtered and therefore all the objects appear on the report.
• Whether and how to display the attribute name for the attribute element list promptsin the report. The options are:
▫ Display the attribute name (for example, Region)
▫ Omit the attribute name
▫ Repeat the attribute name for each prompt answer (for example, Region =North, Region = South)
The browse form of the attribute, which is displayed when a user answers theprompt, is used to display the attribute elements in the prompt details. Forinformation on browse forms, see the Project Design Guide.
• Whether to include unused prompts. An unused prompt occurs when you drill on areport that contains a prompt. The resulting child report can display or omit theprompt details from the parent.
Prompt details: ExamplesThe Regional Revenue by Category report contains the Category and Region attributes,and the Revenue metric. It is prompted for Category and Region. The prompt details areconfigured to display the prompt titles and index. The prompt title is specified when theprompt is created (Category prompt and Region prompt in the example below), and theindex is a number indicating the order of the prompts in the report (Prompt 1 andPrompt 2 below).
If you change the prompt details to omit the prompt titles and index, only the promptanswers are displayed, as shown below:
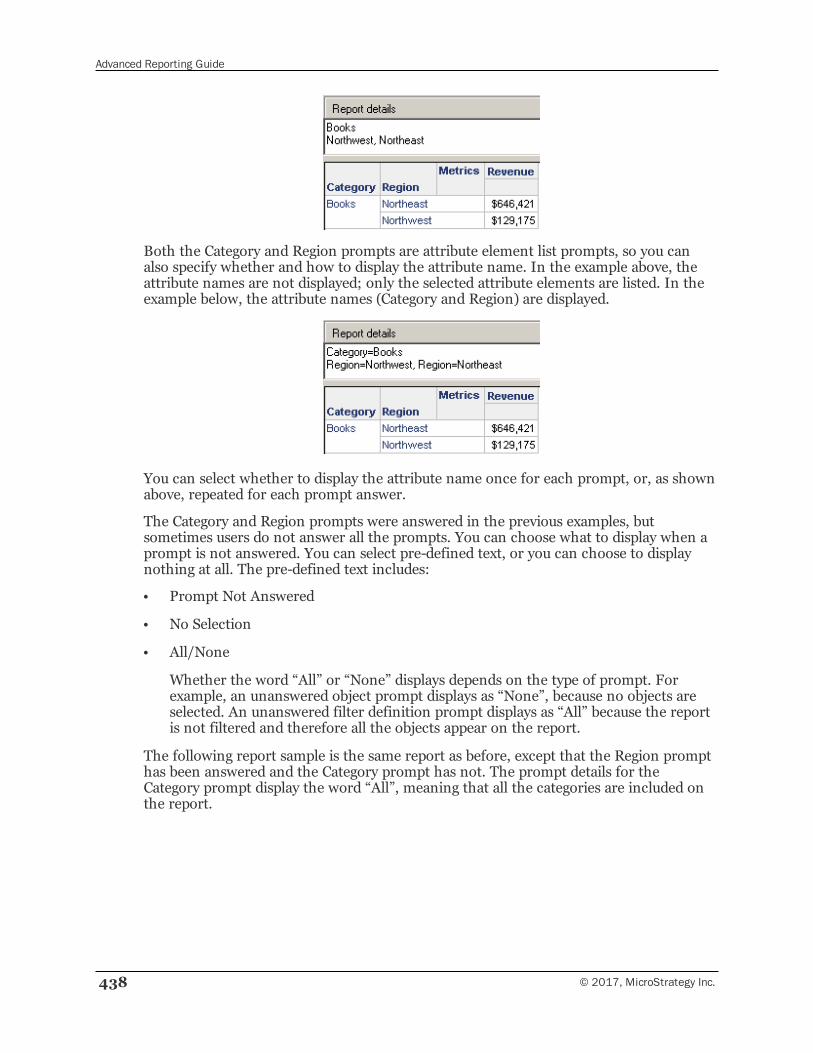
Advanced Reporting Guide
438 © 2017, MicroStrategy Inc.
Both the Category and Region prompts are attribute element list prompts, so you canalso specify whether and how to display the attribute name. In the example above, theattribute names are not displayed; only the selected attribute elements are listed. In theexample below, the attribute names (Category and Region) are displayed.
You can select whether to display the attribute name once for each prompt, or, as shownabove, repeated for each prompt answer.
The Category and Region prompts were answered in the previous examples, butsometimes users do not answer all the prompts. You can choose what to display when aprompt is not answered. You can select pre-defined text, or you can choose to displaynothing at all. The pre-defined text includes:
• Prompt Not Answered
• No Selection
• All/None
Whether the word “All” or “None” displays depends on the type of prompt. Forexample, an unanswered object prompt displays as “None”, because no objects areselected. An unanswered filter definition prompt displays as “All” because the reportis not filtered and therefore all the objects appear on the report.
The following report sample is the same report as before, except that the Region prompthas been answered and the Category prompt has not. The prompt details for theCategory prompt display the word “All”, meaning that all the categories are included onthe report.
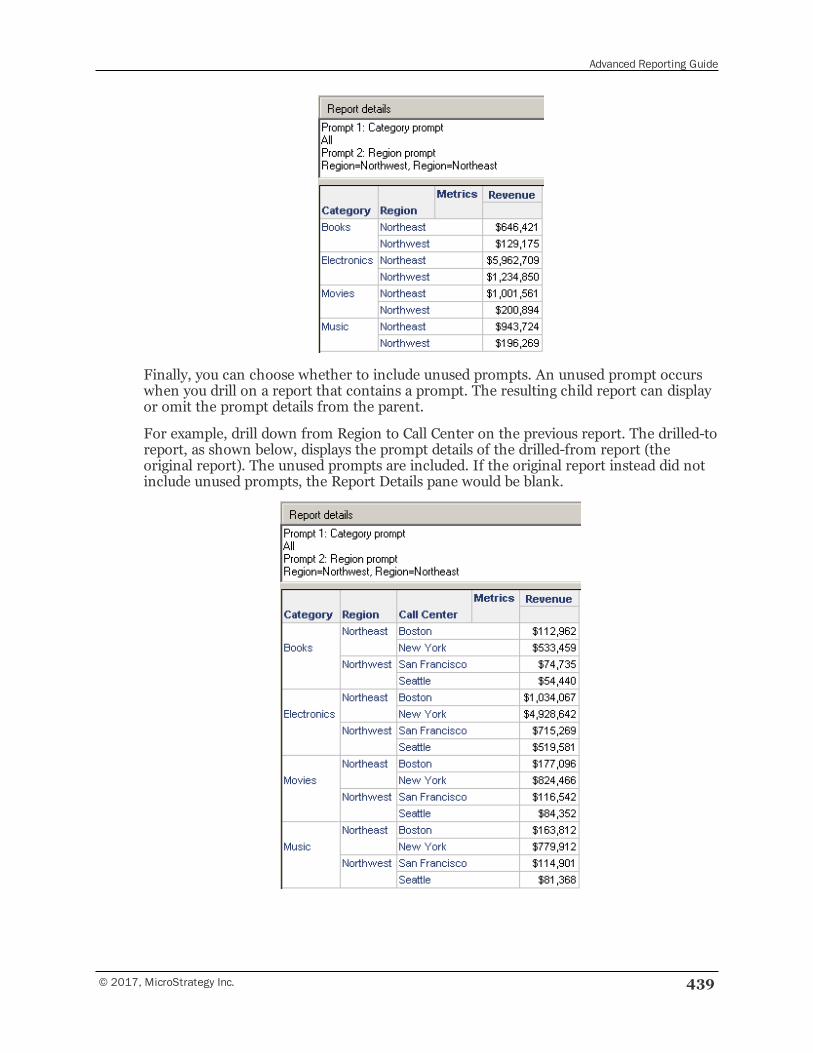
Advanced Reporting Guide
© 2017, MicroStrategy Inc. 439
Finally, you can choose whether to include unused prompts. An unused prompt occurswhen you drill on a report that contains a prompt. The resulting child report can displayor omit the prompt details from the parent.
For example, drill down from Region to Call Center on the previous report. The drilled-toreport, as shown below, displays the prompt details of the drilled-from report (theoriginal report). The unused prompts are included. If the original report instead did notinclude unused prompts, the Report Details pane would be blank.
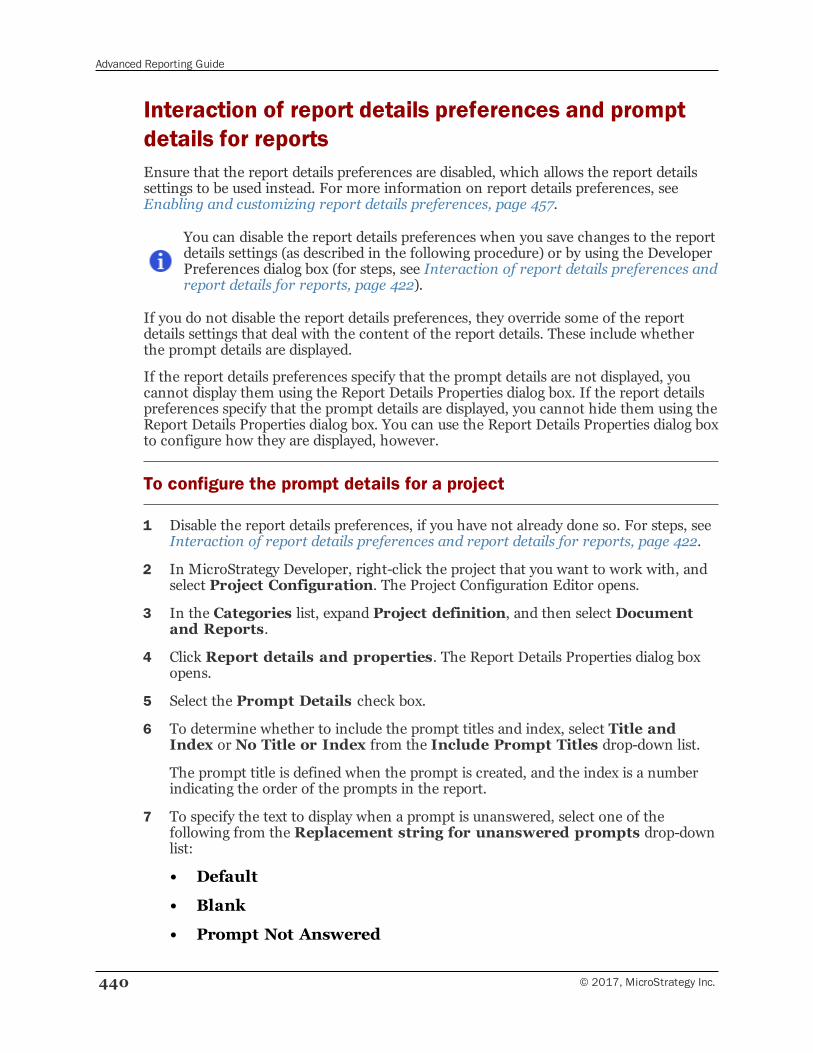
Advanced Reporting Guide
440 © 2017, MicroStrategy Inc.
Interaction of report details preferences and promptdetails for reportsEnsure that the report details preferences are disabled, which allows the report detailssettings to be used instead. For more information on report details preferences, seeEnabling and customizing report details preferences, page 457.
You can disable the report details preferences when you save changes to the reportdetails settings (as described in the following procedure) or by using the DeveloperPreferences dialog box (for steps, see Interaction of report details preferences andreport details for reports, page 422).
If you do not disable the report details preferences, they override some of the reportdetails settings that deal with the content of the report details. These include whetherthe prompt details are displayed.
If the report details preferences specify that the prompt details are not displayed, youcannot display them using the Report Details Properties dialog box. If the report detailspreferences specify that the prompt details are displayed, you cannot hide them using theReport Details Properties dialog box. You can use the Report Details Properties dialog boxto configure how they are displayed, however.
To configure the prompt details for a project
1 Disable the report details preferences, if you have not already done so. For steps, seeInteraction of report details preferences and report details for reports, page 422.
2 In MicroStrategy Developer, right-click the project that you want to work with, andselect Project Configuration. The Project Configuration Editor opens.
3 In the Categories list, expand Project definition, and then select Documentand Reports.
4 Click Report details and properties. The Report Details Properties dialog boxopens.
5 Select the Prompt Details check box.
6 To determine whether to include the prompt titles and index, select Title andIndex or No Title or Index from the Include Prompt Titles drop-down list.
The prompt title is defined when the prompt is created, and the index is a numberindicating the order of the prompts in the report.
7 To specify the text to display when a prompt is unanswered, select one of thefollowing from the Replacement string for unanswered prompts drop-downlist:
• Default
• Blank
• Prompt Not Answered
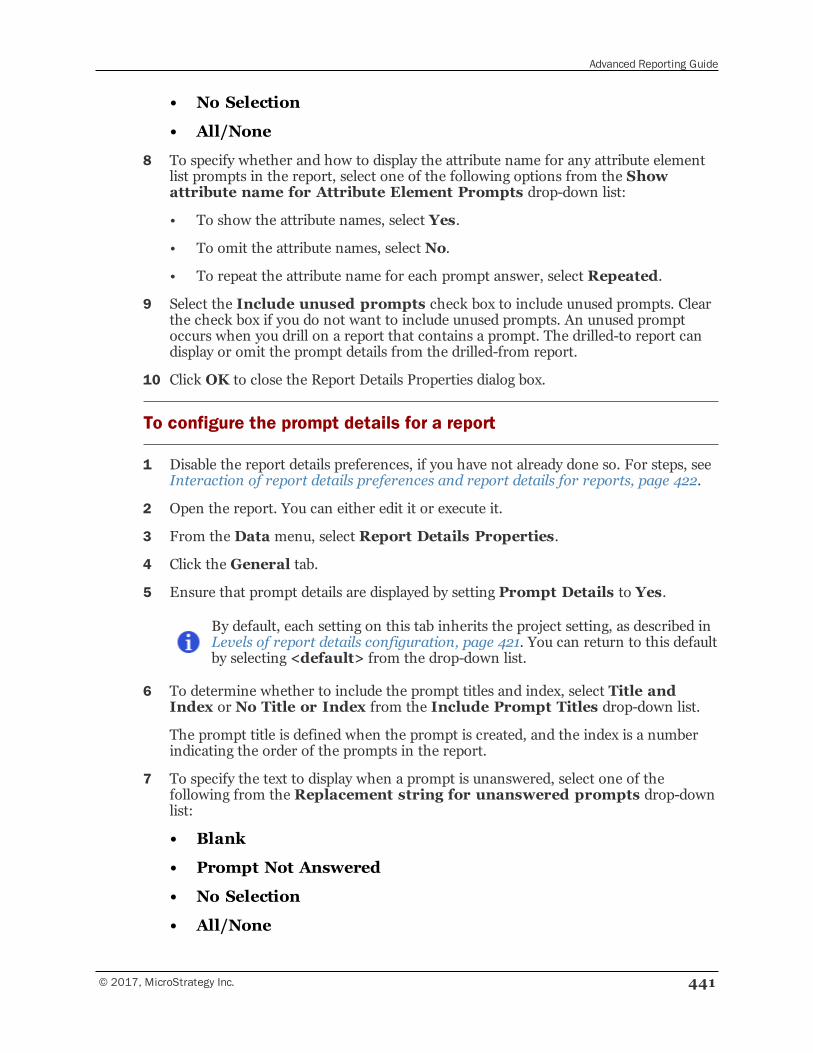
Advanced Reporting Guide
© 2017, MicroStrategy Inc. 441
• No Selection
• All/None
8 To specify whether and how to display the attribute name for any attribute elementlist prompts in the report, select one of the following options from the Showattribute name for Attribute Element Prompts drop-down list:
• To show the attribute names, select Yes.
• To omit the attribute names, select No.
• To repeat the attribute name for each prompt answer, select Repeated.
9 Select the Include unused prompts check box to include unused prompts. Clearthe check box if you do not want to include unused prompts. An unused promptoccurs when you drill on a report that contains a prompt. The drilled-to report candisplay or omit the prompt details from the drilled-from report.
10 Click OK to close the Report Details Properties dialog box.
To configure the prompt details for a report
1 Disable the report details preferences, if you have not already done so. For steps, seeInteraction of report details preferences and report details for reports, page 422.
2 Open the report. You can either edit it or execute it.
3 From the Data menu, select Report Details Properties.
4 Click the General tab.
5 Ensure that prompt details are displayed by setting Prompt Details to Yes.
By default, each setting on this tab inherits the project setting, as described inLevels of report details configuration, page 421. You can return to this defaultby selecting <default> from the drop-down list.
6 To determine whether to include the prompt titles and index, select Title andIndex or No Title or Index from the Include Prompt Titles drop-down list.
The prompt title is defined when the prompt is created, and the index is a numberindicating the order of the prompts in the report.
7 To specify the text to display when a prompt is unanswered, select one of thefollowing from the Replacement string for unanswered prompts drop-downlist:
• Blank
• Prompt Not Answered
• No Selection
• All/None
Advanced Reporting Guide
442 © 2017, MicroStrategy Inc.
8 To specify whether and how to display the attribute name for any attribute elementlist prompts in the report, select one of the following options from the Showattribute name for Attribute Element Prompts drop-down list:
• To show the attribute names, select Yes.
• To omit the attribute names, select No.
• To repeat the attribute name for each prompt answer, select Repeated.
9 To specify whether or to not include unused prompts, select Yes or No from theInclude unused prompts drop-down list. An unused prompt occurs when youdrill on a report that contains a prompt. The resulting child report can display oromit the prompt details from the parent.
10 Click OK to close the Report Details Properties dialog box.
11 If report details preferences are enabled, a message opens, indicating that some ofyour changes may not be applied to the report, as described in Interaction of reportdetails preferences and prompt details for reports, page 440.
▫ To disable report details preferences, click Yes. The changes that you madeaffect the display of prompt details in this report, and report details preferencesare disabled for all reports.
▫ To keep report details preferences enabled, click No. The report detailspreferences override the changes that you made.
Configuring the filter detailsThis section assumes that you are familiar with filters, especially the different typesof filters, stand-alone vs. embedded filters, and the components of filters. Forbackground information, see the Basic Reporting Guide.
The filter details display information about the report filter and report limit used in thereport by default, although other types of filters can be displayed. The filter details havemany configuration settings, which can be grouped into the following categories. This listprovides a summary of the settings.
• You can configure the content of the filter details, by selecting which filter types toinclude (report filter, view filter, report limits, and so on) and how the filters aredisplayed. For example, you can select whether to include the name of the filter typeand whether to display the report limits before or after view filters. See Configuringthe content of the filter details, page 443 for descriptions of all these options.
• For filters that contain attribute element list qualifications, you can configure howthose lists are displayed. For example, you can specify whether to show the attributename (such as Region or Category) and the separator between attribute names. SeeConfiguring how attribute element list qualifications are displayed, page 449 fordescriptions of all these options.
• You can configure how attribute form and set qualifications in filters are displayed.For example, you can select whether to use names or symbols for the operators. See
Advanced Reporting Guide
© 2017, MicroStrategy Inc. 443
Configuring how attribute form and set qualifications are displayed, page 451 fordescriptions of all these options.
• You can configure how logical operators, which join multiple qualifications or filters,are displayed. For example, you can configure whether to include parenthesesaround conditions. See Configuring how logical operators are displayed, page 452for descriptions of all these options.
• You can configure whether aliases replace object names in the filter details. SeeConfiguring whether to use aliases in the filter details , page 454 for a detaileddescription of this option.
For the procedure to configure the filter details, see Configuring the display of filterdetails: Procedure, page 455.
Interaction of report details preferences and filterdetails for reportsEnsure that the report details preferences are disabled, which allows the report detailssettings to be used instead. For more information on report details preferences, seeEnabling and customizing report details preferences, page 457.
You can disable the report details preferences when you save changes to the reportdetails settings (as described in Configuring the display of filter details: Procedure,page 455) or by using the Developer Preferences dialog box (for steps, seeInteraction of report details preferences and report details for reports, page422).
If you do not disable the report details preferences, they override some of the reportdetails settings that deal with the content of the report details. These include whetherthe filter details are displayed.
If the report details preferences specify that the filter details are not displayed, youcannot display them using the Report Details Properties dialog box. If the report detailspreferences specify that the filter details are displayed, you cannot hide them using theReport Details Properties dialog box. You can use the Report Details Properties dialog boxto configure how they are displayed, however.
Configuring the content of the filter detailsYou can choose whether to include each type of filter. The filter types are listed below:
• Report Filter
If the report filter is displayed, you can select whether to display the following:
▫ Report Filter Name. You can also select another option, Automatic. IfAutomatic is chosen, the report filter name is displayed for a stand-alone filter,but is omitted for an embedded filter.
▫ Report Filter Description.
• Report Limits
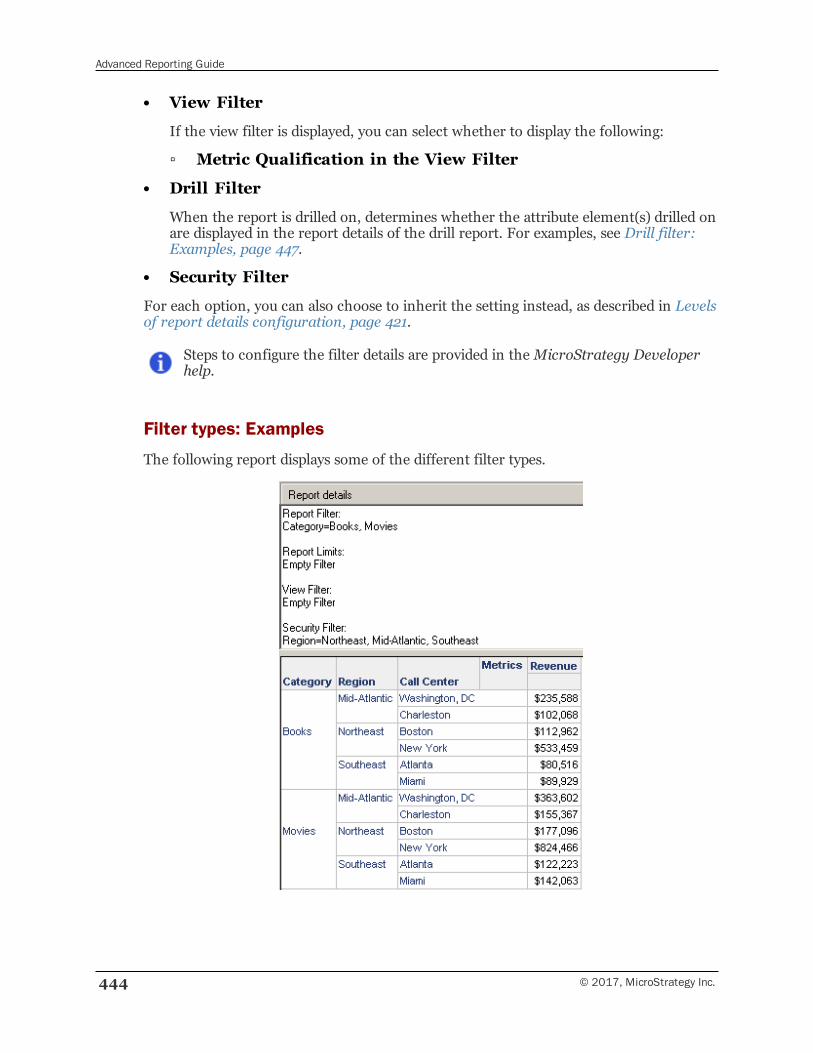
Advanced Reporting Guide
444 © 2017, MicroStrategy Inc.
• View Filter
If the view filter is displayed, you can select whether to display the following:
▫ Metric Qualification in the View Filter
• Drill Filter
When the report is drilled on, determines whether the attribute element(s) drilled onare displayed in the report details of the drill report. For examples, see Drill filter:Examples, page 447.
• Security Filter
For each option, you can also choose to inherit the setting instead, as described in Levelsof report details configuration, page 421.
Steps to configure the filter details are provided in theMicroStrategy Developerhelp.
Filter types: Examples
The following report displays some of the different filter types.
Advanced Reporting Guide
© 2017, MicroStrategy Inc. 445
The report filter is embedded, and the Report Filter Name option is set toAutomatic, therefore no name is displayed for the report filter. If the Report FilterName option was set to Yes instead, the report details would display as:
Report Filter (Local Filter)
Category = Books, Movies
If the report filter was a stand-alone filter (not a filter embedded in that report), thename displays if the Report Filter Name setting is set to Automatic or Yes. Forexample, if the report was filtered by the stand-alone filter named Southern Regions, thereport details display as:
Report Filter (Southern Regions)
Region = South, Southeast, Southwest
The content of the filter types: Examples
You can configure how the filters are displayed in the filter details by specifying thefollowing settings:
• Whether to include the names of the filter types, such as Report Filter, View Filter,and so on.
In the report sample above, the names are displayed. If the names are omitted, thefilter details display as:
(Local Filter): Category=Books, Movies
Region=Northeast, Mid-Atlantic, Southeast
• If the filter type name is included, specify whether to include empty expressions. Anempty expression is a filter type that is not included on the report.
For example, the report sample above lists report limits and view filter, even thoughthe report does not contain either one. The filter details could instead display onlythose filter types that the report contains, such as:
Report Filter (Local Filter):
Category = Books, Movies
Security Filter:
Region=Northeast, Mid-Atlantic, Southeast
• Whether to add a new line after each filter type name, before the actual definition ofthe filter.
For example, the report sample above includes a new line after each filter type name.If the line is omitted, the filter details display as:
Report Filter (Local Filter): Category= Books, Movies
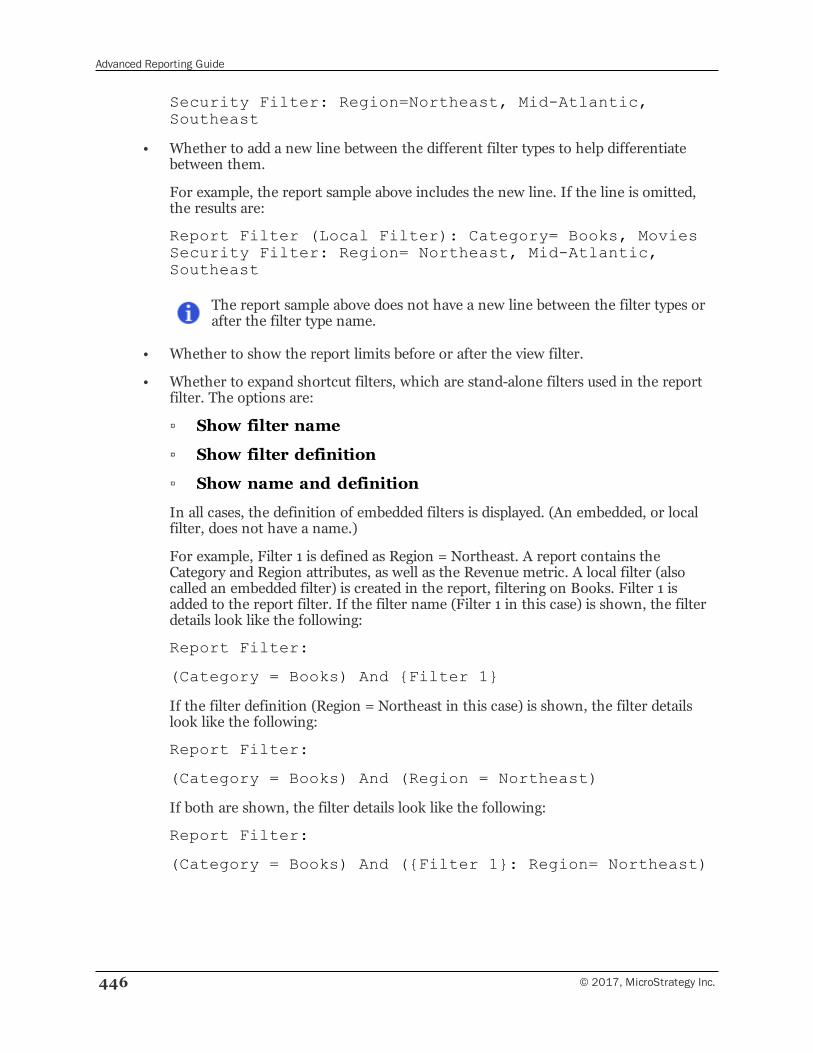
Advanced Reporting Guide
446 © 2017, MicroStrategy Inc.
Security Filter: Region=Northeast, Mid-Atlantic,Southeast
• Whether to add a new line between the different filter types to help differentiatebetween them.
For example, the report sample above includes the new line. If the line is omitted,the results are:
Report Filter (Local Filter): Category= Books, MoviesSecurity Filter: Region= Northeast, Mid-Atlantic,Southeast
The report sample above does not have a new line between the filter types orafter the filter type name.
• Whether to show the report limits before or after the view filter.
• Whether to expand shortcut filters, which are stand-alone filters used in the reportfilter. The options are:
▫ Show filter name
▫ Show filter definition
▫ Show name and definition
In all cases, the definition of embedded filters is displayed. (An embedded, or localfilter, does not have a name.)
For example, Filter 1 is defined as Region = Northeast. A report contains theCategory and Region attributes, as well as the Revenue metric. A local filter (alsocalled an embedded filter) is created in the report, filtering on Books. Filter 1 isadded to the report filter. If the filter name (Filter 1 in this case) is shown, the filterdetails look like the following:
Report Filter:
(Category = Books) And {Filter 1}
If the filter definition (Region = Northeast in this case) is shown, the filter detailslook like the following:
Report Filter:
(Category = Books) And (Region = Northeast)
If both are shown, the filter details look like the following:
Report Filter:
(Category = Books) And ({Filter 1}: Region= Northeast)
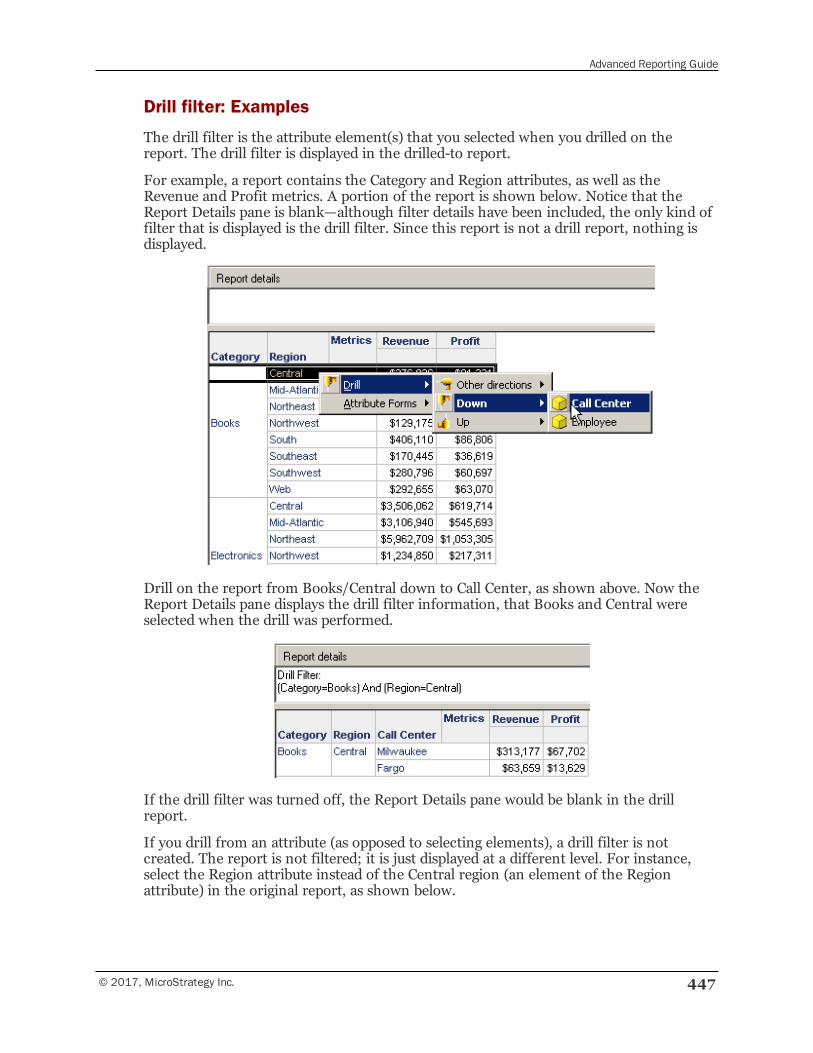
Advanced Reporting Guide
© 2017, MicroStrategy Inc. 447
Drill filter: Examples
The drill filter is the attribute element(s) that you selected when you drilled on thereport. The drill filter is displayed in the drilled-to report.
For example, a report contains the Category and Region attributes, as well as theRevenue and Profit metrics. A portion of the report is shown below. Notice that theReport Details pane is blank—although filter details have been included, the only kind offilter that is displayed is the drill filter. Since this report is not a drill report, nothing isdisplayed.
Drill on the report from Books/Central down to Call Center, as shown above. Now theReport Details pane displays the drill filter information, that Books and Central wereselected when the drill was performed.
If the drill filter was turned off, the Report Details pane would be blank in the drillreport.
If you drill from an attribute (as opposed to selecting elements), a drill filter is notcreated. The report is not filtered; it is just displayed at a different level. For instance,select the Region attribute instead of the Central region (an element of the Regionattribute) in the original report, as shown below.
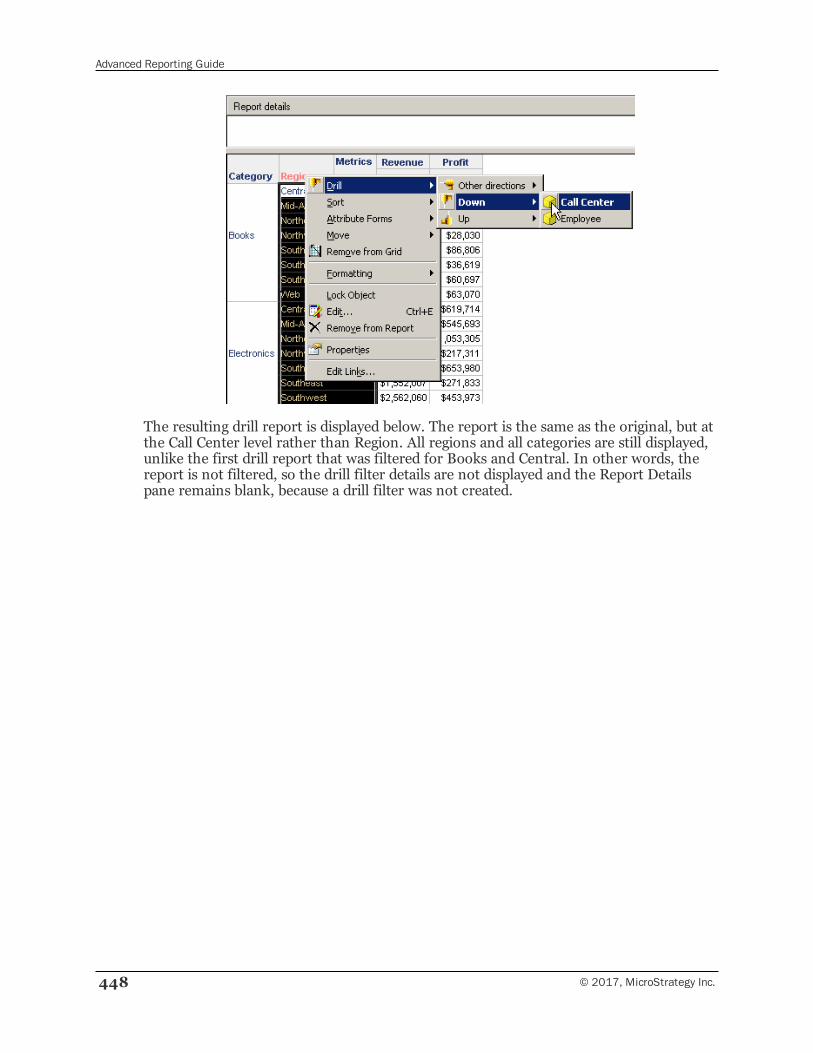
Advanced Reporting Guide
448 © 2017, MicroStrategy Inc.
The resulting drill report is displayed below. The report is the same as the original, but atthe Call Center level rather than Region. All regions and all categories are still displayed,unlike the first drill report that was filtered for Books and Central. In other words, thereport is not filtered, so the drill filter details are not displayed and the Report Detailspane remains blank, because a drill filter was not created.
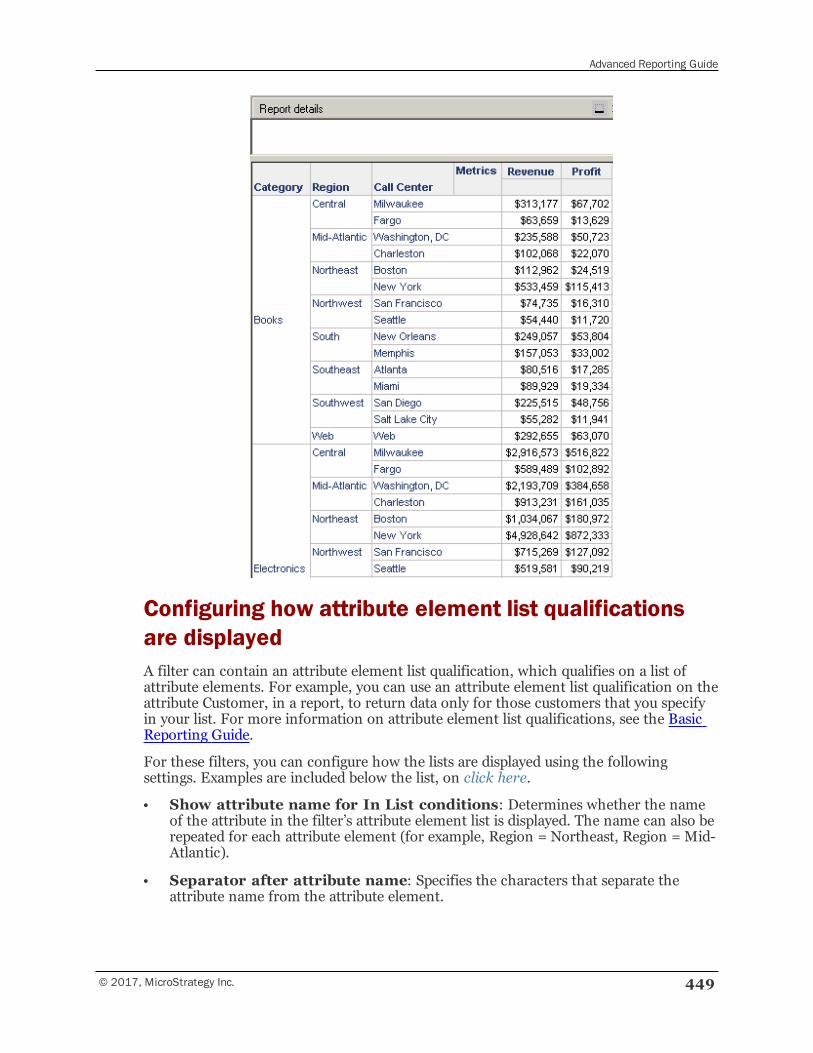
Advanced Reporting Guide
© 2017, MicroStrategy Inc. 449
Configuring how attribute element list qualificationsare displayedA filter can contain an attribute element list qualification, which qualifies on a list ofattribute elements. For example, you can use an attribute element list qualification on theattribute Customer, in a report, to return data only for those customers that you specifyin your list. For more information on attribute element list qualifications, see the BasicReporting Guide.
For these filters, you can configure how the lists are displayed using the followingsettings. Examples are included below the list, on click here.
• Show attribute name for In List conditions: Determines whether the nameof the attribute in the filter’s attribute element list is displayed. The name can also berepeated for each attribute element (for example, Region = Northeast, Region = Mid-Atlantic).
• Separator after attribute name: Specifies the characters that separate theattribute name from the attribute element.
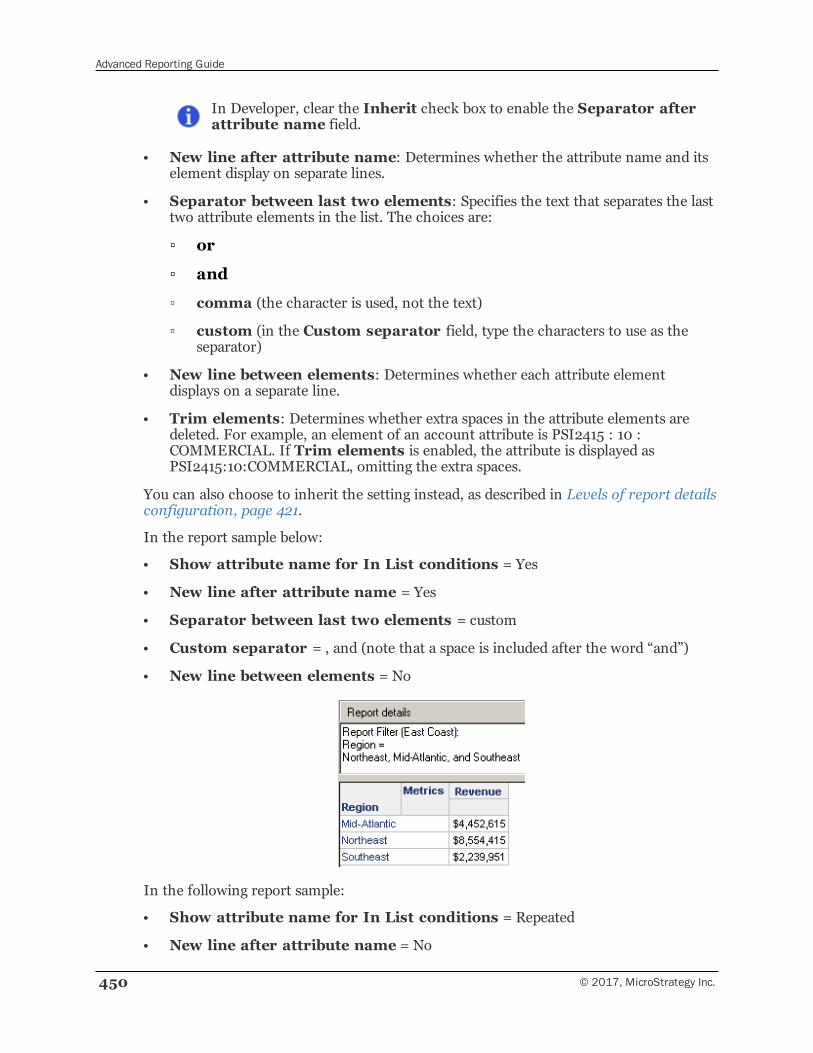
Advanced Reporting Guide
450 © 2017, MicroStrategy Inc.
In Developer, clear the Inherit check box to enable the Separator afterattribute name field.
• New line after attribute name: Determines whether the attribute name and itselement display on separate lines.
• Separator between last two elements: Specifies the text that separates the lasttwo attribute elements in the list. The choices are:
▫ or
▫ and
▫ comma (the character is used, not the text)
▫ custom (in the Custom separator field, type the characters to use as theseparator)
• New line between elements: Determines whether each attribute elementdisplays on a separate line.
• Trim elements: Determines whether extra spaces in the attribute elements aredeleted. For example, an element of an account attribute is PSI2415 : 10 :COMMERCIAL. If Trim elements is enabled, the attribute is displayed asPSI2415:10:COMMERCIAL, omitting the extra spaces.
You can also choose to inherit the setting instead, as described in Levels of report detailsconfiguration, page 421.
In the report sample below:
• Show attribute name for In List conditions = Yes
• New line after attribute name = Yes
• Separator between last two elements = custom
• Custom separator = , and (note that a space is included after the word “and”)
• New line between elements = No
In the following report sample:
• Show attribute name for In List conditions = Repeated
• New line after attribute name = No
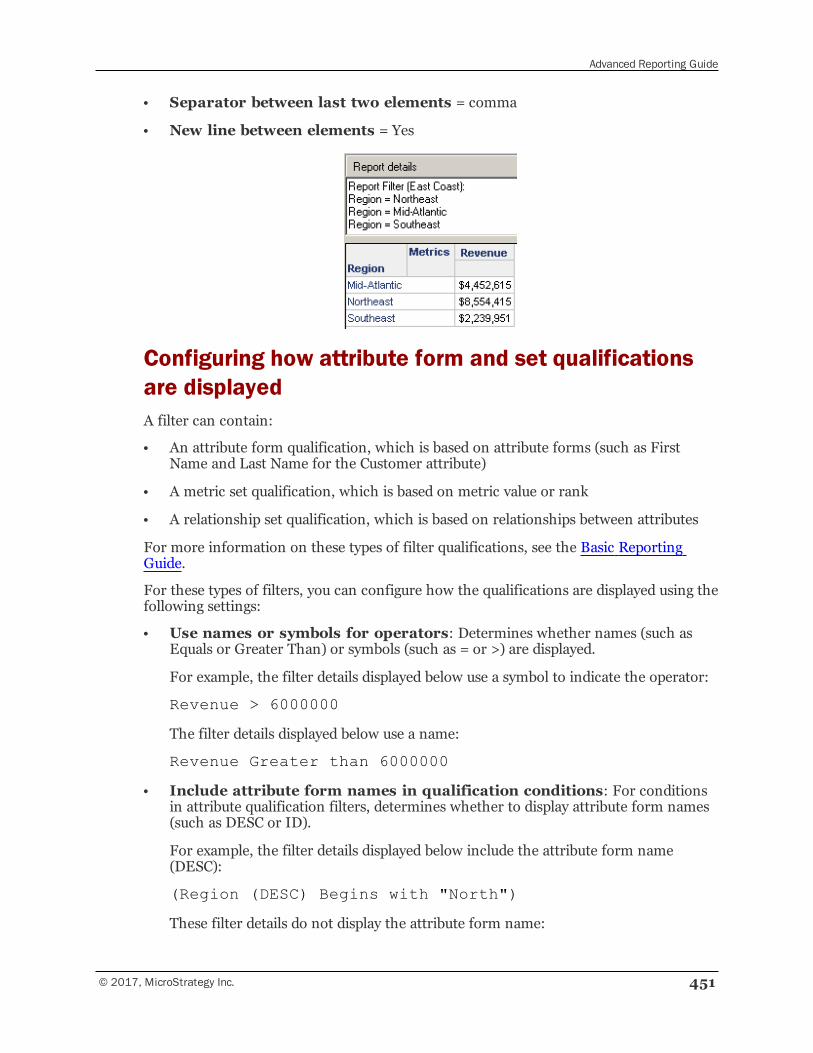
Advanced Reporting Guide
© 2017, MicroStrategy Inc. 451
• Separator between last two elements = comma
• New line between elements = Yes
Configuring how attribute form and set qualificationsare displayedA filter can contain:
• An attribute form qualification, which is based on attribute forms (such as FirstName and Last Name for the Customer attribute)
• A metric set qualification, which is based on metric value or rank
• A relationship set qualification, which is based on relationships between attributes
For more information on these types of filter qualifications, see the Basic ReportingGuide.
For these types of filters, you can configure how the qualifications are displayed using thefollowing settings:
• Use names or symbols for operators: Determines whether names (such asEquals or Greater Than) or symbols (such as = or >) are displayed.
For example, the filter details displayed below use a symbol to indicate the operator:
Revenue > 6000000
The filter details displayed below use a name:
Revenue Greater than 6000000
• Include attribute form names in qualification conditions: For conditionsin attribute qualification filters, determines whether to display attribute form names(such as DESC or ID).
For example, the filter details displayed below include the attribute form name(DESC):
(Region (DESC) Begins with "North")
These filter details do not display the attribute form name:
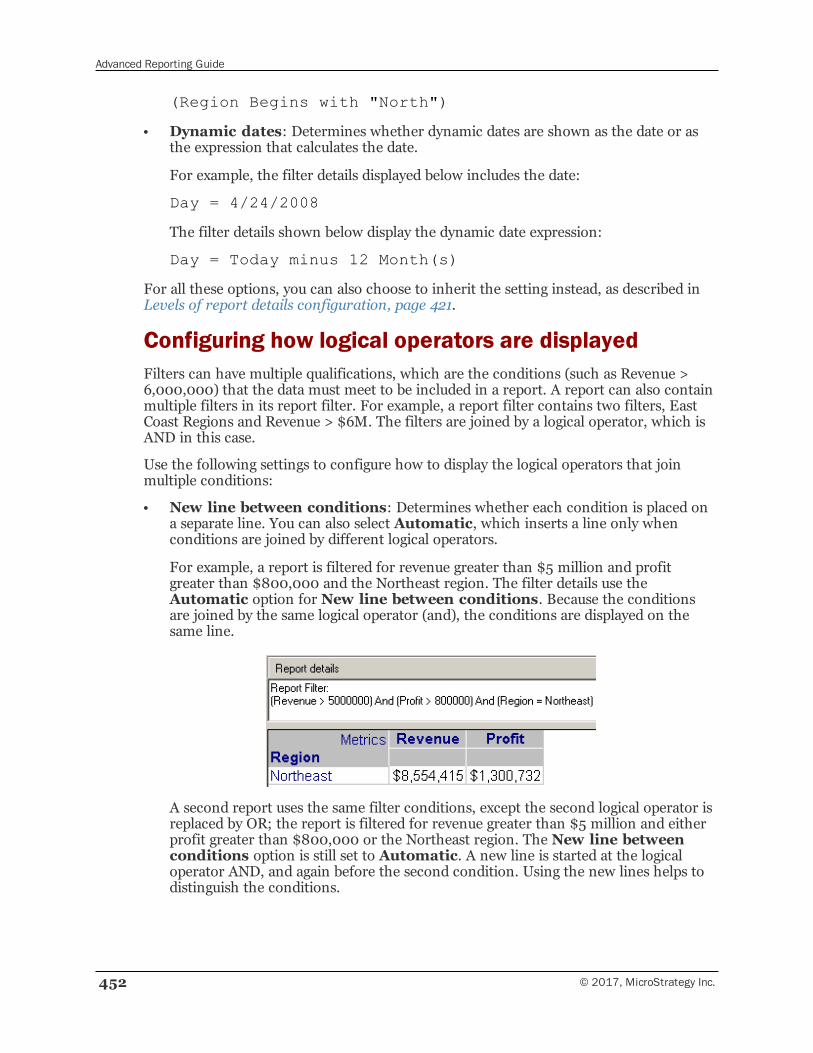
Advanced Reporting Guide
452 © 2017, MicroStrategy Inc.
(Region Begins with "North")
• Dynamic dates: Determines whether dynamic dates are shown as the date or asthe expression that calculates the date.
For example, the filter details displayed below includes the date:
Day = 4/24/2008
The filter details shown below display the dynamic date expression:
Day = Today minus 12 Month(s)
For all these options, you can also choose to inherit the setting instead, as described inLevels of report details configuration, page 421.
Configuring how logical operators are displayedFilters can have multiple qualifications, which are the conditions (such as Revenue >6,000,000) that the data must meet to be included in a report. A report can also containmultiple filters in its report filter. For example, a report filter contains two filters, EastCoast Regions and Revenue > $6M. The filters are joined by a logical operator, which isAND in this case.
Use the following settings to configure how to display the logical operators that joinmultiple conditions:
• New line between conditions: Determines whether each condition is placed ona separate line. You can also select Automatic, which inserts a line only whenconditions are joined by different logical operators.
For example, a report is filtered for revenue greater than $5 million and profitgreater than $800,000 and the Northeast region. The filter details use theAutomatic option for New line between conditions. Because the conditionsare joined by the same logical operator (and), the conditions are displayed on thesame line.
A second report uses the same filter conditions, except the second logical operator isreplaced by OR; the report is filtered for revenue greater than $5 million and eitherprofit greater than $800,000 or the Northeast region. The New line betweenconditions option is still set to Automatic. A new line is started at the logicaloperator AND, and again before the second condition. Using the new lines helps todistinguish the conditions.
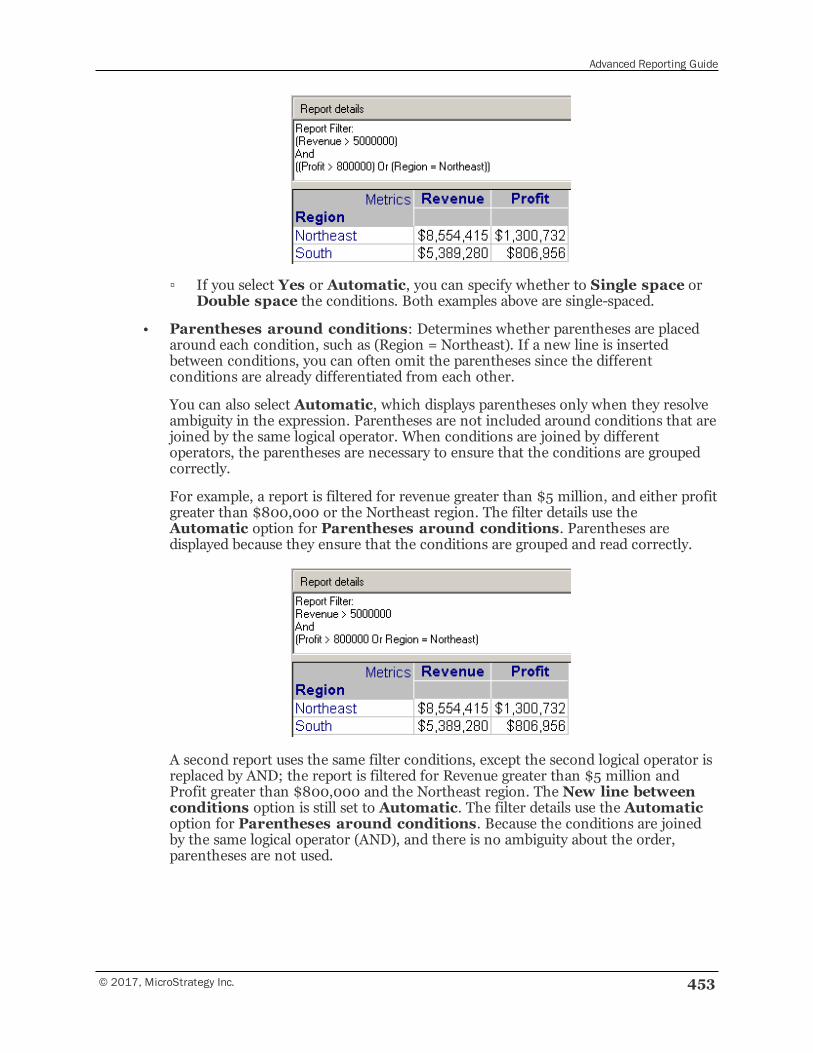
Advanced Reporting Guide
© 2017, MicroStrategy Inc. 453
▫ If you select Yes or Automatic, you can specify whether to Single space orDouble space the conditions. Both examples above are single-spaced.
• Parentheses around conditions: Determines whether parentheses are placedaround each condition, such as (Region = Northeast). If a new line is insertedbetween conditions, you can often omit the parentheses since the differentconditions are already differentiated from each other.
You can also select Automatic, which displays parentheses only when they resolveambiguity in the expression. Parentheses are not included around conditions that arejoined by the same logical operator. When conditions are joined by differentoperators, the parentheses are necessary to ensure that the conditions are groupedcorrectly.
For example, a report is filtered for revenue greater than $5 million, and either profitgreater than $800,000 or the Northeast region. The filter details use theAutomatic option for Parentheses around conditions. Parentheses aredisplayed because they ensure that the conditions are grouped and read correctly.
A second report uses the same filter conditions, except the second logical operator isreplaced by AND; the report is filtered for Revenue greater than $5 million andProfit greater than $800,000 and the Northeast region. The New line betweenconditions option is still set to Automatic. The filter details use the Automaticoption for Parentheses around conditions. Because the conditions are joinedby the same logical operator (AND), and there is no ambiguity about the order,parentheses are not used.
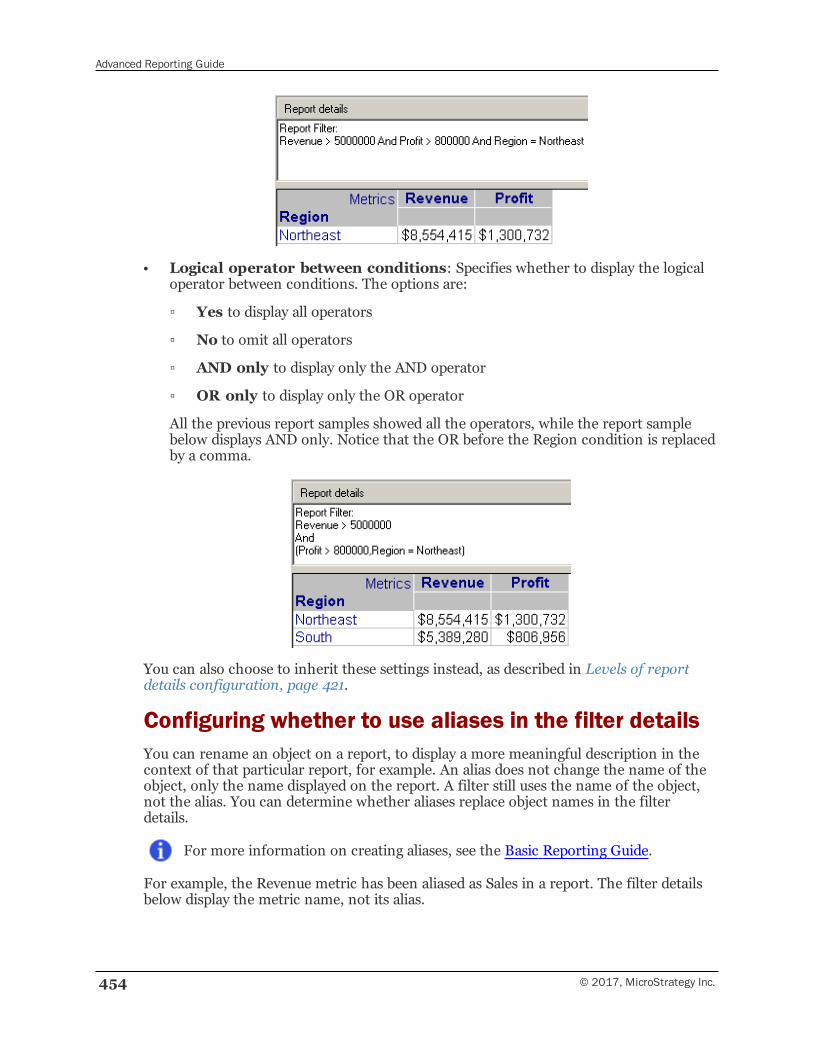
Advanced Reporting Guide
454 © 2017, MicroStrategy Inc.
• Logical operator between conditions: Specifies whether to display the logicaloperator between conditions. The options are:
▫ Yes to display all operators
▫ No to omit all operators
▫ AND only to display only the AND operator
▫ OR only to display only the OR operator
All the previous report samples showed all the operators, while the report samplebelow displays AND only. Notice that the OR before the Region condition is replacedby a comma.
You can also choose to inherit these settings instead, as described in Levels of reportdetails configuration, page 421.
Configuring whether to use aliases in the filter detailsYou can rename an object on a report, to display a more meaningful description in thecontext of that particular report, for example. An alias does not change the name of theobject, only the name displayed on the report. A filter still uses the name of the object,not the alias. You can determine whether aliases replace object names in the filterdetails.
For more information on creating aliases, see the Basic Reporting Guide.
For example, the Revenue metric has been aliased as Sales in a report. The filter detailsbelow display the metric name, not its alias.
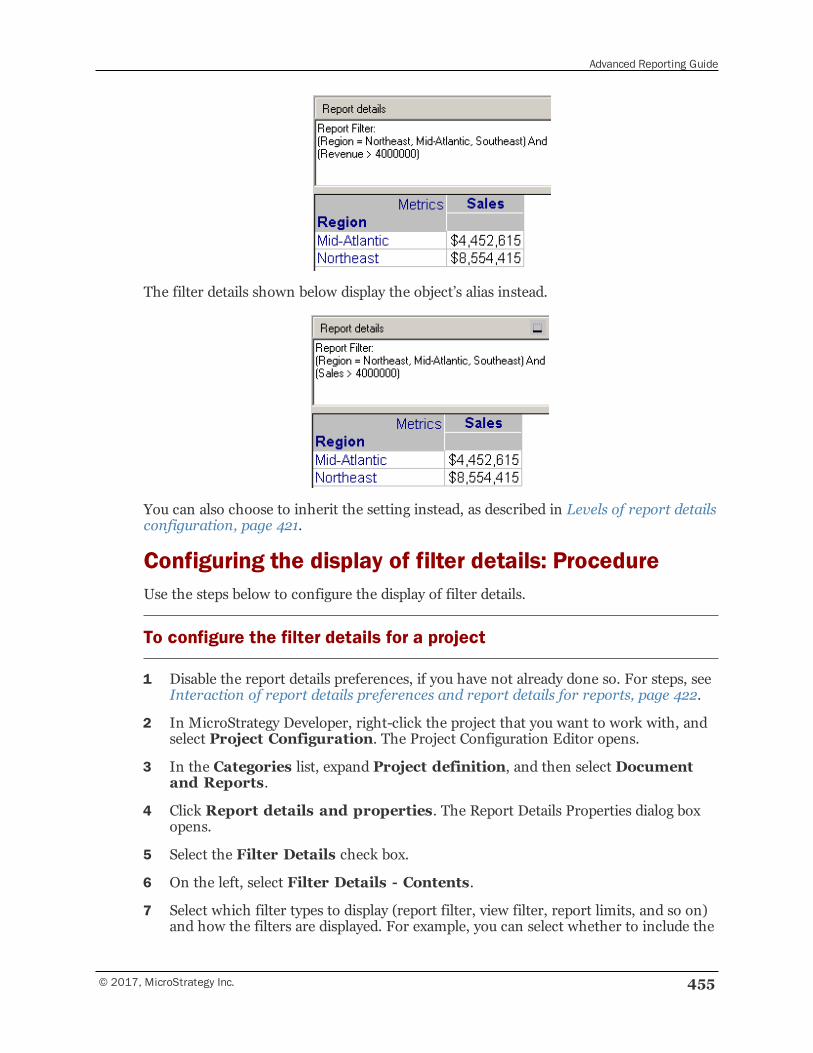
Advanced Reporting Guide
© 2017, MicroStrategy Inc. 455
The filter details shown below display the object’s alias instead.
You can also choose to inherit the setting instead, as described in Levels of report detailsconfiguration, page 421.
Configuring the display of filter details: ProcedureUse the steps below to configure the display of filter details.
To configure the filter details for a project
1 Disable the report details preferences, if you have not already done so. For steps, seeInteraction of report details preferences and report details for reports, page 422.
2 In MicroStrategy Developer, right-click the project that you want to work with, andselect Project Configuration. The Project Configuration Editor opens.
3 In the Categories list, expand Project definition, and then select Documentand Reports.
4 Click Report details and properties. The Report Details Properties dialog boxopens.
5 Select the Filter Details check box.
6 On the left, select Filter Details - Contents.
7 Select which filter types to display (report filter, view filter, report limits, and so on)and how the filters are displayed. For example, you can select whether to include the
Advanced Reporting Guide
456 © 2017, MicroStrategy Inc.
name of the filter type and whether to display the report limits before or after viewfilters. See Configuring the content of the filter details, page 443 for details on allthese options.
8 On the left, select Filter Details - Other.
9 For filters that contain attribute element list qualifications, configure how those listsare displayed. For example, you can specify whether to show the attribute name(such as Region or Category) and the separator between attribute names. SeeConfiguring how attribute element list qualifications are displayed, page 449 fordetails on all these options.
10 For filters that contain attribute form and set qualifications, configure how thequalifications are displayed. For example, you can select whether to use names orsymbols for the operators. See Configuring how attribute form and setqualifications are displayed, page 451 for details on all these options.
11 Configure how logical operators, which join multiple qualifications or filters, aredisplayed. For example, you can select whether to include parentheses aroundconditions. See Configuring how logical operators are displayed, page 452 fordetails on all these options.
12 Click OK to save your changes.
To configure the filter details for a report
1 Disable the report details preferences, if you have not already done so. For steps, seeInteraction of report details preferences and report details for reports, page 422.
2 Open the report. You can either edit it or execute it.
3 From the Data menu, select Report Details Properties.
By default, all the filter details settings inherit the project setting, as describedin Levels of report details configuration, page 421. You can return to thisdefault by selecting <default> from the drop-down list.
4 Click the General tab.
5 To ensure that the filter details are displayed in the report, select Yes from theFilter Details drop-down list.
6 To determine whether to display aliases or object names in the filter details, chooseone of the following from the Use aliases in Filter Details drop-down list:
• To use aliases, select Yes.
• To use object names, select No.
For more information, including examples, see Configuring whether to use aliases inthe filter details , page 454.
7 Click the Filter Details - Contents tab to specify the content of the filter details,by selecting which filter types to include (report filter, view filter, report limits, andso on) and how the filters are displayed. For example, you can select whether to
Advanced Reporting Guide
© 2017, MicroStrategy Inc. 457
include the name of the filter type and whether to display the report limits before orafter view filters. See Configuring the content of the filter details, page 443 fordescriptions of all these options.
8 Click the Filter Details - Other tab.
9 For filters that contain attribute element list qualifications, you can configure howthose lists are displayed. For example, you can specify whether to show the attributename (such as Region or Category) and the separator between attribute names. SeeConfiguring how attribute element list qualifications are displayed, page 449 fordescriptions of all these options.
10 For filters that contain attribute form and set qualifications, you can configure howthe qualifications are displayed. For example, you can select whether to use names orsymbols for the operators. See Configuring how attribute form and setqualifications are displayed, page 451 for descriptions of all these options.
11 You can configure how logical operators, which join multiple qualifications or filters,are displayed. For example, you can select whether to include parentheses aroundconditions. See Configuring how logical operators are displayed, page 452 fordescriptions of all these options.
12 Click OK to save your changes.
13 If report details preferences are enabled, a message opens, indicating that some ofyour changes may not be applied to the report, as described in Interaction of reportdetails preferences and filter details for reports, page 443.
▫ To disable report details preferences, click Yes. The changes that you madeaffect the display of filter details in this report, and report details preferences aredisabled for all reports.
▫ To keep report details preferences enabled, click No. The report detailspreferences override the changes that you made.
Enabling and customizing report detailspreferences
These report details preferences override some of the report details settings that areconfigured in the Report Details Properties dialog box in the Project Configuration Editorand the Report Editor. For example, you choose prompt details as a report detailspreference. When you open a prompted report, the name of each prompt and its promptanswers are displayed in the Report Details pane. You cannot remove the prompt detailsdisplay from that report, unless you remove prompt details as a report details preference.In the report itself, however, you can configure how the prompt details are displayed,such as whether the title of the prompt is displayed.
You can also choose to use the report details settings instead of these report detailspreferences. These settings are available at the project and report level.
To use the report details settings, disable the report details preferences by clearing theApply these Developer preferences to the Report Details check box in the
Advanced Reporting Guide
458 © 2017, MicroStrategy Inc.
Developer Preferences dialog box. For steps, see Interaction of report detailspreferences and report details for reports, page 422.
If the report details preferences are used, you can specify the content of the reportdetails, which can include any of the following:
• Report description: Displays the description of the report written by the creatoror owner of the report.
• Prompt details: Display the name of each prompt on the report, as well as theprompt answer that the user chose before the report was executed.
• Metric details: Display the names of the objects on the report and the definitionsof the metrics on the report.
• Cache status: Displays whether the report used a cached set of data for its results.
• Filter details: Display the name of any shortcut filter, the definition of each reportfilter, and the definition of each report limit used on the report.
A shortcut filter is a stand-alone filter that can be used on multiple reports. Incontrast, a report filter is created within the report and cannot be used in anotherreport.
If filter details are included, you can select either, both, or neither of the following:
• Show definition of shortcut filters: Displays the definition, instead of the filtername, of any stand-alone filters that were added to the report as a shortcut.
• View filter details: Displays the view filter, if one is applied to the report. Viewfilters are not named, so the definition is displayed.
MicroStrategy OLAP Services allows view filters, which are a filter that can beapplied by the user dynamically after the report has been executed and displayed.
The following report sample displays all of the options, including the view filter, in thereport details. The definition of the shortcut filter (East Coast) is displayed.
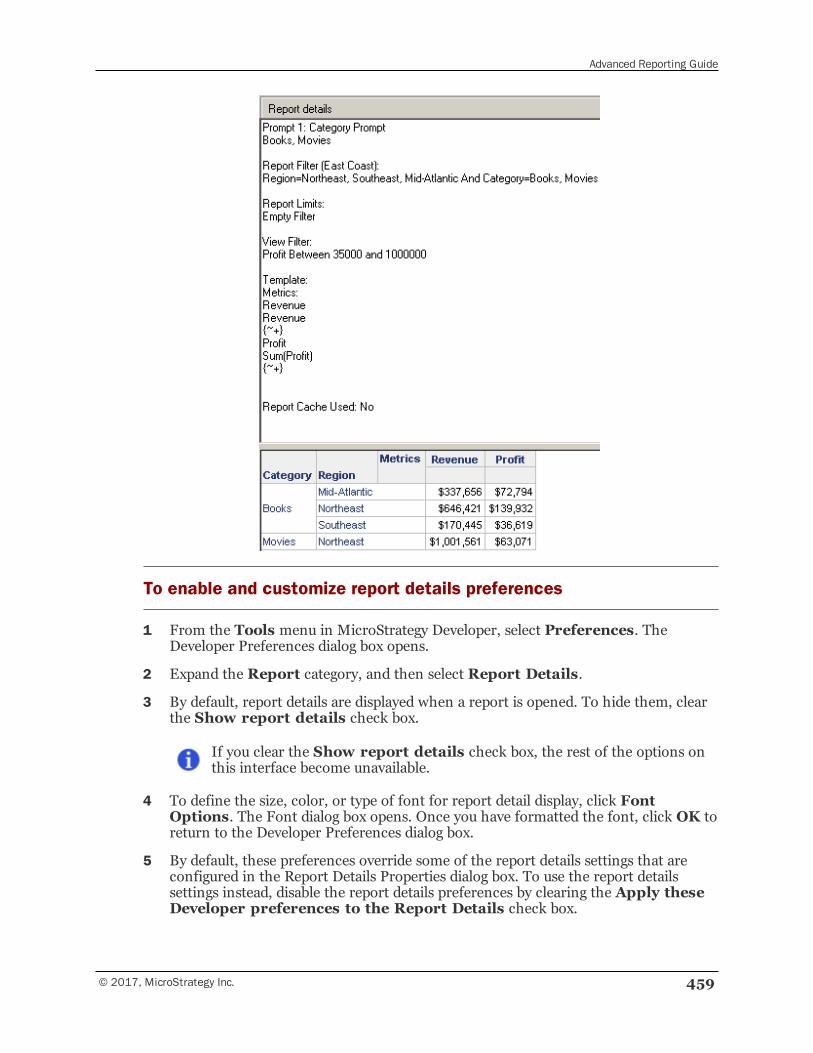
Advanced Reporting Guide
© 2017, MicroStrategy Inc. 459
To enable and customize report details preferences
1 From the Tools menu in MicroStrategy Developer, select Preferences. TheDeveloper Preferences dialog box opens.
2 Expand the Report category, and then select Report Details.
3 By default, report details are displayed when a report is opened. To hide them, clearthe Show report details check box.
If you clear the Show report details check box, the rest of the options onthis interface become unavailable.
4 To define the size, color, or type of font for report detail display, click FontOptions. The Font dialog box opens. Once you have formatted the font, click OK toreturn to the Developer Preferences dialog box.
5 By default, these preferences override some of the report details settings that areconfigured in the Report Details Properties dialog box. To use the report detailssettings instead, disable the report details preferences by clearing the Apply theseDeveloper preferences to the Report Details check box.
Advanced Reporting Guide
460 © 2017, MicroStrategy Inc.
If you clear the Apply these Developer preferences to the ReportDetails check box, the rest of the options on this interface becomeunavailable.
6 To display the short description of the report, select the Include reportdescription check box.
7 To display prompt information for all prompts in the report, select the Includeprompt details check box. This information includes the name of each prompt, aswell as the prompt answer that the user chose before the report was executed.
8 To display filter information, select the Include filter details check box. Thisinformation includes the name of each shortcut filter, the definition of each reportfilter, and the definition of each report limit.
9 To display the definition, instead of the filter name, of any stand-alone filters thatwere added to the report as a shortcut, select the Show definition of shortcutfilters check box.
10 To display view filter information, select the Include view filter details checkbox. View filters are not named, so the definition is displayed.
11 To display information about metrics, select the Include metric details checkbox. This information includes the names of the objects on the report and thedefinitions of the metrics on the report.
12 To display whether the report used a cached set of data for its results, select theInclude cache status check box. The cache status is displayed as Yes when thereport retrieved its results from a saved cache of data on the Intelligence Server. Thecache status is displayed asNo when the report retrieved its data from your datawarehouse.
13 Click OK to save your changes.
10LINKING REPORTS ANDDOCUMENTS
MicroStrategy offers many different ways for users to interact with their data, discoverpatterns, and draw conclusions. The most guided of these options are simple reportmanipulations such as pivoting or displaying and hiding subtotals. The most flexibleoption is report creation, which allows a user to access the entire schema and to useattributes and metrics from any part of the model. Drilling is a middle ground betweenthese extremes, allowing users to navigate from the data that they are viewing todifferent levels of aggregation as defined by project hierarchies and drill maps. Drilling issometimes described as enabling investigative workflows.
Linking reports and documents is another tool to present investigative workflows, onethat is more flexible than traditional drilling but more constrained than full reportcreation. The key feature that distinguishes links from drilling is the ability to use anobject (such as an attribute element) on a report to trigger the execution of anotherreport or a document that is substantially different from the original report. For example,a user viewing an Employee detail report can click a link to execute a Regional SalesBreakdown report, or click a link on a Profit and Loss report to view a DepartmentalSummary document.
A link allows context to be passed to any prompted report or document, whether thedestination report is related to the original. In contrast, drilling always implies that atleast the filter of the drilled-to report is closely connected to the original report. Even thetemplates of the original and drilled-to reports are usually related, unless the drill pathtype is set to template. Template drill path types replace the template of the originalreport with a completely different destination template.
For more information on using drilling in reports, see the Answering Questionsabout Data chapter in the Basic Reporting Guide. For information on creating drillmaps for reports, including template drill path types, see Chapter , Drill Maps.
This section will explore the many options exposed by links and how they can be used tocreate new opportunities for guided analysis.
© 2017, MicroStrategy Inc. 461
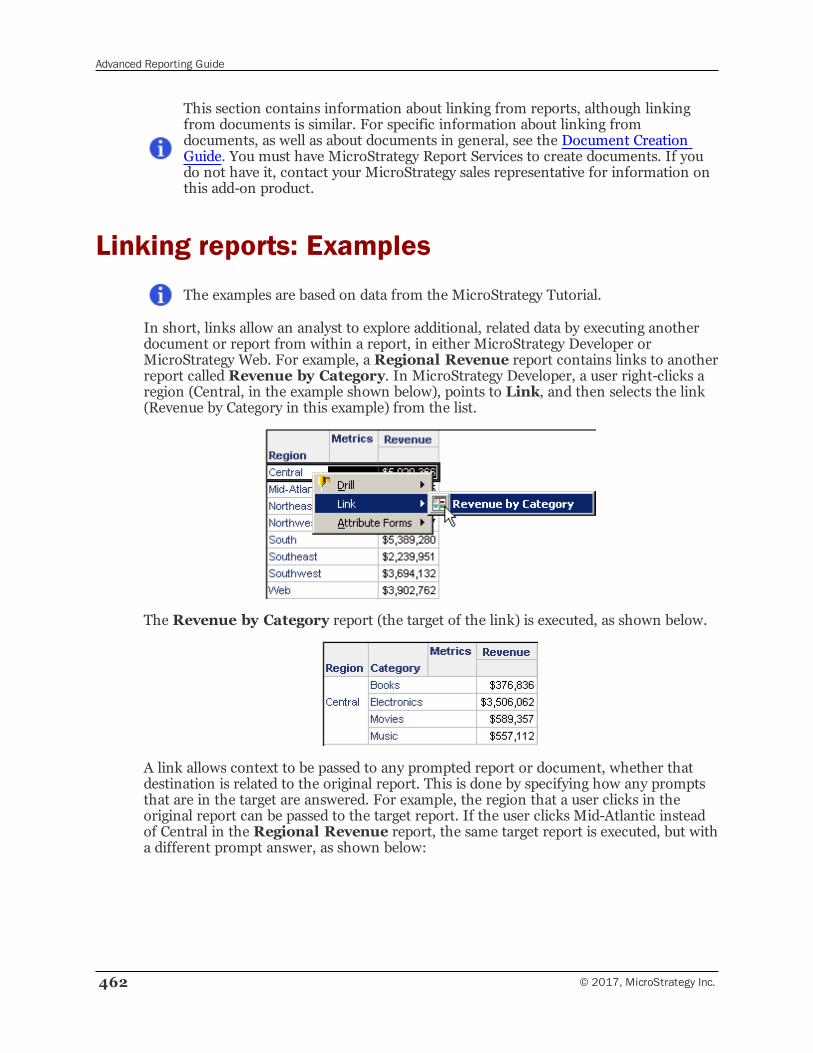
Advanced Reporting Guide
462 © 2017, MicroStrategy Inc.
This section contains information about linking from reports, although linkingfrom documents is similar. For specific information about linking fromdocuments, as well as about documents in general, see the Document CreationGuide. You must have MicroStrategy Report Services to create documents. If youdo not have it, contact your MicroStrategy sales representative for information onthis add-on product.
Linking reports: ExamplesThe examples are based on data from the MicroStrategy Tutorial.
In short, links allow an analyst to explore additional, related data by executing anotherdocument or report from within a report, in either MicroStrategy Developer orMicroStrategy Web. For example, a Regional Revenue report contains links to anotherreport called Revenue by Category. In MicroStrategy Developer, a user right-clicks aregion (Central, in the example shown below), points to Link, and then selects the link(Revenue by Category in this example) from the list.
The Revenue by Category report (the target of the link) is executed, as shown below.
A link allows context to be passed to any prompted report or document, whether thatdestination is related to the original report. This is done by specifying how any promptsthat are in the target are answered. For example, the region that a user clicks in theoriginal report can be passed to the target report. If the user clicks Mid-Atlantic insteadof Central in the Regional Revenue report, the same target report is executed, but witha different prompt answer, as shown below:
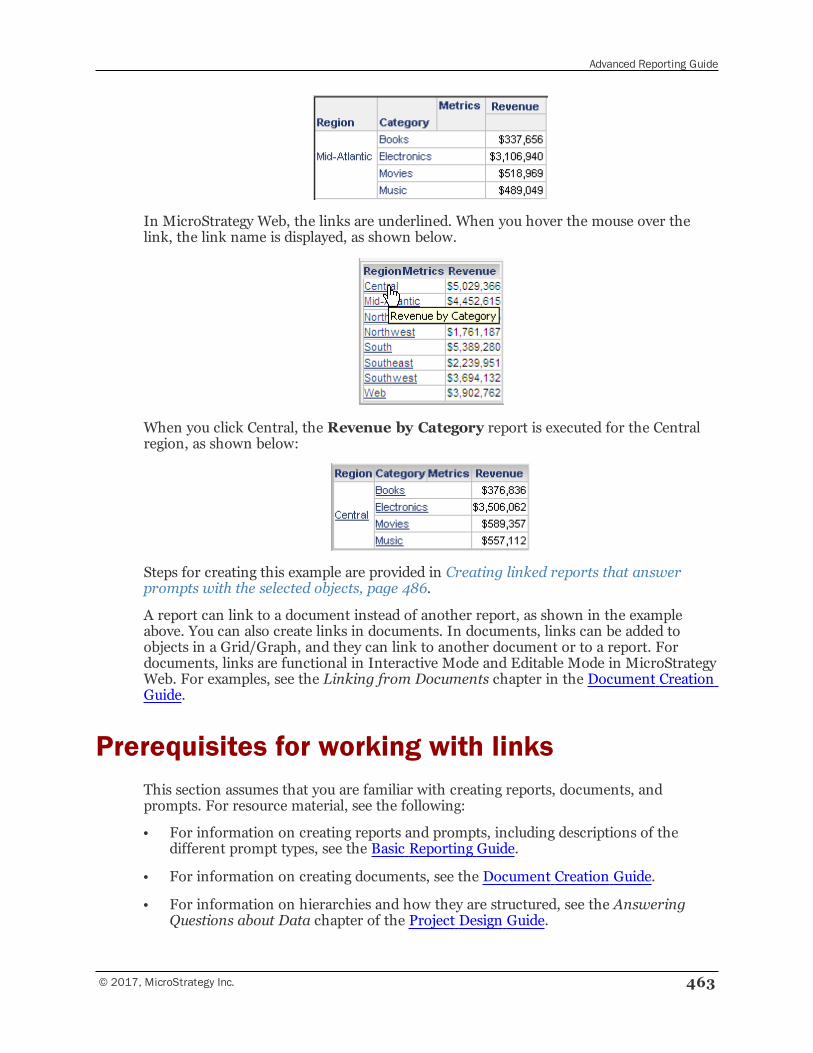
Advanced Reporting Guide
© 2017, MicroStrategy Inc. 463
In MicroStrategy Web, the links are underlined. When you hover the mouse over thelink, the link name is displayed, as shown below.
When you click Central, the Revenue by Category report is executed for the Centralregion, as shown below:
Steps for creating this example are provided in Creating linked reports that answerprompts with the selected objects, page 486.
A report can link to a document instead of another report, as shown in the exampleabove. You can also create links in documents. In documents, links can be added toobjects in a Grid/Graph, and they can link to another document or to a report. Fordocuments, links are functional in Interactive Mode and Editable Mode in MicroStrategyWeb. For examples, see the Linking from Documents chapter in the Document CreationGuide.
Prerequisites for working with linksThis section assumes that you are familiar with creating reports, documents, andprompts. For resource material, see the following:
• For information on creating reports and prompts, including descriptions of thedifferent prompt types, see the Basic Reporting Guide.
• For information on creating documents, see the Document Creation Guide.
• For information on hierarchies and how they are structured, see the AnsweringQuestions about Data chapter of the Project Design Guide.
Advanced Reporting Guide
464 © 2017, MicroStrategy Inc.
About linksA link is a connection in one report or document to another report or document. A linklets an analyst execute another document or report (the target) from a document orreport (the source), and to pass parameters to answer any prompts that are in the target.For example, if a user is viewing a report containing regional sales, the user can click aparticular region to execute another report that displays sales for the stores in thatregion. The source report could also link to a document that displays profit and costvalues as well as the revenue in an interactive dashboard.
Links can:
• Be used from a report (the source)
• Be used from a Grid/Graph in a document (the source)
• Be created on attributes, metrics, hierarchies, or object prompts
• Execute a report or a document (the target)
• Open the target in either a new window or the same window (replacing the source)in MicroStrategy Web
In MicroStrategy Developer, all links open in a new window.
• Answer prompts in the target in a variety of ways, including using existing promptanswers from the source, using the objects selected in the source, running theprompts, sending a list of elements, and others
You can create multiple links for the same object. For example, the Region attribute inthe Regional Revenue report can link to the Revenue by Category report, whichdisplays data for the selected region only (as shown in the example in Linking Reportsand Documents, page 461). The same attribute can also link to a document that providesadditional information about the region, such as revenue forecasts, inventory figures,store listings, employee schedules, and so on. For an example of multiple links, seeComponents of a link, page 465.
Different objects on a report can have different links. For example, the Region attributein the Regional Revenue report can link to the Revenue by Category report, whilethe Revenue metric can link to a document with revenue forecasts and other keyperformance indicators.
Links in documents are similar to links in reports. The similarities and differences arelisted in the following table.
Links in Documents Links in Reports
Can be attributes, metrics, hierarchies, and object promptsin Grid/Graphs displayed as grids
Can be attributes, metrics, hierarchies,and object prompts
Can link to documents and reports Can link to documents and reports
Are not functional in MicroStrategy Developer Are functional in executed reports in
Advanced Reporting Guide
© 2017, MicroStrategy Inc. 465
Links in Documents Links in Reports
MicroStrategy Developer
Are functional in Interactive Mode and Editable Mode inMicroStrategy Web
Are functional in executed reports inMicroStrategy Web
Components of a linkWhen you create a link, you specify the following components:
• The name of the link. By default, the first link is named Link1, the second Link2,and so on, but you can change the names. Since the name of the link appears in bothMicroStrategy Developer and MicroStrategy Web, it should be descriptive andinformative to help users identify the target of the link.
• The target of the link. The target is the report or document that is executed when auser clicks the link.
• The prompt to be answered and how to apply prompt answers to it, ifthe target contains prompts. A list of the prompts in the target is provided. For eachprompt, select a prompt answer method. For example, a prompt can use theexisting prompt answers from the source, can be run so that the user must answer it,or can be answered with the object selected in the source. Other prompt answermethods exist; see Specifying how prompts are answered in the target, page 467 fora full listing, with descriptions.
The list of prompts contains an option named Any other prompt, which controlsany prompts that are not in the target when the link is created. These can be either:
▫ Prompts added to the target after the link is created
▫ Prompts that are created as the result of an answer to one of the originalprompts in the target, such as a prompt-in-prompt answer
For more information about the Any other prompt option, see Specifying howprompts are answered in the target, page 467.
If you create multiple links for the same object, you specify the default link, which isused when a user clicks the object. To choose any of the other links, the user must right-click the object. See Specifying the default link when multiple links are available, page466 for more details on how the other links are displayed. For an example, seeSpecifying the default link when multiple links are available, page 466.
For all the links on an object, you can specify whether the target opens in the samewindow as the source (replacing the source) or in a new window. This applies toMicroStrategy Web only; links open in a new window in MicroStrategy Developerregardless of this setting. By default, the target opens in the same window as the source,effectively replacing it. You can instead choose to open the target in a new window,which allows both the source and the target to be visible simultaneously.
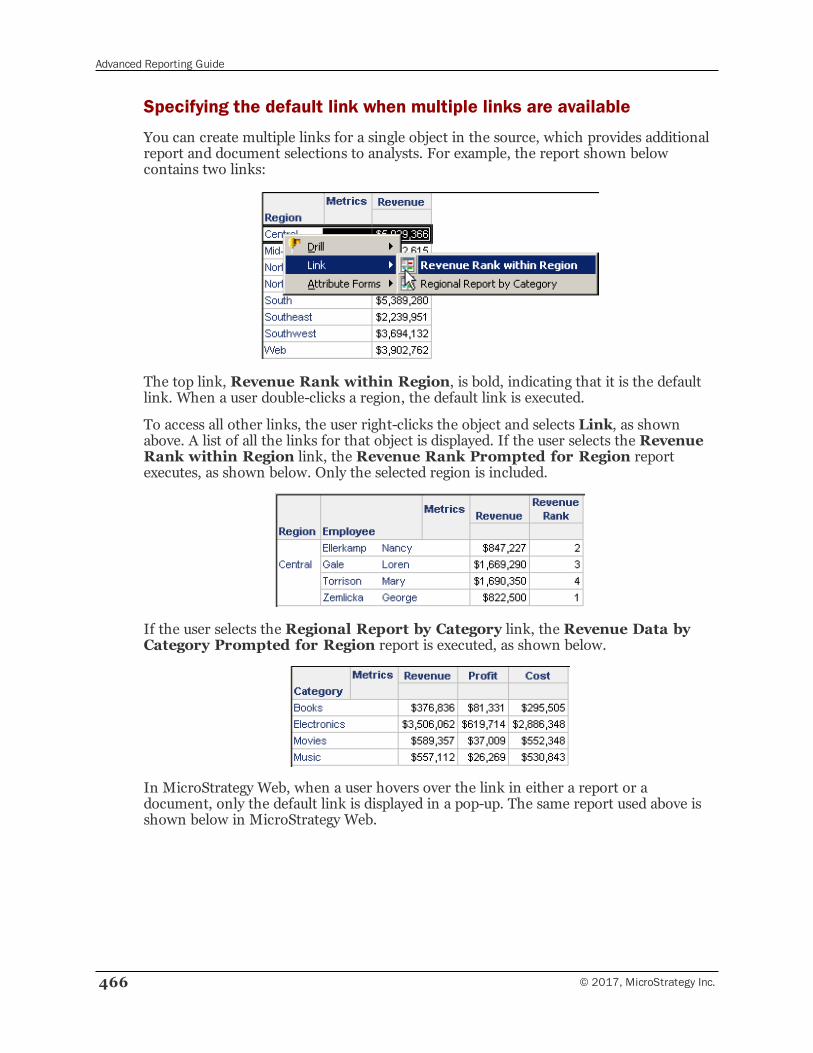
Advanced Reporting Guide
466 © 2017, MicroStrategy Inc.
Specifying the default link when multiple links are available
You can create multiple links for a single object in the source, which provides additionalreport and document selections to analysts. For example, the report shown belowcontains two links:
The top link, Revenue Rank within Region, is bold, indicating that it is the defaultlink. When a user double-clicks a region, the default link is executed.
To access all other links, the user right-clicks the object and selects Link, as shownabove. A list of all the links for that object is displayed. If the user selects the RevenueRank within Region link, the Revenue Rank Prompted for Region reportexecutes, as shown below. Only the selected region is included.
If the user selects the Regional Report by Category link, the Revenue Data byCategory Prompted for Region report is executed, as shown below.
In MicroStrategy Web, when a user hovers over the link in either a report or adocument, only the default link is displayed in a pop-up. The same report used above isshown below in MicroStrategy Web.
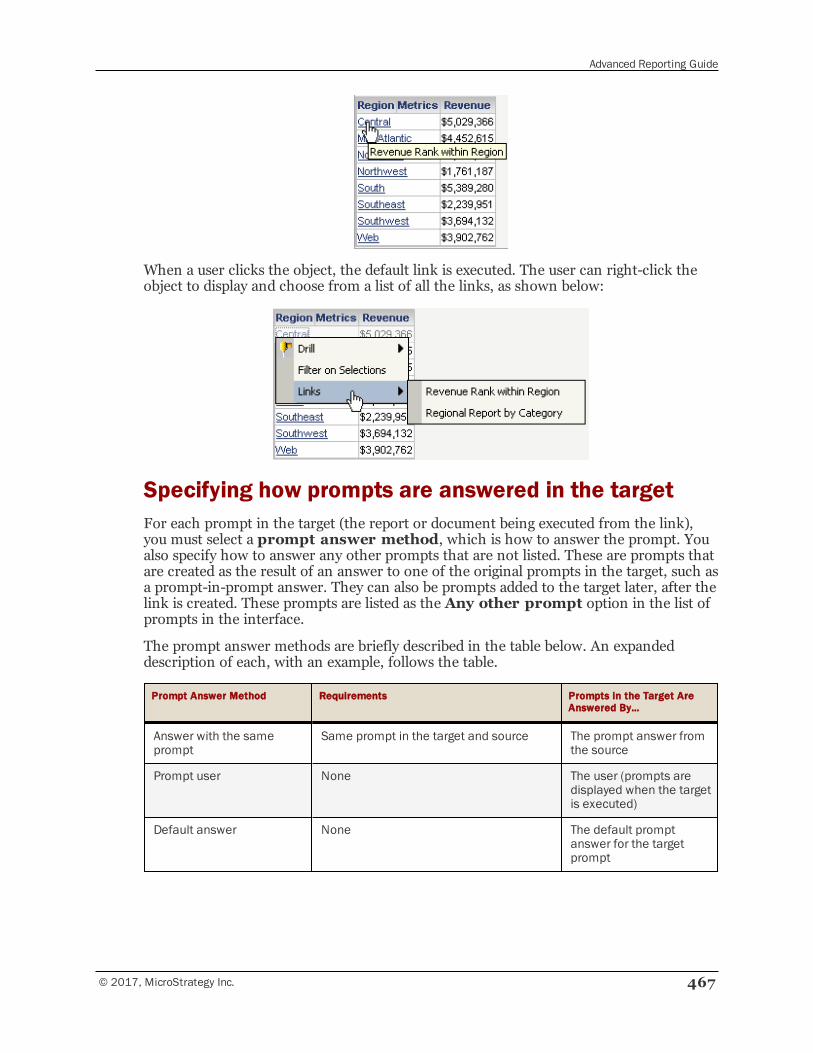
Advanced Reporting Guide
© 2017, MicroStrategy Inc. 467
When a user clicks the object, the default link is executed. The user can right-click theobject to display and choose from a list of all the links, as shown below:
Specifying how prompts are answered in the targetFor each prompt in the target (the report or document being executed from the link),you must select a prompt answer method, which is how to answer the prompt. Youalso specify how to answer any other prompts that are not listed. These are prompts thatare created as the result of an answer to one of the original prompts in the target, such asa prompt-in-prompt answer. They can also be prompts added to the target later, after thelink is created. These prompts are listed as the Any other prompt option in the list ofprompts in the interface.
The prompt answer methods are briefly described in the table below. An expandeddescription of each, with an example, follows the table.
Prompt Answer Method Requirements Prompts in the Target AreAnswered By…
Answer with the sameprompt
Same prompt in the target and source The prompt answer fromthe source
Prompt user None The user (prompts aredisplayed when the targetis executed)
Default answer None The default promptanswer for the targetprompt
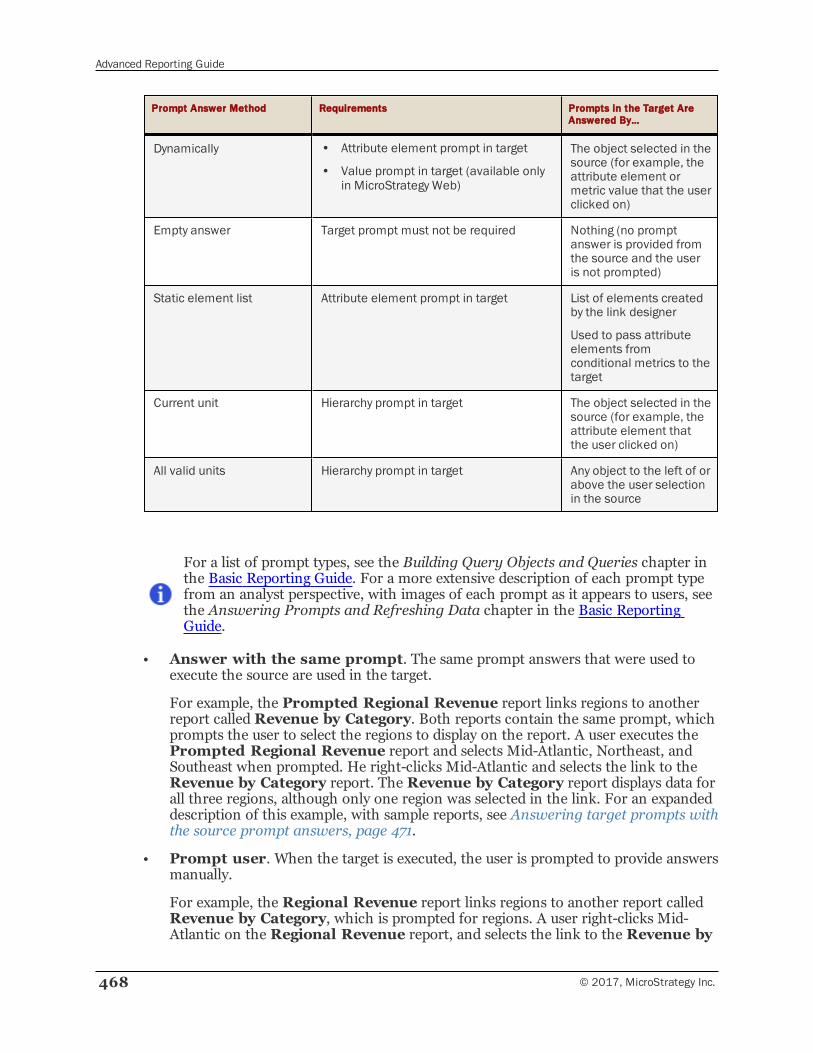
Advanced Reporting Guide
468 © 2017, MicroStrategy Inc.
Prompt Answer Method Requirements Prompts in the Target AreAnswered By…
Dynamically • Attribute element prompt in target
• Value prompt in target (available onlyin MicroStrategy Web)
The object selected in thesource (for example, theattribute element ormetric value that the userclicked on)
Empty answer Target prompt must not be required Nothing (no promptanswer is provided fromthe source and the useris not prompted)
Static element list Attribute element prompt in target List of elements createdby the link designer
Used to pass attributeelements fromconditional metrics to thetarget
Current unit Hierarchy prompt in target The object selected in thesource (for example, theattribute element thatthe user clicked on)
All valid units Hierarchy prompt in target Any object to the left of orabove the user selectionin the source
For a list of prompt types, see the Building Query Objects and Queries chapter inthe Basic Reporting Guide. For a more extensive description of each prompt typefrom an analyst perspective, with images of each prompt as it appears to users, seethe Answering Prompts and Refreshing Data chapter in the Basic ReportingGuide.
• Answer with the same prompt. The same prompt answers that were used toexecute the source are used in the target.
For example, the Prompted Regional Revenue report links regions to anotherreport called Revenue by Category. Both reports contain the same prompt, whichprompts the user to select the regions to display on the report. A user executes thePrompted Regional Revenue report and selects Mid-Atlantic, Northeast, andSoutheast when prompted. He right-clicks Mid-Atlantic and selects the link to theRevenue by Category report. The Revenue by Category report displays data forall three regions, although only one region was selected in the link. For an expandeddescription of this example, with sample reports, see Answering target prompts withthe source prompt answers, page 471.
• Prompt user. When the target is executed, the user is prompted to provide answersmanually.
For example, the Regional Revenue report links regions to another report calledRevenue by Category, which is prompted for regions. A user right-clicks Mid-Atlantic on the Regional Revenue report, and selects the link to the Revenue by
Advanced Reporting Guide
© 2017, MicroStrategy Inc. 469
Category report. The regional prompt is displayed, although a region was selectedon the source report. The Prompt user prompt method does not pass informationto the target report, so the user must answer the prompts manually.
• Default answer. The prompt is answered by the default prompt answer for theprompt in the target. If the target prompt does not have a default answer, theEmpty answer method is used. The prompt is not answered unless it is required,in which case the user is prompted.
For example, continue with the same Regional Revenue and Revenue byCategory reports described above. This time, however, the Default answerprompt method is used in the link, and the regional prompt has a default answer ofCentral. When a user right-clicks Mid-Atlantic on the Regional Revenue report,the Revenue by Category report displays data for Central.
• Dynamically. The object selected in the source is passed to the prompt in thetarget. If this object does not answer the target prompt, the Empty answermethod is used. The prompt is not answered unless it is required, in which case theuser is prompted.
Available for attribute element prompts and value prompts only.
To select the dynamic prompt answer method for value prompts, you must useMicroStrategy Web. For steps, see the MicroStrategy Web Help.
For example, continue with the same Regional Revenue and Revenue byCategory reports described above. This time, the link on Region in the source usesthe Dynamic method. If a user clicks the Central region to run the link, Central ispassed to the target to answer the prompt. The Revenue by Category reportdisplays data for the Central region only. If the user clicks Mid-Atlantic instead, Mid-Atlantic is passed to the target and the Revenue by Category report displays datafor the Mid-Atlantic region only. Linking Reports and Documents, page 461 showssamples for this example of the Dynamic prompt answer method.
• Empty answer. The prompt in the target is ignored, which means that the promptis not answered. No prompt answer is provided from the source and the user is notprompted to provide answers.
The prompt must not be required, otherwise, after the user clicks the link, theprompt is executed and must be answered before the target will execute.
The Empty prompt answer method, when used in conjunction with the dynamicprompt answer method (described above), allows a source report to answer oneprompt in a target report with the user selection, while ignoring any other prompts.
For example, a source report contains Region in the rows and Category in thecolumns. Both attributes link to the same target report, which prompts for Regionand Category. If a user clicks Central in the source, the target report is executed, withdata for all categories for the Central region. If a user clicks Books in the source, thetarget is executed, with data for all regions for the Books category. The prompt forthe selected attribute is answered using the dynamic prompt answer method, whilethe prompt for the other attribute is ignored, using the Empty answer promptmethod. No prompt answer is provided to the target, but the user is not prompted,either. For a more detailed explanation of the Empty answer prompt answer method,
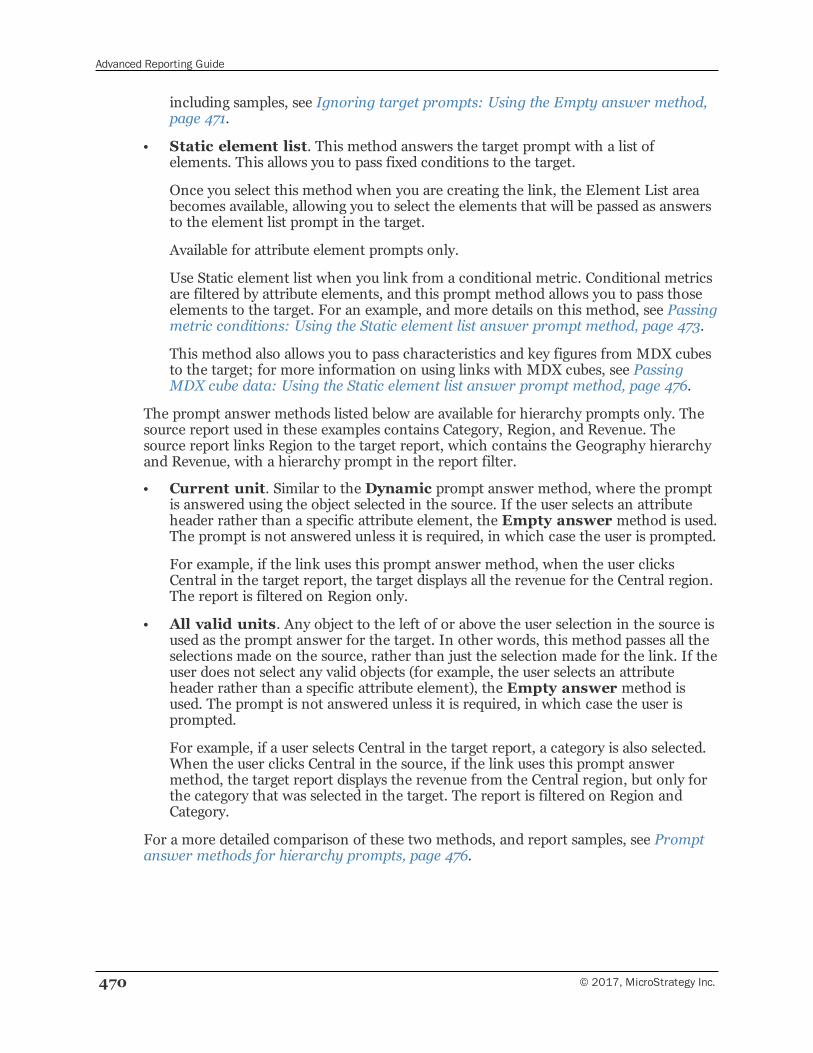
Advanced Reporting Guide
470 © 2017, MicroStrategy Inc.
including samples, see Ignoring target prompts: Using the Empty answer method,page 471.
• Static element list. This method answers the target prompt with a list ofelements. This allows you to pass fixed conditions to the target.
Once you select this method when you are creating the link, the Element List areabecomes available, allowing you to select the elements that will be passed as answersto the element list prompt in the target.
Available for attribute element prompts only.
Use Static element list when you link from a conditional metric. Conditional metricsare filtered by attribute elements, and this prompt method allows you to pass thoseelements to the target. For an example, and more details on this method, see Passingmetric conditions: Using the Static element list answer prompt method, page 473.
This method also allows you to pass characteristics and key figures from MDX cubesto the target; for more information on using links with MDX cubes, see PassingMDX cube data: Using the Static element list answer prompt method, page 476.
The prompt answer methods listed below are available for hierarchy prompts only. Thesource report used in these examples contains Category, Region, and Revenue. Thesource report links Region to the target report, which contains the Geography hierarchyand Revenue, with a hierarchy prompt in the report filter.
• Current unit. Similar to the Dynamic prompt answer method, where the promptis answered using the object selected in the source. If the user selects an attributeheader rather than a specific attribute element, the Empty answer method is used.The prompt is not answered unless it is required, in which case the user is prompted.
For example, if the link uses this prompt answer method, when the user clicksCentral in the target report, the target displays all the revenue for the Central region.The report is filtered on Region only.
• All valid units. Any object to the left of or above the user selection in the source isused as the prompt answer for the target. In other words, this method passes all theselections made on the source, rather than just the selection made for the link. If theuser does not select any valid objects (for example, the user selects an attributeheader rather than a specific attribute element), the Empty answer method isused. The prompt is not answered unless it is required, in which case the user isprompted.
For example, if a user selects Central in the target report, a category is also selected.When the user clicks Central in the source, if the link uses this prompt answermethod, the target report displays the revenue from the Central region, but only forthe category that was selected in the target. The report is filtered on Region andCategory.
For a more detailed comparison of these two methods, and report samples, see Promptanswer methods for hierarchy prompts, page 476.
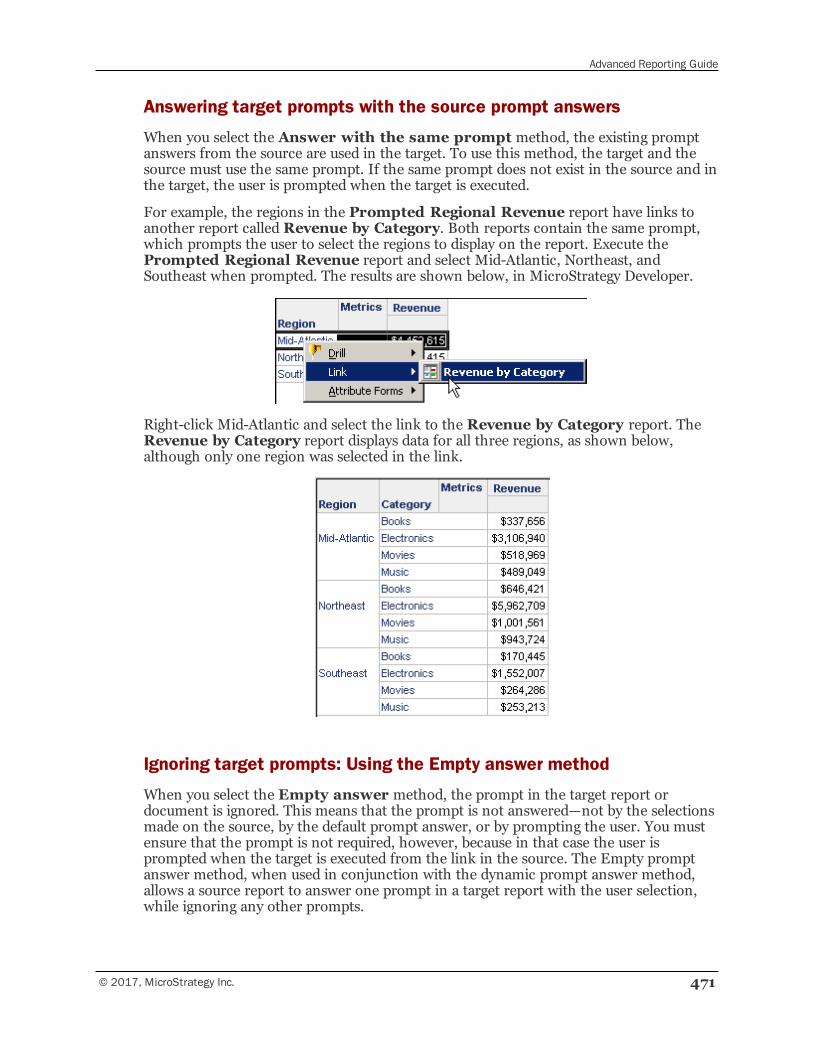
Advanced Reporting Guide
© 2017, MicroStrategy Inc. 471
Answering target prompts with the source prompt answers
When you select the Answer with the same prompt method, the existing promptanswers from the source are used in the target. To use this method, the target and thesource must use the same prompt. If the same prompt does not exist in the source and inthe target, the user is prompted when the target is executed.
For example, the regions in the Prompted Regional Revenue report have links toanother report called Revenue by Category. Both reports contain the same prompt,which prompts the user to select the regions to display on the report. Execute thePrompted Regional Revenue report and select Mid-Atlantic, Northeast, andSoutheast when prompted. The results are shown below, in MicroStrategy Developer.
Right-click Mid-Atlantic and select the link to the Revenue by Category report. TheRevenue by Category report displays data for all three regions, as shown below,although only one region was selected in the link.
Ignoring target prompts: Using the Empty answer method
When you select the Empty answer method, the prompt in the target report ordocument is ignored. This means that the prompt is not answered—not by the selectionsmade on the source, by the default prompt answer, or by prompting the user. You mustensure that the prompt is not required, however, because in that case the user isprompted when the target is executed from the link in the source. The Empty promptanswer method, when used in conjunction with the dynamic prompt answer method,allows a source report to answer one prompt in a target report with the user selection,while ignoring any other prompts.
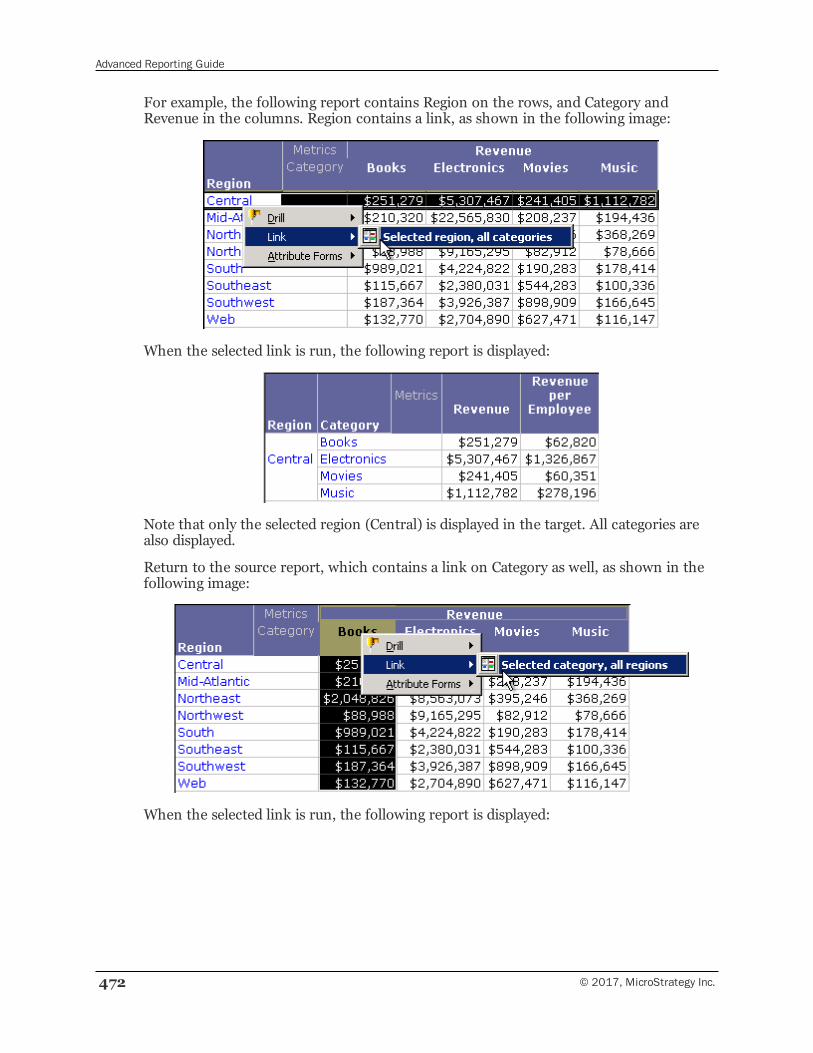
Advanced Reporting Guide
472 © 2017, MicroStrategy Inc.
For example, the following report contains Region on the rows, and Category andRevenue in the columns. Region contains a link, as shown in the following image:
When the selected link is run, the following report is displayed:
Note that only the selected region (Central) is displayed in the target. All categories arealso displayed.
Return to the source report, which contains a link on Category as well, as shown in thefollowing image:
When the selected link is run, the following report is displayed:
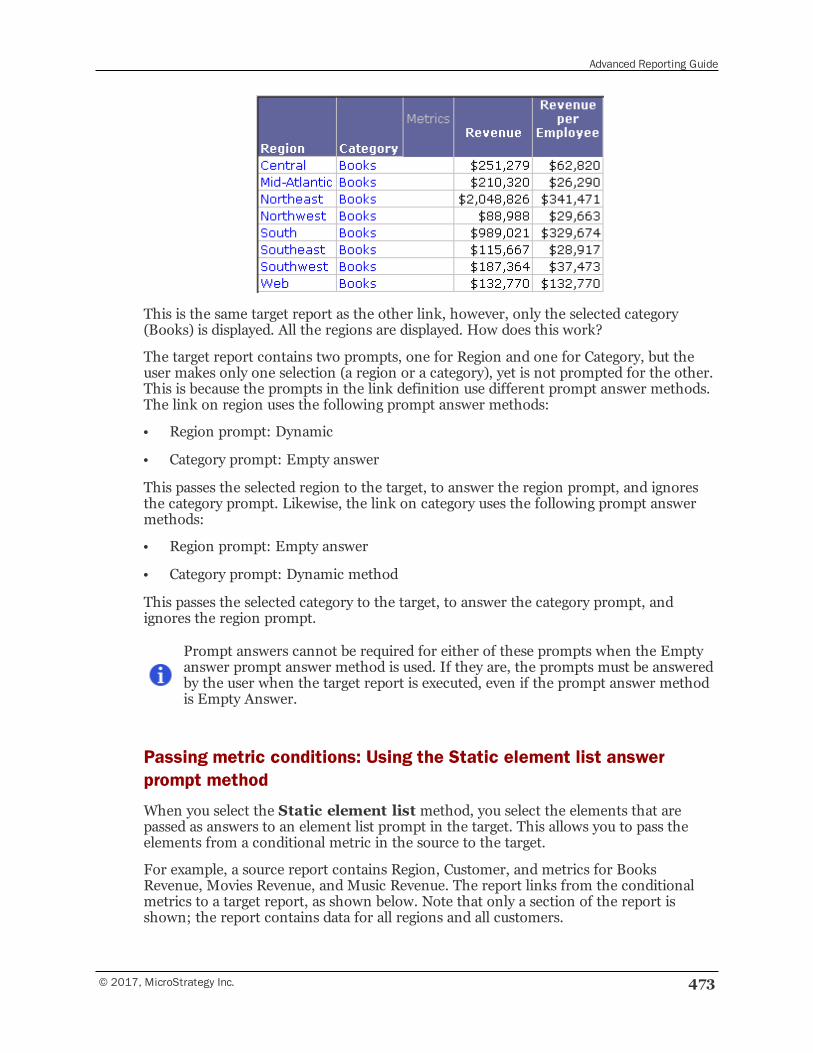
Advanced Reporting Guide
© 2017, MicroStrategy Inc. 473
This is the same target report as the other link, however, only the selected category(Books) is displayed. All the regions are displayed. How does this work?
The target report contains two prompts, one for Region and one for Category, but theuser makes only one selection (a region or a category), yet is not prompted for the other.This is because the prompts in the link definition use different prompt answer methods.The link on region uses the following prompt answer methods:
• Region prompt: Dynamic
• Category prompt: Empty answer
This passes the selected region to the target, to answer the region prompt, and ignoresthe category prompt. Likewise, the link on category uses the following prompt answermethods:
• Region prompt: Empty answer
• Category prompt: Dynamic method
This passes the selected category to the target, to answer the category prompt, andignores the region prompt.
Prompt answers cannot be required for either of these prompts when the Emptyanswer prompt answer method is used. If they are, the prompts must be answeredby the user when the target report is executed, even if the prompt answer methodis Empty Answer.
Passing metric conditions: Using the Static element list answerprompt method
When you select the Static element list method, you select the elements that arepassed as answers to an element list prompt in the target. This allows you to pass theelements from a conditional metric in the source to the target.
For example, a source report contains Region, Customer, and metrics for BooksRevenue, Movies Revenue, and Music Revenue. The report links from the conditionalmetrics to a target report, as shown below. Note that only a section of the report isshown; the report contains data for all regions and all customers.
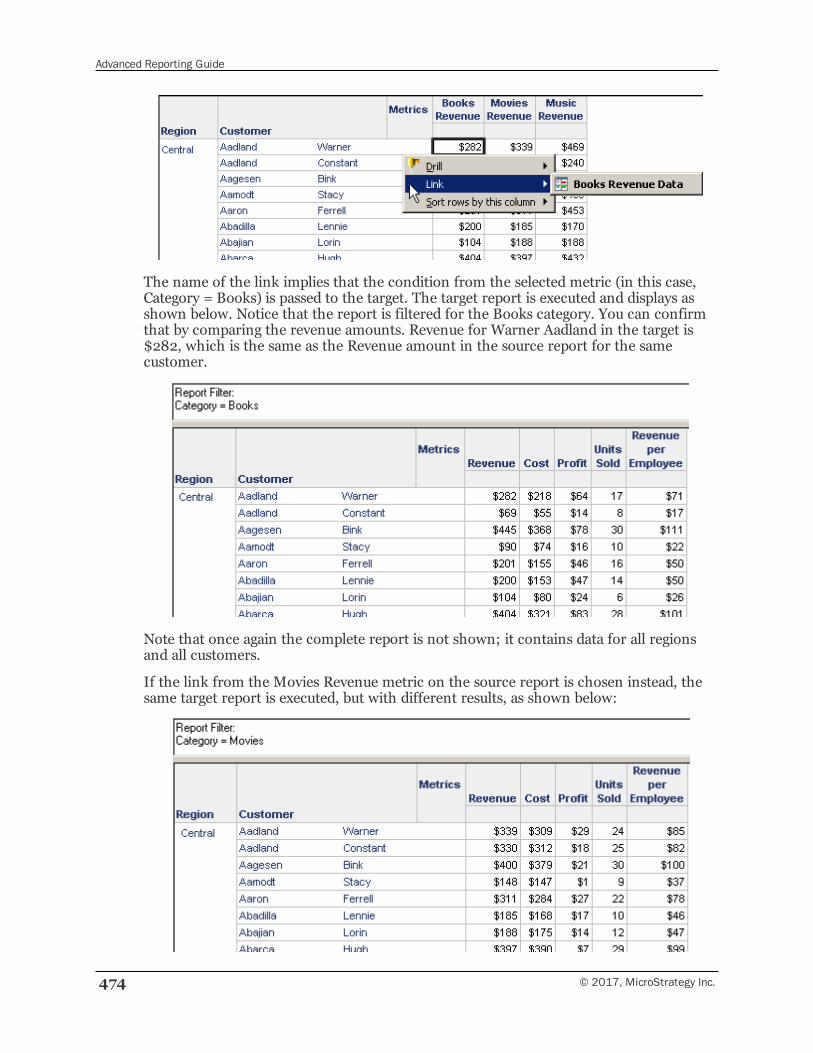
Advanced Reporting Guide
474 © 2017, MicroStrategy Inc.
The name of the link implies that the condition from the selected metric (in this case,Category = Books) is passed to the target. The target report is executed and displays asshown below. Notice that the report is filtered for the Books category. You can confirmthat by comparing the revenue amounts. Revenue for Warner Aadland in the target is$282, which is the same as the Revenue amount in the source report for the samecustomer.
Note that once again the complete report is not shown; it contains data for all regionsand all customers.
If the link from the Movies Revenue metric on the source report is chosen instead, thesame target report is executed, but with different results, as shown below:
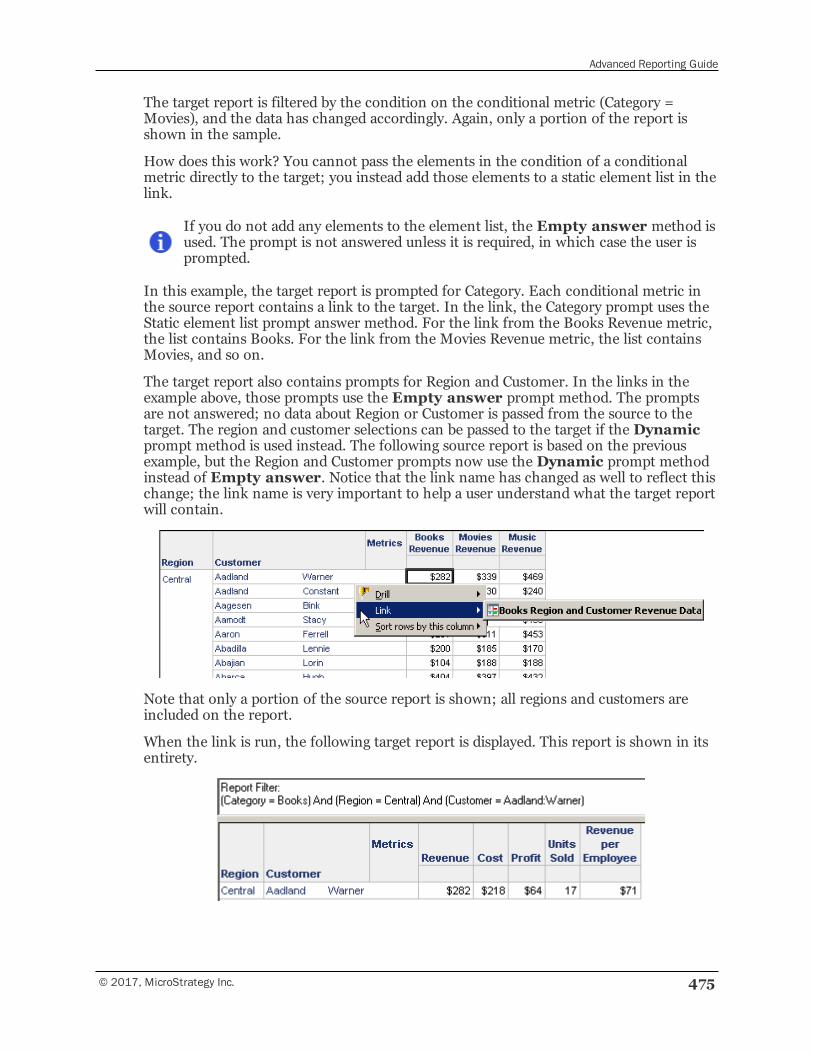
Advanced Reporting Guide
© 2017, MicroStrategy Inc. 475
The target report is filtered by the condition on the conditional metric (Category =Movies), and the data has changed accordingly. Again, only a portion of the report isshown in the sample.
How does this work? You cannot pass the elements in the condition of a conditionalmetric directly to the target; you instead add those elements to a static element list in thelink.
If you do not add any elements to the element list, the Empty answer method isused. The prompt is not answered unless it is required, in which case the user isprompted.
In this example, the target report is prompted for Category. Each conditional metric inthe source report contains a link to the target. In the link, the Category prompt uses theStatic element list prompt answer method. For the link from the Books Revenue metric,the list contains Books. For the link from the Movies Revenue metric, the list containsMovies, and so on.
The target report also contains prompts for Region and Customer. In the links in theexample above, those prompts use the Empty answer prompt method. The promptsare not answered; no data about Region or Customer is passed from the source to thetarget. The region and customer selections can be passed to the target if the Dynamicprompt method is used instead. The following source report is based on the previousexample, but the Region and Customer prompts now use the Dynamic prompt methodinstead of Empty answer. Notice that the link name has changed as well to reflect thischange; the link name is very important to help a user understand what the target reportwill contain.
Note that only a portion of the source report is shown; all regions and customers areincluded on the report.
When the link is run, the following target report is displayed. This report is shown in itsentirety.
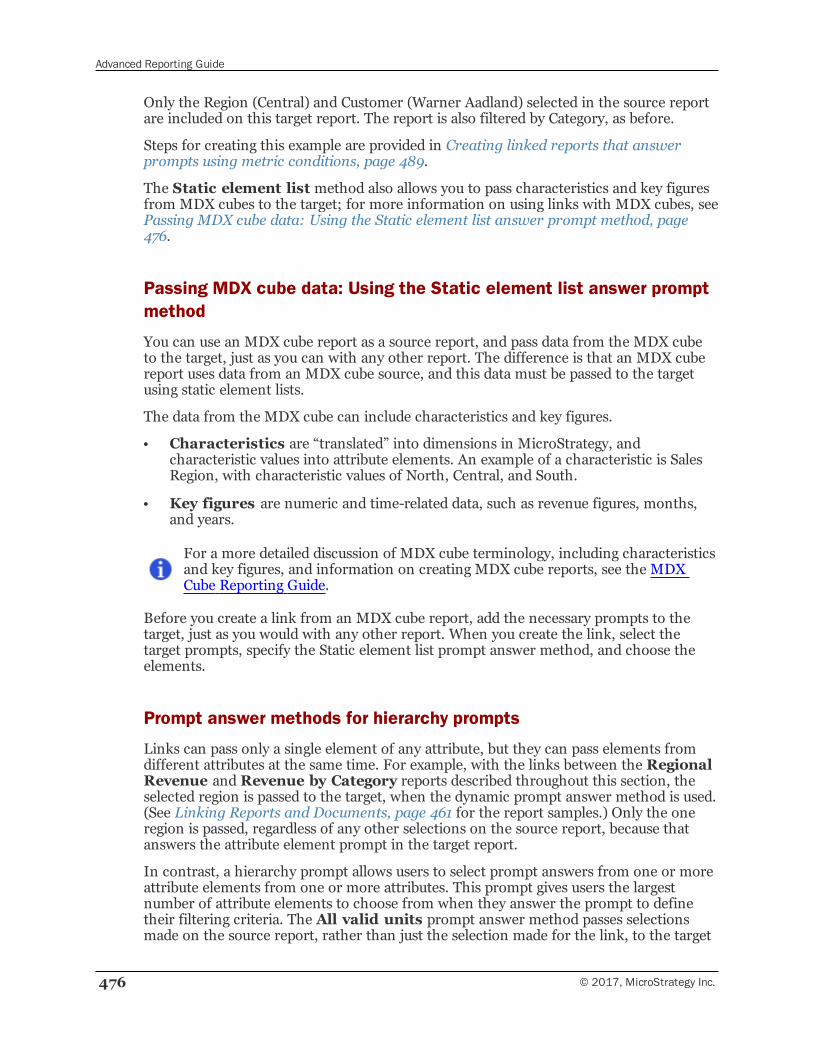
Advanced Reporting Guide
476 © 2017, MicroStrategy Inc.
Only the Region (Central) and Customer (Warner Aadland) selected in the source reportare included on this target report. The report is also filtered by Category, as before.
Steps for creating this example are provided in Creating linked reports that answerprompts using metric conditions, page 489.
The Static element list method also allows you to pass characteristics and key figuresfrom MDX cubes to the target; for more information on using links with MDX cubes, seePassing MDX cube data: Using the Static element list answer prompt method, page476.
Passing MDX cube data: Using the Static element list answer promptmethod
You can use an MDX cube report as a source report, and pass data from the MDX cubeto the target, just as you can with any other report. The difference is that an MDX cubereport uses data from an MDX cube source, and this data must be passed to the targetusing static element lists.
The data from the MDX cube can include characteristics and key figures.
• Characteristics are “translated” into dimensions in MicroStrategy, andcharacteristic values into attribute elements. An example of a characteristic is SalesRegion, with characteristic values of North, Central, and South.
• Key figures are numeric and time-related data, such as revenue figures, months,and years.
For a more detailed discussion of MDX cube terminology, including characteristicsand key figures, and information on creating MDX cube reports, see the MDXCube Reporting Guide.
Before you create a link from an MDX cube report, add the necessary prompts to thetarget, just as you would with any other report. When you create the link, select thetarget prompts, specify the Static element list prompt answer method, and choose theelements.
Prompt answer methods for hierarchy prompts
Links can pass only a single element of any attribute, but they can pass elements fromdifferent attributes at the same time. For example, with the links between the RegionalRevenue and Revenue by Category reports described throughout this section, theselected region is passed to the target, when the dynamic prompt answer method is used.(See Linking Reports and Documents, page 461 for the report samples.) Only the oneregion is passed, regardless of any other selections on the source report, because thatanswers the attribute element prompt in the target report.
In contrast, a hierarchy prompt allows users to select prompt answers from one or moreattribute elements from one or more attributes. This prompt gives users the largestnumber of attribute elements to choose from when they answer the prompt to definetheir filtering criteria. The All valid units prompt answer method passes selectionsmade on the source report, rather than just the selection made for the link, to the target
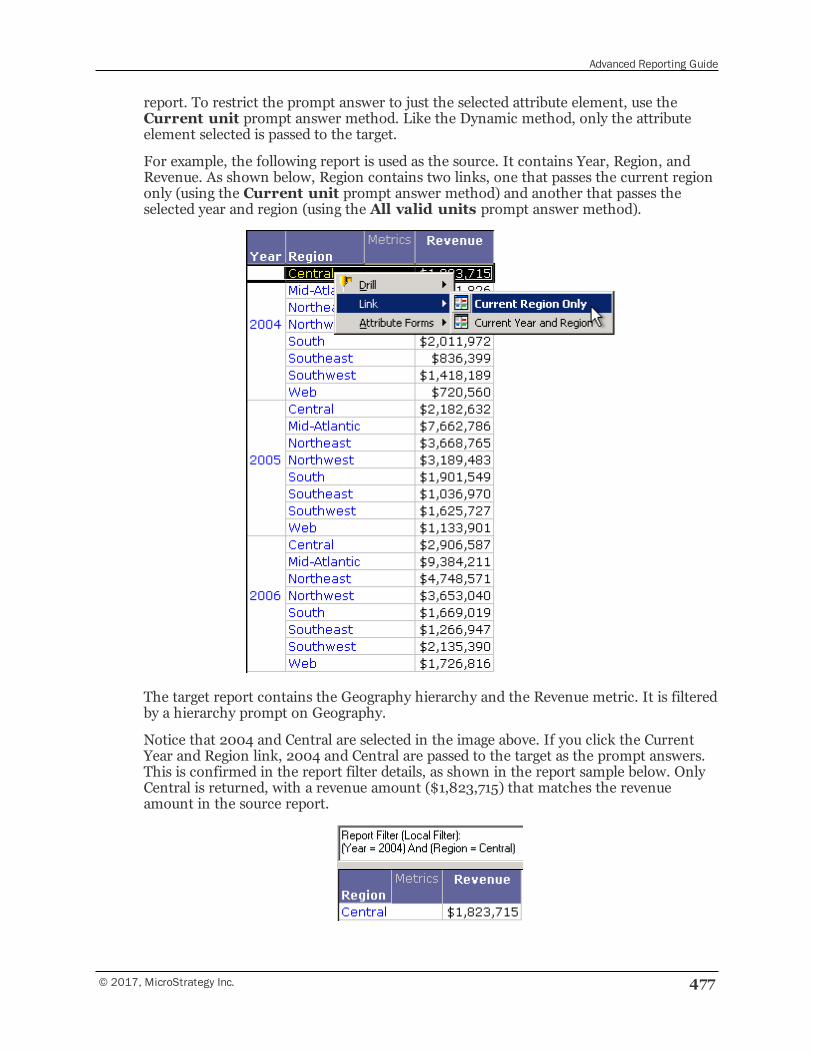
Advanced Reporting Guide
© 2017, MicroStrategy Inc. 477
report. To restrict the prompt answer to just the selected attribute element, use theCurrent unit prompt answer method. Like the Dynamic method, only the attributeelement selected is passed to the target.
For example, the following report is used as the source. It contains Year, Region, andRevenue. As shown below, Region contains two links, one that passes the current regiononly (using the Current unit prompt answer method) and another that passes theselected year and region (using the All valid units prompt answer method).
The target report contains the Geography hierarchy and the Revenue metric. It is filteredby a hierarchy prompt on Geography.
Notice that 2004 and Central are selected in the image above. If you click the CurrentYear and Region link, 2004 and Central are passed to the target as the prompt answers.This is confirmed in the report filter details, as shown in the report sample below. OnlyCentral is returned, with a revenue amount ($1,823,715) that matches the revenueamount in the source report.
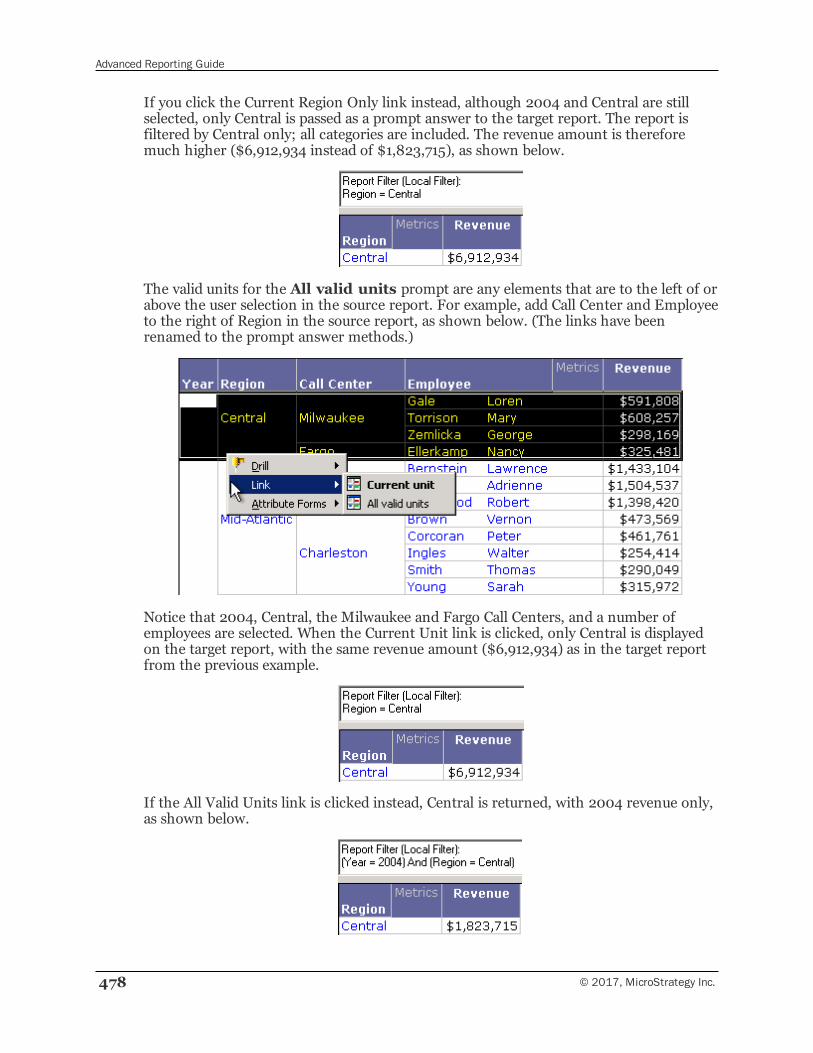
Advanced Reporting Guide
478 © 2017, MicroStrategy Inc.
If you click the Current Region Only link instead, although 2004 and Central are stillselected, only Central is passed as a prompt answer to the target report. The report isfiltered by Central only; all categories are included. The revenue amount is thereforemuch higher ($6,912,934 instead of $1,823,715), as shown below.
The valid units for the All valid units prompt are any elements that are to the left of orabove the user selection in the source report. For example, add Call Center and Employeeto the right of Region in the source report, as shown below. (The links have beenrenamed to the prompt answer methods.)
Notice that 2004, Central, the Milwaukee and Fargo Call Centers, and a number ofemployees are selected. When the Current Unit link is clicked, only Central is displayedon the target report, with the same revenue amount ($6,912,934) as in the target reportfrom the previous example.
If the All Valid Units link is clicked instead, Central is returned, with 2004 revenue only,as shown below.
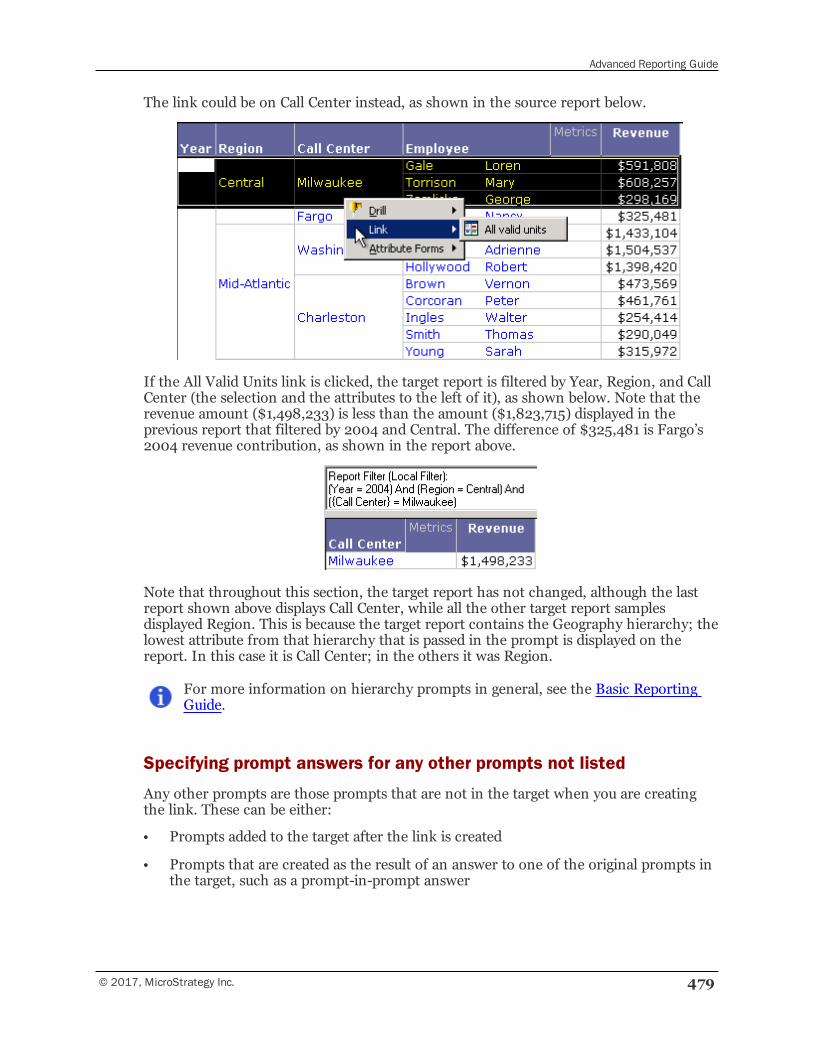
Advanced Reporting Guide
© 2017, MicroStrategy Inc. 479
The link could be on Call Center instead, as shown in the source report below.
If the All Valid Units link is clicked, the target report is filtered by Year, Region, and CallCenter (the selection and the attributes to the left of it), as shown below. Note that therevenue amount ($1,498,233) is less than the amount ($1,823,715) displayed in theprevious report that filtered by 2004 and Central. The difference of $325,481 is Fargo’s2004 revenue contribution, as shown in the report above.
Note that throughout this section, the target report has not changed, although the lastreport shown above displays Call Center, while all the other target report samplesdisplayed Region. This is because the target report contains the Geography hierarchy; thelowest attribute from that hierarchy that is passed in the prompt is displayed on thereport. In this case it is Call Center; in the others it was Region.
For more information on hierarchy prompts in general, see the Basic ReportingGuide.
Specifying prompt answers for any other prompts not listed
Any other prompts are those prompts that are not in the target when you are creatingthe link. These can be either:
• Prompts added to the target after the link is created
• Prompts that are created as the result of an answer to one of the original prompts inthe target, such as a prompt-in-prompt answer
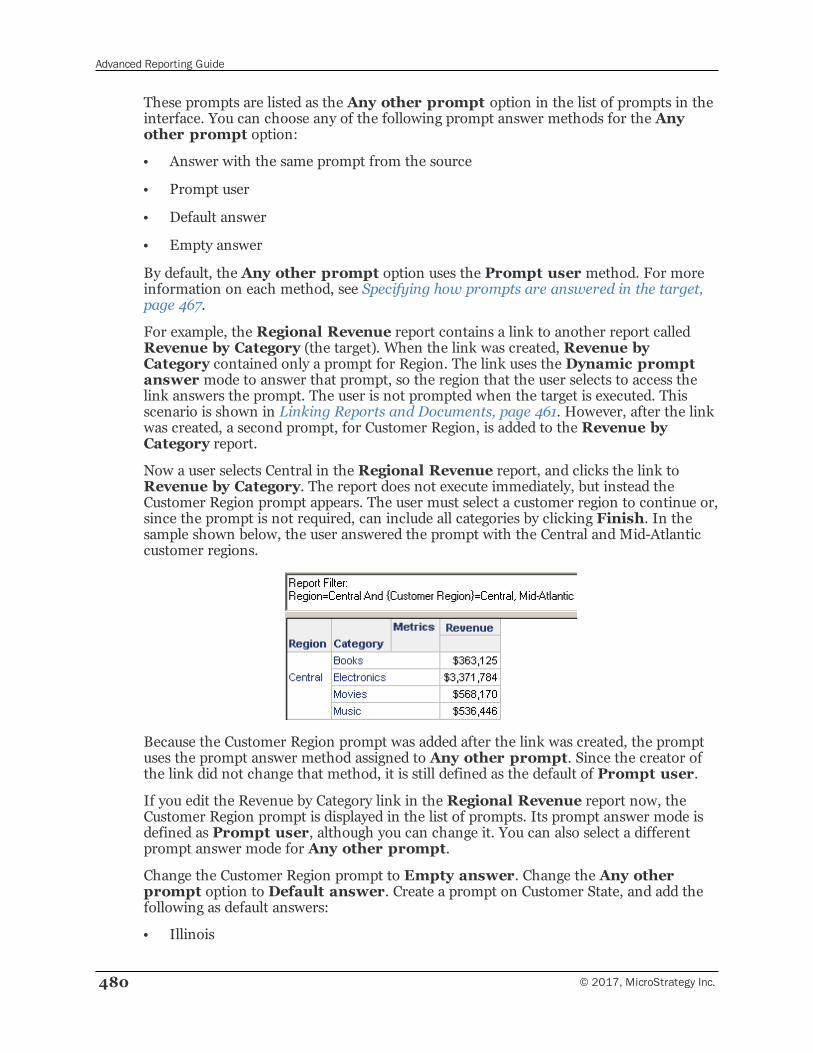
Advanced Reporting Guide
480 © 2017, MicroStrategy Inc.
These prompts are listed as the Any other prompt option in the list of prompts in theinterface. You can choose any of the following prompt answer methods for the Anyother prompt option:
• Answer with the same prompt from the source
• Prompt user
• Default answer
• Empty answer
By default, the Any other prompt option uses the Prompt user method. For moreinformation on each method, see Specifying how prompts are answered in the target,page 467.
For example, the Regional Revenue report contains a link to another report calledRevenue by Category (the target). When the link was created, Revenue byCategory contained only a prompt for Region. The link uses the Dynamic promptanswer mode to answer that prompt, so the region that the user selects to access thelink answers the prompt. The user is not prompted when the target is executed. Thisscenario is shown in Linking Reports and Documents, page 461. However, after the linkwas created, a second prompt, for Customer Region, is added to the Revenue byCategory report.
Now a user selects Central in the Regional Revenue report, and clicks the link toRevenue by Category. The report does not execute immediately, but instead theCustomer Region prompt appears. The user must select a customer region to continue or,since the prompt is not required, can include all categories by clicking Finish. In thesample shown below, the user answered the prompt with the Central and Mid-Atlanticcustomer regions.
Because the Customer Region prompt was added after the link was created, the promptuses the prompt answer method assigned to Any other prompt. Since the creator ofthe link did not change that method, it is still defined as the default of Prompt user.
If you edit the Revenue by Category link in the Regional Revenue report now, theCustomer Region prompt is displayed in the list of prompts. Its prompt answer mode isdefined as Prompt user, although you can change it. You can also select a differentprompt answer mode for Any other prompt.
Change the Customer Region prompt to Empty answer. Change the Any otherprompt option to Default answer. Create a prompt on Customer State, and add thefollowing as default answers:
• Illinois
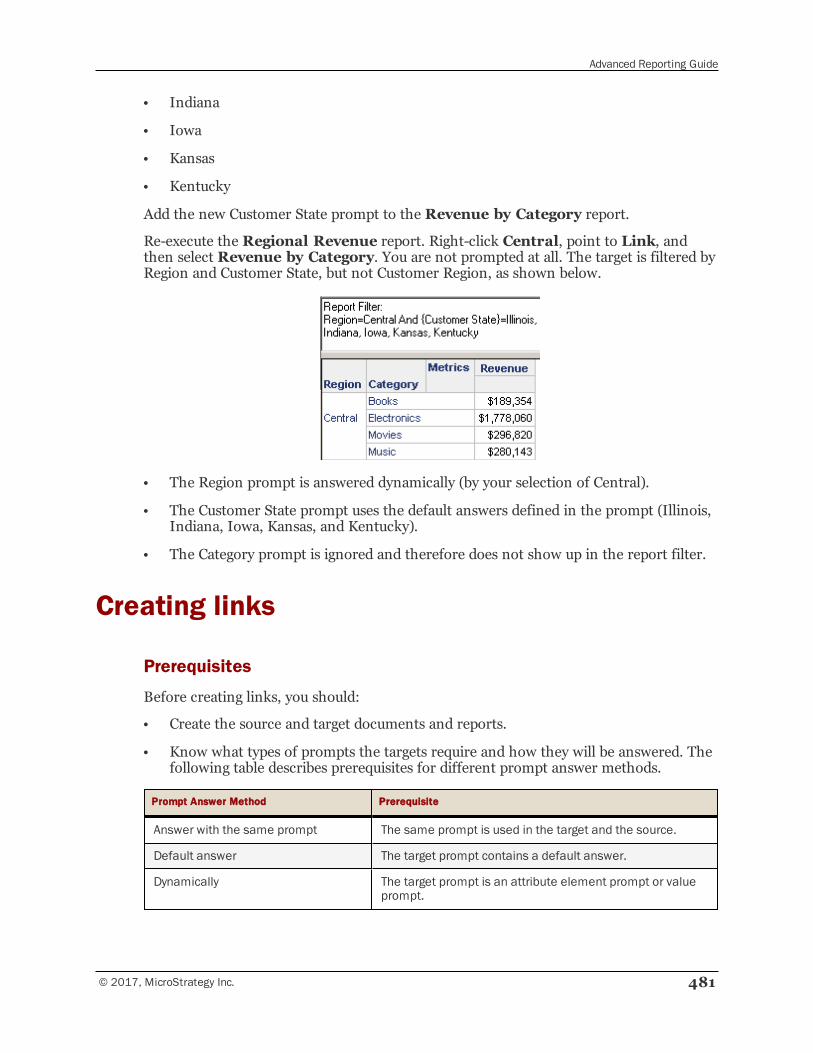
Advanced Reporting Guide
© 2017, MicroStrategy Inc. 481
• Indiana
• Iowa
• Kansas
• Kentucky
Add the new Customer State prompt to the Revenue by Category report.
Re-execute the Regional Revenue report. Right-click Central, point to Link, andthen select Revenue by Category. You are not prompted at all. The target is filtered byRegion and Customer State, but not Customer Region, as shown below.
• The Region prompt is answered dynamically (by your selection of Central).
• The Customer State prompt uses the default answers defined in the prompt (Illinois,Indiana, Iowa, Kansas, and Kentucky).
• The Category prompt is ignored and therefore does not show up in the report filter.
Creating links
Prerequisites
Before creating links, you should:
• Create the source and target documents and reports.
• Know what types of prompts the targets require and how they will be answered. Thefollowing table describes prerequisites for different prompt answer methods.
Prompt Answer Method Prerequisite
Answer with the same prompt The same prompt is used in the target and the source.
Default answer The target prompt contains a default answer.
Dynamically The target prompt is an attribute element prompt or valueprompt.
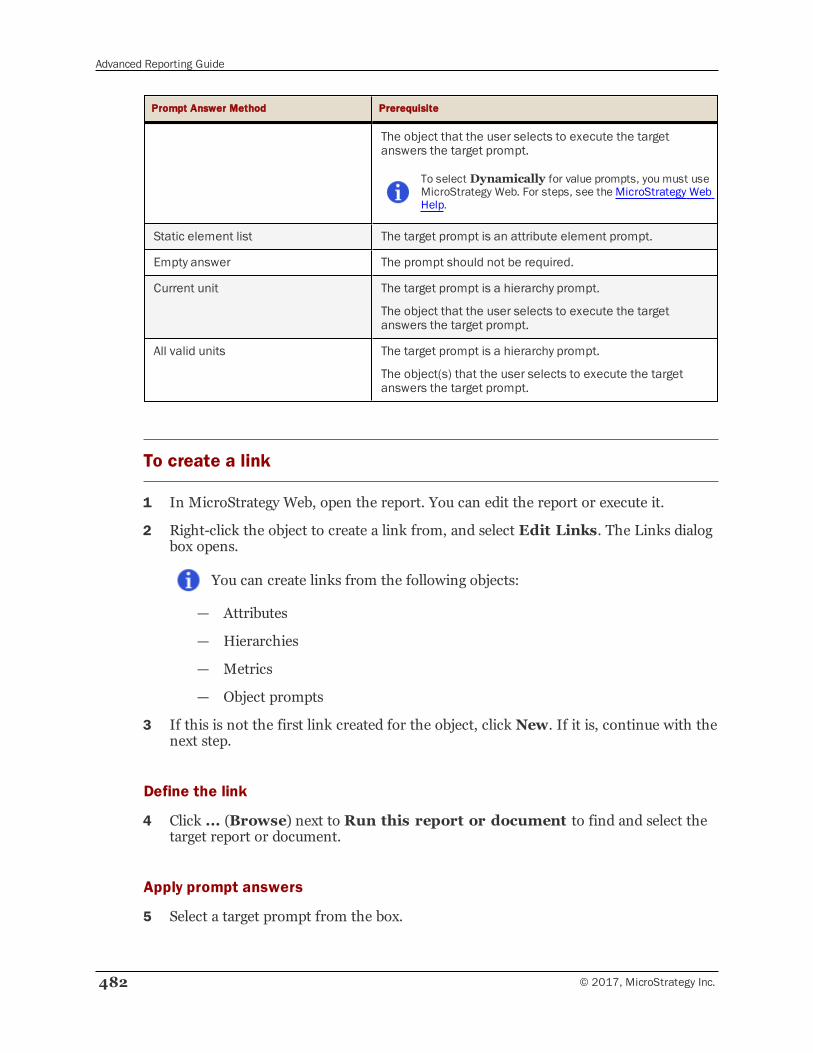
Advanced Reporting Guide
482 © 2017, MicroStrategy Inc.
Prompt Answer Method Prerequisite
The object that the user selects to execute the targetanswers the target prompt.
To select Dynamically for value prompts, you must useMicroStrategy Web. For steps, see the MicroStrategy WebHelp.
Static element list The target prompt is an attribute element prompt.
Empty answer The prompt should not be required.
Current unit The target prompt is a hierarchy prompt.
The object that the user selects to execute the targetanswers the target prompt.
All valid units The target prompt is a hierarchy prompt.
The object(s) that the user selects to execute the targetanswers the target prompt.
To create a link
1 In MicroStrategy Web, open the report. You can edit the report or execute it.
2 Right-click the object to create a link from, and select Edit Links. The Links dialogbox opens.
You can create links from the following objects:
— Attributes
— Hierarchies
— Metrics
— Object prompts
3 If this is not the first link created for the object, click New. If it is, continue with thenext step.
Define the link
4 Click ... (Browse) next to Run this report or document to find and select thetarget report or document.
Apply prompt answers
5 Select a target prompt from the box.
Advanced Reporting Guide
© 2017, MicroStrategy Inc. 483
6 Select a prompt answer method from the drop-down list (unless otherwise indicated,each method is available for all prompt types):
▫ Answer with the same prompt from the source. The same promptanswers that were used to execute the source are used in the target. To use thismethod, the target and the source must use the same prompt.
▫ Prompt user. The user is prompted to provide answers manually when thetarget is executed.
▫ Use default answer. The prompt is answered by the default prompt answerfor the prompt in the target report.
▫ Answer with an empty answer. The prompt in the target is ignored, whichmeans that the prompt is not answered. No prompt answer is provided from thesource and the user is not prompted to provide answers.
If the prompt is required, the prompt is still executed when a user clicks thislink, since a prompt answer must be provided.
▫ Answer Dynamically. The prompt is answered using the object selected inthe source.
Available for attribute element prompts and value prompts only.
▫ Answer using static element list. This method overrides the promptanswers from the source with a list of elements. Once you select this methodwhen you are creating the link, the Element List area becomes available,allowing you to select the elements that will be passed as answers to the elementlist prompt in the target.
Available for attribute element prompts only.
▫ Answer using current unit. Similar to the dynamic prompt answermethod, where the prompt is answered using the object selected in the source.
Available for hierarchy prompts only.
▫ Answer using all valid units. Any object to the left of or above the userselection in the source is used as the prompt answer for the target. In otherwords, this method passes all the selections made on the source, rather than justthe selection made for the link.
Available for hierarchy prompts only.
For examples of each of the prompt answer methods, see Specifying howprompts are answered in the target, page 467. For a list of prompt types, seethe Building Query Objects and Queries chapter in the Basic ReportingGuide.
7 Repeat the above steps, starting with Apply prompt answers, page 482, for eachprompt in the target.
Advanced Reporting Guide
484 © 2017, MicroStrategy Inc.
Specify the prompt answer method for any other prompts
Any other prompts are those prompts that are not in the target when you arecreating the link, such as prompts added to the target later. By default, the Promptuser method is selected for these prompts, but you can change the method. For moreinformation on how these prompts occur, including examples, see Specifying howprompts are answered in the target, page 467.
8 Select Any other prompt in the Target prompts list.
9 Select a Prompt Answer Method from the following list; only these methods areavailable for the Any other prompt option:
▫ Answer with the same prompt from the source
▫ Prompt user
▫ Use default answer
▫ Answer with an empty answer
See the previous list of prompt answer methods for brief descriptions of each.
Rename the link
10 By default, links are named Link1, Link2, and so on. To rename it, click Rename,and replace the name with new text.
You can help identify the link for analysts by using the name of the target and/ordescribe how its prompts are answered.
Create another link on the same object
To create additional links from the same object, continue with the steps below.Otherwise, continue with Specify whether a new window is used in MicroStrategyWeb, page 485. For an example of multiple links and how they work from a sourcereport, see Components of a link, page 465.
11 Click New, and define the link as described above, starting with Define the link,page 482.
12 By default, the first link that is created is set as the default link, which is used when auser clicks the object in MicroStrategy Web or double-clicks it in MicroStrategyDeveloper. To set a different link as the default, select it in the list at the top of thedialog box, and click Set as default. For details on default links, see Componentsof a link, page 465.
13 You can set the order that the links are displayed in the right-click menu. Select alink in the list at the top of the dialog box, and clickMove Up orMove Down tore-order the links.
Advanced Reporting Guide
© 2017, MicroStrategy Inc. 485
Specify whether a new window is used in MicroStrategy Web
For all the links on an object, you can specify whether the target opens in the samewindow as the source (replacing the source) or in a new window when a user clicks thelink in MicroStrategy Web.
14 By default, in MicroStrategy Web, the target report or document opens in the samewindow as the source. To have the target open in a new window, which allows boththe source and the target to be visible simultaneously, select the Open in a newwindow check box.
This setting applies to MicroStrategy Web only; links open in a new window inMicroStrategy Developer regardless of this setting.
15 Click OK to return to the source report.
Copying links to other objects in the reportTo use the same link (or a similar one) on a different report object, copy the link. Thissaves time, and ensures that the links are exactly the same. You can copy only one link ormultiple links.
For example, you want to create three links on Region and the same three links on CallCenter. Create the links on Region, and then copy them to Call Center. If one of the CallCenter links needs to be slightly different, you can edit it after copying it.
Links may already have been defined for the object that you are copying the links to. Inthis case, the following rules apply:
• Any existing links are not removed or overwritten, even if they point to the sametarget.
• If a copied link has the same name as an existing link, the copied link is renamed as“Copy of Name”.
• If a copied link is a default link, it is copied to the object as the default link, unlessthat object already has a default link defined. If it does, the link is copied, but it is notset as the default.
To copy a link
This procedure assumes you have already created the link that you want to copy.For steps, see Creating links, page 481.
1 In MicroStrategy Developer, open the report. You can edit the report or execute it.
2 Right-click the object that contains the link to be copied, and select Edit Links.The Link Editor opens.
3 Click Copy Links. The Copy Links dialog box opens.
4 In the list under Select the links to be copied, select the link or links to becopied.
Advanced Reporting Guide
486 © 2017, MicroStrategy Inc.
5 In the list under Select the units to which the selected links will be copied,select the object or objects to copy the links to.
6 You can choose whether to copy the Open in a new window setting to the newlink. This setting determines whether the target opens in the same window as thesource (replacing the source) or in a new window (simultaneously displaying thetarget and the source) in MicroStrategy Web.
By default, the Open in a new window setting is not copied. To changethis, select the Copy ‘Open in a new window’ setting to the targetunits check box.
7 Click Copy. You are returned to the Link Editor.
8 Click OK to return to the source report.
9 You can modify copied links, as necessary.
▫ Right-click the object that contains the new link, and select Edit Links. TheLink Editor opens.
▫ Make any necessary changes.
▫ Click OK to save the changes and return to the source.
Creating linked reportsThese examples include steps to create the links. They assume you are familiar withcreating prompts and reports. For details on creating reports and prompts, see the BasicReporting Guide.
These examples use data from the MicroStrategy Tutorial. The reports created in thisexample should be saved in the Public Objects\Reports folder or a subdirectory sothat they are available when you log into MicroStrategy Web.
The examples are:
• Creating linked reports that answer prompts with the selected objects
• Creating linked reports that answer prompts using metric conditions
Creating linked reports that answer prompts with theselected objectsThe following steps re-create the example shown in Linking Reports and Documents,page 461. The Regional Revenue report contains a link to the Revenue by Categoryreport. When a user clicks a region in MicroStrategy Web or double-clicks a region inMicroStrategy Developer, the Revenue by Category report is executed, and data foronly the selected region is shown.
The high-level steps to create this example are listed below:
1 Create the prompt for region, page 487
Advanced Reporting Guide
© 2017, MicroStrategy Inc. 487
2 Create the prompted target report (Revenue by Category), page 487
3 Create the source report (Regional Revenue), page 488
Create the prompt for region
This prompt will be used on the target report to determine the region to display. Whenthe link from the source report to the target is used, this prompt is answered by theregion selected in the source.
This is an attribute element list prompt, which allows the link in the source report to usethe dynamic prompt answer method. This method passes the selected region to thetarget report.
To create an attribute element list prompt
1 In MicroStrategy Web, log in to a project.
2 Open any folder page (for example, click the Shared Folders icon on the homepage).
3 Click the Create Prompt icon . The Create Prompt page opens.
4 Click Attribute Element List. The New Prompt page opens.
5 Click Select Attribute. The Select an Object dialog box opens.
6 Select List all elements.
7 Click the General tab.
8 In the Title field, type Region.
9 Clear the Prompt answer is required check box.
10 Save the prompt.
Create the prompted target report (Revenue by Category)
The target report is the report that is executed from the original report (the source). Thetarget report is filtered by the prompt that you created in the previous procedure.
To create a prompted report
1 In MicroStrategy Web, log in to a project.
2 Click the MicroStrategy icon at the upper left of any page and select Create
Report.
3 Add Region, Category, and the Revenuemetric to the report.
Advanced Reporting Guide
488 © 2017, MicroStrategy Inc.
4 Add the Region prompt that you created in the previous procedure to the reportfilter.
5 Save and close the report, naming it Revenue by Category.
Create the source report (Regional Revenue)
The source report is the report that contains the link to the target. The link in thissource report passes the selected region to answer the prompt in the target.
To create a report that links to another report
1 In MicroStrategy Web, log in to a project.
2 Click the MicroStrategy icon at the upper left of any page and select Create
Report.
3 Add Region and the Revenuemetric to the report.
Create the link
4 Right-click Region and select Edit Links. The Links dialog box opens.
5 Click ... (Browse) next to Run this report or document. The Select Targetdialog box opens.
6 Navigate to the Revenue by Category report, select it, and click Open. This reportis the target of the link.
7 Select Region in the Target prompts list. This prompt on the Revenue byCategory report filters the target report by region.
8 Choose Answer Dynamically from the drop-down list under Select PromptAnswer Method. This prompt answer method answers the prompt using theobject selected in the source (in this case, region).
If Answer Dynamically is not an option in the list, the Region prompt isnot an attribute element prompt.
9 By default, the link is named Link1. To help analysts identify the link, rename it.Click Rename, and type Revenue by Category over Link1.
10 Click OK to return to the report.
Save the report
11 Save the report, naming it Regional Revenue.
Advanced Reporting Guide
© 2017, MicroStrategy Inc. 489
To use the link
1 To use the link, do one of the following:
• In MicroStrategy Developer, execute the Regional Revenue report, thendouble-click a region.
• Log in to MicroStrategy Web, execute the Regional Revenue report, and thenclick a region.
The Revenue by Category report is executed, and displays only the data for the selectedregion.
Creating linked reports that answer prompts usingmetric conditionsThe following steps re-create the example shown in Specifying how prompts areanswered in the target, page 467. The Category Revenue by Region andCustomer report contains multiple links to the Revenue Data report. When a userclicks one of the revenue metrics in MicroStrategy Web or double-clicks a revenue metricin MicroStrategy Developer, the Revenue Data report is executed, and data for onlythe category of the metric is shown. This is the default link, which is called CategoryRevenue Data, where Category is replaced by the category of the metric.
The revenue metrics also have a second link to the same report. This link, which is calledCategory Region and Customer Revenue Data, passes the selected region andcustomer to the source, as well as the category of the metric. For example, if a userselects Books Revenue for Warner Aadland in the Central region, and uses the BooksRegion and Customer Revenue Data link, the target report displays data for WarnerAadland, Central, and Books only.
Although the source report in the example contains three revenue metrics, thesesteps use only two, to simplify the process. Also, both links are created at once,while the example replaces the Category Revenue Data link with the CategoryRegion and Customer Revenue Data link.
The high-level steps to create this example are listed below:
1 Create the filters for Books and Movies, page 490
2 Create the conditional metrics, page 490
3 Create the prompts for category, region, and customer, page 491
4 Create the prompted target report (Revenue Data), page 492
5 Create the source report (Category Revenue by Region and Customer), page 492
Advanced Reporting Guide
490 © 2017, MicroStrategy Inc.
Create the filters for Books and Movies
Each conditional metric (Books Revenue and Movies Revenue) contains a filter for theappropriate category.
To create the filters for Books and Movies
1 In MicroStrategy Developer, from the Filemenu, point to New, and then selectFilter. The Filter Editor opens.
If the New Filter dialog box is displayed, click the Empty Filter icon. If you do notwant this dialog box to be shown in the future, select Don't show this dialog inthe future. Click OK. For a full description of object templates, including a list ofthe objects that can use object templates, see Re-using objects via shortcuts andobject templates , page 295.
2 In the Object Browser, double-click Products, then double-click Category.
3 Drag Books from the Object Browser to the Filter definition area, which thendisplays Category in List (Books).
4 Click Save and Close on the toolbar.
5 Name the filter Books.
6 Repeat the steps above, replacing Books withMovies in steps 3 and 5.
Create the conditional metrics
Next, create the conditional metrics. A conditional metric contains a filter; in thisexample, they are the filters on category (Books and Movies) created in the previousprocedure.
To create conditional metrics for category revenue
1 In MicroStrategy Developer, from the Filemenu, point to New, and then selectMetric. The Metric Editor opens.
If the New Metric dialog box is displayed, click the Empty Metric icon. If you donot want this dialog box to be shown in the future, select Don't show this dialogin the future. Click OK. For a full description of object templates, including a listof the objects that can use object templates, see Re-using objects via shortcuts andobject templates , page 295.
2 In the Object Browser, double-click Revenue (the fact).
3 In the top part of the metric definition (underMetric New Metric is definedas), click Condition. The Condition definition pane is displayed below the Metriccomponent pane.
Advanced Reporting Guide
© 2017, MicroStrategy Inc. 491
4 In the Object Browser, find the Books filter. Drag and drop it in the Conditiondefinition pane.
5 Click Save and Close on the toolbar.
6 Name the metric Books Revenue.
7 Repeat the steps above, replacing the Books filter with theMovies filter in step 4and naming the metricMovies Revenue.
Create the prompts for category, region, and customer
These prompts will be used on the target report to determine the category, region, andcustomer to display. When the Category Revenue Data link from the source report tothe target is used, the category prompt is answered by the category in the static elementlist of the link. The region and customer prompt is ignored in that link.
For the Category Region and Customer Revenue Data link, the category promptis answered in the same way, but the region and customer selected in the source reportare passed to the target.
In the names of the links, Category is replaced by the category of the metric.
These are attribute element list prompts, to allow attribute elements to be passed to thetarget report.
To create attribute element list prompts
1 In MicroStrategy Developer, from the Filemenu, point to New, and then choosePrompt. The Prompt Generation Wizard opens.
2 Select the Filter definition prompt option. Then, in the list of filter definitionprompts, select Choose from an attribute element list, and click Next.
3 Type Category in the Attribute field and click Next.
4 Select List all elements and click Next.
5 In the Title field, type Category.
6 Clear the Prompt answer required check box.
7 Click Finish. The Save As dialog box opens.
8 Click Save.
9 Repeat the steps above twice.
• The first time, replace Category with Region in steps 3 and 5.
• The second time, replace Category with Customer in steps 3 and 5.
Advanced Reporting Guide
492 © 2017, MicroStrategy Inc.
Create the prompted target report (Revenue Data)
The target report is the report that is executed from the original report (the source). Thetarget report is filtered by the prompts on category, region, and customer that youcreated in the previous procedure.
To create a prompted report
1 In MicroStrategy Developer, from the Filemenu, point to New, and then selectReport. The Report Editor opens.
If the New Grid dialog box is displayed, click the Empty Report icon. If you do notwant this dialog box to be shown in the future, select Don't show this dialog inthe future. Click OK. For a full description of object templates, including a list ofthe objects that can use object templates, see Re-using objects via shortcuts andobject templates , page 295.
2 Add Region, Customer, and the following metrics to the report:
• Revenue
• Cost
• Profit
• Units Sold
• Revenue Per Employee
3 Add the Category, Region, and Customer prompts that you created in theprevious procedure to the report filter.
4 Save and close the report, naming it Revenue Data.
Create the source report (Category Revenue by Region and Customer)
The source report is the report that contains the links to the target. The links in thissource report pass the category of the selected conditional metric to answer the promptin the target. One link passes the selected region and customer as well, while the otherignores the region and customer prompts in the target.
To create a report that links to another report
1 In MicroStrategy Developer, from the Filemenu, point to New, and then selectReport. The Report Editor opens.
If the New Grid dialog box is displayed, click the Empty Report icon. If you do notwant this dialog box to be shown in the future, select Don't show this dialog inthe future. Click OK. For a full description of object templates, including a list ofthe objects that can use object templates, see Re-using objects via shortcuts andobject templates , page 295.
Advanced Reporting Guide
© 2017, MicroStrategy Inc. 493
2 Add Region, Customer, the Books Revenuemetric, and theMovies Revenuemetric to the report. (These are the metrics that you created in the previousprocedures.)
Create the link that passes category only from the Books Revenue metric
3 Right-click Books Revenue and select Edit Links. The Link Editor opens.
4 Click ... (Browse) next to Run this report or document. The Select Targetdialog box opens.
5 Navigate to the Revenue Data report, select it, and click Open. This report is thetarget of the link.
6 Select Category in the Target prompts list. This prompt on the Revenue Datareport filters the target report by category, and should be answered with the categoryin the conditional metric. Use a static element list to pass that year to the target.
7 Choose Static element list from the drop-down list under Select PromptAnswer Method. This prompt answer method answers the prompt using a list thatyou will create in the next step. The Element List area becomes available.
8 Click Add. The Select Elements dialog box opens.
9 Select Books (because this is the link from the Books Revenuemetric) from thelist of Available objects and click > to move it to the list of Selected objects.
10 Click OK to return to the Link Editor.
11 Select Region in the Target prompts list. This prompt on the Revenue Datareport filters the target report by region. Since all regions should be included in thetarget, this prompt should be ignored.
12 Choose Empty answer from the drop-down list under Select Prompt AnswerMethod. This prompt answer method ignores the prompt, which means that theRegion prompt is not answered. No prompt answer is provided from the source andthe user is not prompted to provide answers.
13 Select Customer in the Target prompts list. This prompt on the Revenue Datareport filters the target report by customer. Since all customers should be included inthe target, this prompt should be ignored.
14 Choose Empty answer from the drop-down list under Select Prompt AnswerMethod.
15 By default, the link is named Link1. To help analysts identify the link, rename it.Click Rename, and type Books Revenue Data over Link1. Including the nameof the report (in this case, a part of the full name) and a description of how itsprompts are answered (in this case, with Books only) helps identify what the targetwill be.
Create the link that passes category, region, and customer from the BooksRevenue metric
16 Click New to start a new link.
Advanced Reporting Guide
494 © 2017, MicroStrategy Inc.
17 By default, the link is named Link2, but you can rename it now. Type over the namewith Books Region and Customer Revenue Data, and press ENTER.Including the name of the report (in this case, a part of the full name) and adescription of how its prompts are answered (in this case, with Books, and theselected region and customer) helps identify what the target will be.
18 Click ... (Browse) next to Run this report or document. The Select Targetdialog box opens.
19 Navigate to the Revenue Data report, select it, and click Open. This report is thetarget of the link.
20 Select Category in the Target prompts list. This prompt should be answered withthe year in the conditional metric. Use a static element list to pass that category tothe target.
21 Choose Static element list from the drop-down list under Select PromptAnswer Method. The Element List area becomes available.
22 Click Add. The Select Elements dialog box opens.
23 Select Books from the list of Available objects and click > to move it to the list ofSelected objects.
24 Click OK to return to the Link Editor.
25 Select Region in the Target prompts list. This prompt on the Revenue Datareport filters the target report by region. Only the region selected on the sourceshould be included in the target.
26 Choose Dynamically from the drop-down list under Select Prompt AnswerMethod. This prompt answer method answers the prompt using the object selectedin the source (in this case, the region).
27 Select Customer in the Target prompts list. This prompt on the Revenue Datareport filters the target report by category. Only the customer selected on the sourceshould be included in the target.
28 Choose Dynamically from the drop-down list under Select Prompt AnswerMethod.
Copy the link from Books Revenue to Movies Revenue
The links from the Movies Revenue metric are the same as those on the Books Revenuemetric, except for the category. Rather than re-creating the links, copy them.
29 Click Copy Links. The Copy Links dialog box opens.
30 In the list under Select the links to be copied, select Books Revenue Dataand Books Revenue and Customer Revenue Data.
31 In the list under Select the units to which the selected links will be copied,selectMovies Revenue.
32 Click Copy. You are returned to the Link Editor.
33 Click OK to return to the report.
Advanced Reporting Guide
© 2017, MicroStrategy Inc. 495
Modify the copied links
The links from the Books Revenue metric are now on the Movies Revenue metric aswell. The category must be changed from Books to Movies in the link names andelement lists.
34 Right-clickMovies Revenue and select Edit Links. The Link Editor opens.
35 Select Books Revenue Data in the list of links.
36 Click Rename.
37 Replace Books withMovies in the name area, since this link is on the MoviesRevenue metric. Press ENTER.
38 Select Category in the Target prompts list.
39 In the Element List area, selectModify. The Select Elements dialog box opens.
40 Select Books in the Selected objects list and click < to move it to the Availableobjects list.
41 SelectMovies in the Available objects list and click > to move it to the Selectedobjects list. Now Movies rather than Books will be passed to the target.
42 Click OK to return to the Link Editor.
43 Select Books Region and Category Revenue Data in the list of links.
44 Repeat steps 36 through 42 above, to replace Books with Movies in the link nameand the element list.
45 Click OK to return to the report.
Save the report
46 Save the report, naming it Category Revenue by Region and Customer.
To use the links
1 To use the links, do one of the following:
• In MicroStrategy Developer, execute the Category Revenue by Region andCustomer report. To use the default link (Category Revenue Data) whichpasses only the category, not region or customer, double-click a revenue amount.To use the link that passes category, region, and customer, right-click a revenueamount, point to Link, and then select Category Region and CustomerRevenue Data.
• Log in to MicroStrategy Web and execute the Category Revenue by Regionand Customer report. To use the default link (Category Revenue Data) whichpasses only the category, not region or customer, click a revenue amount. To usethe link that passes category, region, and customer, right-click a revenueamount, point to Links, and then select Category Region and CustomerRevenue Data.

Advanced Reporting Guide
496 © 2017, MicroStrategy Inc.
In the names of the links, Category is replaced by the category of the metric.
11CUSTOM SQL QUERIES:FREEFORM SQL AND QUERYBUILDER
Freeform SQL and Query Builder provide two alternative methods to access your dataand begin analysis with MicroStrategy. Freeform SQL allows you to write your own SQLstatements to run directly against a data warehouse or operational data store, giving youfull control over accessing your data. Query Builder provides you with a graphical userinterface that helps guide you on building SQL queries that can adapt to different datamodels.
These two features allow you to run queries against ODBC data sources that are not easilymodeled to an attribute and fact schema. This includes databases that are a collection offlat tables rather than being defined into fact and lookup tables. You can also save a greatamount of time setting up a project to use with Freeform SQL or Query Builder becauseyou are not required to create an attribute and fact schema.
Additionally you can connect to third-party web services to retrieve data and report onthat data within MicroStrategy. This is accomplished by using the MicroStrategyFreeform SQL Editor to write XQuery statements to access and retrieve informationfrom a web service.
This section discusses different aspects of the Freeform SQL and Query Builder features,including the following:
• Customize your SQL statements: Freeform SQL, page 498
• Reporting on third-party web services with XQuery, page 524
• Retrieving web folder resources with XQuery, page 545
• Updating data with Transaction Services, page 554
• Customize your SQL queries: Query Builder, page 568
• Connect to databases, Excel files, and text files, page 599
• Map data to non-project objects: Managed objects, page 601
• Creating Intelligent Cubes, page 605
© 2017, MicroStrategy Inc. 497
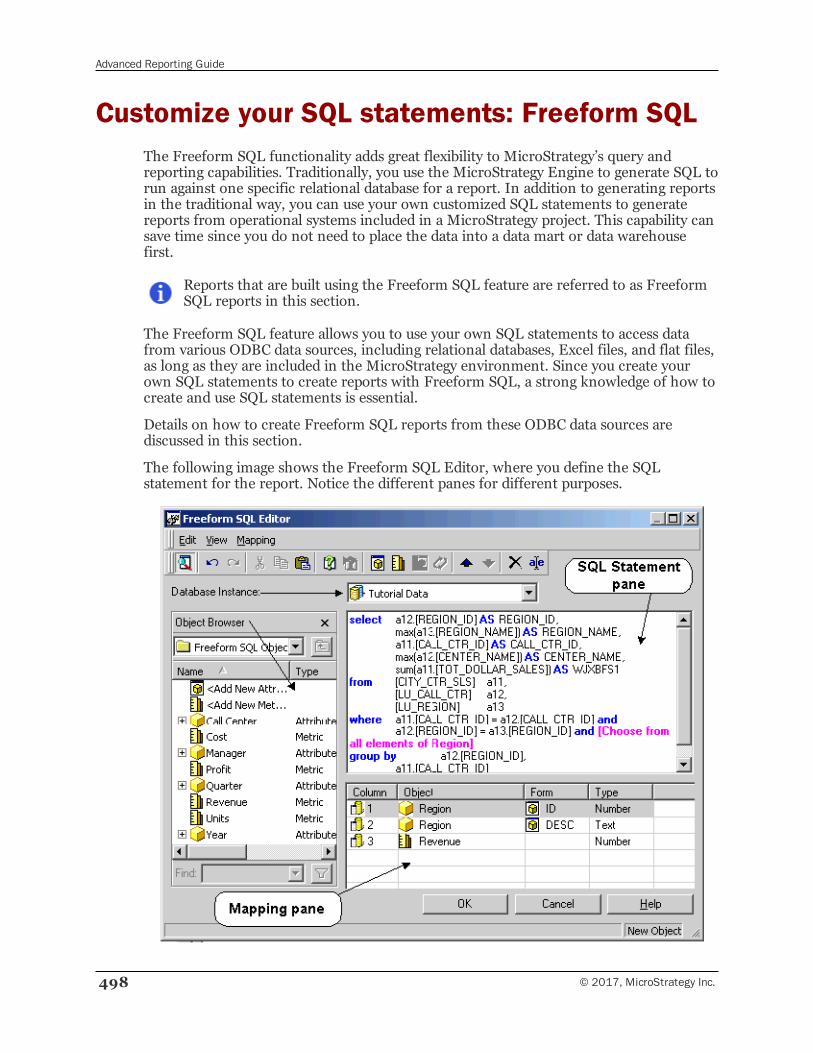
Advanced Reporting Guide
498 © 2017, MicroStrategy Inc.
Customize your SQL statements: Freeform SQLThe Freeform SQL functionality adds great flexibility to MicroStrategy’s query andreporting capabilities. Traditionally, you use the MicroStrategy Engine to generate SQL torun against one specific relational database for a report. In addition to generating reportsin the traditional way, you can use your own customized SQL statements to generatereports from operational systems included in a MicroStrategy project. This capability cansave time since you do not need to place the data into a data mart or data warehousefirst.
Reports that are built using the Freeform SQL feature are referred to as FreeformSQL reports in this section.
The Freeform SQL feature allows you to use your own SQL statements to access datafrom various ODBC data sources, including relational databases, Excel files, and flat files,as long as they are included in the MicroStrategy environment. Since you create yourown SQL statements to create reports with Freeform SQL, a strong knowledge of how tocreate and use SQL statements is essential.
Details on how to create Freeform SQL reports from these ODBC data sources arediscussed in this section.
The following image shows the Freeform SQL Editor, where you define the SQLstatement for the report. Notice the different panes for different purposes.
Advanced Reporting Guide
© 2017, MicroStrategy Inc. 499
Usage scenarios and SQL standardsHow to use the Freeform SQL feature effectively depends on your work environment. Aswith every other MicroStrategy functionality, before you start using this feature, youneed to assess your particular work situation and find a way to strike a good balancebetween project maintainability and fast-paced development. For example, building threeor four Freeform SQL reports could be valuable, but building 100 such reports couldmake maintenance and testing difficult.
Whether you should use the Freeform SQL feature to build reports at all is anotherquestion that you should ask yourself. You may want to consider using this feature if youare in one of the situations discussed below. For information on using the Freeform SQLEditor to report on third-party web services, see Reporting on third-party web serviceswith XQuery, page 524.
When to use the Freeform SQL feature
If your company is accustomed to creating static reports using customized SQL toretrieve data from a certain ODBC data source, and especially if your SQL queries haveworked well in the past, then you may want to simply use MicroStrategy to deploy thosereports to your users. There is no need to recreate the SQL with the MicroStrategyEngine, as is done if the data is moved to a data warehouse for report generation.Freeform SQL allows you to use your own SQL statements rather than generating newand possibly different SQL statements.
If you have existing stored procedures that have proven to be successful, then you cancontinue to use them to generate MicroStrategy reports. One important thing to note isthat you must know what data the stored procedure is supposed to retrieve because thisinformation is essential in building a Freeform SQL report. Specifically, you need toknow the number of columns, column names, and their data types, all of which arenecessary for mapping the columns to MicroStrategy objects.
Another situation for which you might want to use Freeform SQL reporting is when youneed to run queries against a set of OLTP tables that are not set up for OLAP analysis.Data warehouses that do not lend themselves well to MicroStrategy’s attribute and factschema can be accessed with Freeform SQL and mapped to new MicroStrategy objectsautomatically created by the Freeform SQL feature. As for all the Freeform SQL reports,connecting to the desired ODBC data source is a prerequisite.
Freeform SQL can also be a helpful tool to perform database maintenance tasks such asupdates and inserts. For information on this scenario see Using Freeform SQL forupdates, inserts, and other database maintenance tasks, page 503.
SQL query syntax
Well-written SQL queries are the key to building successful Freeform SQL reports. Totake full advantage of the Freeform SQL feature, MicroStrategy recommends that youensure the correctness and validity of your SQL statements before creating any reportsusing Freeform SQL. MicroStrategy does not offer consultation or technical support forthe syntax or composition of your SQL queries.
Depending on your needs, you can compose SQL statements in several ways:
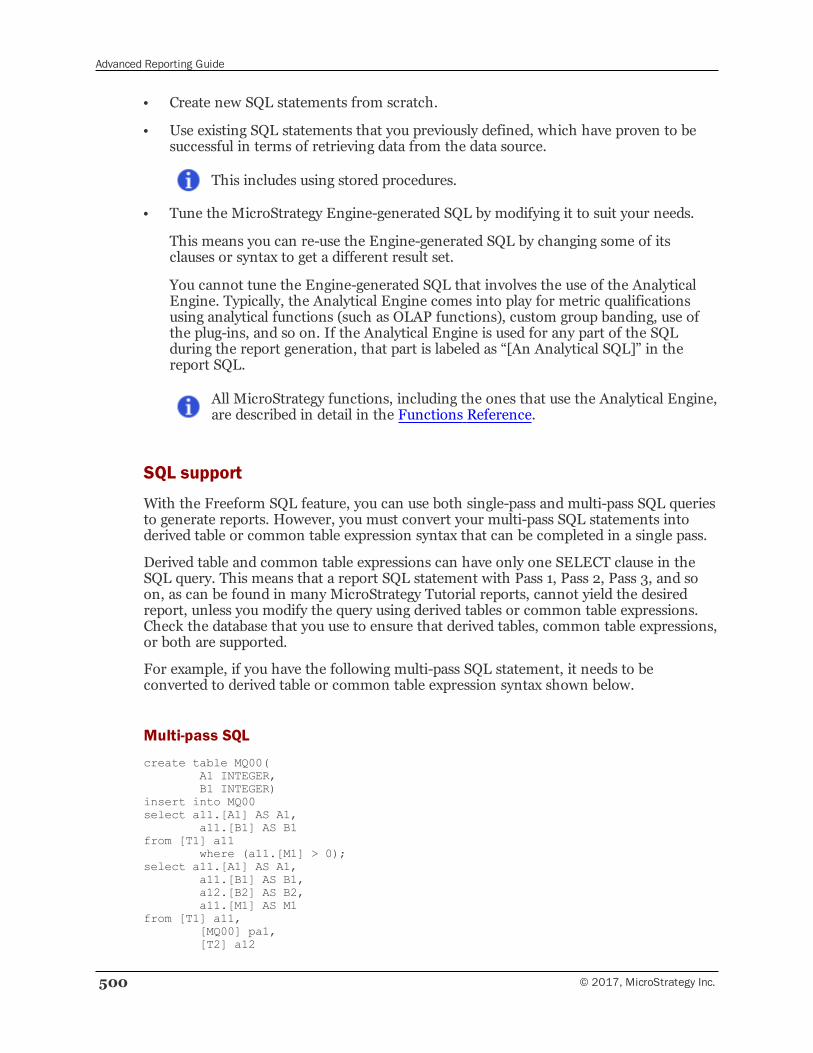
Advanced Reporting Guide
500 © 2017, MicroStrategy Inc.
• Create new SQL statements from scratch.
• Use existing SQL statements that you previously defined, which have proven to besuccessful in terms of retrieving data from the data source.
This includes using stored procedures.
• Tune the MicroStrategy Engine-generated SQL by modifying it to suit your needs.
This means you can re-use the Engine-generated SQL by changing some of itsclauses or syntax to get a different result set.
You cannot tune the Engine-generated SQL that involves the use of the AnalyticalEngine. Typically, the Analytical Engine comes into play for metric qualificationsusing analytical functions (such as OLAP functions), custom group banding, use ofthe plug-ins, and so on. If the Analytical Engine is used for any part of the SQLduring the report generation, that part is labeled as “[An Analytical SQL]” in thereport SQL.
All MicroStrategy functions, including the ones that use the Analytical Engine,are described in detail in the Functions Reference.
SQL support
With the Freeform SQL feature, you can use both single-pass and multi-pass SQL queriesto generate reports. However, you must convert your multi-pass SQL statements intoderived table or common table expression syntax that can be completed in a single pass.
Derived table and common table expressions can have only one SELECT clause in theSQL query. This means that a report SQL statement with Pass 1, Pass 2, Pass 3, and soon, as can be found in many MicroStrategy Tutorial reports, cannot yield the desiredreport, unless you modify the query using derived tables or common table expressions.Check the database that you use to ensure that derived tables, common table expressions,or both are supported.
For example, if you have the following multi-pass SQL statement, it needs to beconverted to derived table or common table expression syntax shown below.
Multi-pass SQL
create table MQ00(A1 INTEGER,B1 INTEGER)
insert into MQ00select a11.[A1] AS A1,
a11.[B1] AS B1from [T1] a11
where (a11.[M1] > 0);select a11.[A1] AS A1,
a11.[B1] AS B1,a12.[B2] AS B2,a11.[M1] AS M1
from [T1] a11,[MQ00] pa1,[T2] a12
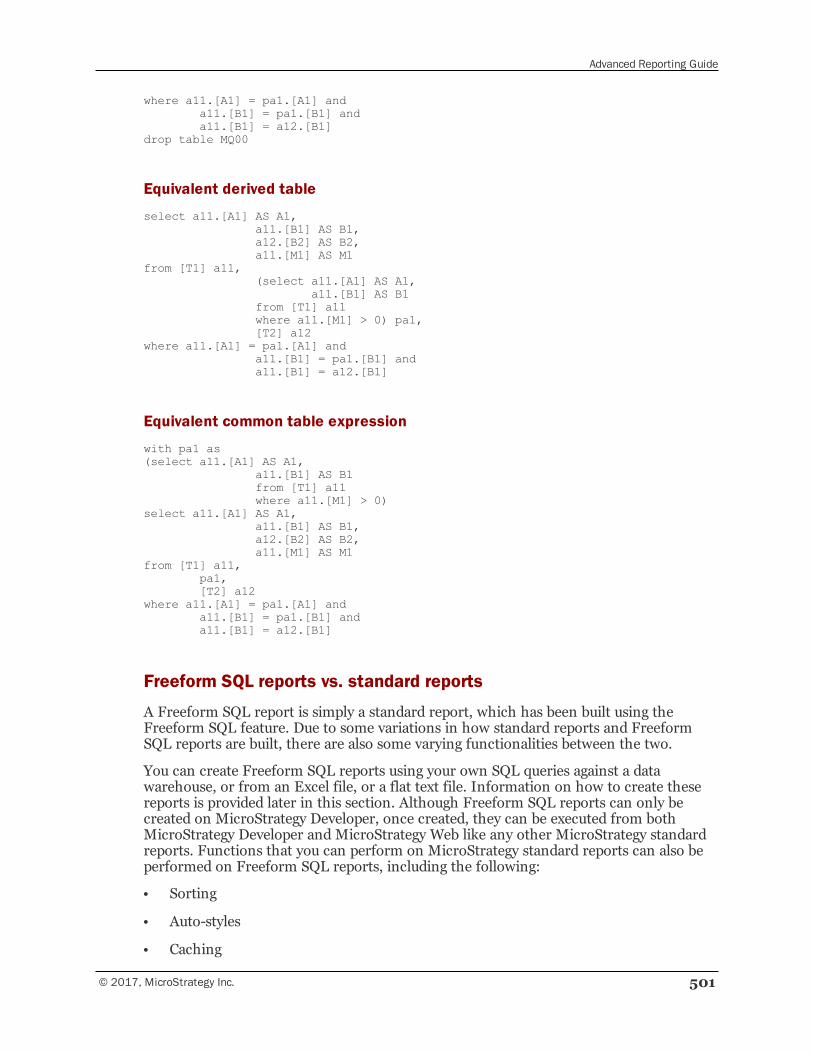
Advanced Reporting Guide
© 2017, MicroStrategy Inc. 501
where a11.[A1] = pa1.[A1] anda11.[B1] = pa1.[B1] anda11.[B1] = a12.[B1]
drop table MQ00
Equivalent derived table
select a11.[A1] AS A1,a11.[B1] AS B1,a12.[B2] AS B2,a11.[M1] AS M1
from [T1] a11,(select a11.[A1] AS A1,
a11.[B1] AS B1from [T1] a11where a11.[M1] > 0) pa1,[T2] a12
where a11.[A1] = pa1.[A1] anda11.[B1] = pa1.[B1] anda11.[B1] = a12.[B1]
Equivalent common table expression
with pa1 as(select a11.[A1] AS A1,
a11.[B1] AS B1from [T1] a11where a11.[M1] > 0)
select a11.[A1] AS A1,a11.[B1] AS B1,a12.[B2] AS B2,a11.[M1] AS M1
from [T1] a11,pa1,[T2] a12
where a11.[A1] = pa1.[A1] anda11.[B1] = pa1.[B1] anda11.[B1] = a12.[B1]
Freeform SQL reports vs. standard reports
A Freeform SQL report is simply a standard report, which has been built using theFreeform SQL feature. Due to some variations in how standard reports and FreeformSQL reports are built, there are also some varying functionalities between the two.
You can create Freeform SQL reports using your own SQL queries against a datawarehouse, or from an Excel file, or a flat text file. Information on how to create thesereports is provided later in this section. Although Freeform SQL reports can only becreated on MicroStrategy Developer, once created, they can be executed from bothMicroStrategy Developer and MicroStrategy Web like any other MicroStrategy standardreports. Functions that you can perform on MicroStrategy standard reports can also beperformed on Freeform SQL reports, including the following:
• Sorting
• Auto-styles
• Caching
Advanced Reporting Guide
502 © 2017, MicroStrategy Inc.
• Exporting
• Thresholds
• Graphing
• Filtering
• Value prompts
• Shortcut-to-a-report qualification. For more information on using a Freeform SQLreport as a shortcut-to-a-report qualification, see Reporting analysis features, page513.
• Narrowcast Server subscriptions and report execution
• Object security
• OLAP services
• Prioritization
• Report Services documents
• Scheduling
• Subtotals
The following features are available for use with Freeform SQL reports if an attribute andfact schema is used to model the data returned from your queries:
• Element list prompts
• Security filters
The following features do not apply to Freeform SQL reports:
• Custom groups
• Consolidations
• Transformations
• Existing filters
• Save as template/filter
• Data marting
Freeform SQL reports in Report Services documents
Once created, Freeform SQL reports can be included in Report Services documents inthe same way as standard reports. The same document can also contain reports fromother data sources, such as MDX cube reports. For information regarding MDX cubereports, refer to the MDX Cube Reporting Guide.
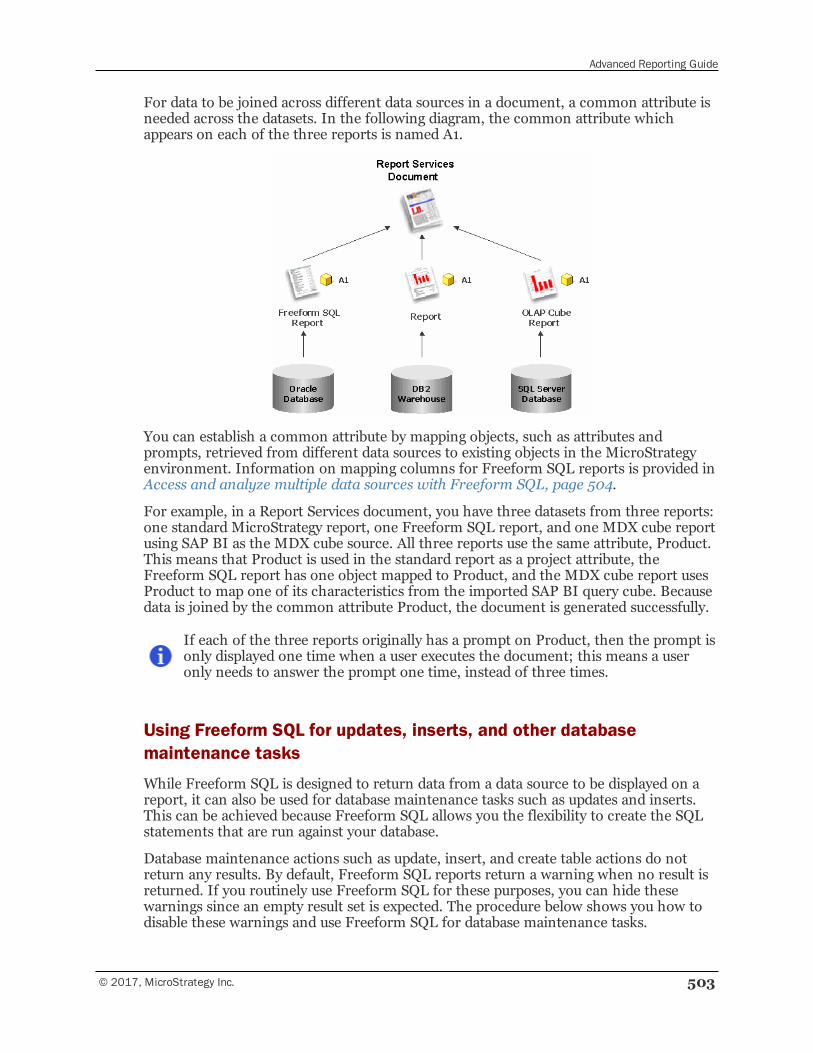
Advanced Reporting Guide
© 2017, MicroStrategy Inc. 503
For data to be joined across different data sources in a document, a common attribute isneeded across the datasets. In the following diagram, the common attribute whichappears on each of the three reports is named A1.
You can establish a common attribute by mapping objects, such as attributes andprompts, retrieved from different data sources to existing objects in the MicroStrategyenvironment. Information on mapping columns for Freeform SQL reports is provided inAccess and analyze multiple data sources with Freeform SQL, page 504.
For example, in a Report Services document, you have three datasets from three reports:one standard MicroStrategy report, one Freeform SQL report, and one MDX cube reportusing SAP BI as the MDX cube source. All three reports use the same attribute, Product.This means that Product is used in the standard report as a project attribute, theFreeform SQL report has one object mapped to Product, and the MDX cube report usesProduct to map one of its characteristics from the imported SAP BI query cube. Becausedata is joined by the common attribute Product, the document is generated successfully.
If each of the three reports originally has a prompt on Product, then the prompt isonly displayed one time when a user executes the document; this means a useronly needs to answer the prompt one time, instead of three times.
Using Freeform SQL for updates, inserts, and other databasemaintenance tasks
While Freeform SQL is designed to return data from a data source to be displayed on areport, it can also be used for database maintenance tasks such as updates and inserts.This can be achieved because Freeform SQL allows you the flexibility to create the SQLstatements that are run against your database.
Database maintenance actions such as update, insert, and create table actions do notreturn any results. By default, Freeform SQL reports return a warning when no result isreturned. If you routinely use Freeform SQL for these purposes, you can hide thesewarnings since an empty result set is expected. The procedure below shows you how todisable these warnings and use Freeform SQL for database maintenance tasks.
Advanced Reporting Guide
504 © 2017, MicroStrategy Inc.
To use Freeform SQL for updates, inserts, and other databasemaintenance tasks
1 In MicroStrategy Developer, on the Filemenu, point to New, and choose Report.The New Grid dialog box opens.
2 On the Freeform Sources tab, select Create Freeform SQL report.
3 In the Source area, select a database instance for the database to access usingFreeform SQL. For information on connecting to databases, see Connect todatabases, page 599.
4 Click OK. The Freeform SQL Editor opens.
5 Create the SQL statement for the database maintenance task.
6 Click OK to complete the Freeform SQL statement definition. The Report Editoropens.
7 From the Data menu, select VLDB Properties. The VLDB Properties Editoropens.
8 In the VLDB Settings list, expand the Freeform SQL folder, and select IgnoreEmpty Result for Freeform SQL.
9 Clear the Use default inherited value check box.
10 Select Turn off warnings for Freeform SQL statements with emptyresults, such as updates to hide all warnings when a Freeform SQL statementcauses a Freeform SQL report to return an empty result. This prevents users fromseeing a warning every time a SQL statement to perform a database maintenancetask is executed using Freeform SQL.
11 Click Save and Close to save your changes and return to the Freeform SQL report.
12 From the toolbar, click the Run Report icon to execute the Freeform SQL report,which executes the database maintenance action you defined.
Access and analyze multiple data sources withFreeform SQLWith Freeform SQL, you can access multiple data sources in the same project and useMicroStrategy reporting features to analyze your data. Connection to databases, Excelfiles, and text files is described in Connect to databases, Excel files, and text files, page599.
For information on using the Freeform SQL Editor to report on third-party web servicesas a data source, see Reporting on third-party web services with XQuery, page 524.
Once you connect to a valid data source, you can create a Freeform SQL report toretrieve and analyze the data from the data source. This section describes the process ofusing Freeform SQL to:
Advanced Reporting Guide
© 2017, MicroStrategy Inc. 505
• Create a Freeform SQL report to access databases, Excel files, or text files, page505
• Create a Freeform SQL report using a stored procedure, page 507
• Mapping columns to metadata objects, page 508
Create a Freeform SQL report to access databases, Excel files, or textfiles
After you create a connection to your data source, you can create a Freeform SQL thatqueries that data source.
The steps to create a Freeform SQL report from a database, Excel file, and text file arethe same, except for which data source the report connects to. For steps to create aFreeform SQL report from a stored procedure, see Create a Freeform SQL report usinga stored procedure, page 507.
Prerequisites
• You must connect Query Builder to a database, Excel file, or text file, which isdescribed in the sections listed below:
▫ Connect to databases, page 599
▫ Connect to Excel files, page 600
▫ Connect to text files, page 600
• Freeform SQL reports can be created on MicroStrategy Developer only. However,these reports can be manipulated and executed from both MicroStrategy Developerand Web. Access to the Freeform SQL Editor is available only to Developers with theDefine Freeform SQL Report privilege and those with the Create schema objectsprivilege.
To create a Freeform SQL report
1 In MicroStrategy Developer, from the Filemenu, select New, and then chooseReport. The New Grid dialog box opens.
2 On the Freeform Sources tab, in the Source area, select a database instance forthe data source to access using Freeform SQL. The sections listed below provide theconfiguration steps for the different data sources:
• Connect to databases, page 599
• Connect to Excel files, page 600
• Connect to text files, page 600
Advanced Reporting Guide
506 © 2017, MicroStrategy Inc.
If a database instance is not defined in the metadata, the Freeform SQL Editorcannot be loaded and a message is displayed.
3 Select Create Freeform SQL report and click OK. The Freeform SQL Editoropens.
4 In the SQL Statement pane (the top pane on the right), type in your SQL query. Beaware of the following when creating a SQL statement:
• Column names in the SQL statement have to match the column names in thedatabase, column headers in the Excel file, or the field names in the text file.
• The column names you use in your SQL query are NOT case sensitive.
• When connecting to Excel and text files, you do not use the file name as thetable name for the “From” clause. You must use the table names you definedwhen creating and connecting to the files. Remember that the Excel file or textfile is the data source that contains the tables, which are named individually.
5 In the Mapping pane (the bottom pane on the right), map the columns in your SQLstatement to attributes and metrics to be used in the report. Be aware of thefollowing when mapping columns in your SQL statement to attributes and metrics:
• When mapping the columns, it is important that you follow the same sequenceof the columns as they appear in the SQL statement. Doing otherwise causes thereport to fail.
• Make sure that the number of mappings is the same as the number of columnsin the SQL statement. For example, if your SQL statement lists 10 columns fromwhich to retrieve data, you should map these columns to exactly 10 attributes ormetrics.
• You must map a column to the ID form for each attribute you use in yourFreeform SQL report.
6 Insert prompts into the SQL statement, if needed. For information on includingprompts in Freeform SQL reports, see Reporting analysis features, page 513.
7 Insert security filter qualifications, if needed. For more information on insertingsecurity filter qualifications in Freeform SQL reports, see Security for data access,page 520.
8 Click OK to close the Freeform SQL Editor. The Report Editor opens.
9 Format and define the Freeform SQL report in the same way as you would astandard report, using features such as sorting, view filters, thresholds, exporting,and so on.
10 From the Filemenu, click Save As. The Save Report As dialog box opens.
You must save the report before you can run it.
11 Enter a name for the report and click Save.
12 Run the Freeform SQL report.
Advanced Reporting Guide
© 2017, MicroStrategy Inc. 507
Create a Freeform SQL report using a stored procedure
Since stored procedures are run against databases, creating a Freeform SQL report usinga successful stored procedure requires you to first connect to a database (see Connect todatabases, page 599). Mapping columns to attributes and metrics requires priorknowledge of your data warehouse structure. Although the stored procedure itself doesnot display any column names, you need to know in advance what columns will beretrieved once the procedure is executed. Without this knowledge, it may be difficult foryou to map the columns.
For example, if you use the following stored procedure:
Execute sp_customer_profit
you may need to map the columns to the following MicroStrategy objects:
• Customer ID
• Customer DESC
• Customer City ID
• Customer City DESC
• Profit
Below are the general steps you need to take when you use a stored procedure to create aFreeform SQL report.
Prerequisites
• Freeform SQL reports can be created on MicroStrategy Developer only. However,these reports can be manipulated and executed from both MicroStrategy Developerand Web. Access to the Freeform SQL Editor is available only to Developers with theDefine Freeform SQL Report privilege and those with the Create schema objectsprivilege.
• You must connect Freeform SQL to a database, which is described in Connect todatabases, page 599.
To use a stored procedure to create a Freeform SQL report
1 In MicroStrategy Developer, on the Filemenu, point to New, and then selectReport. The New Grid dialog box opens.
2 On the Freeform Sources tab, select Create Freeform SQL report.
3 In the Source area, select the database instance you created for Freeform SQLreports with stored procedures.
4 Click OK. The Freeform SQL Editor opens.
5 In the SQL Statement pane (the top pane on the right), type in your storedprocedure.
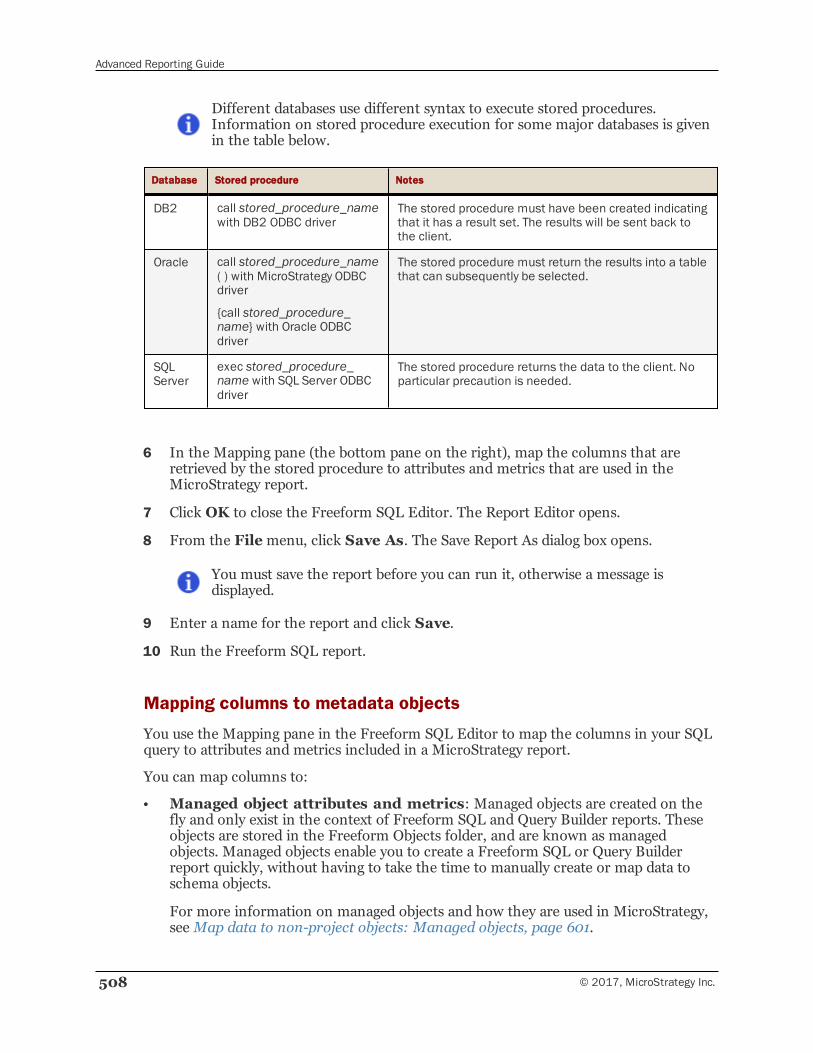
Advanced Reporting Guide
508 © 2017, MicroStrategy Inc.
Different databases use different syntax to execute stored procedures.Information on stored procedure execution for some major databases is givenin the table below.
Database Stored procedure Notes
DB2 call stored_procedure_namewith DB2 ODBC driver
The stored procedure must have been created indicatingthat it has a result set. The results will be sent back tothe client.
Oracle call stored_procedure_name( ) with MicroStrategy ODBCdriver
{call stored_procedure_name} with Oracle ODBCdriver
The stored procedure must return the results into a tablethat can subsequently be selected.
SQLServer
exec stored_procedure_name with SQL Server ODBCdriver
The stored procedure returns the data to the client. Noparticular precaution is needed.
6 In the Mapping pane (the bottom pane on the right), map the columns that areretrieved by the stored procedure to attributes and metrics that are used in theMicroStrategy report.
7 Click OK to close the Freeform SQL Editor. The Report Editor opens.
8 From the Filemenu, click Save As. The Save Report As dialog box opens.
You must save the report before you can run it, otherwise a message isdisplayed.
9 Enter a name for the report and click Save.
10 Run the Freeform SQL report.
Mapping columns to metadata objects
You use the Mapping pane in the Freeform SQL Editor to map the columns in your SQLquery to attributes and metrics included in a MicroStrategy report.
You can map columns to:
• Managed object attributes and metrics: Managed objects are created on thefly and only exist in the context of Freeform SQL and Query Builder reports. Theseobjects are stored in the Freeform Objects folder, and are known as managedobjects. Managed objects enable you to create a Freeform SQL or Query Builderreport quickly, without having to take the time to manually create or map data toschema objects.
For more information on managed objects and how they are used in MicroStrategy,seeMap data to non-project objects: Managed objects, page 601.
Advanced Reporting Guide
© 2017, MicroStrategy Inc. 509
Managed objects are also created when integrating MDX cube sources intoMicroStrategy. MDX cube sources include SAP BW, Microsoft AnalysisServices, Hyperion Essbase, and IBM Cognos TM1. For information onintegrating MDX cube sources into MicroStrategy, see the MDX CubeReporting Guide.
• Project attributes: These attributes exist in the project as part of the relationalschema, and therefore can be used to generate standard reports. Mapping columnsin Freeform SQL reports to project attributes enables you to present a consistentrepresentation of data to report analysts. This also allows you to use Freeform SQLreports as filters on standard reports, as described in Reporting analysis features,page 513.
Project attributes also facilitate joins with standard MicroStrategy reports in a ReportServices document. This capability enables you to create many types of documents.For example, you can create a Report Services document with two datasets that sharea common project attribute. One retrieves historical data from a data warehouse, andthe other contains current data using Freeform SQL from an operational system.
Unlike attributes, which can be mapped to project attributes, all metrics are createdor mapped to managed object metrics. The only existing metrics you can use aremanaged object metrics that are defined for Freeform SQL and Query Builderreports in the current project.
For information on mapping attributes and metrics to columns in your Freeform SQLstatement, see the sections below:
• Mapping a new attribute form to a column, page 509
• Mapping a new metric to a column, page 510
• Mapping an existing object to a column, page 511
• Renaming an object mapped to a column, page 512
• Replacing an object mapped to a column, page 512
Mapping a new attribute form to a column
You can map a column in a SQL statement to a new attribute form in the MicroStrategyenvironment. All new attribute forms are mapped to managed objects, which arediscussed in Map data to non-project objects: Managed objects, page 601.
By default, every newly added attribute uses the ID form. You can change the columnmapped to the ID form by using the Forms drop-down list in the Mapping pane of theFreeform SQL Editor.
Prerequisites
• The procedure below assumes that you have already created a Freeform SQL reportand that it is open in the Freeform SQL Editor.
• You must have the Define Freeform SQL Report and Create Schema Objectsprivileges to access and use the Freeform SQL Editor.
Advanced Reporting Guide
510 © 2017, MicroStrategy Inc.
To map a new attribute form to a column
1 From theMappingmenu, select Add New Attribute Form. An attribute form isinserted into the Mapping pane.
An attribute can have multiple attribute forms, and every attribute must map acolumn to the ID attribute form.
2 Type in the object name of your choice and make the selection for Form and Type.
You can show and hide column data types along with other pertinent information.From the View menu, select Show Column Data Type. This option displays thefull data type information for the column, including Data Type, Precision/Length,and Scale.
3 Ensure that the column number for the object matches the order of the column inthe SQL statement. For example, an object is to be mapped to the second columnlisted in the SELECT clause. In the Mapping pane, the object must be included ascolumn 2. You can use the Move Up and Move Down options in the toolbar tochange the column position of an object.
• Use the DB Query Tool to test the validity of the stored procedurebefore creating any Freeform SQL report.
• If you use a stored procedure, it is important that you know its contentin advance, including exactly which columns the stored procedureretrieves. Otherwise, it may be difficult for you to correctly map thecolumns retrieved.
Mapping a new metric to a column
You can map a column in the SQL statement to a new metric that can be recognized inthe MicroStrategy environment. All new metrics are mapped to managed objects, whichare discussed in Map data to non-project objects: Managed objects, page 601.
Prerequisites
• The procedure below assumes that you have already created a Freeform SQL reportand that it is open in the Freeform SQL Editor.
• You must have the Define Freeform SQL Report and Create Schema Objectsprivileges to access and use the Freeform SQL Editor.
To map a new metric to a column
1 From theMappingmenu, select Add New Metric. A new metric is inserted intothe Mapping pane.
2 Type in the metric name of your choice and make the selection for Form and Type.
Advanced Reporting Guide
© 2017, MicroStrategy Inc. 511
You can show and hide column data types along with other pertinent information.From the View menu, select Show Column Data Type. This option displays thefull data type information for the column, including Data Type, Precision/Length,and Scale.
3 Ensure that the column number for the object matches the order of the column inthe SQL statement. For example, an object is to be mapped to the second columnlisted in the SELECT clause. In the Mapping pane, the object must be included ascolumn 2. You can use the Move Up and Move Down options in the toolbar tochange the column position of an object.
Mapping an existing object to a column
By mapping existing objects to columns in Freeform SQL reports, you can avoid creatingduplicate copies of the same object. Mapping with a project object also serves thepurpose of joining data when the object is used in a Report Services document thatcontains multiple datasets. Using project objects also enables you to use security filterswith your Freeform SQL reports.
An existing object can be:
• An attribute defined in an existing MicroStrategy project that is part of a relationalschema.
• A managed object attribute that has been created for previous Freeform SQL reportsor Query Builder reports in the current project.
• A managed object metric that has been created for previous Freeform SQL reports orQuery Builder reports.
A metric defined in an existing MicroStrategy project that is not a managedobject cannot be used for mapping in Freeform SQL reports or Query Builderreports.
Prerequisites
• The procedure below assumes that you have already created a Freeform SQL reportand that it is open in the Freeform SQL Editor.
• You must have the Define Freeform SQL Report and Create Schema Objectsprivileges to access and use the Freeform SQL Editor.
To map an existing object to a column
1 From theMappingmenu, select Insert. The Select an Object dialog box opens.
2 Browse to and select an attribute or metric, and click OK. You are returned to theFreeform SQL Editor and the object is mapped to a new column.
3 Ensure that the column number for the object matches the order of the column inthe SQL statement. For example, an object is to be mapped to the second columnlisted in the SELECT clause. In the Mapping pane, the object must be included as
Advanced Reporting Guide
512 © 2017, MicroStrategy Inc.
column 2. You can use the Move Up and Move Down options in the toolbar tochange the column position of an object.
Renaming an object mapped to a column
You can use the Rename option to change the name of an attribute or a metric in theObject field in the Mapping pane. Only new attributes and metrics can be renamed. Youcannot rename those that are mapped to existing attributes and metrics that have alreadybeen saved to the metadata, that is those that already exist in the Freeform Objects folderor in any folder displayed in the Object Browser window. This reduces the number ofduplicate metadata objects.
Prerequisites
• The procedure below assumes that you have already created a Freeform SQL reportand that it is open in the Freeform SQL Editor.
• You must have the Define Freeform SQL Report and Create Schema Objectsprivileges to access and use the Freeform SQL Editor.
To rename an object mapped to a column
1 In the Mapping pane, right-click the row for the object you want renamed, andselect Rename.
2 Type the new name for the object.
Replacing an object mapped to a column
You can replace an object mapped to a column with a different existing object. This canbe helpful if you previously used managed object attributes to map your Freeform SQLdata, but now you want to use project attributes that are part of your relational schema.
Prerequisites
• The procedure below assumes that you have already created a Freeform SQL reportand that it is open in the Freeform SQL Editor.
• You must have the Define Freeform SQL Report and Create Schema Objectsprivileges to access and use the Freeform SQL Editor.
To replace an object mapped to a column
1 In MicroStrategy Developer, browse to a Freeform SQL report, right-click the report,and select Edit. The Report Editor opens.
2 If the report is not in Design view, switch the report to Design view.
3 From the Data menu, select Freeform SQL Definition. The Freeform SQLEditor opens.
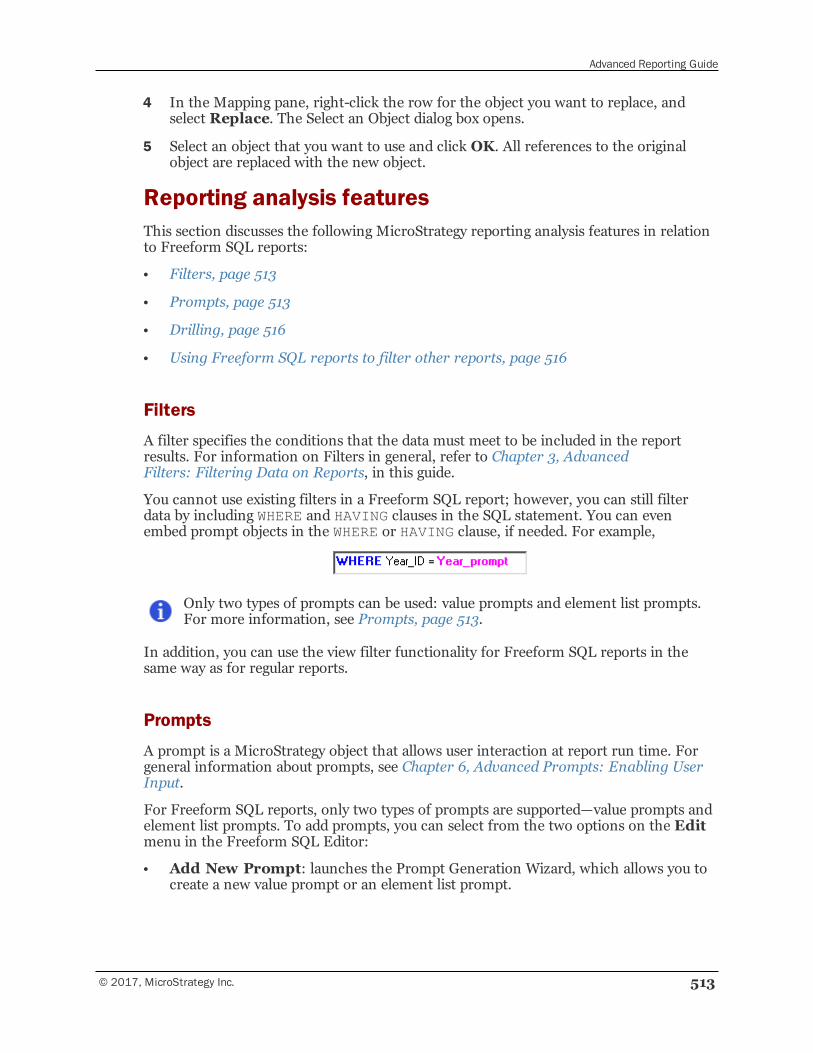
Advanced Reporting Guide
© 2017, MicroStrategy Inc. 513
4 In the Mapping pane, right-click the row for the object you want to replace, andselect Replace. The Select an Object dialog box opens.
5 Select an object that you want to use and click OK. All references to the originalobject are replaced with the new object.
Reporting analysis featuresThis section discusses the following MicroStrategy reporting analysis features in relationto Freeform SQL reports:
• Filters, page 513
• Prompts, page 513
• Drilling, page 516
• Using Freeform SQL reports to filter other reports, page 516
Filters
A filter specifies the conditions that the data must meet to be included in the reportresults. For information on Filters in general, refer to Chapter 3, AdvancedFilters: Filtering Data on Reports, in this guide.
You cannot use existing filters in a Freeform SQL report; however, you can still filterdata by including WHERE and HAVING clauses in the SQL statement. You can evenembed prompt objects in the WHERE or HAVING clause, if needed. For example,
Only two types of prompts can be used: value prompts and element list prompts.For more information, see Prompts, page 513.
In addition, you can use the view filter functionality for Freeform SQL reports in thesame way as for regular reports.
Prompts
A prompt is a MicroStrategy object that allows user interaction at report run time. Forgeneral information about prompts, see Chapter 6, Advanced Prompts: Enabling UserInput.
For Freeform SQL reports, only two types of prompts are supported—value prompts andelement list prompts. To add prompts, you can select from the two options on the Editmenu in the Freeform SQL Editor:
• Add New Prompt: launches the Prompt Generation Wizard, which allows you tocreate a new value prompt or an element list prompt.
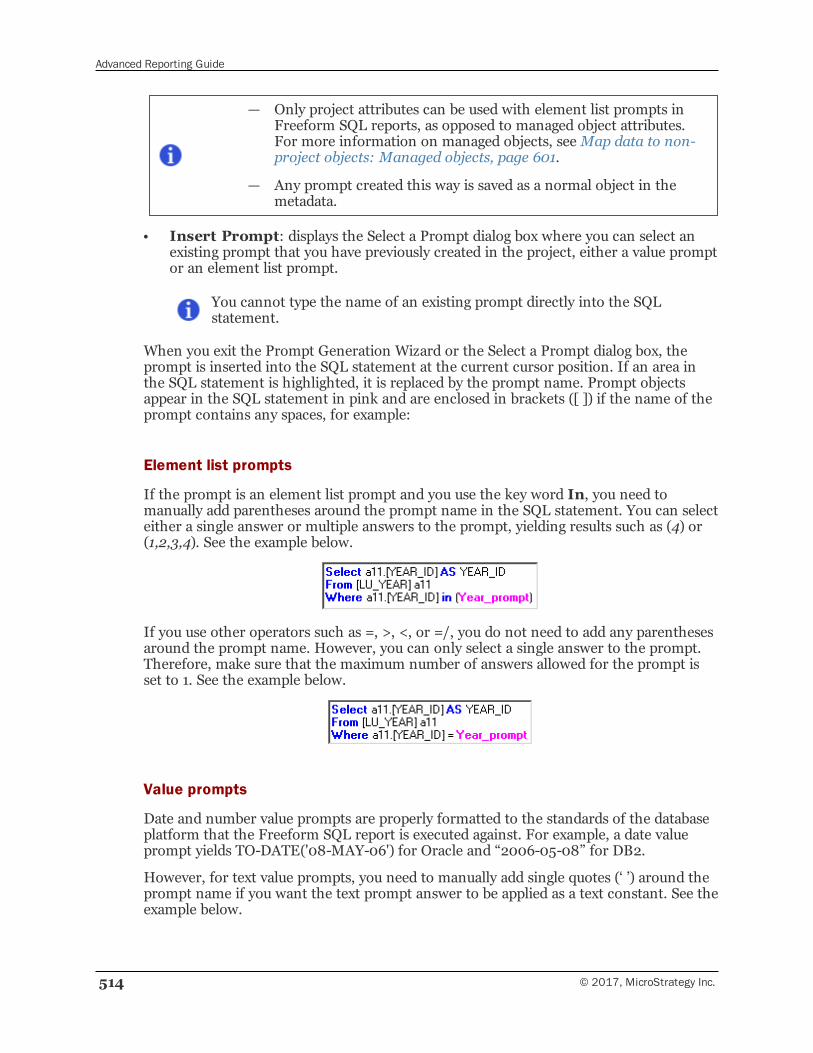
Advanced Reporting Guide
514 © 2017, MicroStrategy Inc.
— Only project attributes can be used with element list prompts inFreeform SQL reports, as opposed to managed object attributes.For more information on managed objects, seeMap data to non-project objects: Managed objects, page 601.
— Any prompt created this way is saved as a normal object in themetadata.
• Insert Prompt: displays the Select a Prompt dialog box where you can select anexisting prompt that you have previously created in the project, either a value promptor an element list prompt.
You cannot type the name of an existing prompt directly into the SQLstatement.
When you exit the Prompt Generation Wizard or the Select a Prompt dialog box, theprompt is inserted into the SQL statement at the current cursor position. If an area inthe SQL statement is highlighted, it is replaced by the prompt name. Prompt objectsappear in the SQL statement in pink and are enclosed in brackets ([ ]) if the name of theprompt contains any spaces, for example:
Element list prompts
If the prompt is an element list prompt and you use the key word In, you need tomanually add parentheses around the prompt name in the SQL statement. You can selecteither a single answer or multiple answers to the prompt, yielding results such as (4) or(1,2,3,4). See the example below.
If you use other operators such as =, >, <, or =/, you do not need to add any parenthesesaround the prompt name. However, you can only select a single answer to the prompt.Therefore, make sure that the maximum number of answers allowed for the prompt isset to 1. See the example below.
Value prompts
Date and number value prompts are properly formatted to the standards of the databaseplatform that the Freeform SQL report is executed against. For example, a date valueprompt yields TO-DATE('08-MAY-06') for Oracle and “2006-05-08” for DB2.
However, for text value prompts, you need to manually add single quotes (‘ ’) around theprompt name if you want the text prompt answer to be applied as a text constant. See theexample below.
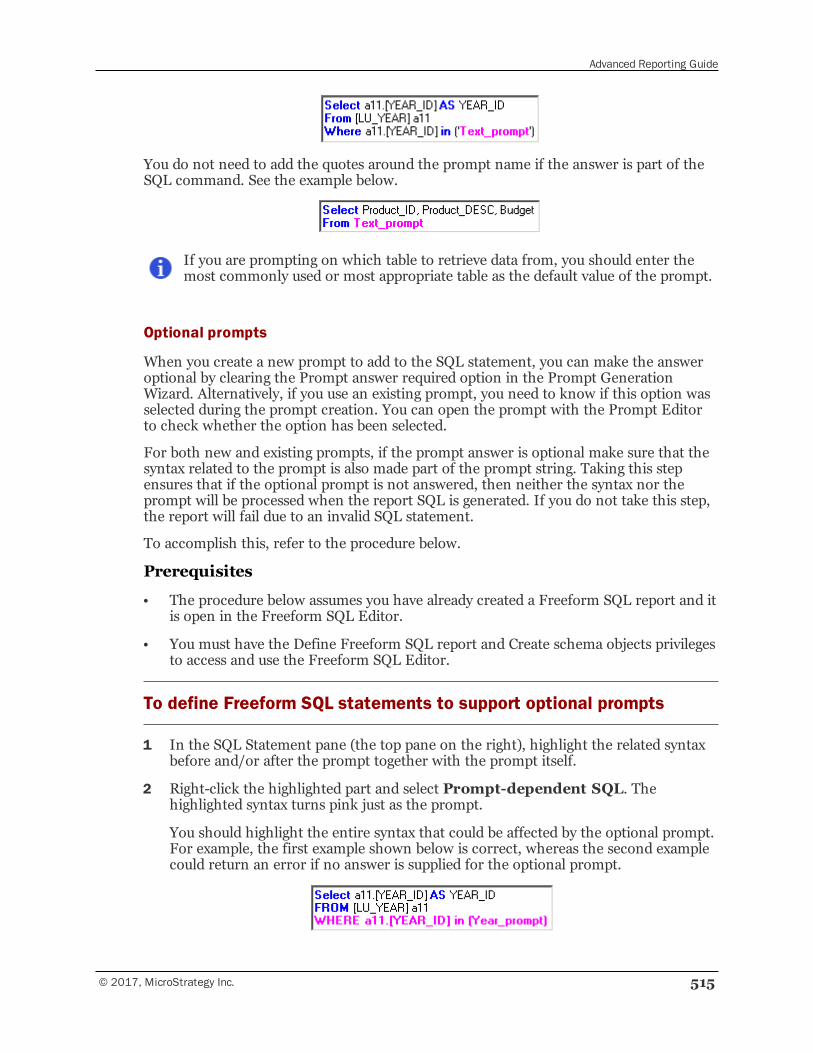
Advanced Reporting Guide
© 2017, MicroStrategy Inc. 515
You do not need to add the quotes around the prompt name if the answer is part of theSQL command. See the example below.
If you are prompting on which table to retrieve data from, you should enter themost commonly used or most appropriate table as the default value of the prompt.
Optional prompts
When you create a new prompt to add to the SQL statement, you can make the answeroptional by clearing the Prompt answer required option in the Prompt GenerationWizard. Alternatively, if you use an existing prompt, you need to know if this option wasselected during the prompt creation. You can open the prompt with the Prompt Editorto check whether the option has been selected.
For both new and existing prompts, if the prompt answer is optional make sure that thesyntax related to the prompt is also made part of the prompt string. Taking this stepensures that if the optional prompt is not answered, then neither the syntax nor theprompt will be processed when the report SQL is generated. If you do not take this step,the report will fail due to an invalid SQL statement.
To accomplish this, refer to the procedure below.
Prerequisites
• The procedure below assumes you have already created a Freeform SQL report and itis open in the Freeform SQL Editor.
• You must have the Define Freeform SQL report and Create schema objects privilegesto access and use the Freeform SQL Editor.
To define Freeform SQL statements to support optional prompts
1 In the SQL Statement pane (the top pane on the right), highlight the related syntaxbefore and/or after the prompt together with the prompt itself.
2 Right-click the highlighted part and select Prompt-dependent SQL. Thehighlighted syntax turns pink just as the prompt.
You should highlight the entire syntax that could be affected by the optional prompt.For example, the first example shown below is correct, whereas the second examplecould return an error if no answer is supplied for the optional prompt.
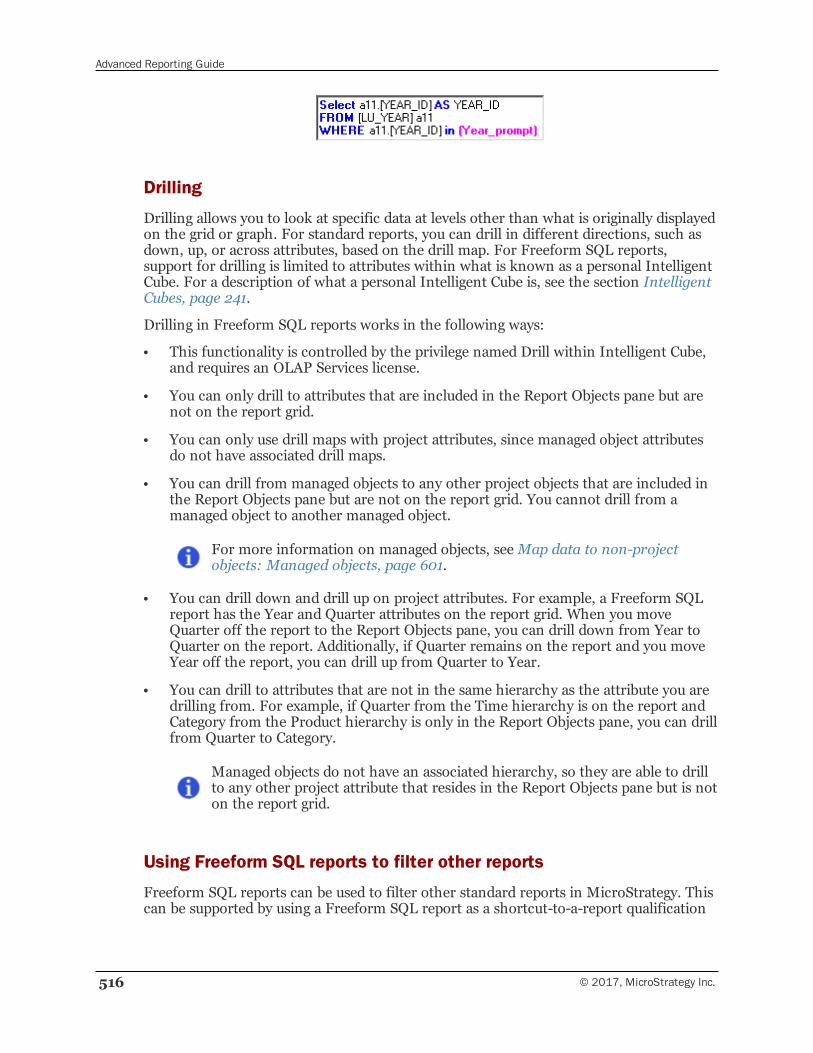
Advanced Reporting Guide
516 © 2017, MicroStrategy Inc.
Drilling
Drilling allows you to look at specific data at levels other than what is originally displayedon the grid or graph. For standard reports, you can drill in different directions, such asdown, up, or across attributes, based on the drill map. For Freeform SQL reports,support for drilling is limited to attributes within what is known as a personal IntelligentCube. For a description of what a personal Intelligent Cube is, see the section IntelligentCubes, page 241.
Drilling in Freeform SQL reports works in the following ways:
• This functionality is controlled by the privilege named Drill within Intelligent Cube,and requires an OLAP Services license.
• You can only drill to attributes that are included in the Report Objects pane but arenot on the report grid.
• You can only use drill maps with project attributes, since managed object attributesdo not have associated drill maps.
• You can drill from managed objects to any other project objects that are included inthe Report Objects pane but are not on the report grid. You cannot drill from amanaged object to another managed object.
For more information on managed objects, seeMap data to non-projectobjects: Managed objects, page 601.
• You can drill down and drill up on project attributes. For example, a Freeform SQLreport has the Year and Quarter attributes on the report grid. When you moveQuarter off the report to the Report Objects pane, you can drill down from Year toQuarter on the report. Additionally, if Quarter remains on the report and you moveYear off the report, you can drill up from Quarter to Year.
• You can drill to attributes that are not in the same hierarchy as the attribute you aredrilling from. For example, if Quarter from the Time hierarchy is on the report andCategory from the Product hierarchy is only in the Report Objects pane, you can drillfrom Quarter to Category.
Managed objects do not have an associated hierarchy, so they are able to drillto any other project attribute that resides in the Report Objects pane but is noton the report grid.
Using Freeform SQL reports to filter other reports
Freeform SQL reports can be used to filter other standard reports in MicroStrategy. Thiscan be supported by using a Freeform SQL report as a shortcut-to-a-report qualification
Advanced Reporting Guide
© 2017, MicroStrategy Inc. 517
on a standard report. For information on shortcut-to-a-report qualifications, see Aboutthe report-as-filter, page 237.
However, there are additional configurations and requirements to allow Freeform SQLreports to be used as a shortcut-to-a-report qualification, as described below:
• The Freeform SQL report must map data to project attributes rather managed objectattributes. This is required in order for the standard report to recognize the data thatis available on the Freeform SQL report. For information on mapping data inFreeform SQL reports to project attributes, see Access and analyze multiple datasources with Freeform SQL, page 504.
• If the Freeform SQL report returns data from a data source that is not the primarydata warehouse, you must have the Execute Multiple Source Report privilege. Thisprivilege is available as part of MicroStrategy MultiSource. For information onMultiSource, see the Project Design Guide.
To add a Freeform SQL report as a shortcut-to-a-report qualification in a standardreport, open the standard report in MicroStrategy Developer. In the Report Filterarea, double-click the arrow to add a new qualification. In the Filtering Options, selectAdd a Shortcut to a Report. Click OK. Click the… (browse button) to select aFreeform SQL report, and click OK. Click OK again to create the filter qualification.
Supporting Grid/Graph filtering of document datasets based onFreeform SQL reports
Report Services document designers can enable Grid/Graphs as report conditionselectors to filter the data in a dataset, allowing users to view subsets of large amounts ofdata, rather than loading and displaying all the data at once. For example, the documentbelow includes a graph that displays the revenue and profit for subcategories of productsduring various years. This document also includes a Grid/Graph report condition selectorthat includes the Category attribute. You can click the categories of this Grid/Graph todisplay results for different categories in the graph.
For example, you can view results for the Books category, as shown below:
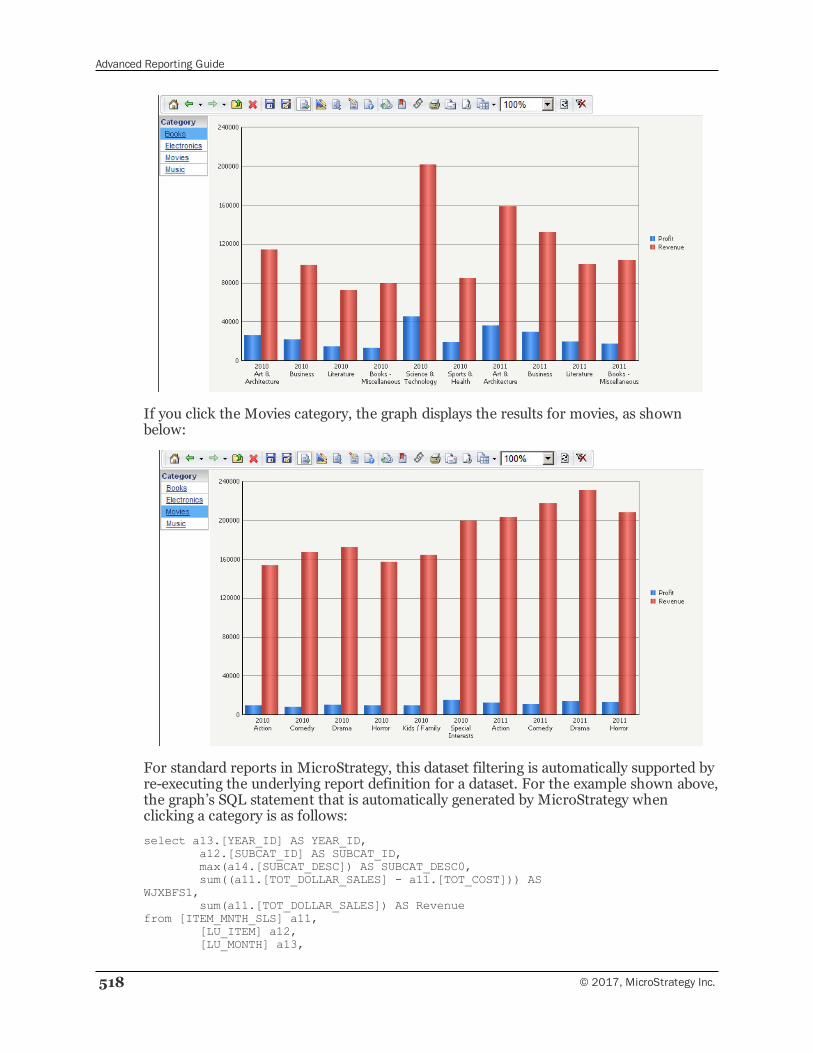
Advanced Reporting Guide
518 © 2017, MicroStrategy Inc.
If you click the Movies category, the graph displays the results for movies, as shownbelow:
For standard reports in MicroStrategy, this dataset filtering is automatically supported byre-executing the underlying report definition for a dataset. For the example shown above,the graph’s SQL statement that is automatically generated by MicroStrategy whenclicking a category is as follows:
select a13.[YEAR_ID] AS YEAR_ID,a12.[SUBCAT_ID] AS SUBCAT_ID,max(a14.[SUBCAT_DESC]) AS SUBCAT_DESC0,sum((a11.[TOT_DOLLAR_SALES] - a11.[TOT_COST])) AS
WJXBFS1,sum(a11.[TOT_DOLLAR_SALES]) AS Revenue
from [ITEM_MNTH_SLS] a11,[LU_ITEM] a12,[LU_MONTH] a13,
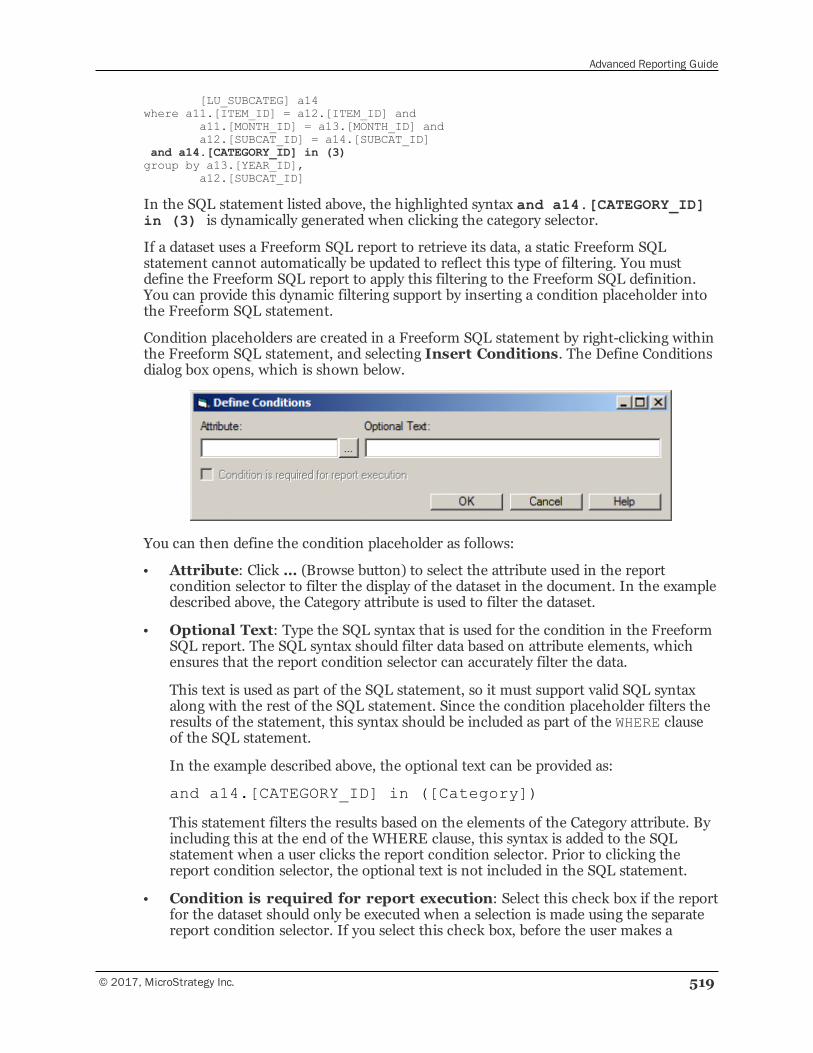
Advanced Reporting Guide
© 2017, MicroStrategy Inc. 519
[LU_SUBCATEG] a14where a11.[ITEM_ID] = a12.[ITEM_ID] and
a11.[MONTH_ID] = a13.[MONTH_ID] anda12.[SUBCAT_ID] = a14.[SUBCAT_ID]
and a14.[CATEGORY_ID] in (3)group by a13.[YEAR_ID],
a12.[SUBCAT_ID]
In the SQL statement listed above, the highlighted syntax and a14.[CATEGORY_ID]in (3) is dynamically generated when clicking the category selector.
If a dataset uses a Freeform SQL report to retrieve its data, a static Freeform SQLstatement cannot automatically be updated to reflect this type of filtering. You mustdefine the Freeform SQL report to apply this filtering to the Freeform SQL definition.You can provide this dynamic filtering support by inserting a condition placeholder intothe Freeform SQL statement.
Condition placeholders are created in a Freeform SQL statement by right-clicking withinthe Freeform SQL statement, and selecting Insert Conditions. The Define Conditionsdialog box opens, which is shown below.
You can then define the condition placeholder as follows:
• Attribute: Click … (Browse button) to select the attribute used in the reportcondition selector to filter the display of the dataset in the document. In the exampledescribed above, the Category attribute is used to filter the dataset.
• Optional Text: Type the SQL syntax that is used for the condition in the FreeformSQL report. The SQL syntax should filter data based on attribute elements, whichensures that the report condition selector can accurately filter the data.
This text is used as part of the SQL statement, so it must support valid SQL syntaxalong with the rest of the SQL statement. Since the condition placeholder filters theresults of the statement, this syntax should be included as part of the WHERE clauseof the SQL statement.
In the example described above, the optional text can be provided as:
and a14.[CATEGORY_ID] in ([Category])
This statement filters the results based on the elements of the Category attribute. Byincluding this at the end of the WHERE clause, this syntax is added to the SQLstatement when a user clicks the report condition selector. Prior to clicking thereport condition selector, the optional text is not included in the SQL statement.
• Condition is required for report execution: Select this check box if the reportfor the dataset should only be executed when a selection is made using the separatereport condition selector. If you select this check box, before the user makes a
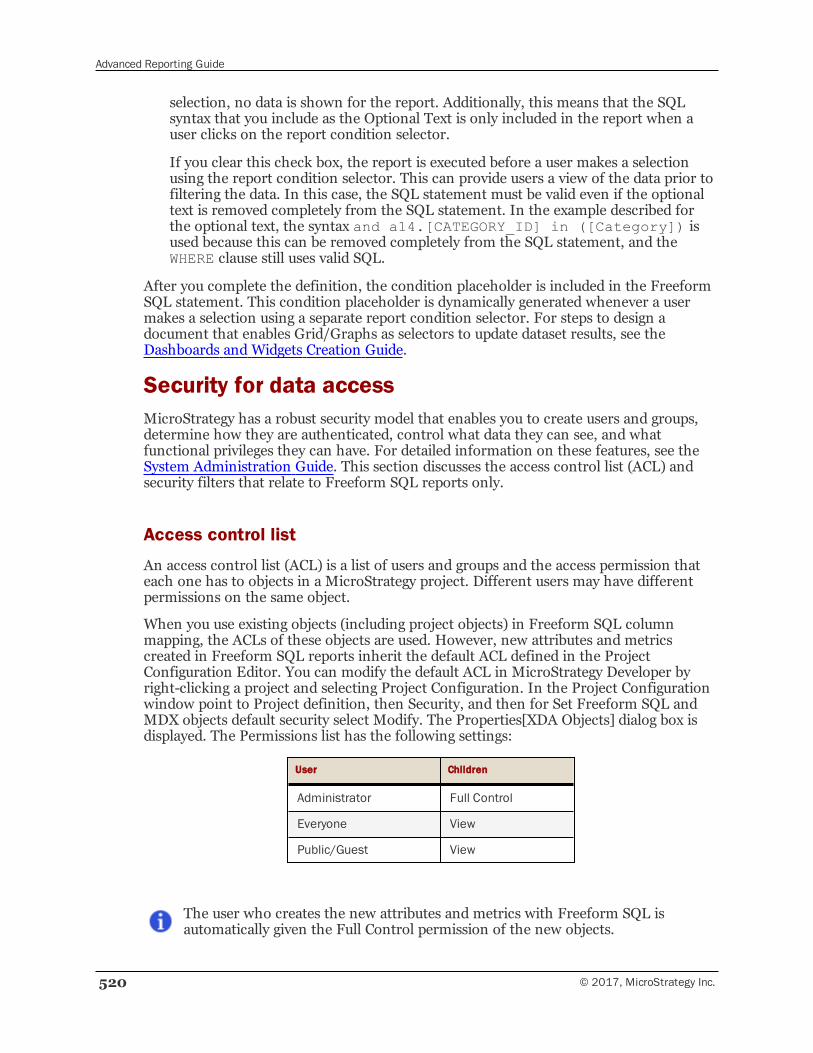
Advanced Reporting Guide
520 © 2017, MicroStrategy Inc.
selection, no data is shown for the report. Additionally, this means that the SQLsyntax that you include as the Optional Text is only included in the report when auser clicks on the report condition selector.
If you clear this check box, the report is executed before a user makes a selectionusing the report condition selector. This can provide users a view of the data prior tofiltering the data. In this case, the SQL statement must be valid even if the optionaltext is removed completely from the SQL statement. In the example described forthe optional text, the syntax and a14.[CATEGORY_ID] in ([Category]) isused because this can be removed completely from the SQL statement, and theWHERE clause still uses valid SQL.
After you complete the definition, the condition placeholder is included in the FreeformSQL statement. This condition placeholder is dynamically generated whenever a usermakes a selection using a separate report condition selector. For steps to design adocument that enables Grid/Graphs as selectors to update dataset results, see theDashboards and Widgets Creation Guide.
Security for data accessMicroStrategy has a robust security model that enables you to create users and groups,determine how they are authenticated, control what data they can see, and whatfunctional privileges they can have. For detailed information on these features, see theSystem Administration Guide. This section discusses the access control list (ACL) andsecurity filters that relate to Freeform SQL reports only.
Access control list
An access control list (ACL) is a list of users and groups and the access permission thateach one has to objects in a MicroStrategy project. Different users may have differentpermissions on the same object.
When you use existing objects (including project objects) in Freeform SQL columnmapping, the ACLs of these objects are used. However, new attributes and metricscreated in Freeform SQL reports inherit the default ACL defined in the ProjectConfiguration Editor. You can modify the default ACL in MicroStrategy Developer byright-clicking a project and selecting Project Configuration. In the Project Configurationwindow point to Project definition, then Security, and then for Set Freeform SQL andMDX objects default security select Modify. The Properties[XDA Objects] dialog box isdisplayed. The Permissions list has the following settings:
User Children
Administrator Full Control
Everyone View
Public/Guest View
The user who creates the new attributes and metrics with Freeform SQL isautomatically given the Full Control permission of the new objects.
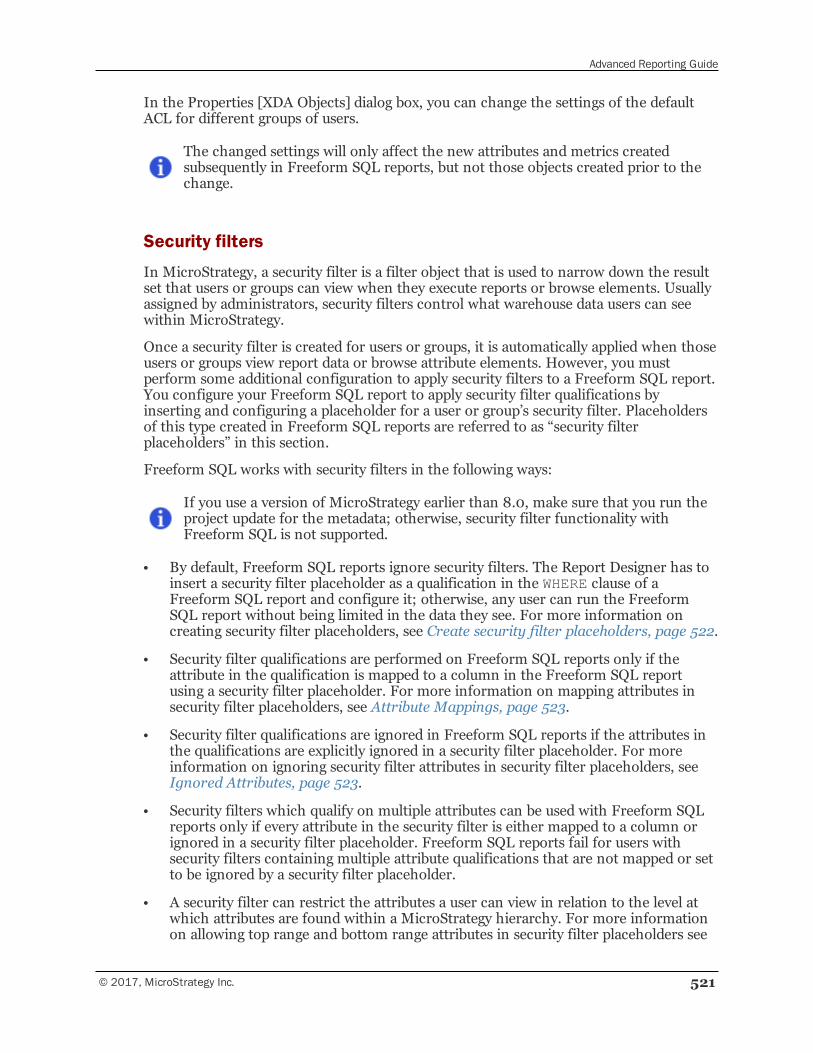
Advanced Reporting Guide
© 2017, MicroStrategy Inc. 521
In the Properties [XDA Objects] dialog box, you can change the settings of the defaultACL for different groups of users.
The changed settings will only affect the new attributes and metrics createdsubsequently in Freeform SQL reports, but not those objects created prior to thechange.
Security filters
In MicroStrategy, a security filter is a filter object that is used to narrow down the resultset that users or groups can view when they execute reports or browse elements. Usuallyassigned by administrators, security filters control what warehouse data users can seewithin MicroStrategy.
Once a security filter is created for users or groups, it is automatically applied when thoseusers or groups view report data or browse attribute elements. However, you mustperform some additional configuration to apply security filters to a Freeform SQL report.You configure your Freeform SQL report to apply security filter qualifications byinserting and configuring a placeholder for a user or group’s security filter. Placeholdersof this type created in Freeform SQL reports are referred to as “security filterplaceholders” in this section.
Freeform SQL works with security filters in the following ways:
If you use a version of MicroStrategy earlier than 8.0, make sure that you run theproject update for the metadata; otherwise, security filter functionality withFreeform SQL is not supported.
• By default, Freeform SQL reports ignore security filters. The Report Designer has toinsert a security filter placeholder as a qualification in the WHERE clause of aFreeform SQL report and configure it; otherwise, any user can run the FreeformSQL report without being limited in the data they see. For more information oncreating security filter placeholders, see Create security filter placeholders, page 522.
• Security filter qualifications are performed on Freeform SQL reports only if theattribute in the qualification is mapped to a column in the Freeform SQL reportusing a security filter placeholder. For more information on mapping attributes insecurity filter placeholders, see Attribute Mappings, page 523.
• Security filter qualifications are ignored in Freeform SQL reports if the attributes inthe qualifications are explicitly ignored in a security filter placeholder. For moreinformation on ignoring security filter attributes in security filter placeholders, seeIgnored Attributes, page 523.
• Security filters which qualify on multiple attributes can be used with Freeform SQLreports only if every attribute in the security filter is either mapped to a column orignored in a security filter placeholder. Freeform SQL reports fail for users withsecurity filters containing multiple attribute qualifications that are not mapped or setto be ignored by a security filter placeholder.
• A security filter can restrict the attributes a user can view in relation to the level atwhich attributes are found within a MicroStrategy hierarchy. For more informationon allowing top range and bottom range attributes in security filter placeholders see
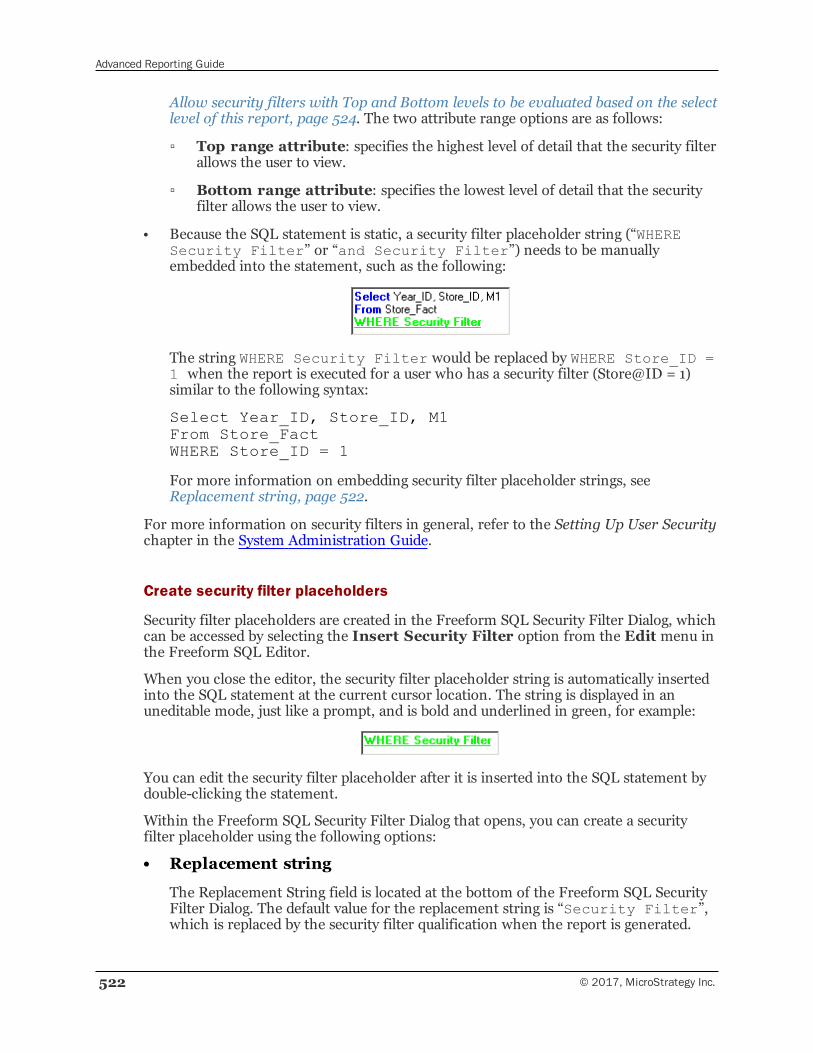
Advanced Reporting Guide
522 © 2017, MicroStrategy Inc.
Allow security filters with Top and Bottom levels to be evaluated based on the selectlevel of this report, page 524. The two attribute range options are as follows:
▫ Top range attribute: specifies the highest level of detail that the security filterallows the user to view.
▫ Bottom range attribute: specifies the lowest level of detail that the securityfilter allows the user to view.
• Because the SQL statement is static, a security filter placeholder string (“WHERESecurity Filter” or “and Security Filter”) needs to be manuallyembedded into the statement, such as the following:
The string WHERE Security Filter would be replaced by WHERE Store_ID =1 when the report is executed for a user who has a security filter (Store@ID = 1)similar to the following syntax:
Select Year_ID, Store_ID, M1From Store_FactWHERE Store_ID = 1
For more information on embedding security filter placeholder strings, seeReplacement string, page 522.
For more information on security filters in general, refer to the Setting Up User Securitychapter in the System Administration Guide.
Create security filter placeholders
Security filter placeholders are created in the Freeform SQL Security Filter Dialog, whichcan be accessed by selecting the Insert Security Filter option from the Edit menu inthe Freeform SQL Editor.
When you close the editor, the security filter placeholder string is automatically insertedinto the SQL statement at the current cursor location. The string is displayed in anuneditable mode, just like a prompt, and is bold and underlined in green, for example:
You can edit the security filter placeholder after it is inserted into the SQL statement bydouble-clicking the statement.
Within the Freeform SQL Security Filter Dialog that opens, you can create a securityfilter placeholder using the following options:
• Replacement string
The Replacement String field is located at the bottom of the Freeform SQL SecurityFilter Dialog. The default value for the replacement string is “Security Filter”,which is replaced by the security filter qualification when the report is generated.
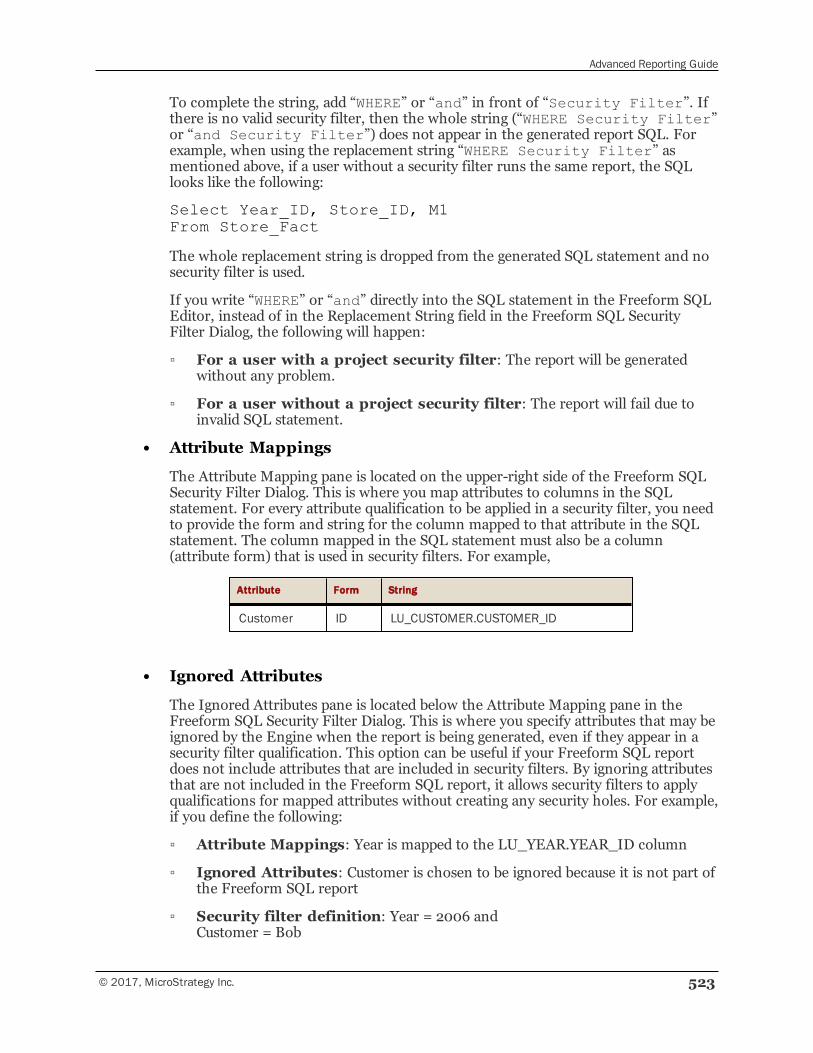
Advanced Reporting Guide
© 2017, MicroStrategy Inc. 523
To complete the string, add “WHERE” or “and” in front of “Security Filter”. Ifthere is no valid security filter, then the whole string (“WHERE Security Filter”or “and Security Filter”) does not appear in the generated report SQL. Forexample, when using the replacement string “WHERE Security Filter” asmentioned above, if a user without a security filter runs the same report, the SQLlooks like the following:
Select Year_ID, Store_ID, M1From Store_Fact
The whole replacement string is dropped from the generated SQL statement and nosecurity filter is used.
If you write “WHERE” or “and” directly into the SQL statement in the Freeform SQLEditor, instead of in the Replacement String field in the Freeform SQL SecurityFilter Dialog, the following will happen:
▫ For a user with a project security filter: The report will be generatedwithout any problem.
▫ For a user without a project security filter: The report will fail due toinvalid SQL statement.
• Attribute Mappings
The Attribute Mapping pane is located on the upper-right side of the Freeform SQLSecurity Filter Dialog. This is where you map attributes to columns in the SQLstatement. For every attribute qualification to be applied in a security filter, you needto provide the form and string for the column mapped to that attribute in the SQLstatement. The column mapped in the SQL statement must also be a column(attribute form) that is used in security filters. For example,
Attribute Form String
Customer ID LU_CUSTOMER.CUSTOMER_ID
• Ignored Attributes
The Ignored Attributes pane is located below the Attribute Mapping pane in theFreeform SQL Security Filter Dialog. This is where you specify attributes that may beignored by the Engine when the report is being generated, even if they appear in asecurity filter qualification. This option can be useful if your Freeform SQL reportdoes not include attributes that are included in security filters. By ignoring attributesthat are not included in the Freeform SQL report, it allows security filters to applyqualifications for mapped attributes without creating any security holes. For example,if you define the following:
▫ Attribute Mappings: Year is mapped to the LU_YEAR.YEAR_ID column
▫ Ignored Attributes: Customer is chosen to be ignored because it is not part ofthe Freeform SQL report
▫ Security filter definition: Year = 2006 andCustomer = Bob
Advanced Reporting Guide
524 © 2017, MicroStrategy Inc.
Users with the security filter defined above are able to run the report with theYear = 2006 qualification applied to the Freeform SQL report. There is nosecurity hole because the Customer attribute does not appear on the report.
You can ignore attributes that are included in the Freeform SQL report, but this cancause security holes because all qualifications on these attributes within securityfilters are ignored.
• Allow security filters with Top and Bottom levels to be evaluatedbased on the select level of this report
This check box option is located in the lower part of the Freeform SQL SecurityFilter Dialog. This option explicitly defines the Select Level of the report (displayedin the line just above this option) as the true level of the data that is retrieved for thereport when Top and Bottom criteria are evaluated.
• Not selecting this option when the user has Top and Bottom levelsdefined causes the report to fail.
• Select this option only when you are sure that your query does notretrieve data outside the restriction defined by the security filters. Thismeans that you may need to check the security filters for individualusers one by one and see how each one may interact with the query.
A security filter can be applied to a Freeform SQL report only if every attribute in thesecurity filter is either mapped to a column or ignored. The report fails if only a subset ofthe attributes used in a security filter are either mapped to columns or ignored within thesecurity filter placeholder. For example, a security filter that includes qualifications onYear and Category is applied for a group of users. In the Freeform SQL report, Year is theonly attribute that has been mapped to a column in the security filter placeholder. SinceCategory is not included either as an attribute mapping or an ignored attribute, the reportfails for all users with this security filter.
Reporting on third-party web services withXQuery
You can connect to third-party web services to retrieve data and report on that datawithin MicroStrategy. This allows further integration of information from these datasources into your MicroStrategy projects.
XQuery is a language for processing XML data. Any web service that uses the RESTarchitecture or SOAP protocol can be accessed by using the MicroStrategy Freeform SQLEditor to write XQuery statements. For example, the MicroStrategy report shown belowreturns city, area code, and zip code information for cities in the state of Virginia.
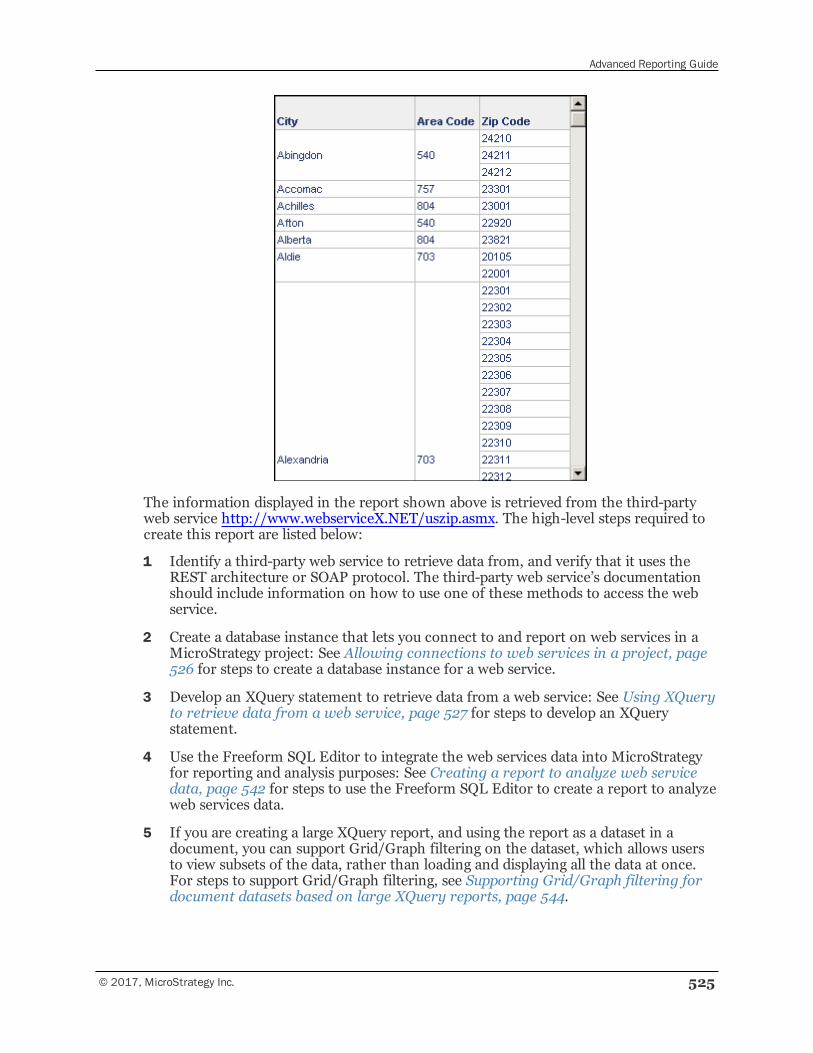
Advanced Reporting Guide
© 2017, MicroStrategy Inc. 525
The information displayed in the report shown above is retrieved from the third-partyweb service http://www.webserviceX.NET/uszip.asmx. The high-level steps required tocreate this report are listed below:
1 Identify a third-party web service to retrieve data from, and verify that it uses theREST architecture or SOAP protocol. The third-party web service’s documentationshould include information on how to use one of these methods to access the webservice.
2 Create a database instance that lets you connect to and report on web services in aMicroStrategy project: See Allowing connections to web services in a project, page526 for steps to create a database instance for a web service.
3 Develop an XQuery statement to retrieve data from a web service: See Using XQueryto retrieve data from a web service, page 527 for steps to develop an XQuerystatement.
4 Use the Freeform SQL Editor to integrate the web services data into MicroStrategyfor reporting and analysis purposes: See Creating a report to analyze web servicedata, page 542 for steps to use the Freeform SQL Editor to create a report to analyzeweb services data.
5 If you are creating a large XQuery report, and using the report as a dataset in adocument, you can support Grid/Graph filtering on the dataset, which allows usersto view subsets of the data, rather than loading and displaying all the data at once.For steps to support Grid/Graph filtering, see Supporting Grid/Graph filtering fordocument datasets based on large XQuery reports, page 544.
Advanced Reporting Guide
526 © 2017, MicroStrategy Inc.
XQuery can also be used to integrate web folder resources into MicroStrategy using theMultimedia widget, as described in Retrieving web folder resources with XQuery, page545.
Allowing connections to web services in a projectTo connect to and report on data from a web service, you can create an XQuery databaseinstance for the web service. The steps below describe how to create a database instance,which allows reports in a MicroStrategy project to connect to web services.
To configure a database instance
1 In MicroStrategy Developer, log in to a project source, using a user account withadministrative privileges.
2 In the Folder List, expand the project source, expand Administration, expandConfiguration Managers, and then select Database Instances.
3 From the Filemenu, point to New, and then select Database Instance. TheDatabase Instances Editor opens.
4 On the General tab, in the Database instance name field, type a descriptivename for the database instance.
5 From the Database connection type drop-down list, select XQuery.
6 In the Database connection area, click New. The Database Connections dialogbox opens.
7 In the Database connection name field, type a descriptive name for the databaseconnection.
8 In the Default database login name area, click New. The Database Loginsdialog box opens.
9 In the Database login field, type a descriptive name for the database login.
10 Choose the login option corresponding to the authentication method accepted by theweb service:
• Basic authentication with a user name and password: Enter a valid user nameand password in the Login ID and Password fields. For information on howyou can include this security in your report so that you can access the webservices data, see Using XQuery to retrieve data from a web service, page 527.
• Integrated authentication using Kerberos: Pass a Kerberos certificate specific toeach user or a single certificate for all users to the XQuery data source. Enter anyuser name in the Login ID field, and leave the Password field blank. For pass-through authentication, the Use network login ID (Windowsauthentication) check box must be selected. For more information, see UsingKerberos to authenticate XQuery data sources, page 533.
• No required authentication: If the web service that you plan to connect to doesnot require a user name and password, enter any user name in the Login ID
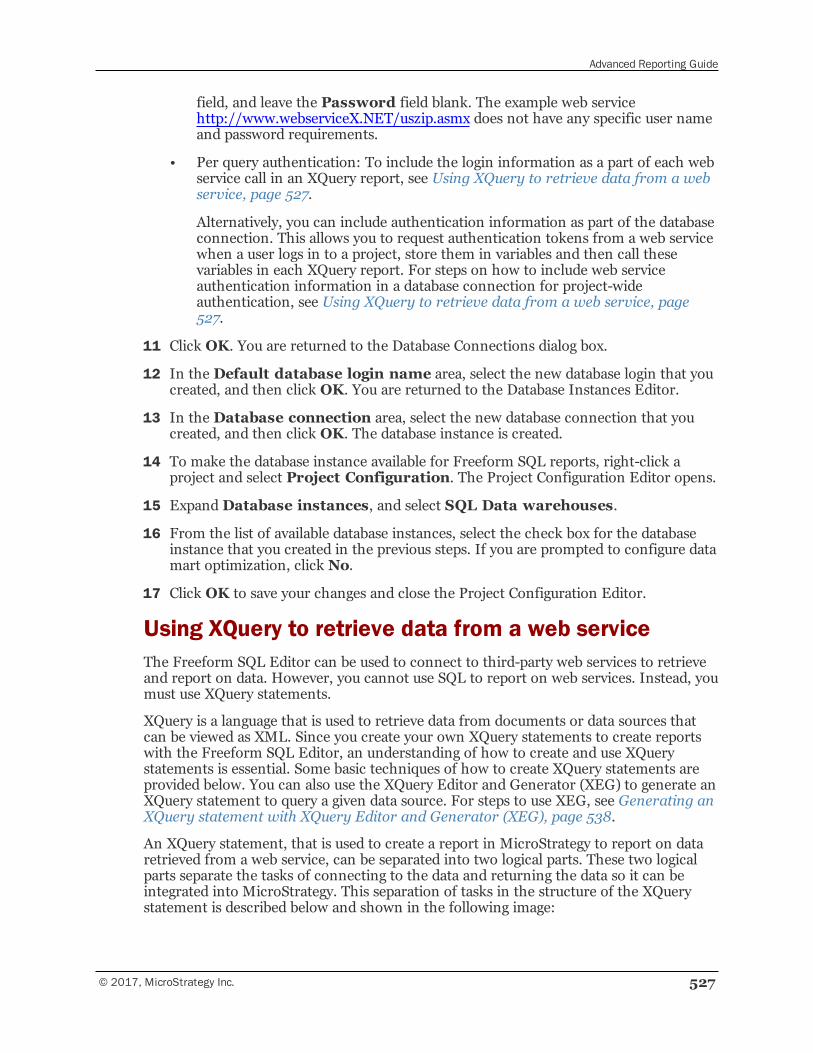
Advanced Reporting Guide
© 2017, MicroStrategy Inc. 527
field, and leave the Password field blank. The example web servicehttp://www.webserviceX.NET/uszip.asmx does not have any specific user nameand password requirements.
• Per query authentication: To include the login information as a part of each webservice call in an XQuery report, see Using XQuery to retrieve data from a webservice, page 527.
Alternatively, you can include authentication information as part of the databaseconnection. This allows you to request authentication tokens from a web servicewhen a user logs in to a project, store them in variables and then call thesevariables in each XQuery report. For steps on how to include web serviceauthentication information in a database connection for project-wideauthentication, see Using XQuery to retrieve data from a web service, page527.
11 Click OK. You are returned to the Database Connections dialog box.
12 In the Default database login name area, select the new database login that youcreated, and then click OK. You are returned to the Database Instances Editor.
13 In the Database connection area, select the new database connection that youcreated, and then click OK. The database instance is created.
14 To make the database instance available for Freeform SQL reports, right-click aproject and select Project Configuration. The Project Configuration Editor opens.
15 ExpandDatabase instances, and select SQL Data warehouses.
16 From the list of available database instances, select the check box for the databaseinstance that you created in the previous steps. If you are prompted to configure datamart optimization, click No.
17 Click OK to save your changes and close the Project Configuration Editor.
Using XQuery to retrieve data from a web serviceThe Freeform SQL Editor can be used to connect to third-party web services to retrieveand report on data. However, you cannot use SQL to report on web services. Instead, youmust use XQuery statements.
XQuery is a language that is used to retrieve data from documents or data sources thatcan be viewed as XML. Since you create your own XQuery statements to create reportswith the Freeform SQL Editor, an understanding of how to create and use XQuerystatements is essential. Some basic techniques of how to create XQuery statements areprovided below. You can also use the XQuery Editor and Generator (XEG) to generate anXQuery statement to query a given data source. For steps to use XEG, see Generating anXQuery statement with XQuery Editor and Generator (XEG), page 538.
An XQuery statement, that is used to create a report in MicroStrategy to report on dataretrieved from a web service, can be separated into two logical parts. These two logicalparts separate the tasks of connecting to the data and returning the data so it can beintegrated into MicroStrategy. This separation of tasks in the structure of the XQuerystatement is described below and shown in the following image:
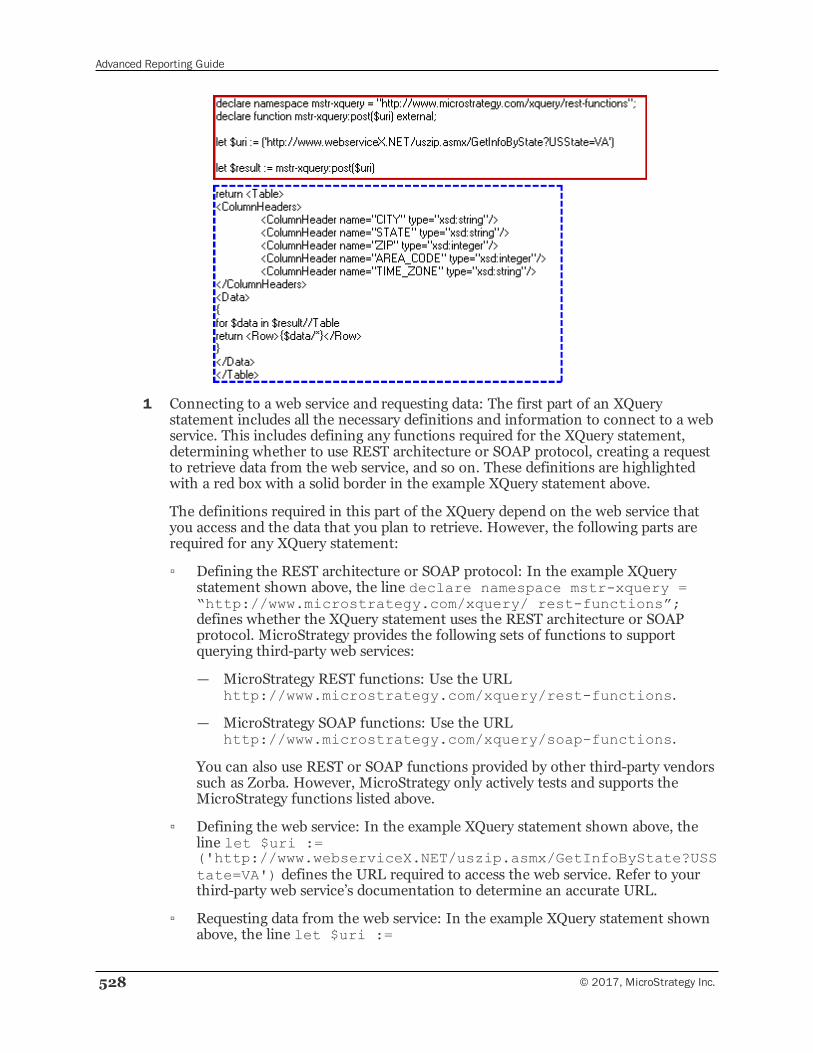
Advanced Reporting Guide
528 © 2017, MicroStrategy Inc.
1 Connecting to a web service and requesting data: The first part of an XQuerystatement includes all the necessary definitions and information to connect to a webservice. This includes defining any functions required for the XQuery statement,determining whether to use REST architecture or SOAP protocol, creating a requestto retrieve data from the web service, and so on. These definitions are highlightedwith a red box with a solid border in the example XQuery statement above.
The definitions required in this part of the XQuery depend on the web service thatyou access and the data that you plan to retrieve. However, the following parts arerequired for any XQuery statement:
▫ Defining the REST architecture or SOAP protocol: In the example XQuerystatement shown above, the line declare namespace mstr-xquery =“http://www.microstrategy.com/xquery/ rest-functions”;defines whether the XQuery statement uses the REST architecture or SOAPprotocol. MicroStrategy provides the following sets of functions to supportquerying third-party web services:
— MicroStrategy REST functions: Use the URLhttp://www.microstrategy.com/xquery/rest-functions.
— MicroStrategy SOAP functions: Use the URLhttp://www.microstrategy.com/xquery/soap-functions.
You can also use REST or SOAP functions provided by other third-party vendorssuch as Zorba. However, MicroStrategy only actively tests and supports theMicroStrategy functions listed above.
▫ Defining the web service: In the example XQuery statement shown above, theline let $uri :=('http://www.webserviceX.NET/uszip.asmx/GetInfoByState?USState=VA') defines the URL required to access the web service. Refer to yourthird-party web service’s documentation to determine an accurate URL.
▫ Requesting data from the web service: In the example XQuery statement shownabove, the line let $uri :=
Advanced Reporting Guide
© 2017, MicroStrategy Inc. 529
('http://www.webserviceX.NET/uszip.asmx/GetInfoByState?USState=VA') also defines the request for data from the web service. The requestfor data is included as the GetInfoByState?USState=VA part of the URL.For this web service, this statement requests data on the state of Virginia.However, not all web service requests can include the request for data as part ofthe URL. Refer to your third-party web service’s documentation to determine therequired syntax for the request of data.
▫ Implementing security: In the example XQuery statement shown above, no logininformation is required to access the web service. However, a web service canrequire various types of login information and security protocols to access thedata. For information on implementing security in an XQuery statement andhow this can change the syntax for the XQuery request, see Implementingsecurity within an XQuery statement, page 529.
2 Returning data from a web service so that it can be integrated into MicroStrategy:The second part of an XQuery statement determines how to return the data retrievedfrom a web service so that it can be integrated into MicroStrategy. These definitionsare highlighted with a blue box with a dashed border in the example XQuerystatement above.
You must return the data in a table format, which is why the XQuery statementshown above starts with return <Table>. This ensures that the data is in aformat that can be understood in MicroStrategy.
The <ColumnHeader> section of the statement defines the columns of data thatare included in the table. The XQuery statement shown above creates columns forcity, state, zip code, area code, and time zone data. These columns become theattributes and metrics of the MicroStrategy report.
The data for these columns is then retrieved in the <Data> section of the statement.How you create an XQuery statement to return data depends on the third-party webservice’s structure, as well as whether you plan to manipulate the data using XQueryprior to integrating it into MicroStrategy.
Implementing security within an XQuery statement
Web services can have various security requirements to access the data that the webservice provides. MicroStrategy’s support of data retrieval from web services usingXQuery statements supports most of the web services security mechanisms available. Aweb service can require HTTP authentication, Web Services Security, or standard username and password security requirements, which are all described below:
• HTTP authentication provides authentication using one of several authenticationmodes. MicroStrategy supports the use of basic and digest HTTP authentication forREST functions, and only basic HTTP authentication for SOAP functions. The username and password that you provide as part of a database login is automatically usedby MicroStrategy to complete any HTTP authentication required by the web service.Creating a database login is part of the steps required to create a database instance toaccess a web service, which is described in Allowing connections to web services ina project, page 526. A default database login is associated with the web service thatyou are connecting to. You can also use connection mapping to determine thedatabase login used for each MicroStrategy user. For information on configuring
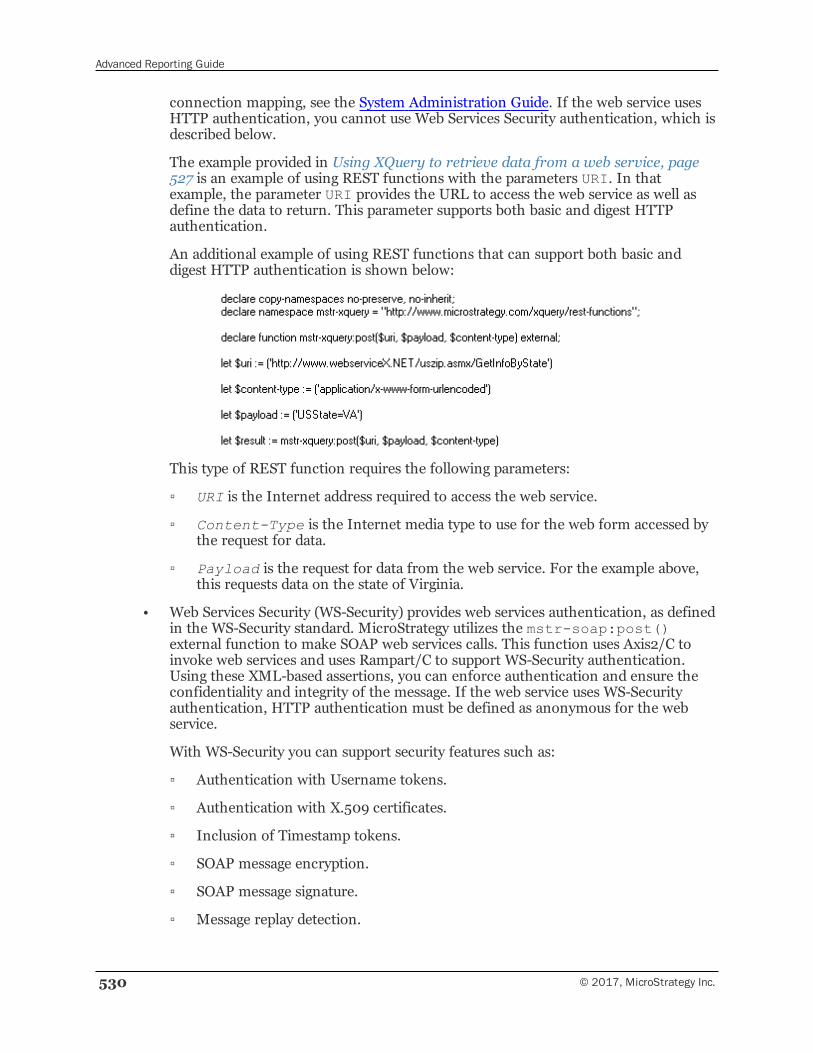
Advanced Reporting Guide
530 © 2017, MicroStrategy Inc.
connection mapping, see the System Administration Guide. If the web service usesHTTP authentication, you cannot use Web Services Security authentication, which isdescribed below.
The example provided in Using XQuery to retrieve data from a web service, page527 is an example of using REST functions with the parameters URI. In thatexample, the parameter URI provides the URL to access the web service as well asdefine the data to return. This parameter supports both basic and digest HTTPauthentication.
An additional example of using REST functions that can support both basic anddigest HTTP authentication is shown below:
This type of REST function requires the following parameters:
▫ URI is the Internet address required to access the web service.
▫ Content-Type is the Internet media type to use for the web form accessed bythe request for data.
▫ Payload is the request for data from the web service. For the example above,this requests data on the state of Virginia.
• Web Services Security (WS-Security) provides web services authentication, as definedin the WS-Security standard. MicroStrategy utilizes the mstr-soap:post()external function to make SOAP web services calls. This function uses Axis2/C toinvoke web services and uses Rampart/C to support WS-Security authentication.Using these XML-based assertions, you can enforce authentication and ensure theconfidentiality and integrity of the message. If the web service uses WS-Securityauthentication, HTTP authentication must be defined as anonymous for the webservice.
With WS-Security you can support security features such as:
▫ Authentication with Username tokens.
▫ Authentication with X.509 certificates.
▫ Inclusion of Timestamp tokens.
▫ SOAP message encryption.
▫ SOAP message signature.
▫ Message replay detection.
Advanced Reporting Guide
© 2017, MicroStrategy Inc. 531
The MicroStrategy function required to utilize WS-Security has the following syntaxand requirements:
mstr-soap:post($URI, $SoapInfo, $WSSPolicy,$SoapCustomHeader, $SoapPayload)
Where:
▫ URI is the Internet address required to access the web service.
▫ SoapInfo is the version and action information of the SOAP request requiredto access the web service. For example, the following is a definition ofSoapInfo for a web service SOAP request:
let $soap-version := element SOAPInfo { elementSOAPVersion{ 'SOAP11' }, element SOAPAction{ ' ' } }
The SoapInfo element shown above is defined as two elements:
— SOAPVersion, which specifies the SOAP Version of the request. The twopossible values for this element are 'SOAP11' or 'SOAP12'.
— SOAPAction, which specifies the required action for the web service.
▫ WSSPolicy is the location of the web service's security policy file, whichconforms to the WS-Security and WS-Security policy assertion language alongwith Rampart/C extensions.
A policy file can be extracted from the Web Services Description Language(WSDL) supplied by a SOAP file. Most web services provide a way to view theWSDL in a web browser. The policy file can also be created based on the securityrequirements of a SOAP web service. Regardless of how you create the policyfile, the file may require manual changes to fully configure the requiredRampart/C behavior. This MicroStrategy documentation assumes you have aworking knowledge of WS-Security, Axis2/C, and Rampart/C technologies.While a comprehensive explanation of these technologies is not provided, thefollowing links are provided for further details and background information onthese subjects:
— The specification for WS-Security can be found at http://docs.oasis-open.org/wss/2004/01/ oasis-200401-wss-soap-message-security-1.0.pdf.
— The specification for WS-Security policy language can be found athttp://specs.xmlsoap.org/ws/2005/07/securitypolicy/ ws-securitypolicy.pdf.
— Information on how Rampart/C can be configured using WS-Security policylanguage can be found athttp://ws.apache.org/rampart/c/docs/configurations.html.
▫ SoapCustomHeader is the SOAP header required to process the informationfrom the web service.
▫ SoapPayload is the statement that determines what information is retrievedfrom the web service.
Advanced Reporting Guide
532 © 2017, MicroStrategy Inc.
• A web service can require additional authentication requirements to access the data.If a web service requires additional authentication through the use of a user nameand password within the body of the request, you can provide a valid user name andpassword in one of the following ways:
▫ Include the user name and password directly in the XQuery statement. Whilethis provides access to the web service, providing a password directly in anXQuery statement can cause a security risk. Additionally, the same securitywould be used regardless of the user running the report.
▫ Use a MicroStrategy database login to provide the user name and password.Creating a database login is part of the steps required to create a databaseinstance to access a web service, which is described in Allowing connections toweb services in a project, page 526. The benefits of this approach include:
— Placeholders are used to supply the database login user name and password,which keeps the user name and password information secure. The requiredsyntax to use the user name and password from a database login in anXQuery statement is #?DBLOGIN_UID?# for the user name and#?DBLOGIN_PWD?# for the password.
— You can use different database logins for each MicroStrategy user. Thisallows the security access to reflect the permissions of the user running thereport. A default database login is associated with the web service that youare connecting to. You can also use connection mapping to determine thedatabase login used for each MicroStrategy user. For information onconfiguring connection mapping, see the System Administration Guide.
Using security filters to restrict results from an XQuery source
By integrating web services data into MicroStrategy using XQuery reports, you can alsotake advantage of standard MicroStrategy security features such as security filters. Youcan include a security filter as part of an XQuery report to restrict the web services datathat a MicroStrategy user can access.
To use security filters to restrict access to web services data returned on XQuery reports,you must do the following:
• The XQuery statement must use the security filter as part of the definition in thewhere clause. As an example, part of an XQuery statement is provided below,including the security filter as part of the XQuery statement.
let $example := XML definition of the third-party webservicereturn<Table><ColumnHeaders><ColumnHeader name=’FIRST_NAME’type=’xs:string’/><ColumnHeader name=’LAST_NAME’type=’xs:string’/><ColumnHeader name=’ADDRESS’type=’xs:string’/>
</ColumnHeaders>
Advanced Reporting Guide
© 2017, MicroStrategy Inc. 533
<Data>{for $example1 in $example/Employees/Employeewhere $example1/Security Filterreturn<Row>
<FIRST_NAME>{fn:data($example1/FIRST_NAME)}</FIRST_NAME>
<LAST_NAME>{fn:data($example1/LAST_NAME)}</LAST_NAME>
<ADDRESS>{fn:data($example1/ADDRESS)}</ADDRESS>
</Row></Data></Table>In the example XQuery statement above, the text Security Filter acts as aplaceholder for the security filter, which is applied to the Employee data.
• You must create the security filter placeholder within the XQuery report. These mustbe created using the same techniques used to create a security filter placeholder inFreeform SQL reports, which is described in Security for data access, page 520 andSecurity for data access, page 520. Additional details related to creating thesesecurity filters in XQuery reports are provided below:
▫ The attribute mappings for the security filter placeholder should match theattribute form that is mapped to the web services data, and thus can be used torestrict data in the XQuery statement. For the example above, you can includethe FIRST_NAME attribute form of the Employee attribute as the attributemapping for the security filter.
▫ The replacement string for the security filter placeholder must match the syntaxfor your XQuery statement. This replacement string defines the text in yourXQuery statement that is replaced when resolving the security filter. In theexample XQuery statement provided above, only the text Security Filter isreplaced. To support the possibility that a user without a security filter runs theXQuery report, you can define the replacement string as:
where $example1/Security Filter
By using this replacement string, when a user without a security filter runs theXQuery report, the entire where clause of the XQuery statement is removed,allowing the report to use correct XQuery syntax.
Using Kerberos to authenticate XQuery data sources
You can use Kerberos to authenticate XQuery data sources. There are two ways toconfigure Kerberos integrated authentication for your XQuery data sources:
• With pass-through: Allows Kerberos credentials for each MicroStrategy Web userto be passed through to the data source for authentication.
▫ If you are already using integrated authentication in your MicroStrategy projectfor web users, you only need to enable the XQuery data source to use integrated
Advanced Reporting Guide
534 © 2017, MicroStrategy Inc.
authentication. For steps, see Enabling integrated authentication to datasources in System Administration Guide.
▫ For more information and steps on how to use integrated authentication, seeEnabling integrated authentication in System Administration Guide.
• Without pass-through: Use a single Kerberos certificate stored on IntelligenceServer to authenticate all users to the data source.
▫ To use this method, you must have completed the required configuration for theKerberos 5 client o Intelligence Server. For more information and steps, seeConfiguring Intelligence Server Universal on UNIX/Linux for integratedauthentication in System Administration Guide.
▫ If you have already setup your XQuery data source with Kerberos pass-through,you will need to clear the Use network login ID (Windowsauthentication) check box in the "Database Logins" dialog box. The Login IDis still required to have a value however, it will not be used when Kerberoswithout pass-through is configured.
To use Kerberos without pass-through to authenticate an XQuery datasource
1 In MicroStrategy Developer, log in to a project source, using a user account withadministrative privileges.
2 In the Folder List, expand the project source, expand Administration, expandConfiguration Managers, and then select Database Instances.
3 Double-click to open the settings for your existing XQuery data source.
4 In the Database connection area, clickModify… The "Database Connections"dialog box opens.
5 Click the Advanced tab and add the following text to the Additional ConnectionString Parameters textbox:
▫ MECHANISM=KerberosWithoutPassthrough
6 Click OK to save your changes.
Using an XQuery source to authenticate users for a MicroStrategy project
Using database authentication, you can authenticate against an XQuery source whenusers log in to a project, and save any tokens returned by the authentication process.These tokens can then be used in XQuery reports for the duration of a given user'sMicroStrategy session. This authentication technique has the added benefit of keepingyour MicroStrategy project secure by authenticating upon login, while allowing the use oftokens to avoid the need to include authentication details in every XQuery report.
The steps below show you how to configure your environment to support authenticatingall XQuery reports for a given project.
Advanced Reporting Guide
© 2017, MicroStrategy Inc. 535
Prerequisite
• An XQuery statement that returns various tokens from a web service, which canthen be used in XQuery reports as authentication tokens, in place of authenticatingwith every request. A common scenario is to return two tokens, including a sessionURL (a URL for subsequent requests) and a session Token (which identifies thecaller as an already authenticated user). You can return up to four distinct pieces ofinformation from a web service.
To use an XQuery source to authenticate users for a MicroStrategyproject
1 In MicroStrategy Developer, log in to a project source, using a user account withadministrative privileges.
2 In the Folder List, expand the project source, expand Administration, expandConfiguration Managers, and then select Database Instances.
3 From the Filemenu, point to New, and then select Database Instance. TheDatabase Instances Editor opens.
4 On the General tab, in the Database instance name field, type a descriptivename for the database instance.
5 From the Database connection type drop-down list, select XQuery.
6 In the Database connection area, click New. The Database Connections dialogbox opens.
7 In the Database connection name field, type a descriptive name for the databaseconnection.
8 In the Default database login name area, click New. The Database Loginsdialog box opens.
9 In the Database login field, type a descriptive name for the database login.
10 Choose the login option corresponding to the authentication method accepted by theweb service:
• If the web service that you plan to connect to requires a user name andpassword, you must type a valid user name and password in the Login ID andPassword fields. For information on how you can include this security in yourreport so that you can access the web services data, see Implementing securitywithin an XQuery statement, page 529.
• If the web service that you plan to connect to does not require a user name andpassword, you can type any user name in the Login ID field, and leave thePassword field blank.
11 Click OK. You are returned to the Database Connections dialog box.
12 In the Default database login name area, select the new database login that youcreated.
Advanced Reporting Guide
536 © 2017, MicroStrategy Inc.
13 On the Advanced tab, in the XQuery authentication parameters field, typethe XQuery statement to return the required authentication credentials from the webservice. A complete XQuery statement can be included in this field, but the returnstatement must have the following structure:
<Table><ColumnHeaders>
<ColumnHeader name="Token1" type="xsd:string" /><ColumnHeader name="Token2" type="xsd:string" /><ColumnHeader name="Token3" type="xsd:string" /><ColumnHeader name="Token4" type="xsd:string" />
<ColumnHeaders><Data>{
<Row><Token1>Example1</Token1><Token2>Example2</Token2><Token3>Example3</Token3><Token4>Example4</Token4>
</Row>}</Data>
</Table>The syntax above returns four separate credentials, which can be supplied in theExample1, Example2, Example3, and Example4 locations respectively. If fewerthan four credentials are required, you can delete the associated <ColumnHeader>tags and <TokenN> tags. For example, the following XQuery statement makes a callto a SOAP web service and returns a session ID and a URI to be used for subsequentconnections to a web service:
declare namespace mstr-soap =http://www.microstrategy.com/xquery/soap-functions;declare function mstr-soap:post($args) external;let $username := '#?DBLOGIN_UID?#'let $password := '#?DBLOGIN_PWD?#'let $uri := 'http://ExampleURI'let $soap-version := element SOAPInfo {elementSOAPVersion {'SOAP11'}, element SOAPAction{''}}let $ws-sec-policy := ''let $soap-custom-header := ''let $soap-payload := concat('<loginxmlns="ExampleNamespace"><username>', $username,'</username><password>', $password,'</password></login>')let $args := ($uri, $soap-version, $ws-sec-policy,$soap-custom-header, $soap-payload)let $response := mstr-soap:post($args)//loginResponselet $sessionToken := $response//sessionIdlet $sessionURI := $response//serverUrlreturn<Table>
<ColumnHeaders><ColumnHeader name="Token1" type="xsd:string" />
Advanced Reporting Guide
© 2017, MicroStrategy Inc. 537
<ColumnHeader name="Token2" type="xsd:string" /></ColumnHeaders><Data>{
<Row><Token1>{$sessionToken}</Token1><Token2>{$sessionURI}</Token2>
</Row>}</Data>
</Table>
14 Once you have typed a valid XQuery statement, click OK. You are returned to theDatabase Instances Editor.
15 In the Database connection area, select the new database connection that youcreated, and then click OK. The database instance is created.
16 To make the database instance available for Freeform SQL reports, right-click aproject and select Project Configuration. The Project Configuration Editor opens.
17 ExpandDatabase instances, and select SQL Data warehouses.
18 From the list of available database instances, select the check box for the databaseinstance that you created in the previous steps. If you are prompted to configure datamart optimization, click No.
19 Within the Database Instances category, expand Authentication, and selectMetadata.
20 From the drop-down list, select the database instance you created earlier in thisprocedure.
21 Click OK to save your changes and close the Project Configuration Editor.
22 Since you must use database authentication, you must perform some additionalconfigurations:
• Modify the MicroStrategy user group Public/Guest so that it has thenecessary privileges to view the projects that use database authentication.
• Modify any required MicroStrategy user accounts to link them to the web serviceaccount. In the User Editor, in the Authentication:Metadata category, typethe login ID in the Database Login field.
• Create a new project source or modify an existing project source to use databaseauthentication.
For additional details on supporting database authentication in MicroStrategy, seethe System Administration Guide.
23 You must also ensure that each XQuery report references the tokens that store theauthentication credentials. The tokens can be accessed by using system prompts inMicroStrategy XQuery reports. These system prompts are stored in the project folderPublic Objects/Prompts/System prompts and are named Token 1,
Advanced Reporting Guide
538 © 2017, MicroStrategy Inc.
Token 2, Token 3, and Token 4. Each token corresponds to the respectivecolumn returned by the XQuery authentication parameters.
Within an XQuery report, you can define variables in an XQuery statement toretrieve the authentication credentials stored in the tokens. For example, thesessionid and uri variables shown below retrieve the authentication credentialsfrom the Token 1 and Token 2 system prompts.
To insert a prompt in an XQuery statement, within the Freeform SQL Editor, fromthe Edit menu, select Insert Prompt. You can then select the relevant Tokenprompt from the list of system prompts. You must include these tokens in anyXQuery report that requires this authentication to connect to a web service.
This completes the steps to configure authentication for all XQuery reports for a givenproject. For additional details on how to create XQuery reports to return data from a webservice, see Creating a report to analyze web service data, page 542.
Generating an XQuery statement with XQuery Editor and Generator(XEG)
MicroStrategy Developer includes the XQuery Editor and Generator (XEG) toautomatically generate XQuery statements. You can provide XEG with appropriate inputparameters, such as the input structure of the web service and any search parametersand data transformations, and XEG generates XQuery statements to query the webservice.
Prerequisites
• To use XEG, you must be on a machine that has MicroStrategy Developer installed.
• On Windows 2008 or Windows 7, you must be logged in as an administrator for themachine you are using.
To start XQuery Editor and Generator
On a machine that has MicroStrategy Developer installed, from the Start menu,point to Programs, thenMicroStrategy Tools, and select XQuery Editor andGenerator. XEG opens.
On Windows 2008, Windows 7, or Windows 8, you must start XEG using theRun As Administrator option. In the Start menu, right-click XQueryEditor and Generator, and select Run as administrator. XEG opens.
Advanced Reporting Guide
© 2017, MicroStrategy Inc. 539
To load an existing XEG scenario
In XEG, from the Filemenu, select Load. Browse to the saved scenario file, selectit, and click OK. The scenario is loaded and each source file is opened in a Tree Viewwindow.
Creating a new XQuery scenario with XEG
XEG can generate XQuery statements to query REST and SOAP web services, as well asXML data sources. Refer to the following sections for steps to create a new XQuerystatement for each type of data source:
• To create a new XQuery XML scenario, page 539
• To create a new XQuery REST scenario, page 539
• To create a new XQuery SOAP scenario, page 540
To create a new XQuery XML scenario
1 In XEG, from the Filemenu, select New. The New Simple XQuery dialog boxopens.
2 From the Source Type drop-down list select XML. The XML Definition pageopens.
3 Click ... (the Browse button) next to the File Name / UNC field. Browse to theXML file that you want to use as a data source and click OK. The XML file is listed inthe File Name / UNC field.
4 To use an XML schema file, click ... (the Browse button) next to the XML Schemafield. Browse to the XSD file that you want to use as an XML schema and click OK.The XSD file is listed in the XML Schema field.
5 Click Finish. The New Simple XQuery dialog box closes. An empty grid is displayedin the main pane, and a Tree View window opens containing the specified XML orXSD file.
6 For steps to use XEG to generate an XQuery statement using this data source, seeGenerating an XQuery statement using XEG, page 542.
To create a new XQuery REST scenario
1 In XEG, from the Filemenu, select New. The New Simple XQuery dialog boxopens.
2 From the Source Type drop-down list select REST. The HTTP URL And Methodpage opens.
Advanced Reporting Guide
540 © 2017, MicroStrategy Inc.
3 In the URL field, type or paste the URL of the REST web service that you are usingas a data source.
4 To add additional query parameters to the URL:
a From the list, specify whether to use a GET or POST request. (PUT andDELETE requests are not supported.)
b In the field, type the parameters.
5 Click Next. The HTTP Authentication page opens.
6 From theMethod drop-down list, select the type of authentication you are using toaccess the REST web service.
7 If you selected an authentication method other than Anonymous, in the Domain,User Name, and Password fields, type the login information you are using toaccess the REST web service.
8 Click Next. The XML Definition Files page opens.
9 Select one:
• To use an XML file as the definition file, click ... (the Browse button) next to theSample XML field. Browse to the XML file that you want to use as a sampleand click OK. The XML file is listed in the Sample XML field.
• OR, to use an XML schema file as the definition file, click ... (the Browsebutton) next to the XML Schema field. Browse to the XSD file that you wantto use as an XML schema and click OK. The XSD file is listed in the XMLSchema field.
10 Click Finish. The New Simple XQuery dialog box closes. An empty grid is displayedin the main pane, and a Tree View window opens containing the specified XML orXSD file.
11 For steps to use XEG to generate an XQuery statement using this data source, seeGenerating an XQuery statement using XEG, page 542.
To create a new XQuery SOAP scenario
1 In XEG, from the Filemenu, select New. The New Simple XQuery dialog boxopens.
2 From the Source Type drop-down list select SOAP. The WSDL And ServiceOptions page opens.
3 Click ... (the Browse button) next to theWSDL File field. Browse to the WSDL filethat you want to use as a sample data source and click OK. The WSDL file is listed intheWSDL File field.
4 From theWSDL Operations list, select the WSDL operation to perform on thedata source.
5 Click Next. The Request Definition page opens.
Advanced Reporting Guide
© 2017, MicroStrategy Inc. 541
6 If the Sample Request field does not contain a sample SOAP request based on theWSDL operation you selected, click Generate Request to generate a samplerequest. Alternately, click ... (the Browse button) to load a saved sample requestfrom a file.
7 Review the sample request and edit it as necessary.
8 The fields in the Service Detail area are pre populated based on the specified WSDLfile and operation. Review these fields and edit them if necessary.
9 Click Next. The Request Security page opens.
10 From theMethod drop-down list, select the type of authentication you are using toaccess the SOAP web service.
11 If you selected an authentication method other than Anonymous, in the Domain,User Name, Password, andWS Security fields, type the login information youare using to access the SOAP web service.
12 If you are using data from a Salesforce or Macro SOAP web service, select theappropriate check box.
13 Click Next. The Response Definition page opens.
14 From the SOAP Version list, specify which version of the SOAP protocol thespecified SOAP web service uses.
15 If the Sample Response Text field does not contain a sample SOAP responsebased on the sample request you specified, click Generate Response to generate asample request. Alternately, click ... (the Browse button) to load a saved samplerequest from a file, or click Capture Response to capture a response from thespecified SOAP web service.
16 To save the text in the sample response field to a file, click Save. A Save dialog boxopens.
17 Browse to the location where you want to save the file, type the file name, and clickOK. The file is saved.
18 Click Next. The Other Information page opens.
19 To use explicit naming in the SOAP XQuery statement, select the Use ExplicitNaming check box.
MicroStrategy does not recommend using explicit naming in XQuerystatements that are designed for use in MicroStrategy’s Freeform SQL Editor.
20 Click Finish. The New Simple XQuery dialog box closes. An empty grid is displayedin the main pane. A Tree View window opens for each of the source files.
21 For steps to use XEG to generate an XQuery statement using this data source, seeGenerating an XQuery statement using XEG, page 542.
Advanced Reporting Guide
542 © 2017, MicroStrategy Inc.
Generating an XQuery statement using XEG
Once you have loaded the source files into XEG, you can begin creating the structure togenerate an XQuery statement.
The Tree View windows contain a tree view of the source files for the XQuery statement.To expand the elements of a source file out to a given level, in the Tree View window,from the Expand Tree Levels drop-down list (next to the file name), select that level.For example, to expand all elements of the source file out to the second level, select 2. Tocompletely collapse the source file, select 0. To expand or collapse individual elements,click the triangle next to each element’s name.
To add an element to the XQuery statement, click and drag the element from the TreeView window to an empty row in the grid. When you add an element to the grid, all itschild elements are automatically added as well.
To edit an element, double-click the value you want to edit. Depending on the value,either type the new value in the field, or select the new value from the drop-down listthat opens.
To delete an element, select the element and pressDelete. The row containing theelement is deleted.
You can save the structure you have created as an XEG scenario. To save an XEGscenario, from the Filemenu, select Save. Specify the file name, browse to the locationyou want to save the scenario, and click OK. The scenario is saved.
To change any of the options you specified in the New Simple XQuery dialog box, fromthe Filemenu, select Edit. The Edit Simple XQuery dialog box opens. This dialog boxhas the same pages as the New Simple XQuery dialog box. Step through the Edit SimpleXQuery dialog box and make any changes necessary. Click Finish on the last page of thedialog box. Your changes are applied to the XQuery scenario in progress.
Once you have added and edited all the elements you need to the XQuery grid, you cangenerate the XQuery statement. From the Filemenu, select Generate. The XQueryGeneration window opens, with the generated XQuery statement.
To test the generated XQuery statement, from the Filemenu, select Execute. TheXQuery statement is executed and the results are displayed in the XQuery Executionwindow.
To use the generated XQuery statement in a Freeform SQL report, copy it to theclipboard and paste it into the Freeform SQL editor. For steps to create a Freeform SQLreport, see Creating a report to analyze web service data, page 542.
Creating a report to analyze web service dataUsing the Freeform SQL Editor you can create a report that integrates web service datainto MicroStrategy for reporting and analysis purposes.
Prerequisites
• Freeform SQL reports can be created in MicroStrategy Developer only. However,these reports can be manipulated and executed from both MicroStrategy Developerand Web. Access to the Freeform SQL Editor is available only to Developers with the
Advanced Reporting Guide
© 2017, MicroStrategy Inc. 543
Define Freeform SQL Report privilege and those with the Create Schema Objectsprivilege.
To create a report to analyze web service data
1 In MicroStrategy Developer, from the Filemenu, select New, and then chooseReport. The New Grid dialog box opens.
2 On the Freeform Sources tab, select Create Freeform XQuery report.
3 In the Source area, select the database instance created to access web services, asdescribed in Allowing connections to web services in a project, page 526.
If no database instance is defined in the metadata, the Freeform SQL Editorcannot be loaded and a message is displayed.
4 Click OK. The Freeform SQL Editor opens.
5 In the SQL Statement pane (the top pane on the right), type or paste your XQuerystatement. For information on how to develop an XQuery statement, along with asample XQuery statement, see Using XQuery to retrieve data from a web service,page 527.
6 In the Mapping pane (the bottom pane on the right), map the columns in yourXQuery statement to attributes and metrics to be used in the report. Follow therequirements listed below when mapping columns in your XQuery statement toattributes and metrics:
• When mapping the columns, it is important that you follow the same sequenceof the columns as they appear in the <ColumnHeaders> section of the XQuerystatement. This ensures that the data is mapped to the correct attributes andmetrics.
• Make sure that the number of mappings is the same as the number of columnsin the <ColumnHeaders> section of the XQuery statement. For example, ifyour XQuery statement lists 10 columns from which to retrieve data, you shouldmap these columns to exactly 10 attributes and metrics.
• You must map a column to the ID form for each attribute that you use in yourFreeform SQL report. You can also map columns to additional attribute formsfor an attribute, but all attribute forms other than the ID form are optional.
• Freeform SQL reports can map data to metadata objects that are part of therelational project, or metadata objects that are known as managed objects. Forinformation on mapping data in Freeform SQL reports to metadata objects, seeAccess and analyze multiple data sources with Freeform SQL, page 504. Thesteps in the procedures linked below describe how to map attributes and metricsfor Freeform SQL reports that use SQL statements. However, the same generalsteps apply for mapping attributes and metrics for Freeform SQL reports that useXQuery statements:
— Access and analyze multiple data sources with Freeform SQL, page 504.
— Access and analyze multiple data sources with Freeform SQL, page 504.
Advanced Reporting Guide
544 © 2017, MicroStrategy Inc.
— Access and analyze multiple data sources with Freeform SQL, page 504.
For the example report displayed in Reporting on third-party web services withXQuery, page 524, the four attributes created are City, State, Zip Code, and AreaCode.
7 Click OK to close the Freeform SQL Editor. The Report Editor opens.
8 Format and define the Freeform SQL report in the same way as you would astandard report, using features such as sorting, view filters, thresholds, exporting,and so on.
9 From the Filemenu, click Save As. The Save Report As dialog box opens.
You must save the report before you can run it, otherwise a message isdisplayed.
10 Enter a name for the report and click Save.
11 Run the Freeform SQL report.
Supporting Grid/Graph filtering for document datasetsbased on large XQuery reportsReport Services document designers can enable Grid/Graphs as report conditionselectors to filter the data in a dataset, allowing users to view subsets of large amounts ofdata, rather than loading and displaying all the data at once. For standard reports inMicroStrategy, this dataset filtering is automatically supported by re-executing theunderlying report definition for a dataset.
An example of using dataset filtering to view subsets of data is described in Reportinganalysis features, page 513.
If your dataset is based on a large XQuery report, a static XQuery statement cannotautomatically be updated to reflect this type of filtering. You must define the XQueryreport to apply this filtering in the XQuery definition, by inserting a conditionplaceholder into the XQuery statement. The steps to add a condition placeholder aredescribed below.
To add a condition placeholder to an XQuery statement
1 In MicroStrategy Developer, navigate to your XQuery report.
2 Right-click the report, and select Edit. The report opens in the Report Editor.
3 From the Data menu, select Freeform SQL Definition. The Freeform SQLEditor opens, with the XQuery statement for the report.
Typically, the placeholder is added before the return statement in XQuery.
For example, an XQuery report retrieves user data using a for loop, shown in thecode fragment below:
<Data>
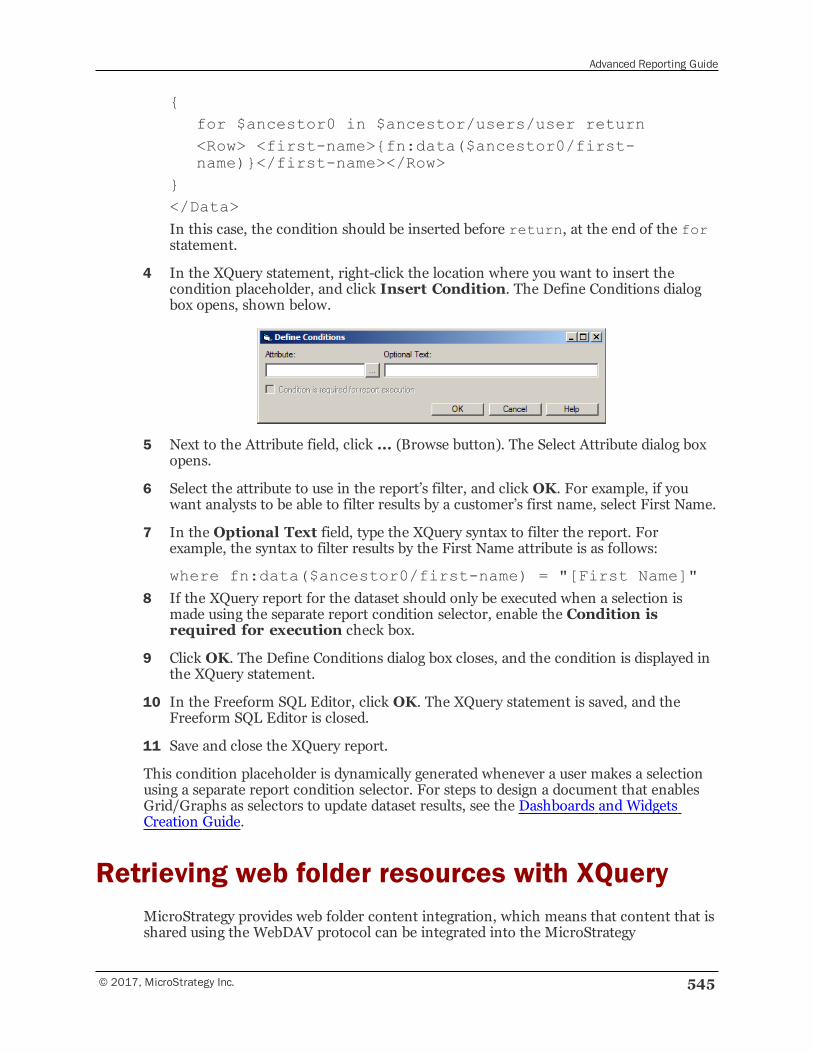
Advanced Reporting Guide
© 2017, MicroStrategy Inc. 545
{for $ancestor0 in $ancestor/users/user return<Row> <first-name>{fn:data($ancestor0/first-name)}</first-name></Row>
}</Data>In this case, the condition should be inserted before return, at the end of the forstatement.
4 In the XQuery statement, right-click the location where you want to insert thecondition placeholder, and click Insert Condition. The Define Conditions dialogbox opens, shown below.
5 Next to the Attribute field, click ... (Browse button). The Select Attribute dialog boxopens.
6 Select the attribute to use in the report’s filter, and click OK. For example, if youwant analysts to be able to filter results by a customer’s first name, select First Name.
7 In the Optional Text field, type the XQuery syntax to filter the report. Forexample, the syntax to filter results by the First Name attribute is as follows:
where fn:data($ancestor0/first-name) = "[First Name]"8 If the XQuery report for the dataset should only be executed when a selection is
made using the separate report condition selector, enable the Condition isrequired for execution check box.
9 Click OK. The Define Conditions dialog box closes, and the condition is displayed inthe XQuery statement.
10 In the Freeform SQL Editor, click OK. The XQuery statement is saved, and theFreeform SQL Editor is closed.
11 Save and close the XQuery report.
This condition placeholder is dynamically generated whenever a user makes a selectionusing a separate report condition selector. For steps to design a document that enablesGrid/Graphs as selectors to update dataset results, see the Dashboards and WidgetsCreation Guide.
Retrieving web folder resources with XQueryMicroStrategy provides web folder content integration, which means that content that isshared using the WebDAV protocol can be integrated into the MicroStrategy
Advanced Reporting Guide
546 © 2017, MicroStrategy Inc.
environment. This integration allows the content within web folders, such as documentsor videos, to be accessed in MicroStrategy Mobile.
The content in your web folders can be integrated into MicroStrategy using XQuery. Firstyou must define an XQuery database instance to access and authenticate the web foldercontent, as described in the steps To configure a database instance to retrieve webfolder resources, page 546 below.
Once the database instance is configured, you can do either of the following to retrieveweb folder resources and make them available to MicroStrategy Mobile users:
• Creating an external mobile folder to allow web folder browsing, page 548
• Creating XQuery reports to retrieve web folder resources, page 549
To configure a database instance to retrieve web folder resources
1 In MicroStrategy Developer, log in to a project source, using a user account withadministrative privileges.
2 In the Folder List, expand the project source, expand Administration, expandConfiguration Managers, and then select Database Instances.
3 From the Filemenu, point to New, and then select Database Instance. TheDatabase Instances Editor opens.
4 On the General tab, in the Database instance name field, type a descriptivename for the database instance.
5 From the Database connection type drop-down list, select XQuery.
6 In the Database connection area, click New. The Database Connections dialogbox opens.
7 In the Database connection name field, type a descriptive name for the databaseconnection.
8 In the Default database login name area, click New. The Database Loginsdialog box opens.
9 In the Database login field, type a descriptive name for the database login.
10 Type a valid user name and password in the Login ID and Password fields,respectively. The login information that you provide is used to authenticate aconnection to the web folder and its contents if you choose to disable warehousepass-through authentication for the database instance, or if you are using anauthentication scheme other than LDAP.
For steps to enable warehouse passthrough authentication for a project, see Toconfigure the project to use the WebDAV database instance, page 547 below.
11 Click OK. You are returned to the Database Connections dialog box.
12 In the Default database login name area, select the new database login that youcreated, and then click OK. You are returned to the Database Instances Editor.
Advanced Reporting Guide
© 2017, MicroStrategy Inc. 547
13 In the Database connection area, select the new database connection that youcreated, and then click OK. The database instance is created.
14 Right-click the new database instance and select Properties. The Properties dialogbox opens. In the General category, copy down or otherwise make note of the IDvalue of the database instance. This ID value is required later if you use an XQueryreport to retrieve web folder resources (see Creating XQuery reports to retrieve webfolder resources, page 549).
To configure the project to use the WebDAV database instance
15 To make the database instance available for Freeform SQL reports, right-click aproject and select Project Configuration. The Project Configuration Editor opens.
16 ExpandDatabase instances, and select SQL Data warehouses.
17 From the list of available database instances, select the check box for the databaseinstance that you created in the previous steps. If you are prompted to configure datamart optimization, click No.
18 Under Database instances, expand Authentication, and selectWarehouse.
19 Depending on which credentials you want to use to access the WebDAV folder, doone of the following:
• To use the credentials that you defined in the database instance above, ensurethe following, as applicable:
— The Use warehouse pass-through credentials from User Editor -> Authentication -> ‘Warehouse’ for warehouse execution checkbox is cleared.
— If the Use warehouse pass-through credentials from User Editor-> Authentication -> ‘Warehouse’ for warehouse execution checkbox is selected, ensure that the For selected database instances optionis selected, and the check box for the WebDAV database instance youcreated above is cleared.
• To use the logged-in user’s credentials:
— Select the Use warehouse pass-through credentials from UserEditor -> Authentication -> ‘Warehouse’ for warehouseexecution check box, and select For selected database instances.Select the check box for the WebDAV database instance you created.
— Use an LDAP authentication scheme. If you are using any otherauthentication scheme, the credentials you defined in the database instanceare used. For steps to enable an LDAP authentication scheme, see theSystem Administration Guide.
— Configure Intelligence Server to update pass-through credentials, which isdescribed in To update pass-through credentials in Intelligence Server,page 548 below.
Advanced Reporting Guide
548 © 2017, MicroStrategy Inc.
For information on choosing whether to use passthrough authentication fordatabase instances, see the Controlling access to data chapter in the SystemAdministration Guide.
20 Click OK to save your changes and close the Project Configuration Editor.
To update pass-through credentials in Intelligence Server
If you selected to authenticate access to web folders and their contents with a user’sLDAP credentials, it is recommended that you configure your Intelligence Server’ssecurity settings to update the credentials every time a user logs in successfully. Ifinstead the database login is to be used to authenticate users, you can skip these stepsand begin to create XQuery reports, as described in Creating XQuery reports toretrieve web folder resources, page 549.
21 In MicroStrategy Developer, from the Administrationmenu, point to Server,and then select Configure MicroStrategy Intelligence Server. TheMicroStrategy Intelligence Server Configuration dialog box opens.
22 Expand the Server Definition category, and then select Security.
23 Within the Authentication Policy area, ensure that the Update pass-throughcredentials when a successful login occurs check box is selected, and selectthe LDAP Authentication option. This ensures that users’ warehouse pass-through credentials are updated every time they log in.
24 Click OK to save your changes and close the MicroStrategy Intelligence ServerConfiguration dialog box. The next step to integrate web folder content intoMicroStrategy is to either:
• Create an external folder to allow for web folder browsing, as described inCreating an external mobile folder to allow web folder browsing, page 548.
• Create XQuery reports to retrieve the web folder resources, as described inCreating XQuery reports to retrieve web folder resources, page 549.
Creating an external mobile folder to allow web folderbrowsingYou can create an external mobile folder to allow MicroStrategy Mobile users directlybrowse folders that are made available over the web. With this web folder integration,MicroStrategy Mobile users can browse the web folder from their MicroStrategy MobileHome screen, their Shared Reports, or through links on documents.
To create an external mobile folder to allow web folder browsing
1 In MicroStrategy Developer, from the Filemenu, point to New, and then selectExternal Mobile Folder. The External Mobile Folder dialog box opens.
2 In the External mobile folder name field, type a name to use for the folderwithin the MicroStrategy project.
Advanced Reporting Guide
© 2017, MicroStrategy Inc. 549
3 From the Database Instance drop-down list, select the database instance createdto access web folder resources, as described in Retrieving web folder resources withXQuery, page 545.
4 In the URL field, type the URL for the web folder. This URL should provide accessto the top-level folder that can be accessed and browsed by MicroStrategy Mobileusers.
5 Click OK to save the new external mobile folder.
Once the external mobile folder is created in MicroStrategy, MicroStrategy Mobile userscan browse the web folder from within their Shared Reports. You can also make the webfolder accessible to MicroStrategy Mobile users in the following ways:
• Custom Home screen: You can provide access to the web folder from aMicroStrategy Mobile user’s Home screen. For steps to configure a custom Homescreen, refer to the MicroStrategy Mobile Design and Administration Guide.
• Links on documents: You can provide a link to the web folder from within adocument. For steps to create links on documents for MicroStrategy Mobile, refer tothe MicroStrategy Mobile Design and Administration Guide.
Creating XQuery reports to retrieve web folderresourcesYou can create XQuery reports to retrieve each web folder resource. This allows you tomake the web folder resources available directly in the Multimedia widget toMicroStrategy Mobile users.
If required, you can define custom icons to display for different file types in your webfolder. For example, you can define your own icon to display for PDF files in the folder.
Prerequisites
• Freeform SQL reports can be created in MicroStrategy Developer only. However,these reports can be manipulated and executed from both MicroStrategy Developerand Web. Access to the Freeform SQL Editor is available only to Developers with theDefine Freeform SQL Report privilege and those with the Create Schema Objectsprivilege.
• You need the ID value of the database instance used to access the web folder. Thisvalue is retrieved as part of the steps Retrieving web folder resources with XQuery,page 545.
• To use custom icons for the file types in your WebDAV folder, you must create theimages to use for the icons, and upload them to a web server. Use the followingguidelines when creating the images:
▫ The recommended image formats are PNG, GIF, or JPEG.
▫ The recommended resolution for the images is 50 x 50 pixels.
▫ To take advantage of high-resolution screens on newer mobile devices, you mayalso upload higher-resolution versions of each image, with the following prefixesafter the file name:
Advanced Reporting Guide
550 © 2017, MicroStrategy Inc.
— @1.5x: Recommended for Android devices with higher resolutions. Therecommended resolution is 75 x 75 pixels.
For example, if the image you want to use for PDF files is icon_PDF.png,and is 50 x 50 pixels, the high-resolution version is [email protected],and is 75 x 75 pixels.
— @2x: Recommended for devices for very high resolutions, such as iOSdevices with retina displays. The recommended resolution is 100 x 100pixels.
For example, if the image you want to use for PDF files is icon_PDF.png,and is 50 x 50 pixels, the high-resolution version is [email protected],and is 100 x 100 pixels.
▫ You can include a generic icon for file types that do not have a custom icondefined. For example, if you have defined icons for PDF and XLS, you caninclude a generic icon for other file types, such as DOC or PPT. If you do notinclude a generic icon, the default icons for the Multimedia widget are used.
To create XQuery reports to retrieve web folder resources
1 In MicroStrategy Developer, from the Filemenu, point to New, and then selectReport. The New Grid dialog box opens.
2 On the Freeform Sources tab, select Create Freeform XQuery report.
3 In the Source area, select the database instance created to access web folderresources, as described in Retrieving web folder resources with XQuery, page 545.
If no database instance is defined in the metadata, the Freeform SQL Editorcannot be loaded and a message is displayed.
4 Click OK. The Freeform SQL Editor opens.
5 In the SQL Statement pane (the top pane on the right), type or paste your XQuerystatement. You can use the statement below to build your XQuery statement. If youuse this statement, make sure you make the following substitutions in this XQuerystatement:
• WebDAV_Folder: The URI for the web folder that contains the resources tomake available using the Multimedia widget. You can access web folders sharedwith the WebDAV protocol that are hosted with IIS, Sharepoint, and Apache.
When providing the URI for a web folder, make sure that you end the URI witha / character. For example, a URI such ashttp://example.com/MyWebFolder/ uses the proper syntax, but supplyingit as http://example.com/MyWebFolder without a / character at the endcan cause connection problems.
• Database_Instance_ID: The ID for the database instance that connects tothe WebDAV resource. You must provide this in the XQuery statement as thevalue for the MW_DBIGUID attribute.
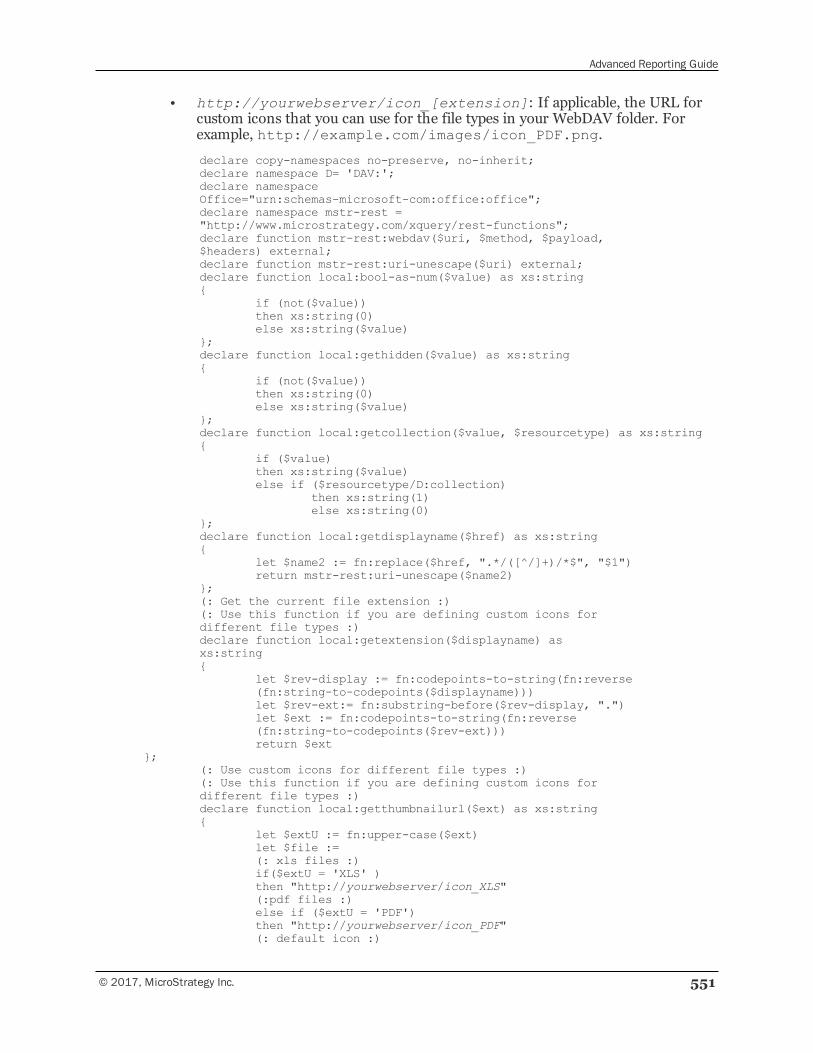
Advanced Reporting Guide
© 2017, MicroStrategy Inc. 551
• http://yourwebserver/icon_[extension]: If applicable, the URL forcustom icons that you can use for the file types in your WebDAV folder. Forexample, http://example.com/images/icon_PDF.png.
declare copy-namespaces no-preserve, no-inherit;declare namespace D= 'DAV:';declare namespaceOffice="urn:schemas-microsoft-com:office:office";declare namespace mstr-rest ="http://www.microstrategy.com/xquery/rest-functions";declare function mstr-rest:webdav($uri, $method, $payload,$headers) external;declare function mstr-rest:uri-unescape($uri) external;declare function local:bool-as-num($value) as xs:string{
if (not($value))then xs:string(0)else xs:string($value)
};declare function local:gethidden($value) as xs:string{
if (not($value))then xs:string(0)else xs:string($value)
};declare function local:getcollection($value, $resourcetype) as xs:string{
if ($value)then xs:string($value)else if ($resourcetype/D:collection)
then xs:string(1)else xs:string(0)
};declare function local:getdisplayname($href) as xs:string{
let $name2 := fn:replace($href, ".*/([^/]+)/*$", "$1")return mstr-rest:uri-unescape($name2)
};(: Get the current file extension :)(: Use this function if you are defining custom icons fordifferent file types :)declare function local:getextension($displayname) asxs:string{
let $rev-display := fn:codepoints-to-string(fn:reverse(fn:string-to-codepoints($displayname)))let $rev-ext:= fn:substring-before($rev-display, ".")let $ext := fn:codepoints-to-string(fn:reverse(fn:string-to-codepoints($rev-ext)))return $ext
};(: Use custom icons for different file types :)(: Use this function if you are defining custom icons fordifferent file types :)declare function local:getthumbnailurl($ext) as xs:string{
let $extU := fn:upper-case($ext)let $file :=(: xls files :)if($extU = 'XLS' )then "http://yourwebserver/icon_XLS"(:pdf files :)else if ($extU = 'PDF')then "http://yourwebserver/icon_PDF"(: default icon :)
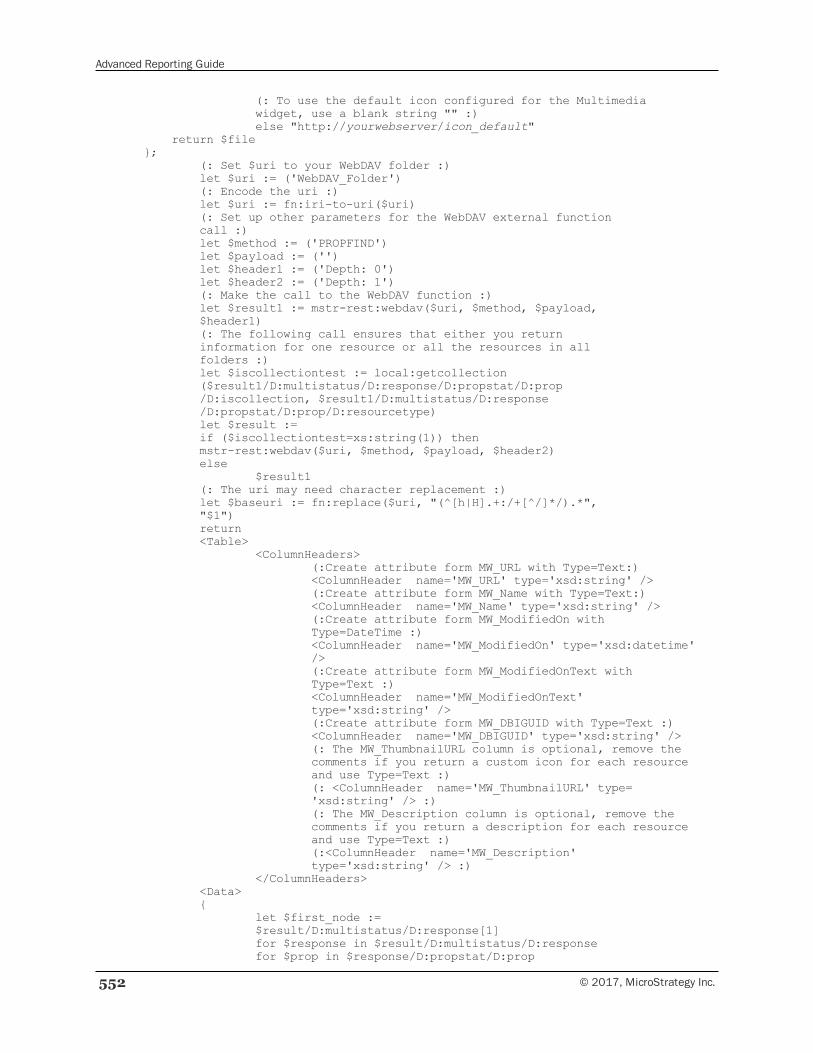
Advanced Reporting Guide
552 © 2017, MicroStrategy Inc.
(: To use the default icon configured for the Multimediawidget, use a blank string "" :)else "http://yourwebserver/icon_default"
return $file};
(: Set $uri to your WebDAV folder :)let $uri := ('WebDAV_Folder')(: Encode the uri :)let $uri := fn:iri-to-uri($uri)(: Set up other parameters for the WebDAV external functioncall :)let $method := ('PROPFIND')let $payload := ('')let $header1 := ('Depth: 0')let $header2 := ('Depth: 1')(: Make the call to the WebDAV function :)let $result1 := mstr-rest:webdav($uri, $method, $payload,$header1)(: The following call ensures that either you returninformation for one resource or all the resources in allfolders :)let $iscollectiontest := local:getcollection($result1/D:multistatus/D:response/D:propstat/D:prop/D:iscollection, $result1/D:multistatus/D:response/D:propstat/D:prop/D:resourcetype)let $result :=if ($iscollectiontest=xs:string(1)) thenmstr-rest:webdav($uri, $method, $payload, $header2)else
$result1(: The uri may need character replacement :)let $baseuri := fn:replace($uri, "(^[h|H].+:/+[^/]*/).*","$1")return<Table>
<ColumnHeaders>(:Create attribute form MW_URL with Type=Text:)<ColumnHeader name='MW_URL' type='xsd:string' />(:Create attribute form MW_Name with Type=Text:)<ColumnHeader name='MW_Name' type='xsd:string' />(:Create attribute form MW_ModifiedOn withType=DateTime :)<ColumnHeader name='MW_ModifiedOn' type='xsd:datetime'/>(:Create attribute form MW_ModifiedOnText withType=Text :)<ColumnHeader name='MW_ModifiedOnText'type='xsd:string' />(:Create attribute form MW_DBIGUID with Type=Text :)<ColumnHeader name='MW_DBIGUID' type='xsd:string' />(: The MW_ThumbnailURL column is optional, remove thecomments if you return a custom icon for each resourceand use Type=Text :)(: <ColumnHeader name='MW_ThumbnailURL' type='xsd:string' /> :)(: The MW_Description column is optional, remove thecomments if you return a description for each resourceand use Type=Text :)(:<ColumnHeader name='MW_Description'type='xsd:string' /> :)
</ColumnHeaders><Data>{
let $first_node :=$result/D:multistatus/D:response[1]for $response in $result/D:multistatus/D:responsefor $prop in $response/D:propstat/D:prop
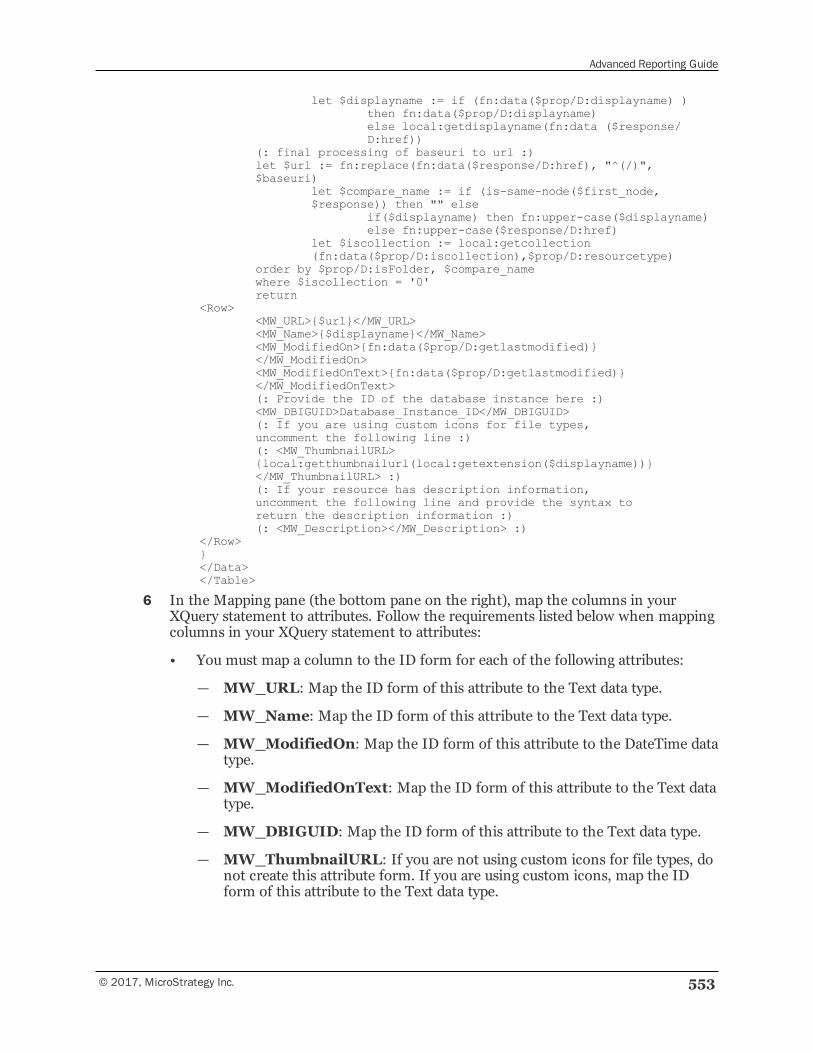
Advanced Reporting Guide
© 2017, MicroStrategy Inc. 553
let $displayname := if (fn:data($prop/D:displayname) )then fn:data($prop/D:displayname)else local:getdisplayname(fn:data ($response/D:href))
(: final processing of baseuri to url :)let $url := fn:replace(fn:data($response/D:href), "^(/)",$baseuri)
let $compare_name := if (is-same-node($first_node,$response)) then "" else
if($displayname) then fn:upper-case($displayname)else fn:upper-case($response/D:href)
let $iscollection := local:getcollection(fn:data($prop/D:iscollection),$prop/D:resourcetype)
order by $prop/D:isFolder, $compare_namewhere $iscollection = '0'return
<Row><MW_URL>{$url}</MW_URL><MW_Name>{$displayname}</MW_Name><MW_ModifiedOn>{fn:data($prop/D:getlastmodified)}</MW_ModifiedOn><MW_ModifiedOnText>{fn:data($prop/D:getlastmodified)}</MW_ModifiedOnText>(: Provide the ID of the database instance here :)<MW_DBIGUID>Database_Instance_ID</MW_DBIGUID>(: If you are using custom icons for file types,uncomment the following line :)(: <MW_ThumbnailURL>{local:getthumbnailurl(local:getextension($displayname))}</MW_ThumbnailURL> :)(: If your resource has description information,uncomment the following line and provide the syntax toreturn the description information :)(: <MW_Description></MW_Description> :)
</Row>}</Data></Table>
6 In the Mapping pane (the bottom pane on the right), map the columns in yourXQuery statement to attributes. Follow the requirements listed below when mappingcolumns in your XQuery statement to attributes:
• You must map a column to the ID form for each of the following attributes:
— MW_URL: Map the ID form of this attribute to the Text data type.
— MW_Name: Map the ID form of this attribute to the Text data type.
— MW_ModifiedOn: Map the ID form of this attribute to the DateTime datatype.
— MW_ModifiedOnText: Map the ID form of this attribute to the Text datatype.
— MW_DBIGUID: Map the ID form of this attribute to the Text data type.
— MW_ThumbnailURL: If you are not using custom icons for file types, donot create this attribute form. If you are using custom icons, map the IDform of this attribute to the Text data type.
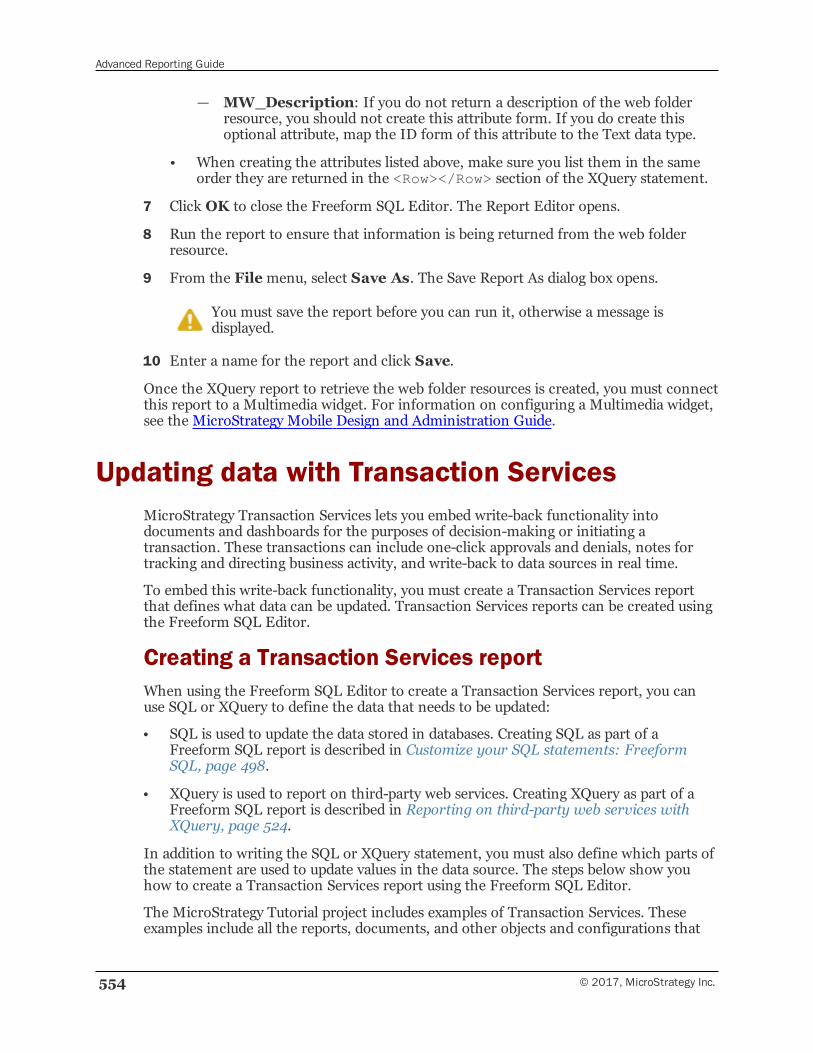
Advanced Reporting Guide
554 © 2017, MicroStrategy Inc.
— MW_Description: If you do not return a description of the web folderresource, you should not create this attribute form. If you do create thisoptional attribute, map the ID form of this attribute to the Text data type.
• When creating the attributes listed above, make sure you list them in the sameorder they are returned in the <Row></Row> section of the XQuery statement.
7 Click OK to close the Freeform SQL Editor. The Report Editor opens.
8 Run the report to ensure that information is being returned from the web folderresource.
9 From the Filemenu, select Save As. The Save Report As dialog box opens.
You must save the report before you can run it, otherwise a message isdisplayed.
10 Enter a name for the report and click Save.
Once the XQuery report to retrieve the web folder resources is created, you must connectthis report to a Multimedia widget. For information on configuring a Multimedia widget,see the MicroStrategy Mobile Design and Administration Guide.
Updating data with Transaction ServicesMicroStrategy Transaction Services lets you embed write-back functionality intodocuments and dashboards for the purposes of decision-making or initiating atransaction. These transactions can include one-click approvals and denials, notes fortracking and directing business activity, and write-back to data sources in real time.
To embed this write-back functionality, you must create a Transaction Services reportthat defines what data can be updated. Transaction Services reports can be created usingthe Freeform SQL Editor.
Creating a Transaction Services reportWhen using the Freeform SQL Editor to create a Transaction Services report, you canuse SQL or XQuery to define the data that needs to be updated:
• SQL is used to update the data stored in databases. Creating SQL as part of aFreeform SQL report is described in Customize your SQL statements: FreeformSQL, page 498.
• XQuery is used to report on third-party web services. Creating XQuery as part of aFreeform SQL report is described in Reporting on third-party web services withXQuery, page 524.
In addition to writing the SQL or XQuery statement, you must also define which parts ofthe statement are used to update values in the data source. The steps below show youhow to create a Transaction Services report using the Freeform SQL Editor.
The MicroStrategy Tutorial project includes examples of Transaction Services. Theseexamples include all the reports, documents, and other objects and configurations that
Advanced Reporting Guide
© 2017, MicroStrategy Inc. 555
are required to use Transaction Services. You can review these Transaction Servicesexample in the following MicroStrategy Tutorial project location:MicroStrategy Tutorial\Public Objects\Reports\MicroStrategy Platform Capabilities\MicroStrategy Transaction Services. High-levelsteps are provided to explain the creation of the example Transaction Services documentItem Order form, see Transaction Services example: Item Order Form, page 561.
Prerequisites
• A license for Transaction Services is required to create a Transaction Services report.
• Access to the Freeform SQL Editor to create a Transaction Services report isavailable only to Developers with the Define Freeform SQL Report, CreateTransaction Report, and Create Schema Objects privileges.
To create a Transaction Services report
1 In MicroStrategy Developer, from the Filemenu, select New, and then chooseReport. The New Grid dialog box opens.
2 On the Freeform Sources tab, select Create Transaction report.
3 In the Source area, select the database instance for the data source to be updatedusing Transaction Services.
4 Click OK. The Freeform SQL Editor opens.
5 If you are using XQuery to connect to and update data, in the SQL Statement pane(the top pane on the right), type the XQuery statement required to connect to thethird-party web service or data source. Creating this part of an XQuery is described aspart of the Connecting to a web service and requesting data step within UsingXQuery to retrieve data from a web service, page 527.
If you are using SQL to connect to and update data, this step is not required.
6 Right-click within the SQL Statement pane (the top pane on the right), and selectInsert Transaction. If you included XQuery syntax as part of the previous steps,you should place the cursor at the end of the XQuery syntax when performing thisaction.
The Transaction Options dialog box opens.
7 To determine whether all records of the table that is updated by the transaction areinserted, select or clear the Insert only distinct records check box.
By default, this check box is cleared and all records are inserted when a transactiontriggers an update. This behavior is intended for using Transaction Services to updatefact tables that store fact data such as revenue and profit.
If you select this check box, only distinct records are inserted. This behavior isintended for using Transaction Services to update lookup tables that store attributeinformation such as customer information.
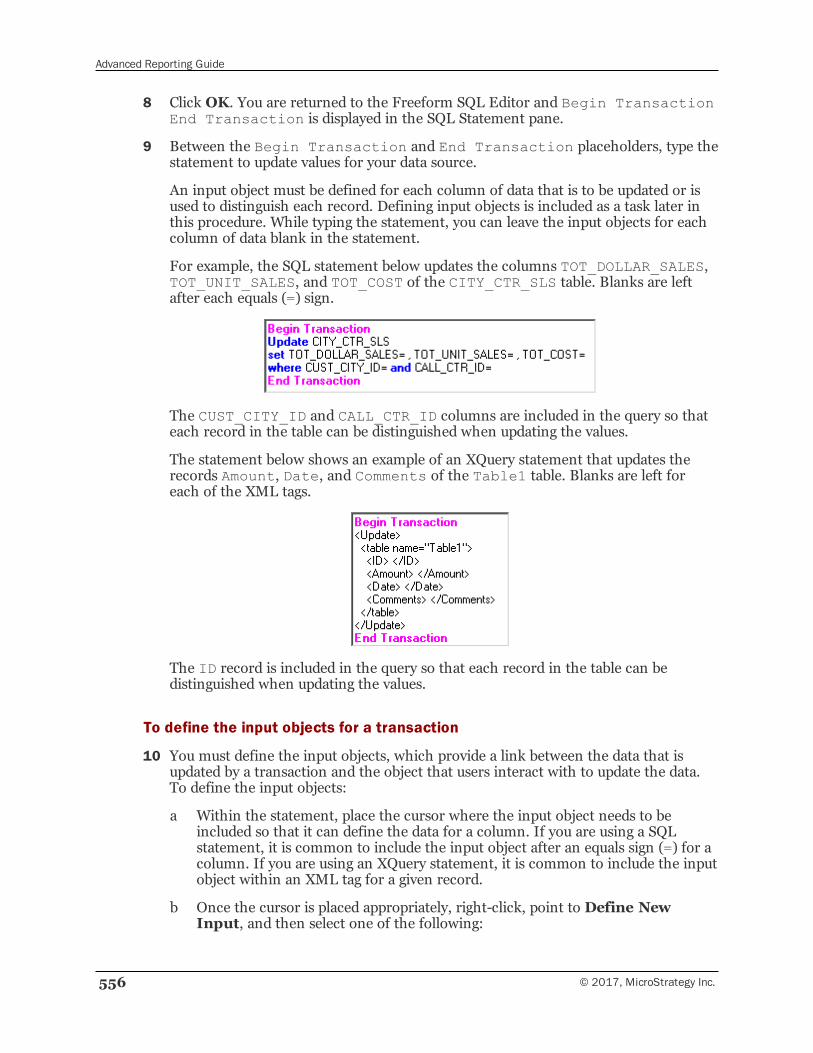
Advanced Reporting Guide
556 © 2017, MicroStrategy Inc.
8 Click OK. You are returned to the Freeform SQL Editor and Begin TransactionEnd Transaction is displayed in the SQL Statement pane.
9 Between the Begin Transaction and End Transaction placeholders, type thestatement to update values for your data source.
An input object must be defined for each column of data that is to be updated or isused to distinguish each record. Defining input objects is included as a task later inthis procedure. While typing the statement, you can leave the input objects for eachcolumn of data blank in the statement.
For example, the SQL statement below updates the columns TOT_DOLLAR_SALES,TOT_UNIT_SALES, and TOT_COST of the CITY_CTR_SLS table. Blanks are leftafter each equals (=) sign.
The CUST_CITY_ID and CALL_CTR_ID columns are included in the query so thateach record in the table can be distinguished when updating the values.
The statement below shows an example of an XQuery statement that updates therecords Amount, Date, and Comments of the Table1 table. Blanks are left foreach of the XML tags.
The ID record is included in the query so that each record in the table can bedistinguished when updating the values.
To define the input objects for a transaction
10 You must define the input objects, which provide a link between the data that isupdated by a transaction and the object that users interact with to update the data.To define the input objects:
a Within the statement, place the cursor where the input object needs to beincluded so that it can define the data for a column. If you are using a SQLstatement, it is common to include the input object after an equals sign (=) for acolumn. If you are using an XQuery statement, it is common to include the inputobject within an XML tag for a given record.
b Once the cursor is placed appropriately, right-click, point to Define NewInput, and then select one of the following:
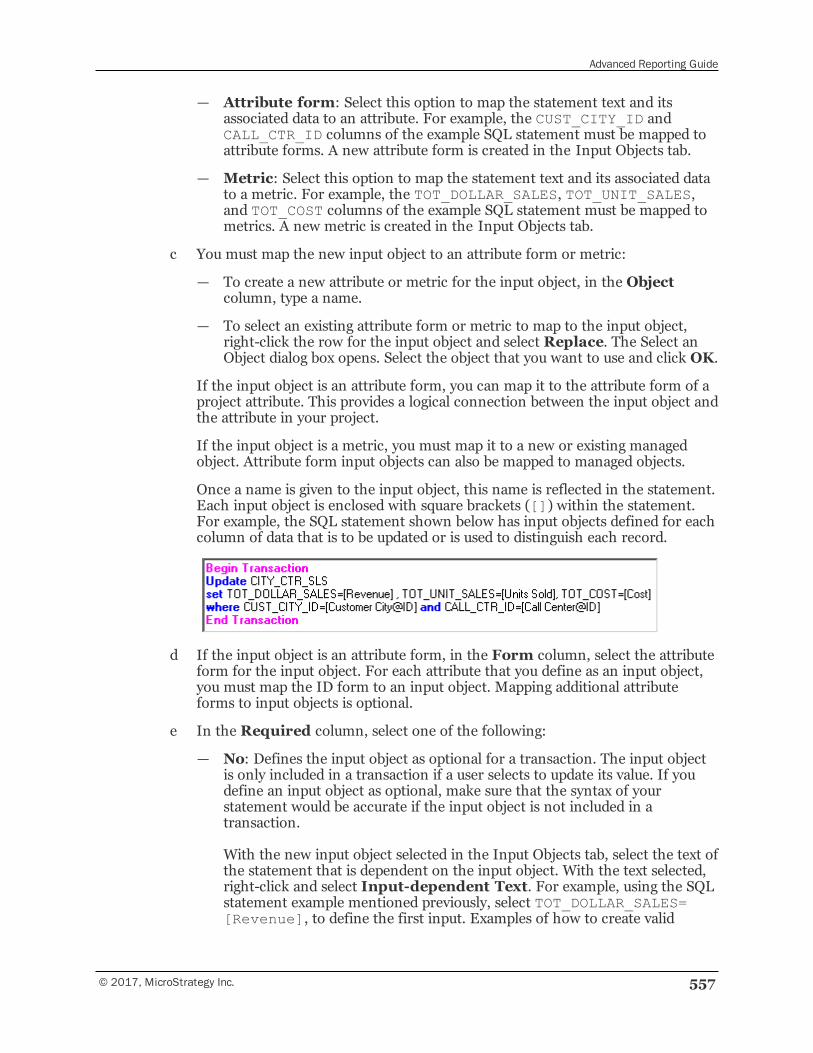
Advanced Reporting Guide
© 2017, MicroStrategy Inc. 557
— Attribute form: Select this option to map the statement text and itsassociated data to an attribute. For example, the CUST_CITY_ID andCALL_CTR_ID columns of the example SQL statement must be mapped toattribute forms. A new attribute form is created in the Input Objects tab.
— Metric: Select this option to map the statement text and its associated datato a metric. For example, the TOT_DOLLAR_SALES, TOT_UNIT_SALES,and TOT_COST columns of the example SQL statement must be mapped tometrics. A new metric is created in the Input Objects tab.
c You must map the new input object to an attribute form or metric:
— To create a new attribute or metric for the input object, in the Objectcolumn, type a name.
— To select an existing attribute form or metric to map to the input object,right-click the row for the input object and select Replace. The Select anObject dialog box opens. Select the object that you want to use and click OK.
If the input object is an attribute form, you can map it to the attribute form of aproject attribute. This provides a logical connection between the input object andthe attribute in your project.
If the input object is a metric, you must map it to a new or existing managedobject. Attribute form input objects can also be mapped to managed objects.
Once a name is given to the input object, this name is reflected in the statement.Each input object is enclosed with square brackets ([]) within the statement.For example, the SQL statement shown below has input objects defined for eachcolumn of data that is to be updated or is used to distinguish each record.
d If the input object is an attribute form, in the Form column, select the attributeform for the input object. For each attribute that you define as an input object,you must map the ID form to an input object. Mapping additional attributeforms to input objects is optional.
e In the Required column, select one of the following:
— No: Defines the input object as optional for a transaction. The input objectis only included in a transaction if a user selects to update its value. If youdefine an input object as optional, make sure that the syntax of yourstatement would be accurate if the input object is not included in atransaction.
With the new input object selected in the Input Objects tab, select the text ofthe statement that is dependent on the input object. With the text selected,right-click and select Input-dependent Text. For example, using the SQLstatement example mentioned previously, select TOT_DOLLAR_SALES=[Revenue], to define the first input. Examples of how to create valid
Advanced Reporting Guide
558 © 2017, MicroStrategy Inc.
statement syntax with optional input objects are provided in Defining input-dependent SQL or XQuery syntax, page 558.
— Yes: Defines the input object as required for a transaction. You must defineany input object that is used to distinguish the record updated using atransaction as required. For the example SQL statement provided, the inputobjects for CUST_CITY_ID and CALL_CTR_ID must be defined as requiredfor the transaction.
Repeat the steps To define the input objects for a transaction, page 556 to createinput objects for each column of data that is to be updated or is used to distinguisheach record in your transaction statement.
To create an output object
11 On the Output Objects tab, right-click and select Add New Metric. A newoutput object is created. This output object does not display any values, but it isrequired to create a Transaction Services report.
12 Type a name for the metric.
To complete and save the Transaction Services report
13 Click OK. If any dialog boxes are displayed which require you to determine whichobject to use for an attribute or metric, select the appropriate object. Remember thatattributes can be mapped to either project or managed objects, but metrics can onlybe mapped to managed objects.
The Freeform SQL Editor closes and you are returned to the Report Editor.
14 From the toolbar, click Save and Close. The Save Report As dialog box opens.
15 Type a name for the report and click Save. The Transaction Services report is saved.
Once you have created a Transaction Services report, use MicroStrategy Web to createReport Services documents, which can use the Transaction Services report to allow usersto update values. This can include interactive documents and dashboards, which can beviewed using MicroStrategy Web as well as MicroStrategy Mobile. For details on how tocreate a document that can use a Transaction Services report, see the MicroStrategy WebHelp. An example of the steps required to create the final Report Services document isalso provided in Transaction Services example: Item Order Form, page 561.
Defining input-dependent SQL or XQuery syntax
While creating a SQL or XQuery statement for a Transaction Services report, you mustdefine which parts of the statement are dependent on an input. When a transaction isrequested, the inputs are included in the SQL or XQuery statement to update the valuesin the data source.
When creating a Transaction Services report, you can make some of the inputs optional.This supports the scenario that a user only wants to update values for certain metrics orattributes, while leaving the other objects with their current data.
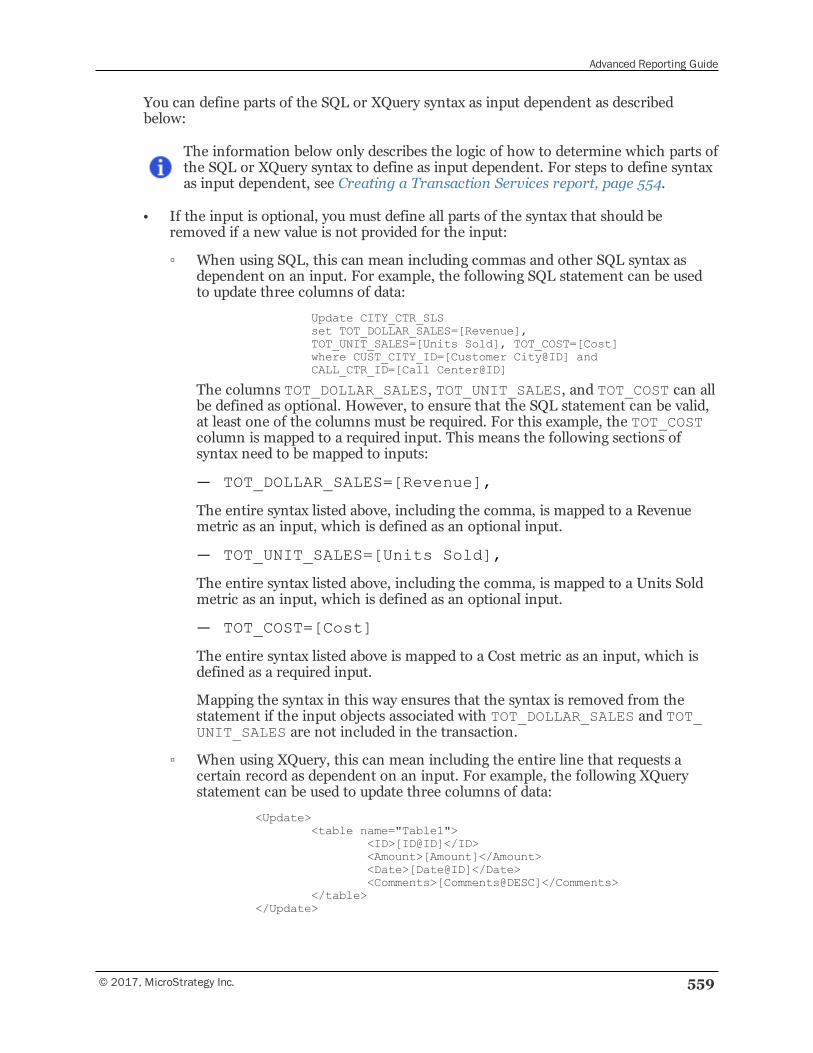
Advanced Reporting Guide
© 2017, MicroStrategy Inc. 559
You can define parts of the SQL or XQuery syntax as input dependent as describedbelow:
The information below only describes the logic of how to determine which parts ofthe SQL or XQuery syntax to define as input dependent. For steps to define syntaxas input dependent, see Creating a Transaction Services report, page 554.
• If the input is optional, you must define all parts of the syntax that should beremoved if a new value is not provided for the input:
▫ When using SQL, this can mean including commas and other SQL syntax asdependent on an input. For example, the following SQL statement can be usedto update three columns of data:
Update CITY_CTR_SLSset TOT_DOLLAR_SALES=[Revenue],TOT_UNIT_SALES=[Units Sold], TOT_COST=[Cost]where CUST_CITY_ID=[Customer City@ID] andCALL_CTR_ID=[Call Center@ID]
The columns TOT_DOLLAR_SALES, TOT_UNIT_SALES, and TOT_COST can allbe defined as optional. However, to ensure that the SQL statement can be valid,at least one of the columns must be required. For this example, the TOT_COSTcolumn is mapped to a required input. This means the following sections ofsyntax need to be mapped to inputs:
— TOT_DOLLAR_SALES=[Revenue],
The entire syntax listed above, including the comma, is mapped to a Revenuemetric as an input, which is defined as an optional input.
— TOT_UNIT_SALES=[Units Sold],
The entire syntax listed above, including the comma, is mapped to a Units Soldmetric as an input, which is defined as an optional input.
— TOT_COST=[Cost]
The entire syntax listed above is mapped to a Cost metric as an input, which isdefined as a required input.
Mapping the syntax in this way ensures that the syntax is removed from thestatement if the input objects associated with TOT_DOLLAR_SALES and TOT_UNIT_SALES are not included in the transaction.
▫ When using XQuery, this can mean including the entire line that requests acertain record as dependent on an input. For example, the following XQuerystatement can be used to update three columns of data:
<Update><table name="Table1">
<ID>[ID@ID]</ID><Amount>[Amount]</Amount><Date>[Date@ID]</Date><Comments>[Comments@DESC]</Comments>
</table></Update>

Advanced Reporting Guide
560 © 2017, MicroStrategy Inc.
The records Amount, Date, and Comments can all be defined as optional. Thismeans the following sections of syntax need to be mapped to inputs:
— <Amount>[Amount]</Amount>
The entire syntax listed above, including the Amount tags, is mapped to anAmount metric as an input, which is defined as an optional input.
— <Date>[Date@ID]</Date>
The entire syntax listed above, including the Date tags, is mapped to a Dateattribute as an input, which is defined as an optional input.
— <Comments>[Comments@DESC]</Comments>
The entire syntax listed above, including the Comments tags, is mapped to aComments attribute as an input, which is defined as an optional input.
Mapping the syntax in this way ensures that the associated syntax is removedfrom the statement if the input objects associated with Amount, Date, andComments are not included in the transaction.
• If the input is required, you can define just the input parameter of the syntax that isused to update the required input. This is done automatically when defining a newinput object. For example, the following SQL statement can be used to update threecolumns of data:
Update CITY_CTR_SLSset TOT_DOLLAR_SALES=[Revenue],TOT_UNIT_SALES=[Units Sold], TOT_COST=[Cost]where CUST_CITY_ID=[Customer City@ID] andCALL_CTR_ID=[Call Center@ID]
The columns CUST_CITY_ID and CALL_CTR_ID are required to make sure theproper record is updated with the transaction. This means the following sections ofsyntax need to be mapped to inputs:
▫ [Customer City@ID]
The entire syntax listed above is mapped to a Customer City attribute as an input,which is defined as a required input.
▫ [Call Center@ID]
The entire syntax listed above is mapped to a Call Center attribute as an input,which is defined as a required input.
Since the inputs are required, a value is always provided for CUST_CITY_ID= andCALL_CTR_ID=, which ensures that the syntax is valid.
For an example of a required input for an XQuery statement, the following XQuerystatement can be used to update three columns of data:
<Update><table name="Table1">
<ID>[ID@ID]</ID><Amount>[Amount]</Amount><Date>[Date@ID]</Date><Comments>[Comments@DESC]</Comments>
</table>
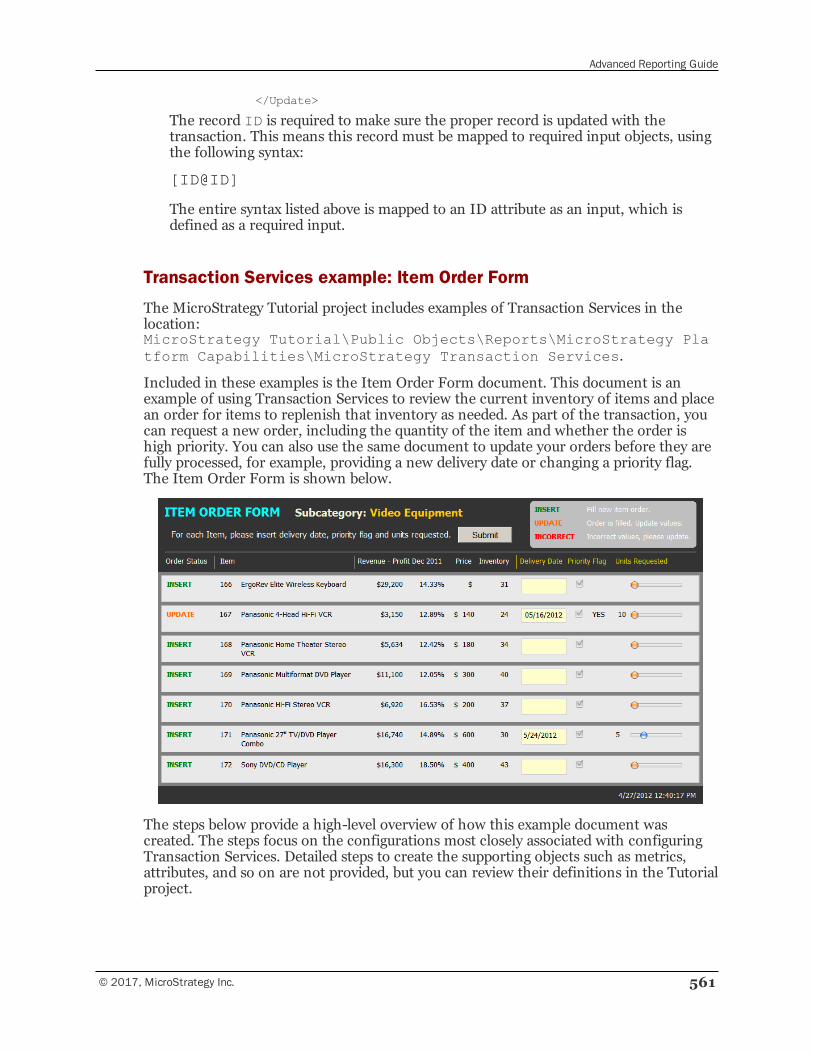
Advanced Reporting Guide
© 2017, MicroStrategy Inc. 561
</Update>
The record ID is required to make sure the proper record is updated with thetransaction. This means this record must be mapped to required input objects, usingthe following syntax:
[ID@ID]
The entire syntax listed above is mapped to an ID attribute as an input, which isdefined as a required input.
Transaction Services example: Item Order Form
The MicroStrategy Tutorial project includes examples of Transaction Services in thelocation:MicroStrategy Tutorial\Public Objects\Reports\MicroStrategy Platform Capabilities\MicroStrategy Transaction Services.
Included in these examples is the Item Order Form document. This document is anexample of using Transaction Services to review the current inventory of items and placean order for items to replenish that inventory as needed. As part of the transaction, youcan request a new order, including the quantity of the item and whether the order ishigh priority. You can also use the same document to update your orders before they arefully processed, for example, providing a new delivery date or changing a priority flag.The Item Order Form is shown below.
The steps below provide a high-level overview of how this example document wascreated. The steps focus on the configurations most closely associated with configuringTransaction Services. Detailed steps to create the supporting objects such as metrics,attributes, and so on are not provided, but you can review their definitions in the Tutorialproject.
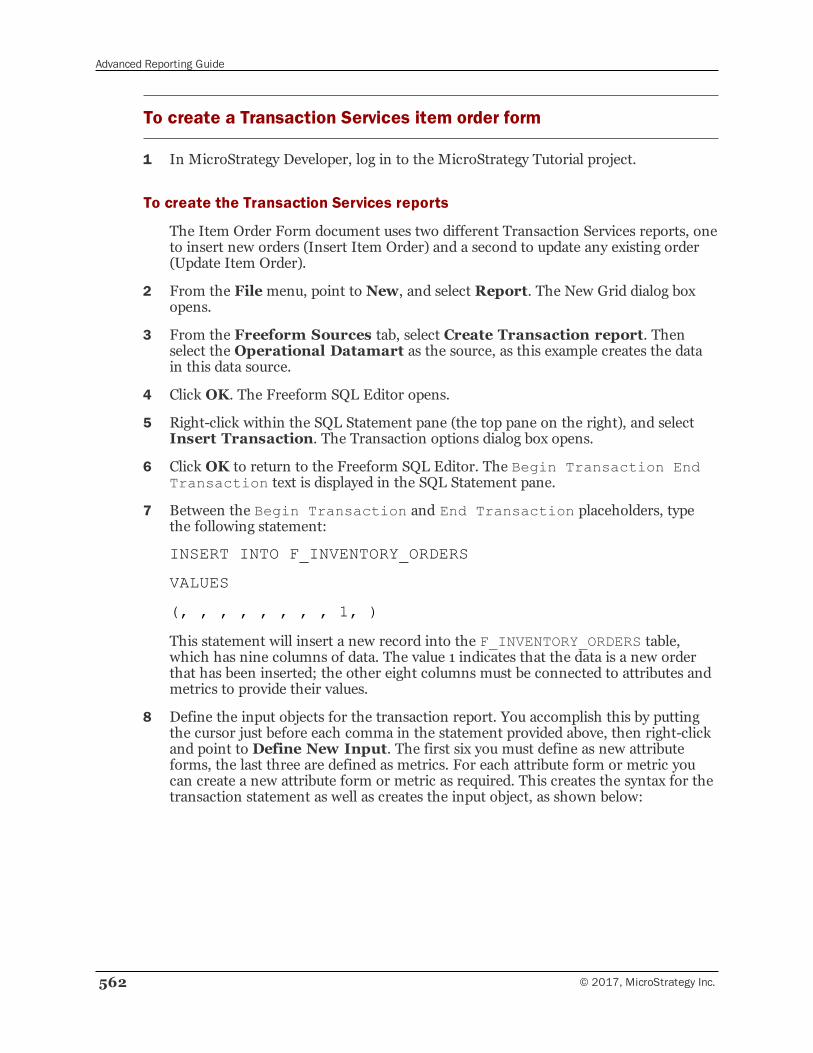
Advanced Reporting Guide
562 © 2017, MicroStrategy Inc.
To create a Transaction Services item order form
1 In MicroStrategy Developer, log in to the MicroStrategy Tutorial project.
To create the Transaction Services reports
The Item Order Form document uses two different Transaction Services reports, oneto insert new orders (Insert Item Order) and a second to update any existing order(Update Item Order).
2 From the Filemenu, point to New, and select Report. The New Grid dialog boxopens.
3 From the Freeform Sources tab, select Create Transaction report. Thenselect the Operational Datamart as the source, as this example creates the datain this data source.
4 Click OK. The Freeform SQL Editor opens.
5 Right-click within the SQL Statement pane (the top pane on the right), and selectInsert Transaction. The Transaction options dialog box opens.
6 Click OK to return to the Freeform SQL Editor. The Begin Transaction EndTransaction text is displayed in the SQL Statement pane.
7 Between the Begin Transaction and End Transaction placeholders, typethe following statement:
INSERT INTO F_INVENTORY_ORDERS
VALUES
(, , , , , , , , 1, )
This statement will insert a new record into the F_INVENTORY_ORDERS table,which has nine columns of data. The value 1 indicates that the data is a new orderthat has been inserted; the other eight columns must be connected to attributes andmetrics to provide their values.
8 Define the input objects for the transaction report. You accomplish this by puttingthe cursor just before each comma in the statement provided above, then right-clickand point to Define New Input. The first six you must define as new attributeforms, the last three are defined as metrics. For each attribute form or metric youcan create a new attribute form or metric as required. This creates the syntax for thetransaction statement as well as creates the input object, as shown below:
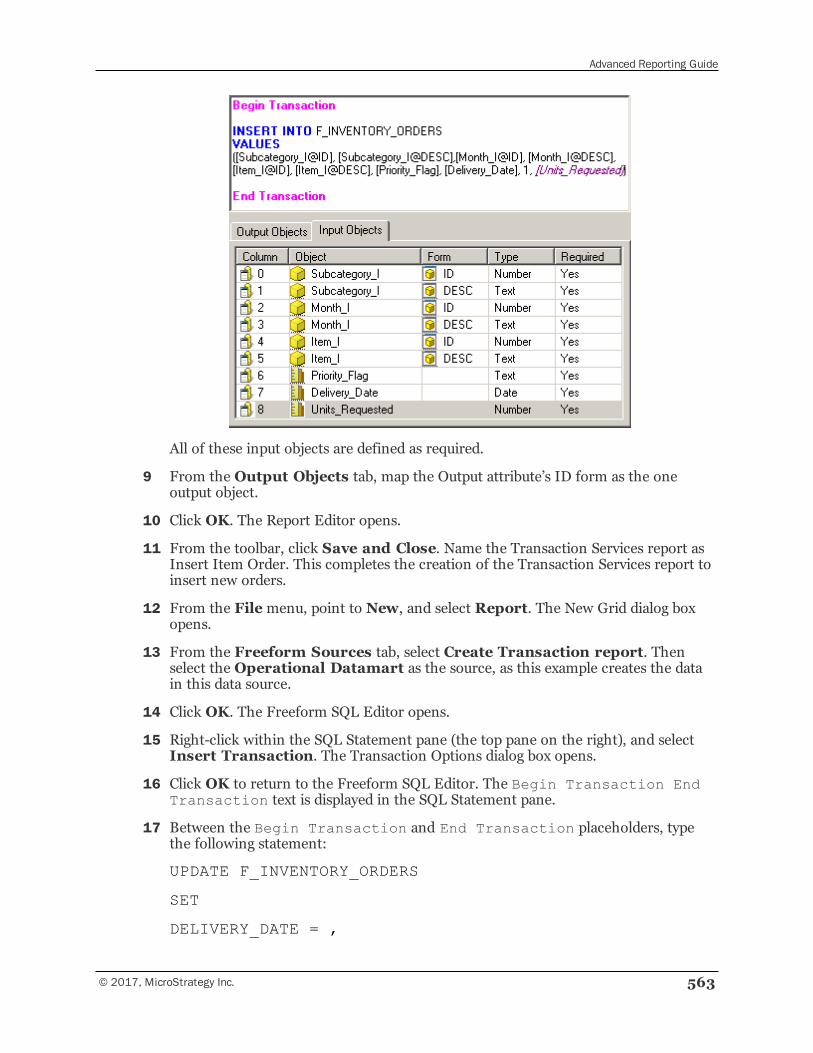
Advanced Reporting Guide
© 2017, MicroStrategy Inc. 563
All of these input objects are defined as required.
9 From the Output Objects tab, map the Output attribute’s ID form as the oneoutput object.
10 Click OK. The Report Editor opens.
11 From the toolbar, click Save and Close. Name the Transaction Services report asInsert Item Order. This completes the creation of the Transaction Services report toinsert new orders.
12 From the Filemenu, point to New, and select Report. The New Grid dialog boxopens.
13 From the Freeform Sources tab, select Create Transaction report. Thenselect the Operational Datamart as the source, as this example creates the datain this data source.
14 Click OK. The Freeform SQL Editor opens.
15 Right-click within the SQL Statement pane (the top pane on the right), and selectInsert Transaction. The Transaction Options dialog box opens.
16 Click OK to return to the Freeform SQL Editor. The Begin Transaction EndTransaction text is displayed in the SQL Statement pane.
17 Between the Begin Transaction and End Transaction placeholders, typethe following statement:
UPDATE F_INVENTORY_ORDERS
SET
DELIVERY_DATE = ,
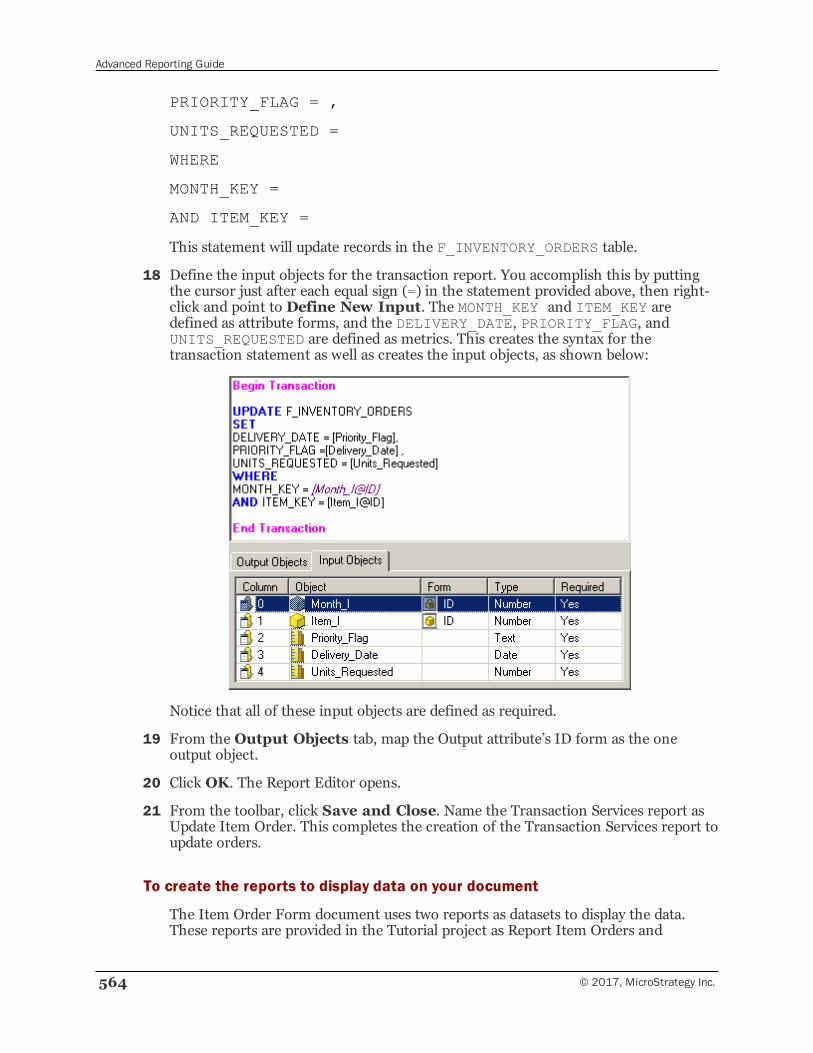
Advanced Reporting Guide
564 © 2017, MicroStrategy Inc.
PRIORITY_FLAG = ,
UNITS_REQUESTED =
WHERE
MONTH_KEY =
AND ITEM_KEY =
This statement will update records in the F_INVENTORY_ORDERS table.
18 Define the input objects for the transaction report. You accomplish this by puttingthe cursor just after each equal sign (=) in the statement provided above, then right-click and point to Define New Input. The MONTH_KEY and ITEM_KEY aredefined as attribute forms, and the DELIVERY_DATE, PRIORITY_FLAG, andUNITS_REQUESTED are defined as metrics. This creates the syntax for thetransaction statement as well as creates the input objects, as shown below:
Notice that all of these input objects are defined as required.
19 From the Output Objects tab, map the Output attribute’s ID form as the oneoutput object.
20 Click OK. The Report Editor opens.
21 From the toolbar, click Save and Close. Name the Transaction Services report asUpdate Item Order. This completes the creation of the Transaction Services report toupdate orders.
To create the reports to display data on your document
The Item Order Form document uses two reports as datasets to display the data.These reports are provided in the Tutorial project as Report Item Orders and
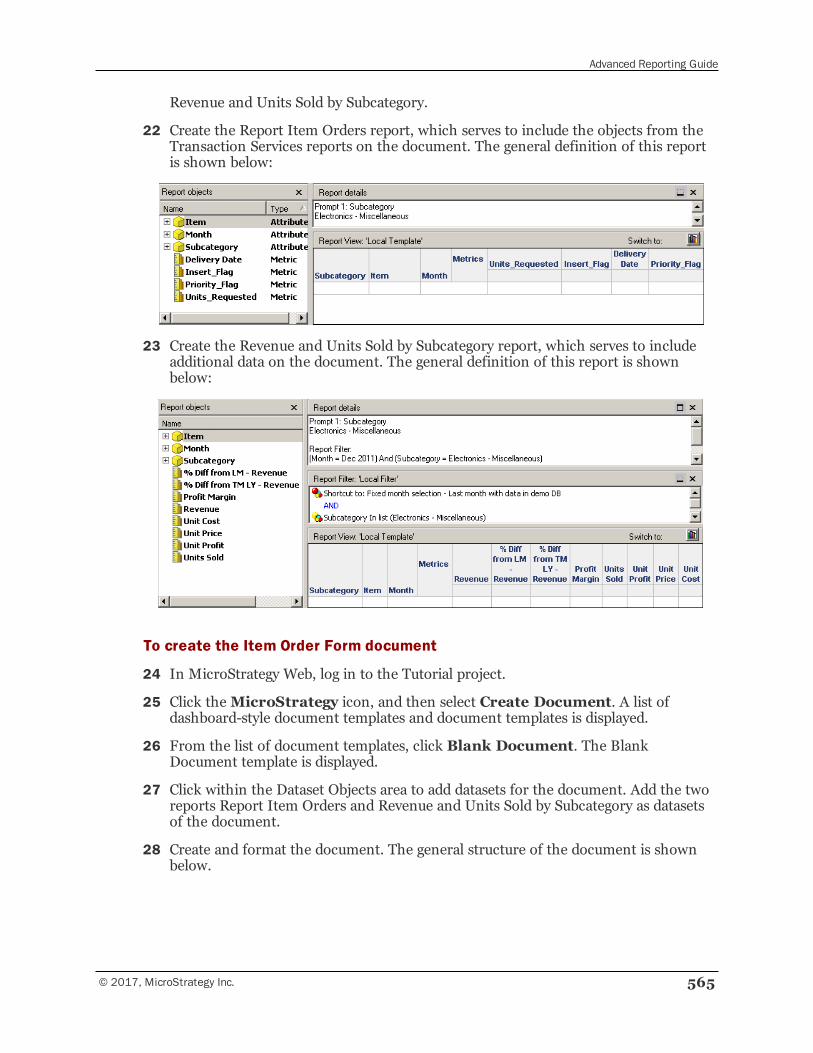
Advanced Reporting Guide
© 2017, MicroStrategy Inc. 565
Revenue and Units Sold by Subcategory.
22 Create the Report Item Orders report, which serves to include the objects from theTransaction Services reports on the document. The general definition of this reportis shown below:
23 Create the Revenue and Units Sold by Subcategory report, which serves to includeadditional data on the document. The general definition of this report is shownbelow:
To create the Item Order Form document
24 In MicroStrategy Web, log in to the Tutorial project.
25 Click theMicroStrategy icon, and then select Create Document. A list ofdashboard-style document templates and document templates is displayed.
26 From the list of document templates, click Blank Document. The BlankDocument template is displayed.
27 Click within the Dataset Objects area to add datasets for the document. Add the tworeports Report Item Orders and Revenue and Units Sold by Subcategory as datasetsof the document.
28 Create and format the document. The general structure of the document is shownbelow.
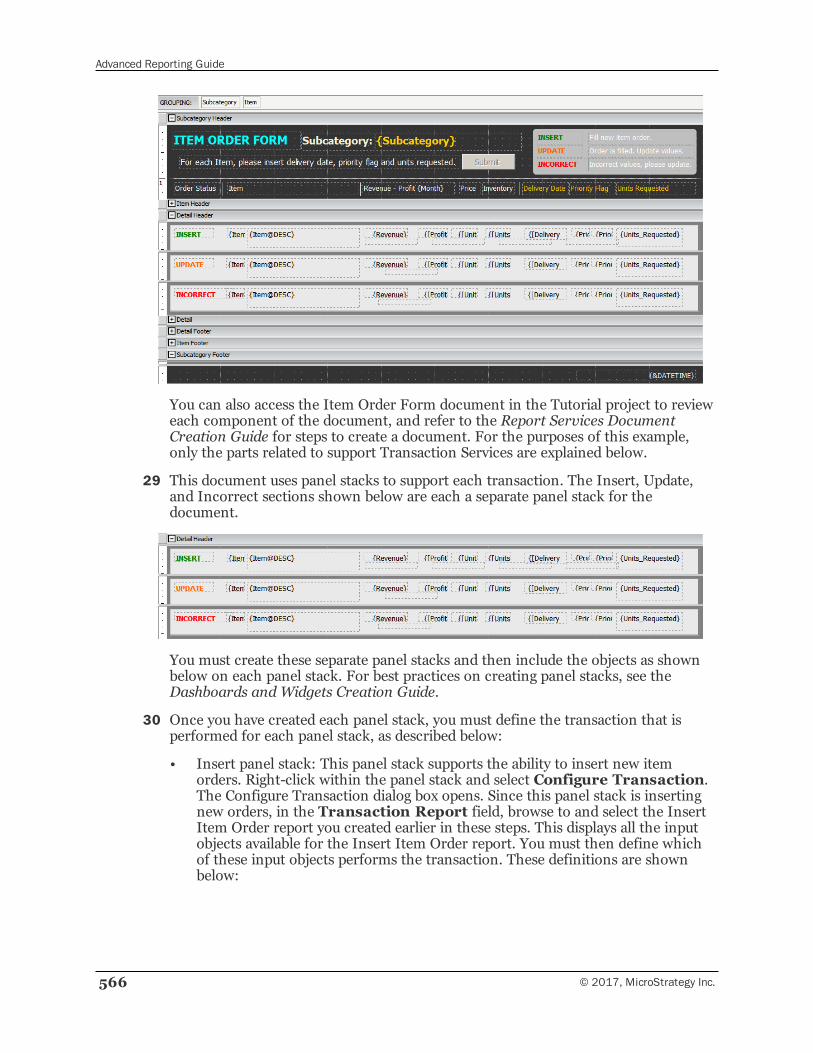
Advanced Reporting Guide
566 © 2017, MicroStrategy Inc.
You can also access the Item Order Form document in the Tutorial project to revieweach component of the document, and refer to the Report Services DocumentCreation Guide for steps to create a document. For the purposes of this example,only the parts related to support Transaction Services are explained below.
29 This document uses panel stacks to support each transaction. The Insert, Update,and Incorrect sections shown below are each a separate panel stack for thedocument.
You must create these separate panel stacks and then include the objects as shownbelow on each panel stack. For best practices on creating panel stacks, see theDashboards and Widgets Creation Guide.
30 Once you have created each panel stack, you must define the transaction that isperformed for each panel stack, as described below:
• Insert panel stack: This panel stack supports the ability to insert new itemorders. Right-click within the panel stack and select Configure Transaction.The Configure Transaction dialog box opens. Since this panel stack is insertingnew orders, in the Transaction Report field, browse to and select the InsertItem Order report you created earlier in these steps. This displays all the inputobjects available for the Insert Item Order report. You must then define whichof these input objects performs the transaction. These definitions are shownbelow:
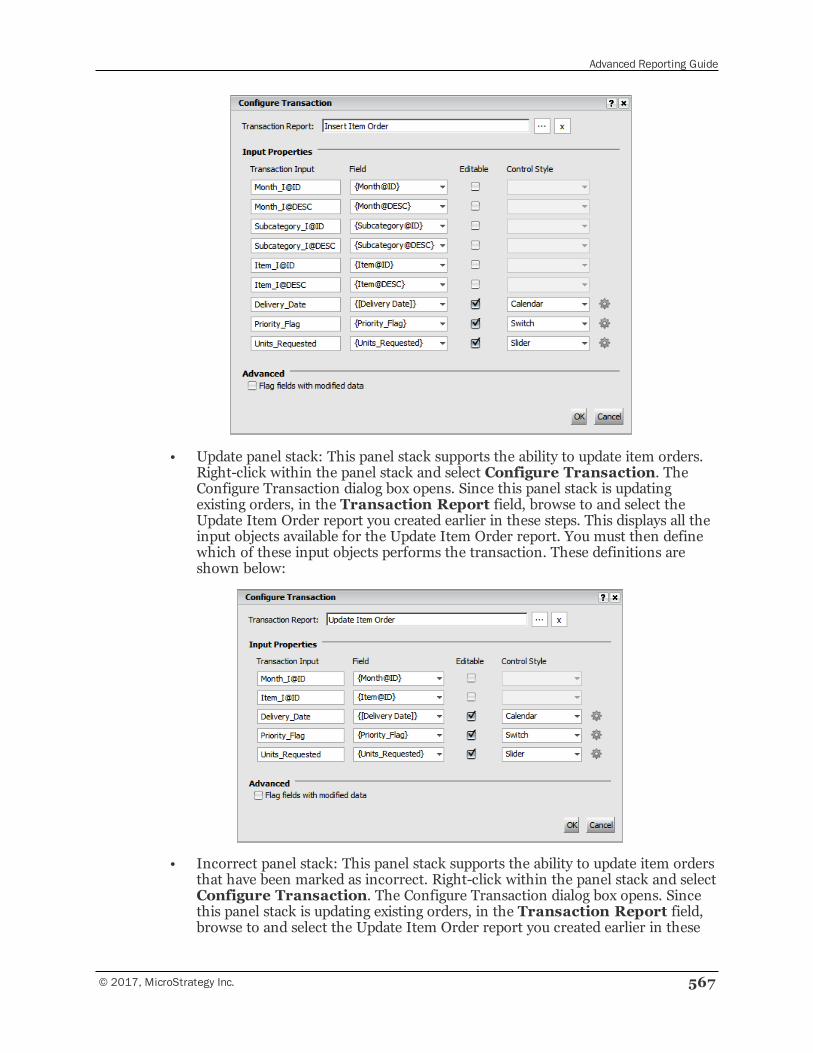
Advanced Reporting Guide
© 2017, MicroStrategy Inc. 567
• Update panel stack: This panel stack supports the ability to update item orders.Right-click within the panel stack and select Configure Transaction. TheConfigure Transaction dialog box opens. Since this panel stack is updatingexisting orders, in the Transaction Report field, browse to and select theUpdate Item Order report you created earlier in these steps. This displays all theinput objects available for the Update Item Order report. You must then definewhich of these input objects performs the transaction. These definitions areshown below:
• Incorrect panel stack: This panel stack supports the ability to update item ordersthat have been marked as incorrect. Right-click within the panel stack and selectConfigure Transaction. The Configure Transaction dialog box opens. Sincethis panel stack is updating existing orders, in the Transaction Report field,browse to and select the Update Item Order report you created earlier in these
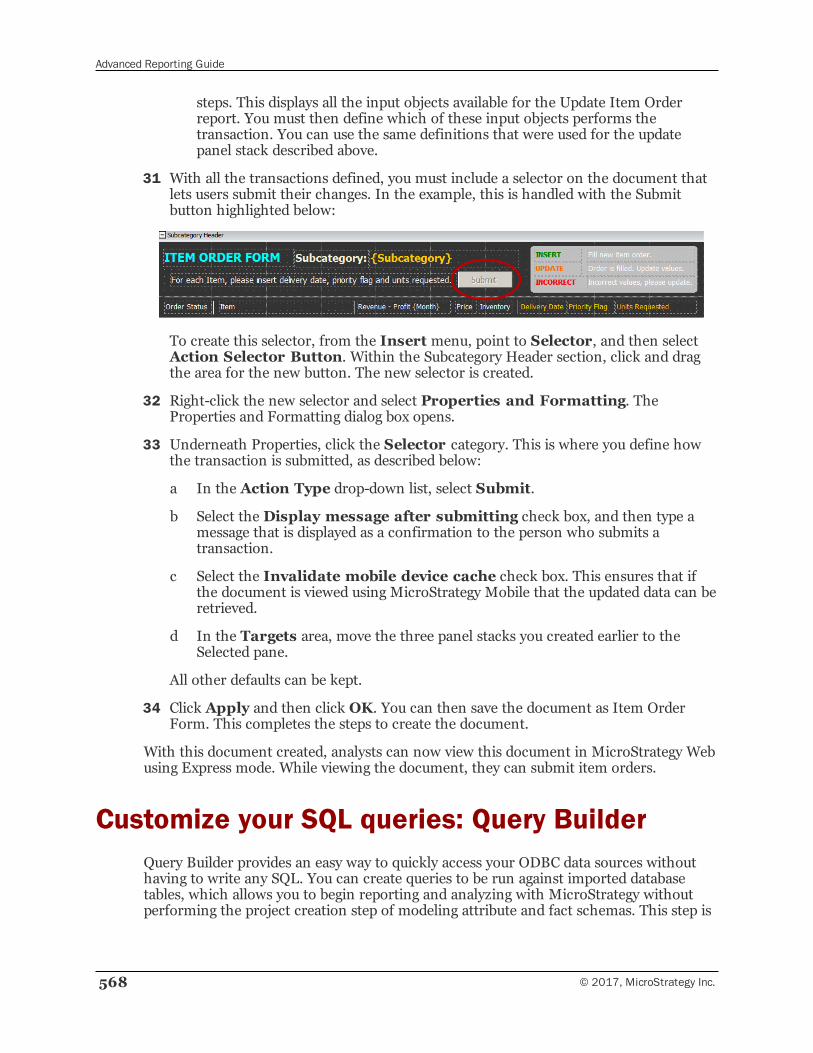
Advanced Reporting Guide
568 © 2017, MicroStrategy Inc.
steps. This displays all the input objects available for the Update Item Orderreport. You must then define which of these input objects performs thetransaction. You can use the same definitions that were used for the updatepanel stack described above.
31 With all the transactions defined, you must include a selector on the document thatlets users submit their changes. In the example, this is handled with the Submitbutton highlighted below:
To create this selector, from the Insert menu, point to Selector, and then selectAction Selector Button. Within the Subcategory Header section, click and dragthe area for the new button. The new selector is created.
32 Right-click the new selector and select Properties and Formatting. TheProperties and Formatting dialog box opens.
33 Underneath Properties, click the Selector category. This is where you define howthe transaction is submitted, as described below:
a In the Action Type drop-down list, select Submit.
b Select the Display message after submitting check box, and then type amessage that is displayed as a confirmation to the person who submits atransaction.
c Select the Invalidate mobile device cache check box. This ensures that ifthe document is viewed using MicroStrategy Mobile that the updated data can beretrieved.
d In the Targets area, move the three panel stacks you created earlier to theSelected pane.
All other defaults can be kept.
34 Click Apply and then click OK. You can then save the document as Item OrderForm. This completes the steps to create the document.
With this document created, analysts can now view this document in MicroStrategy Webusing Express mode. While viewing the document, they can submit item orders.
Customize your SQL queries: Query BuilderQuery Builder provides an easy way to quickly access your ODBC data sources withouthaving to write any SQL. You can create queries to be run against imported databasetables, which allows you to begin reporting and analyzing with MicroStrategy withoutperforming the project creation step of modeling attribute and fact schemas. This step is
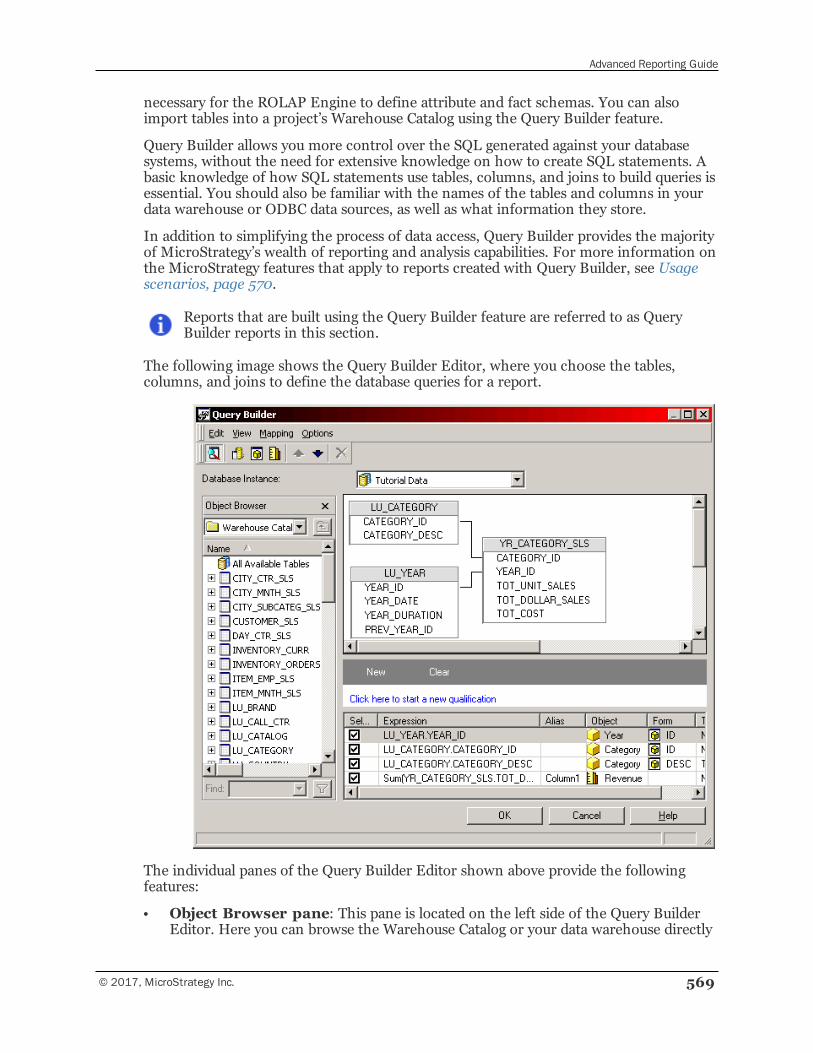
Advanced Reporting Guide
© 2017, MicroStrategy Inc. 569
necessary for the ROLAP Engine to define attribute and fact schemas. You can alsoimport tables into a project’s Warehouse Catalog using the Query Builder feature.
Query Builder allows you more control over the SQL generated against your databasesystems, without the need for extensive knowledge on how to create SQL statements. Abasic knowledge of how SQL statements use tables, columns, and joins to build queries isessential. You should also be familiar with the names of the tables and columns in yourdata warehouse or ODBC data sources, as well as what information they store.
In addition to simplifying the process of data access, Query Builder provides the majorityof MicroStrategy’s wealth of reporting and analysis capabilities. For more information onthe MicroStrategy features that apply to reports created with Query Builder, see Usagescenarios, page 570.
Reports that are built using the Query Builder feature are referred to as QueryBuilder reports in this section.
The following image shows the Query Builder Editor, where you choose the tables,columns, and joins to define the database queries for a report.
The individual panes of the Query Builder Editor shown above provide the followingfeatures:
• Object Browser pane: This pane is located on the left side of the Query BuilderEditor. Here you can browse the Warehouse Catalog or your data warehouse directly
Advanced Reporting Guide
570 © 2017, MicroStrategy Inc.
for tables to include in your queries. You can also browse the project folders forobjects such as attributes that can also be used to build your queries.
• Tables and Joins pane: This is the top pane on the right side of the QueryBuilder Editor. Tables and joins can be added to the definition of your queries here,which hold the columns that provide the data from which your report results aredrawn. For more information on how Query Builder uses tables and joins to buildqueries, see Access and analyze multiple data sources with Query Builder, page 573.
• Conditions pane: This is the middle pane on the right side of the Query BuilderEditor. Here you can define qualifications and insert security filters that will beincluded in the WHERE or HAVING clause of your SQL queries, which filter the datathat appears on the resulting report. For more information on defining qualificationsfor Query Builder reports, see Reporting analysis features, page 587.
• Selections pane: This is the bottom pane on the right side of the Query BuilderEditor. Columns added to this pane are included in the SELECT clause of your SQLqueries and become the attributes and metrics on the resulting report. For moreinformation on selecting columns in Query Builder, see Access and analyze multipledata sources with Query Builder, page 573.
Usage scenariosQuery Builder allows more control over the queries against your database tables thannormal MicroStrategy reports allow, without having to write any SQL statements byhand with the Freeform SQL feature. It allows you to create queries by dragging databasetables from the warehouse catalog or directly from the data warehouse into the QueryBuilder Editor, defining the joins between tables, and selecting the columns of data to bereturned. These queries create reports that can be displayed in MicroStrategy Developeror Web. This functionality can be useful in the following scenarios.
When should I use the Query Builder feature?
You can use Query Builder to run queries against a set of database tables that are noteasily modeled to an attribute and fact schema. This includes databases that are acollection of flat tables rather than being defined into fact and lookup tables, or otheroperational data stores. It can also save time when setting up your project since QueryBuilder only requires that database tables are imported to a project’s Warehouse Catalog.Query Builder does not require you to create an attribute and fact schema for yourproject. You can even import tables into a project’s Warehouse Catalog within the QueryBuilder Editor. For more information on importing tables with the Query Builder Editor,see Access and analyze multiple data sources with Query Builder, page 573.
Query Builder allows you to pick the tables, columns, and joins used in your queries. Thiscan be helpful if you are more accustomed to creating queries at this level. Query Builderallows you more control over the SQL generated against your database without the needfor extensive knowledge on how to create SQL statements.
Query Builder also provides a robust system when moving from one data warehouse toanother. Unlike Freeform SQL, which uses static SQL statements that you provide,Query Builder creates the SQL statements based on tables and columns you select andmap to MicroStrategy objects. Because of this functionality, Query Builder SQLstatements can automatically change to reflect the syntax of a data warehouse.
Advanced Reporting Guide
© 2017, MicroStrategy Inc. 571
For example, if you move from a development Oracle data warehouse to a productionSQL Server data warehouse, the SQL statements for your Query Builder reportsautomatically change to reflect SQL Server syntax. For Query Builder reports, thisseamless move from a development to a production data warehouse requires that bothdata warehouses have the same exact table structures, relationships, and column namingconventions.
Query Builder reports vs. standard reports
A Query Builder report is simply a standard report, which has been built using the QueryBuilder feature. Due to some variations in how standard reports and Query Builderreports are built, there are also some varying functionalities between the two.
You can create Query Builder reports by building your own queries against importeddatabase tables. Although Query Builder reports can only be created on MicroStrategyDeveloper, once created, they can be executed from both MicroStrategy Developer andWeb like any other MicroStrategy standard reports. Functions that you can perform onMicroStrategy standard reports can also be performed on Query Builder reports,including the following:
• Formatting
• Exporting
• Thresholds
• Filtering
• Value prompts
• Graphing
• Shortcut-to-a-report qualification. For more information on using a Query Builderreport as a shortcut-to-a-report qualification, see Reporting analysis features, page587.
• Narrowcast Server subscriptions and report execution
• Object security
• OLAP services
• Prioritization
• Report Services documents
• Drilling within a personal Intelligent Cube
• Scheduling
• Subtotals
The following features are available for use with Query Builder reports if an attribute andfact schema is used to model the data returned from your queries:
• Element list prompts
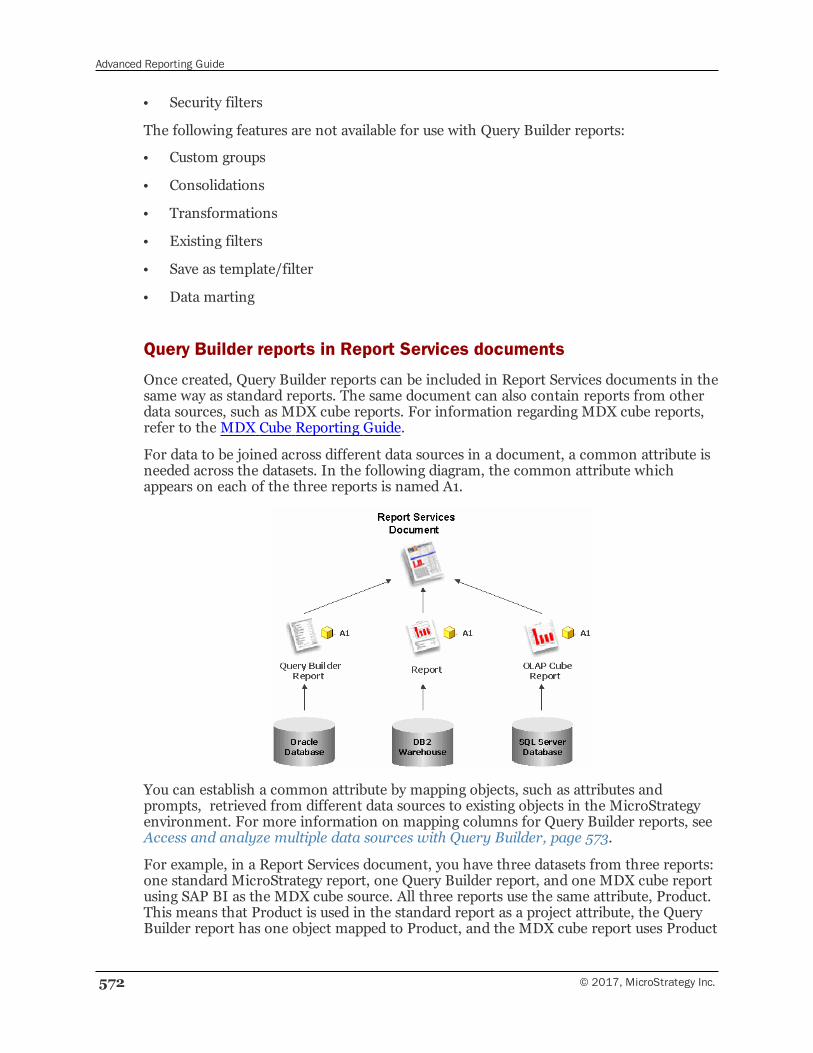
Advanced Reporting Guide
572 © 2017, MicroStrategy Inc.
• Security filters
The following features are not available for use with Query Builder reports:
• Custom groups
• Consolidations
• Transformations
• Existing filters
• Save as template/filter
• Data marting
Query Builder reports in Report Services documents
Once created, Query Builder reports can be included in Report Services documents in thesame way as standard reports. The same document can also contain reports from otherdata sources, such as MDX cube reports. For information regarding MDX cube reports,refer to the MDX Cube Reporting Guide.
For data to be joined across different data sources in a document, a common attribute isneeded across the datasets. In the following diagram, the common attribute whichappears on each of the three reports is named A1.
You can establish a common attribute by mapping objects, such as attributes andprompts, retrieved from different data sources to existing objects in the MicroStrategyenvironment. For more information on mapping columns for Query Builder reports, seeAccess and analyze multiple data sources with Query Builder, page 573.
For example, in a Report Services document, you have three datasets from three reports:one standard MicroStrategy report, one Query Builder report, and one MDX cube reportusing SAP BI as the MDX cube source. All three reports use the same attribute, Product.This means that Product is used in the standard report as a project attribute, the QueryBuilder report has one object mapped to Product, and the MDX cube report uses Product
Advanced Reporting Guide
© 2017, MicroStrategy Inc. 573
to map one of its characteristics from the imported SAP BI query cube. Because data isjoined by the common attribute Product, the document is generated successfully.
If each of the three reports originally has a prompt on Product, then the promptwill only be displayed one time when a user executes the document; this means auser only needs to answer the prompt one time, instead of three times.
Access and analyze multiple data sources with QueryBuilderWith Query Builder, you can access multiple data sources in the same project and useMicroStrategy reporting features to analyze your data. Connection to databases, Excelfile, and text files is described in Connect to databases, Excel files, and text files, page599.
Once you connect to a valid data source, you can create a Query Builder report to retrieveand analyze the data from the data source. The Query Builder Editor helps you createand modify SQL queries to run against your ODBC data sources, while requiring only abasic knowledge of SQL functionality. These queries are the basis of any Query Builderreport, which enable you to analyze the data returned from the data source.
The sections below describe how to create Query Builder reports:
• Create a Query Builder report to access relational databases, page 573
• Create a Query Builder report to access Excel files, page 576
• Create a Query Builder report to access text files, page 577
• Select and add tables, page 578
• Define joins, page 579
• Automatically join columns, page 581
• Select columns of data to return, page 583
Create a Query Builder report to access relational databases
The following steps run through a scenario to create a Query Builder report that accessesthe database provided with the MicroStrategy Tutorial project. The report created inthese steps is used throughout the rest of this Query Builder section to demonstrate thedifferent features available.
The MicroStrategy Tutorial project comes with a fully developed attribute and factschema, which is not necessary to build Query Builder reports.
Prerequisites
• Query Builder reports can be created in MicroStrategy Developer only. However,these reports can be manipulated and executed from both MicroStrategy Developerand Web. Access to the Query Builder Editor is available only to Developers with the
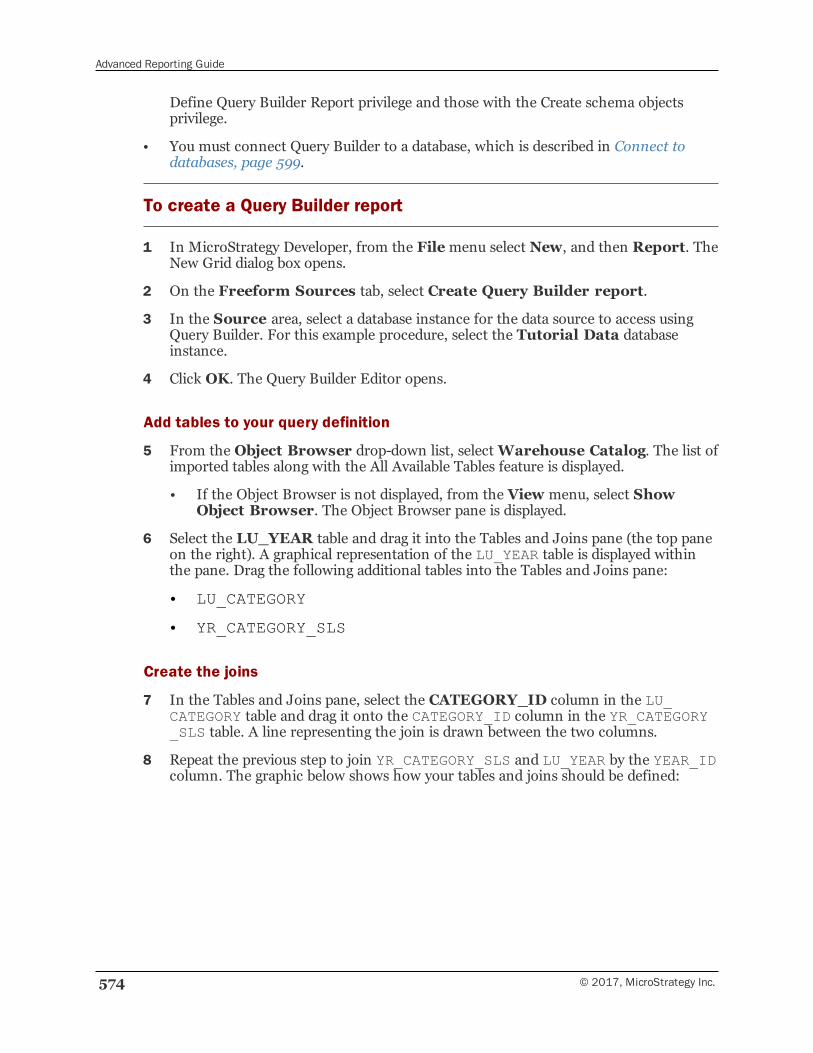
Advanced Reporting Guide
574 © 2017, MicroStrategy Inc.
Define Query Builder Report privilege and those with the Create schema objectsprivilege.
• You must connect Query Builder to a database, which is described in Connect todatabases, page 599.
To create a Query Builder report
1 In MicroStrategy Developer, from the Filemenu select New, and then Report. TheNew Grid dialog box opens.
2 On the Freeform Sources tab, select Create Query Builder report.
3 In the Source area, select a database instance for the data source to access usingQuery Builder. For this example procedure, select the Tutorial Data databaseinstance.
4 Click OK. The Query Builder Editor opens.
Add tables to your query definition
5 From the Object Browser drop-down list, selectWarehouse Catalog. The list ofimported tables along with the All Available Tables feature is displayed.
• If the Object Browser is not displayed, from the View menu, select ShowObject Browser. The Object Browser pane is displayed.
6 Select the LU_YEAR table and drag it into the Tables and Joins pane (the top paneon the right). A graphical representation of the LU_YEAR table is displayed withinthe pane. Drag the following additional tables into the Tables and Joins pane:
• LU_CATEGORY
• YR_CATEGORY_SLS
Create the joins
7 In the Tables and Joins pane, select the CATEGORY_ID column in the LU_CATEGORY table and drag it onto the CATEGORY_ID column in the YR_CATEGORY_SLS table. A line representing the join is drawn between the two columns.
8 Repeat the previous step to join YR_CATEGORY_SLS and LU_YEAR by the YEAR_IDcolumn. The graphic below shows how your tables and joins should be defined:
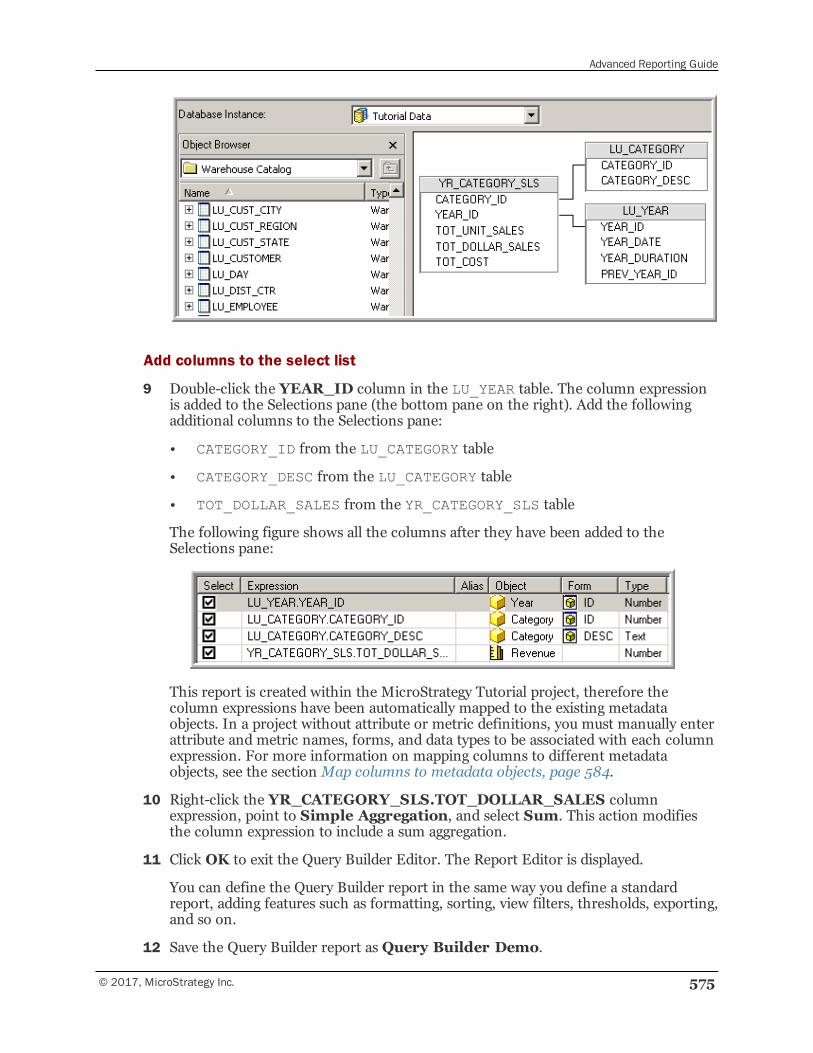
Advanced Reporting Guide
© 2017, MicroStrategy Inc. 575
Add columns to the select list
9 Double-click the YEAR_ID column in the LU_YEAR table. The column expressionis added to the Selections pane (the bottom pane on the right). Add the followingadditional columns to the Selections pane:
• CATEGORY_ID from the LU_CATEGORY table
• CATEGORY_DESC from the LU_CATEGORY table
• TOT_DOLLAR_SALES from the YR_CATEGORY_SLS table
The following figure shows all the columns after they have been added to theSelections pane:
This report is created within the MicroStrategy Tutorial project, therefore thecolumn expressions have been automatically mapped to the existing metadataobjects. In a project without attribute or metric definitions, you must manually enterattribute and metric names, forms, and data types to be associated with each columnexpression. For more information on mapping columns to different metadataobjects, see the section Map columns to metadata objects, page 584.
10 Right-click the YR_CATEGORY_SLS.TOT_DOLLAR_SALES columnexpression, point to Simple Aggregation, and select Sum. This action modifiesthe column expression to include a sum aggregation.
11 Click OK to exit the Query Builder Editor. The Report Editor is displayed.
You can define the Query Builder report in the same way you define a standardreport, adding features such as formatting, sorting, view filters, thresholds, exporting,and so on.
12 Save the Query Builder report as Query Builder Demo.
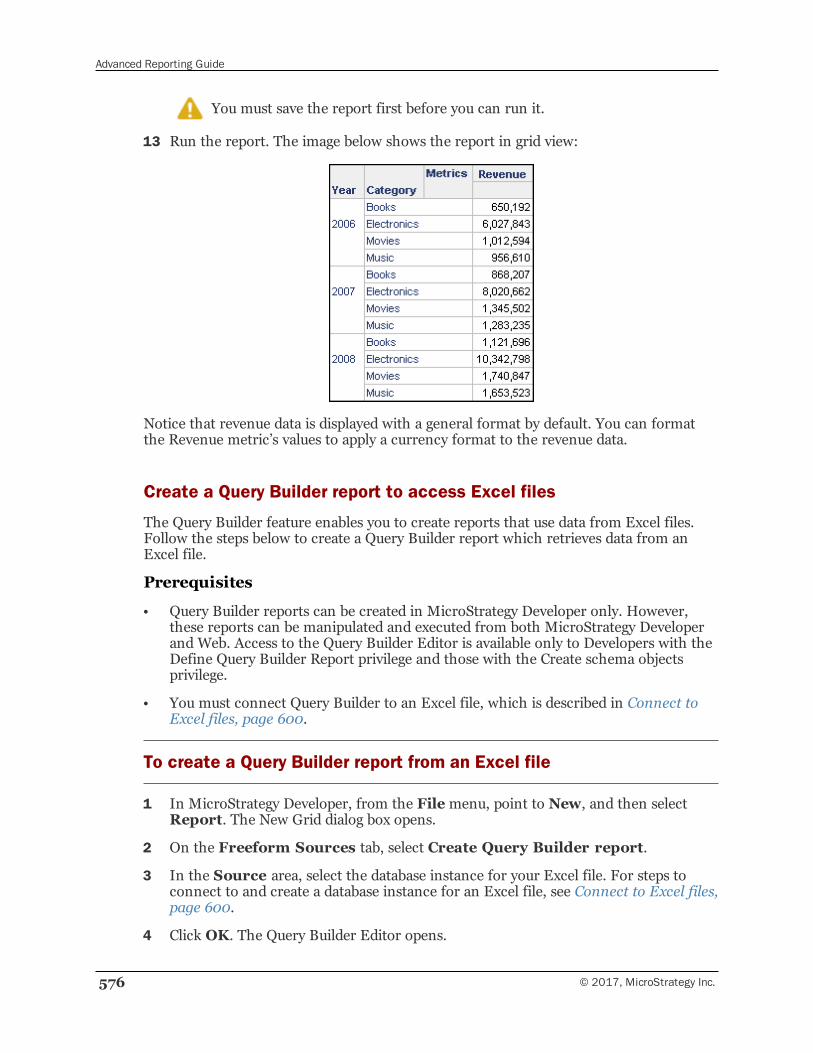
Advanced Reporting Guide
576 © 2017, MicroStrategy Inc.
You must save the report first before you can run it.
13 Run the report. The image below shows the report in grid view:
Notice that revenue data is displayed with a general format by default. You can formatthe Revenue metric’s values to apply a currency format to the revenue data.
Create a Query Builder report to access Excel files
The Query Builder feature enables you to create reports that use data from Excel files.Follow the steps below to create a Query Builder report which retrieves data from anExcel file.
Prerequisites
• Query Builder reports can be created in MicroStrategy Developer only. However,these reports can be manipulated and executed from both MicroStrategy Developerand Web. Access to the Query Builder Editor is available only to Developers with theDefine Query Builder Report privilege and those with the Create schema objectsprivilege.
• You must connect Query Builder to an Excel file, which is described in Connect toExcel files, page 600.
To create a Query Builder report from an Excel file
1 In MicroStrategy Developer, from the Filemenu, point to New, and then selectReport. The New Grid dialog box opens.
2 On the Freeform Sources tab, select Create Query Builder report.
3 In the Source area, select the database instance for your Excel file. For steps toconnect to and create a database instance for an Excel file, see Connect to Excel files,page 600.
4 Click OK. The Query Builder Editor opens.
Advanced Reporting Guide
© 2017, MicroStrategy Inc. 577
You can now use the tables created by the Excel file to build your Query Builder reportusing the methods described in the sections listed below:
• Select and add tables, page 578
• Define joins, page 579
• Automatically join columns, page 581
• Select columns of data to return, page 583
Create a Query Builder report to access text files
The Query Builder feature enables you to create reports using data from text files. Followthe steps below to create a Query Builder report which retrieves data from a text file.
Prerequisites
• Query Builder reports can be created in MicroStrategy Developer only. However,these reports can be manipulated and executed from both MicroStrategy Developerand Web. Access to the Query Builder Editor is available only to Developers with theDefine Query Builder Report privilege and those with the Create schema objectsprivilege.
• You must connect Query Builder to a text file, which is described in Connect to textfiles, page 600.
To create a Query Builder report from a text file
1 In MicroStrategy Developer, on the Filemenu, point to New, and then selectReport. The New Grid dialog box opens.
2 On the Freeform Sources tab, select Create Query Builder report.
3 In the Source area, select the database instance for your text file. For steps toconnect to and create a database instance for a text file, see Connect to text files,page 600.
4 Click OK. The Query Builder Editor opens.
You can now use the tables created by the text file to build your Query Builder reportusing the methods described in the sections listed below:
• Select and add tables, page 578
• Define joins, page 579
• Automatically join columns, page 581
• Select columns of data to return, page 583
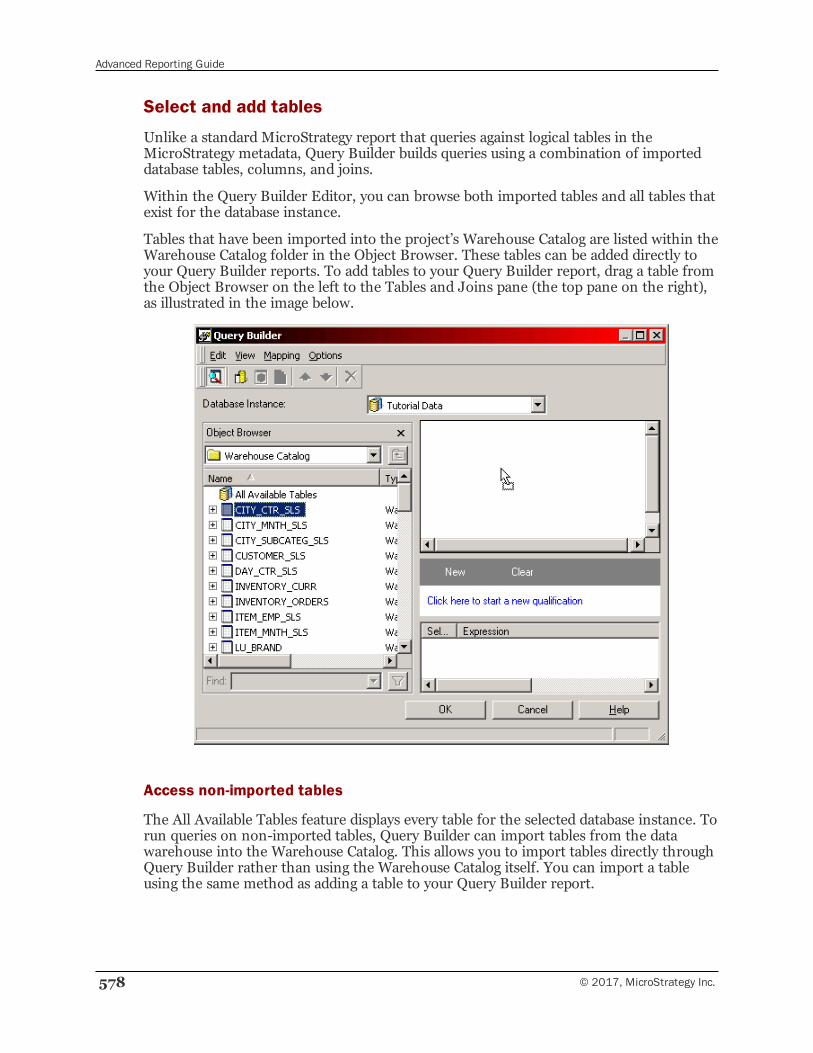
Advanced Reporting Guide
578 © 2017, MicroStrategy Inc.
Select and add tables
Unlike a standard MicroStrategy report that queries against logical tables in theMicroStrategy metadata, Query Builder builds queries using a combination of importeddatabase tables, columns, and joins.
Within the Query Builder Editor, you can browse both imported tables and all tables thatexist for the database instance.
Tables that have been imported into the project’s Warehouse Catalog are listed within theWarehouse Catalog folder in the Object Browser. These tables can be added directly toyour Query Builder reports. To add tables to your Query Builder report, drag a table fromthe Object Browser on the left to the Tables and Joins pane (the top pane on the right),as illustrated in the image below.
Access non-imported tables
The All Available Tables feature displays every table for the selected database instance. Torun queries on non-imported tables, Query Builder can import tables from the datawarehouse into the Warehouse Catalog. This allows you to import tables directly throughQuery Builder rather than using the Warehouse Catalog itself. You can import a tableusing the same method as adding a table to your Query Builder report.
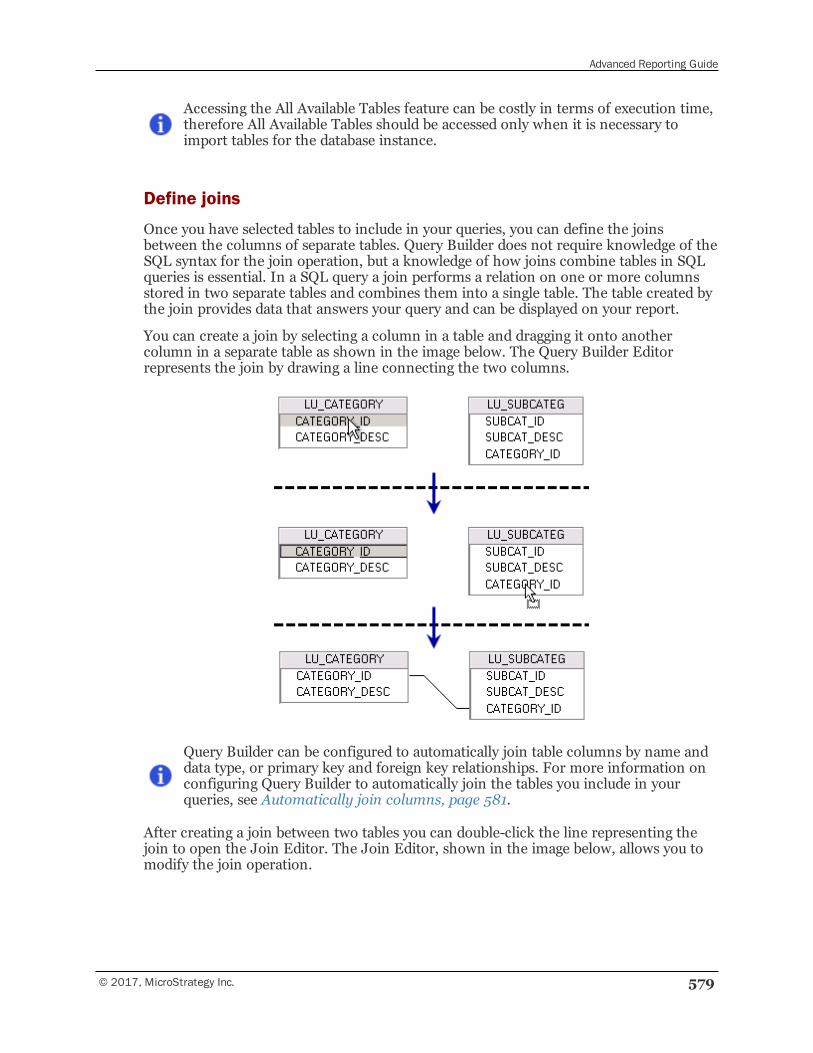
Advanced Reporting Guide
© 2017, MicroStrategy Inc. 579
Accessing the All Available Tables feature can be costly in terms of execution time,therefore All Available Tables should be accessed only when it is necessary toimport tables for the database instance.
Define joins
Once you have selected tables to include in your queries, you can define the joinsbetween the columns of separate tables. Query Builder does not require knowledge of theSQL syntax for the join operation, but a knowledge of how joins combine tables in SQLqueries is essential. In a SQL query a join performs a relation on one or more columnsstored in two separate tables and combines them into a single table. The table created bythe join provides data that answers your query and can be displayed on your report.
You can create a join by selecting a column in a table and dragging it onto anothercolumn in a separate table as shown in the image below. The Query Builder Editorrepresents the join by drawing a line connecting the two columns.
Query Builder can be configured to automatically join table columns by name anddata type, or primary key and foreign key relationships. For more information onconfiguring Query Builder to automatically join the tables you include in yourqueries, see Automatically join columns, page 581.
After creating a join between two tables you can double-click the line representing thejoin to open the Join Editor. The Join Editor, shown in the image below, allows you tomodify the join operation.
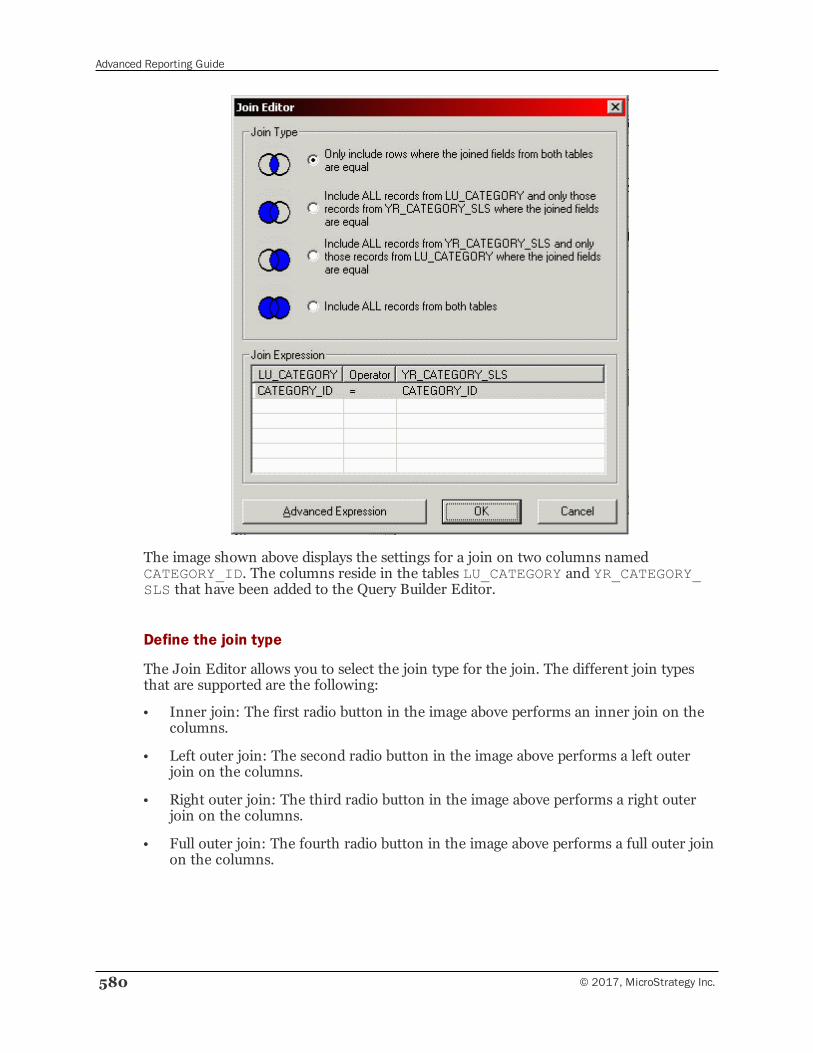
Advanced Reporting Guide
580 © 2017, MicroStrategy Inc.
The image shown above displays the settings for a join on two columns namedCATEGORY_ID. The columns reside in the tables LU_CATEGORY and YR_CATEGORY_SLS that have been added to the Query Builder Editor.
Define the join type
The Join Editor allows you to select the join type for the join. The different join typesthat are supported are the following:
• Inner join: The first radio button in the image above performs an inner join on thecolumns.
• Left outer join: The second radio button in the image above performs a left outerjoin on the columns.
• Right outer join: The third radio button in the image above performs a right outerjoin on the columns.
• Full outer join: The fourth radio button in the image above performs a full outer joinon the columns.
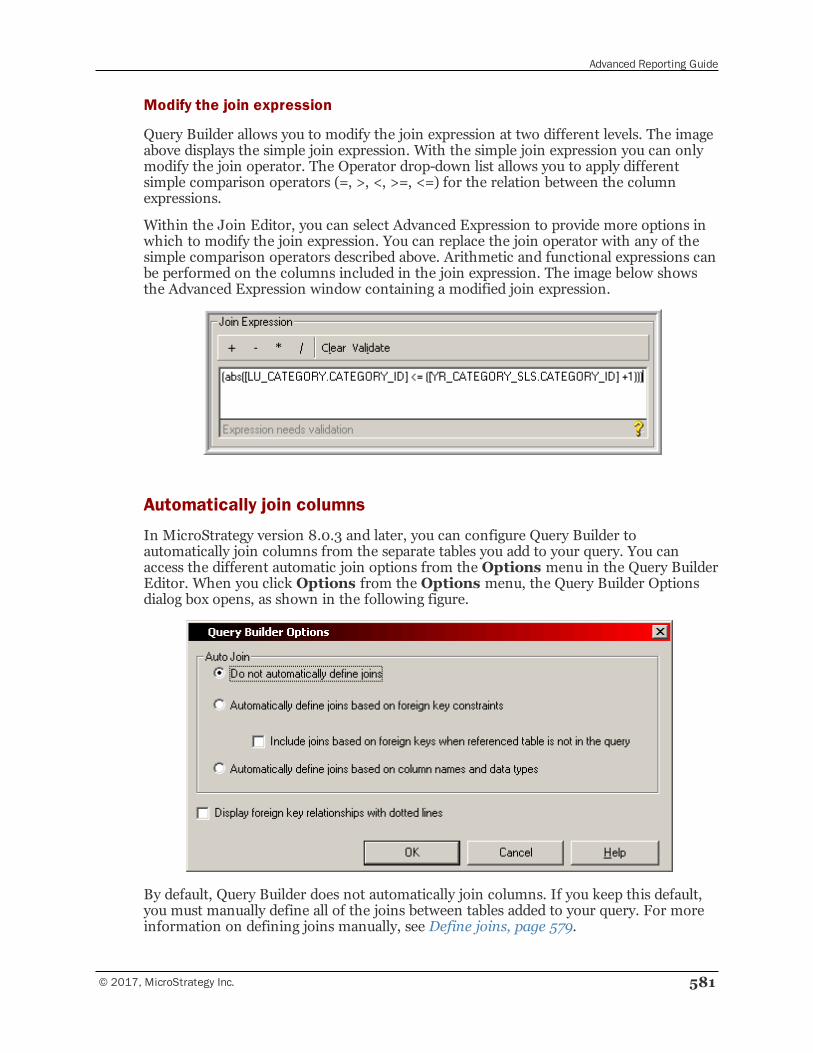
Advanced Reporting Guide
© 2017, MicroStrategy Inc. 581
Modify the join expression
Query Builder allows you to modify the join expression at two different levels. The imageabove displays the simple join expression. With the simple join expression you can onlymodify the join operator. The Operator drop-down list allows you to apply differentsimple comparison operators (=, >, <, >=, <=) for the relation between the columnexpressions.
Within the Join Editor, you can select Advanced Expression to provide more options inwhich to modify the join expression. You can replace the join operator with any of thesimple comparison operators described above. Arithmetic and functional expressions canbe performed on the columns included in the join expression. The image below showsthe Advanced Expression window containing a modified join expression.
Automatically join columns
In MicroStrategy version 8.0.3 and later, you can configure Query Builder toautomatically join columns from the separate tables you add to your query. You canaccess the different automatic join options from the Options menu in the Query BuilderEditor. When you click Options from the Options menu, the Query Builder Optionsdialog box opens, as shown in the following figure.
By default, Query Builder does not automatically join columns. If you keep this default,you must manually define all of the joins between tables added to your query. For moreinformation on defining joins manually, see Define joins, page 579.
Advanced Reporting Guide
582 © 2017, MicroStrategy Inc.
Both automatic join options described below share the following behaviors:
• Select an automatic join option before adding tables to your query. Automatic joinsare created when tables are added to your query. If you modify the automatic joinoption after you have added your tables to your query, no automatic joins are definedor deleted. For more information on adding tables to your query, see Select and addtables, page 578.
• If you enable automatic joins, you can still manually define, modify, and delete joins.For more information on manually defining joins, see Define joins, page 579.
Automatically define joins based on foreign key constraints
You can configure Query Builder to automatically join columns based on your databasetables’ primary key and foreign key constraints. When this option is selected, primary keycolumns are automatically joined with their associated foreign key columns.
For example, you have two lookup tables in your database. One table is named LU_CATEGORY for the Category attribute and one table is named LU_SUBCATEG for theSubcategory attribute. You define the CATEGORY_ID column as the primary key for theLU_CATEGORY table. The LU_SUBCATEG table includes its own primary key SUBCAT_ID and the foreign key CATEGORY_ID. When you add the tables LU_CATEGORY andLU_SUBCATEG, a join is automatically created on CATEGORY_ID to join the two tables.
If you select to automatically define joins based on foreign key constraints, you also havethe option to automatically create joins based on foreign keys when the table containingthe primary key is not in the query. When this option is selected, the same foreign keycolumns in different tables are automatically joined even if the table that defines thecolumn as a primary key is not in the query. However, the column must be defined as aprimary key in at least one table in the database.
For example, recall the example scenario above. Along with the tables LU_CATEGORYand LU_SUBCATEG you have a lookup table named LU_ITEM for the attribute Item.The LU_ITEM table includes CATEGORY_ID as a foreign key. If you add LU_SUBCATEGand LU_ITEM to your query without adding LU_CATEGORY, a join is automaticallycreated on CATEGORY_ID to join the two tables. Since no table is included in the querythat defines CATEGORY_ID as a primary key, this join is created by searching thedatabase tables for relevant primary keys. Once it is determined that CATEGORY_ID is aprimary key, the join between LU_SUBCATEG and LU_ITEM on CATEGORY_ID as aforeign key is created. If LU_CATEGORY is included before or after the other two tables,the joins are created based on CATEGORY_ID as a primary key and any redundant joinsare deleted.
You can update primary key and foreign key information for your database tables byupdating the structure of your database tables in the Warehouse Catalog. For moreinformation on updating table structure, see the Project Design Guide.
Automatically define joins based on column names and data types
You can configure Query Builder to automatically join columns based on column namesand data types. When this option is selected, columns are automatically joined bymatching columns by name and data type, as long as no primary key columns areincluded in the tables of your query.
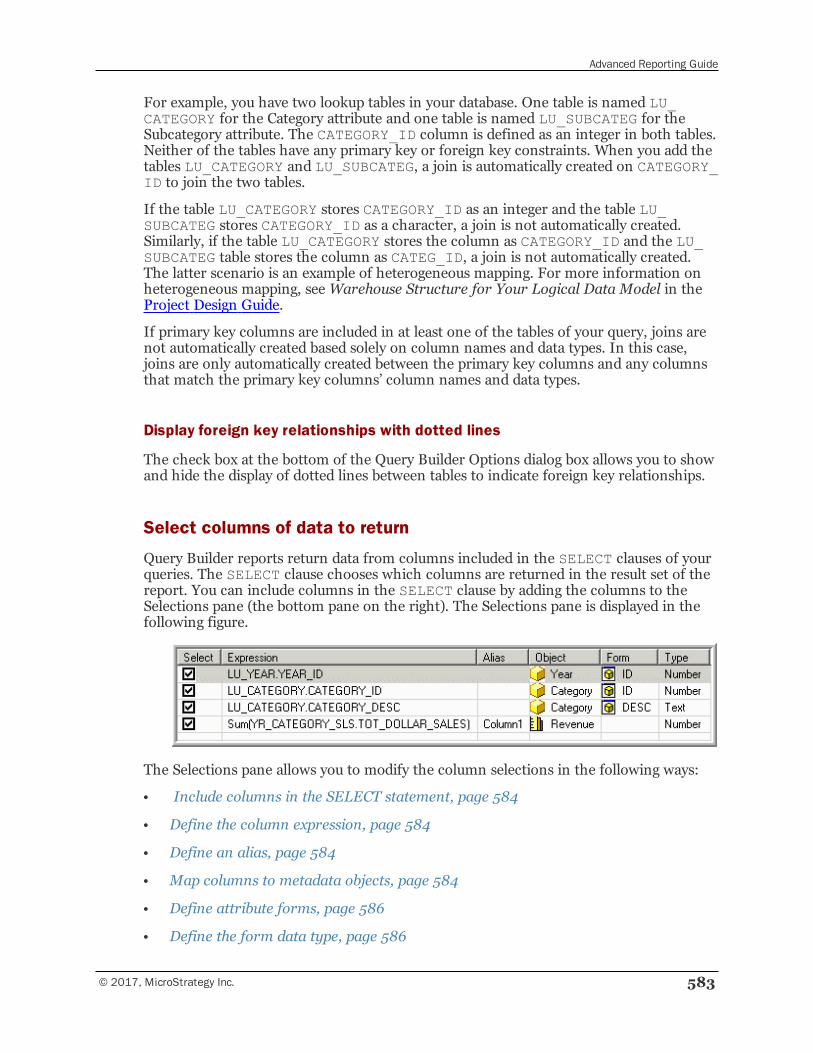
Advanced Reporting Guide
© 2017, MicroStrategy Inc. 583
For example, you have two lookup tables in your database. One table is named LU_CATEGORY for the Category attribute and one table is named LU_SUBCATEG for theSubcategory attribute. The CATEGORY_ID column is defined as an integer in both tables.Neither of the tables have any primary key or foreign key constraints. When you add thetables LU_CATEGORY and LU_SUBCATEG, a join is automatically created on CATEGORY_ID to join the two tables.
If the table LU_CATEGORY stores CATEGORY_ID as an integer and the table LU_SUBCATEG stores CATEGORY_ID as a character, a join is not automatically created.Similarly, if the table LU_CATEGORY stores the column as CATEGORY_ID and the LU_SUBCATEG table stores the column as CATEG_ID, a join is not automatically created.The latter scenario is an example of heterogeneous mapping. For more information onheterogeneous mapping, seeWarehouse Structure for Your Logical Data Model in theProject Design Guide.
If primary key columns are included in at least one of the tables of your query, joins arenot automatically created based solely on column names and data types. In this case,joins are only automatically created between the primary key columns and any columnsthat match the primary key columns’ column names and data types.
Display foreign key relationships with dotted lines
The check box at the bottom of the Query Builder Options dialog box allows you to showand hide the display of dotted lines between tables to indicate foreign key relationships.
Select columns of data to return
Query Builder reports return data from columns included in the SELECT clauses of yourqueries. The SELECT clause chooses which columns are returned in the result set of thereport. You can include columns in the SELECT clause by adding the columns to theSelections pane (the bottom pane on the right). The Selections pane is displayed in thefollowing figure.
The Selections pane allows you to modify the column selections in the following ways:
• Include columns in the SELECT statement, page 584
• Define the column expression, page 584
• Define an alias, page 584
• Map columns to metadata objects, page 584
• Define attribute forms, page 586
• Define the form data type, page 586
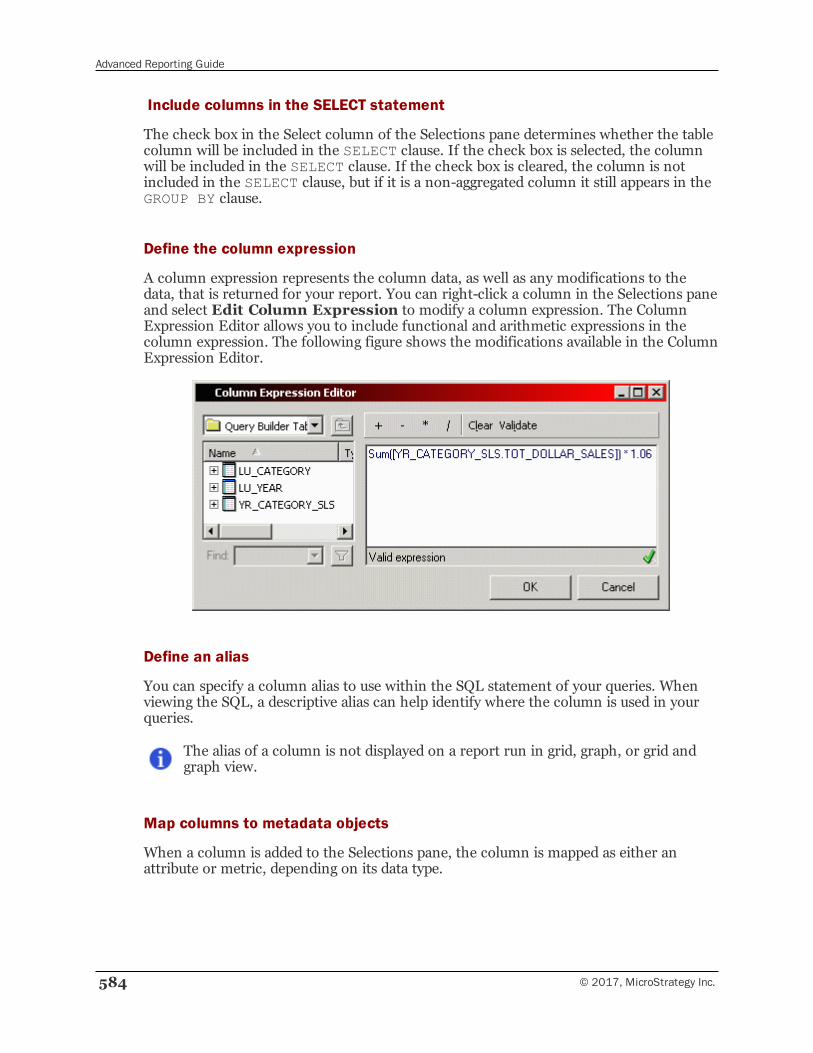
Advanced Reporting Guide
584 © 2017, MicroStrategy Inc.
Include columns in the SELECT statement
The check box in the Select column of the Selections pane determines whether the tablecolumn will be included in the SELECT clause. If the check box is selected, the columnwill be included in the SELECT clause. If the check box is cleared, the column is notincluded in the SELECT clause, but if it is a non-aggregated column it still appears in theGROUP BY clause.
Define the column expression
A column expression represents the column data, as well as any modifications to thedata, that is returned for your report. You can right-click a column in the Selections paneand select Edit Column Expression to modify a column expression. The ColumnExpression Editor allows you to include functional and arithmetic expressions in thecolumn expression. The following figure shows the modifications available in the ColumnExpression Editor.
Define an alias
You can specify a column alias to use within the SQL statement of your queries. Whenviewing the SQL, a descriptive alias can help identify where the column is used in yourqueries.
The alias of a column is not displayed on a report run in grid, graph, or grid andgraph view.
Map columns to metadata objects
When a column is added to the Selections pane, the column is mapped as either anattribute or metric, depending on its data type.
Advanced Reporting Guide
© 2017, MicroStrategy Inc. 585
You can modify this default mapping in the Query Builder Editor by browsing tothe Freeform Objects folder and dragging either <Add New Attribute Form> or<Add New Metric> onto the column in the Selections pane.
Query Builder supports history mapping of column expressions to simplify and improvethe process of mapping column expressions to attributes or metrics. When you map acolumn expression to an attribute or metric in a Query Builder report, a connectionbetween the column expression and the attribute or metric is saved. If you build anotherreport with Query Builder and select the same column expression, the column expressionis automatically mapped to the same metadata object you used in your previous QueryBuilder report.
For example, in the MicroStrategy Tutorial you can select the column REGION_ID fromthe LU_REGION table in Query Builder. If you map this column expression in QueryBuilder to the attribute Region, the REGION_ID column expression is automaticallymapped to the attribute Region the next time you use the Query Builder feature andselect the REGION_ID column.
Automatically mapping column expressions to attributes and metrics have the followingbehaviors:
• Each column expression can have multiple history mappings to choose from. Forexample, you can map a fact column TOT_DOLLAR_SALES from the YR_CATEGORY_SLS table to two different metrics, Revenue and Sales. The next timeyou select the TOT_DOLLAR_SALES column, the drop-down list includes the metricsRevenue and Sales to choose from.
• Attributes and metrics can have only one column expression saved as a historymapping. Only the most recent column expression mapped to the attribute or metricis saved and used to automatically map attributes and metrics.
For example, consider the fact column TOT_COST from the DAY_CTR_SLS table.For the first Query Builder report, you map the expression as Sum(DAY_CTR_SLS.TOT_COST) to the metric Cost. The next time you build a report with QueryBuilder, you map the expression Sum(DAY_CTR_SLS.TOT_COST*1.06) to themetric Cost. This updates the Cost history mapping to be associated with the newexpression. The next time you map the expression Sum(DAY_CTR_SLS.TOT_COST), the metric Cost is not automatically mapped. However, if you change theexpression to Sum(DAY_CTR_SLS.TOT_COST*1.06) the metric Cost isautomatically mapped.
• You can choose to map a column to a different metadata object than is chosen by theautomatic mapping.
If you previously defined a ROLAP schema by modeling attributes and metrics for yourproject, columns can be manually mapped to existing project attributes. For example,within the MicroStrategy Tutorial project, the YEAR_ID column from the LU_YEARtable can be mapped to the existing Year attribute. Mapping columns to attributes thatare part of a ROLAP schema allows Query Builder reports to use the followingMicroStrategy features:
• Security filters
• Element list prompts
Advanced Reporting Guide
586 © 2017, MicroStrategy Inc.
• Shortcut-to-a-report qualification. For more information on using a Query Builderreport as a shortcut-to-a-report qualification, see Reporting analysis features, page587.
Columns in your Query Builder reports that are mapped to metrics can be mapped onlyto managed object metrics. Query Builder reports cannot use metrics previously createdwithin your project that are built from an attribute and fact schema. However, managedobject metrics can be mapped to columns in multiple Freeform SQL reports.
If a column is not mapped to an existing attribute or it is mapped to a metric, a managedobject is created with the name you enter into the Object field. Once a managed object iscreated, you can map it to columns in other Query Builder reports by specifying thename of the managed object in the Object field. For example, if there is a managed objectnamed Year, you can map the YEAR_ID column from the LU_YEAR table to this existingobject by typing “Year” into the Object field. A new managed object is created if you donot enter the exact name in the Object field, such as “Years.” For more information onmanaged objects related to Query Builder, seeMap data to non-project objects:Managed objects, page 601.
Define attribute forms
Each column expression which is mapped to an attribute must be mapped to an attributeform. The Form drop-down list includes the following options:
• ID
• DESC
• Any other forms that have been defined for the attribute
Each attribute must have a column mapped to the ID form of the attribute.
You can also type in a new form name to map the column to a new attribute form.
For more information about attribute forms, see the Project Design Guide.
Define the form data type
Attributes and metrics must map a form data type to each column expression. The Typedrop-down list includes the following options:
• Number
• Text
• Datetime
• Date
• Time
• URL
Advanced Reporting Guide
© 2017, MicroStrategy Inc. 587
• HTML Tag
• Picture
• Big Decimal
For more information about attribute form data types, see the Project DesignGuide.
Reporting analysis featuresThis section discusses the following MicroStrategy reporting analysis features as theyrelate to Query Builder reports:
• Filters, page 587
• Prompts, page 590
• Drilling, page 594
• Using Query Builder reports to filter other reports, page 595
Filters
A filter specifies the conditions that data must meet to be included in the report results.For more information on filters, refer to Chapter 3, Advanced Filters: Filtering Data onReports, in this guide.
You cannot use existing filters in a Query Builder report; however, you can filter reportdata by including a qualification that will be used in either the WHERE or HAVING clauseof the SQL statement. The Conditions pane (the middle pane on the right) allows you tocreate qualifications for your queries.
The Conditions pane reflects whether your qualification is used in the WHERE or HAVINGclause of the SQL query.
WHERE clause
Qualifications within the WHERE clause of a SQL statement are evaluated before anyaggregation is performed. For example, if your report includes Year, Category, andRevenue you can include a qualification that restricts your result set to data for the year2006 only. This restriction is performed first, and then Revenue data is aggregated onlyfor the year 2006, instead of aggregating data across all years.
If the qualification does not contain an aggregated column expression, it is included inthe WHERE clause and appears at the top of the Conditions pane.
To create a WHERE clause qualification
This procedure uses the Query Builder Demo report created in the section Access andanalyze multiple data sources with Query Builder, page 573.
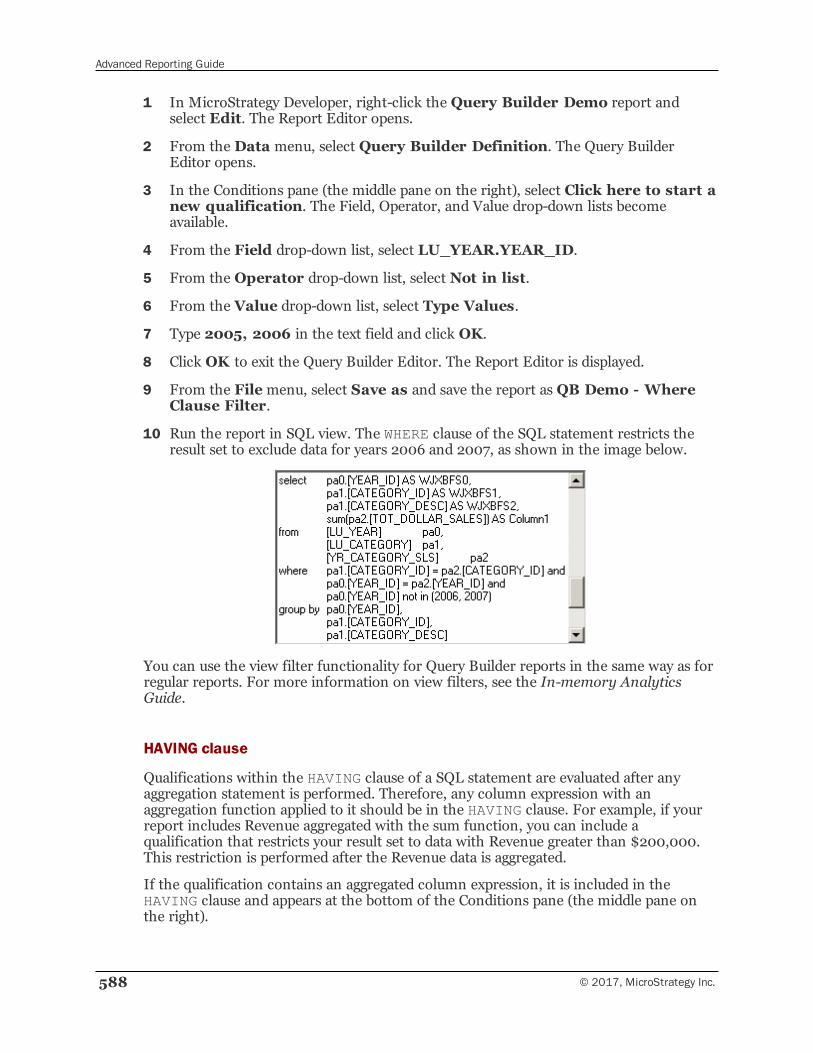
Advanced Reporting Guide
588 © 2017, MicroStrategy Inc.
1 In MicroStrategy Developer, right-click the Query Builder Demo report andselect Edit. The Report Editor opens.
2 From the Data menu, select Query Builder Definition. The Query BuilderEditor opens.
3 In the Conditions pane (the middle pane on the right), select Click here to start anew qualification. The Field, Operator, and Value drop-down lists becomeavailable.
4 From the Field drop-down list, select LU_YEAR.YEAR_ID.
5 From the Operator drop-down list, select Not in list.
6 From the Value drop-down list, select Type Values.
7 Type 2005, 2006 in the text field and click OK.
8 Click OK to exit the Query Builder Editor. The Report Editor is displayed.
9 From the Filemenu, select Save as and save the report as QB Demo - WhereClause Filter.
10 Run the report in SQL view. The WHERE clause of the SQL statement restricts theresult set to exclude data for years 2006 and 2007, as shown in the image below.
You can use the view filter functionality for Query Builder reports in the same way as forregular reports. For more information on view filters, see the In-memory AnalyticsGuide.
HAVING clause
Qualifications within the HAVING clause of a SQL statement are evaluated after anyaggregation statement is performed. Therefore, any column expression with anaggregation function applied to it should be in the HAVING clause. For example, if yourreport includes Revenue aggregated with the sum function, you can include aqualification that restricts your result set to data with Revenue greater than $200,000.This restriction is performed after the Revenue data is aggregated.
If the qualification contains an aggregated column expression, it is included in theHAVING clause and appears at the bottom of the Conditions pane (the middle pane onthe right).
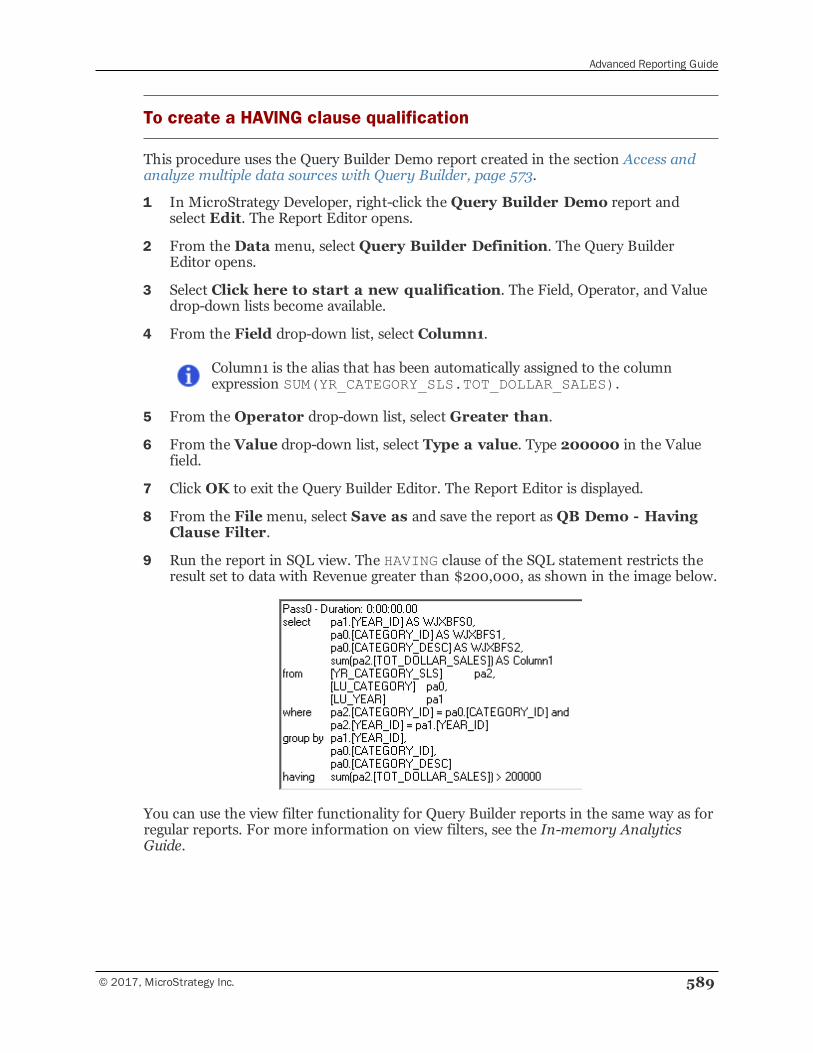
Advanced Reporting Guide
© 2017, MicroStrategy Inc. 589
To create a HAVING clause qualification
This procedure uses the Query Builder Demo report created in the section Access andanalyze multiple data sources with Query Builder, page 573.
1 In MicroStrategy Developer, right-click the Query Builder Demo report andselect Edit. The Report Editor opens.
2 From the Data menu, select Query Builder Definition. The Query BuilderEditor opens.
3 Select Click here to start a new qualification. The Field, Operator, and Valuedrop-down lists become available.
4 From the Field drop-down list, select Column1.
Column1 is the alias that has been automatically assigned to the columnexpression SUM(YR_CATEGORY_SLS.TOT_DOLLAR_SALES).
5 From the Operator drop-down list, select Greater than.
6 From the Value drop-down list, select Type a value. Type 200000 in the Valuefield.
7 Click OK to exit the Query Builder Editor. The Report Editor is displayed.
8 From the Filemenu, select Save as and save the report as QB Demo - HavingClause Filter.
9 Run the report in SQL view. The HAVING clause of the SQL statement restricts theresult set to data with Revenue greater than $200,000, as shown in the image below.
You can use the view filter functionality for Query Builder reports in the same way as forregular reports. For more information on view filters, see the In-memory AnalyticsGuide.
Advanced Reporting Guide
590 © 2017, MicroStrategy Inc.
Prompts
A prompt is a MicroStrategy object that allows user interaction at report run time. Forgeneral information on prompts, refer to Chapter 6, Advanced Prompts: Enabling UserInput, in this guide.
For Query Builder reports, only two types of prompts are supported, which includesvalue prompts and element list prompts. Prompts can be included using differentmethods for the following panes in the Query Builder Editor:
• Conditions pane (the middle pane on the right): You can include element listprompts and value prompts in qualifications for your Query Builder reports. Theseprompts are inserted in the WHERE or HAVING clauses of your SQL query, dependingon the type of qualification they are included in. For more information on creatingqualifications in the Query Builder Editor, see Filters, page 587.
• Selections pane (the bottom pane on the right): Element list prompts and valueprompts can be referenced within a column expression in the Selections pane, andare then used in the SELECT clause of the SQL query.
Include element list prompts in attribute qualifications
Element list prompts must be created before adding it to your Query Builder report. Formore information on creating element list prompts, see Filtering data on attributes,attribute forms, attribute elements, or metrics: Filter definition prompts , page 204.
You can use existing element list prompts to qualify on a column which has been mappedto an attribute in the project. For more information on mapping columns to attributes inthe project, see Access and analyze multiple data sources with Query Builder, page 573.
Only project attributes can be used to create element list prompts in Query Builderreports.
Using an element list prompt in the WHERE clause
This procedure uses the Query Builder Demo report created in the section Access andanalyze multiple data sources with Query Builder, page 573.
1 In MicroStrategy Developer, create an element list prompt that lists all elements ofthe attribute Year without restrictions. Save the prompt as Year Element ListPrompt.
2 Right-click the Query Builder Demo report, and select Edit. The Report Editoropens.
3 From the Data menu, select Query Builder Definition. The Query BuilderEditor opens.
4 Select Click here to start a new qualification. The Field, Operator, and Valuedrop-down lists become available.
5 From the Field drop-down list, select LU_YEAR.YEAR_ID.
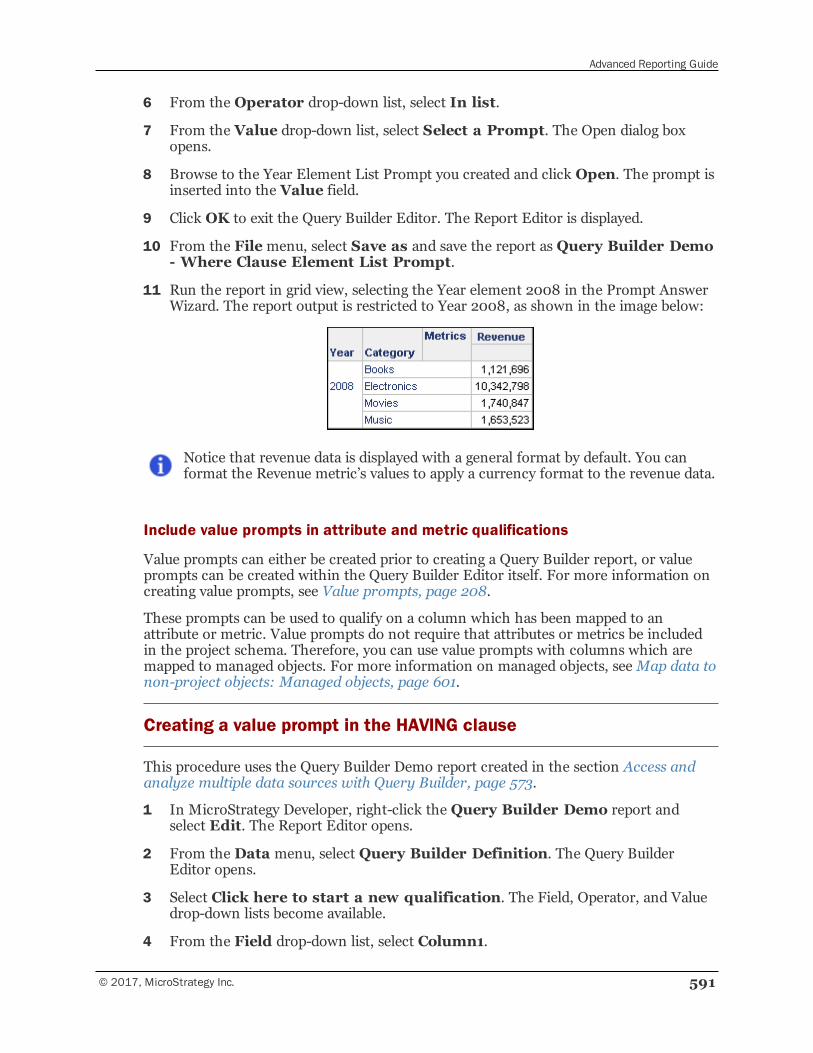
Advanced Reporting Guide
© 2017, MicroStrategy Inc. 591
6 From the Operator drop-down list, select In list.
7 From the Value drop-down list, select Select a Prompt. The Open dialog boxopens.
8 Browse to the Year Element List Prompt you created and click Open. The prompt isinserted into the Value field.
9 Click OK to exit the Query Builder Editor. The Report Editor is displayed.
10 From the Filemenu, select Save as and save the report as Query Builder Demo- Where Clause Element List Prompt.
11 Run the report in grid view, selecting the Year element 2008 in the Prompt AnswerWizard. The report output is restricted to Year 2008, as shown in the image below:
Notice that revenue data is displayed with a general format by default. You canformat the Revenue metric’s values to apply a currency format to the revenue data.
Include value prompts in attribute and metric qualifications
Value prompts can either be created prior to creating a Query Builder report, or valueprompts can be created within the Query Builder Editor itself. For more information oncreating value prompts, see Value prompts, page 208.
These prompts can be used to qualify on a column which has been mapped to anattribute or metric. Value prompts do not require that attributes or metrics be includedin the project schema. Therefore, you can use value prompts with columns which aremapped to managed objects. For more information on managed objects, seeMap data tonon-project objects: Managed objects, page 601.
Creating a value prompt in the HAVING clause
This procedure uses the Query Builder Demo report created in the section Access andanalyze multiple data sources with Query Builder, page 573.
1 In MicroStrategy Developer, right-click the Query Builder Demo report andselect Edit. The Report Editor opens.
2 From the Data menu, select Query Builder Definition. The Query BuilderEditor opens.
3 Select Click here to start a new qualification. The Field, Operator, and Valuedrop-down lists become available.
4 From the Field drop-down list, select Column1.
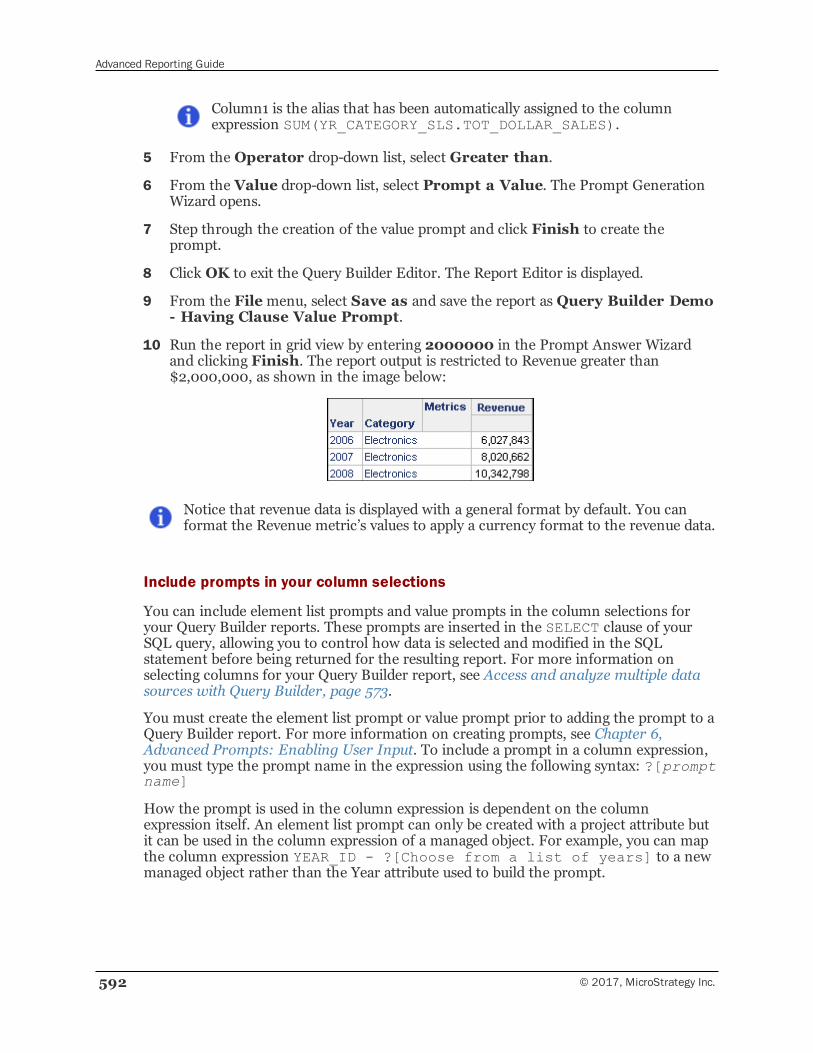
Advanced Reporting Guide
592 © 2017, MicroStrategy Inc.
Column1 is the alias that has been automatically assigned to the columnexpression SUM(YR_CATEGORY_SLS.TOT_DOLLAR_SALES).
5 From the Operator drop-down list, select Greater than.
6 From the Value drop-down list, select Prompt a Value. The Prompt GenerationWizard opens.
7 Step through the creation of the value prompt and click Finish to create theprompt.
8 Click OK to exit the Query Builder Editor. The Report Editor is displayed.
9 From the Filemenu, select Save as and save the report as Query Builder Demo- Having Clause Value Prompt.
10 Run the report in grid view by entering 2000000 in the Prompt Answer Wizardand clicking Finish. The report output is restricted to Revenue greater than$2,000,000, as shown in the image below:
Notice that revenue data is displayed with a general format by default. You canformat the Revenue metric’s values to apply a currency format to the revenue data.
Include prompts in your column selections
You can include element list prompts and value prompts in the column selections foryour Query Builder reports. These prompts are inserted in the SELECT clause of yourSQL query, allowing you to control how data is selected and modified in the SQLstatement before being returned for the resulting report. For more information onselecting columns for your Query Builder report, see Access and analyze multiple datasources with Query Builder, page 573.
You must create the element list prompt or value prompt prior to adding the prompt to aQuery Builder report. For more information on creating prompts, see Chapter 6,Advanced Prompts: Enabling User Input. To include a prompt in a column expression,you must type the prompt name in the expression using the following syntax: ?[promptname]
How the prompt is used in the column expression is dependent on the columnexpression itself. An element list prompt can only be created with a project attribute butit can be used in the column expression of a managed object. For example, you can mapthe column expression YEAR_ID - ?[Choose from a list of years] to a newmanaged object rather than the Year attribute used to build the prompt.
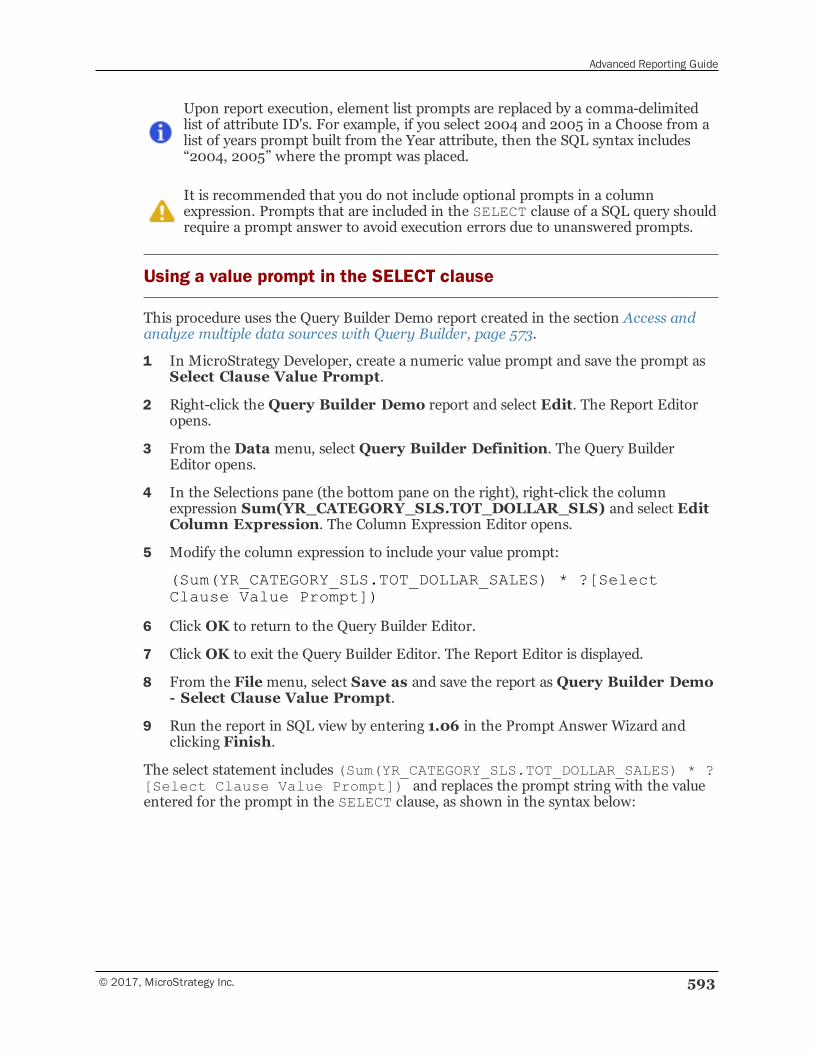
Advanced Reporting Guide
© 2017, MicroStrategy Inc. 593
Upon report execution, element list prompts are replaced by a comma-delimitedlist of attribute ID's. For example, if you select 2004 and 2005 in a Choose from alist of years prompt built from the Year attribute, then the SQL syntax includes“2004, 2005” where the prompt was placed.
It is recommended that you do not include optional prompts in a columnexpression. Prompts that are included in the SELECT clause of a SQL query shouldrequire a prompt answer to avoid execution errors due to unanswered prompts.
Using a value prompt in the SELECT clause
This procedure uses the Query Builder Demo report created in the section Access andanalyze multiple data sources with Query Builder, page 573.
1 In MicroStrategy Developer, create a numeric value prompt and save the prompt asSelect Clause Value Prompt.
2 Right-click the Query Builder Demo report and select Edit. The Report Editoropens.
3 From the Data menu, select Query Builder Definition. The Query BuilderEditor opens.
4 In the Selections pane (the bottom pane on the right), right-click the columnexpression Sum(YR_CATEGORY_SLS.TOT_DOLLAR_SLS) and select EditColumn Expression. The Column Expression Editor opens.
5 Modify the column expression to include your value prompt:
(Sum(YR_CATEGORY_SLS.TOT_DOLLAR_SALES) * ?[SelectClause Value Prompt])
6 Click OK to return to the Query Builder Editor.
7 Click OK to exit the Query Builder Editor. The Report Editor is displayed.
8 From the Filemenu, select Save as and save the report as Query Builder Demo- Select Clause Value Prompt.
9 Run the report in SQL view by entering 1.06 in the Prompt Answer Wizard andclicking Finish.
The select statement includes (Sum(YR_CATEGORY_SLS.TOT_DOLLAR_SALES) * ?[Select Clause Value Prompt]) and replaces the prompt string with the valueentered for the prompt in the SELECT clause, as shown in the syntax below:
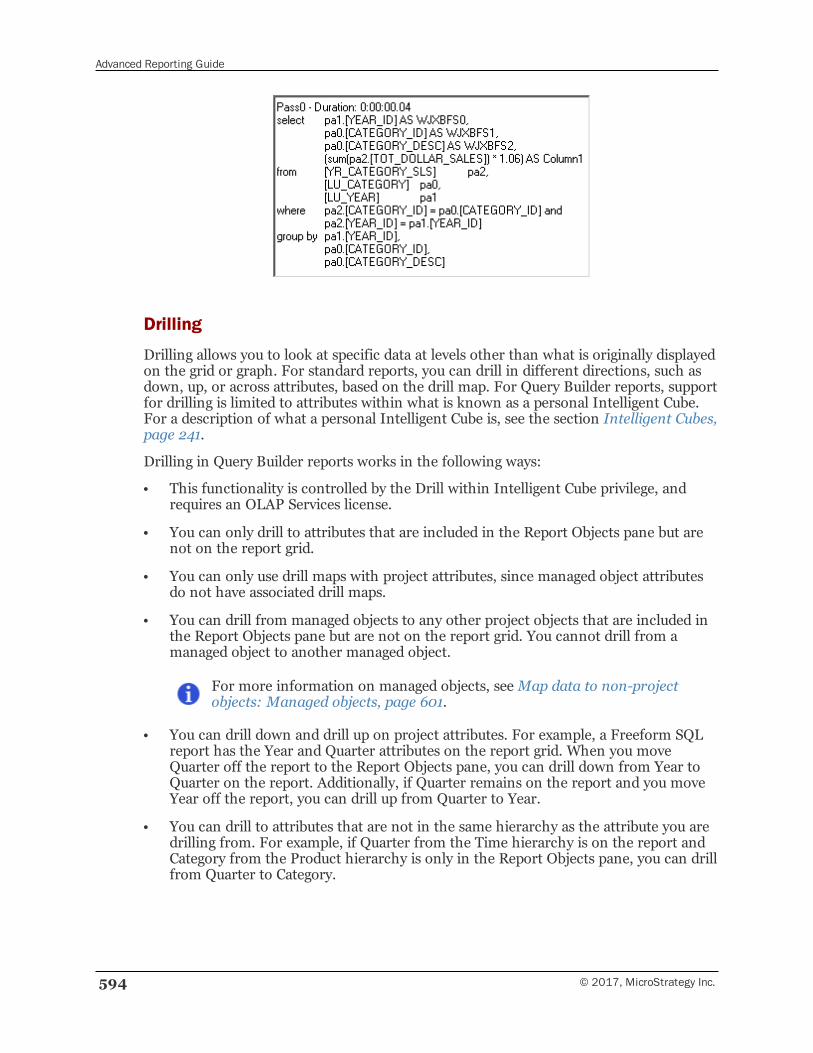
Advanced Reporting Guide
594 © 2017, MicroStrategy Inc.
Drilling
Drilling allows you to look at specific data at levels other than what is originally displayedon the grid or graph. For standard reports, you can drill in different directions, such asdown, up, or across attributes, based on the drill map. For Query Builder reports, supportfor drilling is limited to attributes within what is known as a personal Intelligent Cube.For a description of what a personal Intelligent Cube is, see the section Intelligent Cubes,page 241.
Drilling in Query Builder reports works in the following ways:
• This functionality is controlled by the Drill within Intelligent Cube privilege, andrequires an OLAP Services license.
• You can only drill to attributes that are included in the Report Objects pane but arenot on the report grid.
• You can only use drill maps with project attributes, since managed object attributesdo not have associated drill maps.
• You can drill from managed objects to any other project objects that are included inthe Report Objects pane but are not on the report grid. You cannot drill from amanaged object to another managed object.
For more information on managed objects, seeMap data to non-projectobjects: Managed objects, page 601.
• You can drill down and drill up on project attributes. For example, a Freeform SQLreport has the Year and Quarter attributes on the report grid. When you moveQuarter off the report to the Report Objects pane, you can drill down from Year toQuarter on the report. Additionally, if Quarter remains on the report and you moveYear off the report, you can drill up from Quarter to Year.
• You can drill to attributes that are not in the same hierarchy as the attribute you aredrilling from. For example, if Quarter from the Time hierarchy is on the report andCategory from the Product hierarchy is only in the Report Objects pane, you can drillfrom Quarter to Category.
Advanced Reporting Guide
© 2017, MicroStrategy Inc. 595
Managed objects do not have an associated hierarchy, so they are able to drillto any other project attribute that resides in the Report Objects pane but is noton the report grid.
Using Query Builder reports to filter other reports
Query Builder reports can be used to filter other standard reports in MicroStrategy. Thiscan be supported by using a Query Builder report as a shortcut-to-a-report qualificationon a standard report. For information on shortcut-to-a-report qualifications, see Aboutthe report-as-filter, page 237.
However, there are additional configurations and requirements to allow Query Builderreports to be used as a shortcut-to-a-report qualification, as described below:
• The Query Builder report must map data to project attributes rather managed objectattributes. This is required in order for the standard report to recognize the data thatis available on the Query Builder report. For information on mapping data in QueryBuilder reports to project attributes, see Access and analyze multiple data sourceswith Query Builder, page 573.
• If the Query Builder report returns data from a data source that is not the primarydata warehouse, you must have the Execute Multiple Source Report privilege. Thisprivilege is available as part of MicroStrategy MultiSource. For information onMultiSource, see the Project Design Guide.
To add a Query Builder report as a shortcut-to-a-report qualification in a standard report,open the standard report in MicroStrategy Developer. In the Report Filter area,double-click the arrow to add a new qualification. In the Filtering Options, select Adda Shortcut to a Report. Click OK. Click the ... (browse button) to select a QueryBuilder report, and click OK. Click OK again to create the filter qualification.
Security for data accessMicroStrategy has a robust security model that enables you to create users and groups,determine how they are authenticated, control what data they can see, and whatfunctional privileges they can have. For detailed information on these features,see theSystem Administration Guide. This section discusses the access control list (ACL) andsecurity filters that relate to Query Builder reports only.
Access control list
An access control list (ACL) is a list of users and groups and the access permission thateach one has to objects in a MicroStrategy project. Different users may have differentpermissions on the same object.
When you use existing objects (including project objects) in Query Builder columnmapping, the ACLs of these objects are used. However, new attributes and metricscreated in Query Builder reports inherit the default ACL defined in the ProjectConfiguration Editor. You can modify the default ACL in MicroStrategy Developer byright-clicking a project and selecting Project Configuration. In the Project Configurationwindow point to Project definition, then Security, and then for Set Freeform SQL and
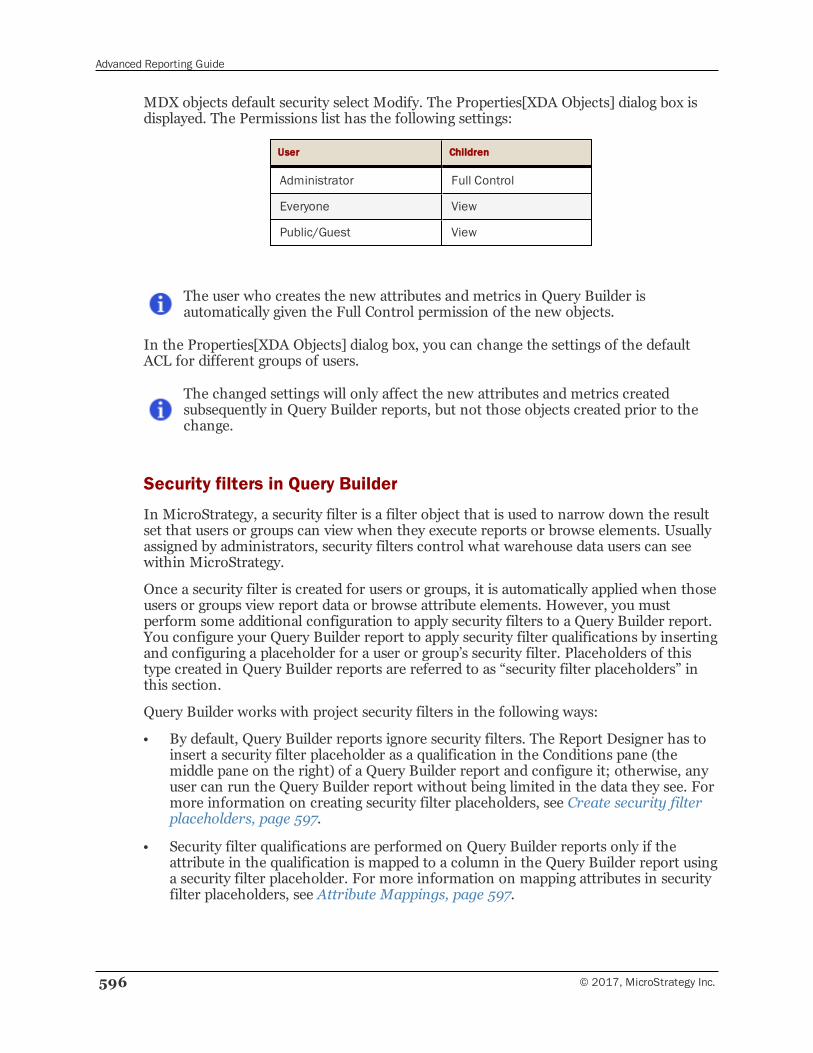
Advanced Reporting Guide
596 © 2017, MicroStrategy Inc.
MDX objects default security select Modify. The Properties[XDA Objects] dialog box isdisplayed. The Permissions list has the following settings:
User Children
Administrator Full Control
Everyone View
Public/Guest View
The user who creates the new attributes and metrics in Query Builder isautomatically given the Full Control permission of the new objects.
In the Properties[XDA Objects] dialog box, you can change the settings of the defaultACL for different groups of users.
The changed settings will only affect the new attributes and metrics createdsubsequently in Query Builder reports, but not those objects created prior to thechange.
Security filters in Query Builder
In MicroStrategy, a security filter is a filter object that is used to narrow down the resultset that users or groups can view when they execute reports or browse elements. Usuallyassigned by administrators, security filters control what warehouse data users can seewithin MicroStrategy.
Once a security filter is created for users or groups, it is automatically applied when thoseusers or groups view report data or browse attribute elements. However, you mustperform some additional configuration to apply security filters to a Query Builder report.You configure your Query Builder report to apply security filter qualifications by insertingand configuring a placeholder for a user or group’s security filter. Placeholders of thistype created in Query Builder reports are referred to as “security filter placeholders” inthis section.
Query Builder works with project security filters in the following ways:
• By default, Query Builder reports ignore security filters. The Report Designer has toinsert a security filter placeholder as a qualification in the Conditions pane (themiddle pane on the right) of a Query Builder report and configure it; otherwise, anyuser can run the Query Builder report without being limited in the data they see. Formore information on creating security filter placeholders, see Create security filterplaceholders, page 597.
• Security filter qualifications are performed on Query Builder reports only if theattribute in the qualification is mapped to a column in the Query Builder report usinga security filter placeholder. For more information on mapping attributes in securityfilter placeholders, see Attribute Mappings, page 597.
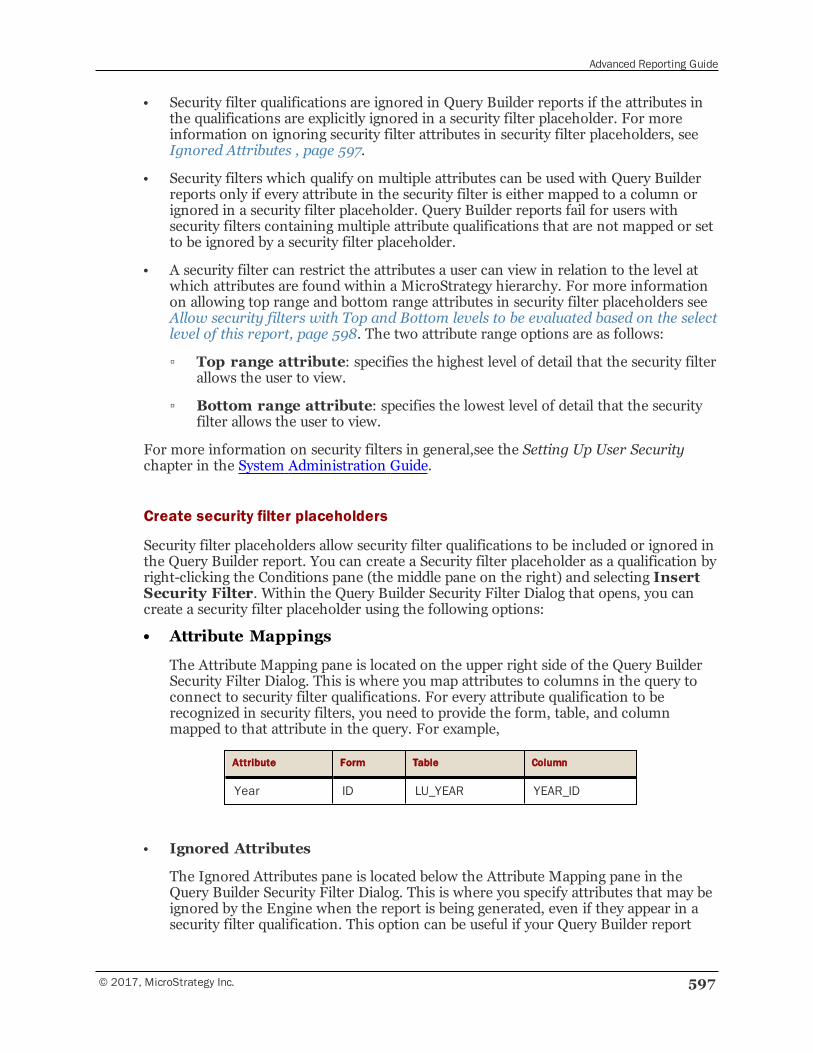
Advanced Reporting Guide
© 2017, MicroStrategy Inc. 597
• Security filter qualifications are ignored in Query Builder reports if the attributes inthe qualifications are explicitly ignored in a security filter placeholder. For moreinformation on ignoring security filter attributes in security filter placeholders, seeIgnored Attributes , page 597.
• Security filters which qualify on multiple attributes can be used with Query Builderreports only if every attribute in the security filter is either mapped to a column orignored in a security filter placeholder. Query Builder reports fail for users withsecurity filters containing multiple attribute qualifications that are not mapped or setto be ignored by a security filter placeholder.
• A security filter can restrict the attributes a user can view in relation to the level atwhich attributes are found within a MicroStrategy hierarchy. For more informationon allowing top range and bottom range attributes in security filter placeholders seeAllow security filters with Top and Bottom levels to be evaluated based on the selectlevel of this report, page 598. The two attribute range options are as follows:
▫ Top range attribute: specifies the highest level of detail that the security filterallows the user to view.
▫ Bottom range attribute: specifies the lowest level of detail that the securityfilter allows the user to view.
For more information on security filters in general,see the Setting Up User Securitychapter in the System Administration Guide.
Create security filter placeholders
Security filter placeholders allow security filter qualifications to be included or ignored inthe Query Builder report. You can create a Security filter placeholder as a qualification byright-clicking the Conditions pane (the middle pane on the right) and selecting InsertSecurity Filter. Within the Query Builder Security Filter Dialog that opens, you cancreate a security filter placeholder using the following options:
• Attribute Mappings
The Attribute Mapping pane is located on the upper right side of the Query BuilderSecurity Filter Dialog. This is where you map attributes to columns in the query toconnect to security filter qualifications. For every attribute qualification to berecognized in security filters, you need to provide the form, table, and columnmapped to that attribute in the query. For example,
Attribute Form Table Column
Year ID LU_YEAR YEAR_ID
• Ignored Attributes
The Ignored Attributes pane is located below the Attribute Mapping pane in theQuery Builder Security Filter Dialog. This is where you specify attributes that may beignored by the Engine when the report is being generated, even if they appear in asecurity filter qualification. This option can be useful if your Query Builder report
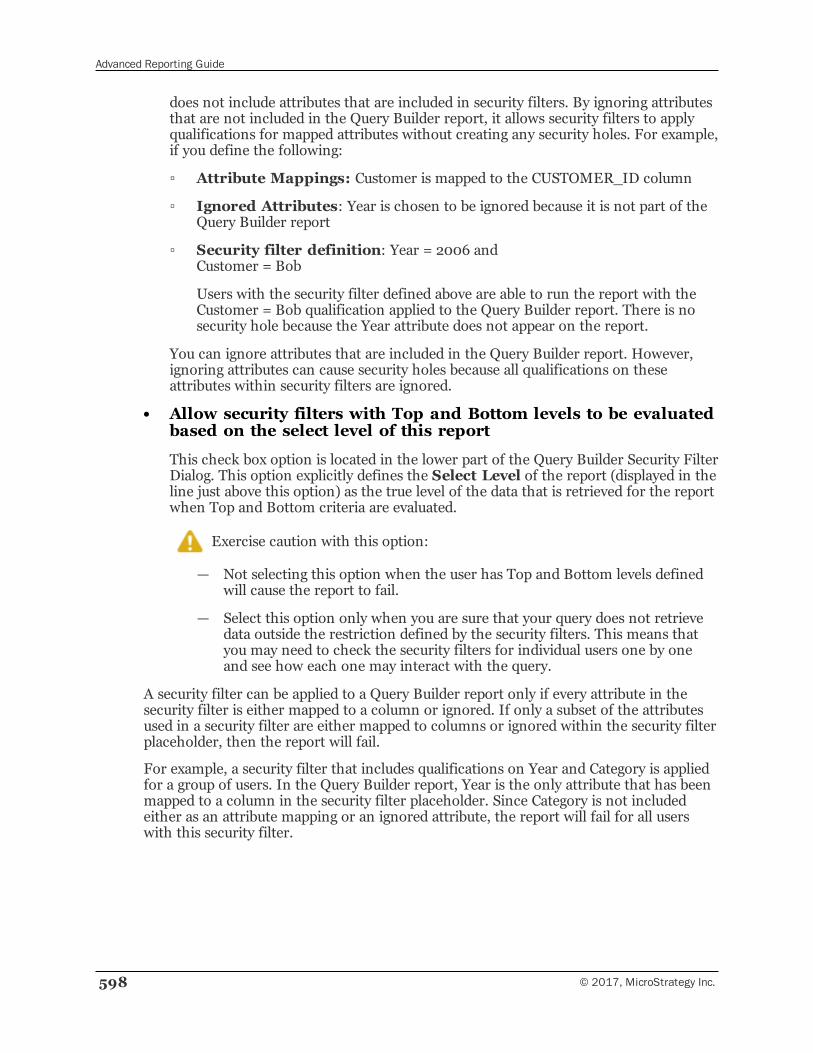
Advanced Reporting Guide
598 © 2017, MicroStrategy Inc.
does not include attributes that are included in security filters. By ignoring attributesthat are not included in the Query Builder report, it allows security filters to applyqualifications for mapped attributes without creating any security holes. For example,if you define the following:
▫ Attribute Mappings: Customer is mapped to the CUSTOMER_ID column
▫ Ignored Attributes: Year is chosen to be ignored because it is not part of theQuery Builder report
▫ Security filter definition: Year = 2006 andCustomer = Bob
Users with the security filter defined above are able to run the report with theCustomer = Bob qualification applied to the Query Builder report. There is nosecurity hole because the Year attribute does not appear on the report.
You can ignore attributes that are included in the Query Builder report. However,ignoring attributes can cause security holes because all qualifications on theseattributes within security filters are ignored.
• Allow security filters with Top and Bottom levels to be evaluatedbased on the select level of this report
This check box option is located in the lower part of the Query Builder Security FilterDialog. This option explicitly defines the Select Level of the report (displayed in theline just above this option) as the true level of the data that is retrieved for the reportwhen Top and Bottom criteria are evaluated.
Exercise caution with this option:
— Not selecting this option when the user has Top and Bottom levels definedwill cause the report to fail.
— Select this option only when you are sure that your query does not retrievedata outside the restriction defined by the security filters. This means thatyou may need to check the security filters for individual users one by oneand see how each one may interact with the query.
A security filter can be applied to a Query Builder report only if every attribute in thesecurity filter is either mapped to a column or ignored. If only a subset of the attributesused in a security filter are either mapped to columns or ignored within the security filterplaceholder, then the report will fail.
For example, a security filter that includes qualifications on Year and Category is appliedfor a group of users. In the Query Builder report, Year is the only attribute that has beenmapped to a column in the security filter placeholder. Since Category is not includedeither as an attribute mapping or an ignored attribute, the report will fail for all userswith this security filter.
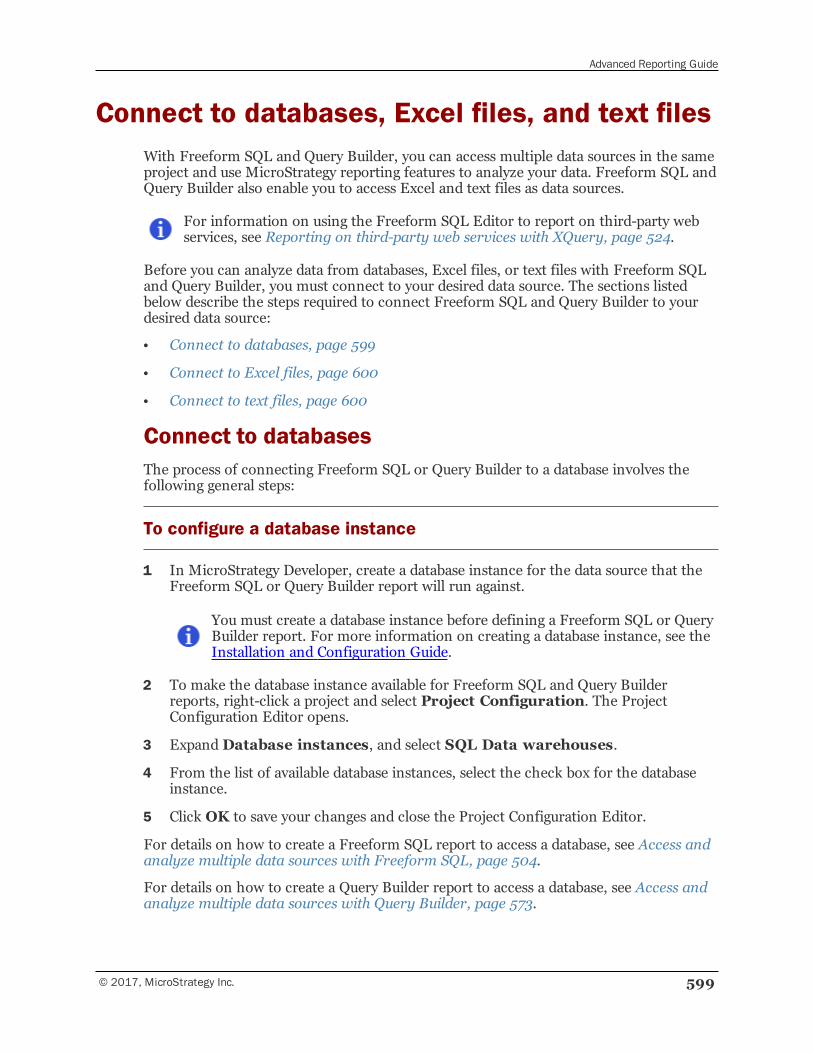
Advanced Reporting Guide
© 2017, MicroStrategy Inc. 599
Connect to databases, Excel files, and text filesWith Freeform SQL and Query Builder, you can access multiple data sources in the sameproject and use MicroStrategy reporting features to analyze your data. Freeform SQL andQuery Builder also enable you to access Excel and text files as data sources.
For information on using the Freeform SQL Editor to report on third-party webservices, see Reporting on third-party web services with XQuery, page 524.
Before you can analyze data from databases, Excel files, or text files with Freeform SQLand Query Builder, you must connect to your desired data source. The sections listedbelow describe the steps required to connect Freeform SQL and Query Builder to yourdesired data source:
• Connect to databases, page 599
• Connect to Excel files, page 600
• Connect to text files, page 600
Connect to databasesThe process of connecting Freeform SQL or Query Builder to a database involves thefollowing general steps:
To configure a database instance
1 In MicroStrategy Developer, create a database instance for the data source that theFreeform SQL or Query Builder report will run against.
You must create a database instance before defining a Freeform SQL or QueryBuilder report. For more information on creating a database instance, see theInstallation and Configuration Guide.
2 To make the database instance available for Freeform SQL and Query Builderreports, right-click a project and select Project Configuration. The ProjectConfiguration Editor opens.
3 ExpandDatabase instances, and select SQL Data warehouses.
4 From the list of available database instances, select the check box for the databaseinstance.
5 Click OK to save your changes and close the Project Configuration Editor.
For details on how to create a Freeform SQL report to access a database, see Access andanalyze multiple data sources with Freeform SQL, page 504.
For details on how to create a Query Builder report to access a database, see Access andanalyze multiple data sources with Query Builder, page 573.
Advanced Reporting Guide
600 © 2017, MicroStrategy Inc.
Connect to Excel filesThe Freeform SQL and Query Builder reporting features enable you to create reportsusing data from Excel files. The connection process to Excel files involves the followingsteps:
• To connect to Excel file data, you must first prepare the Excel file as a valid datasource and create a data source name for the Excel file. The steps to perform theseconfigurations are included in Appendix A: Connecting to Databases of theInstallation and Configuration Guide.
• Create a database instance for an Excel file, page 600
Create a database instance for an Excel file
To use an Excel file as a data source, you must create a database instance inMicroStrategy. This database instance is used to connect to the Excel file. Follow thesteps below to create a database instance for an Excel file.
To create a database instance for the Excel file
1 In MicroStrategy Developer, create a new database instance that points to the DSNfor the Excel file.
It is recommended that you use Microsoft Excel 2000/2003 as the DataConnection Type for the database instance. For more information on settingup a database instance, see the Installation and Configuration Guide.
2 To make the database instance available for Freeform SQL reports, right-click aproject and select Project Configuration. The Project Configuration Editor opens.
3 ExpandDatabase instances, and select SQL Data warehouses.
4 From the list of available database instances, select the check box for the Excel filedatabase instance.
5 Click OK to save your changes and close the Project Configuration Editor.
For details on how to create a Freeform SQL report to access your Excel file, see Accessand analyze multiple data sources with Freeform SQL, page 504.
For details on how to create a Query Builder report to access your Excel file, see Accessand analyze multiple data sources with Query Builder, page 573.
Connect to text filesThe Freeform SQL and Query Builder reporting features enable you to create reportsusing data from text files. The creation process involves the following steps:
• To connect to text file data, you must first prepare the text file as a valid data sourceand create a data source name for the text file. The steps to perform these
Advanced Reporting Guide
© 2017, MicroStrategy Inc. 601
configurations are included in Appendix A: Connecting to Databases of theInstallation and Configuration Guide.
• Create a database instance for a text file, page 601
Create a database instance for a text file
To use a text file as a data source, you must create a database instance in MicroStrategy.This database instance is used to connect to the text file. Follow the steps below to createa database instance for a text file.
To create a database instance for the text file
1 In MicroStrategy Developer, create a new database instance that points to the DSNfor the text file.
It is recommended that you use Generic DBMS for the Data Connection Type.For more information on setting up a database instance, see the Installationand Configuration Guide.
2 To make the new database instance available for your Freeform SQL report, right-click a project and select Project Configuration, the Project Configuration Editoropens.
3 ExpandDatabase instances, and select SQL Data warehouses.
4 From the list of available database instances, select the check box for the text filedatabase instance.
5 Click OK to save your changes and close the Project Configuration Editor.
For details on how to create a Freeform SQL report to access a text file, see Access andanalyze multiple data sources with Freeform SQL, page 504.
For details on how to create a Query Builder report to access a text file, see Access andanalyze multiple data sources with Query Builder, page 573.
Map data to non-project objects: Managedobjects
A managed object is just like a normal object in MicroStrategy except that it is created bythe system and is stored in a special system folder. When you create a Freeform SQL orQuery Builder report, you can use existing attributes, including project attributes, to mapto the column selections in the SQL query in the Freeform SQL Editor or Query BuilderEditor. Alternatively, you can create new attributes, attribute forms, and metrics on thefly in Freeform SQL or Query Builder to which to map the columns in the SQL query;these new objects are managed objects.
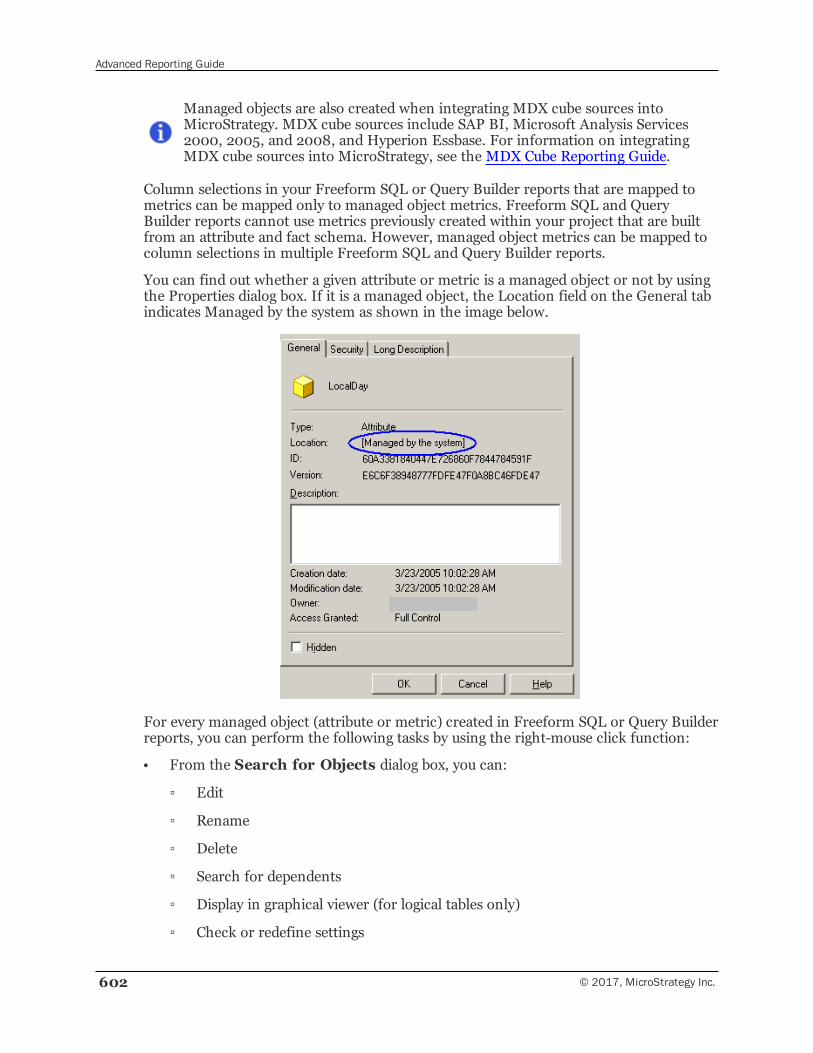
Advanced Reporting Guide
602 © 2017, MicroStrategy Inc.
Managed objects are also created when integrating MDX cube sources intoMicroStrategy. MDX cube sources include SAP BI, Microsoft Analysis Services2000, 2005, and 2008, and Hyperion Essbase. For information on integratingMDX cube sources into MicroStrategy, see the MDX Cube Reporting Guide.
Column selections in your Freeform SQL or Query Builder reports that are mapped tometrics can be mapped only to managed object metrics. Freeform SQL and QueryBuilder reports cannot use metrics previously created within your project that are builtfrom an attribute and fact schema. However, managed object metrics can be mapped tocolumn selections in multiple Freeform SQL and Query Builder reports.
You can find out whether a given attribute or metric is a managed object or not by usingthe Properties dialog box. If it is a managed object, the Location field on the General tabindicates Managed by the system as shown in the image below.
For every managed object (attribute or metric) created in Freeform SQL or Query Builderreports, you can perform the following tasks by using the right-mouse click function:
• From the Search for Objects dialog box, you can:
▫ Edit
▫ Rename
▫ Delete
▫ Search for dependents
▫ Display in graphical viewer (for logical tables only)
▫ Check or redefine settings
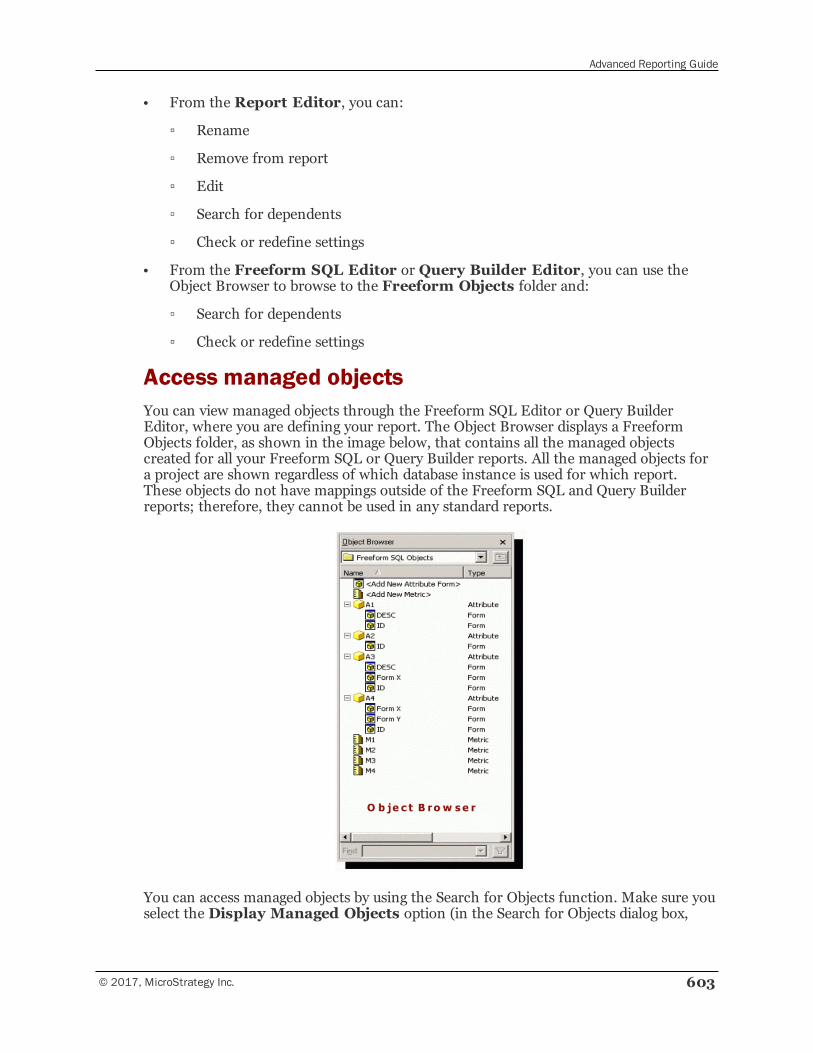
Advanced Reporting Guide
© 2017, MicroStrategy Inc. 603
• From the Report Editor, you can:
▫ Rename
▫ Remove from report
▫ Edit
▫ Search for dependents
▫ Check or redefine settings
• From the Freeform SQL Editor or Query Builder Editor, you can use theObject Browser to browse to the Freeform Objects folder and:
▫ Search for dependents
▫ Check or redefine settings
Access managed objectsYou can view managed objects through the Freeform SQL Editor or Query BuilderEditor, where you are defining your report. The Object Browser displays a FreeformObjects folder, as shown in the image below, that contains all the managed objectscreated for all your Freeform SQL or Query Builder reports. All the managed objects fora project are shown regardless of which database instance is used for which report.These objects do not have mappings outside of the Freeform SQL and Query Builderreports; therefore, they cannot be used in any standard reports.
You can access managed objects by using the Search for Objects function. Make sure youselect the Display Managed Objects option (in the Search for Objects dialog box,
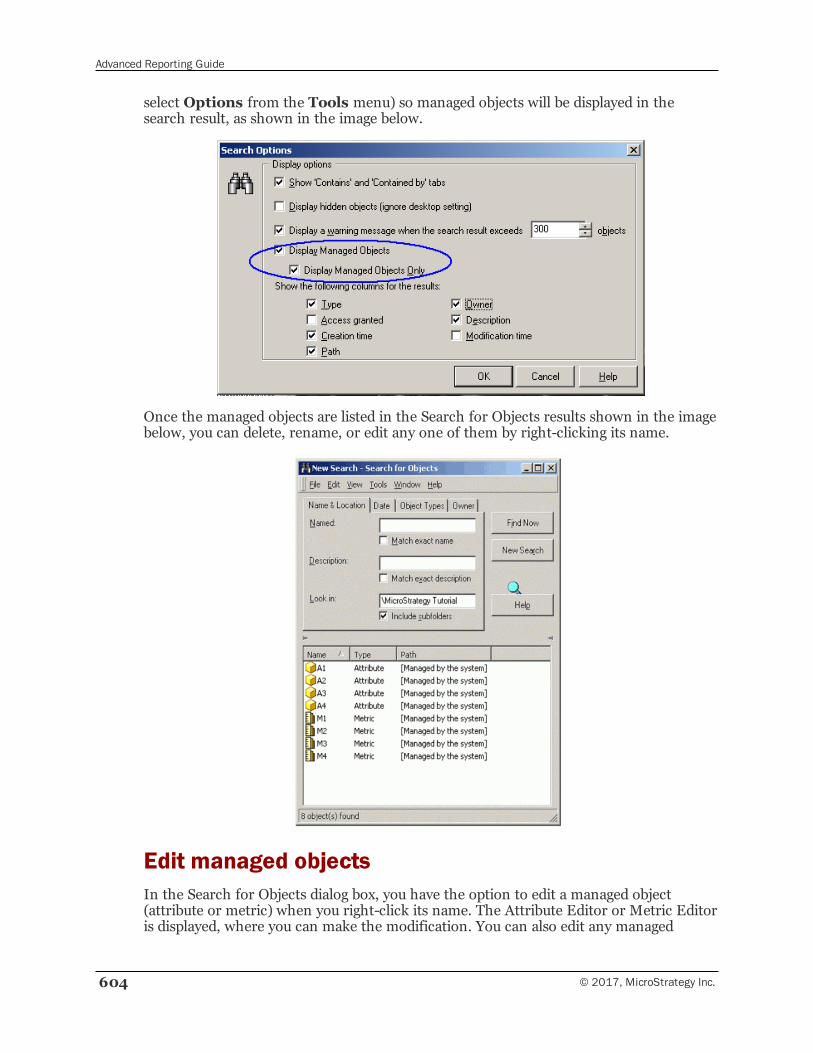
Advanced Reporting Guide
604 © 2017, MicroStrategy Inc.
select Options from the Tools menu) so managed objects will be displayed in thesearch result, as shown in the image below.
Once the managed objects are listed in the Search for Objects results shown in the imagebelow, you can delete, rename, or edit any one of them by right-clicking its name.
Edit managed objectsIn the Search for Objects dialog box, you have the option to edit a managed object(attribute or metric) when you right-click its name. The Attribute Editor or Metric Editoris displayed, where you can make the modification. You can also edit any managed
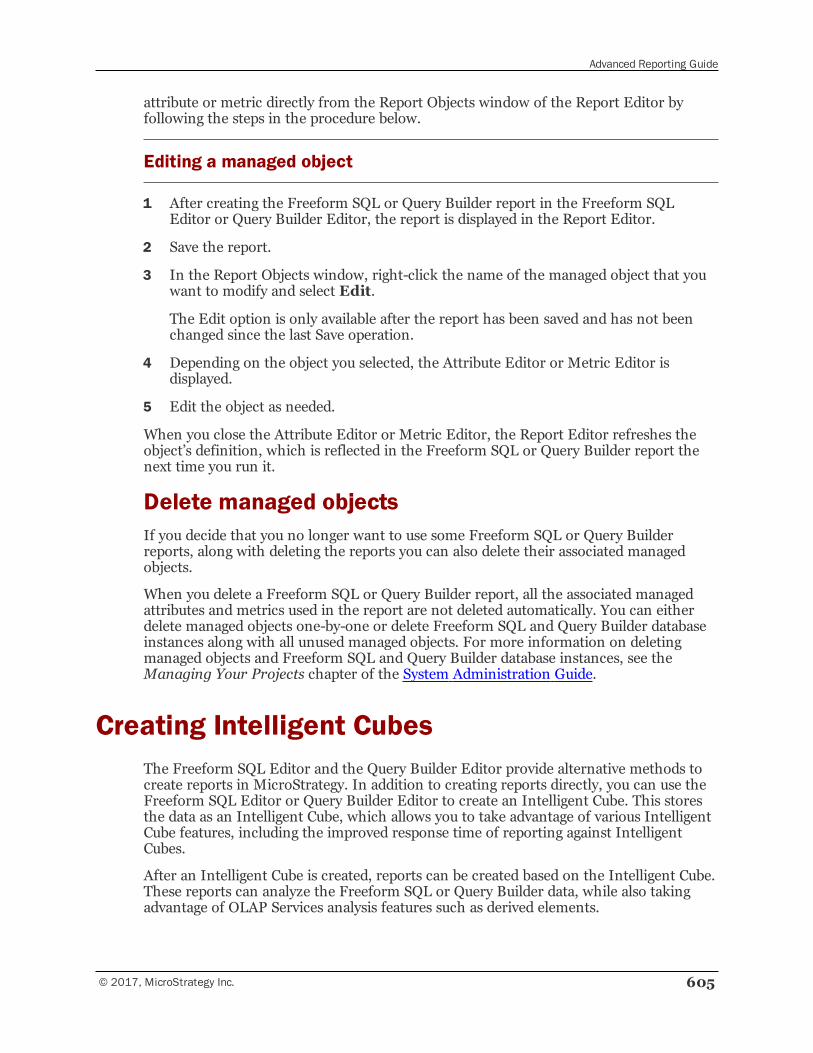
Advanced Reporting Guide
© 2017, MicroStrategy Inc. 605
attribute or metric directly from the Report Objects window of the Report Editor byfollowing the steps in the procedure below.
Editing a managed object
1 After creating the Freeform SQL or Query Builder report in the Freeform SQLEditor or Query Builder Editor, the report is displayed in the Report Editor.
2 Save the report.
3 In the Report Objects window, right-click the name of the managed object that youwant to modify and select Edit.
The Edit option is only available after the report has been saved and has not beenchanged since the last Save operation.
4 Depending on the object you selected, the Attribute Editor or Metric Editor isdisplayed.
5 Edit the object as needed.
When you close the Attribute Editor or Metric Editor, the Report Editor refreshes theobject’s definition, which is reflected in the Freeform SQL or Query Builder report thenext time you run it.
Delete managed objectsIf you decide that you no longer want to use some Freeform SQL or Query Builderreports, along with deleting the reports you can also delete their associated managedobjects.
When you delete a Freeform SQL or Query Builder report, all the associated managedattributes and metrics used in the report are not deleted automatically. You can eitherdelete managed objects one-by-one or delete Freeform SQL and Query Builder databaseinstances along with all unused managed objects. For more information on deletingmanaged objects and Freeform SQL and Query Builder database instances, see theManaging Your Projects chapter of the System Administration Guide.
Creating Intelligent CubesThe Freeform SQL Editor and the Query Builder Editor provide alternative methods tocreate reports in MicroStrategy. In addition to creating reports directly, you can use theFreeform SQL Editor or Query Builder Editor to create an Intelligent Cube. This storesthe data as an Intelligent Cube, which allows you to take advantage of various IntelligentCube features, including the improved response time of reporting against IntelligentCubes.
After an Intelligent Cube is created, reports can be created based on the Intelligent Cube.These reports can analyze the Freeform SQL or Query Builder data, while also takingadvantage of OLAP Services analysis features such as derived elements.
Advanced Reporting Guide
606 © 2017, MicroStrategy Inc.
The steps below show you how to create an Intelligent Cube using Freeform SQL orQuery Builder.
Prerequisites
• You must make the data sources to report on available for use with Freeform SQLand Query Builder. You can make data sources available for the following tasks:
▫ To access data sources such as databases, Microsoft Excel files, and text filesusing the Freeform SQL Editor, see Access and analyze multiple data sourceswith Freeform SQL, page 504.
▫ To access web services using the Freeform SQL Editor, see Allowingconnections to web services in a project, page 526.
▫ To access data sources such as databases, Microsoft Excel files, and text filesusing the Query Builder Editor, see Access and analyze multiple data sourceswith Query Builder, page 573.
• You need the Use Intelligent Cube Editor privilege to create Intelligent Cubes. Thisprivilege is part of OLAP Services.
To create an Intelligent Cube using Freeform SQL or Query Builder
1 Using MicroStrategy Developer, log in to a project connected to an MDX cubesource.
2 From the Filemenu, select New, and then select Intelligent Cube. The NewIntelligent Cube dialog box opens.
3 On the Freeform Sources tab, select one of the following options:
• To create an Intelligent Cube by creating SQL statements using the FreeformSQL Editor, select Create Freeform SQL report.
• To create an Intelligent Cube by creating XQuery statements using the FreeformSQL Editor, select Create Freeform XQuery report.
• To create an Intelligent Cube using the Query Builder Editor, select CreateQuery Builder report.
4 In the Source area, select the database instance that connects to the data source toreport on using Freeform SQL or Query Builder, and then click OK. The FreeformSQL Editor or Query Builder Editor opens.
5 You can now begin to create the Intelligent Cube using the standard techniques tocreate a Freeform SQL report or Query Builder report, which include:
• Access and analyze multiple data sources with Freeform SQL, page 504
• Access and analyze multiple data sources with Freeform SQL, page 504
• Creating a report to analyze web service data, page 542
• Access and analyze multiple data sources with Query Builder, page 573
• Access and analyze multiple data sources with Query Builder, page 573
Advanced Reporting Guide
© 2017, MicroStrategy Inc. 607
• Access and analyze multiple data sources with Query Builder, page 573
6 After you have finished developing the Intelligent Cube, in the Report Editor, fromthe Filemenu, select Save. The Save Intelligent Cube As dialog box opens.
7 In the Object name field, type a descriptive name for the Intelligent Cube.
8 Click OK to save the Intelligent Cube and return to the Report Editor.
9 To make the Intelligent Cube available to be reported on, you must publish theIntelligent Cube. This can be done by selecting Run Report in the toolbar. Forimportant details on publishing Intelligent Cubes, including prerequisites to considerbefore publishing an Intelligent Cube, see the In-memory Analytics Guide.
10 After the Intelligent Cube is published, reports can be created on the IntelligentCube. For steps on how to report on Intelligent Cubes, see the In-memory AnalyticsGuide.
12ACCESSING SUBSETS OFDATA: DATA MARTS
A data mart is a data repository where you store the results of a report as a relationaltable in a data warehouse. After creating a data mart, you can use it as a source table inyour projects, and execute reports against it.
The primary objective of building a data mart is to provide an alternative location forstoring frequently-used data that pertains to a particular business process or unit. Thisenables reports to pull data more effectively and efficiently for analysis and decisionmaking. You can use data marts to achieve many business needs, including the following:
• Create aggregate fact tables. Aggregate fact tables improve the response time forreports that request summarized data from the warehouse.
• Create tables for very large results sets and then use other applications such asMicrosoft Excel or Microsoft Access to access the data. This allows you to create asingle table to feed a mass-mailing software tool or a similar closed-loop application.
• Create tables for offline analysis using direct SQL queries.
• If you have data in an MDX source, such as an SAP BW cube, you can transfer thatdata to a data mart and use features that cannot be used directly on MDX reports.These features include, but are not limited to custom groups, consolidations, andmetrics with complex definitions.
For information on using MDX data sources, see the MDX Cube Reporting Guide.
This section contains information on how to create a data mart in MicroStrategyDeveloper, by creating and executing a data mart report which then creates a data marttable. It also shows you how to run standard MicroStrategy reports against your new datamart table, using the data mart table as a source table in the project in which the datamart was created. Topics include:
• Getting started with data marts
• Creating data marts
• Using a data mart table as a source table
• Specifying governors, table creation options, and custom SQL statements
© 2017, MicroStrategy Inc. 608
Advanced Reporting Guide
609 © 2017, MicroStrategy Inc.
Getting started with data martsCreating data marts involves creating two components:
• Data mart report: A metadata object that you create using the Report Editor. Whenthis object is executed, it creates the data mart table in the warehouse of your choice.The data mart report contains attributes, metrics, and other application objects thattranslate into columns in the data mart table.
• Data mart table: A relational table that is created in the data warehouse when a datamart report is executed. You can use multiple data mart reports to modify a data marttable.
Creating data martsTo create a data mart table, you first create a data mart report that defines the columnsof the data mart table. You then create the data mart table and populate it with data.
The steps below walk you through the process of creating a data mart report and thenexecuting the report to create a data mart table. The steps also include an example formost steps, based on Tutorial sample data in the MicroStrategy Tutorial project.
Prerequisites
• You must specify a data warehouse in which to create the data mart table, using adatabase instance. The database instance specifies warehouse connectioninformation, such as the DSN, user name, password, and other warehouse-specificinformation. You can use the following database instances as the data mart’sdatabase instance:
▫ Your project’s primary database instance
To identify the project’s primary database instance, in the Folder List, right-clickthe project's name, and select Project Configuration. Expand the Databaseinstances category, and choose SQL Data Warehouses. Under the Selectthe Primary Database Instance for the Project drop-down, note whichdatabase instance is selected.
▫ A database instance other than your project’s primary database instance, whichpoints to the same warehouse as the primary database instance. You must ensurethat the database instance has been created, and is available to the project, asdescribed below.
You can also enable data mart optimization for this database instance, which canimprove the performance of reports that use the data mart. For information onenabling data mart optimization, see Enabling data mart optimization, page618.
▫ A database instance other than your project’s primary database instance, whichpoints to a different data warehouse than the primary database instance. You
Advanced Reporting Guide
© 2017, MicroStrategy Inc. 610
must ensure that the database instance has been created, and is available to theproject.
You must have the MicroStrategy MultiSource Option installed to use datamarts that you save to a different database instance than your project’sprimary database instance.
• Ensure that any metric column aliases follow the naming conventions for yourdatabase, as they are used as column names in the data mart table. To change themetric column alias, open a metric in the Metric Editor. Under Tools, selectAdvanced Settings and selectMetric Column Options. For information oncolumn aliases, seeMetric column aliases: SQL identifiers and data types, page 106.
• If you need to run SQL statements before or after the data mart is executed, youmust have the Use SQL Statements tab in Datamart/Bulk Export editors privilege inthe Developer privileges.
To create a data mart
1 In MicroStrategy Developer, create a new report or select an existing report to use asthe data mart table. The report should contain the attributes, metrics, and otherobjects that you want to use as columns in the data mart table and which willpopulate the data mart table when the data mart report is executed.
Your report cannot be used as a data mart if it contains any of the following:
— View filters
— Report Objects that are not included in the template
— Derived metrics
• For this example, use the sample Tutorial project to create a new report withCustomer Region as the attribute and Revenue as the metric.
2 From the Filemenu, select Save, and select an appropriate folder in which to savethe report.
• For this example, save the report with the name My_Report, in a folder of yourchoice.
3 To use the report as a data mart report, from the Data menu, select ConfigureData Mart. The Report Data Mart Setup dialog box opens, as shown below:
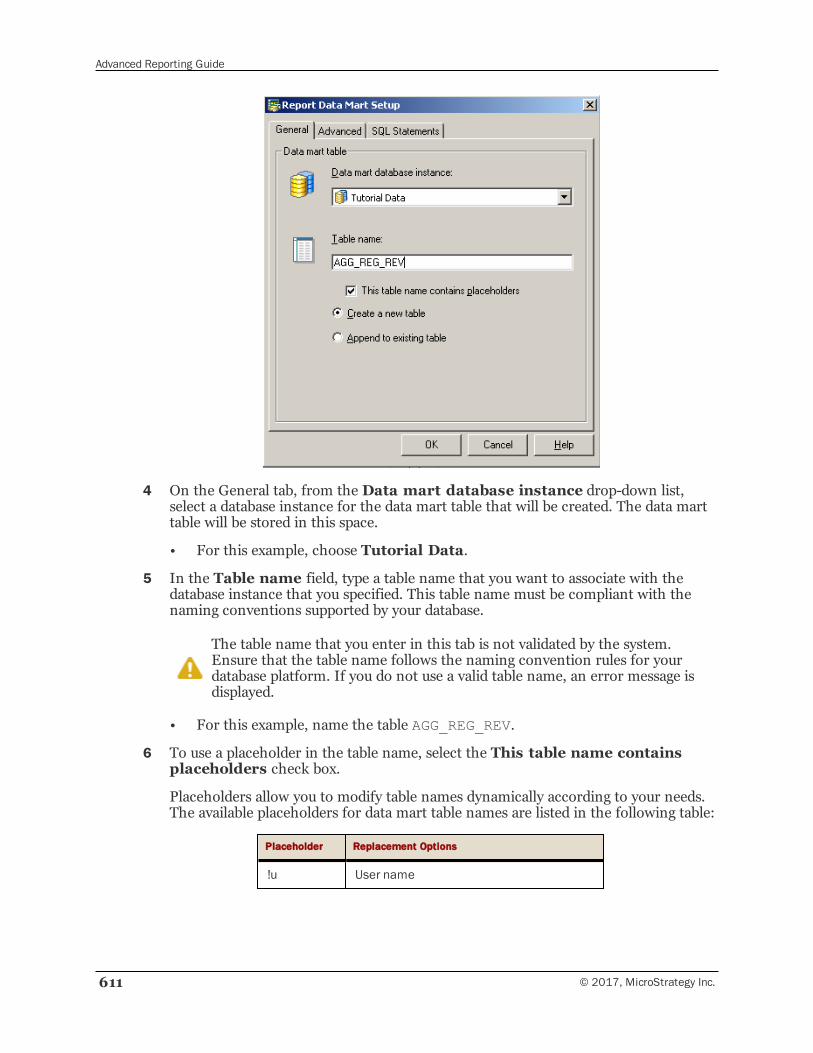
Advanced Reporting Guide
611 © 2017, MicroStrategy Inc.
4 On the General tab, from the Data mart database instance drop-down list,select a database instance for the data mart table that will be created. The data marttable will be stored in this space.
• For this example, choose Tutorial Data.
5 In the Table name field, type a table name that you want to associate with thedatabase instance that you specified. This table name must be compliant with thenaming conventions supported by your database.
The table name that you enter in this tab is not validated by the system.Ensure that the table name follows the naming convention rules for yourdatabase platform. If you do not use a valid table name, an error message isdisplayed.
• For this example, name the table AGG_REG_REV.
6 To use a placeholder in the table name, select the This table name containsplaceholders check box.
Placeholders allow you to modify table names dynamically according to your needs.The available placeholders for data mart table names are listed in the following table:
Placeholder Replacement Options
!u User name
Advanced Reporting Guide
© 2017, MicroStrategy Inc. 612
Placeholder Replacement Options
!d Date on which the table was created
!o Report name
!j Job ID
!r Report GUID
!t Timestamp
!p Project Name
!z Project GUID
!s User session GUID
If you use a placeholder character other than those listed in the table, theplaceholder is deleted from the table name.
For this example, disable the This table name contains placeholders checkbox.
7 Select whether to Create a new table or Append to existing table, describedbelow:
• Create a new table: Select this option to replace the existing table each timethe data mart report is run. The SQL statements drop and create the table eachtime the report is run.
• Append to existing table: Select this option to add the data mart reportresults to an existing table.
• For this example, select Create a new table.
8 If you need to specify governors, table creation settings, and custom SQL for tablecreation, see Specifying governors, table creation options, and custom SQLstatements, page 620
9 Click OK.
Create the data mart table
10 Execute the data mart report. MicroStrategy creates the data mart table in thedatabase you selected.
When the data mart table is created, the system displays a message that includes thedata mart table name and a notification that the data mart table creation wassuccessful, as shown in the example message below:
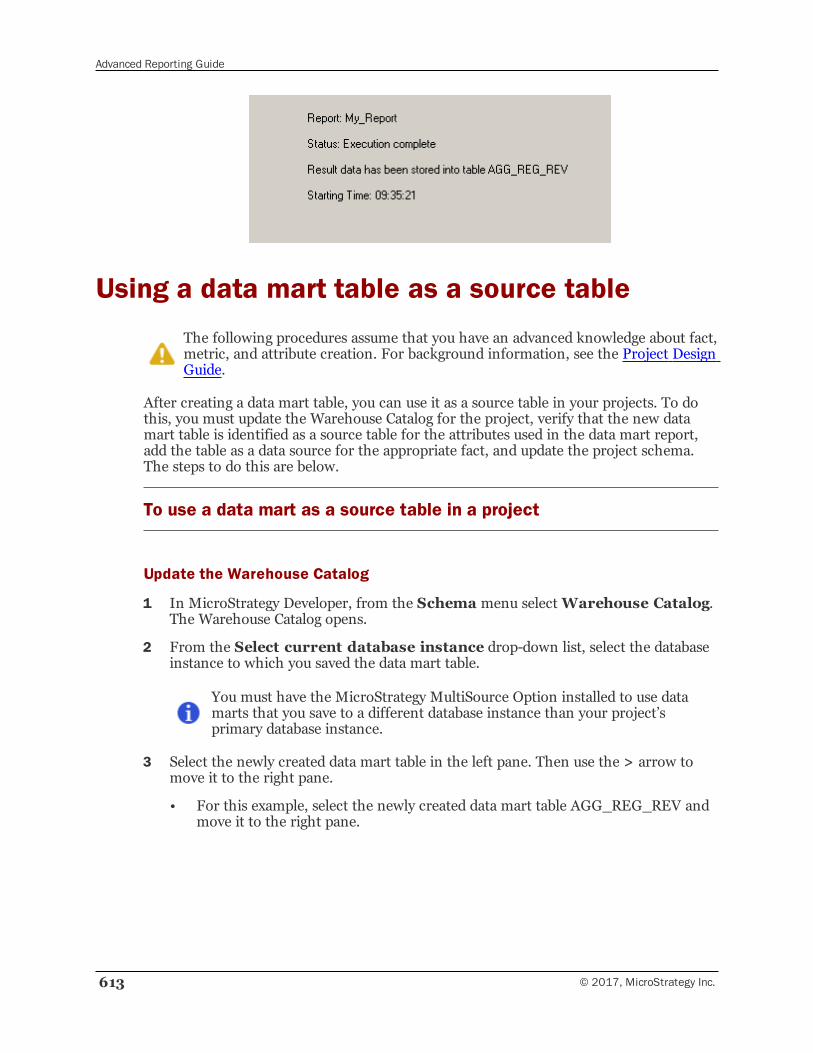
Advanced Reporting Guide
613 © 2017, MicroStrategy Inc.
Using a data mart table as a source tableThe following procedures assume that you have an advanced knowledge about fact,metric, and attribute creation. For background information, see the Project DesignGuide.
After creating a data mart table, you can use it as a source table in your projects. To dothis, you must update the Warehouse Catalog for the project, verify that the new datamart table is identified as a source table for the attributes used in the data mart report,add the table as a data source for the appropriate fact, and update the project schema.The steps to do this are below.
To use a data mart as a source table in a project
Update the Warehouse Catalog
1 In MicroStrategy Developer, from the Schema menu selectWarehouse Catalog.The Warehouse Catalog opens.
2 From the Select current database instance drop-down list, select the databaseinstance to which you saved the data mart table.
You must have the MicroStrategy MultiSource Option installed to use datamarts that you save to a different database instance than your project’sprimary database instance.
3 Select the newly created data mart table in the left pane. Then use the > arrow tomove it to the right pane.
• For this example, select the newly created data mart table AGG_REG_REV andmove it to the right pane.
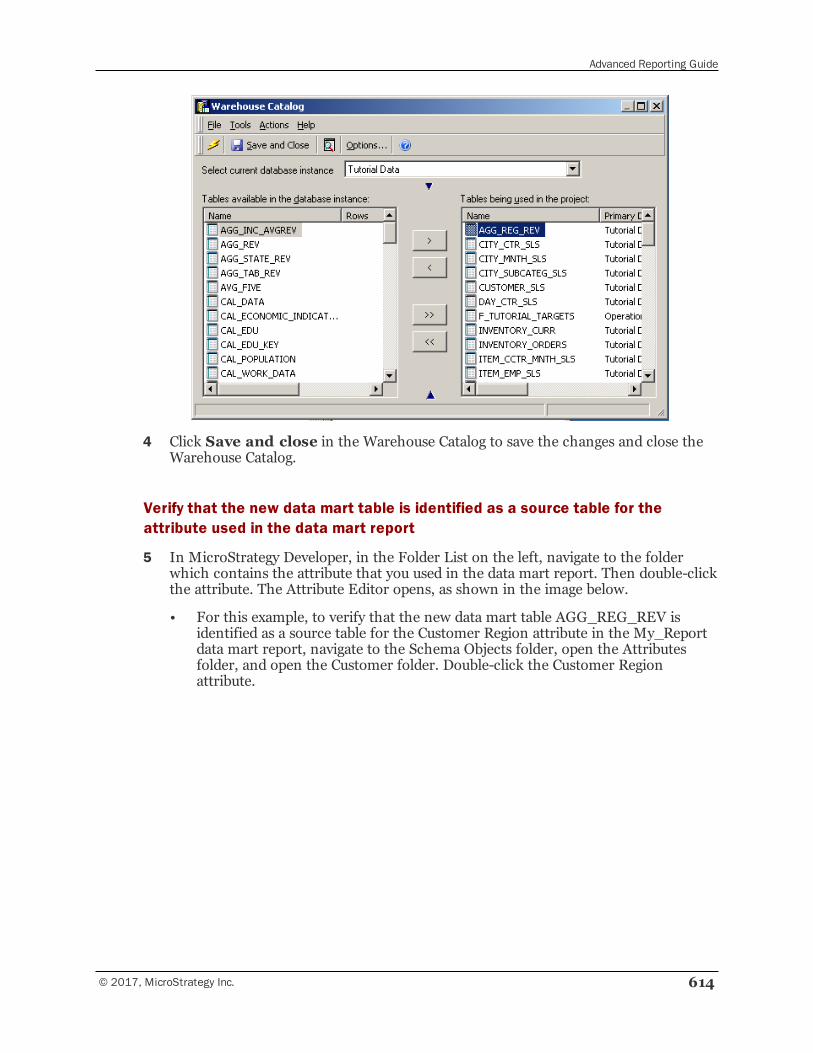
Advanced Reporting Guide
© 2017, MicroStrategy Inc. 614
4 Click Save and close in the Warehouse Catalog to save the changes and close theWarehouse Catalog.
Verify that the new data mart table is identified as a source table for theattribute used in the data mart report
5 In MicroStrategy Developer, in the Folder List on the left, navigate to the folderwhich contains the attribute that you used in the data mart report. Then double-clickthe attribute. The Attribute Editor opens, as shown in the image below.
• For this example, to verify that the new data mart table AGG_REG_REV isidentified as a source table for the Customer Region attribute in the My_Reportdata mart report, navigate to the Schema Objects folder, open the Attributesfolder, and open the Customer folder. Double-click the Customer Regionattribute.
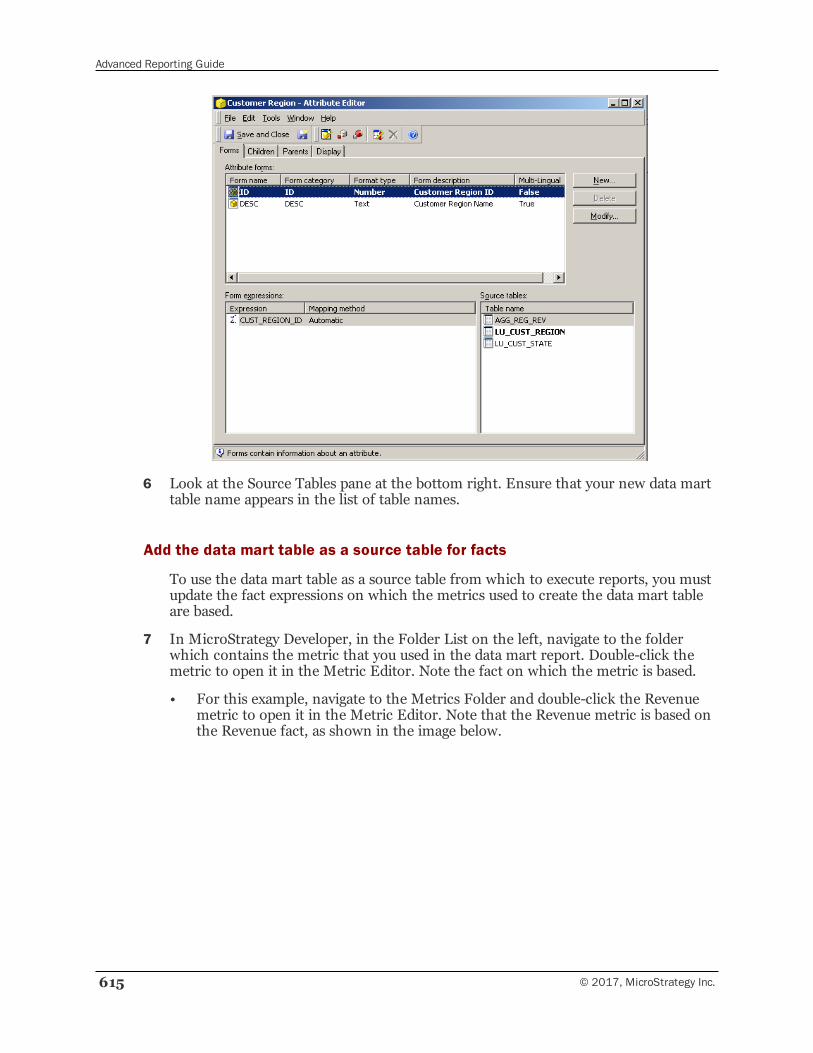
Advanced Reporting Guide
615 © 2017, MicroStrategy Inc.
6 Look at the Source Tables pane at the bottom right. Ensure that your new data marttable name appears in the list of table names.
Add the data mart table as a source table for facts
To use the data mart table as a source table from which to execute reports, you mustupdate the fact expressions on which the metrics used to create the data mart tableare based.
7 In MicroStrategy Developer, in the Folder List on the left, navigate to the folderwhich contains the metric that you used in the data mart report. Double-click themetric to open it in the Metric Editor. Note the fact on which the metric is based.
• For this example, navigate to the Metrics Folder and double-click the Revenuemetric to open it in the Metric Editor. Note that the Revenue metric is based onthe Revenue fact, as shown in the image below.
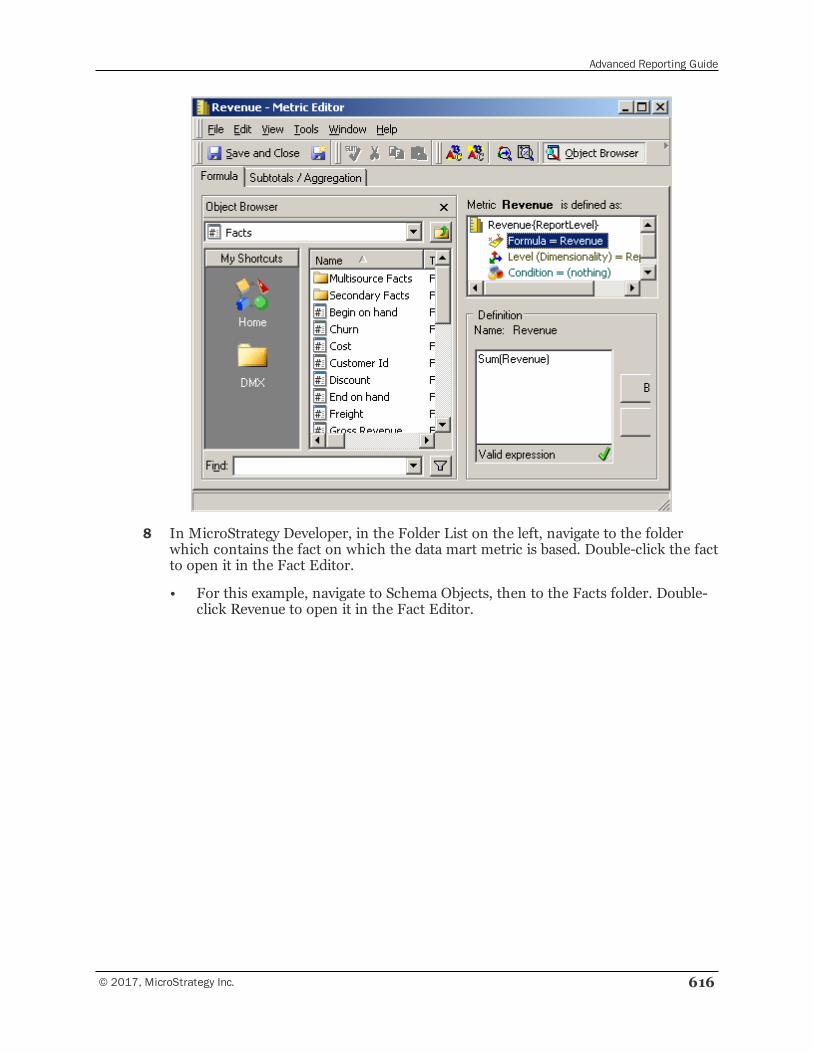
Advanced Reporting Guide
© 2017, MicroStrategy Inc. 616
8 In MicroStrategy Developer, in the Folder List on the left, navigate to the folderwhich contains the fact on which the data mart metric is based. Double-click the factto open it in the Fact Editor.
• For this example, navigate to Schema Objects, then to the Facts folder. Double-click Revenue to open it in the Fact Editor.
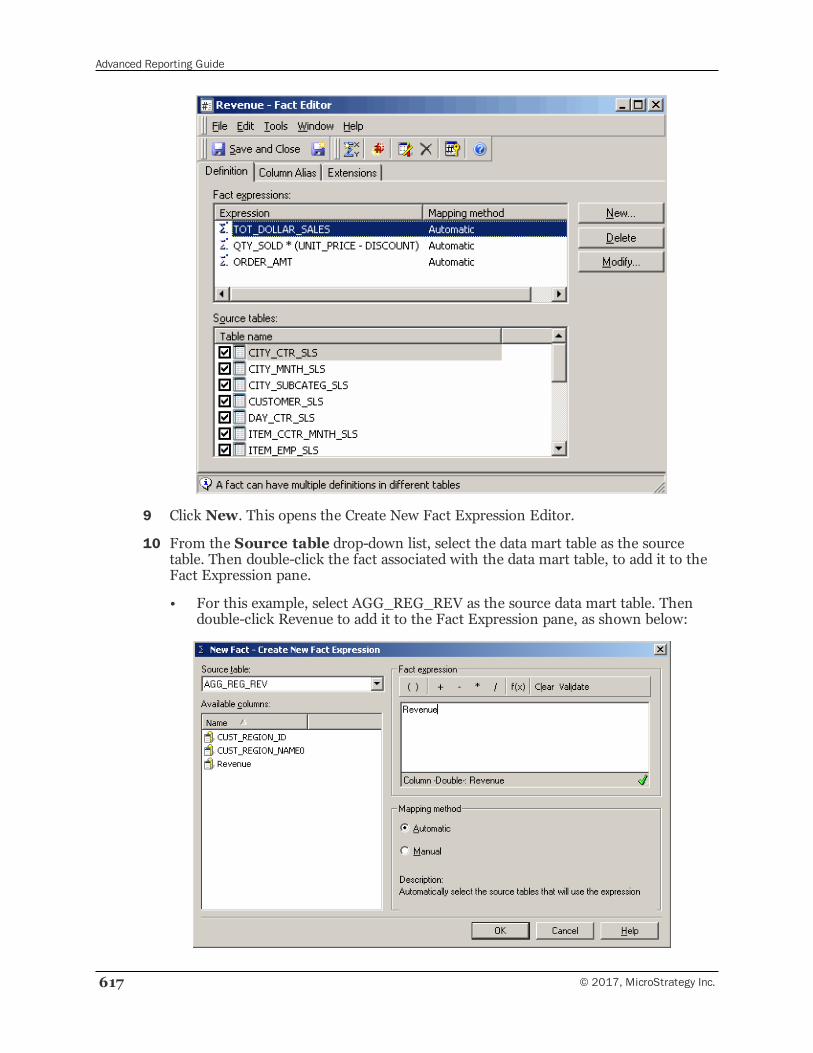
Advanced Reporting Guide
617 © 2017, MicroStrategy Inc.
9 Click New. This opens the Create New Fact Expression Editor.
10 From the Source table drop-down list, select the data mart table as the sourcetable. Then double-click the fact associated with the data mart table, to add it to theFact Expression pane.
• For this example, select AGG_REG_REV as the source data mart table. Thendouble-click Revenue to add it to the Fact Expression pane, as shown below:
Advanced Reporting Guide
© 2017, MicroStrategy Inc. 618
11 Under Mapping method, select Automatic. This ensures that if more data marts arecreated with the same metric, they are automatically added as source tables for thefact.
12 Click OK to return to the Fact Editor.
13 Click Save and Close to save the changes.
Update the project schema
14 In MicroStrategy Developer, from the Schema menu, select Update Schema.
15 When prompted to select update options, ensure that all check boxes are selectedand click Update.
Enabling data mart optimizationIf you created the data mart table using a different database instance than the primarydatabase instance used by your project, but which points to the same data warehouse,you can enable data mart optimization for the database instance. This can improve theperformance of reports that access the data mart.
For example, you have built a data mart report to create an aggregate fact table in yourdata warehouse. You have specified a database instance that is different from yourproject's primary database instance, but points to the same data warehouse as the latter.When you execute the report without using data mart optimization, Intelligence Servertreats the database instance as one that points to a different database, and the followingoperations are performed:
• The results for the data mart are fetched from the warehouse into IntelligenceServer’s memory.
• A new table for the data mart is created in the data warehouse.
• The results are loaded into the table, one row at a time.
However, if you use data mart optimization, the following operations are performed:
• A new table for the data mart is created in the data warehouse.
• The results for the data mart are loaded into the new table directly, without beingloaded into Intelligence Server’s memory.
In this example, using data mart optimization thus results in simpler SQL queries, andcan conserve Intelligence Server’s resources.
Do not use data mart optimization unless you are sure that the database instancefor the data mart points to the same data warehouse as the project’s primarydatabase instance.
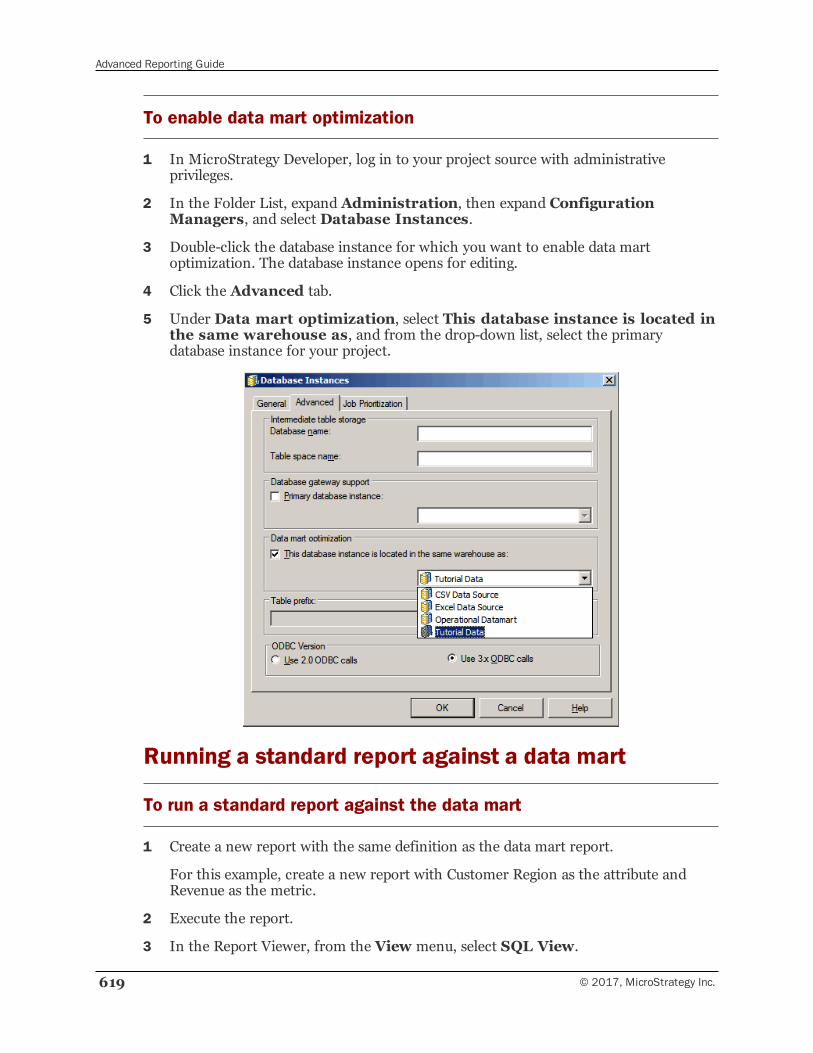
Advanced Reporting Guide
619 © 2017, MicroStrategy Inc.
To enable data mart optimization
1 In MicroStrategy Developer, log in to your project source with administrativeprivileges.
2 In the Folder List, expand Administration, then expand ConfigurationManagers, and select Database Instances.
3 Double-click the database instance for which you want to enable data martoptimization. The database instance opens for editing.
4 Click the Advanced tab.
5 Under Data mart optimization, select This database instance is located inthe same warehouse as, and from the drop-down list, select the primarydatabase instance for your project.
Running a standard report against a data mart
To run a standard report against the data mart
1 Create a new report with the same definition as the data mart report.
For this example, create a new report with Customer Region as the attribute andRevenue as the metric.
2 Execute the report.
3 In the Report Viewer, from the View menu, select SQL View.
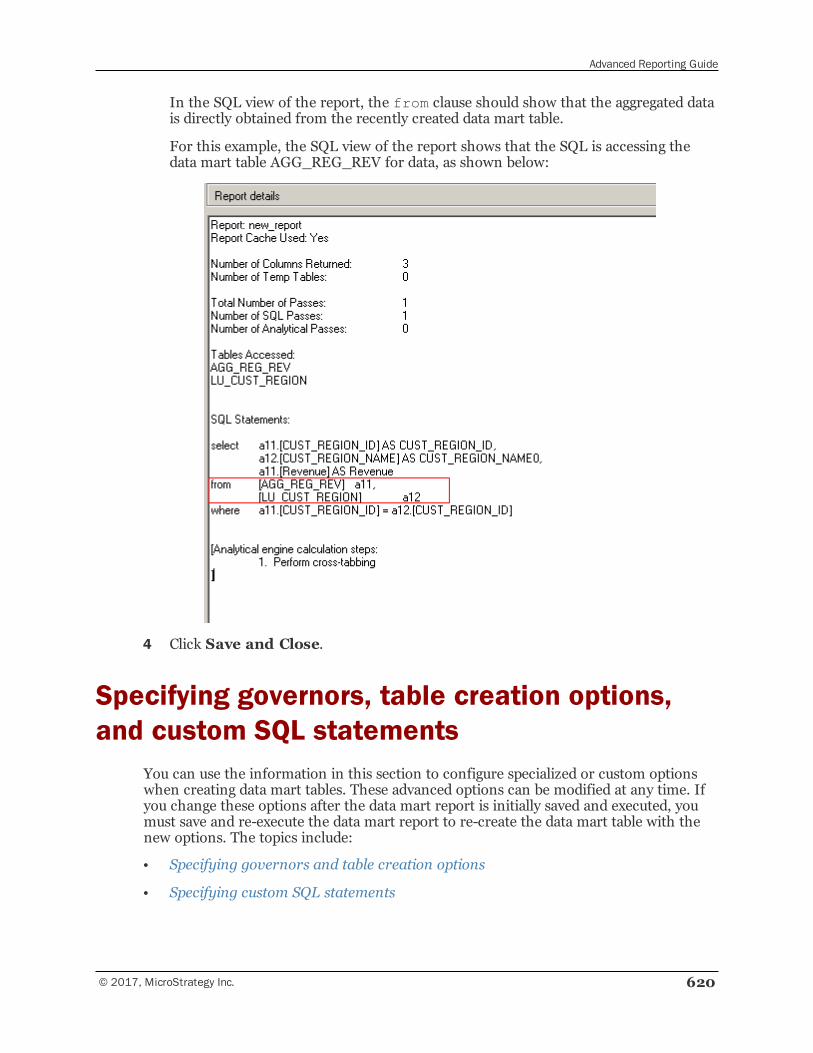
Advanced Reporting Guide
© 2017, MicroStrategy Inc. 620
In the SQL view of the report, the from clause should show that the aggregated datais directly obtained from the recently created data mart table.
For this example, the SQL view of the report shows that the SQL is accessing thedata mart table AGG_REG_REV for data, as shown below:
4 Click Save and Close.
Specifying governors, table creation options,and custom SQL statements
You can use the information in this section to configure specialized or custom optionswhen creating data mart tables. These advanced options can be modified at any time. Ifyou change these options after the data mart report is initially saved and executed, youmust save and re-execute the data mart report to re-create the data mart table with thenew options. The topics include:
• Specifying governors and table creation options
• Specifying custom SQL statements
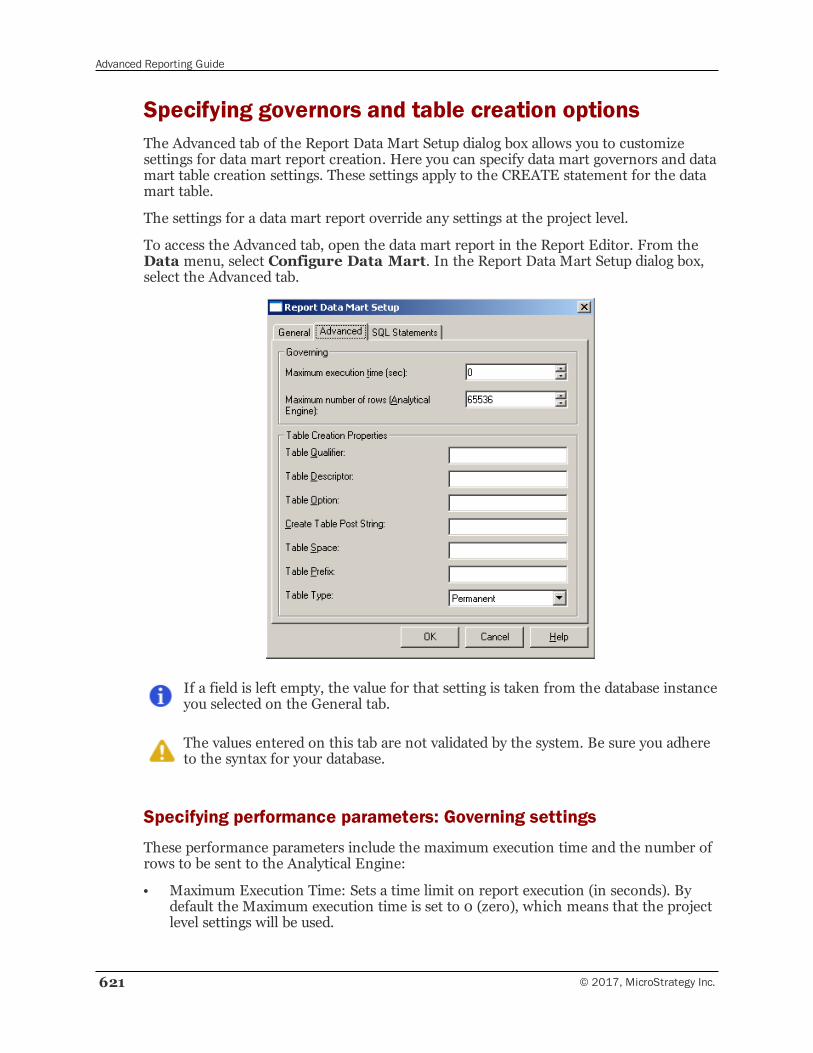
Advanced Reporting Guide
621 © 2017, MicroStrategy Inc.
Specifying governors and table creation optionsThe Advanced tab of the Report Data Mart Setup dialog box allows you to customizesettings for data mart report creation. Here you can specify data mart governors and datamart table creation settings. These settings apply to the CREATE statement for the datamart table.
The settings for a data mart report override any settings at the project level.
To access the Advanced tab, open the data mart report in the Report Editor. From theData menu, select Configure Data Mart. In the Report Data Mart Setup dialog box,select the Advanced tab.
If a field is left empty, the value for that setting is taken from the database instanceyou selected on the General tab.
The values entered on this tab are not validated by the system. Be sure you adhereto the syntax for your database.
Specifying performance parameters: Governing settings
These performance parameters include the maximum execution time and the number ofrows to be sent to the Analytical Engine:
• Maximum Execution Time: Sets a time limit on report execution (in seconds). Bydefault the Maximum execution time is set to 0 (zero), which means that the projectlevel settings will be used.
Advanced Reporting Guide
© 2017, MicroStrategy Inc. 622
• Maximum Number of Rows (Analytical Engine): This setting governs the maximumnumber of rows to send to the Analytical Engine at one time when the table iscreated. The default value is set to 65536.
Data mart VLDB properties: Table creation settings
These settings collectively are the VLDB properties for data marts. VLDB properties offerspecialized configurations to support or optimize your reporting and analysisrequirements. For background information on VLDB properties, see the SupplementalReference for System Administration.
The Table Creation settings are only applicable to permanent tables.
• Table Qualifier: Specify a string to be placed before the TABLE keyword in theCREATE TABLE statement.
• Table Descriptor: Specify a string to be placed after the TABLE keyword in theCREATE TABLE statement.
• Table Option: Specify a string to be placed after the table name in CREATE TABLEstatements.
• Create Table Post String: Append a string after the CREATE TABLE statement.
• Table Space: Append a string at the end of the CREATE TABLE statement, butbefore any index definitions.
• Table Prefix: Specify a prefix for a table name in CREATE TABLE statements.
• Table type: Set whether the table is permanent or true temporary.
Specifying custom SQL statementsThe SQL Statements tab of the Report Data Mart Setup dialog box allows you to entercustom SQL statements for a data mart table. You can add any pre-creation or postcreation SQL statements to your data mart table definition.
The SQL Statements tab is only visible if you have the Use SQL Statements tab inDatamart/Bulk Export editors privilege in the Developer privileges.
To access the SQL Statements tab, open the data mart report in the Report Editor. Fromthe Data menu, select Configure Data Mart. In the Report Data Mart Setup dialogbox, select the SQL Statements tab.
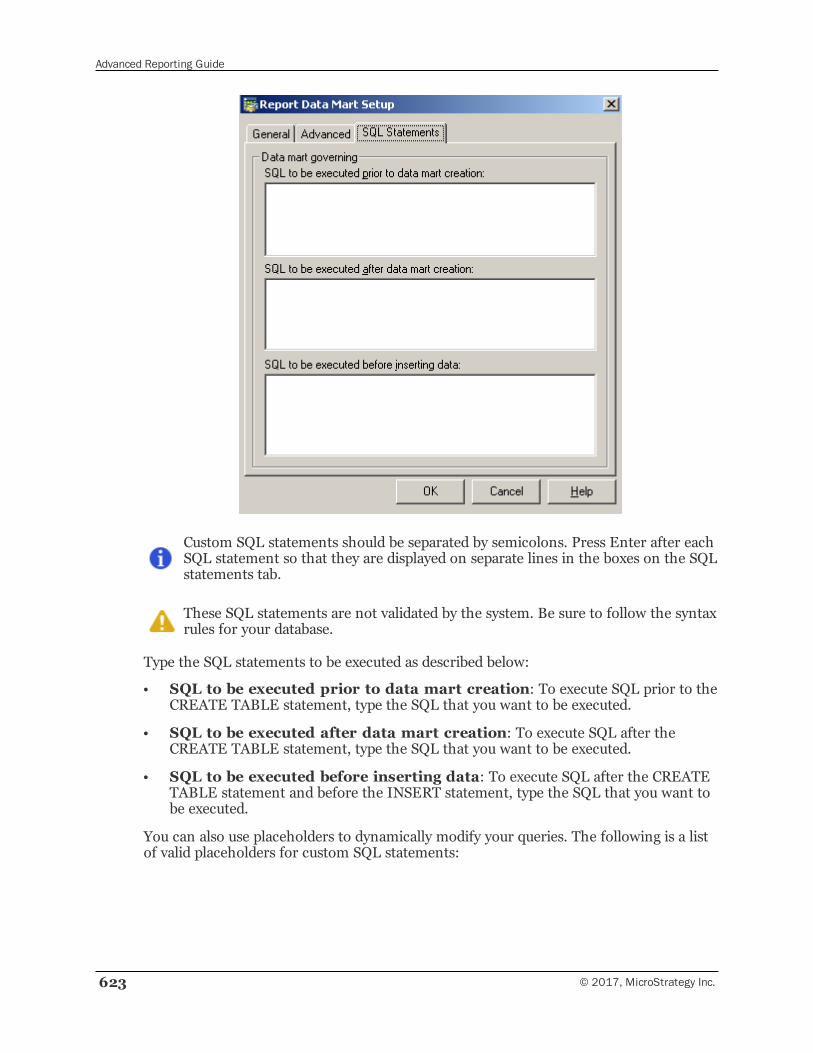
Advanced Reporting Guide
623 © 2017, MicroStrategy Inc.
Custom SQL statements should be separated by semicolons. Press Enter after eachSQL statement so that they are displayed on separate lines in the boxes on the SQLstatements tab.
These SQL statements are not validated by the system. Be sure to follow the syntaxrules for your database.
Type the SQL statements to be executed as described below:
• SQL to be executed prior to data mart creation: To execute SQL prior to theCREATE TABLE statement, type the SQL that you want to be executed.
• SQL to be executed after data mart creation: To execute SQL after theCREATE TABLE statement, type the SQL that you want to be executed.
• SQL to be executed before inserting data: To execute SQL after the CREATETABLE statement and before the INSERT statement, type the SQL that you want tobe executed.
You can also use placeholders to dynamically modify your queries. The following is a listof valid placeholders for custom SQL statements:
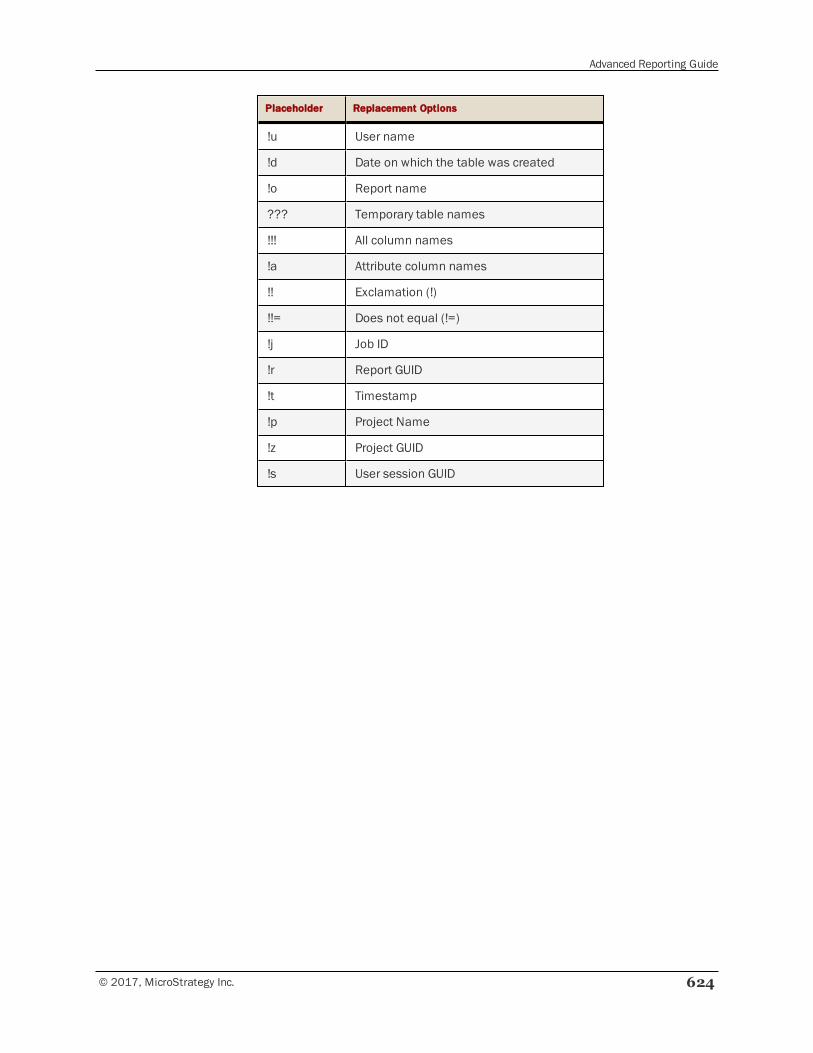
Advanced Reporting Guide
© 2017, MicroStrategy Inc. 624
Placeholder Replacement Options
!u User name
!d Date on which the table was created
!o Report name
??? Temporary table names
!!! All column names
!a Attribute column names
!! Exclamation (!)
!!= Does not equal (!=)
!j Job ID
!r Report GUID
!t Timestamp
!p Project Name
!z Project GUID
!s User session GUID
13DATA MINING SERVICES
Data mining generally refers to examining a large amount of data to extract valuableinformation. The data mining process involves using the predictive models based onexisting and historical data to project potential outcome for business activities andtransactions. MicroStrategy Data Mining Services facilitates the development anddeployment of these predictive models.
This section introduces MicroStrategy Data Mining Services, which includes thesefeatures:
• Using MicroStrategy to create multi-variate linear regressions, multi-variateexponential regressions, logistic regressions, decision trees, clustering predictivemodels, association rules, and time series models
• Support for importing third-party predictive models using the PMML industrystandard
• A Predictive Model Viewer that visualizes the predictive model
• Data mining examples included in the MicroStrategy Tutorial project, in\Public Objects\Reports\MicroStrategy Platform Capabilities\MicroStrategy Data Mining Services
In addition, this section describes the process of how to create and use predictive modelswith MicroStrategy and provides a business case for illustration. Topics include:
• Data Mining Services: Overview
• Creating a dataset report
• Creating a predictive model
• Importing the predictive model
• Using the predictive metric
• Data mining examples
Data Mining Services: OverviewThe ultimate goal of data mining is to find hidden predictive information from a largeamount of data. The data mining process involves using existing information to gain new
© 2017, MicroStrategy Inc. 625
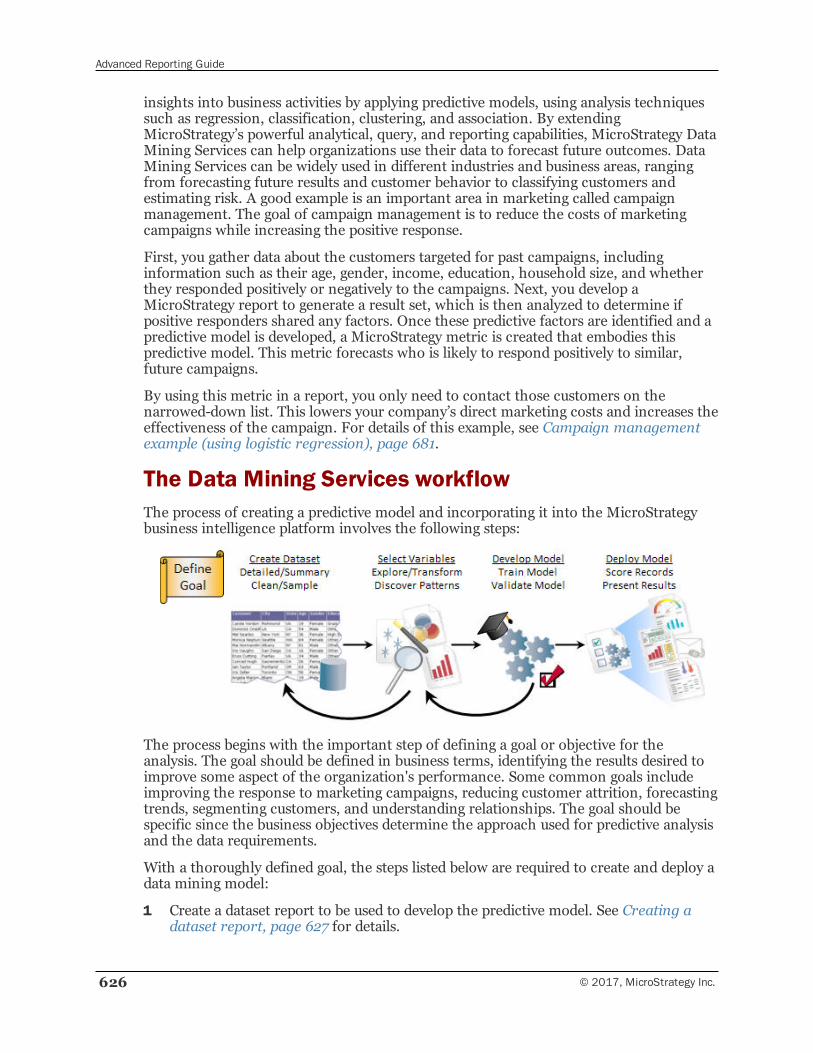
Advanced Reporting Guide
626 © 2017, MicroStrategy Inc.
insights into business activities by applying predictive models, using analysis techniquessuch as regression, classification, clustering, and association. By extendingMicroStrategy’s powerful analytical, query, and reporting capabilities, MicroStrategy DataMining Services can help organizations use their data to forecast future outcomes. DataMining Services can be widely used in different industries and business areas, rangingfrom forecasting future results and customer behavior to classifying customers andestimating risk. A good example is an important area in marketing called campaignmanagement. The goal of campaign management is to reduce the costs of marketingcampaigns while increasing the positive response.
First, you gather data about the customers targeted for past campaigns, includinginformation such as their age, gender, income, education, household size, and whetherthey responded positively or negatively to the campaigns. Next, you develop aMicroStrategy report to generate a result set, which is then analyzed to determine ifpositive responders shared any factors. Once these predictive factors are identified and apredictive model is developed, a MicroStrategy metric is created that embodies thispredictive model. This metric forecasts who is likely to respond positively to similar,future campaigns.
By using this metric in a report, you only need to contact those customers on thenarrowed-down list. This lowers your company’s direct marketing costs and increases theeffectiveness of the campaign. For details of this example, see Campaign managementexample (using logistic regression), page 681.
The Data Mining Services workflowThe process of creating a predictive model and incorporating it into the MicroStrategybusiness intelligence platform involves the following steps:
The process begins with the important step of defining a goal or objective for theanalysis. The goal should be defined in business terms, identifying the results desired toimprove some aspect of the organization's performance. Some common goals includeimproving the response to marketing campaigns, reducing customer attrition, forecastingtrends, segmenting customers, and understanding relationships. The goal should bespecific since the business objectives determine the approach used for predictive analysisand the data requirements.
With a thoroughly defined goal, the steps listed below are required to create and deploy adata mining model:
1 Create a dataset report to be used to develop the predictive model. See Creating adataset report, page 627 for details.
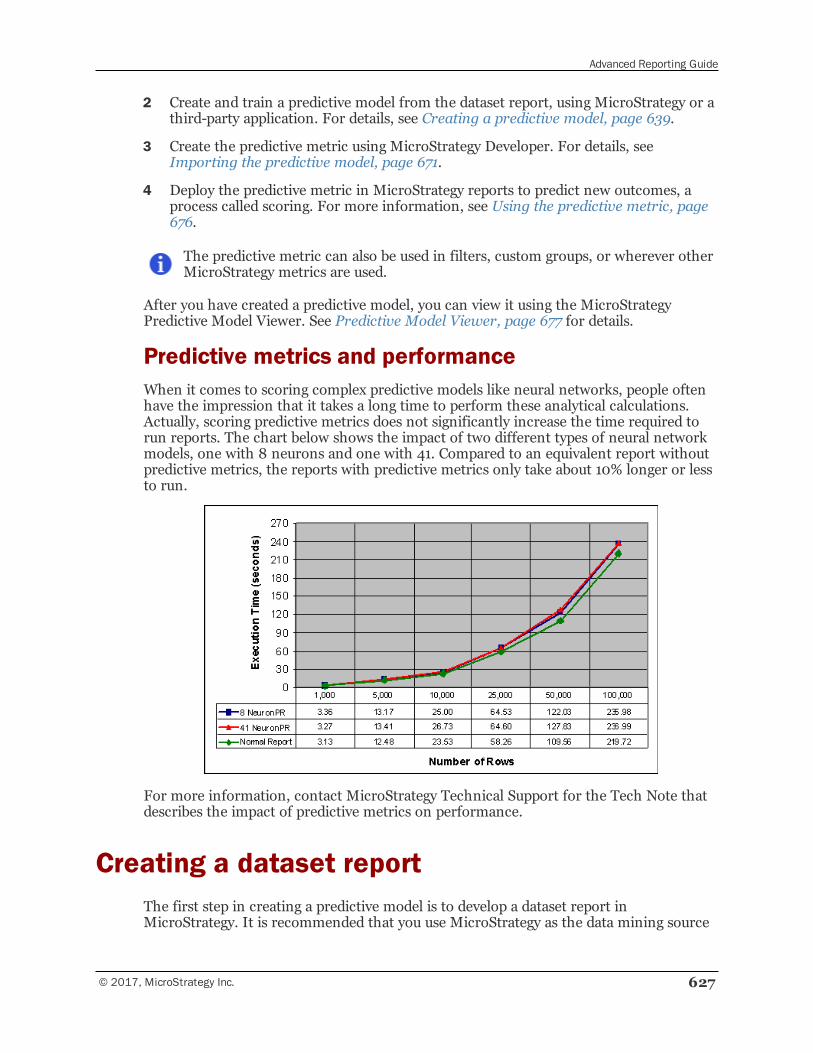
Advanced Reporting Guide
© 2017, MicroStrategy Inc. 627
2 Create and train a predictive model from the dataset report, using MicroStrategy or athird-party application. For details, see Creating a predictive model, page 639.
3 Create the predictive metric using MicroStrategy Developer. For details, seeImporting the predictive model, page 671.
4 Deploy the predictive metric in MicroStrategy reports to predict new outcomes, aprocess called scoring. For more information, see Using the predictive metric, page676.
The predictive metric can also be used in filters, custom groups, or wherever otherMicroStrategy metrics are used.
After you have created a predictive model, you can view it using the MicroStrategyPredictive Model Viewer. See Predictive Model Viewer, page 677 for details.
Predictive metrics and performanceWhen it comes to scoring complex predictive models like neural networks, people oftenhave the impression that it takes a long time to perform these analytical calculations.Actually, scoring predictive metrics does not significantly increase the time required torun reports. The chart below shows the impact of two different types of neural networkmodels, one with 8 neurons and one with 41. Compared to an equivalent report withoutpredictive metrics, the reports with predictive metrics only take about 10% longer or lessto run.
For more information, contact MicroStrategy Technical Support for the Tech Note thatdescribes the impact of predictive metrics on performance.
Creating a dataset reportThe first step in creating a predictive model is to develop a dataset report inMicroStrategy. It is recommended that you use MicroStrategy as the data mining source
Advanced Reporting Guide
628 © 2017, MicroStrategy Inc.
for the following reasons:
• Enterprise data warehouse: MicroStrategy projects typically use the enterprisedata warehouse, which often contains clean, high-quality data. Since creating a gooddataset report is typically 50-75% of the data mining effort, using MicroStrategy cangreatly reduce that effort.
• Analytical functions: It is easy to create new metrics using MicroStrategy’s vastlibrary of over 200 analytical functions, which range from OLAP functions such asRank, Percentile, and Moving Averages to advanced statistical functions. Raw facts inthe database are easily turned into simple, and sometimes sophisticated, predictiveinputs using these functions.
• Relational databases: MicroStrategy is optimized for all the major relationaldatabase vendors, which means that dataset reports are optimized to take advantageof these database capabilities.
• Security model: MicroStrategy’s robust security model ensures that users can onlyaccess the data that they are permitted to access. The MicroStrategy businessintelligence platform can address privacy-preserving issues as the predictive model isdeveloped and also when it is deployed.
• Easy handling of reports: The dataset report can be easily created, refreshed,and accessed, even if it is large or contains complex calculations. Users do not haveto be database administrators nor do they have to code queries to access the datathey need.
• Consistent use of variable definitions: The exact definitions of variables thatwere used to develop the model are re-used when the predictive model is deployed.This process is performed automatically, which ensures the results are consistentwith the way the model was developed.
• Data sampling: The dataset report can be sampled from a large number ofrecords.
For further information, see:
• Data mining dataset reports
• Guidelines for creating a dataset report
• Inputs for predictive metrics
• Using non-MicroStrategy dataset reports
Data mining dataset reportsData mining dataset reports have a very simple structure. The data usually focuses on aspecific subject or attribute, for example, customers, transactions, or products; thisinformation is used to develop a predictive model.
A dataset report is like a table in a database and usually has the following features:
• Each row represents a specific attribute, such as customer, transaction, or product.
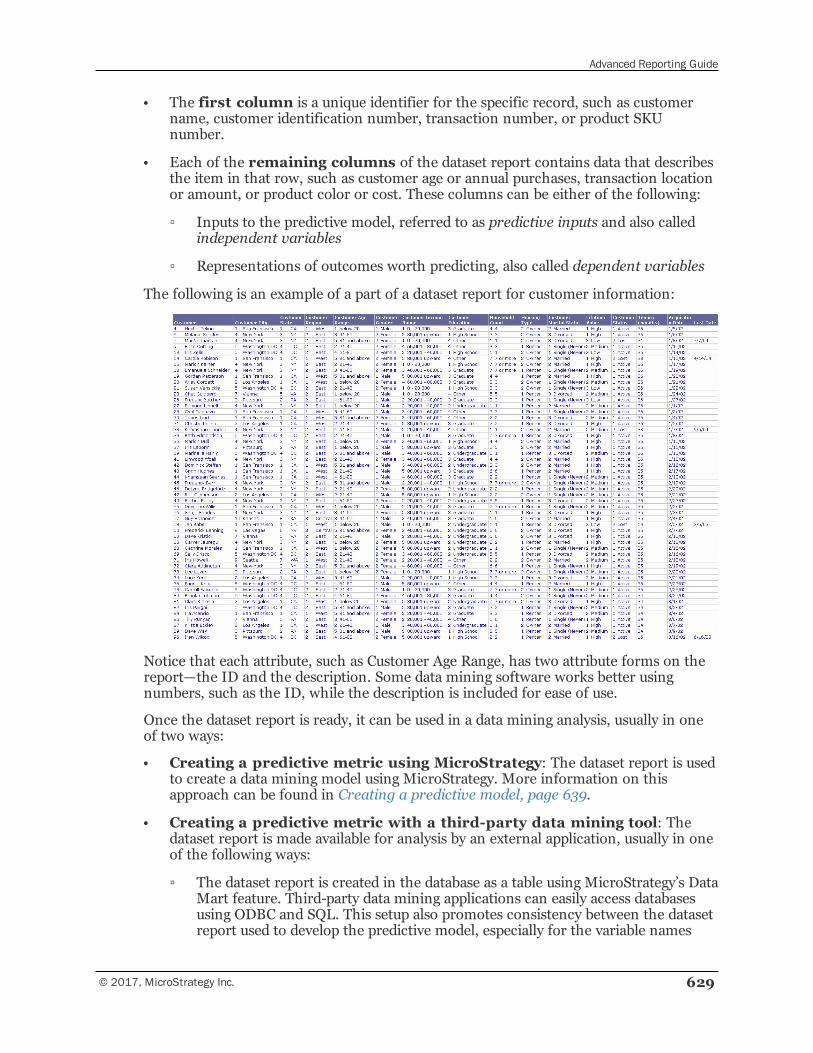
Advanced Reporting Guide
© 2017, MicroStrategy Inc. 629
• The first column is a unique identifier for the specific record, such as customername, customer identification number, transaction number, or product SKUnumber.
• Each of the remaining columns of the dataset report contains data that describesthe item in that row, such as customer age or annual purchases, transaction locationor amount, or product color or cost. These columns can be either of the following:
▫ Inputs to the predictive model, referred to as predictive inputs and also calledindependent variables
▫ Representations of outcomes worth predicting, also called dependent variables
The following is an example of a part of a dataset report for customer information:
Notice that each attribute, such as Customer Age Range, has two attribute forms on thereport—the ID and the description. Some data mining software works better usingnumbers, such as the ID, while the description is included for ease of use.
Once the dataset report is ready, it can be used in a data mining analysis, usually in oneof two ways:
• Creating a predictive metric using MicroStrategy: The dataset report is usedto create a data mining model using MicroStrategy. More information on thisapproach can be found in Creating a predictive model, page 639.
• Creating a predictive metric with a third-party data mining tool: Thedataset report is made available for analysis by an external application, usually in oneof the following ways:
▫ The dataset report is created in the database as a table using MicroStrategy’s DataMart feature. Third-party data mining applications can easily access databasesusing ODBC and SQL. This setup also promotes consistency between the datasetreport used to develop the predictive model, especially for the variable names
Advanced Reporting Guide
630 © 2017, MicroStrategy Inc.
and data types. It does require database accessibility and database storage space.For more information on data marts, see Chapter 12, Accessing Subsets of Data:Data Marts.
▫ The dataset report is exported to a particular file format using MicroStrategy’sexport capabilities. Third-party data mining applications can access many fileformats such as Microsoft Excel, text files, and so on. Exporting files requiresthat the data type of each variable is determined on-the-fly by the data miningapplication. This interpretation may need correction by the user. On the otherhand, this approach is usually easier for most people and does not require helpwith database administration. See the MicroStrategy online help for moreinformation on exporting reports from MicroStrategy.
Guidelines for creating a dataset reportBefore creating the dataset report, you need to make sure the attributes and metrics to beused as predictive inputs in the dataset report can also be used as inputs to the predictivemetric. Recall that the predictive metric is the metric created from the predictive modelafter it is imported into MicroStrategy. By defining predictive inputs properly when youbuild the dataset report, you are guaranteed that the predictive model developed fromthat data receives the same inputs regardless of how that model is used in MicroStrategy.
You can also use an MDX cube as the dataset for your predictive model. This allows youto perform predictive analysis for your MDX cube data. The same guidelines for datasetreports listed below also apply to using MDX cubes as a dataset for your predictive model.For steps to integrate MDX cubes into MicroStrategy, see the MDX Cube ReportingGuide.
The following guidelines are intended to help you create your dataset report.
• Use a flat report template.
In a flat report template, attributes must be placed on rows and metrics on columns.Since the dataset report is a table consisting of a single header row followed by rowsof data, placing attributes in the columns usually creates multiple header rows oneach column, which cannot be easily represented in a database table.
• Use attributes and metrics as predictive inputs.
To create predictive metrics, you can use both metrics and attributes as inputs, asdescribed in:
▫ Inputs for predictive metrics, page 631
▫ Inputs for predictive metrics, page 631
▫ Inputs for predictive metrics, page 631
You can use metrics and attributes as inputs for predictive metrics by creating atraining metric (see Creating a predictive model using MicroStrategy, page 640).
• Match each metric’s level with the attribute used on the rows of thedataset report.
The attributes on the rows of the dataset report control the level, or dimensionality,of the dataset report. If a metric is used in the predictive model without a level, the
Advanced Reporting Guide
© 2017, MicroStrategy Inc. 631
metric results change based on the attributes of the report using the predictivemetric. Creating another type metric for the predictive metric, which sets the metriclevel, can resolve this problem. For more information, see Inputs for predictivemetrics, page 631.
• Set a condition on the metric that provides the proper grouping, whengrouping a metric’s results by an attribute.
A metric condition is essentially a filter that allows an attribute to qualify metrics.For example, you can display customer revenue by payment method. For moreinformation, see Inputs for predictive metrics, page 631.
• Set the attribute join type for the report.
Setting the attribute join type ensures that any missing data does not cause rows tobe deleted. To do this, complete the following procedure.
To set the attribute join type for the report
1 Open the report in the Report Editor.
2 Select Report Data Options from the Data menu.
3 Under Categories, expand Calculations, and then select Attribute Join Type.
4 Clear the Use Defaults check box.
5 Set the attribute join type of the report to either of the following:
• Preserve lookup table elements joined to the final pass result tablebased on the template attributes with filter keeps all attribute elementsand applies all related filtering conditions.
• Preserve lookup table elements joined to the final pass result tablebased on the template attributes without filter keeps all attributeelements and ignores all related filtering conditions.
6 Click OK.
Inputs for predictive metricsA predictive metric can be created using attributes and metrics as its inputs. How youdefine the attributes and metrics you use as inputs for your predictive metrics affects theresulting predictive metrics, as described in:
• Attributes as inputs for predictive metrics, page 632
• Level metrics as inputs for predictive metrics, page 634
• Conditional metrics as inputs for predictive metrics, page 636
Advanced Reporting Guide
632 © 2017, MicroStrategy Inc.
Attributes as inputs for predictive metrics
Attributes can be used as inputs for predictive metrics. Data mining often analyzes non-numeric, demographic, and psychographic information about customers, looking forattributes that are strong predictors.
For example, your MicroStrategy project contains a Customer attribute with relatedattributes for age, gender, and income. You can include an attribute, such as theCustomer attribute, directly in a training metric, as described in Creating a predictivemodel using MicroStrategy, page 640.
By including an attribute directly in a training metric, a predictive metric is then createdthat includes the attribute as one of its inputs. When using attributes directly in trainingmetrics to create predictive metrics, be aware of the following:
• The ID attribute form for the attribute is used by the training metric to include theattribute information in a predictive metric. If attributes include additional attributeforms other than the ID form that are to be used as inputs for predictive metrics,you can create metrics based on these attribute forms. Once these metrics arecreated, they can then be used as inputs for predictive metrics. This scenario forcreating attribute-based predictive metrics is described in Creating metrics to useadditional attribute forms as inputs for predictive metrics, page 632 below.
• Attribute forms must use a text or numeric data type. If the attribute form uses a datedata type, the data cannot be correctly represented when creating the predictivemetric. If an attribute form uses date values, you must convert the date values into anumeric format to use the attribute form to create predictive metrics.
Creating metrics to use additional attribute forms as inputs for predictivemetrics
If attributes include additional attribute forms other than their ID form that are to beused as inputs for predictive metrics, you can create metrics based on these attributeforms. The resulting metric can then be used as an input for a predictive metric, thusallowing the attribute information to be included in a predictive metric.
The steps below show you how to create a metric based on an attribute form. Theresulting metric, which contains the attribute information, can then be used to create apredictive metric.
Prerequisite
• This procedure assumes you are familiar with the process of creating a metric. Forsteps on how to create metrics, see Chapter 2, Advanced Metrics.
To create metrics to use additional attribute forms as inputs forpredictive metrics
1 Using the Metric Editor, create a new metric expression. All metric expressions musthave an aggregation function. To support including attribute information in themetric expression, in the Definition area, type Max() to use the Max aggregationfunction.
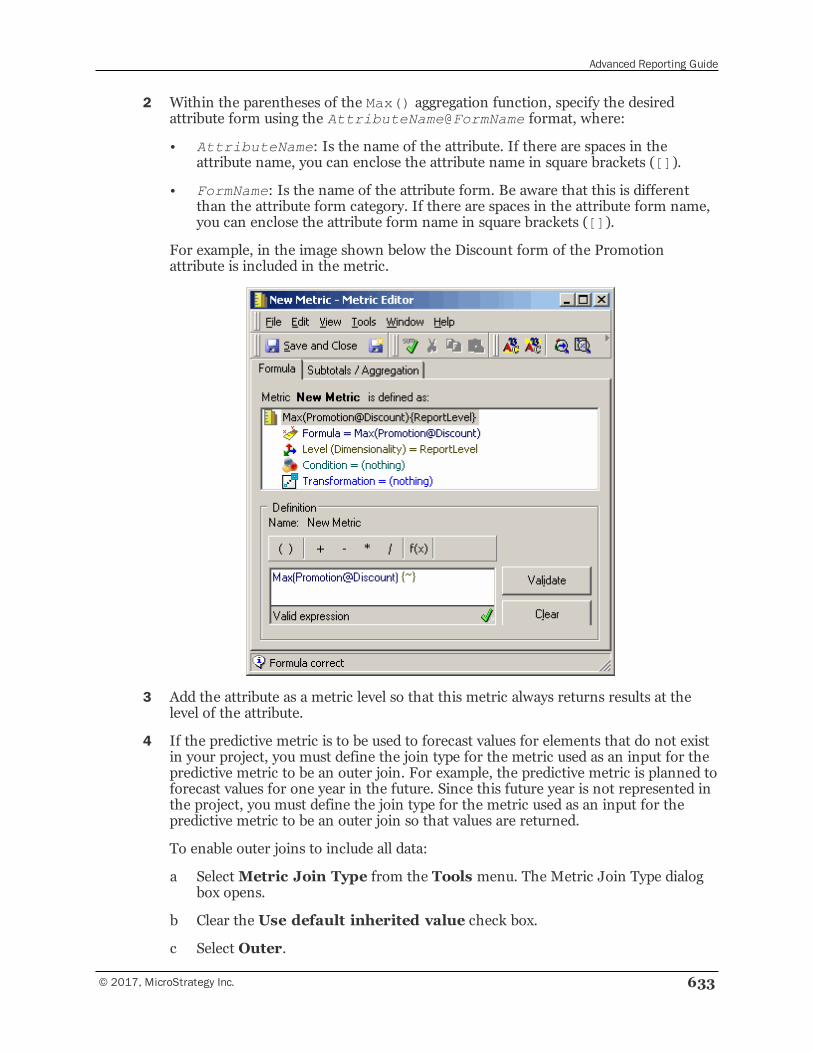
Advanced Reporting Guide
© 2017, MicroStrategy Inc. 633
2 Within the parentheses of the Max() aggregation function, specify the desiredattribute form using the AttributeName@FormName format, where:
• AttributeName: Is the name of the attribute. If there are spaces in theattribute name, you can enclose the attribute name in square brackets ([]).
• FormName: Is the name of the attribute form. Be aware that this is differentthan the attribute form category. If there are spaces in the attribute form name,you can enclose the attribute form name in square brackets ([]).
For example, in the image shown below the Discount form of the Promotionattribute is included in the metric.
3 Add the attribute as a metric level so that this metric always returns results at thelevel of the attribute.
4 If the predictive metric is to be used to forecast values for elements that do not existin your project, you must define the join type for the metric used as an input for thepredictive metric to be an outer join. For example, the predictive metric is planned toforecast values for one year in the future. Since this future year is not represented inthe project, you must define the join type for the metric used as an input for thepredictive metric to be an outer join so that values are returned.
To enable outer joins to include all data:
a SelectMetric Join Type from the Tools menu. The Metric Join Type dialogbox opens.
b Clear the Use default inherited value check box.
c Select Outer.
Advanced Reporting Guide
634 © 2017, MicroStrategy Inc.
d Click OK to close the dialog box.
5 If you plan to export predictive metric results to a third-party tool, you should definethe column alias for the metric used as an input for the predictive metric. Thisensures that the name of the metric used as an input for the predictive metric can beviewed when viewing the exported results in the third-party tool.
To create a metric column alias to ensure the column name matches the metric’sname:
a Select Advanced Settings from the Tools menu, and then selectMetricColumn Options. The Metric Column Alias Options dialog box opens.
b In the Column Name field, type the alias.
c Click OK to close the dialog box.
6 Save the metric, using the alias from the previous step as the metric name. You cannow include the metric in a training metric to create a predictive metric, as describedin Creating a predictive model using MicroStrategy, page 640.
Level metrics as inputs for predictive metrics
The attribute used on the rows of the dataset report sets the level of the data byrestricting the data to a particular level, or dimension, of the data model.
For example, if the Customer attribute is placed on the rows and the Revenue metric onthe columns of a report, the data in the Revenue column is at the customer level. If theRevenue metric is used in the predictive model without any levels, then the data itproduces changes based on the attribute of the report using the predictive metric. If Yearis placed on the rows of the report described previously, the predictive metric calculatesyearly revenue rather than customer revenue. Passing yearly revenue to a predictivemodel based on customer revenue yields the wrong results.
This problem can be easily resolved by creating a separate metric, which is then used asan input for the predictive metric. This separate metric can be created to match themetric definition for Revenue, but also define its level as Customer. This approach isbetter than adding a level directly to the Revenue metric itself because the Revenuemetric may be used in other situations where the level should not be set to Customer.Such a metric would look like the following.
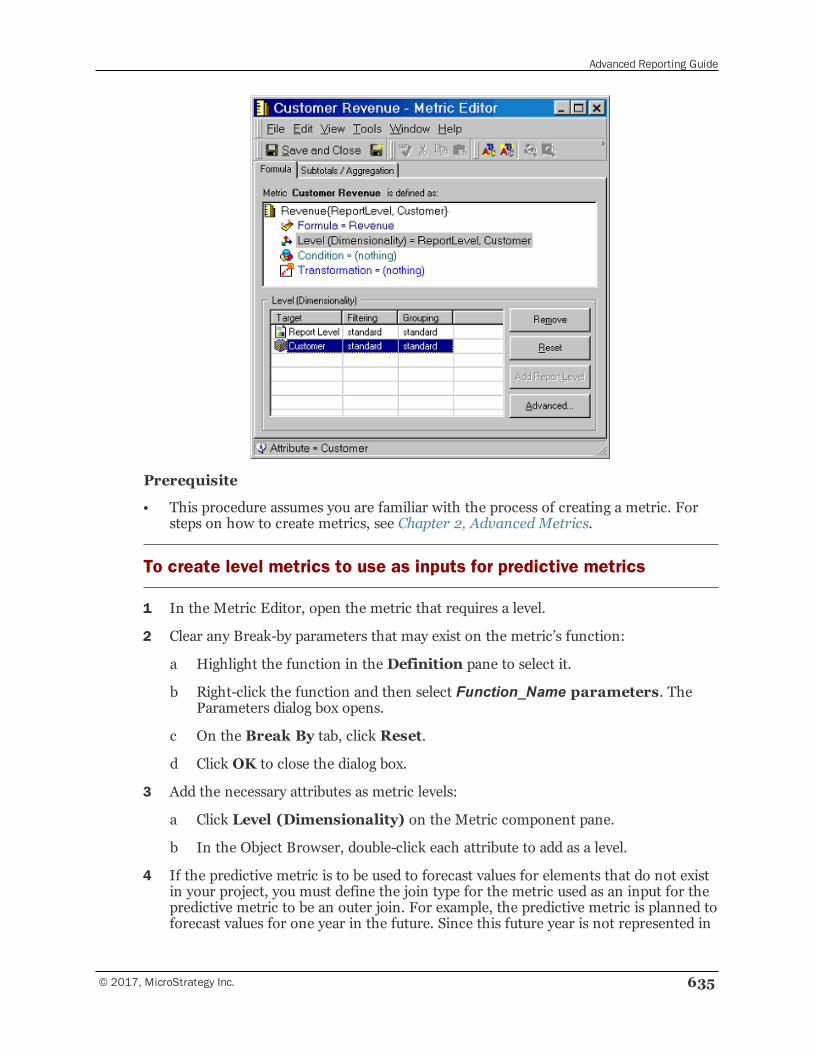
Advanced Reporting Guide
© 2017, MicroStrategy Inc. 635
Prerequisite
• This procedure assumes you are familiar with the process of creating a metric. Forsteps on how to create metrics, see Chapter 2, Advanced Metrics.
To create level metrics to use as inputs for predictive metrics
1 In the Metric Editor, open the metric that requires a level.
2 Clear any Break-by parameters that may exist on the metric’s function:
a Highlight the function in the Definition pane to select it.
b Right-click the function and then select Function_Name parameters. TheParameters dialog box opens.
c On the Break By tab, click Reset.
d Click OK to close the dialog box.
3 Add the necessary attributes as metric levels:
a Click Level (Dimensionality) on the Metric component pane.
b In the Object Browser, double-click each attribute to add as a level.
4 If the predictive metric is to be used to forecast values for elements that do not existin your project, you must define the join type for the metric used as an input for thepredictive metric to be an outer join. For example, the predictive metric is planned toforecast values for one year in the future. Since this future year is not represented in
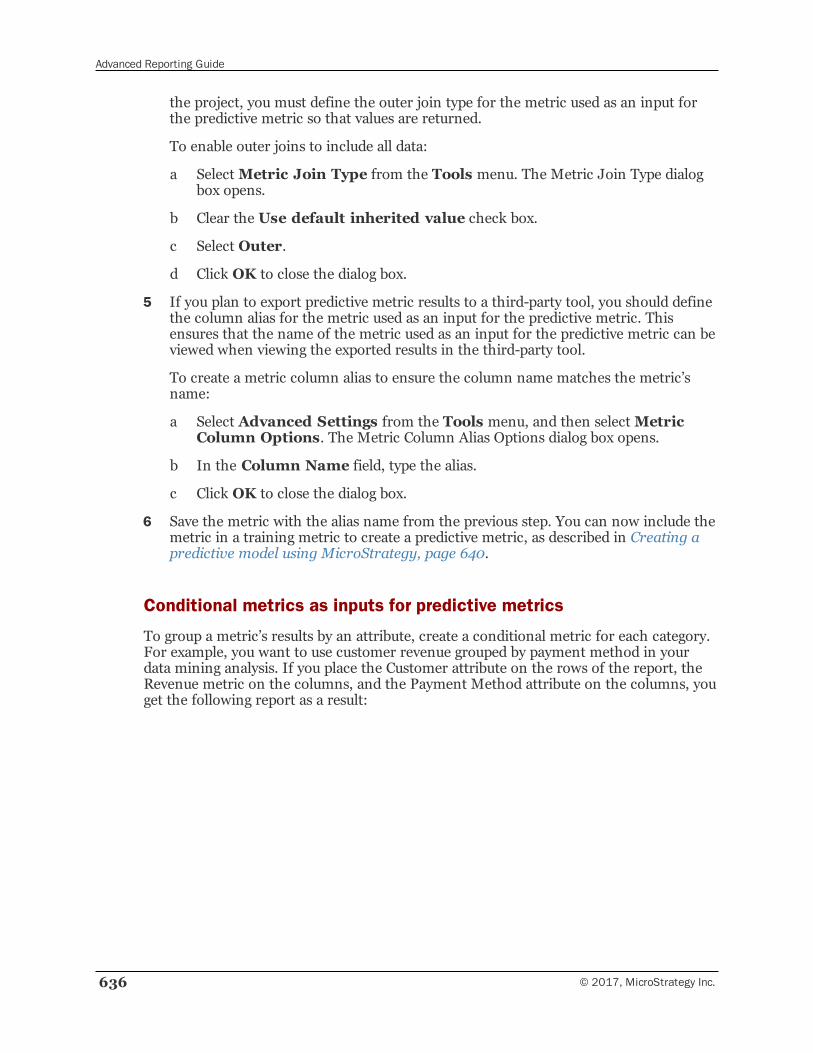
Advanced Reporting Guide
636 © 2017, MicroStrategy Inc.
the project, you must define the outer join type for the metric used as an input forthe predictive metric so that values are returned.
To enable outer joins to include all data:
a SelectMetric Join Type from the Tools menu. The Metric Join Type dialogbox opens.
b Clear the Use default inherited value check box.
c Select Outer.
d Click OK to close the dialog box.
5 If you plan to export predictive metric results to a third-party tool, you should definethe column alias for the metric used as an input for the predictive metric. Thisensures that the name of the metric used as an input for the predictive metric can beviewed when viewing the exported results in the third-party tool.
To create a metric column alias to ensure the column name matches the metric’sname:
a Select Advanced Settings from the Tools menu, and then selectMetricColumn Options. The Metric Column Alias Options dialog box opens.
b In the Column Name field, type the alias.
c Click OK to close the dialog box.
6 Save the metric with the alias name from the previous step. You can now include themetric in a training metric to create a predictive metric, as described in Creating apredictive model using MicroStrategy, page 640.
Conditional metrics as inputs for predictive metrics
To group a metric’s results by an attribute, create a conditional metric for each category.For example, you want to use customer revenue grouped by payment method in yourdata mining analysis. If you place the Customer attribute on the rows of the report, theRevenue metric on the columns, and the Payment Method attribute on the columns, youget the following report as a result:
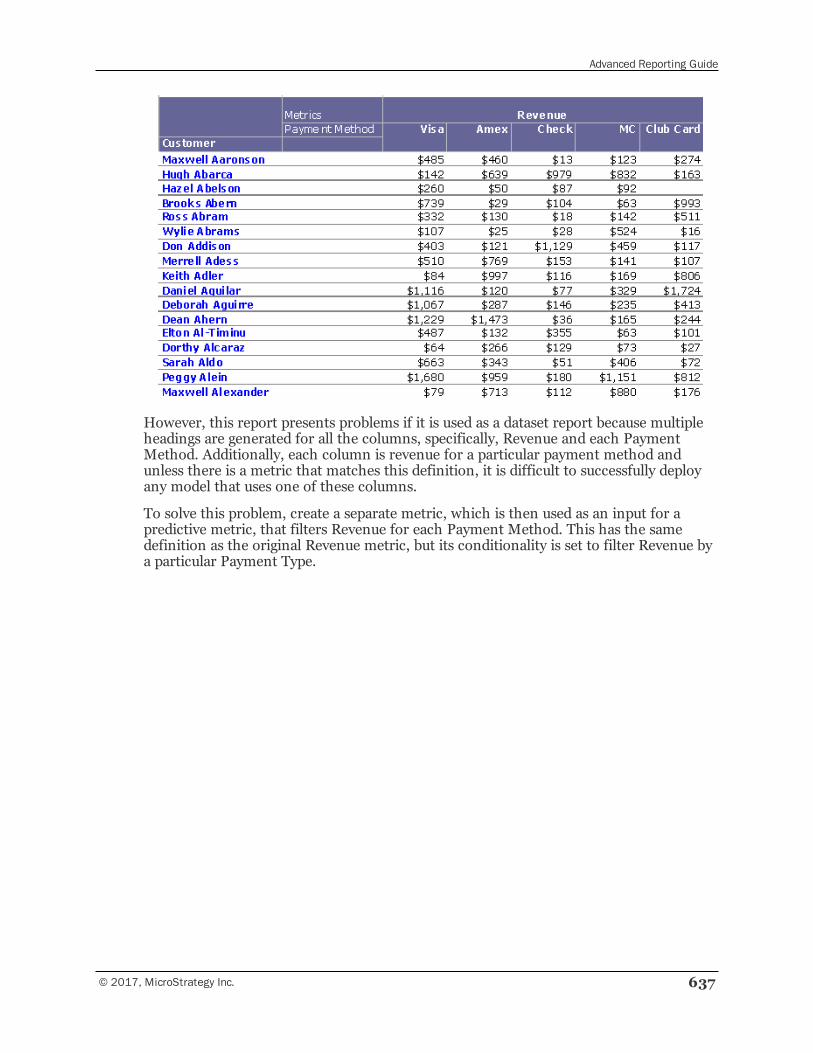
Advanced Reporting Guide
© 2017, MicroStrategy Inc. 637
However, this report presents problems if it is used as a dataset report because multipleheadings are generated for all the columns, specifically, Revenue and each PaymentMethod. Additionally, each column is revenue for a particular payment method andunless there is a metric that matches this definition, it is difficult to successfully deployany model that uses one of these columns.
To solve this problem, create a separate metric, which is then used as an input for apredictive metric, that filters Revenue for each Payment Method. This has the samedefinition as the original Revenue metric, but its conditionality is set to filter Revenue bya particular Payment Type.
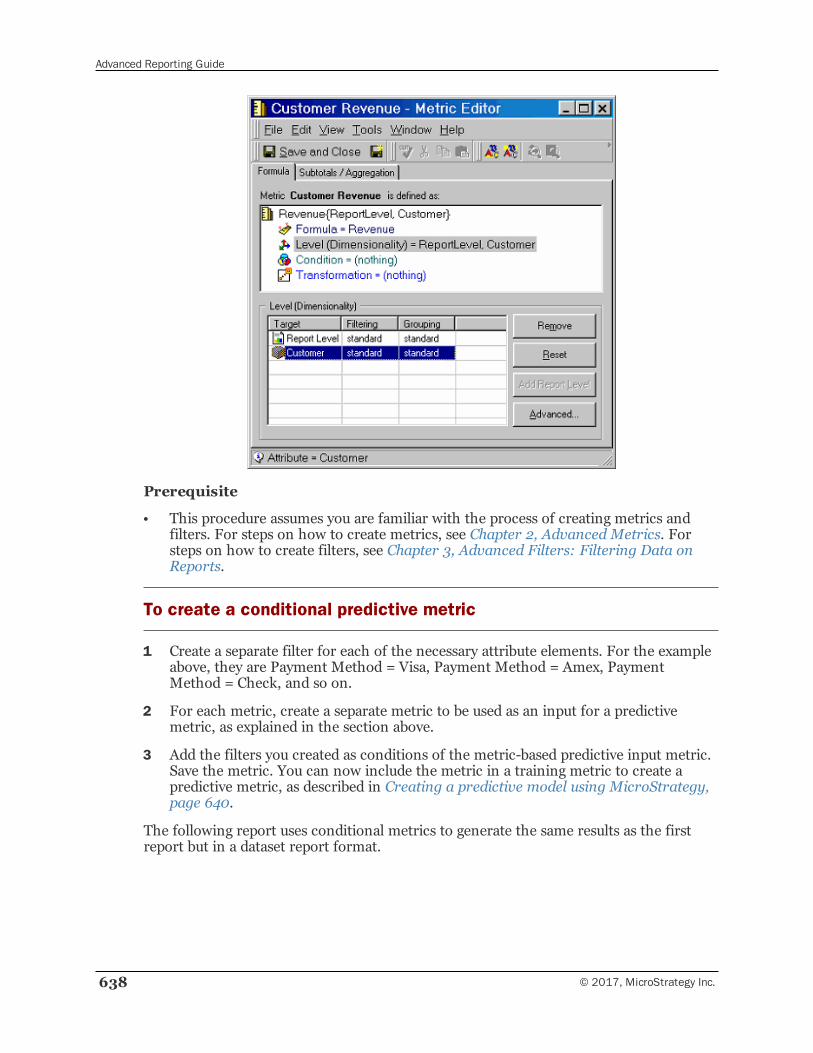
Advanced Reporting Guide
638 © 2017, MicroStrategy Inc.
Prerequisite
• This procedure assumes you are familiar with the process of creating metrics andfilters. For steps on how to create metrics, see Chapter 2, Advanced Metrics. Forsteps on how to create filters, see Chapter 3, Advanced Filters: Filtering Data onReports.
To create a conditional predictive metric
1 Create a separate filter for each of the necessary attribute elements. For the exampleabove, they are Payment Method = Visa, Payment Method = Amex, PaymentMethod = Check, and so on.
2 For each metric, create a separate metric to be used as an input for a predictivemetric, as explained in the section above.
3 Add the filters you created as conditions of the metric-based predictive input metric.Save the metric. You can now include the metric in a training metric to create apredictive metric, as described in Creating a predictive model using MicroStrategy,page 640.
The following report uses conditional metrics to generate the same results as the firstreport but in a dataset report format.
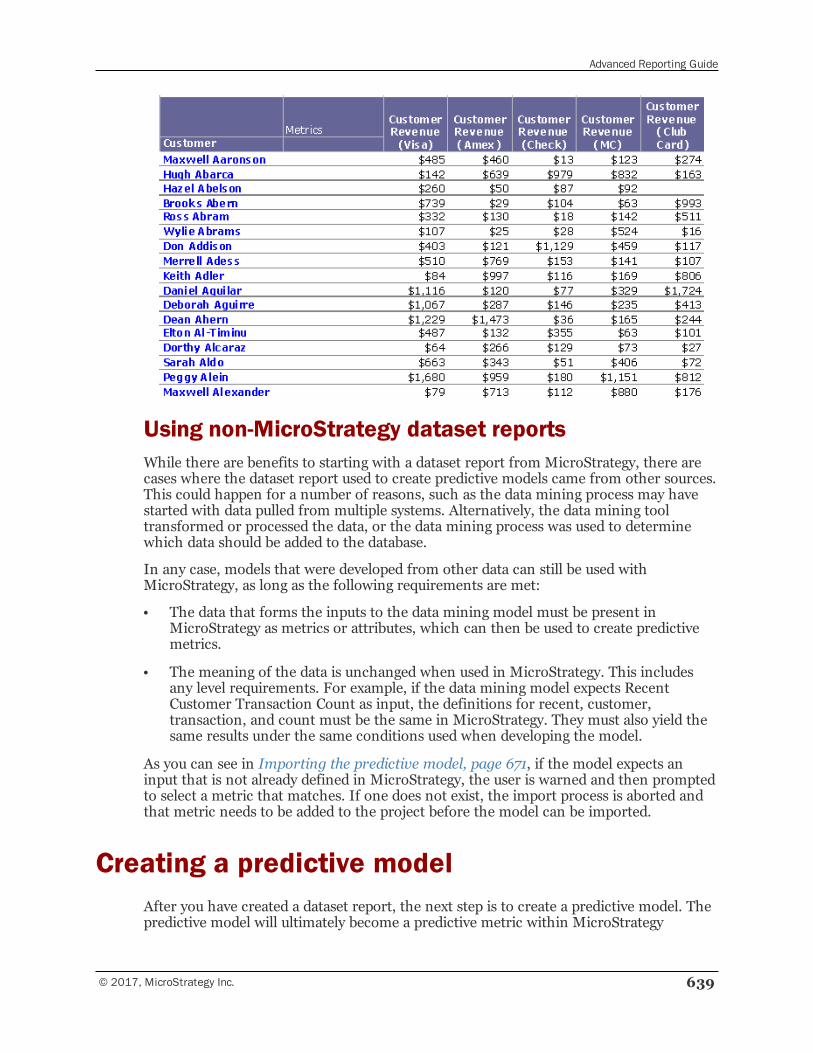
Advanced Reporting Guide
© 2017, MicroStrategy Inc. 639
Using non-MicroStrategy dataset reportsWhile there are benefits to starting with a dataset report from MicroStrategy, there arecases where the dataset report used to create predictive models came from other sources.This could happen for a number of reasons, such as the data mining process may havestarted with data pulled from multiple systems. Alternatively, the data mining tooltransformed or processed the data, or the data mining process was used to determinewhich data should be added to the database.
In any case, models that were developed from other data can still be used withMicroStrategy, as long as the following requirements are met:
• The data that forms the inputs to the data mining model must be present inMicroStrategy as metrics or attributes, which can then be used to create predictivemetrics.
• The meaning of the data is unchanged when used in MicroStrategy. This includesany level requirements. For example, if the data mining model expects RecentCustomer Transaction Count as input, the definitions for recent, customer,transaction, and count must be the same in MicroStrategy. They must also yield thesame results under the same conditions used when developing the model.
As you can see in Importing the predictive model, page 671, if the model expects aninput that is not already defined in MicroStrategy, the user is warned and then promptedto select a metric that matches. If one does not exist, the import process is aborted andthat metric needs to be added to the project before the model can be imported.
Creating a predictive modelAfter you have created a dataset report, the next step is to create a predictive model. Thepredictive model will ultimately become a predictive metric within MicroStrategy
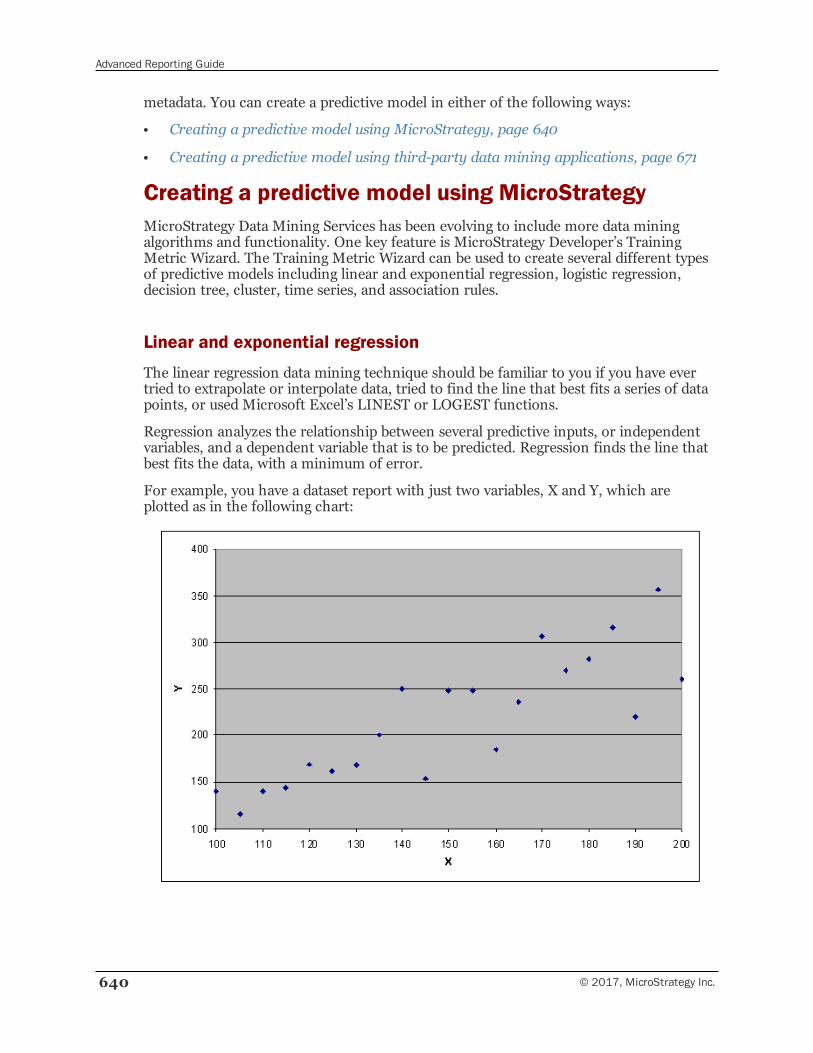
Advanced Reporting Guide
640 © 2017, MicroStrategy Inc.
metadata. You can create a predictive model in either of the following ways:
• Creating a predictive model using MicroStrategy, page 640
• Creating a predictive model using third-party data mining applications, page 671
Creating a predictive model using MicroStrategyMicroStrategy Data Mining Services has been evolving to include more data miningalgorithms and functionality. One key feature is MicroStrategy Developer’s TrainingMetric Wizard. The Training Metric Wizard can be used to create several different typesof predictive models including linear and exponential regression, logistic regression,decision tree, cluster, time series, and association rules.
Linear and exponential regression
The linear regression data mining technique should be familiar to you if you have evertried to extrapolate or interpolate data, tried to find the line that best fits a series of datapoints, or used Microsoft Excel’s LINEST or LOGEST functions.
Regression analyzes the relationship between several predictive inputs, or independentvariables, and a dependent variable that is to be predicted. Regression finds the line thatbest fits the data, with a minimum of error.
For example, you have a dataset report with just two variables, X and Y, which areplotted as in the following chart:
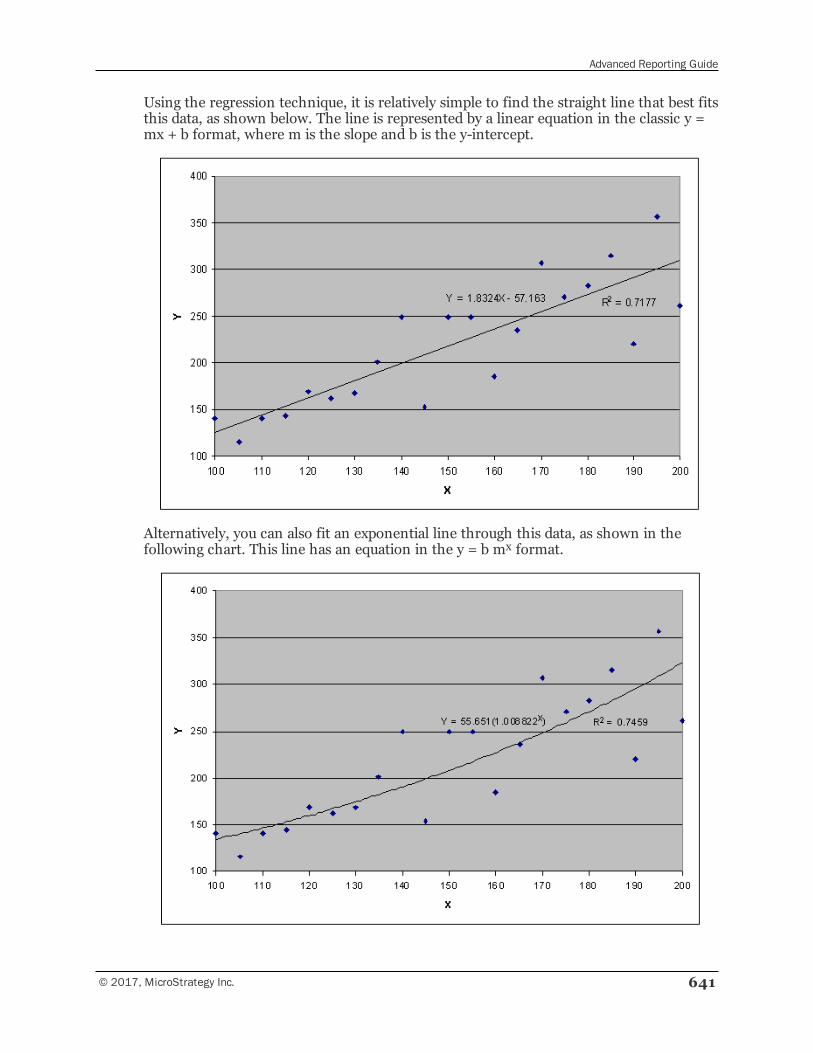
Advanced Reporting Guide
© 2017, MicroStrategy Inc. 641
Using the regression technique, it is relatively simple to find the straight line that best fitsthis data, as shown below. The line is represented by a linear equation in the classic y =mx + b format, where m is the slope and b is the y-intercept.
Alternatively, you can also fit an exponential line through this data, as shown in thefollowing chart. This line has an equation in the y = b mx format.
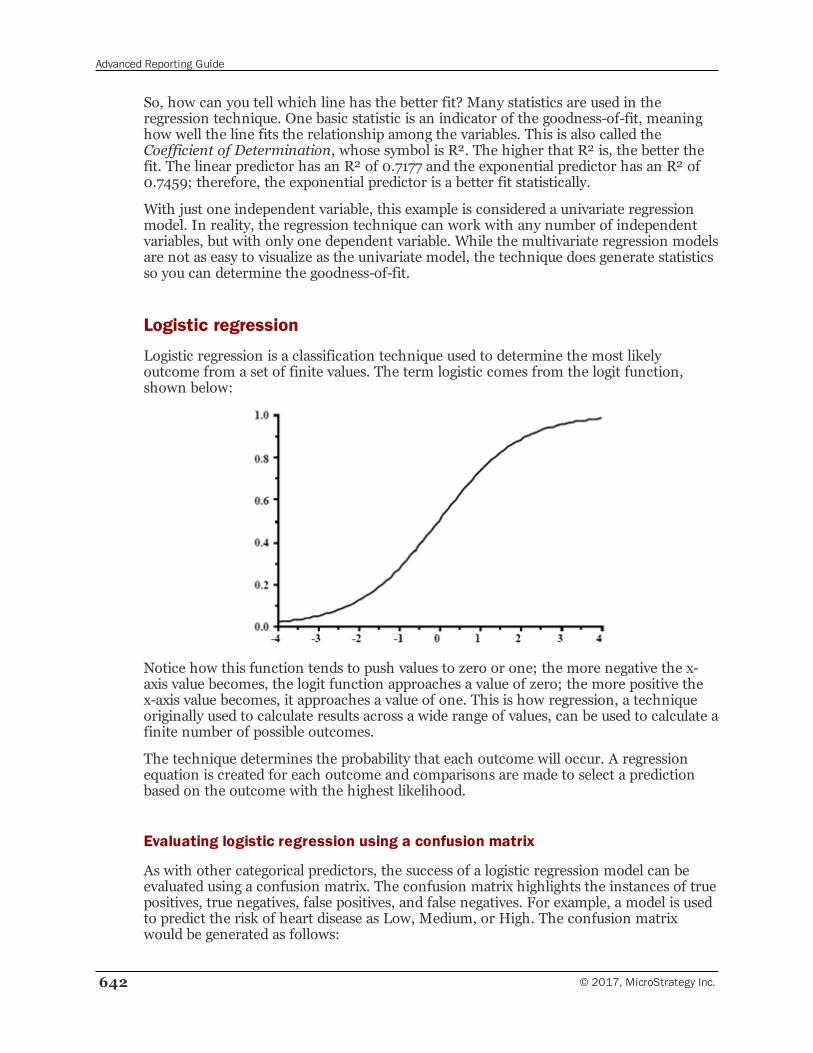
Advanced Reporting Guide
642 © 2017, MicroStrategy Inc.
So, how can you tell which line has the better fit? Many statistics are used in theregression technique. One basic statistic is an indicator of the goodness-of-fit, meaninghow well the line fits the relationship among the variables. This is also called theCoefficient of Determination, whose symbol is R2. The higher that R2 is, the better thefit. The linear predictor has an R2 of 0.7177 and the exponential predictor has an R2 of0.7459; therefore, the exponential predictor is a better fit statistically.
With just one independent variable, this example is considered a univariate regressionmodel. In reality, the regression technique can work with any number of independentvariables, but with only one dependent variable. While the multivariate regression modelsare not as easy to visualize as the univariate model, the technique does generate statisticsso you can determine the goodness-of-fit.
Logistic regression
Logistic regression is a classification technique used to determine the most likelyoutcome from a set of finite values. The term logistic comes from the logit function,shown below:
Notice how this function tends to push values to zero or one; the more negative the x-axis value becomes, the logit function approaches a value of zero; the more positive thex-axis value becomes, it approaches a value of one. This is how regression, a techniqueoriginally used to calculate results across a wide range of values, can be used to calculate afinite number of possible outcomes.
The technique determines the probability that each outcome will occur. A regressionequation is created for each outcome and comparisons are made to select a predictionbased on the outcome with the highest likelihood.
Evaluating logistic regression using a confusion matrix
As with other categorical predictors, the success of a logistic regression model can beevaluated using a confusion matrix. The confusion matrix highlights the instances of truepositives, true negatives, false positives, and false negatives. For example, a model is usedto predict the risk of heart disease as Low, Medium, or High. The confusion matrixwould be generated as follows:
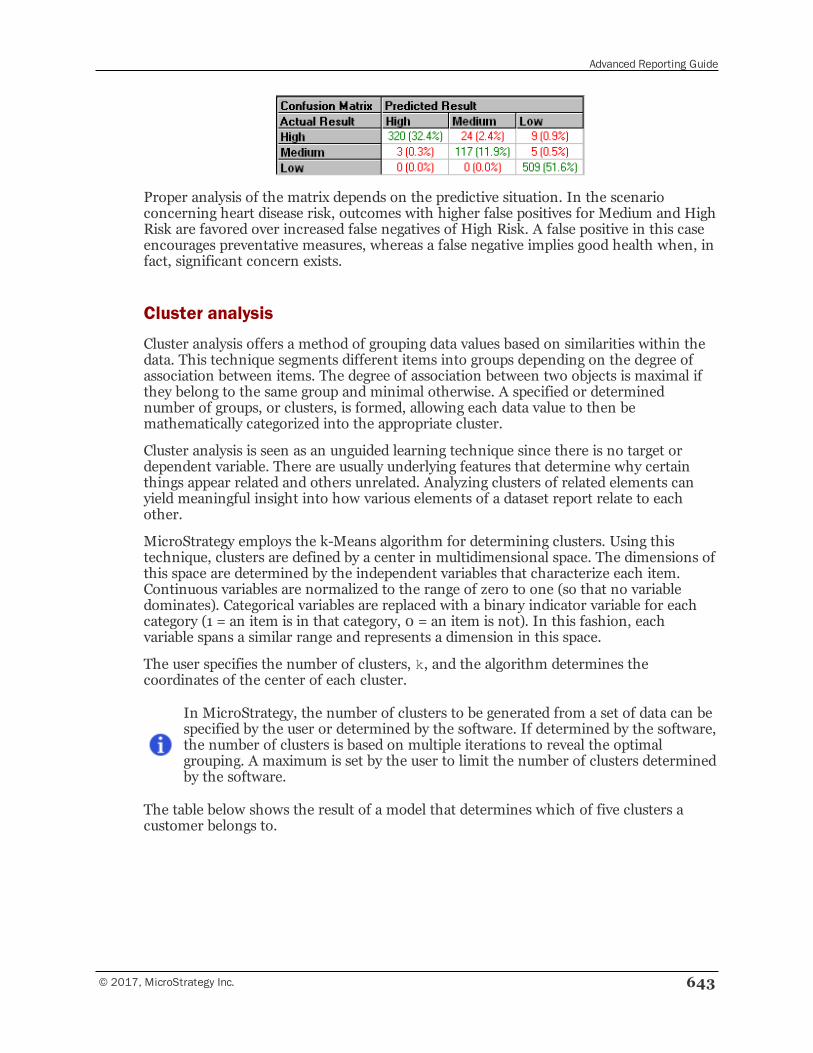
Advanced Reporting Guide
© 2017, MicroStrategy Inc. 643
Proper analysis of the matrix depends on the predictive situation. In the scenarioconcerning heart disease risk, outcomes with higher false positives for Medium and HighRisk are favored over increased false negatives of High Risk. A false positive in this caseencourages preventative measures, whereas a false negative implies good health when, infact, significant concern exists.
Cluster analysis
Cluster analysis offers a method of grouping data values based on similarities within thedata. This technique segments different items into groups depending on the degree ofassociation between items. The degree of association between two objects is maximal ifthey belong to the same group and minimal otherwise. A specified or determinednumber of groups, or clusters, is formed, allowing each data value to then bemathematically categorized into the appropriate cluster.
Cluster analysis is seen as an unguided learning technique since there is no target ordependent variable. There are usually underlying features that determine why certainthings appear related and others unrelated. Analyzing clusters of related elements canyield meaningful insight into how various elements of a dataset report relate to eachother.
MicroStrategy employs the k-Means algorithm for determining clusters. Using thistechnique, clusters are defined by a center in multidimensional space. The dimensions ofthis space are determined by the independent variables that characterize each item.Continuous variables are normalized to the range of zero to one (so that no variabledominates). Categorical variables are replaced with a binary indicator variable for eachcategory (1 = an item is in that category, 0 = an item is not). In this fashion, eachvariable spans a similar range and represents a dimension in this space.
The user specifies the number of clusters, k, and the algorithm determines thecoordinates of the center of each cluster.
In MicroStrategy, the number of clusters to be generated from a set of data can bespecified by the user or determined by the software. If determined by the software,the number of clusters is based on multiple iterations to reveal the optimalgrouping. A maximum is set by the user to limit the number of clusters determinedby the software.
The table below shows the result of a model that determines which of five clusters acustomer belongs to.
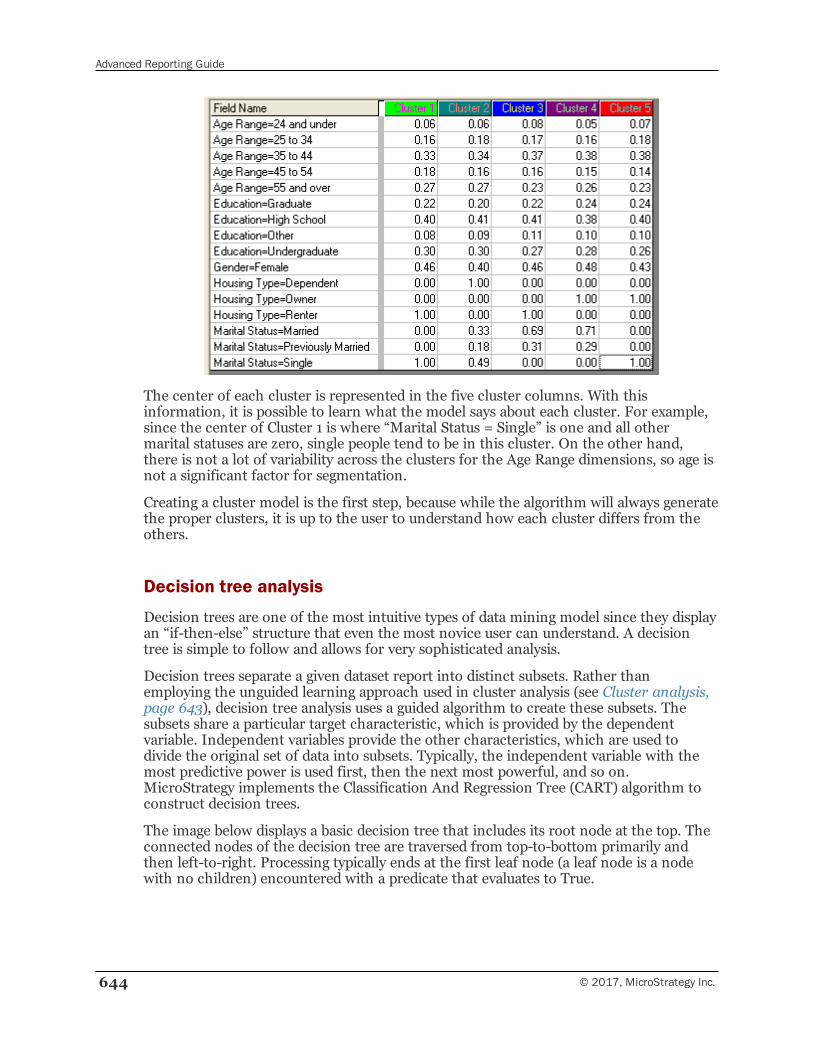
Advanced Reporting Guide
644 © 2017, MicroStrategy Inc.
The center of each cluster is represented in the five cluster columns. With thisinformation, it is possible to learn what the model says about each cluster. For example,since the center of Cluster 1 is where “Marital Status = Single” is one and all othermarital statuses are zero, single people tend to be in this cluster. On the other hand,there is not a lot of variability across the clusters for the Age Range dimensions, so age isnot a significant factor for segmentation.
Creating a cluster model is the first step, because while the algorithm will always generatethe proper clusters, it is up to the user to understand how each cluster differs from theothers.
Decision tree analysis
Decision trees are one of the most intuitive types of data mining model since they displayan “if-then-else” structure that even the most novice user can understand. A decisiontree is simple to follow and allows for very sophisticated analysis.
Decision trees separate a given dataset report into distinct subsets. Rather thanemploying the unguided learning approach used in cluster analysis (see Cluster analysis,page 643), decision tree analysis uses a guided algorithm to create these subsets. Thesubsets share a particular target characteristic, which is provided by the dependentvariable. Independent variables provide the other characteristics, which are used todivide the original set of data into subsets. Typically, the independent variable with themost predictive power is used first, then the next most powerful, and so on.MicroStrategy implements the Classification And Regression Tree (CART) algorithm toconstruct decision trees.
The image below displays a basic decision tree that includes its root node at the top. Theconnected nodes of the decision tree are traversed from top-to-bottom primarily andthen left-to-right. Processing typically ends at the first leaf node (a leaf node is a nodewith no children) encountered with a predicate that evaluates to True.
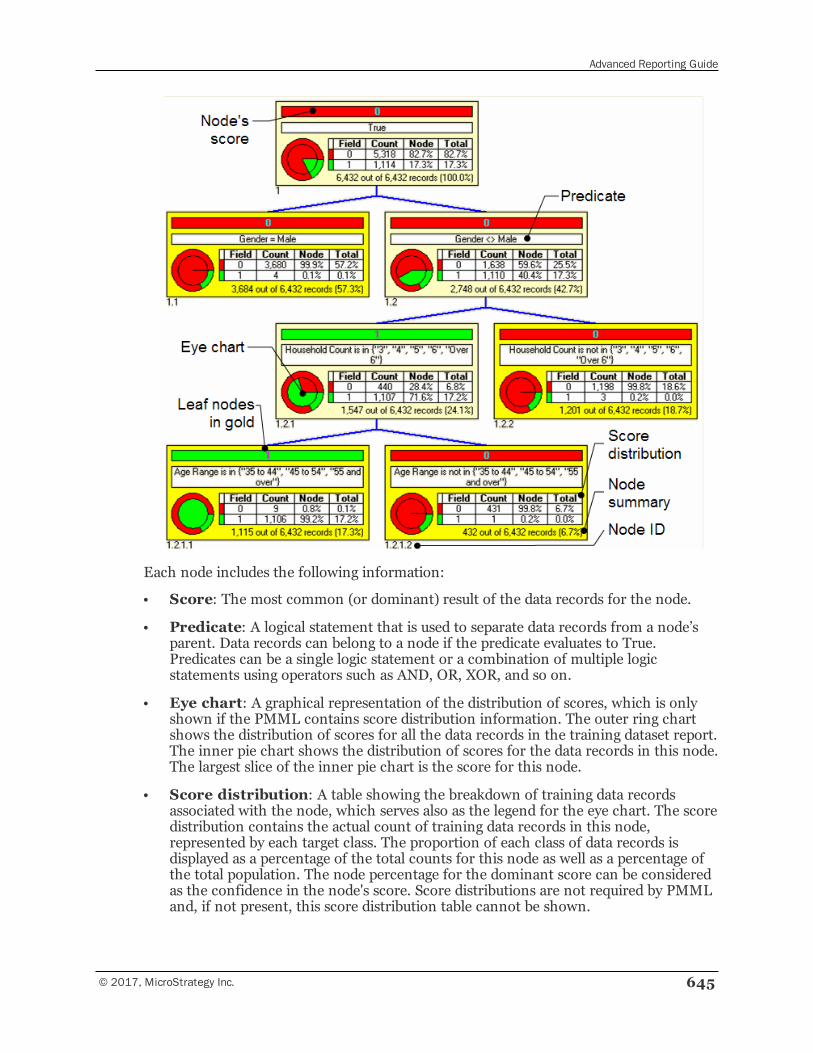
Advanced Reporting Guide
© 2017, MicroStrategy Inc. 645
Each node includes the following information:
• Score: The most common (or dominant) result of the data records for the node.
• Predicate: A logical statement that is used to separate data records from a node’sparent. Data records can belong to a node if the predicate evaluates to True.Predicates can be a single logic statement or a combination of multiple logicstatements using operators such as AND, OR, XOR, and so on.
• Eye chart: A graphical representation of the distribution of scores, which is onlyshown if the PMML contains score distribution information. The outer ring chartshows the distribution of scores for all the data records in the training dataset report.The inner pie chart shows the distribution of scores for the data records in this node.The largest slice of the inner pie chart is the score for this node.
• Score distribution: A table showing the breakdown of training data recordsassociated with the node, which serves also as the legend for the eye chart. The scoredistribution contains the actual count of training data records in this node,represented by each target class. The proportion of each class of data records isdisplayed as a percentage of the total counts for this node as well as a percentage ofthe total population. The node percentage for the dominant score can be consideredas the confidence in the node's score. Score distributions are not required by PMMLand, if not present, this score distribution table cannot be shown.
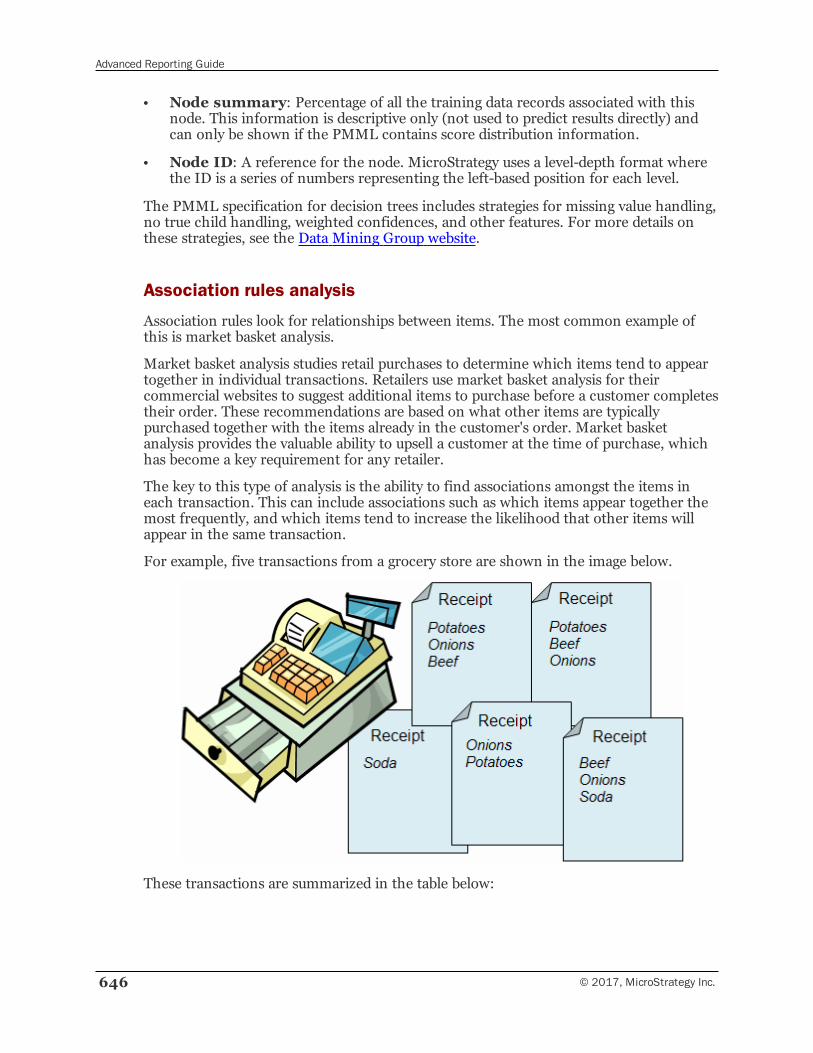
Advanced Reporting Guide
646 © 2017, MicroStrategy Inc.
• Node summary: Percentage of all the training data records associated with thisnode. This information is descriptive only (not used to predict results directly) andcan only be shown if the PMML contains score distribution information.
• Node ID: A reference for the node. MicroStrategy uses a level-depth format wherethe ID is a series of numbers representing the left-based position for each level.
The PMML specification for decision trees includes strategies for missing value handling,no true child handling, weighted confidences, and other features. For more details onthese strategies, see the Data Mining Group website.
Association rules analysis
Association rules look for relationships between items. The most common example ofthis is market basket analysis.
Market basket analysis studies retail purchases to determine which items tend to appeartogether in individual transactions. Retailers use market basket analysis for theircommercial websites to suggest additional items to purchase before a customer completestheir order. These recommendations are based on what other items are typicallypurchased together with the items already in the customer's order. Market basketanalysis provides the valuable ability to upsell a customer at the time of purchase, whichhas become a key requirement for any retailer.
The key to this type of analysis is the ability to find associations amongst the items ineach transaction. This can include associations such as which items appear together themost frequently, and which items tend to increase the likelihood that other items willappear in the same transaction.
For example, five transactions from a grocery store are shown in the image below.
These transactions are summarized in the table below:
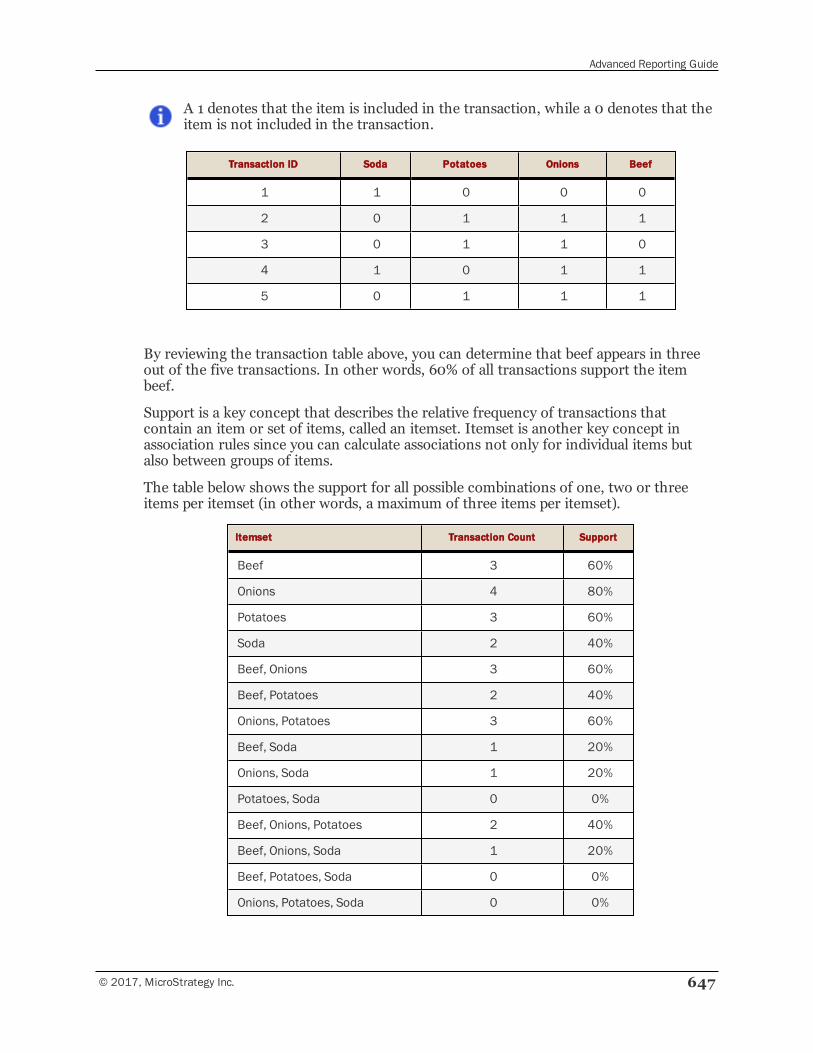
Advanced Reporting Guide
© 2017, MicroStrategy Inc. 647
A 1 denotes that the item is included in the transaction, while a 0 denotes that theitem is not included in the transaction.
Transaction ID Soda Potatoes Onions Beef
1 1 0 0 0
2 0 1 1 1
3 0 1 1 0
4 1 0 1 1
5 0 1 1 1
By reviewing the transaction table above, you can determine that beef appears in threeout of the five transactions. In other words, 60% of all transactions support the itembeef.
Support is a key concept that describes the relative frequency of transactions thatcontain an item or set of items, called an itemset. Itemset is another key concept inassociation rules since you can calculate associations not only for individual items butalso between groups of items.
The table below shows the support for all possible combinations of one, two or threeitems per itemset (in other words, a maximum of three items per itemset).
Itemset Transaction Count Support
Beef 3 60%
Onions 4 80%
Potatoes 3 60%
Soda 2 40%
Beef, Onions 3 60%
Beef, Potatoes 2 40%
Onions, Potatoes 3 60%
Beef, Soda 1 20%
Onions, Soda 1 20%
Potatoes, Soda 0 0%
Beef, Onions, Potatoes 2 40%
Beef, Onions, Soda 1 20%
Beef, Potatoes, Soda 0 0%
Onions, Potatoes, Soda 0 0%
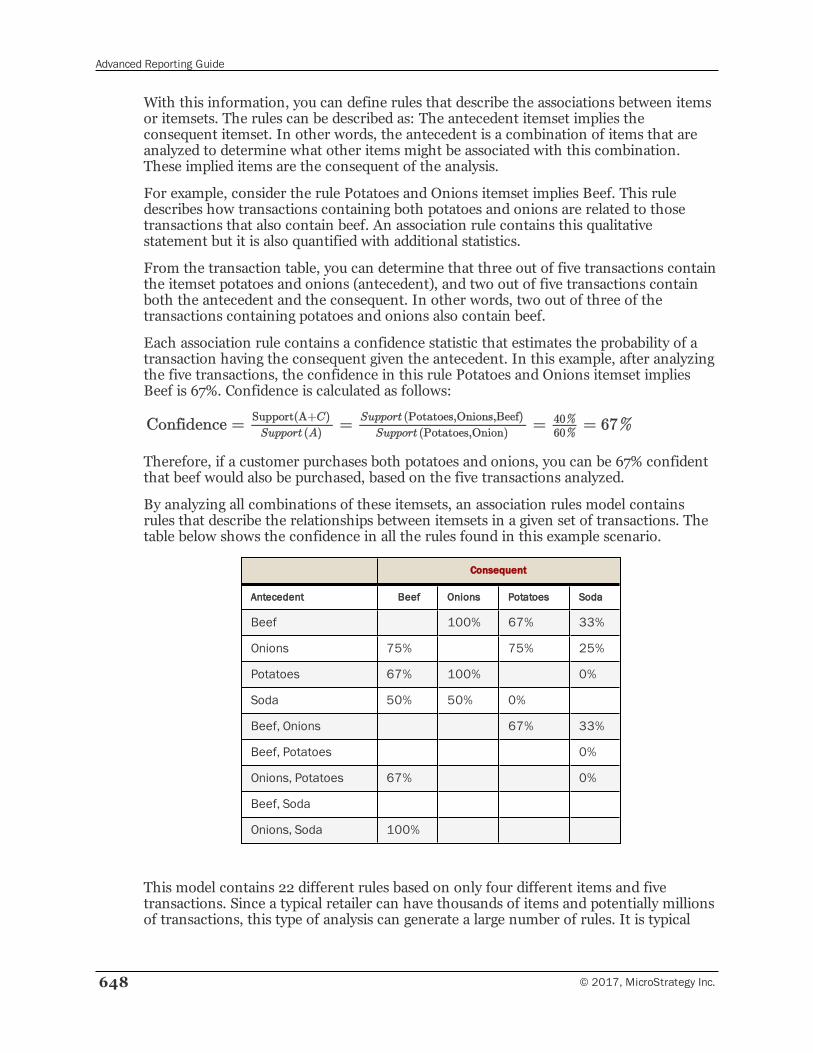
Advanced Reporting Guide
648 © 2017, MicroStrategy Inc.
With this information, you can define rules that describe the associations between itemsor itemsets. The rules can be described as: The antecedent itemset implies theconsequent itemset. In other words, the antecedent is a combination of items that areanalyzed to determine what other items might be associated with this combination.These implied items are the consequent of the analysis.
For example, consider the rule Potatoes and Onions itemset implies Beef. This ruledescribes how transactions containing both potatoes and onions are related to thosetransactions that also contain beef. An association rule contains this qualitativestatement but it is also quantified with additional statistics.
From the transaction table, you can determine that three out of five transactions containthe itemset potatoes and onions (antecedent), and two out of five transactions containboth the antecedent and the consequent. In other words, two out of three of thetransactions containing potatoes and onions also contain beef.
Each association rule contains a confidence statistic that estimates the probability of atransaction having the consequent given the antecedent. In this example, after analyzingthe five transactions, the confidence in this rule Potatoes and Onions itemset impliesBeef is 67%. Confidence is calculated as follows:
Therefore, if a customer purchases both potatoes and onions, you can be 67% confidentthat beef would also be purchased, based on the five transactions analyzed.
By analyzing all combinations of these itemsets, an association rules model containsrules that describe the relationships between itemsets in a given set of transactions. Thetable below shows the confidence in all the rules found in this example scenario.
Consequent
Antecedent Beef Onions Potatoes Soda
Beef 100% 67% 33%
Onions 75% 75% 25%
Potatoes 67% 100% 0%
Soda 50% 50% 0%
Beef, Onions 67% 33%
Beef, Potatoes 0%
Onions, Potatoes 67% 0%
Beef, Soda
Onions, Soda 100%
This model contains 22 different rules based on only four different items and fivetransactions. Since a typical retailer can have thousands of items and potentially millionsof transactions, this type of analysis can generate a large number of rules. It is typical
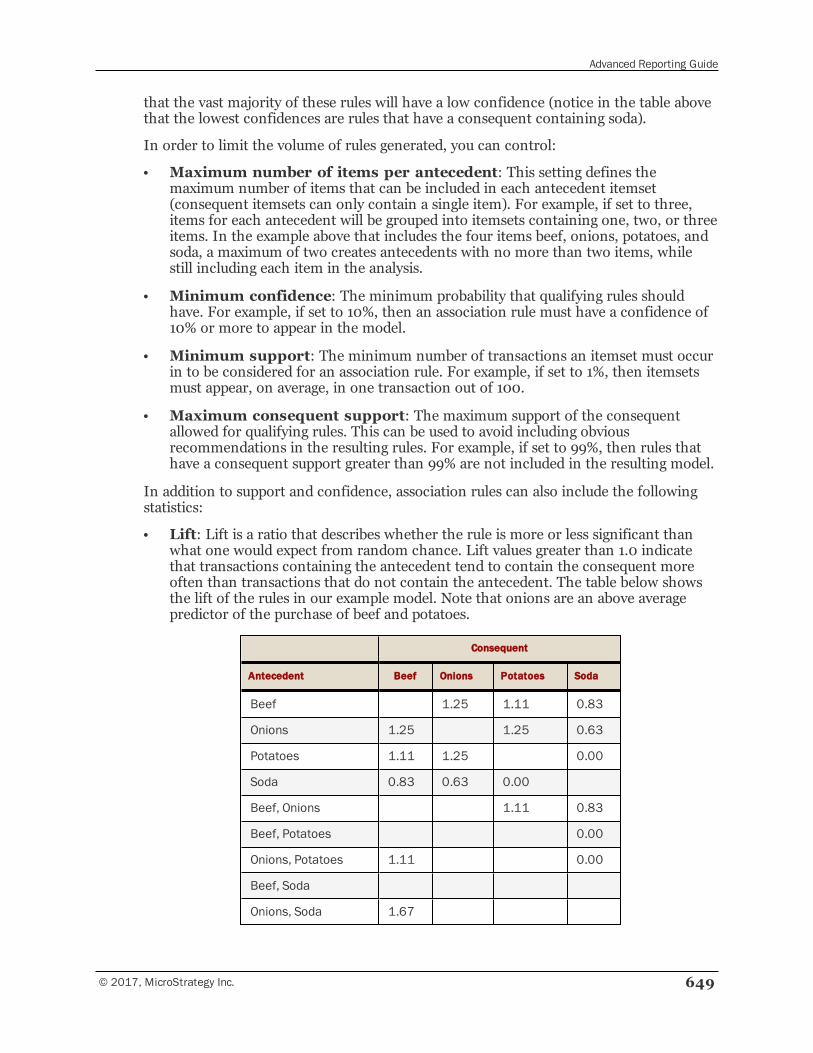
Advanced Reporting Guide
© 2017, MicroStrategy Inc. 649
that the vast majority of these rules will have a low confidence (notice in the table abovethat the lowest confidences are rules that have a consequent containing soda).
In order to limit the volume of rules generated, you can control:
• Maximum number of items per antecedent: This setting defines themaximum number of items that can be included in each antecedent itemset(consequent itemsets can only contain a single item). For example, if set to three,items for each antecedent will be grouped into itemsets containing one, two, or threeitems. In the example above that includes the four items beef, onions, potatoes, andsoda, a maximum of two creates antecedents with no more than two items, whilestill including each item in the analysis.
• Minimum confidence: The minimum probability that qualifying rules shouldhave. For example, if set to 10%, then an association rule must have a confidence of10% or more to appear in the model.
• Minimum support: The minimum number of transactions an itemset must occurin to be considered for an association rule. For example, if set to 1%, then itemsetsmust appear, on average, in one transaction out of 100.
• Maximum consequent support: The maximum support of the consequentallowed for qualifying rules. This can be used to avoid including obviousrecommendations in the resulting rules. For example, if set to 99%, then rules thathave a consequent support greater than 99% are not included in the resulting model.
In addition to support and confidence, association rules can also include the followingstatistics:
• Lift: Lift is a ratio that describes whether the rule is more or less significant thanwhat one would expect from random chance. Lift values greater than 1.0 indicatethat transactions containing the antecedent tend to contain the consequent moreoften than transactions that do not contain the antecedent. The table below showsthe lift of the rules in our example model. Note that onions are an above averagepredictor of the purchase of beef and potatoes.
Consequent
Antecedent Beef Onions Potatoes Soda
Beef 1.25 1.11 0.83
Onions 1.25 1.25 0.63
Potatoes 1.11 1.25 0.00
Soda 0.83 0.63 0.00
Beef, Onions 1.11 0.83
Beef, Potatoes 0.00
Onions, Potatoes 1.11 0.00
Beef, Soda
Onions, Soda 1.67
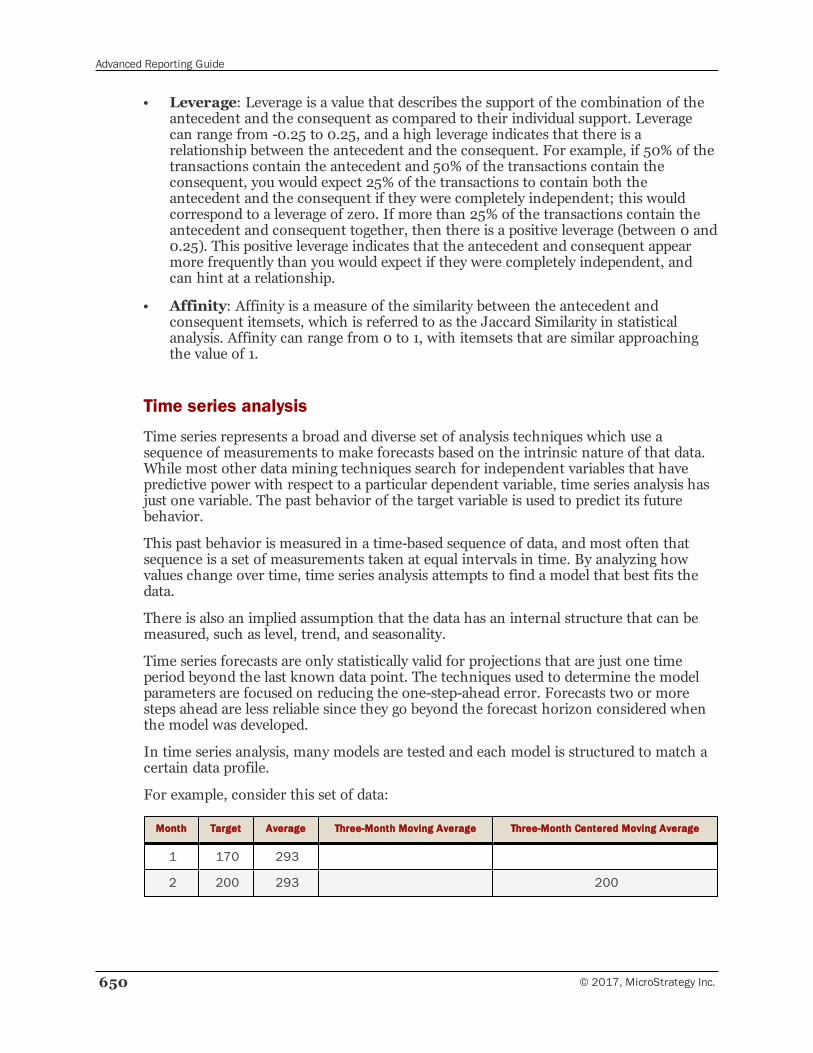
Advanced Reporting Guide
650 © 2017, MicroStrategy Inc.
• Leverage: Leverage is a value that describes the support of the combination of theantecedent and the consequent as compared to their individual support. Leveragecan range from -0.25 to 0.25, and a high leverage indicates that there is arelationship between the antecedent and the consequent. For example, if 50% of thetransactions contain the antecedent and 50% of the transactions contain theconsequent, you would expect 25% of the transactions to contain both theantecedent and the consequent if they were completely independent; this wouldcorrespond to a leverage of zero. If more than 25% of the transactions contain theantecedent and consequent together, then there is a positive leverage (between 0 and0.25). This positive leverage indicates that the antecedent and consequent appearmore frequently than you would expect if they were completely independent, andcan hint at a relationship.
• Affinity: Affinity is a measure of the similarity between the antecedent andconsequent itemsets, which is referred to as the Jaccard Similarity in statisticalanalysis. Affinity can range from 0 to 1, with itemsets that are similar approachingthe value of 1.
Time series analysis
Time series represents a broad and diverse set of analysis techniques which use asequence of measurements to make forecasts based on the intrinsic nature of that data.While most other data mining techniques search for independent variables that havepredictive power with respect to a particular dependent variable, time series analysis hasjust one variable. The past behavior of the target variable is used to predict its futurebehavior.
This past behavior is measured in a time-based sequence of data, and most often thatsequence is a set of measurements taken at equal intervals in time. By analyzing howvalues change over time, time series analysis attempts to find a model that best fits thedata.
There is also an implied assumption that the data has an internal structure that can bemeasured, such as level, trend, and seasonality.
Time series forecasts are only statistically valid for projections that are just one timeperiod beyond the last known data point. The techniques used to determine the modelparameters are focused on reducing the one-step-ahead error. Forecasts two or moresteps ahead are less reliable since they go beyond the forecast horizon considered whenthe model was developed.
In time series analysis, many models are tested and each model is structured to match acertain data profile.
For example, consider this set of data:
Month Target Average Three-Month Moving Average Three-Month Centered Moving Average
1 170 293
2 200 293 200
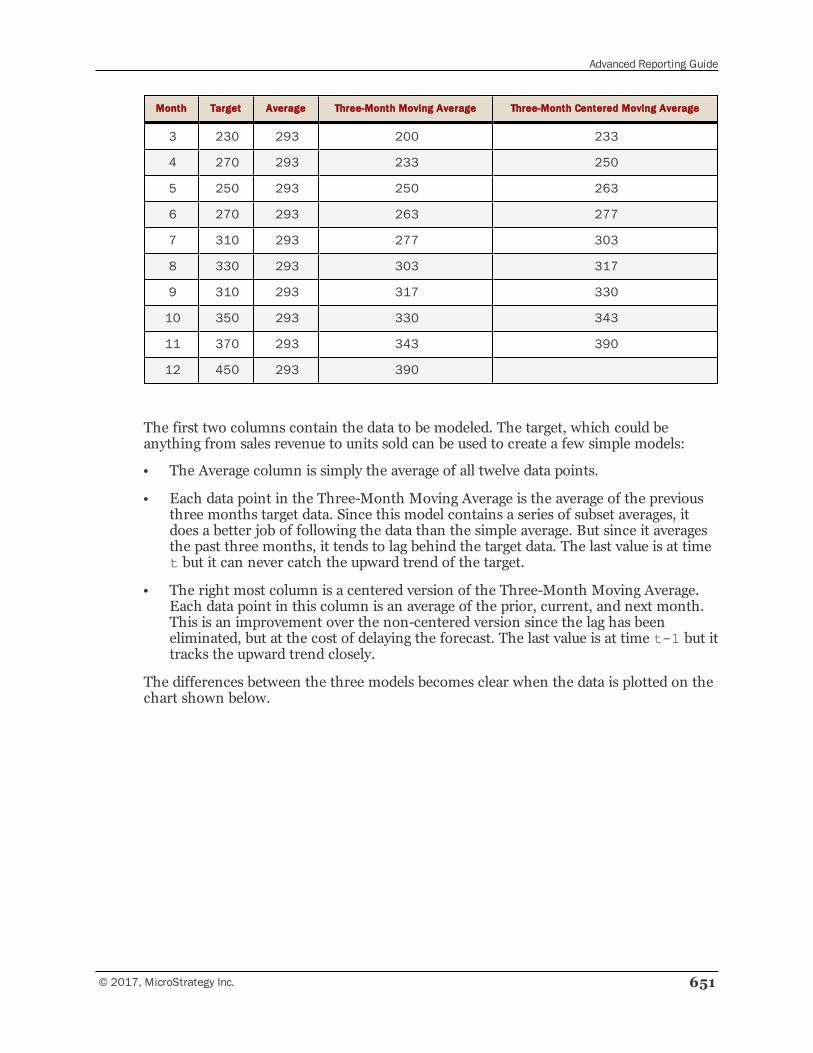
Advanced Reporting Guide
© 2017, MicroStrategy Inc. 651
Month Target Average Three-Month Moving Average Three-Month Centered Moving Average
3 230 293 200 233
4 270 293 233 250
5 250 293 250 263
6 270 293 263 277
7 310 293 277 303
8 330 293 303 317
9 310 293 317 330
10 350 293 330 343
11 370 293 343 390
12 450 293 390
The first two columns contain the data to be modeled. The target, which could beanything from sales revenue to units sold can be used to create a few simple models:
• The Average column is simply the average of all twelve data points.
• Each data point in the Three-Month Moving Average is the average of the previousthree months target data. Since this model contains a series of subset averages, itdoes a better job of following the data than the simple average. But since it averagesthe past three months, it tends to lag behind the target data. The last value is at timet but it can never catch the upward trend of the target.
• The right most column is a centered version of the Three-Month Moving Average.Each data point in this column is an average of the prior, current, and next month.This is an improvement over the non-centered version since the lag has beeneliminated, but at the cost of delaying the forecast. The last value is at time t-1 but ittracks the upward trend closely.
The differences between the three models becomes clear when the data is plotted on thechart shown below.
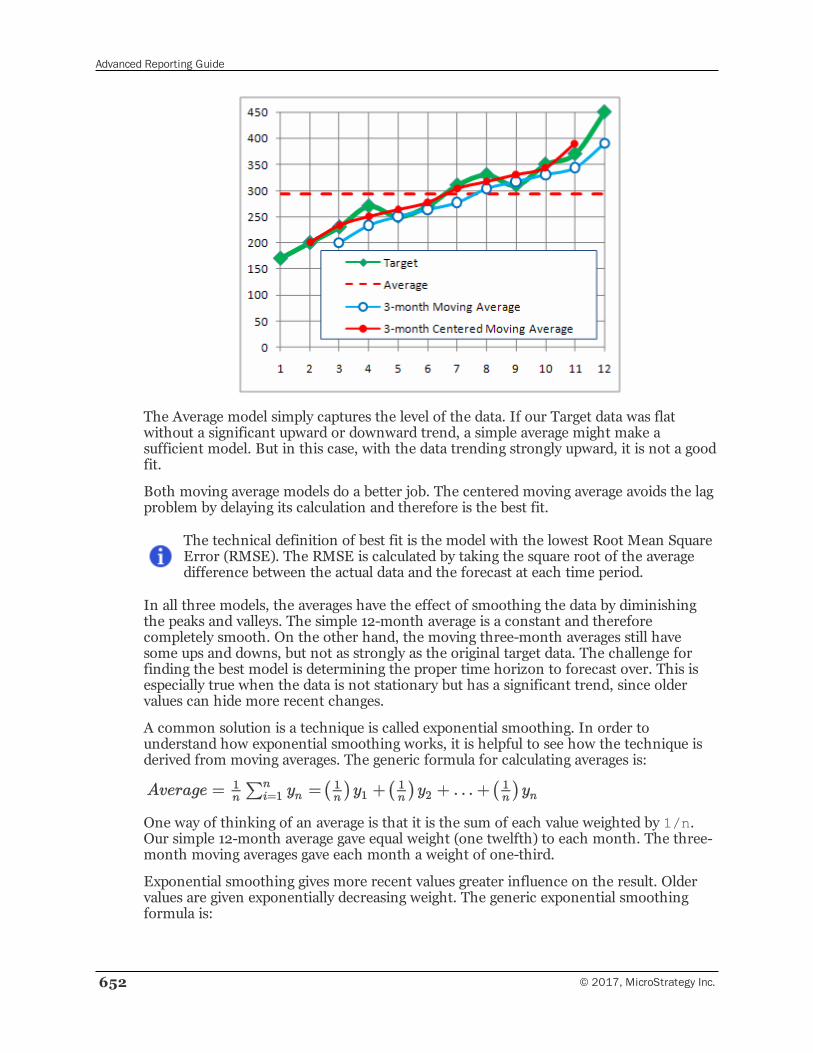
Advanced Reporting Guide
652 © 2017, MicroStrategy Inc.
The Average model simply captures the level of the data. If our Target data was flatwithout a significant upward or downward trend, a simple average might make asufficient model. But in this case, with the data trending strongly upward, it is not a goodfit.
Both moving average models do a better job. The centered moving average avoids the lagproblem by delaying its calculation and therefore is the best fit.
The technical definition of best fit is the model with the lowest Root Mean SquareError (RMSE). The RMSE is calculated by taking the square root of the averagedifference between the actual data and the forecast at each time period.
In all three models, the averages have the effect of smoothing the data by diminishingthe peaks and valleys. The simple 12-month average is a constant and thereforecompletely smooth. On the other hand, the moving three-month averages still havesome ups and downs, but not as strongly as the original target data. The challenge forfinding the best model is determining the proper time horizon to forecast over. This isespecially true when the data is not stationary but has a significant trend, since oldervalues can hide more recent changes.
A common solution is a technique is called exponential smoothing. In order tounderstand how exponential smoothing works, it is helpful to see how the technique isderived from moving averages. The generic formula for calculating averages is:
One way of thinking of an average is that it is the sum of each value weighted by 1/n.Our simple 12-month average gave equal weight (one twelfth) to each month. The three-month moving averages gave each month a weight of one-third.
Exponential smoothing gives more recent values greater influence on the result. Oldervalues are given exponentially decreasing weight. The generic exponential smoothingformula is:
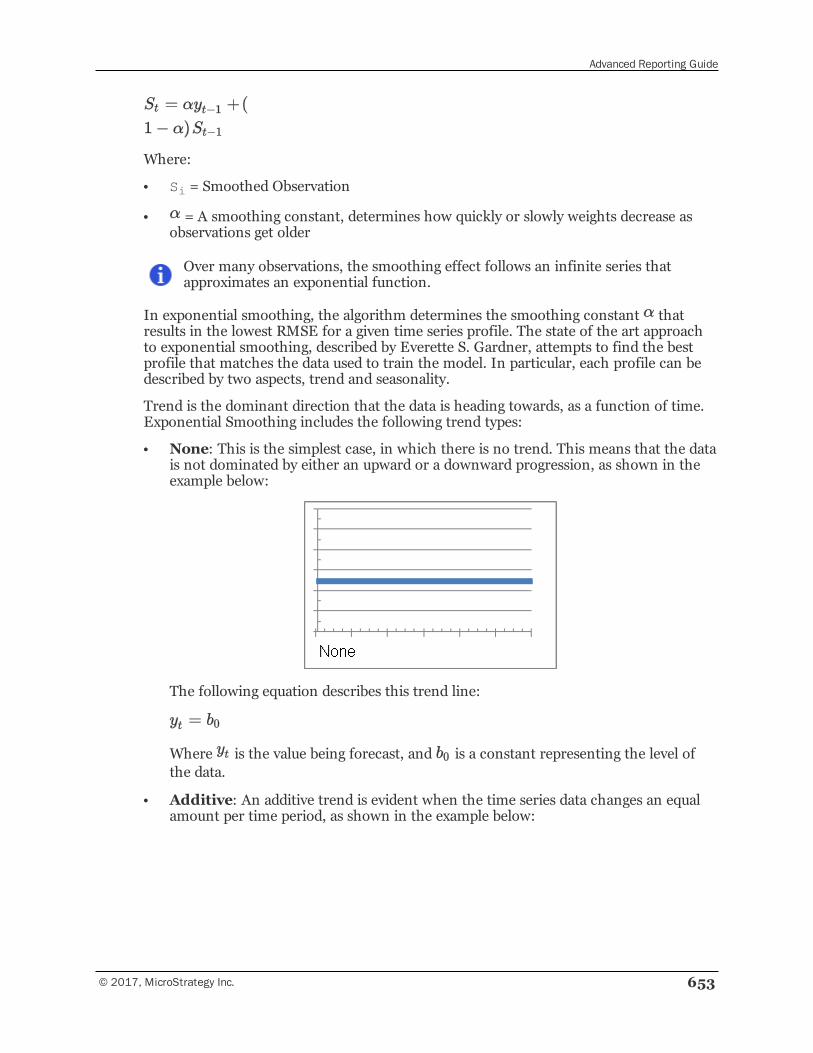
Advanced Reporting Guide
© 2017, MicroStrategy Inc. 653
Where:
• Si = Smoothed Observation
• = A smoothing constant, determines how quickly or slowly weights decrease asobservations get older
Over many observations, the smoothing effect follows an infinite series thatapproximates an exponential function.
In exponential smoothing, the algorithm determines the smoothing constant thatresults in the lowest RMSE for a given time series profile. The state of the art approachto exponential smoothing, described by Everette S. Gardner, attempts to find the bestprofile that matches the data used to train the model. In particular, each profile can bedescribed by two aspects, trend and seasonality.
Trend is the dominant direction that the data is heading towards, as a function of time.Exponential Smoothing includes the following trend types:
• None: This is the simplest case, in which there is no trend. This means that the datais not dominated by either an upward or a downward progression, as shown in theexample below:
The following equation describes this trend line:
Where is the value being forecast, and is a constant representing the level ofthe data.
• Additive: An additive trend is evident when the time series data changes an equalamount per time period, as shown in the example below:
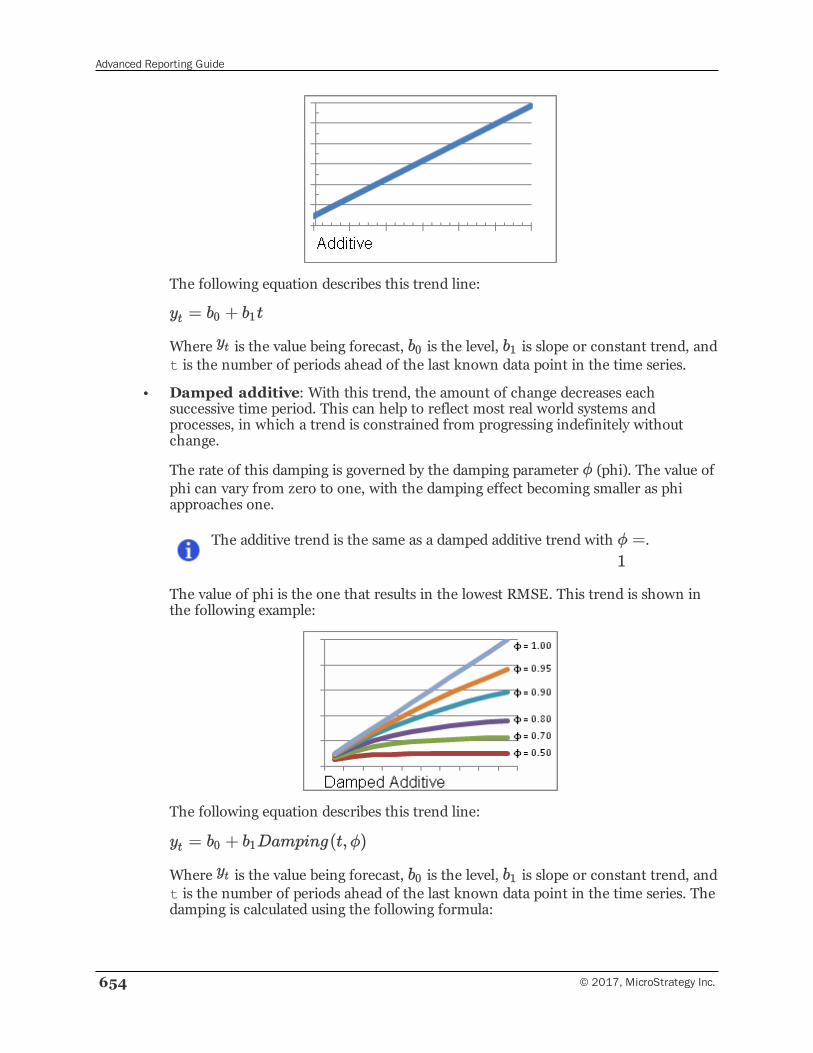
Advanced Reporting Guide
654 © 2017, MicroStrategy Inc.
The following equation describes this trend line:
Where is the value being forecast, is the level, is slope or constant trend, andt is the number of periods ahead of the last known data point in the time series.
• Damped additive: With this trend, the amount of change decreases eachsuccessive time period. This can help to reflect most real world systems andprocesses, in which a trend is constrained from progressing indefinitely withoutchange.
The rate of this damping is governed by the damping parameter (phi). The value ofphi can vary from zero to one, with the damping effect becoming smaller as phiapproaches one.
The additive trend is the same as a damped additive trend with .
The value of phi is the one that results in the lowest RMSE. This trend is shown inthe following example:
The following equation describes this trend line:
Where is the value being forecast, is the level, is slope or constant trend, andt is the number of periods ahead of the last known data point in the time series. Thedamping is calculated using the following formula:
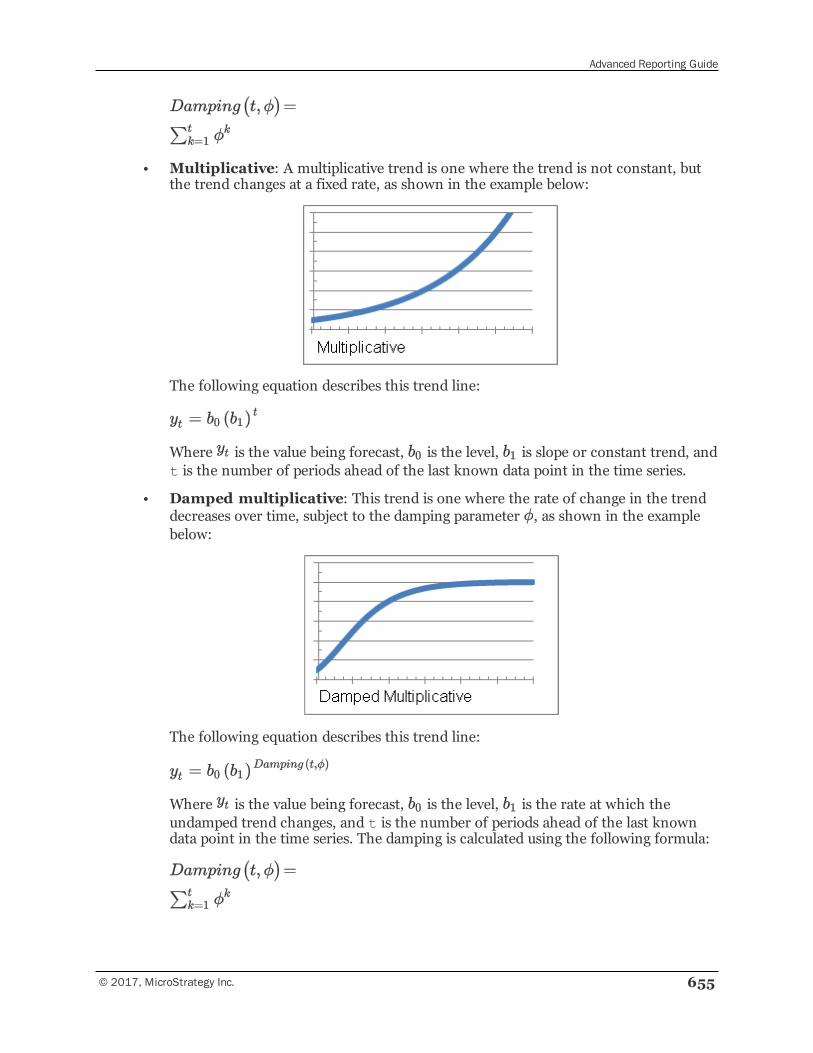
Advanced Reporting Guide
© 2017, MicroStrategy Inc. 655
• Multiplicative: A multiplicative trend is one where the trend is not constant, butthe trend changes at a fixed rate, as shown in the example below:
The following equation describes this trend line:
Where is the value being forecast, is the level, is slope or constant trend, andt is the number of periods ahead of the last known data point in the time series.
• Damped multiplicative: This trend is one where the rate of change in the trenddecreases over time, subject to the damping parameter , as shown in the examplebelow:
The following equation describes this trend line:
Where is the value being forecast, is the level, is the rate at which theundamped trend changes, and t is the number of periods ahead of the last knowndata point in the time series. The damping is calculated using the following formula:
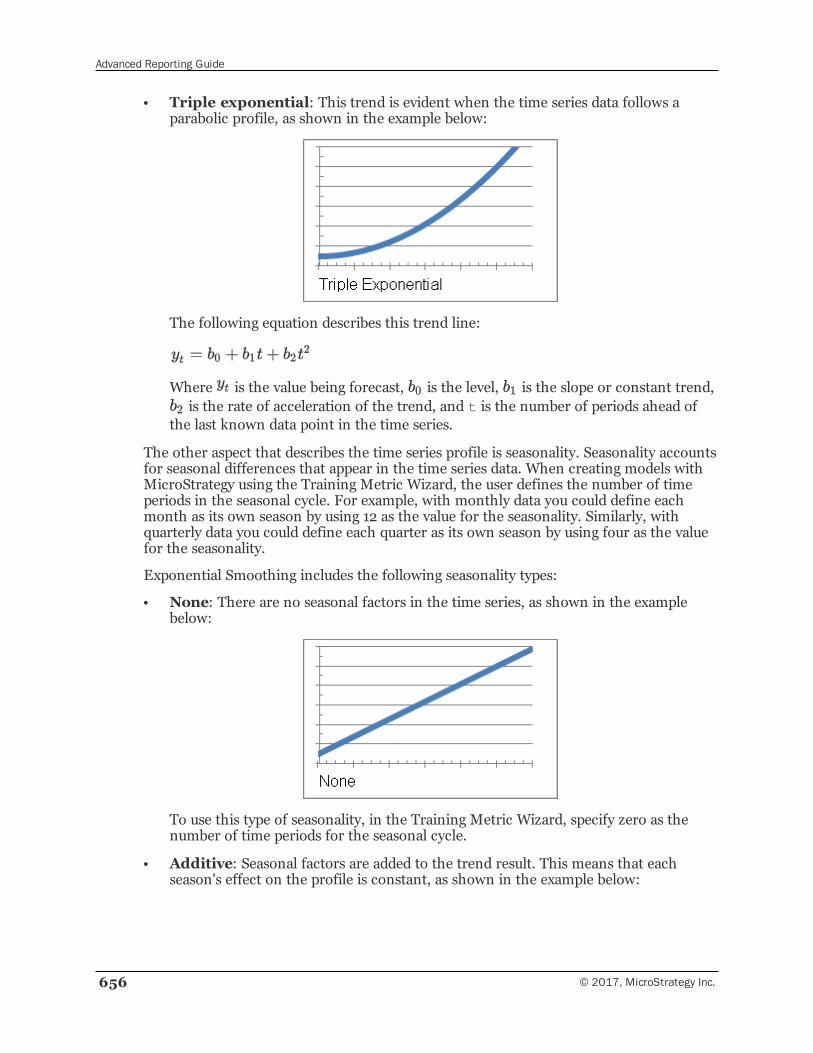
Advanced Reporting Guide
656 © 2017, MicroStrategy Inc.
• Triple exponential: This trend is evident when the time series data follows aparabolic profile, as shown in the example below:
The following equation describes this trend line:
Where is the value being forecast, is the level, is the slope or constant trend,is the rate of acceleration of the trend, and t is the number of periods ahead of
the last known data point in the time series.
The other aspect that describes the time series profile is seasonality. Seasonality accountsfor seasonal differences that appear in the time series data. When creating models withMicroStrategy using the Training Metric Wizard, the user defines the number of timeperiods in the seasonal cycle. For example, with monthly data you could define eachmonth as its own season by using 12 as the value for the seasonality. Similarly, withquarterly data you could define each quarter as its own season by using four as the valuefor the seasonality.
Exponential Smoothing includes the following seasonality types:
• None: There are no seasonal factors in the time series, as shown in the examplebelow:
To use this type of seasonality, in the Training Metric Wizard, specify zero as thenumber of time periods for the seasonal cycle.
• Additive: Seasonal factors are added to the trend result. This means that eachseason's effect on the profile is constant, as shown in the example below:
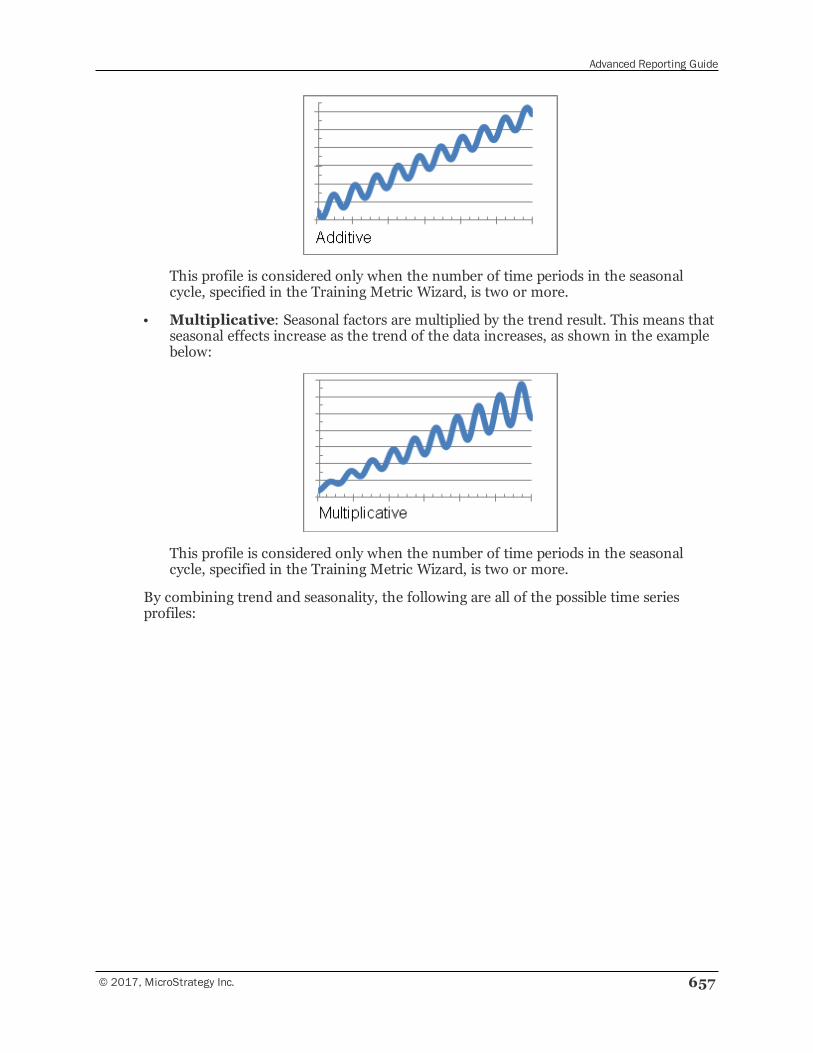
Advanced Reporting Guide
© 2017, MicroStrategy Inc. 657
This profile is considered only when the number of time periods in the seasonalcycle, specified in the Training Metric Wizard, is two or more.
• Multiplicative: Seasonal factors are multiplied by the trend result. This means thatseasonal effects increase as the trend of the data increases, as shown in the examplebelow:
This profile is considered only when the number of time periods in the seasonalcycle, specified in the Training Metric Wizard, is two or more.
By combining trend and seasonality, the following are all of the possible time seriesprofiles:
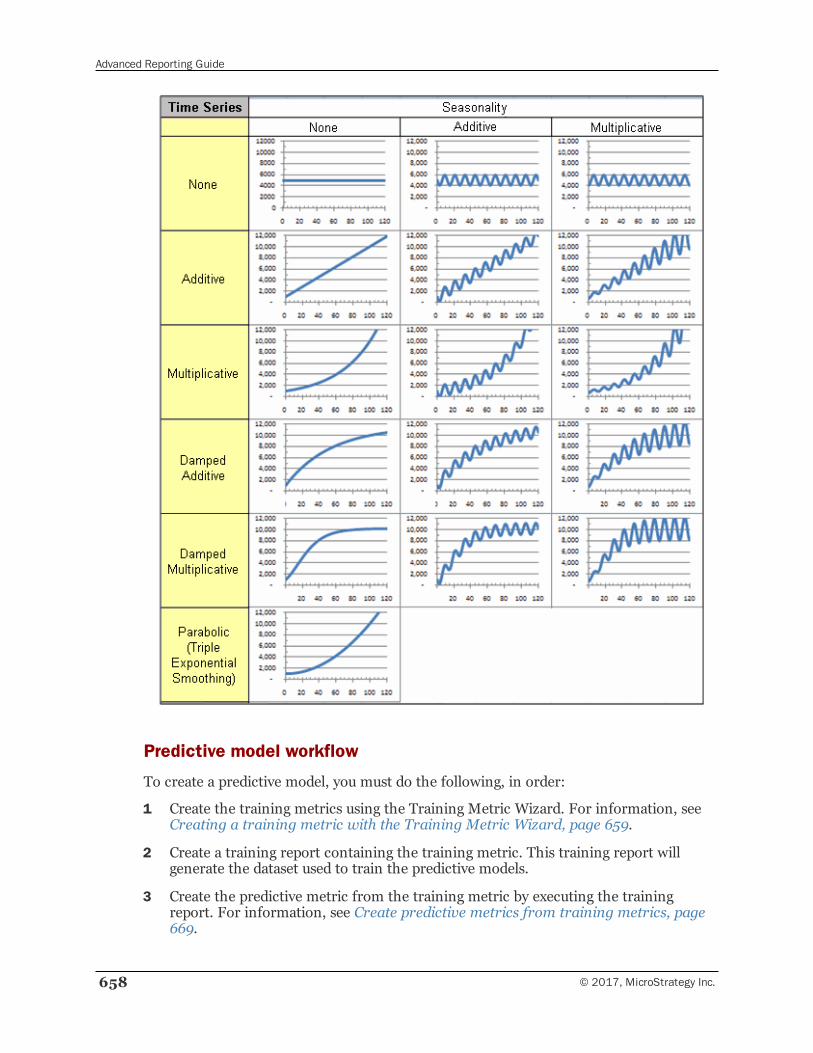
Advanced Reporting Guide
658 © 2017, MicroStrategy Inc.
Predictive model workflow
To create a predictive model, you must do the following, in order:
1 Create the training metrics using the Training Metric Wizard. For information, seeCreating a training metric with the Training Metric Wizard, page 659.
2 Create a training report containing the training metric. This training report willgenerate the dataset used to train the predictive models.
3 Create the predictive metric from the training metric by executing the trainingreport. For information, see Create predictive metrics from training metrics, page669.
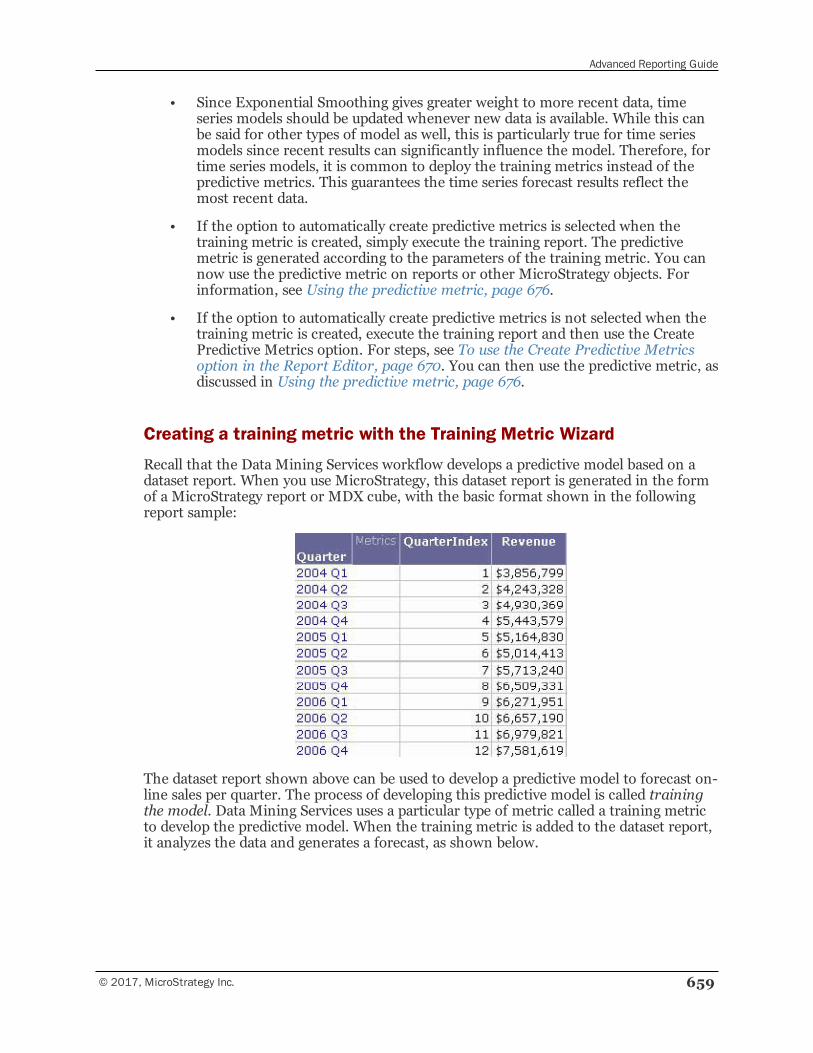
Advanced Reporting Guide
© 2017, MicroStrategy Inc. 659
• Since Exponential Smoothing gives greater weight to more recent data, timeseries models should be updated whenever new data is available. While this canbe said for other types of model as well, this is particularly true for time seriesmodels since recent results can significantly influence the model. Therefore, fortime series models, it is common to deploy the training metrics instead of thepredictive metrics. This guarantees the time series forecast results reflect themost recent data.
• If the option to automatically create predictive metrics is selected when thetraining metric is created, simply execute the training report. The predictivemetric is generated according to the parameters of the training metric. You cannow use the predictive metric on reports or other MicroStrategy objects. Forinformation, see Using the predictive metric, page 676.
• If the option to automatically create predictive metrics is not selected when thetraining metric is created, execute the training report and then use the CreatePredictive Metrics option. For steps, see To use the Create Predictive Metricsoption in the Report Editor, page 670. You can then use the predictive metric, asdiscussed in Using the predictive metric, page 676.
Creating a training metric with the Training Metric Wizard
Recall that the Data Mining Services workflow develops a predictive model based on adataset report. When you use MicroStrategy, this dataset report is generated in the formof a MicroStrategy report or MDX cube, with the basic format shown in the followingreport sample:
The dataset report shown above can be used to develop a predictive model to forecast on-line sales per quarter. The process of developing this predictive model is called trainingthe model. Data Mining Services uses a particular type of metric called a training metricto develop the predictive model. When the training metric is added to the dataset report,it analyzes the data and generates a forecast, as shown below.
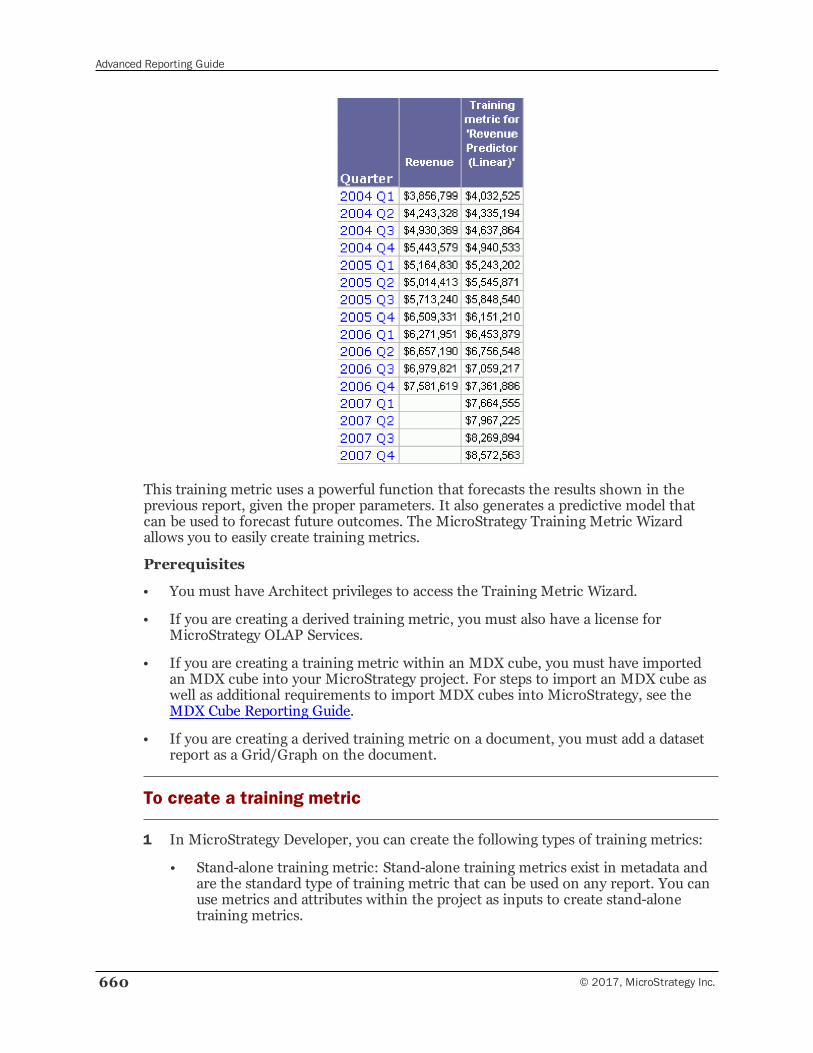
Advanced Reporting Guide
660 © 2017, MicroStrategy Inc.
This training metric uses a powerful function that forecasts the results shown in theprevious report, given the proper parameters. It also generates a predictive model thatcan be used to forecast future outcomes. The MicroStrategy Training Metric Wizardallows you to easily create training metrics.
Prerequisites
• You must have Architect privileges to access the Training Metric Wizard.
• If you are creating a derived training metric, you must also have a license forMicroStrategy OLAP Services.
• If you are creating a training metric within an MDX cube, you must have importedan MDX cube into your MicroStrategy project. For steps to import an MDX cube aswell as additional requirements to import MDX cubes into MicroStrategy, see theMDX Cube Reporting Guide.
• If you are creating a derived training metric on a document, you must add a datasetreport as a Grid/Graph on the document.
To create a training metric
1 In MicroStrategy Developer, you can create the following types of training metrics:
• Stand-alone training metric: Stand-alone training metrics exist in metadata andare the standard type of training metric that can be used on any report. You canuse metrics and attributes within the project as inputs to create stand-alonetraining metrics.
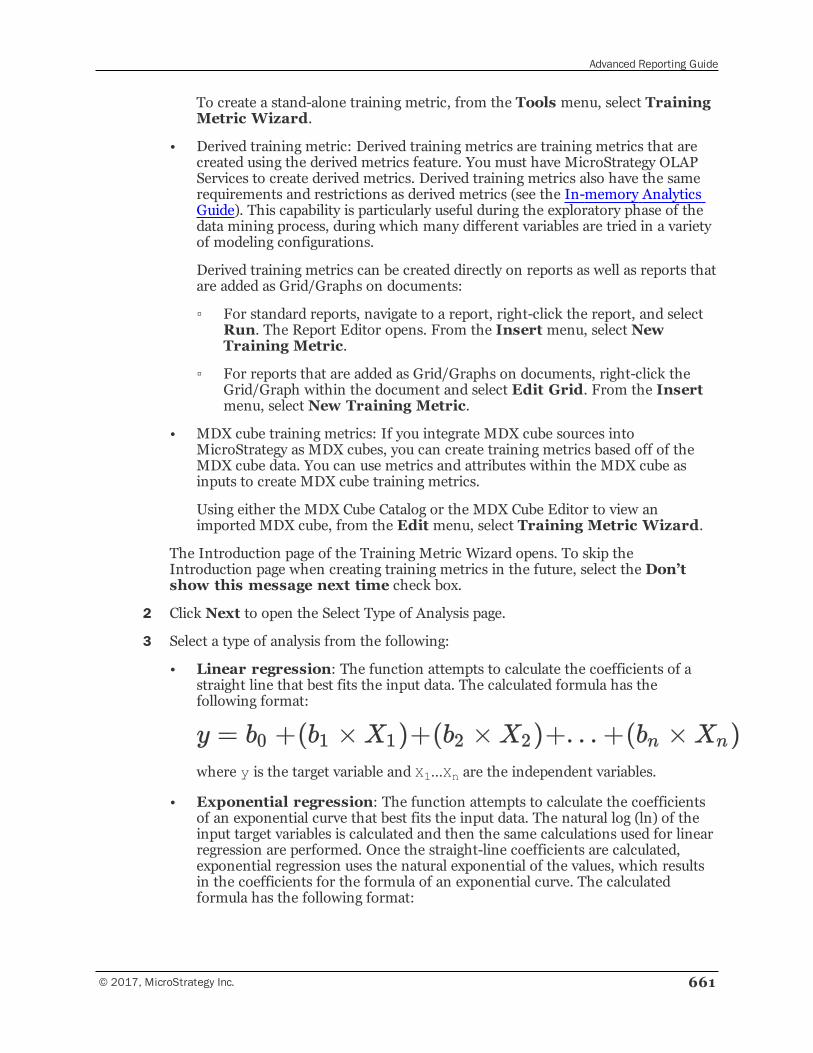
Advanced Reporting Guide
© 2017, MicroStrategy Inc. 661
To create a stand-alone training metric, from the Tools menu, select TrainingMetric Wizard.
• Derived training metric: Derived training metrics are training metrics that arecreated using the derived metrics feature. You must have MicroStrategy OLAPServices to create derived metrics. Derived training metrics also have the samerequirements and restrictions as derived metrics (see the In-memory AnalyticsGuide). This capability is particularly useful during the exploratory phase of thedata mining process, during which many different variables are tried in a varietyof modeling configurations.
Derived training metrics can be created directly on reports as well as reports thatare added as Grid/Graphs on documents:
▫ For standard reports, navigate to a report, right-click the report, and selectRun. The Report Editor opens. From the Insert menu, select NewTraining Metric.
▫ For reports that are added as Grid/Graphs on documents, right-click theGrid/Graph within the document and select Edit Grid. From the Insertmenu, select New Training Metric.
• MDX cube training metrics: If you integrate MDX cube sources intoMicroStrategy as MDX cubes, you can create training metrics based off of theMDX cube data. You can use metrics and attributes within the MDX cube asinputs to create MDX cube training metrics.
Using either the MDX Cube Catalog or the MDX Cube Editor to view animported MDX cube, from the Edit menu, select Training Metric Wizard.
The Introduction page of the Training Metric Wizard opens. To skip theIntroduction page when creating training metrics in the future, select the Don’tshow this message next time check box.
2 Click Next to open the Select Type of Analysis page.
3 Select a type of analysis from the following:
• Linear regression: The function attempts to calculate the coefficients of astraight line that best fits the input data. The calculated formula has thefollowing format:
where y is the target variable and X1…Xn are the independent variables.
• Exponential regression: The function attempts to calculate the coefficientsof an exponential curve that best fits the input data. The natural log (ln) of theinput target variables is calculated and then the same calculations used for linearregression are performed. Once the straight-line coefficients are calculated,exponential regression uses the natural exponential of the values, which resultsin the coefficients for the formula of an exponential curve. The calculatedformula has the following format:

Advanced Reporting Guide
662 © 2017, MicroStrategy Inc.
where y is the target variable and X1…Xn are the independent variables.
• Logistic regression: The function is used to determine the most likelyoutcome of a set of finite values. The technique uses a chi-square test todetermine the probability of each possible value and provide a predicted outcomebased on the highest likelihood.
• Cluster: This function offers a method of grouping data values based onsimilarities within the data. A specified or determined number of groups, orclusters, is formed allowing each data value to be mathematically categorizedinto the appropriate cluster.
• Decision tree: The function generates a series of conditions based onindependent input to determine a predicted outcome. The result is a hierarchicalstructure with the ability to lead a set of input to the most likely outcome.
• Time Series: This function attempts to make forecasts based on a series oftime-related input data. It consists of numerous techniques that can be appliedto either seasonal or non-seasonal data.
• Association: This function looks for relationships between items. The mostcommon example of this is market basket analysis.
4 Set specialized parameters based on the Type of Analysis selected:
Analysis Type Parameters
Cluster Do one of the following:
• Specify the exact number of clusters to be generated from the set of data.
• Allow MicroStrategy Data Mining Services to determine the optimal number ofclusters based on the training data. The algorithm creates multiple models, startingwith two clusters, and continues to add more clusters one at a time. With eachadditional cluster, the quality of the model is assessed. The quality of the currentmodel is measured by calculating the total distance of all records to the centers oftheir assigned clusters (DCurr). This result is compared to the same result for thepreviously generated model (DPrev). This process continues until the amount ofimprovement, (DPrev – DCurr) / DPrev, is less than the amount specifiedby the percent improvement parameter, or the maximum number of clusters isreached. Upon completion of this process, the model with the best quality is used inthe predictive metric.
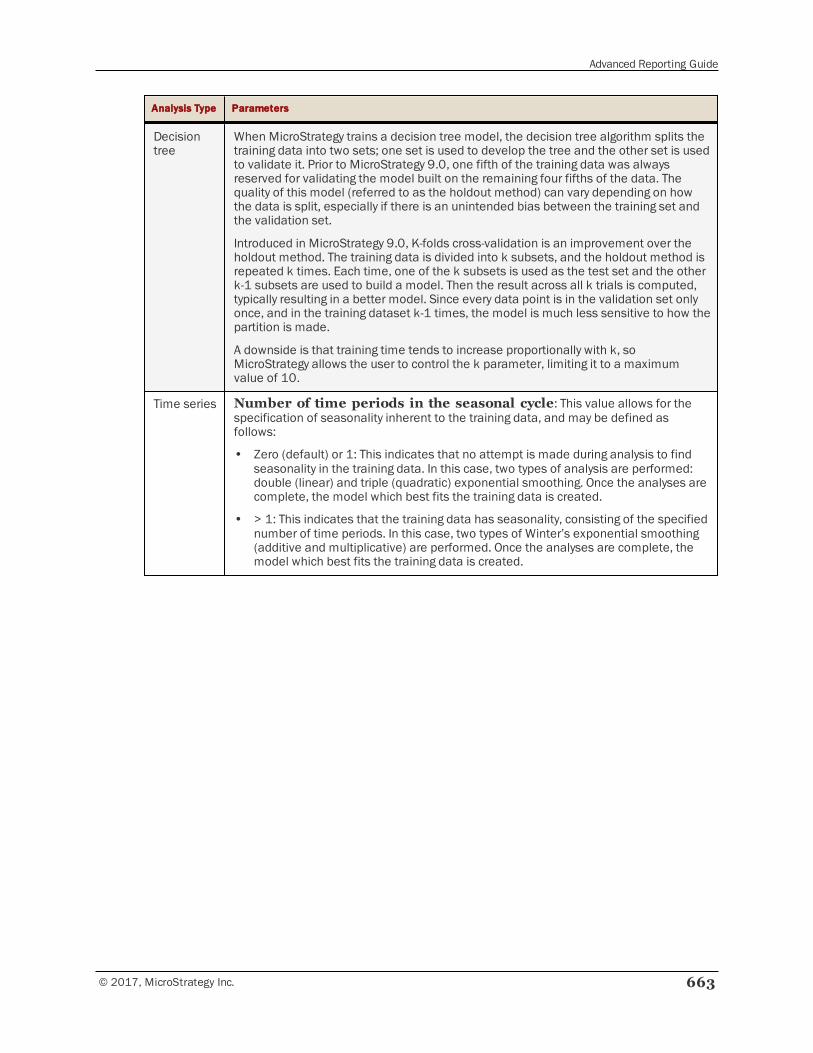
Advanced Reporting Guide
© 2017, MicroStrategy Inc. 663
Analysis Type Parameters
Decisiontree
When MicroStrategy trains a decision tree model, the decision tree algorithm splits thetraining data into two sets; one set is used to develop the tree and the other set is usedto validate it. Prior to MicroStrategy 9.0, one fifth of the training data was alwaysreserved for validating the model built on the remaining four fifths of the data. Thequality of this model (referred to as the holdout method) can vary depending on howthe data is split, especially if there is an unintended bias between the training set andthe validation set.
Introduced in MicroStrategy 9.0, K-folds cross-validation is an improvement over theholdout method. The training data is divided into k subsets, and the holdout method isrepeated k times. Each time, one of the k subsets is used as the test set and the otherk-1 subsets are used to build a model. Then the result across all k trials is computed,typically resulting in a better model. Since every data point is in the validation set onlyonce, and in the training dataset k-1 times, the model is much less sensitive to how thepartition is made.
A downside is that training time tends to increase proportionally with k, soMicroStrategy allows the user to control the k parameter, limiting it to a maximumvalue of 10.
Time series Number of time periods in the seasonal cycle: This value allows for thespecification of seasonality inherent to the training data, and may be defined asfollows:
• Zero (default) or 1: This indicates that no attempt is made during analysis to findseasonality in the training data. In this case, two types of analysis are performed:double (linear) and triple (quadratic) exponential smoothing. Once the analyses arecomplete, the model which best fits the training data is created.
• > 1: This indicates that the training data has seasonality, consisting of the specifiednumber of time periods. In this case, two types of Winter’s exponential smoothing(additive and multiplicative) are performed. Once the analyses are complete, themodel which best fits the training data is created.
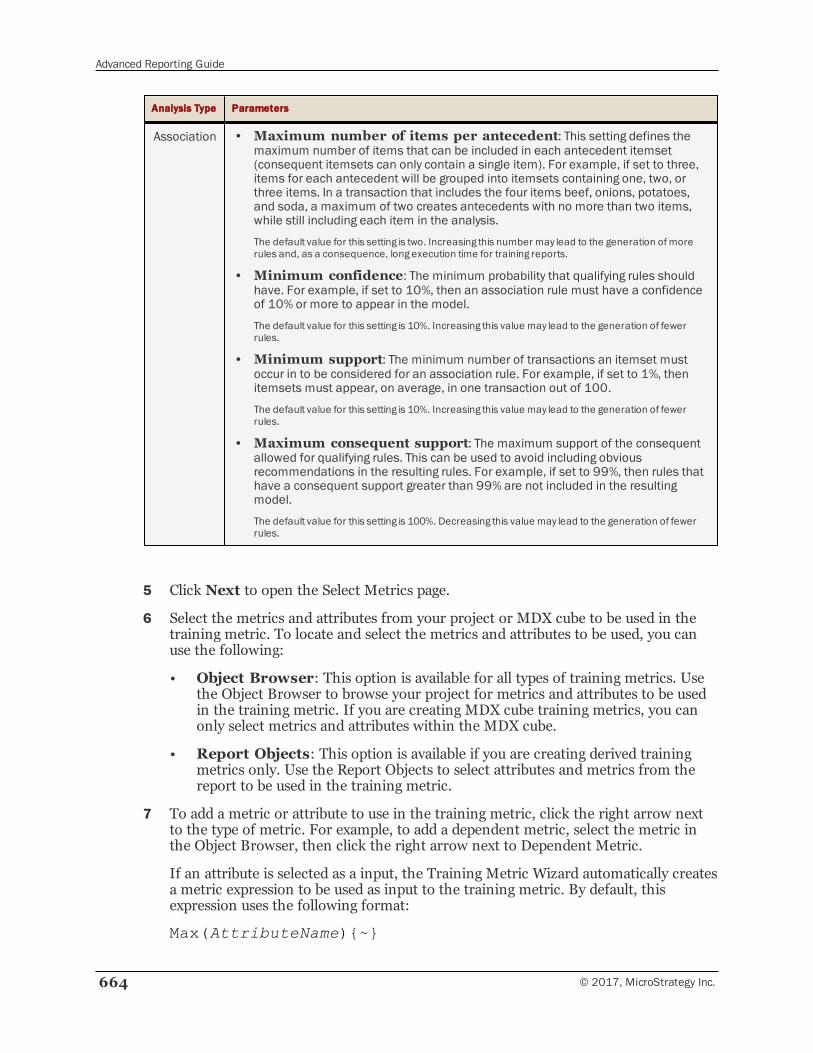
Advanced Reporting Guide
664 © 2017, MicroStrategy Inc.
Analysis Type Parameters
Association • Maximum number of items per antecedent: This setting defines themaximum number of items that can be included in each antecedent itemset(consequent itemsets can only contain a single item). For example, if set to three,items for each antecedent will be grouped into itemsets containing one, two, orthree items. In a transaction that includes the four items beef, onions, potatoes,and soda, a maximum of two creates antecedents with no more than two items,while still including each item in the analysis.
The default value for this setting is two. Increasing this number may lead to the generation of morerules and, as a consequence, long execution time for training reports.
• Minimum confidence: The minimum probability that qualifying rules shouldhave. For example, if set to 10%, then an association rule must have a confidenceof 10% or more to appear in the model.
The default value for this setting is 10%. Increasing this value may lead to the generation of fewerrules.
• Minimum support: The minimum number of transactions an itemset mustoccur in to be considered for an association rule. For example, if set to 1%, thenitemsets must appear, on average, in one transaction out of 100.
The default value for this setting is 10%. Increasing this value may lead to the generation of fewerrules.
• Maximum consequent support: The maximum support of the consequentallowed for qualifying rules. This can be used to avoid including obviousrecommendations in the resulting rules. For example, if set to 99%, then rules thathave a consequent support greater than 99% are not included in the resultingmodel.
The default value for this setting is 100%. Decreasing this value may lead to the generation of fewerrules.
5 Click Next to open the Select Metrics page.
6 Select the metrics and attributes from your project or MDX cube to be used in thetraining metric. To locate and select the metrics and attributes to be used, you canuse the following:
• Object Browser: This option is available for all types of training metrics. Usethe Object Browser to browse your project for metrics and attributes to be usedin the training metric. If you are creating MDX cube training metrics, you canonly select metrics and attributes within the MDX cube.
• Report Objects: This option is available if you are creating derived trainingmetrics only. Use the Report Objects to select attributes and metrics from thereport to be used in the training metric.
7 To add a metric or attribute to use in the training metric, click the right arrow nextto the type of metric. For example, to add a dependent metric, select the metric inthe Object Browser, then click the right arrow next to Dependent Metric.
If an attribute is selected as a input, the Training Metric Wizard automatically createsa metric expression to be used as input to the training metric. By default, thisexpression uses the following format:
Max(AttributeName){~}
Advanced Reporting Guide
© 2017, MicroStrategy Inc. 665
The ID form of the attribute is used as an input to the training metric. If a differentattribute form should be used as an input, a metric must be manually created prior tocreating the training metric. For steps on how to create this metric, see Inputs forpredictive metrics, page 631.
The different metrics that make up the training metric are described below.
• Dependent Metric is the metric or attribute representing the field value to bepredicted by the model. All types of analysis except cluster analysis require adependent metric.
You can select only one dependent metric or attribute.
• Independent Metrics are the metrics and attributes for each of theindependent variables to be considered while generating the predictive model.All types of analysis require independent metrics or attributes.
Select at least one independent metric or attribute.
• Segmentation Metrics are optional selections that apply only to linear,exponential, and logistic regression analyses. The Training Metric Wizard cangenerate either regression models or tree regression models.
— In a tree regression model, the leaves of the tree contain a regression modeltrained on the records associated with that leaf of the tree. For example, if ametric or attribute representing a geographic region is used as aSegmentation Metric, each region will have its own unique forecast. Thus,multiple regression models can be included in a single predictive metric.
— Add one metric or attribute to represent each level within the tree of themodel.
— If no Segmentation Metrics are specified, a standard regression model isgenerated.
8 You can use the default options for the algorithm and variable settings by clearingthe Show advanced options check box. To specify more options for thesesettings, do the following:
a Select the Show advanced options check box.
b Click Next to open the Advanced Options page.
c You can define variable reduction for linear and exponential regression. Refer tothe MicroStrategy online help for more information on this setting.
d To specify options for independent and dependent inputs, click AdvancedVariable Settings. See the online help for more information on these settings.To save your changes and return to the Advanced Options page, click OK.
9 Click Next to open the Select Output page.
10 Select the destination of where each predictive metric is saved. Your options dependon the type of training metric being created:
• Folder: This option is available if you are creating stand-alone training metricsor derived training metrics. Click ... (the Browse button) to define the location
Advanced Reporting Guide
666 © 2017, MicroStrategy Inc.
in your MicroStrategy project to save the predictive metrics created by thetraining metric. If you select this option, predictive metrics are saved as stand-alone predictive metrics.
If you are using derived training metrics, you should select this option when apredictive model worthy of deployment is found. Selecting this option saves thepredictive model as stand-alone predictive metrics.
• Report Objects: This option is available if you are creating derived trainingmetrics only. Select this option to create the predictive metrics as derivedpredictive metrics. A derived predictive metric exists only within the report usedto create the predictive metric. This capability is particularly useful during theexploratory phase of the data mining process, during which you can test manyvariables and create a large variety of models.
The way in which derived predictive metrics are created depends on whether thederived training metrics are included directly on a report or on a report includedin a document as a Grid/Graph:
▫ When the report is executed to create predictive metrics (see Createpredictive metrics from training metrics, page 669), the following occurs:
— The derived training metrics are moved off the report’s template; thetemplate determines what is displayed for the report. The derivedtraining metrics are still available in the Report Objects of the report,which supplies the definition of the report. If you update the derivedtraining metrics and need to re-create their associated derived predictivemetrics, you must add the derived training metrics back to the templateof the report. When the derived predictive metrics are re-created, newversions are created to keep a history of the predictive modeling.
— Any derived training metrics that are moved off the report's templateduring report execution are replaced with the first predictive metricselected to be generated for the derived training metric. When thederived training metric is initially replaced with the derived predictivemetric, the values are not automatically updated to reflect the predictivemetric analysis. Re-execute the report to update the values for thederived predictive metric.
— All other predictive metrics selected to be generated are added to theReport Objects and are not on the report grid by default. This makes thepredictive model available for viewing only. To execute the derivedpredictive metric, you must add the derived predictive metric to the gridof the report.
▫ When the document including the report as a Grid/Graph is executed tocreate predictive metrics (see Create predictive metrics from trainingmetrics, page 669), the following occurs:
— All predictive metrics are added to the available dataset objects for thereport and are not included on the report grid by default. Thesepredictive metrics are not saved in the report itself and are only availablewith the report as a dataset in the current document. This makes thepredictive model available for viewing only. To execute the derived
Advanced Reporting Guide
© 2017, MicroStrategy Inc. 667
predictive metrics, you must add the derived predictive metrics to thegrid of the report or directly to a section within the document.
• Managed Objects folder: If you are creating MDX cube training metrics, thetraining metrics are created in the Managed Objects folder of the MicroStrategyproject.
11 To automatically create the predictive metric each time a report that contains thetraining metric is executed, select the Automatically create on reportexecution check box. This option automatically overwrites any predictive metricssaved with the same name in the specified location. If you do not want to overwritethe predictive metric, clear this check box. For more information, see Createpredictive metrics from training metrics, page 669.
If you are creating a derived training metric, the Automatically create on reportexecution check box is selected and cannot be cleared. This is to ensure thatpredictive metrics can be created for the derived training metric, since derivedtraining metrics are only available as part of a report or document.
12 To include verification records within the model, specify the number of records toinclude.
If the number of records is set to zero, model verification is not included inthe model.
Model verification records are used by the consumer of the model to insure that theresults of the consumer are equal to the results intended by the model producer.Each record contains a row of input from the training data along with the expectedpredicted output from the model.
13 If you are performing Association rules analysis, click Rules. The Rules to Returndialog box opens.
These criteria determine which rules will be returned as output for a particular inputitemset. You can choose from the following options:
• Rule selection criteria:
— Antecedent only (Recommendation): Select rules when the inputitemset includes the antecedent itemset only. This is the default behavior. Itspurpose is to provide a recommendation, based on the input itemset.
— Antecedent and consequent (Rule matching): Select rules when theinput itemset includes both the antecedent and consequent itemsets. Itspurpose is to locate rules that match the input itemset.
• Return the top ranked rules: These options allow for the specification ofexactly which rule is to be returned, based on its ranking among all selectedrules.
— Return the top ranked rules up to this amount: Defines themaximum number of rules that are to be returned. For instance, if set tothree, the top three rules can be returned as output. In this case, threeseparate predictive metrics are created. The default value for this setting isone, and its maximum value is 10.
Advanced Reporting Guide
668 © 2017, MicroStrategy Inc.
— Rank selected rules by: Defines whether the rules are be ranked byconfidence, support, or lift. Multiple selections may be specified.
• Select all rules (One rule per row): This option allows for the creation ofa report which displays all rules found within the model. If the correspondingpredictive metric is placed on a report, a single rule is returned for each row ofthe report. The rules are returned in the order they appear within the model,and are not based on an input itemset.
14 Select the Predictive Metric(s) to generate.
• A training metric can produce different output models when it is run on atraining report. You must select at least one output model so that the trainingmetric is created, although you can select multiple outputs. A predictive metricwill be generated for each output.
For example, if Predicted Value and Probability are selected as output models,then two predictive metrics will be created during the training process. One willoutput the predicted outcome when used on a report while the other will outputthe probability of the predicted outcome.
If no predictor type is selected, Predicted Value is selected automatically.
• A default aggregation function is displayed for all types of predictive metrics. Thedefault is the recommended function based on the type of values produced byeach model. The aggregation function ensures proper results when drilling andaggregating from a MicroStrategy report.
If desired, you can change the aggregation functions by using the drop-down listsof functions.
If non-leaf level metrics from different hierarchies are used as independentmetrics and tree level metrics, you may want to set the aggregation function toNone. This can avoid unnecessary calculations and performance degradation.For example, the Quarter attribute from the Time hierarchy is used as anindependent variable and Region from the Geography hierarchy is used as atree level metric. Multiple calculations for each quarter's region can result.
15 Click Next. The Summary page opens.
16 Review the summary of the training metric before creating the metric. Then clickFinish to create the metric. If it is a derived training metric, the derived trainingmetric is saved in the report with a default name. Otherwise, the Save As dialog boxopens.
17 Select the MicroStrategy project folder in which to save the new metric. MDX cubetraining metrics must be saved in the Managed Objects folder of the MicroStrategyproject.
18 Enter a name for the new metric.
19 Click Save.
Advanced Reporting Guide
© 2017, MicroStrategy Inc. 669
Create predictive metrics from training metrics
You can quickly and easily create predictive metrics from training metrics in either of thefollowing ways:
• If the option to automatically create predictive metrics is disabled on the trainingmetric, execute the training report and then use the Create Predictive Metrics option.For steps, see To use the Create Predictive Metrics option in the Report Editor, page670.
The Create Predictive Metrics option is available only when you are runningreports in MicroStrategy Developer.
• If the option to automatically create predictive metrics is enabled on the trainingmetric, execute the training report to create the predictive metric. This is the defaultbehavior, and is controlled by the Automatically create on report executioncheck box described in Creating a training metric with the Training Metric Wizard,page 659.
If you are using derived predictive metrics and have selected to save the derivedpredictive metrics to the Report Objects, these derived predictive metrics are createdin the following ways:
▫ When a report is executed to create predictive metrics, the following occurs:
— The derived training metrics are moved off the report’s template; thetemplate determines what is displayed for the report. The derived trainingmetrics are still available in the Report Objects of the report, which suppliesthe definition of the report. If you update the derived training metrics andneed to re-create their associated derived predictive metrics, you must addthe derived training metrics back to the template of the report. When thederived predictive metrics are re-created, new versions are created to keep ahistory of the predictive modeling.
— Any derived training metrics that are moved off the report's template duringreport execution are replaced with the first predictive metric selected to begenerated for the derived training metric. When the derived training metricis initially replaced with the derived predictive metric, the values are notautomatically updated to reflect the predictive metric analysis. Re-executethe report to update the values for the derived predictive metric.
— All other predictive metrics selected to be generated are added to the ReportObjects and are not on the report grid by default. This makes the predictivemodel available for viewing only. To execute the derived predictive metric,you must add the derived predictive metric to the grid of the report.
▫ When a document including the report as a Grid/Graph is executed to createpredictive metrics, the following occurs:
— All predictive metrics are added to the available dataset objects for the reportand are not included on the report grid by default. These predictive metricsare not saved in the report itself and are only available with the report as adataset in the current document. This makes the predictive model availablefor viewing only. To execute the derived predictive metrics, you must add the
Advanced Reporting Guide
670 © 2017, MicroStrategy Inc.
derived predictive metrics to the grid of the report or directly to a sectionwithin the document.
After the predictive metric is created in any of these ways, you can use it in reports,documents, and other objects, as discussed in Using the predictive metric, page 676.
Prerequisites
• You must have created a training metric in the Training Metric Wizard. For steps,see To create a training metric, page 660. However, if you have an OLAP Serviceslicense, you can create derived training metrics directly on a report. For informationon creating derived training metrics, see theMicroStrategy Developer help.
• If the training metric is based off an MDX cube, the training metric must be includedin an MDX cube report. For steps to create an MDX cube report, see the MDX CubeReporting Guide.
To use the Create Predictive Metrics option in the Report Editor
1 Using MicroStrategy Developer, add the training metric to a report.
Ensure that the training metric is on the grid of the report. If the training metric isonly in the Report Objects but not on the report grid, no predictive metrics arecreated for the training metric when the report is executed.
2 Execute the training report in MicroStrategy Developer.
The Create Predictive Metrics option is available only when you are runningreports in MicroStrategy Developer.
3 From the Data menu, select Create Predictive Metric(s). The Create PredictiveMetric(s) dialog box opens.
4 To view information about a training metric, select it from theMetrics list, whichcontains all the training metrics on the report.
5 To temporarily rename the predictive metric created by the selected training metric,enter the new name in the Name box.
The new name is generated when you click OK, but the changes are not savedwhen the report is closed.
6 You can change the options and associated aggregation function for producing thepredictive metric in the Aggregation function area.
The new options are applied when you click OK, but the changes are not savedwhen the report is closed.
7 You can save the PMML from the generated model. To do so, click GeneratePMML File and then select a location in which to save the PMML file.
8 Click OK to return to the report.
Advanced Reporting Guide
© 2017, MicroStrategy Inc. 671
The predictive metric is created in the location specified by the training metric. It isgenerated according to the parameters of the training metric.
Creating a predictive model using third-party datamining applicationsMany companies offer data mining applications and workbenches. These tools arespecialized for the data mining workflow and are usually rich in data mining features andoptions. MicroStrategy Data Mining Services integrates seamlessly with theseapplications in the following ways:
• MicroStrategy is used as the source of the data mining dataset.
• After the third-party application develops the PMML-based predictive model basedon the dataset, the model is imported into MicroStrategy and used to generatereports.
You can use any of the following options to provide the MicroStrategy dataset report tothird-party applications:
• Save the dataset report as a data mart in MicroStrategy. For more information ondata marts, see Chapter 12, Accessing Subsets of Data: Data Marts.
• Export to a particular file format. See the MicroStrategy online help for moreinformation on exporting reports from MicroStrategy.
Importing the predictive modelAfter you have created a predictive model and generated PMML to represent that model,the next step is to import the PMML file into your MicroStrategy project. The importfunction creates predictive metrics from the PMML file.
In addition to importing predictive models directly into your MicroStrategy project, youcan also import predictive models into the MDX cubes you have integrated intoMicroStrategy, as described in Importing predictive models for MDX cubes, page 673.
Prerequisites
• You have created a dataset report, which is the first step in creating a predictivemodel. For information on this process, see Creating a dataset report, page 627.
• You have created and trained a predictive model from the dataset report, usingMicroStrategy or a third-party application. For information on this process, seeCreating a predictive model, page 639.
• You must have the Create Application Objects and Use Metric Editor privileges toaccess the Import Data Mining Model option. For information on viewing orchanging your privileges, see the Supplemental Reference for System Administration.
Advanced Reporting Guide
672 © 2017, MicroStrategy Inc.
To import a predictive model into MicroStrategy
1 In MicroStrategy Developer, from the Tools menu, select Import Data MiningModel. The Import Data Mining Model dialog box opens.
2 Select the PMML file to import by clicking… (the Browse button), and then clickOpen.
3 You can make the following changes for the predictive metrics:
• Select the Predictive Metric Type: The columns in this table areautomatically populated when a predictive model is selected. You can change theinformation in this table as follows:
— Predictor Type: By default, predictive metrics for all outputs definedwithin the model selected above will be created and displayed in thiscolumn. Clear any outputs for which you do not want to create predictivemetrics.
— Name: Displays the default names provided for each predictive metric,which can be changed.
— Aggregation function: Displays the default aggregation functions for theselected predictive metric types. You can change these functions todetermine how the output of the model should be aggregated. For moredetails, see Aggregating predictive metrics, page 675.
4 Click OK to import the model or models.
5 Select the folder in which to save all the predictive metrics.
The import feature reads the PMML automatically and creates the predictive metrics inthe folder specified. During the importing process, several key model characteristics aredetermined from the PMML, including the following:
• The type of data mining algorithm: Based on this, the appropriateMicroStrategy data mining function is used in the expression of the metric.
• The inputs to the data mining function: Matching the column alias of thepredictive input metric is important. Since Data Mining applications use this name toidentify each variable, you can use the name of each variable in the PMML toidentify which MicroStrategy metric should be used. The import feature robustlyhandles all potential circumstances in this area as follows:
▫ Only one MicroStrategy metric with that name exists: That metric is usedautomatically as an input to the function.
▫ Multiple MicroStrategy metrics with that name exist: The user is prompted toselect the right metric.
▫ No MicroStrategy metrics with that name exist: The user is prompted to select ametric from within the project, or the user can cancel the import and try againlater.
Advanced Reporting Guide
© 2017, MicroStrategy Inc. 673
• The version of PMML: Since different versions of PMML have differentspecifications, the version is identified so models are processed properly.
• PMML validation: The PMML is validated for consistency with the PMMLstandard and known vendor-specific extensions.
• Model verification: The Import dialog box detects whether the PMML containsverification data and reports this information at the bottom of the dialog box.Verification data can be viewed and tested for expected results by accessing theModel Viewer from the predictive metric.
Once the predictive metric is created, you can use it in reports and other objects. SeeUsing the predictive metric, page 676 for more information.
Importing predictive models for MDX cubesMicroStrategy allows you to integrate data from MDX cube sources such as SAP BW andMicrosoft Analysis Services. Once integrated into MicroStrategy as MDX cubes, you canuse the MicroStrategy reporting and analysis features to further analyze your MDX cubesource data. For information on integrating MDX cube sources into MicroStrategy, seethe MDX Cube Reporting Guide.
This also includes performing predictive analysis on your MDX cube data. The stepsbelow show you how to import a predictive model into your MDX cube.
Prerequisites
• You have imported an MDX cube. For steps to import an MDX cube as well asadditional requirements to import MDX cubes into MicroStrategy, see the MDXCube Reporting Guide.
• You have created and trained a predictive model from the dataset report, usingMicroStrategy or a third-party application. For information on this process, seeCreating a predictive model, page 639.
• You must have the Create Application Objects and Use Metric Editor privileges toaccess the Import Data Mining Model option. For information on viewing orchanging your privileges, see the Supplemental Reference for System Administration.
To import a predictive model into MicroStrategy for an MDX cube
1 In MicroStrategy Developer, log in to a project that is connected to an MDX cubesource.
2 If you are using read only mode for the project, from the Schema menu, clear theRead Only Mode option to switch to edit mode.
Only one user can be editing a project at a given time. Therefore, if someone else ismodifying the project, you cannot use the MDX Cube Catalog.
3 From the Schema menu, selectMDX Cube Catalog.
• If you have a single MDX cube source database instance created for the project,the MDX Cube Catalog opens.
Advanced Reporting Guide
674 © 2017, MicroStrategy Inc.
• If you have multiple MDX cube source database instances created for the project,a Database Instance dialog box opens. Select a valid MDX cube source databaseinstance, click OK, and the MDX Cube Catalog opens.
4 Click the Cube Mapping tab.
5 From the Catalog\Cube drop-down list, select the MDX cube to import a predictivemodel to.
6 From the Edit menu, select Import Data Mining Model. The Import DataMining Model dialog box opens.
7 Select the PMML file to import by clicking… (the Browse button), and then clickOpen.
8 You can make the following changes for the predictive metrics:
9 The columns in the Select the Predictive Metric Type table are automaticallypopulated when a predictive model is selected. You can change the information inthis table as follows:
• By default, predictive metrics for all outputs defined within the model selectedabove will be created and displayed in the Predictor Type column. Clear anyoutputs for which you do not want to create predictive metrics.
• The default names of the predictive metrics are listed in the Name column. Youcan change any name.
• The Aggregation function column displays the default aggregation functionsfor the selected predictive metric types. You can change these functions todetermine how the output of the model should be aggregated. For more details,see Aggregating predictive metrics, page 675.
10 Click OK to import the model or models.
The import feature reads the PMML automatically and creates the predictive metricswithin the Compound Metrics of the MDX cube. During the importing process, severalkey model characteristics are determined from the PMML, including the following:
• The type of data mining algorithm: Based on this, the appropriateMicroStrategy data mining function is used in the expression of the metric.
• The inputs to the data mining function: Matching the column alias of thepredictive input metric is important. Since Data Mining applications use this name toidentify each variable, you can use the name of each variable in the PMML toidentify which metric within the MDX cube should be used. The import featurerobustly handles all potential circumstances in this area as follows:
▫ Only one metric with that name exists in the MDX cube: That metric is usedautomatically as an input to the function.
▫ Multiple metrics with that name exist in the MDX cube: The user is prompted toselect the right metric.
▫ No metrics with that name exist in the MDX cube: The user is prompted toselect a metric from within the MDX cube, or the user can cancel the importand try again later.
Advanced Reporting Guide
© 2017, MicroStrategy Inc. 675
• The version of PMML: Since different versions of PMML have differentspecifications, the version is identified so models are processed properly.
• PMML validation: The PMML is validated for consistency with the PMMLstandard and known vendor-specific extensions.
• Model verification: The Import Data Mining Model dialog box detects whetherthe PMML contains verification data and reports this information at the bottom ofthe dialog box. Verification data can be viewed and tested for expected results byaccessing the Model Viewer from the predictive metric.
Once the predictive metric is created, you can use it in reports and other objects. SeeUsing the predictive metric, page 676 for more information.
Aggregating predictive metricsOne of the most powerful features of integrating data mining models with a businessintelligence platform is the ability to drill up and down through layers of data. Forpredictive results to make sense, the aggregation function to be used must be specified.
The steps that need to be taken to ensure the predictive metric aggregates properly underall circumstances are described below:
• Place the predictive function within an aggregation function.
• Specify the dynamic aggregation function on the predictive metric. This is requiredonly when the predictive metric is used with MicroStrategy OLAP Services.
Choosing proper aggregation function requires some knowledge about how the modelbehaves. For example:
• If the predictive metric generates a score that is a zero or a one, use Sum to calculatethe number of “one” scores.
• If the predictive metric generates a “linear” output, like “Forecasted Revenue,”usually from a regression predictor, use Sum to roll up the predictive results.
• If the predictive metric generates a confidence or percentage, use Average tocalculate the mean confidence.
• If the predictive metric generates a numeric classifier, like a cluster/segmentnumber, use Mode to calculate the most common classifier.
• For models with outputs that cannot be aggregated, select “None” as the aggregationfunction.
While an explicit aggregation function is useful for normal reports, deployments that takeadvantage of MicroStrategy OLAP Services should also set the predictive metric'sdynamic aggregation function. The Import Data Mining Model feature in MicroStrategyDeveloper does this automatically, but you can also set the dynamic aggregation functionusing the Metric Editor.
To set the dynamic aggregation function
1 Open the predictive metric in the Metric Editor.
Advanced Reporting Guide
676 © 2017, MicroStrategy Inc.
2 Select the Subtotals/Aggregation tab.
3 Select the appropriate Dynamic Aggregation function.
Using the predictive metricYou can use the predictive metric in reports or documents, as well as in other objects.You can also view the PMML information of a predictive metric, using the PredictiveModel Viewer. For descriptions, see:
• Using the predictive metric in reports and documents
• Using the predictive metric in other objects
• Predictive Model Viewer
Using the predictive metric in reports and documentsWith the predictive model implemented as a metric, it can be used in reports ordocuments to determine possible trends and outcomes. Creating a report or documentfor data mining is similar to creating a regular report or document. There are no specialrequirements, other than including the predictive metric. For steps to create a report, seethe Basic Reporting Guide. For steps to create a document, see the Document CreationGuide
Predictive models are generated based on a certain level of input data. Therefore, inorder for a model to produce valid results when scored, the model must be provided withthe same level of input data. If the user of the model does not have access to this level ofdata, then the model cannot be expected to return valid scores. For example, a securityfilter on the user does not allow access to the appropriate level of data.
Since Exponential Smoothing gives greater weight to more recent data, time seriesmodels (see Creating a predictive model using MicroStrategy, page 640) should beupdated whenever new data is available. While this can be said for other types of modelas well, this is particularly true for time series models since recent results cansignificantly influence the model. Therefore, for time series models, it is common todeploy the training metrics (see Creating a predictive model using MicroStrategy, page640) instead of the predictive metrics (see Creating a predictive model usingMicroStrategy, page 640). This guarantees the time series forecast results reflect themost recent data.
Using the predictive metric in other objectsIn addition to reports and documents, predictive metrics can also be used in otherobjects. Generally, wherever a regular MicroStrategy metric is used, a predictive metriccan be used. The objects where predictive metrics can be used include:
• Filters
• Custom Groups
• Consolidations
• Derived metrics
Advanced Reporting Guide
© 2017, MicroStrategy Inc. 677
• Shortcut metrics
For more information on using or creating any of these objects, see the online help orthe Basic Reporting Guide.
Predictive Model ViewerPredictive metrics are different from other MicroStrategy metrics since they implement adata mining model, which is more than a mathematical expression. These predictivemodels, and the PMML that describes them, contain information about variables,variable transformations, and details about the data mining techniques they implement.All this information can be viewed on MicroStrategy Developer using the PredictiveModel Viewer.
You can access the Predictive Model Viewer in one of the following ways:
• In MicroStrategy Developer, right-click a predictive metric in the right pane andselect View Predictive Model.
• In the Metric Editor, when you are editing a predictive metric, select ViewPredictive Model from the Tools menu.
• In a MicroStrategy Developer report or graph, right-click a predictive metric in theright-hand pane and select View Predictive Model.
For information on how to use this viewer, see the online help.
Data mining examples• Revenue forecasting example (using linear and seasonal regression), page 678: To
aid in setting goals for next year, you want to establish a forecast of your company'srevenue based on existing trends.
• Campaign management example (using logistic regression), page 681: Yourcompany wants to improve the effectiveness of its marketing campaigns, with thegoals of reducing costs and increasing the percentage of positive responses.
• Segmentation example (using cluster analysis), page 683: You use cluster analysis togroup your customers into exactly five segments based on demographics andpsychographics.
• Telco churn example (using decision tree analysis), page 685: You are reviewingyour telecommunication trends and are interested in the likelihood of customers tochurn based on psychographics and communication habits.
• Campaign management example: Importing a third-party neural network model,page 687: You want to execute a scenario similar to the campaign managementexample created using logistic regression, but instead use a third-party data miningapplication.
• Market basket analysis (using association rules analysis), page 690: Market basketanalysis studies retail purchases to determine which items tend to appear together inindividual transactions. Retailers use market basket analysis for their commercial
Advanced Reporting Guide
678 © 2017, MicroStrategy Inc.
websites to suggest additional items to purchase before a customer completes hisorder.
Revenue forecasting example (using linear andseasonal regression)To aid in setting goals for next year, you would like to establish a forecast of yourcompany's revenue based on existing trends.
You will use the revenue values already available in your MicroStrategy project.Predictions of future revenue will be determined at quarterly intervals. The quarters forthe future dates are already defined in your MicroStrategy project, but revenue figures foreach are not yet available.
Your model will require a continuous input of quarters to recognize a regression pattern.A Quarter attribute is commonly formatted to represent a year followed by a quarter, andtherefore cannot be used as a continuous index into the quarters. To address thisrequirement, create a Quarter Index metric using the Quarter attribute. Since a yearfollowed by a quarter is still a sequential list of values, you can often create a QuarterIndex metric with the following simple expression:
Rank(Max(Quarter@ID) {Quarter})
This uses the ID values for a Quarter attribute, and creates a sequential list of values byranking them. For example, assume you are using values dating back to the beginning of2012. Quarter 201202 (Q2 in year 2012) has an index of 2 since it is the second quarteroverall. Quarter 201403 (Q3 in year 2014) has an index of 11.
If the ID values for your attribute representing quarter data are not sequential, you mustdetermine a way to convert the ID values into a sequential list of values.
The example Tutorial project includes a Quarter Index metric, along with otherreports and metrics created for this forecasting example. Some of the definitions ofmetrics and reports within the Tutorial project are different than the simplifieddescriptions in this example. You can use the definitions provided in the stepshere, or the definitions in the Tutorial project, depending on what works best foryour reporting environment.
To begin your data mining analysis, use the Training Metric Wizard to design a trainingmetric, following the steps described below.
To create a training metric for linear regression analysis
1 In MicroStrategy Developer, select Training Metric Wizard from the Toolsmenu. The Training Metric Wizard opens on the Introduction page.
2 Click Next. The Select Type of Analysis page opens.
3 Select Linear regression as the type of analysis.
4 Click Next. The Select Metrics page opens.
5 Add Revenue as the Dependent Metric.
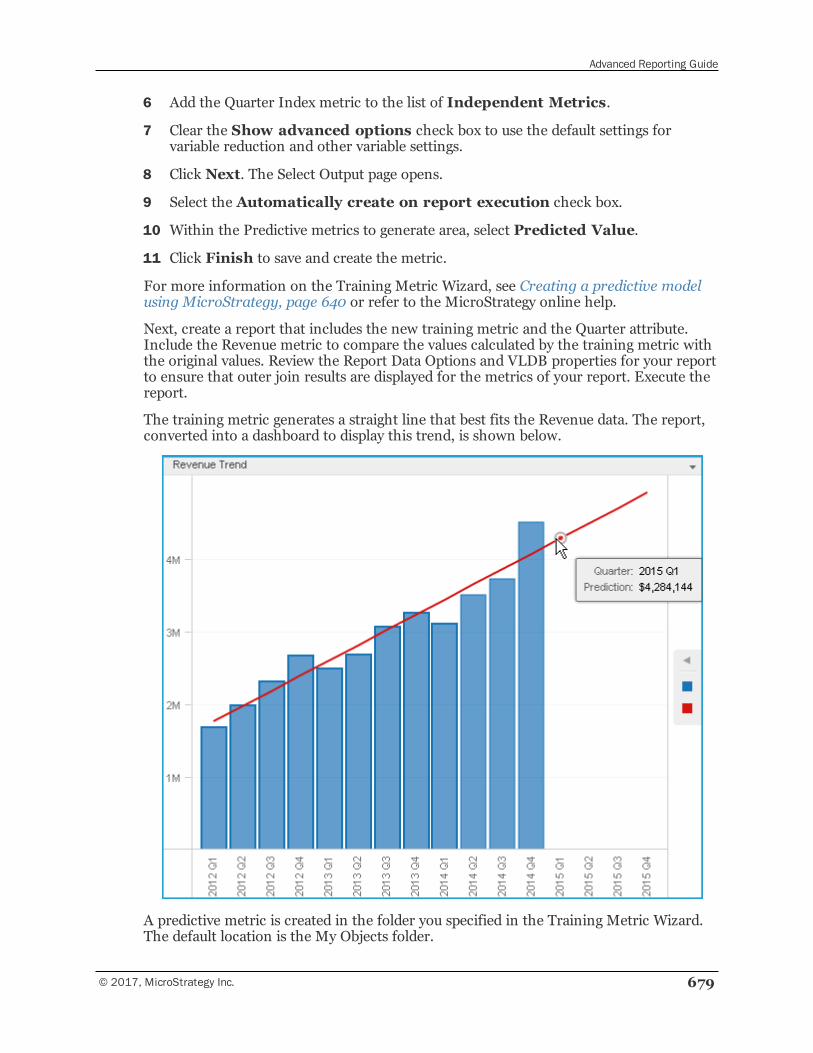
Advanced Reporting Guide
© 2017, MicroStrategy Inc. 679
6 Add the Quarter Index metric to the list of Independent Metrics.
7 Clear the Show advanced options check box to use the default settings forvariable reduction and other variable settings.
8 Click Next. The Select Output page opens.
9 Select the Automatically create on report execution check box.
10 Within the Predictive metrics to generate area, select Predicted Value.
11 Click Finish to save and create the metric.
For more information on the Training Metric Wizard, see Creating a predictive modelusing MicroStrategy, page 640 or refer to the MicroStrategy online help.
Next, create a report that includes the new training metric and the Quarter attribute.Include the Revenue metric to compare the values calculated by the training metric withthe original values. Review the Report Data Options and VLDB properties for your reportto ensure that outer join results are displayed for the metrics of your report. Execute thereport.
The training metric generates a straight line that best fits the Revenue data. The report,converted into a dashboard to display this trend, is shown below.
A predictive metric is created in the folder you specified in the Training Metric Wizard.The default location is the My Objects folder.
Advanced Reporting Guide
680 © 2017, MicroStrategy Inc.
The predictive metric accurately depicts a linear line through the Revenue data, but forthis example, assume that you are not satisfied with the predictions. Your data is seasonaland you need to forecast the fluctuations that will occur throughout the year.
Seasonality is recognized by adding another independent metric to the training metric.This additional metric specifies the quarter within the year associated with each QuarterIndex value. For example, the Quarter Index values of 1, 5, and 9 are all from the firstquarter. The Quarter of Year metric uses the same basic formula as Quarter Index. TheBreakBy parameter is defined as year so that the ranking is restarted for each year,allowing each quarter to be numbered 1 through 4 for a given year. The formula is shownbelow:
Rank<BreakBy={Year}>(Max(Quarter@ID) {Quarter} )
To include seasonality in your data mining model, complete the following steps.
To add seasonality to the data mining model
1 In MicroStrategy Developer, double-click the training metric you created in Tocreate a training metric for linear regression analysis, page 678 to open theTraining Metric Wizard to the Introduction page.
2 Click Next. The Select Type of Analysis page opens.
3 Do not change any of the values on this page. Click Next. The Select Metrics pageopens.
4 Add the Quarter of Year metric to the list of Independent Metrics, which alreadyincludes the Quarter Index metric.
5 Click Next. The Select Output page opens.
6 Rename the predictive metric so that the existing linear predictive metric is notoverwritten.
7 Save the training metric with a new name to distinguish it as a seasonal prediction.
For more information on the Training Metric Wizard, see Creating a predictivemodel using MicroStrategy, page 640 or refer to the MicroStrategy online help.
You can now re-execute the report you created earlier that included the training metric,Quarter, and Revenue. The results of the training metric now recognize the fluctuationsin revenue throughout each year and predict values accordingly. Notice that the dataaccounts for seasonality and is no longer a straight line, as shown in the report below.
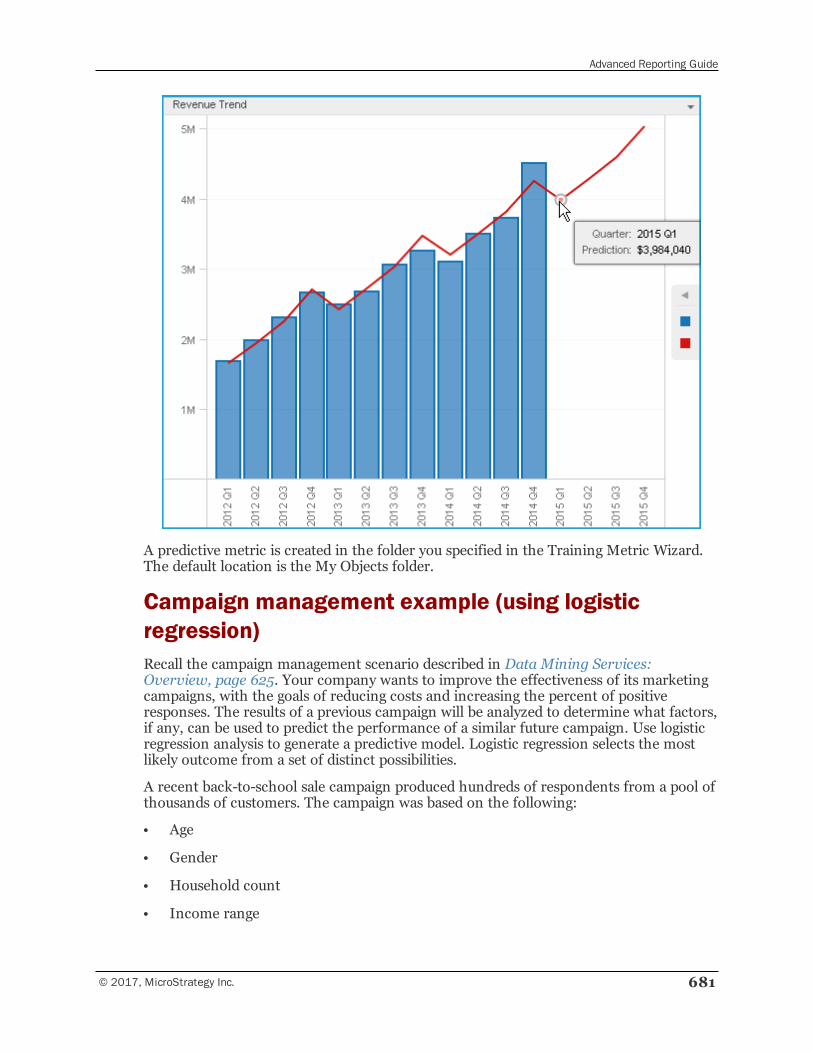
Advanced Reporting Guide
© 2017, MicroStrategy Inc. 681
A predictive metric is created in the folder you specified in the Training Metric Wizard.The default location is the My Objects folder.
Campaign management example (using logisticregression)Recall the campaign management scenario described in Data Mining Services:Overview, page 625. Your company wants to improve the effectiveness of its marketingcampaigns, with the goals of reducing costs and increasing the percent of positiveresponses. The results of a previous campaign will be analyzed to determine what factors,if any, can be used to predict the performance of a similar future campaign. Use logisticregression analysis to generate a predictive model. Logistic regression selects the mostlikely outcome from a set of distinct possibilities.
A recent back-to-school sale campaign produced hundreds of respondents from a pool ofthousands of customers. The campaign was based on the following:
• Age
• Gender
• Household count
• Income range
Advanced Reporting Guide
682 © 2017, MicroStrategy Inc.
To predict future campaigns based on the back-to-school sale campaign, you want to useall of these attributes as predictors in the predictive model. Therefore, you must createmetrics for each attribute form. Some example metrics for this report are as follows:
Max([Customer Age Range]@ID) {Customer}Max([Customer Gender]@DESC) {Customer}Max([Customer Household Count]@DESC){Customer}
The example Tutorial project includes reports, metrics, and other objects createdfor this campaign management example (search the project for “CampaignManagement”). You can use the objects in the Tutorial project to step through theexample and determine how it can be applied to your reporting environment.
Use the Training Metric Wizard to design a training metric, following the procedurebelow.
To create a training metric for logistic regression analysis
This procedure assumes you have already created a Back-to-School Sale Respondermetric to use as the dependent metric.
1 In MicroStrategy Developer, select Training Metric Wizard from the Toolsmenu. The Training Metric Wizard opens on the Introduction page.
To skip the Introduction page when creating training metrics in the future, select theDon’t show this message next time check box.
2 Click Next to open the Select Type of Analysis page.
3 Select Logistic regression as the type of analysis.
4 Click Next to open the Select Metrics page.
5 Select Back-to-School Sale Responder as the Dependent Metric.
6 Add the Age Range, Gender, andHousehold Count metrics to the list ofIndependent Metrics.
7 Click Next to open the Select Output page.
8 Select the Automatically create on report execution check box.
9 Select Predicted Value.
10 Click Finish to save and create the metric. You can now include the metric in atraining metric to create a predictive metric, as described in Creating a predictivemodel using MicroStrategy, page 640.
11 Create a new report with the training metric, Back-to-School Sale Responder metric,and the Customer and Order attributes.
12 Filter the report to include only orders dated during the back-to-school promotionalperiod. For example, you can create a filter that only includes the months of Augustand September.
Advanced Reporting Guide
© 2017, MicroStrategy Inc. 683
13 Execute the report to generate a logistic regression model.
A predictive metric is created in the folder you specified in the Training Metric Wizard.The default location is the My Objects folder.
By adding the predictive metric to a new report along with the Customer attribute andthe Back-to-School Sale Responder metric, the accuracy of the prediction is shown to becorrect almost 100% of the time; there were only a few incorrect predictions out ofthousands of customers.
The predictive metric is ready to be used to target customers who are likely to respond toa future campaign.
Segmentation example (using cluster analysis)Clustering attempts to segment items so that members of one group are more similar toeach other than to members of other groups. These items are most often customers, butcan also be products, patients, prescriptions, phone calls, emails, or any other itemrelevant to the enterprise. Clustering algorithms do the segmentation by analyzing thecharacteristics of the items and finding the best ways to group them by similarities.
You will use cluster analysis in the following example to group your customers intoexactly five segments based on demographics and psychographics.
Each of the following will be used as inputs into the training metric:
• Age Range
• Education
• Gender
• Housing Type
• Marital Status
As before, you must create a metric for each attribute form, which can then be used tocreate a predictive metric. Examples are:
Max([Customer Age Range]@ID) {Customer}Max([Customer Gender]@DESC) {Customer}Max([Housing Type]@DESC){Customer}
The example Tutorial project includes reports, metrics, and other objects createdfor this segmentation example (search the project for “Cluster Analysis”). You canuse the objects in the Tutorial project to step through the example and determinehow it can be applied to your reporting environment.
Use the Training Metric Wizard to design a training metric, following the procedurebelow.
To create a training metric for cluster analysis
1 In MicroStrategy Developer, select Training Metric Wizard from the Toolsmenu. The Training Metric Wizard opens on the Introduction page.
Advanced Reporting Guide
684 © 2017, MicroStrategy Inc.
To skip the Introduction page when creating training metrics in the future, select theDon’t show this message next time check box.
2 Click Next to open the Select Type of Analysis page.
3 Select Cluster as the type of analysis.
4 Specify exactly 5 clusters forModel Specifications.
5 Click Next to open the Select Metrics page.
6 Add the Age Range, Education, Gender,Marital Status, andHousing Typemetrics to the list of Independent Metrics.
7 Click Next to open the Select Output page.
8 Select the Automatically create on report execution check box.
9 Select Predicted Value.
10 Click Finish to save and create the metric. You can now include the metric in atraining metric to create a predictive metric, as described in Creating a predictivemodel using MicroStrategy, page 640.
11 Often, training reports do not require a large number of rows of data to formulate anacceptable result. You will need to reduce the number of rows in your training reportby sampling the data. For this example, your sample will include a random set of20% of the customers. Create a filter to define this random set. Use the filter on anew report with the Customer attribute and the training metric created above.
12 Execute the report.
A predictive metric is created in the folder you specified in the Training Metric Wizard.The default location is the My Objects folder.
Add the predictive metric to a new report with Customer, Age Range, Gender, Education,Housing Type, and Marital Status to see the relationships between segments.
A custom group can be created based on each segment to further segregate thegroupings.
In some cases, the ideal number of clusters is not known before performing an analysis.To overcome this obstacle, Data Mining Services offers a feature to determine theoptimal number of clusters while training the cluster model. Retrain the model above,allowing Data Mining Services to determine how many clusters to create, following theprocedure below.
To retrain the model to automatically determine the number ofclusters
1 Double-click the existing training metric to open the Training Metric Wizard.
2 Click Next to open the Select Type of Analysis page.
3 Specify the maximum number of clusters as 10 inModel Specifications.
4 Click Next to open the Select Metrics page.
Advanced Reporting Guide
© 2017, MicroStrategy Inc. 685
5 Click Next to open the Select Output page.
6 Rename the predictive metric to prevent overwriting the existing cluster predictivemetric.
7 Save the training metric with a new name, specifying that it is optimal.
8 Add the optimal training metric to a new report that contains the Customerattribute. Filter the report on a random 20% sample of customers.
9 Execute the report.
Notice that Data Mining Services creates a predictive model with only two clusters, theoptimal number of clusters less than the maximum allowed. Recall that the maximumspecified in the Training Metric Wizard was 10.
A predictive metric is created in the folder you specified in the Training Metric Wizard.The default location is the My Objects folder.
Telco churn example (using decision tree analysis)You are reviewing your telecommunication trends and are interested in the likelihood ofcustomers to churn based on psychographics and communication habits.
Use a decision tree to analyze the following inputs:
• Average Minutes during Off-Peak times
• Average Minutes during Peak times
• Dropped Calls
• Helpdesk Calls
• Renewals
• Age Range
• Gender
• Household Count
• Marital Status
• Income Bracket
You will need to create metrics for each attribute form. These metrics will be used asinputs into the training metric. Examples are:
Max([Customer Age Range]@ID) {Customer}Max([Customer Gender]@DESC) {Customer}Max([Household Count]@DESC){Customer}
The example Tutorial project includes reports, metrics, and other objects createdfor this telco churn example (search the project for “Telco Churn”). You can usethe objects in the Tutorial project to step through the example and determine howit can be applied to your reporting environment.
Advanced Reporting Guide
686 © 2017, MicroStrategy Inc.
Use the Training Metric Wizard to design a training metric, following the procedurebelow.
To create a training metric for decision tree analysis
This procedure assumes you have already created a TelcoChurn metric to use asthe dependent metric.
1 In MicroStrategy Developer, select Training Metric Wizard from the Toolsmenu. The Training Metric Wizard opens on the Introduction page.
To skip the Introduction page when creating training metrics in the future, select theDon’t show this message next time check box.
2 Click Next to open the Select Type of Analysis page.
3 Select Decision tree as the type of analysis.
4 Specify the k value for k-Fold Cross Validation.
5 Click Next to open the Select Metrics page.
6 Select TelcoChurn metric as the Dependent Metric.
7 Add the following metrics to the list of Independent Metrics:
• AvgMinOffPeak
• AvgMinPeak
• DroppedCalls
• HelpdeskCalls
• Renewals
• Age Range
• Gender
• Household Count
• Marital Status
• Income Bracket
8 Click Next to open the Select Output page.
9 Select the Automatically create on report execution check box.
10 Select Predicted Value.
11 Click Finish to save and create the metric. You can now include the metric in atraining metric to create a predictive metric, as described in Creating a predictivemodel using MicroStrategy, page 640.
Advanced Reporting Guide
© 2017, MicroStrategy Inc. 687
12 Create a new report containing the training metric and the Customer attribute. Filterthe report on every seventh customer. (Which customers to include is arbitrary butmust offer a decent sample size of the data.)
13 Execute the report to generate a decision tree model.
A predictive metric is created in the folder you specified in the Training Metric Wizard.The default location is the My Objects folder.
When applied to all customers, the predictive metric reveals hundreds of customers outof thousands of customers that are likely to churn. Efforts can now be made to targetthese customers for extra deals or value analysis.
Campaign management example: Importing a third-party neural network modelThe Campaign management example (using logistic regression), page 681 used DataMining Services to generate a logistic regression model to improve the effectiveness ofmarketing campaigns, with the goals of reducing costs and increasing the percent ofpositive responses. You would like to execute a similar scenario using a third-party datamining application.
A recent back-to-school sale campaign was based on the following:
• Age
• Gender
• Education
• Household count
• Revenue
The results of a previous campaign will be analyzed to determine what factors, if any, canbe used to predict the performance of a similar future campaign. The previous campaigncounted hundreds of favorable responses out of thousands of customer orders. Accuratedata on the targeted customers and their responses have been entered into aMicroStrategy project.
The first step in data mining is to design a dataset report. The pertinent information forthis report is listed below:
• Customer
• Order
• Age Range
• Education
• Gender
• Household count
• Revenue
• Promotion ID
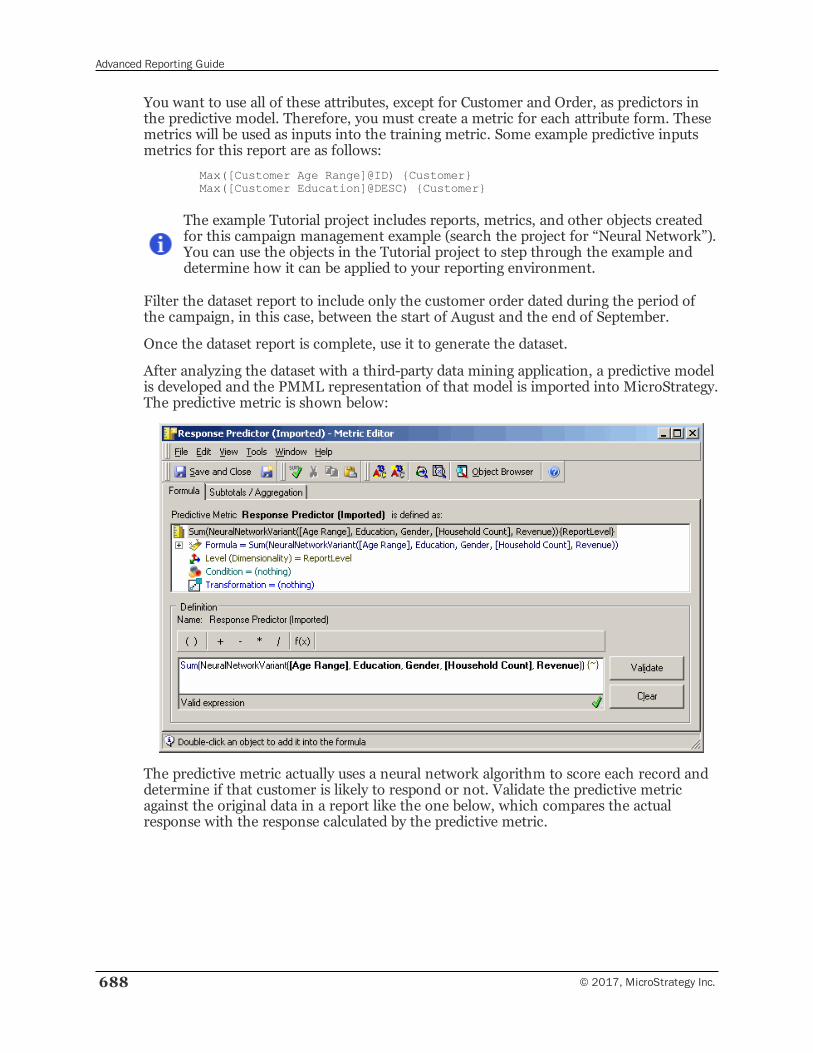
Advanced Reporting Guide
688 © 2017, MicroStrategy Inc.
You want to use all of these attributes, except for Customer and Order, as predictors inthe predictive model. Therefore, you must create a metric for each attribute form. Thesemetrics will be used as inputs into the training metric. Some example predictive inputsmetrics for this report are as follows:
Max([Customer Age Range]@ID) {Customer}Max([Customer Education]@DESC) {Customer}
The example Tutorial project includes reports, metrics, and other objects createdfor this campaign management example (search the project for “Neural Network”).You can use the objects in the Tutorial project to step through the example anddetermine how it can be applied to your reporting environment.
Filter the dataset report to include only the customer order dated during the period ofthe campaign, in this case, between the start of August and the end of September.
Once the dataset report is complete, use it to generate the dataset.
After analyzing the dataset with a third-party data mining application, a predictive modelis developed and the PMML representation of that model is imported into MicroStrategy.The predictive metric is shown below:
The predictive metric actually uses a neural network algorithm to score each record anddetermine if that customer is likely to respond or not. Validate the predictive metricagainst the original data in a report like the one below, which compares the actualresponse with the response calculated by the predictive metric.
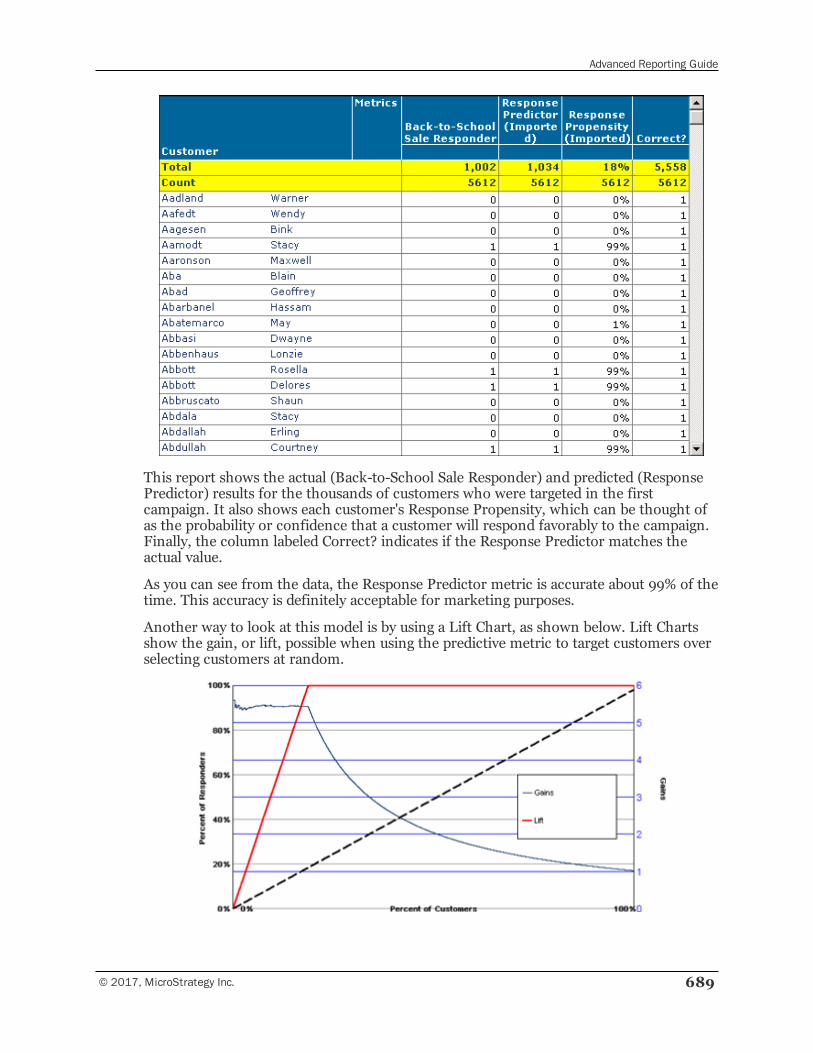
Advanced Reporting Guide
© 2017, MicroStrategy Inc. 689
This report shows the actual (Back-to-School Sale Responder) and predicted (ResponsePredictor) results for the thousands of customers who were targeted in the firstcampaign. It also shows each customer's Response Propensity, which can be thought ofas the probability or confidence that a customer will respond favorably to the campaign.Finally, the column labeled Correct? indicates if the Response Predictor matches theactual value.
As you can see from the data, the Response Predictor metric is accurate about 99% of thetime. This accuracy is definitely acceptable for marketing purposes.
Another way to look at this model is by using a Lift Chart, as shown below. Lift Chartsshow the gain, or lift, possible when using the predictive metric to target customers overselecting customers at random.
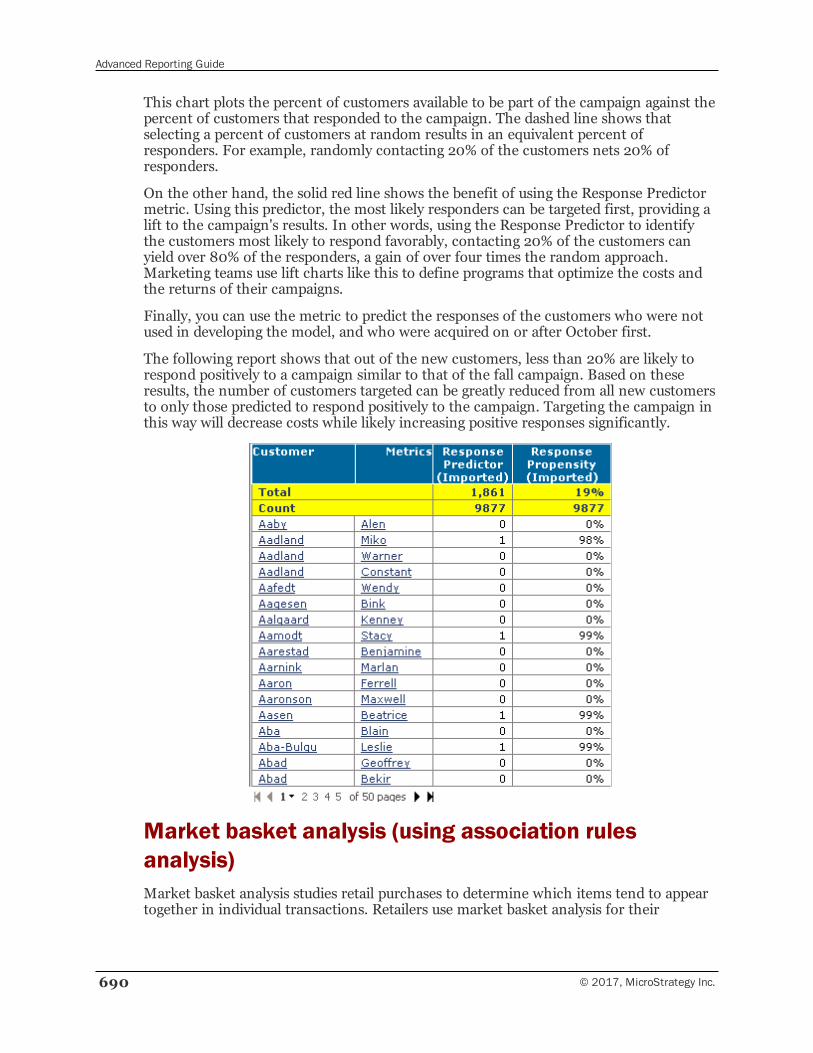
Advanced Reporting Guide
690 © 2017, MicroStrategy Inc.
This chart plots the percent of customers available to be part of the campaign against thepercent of customers that responded to the campaign. The dashed line shows thatselecting a percent of customers at random results in an equivalent percent ofresponders. For example, randomly contacting 20% of the customers nets 20% ofresponders.
On the other hand, the solid red line shows the benefit of using the Response Predictormetric. Using this predictor, the most likely responders can be targeted first, providing alift to the campaign's results. In other words, using the Response Predictor to identifythe customers most likely to respond favorably, contacting 20% of the customers canyield over 80% of the responders, a gain of over four times the random approach.Marketing teams use lift charts like this to define programs that optimize the costs andthe returns of their campaigns.
Finally, you can use the metric to predict the responses of the customers who were notused in developing the model, and who were acquired on or after October first.
The following report shows that out of the new customers, less than 20% are likely torespond positively to a campaign similar to that of the fall campaign. Based on theseresults, the number of customers targeted can be greatly reduced from all new customersto only those predicted to respond positively to the campaign. Targeting the campaign inthis way will decrease costs while likely increasing positive responses significantly.
Market basket analysis (using association rulesanalysis)Market basket analysis studies retail purchases to determine which items tend to appeartogether in individual transactions. Retailers use market basket analysis for their
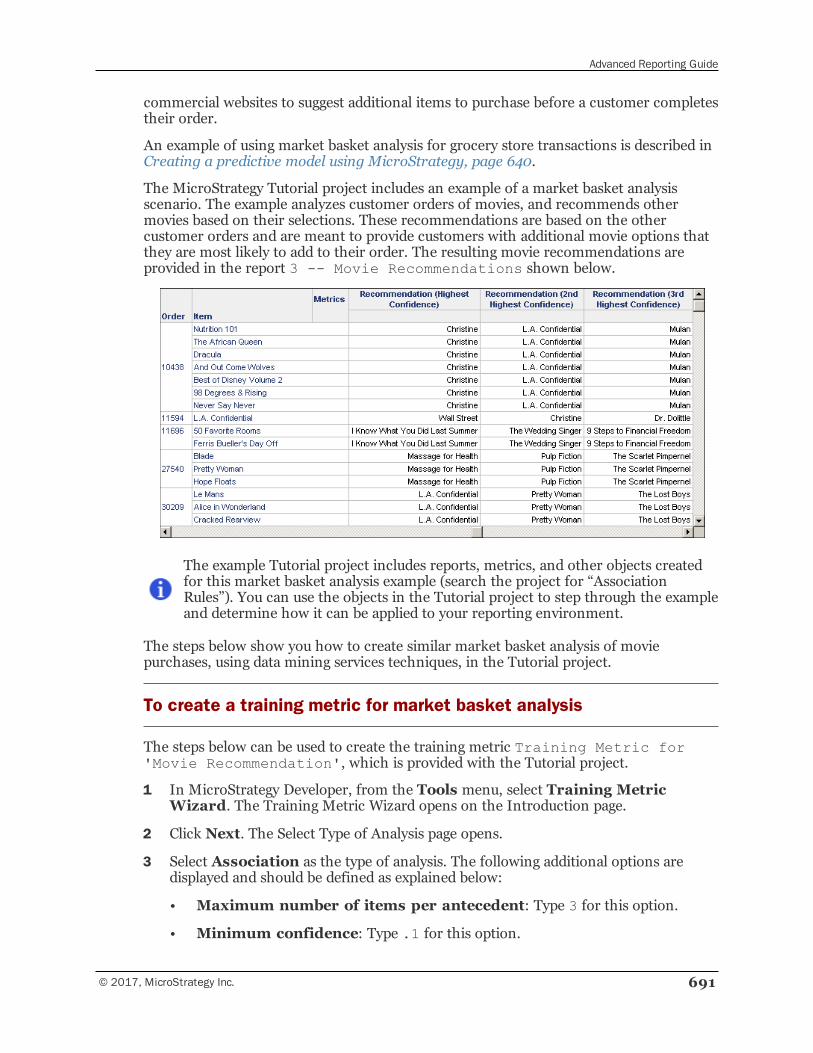
Advanced Reporting Guide
© 2017, MicroStrategy Inc. 691
commercial websites to suggest additional items to purchase before a customer completestheir order.
An example of using market basket analysis for grocery store transactions is described inCreating a predictive model using MicroStrategy, page 640.
The MicroStrategy Tutorial project includes an example of a market basket analysisscenario. The example analyzes customer orders of movies, and recommends othermovies based on their selections. These recommendations are based on the othercustomer orders and are meant to provide customers with additional movie options thatthey are most likely to add to their order. The resulting movie recommendations areprovided in the report 3 -- Movie Recommendations shown below.
The example Tutorial project includes reports, metrics, and other objects createdfor this market basket analysis example (search the project for “AssociationRules”). You can use the objects in the Tutorial project to step through the exampleand determine how it can be applied to your reporting environment.
The steps below show you how to create similar market basket analysis of moviepurchases, using data mining services techniques, in the Tutorial project.
To create a training metric for market basket analysis
The steps below can be used to create the training metric Training Metric for'Movie Recommendation', which is provided with the Tutorial project.
1 In MicroStrategy Developer, from the Tools menu, select Training MetricWizard. The Training Metric Wizard opens on the Introduction page.
2 Click Next. The Select Type of Analysis page opens.
3 Select Association as the type of analysis. The following additional options aredisplayed and should be defined as explained below:
• Maximum number of items per antecedent: Type 3 for this option.
• Minimum confidence: Type .1 for this option.
Advanced Reporting Guide
692 © 2017, MicroStrategy Inc.
• Minimum support: Type .1 for this option.
4 Click Next. The Select Metrics page opens.
5 Browse to the Order metric, which is stored inTutorial\Public Objects\Reports\MicroStrategy PlatformCapabilities\MicroStrategy Data Mining Services\Support Objects. Select the Order metric and click the arrow next to Transaction metric.
The Order metric’s definition is Max<FactID=Revenue>(Order){~},which is based on the Order attribute. The parameter <FactID=Revenue>is included to ensure the attribute information can be joined together anddisplayed on a report.
6 In the same folder, select the Item metric and click the arrow next to Item metric.
The Item metric’s definition is Max<FactID=Revenue>(Item@DESC){~},which is based on the Item attribute. The parameter <FactID=Revenue> isincluded to ensure the attribute information can be joined together anddisplayed on a report.
7 Click Next. The Select Output page opens.
8 Click ... (browse button) for the Folder option to select a folder to save the trainingmetric to.
9 Clear the Include extended statistical analysis with the model check box.
10 Click Rules. The Rules to Return dialog box opens.
11 For the Return the top ranked rules up to this amount option, change thevalue to 3, which returns the top three movie recommendations based on the moviesin a customer’s order.
12 Click OK to return to the Select Output page.
13 In the Predictive metric(s) to generate area, make the following changes:
a Keep the Rule predictor type selected. For the Name field, type MovieRecommendation Rule.
b Select the Consequent predictor type. For the Name field, typeRecommendation.
14 Click Next. The summary page opens.
15 Click Finish to create the training metric. The Save As dialog box opens.
16 In the Object name field, type Training Metric for 'MovieRecommendation', and click Save.
After creating a training metric, you must create a report that includes the new trainingmetric.
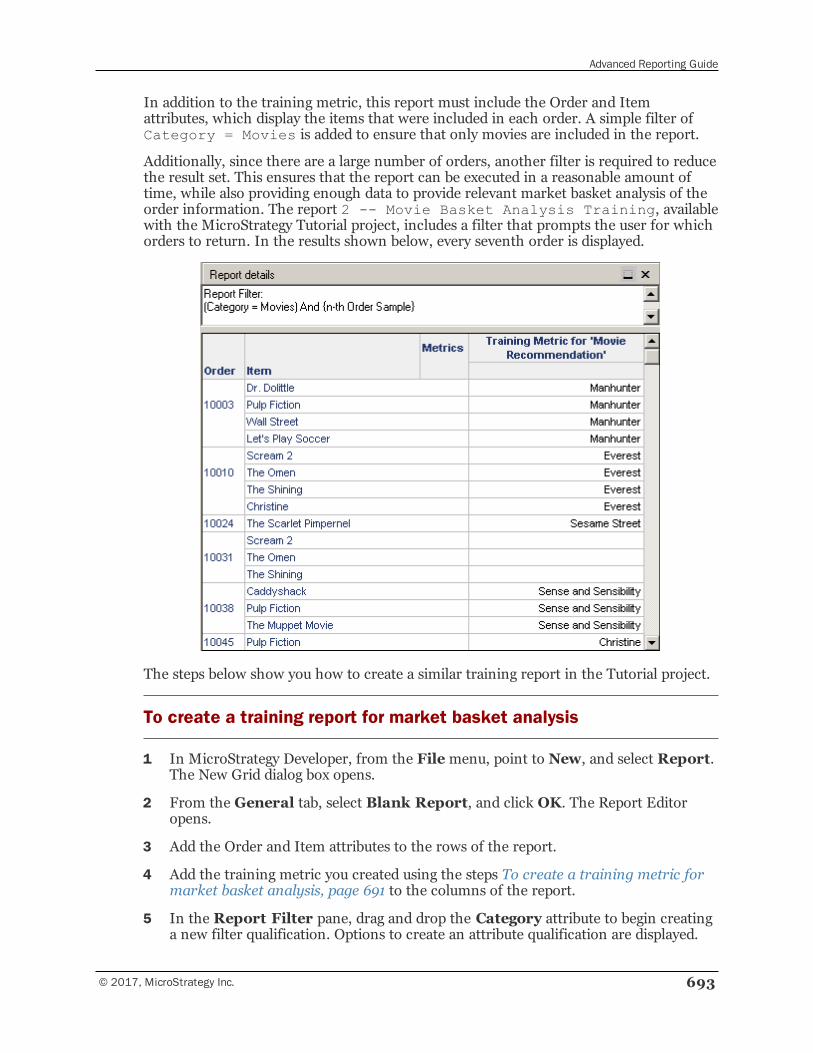
Advanced Reporting Guide
© 2017, MicroStrategy Inc. 693
In addition to the training metric, this report must include the Order and Itemattributes, which display the items that were included in each order. A simple filter ofCategory = Movies is added to ensure that only movies are included in the report.
Additionally, since there are a large number of orders, another filter is required to reducethe result set. This ensures that the report can be executed in a reasonable amount oftime, while also providing enough data to provide relevant market basket analysis of theorder information. The report 2 -- Movie Basket Analysis Training, availablewith the MicroStrategy Tutorial project, includes a filter that prompts the user for whichorders to return. In the results shown below, every seventh order is displayed.
The steps below show you how to create a similar training report in the Tutorial project.
To create a training report for market basket analysis
1 In MicroStrategy Developer, from the Filemenu, point to New, and select Report.The New Grid dialog box opens.
2 From the General tab, select Blank Report, and click OK. The Report Editoropens.
3 Add the Order and Item attributes to the rows of the report.
4 Add the training metric you created using the steps To create a training metric formarket basket analysis, page 691 to the columns of the report.
5 In the Report Filter pane, drag and drop the Category attribute to begin creatinga new filter qualification. Options to create an attribute qualification are displayed.
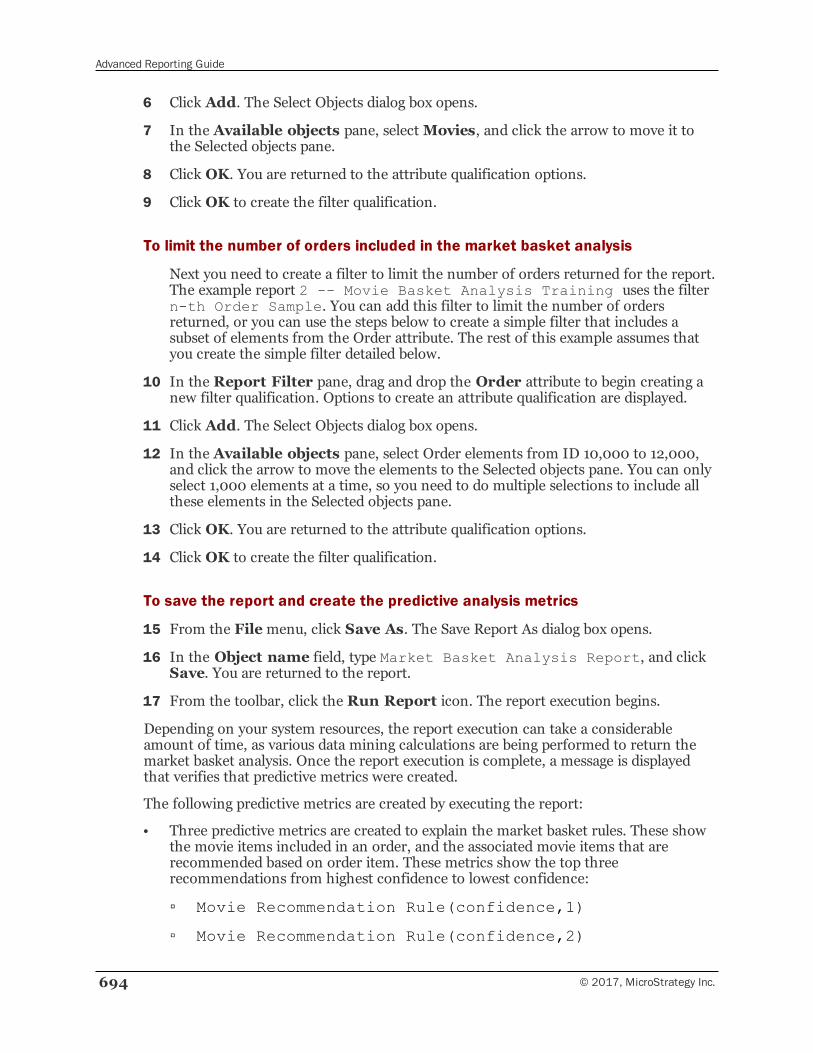
Advanced Reporting Guide
694 © 2017, MicroStrategy Inc.
6 Click Add. The Select Objects dialog box opens.
7 In the Available objects pane, selectMovies, and click the arrow to move it tothe Selected objects pane.
8 Click OK. You are returned to the attribute qualification options.
9 Click OK to create the filter qualification.
To limit the number of orders included in the market basket analysis
Next you need to create a filter to limit the number of orders returned for the report.The example report 2 -- Movie Basket Analysis Training uses the filtern-th Order Sample. You can add this filter to limit the number of ordersreturned, or you can use the steps below to create a simple filter that includes asubset of elements from the Order attribute. The rest of this example assumes thatyou create the simple filter detailed below.
10 In the Report Filter pane, drag and drop the Order attribute to begin creating anew filter qualification. Options to create an attribute qualification are displayed.
11 Click Add. The Select Objects dialog box opens.
12 In the Available objects pane, select Order elements from ID 10,000 to 12,000,and click the arrow to move the elements to the Selected objects pane. You can onlyselect 1,000 elements at a time, so you need to do multiple selections to include allthese elements in the Selected objects pane.
13 Click OK. You are returned to the attribute qualification options.
14 Click OK to create the filter qualification.
To save the report and create the predictive analysis metrics
15 From the Filemenu, click Save As. The Save Report As dialog box opens.
16 In the Object name field, type Market Basket Analysis Report, and clickSave. You are returned to the report.
17 From the toolbar, click the Run Report icon. The report execution begins.
Depending on your system resources, the report execution can take a considerableamount of time, as various data mining calculations are being performed to return themarket basket analysis. Once the report execution is complete, a message is displayedthat verifies that predictive metrics were created.
The following predictive metrics are created by executing the report:
• Three predictive metrics are created to explain the market basket rules. These showthe movie items included in an order, and the associated movie items that arerecommended based on order item. These metrics show the top threerecommendations from highest confidence to lowest confidence:
▫ Movie Recommendation Rule(confidence,1)
▫ Movie Recommendation Rule(confidence,2)
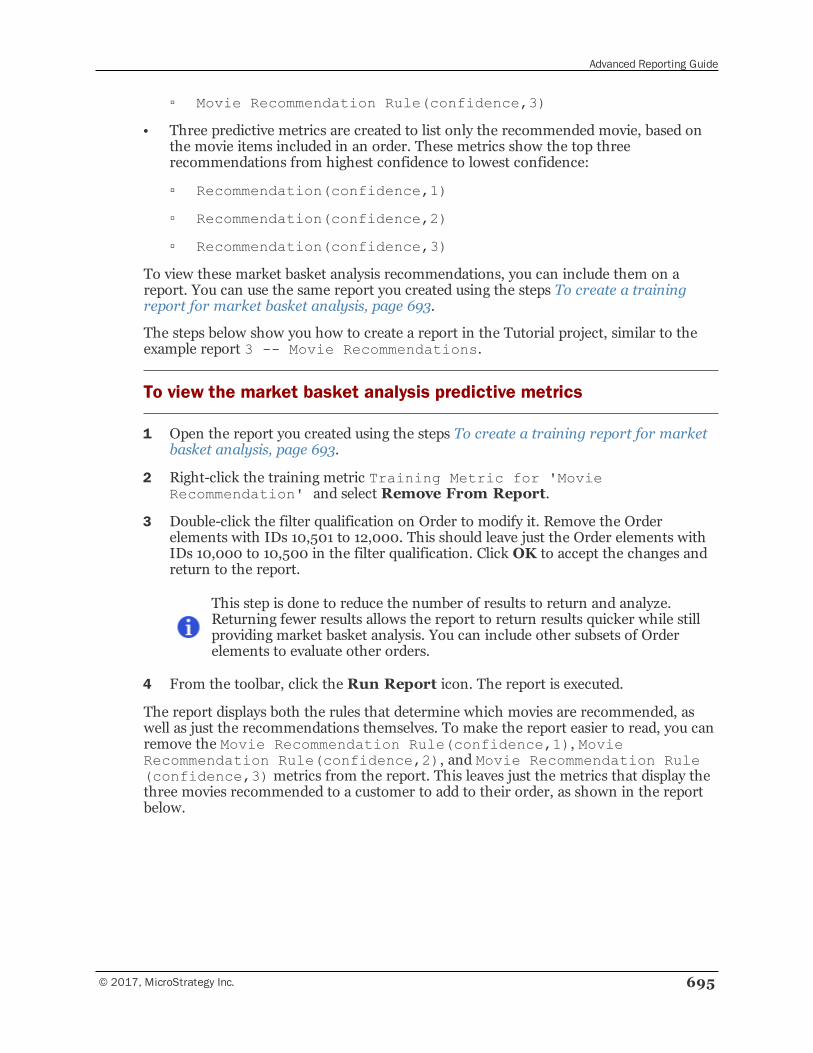
Advanced Reporting Guide
© 2017, MicroStrategy Inc. 695
▫ Movie Recommendation Rule(confidence,3)
• Three predictive metrics are created to list only the recommended movie, based onthe movie items included in an order. These metrics show the top threerecommendations from highest confidence to lowest confidence:
▫ Recommendation(confidence,1)
▫ Recommendation(confidence,2)
▫ Recommendation(confidence,3)
To view these market basket analysis recommendations, you can include them on areport. You can use the same report you created using the steps To create a trainingreport for market basket analysis, page 693.
The steps below show you how to create a report in the Tutorial project, similar to theexample report 3 -- Movie Recommendations.
To view the market basket analysis predictive metrics
1 Open the report you created using the steps To create a training report for marketbasket analysis, page 693.
2 Right-click the training metric Training Metric for 'MovieRecommendation' and select Remove From Report.
3 Double-click the filter qualification on Order to modify it. Remove the Orderelements with IDs 10,501 to 12,000. This should leave just the Order elements withIDs 10,000 to 10,500 in the filter qualification. Click OK to accept the changes andreturn to the report.
This step is done to reduce the number of results to return and analyze.Returning fewer results allows the report to return results quicker while stillproviding market basket analysis. You can include other subsets of Orderelements to evaluate other orders.
4 From the toolbar, click the Run Report icon. The report is executed.
The report displays both the rules that determine which movies are recommended, aswell as just the recommendations themselves. To make the report easier to read, you canremove the Movie Recommendation Rule(confidence,1), MovieRecommendation Rule(confidence,2), and Movie Recommendation Rule(confidence,3) metrics from the report. This leaves just the metrics that display thethree movies recommended to a customer to add to their order, as shown in the reportbelow.
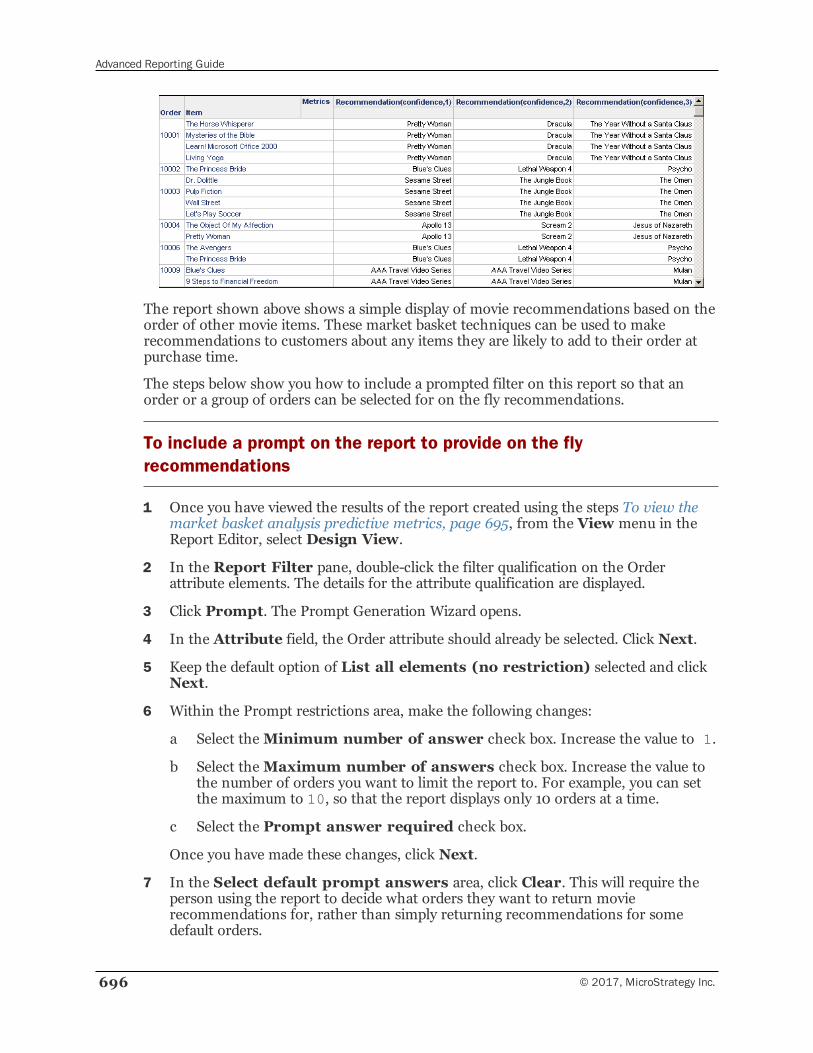
Advanced Reporting Guide
696 © 2017, MicroStrategy Inc.
The report shown above shows a simple display of movie recommendations based on theorder of other movie items. These market basket techniques can be used to makerecommendations to customers about any items they are likely to add to their order atpurchase time.
The steps below show you how to include a prompted filter on this report so that anorder or a group of orders can be selected for on the fly recommendations.
To include a prompt on the report to provide on the flyrecommendations
1 Once you have viewed the results of the report created using the steps To view themarket basket analysis predictive metrics, page 695, from the View menu in theReport Editor, select Design View.
2 In the Report Filter pane, double-click the filter qualification on the Orderattribute elements. The details for the attribute qualification are displayed.
3 Click Prompt. The Prompt Generation Wizard opens.
4 In the Attribute field, the Order attribute should already be selected. Click Next.
5 Keep the default option of List all elements (no restriction) selected and clickNext.
6 Within the Prompt restrictions area, make the following changes:
a Select theMinimum number of answer check box. Increase the value to 1.
b Select theMaximum number of answers check box. Increase the value tothe number of orders you want to limit the report to. For example, you can setthe maximum to 10, so that the report displays only 10 orders at a time.
c Select the Prompt answer required check box.
Once you have made these changes, click Next.
7 In the Select default prompt answers area, click Clear. This will require theperson using the report to decide what orders they want to return movierecommendations for, rather than simply returning recommendations for somedefault orders.
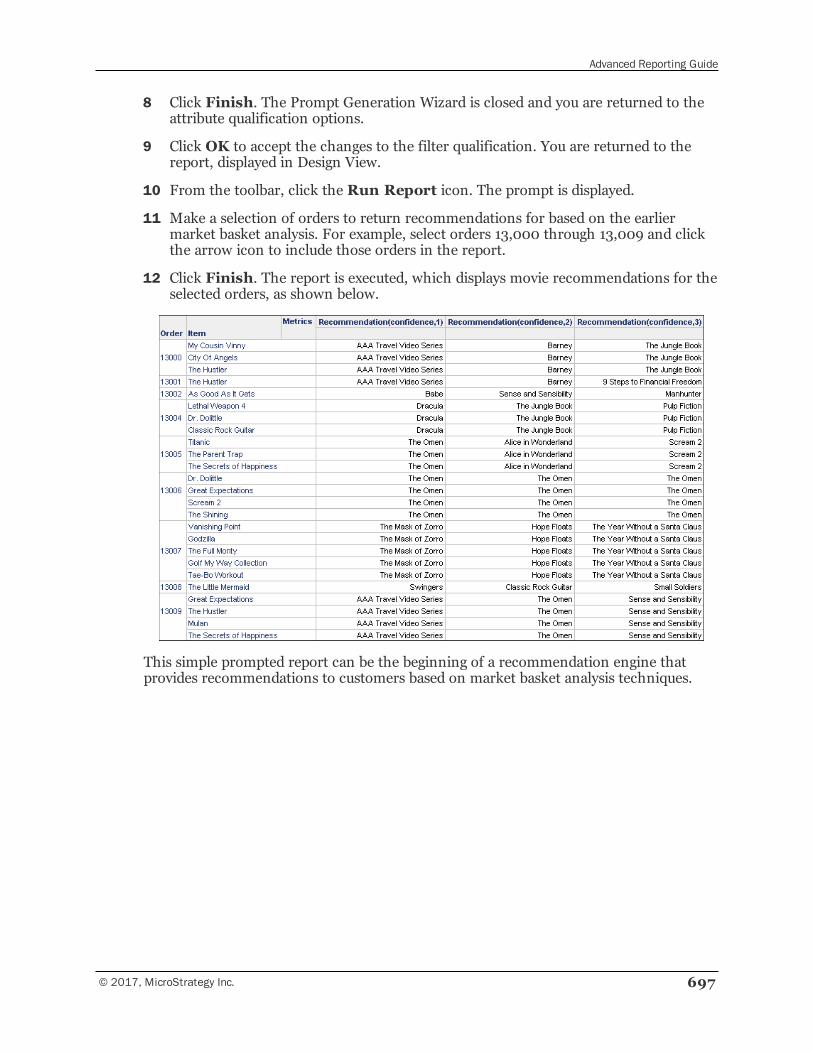
Advanced Reporting Guide
© 2017, MicroStrategy Inc. 697
8 Click Finish. The Prompt Generation Wizard is closed and you are returned to theattribute qualification options.
9 Click OK to accept the changes to the filter qualification. You are returned to thereport, displayed in Design View.
10 From the toolbar, click the Run Report icon. The prompt is displayed.
11 Make a selection of orders to return recommendations for based on the earliermarket basket analysis. For example, select orders 13,000 through 13,009 and clickthe arrow icon to include those orders in the report.
12 Click Finish. The report is executed, which displays movie recommendations for theselected orders, as shown below.
This simple prompted report can be the beginning of a recommendation engine thatprovides recommendations to customers based on market basket analysis techniques.
14VLDB PROPERTIES
VLDB properties allow you to customize the SQL that MicroStrategy generates. Thesesettings affect how MicroStrategy Intelligence Server manages joins, metric calculations,and query optimizations, among other options. This section focuses on the VLDBproperties that are set at the metric and report level. This section includes the followingsections:
• Levels of VLDB properties, page 698
• VLDB properties at the metric level, page 699
• VLDB properties at the report level, page 703
• VLDB properties at the database instance level, page 716
For more information on VLDB properties set at other levels and the VLDBProperties Editor, see the Supplemental Reference for System Administration.
Levels of VLDB propertiesVLDB properties are available at multiple levels, so that SQL generated for one reportcan be manipulated separately from the SQL generated for another, similar report. Thisflexibility is an important benefit of VLDB properties.
The hierarchy, or order of precedence, for VLDB properties is outlined in the followingfigure.
© 2017, MicroStrategy Inc. 698
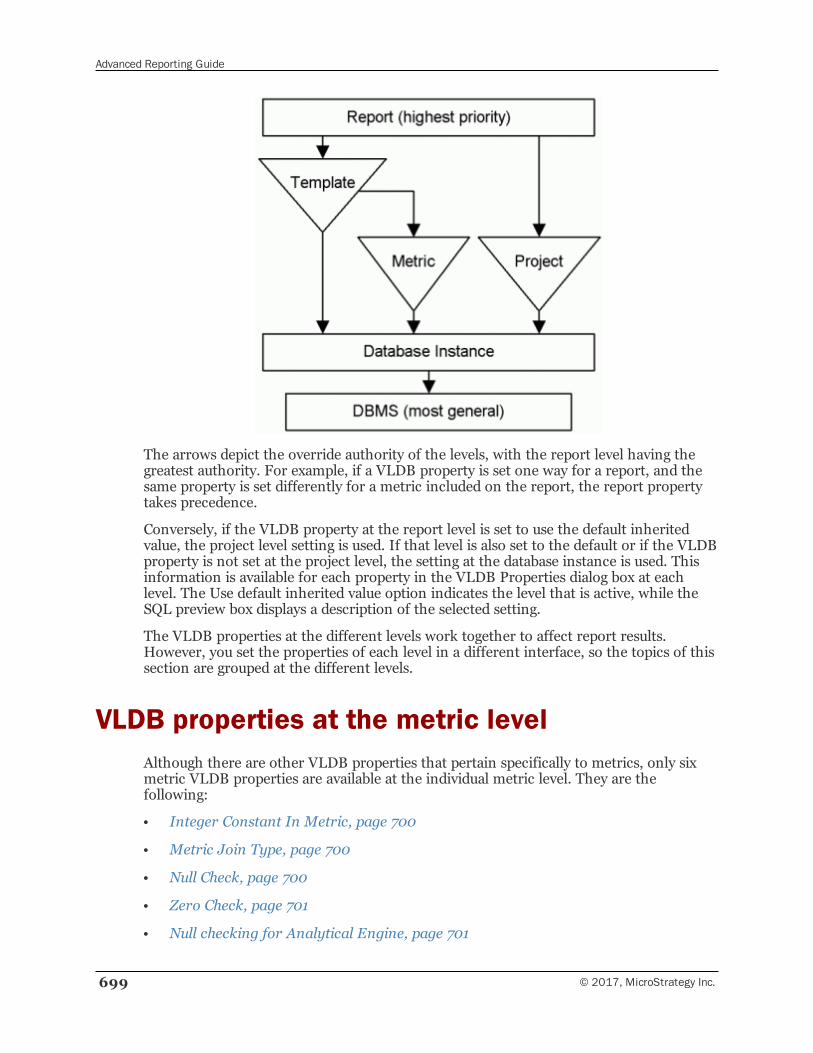
Advanced Reporting Guide
699 © 2017, MicroStrategy Inc.
The arrows depict the override authority of the levels, with the report level having thegreatest authority. For example, if a VLDB property is set one way for a report, and thesame property is set differently for a metric included on the report, the report propertytakes precedence.
Conversely, if the VLDB property at the report level is set to use the default inheritedvalue, the project level setting is used. If that level is also set to the default or if the VLDBproperty is not set at the project level, the setting at the database instance is used. Thisinformation is available for each property in the VLDB Properties dialog box at eachlevel. The Use default inherited value option indicates the level that is active, while theSQL preview box displays a description of the selected setting.
The VLDB properties at the different levels work together to affect report results.However, you set the properties of each level in a different interface, so the topics of thissection are grouped at the different levels.
VLDB properties at the metric levelAlthough there are other VLDB properties that pertain specifically to metrics, only sixmetric VLDB properties are available at the individual metric level. They are thefollowing:
• Integer Constant In Metric, page 700
• Metric Join Type, page 700
• Null Check, page 700
• Zero Check, page 701
• Null checking for Analytical Engine, page 701
Advanced Reporting Guide
© 2017, MicroStrategy Inc. 700
• Subtotal Dimensionality Aware, page 702
The other metric properties are described in the Supplemental Reference forSystem Administration.
To access metric VLDB properties
1 In the Metric Editor, from the Tools menu select Advanced Settings.
2 Choose VLDB Properties to access the VLDB Properties (Metric) dialog box. TheNull Checking for Analytical Engine and Subtotal Dimensionality Aware settings arecontained in the Analytical Engine folder, while the others are found in the Metricsfolder.
Integer Constant In MetricThis setting determines whether to add a “.0” after an integer (a whole number). Thisprevents imprecise rounding when division is performed. For example, 2/7 returns theinteger 0 if “.0” has not been added. Generally, the “.0” is added, so that the samecalculation returns a more accurate result, for example, 2.0/7.0 = 0.3. The use of “.0” isusual.
Some databases have trouble with this change because certain database functions onlywork with integer data types. Therefore this setting is offered so you can disable theaddition of the “.0”.
The options for this property are as follows:
• Add “.0” to integer constants in metric expressions
• Do not add “.0” to integer constants in metric expressions
• Use default inherited value
Metric Join TypeThis property sets the type of join used in the metric. The options are:
• Inner join, which includes only rows that have data present for all metrics acrossthat row in a report
• Outer join, which shows all rows for the metric, regardless of other metrics on thereport
• Use default inherited value
For more information on join types, see Join specifications, page 104.
Null CheckThe Null Check property indicates how to handle arithmetic operations that contain nullvalues. When the null check is performed, null values are changed to zero in arithmeticcalculations (+, -, *, and /).

Advanced Reporting Guide
701 © 2017, MicroStrategy Inc.
The options for this property are as follows:
• Do nothing, which means that the database rather than the Analytical Enginehandles arithmetic calculations including a null value
• Check in all queries
• Check in temporary table join only
• Use default inherited value
This property can also be set at the report level, which overwrites the setting at themetric level.
Zero CheckThe Zero Check property indicates how to handle division by zero and when to check forzeros in the denominator during division. When a zero check is performed, a zero in thedenominator of a division calculation is changed to a null value.
The options for this property are as follows:
• Do nothing, which means that the database rather than the Analytical Enginehandles division by a zero
• Check in all queries
• Check in temporary table join only
• Use default inherited value
This property can also be set at the report level, which overwrites the setting at themetric level.
Null checking for Analytical EngineThis setting determines whether a null value is interpreted as zero when the AnalyticalEngine performs calculations. It is found in the Analytical Engine folder of the VLDBProperties (Metric) dialog box, pictured below.
For users with environments and metadata updated to MicroStrategy 10.8, the AnalyticalEngine will ignore null values for aggregation functions in new projects by default. Anyexisting projects will retain the null checking behavior that was applied before theupgrade. Default null check behavior is applied to function types as follows:
• Aggregation: Ignore nulls
• Scalar (including Date and String functions): Nulls treated as zero
• Boolean: Nulls are treated as nulls
• Rank: Nulls are treated as nulls
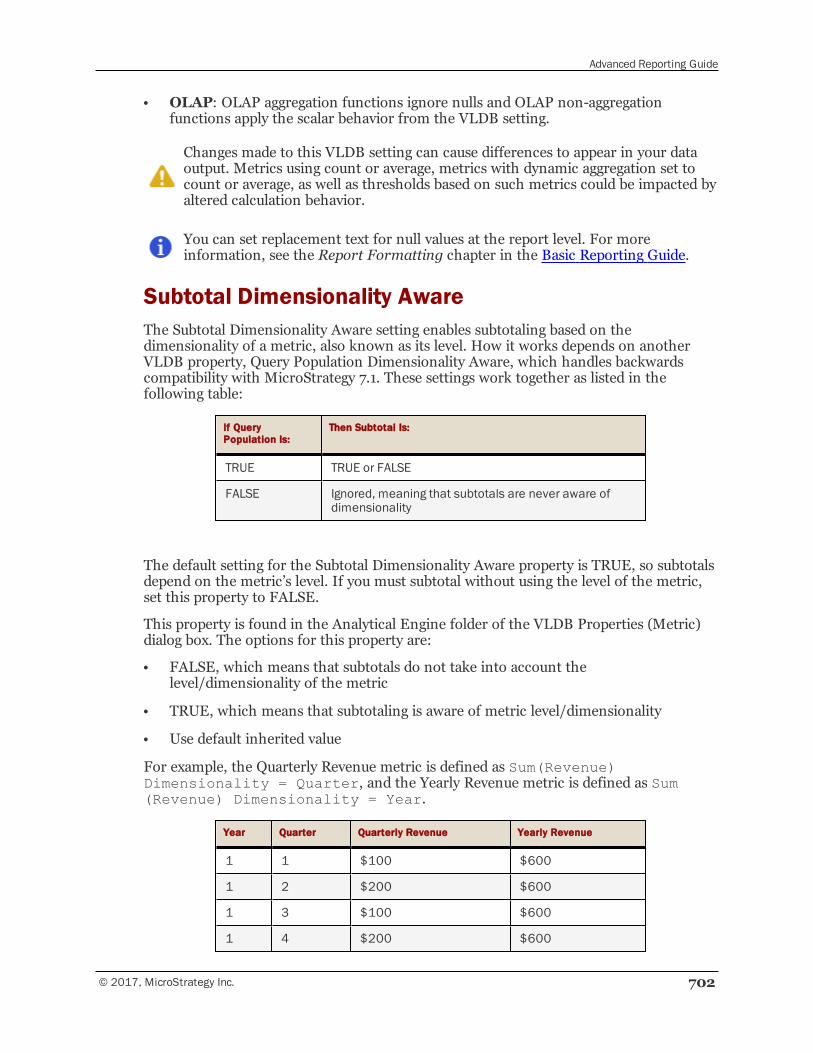
Advanced Reporting Guide
© 2017, MicroStrategy Inc. 702
• OLAP: OLAP aggregation functions ignore nulls and OLAP non-aggregationfunctions apply the scalar behavior from the VLDB setting.
Changes made to this VLDB setting can cause differences to appear in your dataoutput. Metrics using count or average, metrics with dynamic aggregation set tocount or average, as well as thresholds based on such metrics could be impacted byaltered calculation behavior.
You can set replacement text for null values at the report level. For moreinformation, see the Report Formatting chapter in the Basic Reporting Guide.
Subtotal Dimensionality AwareThe Subtotal Dimensionality Aware setting enables subtotaling based on thedimensionality of a metric, also known as its level. How it works depends on anotherVLDB property, Query Population Dimensionality Aware, which handles backwardscompatibility with MicroStrategy 7.1. These settings work together as listed in thefollowing table:
If QueryPopulation Is:
Then Subtotal Is:
TRUE TRUE or FALSE
FALSE Ignored, meaning that subtotals are never aware ofdimensionality
The default setting for the Subtotal Dimensionality Aware property is TRUE, so subtotalsdepend on the metric’s level. If you must subtotal without using the level of the metric,set this property to FALSE.
This property is found in the Analytical Engine folder of the VLDB Properties (Metric)dialog box. The options for this property are:
• FALSE, which means that subtotals do not take into account thelevel/dimensionality of the metric
• TRUE, which means that subtotaling is aware of metric level/dimensionality
• Use default inherited value
For example, the Quarterly Revenue metric is defined as Sum(Revenue)Dimensionality = Quarter, and the Yearly Revenue metric is defined as Sum(Revenue) Dimensionality = Year.
Year Quarter Quarterly Revenue Yearly Revenue
1 1 $100 $600
1 2 $200 $600
1 3 $100 $600
1 4 $200 $600
Advanced Reporting Guide
703 © 2017, MicroStrategy Inc.
If Subtotal Dimensionality Aware is set to FALSE, the quarterly subtotal is calculated as$600, the total of the Quarterly Revenue values. The yearly subtotal is calculated as$2400, the total of the Yearly Revenue values. This is how MicroStrategy 7.1 calculatedthe subtotal.
If Subtotal Dimensionality Aware is set to TRUE, the quarterly subtotal is still $600.MicroStrategy is aware of the level of the Yearly Revenue metric, so rather than simplyadding the column values, it calculates the total as $600.
VLDB properties at the report levelThe report level contains numerous VLDB properties. The most commonly used arelisted below. The top level of the list indicates the folder in the VLDB Properties dialogbox in which the property is found.
• Joins:
▫ Cartesian Join Warning, page 704
▫ Full Outer Join Support, page 705
▫ Preserve All Final Pass Result Elements, page 705
▫ Preserve All Lookup Table Elements, page 707
The term “cross join” is used interchangeably with Cartesian join in these sections.
• Metrics:
▫ Null Check
▫ Zero Check
The metric properties above can also be set at the metric level, although the settingat the report level overwrites it. These properties are described in VLDB propertiesat the metric level, page 699.
• Pre/Post Statements:
▫ Report Post Statement, page 709
▫ Report Pre Statement, page 709
▫ Table Post Statement, page 709
• Query Optimizations:
▫ Sub Query Type, page 710
▫ WHERE Clause Driving Table, page 710
• Select/Insert:
▫ Attribute and Attribute Form Selection Option for Intermediate Passesproperties, page 711
Advanced Reporting Guide
© 2017, MicroStrategy Inc. 704
▫ Attribute and Attribute Form Selection Option for Intermediate Passesproperties, page 711
▫ GROUP BY ID Attribute, page 712
▫ GROUP BY Non-ID Attribute, page 713
▫ SQL Hint, page 713
▫ UNION Multiple INSERT, page 713
• Tables:
▫ Drop Temp Table Method, page 714
▫ FallBack Table Type, page 714
▫ Intermediate Table Type, page 714
▫ Table Option and Table Space properties, page 715
▫ Table Option and Table Space properties, page 715
For information on other report level VLDB properties, refer to the SupplementalReference for System Administration
Accessing report VLDB propertiesTo set these properties, open the report in the Report Editor or Report Viewer. SelectVLDB Properties from the Data menu to access the VLDB Properties (Report) dialogbox. The properties are saved in different folders, as indicated in the previous list.
The following settings are advanced properties which are hidden by default:
• Full Outer Join Support
• Preserve All Final Pass Result Elements
• GROUP BY ID Attribute
To access them, select Show Advanced Settings from the Tools menu in the VLDBProperties (Report) dialog box.
Cartesian Join WarningThe Cartesian Join Warning indicates the action that occurs when the Analytical Enginegenerates a report that contains a Cartesian join. In a Cartesian join, every row in onetable is joined to every row in the other table. The query returns every possible rowcombination of the two tables, so a Cartesian join is usually costly to perform. Since aCartesian join of two warehouse tables is much more costly than a Cartesian join of twointermediate tables, additional options are included to govern these cases.
The options for this property are
• Execute
When a Cartesian join occurs, the report is executed without any warning.
Advanced Reporting Guide
705 © 2017, MicroStrategy Inc.
• Cancel execution
When a Cartesian join occurs, report execution is canceled without any warning.
• Cancel execution only when warehouse table is involved ineither side of Cartesian join
A Cartesian join is allowed only when all tables involved in it are intermediate tables.No warning is sent.
• If only one side of Cartesian join contains warehouse tables, SQLwill be executed without warning
A Cartesian join is allowed if only one warehouse table is involved, otherwise it iscanceled without warning.
• Use default inherited value
Some Cartesian joins are not a direct table-to-table join. If one join Cartesian joinsto another join, and one of the joins contains a warehouse table (not anintermediate table), then the execution is either canceled or allowed depending onthe option selected. For example, when a Cartesian join is performed between thejoin of two intermediate tables (TT_A join TT_B) and the join of an intermediatetable and a warehouse table (TT_C join WH_D), the following happens:
▫ When Cancel execution only when warehouse table is involved ineither side of Cartesian join is selected, the report is canceled. In the aboveexample, execution is canceled because a warehouse table is used, even thoughTT_A, TT_B, and TT_C are all intermediate tables.
▫ When If only one side of Cartesian is selected, the report runs withoutwarning. In the above example, execution continues because a warehouse table(WH_D) is used on only one side of the join.
Full Outer Join SupportThe Full Outer Join Support setting specifies if the database platform supports full outerjoin syntax.
The options for this property are
• No support
• Support, which assumes that the Join Type VLDB setting is Join 92; any other valuein Join Type is ignored
• Use default inherited value
Full Outer Join Support is an advanced property that is hidden by default.
Preserve All Final Pass Result ElementsThe Preserve All Final Pass Result Elements setting determines how to join on the finalresult and the lookup and relationship tables.
Advanced Reporting Guide
© 2017, MicroStrategy Inc. 706
Preserve All Final Pass Result Elements is an advanced property that is hidden bydefault.
The options for this property are:
• Preserve common elements of final pass result table and lookup table
The SQL Engine generates an equi-join, which is a join which combines the tablerows. These are added to the results only when the joined columns have equal values.
Therefore, the report contains only the elements that are common to both tables.
• Preserve all final result pass elements
The SQL Engine generates an outer join from the fact table to the lookup table, aswell as to any relationship tables. This occurs because it is hard to distinguish whichtable is used as a lookup table and which table is used as a relationship table. Forexample, LOOKUP_DAY serves as a lookup table for the Day attribute and arelationship table for Day and Month.
The report contains all of the elements that are in the final result set.
This setting should not be used in standard data warehouses, where the lookuptables are properly maintained and all elements in the fact table have entriesin the respective lookup table. It should be used only when a certain attributein the fact table contains more (unique) attribute elements than itscorresponding lookup table. The lookup table, by definition, should contain allthe attribute elements, but this scenario could occur if the fact tables areupdated more often than the lookup tables.
• Preserve all elements of final pass result table with respect to lookup table but notrelationship table
The SQL Engine generates an inner join on all passes except the final pass, whichuses an outer join.
• Do not listen to per report level setting, preserve elements of final pass according tothe setting at attribute level. If this choice is selected at attribute level, it will betreated as preserve common elements (i.e. choice 1) option
If this option is selected at the database instance or template level, the setting for thisVLDB property at the attribute level is used. This value should not be selected at theattribute level. However, if you choose this setting at the attribute level, the VLDBproperty is set to the Preserve common elements of final pass result table and lookuptable option.
This setting is useful if you have only a few attributes that require different join types.For example, if among the attributes in a report only one needs to preserve elementsfrom the final pass table, you can set the VLDB property to Preserve all final passresult elements setting for that one attribute. You can then set the report to the Donot listen setting for the VLDB property. When the report is run, only the attributeset differently causes an outer join in SQL. All other attribute lookup tables will bejoined using an equal join, which leads to better SQL performance.
• Use default inherited value
Advanced Reporting Guide
707 © 2017, MicroStrategy Inc.
For examples of these settings in use, see the Supplemental Reference for SystemAdministration.
Preserve All Lookup Table ElementsThe Preserve All Lookup Table Elements setting is used to show all attribute elementsthat exist in the lookup table, even though there is no corresponding fact in the resultset. For example, your report contains Store and Sum(Sales). You need to show all thestores in the report, even those stores that do not have sales. Instead of relying on thestores in the sales fact table, you must ensure that all the stores from the lookup table areincluded. The SQL Engine must use a left outer join from the lookup table to the facttable.
The report can include multiple attributes. To keep all of them, the Analytical Enginemust use a Cartesian join between the attributes’ lookup tables before doing a left outerjoin to the fact table.
The options for this property are:
• Preserve common elements of lookup and final pass result table
The Analytical Engine does a normal join (equi-join) to the lookup table.
• Preserve lookup table elements joined to final pass result table based on fact keys
If the fact table level is not the same as the report level, this option first uses a leftouter join to keep all the attribute elements at the fact table level. Next, it aggregatesto the report level. The advantage of this approach is the same pass of SQL performsthe left outer join and aggregation. The disadvantage is that the Cartesian join withthe lookup tables is at a much lower level and can result in a very large joined table.
• Preserve lookup table elements joined to final pass result table based on templateattributes without filter
If the fact table level is not the same as the report level, this option first aggregates tothe report level, then uses a left outer join to take in all the attribute elements. This isthe reverse of the approach described above. It needs an additional pass, but thecross join table is usually smaller.
• Preserve lookup table elements joined to final pass result table based on templateattributes with filter
This option is similar to the previous option, the difference being that the reportfilter is applied in the final pass.
• Use default inherited value
The various “Preserve lookup table elements” options are described in more detailin Example: Different levels for fact table and report, page 708.
When you use any of the “Preserve lookup table elements” options, it is assumed youwant to keep all the elements of the attributes in their lookup tables. However, you maywant the setting to affect only some of the attributes on a template. For example, areport contains Store, Month, and the Sum(Sales) metric. You want to show all the storenames, even if they do not have sales, but not necessarily all the months in the
Advanced Reporting Guide
© 2017, MicroStrategy Inc. 708
LOOKUP_MONTH table. You can individually select attributes on the report that needto preserve elements with the Attribute Join Type setting in Report Data Options. Formore information, see Selecting an attribute join type, page 284.
Example: Different levels for fact table and report
The fact table level is not always the same as the report level. For example, a reportcontains Store, Month, and the Sum(Sales) metric, but the fact table is at the level ofStore, Day, and Item. You can choose any of the “Preserve lookup table elements”options to accomplish this, as described below.
Preserve lookup table elements joined to final pass result tablebased on fact table keys
First, a left outer join keeps all the attribute elements at the Store, Day, and Item level.Then the results are aggregated to the Store and Month level. Two SQL passes are run:
• Pass 1: LOOKUP_STORE cross join with LOOKUP_DAY cross join LOOKUP_ITEM produces TempTable1
• Pass 2: TempTable1 left outer join with Fact_Table on (Store, Day, Item)
The advantage is that the left outer join and aggregation is completed in the same pass(Pass 2). The disadvantage is that the Cartesian join with the lookup tables is performedat a much lower level (Pass 1) so the result of the Cartesian joined table (TempTable1) canbe very large.
Preserve lookup table elements joined to final pass result tablebased on template attributes without filter
The aggregation is completed first, then a left outer join brings in all the attributeelements. Three SQL passes are run:
• Pass 1: Aggregates the Fact_Table to TempTable1 at Store and Month. This isactually the final pass of a normal report without turning on this setting.
• Pass 2: LOOKUP_STORE cross join with LOOKUP_MONTH producesTempTable2
• Pass 3: TempTable2 left outer join with TempTable1 on (Store, Month)
This approach needs one more pass than the previous option, but the Cartesian join table(TempTable2) is usually smaller.
Preserve lookup table elements joined to final pass result tablebased on template attributes with filter
This option is similar to the previous option. The only difference is that the report filteris applied in the final pass (Pass 3). For example, a report contains Store, Month, theSum(Sales) metric, and a filter of Year = 2002. You want to display every store in everymonth in 2002, regardless of whether sales occurred. However, you do not want to showmonths from any other years. This setting resolves the issue.
Advanced Reporting Guide
709 © 2017, MicroStrategy Inc.
Report Post StatementThe Report Post Statement settings insert custom SQL statements after the finalSELECT statement but before the DROP statements. The settings are numbered 1-5.Each text string entered in Report Post Statement 1 through Report Post Statement 4 isexecuted separately as a single statement. To execute more than five statements, insertmultiple statements in Report Post Statement 5, separating each statement with asemicolon (;). The SQL Engine breaks them into individual statements at the semicolonsand executes each separately. The custom SQL is applied to every intermediate table orview.
These settings are applicable when the Intermediate Table Type property is set toPermanent table, True temporary table, or Temporary view. For a description ofthat property, see Intermediate Table Type, page 714.
Report Pre StatementThe Report Pre Statement settings insert custom SQL statements at the beginning of thereport SQL. The settings are numbered 1-5. Each text string entered in Report PreStatement 1 through Report Pre Statement 4 is executed separately as a single statement.To execute more than five statements, insert multiple statements in Report PreStatement 5, separating each statement with a semicolon (;). The SQL Engine breaksthem into individual statements at the semicolons and executes each separately.
Multi-source Report Pre and Post StatementsReport Pre and Post SQL statements can be applied and executed against multipledatabases used as a data source for reports. The Pre and Post SQL statements do nothave to be placed in a particular order in the overall query as they operate independentlyfrom one another.
Example
For examples of the syntax required for these statements, see the Report Pre Statementand Report Post Statement sections.
Table Post StatementThe Table Post Statement settings insert custom SQL statements after the CREATETABLE and INSERT INTO statement. The settings are numbered 1-5. Each text stringentered in Table Post Statement 1 through Table Post Statement 4 is executed separatelyas a single statement. To execute more than five statements, insert multiple statements inTable Post Statement 5, separating each statement with a semicolon (;). The SQL Enginebreaks them into individual statements at the semicolons and executes each separately.The custom SQL is applied to every intermediate table or view.
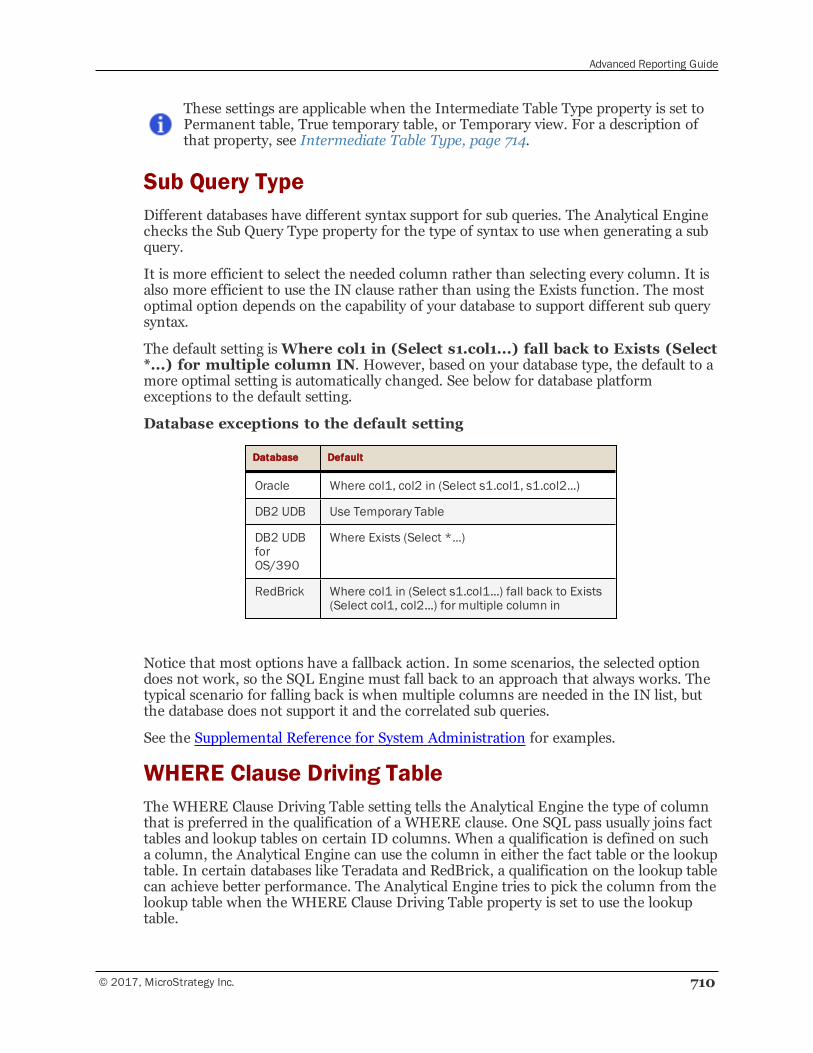
Advanced Reporting Guide
© 2017, MicroStrategy Inc. 710
These settings are applicable when the Intermediate Table Type property is set toPermanent table, True temporary table, or Temporary view. For a description ofthat property, see Intermediate Table Type, page 714.
Sub Query TypeDifferent databases have different syntax support for sub queries. The Analytical Enginechecks the Sub Query Type property for the type of syntax to use when generating a subquery.
It is more efficient to select the needed column rather than selecting every column. It isalso more efficient to use the IN clause rather than using the Exists function. The mostoptimal option depends on the capability of your database to support different sub querysyntax.
The default setting isWhere col1 in (Select s1.col1...) fall back to Exists (Select*...) for multiple column IN. However, based on your database type, the default to amore optimal setting is automatically changed. See below for database platformexceptions to the default setting.
Database exceptions to the default setting
Database Default
Oracle Where col1, col2 in (Select s1.col1, s1.col2...)
DB2 UDB Use Temporary Table
DB2 UDBforOS/390
Where Exists (Select *...)
RedBrick Where col1 in (Select s1.col1...) fall back to Exists(Select col1, col2...) for multiple column in
Notice that most options have a fallback action. In some scenarios, the selected optiondoes not work, so the SQL Engine must fall back to an approach that always works. Thetypical scenario for falling back is when multiple columns are needed in the IN list, butthe database does not support it and the correlated sub queries.
See the Supplemental Reference for System Administration for examples.
WHERE Clause Driving TableThe WHERE Clause Driving Table setting tells the Analytical Engine the type of columnthat is preferred in the qualification of a WHERE clause. One SQL pass usually joins facttables and lookup tables on certain ID columns. When a qualification is defined on sucha column, the Analytical Engine can use the column in either the fact table or the lookuptable. In certain databases like Teradata and RedBrick, a qualification on the lookup tablecan achieve better performance. The Analytical Engine tries to pick the column from thelookup table when the WHERE Clause Driving Table property is set to use the lookuptable.
Advanced Reporting Guide
711 © 2017, MicroStrategy Inc.
If this property is set to lookup table, but no lookup table exists in the FROM clause forthe column being qualified on, the Analytical Engine does not add the lookup table to theFROM clause. To ensure that the qualification uses a lookup table column, set the DSSStar Join setting to use a partial star join.
For more information on the DSS Star Join setting, see the Supplemental Reference forSystem Administration.
The options for this property are
• Use lookup table
• Use fact table
• Use default inherited value
Attribute and Attribute Form Selection Option forIntermediate Passes properties
This section describes both the Attribute Selection Option for Intermediate Passesand the Attribute Form Selection Option for Intermediate Passes properties.
Normally, the MicroStrategy SQL Engine selects the minimum number of columns thatare needed in each pass. For an intermediate pass, the SQL Engine usually selects onlyattribute ID forms. The SQL Engine also selects the attributes necessary to make thejoin, usually key attributes. Then in the final pass, additional attributes or attribute formsthat are necessary for report display can be joined.
This algorithm is optimal in most cases, as it minimizes the size of intermediate tables.However, in certain schemas, especially denormalized ones, and schemas that use facttables as both lookup tables and relationship tables, such an algorithm can causeadditional joins in the final pass.
Example
A report contains Region, Store, Metric1, and Metric2. Metric1 uses FactTable1, whichcontains Store_ID, Store_Desc, Region_ID, Region_Desc, and F1. Metric2 usesFactTable2, which contains Store_ID, Store_Desc, Region_ID, Region_Desc, and F2.
With the normal SQL Engine algorithm, the intermediate pass that calculates Metric1selects Store_ID and F1. The intermediate pass that calculates Metric2 selects Store_IDand F2. Then the final pass joins these two intermediate tables together. Since Region isin the report, it should join upward to the region level and find the Region_Desc form.This can be done by joining either fact table in the final pass. So either FactTable1 orFactTable2 is accessed twice. If these tables are big, which is usual, the performance canbe very slow. On the other hand, if Store_ID, Store_Desc, Region_ID, and Region_Descare picked up in the intermediate passes, neither FactTable1 or FactTable2 needs to bejoined in the final pass, thus boosting performance.
The Attribute Selection Option for Intermediate Pass and Attribute Form SelectionOption for Intermediate Pass settings allow the SQL Engine to select additional attributesor attribute forms in the intermediate pass, when they are directly available. When these
Advanced Reporting Guide
© 2017, MicroStrategy Inc. 712
settings are selected, the SQL Engine does not join additional tables to select moreattributes or forms. So for intermediate passes, the number of tables to be joined is thesame as turning the setting off.
• These settings intend to use bigger (wider) intermediate tables to saveadditional joins in the final pass and exchange space for time.
• These settings work independently. One does not influence the other.
• Each setting has two values. The default behavior is the originalalgorithm.
Attribute Form Selection Option for Intermediate Pass
This property determines whether the SQL Engine selects the needed attribute forms inthe intermediate passes if available. See the previous section, Attribute and AttributeForm Selection Option for Intermediate Passes properties, page 711, for more detailedinformation and an example.
The options for this property are
• Select ID form only (default algorithm)
• Select ID and other forms if they are on template and available on existing join tree
• Use default inherited value
Attribute Selection Option for Intermediate Pass
This property determines whether the SQL Engine selects additional attributes neededon the report in the intermediate passes. These attributes are in addition to the neededjoin ID columns and are usually parent attributes. See the previous section, Attribute andAttribute Form Selection Option for Intermediate Passes properties, page 711, for moredetailed information and an example.
The options for this property are
• Select only the attributes needed (default algorithm)
• Select other attributes in current join tree if they are on template and their childattributes have already been selected
• Use default inherited value
GROUP BY ID AttributeThis property determines how to group by a selected ID column when an expression isperformed on the ID expression. Each of the options is described below. The codefragment following each description replaces the section named group by ID in thefollowing sample SQL statement.
select a22.STORE_NBR STORE_NBR,
a22.MARKET_NBR * 10 MARKET_ID,
Advanced Reporting Guide
713 © 2017, MicroStrategy Inc.
sum(a21.REG_SLS_DLR) WJXBFS1
from STORE_DIVISION a21
join LOOKUP_STORE a22
on (a21.STORE_NBR = a22.STORE_NBR)
where a22.STORE_NBR = 1
group by a22.STORE_NBR, group by ID
The options for this property are
• Group by expression: Group by the expression performed in the Select statementon the ID column.
a22.MARKET_NBR * 10
• Group by alias: Group by the expression alias in the Select statement.
MARKET_ID
• Group by column: Group by the column ID, ignoring the expression performedon the ID column.
a22.MARKET_NBR
• Group by position: Group by the physical table position of the ID column.
• Use default inherited value
GROUP BY ID Attribute is an advanced property that is hidden by default.
GROUP BY Non-ID AttributeThe GROUP BY Non-ID Attribute property controls whether non-ID attribute forms,such as descriptions, are used in the GROUP BY clause. If you do not want non-IDcolumns in the GROUP BY, you can use a MAX function when the column is selected sothat it is not used in the GROUP BY.
For an example, see the Supplemental Reference for System Administration.
SQL HintThe SQL Hint property is used for the Oracle SQL Hint pattern. This string is placedafter the SELECT in the Select statement. This setting can insert any SQL string thatmakes sense after the SELECT in a Select statement, but it is added specifically forOracle SQL hints.
UNION Multiple INSERTThe Union Multiple Insert property allows the Analytical Engine to UNION multipleselect statements into a single table before performing an insert. This allows for a single
Advanced Reporting Guide
© 2017, MicroStrategy Inc. 714
insert statement to be performed rather than separate inserts for each select statement.This is a database-specific setting, and some databases do not support unions.
Drop Temp Table MethodThe Drop Temp Table Method property specifies whether the intermediate tables,permanent tables, temporary tables, and views are to be deleted, or dropped, after reportexecution. Dropping the tables can lock catalog tables and affect performance, sodropping the tables manually in a batch process when the database is less active canresult in a performance gain. The trade-off is space on the database server. The tablesremain on the database server using space until the database administrator drops them.
FallBack Table TypeAll reports can be resolved using permanent or temporary intermediate tables. Reportscan also be resolved by generating derived tables, common table expressions, and views,but these means cannot cover all possible scenarios. For example, they cannot be usedwhen the report contains Analytical Engine SQL, partitioning, or certain outer joins. Insuch a situation, the MicroStrategy SQL Engine needs another solution, which isprovided by the Fallback Table Type property. If the Intermediate Table Type property isset to Derived table, Common table expression, or Temporary view and the SQL Engineconcludes that the report cannot be resolved using the setting, it uses the Fallback TableType property to resolve the report.
The options for this property are
• Permanent table
• True temporary table
• Use default inherited value
Intermediate Table TypeThe Intermediate Table Type property determines the type of intermediate tables, alsoreferred to as temporary tables, are used to execute the report. All reports can beexecuted using permanent and temporary tables. Reports can also be resolved bygenerating derived tables, common table expressions, and views. However, certainscenarios involving partitioning, outer joins, or analytical functions cannot use thesealternatives. In this case, the Fallback Table Type property is used to execute the report.
Only UDB DB2 and Oracle 9i support common tables.
This setting can have a major impact on the performance of the report. Permanenttables are usually less optimal. Derived tables and common table expressions usuallyperform well, but they do not work in all cases and for all databases. True temporarytables also usually perform well, but not all databases support them. The default setting ispermanent tables, because it works for all databases in all situations. However, based onyour database type, this setting is automatically changed to what is generally the mostoptimal option for that platform, although other options could prove to be more optimalon a report-by-report basis. The database-specific settings are noted below.
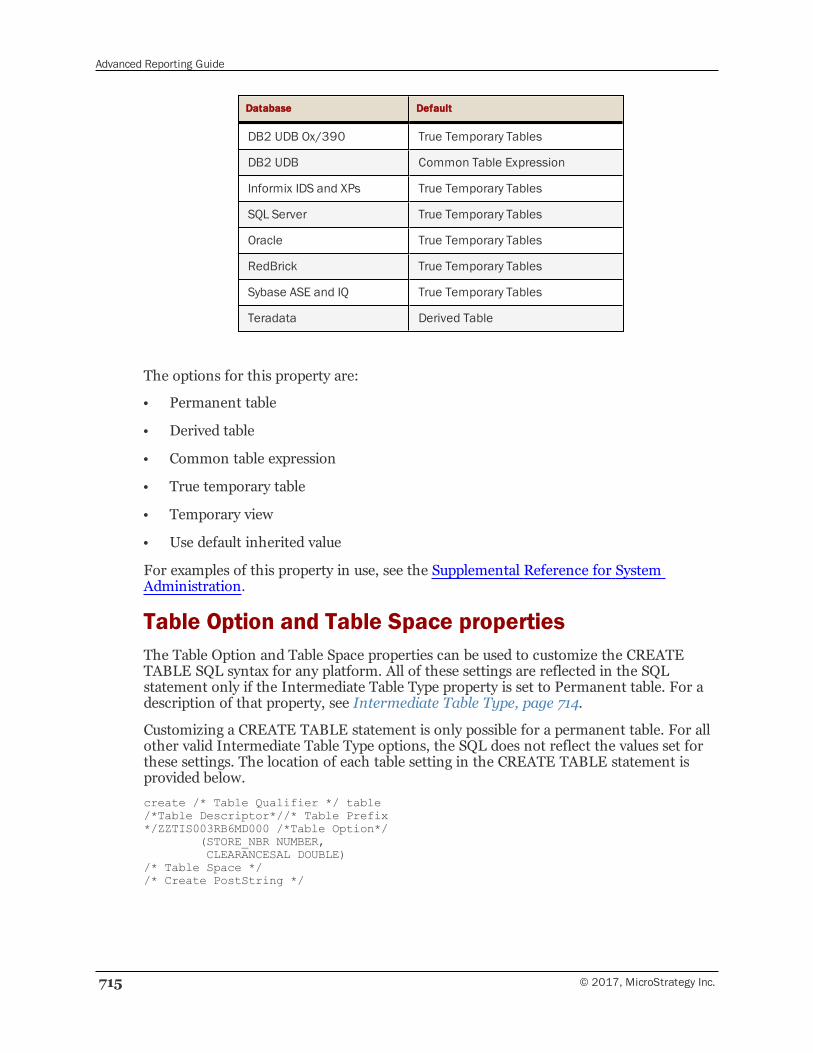
Advanced Reporting Guide
715 © 2017, MicroStrategy Inc.
Database Default
DB2 UDB Ox/390 True Temporary Tables
DB2 UDB Common Table Expression
Informix IDS and XPs True Temporary Tables
SQL Server True Temporary Tables
Oracle True Temporary Tables
RedBrick True Temporary Tables
Sybase ASE and IQ True Temporary Tables
Teradata Derived Table
The options for this property are:
• Permanent table
• Derived table
• Common table expression
• True temporary table
• Temporary view
• Use default inherited value
For examples of this property in use, see the Supplemental Reference for SystemAdministration.
Table Option and Table Space propertiesThe Table Option and Table Space properties can be used to customize the CREATETABLE SQL syntax for any platform. All of these settings are reflected in the SQLstatement only if the Intermediate Table Type property is set to Permanent table. For adescription of that property, see Intermediate Table Type, page 714.
Customizing a CREATE TABLE statement is only possible for a permanent table. For allother valid Intermediate Table Type options, the SQL does not reflect the values set forthese settings. The location of each table setting in the CREATE TABLE statement isprovided below.
create /* Table Qualifier */ table/*Table Descriptor*//* Table Prefix*/ZZTIS003RB6MD000 /*Table Option*/
(STORE_NBR NUMBER,CLEARANCESAL DOUBLE)
/* Table Space *//* Create PostString */
Advanced Reporting Guide
© 2017, MicroStrategy Inc. 716
For more information on the Table Qualifier, Table Descriptor, Table Prefix, andCreate Post String properties, see the Supplemental Reference for SystemAdministration.
For platforms like Teradata and DB2 UDB 6.x and 7.x, the Primary Index or the PartitionKey SQL syntax is placed between the Table Space and Create Post String VLDB setting.
Table Option
The Table Option property defines the string to be placed after the table name in theCREATE TABLE statement.
Table Space
The Table Space property contains the string appended after the CREATE TABLEStatement but before any Primary Index/Partition key definitions.
To populate dynamic information by the Analytical Engine, insert the followingsyntax into the string:
!d inserts the date.
!o inserts the report name.
!u inserts the user name.
VLDB properties at the database instance levelThe database instance level contains numerous VLDB properties. Those that are mostcommonly used are listed below:
• Maximum SQL/MDX Size, page 717
• SQL Date Format, page 717
For information on other database instance-level VLDB properties, refer to theSupplemental Reference for System Administration
Accessing database instance VLDB propertiesTo set these properties, right-click a project within the database instance to be updated.Select Project Configuration. The Project Configuration Editor opens. Expand theDatabase instances folder. The Database instances - SQL Data warehouses panedisplays. Click VLDB Properties. The VLDB Properties (Database Instance) dialog boxopens.
The Maximum SQL/MDX Size property is contained in the Governing folder, while theSQL Date Format property is found in the Select/Insert folder.
Advanced Reporting Guide
717 © 2017, MicroStrategy Inc.
Maximum SQL/MDX SizeThe Maximum SQL Size property specifies the SQL size on a pass-by-pass basis. If thelimit is exceeded, report execution is terminated.
The options are:
• 0, for no limit
• Any other number, which is the maximum SQL pass size in bytes
• Use default inherited value
SQL Date FormatThe SQL Date Format property specifies the format of the date string literal in the SQLstatements. This setting is used when a report contains date-related qualifications.
Enter the date format using the following characters:
• mm or mmm for month
• dd for date
• yy or yyyy for year
• separators such as / and -
For example, the default format is yyyy-mm-dd. Oracle uses dd-mmm-yy and Teradatauses yyyy/mm/dd.

ALOGICAL AND MATHEMATICALOPERATORS FOR FILTERING
As discussed in Types of qualifications, page 110, you can use logical operators, such asAND, OR, NOT, and so on, to add additional qualifications to filters and report limits.These logical operators set conditions for the report query to retrieve data from the datawarehouse and display the data in the report.
This section discusses operators, specifically what logical operators are and how to usethem.
What is an operator? 718
What is an operator?Operators are used to manipulate individual data items and data sets. These data itemsare called operands or arguments. Operators are represented by special characters or bykeywords. For example, multiplication is represented by an asterisk (*) and division isrepresented by a slash (/). Filtering conditions are expressions built from attribute forms,metrics, constants, expressions, and operators. For example, consider the followingfiltering definition:
Store_ID = 1
The definition above contains an attribute (Store), an attribute form (Store_ID), acomparison operator (=), and a numeric constant (1).
The following types of operators are used when specifying filtering conditions:
• logical
• comparison
• rank and percent
• pattern
© 2017, MicroStrategy Inc. 718
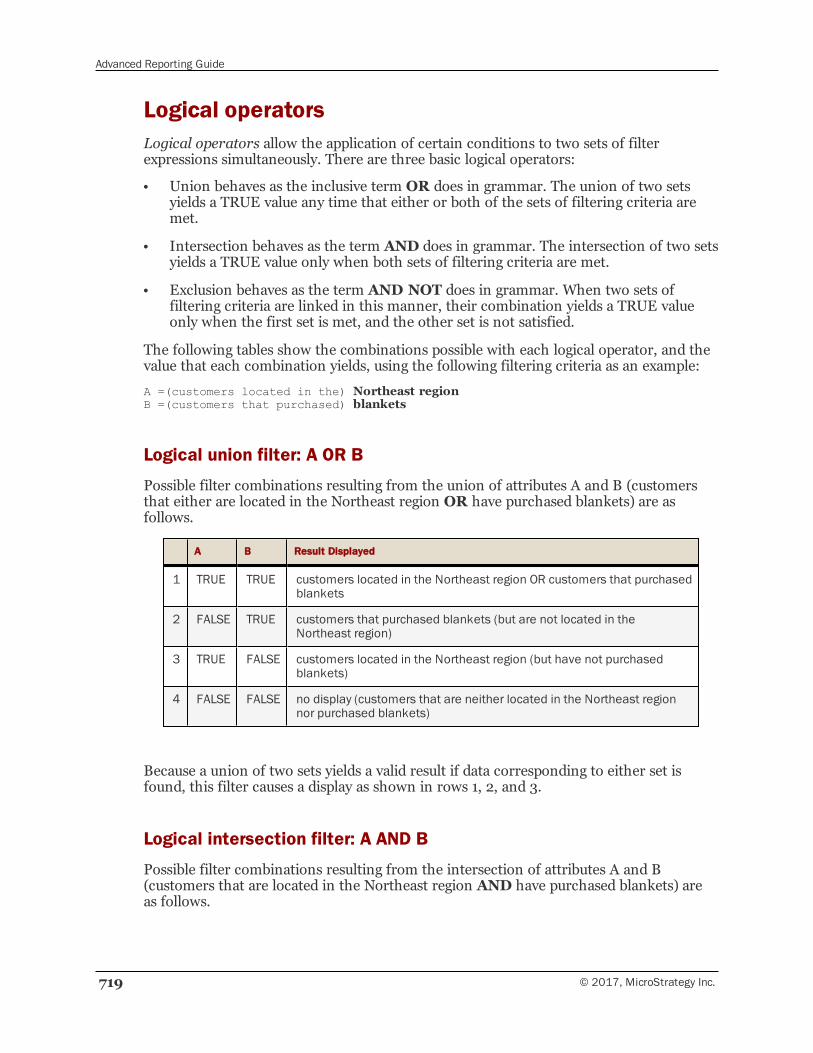
Advanced Reporting Guide
719 © 2017, MicroStrategy Inc.
Logical operatorsLogical operators allow the application of certain conditions to two sets of filterexpressions simultaneously. There are three basic logical operators:
• Union behaves as the inclusive term OR does in grammar. The union of two setsyields a TRUE value any time that either or both of the sets of filtering criteria aremet.
• Intersection behaves as the term AND does in grammar. The intersection of two setsyields a TRUE value only when both sets of filtering criteria are met.
• Exclusion behaves as the term AND NOT does in grammar. When two sets offiltering criteria are linked in this manner, their combination yields a TRUE valueonly when the first set is met, and the other set is not satisfied.
The following tables show the combinations possible with each logical operator, and thevalue that each combination yields, using the following filtering criteria as an example:
A =(customers located in the) Northeast regionB =(customers that purchased) blankets
Logical union filter: A OR B
Possible filter combinations resulting from the union of attributes A and B (customersthat either are located in the Northeast region OR have purchased blankets) are asfollows.
A B Result Displayed
1 TRUE TRUE customers located in the Northeast region OR customers that purchasedblankets
2 FALSE TRUE customers that purchased blankets (but are not located in theNortheast region)
3 TRUE FALSE customers located in the Northeast region (but have not purchasedblankets)
4 FALSE FALSE no display (customers that are neither located in the Northeast regionnor purchased blankets)
Because a union of two sets yields a valid result if data corresponding to either set isfound, this filter causes a display as shown in rows 1, 2, and 3.
Logical intersection filter: A AND B
Possible filter combinations resulting from the intersection of attributes A and B(customers that are located in the Northeast region AND have purchased blankets) areas follows.
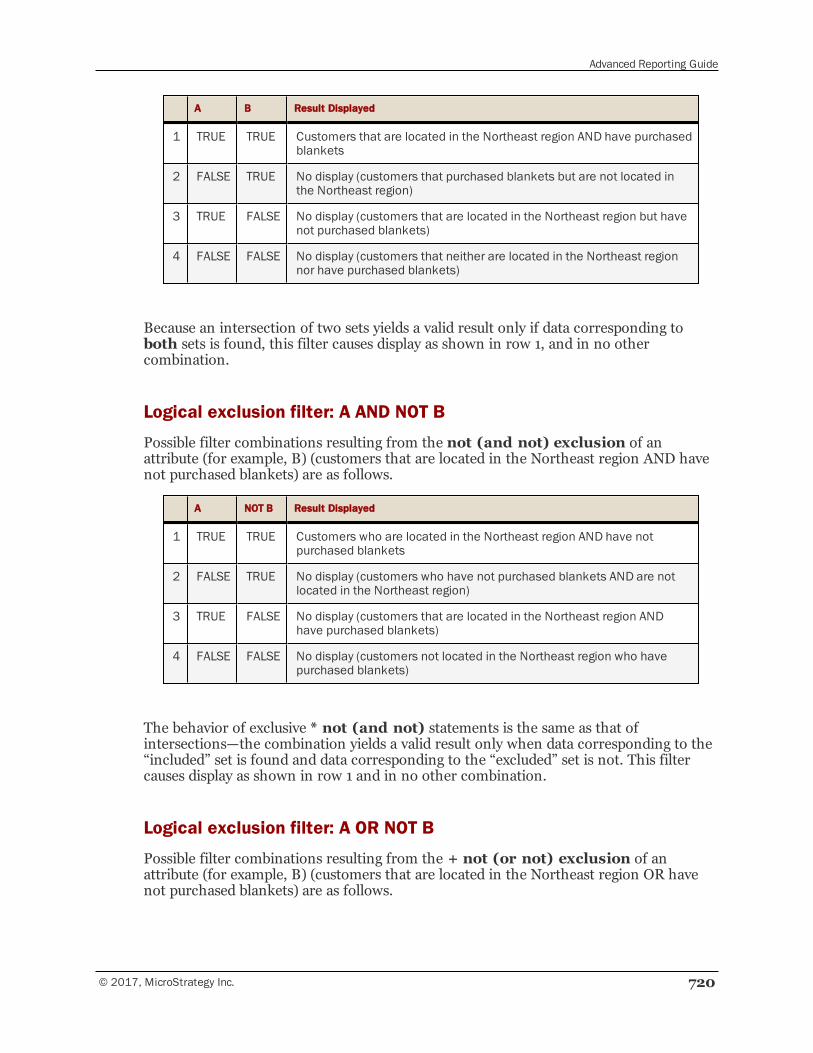
Advanced Reporting Guide
© 2017, MicroStrategy Inc. 720
A B Result Displayed
1 TRUE TRUE Customers that are located in the Northeast region AND have purchasedblankets
2 FALSE TRUE No display (customers that purchased blankets but are not located inthe Northeast region)
3 TRUE FALSE No display (customers that are located in the Northeast region but havenot purchased blankets)
4 FALSE FALSE No display (customers that neither are located in the Northeast regionnor have purchased blankets)
Because an intersection of two sets yields a valid result only if data corresponding toboth sets is found, this filter causes display as shown in row 1, and in no othercombination.
Logical exclusion filter: A AND NOT B
Possible filter combinations resulting from the not (and not) exclusion of anattribute (for example, B) (customers that are located in the Northeast region AND havenot purchased blankets) are as follows.
A NOT B Result Displayed
1 TRUE TRUE Customers who are located in the Northeast region AND have notpurchased blankets
2 FALSE TRUE No display (customers who have not purchased blankets AND are notlocated in the Northeast region)
3 TRUE FALSE No display (customers that are located in the Northeast region ANDhave purchased blankets)
4 FALSE FALSE No display (customers not located in the Northeast region who havepurchased blankets)
The behavior of exclusive * not (and not) statements is the same as that ofintersections—the combination yields a valid result only when data corresponding to the“included” set is found and data corresponding to the “excluded” set is not. This filtercauses display as shown in row 1 and in no other combination.
Logical exclusion filter: A OR NOT B
Possible filter combinations resulting from the + not (or not) exclusion of anattribute (for example, B) (customers that are located in the Northeast region OR havenot purchased blankets) are as follows.
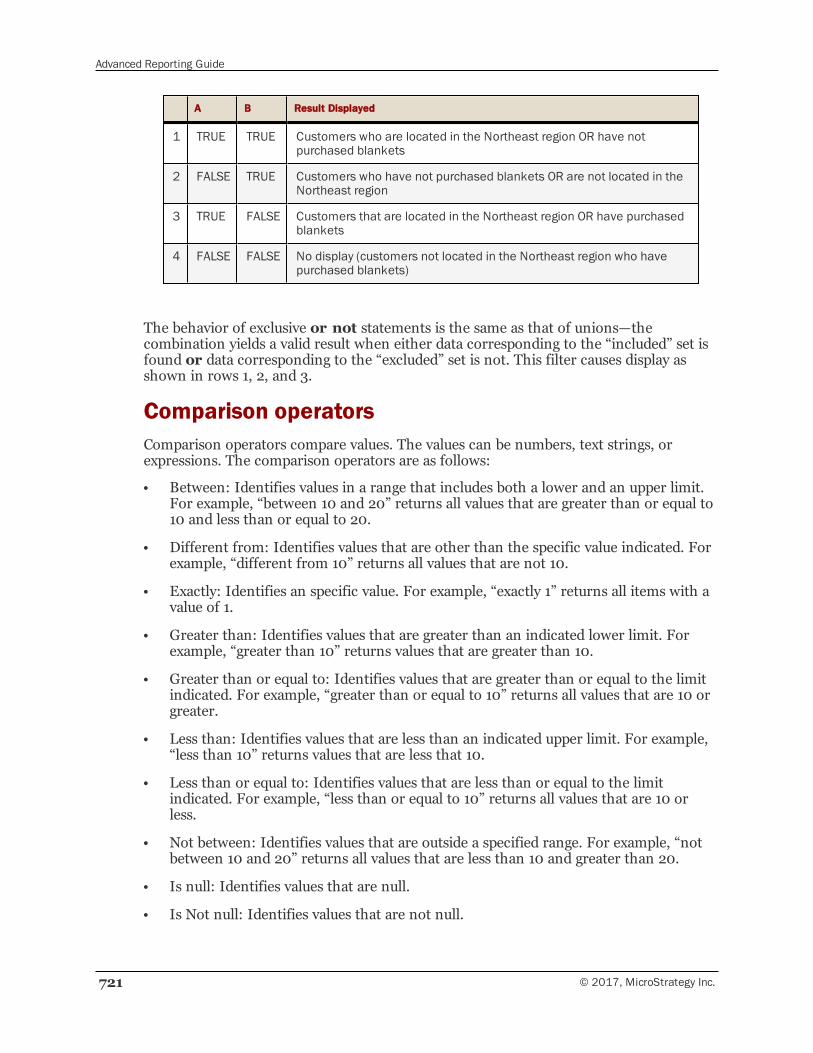
Advanced Reporting Guide
721 © 2017, MicroStrategy Inc.
A B Result Displayed
1 TRUE TRUE Customers who are located in the Northeast region OR have notpurchased blankets
2 FALSE TRUE Customers who have not purchased blankets OR are not located in theNortheast region
3 TRUE FALSE Customers that are located in the Northeast region OR have purchasedblankets
4 FALSE FALSE No display (customers not located in the Northeast region who havepurchased blankets)
The behavior of exclusive or not statements is the same as that of unions—thecombination yields a valid result when either data corresponding to the “included” set isfound or data corresponding to the “excluded” set is not. This filter causes display asshown in rows 1, 2, and 3.
Comparison operatorsComparison operators compare values. The values can be numbers, text strings, orexpressions. The comparison operators are as follows:
• Between: Identifies values in a range that includes both a lower and an upper limit.For example, “between 10 and 20” returns all values that are greater than or equal to10 and less than or equal to 20.
• Different from: Identifies values that are other than the specific value indicated. Forexample, “different from 10” returns all values that are not 10.
• Exactly: Identifies an specific value. For example, “exactly 1” returns all items with avalue of 1.
• Greater than: Identifies values that are greater than an indicated lower limit. Forexample, “greater than 10” returns values that are greater than 10.
• Greater than or equal to: Identifies values that are greater than or equal to the limitindicated. For example, “greater than or equal to 10” returns all values that are 10 orgreater.
• Less than: Identifies values that are less than an indicated upper limit. For example,“less than 10” returns values that are less that 10.
• Less than or equal to: Identifies values that are less than or equal to the limitindicated. For example, “less than or equal to 10” returns all values that are 10 orless.
• Not between: Identifies values that are outside a specified range. For example, “notbetween 10 and 20” returns all values that are less than 10 and greater than 20.
• Is null: Identifies values that are null.
• Is Not null: Identifies values that are not null.
Advanced Reporting Guide
© 2017, MicroStrategy Inc. 722
When you use these operators on a description for a date, the results can appear tobe incorrect. For example, assume the date description is formatted as Jan 2003.Create a filter on the description attribute using the Between operator to returnthe months between January 2003 and June 2003. The results are Jan 2003, Jul2003, and Jul 2003, not the first six months of the year as expected. This occursbecause the description attribute is formatted as text, not as numbers or dates, andtherefore the SQL sorts the data alphabetically. To obtain results of January 2003,February 2003, March 2003, April 2003, May 2003, and June 2003, filter on theID rather than the description or use the in list operator.
Rank and percent operatorsRank and percent operators are only applicable to metrics. The following operators arevisible when you qualify on the Rank or Percent function:
• Between: Identifies values in a range that has both a lower and an upper limit. Forexample, “between 10 and 20” returns all values that are greater than or equal to 10and less than or equal to 20.
• Bottom: Identifies the lowest set of values in a range. For example, “bottom 40”returns the 40 lowest values within a given range selected.
In MicroStrategy Web, this is called Lowest.
• Different from: Identifies values that are other than the specific value indicated. Forexample, “different from 10” returns all values that are not 10.
• Exactly: Identifies a specific value. For example, “exactly 1” returns all items with avalue of 1.
• Exclude top: Is used in rank and percent calculations, discards a range of top valuesfrom a given set. For example, “exclude top 10” returns all values in the set but thetop 10 percent.
• Exclude bottom: Is used in rank and percent calculations, discards a range of bottomvalues from a given set. For example, “exclude bottom 10” returns all values in the setbut the bottom 10 percent.
• Is null: Identifies values that are null
• Is not null: Identifies values that are not null
• Not between: identifies values that are outside a specified range. For example, “notbetween 10 and 20” returns all values that are less than 10 and greater than 20.
• Top: Indicates the topmost value range in a given set. For example, “top 40” returnsthe 40 highest values in a set.
In MicroStrategy Web, this is called Highest.
Advanced Reporting Guide
723 © 2017, MicroStrategy Inc.
Pattern operatorsPattern operators allow text strings to be compared. Pattern operators are case-sensitive.The following pattern operators are available in MicroStrategy:
• Begins with: Returns a result set that starts with a specified value. For example,“begins with J” returns all strings beginning with J, including January, June, andJuly.
• Ends with: Returns a result set that ends with a specified value. For example, “endwith r” returns all strings ending with r, including September, October, and all theother months meeting the criterion.
• Contains: Returns a result set that contains a specified value. For example, “containsua” returns all strings that contain ua, such as January and February.
• Does not begin with: Returns a result set that does not start with a specified value.For example, “does not begin with J” returns only those values that do not beginwith J, such as May, February, October, and so on.
• Does not end with: Returns a result set that does not end with a specified value. Forexample, “does not end with r” returns only those strings that do not end with r,such as March, April, and all the other months meeting the criterion.
• Does not contain: Returns a result set that does not contain a specified value. Forexample, “does not contain ua” returns only those values that do not contain ua,such as March, May, and so on.
BFORMATTING DEFAULTVALUES
An autostyle is a collection of all the formatting layers, allowing you to format differentgrid units on different report sections. Not every grid unit must be configured to createan autostyle, so any grid unit can have formatting options set to default. Recall thatformats are applied in a particular order, as described in Order of layers, page 269.When the lowest layer is set to default, the options are supplied by the guiprop.pdsfile. This file is saved in the \Common Files\MicroStrategy directory.
This appendix provides the default values for all the formatting options. Each tab of theFormat dialog box is listed below, with the default values for each option on that tab.
Default values
NumberThe default values for the Number tab are:
• Category—general
• Decimal places—zero
• Use thousand separator—yes
• Negative numbers—no special consideration, meaning that neither a red font norparentheses are used
• Currency symbol—value determined by locale settings
• Currency position—value determined by locale settings
• Format—the number’s data type determines how the value is formatted; for example,a date is formatted differently than a time
© 2017, MicroStrategy Inc. 724
Advanced Reporting Guide
725 © 2017, MicroStrategy Inc.
Default values
NumberThe default values for the Number tab are:
• Category—general
• Decimal places—zero
• Use thousand separator—yes
• Negative numbers—no special consideration, meaning that neither a red font norparentheses are used
• Currency symbol—value determined by locale settings
• Currency position—value determined by locale settings
• Format—the number’s data type determines how the value is formatted; for example,a date is formatted differently than a time
AlignmentFor report rows, the default values for the alignment settings are:
• Horizontal alignment—left
• Vertical alignment—center
• Wrap text—yes
For report columns, the default values for the alignment settings are:
• Horizontal alignment—center
• Vertical alignment—bottom
• Wrap text—yes
FontThe default font values are:
• Name—value determined by localization settings
• Script—western
• Bold—no
• Italic—no
• Size—10
• Strikeout—no
• Underline—no
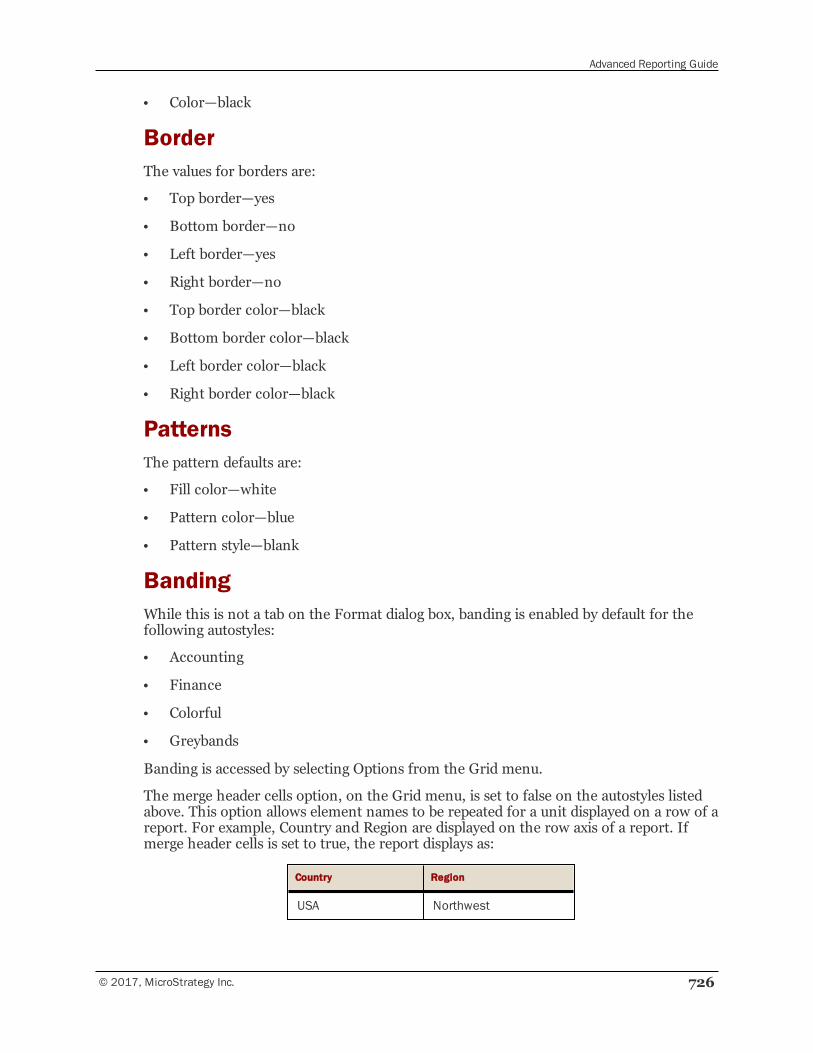
Advanced Reporting Guide
© 2017, MicroStrategy Inc. 726
• Color—black
BorderThe values for borders are:
• Top border—yes
• Bottom border—no
• Left border—yes
• Right border—no
• Top border color—black
• Bottom border color—black
• Left border color—black
• Right border color—black
PatternsThe pattern defaults are:
• Fill color—white
• Pattern color—blue
• Pattern style—blank
BandingWhile this is not a tab on the Format dialog box, banding is enabled by default for thefollowing autostyles:
• Accounting
• Finance
• Colorful
• Greybands
Banding is accessed by selecting Options from the Grid menu.
The merge header cells option, on the Grid menu, is set to false on the autostyles listedabove. This option allows element names to be repeated for a unit displayed on a row of areport. For example, Country and Region are displayed on the row axis of a report. Ifmerge header cells is set to true, the report displays as:
Country Region
USA Northwest
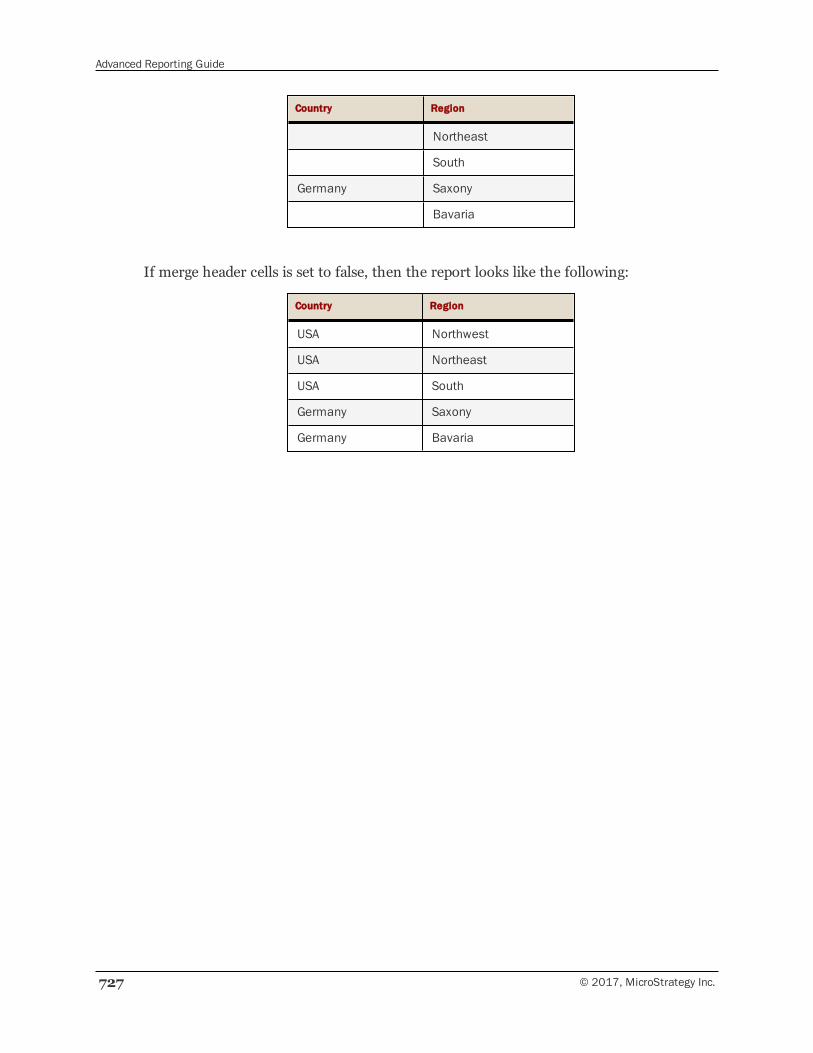
Advanced Reporting Guide
727 © 2017, MicroStrategy Inc.
Country Region
Northeast
South
Germany Saxony
Bavaria
If merge header cells is set to false, then the report looks like the following:
Country Region
USA Northwest
USA Northeast
USA South
Germany Saxony
Germany Bavaria
CMICROSTRATEGY DEVELOPERCOMMANDS
MicroStrategy Developer commands are a collection of methods that MicroStrategyDeveloper supports. These commands provide functionalities such as executing a report,loading an editor, and so on. With these commands you can create your own projecthomepage and customize it according to your user community’s needs.
Even though MicroStrategy Developer commands can be invoked from thecommand line, this appendix focuses on the MicroStrategy Developer Homepageusage and describes the commands from an HTML perspective.
This section covers the following topics on how MicroStrategy Developer commands canbe used in MicroStrategy products:
Basics 728
Enabling the MicroStrategy Developer homepage 729
Viewing the MicroStrategy Developer commands 730
Commands 731
BasicsMicroStrategy Developer commands are created using HTML anchor elements. Anchorelements typically contain a reference to a uniform resource locator (URL). When ananchor is clicked, it performs an operation depending on the URL scheme.
For example, a file transfer protocol (ftp) anchor starts a file transfer operation; otherschemes are http, gopher, and so on. To differentiate a MicroStrategy Developercommand from other anchors, MicroStrategy Developer commands use a unique syntax.An anchor with this special syntax is referred to as a Developer anchor. The following isthe HTML syntax of a Developer anchor:
<a href=”dss://Command Parameters”></a>
© 2017, MicroStrategy Inc. 728
Advanced Reporting Guide
729 © 2017, MicroStrategy Inc.
Enabling the MicroStrategy Developerhomepage
The MicroStrategy Developer homepage is the first window displayed when you log in toa MicroStrategy project in the MicroStrategy Developer environment. It serves as theprimary point of access to the editors, dialogs, and wizards that enable the use ofMicroStrategy Developer interface functionality.
When you select a project in MicroStrategy Developer, you see the HTML homepage.This homepage can display links to the reports, folders, documents, description of theproject, and so on. To see an HTML page as shown in step 6 of the following procedure,log in to MicroStrategy Tutorial asUser.
The MicroStrategy Developer homepage is displayed when you select the project within aproject source. The objects within the project are always displayed as folders.
You can choose to display the project homepage or the Folder List. The procedure belowdescribes how to enable and select a project homepage.
To enable and select a project homepage1 Log in to the MicroStrategy project source containing the project to enable a project
homepage for.
2 From the Tools menu, selectMy Preferences. The My Preferences dialog boxopens.
3 Select the Enable project home page functionality check box.
4 Browse for and locate the HTML file for the project homepage in theHTML filepath box or use the default homepage location displayed in this box.
If you have created your own customized HTML page to use in the project,locate the file using Browse button. Otherwise, the project uses the defaulthomepage designed by MicroStrategy.
5 Click OK.
6 Select the project within the project source. A project homepage is displayed. Forexample, in the MicroStrategy Tutorial you will see the HTML homepage whichlooks like the following:
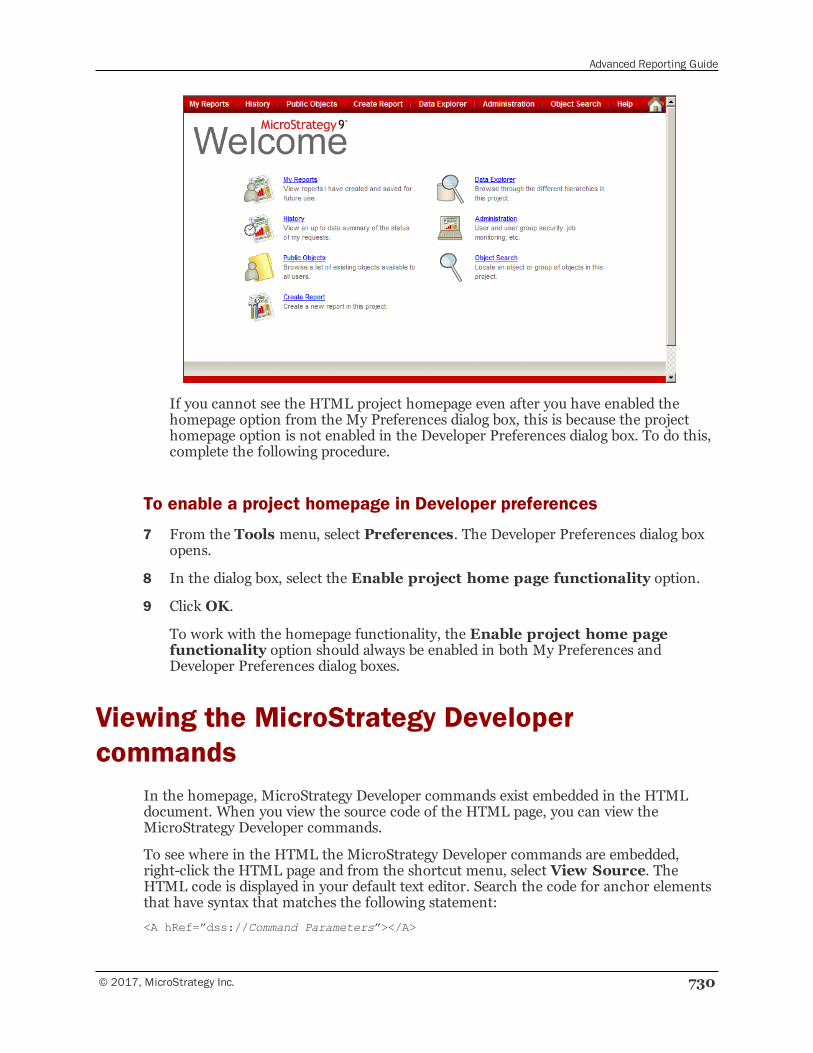
Advanced Reporting Guide
© 2017, MicroStrategy Inc. 730
If you cannot see the HTML project homepage even after you have enabled thehomepage option from the My Preferences dialog box, this is because the projecthomepage option is not enabled in the Developer Preferences dialog box. To do this,complete the following procedure.
To enable a project homepage in Developer preferences
7 From the Tools menu, select Preferences. The Developer Preferences dialog boxopens.
8 In the dialog box, select the Enable project home page functionality option.
9 Click OK.
To work with the homepage functionality, the Enable project home pagefunctionality option should always be enabled in both My Preferences andDeveloper Preferences dialog boxes.
Viewing the MicroStrategy Developercommands
In the homepage, MicroStrategy Developer commands exist embedded in the HTMLdocument. When you view the source code of the HTML page, you can view theMicroStrategy Developer commands.
To see where in the HTML the MicroStrategy Developer commands are embedded,right-click the HTML page and from the shortcut menu, select View Source. TheHTML code is displayed in your default text editor. Search the code for anchor elementsthat have syntax that matches the following statement:
<A hRef=”dss://Command Parameters”></A>
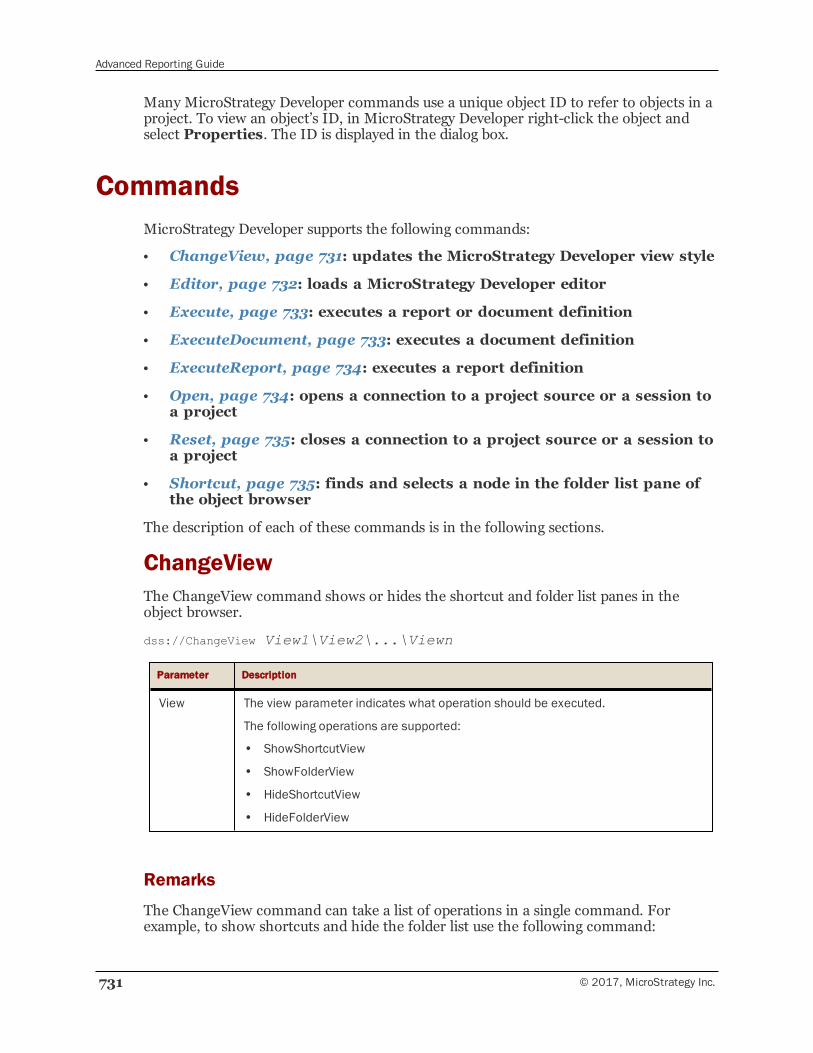
Advanced Reporting Guide
731 © 2017, MicroStrategy Inc.
Many MicroStrategy Developer commands use a unique object ID to refer to objects in aproject. To view an object’s ID, in MicroStrategy Developer right-click the object andselect Properties. The ID is displayed in the dialog box.
CommandsMicroStrategy Developer supports the following commands:
• ChangeView, page 731: updates the MicroStrategy Developer view style
• Editor, page 732: loads a MicroStrategy Developer editor
• Execute, page 733: executes a report or document definition
• ExecuteDocument, page 733: executes a document definition
• ExecuteReport, page 734: executes a report definition
• Open, page 734: opens a connection to a project source or a session toa project
• Reset, page 735: closes a connection to a project source or a session toa project
• Shortcut, page 735: finds and selects a node in the folder list pane ofthe object browser
The description of each of these commands is in the following sections.
ChangeViewThe ChangeView command shows or hides the shortcut and folder list panes in theobject browser.
dss://ChangeView View1\View2\...\Viewn
Parameter Description
View The view parameter indicates what operation should be executed.
The following operations are supported:
• ShowShortcutView
• ShowFolderView
• HideShortcutView
• HideFolderView
Remarks
The ChangeView command can take a list of operations in a single command. Forexample, to show shortcuts and hide the folder list use the following command:
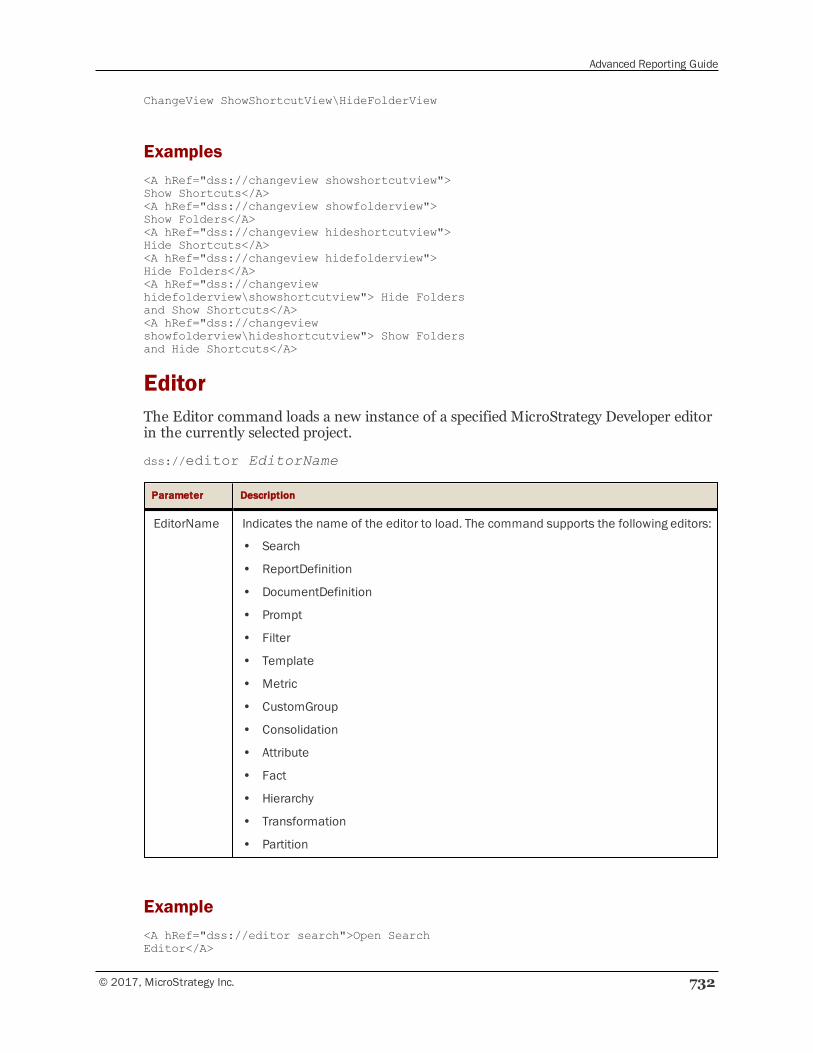
Advanced Reporting Guide
© 2017, MicroStrategy Inc. 732
ChangeView ShowShortcutView\HideFolderView
Examples<A hRef="dss://changeview showshortcutview">Show Shortcuts</A><A hRef="dss://changeview showfolderview">Show Folders</A><A hRef="dss://changeview hideshortcutview">Hide Shortcuts</A><A hRef="dss://changeview hidefolderview">Hide Folders</A><A hRef="dss://changeviewhidefolderview\showshortcutview"> Hide Foldersand Show Shortcuts</A><A hRef="dss://changeviewshowfolderview\hideshortcutview"> Show Foldersand Hide Shortcuts</A>
EditorThe Editor command loads a new instance of a specified MicroStrategy Developer editorin the currently selected project.
dss://editor EditorName
Parameter Description
EditorName Indicates the name of the editor to load. The command supports the following editors:
• Search
• ReportDefinition
• DocumentDefinition
• Prompt
• Filter
• Template
• Metric
• CustomGroup
• Consolidation
• Attribute
• Fact
• Hierarchy
• Transformation
• Partition
Example<A hRef="dss://editor search">Open SearchEditor</A>
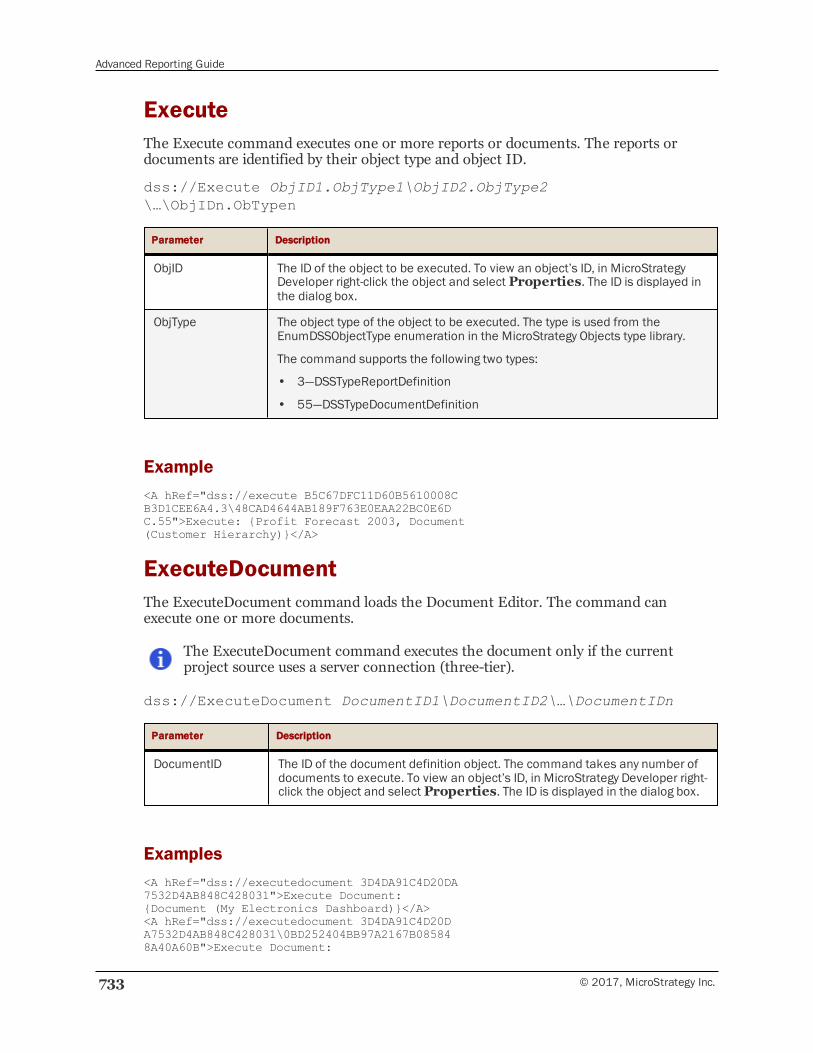
Advanced Reporting Guide
733 © 2017, MicroStrategy Inc.
ExecuteThe Execute command executes one or more reports or documents. The reports ordocuments are identified by their object type and object ID.
dss://Execute ObjID1.ObjType1\ObjID2.ObjType2\…\ObjIDn.ObTypen
Parameter Description
ObjID The ID of the object to be executed. To view an object’s ID, in MicroStrategyDeveloper right-click the object and select Properties. The ID is displayed inthe dialog box.
ObjType The object type of the object to be executed. The type is used from theEnumDSSObjectType enumeration in the MicroStrategy Objects type library.
The command supports the following two types:
• 3—DSSTypeReportDefinition
• 55—DSSTypeDocumentDefinition
Example<A hRef="dss://execute B5C67DFC11D60B5610008CB3D1CEE6A4.3\48CAD4644AB189F763E0EAA22BC0E6DC.55">Execute: {Profit Forecast 2003, Document(Customer Hierarchy)}</A>
ExecuteDocumentThe ExecuteDocument command loads the Document Editor. The command canexecute one or more documents.
The ExecuteDocument command executes the document only if the currentproject source uses a server connection (three-tier).
dss://ExecuteDocument DocumentID1\DocumentID2\…\DocumentIDn
Parameter Description
DocumentID The ID of the document definition object. The command takes any number ofdocuments to execute. To view an object’s ID, in MicroStrategy Developer right-click the object and select Properties. The ID is displayed in the dialog box.
Examples<A hRef="dss://executedocument 3D4DA91C4D20DA7532D4AB848C428031">Execute Document:{Document (My Electronics Dashboard)}</A><A hRef="dss://executedocument 3D4DA91C4D20DA7532D4AB848C428031\0BD252404BB97A2167B085848A40A60B">Execute Document:
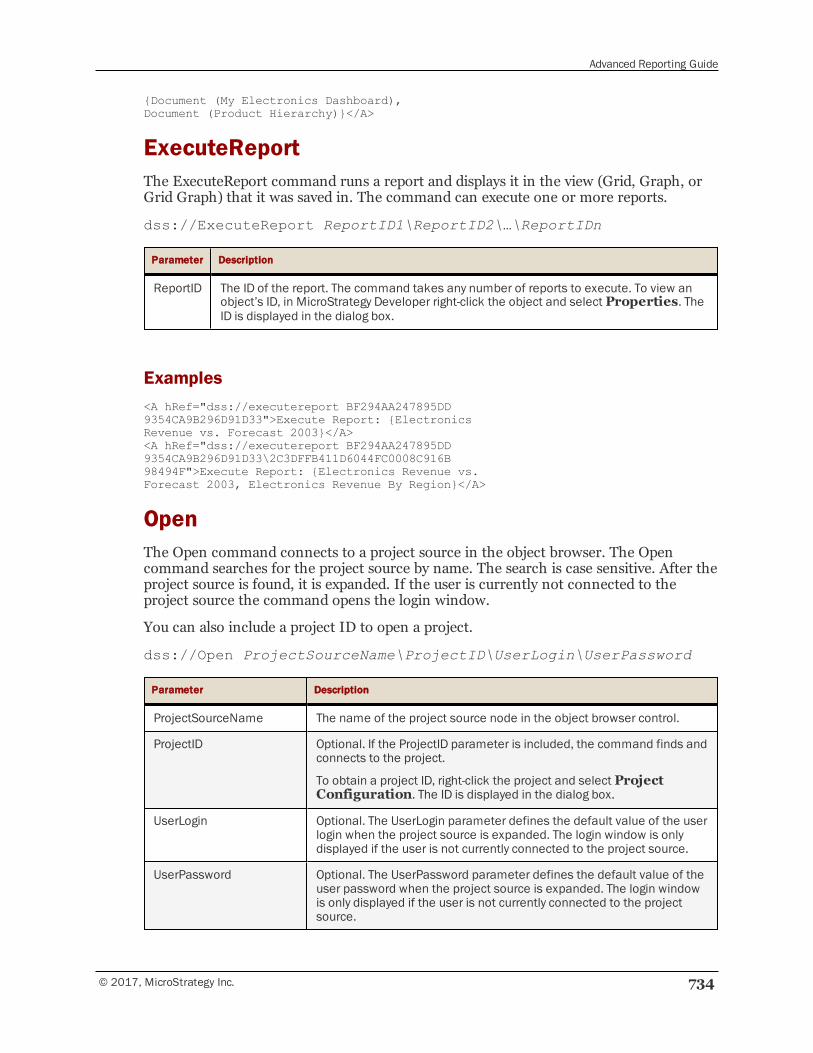
Advanced Reporting Guide
© 2017, MicroStrategy Inc. 734
{Document (My Electronics Dashboard),Document (Product Hierarchy)}</A>
ExecuteReportThe ExecuteReport command runs a report and displays it in the view (Grid, Graph, orGrid Graph) that it was saved in. The command can execute one or more reports.
dss://ExecuteReport ReportID1\ReportID2\…\ReportIDn
Parameter Description
ReportID The ID of the report. The command takes any number of reports to execute. To view anobject’s ID, in MicroStrategy Developer right-click the object and select Properties. TheID is displayed in the dialog box.
Examples<A hRef="dss://executereport BF294AA247895DD9354CA9B296D91D33">Execute Report: {ElectronicsRevenue vs. Forecast 2003}</A><A hRef="dss://executereport BF294AA247895DD9354CA9B296D91D33\2C3DFFB411D6044FC0008C916B98494F">Execute Report: {Electronics Revenue vs.Forecast 2003, Electronics Revenue By Region}</A>
OpenThe Open command connects to a project source in the object browser. The Opencommand searches for the project source by name. The search is case sensitive. After theproject source is found, it is expanded. If the user is currently not connected to theproject source the command opens the login window.
You can also include a project ID to open a project.
dss://Open ProjectSourceName\ProjectID\UserLogin\UserPassword
Parameter Description
ProjectSourceName The name of the project source node in the object browser control.
ProjectID Optional. If the ProjectID parameter is included, the command finds andconnects to the project.
To obtain a project ID, right-click the project and select ProjectConfiguration. The ID is displayed in the dialog box.
UserLogin Optional. The UserLogin parameter defines the default value of the userlogin when the project source is expanded. The login window is onlydisplayed if the user is not currently connected to the project source.
UserPassword Optional. The UserPassword parameter defines the default value of theuser password when the project source is expanded. The login windowis only displayed if the user is not currently connected to the projectsource.
Advanced Reporting Guide
735 © 2017, MicroStrategy Inc.
Examples<A hRef="dss://open MicroStrategy Tutorial">Open the MicroStrategy Tutorial project source</A><A hRef="dss://open MicroStrategy Tutorial\B19DEDCC11D4E0EFC000EB9495D0F44F">Open TutorialProject</A><A hRef="dss://open MicroStrategy Tutorial\B19DEDCC11D4E0EFC000EB9495D0F44F\Administrator">Open Tutorial Project usingAdministrator login </A>
ResetThe Reset command closes a session to a project or a connection to a project source.
dss://Reset ProjectSourceName\ProjectID
Parameter Description
ProjectSourceName The name of the project source in the folder list.
ProjectID Optional. If the ProjectID parameter is sent, the command closes thesession to the project. Otherwise, the command closes theconnection to the project source.
To obtain a project ID, right-click the project and select ProjectConfiguration. The ID is displayed in the dialog box.
Examples
<A hRef="dss://reset MicroStrategy Analytics Modules"> Closeconnection to the MicroStrategyAnalytics Modules project source</A><A hRef="dss://reset MicroStrategy Tutorial\B19DEDCC11D4E0EFC000EB9495D0F44F"> Close sessionto Tutorial Project</A>
ShortcutThe Shortcut command opens a folder in the object browser and displays the contents ofthe folder. This command searches for the folder ID in the project that the user iscurrently browsing. To select a project in the object browser use the Open command (seeOpen, page 734).
dss://Shortcut FolderID
Parameter Description
FolderID The ID of the target folder. To obtain a folder ID, right-click the folder and selectProperties. The Properties dialog box displays the ID of the folder.
Advanced Reporting Guide
© 2017, MicroStrategy Inc. 736
The folder ID parameter can specify one of the following special folder names instead ofa folder ID.
Profile_MyAnswers Public_Reports Public_Templates
Profile_MyFavorites Public_Prompts Schema_Partition_Mappings
Profile_MyObjects Public_Searches Schema_Tables
Profile_MyReports Public_Metrics Schema_Hierarchies
Public_Autostyles Public_Filters Schema_Functions
Public_Consolidations Schema_Objects Data_Explorer
Public_Custom_Groups Schema_Attributes Server_Admin
Public_Objects Schema_Facts Schema_Transformations
Examples<A hRef="dss://shortcut A20C898211D60AE310008BB3D1CEE6A4">Financial Reports</A><A hRef="dss://shortcut profile_myreports">My Reports</A>
DSORTING AND BROWSINGSTANDARDS
MicroStrategy employs its own sorting and browsing standards for characters andMicroStrategy projects.
The sorting is also dependent on your machine’s locale. International Components forUnicode (ICU) libraries are used to compare strings. ICU uses the Unicode CollationAlgorithm, which sorts on multiple levels, as described below:
1 Letters are sorted first.
2 Differences in accents resolve any ties resulting from the first sort level.
3 Differences in case (lower case vs. upper case) resolve any ties.
4 Differences in punctuation resolve any ties.
For more information, see:
Sort order of characters in MicroStrategy 737
Project order in MicroStrategy Developer and Web 738
Sort order of characters in MicroStrategyThe sort order of characters in MicroStrategy is different from ASCII standards. TheMicroStrategy sort order of characters affects:
• The order of files and folders in MicroStrategy Developer and MicroStrategy Web
• The order of ascending and descending sorts of alphanumeric values inMicroStrategy reports
The sort order described below is for English locales only. The sort order may bedifferent in different locales.
The table below lists the non-printable characters which are first in the sort order. Allthese characters are equal to each other, so the final sorting order is determined bywhich character is retrieved from the data warehouse first.
© 2017, MicroStrategy Inc. 737
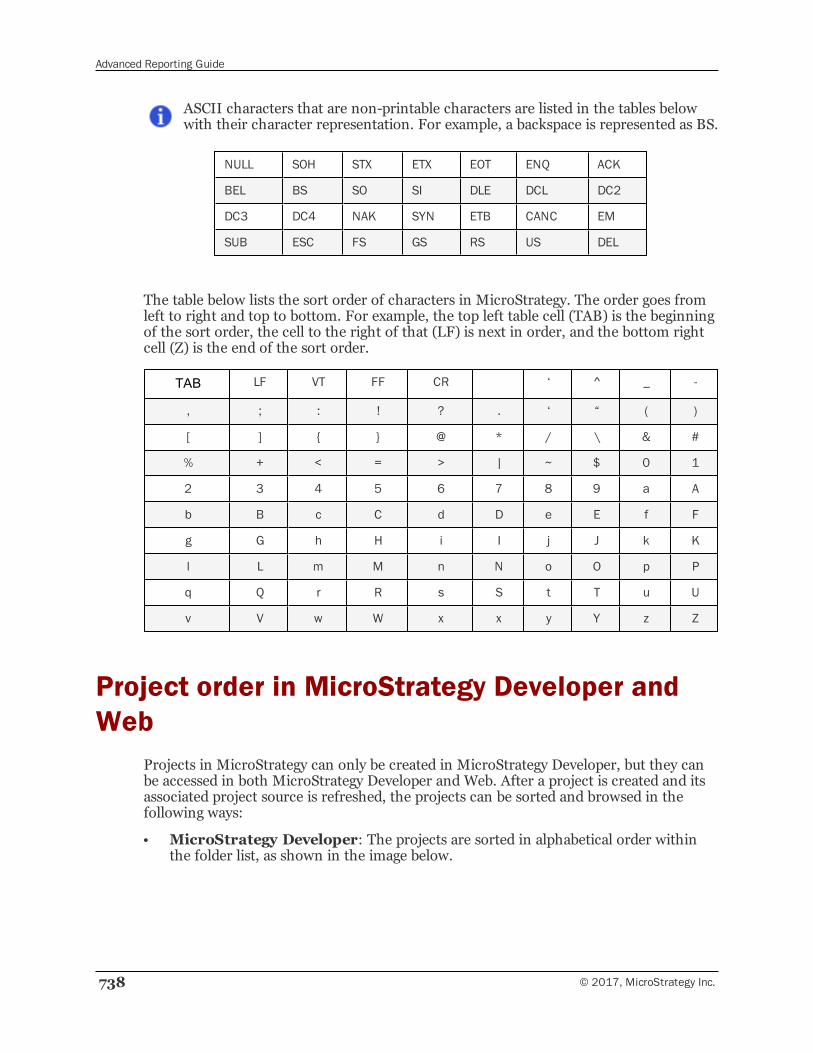
Advanced Reporting Guide
738 © 2017, MicroStrategy Inc.
ASCII characters that are non-printable characters are listed in the tables belowwith their character representation. For example, a backspace is represented as BS.
NULL SOH STX ETX EOT ENQ ACK
BEL BS SO SI DLE DCL DC2
DC3 DC4 NAK SYN ETB CANC EM
SUB ESC FS GS RS US DEL
The table below lists the sort order of characters in MicroStrategy. The order goes fromleft to right and top to bottom. For example, the top left table cell (TAB) is the beginningof the sort order, the cell to the right of that (LF) is next in order, and the bottom rightcell (Z) is the end of the sort order.
TAB LF VT FF CR ‘ ^ _ -
, ; : ! ? . ‘ “ ( )
[ ] { } @ * / \ & #
% + < = > | ~ $ 0 1
2 3 4 5 6 7 8 9 a A
b B c C d D e E f F
g G h H i I j J k K
l L m M n N o O p P
q Q r R s S t T u U
v V w W x x y Y z Z
Project order in MicroStrategy Developer andWeb
Projects in MicroStrategy can only be created in MicroStrategy Developer, but they canbe accessed in both MicroStrategy Developer and Web. After a project is created and itsassociated project source is refreshed, the projects can be sorted and browsed in thefollowing ways:
• MicroStrategy Developer: The projects are sorted in alphabetical order withinthe folder list, as shown in the image below.
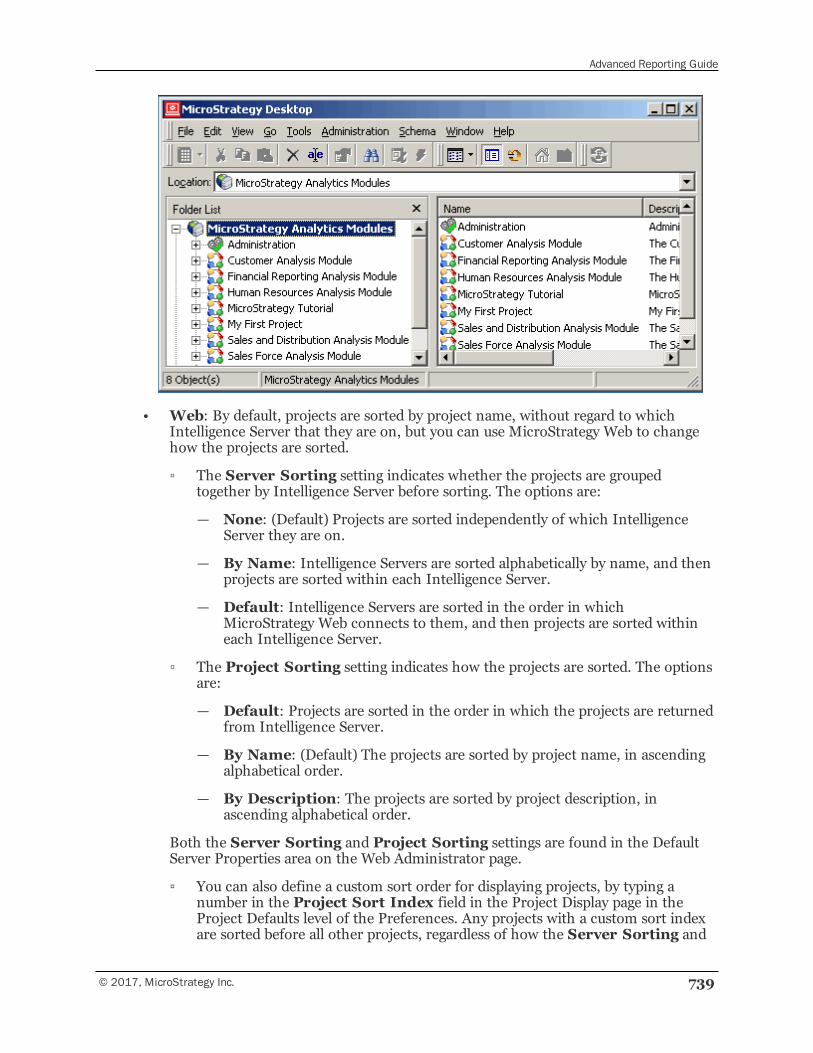
Advanced Reporting Guide
© 2017, MicroStrategy Inc. 739
• Web: By default, projects are sorted by project name, without regard to whichIntelligence Server that they are on, but you can use MicroStrategy Web to changehow the projects are sorted.
▫ The Server Sorting setting indicates whether the projects are groupedtogether by Intelligence Server before sorting. The options are:
— None: (Default) Projects are sorted independently of which IntelligenceServer they are on.
— By Name: Intelligence Servers are sorted alphabetically by name, and thenprojects are sorted within each Intelligence Server.
— Default: Intelligence Servers are sorted in the order in whichMicroStrategy Web connects to them, and then projects are sorted withineach Intelligence Server.
▫ The Project Sorting setting indicates how the projects are sorted. The optionsare:
— Default: Projects are sorted in the order in which the projects are returnedfrom Intelligence Server.
— By Name: (Default) The projects are sorted by project name, in ascendingalphabetical order.
— By Description: The projects are sorted by project description, inascending alphabetical order.
Both the Server Sorting and Project Sorting settings are found in the DefaultServer Properties area on the Web Administrator page.
▫ You can also define a custom sort order for displaying projects, by typing anumber in the Project Sort Index field in the Project Display page in theProject Defaults level of the Preferences. Any projects with a custom sort indexare sorted before all other projects, regardless of how the Server Sorting and

Advanced Reporting Guide
740 © 2017, MicroStrategy Inc.
Project Sorting settings are defined. If two projects have the same sort orderindex, then they are listed in the order specified by the Project Sorting settingdescribed above.
EUSING SECURE FREEFORMSQL TEXT PROMPTS
For security reasons, Freeform SQL reports using the text prompt feature should useparameterized queries (also called prepared statements) to guard against malicious SQLinjections. For data sources that do not support parameterized queries, a redesign of theFreeform SQL reports may be necessary.
The following steps provide an overview for configuring secure Freeform SQL textprompts:
Step 1: Identify database support for parameterized queries
Step 2: Enabling parameterized queries (for supported databases)
Step 3: Define secure Freeform SQL reports (for supported and unsupporteddatabases)
Note the following regarding parameterized queries:
• Escaping special characters in input data is not required because SQL instruction anddata get separated.
• Single quotes provided as user input data are always escaped to reduce the risk of anSQL injection attack.
As a result, the following VLDB setting is deprecated:
<PROPERTYDEF NAME="FFSQL Text Prompt Escape SpecialCharacters" TYPE="long" DEFAULT="1" GROUPS="DBRole,DBMS"/>
Identify database support for parameterizedqueries
• Supported databases:The following databases support parameterized queries without additional DataSource Name (DSN) settings:
▫ Actian Vectorwise with native driver
© 2017, MicroStrategy Inc. 741
Advanced Reporting Guide
742 © 2017, MicroStrategy Inc.
▫ Amazon Redshift with PostgreSQL driver
▫ Amazon Redshift with MicroStrategy driver
▫ Aster nCluster 4.6.x and higher with native driver
▫ EnterpriseDB with native driver
▫ EXASolution with native driver
▫ HP Neoview with native driver
▫ IBM DB2 UDB for iSeries with MicroStrategy driver
▫ IBM DB2 UDB for iSeries with native driver
▫ IBM DB2 UDB for Linux, UNIX &Windows with MicroStrategy driver
▫ IBM DB2 UDB for Linux, UNIX &Windows with native driver
▫ IBM DB2 UDB for z/OS with MicroStrategy driver
▫ IBM DB2 UDB for z/OS with native driver
▫ IBM Netezza with native driver
▫ Infobright with MicroStrategy driver
▫ Informix Dynamic Server with native driver
▫ Microsoft SQL Database with MicroStrategy driver
▫ Microsoft SQL Database with native driver - Windows
▫ Microsoft SQL Server with SQL Server - Windows
▫ Microsoft SQL Server with Native Client - Windows
▫ Microsoft SQL Server with MicroStrategy driver
▫ MySQL Community Server with native driver
▫ Oracle with native driver
▫ ParAccel with native driver
▫ Red Brick with native driver
▫ Salesforce with MicroStrategy driver
▫ SAP HANA 1.0 Sp2 with native driver
▫ Sybase IQ with native driver
▫ Teradata with native driver
▫ Text files with native driver
▫ Vertica with native driver
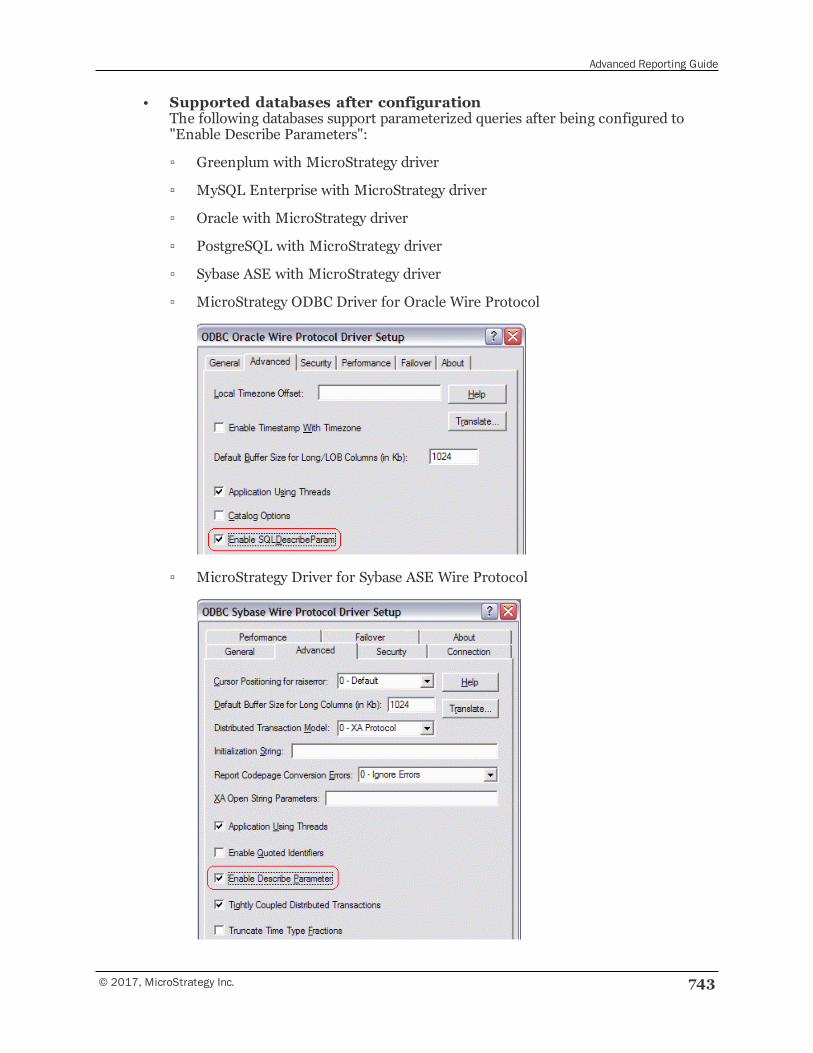
Advanced Reporting Guide
© 2017, MicroStrategy Inc. 743
• Supported databases after configurationThe following databases support parameterized queries after being configured to"Enable Describe Parameters":
▫ Greenplum with MicroStrategy driver
▫ MySQL Enterprise with MicroStrategy driver
▫ Oracle with MicroStrategy driver
▫ PostgreSQL with MicroStrategy driver
▫ Sybase ASE with MicroStrategy driver
▫ MicroStrategy ODBC Driver for Oracle Wire Protocol
▫ MicroStrategy Driver for Sybase ASE Wire Protocol
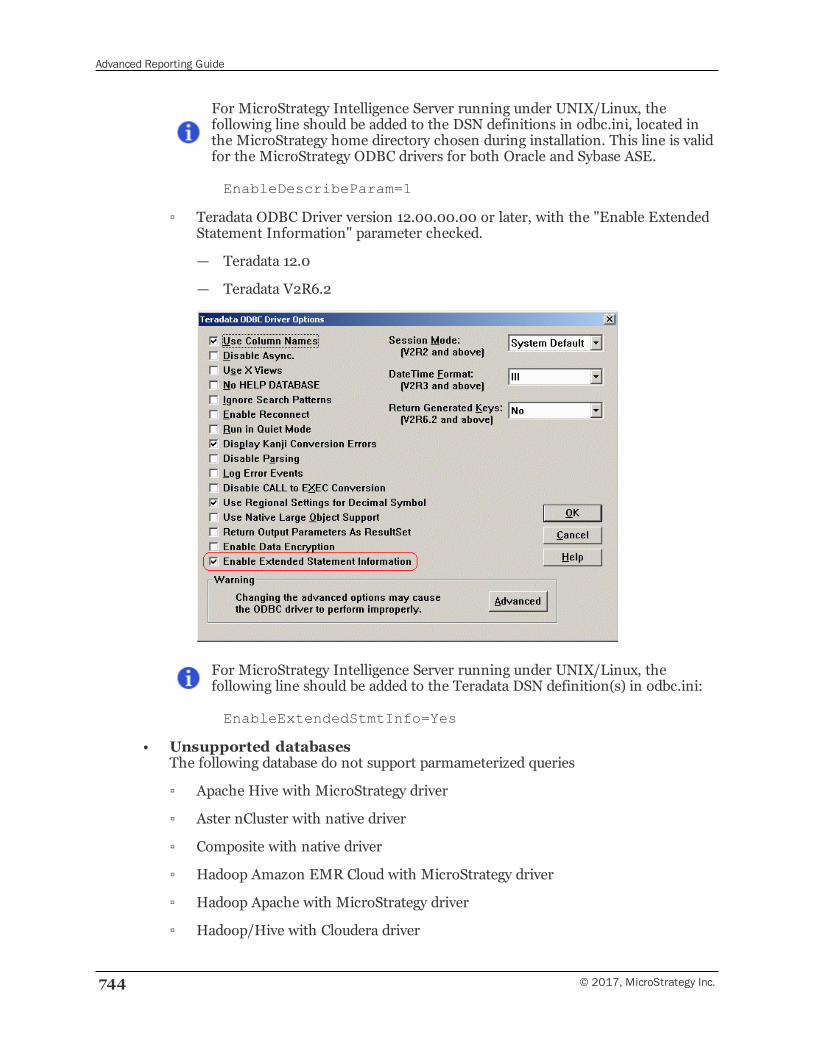
Advanced Reporting Guide
744 © 2017, MicroStrategy Inc.
For MicroStrategy Intelligence Server running under UNIX/Linux, thefollowing line should be added to the DSN definitions in odbc.ini, located inthe MicroStrategy home directory chosen during installation. This line is validfor the MicroStrategy ODBC drivers for both Oracle and Sybase ASE.
EnableDescribeParam=1
▫ Teradata ODBC Driver version 12.00.00.00 or later, with the "Enable ExtendedStatement Information" parameter checked.
— Teradata 12.0
— Teradata V2R6.2
For MicroStrategy Intelligence Server running under UNIX/Linux, thefollowing line should be added to the Teradata DSN definition(s) in odbc.ini:
EnableExtendedStmtInfo=Yes
• Unsupported databasesThe following database do not support parmameterized queries
▫ Apache Hive with MicroStrategy driver
▫ Aster nCluster with native driver
▫ Composite with native driver
▫ Hadoop Amazon EMR Cloud with MicroStrategy driver
▫ Hadoop Apache with MicroStrategy driver
▫ Hadoop/Hive with Cloudera driver
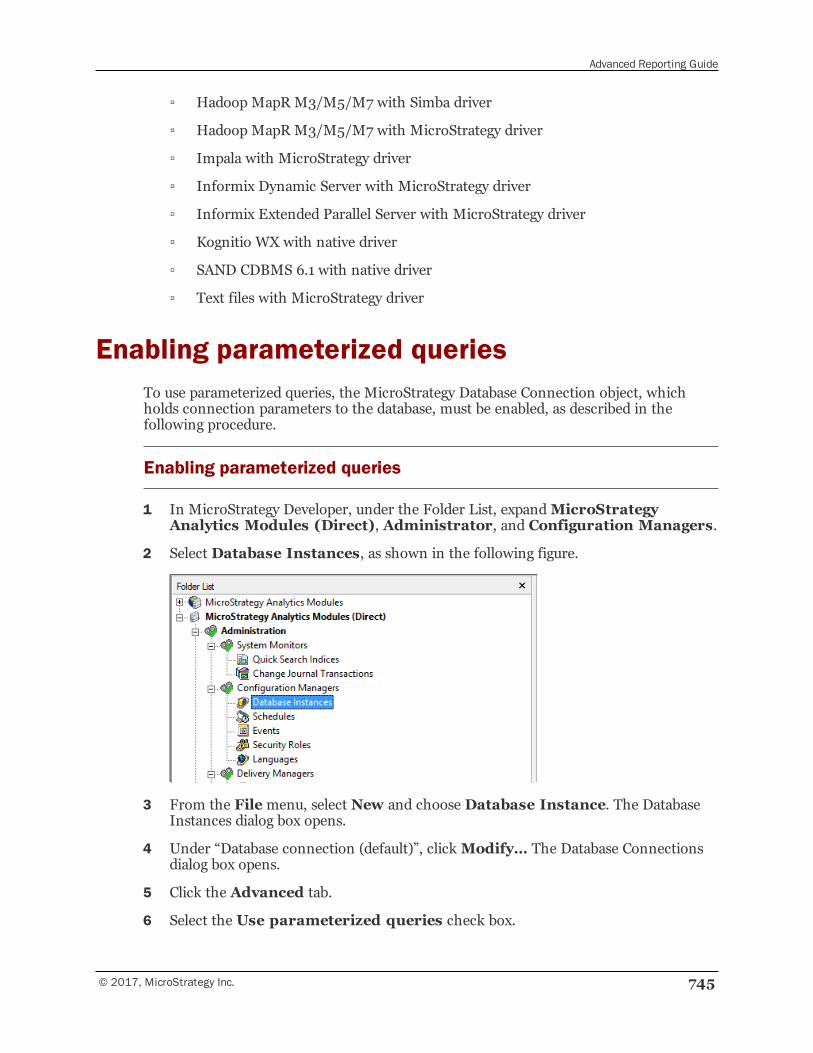
Advanced Reporting Guide
© 2017, MicroStrategy Inc. 745
▫ Hadoop MapR M3/M5/M7 with Simba driver
▫ Hadoop MapR M3/M5/M7 with MicroStrategy driver
▫ Impala with MicroStrategy driver
▫ Informix Dynamic Server with MicroStrategy driver
▫ Informix Extended Parallel Server with MicroStrategy driver
▫ Kognitio WX with native driver
▫ SAND CDBMS 6.1 with native driver
▫ Text files with MicroStrategy driver
Enabling parameterized queriesTo use parameterized queries, the MicroStrategy Database Connection object, whichholds connection parameters to the database, must be enabled, as described in thefollowing procedure.
Enabling parameterized queries
1 In MicroStrategy Developer, under the Folder List, expandMicroStrategyAnalytics Modules (Direct), Administrator, and Configuration Managers.
2 Select Database Instances, as shown in the following figure.
3 From the Filemenu, select New and choose Database Instance. The DatabaseInstances dialog box opens.
4 Under “Database connection (default)”, clickModify… The Database Connectionsdialog box opens.
5 Click the Advanced tab.
6 Select the Use parameterized queries check box.
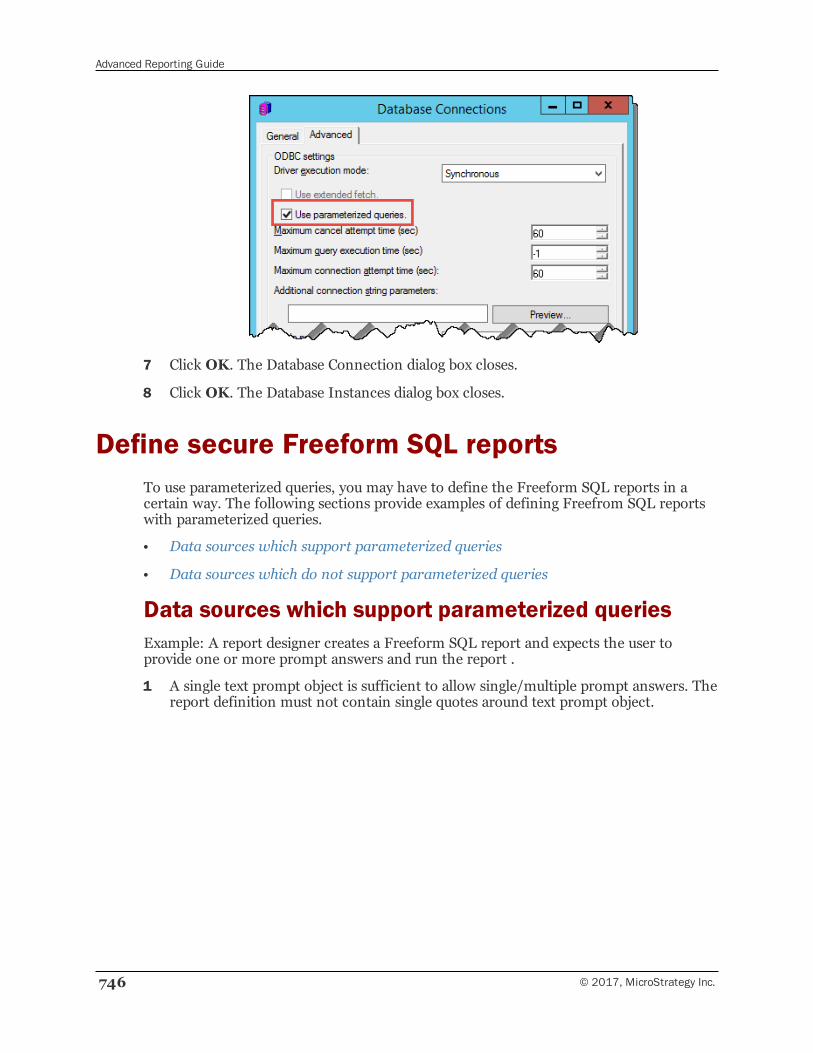
Advanced Reporting Guide
746 © 2017, MicroStrategy Inc.
7 Click OK. The Database Connection dialog box closes.
8 Click OK. The Database Instances dialog box closes.
Define secure Freeform SQL reportsTo use parameterized queries, you may have to define the Freeform SQL reports in acertain way. The following sections provide examples of defining Freefrom SQL reportswith parameterized queries.
• Data sources which support parameterized queries
• Data sources which do not support parameterized queries
Data sources which support parameterized queriesExample: A report designer creates a Freeform SQL report and expects the user toprovide one or more prompt answers and run the report .
1 A single text prompt object is sufficient to allow single/multiple prompt answers. Thereport definition must not contain single quotes around text prompt object.
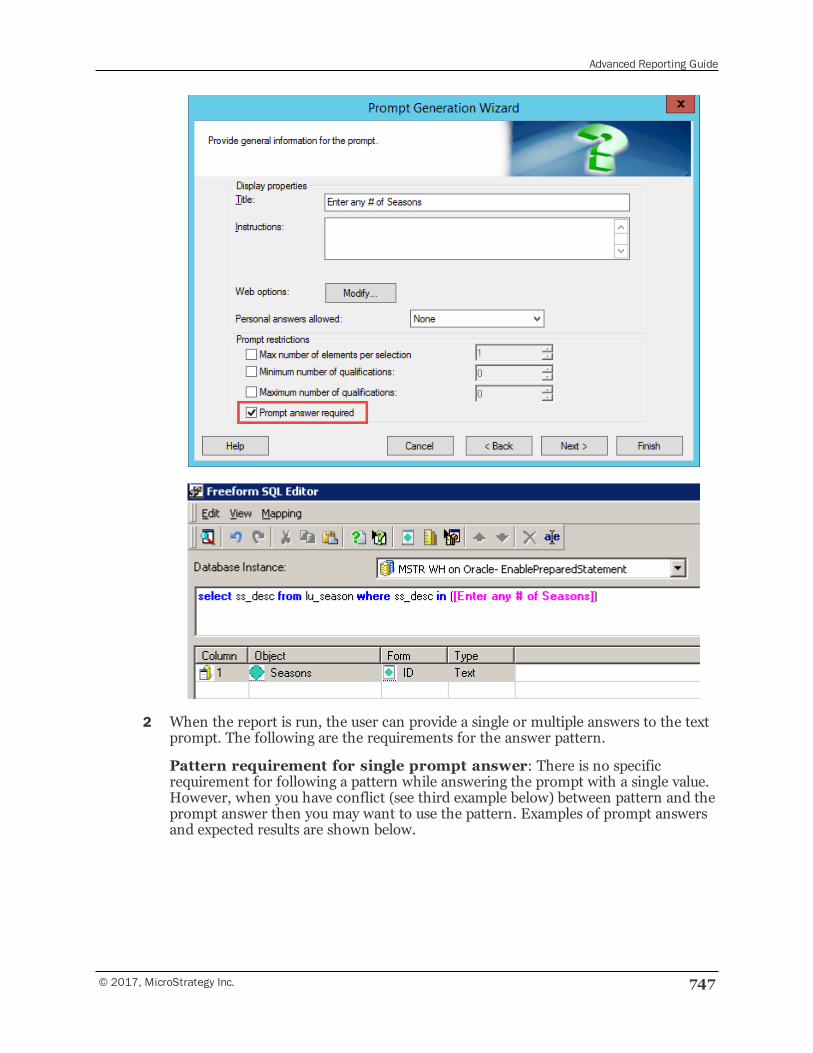
Advanced Reporting Guide
© 2017, MicroStrategy Inc. 747
2 When the report is run, the user can provide a single or multiple answers to the textprompt. The following are the requirements for the answer pattern.
Pattern requirement for single prompt answer: There is no specificrequirement for following a pattern while answering the prompt with a single value.However, when you have conflict (see third example below) between pattern and theprompt answer then you may want to use the pattern. Examples of prompt answersand expected results are shown below.
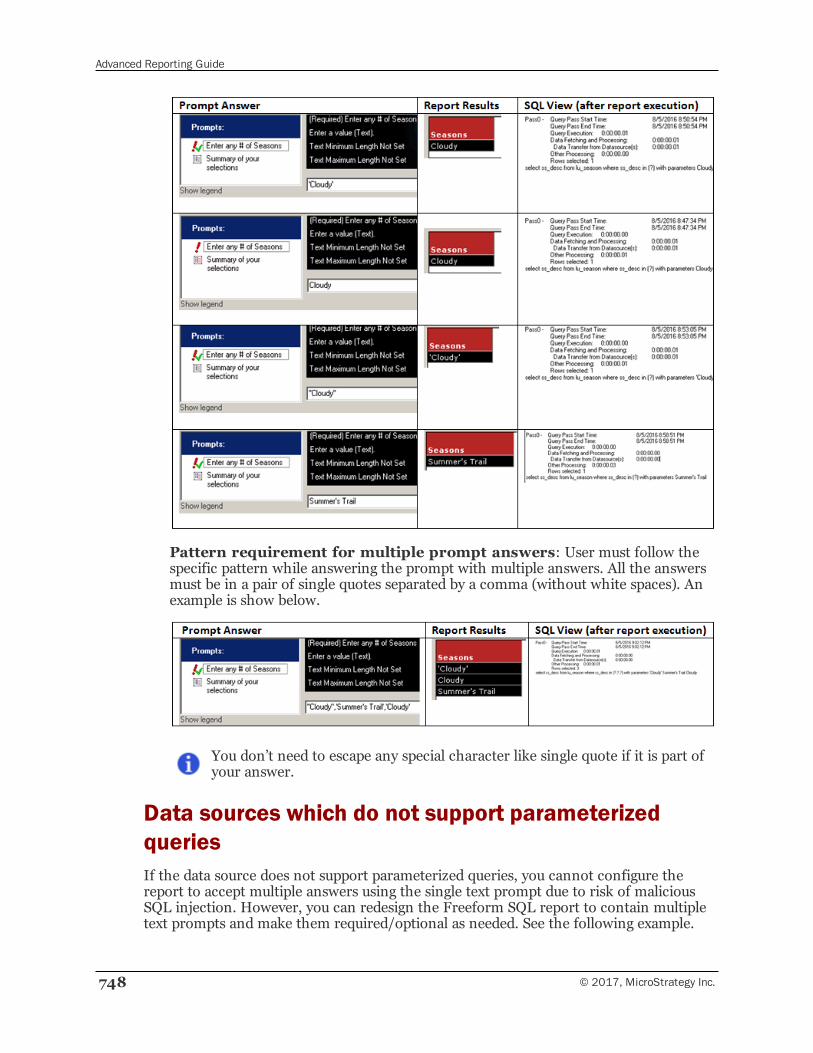
Advanced Reporting Guide
748 © 2017, MicroStrategy Inc.
Pattern requirement for multiple prompt answers: User must follow thespecific pattern while answering the prompt with multiple answers. All the answersmust be in a pair of single quotes separated by a comma (without white spaces). Anexample is show below.
You don’t need to escape any special character like single quote if it is part ofyour answer.
Data sources which do not support parameterizedqueriesIf the data source does not support parameterized queries, you cannot configure thereport to accept multiple answers using the single text prompt due to risk of maliciousSQL injection. However, you can redesign the Freeform SQL report to contain multipletext prompts and make them required/optional as needed. See the following example.
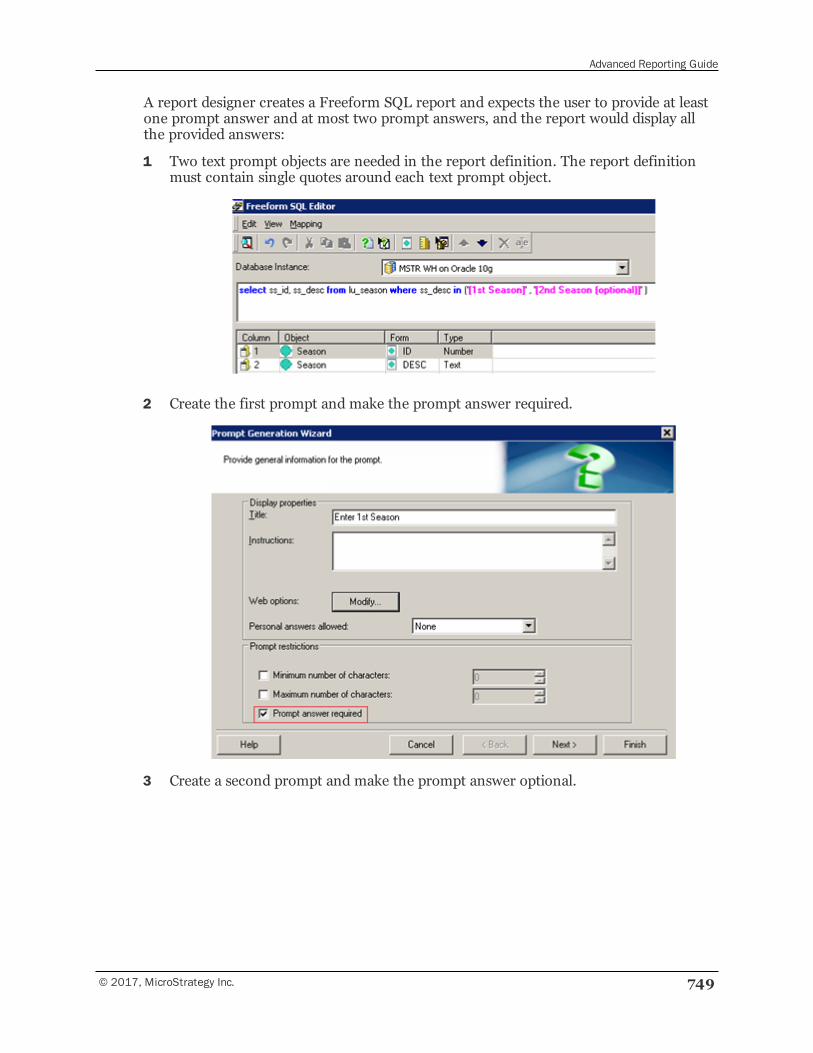
Advanced Reporting Guide
© 2017, MicroStrategy Inc. 749
A report designer creates a Freeform SQL report and expects the user to provide at leastone prompt answer and at most two prompt answers, and the report would display allthe provided answers:
1 Two text prompt objects are needed in the report definition. The report definitionmust contain single quotes around each text prompt object.
2 Create the first prompt and make the prompt answer required.
3 Create a second prompt and make the prompt answer optional.
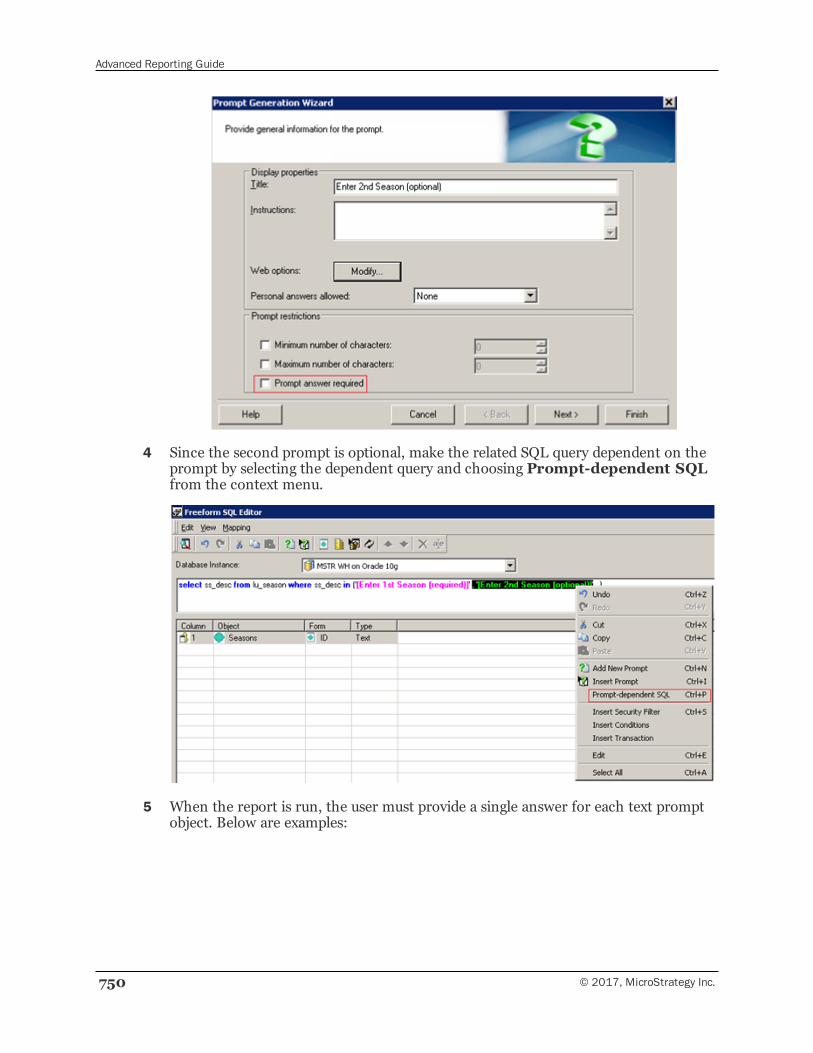
Advanced Reporting Guide
750 © 2017, MicroStrategy Inc.
4 Since the second prompt is optional, make the related SQL query dependent on theprompt by selecting the dependent query and choosing Prompt-dependent SQLfrom the context menu.
5 When the report is run, the user must provide a single answer for each text promptobject. Below are examples:
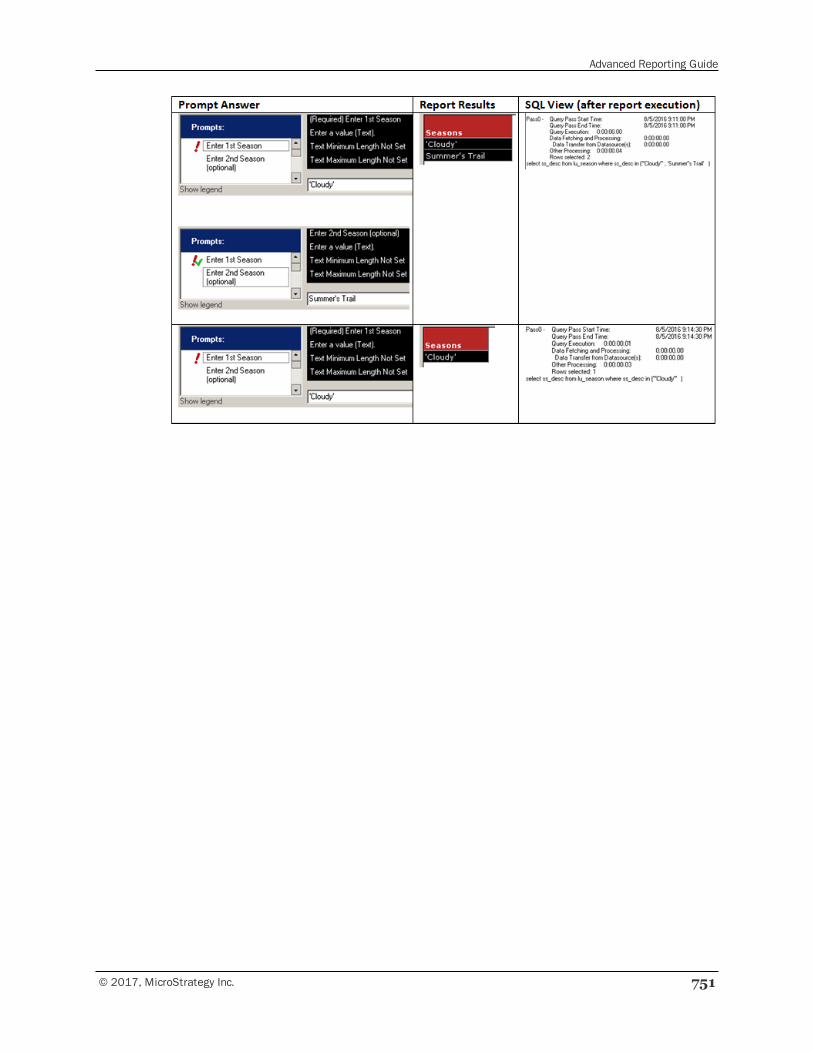
Advanced Reporting Guide
© 2017, MicroStrategy Inc. 751
INDEX
3
3D surface graph 345
Auto Arrange 404
best practices 346
example 345
A
access control list
Freeform SQL report and 520
Query Builder report and 595
across level subtotals 242
add-in function. See customfunction. 103
Advanced Metric Assistant, creatingmultiple metrics with 87
advanced qualification 110
activating 110
custom expression 131, 133
joint element list 146
advanced subtotals
across a level 242
by position 242
group by 243
aggregation, grouping in a levelmetric 26
Alerter. See threshold. 268
alias for a metric column 106
alignment formatting default 725
analysis, time-series 81
Analytical Engine, null checking in 701
Apply function 140
custom expression 140
example 142-144
handling by the SQL Engine 104
syntax 141
ApplyAgg 140
ApplyComparison 140
applying series effect to a graphreport 308
ApplyLogical 140
ApplyOLAP 140
ApplySimple 140
© 2017, MicroStrategy Inc. 752
Advanced Reporting Guide
area graph 318
best practices 320
combination graph 338
curved effect 320
example 319
association
drill map 199
level 200
removing 201
association rules analysis 646
example 690
attribute
element
on a report 281
grouping multiple in a joint elementlist 146
headers on a report 276
on a report 281
virtual (consolidation) 175
attribute-to-attribute qualificationfilter 112
creating 112, 136
custom expression in 135
example 113-114, 136
attribute element list qualification 110
attribute element prompt
link and 469-470
attribute form qualification 110
attribute form selection option forintermediate passes 711
attribute join type 280-281
changing 284
object prompt and 285
attribute level of a set qualification 125
attribute qualification 110
attribute element listqualification 110
attribute form qualification 110
Date and Time Editor 117
date offset 116
dynamic date 116
exported filter element 124
imported filter element 122
prompted 148
attribute qualification prompt 205
in a filter 148
attribute selection option forintermediate passes 711
Auto Arrange in a graph 404
automatic layout in a graph 400
autostyle 275
default format 724
distributing 275
average
moving 100
running 100
axis formatting
graph 397
report 271
B
banding 158
count 159
formatting 271
753 © 2017, MicroStrategy Inc.
Advanced Reporting Guide
formatting default 726
metric value 159
output level 158
point 159
qualification 158
size 158
type 158
bar graph 320
best practices 326
combination graph 338
example 321
bevel effect on a graph object 308
border of a report 272
default formatting 726
box and whisker plot. See boxplot. 354
boxplot 354
best practices 356
example 354
break by for a filter 127
browsing
project order in Developer andWeb 738
standards in MicroStrategy 737
bubble chart 337
best practices 338
example 337
budgeting graph
lipstick bar graph 323
overlapping bar graph 323
bulk exporting 303
by position subtotals 242
C
cache 302
default setting 302
disabling 302
disabling for a report 302
enabling 302
enabling for a report 302
Intelligent Cube 241, 302
invalidating 302
report 302
Cartesian join 704
warning 704
categories 315
in a graph 315
specifying number of 317
ChangeView command 731
character sort order 737
choose from all attributes in ahierarchy prompt 204
choose from attribute element listprompt 205
circle graph. See pie chart. 329
cluster analysis 643
example 683
color palette for a graph 360
color style for a graph 360
column alias for a metric 106
column subtotal formatting 271
combination graph 338
comparison operator 721
© 2017, MicroStrategy Inc. 754
Advanced Reporting Guide
compound metric 18, 84
count function 98
moving average 100
moving sum 100
n-tile 101
non-group function 97
rank function 97
running average 100
running sum 100
smart metric 85
smart subtotals 86
condition. See filter. 109
conditional metric 58
advanced options 63, 79
default 77
combining embedding method andremove related elementssettings 69
creating 62
Advanced Metric Assistant 87
embedding method 63
example 58
level and condition 60
link and 470, 473
multiple conditions 59
remember option setting 77
removing related report filterelements 67
report filter interaction 63
conditional predictive input metric 636
creating 638
confusion matrix 642
consolidation 153, 174
custom group comparison 187
element. See consolidationelement. 176
evaluation order 179, 292
evaluation order error example 292
example 186
formatting 269
importing an element 179
row level math 176
SQL generation and 180
subtotal 181
virtual attribute 175
consolidation element 176
formatting 176, 272
from attributes in differenthierarchies 179
from different levels of the samehierarchy 178
from the same attribute 178
importing 179
using existing 179
contribution metric 20
conversion rate, prompting for 209
converting currency 209
count distinct 99
count function 98
count metric 98
currency conversion 209
current date offset 116
curved effect
applying to a graph object 308
755 © 2017, MicroStrategy Inc.
Advanced Reporting Guide
applying to a line graph 328
applying to an area graph 320
custom expression 131
Apply function in 140
attribute-to-attribute qualificationfilter 135
qualification filter 133
example 134
string manipulation in 134
relationship qualification filter 137
string manipulation in 134
using a date 134
custom format 259
character/text data 261
color 263
conditional 264
currency 263
date 261
example 264
numeric data 260
time 261
custom function 103
R Integration Pack 104
custom graph 339
custom group 153-154
advantages 158
banding qualification 158
consolidation comparison 187
creating 163
creating multiple simultaneously 163
deleting 174
condition 174
element 174
element 155, 172
editing 170
element header 155
element header position 165
example 156
formatting 164, 269, 272
hierarchical display 161
keeping the group structure 168
prompt 169
report filter interaction with 169
sorting 166
by item metric value 168
sorting by metric values ofitems 168
SQL generation and 158
store inventory example 156
structure on report 161
subtotals 165
position 166
totals 165
position 166
custom prompt style for MicroStrategyWeb 219
custom report subtotals 246
customizing a drill map 191
D
data access using a security filter
Freeform SQL 521
Query Builder 596
© 2017, MicroStrategy Inc. 756
Advanced Reporting Guide
data definition 240
evaluation order 288
object 240
data mart 608, 620
creating 609
governing settings 621
metric alias 106
objective of 608
optimizing 618
performance parameters 621
report 609
running a report against 619
SQL statement 622
table 609
used as a source table 613
data mining 625
association rules analysis 646
example 690
cluster analysis 643
example 683
confusion matrix 642
dataset report 628
decision tree analysis 644
example 685
example 677, 681
exponential regression 661
importing a third-party neuralnetwork model 687
integrating with third-partyapplication 671
linear regression 661
example 678
logistic regression 642
example 681
market basket analysis 646
example 690
multivariate regression model 642
overview 625
regression 640
seasonal regression 678
standard regression model 665
time series analysis 650
training metric 659
Training Metric Wizard 660
training the model 659
tree regression model 665
univariate regression model 642
workflow 626
data source 599
database
connecting Freeform SQL to 599
connecting Query Builder to 599
database-specific function 131, 140
database instance
VLDB property 716
web service 526
dataset report for data mining 628
creating 627
guidelines for creating 630
non-MicroStrategy 639
date
dynamic 116
in a custom expression 134
757 © 2017, MicroStrategy Inc.
Advanced Reporting Guide
in an Apply function 144
Date and Time Editor 117
date offset 116
decision tree analysis 644
example 685
default
drill path 194
evaluation order 287
inherited value 699
link 465
Design View 228
dimensional subtotals 91
dimensionality. See level. 19
distributing reports 295
Object Templates folder 302
Public Objects folder 302
re-using an object 295
report 301
Shared Reports folder 302
Distribution Services bulk exportingreports 303
division by zero 701
document
Freeform SQL report in 502
moving sum example 100
n-tile function example 101
Query Builder report in 572
rank example 98
running sum example 100
widget in 418
drill map 189-190
association 199
level 200
removing 201
template 201
creating 191
custom 191
default 190, 199
deleting 190
destination 191
drill path type 192
drill path. See also drill path. 190
grid unit level 200
project 201
project default 190
project level 200
report level 200
See also drilling.[drill map
aaa] 189
template 201
template level 200
drill path 190
base template 198
creating 191
custom 191
default 190, 194
destination 191
display mode 199
display name 193
drilled-on object 198
filter interaction 194
© 2017, MicroStrategy Inc. 758
Advanced Reporting Guide
keep parent 198
page-by 197
priority 193
properties 193
set name 193
system hierarchy 190
threshold 198
type 192
VLDB properties 199
drilling 189
drill map. See also drill map. 190
drill path. See also drill path. 190
filter interaction 190, 194
filtering a drilled-to report 238
Freeform SQL report and 516
Query Builder report and 594
shortcut to an existing drill map 192
to a template 192
dropping temp table method 714
dynamic date 116
Date and Time Editor 117
prompt and 119
dynamic graph title 376
E
Editor command 732
element of a consolidation. See alsoconsolidation element. 176
embedded
filter 110, 298
See also shortcut-to-a-filterqualification. 110
shortcut vs. 150
template 296
embedding method 63
changing default 77
combining with remove relatedelements setting 69
example 65, 77
empty object template 299
user-defined 300
equi-join 706
evaluation order
consolidation 179
example 292
data 288
example 289, 292
default 287
defining 288
derived metric 288
incompatibility error example 289,292
report 286
view 288
example 289, 292
example
attribute-to-attribute qualificationfilter 113-114
conditional metric 58
consolidation 186
currency conversion 209
custom expression qualificationfilter 134
custom format 264
759 © 2017, MicroStrategy Inc.
Advanced Reporting Guide
data mining. See example, datamining. 677
dynamic date 117
evaluation order data 289, 292
evaluation order error 289, 292
finding 10
First function 92
graph. See example, graph. 345
level prompt 211
link. See example, link. 462
metric qualification 235
metric. See example, metric. 84
nonaggregatable metrics and levelgrouping 31
relationship qualification filter 138
Report Details pane 419
report details. See example, reportdetails. 425
running sum 100
subtotals across level 244
subtotals by position 243
subtotals group by 245
subtotals, user-defined 92
user-defined subtotals 92, 94
value prompt 209
view evaluation order 289, 292
year-to-date transformation 82
example, data mining 677, 681
cluster analysis 683
decision tree analysis 685
linear regression 678
logistic regression 681
seasonal regression 678
example, graph
3D surface graph 345
area graph 319
bar graph 321
boxplot 354
bubble chart 337
funnel graph 349
gauge graph 347
graph style 318
histogram 344
line graph 328
pareto chart 351
pie chart 329
polar chart 333
radar chart 335
scatter plot 331
stock graph 341
example, link
answering a hierarchy prompt 477
answering a target prompt withsource prompt answers 471
conditional metric and 473
ignoring a target prompt 472
linking reports 462
multiple links 466
prompt answer for any otherprompts not listed 480
example, metric
compound 84
conditional metric with multiplequalifications 59
© 2017, MicroStrategy Inc. 760
Advanced Reporting Guide
embedding method 65, 77
level 37, 41
level grouping with anonaggregatable metric 31
rank 98
removing the report level 36
reusing metrics with the Filtersetting 53
transformation 81
example, report details 425
filter details 450-451
alias display 454
content of 445
drill filter 447
filter type 444
logical operator display 452
prompt details 437
report details delimiters 423
report details preferences 458
template details 429, 431
Excel
connecting Freeform SQL to 600
connecting Query Builder to 600
Execute command 733
ExecuteDocument command 733
ExecuteReport command 734
exponential regression 661
exporting 303
filter element 124
graph 416
F
fallback table type 714
filter 108-109, 229-230
adding to a report 149-150
attribute level 125
comparison operator 721
conditional metric and 63
creating. See filter, creating. 112
custom expression qualificationin 133
date offset 116
drilled-to report 238
drilling and 190
dynamic date 116, 119
embedded 150, 298
exporting a filter element 124
Freeform SQL report and 513
importing a filter element 122
linked 149
local 150
logical operator 110, 719
metric 58
metric and report interaction 63,67, 77
operator 718
output level 125
pattern operator 723
prompted. See also filter,prompted. 147
qualification types. See filterqualification types.[filter
aaa] 110
761 © 2017, MicroStrategy Inc.
Advanced Reporting Guide
Query Builder report and 587
rank and percent operator 722
report and 32
report and metric interaction 63,67, 77
report as filter 237
security 521, 596
shortcut to 149-150, 298
stand-alone 149-150
filter details 442
alias display 454
attribute element list qualificationdisplay 449
example 450
attribute form and set qualificationdisplay 451
configuring 455
content of 443, 445
example 445
drill filter 447
example 447
filter type 443-444
example 444
logical operator 452
report details preferencesinteraction 443
filter object prompt 149
filter qualification types 110
advanced qualification 111
attribute-to-attributequalification 136
attribute qualification 110
joint element list qualification 146
relationship qualification 137
set qualification 110
shortcut-to-a-filter qualification 110
shortcut-to-a-reportqualification 110
filter, creating
attribute-to-attributequalification 112, 136
attribute qualification using adynamic date 117
custom expression qualification 133
dynamic date based on a promptanswer 120
joint element list 146
filter, prompted 147
attribute qualification prompt 148
filter definition prompt 204
metric qualification prompt 148
object prompt 149
report object prompt 149
find and replace 276
privilege 276
First function 92, 102
Flash Mode graph visualization 418
font
anti-aliasing applied to graphtext 309
formatting default 725
Format Cells dialog box 259
formatting
autostyle 275
custom 259
default project 300
© 2017, MicroStrategy Inc. 762
Advanced Reporting Guide
default value 724
graph. See also graphformatting. 359
grid unit 266
layer. See also formatting layer. 265
report 258
threshold 268
using empty object template 300
zone 266
formatting layer
consolidation 272
custom group 272
formatting layer 265
all metrics 271
axis 271
banding 271
column subtotals 271
grid unit 271
metric 271
metrics label 271
order of layers 269
report border 272
report metric 271
row subtotals 272
threshold 272
formula join type for a compoundmetric 86
Freeform SQL functionality 497
Freeform SQL report 498
access control list 520
common table expression 501
creating. See Freeform SQL report
creation. 599
derived table 501
document 502
drilling 516
filter 513
managed object 601
multi-pass SQL 500
MultiSource Option 516
prompt 513
query syntax 499
security filter 521
security for data access 520
shortcut-to-a-reportqualification 516
SQL support 500
standard report versus 501
Freeform SQL report creation
from a database 599
from a text file 600
from a web service 524
from an Excel file 600
using a stored procedure 507
Freeform SQL used to create anIntelligent Cube 605
Freeform SQL, secure text prompts 741
full outer join support 705
function
add-in. See custom function. 103
Apply 140
ApplyAgg 140
ApplyComparison 140
ApplyLogical 140
763 © 2017, MicroStrategy Inc.
Advanced Reporting Guide
ApplyOLAP 140
ApplySimple 140
custom 103
database-specific 140
First 102
Last 102
OLAP 100
Pass-through 140
plug-in 103
funnel graph 349
best practices 350
example 349
G
gantt chart 356
gauge graph 347
best practices 348
displaying multiple gauges 348
example 347
gradient, applying to a graphobject 308
grand totals
default 89
displaying 89, 244
function 90
total subtotal function 90
graph 306
adding data to 310
Auto Arrange 404
best practices 307
categories 315
categories and series 317
copying into a third-partyapplication 417
dynamic title 376
exporting 416
footnotes 374
creating 375
formatting. See graphformatting. 359
insufficient data for 315
label. See graph label. 392
layout. See graph layout. 400
legend. See graph legend. 393
moving an object on 315
object placement in 314
resizing 403
scaling 400, 404
selector and 308
series 315
sharing 416
sizing 400
thresholds 369-370
title 374
creating 375
variables for a title 376
viewing 309
graph formatting 360
axes 380
axis label 397
background picture 374
bevel effect 374
color 360
effects 360
© 2017, MicroStrategy Inc. 764
Advanced Reporting Guide
footnotes 374
gradient 373
gradient (using MicroStrategyWeb) 367
graph object manual format 372
graph series (using MicroStrategyWeb) 365
label 393
layout 400
legend 393
metric color 362
inheriting 365
numeric values 387
inheriting 388
pattern 374
positioning a chart element 400
shading 360
texture 374
thresholds 369
example 370
title 374, 377
tooltip 397
transparency 373-374
graph label
displaying 392
formatting 393
graph layout 400
Auto Arrange 404
automatic 400
automatic vs. manual 401
example 402
manual 402
selecting 401
graph legend
displaying
using MicroStrategyDeveloper 393
using MicroStrategy Web 395
formatting 395
using MicroStrategyDeveloper 395
manually positioning 402
graph style
3D surface 345
advanced styles 340
applying custom 412
area 318
bar graph 320
boxplot 354
bubble chart 337
budgeting graph 323
choosing appropriate 311
combination 338
creating custom 412
custom 339
example and usage scenario 318
funnel 349
gantt chart 356
gauge graph 347
histogram 343
insufficient data for 315
line graph 327
lipstick bar graph 323
minimum object requirements
765 © 2017, MicroStrategy Inc.
Advanced Reporting Guide
for 311
object placement in 314
overlapping bar graph 323
pareto chart 351
pie chart 329
polar chart 333
radar chart 334
report object placement for 314
scatter plot 331
selecting 313
stock graph 340
Graph view 309
Grid Graph view 307, 309
grid unit 266
formatting 266, 271
subtotal formatting 267
Grid/Graph, link in 464
group by
ID attribute 712
non-ID attribute 713
subtotals 243
grouping elements in a joint elementlist 146
growth percentage 81
H
hierarchical sorting 249
hierarchy as the target of a levelmetric 45
hierarchy prompt and linking 470, 476
histogram 343
best practices 345
example 344
homepage in MicroStrategyDeveloper 729
HTTP authentication for an XQuerystatement 530
I
importing
data 14
filter element 122
table 578
importing data
analyzing system information 15
inner join 105
integer constant in a metric 700
Intelligent Cube 242
cache 302
Freeform SQL 605
personal 241
Query Builder 605
report cache 302
shared 242
intermediate table type 714
internationalization, convertingcurrency for 209
inventory metric 26
J
join
attribute 280
Cartesian 704
equi-join 706
formula 86
© 2017, MicroStrategy Inc. 766
Advanced Reporting Guide
inner 105
metric 104
outer 105
outer join support VLDBproperty 705
Query Builder report and 579
report 104
type 86
joint element list qualification 146
L
label on a graph. See also graphlabel. 392
Last function 102
layout of a graph. See also graphlayout. 400
legend on a graph. See also graphlegend. 393
level 19
grouping 26
grouping for a nonaggregatablemetric 26
metric. See also level metric. 19
prompt. See also level prompt 210
properties 22
displaying 22
report level 35
removing 36
target 26
level metric 19, 22
advanced options 50, 55, 79
aggregation in 26
allowing other users to add extraunits to the definition 55
applying the metric filter to themetric calculation 50
attribute level 26
elements of 21
filter setting 50
grouping 26
hierarchy as the target 45
overview 22
properties 22
property symbols defined 22
removing the report level 36
report level 19, 35
security filter 41
target 26
level prompt 210
creating 212
example 211
object prompt vs. 211
line graph 327
applying a curved effect 328
best practices 328
combination graph 338
example 328
linear regression 661
example 678
link 461, 464
components 465
conditional metric and 470
copying 485
creating 481
prerequisites 481
767 © 2017, MicroStrategy Inc.
Advanced Reporting Guide
default 465
in MicroStrategy Developer 466
in MicroStrategy Web 466
example 462
MDX cube report as the source 476
multiple 464
default link 466
example 466
prerequisites 463
prompt and 465
prompt answer method. See alsoprompt answer method for alink. 467
source 464
target 465
linked template. See shortcut to atemplate. 296
linking reports and documents 461
comparison of 464
creating 486, 489
example 462
prerequisites 463
See also link.[linking reports anddocuments
aaa] 461
lipstick bar graph 323
local filter 150
logical operator
exclusion 720
filter 110
functional description 719
intersection 719
union 719
logistic regression 642
confusion matrix 642
example 681
M
managed object 603
accessing 603
deleting 605
editing 604
market basket analysis
data mining 646
example 690
maximum SQL size 717
MDX cube
importing a predictive modelfor 673
Intelligent Cube based on 605
MDX cube report
linking from 476
merging header cells 726
metric 18
column alias 106
compound 18, 84
conditional. See also conditionalmetric. 58
contribution 20
count 98
creating multiple simultaneously 87
creating, using Advanced MetricAssistant 87
default subtotal function 90
dimensionality. See level. 19
division by zero 701
© 2017, MicroStrategy Inc. 768
Advanced Reporting Guide
formula 18
formula join type 86
function plug-in 103
integer constant in 700
inventory 26
join 104
join default 105
join type 86, 105, 700
level. See also level metric. 19
nested 55
nonaggregatable 26
null checking 700
predictive 627
predictive input 631
prompted 58
simple 18
smart 85
sorting hierarchically 249
subtotal dimensionality 701
subtotals 89, 242
total subtotal function 90
transformation. See alsotransformation metric. 80
type 18
VLDB properties 106, 699
zero checking 701
metric-based predictive inputmetric 635
metric-to-metric comparison 128
Metric Editor
condition 61
level 21
metric join type 104
Subtotals/Aggregation tab 90
transformation 83
metric filter
conditional metric and 63
report filter and 63
metric formatting
defining a graph color 362
metric headers 271
metric level 271
metric values 271
metrics label 271
Metric Formula Join Type dialogbox 86
metric join type 700
metric level. See level metric. 19
metric qualification 110, 234
advanced options 129
example 235
in relationship qualificationfilter 138
merging attribute qualifications 129
metric-to-metric comparison 128
output level 126
prompt 205
prompted 148
resolving in a report 129
metric set qualification. See metricqualification. 110
MicroStrategy Developer
anchor 728
769 © 2017, MicroStrategy Inc.
Advanced Reporting Guide
commands 728, 731
ChangeView 731
Editor 732
Execute 733
ExecuteDocument 733
ExecuteReport 734
Open 734
Reset 735
Shortcut 735
syntax 728
viewing 730
setting the homepage 729
MicroStrategy Mobile
web folder browsing 548
web folder in Multimediawidget 549
MicroStrategy TransactionServices 554
report 554
MicroStrategy Web
browsing and sorting order forprojects 738
configuring graph image formatfor 415
prompt display in 216
moving
average 100
sum 100
multiple-key sorting 249
multiple links 464
MultiSource Option
Freeform SQL report 516
Query Builder report 595
multivariate regression model 642
N
n-tile function 101
example 101
nested aggregation metric 55
nested metric 55
creating 57
non-group function 97
moving average 100
moving sum 100
n-tile 101
rank 97
running average 100
running sum 100
nonaggregatable metric 26
grouping 26
null checking 700
Analytical Engine 701
null value sorting 255
number formatting default 724-725
O
object name delimiter for reportdetails 423
object prompt 206
attribute join type and 285
level prompt vs. 211
object re-use 295
object template 299
default 301
empty 299
making available to users 301
© 2017, MicroStrategy Inc. 770
Advanced Reporting Guide
Object Templates folder 302
user-defined empty 300
viewing folder 302
OLAP function 100
Open command 734
operator 718
comparison 721
filter 718
logical 719
pattern 723
rank and percent 722
optimizing a data mart 618
Oracle SQL hint 713
outer join 105
output level
banding 158
filter 125
metric qualification 126
relating to the filterqualification 126
relationship qualification 125
set qualification 125
overlapping bar graph 323
P
pareto chart 351
best practices 353
example 351
Pass-through expression. See Applyfunction. 140
Pass-through function. See Applyfunction. 140
pattern formatting default 726
pattern operator 723
personal Intelligent Cube 241
pie chart 329
best practices 330
example 329
Plug-In Wizard 103
polar chart 333
best practices 334
example 333
predesigned report
accessing 301
predictive input metric 631
conditional 636
predictive metric 676
aggregating 675
attribute as input 632
conditional metric as input 637
in a document 676
in a report 676
in other objects 676
level metric as input 634
performance 627
predictive model 639
creating 639
importing 671
importing for an MDX cube 673
workflow 658
Predictive Model Viewer 677
prerequisites 12
prerequisites for Advanced ReportingGuide 10
771 © 2017, MicroStrategy Inc.
Advanced Reporting Guide
preserving all final pass resultelements 705
preserving all lookup tableelements 707
priority of a drill path 193
project sorting and browsing order 738
project time line. See gantt chart. 356
prompt 202-203
attribute qualification 205
choose from all attributes in ahierarchy 204
choose from attribute elementlist 205
custom group and 169
custom prompt style forMicroStrategy Web 219
display style for MicroStrategyWeb 216
dynamic date filter and 119
expression properties forMicroStrategy Web 222
filter 147
filter definition 204
Freeform SQL report and 513
function and 204
level 210
link and. See prompt answermethod. 465
metric qualification 205
MicroStrategy Web display 216
object 206
Query Builder report and 590
scheduled report and 203
search object 206
style properties for MicroStrategyWeb 219
system prompt 215
type 204
user login system prompt 215
value 208
prompt answer method for a link 465,467
All valid units 470, 476
example 477
Answer with the same prompt 468,471
example 471
Any other prompts 465, 479
example 480
by prompt type
attribute element prompt 469-470
hierarchy prompt 470, 476
value prompt 469
Current unit 470, 477
example 477
Default answer 469
Dynamically 469
example 462
Empty answer 469, 471
example 472
Prompt user 468
selecting 482
Static element list 470, 473
example 473
MDX cube data and 476
© 2017, MicroStrategy Inc. 772
Advanced Reporting Guide
prompt details 436
configuring 441
example 437
report details preferencesinteraction 440
prompted
custom group 169
filter 147-148
attribute qualification 148
shortcut-to-a-filterqualification 149
shortcut-to-a-reportqualification 149
metric 58
prompts (text), Freeform SQL 741
Public Objects folder 302
Q
qualification
advanced 111
attribute 110
attribute prompt 205
banding 158
filter 110
logical operator 110
metric 110
prompted attribute 148
prompted metric 148
prompted shortcut-to-a-filter 149
prompted shortcut-to-a-report 149
relationship 110
set 110
shortcut-to-a-filter 110
shortcut-to-a-report 110
type 110
qualify on a metric prompt 205
Query Builder 568
creating an Intelligent Cube 605
Freeform SQL and 497
Query Builder report
access control list 595
attribute form 586
column 583
creating 573
from a database 599
from a text file 577, 600
from an Excel file 576, 600
document 572
drilling 594
filter 587
join 579
managed object 601
MultiSource Option 595
prompt 590
security filter 596
security for data access 595
selecting a table 577
shortcut-to-a-reportqualification 595
standard report versus 571
R
R (analytics) integration withMicroStrategy 104
R Integration Pack 104
773 © 2017, MicroStrategy Inc.
Advanced Reporting Guide
radar chart 334
best practices 336
example 335
rank and percent operator 722
rank function 97
RDBMS function 140
re-using an object 295
regression 640
relating the output level and filterqualification 126
relation in a relationship qualificationfilter 139
relationship qualification 110, 137
advanced options 130
applying a qualificationindependently 130
example 138
output level 125
filter relation and 126
relationship table 139
relationship qualification filter. Seerelationship qualification. 137
relationship set qualification. Seerelationship qualification. 110
remember option setting (conditionalmetric) 77
removing related report filter elementsin a metric 67
default 77
embedding method and 69
replace. See find and replace. 276
report 226
attribute headers 276
cache 302
data definition 240
Design View 228
distributing 295, 301
embedded template 296
evaluation order 286
default 287
defining 288
execution flow 240
exporting 303
filter 229-230
adding a filter to a report 150
formatting. See also reportformatting. 258
Intelligent Cube 241
join 104
MicroStrategy TransactionServices 554
object re-use 295
Object Templates folder 302
prerequisites 227
Public Objects folder 302
reducing SQL passes 237
report limit 231
Shared Reports folder 302
shortcut to 237
sorting 249
advanced 249
hierarchical 249
multiple-key 249
SQL optimization 237
subtotals. See also subtotals. 89
Transaction Services 554
© 2017, MicroStrategy Inc. 774
Advanced Reporting Guide
validating changes to a template 298
view definition 240
VLDB properties 703
web service data 542
report as filter. See shortcut-to-a-reportqualification. 110
report border formatting 272
report cache invalidated with find andreplace 276
report creation 227
Report Data Options
attribute join type 280
evaluation order 180, 288
metric join type 104
report limit 231
report description in the reportdetails 425
report design 227
multiple simultaneously 227
report details 419
configuring 427
disabling 421
displaying 420
enabling 421
example 425
filter details 442
hiding 420
level of configuration 421
document 421
order of precedence 421
project level 421
report level 421
text field 421
object name delimiter 423
prompt details 436
report description 425
report details preferences and 422,427
template details 428
types 423
Report Details pane 419
example 419
report details preferences 457
customizing 459
disabling 422
enabling 459
example 458
filter details interaction 443
prompt details interaction 440
report details interaction 422, 427
template details interaction 433
report filter
conditional metric and 63
custom group and 169
drilling and 190
removing related elements of 67
report limit and 231, 233
report formatting
autostyle 275
autostyle default 724
axis layer 271
banding layer 271
column subtotal layer 271
consolidation layer 272
775 © 2017, MicroStrategy Inc.
Advanced Reporting Guide
custom 259
custom group layer 272
default values 724
formatting layers 265
order of 269
grid unit 266
grid unit layer 271
metric header layer 271
metric layer 271
metric value layer 271
metrics label layer 271
report border layer 272
report metric layer 271
row subtotal layer 272
subtotal 267
threshold 268
threshold layer 272
zone 266
report level 19, 35
removing 36
report limit
report filter and 233
report filter versus 231
report object prompt filter 149
report post statement 709
report pre statement 709
report qualification. See shortcut-to-a-report qualification. 110
Reset command 735
resetting a metric qualificationfilter 127
resizing a graph 403
REST architecture 524
row subtotal formatting layer 272
running
average 100
sum 100
S
saving a report with a shortcut to astand-alone filter 151, 297
scaling a graph 400, 404
scatter graph. See scatter plot. 331
scatter plot 331
best practices 332
example 331
scheduled report containing aprompt 203
scheduling bulk exports 303
scope of analysis. See IntelligentCube. 302
search object 206
searching for dependents 295
seasonal regression example 678
security
Freeform SQL report 520
Query Builder report 595
XQuery statement 529
security filter 521
creating 522
Freeform SQL and 521
in a level metric 41
Query Builder report and 596
segmentation 101
selector, controlling a graph with 308
© 2017, MicroStrategy Inc. 776
Advanced Reporting Guide
series 315
graph 315
specifying the number of 317
set qualification 110
attribute level 125
metric qualification 110
output level 125
relationship qualification 110
Shared Reports folder 302
shortcut
to a filter 149
saving a report with 151, 297
to a report 237
to a template 296
validating changes 298
shortcut-to-a-filter qualification 110
advanced options 129
merging attribute qualifications 129
prompted 149
resolving in a report 129
shortcut-to-a-report qualification 110
example 237
Freeform SQL reports 516
prompted 149
Query Builder report 595
Shortcut command 735
simple metric 18
sizing a graph 400
smart metric 85
smart subtotals 86
SOAP protocol 524
sorting 249
advanced 249
attribute form 252
character sort order 737
custom group 166, 168
default order 249
hierarchical 249
multiple-key 249
multiple attribute forms 252
null values 255
project order in Developer andWeb 738
standards in MicroStrategy 737
source of a link 464
source table 613
SQL
common table expression 501
creating a Transaction Servicesreport 554
customization 568
date formatting 717
derived table 501
Freeform SQL report 498
in a document 502
standard report versus 501
hint 713
maximum size 717
metric alias 106
multi-pass SQL 500
passes, reducing in a report 237
query syntax 499
report post statement 709
777 © 2017, MicroStrategy Inc.
Advanced Reporting Guide
report pre statement 709
support 500
table post statement 709
VLDB property 698
stock graph 340
best practices 342
example 341
string manipulation 134
using a custom expression 134
sub query type 710
Subtotal Editor 91
subtotal function 90
subtotals 89, 242
across a level 242
example 244
advanced 242
applied level option 242
by position 242
example 243
column subtotals formattinglayer 271
consolidation 181
custom 246
custom group 165
dimensional 91
Dimensionality Aware VLDBproperty 702
function
default 90
multiple 91
nested 91
predefined 90
standard subtotal 90
group by 243
example 245
memory usage and 248
metric dimensionality 702
metric in the formula 91
report 242
row subtotals formatting layer 272
smart 86
tasks. See subtotals - tasks. 17
user-defined 91
weighted 94
subtotals - tasks
creating 91-92
disabling 97
displaying on a report 89, 244
formatting 267
sum
moving 100
running 100
system hierarchy drill path 190
system prompt 215
user login 215
T
table
importing 578
selecting in a Query Builderreport 577
VLDB properties
Cartesian join 704
option 715
© 2017, MicroStrategy Inc. 778
Advanced Reporting Guide
post statement 709
space 715
target of a link 465
template 299
embedded 296
empty object 299
object 299
shortcut to 296
validating changes to 298
Template Dependency Validator 298
template details 428
base report 429
example 429
base template name 430
example 431
configuring 428, 435
report details preferencesinteraction 433
view report 429
example 429
temporary table
dropping 714
intermediate table type 714
text file, exporting a report to 303
third-party web service, connectingto 524
threshold 268
formatting 268, 272
graph report 369
time series analysis 81, 650
title, formatting in a graph 377
tooltip for a graph 397
totals 242
disabling 97
formatting 267
metric 89
overview 242
report 242
smart 86
user-defined subtotals 91
training metric 659
dependent metric 665
exponential regression 661
independent metric 665
linear regression 661
output model 668
segmentation metric 665
tree level metric 665
Training Metric Wizard 640, 660
training the model 659
Transaction Services. See MicroStrategyTransaction Services. 554
transformation 80
transformation metric 80
creating 83
Advanced Metric Assistant 87
multiple transformations 84
year-to-date 82
transparency on a graph object 308
U
union multiple insert 713
univariate regression model 642
updating data with MicroStrategy
779 © 2017, MicroStrategy Inc.
Advanced Reporting Guide
Transaction Services 554
user-defined empty objecttemplate 300
user-defined function. See customfunction. 103
user-defined subtotals 91
creating 92
example 92, 94
user audience 10
user input with a prompted filter 147
user login system prompt 215
using MicroStrategy Web 395
V
validating changes to a template 298
value prompt 208
link and 469
variable for a graph title 376
variance 81
view definition 240
evaluation order 288
Intelligent Cube 241
object 241
virtual attribute (consolidation) 175
VLDB property 698
accessing
advanced report VLDBproperties 704
database instance VLDBproperties 716
metric VLDB properties 700
report VLDB properties 704
Attribute Form Selection Option forIntermediate Passes 711
Attribute Selection Option forIntermediate Passes 711
Cartesian Join Warning 704
database instance level 716
default inherited value 699
Drop Temp Table Method 714
Fallback Table Type 714
Full Outer Join Support 705
Group by ID Attribute 712
Group by Non-ID Attribute 713
hierarchy of 698
Integer Constant in Metric 700
Intermediate Table Type 714
Maximum SQL Size 717
metric level 699
Null Check 700
Null Checking for AnalyticalEngine 701
order of precedence 698
Preserve All Final Pass ResultElements 705
Preserve All Lookup TableElement 707
report level 703
Report Post Statement 709
Report Pre Statement 709
SQL Date Format 717
SQL Hint 713
Sub Query Type 710
Subtotal Dimensionality Aware 702
Table Option 715
Table Post Statement 709
Table Space 715
© 2017, MicroStrategy Inc. 780
Advanced Reporting Guide
Union Multiple Insert 713
Where Clause Driving Table 710
Zero Check 701
W
web service
as a data source 524
connecting MicroStrategy to 526
creating a report 542
security in an XQuerystatement 529
XQuery for data retrieval from 527
Web Services Security (WS-Security) foran XQuery statement 530
weighted subtotals 94
Where Clause Driving Table VLDBproperty 710
widget 418
write-back. See MicroStrategyTransaction Services. 554
WS-Security. See Web ServicesSecurity. 530
X
xQuery
retrieving web folder resources 545
supporting filtering fordocuments 544
XQuery 524
creating a Transaction Servicesreport 554
retrieving data from a webservice 527
security 529
Z
zero checking 701
zone formatting 266
subtotals 267
781 © 2017, MicroStrategy Inc.


