Embed Size (px)
Citation preview

Adoption of Mobile Devices/Services – Searching for Answers with the UTAUT
*Christer Carlsson, *Joanna Carlsson, **Kaarina Hyvönen,
***Jussi Puhakainen, *Pirkko Walden *Institute for Advanced Management Systems Research, Åbo Akademi,Finland
**National Consumer Research Centre, Finland ***Turku School for Economics and Business Administration, Finland
*{christer.carlsson; joanna.carlsson; pirkko.walden}@abo.fi **[email protected]
Abstract
The future of mobile telephony is expected to rely on mobile services and the use of mobile services will be an integral part of the revenues to be generated by third generation mobile telephony. The adoption of new mobile services contradicts this proposition as it has been much slower than expected, especially in Europe. Basic services such as SMS, ring tones, icons and logos are still the most popular services. Several reasons have been suggested for the slow adoption rate, ranging from cultural to business models. In this paper we are searching for answers to the adoption rates by testing the applicability of the Unified Theory of Acceptance and Use of Technology (UTAUT) to explain the acceptance of mobile devices/services. Based on our empirical evidence from a survey con-ducted in Finland, it seems that the UTAUT to some extent and with some reservations can be used as a starting point to find some explanations for the adop-tion of mobile devices/services.
.
1. Introduction
The commercialization of mobile services is ap-proaching a critical stage in Europe. Industry esti-mates are daunting, especially in the long term [13].The development of mobile services – or mobile commerce or mobile Internet – has been intense for years but adoption has not progressed as expected. We are witnessing a classical supply and demand mismatch, especially in the European markets. Japan and Korea have typically been considered forerunners in adoption rates of mobile services but even there, rather basic services such as messaging and ring tones
(or e-mail in Japan) have been most successful [7, 24, 12]. Such services have during recent years been popular also in Europe [3, 16], but more advanced services have not yet found their ways into the every-day lives of consumers. This is a challenging situation for the industry and researchers alike, since the holy grail of adoption and use is missing.
Europe is gaining much attention due to third gen-eration mobile telephony (3G), which is expected to take off commercially in 2005-6. Initially 3G was limited mostly to Hutchison's networks in various countries but this is changing rapidly as more conven-tional mobile operators are launching their networks. From the perspective of service development, this is a significant step as 3G has been planned to be the basis of new business growth and to generate new revenues from services. Multimedia and web browsing are ex-amples of new services attributed to 3G [27, 19].
Although many promising new services have been attributed to 3G [21, 27], they have in fact already reached mature stages. Even services, which rely on graphical browsing or multimedia messaging, have approached basic availability for regular users. Fur-thermore, most service types have been available for users already for a number of years. Information ser-vices, ticketing and different forms of entertainment are examples of service types which can be used over a number of mobile technologies, including SMS (Short Message Service, e.g. text messaging). Studies of the mobile Internet tend to neglect this because they do not consider SMS to be an Internet technol-ogy [cf. 11, 7].
The basic challenge is to understand how and why people adopt or do not adopt mobile services. Tech-nology development is often seen as the key in ser-
Proceedings of the 39th Hawaii International Conference on System Sciences - 2006
10-7695-2507-5/06/$20.00 (C) 2006 IEEE

vice adoption, but as Anckar & D’Incau [2] pointed out, more is needed. Sarker and Wells [23] showed that there is missing a clear understanding of the mo-tivations and circumstances which guide consumers to adopt and use mobile devices. As they realize that there cannot be any business applications unless there is [cf. 23, p. 36] “widespread proliferation of wireless devices and related applications, there is a clear need to comprehend how and why individuals (potential m-commerce consumers) adopt such devices”. Knutsen [13] illustrates that even if research on culture, infra-structure, inter-firm collaboration and business mod-els may shed light on the phenomenon; the basic re-curring theme suggested for further research is the value of services for the user. In a recent study (cf. [3]), we actually found out that there is a significant link between the mobile technology used and the mo-bile services either being used or being tested. This indicates that part of the value the user perceives may be a function of the technology used, which again may support a proposal that the more advanced the technology the easier it may be to use. It is, of course, self-evident that mobile services are not possible in practice without mobile technology but there is an interesting symbiosis between technology and ser-vices: (i) assume that the technology gets accepted, (ii) the acceptance is supported by the availability of services, but (iii) mobile services may not be accepted despite the availability of technology. This material will be reported in a forthcoming paper.
In this paper the main focus is to test the Unified Theory of Acceptance and Use of Technology (UTAUT) (cf. [30]). Technology acceptance models originate from organizational contexts and it is ques-tionable if they should be used in non-organizational circumstances [see 30]. We will here make an at-tempt to see which if any of the constructs will ex-plain the acceptance of mobile devices/services.
We begin by presenting mobile technology and mobile services, after which we (in section 3) will work through the research model and our hypotheses, in section 4 we present the data collection and the data analysis, section 5 summarizes the results and section 6 gives some conclusions.
2. Mobile technology and mobile services
There has been a lack of common standards since the early days of mobile communications. Europe and North America took divergent approaches in manag-ing the spectrum for wireless voice and data services. This was especially visible in the 2G and post-2G markets ([8, 25]). While the European approach to 2G (GSM) was to put one’s faith in mandated standards developed by the EU, the American approach, which
created several standards (CDMA/IS-95, GSM, TDMA, iDEN) relied on letting the market determine the standards [8]. The third way, applied by the Japa-nese, was to trust in their own proprietary standard called PDC ([8, 25]).
Basic services evolved along and after the fore-mentioned standards. A good example is SMS, which became surprisingly popular after 1995 as users began sending messages to each other (which was actually not the planned function, since SMS was meant as a pager). Later, SMS became a major platform for a wide range of services that reach an extensive clien-tele, but are - compared to more advanced applica-tions - cumbersome to use as they require typing and the memorizing of service numbers.
The Wireless Application Protocol (WAP) was in-troduced to enhance usability and availability. WAP was meant to bring the Internet and its services into mobile phones. The first devices and services were introduced with great expectations at the end of 1999, but very quickly WAP turned out to be a major disap-pointment. Services offered were fairly undeveloped, and neither the majority of the mobile service users [6] nor the Internet community were particularly will-ing to try them [26]. Nevertheless, from the perspec-tive of service development, WAP was a big step for-ward as it made Internet browsing possible on mobile phones. The Japanese i-MODE was, and still is, a big success in Japan [25]. Then it is rather surprising that the introduction of i-Mode in UK, Germany and The Netherlands has been very slow and that it will probably not become an alternative to WAP, GPRS and UMTS.
General Packet Radio Service (GPRS) is an en-hancement to the GSM network and is often referred to as 2.5G. GPRS made packet based data transfer possible, which is an important service provision; users do not need to stay connected all the time to use services and they only pay for downloaded data in-stead of connection time. Overall, GPRS is faster and cheaper to use than circuit data over GSM. The En-hanced Data for Global Evolution (EDGE) comple-ments the packet based data transfer. EDGE is similar to GPRS but three times more efficient; nevertheless it is significantly less widespread among users.
A number of technological advances took place alongside the introduction of GPRS in Europe. For example, colour screens, cameras and Multimedia Messaging Service (MMS) became available. Such features were first pioneered in high-end smart phones, which operated with the Symbian OS that supports third party services. Java became more ma-ture, which lead to the birth of a market for downloadable applications, in particular for games.
Proceedings of the 39th Hawaii International Conference on System Sciences - 2006
2

Even streaming video to mobile phones became func-tional [20].
At the moment we are moving into the 3G stan-dard, which is a generic term that describes the next generation of mobile communication. The significant contributions by 3G are high speed communication and multimedia data services. The standard supports a concurrent use of multiple services and bridges the gap between mobile phones and computing [9, 27]. Two main standards have been proposed and are cur-rently in use. These are UMTS (or WCDMA) and CDMA2000; the former is a European standard (cur-rently, commercial UMTS has been deployed in 17 European countries and 12 countries elsewhere with the majority of deployments taking place in 2004 [cf. 28]) and the latter is preferred in the USA and certain parts of Asia, such as Korea. Both standards are available in Japan [8], and to make things more inter-esting, the Chinese have their own standard, called TD-SCDMA [15].
In these “standard wars” there is no clear answer to the question of which approach (mandated or market-driven) is the best one. GSM clearly is a triumph for the mandated approach, but the market-driven stan-dards have worked for the Americans in the case of high definition television (HDTV) and for the Japa-nese in the 3G-markets [25, 8].
Most technologies and markets grow in tandem, and it is important to realise that the development of the mobile markets will be evolutionary, i.e. new products and services will have a backbone and a ba-sis in the existing products and services. Recent his-tory shows that a number of applications, which were first introduced in the GSM networks and then dis-carded because they were slow and cumbersome, have now reappeared in the GPRS networks and are gaining acceptance. The WAP was a failure in the GSM era, but is obtaining increasing approval in the GPRS networks. News, information and entertain-ment services that were built as WAP applications are now gaining more acceptance.
From a historical point of view, third generation mobile telephony seems more evolutionary than revo-lutionary [17]. Much of the infrastructure needed for service provision had already been developed and turned commercial before 3G. Urbaczewski et al. [29] state that in 1998 m-commerce was full of promise that turned to optimism driven by WAP, SMS and (then) a coming UMTS. Optimism was converted to hype due to the build up by market analysts such as IDC. Then, something happened [cf. 29, p. 32]: “…not nearly enough people stepped up to use these services; carriers went bankrupt, device manufactur-ers endured extreme financial hardship …”
Vesa [31] illustrates the current era by using tech-nology and user-centric approaches as polar ends. The technology-centric (WAP, Digi-TV, 3G) approach relies on investments in technology and marketing, not in the service or user needs. The user-centric ap-proach (WiFi,WLan, Internet, SMS) focuses upon the number of users as the growth source. Naturally, nei-ther is optimal, but the former approach and its short-comings may explain why the service adoption has been slow. Also, there is even the real possibility that in the near future the user-centric technologies (WiFi, WLan) will change the mobile service markets by offering access to the services and thus bypassing operators ([4, 14]).
In summary, advances in mobile technology are enablers for mobile services. We could expect that the emergence of these advances will drive both the mate-rialization and the acceptance of new and/or enhanced mobile services. As we found out in our earlier study (cf. [3]), the conservatism of consumers should not be underestimated. Many users of advanced mobile phones appear to stick to their old mobile services and user habits, meaning that they continue to use the ser-vices they once learned to use with their GSM phones.
3. Research model and hypotheses
We approach the adoption of mobile services from the perspective of technology acceptance. This ap-proach has previously been used in a number of stud-ies on mobile services [13, 3, 1, 19, 26, 22, and 10, for example]. The technology acceptance models have typically not been tested in the studies but have been used as conceptual tools to identify central is-sues. We shall do the same.
Of the acceptance models, the Technology Accep-tance Model (TAM) is best known [5] and is repeat-edly used in studies which focus on users. In studies on the adoption of mobile services, results have fairly well complied with central factors in the TAM: per-ceived ease of use and perceived usefulness [19, 26], the latter study, however, focused on mobile phones. In a previous study [3] we have shown that there are good reasons to make a distinction between the accep-tance of mobile phones (and the technology they rep-resent) and mobile services. A number of modifica-tions and changes to the original TAM model have been made. The most prominent of these is the Uni-fied Theory of Acceptance and Use of Technology (UTAUT). The unified model is based on studies of eight prominent models in IS adoption research. The model has been empirically examined and found to outperform the eight individual models, including the TAM model.
Proceedings of the 39th Hawaii International Conference on System Sciences - 2006
3

UTAUT states that there are three direct determi-nants of intention to use (performance expectancy, effort expectancy and social influence) and two direct determinants of usage behaviour (intention and facili-tating conditions) [30]. Attitudes toward using tech-nology, self-efficacy, and anxiety are theorized not to be direct determinants of intention. UTAUT includes four moderators (i.e. age, gender, experience and vol-untariness of use), which contribute to a better under-standing of the complexity of technology acceptance by individuals. It should be pointed out that both the TAM and the UTAUT describe and explain the or-ganizational acceptance of a technology; in the previ-ous study [3] we pointed out that the setting for mo-bile devices/services is different: the acceptance is on an individual level and the context is mass use of a technology/service. Despite these reservations we will try out the UTAUT on our material in order to find out how useful the theory can be, but it is clear that we will have to return to this issue in some forthcom-ing research and probably modify the UTAUT to some extent.
The effects of performance expectancy (PE), effort expectancy (EE), social influence (SI), facilitating conditions (FC), mobile device/service anxiety (ANX), and attitude towards mobile device/services (ATT) on behavioural intention (BI) and on the use of mobile services (UB) are examined. The impacts of moderators in the UTAUT by Venkatesh et al. will not be included in this test. The set of hypotheses is modified (cf. [30]) to fit our context of mobile de-vices/services. Therefore, the expected relationships for direct effects are:
H1: Performance expectancy has an influence on behavioural intention.
H2: Effort expectancy has an influence on behav-ioural intention.
H3: Social influence has an influence on behav-ioural intention.
H4a: Facilitating conditions will not have an influ-ence on behavioural intention.
H4b: Facilitating conditions have an influence on usage.
H5: Mobile device/service anxiety will not have an influence on behavioural intention.
H6: Attitudes towards mobile devices/services will not have an influence on behavioural intention.
H7: Behavioural intention will have a positive in-fluence on usage. 4. Research method 4.1. Data collection
In June 2004 we carried out an empirical study among 300 Finnish consumers residing on the Åland islands. Respondents were selected by the Finnish Population Register Centre and random sampling was used. The study is a part of larger, ongoing longitudi-nal series of studies, which have been carried out yearly since 2002.
A questionnaire was distributed to all subjects by regular mail and in order to ensure a high return rate, the respondents had a possibility to participate in a drawing of a new MMS capable phone. Out of 300 consumers, 157 took part in the survey accumulating a response rate of 52.3%.
The gender distribution of the study subjects was 56.1% females and 43.9% males, respectively. Re-spondents between the ages of 51-64 formed the larg-est age group (34.4%) followed by the 36-50 -year olds (29.3%). 86.6% of the survey participants had at least one mobile device in use. At one polar end the device supported only basic GSM technology (29.2%) and at the other end it supported MMS (Multimedia Messaging) (19.7%). 30.7% of the participants had an annual income of 20-30’000 € (before taxes). When comparing these figures against the whole population of Finland, the age percentages were very close to the total population. Women were slightly overrepre-sented. The capabilities of the mobile phones have changed markedly since the surveys we conducted in 2002-2003.
4.2. Data analysis
The central constructs of the UTAUT (PE, EE, SI, FC, ANX, ATT, BI), excluding the use of mobile services (UB), were formed by using factor analysis (principal component factor analysis, varimax-rotation) to identify components with similar content, which then were represented by summated scale vari-ables. The statements in the questionnaire used were based on some previously conducted tests of the UTAUT as well as on research relating to the adop-tion and use of technology and mobile services [3, 30]. The variables were measured with 5-point scales for all model components (which differed from the 7-point scales in the original UTAUT; a 5-point scale proved to be more robust for the type of survey we carried out), in which 1 equalled the negative end (fully disagree) and 5 the positive end of the scale (fully agree).
The internal consistency reliabilities of the sum-mated scale variables were tested with Cronbach’s Alpha coefficient ( ), that should not, according to recommendations, be below 0.70 [18]. The items with insufficient loadings were not included in the sum-mated scale variables in order to increase consistency
Proceedings of the 39th Hawaii International Conference on System Sciences - 2006
4

and thus reliability. However, in some cases (e.g. ef-fort expectancy) all the items describing the construct were included in the summated scale variable though alpha did not exceed the 0.70 threshold; the content of the statements were considered valuable [cf. 30].
The final construct of performance expectancy consisted of 11 items ( = .75), effort expectancy of eight items ( =.64), social influence of four items ( = .62), facilitating conditions of 12 items ( =.82), anxiety of two items ( = .62), attitude of three items ( = .76) and behavioural intention of four items ( = .78). The items selected describing the constructs are presented in Appendix 1.
While studying the use of mobile services, a 5-point scale was used, where 1 equalled to “never used” and 5 to “use daily”. For the purpose of further analysis, the use of mobile services (MMS, search services and ring tones) was coded as a dummy vari-able (use as 1 and never used as 0). Figure 1 shows the percentages of usage of MMS, search services and ring tones among respondents.
Do you use - mservice?
51,5 % 51,8 %
8 4 ,6 %
4 8 ,5 % 4 8 ,2 %
15,4 %0,0 %
20,0 %
40,0 %
60,0 %
80,0 %
100,0 %
M M S ( n=13 6 ) Search services( n=13 6 )
R ing t o nes( n=13 7)
Using the mservice (" 2-5" on a 5-point scale) Not using the mservice
Figure 1. Percentage of respondents us-ing/not using a mobile service
The relationships between the various constructs in
the UTAUT were examined by using regression analysis. Interactions between independent variables (PE, EE, SI, FC, ANX, and ATT) as well as associa-tions between independent variables and intention to use mobile devices/services (BI) were studied by ap-plying linear regression analysis. In order to study which independent variables (PE, EE, SI, FC, ANX ATT, and BI) show a relationship with the use of mo-bile services, we used logistic regression models that are suitable for analyses with a dummy dependent variable. The models were used to find out whether independent variables have a direct effect on depend-ent variables. First we analyzed the unadjusted ef-fects, i.e. crude effects (meaning that there was only one independent variable in the model) and then the adjusted effects of variables (by adding other inde-pendent variables into the model). In other words, we analyzed the regression coefficients and odds ratios of
determination and their possible changes in various models. 5. Results
Testing the UTAUT in the mobile device/service environment concentrated on the one hand on exam-ining the factors affecting the intention to use mobile devices/services and on the other hand on factors af-fecting the use of mobile devices/services. At first, the relationships between the six independent variables of the model (PE, EE, SI, FC, ANX, and ATT) and in-tention to use mobile devices/services (BI) were stud-ied. The results obtained by linear regression analysis are presented in table 1. Table 1. Effects of independent variables on behavioural intention (BI) based on linear re-
gression models
Independent variables in the model, dependent variable BI
Coefficient p-value
Performance expectancy
PE PE, EE PE, SI PE, FC PE, ANX PE, ATT PE, EE, SI, FC, ANX PE, EE, SI, FC, ANX, ATT
0.782*** 0.621*** 0.686*** 0.848*** 0.748*** 0.415*** 0.557*** 0.329**
.000
.000
.000
.000
.000
.000
.000
.006
Effort expectancy EE EE, PE EE, SI EE, FC EE, ANX EE, ATT EE, PE, SI, FC, ANX EE, PE, SI, FC, ANX, ATT
0.619*** 0.621*** 0.516*** 0.661*** 0.593*** 0.301** 0.355** 0.206*
.000
.000
.000
.000
.000
.003
.005
.050
Social influence SI SI, PE SI, EE SI, FC SI, ANX SI, ATT SI, PE, EE, FC, ANX SI, PE, EE, FC, ANX, ATT
0.178*** 0,069 0.122** 0.209*** 0.161*** 0.041 0.094* 0.000
.000
.117
.004
.000
.000
.251
.036
.996
Facilitating conditions FC FC, PE FC, EE FC, SI, FC, ANX FC, ATT FC, PE, EE FC, PE, EE, SI FC, PE, EE, SI, ANX FC, PE, EE, SI, ANX, ATT
0.035 -0.171 -0.096 -0.176 -0.008 0.016 -0,206* -0,274** -0.279** -0.123
.741
.074
.334
.109
.938
.833 ,028 ,005 .005 .142
Anxiety ANX ANX, PE
0,199** 0.064
.010
.365
Proceedings of the 39th Hawaii International Conference on System Sciences - 2006
5
ANX, EE ANX, SI ANX, FC ANX, ATT ANX, PE, EE, SI, FC FC, PE, EE, SI, ANX, ATT
0.144* 0.143 0.200** 0.160** 0.066 0.103
.043
.053
.010
.004
.326
.066
Attitudes ATT ATT, PE ATT, EE ATT, SI ATT, FC ATT, ANX ATT, PE, EE, SI, FC ATT, PE, EE, SI, FC, ANX
0.580*** 0.483*** 0.523*** 0.522*** 0.579*** 0.570*** 0.449*** 0.459***
.000
.000
.000
.000
.000
.000
.000
.000
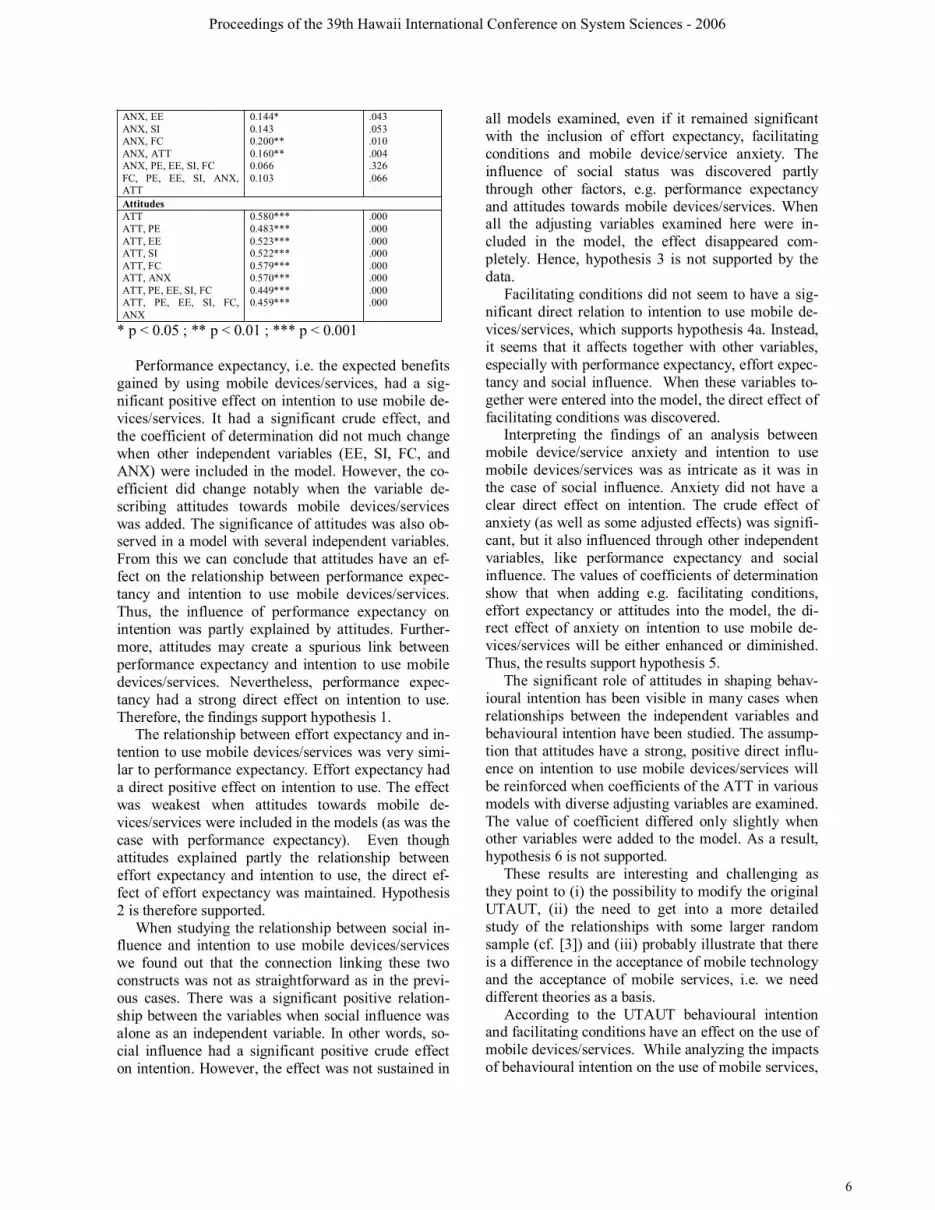
* p < 0.05 ; ** p < 0.01 ; *** p < 0.001
Performance expectancy, i.e. the expected benefits gained by using mobile devices/services, had a sig-nificant positive effect on intention to use mobile de-vices/services. It had a significant crude effect, and the coefficient of determination did not much change when other independent variables (EE, SI, FC, and ANX) were included in the model. However, the co-efficient did change notably when the variable de-scribing attitudes towards mobile devices/services was added. The significance of attitudes was also ob-served in a model with several independent variables. From this we can conclude that attitudes have an ef-fect on the relationship between performance expec-tancy and intention to use mobile devices/services. Thus, the influence of performance expectancy on intention was partly explained by attitudes. Further-more, attitudes may create a spurious link between performance expectancy and intention to use mobile devices/services. Nevertheless, performance expec-tancy had a strong direct effect on intention to use. Therefore, the findings support hypothesis 1.
The relationship between effort expectancy and in-tention to use mobile devices/services was very simi-lar to performance expectancy. Effort expectancy had a direct positive effect on intention to use. The effect was weakest when attitudes towards mobile de-vices/services were included in the models (as was the case with performance expectancy). Even though attitudes explained partly the relationship between effort expectancy and intention to use, the direct ef-fect of effort expectancy was maintained. Hypothesis 2 is therefore supported.
When studying the relationship between social in-fluence and intention to use mobile devices/services we found out that the connection linking these two constructs was not as straightforward as in the previ-ous cases. There was a significant positive relation-ship between the variables when social influence was alone as an independent variable. In other words, so-cial influence had a significant positive crude effect on intention. However, the effect was not sustained in
all models examined, even if it remained significant with the inclusion of effort expectancy, facilitating conditions and mobile device/service anxiety. The influence of social status was discovered partly through other factors, e.g. performance expectancy and attitudes towards mobile devices/services. When all the adjusting variables examined here were in-cluded in the model, the effect disappeared com-pletely. Hence, hypothesis 3 is not supported by the data.
Facilitating conditions did not seem to have a sig-nificant direct relation to intention to use mobile de-vices/services, which supports hypothesis 4a. Instead, it seems that it affects together with other variables, especially with performance expectancy, effort expec-tancy and social influence. When these variables to-gether were entered into the model, the direct effect of facilitating conditions was discovered.
Interpreting the findings of an analysis between mobile device/service anxiety and intention to use mobile devices/services was as intricate as it was in the case of social influence. Anxiety did not have a clear direct effect on intention. The crude effect of anxiety (as well as some adjusted effects) was signifi-cant, but it also influenced through other independent variables, like performance expectancy and social influence. The values of coefficients of determination show that when adding e.g. facilitating conditions, effort expectancy or attitudes into the model, the di-rect effect of anxiety on intention to use mobile de-vices/services will be either enhanced or diminished. Thus, the results support hypothesis 5.
The significant role of attitudes in shaping behav-ioural intention has been visible in many cases when relationships between the independent variables and behavioural intention have been studied. The assump-tion that attitudes have a strong, positive direct influ-ence on intention to use mobile devices/services will be reinforced when coefficients of the ATT in various models with diverse adjusting variables are examined. The value of coefficient differed only slightly when other variables were added to the model. As a result, hypothesis 6 is not supported.
These results are interesting and challenging as they point to (i) the possibility to modify the original UTAUT, (ii) the need to get into a more detailed study of the relationships with some larger random sample (cf. [3]) and (iii) probably illustrate that there is a difference in the acceptance of mobile technology and the acceptance of mobile services, i.e. we need different theories as a basis.
According to the UTAUT behavioural intention and facilitating conditions have an effect on the use of mobile devices/services. While analyzing the impacts of behavioural intention on the use of mobile services,
Proceedings of the 39th Hawaii International Conference on System Sciences - 2006
6

we also studied whether the possible individual de-terminants of behavioural intention (PE, EE, SI, ANX, ATT, and FC) had some effect other than through BI. Three different kinds of mobile services were selected as study subjects: MMS, search services and ring tones. The results of a logistic regression analyses on the effect of independent variables on the use of mobile services are presented in Tables 2, 3 and 4.
Table 2. The role of behavioural intention (BI)
as a determinant of use of mobile services based on logistic regression models
Odds ratios Independent
variables in the model
dependent: MMS
dependent: search services
dependent: ring tones
BI 1.921** 2.295*** 2.297*** BI, PE 1.981* 1.730* 1.765* BI, EE 2.038* 1.913** 2.044** BI, SI 1.804* 2.000** 2.023** BI, ANX 1.870* 2.149*** 2.209*** BI, ATT 1.346 1.606 1.601 BI, FC 1.918* 2.269*** 2.275*** BI, FC, ANX 1.870* 2.149*** 2.200*** BI, SI, FC, ANX 1.759* 1.857* 1.836* BI, PE, EE, ATT 1.452 1.177 1.247 BI, PE, EE, SI, FC, ANX
1.986* 1.342 1.359
BI, PE, EE, SI, FC, ANX, ATT
1.427 1.048 1.082
* p < 0.05; ** p < 0.01; *** p < 0.001
Behavioural intention (BI), i.e. intention to use mobile devices/services had a significant positive influence on the use of studied mobile services: MMS, search services and ring tones (Table 2). When intention to use was reinforced, an augmentation in use of mobile services could be observed. Hence, the data analysis substantiates the relationship in hy-pothesis 7. The significant relationship between inten-tion to use and actual use of mobile services occurred not only in the case of the crude effect but also when the model was adjusted for other variables such as PE, EE, SI, ANX, and FC or for many combinations of these. Exceptions were formed by models, in which attitudes towards mobile devices/services were added; the strong direct effect of attitudes on intention was clearly visible in these models.
The direct effect of BI disappeared whether the model contained solely attitudes or the variables of PE, EE and ATT together or all the examined inde-pendent variables jointly. In some of the cases of search services and ring tones, the influence was nearly removed altogether. This shows that these variables form a central part of the influence of be-havioural intention on the use of mobile services. In the case of search services and ring tones, the signifi-cant relationship was missing too when independent
variables, excluding attitudes, were added to the model.
Odd ratios remained nearly the same in all models concerning MMS services (with the exception of models containing attitudes), but varied considerably regarding search services and ring tones. A partial explanation for the differences may be that MMS is not available on all phones but that search services and ring tones are; another partial reason may be that the services are quite different in functionality. The actual number of MMS users was much less (15.4%) than the users of search services (51.5%) and ring tones (51.8%) (cf. Figure 1.).
Table 3 shows, that in all occurrences studied, in-corporating BI into the models will diminish the ef-fects of independent variables (PE, EE, SI, ANX, ATT and FC) on the use of mobile services with one exception, i.e. when facilitating conditions is the in-dependent variable of ring tones. Thus, the assump-tion that PE, EE, SI, ANX and ATT are affecting through behavioural intention, is partly correct. When compared to MMS, search services and ring tones were influenced by the fore-mentioned independent variables to lesser extent through behavioural inten-tion. In other words, independent variables had also more “external” effect to the use. The odd ratios of search services and ring tones were higher than the ones of MMS services, hence the dissimilarity of re-sults. This supports the partial explanation we offered for the differences, but the observation is interesting and merits further study with some other type of re-search design. Therefore, the results do not entirely support hypothesis 7.
Table 3. Effects of independent variables on use of mobile services based on logistic re-
gression models
Odds ratios Inde-pen-dent vari-ables
dependent: MMS dependent: search services
dependent: ring tones
Crude Adjusted
for BI Crude Adjusted
for BI Crude Adjusted
for BI PE 1.595 0.916 3.880*** 2.635* 3.047*** 2.431* EE 1.326 0.816 3.328*** 2.330* 2.147* 1.659 SI 1.215 1.098 1.421** 1.280* 1.386** 1.247 ANX 1.271 1.122 1.430* 1.264 1.272 1.111 ATT 1.926** 1.585 2.031*** 1.582 2.035*** 1.593 FC 1.042 1.025 1.100 1.043 0.788 0.790
* p < 0.05 ; ** p < 0.01 ; *** p < 0.001
As opposed to hypothesis 4b, facilitating condi-tions did not have a direct influence on the use of the respective mobile services (cf. Tables 3 and 4). Nei-ther did it have an effect on the use of mobile services through behavioural intention.
Proceedings of the 39th Hawaii International Conference on System Sciences - 2006
7

Table 4. Facilitating conditions (FC) as a de-terminant of use of mobile services based on
logistic regression models
Odds ratios Independ-ent vari-ables in the model
dependent: MMS
dependent: search services
dependent: ring tones
FC 1.042 1.100 0.788 FC, PE 0.903 0.747 0.506* FC, EE 0.974 0.833 0.616 FC, SI 0.846 0.684 0.502* FC, ANX 1.028 0.975 0.771 FC, ATT 1.033 1.037 0.791 FC,PE, EE,SI, ATT
0.973 0.628 0.451*
FC, PE, EE, SI, ANX, ATT
0.991 0.631 0.454*
However, Table 4 shows that facilitating conditions had an indirect effect on the use of ring tones. It was associated with other variables, especially with per-formance expectancy and social influence. 6. Conclusions
In this paper we have studied the factors affecting intention to use mobile devices/services by testing the UTAUT. We found that performance expectancy and effort expectancy could be found as explanations for behavioural intention, but that social influence could not be used as such for explanations. We also found that attitudes towards mobile devices/services influ-ence behavioural intention but that mobile de-vice/service anxiety did not. We could also substanti-ate that behavioural intention will have a positive in-fluence on usage by analysing the actual use of three different mobile services: MMS, search services and icons and ring tones. Furthermore, facilitating condi-tions did not have a link to the use of mobile services. Thus the results we obtained do not support in all cases the original UTAUT hypotheses.
We had to make some reservations on the use of the UTAUT in an earlier study (cf. [3]) that the adop-tion of mobile technology and mobile services is asynchronous, which points to the fact that we should make a distinction between mobile devices and mo-bile services. This requires a modification and exten-sion of the UTAUT, which is an interesting challenge we will undertake in a future paper as we have a lar-ger random sample of consumers available. Another reservation is that the UTAUT was developed to de-scribe and explain organizational adoption of infor-mation technologies but that the mobile technology adoption is more individual, more personalised and
focused on the services made available by the tech-nology.
7. References [1] Amberg, M., Hirschmeier, M., Wehrmann, J., “The Compass Acceptance Model for the Analysis and Evalua-tion of Mobile Services”, International Journal of Mobile Communications, 2004, Vol. 2, No. 3, pp. 248 - 259.
[2] Anckar, B., D’Incau, D., “Value creation in mobile com-merce: Findings from a consumer survey”, Journal of In-formation Technology Theory and Application, 2002, Vol. 4, pp. 43-65.
[3] Carlsson, C., Hyvönen, K., Repo, P., Walden, P., “Asynchronous Adoption Patterns of Mobile Services”, Proceedings of the 38th Hawaii International Conference on System Sciences (HICSS-38), Island of Hawaii, USA, January 3 - 6, 2005.
[4] Cheng, J. Z., Tsyu, J. Z., Yu, H-C. D., “Boom and gloom in the global telecommunications industry”, Tech-nology in Society, 2003, Vol. 25, pp. 65 - 81.
[5] Davis, F., Bagozzi, R., Warshaw, P., “User Acceptance of Computer Technology: A Comparison of Two Theoreti-cal Models”, Management Science, Vol. 37, 1989, No. 8, pp. 982 - 1002.
[6] Eriksson, P., Hyvönen, K., Raijas, A., Tinnilä, M., ”Mo-biilipalvelujen käyttö 2001: asiantuntijoille työtä ja miehille leikkiä? (Mobile service use 2001: Work for professionals and play for men?)”, National Consumer Research Centre, Helsinki, 2001.
[7] Funk, J. L., “The Future of the Mobile Phone Internet: An Analysis of Technological Trajectories and Lead Users in the Japanese Market”, Technology in Society, 2005, Vol. 27, pp. 69 - 83.
[8] Gandal, N., Salant, D., Wawerman, L., “Standards in wireless telephone networks”, Telecommunications Policy, 2003, Vol. 27, pp. 325 - 332.
[9] GSM World, 2004. Available at: http://www.gsmworld.com/index.shtml
[10] Hung, S.-Y., Ku, C.-Y., Chang, C.-M., “Empirical Test of a WAP Adoption Model”, Proceedings of the Fourth International Conference on Electronic Commerce, Hong Kong, China, 2002.
[11] Ishii, K., “Internet Use via Mobile Phone in Japan”, Telecommunications Policy, 2004, Vol. 28, No. 1, pp. 43 - 58.
[12] Kim, J., Lee, I., Lee, Y., Choi, B., “Exploring E-Business Implications of the Mobile Internet: A Cross-National Survey in Hong Kong, Japan and Korea”, Interna-tional Journal of Mobile Communications, 2004, Vol. 2, No.1, pp. 1 - 21.
[13] Knutsen, L. A., “M-service Expectancies and Atti-tudes: Linkages and Effects of First Impressions”, Proceed-
Proceedings of the 39th Hawaii International Conference on System Sciences - 2006
8

ings of the 38th Hawaii International Conference on System Sciences (HICSS-38), Island of Hawaii, USA, January 3 - 6, 2005.
[14] Lehr, W., McKnight, L.W, “Wireless Internet access: 3G vs. WiFi?”, Telecommunications Policy, 2003, Vol. 27, pp. 351 - 370.
[15] McGinty, A., Bona, D.D., “3G Licensing in China: a waiting game”, Computer Law and Security Report, 2004, Vol. 20, No. 6, pp. 480-481.
[16] Mylonopoulos, N. A., Doukidis, G. I., “Introduction to the Special Issue: Mobile Business: Technological Plural-ism, Social Assimilation, and Growth”, International Jour-nal of Electronic Commerce, 2003, Vol. 8, No. 1, pp. 5 - 22.
[17] Nokia Networks, “A History of Third Generation Mo-bile”, Nokia Networks, Espoo, 2003.
[18] Nunnally, J.C., Bernstein, I.H., Psychometric Theory (3rd ed.), McGraw-Hill, New York, 1994. [19] Pagani, M., “Determinants of Adoption of Third Gen-eration Mobile Multimedia Services”, Journal of Interactive Marketing, 2004, Vol. 18, No. 3, pp. 46 - 59.
[20] Repo, P., Hyvönen, K., Pantzar, M., Timonen, P., “Us-ers Inventing Ways to Enjoy New Mobile Services - The Case of Watching Mobile Videos”, Proceedings of the 37th Hawaii International Conference on System Sciences (HICSS-37), Island of Hawaii, USA, January 5 - 8, 2004.
[21] Robins, F., “The Marketing of 3G”, Marketing Intelli-gence & Planning, 2003, Vol. 21, No. 6, pp. 370 - 378.
[22] Samtani, A., Tze, T. L., Hoon, M. L., Gin, J. G. P., “Overcoming Barriers to the Successful Adoption of Mobile Commerce in Singapore”, International Journal of Mobile Communications, 2003, Vol. 1, No. 1-2, pp. 194 - 231. [23] Sarker, S., Wells, D., “Understanding mobile handheld device use and adoption”, Commun. ACM, 2003, Vol. 46, No. 12, pp. 35 - 40.
[24] Srivastava, L., “Japan's Ubiquitous Mobile Information Society”, Info, 2004, Vol. 6, No. 4, pp. 234 - 251.
[25] Steinbock, D., Wireless Horizon, American Manage-ment Association, 2002.
[26] Teo, T.S.H., Pok, S.H., “Adoption of WAP-Enabled Mobile Phones Among Internet Users”, Omega, 2003, Vol. 31, No. 6, pp. 483 - 498.
[27] UMTS Forum, “Mobile Evolution: Shaping the Fu-ture”, 2003. Available at: http://www.umtsforum.org/servlet/dycon/ztumts/umts/Live/en/umts/Resources_Papers_index, Last accessed March 31, 2004.
[28] UMTS Forum, “3G/UMTS Commercial Deploy-ments”, 2005. Available at: http://www.umtsforum.org/servlet/dycon/ztumts/umts/Live/en/umts/Resources_Deployment_index, Last accessed Janu-ary 26, 2005.
[29] Urbaczewski, A., Wells, J., Suprateek, S., & Koivisto, M., “Exploring Cultural Differences as a Means for Under-standing the Global Mobile Internet: A Theoretical Basis and Program of Research”, Proceedings of the 35th Hawaii International Conference on System Sciences, Big Island, Hawaii, Los Alamitos, CA: IEEE Computer Society Press, January 7-10, 2002.
[30] Venkatesh, V., Morris, M.G., Davis, G.B., Davis, F.D., “User Acceptance of Information Technology: Toward a Unified View”, MIS Quarterly, 2003, Vol. 27, No. 3, pp. 425 - 78.
[31] Vesa, J., Mobile Services in the Networked Economy, IRM Press, London, 2005
8. Appendix 1: Items used in forming the constructs of the modified UTAUT
Performance expectancy Using a mobile device is flexible since I may use it anywhere. Using a mobile device is flexible since I may use it anytime. In my opinion, using a mobile device is useful. I am in real time since I carry a mobile device with me that is always connected to the network. I save time by using a mobile device. Using mobile services is flexible since I may use them anywhere. Using mobile services is flexible since I may use them anytime. In my opinion, using mobile services is useful. I save time by using mobile services. I may personalize the mobile services that interest me. Mobile services make the time fly, when there is nothing else to do. Effort expectancy It is ease for me to use a mobile device. In my opinion, using a mobile device is handy. In my opinion, the capacity of a mobile device is gen-erally adequate. In my opinion, the screen size of a mobile device is generally adequate. I have a clear understanding of what mobile services can be used with my mobile device. It is ease for me to download mobile services. It is ease for me to use mobile services. I learn easily to employ new technologies (e.g. GPRS, WAP, Bluetooth). Social influence My friends/family members value my choice of a mobile device.
Proceedings of the 39th Hawaii International Conference on System Sciences - 2006
9

I am trendy while using a mobile device. My friends/family members value the mobile services I use. I am trendy while using mobile services. Facilitating conditions In my opinion, the initial costs do not inhibit the use of a mobile device. In my opinion, the operating costs do not inhibit the use of a mobile device. In my opinion, there are adequately available such mobile devices that suit my purposes. My friends/family members guide me in the use of a mobile device. My work community guides me in the use of a mobile device. I get help from the manufacturer/retailer for the prob-lems relating to the use of a mobile device. In my opinion, the initial costs do not prevent the use of mobile services. In my opinion, the operating costs do not prevent the use of mobile services. My friends/family members guide me in the use of mobile services. My work community guides me in the use of mobile services. I get help from the operator for the problems relating to the use of mobile services. I get help from the service provider for the problems relating to the use of mobile services.
Anxiety In my opinion, there are no health risks involved in using a mobile device (e.g. radiation). In my opinion, there are no security risks involved in using mobile services. Attitude toward using mobile device/service I want my mobile device to be the latest model. I prefer to buy a more expensive mobile device with versatile features instead of a cheaper basic mobile phone. I like to try out the latest mobile technologies. Behavioural intention I use, when possible, mobile services instead of the traditional ones. I am among the first ones to employ new technologies and devices. I want to be among the first ones to try out new mo-bile devices. I aim to use mobile services instead of the traditional ones. Use behaviour 1. Do you use MMS? 2. Do you use search services? 3. Do you use ring tones?
Proceedings of the 39th Hawaii International Conference on System Sciences - 2006
10