Embed Size (px)
Citation preview

Adenosine Monophosphate Forms Ordered Arrays inMultilamellar Lipid Matrices: Insights into Assembly ofNucleic Acid for Primitive LifeLaura Toppozini1,2*, Hannah Dies1, David W. Deamer3*, Maikel C. Rheinstadter1,2,4*
1 Department of Physics and Astronomy, McMaster University, Hamilton, Ontario, Canada, 2 Origins Institute, McMaster University, Hamilton, Ontario, Canada,
3 Department of Biomolecular Engineering, University of California Santa Cruz, Santa Cruz, California, United States of America, 4 Canadian Neutron Beam Centre, National
Research Council Canada, Chalk River Laboratories, Chalk River, Ontario, Canada
Abstract
A fundamental question of biology is how nucleic acids first assembled and then were incorporated into the earliest formsof cellular life 4 billion years ago. The polymerization of nucleotides is a condensation reaction in which phosphodiesterbonds are formed. This reaction cannot occur in aqueous solutions, but guided polymerization in an anhydrous lipidenvironment could promote a non-enzymatic condensation reaction in which oligomers of single stranded nucleic acids aresynthesized. We used X-ray scattering to investigate 59-adenosine monophosphate (AMP) molecules captured in amultilamellar phospholipid matrix composed of dimyristoylphosphatidylcholine. Bragg peaks corresponding to the lateralorganization of the confined AMP molecules were observed. Instead of forming a random array, the AMP molecules arehighly entangled, with the phosphate and ribose groups in close proximity. This structure may facilitate polymerization ofthe nucleotides into RNA-like polymers.
Citation: Toppozini L, Dies H, Deamer DW, Rheinstadter MC (2013) Adenosine Monophosphate Forms Ordered Arrays in Multilamellar Lipid Matrices: Insightsinto Assembly of Nucleic Acid for Primitive Life. PLoS ONE 8(5): e62810. doi:10.1371/journal.pone.0062810
Editor: Heidar-Ali Tajmir-Riahi, University of Quebect at Trois-Rivieres, Canada
Received February 4, 2013; Accepted March 26, 2013; Published May 7, 2013
Copyright: � 2013 Toppozini et al. This is an open-access article distributed under the terms of the Creative Commons Attribution License, which permitsunrestricted use, distribution, and reproduction in any medium, provided the original author and source are credited.
Funding: This research was funded by the Natural Sciences and Engineering Research Council of Canada (NSERC), the National Research Council Canada (NRC),the Canada Foundation for Innovation (CFI) and the Ontario Ministry of Economic Development and Innovation. H.D. is the recipient of an NSERC-UndergraduateStudent Research Award, M.C.R. is the recipient of an Early Researcher Award of the Province of Ontario. L.T. is supported through a QEII scholarship through theOrigins Institute at McMaster. D.W.D. is the recipient of the Lonsdale Research Award that supports research on the origin of life. The funders had no role in studydesign, data collection and analysis, decision to publish, or preparation of the manuscript.
Competing Interests: The authors have declared that no competing interests exist.
* E-mail: [email protected] (LT); [email protected] (DWD); [email protected] (MCR)
Introduction
Prior studies have shown that RNA-like polymers can be
synthesized non-enzymatically from mononucleotides in condi-
tions simulating a prebiotic hydrothermal site undergoing cyclic
fluctuations in hydration [1]. The presence of a phospholipid such
as phosphatidylcholine markedly enhanced the yield of polymeric
products, presumably because the lipid matrix serves to concen-
trate and organize the mononucleotides. The idea of guided
polymerization dates back more than forty years ago [2–4], but
there have been no studies of the arrangement of monomers
within an organizing matrix. The primary aim of the research
reported here was to determine whether in fact mononucleotides
are captured and organized within a multilamellar structure that is
produced when liposomes and solutes undergo dehydration. The
results also represent a critical test of the proposed mechanism by
which mononucleotides polymerize within the matrix. If it cannot
be demonstrated that mononucleotides are captured in layers
between lipid lamellae, the hypothesis would be excluded as a
possible explanation.
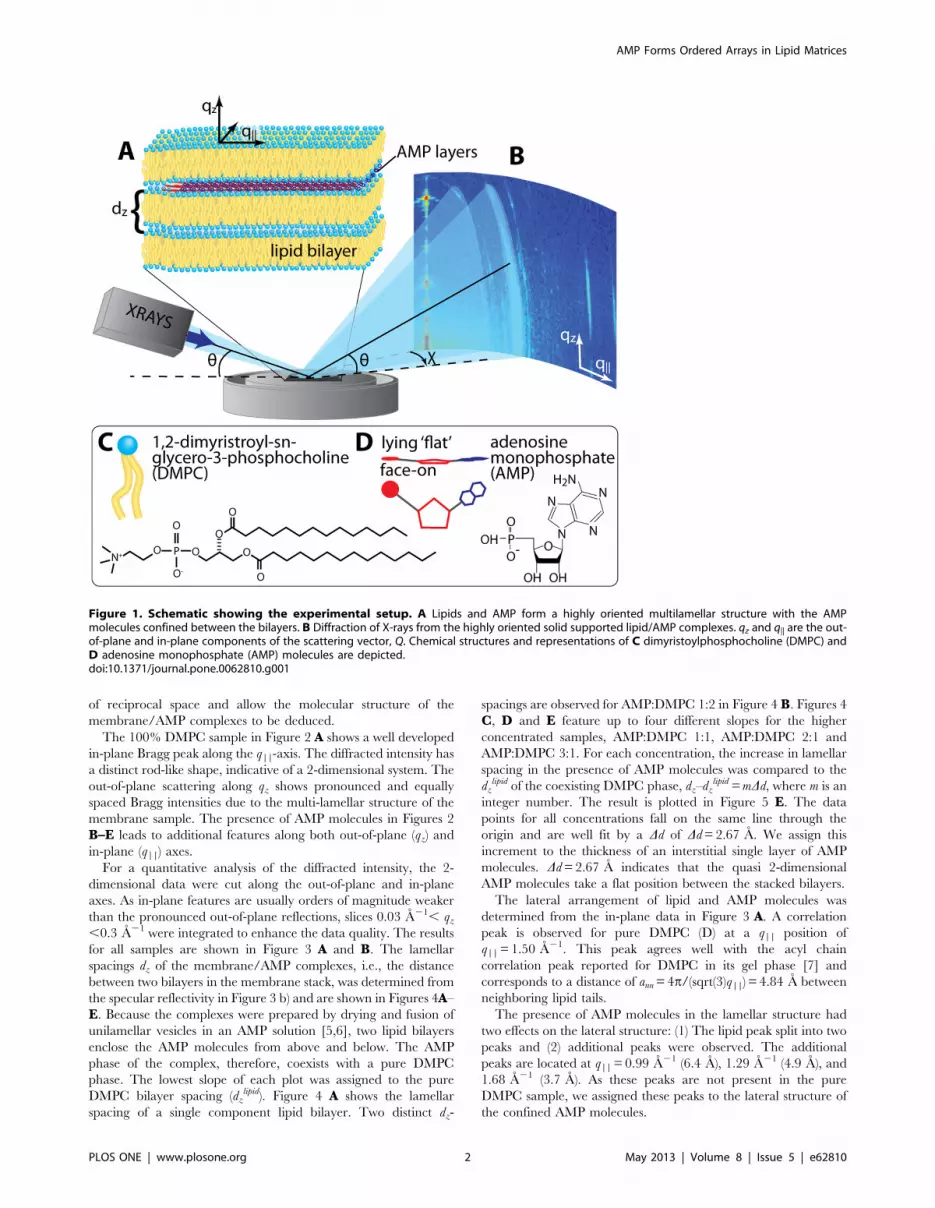
To test whether such organization occurs, we used X-ray
scattering to investigate 59-adenosine monophosphate (AMP)
molecules captured in a multilamellar phospholipid matrix
composed of 1,2-Dimyristoyl-sn-glycero-3-phosphocholine
(DMPC), as shown in Figure 1. We chose AMP for this study
because it was used in the earlier report that demonstrated its
polymerization in a lipid matrix. Guanosine monophosphate
(GMP) was not investigated because of its well known tendency to
form relatively insoluble aggregates. The in-plane and out-of-plane
structure of the bilayer/AMP complexes was determined with sub-
nanometer resolution from these measurements, and Bragg peaks
corresponding to the lateral organization of the confined AMP
molecules were observed. Instead of forming a random array, or a
geometrically favorable herringbone or chevron structure, the
AMP molecules are highly entangled, with the phosphate and
ribose groups in close proximity. This structure may facilitate
polymerization of the nucleotides into RNA-like polymers.
Results
Five different membrane complexes with different concentra-
tions of AMP molecules were studied, as detailed in the Materials
and Methods Section. Figure 2 shows 2-dimensional X-ray
intensity maps for all measured concentrations: A pure DMPC
(D), B AMP:DMPC 1:2, C AMP:DMPC 1:1, D AMP:DMPC 2:1
and E AMP:DMPC 3:1. The ratios are given as molar ratios. As
depicted in Figure 1, the samples were oriented such that the q||axis probed lateral membrane structure and the perpendicular
axis, qz, probed out-of-plane structure of the multilamellar
membrane complexes. The data in Figure 2 cover a large area
PLOS ONE | www.plosone.org 1 May 2013 | Volume 8 | Issue 5 | e62810
of reciprocal space and allow the molecular structure of the
membrane/AMP complexes to be deduced.
The 100% DMPC sample in Figure 2 A shows a well developed
in-plane Bragg peak along the q||-axis. The diffracted intensity has
a distinct rod-like shape, indicative of a 2-dimensional system. The
out-of-plane scattering along qz shows pronounced and equally
spaced Bragg intensities due to the multi-lamellar structure of the
membrane sample. The presence of AMP molecules in Figures 2
B–E leads to additional features along both out-of-plane (qz) and
in-plane (q||) axes.
For a quantitative analysis of the diffracted intensity, the 2-
dimensional data were cut along the out-of-plane and in-plane
axes. As in-plane features are usually orders of magnitude weaker
than the pronounced out-of-plane reflections, slices 0.03 A21, qz,0.3 A21 were integrated to enhance the data quality. The results
for all samples are shown in Figure 3 A and B. The lamellar
spacings dz of the membrane/AMP complexes, i.e., the distance
between two bilayers in the membrane stack, was determined from
the specular reflectivity in Figure 3 b) and are shown in Figures 4A–
E. Because the complexes were prepared by drying and fusion of
unilamellar vesicles in an AMP solution [5,6], two lipid bilayers
enclose the AMP molecules from above and below. The AMP
phase of the complex, therefore, coexists with a pure DMPC
phase. The lowest slope of each plot was assigned to the pure
DMPC bilayer spacing (dzlipid). Figure 4 A shows the lamellar
spacing of a single component lipid bilayer. Two distinct dz-
spacings are observed for AMP:DMPC 1:2 in Figure 4 B. Figures 4
C, D and E feature up to four different slopes for the higher
concentrated samples, AMP:DMPC 1:1, AMP:DMPC 2:1 and
AMP:DMPC 3:1. For each concentration, the increase in lamellar
spacing in the presence of AMP molecules was compared to the
dzlipid of the coexisting DMPC phase, dz–dz
lipid = mDd, where m is an
integer number. The result is plotted in Figure 5 E. The data
points for all concentrations fall on the same line through the
origin and are well fit by a Dd of Dd= 2.67 A. We assign this
increment to the thickness of an interstitial single layer of AMP
molecules. Dd= 2.67 A indicates that the quasi 2-dimensional
AMP molecules take a flat position between the stacked bilayers.
The lateral arrangement of lipid and AMP molecules was
determined from the in-plane data in Figure 3 A. A correlation
peak is observed for pure DMPC (D) at a q|| position of
q|| = 1.50 A21. This peak agrees well with the acyl chain
correlation peak reported for DMPC in its gel phase [7] and
corresponds to a distance of ann = 4p/(sqrt(3)q||) = 4.84 A between
neighboring lipid tails.
The presence of AMP molecules in the lamellar structure had
two effects on the lateral structure: (1) The lipid peak split into two
peaks and (2) additional peaks were observed. The additional
peaks are located at q|| = 0.99 A21 (6.4 A), 1.29 A21 (4.9 A), and
1.68 A21 (3.7 A). As these peaks are not present in the pure
DMPC sample, we assigned these peaks to the lateral structure of
the confined AMP molecules.
Figure 1. Schematic showing the experimental setup. A Lipids and AMP form a highly oriented multilamellar structure with the AMPmolecules confined between the bilayers. B Diffraction of X-rays from the highly oriented solid supported lipid/AMP complexes. qz and q|| are the out-of-plane and in-plane components of the scattering vector, Q. Chemical structures and representations of C dimyristoylphosphocholine (DMPC) andD adenosine monophosphate (AMP) molecules are depicted.doi:10.1371/journal.pone.0062810.g001
AMP Forms Ordered Arrays in Lipid Matrices
PLOS ONE | www.plosone.org 2 May 2013 | Volume 8 | Issue 5 | e62810

Each AMP-containing sample has two central peaks corre-
sponding to an average distance between two lipid acyl tails in the
bilayers of q|| = 1.46 A21 (4.97 A) and 1.51 A21 (4.80 A). The
smaller tail-spacing agrees well with the spacing determined in the
pure DMPC bilayer and was, therefore, assigned to the DMPC
phase of the complex. The second peak at slightly larger nearest
neighbor distances was assigned to the AMP phase, i.e., to the
regions of the bilayers interacting with the AMP molecules. The
distance between two neighboring acyl chains was found to slightly
increase when in contact with AMP molecules from 4.84 A to
4.97 A. This is most likely a sign of an interdigitated structure. The
ratio between the pure lipid phase and the DMPC/AMP phase
was determined from the ratio between the integrated intensities of
the two peaks and is given in Table 1. As expected, this ratio is
close to 1:1 for all samples and basically a result of the way the
lipid/AMP complexes were prepared.
The area per lipid can be determined by assuming that the lipid
tails form a densely packed structure with hexagonal symmetry
(planar group P6). The lipid area is then determined from the
position of the lipid acyl chain correlation peak to
AL = 16p2(sqrt(3)qT2) [8,9].
Discussion
Possible 2-dimensional structures and their corresponding
diffraction patterns are depicted in Figure 5. The occurrence of
a series of correlation peaks is indicative of a well ordered structure
rather than a gas or fluid phase of molecules having positional and
orientational disorder. The two most intuitive planar arrange-
ments of kinked, ’v’-shaped 2-dimensional molecules are the
herringbone (Figure 5 B) and the chevron structure (Figure 5 C).
Both structures are described by a tetragonal planar space group.
However, the calculated diffraction patterns do not agree with the
observed pattern. The diffraction pattern observed in Figure 3 Aindicates a more densely packed, entangled structure. The
molecular arrangement of the AMP molecules, which is compat-
ible with the experimental data, is shown in Figure 5 D: the AMP
Figure 2. Two-dimensional X-ray intensity maps for all measured concentrations: A pure DMPC; B AMP:DMPC 1:2; C AMP:DMPC 1:1; D AMP:DMPC2:1; E AMP:DMPC 3:1. All ratios are molar ratios. qz and q|| are the out-of-plane and in-plane components of the scattering vector, Q.doi:10.1371/journal.pone.0062810.g002
AMP Forms Ordered Arrays in Lipid Matrices
PLOS ONE | www.plosone.org 3 May 2013 | Volume 8 | Issue 5 | e62810

forms 2-dimensional crystalline patches with positional and
orientational ordering of the molecules. The corresponding unit
cell is rectangular with lattice parameters a= 6.25 A and b= 4.8 A.
Calculated and measured patterns show excellent agreement
within the resolution and statistics of this experiment. The absence
of Bragg reflections other than those from the lamellar membrane
structure in the out-of-plane data in Figure 4 indicates that the
AMP crystallites consist of 2-dimensional ordered layers, which are
randomly oriented along the perpendicular z direction.
This 2-dimensional structure of the confined AMP molecules is
significantly different from the structure of crystalline AMP, which
crystallizes in a less densely packed 3-dimensional monoclinic
structure P21 with unit cell dimensions of a= 12.77 A, b= 11.82 A,
c= 4.882 A and b= 92.24u [10].
The AMP pattern in Figure 5 D can also be validated by the
observed increase in lamellar spacings. The ratio between the area
per lipid and the area per AMP molecule from the in-plane data in
Table 1 determines the maximum number of AMP molecules that
can be hosted by one lipid molecule. When multiplied by the total
number of AMP molecules per lipid molecule, the number of
AMP layers can be calculated. The area per lipid in the
AMP:DMPC 3:1 sample for instance is determined to be 42.2
A2; the area per AMP is 30.0 A2. The ratio 30.0/42.2 = 0.71 is
multiplied by the number of AMP molecules between the bilayers
to receive the thickness of the AMP crystallite, 0.71612 = 8.5.
Experimentally, dz-spacings corresponding to 8 and 9 AMP layers
were observed, as listed in Table 1, to be in excellent agreement.
The more spacious herringbone and chevron structures with their
larger areas per AMP molecule would lead to distinctly thicker
AMP structures as the lipids can host fewer AMP molecules, in
disagreement with the experimental observations.
The positions of the in-plane correlation peaks did not change
with increasing AMP concentrations, as indicated by the vertical
lines in Figure 3A. The addition of more AMP molecules in more
concentrated samples increases the thickness of the AMP layers
but did not change the lateral structure. Additional peaks were
observed at the highest concentration of AMP:DMPC 3:1 at
positions of q|| = 1.1 A21, q|| = 1.17 A21 and q|| = 2.2 A21. The
new peaks co-exist with the structural peaks from the entangled
structure in Figure 5 D and can be described by a tetragonal unit
cell with lattice parameters of a= 5.35 A and b= 5.7 A. The
resulting structure is compatible with AMP molecules taking an
upright position between the bilayers, as shown in Figure 6. This
occurs when the thickness of the AMP crystallites becomes larger
than the length of an AMP molecule of ,17.5 A. The
concentration of AMP:DMPC 2:1, therefore, is the maximum
concentration at which the purely 2-dimensional AMP structure in
Figure 5 D can be observed. The lowest concentration for which
this entangled AMP structure was observed in the experiment was
the AMP:DMPC 1:2 ratio. This concentration was found to result
in a single layer of AMP molecules between the membranes, as
listed in Table 1. We can, however, not exclude that small ordered
patches would form at even lower concentrations of AMP.
The pattern in 5 D brings the phosphate group in close
proximity to the 39 position of the ribose. The distance between
the two groups (phosphorus and 39 oxygen) can be estimated from
the molecular structure to be ,2.1 A, approximately the length of
a P-O bond [11]. Thus, the observed pattern of the confined AMP
molecules may favor the formation of RNA-like structures when
chemical binding is induced. When confined between the stacked
membranes, the chemical potential provided by anhydrous
conditions and elevated temperature may be sufficient to drive
the synthesis of phosphodiester bonds between nucleoside
monophosphates to form RNA-like structures [1,12–14]. Further-
more, there is a growing consensus that self-assembled lipid
membranes would have provided the compartments necessary to
maintain systems of polymeric catalysts in the evolutionary
pathway leading to the origin of cellular life [15–17].
ConclusionThere is a consensus that a form of life based primarily on RNA
likely preceded the RNA-DNA-protein world of the ancestral cell.
However, in the absence of enzymes and metabolism there has
been no obvious way for RNA-like molecules to be produced [18]
and then encapsulated in cellular compartments, an essential first
step in the origin of cellular life. Hydrothermal springs have been
proposed as analogues of the prebiotic Earth [4,19]. Cycles of
hydration and dehydration at elevated temperatures can be used
to simulate conditions in the neighborhood of volcanic hydro-
thermal springs. Rajamani et al. [1] showed that such conditions
activate condensation reactions that can polymerize mononucle-
otides organized in a lipid matrix.
The present study adds significant weight to this model, because
the pattern shown in 5 D brings the phosphate group of AMP in
close proximity to the 39 position of the ribose. The distance
between the two groups can be estimated from the molecular
structure to be ,2.1 A. The observed pattern of the confined
AMP molecules may thus favor the formation of RNA-like
polymers when the chemical potential provided by anhydrous
conditions drives the synthesis of phosphodiester bonds between
nucleoside monophosphates.
Materials and Methods
Preparation of the Supported Bilayer-AMP ComplexesMulti lamellar solid-supported lipid bilayers were prepared on
single-side polished silicon wafers by vesicle fusion [20–22].
300 mm thick Si(100)-wafers were pre-cut into 161 cm2 chips
and cleaned by immersing the wafers in an H2O2/sulfuric acid
mixture (volume fraction of 75% concentrated H2SO4, 25% H2O2
Figure 3. Projections of the 2-dimensional data in Figures 2 along theA in-plane and B out-of-plane axis. AMP:DMPC 3:1 (red); AMP:DMPC 2:1(blue) AMP:DMPC 1:1 (magenta); AMP:DMPC 1:2 (cyan); DMPC only(green). The lateral arrangement of the AMP molecules was determinedfrom the in-plane peaks in A. The distance between two bilayers in thestack is determined by the analysis of the out-of-plane reflections in B.doi:10.1371/journal.pone.0062810.g003
AMP Forms Ordered Arrays in Lipid Matrices
PLOS ONE | www.plosone.org 4 May 2013 | Volume 8 | Issue 5 | e62810

at 40uC for ,1 hour). This strongly oxidizing combination
removes all organic contaminants on the surface, but does not
disturb the native silicon oxide layer. The wafers were then rinsed
and stored under ultra pure water with a resistivity of 18.2 MV?cm
before use [23].
Small lipid vesicles (liposomes) were prepared by dispersing 1,2-
dimyristoyl-sn-glycero- 3-phoshatidylcholine (DMPC) in ultra pure
water to produce concentrations of 10 mM and 20 mM. The
milky solution, which initially contained multilamellar vesicles
(MLVs), was sonicated for 15 minutes until the solution became
transparent, indicating that small unilamellar vesicles (SUVs)
formed. The free acid form of 59-adenosine monophosphate
(AMP) powder was added to ultra pure water in 10 mM and
20 mM concentrations and heated in a water bath until
completely dissolved. The AMP solution and DMPC suspension
were then mixed in molar ratios of (AMP:DMPC) 1:2, 1:1, 2:1,
and 3:1.
A silicon chip was placed on a hot-plate and heated to 85uC. A
50 mL aliquot of the final suspension was pipetted onto the wafer,
forming a 5 mm drop that completely dried in ,1 minute. A
control sample of pure DMPC was prepared from the 10 mM
SUV dispersion. Care was taken to maintain the lipid and
nucleotide solution at a temperature of at least 30uC during the
deposition process and storage to keep the bilayers in their fluid
phase above the phase transition temperature (Tm) of 23.9uC [24].
By applying this procedure, small bilayer patches initially form on
the substrate, which eventually undergo a transition into larger,
more uniform layers. The sharp Bragg peaks in the X-ray
experiment (see below) indicated that a highly oriented, multi-
lamellar structure forms on the silicon wafer with a total thickness
of ,10 mm. Because the unilamellar vesicles and AMP solutions
are prepared separately before being mixed, the interior of the
vesicles does not contain any AMP molecules. During drying, the
vesicles first form a concentrated gel on the silicon surface, then
undergo further drying and fusion into multilamellar structures
parallel to the plane of the silicon surface. Previous studies [5,6]
demonstrated that small solutes such as AMP are confined
between alternating bilayers because the empty interiors of the
vesicles exclude solutes during the fusion process. We envision that
a typical structure consists of a thin layer of AMP molecules
separated from the next AMP layer by two lipid bilayers (Figure 1).
Figure 4. Peak order of peaks from the out-of-plane data in Figure 3 vs. sin(h), where h is the Bragg angle. The slope of each line shownis proportional to the distance between membranes in the stack, dz (n= 2dz/l sin(h)). A pure DMPC, B AMP:DMPC 1:2, C AMP:DMPC 1:1, D AMP:DMPC2:1, E AMP:DMPC 3:1. Values for the different dz are given in the Figures.doi:10.1371/journal.pone.0062810.g004
AMP Forms Ordered Arrays in Lipid Matrices
PLOS ONE | www.plosone.org 5 May 2013 | Volume 8 | Issue 5 | e62810

X-ray Scattering ExperimentX-ray scattering data was obtained using the Biological Large
Angle Diffraction Experiment (BLADE) in the Laboratory for
Membrane and Protein Dynamics at McMaster University.
BLADE uses a 9 kW (45 kV, 200 mA) CuK rotating anode at a
wavelength of 1.5418 A. Both source and detector are mounted on
Figure 5. Crystal structure determination. A Schematic of out-of-plane structure of the lipid/AMP complex. The lamellar spacings determined inFigure 4 all fall on a master curve. The thickness of a single AMP layer, Dd, is determined by the slope to Dd = 2.67 A. B-D show proposed AMP in-plane crystal structures and the resulting diffraction pattern (black) compared against the peak locations in our in-plane data (blue). B A herringbonestructure would be geometrically favorable due to the shape of AMP. The diffraction pattern, however, does not agree with our experimental data. CThe chevron pattern is also a favorable structure for the packing of ’v’ shaped molecules, however the diffraction pattern that would be producedfrom this structure is not consistent with the experiential data. D The tetragonal 2-dimensional unit cell with lattice parameters of a = 6.25 A andb = 4.8 A gives the most plausible structure of the AMP molecules. E Molecular representation of the crystalline AMP between the stacked DMPCbilayers; in-plane representation below. The molecular coordinates for the DMPC bilayer were taken from [29]. Molecular structure files of thestructures in D and E are provided in Structure Files S1 and S2.doi:10.1371/journal.pone.0062810.g005
Table 1. Molar concentrations, number of AMP molecules associated with each lipid, and number of AMP molecules in the inter-lamellar space between two lipids (assuming that approximately every second bilayer excludes AMP molecules).
AMP:DMPC AMP/lipidAMP/lipids inter-lamellar Lipid/AMP Fraction
Area per lipidmolecule (A2)
# of layerscalculated
# of layersobserved
0:1 0 0 – 40.8 – –
1:2 1 2 0.76:1 40.0 1.4 1
1:1 2 4 0.67:1 40.0 2.8 1,2
2:1 4 8 0.89:1 40.0 5.9 2,4,8
3:1 6 12 0.78:1 40.0 8.5 8,9
The Lipid/AMP fraction refers to the ratio of lipid correlation peaks in Figure 3 A, normalized to the pure lipid peak. The positions of these lipid peaks were used tocalculate the area per lipid molecule, which increased from 40.0 to 42.8 A with AMP present. The area per AMP was calculated by multiplying the unit cell parameters ofthe tetragonal unit cell to 30.0 A. The number of layers between a bilayer as obtained from calculation and from the data in Figure 4 is also included.doi:10.1371/journal.pone.0062810.t001
AMP Forms Ordered Arrays in Lipid Matrices
PLOS ONE | www.plosone.org 6 May 2013 | Volume 8 | Issue 5 | e62810

movable arms such that the membranes stay horizontal during the
measurements. Focusing multi-layer optics provides a high
intensity parallel beam with monochromatic X-ray intensities up
to 1010 counts/(mm26s). This beam geometry provides optimal
illumination of the solid supported membrane samples to
maximize the scattering signal. A sketch of the scattering geometry
is shown in Figure 1. Note that there is no risk of sample damage
using this in-house technique because of the large beam size and
relatively low intensity of the X-ray beam as compared to
synchrotron sources.
By using highly oriented, solid-supported lipid bilayers, the in-
plane (q||) and out-of-plane (qz) structure of the membranes was
determined. From the high-resolution X-ray diffraction experi-
ments we determine the molecular structure of the membranes in
two different ways: (1) the out-of-plane X-ray data is used to
determine the structure perpendicular to the membranes and (2)
the lateral organization of the molecular components in the plane
of the membrane, as sketched in Figure 1. The result of such an X-
ray experiment is a 2-dimensional intensity map of a large area
(0.03 A21, qz ,1.2 A21 and 0.003 A21, q|| ,3.1 A21) of the
reciprocal space, as sketched in Figure 1. All scans were measured
at 20uC and 50% hydration, in the gel (Lb) phase of the DMPC
bilayers [25,26]. Structural features are more pronounced in this
state as fluctuations, which lead to attenuation and smearing of
Bragg peaks, are suppressed. The sample was mounted in a so-
called humidity chamber during the measurements in a saturated
Mg(NO3)2 salt solution, which provided a relative humidity of
52.9%. The temperature was controlled using a circulating bath
controller to 20uC with a stability of 0.1uC.
The lamellar spacing of the membrane AMP complexes was
determined from the specular reflectivity. Figure 3 B shows out-of-
plane data and fits for the five samples. Up to 24 Bragg peaks
could be identified for a given sample and assigned to different dz-
spacings and phases. The peaks were well fit by Gaussian peak
profiles. To assign the peaks to different phases, Braggs law can be
re-written as n = 2dz/l sin(h). By plotting the order of the different
Bragg reflections against the sine of the Bragg angles, n vs. sin(h(n)),peaks which belong to the same dz-spacing fall on a straight line
through the origin, whose slope is proportional to dz. The
corresponding data are shown in Figures 4 A–E; up to a peak
order n of 12 was observed. Not all diffraction orders are
necessarily observed for the different dz-spacings as their scattering
intensity depends on the form factor of the bilayers and oscillates
between zero and maximum intensity as a function of qz.
We note that this experiment cannot be compared to protein
crystallography, where atomic resolution protein structure is
determined from protein crystals. The AMP molecules in our
experiment are embedded in a lamellar membrane complex. The
corresponding structure is inherently disordered, which leads to a
strong suppression of higher order Bragg peaks in the experimen-
tal data. The organization of DNA molecules in liposomes/DNA
complexes was reported using a similar technique [27]. The
atomic structure of the AMP molecules was taken from [10]. The
molecule was found to be very flexible, especially in the rotation of
the adenine group such that the AMP molecules in the
confinement of the lipids may take a slightly different atomic
structure than that determined from crystalline AMP [28].
Supporting Information
Structure File S1 PDB structure files of the molecular structure
in Figure 5 D.(PDB)
Structure File S2 PDB structure files of the molecular structure
in Figure 5 E.(PDB)
Structure File S3 PDB structure files of the molecular structure
in Figure 6.
(PDB)
Author Contributions
Conceived and designed the experiments: LT DWD MCR. Performed the
experiments: LT HD MCR. Analyzed the data: LT HD MCR.
Contributed reagents/materials/analysis tools: LT DWD HD. Wrote the
paper: LT DWD MCR.
References
1. Rajamani S, Vlassov A, Benner S, Coombs A, Olasagasti F, et al. (2008) Lipid-assisted synthesis of RNA-like polymers from mononucleotides. Orig. Life Evol.
Biospheres 38: 57–74.
2. Blumstein A, Kitagawa N, Blumstein R (1971) Polymerization of p-methacry-
loyloxy benzoic acid within liquid crystalline media. Mol. Cryst. Liq. Cryst. 12:
215–227.
3. Barrall EM, Johnson JF (1979) A review of the status of polymerization in
thermotropic liquid crystal media and liquid crystalline monomers. J. Macromol.Sci., Part C 17: 137–170.
4. Deamer D (2012) Liquid-crystalline nanostructures: organizing matrices for non-enzymatic nucleic acid polymerization. Chem. Soc. Rev. 41: 5375–5379.
5. Shew R, Deamer D (1985) A novel method for encapsulating macromolecules in
liposomes. Biochim. Biophys. Acta, Biomembr. 816: 1–8.
6. Deamer DW, Barchfeld GL (1982) Encapsulation of macromolecules by lipid
vesicles under simulated prebiotic conditions. J. Mol. Evol. 18: 203–206.
7. Tristram-Nagle S, Liu Y, Legleiter J, Nagle JF (2002) Structure of gel phase
DMPC determined by X-ray diffraction. Biophys. J. 83: 3324–3335.
8. Mills TT, Toombes GES, Tristram-Nagle S, Smilgies D-M, Feigenson GW, et
al. (2008) Order parameters and areas in fluid-phase oriented lipid membranes
using wide angle X-ray scattering. Biophys. J. 95: 669–681.
9. Barrett MA, Zheng S, Roshankar G, Alsop RJ, Belanger RK, et al. (2012)
Interaction of aspirin (acetylsalicylic acid) with lipid membranes. PLoS ONE 7,
e34357.
10. Kraut J, Jansen L (1963) Refinement of the crystal structure of Adenosine-59-
Phosphate. Acta Cryst. 16: 79–88.
Figure 6. Structure in A:D 3:1 bilayers. In the 3:1 fit in Figure 3 A,the planar structure (as in all other AMP/DMPC samples) was found tocoexist with another structure. The new crystal structure is compatiblewith AMP molecules oriented perpendicular to the existing structure. AThe coexistence of two crystal structures as viewed in the plane of thebilayers. A unit cell is drawn for clarity. B Crystal structures as viewedfrom out of the plane of the lipid bilayers. A molecular structure file ofthe structures is provided in Structure File S3.doi:10.1371/journal.pone.0062810.g006
AMP Forms Ordered Arrays in Lipid Matrices
PLOS ONE | www.plosone.org 7 May 2013 | Volume 8 | Issue 5 | e62810
11. Bartell LS, Su LS, Yow H (1970) Lengths of phosphorus-oxygen and sulfur-
oxygen bonds. An extended Huckel molecular orbital examination ofCruickshank’s dp - pp picture. Inorg. Chem. 9: 1903–1912.
12. Lohrman R, Orgel LE (1973) Prebiotic activation processes. Nature 244: 418–
420.13. Verlander MS, Lohrmann R, Orgel LE (1973) Catalysts for the self-
polymerization of adenosine cyclic 29, 39-phosphate. J. Mol. Evol. 2: 303–313.14. Usher DA, McHale AH (1976) Nonenzymic joining of oligoadenylates on a
polyuridylic acid template. Science 192: 53–54.
15. Szostak J, Bartel D, Luisi PL (2001) Synthesizing life. Nature 409: 387–390.16. Mansy SS, Schrum JP, Krishnamurthy M, Tobe S, Treco DA, et al. (2008)
Template-directed synthesis of a genetic polymer in a model protocell. Nature454: 122–125.
17. Kuruma Y, Stano P, Ueda T, Luisi PL (2009) A synthetic biology approach tothe construction of membrane proteins in semi-synthetic minimal cells. Biochim.
Biophys. Acta, Biomembr. 1788: 567–574.
18. Malathi R, Johnson IM (2001) From RNA world to protein: an eagle’s eye viewof the role of guanosine in tracing the antiquity of the intron. J Biomol Struct
Dyn. Apr;18(5): 709–12.19. Mulkidjanian AY, Bychkov AY, Dibrova DV, Galperin MY, Koonin EV (2012)
Origin of first cells at terrestrial, anoxic geothermal fields. Proc. Natl. Acad. Sci.
USA 109: E821–E830.20. Watts T, Brian A, Kappler J, Marrack P, McConnell H (1984) Antigen
presentation by supported planar membranes containing affinity-purified I-Ad.Proc. Natl. Acad. Sci. U.S.A. 81: 7564–7568.
21. Richter R, Mukhopadhyay A, Brisson A (2003) Pathways of lipid vesicledeposition on solid surfaces: A Combined QCM-D and AFM Study. Biophys. J.
85: 3035–3047.
22. Oliynyk V, Kaatze U, Heimburg T (2007) Defect formation of lytic peptides in
lipid membranes and their influence on the thermodynamic properties of the
pore environment. Biochim. Biophys. Acta 1768: 236–245.
23. Tidswell I, Ocko B, Pershan P, Wasserman S, Whitesides G, et al. (1990) X-ray
specular reflection studies of silicon coated by organic monolayers (alkylsilox-
anes). Phys. Rev. B 41: 1111–1128.
24. Mabrey S, Sturtevant JM (1976) Investigation of phase transitions of lipids and
lipid mixtures by sensitivity differential scanning calorimetry. Proc. Natl. Acad.
Sci. U.S.A. 73: 3862–3866.
25. Nomura K, Lintuluoto M, Morigaki K (2011) Hydration and temperature
dependence of 13C and 1H NMR spectra of the DMPC phospholipid membrane
and complete resonance assignment of its crystalline state. J. Phys. Chem. B 115:
14991–15001.
26. de Meyer FJ-M, Benjamini A, Rodgers JM, Misteli Y, Smit B (2010) Molecular
simulation of the DMPC-cholesterol phase diagram. J. Phys. Chem. B 114:
10451–10461.
27. Radler J, Koltover I, Salditt T, Safinya C (1997) Structure of DNA-cationic
liposome complexes: DNA intercalation in multi-lamellar membranes in distinct
interhelical packing regimes. Science 275: 810–814.
28. Neidle S, Kuhlbrandt W, Achari A (1976) The crystal structure of an
orthorhombic form of Adenosine-5’-monophosphate. Acta Cryst. 32: 1850–
1855.
29. de Groot BL, Tieleman DP, Pohl P, Grubmuller H (2002) Water permeation
through gramicidin A: desformylation and the double helix: a molecular
dynamics study. Biophys J. 82(6): 2934–42.
AMP Forms Ordered Arrays in Lipid Matrices
PLOS ONE | www.plosone.org 8 May 2013 | Volume 8 | Issue 5 | e62810


